

Compact Muon Solenoid
LHC, CERN
| CMS-B2G-17-011 ; CERN-EP-2018-069 | ||
| Search for vector-like T and B quark pairs in final states with leptons at $\sqrt{s} = $ 13 TeV | ||
| CMS Collaboration | ||
| 13 May 2018 | ||
| JHEP 08 (2018) 177 | ||
| Abstract: A search is presented for pair production of heavy vector-like T and B quarks in proton-proton collisions at $\sqrt{s} = $ 13 TeV. The data sample corresponds to an integrated luminosity of 35.9 fb$^{-1}$, collected with the CMS detector at the CERN LHC in 2016. Pair production of T quarks would result in a wide range of final states, since vector-like T quarks of charge 2$e$/3 are predicted to decay to bW, tZ, and tH. Likewise, vector-like B quarks are predicted to decay to tW, bZ, and bH. Three channels are considered, corresponding to final states with a single lepton, two leptons with the same sign of the electric charge, or at least three leptons. The results exclude T quarks with masses below 1140-1300 GeV and B quarks with masses below 910-1240 GeV for various branching fraction combinations, extending the reach of previous CMS searches by 200-600 GeV. These are the strongest exclusion limits to date for T quarks with a branching fraction to tZ greater than ${\approx}$ 0.5 and for B quarks with a branching fraction to tW less than ${\approx}$ 0.6. | ||
| Links: e-print arXiv:1805.04758 [hep-ex] (PDF) ; CDS record ; inSPIRE record ; CADI line (restricted) ; | ||
| Figures | |
png pdf |
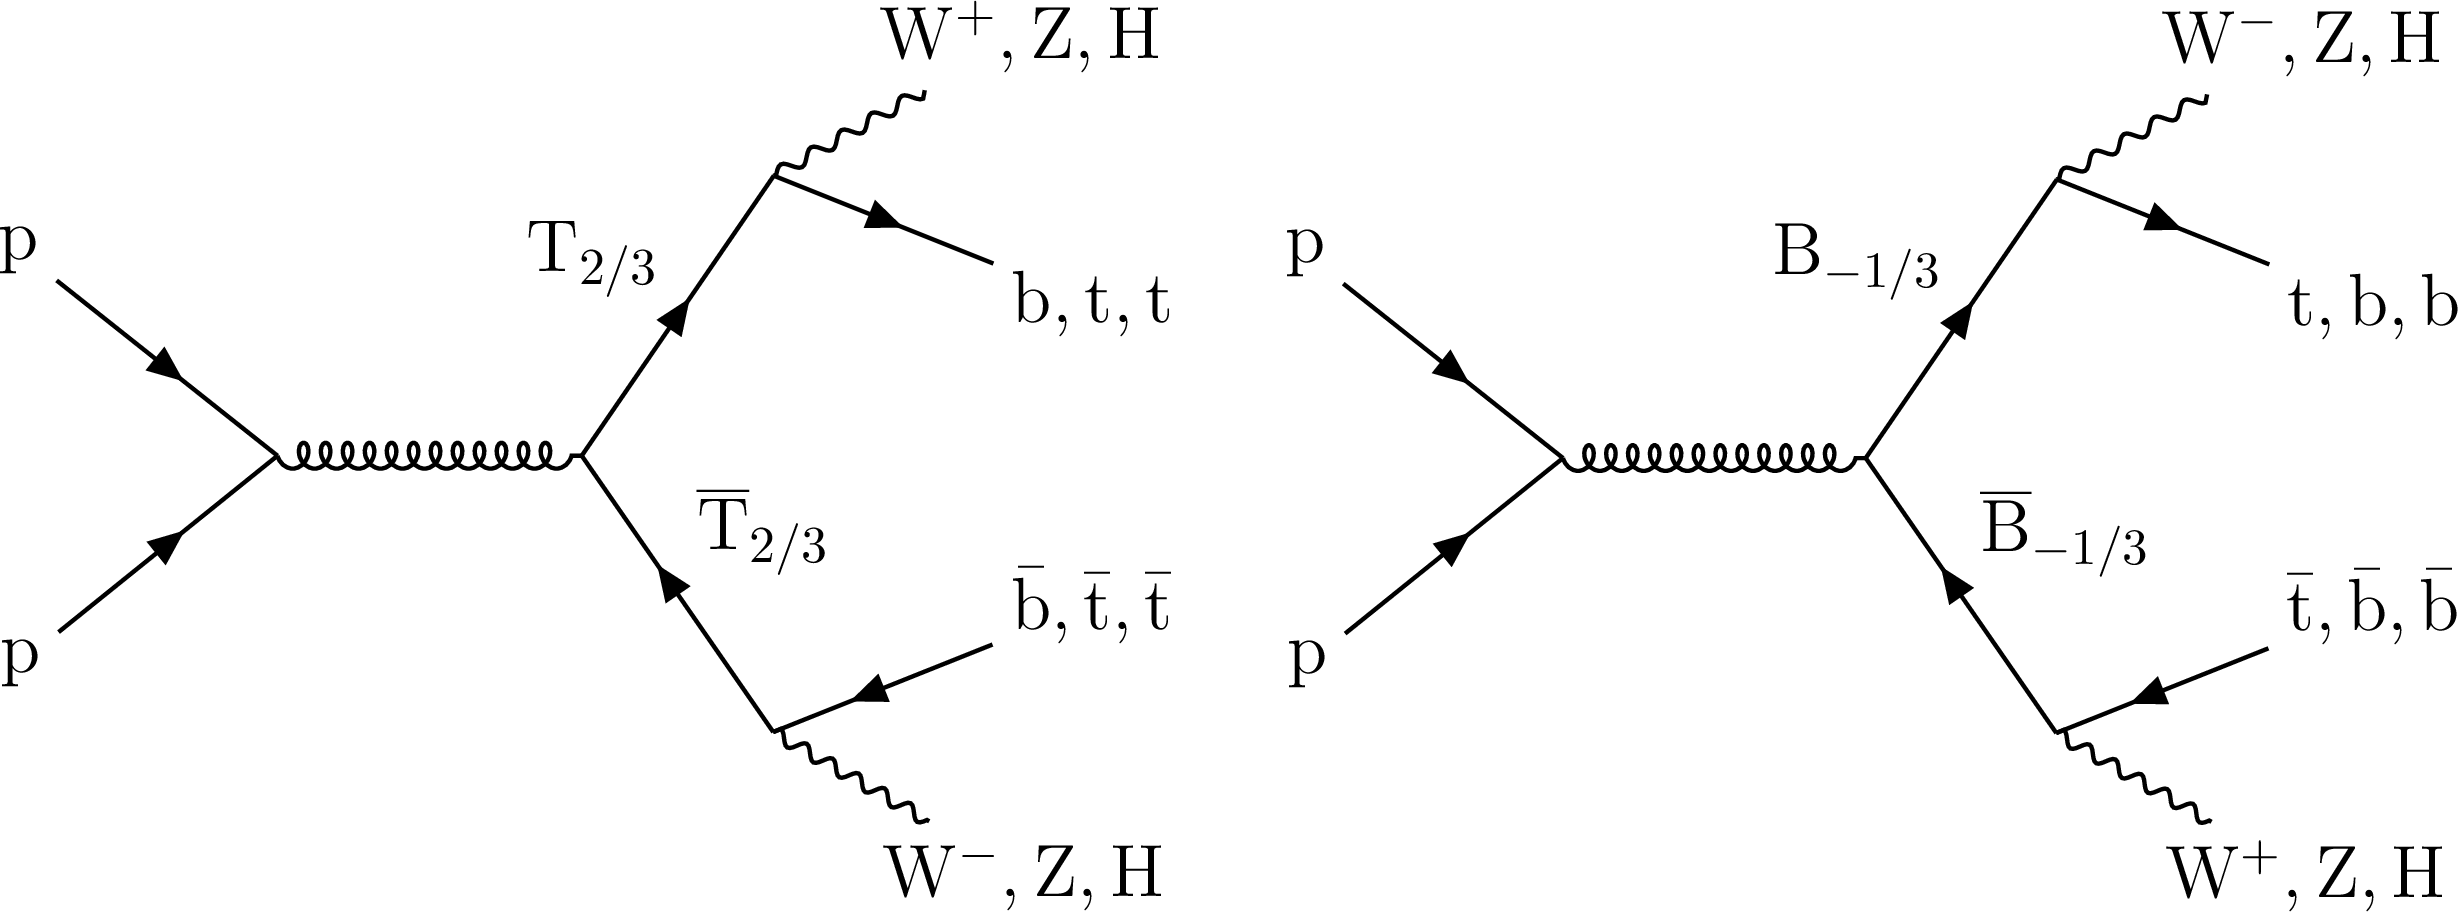
Figure 1:
Leading order Feynman diagrams showing pair production and decays of $ {{\mathrm {T}} {\overline {\mathrm {T}}}} $ (left) and $ {{\mathrm {B}} {\overline {\mathrm {B}}}} $ (right). |

png pdf |
Figure 1-a:
Leading order Feynman diagrams showing pair production and decays of $ {{\mathrm {T}} {\overline {\mathrm {T}}}} $. |
png pdf |
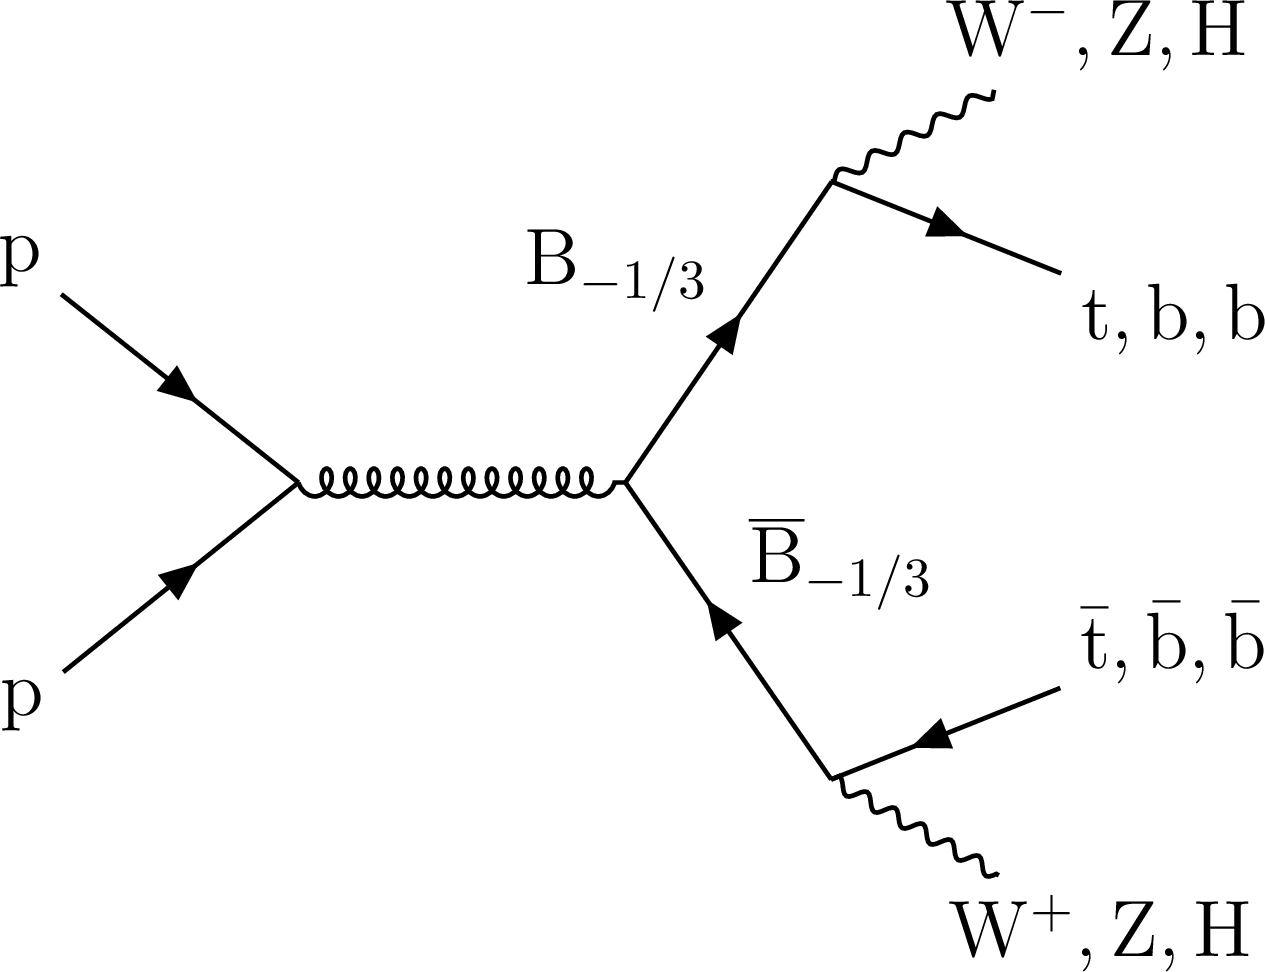
Figure 1-b:
Leading order Feynman diagrams showing pair production and decays of $ {{\mathrm {B}} {\overline {\mathrm {B}}}} $. |

png pdf |
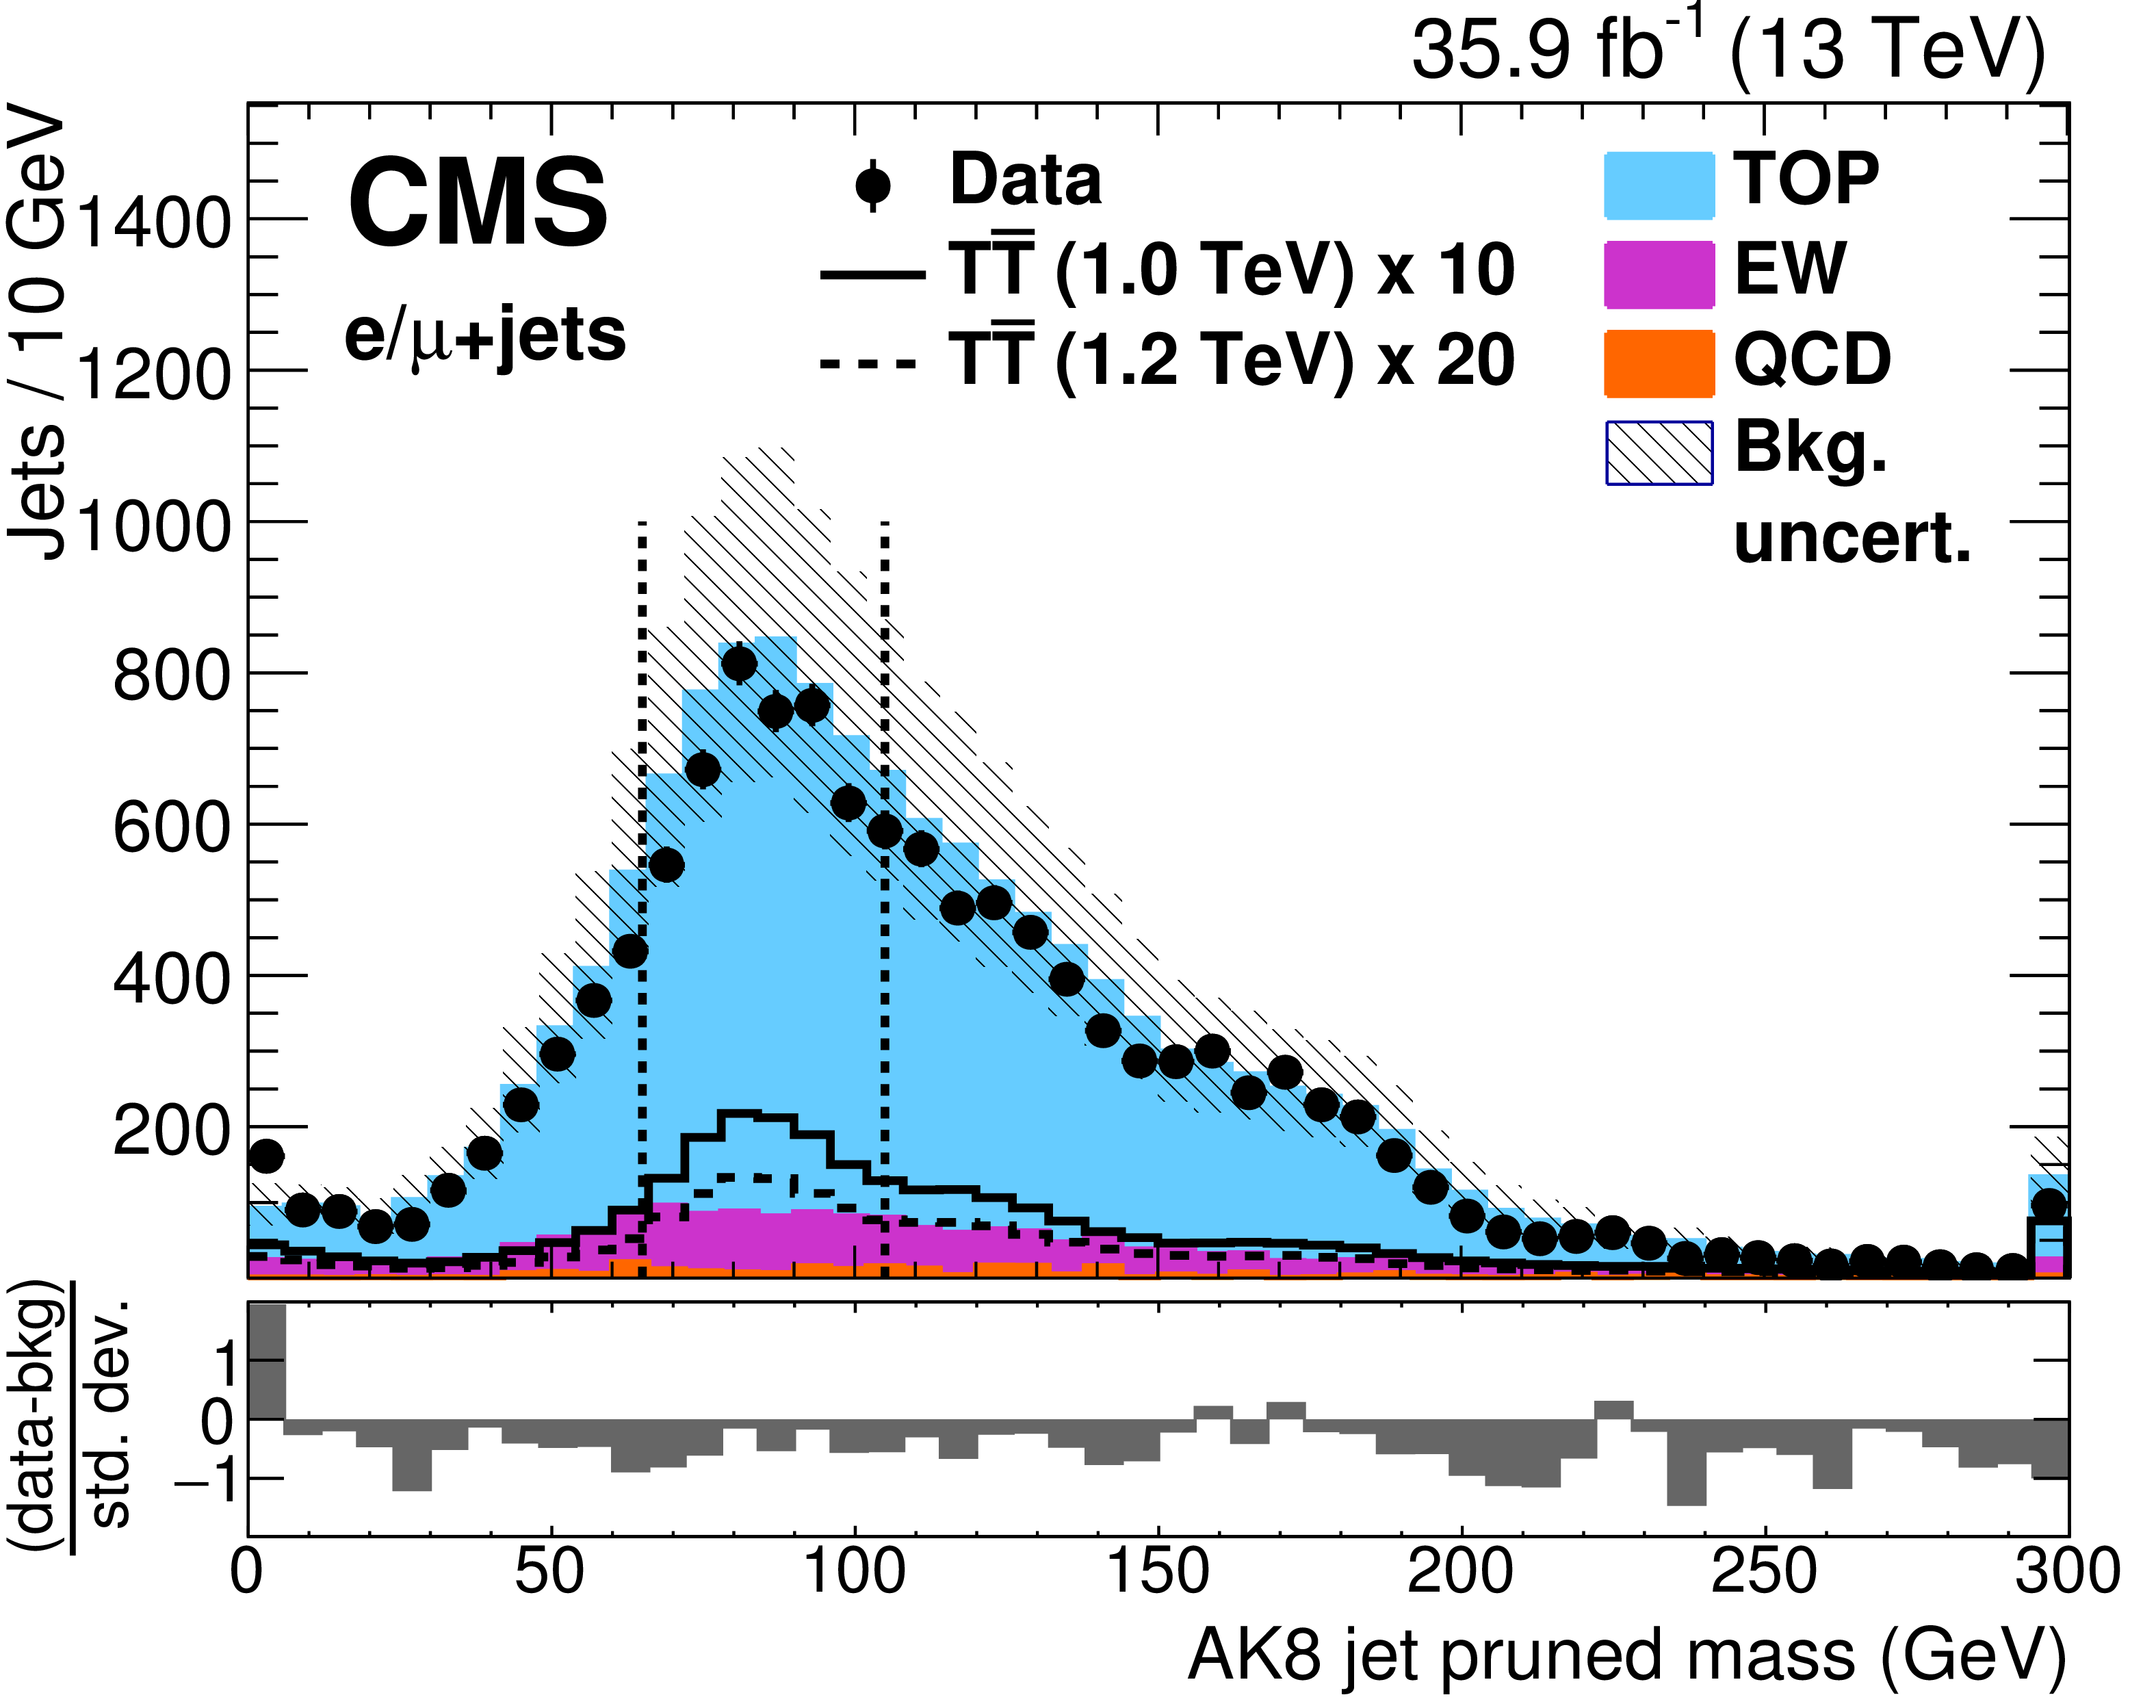
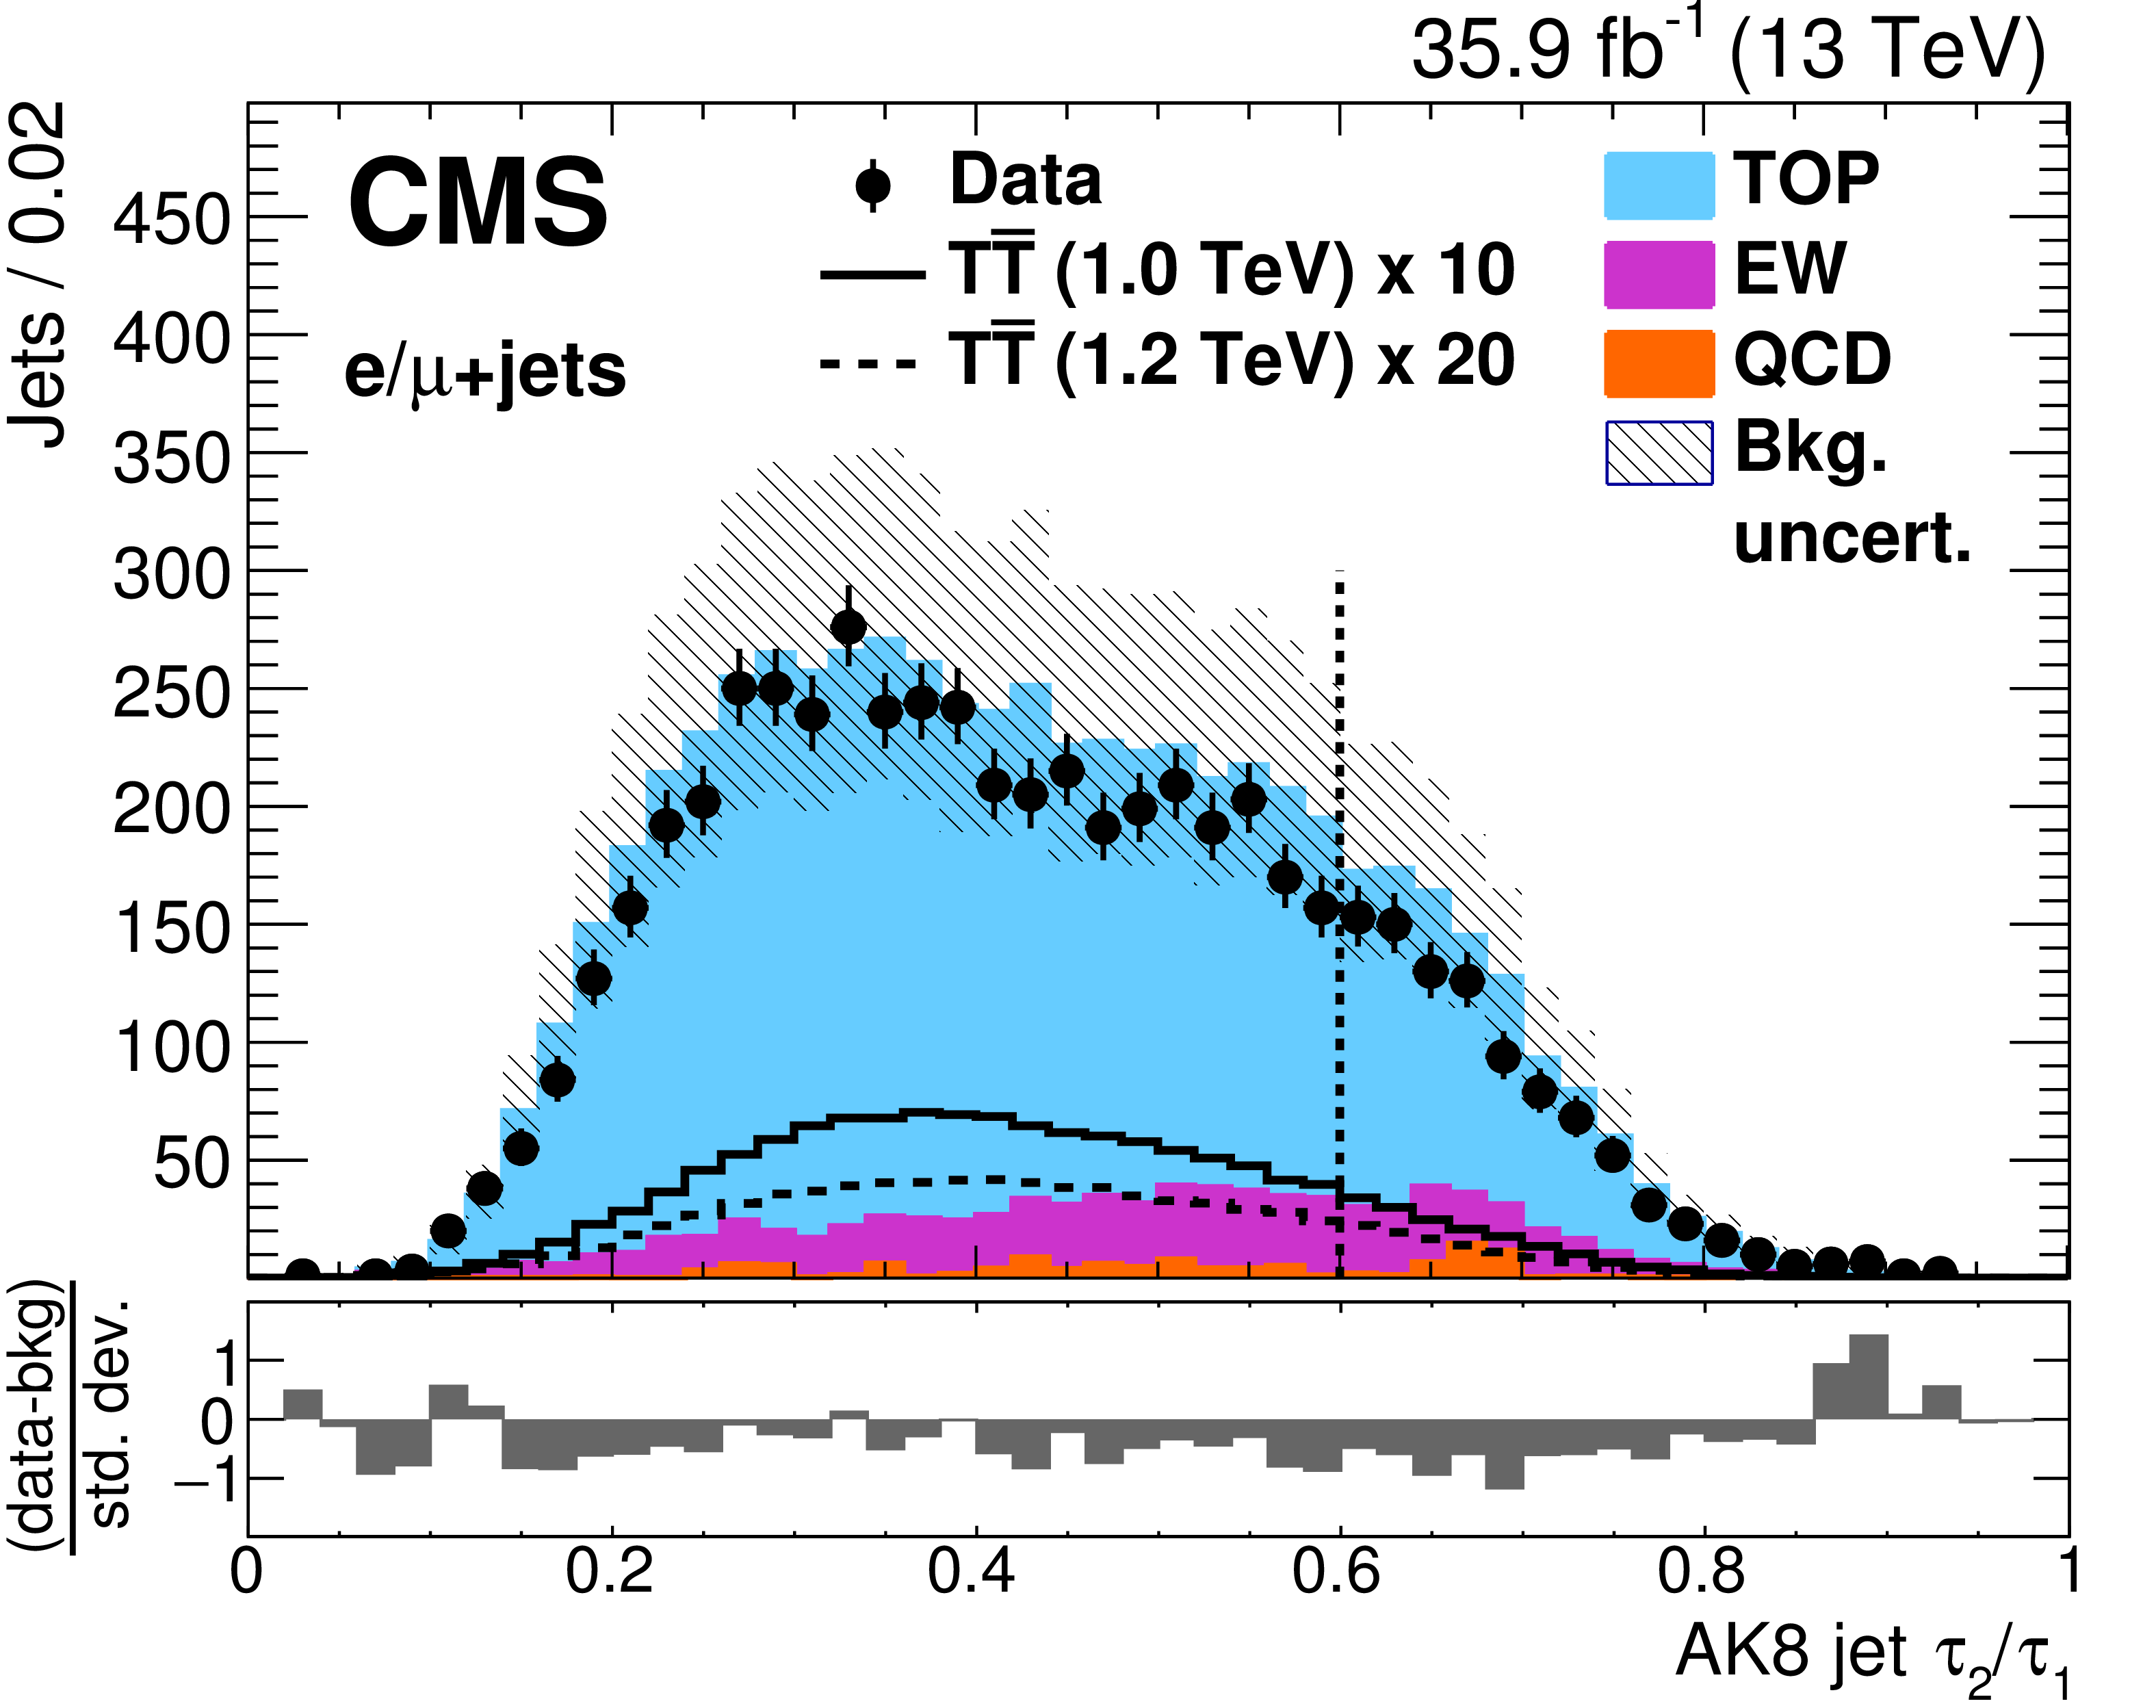
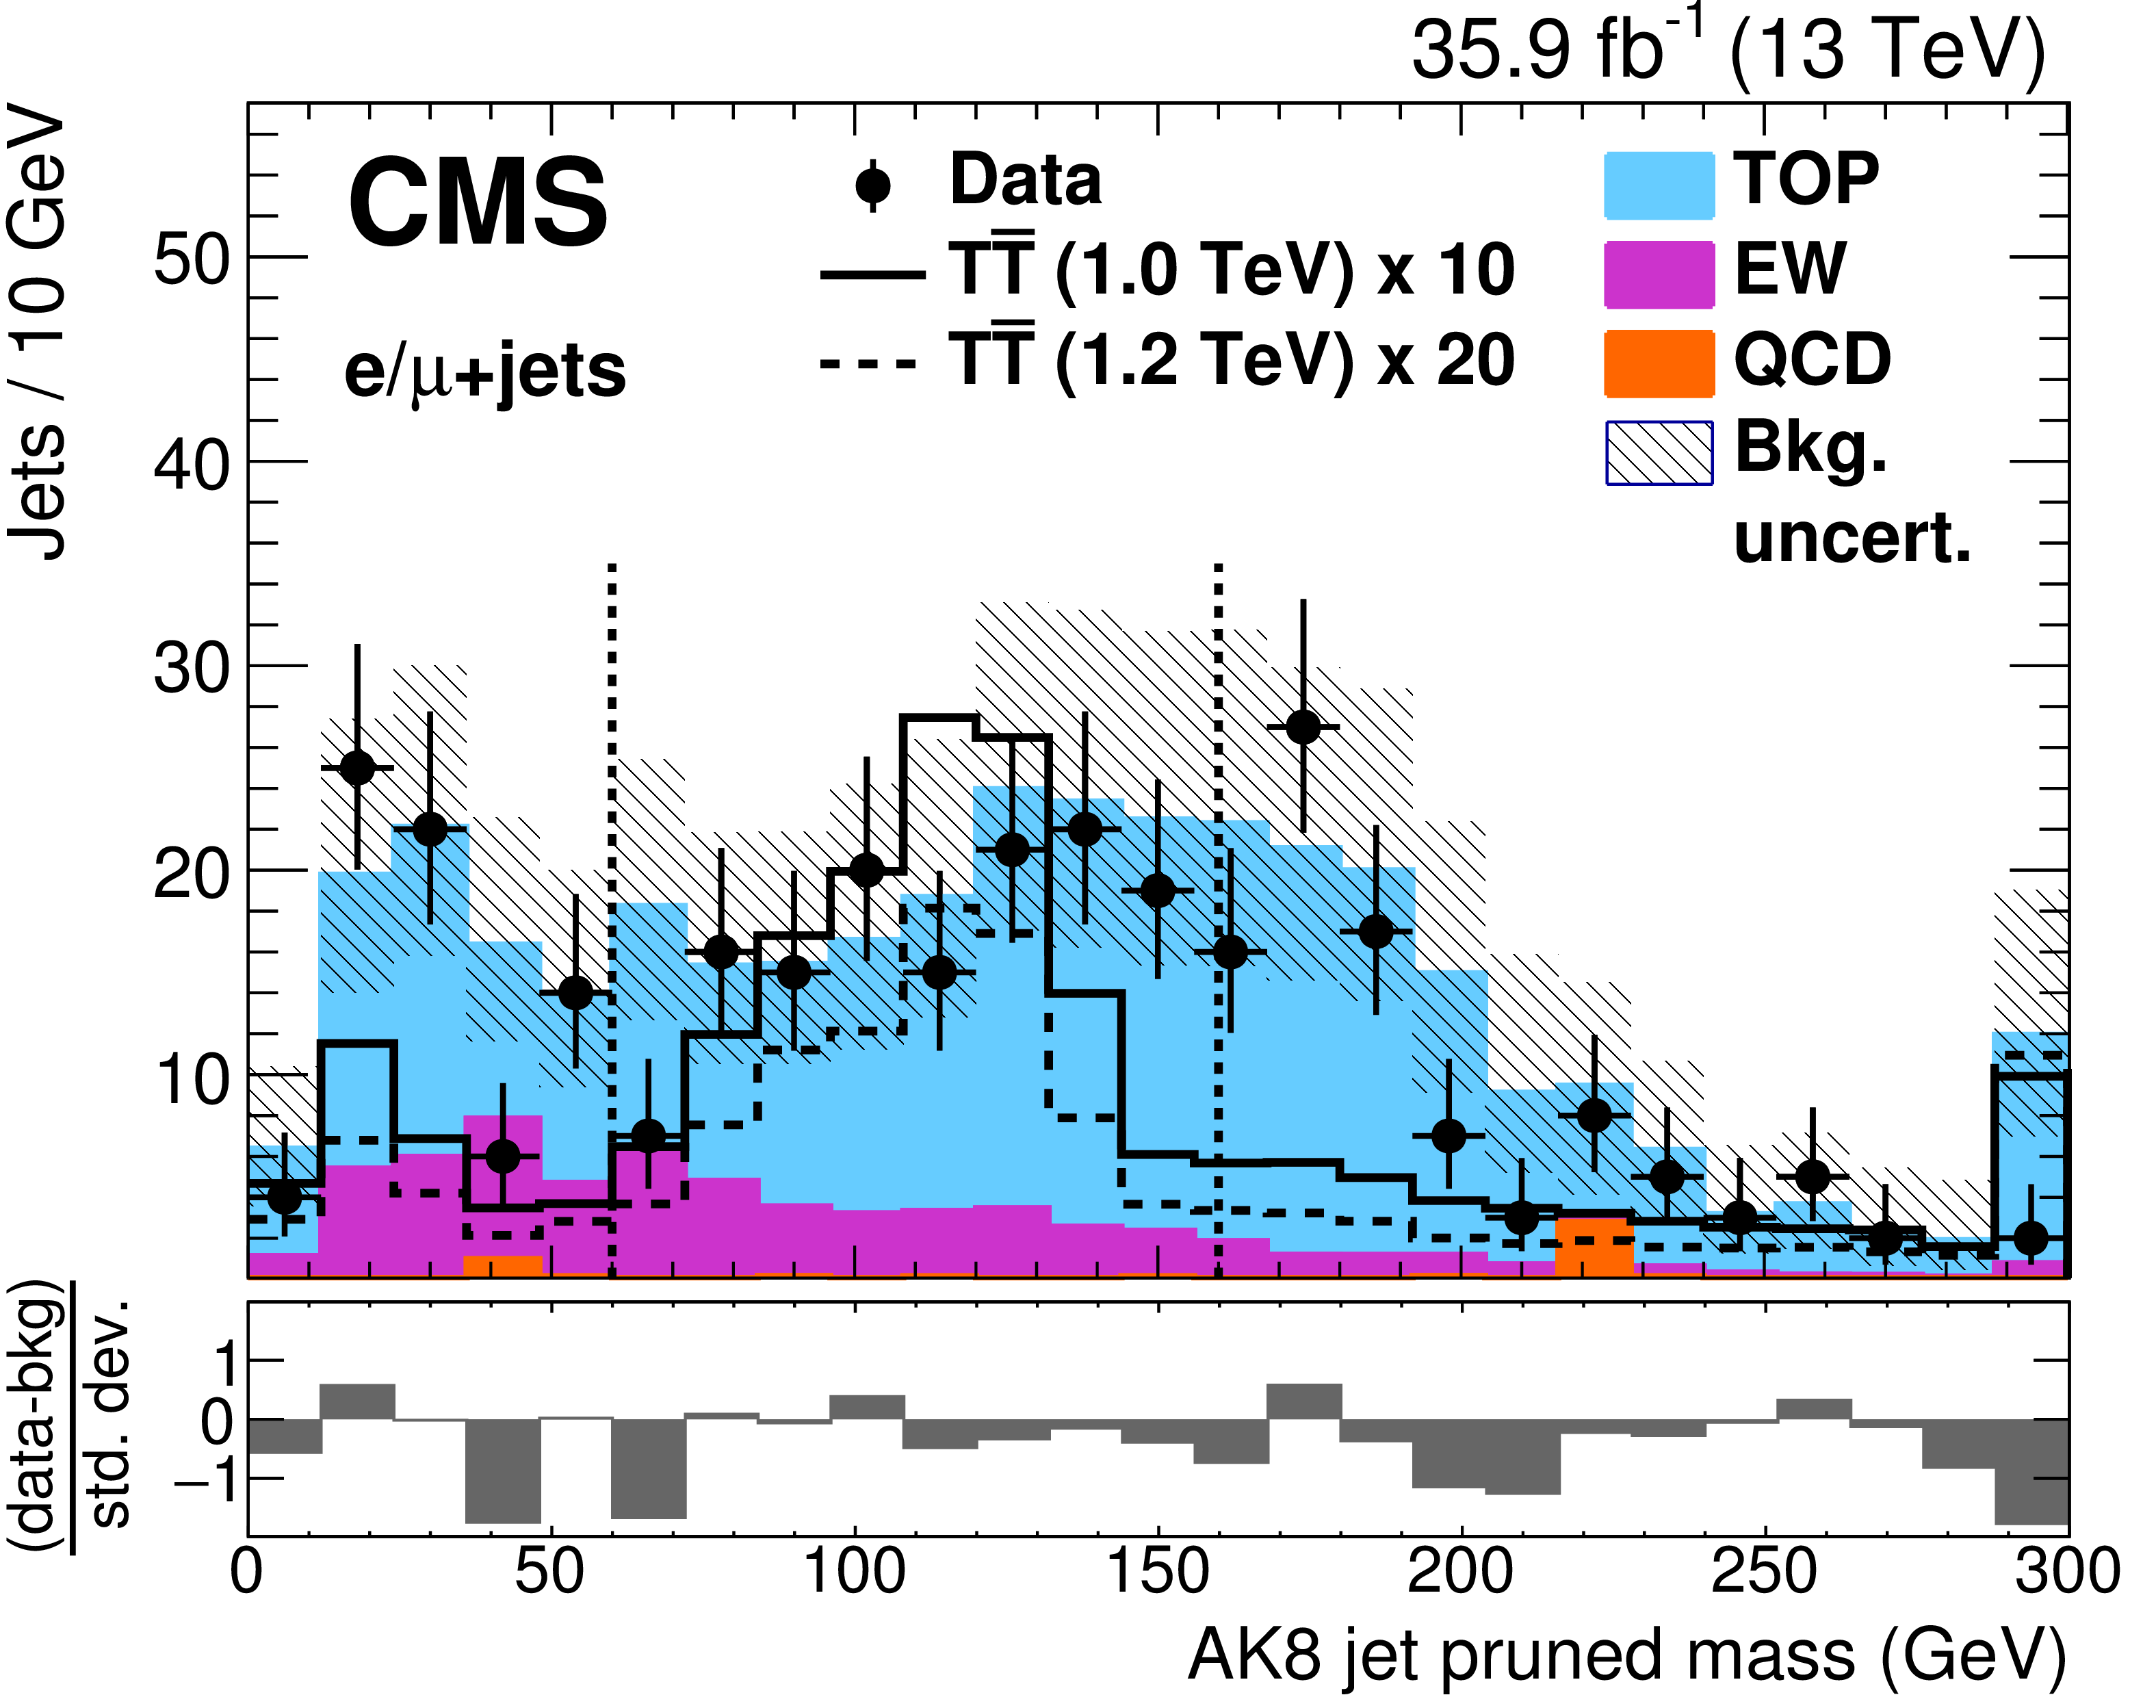
Figure 2:
Distributions of W and H tagging input variables after all selection requirements: pruned mass in AK8 jets with $\tau _2/\tau _1 < $ 0.6 (upper left), $N$-subjettiness $\tau _2/\tau _1$ ratio in AK8 jets with pruned mass between 65-105 GeV (upper right), pruned mass in AK8 jets with two b-tagged subjets (lower left), and number of b-tagged subjets in AK8 jets with pruned mass in the range 60-160 GeV (lower right). Vertical dashed lines mark the selection windows for each distribution. The black points are the data and the filled histograms show the simulated background distributions, grouped into categories as described in Section 3. The expected signal is shown by solid and dotted lines for T quark masses of 1.0 and 1.2 TeV. The final bin includes overflow events. Uncertainties, indicated by the hatched area, include both statistical and systematic components. The lower panel shows the difference between data and background divided by the total uncertainty. |
png pdf |
Figure 2-a:
Distributions of W and H tagging input variables after all selection requirements: pruned mass in AK8 jets with $\tau _2/\tau _1 < $ 0.6. Vertical dashed lines mark the selection windows for each distribution. The black points are the data and the filled histograms show the simulated background distributions, grouped into categories as described in Section 3. The expected signal is shown by solid and dotted lines for T quark masses of 1.0 and 1.2 TeV. The final bin includes overflow events. Uncertainties, indicated by the hatched area, include both statistical and systematic components. The lower panel shows the difference between data and background divided by the total uncertainty. |
png pdf |
Figure 2-b:
Distributions of W and H tagging input variables after all selection requirements: pruned mass in AK8 jets with $N$-subjettiness $\tau _2/\tau _1$ ratio in AK8 jets with pruned mass between 65-105 GeV. Vertical dashed lines mark the selection windows for each distribution. The black points are the data and the filled histograms show the simulated background distributions, grouped into categories as described in Section 3. The expected signal is shown by solid and dotted lines for T quark masses of 1.0 and 1.2 TeV. The final bin includes overflow events. Uncertainties, indicated by the hatched area, include both statistical and systematic components. The lower panel shows the difference between data and background divided by the total uncertainty. |
png pdf |
Figure 2-c:
Distributions of W and H tagging input variables after all selection requirements: pruned mass in AK8 jets with pruned mass in AK8 jets with two b-tagged subjets.Vertical dashed lines mark the selection windows for each distribution. The black points are the data and the filled histograms show the simulated background distributions, grouped into categories as described in Section 3. The expected signal is shown by solid and dotted lines for T quark masses of 1.0 and 1.2 TeV. The final bin includes overflow events. Uncertainties, indicated by the hatched area, include both statistical and systematic components. The lower panel shows the difference between data and background divided by the total uncertainty. |
png pdf |
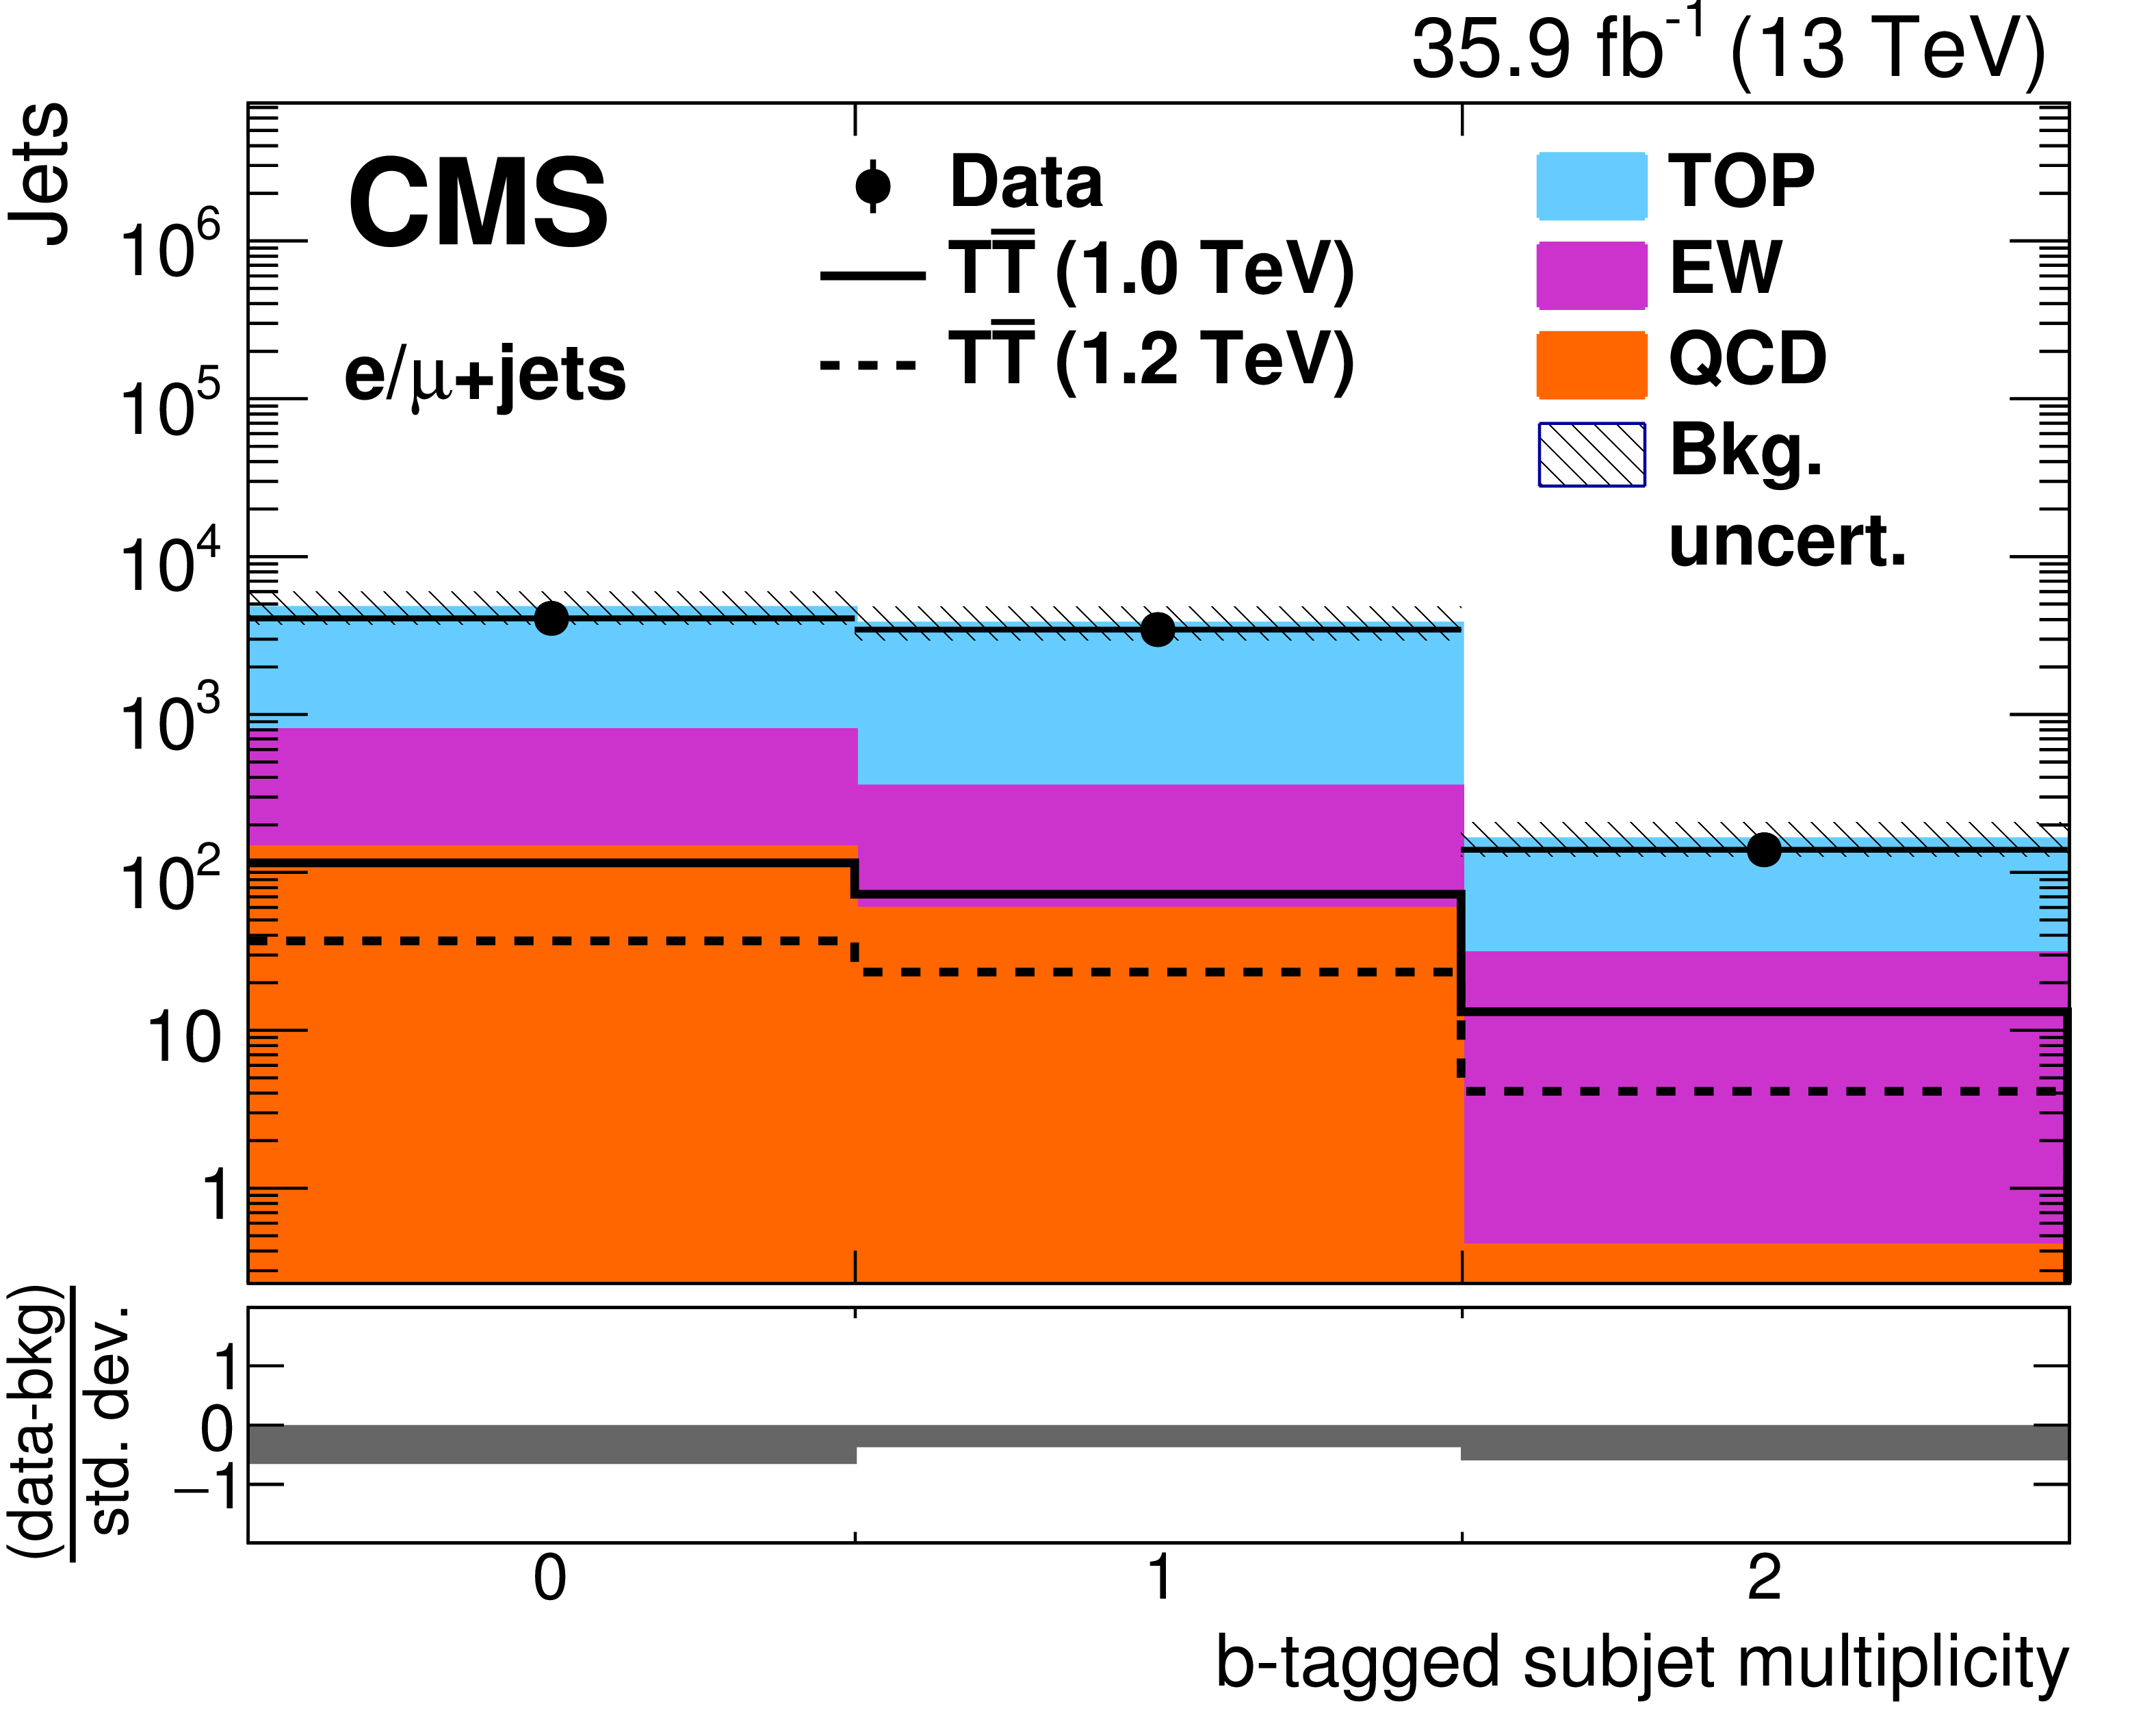
Figure 2-d:
Distributions of W and H tagging input variables after all selection requirements: pruned mass in AK8 jets with number of b-tagged subjets in AK8 jets with pruned mass in the range 60-160 GeV. Vertical dashed lines mark the selection windows for each distribution. The black points are the data and the filled histograms show the simulated background distributions, grouped into categories as described in Section 3. The expected signal is shown by solid and dotted lines for T quark masses of 1.0 and 1.2 TeV. The final bin includes overflow events. Uncertainties, indicated by the hatched area, include both statistical and systematic components. The lower panel shows the difference between data and background divided by the total uncertainty. |
png pdf |
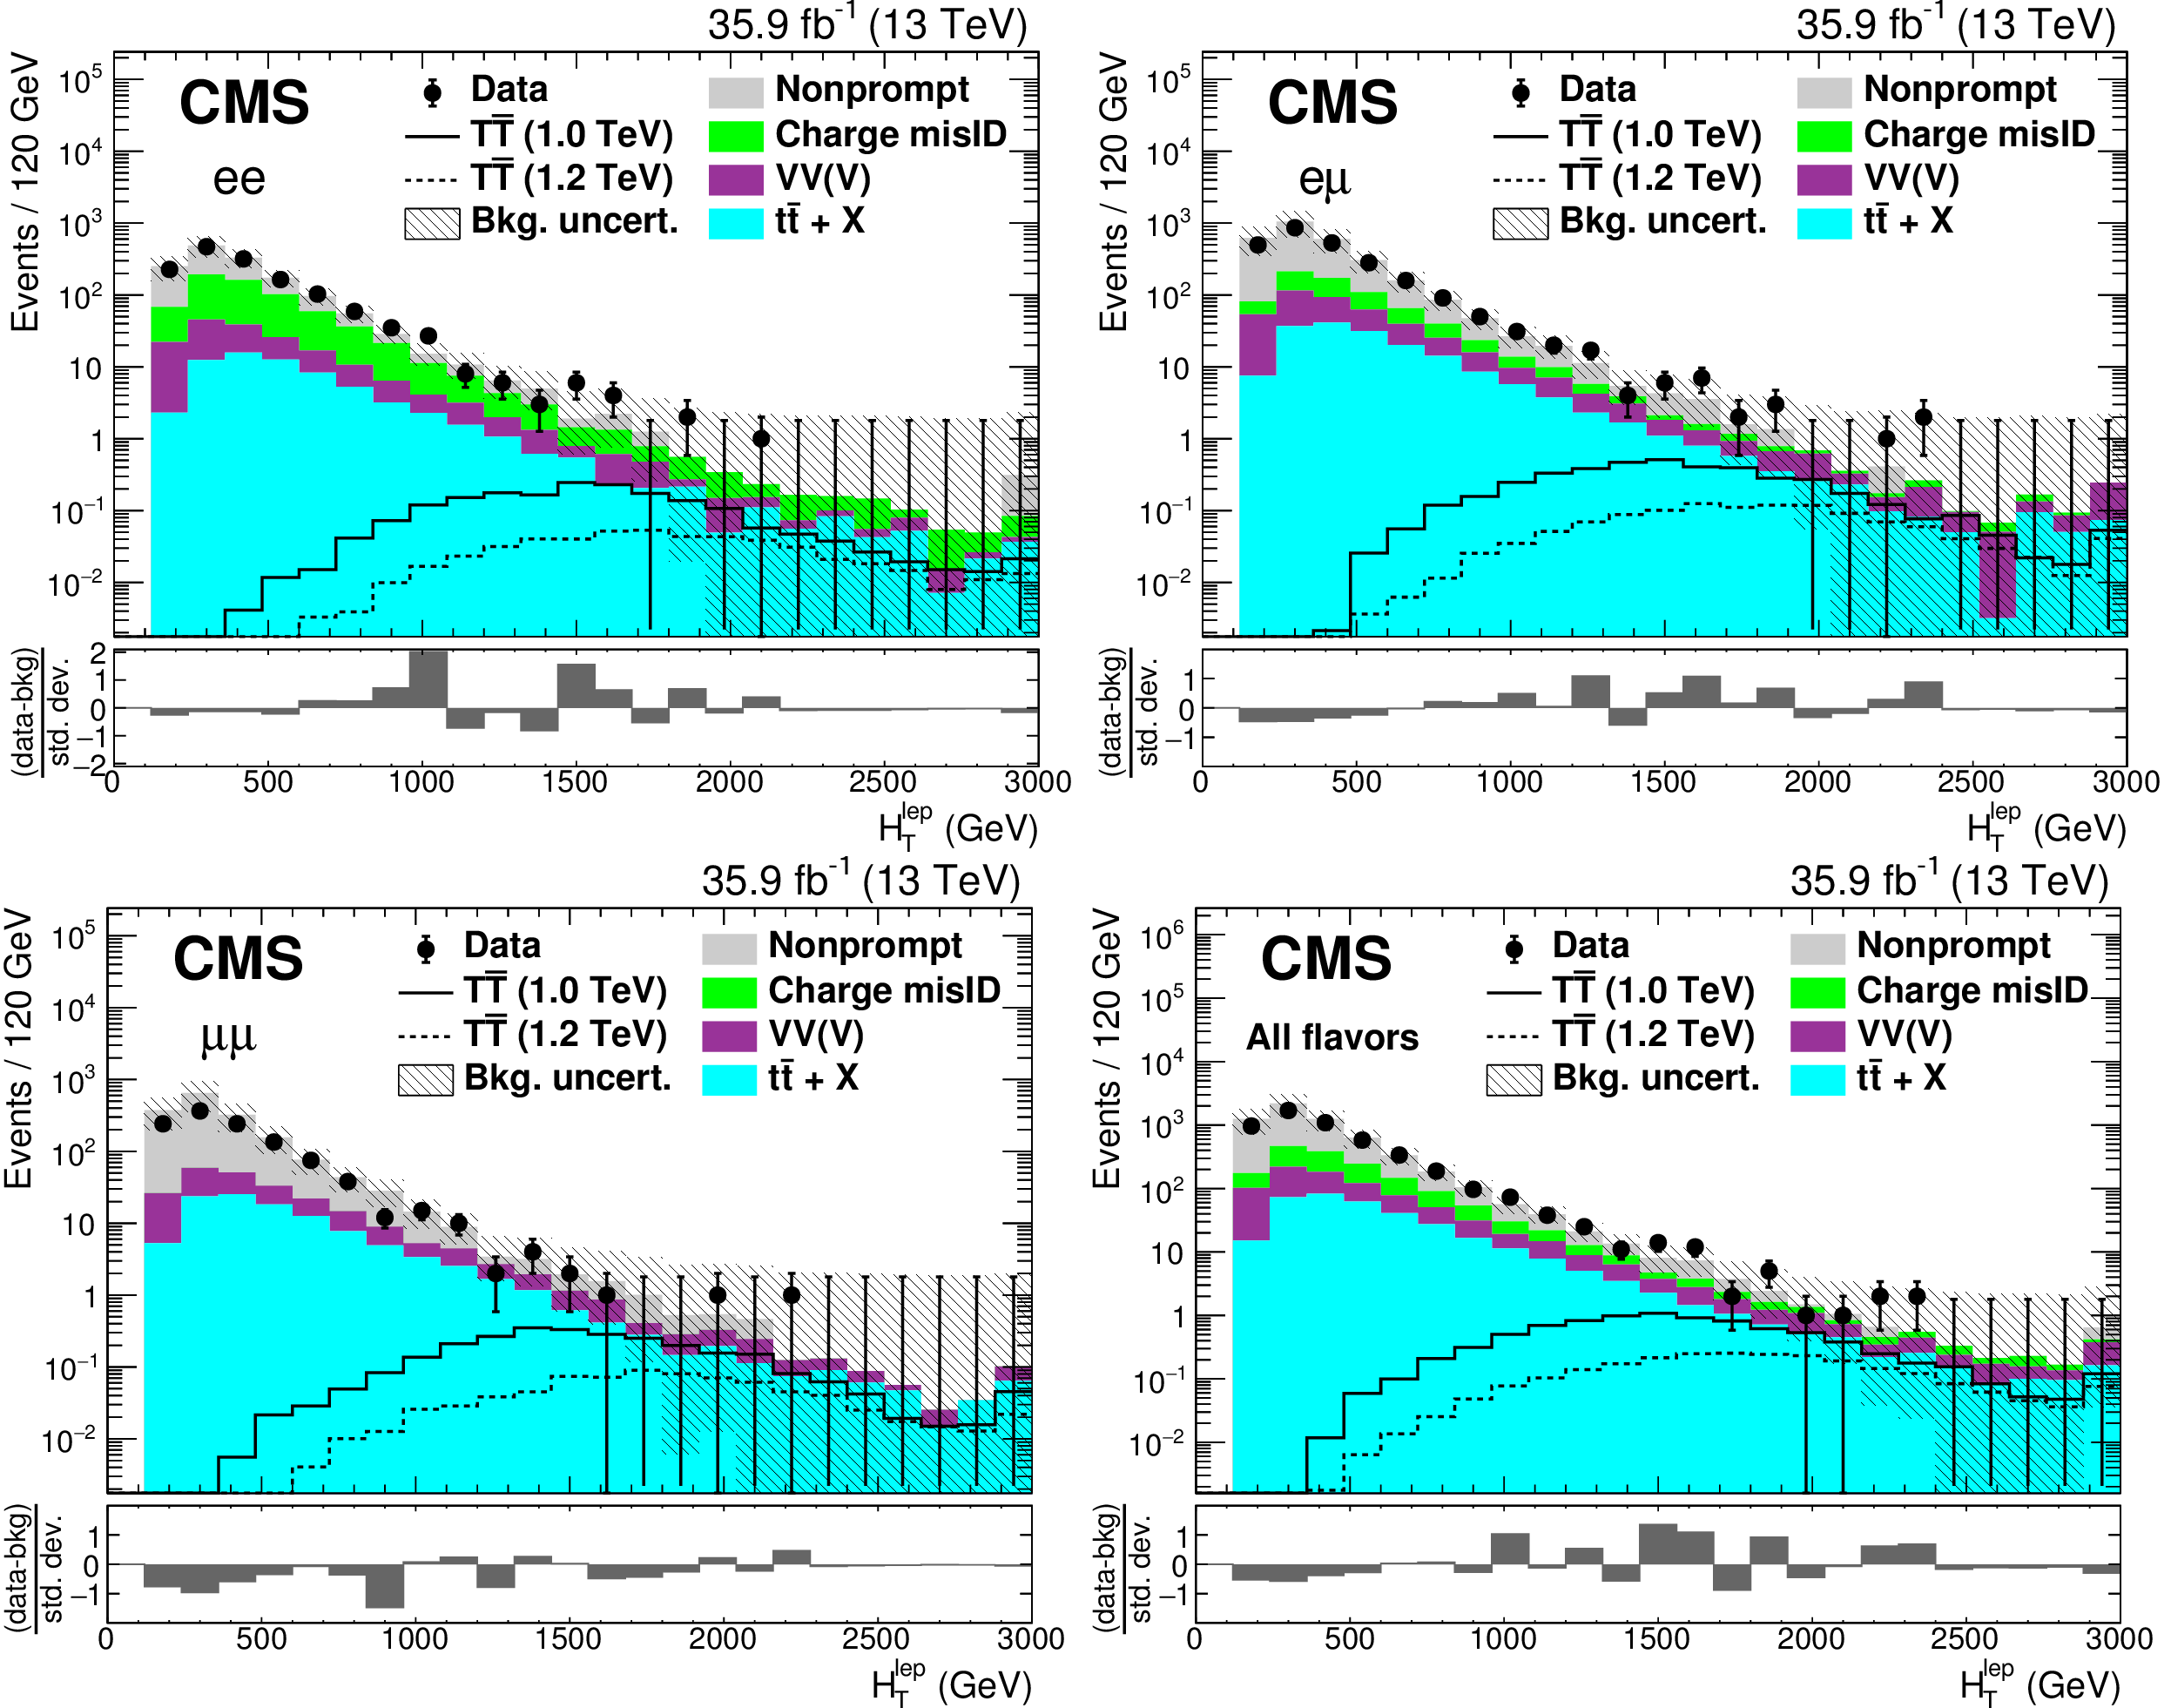
Figure 3:
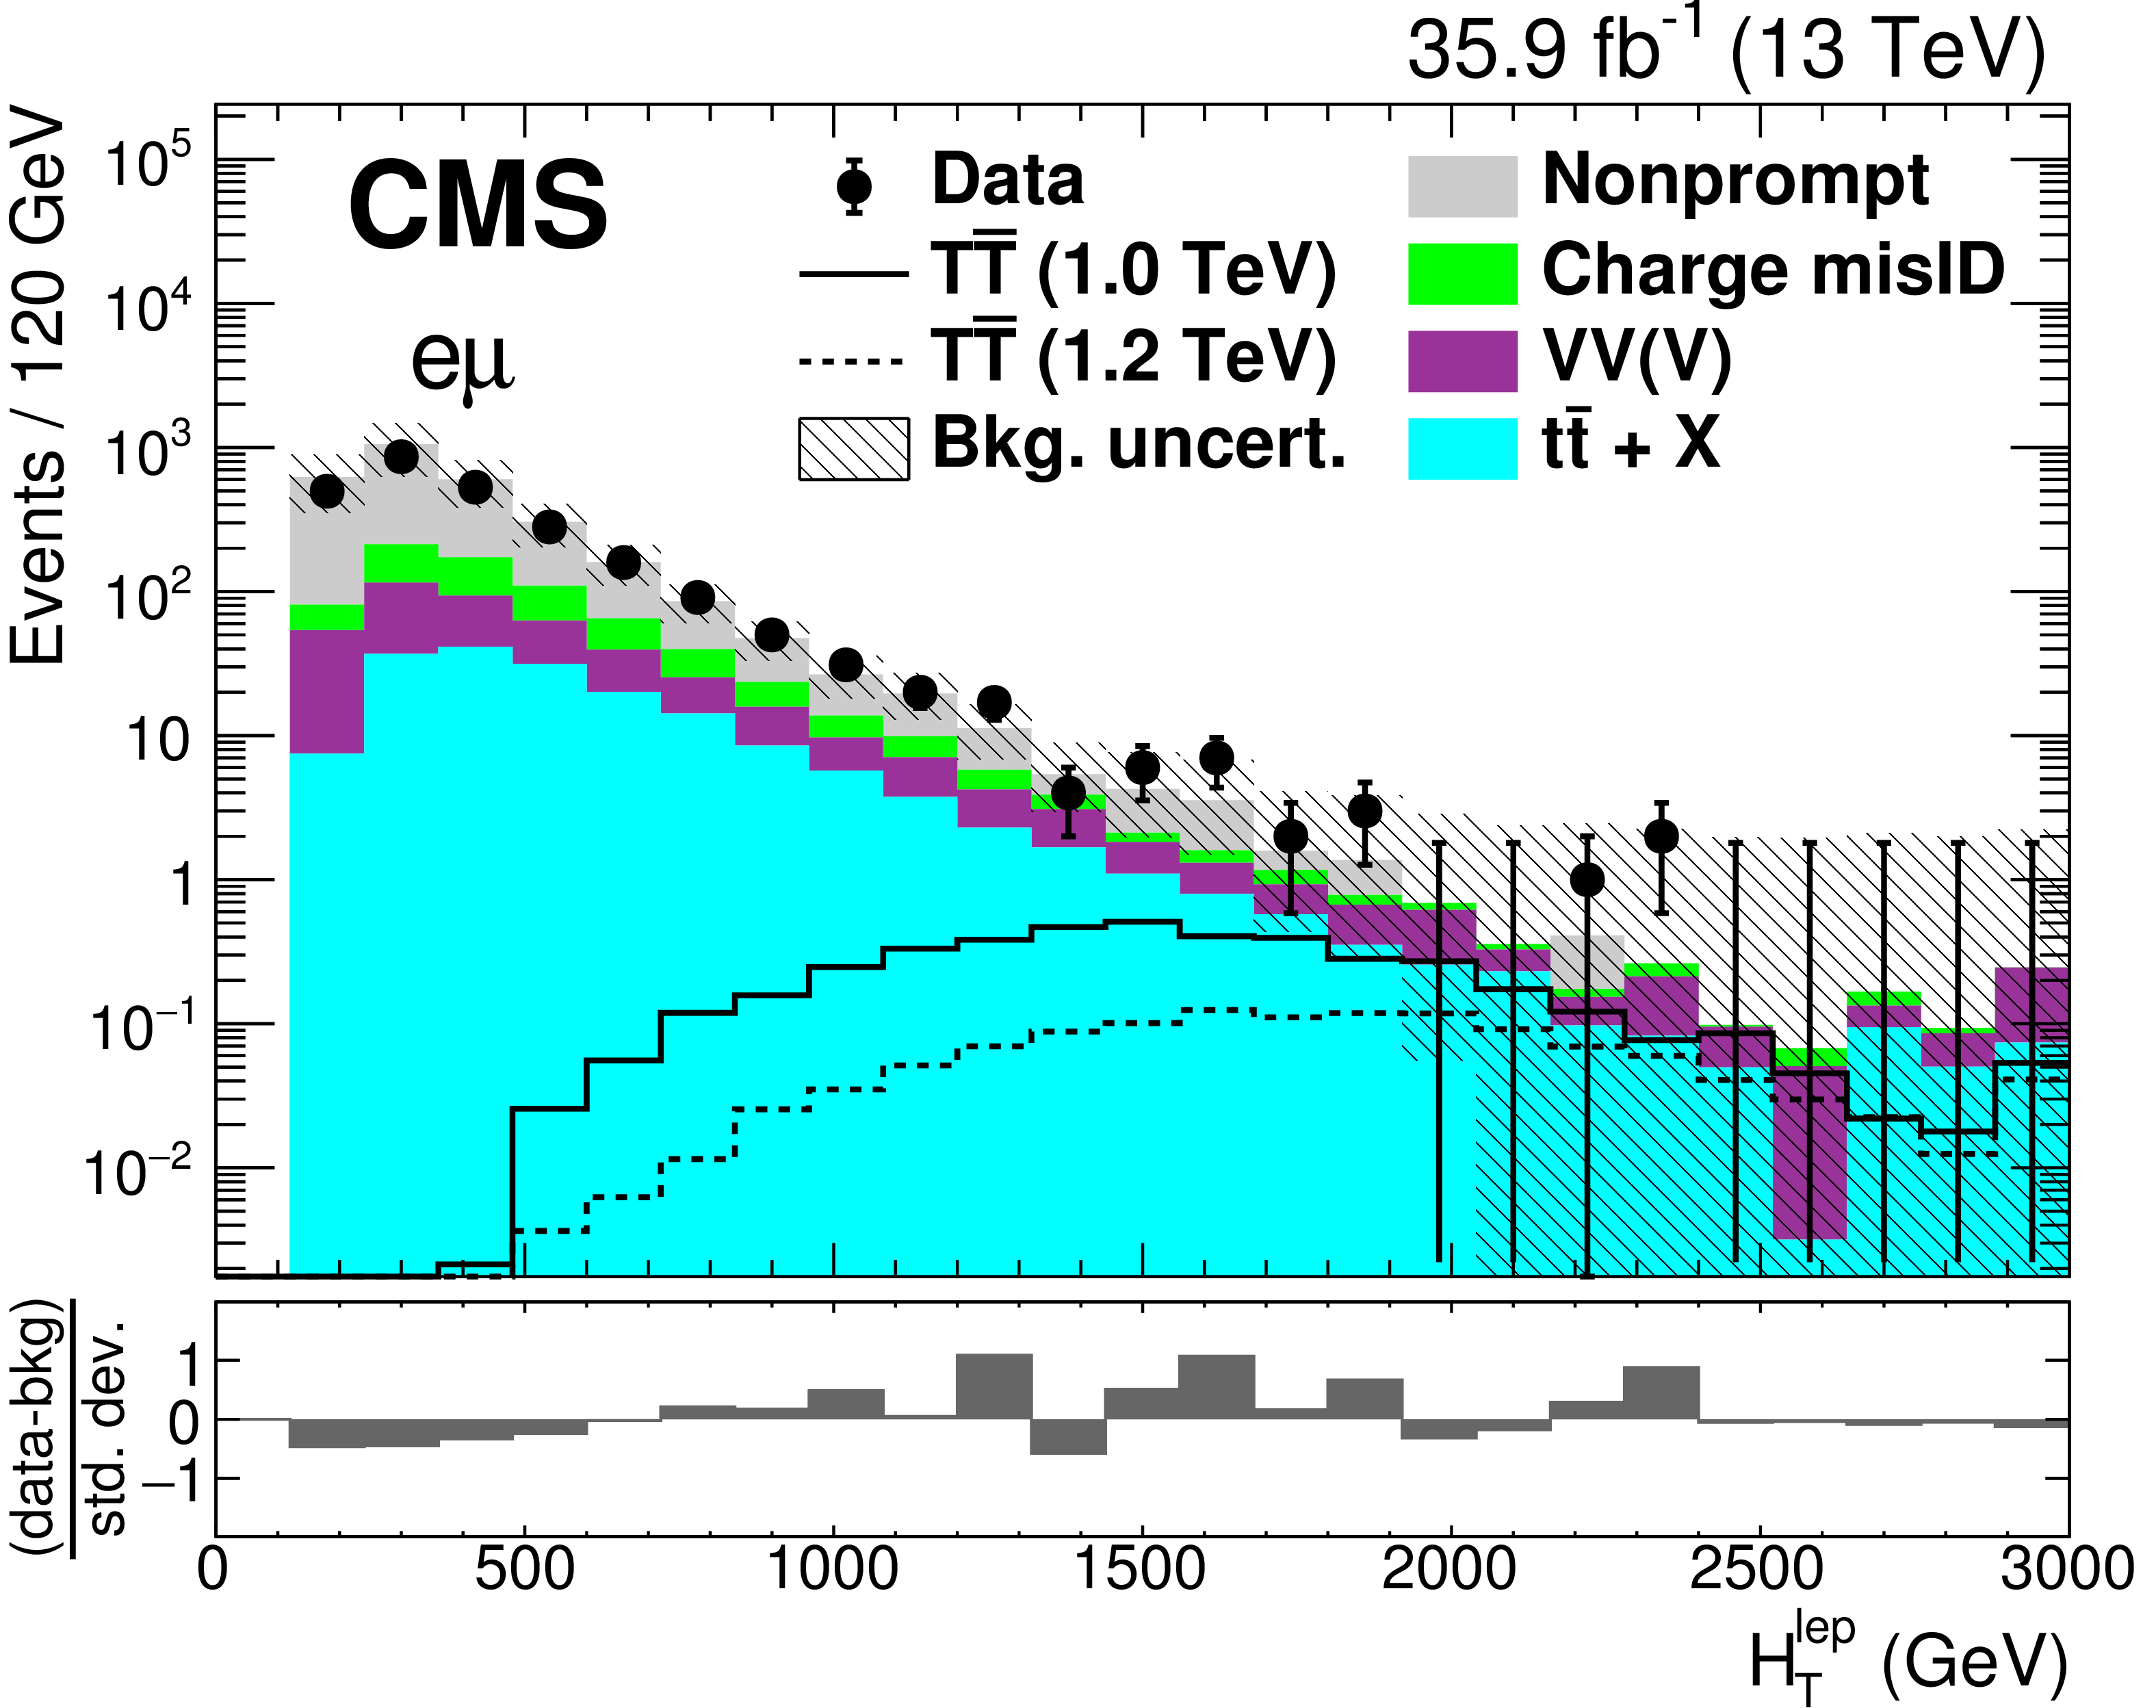
The $ {{H_{\mathrm {T}}} ^{\text {lep}}} $ distributions in events with at least two jets after the SS dilepton selection and Z-boson/quarkonia vetoes, for the $ {\mathrm {e}} {\mathrm {e}}$, $ {\mathrm {e}}\mu $, and $\mu \mu $ categories, and for the combination of all categories. The black points are the data and the filled histograms show the background distributions, with simulated backgrounds grouped into categories as described in Section 3. The expected signal is shown by solid and dotted lines for T quark masses of 1.0 and 1.2 TeV. The final bin includes overflow events. Uncertainties, indicated by the hatched area, include both statistical and systematic components. The lower panel shows the difference between data and background divided by the total uncertainty. Accepted events are required to have $ {{H_{\mathrm {T}}} ^{\text {lep}}} > $ 1200 GeV. |
png pdf |
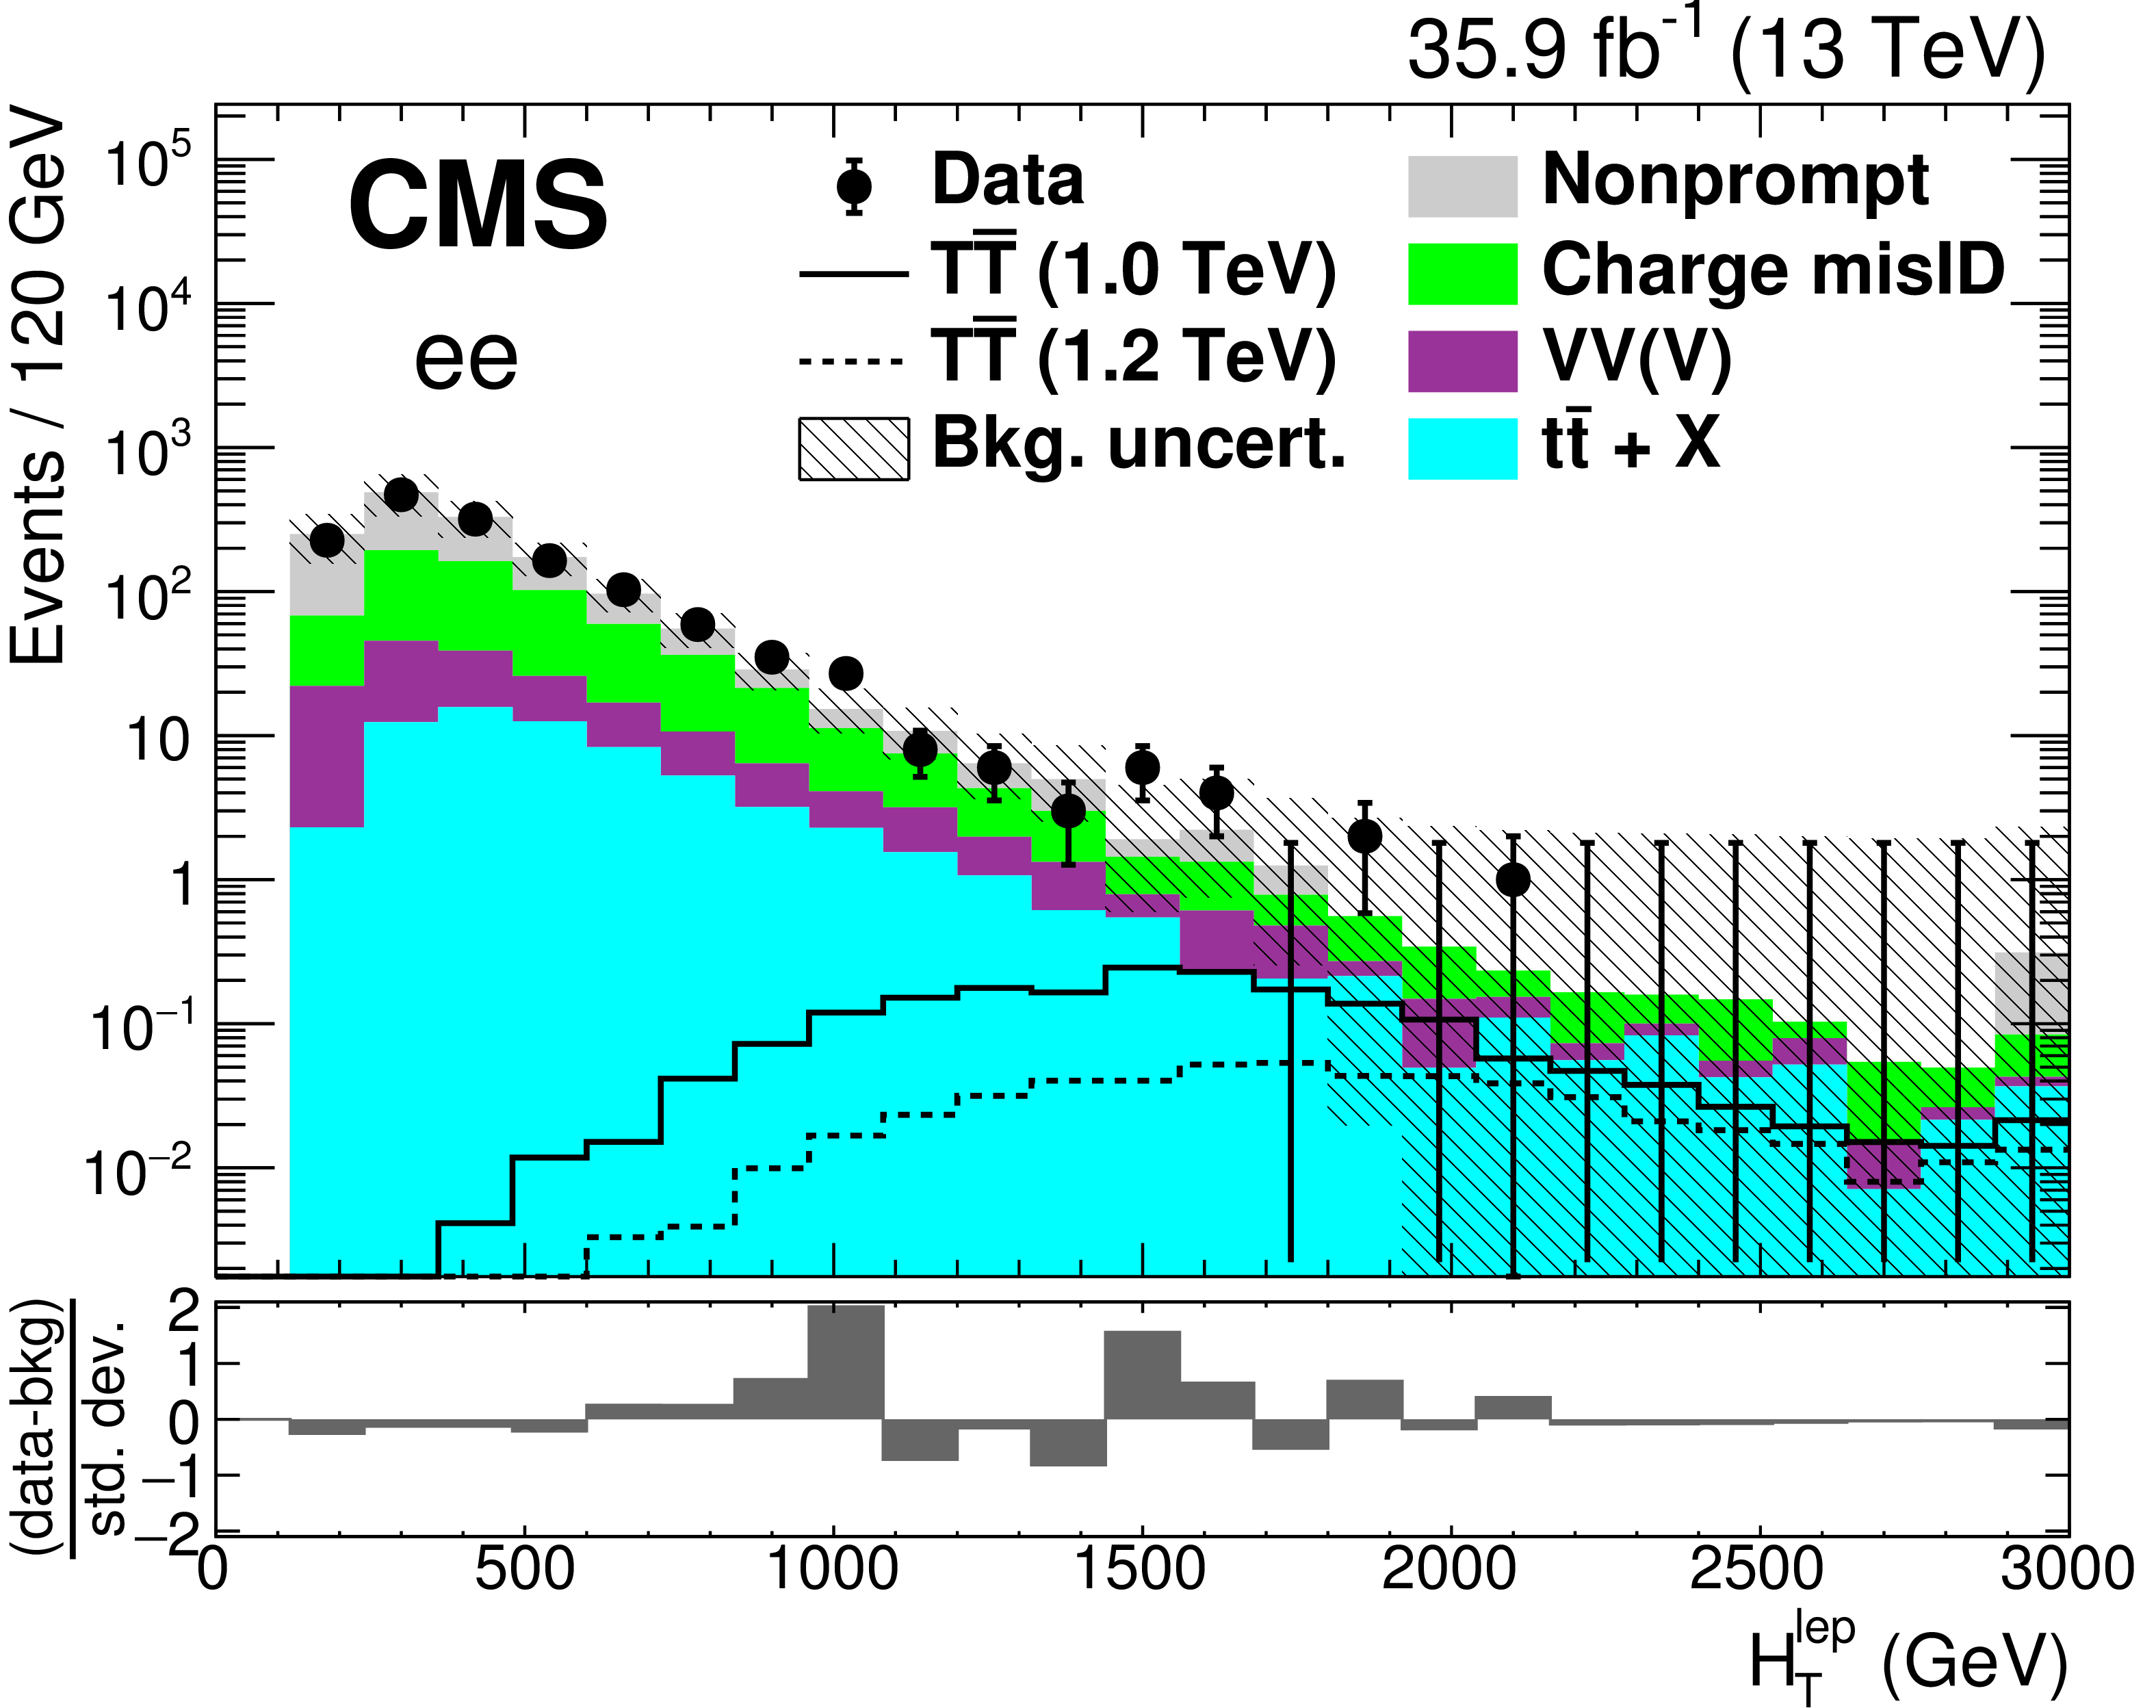
Figure 3-a:
The $ {{H_{\mathrm {T}}} ^{\text {lep}}} $ distribution in events with at least two jets after the SS dilepton selection and Z-boson/quarkonia vetoes, for the $ {\mathrm {e}} {\mathrm {e}}$ category. The black points are the data and the filled histograms show the background distributions, with simulated backgrounds grouped into categories as described in Section 3. The expected signal is shown by solid and dotted lines for T quark masses of 1.0 and 1.2 TeV. The final bin includes overflow events. Uncertainties, indicated by the hatched area, include both statistical and systematic components. The lower panel shows the difference between data and background divided by the total uncertainty. Accepted events are required to have $ {{H_{\mathrm {T}}} ^{\text {lep}}} > $ 1200 GeV. |
png pdf |
Figure 3-b:
The $ {{H_{\mathrm {T}}} ^{\text {lep}}} $ distribution in events with at least two jets after the SS dilepton selection and Z-boson/quarkonia vetoes, for the $ {\mathrm {e}}\mu $ category. The black points are the data and the filled histograms show the background distributions, with simulated backgrounds grouped into categories as described in Section 3. The expected signal is shown by solid and dotted lines for T quark masses of 1.0 and 1.2 TeV. The final bin includes overflow events. Uncertainties, indicated by the hatched area, include both statistical and systematic components. The lower panel shows the difference between data and background divided by the total uncertainty. Accepted events are required to have $ {{H_{\mathrm {T}}} ^{\text {lep}}} > $ 1200 GeV. |
png pdf |
Figure 3-c:
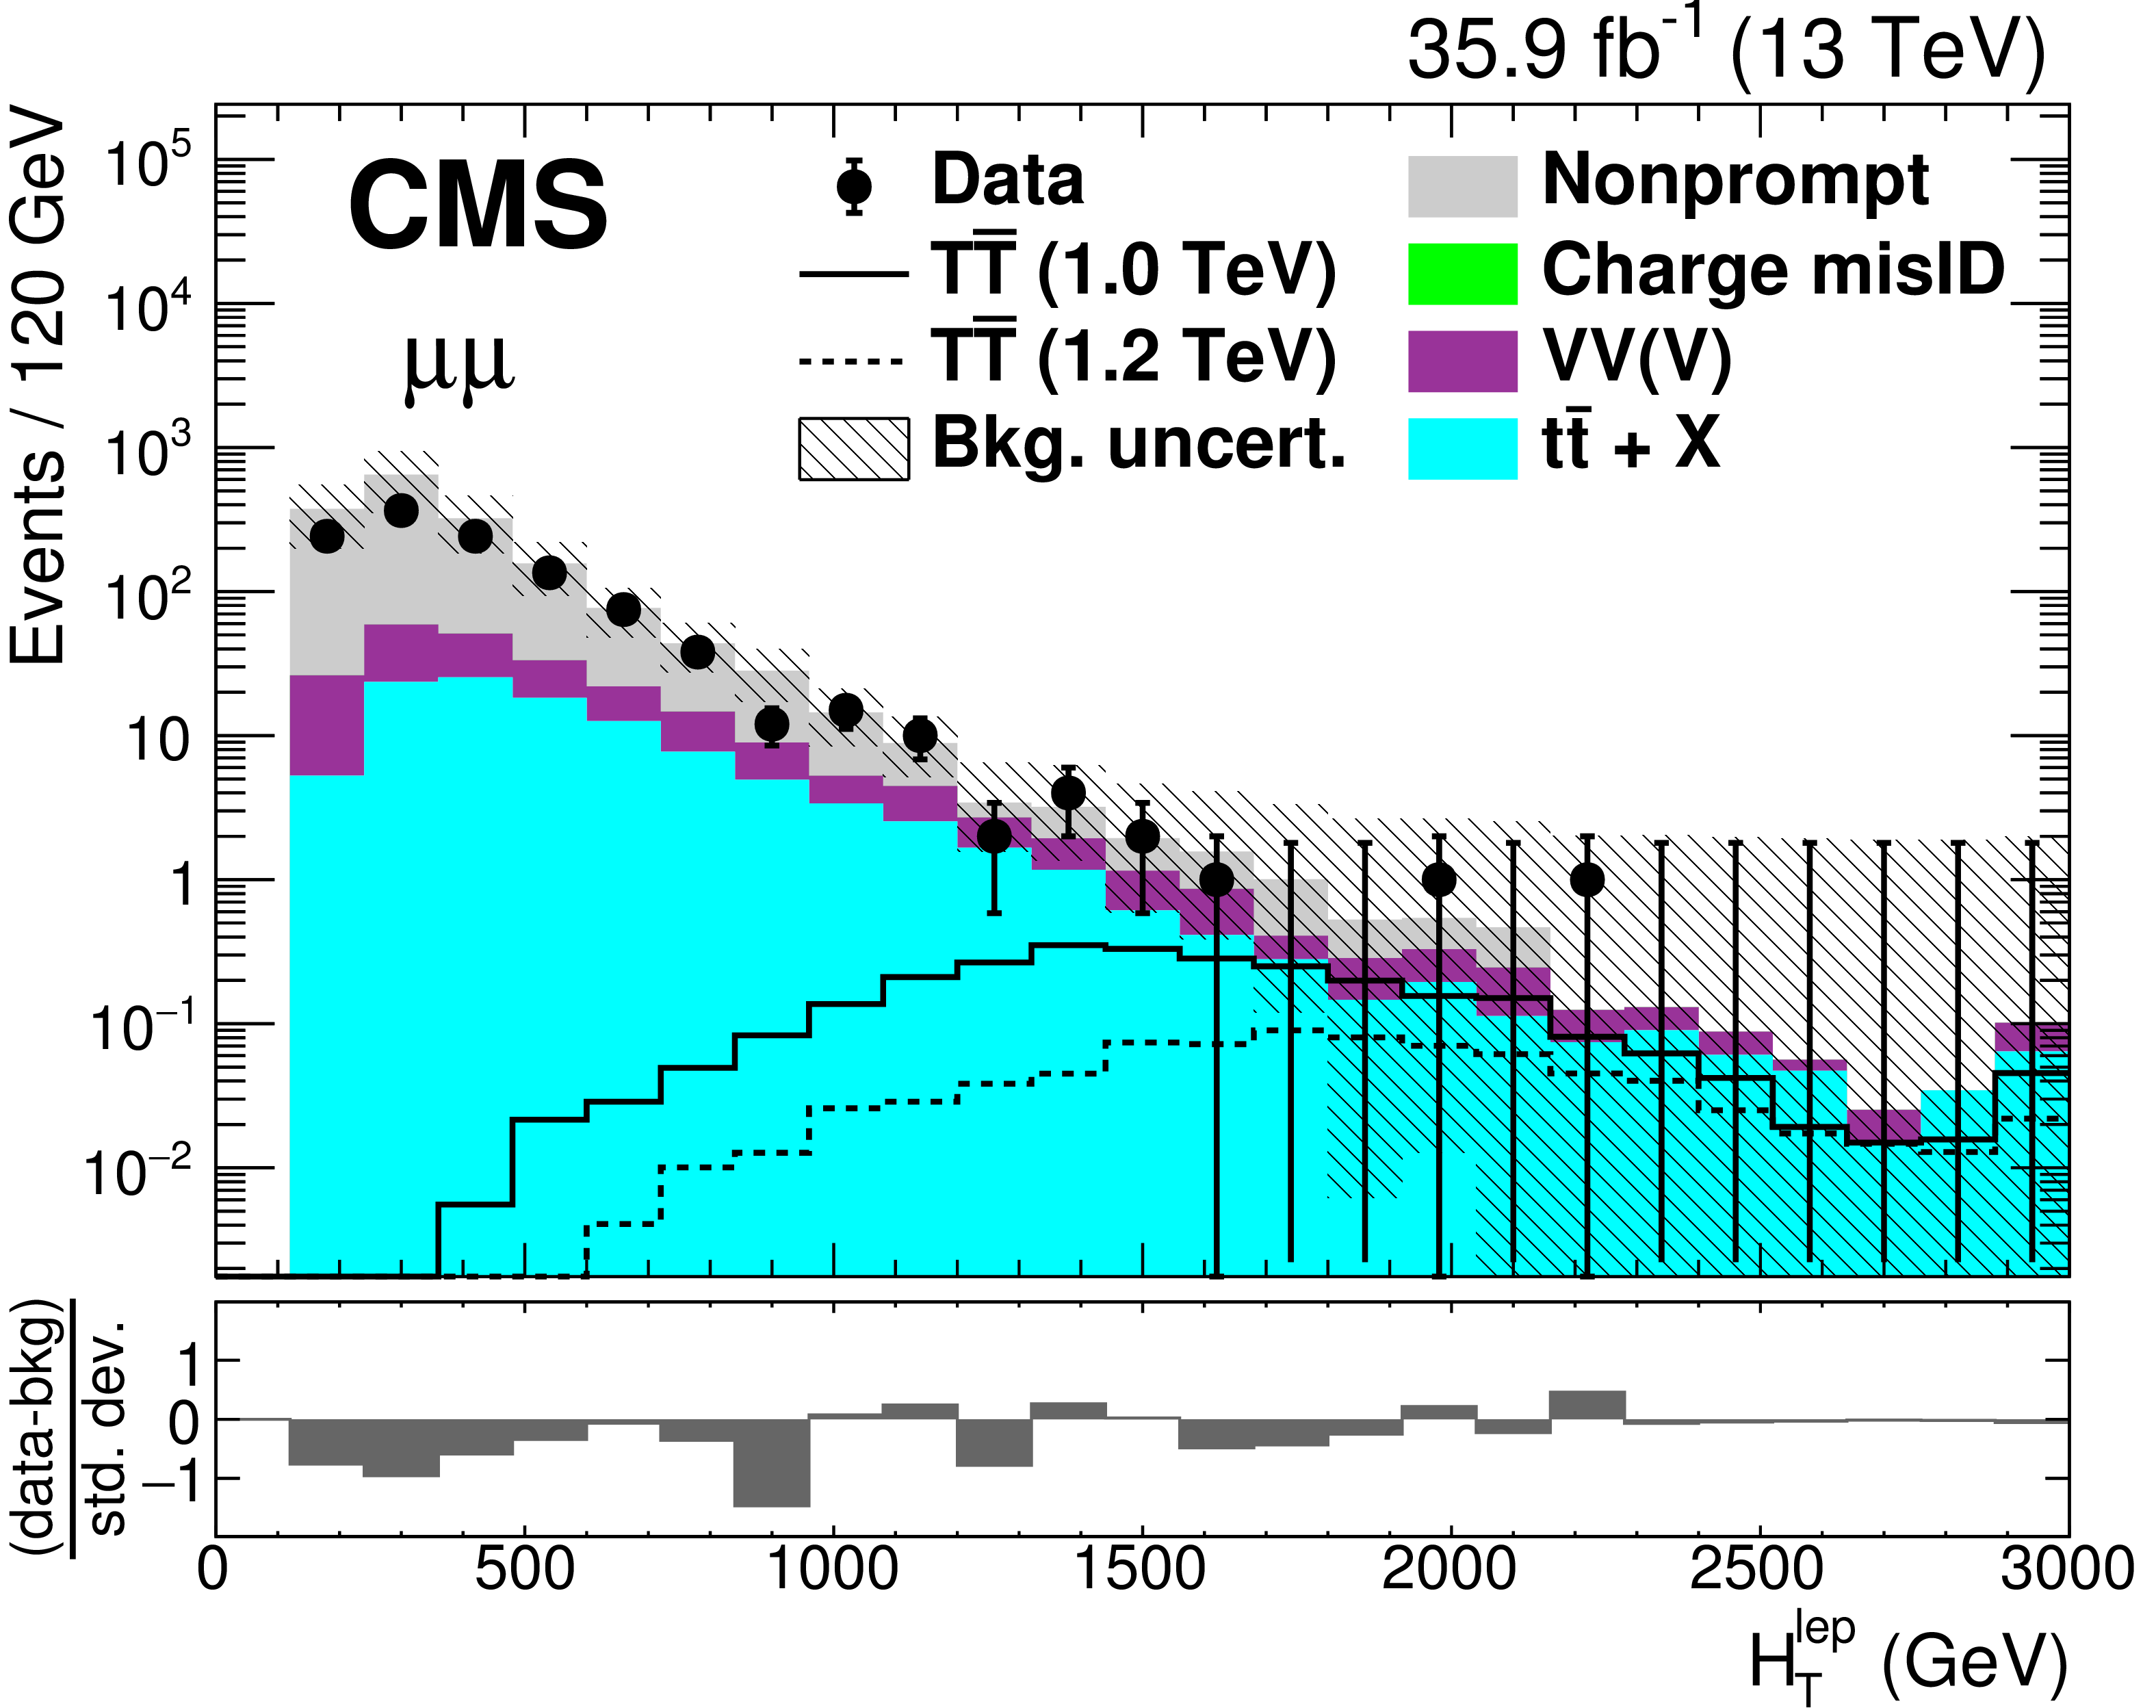
The $ {{H_{\mathrm {T}}} ^{\text {lep}}} $ distribution in events with at least two jets after the SS dilepton selection and Z-boson/quarkonia vetoes, for the $\mu \mu $ categories. The black points are the data and the filled histograms show the background distributions, with simulated backgrounds grouped into categories as described in Section 3. The expected signal is shown by solid and dotted lines for T quark masses of 1.0 and 1.2 TeV. The final bin includes overflow events. Uncertainties, indicated by the hatched area, include both statistical and systematic components. The lower panel shows the difference between data and background divided by the total uncertainty. Accepted events are required to have $ {{H_{\mathrm {T}}} ^{\text {lep}}} > $ 1200 GeV. |
png pdf |
Figure 3-d:
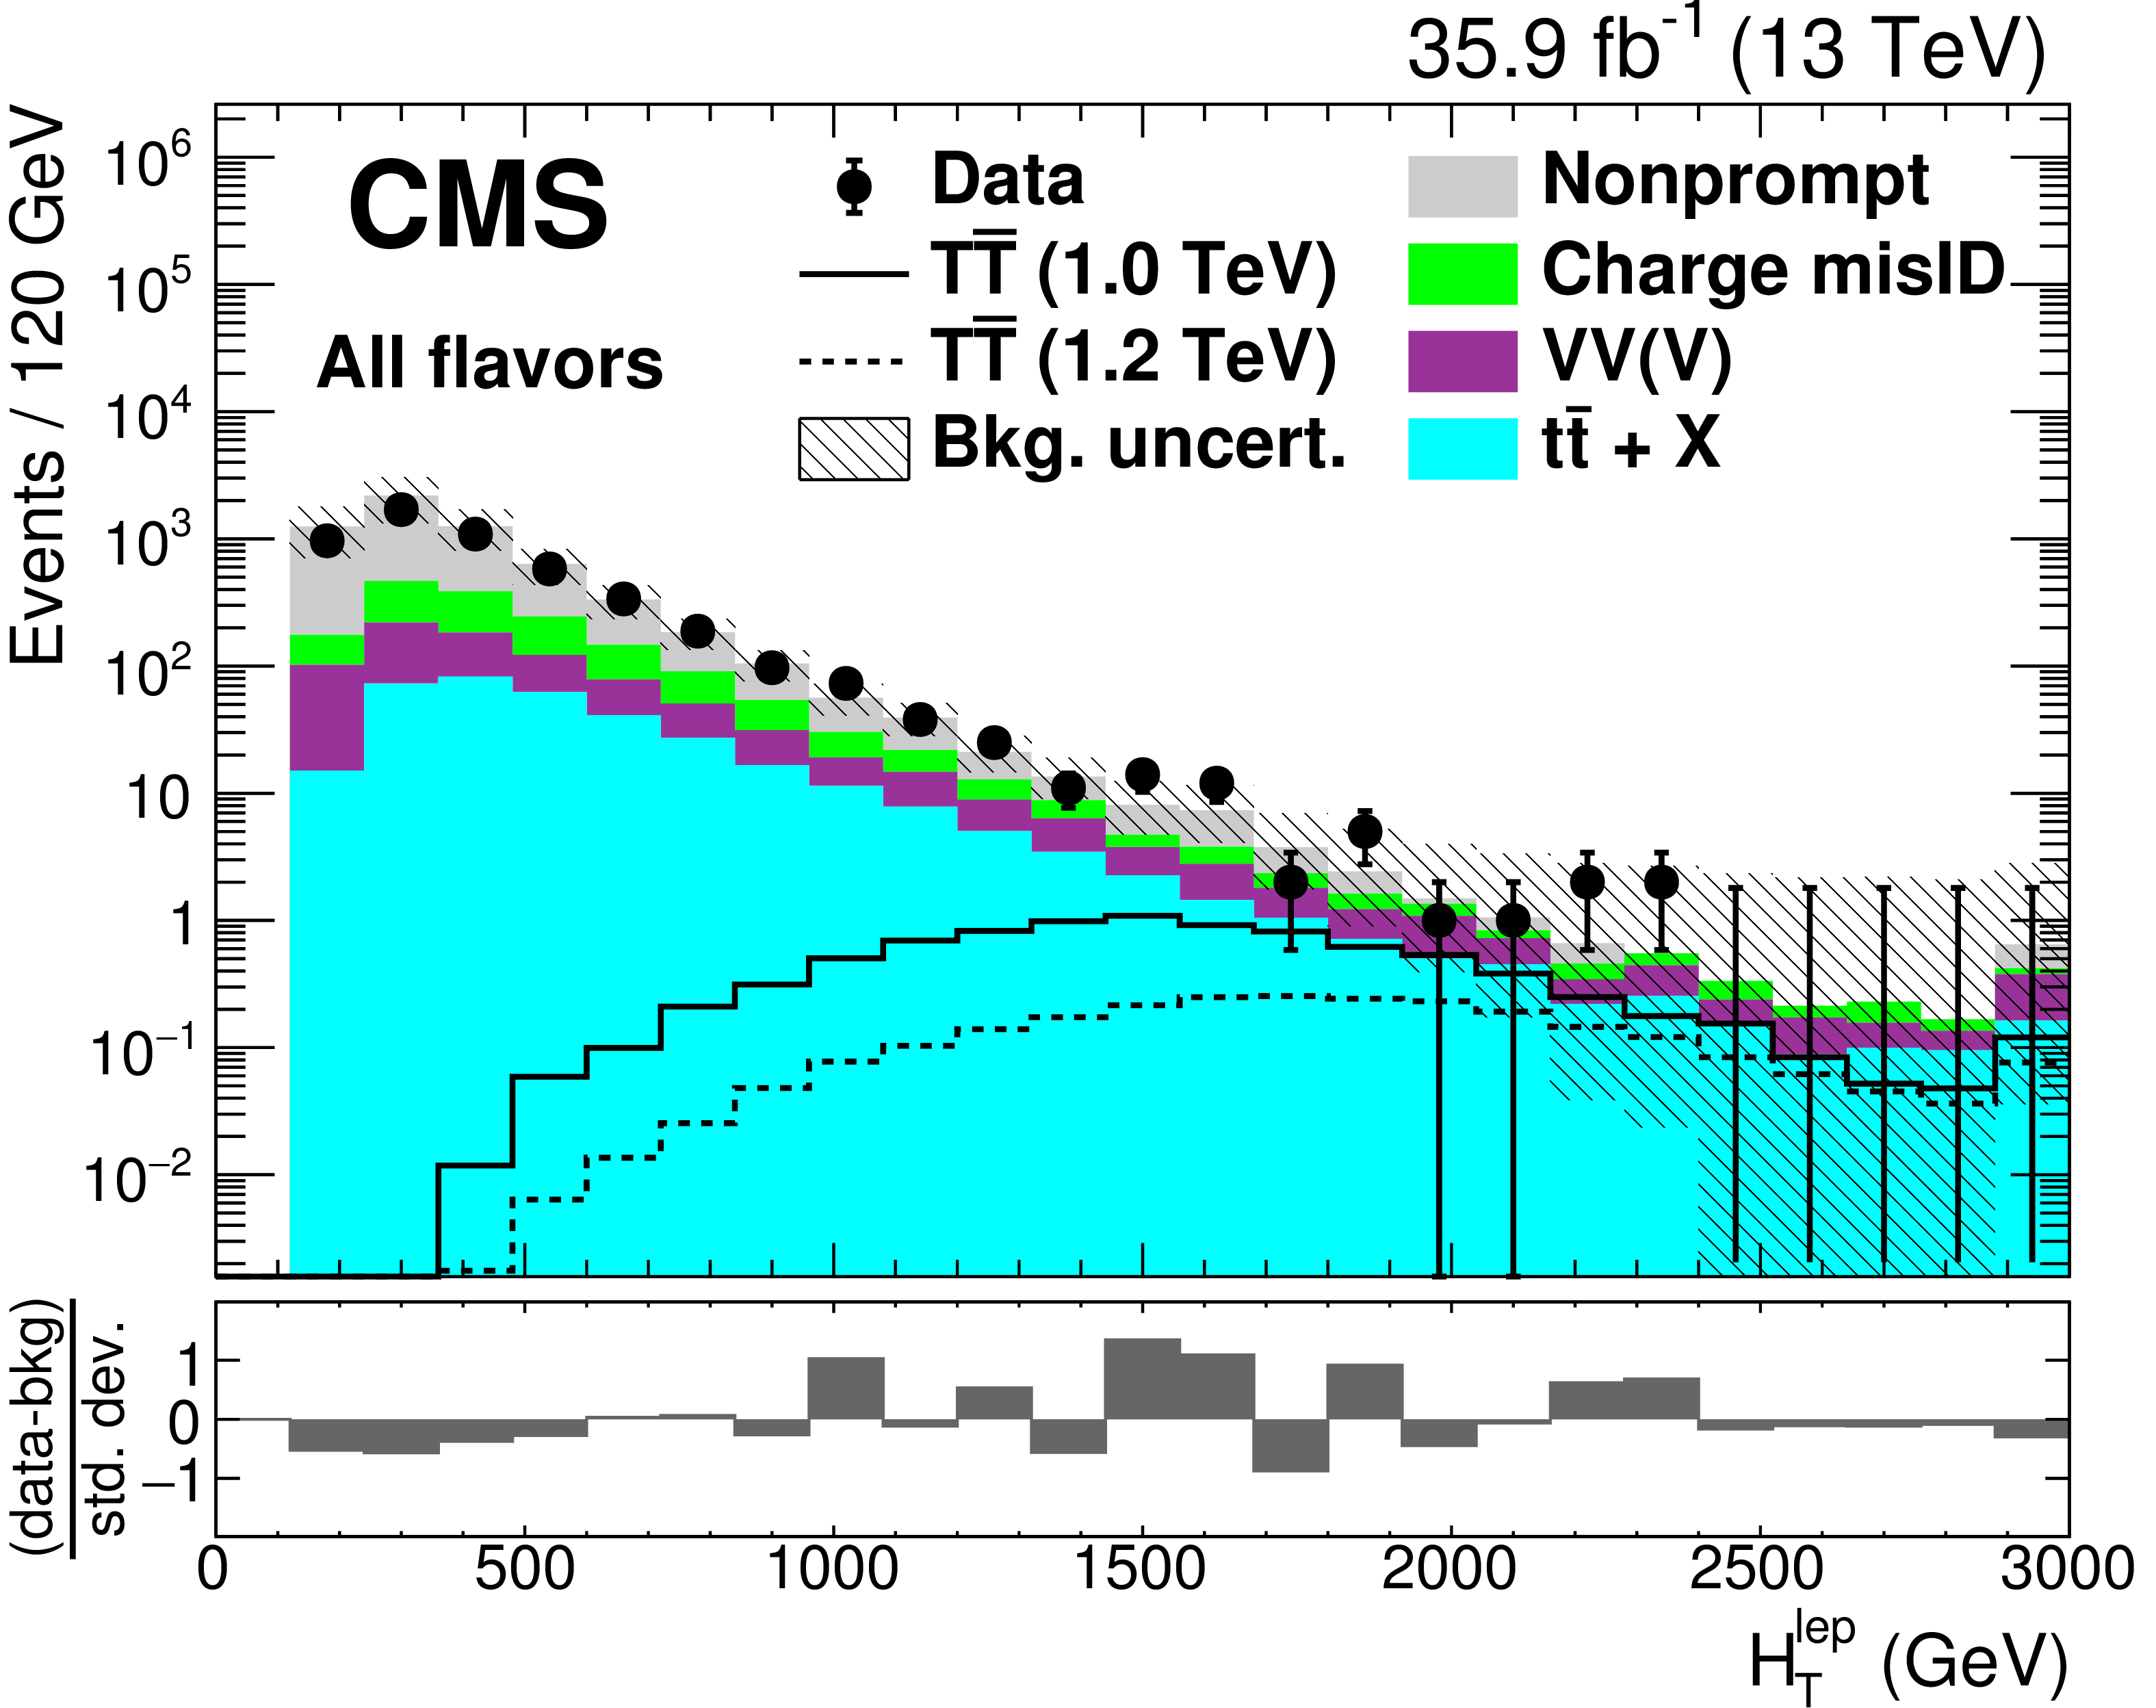
The $ {{H_{\mathrm {T}}} ^{\text {lep}}} $ distribution in events with at least two jets after the SS dilepton selection and Z-boson/quarkonia vetoes, for the combination of $ {\mathrm {e}} {\mathrm {e}}$, $ {\mathrm {e}}\mu $, and $\mu \mu $ category. The black points are the data and the filled histograms show the background distributions, with simulated backgrounds grouped into categories as described in Section 3. The expected signal is shown by solid and dotted lines for T quark masses of 1.0 and 1.2 TeV. The final bin includes overflow events. Uncertainties, indicated by the hatched area, include both statistical and systematic components. The lower panel shows the difference between data and background divided by the total uncertainty. Accepted events are required to have $ {{H_{\mathrm {T}}} ^{\text {lep}}} > $ 1200 GeV. |
png pdf |
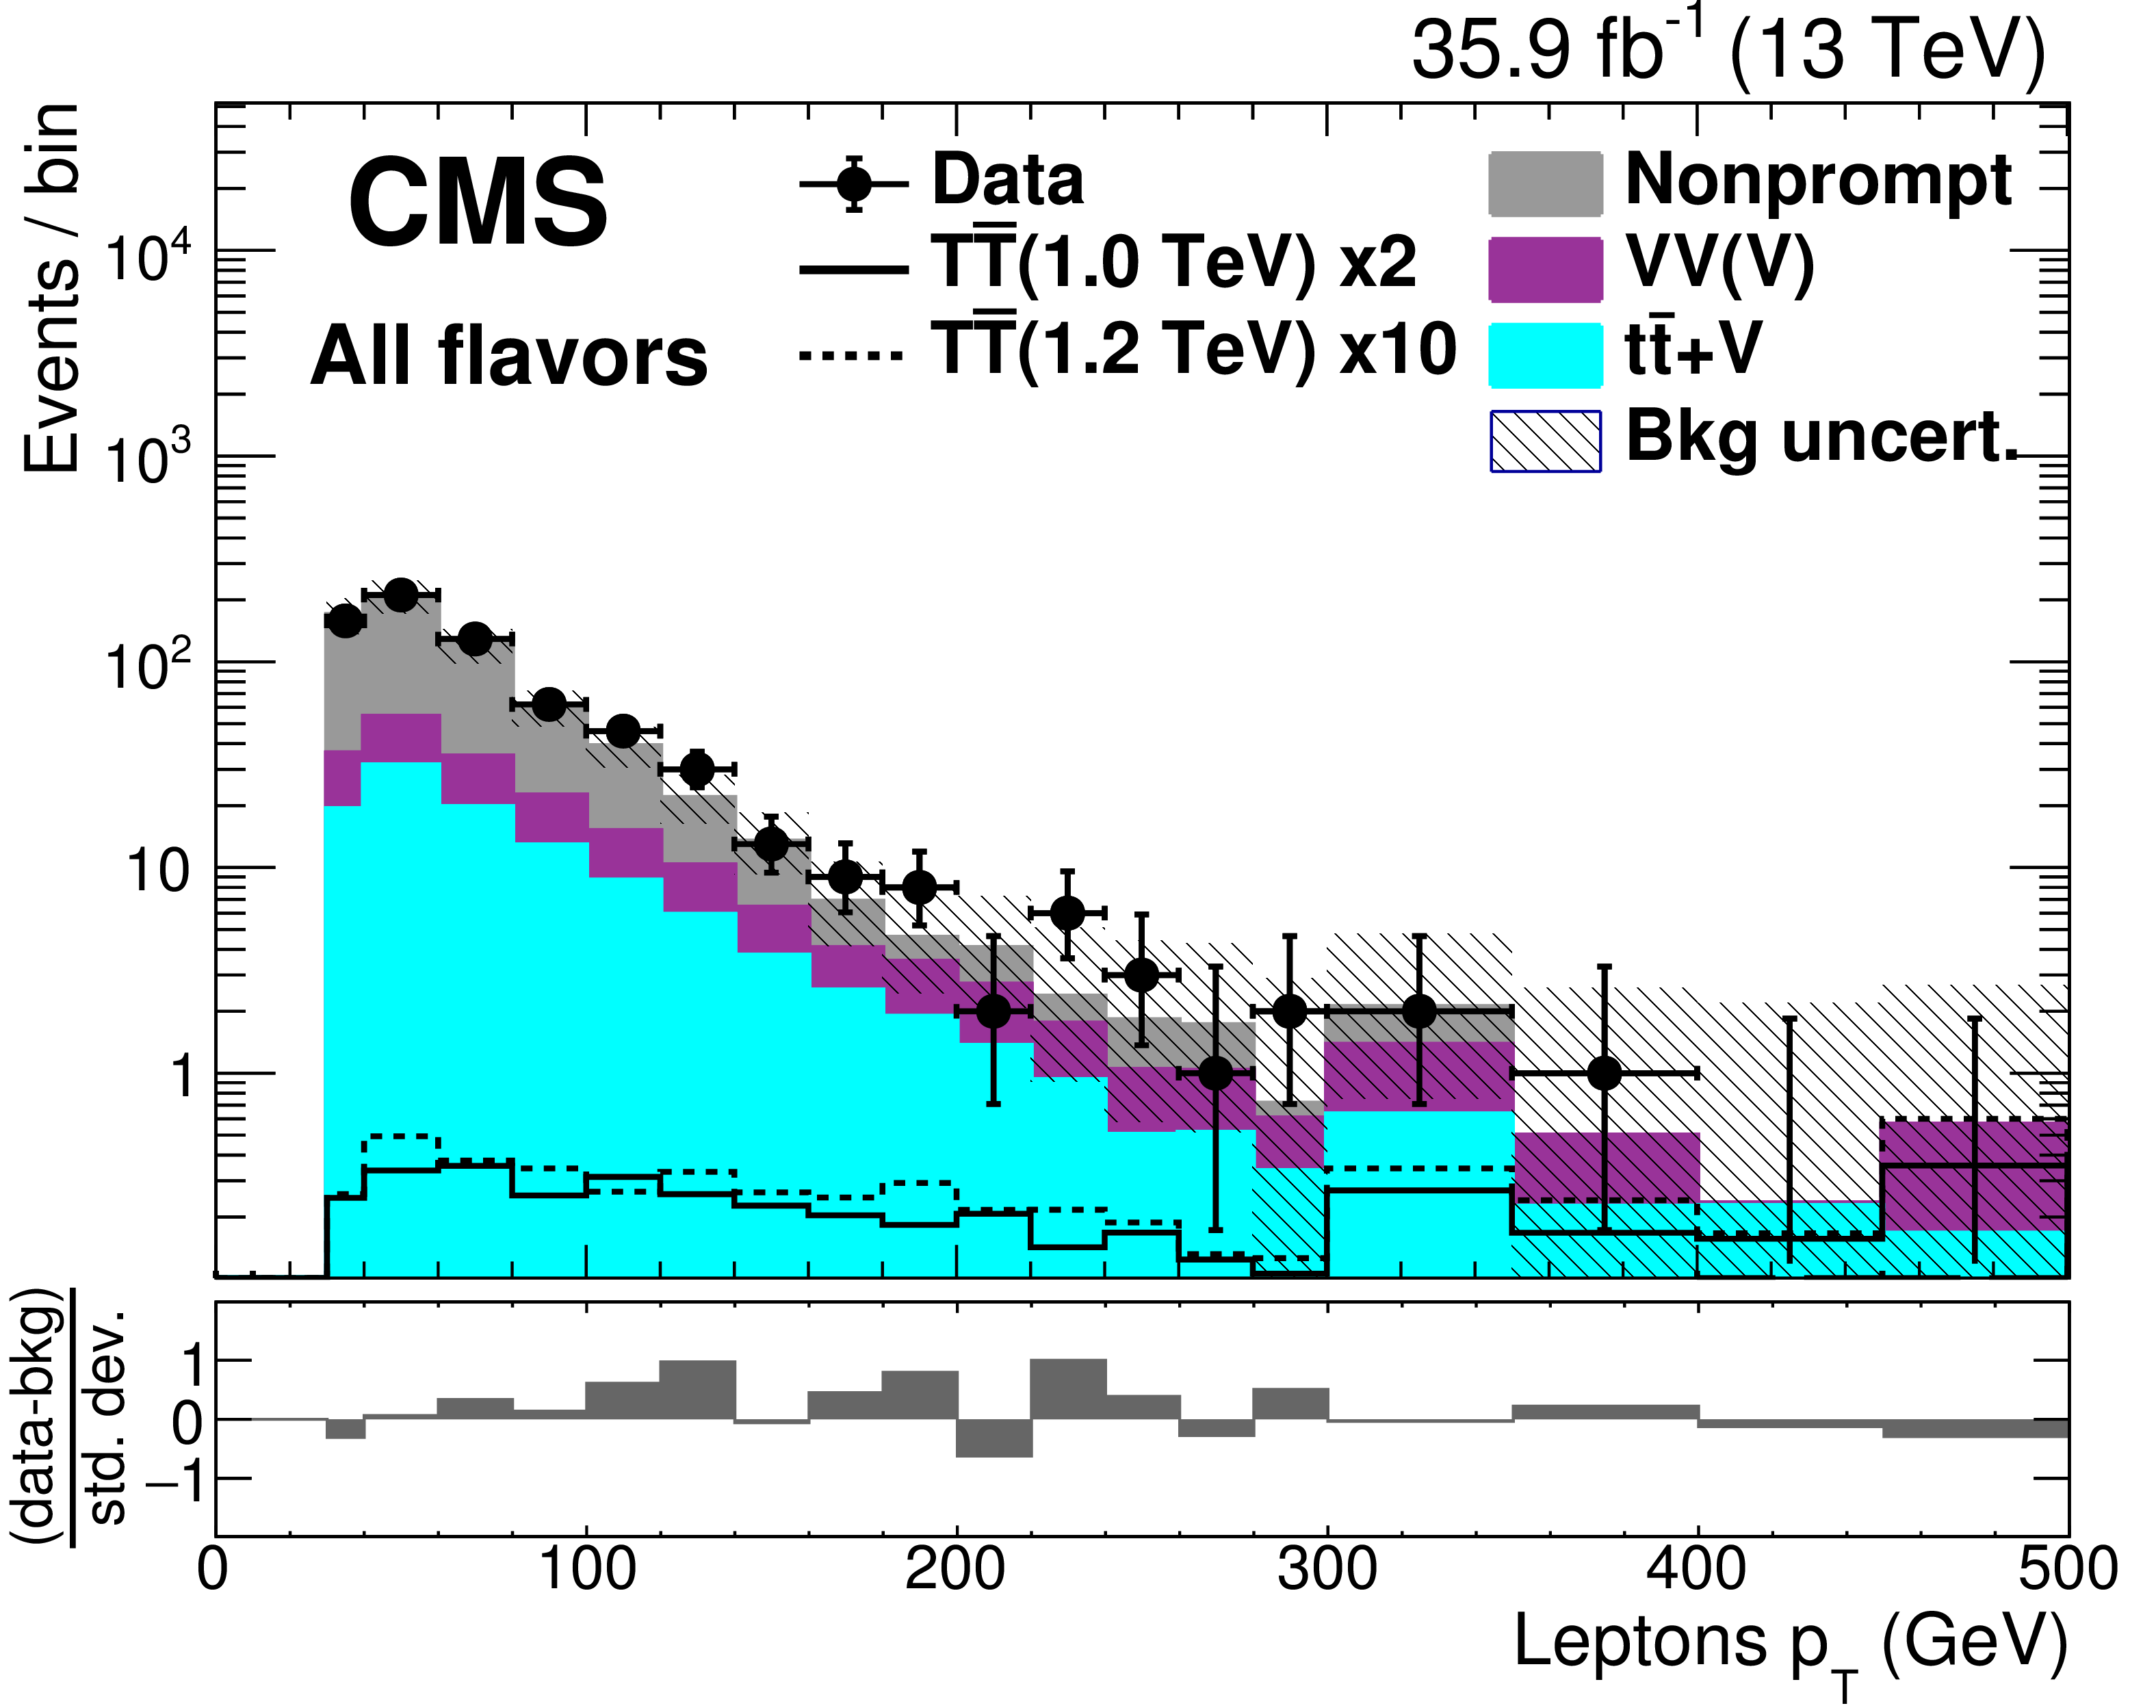
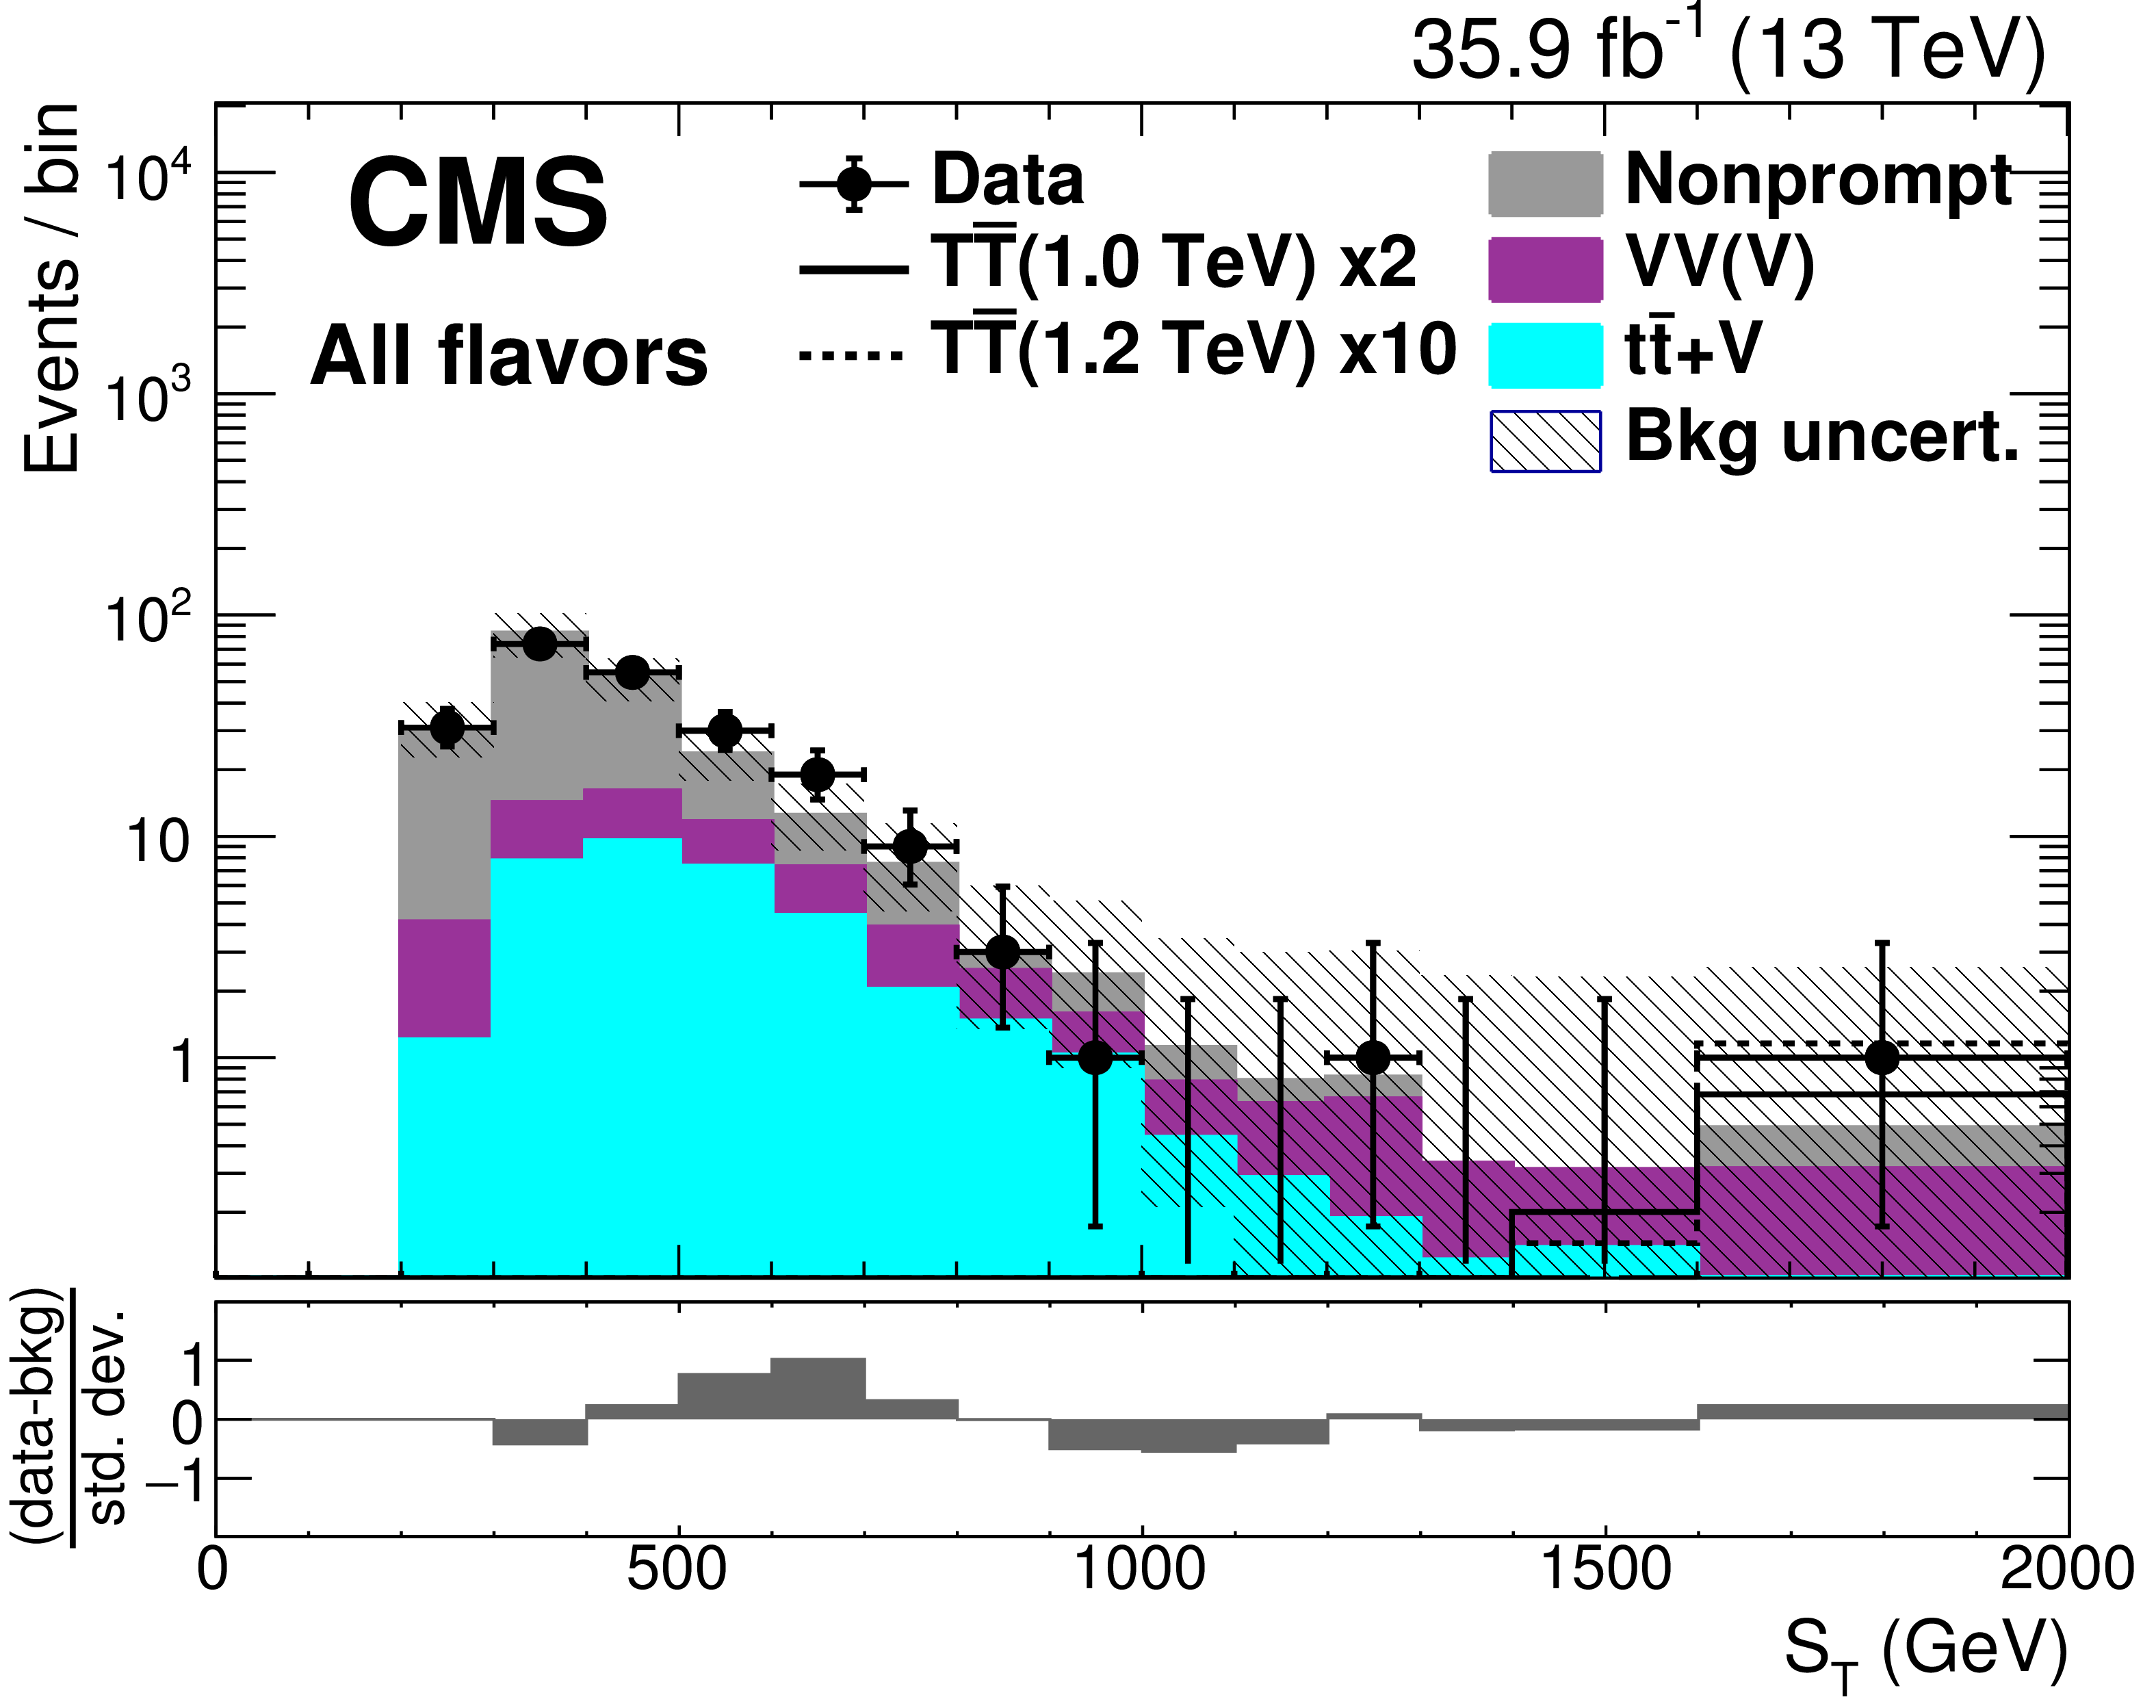
Figure 4:
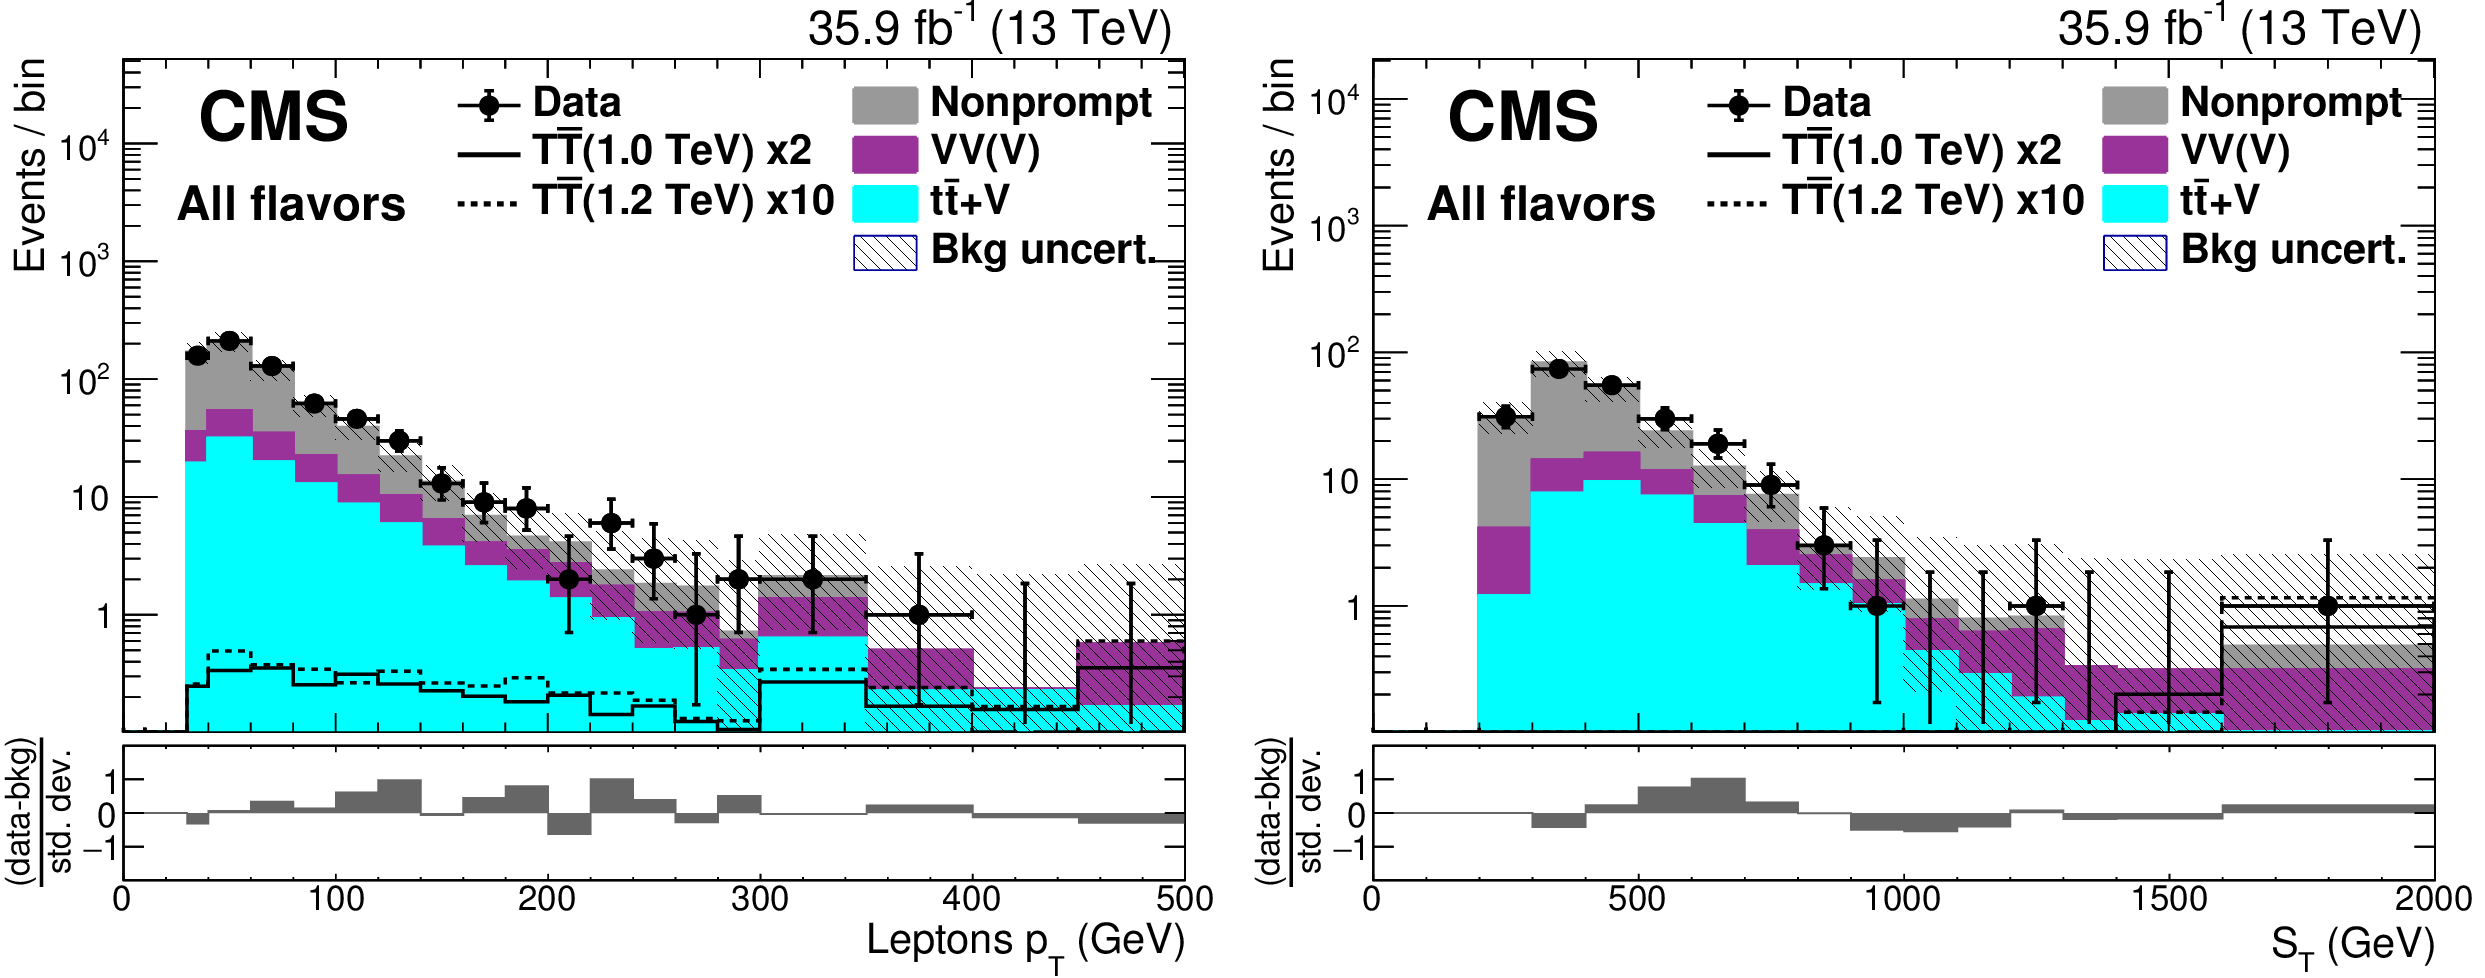
Distributions of lepton $ {p_{\mathrm {T}}} $ (left) and $ {S_\mathrm {T}} $ (right) in the control region of the trilepton channel. The black points are the data (horizontal bars indicate the bin width) and the filled histograms show the background distributions, with simulated backgrounds grouped into categories as described in Section 3. The expected signal is shown by solid and dotted lines for T quark masses of 1.0 and 1.2 TeV. The final bin includes overflow events. Uncertainties, indicated by the hatched area, include both statistical and systematic components. The lower panel shows the difference between data and background divided by the total uncertainty. |
png pdf |
Figure 4-a:
Distribution of lepton $ {p_{\mathrm {T}}} $ in the control region of the trilepton channel. The black points are the data (horizontal bars indicate the bin width) and the filled histograms show the background distributions, with simulated backgrounds grouped into categories as described in Section 3. The expected signal is shown by solid and dotted lines for T quark masses of 1.0 and 1.2 TeV. The final bin includes overflow events. Uncertainties, indicated by the hatched area, include both statistical and systematic components. The lower panel shows the difference between data and background divided by the total uncertainty. |
png pdf |
Figure 4-b:
Distribution of lepton $ {S_\mathrm {T}} $ in the control region of the trilepton channel. The black points are the data (horizontal bars indicate the bin width) and the filled histograms show the background distributions, with simulated backgrounds grouped into categories as described in Section 3. The expected signal is shown by solid and dotted lines for T quark masses of 1.0 and 1.2 TeV. The final bin includes overflow events. Uncertainties, indicated by the hatched area, include both statistical and systematic components. The lower panel shows the difference between data and background divided by the total uncertainty. |
png pdf |
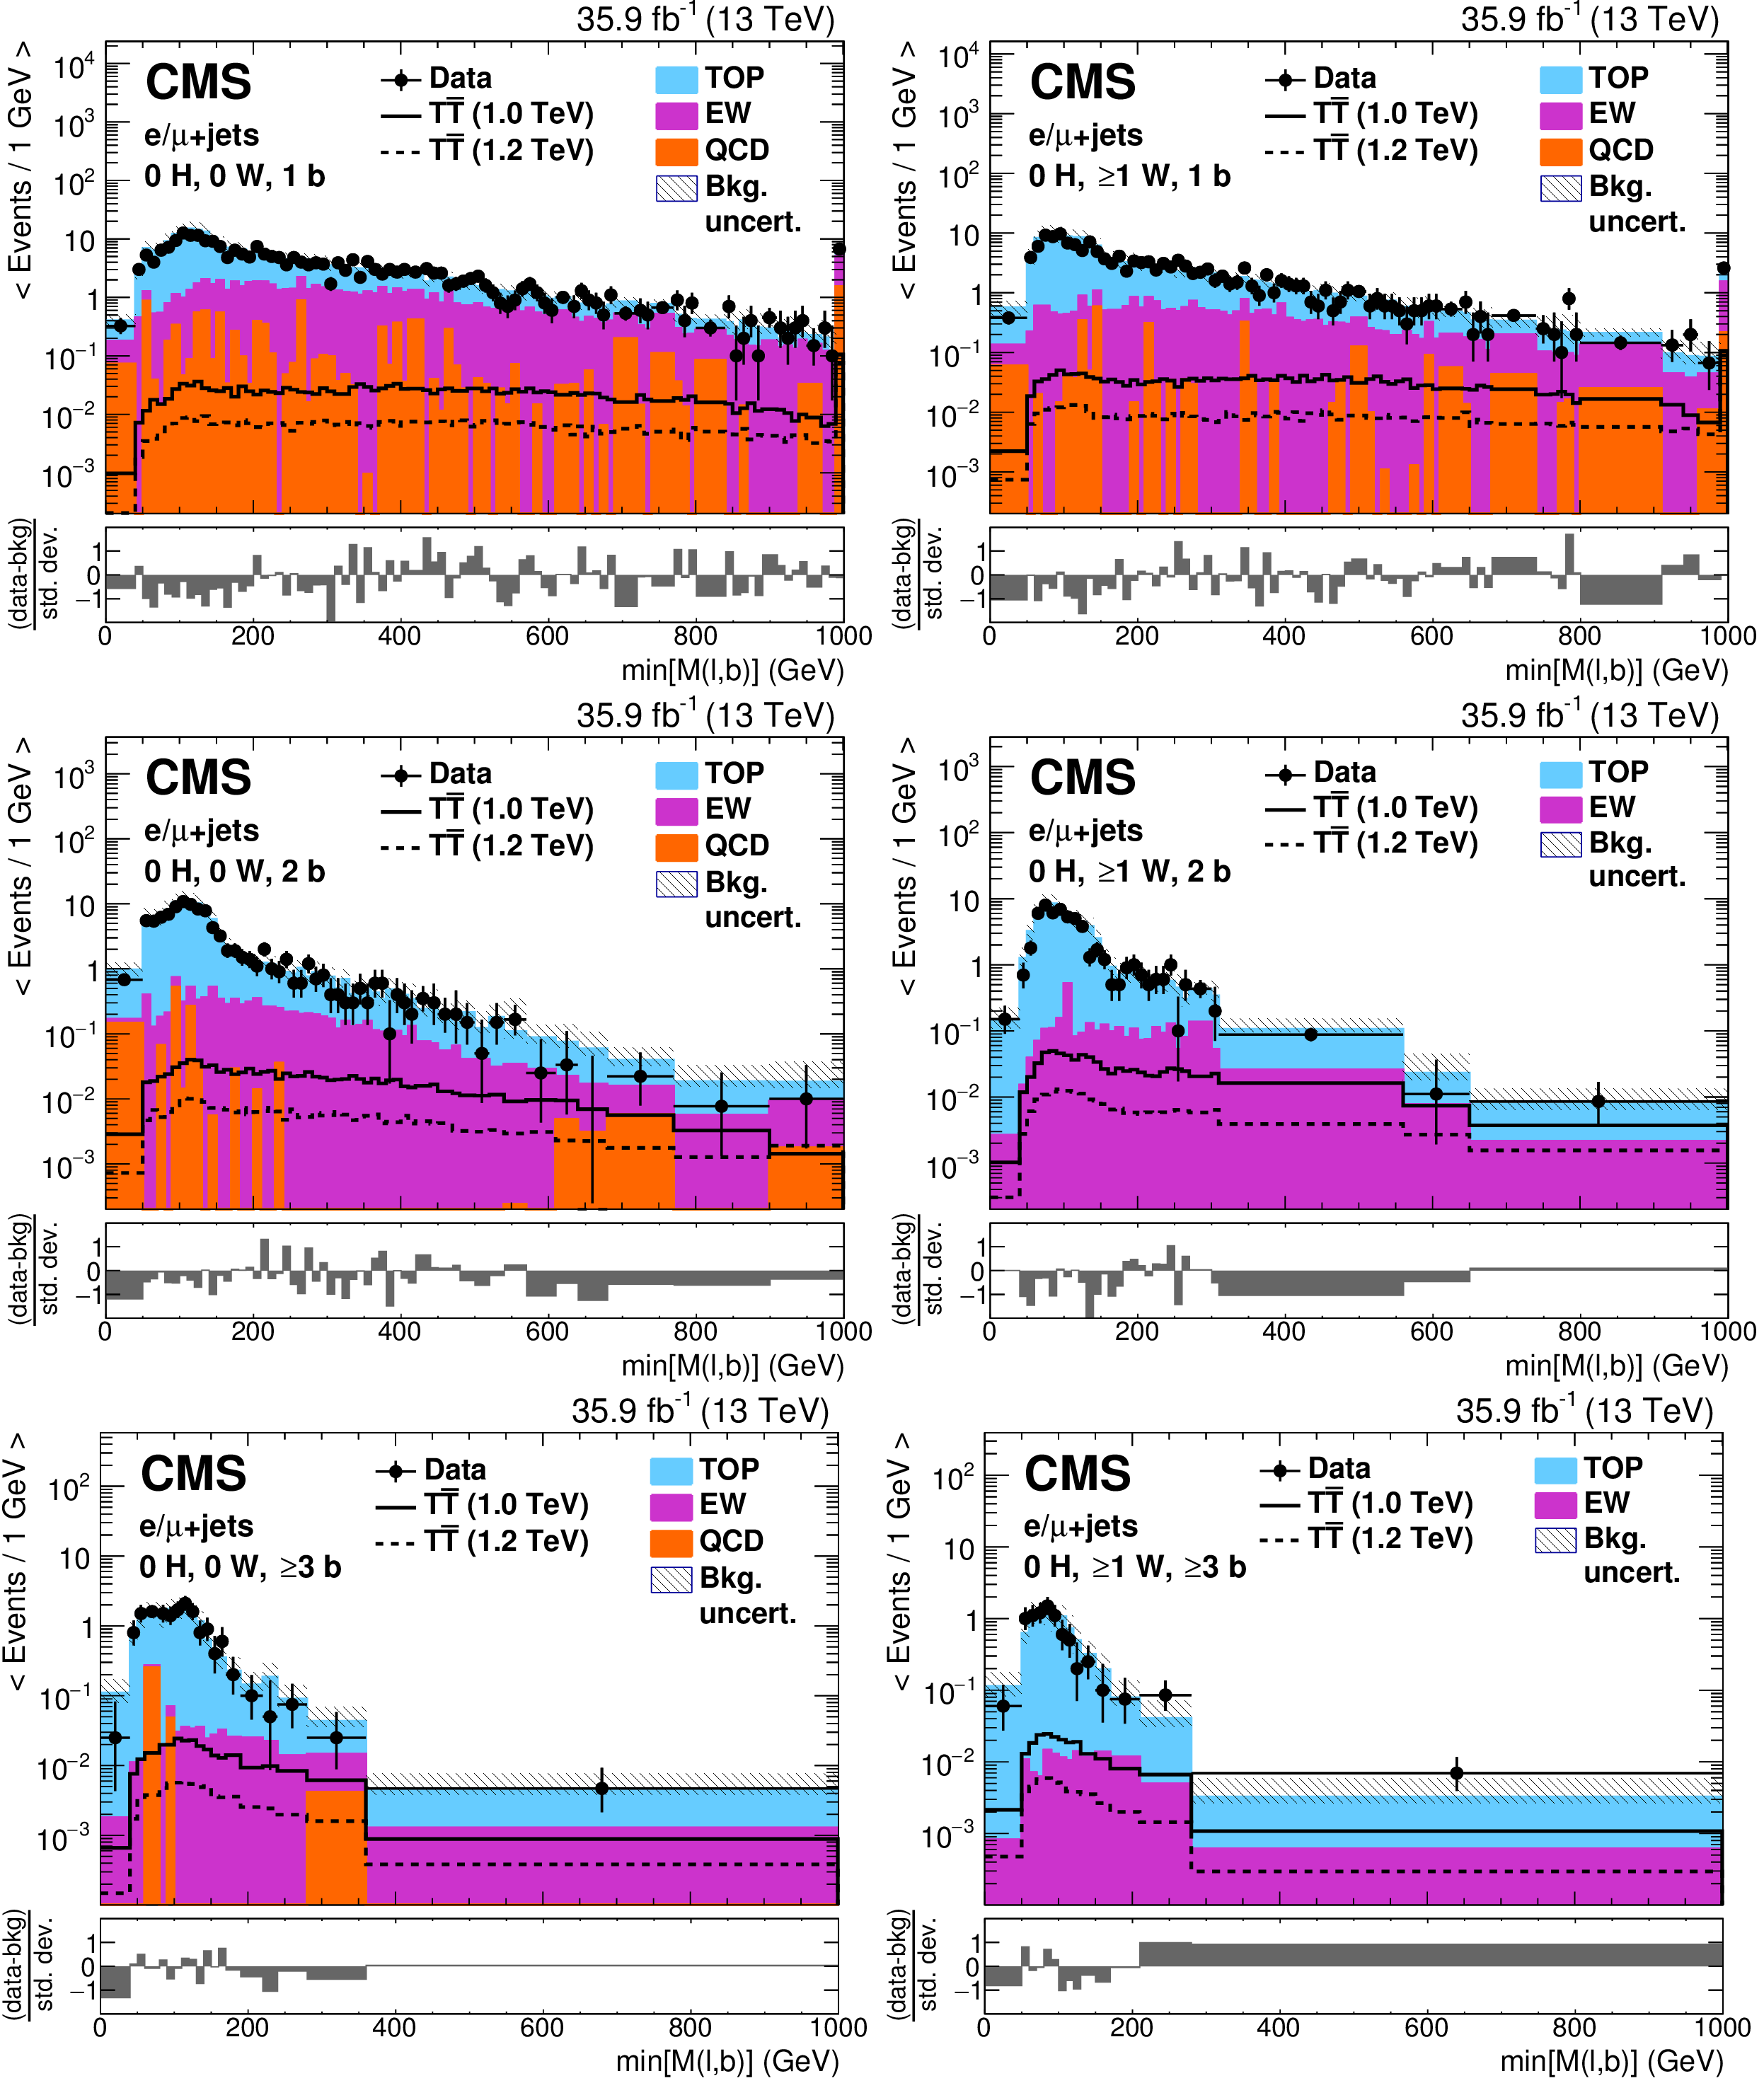
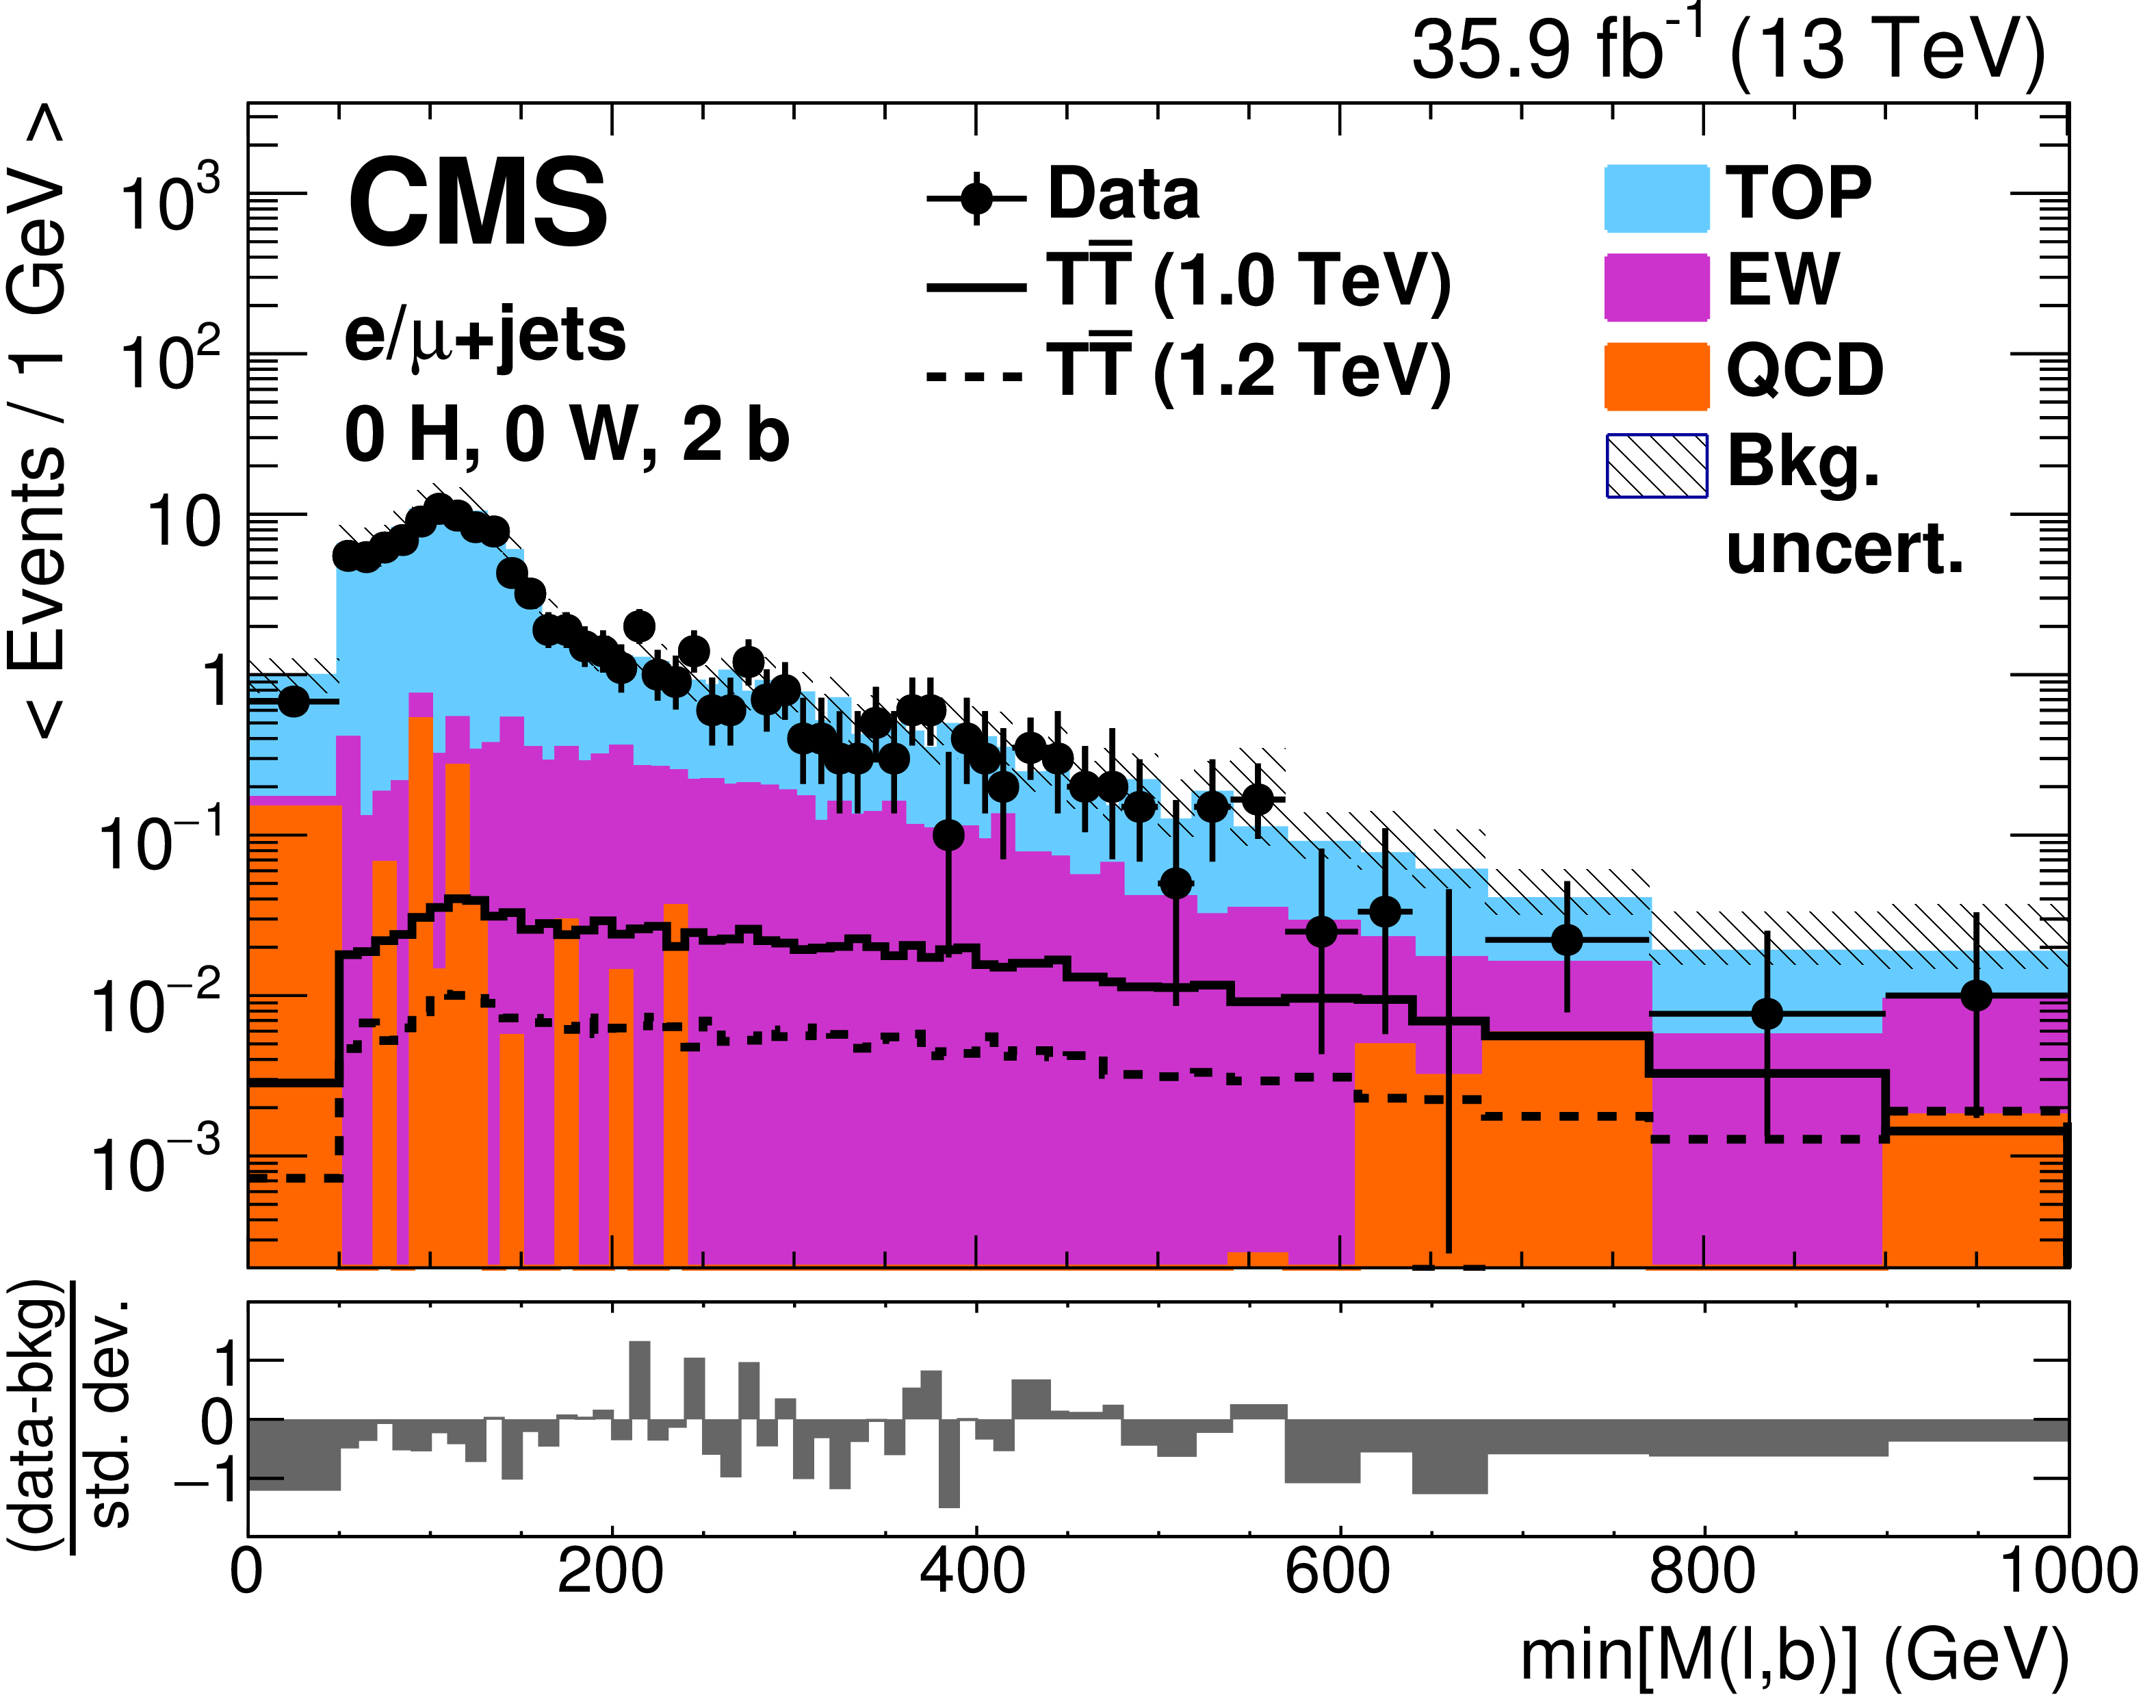
Figure 5:
Distributions of $ \mathrm{min}{[M(\ell, {\mathrm {b}})]} $ before the fit to data in the single-lepton W0 (left) or W1 (right) categories with 1, 2, or ${\geq}$3 (upper to lower) b-tagged jets. The black points are the data (horizontal bars indicate the bin width) and the filled histograms show the simulated background distributions, grouped into categories as described in Section 3. The expected signal is shown by solid and dotted lines for T quark masses of 1.0 and 1.2 TeV. The final bin includes overflow events. Uncertainties, indicated by the hatched area, include both statistical and systematic components The lower panel shows the difference between data and background divided by the total uncertainty. |

png pdf |
Figure 5-a:
Distribution of $ \mathrm{min}{[M(\ell, {\mathrm {b}})]} $ before the fit to data in the single-lepton W0 category with 1 b-tagged jet. The black points are the data (horizontal bars indicate the bin width) and the filled histograms show the simulated background distributions, grouped into categories as described in Section 3. The expected signal is shown by solid and dotted lines for T quark masses of 1.0 and 1.2 TeV. The final bin includes overflow events. Uncertainties, indicated by the hatched area, include both statistical and systematic components The lower panel shows the difference between data and background divided by the total uncertainty. |
png pdf |
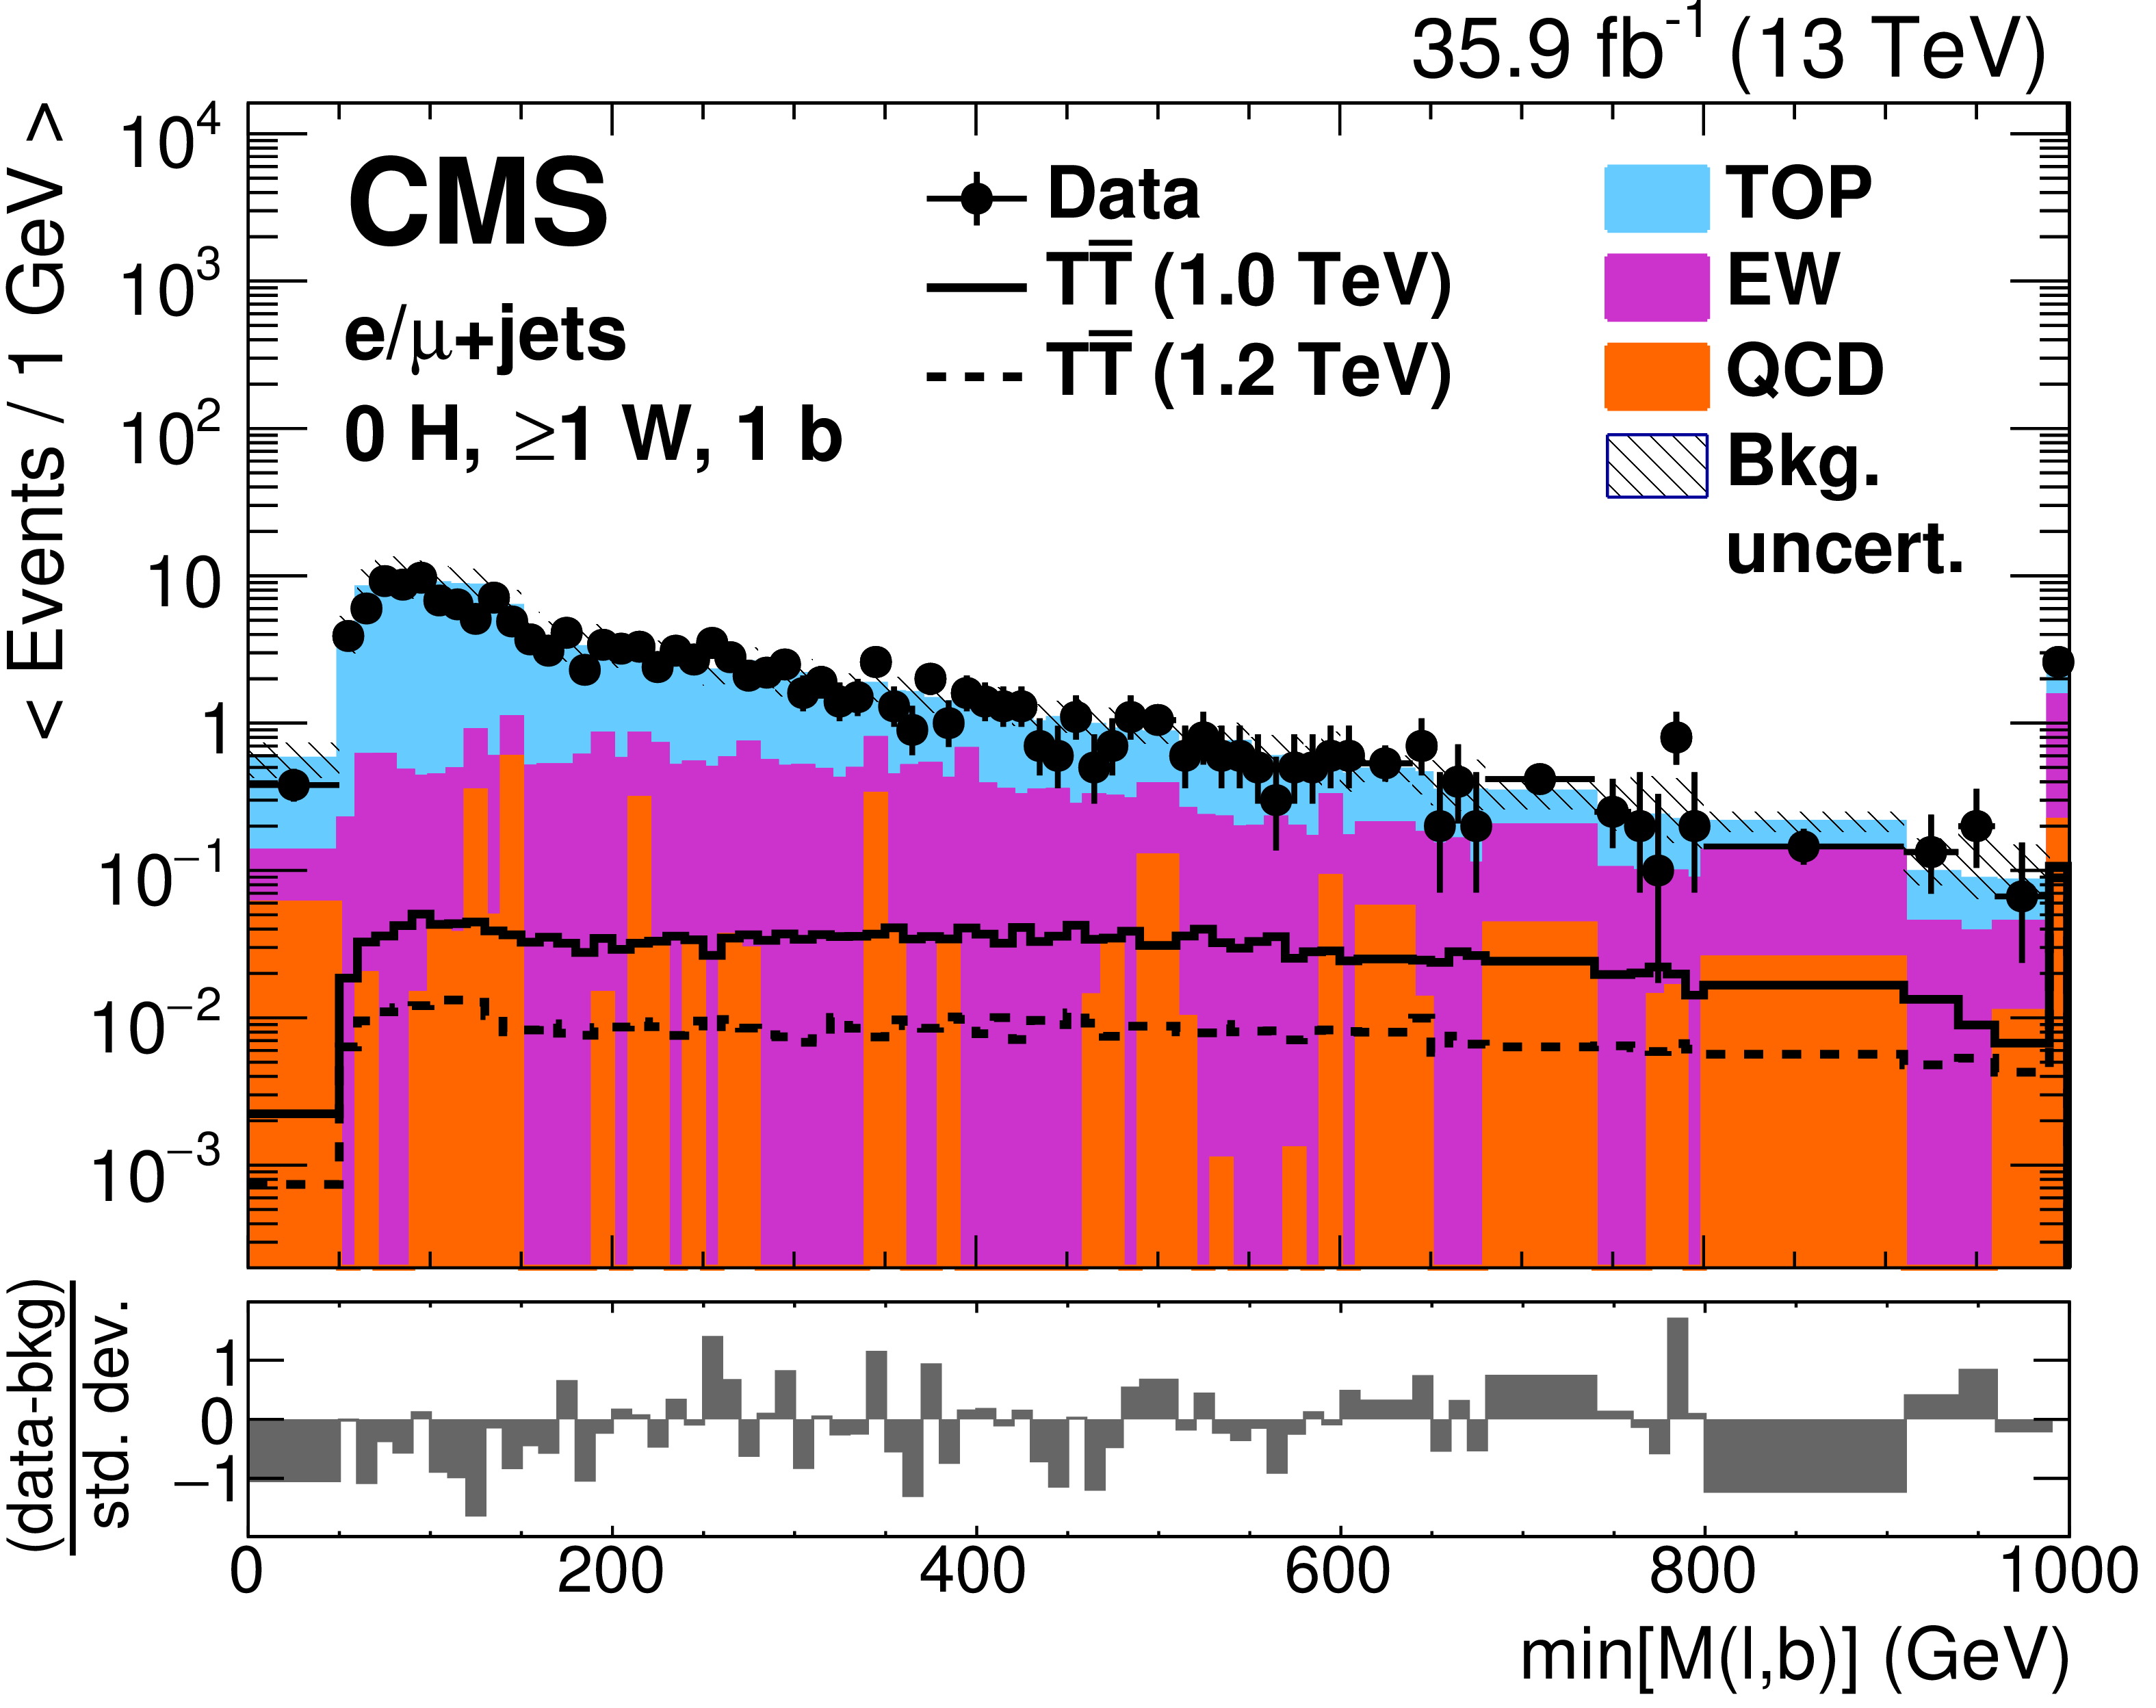
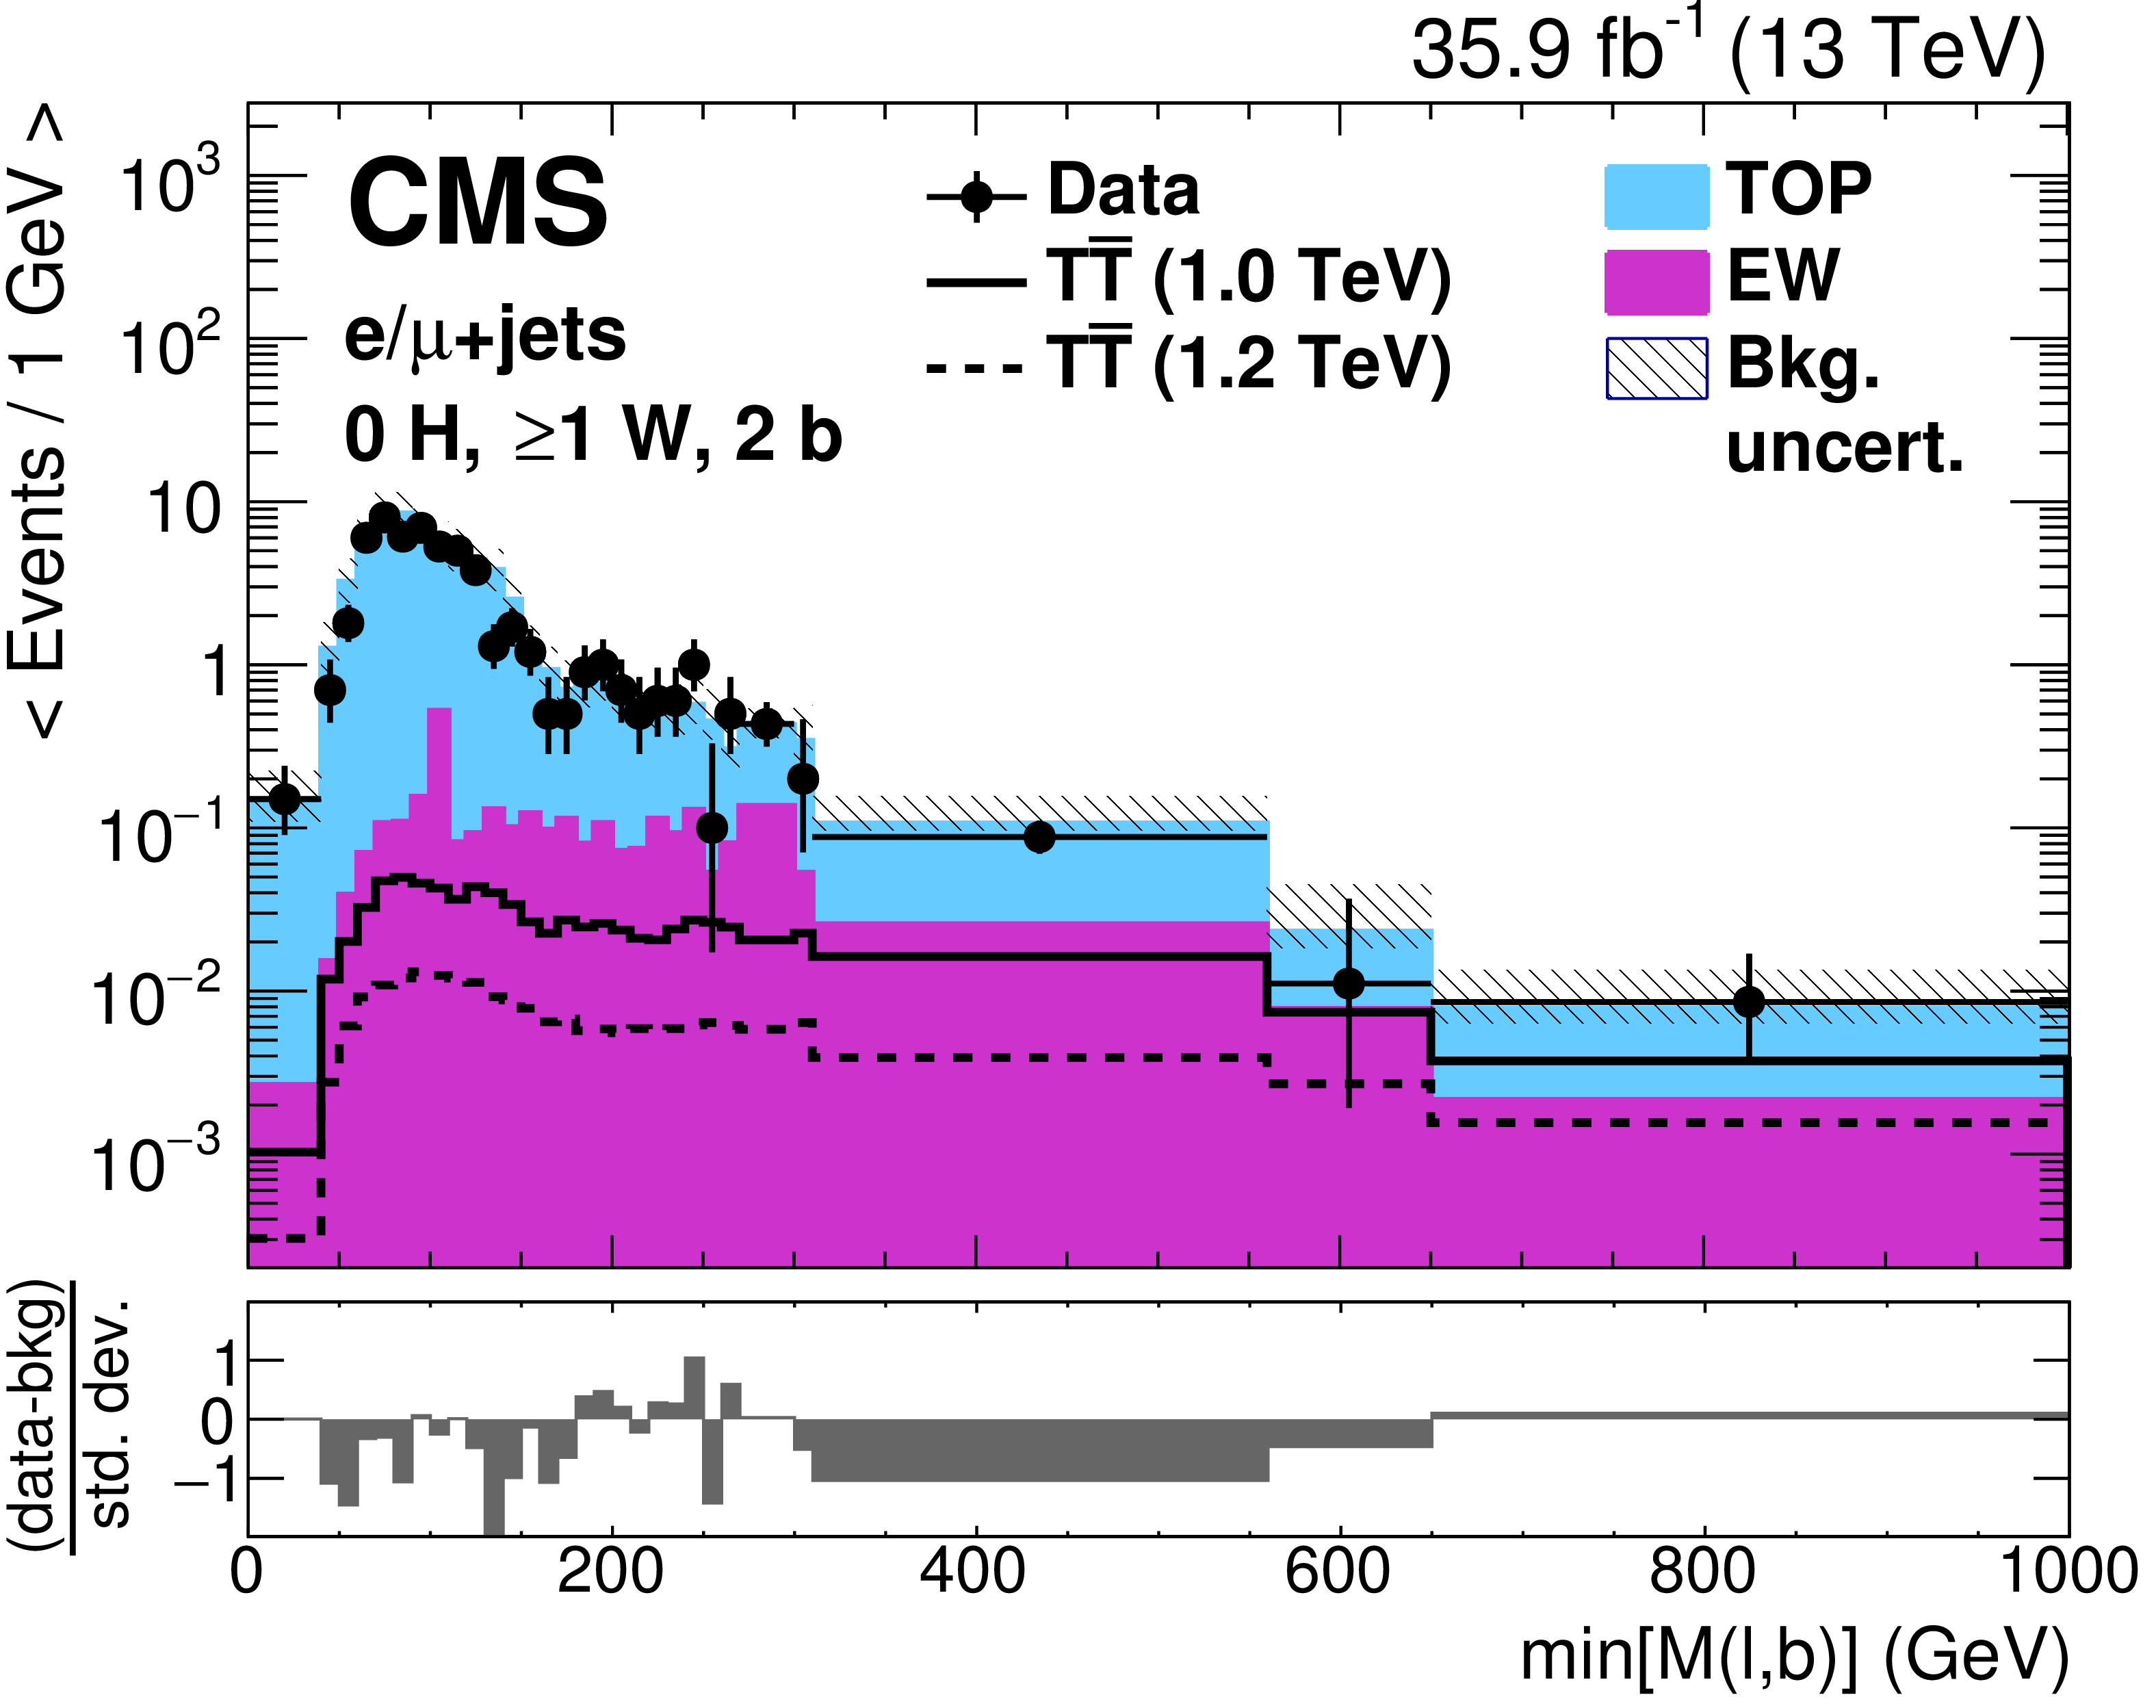
Figure 5-b:
Distribution of $ \mathrm{min}{[M(\ell, {\mathrm {b}})]} $ before the fit to data in the single-lepton W1 category with 1 b-tagged jet. The black points are the data (horizontal bars indicate the bin width) and the filled histograms show the simulated background distributions, grouped into categories as described in Section 3. The expected signal is shown by solid and dotted lines for T quark masses of 1.0 and 1.2 TeV. The final bin includes overflow events. Uncertainties, indicated by the hatched area, include both statistical and systematic components The lower panel shows the difference between data and background divided by the total uncertainty. |
png pdf |
Figure 5-c:
Distribution of $ \mathrm{min}{[M(\ell, {\mathrm {b}})]} $ before the fit to data in the single-lepton W0 category with 2 b-tagged jets. The black points are the data (horizontal bars indicate the bin width) and the filled histograms show the simulated background distributions, grouped into categories as described in Section 3. The expected signal is shown by solid and dotted lines for T quark masses of 1.0 and 1.2 TeV. The final bin includes overflow events. Uncertainties, indicated by the hatched area, include both statistical and systematic components The lower panel shows the difference between data and background divided by the total uncertainty. |
png pdf |
Figure 5-d:
Distribution of $ \mathrm{min}{[M(\ell, {\mathrm {b}})]} $ before the fit to data in the single-lepton W1 category with 2 b-tagged jets. The black points are the data (horizontal bars indicate the bin width) and the filled histograms show the simulated background distributions, grouped into categories as described in Section 3. The expected signal is shown by solid and dotted lines for T quark masses of 1.0 and 1.2 TeV. The final bin includes overflow events. Uncertainties, indicated by the hatched area, include both statistical and systematic components The lower panel shows the difference between data and background divided by the total uncertainty. |
png pdf |
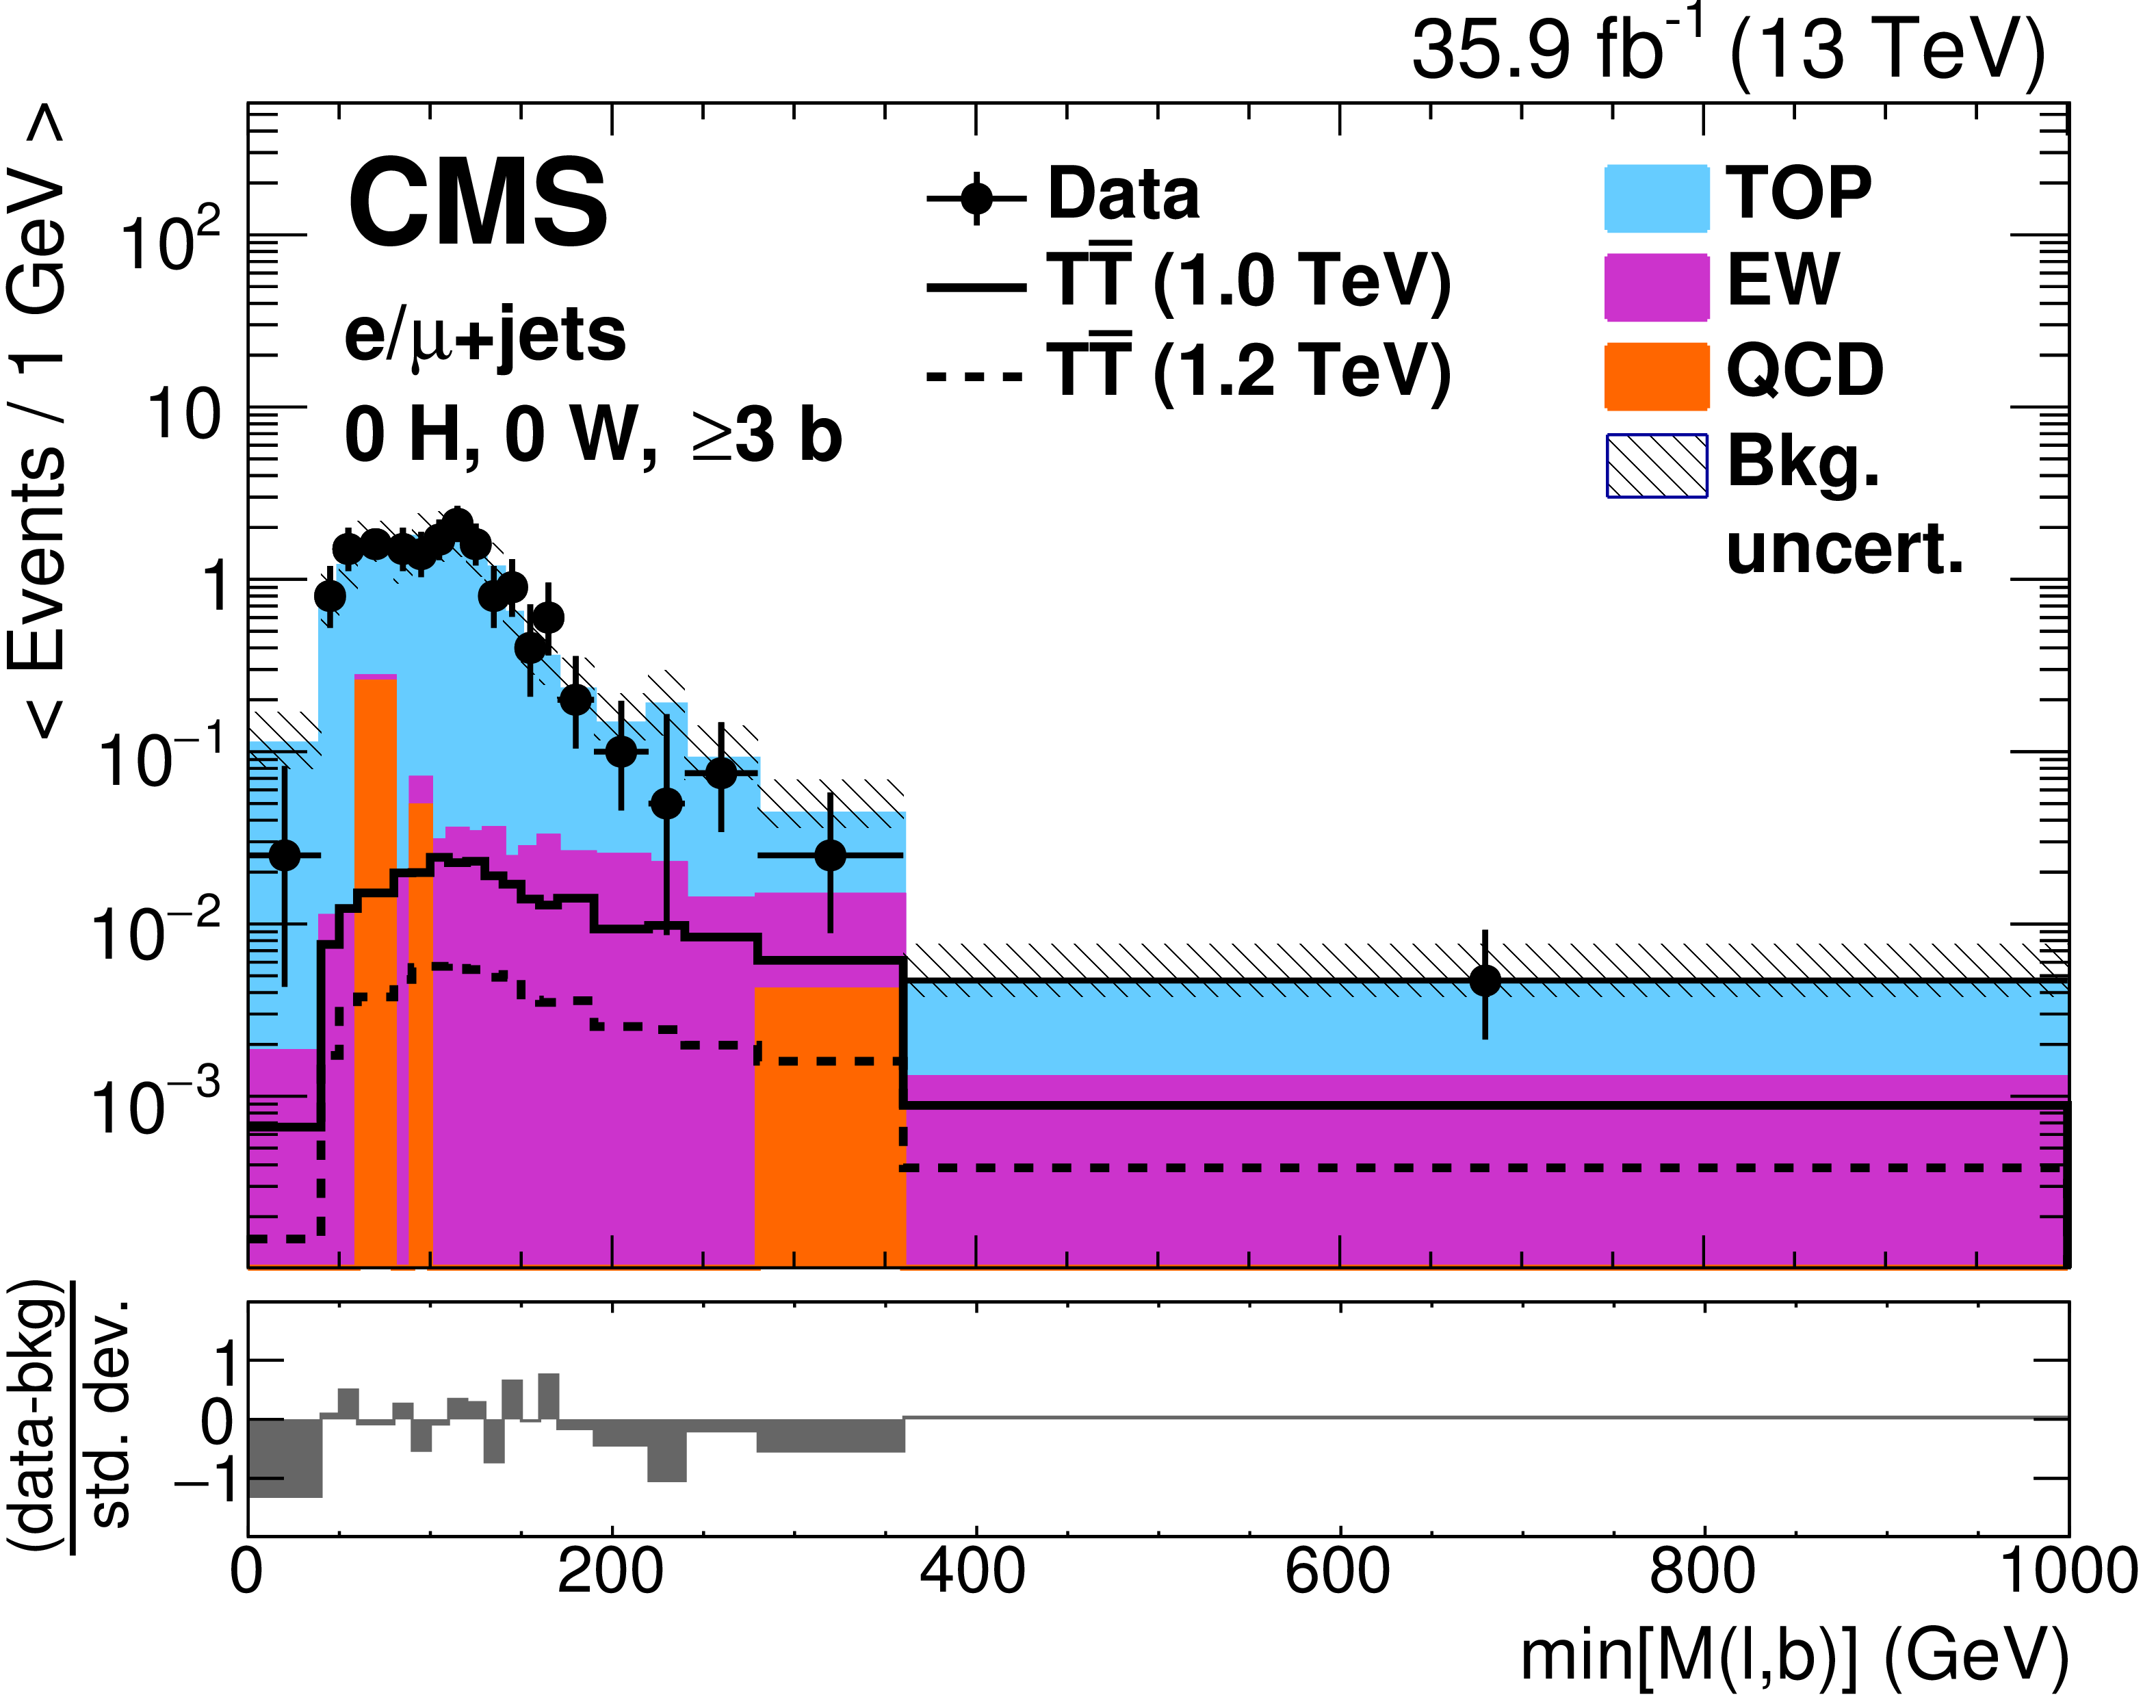
Figure 5-e:
Distribution of $ \mathrm{min}{[M(\ell, {\mathrm {b}})]} $ before the fit to data in the single-lepton W0 category with ${\geq}$3 b-tagged jets. The black points are the data (horizontal bars indicate the bin width) and the filled histograms show the simulated background distributions, grouped into categories as described in Section 3. The expected signal is shown by solid and dotted lines for T quark masses of 1.0 and 1.2 TeV. The final bin includes overflow events. Uncertainties, indicated by the hatched area, include both statistical and systematic components The lower panel shows the difference between data and background divided by the total uncertainty. |
png pdf |
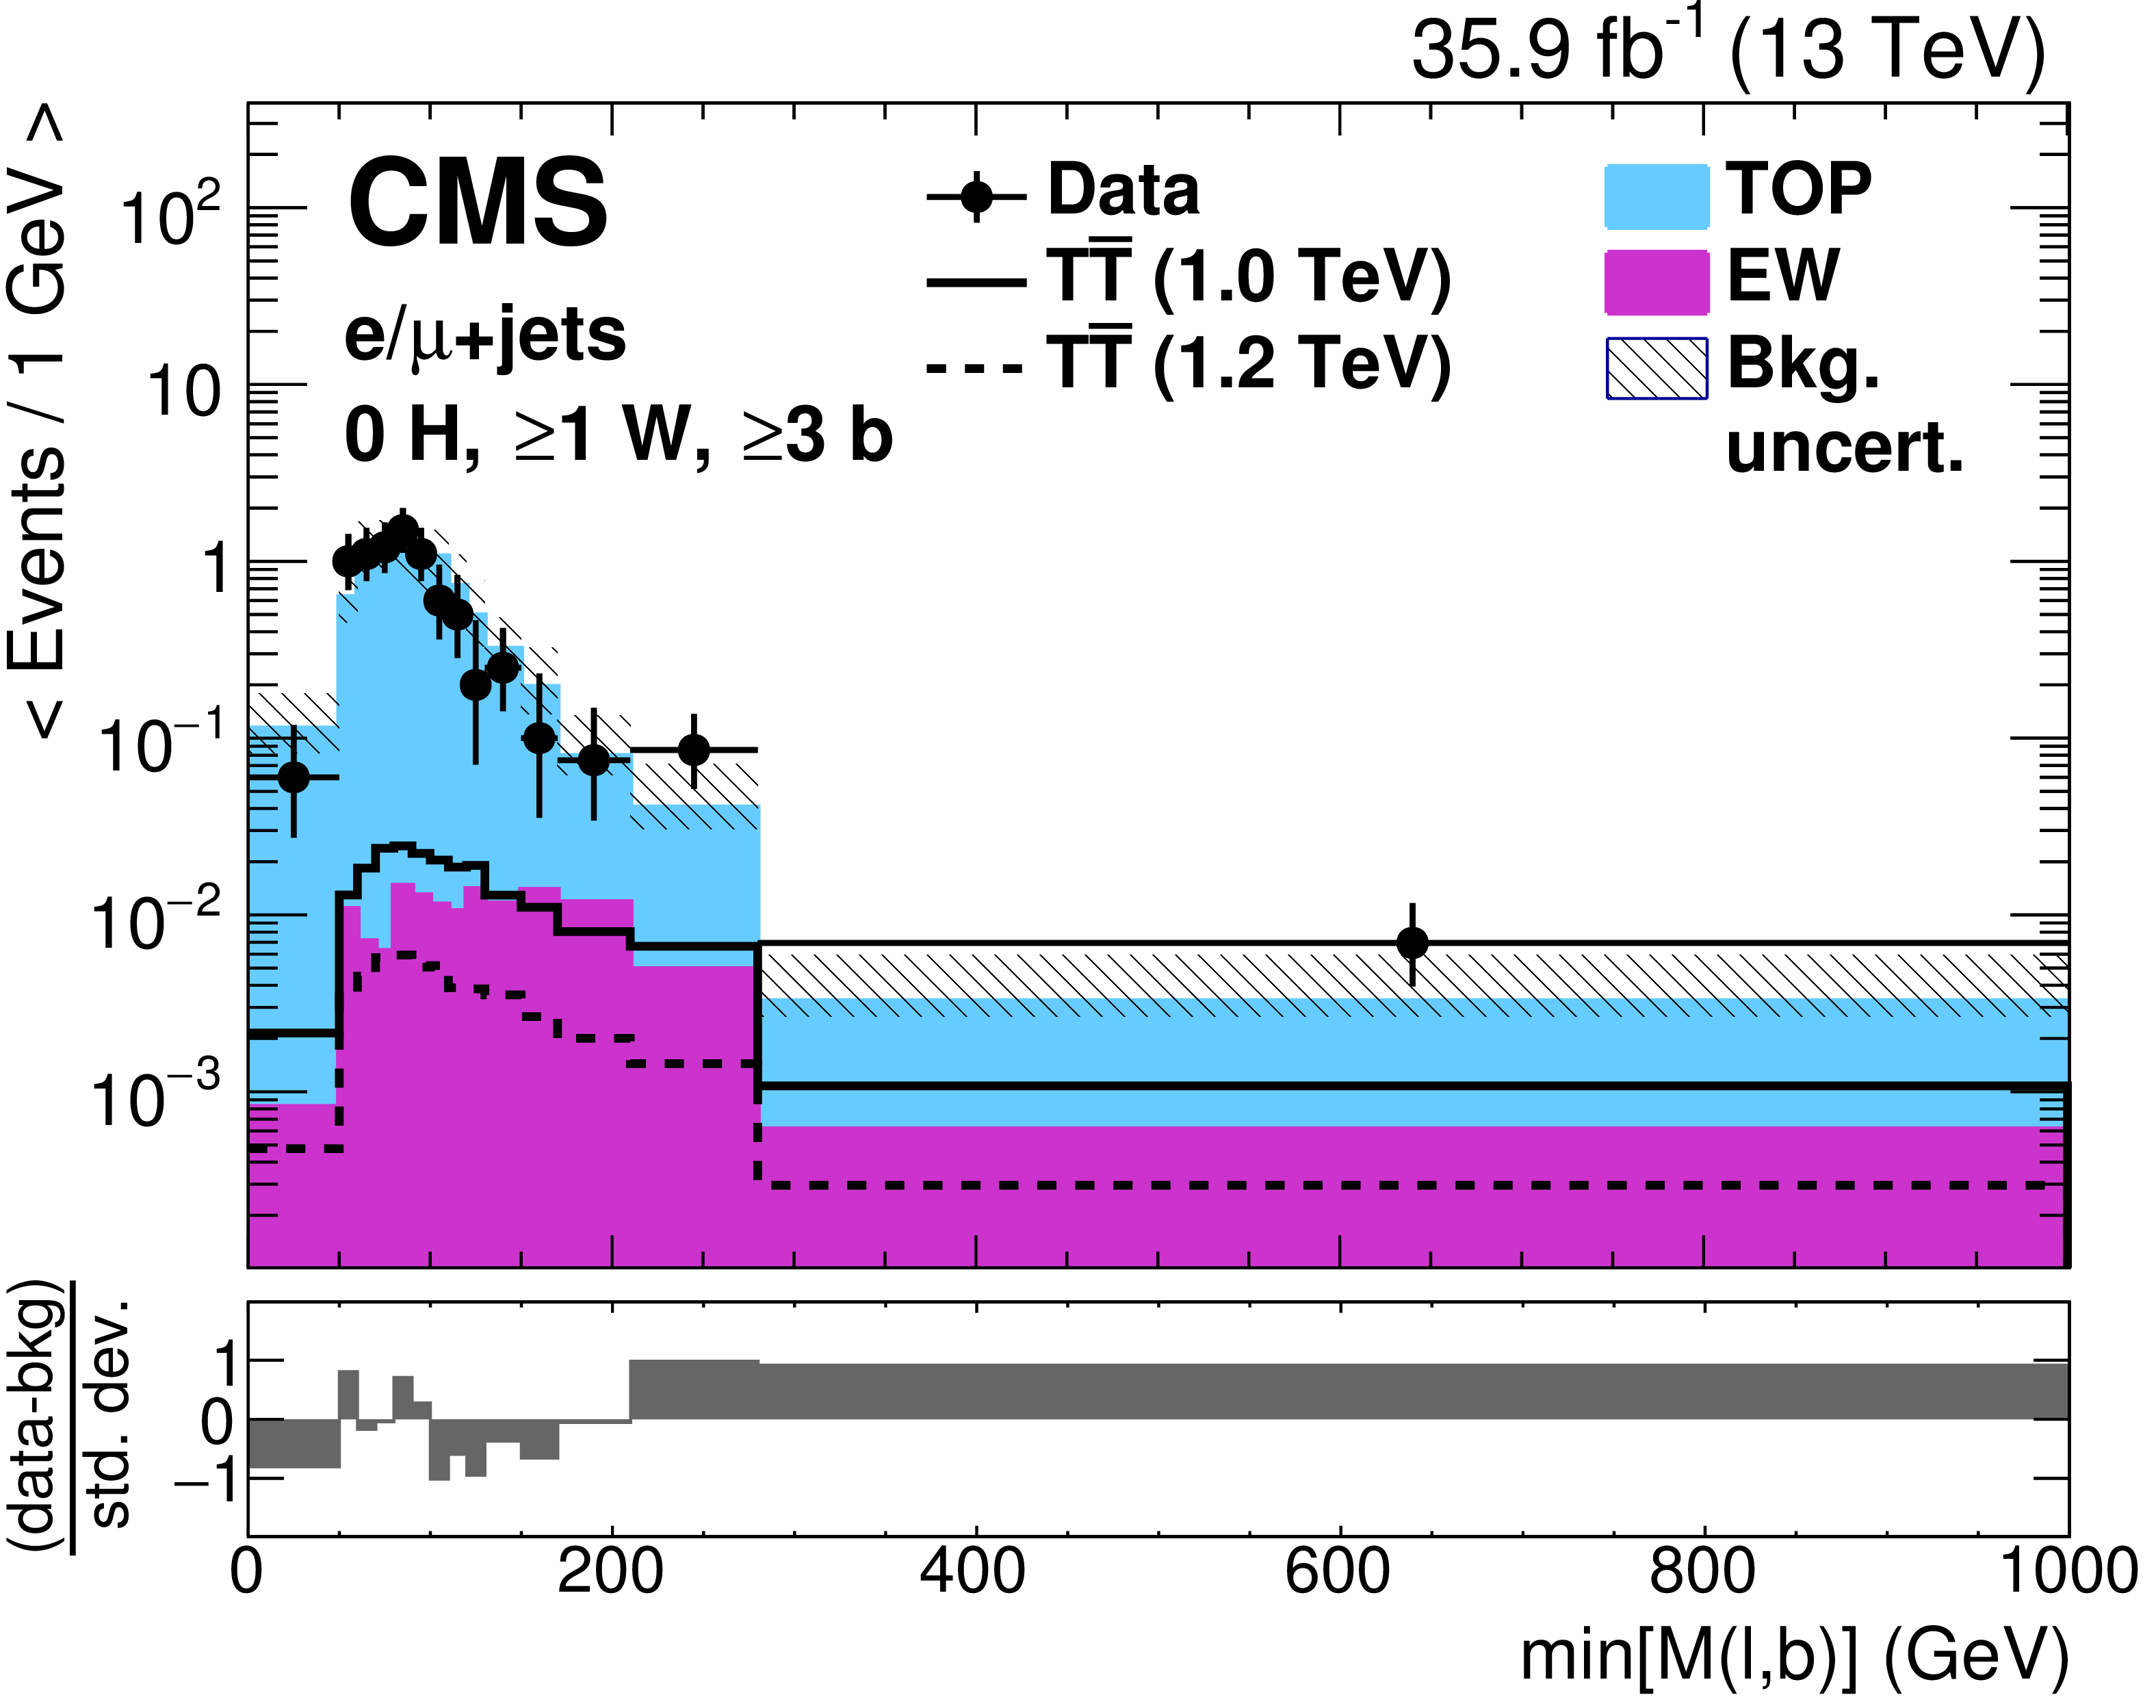
Figure 5-f:
Distribution of $ \mathrm{min}{[M(\ell, {\mathrm {b}})]} $ before the fit to data in the single-lepton W1 category with ${\geq}$3 b-tagged jets. The black points are the data (horizontal bars indicate the bin width) and the filled histograms show the simulated background distributions, grouped into categories as described in Section 3. The expected signal is shown by solid and dotted lines for T quark masses of 1.0 and 1.2 TeV. The final bin includes overflow events. Uncertainties, indicated by the hatched area, include both statistical and systematic components The lower panel shows the difference between data and background divided by the total uncertainty. |
png pdf |
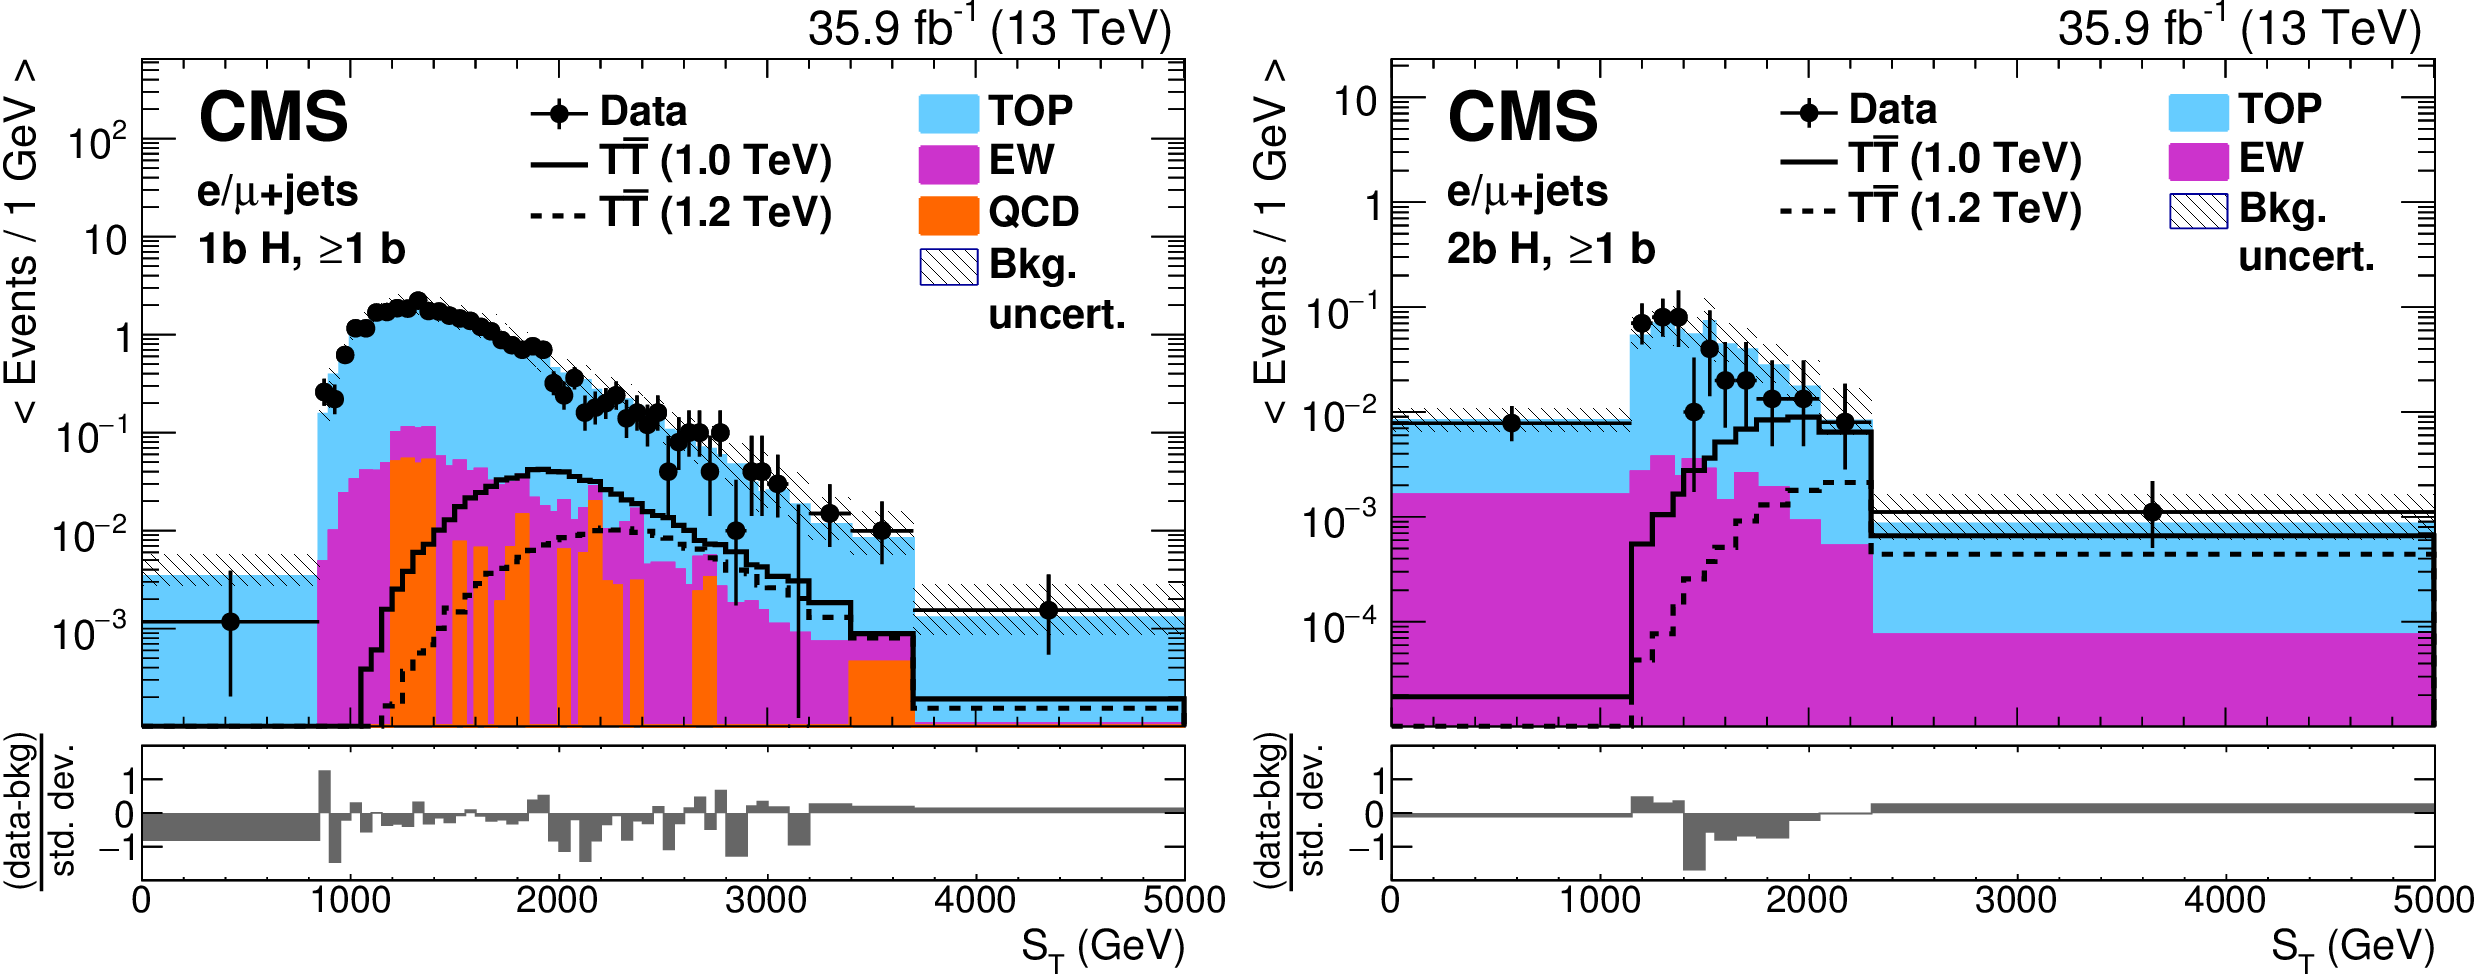
Figure 6:
Distributions of $ {S_\mathrm {T}} $ before the fit to data in the single-lepton H1b (left) or H2b (right) categories. Uncertainties, indicated by the hatched area, include both statistical and systematic components. The black points are the data (horizontal bars indicate the bin width) and the filled histograms show the simulated background distributions, grouped into categories as described in Section 3. The final bin includes overflow events. The expected signal is shown by solid and dotted lines for T quark masses of 1.0 and 1.2 TeV. The lower panel shows the difference between data and background divided by the total uncertainty. |
png pdf |
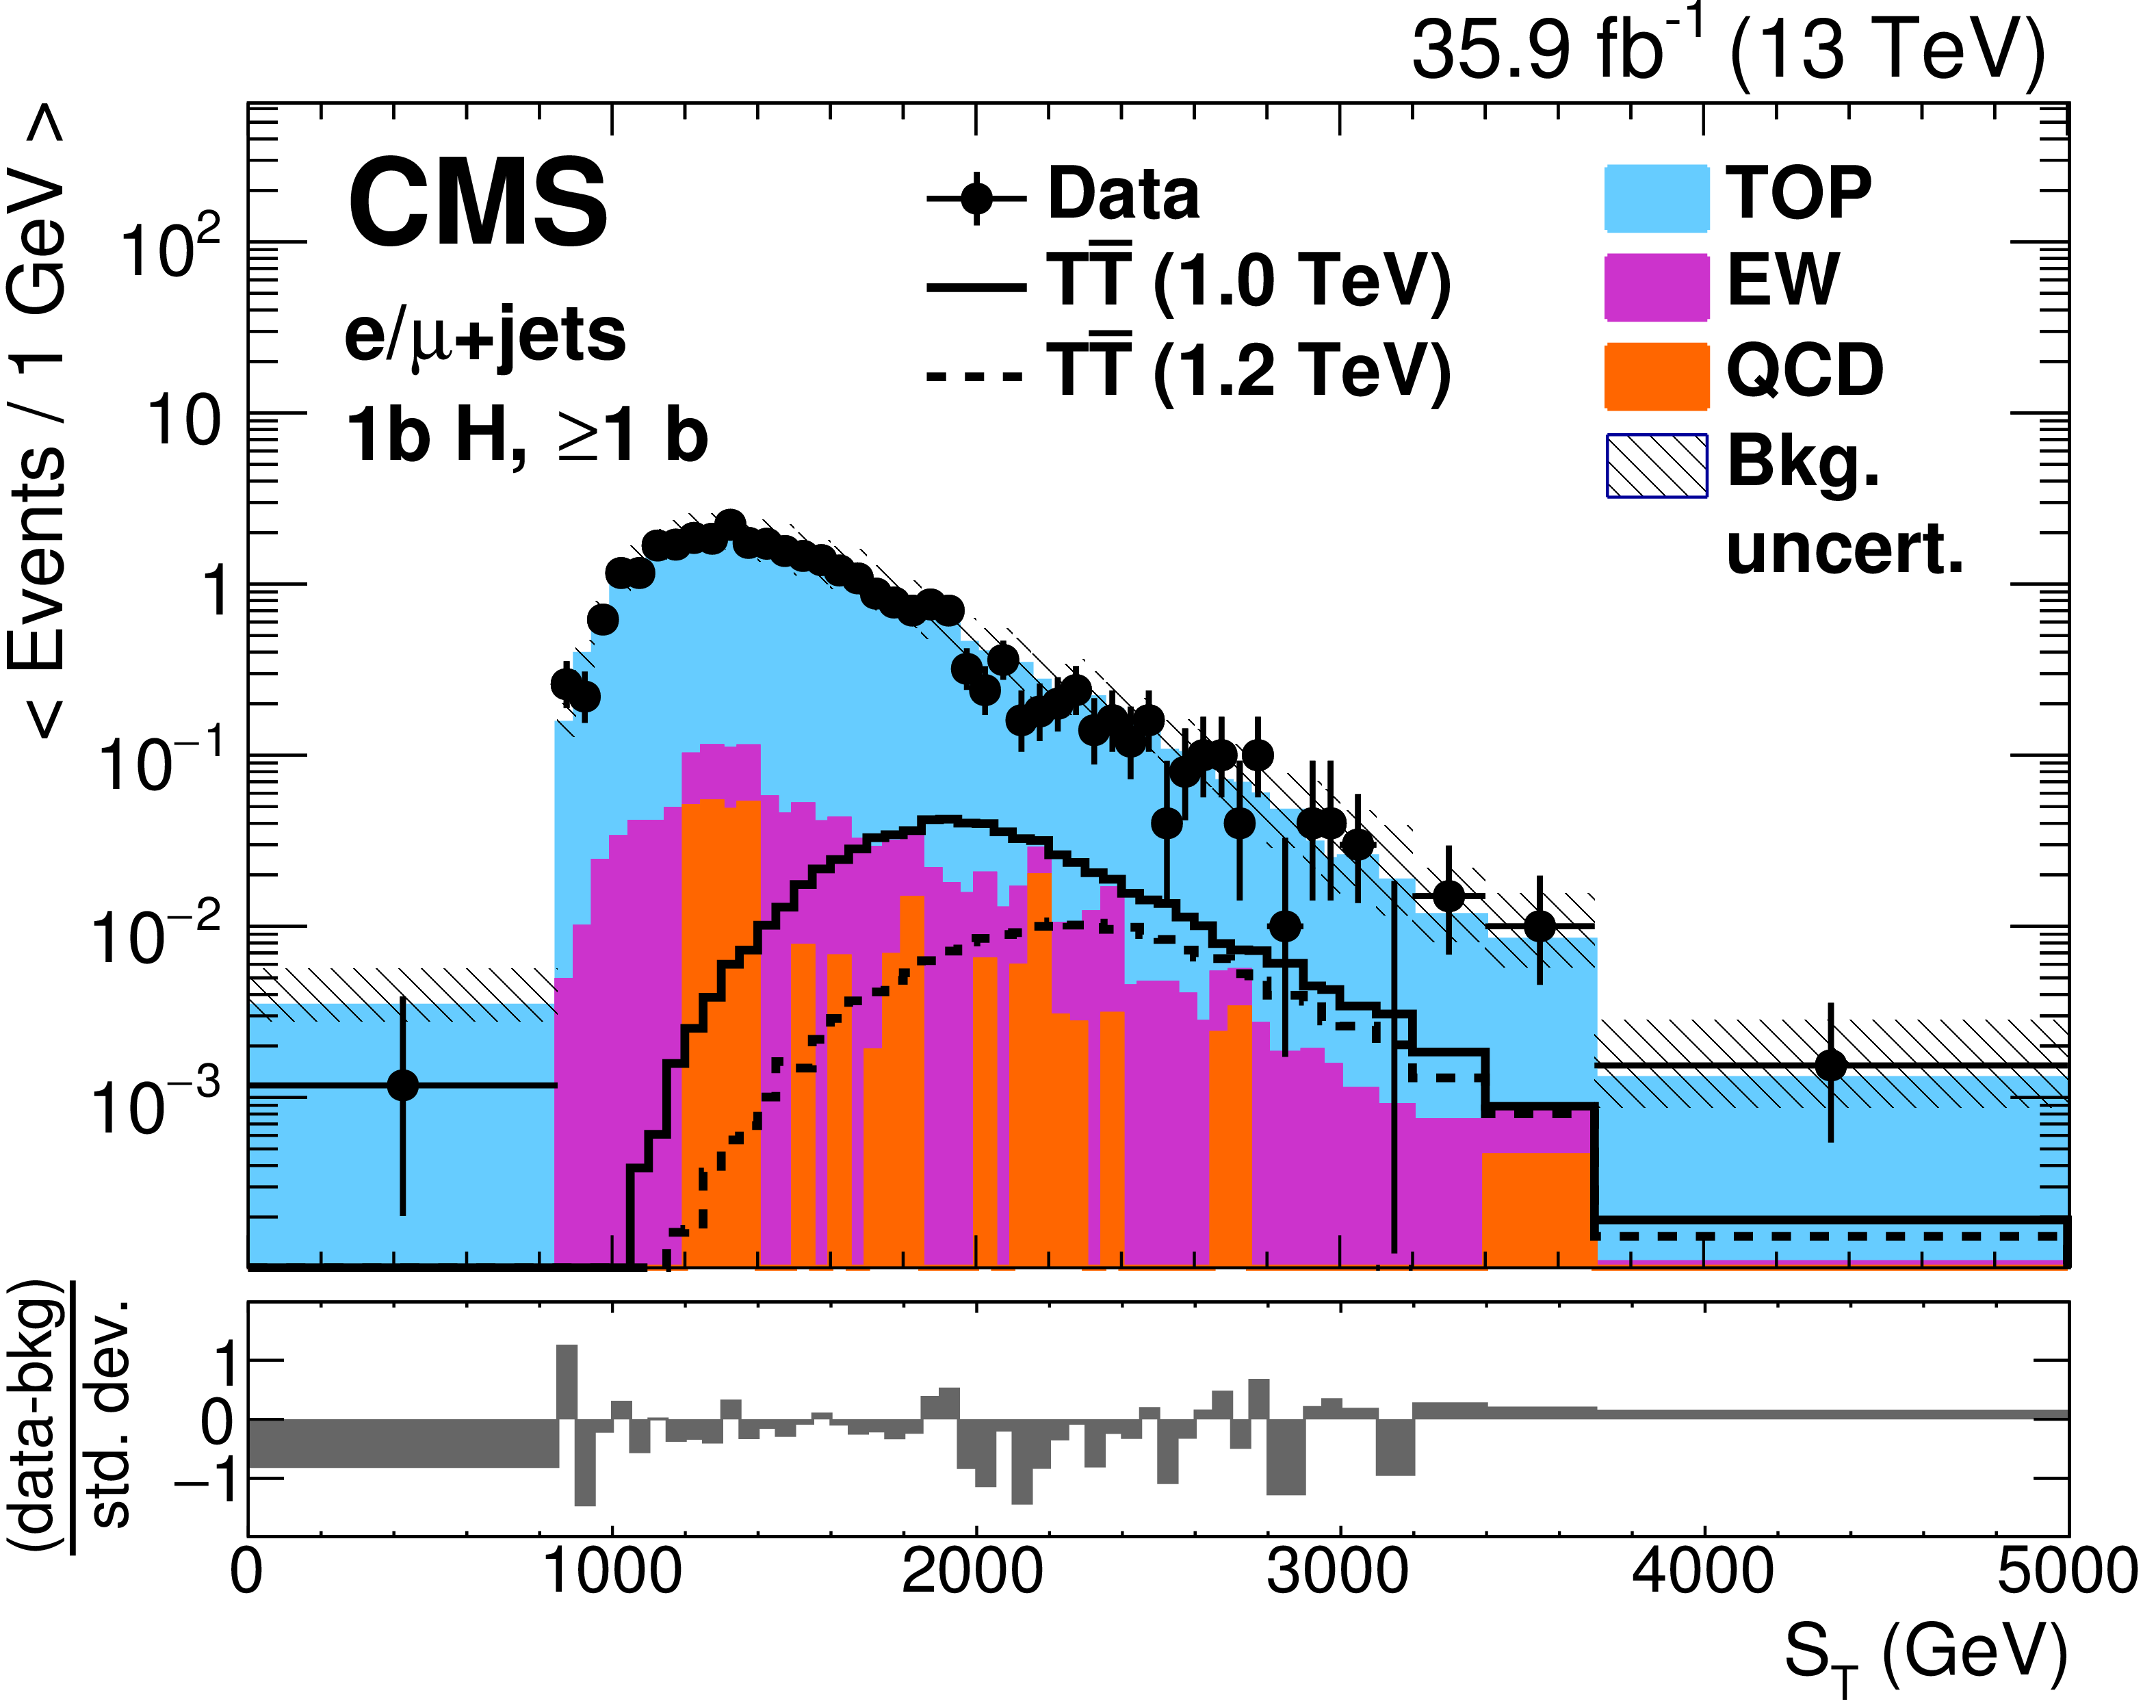
Figure 6-a:
Distribution of $ {S_\mathrm {T}} $ before the fit to data in the single-lepton H1b category. Uncertainties, indicated by the hatched area, include both statistical and systematic components. The black points are the data (horizontal bars indicate the bin width) and the filled histograms show the simulated background distributions, grouped into categories as described in Section 3. The final bin includes overflow events. The expected signal is shown by solid and dotted lines for T quark masses of 1.0 and 1.2 TeV. The lower panel shows the difference between data and background divided by the total uncertainty. |
png pdf |
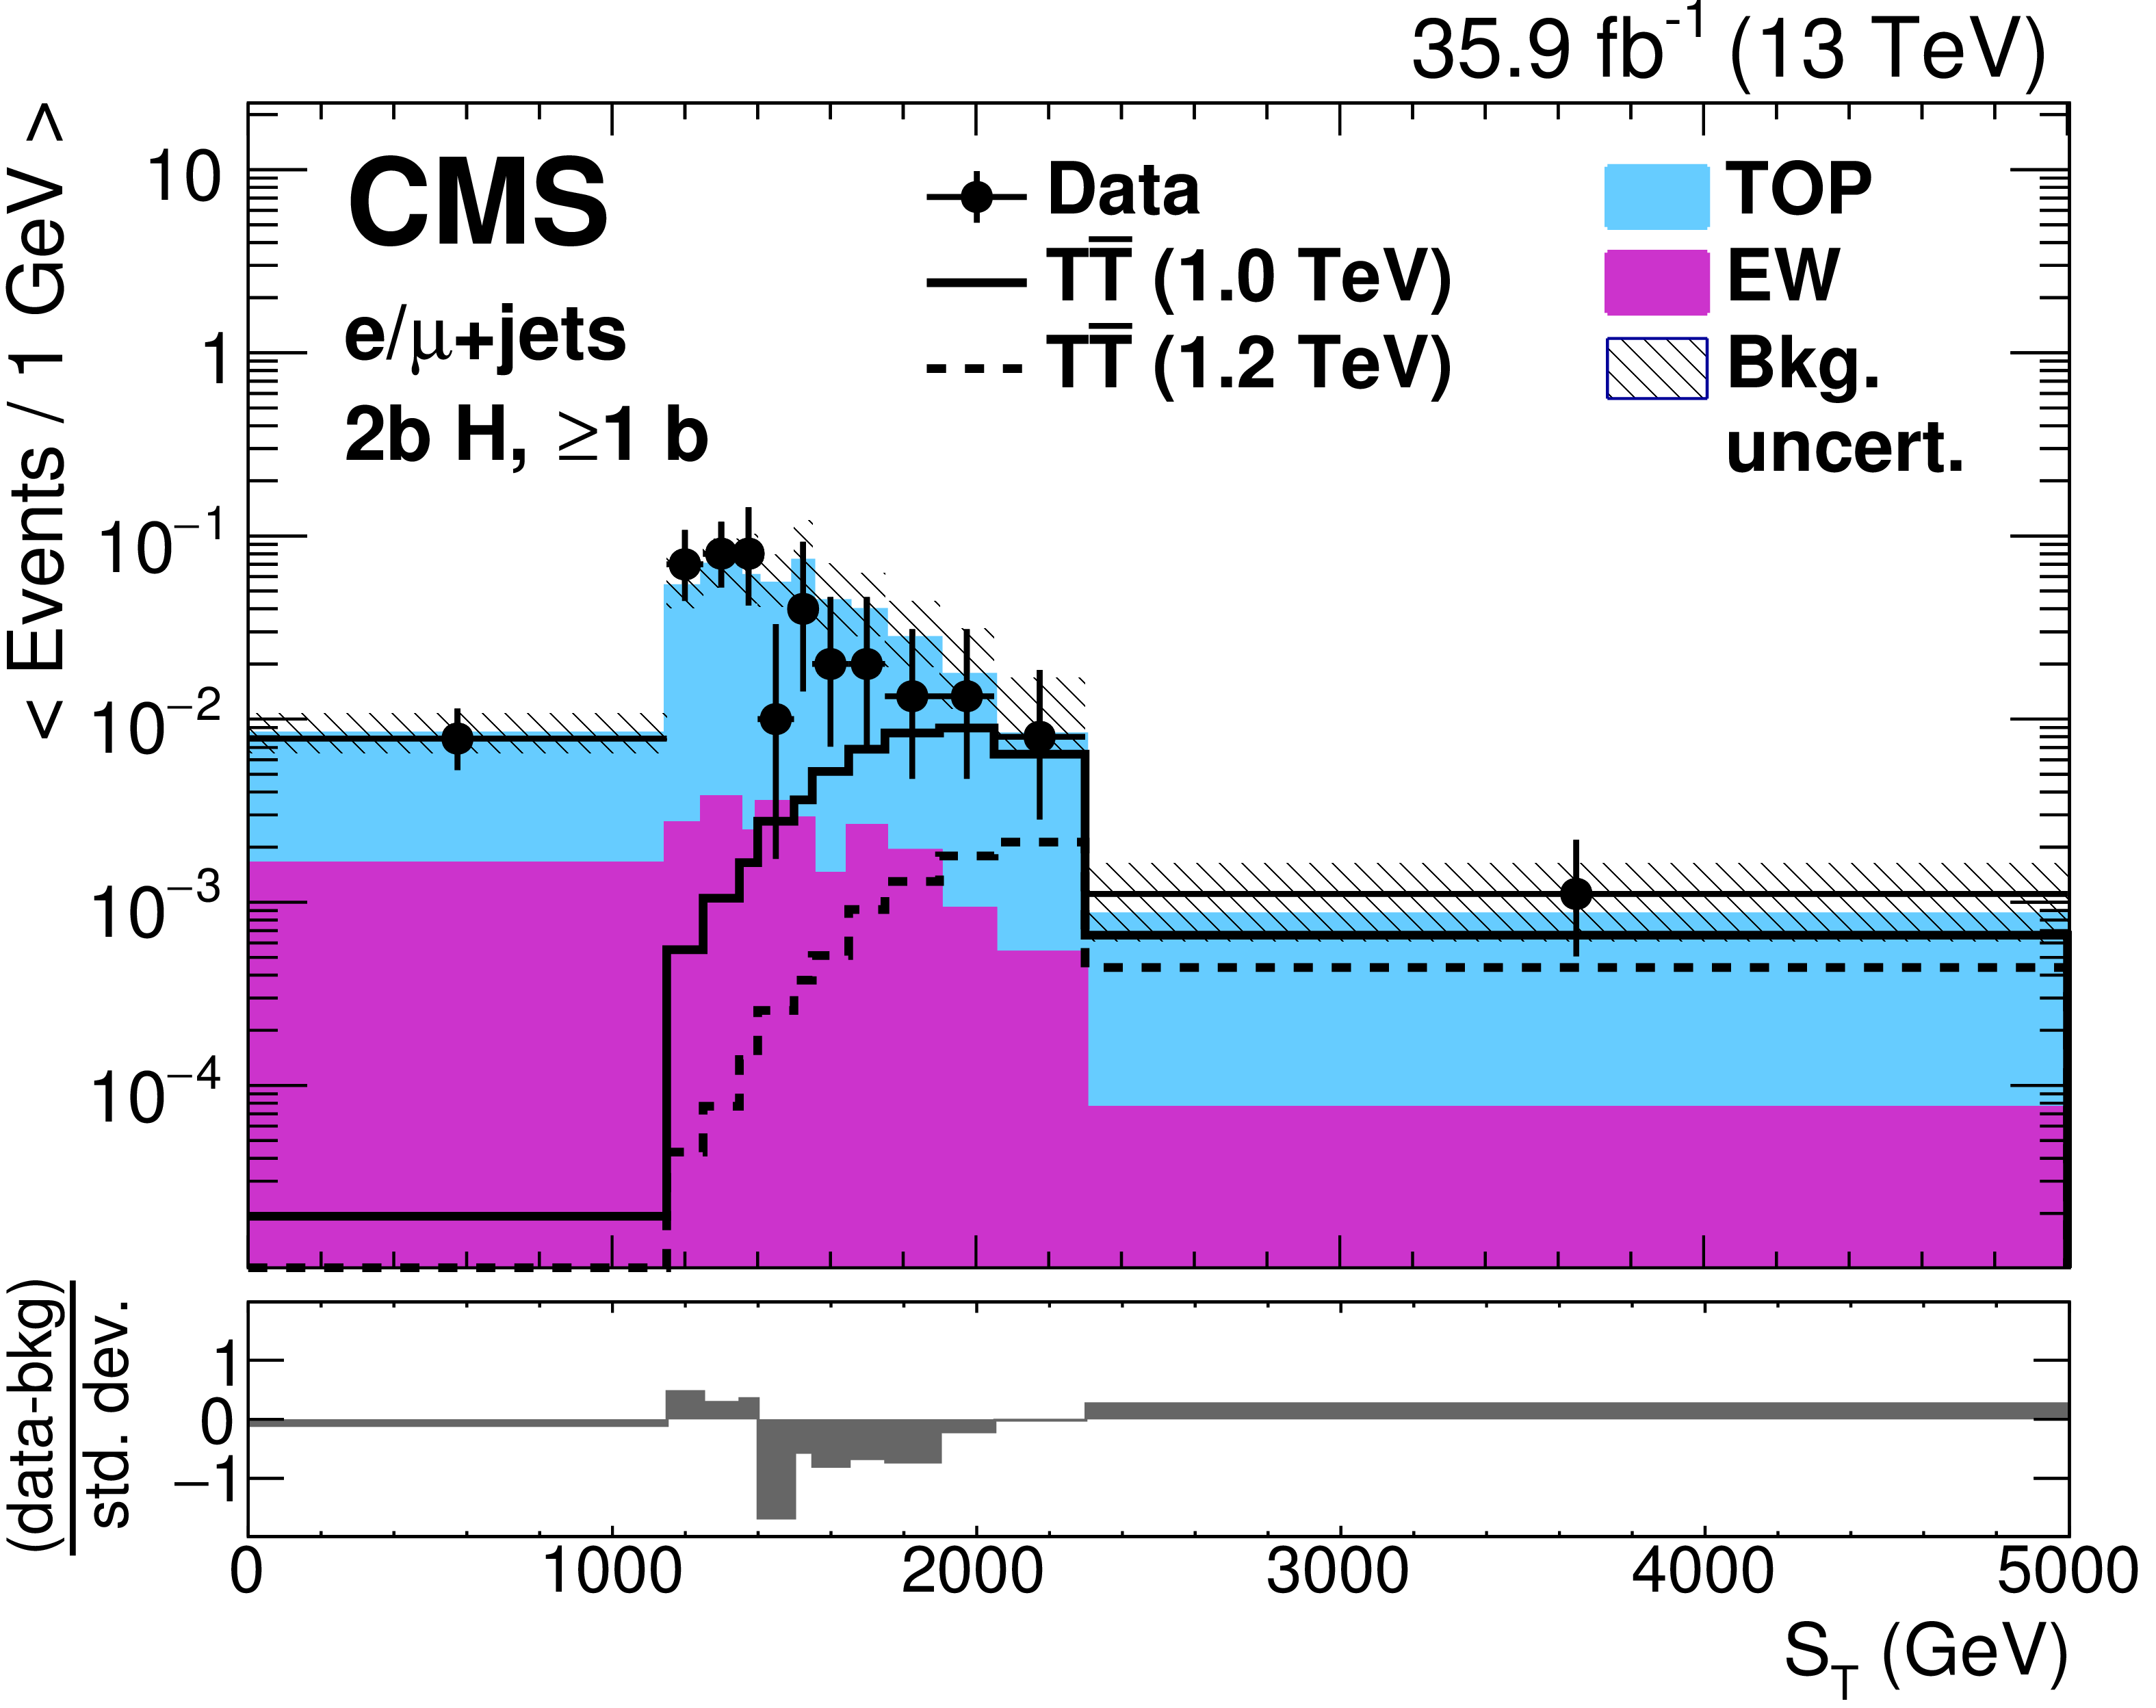
Figure 6-b:
Distribution of $ {S_\mathrm {T}} $ before the fit to data in the single-lepton H2b category. Uncertainties, indicated by the hatched area, include both statistical and systematic components. The black points are the data (horizontal bars indicate the bin width) and the filled histograms show the simulated background distributions, grouped into categories as described in Section 3. The final bin includes overflow events. The expected signal is shown by solid and dotted lines for T quark masses of 1.0 and 1.2 TeV. The lower panel shows the difference between data and background divided by the total uncertainty. |
png pdf |
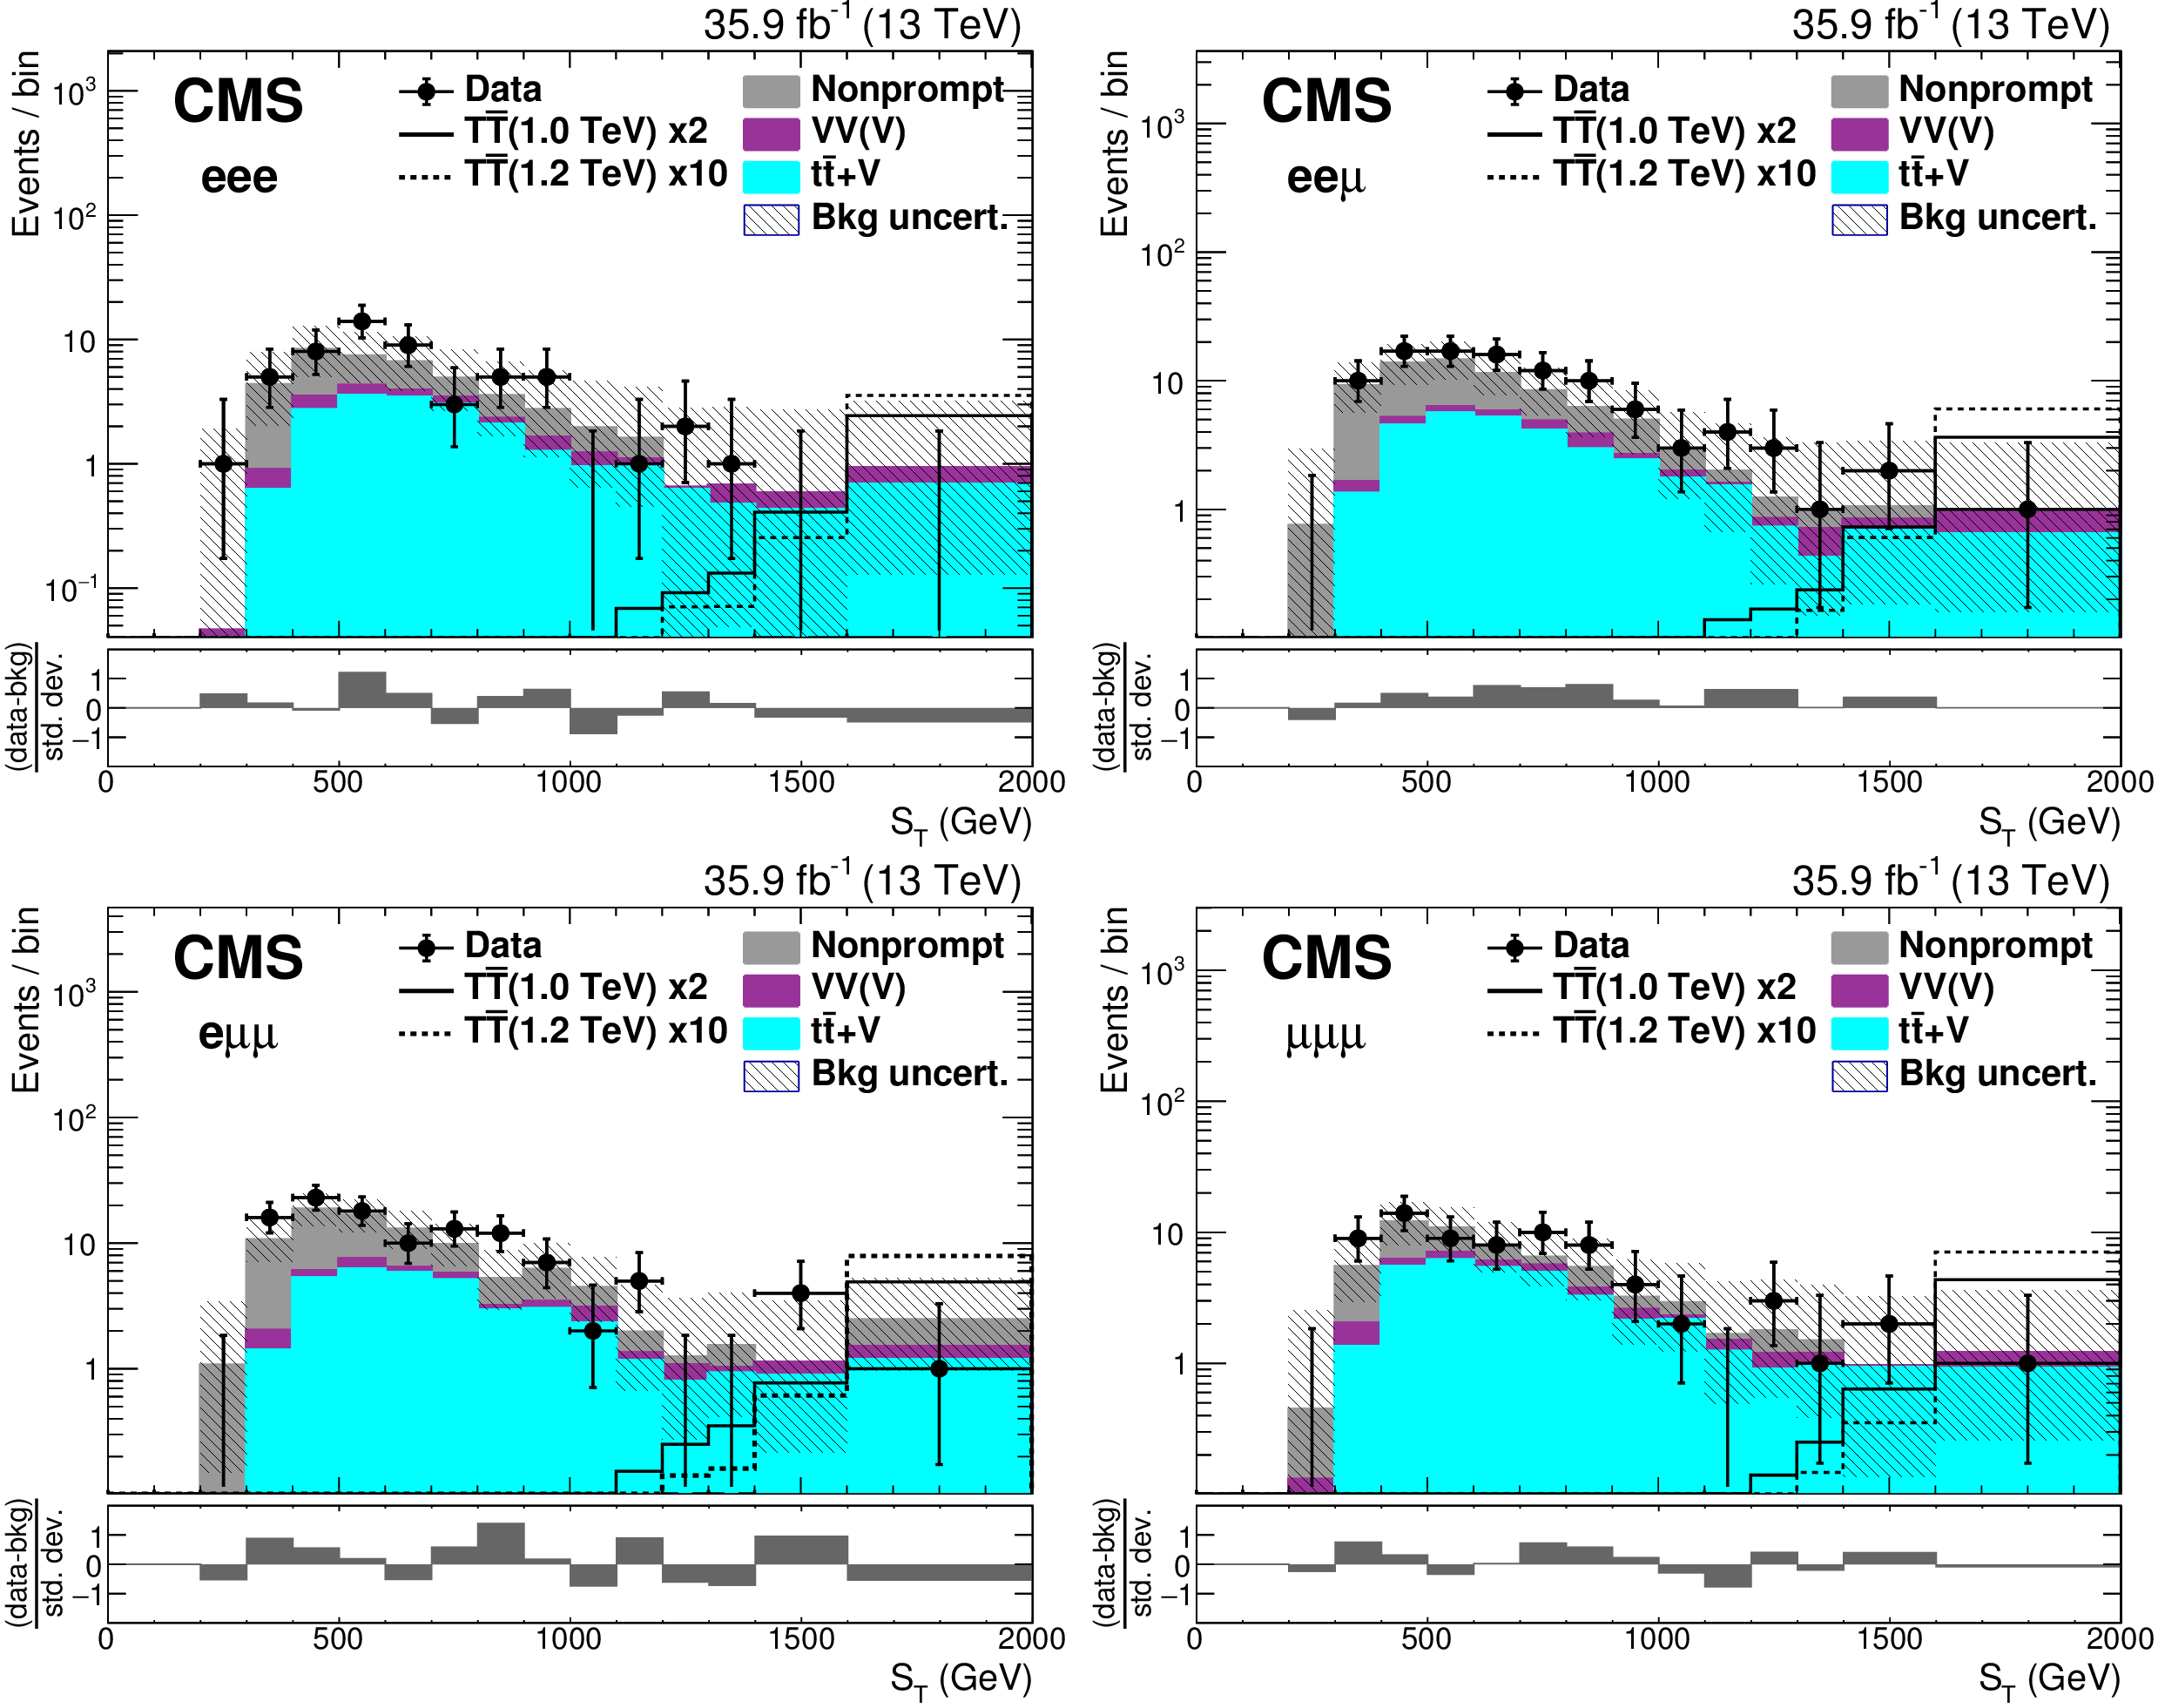
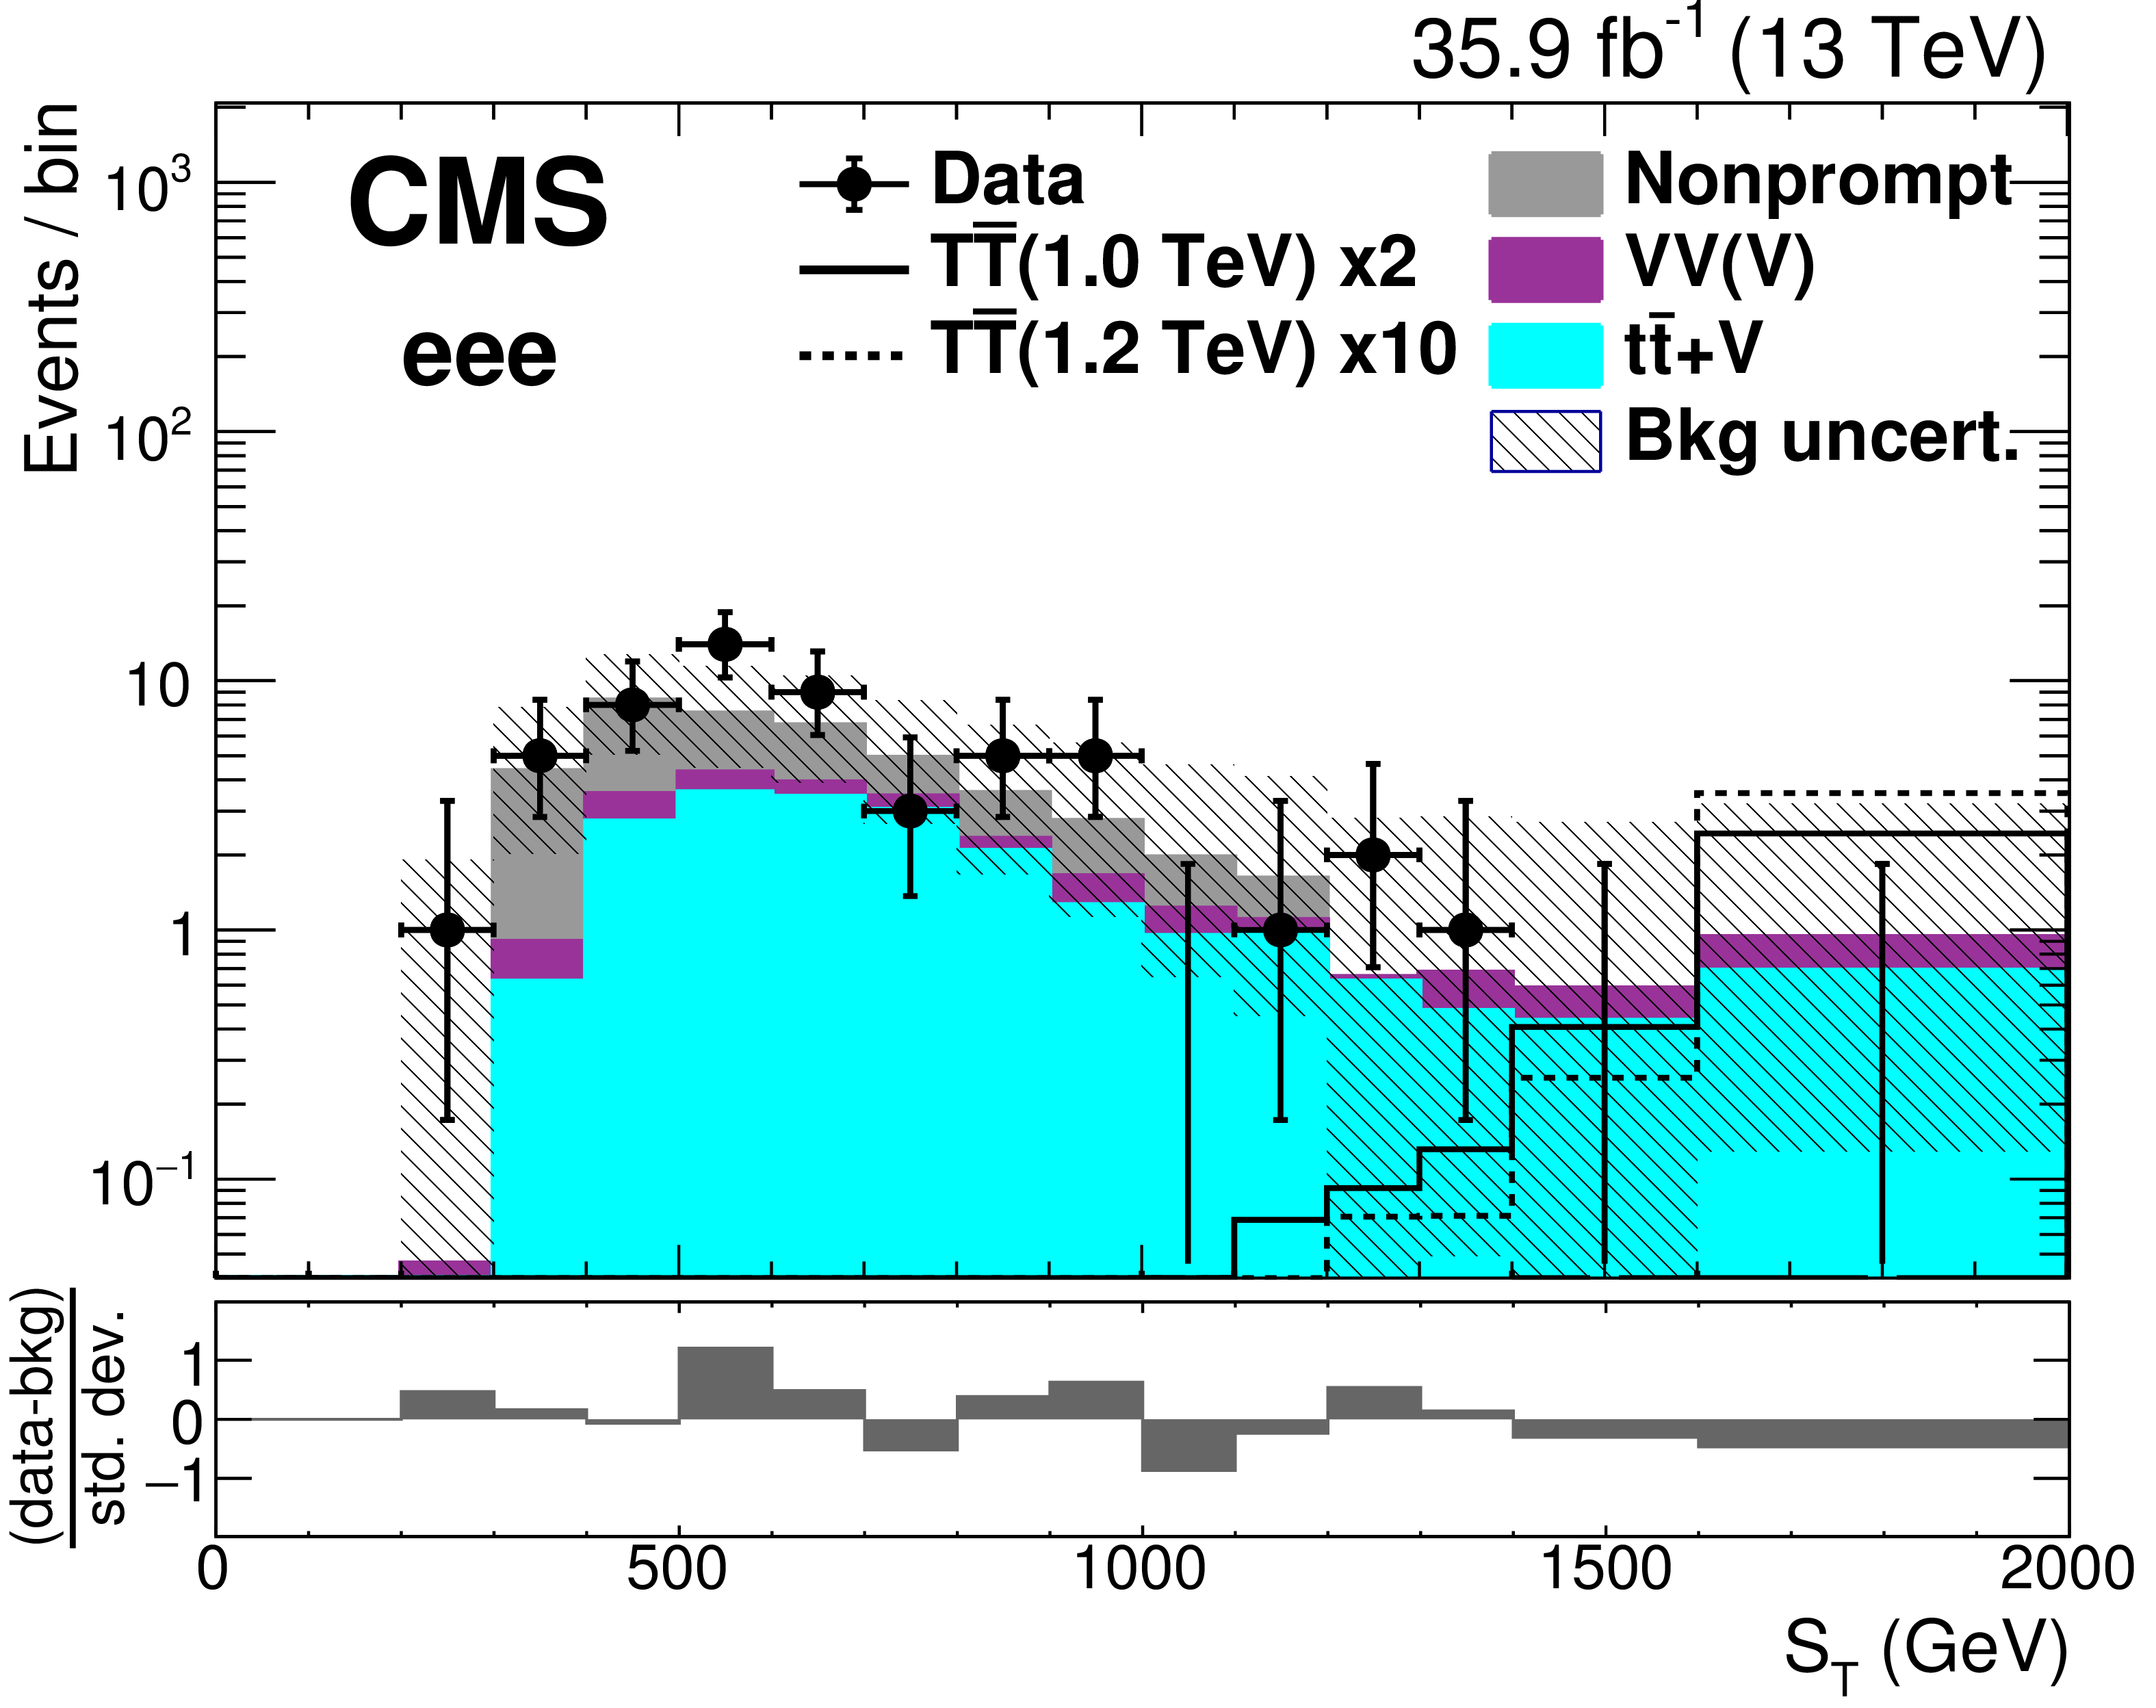
Figure 7:
Distributions of $ {S_\mathrm {T}} $ in the trilepton final state before the fit to data, in the four flavor categories. The black points are the data (horizontal bars indicate the bin width) and the filled histograms show the background distributions, with simulated backgrounds grouped into categories as described in Section 3. The expected signal is shown by solid and dotted lines for T quark masses of 1.0 and 1.2 TeV. The final bin includes overflow events. Uncertainties, indicated by the hatched area, include both statistical and systematic components. The lower panel shows the difference between data and background divided by the total uncertainty. |
png pdf |
Figure 7-a:
Distribution of $ {S_\mathrm {T}} $ in the trilepton final state before the fit to data, in the $eee$ category. The black points are the data (horizontal bars indicate the bin width) and the filled histograms show the background distributions, with simulated backgrounds grouped into categories as described in Section 3. The expected signal is shown by solid and dotted lines for T quark masses of 1.0 and 1.2 TeV. The final bin includes overflow events. Uncertainties, indicated by the hatched area, include both statistical and systematic components. The lower panel shows the difference between data and background divided by the total uncertainty. |
png pdf |
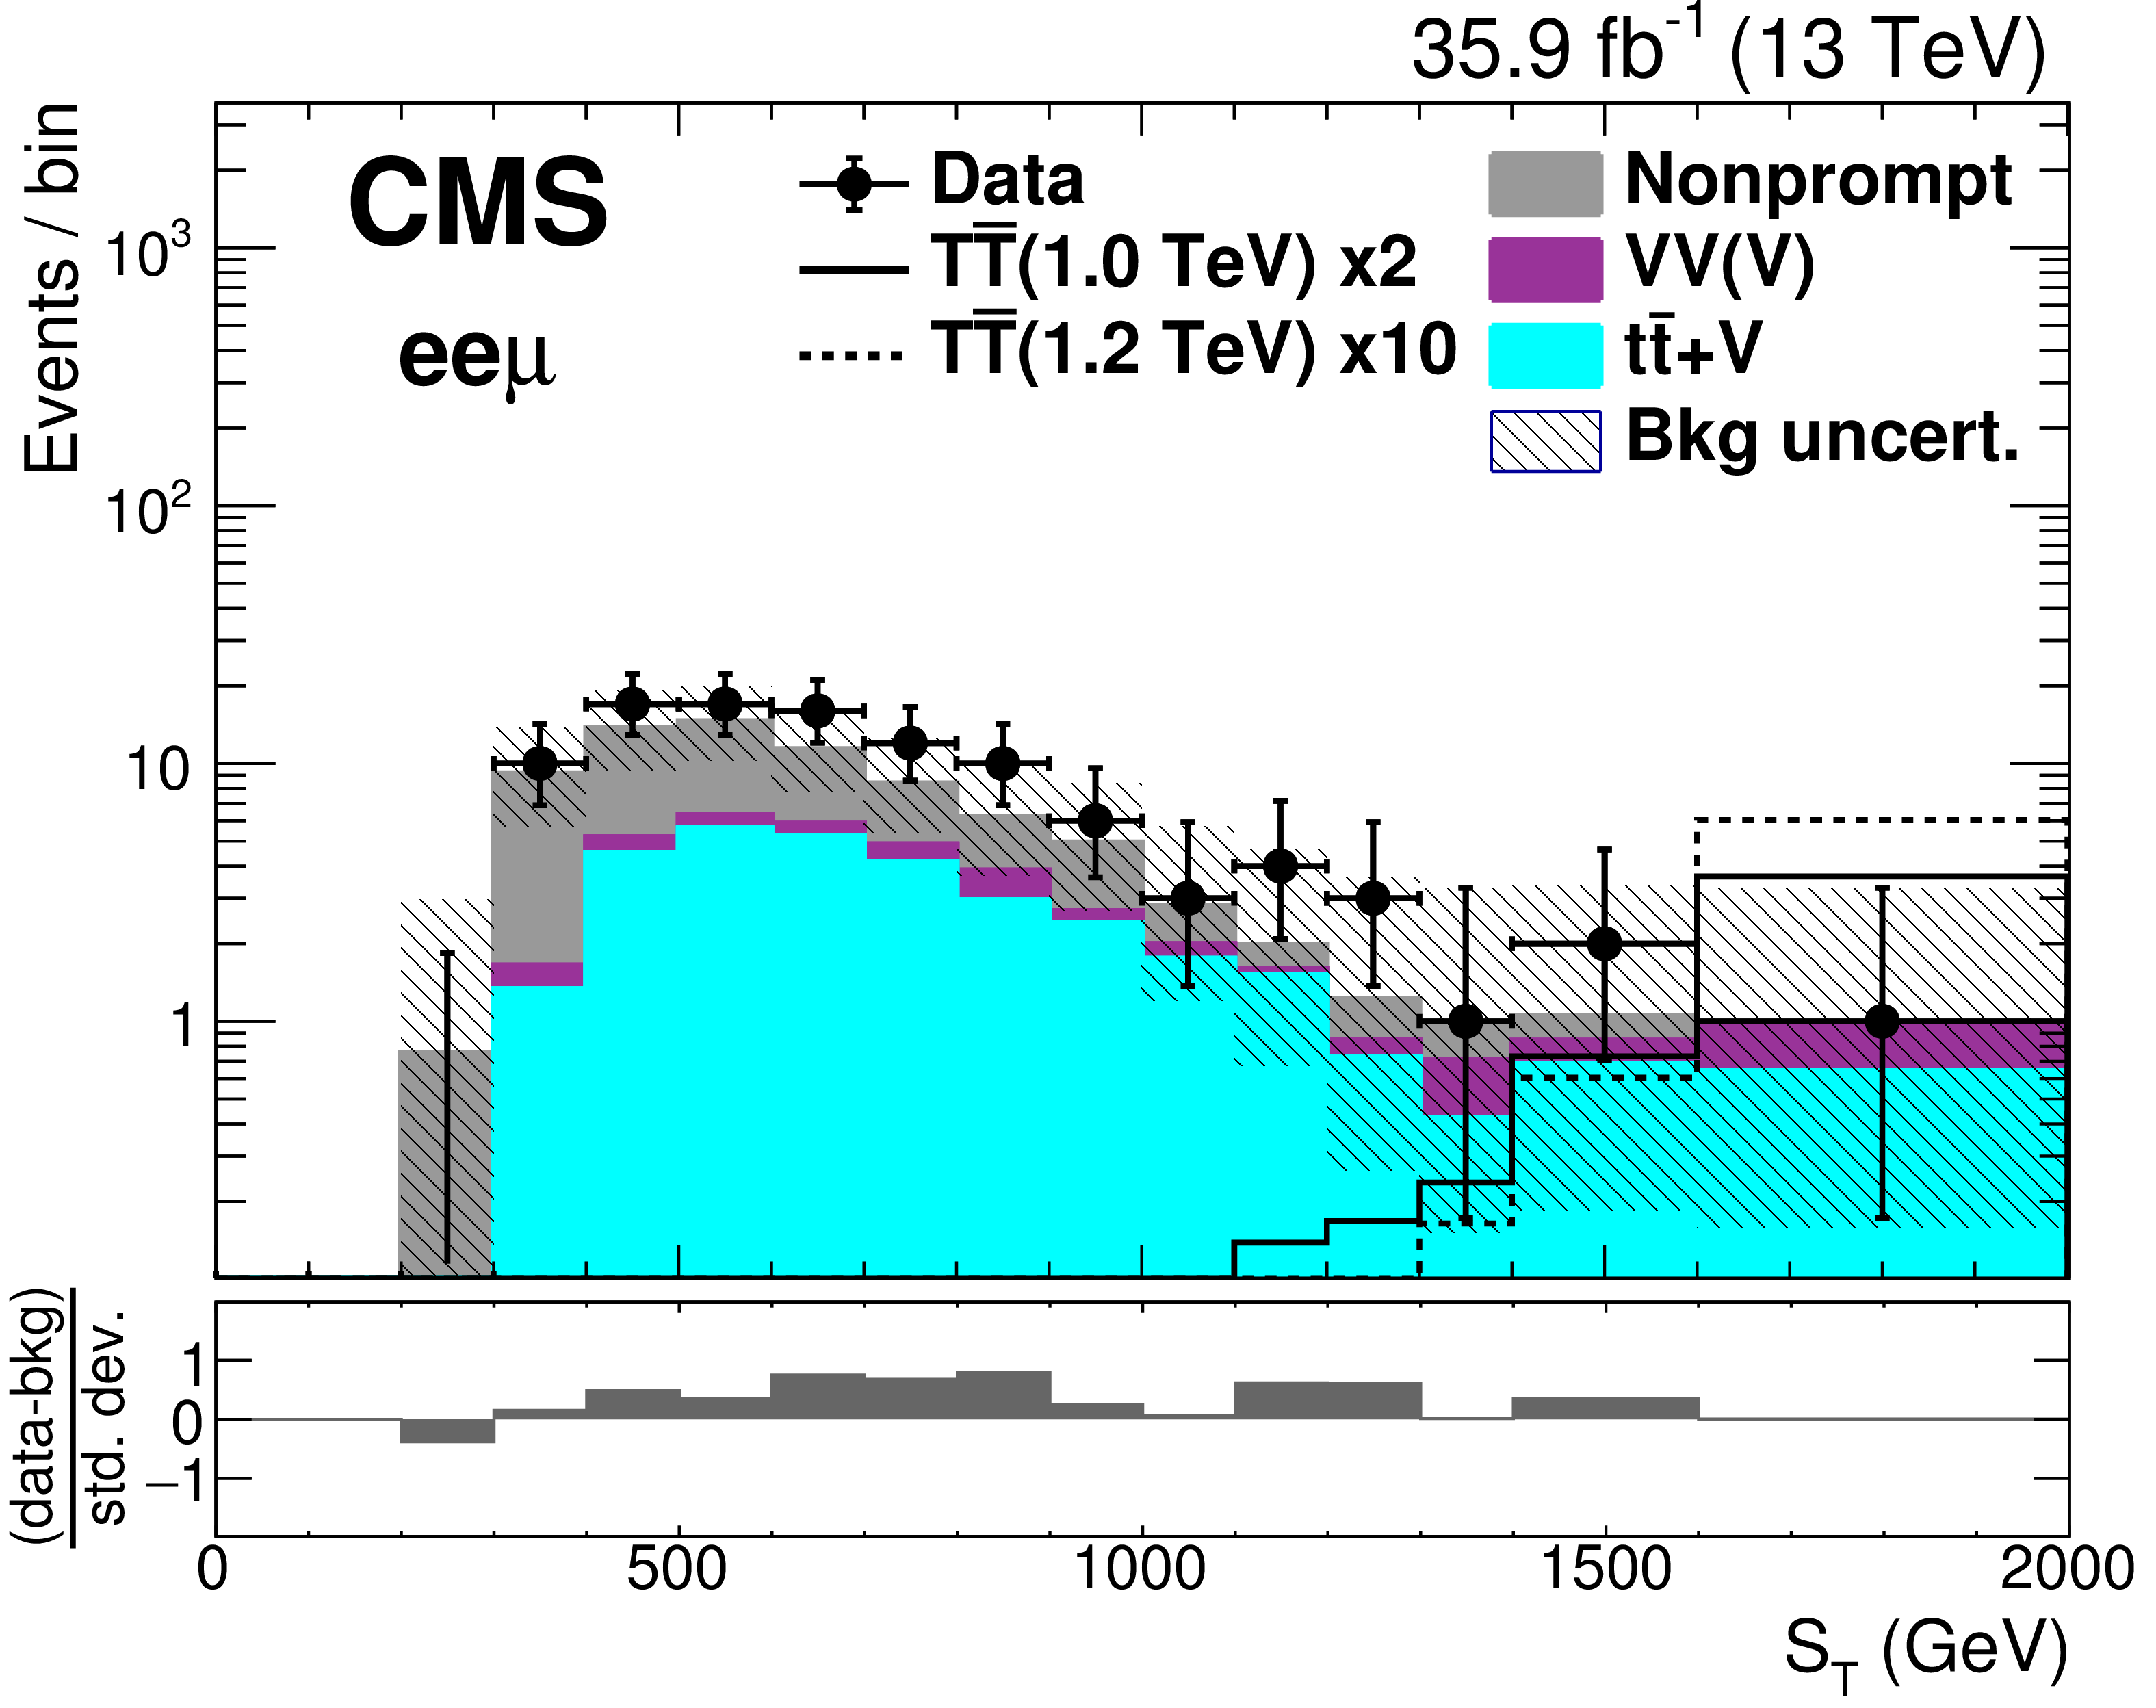
Figure 7-b:
Distribution of $ {S_\mathrm {T}} $ in the trilepton final state before the fit to data, in the $ee\mu$ category. The black points are the data (horizontal bars indicate the bin width) and the filled histograms show the background distributions, with simulated backgrounds grouped into categories as described in Section 3. The expected signal is shown by solid and dotted lines for T quark masses of 1.0 and 1.2 TeV. The final bin includes overflow events. Uncertainties, indicated by the hatched area, include both statistical and systematic components. The lower panel shows the difference between data and background divided by the total uncertainty. |

png pdf |
Figure 7-c:
Distribution of $ {S_\mathrm {T}} $ in the trilepton final state before the fit to data, in the $e\mu\mu$ category. The black points are the data (horizontal bars indicate the bin width) and the filled histograms show the background distributions, with simulated backgrounds grouped into categories as described in Section 3. The expected signal is shown by solid and dotted lines for T quark masses of 1.0 and 1.2 TeV. The final bin includes overflow events. Uncertainties, indicated by the hatched area, include both statistical and systematic components. The lower panel shows the difference between data and background divided by the total uncertainty. |
png pdf |
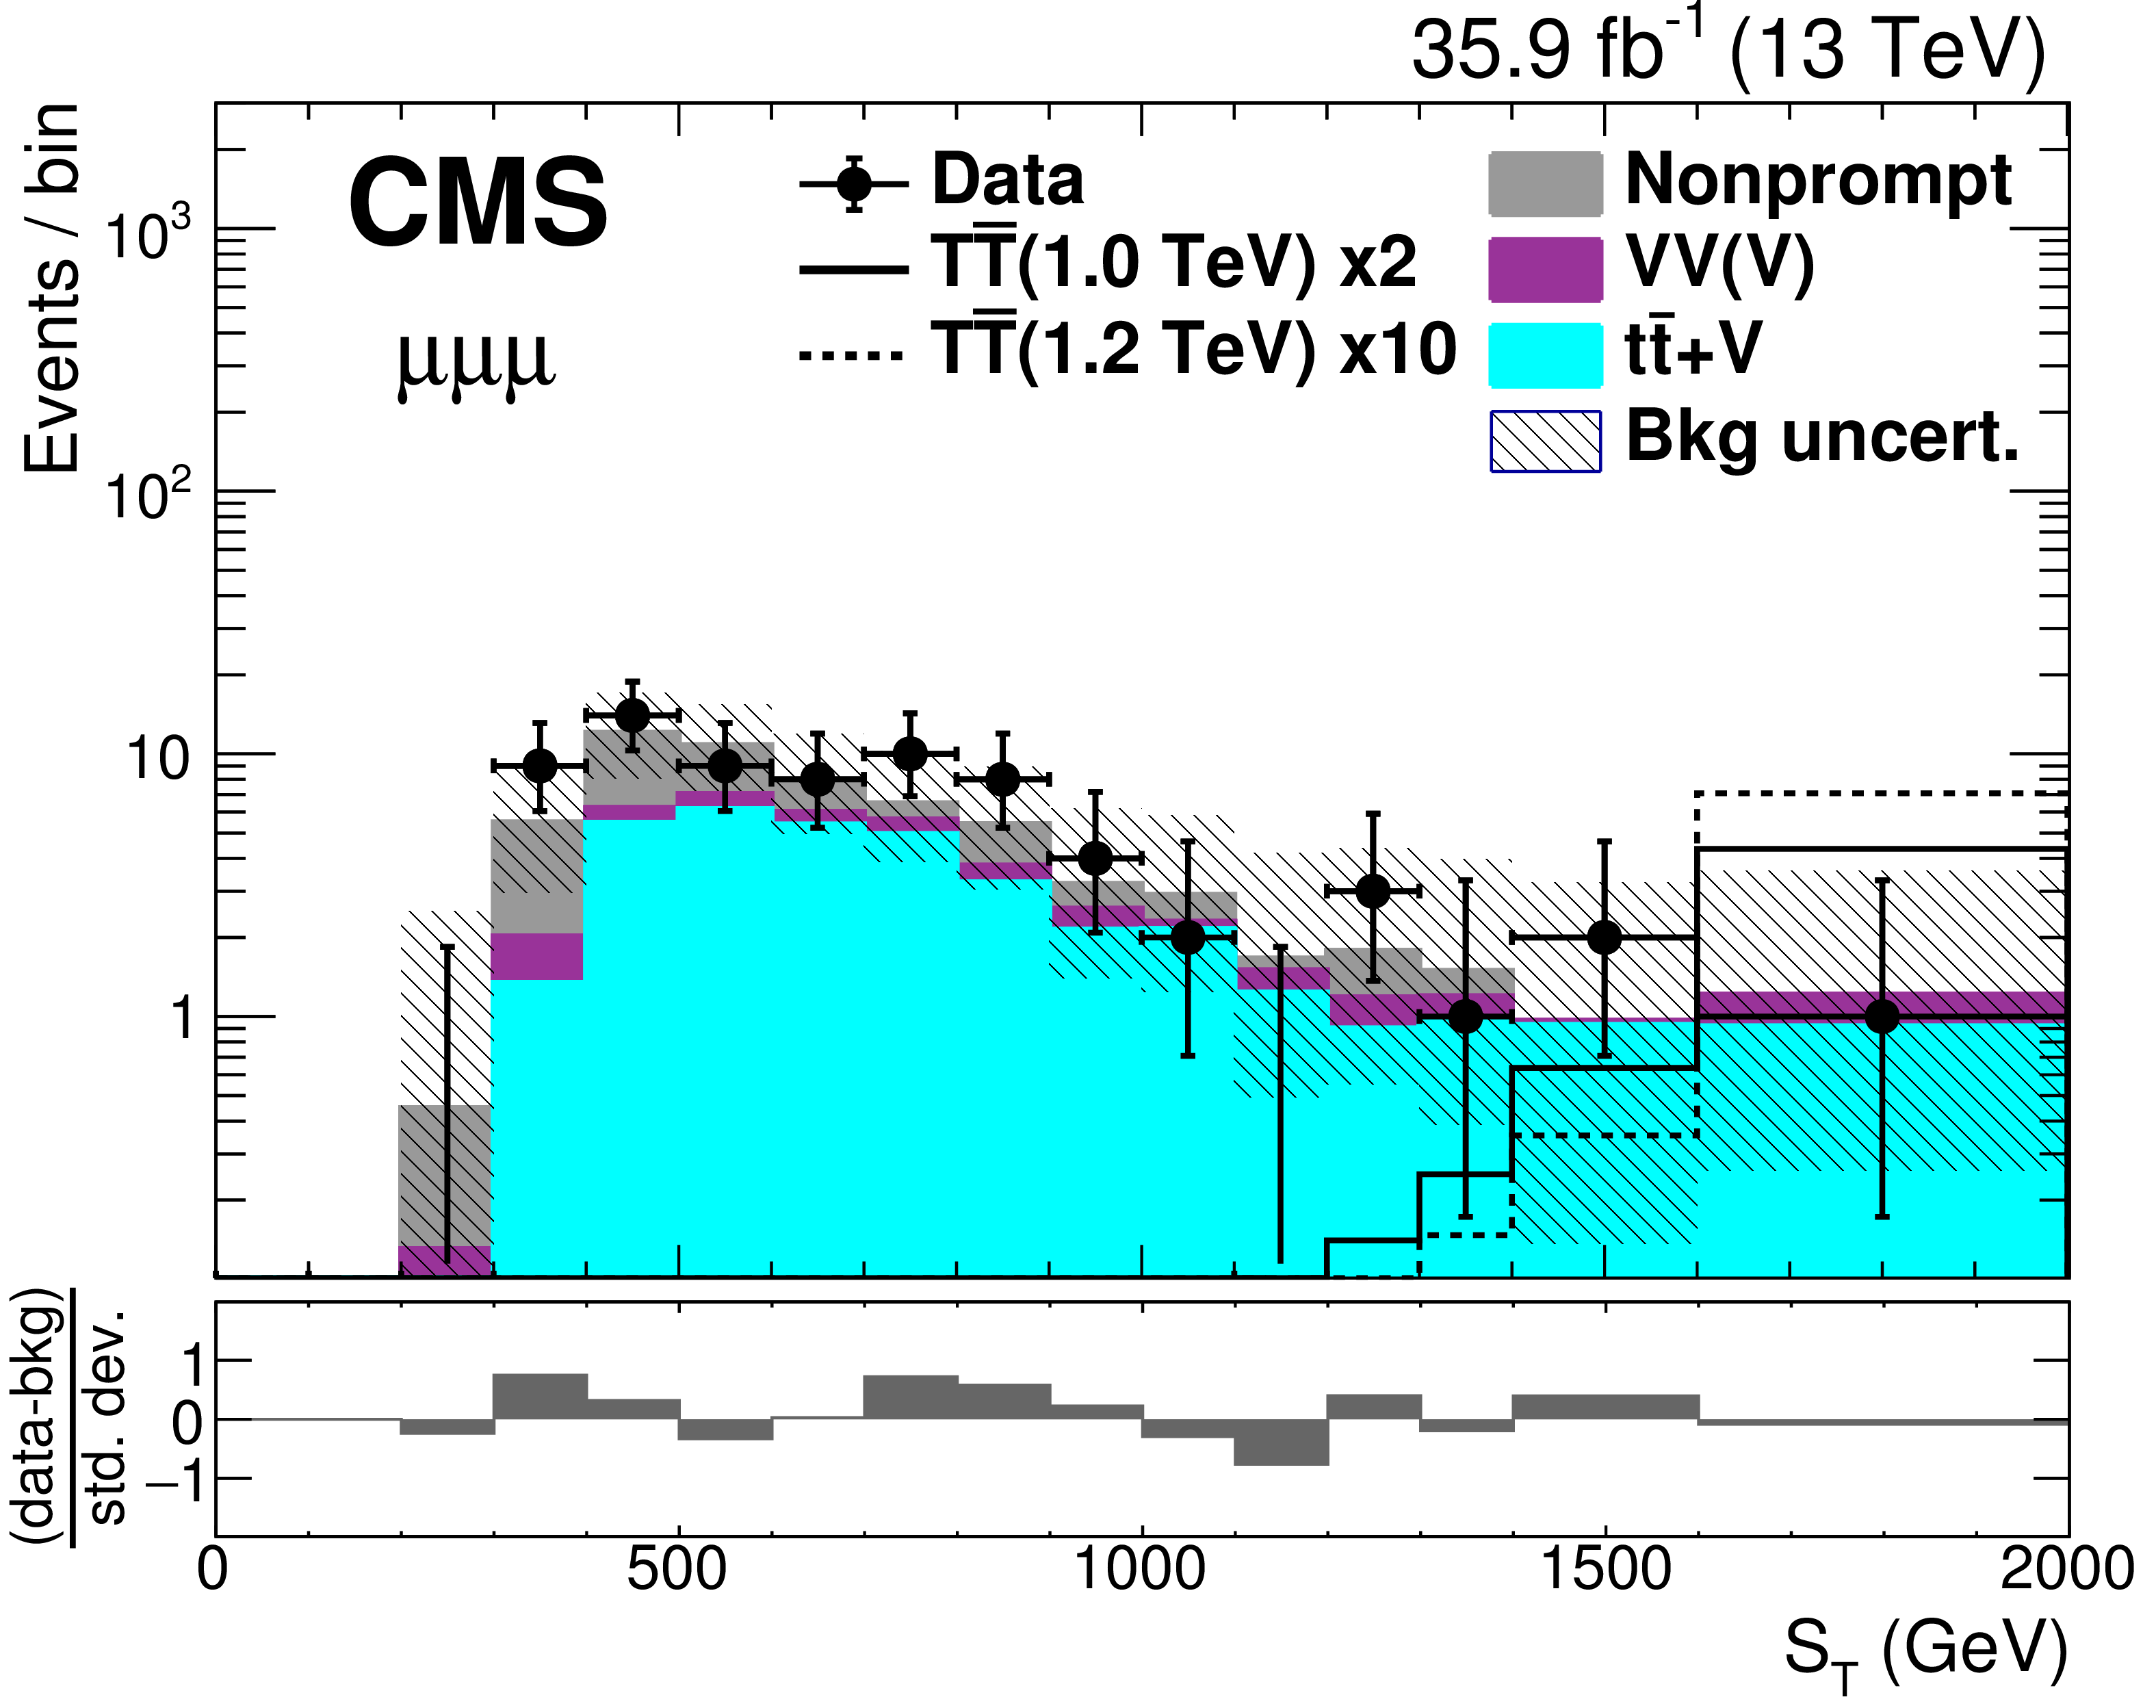
Figure 7-d:
Distribution of $ {S_\mathrm {T}} $ in the trilepton final state before the fit to data, in the $\mu\mu\mu$ category. The black points are the data (horizontal bars indicate the bin width) and the filled histograms show the background distributions, with simulated backgrounds grouped into categories as described in Section 3. The expected signal is shown by solid and dotted lines for T quark masses of 1.0 and 1.2 TeV. The final bin includes overflow events. Uncertainties, indicated by the hatched area, include both statistical and systematic components. The lower panel shows the difference between data and background divided by the total uncertainty. |
png pdf |
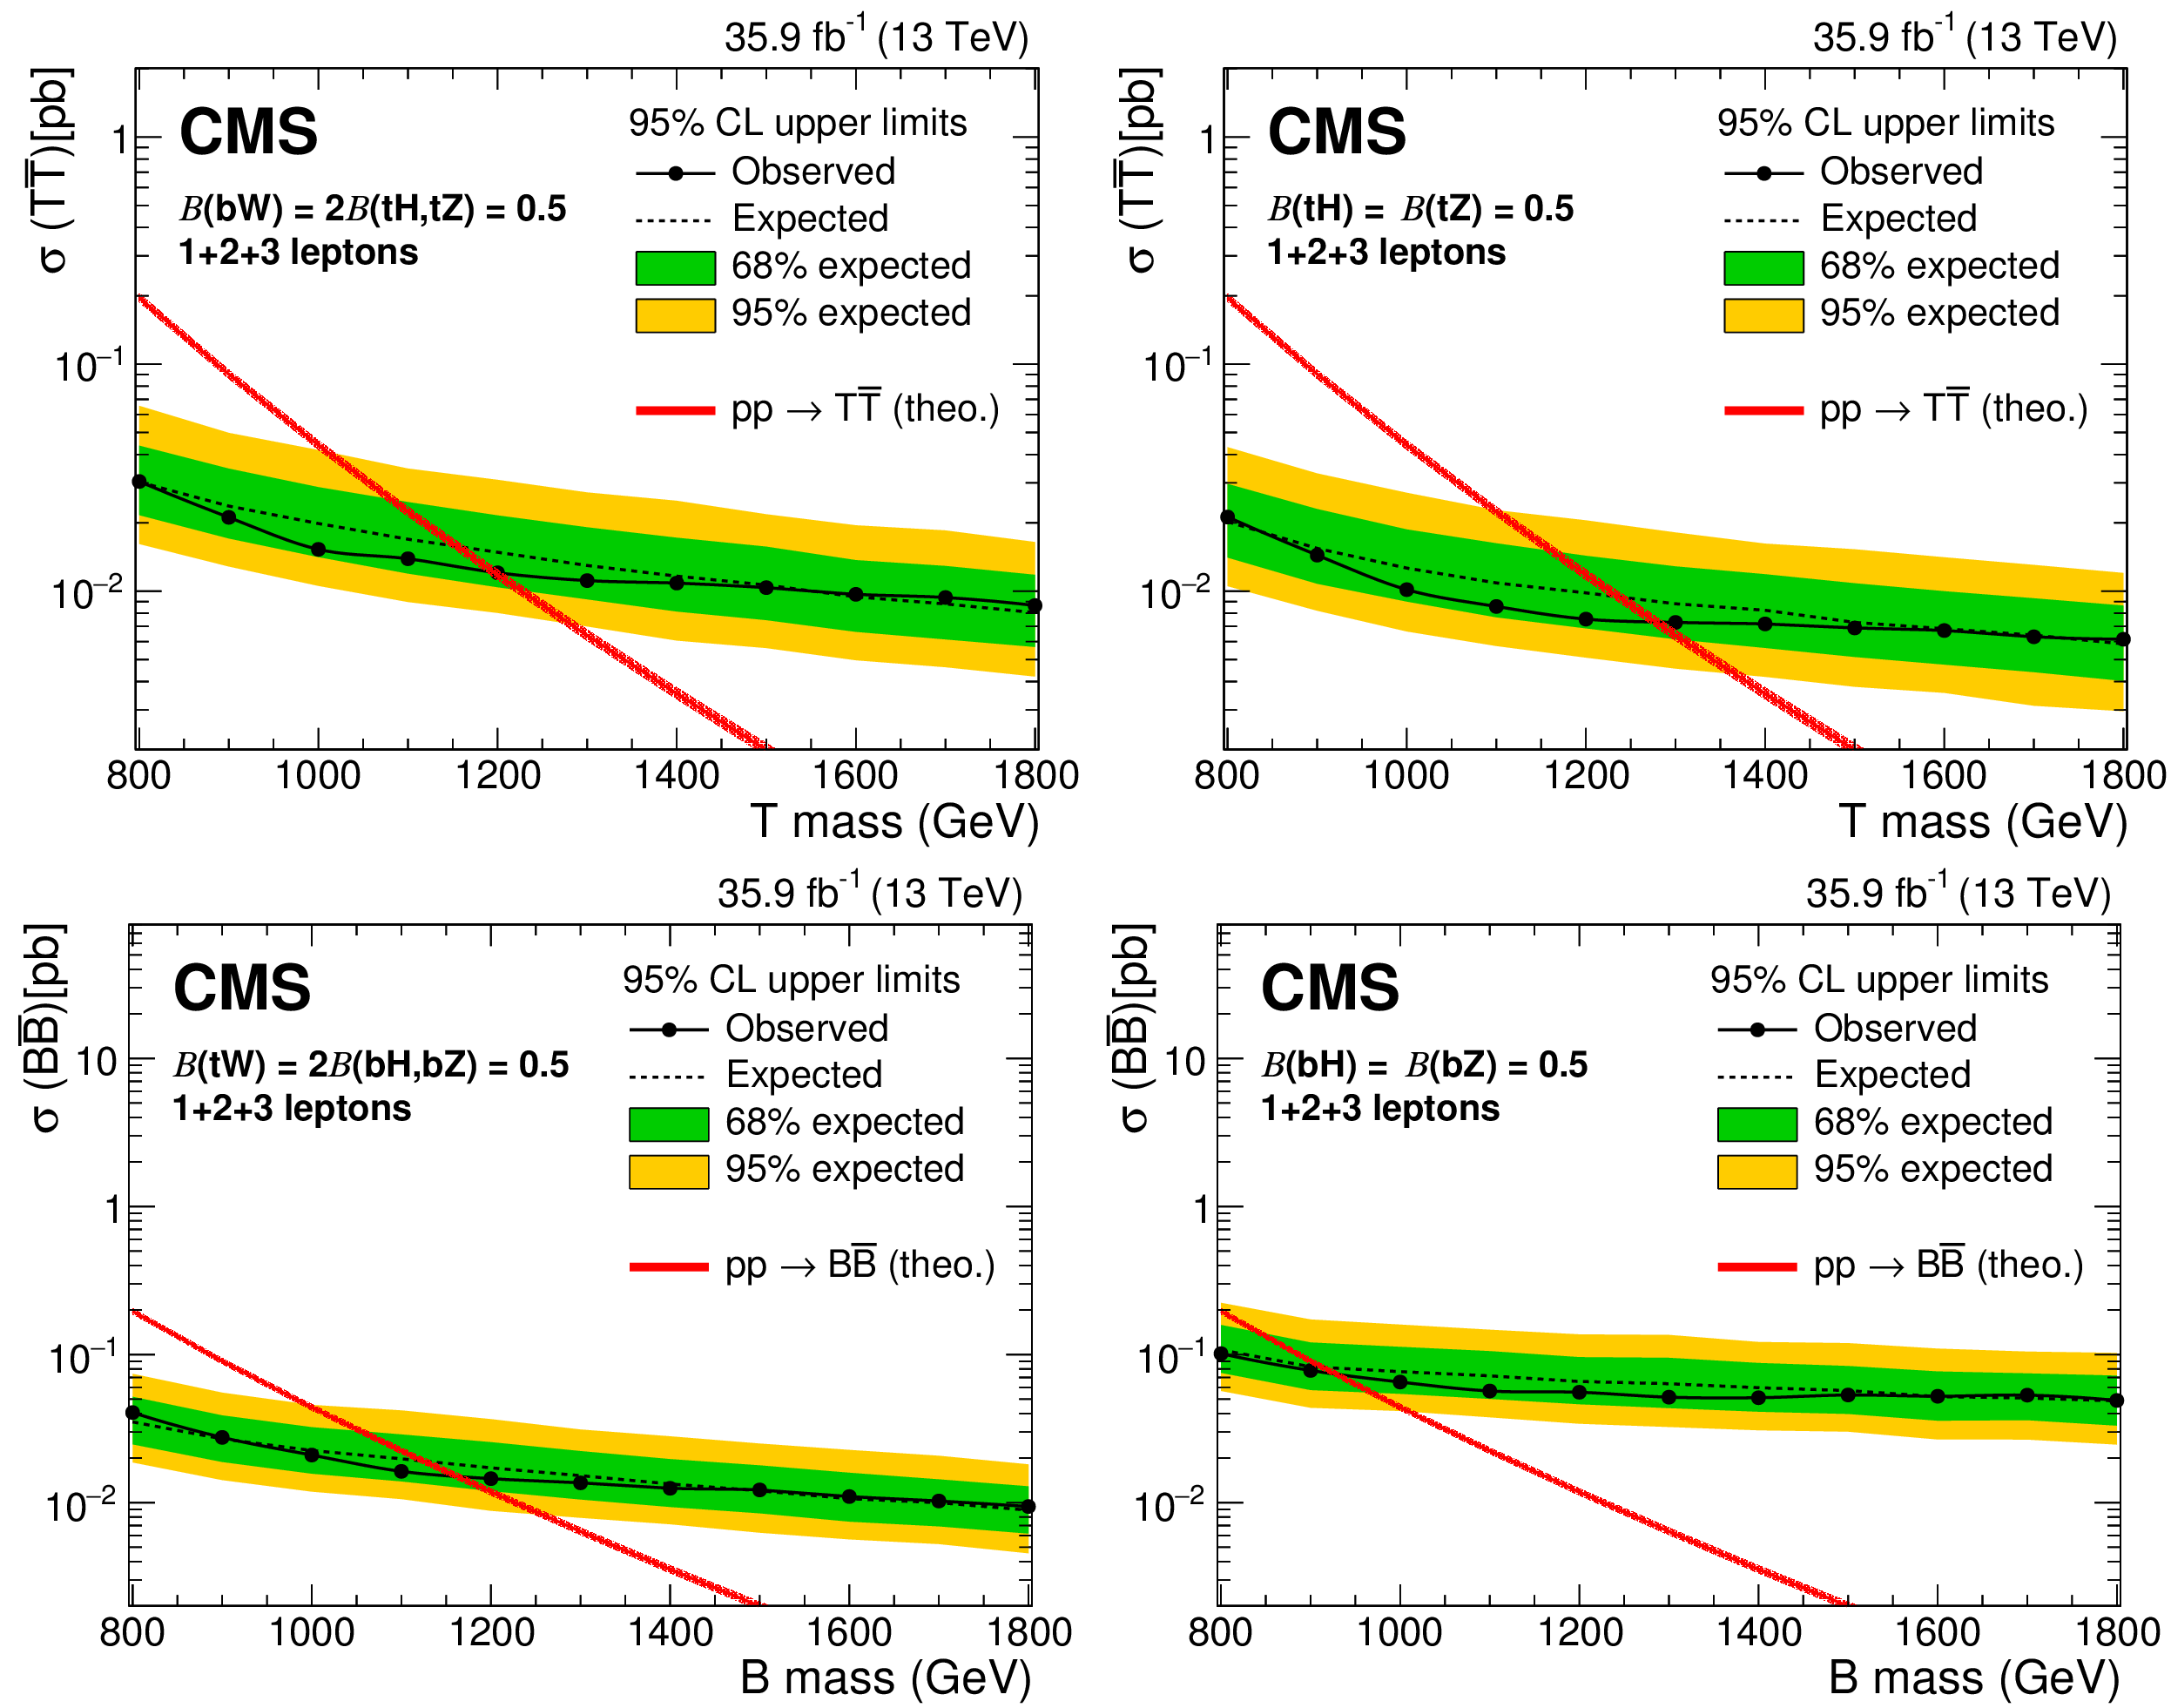
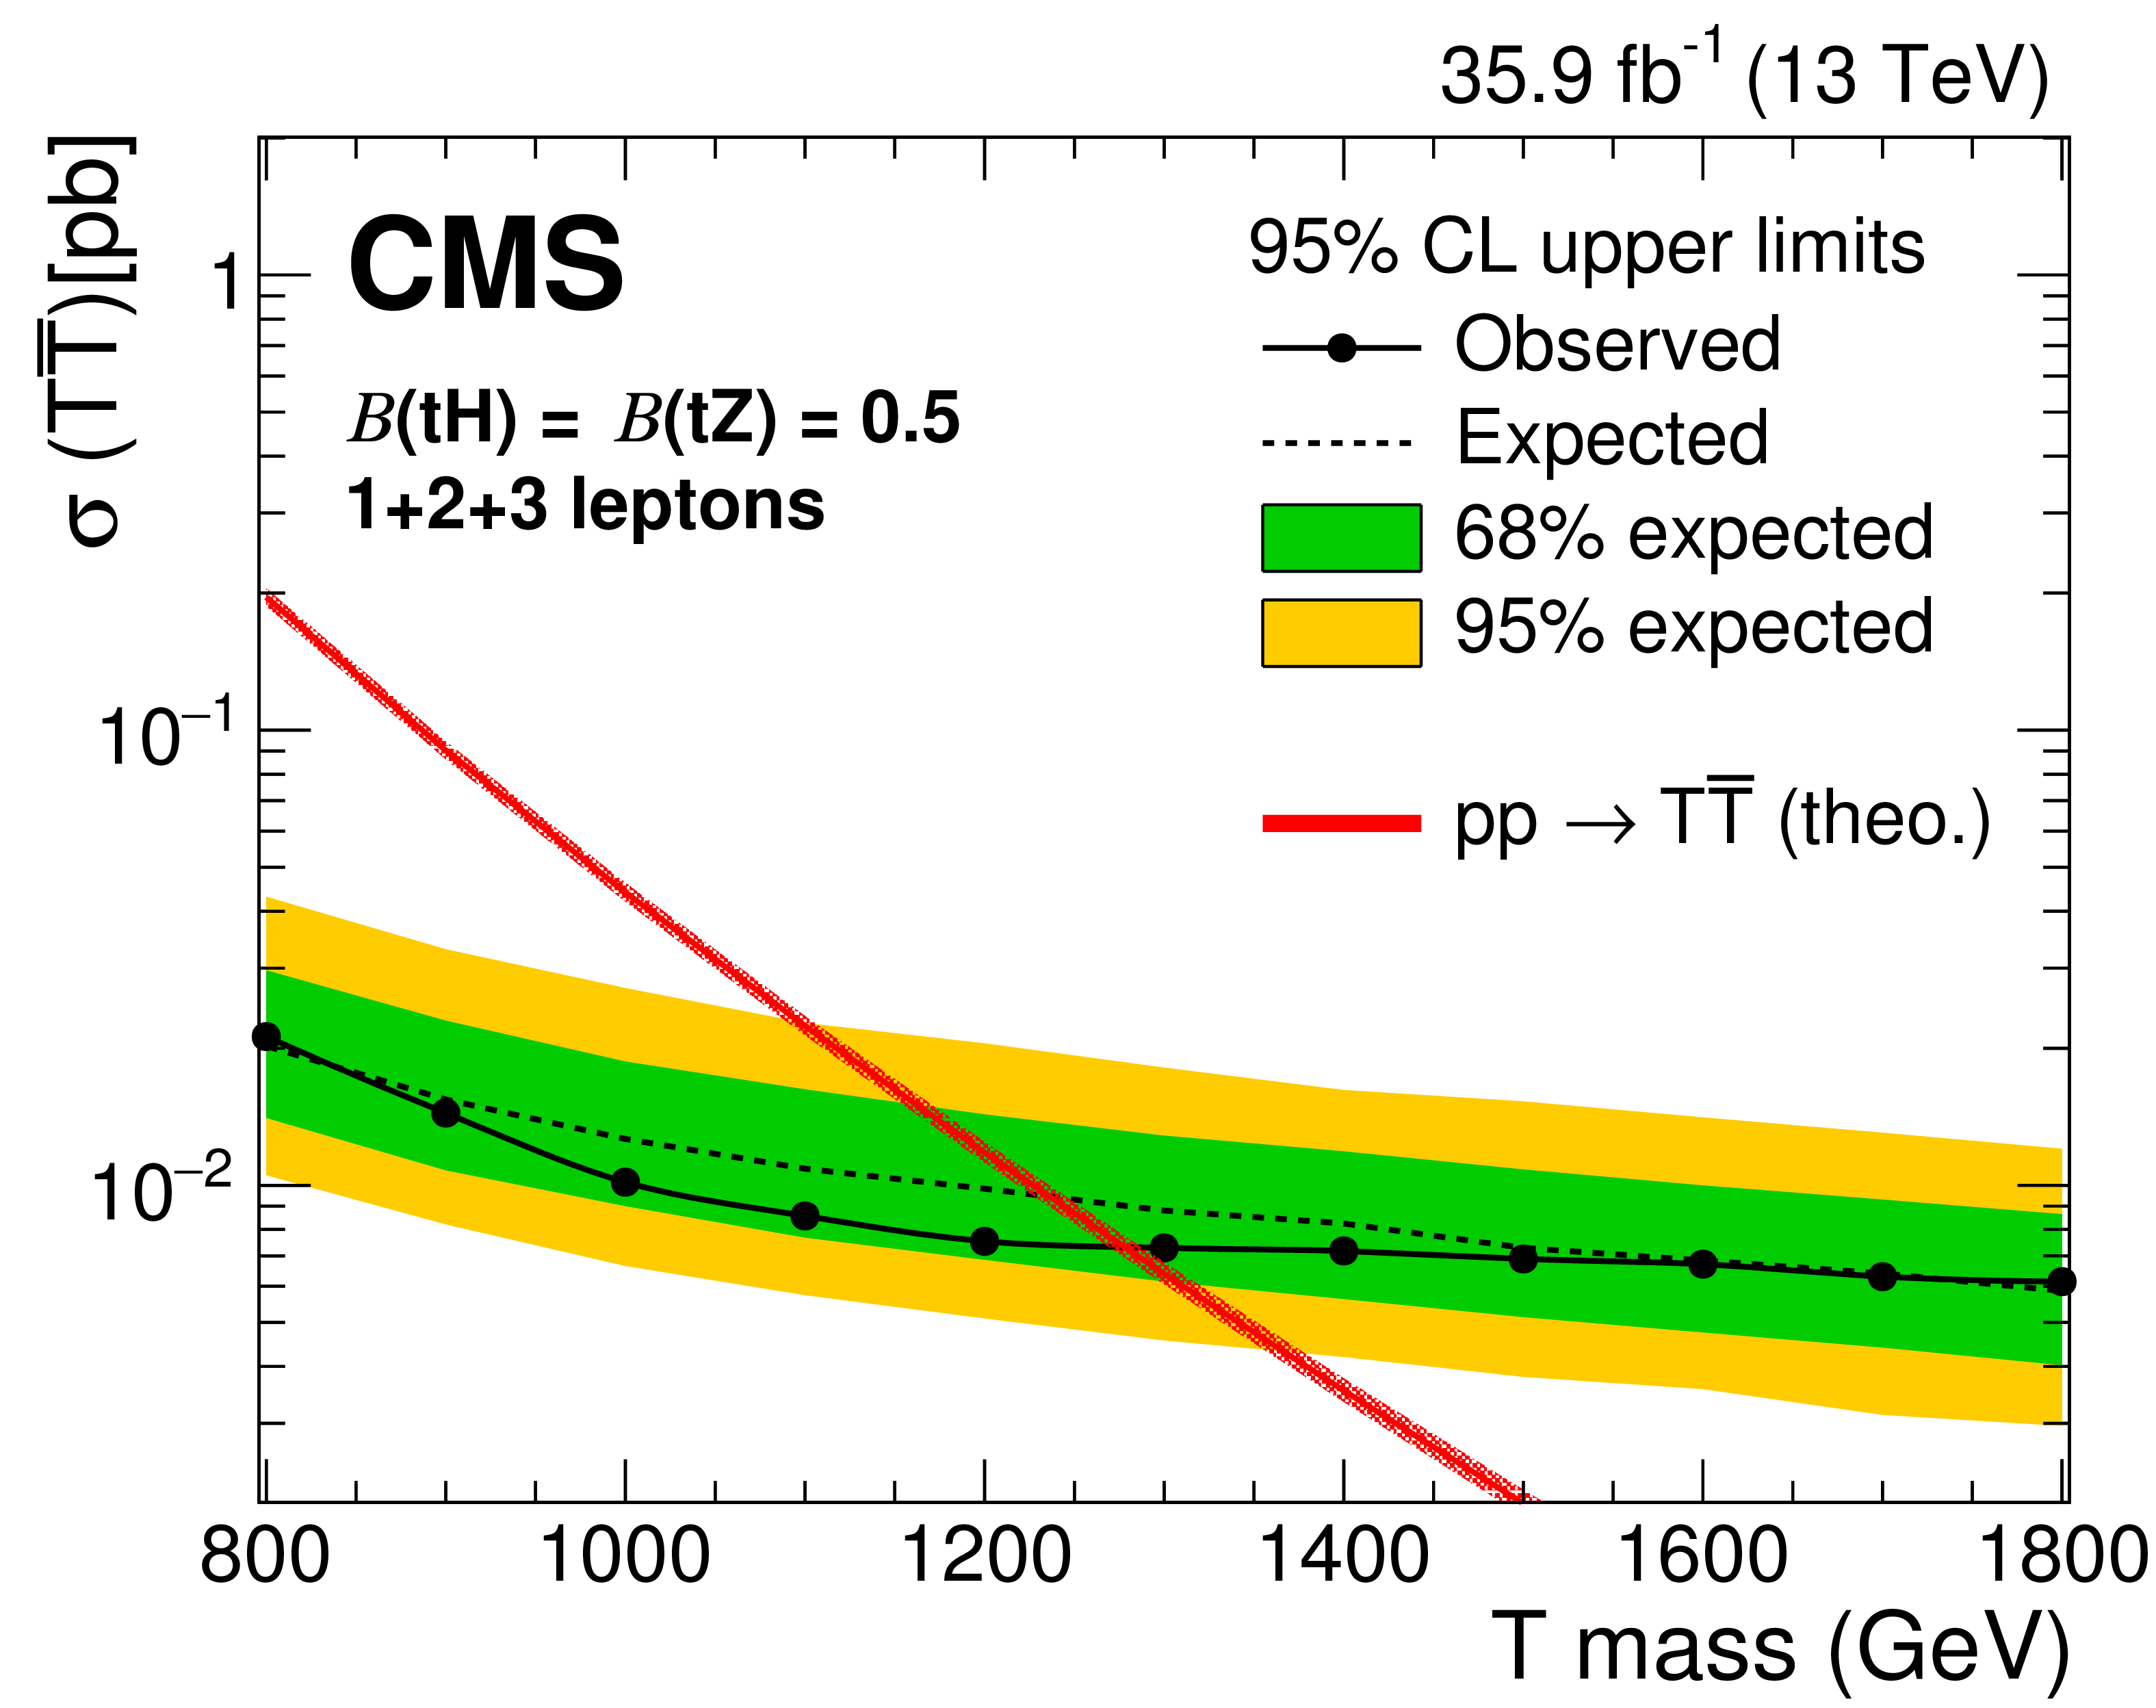
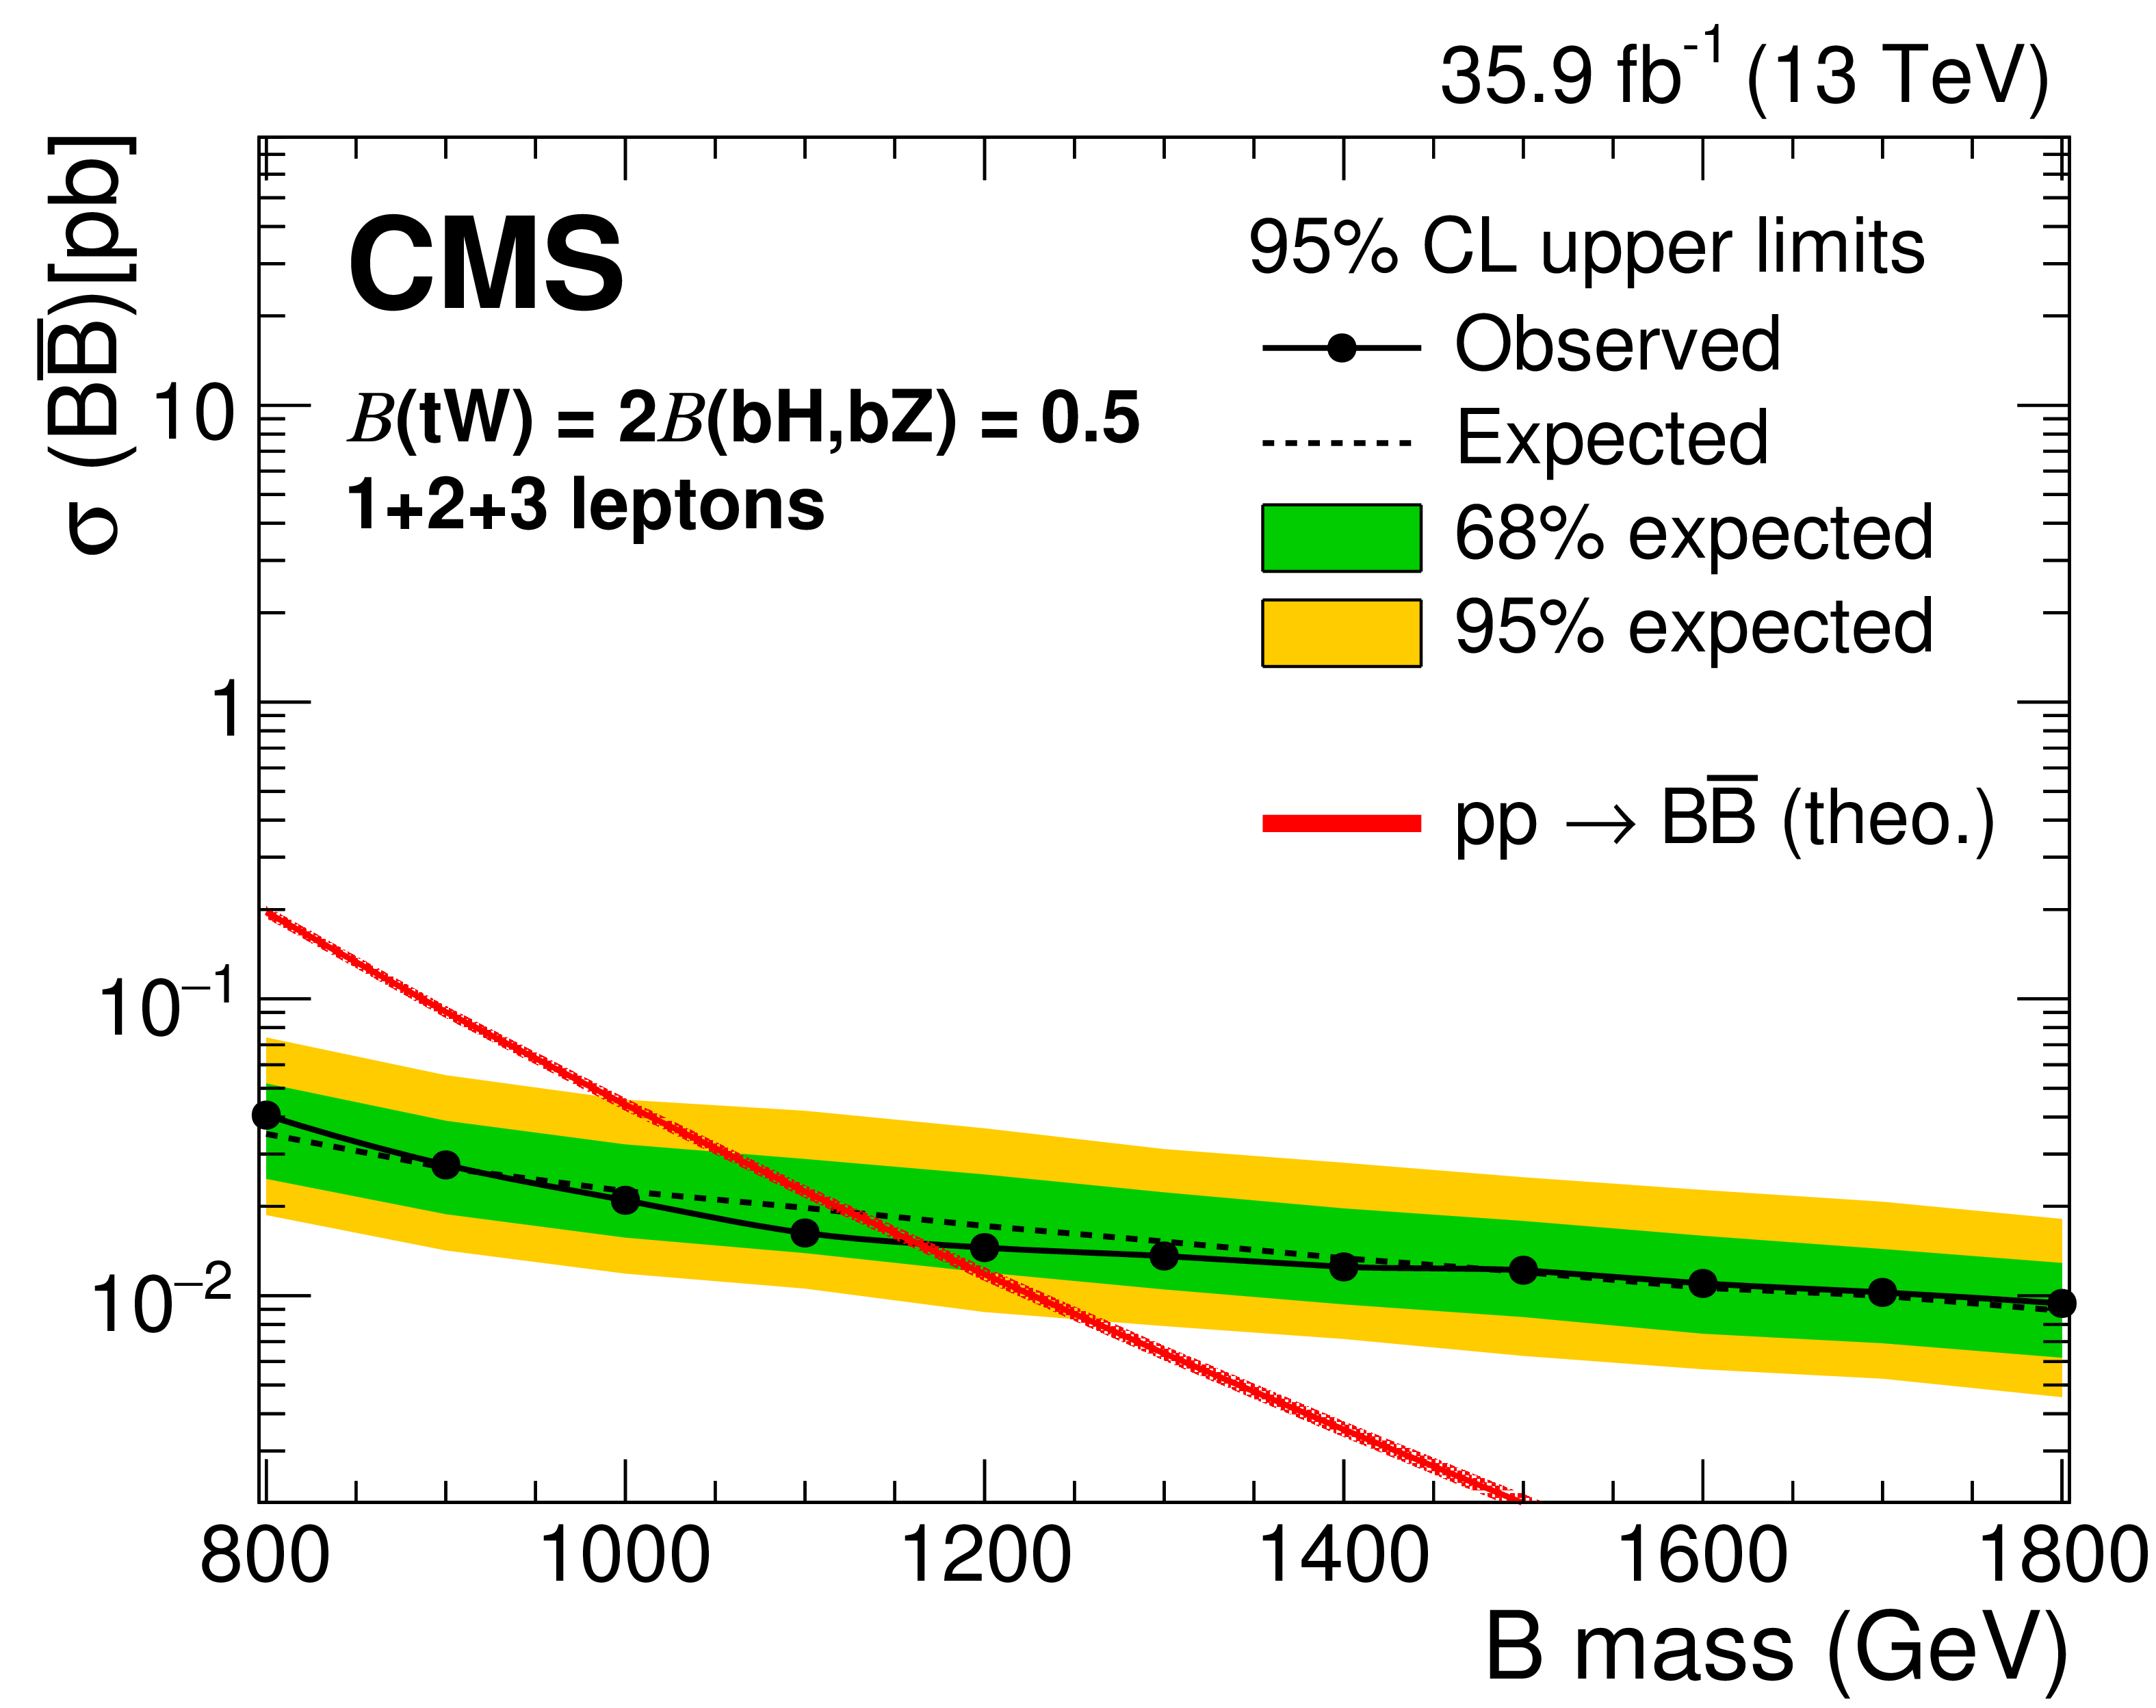
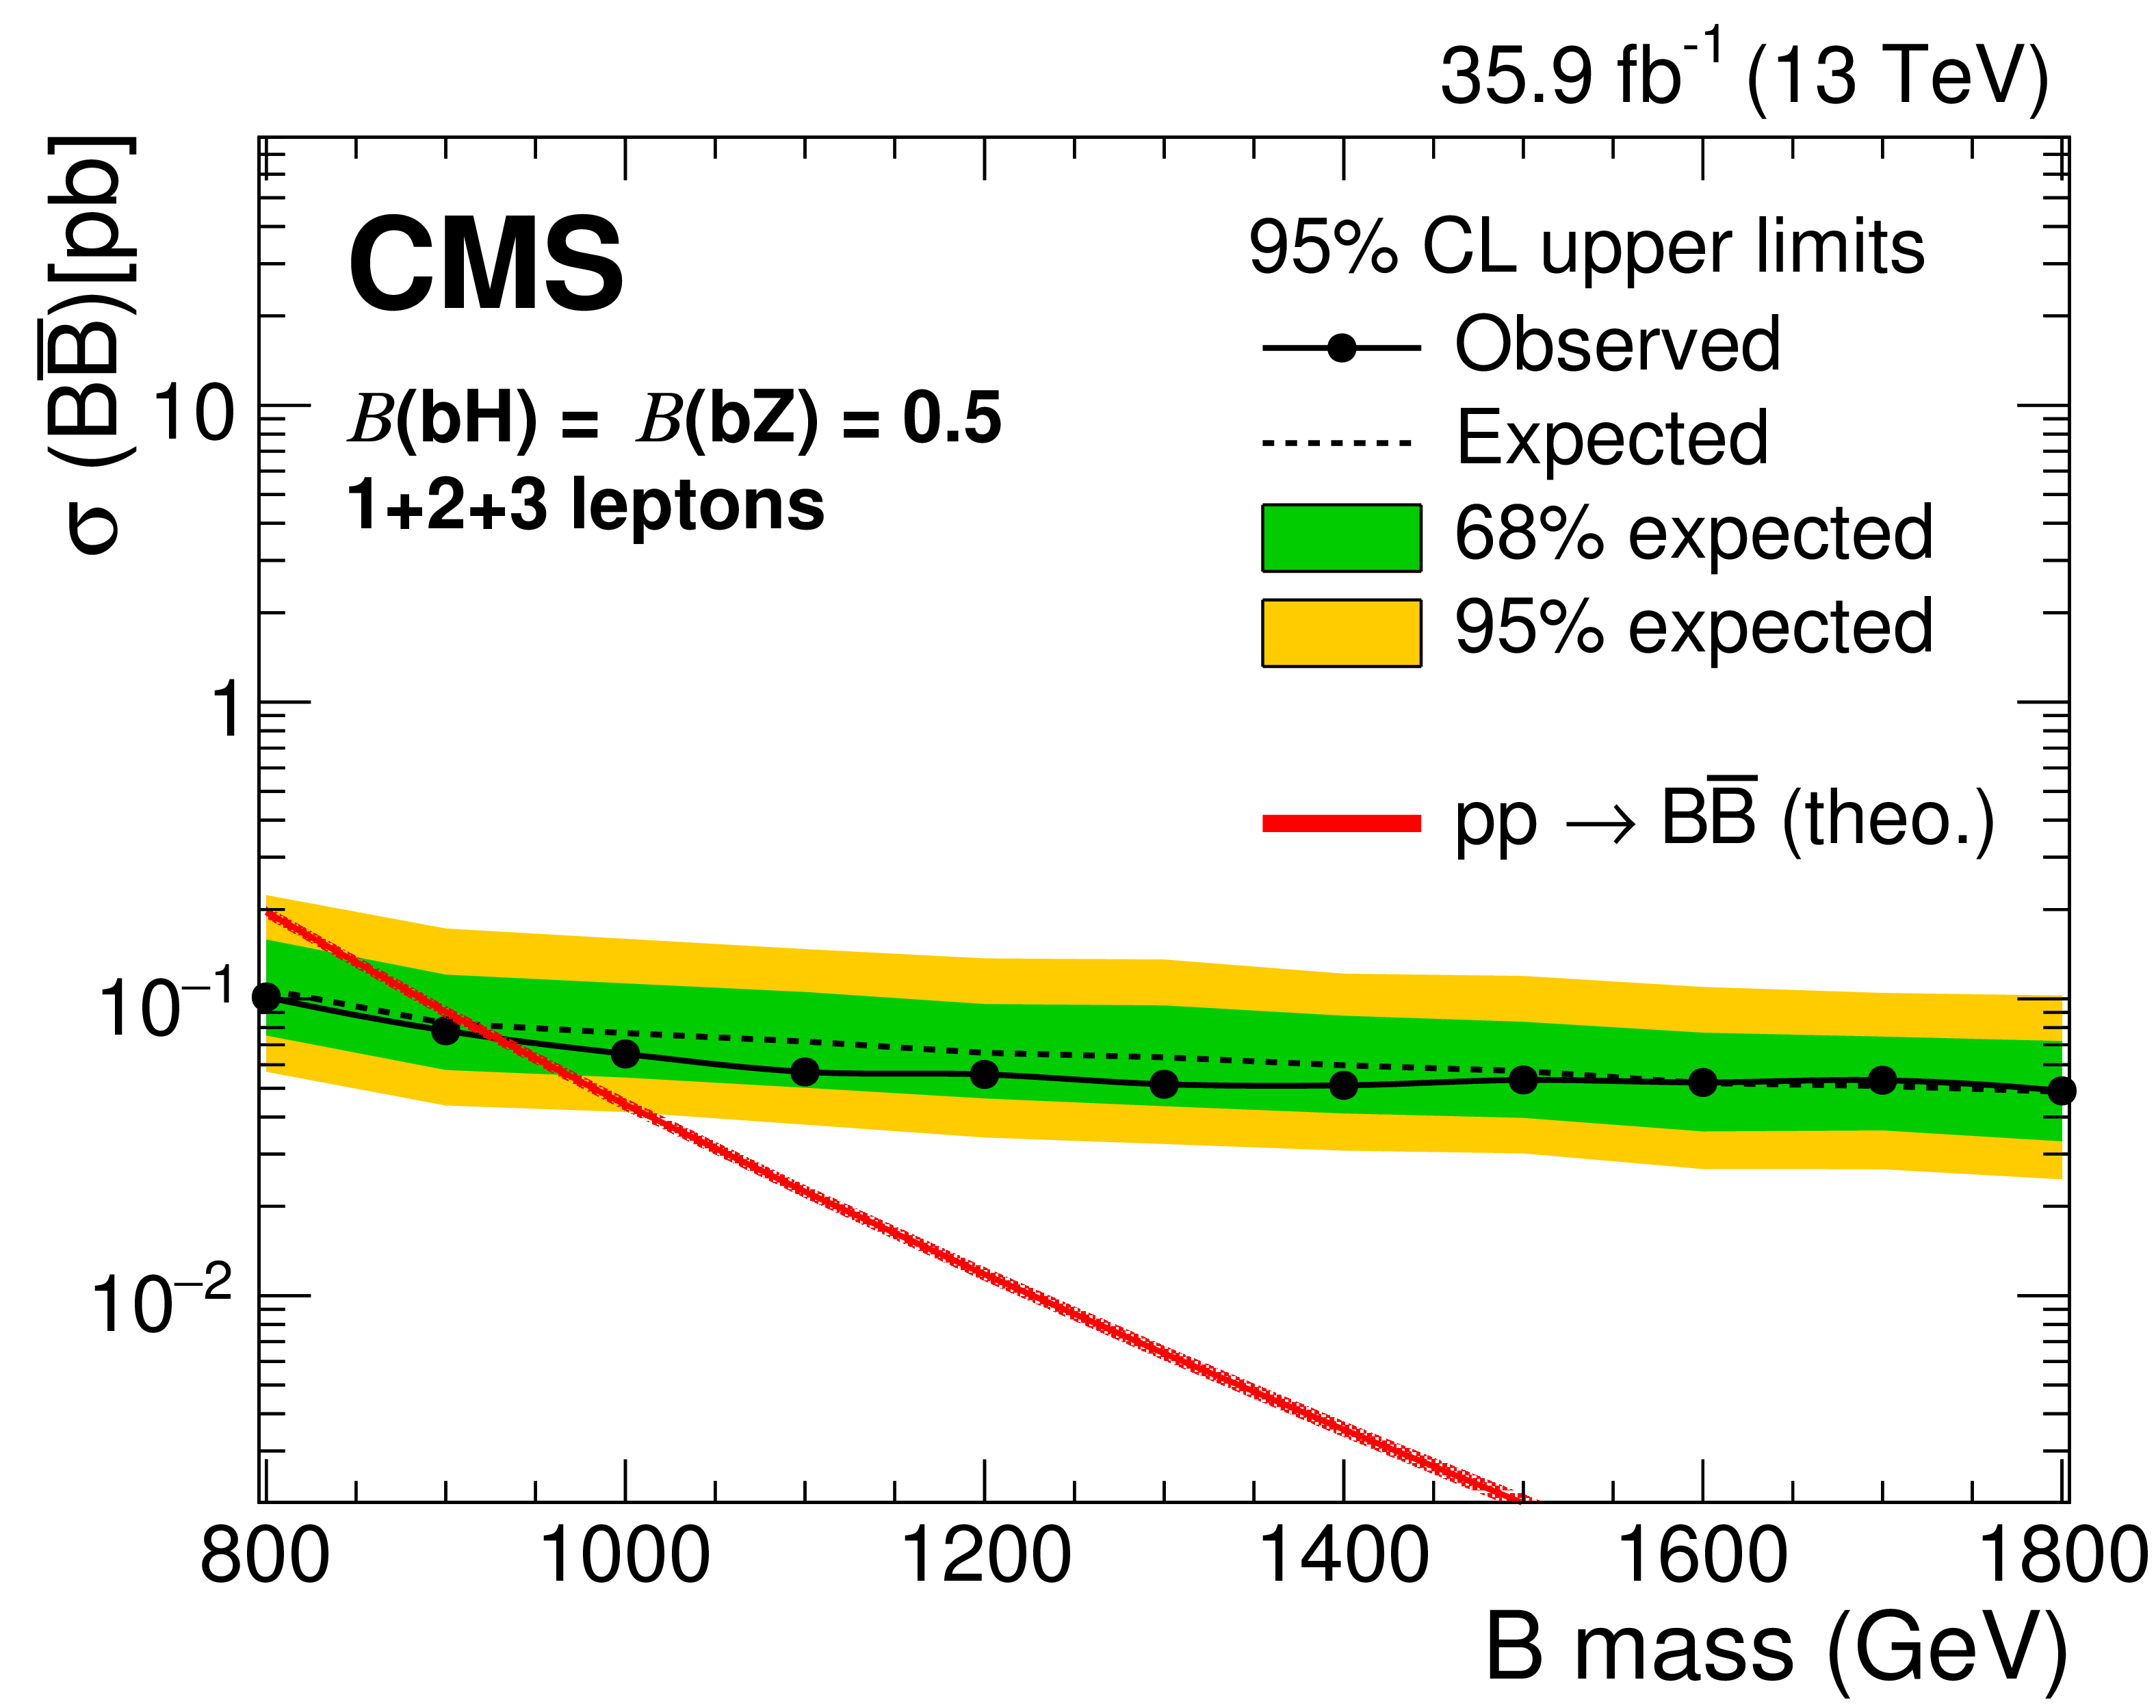
Figure 8:
The 95% CL expected and observed upper limits on the cross section of $ {{\mathrm {T}} {\overline {\mathrm {T}}}} $ (upper row) and $ {{\mathrm {B}} {\overline {\mathrm {B}}}} $ (lower row) production after combining all channels for the singlet (left) and doublet (right) branching fraction scenarios. The predicted cross sections are shown by the red curve, with the uncertainty indicated by the width of the line. |

png pdf |
Figure 8-a:
The 95% CL expected and observed upper limits on the cross section of $ {{\mathrm {T}} {\overline {\mathrm {T}}}} $ production after combining all channels for the singlet branching fraction scenario. The predicted cross sections are shown by the red curve, with the uncertainty indicated by the width of the line. |
png pdf |
Figure 8-b:
The 95% CL expected and observed upper limits on the cross section of $ {{\mathrm {T}} {\overline {\mathrm {T}}}} $ production after combining all channels for the doublet branching fraction scenario. The predicted cross sections are shown by the red curve, with the uncertainty indicated by the width of the line. |
png pdf |
Figure 8-c:
The 95% CL expected and observed upper limits on the cross section of $ {{\mathrm {B}} {\overline {\mathrm {B}}}} $ production after combining all channels for the singlet branching fraction scenario. The predicted cross sections are shown by the red curve, with the uncertainty indicated by the width of the line. |
png pdf |
Figure 8-d:
The 95% CL expected and observed upper limits on the cross section of $ {{\mathrm {B}} {\overline {\mathrm {B}}}} $ production after combining all channels for the doublet branching fraction scenario. The predicted cross sections are shown by the red curve, with the uncertainty indicated by the width of the line. |
png pdf |
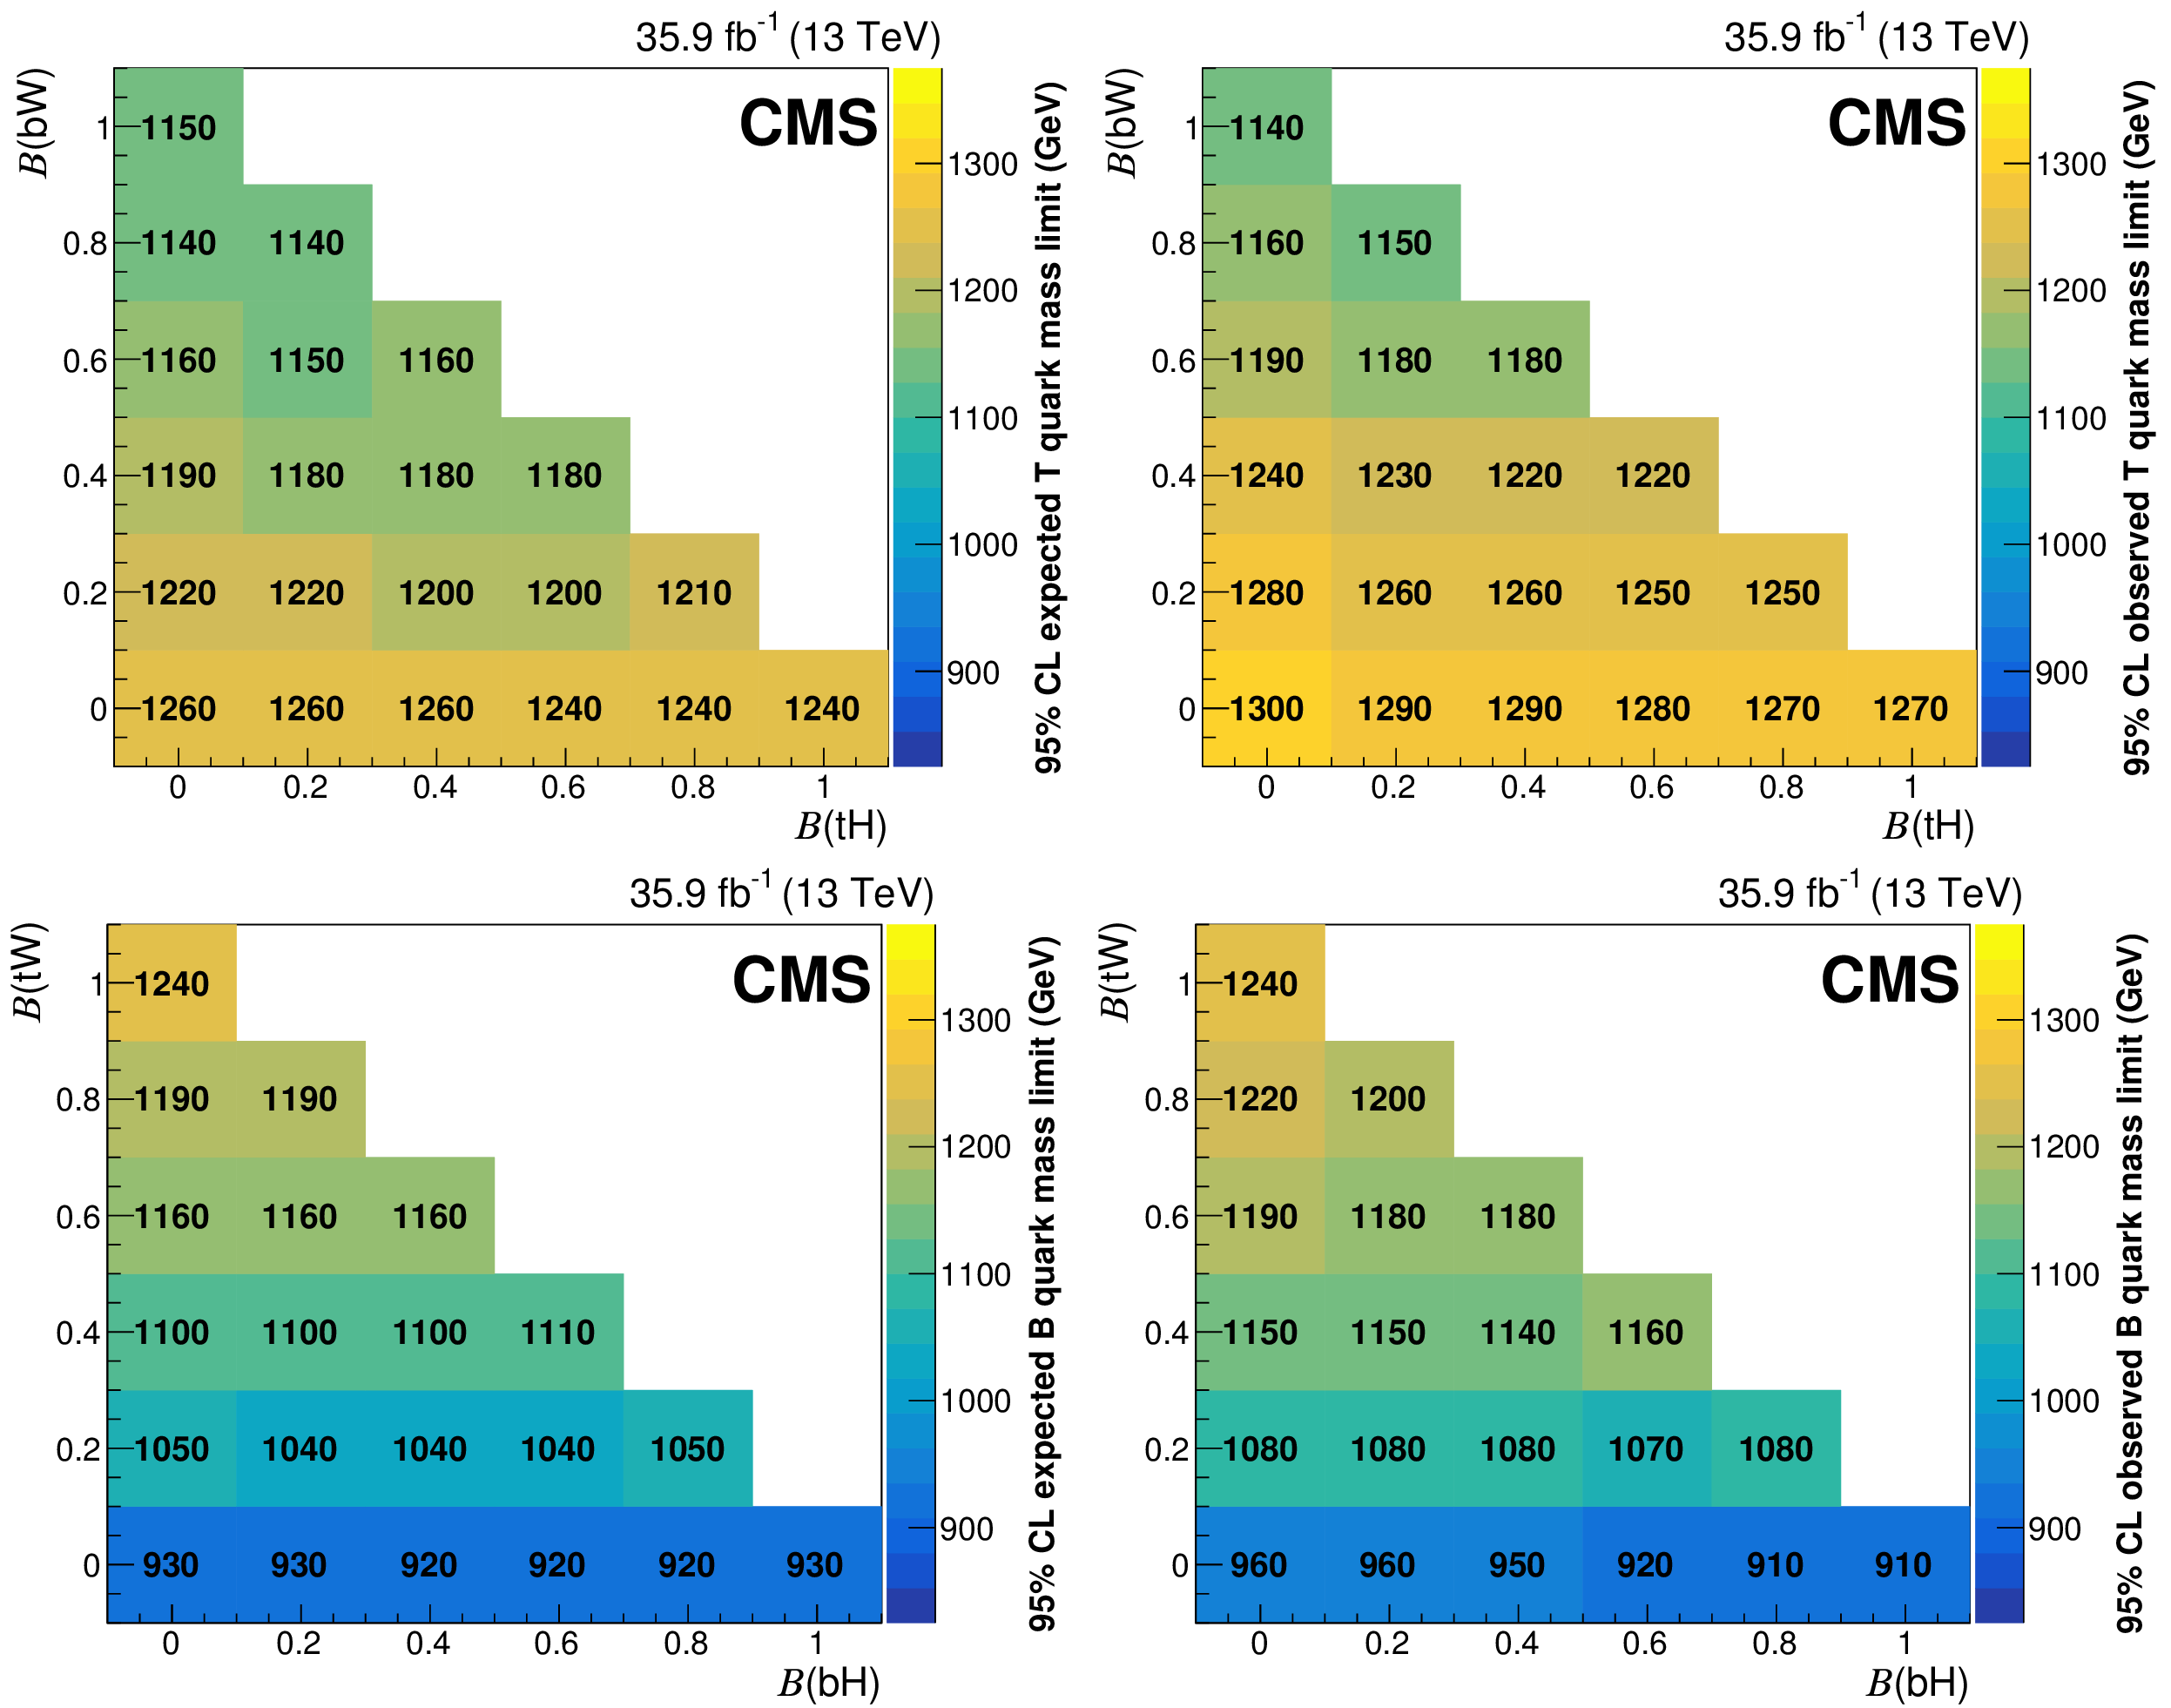
Figure 9:
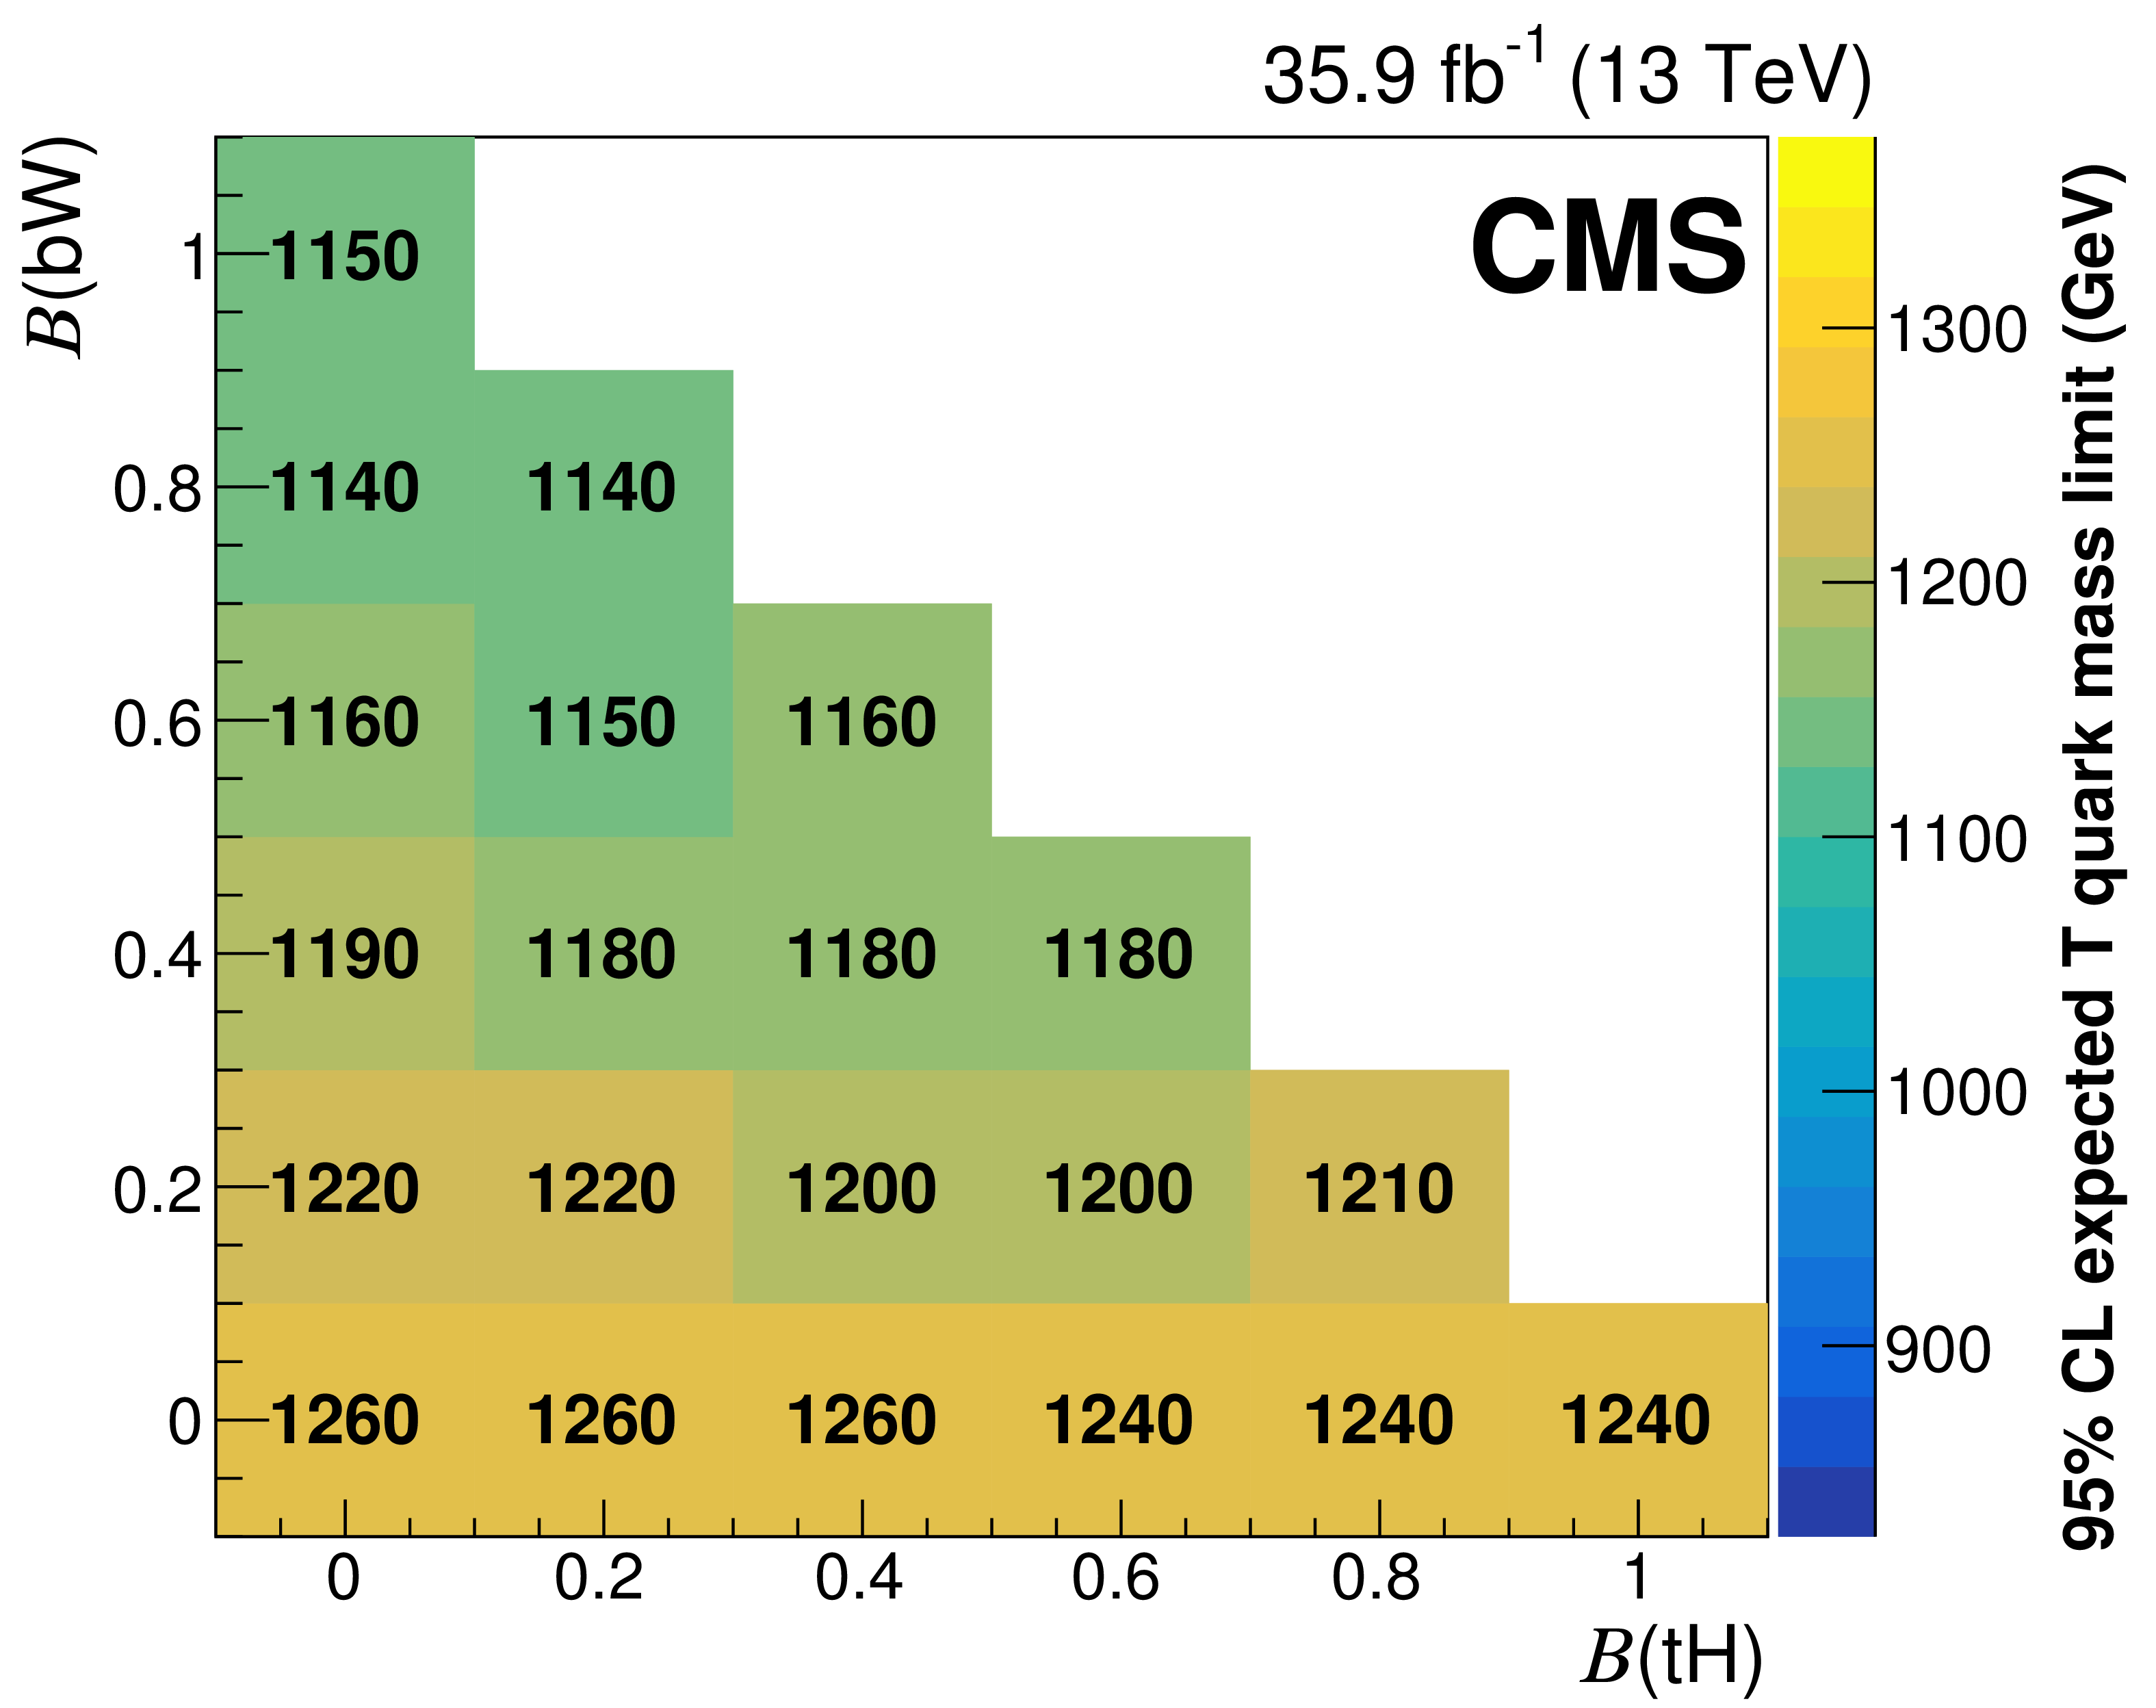
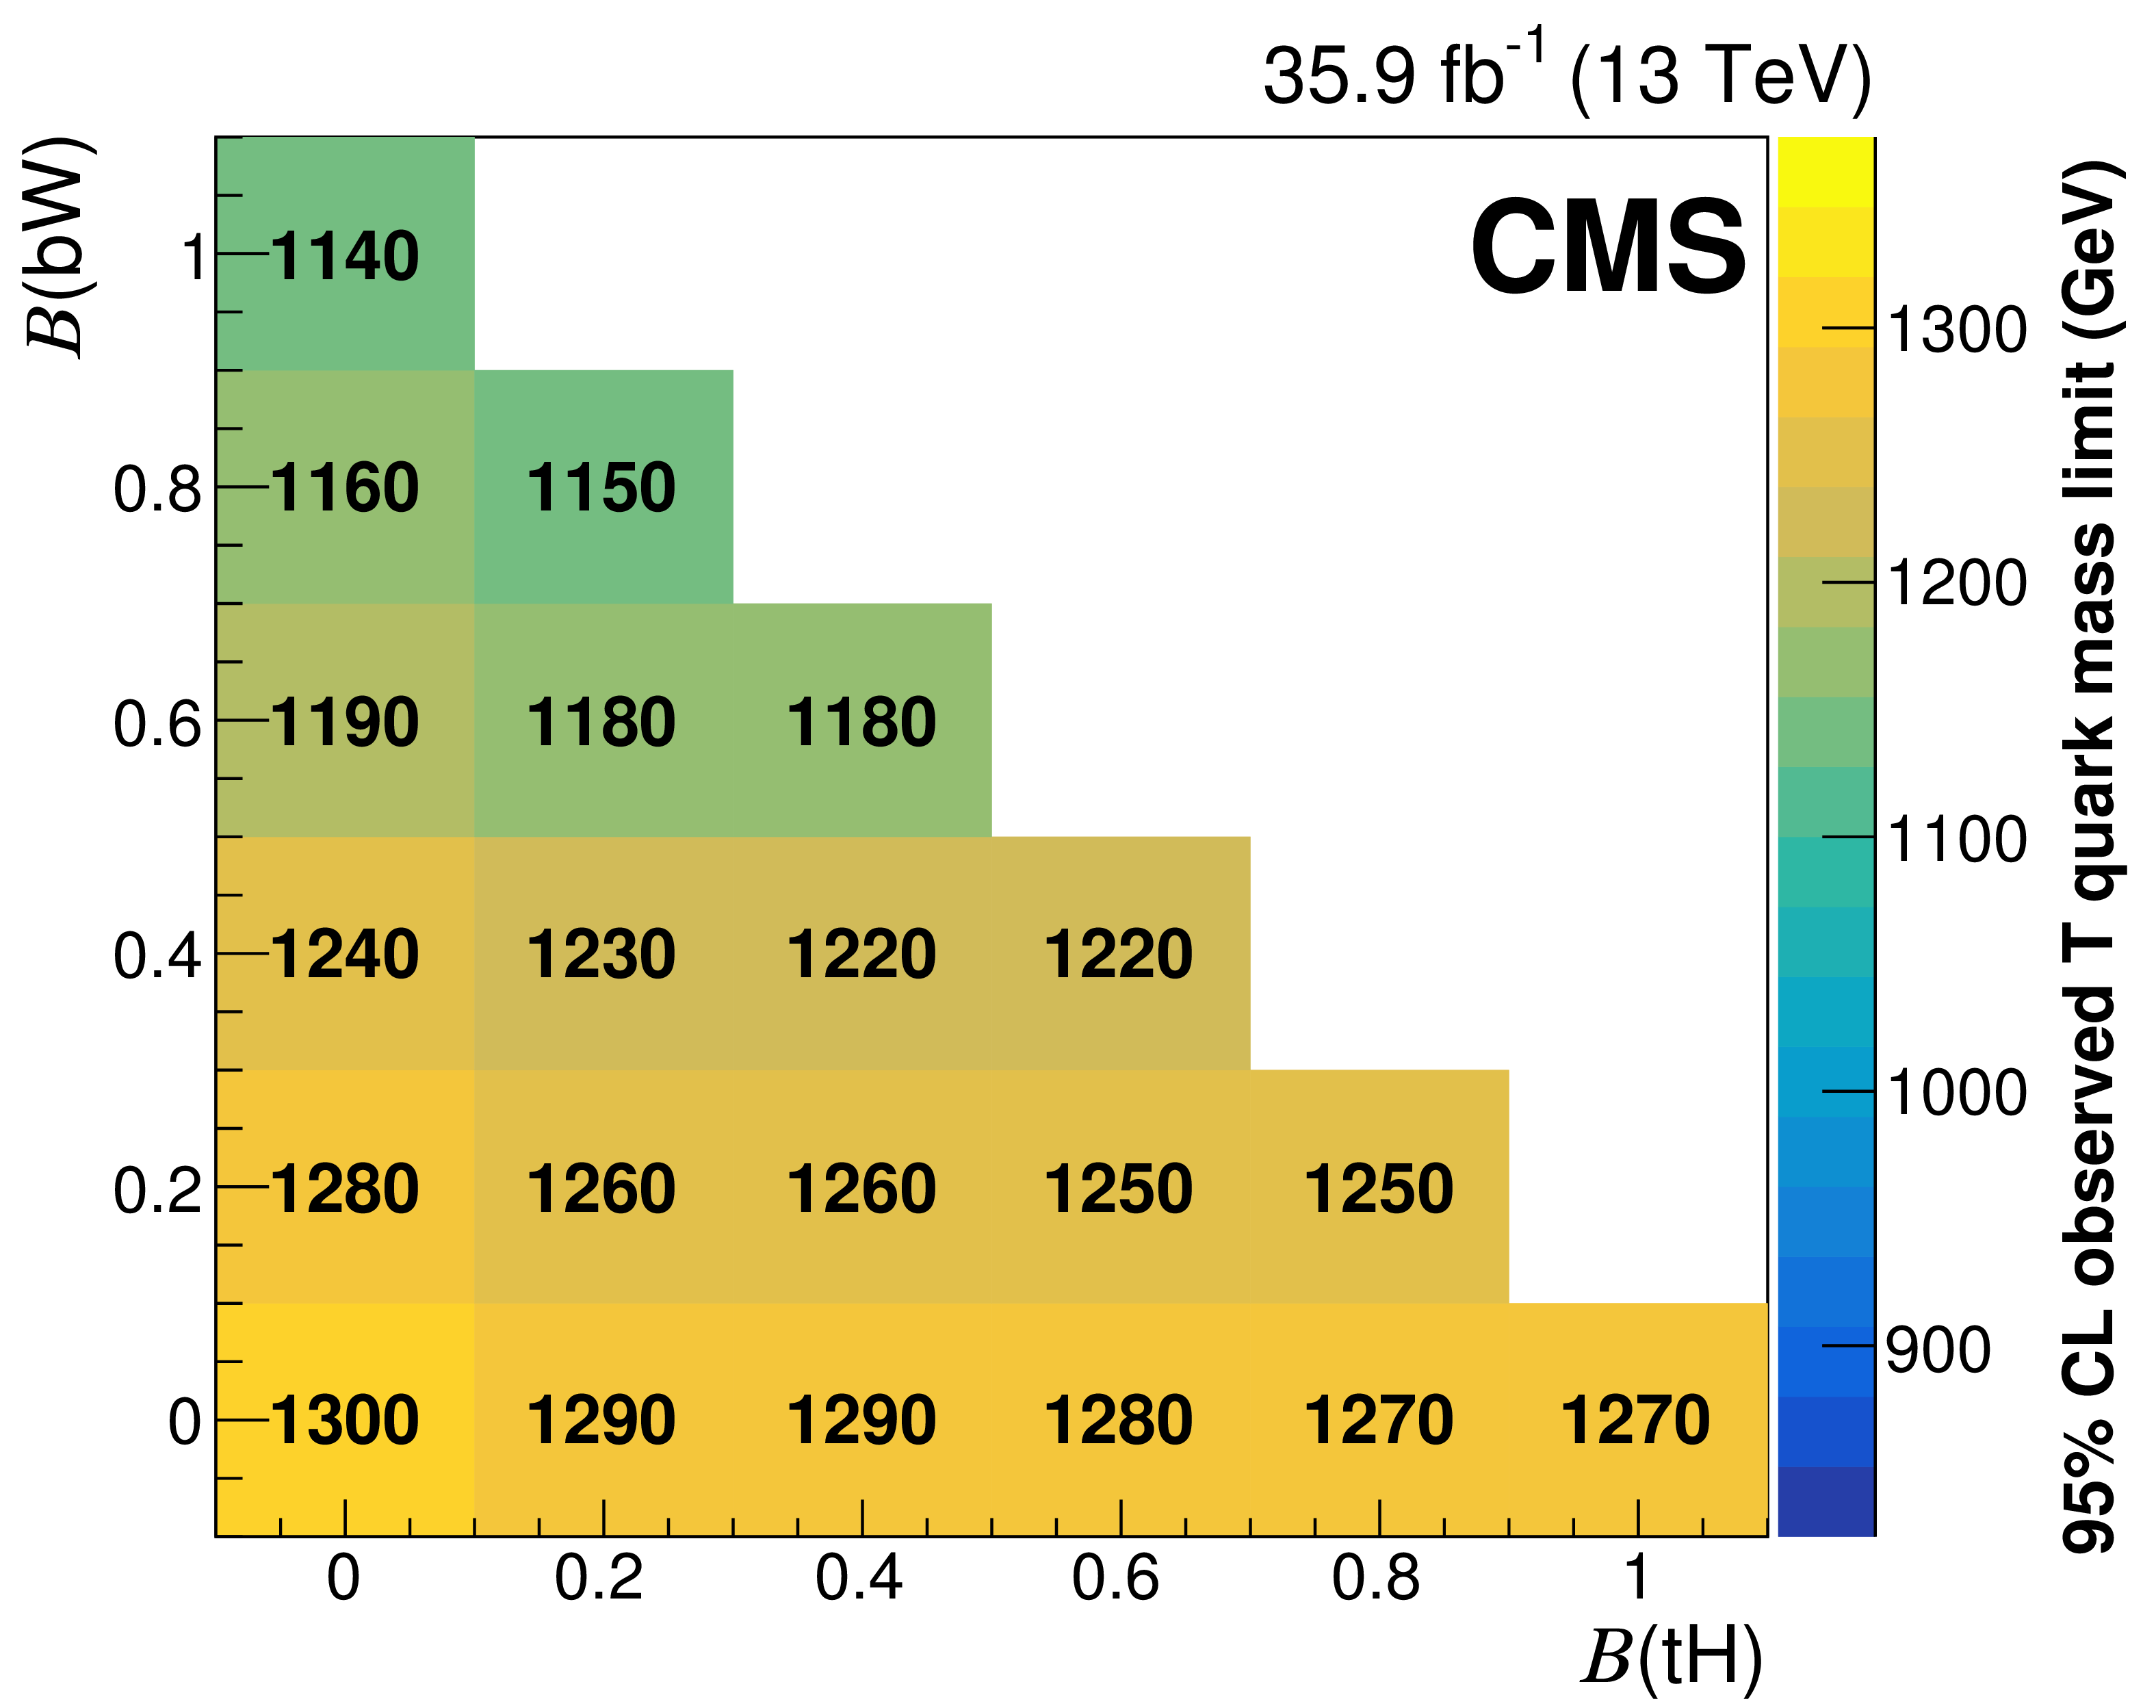
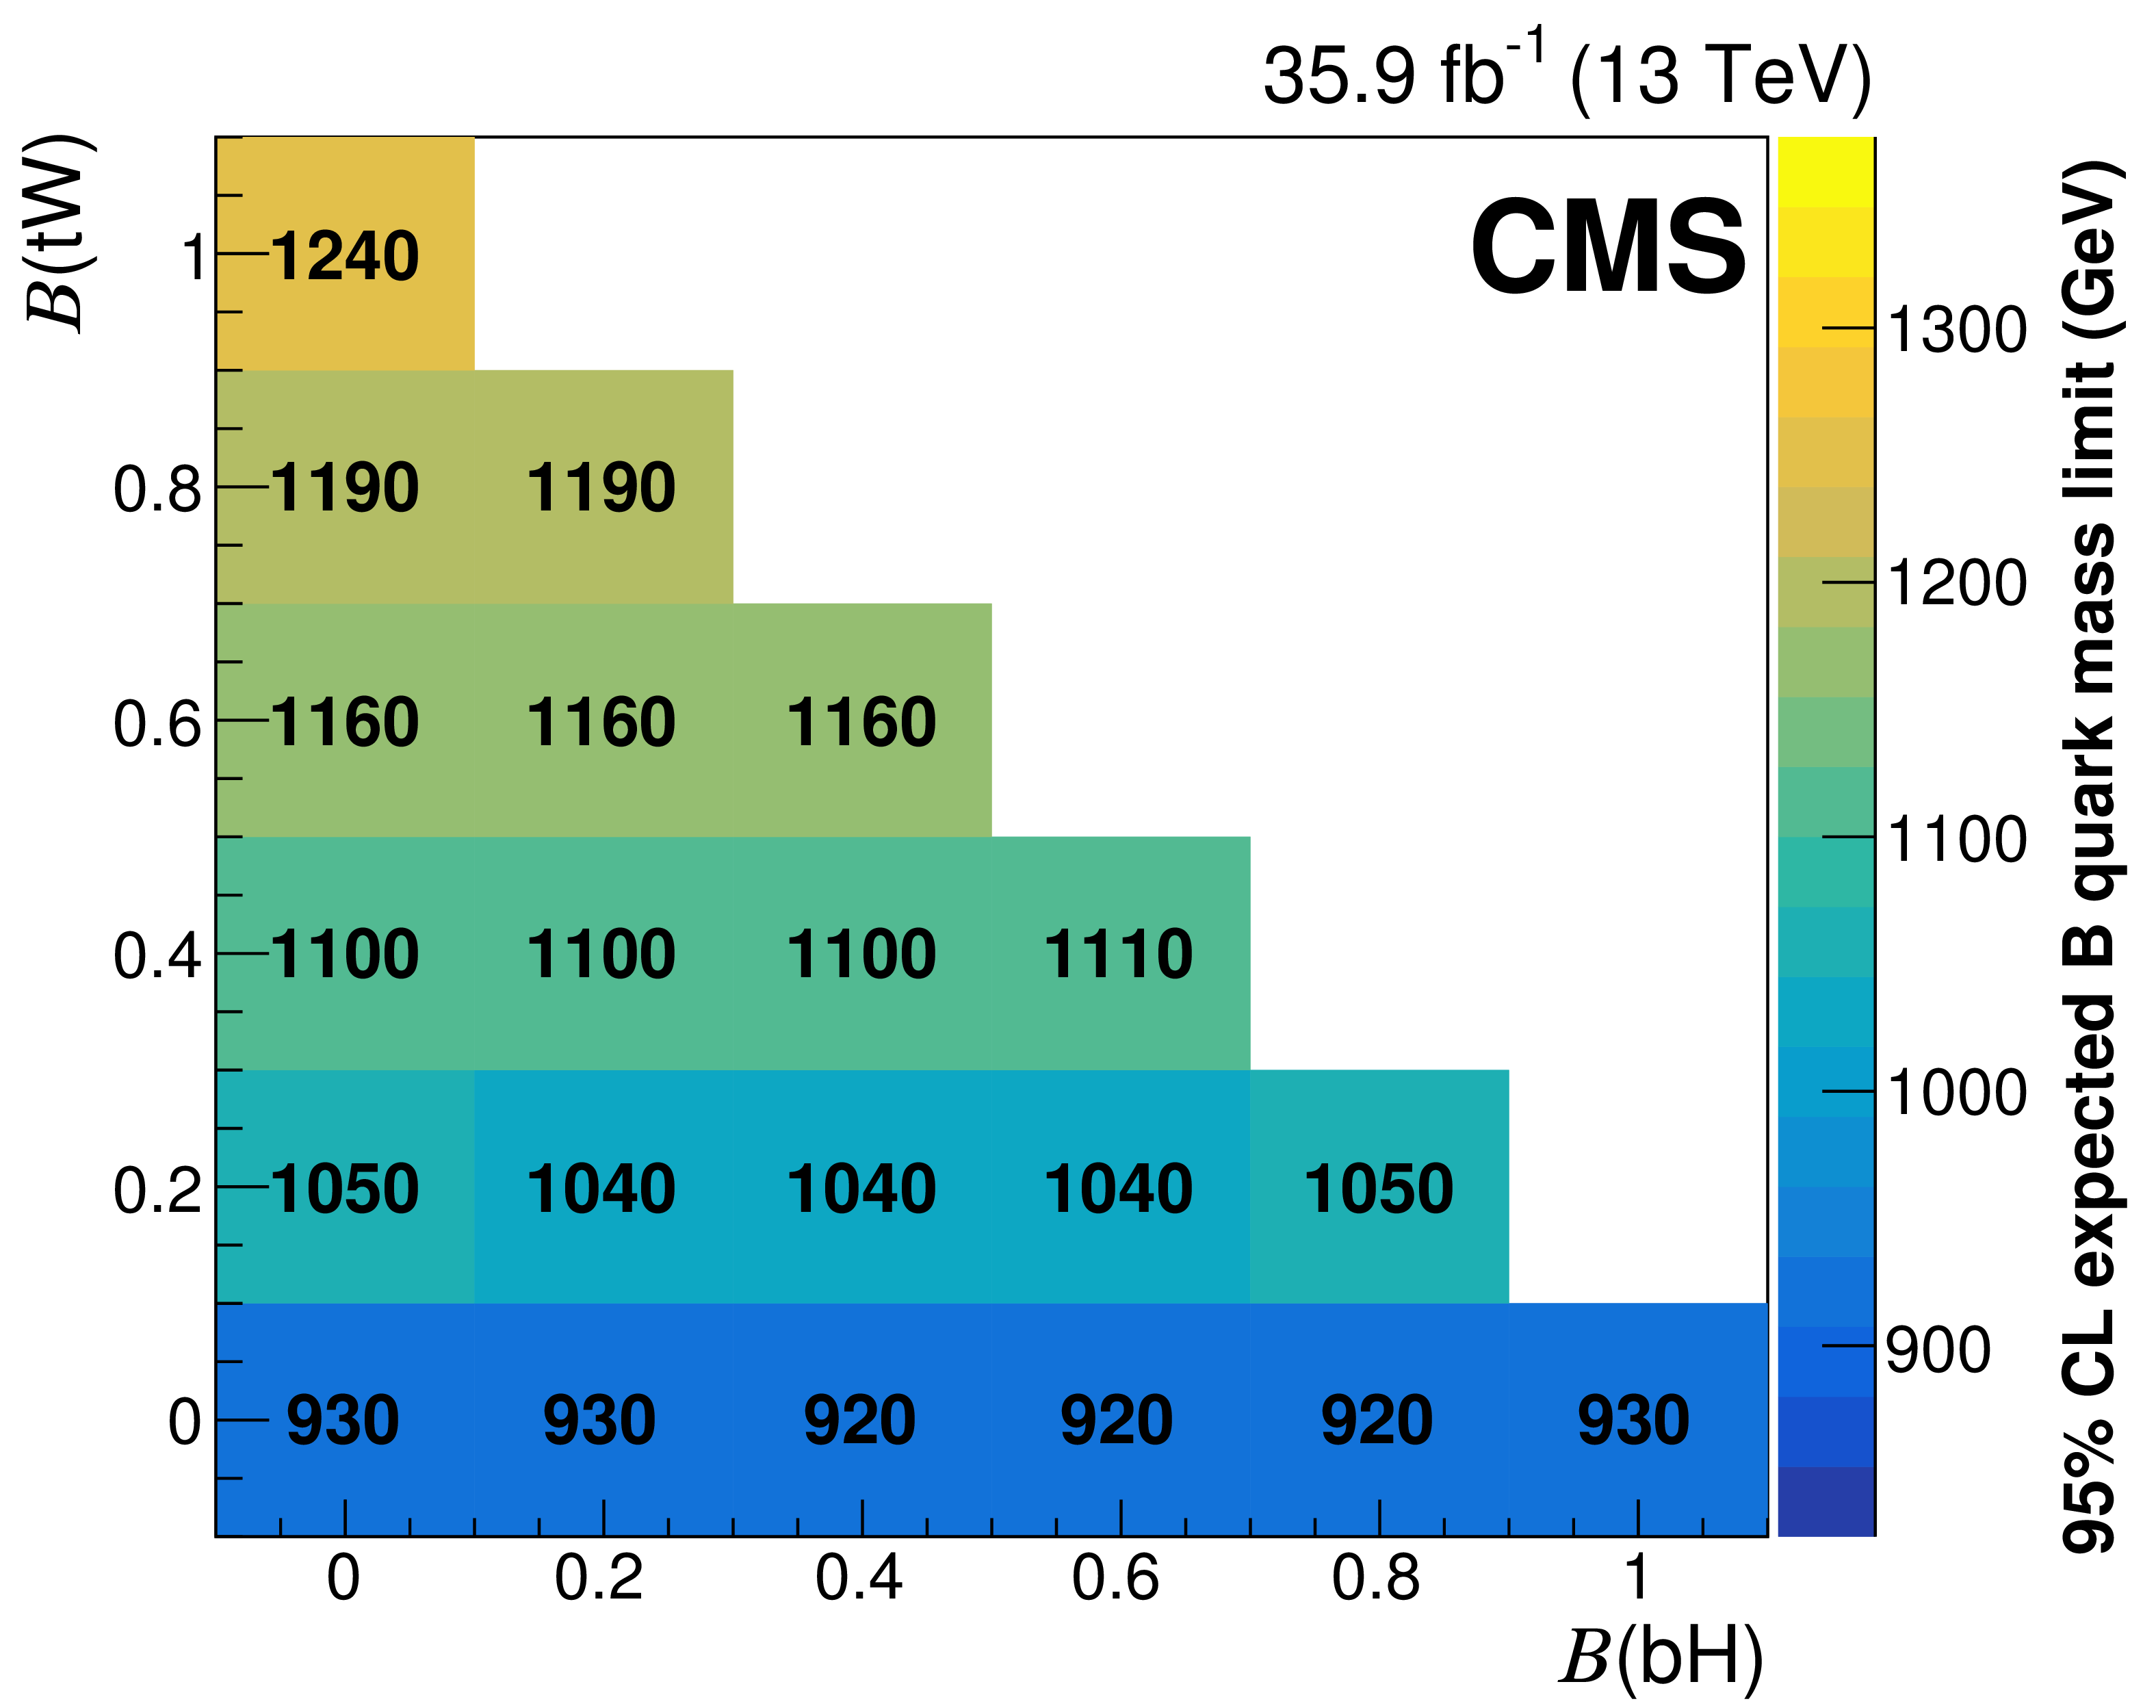
The 95% CL expected (left) and observed (right) lower limits on the T quark (upper row) and B quark (lower row) mass, expressed in GeV, after combining all channels for various branching fraction scenarios. |
png pdf |
Figure 9-a:
The 95% CL expected lower limits on the T quark mass, expressed in GeV, after combining all channels for various branching fraction scenarios. |
png pdf |
Figure 9-b:
The 95% CL observed lower limits on the T quark mass, expressed in GeV, after combining all channels for various branching fraction scenarios. |
png pdf |
Figure 9-c:
The 95% CL expected lower limits on the B quark mass, expressed in GeV, after combining all channels for various branching fraction scenarios. |

png pdf |
Figure 9-d:
The 95% CL observed lower limits on the B quark mass, expressed in GeV, after combining all channels for various branching fraction scenarios. |
| Tables | |
png pdf |
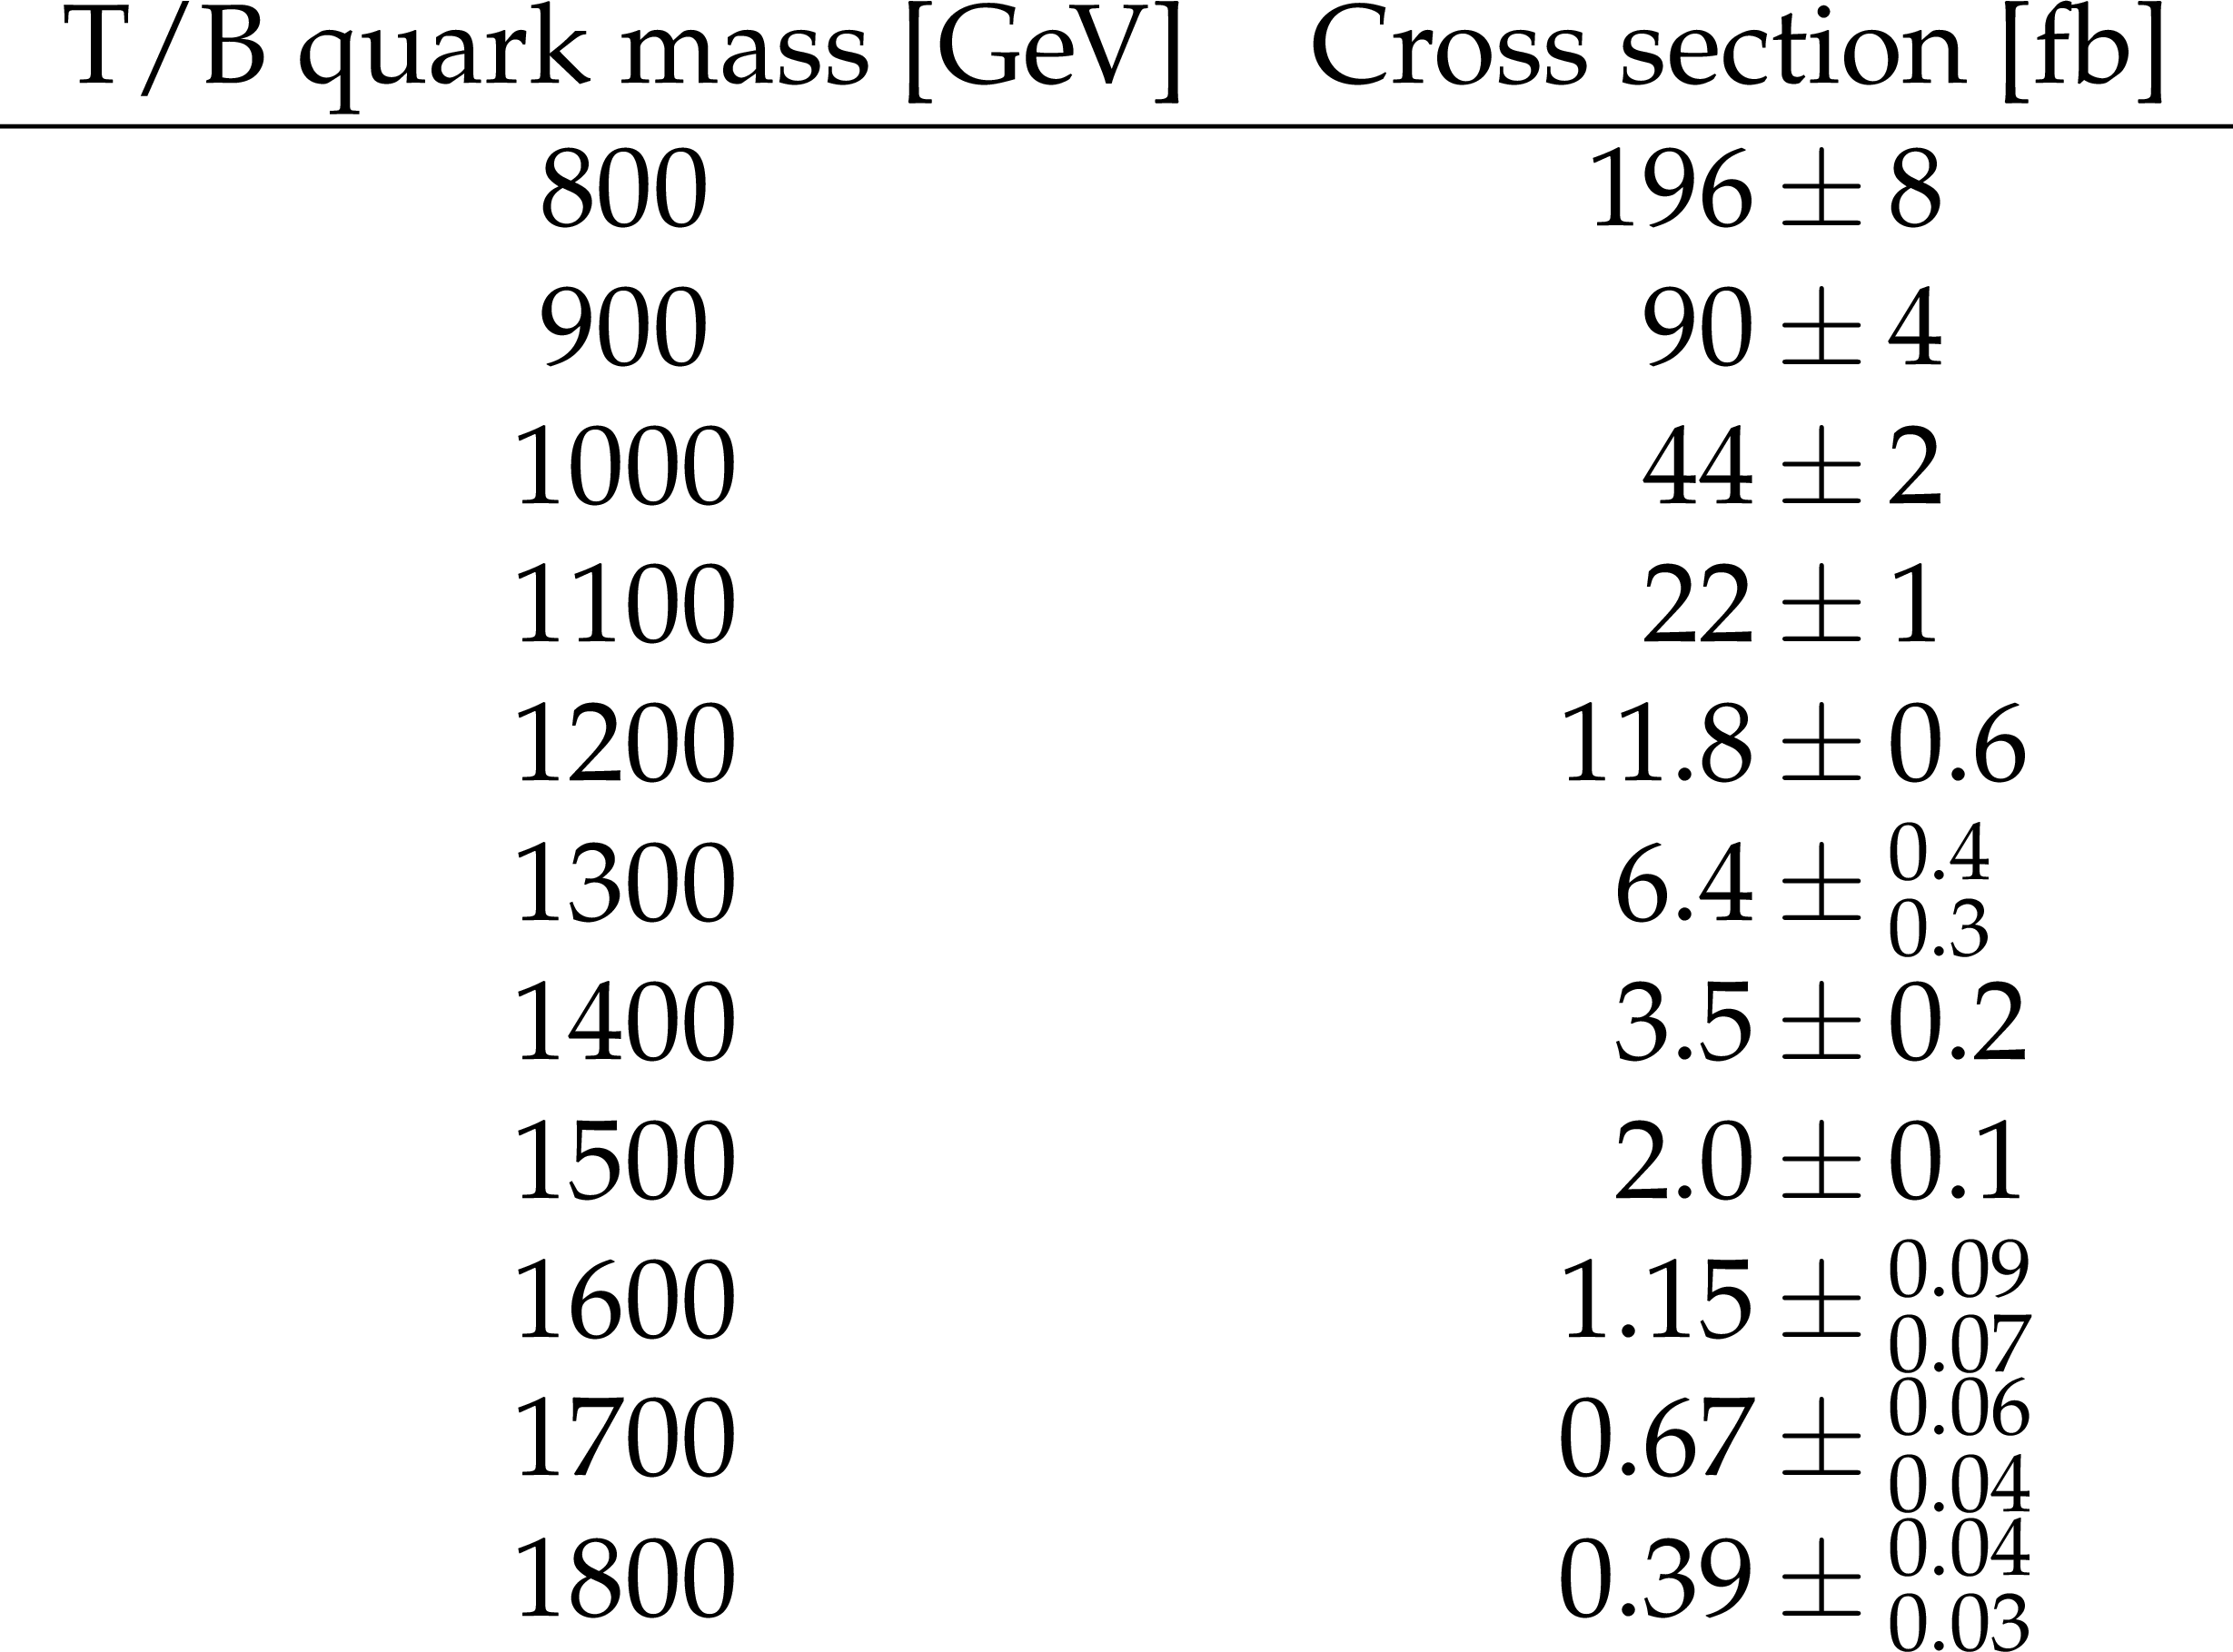
Table 1:
Theoretical cross sections of $ {{\mathrm {T}} {\overline {\mathrm {T}}}} $ or $ {{\mathrm {B}} {\overline {\mathrm {B}}}} $ production, for various masses, assuming a width of 10 GeV at each mass point. The cross section uncertainties include contributions from uncertainties in the PDFs and uncertainties estimated by varying factorization and renormalization scales by a factor of two. |

png pdf |
Table 2:
Predicted and observed event yields in the aggregated control region categories of the single-lepton channel. Uncertainties include both statistical and systematic components. |

png pdf |
Table 3:
Summary of values for normalization uncertainties and dependencies for shape uncertainties. The symbol $\sigma $ denotes one standard deviation of the uncertainty and "env'' denotes an envelope of values. Background from opposite-sign dilepton events is denoted "OS'', background from nonprompt leptons is denoted "NP'', while other backgrounds modeled from simulation are denoted "MC''. For signals, theoretical uncertainties are labeled as "Shape'' for shape-based searches, and "Accept.'' for counting experiments. Additionally, "CR'' denotes control region and "RMS'' denotes root mean square. |
png pdf |
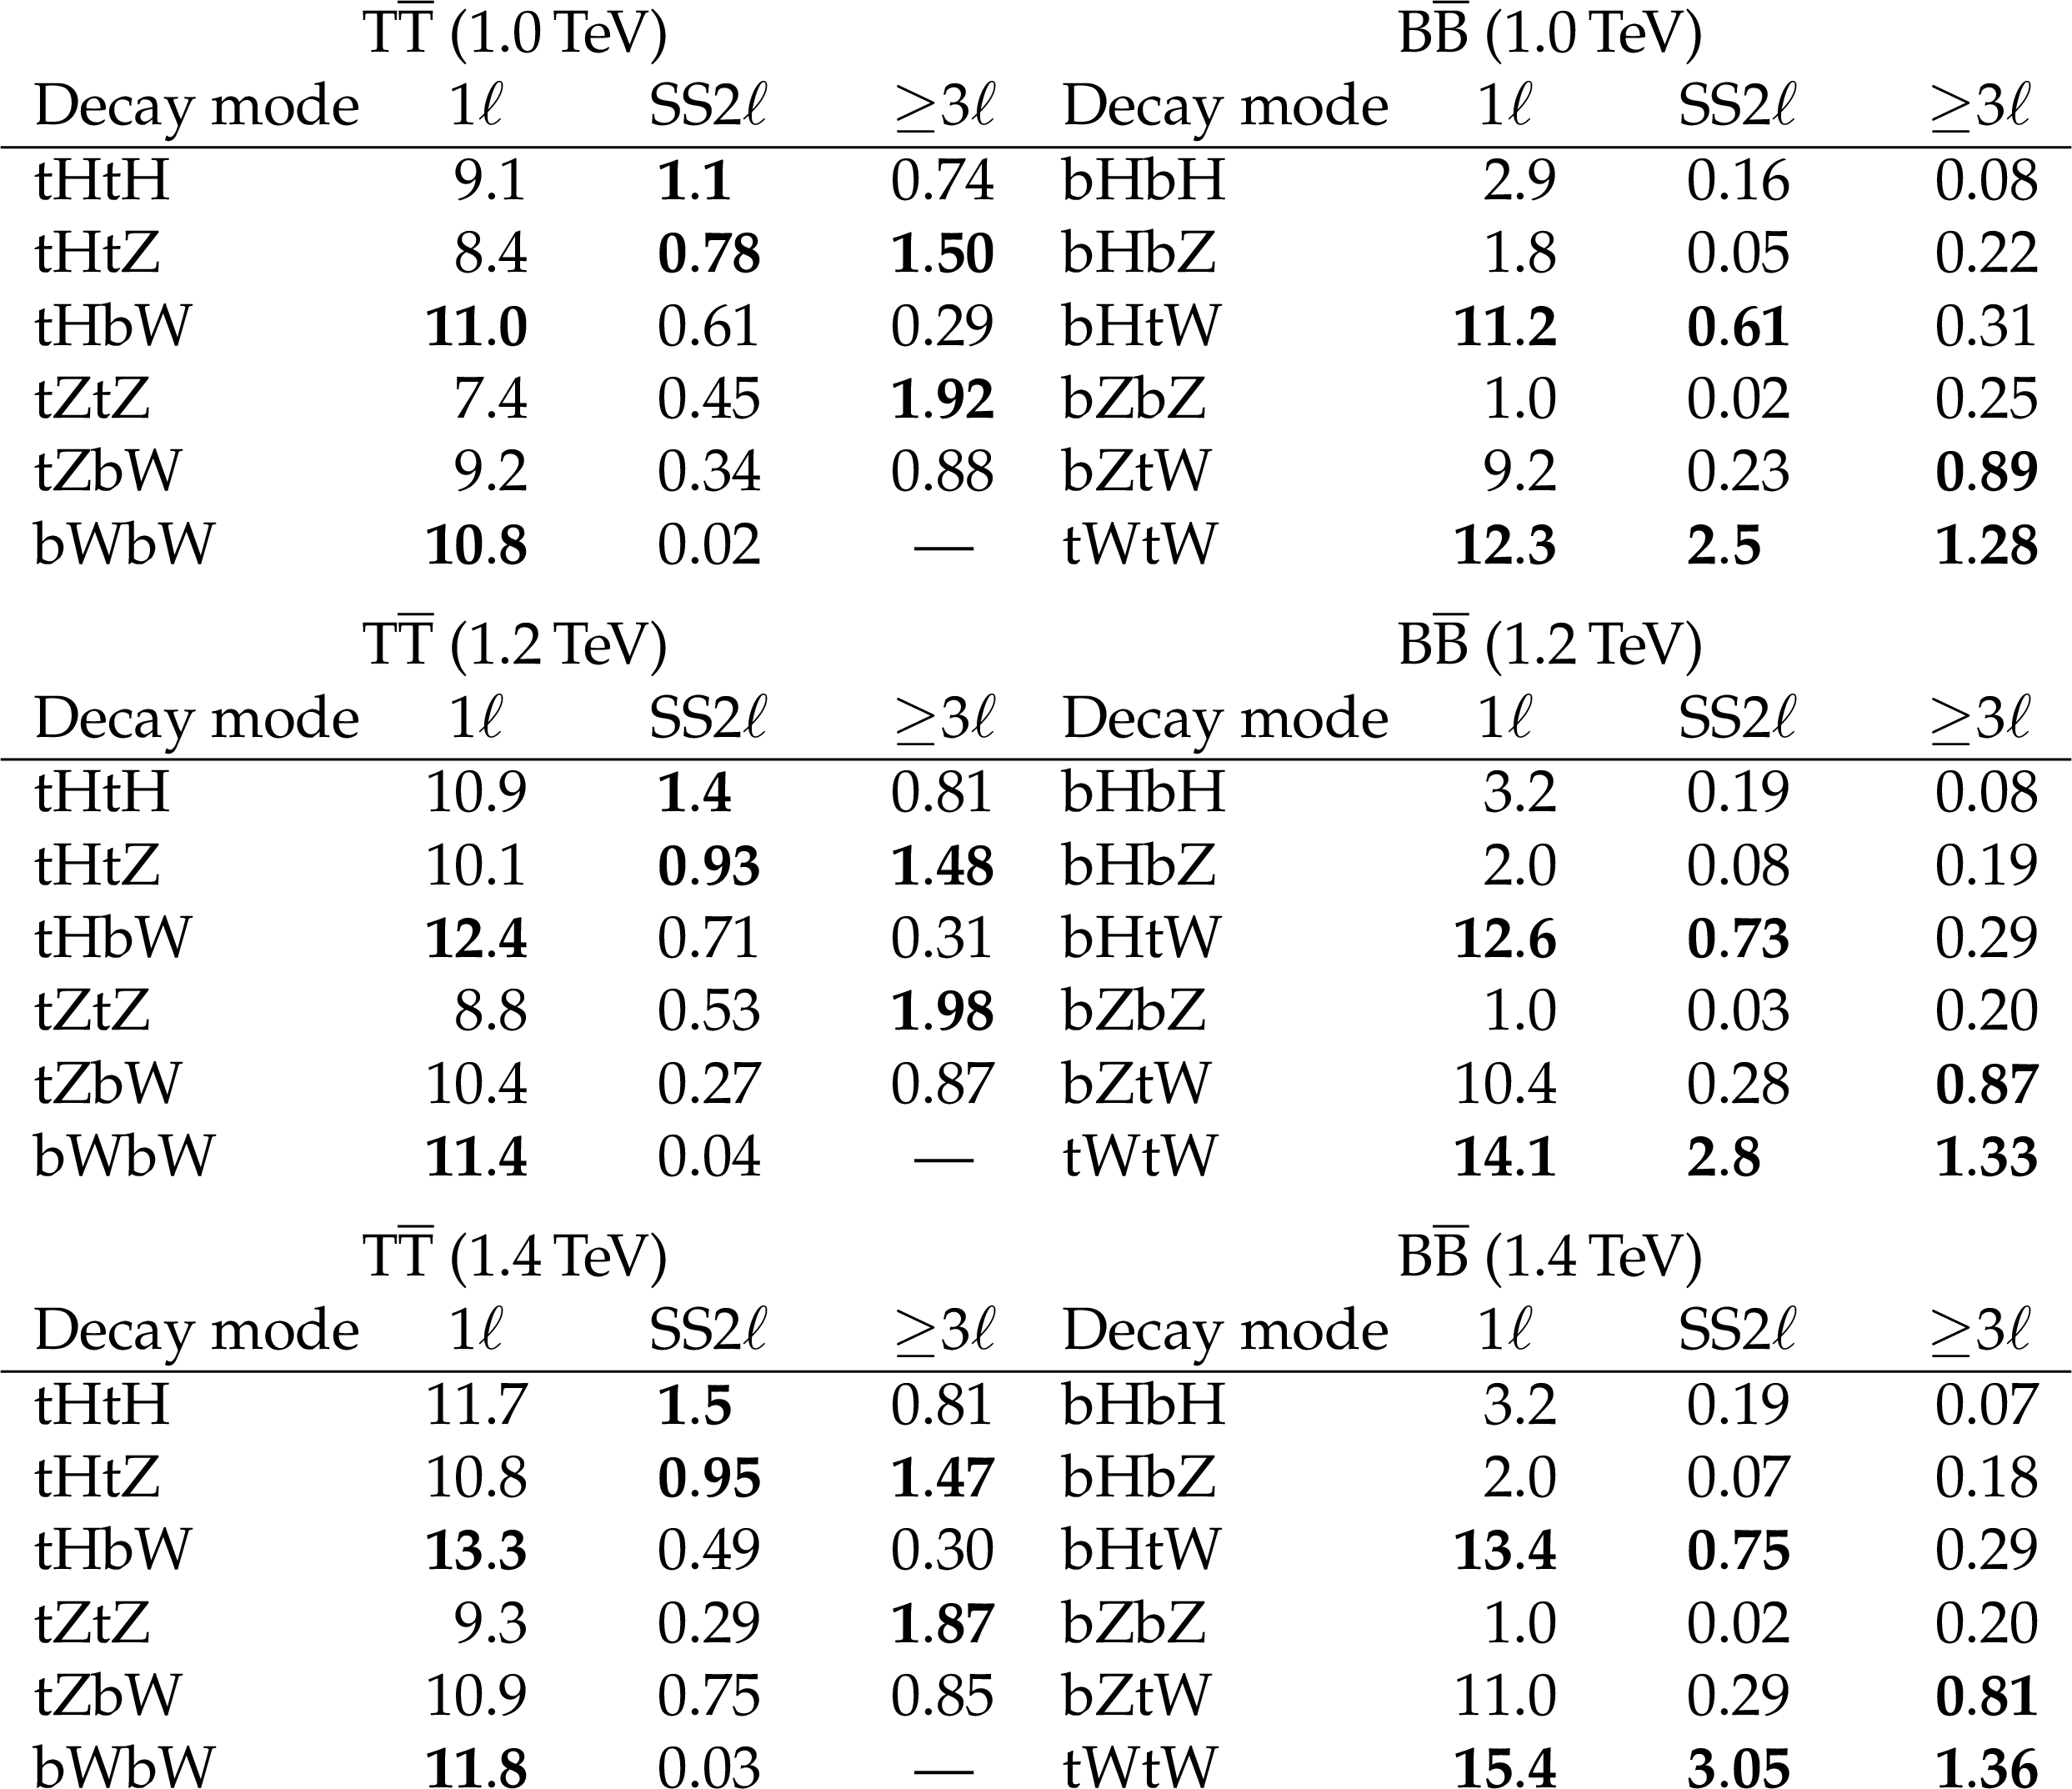
Table 4:
Signal efficiencies in the single-lepton, same-sign dilepton, and trilepton channels, split into the six possible final states of both $ {{\mathrm {T}} {\overline {\mathrm {T}}}} $ and $ {{\mathrm {B}} {\overline {\mathrm {B}}}} $ production, for three mass points. Efficiencies, stated in percent, are calculated with respect to the expected number of events in the corresponding decay mode, before any selection. The most sensitive decay modes for each channel are noted in bold. The efficiency for bWbW events in the same-sign dilepton and trilepton channels is negligible, as is the efficiency for bZbZ events in the same-sign dilepton channel. |

png pdf |
Table 5:
Numbers of predicted and observed events for signal region categories of the single-lepton channel before the fit to data. Uncertainties include both statistical and systematic components. |
png pdf |
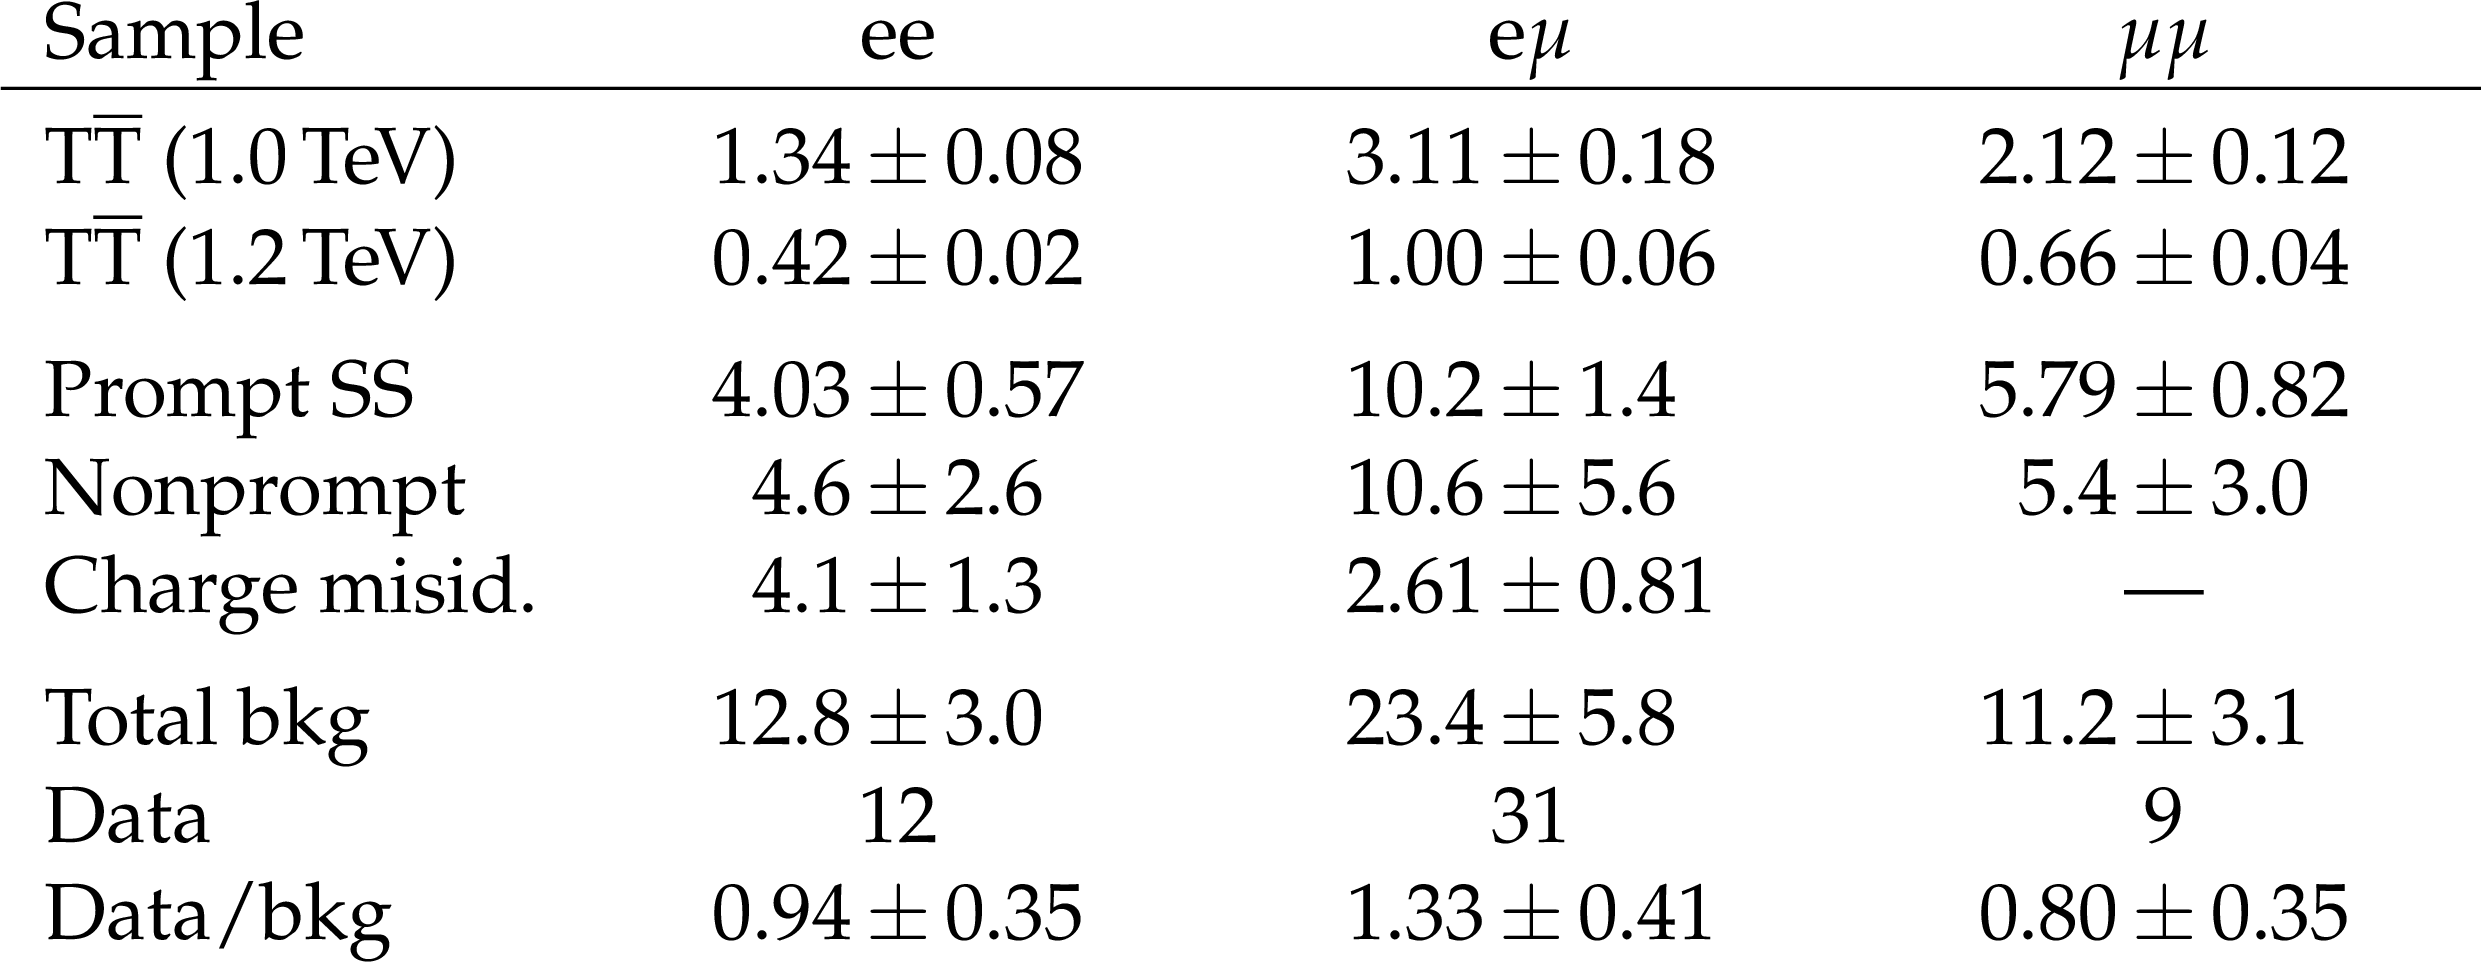
Table 6:
Numbers of predicted and observed events for lepton flavor categories in the same-sign dilepton channel before the fit to data. Uncertainties include both statistical and systematic components. |
png pdf |
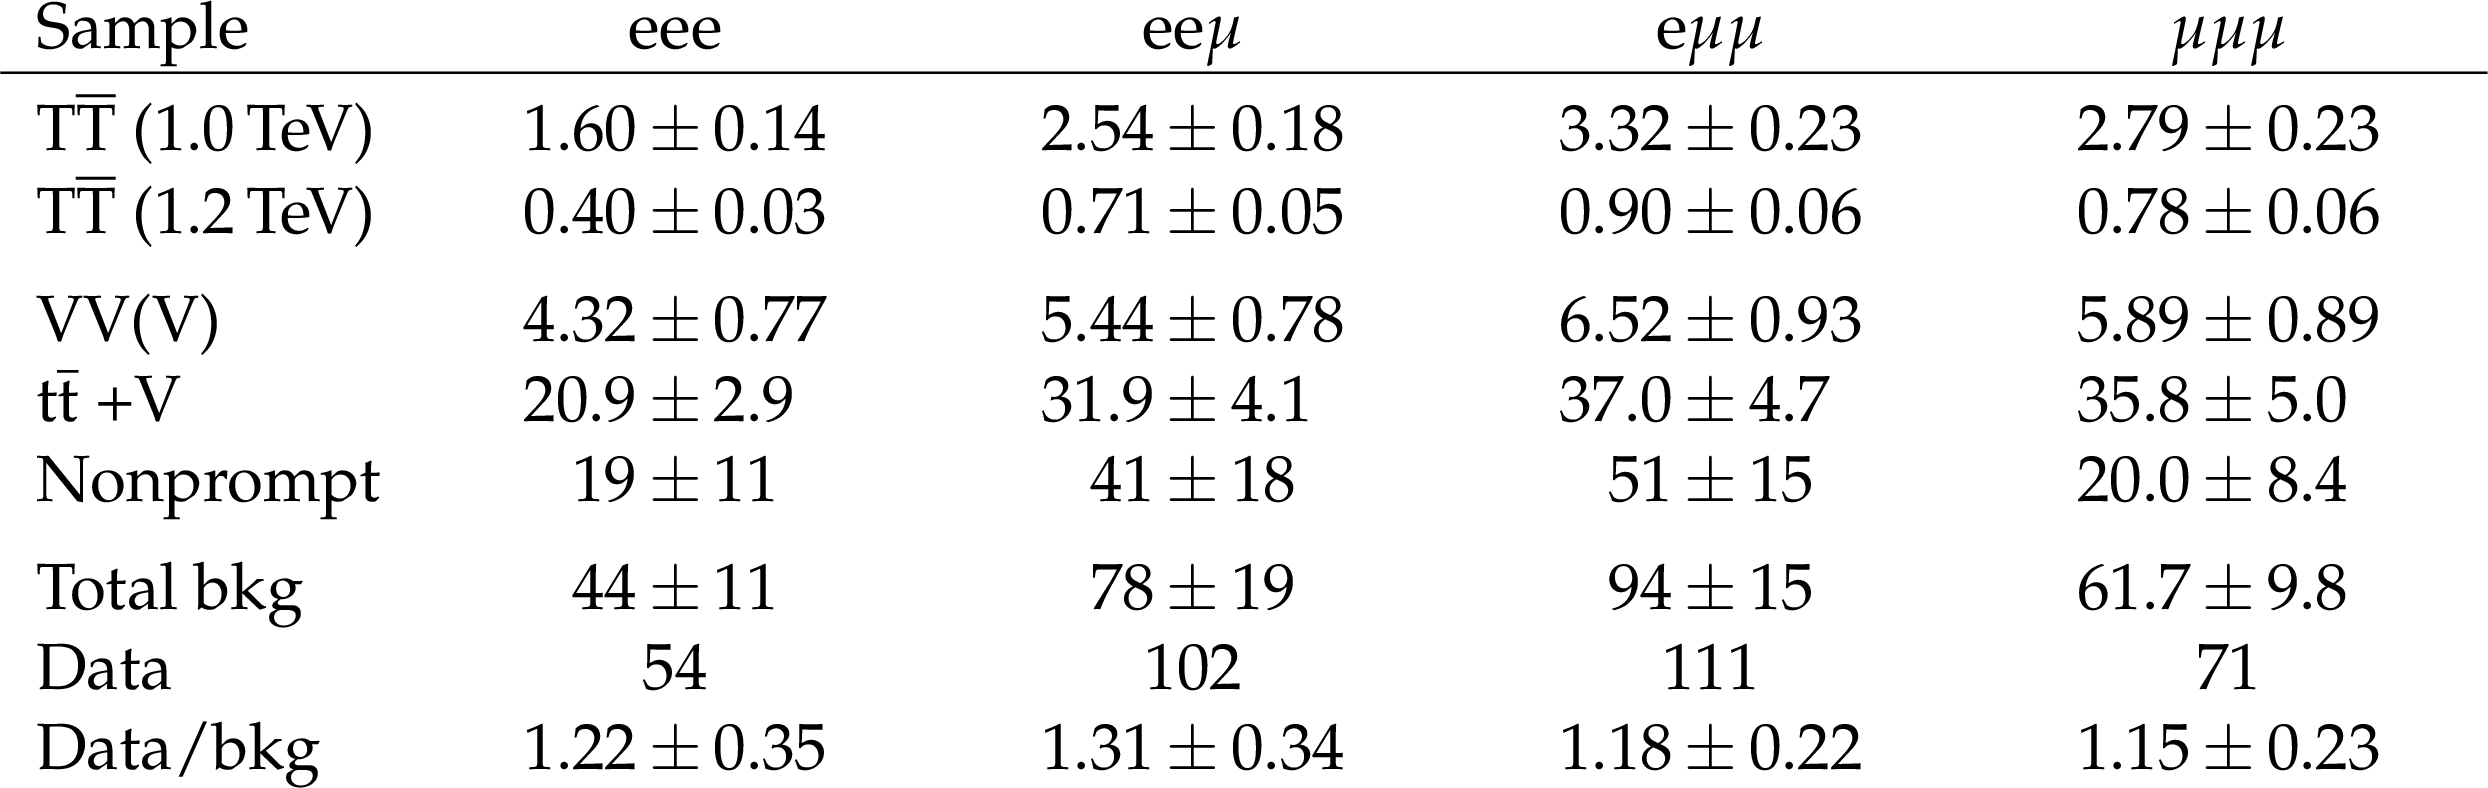
Table 7:
Numbers of predicted and observed events for lepton flavor categories in the trilepton channel before the fit to data. Uncertainties include both statistical and systematic components. |
| Summary |
| A search has been presented for pair-produced vector-like T and B quarks in a data sample of proton-proton collisions recorded during 2016 by the CMS experiment, and corresponding to an integrated luminosity of 35.9 fb$^{-1}$. The search is performed in channels with one lepton, two same-sign leptons, or at least three leptons in the final state and makes use of techniques to identify Lorentz-boosted hadronically decaying W and Higgs bosons. Combining these channels, we exclude T (B) quarks at 95% confidence level with masses below 1200 (1170) GeV in the singlet branching fraction scenario and 1280 (940) GeV in the doublet branching fraction scenario. For other branching fraction scenarios this search excludes T (B) quark masses below 1140-1300 GeV (910-1240 GeV). This represents an improvement in sensitivity of typically 200-600 GeV, compared to previous CMS results. These results are the strongest exclusion limits to date for T quarks with $\mathcal{B}(\mathrm{t}\mathrm{Z})$ greater than ${\approx}$0.5 and for B quarks with $\mathcal{B}(\mathrm{t}\mathrm{W})$ less than ${\approx}$0.6. |
| References | ||||
| 1 | ATLAS Collaboration | Observation of a new particle in the search for the standard model Higgs boson with the ATLAS detector at the LHC | PLB 716 (2012) 1 | 1207.7214 |
| 2 | CMS Collaboration | Observation of a new boson at a mass of 125 GeV with the CMS experiment at the LHC | PLB 716 (2012) 30 | CMS-HIG-12-028 1207.7235 |
| 3 | CMS Collaboration | Observation of a new boson with mass near 125 GeV in pp collisions at $ \sqrt{s} = $ 7 and 8 TeV | JHEP 06 (2013) 081 | CMS-HIG-12-036 1303.4571 |
| 4 | M. Perelstein, M. E. Peskin, and A. Pierce | Top quarks and electroweak symmetry breaking in little Higgs models | PRD 69 (2004) 075002 | hep-ph/0310039 |
| 5 | O. Matsedonskyi, G. Panico, and A. Wulzer | Light top partners for a light composite Higgs | JHEP 01 (2013) 164 | 1204.6333 |
| 6 | R. Contino, L. Da Rold, and A. Pomarol | Light custodians in natural composite Higgs models | PRD 75 (2007) 055014 | hep-ph/0612048 |
| 7 | R. Contino, T. Kramer, M. Son, and R. Sundrum | Warped/composite phenomenology simplified | JHEP 05 (2007) 074 | hep-ph/0612180 |
| 8 | D. B. Kaplan | Flavor at SSC energies: A new mechanism for dynamically generated fermion masses | NPB 365 (1991) 259 | |
| 9 | M. J. Dugan, H. Georgi, and D. B. Kaplan | Anatomy of a composite higgs model | NPB 254 (1985) 299 | |
| 10 | J. A. Aguilar-Saavedra | Mixing with vector-like quarks: constraints and expectations | EPJ Web Conf. 60 (2013) 16012 | 1306.4432 |
| 11 | F. del Aguila, J. A. Aguilar-Saavedra, and R. Miquel | Constraints on top couplings in models with exotic quarks | PRL 82 (1999) 1628 | hep-ph/9808400 |
| 12 | ALEPH, DELPHI, L3, and OPAL Collaborations | Electroweak Measurements in Electron-Positron Collisions at W-Boson-Pair Energies at LEP | PR 532 (2013) 119 | 1302.3415 |
| 13 | O. Eberhardt et al. | Impact of a Higgs boson at a mass of 126 GeV on the standard model with three and four fermion generations | PRL 109 (2012) 241802 | 1209.1101 |
| 14 | A. Djouadi and A. Lenz | Sealing the fate of a fourth generation of fermions | PLB 715 (2012) 310 | 1204.1252 |
| 15 | CMS Collaboration | Searches for Higgs bosons in pp collisions at $ \sqrt{s}= $ 7 and 8 TeV in the context of four-generation and fermiophobic models | PLB 725 (2013) 36 | CMS-HIG-12-013 1302.1764 |
| 16 | J. A. Aguilar-Saavedra, R. Benbrik, S. Heinemeyer, and M. P\'erez-Victoria | Handbook of vectorlike quarks: Mixing and single production | PRD 88 (2013) 094010 | 1306.0572 |
| 17 | A. De Simone, O. Matsedonskyi, R. Rattazzi, and A. Wulzer | A first top partner hunter's guide | JHEP 04 (2013) 1 | 1211.5663 |
| 18 | F. del Aguila, L. Ametller, G. L. Kane, and J. Vidal | Vector-like fermion and standard Higgs production at hadron colliders | NPB 334 (1990) 1 | |
| 19 | CMS Collaboration | Search for a vector-like quark with charge 2/3 in t + Z events from pp collisions at $ \sqrt{s}= $ 7 TeV | PRL 107 (2011) 271802 | CMS-EXO-11-005 1109.4985 |
| 20 | CMS Collaboration | Search for pair produced fourth-generation up-type quarks in pp collisions at $ \sqrt{s}= $ 7 TeV with a lepton in the final state | PLB 718 (2012) 307 | CMS-EXO-11-099 1209.0471 |
| 21 | ATLAS Collaboration | Search for pair production of a new quark that decays to a Z boson and a bottom quark with the ATLAS detector | PRL 109 (2012) 071801 | 1204.1265 |
| 22 | CMS Collaboration | Search for vector-like charge 2/3 T quarks in proton-proton collisions at $ \sqrt{s} = $ 8 TeV | PRD 92 (2016) 012003 | CMS-B2G-13-005 1509.04177 |
| 23 | CMS Collaboration | Inclusive search for a vector-like T quark with charge $ \frac{2}{3} $ in pp collisions at $ \sqrt{s} = $ 8 TeV | PLB 729 (2014) 149 | CMS-B2G-12-015 1311.7667 |
| 24 | ATLAS Collaboration | Search for pair production of a new heavy quark that decays into a $ W $ boson and a light quark in $ pp $ collisions at $ \sqrt{s} = $ 8 TeV with the ATLAS detector | PRD 92 (2015) 112007 | 1509.04261 |
| 25 | ATLAS Collaboration | Search for production of vector-like quark pairs and of four top quarks in the lepton-plus-jets final state in $ pp $ collisions at $ \sqrt{s}= $ 8 TeV with the ATLAS detector | JHEP 08 (2015) 105 | 1505.04306 |
| 26 | ATLAS Collaboration | Search for pair production of vector-like top quarks in events with one lepton, jets, and missing transverse momentum in $ \sqrt{s}=13 TeV pp $ collisions with the ATLAS detector | JHEP 08 (2017) 052 | 1705.10751 |
| 27 | ATLAS Collaboration | Search for pair production of heavy vector-like quarks decaying to high-p$ _{T} $ W bosons and b quarks in the lepton-plus-jets final state in pp collisions at $ \sqrt{s}= $ 13 TeV with the ATLAS detector | JHEP 10 (2017) 141 | 1707.03347 |
| 28 | CMS Collaboration | Search for pair production of vector-like T and B quarks in single-lepton final states using boosted jet substructure in proton-proton collisions at $ \sqrt{s}= $ 13 TeV | JHEP 11 (2017) 085 | CMS-B2G-16-024 1706.03408 |
| 29 | CMS Collaboration | Search for pair production of vector-like quarks in the bW$ \overline{\mathrm{b}} $W channel from proton-proton collisions at $ \sqrt{s} = $ 13 TeV | PLB 779 (2018) 82 | CMS-B2G-17-003 1710.01539 |
| 30 | ATLAS Collaboration | Search for pair production of up-type vector-like quarks and for four-top-quark events in final states with multiple $ b $-jets with the ATLAS detector | Submitted to \it JHEP | 1803.09678 |
| 31 | CMS Collaboration | The CMS experiment at the CERN LHC | JINST 3 (2008) S08004 | CMS-00-001 |
| 32 | CMS Collaboration | Particle-flow reconstruction and global event description with the CMS detector | JINST 12 (2017) P10003 | CMS-PRF-14-001 1706.04965 |
| 33 | M. Cacciari, G. P. Salam, and G. Soyez | The anti-$ {k_{\mathrm{T}}} $ jet clustering algorithm | JHEP 04 (2008) 063 | 0802.1189 |
| 34 | M. Cacciari, G. P. Salam, and G. Soyez | FastJet user manual | EPJC 72 (2012) 1896 | 1111.6097 |
| 35 | M. Cacciari, G. P. Salam, and G. Soyez | The catchment area of jets | JHEP 04 (2008) 005 | 0802.1188 |
| 36 | CMS Collaboration | Determination of jet energy calibration and transverse momentum resolution in CMS | JINST 6 (2011) P11002 | CMS-JME-10-011 1107.4277 |
| 37 | CMS Collaboration | Jet algorithms performance in 13 TeV data | CMS-PAS-JME-16-003 | CMS-PAS-JME-16-003 |
| 38 | CMS Collaboration | The CMS trigger system | JINST 12 (2017) P01020 | CMS-TRG-12-001 1609.02366 |
| 39 | NNPDF Collaboration | Parton distributions for the LHC Run II | JHEP 04 (2015) 040 | 1410.8849 |
| 40 | P. Nason | A new method for combining NLO QCD with shower Monte Carlo algorithms | JHEP 11 (2004) 040 | hep-ph/0409146 |
| 41 | S. Frixione, P. Nason, and C. Oleari | Matching NLO QCD computations with Parton Shower simulations: the POWHEG method | JHEP 11 (2007) 070 | 0709.2092 |
| 42 | S. Alioli, P. Nason, C. Oleari, and E. Re | A general framework for implementing NLO calculations in shower Monte Carlo programs: the POWHEG BOX | JHEP 06 (2010) 043 | 1002.2581 |
| 43 | S. Frixione, P. Nason, and G. Ridolfi | A positive-weight next-to-leading-order Monte Carlo for heavy flavour hadroproduction | JHEP 09 (2007) 126 | 0707.3088 |
| 44 | J. Alwall et al. | The automated computation of tree-level and next-to-leading order differential cross sections, and their matching to parton shower simulations | JHEP 07 (2014) 079 | 1405.0301 |
| 45 | R. Frederix and S. Frixione | Merging meets matching in MC@NLO | JHEP 12 (2012) 061 | 1209.6215 |
| 46 | J. Alwall et al. | Comparative study of various algorithms for the merging of parton showers and matrix elements in hadronic collisions | EPJC 53 (2008) 473 | 0706.2569 |
| 47 | T. Sjostrand, S. Mrenna, and P. Skands | PYTHIA 6.4 physics and manual | JHEP 05 (2006) 026 | hep-ph/0603175 |
| 48 | T. Sjostrand et al. | An introduction to PYTHIA 8.2 | CPC 191 (2015) 159 | 1410.3012 |
| 49 | CMS Collaboration | Investigations of the impact of the parton shower tuning in Pythia 8 in the modelling of $ \mathrm{t\overline{t}} $ at $ \sqrt{s}= $ 8 and 13 TeV | CMS-PAS-TOP-16-021 | CMS-PAS-TOP-16-021 |
| 50 | CMS Collaboration | Event generator tunes obtained from underlying event and multiparton scattering measurements | EPJC 76 (2016) 155 | CMS-GEN-14-001 1512.00815 |
| 51 | GEANT4 Collaboration | GEANT4---a simulation toolkit | NIMA 506 (2003) 250 | |
| 52 | M. Czakon and A. Mitov | Top++: A Program for the calculation of the top-pair cross-section at hadron colliders | CPC 185 (2014) 2930 | 1112.5675 |
| 53 | M. Czakon, P. Fiedler, and A. Mitov | Total top-quark pair-production cross section at hadron colliders through $ \mathcal{O}(\alpha^{4}_{S}) $ | PRL 110 (2013) 252004 | 1303.6254 |
| 54 | M. Czakon and A. Mitov | NNLO corrections to top pair production at hadron colliders: the quark-gluon reaction | JHEP 01 (2013) 080 | 1210.6832 |
| 55 | M. Czakon and A. Mitov | NNLO corrections to top-pair production at hadron colliders: the all-fermionic scattering channels | JHEP 12 (2012) 054 | 1207.0236 |
| 56 | P. Barnreuther, M. Czakon, and A. Mitov | Percent level precision physics at the Tevatron: first genuine NNLO QCD corrections to $ q \bar{q} \to t \bar{t} + X $ | PRL 109 (2012) 132001 | 1204.5201 |
| 57 | M. Cacciari et al. | Top-pair production at hadron colliders with next-to-next-to-leading logarithmic soft-gluon resummation | PLB 710 (2012) 612 | 1111.5869 |
| 58 | CMS Collaboration | Description and performance of track and primary-vertex reconstruction with the CMS tracker | JINST 9 (2014) P10009 | CMS-TRK-11-001 1405.6569 |
| 59 | CMS Collaboration | Performance of electron reconstruction and selection with the CMS detector in proton-proton collisions at $ \sqrt{s} = $ 8 TeV | JINST 10 (2015) P06005 | CMS-EGM-13-001 1502.02701 |
| 60 | CMS Collaboration | Performance of CMS muon reconstruction in $ pp $ collision events at $ \sqrt{s} = $ 7 TeV | JINST 7 (2012) P10002 | CMS-MUO-10-004 1206.4071 |
| 61 | CMS Collaboration | Identification of heavy-flavour jets with the CMS detector in pp collisions at 13 TeV | JINST 13 (2018) P05011 | CMS-BTV-16-002 1712.07158 |
| 62 | J. Thaler and K. Van Tilburg | Identifying boosted objects with N-subjettiness | JHEP 03 (2011) 015 | 1011.2268 |
| 63 | S. D. Ellis, C. K. Vermilion, and J. R. Walsh | Techniques for improved heavy particle searches with jet substructure | PRD 80 (2009) 051501 | 0903.5081 |
| 64 | A. J. Larkoski, S. Marzani, G. Soyez, and J. Thaler | Soft drop | JHEP 05 (2014) 146 | 1402.2657 |
| 65 | M. Dasgupta, A. Fregoso, S. Marzani, and G. P. Salam | Towards an understanding of jet substructure | JHEP 09 (2013) 029 | 1307.0007 |
| 66 | CMS Collaboration | Measurement of differential cross sections for top quark pair production using the lepton+jets final state in proton-proton collisions at 13 TeV | PRD 95 (2017) 092001 | CMS-TOP-16-008 1610.04191 |
| 67 | CMS Collaboration | Search for electroweak production of a vector-like quark decaying to a top quark and a Higgs boson using boosted topologies in fully hadronic final states | JHEP 04 (2017) 136 | CMS-B2G-16-005 1612.05336 |
| 68 | CMS Collaboration | Search for single production of vector-like quarks decaying into a b quark and a W boson in proton-proton collisions at $ \sqrt s = $ 13 TeV | PLB 772 (2017) 634 | CMS-B2G-16-006 1701.08328 |
| 69 | CMS Collaboration | Search for new physics with same-sign isolated dilepton events with jets and missing transverse energy at the LHC | JHEP 06 (2011) 077 | CMS-SUS-10-004 1104.3168 |
| 70 | CMS Collaboration | CMS luminosity measurement for the 2016 data taking period | CMS-PAS-LUM-17-001 | CMS-PAS-LUM-17-001 |
| 71 | CMS Collaboration | Measurement of the $ {\mathrm{W}}^{+}\mathrm{W}^{-} $ cross section in pp collisions at $ \sqrt{s}= $ 8 TeV and limits on anomalous gauge couplings | EPJC 76 (2016) 401 | CMS-SMP-14-016 1507.03268 |
| 72 | CMS Collaboration | Measurement of the WZ production cross section in pp collisions at $ \sqrt{s} = $ 13 TeV | PLB 766 (2017) 268 | CMS-SMP-16-002 1607.06943 |
| 73 | CMS Collaboration | Measurement of the ZZ production cross section and $ \mathrm{Z}\to\ell^+\ell^-\ell'^+\ell'^- $ branching fraction in pp collisions at $ \sqrt{s}= $ 13 TeV | PLB 763 (2016) 280 | CMS-SMP-16-001 1607.08834 |
| 74 | CMS Collaboration | Measurement of the inelastic proton-proton cross section at $ \sqrt{s}= $ 13 TeV | Submitted to \it JHEP | CMS-FSQ-15-005 1802.02613 |
| 75 | J. Ott | Theta--A framework for template-based modeling and inference | 2010 \url http://www-ekp.physik.uni-karlsruhe.de/\ ott/theta/theta-auto | |
| 76 | Particle Data Group, C. Patrignani et al. | Review of particle physics | CPC 40 (2016) 100001 | |
| 77 | R. J. Barlow and C. Beeston | Fitting using finite Monte Carlo samples | CPC 77 (1993) 219 | |
| 78 | J. S. Conway | Incorporating nuisance parameters in likelihoods for multisource spectra | in Proceedings, PHYSTAT 2011 Workshop on Statistical Issues Related to Discovery Claims in Search Experiments and Unfolding, address = CERN,Geneva, Switzerland, month = January, p. 115 2011 | 1103.0354 |
|
|
Compact Muon Solenoid LHC, CERN |
|

|

|

|

|

|