

Compact Muon Solenoid
LHC, CERN
| CMS-HIG-16-017 ; CERN-EP-2018-204 | ||
| Search for resonances in the mass spectrum of muon pairs produced in association with b quark jets in proton-proton collisions at $\sqrt{s} = $ 8 and 13 TeV | ||
| CMS Collaboration | ||
| 6 August 2018 | ||
| JHEP 11 (2018) 161 | ||
| Abstract: A search for resonances in the mass range 12-70 GeV produced in association with a b quark jet and a second jet, and decaying to a muon pair, is reported. The analysis is based on data from proton-proton collisions at center-of-mass energies of 8 and 13 TeV, collected with the CMS detector at the LHC and corresponding to integrated luminosities of 19.7 and 35.9 fb$^{-1}$, respectively. The search is carried out in two mutually exclusive event categories. Events in the first category are required to have a b quark jet in the central region ($ | \eta | \le $ 2.4) and at least one jet in the forward region ($ | \eta | > $ 2.4). Events in the second category are required to have two jets in the central region, at least one of which is identified as a b quark jet, no jets in the forward region, and low missing transverse momentum. An excess of events above the background near a dimuon mass of 28 GeV is observed in the 8 TeV data, corresponding to local significances of 4.2 and 2.9 standard deviations for the first and second event categories, respectively. A similar analysis conducted with the 13 TeV data results in a mild excess over the background in the first event category corresponding to a local significance of 2.0 standard deviations, while the second category results in a 1.4 standard deviation deficit. The fiducial cross section measurements and 95% confidence level upper limits on those for a resonance consistent with the 8 TeV excess are provided at both collision energies. | ||
| Links: e-print arXiv:1808.01890 [hep-ex] (PDF) ; CDS record ; inSPIRE record ; CADI line (restricted) ; | ||
| Figures & Tables | Summary | Additional Figures | References | CMS Publications |
|---|
| Figures | |
png pdf |
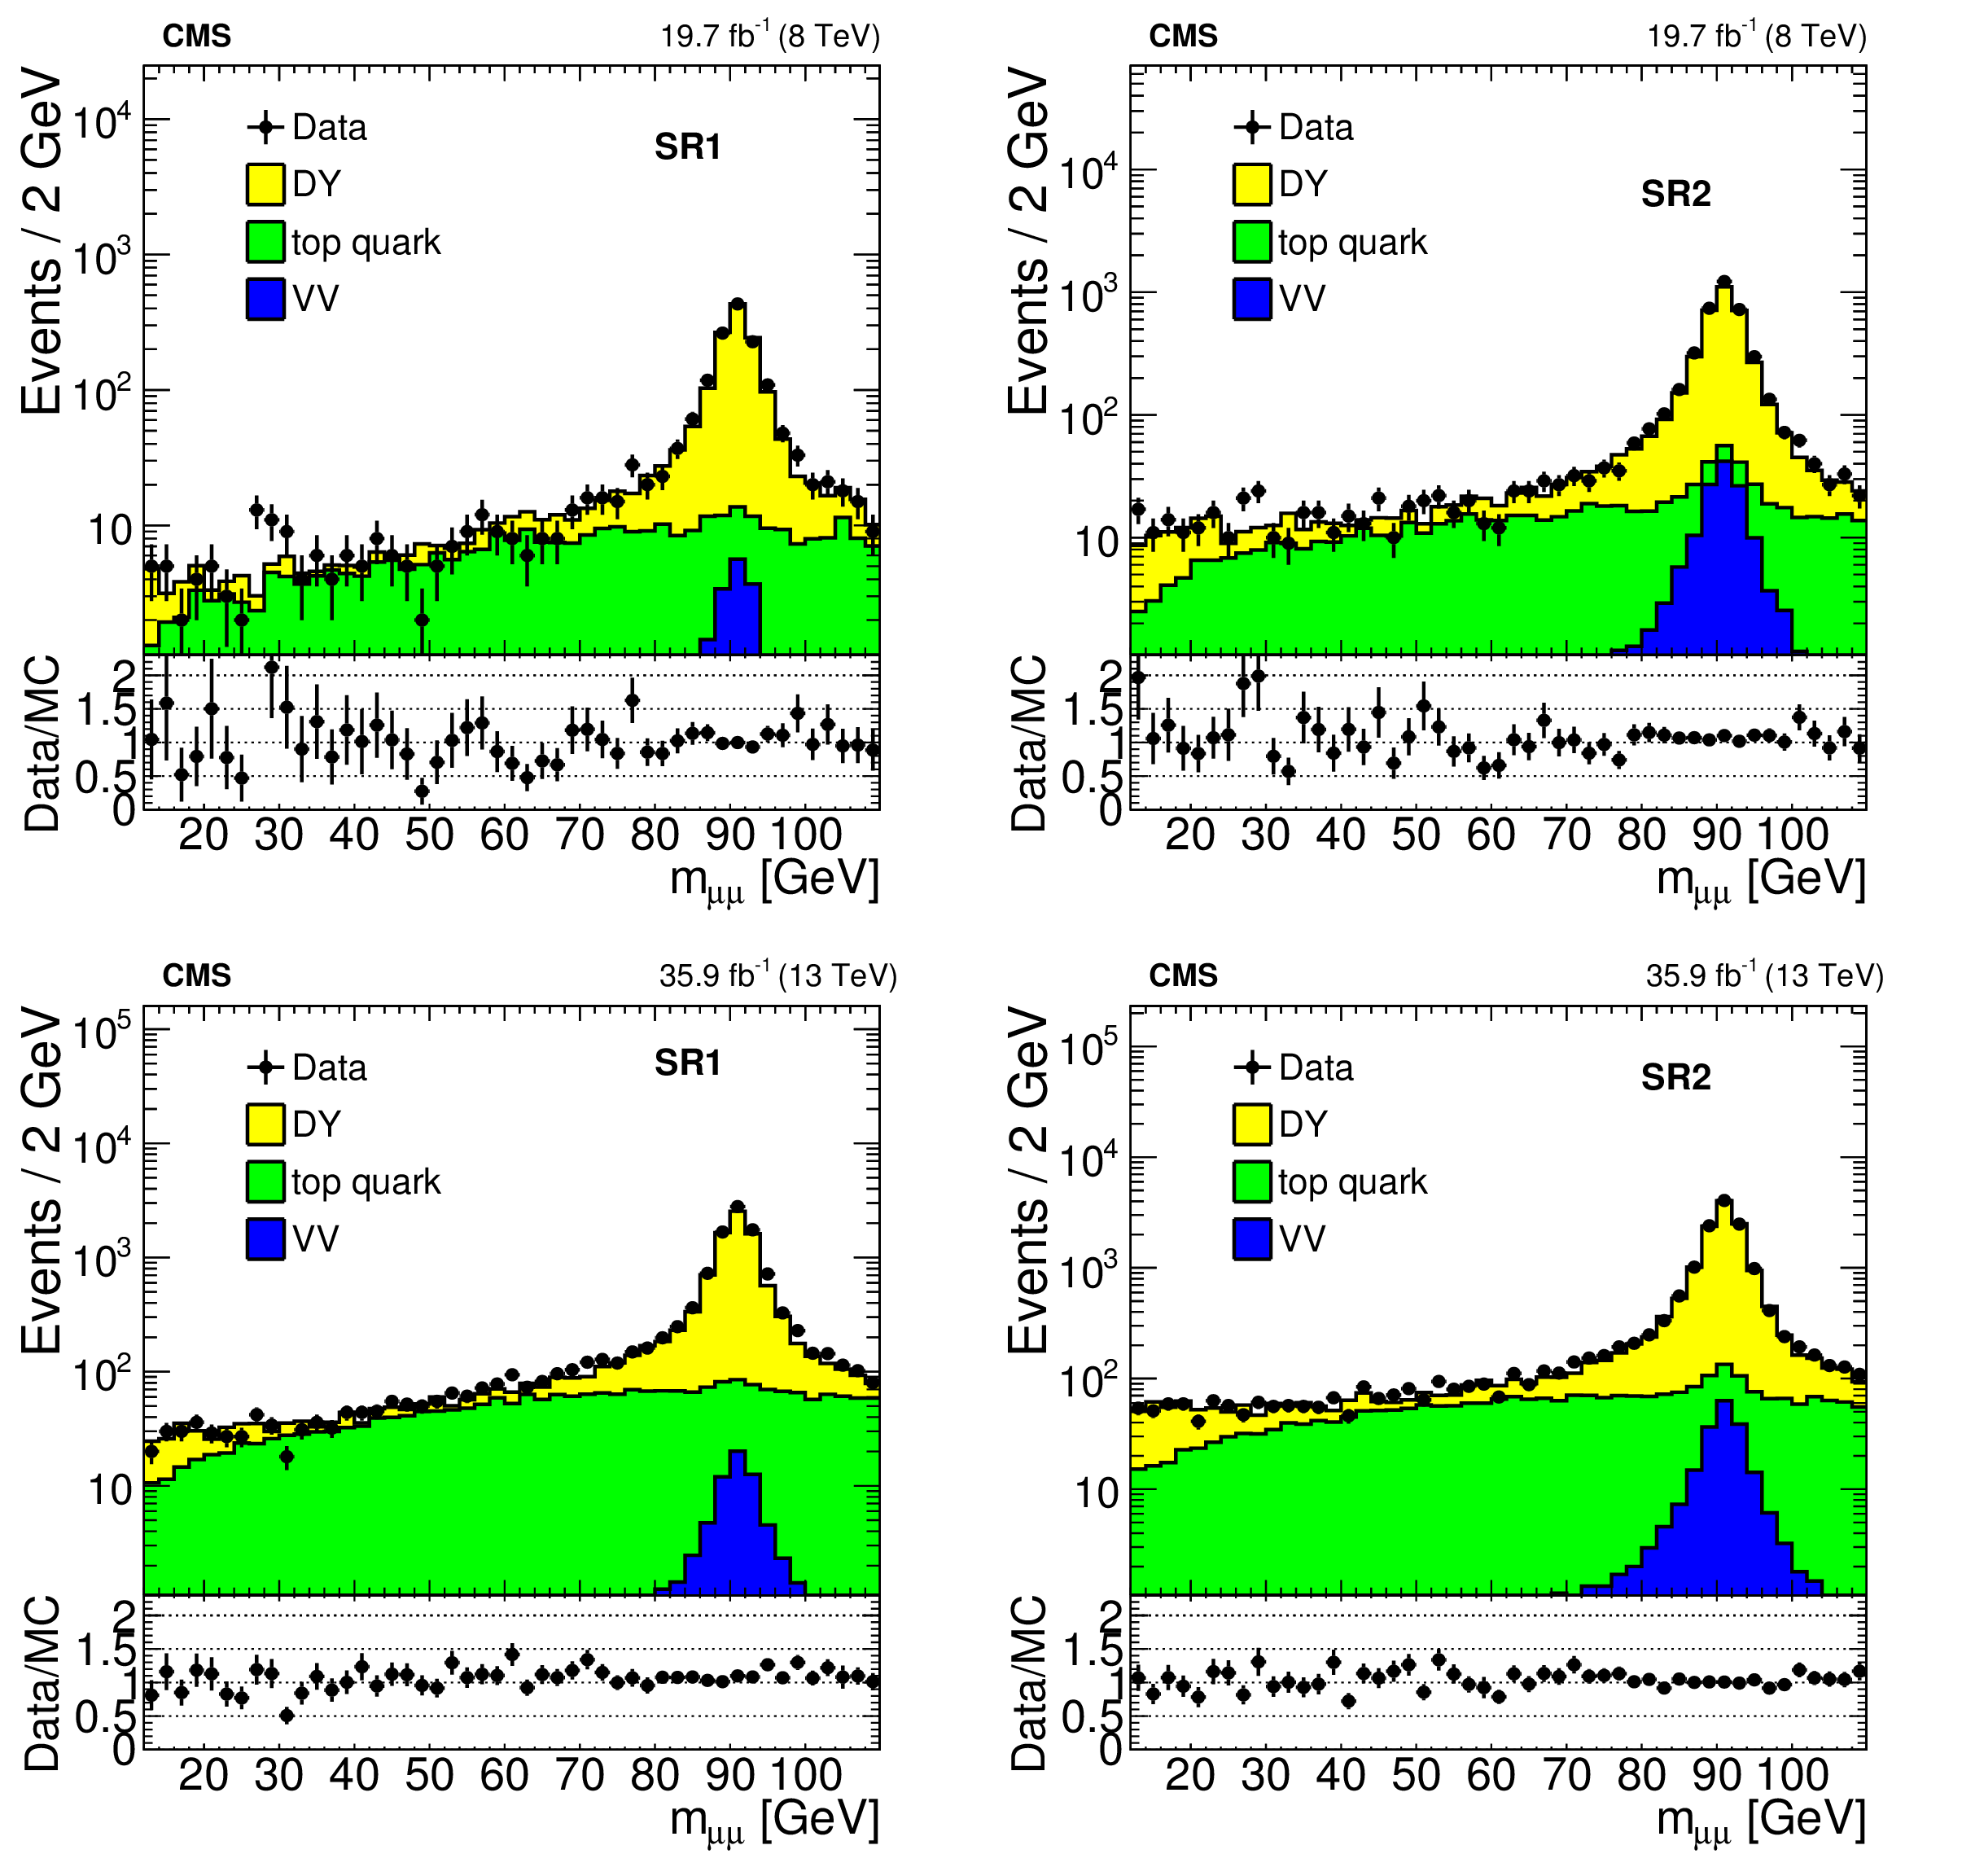
Figure 1:
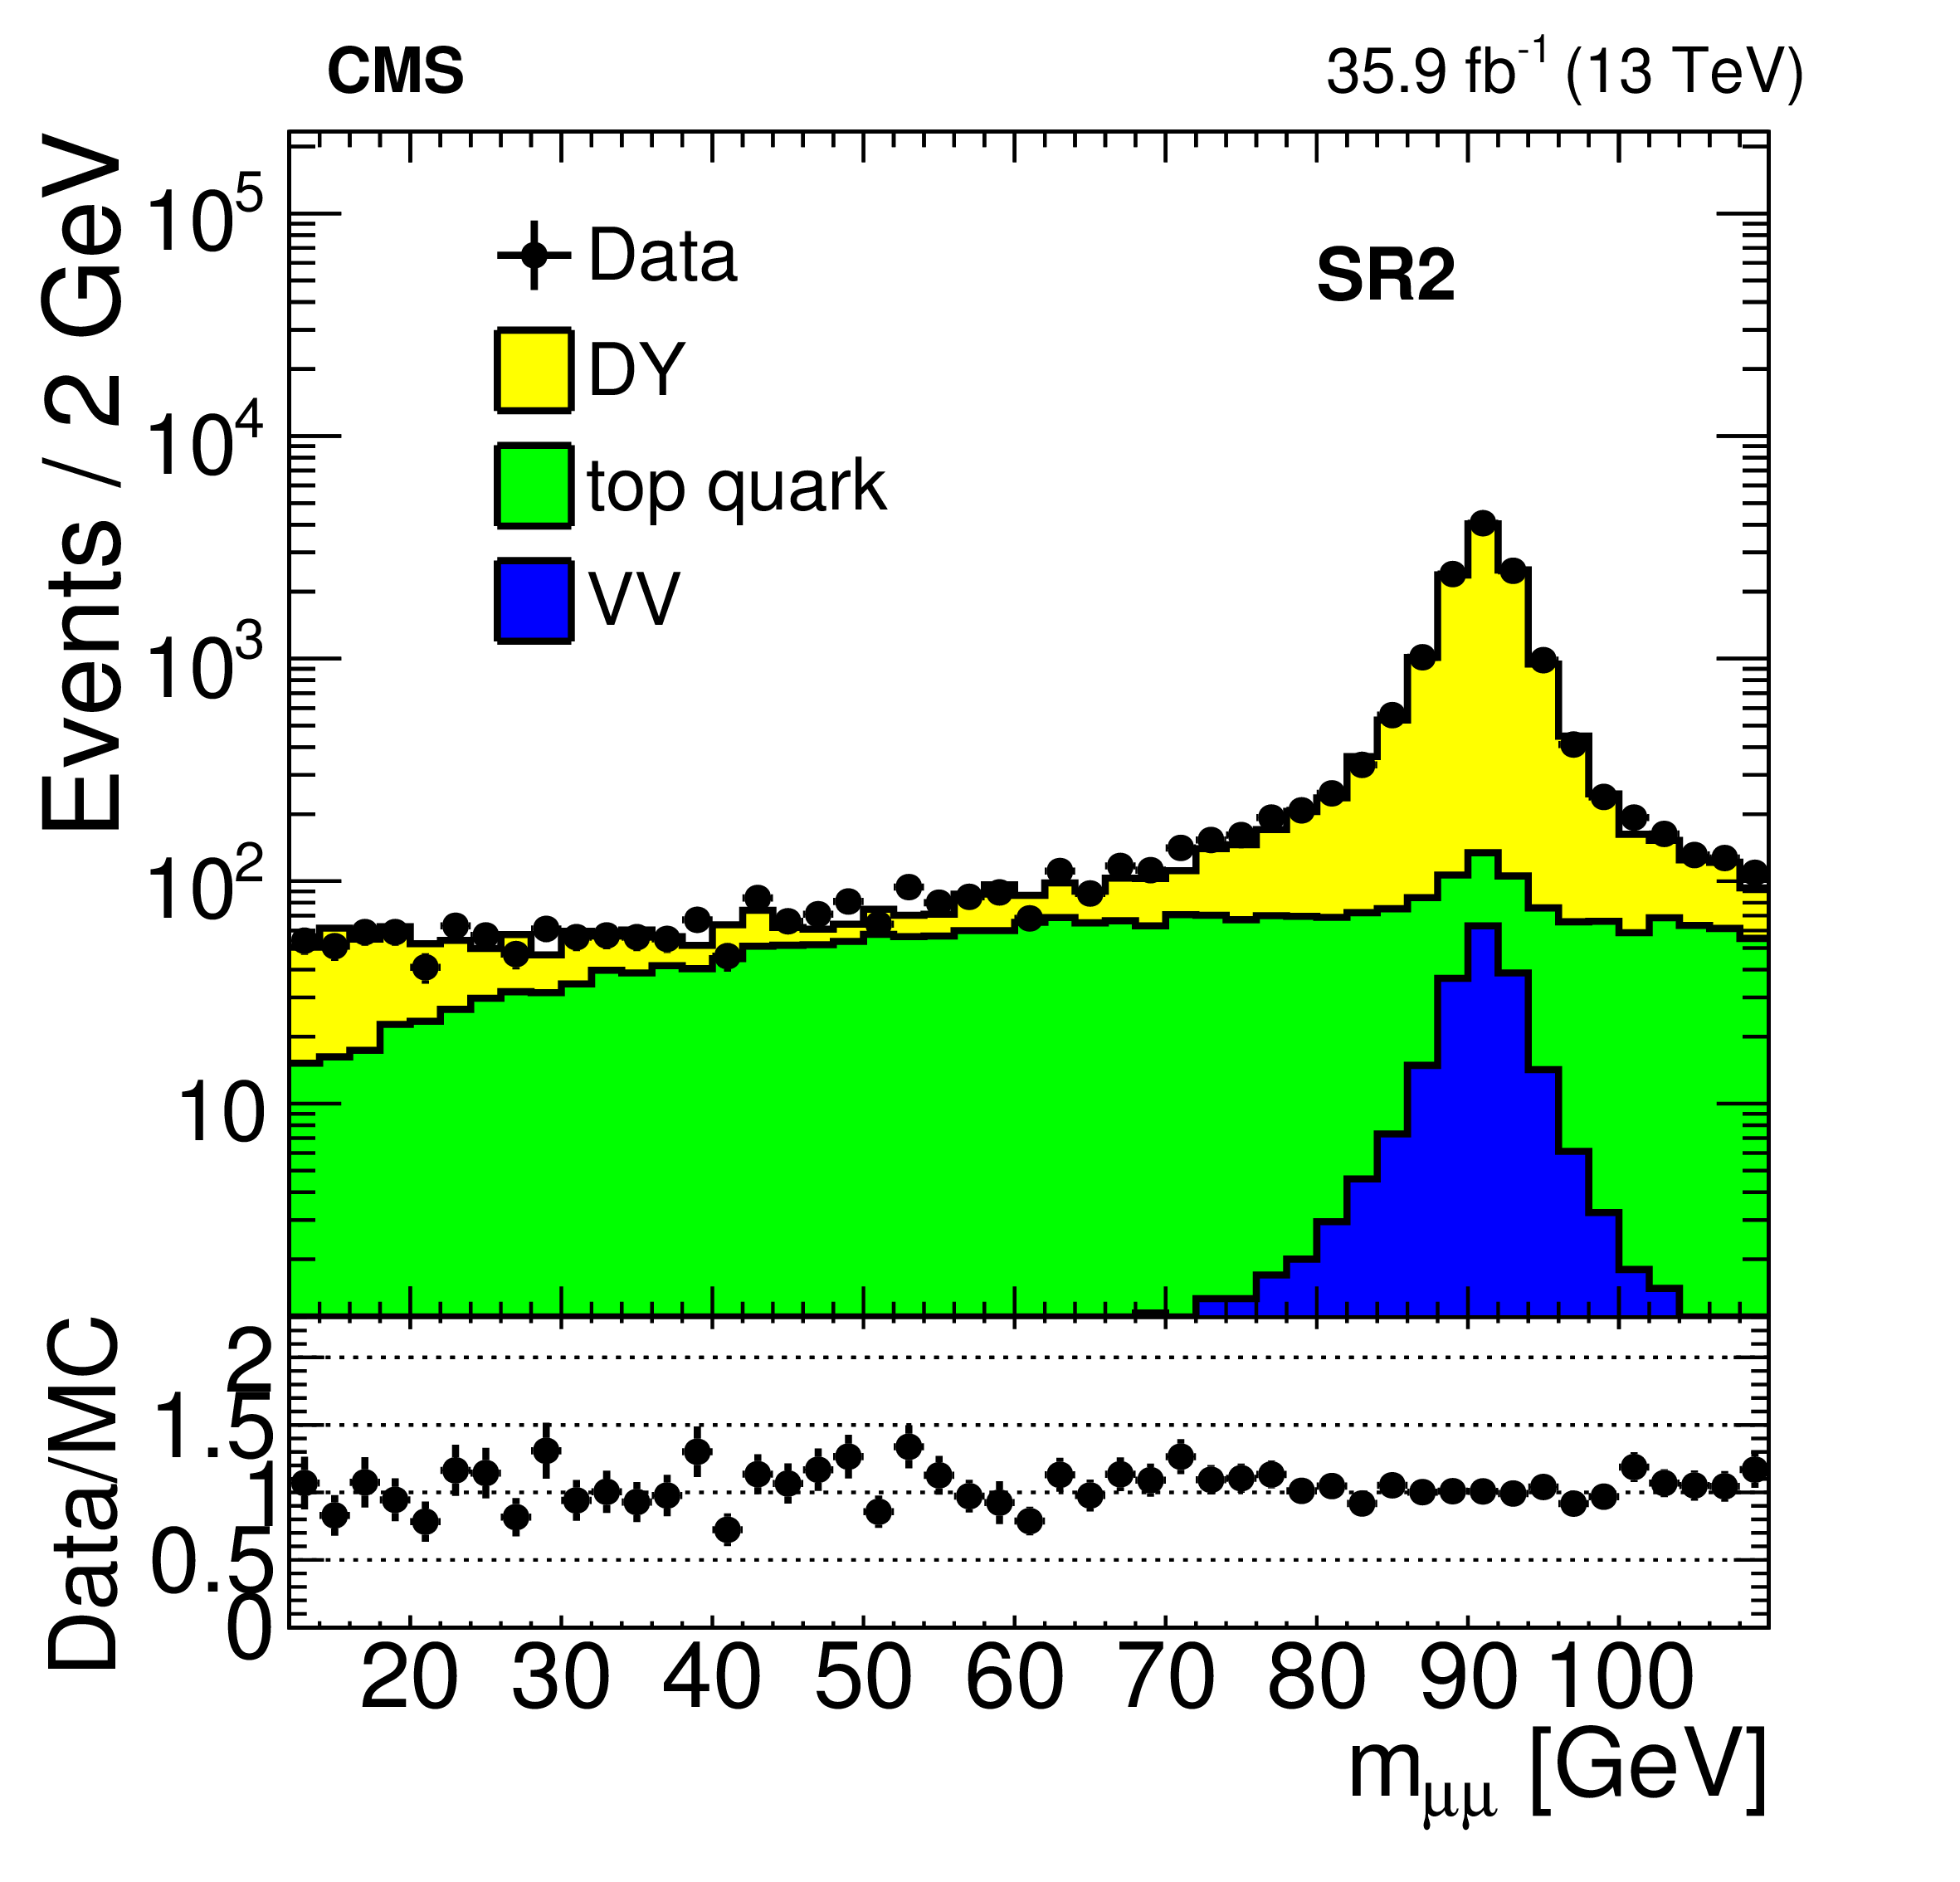
Upper row: the dimuon mass distribution in SR1 (left) and SR2 (right) in the 8 TeV analysis, with the simulation-based background expectations superimposed. Lower row: the dimuon mass distribution in SR1 (left) and SR2 (right) in the 13 TeV analysis, with the simulation-based background expectations superimposed. |
png pdf |
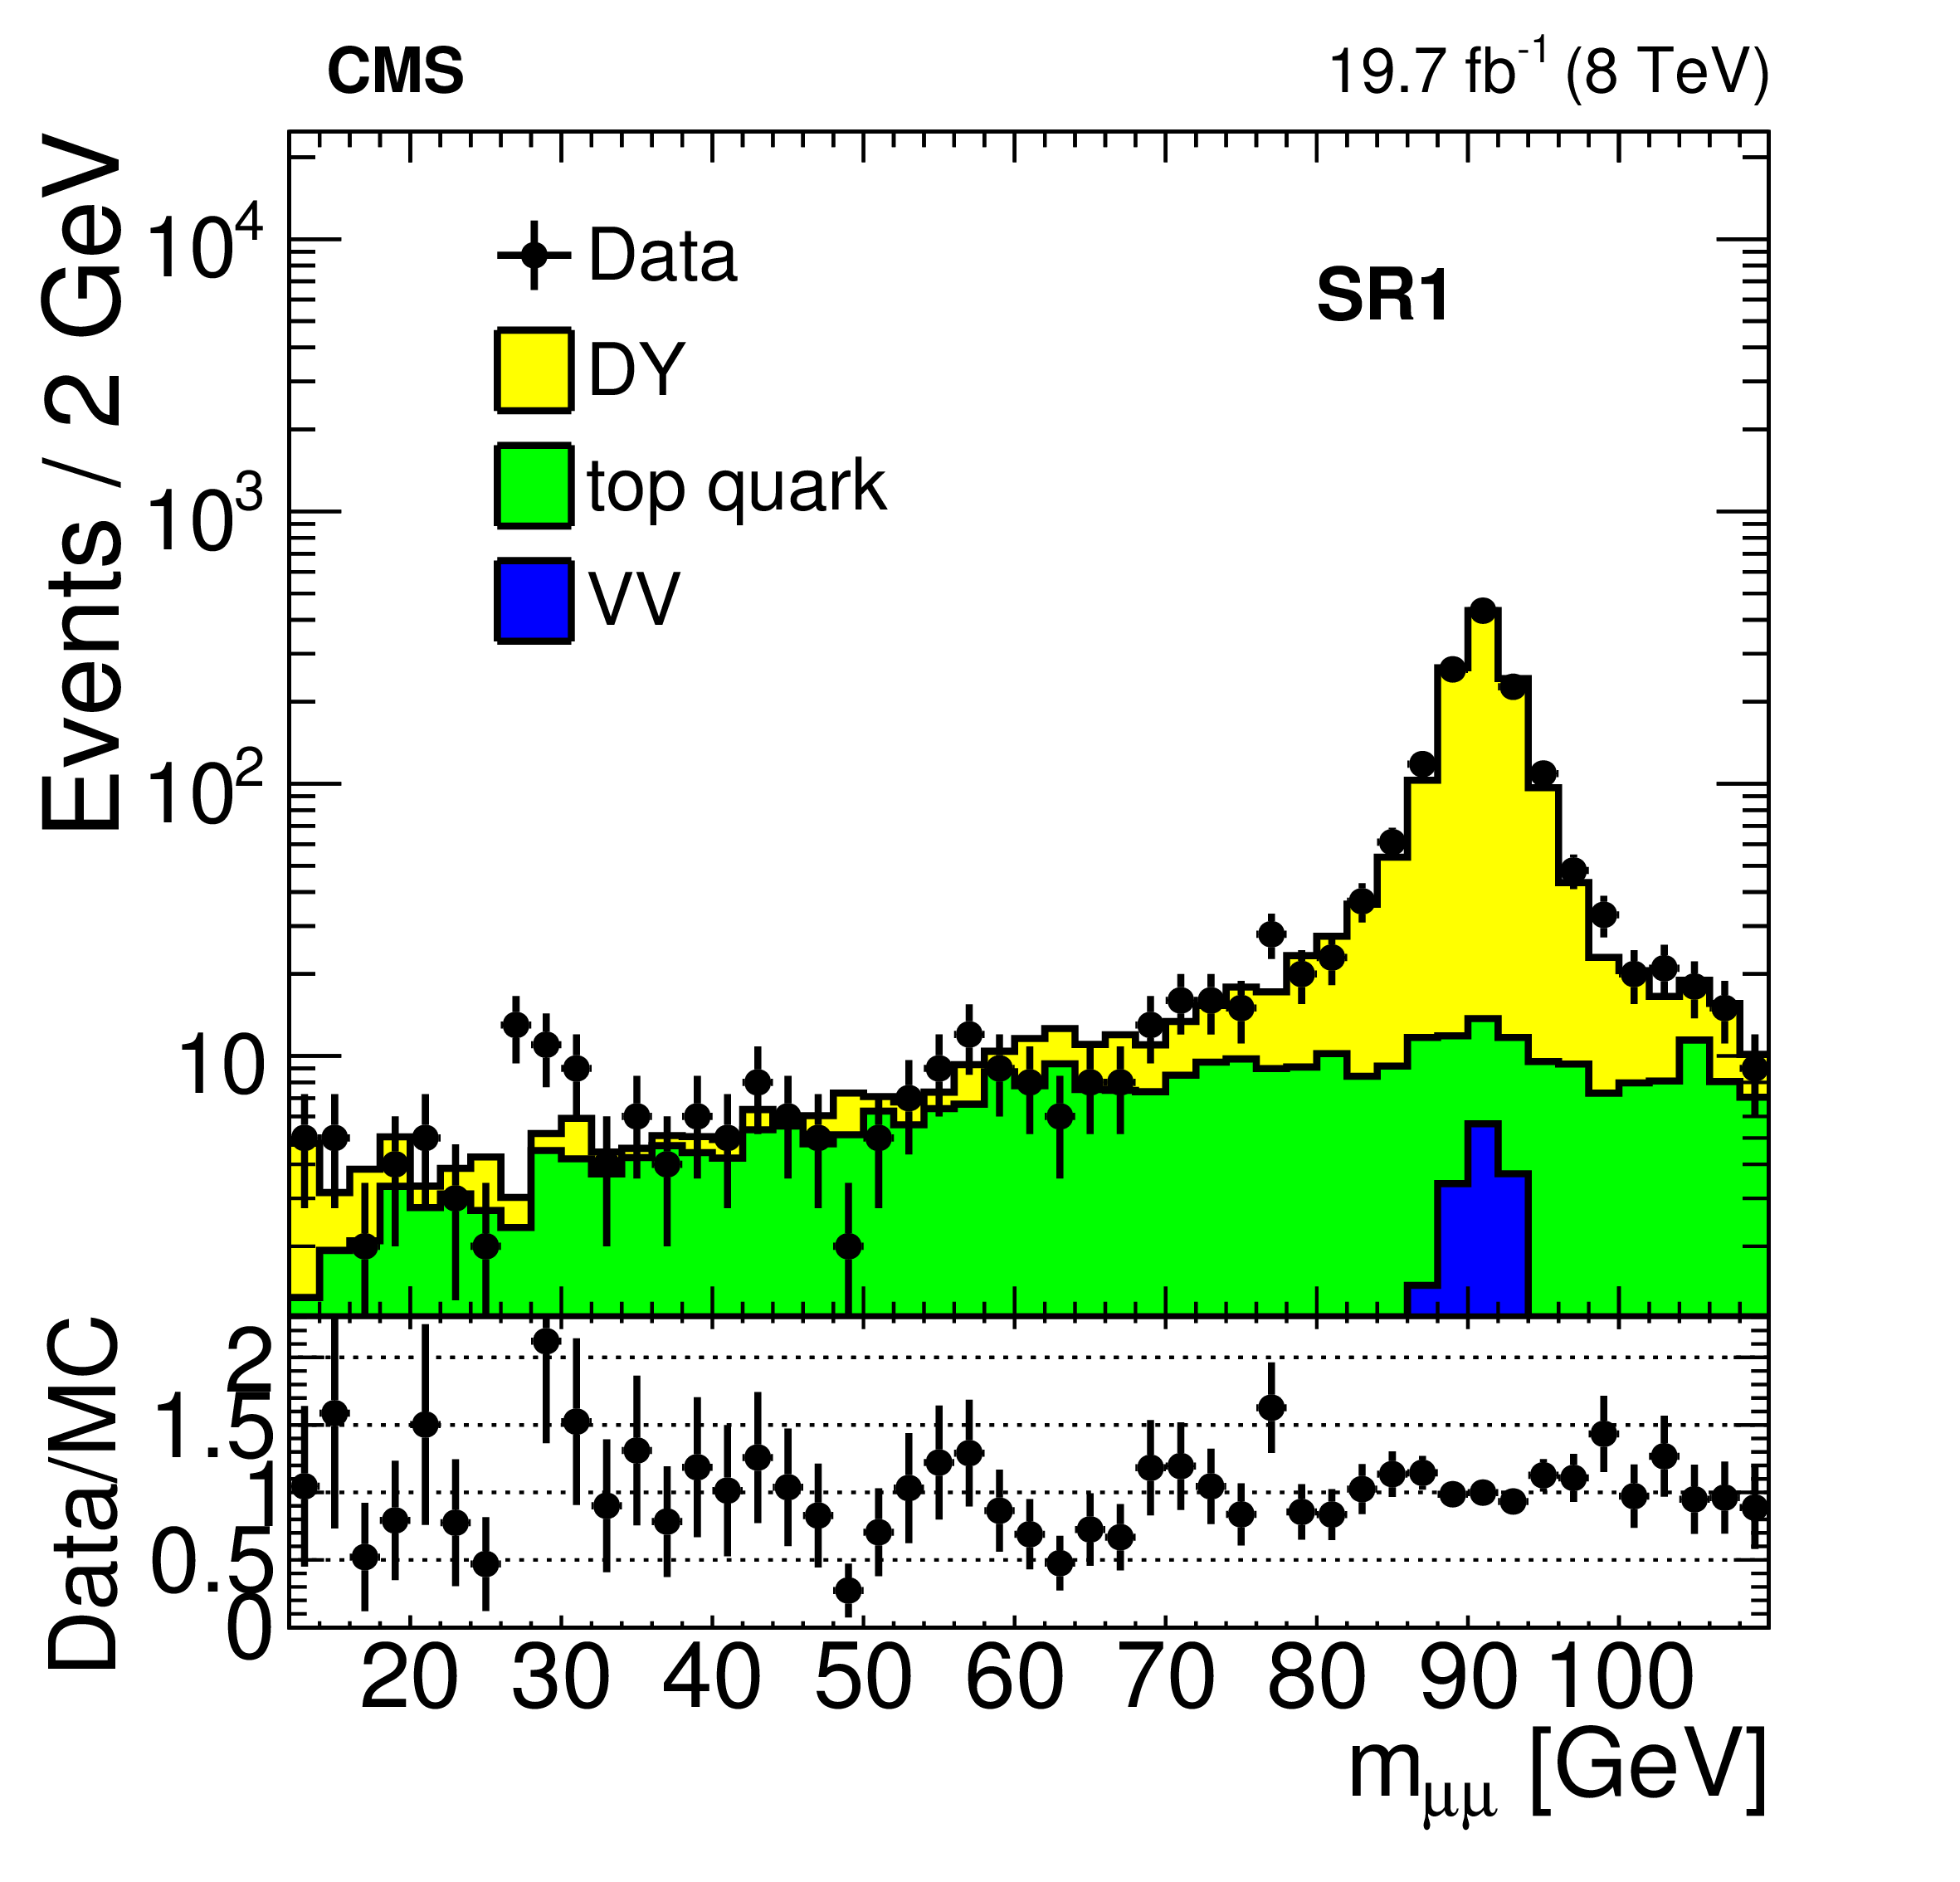
Figure 1-a:
The dimuon mass distribution in SR1 in the 8 TeV analysis, with the simulation-based background expectations superimposed. |
png pdf |
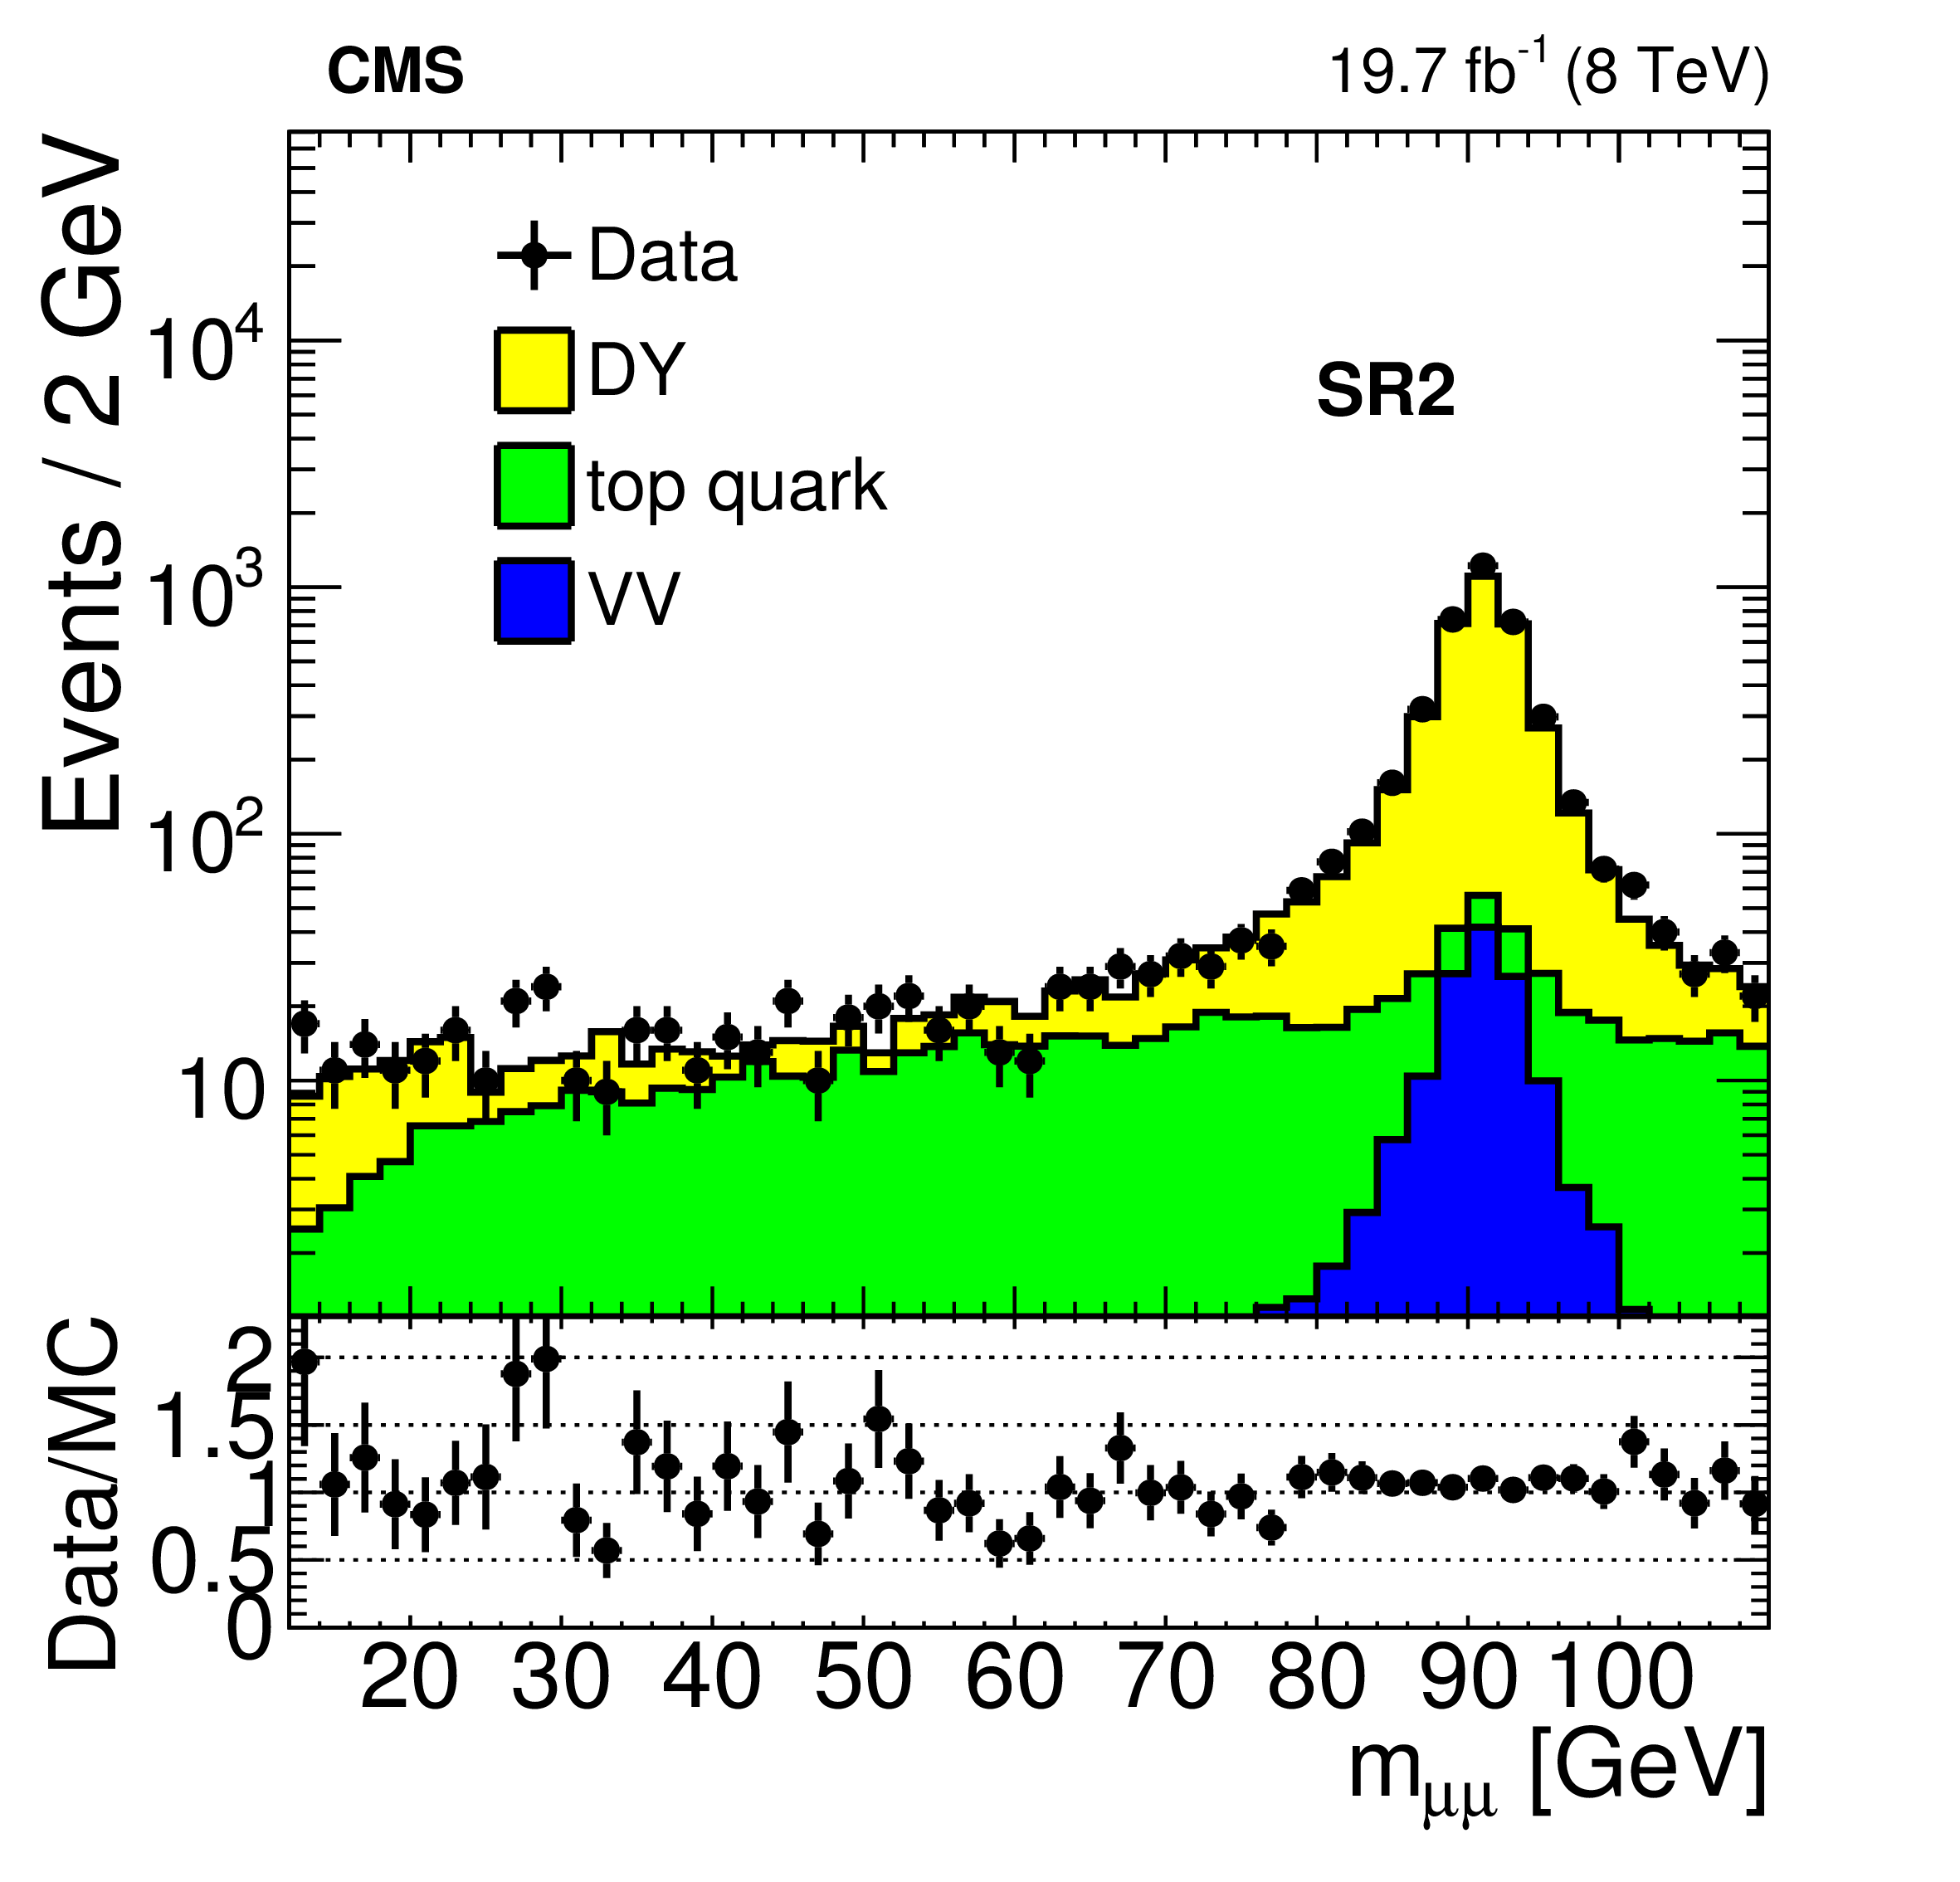
Figure 1-b:
The dimuon mass distribution in SR2 in the 8 TeV analysis, with the simulation-based background expectations superimposed. |
png pdf |
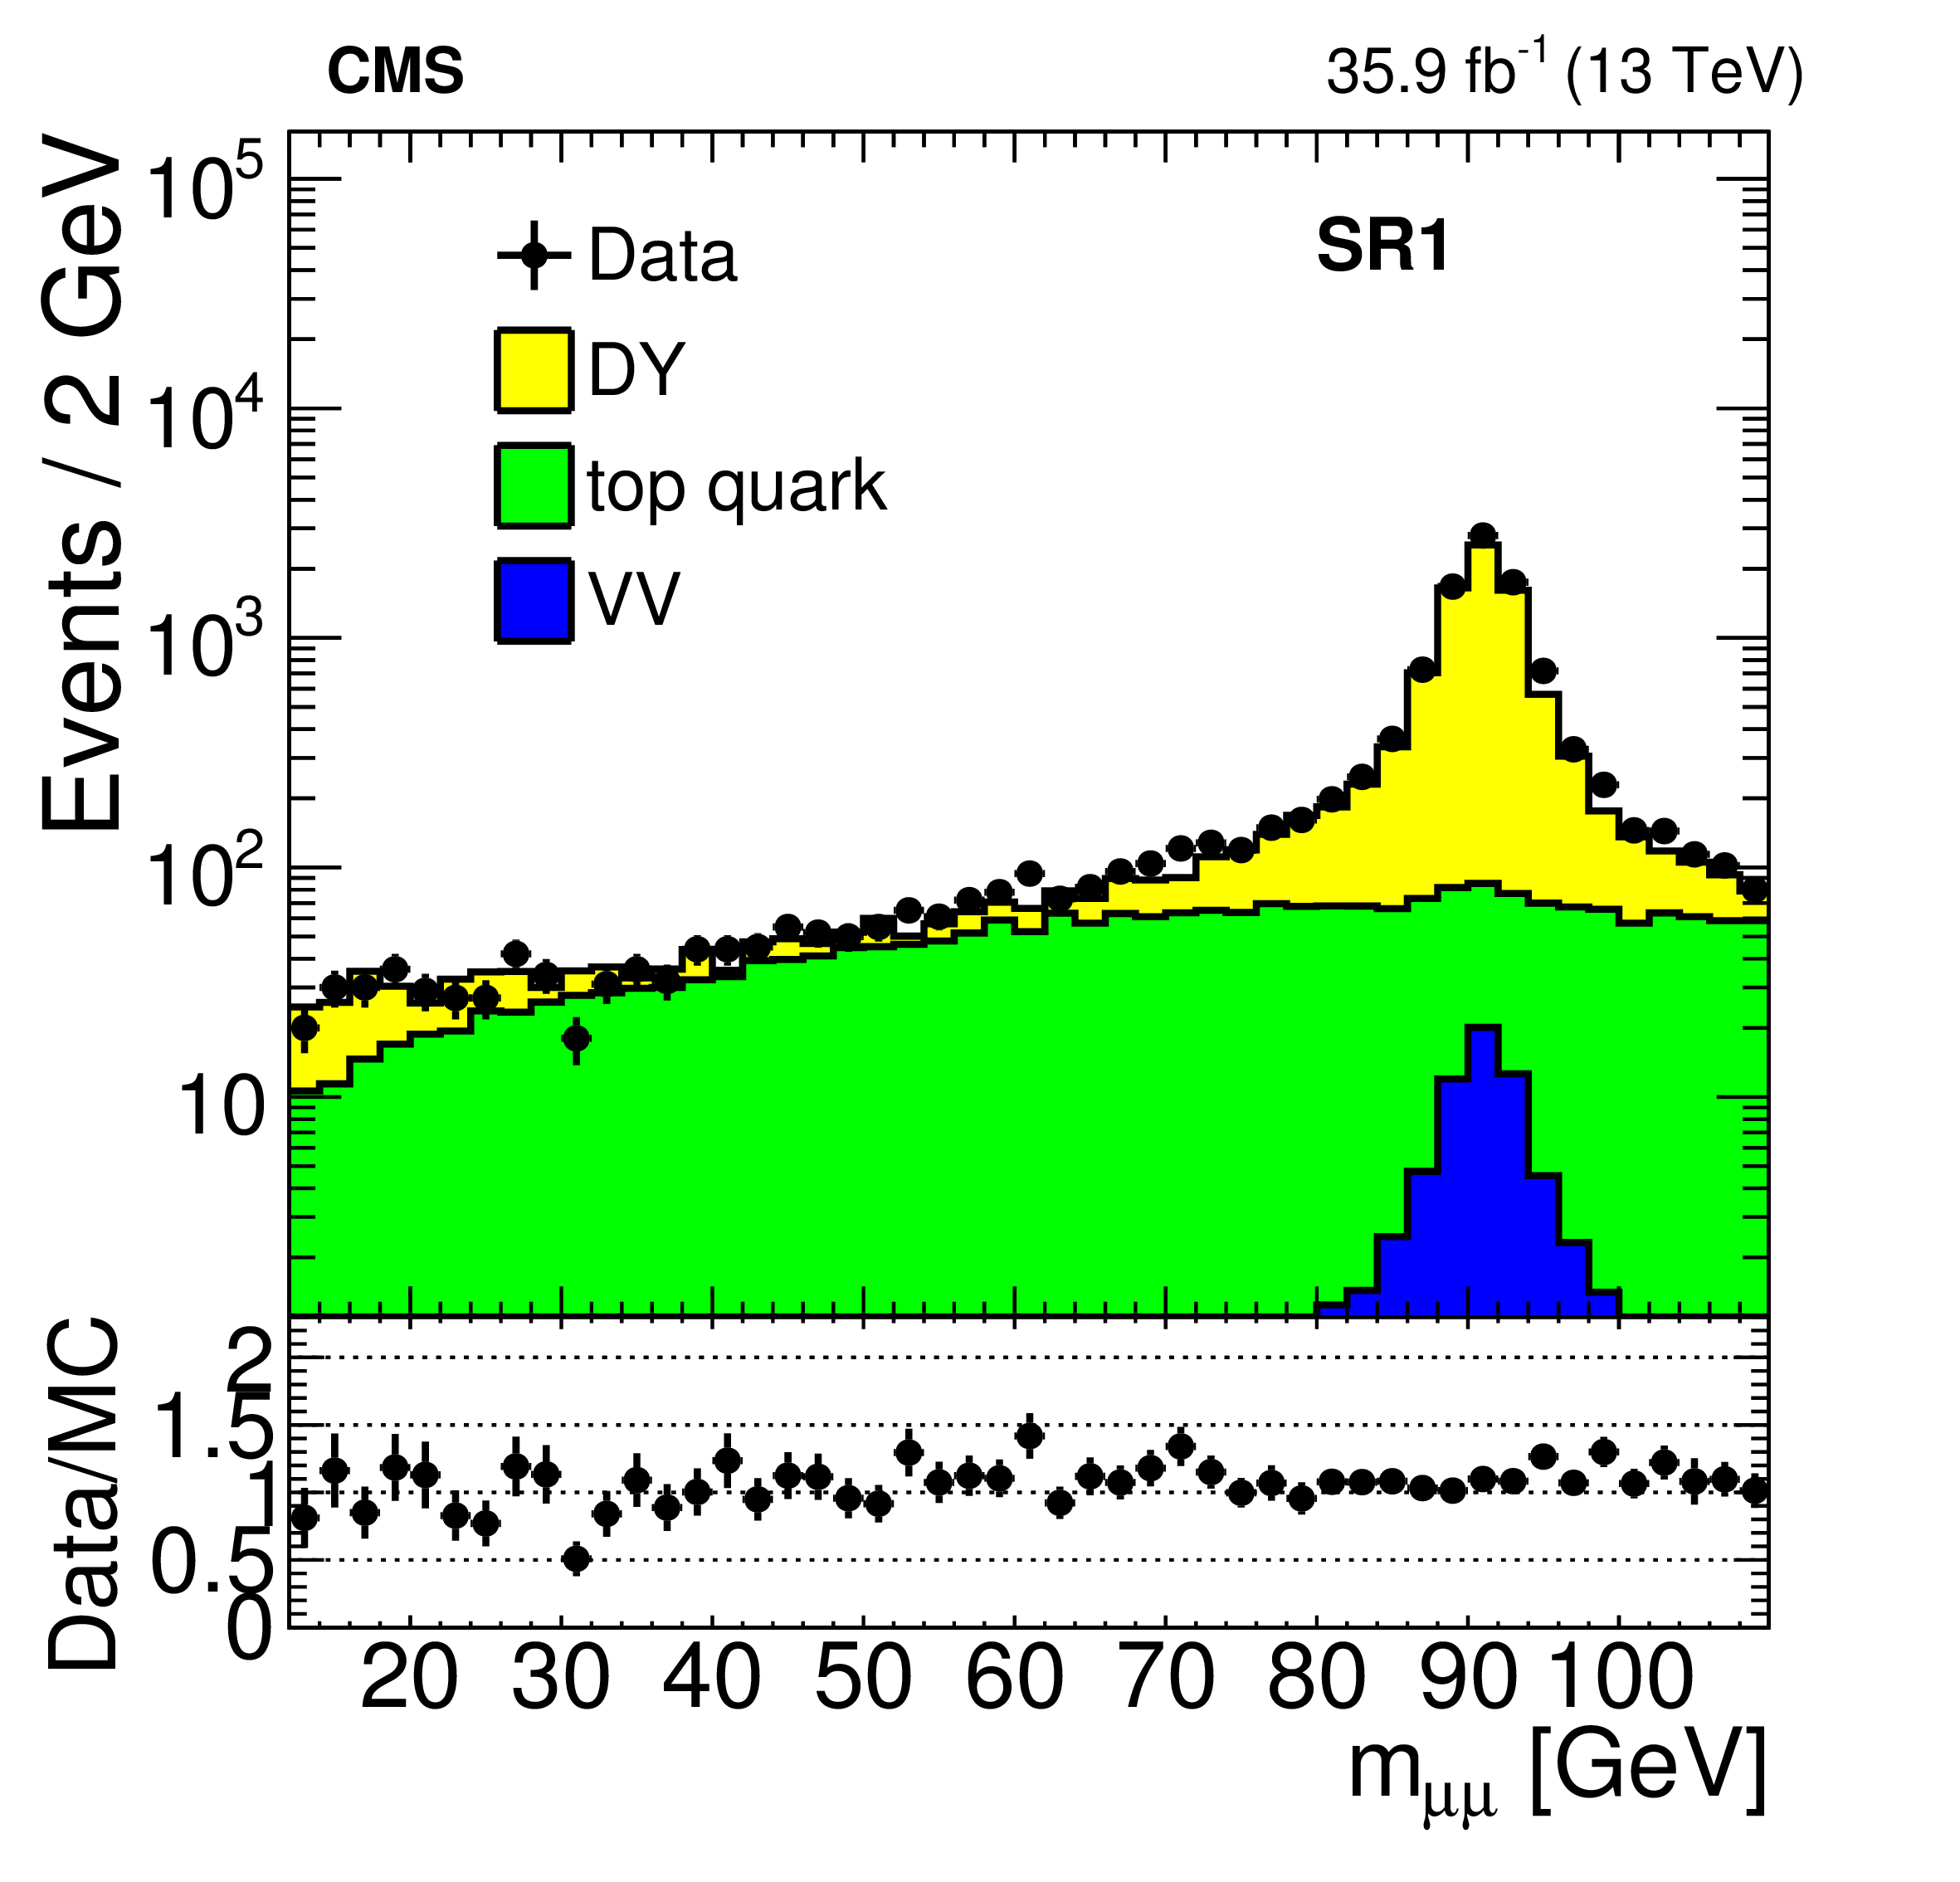
Figure 1-c:
The dimuon mass distribution in SR1 in the 13 TeV analysis, with the simulation-based background expectations superimposed. |
png pdf |
Figure 1-d:
The dimuon mass distribution in SR2 in the 13 TeV analysis, with the simulation-based background expectations superimposed. |
png pdf |
Figure 2:
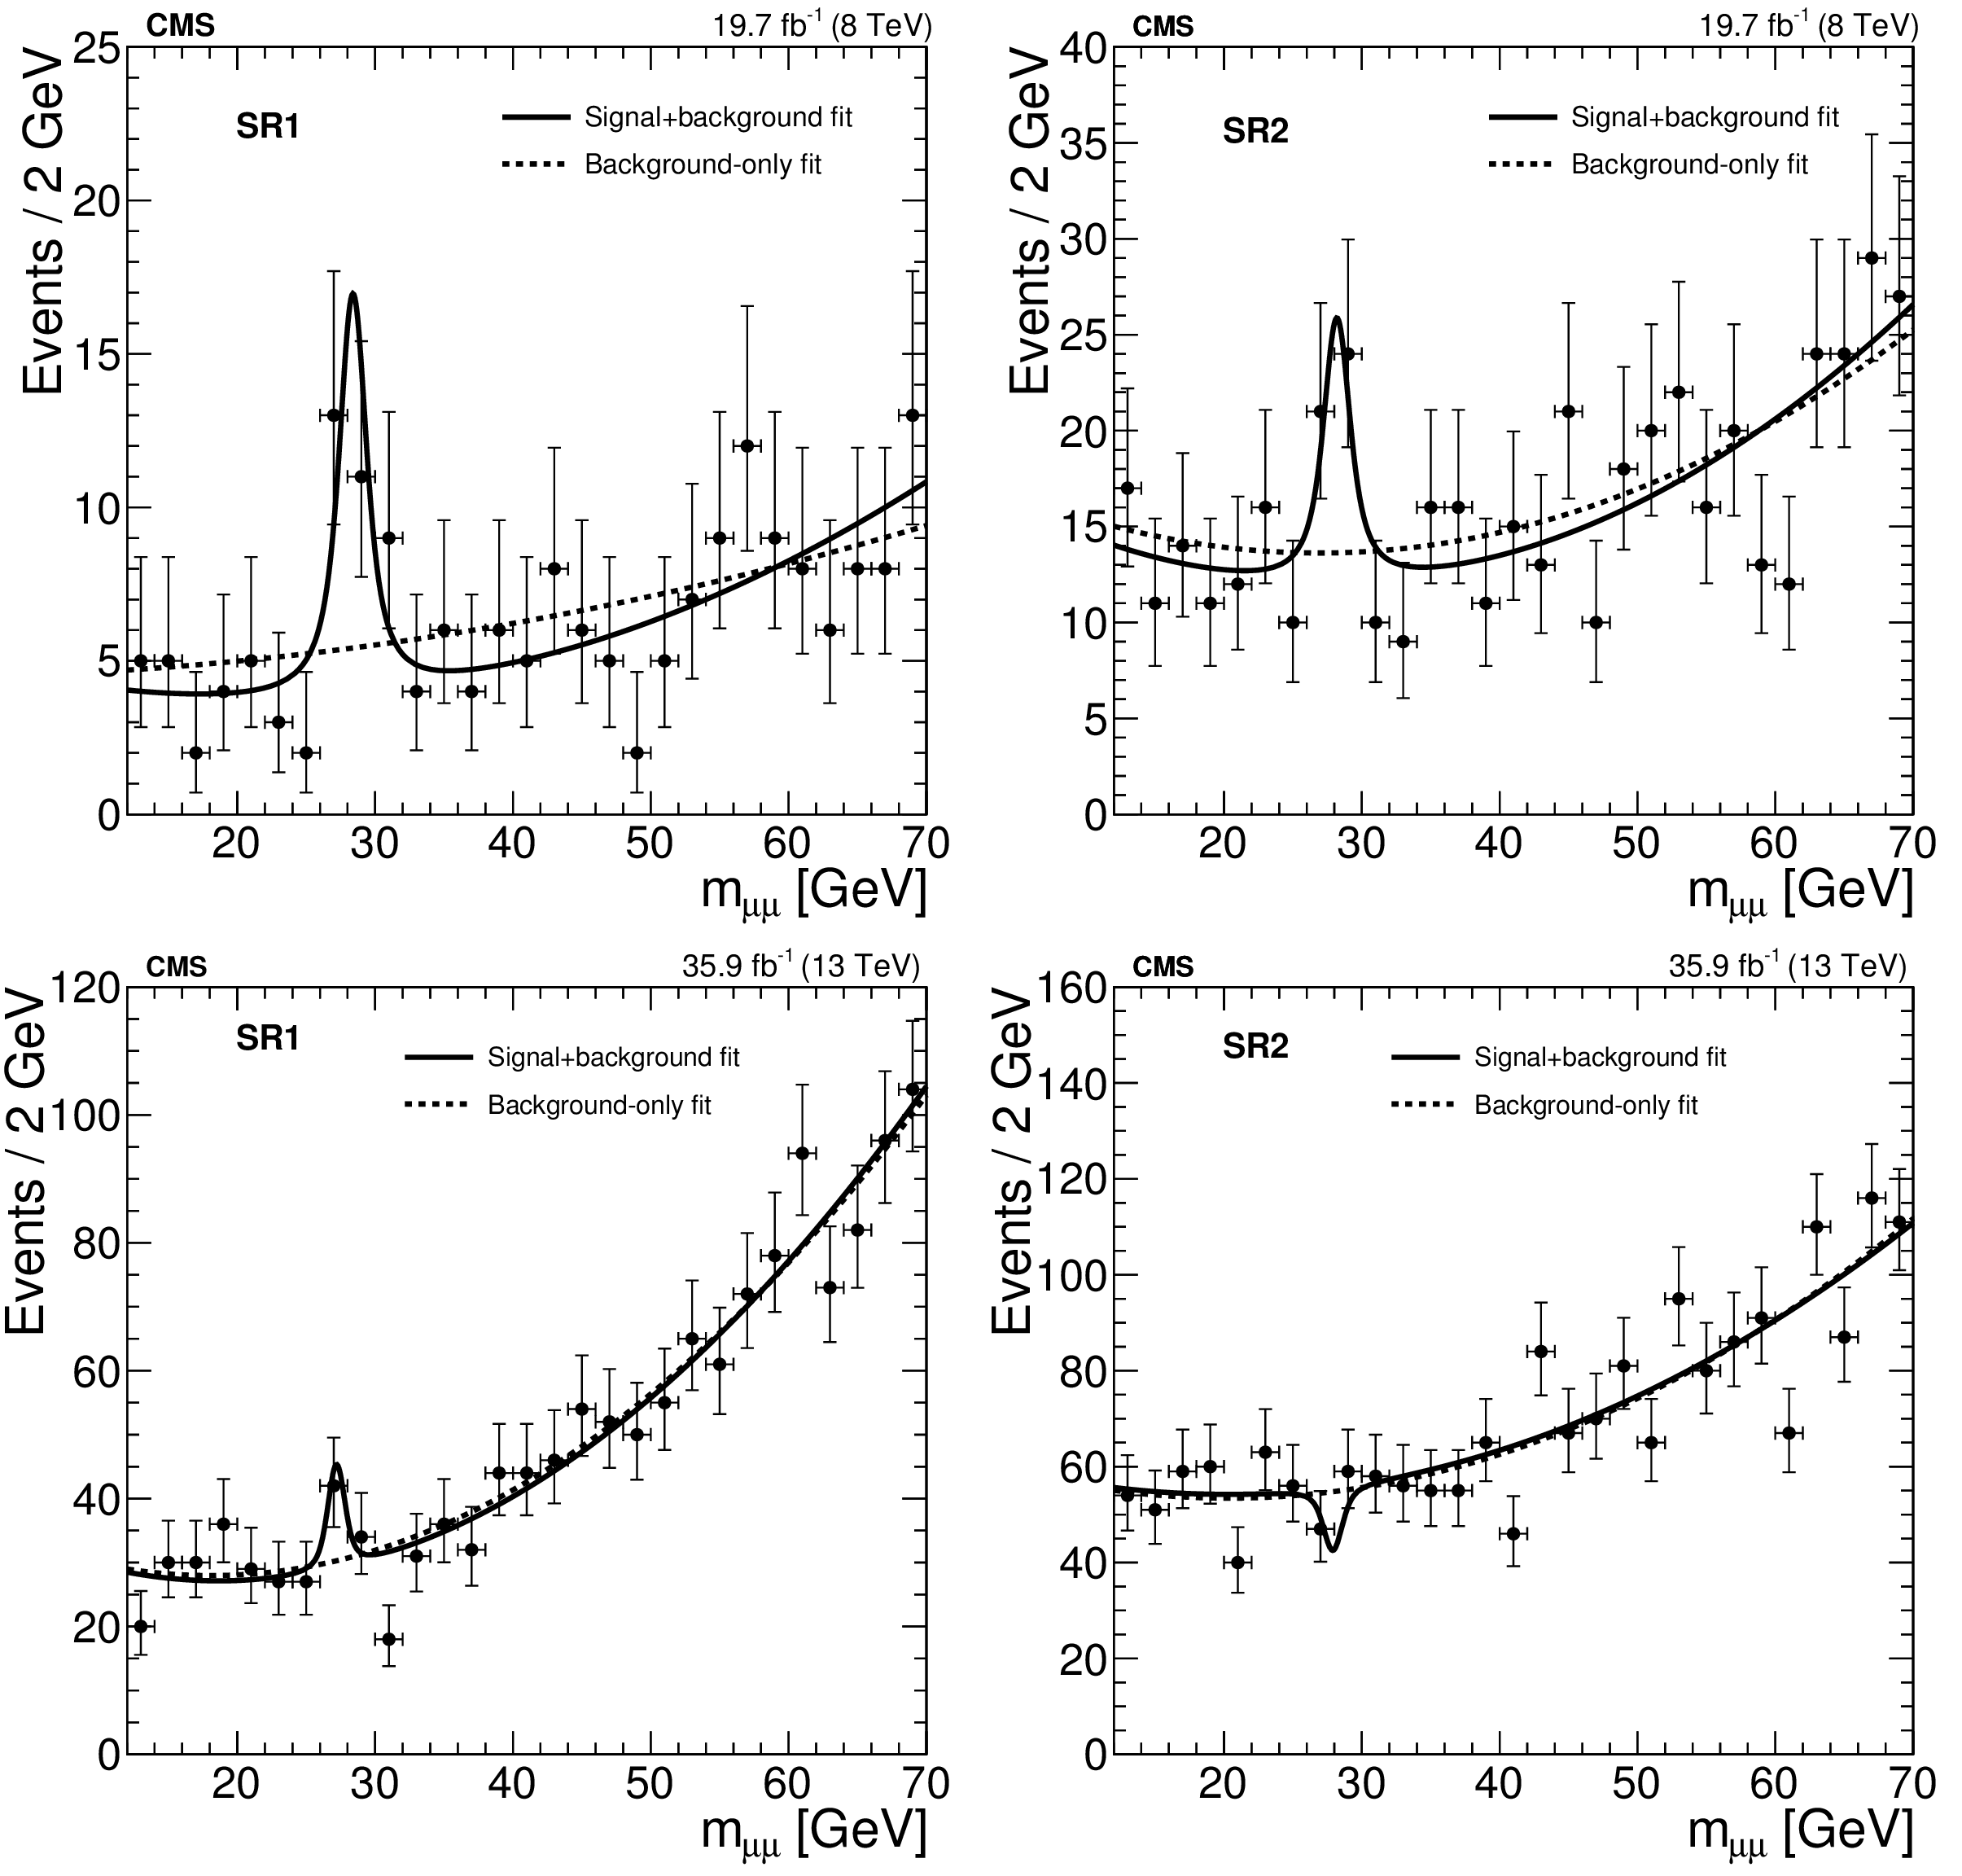
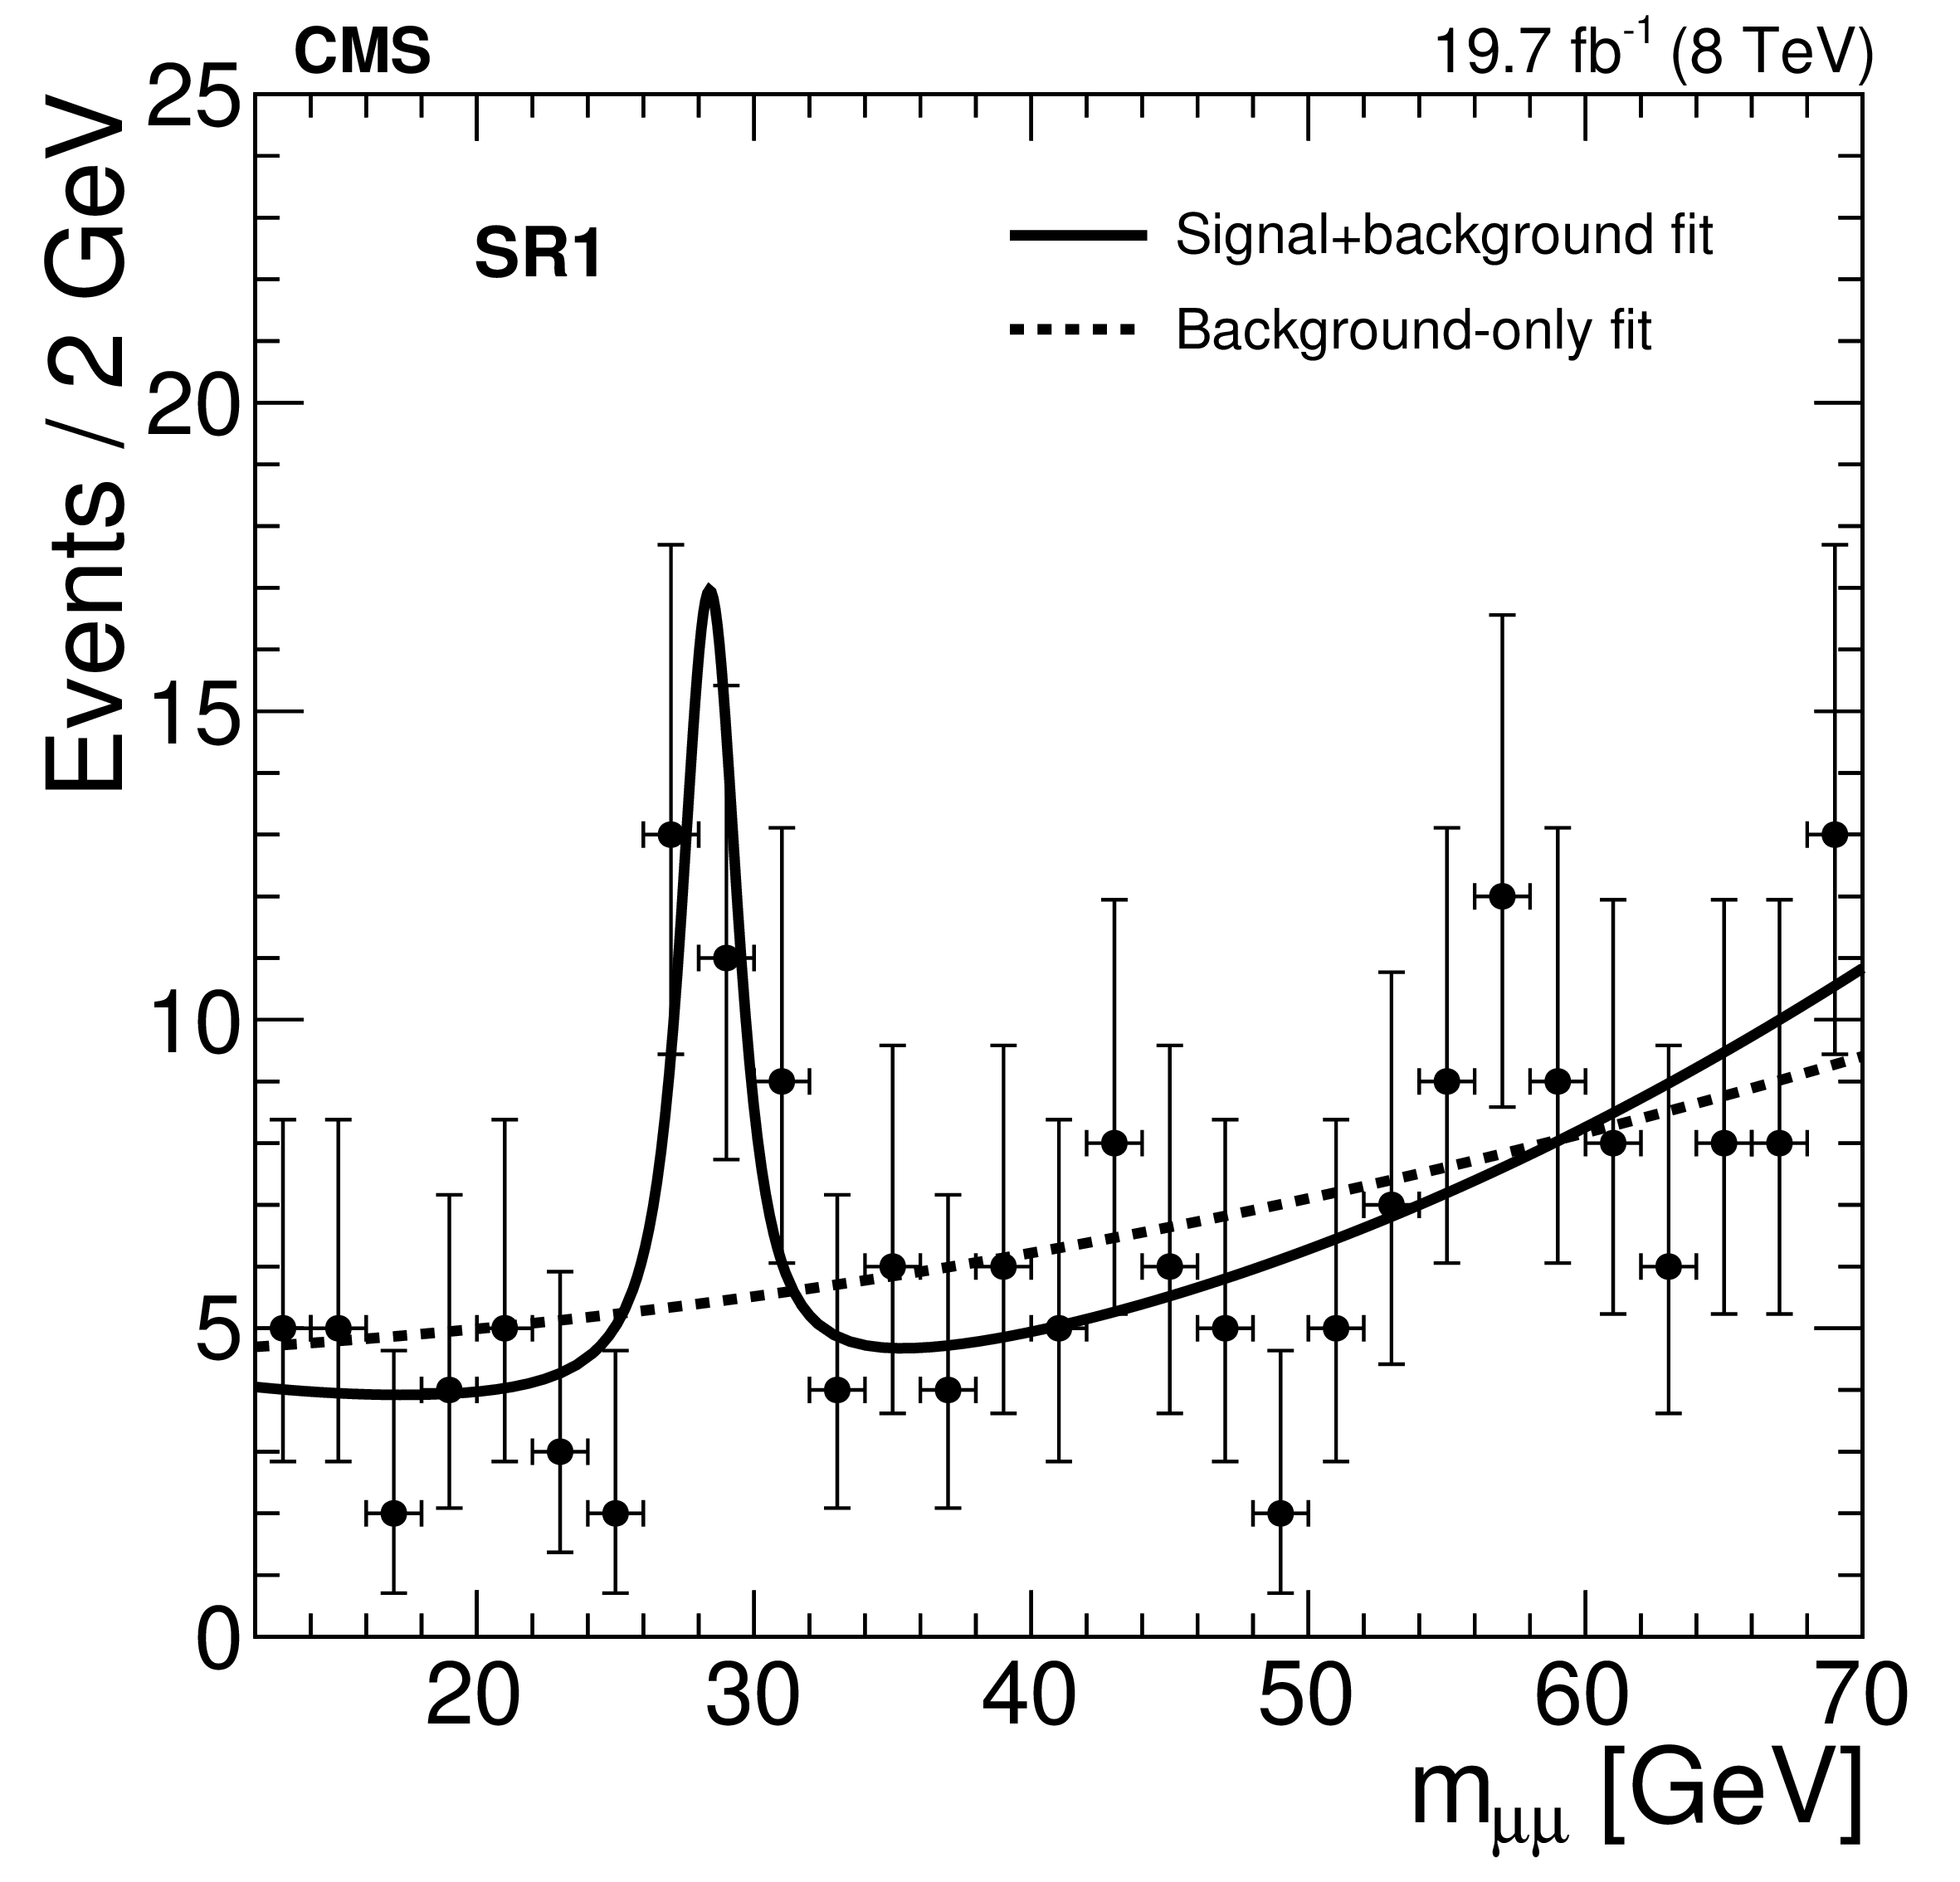
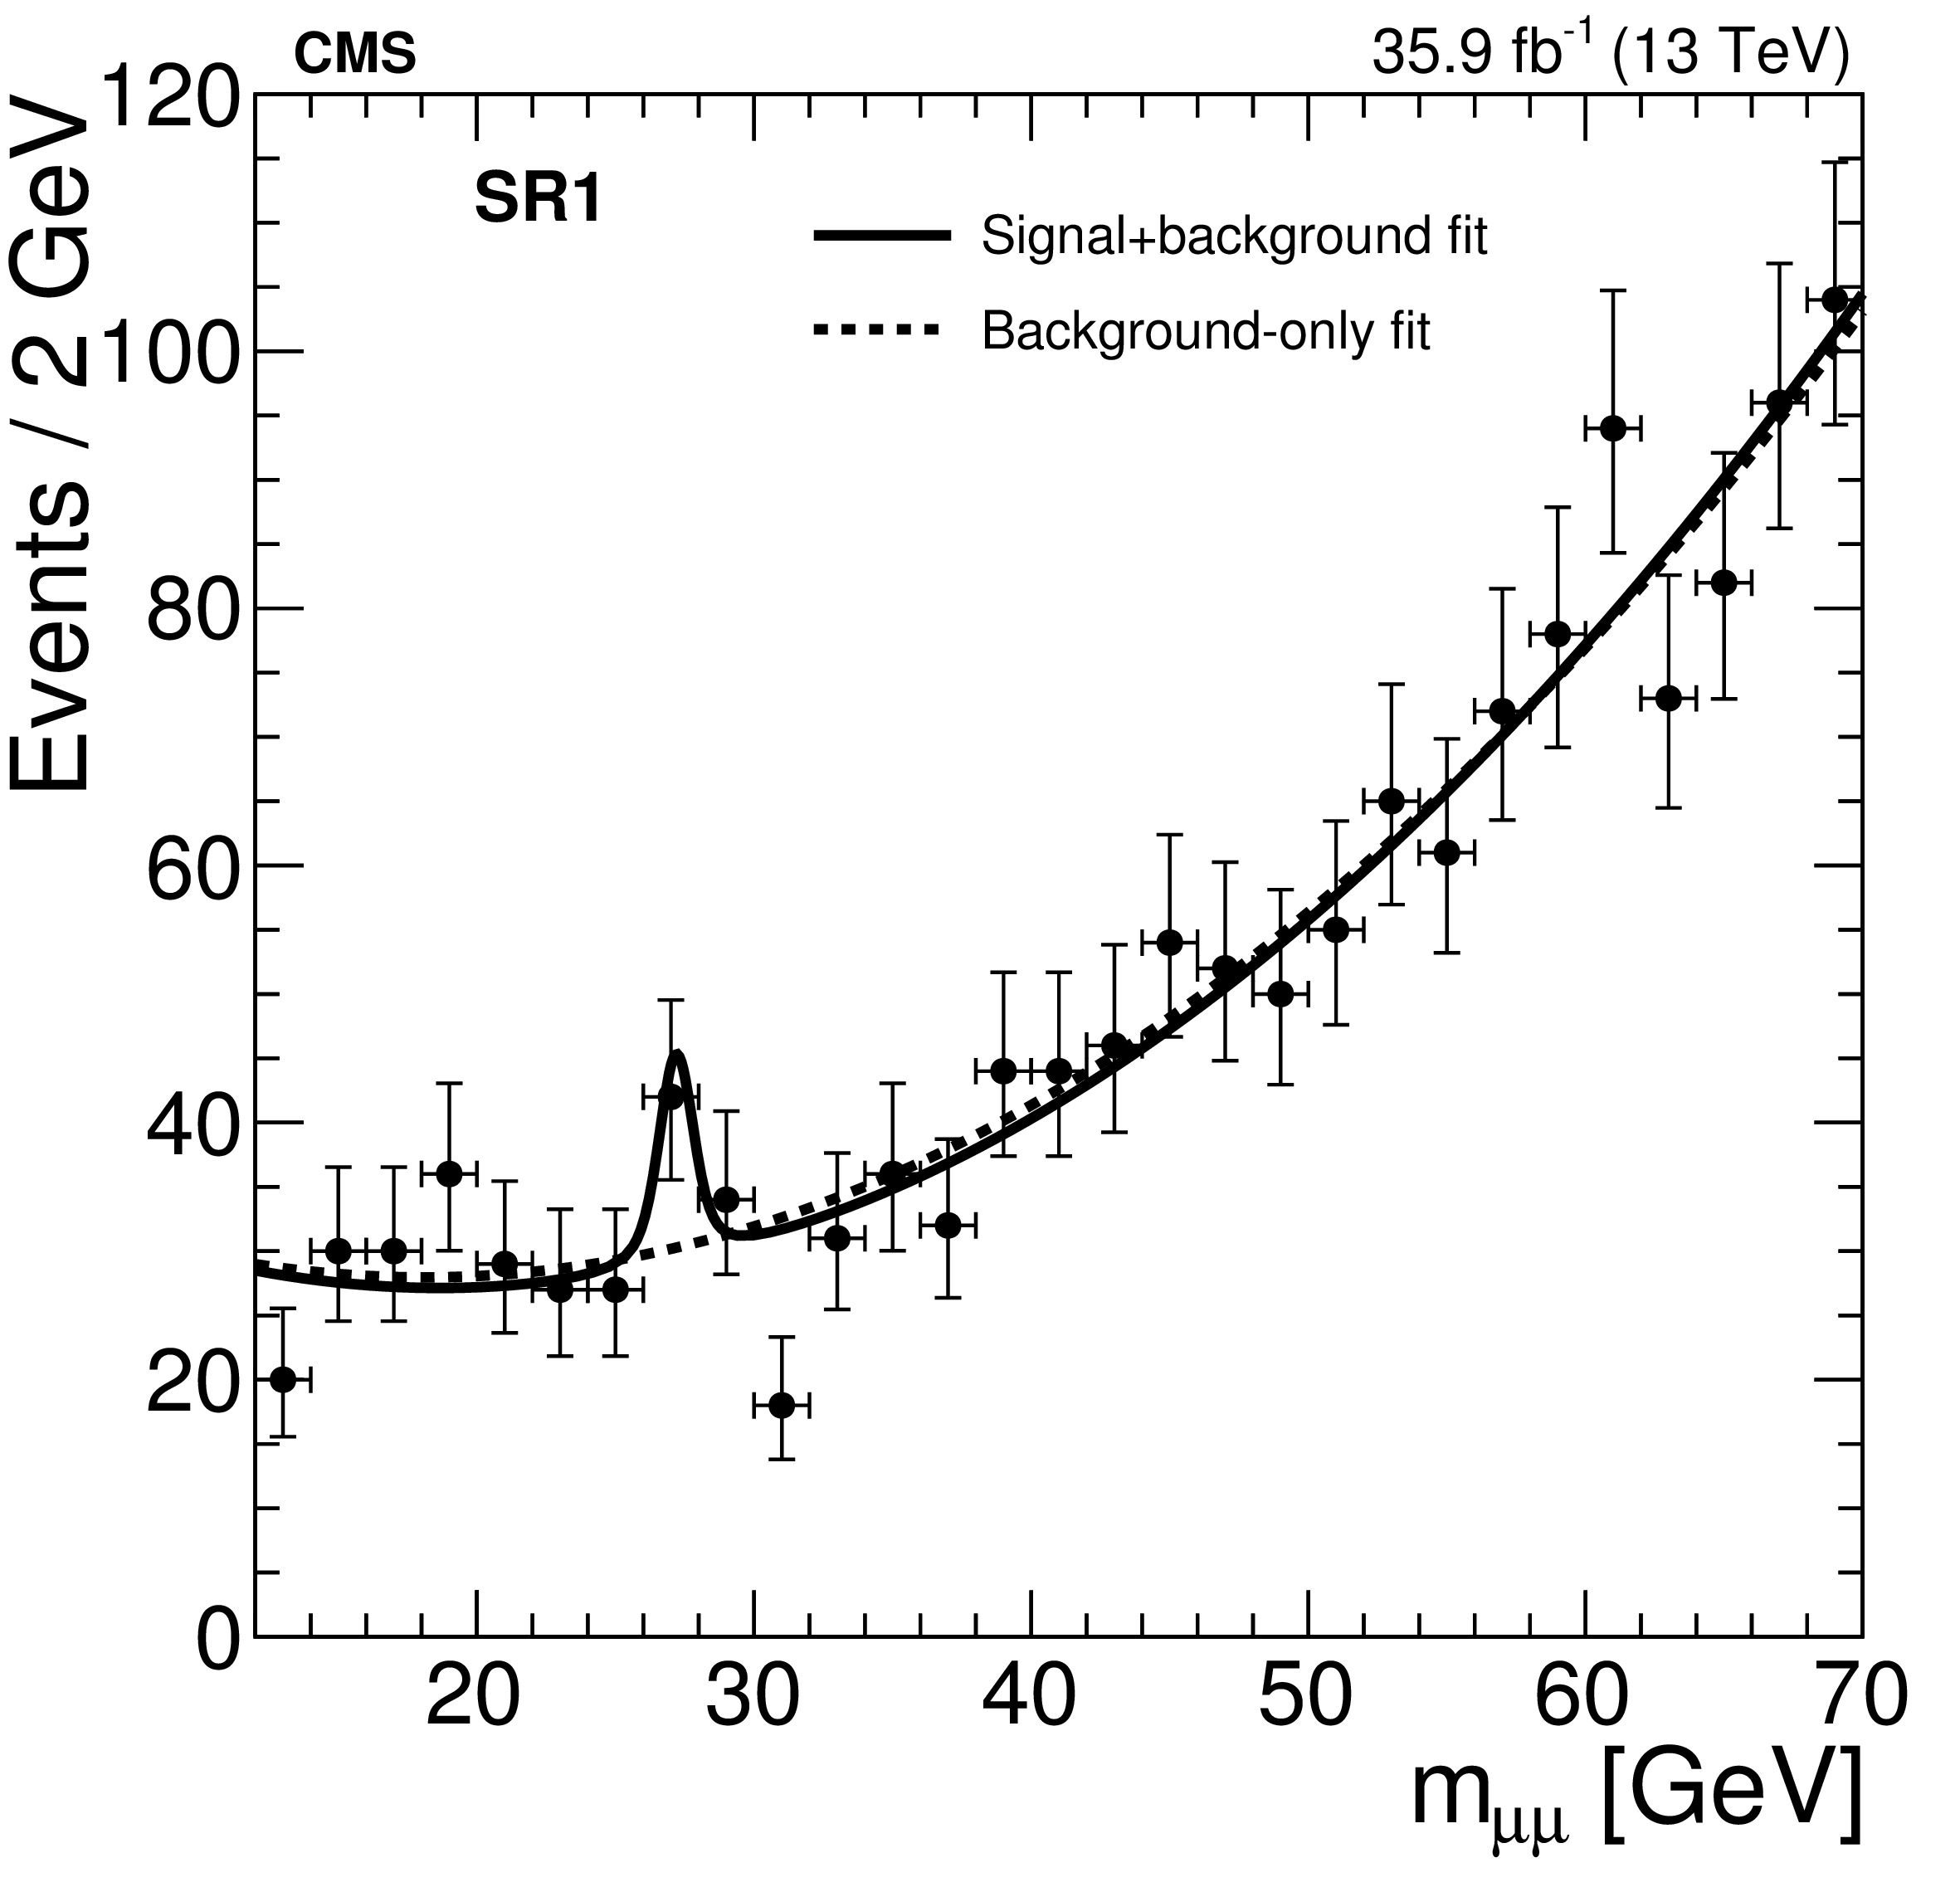
Upper row: the 12 $ < {m_{{\mu} {\mu}}} < $ 70 GeV range in SR1 (left) and SR2 (right) in the 8 TeV analysis. Lower row: the 12 $ < {m_{{\mu} {\mu}}} < $ 70 GeV range in SR1 (left) and SR2 (right) in the 13 TeV analysis. The results of an unbinned maximum likelihood fit for the signal-plus-background (solid lines) and background-only (dashed lines) hypotheses are superimposed. |
png pdf |
Figure 2-a:
The 12 $ < {m_{{\mu} {\mu}}} < $ 70 GeV range in SR1 in the 8 TeV analysis. The results of an unbinned maximum likelihood fit for the signal-plus-background (solid lines) and background-only (dashed lines) hypotheses are superimposed. |

png pdf |
Figure 2-b:
The 12 $ < {m_{{\mu} {\mu}}} < $ 70 GeV range in SR2 in the 8 TeV analysis. The results of an unbinned maximum likelihood fit for the signal-plus-background (solid lines) and background-only (dashed lines) hypotheses are superimposed. |
png pdf |
Figure 2-c:
The 12 $ < {m_{{\mu} {\mu}}} < $ 70 GeV range in SR1 in the 13 TeV analysis. The results of an unbinned maximum likelihood fit for the signal-plus-background (solid lines) and background-only (dashed lines) hypotheses are superimposed. |

png pdf |
Figure 2-d:
The 12 $ < {m_{{\mu} {\mu}}} < $ 70 GeV range in SR2 in the 13 TeV analysis. The results of an unbinned maximum likelihood fit for the signal-plus-background (solid lines) and background-only (dashed lines) hypotheses are superimposed. |

png pdf |
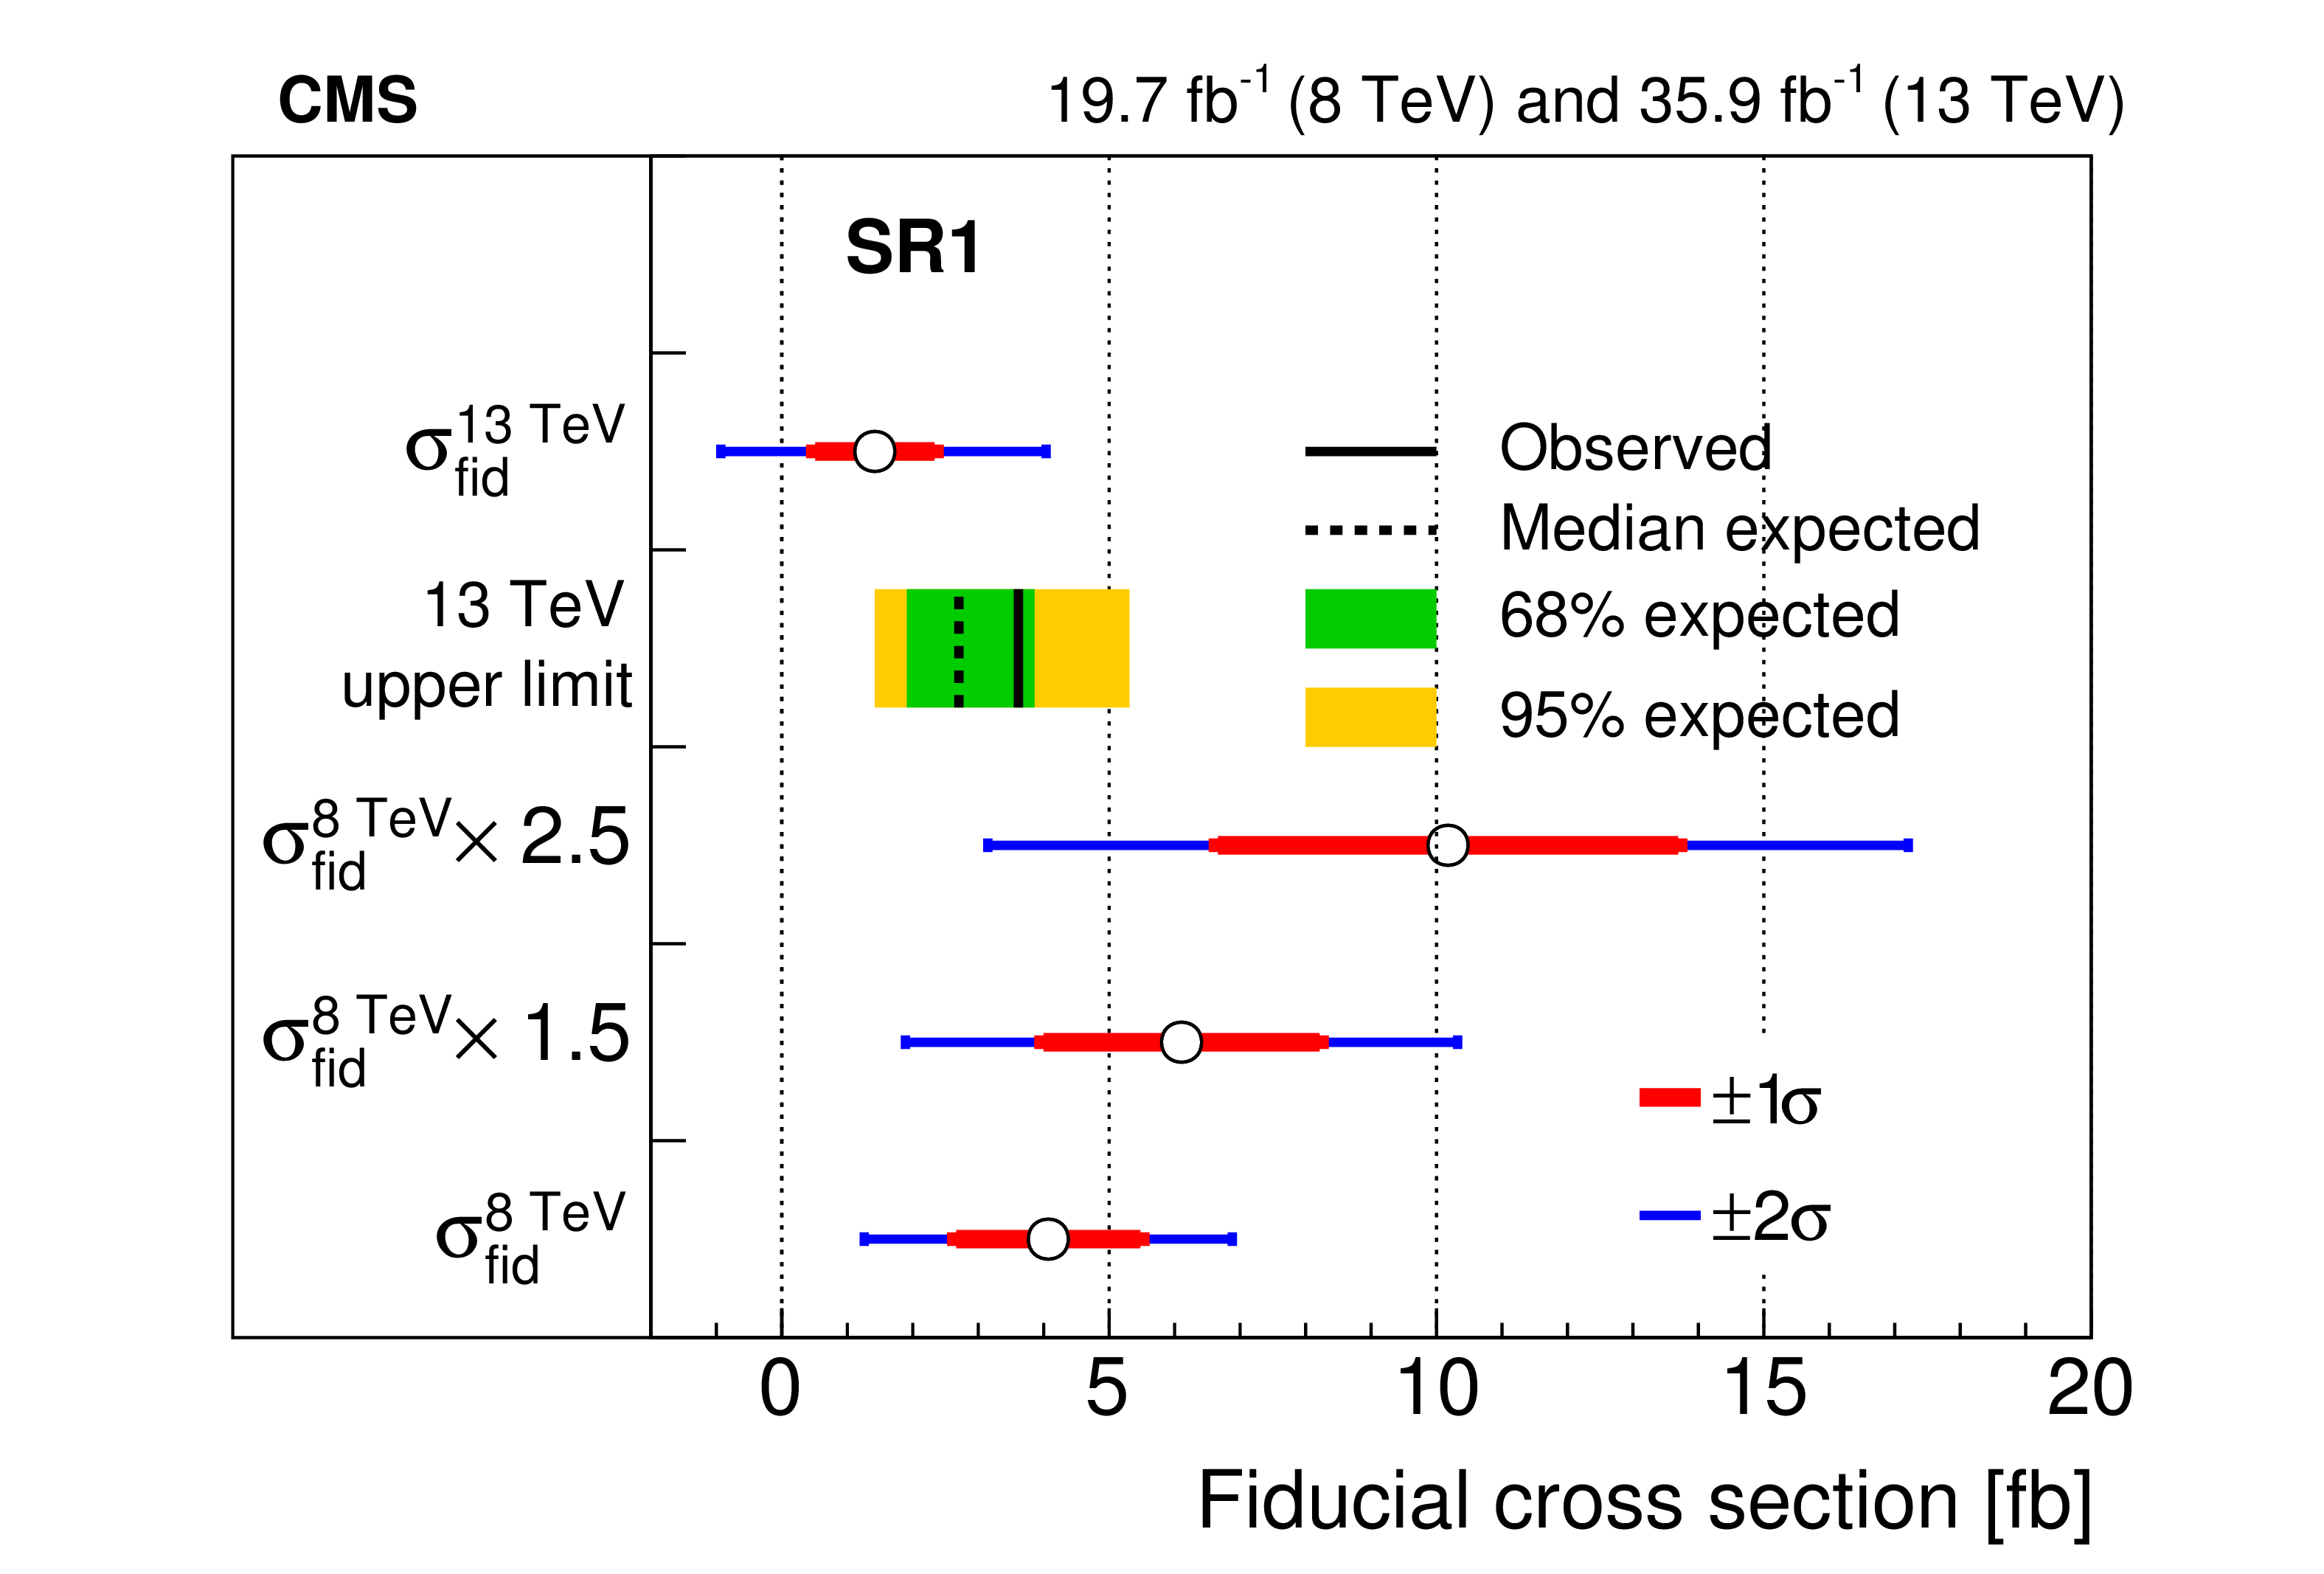
Figure 3:
The measured fiducial signal cross sections and the 95% CL upper limits on those in SR1 (left) and SR2 (right). The expected (observed) upper limits are shown as vertical dashed (solid) lines, together with the 68 and 95% CL uncertainties in the expected limits (under the background-only hypothesis). Also shown are the expected 13 TeV cross sections and their uncertainties obtained by scaling the measured 8 TeV cross sections by the factors of 1.5 and 2.5, as discussed in the text. |
png pdf |
Figure 3-a:
The measured fiducial signal cross sections and the 95% CL upper limits on those in SR1. The expected (observed) upper limits are shown as vertical dashed (solid) lines, together with the 68 and 95% CL uncertainties in the expected limits (under the background-only hypothesis). Also shown are the expected 13 TeV cross sections and their uncertainties obtained by scaling the measured 8 TeV cross sections by the factors of 1.5 and 2.5, as discussed in the text. |

png pdf |
Figure 3-b:
The measured fiducial signal cross sections and the 95% CL upper limits on those in SR2. The expected (observed) upper limits are shown as vertical dashed (solid) lines, together with the 68 and 95% CL uncertainties in the expected limits (under the background-only hypothesis). Also shown are the expected 13 TeV cross sections and their uncertainties obtained by scaling the measured 8 TeV cross sections by the factors of 1.5 and 2.5, as discussed in the text. |
| Tables | |
png pdf |
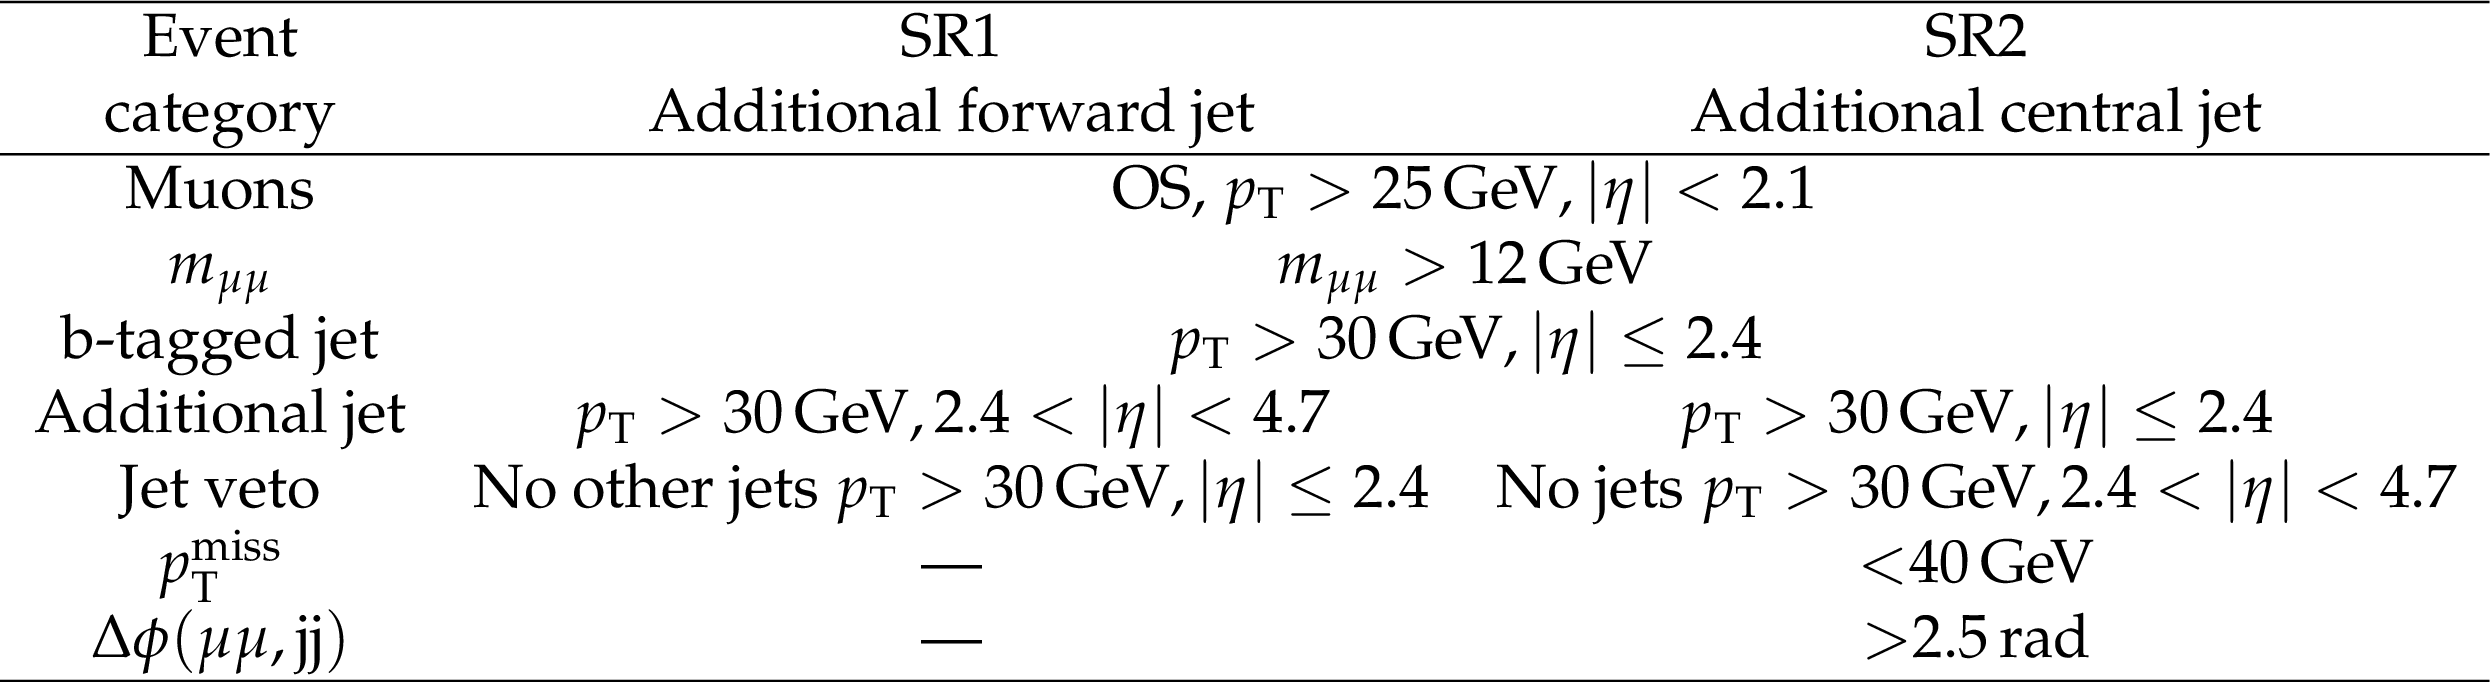
Table 1:
Event selection in the two search regions. A dash means that the variable is not used for selection. |
png pdf |
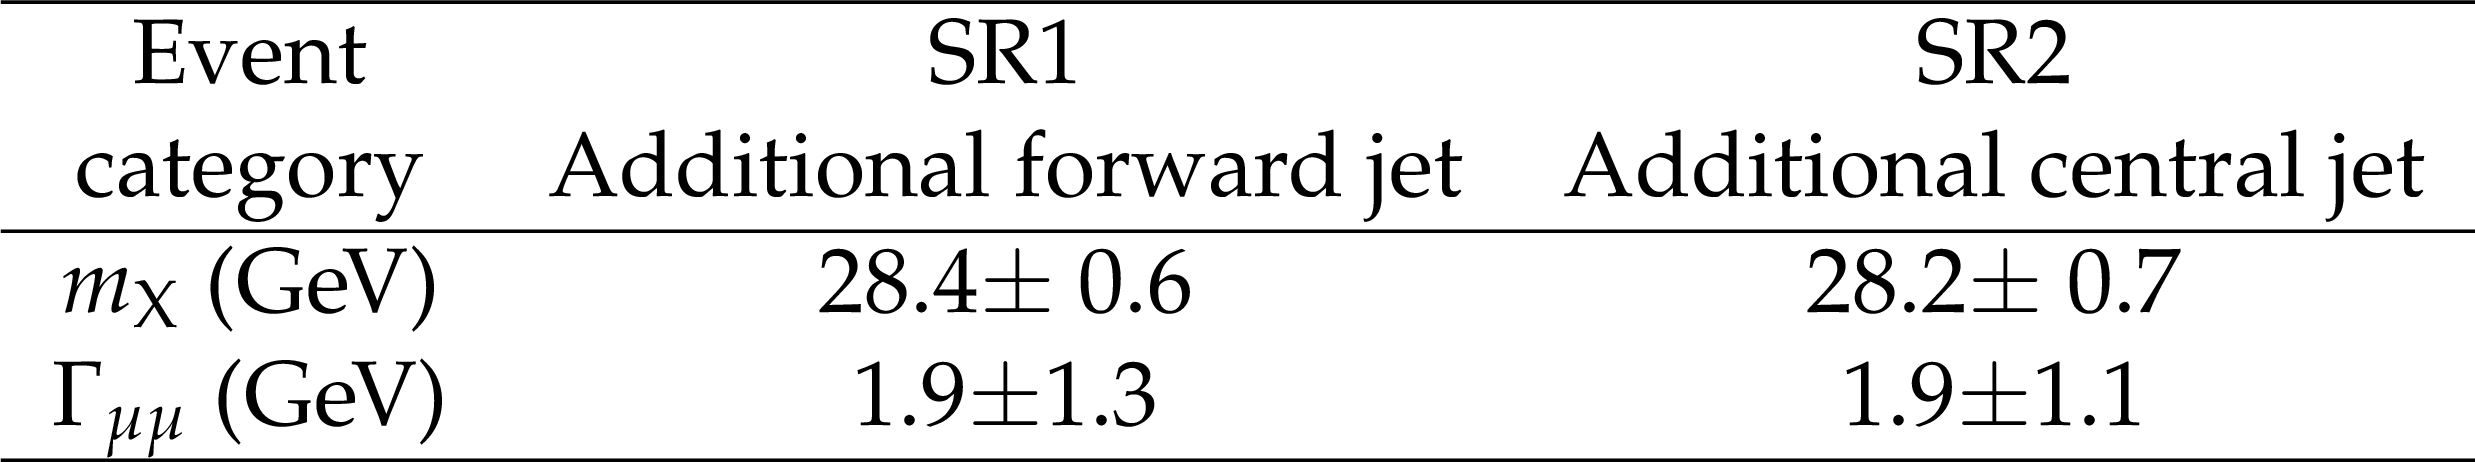
Table 2:
The mass and width of the event excess obtained in the 8 TeV analysis. |
png pdf |
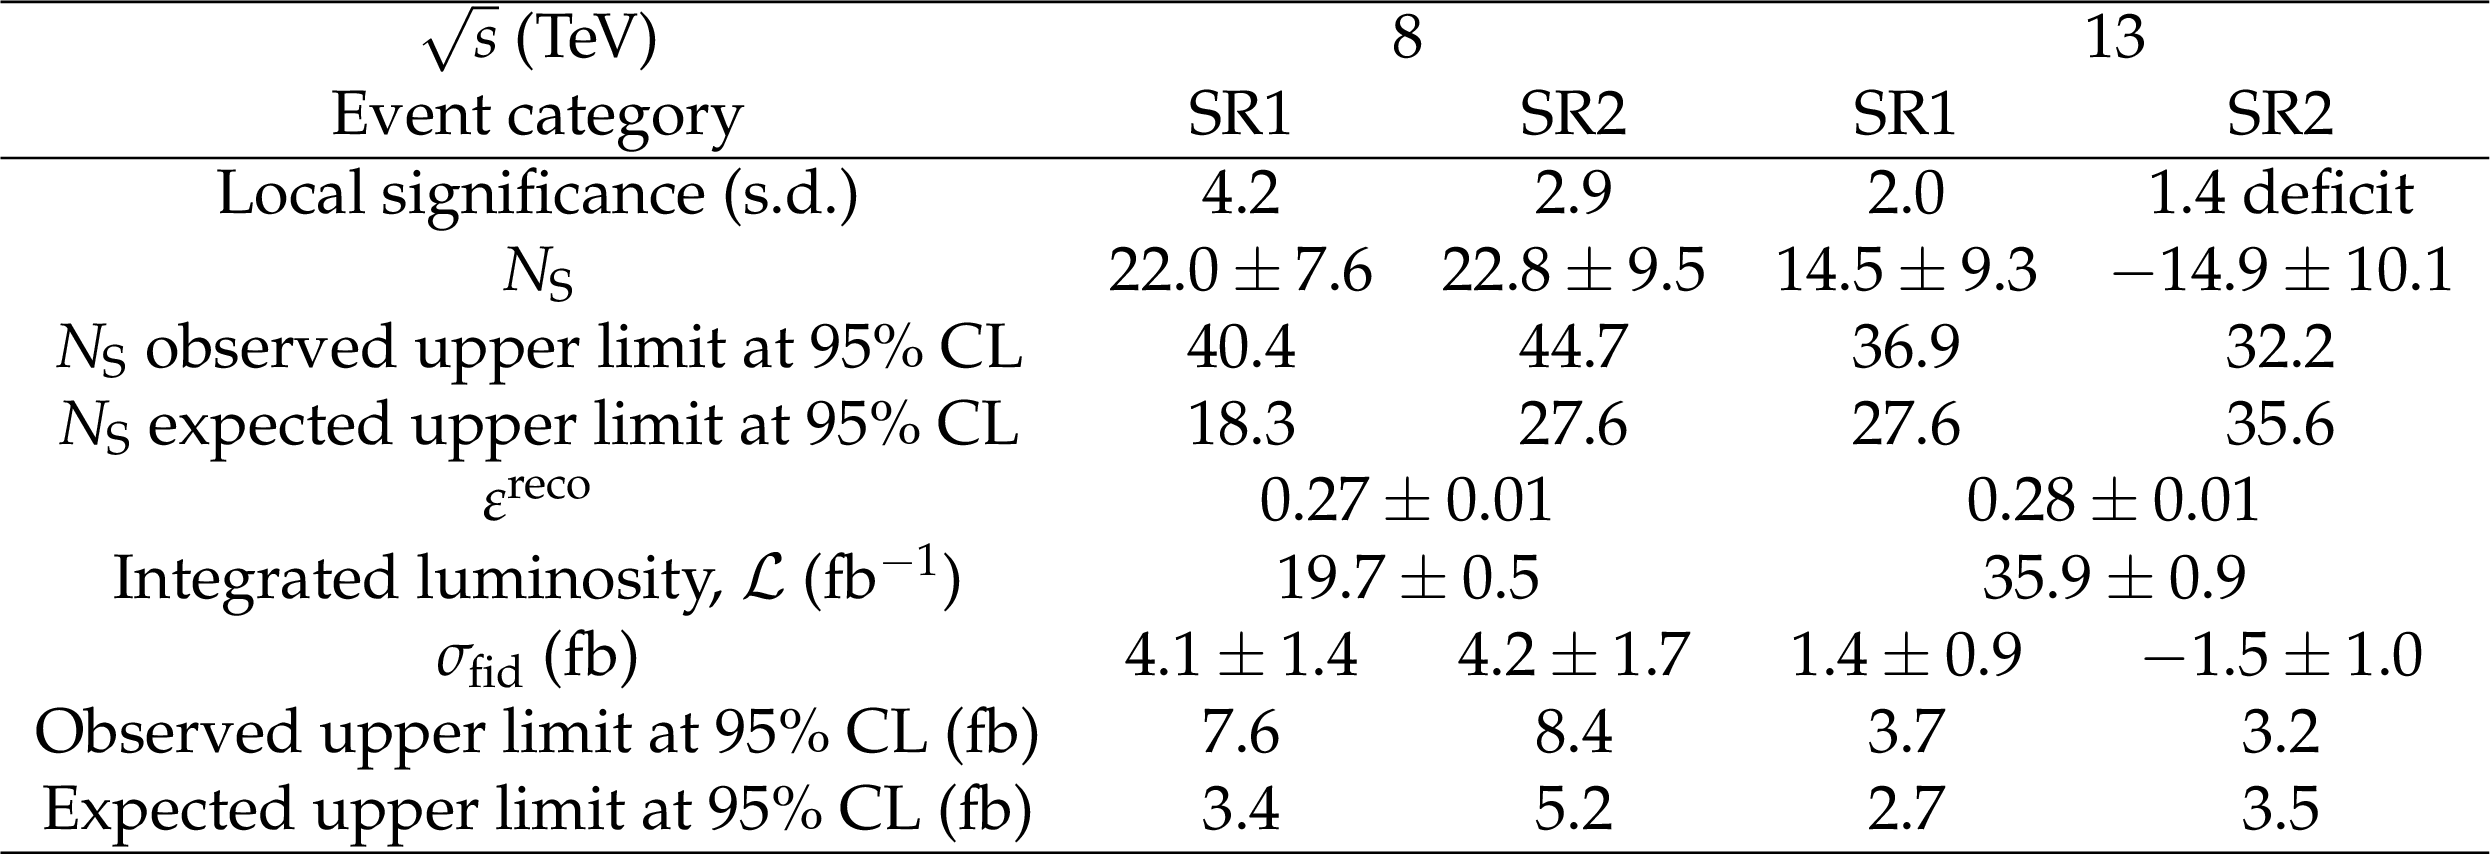
Table 3:
The local significances, the measured fiducial signal cross sections with $ \pm $1 s.d. uncertainties, and the upper limits at 95% CL, together with the values of $ {N_\mathrm {S}} $ for the two SRs and two collision energies. The reconstruction efficiencies and the integrated luminosities are also listed. |
| Summary |
|
We report on a search for resonances in the mass range 12-70 GeV, produced in association with a b quark jet and another jet, and decaying to a muon pair. The analysis is based on data from proton-proton collisions at center-of-mass energies of 8 and 13 TeV, collected with the CMS detector at the LHC and corresponding to integrated luminosities of 19.7 and 35.9 fb$^{-1}$, respectively. The search is carried out in two mutually exclusive event categories. Events in the first category are required to have a b quark jet in the central region ($ | \eta |\le $ 2.4) and at least one jet in the forward region ($ | \eta | > $ 2.4). Events in the second category are required to have two jets in the central region, at least one of which is identified as a b quark jet, no jets in the forward region, and low missing transverse momentum. An excess of events above the background near a dimuon mass of 28 GeV is observed in both event categories in the 8 TeV data, corresponding to local significances of 4.2 and 2.9 standard deviations, respectively. A mild excess of data over the background in the first event category is observed in 13 TeV data and corresponds to a local significance of 2.0 standard deviations, while the second category results in a deficit with a local significance of 1.4 standard deviations. We provide a measurement of the fiducial cross sections and the upper limits on those at 95% confidence level, evaluated for the mass and the width values obtained from the combined fit to the two event categories in $\sqrt{s} = $ 8 TeV data. In the lack of a realistic signal model, the 13 TeV results are not sufficient to make a definitive statement about the origin of the 8 TeV excess. Therefore, more data and additional theoretical input are both required to fully understand the results presented in this paper. |
| Additional Figures | |
png pdf |
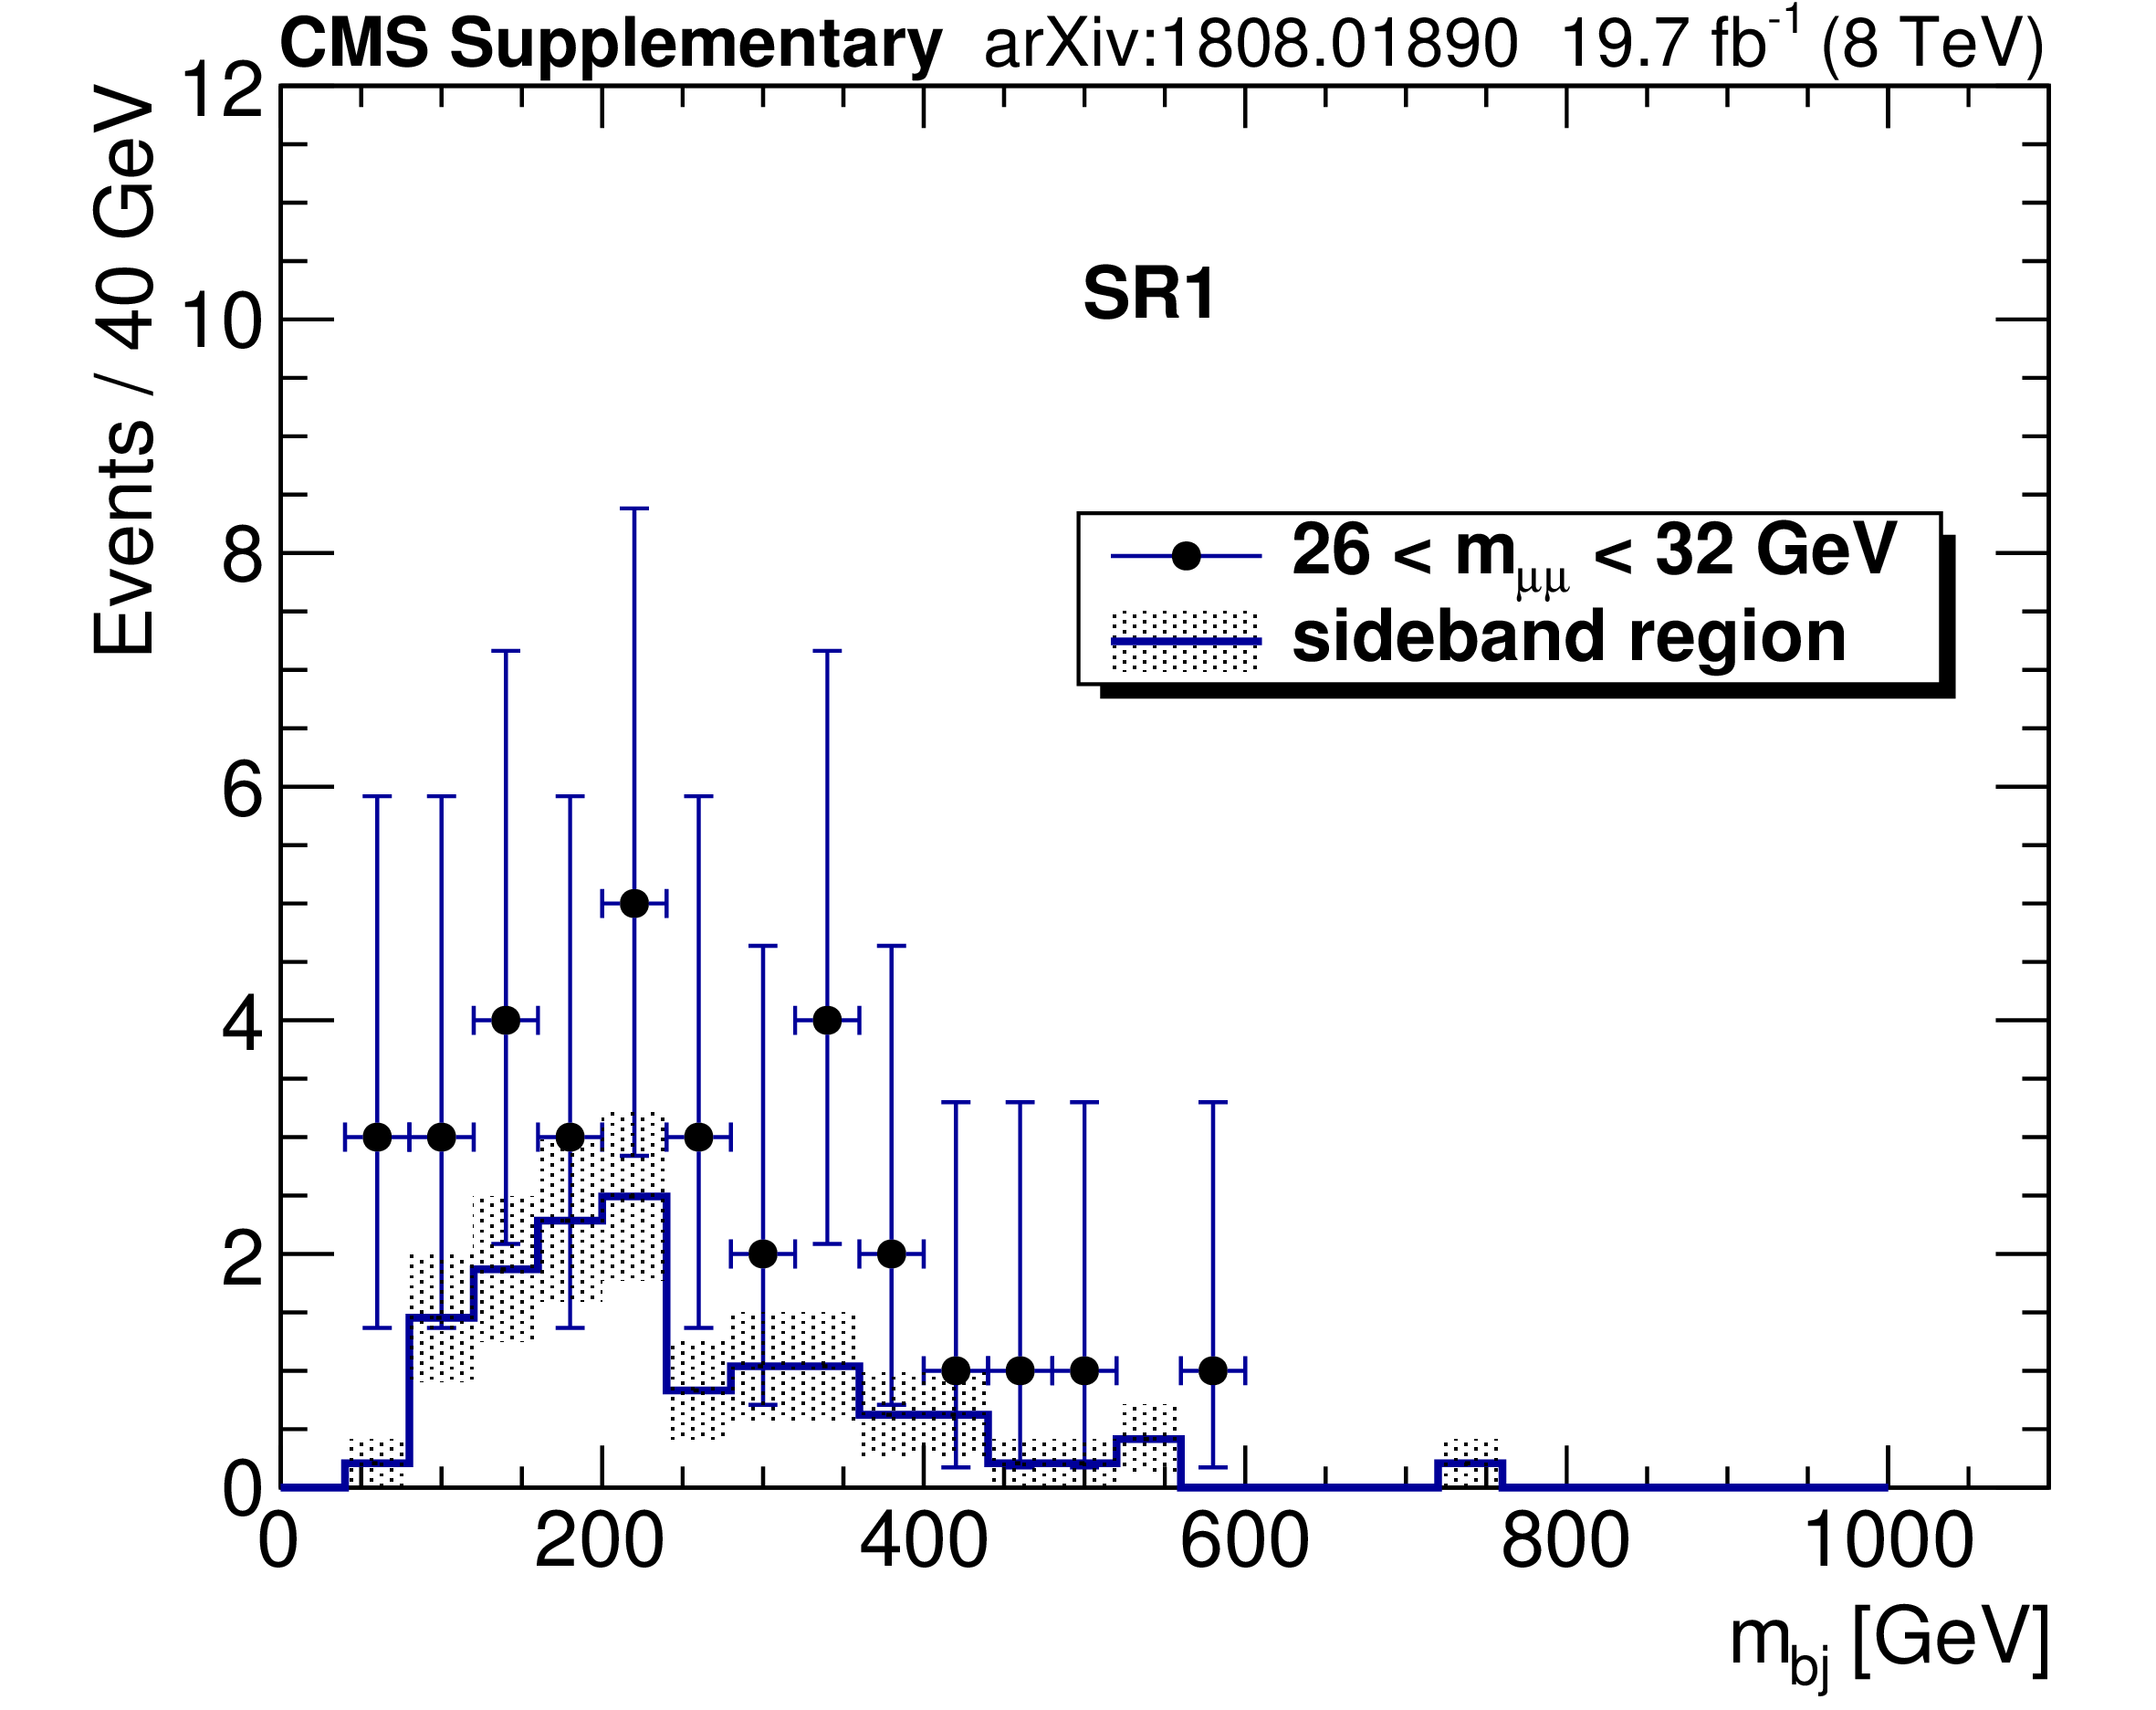
Additional Figure 1:
Dijet mass spectra in SR1 at $\sqrt {s} = $ 8 TeV in the dimuon mass range of 26 $ < m_{\mu \mu} < $ 32 GeV and the sideband between 12 and 24 GeV or between 34 and 50 GeV. The sideband histogram is normalized to the number of expected background events in the range of 26 $ < m_{\mu \mu} < $ 32 GeV. The shaded area of the sideband histogram represents the statistical uncertainty. |
png pdf |
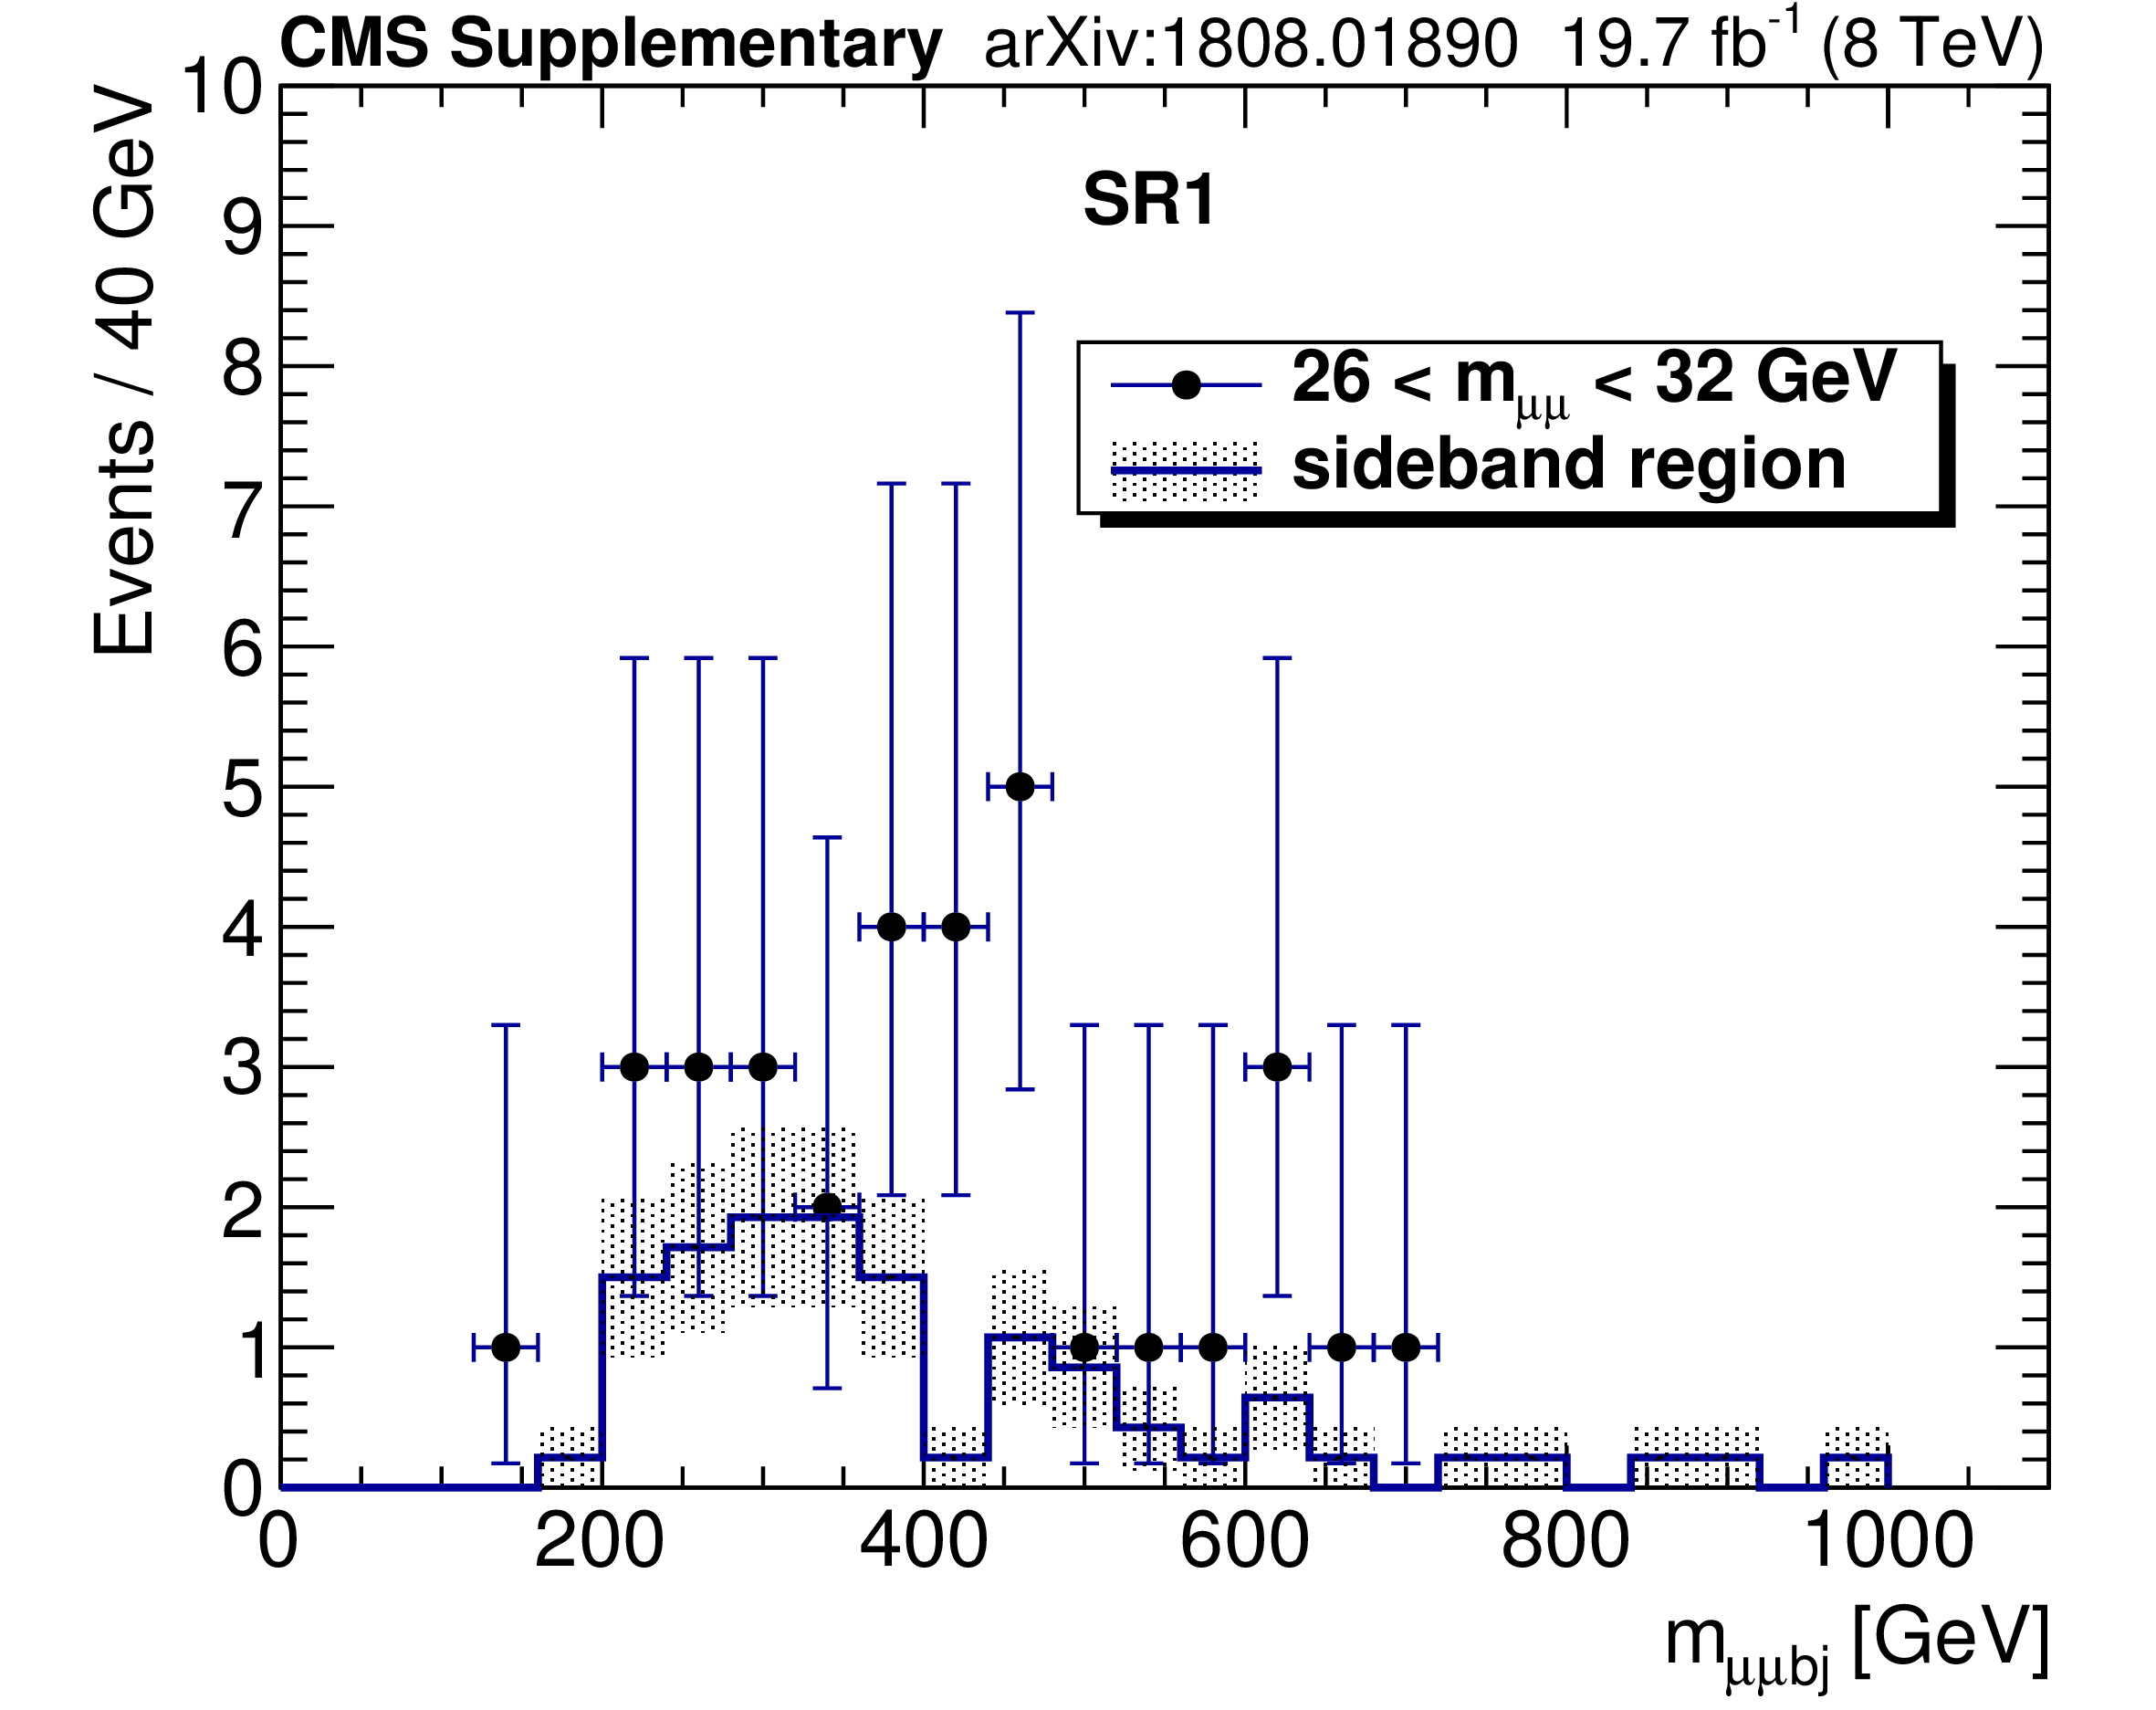
Additional Figure 2:
Dimuon plus dijet mass spectra in SR1 at $\sqrt {s} = $ 8 TeV in the dimuon mass range of 26 $ < m_{\mu \mu} < $ 32 GeV and the sideband between 12 and 24 GeV or between 34 and 50 GeV. The sideband histogram is normalized to the number of expected background events in the range of 26 $ < m_{\mu \mu} < $ 32 GeV. The shaded area of the sideband histogram represents the statistical uncertainty. |
png pdf |
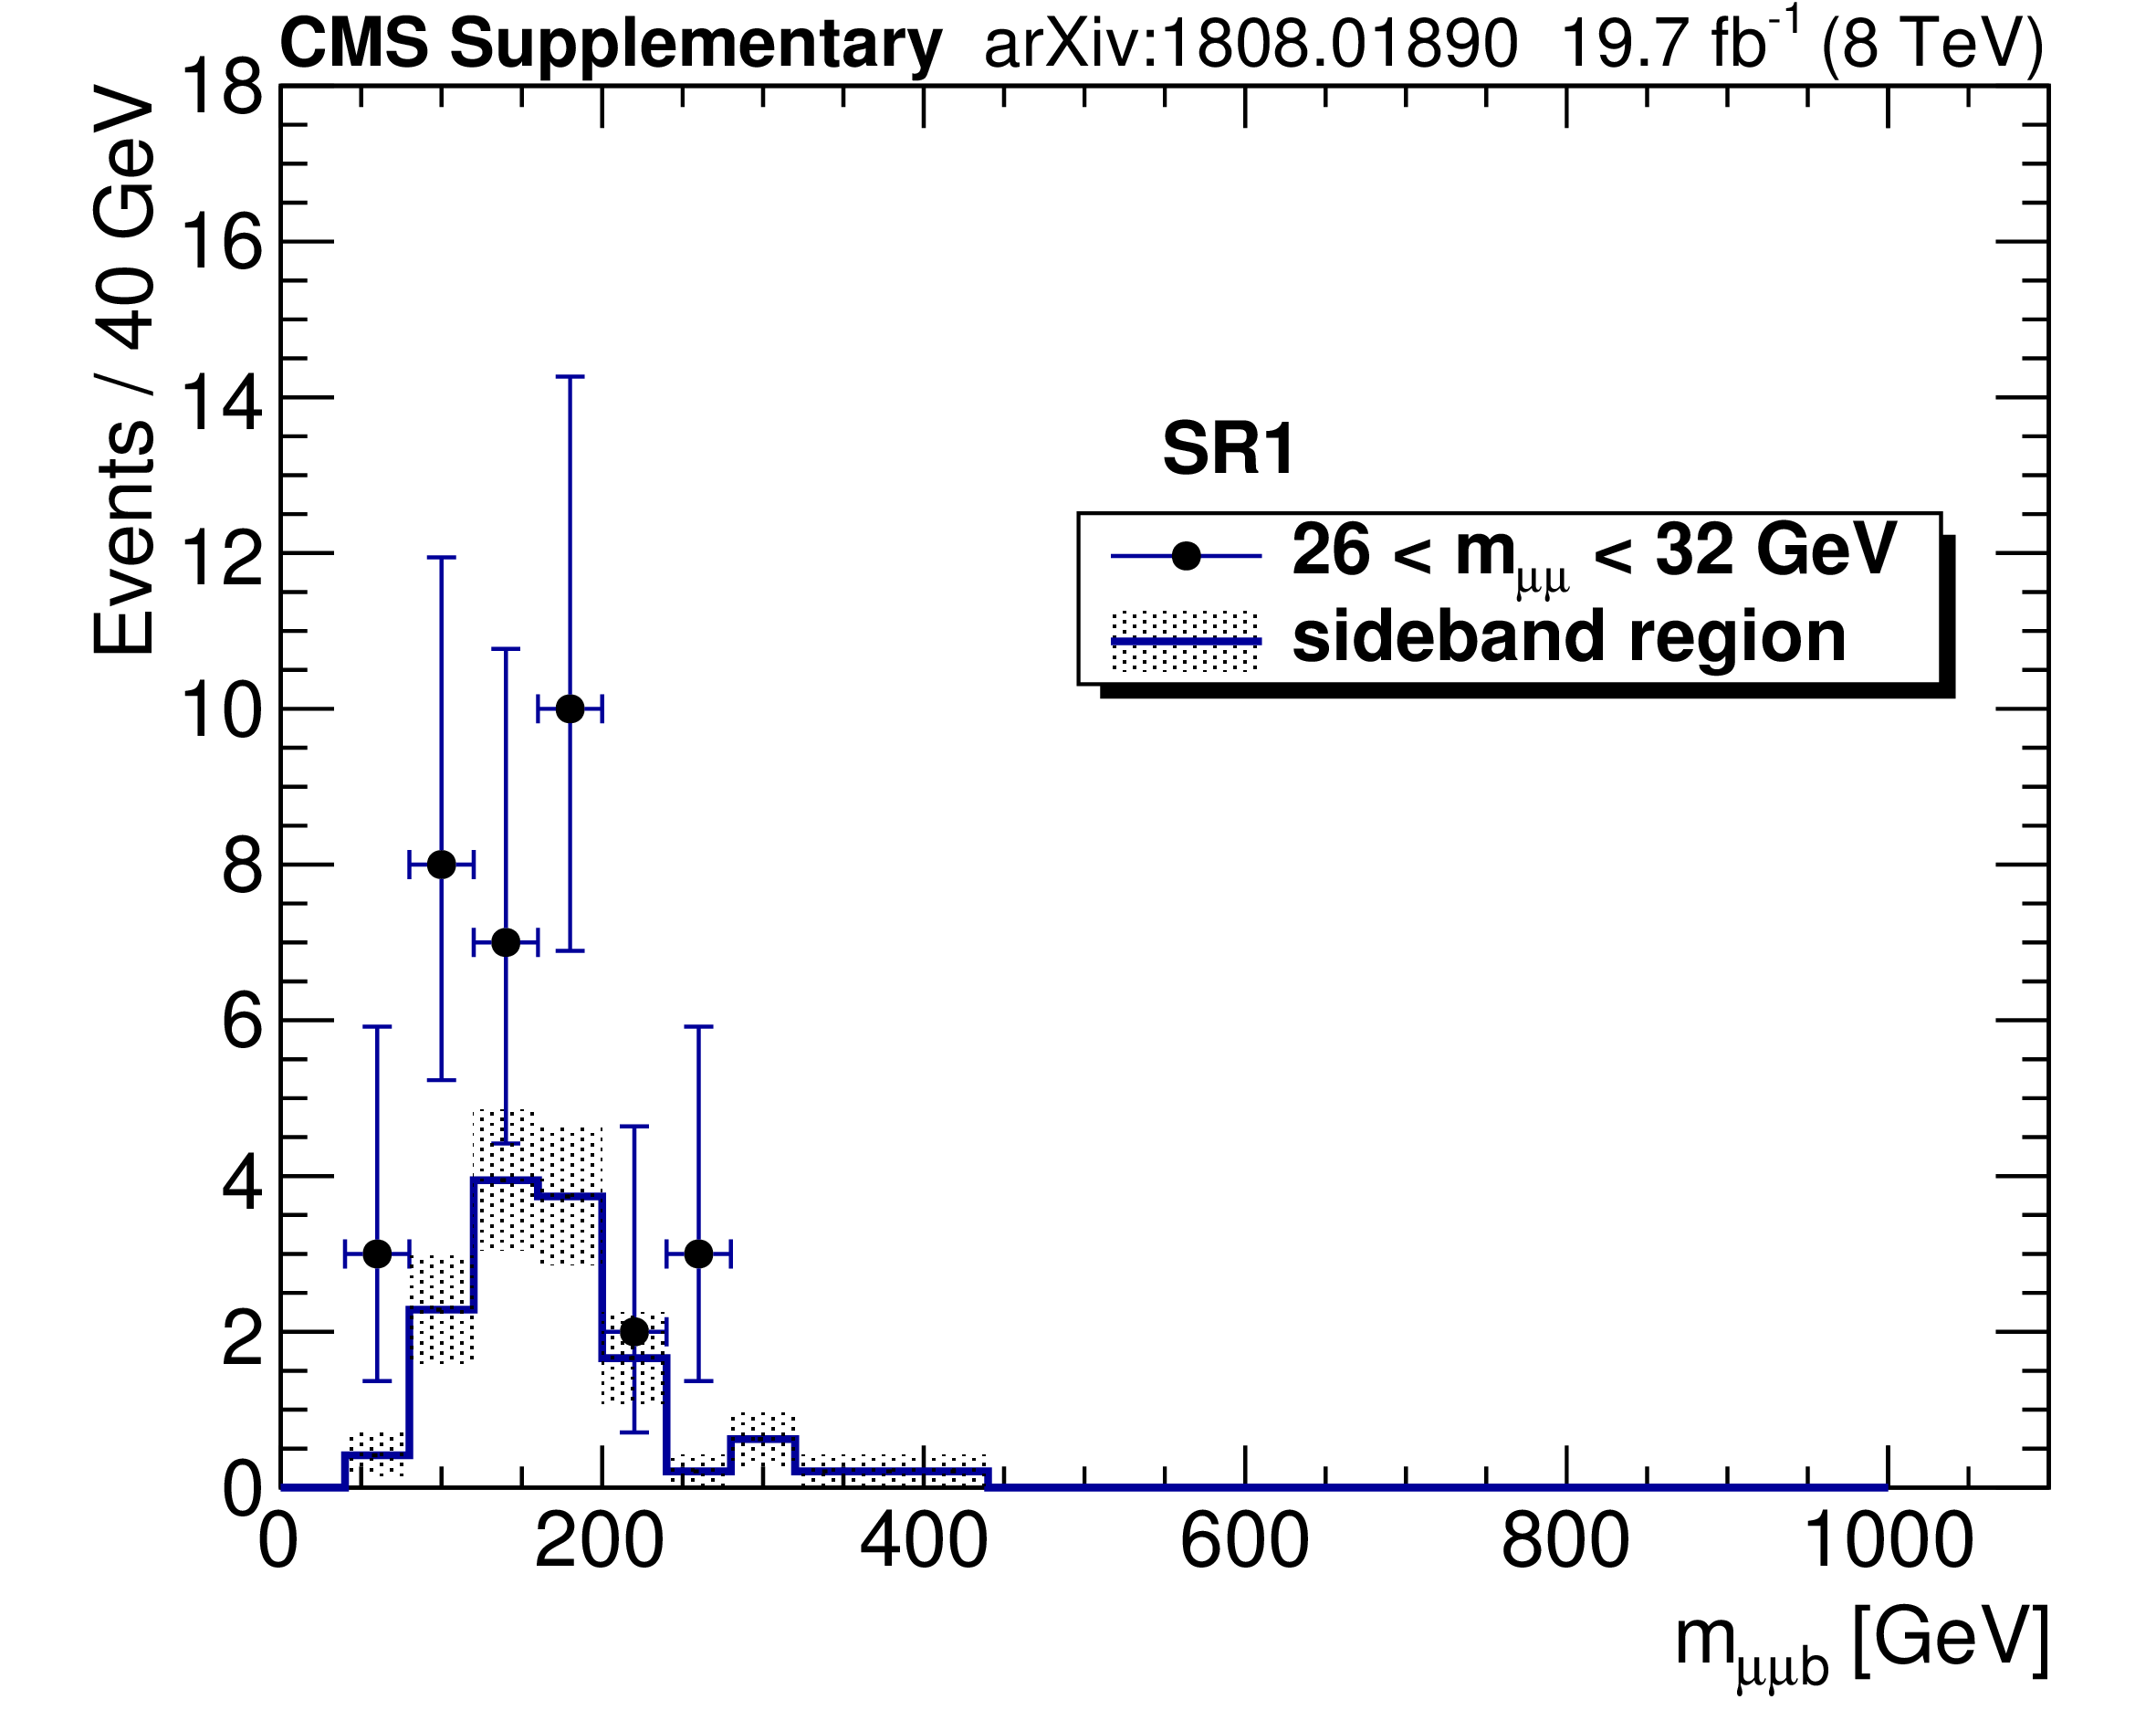
Additional Figure 3:
Dimuon plus b-tagged jet mass spectra in SR1 at $\sqrt {s} = $ 8 TeV in the dimuon mass range of 26 $ < m_{\mu \mu} < $ 32 GeV and the sideband between 12 and 24 GeV or between 34 and 50 GeV. The sideband histogram is normalized to the number of expected background events in the range of 26 $ < m_{\mu \mu} < $ 32 GeV. The shaded area of the sideband histogram represents the statistical uncertainty. |

png pdf |
Additional Figure 4:
Dimuon plus untagged jet mass spectra in SR1 at $\sqrt {s} = $ 8 TeV in the dimuon mass range of 26 $ < m_{\mu \mu} < $ 32 GeV and the sideband between 12 and 24 GeV or between 34 and 50 GeV. The sideband histogram is normalized to the number of expected background events in the range of 26 $ < m_{\mu \mu} < $ 32 GeV. The shaded area of the sideband histogram represents the statistical uncertainty. |
png pdf |
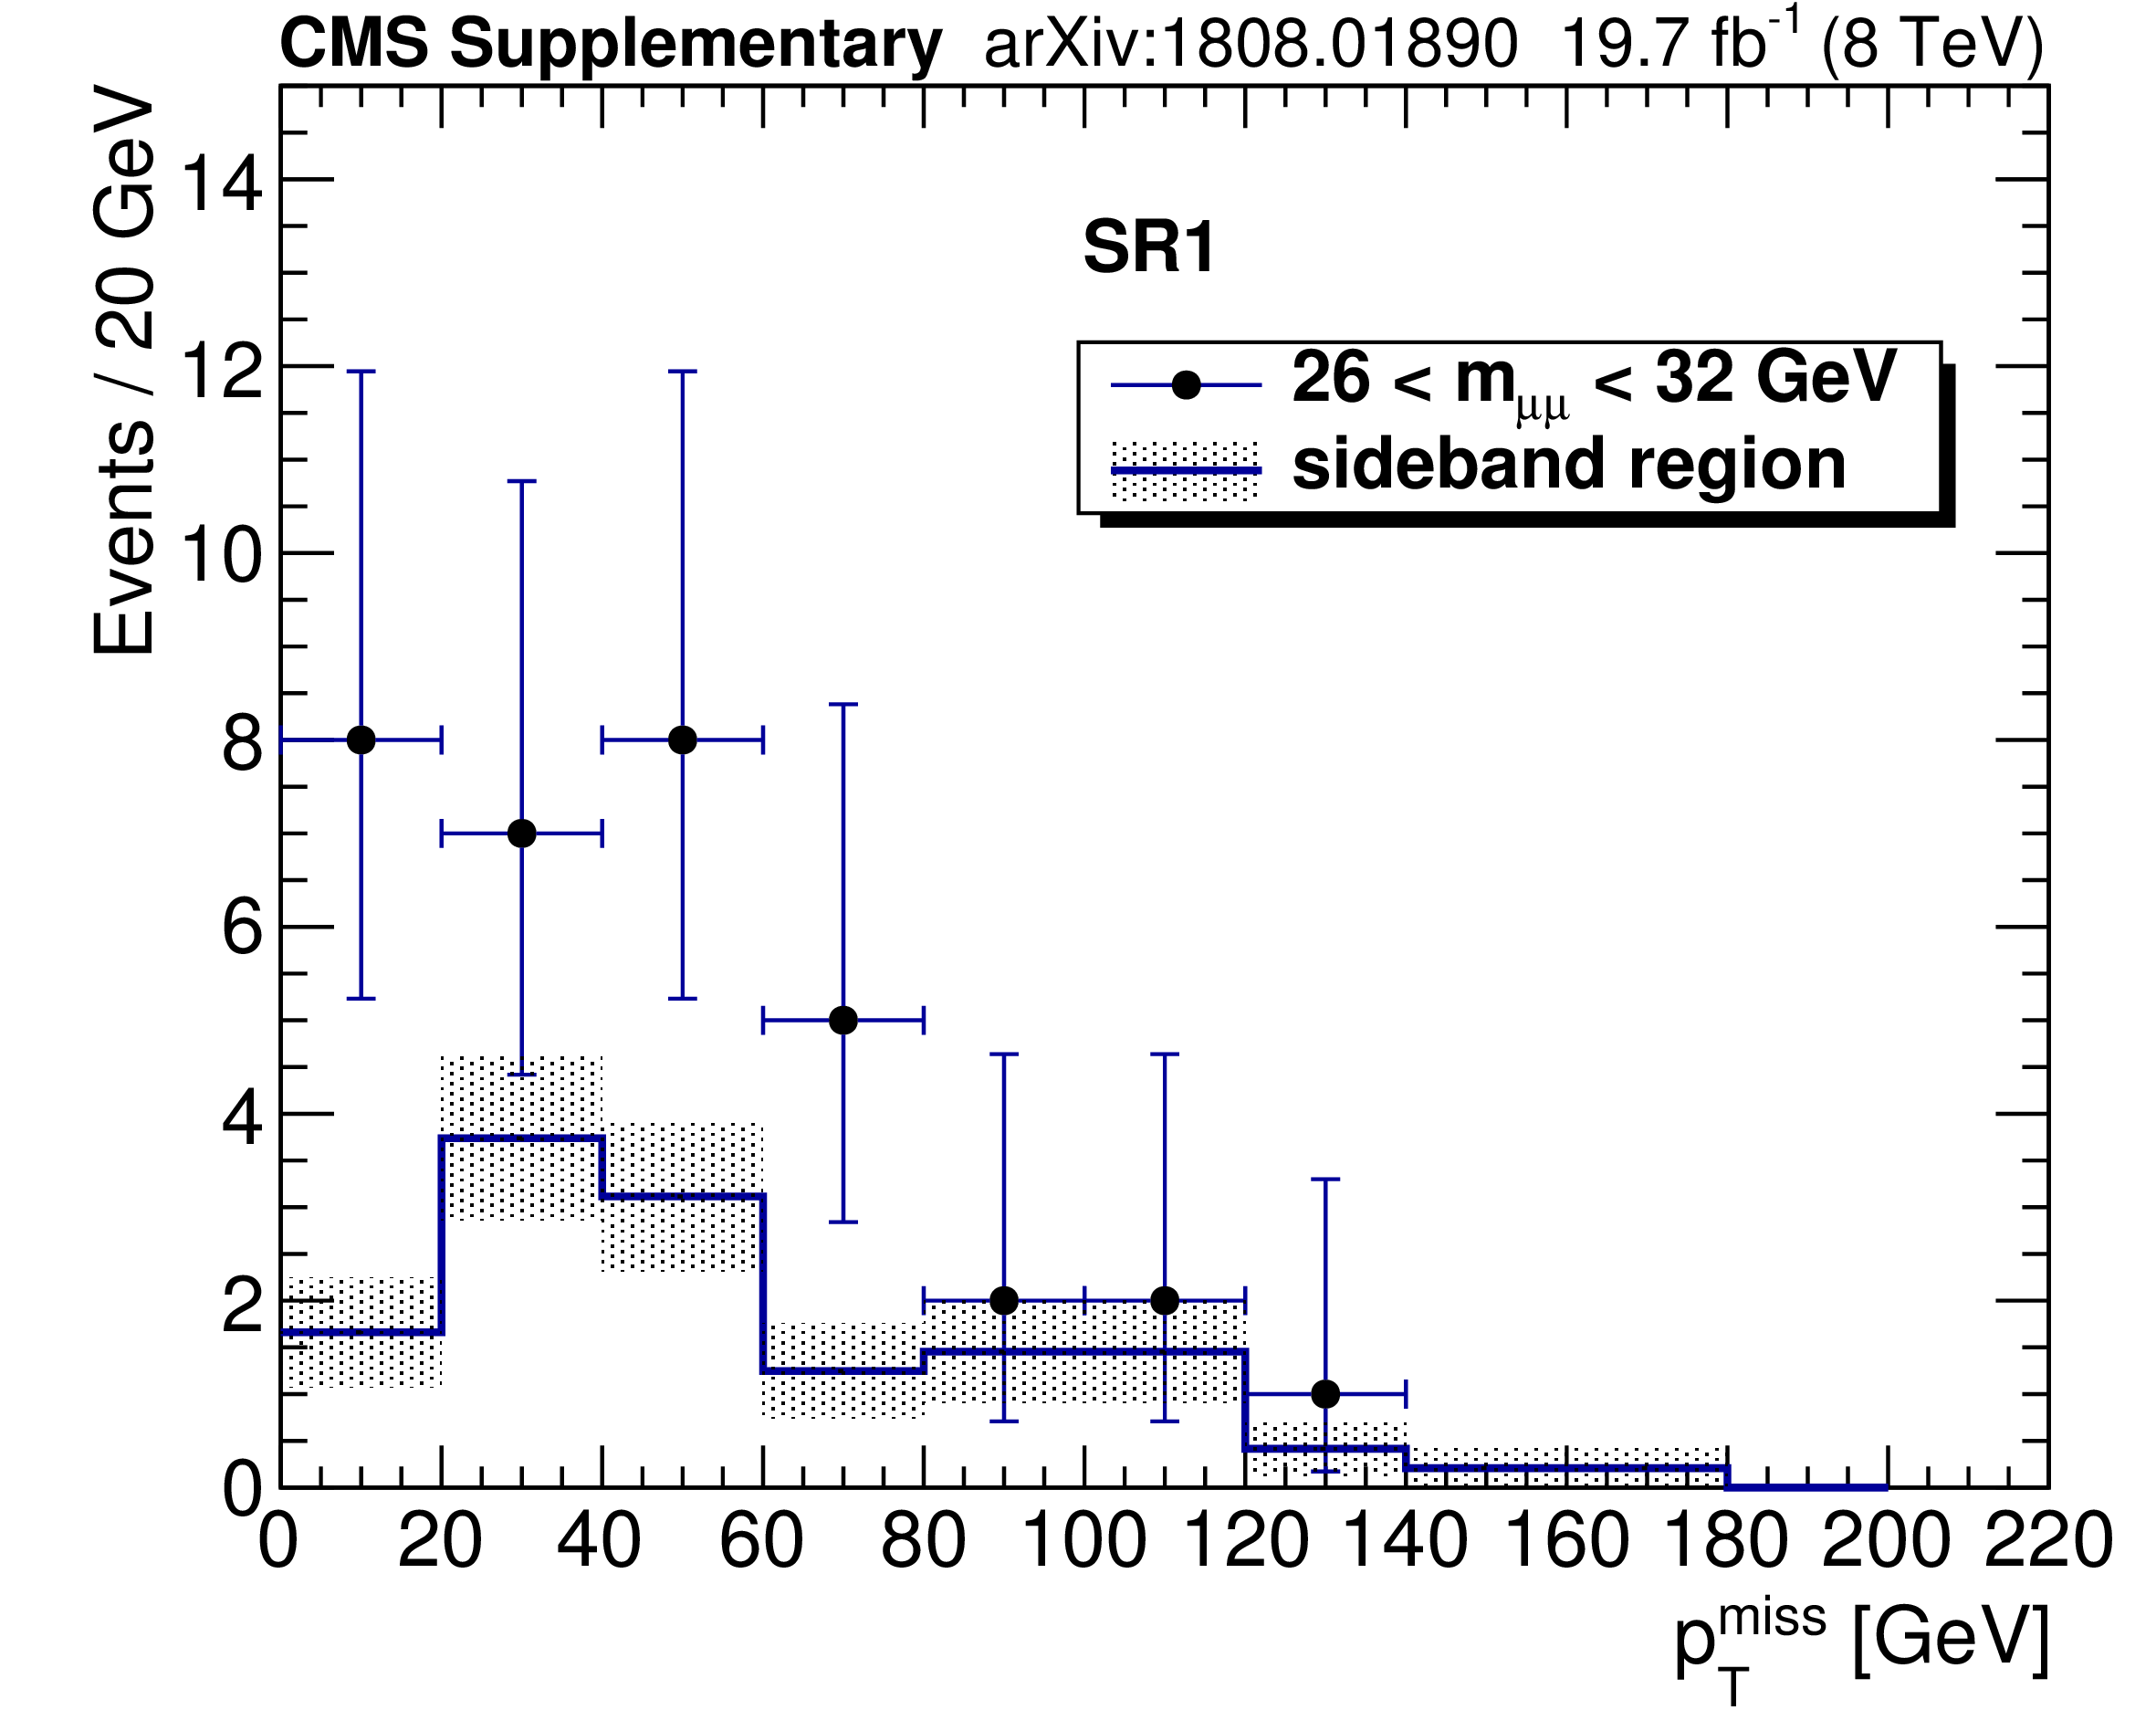
Additional Figure 5:
The ${\vec{p}}_{\mathrm {T}}^{\,\text {miss}}$ spectra in SR1 at $\sqrt {s} = $ 8 TeV in the dimuon mass range of 26 $ < m_{\mu \mu} < $ 32 GeV and the sideband between 12 and 24 GeV or between 34 and 50 GeV. The sideband histogram is normalized to the number of expected background events in the range of 26 $ < m_{\mu \mu} < $ 32 GeV. The shaded area of the sideband histogram represents the statistical uncertainty. |
png pdf |
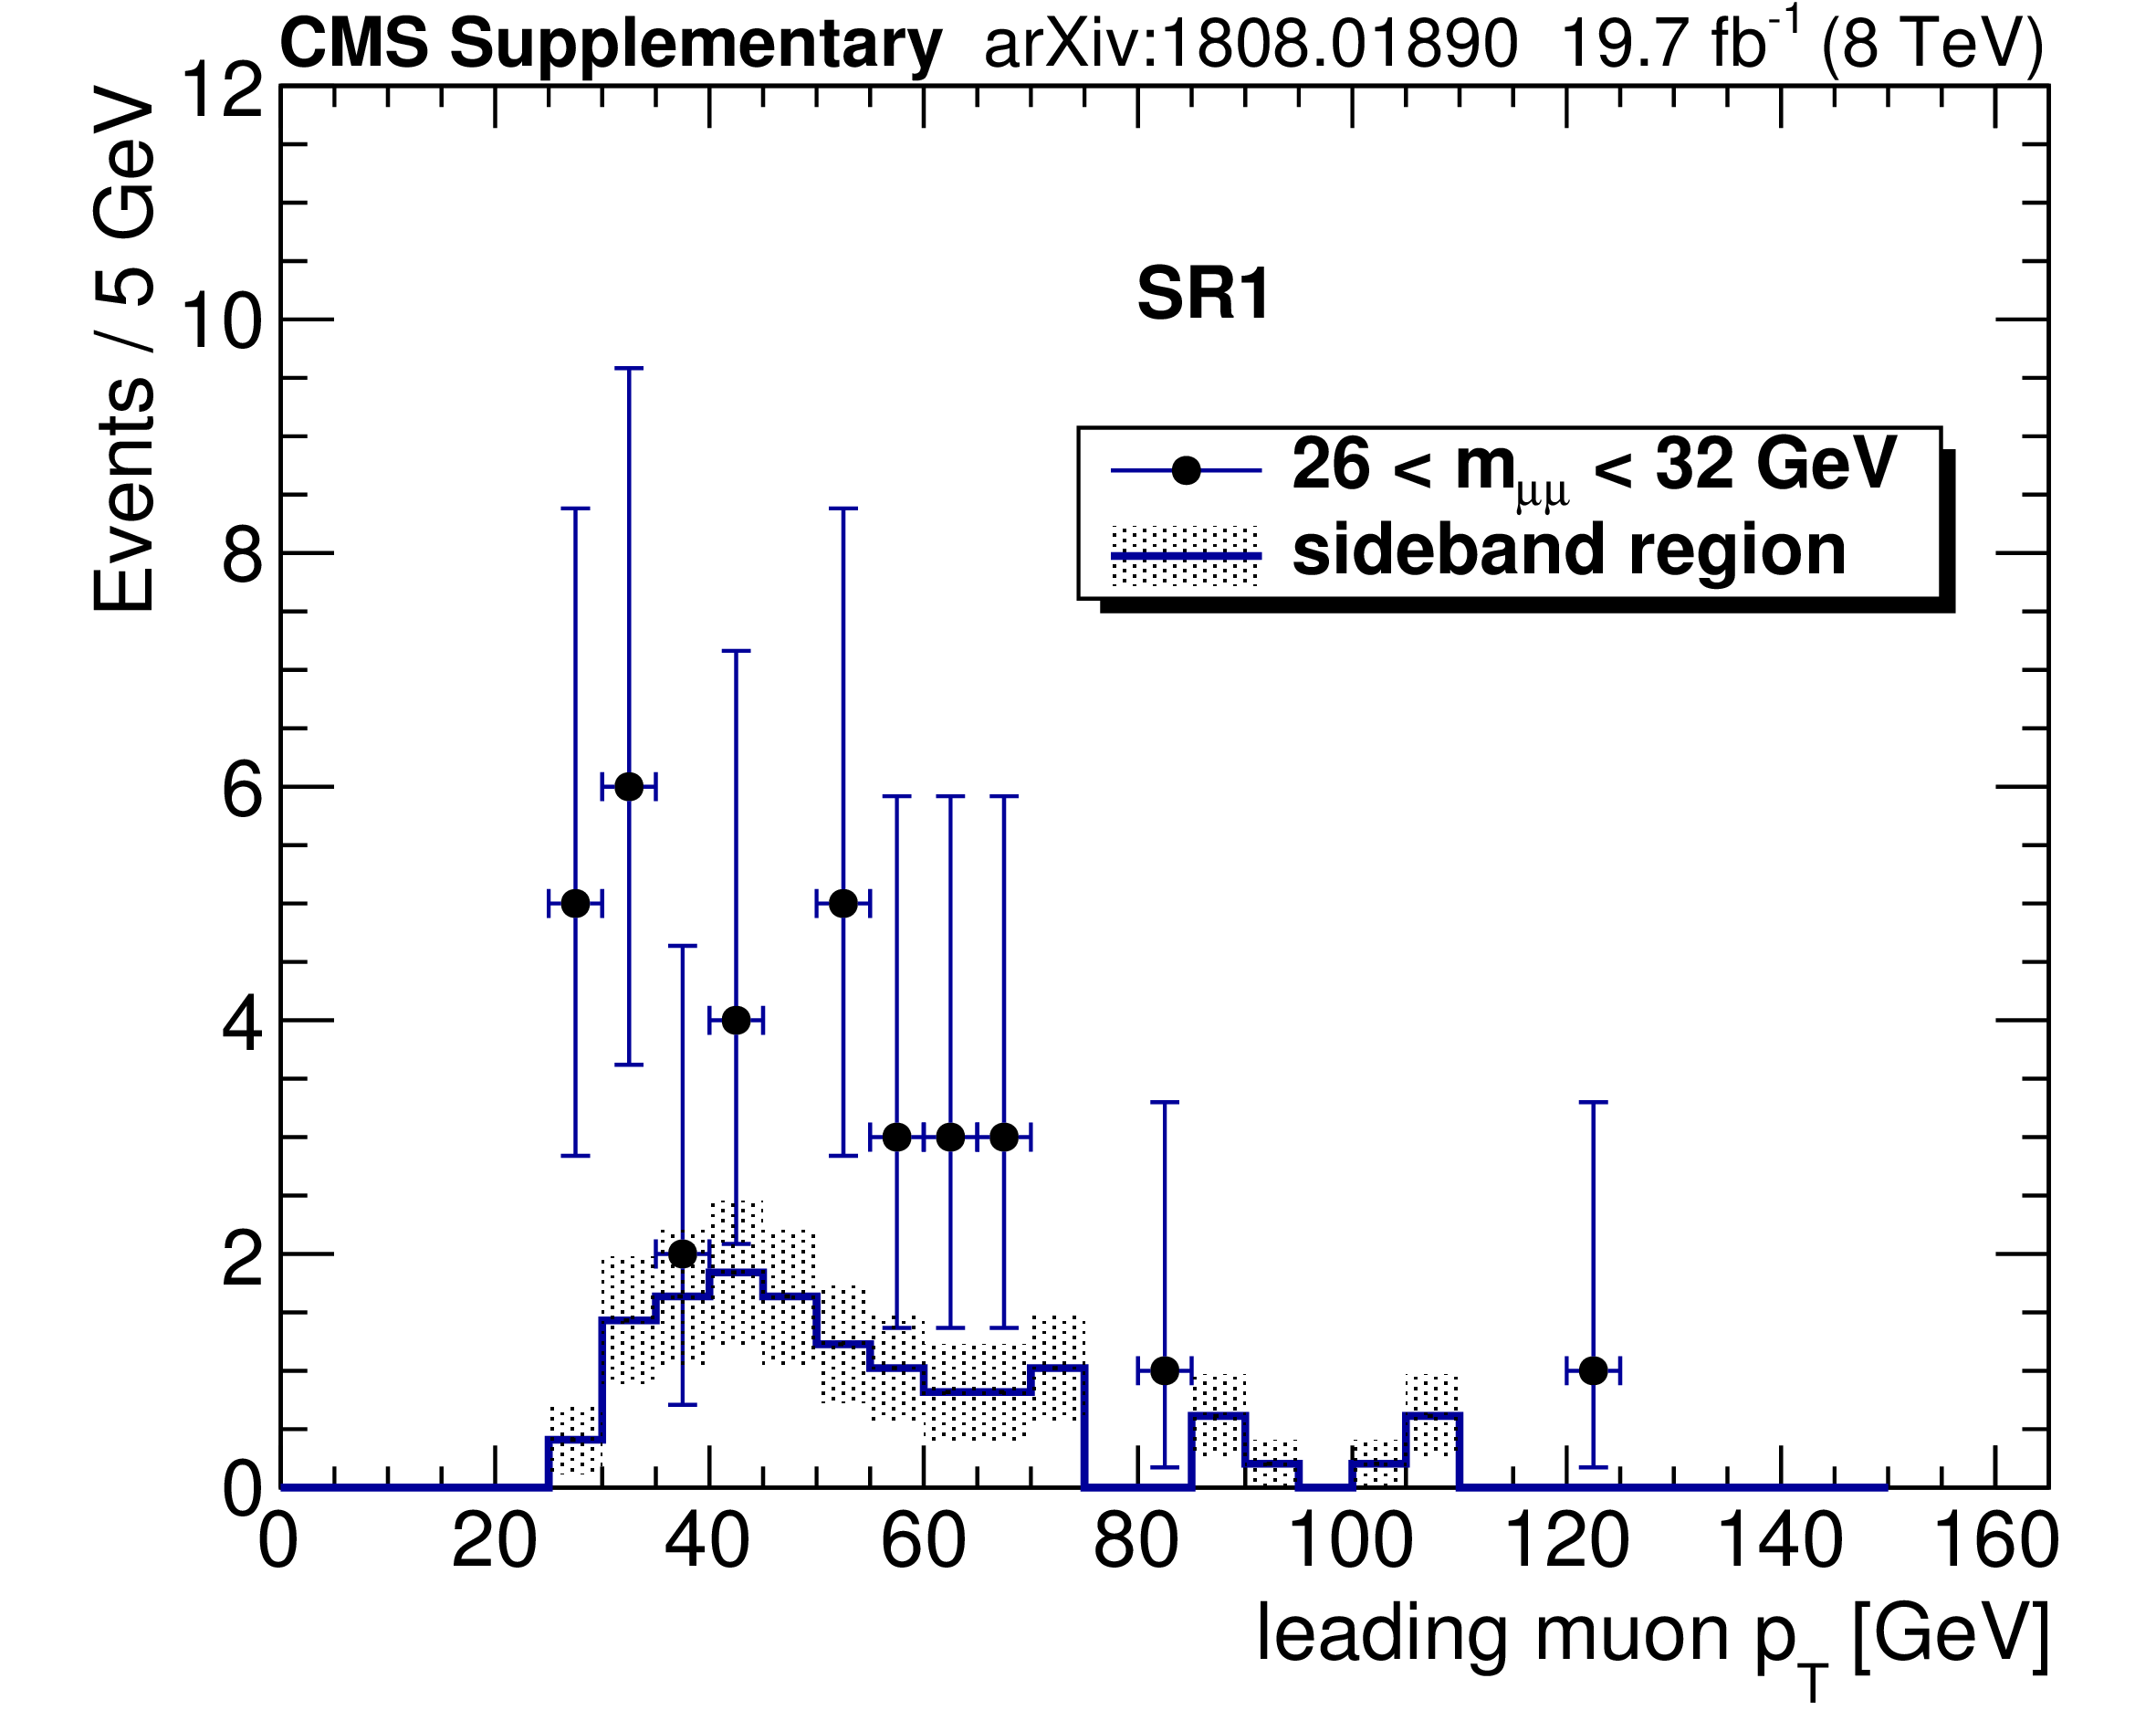
Additional Figure 6:
The transverse momentum of the leading $ {p_{\mathrm {T}}} $ muon in SR1 at $\sqrt {s} = $ 8 TeV in the dimuon mass range of 26 $ < m_{\mu \mu} < $ 32 GeV and the sideband between 12 and 24 GeV or between 34 and 50 GeV. The sideband histogram is normalized to the number of expected background events in the range of 26 $ < m_{\mu \mu} < $ 32 GeV. The shaded area of the sideband histogram represents the statistical uncertainty. |
png pdf |
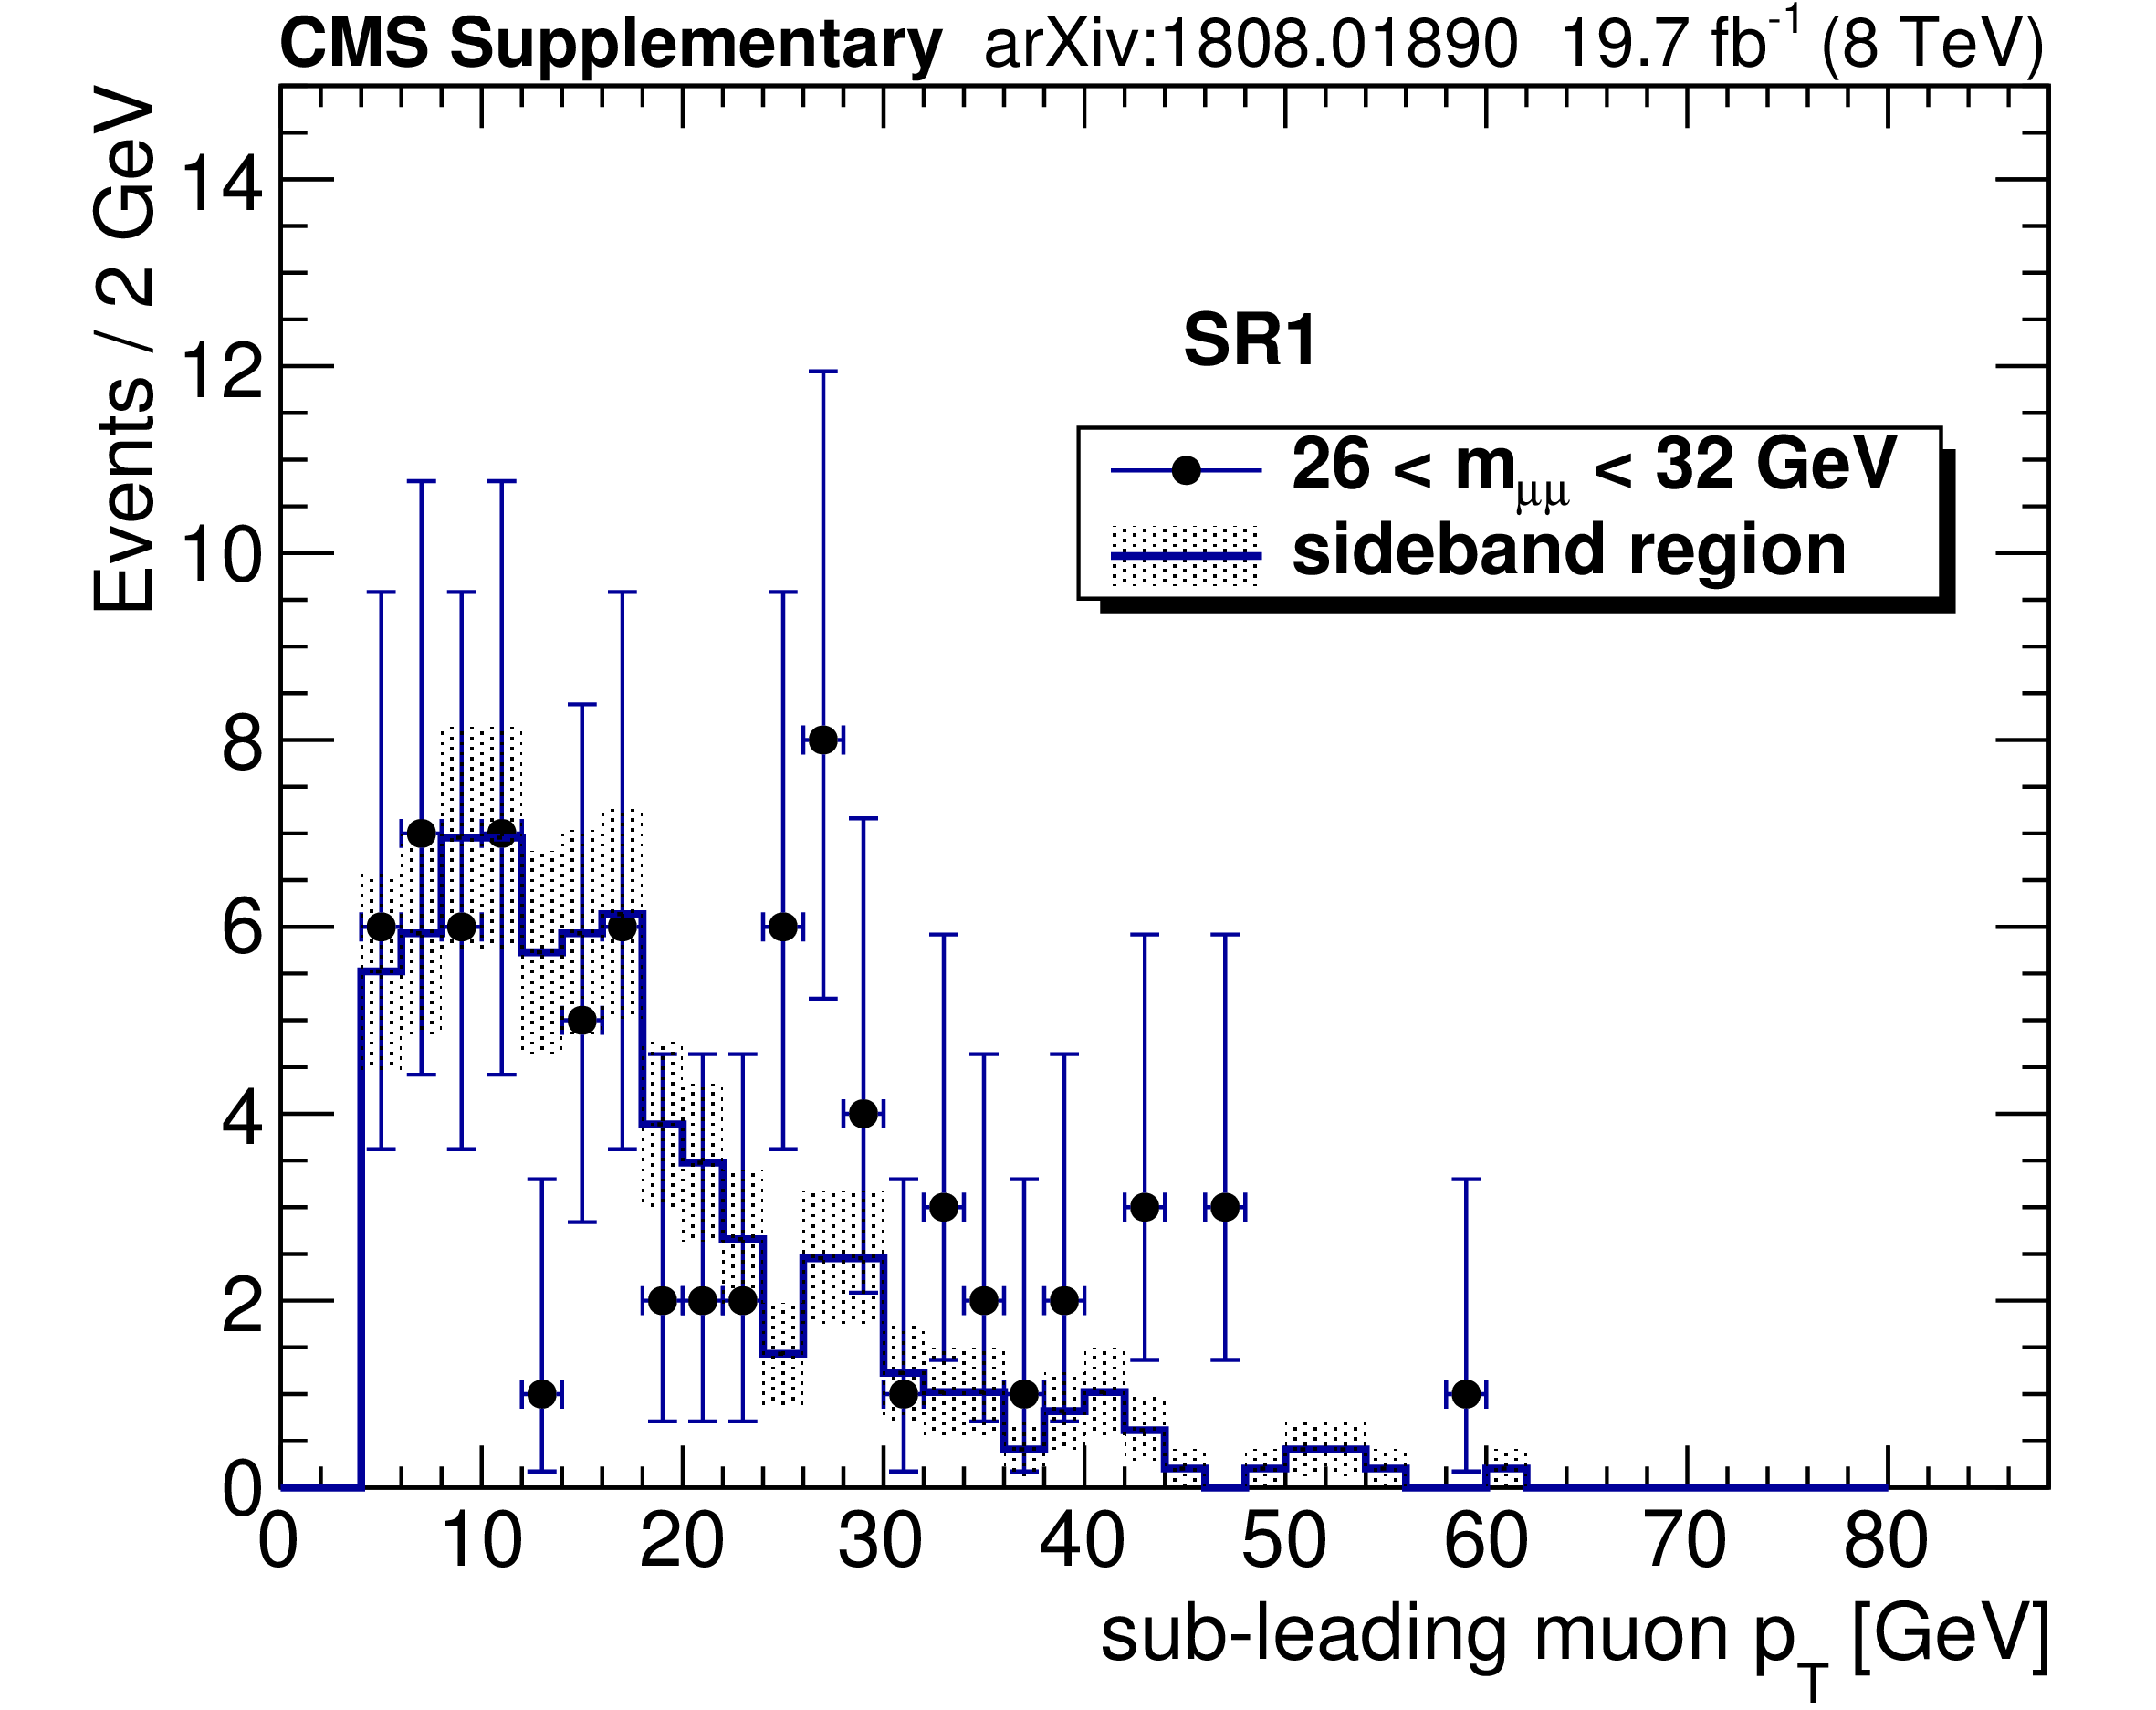
Additional Figure 7:
The transverse momentum of the second leading $ {p_{\mathrm {T}}} $ muon in SR1 at $\sqrt {s} = $ 8 TeV in the dimuon mass range of 26 $ < m_{\mu \mu} < $ 32 GeV and the sideband between 12 and 24 GeV or between 34 and 50 GeV. The sideband histogram is normalized to the number of expected background events in the range of 26 $ < m_{\mu \mu} < $ 32 GeV. The shaded area of the sideband histogram represents the statistical uncertainty. |
png pdf |
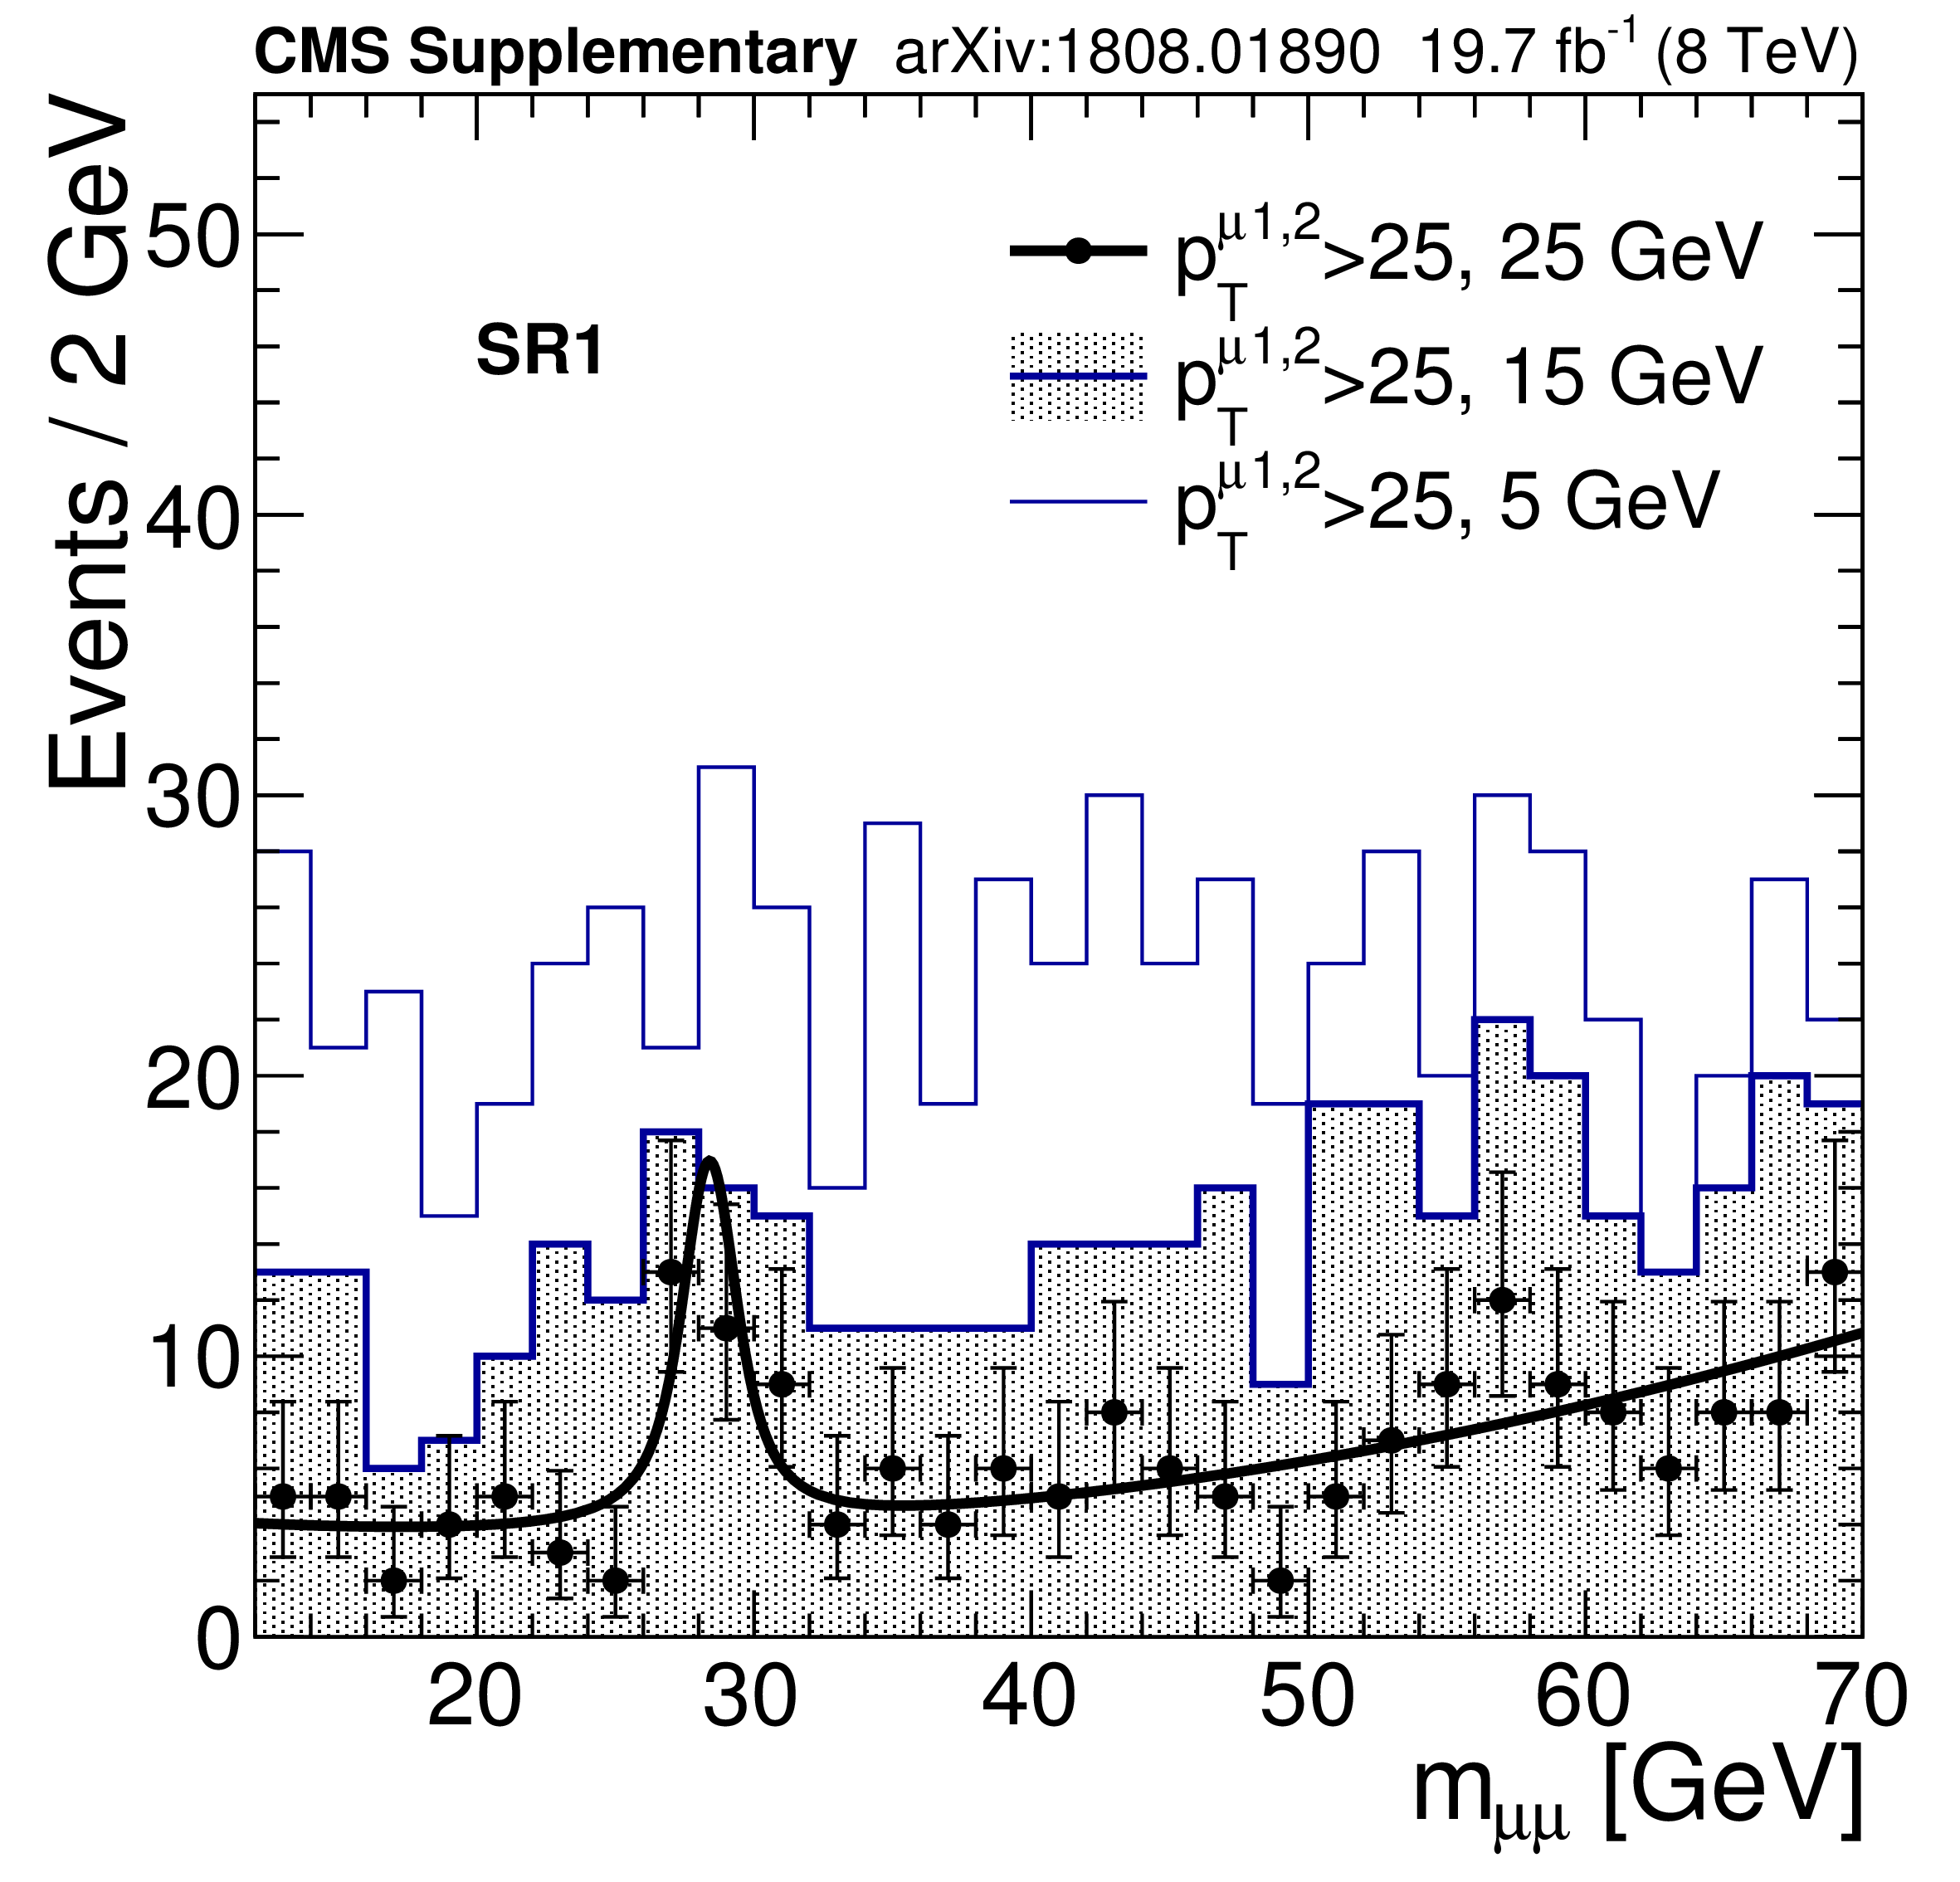
Additional Figure 8:
The dimuon mass spectra in SR1 at $\sqrt {s} = $ 8 TeV in the mass range of 12 $ < m_{\mu \mu} < $ 70 GeV when the threshold on the second leading muon $ {p_{\mathrm {T}}} $ is set to 25 GeV, 15 GeV, and 5 GeV. The shaded area of the sideband histogram represents the statistical uncertainty. |
png pdf |
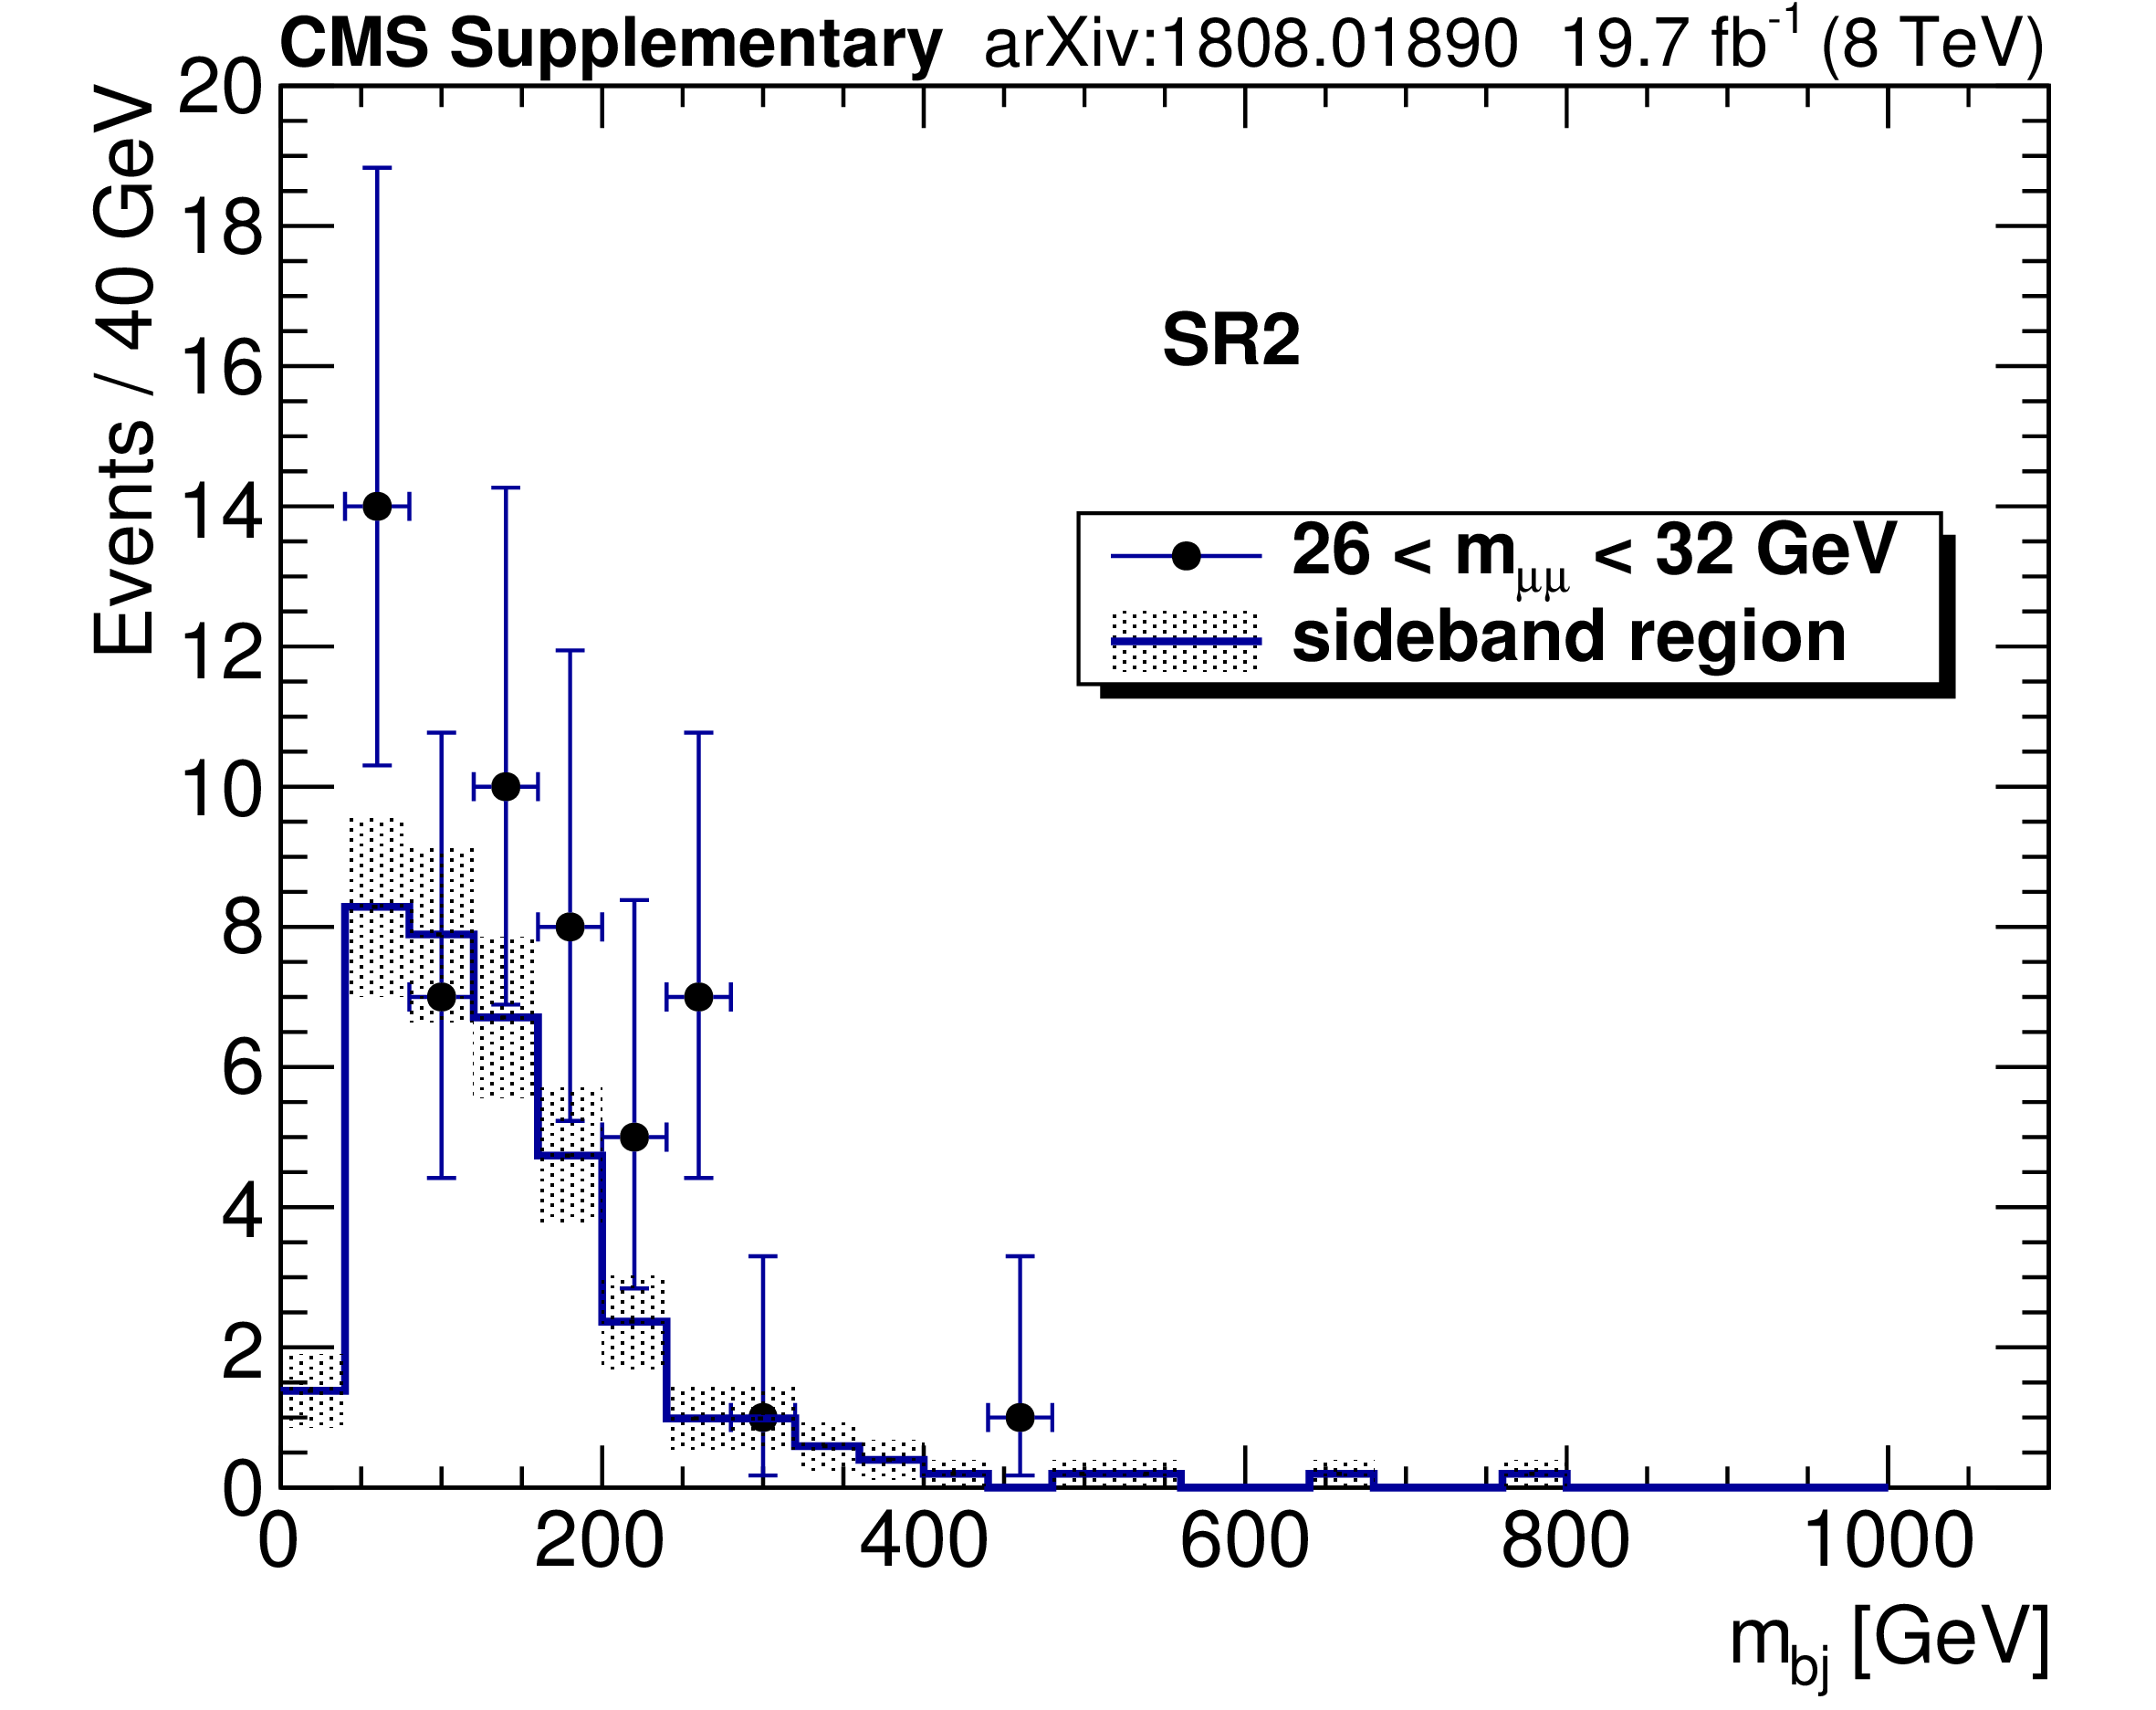
Additional Figure 9:
Dijet mass spectra in SR2 at $\sqrt {s} = $ 8 TeV in the dimuon mass range of 26 $ < m_{\mu \mu} < $ 32 GeV and the sideband between 12 and 24 GeV or between 34 and 50 GeV. The sideband histogram is normalized to the number of expected background events in the range of 26 $ < m_{\mu \mu} < $ 32 GeV. The shaded area of the sideband histogram represents the statistical uncertainty. |

png pdf |
Additional Figure 10:
Dimuon plus dijet mass spectra in SR2 at $\sqrt {s} = $ 8 TeV in the dimuon mass range of 26 $ < m_{\mu \mu} < $ 32 GeV and the sideband between 12 and 24 GeV or between 34 and 50 GeV. The sideband histogram is normalized to the number of expected background events in the range of 26 $ < m_{\mu \mu} < $ 32 GeV. The shaded area of the sideband histogram represents the statistical uncertainty. |
png pdf |
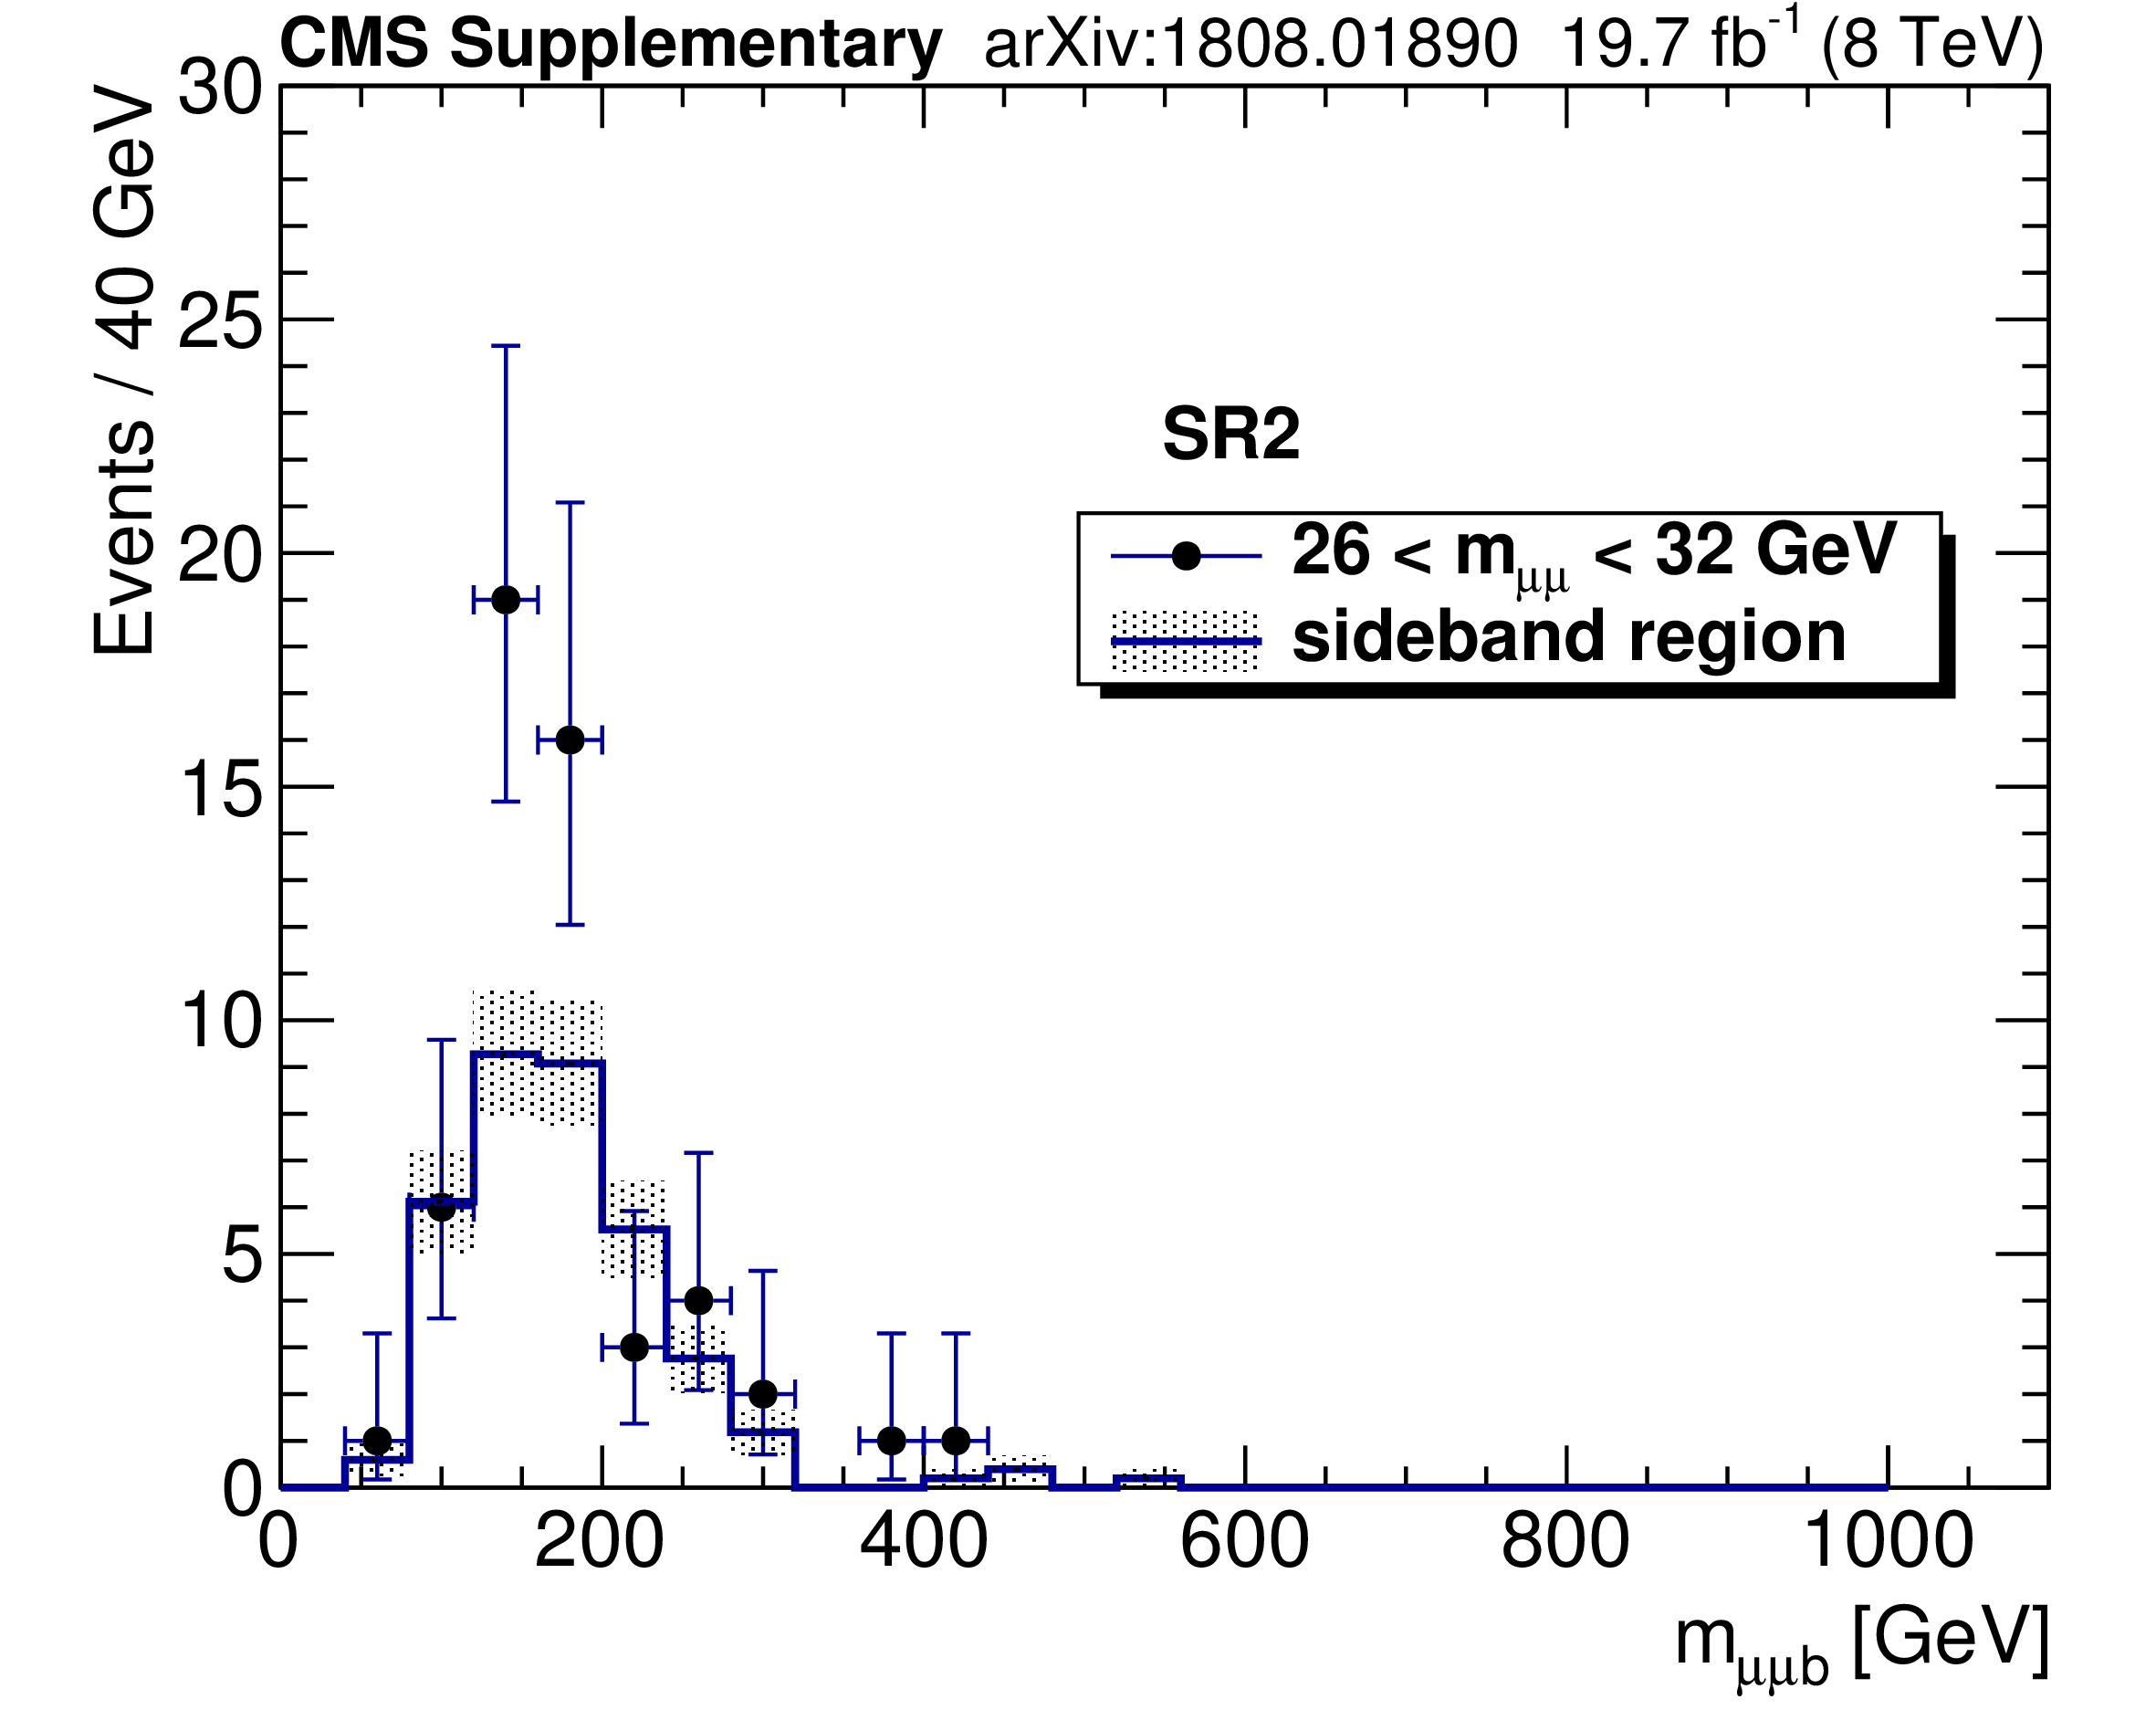
Additional Figure 11:
Dimuon plus b-tagged jet mass spectra in SR2 at $\sqrt {s} = $ 8 TeV in the dimuon mass range of 26 $ < m_{\mu \mu} < $ 32 GeV and the sideband between 12 and 24 GeV or between 34 and 50 GeV. The sideband histogram is normalized to the number of expected background events in the range of 26 $ < m_{\mu \mu} < $ 32 GeV. The shaded area of the sideband histogram represents the statistical uncertainty. |
png pdf |
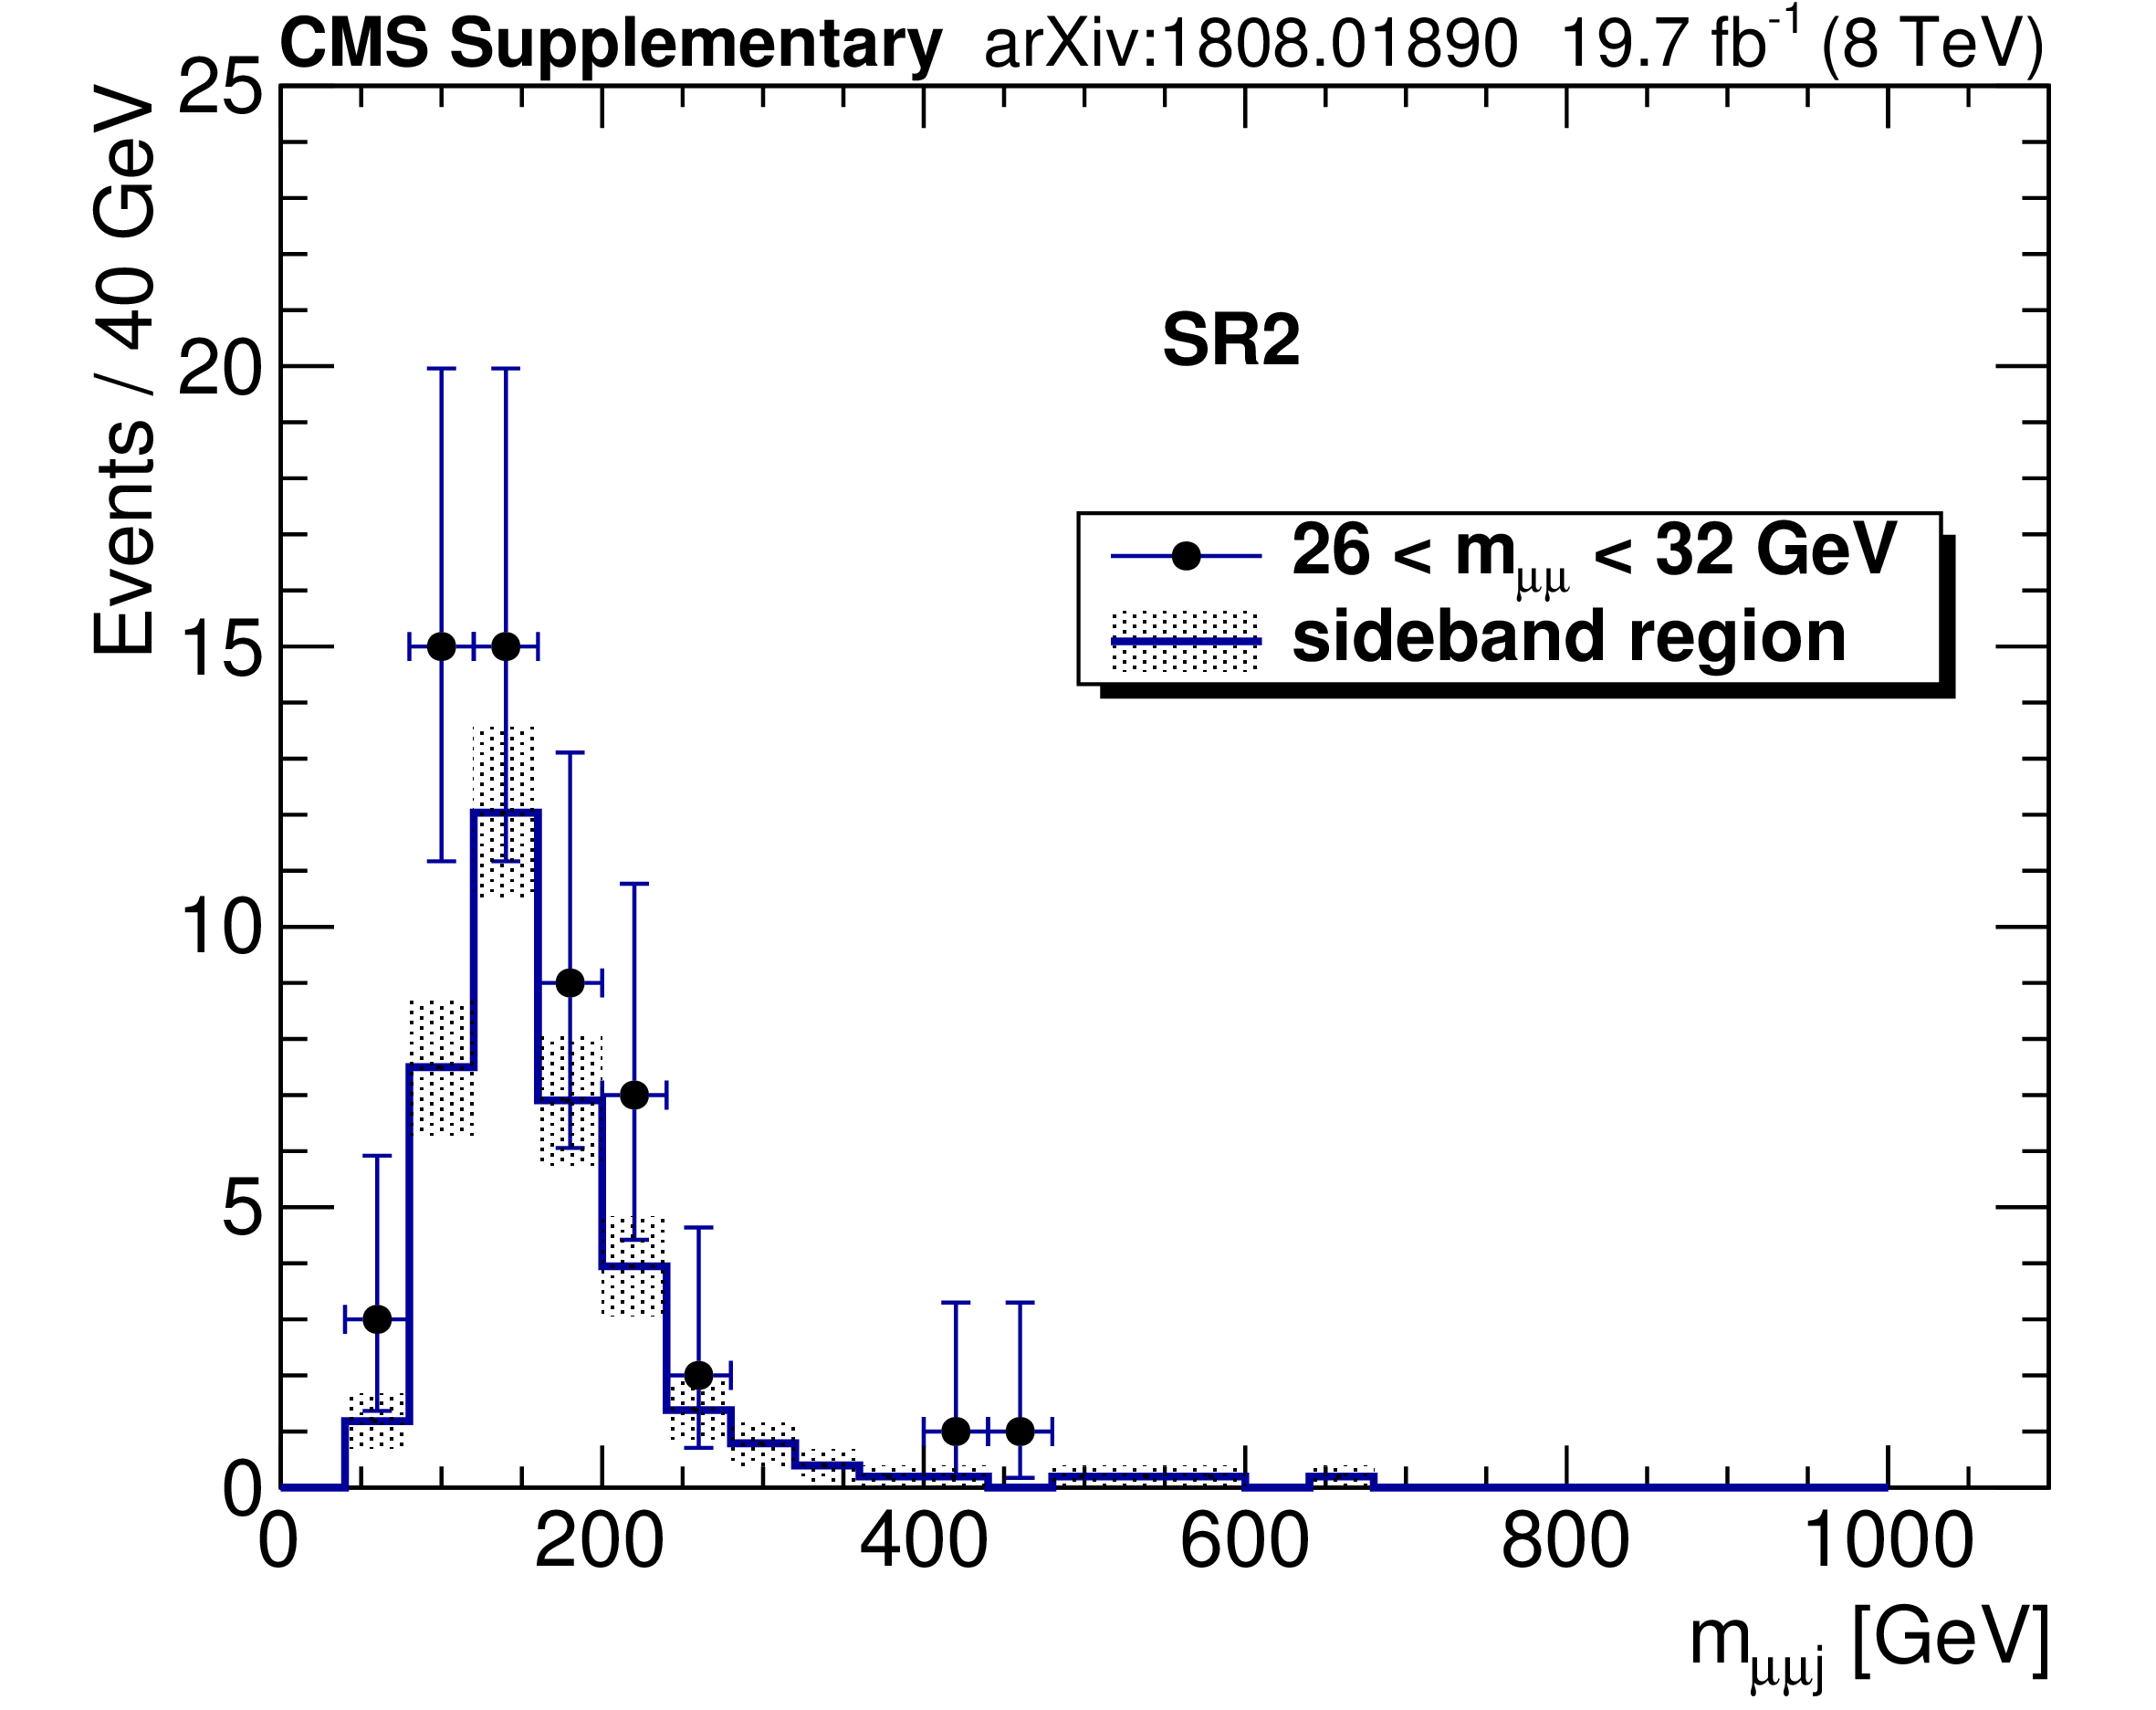
Additional Figure 12:
Dimuon plus untagged jet mass spectra in SR2 at $\sqrt {s} = $ 8 TeV in the dimuon mass range of 26 $ < m_{\mu \mu} < $ 32 GeV and the sideband between 12 and 24 GeV or between 34 and 50 GeV. The sideband histogram is normalized to the number of expected background events in the range of 26 $ < m_{\mu \mu} < $ 32 GeV. The shaded area of the sideband histogram represents the statistical uncertainty. |
png pdf |
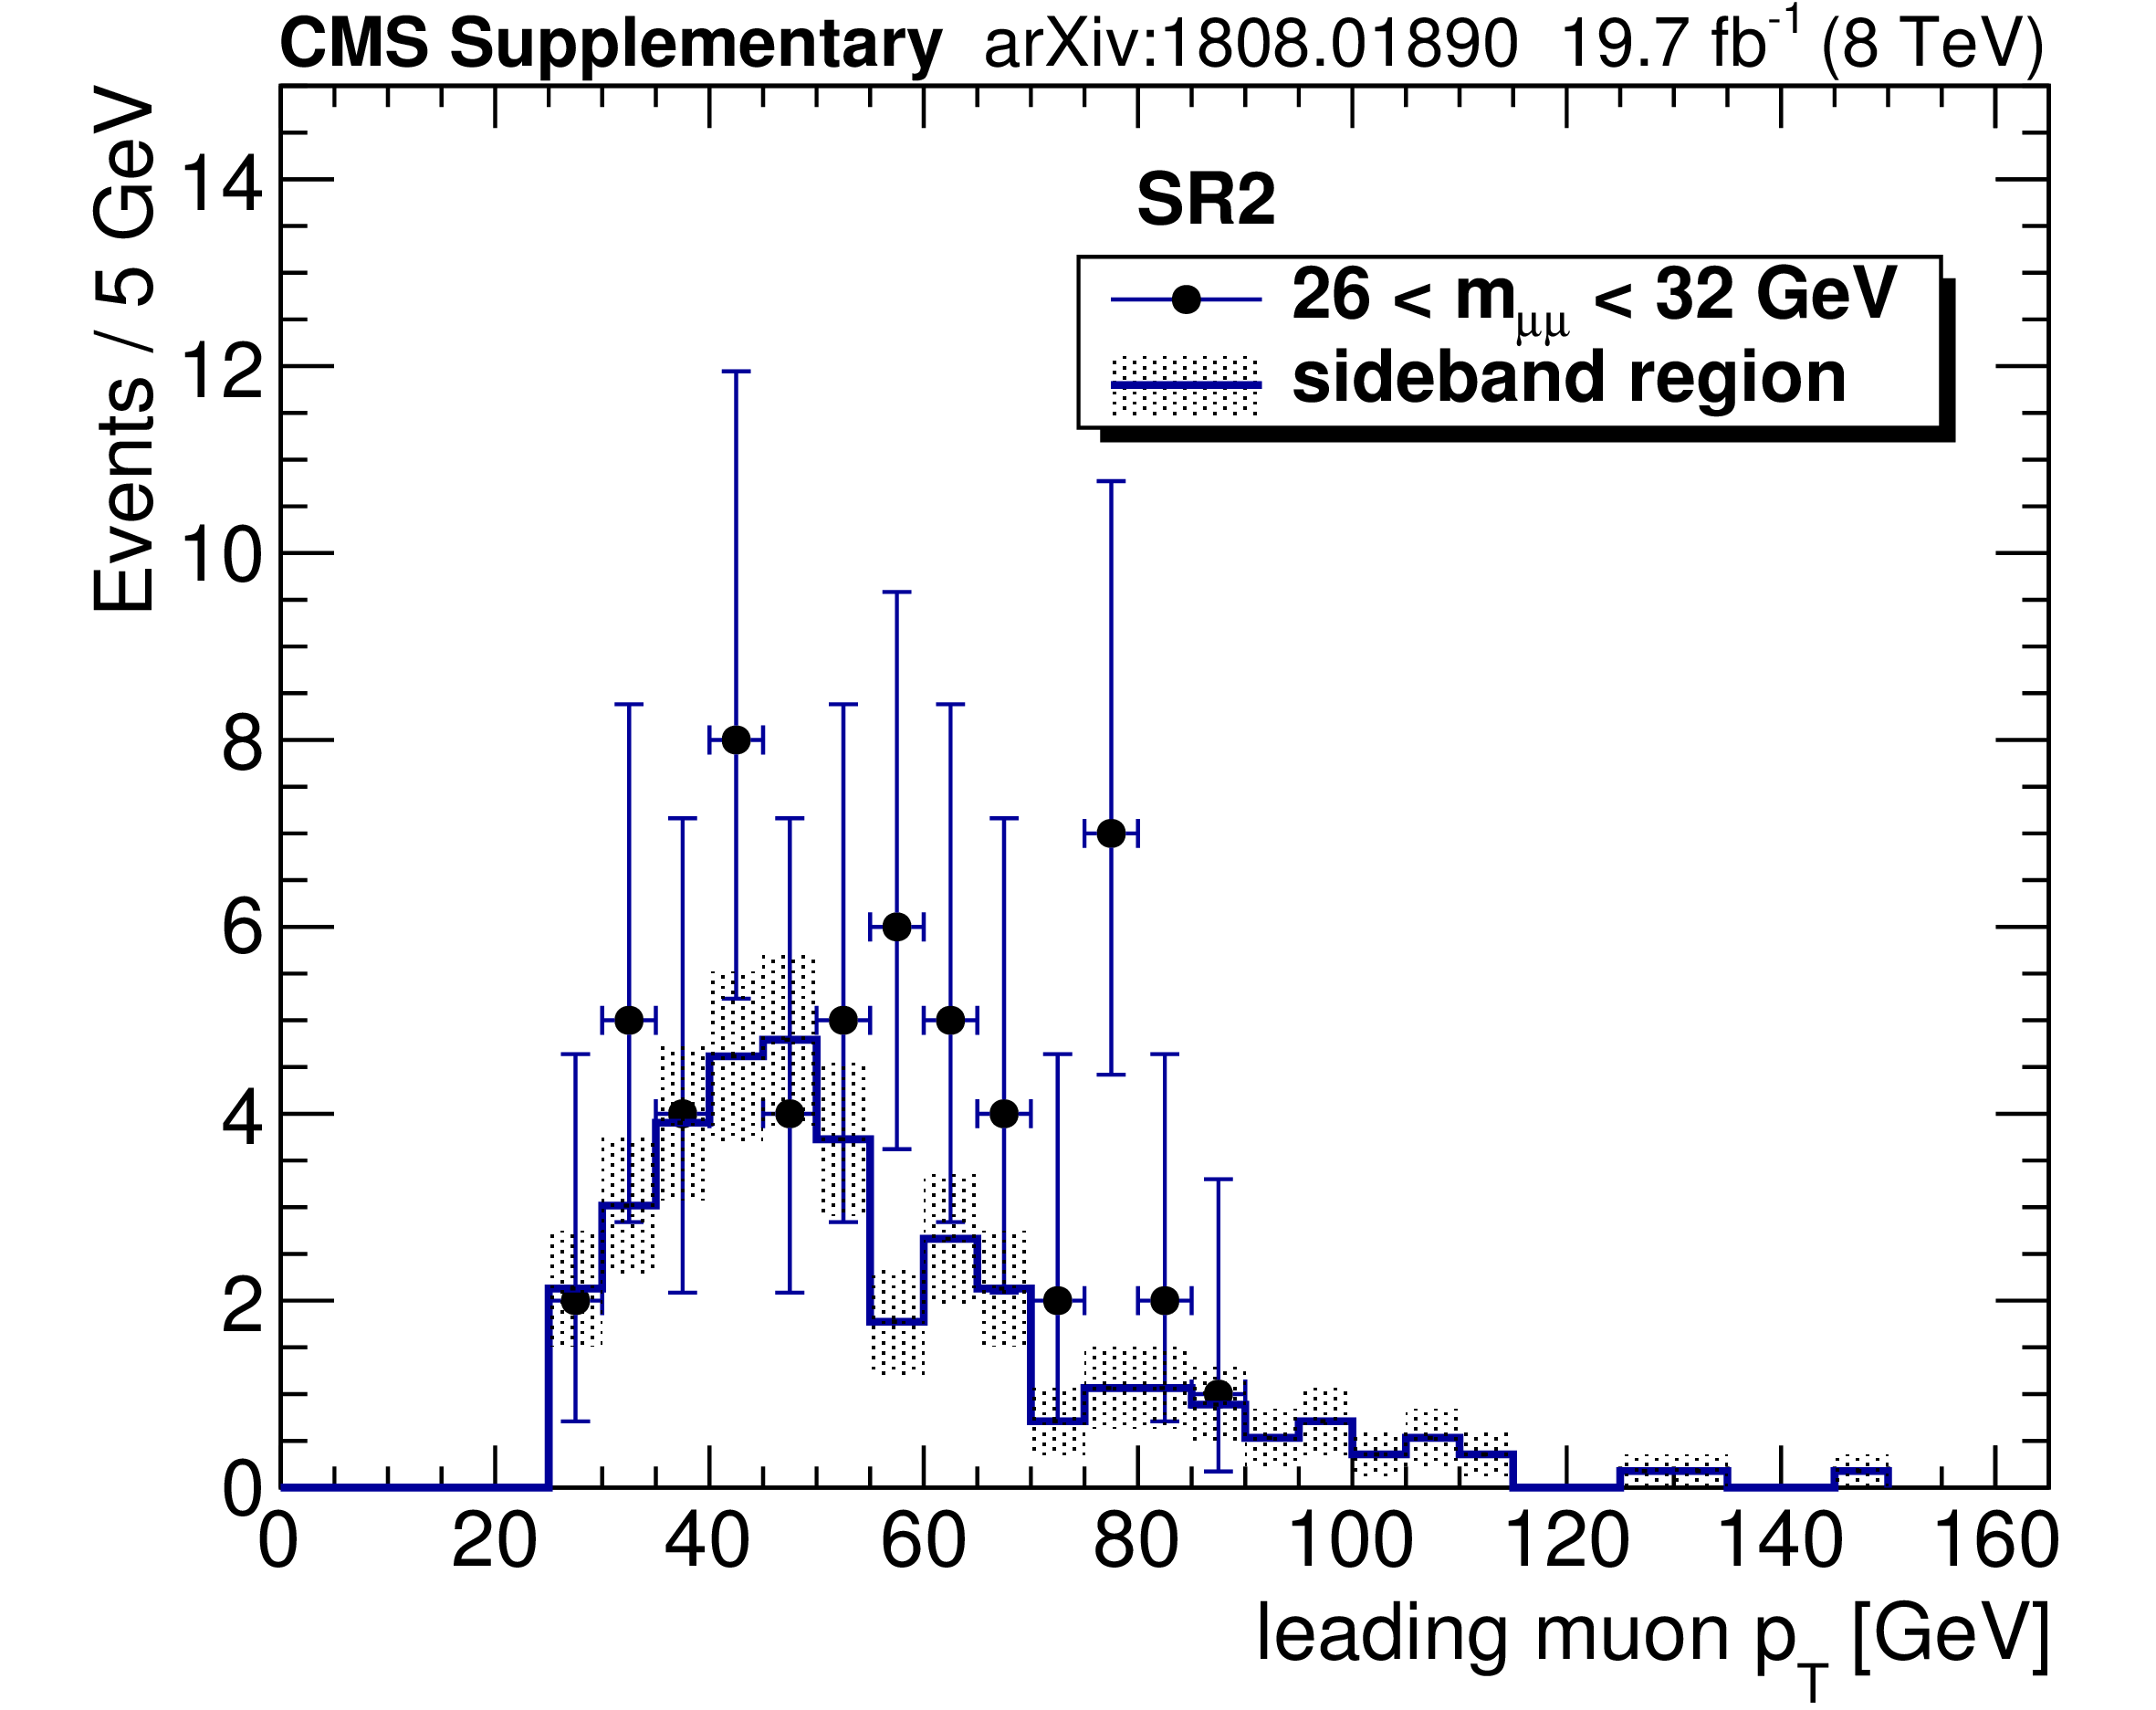
Additional Figure 13:
The transverse momentum of the leading $ {p_{\mathrm {T}}} $ muon in SR2 at $\sqrt {s} = $ 8 TeV in the dimuon mass range of 26 $ < m_{\mu \mu} < $ 32 GeV and the sideband between 12 and 24 GeV or between 34 and 50 GeV. The sideband histogram is normalized to the number of expected background events in the range of 26 $ < m_{\mu \mu} < $ 32 GeV. The shaded area of the sideband histogram represents the statistical uncertainty. |

png pdf |
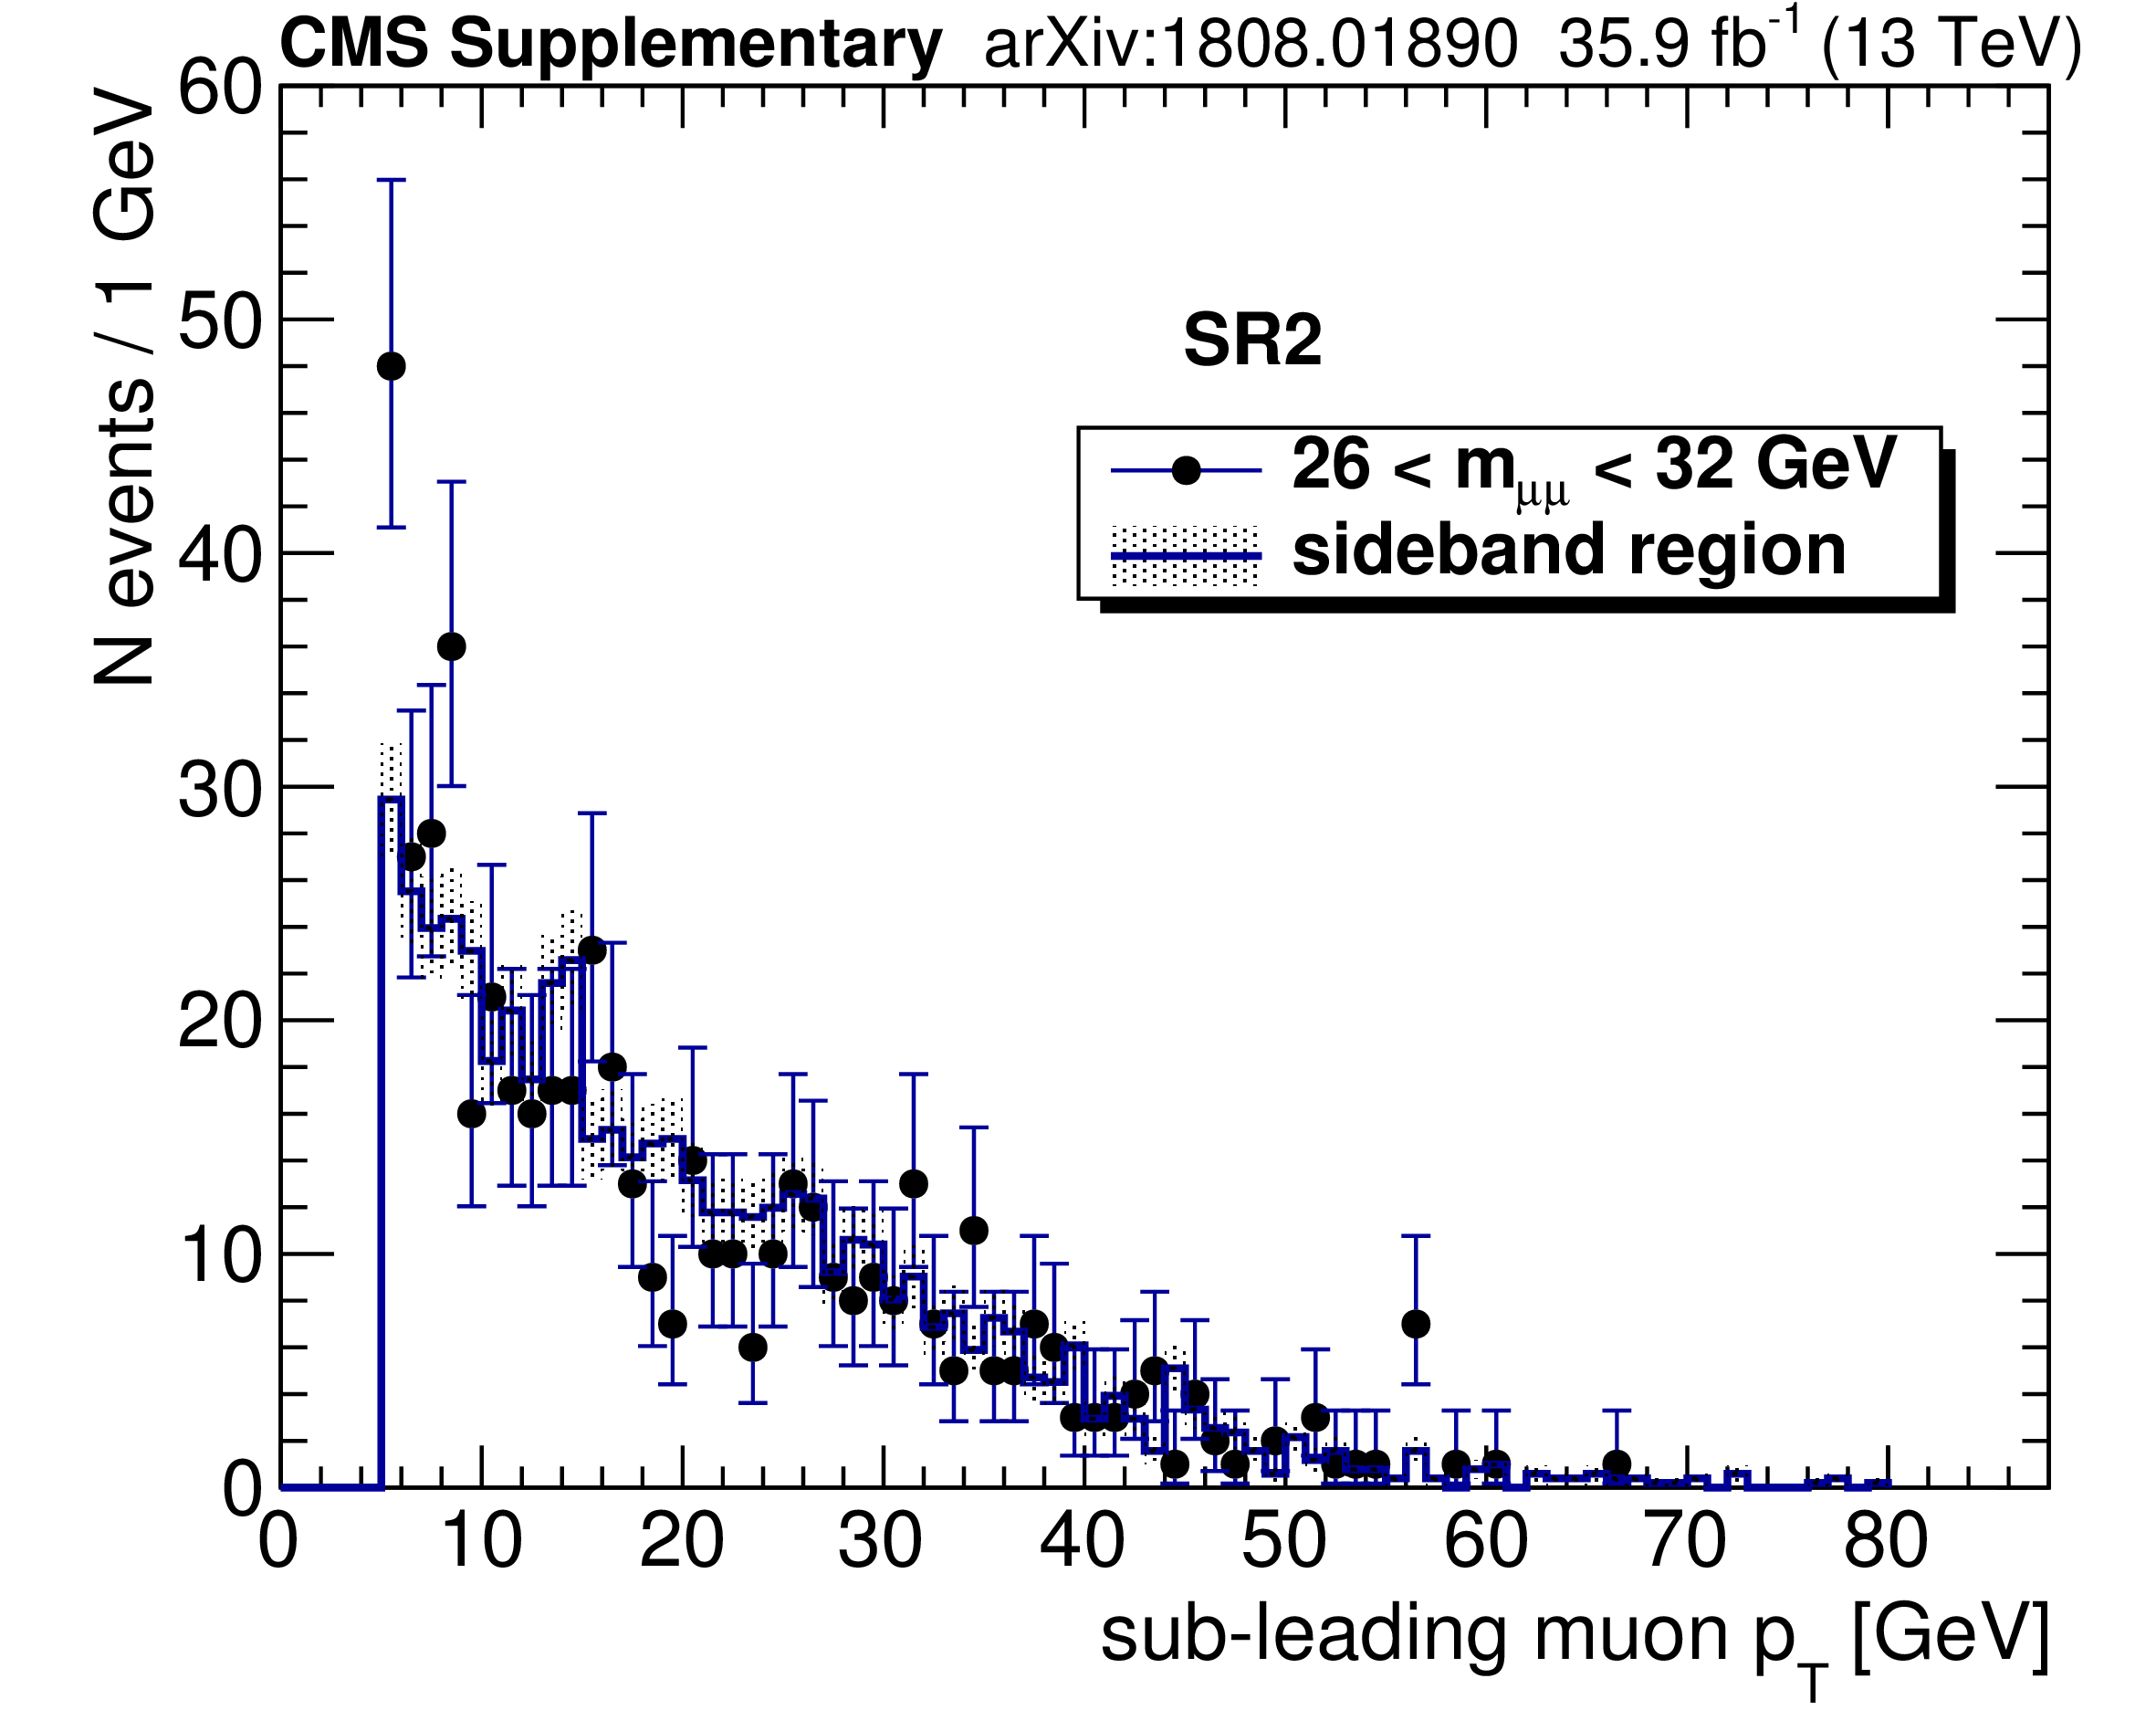
Additional Figure 14:
The transverse momentum of the second leading $ {p_{\mathrm {T}}} $ muon in SR2 at $\sqrt {s} = $ 8 TeV in the dimuon mass range of 26 $ < m_{\mu \mu} < $ 32 GeV and the sideband between 12 and 24 GeV or between 34 and 50 GeV. The sideband histogram is normalized to the number of expected background events in the range of 26 $ < m_{\mu \mu} < $ 32 GeV. The shaded area of the sideband histogram represents the statistical uncertainty. |
png pdf |
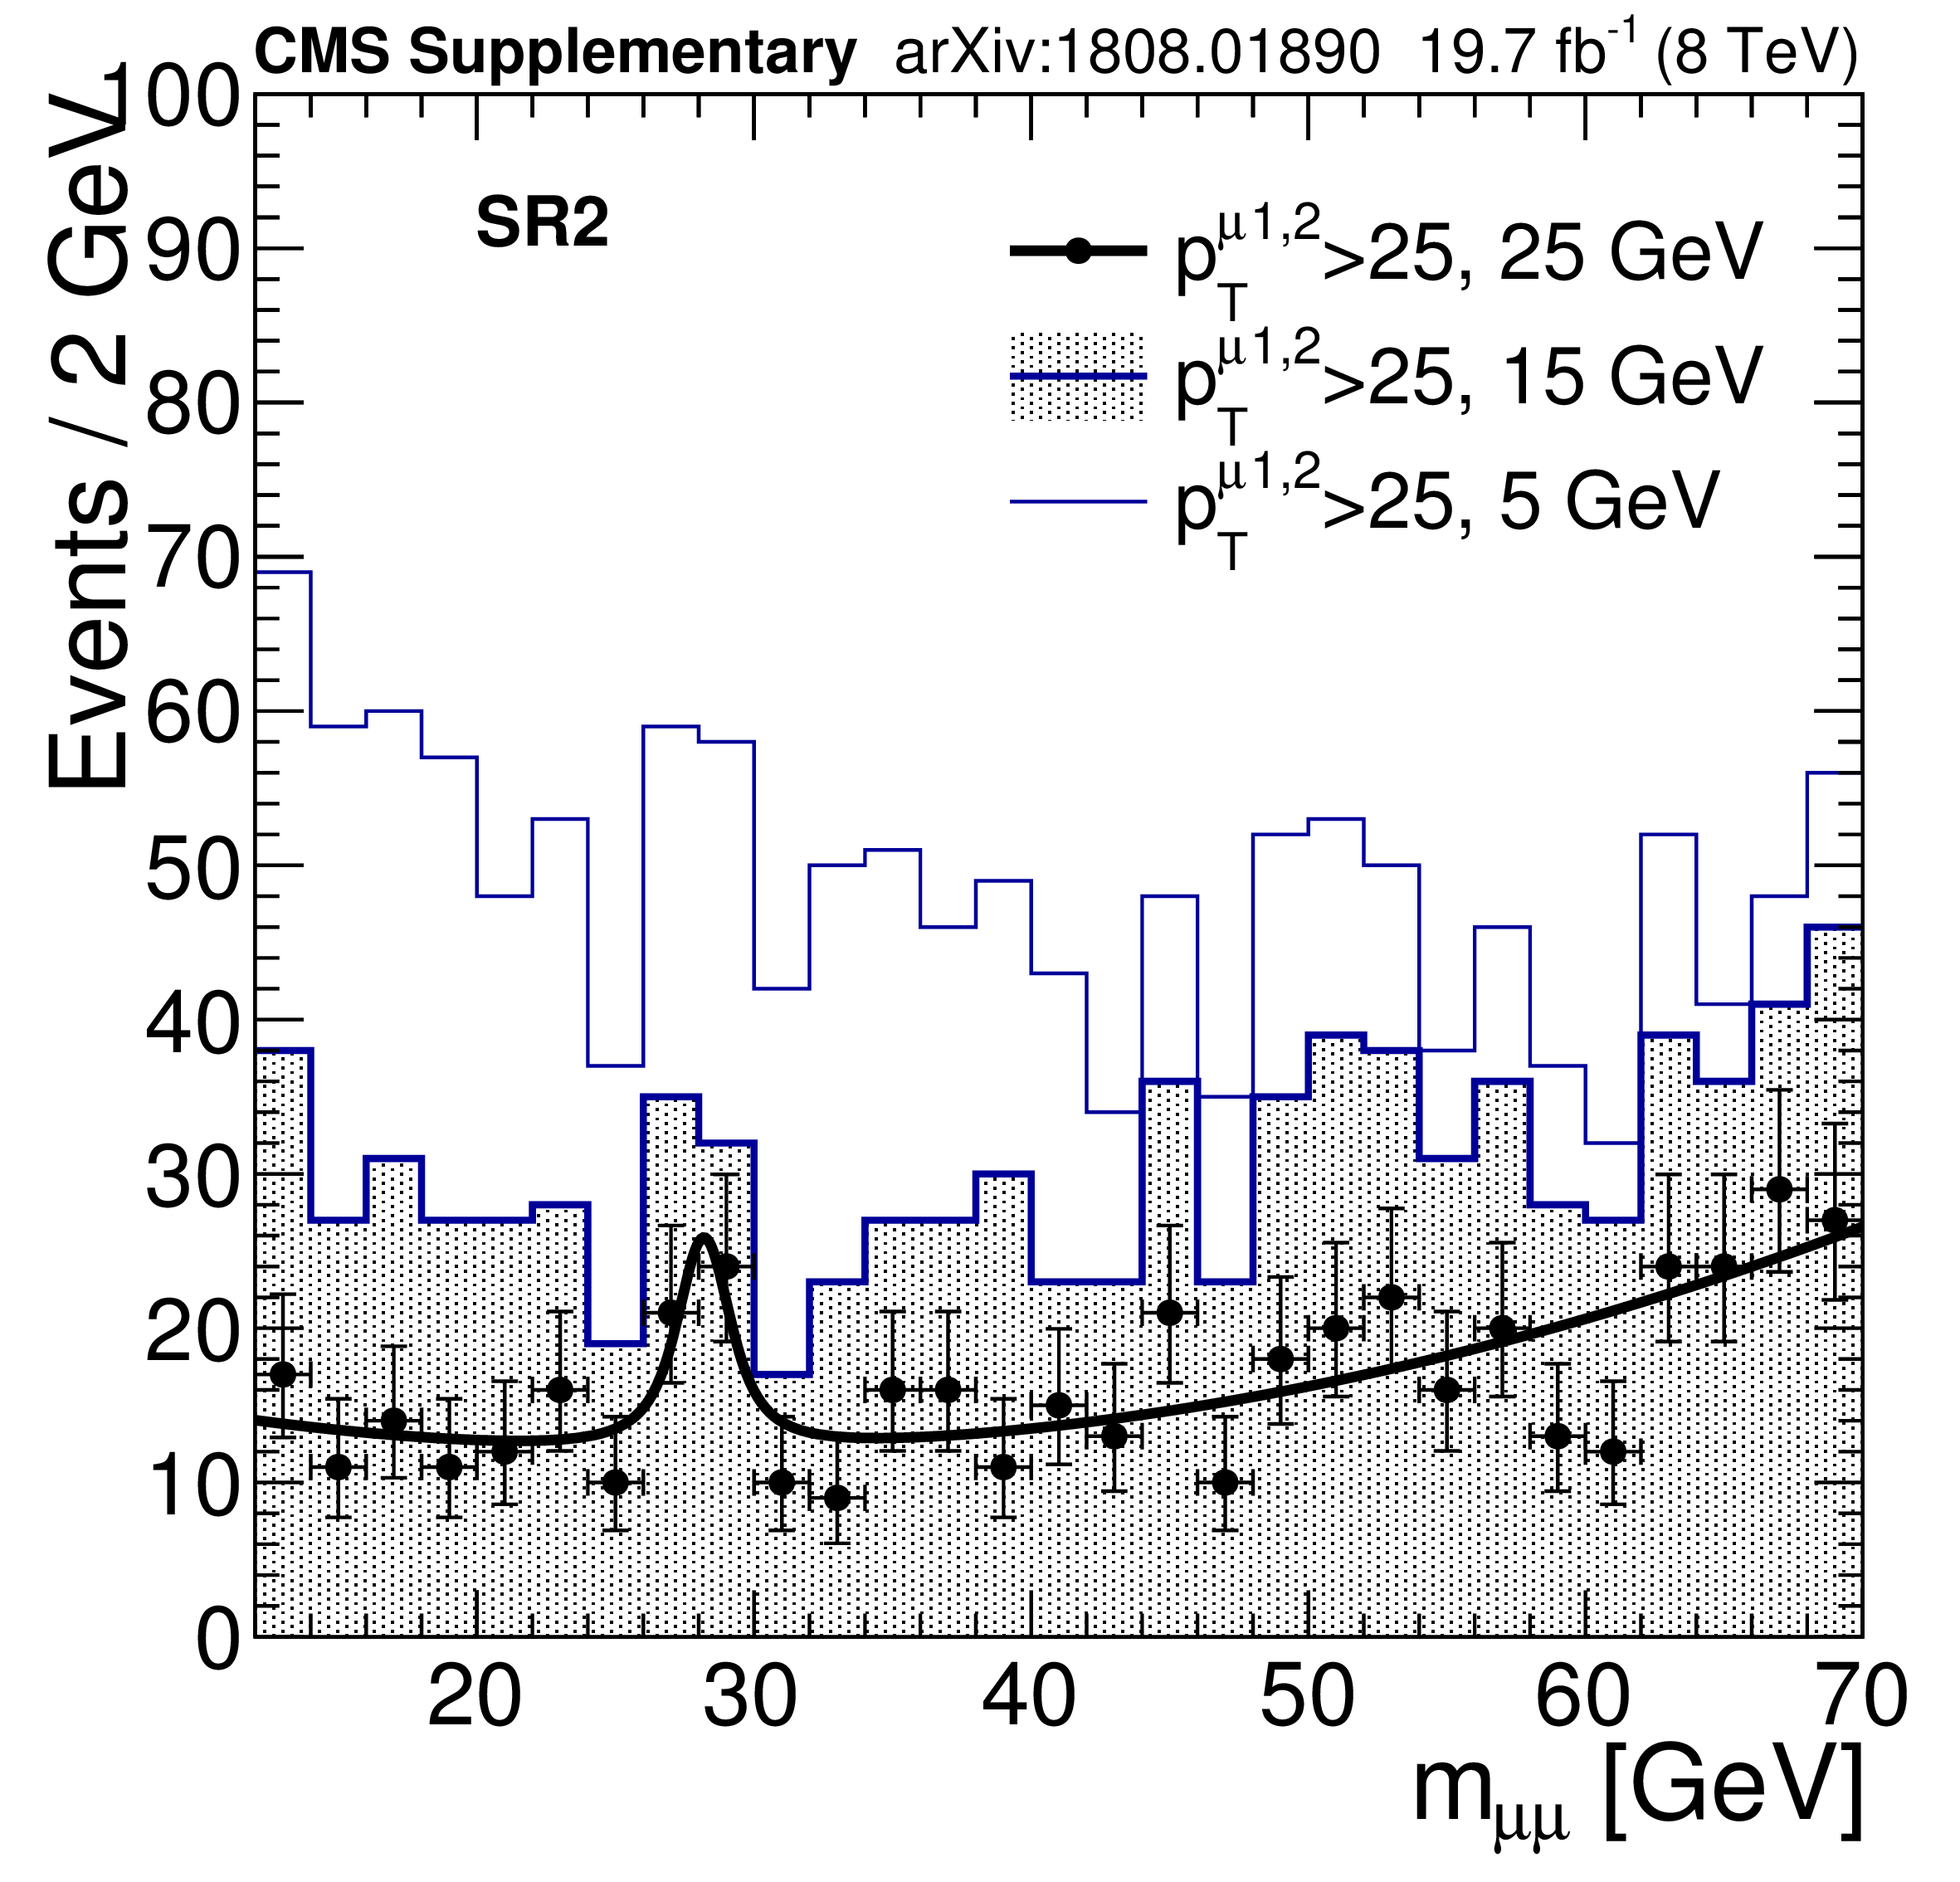
Additional Figure 15:
The dimuon mass spectra in SR2 at $\sqrt {s} = $ 8 TeV in the mass range of 12 $ < m_{\mu \mu} < $ 70 GeV when the threshold on the second leading muon $ {p_{\mathrm {T}}} $ is set to 25 GeV, 15 GeV, and 5 GeV. The shaded area of the sideband histogram represents the statistical uncertainty. |
png pdf |
Additional Figure 16:
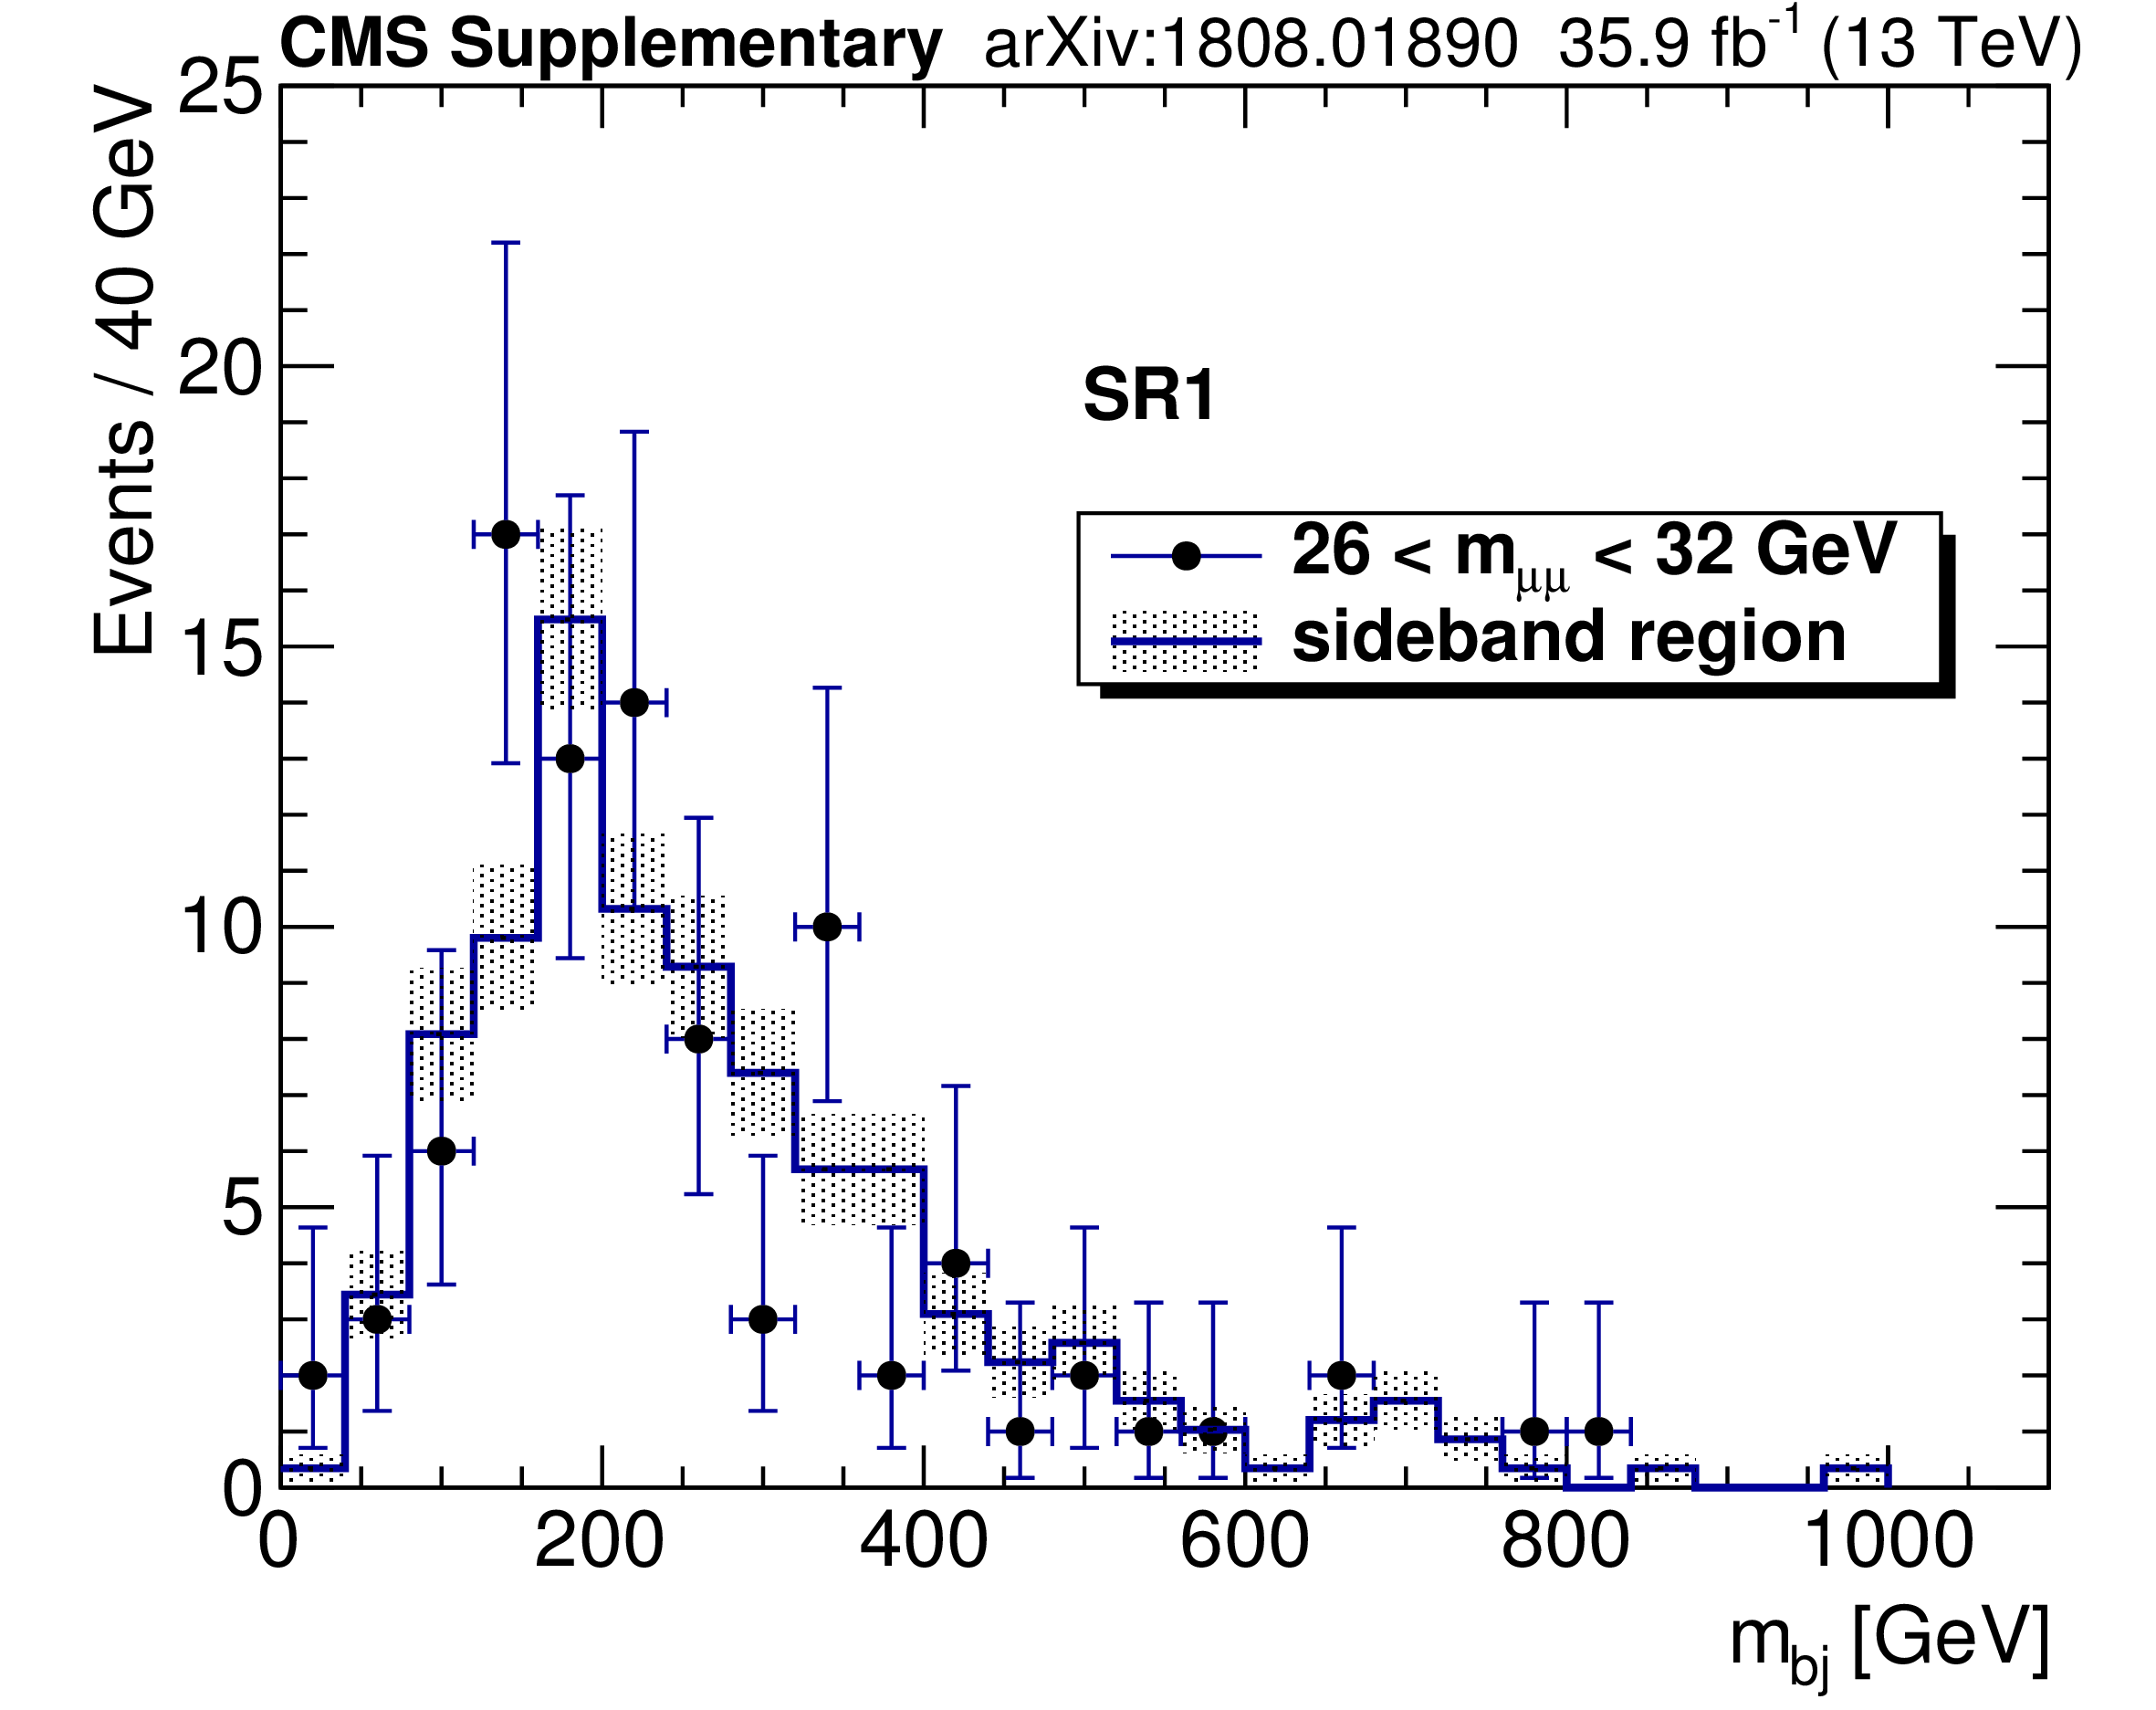
Dijet mass spectra in SR1 at $\sqrt {s} = $ 13 TeV in the dimuon mass range of 26 $ < m_{\mu \mu} < $ 32 GeV and the sideband between 12 and 24 GeV or between 34 and 50 GeV. The sideband histogram is normalized to the number of events in the range of 26 $ < m_{\mu \mu} < $ 32 GeV. The shaded area of the sideband histogram represents the statistical uncertainty. |
png pdf |
Additional Figure 17:
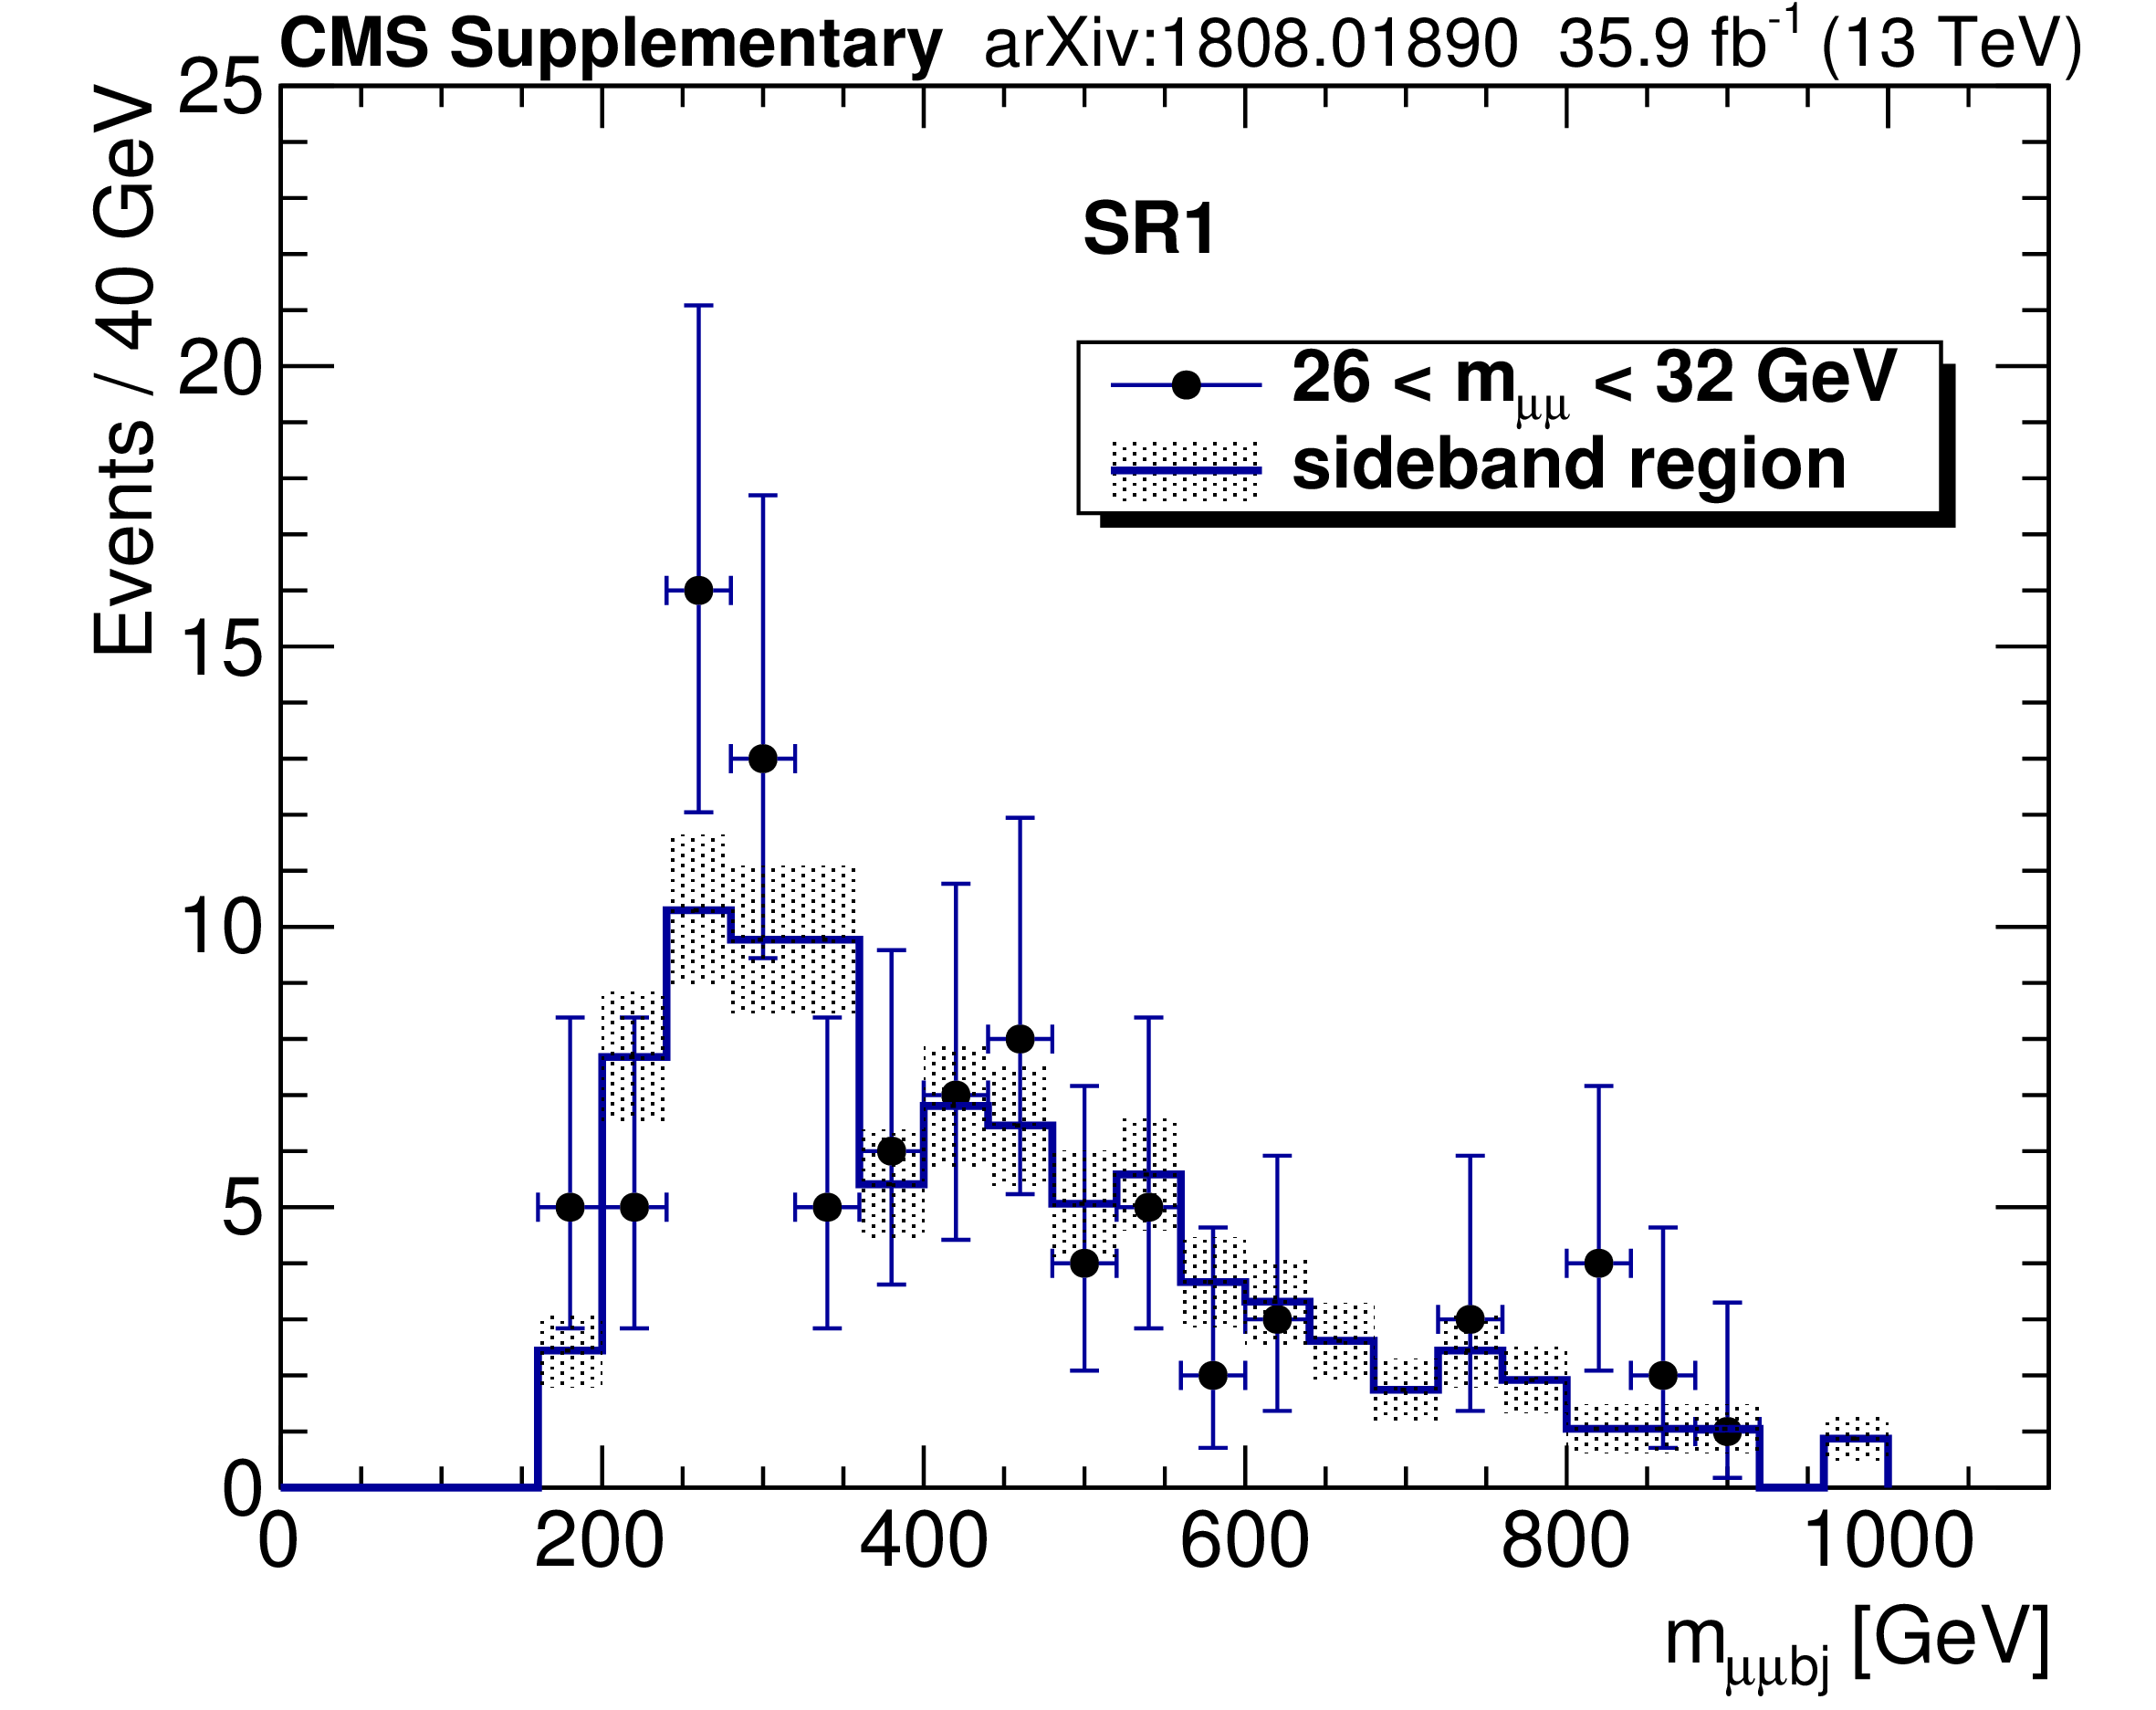
Dimuon plus dijet mass spectra in SR1 at $\sqrt {s} = $ 13 TeV in the dimuon mass range of 26 $ < m_{\mu \mu} < $ 32 GeV and the sideband between 12 and 24 GeV or between 34 and 50 GeV. The sideband histogram is normalized to the number of events in the range of 26 $ < m_{\mu \mu} < $ 32 GeV. The shaded area of the sideband histogram represents the statistical uncertainty. |

png pdf |
Additional Figure 18:
Dimuon plus b-tagged jet mass spectra in SR1 at $\sqrt {s} = $ 13 TeV in the dimuon mass range of 26 $ < m_{\mu \mu} < $ 32 GeV and the sideband between 12 and 24 GeV or between 34 and 50 GeV. The sideband histogram is normalized to the number of events in the range of 26 $ < m_{\mu \mu} < $ 32 GeV. The shaded area of the sideband histogram represents the statistical uncertainty. |

png pdf |
Additional Figure 19:
Dimuon plus untagged jet mass spectra in SR1 at $\sqrt {s} = $ 13 TeV in the dimuon mass range of 26 $ < m_{\mu \mu} < $ 32 GeV and the sideband between 12 and 24 GeV or between 34 and 50 GeV. The sideband histogram is normalized to the number of events in the range of 26 $ < m_{\mu \mu} < $ 32 GeV. The shaded area of the sideband histogram represents the statistical uncertainty. |
png pdf |
Additional Figure 20:
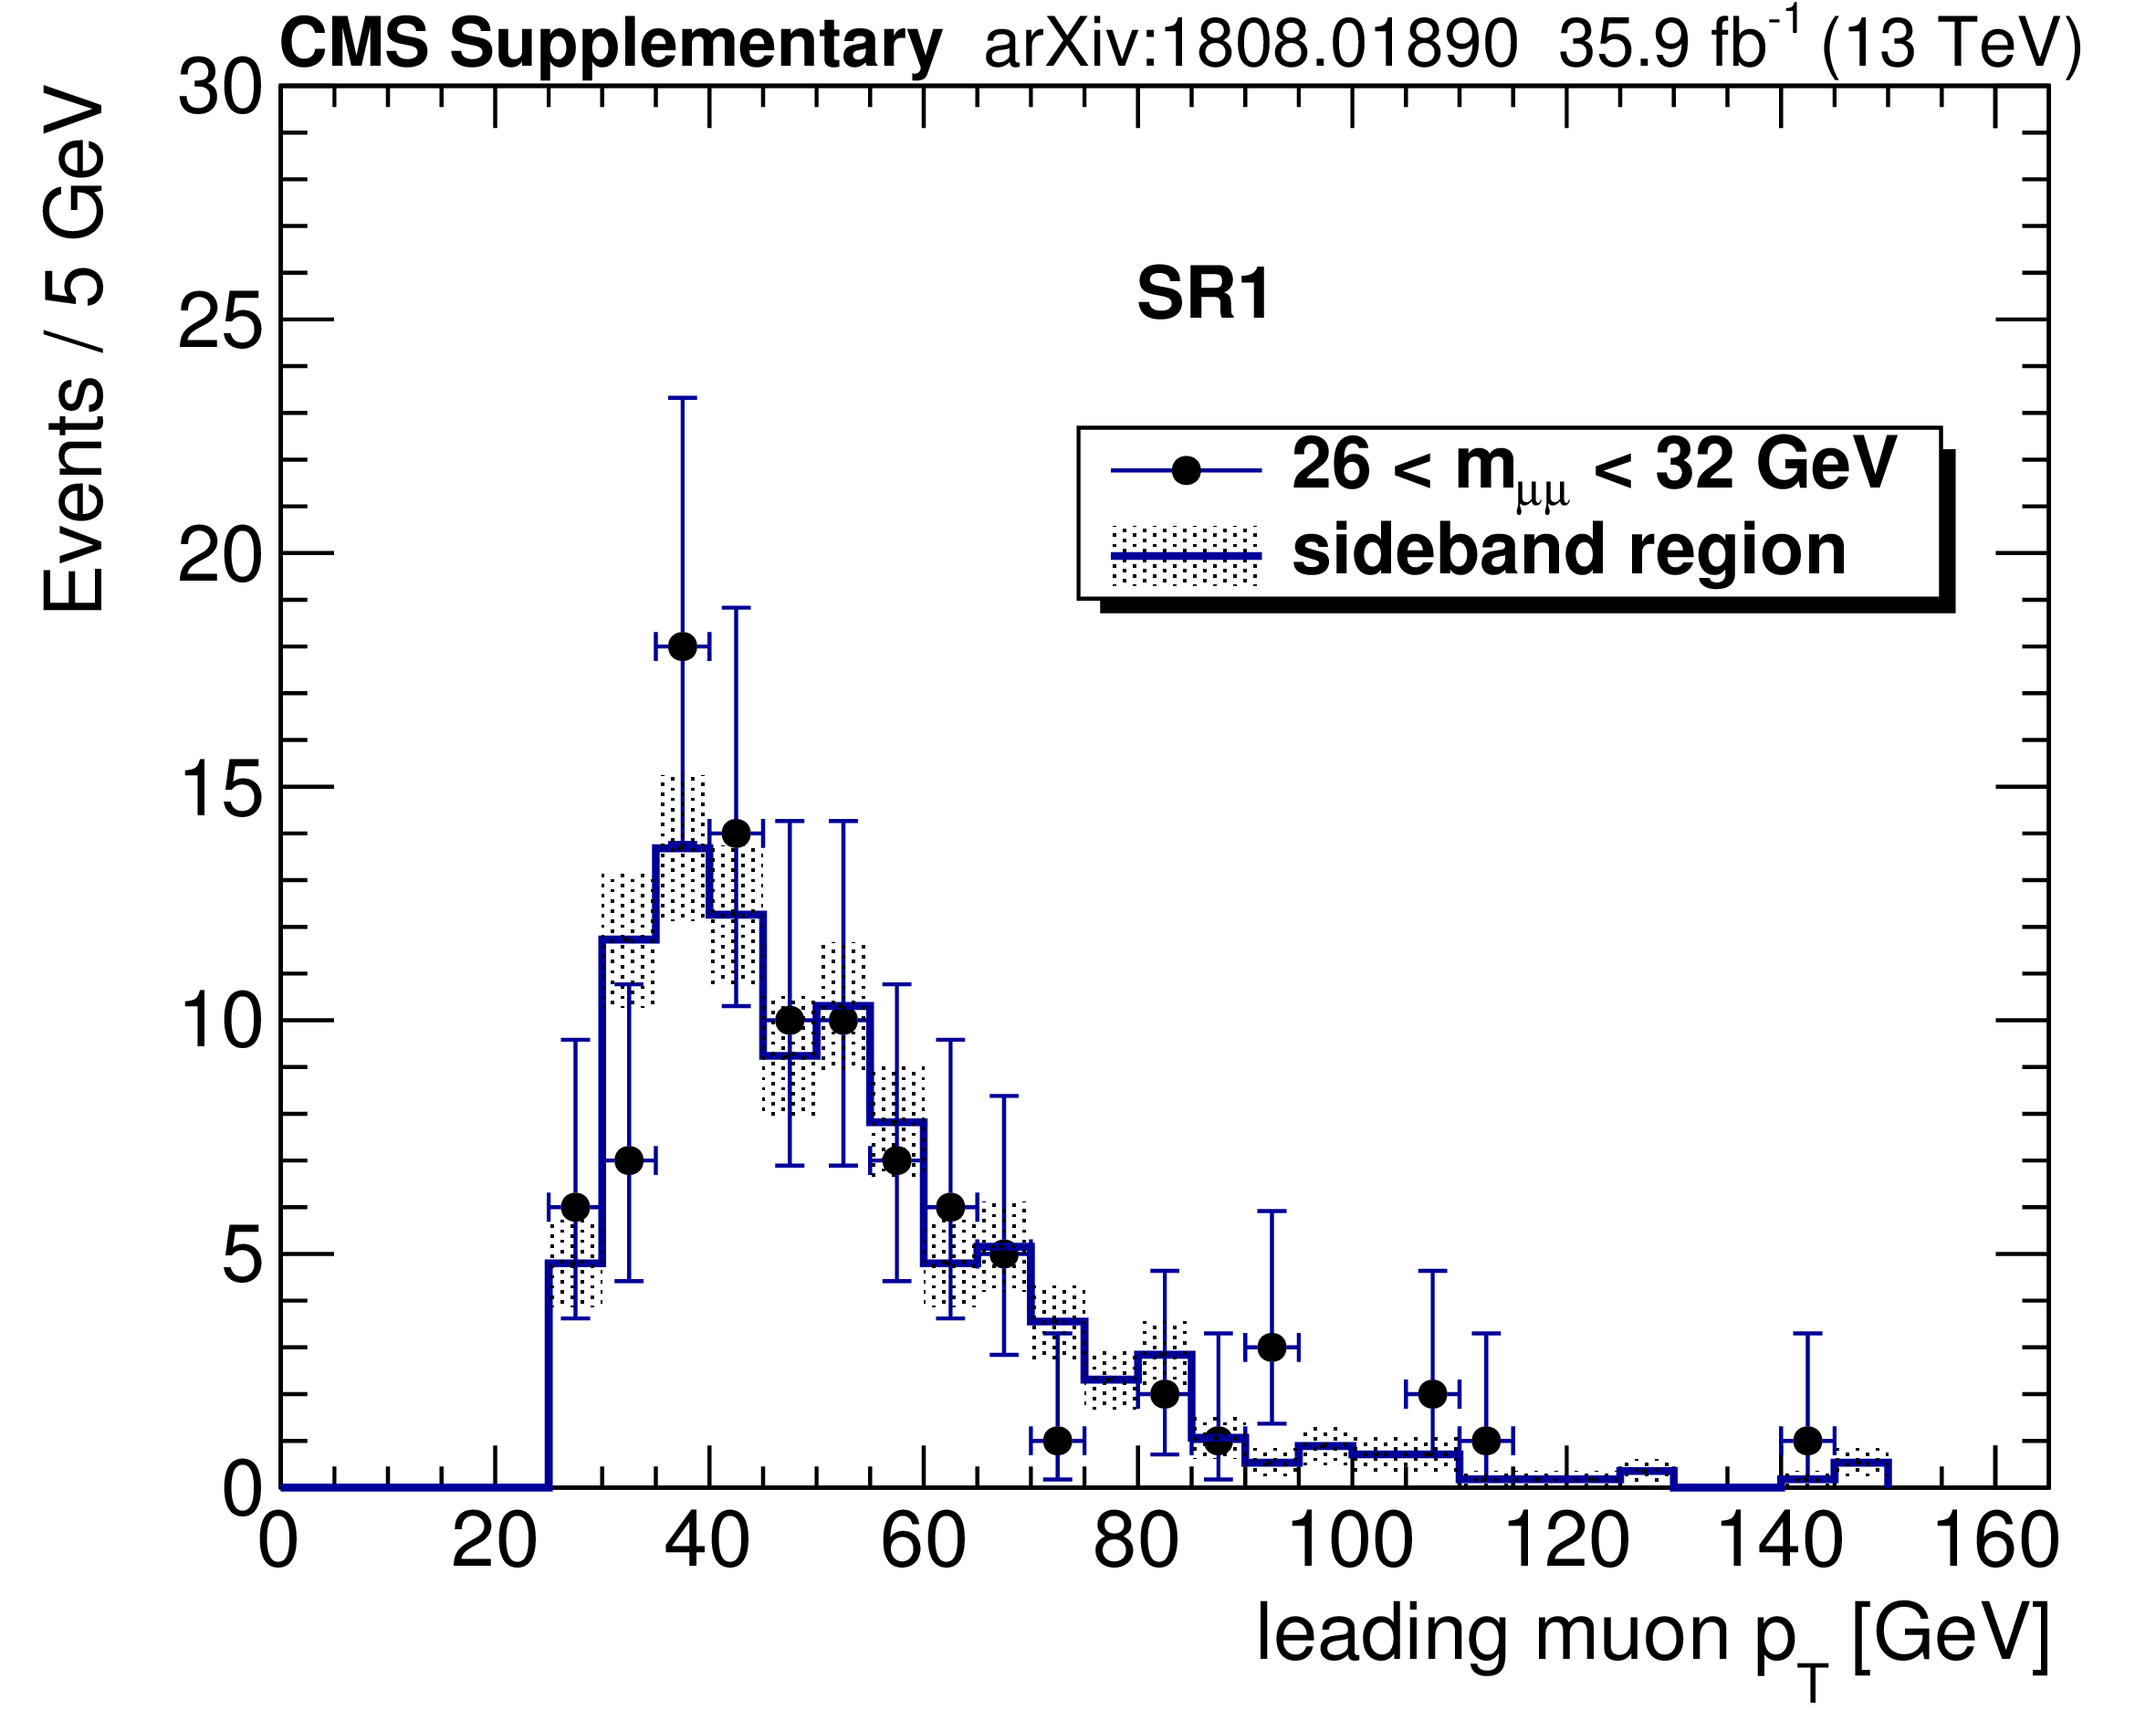
The transverse momentum of the leading $ {p_{\mathrm {T}}} $ muon in SR1 at $\sqrt {s} = $ 13 TeV in the dimuon mass range of 26 $ < m_{\mu \mu} < $ 32 GeV and the sideband between 12 and 24 GeV or between 34 and 50 GeV. The sideband histogram is normalized to the number of events in the range of 26 $ < m_{\mu \mu} < $ 32 GeV. The shaded area of the sideband histogram represents the statistical uncertainty. |
png pdf |
Additional Figure 21:
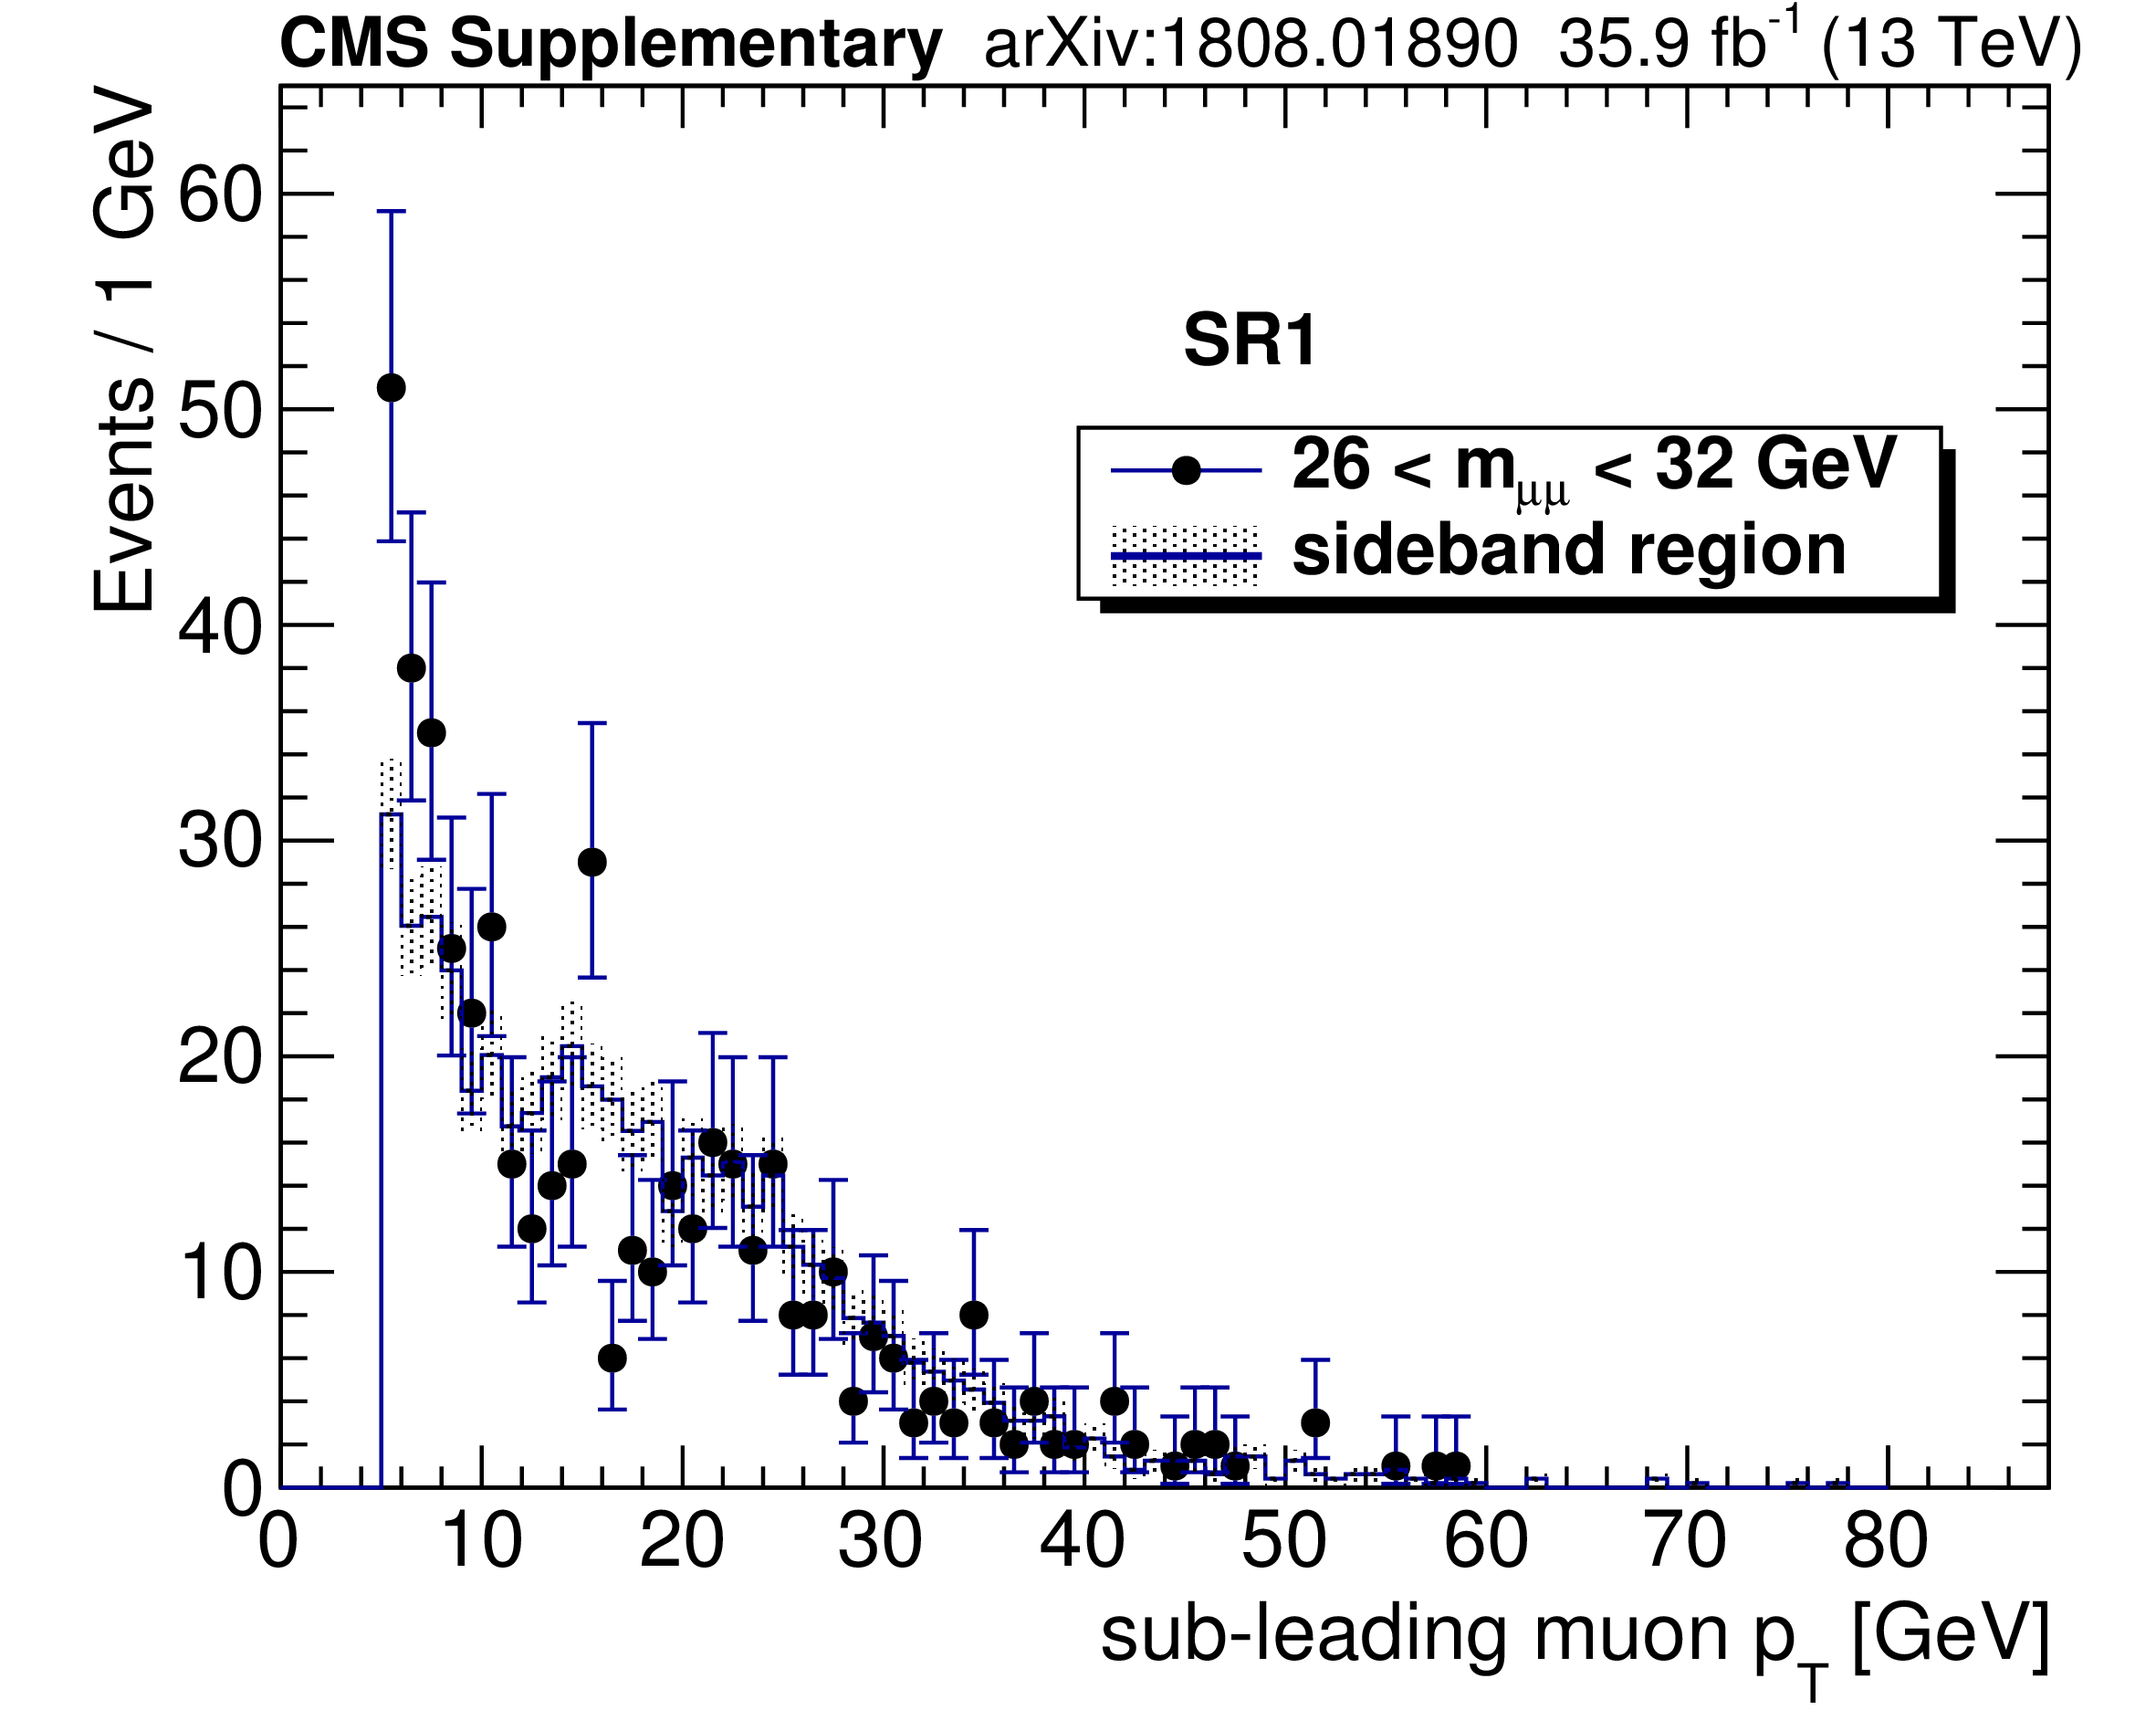
The transverse momentum of the second leading $ {p_{\mathrm {T}}} $ muon in SR1 at $\sqrt {s} = $ 13 TeV in the dimuon mass range of 26 $ < m_{\mu \mu} < $ 32 GeV and the sideband between 12 and 24 GeV or between 34 and 50 GeV. The sideband histogram is normalized to the number of events in the range of 26 $ < m_{\mu \mu} < $ 32 GeV. The shaded area of the sideband histogram represents the statistical uncertainty. |
png pdf |
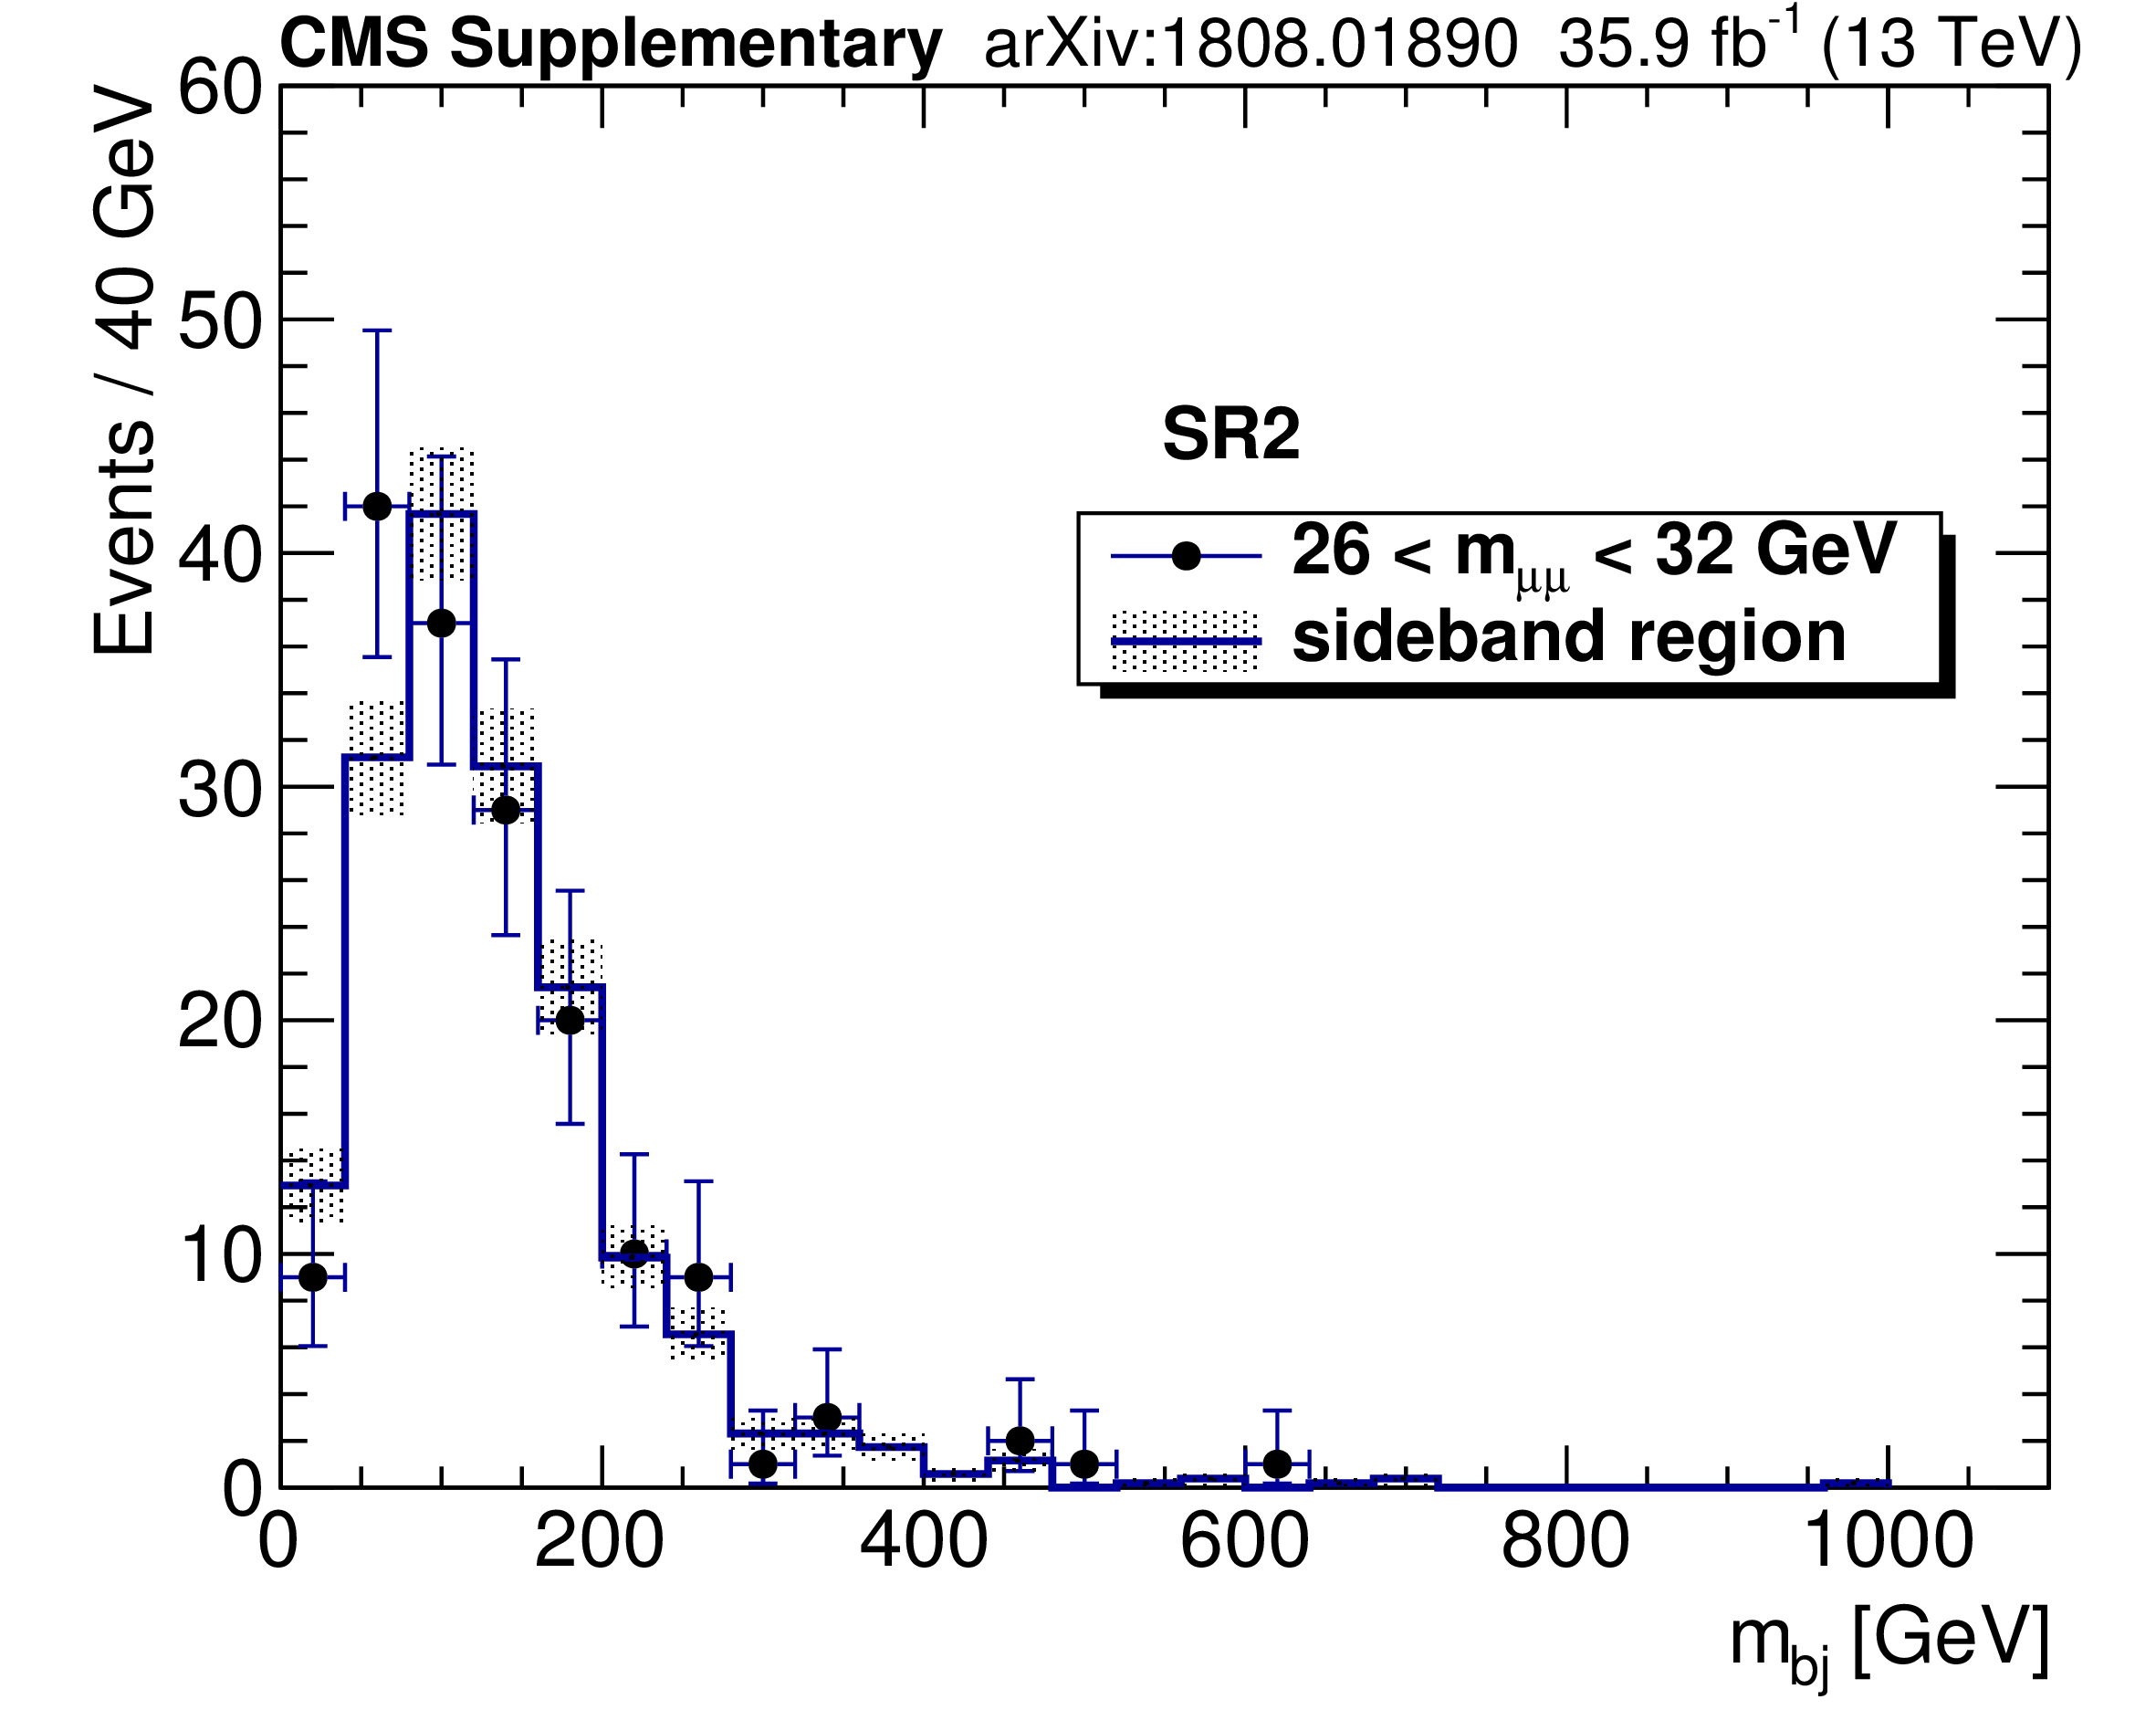
Additional Figure 22:
Dijet mass spectra in SR2 at $\sqrt {s} = $ 13 TeV in the dimuon mass range of 26 $ < m_{\mu \mu} < $ 32 GeV and the sideband between 12 and 24 GeV or between 34 and 50 GeV. The sideband histogram is normalized to the number of events in the range of 26 $ < m_{\mu \mu} < $ 32 GeV. The shaded area of the sideband histogram represents the statistical uncertainty. |
png pdf |
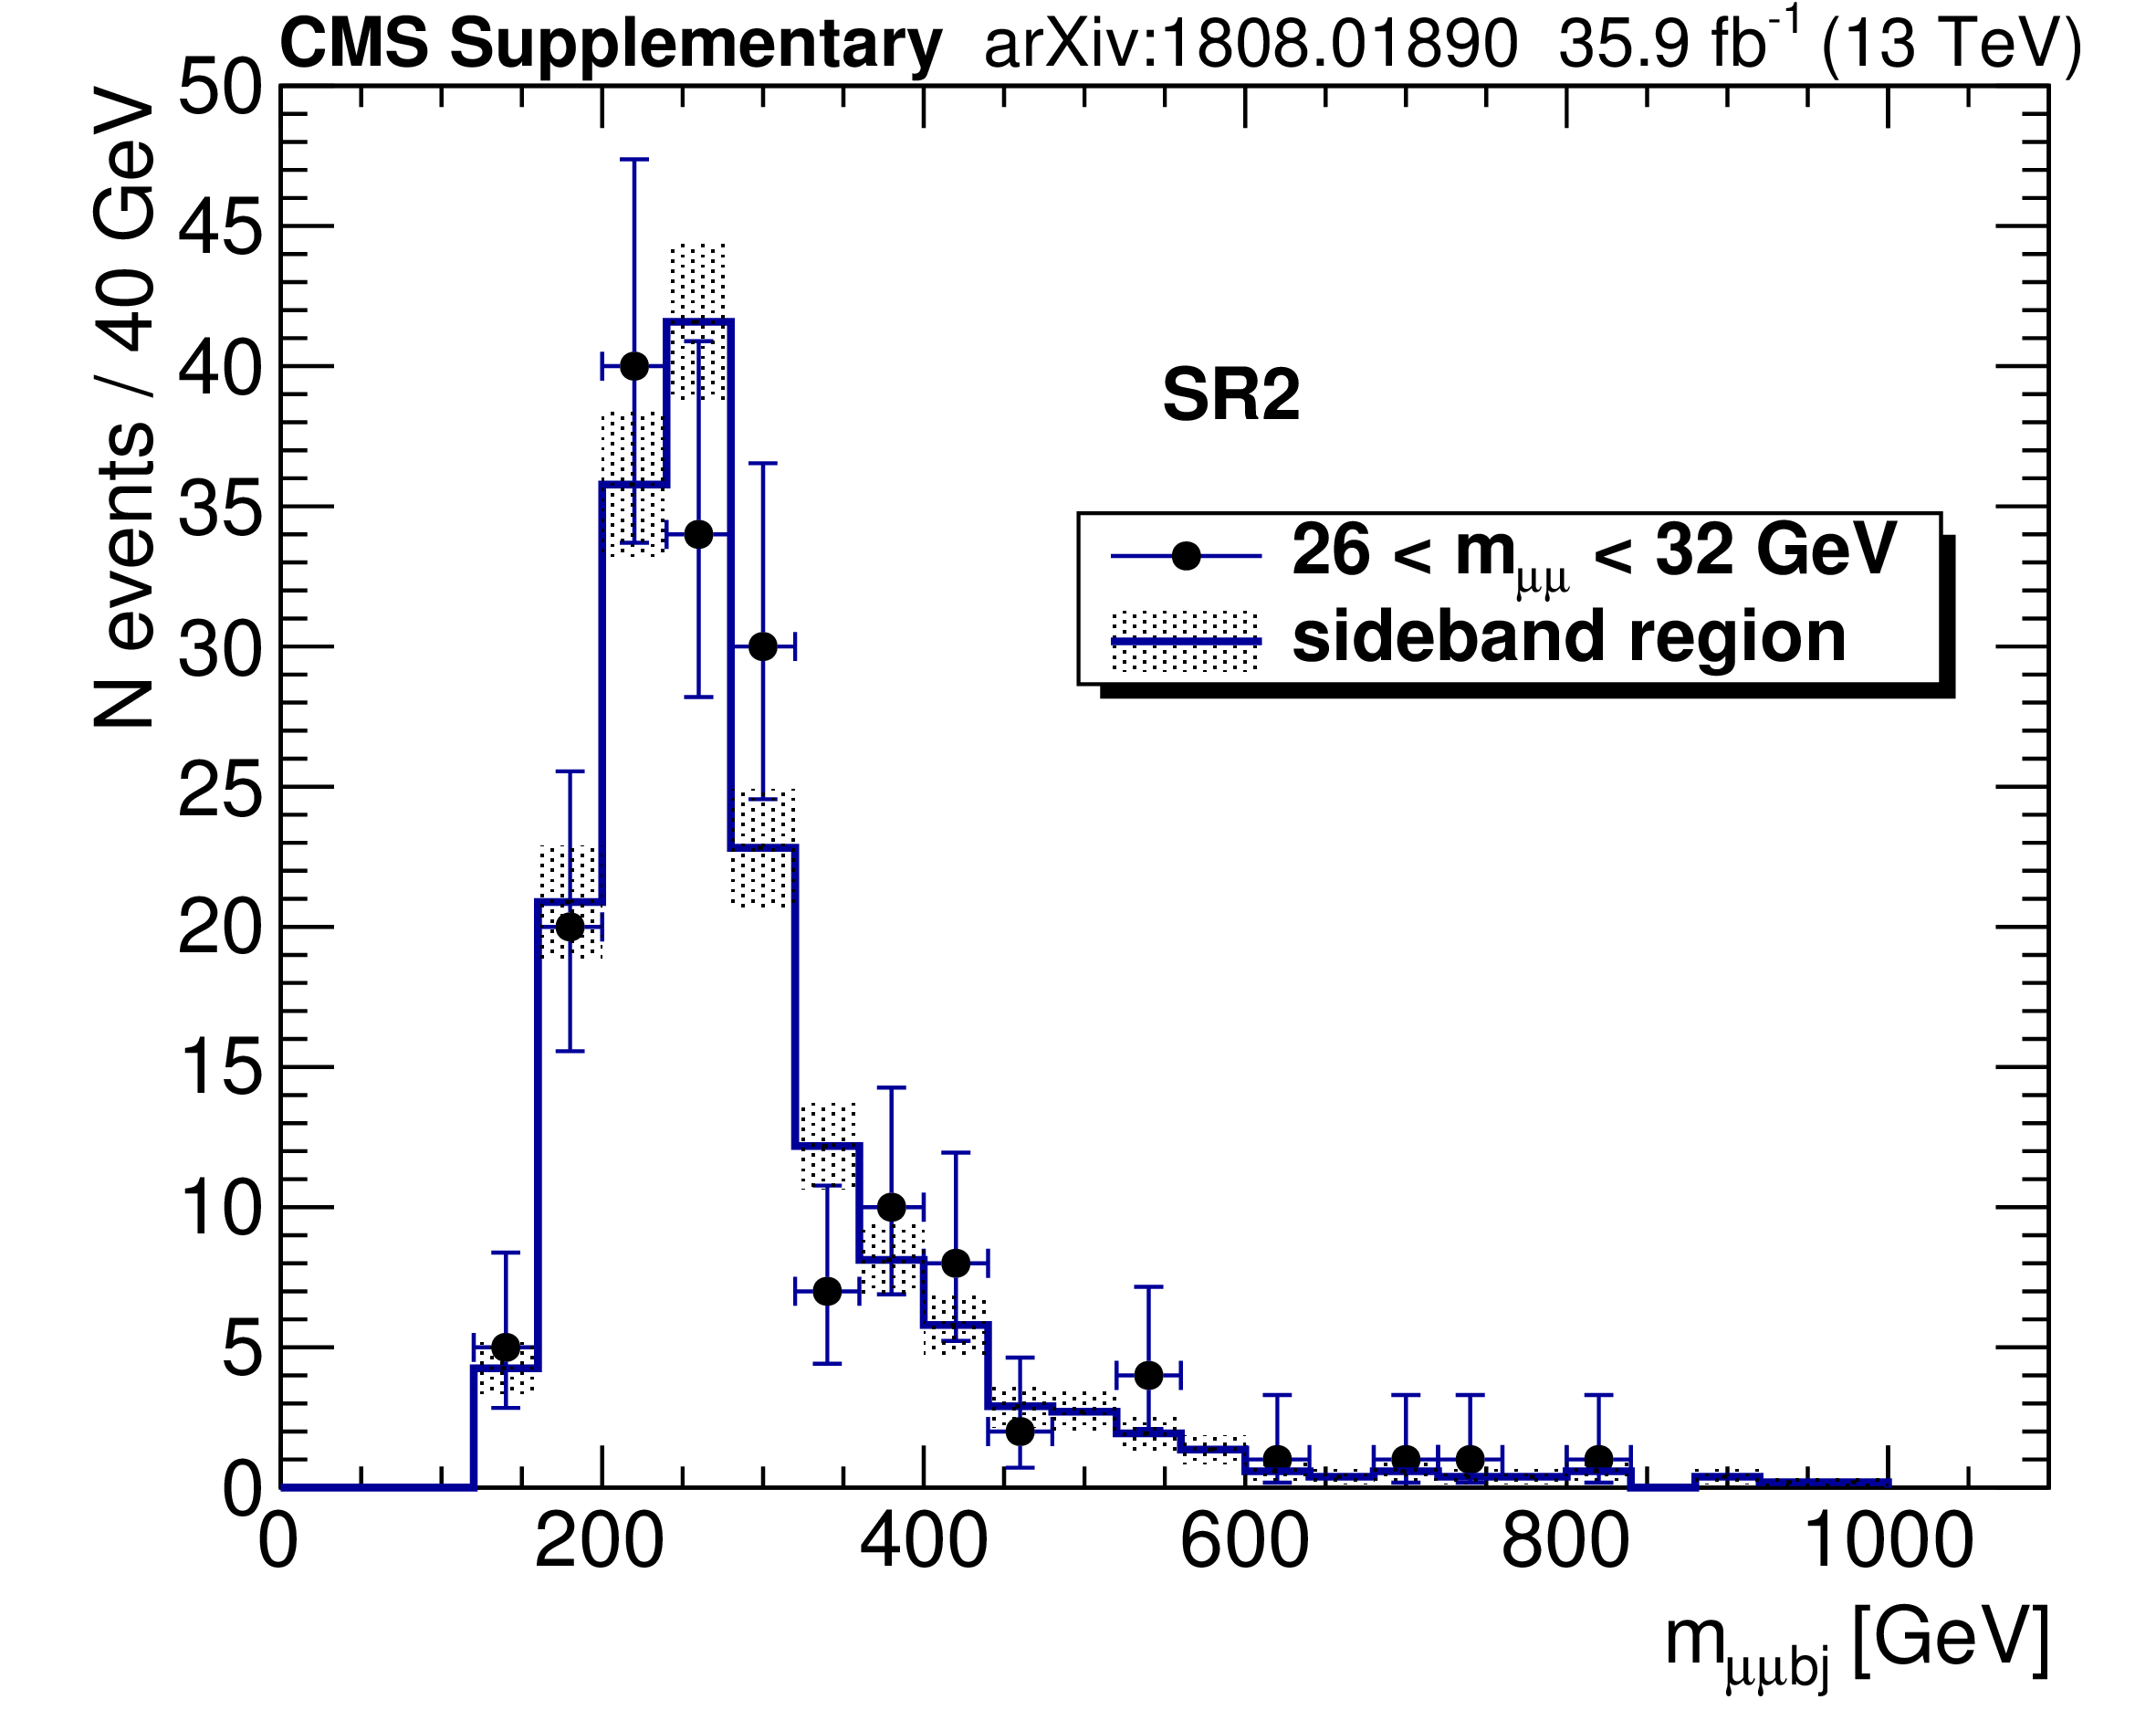
Additional Figure 23:
Dimuon plus dijet mass spectra in SR2 at $\sqrt {s} = $ 13 TeV in the dimuon mass range of 26 $ < m_{\mu \mu} < $ 32 GeV and the sideband between 12 and 24 GeV or between 34 and 50 GeV. The sideband histogram is normalized to the number of events in the range of 26 $ < m_{\mu \mu} < $ 32 GeV. The shaded area of the sideband histogram represents the statistical uncertainty. |
png pdf |
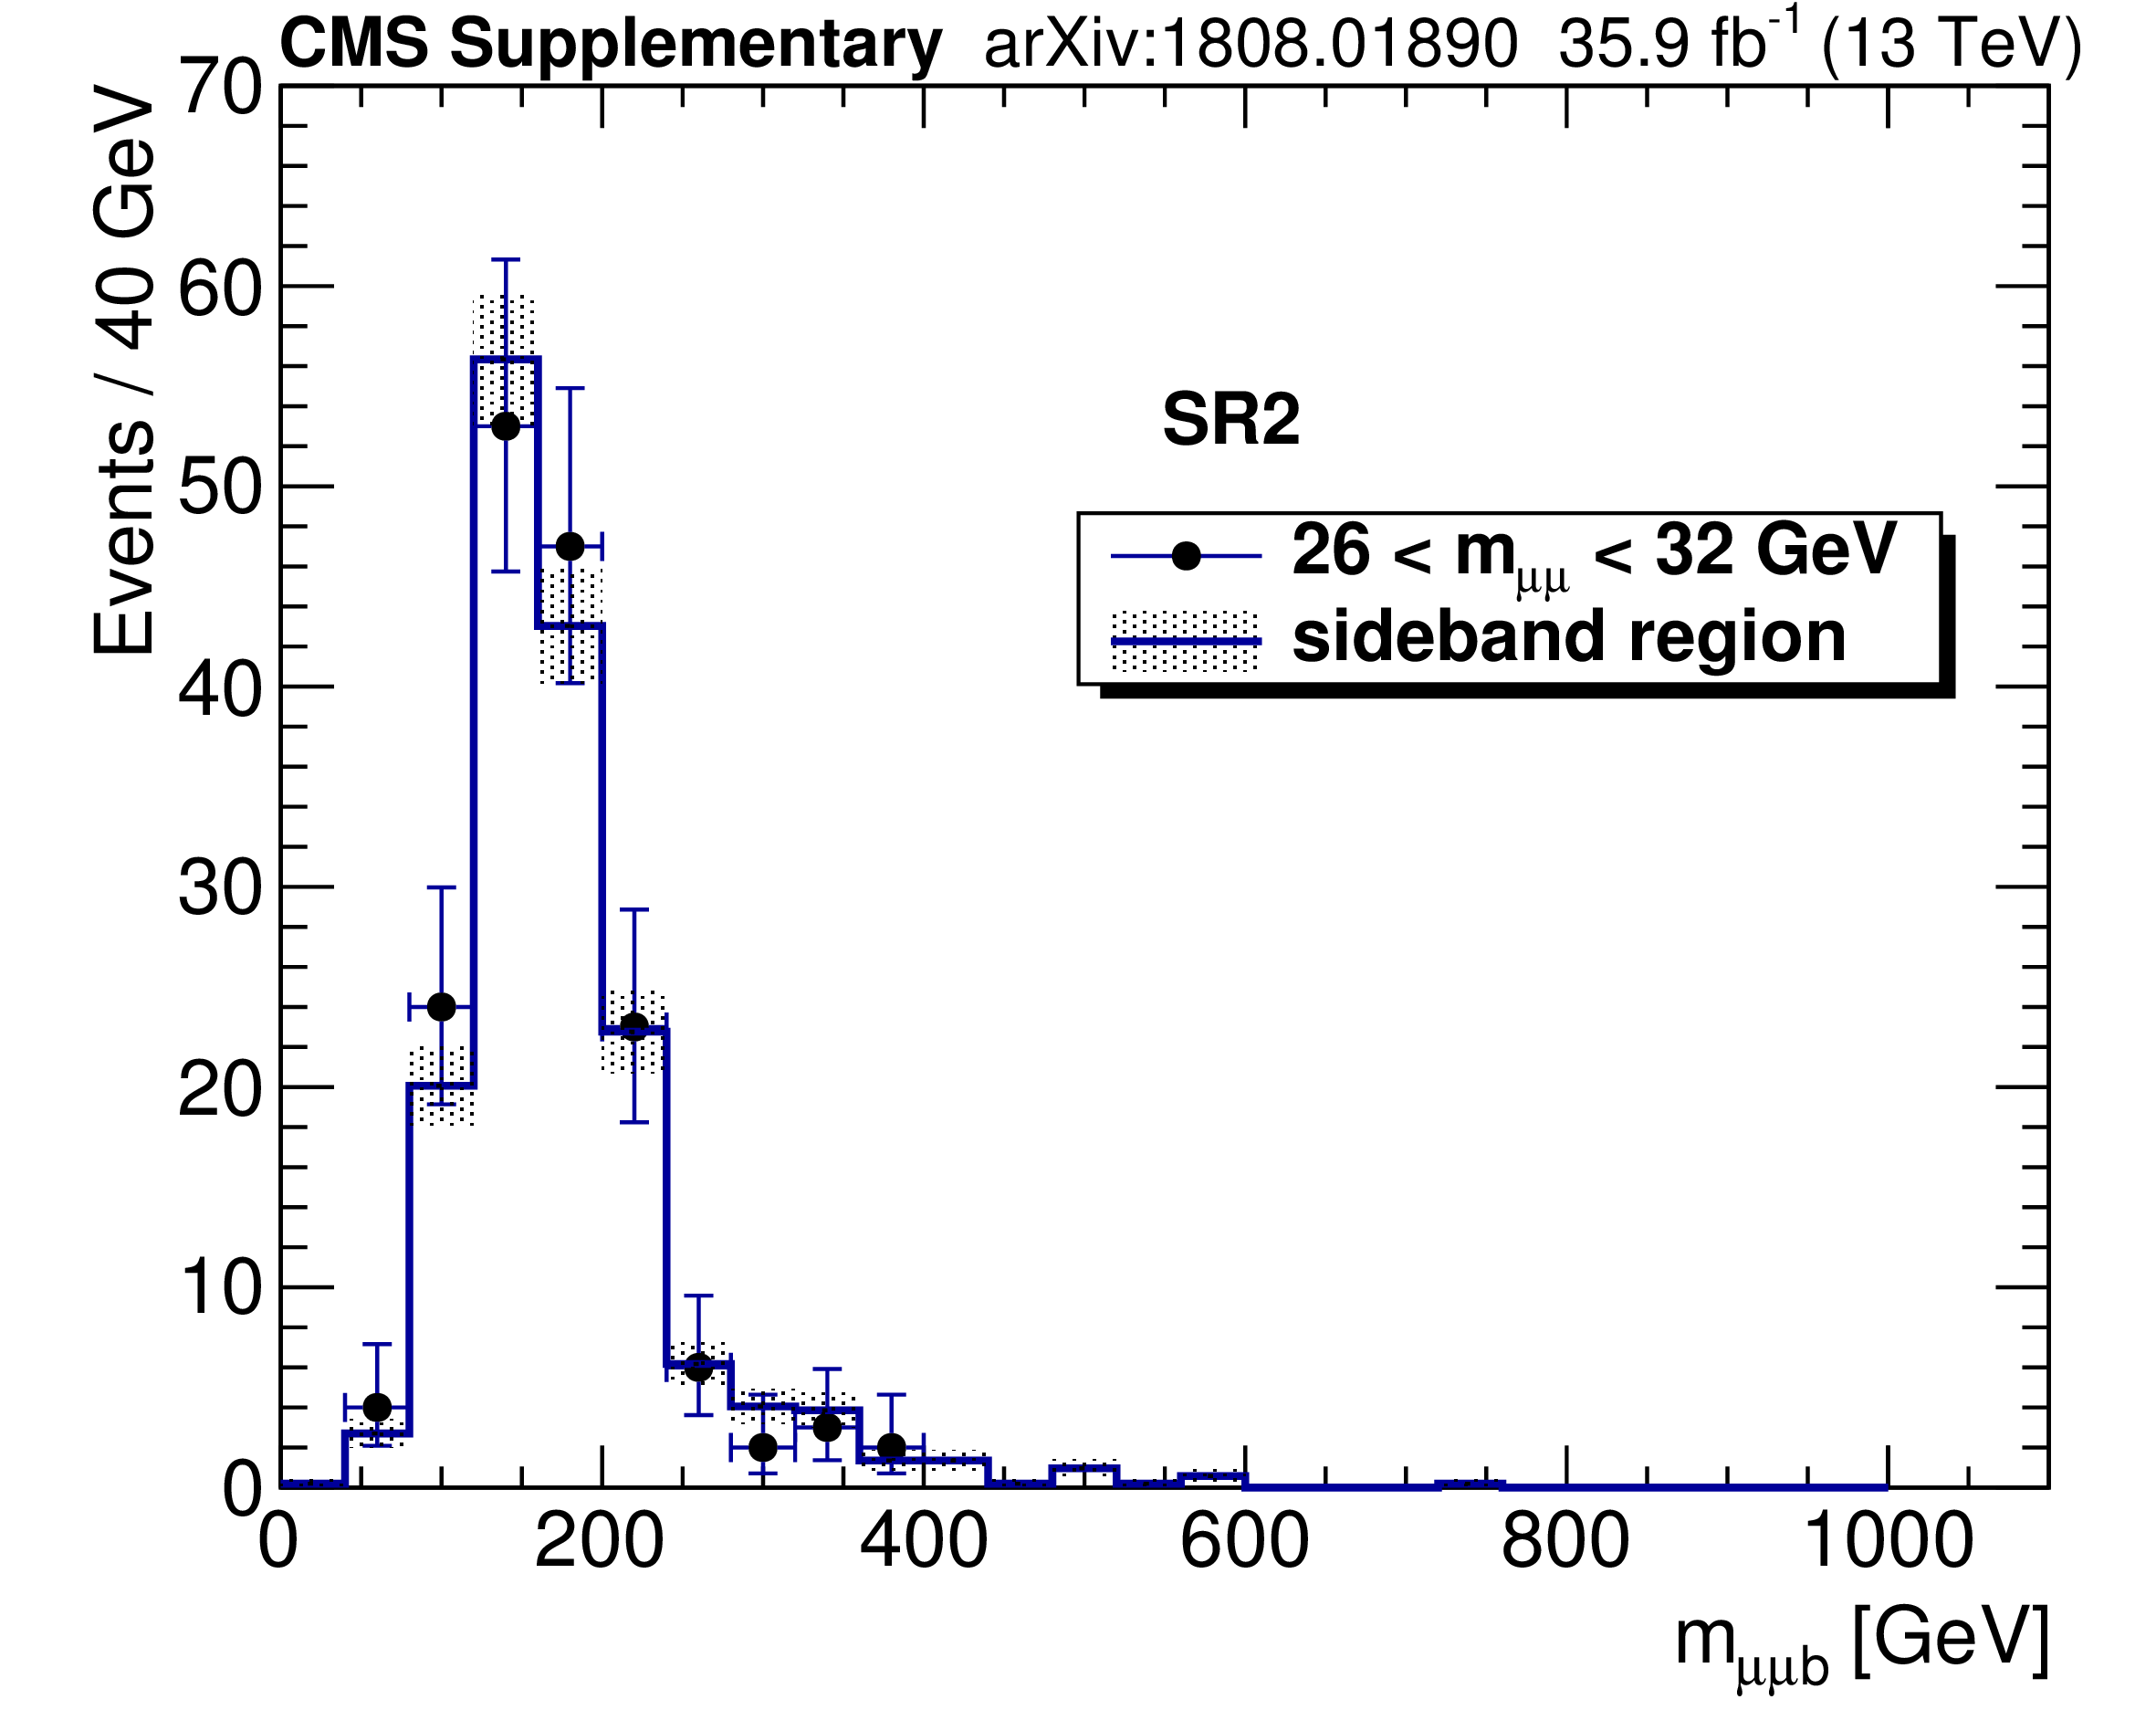
Additional Figure 24:
Dimuon plus b-tagged jet mass spectra in SR2 at $\sqrt {s} = $ 13 TeV in the dimuon mass range of 26 $ < m_{\mu \mu} < $ 32 GeV and the sideband between 12 and 24 GeV or between 34 and 50 GeV. The sideband histogram is normalized to the number of events in the range of 26 $ < m_{\mu \mu} < $ 32 GeV. The shaded area of the sideband histogram represents the statistical uncertainty. |
png pdf |
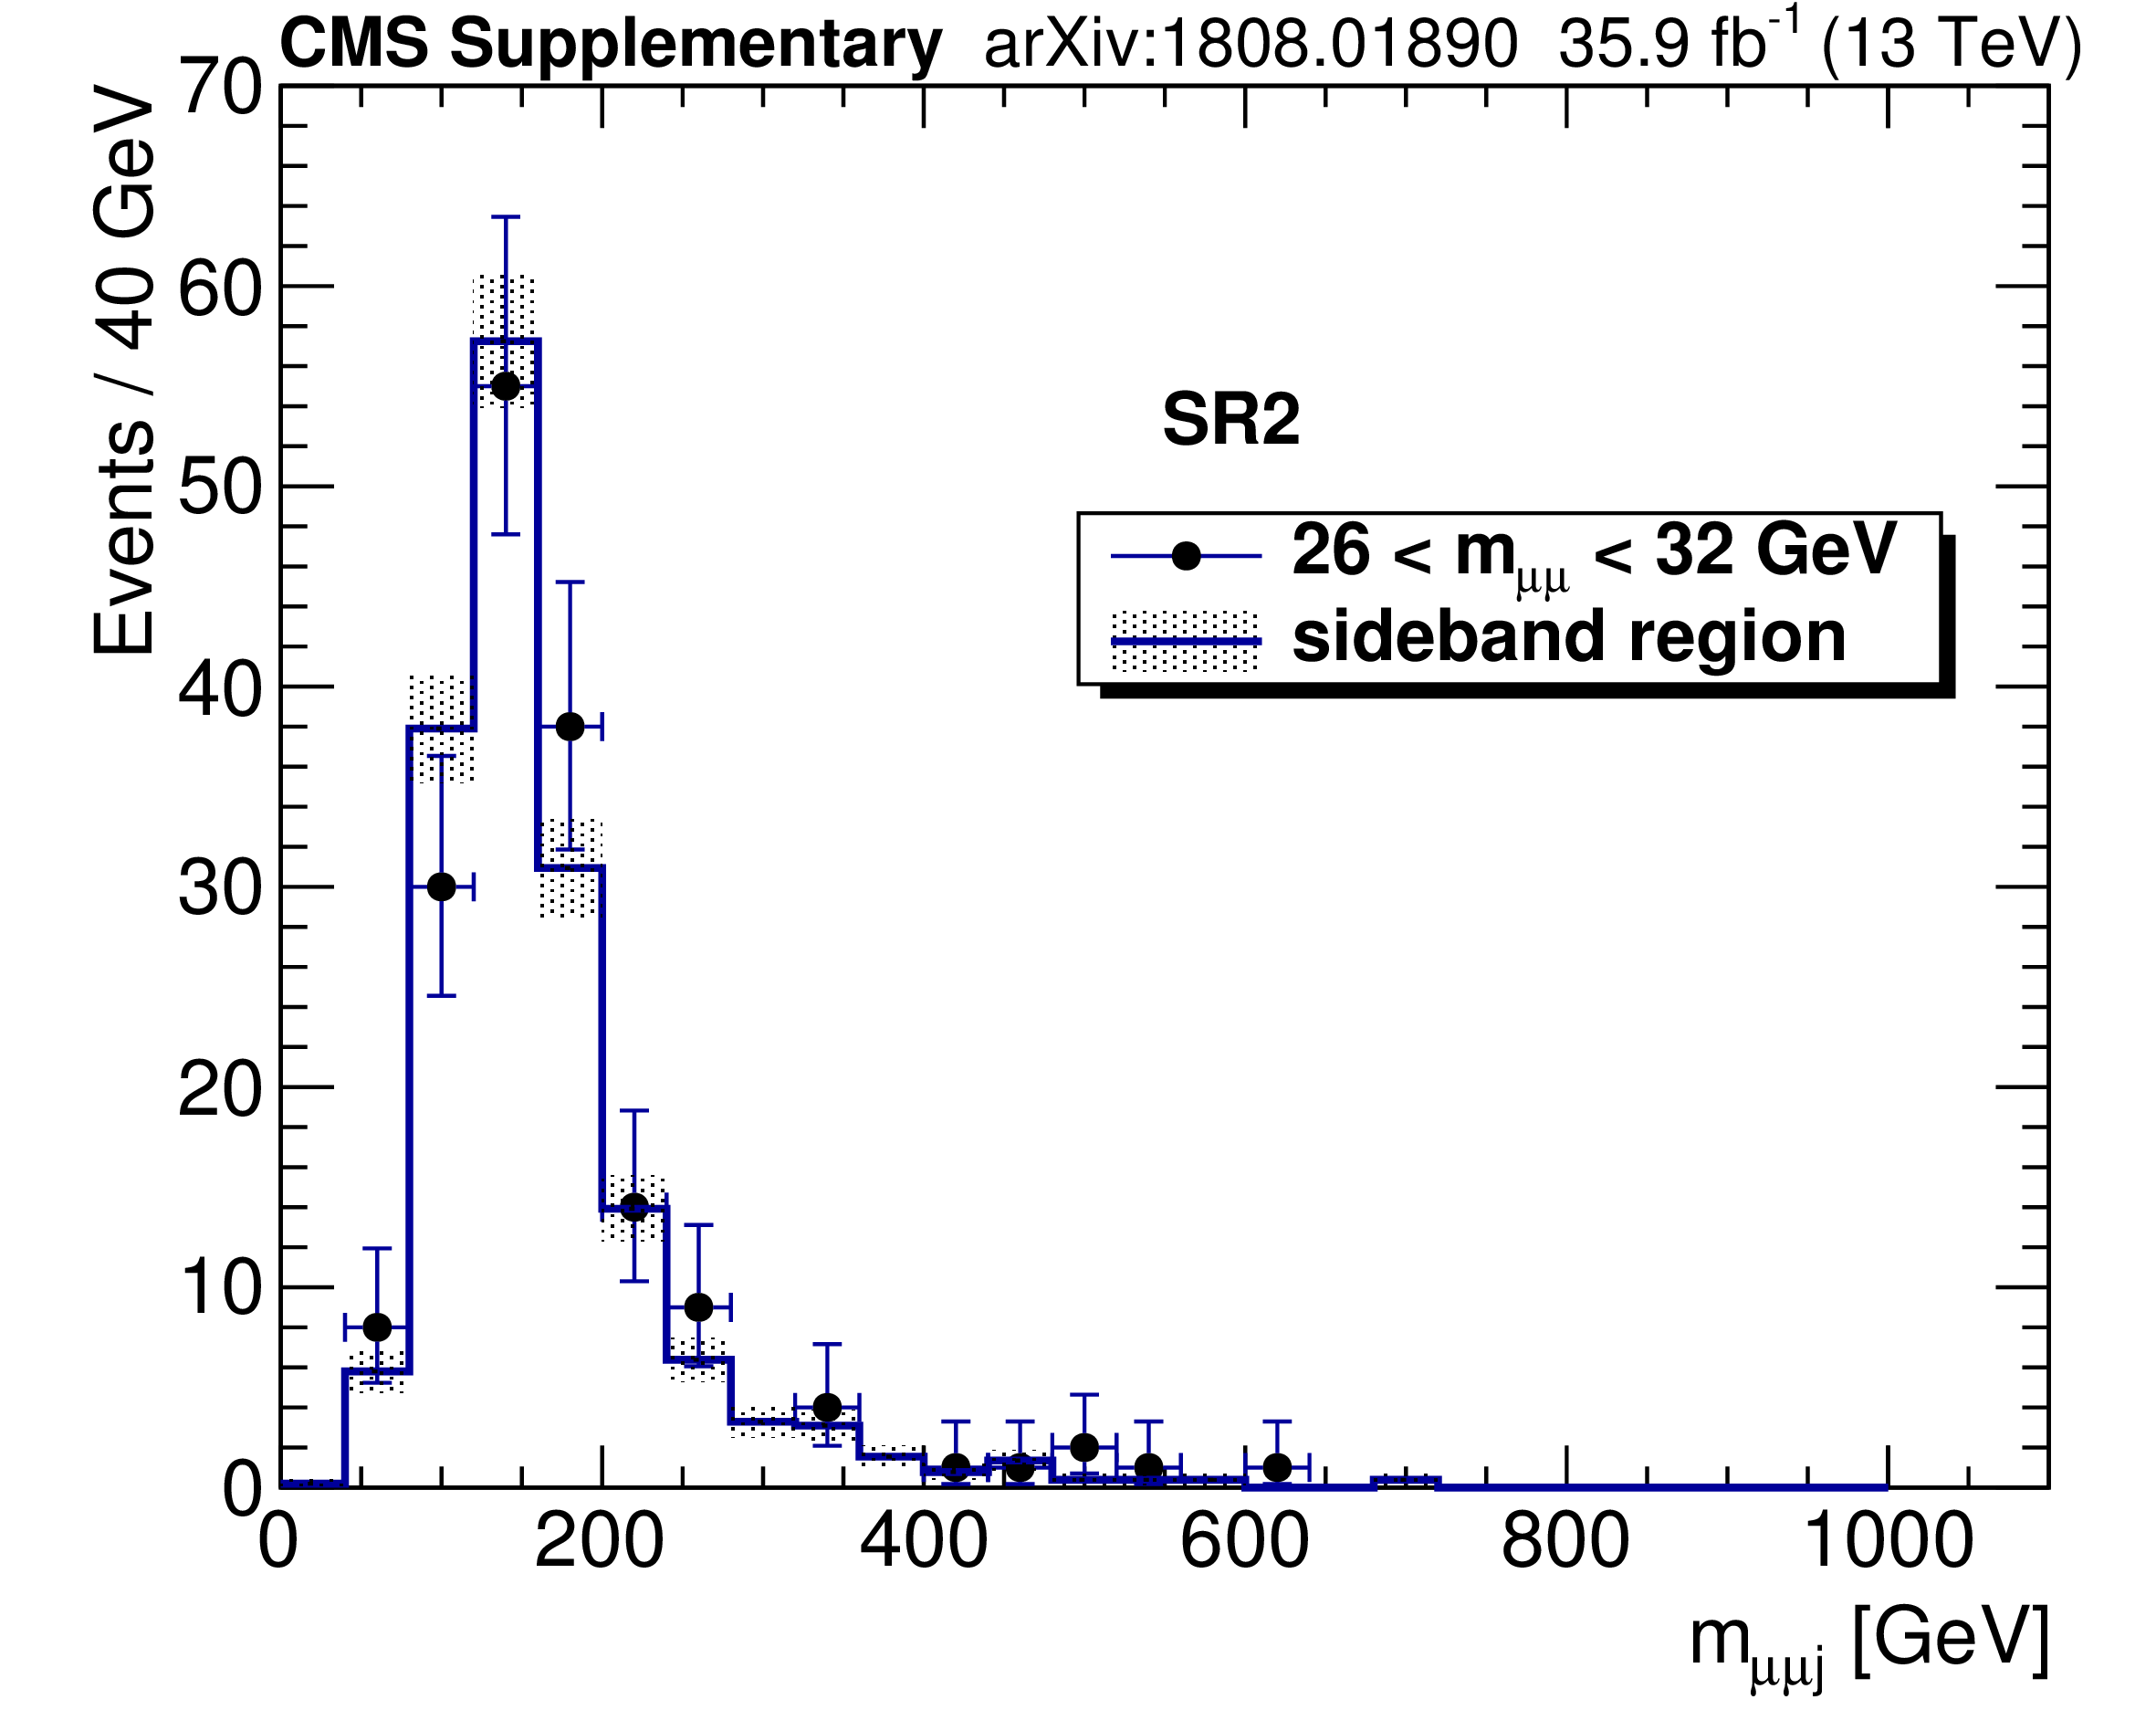
Additional Figure 25:
Dimuon plus untagged jet mass spectra in SR2 at $\sqrt {s} = $ 13 TeV in the dimuon mass range of 26 $ < m_{\mu \mu} < $ 32 GeV and the sideband between 12 and 24 GeV or between 34 and 50 GeV. The sideband histogram is normalized to the number of events in the range of 26 $ < m_{\mu \mu} < $ 32 GeV. The shaded area of the sideband histogram represents the statistical uncertainty. |

png pdf |
Additional Figure 26:
The transverse momentum of the leading $ {p_{\mathrm {T}}} $ muon in SR2 at $\sqrt {s} = $ 13 TeV in the dimuon mass range of 26 $ < m_{\mu \mu} < $ 32 GeV and the sideband between 12 and 24 GeV or between 34 and 50 GeV. The sideband histogram is normalized to the number of events in the range of 26 $ < m_{\mu \mu} < $ 32 GeV. The shaded area of the sideband histogram represents the statistical uncertainty. |
png pdf |
Additional Figure 27:
The transverse momentum of the second leading $ {p_{\mathrm {T}}} $ muon in SR2 at $\sqrt {s} = $ 13 TeV in the dimuon mass range of 26 $ < m_{\mu \mu} < $ 32 GeV and the sideband between 12 and 24 GeV or between 34 and 50 GeV. The sideband histogram is normalized to the number of events in the range of 26 $ < m_{\mu \mu} < $ 32 GeV. The shaded area of the sideband histogram represents the statistical uncertainty. |
| References | ||||
| 1 | ATLAS Collaboration | Observation of a new particle in the search for the standard model Higgs boson with the ATLAS detector at the LHC | PLB 716 (2012) 1 | 1207.7214 |
| 2 | CMS Collaboration | Observation of a new boson at a mass of 125 GeV with the CMS experiment at the LHC | PLB 716 (2012) 30 | CMS-HIG-12-028 1207.7235 |
| 3 | CMS Collaboration | Observation of a new boson with mass near 125 GeV in pp collisions at $ \sqrt{s} = $ 7 and 8 TeV | JHEP 06 (2013) 081 | CMS-HIG-12-036 1303.4571 |
| 4 | ATLAS and CMS Collaborations | Combined measurement of the Higgs boson mass in $ pp $ collisions at $ \sqrt{s}= $ 7 and 8 TeV with the ATLAS and CMS experiments | PRL 114 (2015) 191803 | 1503.07589 |
| 5 | CMS Collaboration | Measurements of properties of the Higgs boson decaying into the four-lepton final state in pp collisions at $ \sqrt{s}= $ 13 TeV | JHEP 11 (2017) 047 | CMS-HIG-16-041 1706.09936 |
| 6 | G. C. Branco et al. | Theory and phenomenology of two-Higgs-doublet models | PR 516 (2012) 1 | 1106.0034 |
| 7 | U. Ellwanger, C. Hugonie, and A. M. Teixeira | The next-to-minimal supersymmetric standard model | PR 496 (2010) 1 | 0910.1785 |
| 8 | ALEPH Collaboration | Search for neutral Higgs bosons decaying into four taus at LEP2 | JHEP 05 (2010) 049 | 1003.0705 |
| 9 | DELPHI, OPAL, ALEPH, LEP Working Group for Higgs Boson Searches, L3 Collaboration | Search for neutral MSSM Higgs bosons at LEP | EPJC 47 (2006) 547 | hep-ex/0602042 |
| 10 | OPAL Collaboration | Search for neutral Higgs boson in CP-conserving and CP-violating MSSM scenarios | EPJC 37 (2004) 49 | hep-ex/0406057 |
| 11 | DELPHI Collaboration | Higgs boson searches in CP-conserving and CP-violating MSSM scenarios with the DELPHI detector | EPJC 54 (2008) 1 | 0801.3586 |
| 12 | OPAL Collaboration | Search for a low mass CP odd Higgs boson in e+ e- collisions with the OPAL detector at LEP-2 | EPJC 27 (2003) 483 | hep-ex/0209068 |
| 13 | ATLAS Collaboration | Search for Higgs bosons decaying to $ aa $ in the $ \mu\mu\tau\tau $ final state in $ pp $ collisions at $ \sqrt{s} = $ 8 TeV with the ATLAS experiment | PRD 92 (2015) 052002 | 1505.01609 |
| 14 | ATLAS Collaboration | Search for new phenomena in events with at least three photons collected in $ pp $ collisions at $ \sqrt{s} = $ 8 TeV with the ATLAS detector | EPJC 76 (2016) 210 | 1509.05051 |
| 15 | ATLAS Collaboration | Search for the Higgs boson produced in association with a $ W $ boson and decaying to four $ b $-quarks via two spin-zero particles in pp collisions at 13 TeV with the ATLAS detector | EPJC 76 (2016) 605 | 1606.08391 |
| 16 | ATLAS Collaboration | Search for Higgs boson decays to beyond-the-Standard-Model light bosons in four-lepton events with the ATLAS detector at $ \sqrt{s}= $ 13 TeV | JHEP 06 (2018) 166 | 1802.03388 |
| 17 | ATLAS Collaboration | Search for Higgs boson decays into pairs of light (pseudo)scalar particles in the $ \gamma\gamma jj $ final state in $ pp $ collisions at $ \sqrt{s}= $ 13 TeV with the ATLAS detector | PLB 782 (2018) 750 | 1803.11145 |
| 18 | CMS Collaboration | Search for a light pseudoscalar Higgs boson in the dimuon decay channel in pp collisions at $ \sqrt{s}= $ 7 TeV | PRL 109 (2012) 121801 | CMS-HIG-12-004 1206.6326 |
| 19 | CMS Collaboration | Search for neutral MSSM Higgs bosons decaying to $ \mu^{+} \mu^{-} $ in pp collisions at $ \sqrt{s} = $ 7 and 8 TeV | PLB 752 (2016) 221 | CMS-HIG-13-024 1508.01437 |
| 20 | CMS Collaboration | Search for a very light NMSSM Higgs boson produced in decays of the 125 GeV scalar boson and decaying into $ \tau $ leptons in pp collisions at $ \sqrt{s}= $ 8 TeV | JHEP 01 (2016) 079 | CMS-HIG-14-019 1510.06534 |
| 21 | CMS Collaboration | Search for a low-mass pseudoscalar Higgs boson produced in association with a $ \mathrm{b\bar{b}} $ pair in pp collisions at $ \sqrt{s} = $ 8 TeV | PLB 758 (2016) 296 | CMS-HIG-14-033 1511.03610 |
| 22 | CMS Collaboration | A search for pair production of new light bosons decaying into muons | PLB 752 (2016) 146 | CMS-HIG-13-010 1506.00424 |
| 23 | CMS Collaboration | Search for light bosons in decays of the 125 GeV Higgs boson in proton-proton collisions at $ \sqrt{s}= $ 8 TeV | JHEP 10 (2017) 076 | CMS-HIG-16-015 1701.02032 |
| 24 | CMS Collaboration | Search for Higgs boson pair production in the $ \mathrm{bb}\tau\tau $ final state in proton-proton collisions at $ \sqrt{s}= $ 8 TeV | PRD 96 (2017) 072004 | CMS-HIG-15-013 1707.00350 |
| 25 | CMS Collaboration | Search for a light pseudoscalar Higgs boson produced in association with bottom quarks in pp collisions at $ \sqrt{s}= $ 8 TeV | JHEP 11 (2017) 010 | CMS-HIG-15-009 1707.07283 |
| 26 | LHCb Collaboration | Limits on neutral Higgs boson production in the forward region in pp collisions at $ \sqrt{s} = $ 7 TeV | JHEP 05 (2013) 132 | 1304.2591 |
| 27 | R. Aggleton et al. | Review of LHC experimental results on low mass bosons in multi Higgs models | JHEP 02 (2017) 035 | 1609.06089 |
| 28 | CMS Collaboration | Search for low mass vector resonances decaying to quark-antiquark pairs in proton-proton collisions at $ \sqrt{s}= $ 13 TeV | PRL 119 (2017) 111802 | CMS-EXO-16-030 1705.10532 |
| 29 | CMS Collaboration | Inclusive search for a highly boosted Higgs boson decaying to a bottom quark-antiquark pair | PRL 120 (2018) 071802 | CMS-HIG-17-010 1709.05543 |
| 30 | CMS Collaboration | Search for low mass vector resonances decaying into quark-antiquark pairs in proton-proton collisions at $ \sqrt{s}= $ 13 TeV | JHEP 01 (2018) 097 | CMS-EXO-17-001 1710.00159 |
| 31 | ATLAS Collaboration | Search for light resonances decaying to boosted quark pairs and produced in association with a photon or a jet in proton-proton collisions at $ \sqrt{s}= $ 13 TeV with the ATLAS detector | Submitted to PLB | 1801.08769 |
| 32 | ATLAS Collaboration | Search for new light gauge bosons in Higgs boson decays to four-lepton final states in $ pp $ collisions at $ \sqrt{s}= $ 8 TeV with the ATLAS detector at the LHC | PRD 92 (2015) 092001 | 1505.07645 |
| 33 | LHCb Collaboration | Search for dark photons produced in 13 TeV pp collisions | PRL 120 (2018) 061801 | 1710.02867 |
| 34 | M. Abdullah et al. | Bottom-quark fusion processes at the LHC for probing $ Z^{\prime} $ models and $ B $-meson decay anomalies | PRD 97 (2018) 075035 | 1707.07016 |
| 35 | J. F. Kamenik, Y. Soreq, and J. Zupan | Lepton flavor universality violation without new sources of quark flavor violation | PRD 97 (2018) 035002 | 1704.06005 |
| 36 | LHCb Collaboration | Test of lepton universality using $ B^{+}\rightarrow K^{+}\ell^{+}\ell^{-} $ decays | PRL 113 (2014) 151601 | 1406.6482 |
| 37 | LHCb Collaboration | Test of lepton universality with $ B^{0} \rightarrow K^{*0}\ell^{+}\ell^{-} $ decays | JHEP 08 (2017) 055 | 1705.05802 |
| 38 | J. Bernon, J. F. Gunion, Y. Jiang, and S. Kraml | Light Higgs bosons in two-Higgs-doublet models | PRD 91 (2015) 075019 | 1412.3385 |
| 39 | CMS Collaboration | Performance of CMS muon reconstruction in pp collision events at $ \sqrt{s}= $ 7 TeV | JINST 7 (2012) P10002 | CMS-MUO-10-004 1206.4071 |
| 40 | M. Cacciari, G. P. Salam, and G. Soyez | The anti-$ {k_{\mathrm{T}}} $ jet clustering algorithm | JHEP 04 (2008) 063 | 0802.1189 |
| 41 | M. Cacciari, G. P. Salam, and G. Soyez | FastJet user manual | EPJC 72 (2012) 1896 | 1111.6097 |
| 42 | CMS Collaboration | The CMS trigger system | JINST 12 (2017) P01020 | CMS-TRG-12-001 1609.02366 |
| 43 | CMS Collaboration | The CMS Experiment at the CERN LHC | JINST 3 (2008) S08004 | CMS-00-001 |
| 44 | CMS Collaboration | Particle-flow reconstruction and global event description with the CMS detector | JINST 12 (2017) P10003 | CMS-PRF-14-001 1706.04965 |
| 45 | M. Cacciari and G. P. Salam | Pileup subtraction using jet areas | PLB 659 (2008) 119 | 0707.1378 |
| 46 | CMS Collaboration | Jet energy scale and resolution in the CMS experiment in pp collisions at 8 TeV | JINST 12 (2017) P02014 | CMS-JME-13-004 1607.03663 |
| 47 | CMS Collaboration | Jet performance in pp collisions at $ \sqrt{s} = $ 7 TeV | CMS-PAS-JME-10-003 | |
| 48 | CMS Collaboration | Pileup jet identification | CMS-PAS-JME-13-005 | CMS-PAS-JME-13-005 |
| 49 | CMS Collaboration | Identification of b-quark jets with the CMS experiment | JINST 8 (2013) P04013 | CMS-BTV-12-001 1211.4462 |
| 50 | CMS Collaboration | Performance of b tagging at $ \sqrt{s}= $ 8 TeV in multijet, $ {\rm t\bar t} $ and boosted topology events | CMS-PAS-BTV-13-001 | |
| 51 | CMS Collaboration | Identification of heavy-flavour jets with the CMS detector in pp collisions at 13 TeV | JINST 13 (2018) P05011 | CMS-BTV-16-002 1712.07158 |
| 52 | CMS Collaboration | Description and performance of track and primary-vertex reconstruction with the CMS tracker | JINST 9 (2014) P10009 | CMS-TRK-11-001 1405.6569 |
| 53 | CMS Collaboration | The performance of the CMS muon detector in proton-proton collisions at $ \sqrt{s} = $ 7 TeV at the LHC | JINST 8 (2013) P11002 | CMS-MUO-11-001 1306.6905 |
| 54 | CMS Collaboration | Performance of the CMS muon detector and muon reconstruction with proton-proton collisions at $ \sqrt{s}= $ 13 TeV | JINST 13 (2018) P06015 | CMS-MUO-16-001 1804.04528 |
| 55 | J. Alwall et al. | MadGraph 5: going beyond | JHEP 06 (2011) 128 | 1106.0522 |
| 56 | S. Alioli, P. Nason, C. Oleari, and E. Re | A general framework for implementing NLO calculations in shower Monte Carlo programs: the POWHEG BOX | JHEP 06 (2010) 043 | 1002.2581 |
| 57 | P. Nason | A new method for combining NLO QCD with shower Monte Carlo algorithms | JHEP 11 (2004) 040 | hep-ph/0409146 |
| 58 | S. Frixione, P. Nason, and C. Oleari | Matching NLO QCD computations with parton shower simulations: the POWHEG method | JHEP 11 (2007) 070 | 0709.2092 |
| 59 | J. Pumplin et al. | New generation of parton distributions with uncertainties from global QCD analysis | JHEP 07 (2002) 012 | hep-ph/0201195 |
| 60 | T. Sjostrand, S. Mrenna, and P. Z. Skands | PYTHIA 6.4 physics and manual | JHEP 05 (2006) 026 | hep-ph/0603175 |
| 61 | CMS Collaboration | Study of the underlying event at forward rapidity in pp collisions at $ \sqrt{s} = $ 0.9, 2.76, and 7 TeV | JHEP 04 (2013) 072 | CMS-FWD-11-003 1302.2394 |
| 62 | CMS Collaboration | Event generator tunes obtained from underlying event and multiparton scattering measurements | EPJC 76 (2016) 155 | CMS-GEN-14-001 1512.00815 |
| 63 | J. Alwall et al. | The automated computation of tree-level and next-to-leading order differential cross sections, and their matching to parton shower simulations | JHEP 07 (2014) 079 | 1405.0301 |
| 64 | NNPDF Collaboration | Parton distributions for the LHC Run II | JHEP 04 (2015) 040 | 1410.8849 |
| 65 | T. Sjostrand et al. | An introduction to PYTHIA 8.2 | CPC 191 (2015) 159 | 1410.3012 |
| 66 | GEANT4 Collaboration | GEANT4---a simulation toolkit | NIMA 506 (2003) 250 | |
| 67 | G. Cowan, K. Cranmer, E. Gross, and O. Vitells | Asymptotic formulae for likelihood-based tests of new physics | EPJC 71 (2011) 1554 | 1007.1727 |
| 68 | L. Lyons | Open statistical issues in Particle Physics | Ann. Appl. Stat. 2 (2008) 887 | |
| 69 | CMS Collaboration | Performance of jet-plus-tracks algorithm in Run I | CMS-PAS-JME-14-005 | CMS-PAS-JME-14-005 |
| 70 | T. Junk | Confidence level computation for combining searches with small statistics | NIMA 434 (1999) 435 | hep-ex/9902006 |
| 71 | A. L. Read | Presentation of search results: The $ CL_s $ technique | JPG 28 (2002) 2693 | |
| 72 | CMS Collaboration | CMS luminosity based on pixel cluster counting---summer 2013 update | CMS-PAS-LUM-13-001 | |
| 73 | CMS Collaboration | CMS luminosity measurements for the 2016 data-taking period | CMS-PAS-LUM-17-001 | CMS-PAS-LUM-17-001 |
| 74 | V. Bertone, S. Carrazza, and J. Rojo | APFEL: A PDF Evolution Library with QED corrections | CPC 185 (2014) 1647 | 1310.1394 |
| 75 | S. Carrazza, A. Ferrara, D. Palazzo, and J. Rojo | APFEL Web | JPG 42 (2015) 057001 | 1410.5456 |
|
|
Compact Muon Solenoid LHC, CERN |
|

|

|

|

|

|