

Compact Muon Solenoid
LHC, CERN
| CMS-HIG-16-018 ; CERN-EP-2018-124 | ||
| Search for beyond the standard model Higgs bosons decaying into a $ \mathrm{b\bar{b}} $ pair in pp collisions at $\sqrt{s} = $ 13 TeV | ||
| CMS Collaboration | ||
| 31 May 2018 | ||
| JHEP 08 (2018) 113 | ||
| Abstract: A search for Higgs bosons that decay into a bottom quark-antiquark pair and are accompanied by at least one additional bottom quark is performed with the CMS detector. The data analyzed were recorded in proton-proton collisions at a centre-of-mass energy of $\sqrt{s} = $ 13 TeV at the LHC, corresponding to an integrated luminosity of 35.7 fb$^{-1}$. The final state considered in this analysis is particularly sensitive to signatures of a Higgs sector beyond the standard model, as predicted in the generic class of two Higgs doublet models (2HDMs). No signal above the standard model background expectation is observed. Stringent upper limits on the cross section times branching fraction are set for Higgs bosons with masses up to 1300 GeV. The results are interpreted within several MSSM and 2HDM scenarios. | ||
| Links: e-print arXiv:1805.12191 [hep-ex] (PDF) ; CDS record ; inSPIRE record ; HepData record ; CADI line (restricted) ; | ||
| Figures & Tables | Summary | Additional Figures | References | CMS Publications |
|---|
| Figures | |
png pdf |
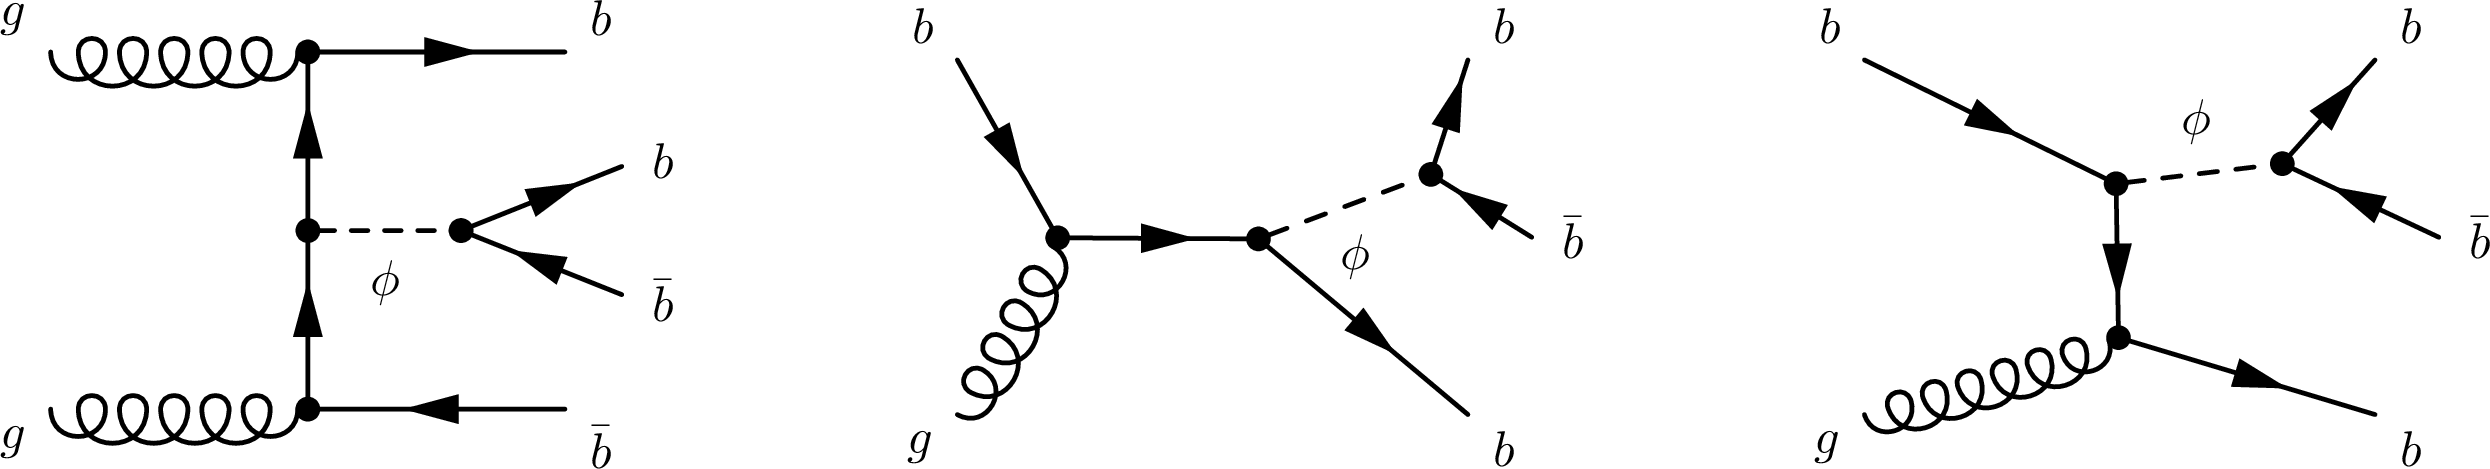
Figure 1:
Example Feynman diagrams for the signal processes. |
png pdf |
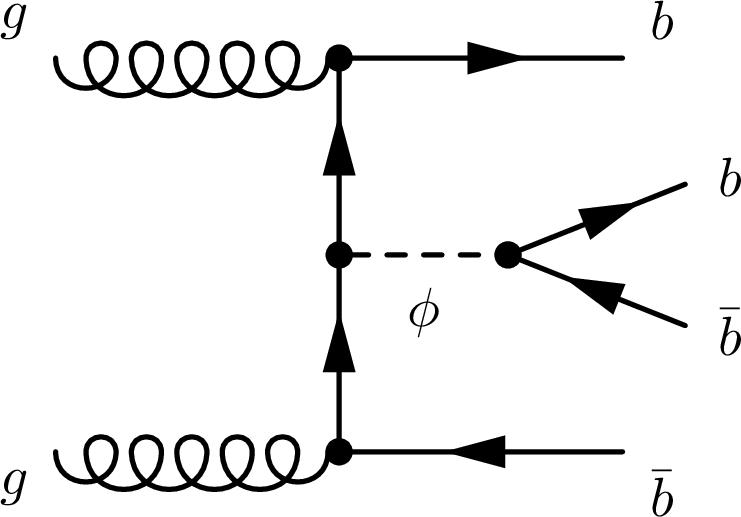
Figure 1-a:
Example Feynman diagram for the signal processes. |

png pdf |
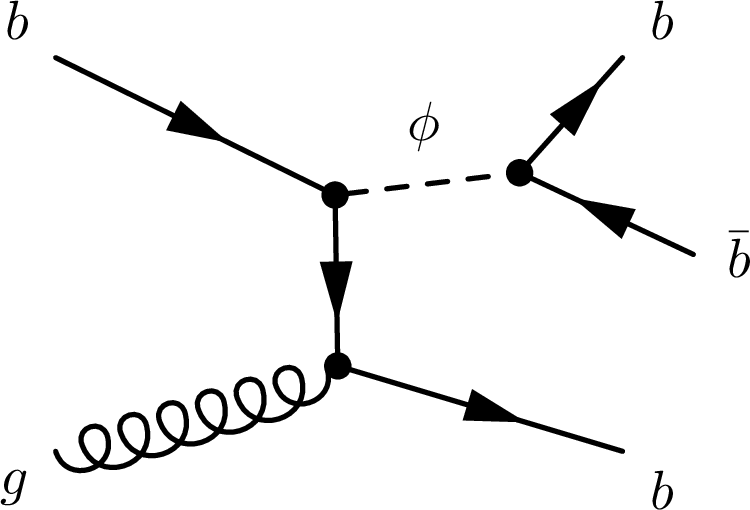
Figure 1-b:
Example Feynman diagram for the signal processes. |
png pdf |
Figure 1-c:
Example Feynman diagram for the signal processes. |
png pdf |
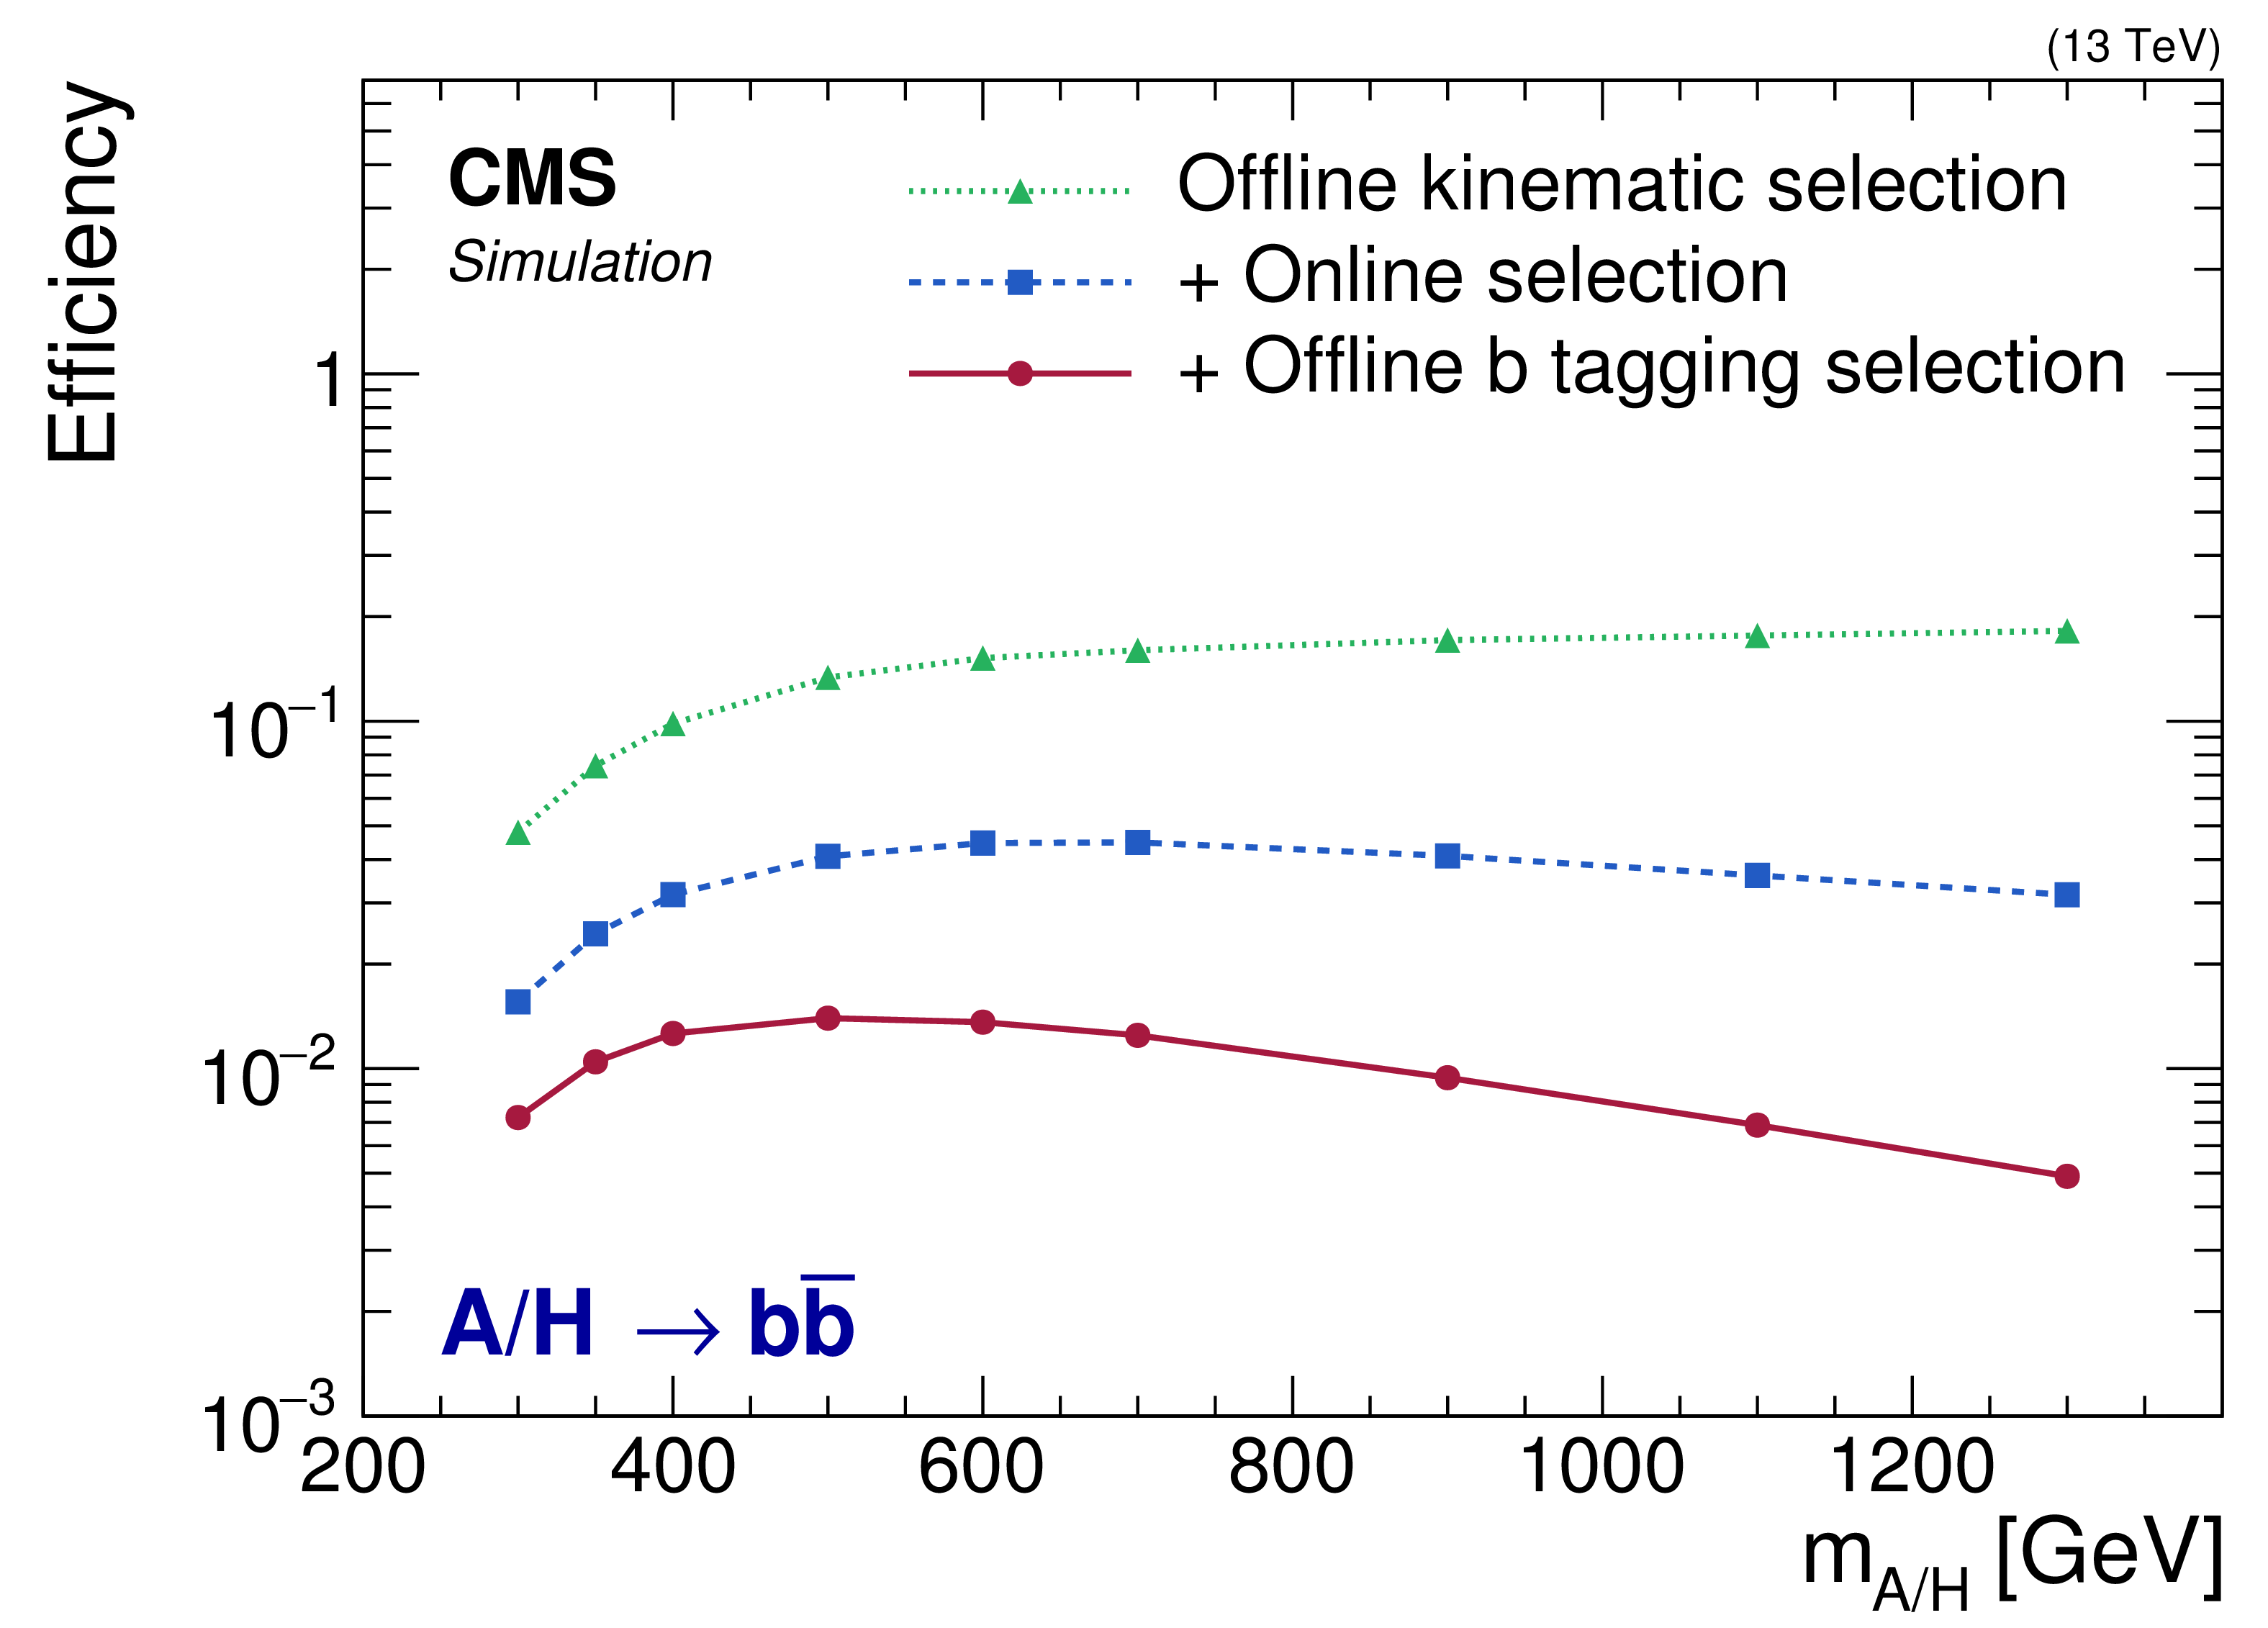
Figure 2:
Signal efficiency as a function of the Higgs boson mass after different stages of event selection. |

png pdf |
Figure 3:
Invariant mass distributions of the two leading b jets in simulated signal events and their parameterizations for three different ${\mathrm {A}} / {\mathrm {H}}$ masses, normalized to unity. |
png pdf |
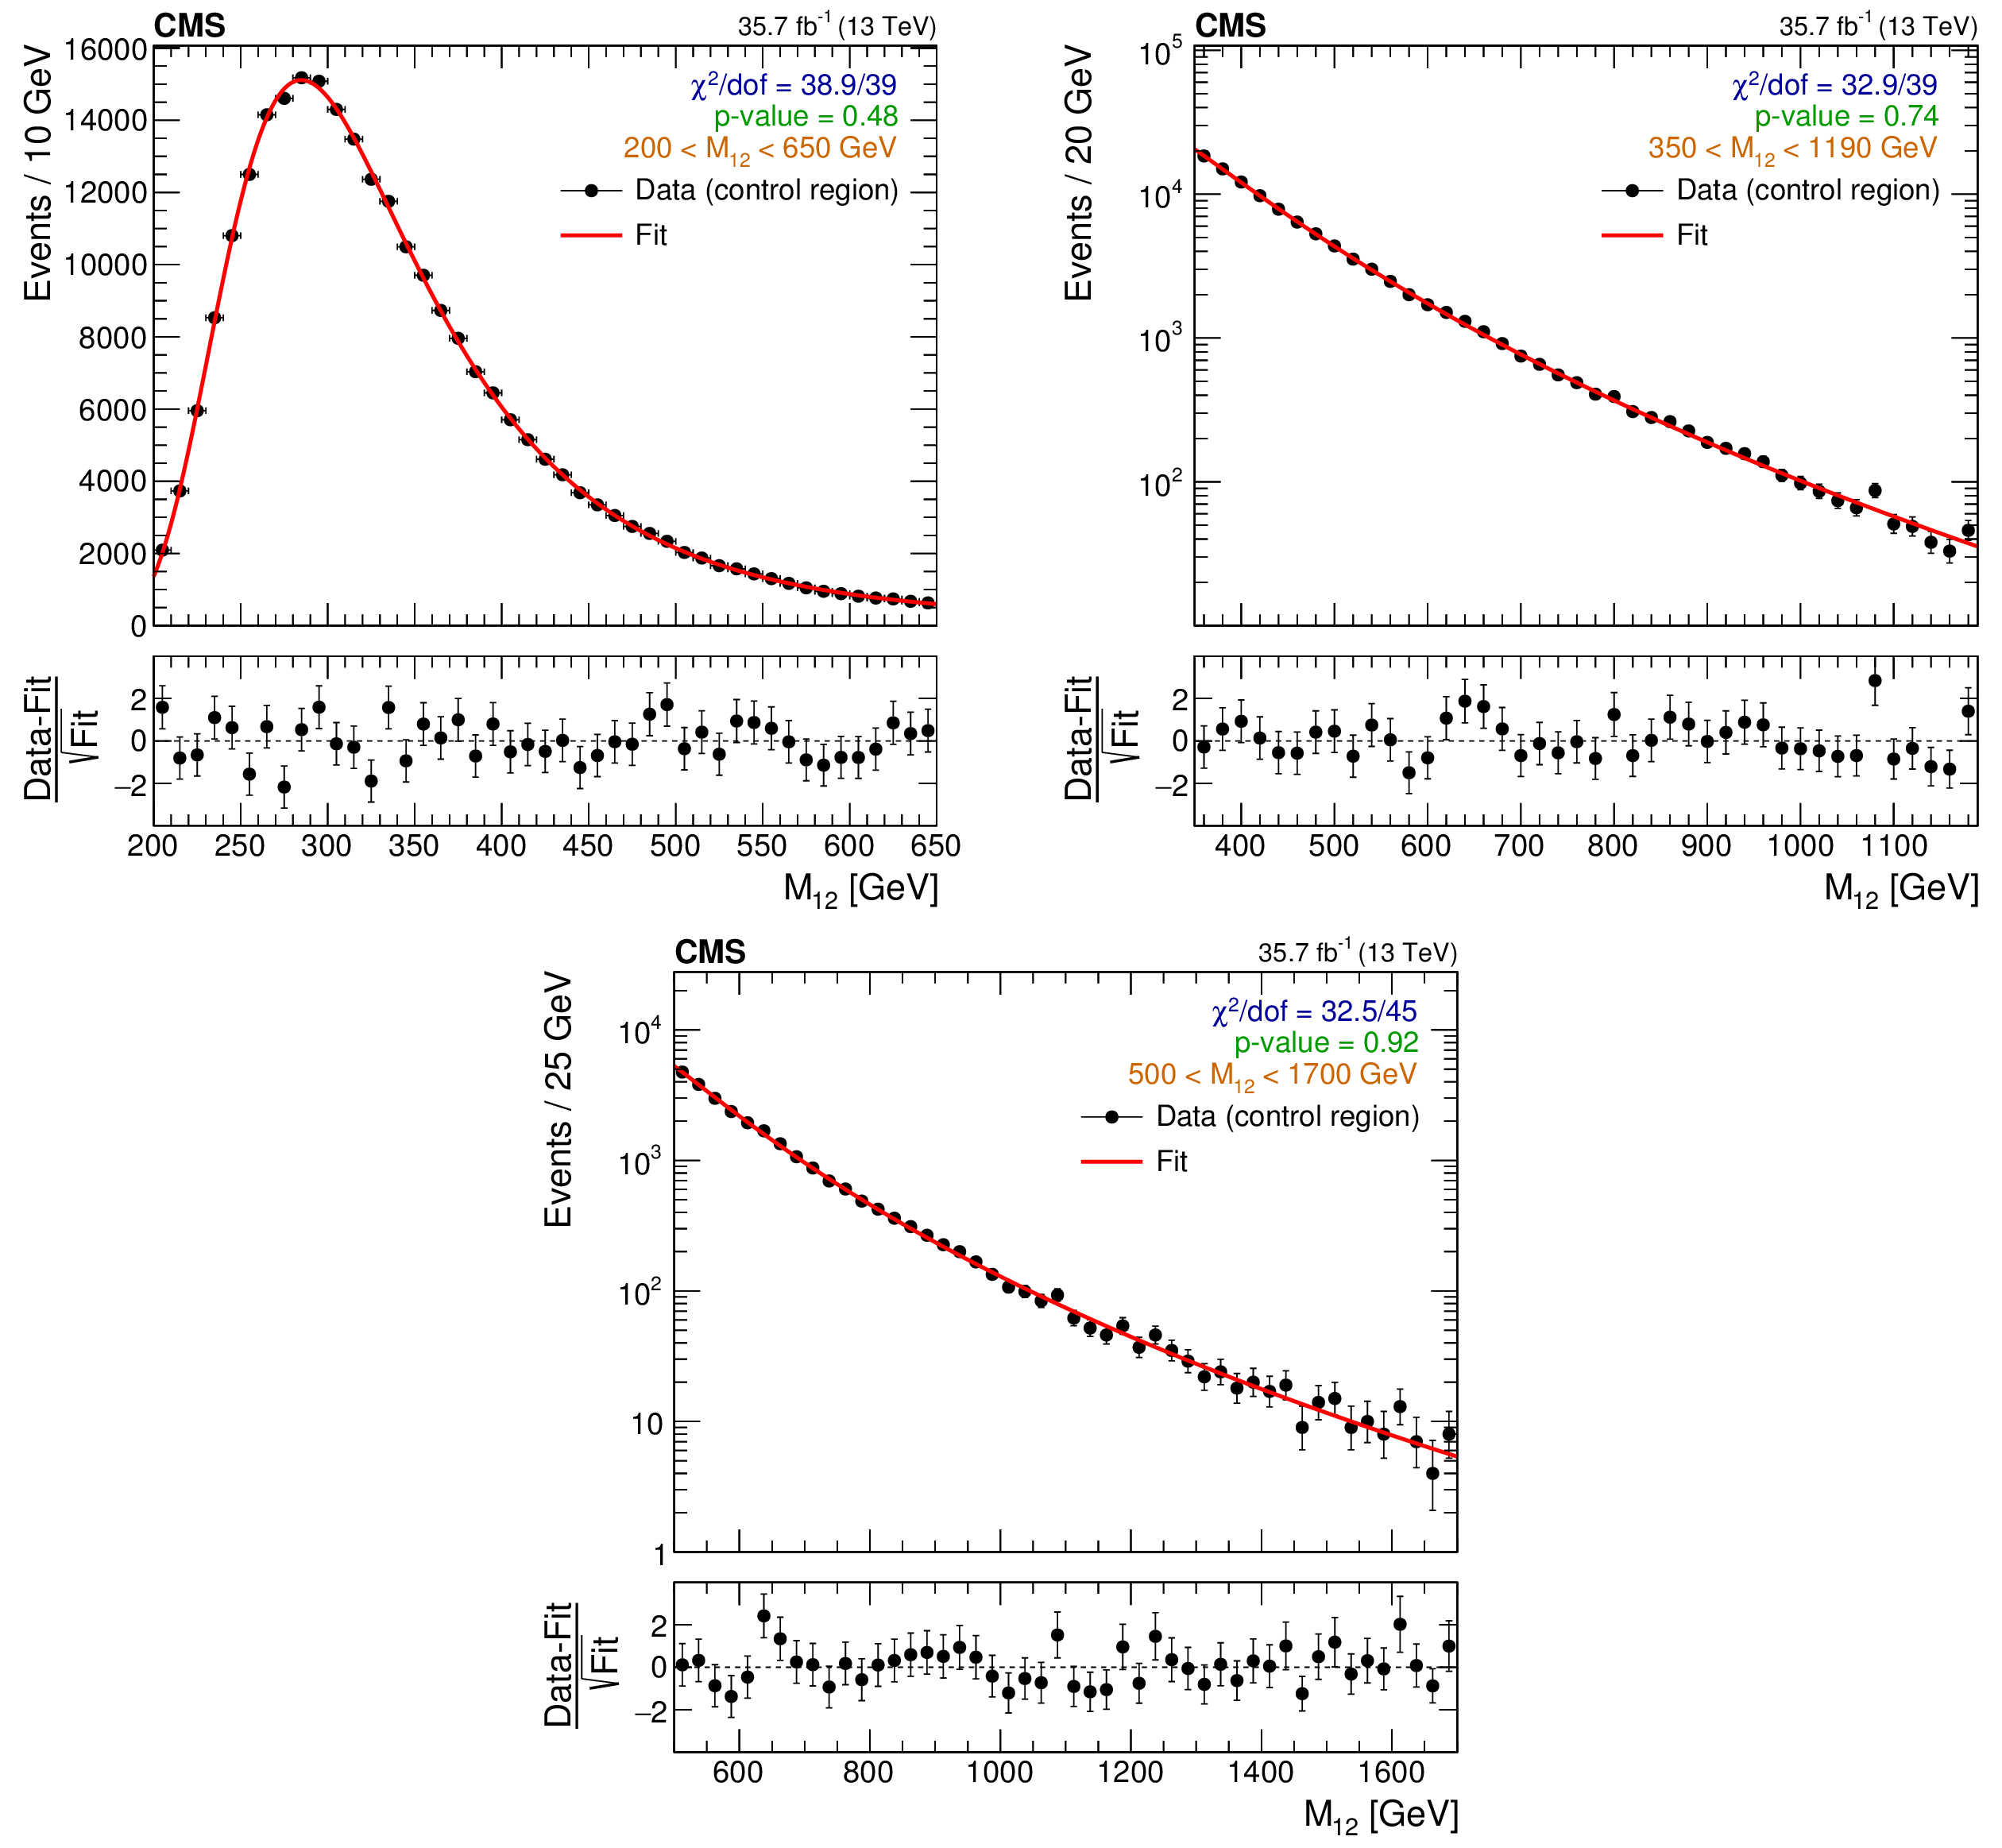
Figure 4:
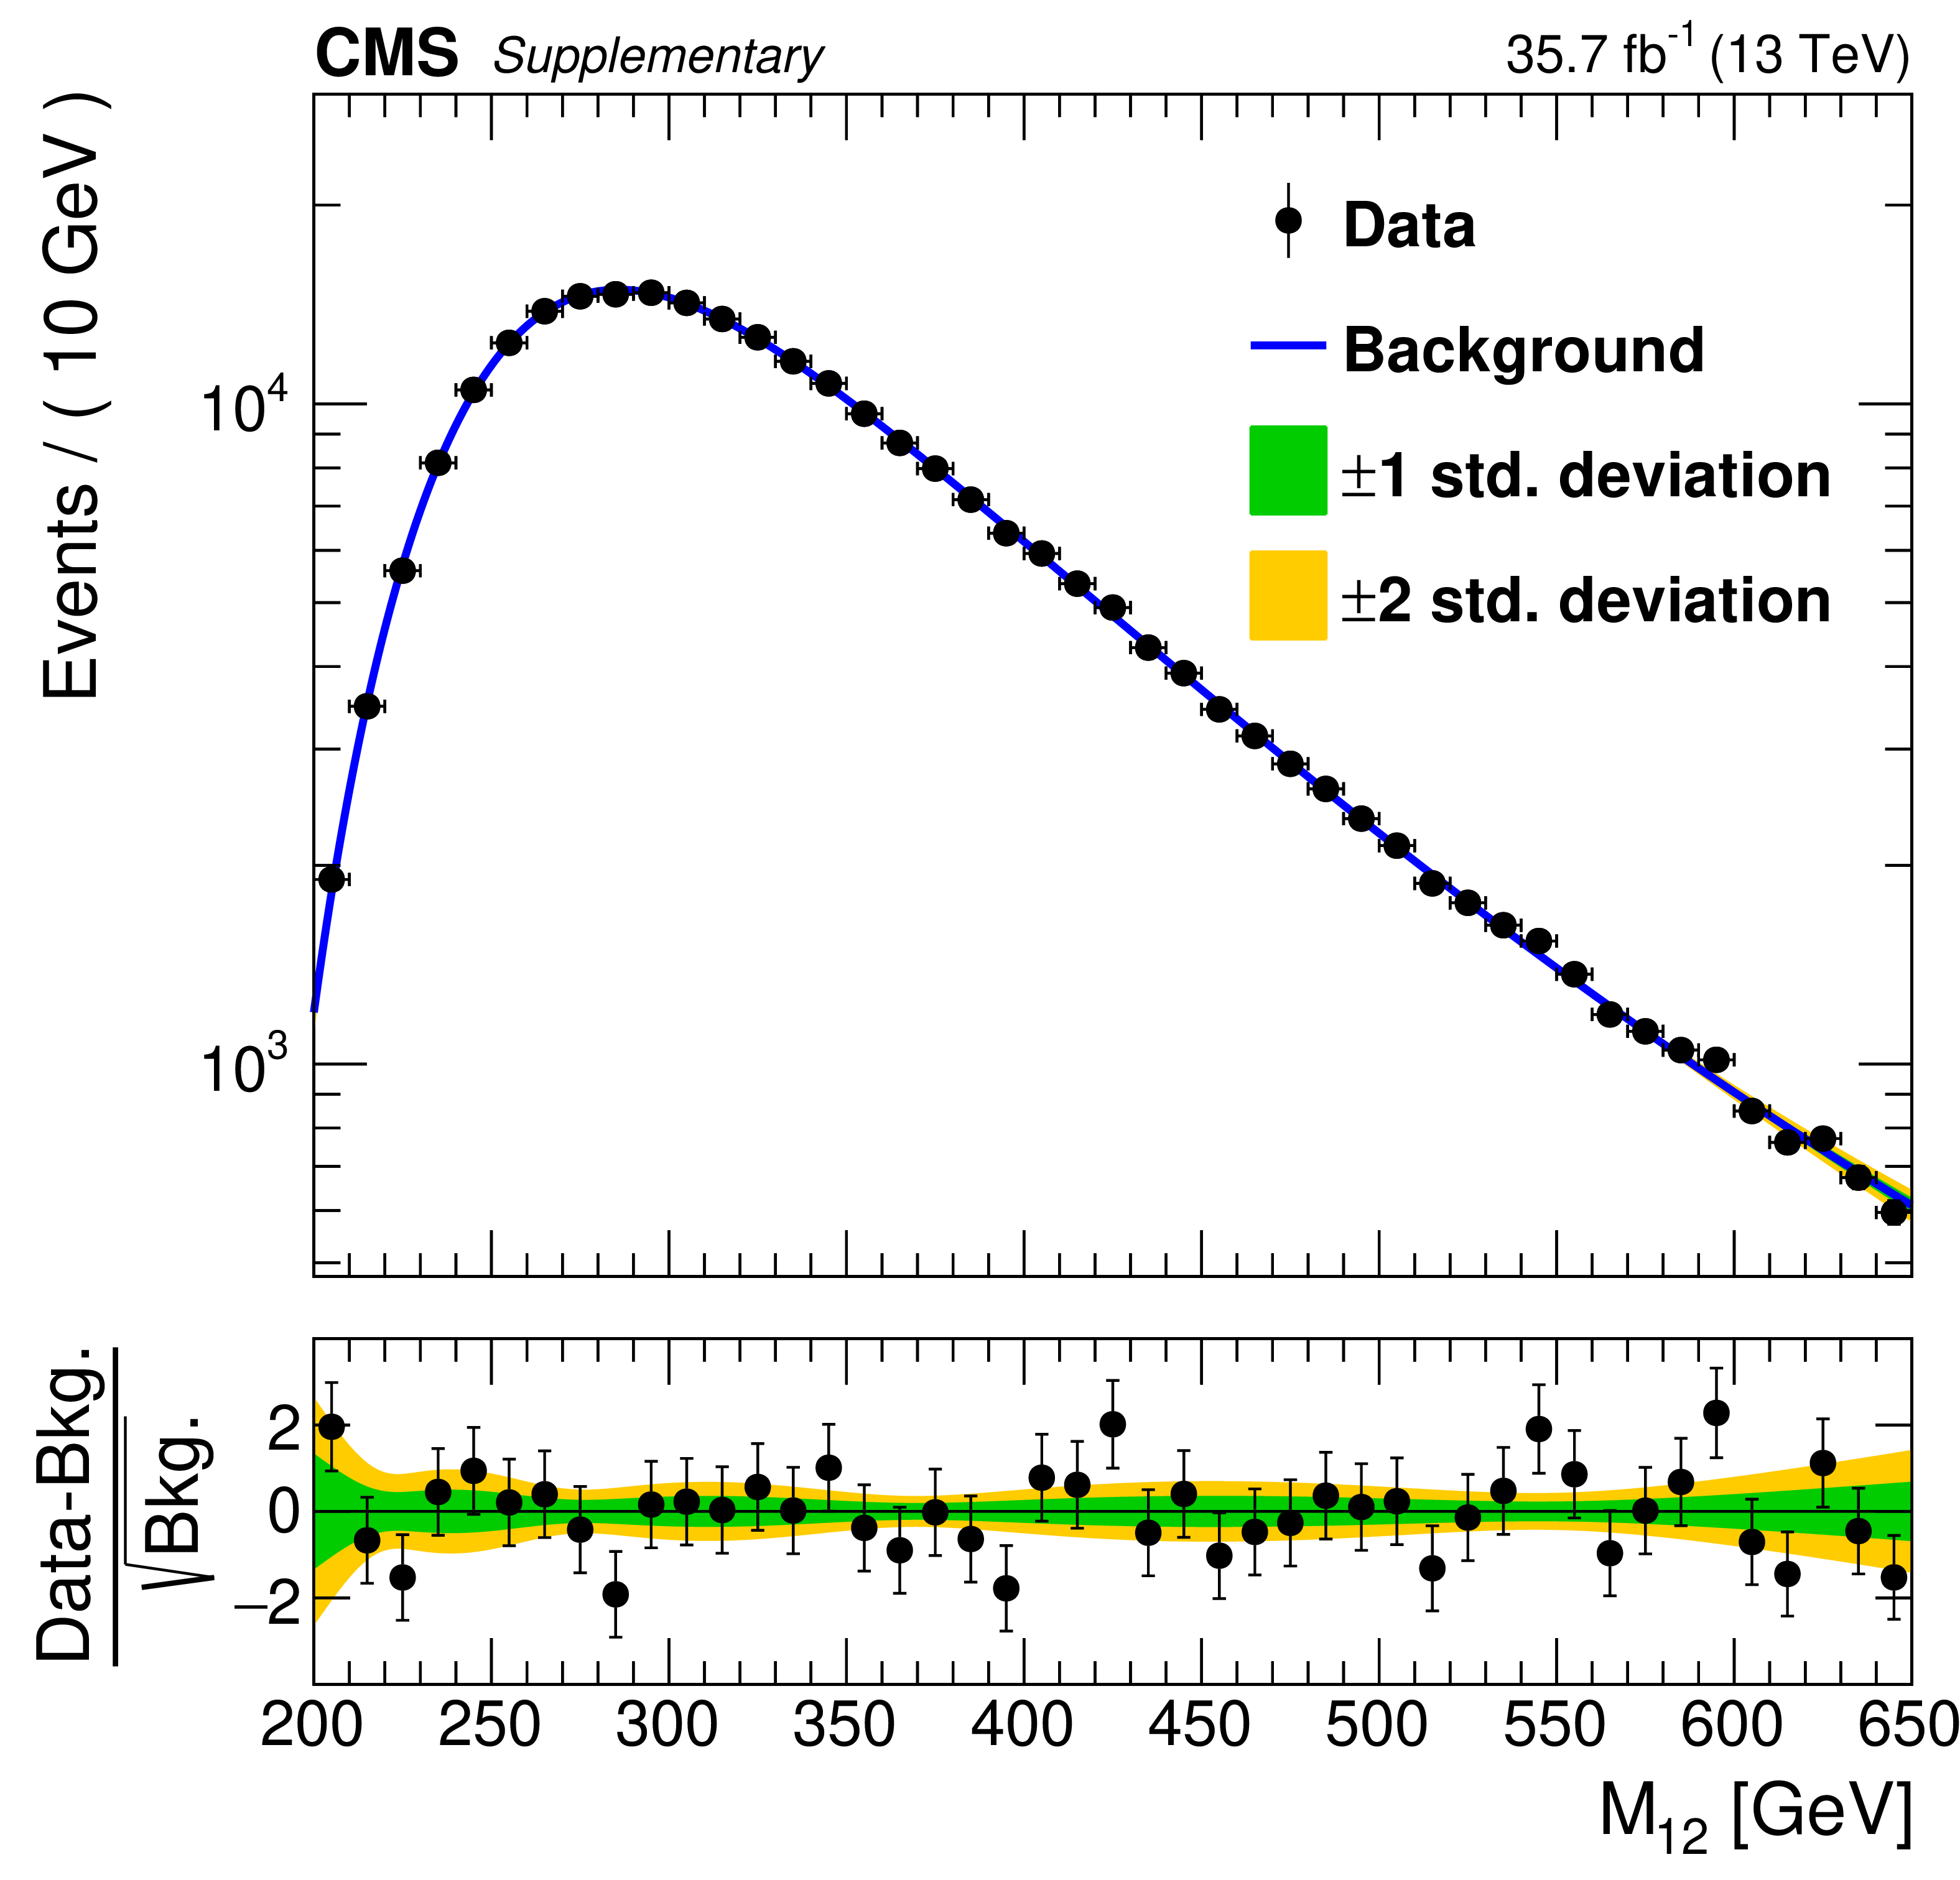
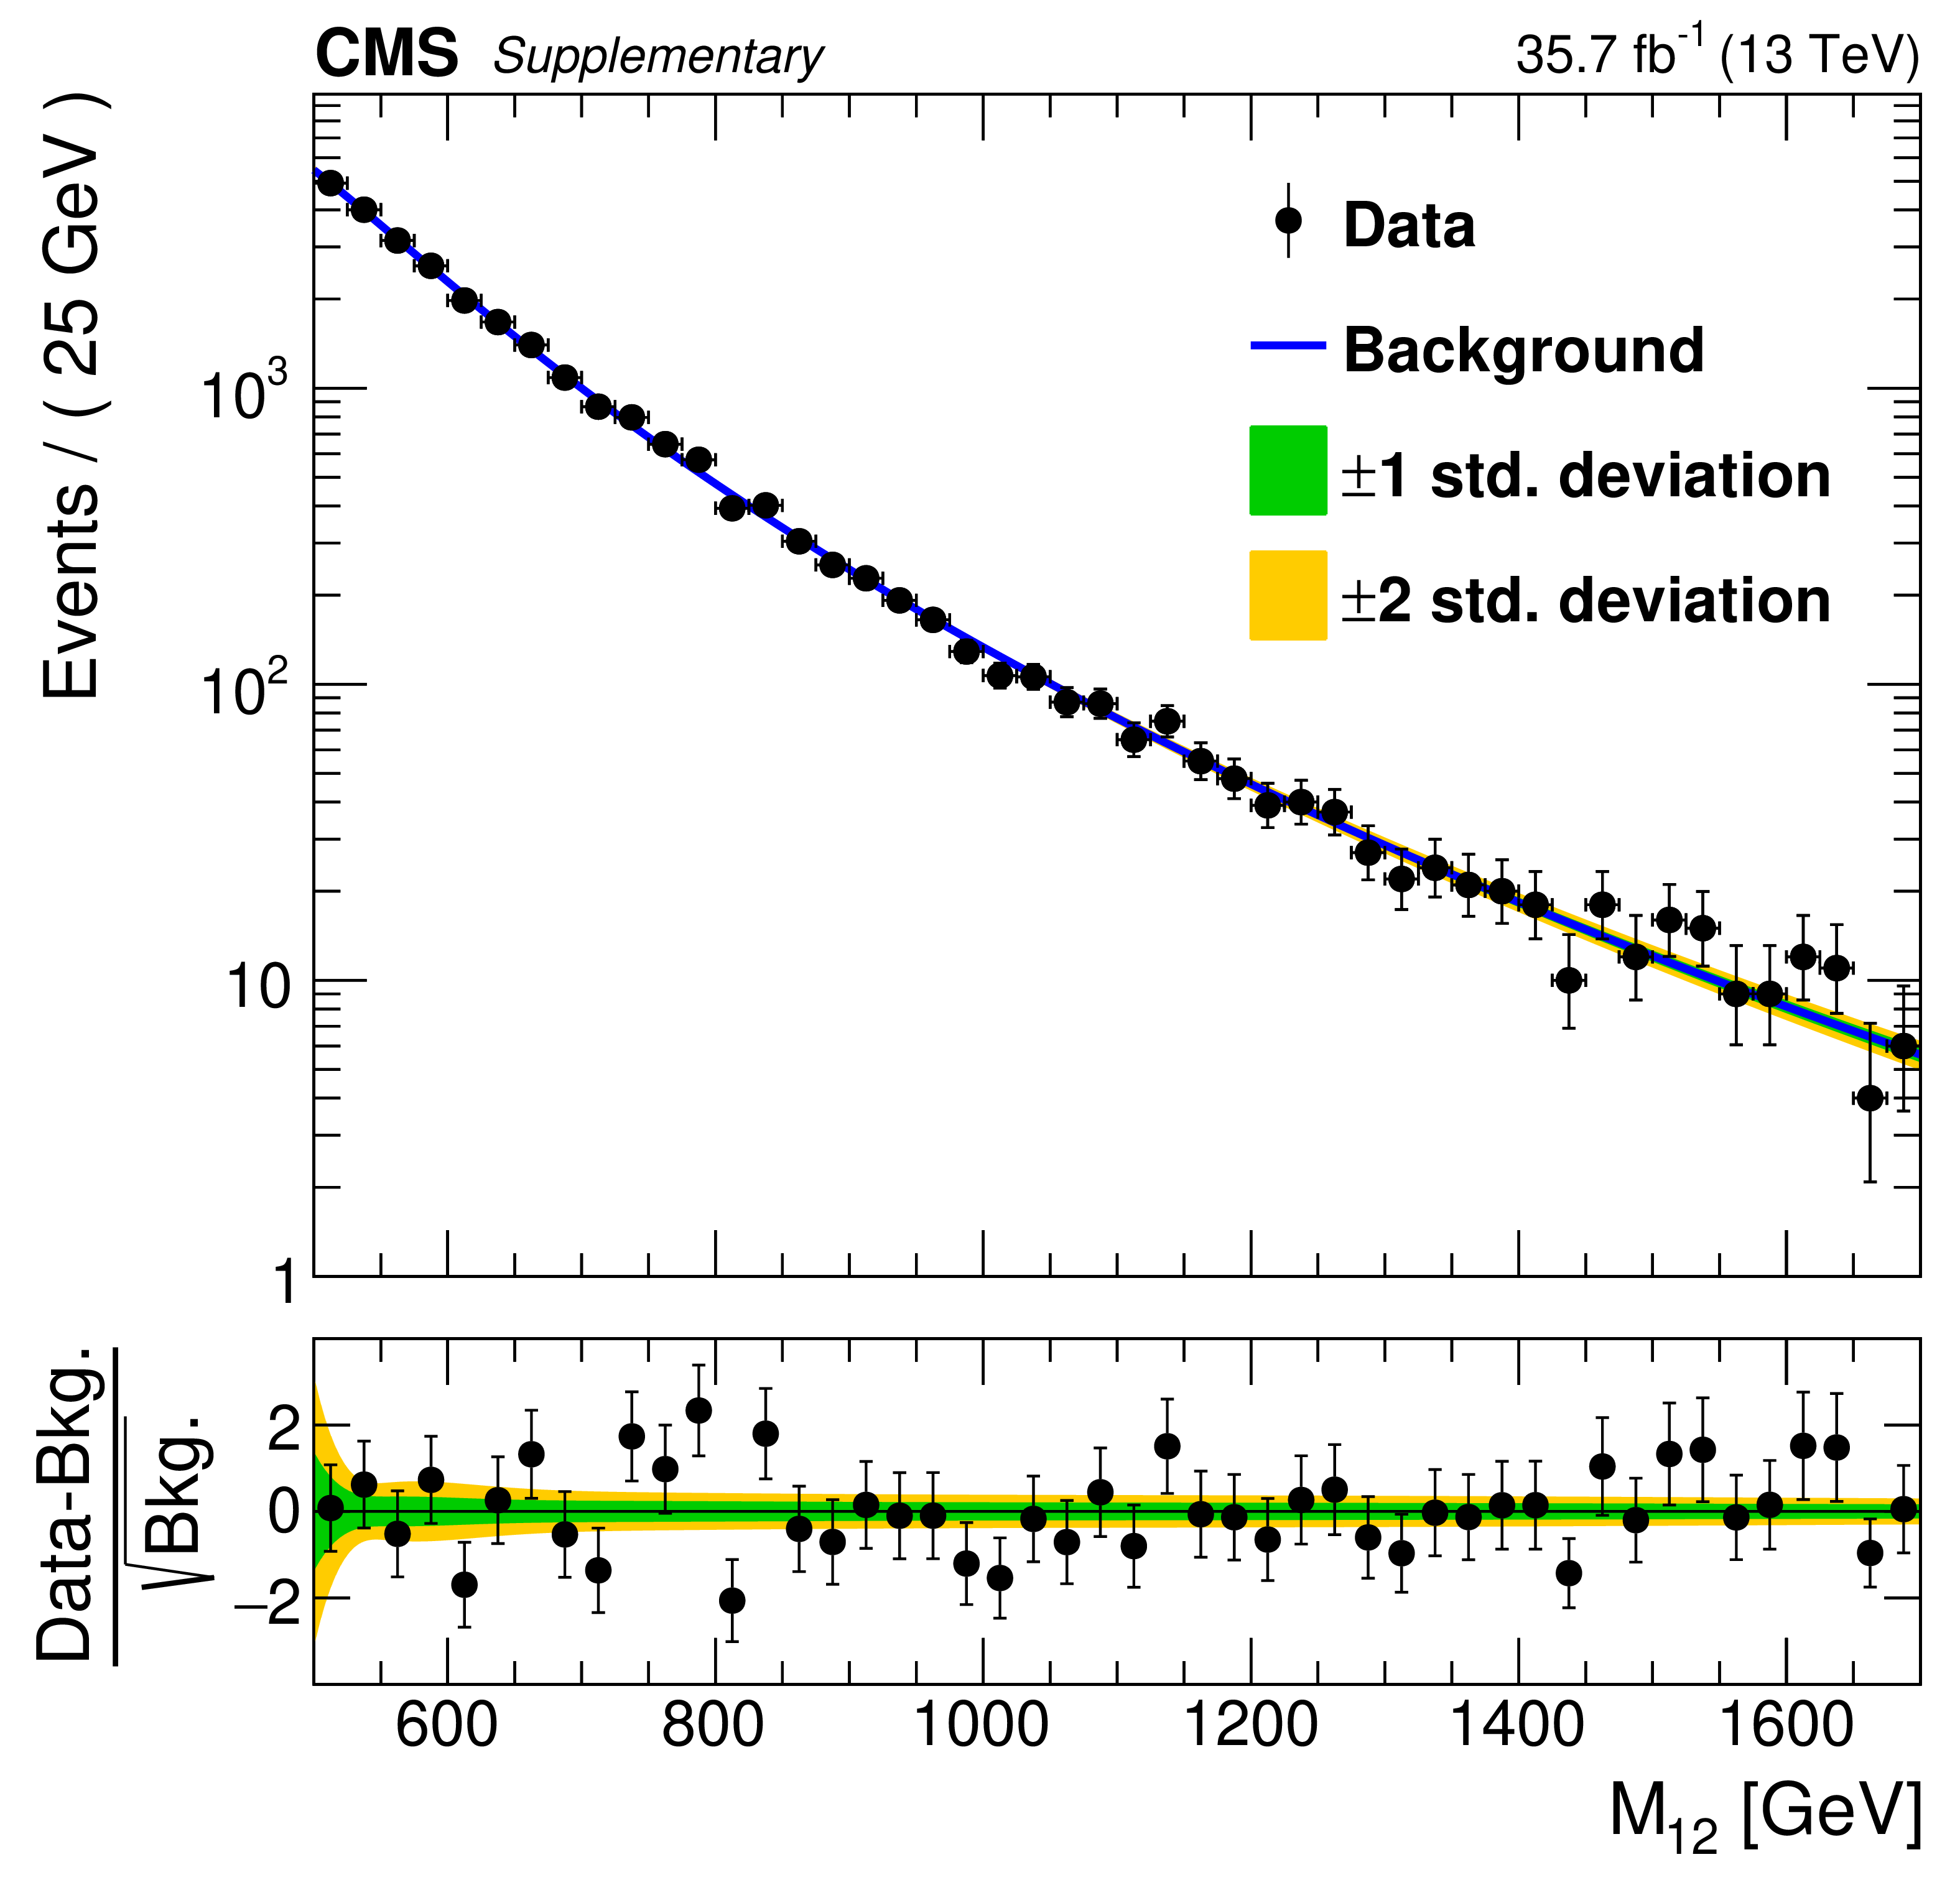
Distributions of the dijet invariant mass ${M_{12}}$, obtained from the b tag veto CR as described in the text in the three subranges used for the fit: $ {M_{12}} = $ [200, 650] GeV (upper left) in linear scale, $ {M_{12}} = $ [350, 1190] GeV (upper right) and $ {M_{12}} = $ [500, 1700] GeV (lower) in logarithmic scale. The dots represent the data. The full line is the result of the fit of the background parameterizations described in the text. In the bottom panel of each plot, the normalized difference [(Data-Fit)/$\sqrt {\mathrm {Fit}}$] is shown. |
png pdf |
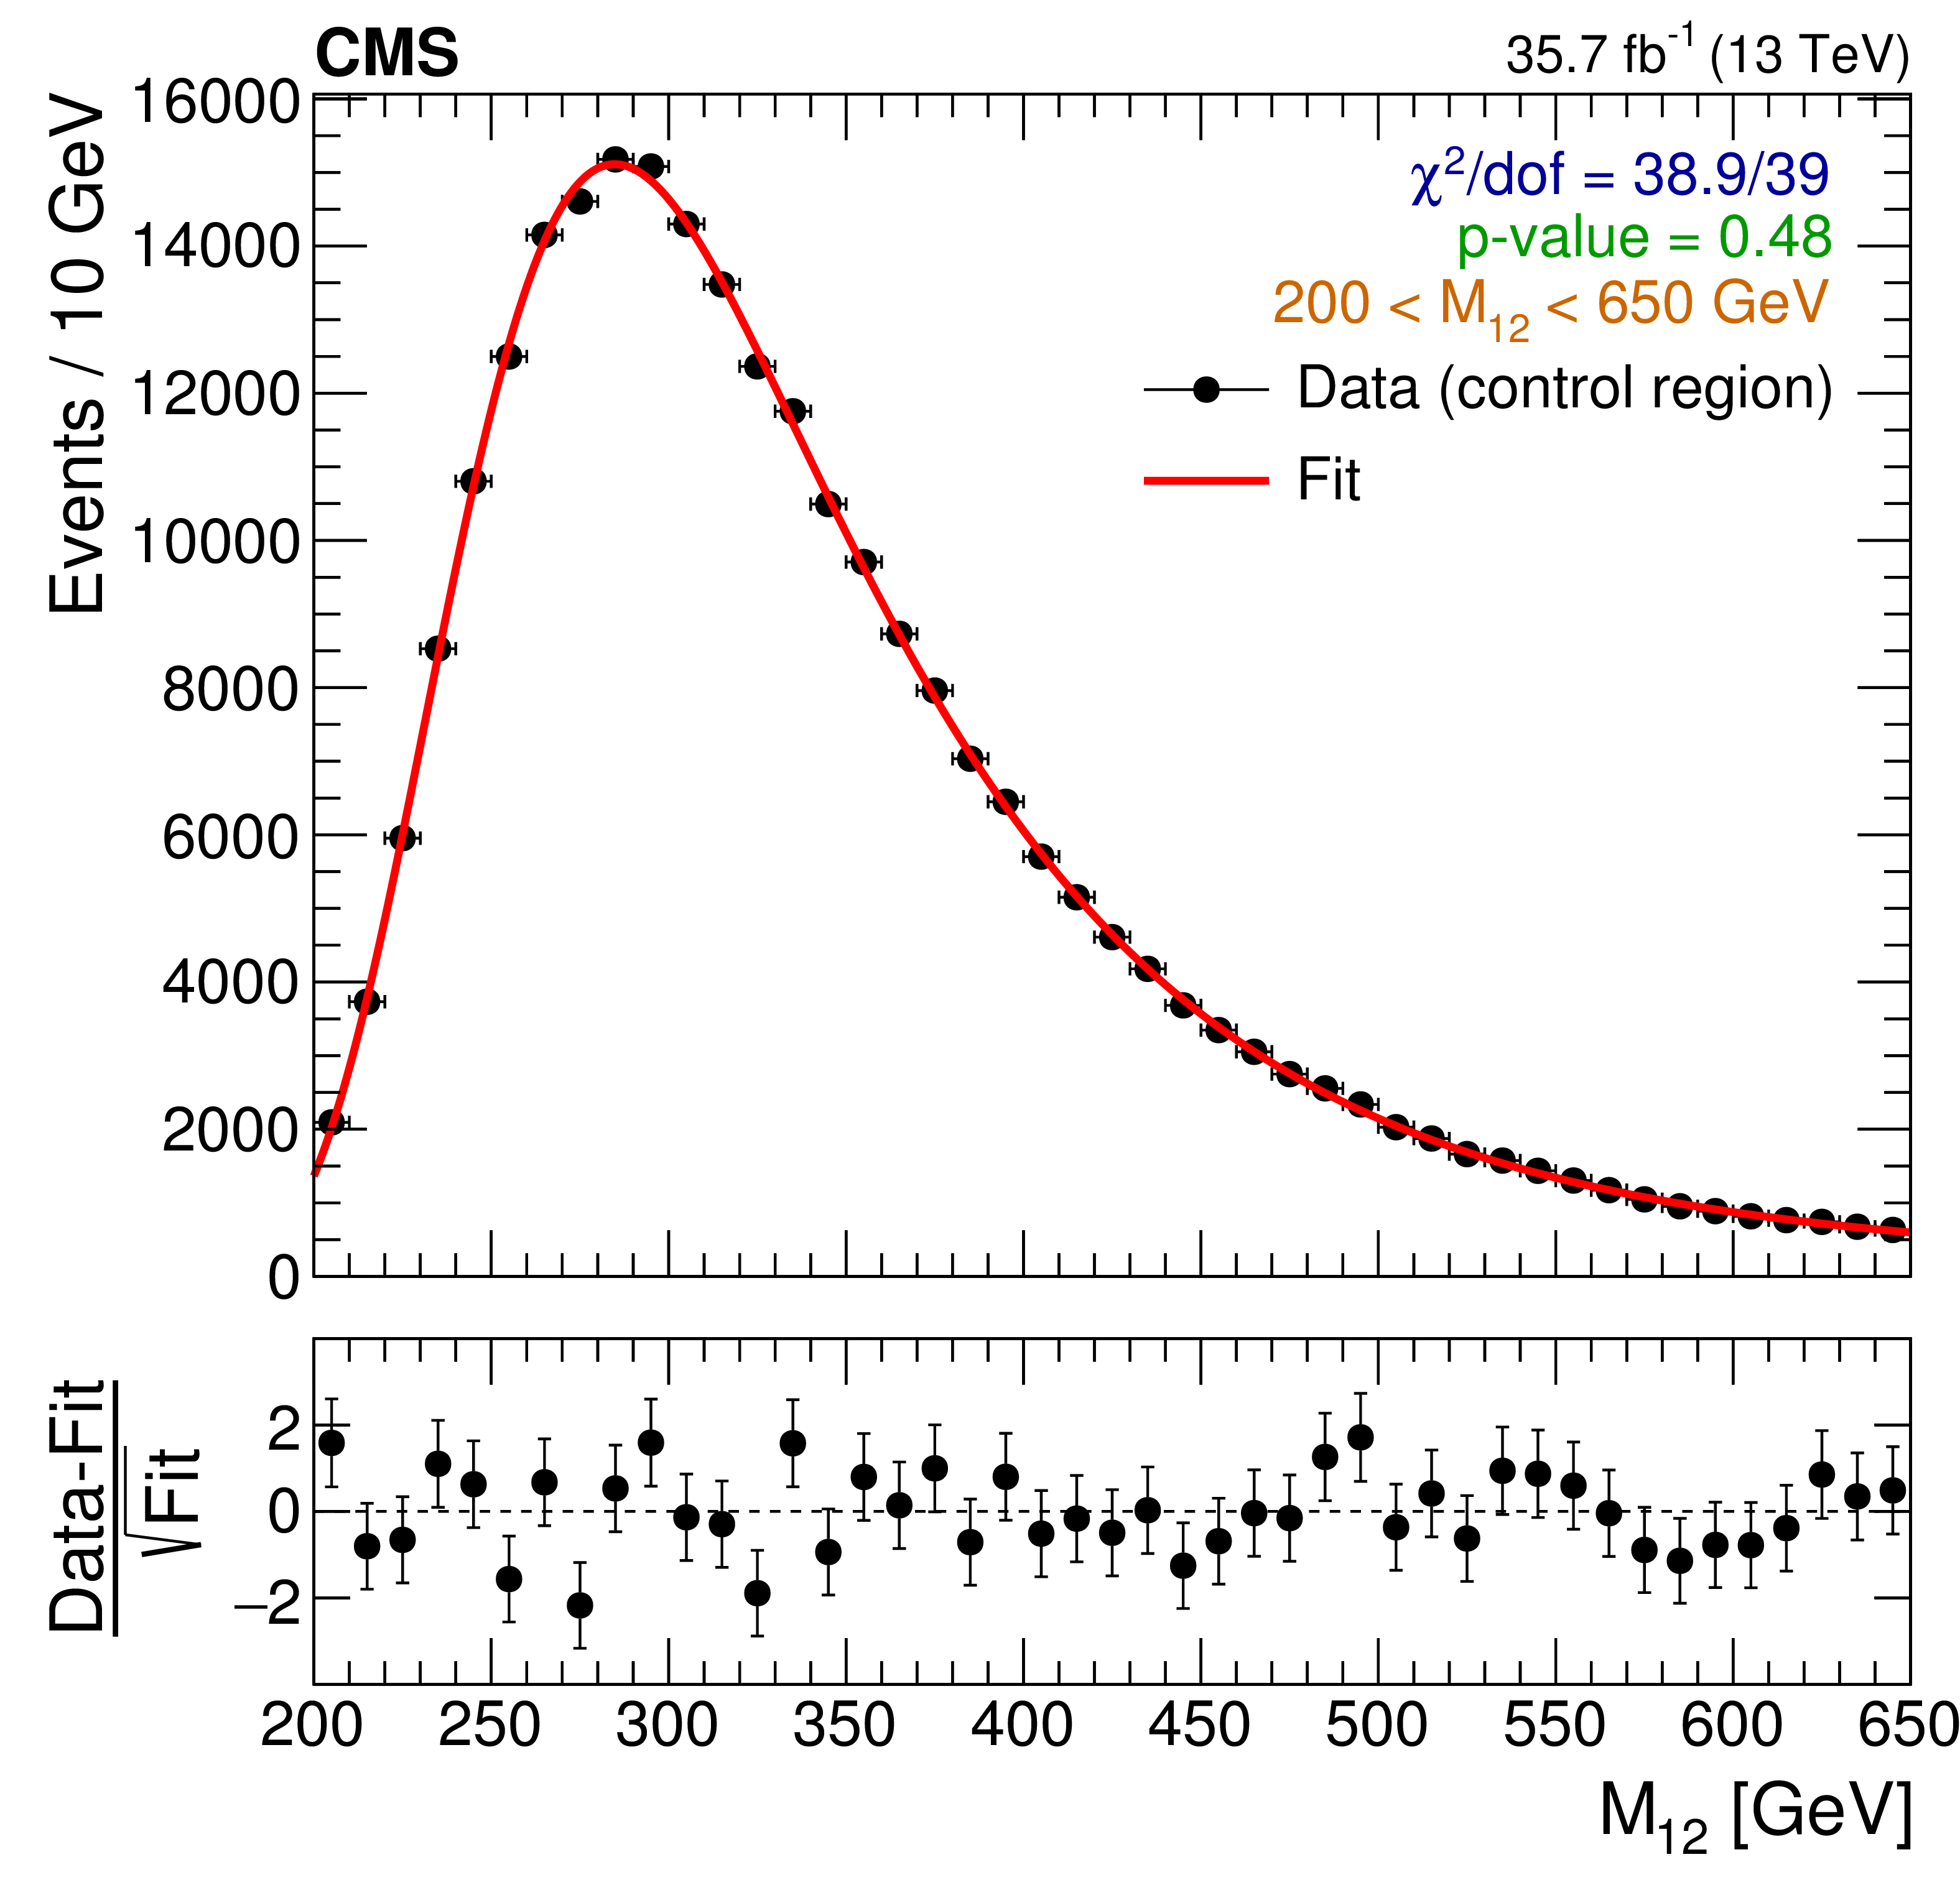
Figure 4-a:
Distribution of the dijet invariant mass ${M_{12}}$, obtained from the b tag veto CR as described in the text in one of the three subranges used for the fit: $ {M_{12}} = $ [200, 650] GeV in linear scale. The dots represent the data. The full line is the result of the fit of the background parameterizations described in the text. In the bottom panel of each plot, the normalized difference [(Data-Fit)/$\sqrt {\mathrm {Fit}}$] is shown. |
png pdf |
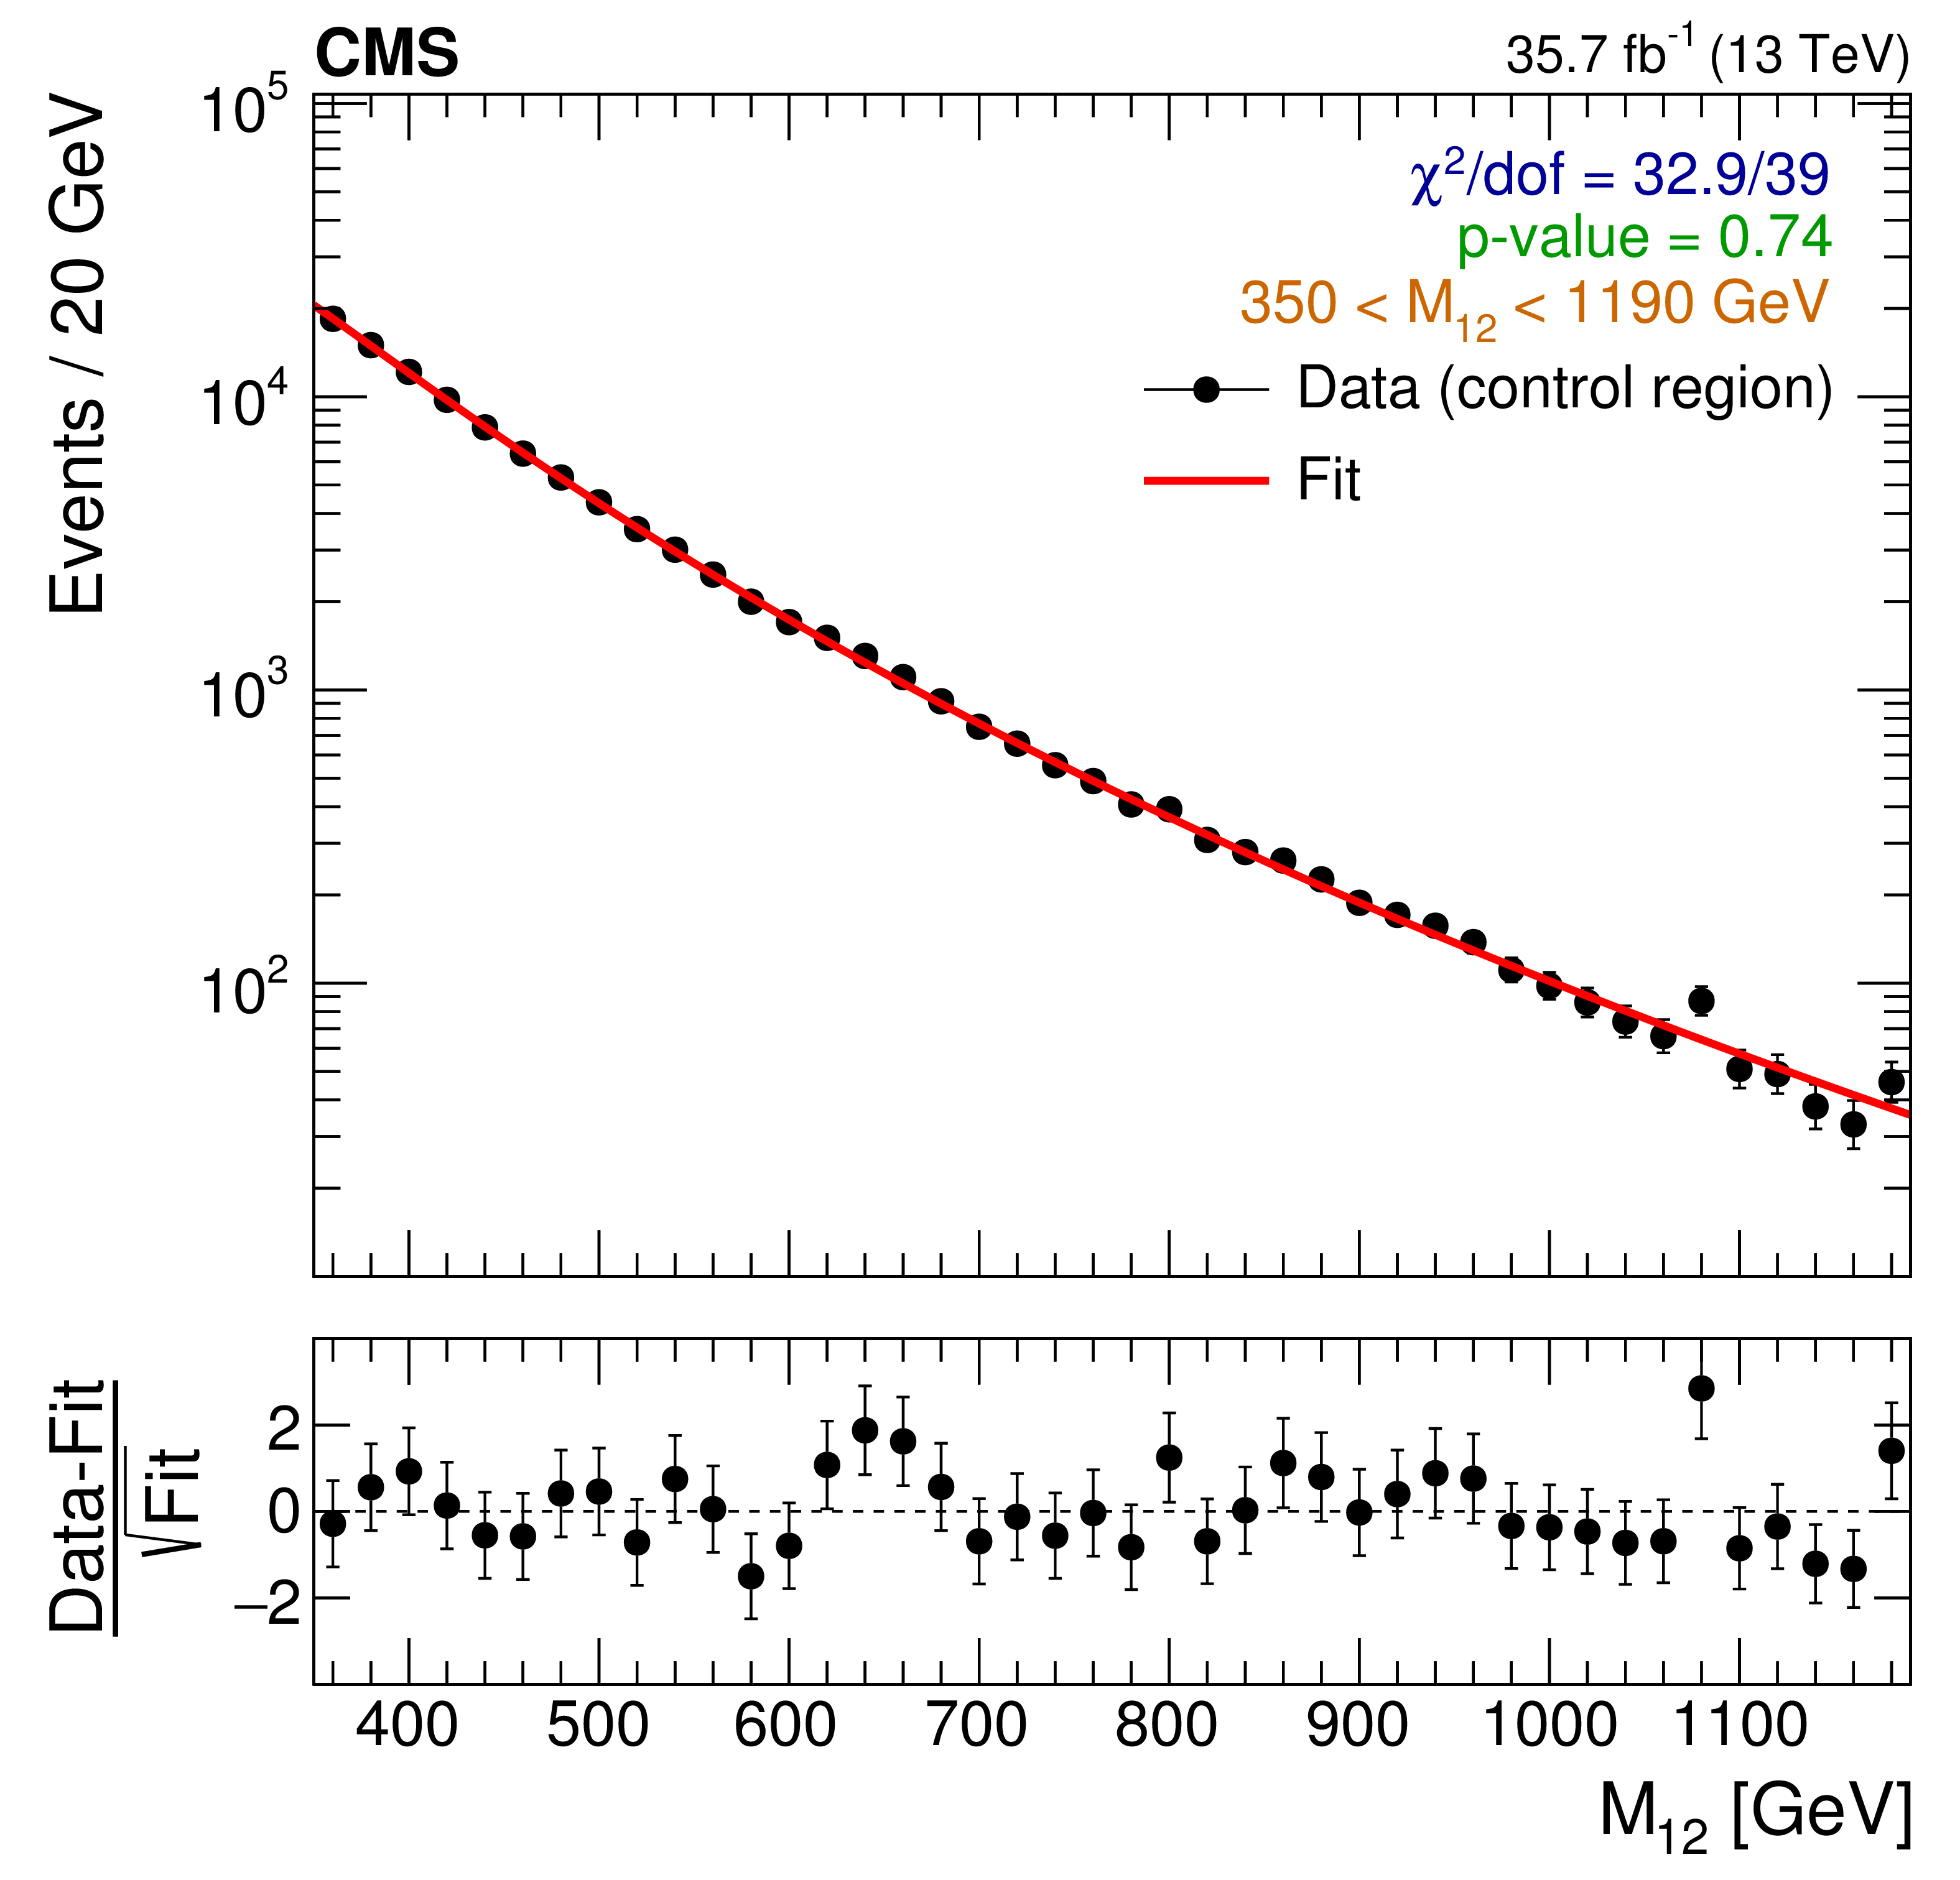
Figure 4-b:
Distribution of the dijet invariant mass ${M_{12}}$, obtained from the b tag veto CR as described in the text in one of the three subranges used for the fit: $ {M_{12}} = $ [350, 1190] GeV in logarithmic scale. The dots represent the data. The full line is the result of the fit of the background parameterizations described in the text. In the bottom panel of each plot, the normalized difference [(Data-Fit)/$\sqrt {\mathrm {Fit}}$] is shown. |

png pdf |
Figure 4-c:
Distribution of the dijet invariant mass ${M_{12}}$, obtained from the b tag veto CR as described in the text in one of the three subranges used for the fit: $ {M_{12}} = $ [500, 1700] GeV in logarithmic scale. The dots represent the data. The full line is the result of the fit of the background parameterizations described in the text. In the bottom panel of each plot, the normalized difference [(Data-Fit)/$\sqrt {\mathrm {Fit}}$] is shown. |
png pdf |
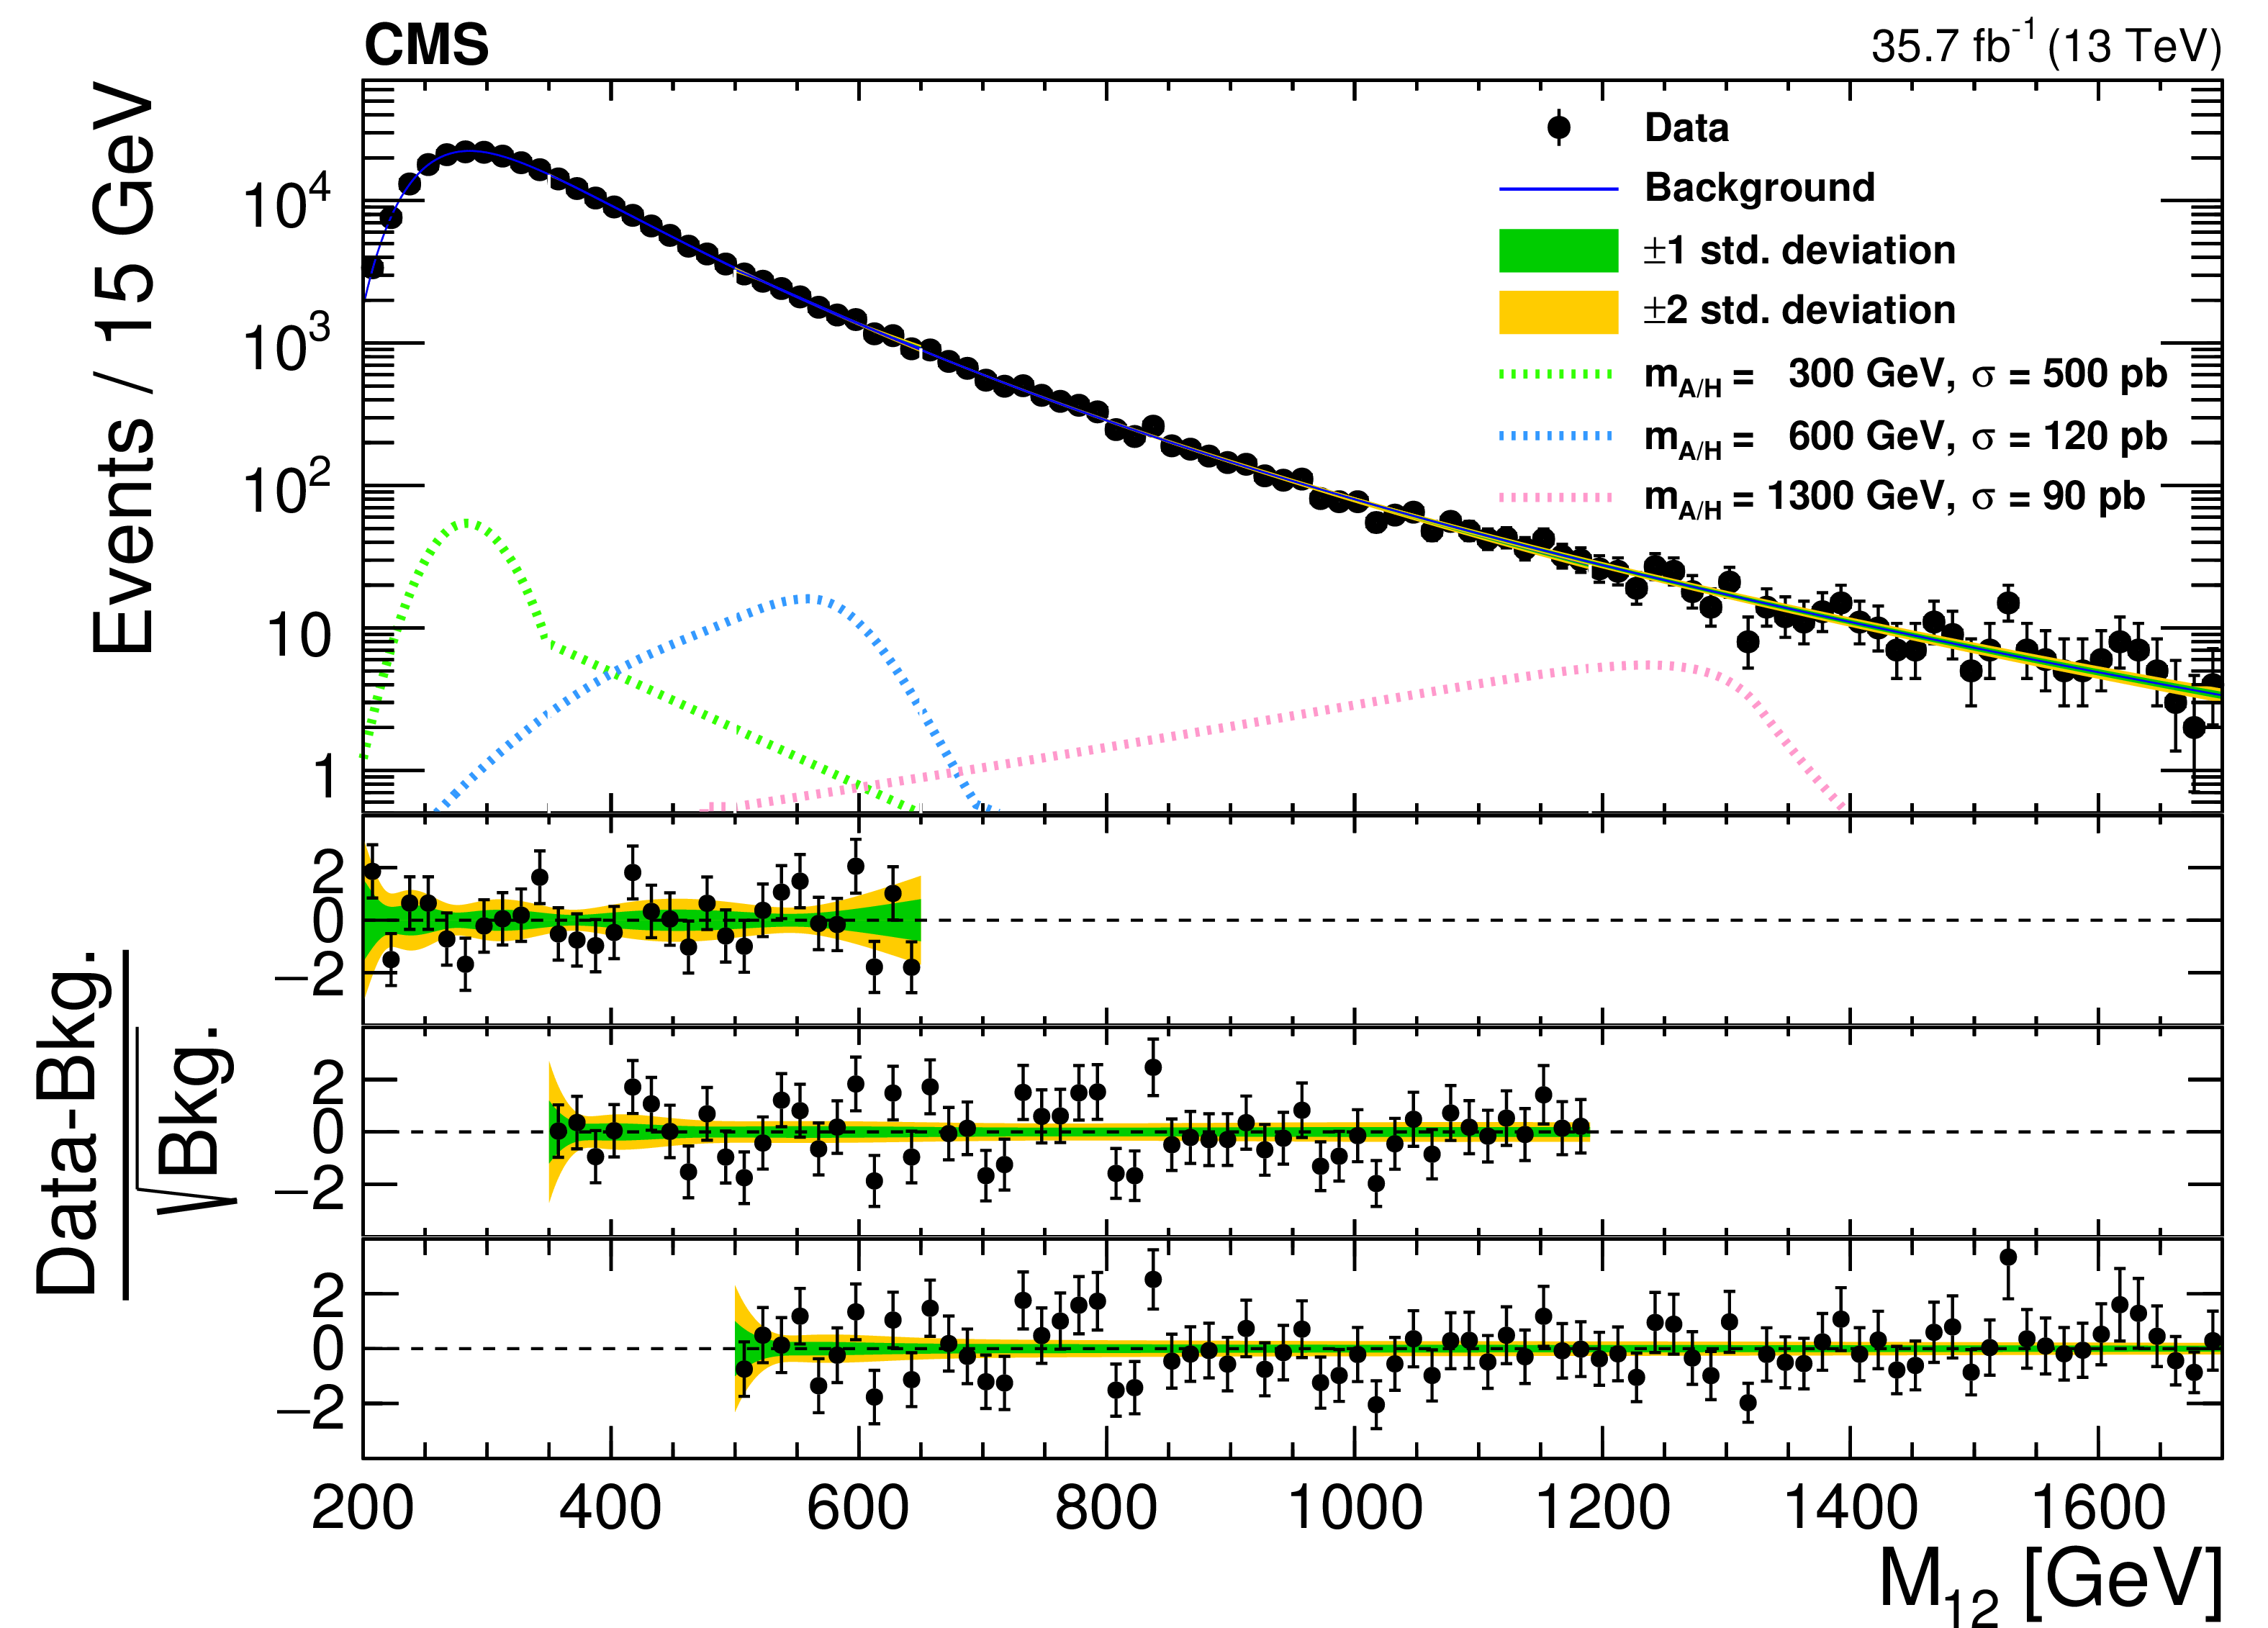
Figure 5:
Distribution of the dijet invariant mass ${M_{12}}$ in the data triple b tag sample showing the three subranges together with the corresponding background-only fits. The shaded area shows the post-fit uncertainty. For illustration, the expected signal contribution for three representative mass points is shown, scaled to cross sections suitable for visualization. The change of slope around 350 GeV of the 300 GeV signal shape is caused by wrong jet pairing. In the bottom panels the normalized difference ((Data-Bkg)/$\sqrt {\mathrm {Bkg}}$), where Bkg is the background as estimated by the fit, for the three subranges is shown. |
png pdf |
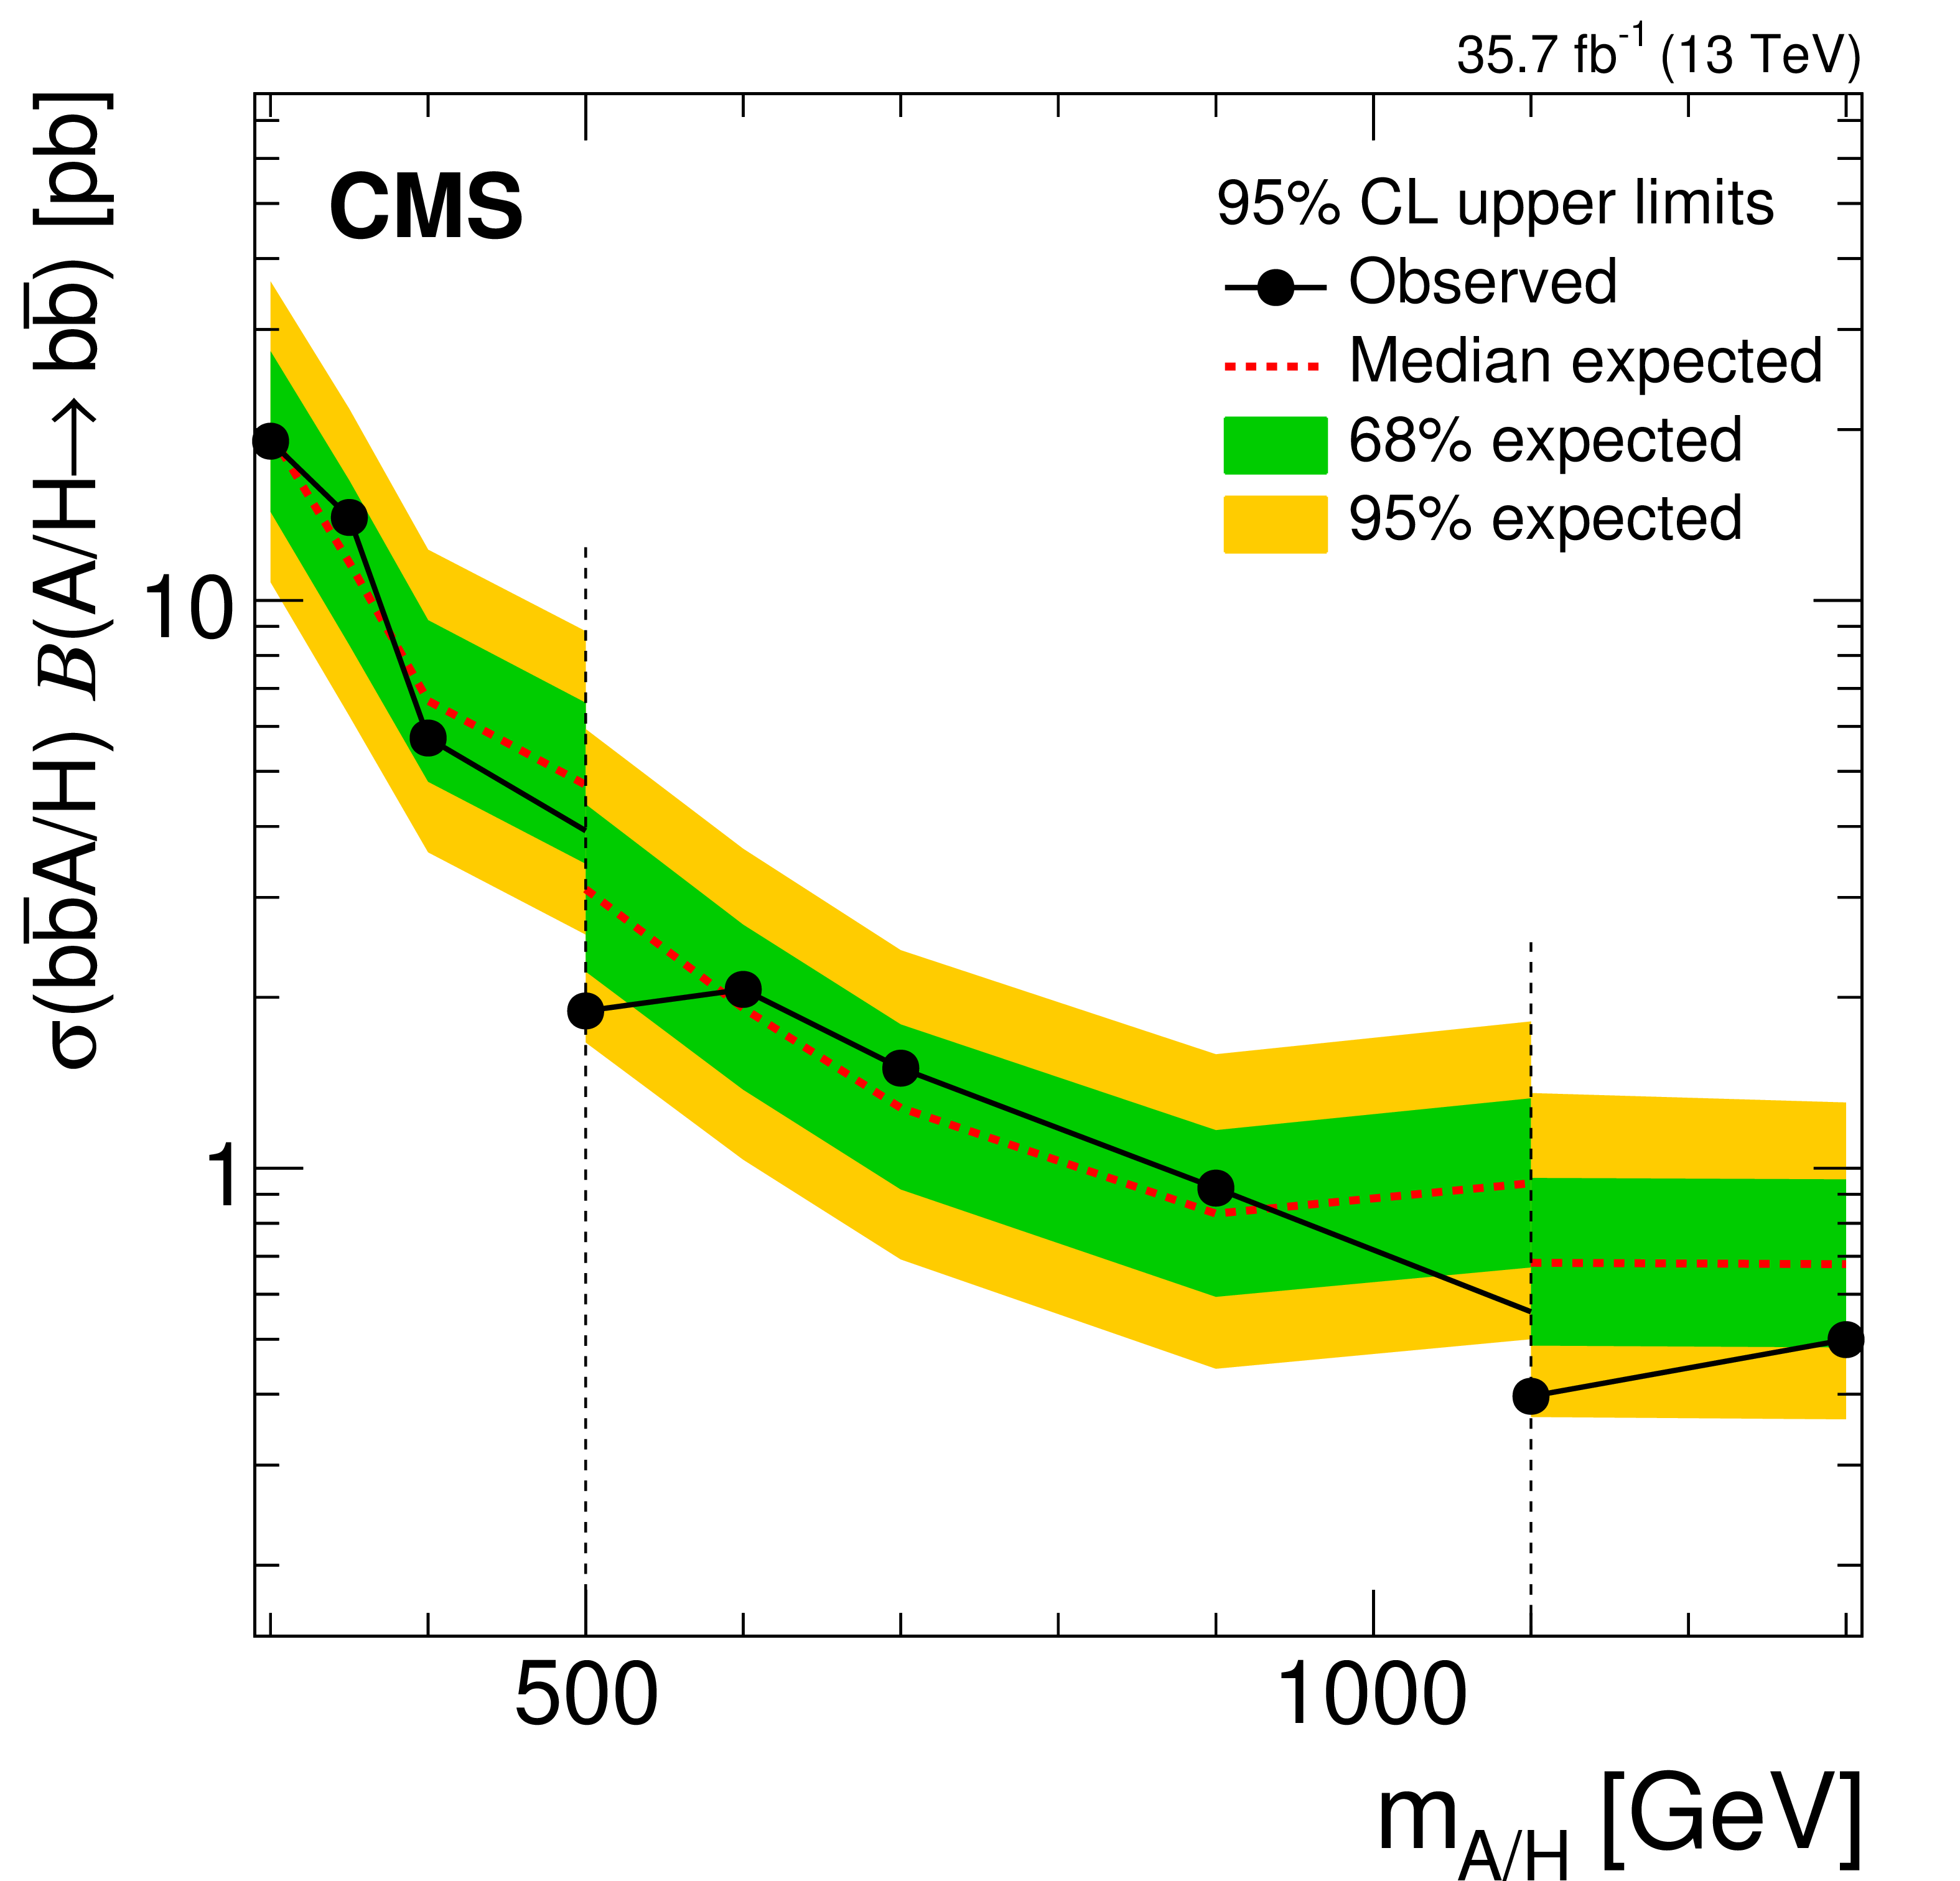
Figure 6:
Expected and observed upper limits on $\sigma ({\mathrm {p}} {\mathrm {p}}\to {\mathrm {b}} {\mathrm {A}} / {\mathrm {H}} +\mathrm {X})\,\mathcal {B}({\mathrm {A}} / {\mathrm {H}} \to {{\mathrm {b}} {\overline {\mathrm {b}}}})$ at 95% CL as a function of the Higgs boson mass $ {m_{{\mathrm {A}} / {\mathrm {H}}}} $. The inner and the outer bands indicate the regions containing 68 and 95%, respectively, of the distribution of limits expected under the background-only hypothesis. The dashed horizontal lines illustrate the borders between the three subranges in which the results have been obtained. |

png pdf |
Figure 7:
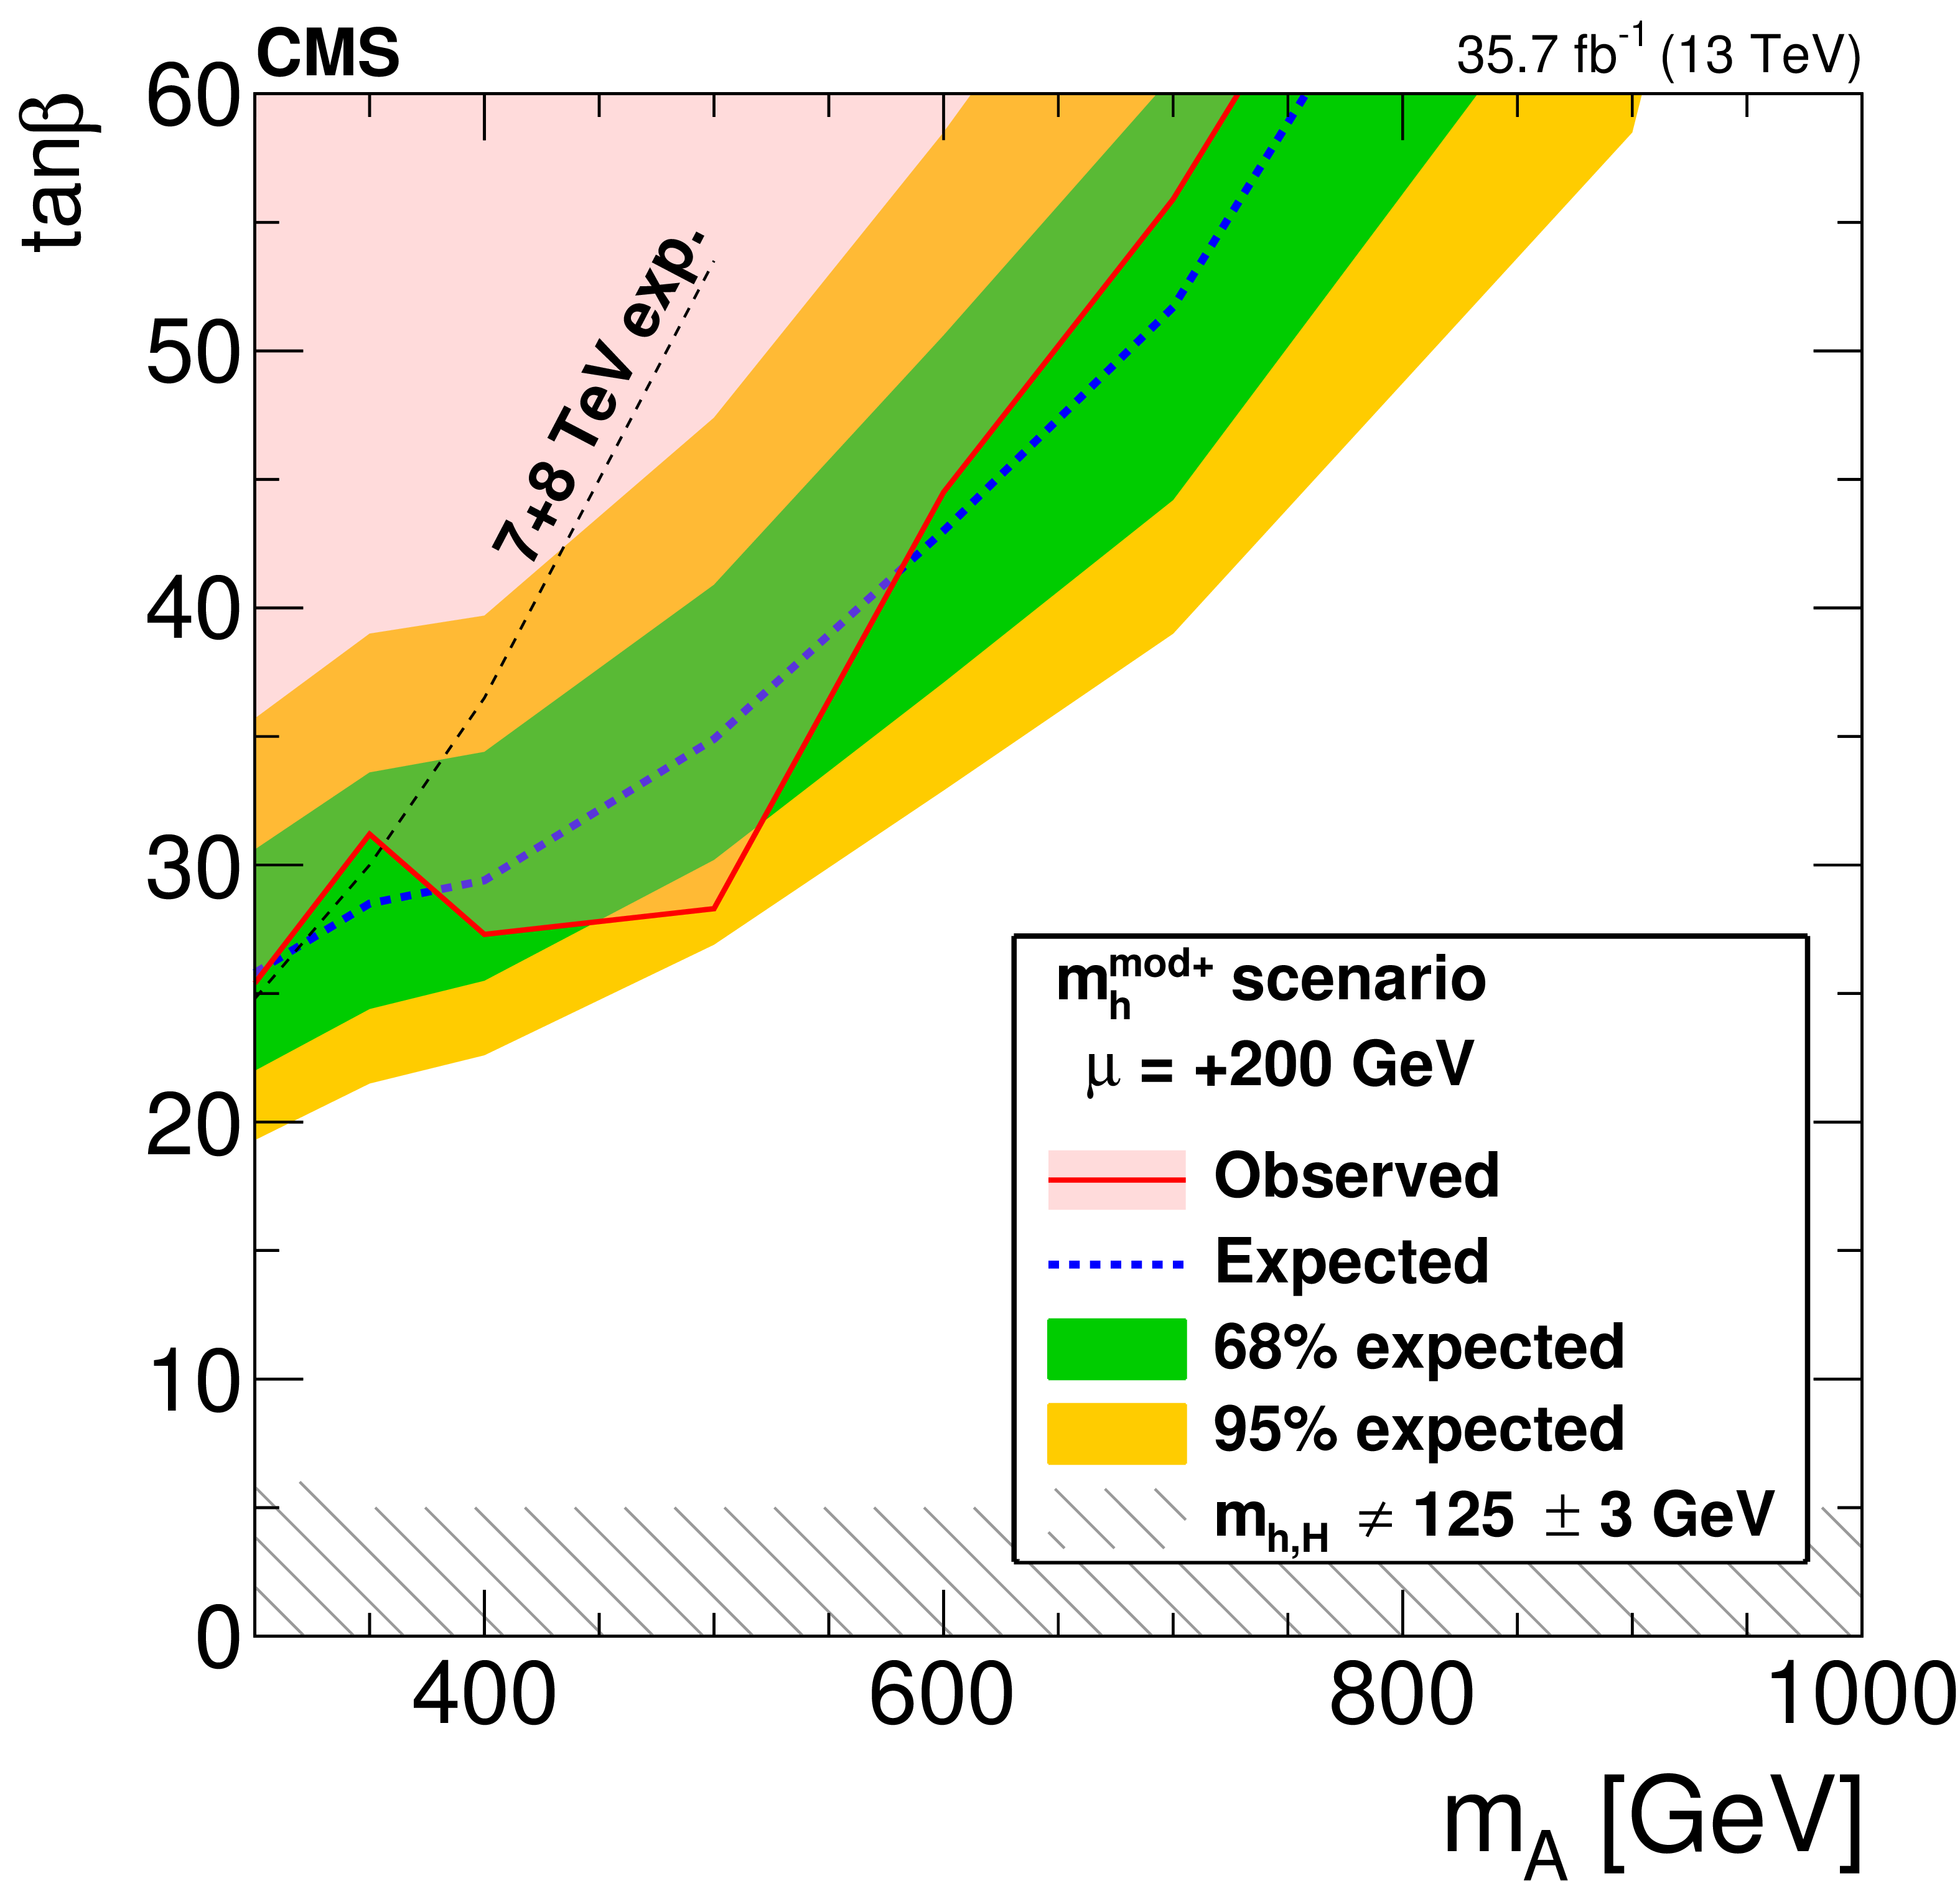
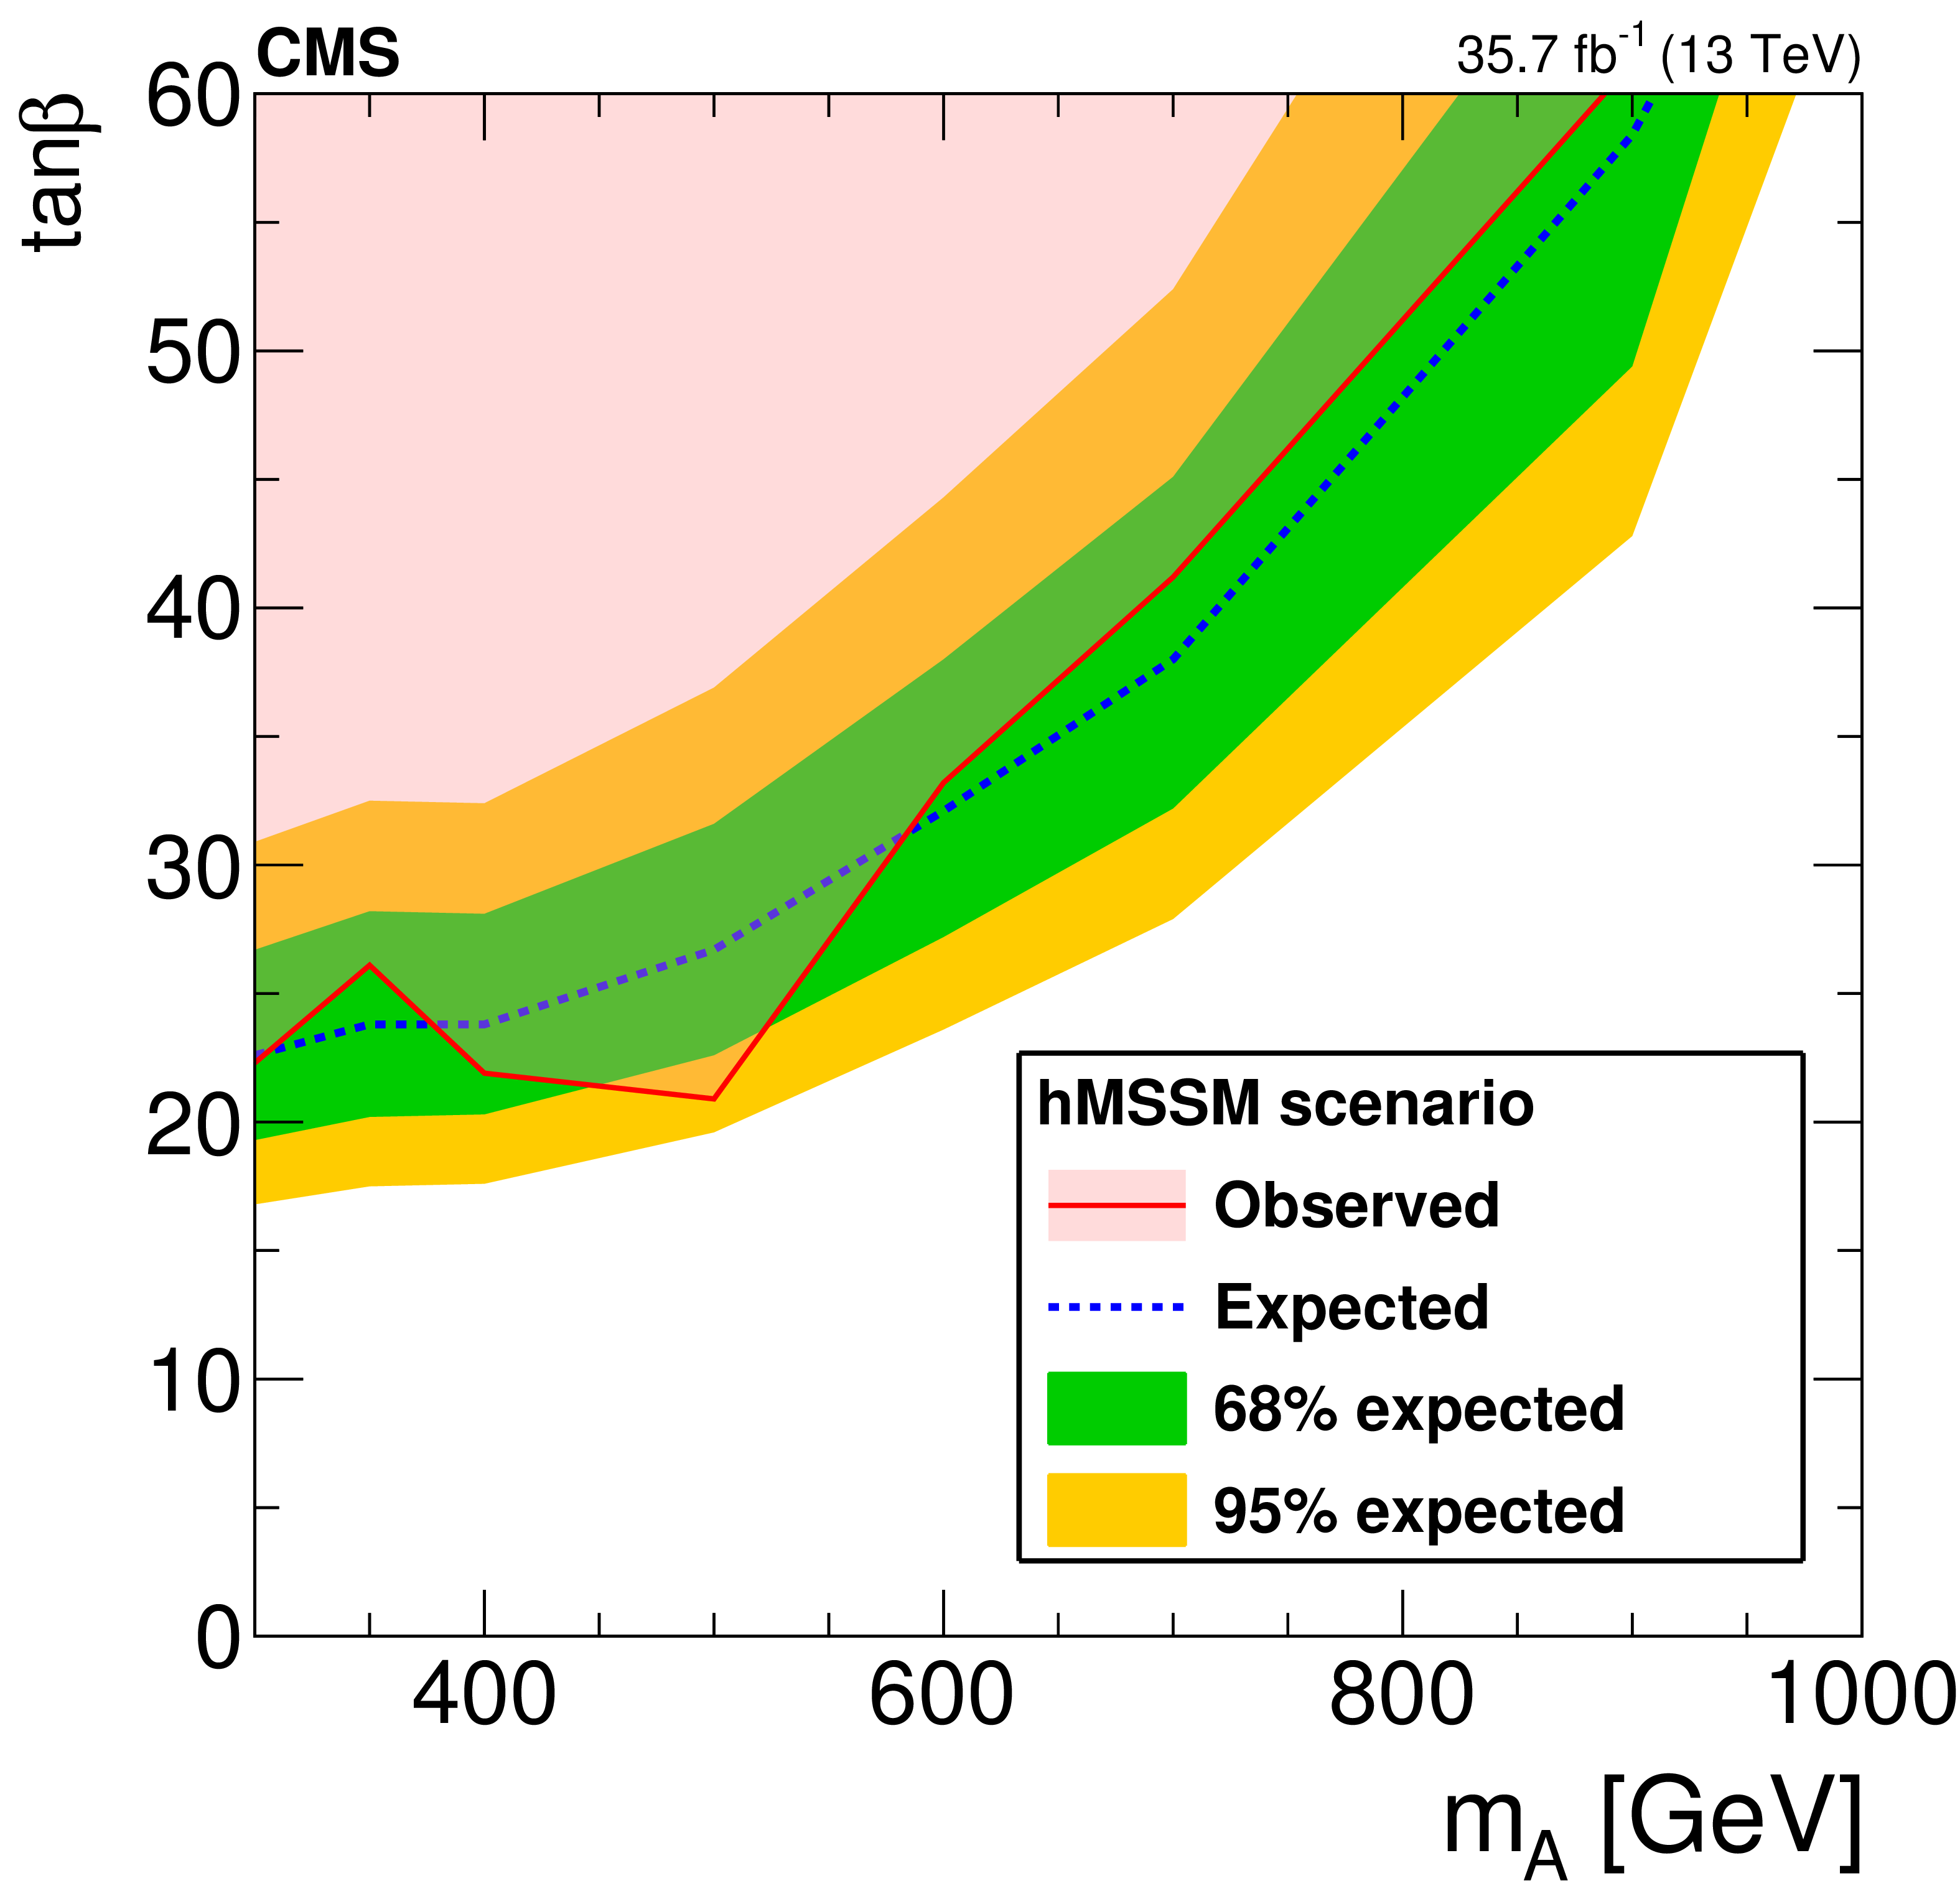
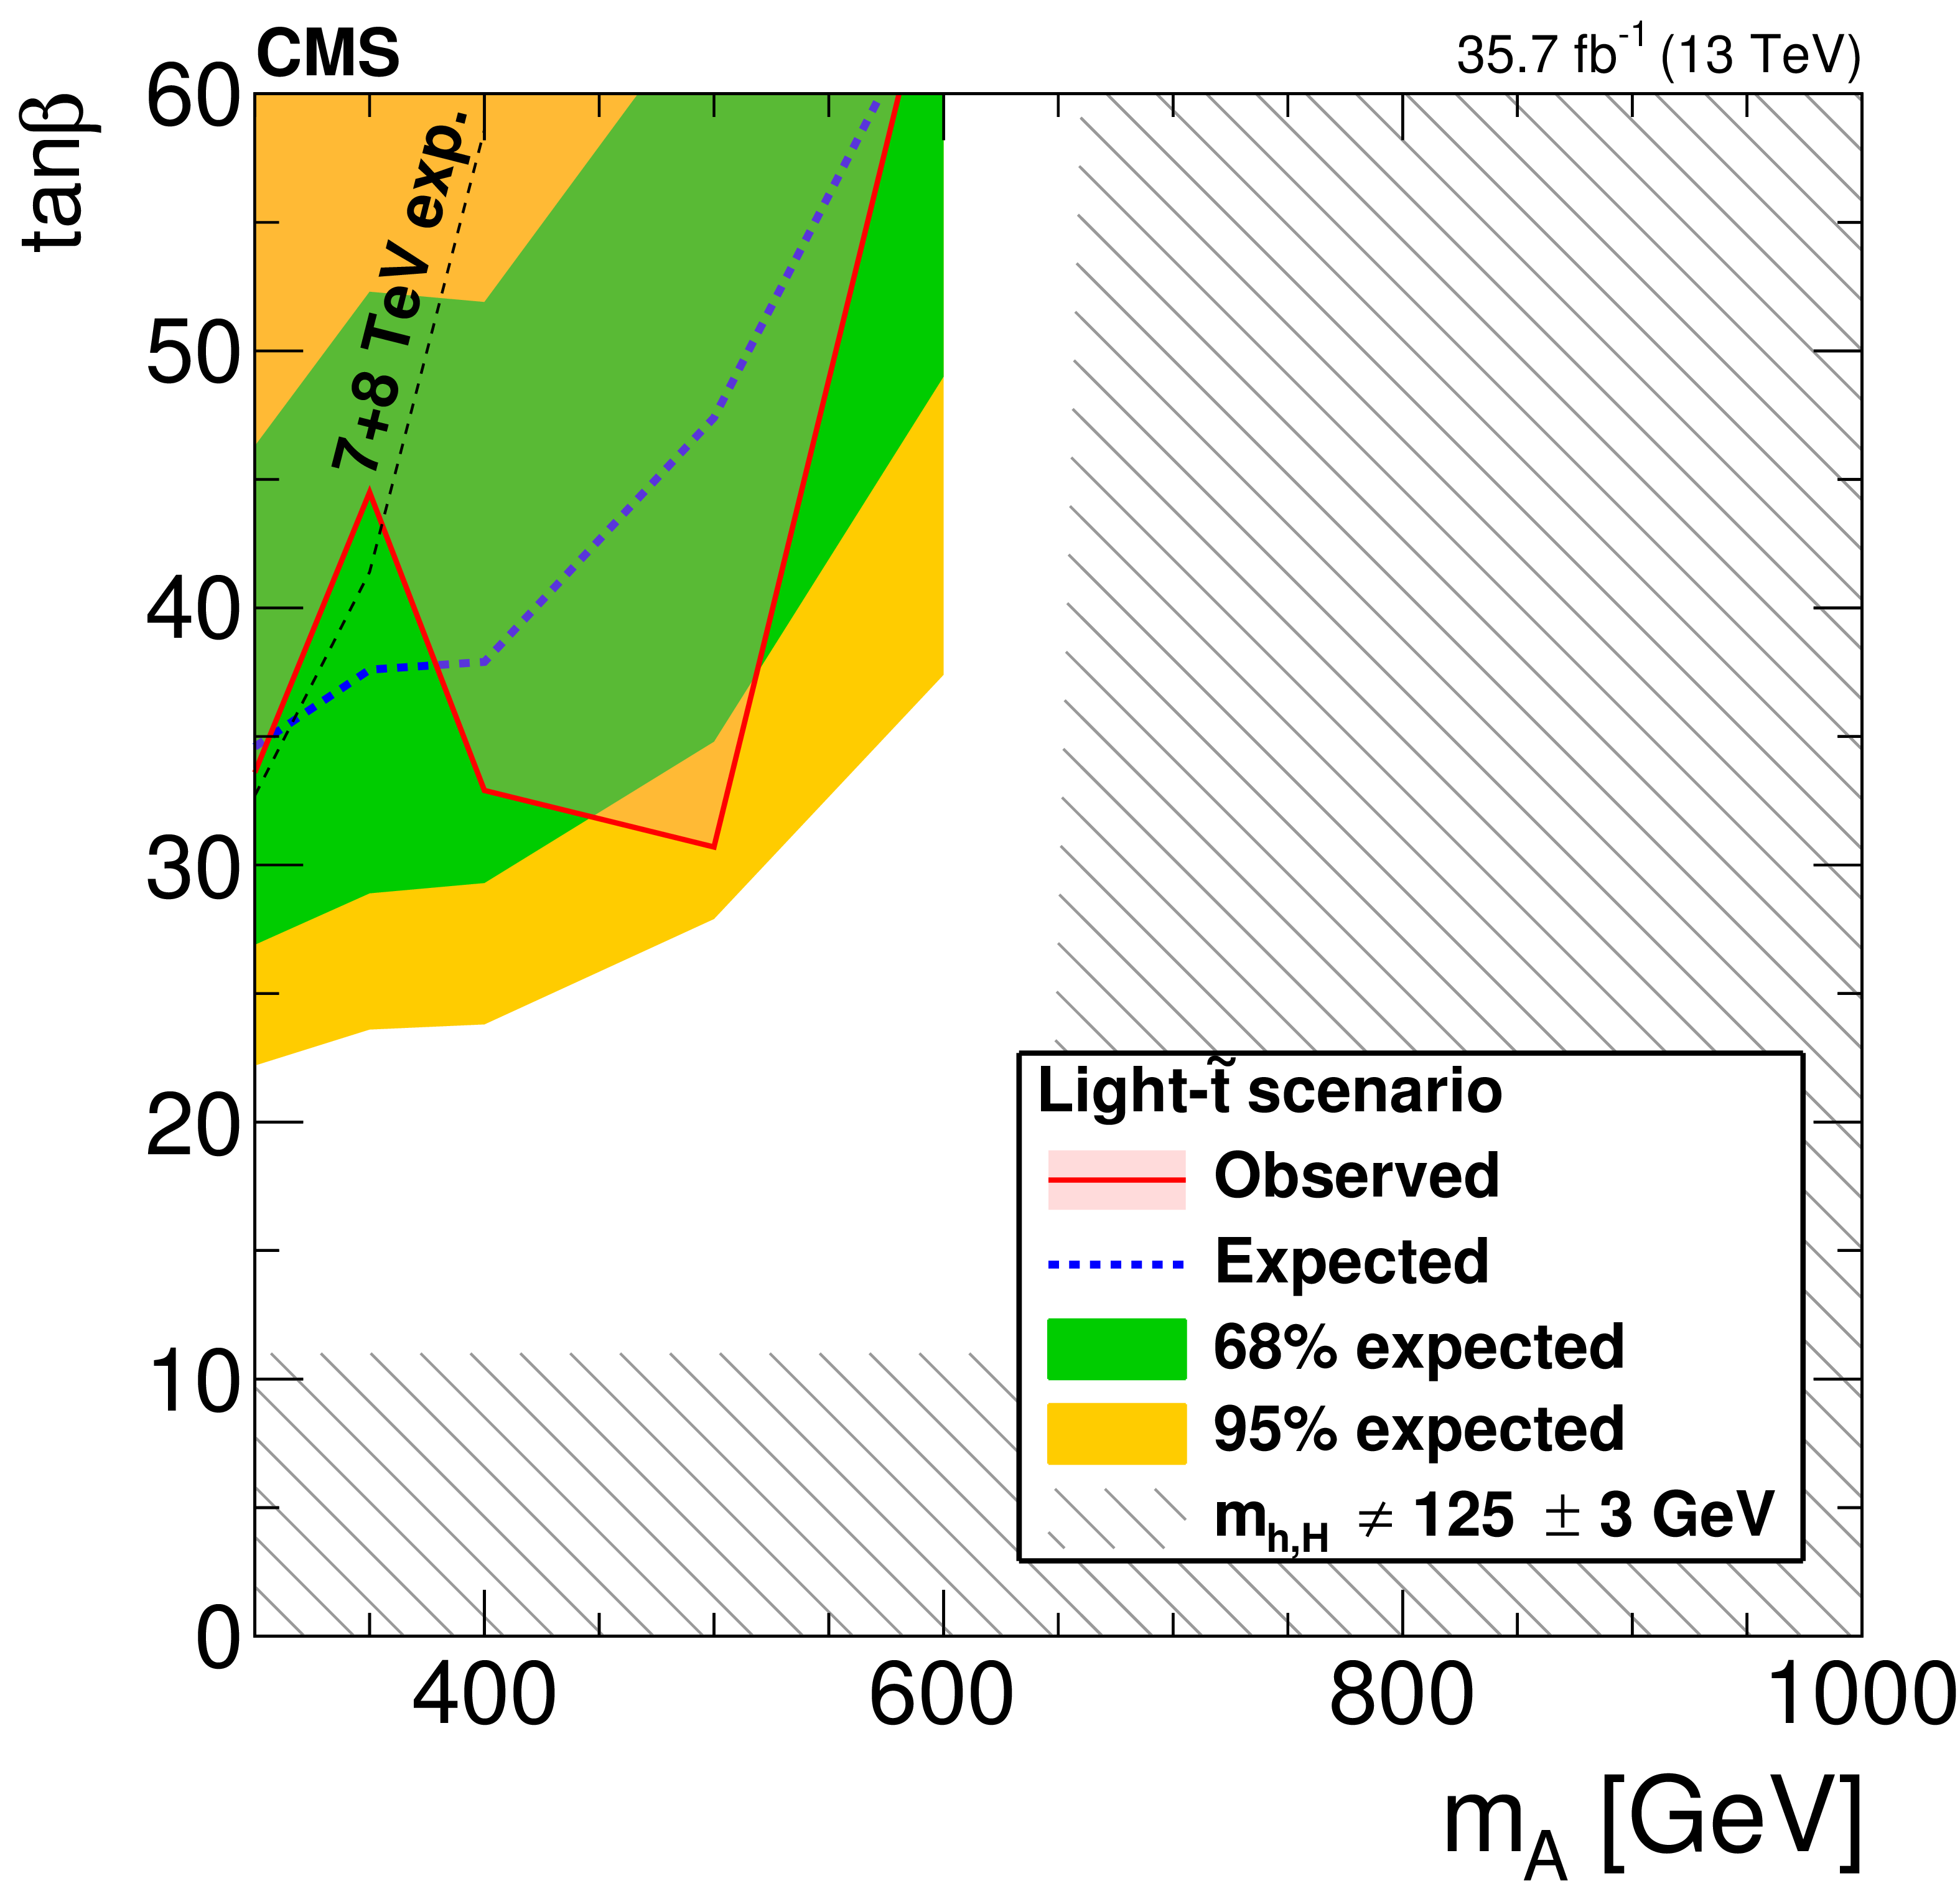
Expected and observed upper limits at 95% CL for ${m_{{\mathrm {A}}}}$ vs. the MSSM parameter $ \tan \beta $ in the (upper left) $m_ {\mathrm {h}} ^\mathrm {mod+}$ benchmark scenario with $\mu =+$200 GeV , in the (upper right) hMSSM, the (lower left) light $ {\tilde{\tau}} $, and the (lower right) light $ {\tilde{\mathrm {t}}} $ benchmark scenarios. The inner and outer bands indicate the regions containing 68 and 95%, respectively, of the distribution of limits expected under the background-only hypothesis. The excluded parameter space is indicated by the red shaded area. The hashed area is excluded because $m_{{\mathrm {h}}, {\mathrm {H}}}$ would deviate by more than $ \pm $3 GeV from the mass of the observed Higgs boson at 125 GeV. Since theoretical calculations for $ \tan \beta > $ 60 are not reliable, no limits are set beyond this value. |
png pdf |
Figure 7-a:
Expected and observed upper limits at 95% CL for ${m_{{\mathrm {A}}}}$ vs. the MSSM parameter $ \tan \beta $ in the $m_ {\mathrm {h}} ^\mathrm {mod+}$ benchmark scenario with $\mu =+$200 GeV. The inner and outer bands indicate the regions containing 68 and 95%, respectively, of the distribution of limits expected under the background-only hypothesis. The excluded parameter space is indicated by the red shaded area. The hashed area is excluded because $m_{{\mathrm {h}}, {\mathrm {H}}}$ would deviate by more than $ \pm $3 GeV from the mass of the observed Higgs boson at 125 GeV. Since theoretical calculations for $ \tan \beta > $ 60 are not reliable, no limits are set beyond this value. |
png pdf |
Figure 7-b:
Expected and observed upper limits at 95% CL for ${m_{{\mathrm {A}}}}$ vs. the MSSM parameter $ \tan \beta $ in the hMSSM benchmark scenario. The inner and outer bands indicate the regions containing 68 and 95%, respectively, of the distribution of limits expected under the background-only hypothesis. The excluded parameter space is indicated by the red shaded area. The hashed area is excluded because $m_{{\mathrm {h}}, {\mathrm {H}}}$ would deviate by more than $ \pm $3 GeV from the mass of the observed Higgs boson at 125 GeV. Since theoretical calculations for $ \tan \beta > $ 60 are not reliable, no limits are set beyond this value. |

png pdf |
Figure 7-c:
Expected and observed upper limits at 95% CL for ${m_{{\mathrm {A}}}}$ vs. the MSSM parameter $ \tan \beta $ in the light $ {\tilde{\tau}} $ benchmark scenario. The inner and outer bands indicate the regions containing 68 and 95%, respectively, of the distribution of limits expected under the background-only hypothesis. The excluded parameter space is indicated by the red shaded area. The hashed area is excluded because $m_{{\mathrm {h}}, {\mathrm {H}}}$ would deviate by more than $ \pm $3 GeV from the mass of the observed Higgs boson at 125 GeV. Since theoretical calculations for $ \tan \beta > $ 60 are not reliable, no limits are set beyond this value. |
png pdf |
Figure 7-d:
Expected and observed upper limits at 95% CL for ${m_{{\mathrm {A}}}}$ vs. the MSSM parameter $ \tan \beta $ in the light $ {\tilde{\mathrm {t}}} $ benchmark scenario. The inner and outer bands indicate the regions containing 68 and 95%, respectively, of the distribution of limits expected under the background-only hypothesis. The excluded parameter space is indicated by the red shaded area. The hashed area is excluded because $m_{{\mathrm {h}}, {\mathrm {H}}}$ would deviate by more than $ \pm $3 GeV from the mass of the observed Higgs boson at 125 GeV. Since theoretical calculations for $ \tan \beta > $ 60 are not reliable, no limits are set beyond this value. |
png pdf |
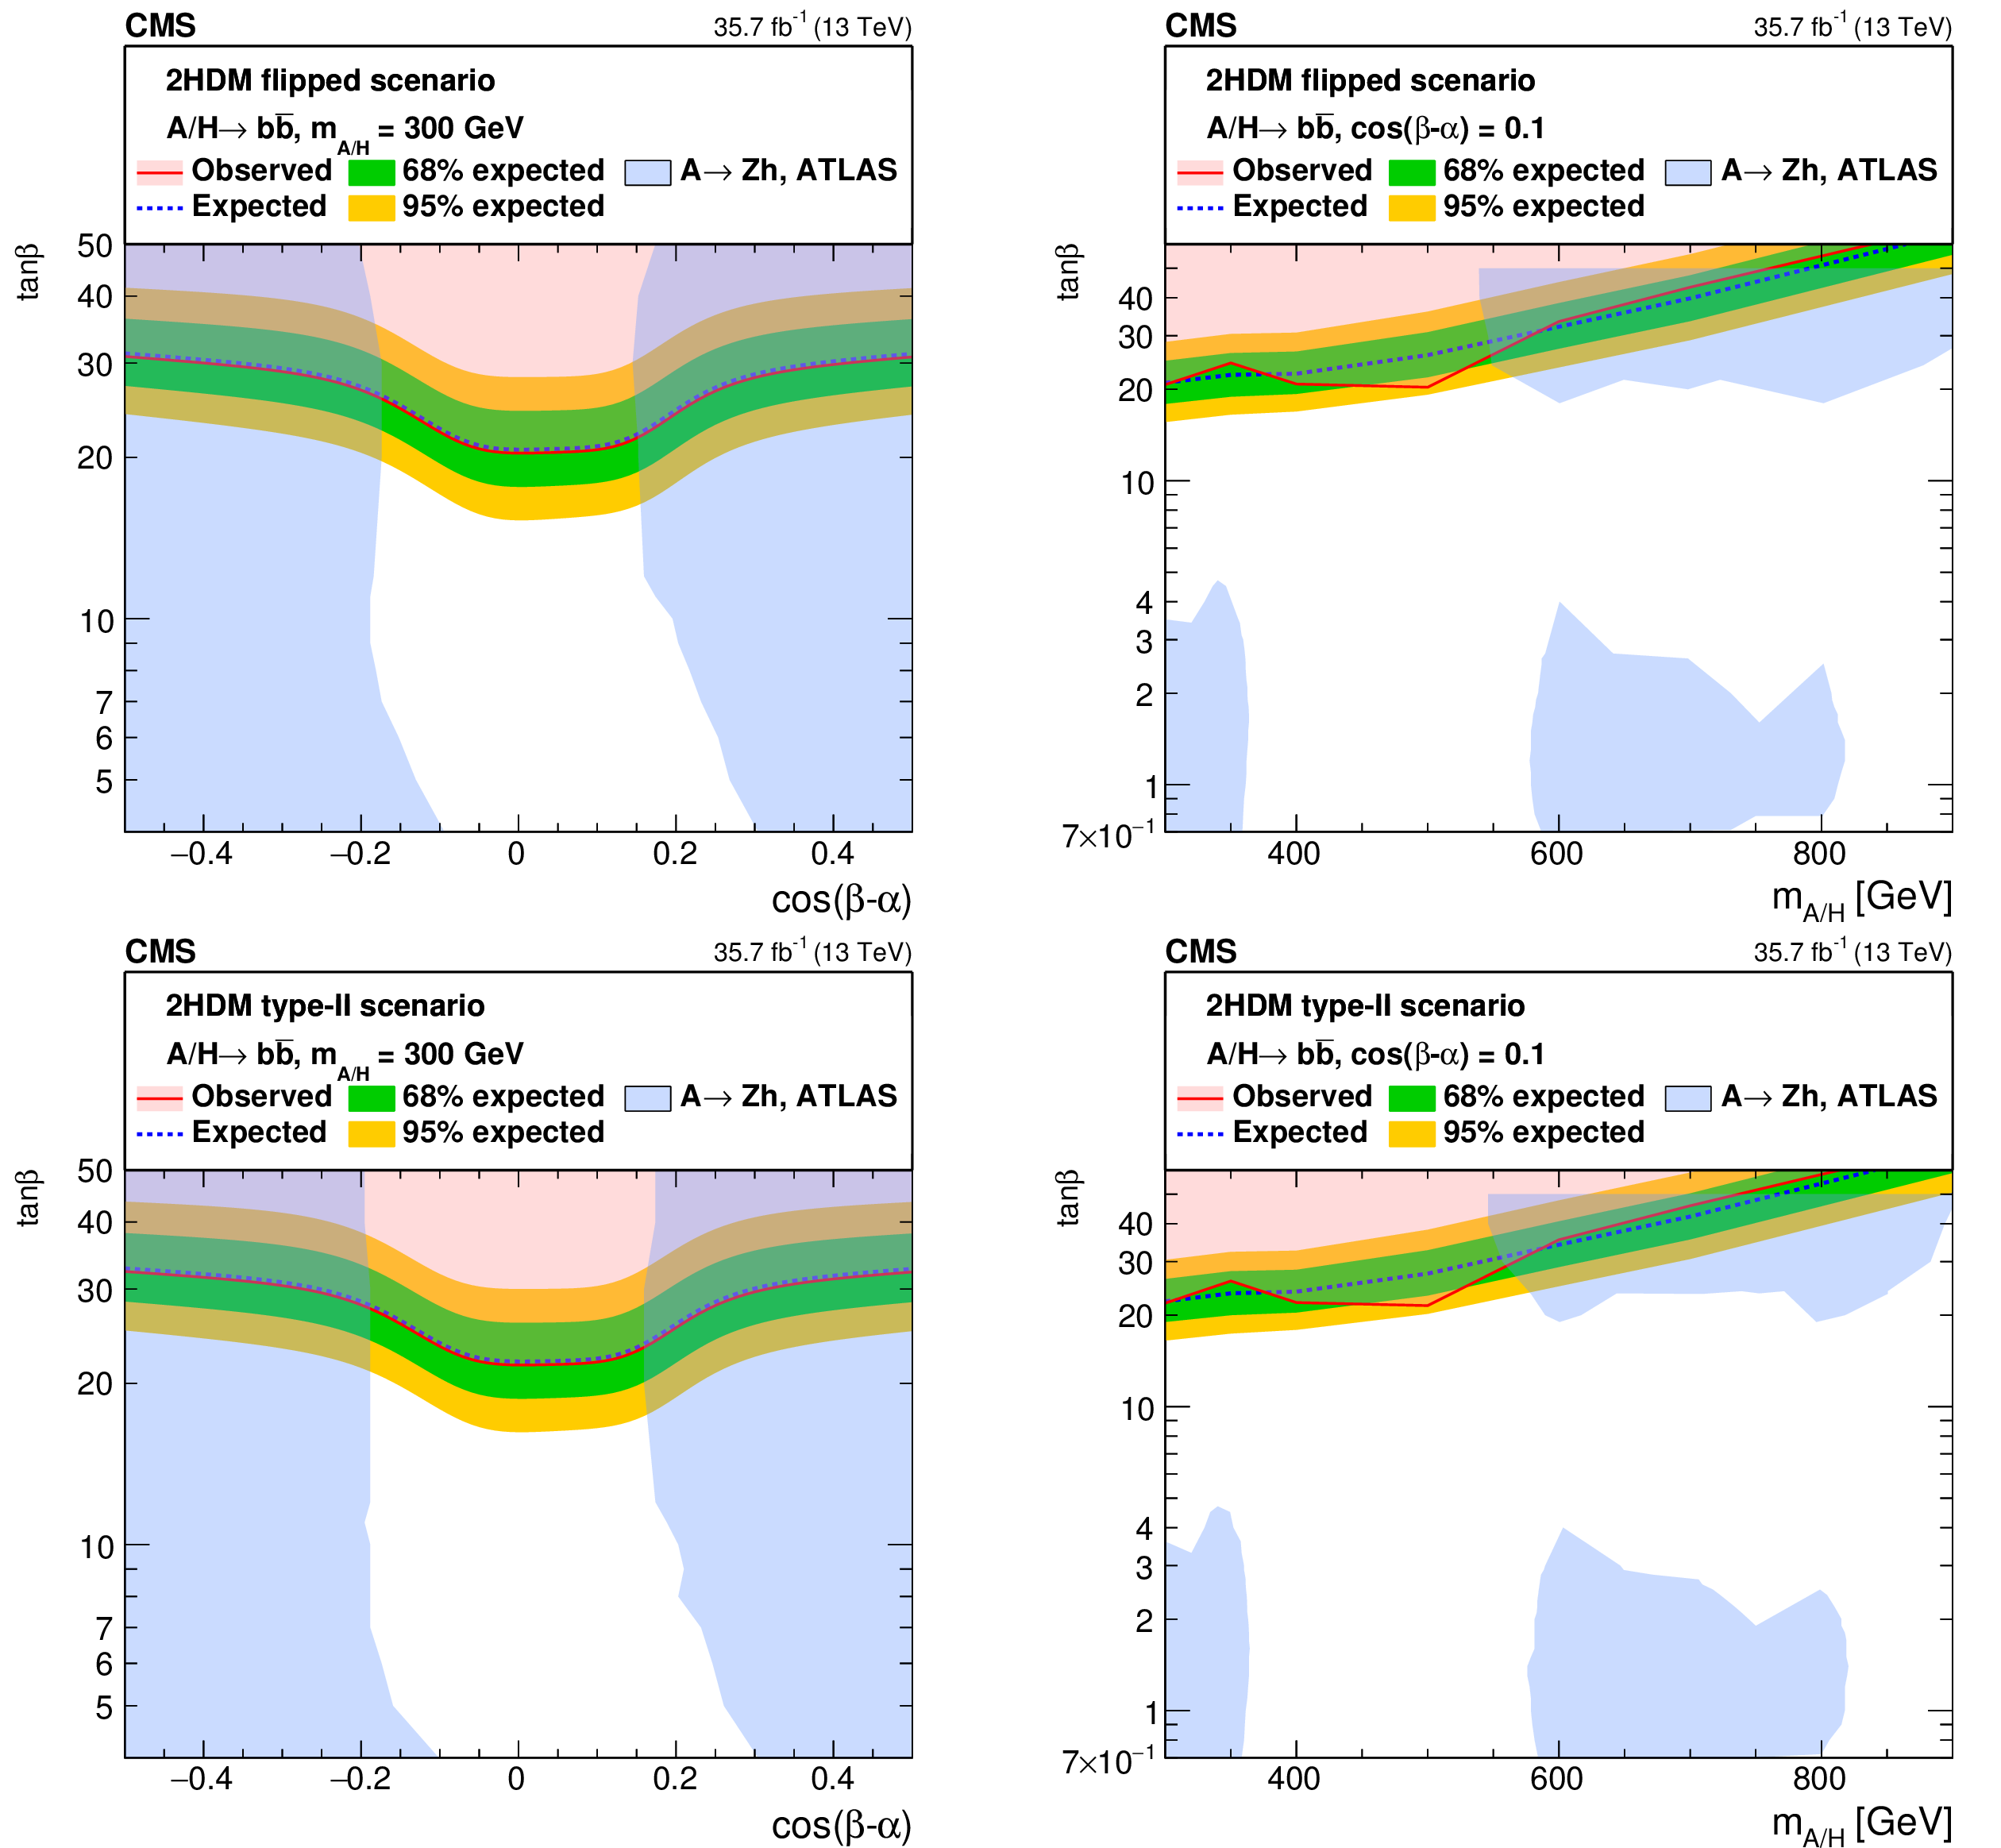
Figure 8:
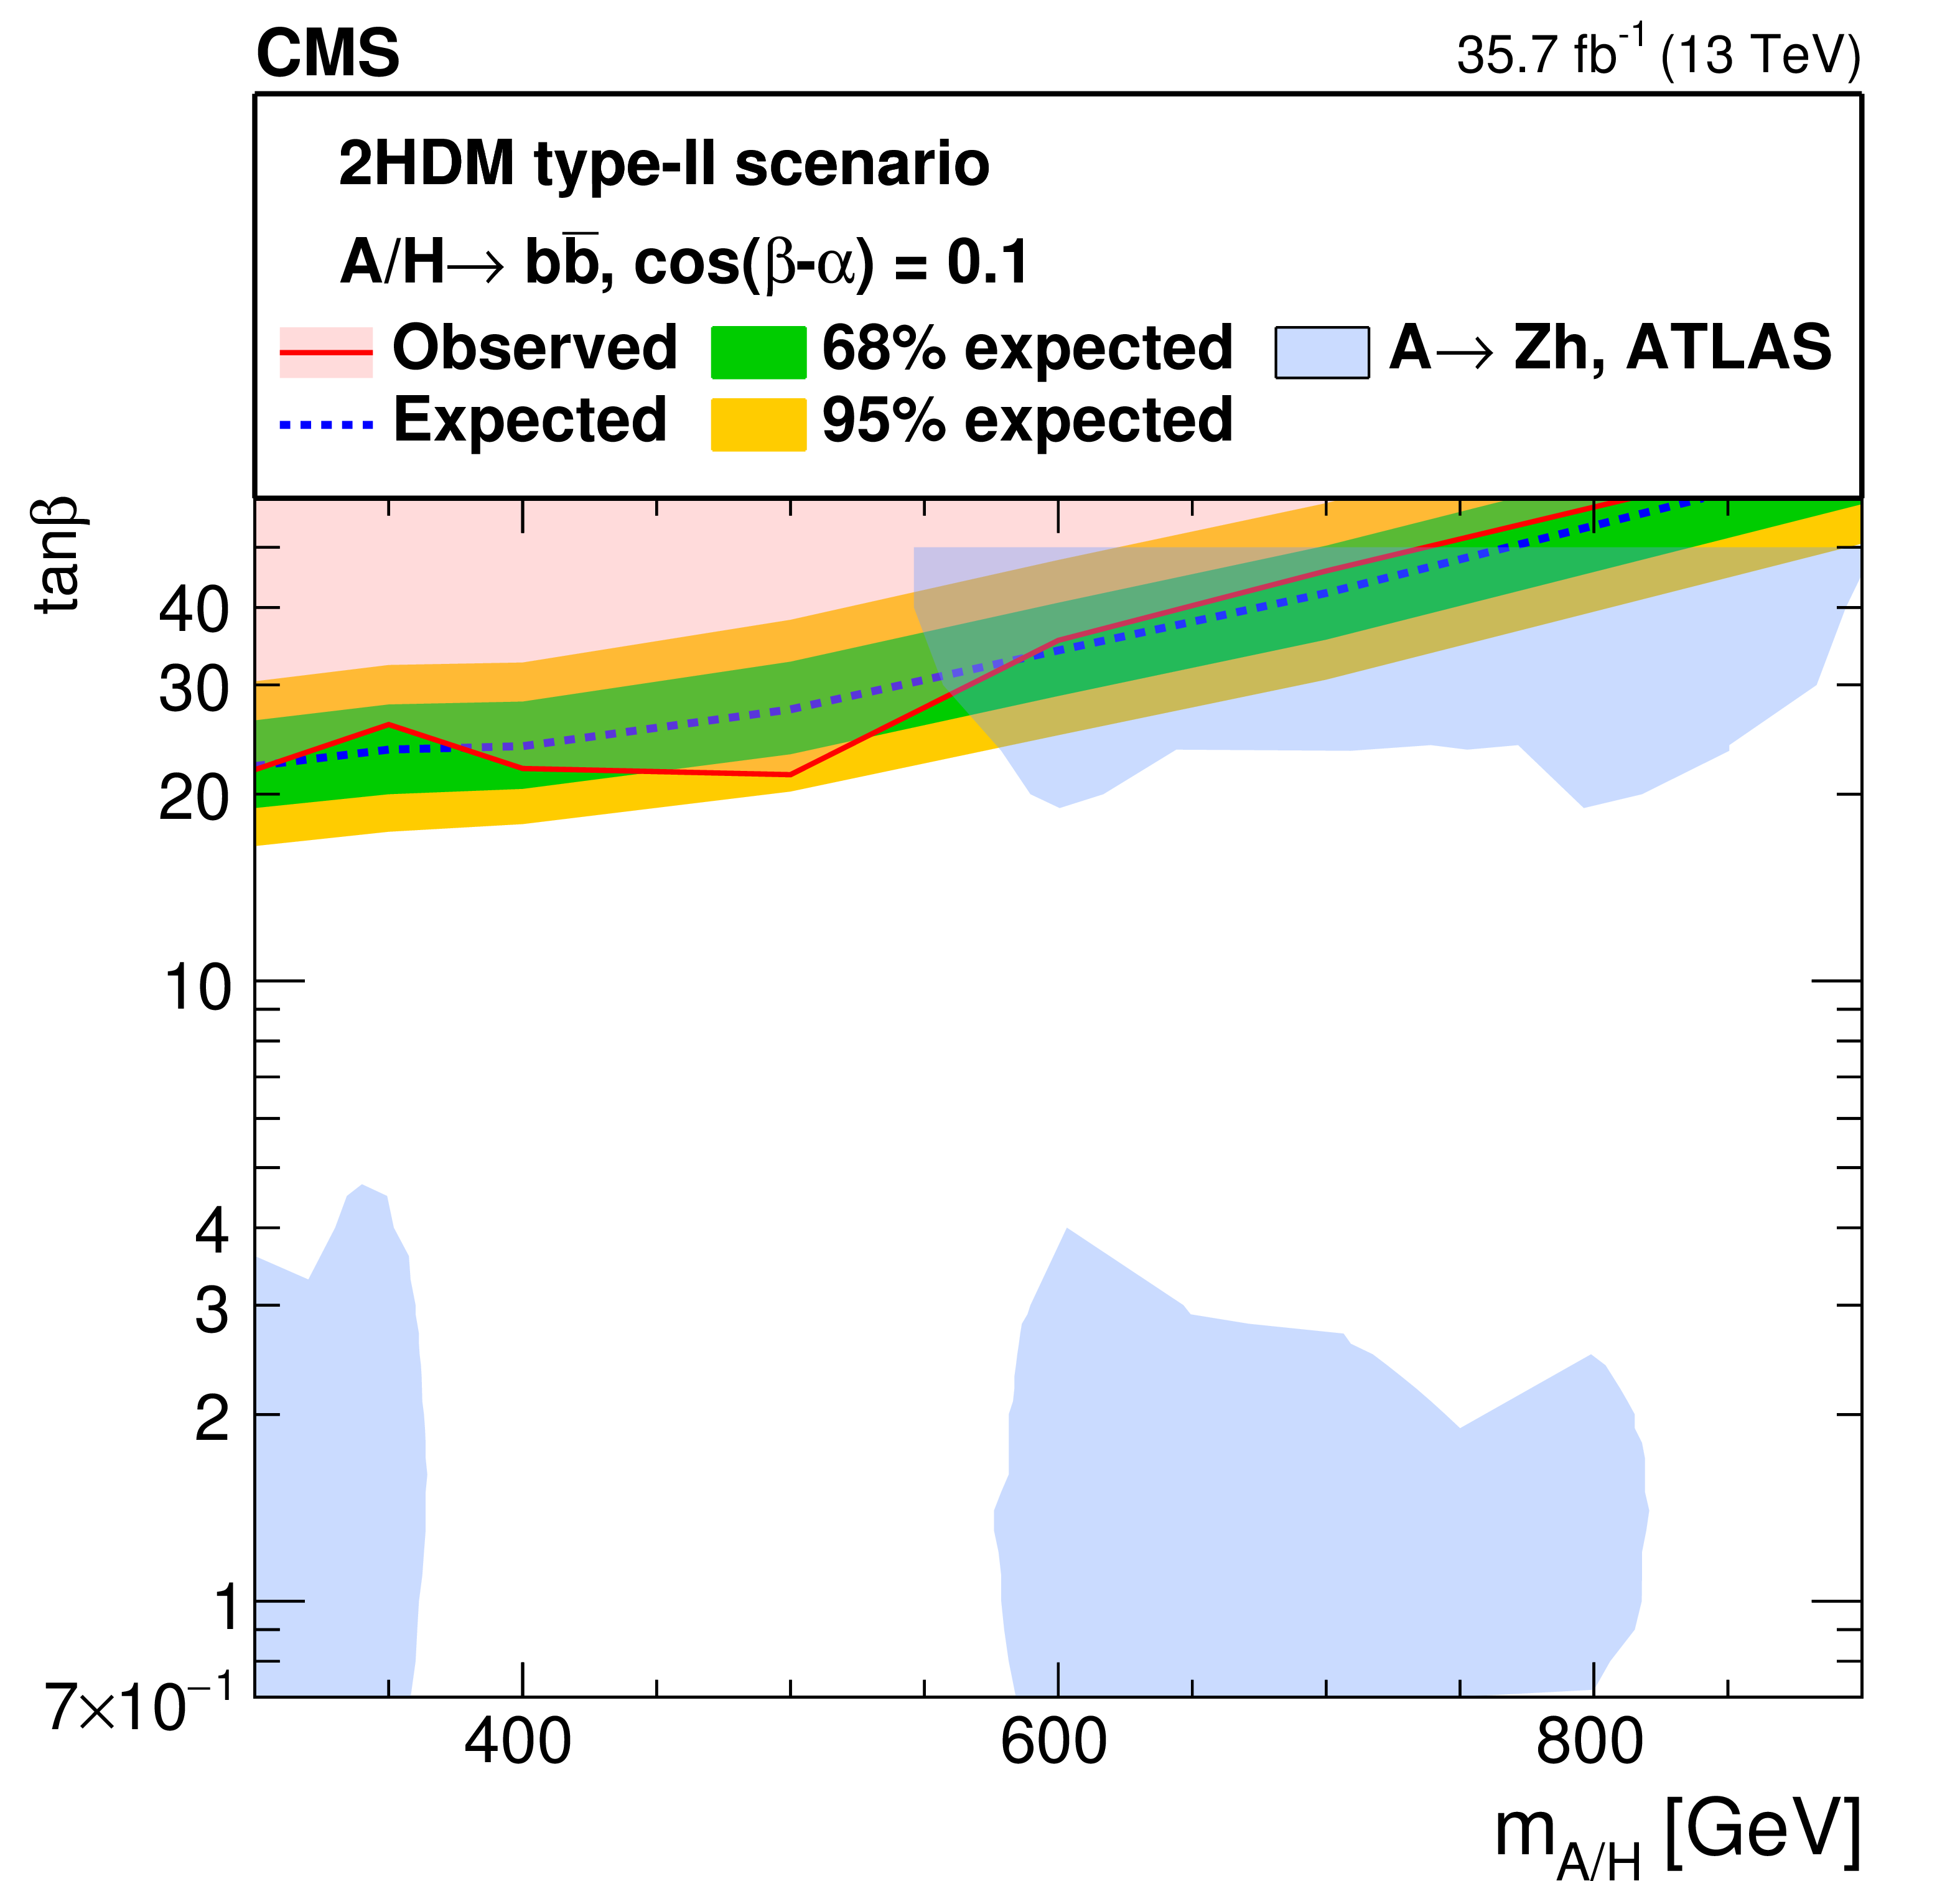
Upper limits for the parameter $ \tan \beta $ at 95% CL for the flipped (upper) and type-II (lower) models, as a function of $ {\cos(\beta -\alpha)} $ in the range of $[-0.5,0.5]$ for the mass $m_ {\mathrm {H}} =m_ {\mathrm {A}} = $ 300 GeV (left) and as a function of $ {m_{{\mathrm {A}} / {\mathrm {H}}}} $ when $ {\cos(\beta -\alpha)} $ = 0.1 (right). The results from the ATLAS $ {\mathrm {A}} \to {\mathrm {Z}} {\mathrm {h}} $ analysis [24], which provide limits up to $ \tan \beta = $ 50 at 95% CL, are also shown as blue shaded area for comparison. |
png pdf |
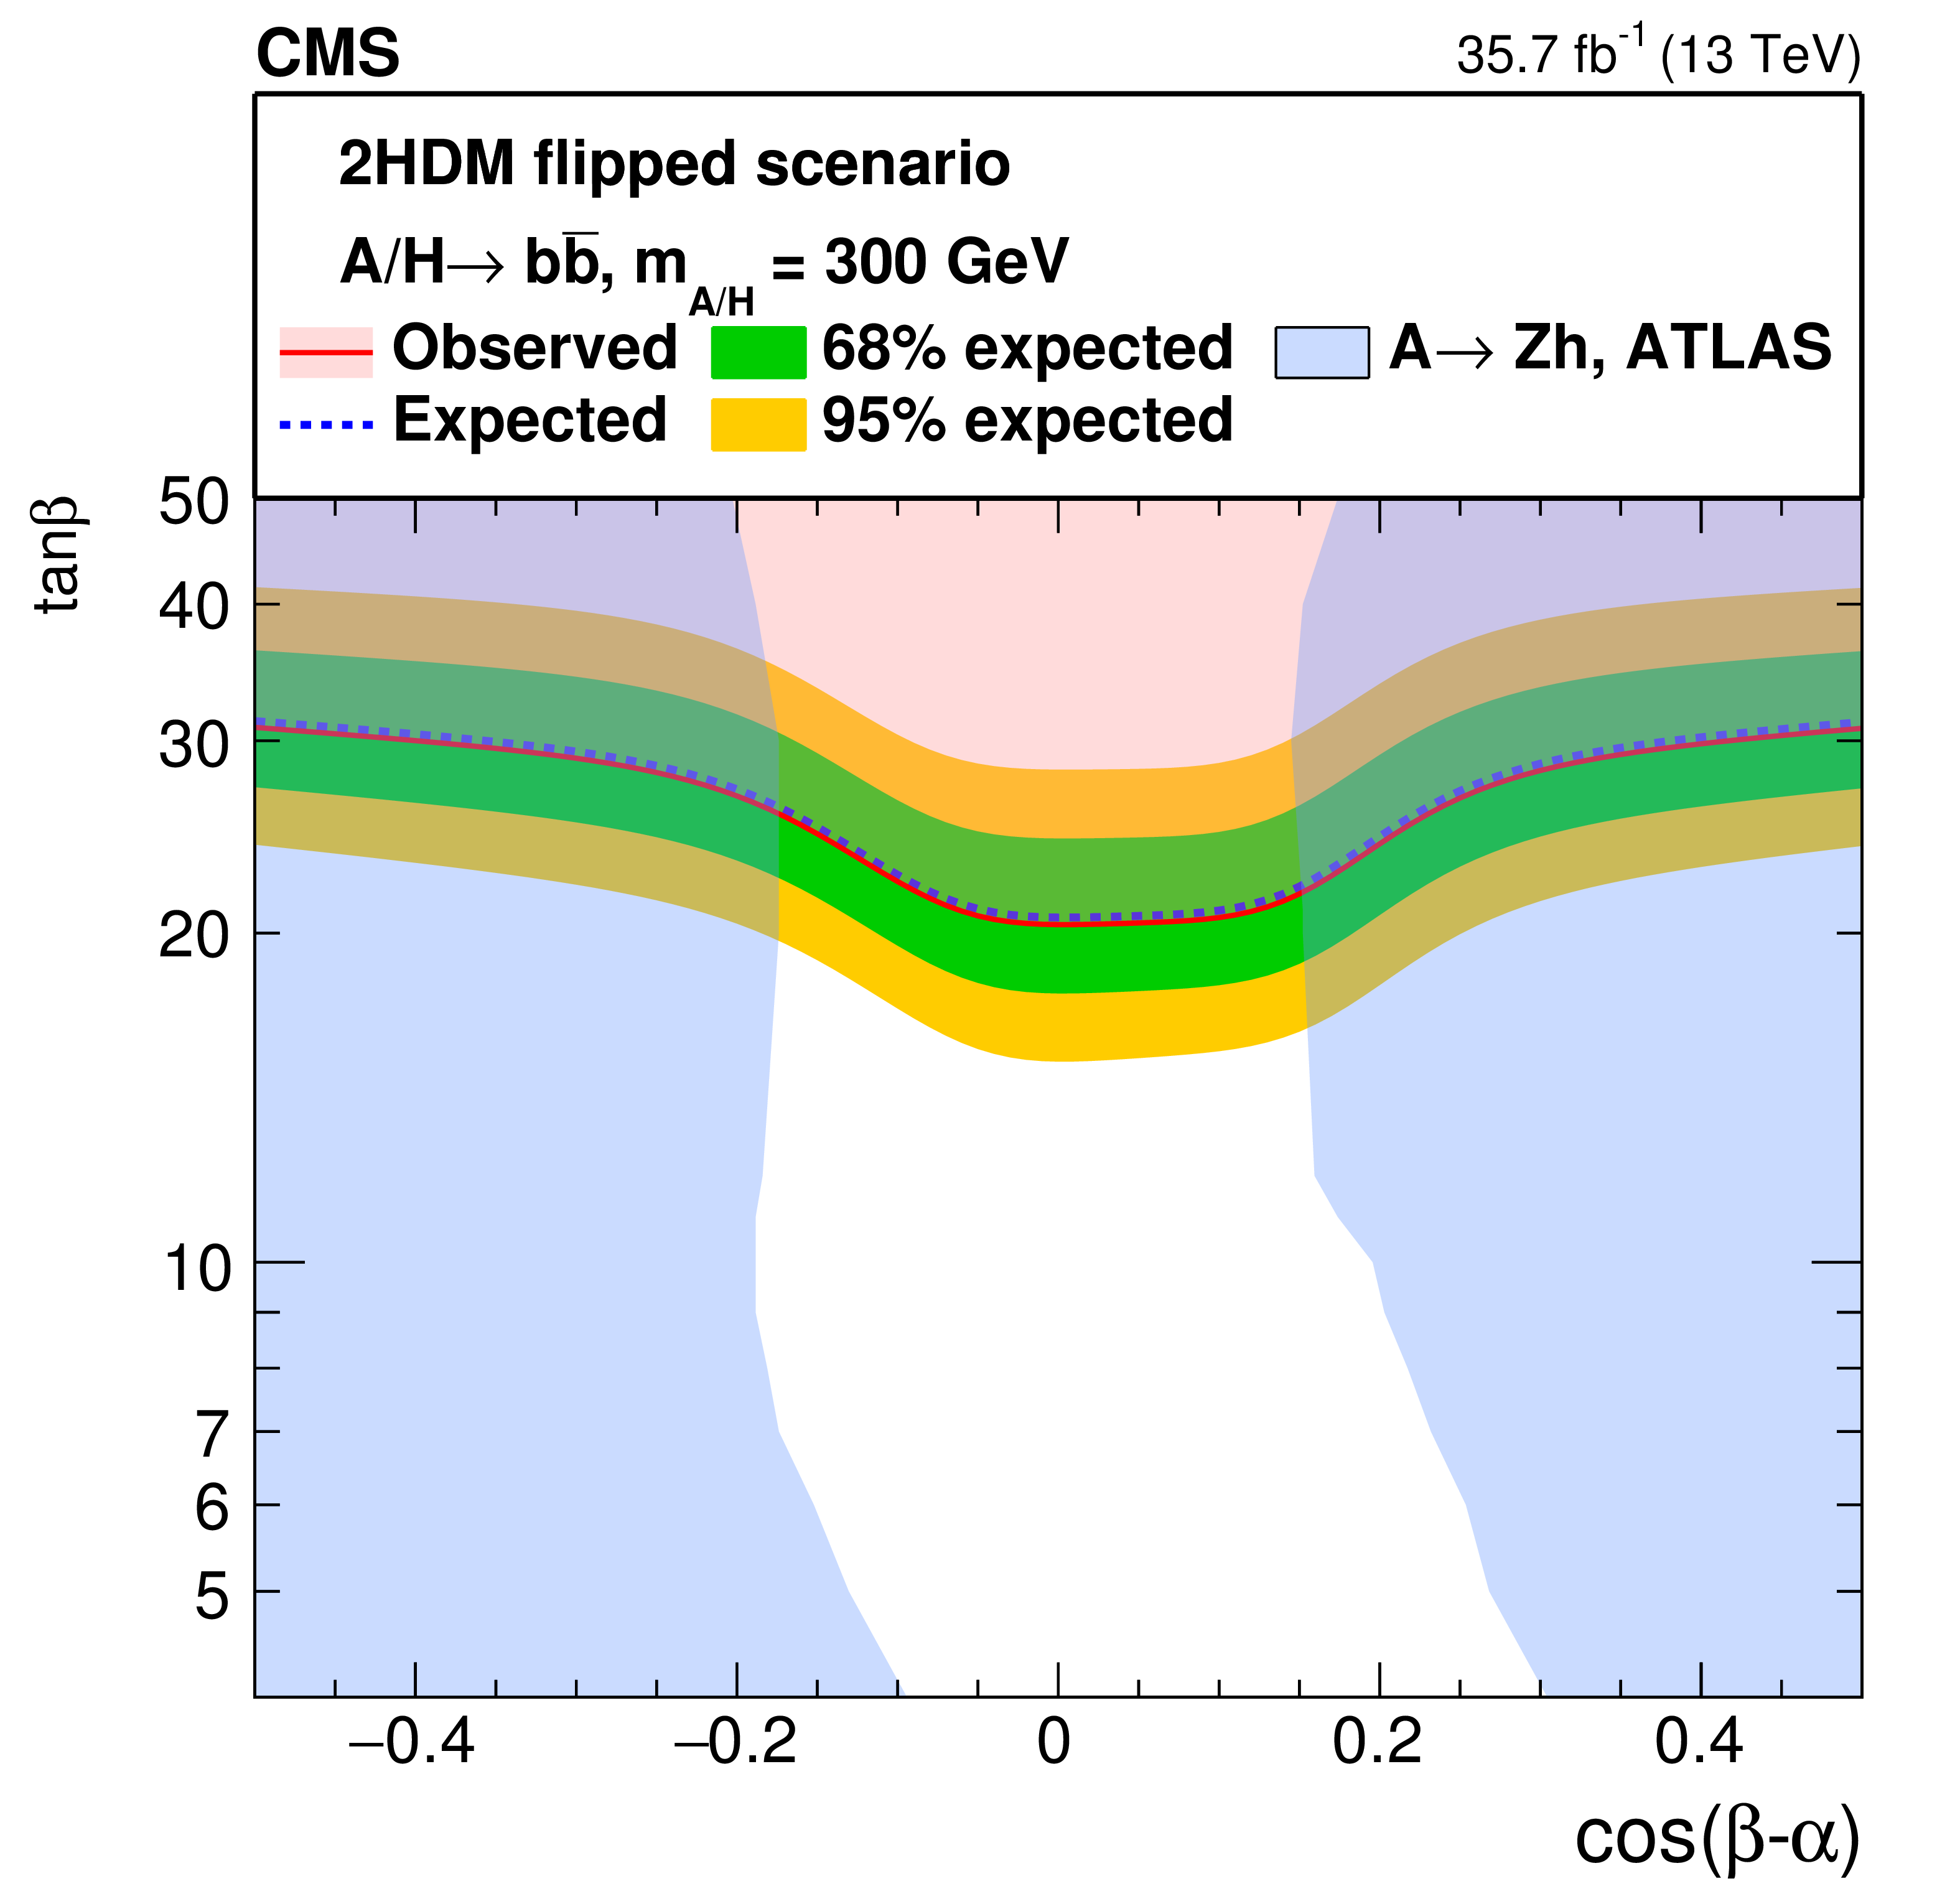
Figure 8-a:
Upper limits for the parameter $ \tan \beta $ at 95% CL for the flipped model, as a function of $ {\cos(\beta -\alpha)} $ in the range of $[-0.5,0.5]$ for the mass $m_ {\mathrm {H}} =m_ {\mathrm {A}} = $ 300 GeV. The results from the ATLAS $ {\mathrm {A}} \to {\mathrm {Z}} {\mathrm {h}} $ analysis [24], which provide limits up to $ \tan \beta = $ 50 at 95% CL, are also shown as blue shaded area for comparison. |
png pdf |
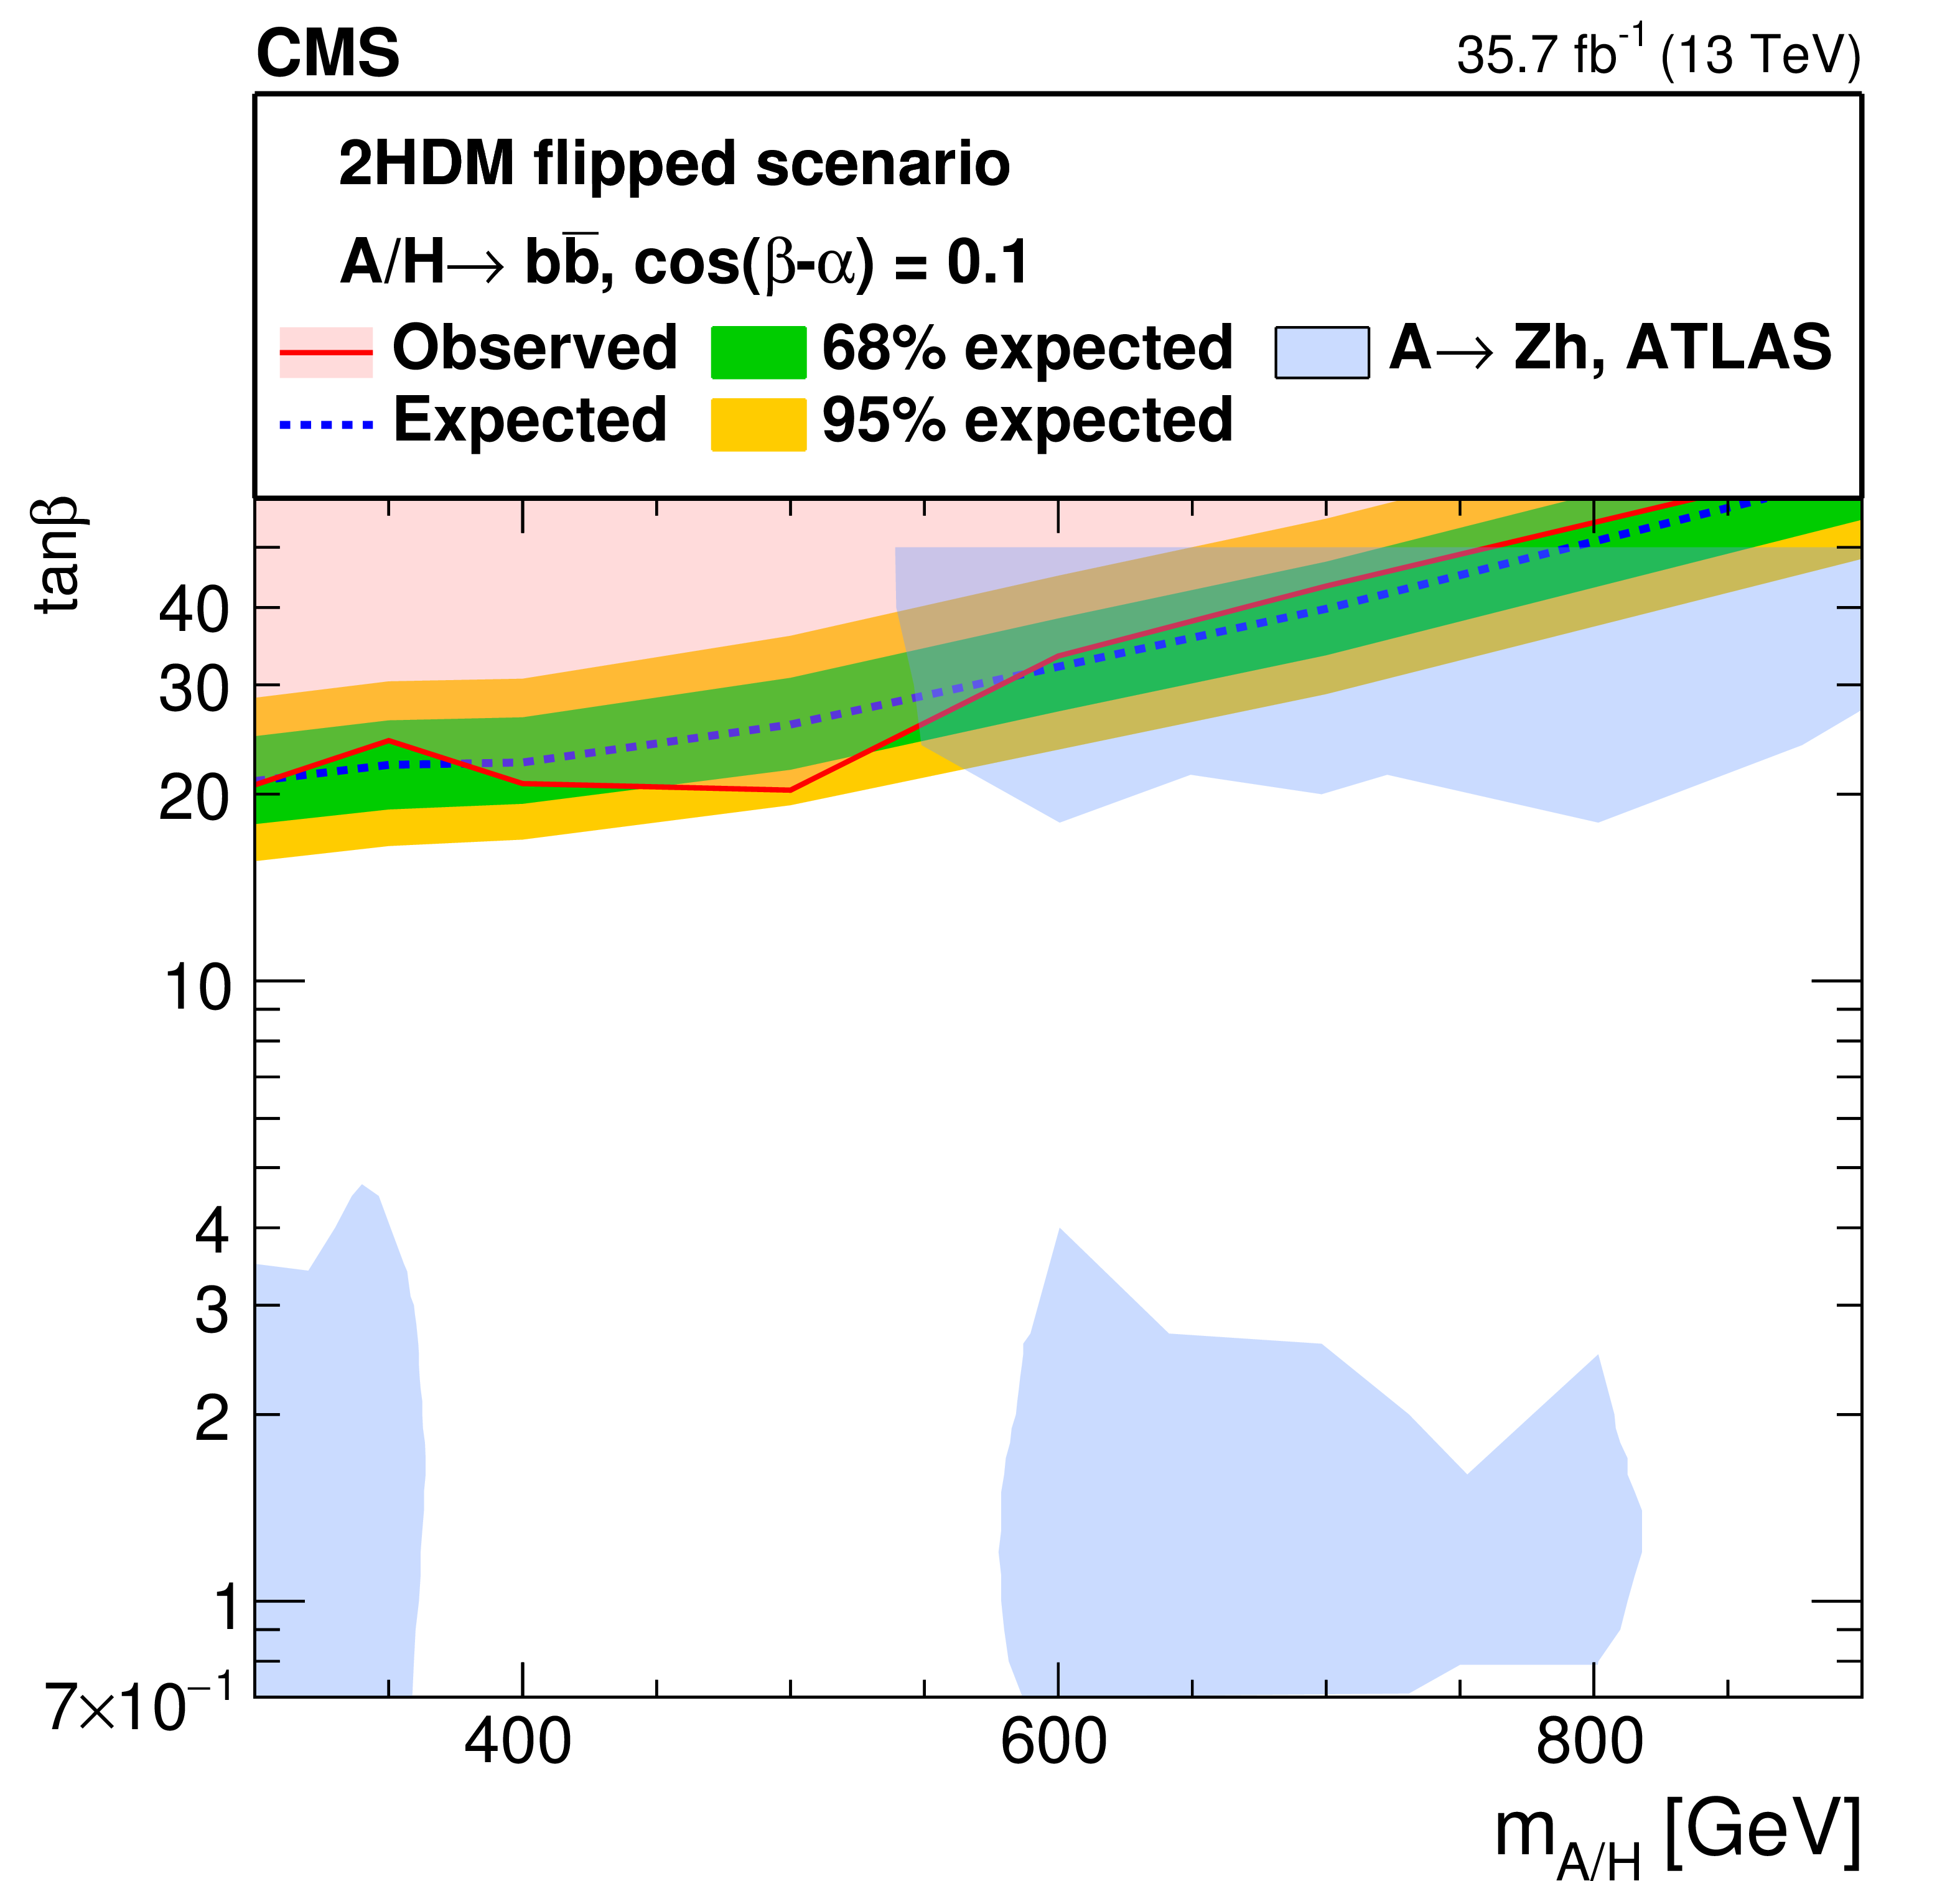
Figure 8-b:
Upper limits for the parameter $ \tan \beta $ at 95% CL for the flipped model, as a function of $ {m_{{\mathrm {A}} / {\mathrm {H}}}} $ when $ {\cos(\beta -\alpha)} $ = 0.1. The results from the ATLAS $ {\mathrm {A}} \to {\mathrm {Z}} {\mathrm {h}} $ analysis [24], which provide limits up to $ \tan \beta = $ 50 at 95% CL, are also shown as blue shaded area for comparison. |
png pdf |
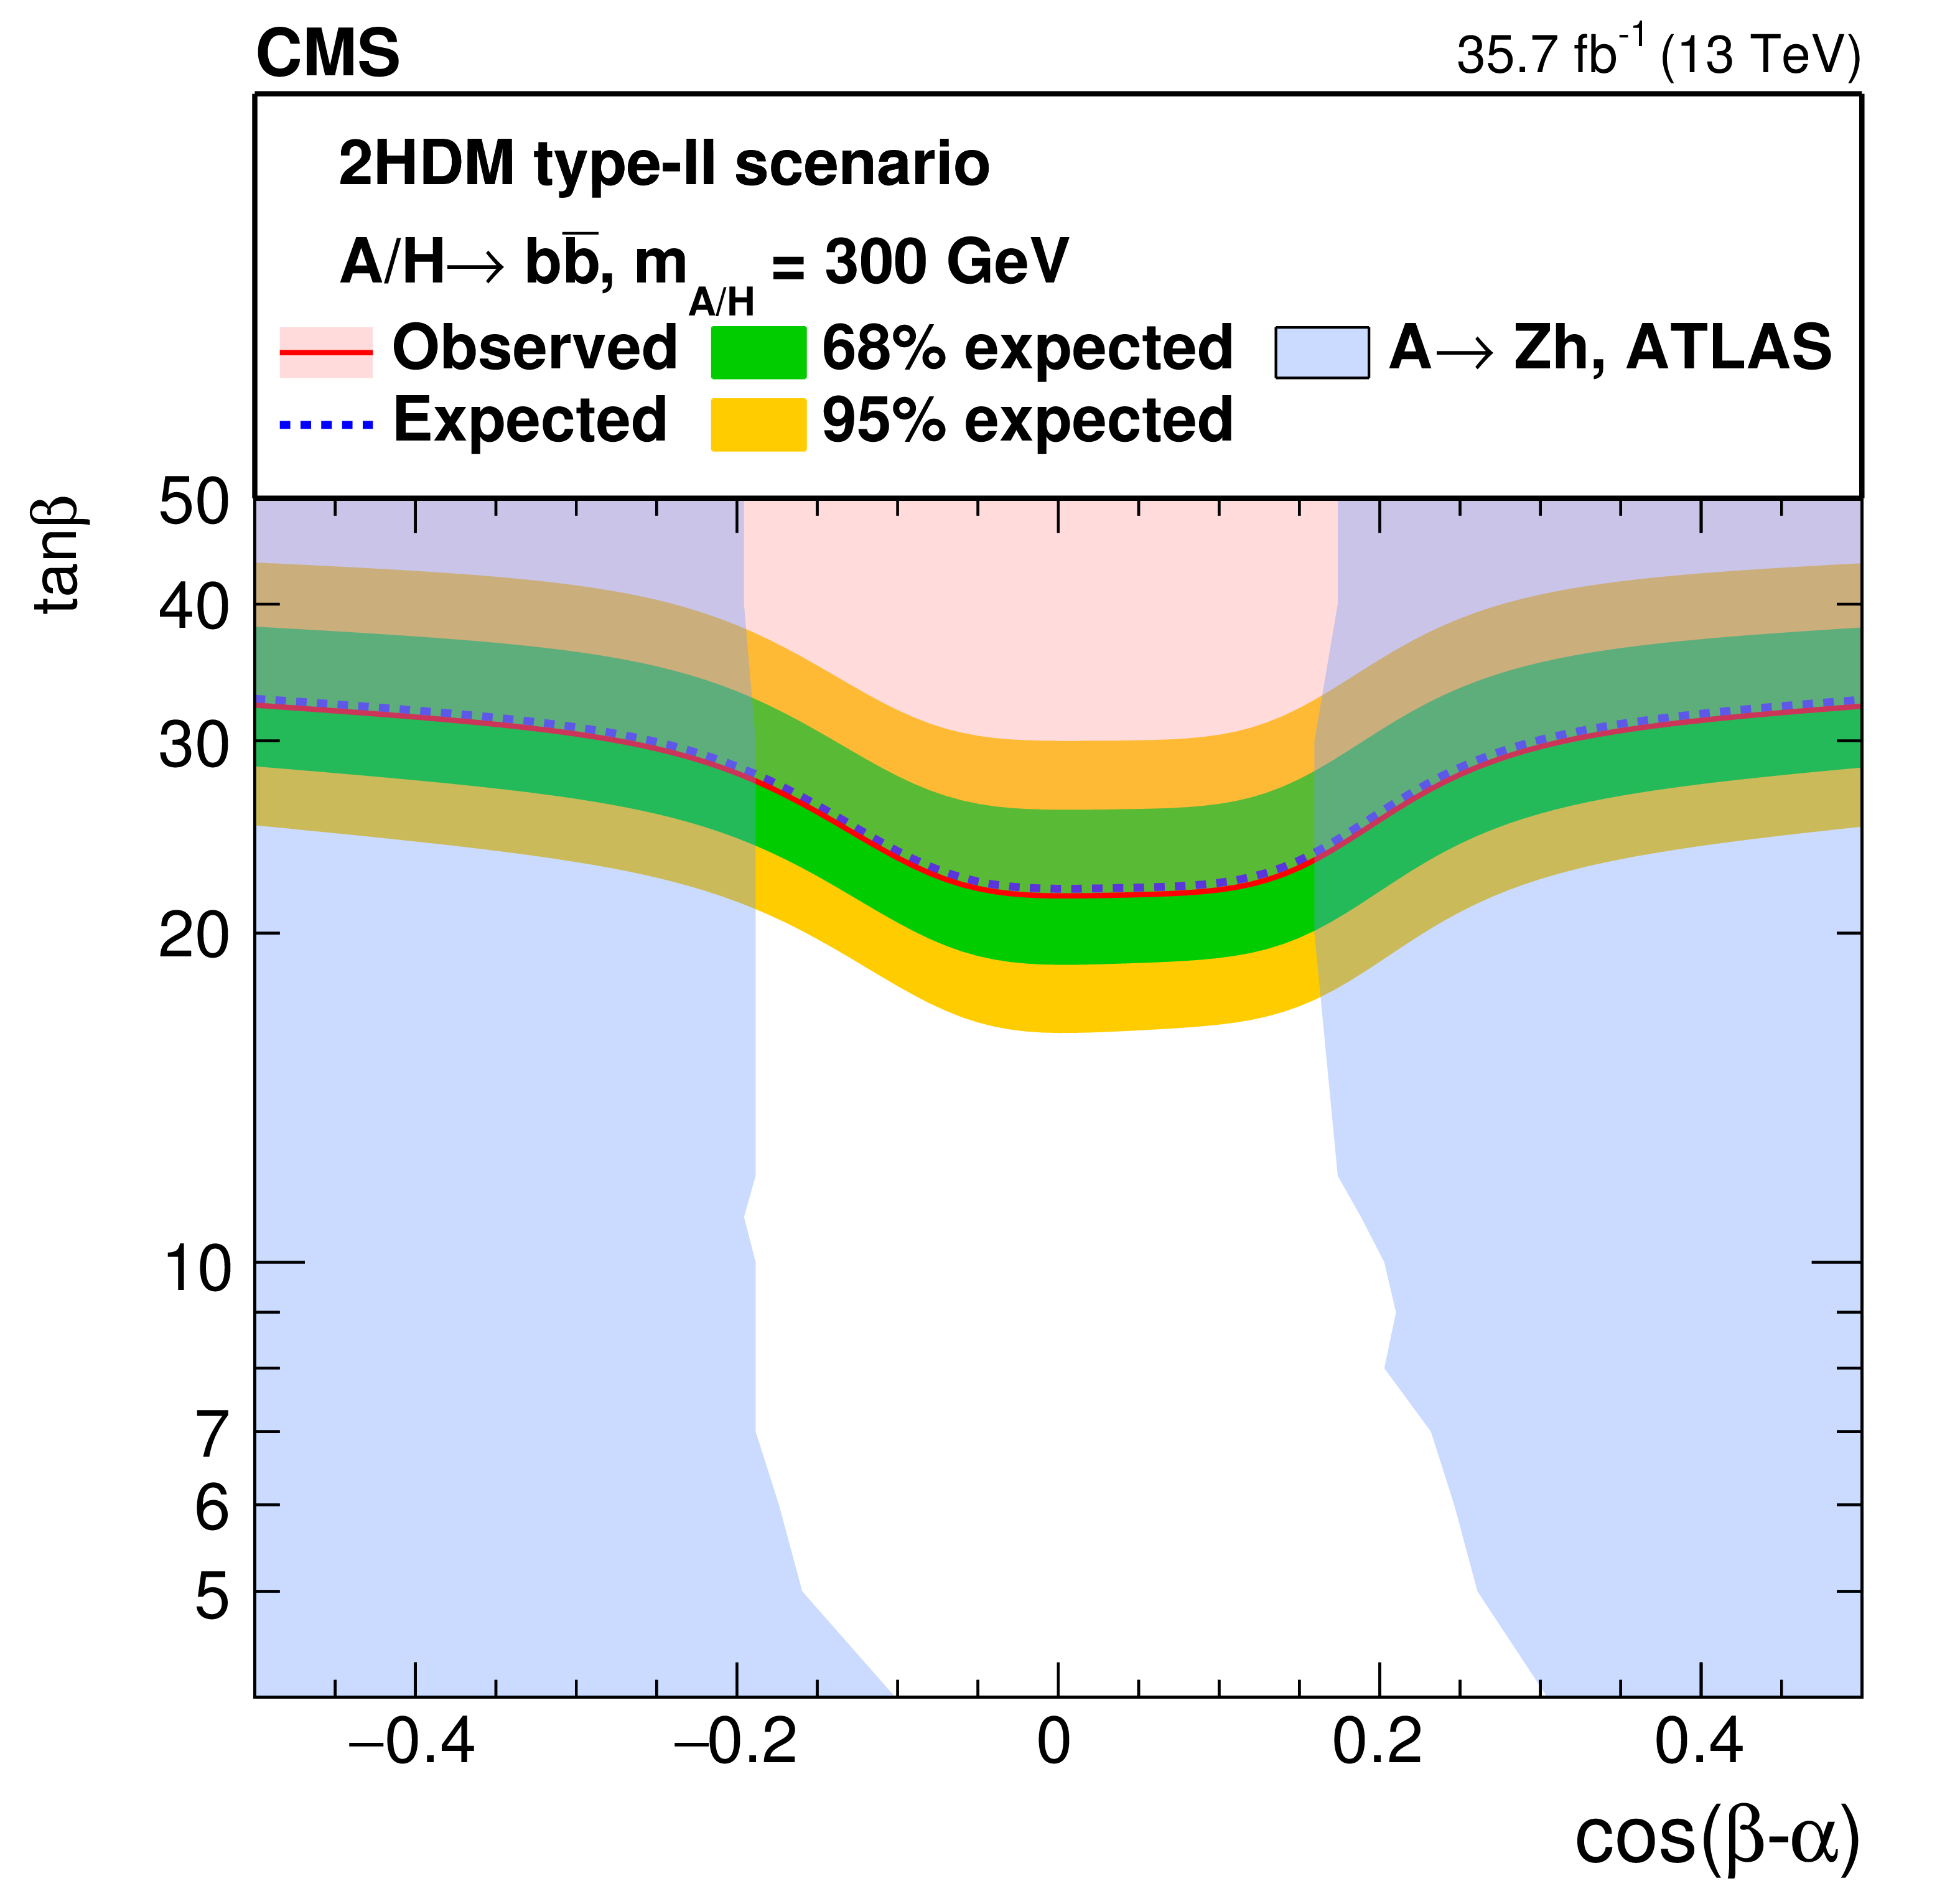
Figure 8-c:
Upper limits for the parameter $ \tan \beta $ at 95% CL for the type-II model, as a function of $ {\cos(\beta -\alpha)} $ in the range of $[-0.5,0.5]$ for the mass $m_ {\mathrm {H}} =m_ {\mathrm {A}} = $ 300 GeV. The results from the ATLAS $ {\mathrm {A}} \to {\mathrm {Z}} {\mathrm {h}} $ analysis [24], which provide limits up to $ \tan \beta = $ 50 at 95% CL, are also shown as blue shaded area for comparison. |
png pdf |
Figure 8-d:
Upper limits for the parameter $ \tan \beta $ at 95% CL for the type-II model, as a function of $ {m_{{\mathrm {A}} / {\mathrm {H}}}} $ when $ {\cos(\beta -\alpha)} $ = 0.1. The results from the ATLAS $ {\mathrm {A}} \to {\mathrm {Z}} {\mathrm {h}} $ analysis [24], which provide limits up to $ \tan \beta = $ 50 at 95% CL, are also shown as blue shaded area for comparison. |

png pdf |
Figure 9:
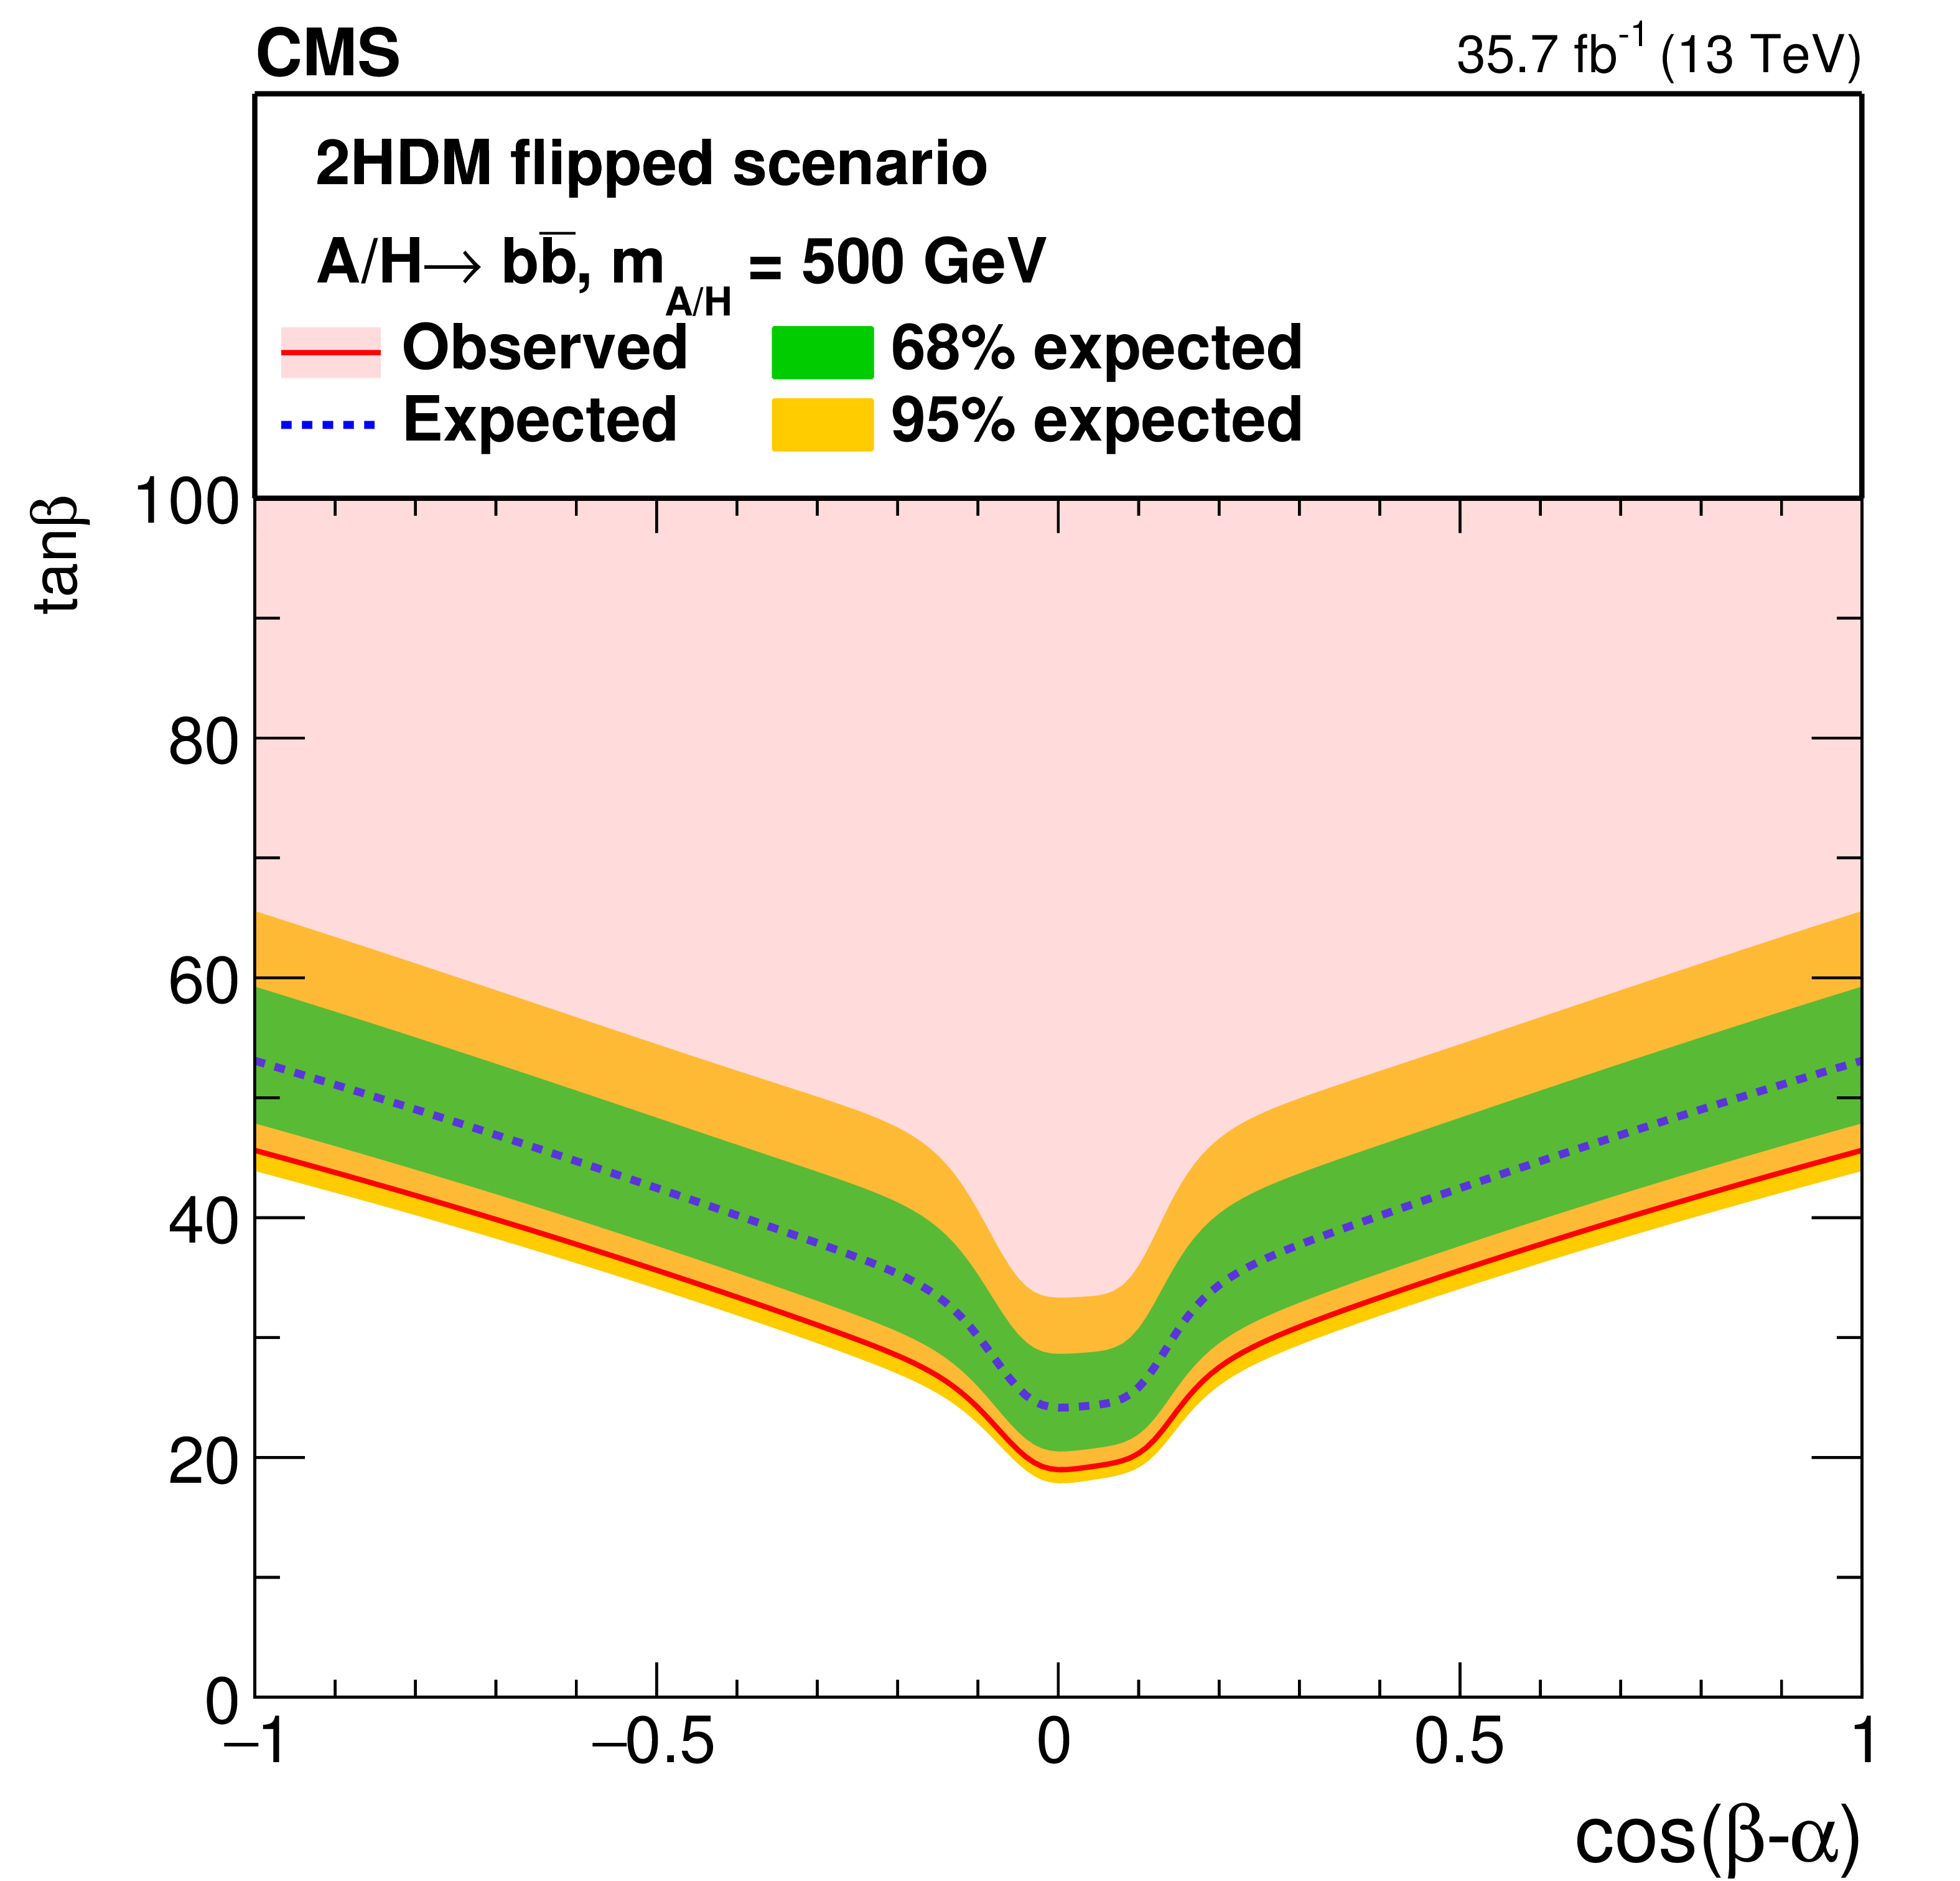
Upper limits for the parameter $ \tan \beta $ at 95% confidence level for the flipped (left) and type-II (right) models as a function of $ {\cos(\beta -\alpha)} $ in the full range of $[-1.0,1.0]$, for the mass $m_ {\mathrm {H}} =m_ {\mathrm {A}} = $ 500 GeV. The inner and outer bands indicate the regions containing 68 and 95%, respectively, of the distribution of limits expected under the background-only hypothesis. |
png pdf |
Figure 9-a:
Upper limits for the parameter $ \tan \beta $ at 95% confidence level for the flipped model as a function of $ {\cos(\beta -\alpha)} $ in the full range of $[-1.0,1.0]$, for the mass $m_ {\mathrm {H}} =m_ {\mathrm {A}} = $ 500 GeV. The inner and outer bands indicate the regions containing 68 and 95%, respectively, of the distribution of limits expected under the background-only hypothesis. |

png pdf |
Figure 9-b:
Upper limits for the parameter $ \tan \beta $ at 95% confidence level for the type-II model as a function of $ {\cos(\beta -\alpha)} $ in the full range of $[-1.0,1.0]$, for the mass $m_ {\mathrm {H}} =m_ {\mathrm {A}} = $ 500 GeV. The inner and outer bands indicate the regions containing 68 and 95%, respectively, of the distribution of limits expected under the background-only hypothesis. |
| Tables | |

png pdf |
Table 1:
Expected and observed 95% CLs upper limits on $\sigma ({\mathrm {p}} {\mathrm {p}}\to {\mathrm {b}} {\mathrm {A}} / {\mathrm {H}} +\mathrm {X})\,\mathcal {B}({\mathrm {A}} / {\mathrm {H}} \to {{\mathrm {b}} {\overline {\mathrm {b}}}})$ in pb as a function of $ {m_{{\mathrm {A}} / {\mathrm {H}}}} $. |
png pdf |
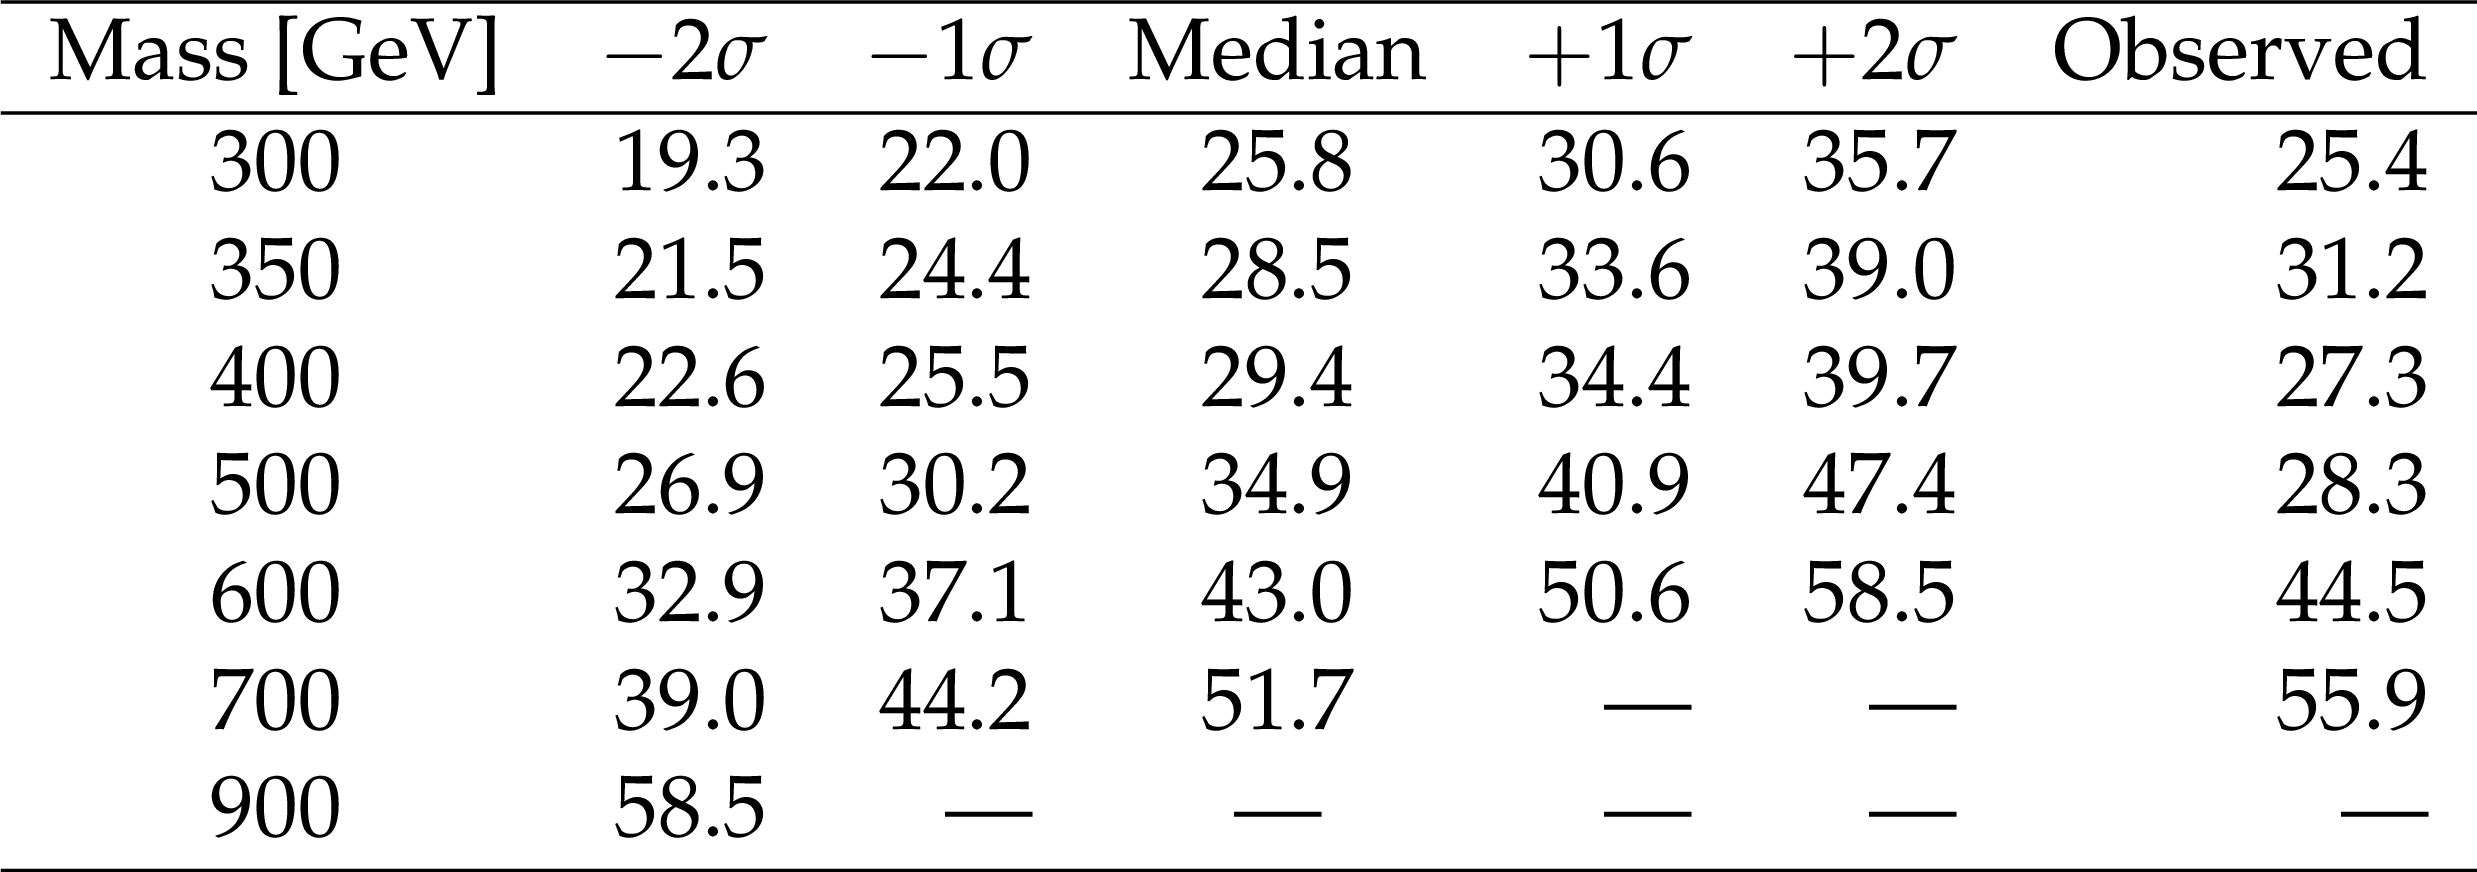
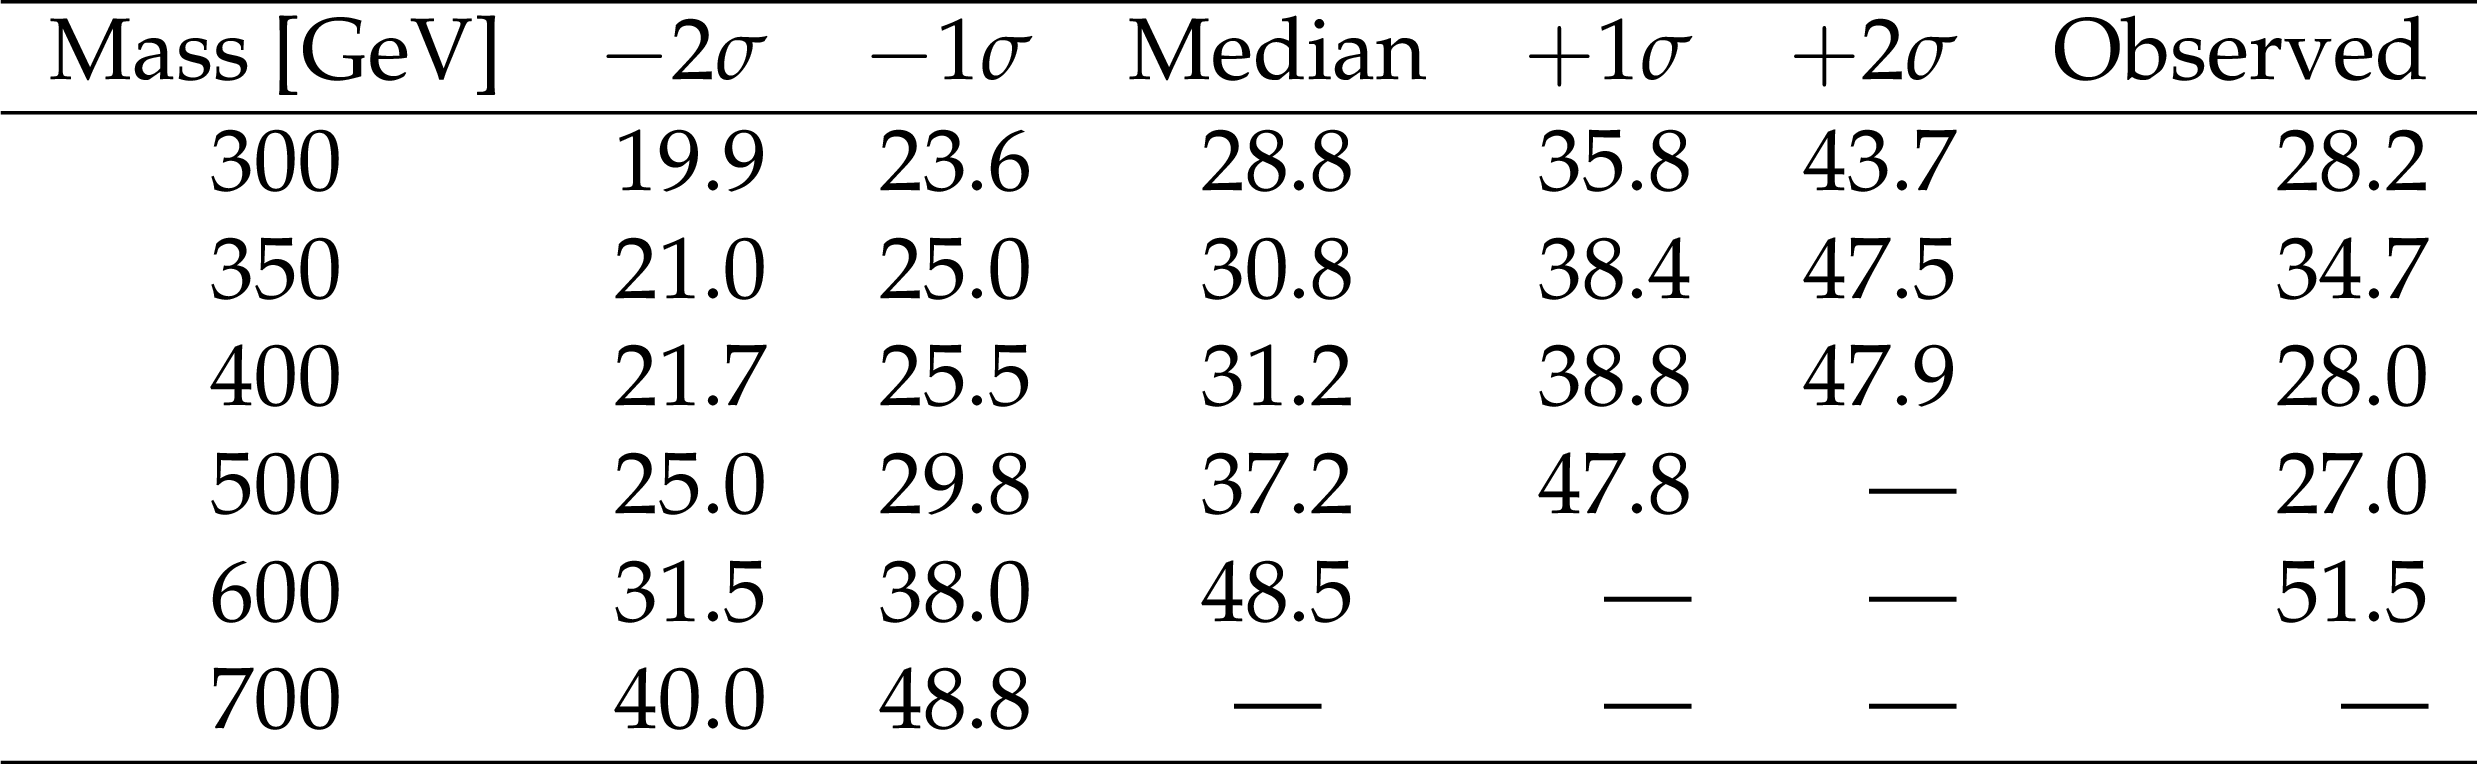
Table 2:
Expected and observed 95% CLs upper limits on $ \tan \beta $ as a function of ${m_{{\mathrm {A}}}}$ in the ${m_{{\mathrm {h}}}^{\text {mod+}}}$, $\mu = +$200 GeV, benchmark scenario. Since theoretical predictions for $ \tan \beta > $ 60 are not reliable, entries for which $ \tan \beta $ would exceed this value are indicated by --. |
png pdf |
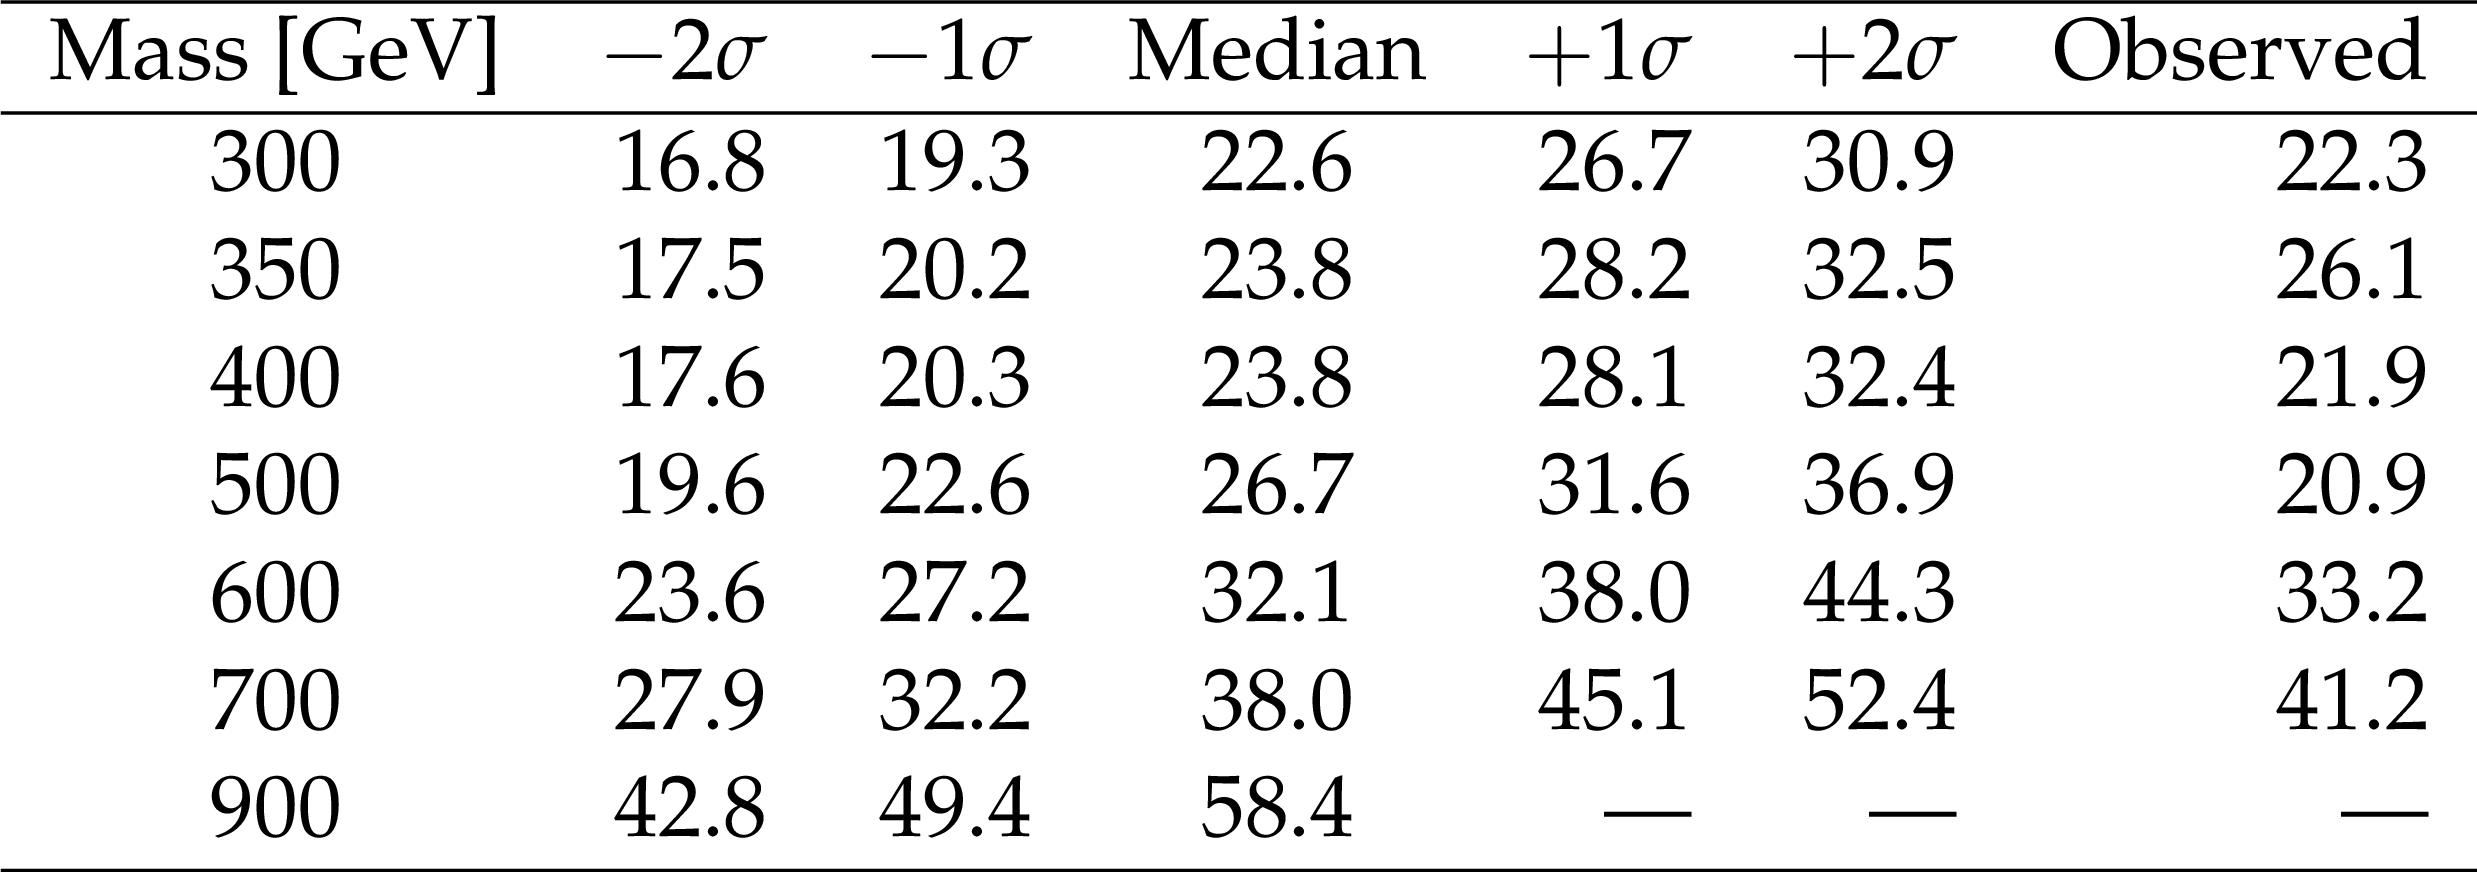
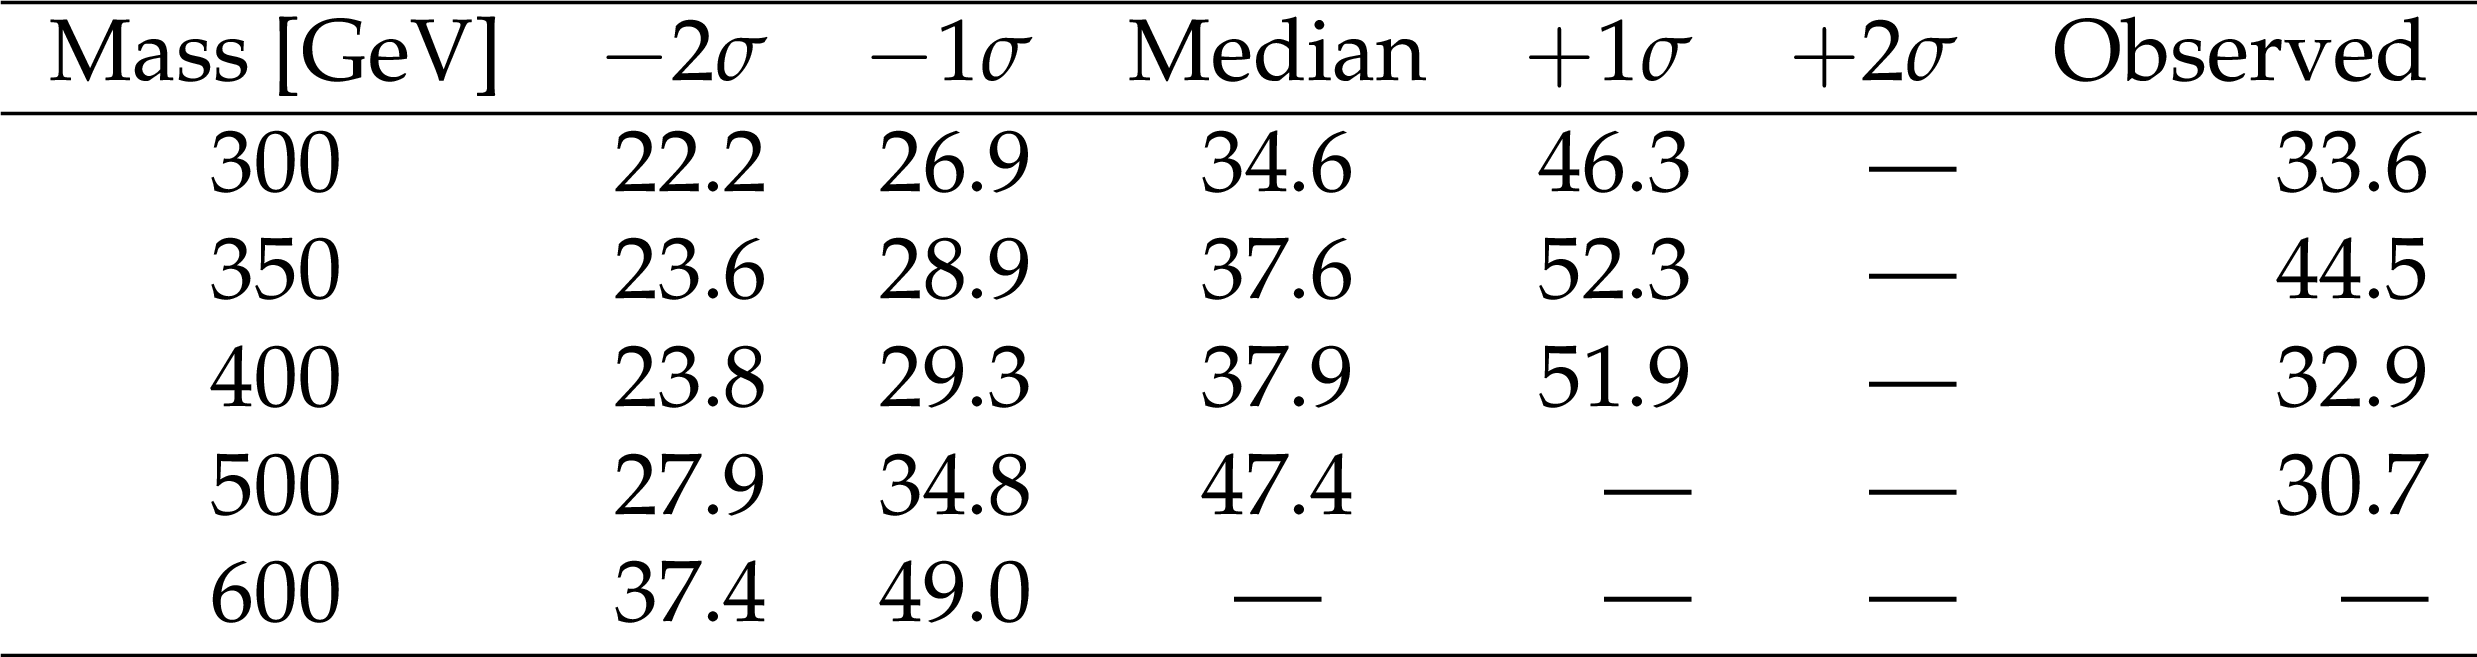
Table 3:
Expected and observed 95% CLs upper limits on $ \tan \beta $ as a function of ${m_{{\mathrm {A}}}}$ in the hMSSM benchmark scenario. Since theoretical predictions for $ \tan \beta > $ 60 are not reliable, entries for which $ \tan \beta $ would exceed this value are indicated by --. |
png pdf |
Table 4:
Expected and observed 95% CLs upper limits on $ \tan \beta $ as a function of ${m_{{\mathrm {A}}}}$ in the light $ {\tilde{\tau}} $ benchmark scenario. Since theoretical predictions for $ \tan \beta > $ 60 are not reliable, entries for which $ \tan \beta $ would exceed this value are indicated by --. |
png pdf |
Table 5:
Expected and observed 95% CLs upper limits on $ \tan \beta $ as a function of ${m_{{\mathrm {A}}}}$ in the light $ {\tilde{\mathrm {t}}} $ benchmark scenario. Since theoretical predictions for $ \tan \beta > $ 60 are not reliable, entries for which $ \tan \beta $ would exceed this value are indicated by --. |
| Summary |
|
A search for a heavy Higgs boson decaying into a bottom quark-antiquark pair and accompanied by at least one additional bottom quark has been performed. The data analyzed correspond to an integrated luminosity of 35.7 fb$^{-1}$, recorded in proton-proton collisions at a centre-of-mass energy of $\sqrt{s} = $ 13 TeV at the LHC. For this purpose, dedicated triggers using all-hadronic jet signatures combined with online b tagging were developed. The signal is characterized by events with at least three b-tagged jets. The search has been performed in the invariant mass spectrum of the two leading jets that are also required to be b-tagged. No evidence for a signal is found. Upper limits on the Higgs boson cross section times branching fraction are obtained in the mass region 300-1300 GeV at 95% confidence level. They range from about 20 pb at the lower end of the mass range, to about 0.4 pb at 1100 GeV, and extend to considerably higher masses than those accessible to previous analyses in this channel. The results are interpreted within various benchmark scenarios of the minimal supersymmetric extension of the standard model (MSSM). They yield upper limits on the model parameter $ {\tan\beta} $ as a function of the mass parameter $ {m_{\mathrm{A} }} $. The observed limit at 95% confidence level for $ {\tan\beta} $ is as low as about 25 at the lowest $ {m_{\mathrm{A} }} $ value of 300 GeV in the ${m_{\mathrm{h}}^{\text{mod+}}} $ scenario with a higgsino mass parameter of $\mu= +$200 GeV. In the hMSSM, scenarios with $ {\tan\beta} $ values above 22 to 60 for Higgs boson masses from 300 to 900 GeV are excluded at 95% confidence level. The results are also interpreted in the two Higgs doublet model (2HDM) type-II and flipped scenarios. In the flipped 2HDM scenario, similar upper limits on $ {\tan\beta} $ as for the hMSSM are set over the full $ {\cos(\beta-\alpha)} $ range and for Higgs boson masses from 300 to 850 GeV. The limits obtained for the flipped scenario provide competitive upper limits in the region around zero of $\cos(\beta-\alpha)$ and provide strong unique constraints on ${\tan\beta}$. |
| Additional Figures | |

png pdf |
Additional Figure 1:
Dijet invariant mass $\mathrm {M}_{12}$ in the triple b tag signal region in the three subranges used for the fit: $\mathrm {M}_{12} = [200, 650]$ GeV (top left), $\mathrm {M}_{12} = [350, 1190]$ GeV (upper right), and $\mathrm {M}_{12} = [500, 1700]$ GeV (lower) in logarithmic scale. The dots represent the data. The blue line is the result of the fit of the background parameterizations described in the text. The shaded areas show the post-fit uncertainty. In the bottom panel of each plot the normalized difference (${\mathrm {Data}-\mathrm {Bkg}}/{\sqrt {\mathrm {Bkg}}}$) is shown. |
png pdf |
Additional Figure 1-a:
Dijet invariant mass $\mathrm {M}_{12}$ in the triple b tag signal region in the $\mathrm {M}_{12} = [200, 650]$ GeV subrange, in logarithmic scale. The dots represent the data. The blue line is the result of the fit of the background parameterizations described in the text. The shaded areas show the post-fit uncertainty. In the bottom panel the normalized difference (${\mathrm {Data}-\mathrm {Bkg}}/{\sqrt {\mathrm {Bkg}}}$) is shown. |

png pdf |
Additional Figure 1-b:
Dijet invariant mass $\mathrm {M}_{12}$ in the triple b tag signal region in the $\mathrm {M}_{12} = [350, 1190]$ GeV subrange, in logarithmic scale. The dots represent the data. The blue line is the result of the fit of the background parameterizations described in the text. The shaded areas show the post-fit uncertainty. In the bottom panel the normalized difference (${\mathrm {Data}-\mathrm {Bkg}}/{\sqrt {\mathrm {Bkg}}}$) is shown. |
png pdf |
Additional Figure 1-c:
Dijet invariant mass $\mathrm {M}_{12}$ in the triple b tag signal region in the $\mathrm {M}_{12} = [500, 1700]$ GeV subrange, in logarithmic scale. The dots represent the data. The blue line is the result of the fit of the background parameterizations described in the text. The shaded areas show the post-fit uncertainty. In the bottom panel the normalized difference (${\mathrm {Data}-\mathrm {Bkg}}/{\sqrt {\mathrm {Bkg}}}$) is shown. |
png pdf |
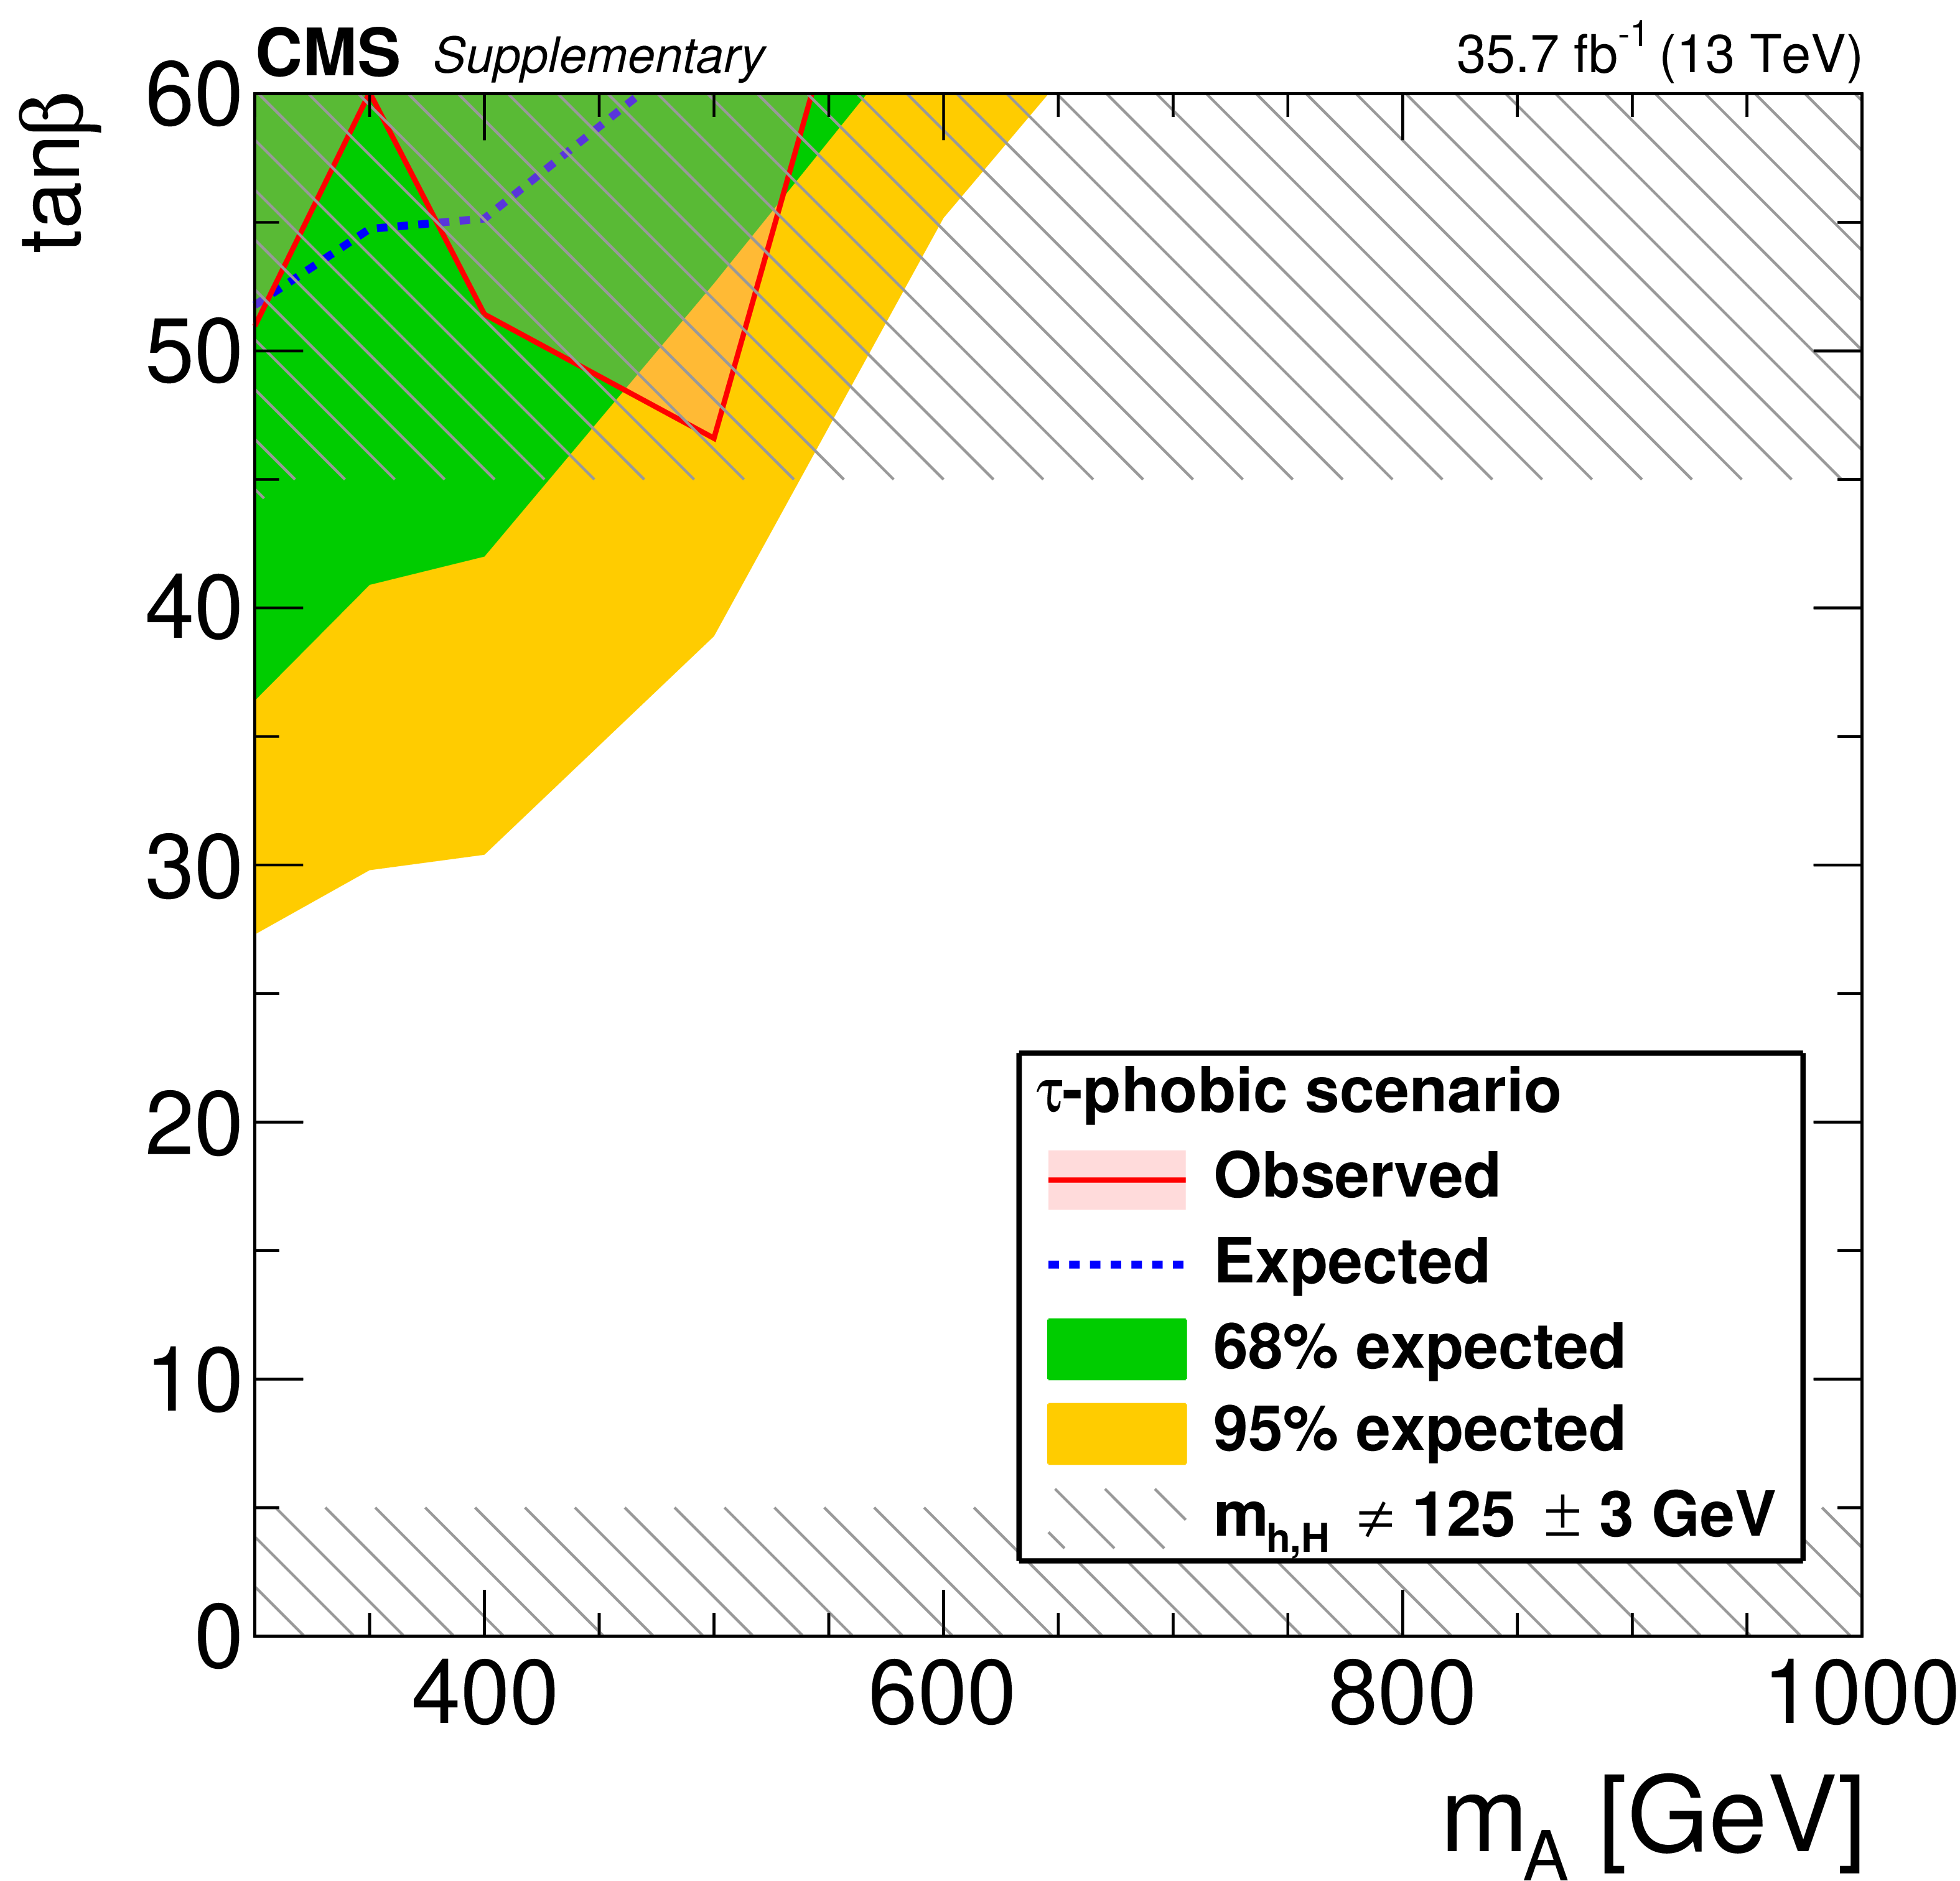
Additional Figure 2:
Expected and observed upper limits at 95% CL for $m_{\mathrm {A}}$ vs. the MSSM parameter $\tan\beta$ in the tau-phobic benchmark scenario. The inner (green) band and the outer (yellow) band indicate the regions containing 68 and 95%, respectively, of the distribution of limits expected under the background-only hypothesis. The excluded parameter space is indicated by the red shaded area. |

png pdf |
Additional Figure 3:
Expected and observed upper limits at 95% CL for $m_{\mathrm {A}}$ vs. the MSSM parameter $\tan\beta$ in the $M_{\mathrm {h}}^{125}$ benchmark scenario, as proposed in arxiv:1808.07542. The inner (green) band and the outer (yellow) band indicate the regions containing 68 and 95%, respectively, of the distribution of limits expected under the background-only hypothesis. The excluded parameter space is indicated by the red shaded area. |
png pdf |
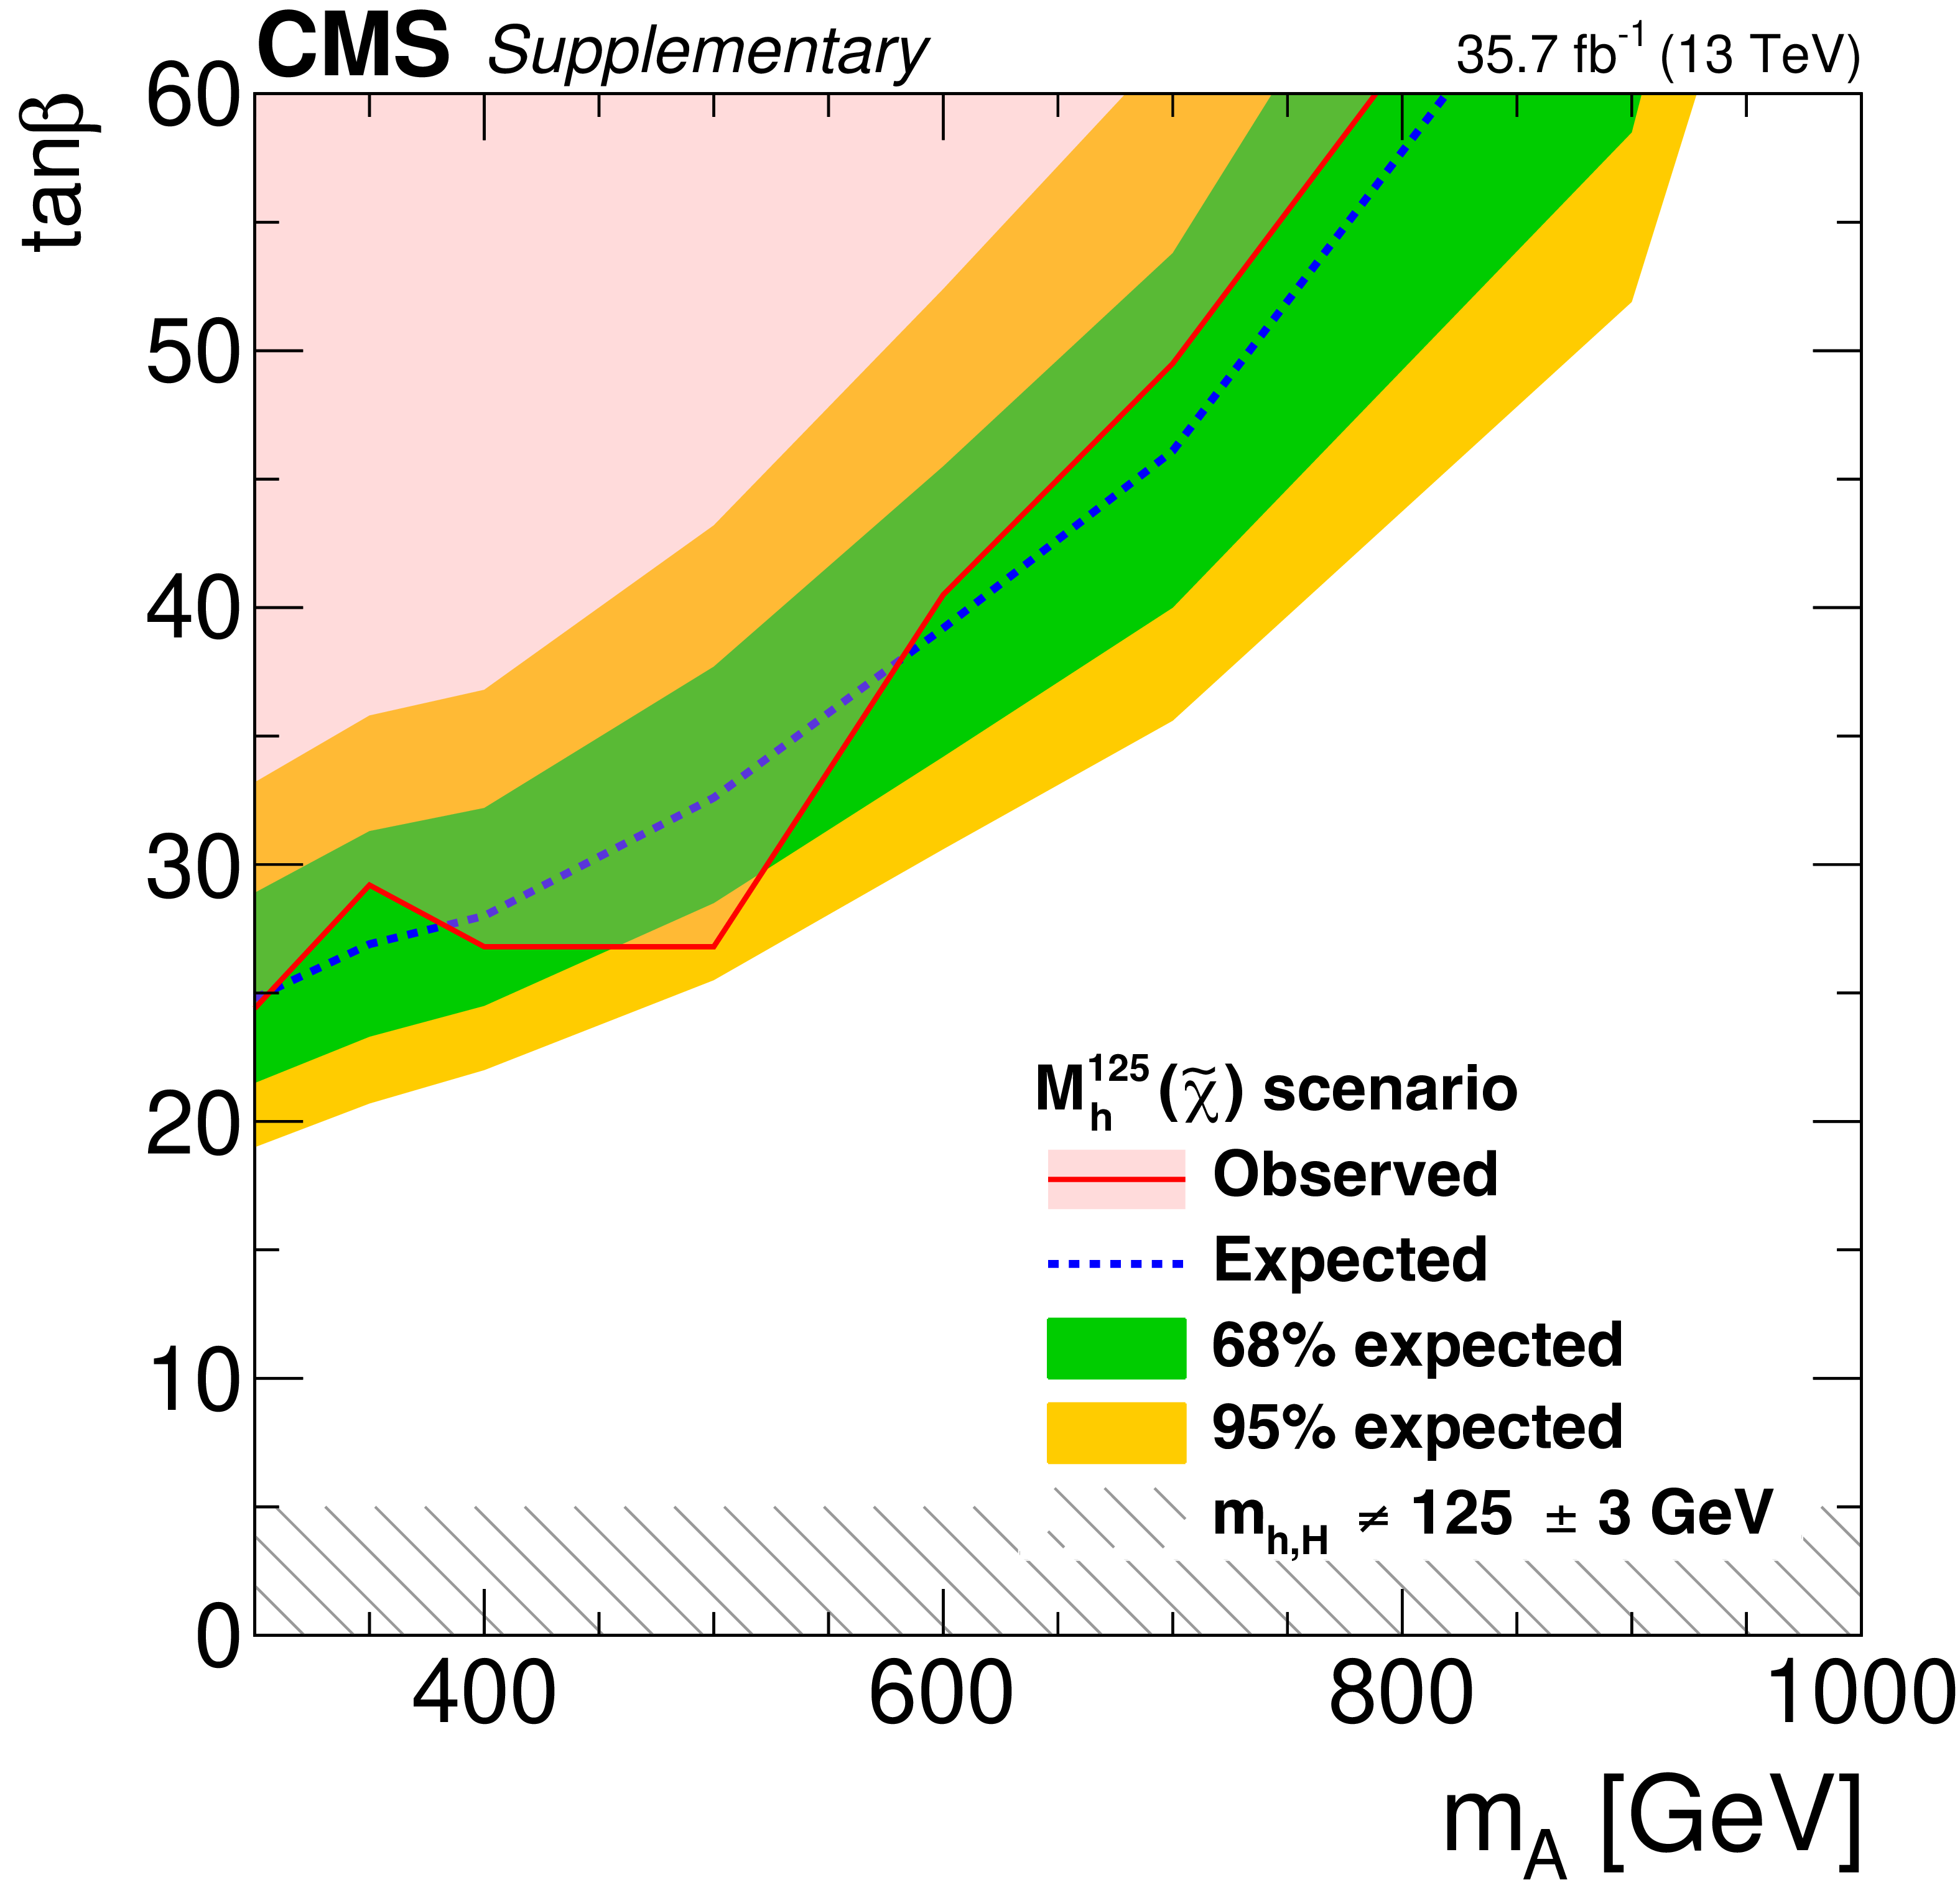
Additional Figure 4:
Expected and observed upper limits at 95% CL for $m_{\mathrm {A}}$ vs. the MSSM parameter $\tan\beta$ in the $M_{\mathrm {h}}^{125}(\tilde{\chi})$ benchmark scenario, as proposed in arxiv:1808.07542. The inner (green) band and the outer (yellow) band indicate the regions containing 68 and 95%, respectively, of the distribution of limits expected under the background-only hypothesis. The excluded parameter space is indicated by the red shaded area. |
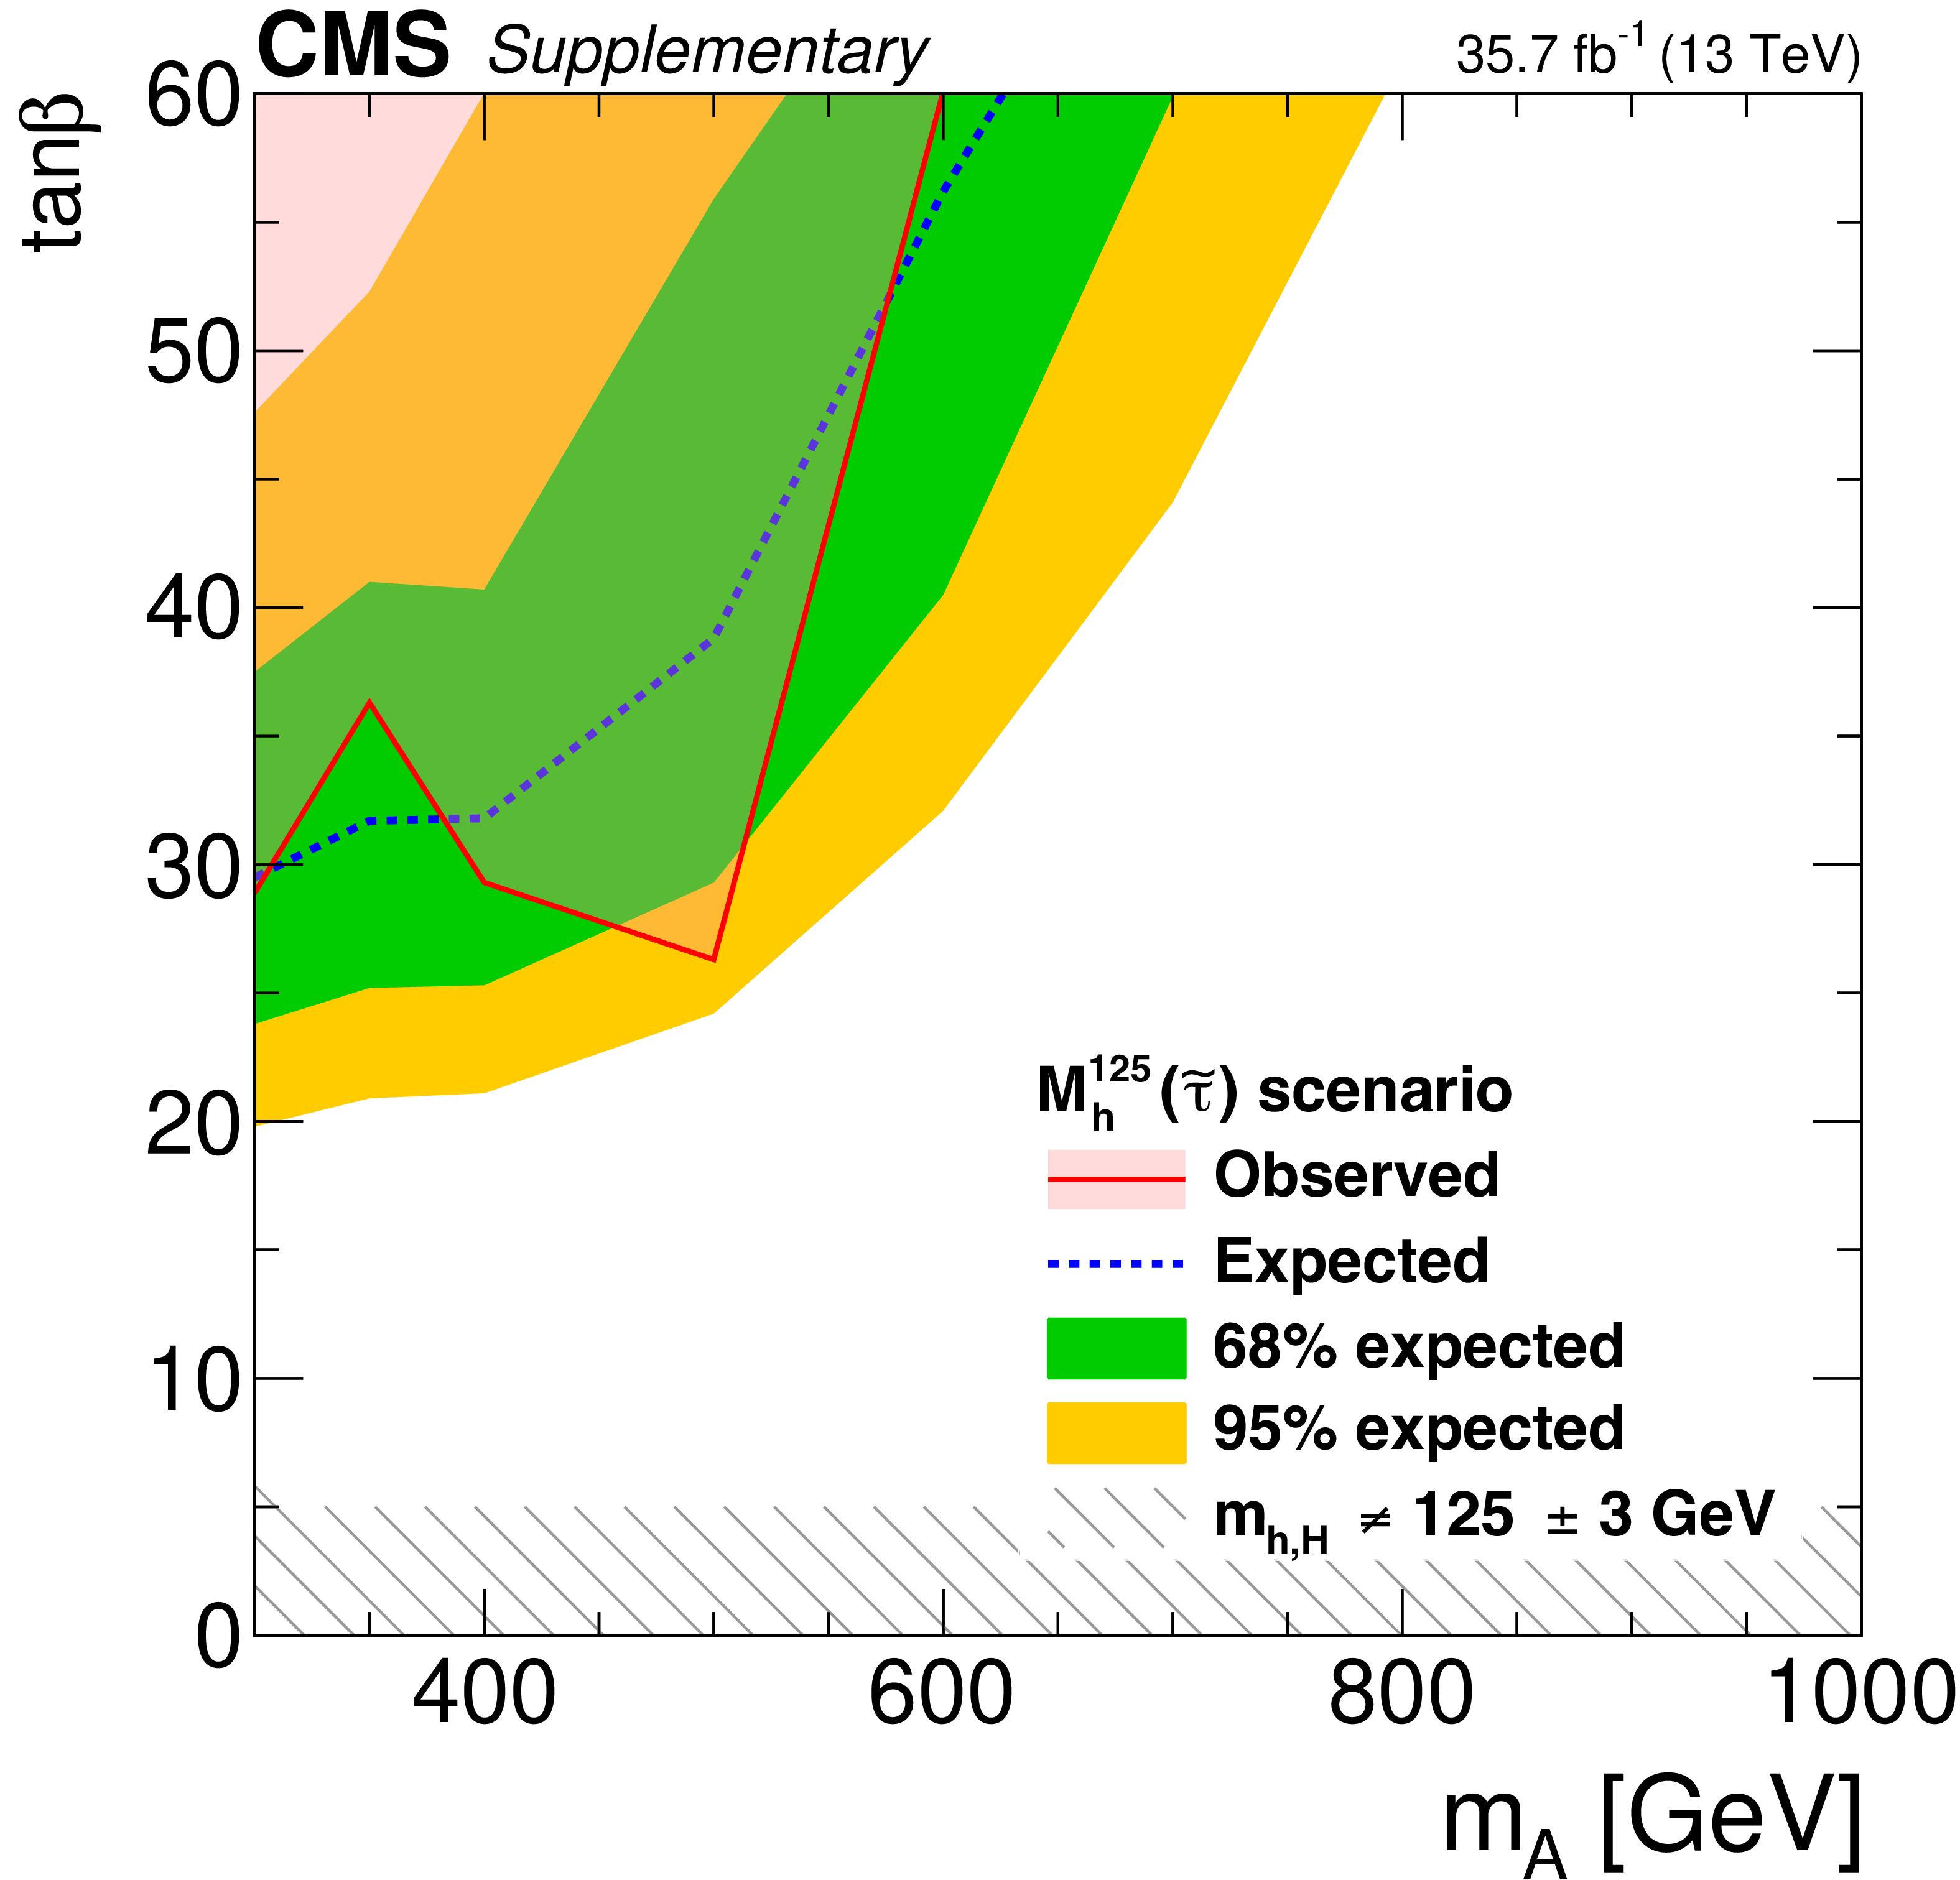
png pdf |
Additional Figure 5:
Expected and observed upper limits at 95% CL for $m_{\mathrm {A}}$ vs. the MSSM parameter $\tan\beta$ in the $M_{\mathrm {h}}^{125}(\tilde{\tau})$ benchmark scenario, as proposed in arxiv:1808.07542. The inner (green) band and the outer (yellow) band indicate the regions containing 68 and 95%, respectively, of the distribution of limits expected under the background-only hypothesis. The excluded parameter space is indicated by the red shaded area. |
| References | ||||
| 1 | G. C. Branco et al. | Theory and phenomenology of two-Higgs-doublet models | Phys. Rep. 516 (2012) 1 | 1106.0034 |
| 2 | H. P. Nilles | Supersymmetry, supergravity and particle physics | Phys. Rep. 110 (1984) 1 | |
| 3 | ATLAS Collaboration | Observation of a new particle in the search for the standard model Higgs boson with the ATLAS detector at the LHC | PLB 716 (2012) 1 | 1207.7214 |
| 4 | CMS Collaboration | Observation of a new boson at a mass of 125 GeV with the CMS experiment at the LHC | PLB 716 (2012) 30 | CMS-HIG-12-028 1207.7235 |
| 5 | CMS Collaboration | Observation of a new boson with mass near 125 GeV in pp collisions at $ \sqrt{s} = $ 7 and 8 TeV | JHEP 06 (2013) 081 | CMS-HIG-12-036 1303.4571 |
| 6 | CMS Collaboration | Measurements of properties of the Higgs boson decaying into the four-lepton final state in pp collisions at $ \sqrt{s}=$ 13 TeV | JHEP 11 (2017) 047 | CMS-HIG-16-041 1706.09936 |
| 7 | M. Carena et al. | MSSM Higgs boson searches at the LHC: benchmark scenarios after the discovery of a Higgs-like particle | EPJC 73 (2013) 2552 | 1302.7033 |
| 8 | M. S. Carena, S. Heinemeyer, C. E. M. Wagner, and G. Weiglein | MSSM Higgs boson searches at the Tevatron and the LHC: Impact of different benchmark scenarios | EPJC 45 (2006) 797 | hep-ph/0511023 |
| 9 | A. Djouadi et al. | The post-Higgs MSSM scenario: Habemus MSSM? | EPJC 73 (2013) 2650 | 1307.5205 |
| 10 | ALEPH, DELPHI, L3, and OPAL Collaborations, LEP Working Group for Higgs Boson Searches | Search for neutral MSSM Higgs bosons at LEP | EPJC 47 (2006) 547 | hep-ex/0602042 |
| 11 | M. Carena, S. Heinemeyer, C. E. M. Wagner, and G. Weiglein | Suggestions for benchmark scenarios for MSSM Higgs boson searches at hadron colliders | EPJC 26 (2003) 601 | hep-ph/0202167 |
| 12 | S. Heinemeyer, W. Hollik, and G. Weiglein | Constraints on $ {\tan\beta} $ in the MSSM from the upper bound on the mass of the lightest Higgs boson | JHEP 06 (2000) 009 | hep-ph/9909540 |
| 13 | G. Degrassi et al. | Towards high-precision predictions for the MSSM Higgs sector | EPJC 28 (2003) 133 | hep-ph/0212020 |
| 14 | B. C. Allanach et al. | Precise determination of the neutral Higgs boson masses in the MSSM | JHEP 09 (2004) 044 | hep-ph/0406166 |
| 15 | L. Maiani, A. D. Polosa, and V. Riquer | Bounds to the Higgs sector masses in minimal supersymmetry from LHC data | PLB 724 (2013) 274 | 1305.2172 |
| 16 | A. Djouadi et al. | Fully covering the MSSM Higgs sector at the LHC | JHEP 06 (2015) 168 | 1502.05653 |
| 17 | LHC Higgs Cross Section Working Group | Benchmark scenarios for low $ {\tan\beta} $ in the MSSM | LHCHXSWG-2015-002 | |
| 18 | ATLAS and CMS Collaborations | Combined measurement of the Higgs boson mass in pp collisions at $ \sqrt{s}= $ 7 and 8 TeV with the ATLAS and CMS experiments | PRL 114 (2015) 191803 | 1503.07589 |
| 19 | LHC Higgs Cross Section Working Group | Handbook of LHC Higgs cross sections: 3. Higgs properties | CERN (2013) | 1307.1347 |
| 20 | CMS Collaboration | Search for neutral Higgs bosons decaying to tau pairs in pp collisions at $ \sqrt{s}=$ 7 TeV | PLB 713 (2012) 68 | CMS-HIG-11-029 1202.4083 |
| 21 | ATLAS Collaboration | Search for the neutral Higgs bosons of the minimal supersymmetric standard model in pp collisions at $ \sqrt{s}=$ 7 TeV with the ATLAS detector | JHEP 02 (2013) 095 | 1211.6956 |
| 22 | CMS Collaboration | Search for neutral MSSM Higgs bosons decaying to a pair of tau leptons in pp collisions | JHEP 10 (2014) 160 | CMS-HIG-13-021 1408.3316 |
| 23 | ATLAS Collaboration | Search for neutral Higgs bosons of the minimal supersymmetric standard model in pp collisions at $ \sqrt{s} = $ 8 TeV with the ATLAS detector | JHEP 11 (2014) 056 | 1409.6064 |
| 24 | ATLAS Collaboration | Search for additional heavy neutral Higgs and gauge bosons in the ditau final state produced in 36 fb$^{-1}$ of pp collisions at $ \sqrt{s}=$ 13 TeV with the ATLAS detector | JHEP 01 (2018) 055 | 1709.07242 |
| 25 | CMS Collaboration | Search for additional neutral MSSM Higgs bosons in the $ \tau\tau $ final state in proton-proton collisions at $ \sqrt{s}= $ 13 TeV | Submitted to JHEP | CMS-HIG-17-020 1803.06553 |
| 26 | CDF Collaboration | Search for Higgs bosons predicted in two-Higgs-doublet models via decays to tau lepton pairs in 1.96 $ TeV {\mathrm{p}}\mathrm{\bar{p}} $ collisions | PRL 103 (2009) 201801 | 0906.1014 |
| 27 | D0 Collaboration | Search for Higgs bosons decaying to tau pairs in $ {\mathrm{p}}\mathrm{\bar{p}} $ collisions with the D0 detector | PRL 101 (2008) 071804 | 0805.2491 |
| 28 | D0 Collaboration | Search for Higgs bosons of the minimal supersymmetric standard model $ {\mathrm{p}}\mathrm{\bar{p}} $ in collisions at $ \sqrt{s}=1.96{TeV} $ | PLB 710 (2012) 569 | 1112.5431 |
| 29 | CMS Collaboration | Search for neutral MSSM Higgs bosons decaying to $ \mu^{+} \mu^{-} $ in pp collisions at $ \sqrt{s} = $ 7 and 8 TeV | PLB 752 (2016) 221 | CMS-HIG-13-024 1508.01437 |
| 30 | CMS Collaboration | Search for a light pseudoscalar Higgs boson produced in association with bottom quarks in pp collisions at $ \sqrt{s}=$ 8 TeV | JHEP 11 (2017) 010 | CMS-HIG-15-009 1707.07283 |
| 31 | CDF and D0 Collaborations | Search for neutral Higgs bosons in events with multiple bottom quarks at the Tevatron | PRD 86 (2012) 091101 | 1207.2757 |
| 32 | CMS Collaboration | Search for a Higgs boson decaying into a b-quark pair and produced in association with b quarks in proton-proton collisions at 7 TeV | PLB 722 (2013) 207 | CMS-HIG-12-033 1302.2892 |
| 33 | CMS Collaboration | Search for neutral MSSM Higgs bosons decaying into a pair of bottom quarks | JHEP 11 (2015) 071 | CMS-HIG-14-017 1506.08329 |
| 34 | ATLAS Collaboration | Search for a CP-odd Higgs boson decaying to $ \mathrm{Z}\mathrm{h} $ in pp collisions at $ \sqrt{s} = $ 8 TeV with the ATLAS detector | PLB 744 (2015) 163 | 1502.04478 |
| 35 | ATLAS Collaboration | Search for heavy resonances decaying into a $ \mathrm{W} $ or $ \mathrm{Z} $ boson and a Higgs boson in final states with leptons and b jets in 36 fb$^{-1}$ of $ \sqrt{s} = $ 13 TeV pp collisions with the ATLAS detector | JHEP 03 (2018) 174 | 1712.06518 |
| 36 | CMS Collaboration | Search for a pseudoscalar boson decaying into a $ \mathrm{Z} $ boson and the 125 GeV Higgs boson in $ \ell^+\ell^-{\mathrm{b\bar{b}}} $ final states | PLB 748 (2015) 221 | CMS-HIG-14-011 1504.04710 |
| 37 | CMS Collaboration | The CMS experiment at the CERN LHC | JINST 3 (2008) S08004 | CMS-00-001 |
| 38 | CMS Collaboration | Particle-flow reconstruction and global event description with the CMS detector | JINST 12 (2017) P10003 | CMS-PRF-14-001 1706.04965 |
| 39 | M. Cacciari, G. P. Salam, and G. Soyez | The anti-$ {k_{\mathrm{T}}} $ jet clustering algorithm | JHEP 04 (2008) 063 | 0802.1189 |
| 40 | M. Cacciari, G. P. Salam, and G. Soyez | FastJet user manual | EPJC 72 (2012) | 1111.6097 |
| 41 | CMS Collaboration | Pileup removal algorithms | CMS-PAS-JME-14-001 | CMS-PAS-JME-14-001 |
| 42 | M. Cacciari and G. P. Salam | Pileup subtraction using jet areas | PLB 659 (2008) 119 | 0707.1378 |
| 43 | CMS Collaboration | Jet energy scale and resolution in the CMS experiment in pp collisions at 8 TeV | JINST 12 (2017) P02014 | CMS-JME-13-004 1607.03663 |
| 44 | CMS Collaboration | Identification of heavy-flavour jets with the CMS detector in pp collisions at 13 TeV | JINST 13 (2018) P05011 | CMS-BTV-16-002 1712.07158 |
| 45 | T. Sjostrand, S. Mrenna, and P. Skands | A brief introduction to PYTHIA 8.1 | Comput. Phys. Comm. 178 (2008) 852 | 0710.3820 |
| 46 | LHC Higgs Cross Section Working Group | Handbook of LHC Higgs cross sections: 2. Differential distributions | CERN (2012) | 1201.3084 |
| 47 | J. Alwall et al. | The automated computation of tree-level and next-to-leading order differential cross sections, and their matching to parton shower simulations | JHEP 07 (2014) 079 | 1405.0301 |
| 48 | M. Wiesemann et al. | Higgs production in association with bottom quarks | JHEP 02 (2015) 132 | 1409.5301 |
| 49 | R. Frederix, S. Frixione, F. Maltoni, and T. Stelzer | Automation of next-to-leading order computations in QCD: The FKS subtraction | JHEP 10 (2009) 003 | 0908.4272 |
| 50 | V. Hirschi et al. | Automation of one-loop QCD corrections | JHEP 05 (2011) 044 | 1103.0621 |
| 51 | J. Alwall et al. | Comparative study of various algorithms for the merging of parton showers and matrix elements in hadronic collisions | EPJC 53 (2008) 473 | 0706.2569 |
| 52 | R. D. Ball et al. | Impact of heavy quark masses on parton distributions and LHC phenomenology | NPB 849 (2011) 296 | 1101.1300 |
| 53 | CMS Collaboration | Event generator tunes obtained from underlying event and multiparton scattering measurements | EPJC 76 (2016) 155 | CMS-GEN-14-001 1512.00815 |
| 54 | GEANT4 Collaboration | GEANT4--a simulation toolkit | NIMA 506 (2003) 250 | |
| 55 | CMS Collaboration | The CMS trigger system | JINST 12 (2017) P01020 | CMS-TRG-12-001 1609.02366 |
| 56 | Belle Collaboration | A detailed test of the CsI(Tl) calorimeter for BELLE with photon beams of energy between 20 MeV and 5.4 GeV | NIMA 441 (2000) 401 | |
| 57 | CMS Collaboration | Search for massive resonances decaying into $ \mathrm{W}\mathrm{W}, \mathrm{W}\mathrm{Z} $ or ZZ bosons in proton-proton collisions at $ \sqrt{s} = $ 13 TeV | JHEP 03 (2017) 162 | CMS-B2G-16-004 1612.09159 |
| 58 | CMS Collaboration | CMS luminosity measurements for the 2016 data taking period | CMS-PAS-LUM-17-001 | CMS-PAS-LUM-17-001 |
| 59 | LHC Higgs Cross Section Working Group | Handbook of LHC Higgs cross sections: 4. Deciphering the nature of the Higgs sector | CERN (2016) | 1610.07922 |
| 60 | CMS Collaboration | Constraints on the double-parton scattering cross section from same-sign $ \mathrm{W} $ boson pair production in proton-proton collisions at $ \sqrt{s}=$ 8 TeV | JHEP 02 (2018) 032 | CMS-FSQ-16-005 1712.02280 |
| 61 | T. Junk | Confidence level computation for combining searches with small statistics | NIMA 434 (1999) 435 | hep-ex/9902006 |
| 62 | A. L. Read | Presentation of search results: The CLs technique | JPG 28 (2002) 2693 | |
| 63 | G. Cowan, K. Cranmer, E. Gross, and O. Vitells | Asymptotic formulae for likelihood-based tests of new physics | EPJC 71 (2011) 1554 | 1007.1727 |
| 64 | L. Moneta et al. | The RooStats Project | in 13$^\textth$ International Workshop on Advanced Computing and Analysis Techniques in Physics Research (ACAT2010) SISSA | 1009.1003 |
| 65 | S. Dittmaier, M. Kramer, and M. Spira | Higgs radiation off bottom quarks at the Tevatron and the CERN LHC | PRD 70 (2004) 074010 | hep-ph/0309204 |
| 66 | S. Dawson, C. B. Jackson, L. Reina, and D. Wackeroth | Exclusive Higgs boson production with bottom quarks at hadron colliders | PRD 69 (2004) 074027 | hep-ph/0311067 |
| 67 | R. V. Harlander and W. B. Kilgore | Higgs boson production in bottom quark fusion at next-to-next-to leading order | PRD 68 (2003) 013001 | hep-ph/0304035 |
| 68 | R. V. Harlander, M. Kramer, and M. Schumacher | Bottom-quark associated Higgs-boson production: reconciling the four- and five-flavour scheme approach | CERN-PH-TH-2011-134 | 1112.3478 |
| 69 | M. Frank et al. | The Higgs boson masses and mixings of the complex MSSM in the Feynman-diagrammatic approach | JHEP 02 (2007) 047 | hep-ph/0611326 |
| 70 | S. Heinemeyer, W. Hollik, and G. Weiglein | FeynHiggs: A program for the calculation of the masses of the neutral CP-even higgs bosons in the MSSM | CPC 124 (2000) 76 | hep-ph/9812320 |
| 71 | S. Heinemeyer, W. Hollik, and G. Weiglein | The masses of the neutral CP-even Higgs bosons in the MSSM: Accurate analysis at the two loop level | EPJC 9 (1999) 343 | hep-ph/9812472 |
| 72 | A. Djouadi, J. Kalinowski, and M. Spira | HDECAY: A program for Higgs boson decays in the standard model and its supersymmetric extension | CPC 108 (1998) 56 | hep-ph/9704448 |
| 73 | A. Djouadi, M. M. Muhlleitner, and M. Spira | Decays of supersymmetric particles: The program SUSY-HIT | in Proceedings, Physics at LHC, 2006, volume 38, p. 635 2007 | hep-ph/0609292 |
| 74 | R. V. Harlander, S. Liebler, and H. Mantler | SusHi: A program for the calculation of Higgs production in gluon fusion and bottom-quark annihilation in the standard model and the MSSM | CPC 184 (2013) 1605 | 1212.3249 |
| 75 | D. Eriksson, J. Rathsman, and O. Staal | 2HDMC: Two-Higgs-Doublet Model Calculator physics and manual | CPC 181 (2010) 189 | 0902.0851 |
| 76 | A. Buckley et al. | LHAPDF6: parton density access in the LHC precision era | EPJC 75 (2015) 132 | 1412.7420 |
| 77 | H. E. Haber and O. Staal | New LHC benchmarks for the CP-conserving two-Higgs-doublet model | EPJC 75 (2015) 491 | 1507.04281 |
| 78 | R. Brun and F. Rademakers | ROOT: An object oriented data analysis framework | NIMA 389 (1997) 81 | |
|
|
Compact Muon Solenoid LHC, CERN |
|

|

|

|

|

|