

Compact Muon Solenoid
LHC, CERN
| CMS-SMP-17-011 ; CERN-EP-2019-022 | ||
| Measurement of electroweak production of a W boson in association with two jets in proton-proton collisions at $\sqrt{s} = $ 13 TeV | ||
| CMS Collaboration | ||
| 10 March 2019 | ||
| Eur. Phys. J. C 80 (2020) 43 | ||
| Abstract: A measurement is presented of electroweak (EW) production of a W boson in association with two jets in proton-proton collisions at $\sqrt{s} = $ 13 TeV. The data sample was recorded by the CMS Collaboration at the LHC and corresponds to an integrated luminosity of 35.9 fb$^{-1}$. The measurement is performed for the $\ell\nu\mathrm{jj}$ final state (with $\ell\nu$ indicating a lepton-neutrino pair, and j representing the quarks produced in the hard interaction) in a kinematic region defined by invariant mass $m_\mathrm{jj} > $ 120 GeV and transverse momenta $p_\mathrm{T j} > $ 25 GeV. The cross section of the process is measured in the electron and muon channels yielding $\sigma_\mathrm{EW}(\mathrm{W}\mathrm{jj})= $ 6.23 $\pm$ 0.12 (stat) $\pm$ 0.61 (syst) pb per channel, in agreement with leading-order standard model predictions. The additional hadronic activity of events in a signal-enriched region is studied, and the measurements are compared with predictions. The final state is also used to perform a search for anomalous trilinear gauge couplings. Limits on anomalous trilinear gauge couplings associated with dimension-six operators are given in the framework of an effective field theory. The corresponding 95% confidence level intervals are $-2.3 < c_{{\mathrm{W}\mathrm{W}\mathrm{W}}}/\Lambda^2 < 2.5 $ TeV$^{-2}$, $-8.8 < c_{\mathrm{W}}/\Lambda^2 < 16$ TeV$^{-2}$, and $-45 < c_{\mathrm{B}}/\Lambda^2 < 46 $ TeV$^{-2}$. These results are combined with the CMS EW Zjj analysis, yielding the most stringent limit to date on the $c_{{\mathrm{W}\mathrm{W}\mathrm{W}}}$ coupling : $-1.8 < c_{{\mathrm{W}\mathrm{W}\mathrm{W}}}/\Lambda^2 < 2.0 $ TeV$^{-2}$. | ||
| Links: e-print arXiv:1903.04040 [hep-ex] (PDF) ; CDS record ; inSPIRE record ; HepData record ; CADI line (restricted) ; | ||
| Figures | |
png pdf |
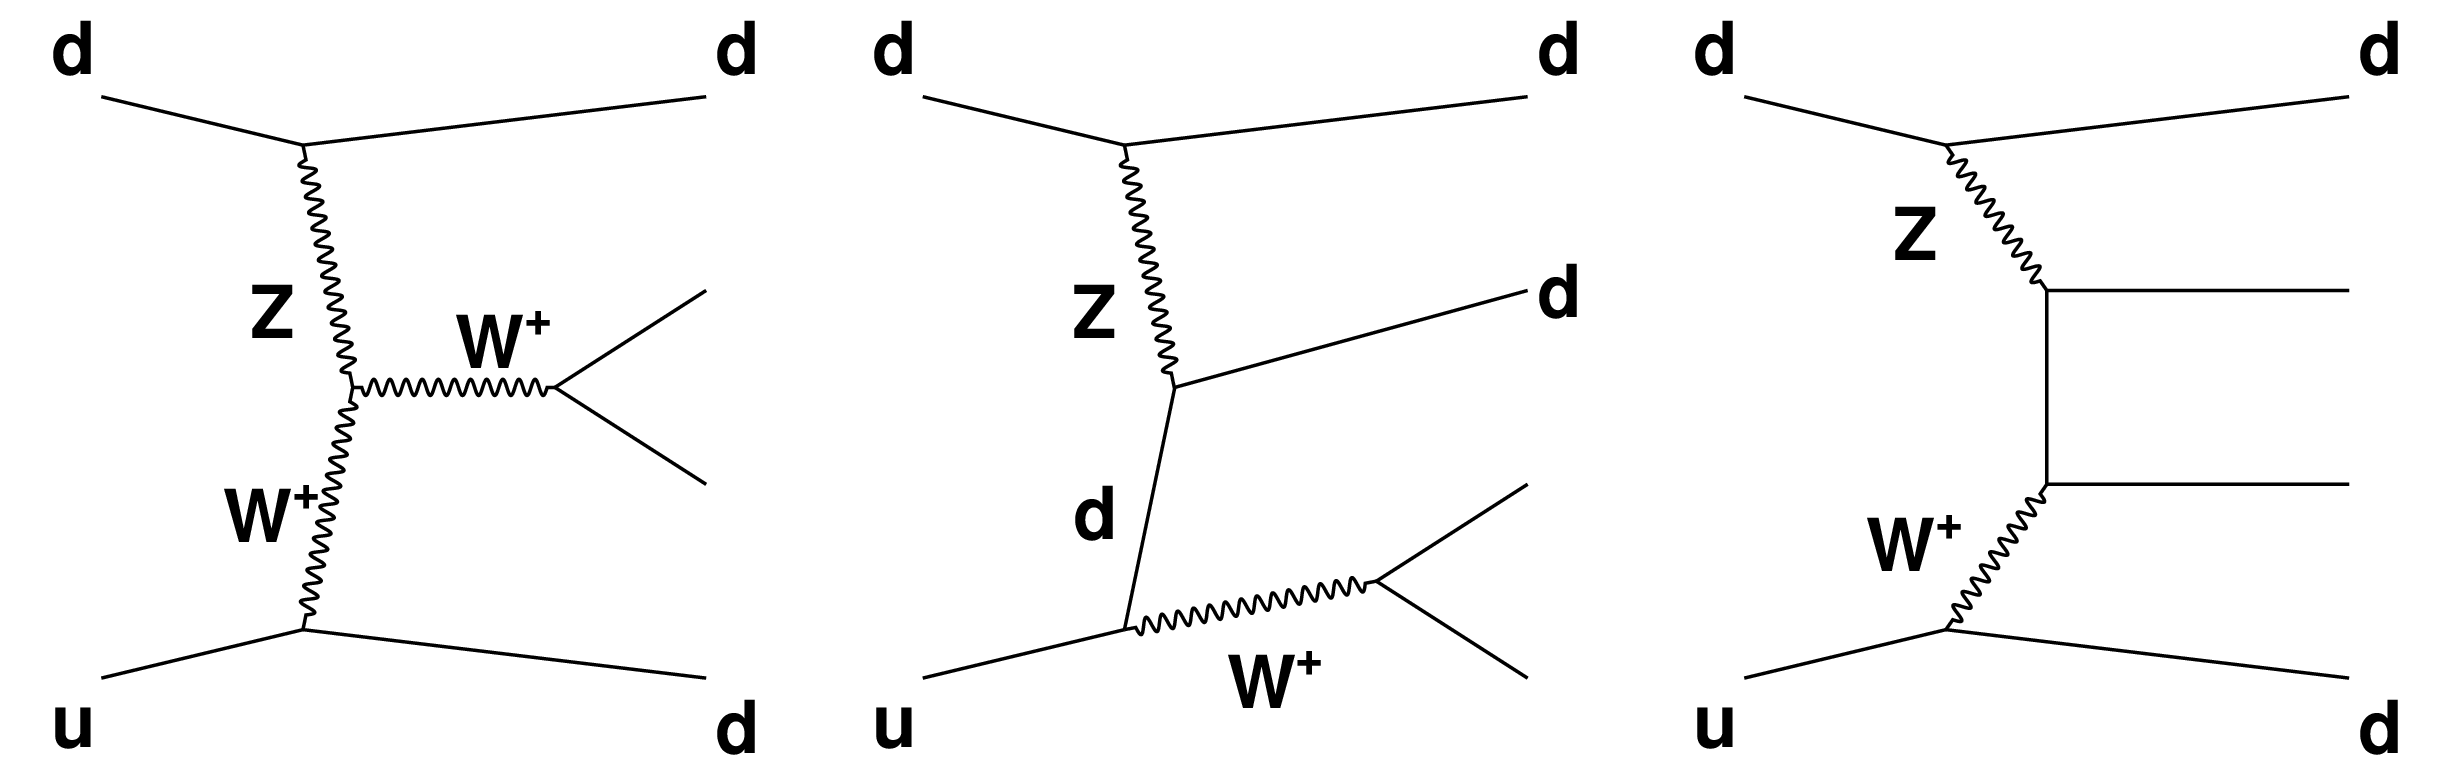
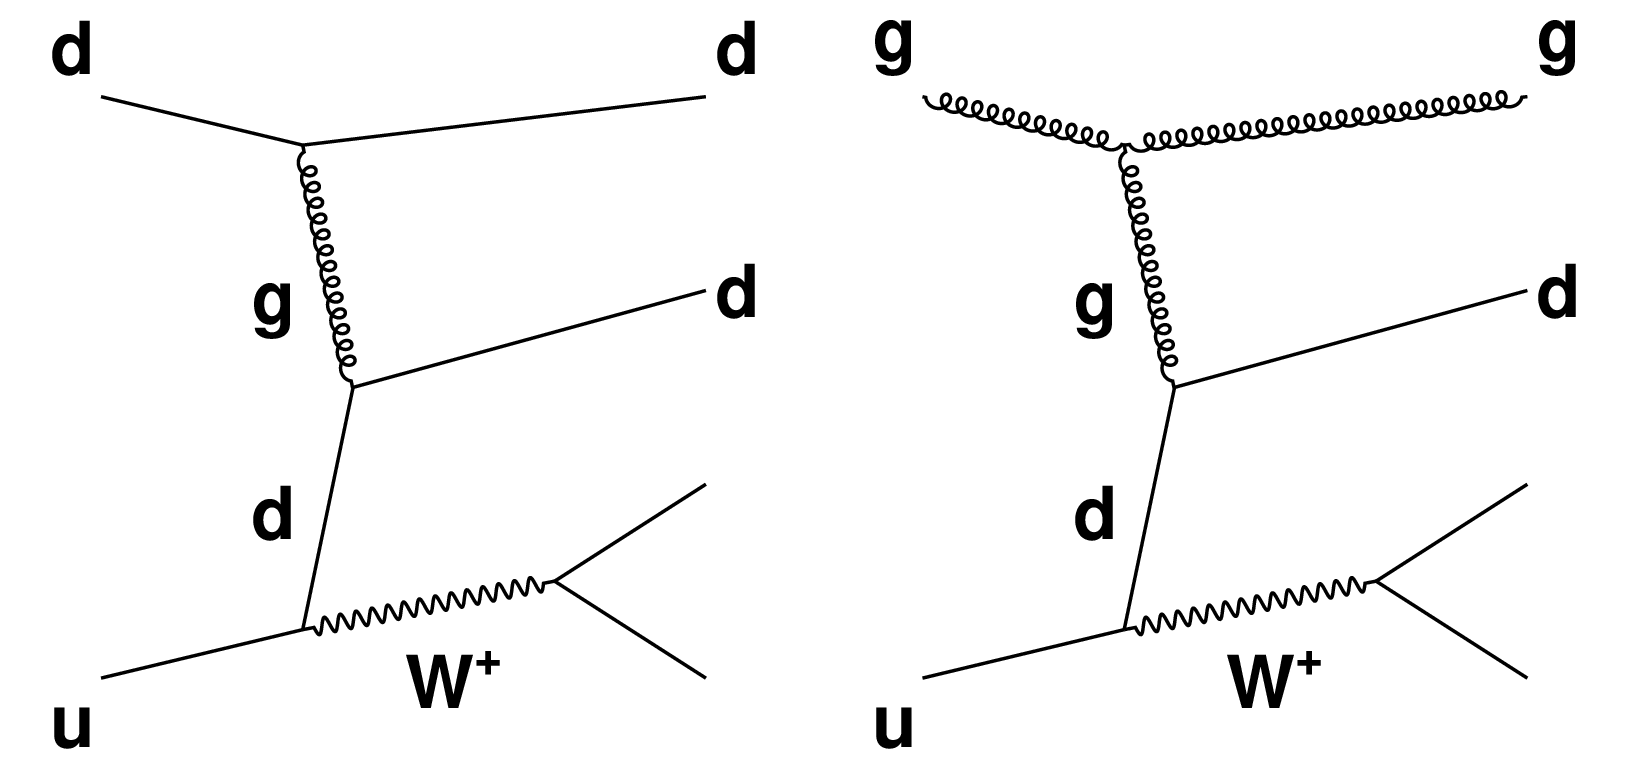
Figure 1:
Representative Feynman diagrams for lepton-neutrino production in association with two jets from purely electroweak amplitudes: vector boson fusion (left), bremsstrahlung-like (center), and multiperipheral (right) production. |
png pdf |
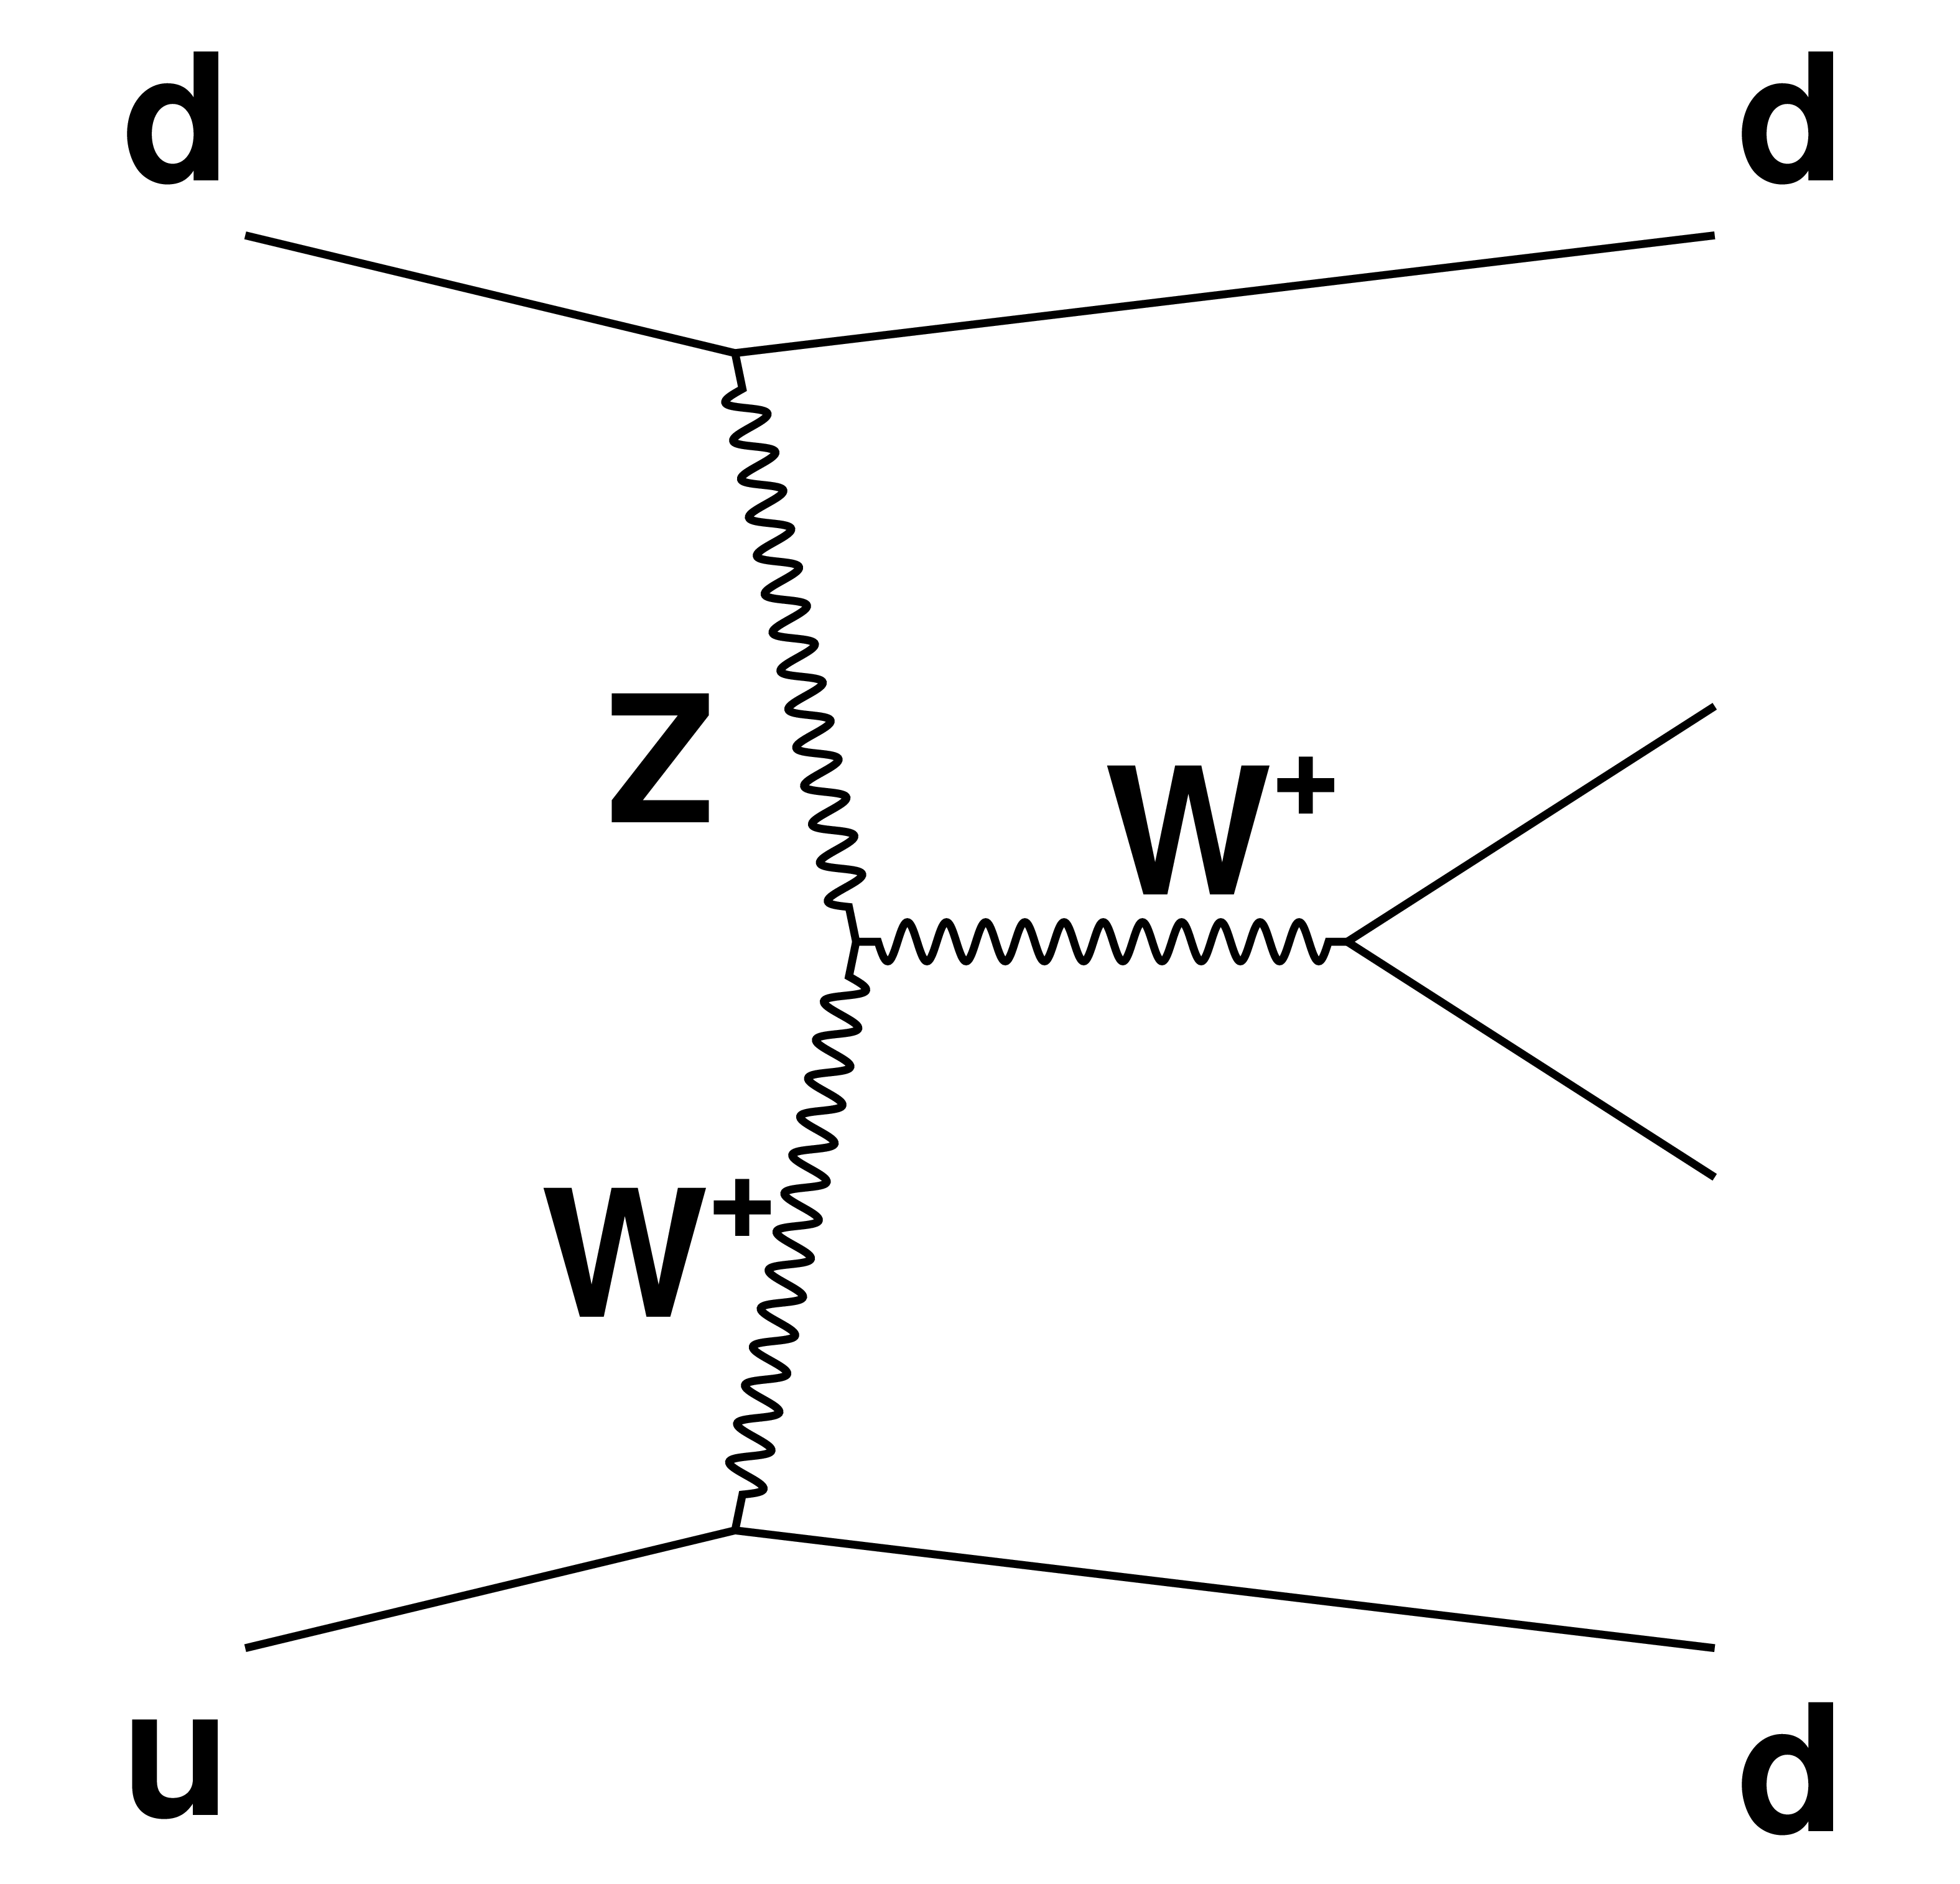
Figure 1-a:
Representative Feynman diagram for lepton-neutrino production in association with two jets from purely electroweak amplitudes: vector boson fusion production. |
png pdf |
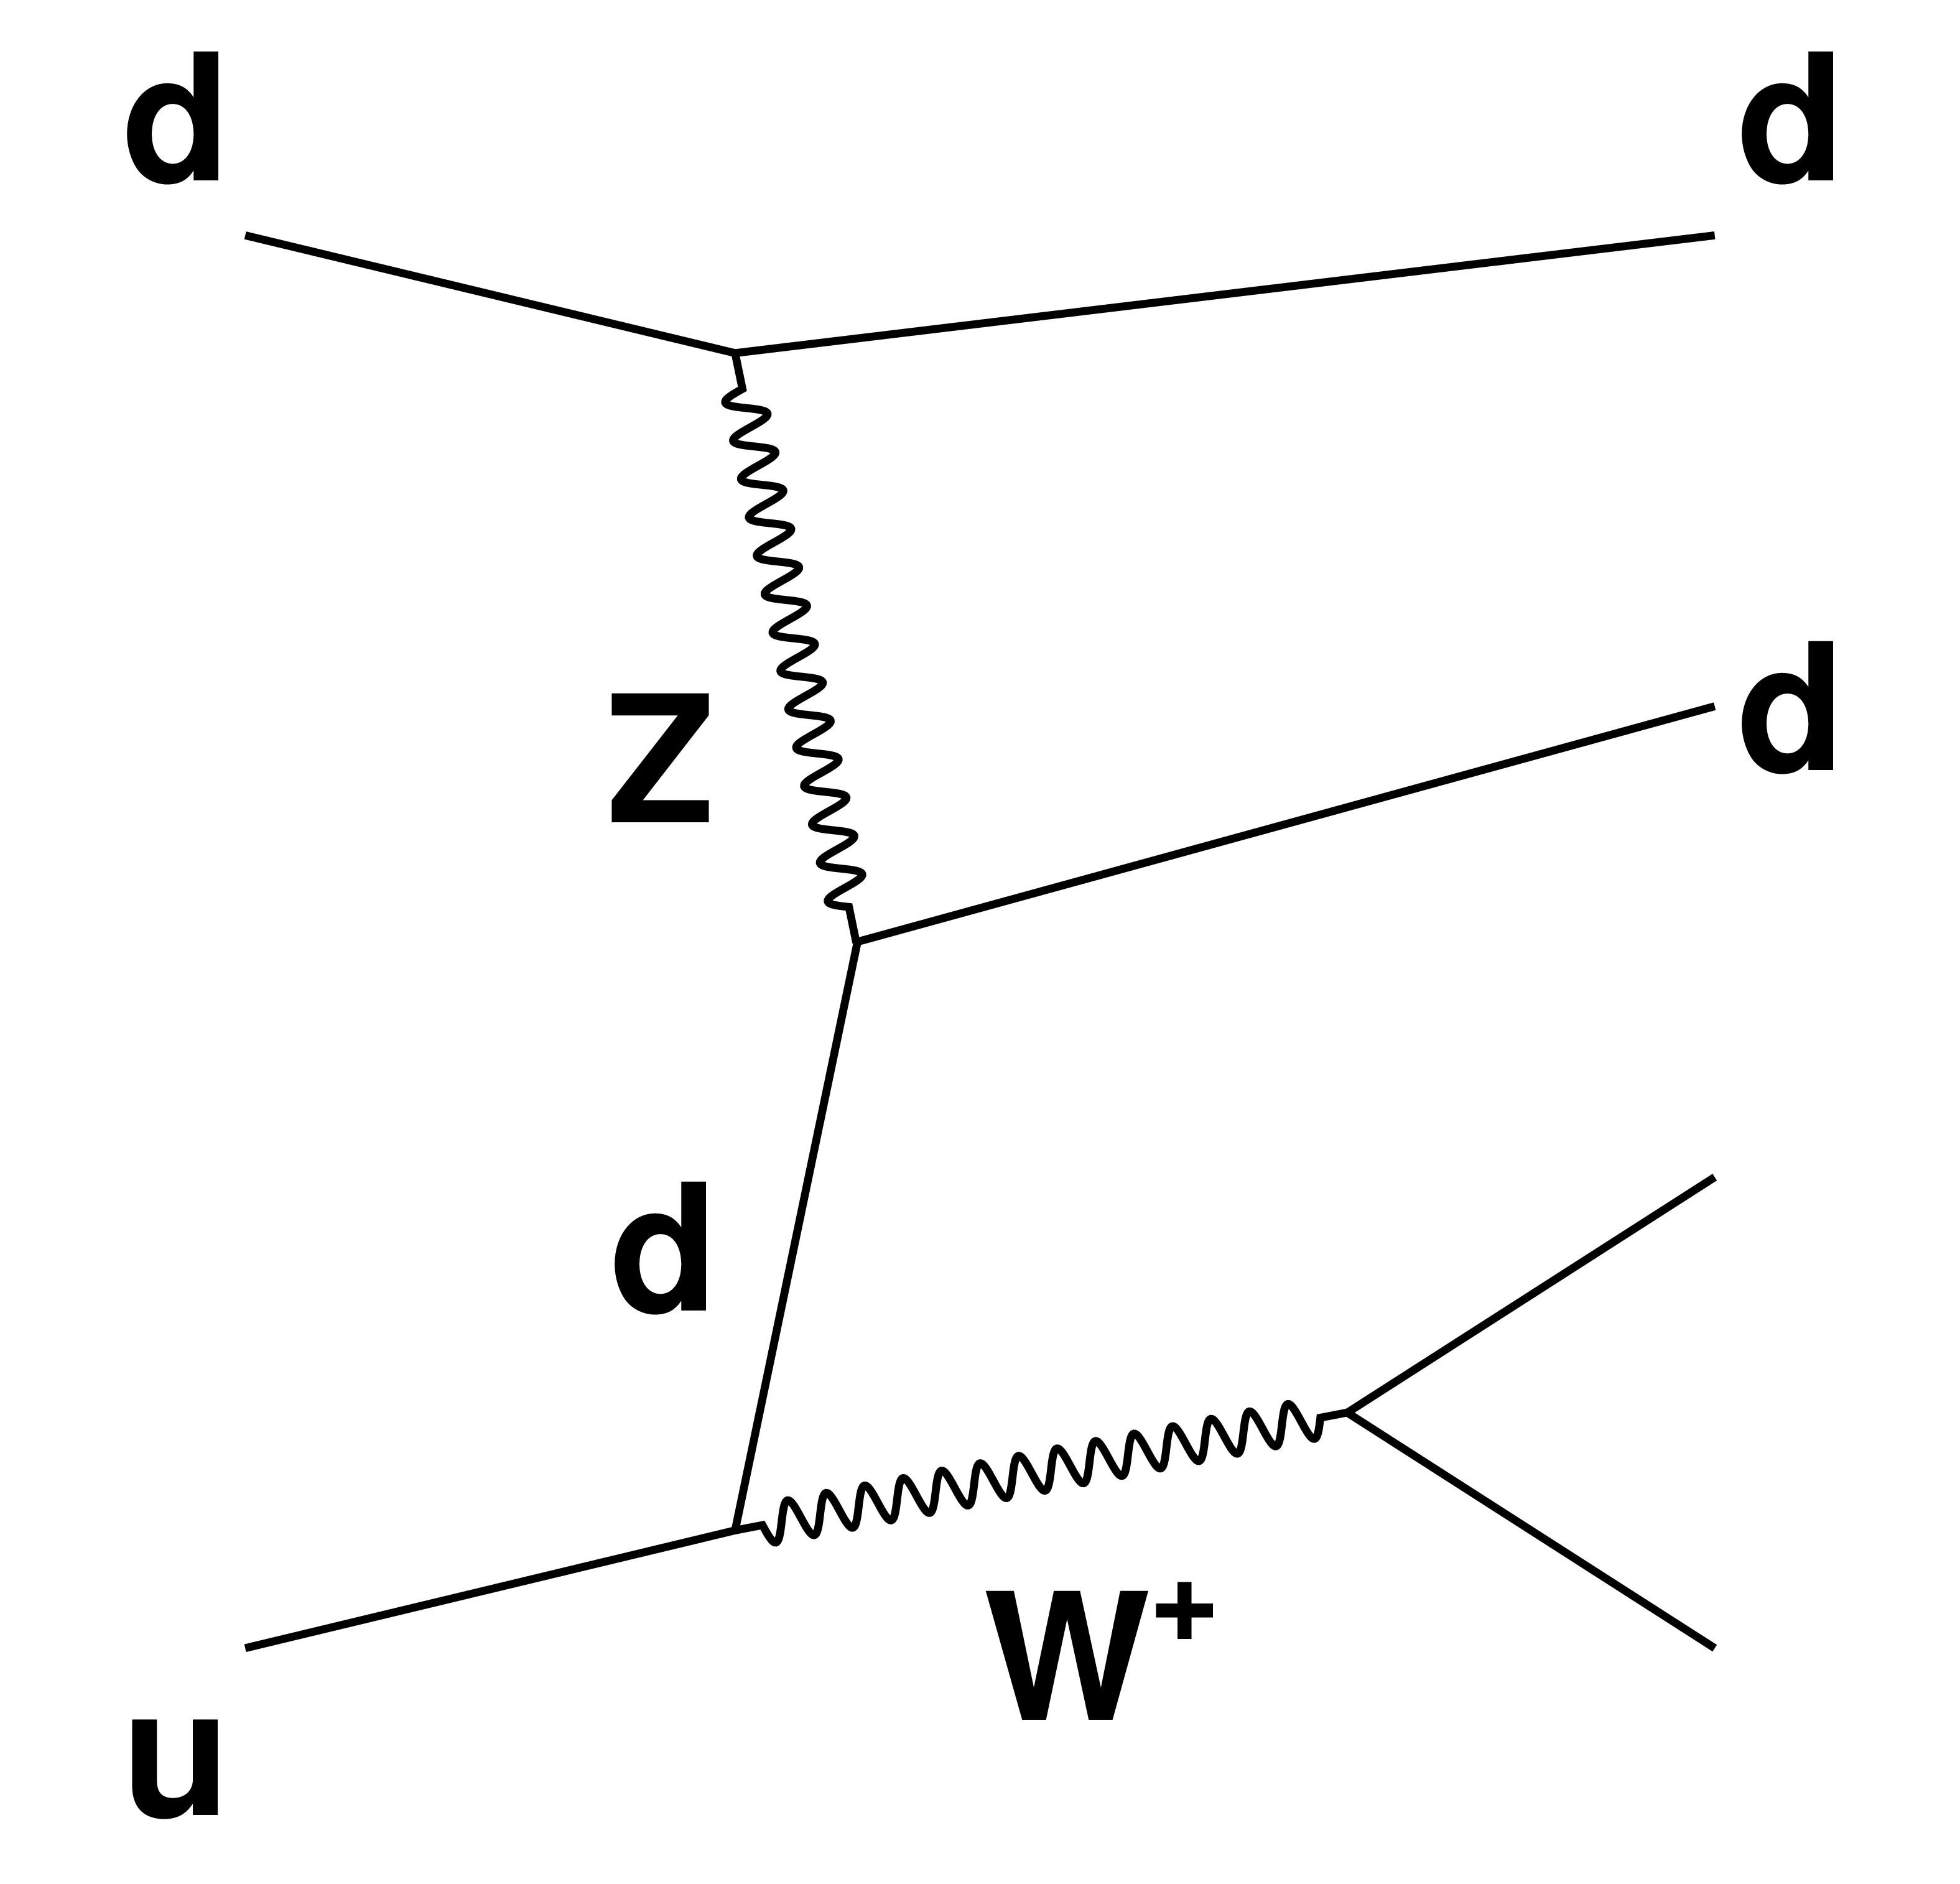
Figure 1-b:
Representative Feynman diagram for lepton-neutrino production in association with two jets from purely electroweak amplitudes: bremsstrahlung-like production. |
png pdf |
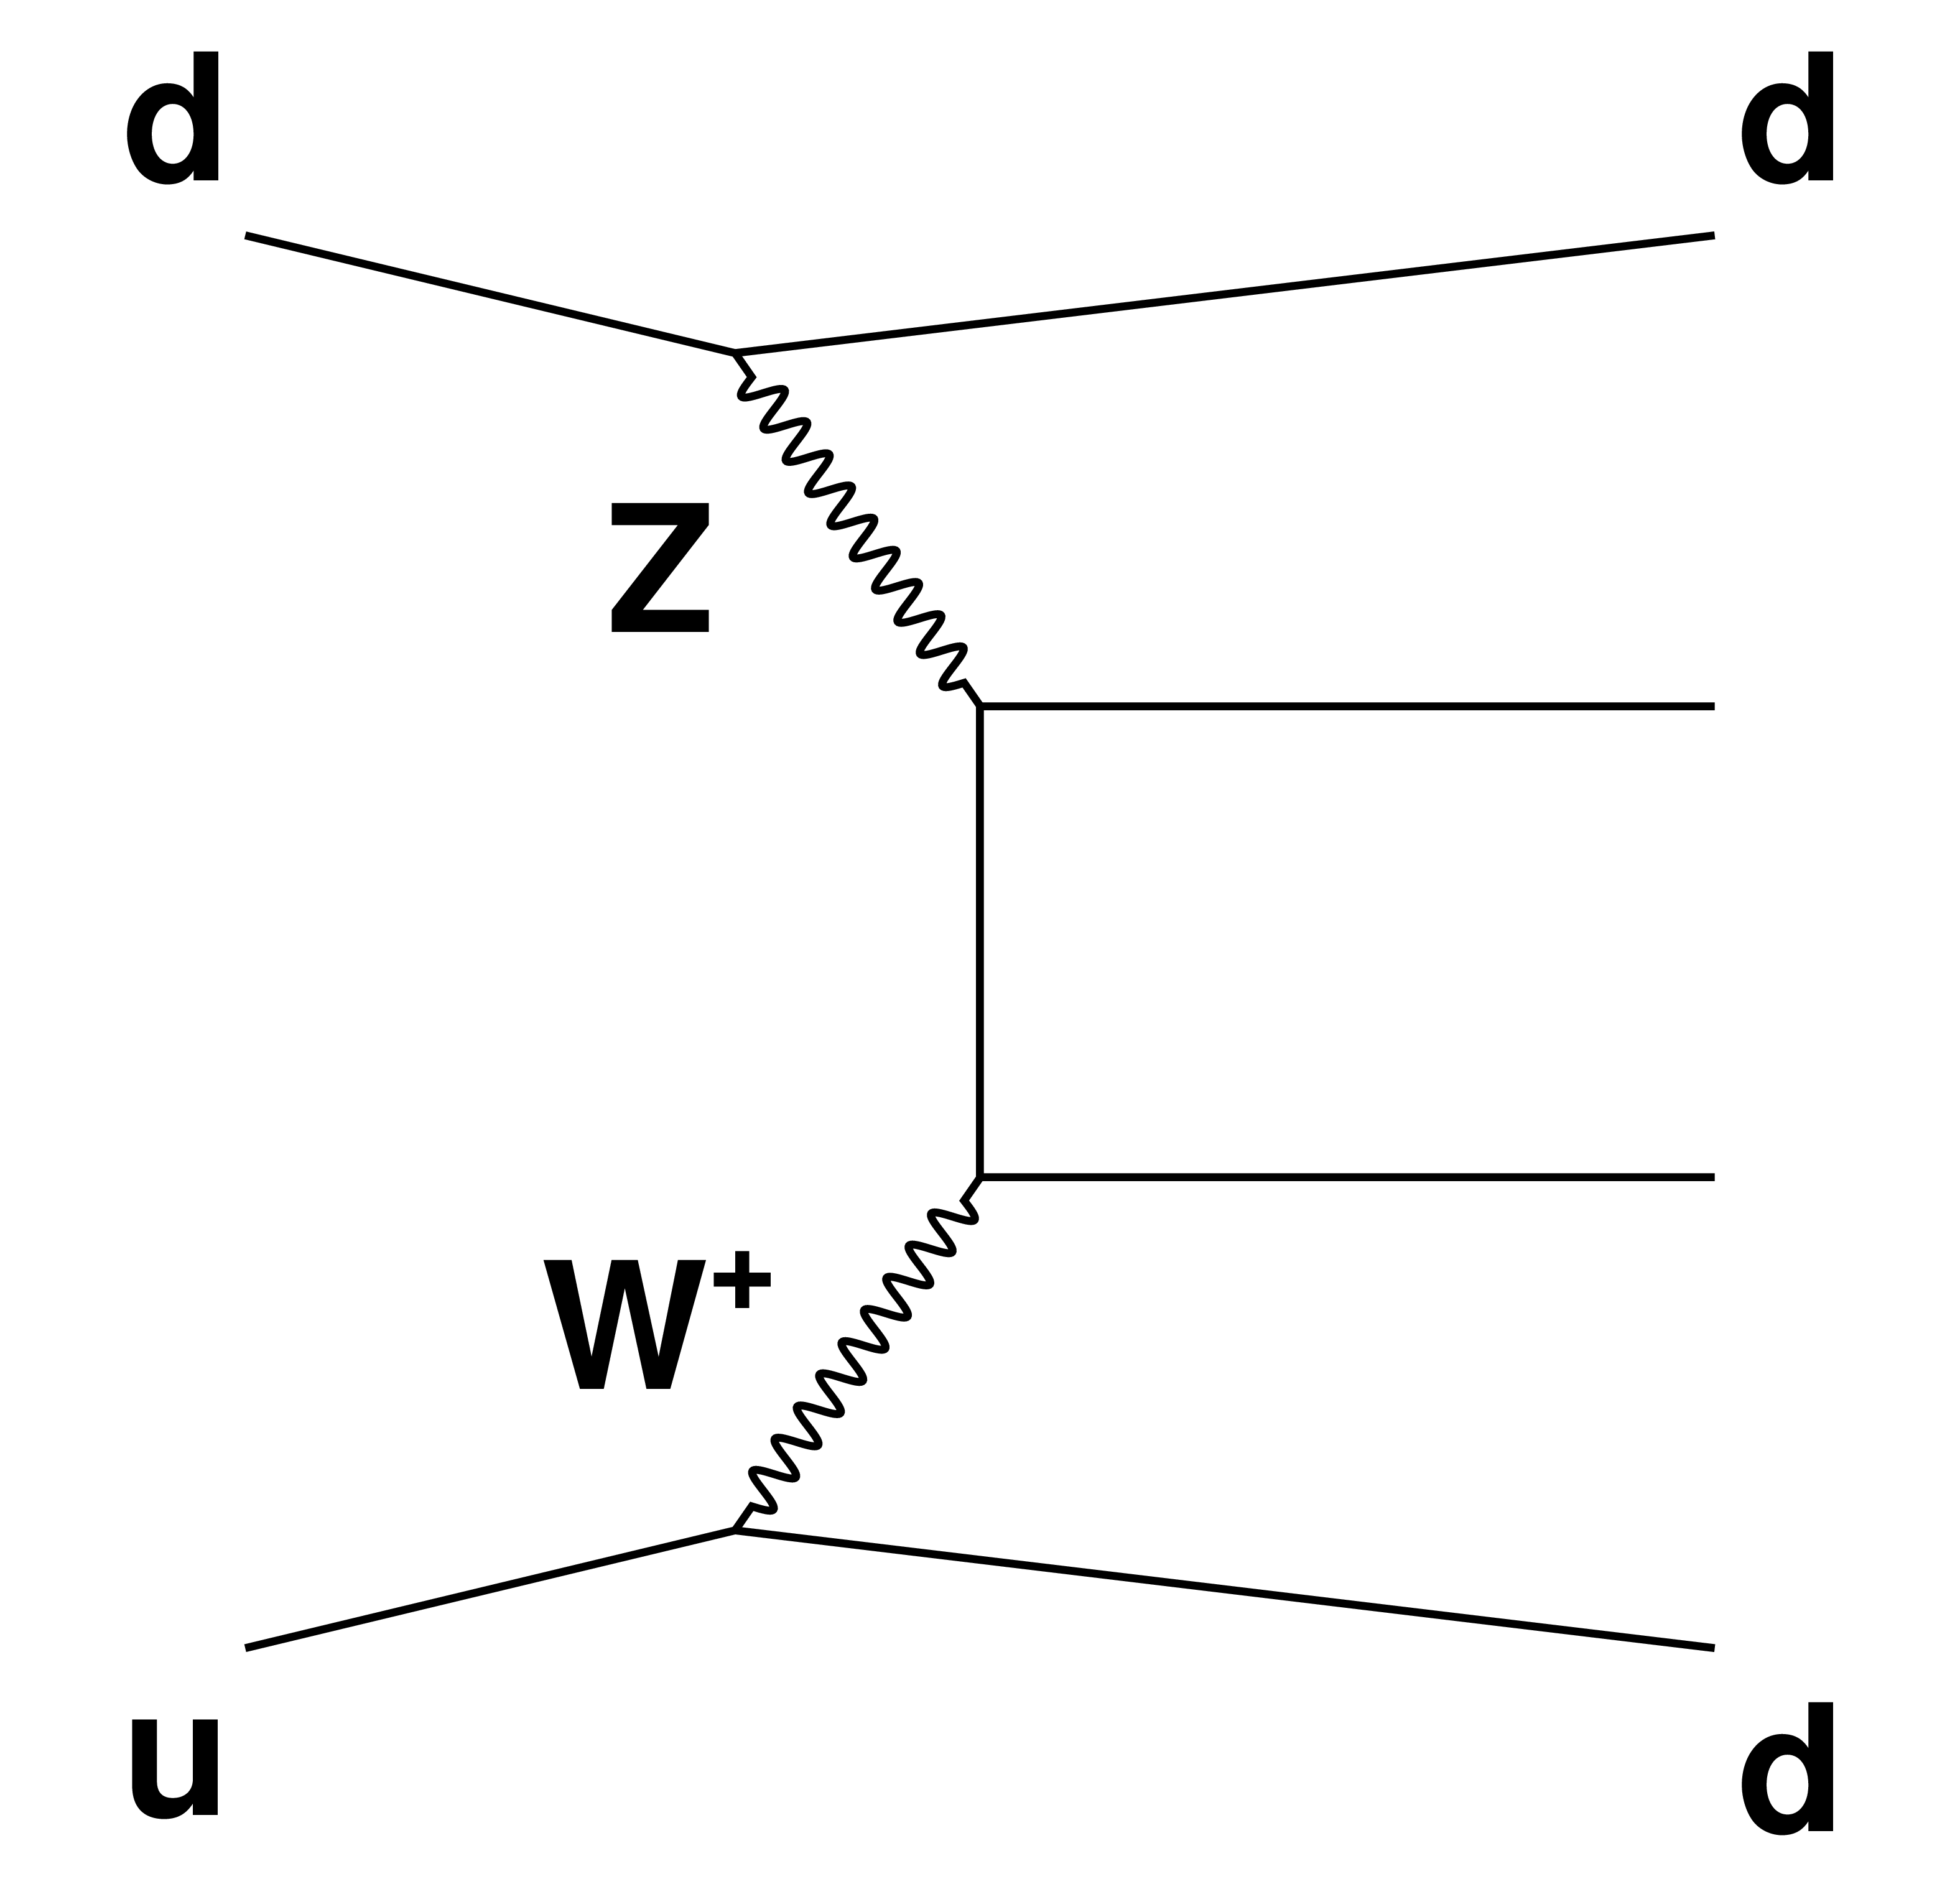
Figure 1-c:
Representative Feynman diagram for lepton-neutrino production in association with two jets from purely electroweak amplitudes: multiperipheral production. |
png pdf |
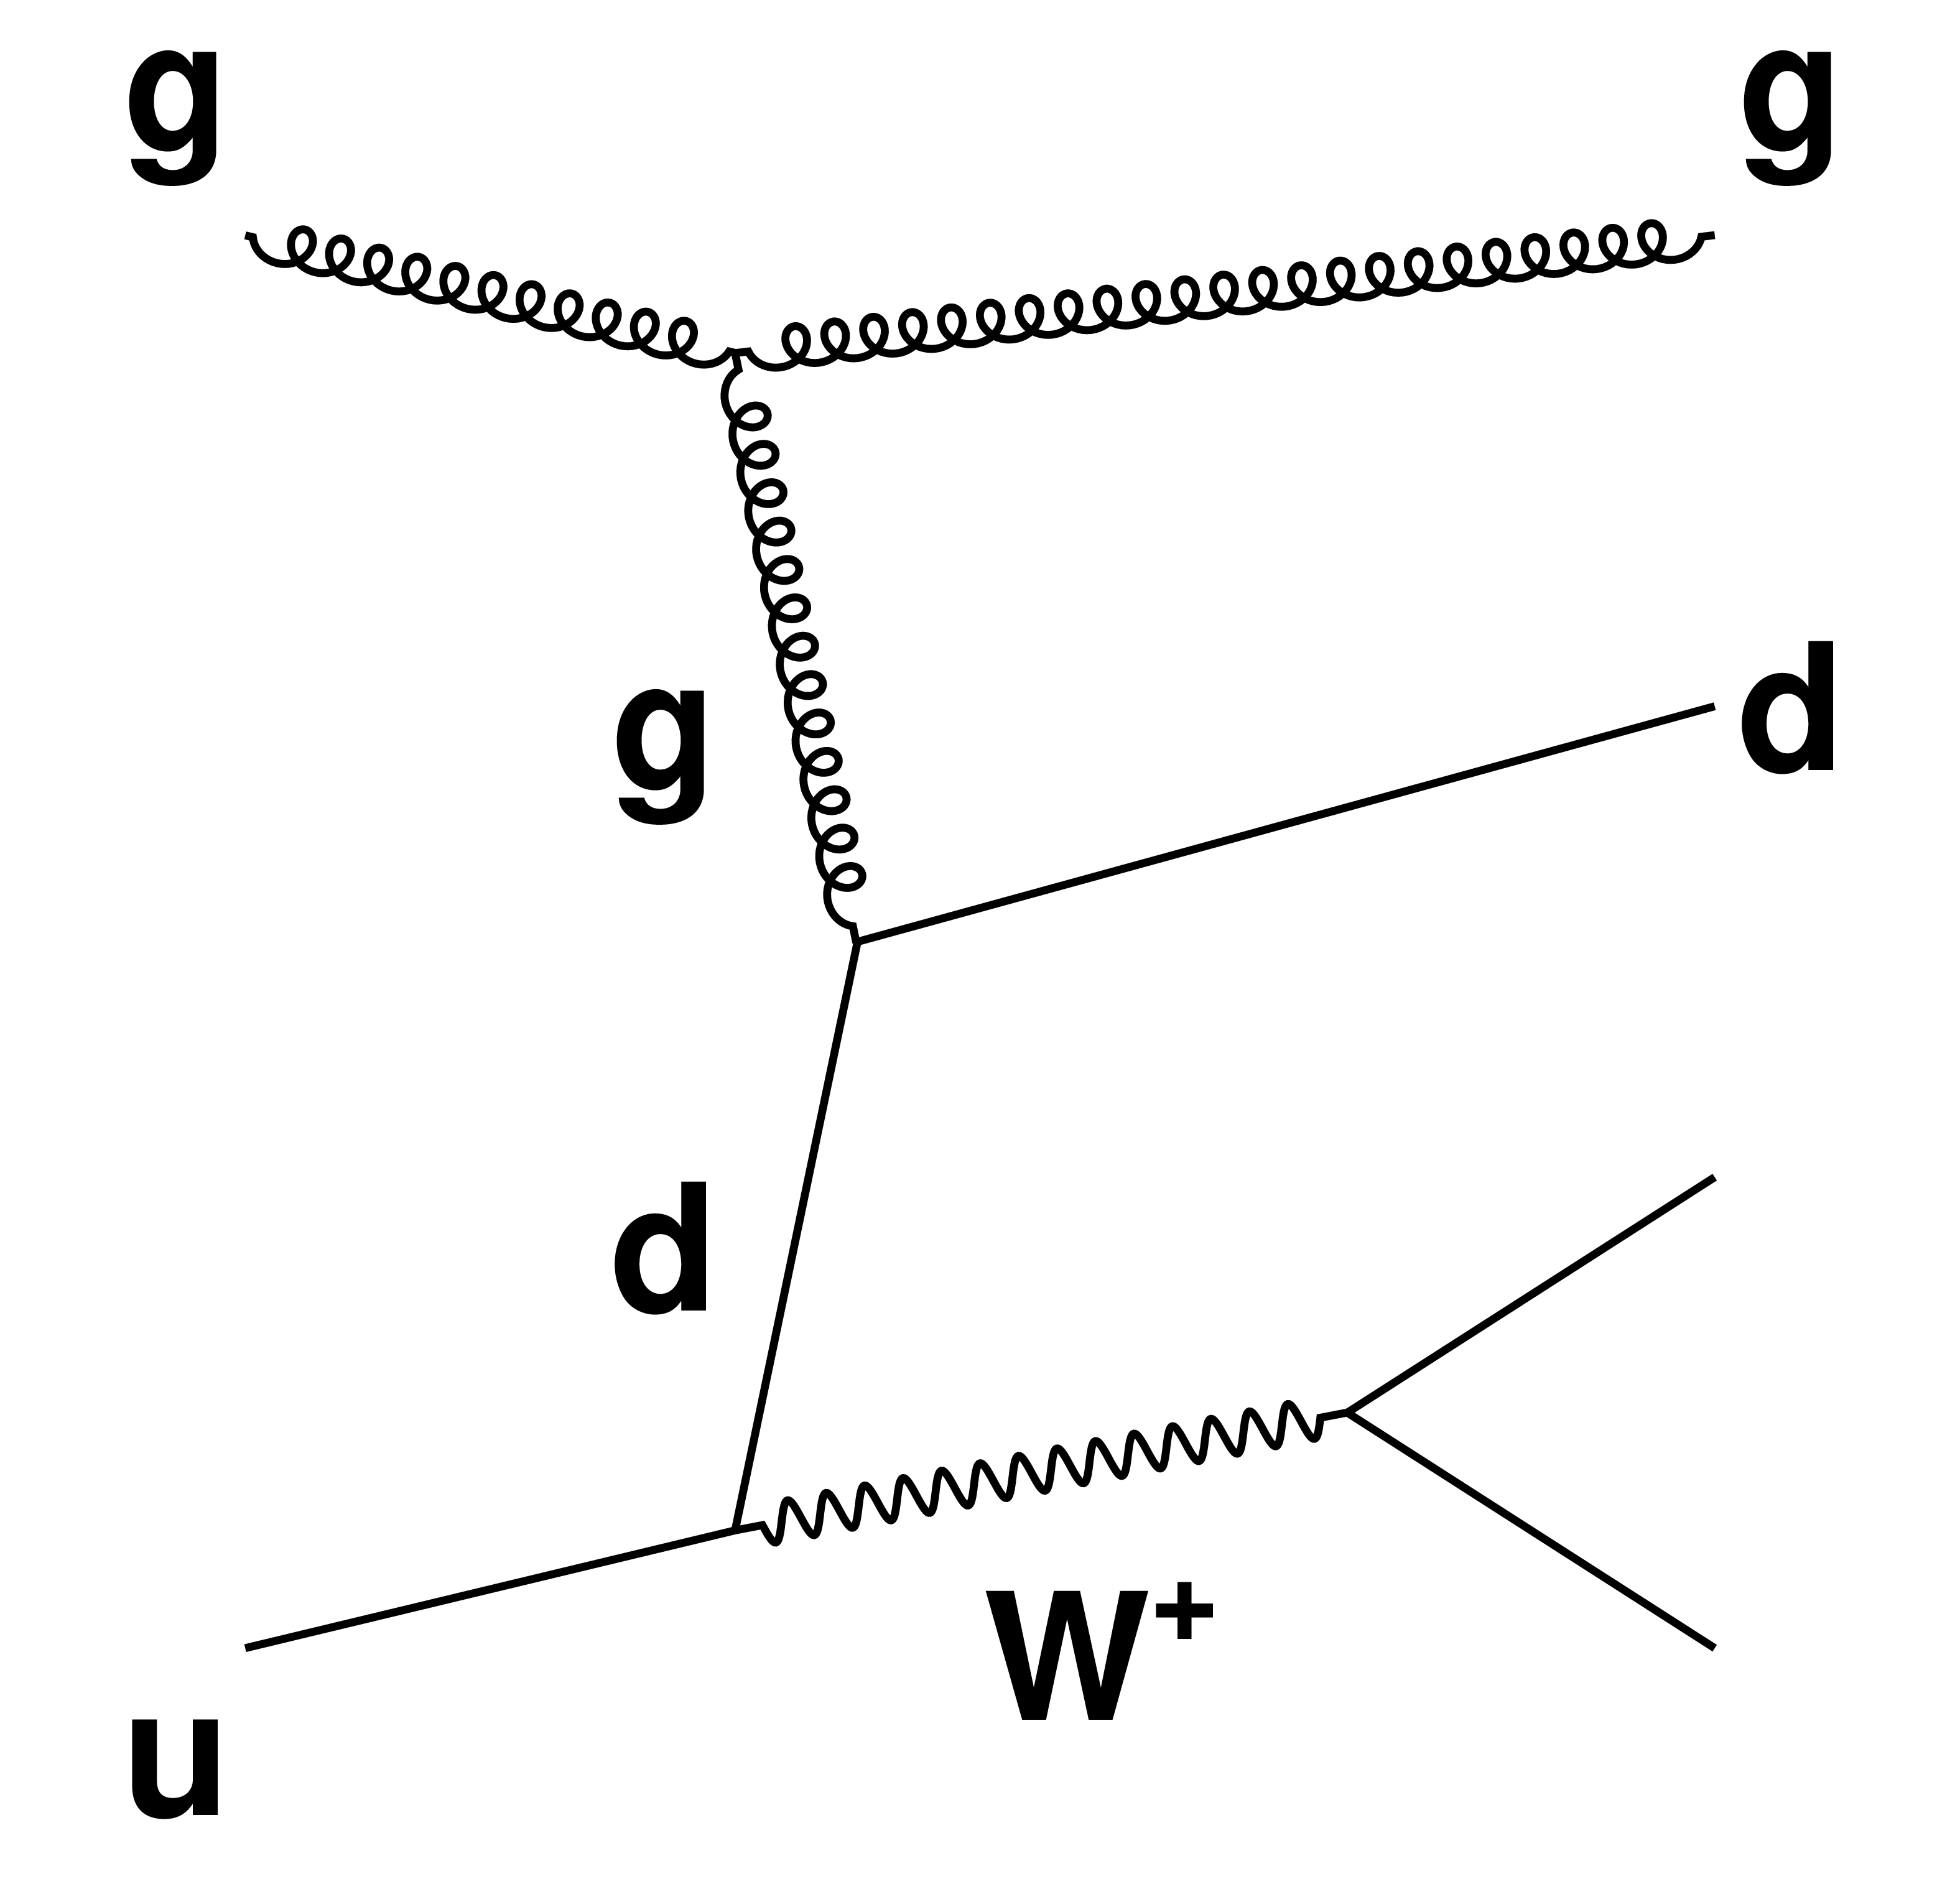
Figure 2:
Representative diagrams for W boson production in association with two jets (DY ${\mathrm {W}}\mathrm {jj}$) that constitute the main background for the measurement. |

png pdf |
Figure 2-a:
Representative diagram for W boson production in association with two jets (DY ${\mathrm {W}}\mathrm {jj}$) that constitute the main background for the measurement. |
png pdf |
Figure 2-b:
Representative diagram for W boson production in association with two jets (DY ${\mathrm {W}}\mathrm {jj}$) that constitute the main background for the measurement. |
png pdf |
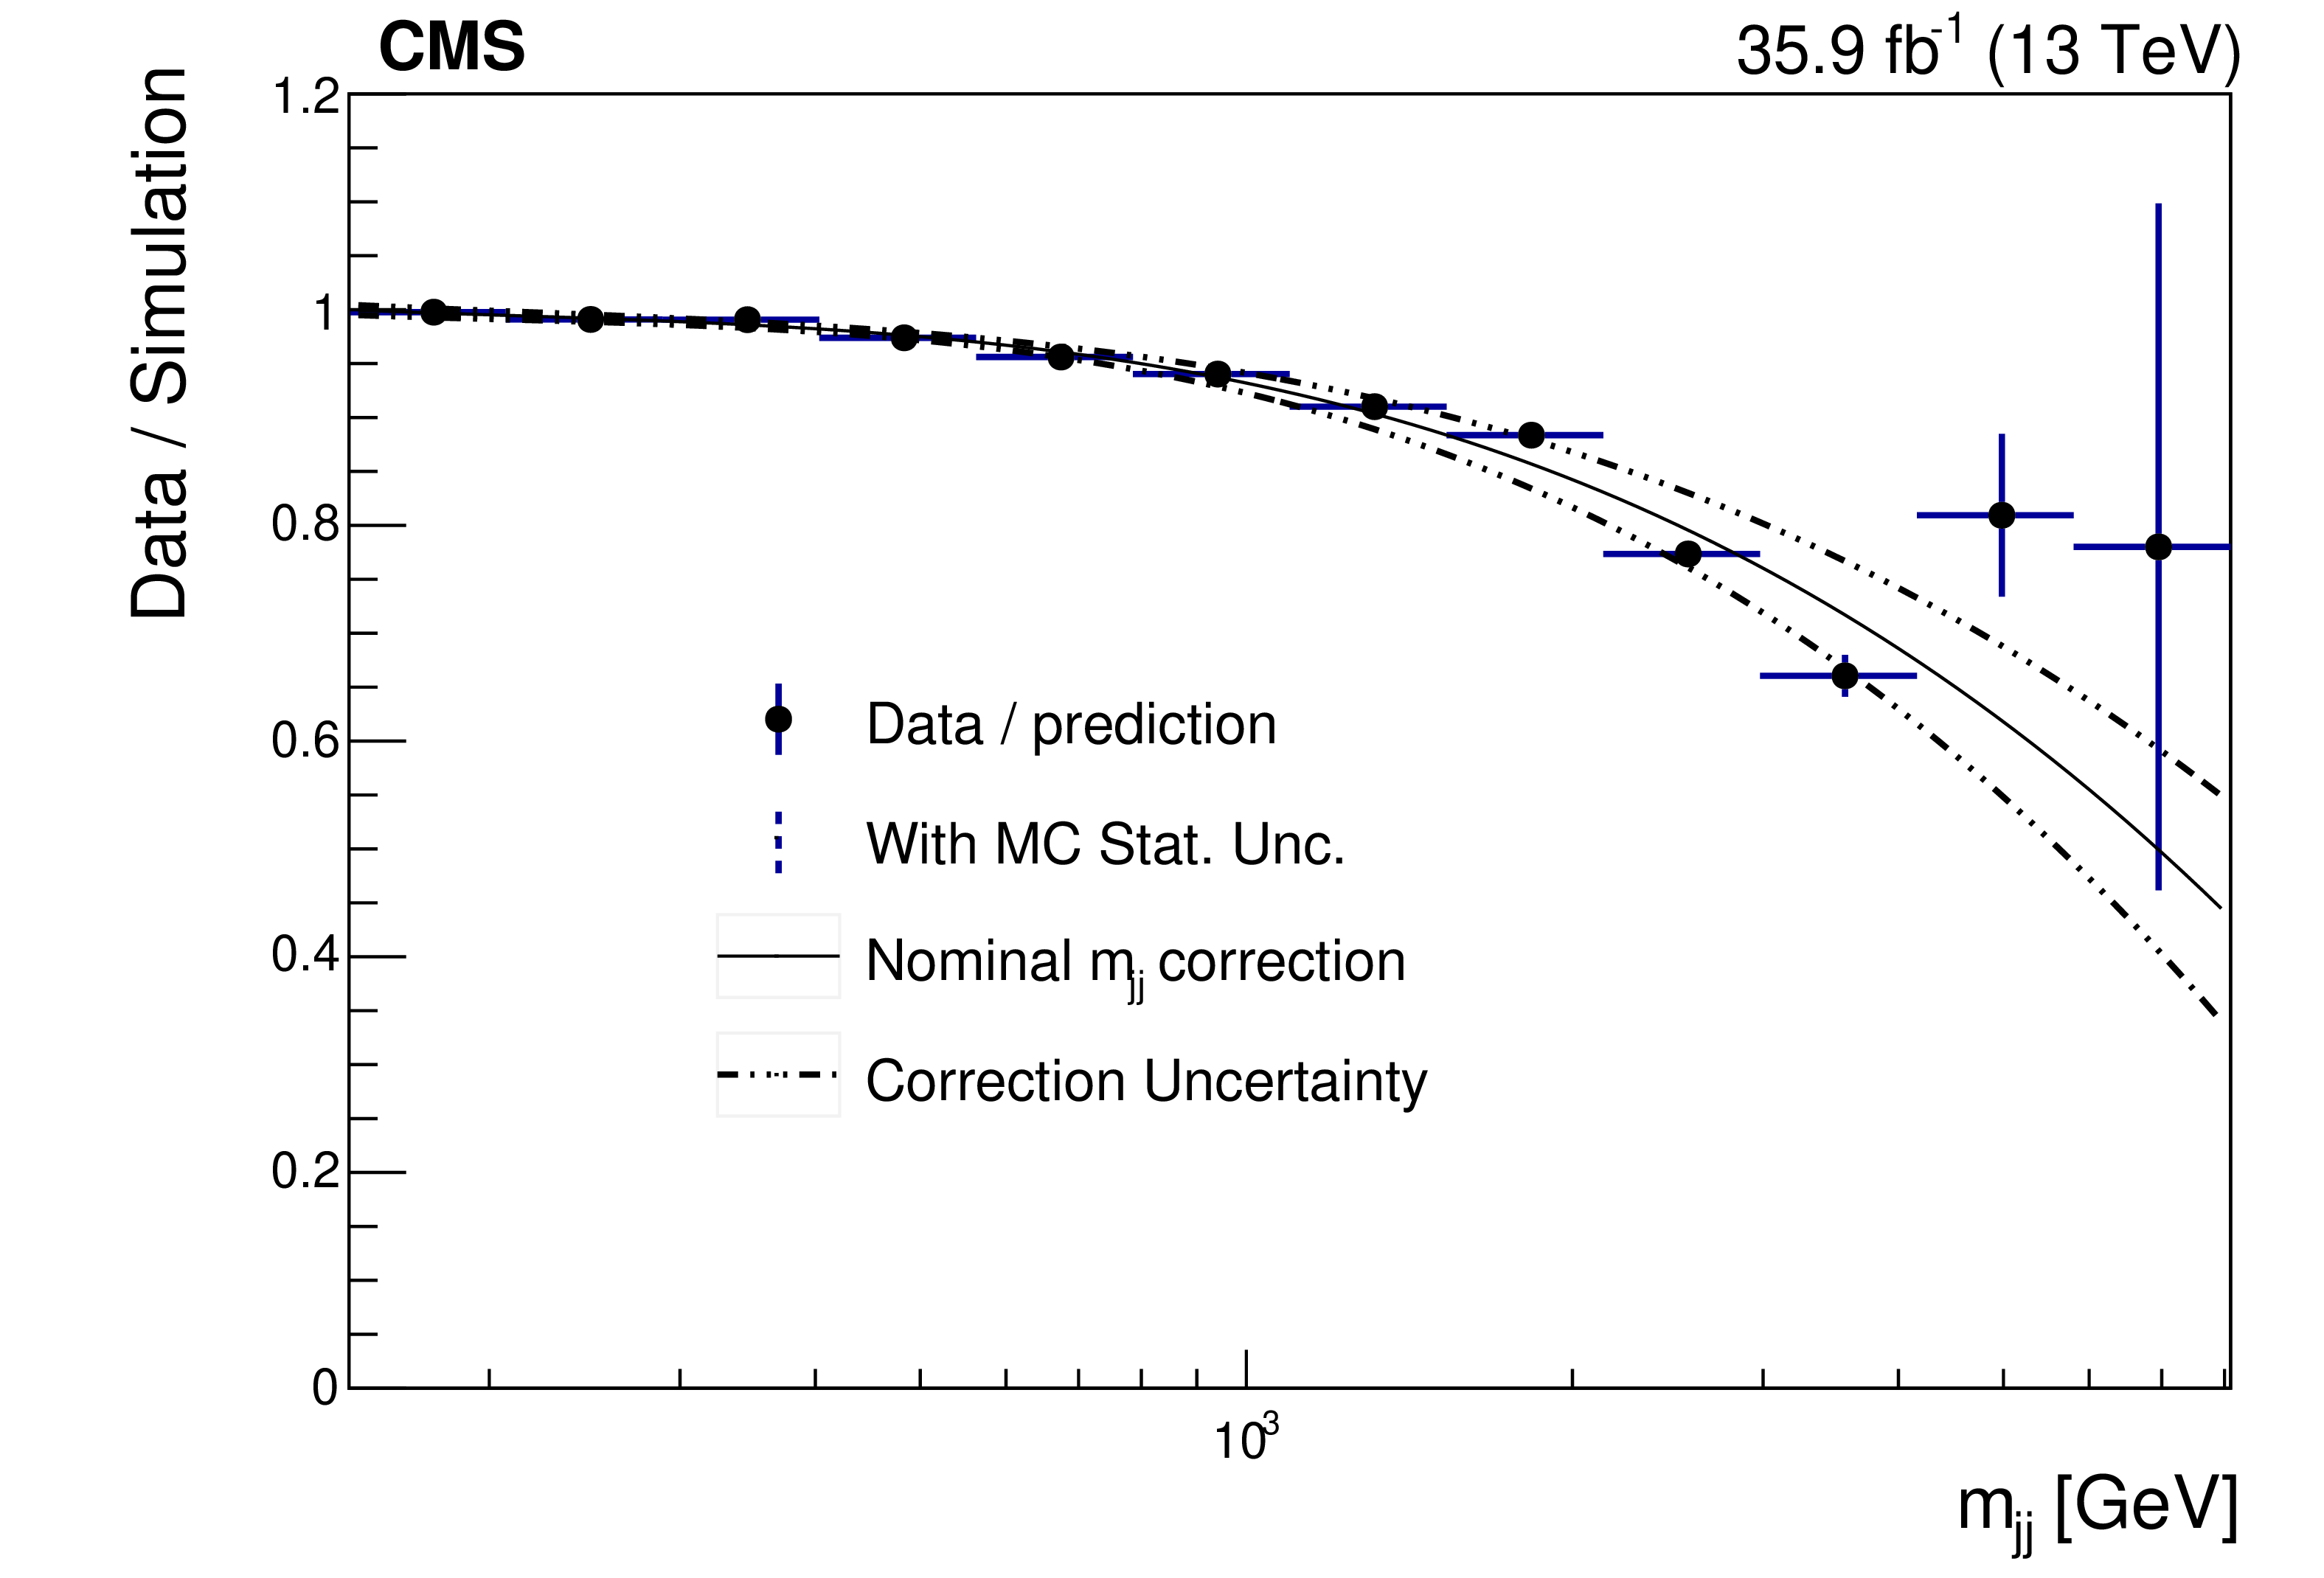
Figure 3:
Data divided by simulation as a function of $\ln(m_ {\mathrm {jj}} / \mathrm{GeV})$ in a signal-depleted control sample with $R({p_{\mathrm {T}}}) > $ 0.2. This distribution is fit by a third-order polynomial (solid black line) in order to derive a correction on the simulation $m_ {\mathrm {jj}} $ prediction. The points are varied by the uncertainty, including the effect of the limited number of simulated events (dashed error bars) and refitted in order to derive the systematic variations on the correction (dashed lines) corresponding to a standard deviation (s.d.). |
png pdf |
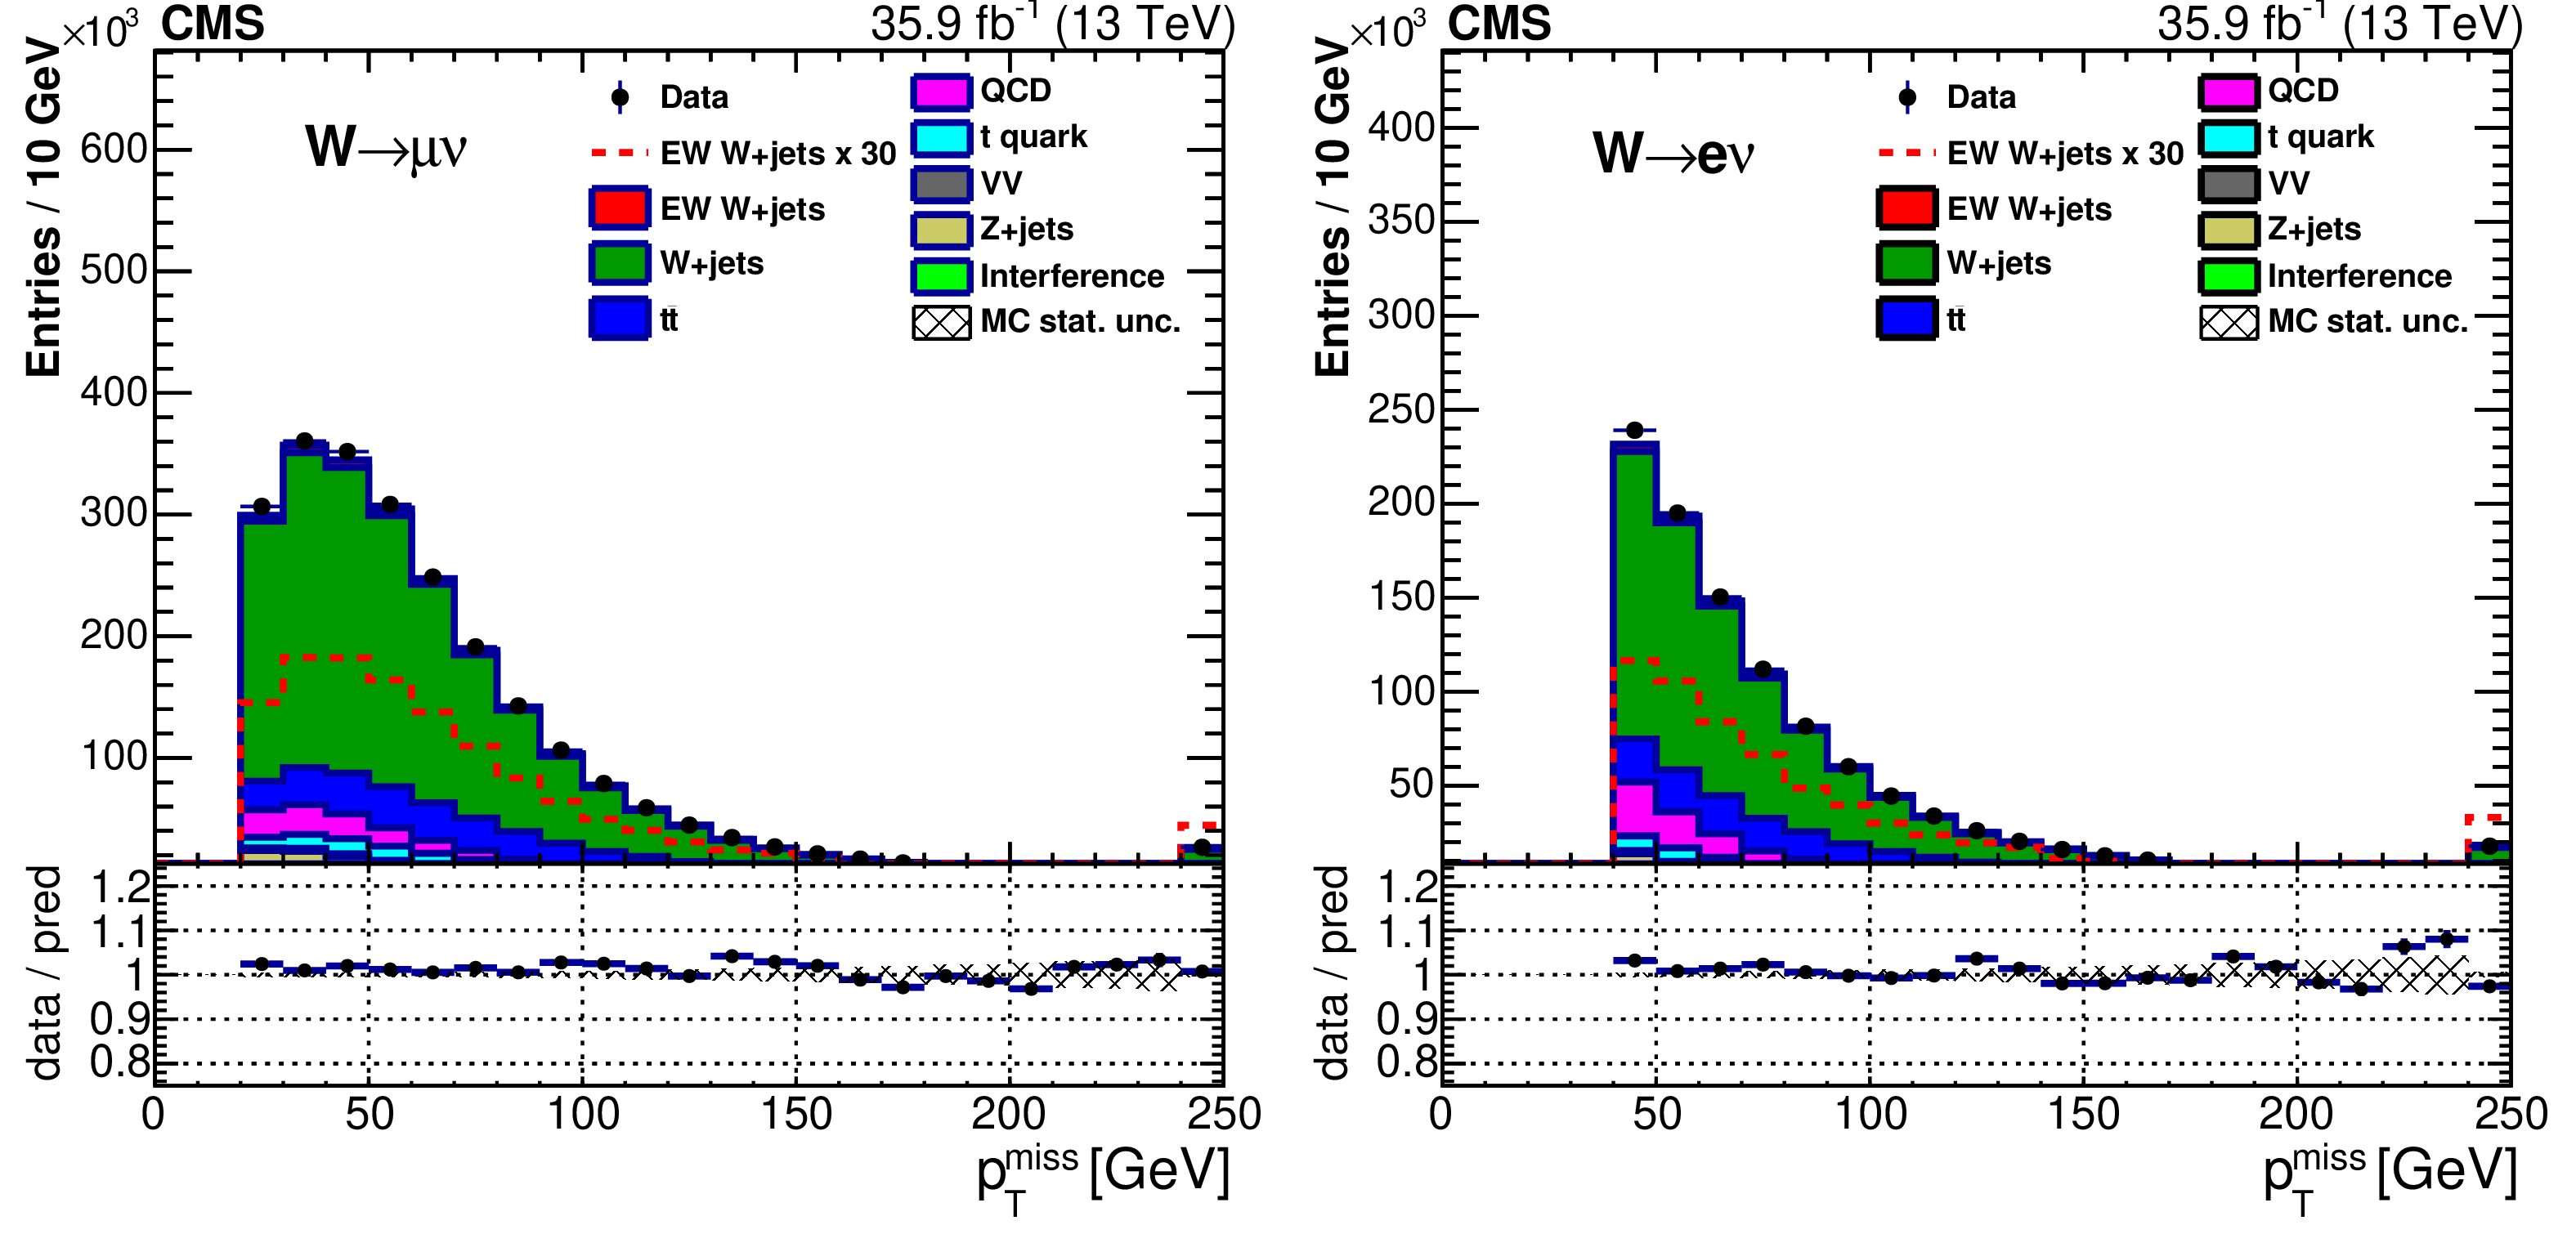
Figure 4-a:
Distribution of the missing transverse momentum after the event preselection for the selected leading lepton in the event, in the muon (left) and electron (right) channels. In all plots the last bin contains overflow events. |
png pdf |
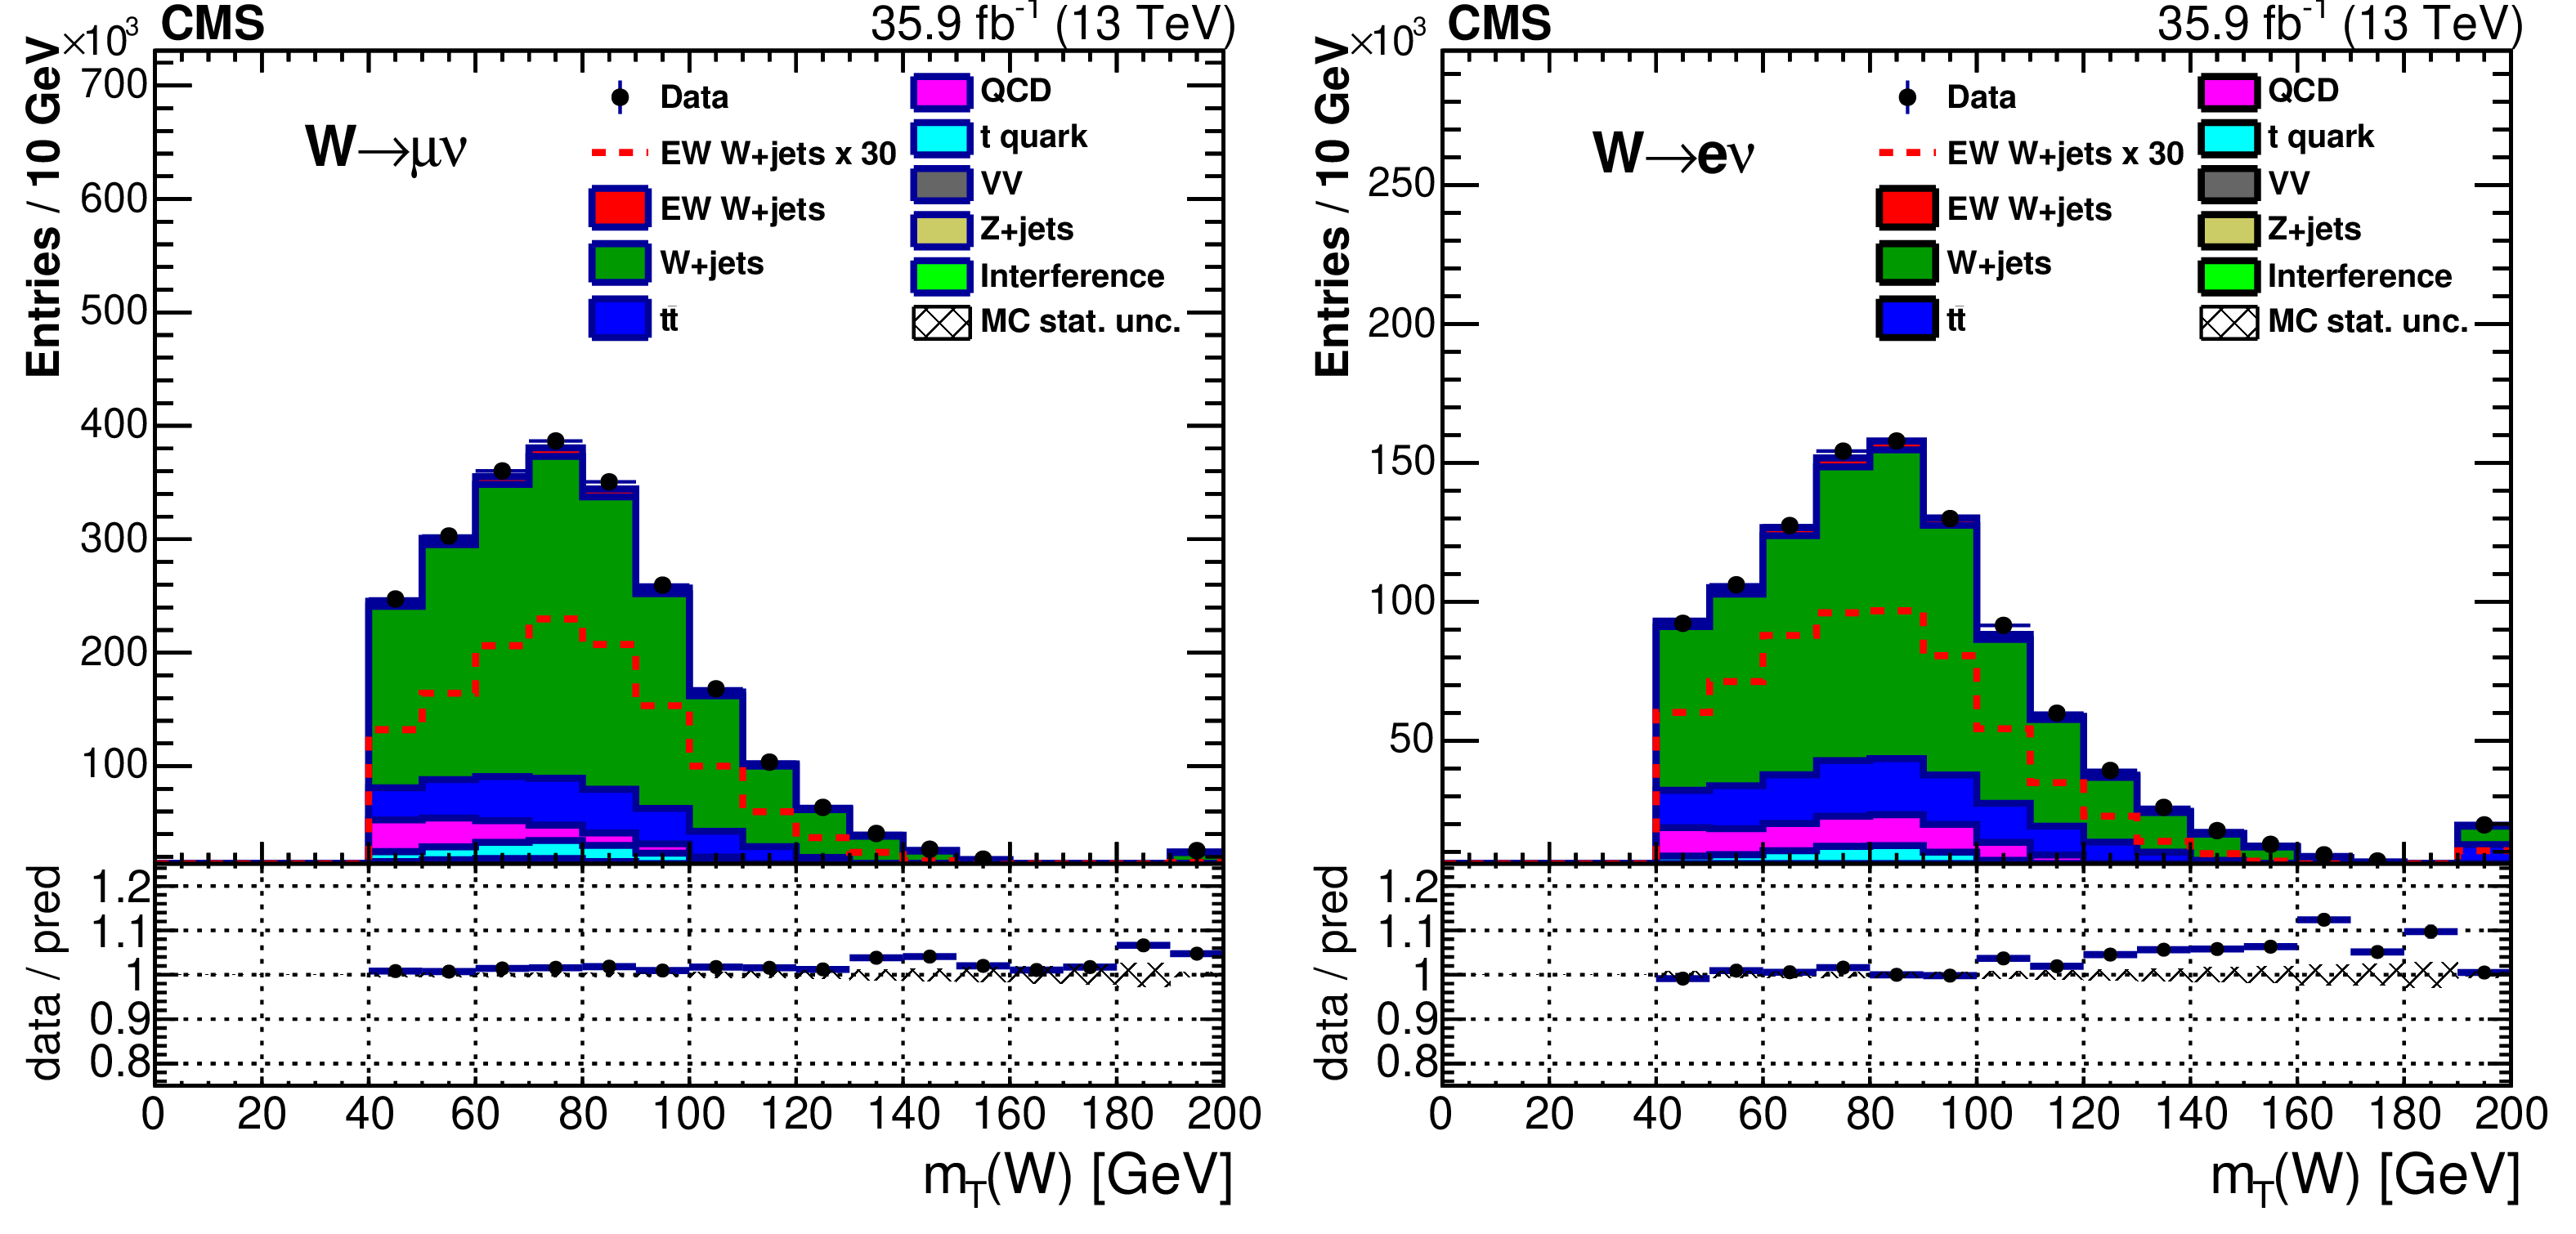
Figure 4-b:
Distribution of the lepton-$ {{p_{\mathrm {T}}} ^{\text {miss}}}$ system transverse mass after the event preselection for the selected leading lepton in the event, in the muon (left) and electron (right) channels. In all plots the last bin contains overflow events. |
png pdf |
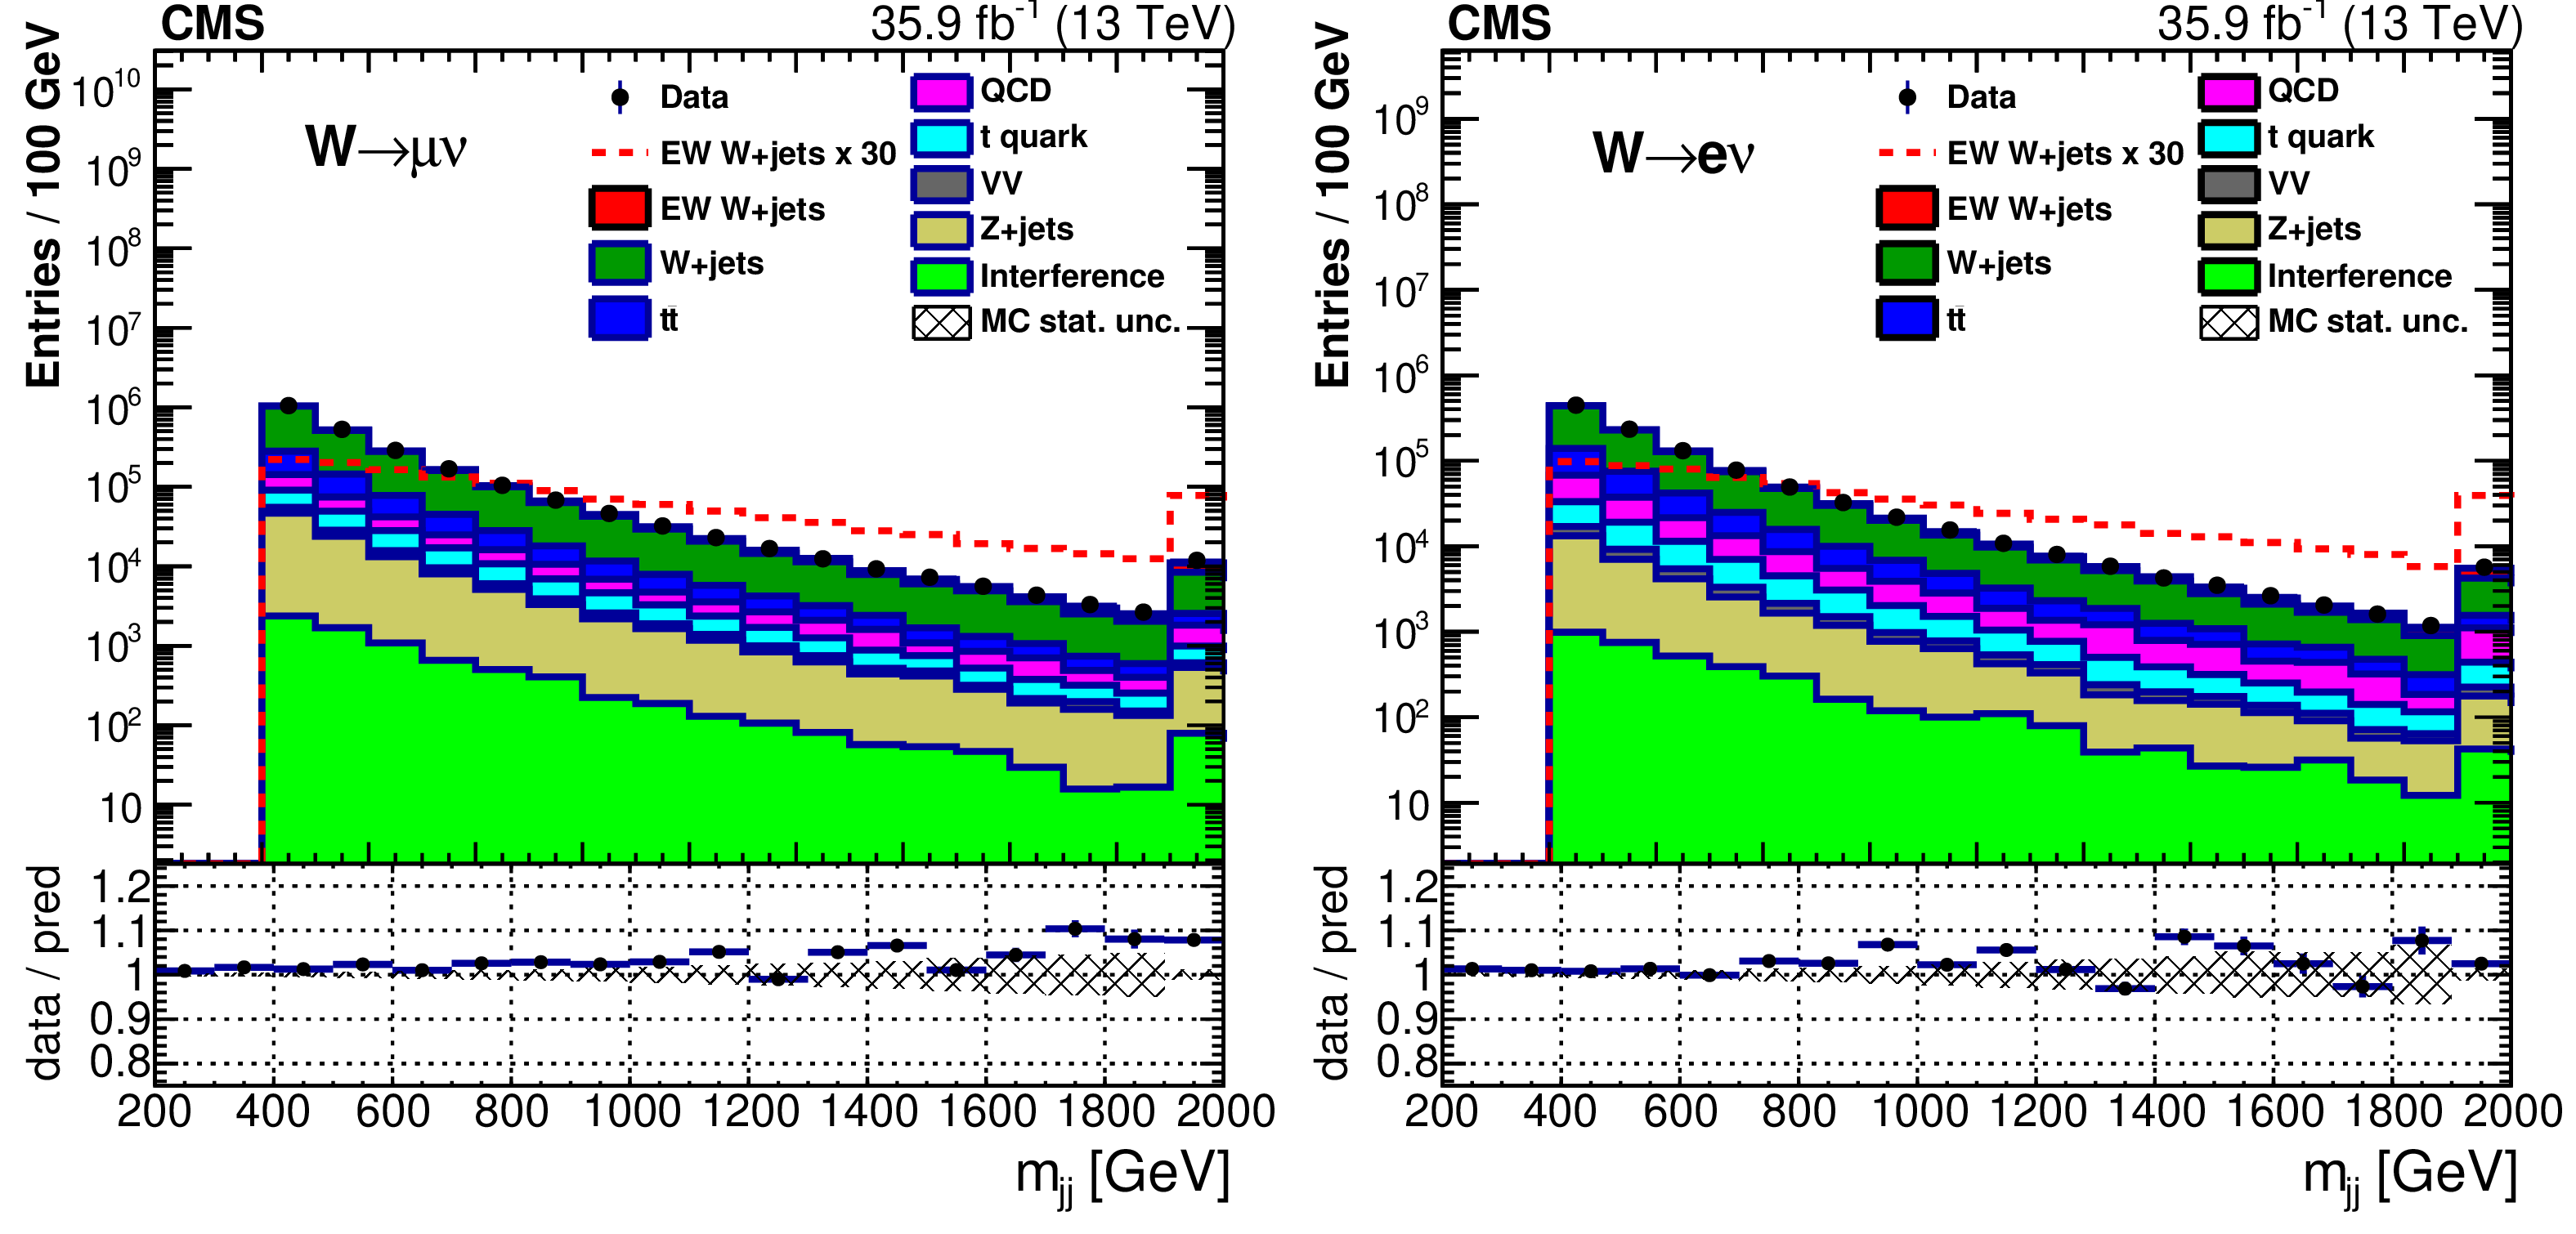
Figure 5-a:
Dijet invariant mass distributions after the event preselection, in the muon (left) and electron (right) channels. In all plots the last bin contains overflow events. |
png pdf |
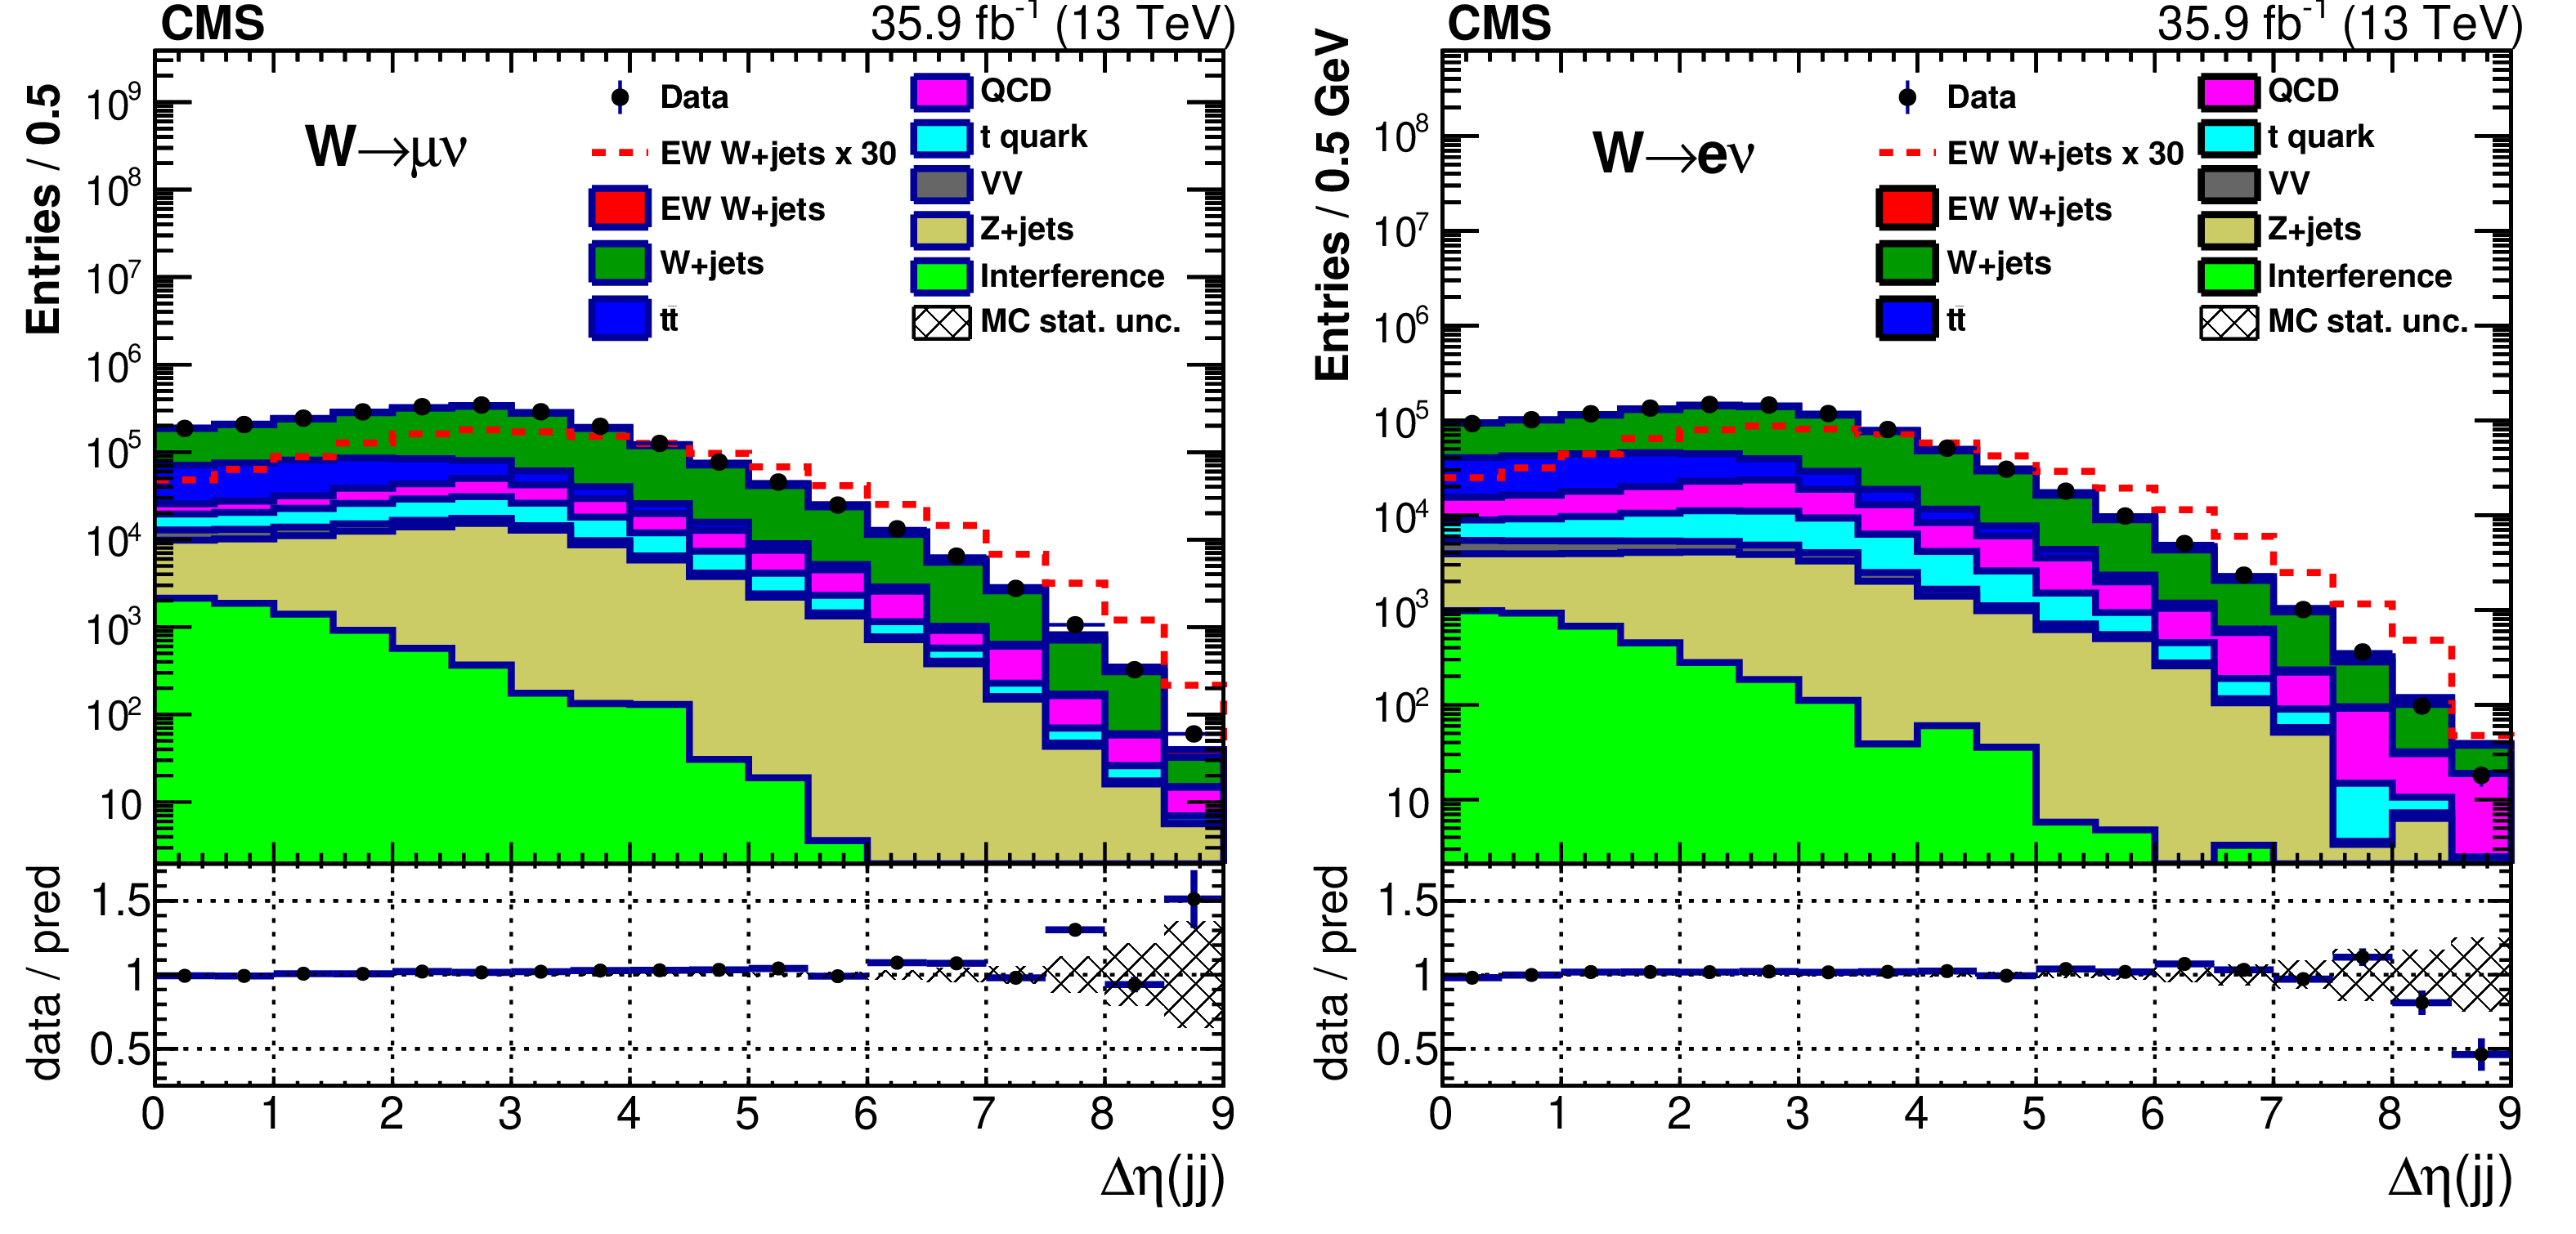
Figure 5-b:
Pseudorapidity difference distributions after the event preselection, in the muon (left) and electron (right) channels. In all plots the last bin contains overflow events. |
png pdf |
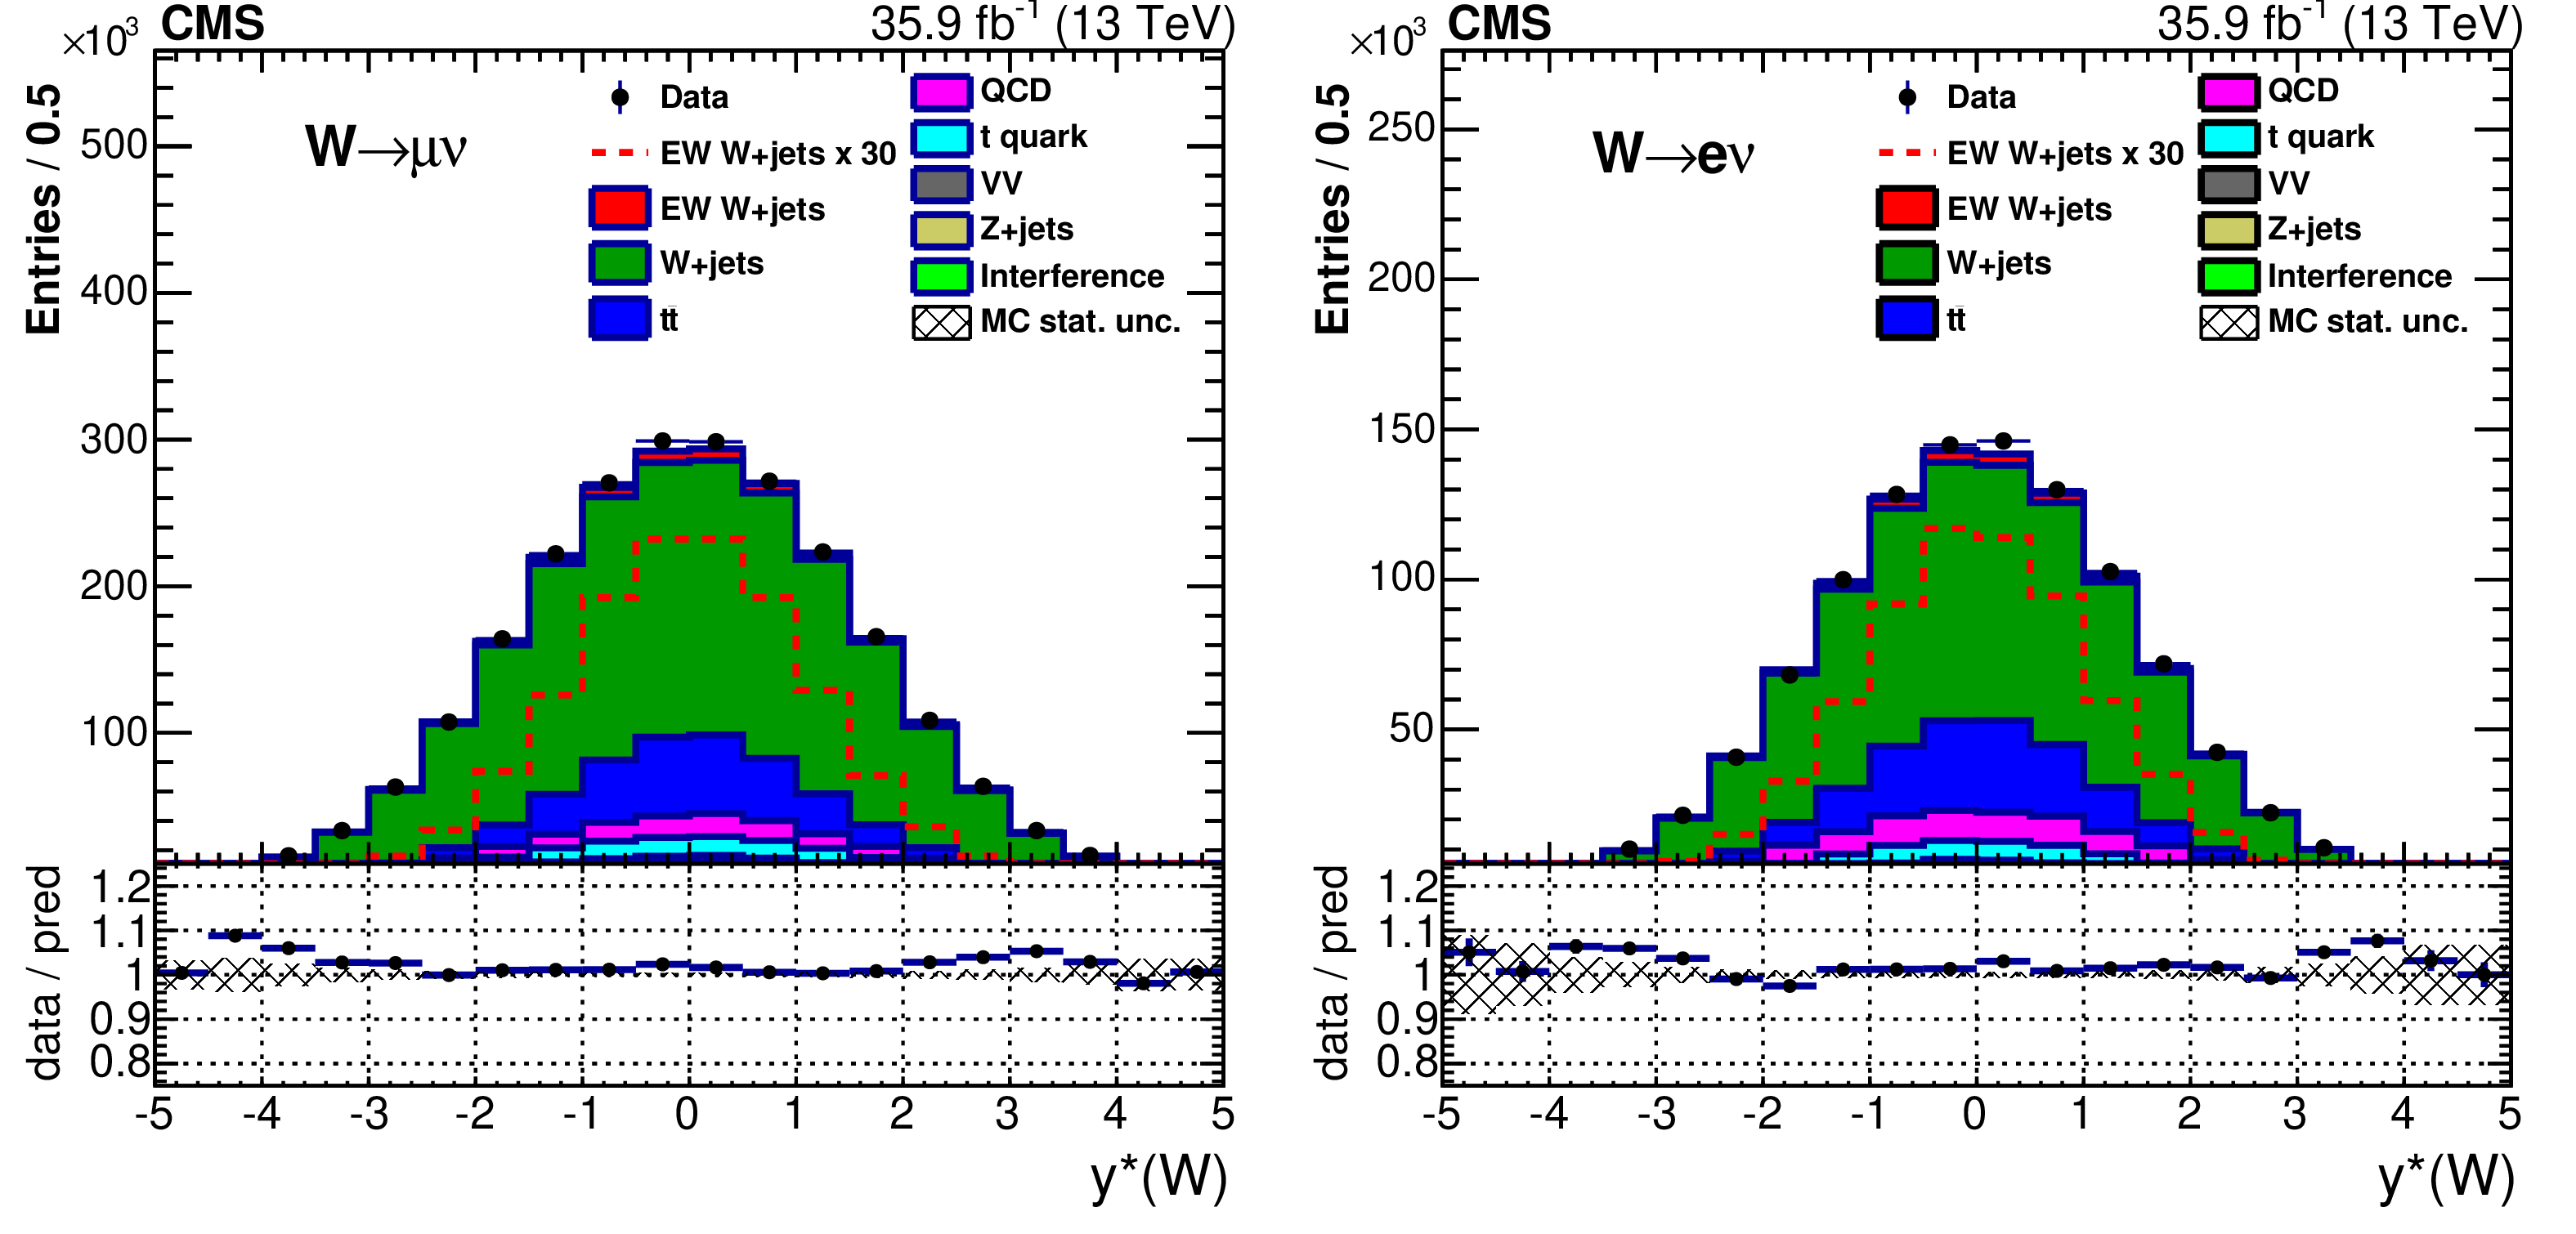
Figure 6-a:
Distributions of the "Zeppenfeld'' variable $y^\star $(W) after event preselection in the muon (left) and electron (right) channels. In all plots the last bin contains overflow events. |
png pdf |
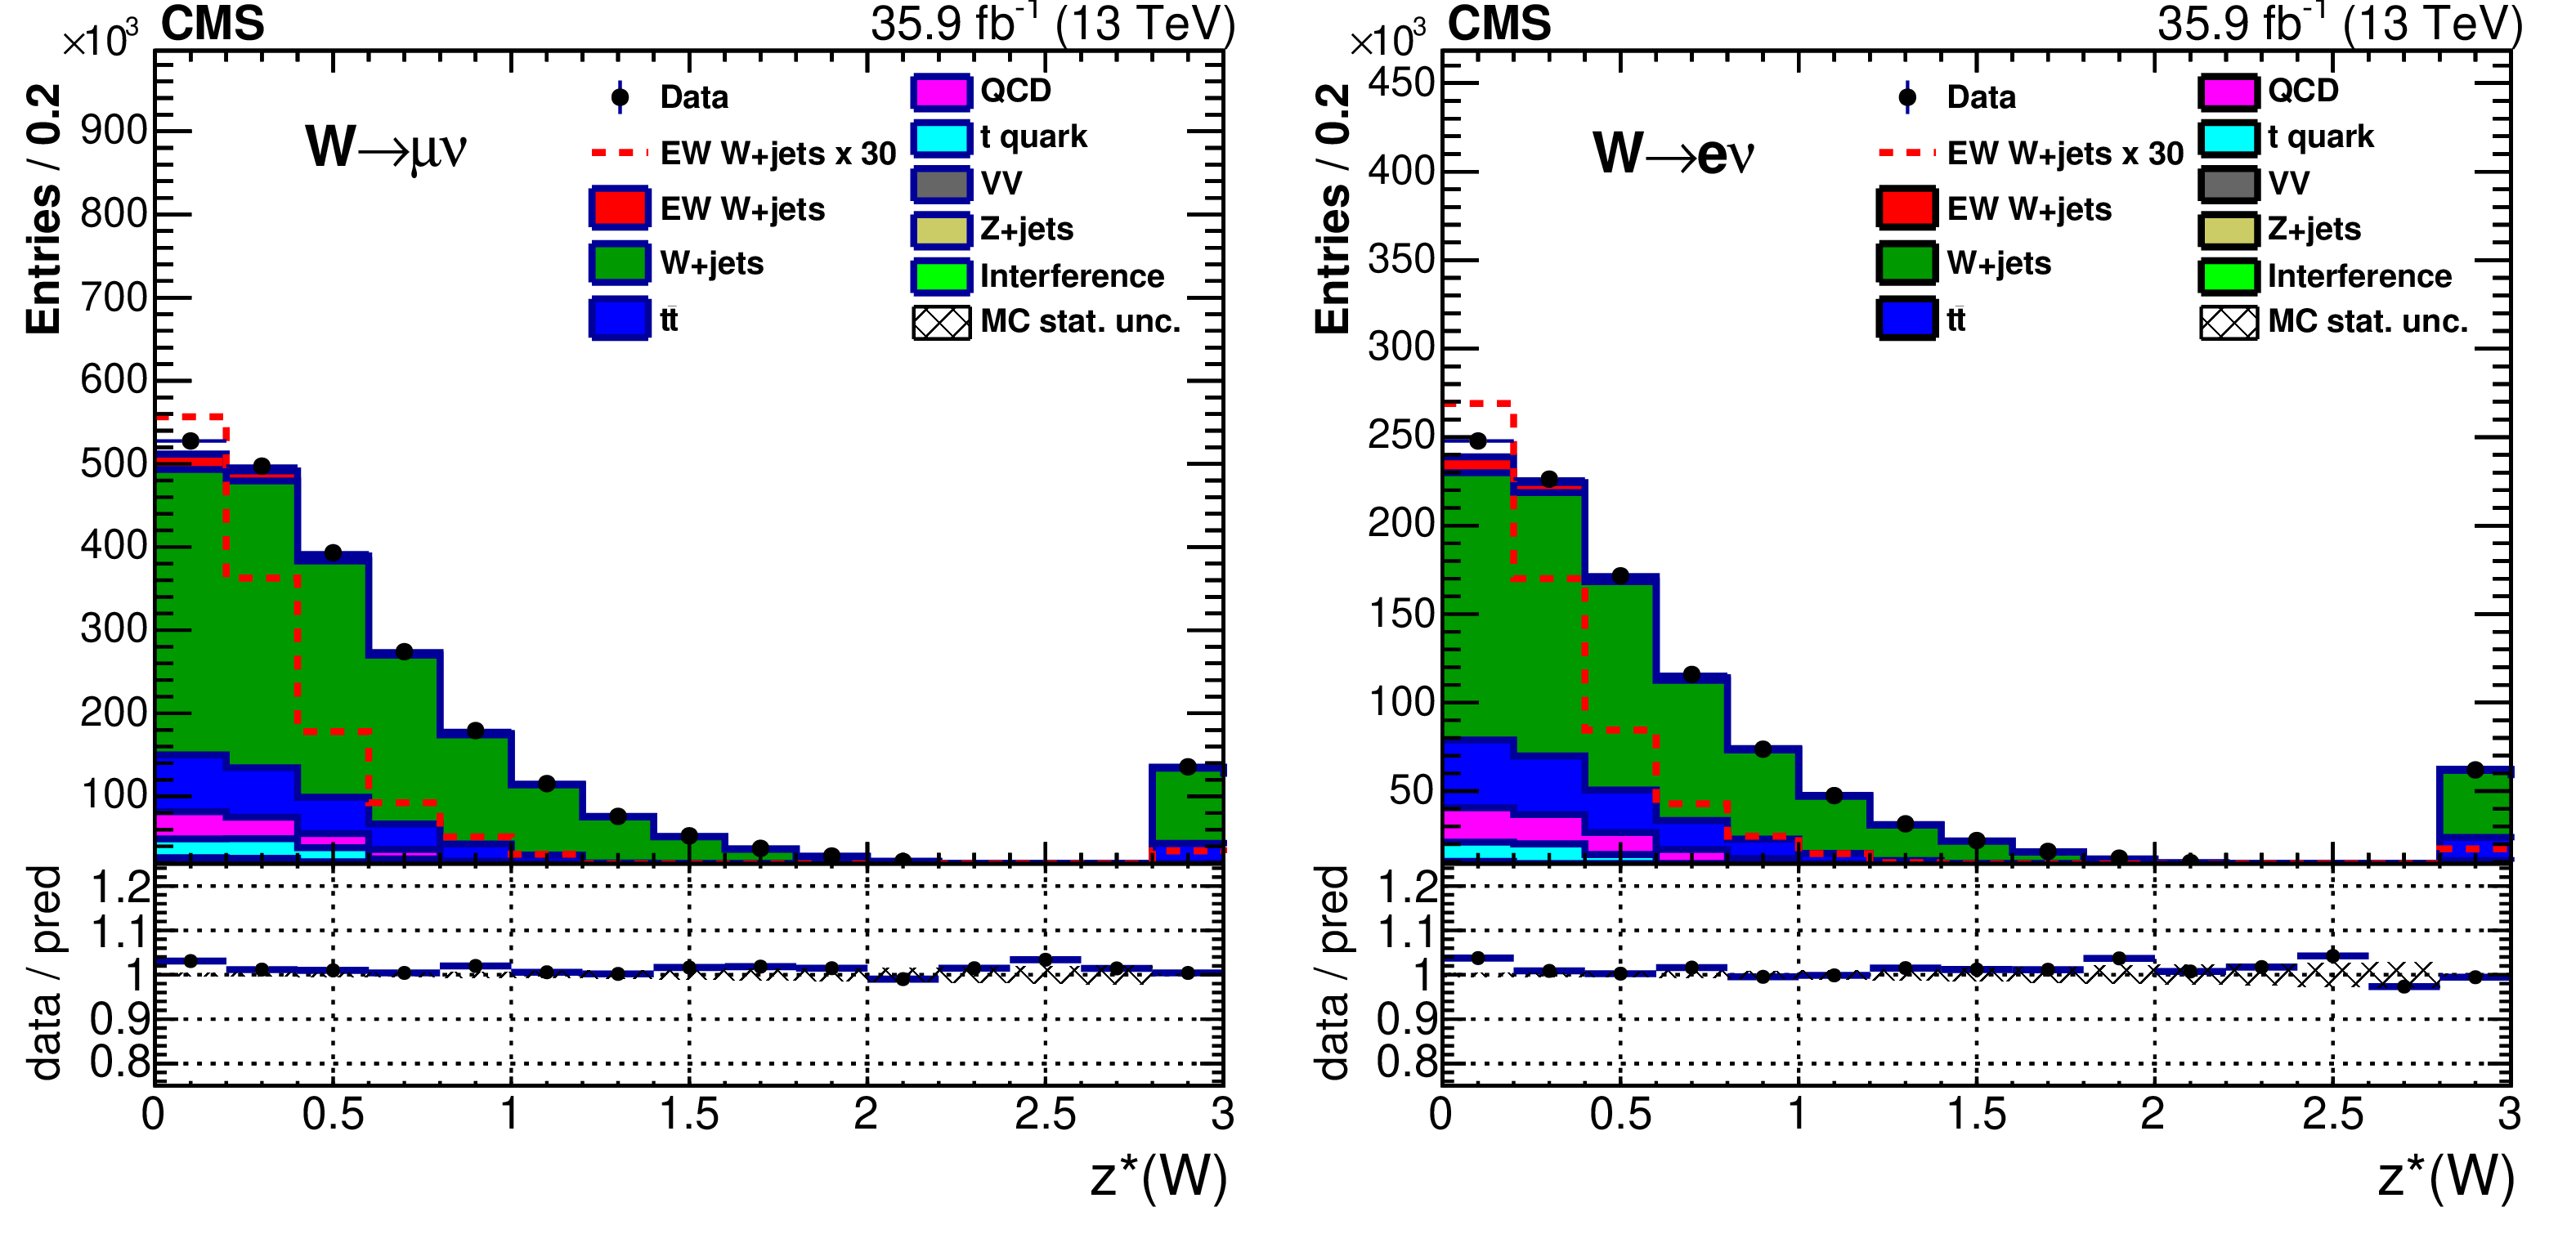
Figure 6-b:
Distributions of the "Zeppenfeld'' variable $z^\star $(W) after event preselection in the muon (left) and electron (right) channels. In all plots the last bin contains overflow events. |
png pdf |
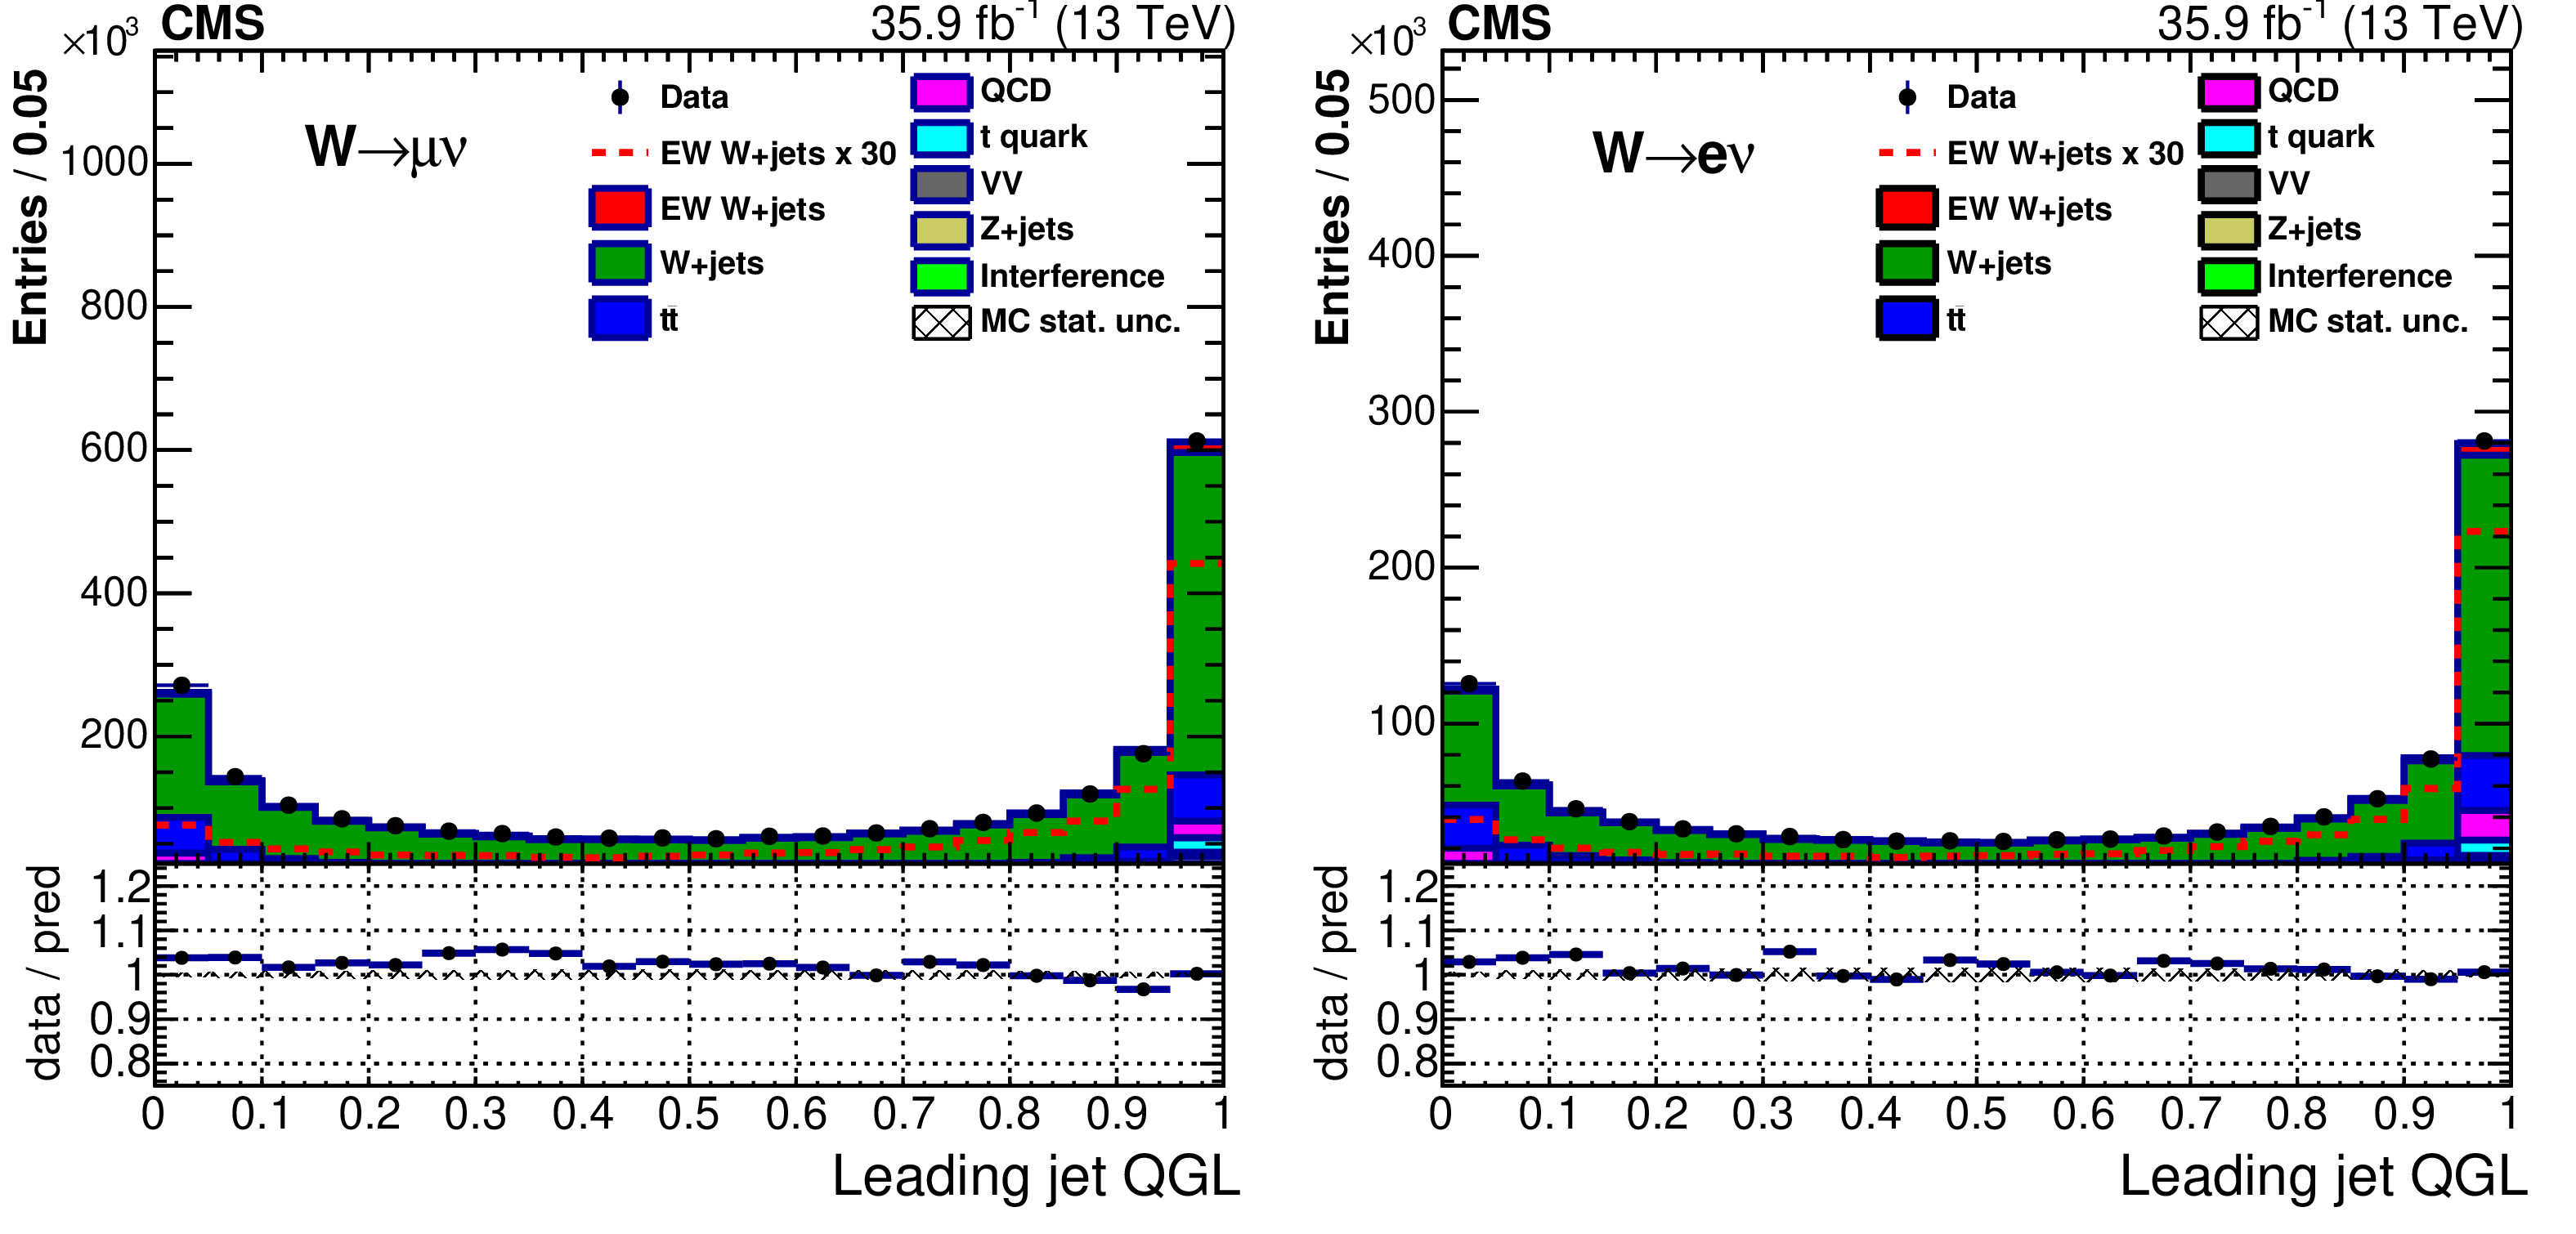
Figure 7-a:
The QGL output for the leading quark jet candidates in the preselected muon (left) and electron (right) samples. |
png pdf |
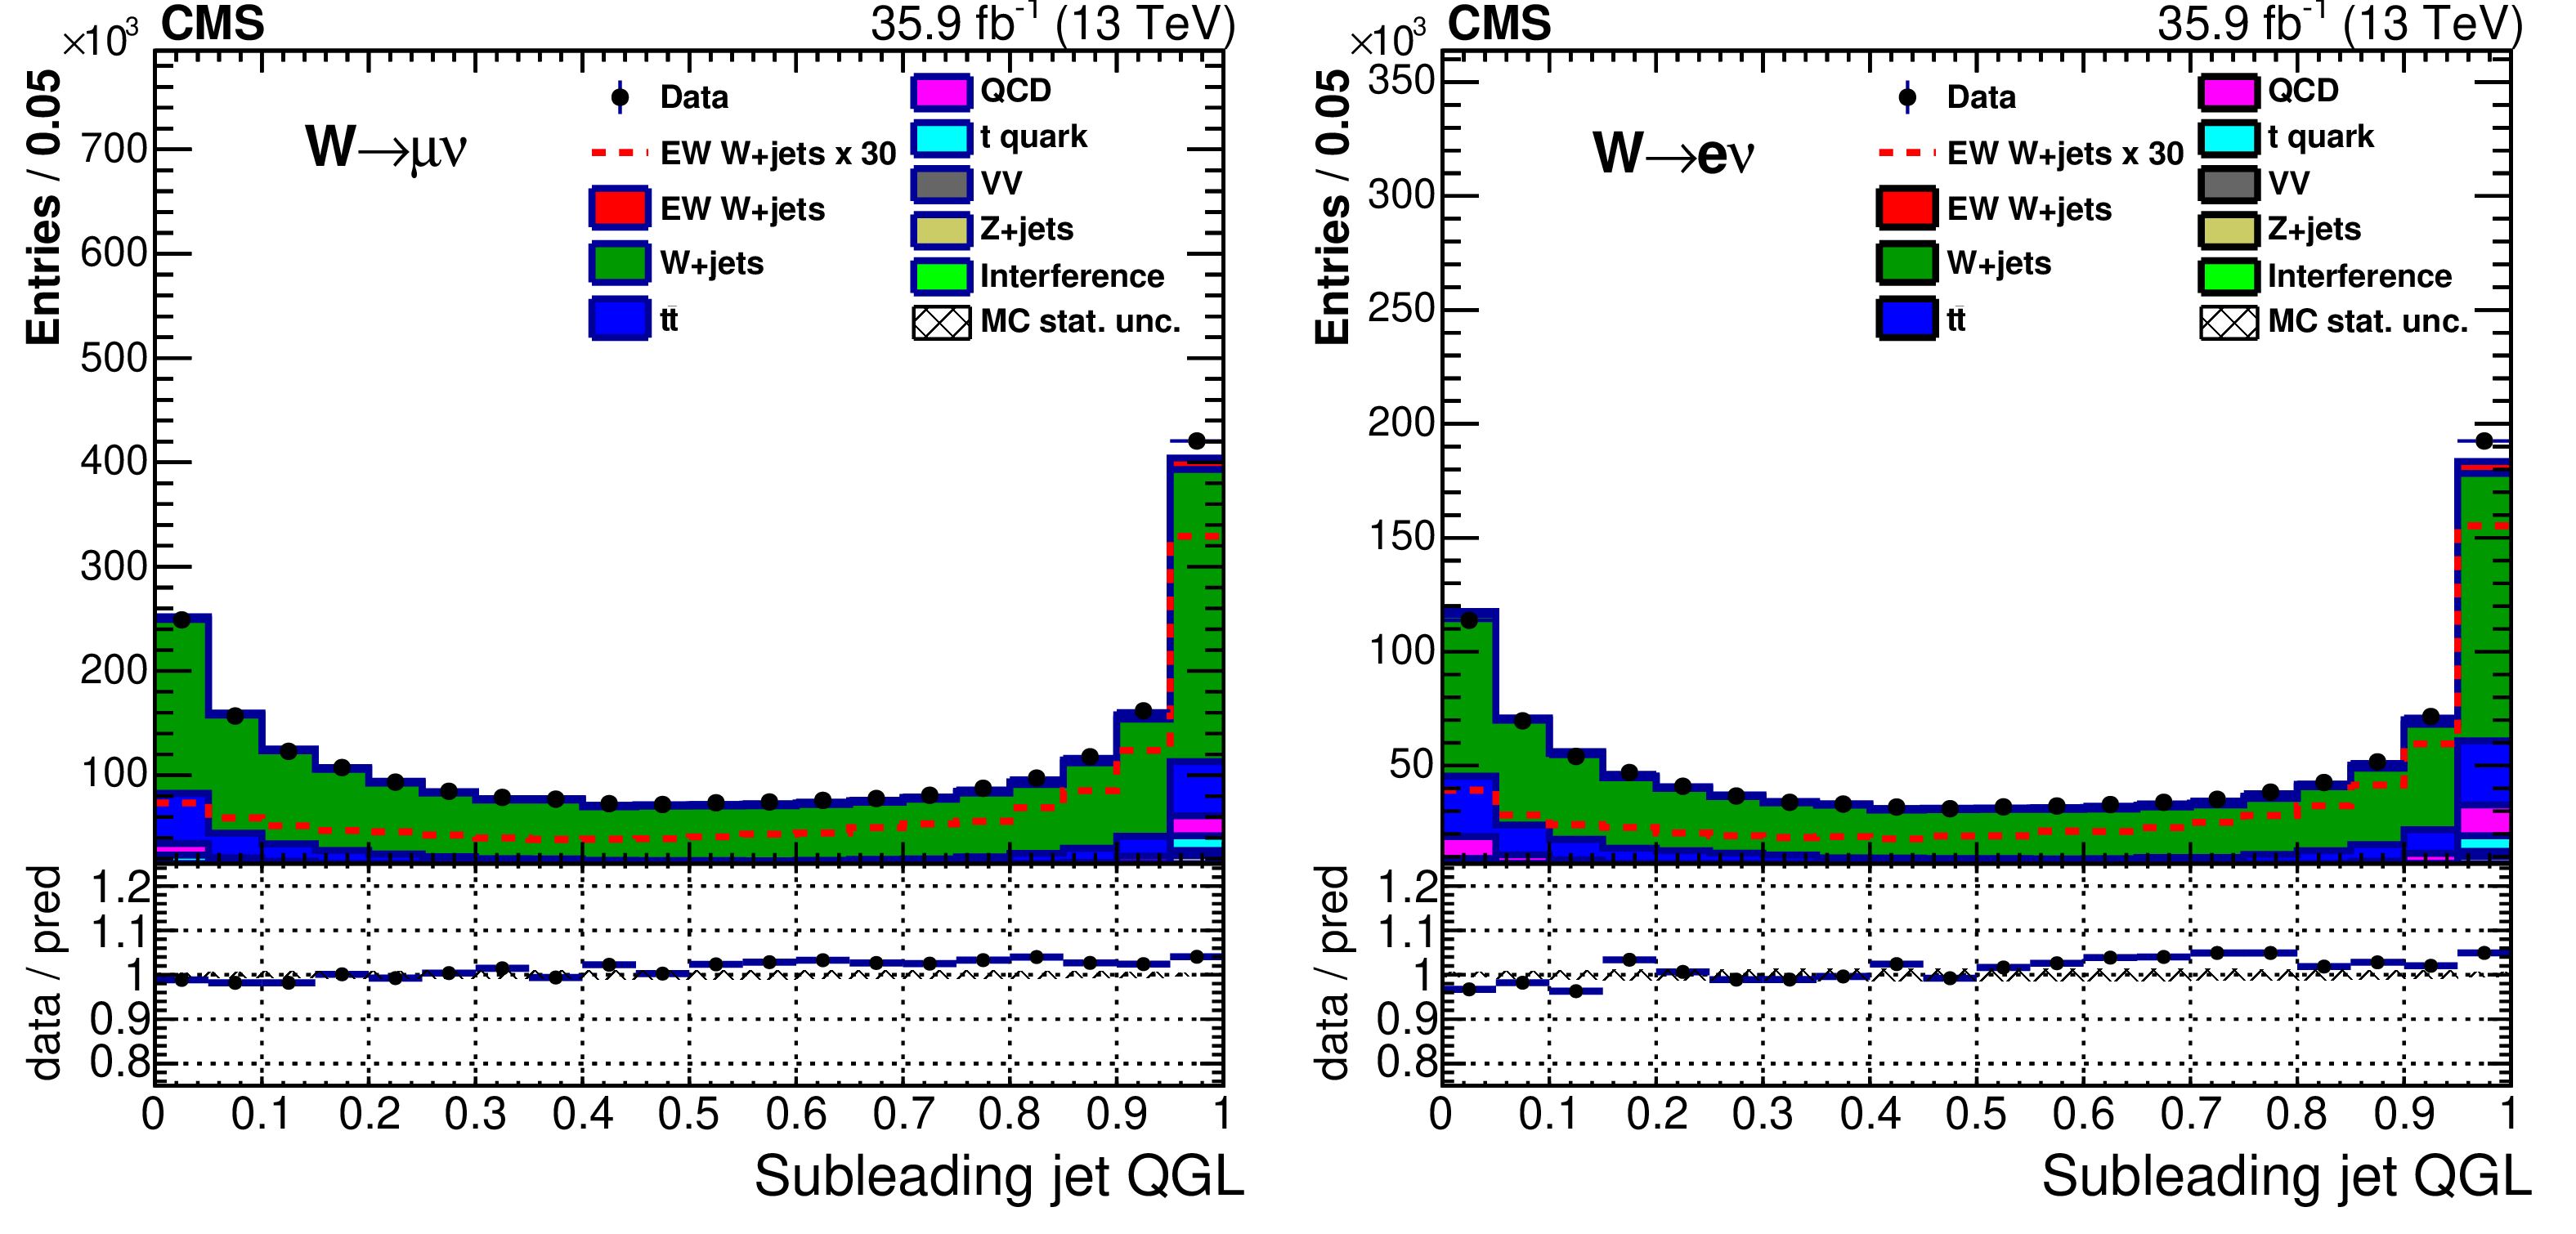
Figure 7-b:
The QGL output for the subleading quark jet candidates in the preselected muon (left) and electron (right) samples. |
png pdf |
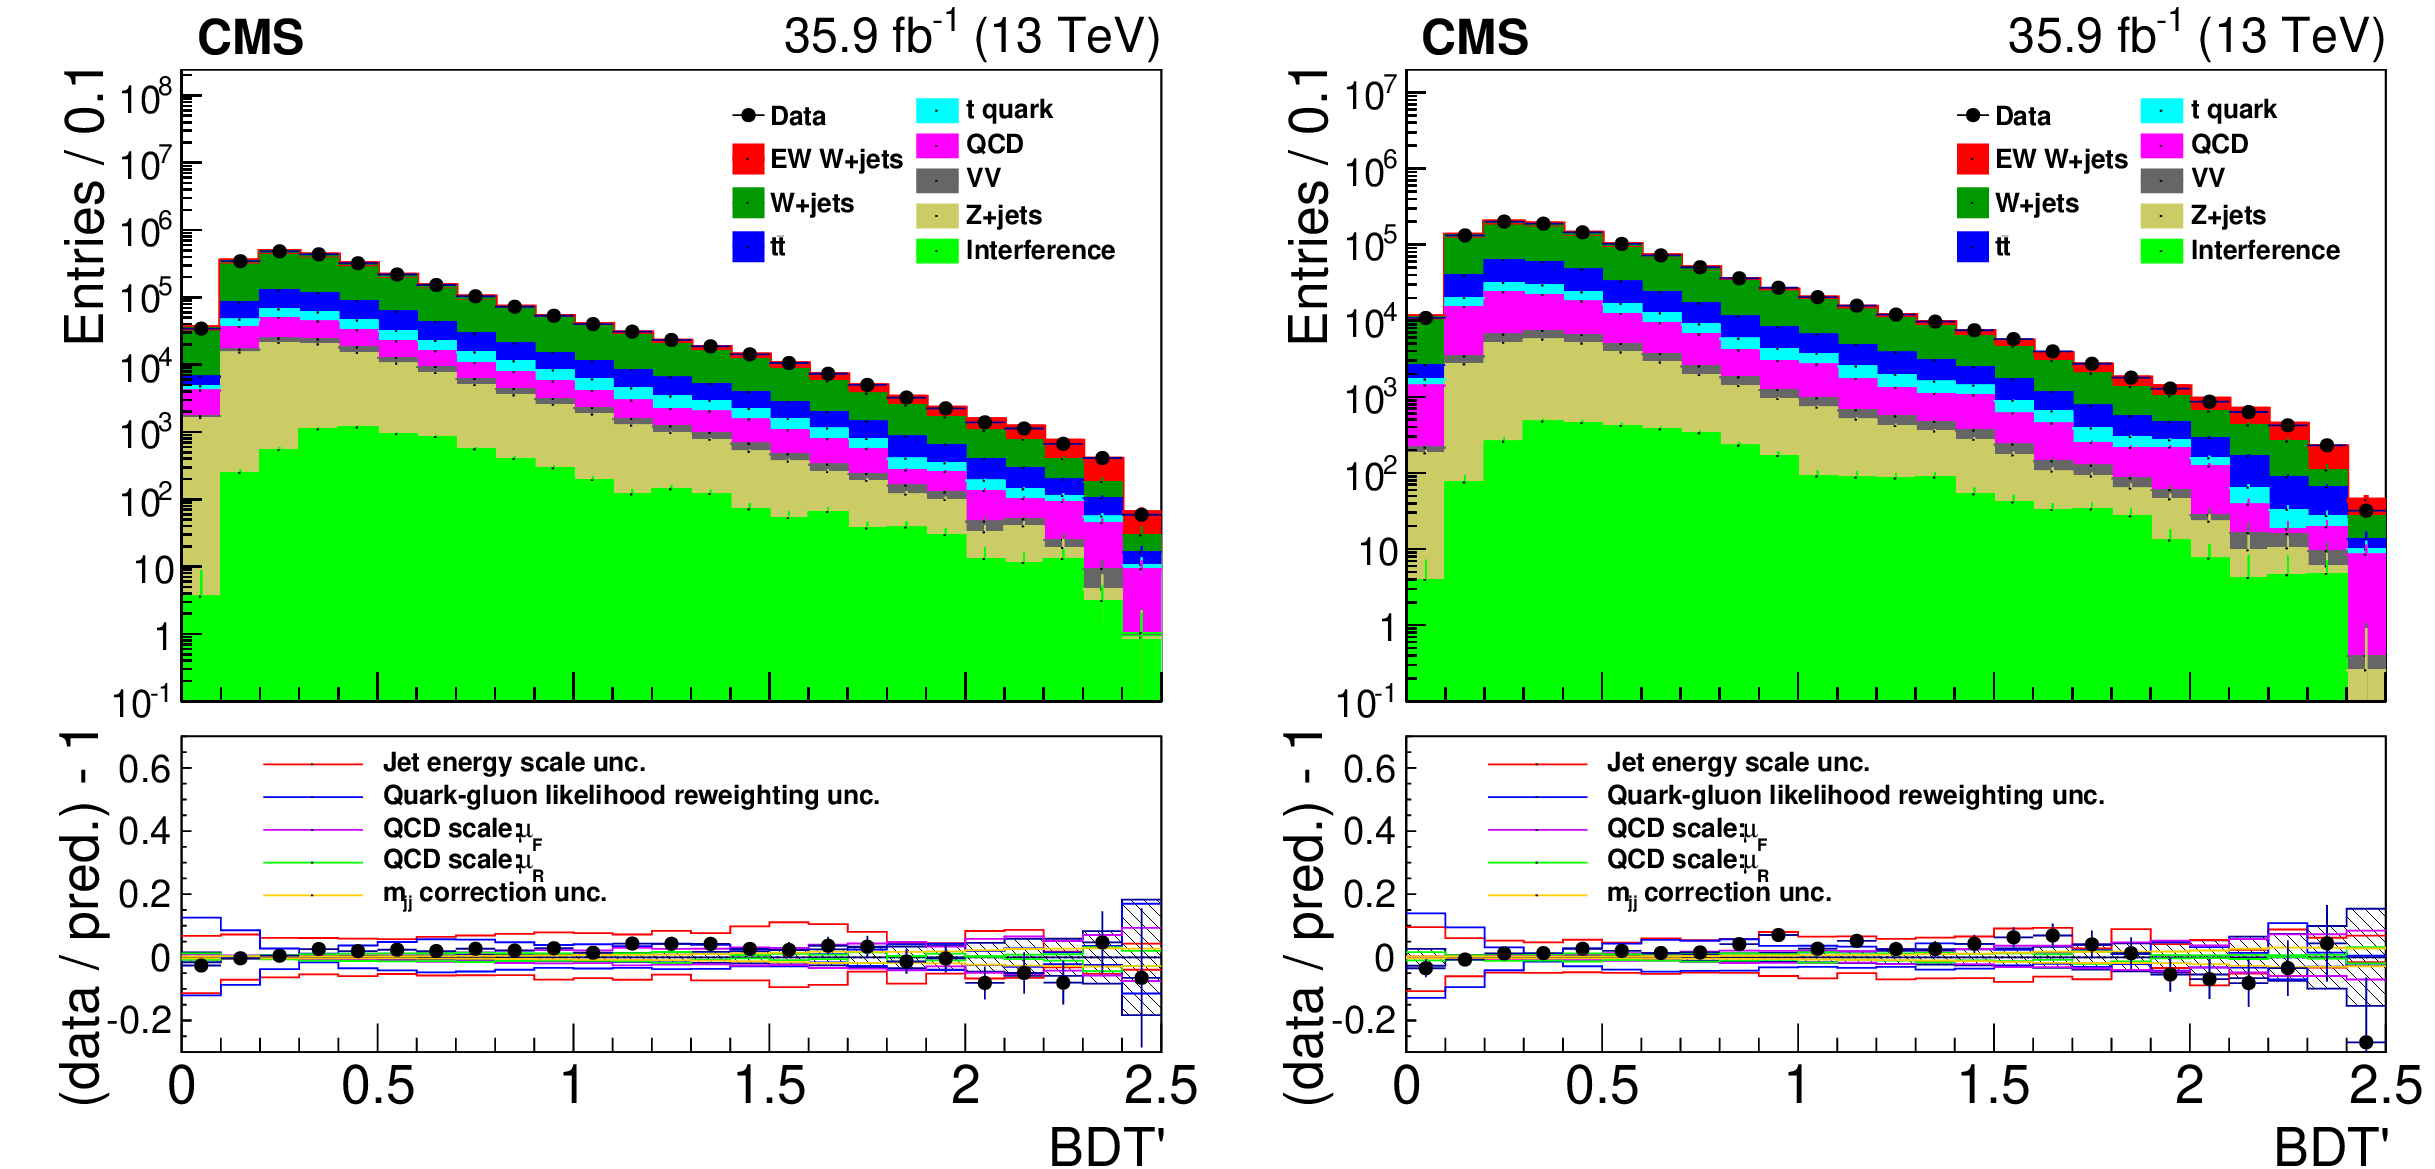
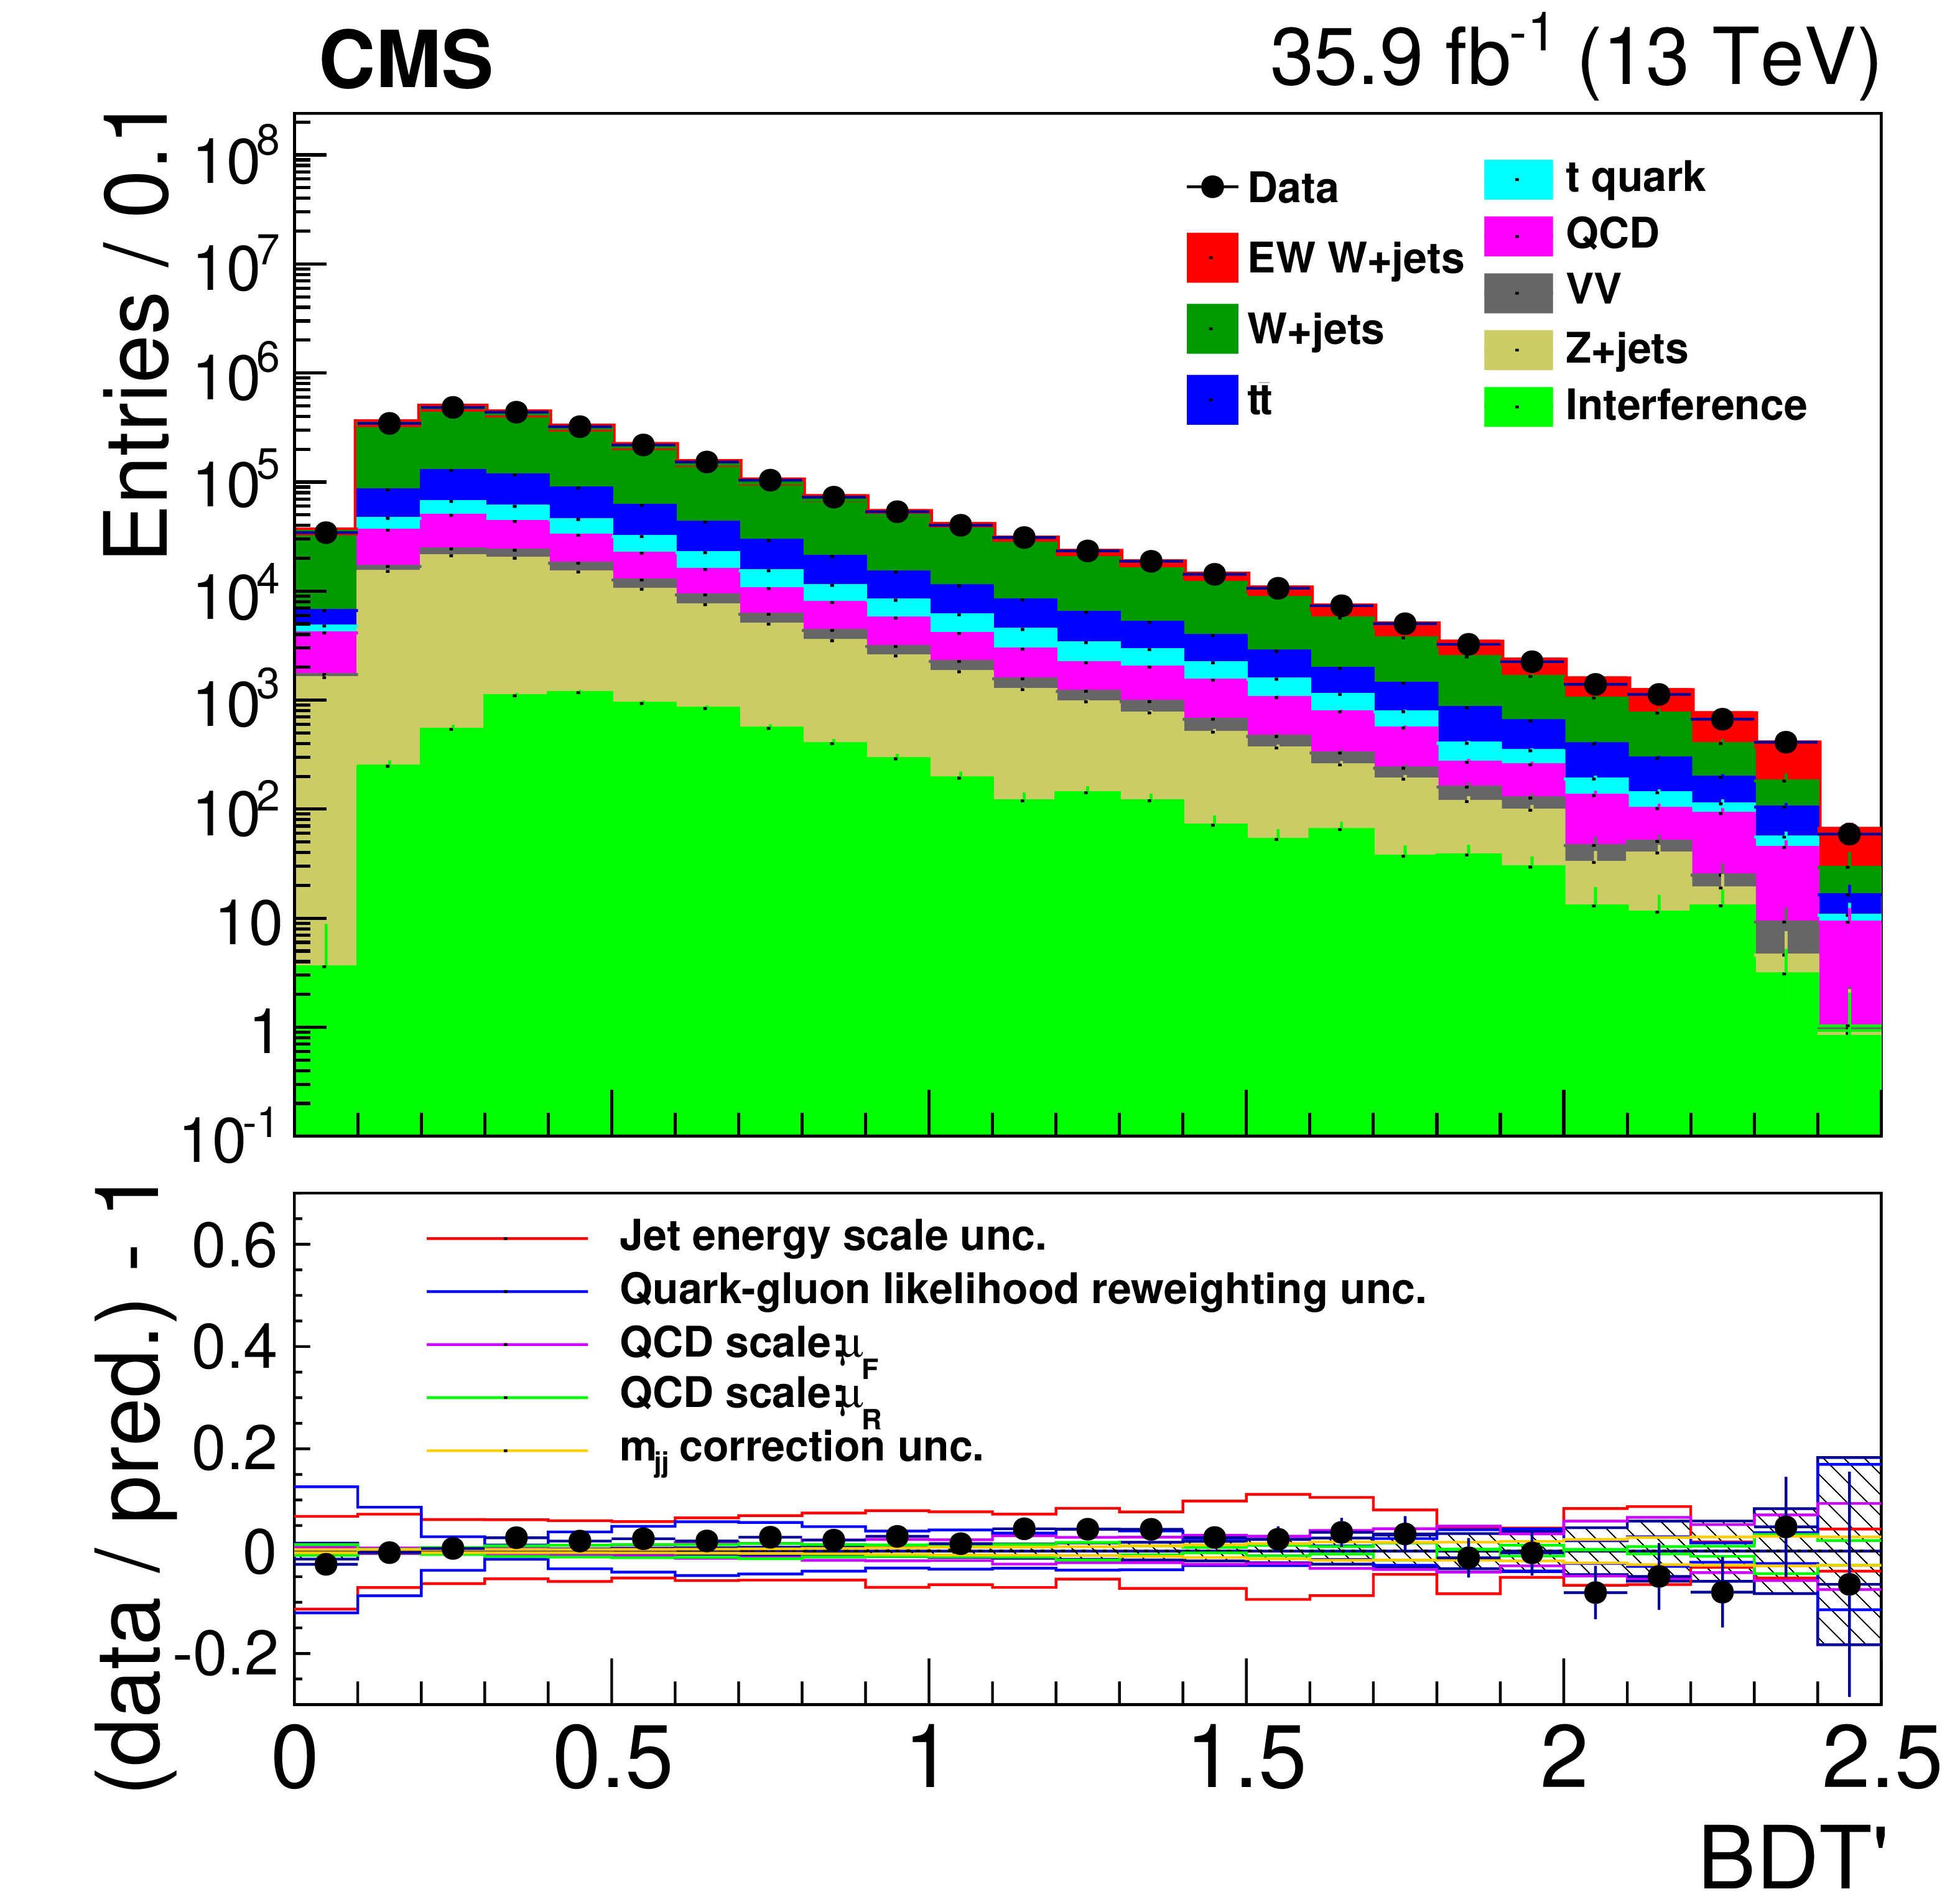
Figure 8:
Data and MC simulation BDT' output distributions for the muon (left) and electron (right) channels, using the BDT output transformed with the $\tanh^{-1}$ function to enhance the purest signal region. The ratio panel shows the statistical uncertainty from the simulation as well as the independent systematic uncertainties front the leading sources. |
png pdf |
Figure 8-a:
Data and MC simulation BDT' output distributions for the muon channel, using the BDT output transformed with the $\tanh^{-1}$ function to enhance the purest signal region. The ratio panel shows the statistical uncertainty from the simulation as well as the independent systematic uncertainties front the leading sources. |

png pdf |
Figure 8-b:
Data and MC simulation BDT' output distributions for the electron channel, using the BDT output transformed with the $\tanh^{-1}$ function to enhance the purest signal region. The ratio panel shows the statistical uncertainty from the simulation as well as the independent systematic uncertainties front the leading sources. |
png pdf |
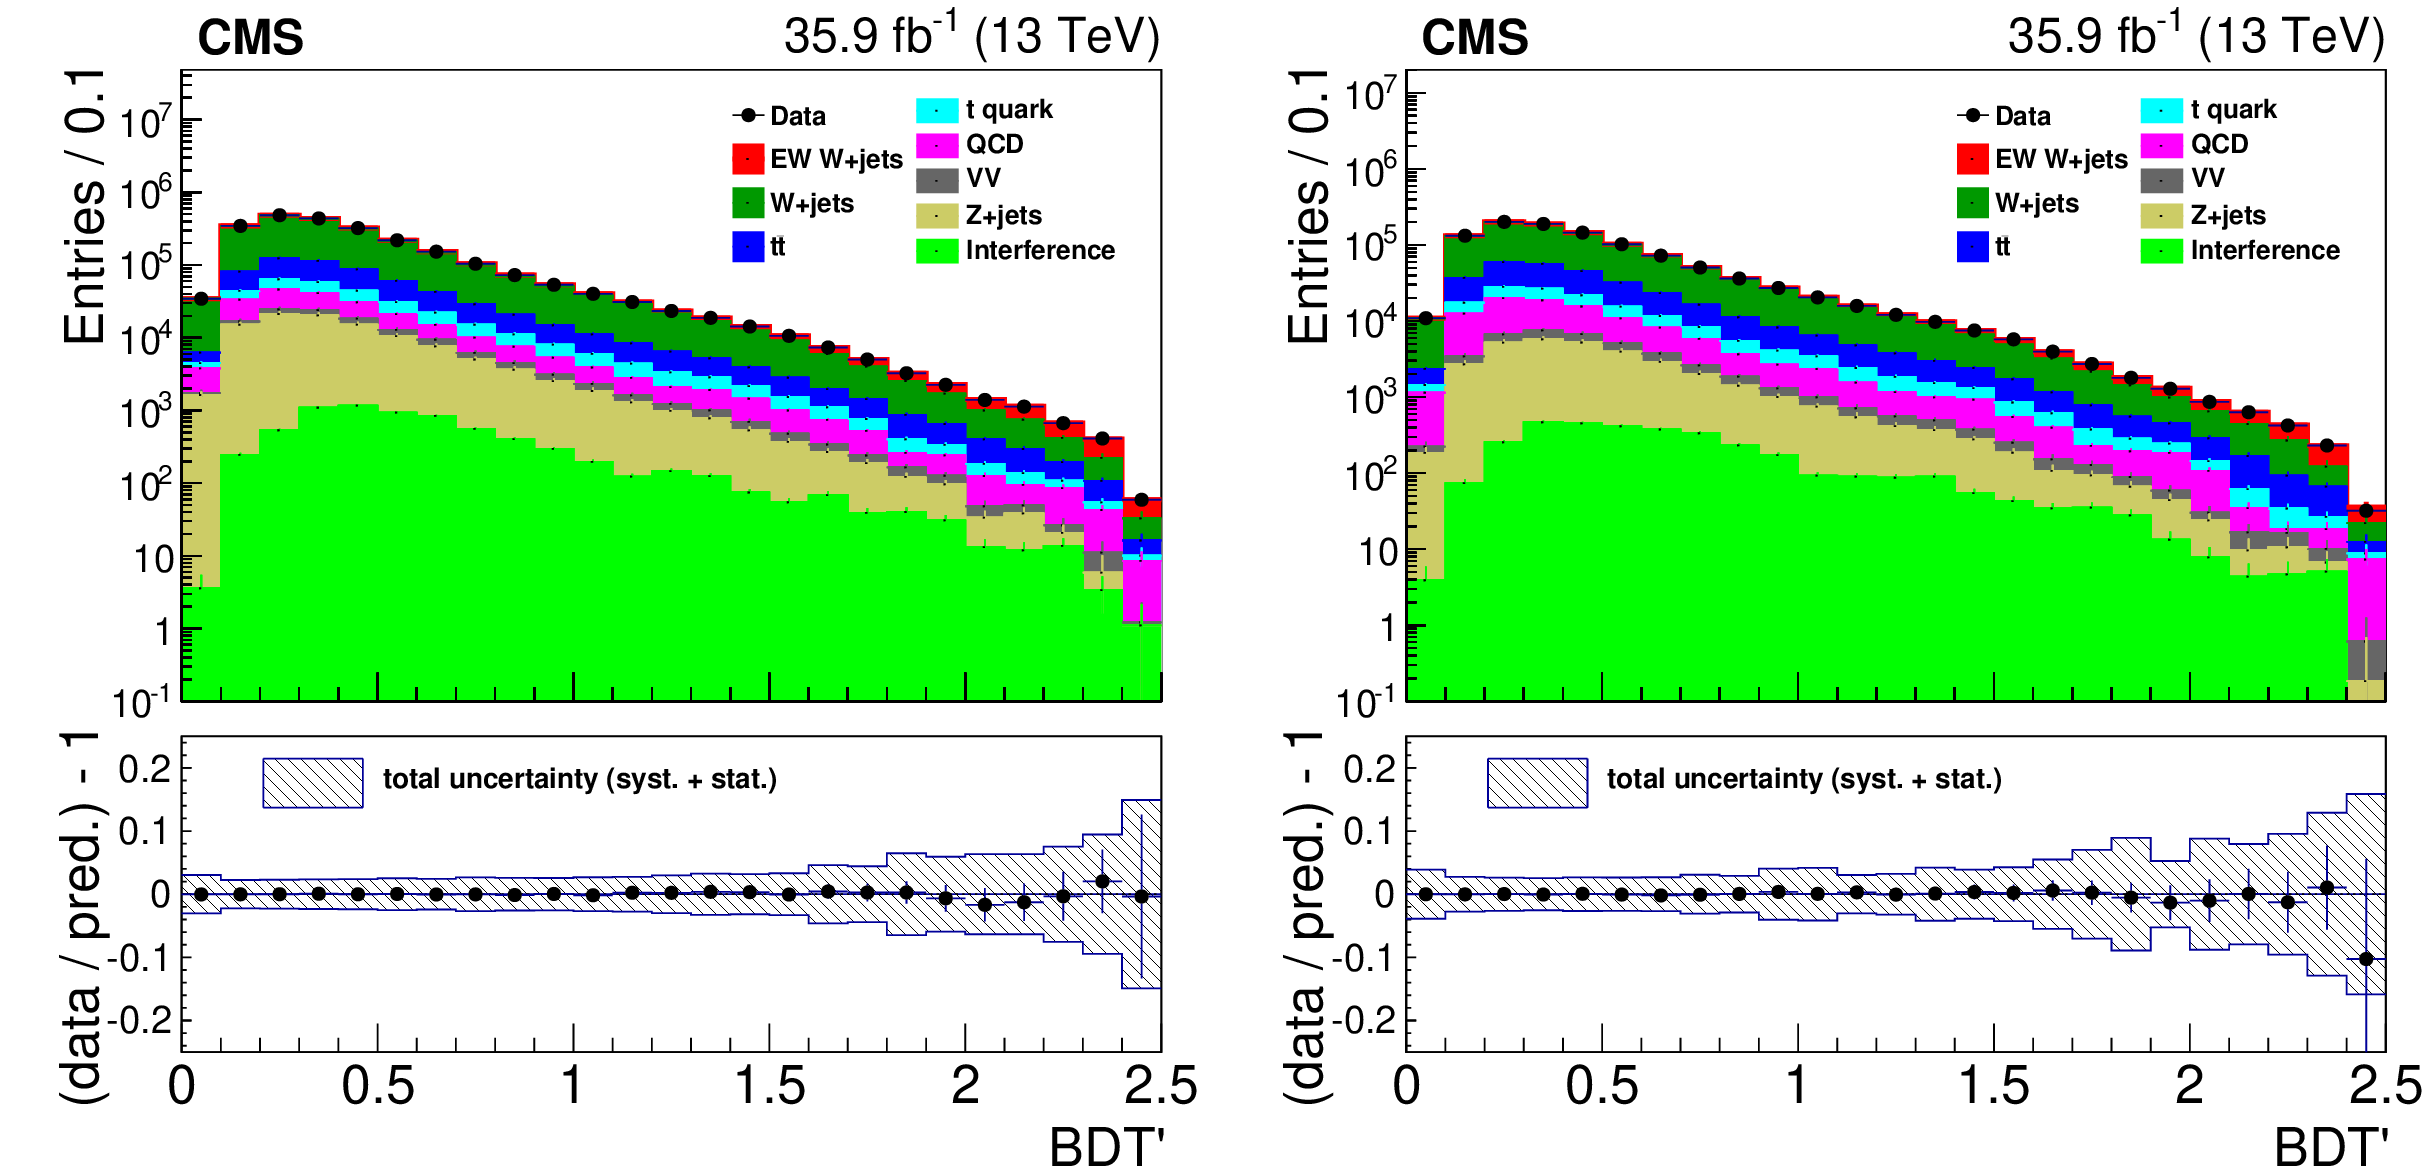
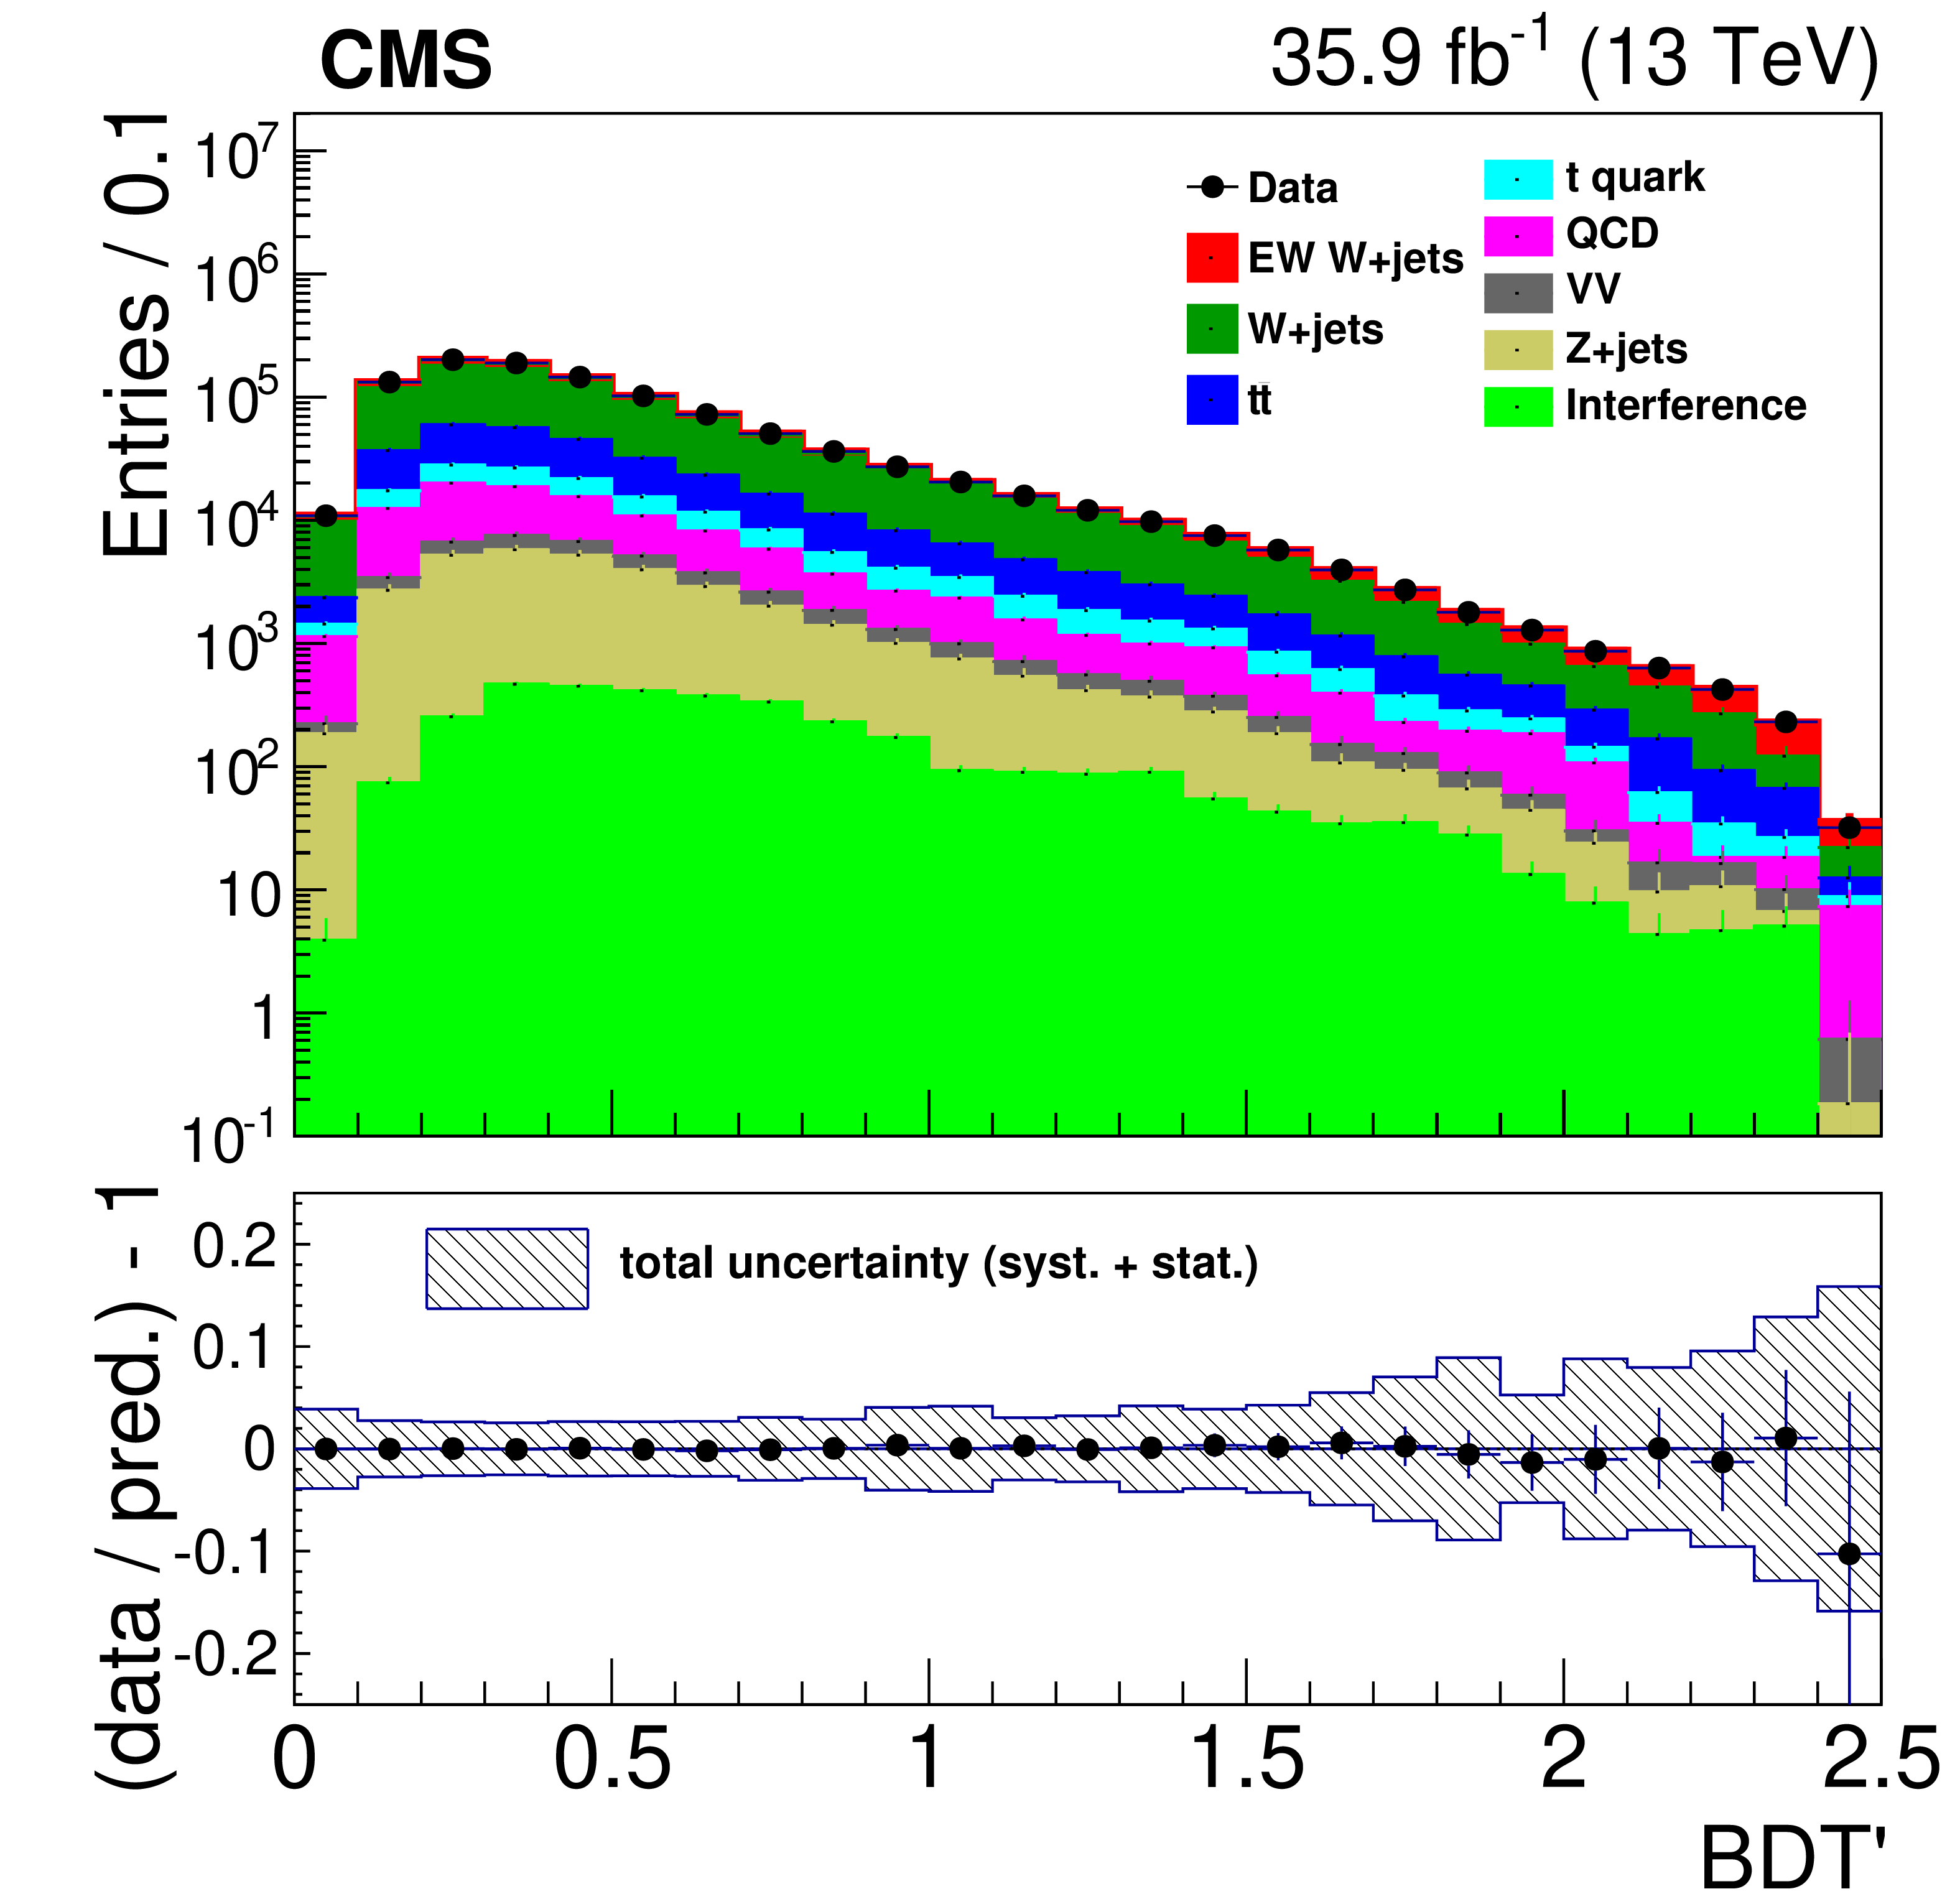
Figure 9:
Data compared with simulation for the BDT' output distribution for the muon (left) and electron (right) channels, after the fit. The grey uncertainty band in the ratio panel includes all systematic uncertainties. |

png pdf |
Figure 9-a:
Data compared with simulation for the BDT' output distribution for the muon channel, after the fit. The grey uncertainty band in the ratio panel includes all systematic uncertainties. |
png pdf |
Figure 9-b:
Data compared with simulation for the BDT' output distribution for the electron channel, after the fit. The grey uncertainty band in the ratio panel includes all systematic uncertainties. |
png pdf |
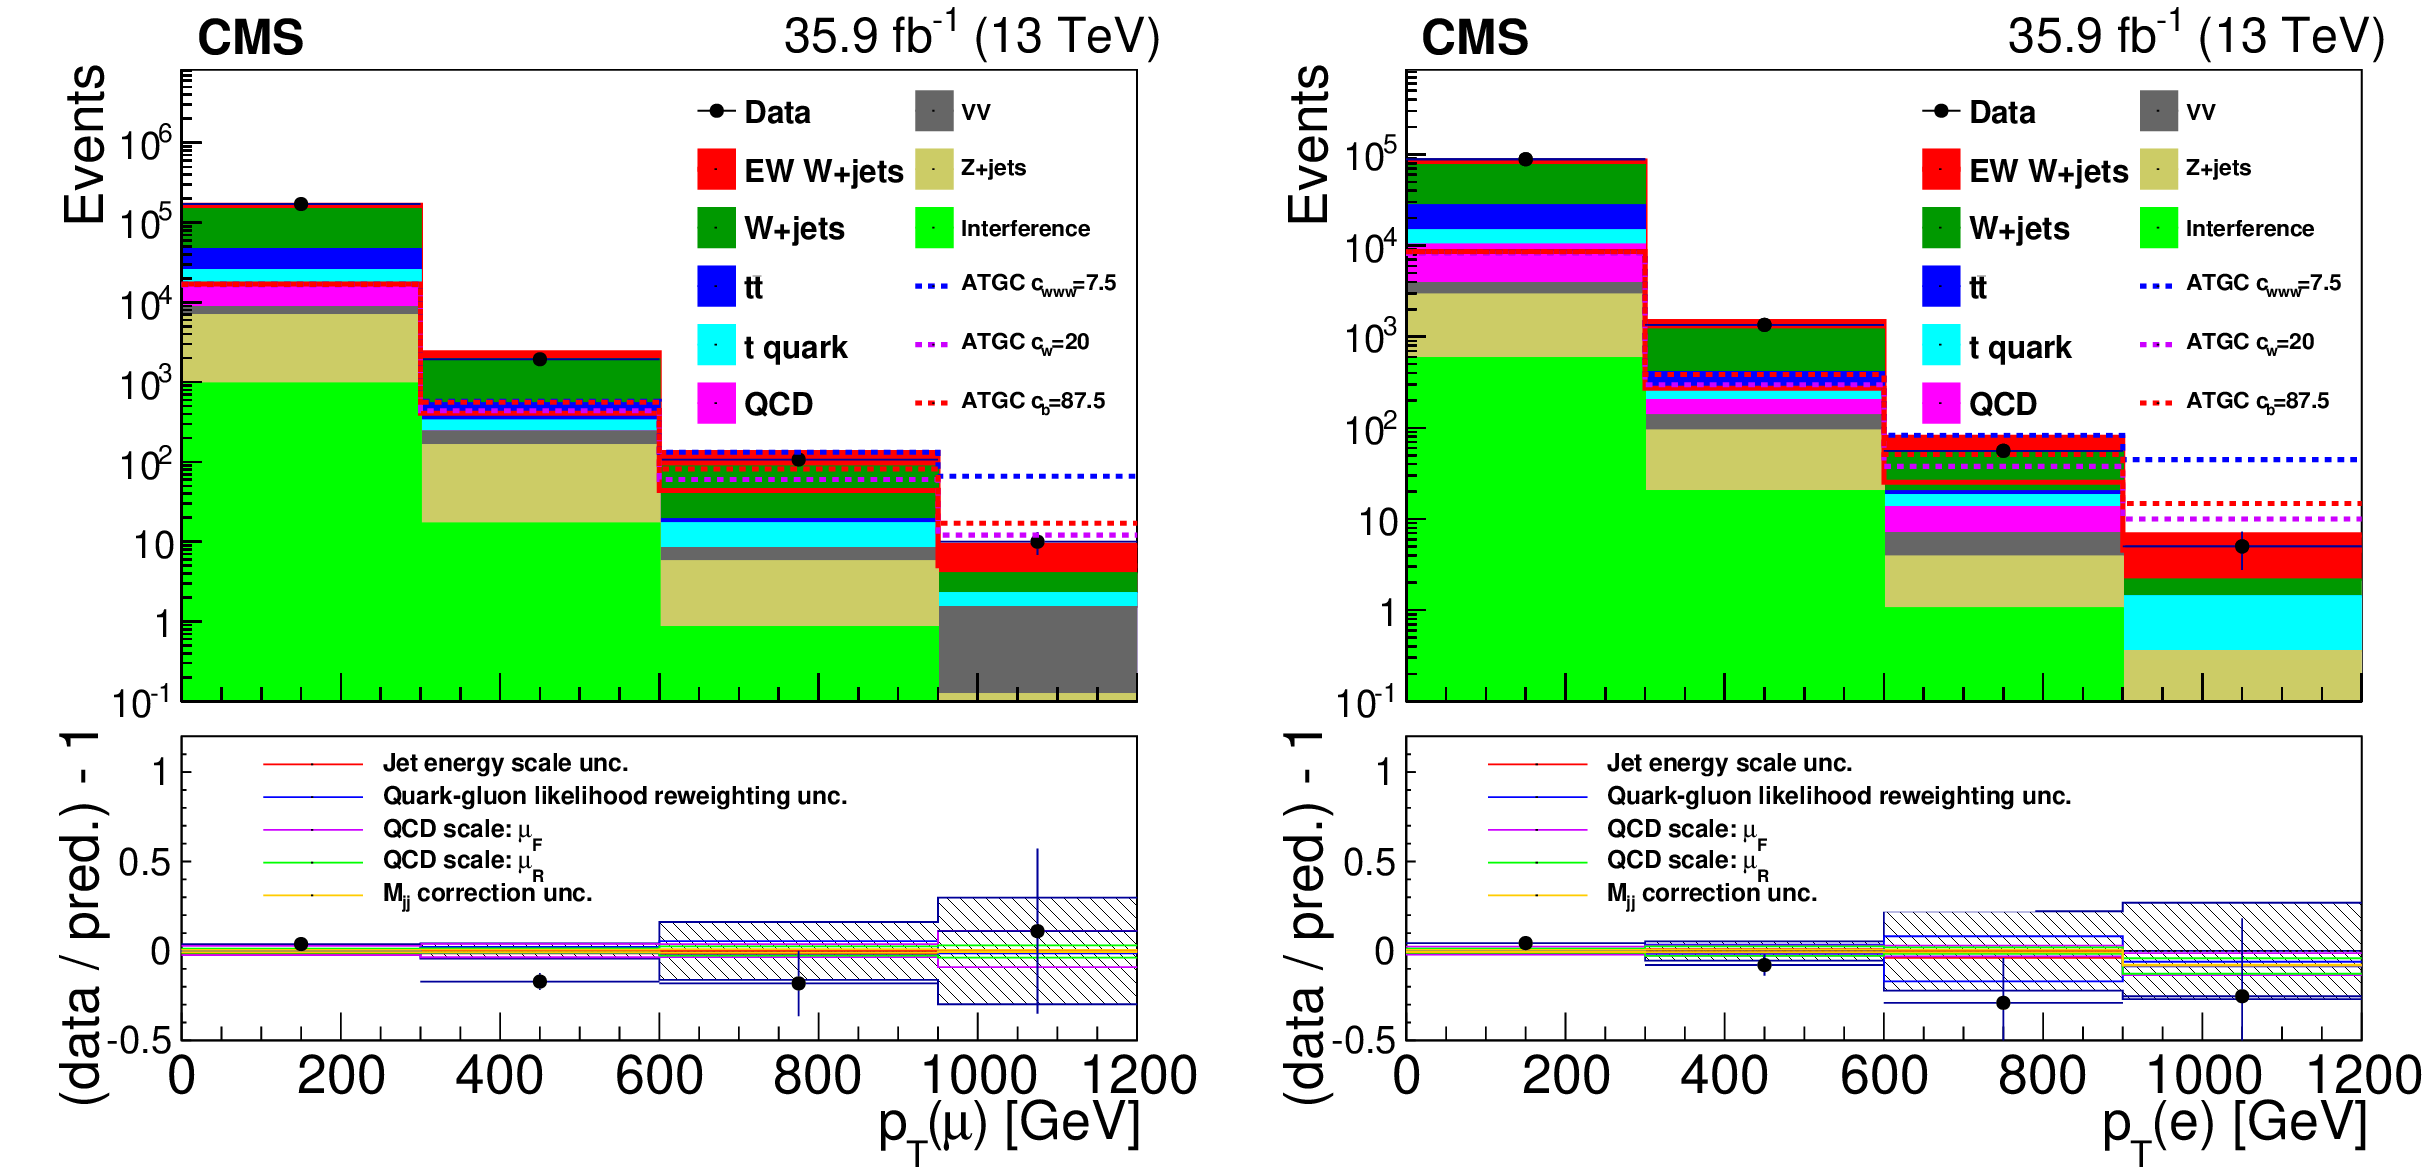
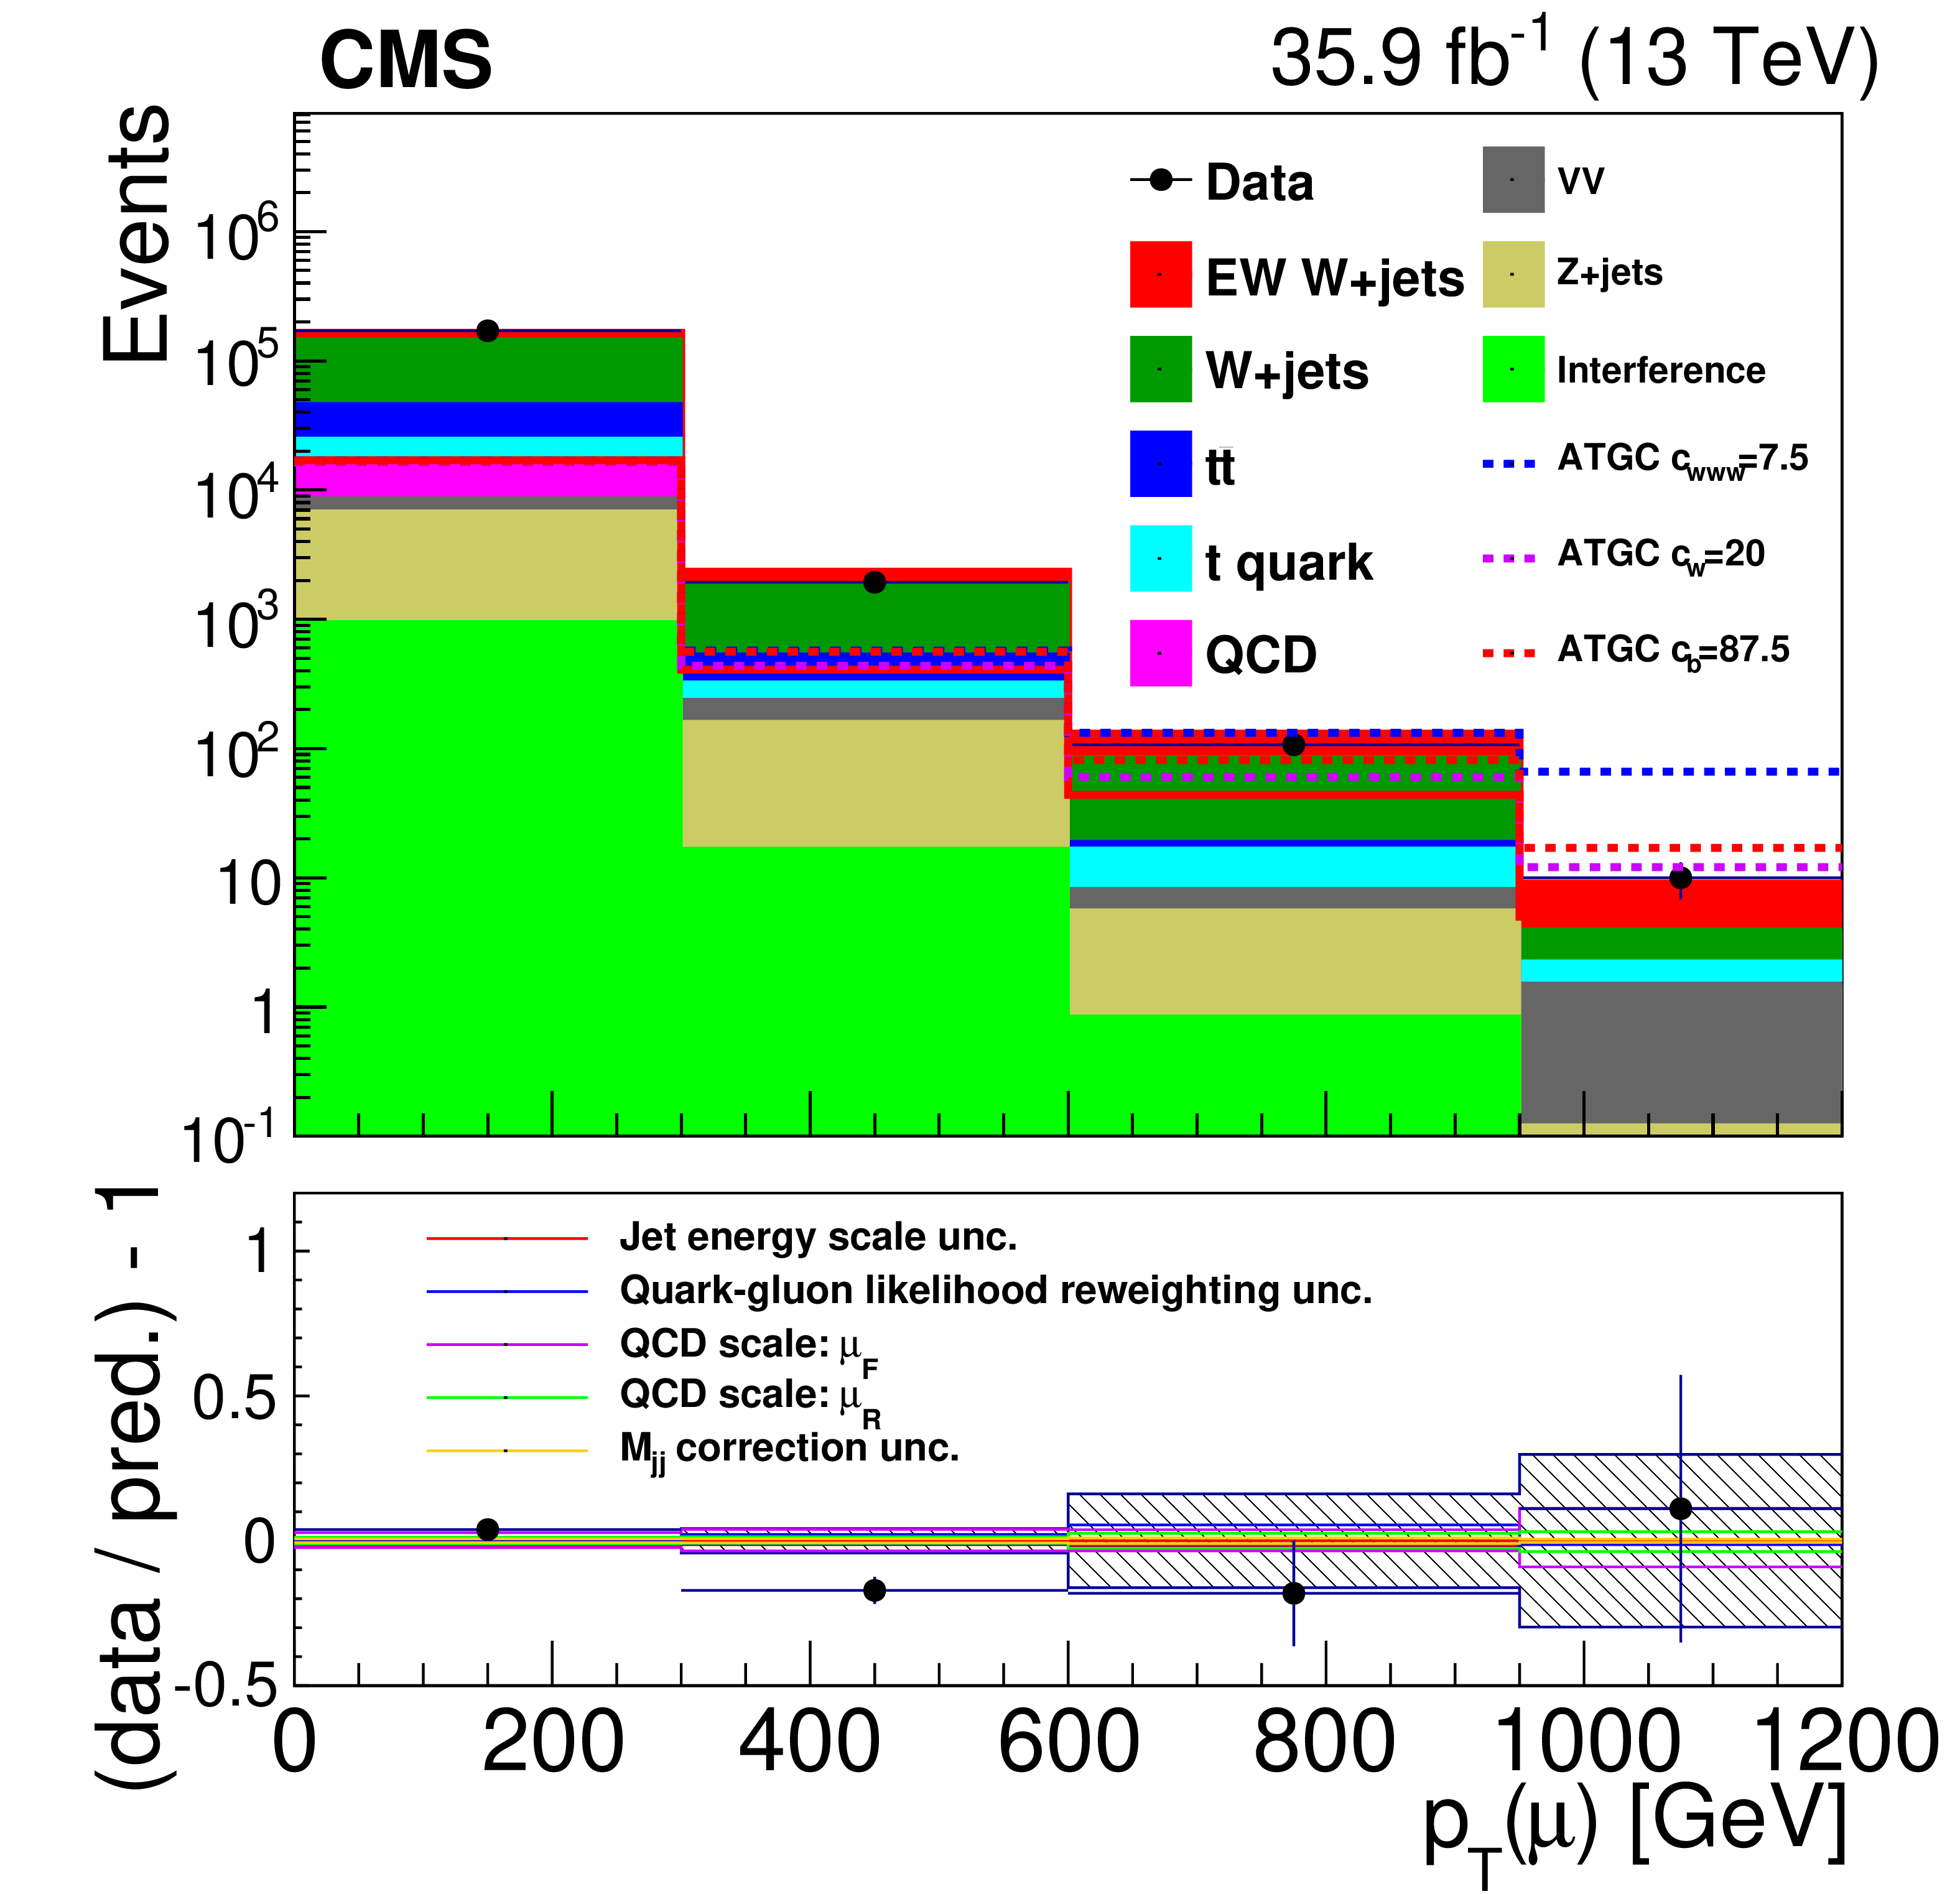
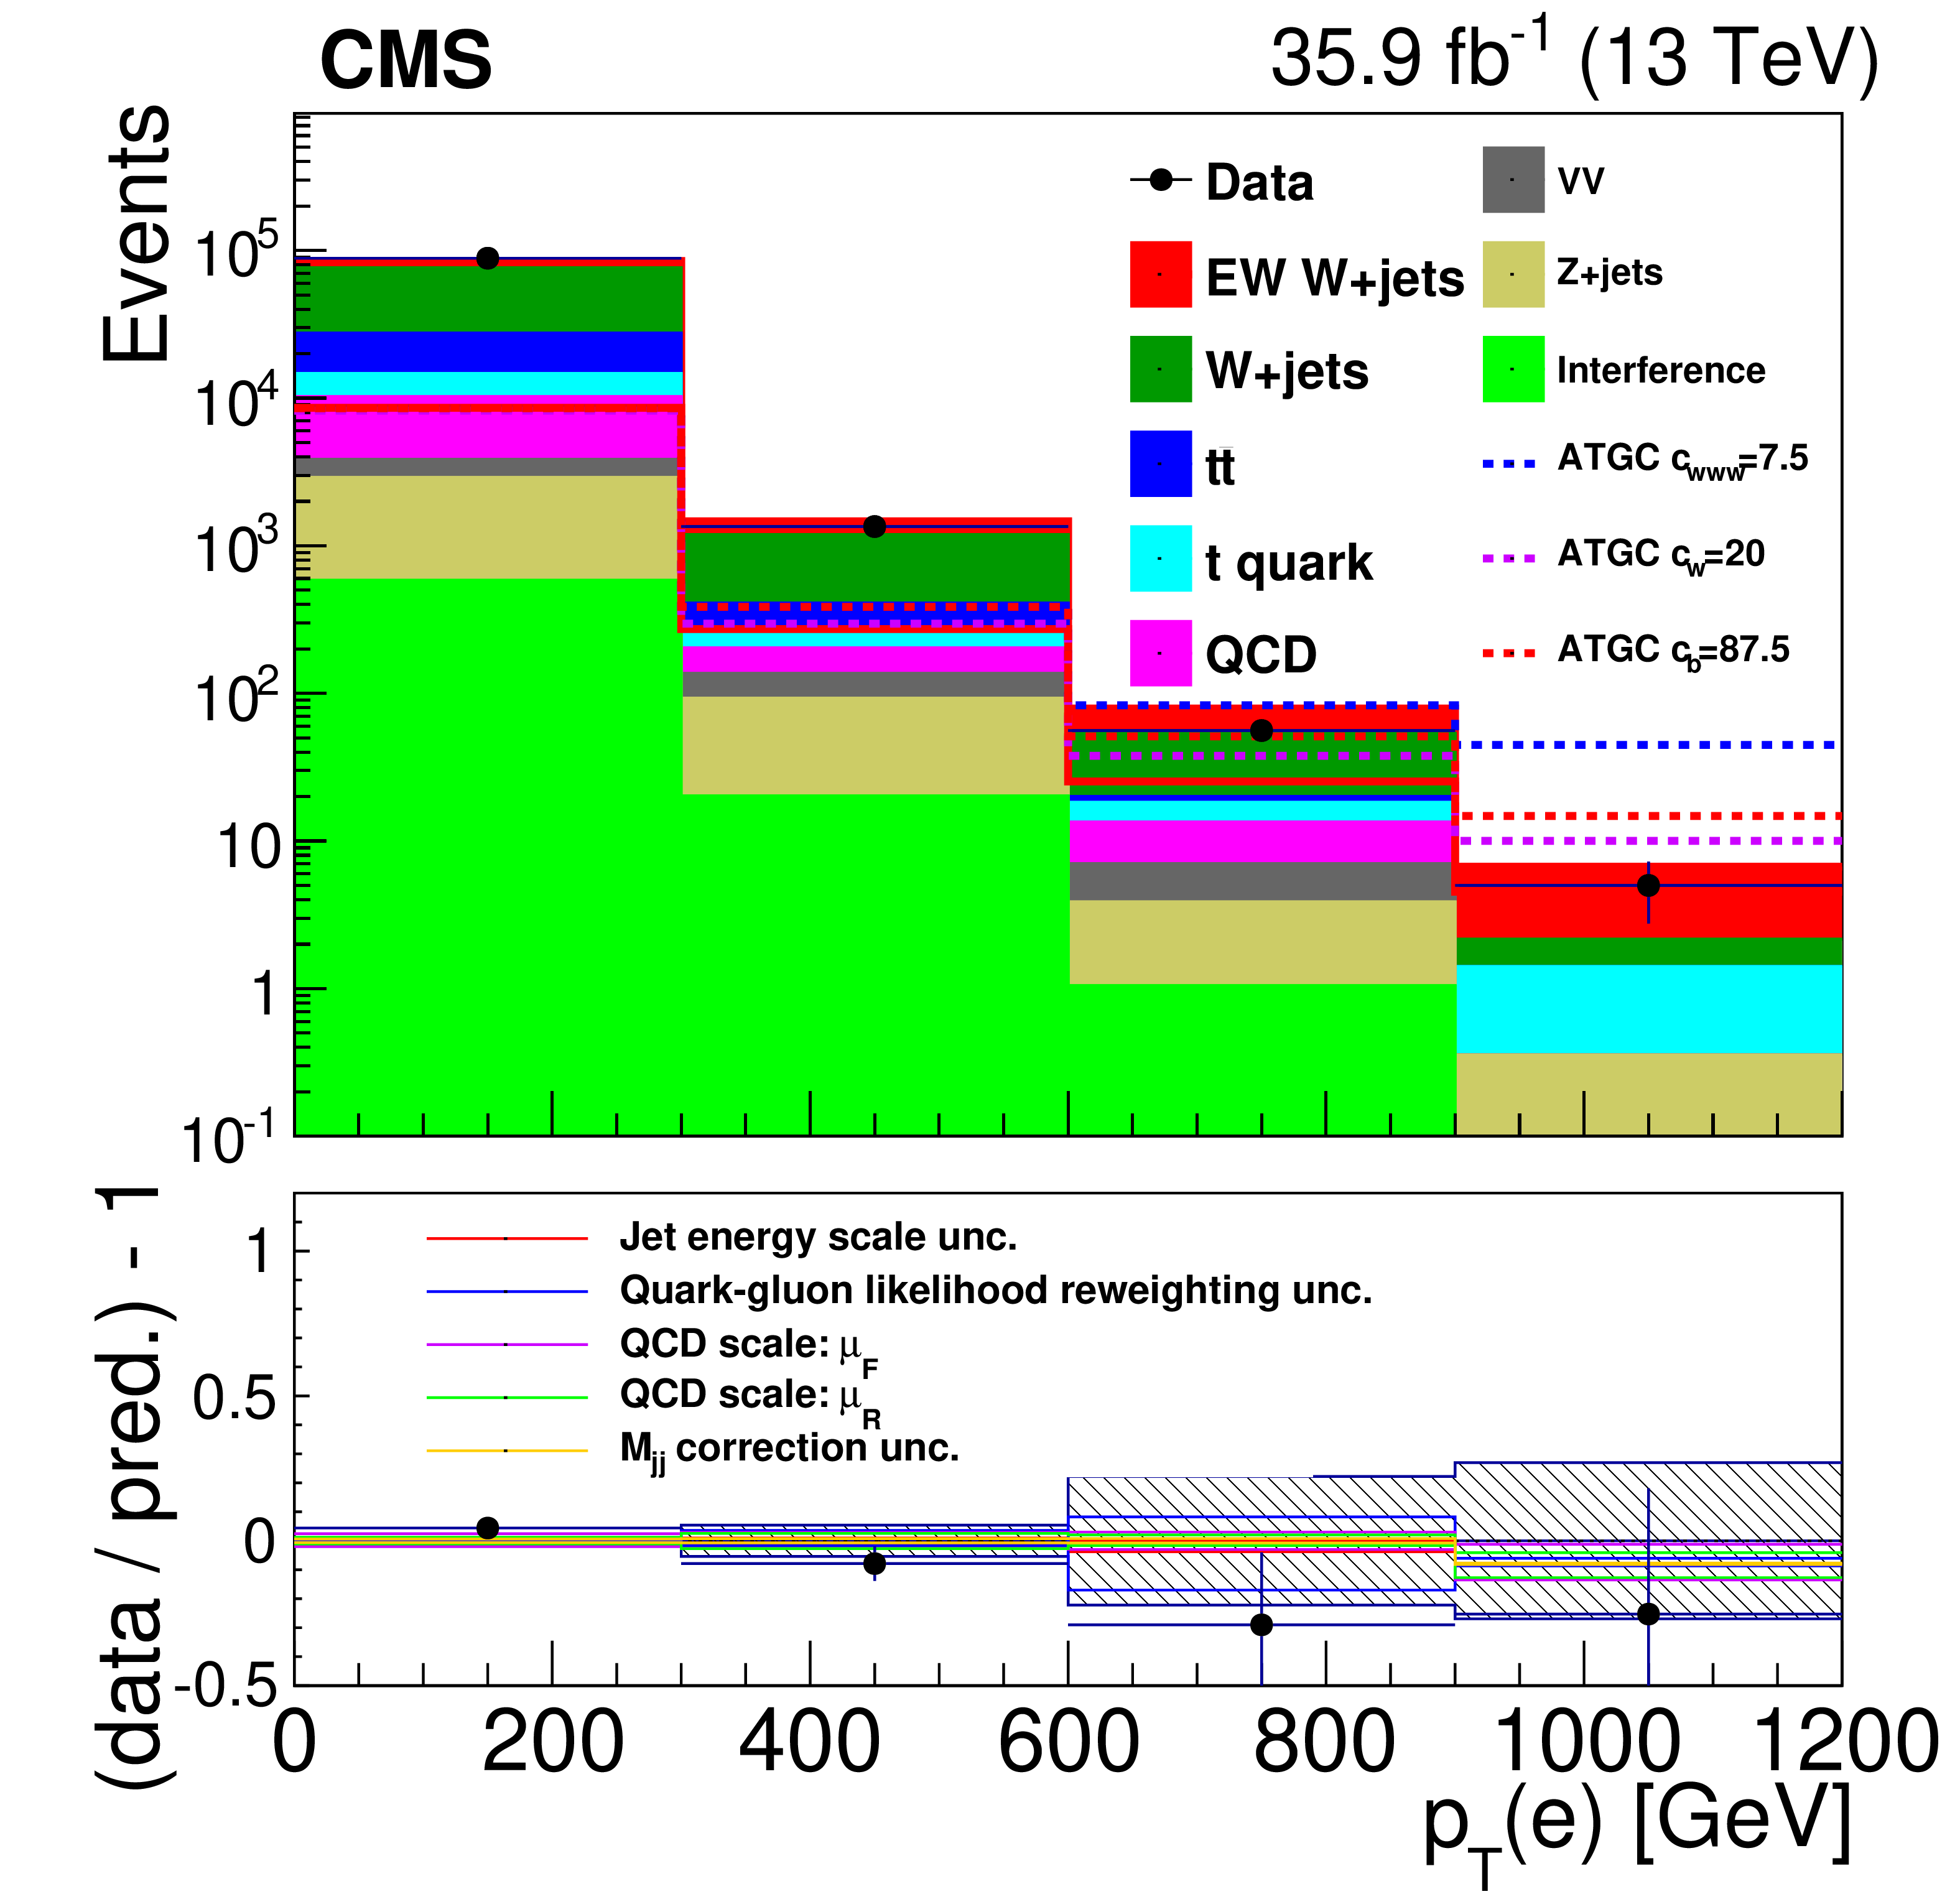
Figure 10:
Distributions of $ {p_{\mathrm {T}}} ^\ell $ in data and SM backgrounds, and various ATGC scenarios in the muon (left) and electron (right) channels. For each ATGC scenario plotted a particular parameter is varied while the other ATGC parameters are fixed to zero. The lower panels show the ratio between data and prediction minus one with the statistical uncertainty from simulation (grey hatched band) as well as the leading systematic uncertainties in the shape of the $ {p_{\mathrm {T}}} ^\ell $ distribution. |
png pdf |
Figure 10-a:
Distribution of $ {p_{\mathrm {T}}} ^\ell $ in data and SM backgrounds, and various ATGC scenarios in the muon channel. For each ATGC scenario plotted a particular parameter is varied while the other ATGC parameters are fixed to zero. The lower panel shows the ratio between data and prediction minus one with the statistical uncertainty from simulation (grey hatched band) as well as the leading systematic uncertainties in the shape of the $ {p_{\mathrm {T}}} ^\ell $ distribution. |
png pdf |
Figure 10-b:
Distribution of $ {p_{\mathrm {T}}} ^\ell $ in data and SM backgrounds, and various ATGC scenarios in the electron channel. For each ATGC scenario plotted a particular parameter is varied while the other ATGC parameters are fixed to zero. The lower panel shows the ratio between data and prediction minus one with the statistical uncertainty from simulation (grey hatched band) as well as the leading systematic uncertainties in the shape of the $ {p_{\mathrm {T}}} ^\ell $ distribution. |
png pdf |
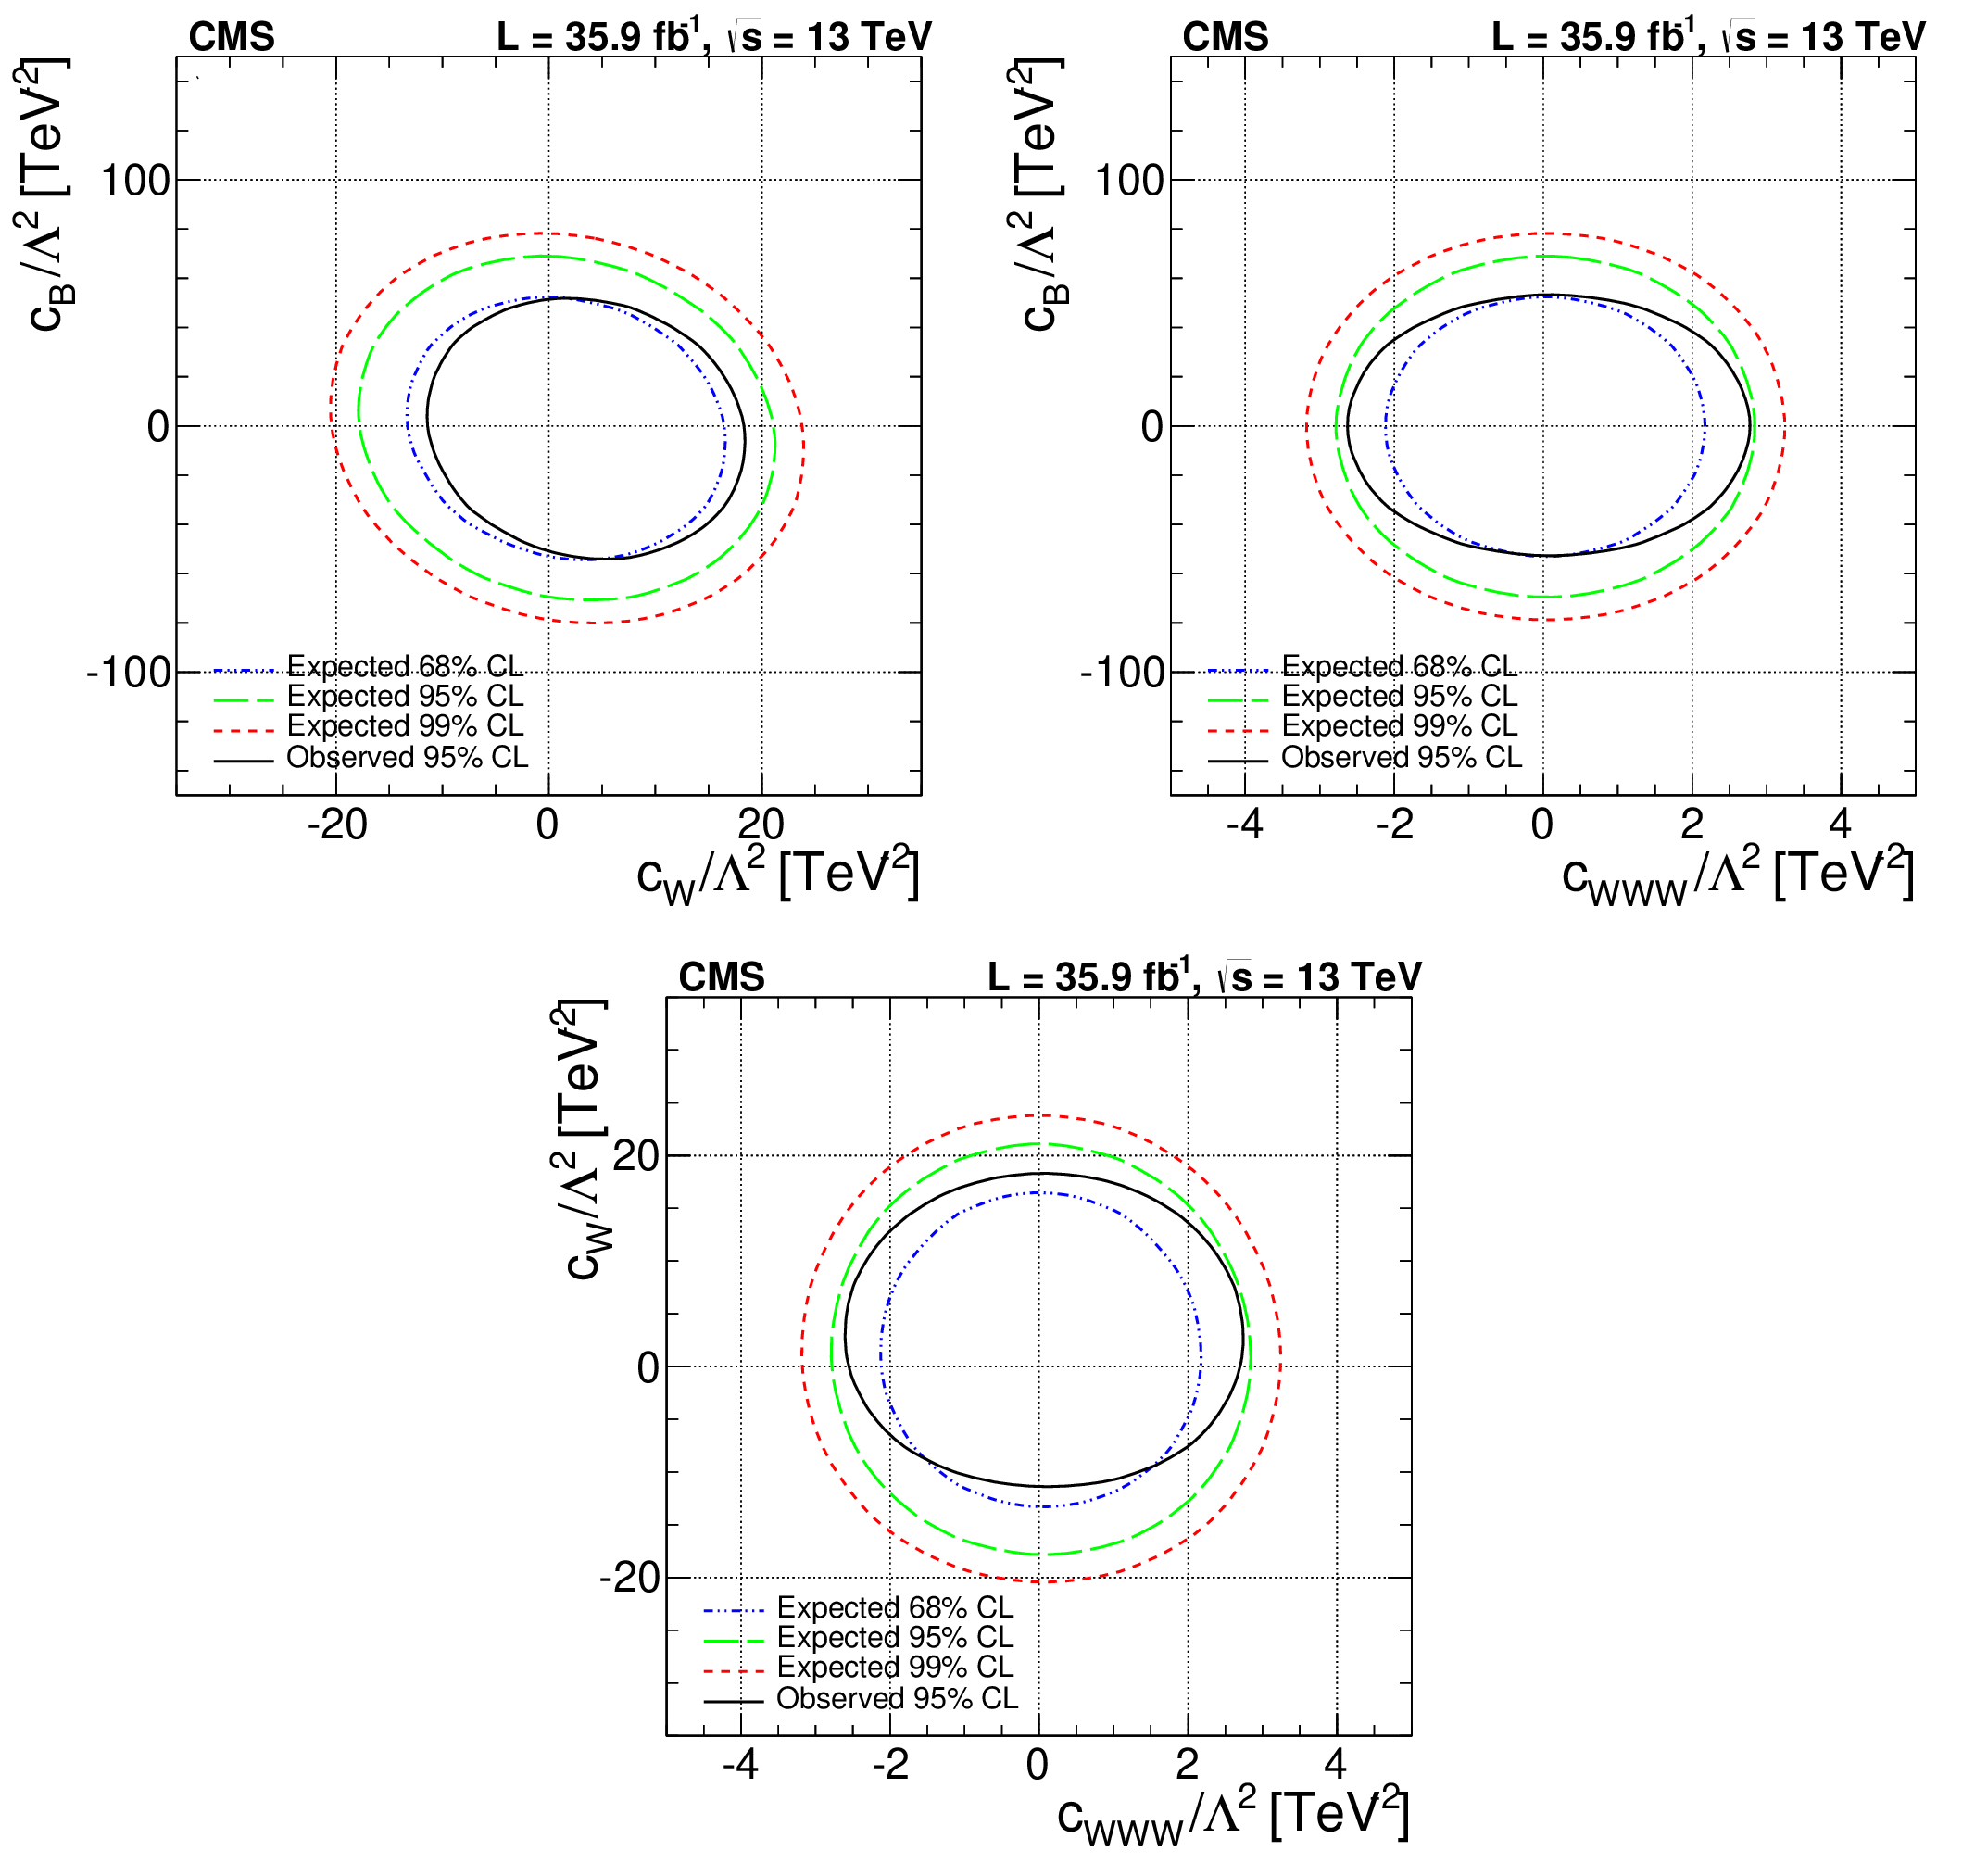
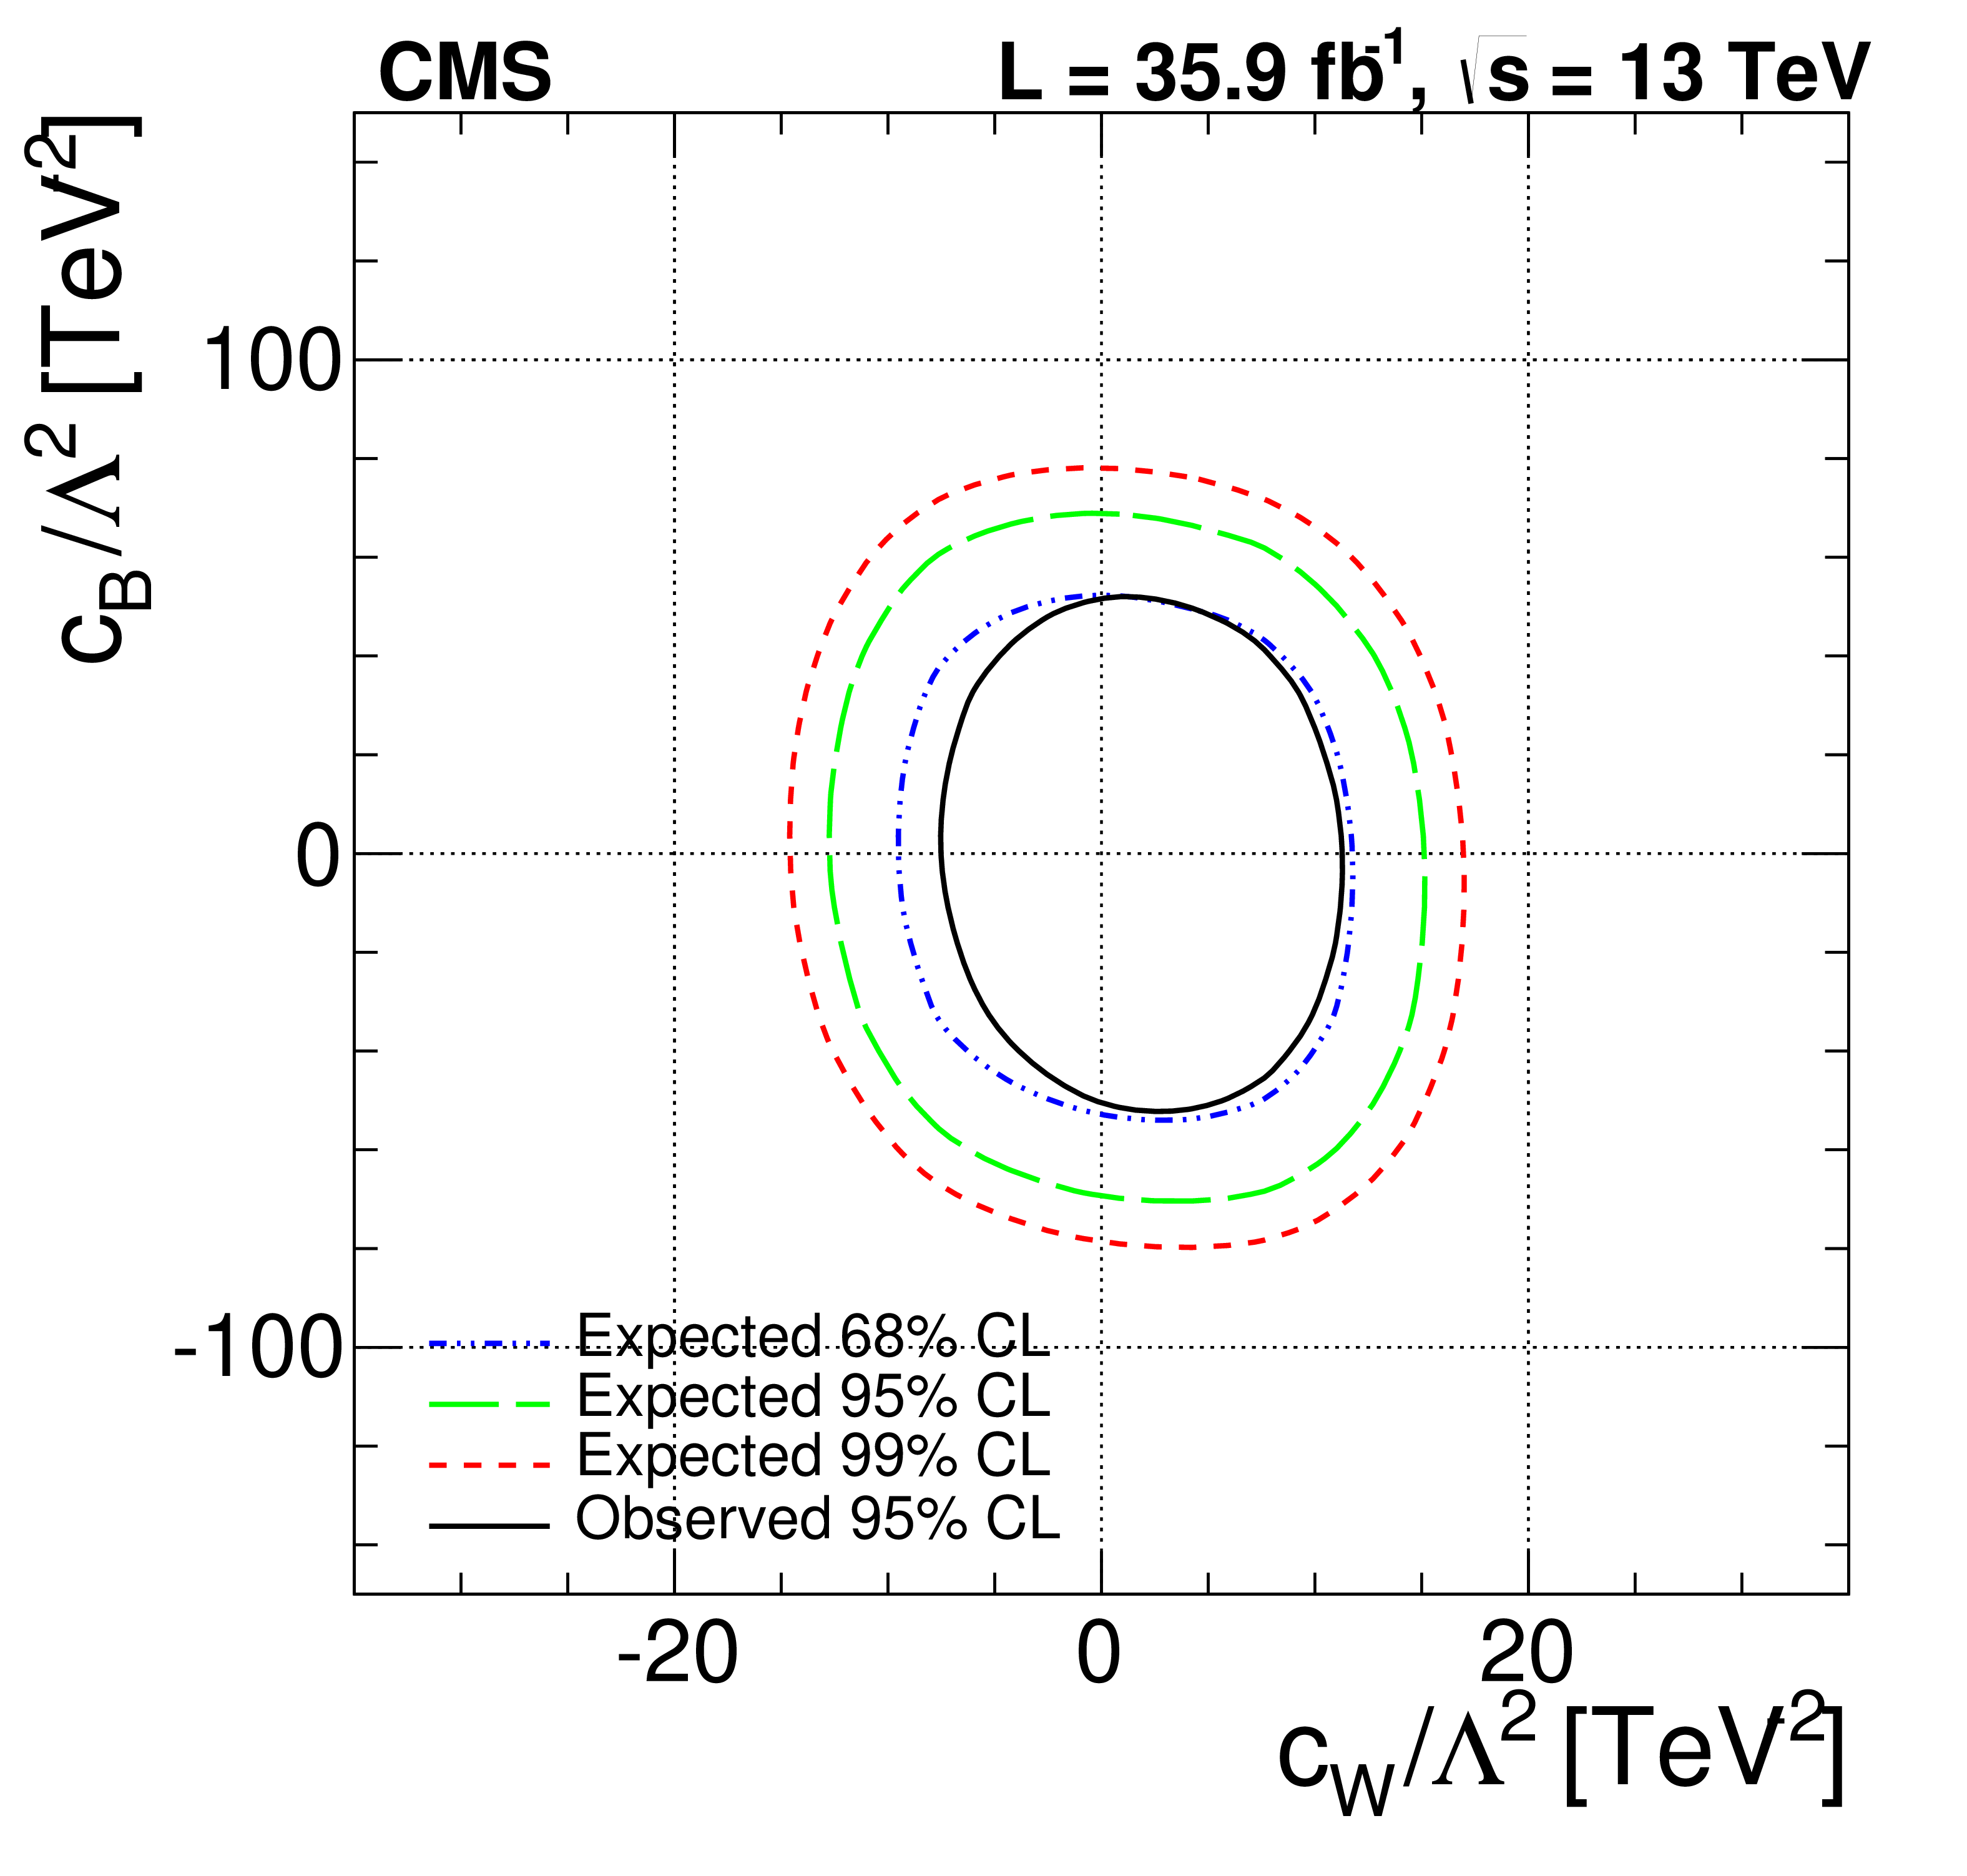
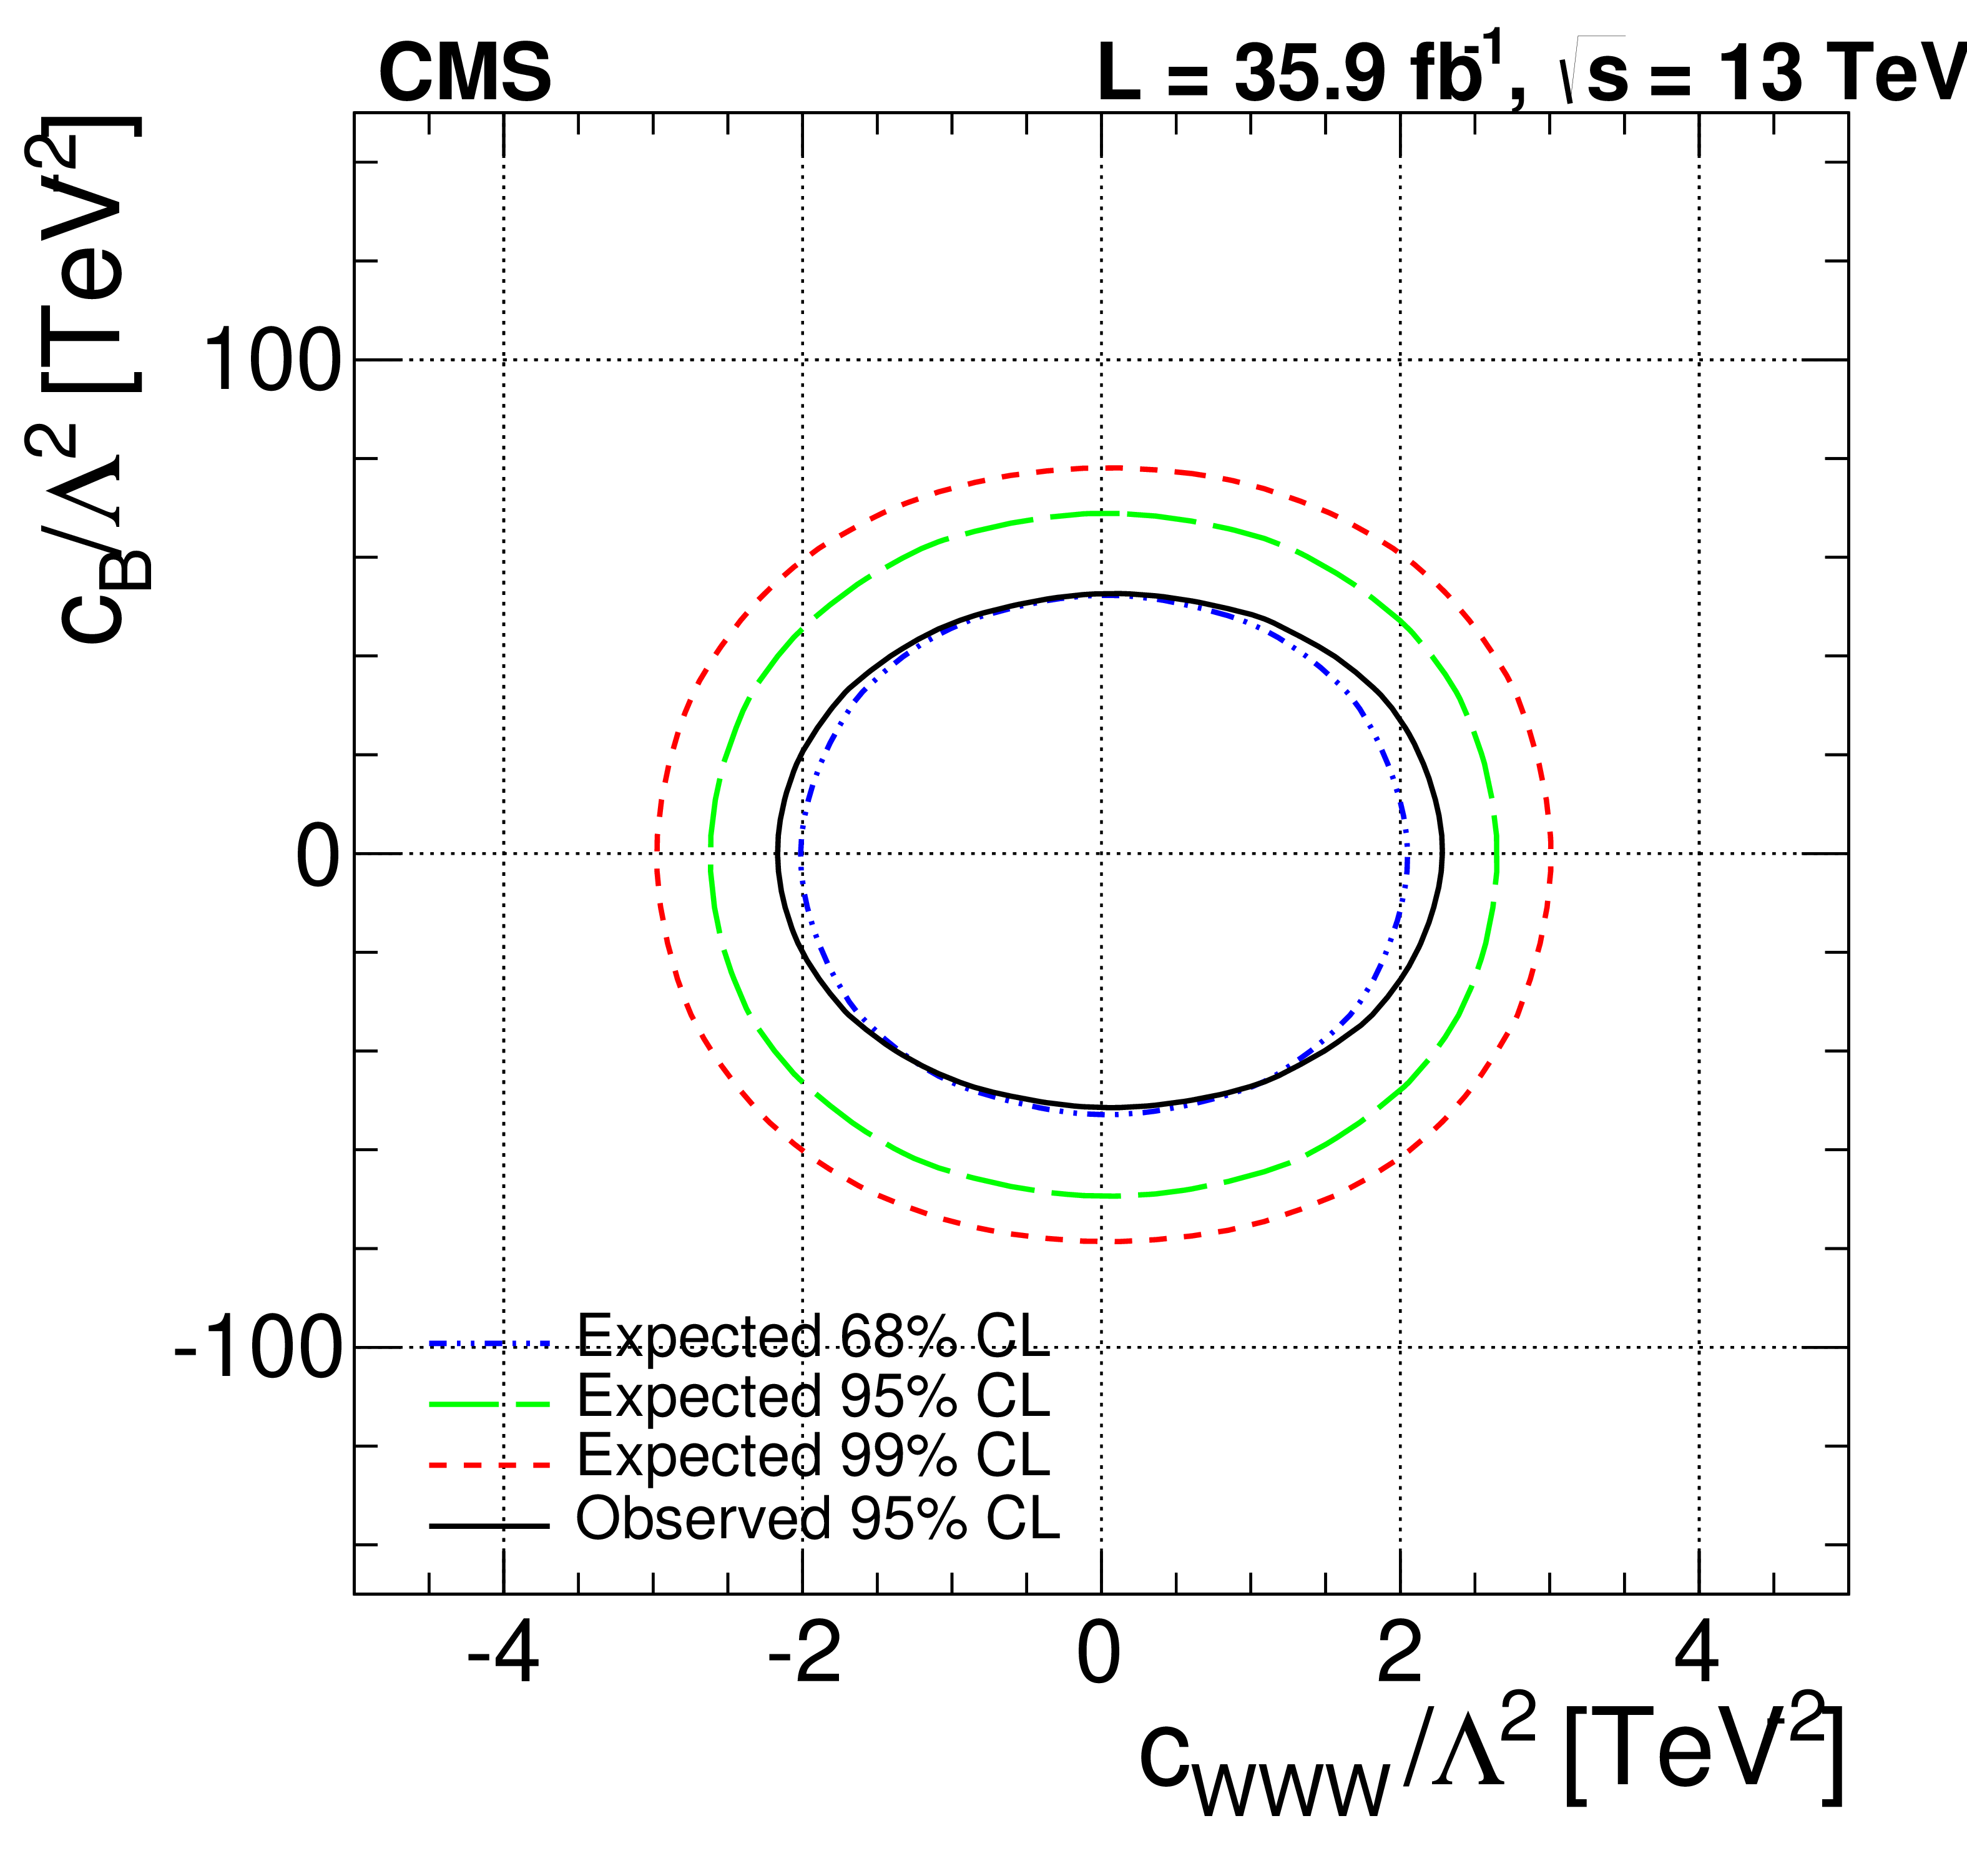
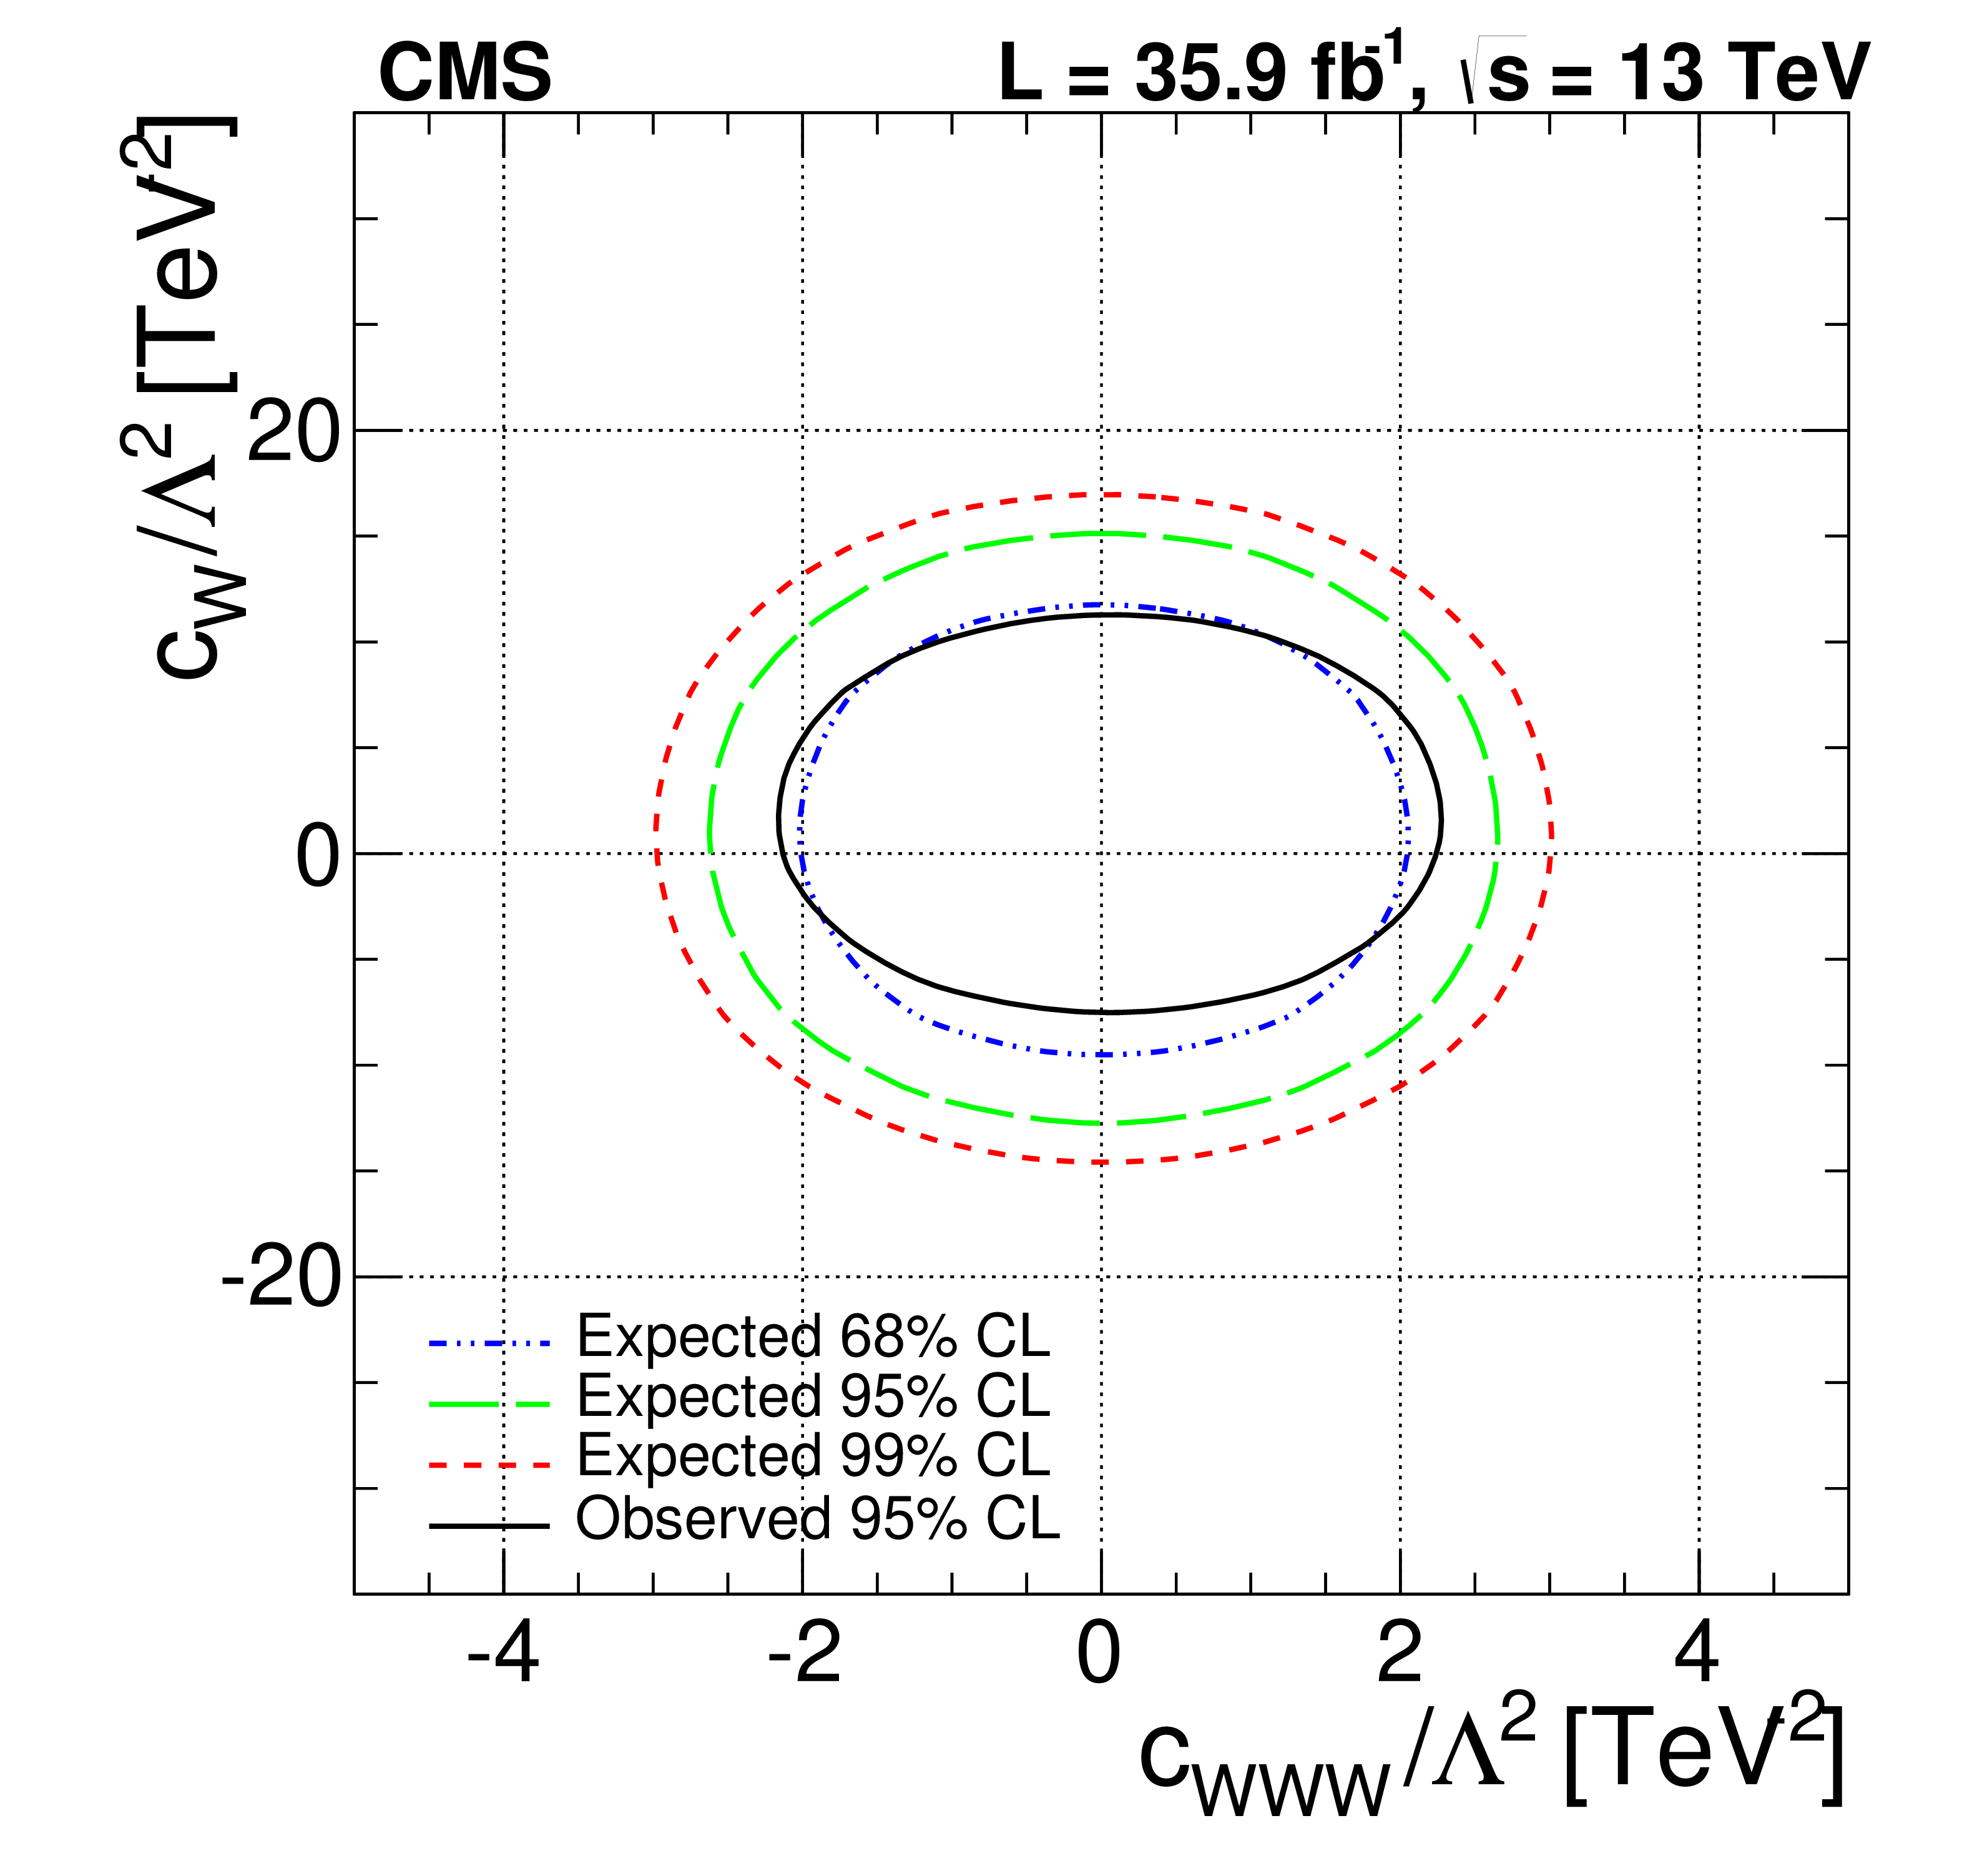
Figure 11:
Expected and observed two-dimensional limits on the EFT parameters at 95% CL. |

png pdf |
Figure 11-a:
Expected and observed two-dimensional limits on the EFT parameters at 95% CL. |
png pdf |
Figure 11-b:
Expected and observed two-dimensional limits on the EFT parameters at 95% CL. |
png pdf |
Figure 11-c:
Expected and observed two-dimensional limits on the EFT parameters at 95% CL. |

png pdf |
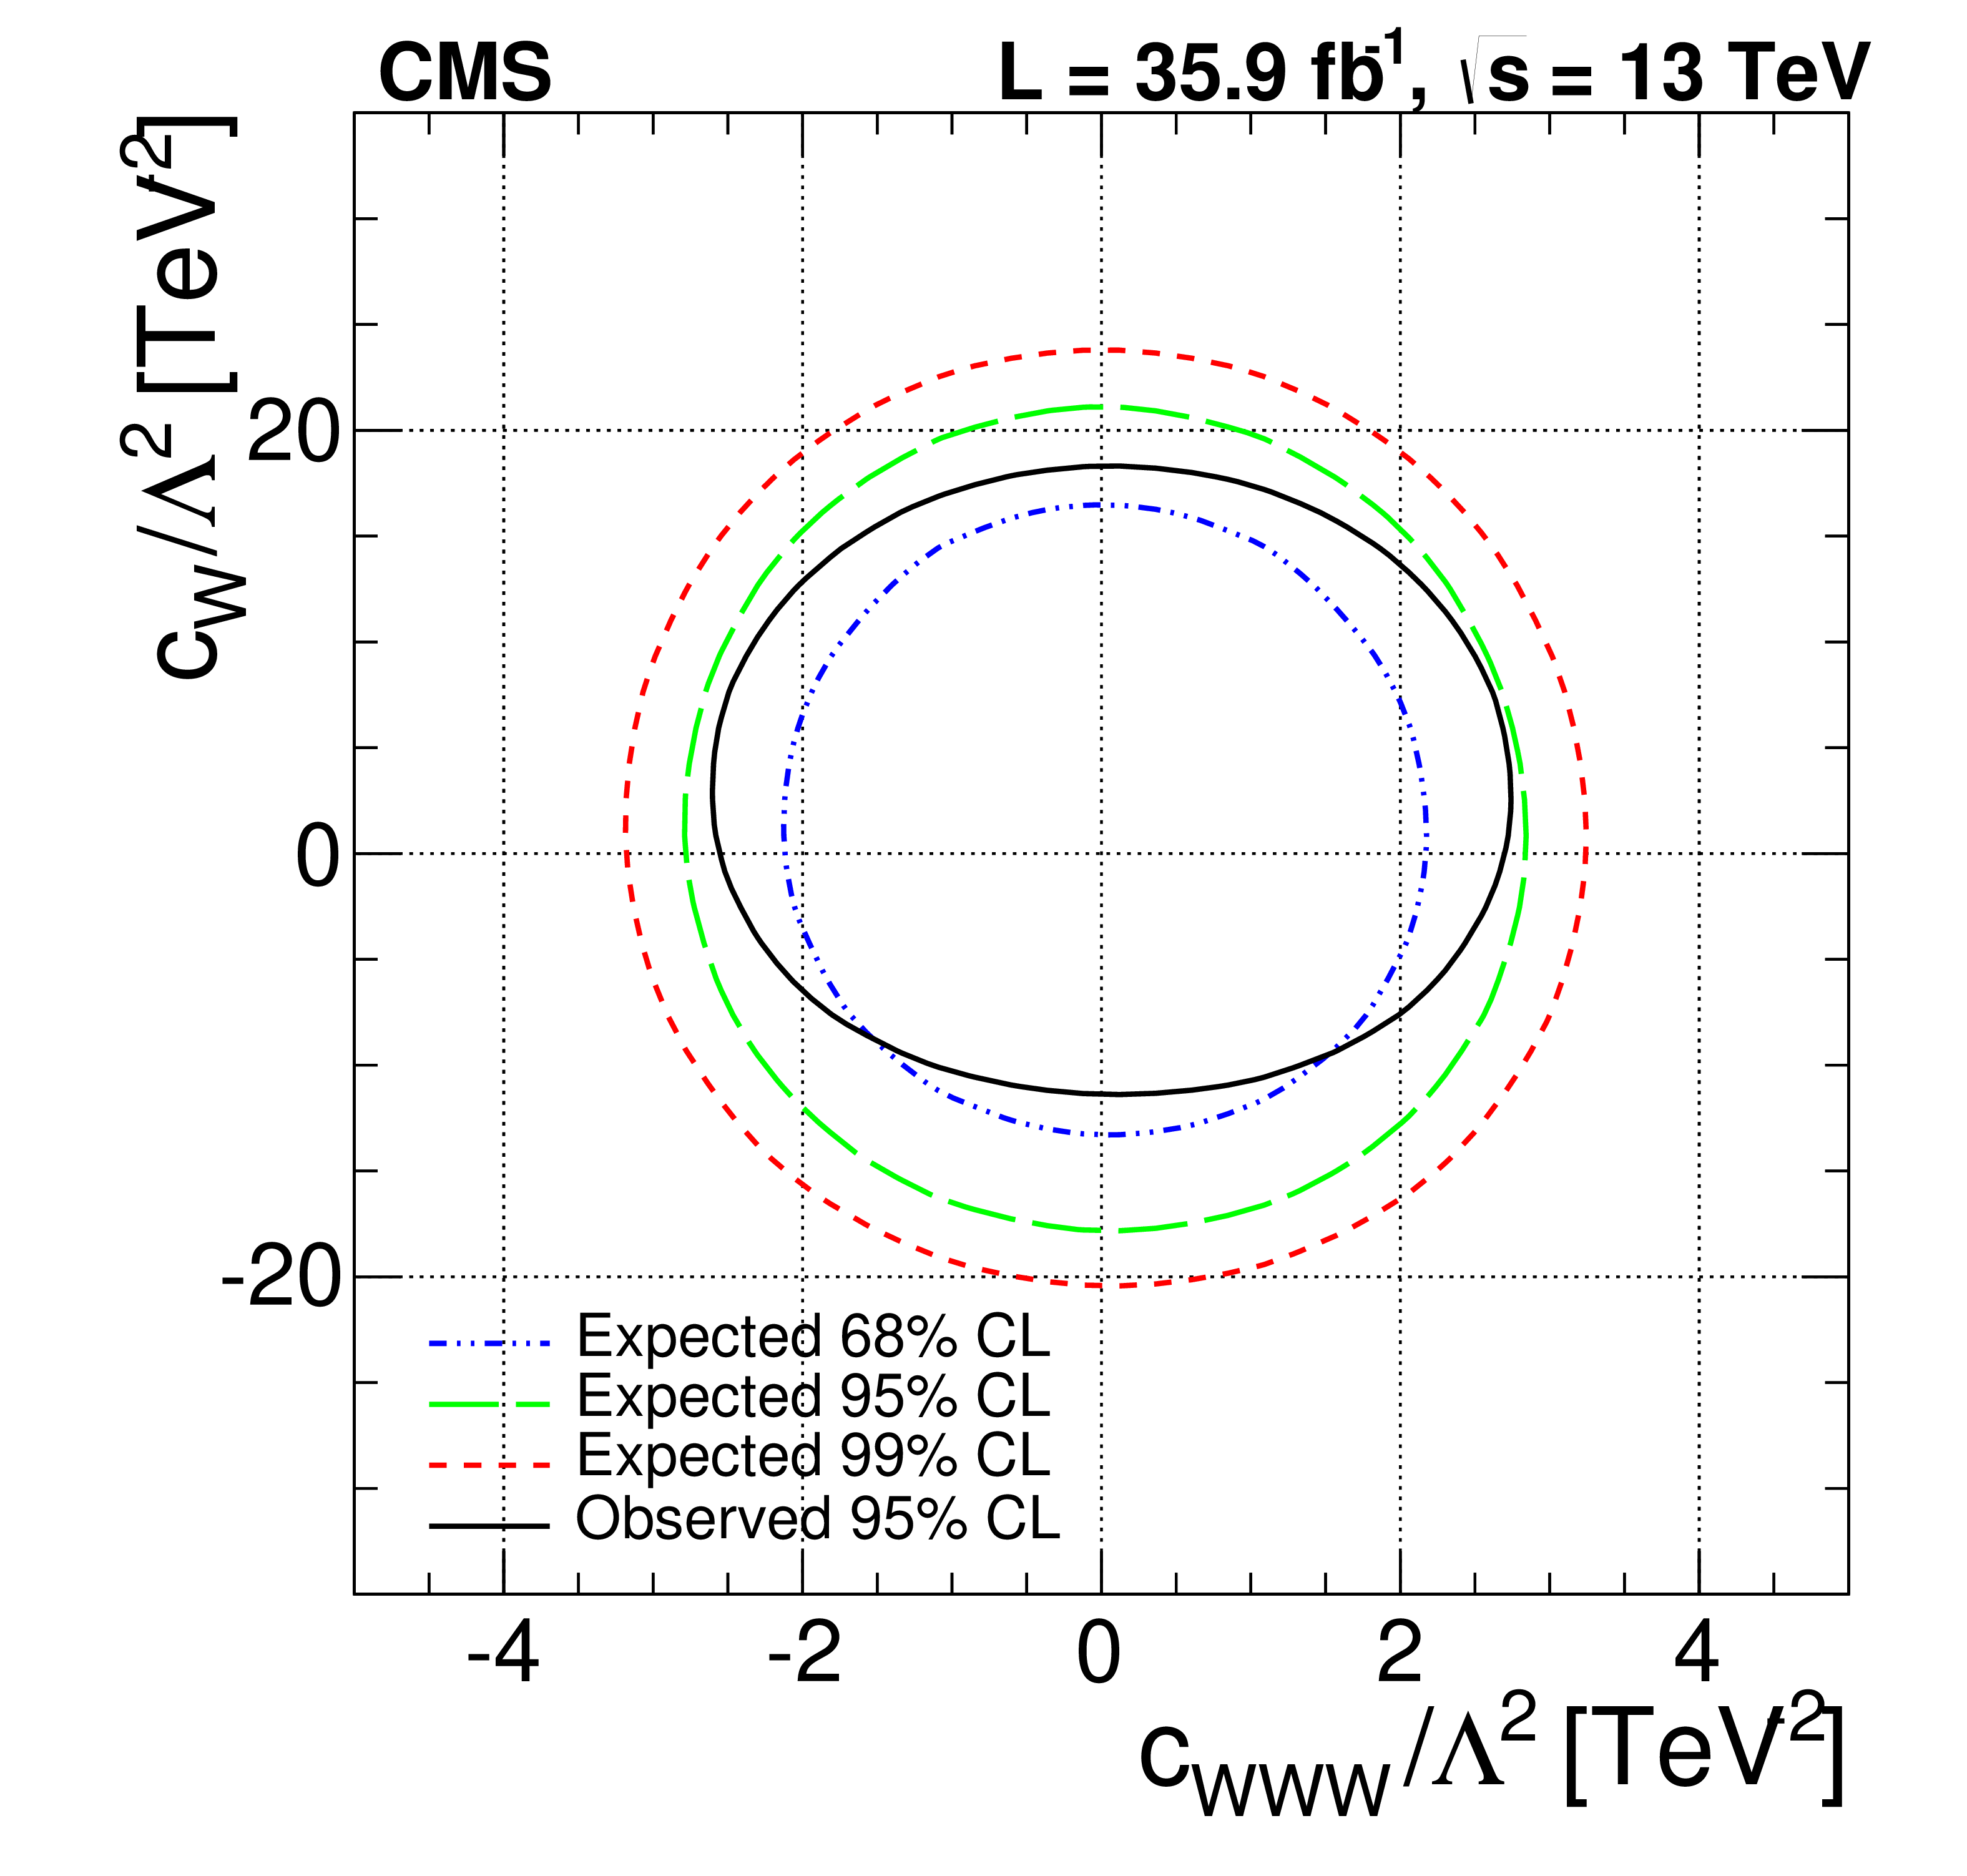
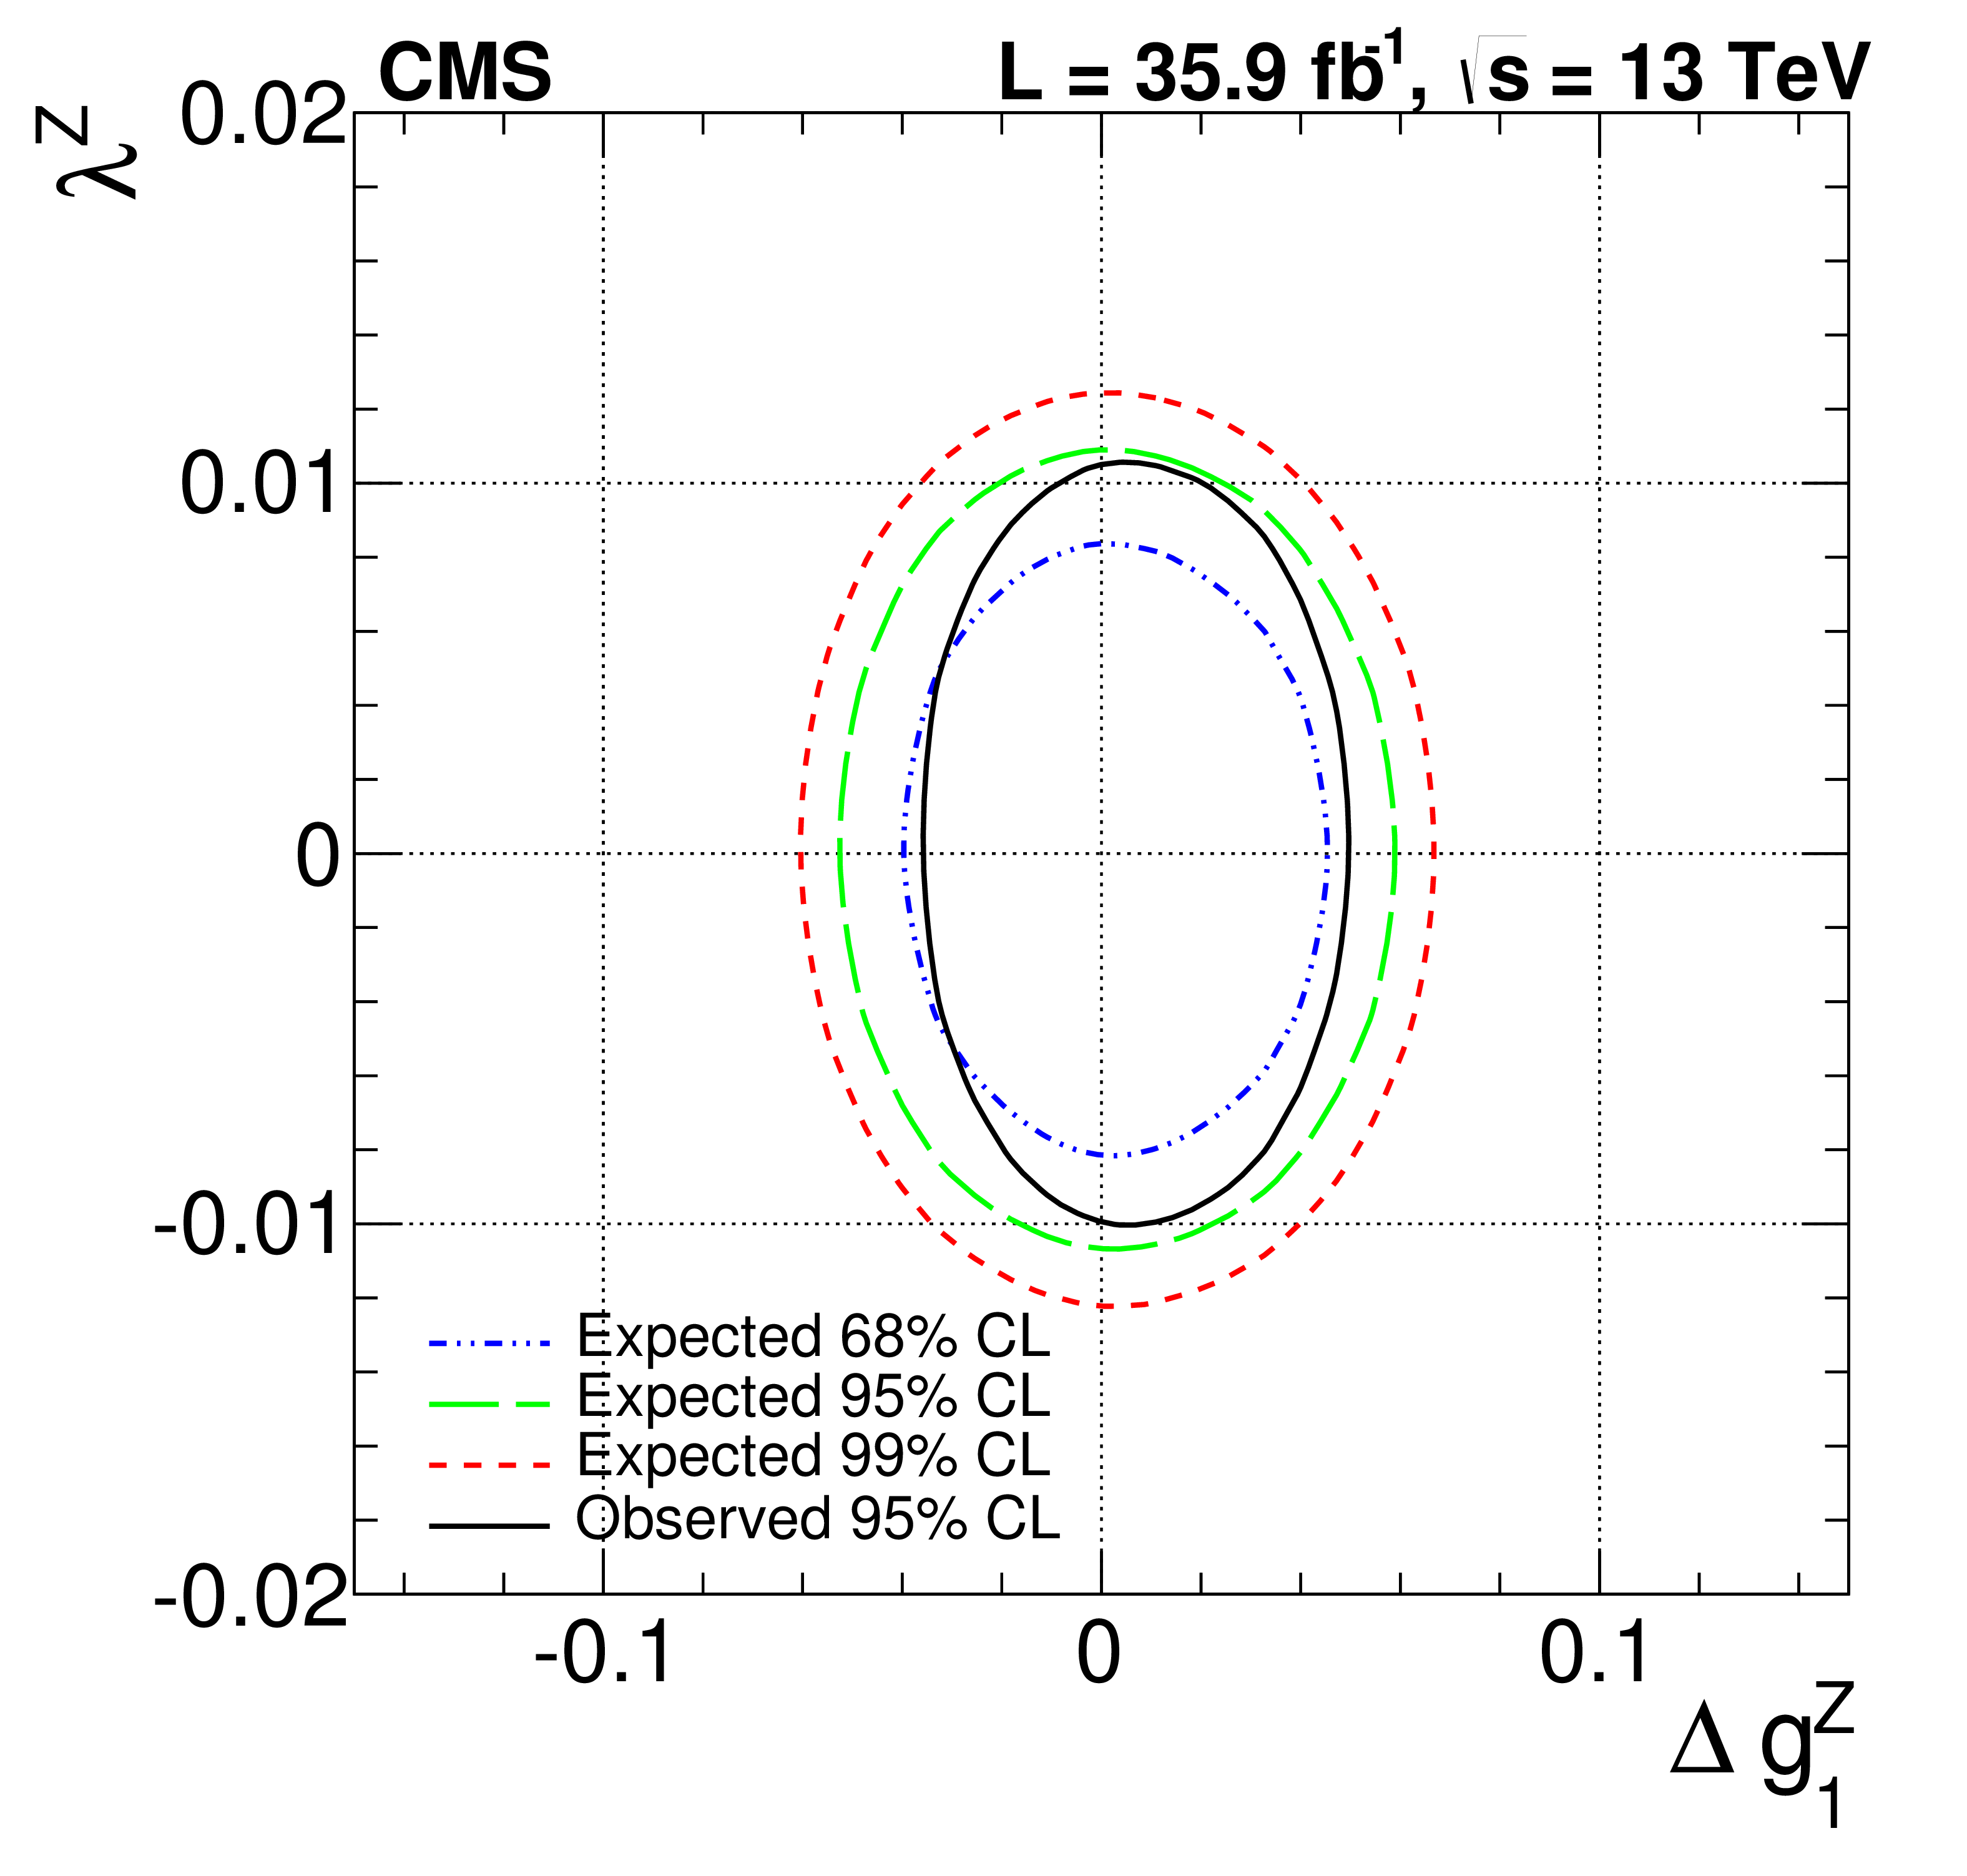
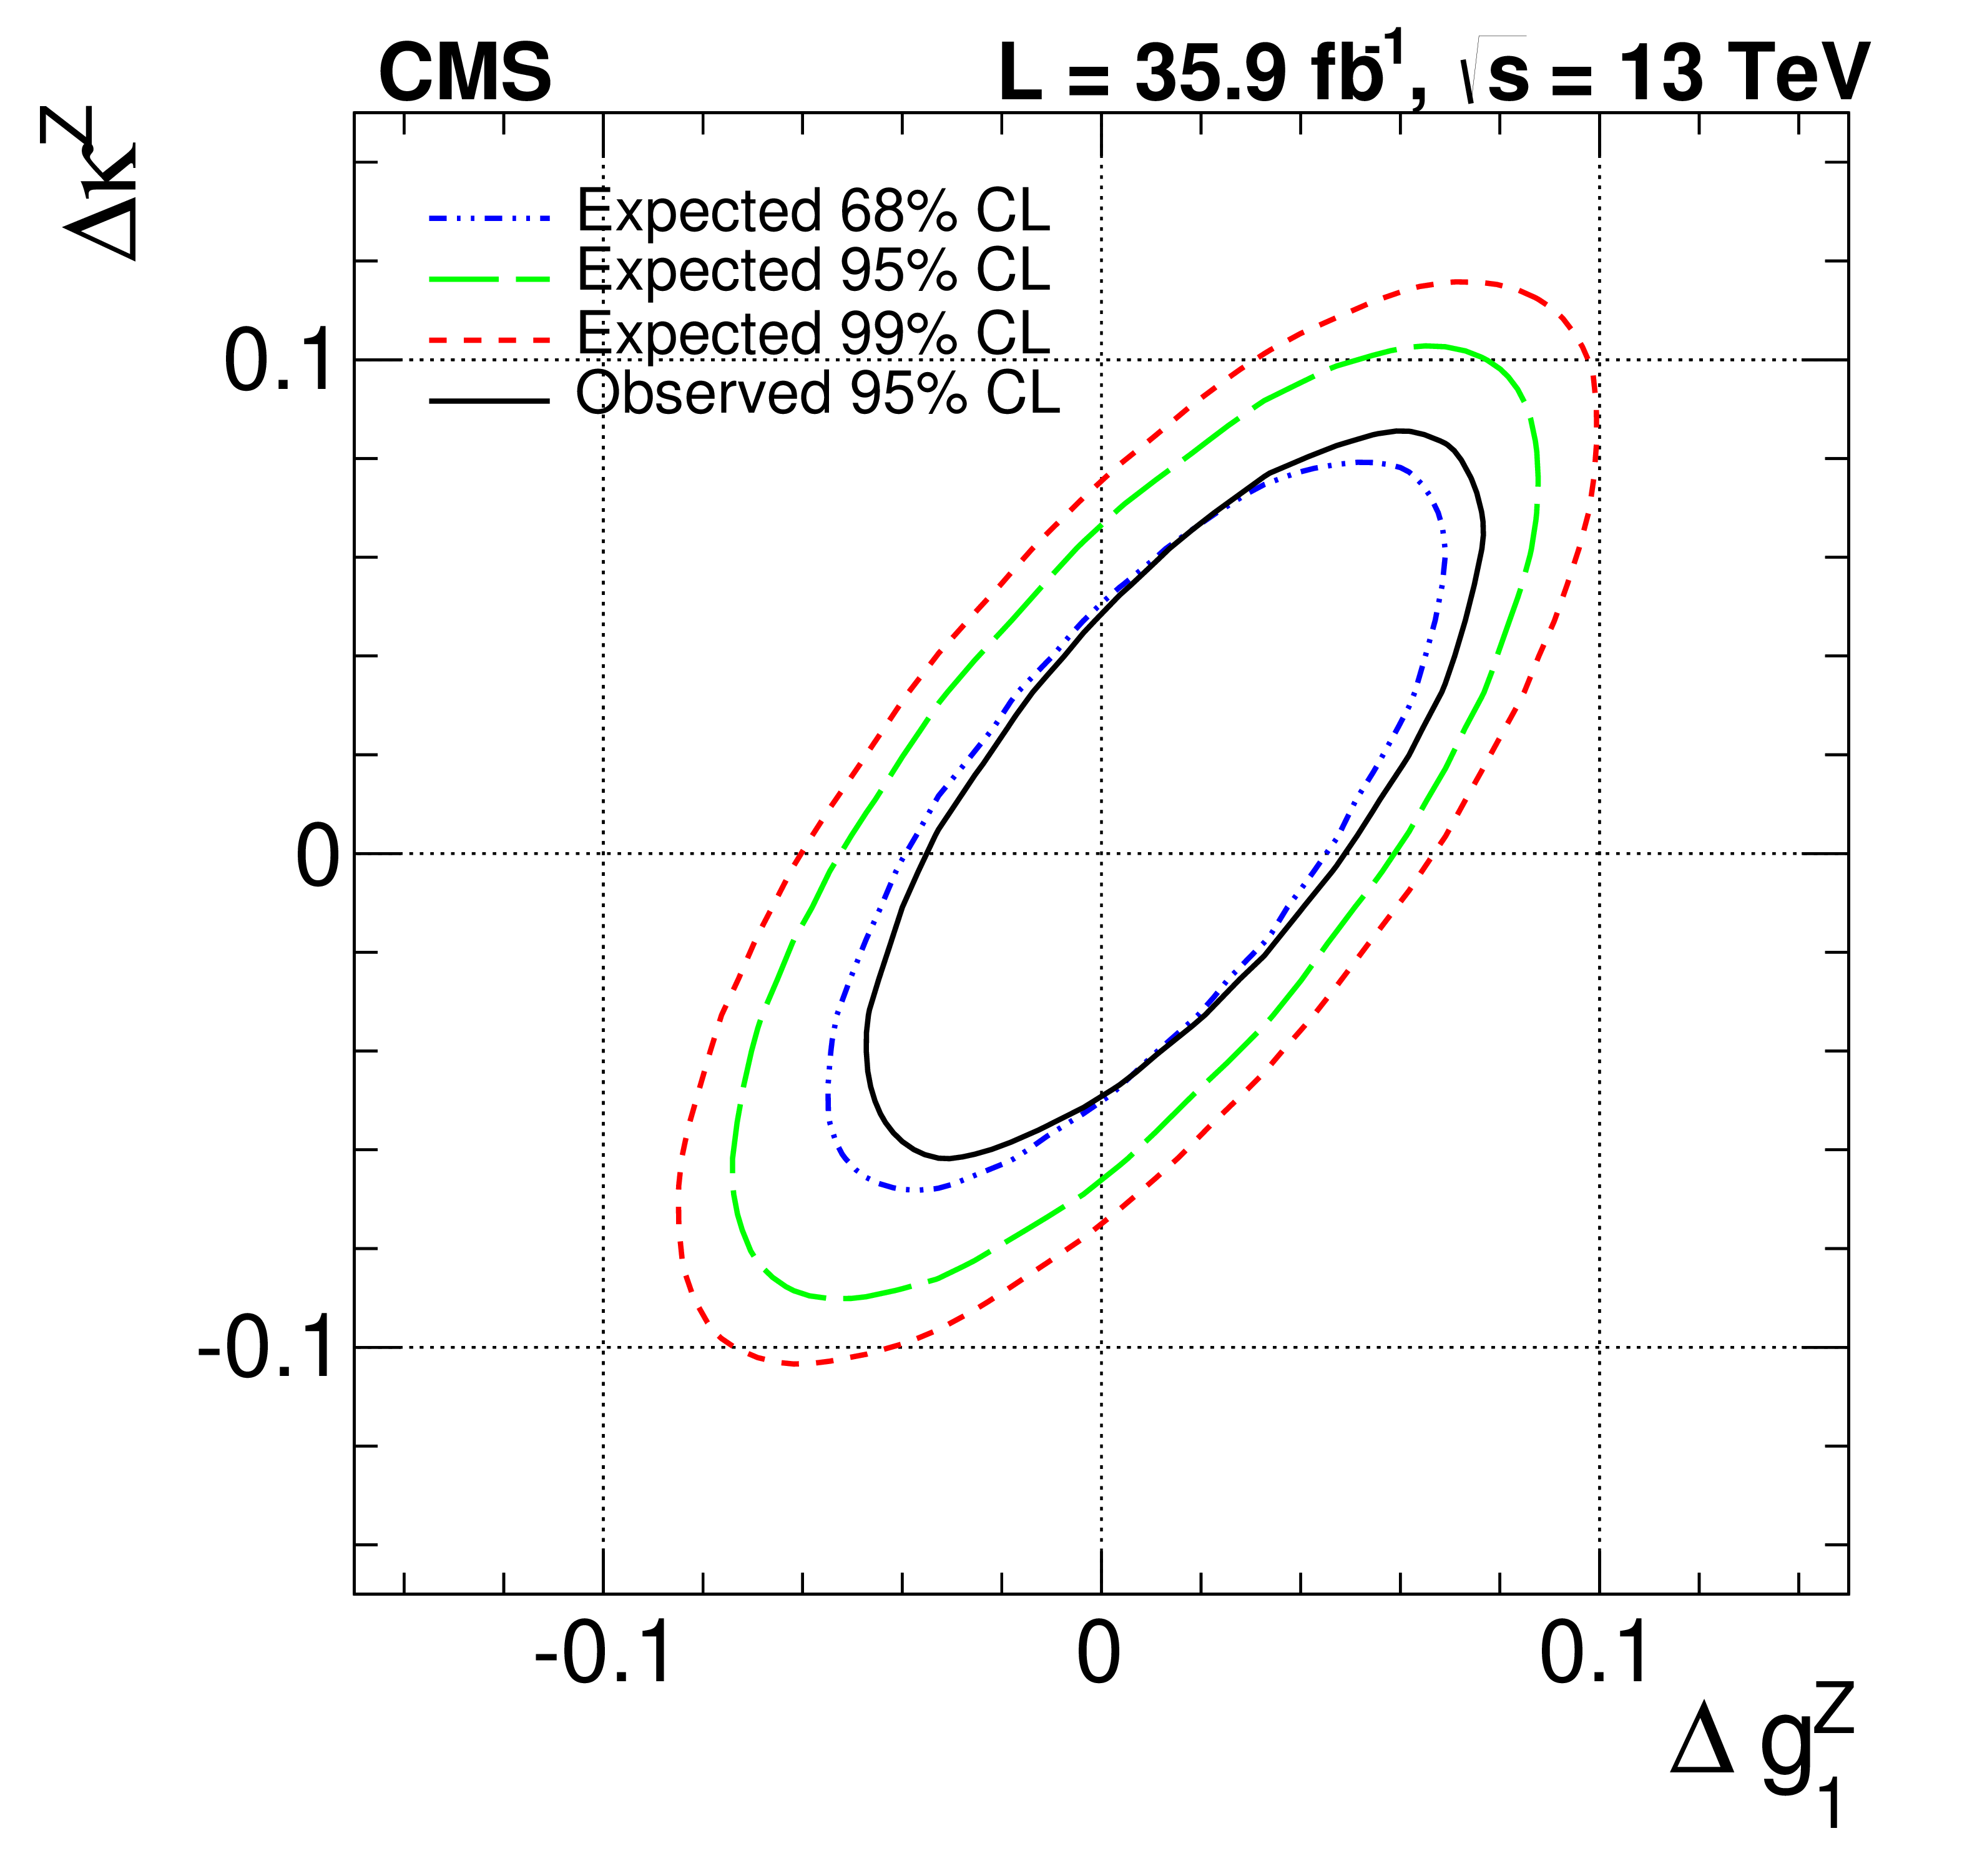
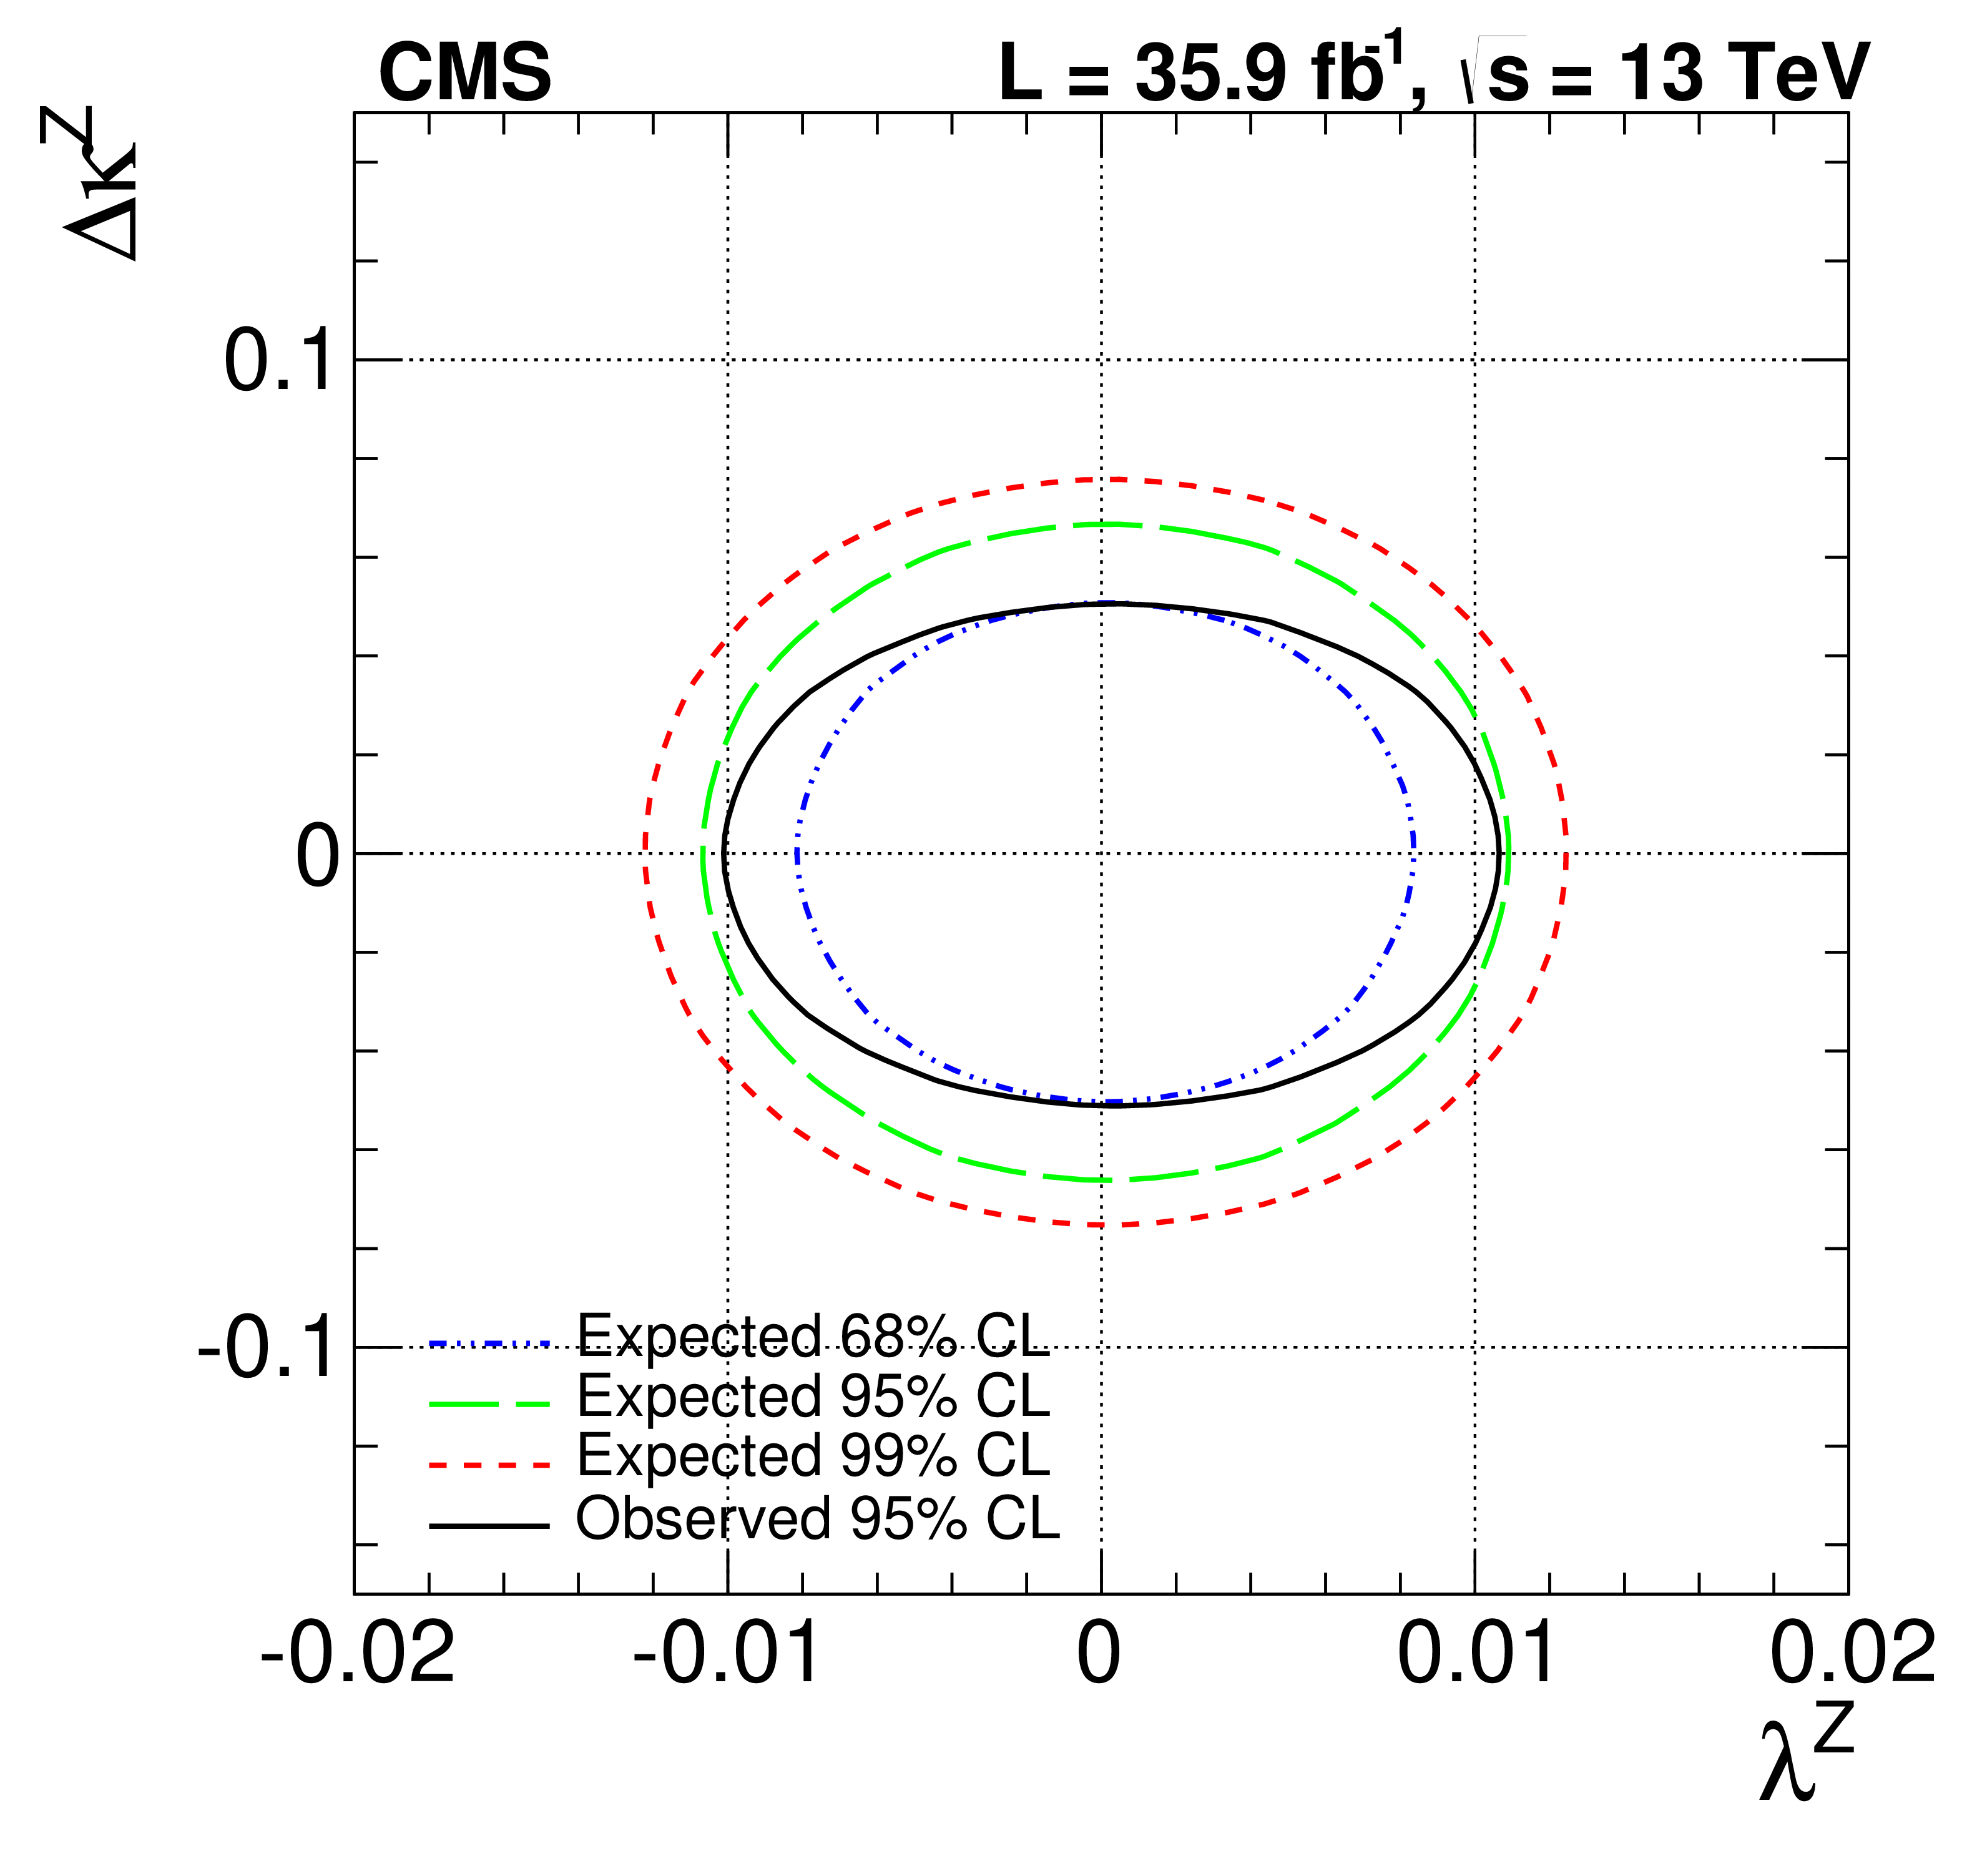
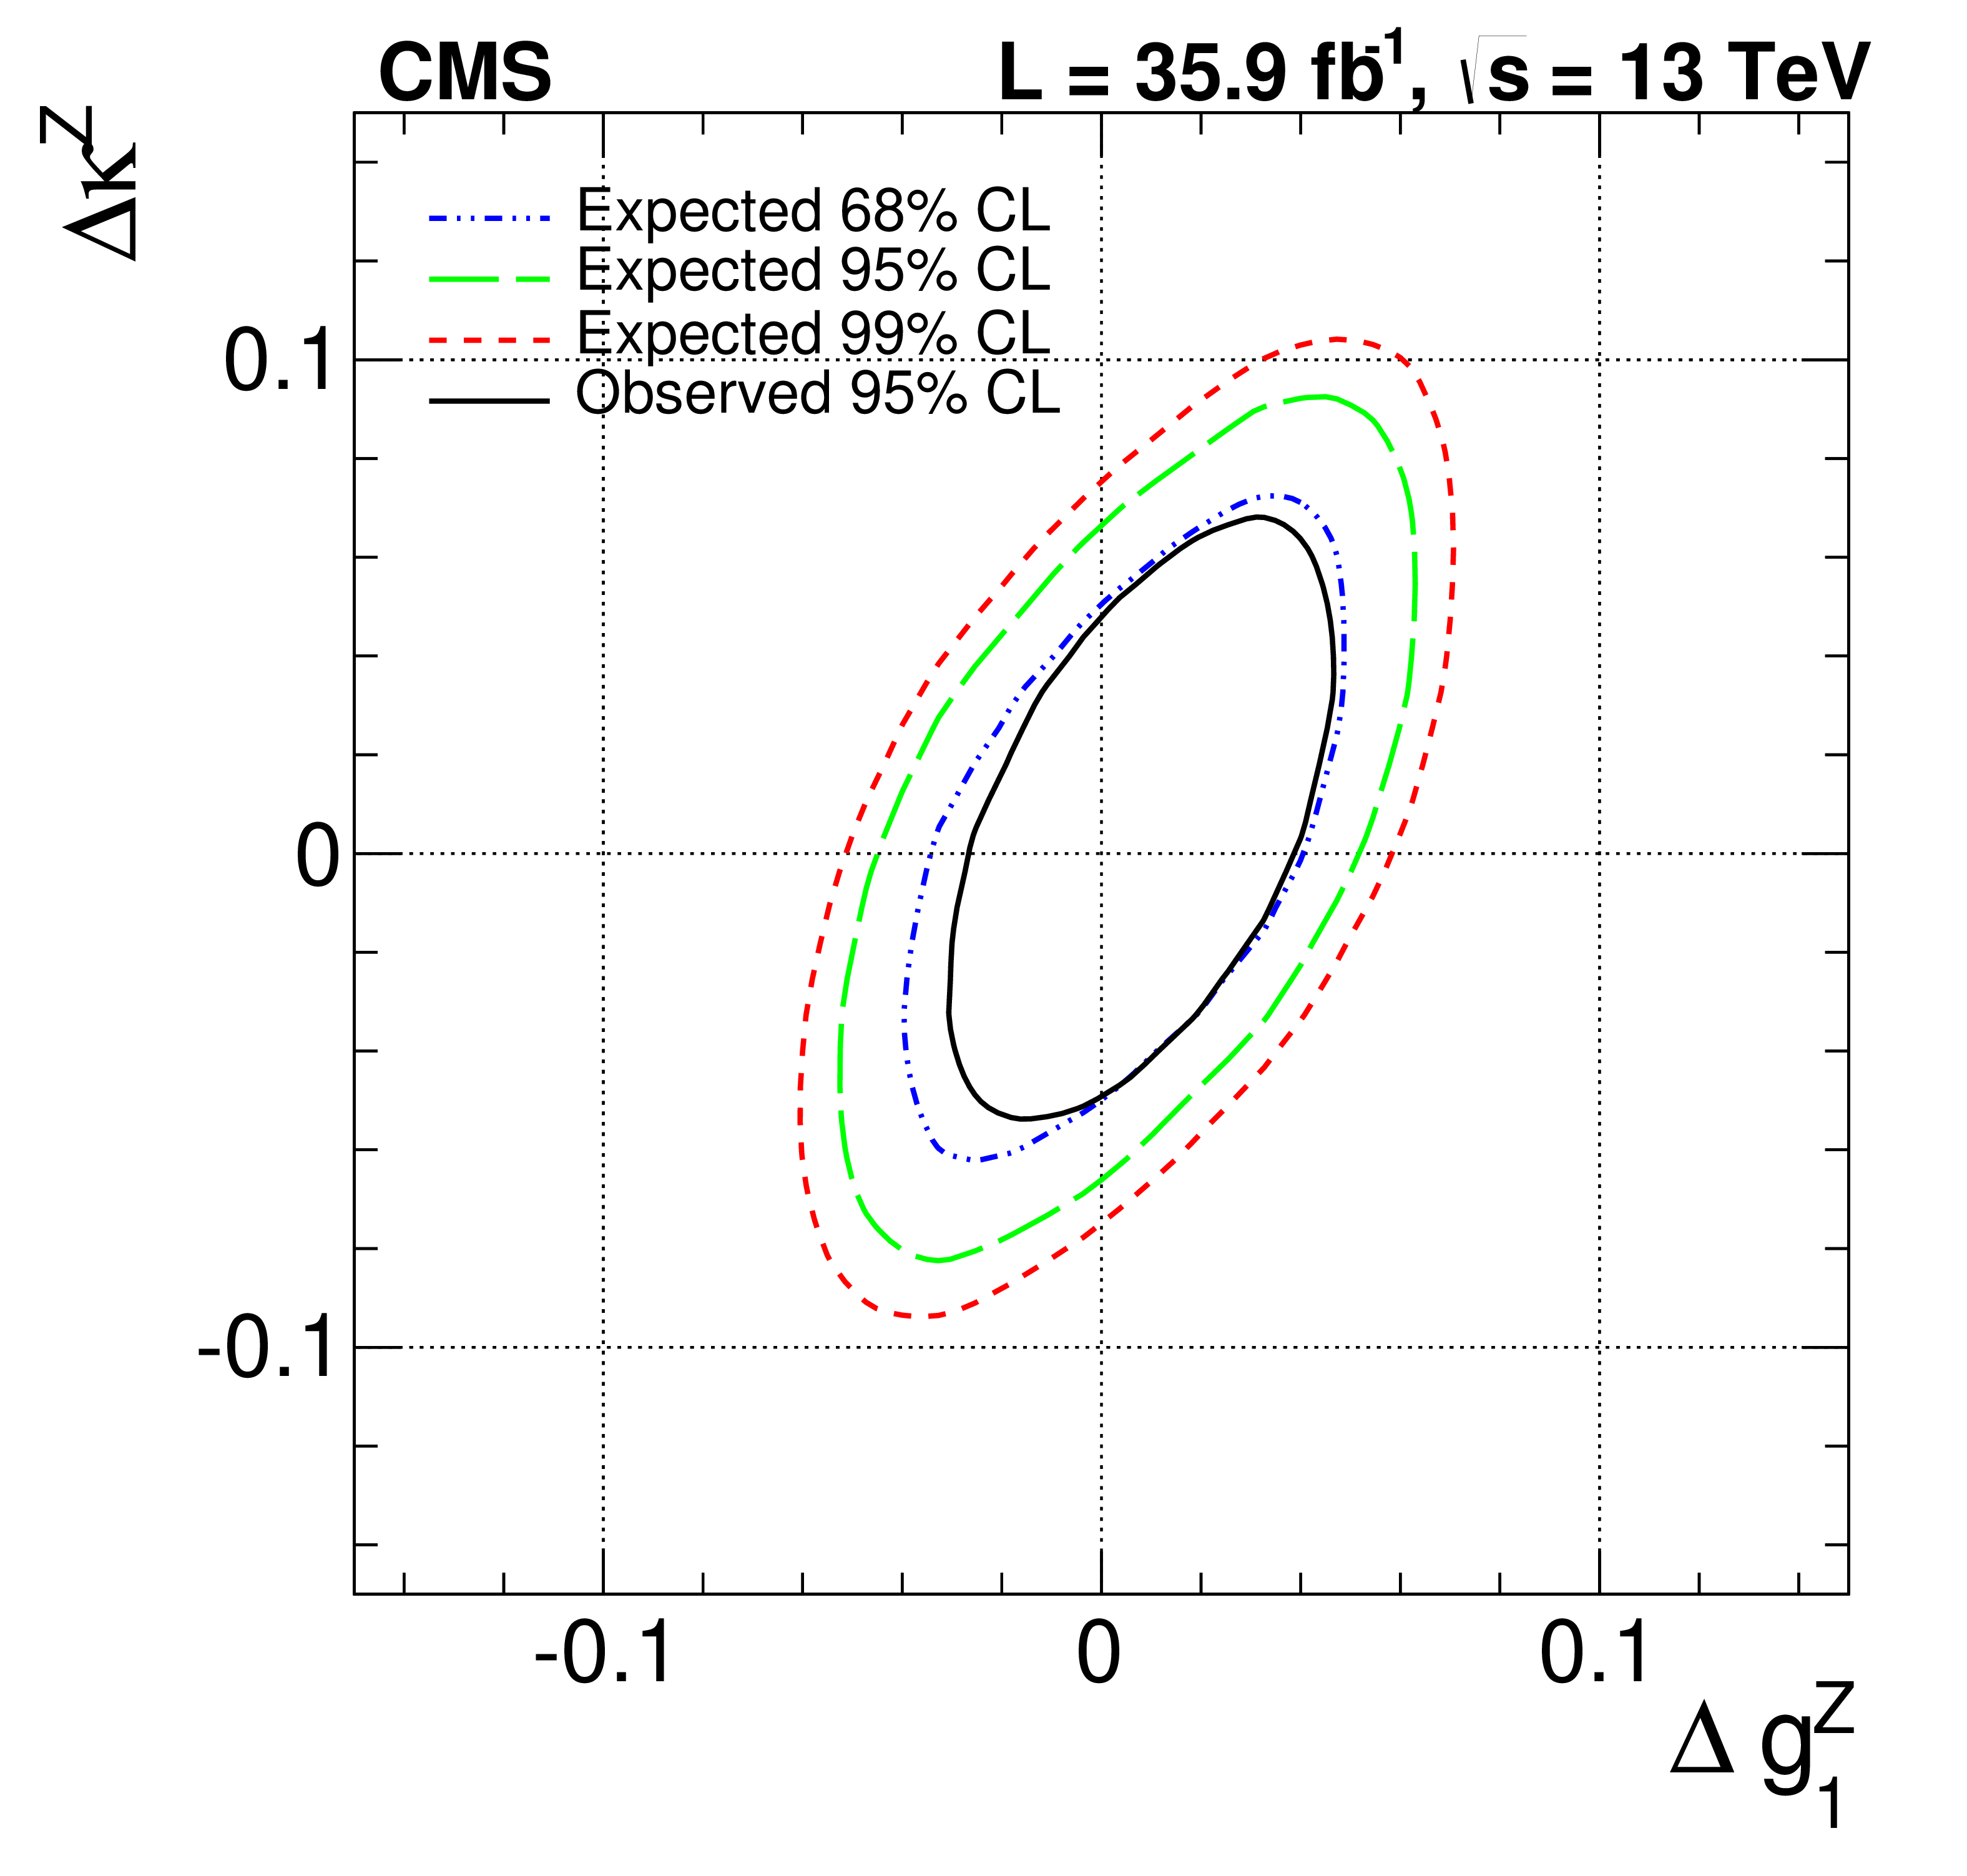
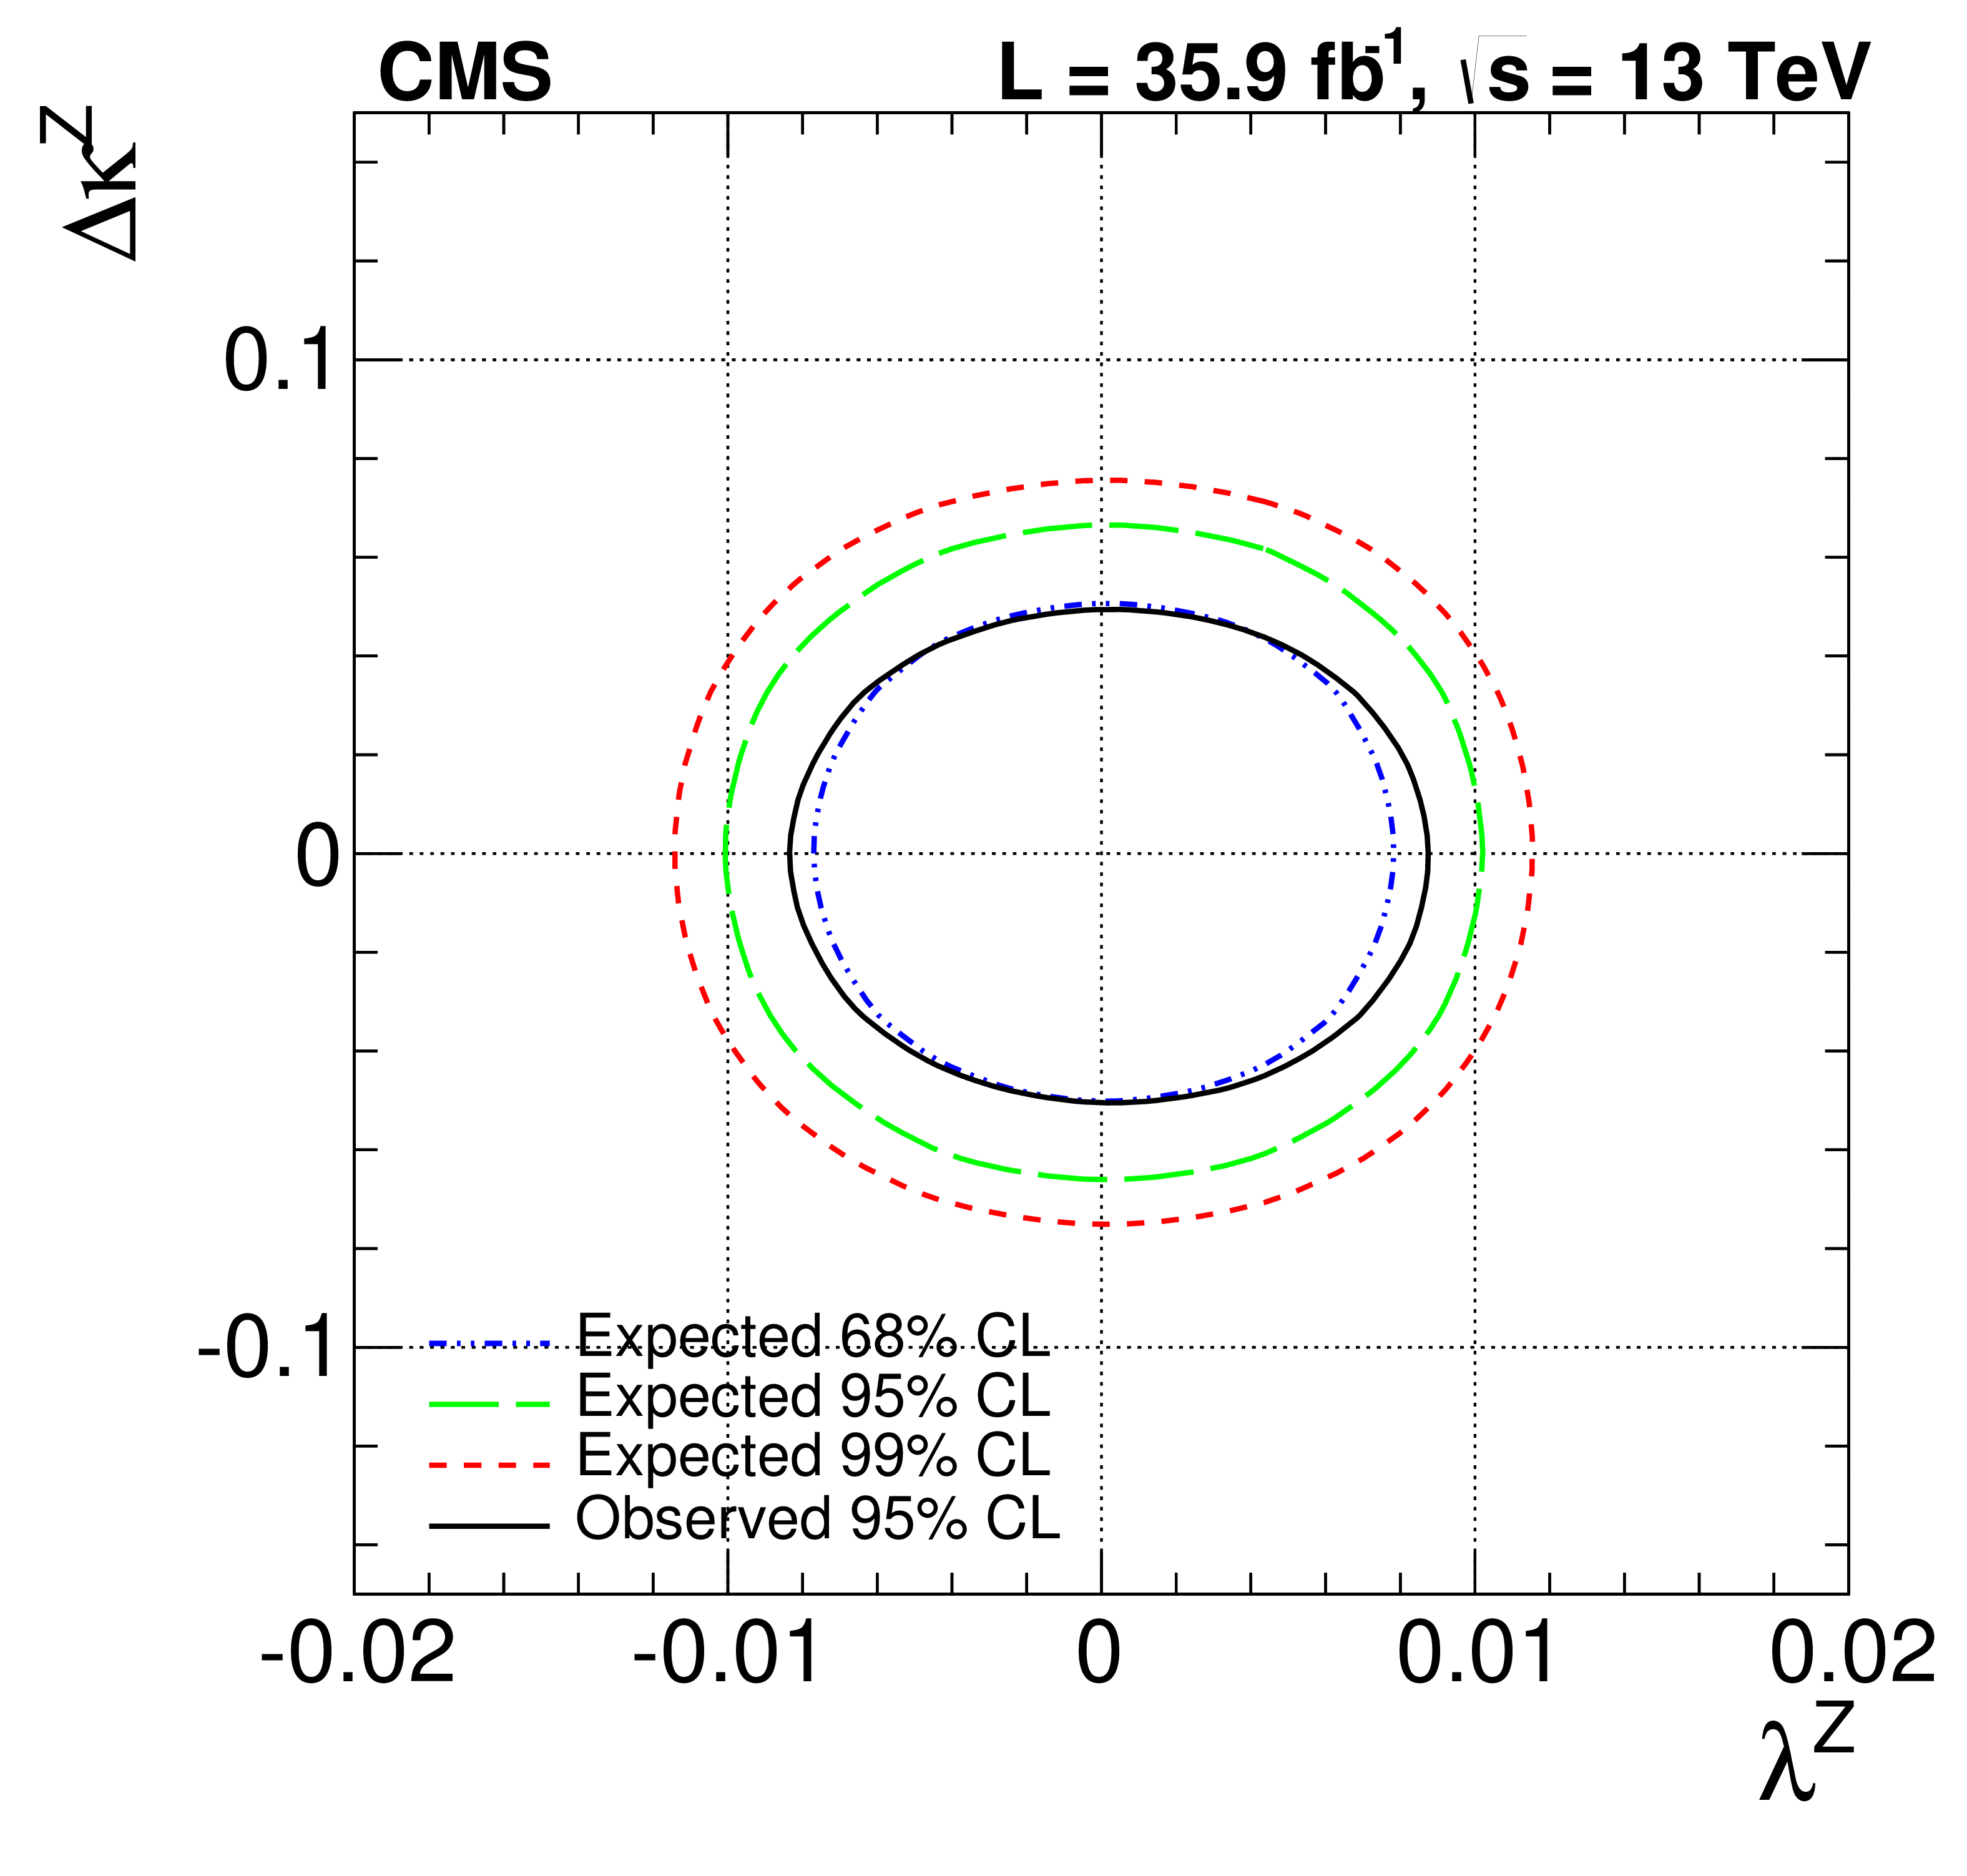
Figure 12:
Expected and observed two-dimensional limits on the ATGC effective Lagrangian (LEP parametrization) parameters at 95% CL. |
png pdf |
Figure 12-a:
Expected and observed two-dimensional limits on the ATGC effective Lagrangian (LEP parametrization) parameters at 95% CL. |
png pdf |
Figure 12-b:
Expected and observed two-dimensional limits on the ATGC effective Lagrangian (LEP parametrization) parameters at 95% CL. |
png pdf |
Figure 12-c:
Expected and observed two-dimensional limits on the ATGC effective Lagrangian (LEP parametrization) parameters at 95% CL. |

png pdf |
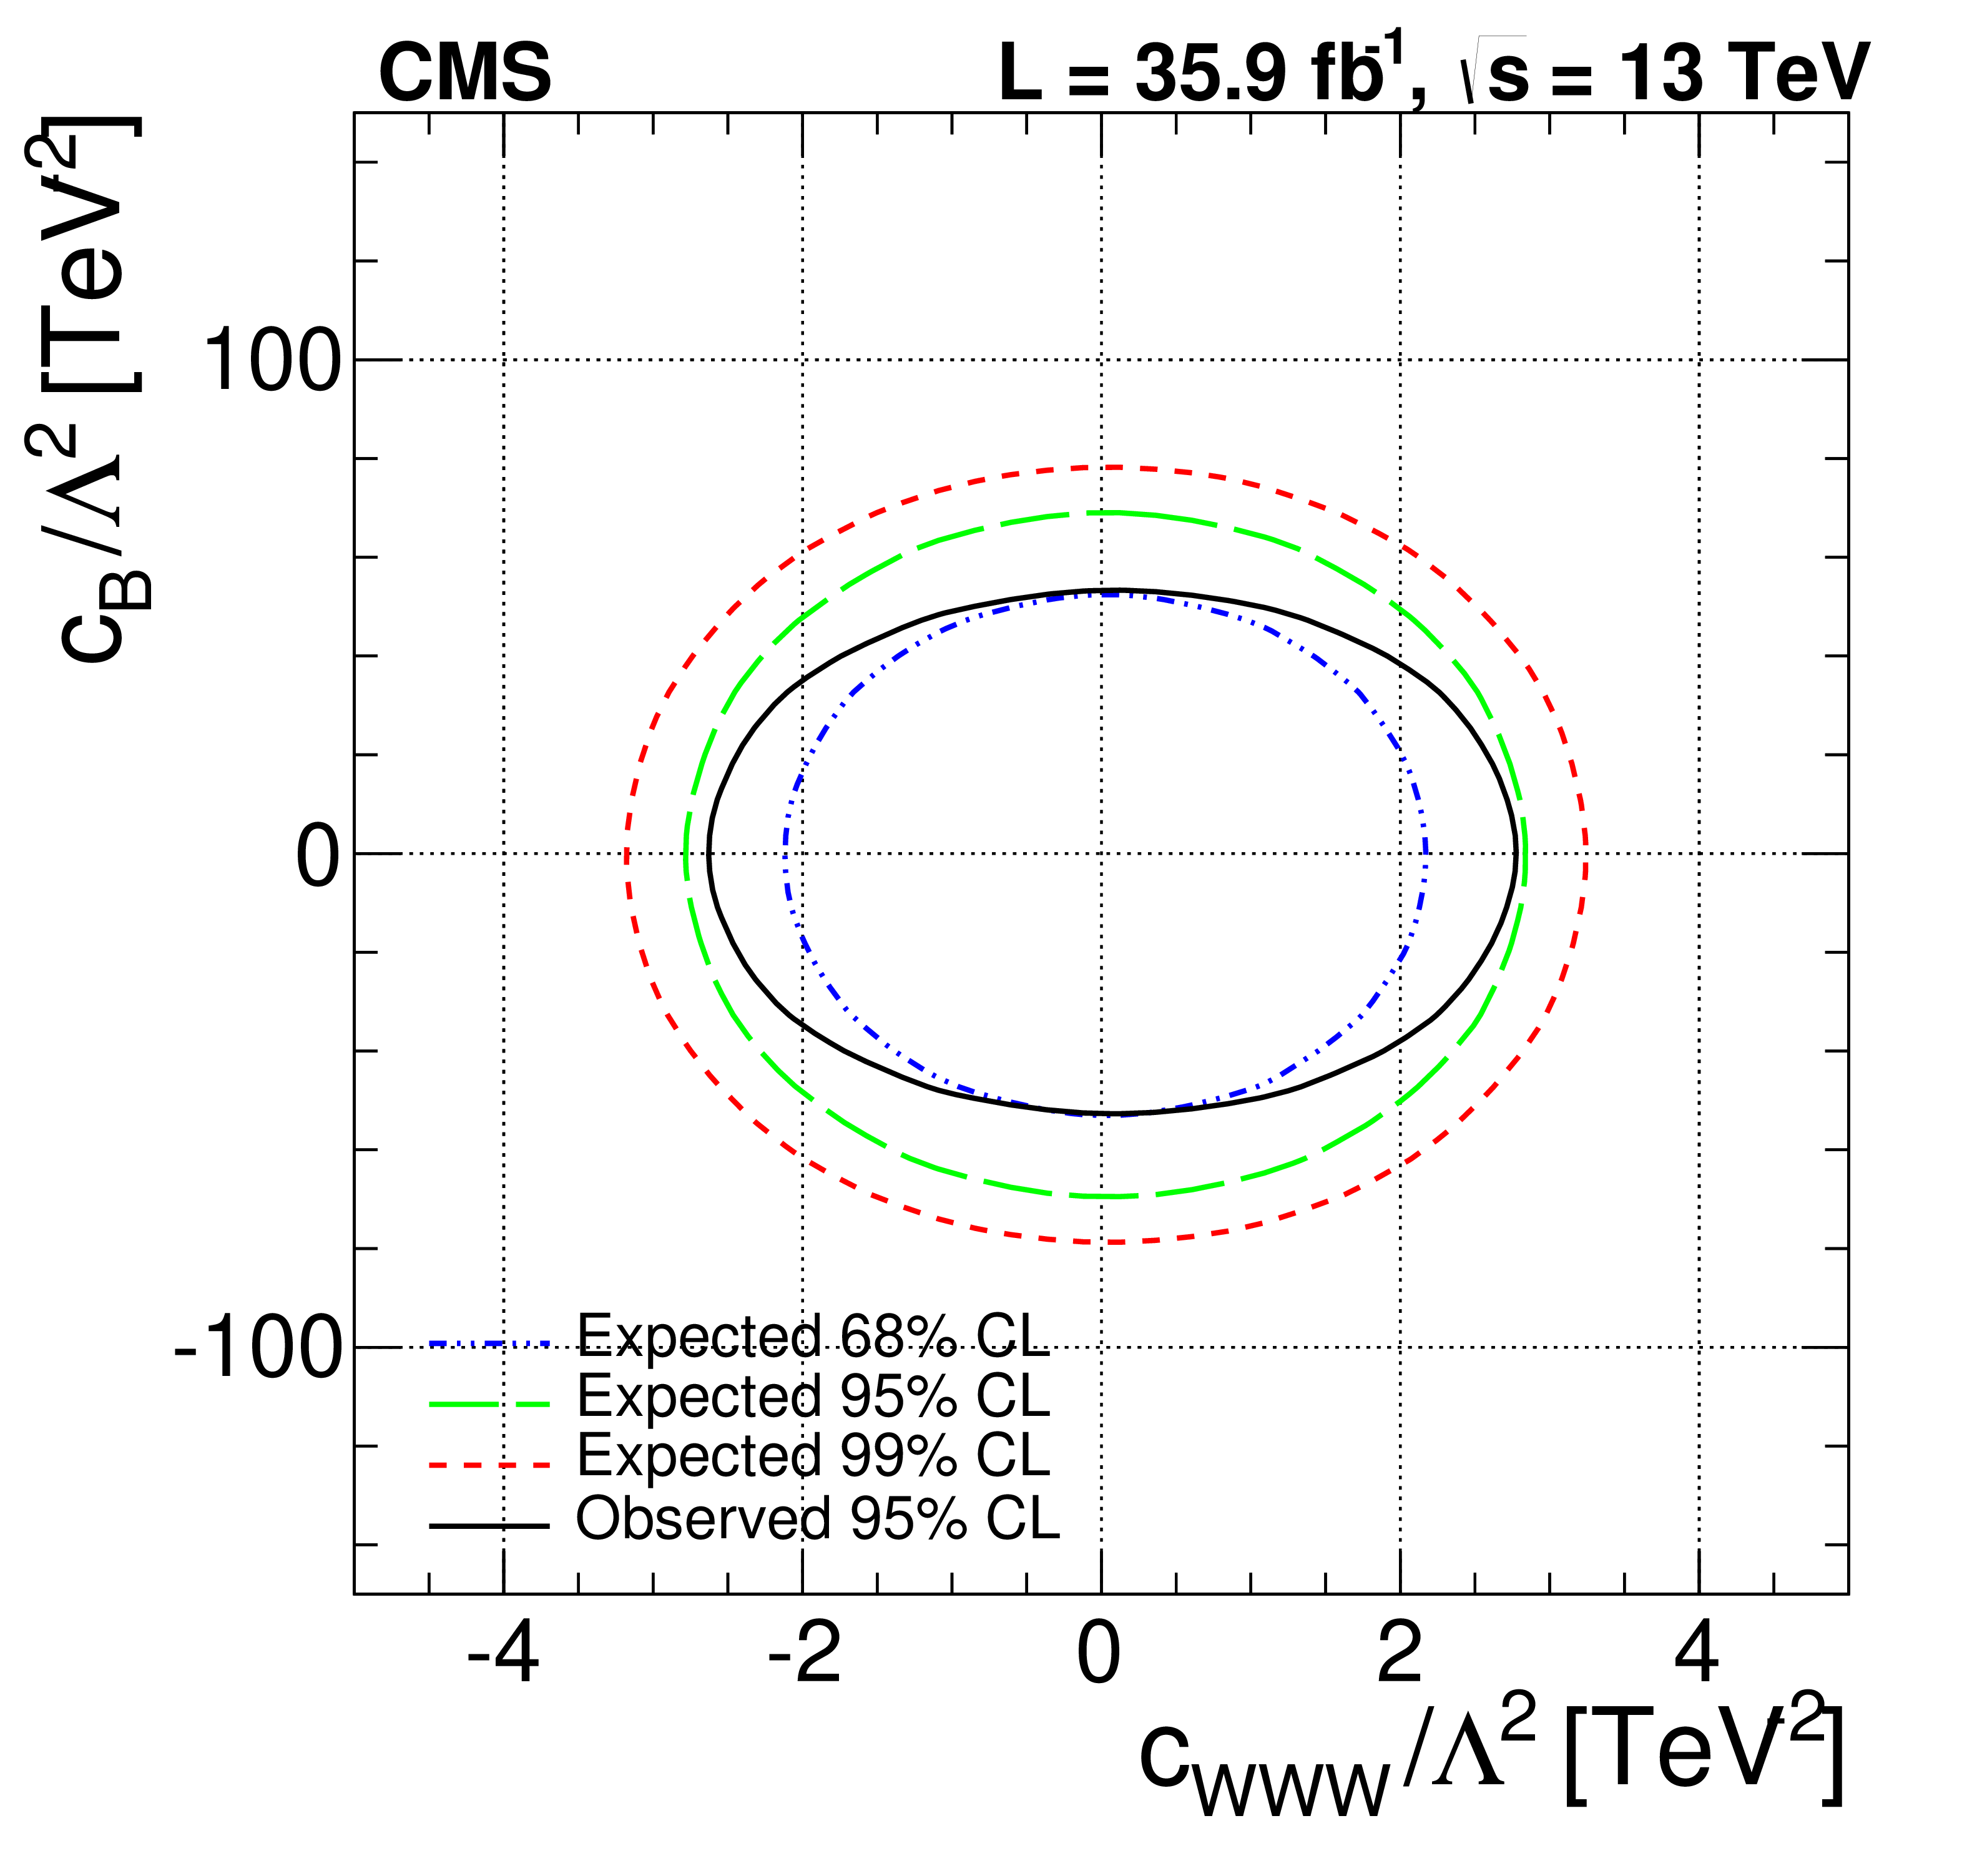
Figure 13:
Expected and observed two-dimensional limits on the EFT parameters at 95% CL from the combination of EW ${{\mathrm {W}}\mathrm {jj}} $ and EW ${{\mathrm {Z}}\mathrm {jj}} $ analyses. |
png pdf |
Figure 13-a:
Expected and observed two-dimensional limits on the EFT parameters at 95% CL from the combination of EW ${{\mathrm {W}}\mathrm {jj}} $ and EW ${{\mathrm {Z}}\mathrm {jj}} $ analyses. |
png pdf |
Figure 13-b:
Expected and observed two-dimensional limits on the EFT parameters at 95% CL from the combination of EW ${{\mathrm {W}}\mathrm {jj}} $ and EW ${{\mathrm {Z}}\mathrm {jj}} $ analyses. |
png pdf |
Figure 13-c:
Expected and observed two-dimensional limits on the EFT parameters at 95% CL from the combination of EW ${{\mathrm {W}}\mathrm {jj}} $ and EW ${{\mathrm {Z}}\mathrm {jj}} $ analyses. |

png pdf |
Figure 14:
Expected and observed two-dimensional limits on the ATGC effective Lagrangian (LEP parametrization) parameters at 95% CL from the combination of EW ${{\mathrm {W}}\mathrm {jj}} $ and EW ${{\mathrm {Z}}\mathrm {jj}} $ analyses. |

png pdf |
Figure 14-a:
Expected and observed two-dimensional limits on the ATGC effective Lagrangian (LEP parametrization) parameters at 95% CL from the combination of EW ${{\mathrm {W}}\mathrm {jj}} $ and EW ${{\mathrm {Z}}\mathrm {jj}} $ analyses. |
png pdf |
Figure 14-b:
Expected and observed two-dimensional limits on the ATGC effective Lagrangian (LEP parametrization) parameters at 95% CL from the combination of EW ${{\mathrm {W}}\mathrm {jj}} $ and EW ${{\mathrm {Z}}\mathrm {jj}} $ analyses. |
png pdf |
Figure 14-c:
Expected and observed two-dimensional limits on the ATGC effective Lagrangian (LEP parametrization) parameters at 95% CL from the combination of EW ${{\mathrm {W}}\mathrm {jj}} $ and EW ${{\mathrm {Z}}\mathrm {jj}} $ analyses. |
png pdf |
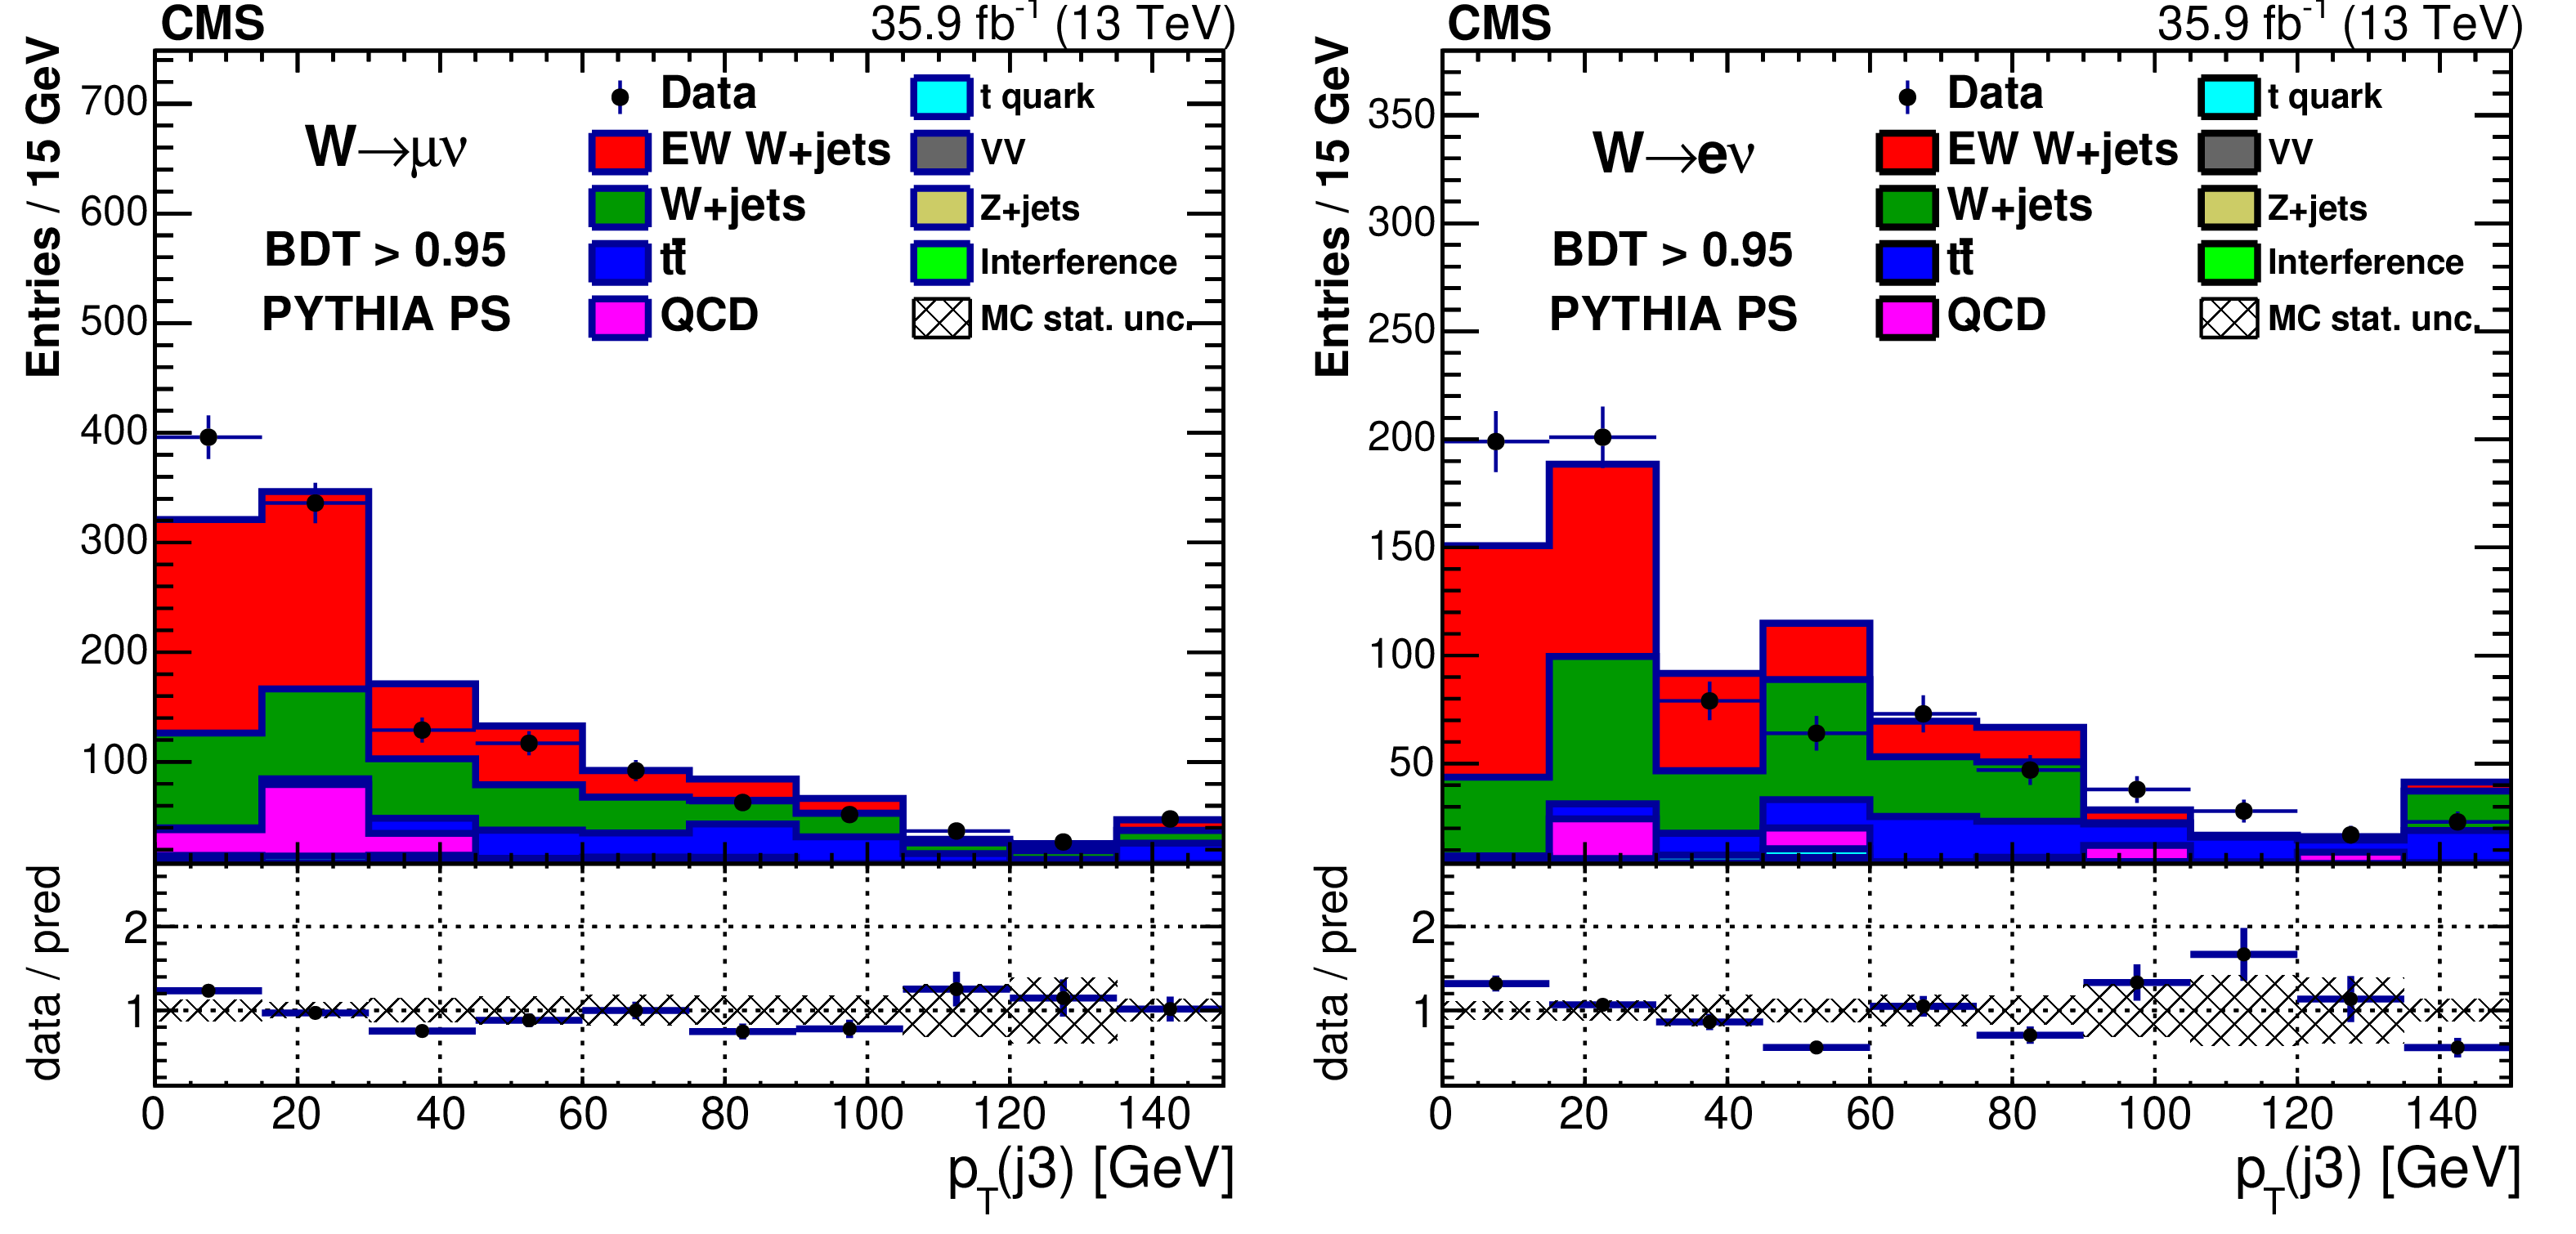
Figure 15-a:
Leading additional jet ${p_{\mathrm {T}}}$ (${p_{\mathrm {T}}}$ (j3)) for $\mathrm {BDT} > $ 0.95 in the muon (left) and electron (right) channels including signal with PYTHIA parton showering. In all plots the last bin contains overflow events, and the first bin contains events where no additional jet with ${p_{\mathrm {T}}} > $ 15 GeV is present. |
png pdf |
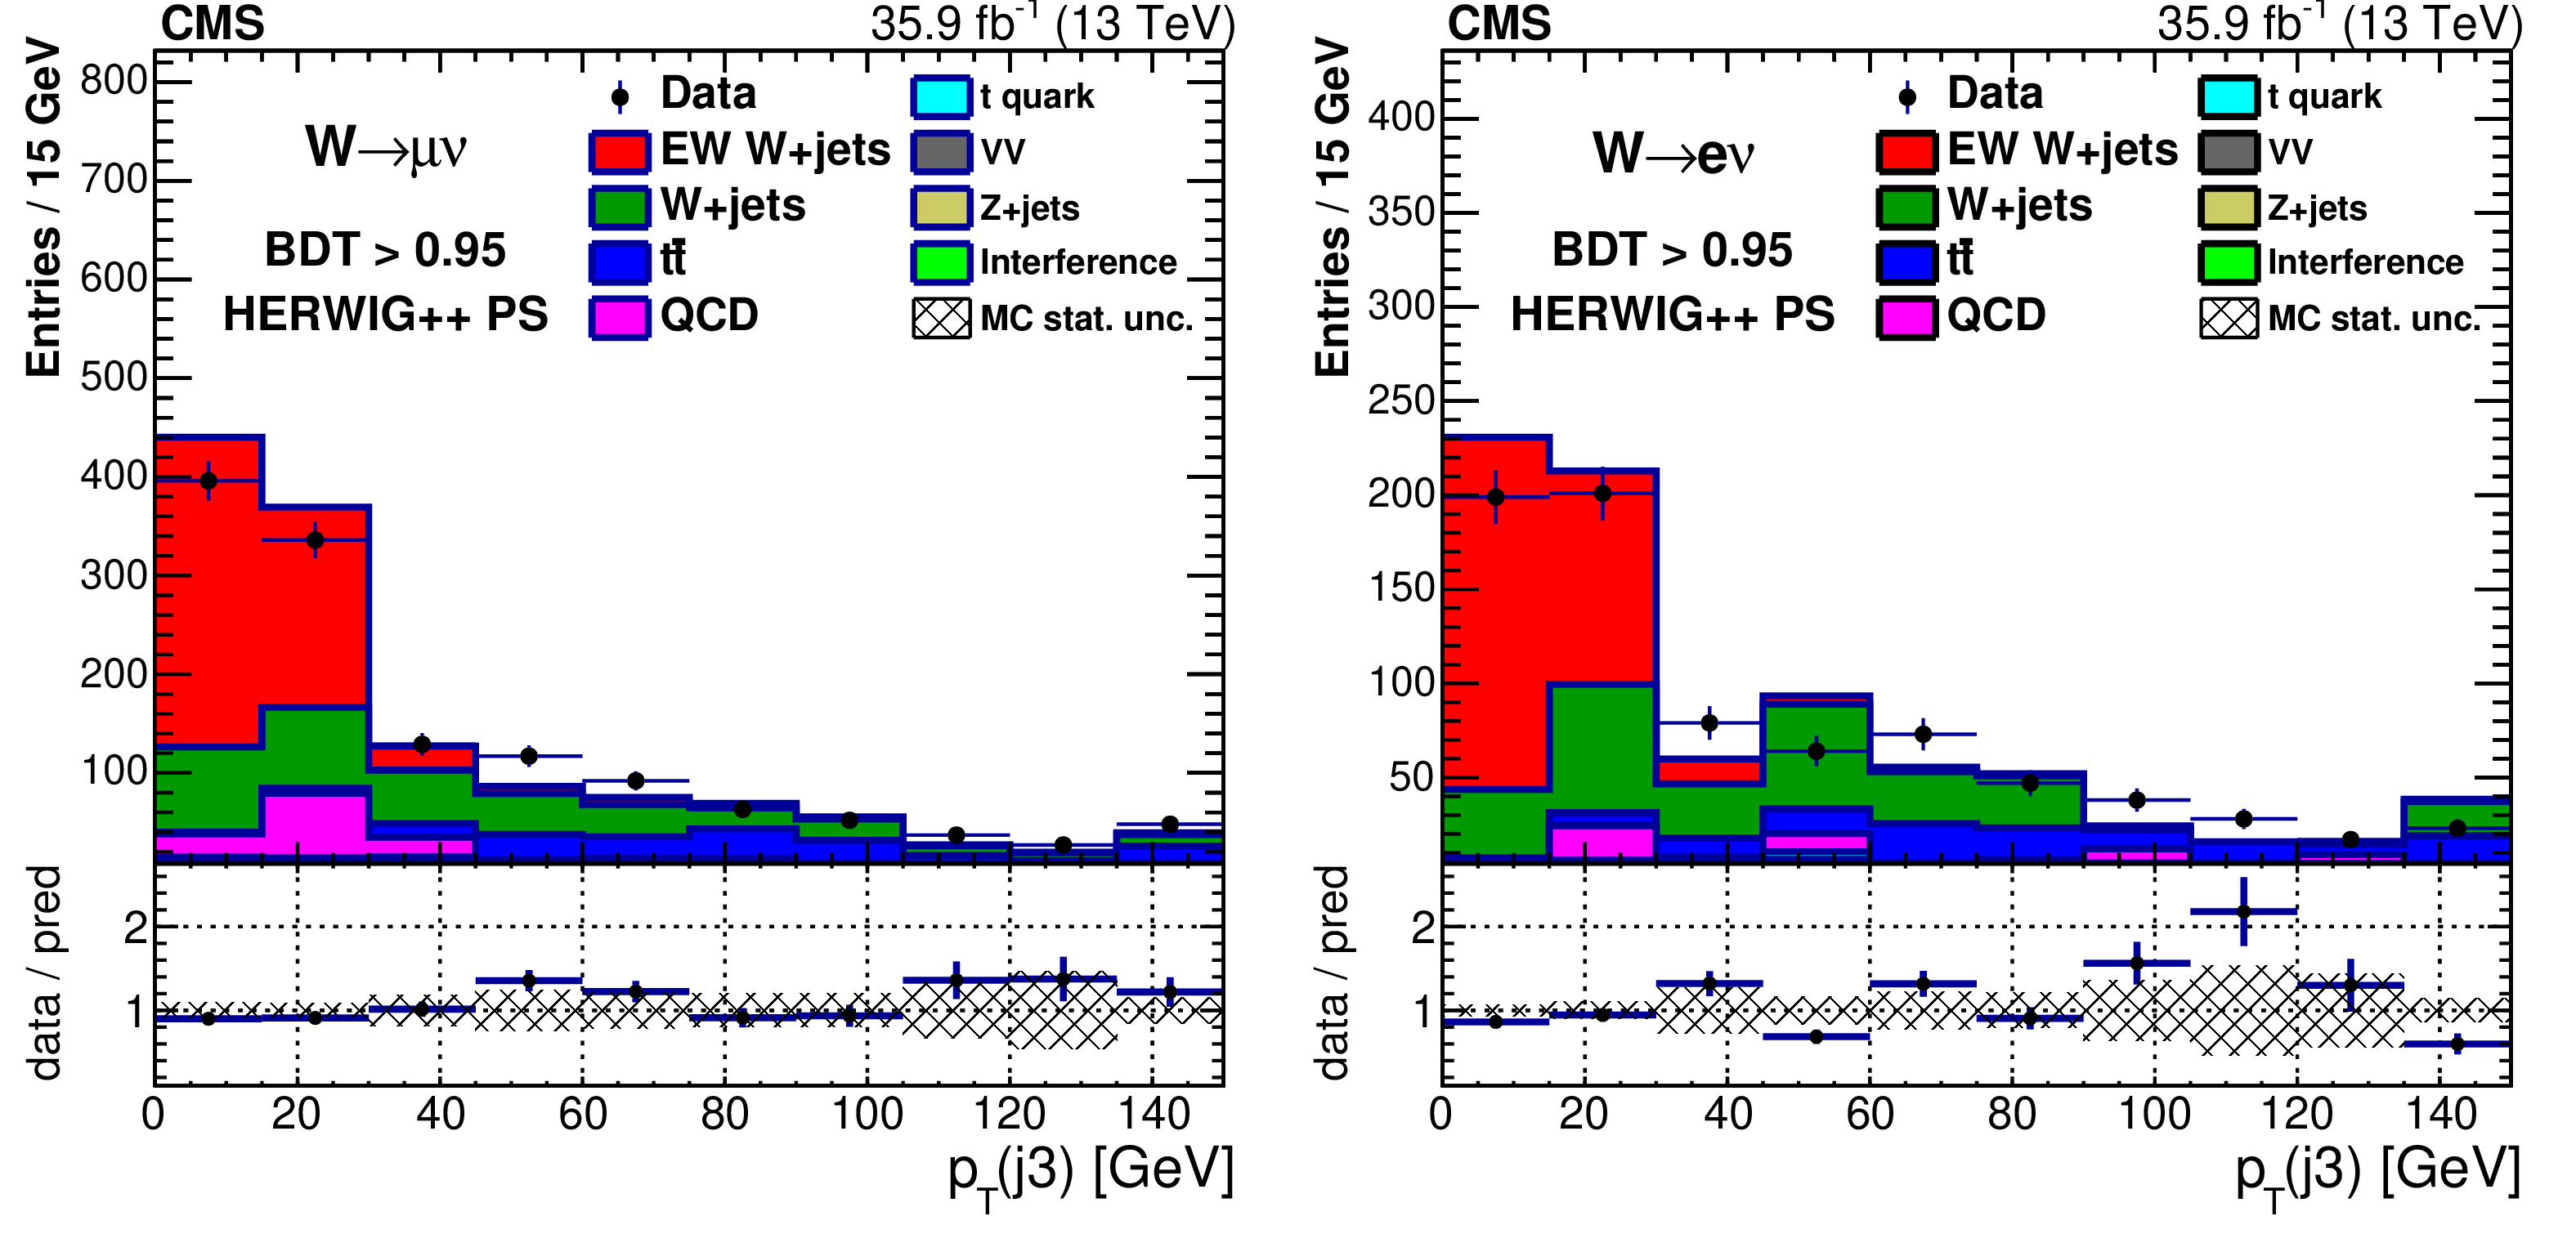
Figure 15-b:
Leading additional jet ${p_{\mathrm {T}}}$ (${p_{\mathrm {T}}}$ (j3)) for $\mathrm {BDT} > $ 0.95 in the muon (left) and electron (right) channels including signal with HERWIG++ parton showering. In all plots the last bin contains overflow events, and the first bin contains events where no additional jet with ${p_{\mathrm {T}}} > $ 15 GeV is present. |
png pdf |
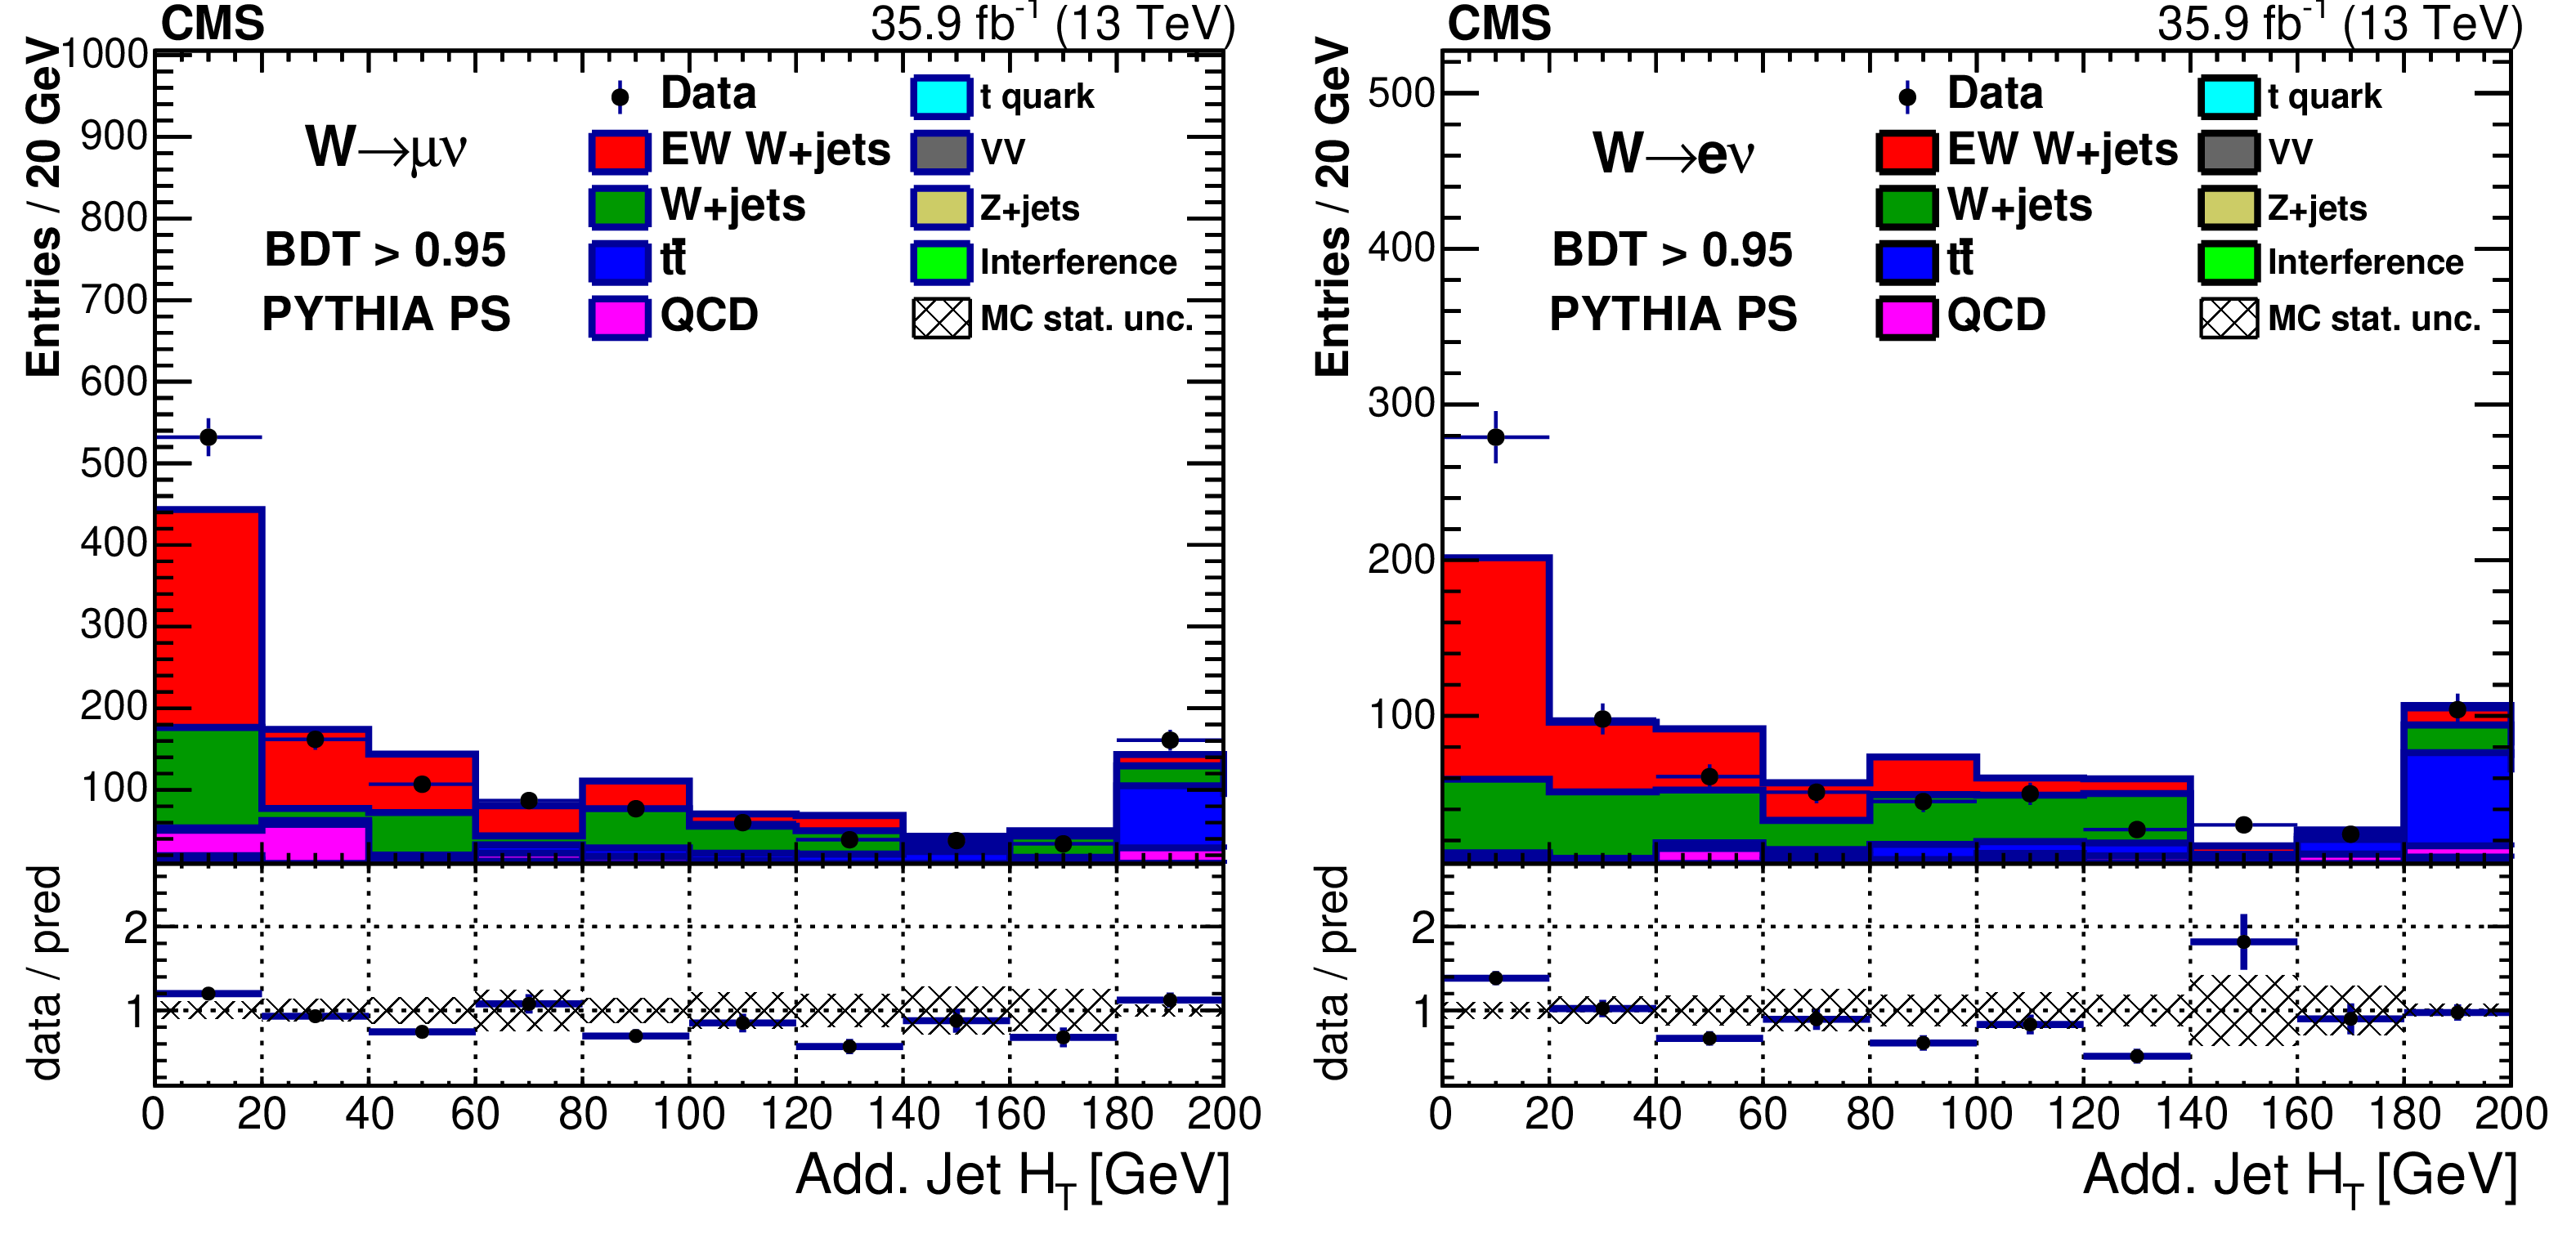
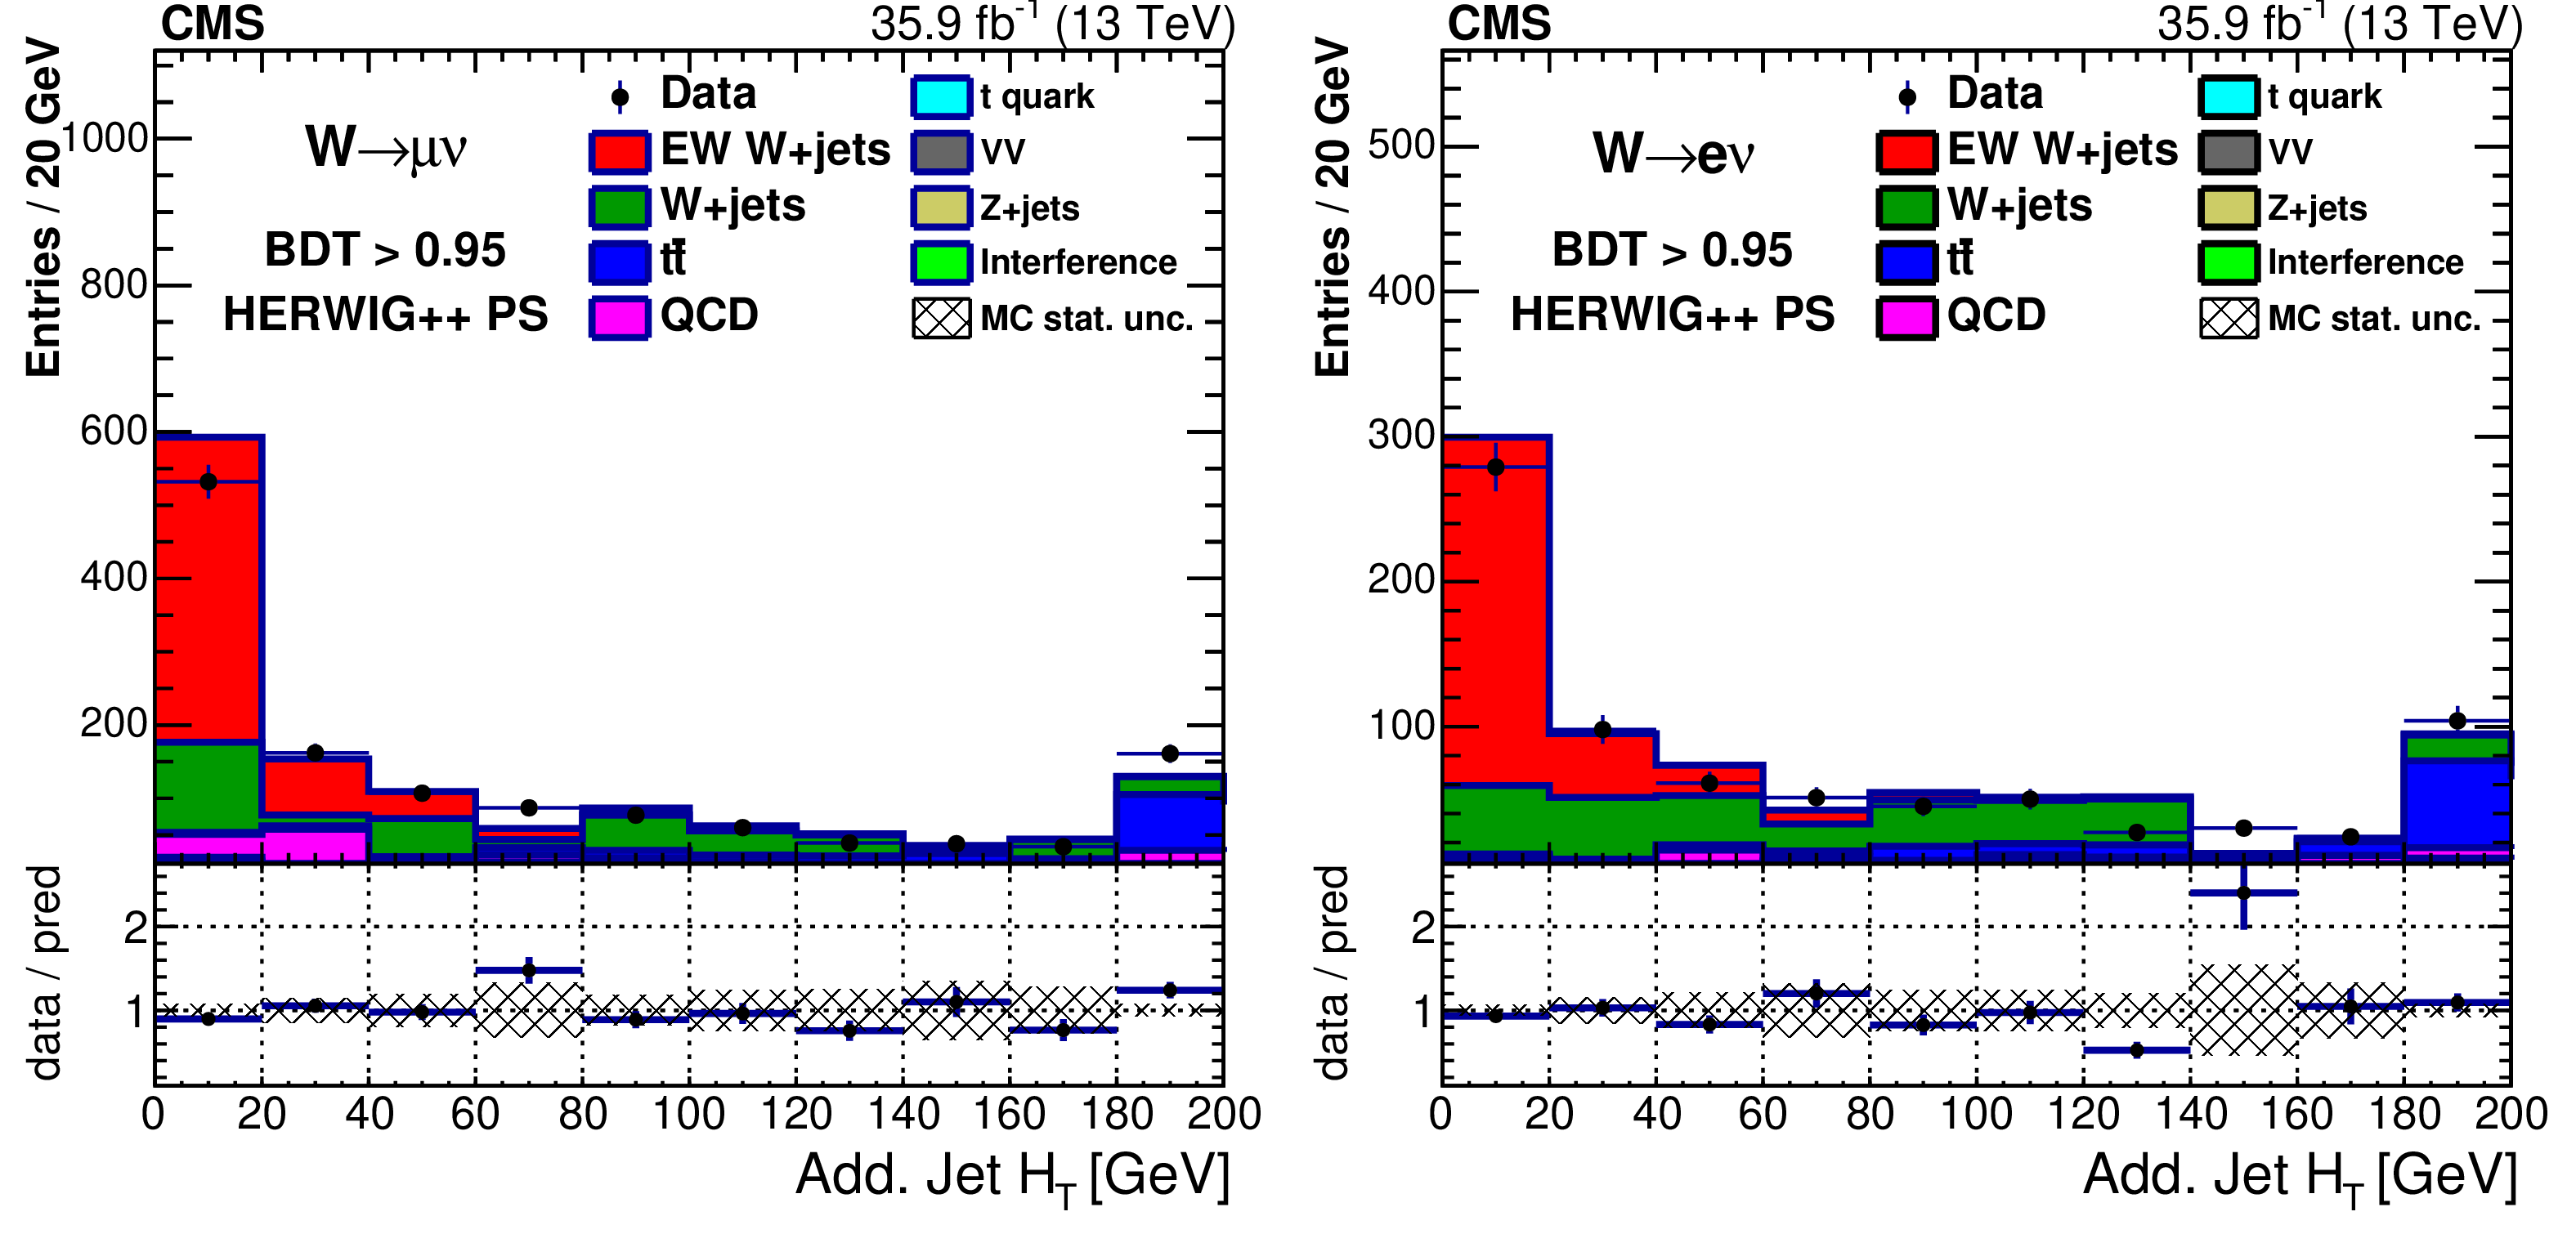
Figure 16-a:
Total ${H_{\mathrm {T}}}$ of the additional jets for $\mathrm {BDT} > $ 0.95 in the muon (left) and electron (right) channels including signal with PYTHIA parton showering. In all plots the last bin contains overflow events, and the first bin contains events where no additional jet with $ {p_{\mathrm {T}}} > $ 15 GeV is present. |
png pdf |
Figure 16-b:
Total ${H_{\mathrm {T}}}$ of the additional jets for $\mathrm {BDT} > $ 0.95 in the muon (left) and electron (right) channels including signal with HERWIG++ parton showering. In all plots the last bin contains overflow events, and the first bin contains events where no additional jet with $ {p_{\mathrm {T}}} > $ 15 GeV is present. |
png pdf |
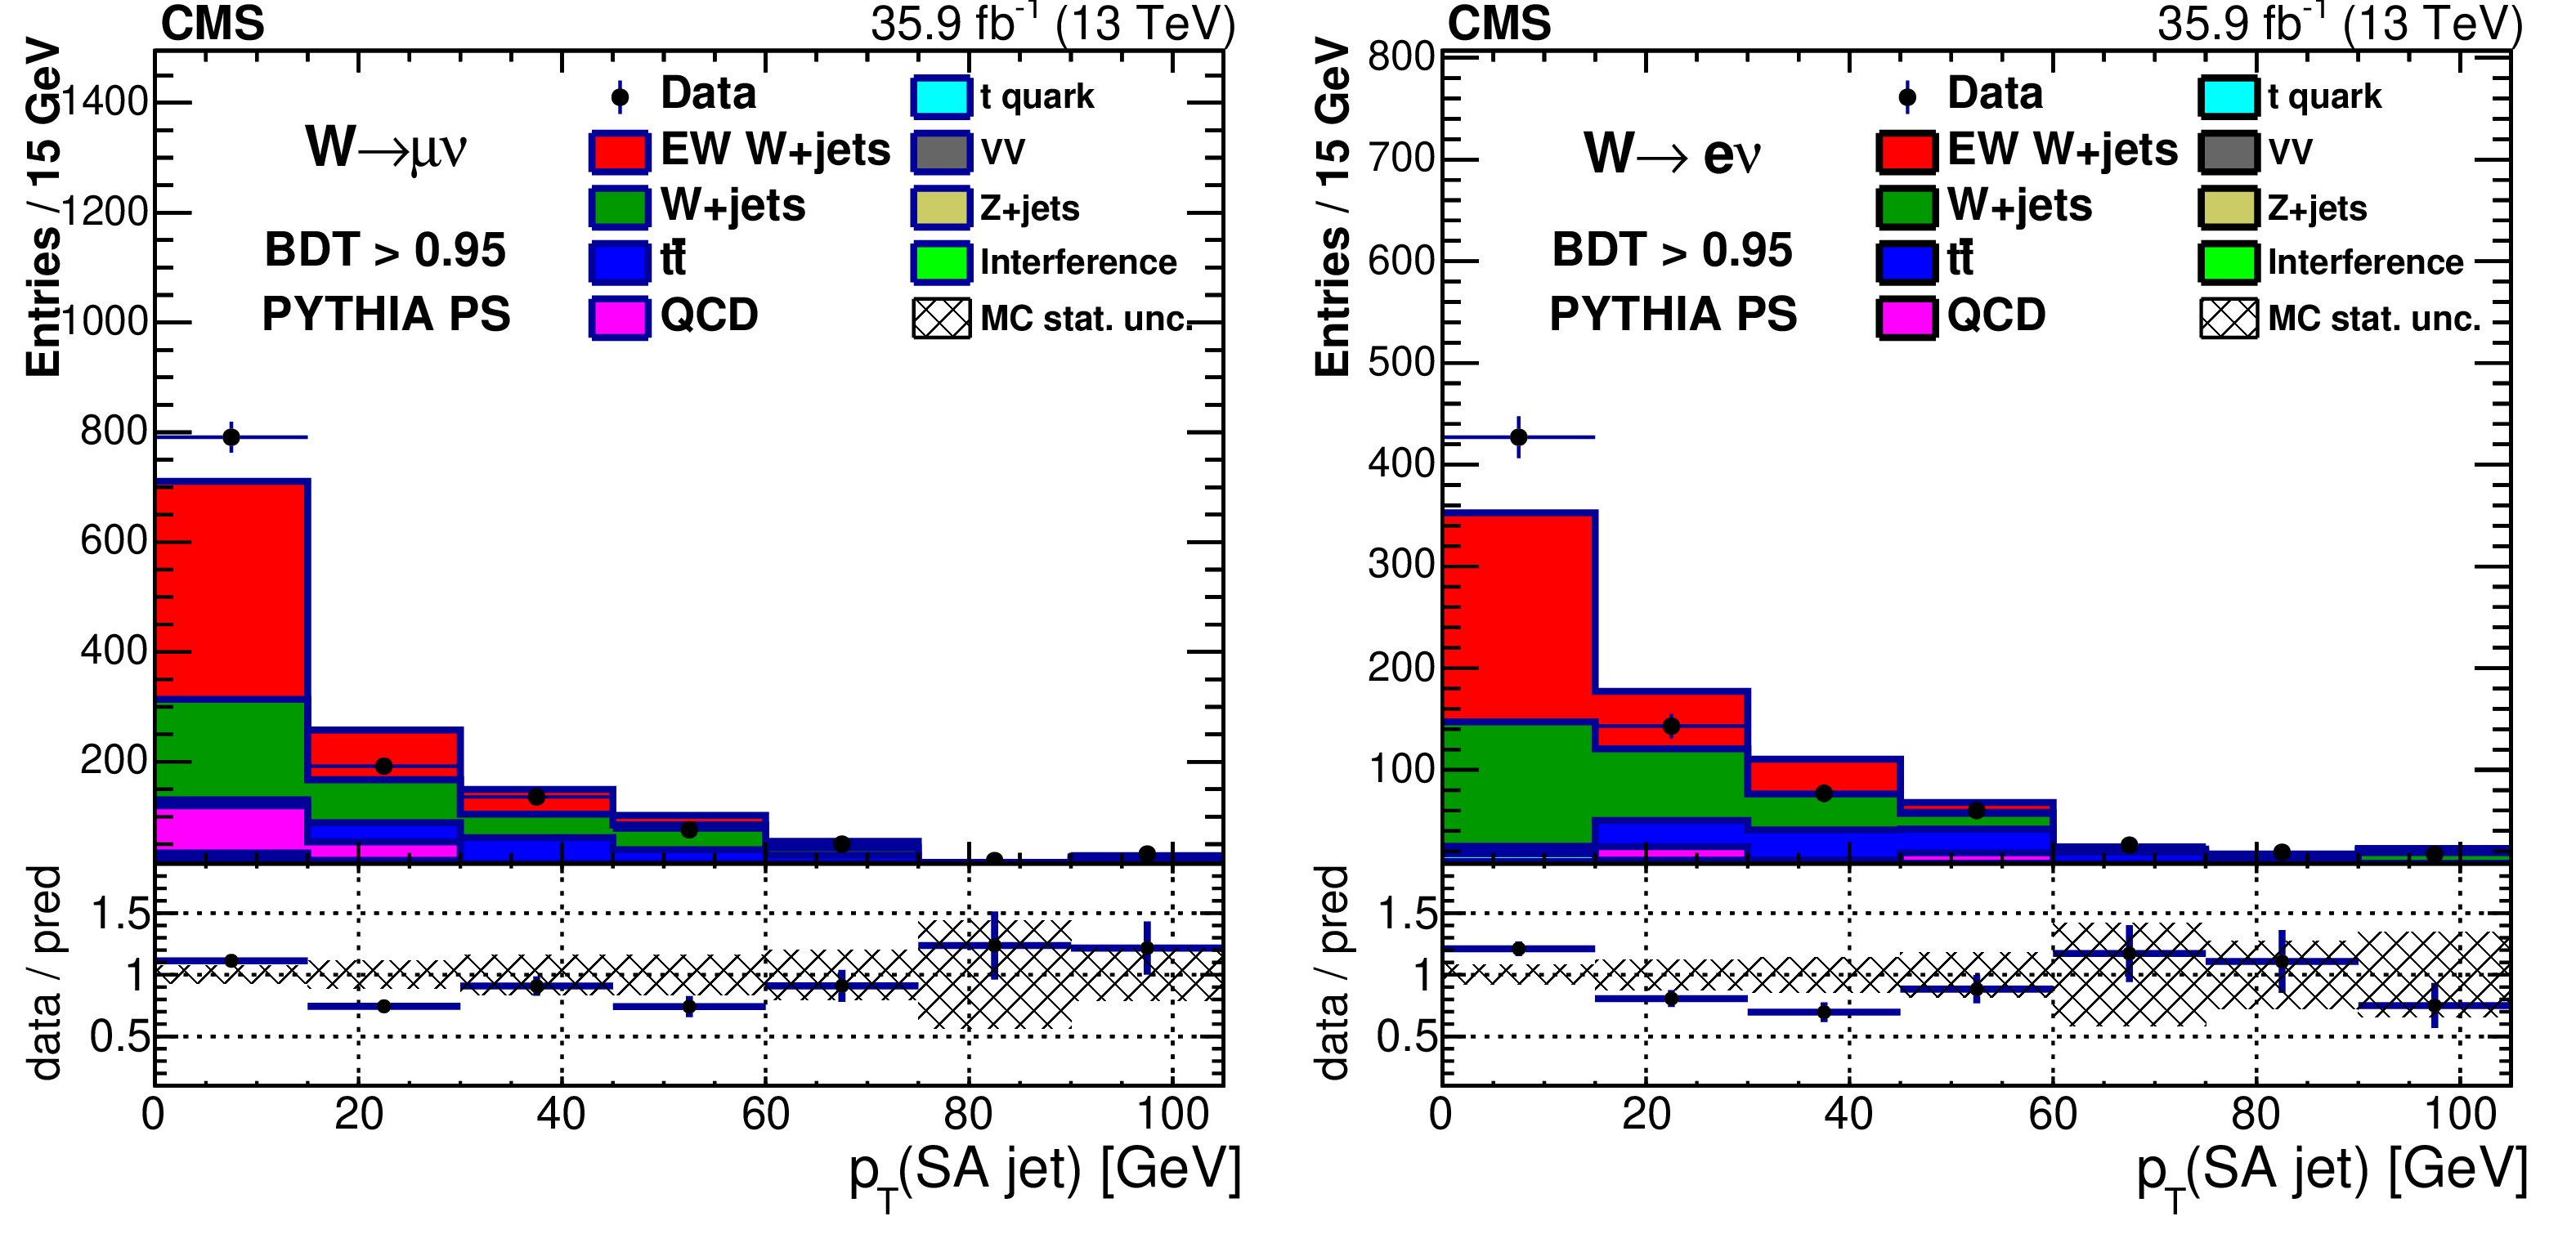
Figure 17-a:
Leading additional soft-activity (SA) jet ${p_{\mathrm {T}}}$ for BDT $ > $ 0.95 in the muon (left) and electron (right) channels including signal with PYTHIA parton showering. |
png pdf |
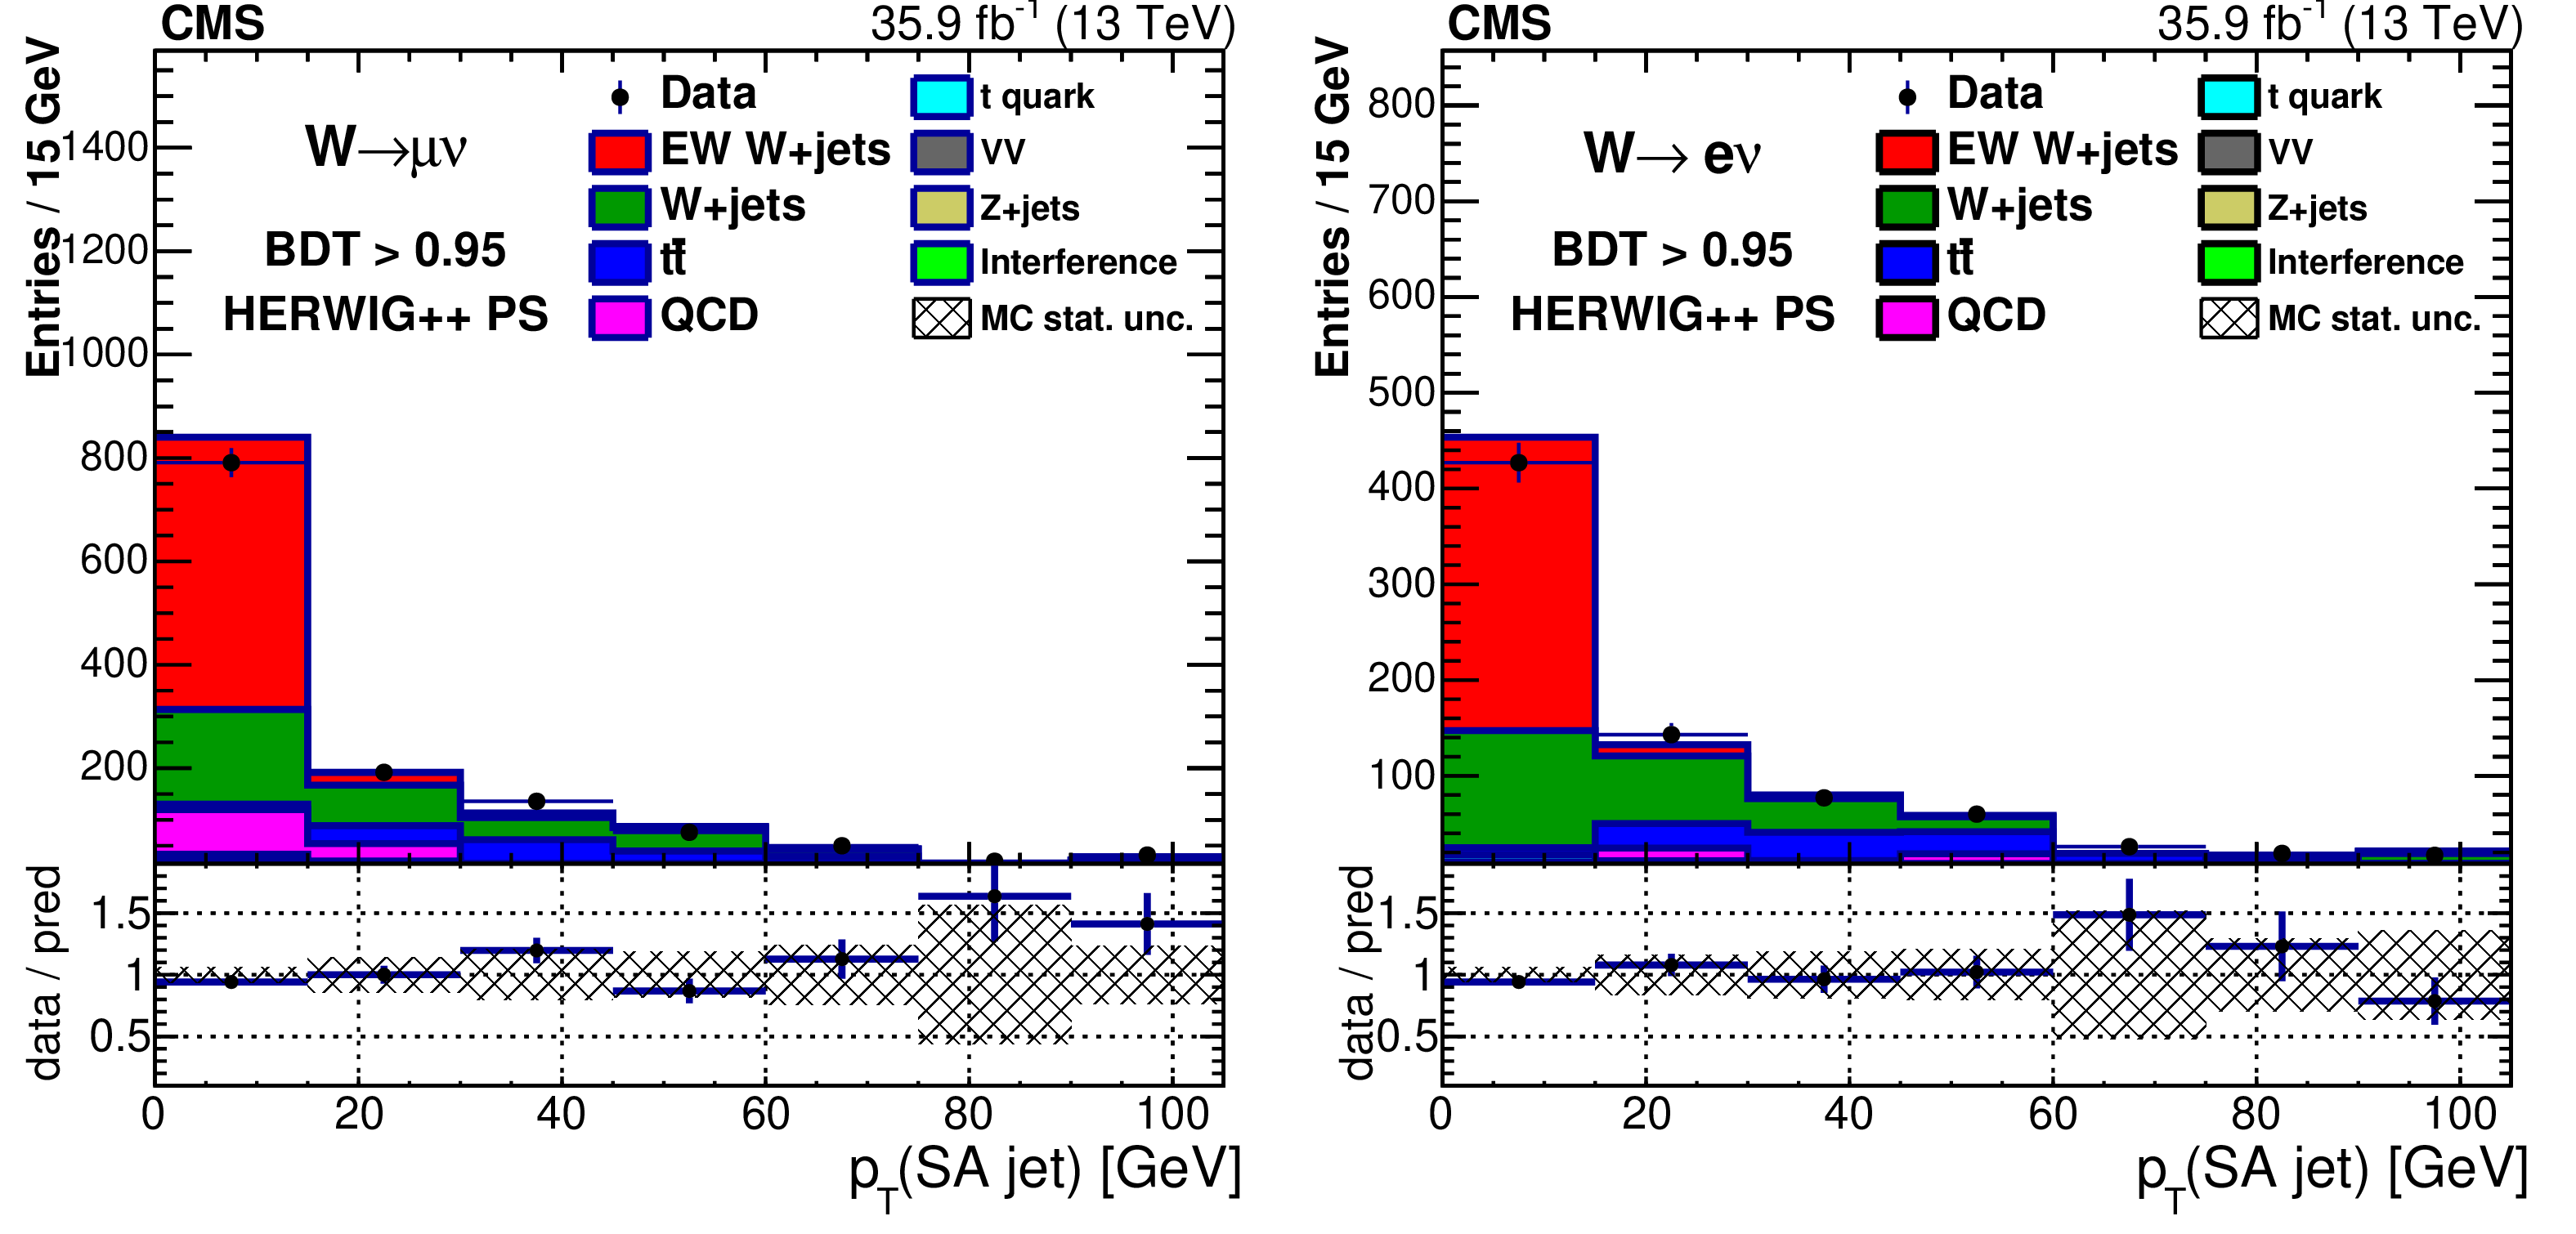
Figure 17-b:
Leading additional soft-activity (SA) jet ${p_{\mathrm {T}}}$ for BDT $ > $ 0.95 in the muon (left) and electron (right) channels including signal with HERWIG++ parton showering. |

png pdf |
Figure 18-a:
Total soft activity (SA) jet ${H_{\mathrm {T}}}$ for BDT $ > $ 0.95 in the muon (left) and electron (right) channels including signal with PYTHIA parton showering. In all plots the last bin contains overflow events. |
png pdf |
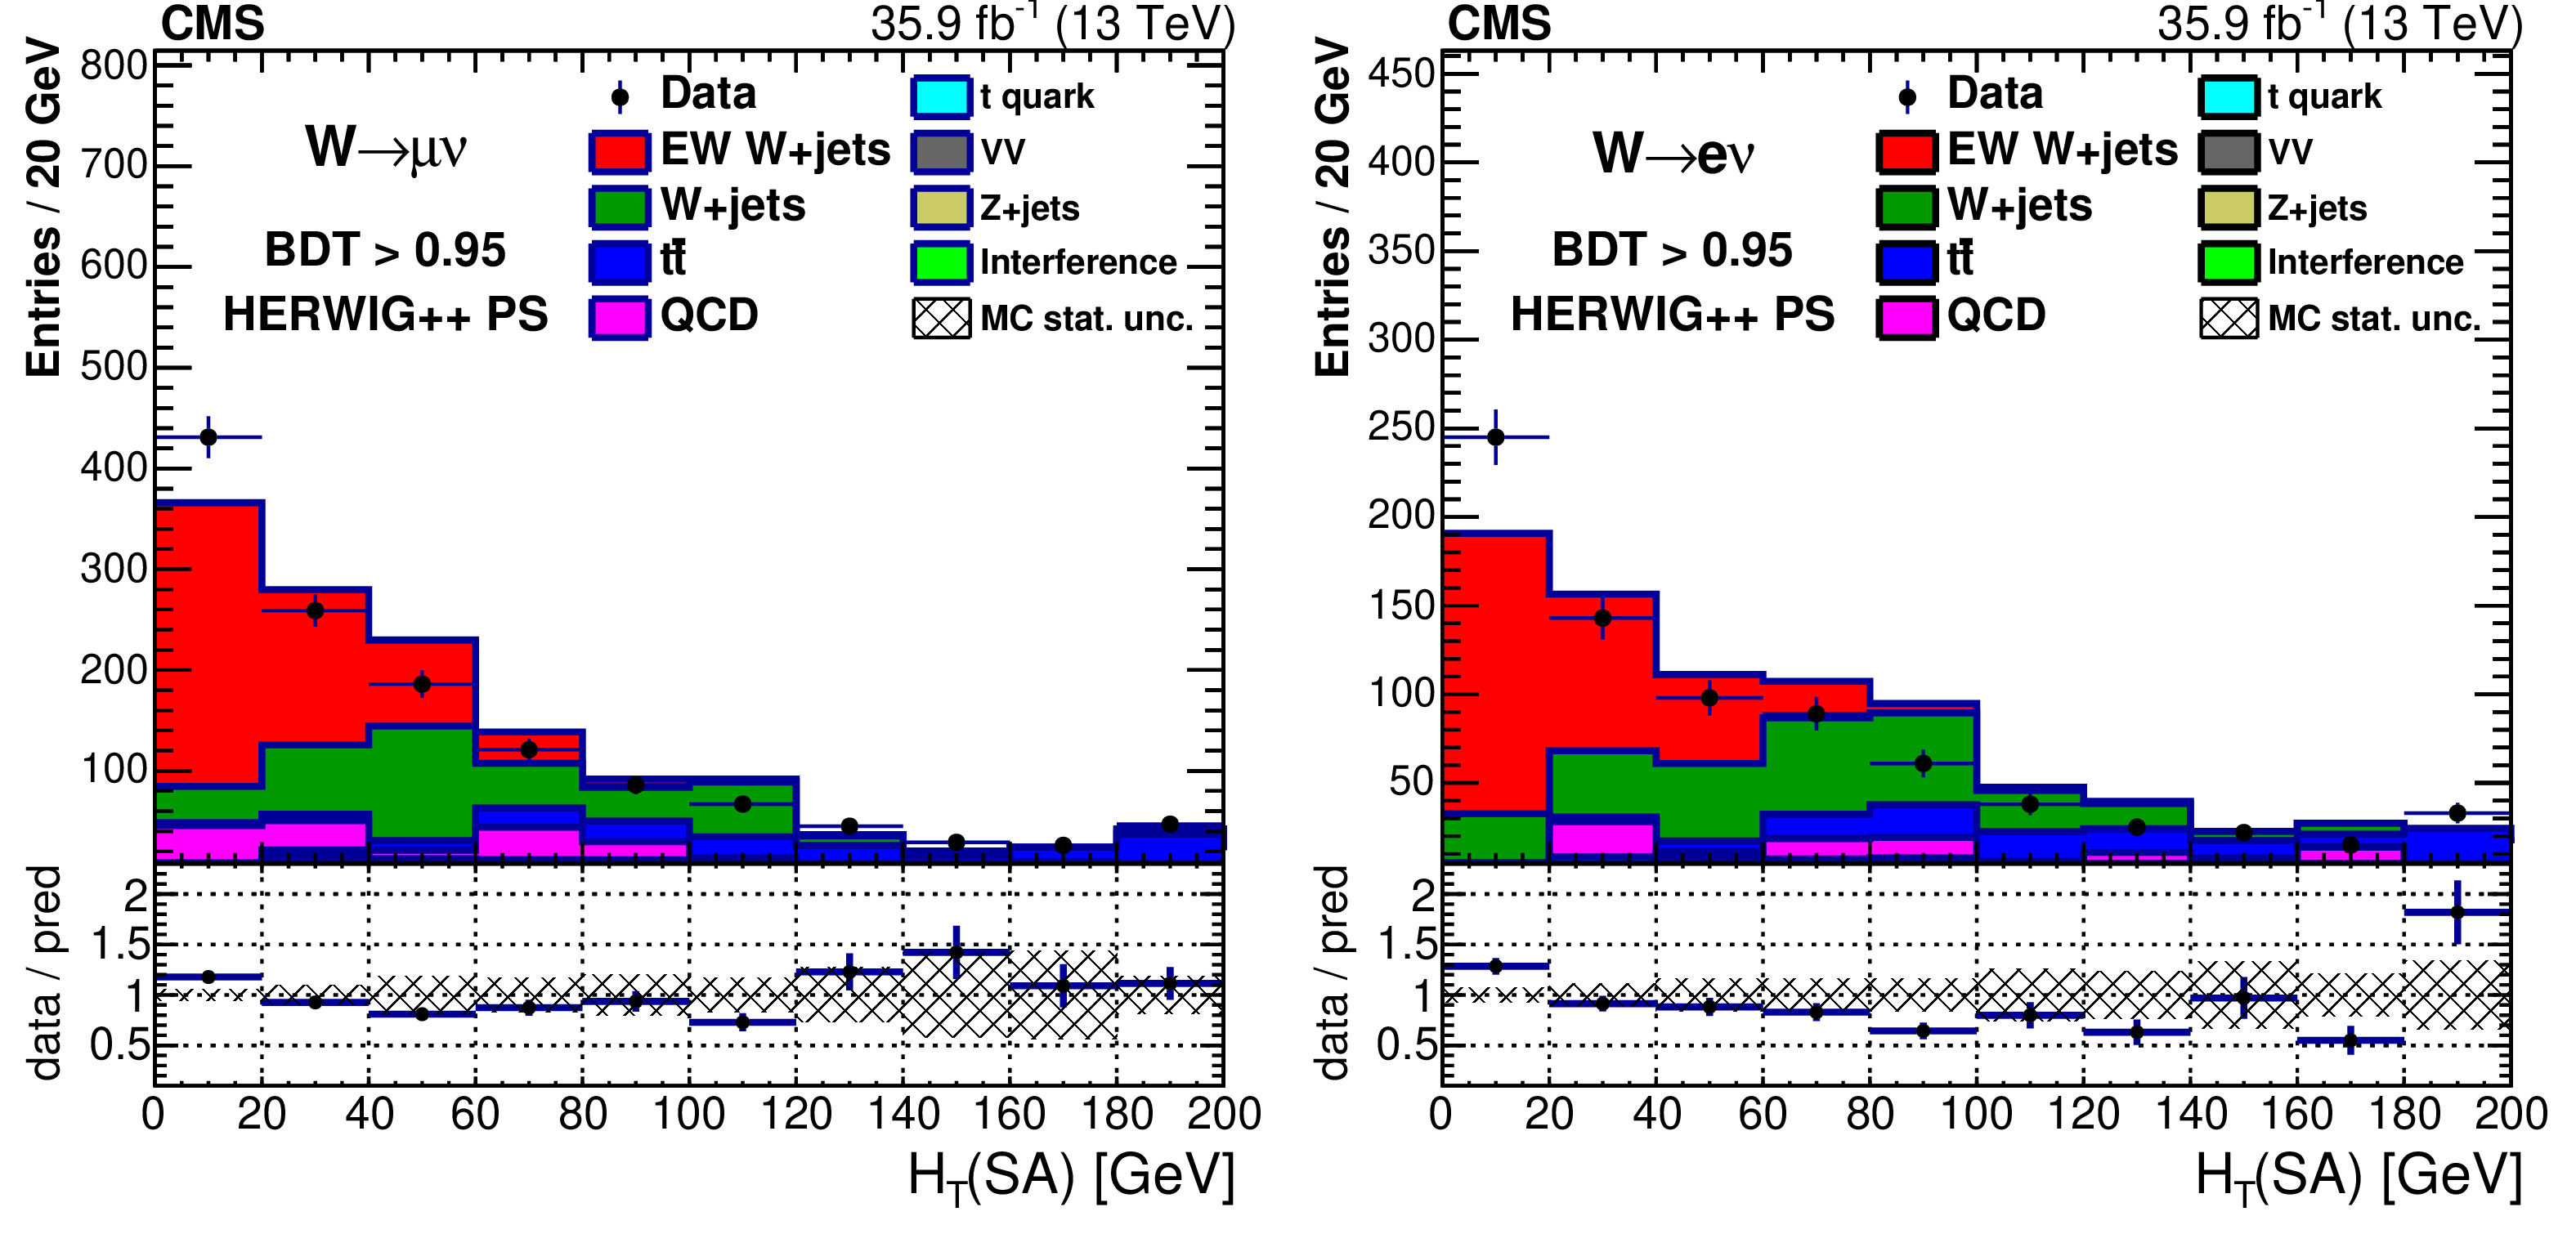
Figure 18-b:
Total soft activity (SA) jet ${H_{\mathrm {T}}}$ for BDT $ > $ 0.95 in the muon (left) and electron (right) channels including signal with HERWIG++ parton showering. In all plots the last bin contains overflow events. |
png pdf |
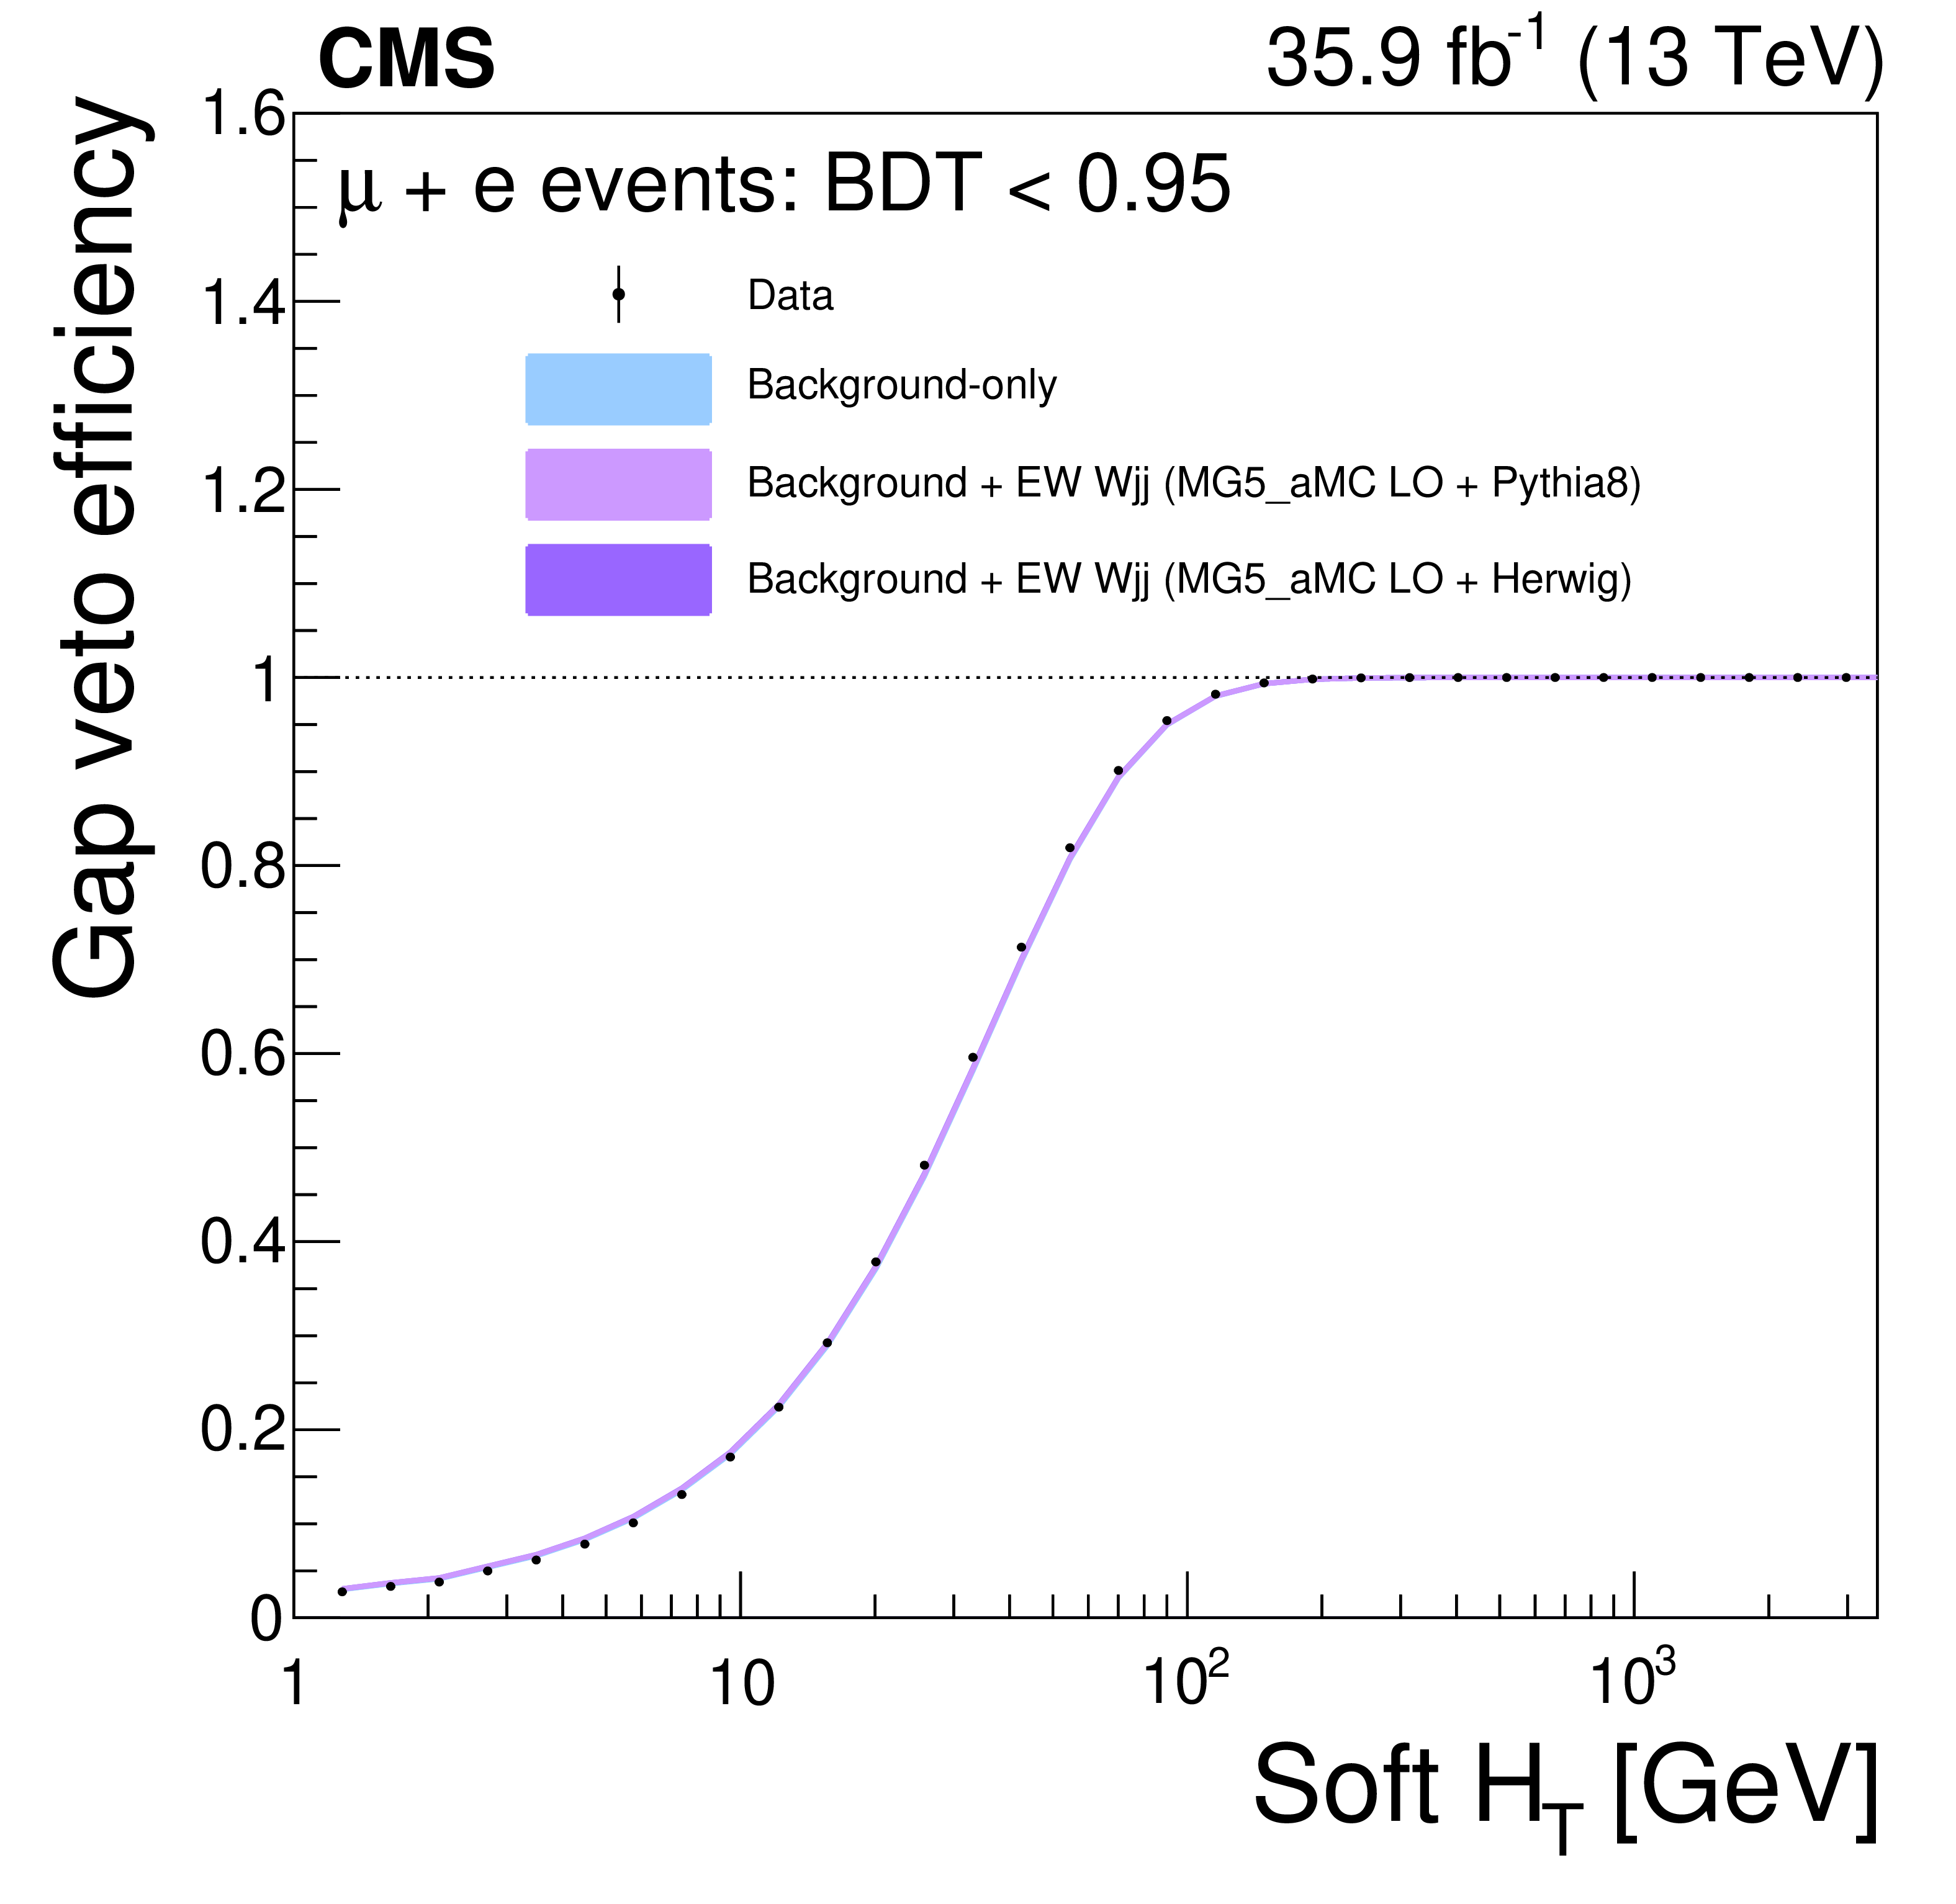
Figure 19:
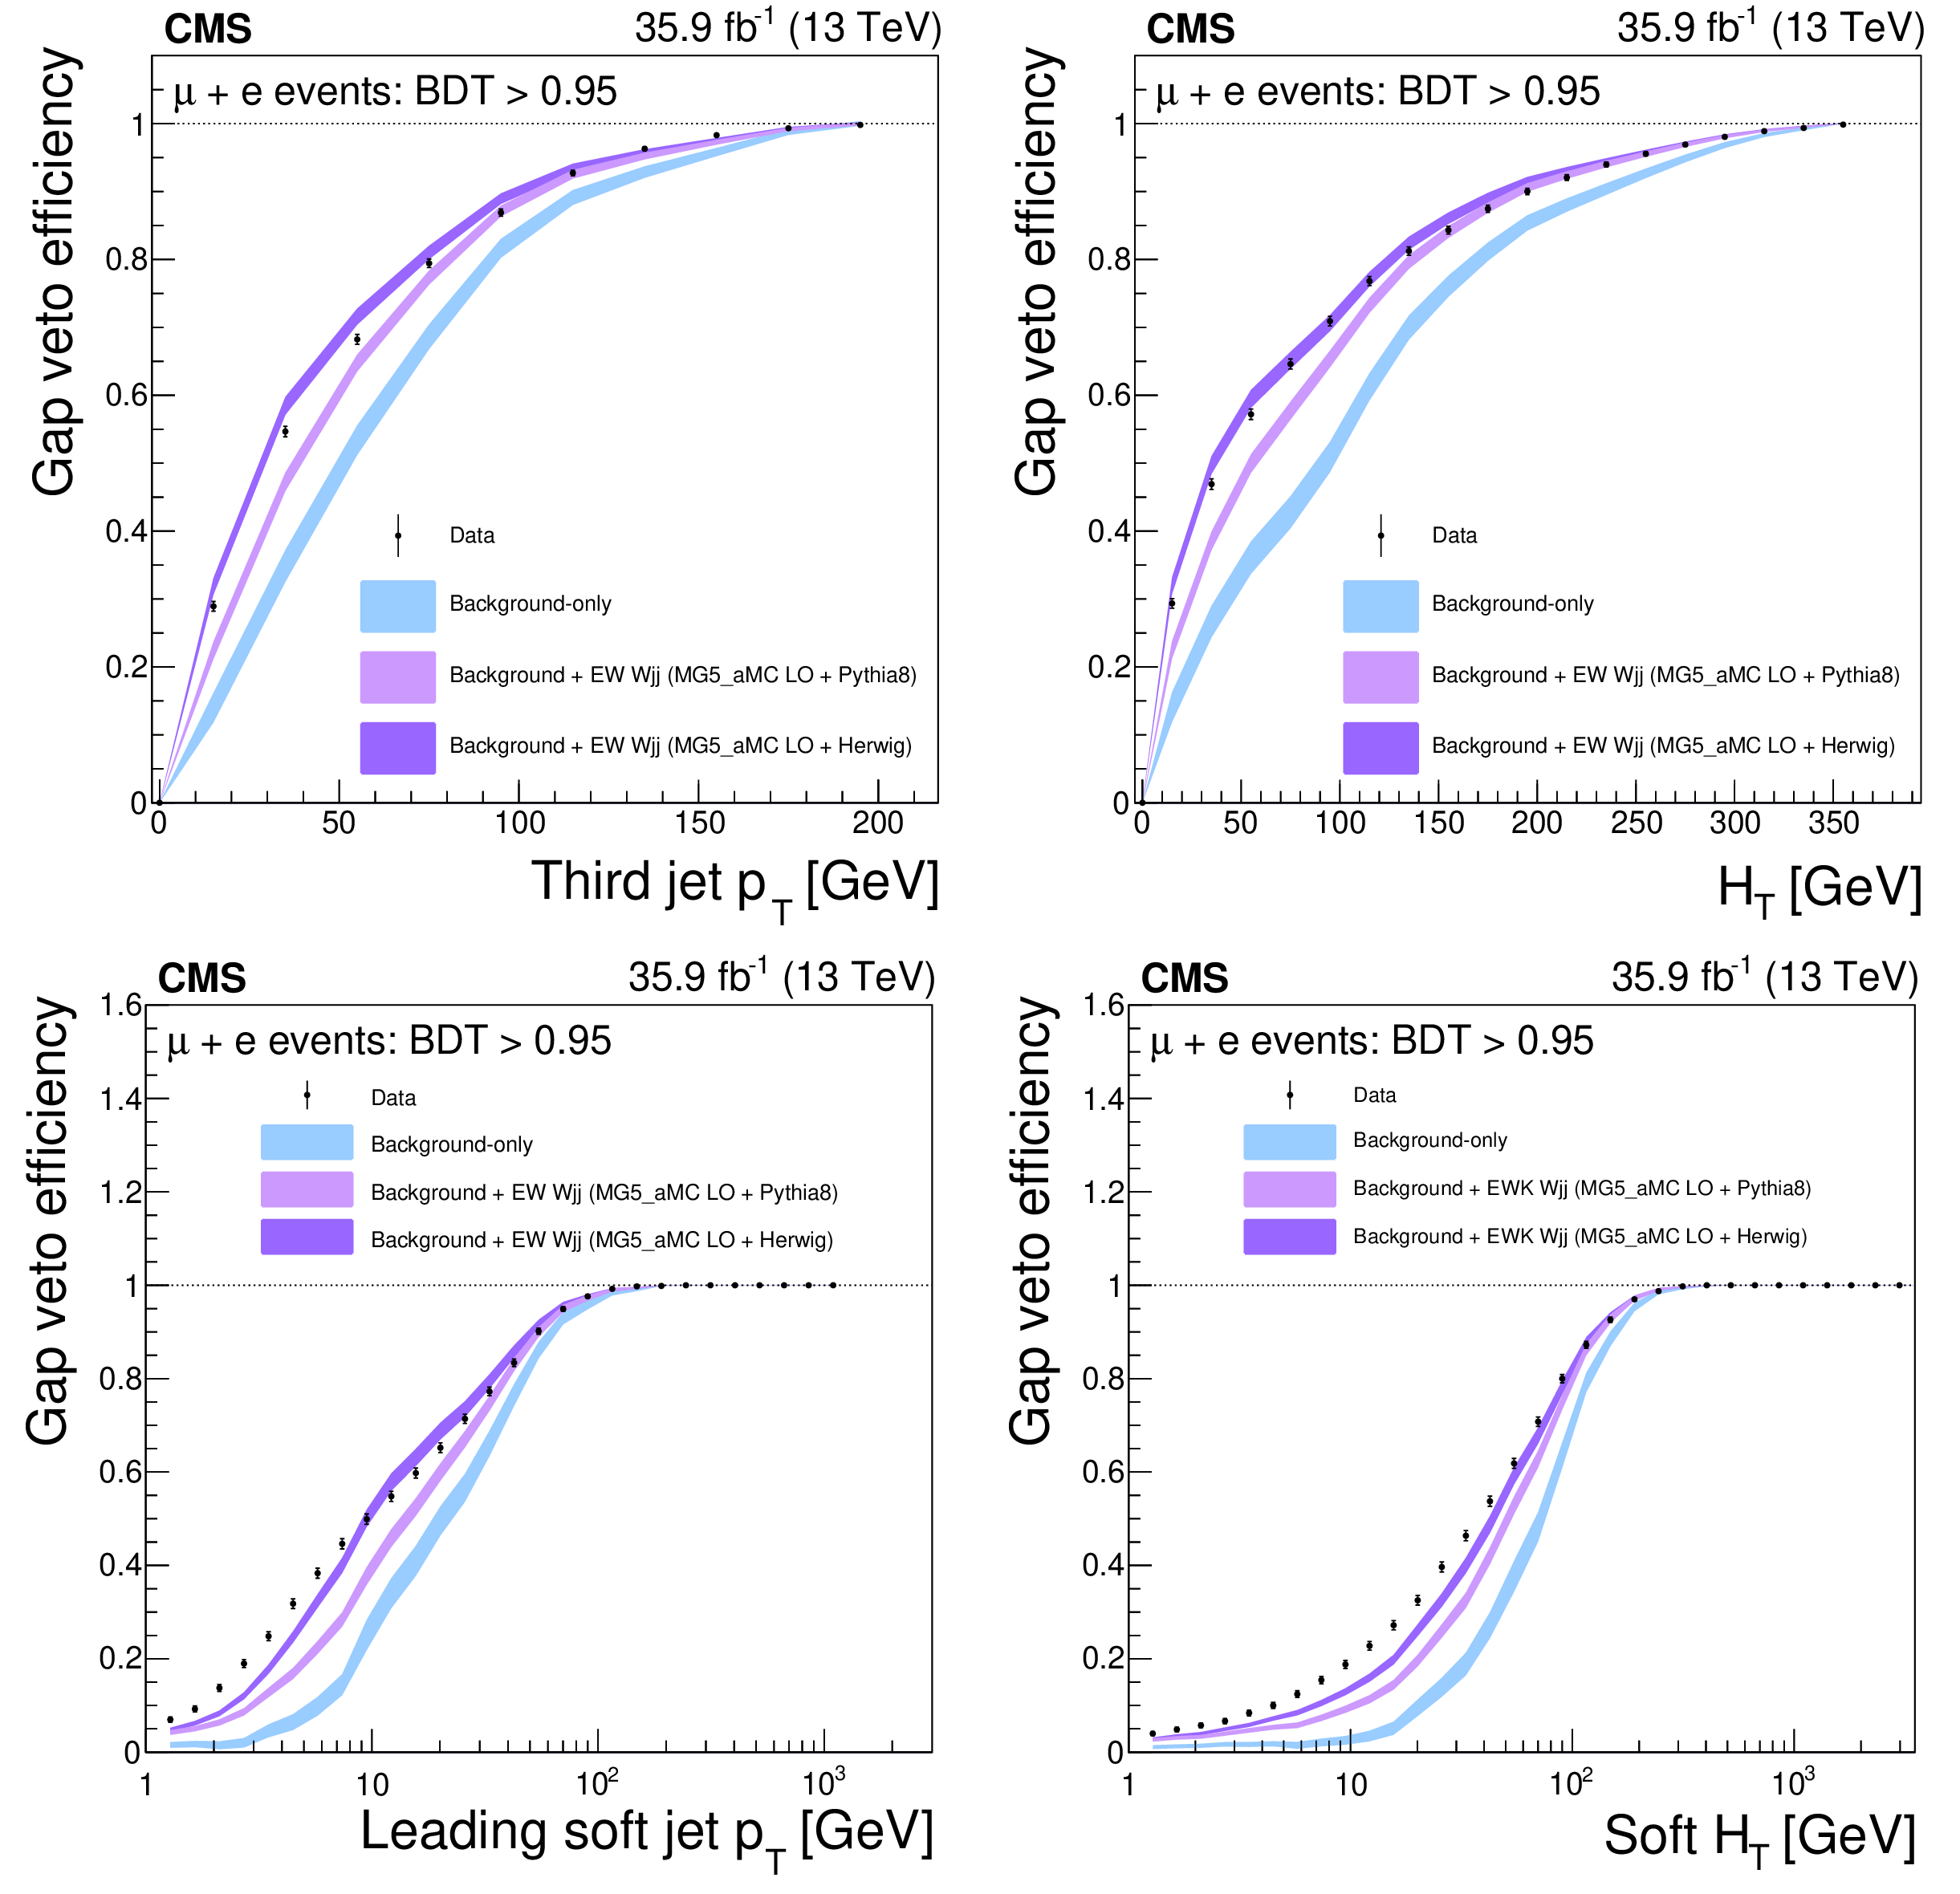
Hadronic activity veto efficiencies in the signal-enriched $\mathrm {BDT} > $ 0.95 region for the muon and electron channels combined, as a function of the leading additional jet ${p_{\mathrm {T}}}$ (upper left), additional jet ${H_{\mathrm {T}}}$ (upper right), leading soft-activity jet ${p_{\mathrm {T}}}$ (lower left), and soft-activity jet ${H_{\mathrm {T}}}$ (lower right). The data are compared with the background-only prediction as well as background+signal with PYTHIA parton showering and background+signal with HERWIG++ parton showering. The uncertainty bands include only the statistical uncertainty in the prediction from simulation. |
png pdf |
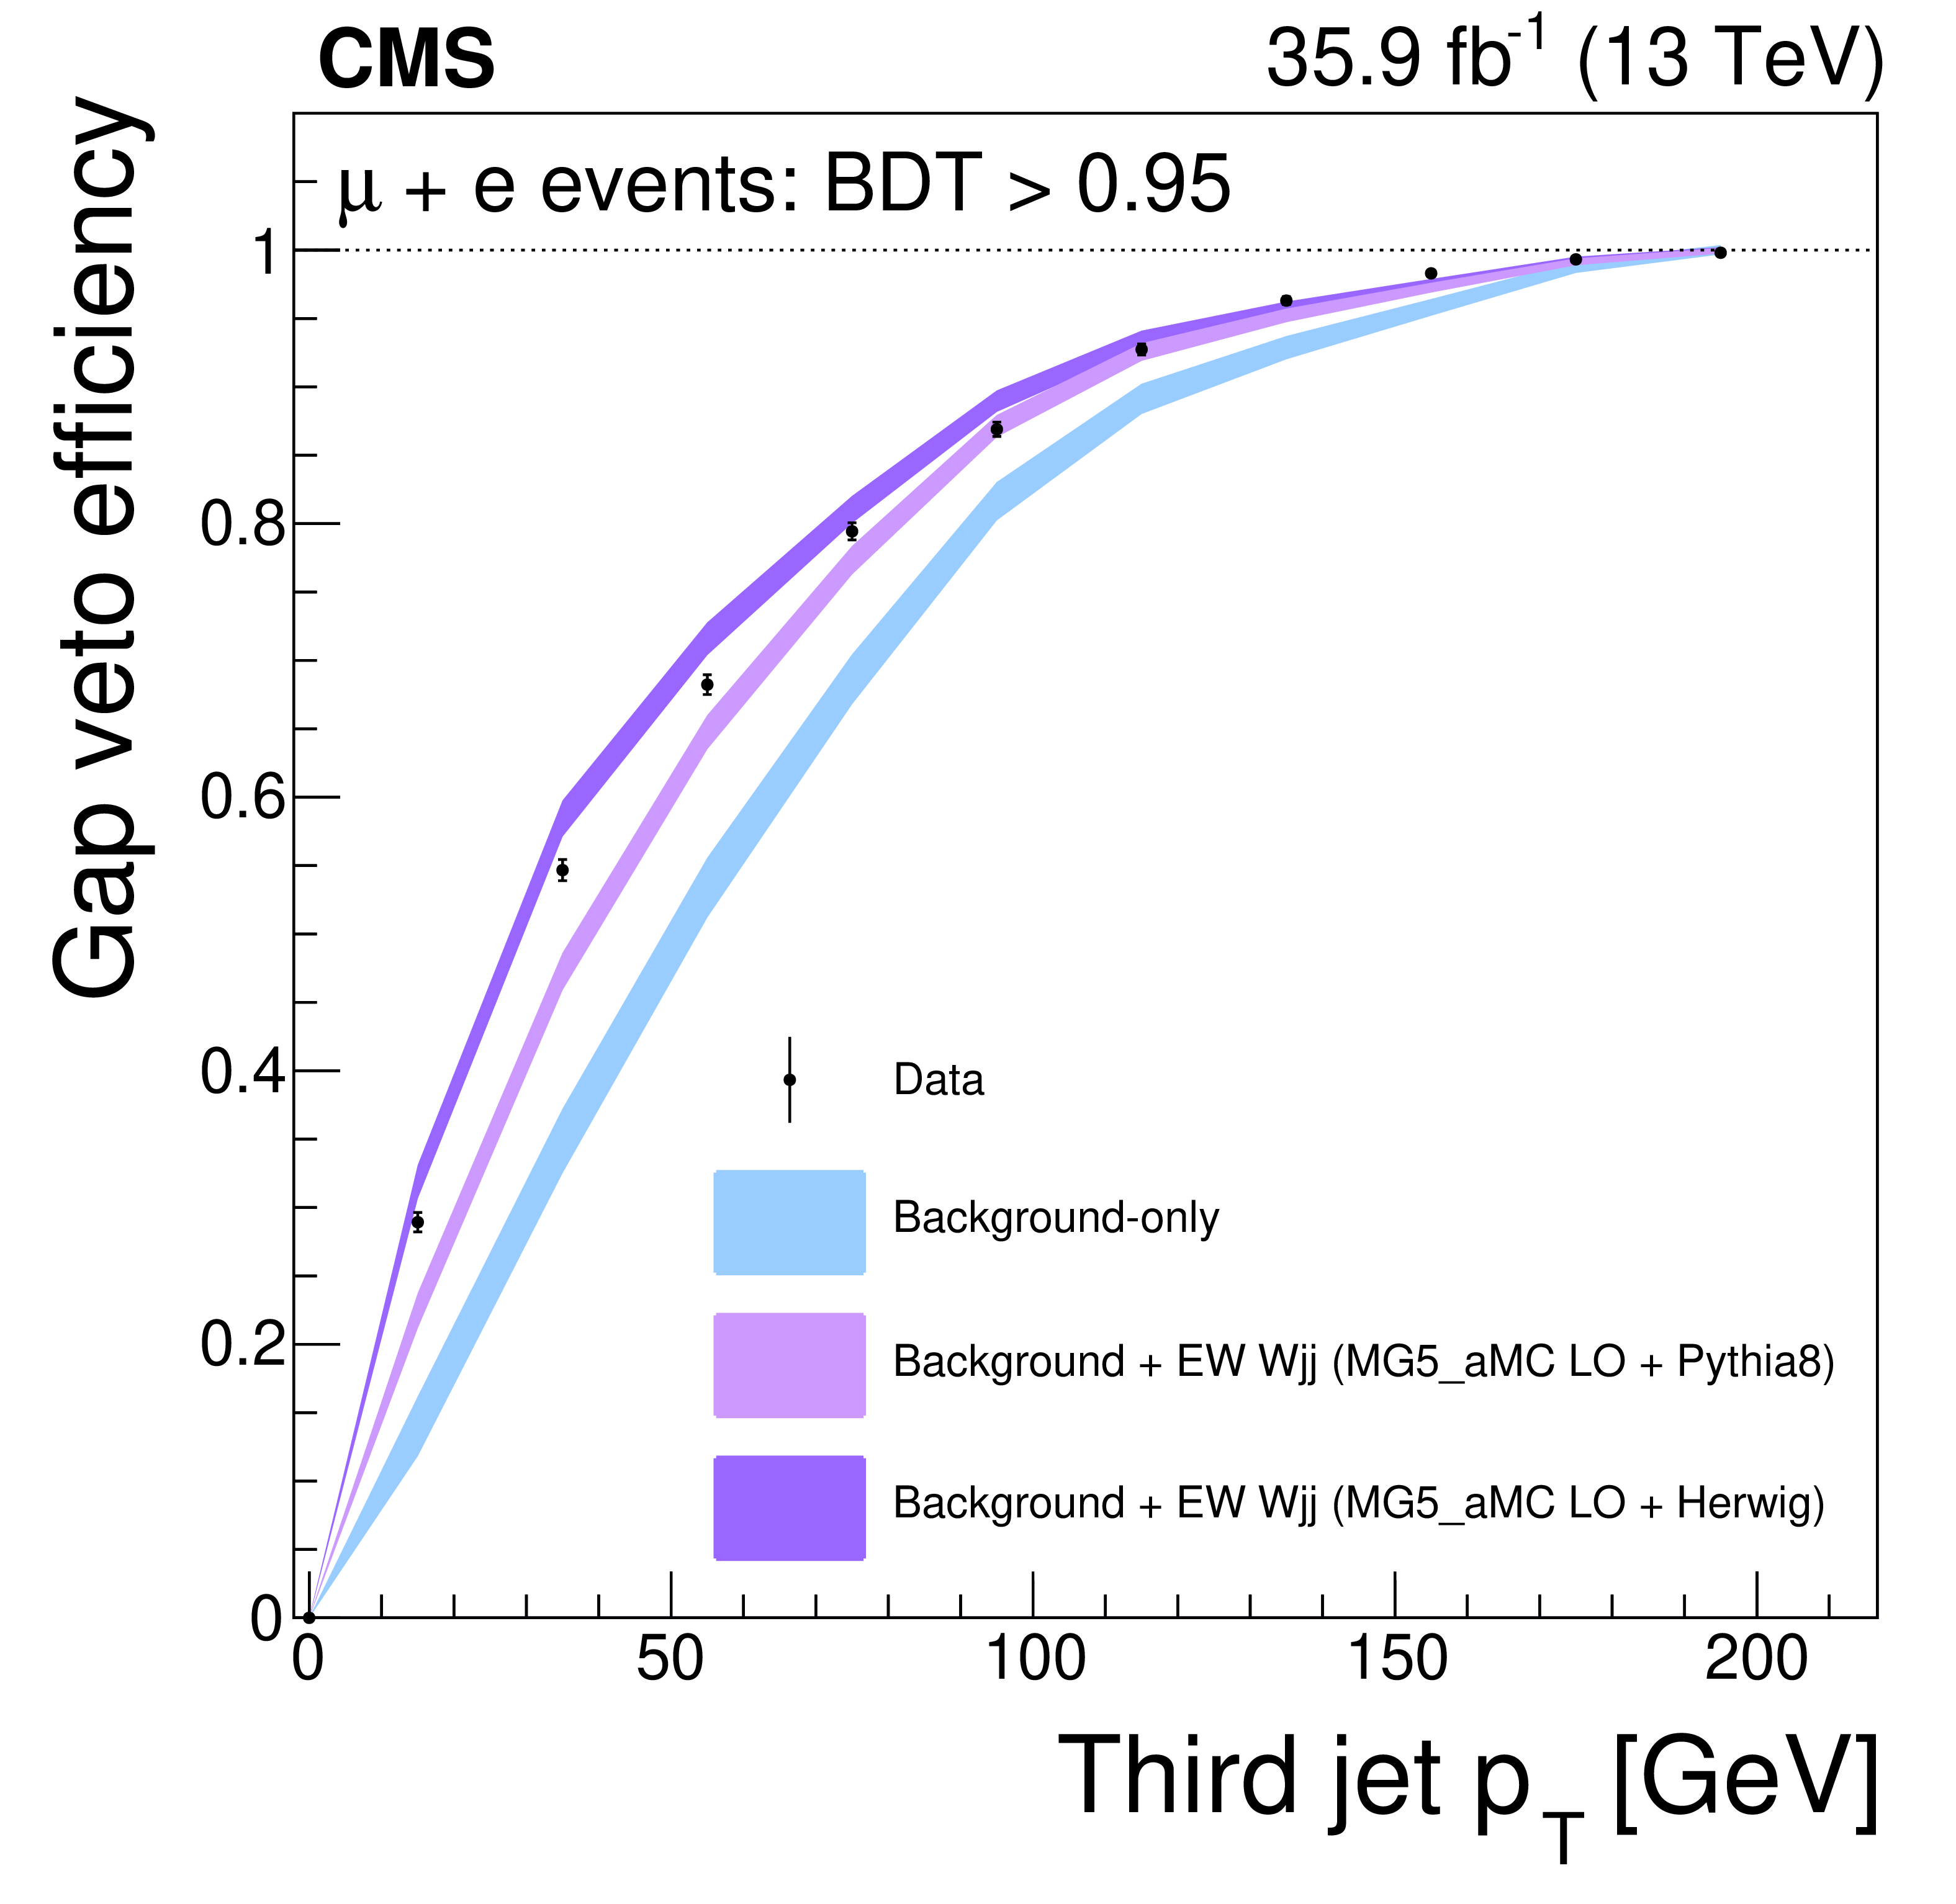
Figure 19-a:
Hadronic activity veto efficiencies in the signal-enriched $\mathrm {BDT} > $ 0.95 region for the muon and electron channels combined, as a function of the leading additional jet ${p_{\mathrm {T}}}$. The data are compared with the background-only prediction as well as background+signal with PYTHIA parton showering and background+signal with HERWIG++ parton showering. The uncertainty bands include only the statistical uncertainty in the prediction from simulation. |
png pdf |
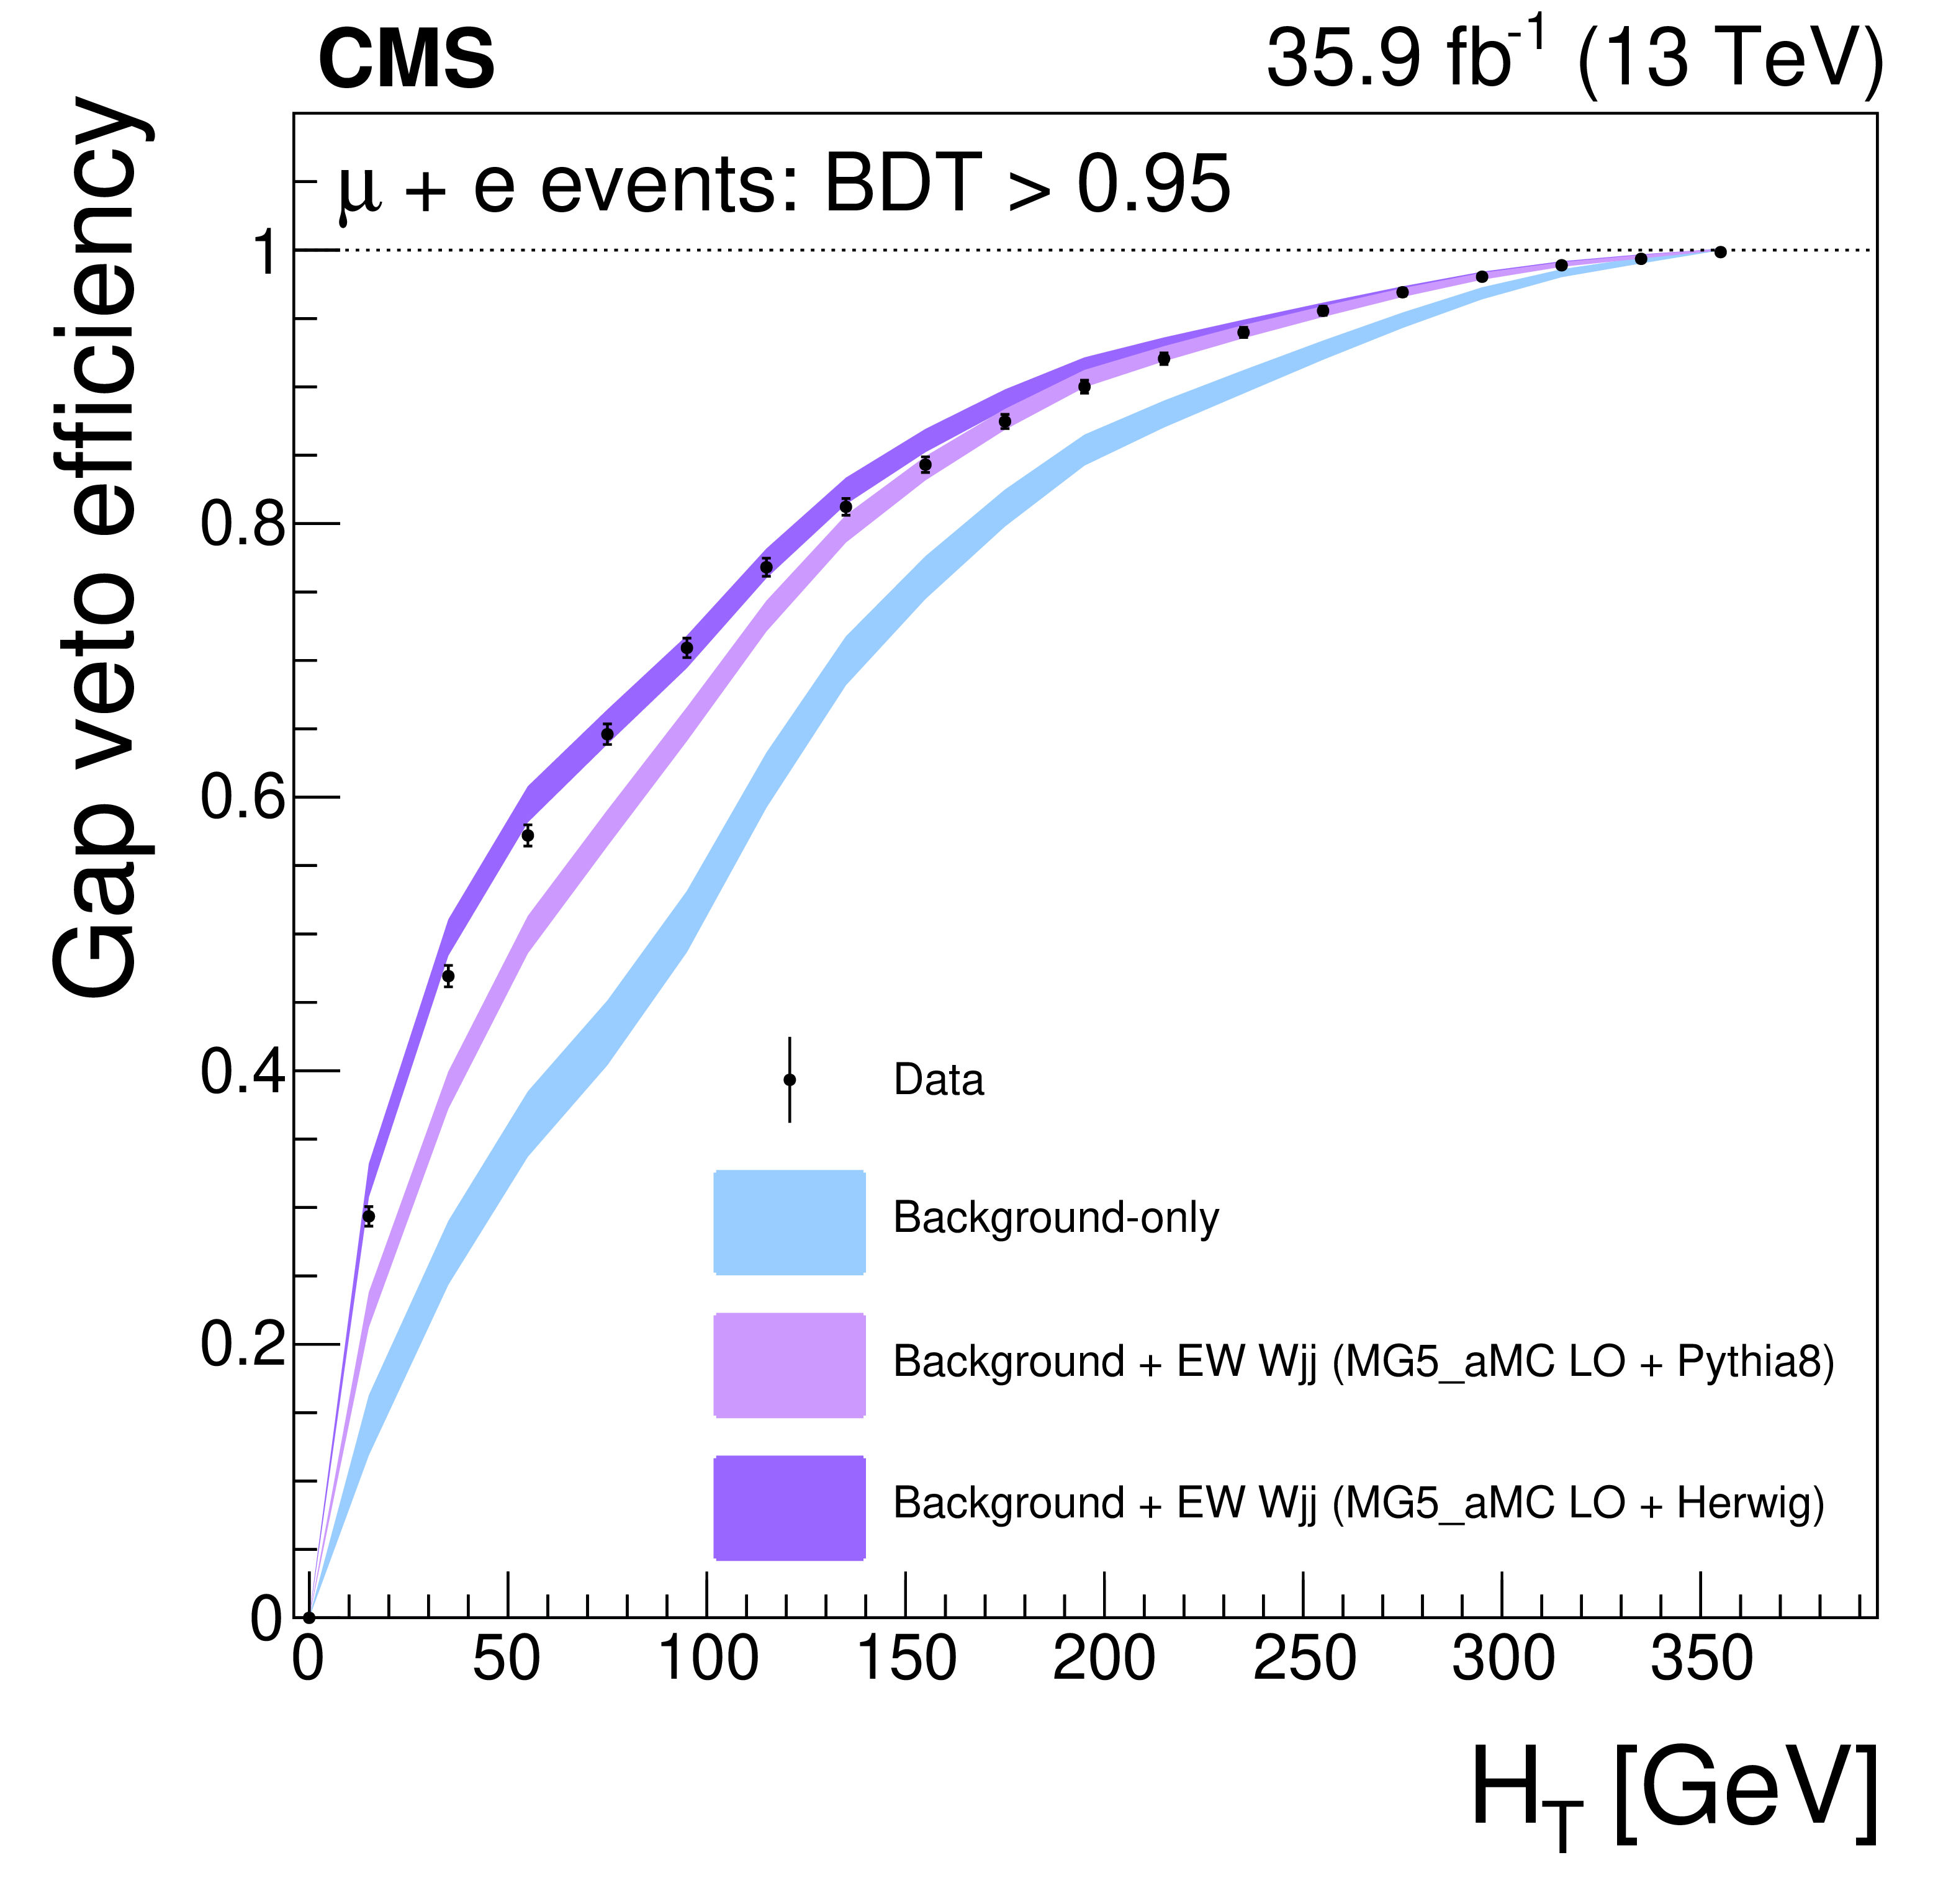
Figure 19-b:
Hadronic activity veto efficiencies in the signal-enriched $\mathrm {BDT} > $ 0.95 region for the muon and electron channels combined, as a function of additional jet ${H_{\mathrm {T}}}$. The data are compared with the background-only prediction as well as background+signal with PYTHIA parton showering and background+signal with HERWIG++ parton showering. The uncertainty bands include only the statistical uncertainty in the prediction from simulation. |
png pdf |
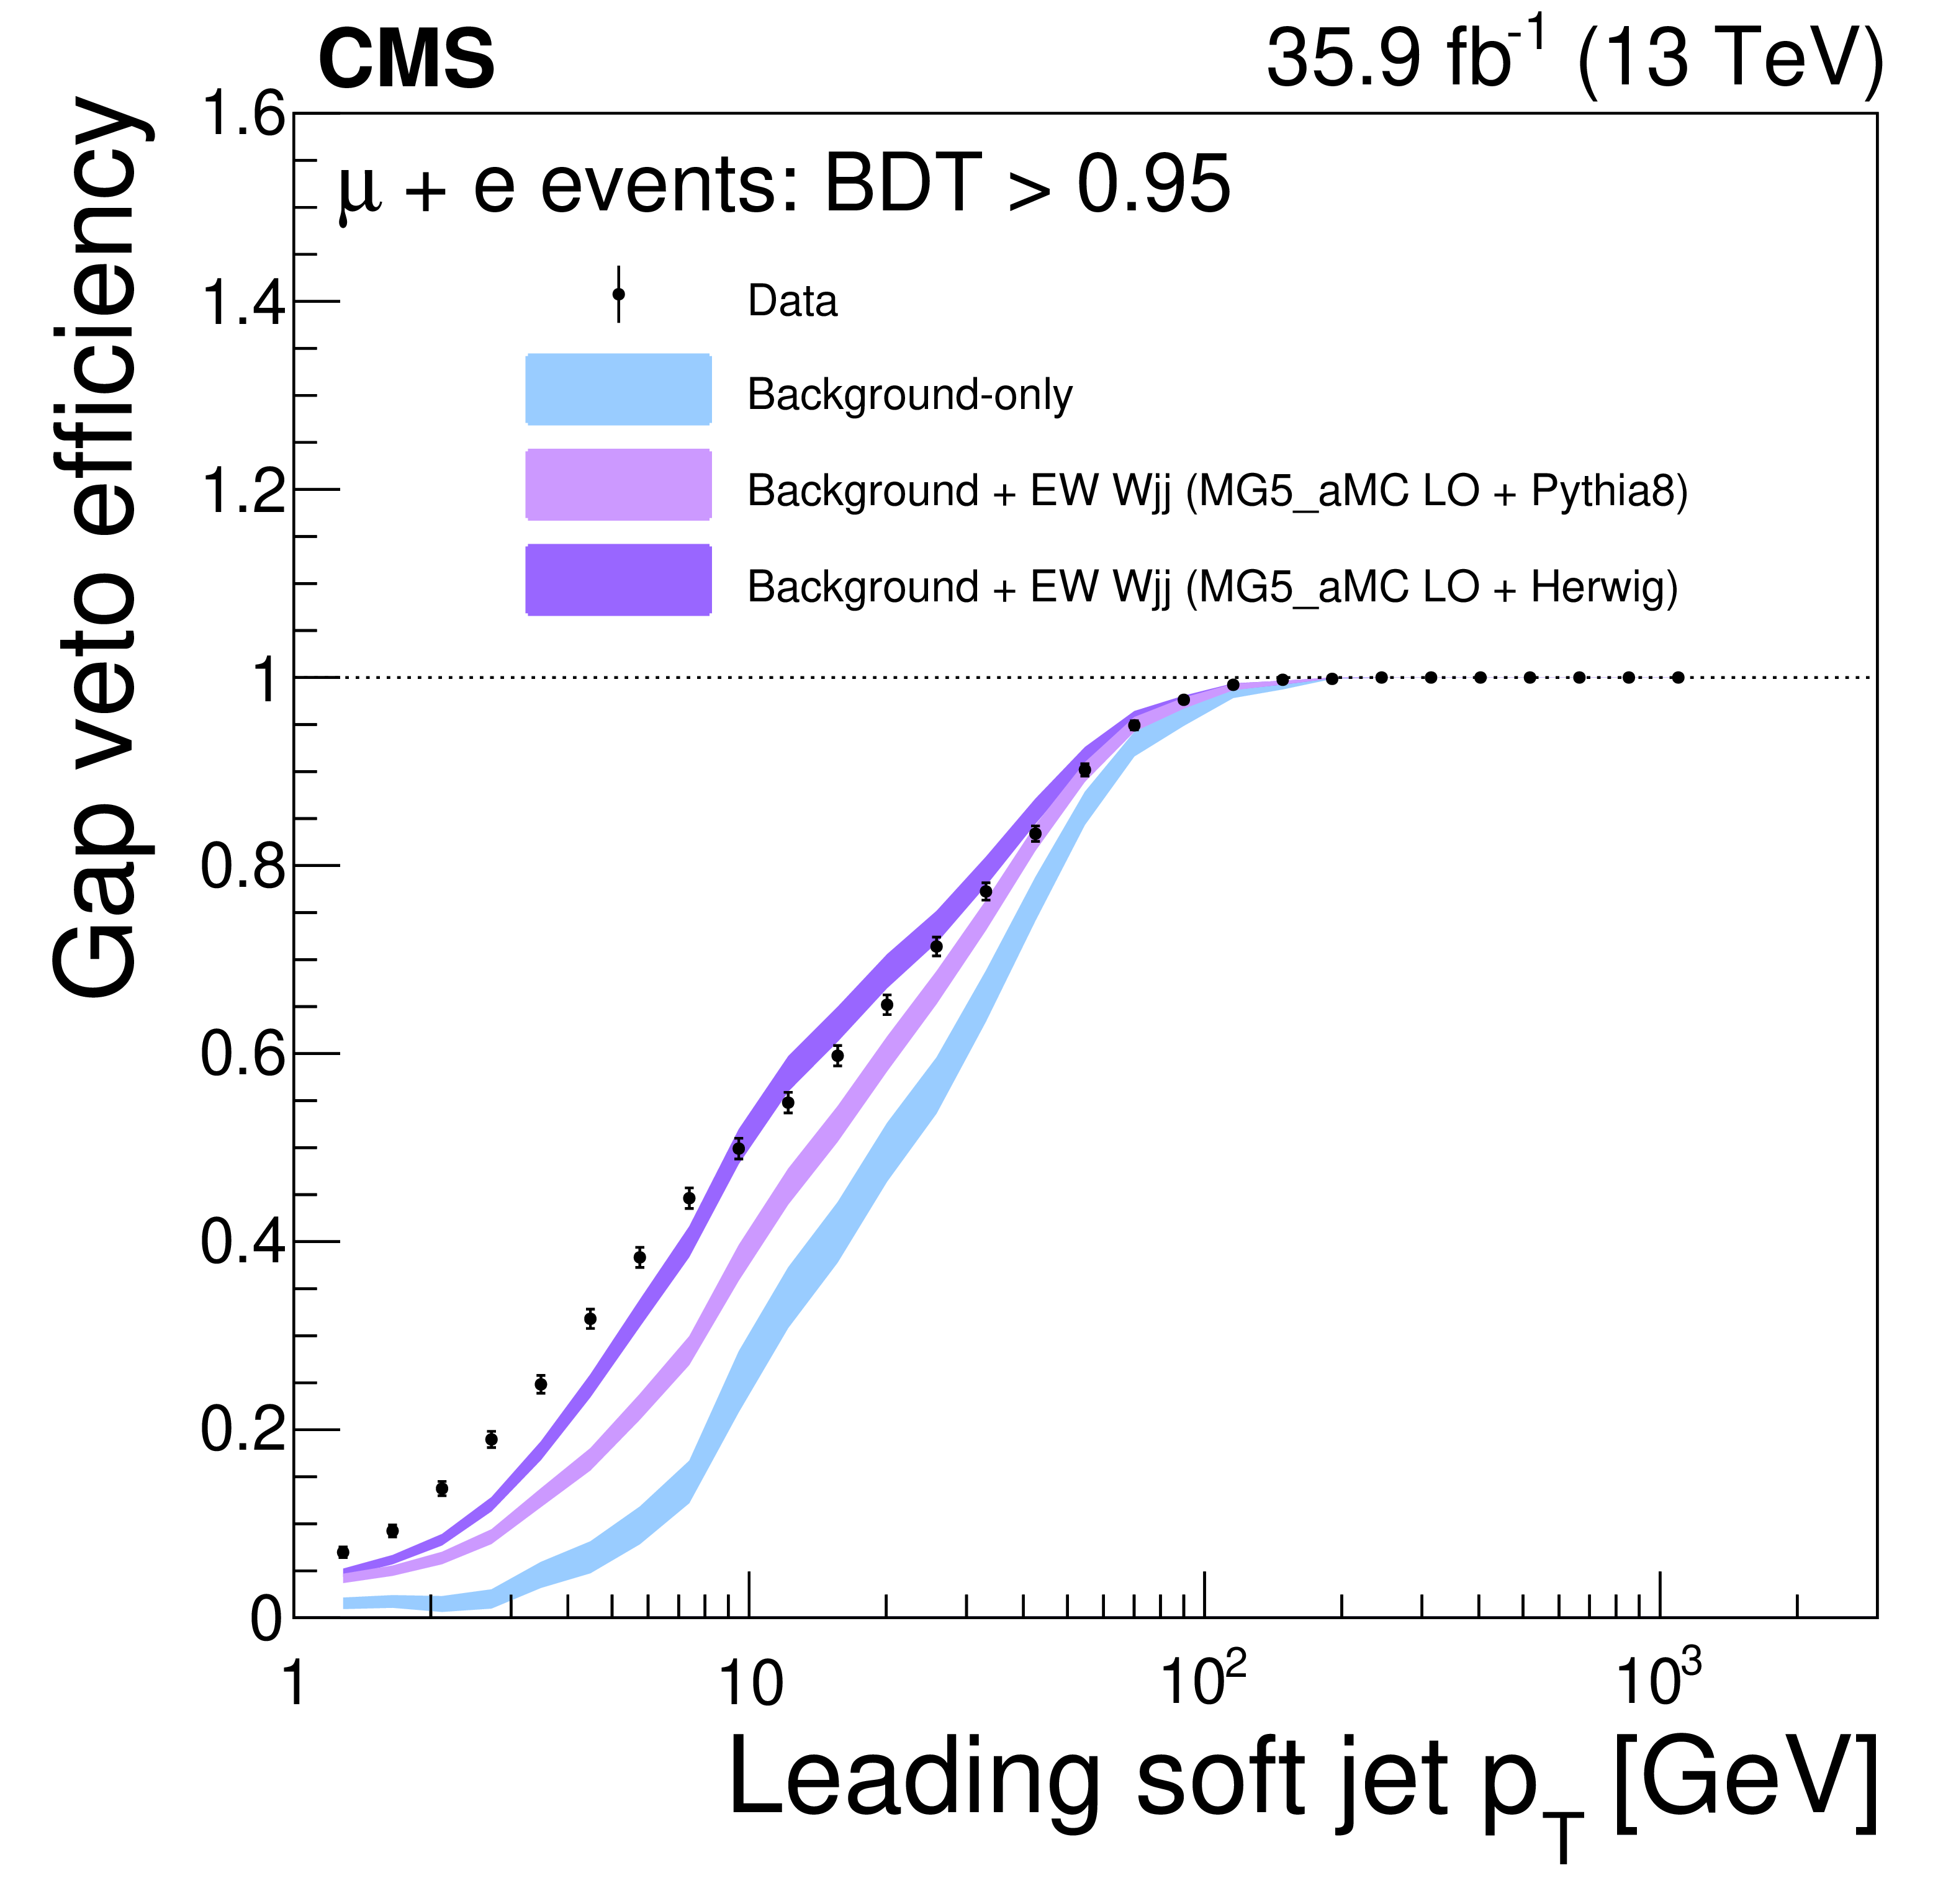
Figure 19-c:
Hadronic activity veto efficiencies in the signal-enriched $\mathrm {BDT} > $ 0.95 region for the muon and electron channels combined, as a function of leading soft-activity jet ${p_{\mathrm {T}}}$. The data are compared with the background-only prediction as well as background+signal with PYTHIA parton showering and background+signal with HERWIG++ parton showering. The uncertainty bands include only the statistical uncertainty in the prediction from simulation. |

png pdf |
Figure 19-d:
Hadronic activity veto efficiencies in the signal-enriched $\mathrm {BDT} > $ 0.95 region for the muon and electron channels combined, as a function of soft-activity jet ${H_{\mathrm {T}}}$. The data are compared with the background-only prediction as well as background+signal with PYTHIA parton showering and background+signal with HERWIG++ parton showering. The uncertainty bands include only the statistical uncertainty in the prediction from simulation. |
png pdf |
Figure 20-a:
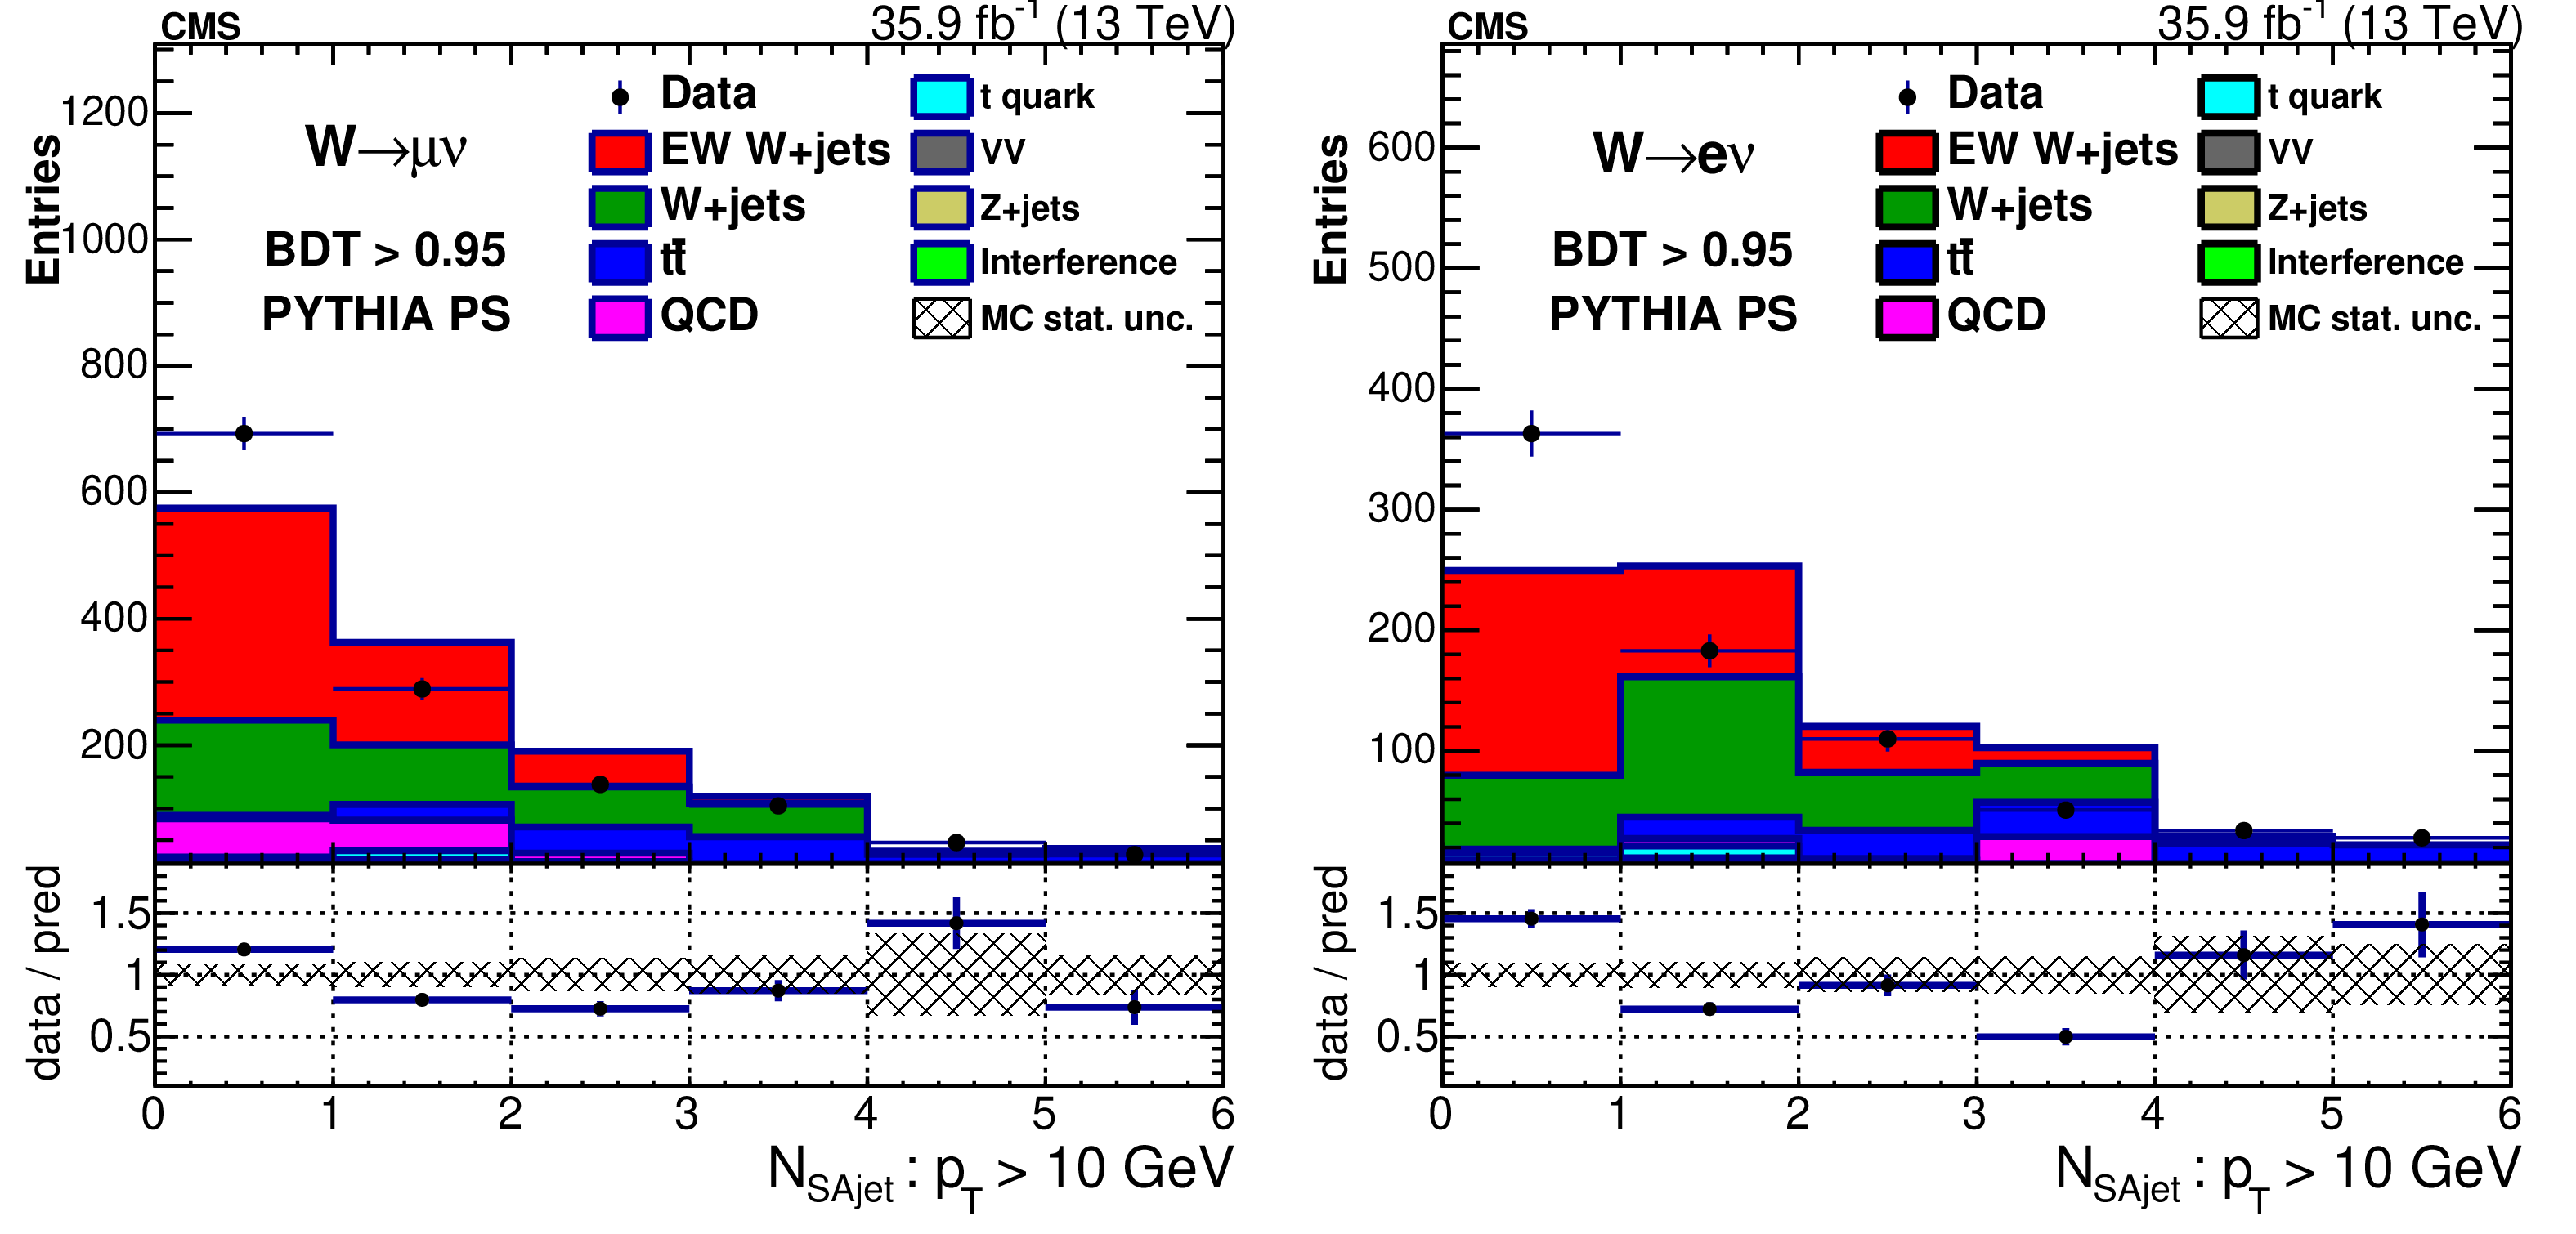
Number of soft activity jets with $ {p_{\mathrm {T}}} > $ 10 GeV in the rapidity gap for $\mathrm {BDT} > $ 0.95 in the muon (left) and electron (right) channels including signal with PYTHIA parton showering. In all plots the last bin contains overflow events. |
png pdf |
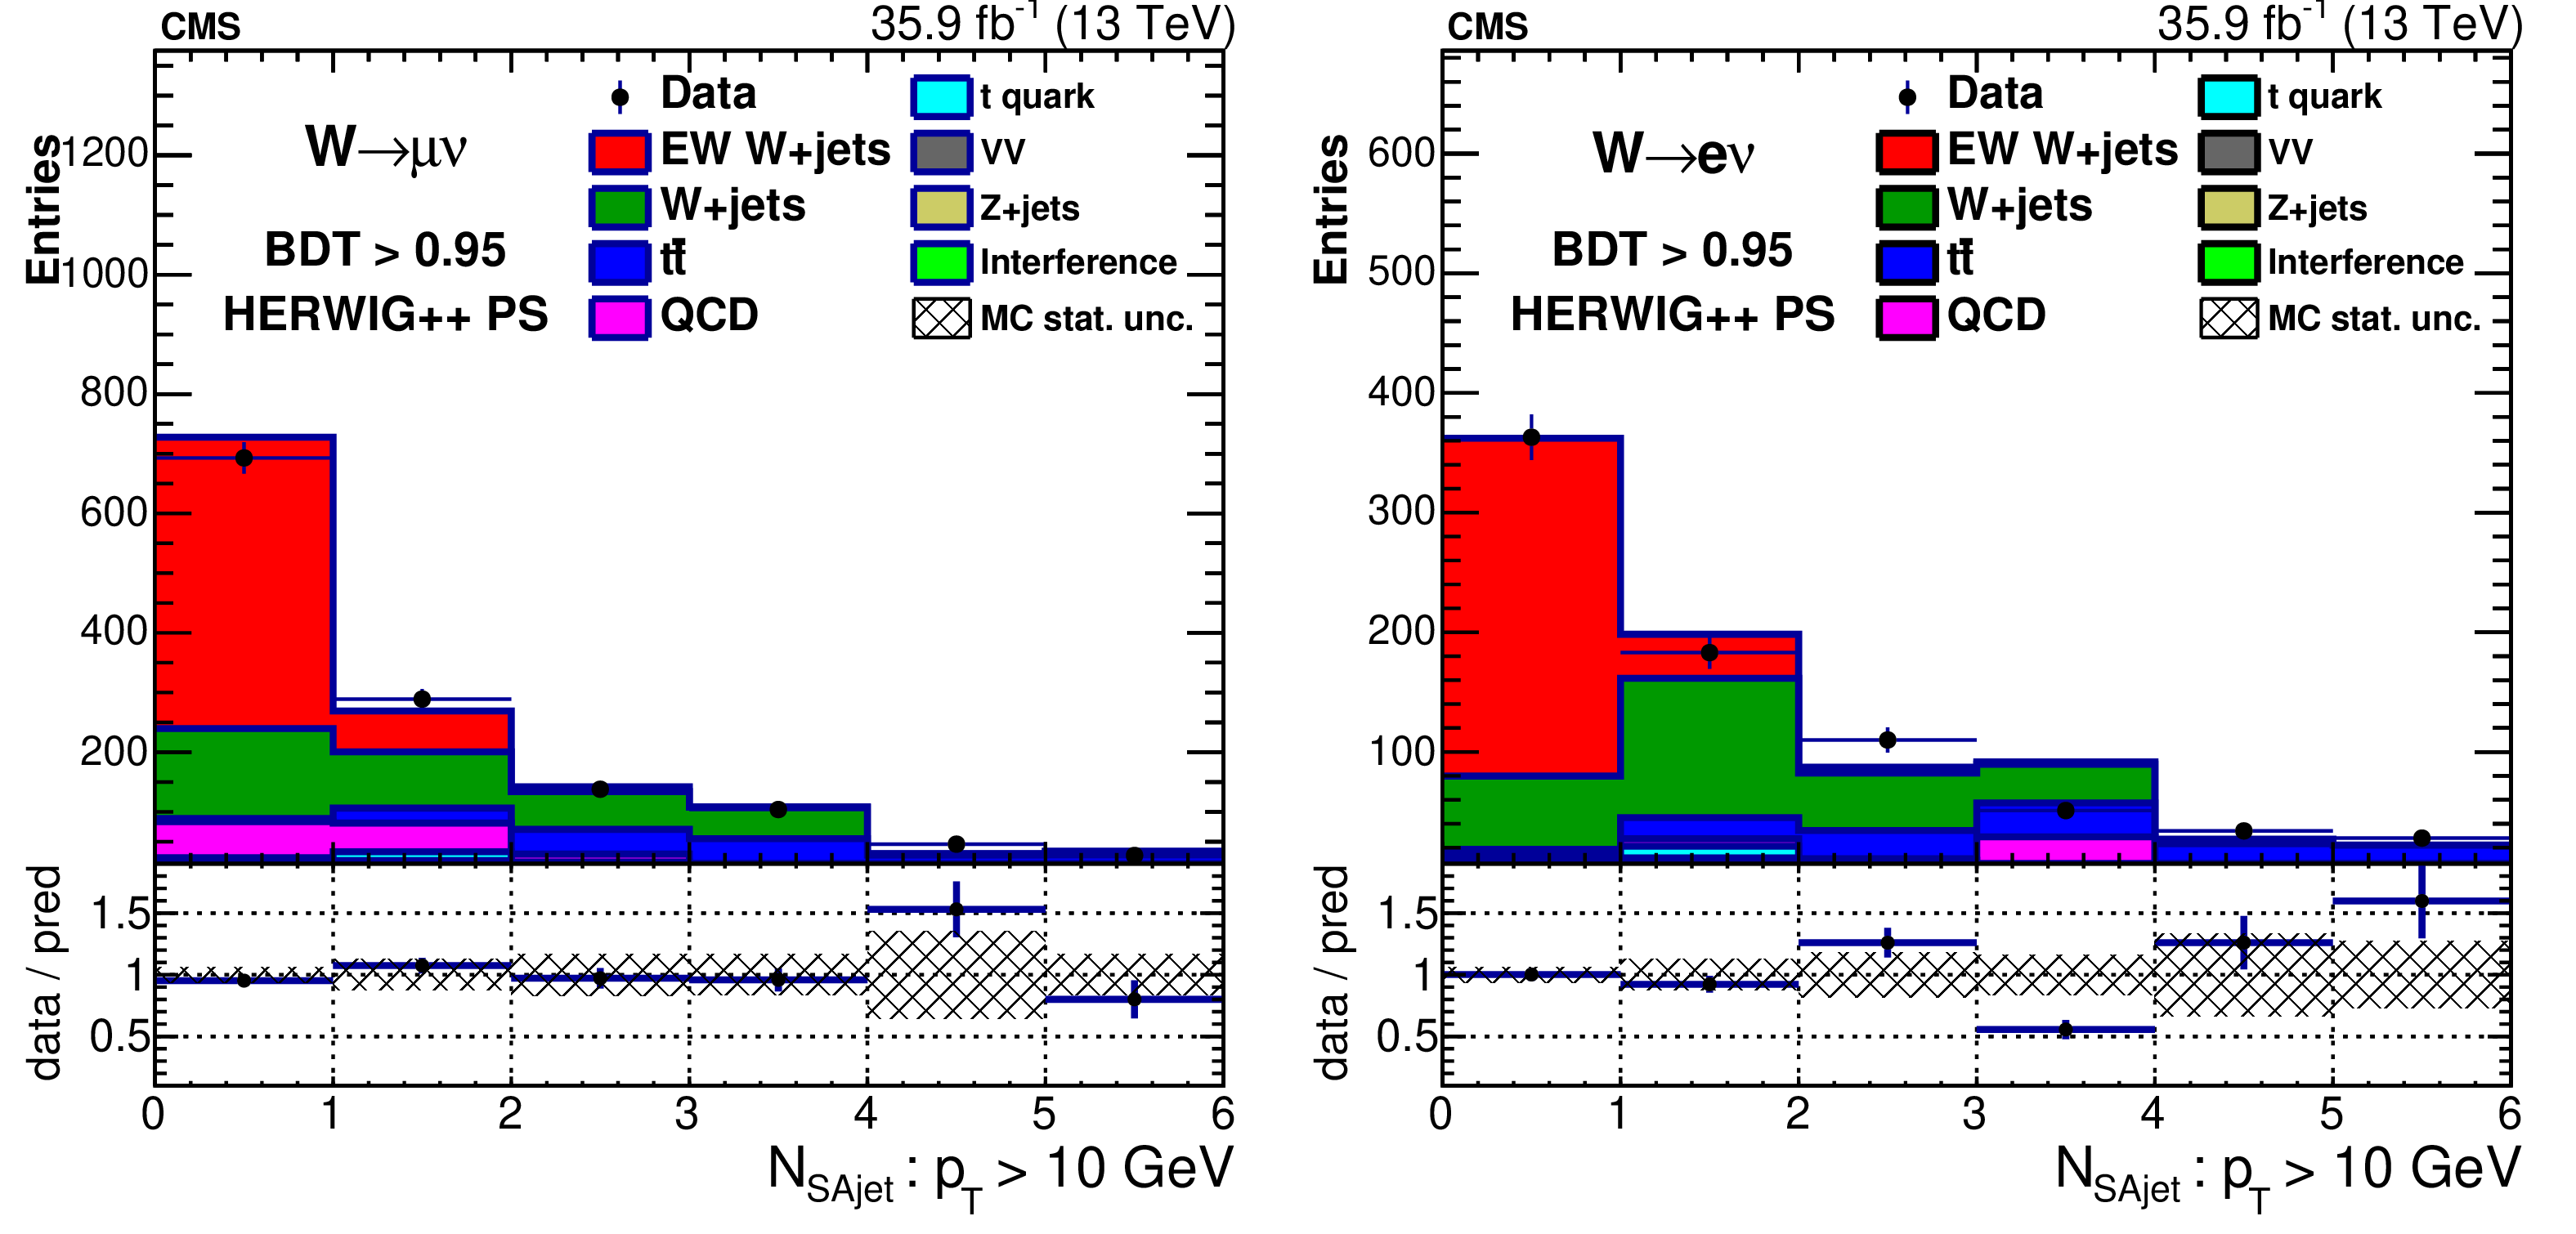
Figure 20-b:
Number of soft activity jets with $ {p_{\mathrm {T}}} > $ 10 GeV in the rapidity gap for $\mathrm {BDT} > $ 0.95 in the muon (left) and electron (right) channels including signal with HERWIG++ parton showering. In all plots the last bin contains overflow events. |
png pdf |
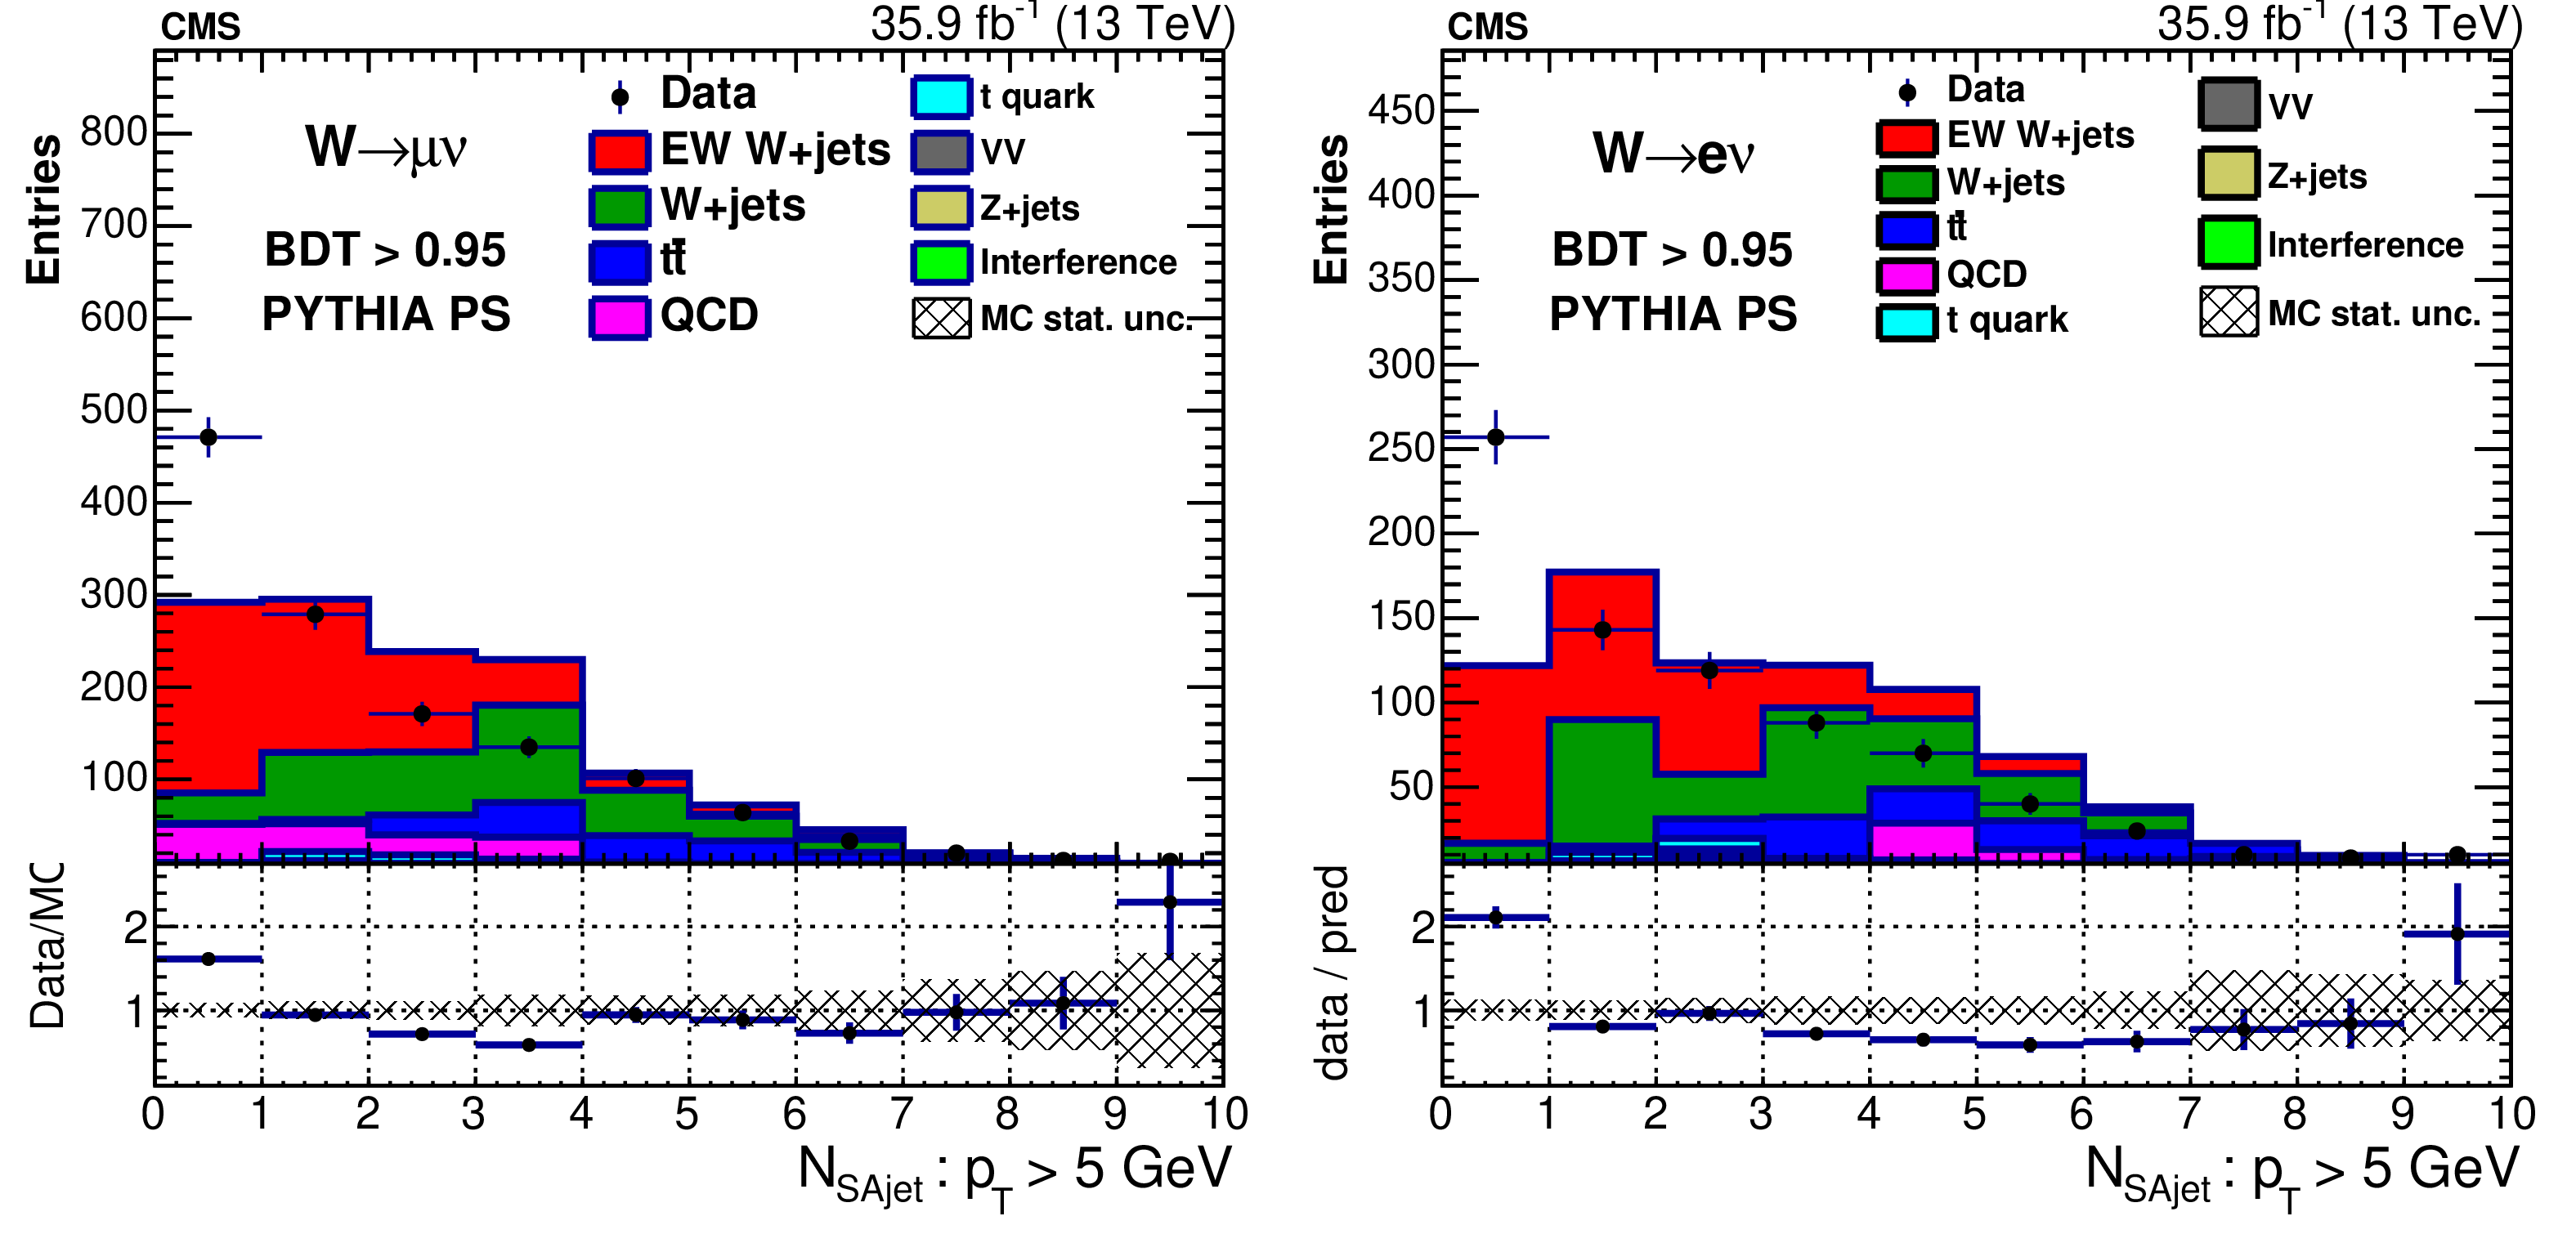
Figure 21-a:
Number of soft activity jets with $ {p_{\mathrm {T}}} > $ 5 GeV in the rapidity gap for $\mathrm {BDT} > $ 0.95 in the muon (left) and electron (right) channels including signal with PYTHIA parton showering. |
png pdf |
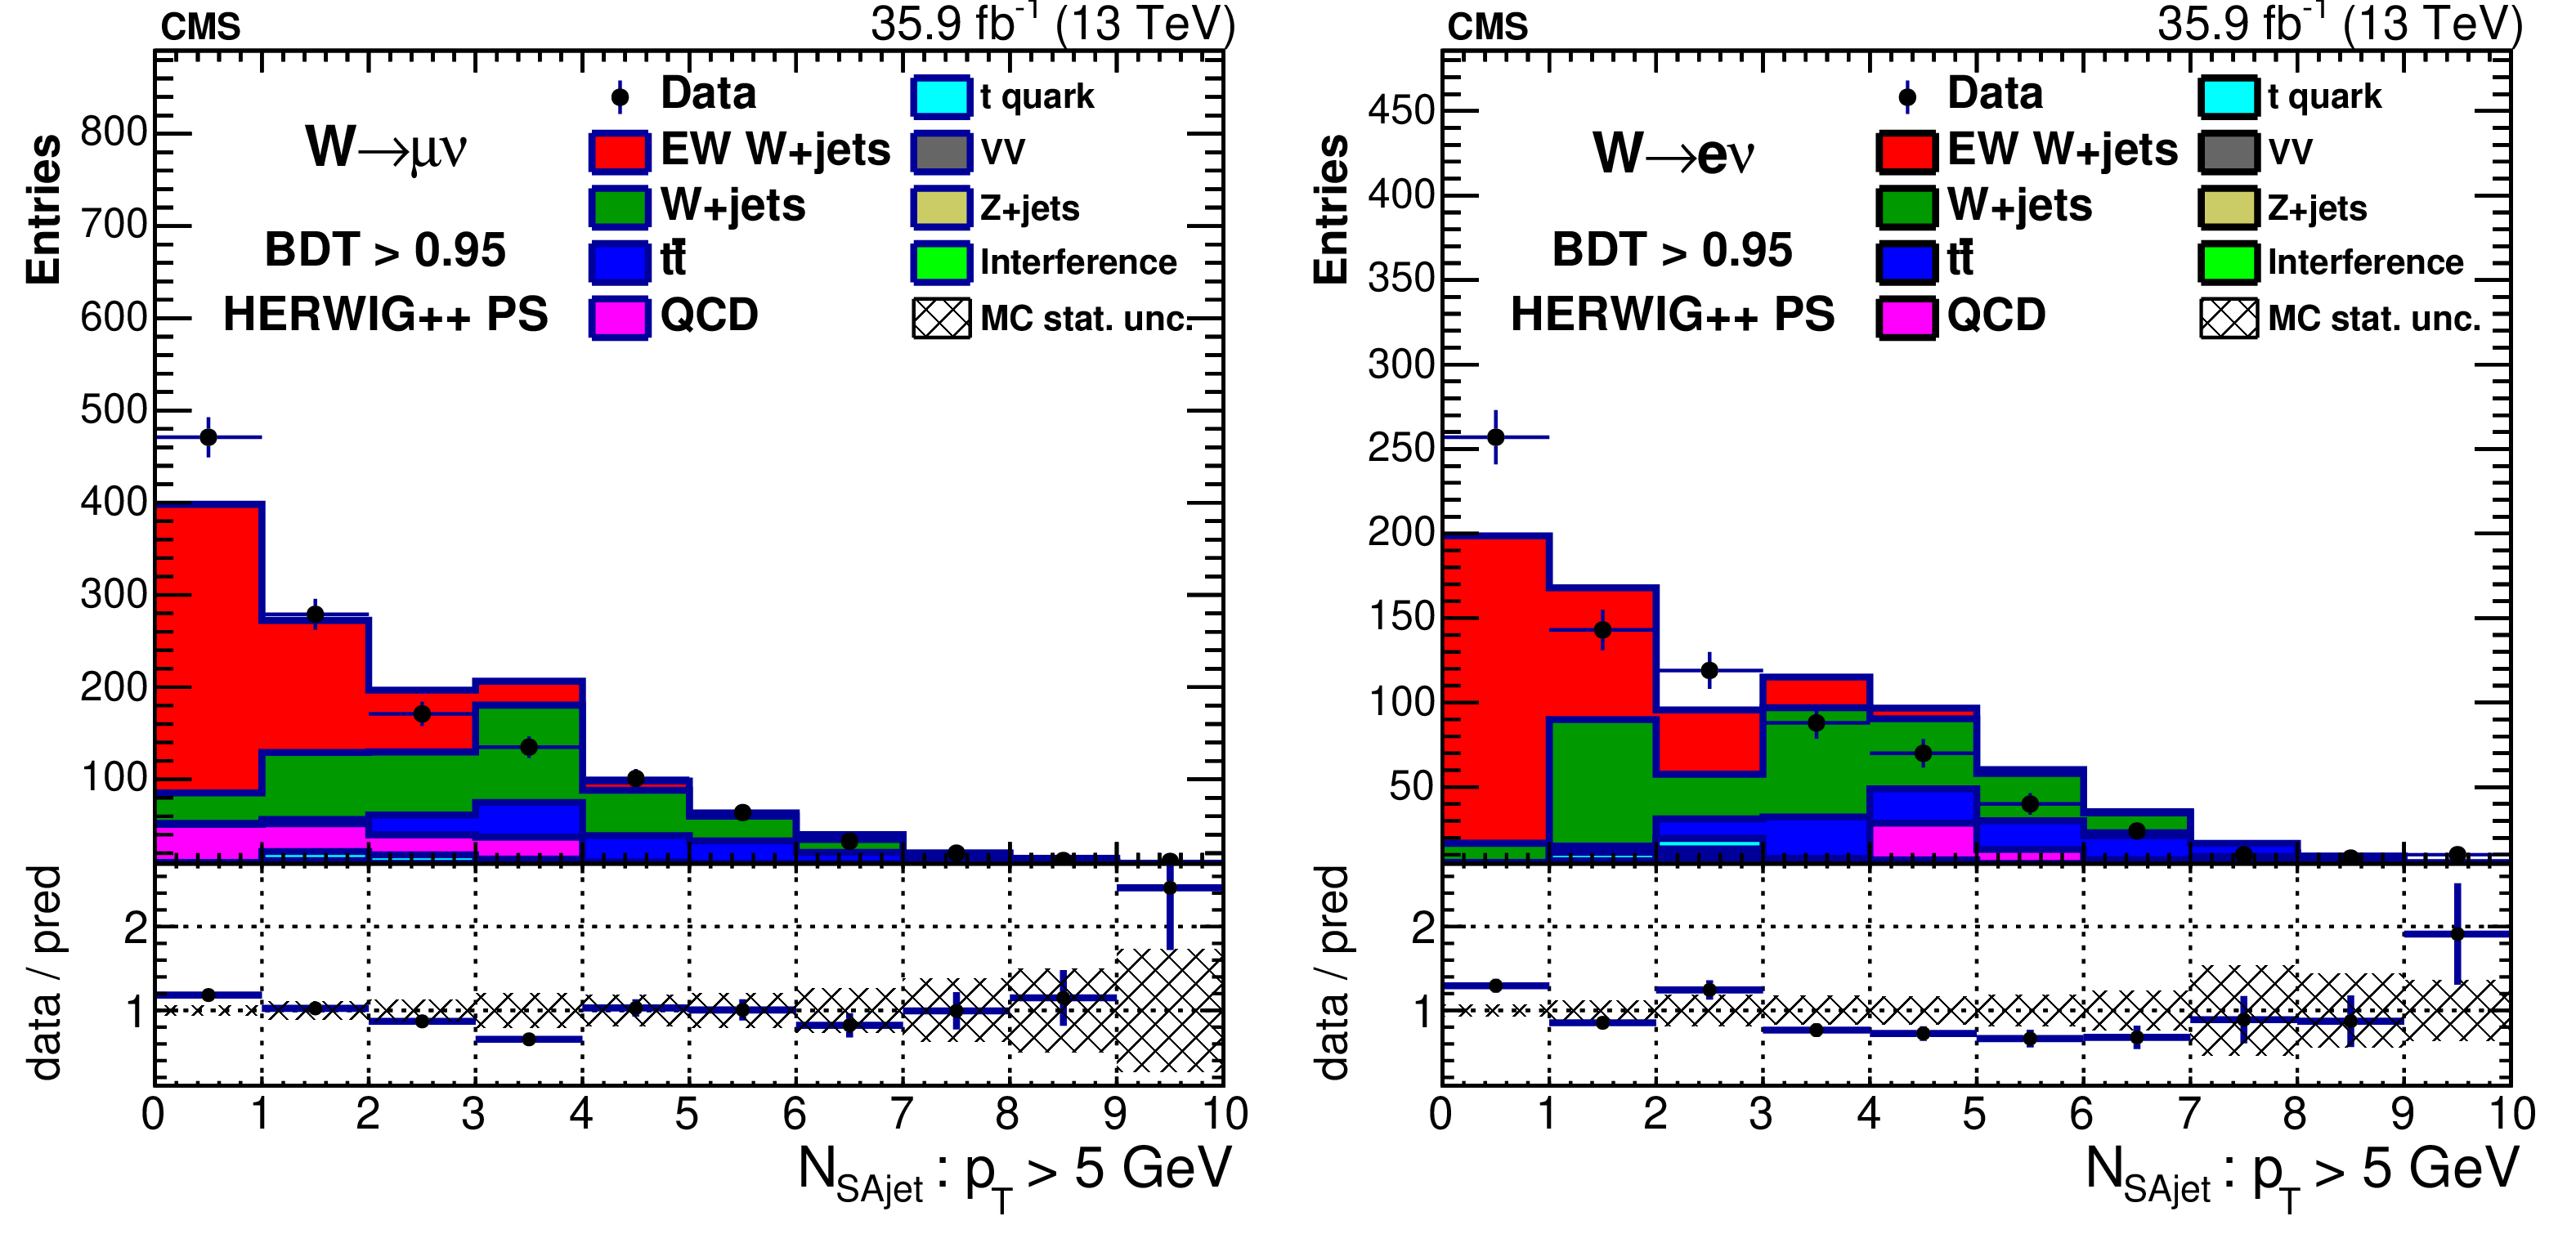
Figure 21-b:
Number of soft activity jets with $ {p_{\mathrm {T}}} > $ 5 GeV in the rapidity gap for $\mathrm {BDT} > $ 0.95 in the muon (left) and electron (right) channels including signal with HERWIG++ parton showering. |
png pdf |
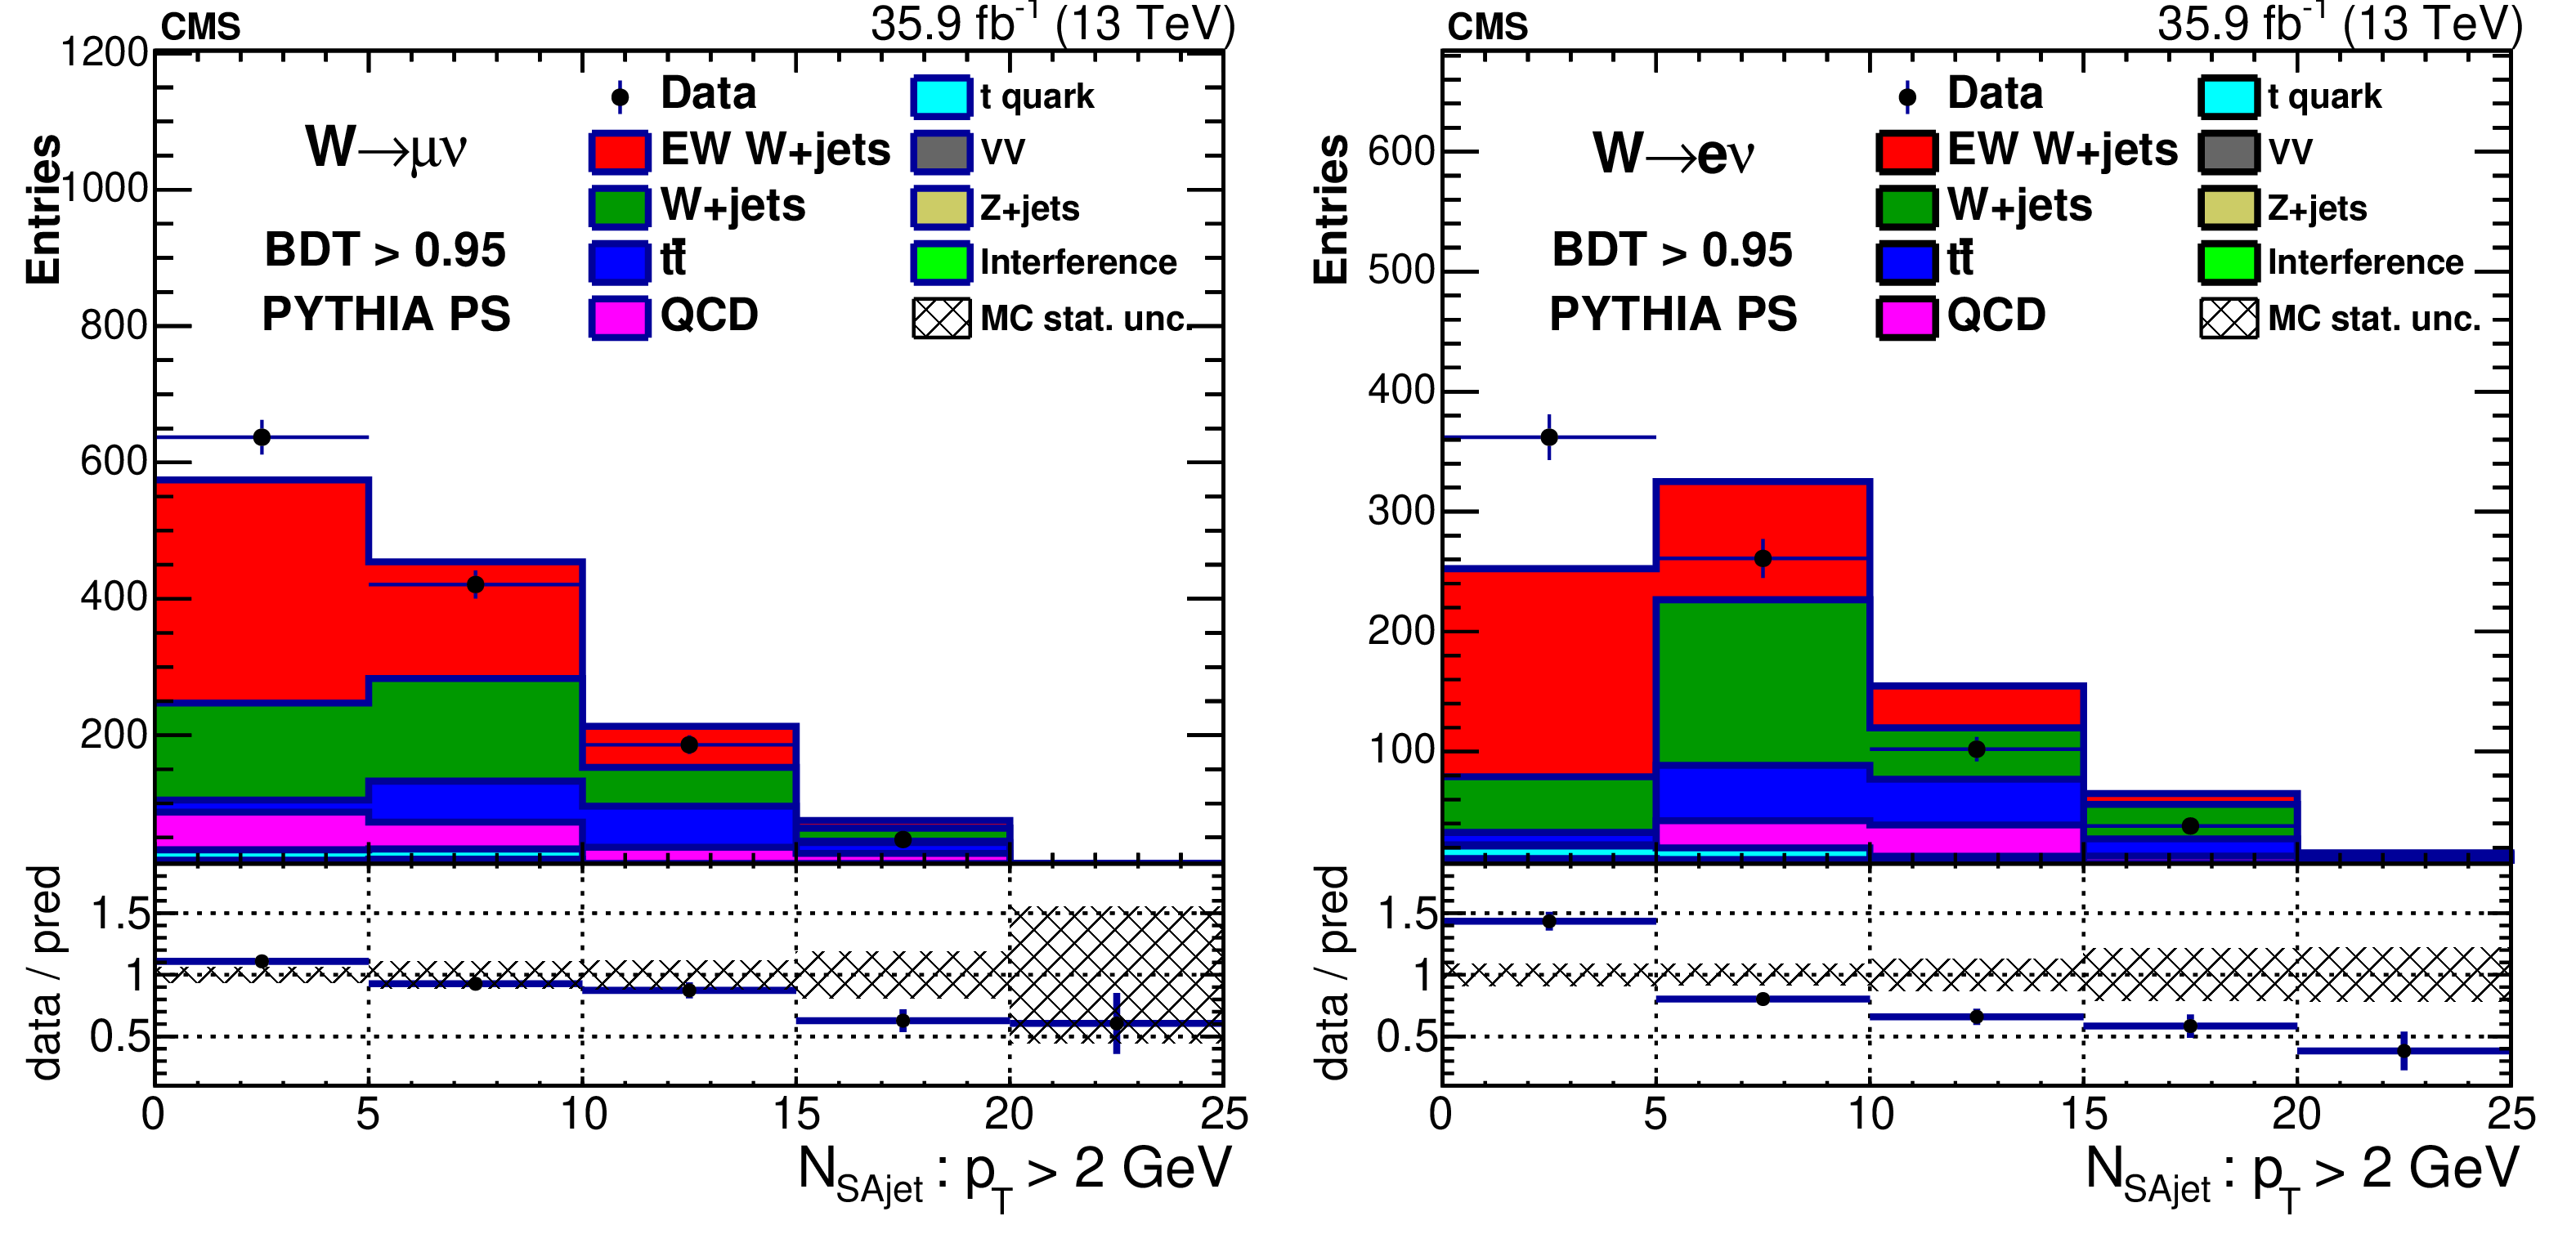
Figure 22-a:
Number of soft activity jets with $ {p_{\mathrm {T}}} > $ 2 GeV in the rapidity gap for $\mathrm {BDT} > $ 0.95 in the muon (left) and electron (right) channels including signal with PYTHIA parton showering. |
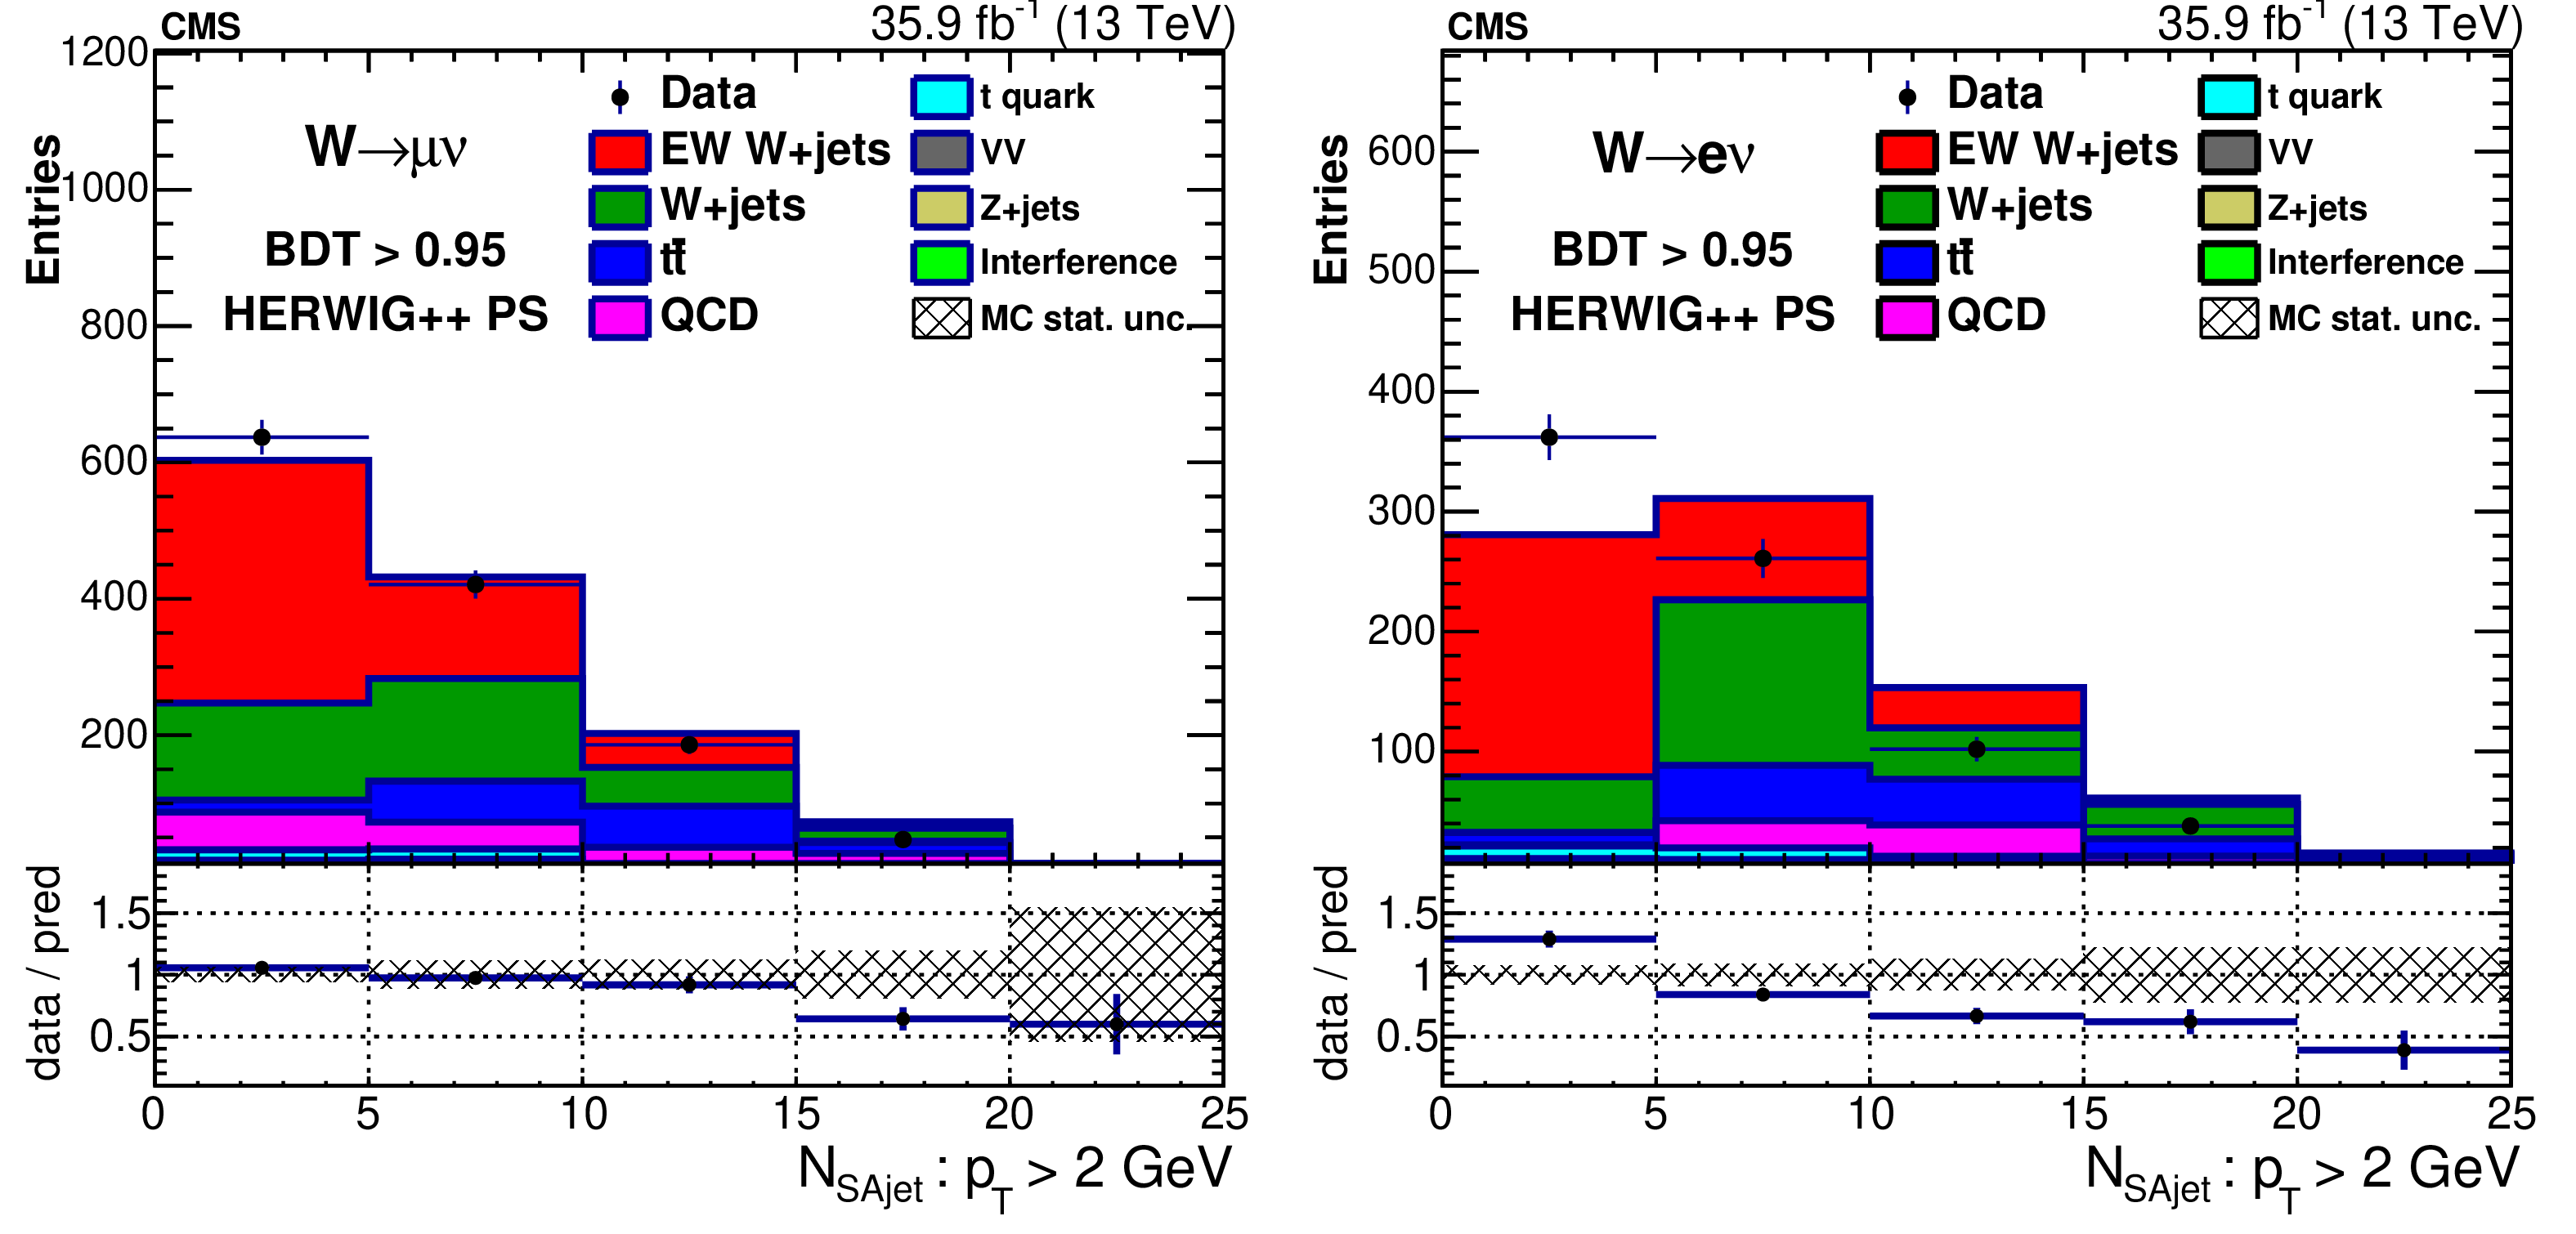
png pdf |
Figure 22-b:
Number of soft activity jets with $ {p_{\mathrm {T}}} > $ 2 GeV in the rapidity gap for $\mathrm {BDT} > $ 0.95 in the muon (left) and electron (right) channels including signal with HERWIG++ parton showering. |
png pdf |
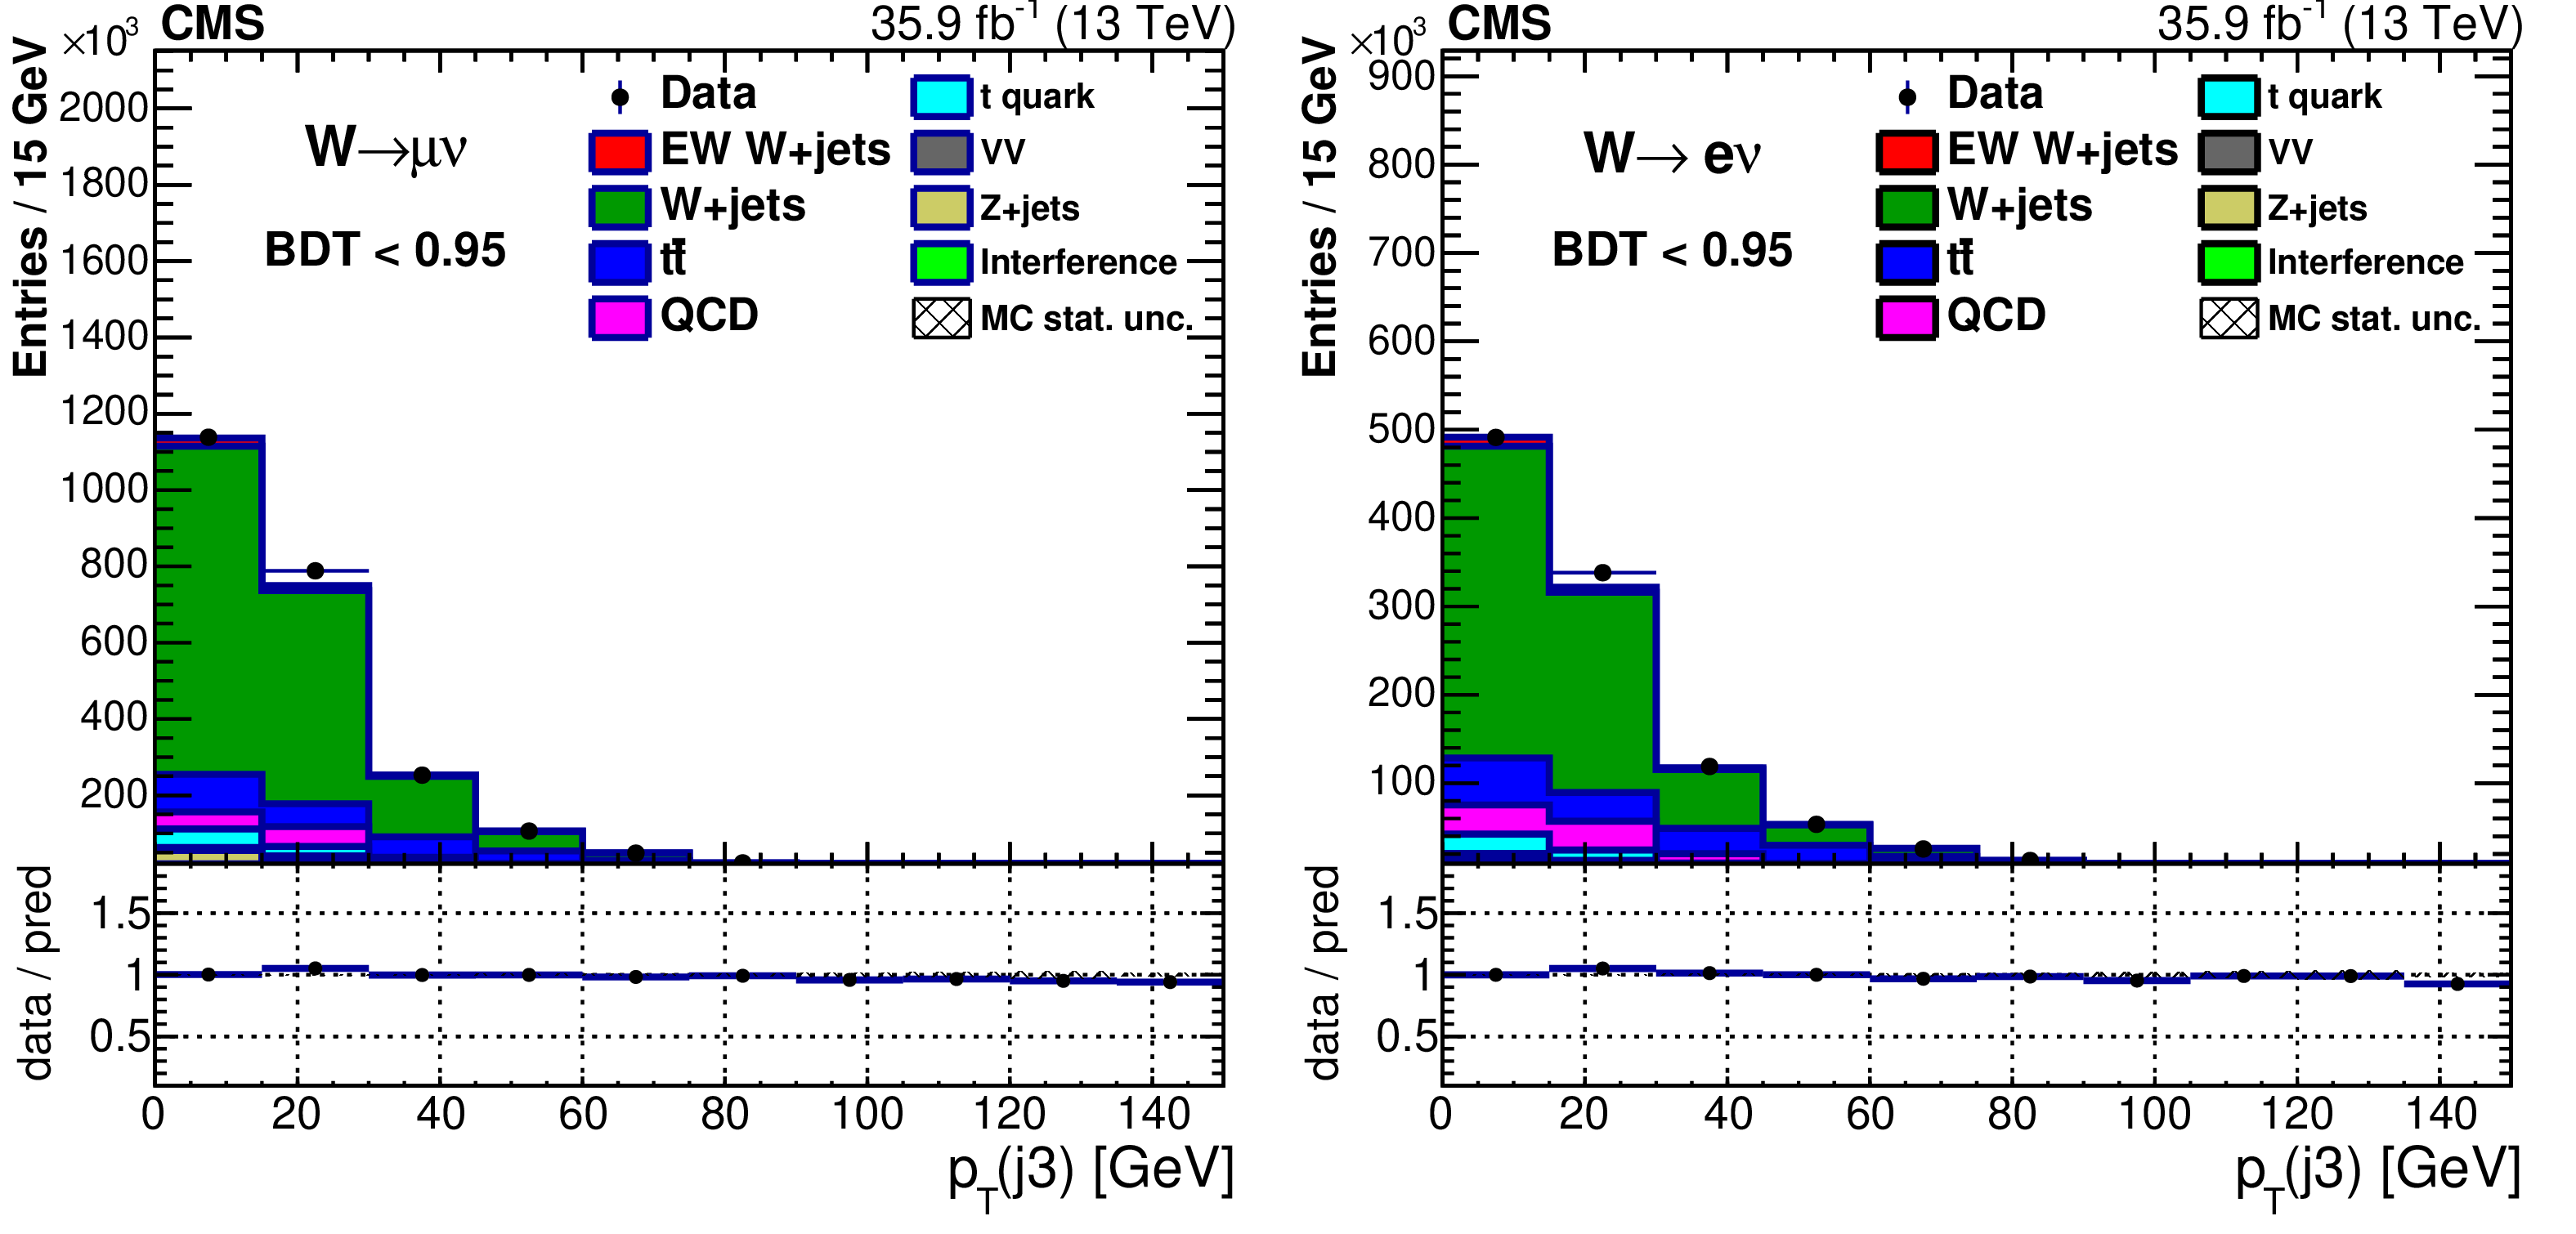
Figure 23:
Leading additional jet ${p_{\mathrm {T}}} ({p_{\mathrm {T}}}$ (j3)) for BDT $ < $ 0.95 in the muon (left) and electron (right) channels. In all plots the first bin contains events where no additional jet with $ {p_{\mathrm {T}}} > $ 15 GeV is present. |

png pdf |
Figure 24:
Total ${H_{\mathrm {T}}}$ of the additional jets for BDT $ < $ 0.95 in the muon (left) and electron (right) channels. In all plots the fist bin contains events where no additional jet with $ {p_{\mathrm {T}}} > $ 15 GeV is present. |
png pdf |
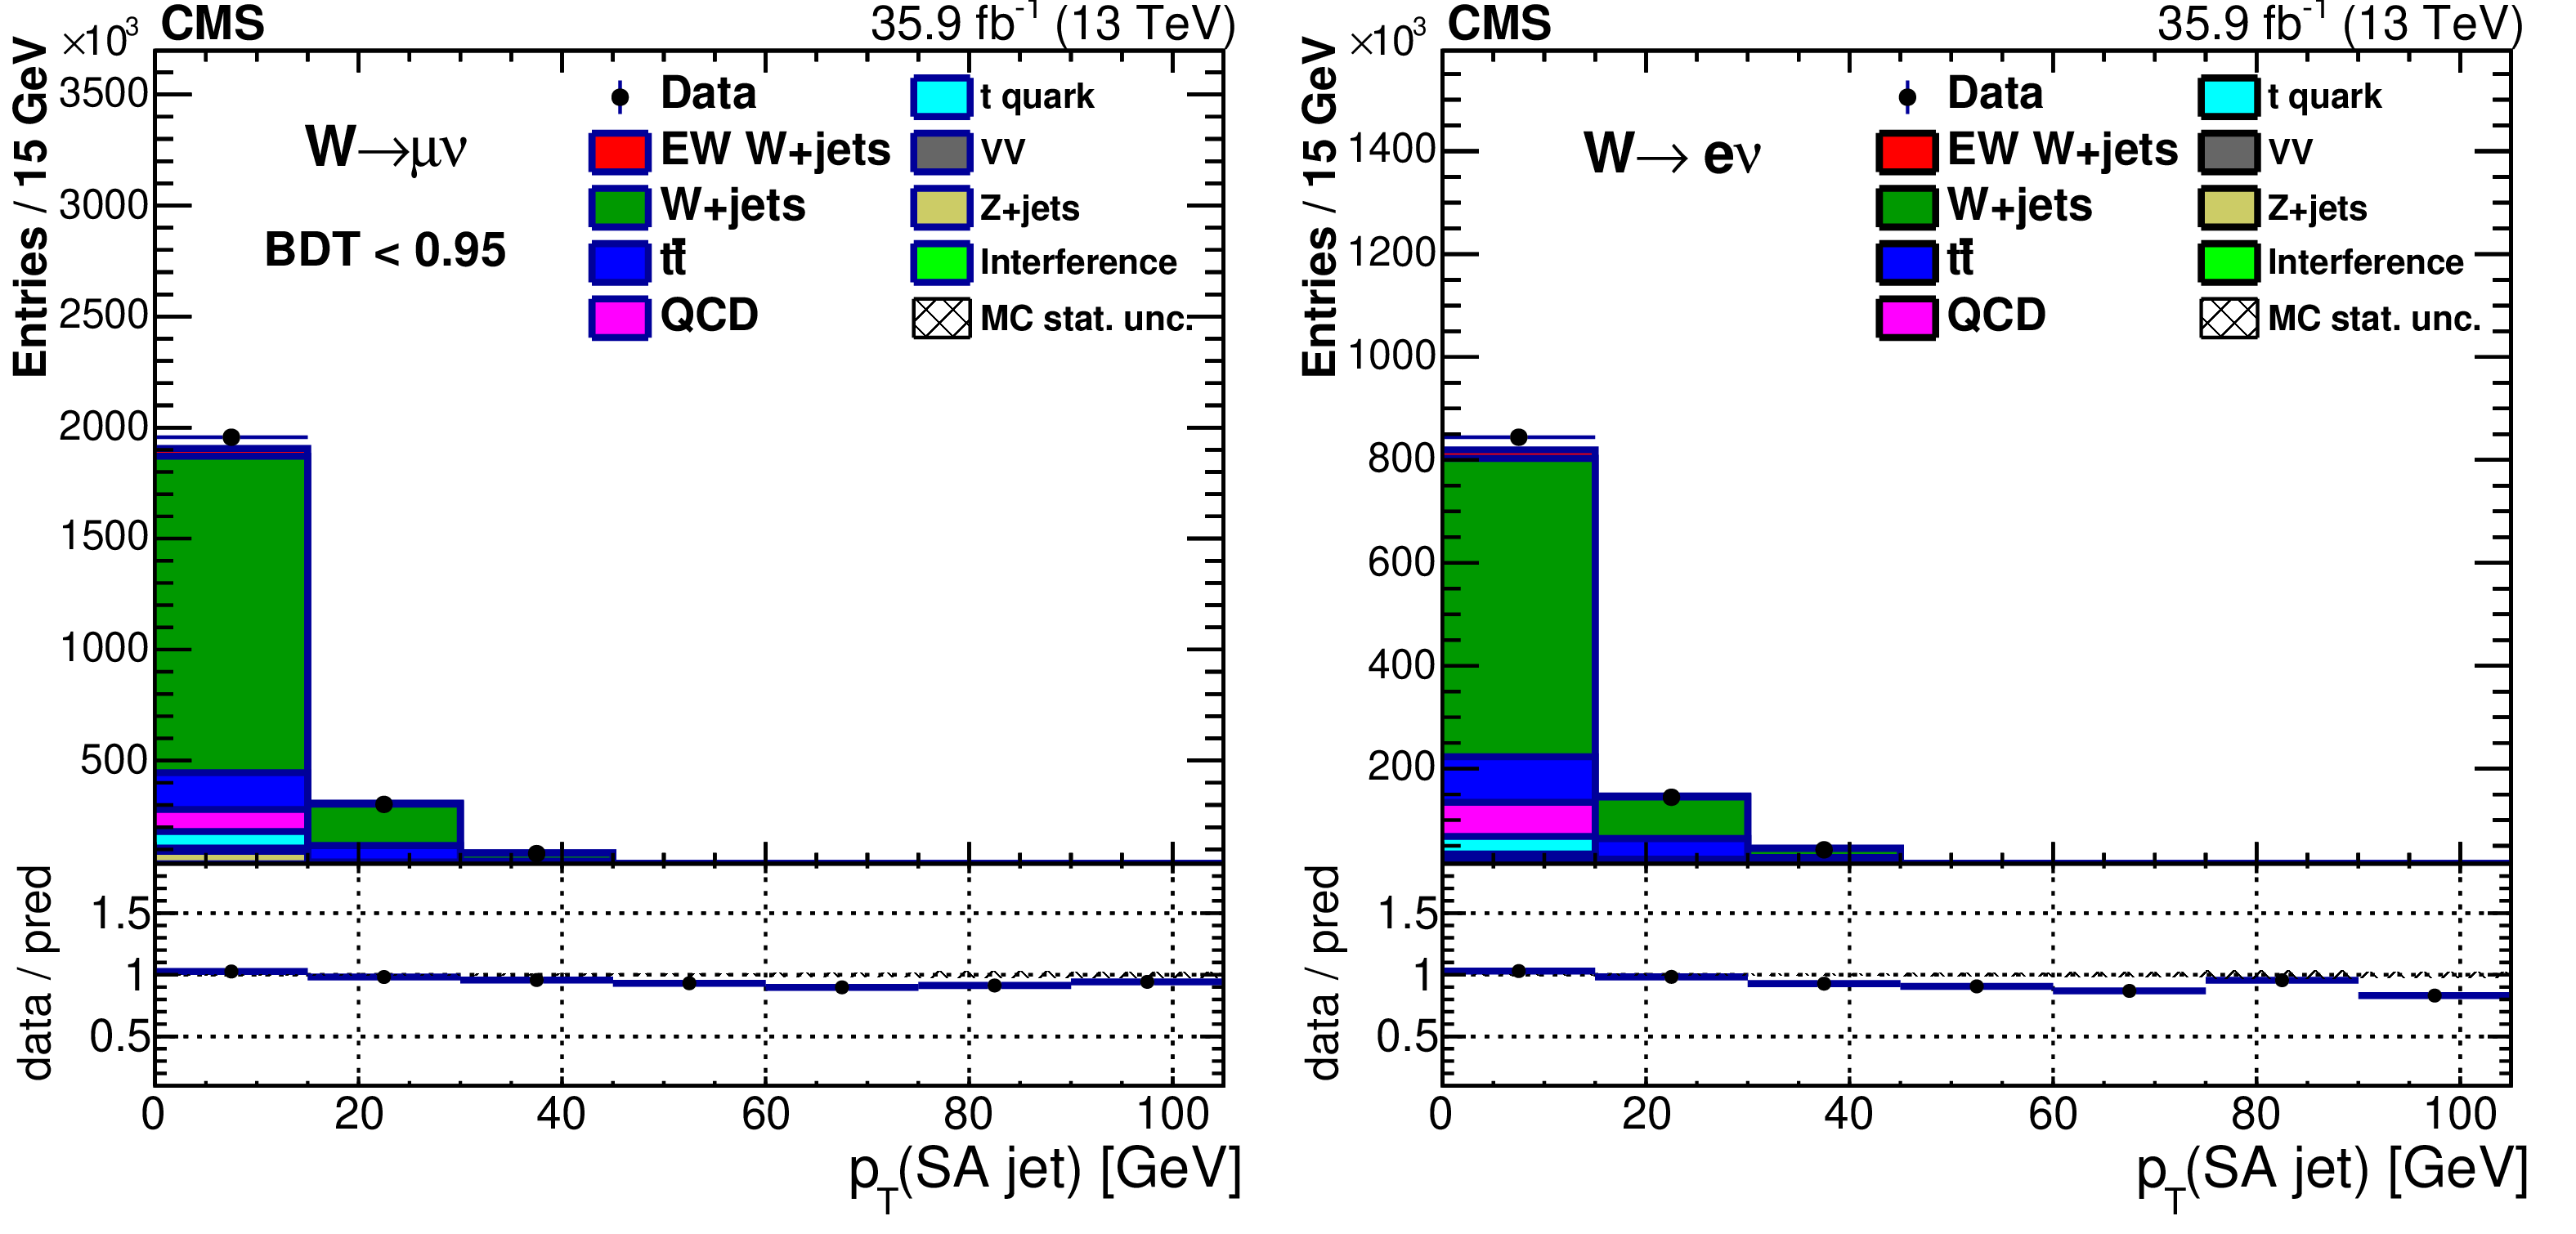
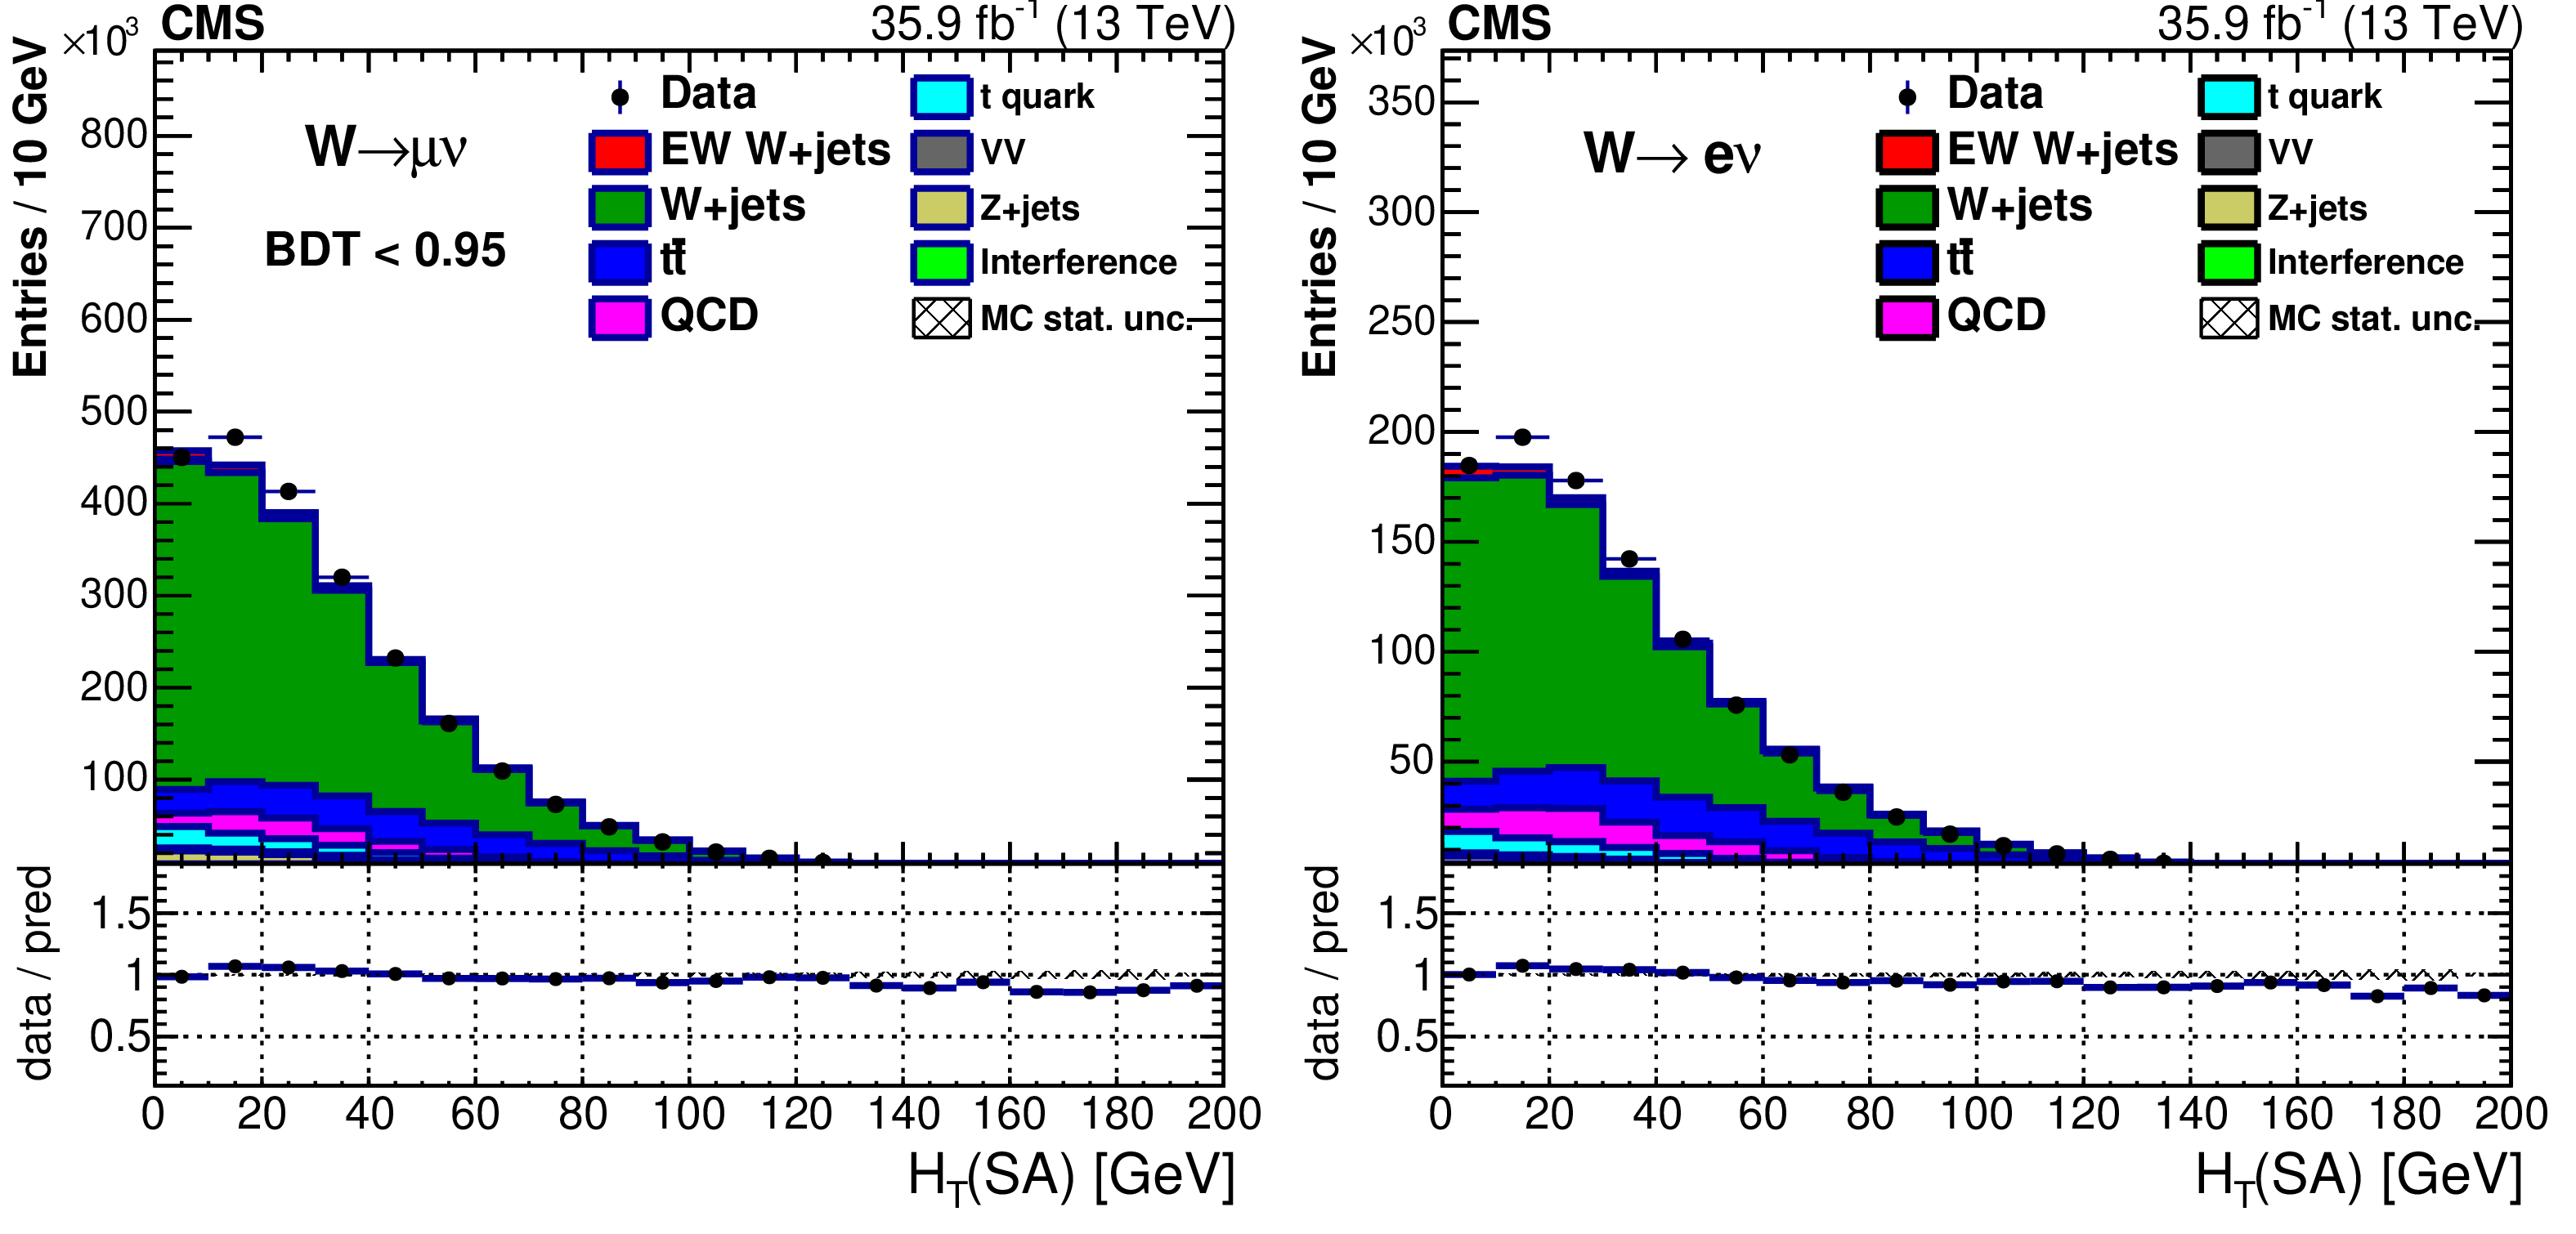
Figure 25:
Leading additional soft-activity (SA) jet ${p_{\mathrm {T}}}$ for BDT $ < $ 0.95 in the muon (left) and electron (right) |
png pdf |
Figure 26:
Total soft activity (SA) jet ${H_{\mathrm {T}}}$ for BDT $ < $ 0.95 in the muon (left) and electron (right) channels. |

png pdf |
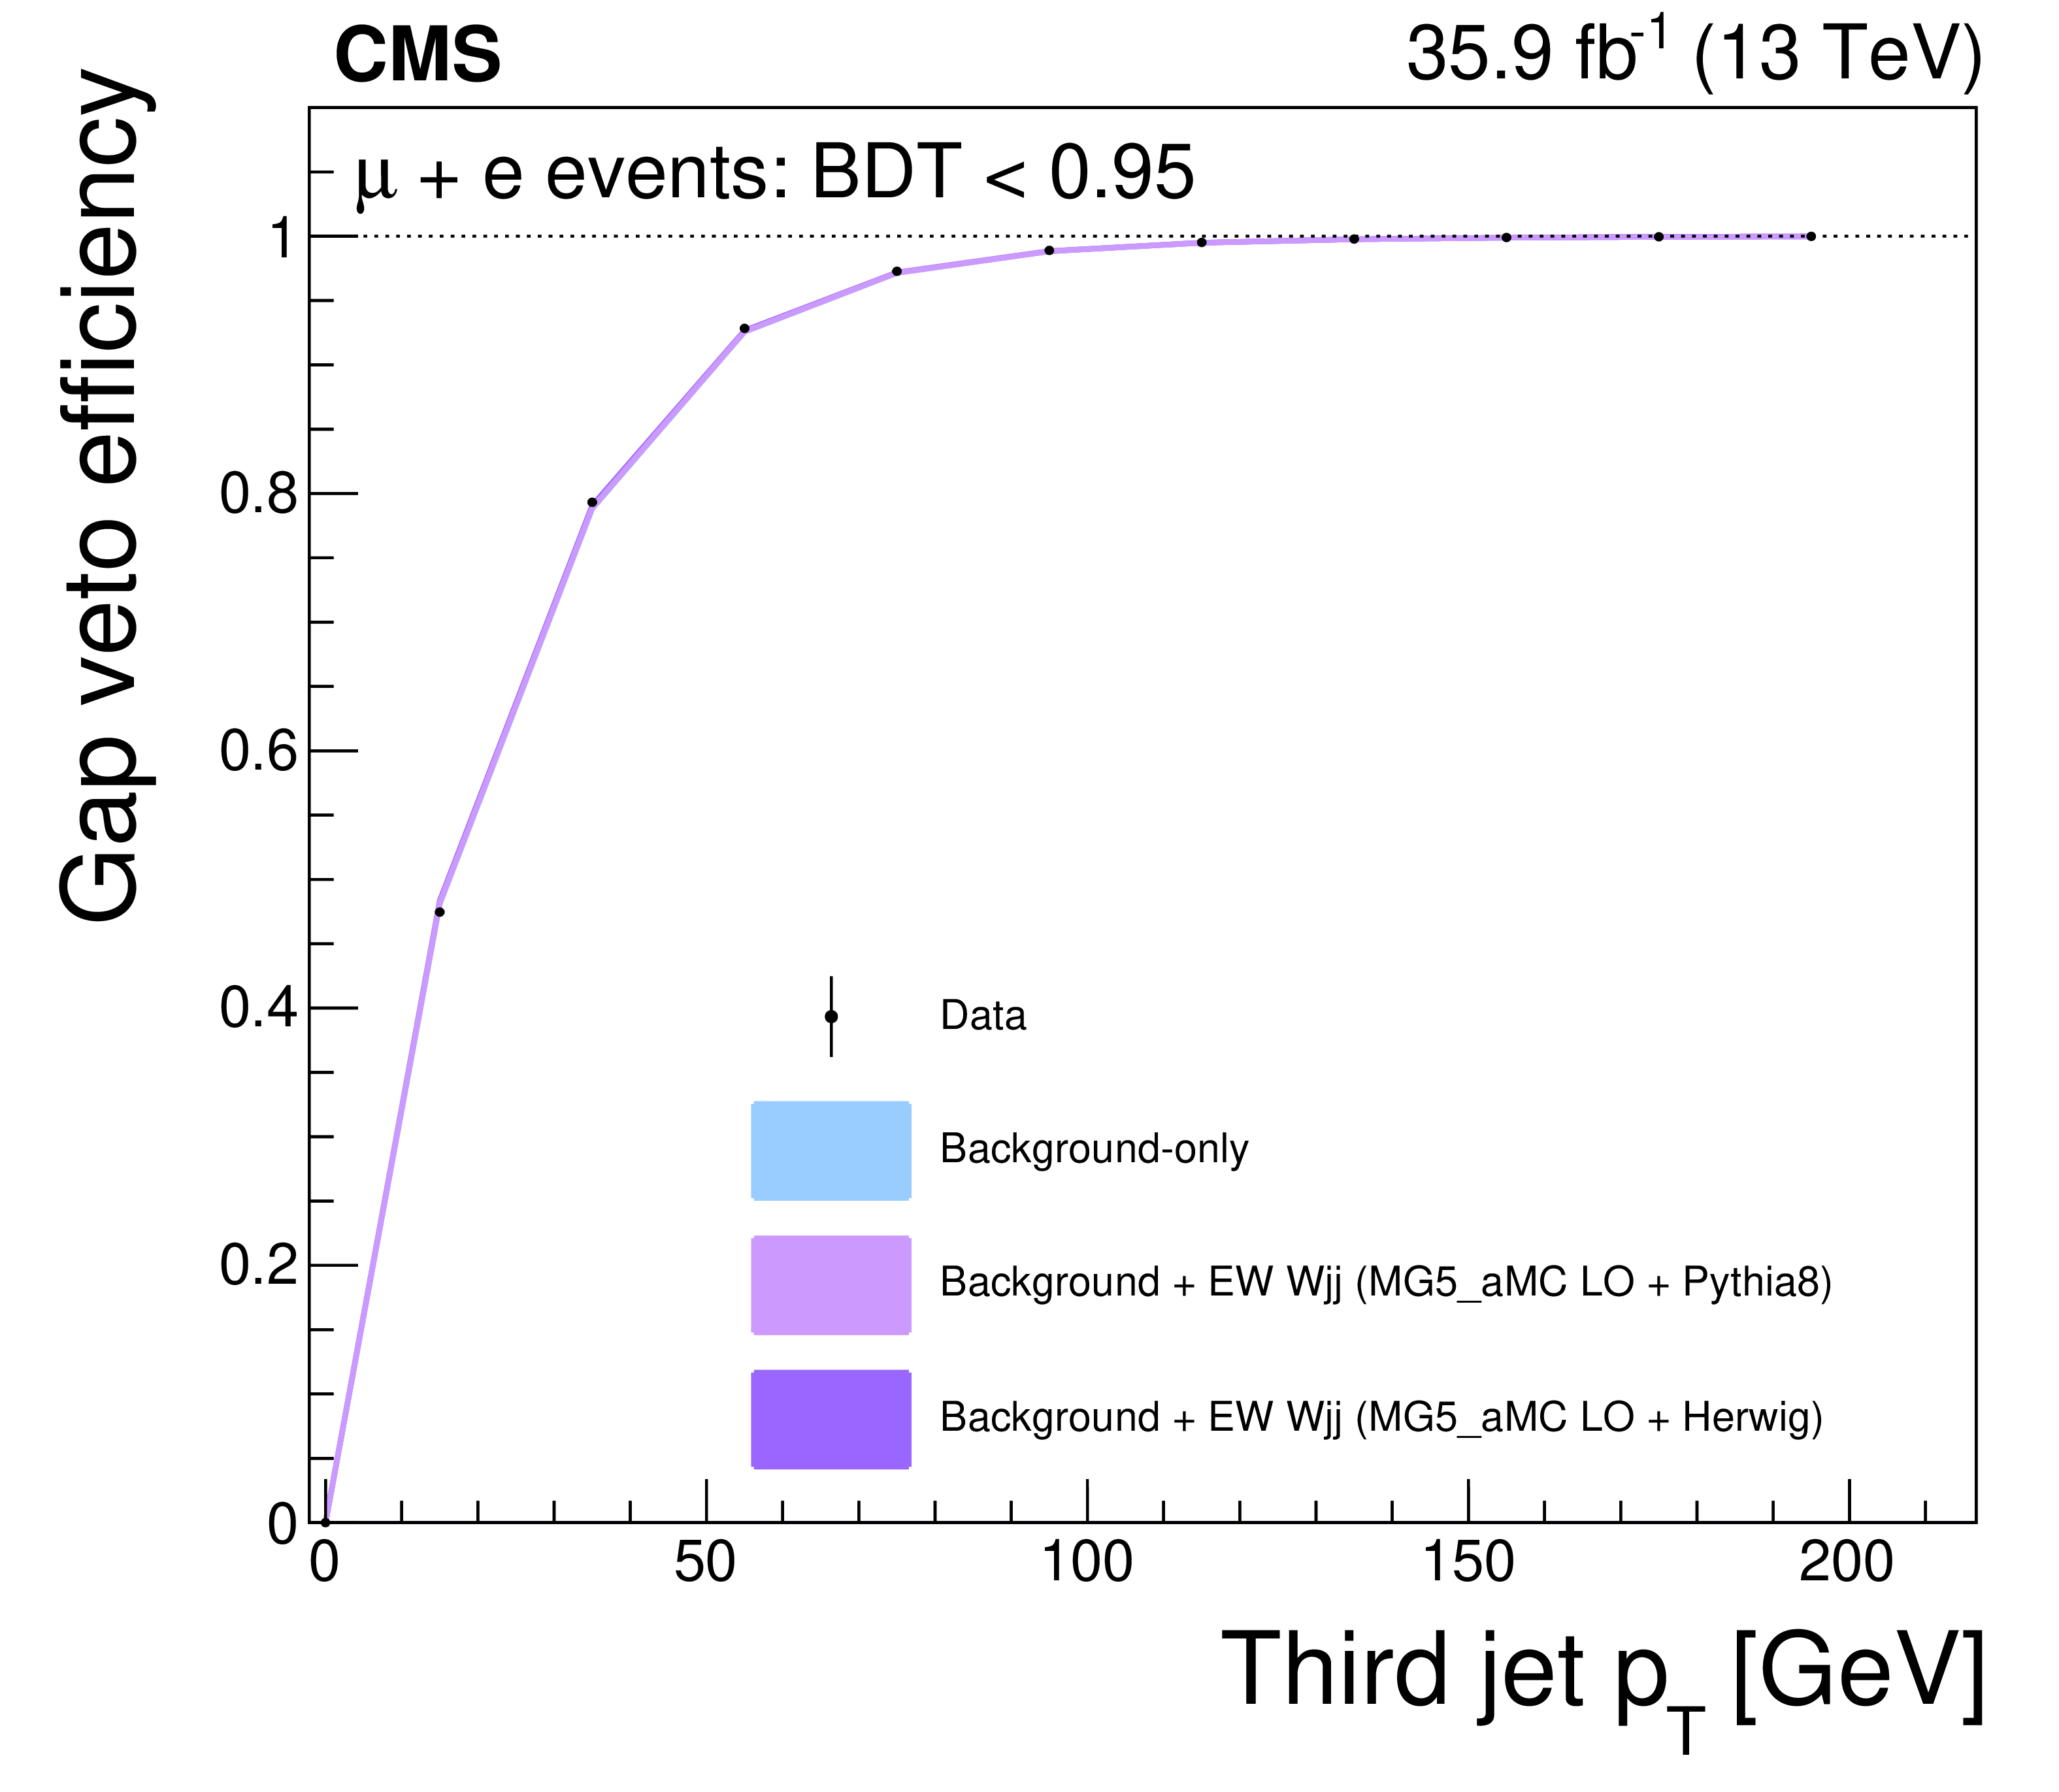
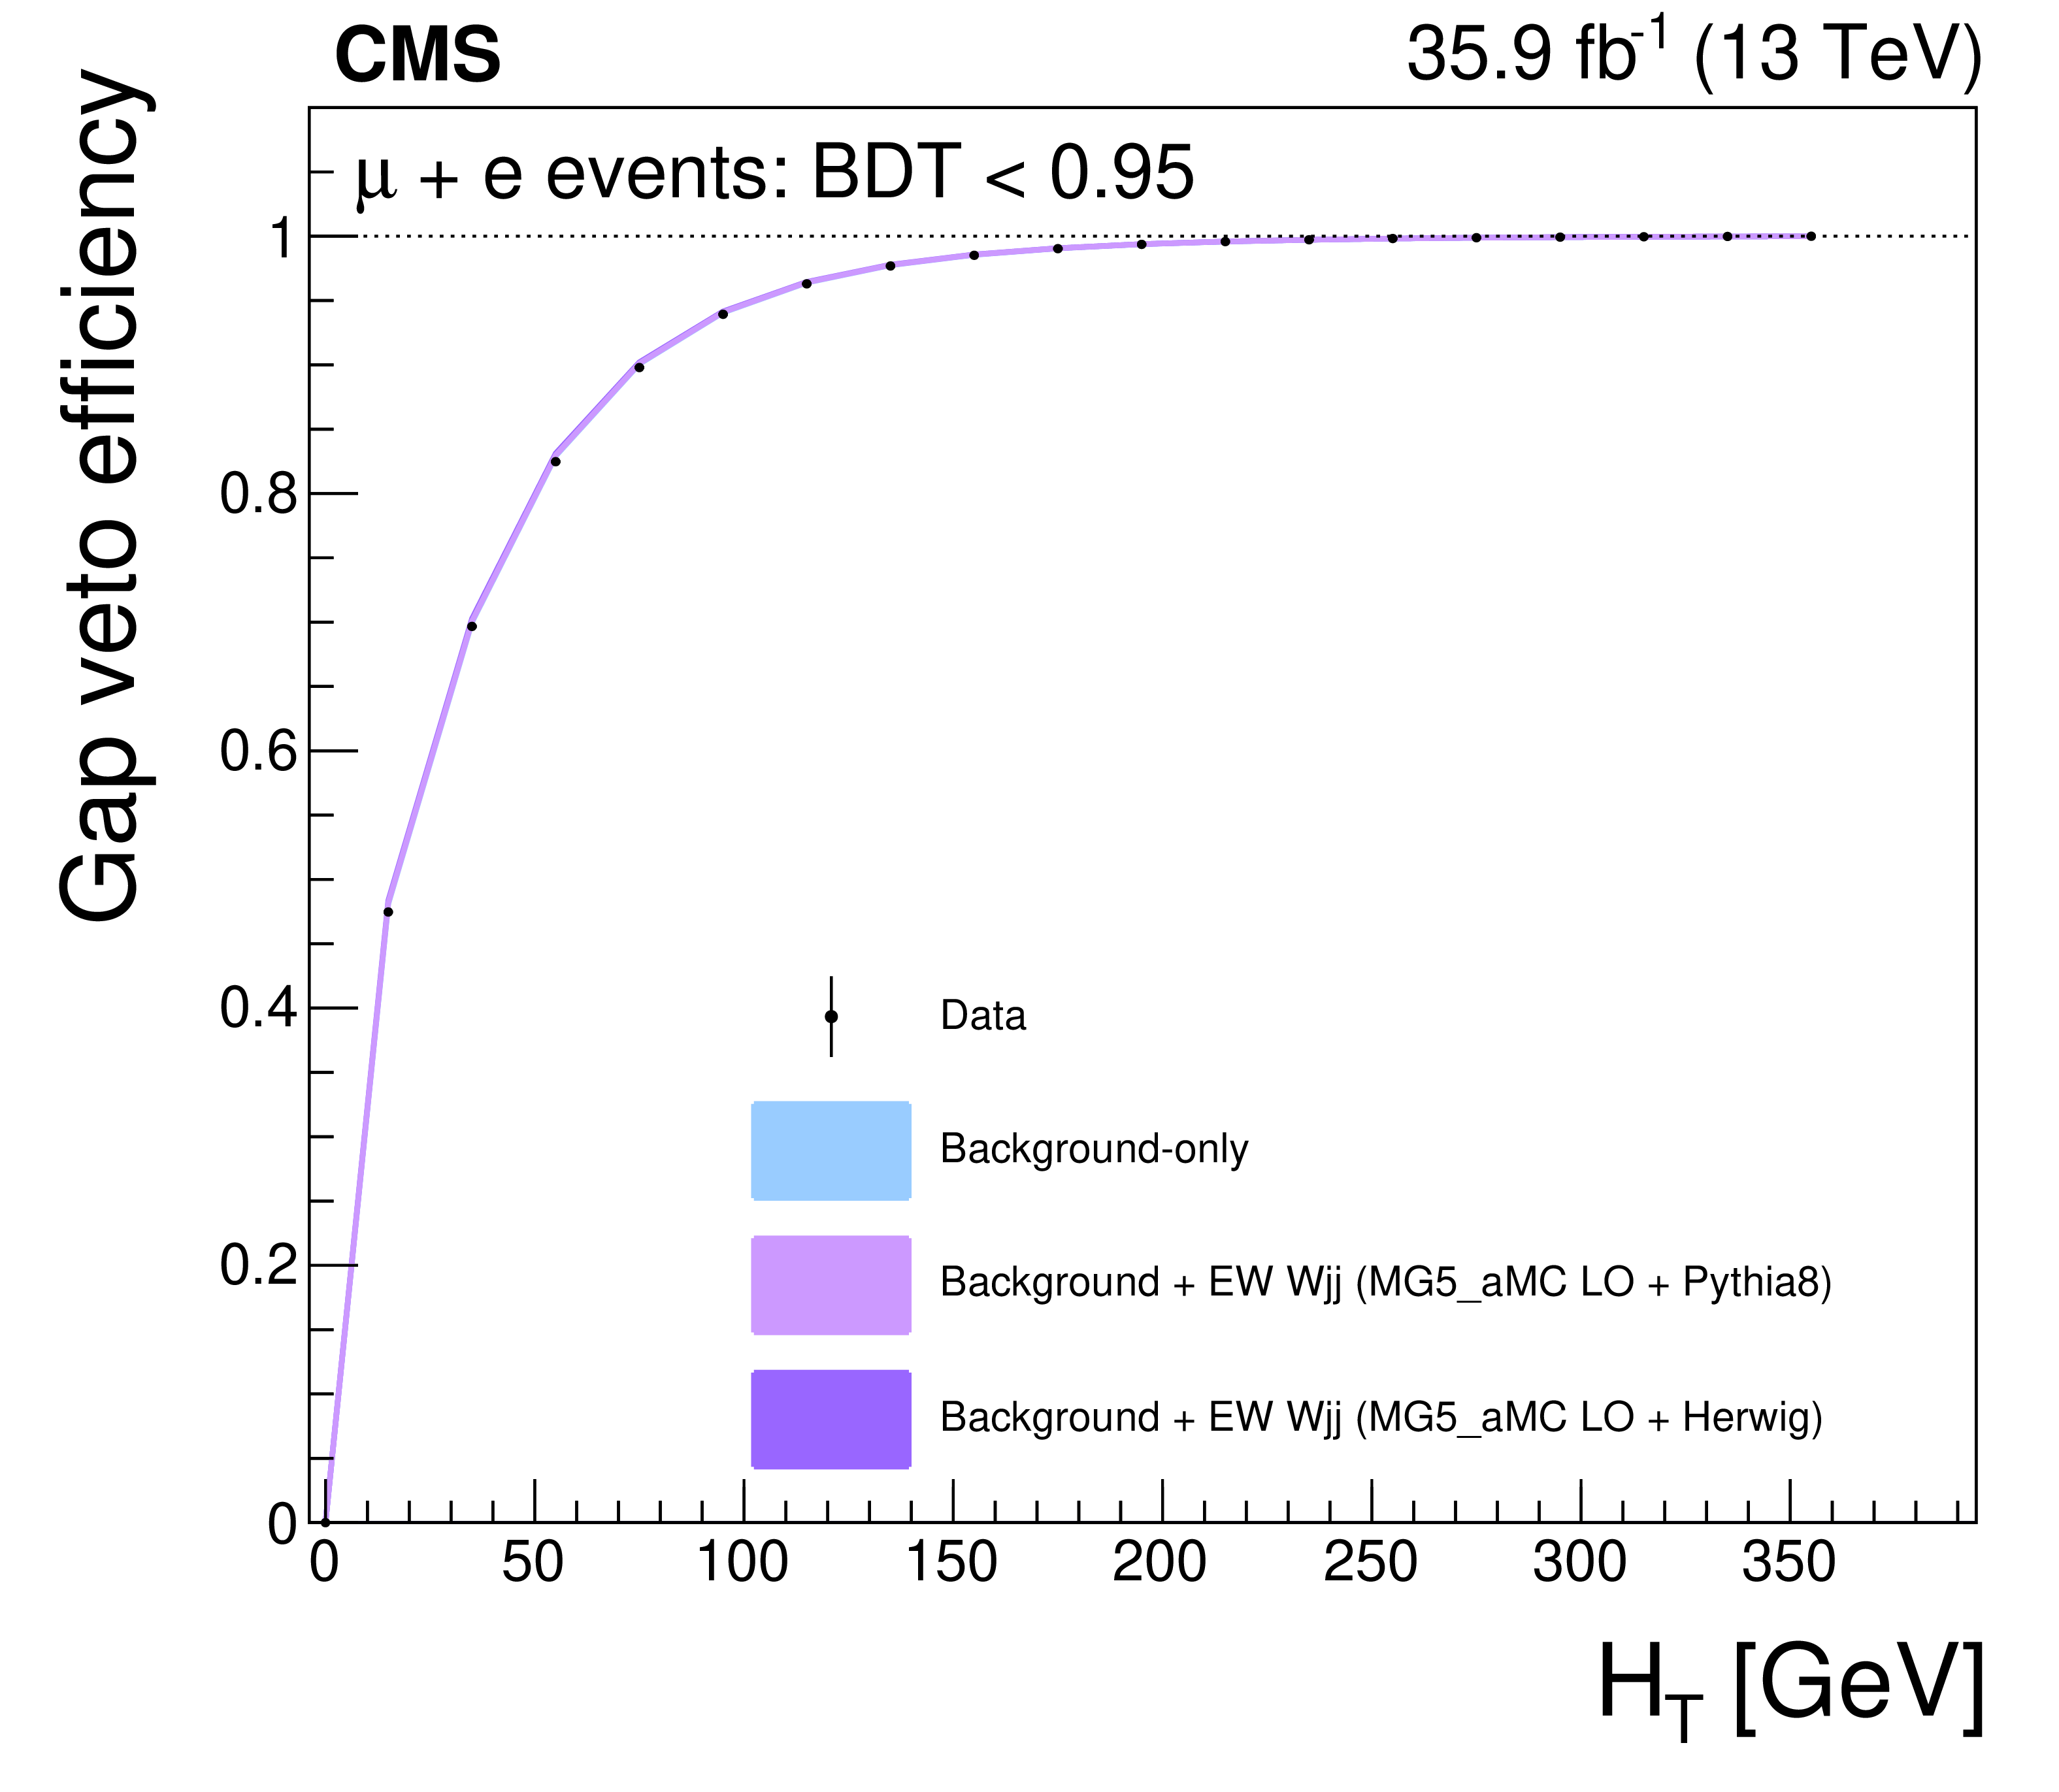
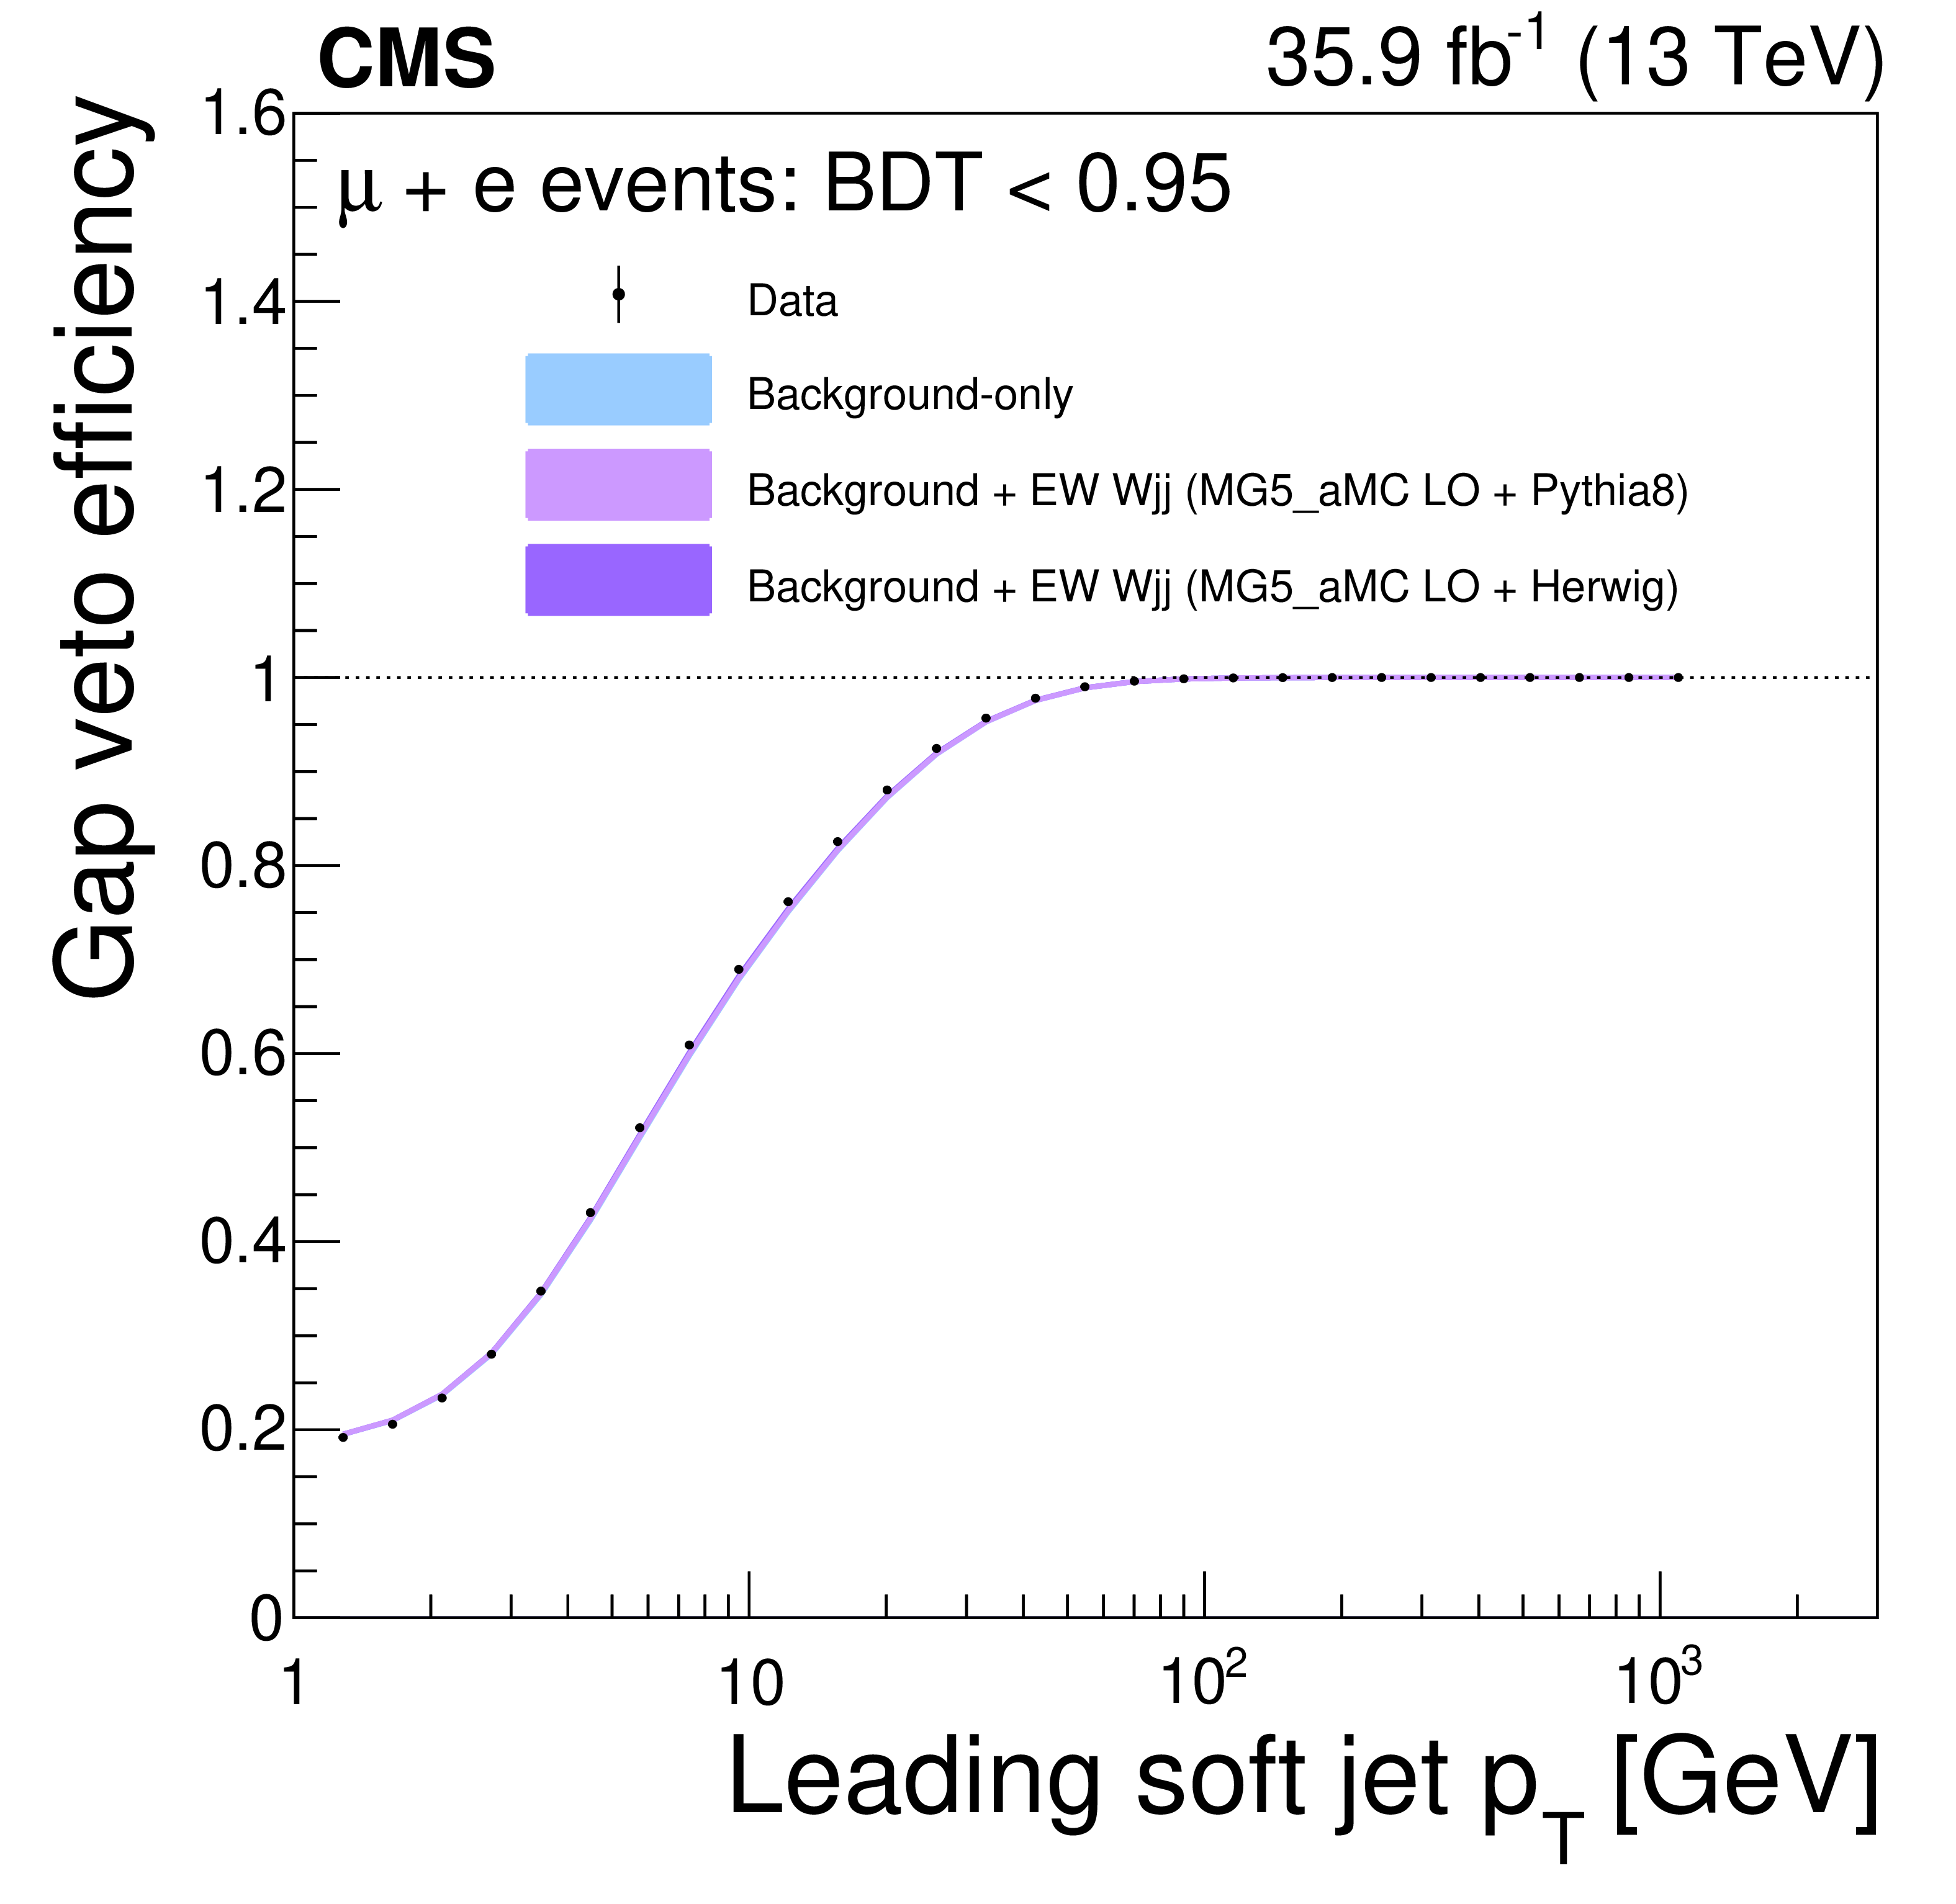
Figure 27:
Hadronic activity veto efficiencies in the signal-depleted BDT $ < $ 0.95 region for the muon and electron channels combined, as a function of the leading additional jet ${p_{\mathrm {T}}}$ (upper left), additional jet ${H_{\mathrm {T}}}$ (upper right), leading soft-activity jet ${p_{\mathrm {T}}}$ (lower left), and soft-activity jet ${H_{\mathrm {T}}}$ (lower right). The data are compared with the background-only prediction as well as background+signal with PYTHIA parton showering and background+signal with HERWIG++ parton showering. The uncertainty bands include only the statistical uncertainty in the prediction from simulation. There is very little difference between the predictions due to the small fraction of signal in this region. |
png pdf |
Figure 27-a:
Hadronic activity veto efficiencies in the signal-depleted BDT $ < $ 0.95 region for the muon and electron channels combined, as a function of the leading additional jet ${p_{\mathrm {T}}}$. The data are compared with the background-only prediction as well as background+signal with PYTHIA parton showering and background+signal with HERWIG++ parton showering. The uncertainty bands include only the statistical uncertainty in the prediction from simulation. There is very little difference between the predictions due to the small fraction of signal in this region. |
png pdf |
Figure 27-b:
Hadronic activity veto efficiencies in the signal-depleted BDT $ < $ 0.95 region for the muon and electron channels combined, as a function of additional jet ${H_{\mathrm {T}}}$. The data are compared with the background-only prediction as well as background+signal with PYTHIA parton showering and background+signal with HERWIG++ parton showering. The uncertainty bands include only the statistical uncertainty in the prediction from simulation. There is very little difference between the predictions due to the small fraction of signal in this region. |
png pdf |
Figure 27-c:
Hadronic activity veto efficiencies in the signal-depleted BDT $ < $ 0.95 region for the muon and electron channels combined, as a function of leading soft-activity jet ${p_{\mathrm {T}}}$. The data are compared with the background-only prediction as well as background+signal with PYTHIA parton showering and background+signal with HERWIG++ parton showering. The uncertainty bands include only the statistical uncertainty in the prediction from simulation. There is very little difference between the predictions due to the small fraction of signal in this region. |
png pdf |
Figure 27-d:
Hadronic activity veto efficiencies in the signal-depleted BDT $ < $ 0.95 region for the muon and electron channels combined, as a function of soft-activity jet ${H_{\mathrm {T}}}$. The data are compared with the background-only prediction as well as background+signal with PYTHIA parton showering and background+signal with HERWIG++ parton showering. The uncertainty bands include only the statistical uncertainty in the prediction from simulation. There is very little difference between the predictions due to the small fraction of signal in this region. |
| Tables | |

png pdf |
Table 1:
Event yields expected for background and signal processes using the initial selections and with a selection on the multivariate analysis output (BDT) that provides similar signal and background yields. The yields are compared to the data observed in the different channels and categories. The total uncertainties quoted for signal, DY ${\mathrm {W}}\mathrm {jj}$ and diboson backgrounds, and processes with top quarks (${{\mathrm {t}\overline {\mathrm {t}}}}$ and single top quarks) include the systematic uncertainties. |
png pdf |
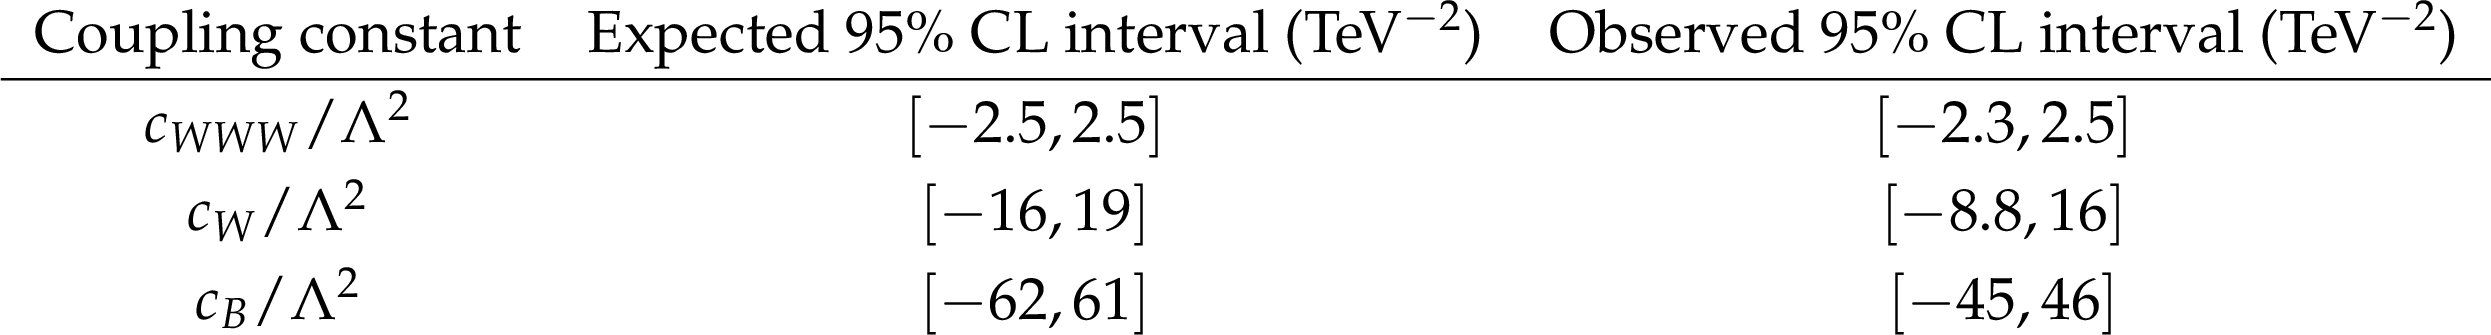
Table 2:
One-dimensional limits on the ATGC EFT parameters at 95% CL. |
png pdf |
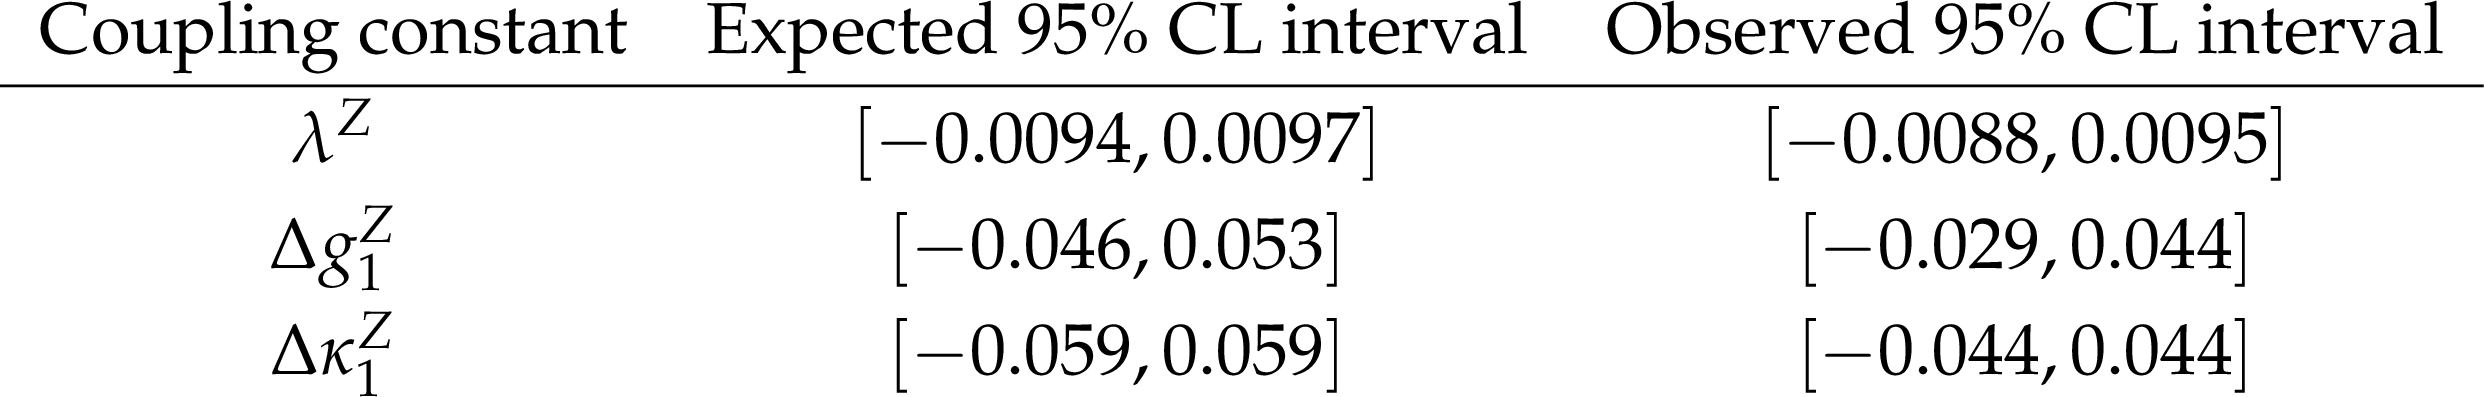
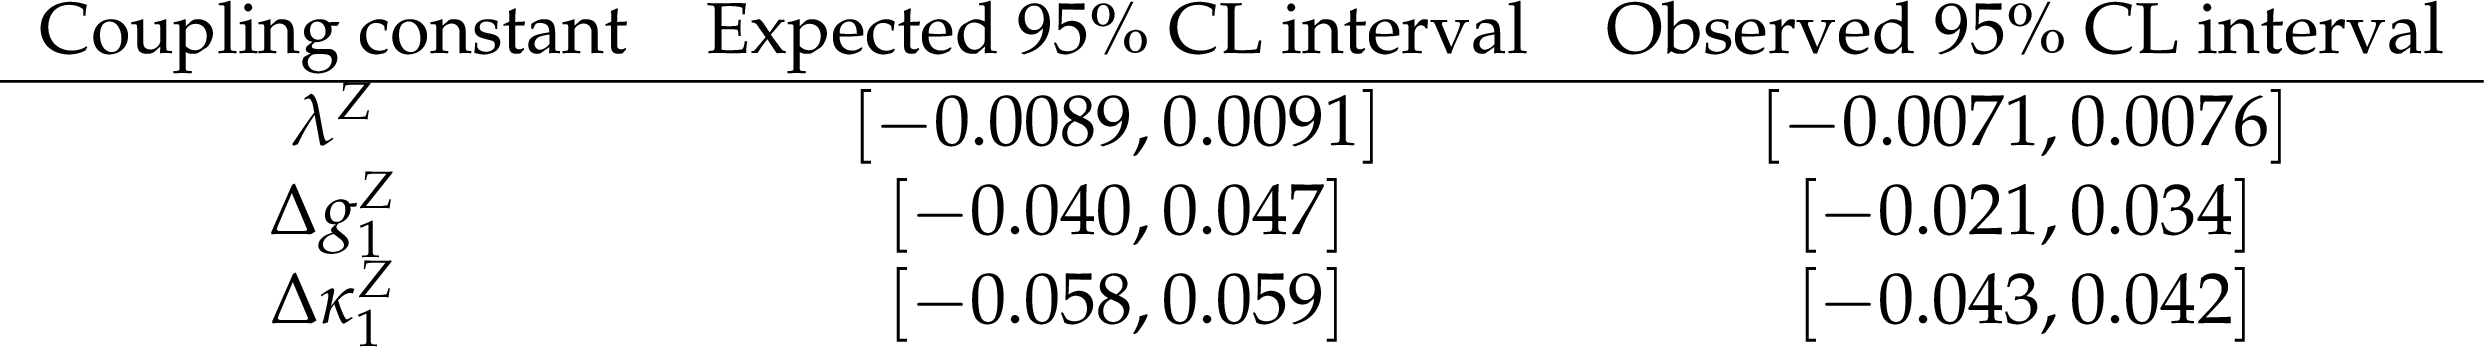
Table 3:
One-dimensional limits on the ATGC effective Lagrangian (LEP parametrization) parameters at 95% CL. |
png pdf |
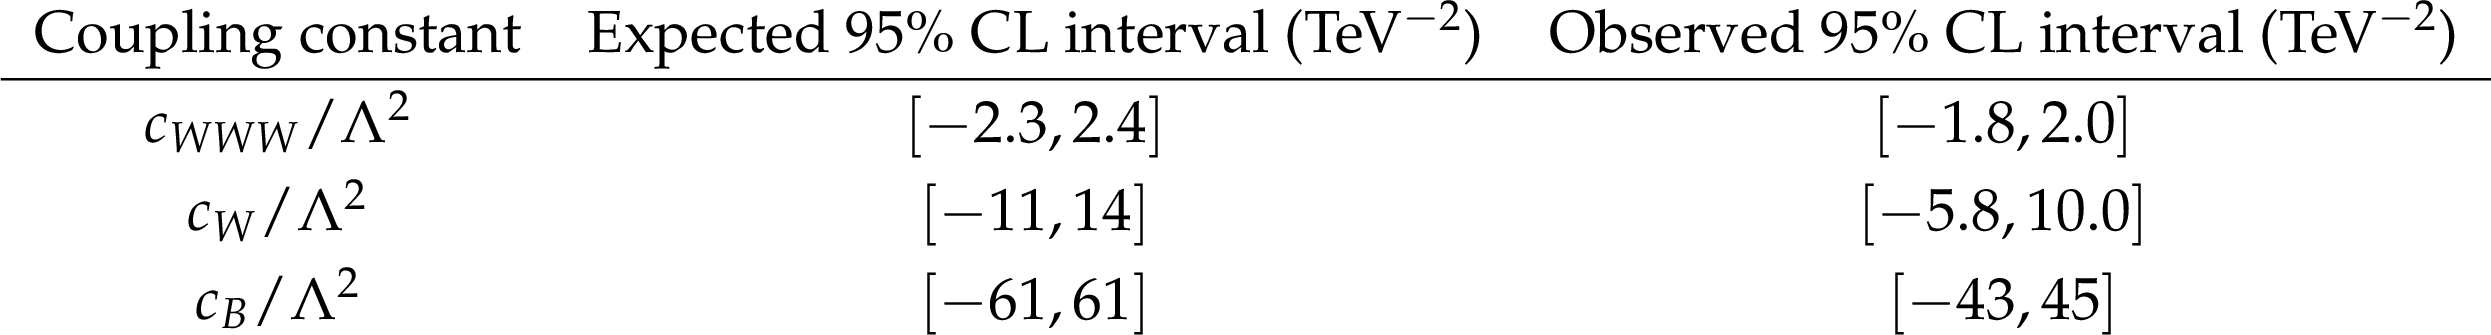
Table 4:
One-dimensional limits on the ATGC EFT parameters at 95% CL from the combination of EW ${{\mathrm {W}}\mathrm {jj}} $ and EW ${{\mathrm {Z}}\mathrm {jj}} $ analyses. |
png pdf |
Table 5:
test. One-dimensional limits on the ATGC effective Lagrangian (LEP parametrization) parameters at 95% CL from the combination of EW ${{\mathrm {W}}\mathrm {jj}} $ and EW ${{\mathrm {Z}}\mathrm {jj}} $ analyses. |
| Summary |
|
The fiducial cross section of the electroweak production of a W boson in association with two jets is measured in the kinematic region defined as invariant mass $m_\mathrm{jj} > $ 120 GeV and transverse momenta $p_\mathrm{T j} > $ 25 GeV. The data sample corresponds to an integrated luminosity of 35.9 fb$^{-1}$ of proton-proton collisions at centre-of-mass energy $\sqrt{s} = $ 13 TeV recorded by the CMS Collaboration at the LHC. The measured cross section $\sigma_\mathrm{EW}(\mathrm{W}\mathrm{jj})= $ 6.23 $\pm$ 0.12 (stat) $\pm$ 0.61 (syst) pb agrees with the leading order standard model prediction. This is the first observation of this process at $\sqrt{s} = $ 13 TeV. A search is performed for anomalous trilinear gauge couplings associated with dimension-six operators as given in the framework of an effective field theory. No evidence for ATGCs is found, and the corresponding 95% confidence level intervals on the dimension-six operators are $-2.3 < c_{{\mathrm{W}\mathrm{W}\mathrm{W}}}/\Lambda^2 < 2.5 $ TeV$^{-2}$, $-8.8 < c_{\mathrm{W}}/\Lambda^2 < 16 $ TeV$^{-2}$, and $-45 < c_{\mathrm{B}}/\Lambda^2 < 46$ TeV$^{-2}$. These results are combined with previous results on the electroweak production of a Z boson in association with two jets, yielding the most stringent limit to date on the $c_{{\mathrm{W}\mathrm{W}\mathrm{W}}}$ coupling $-1.8 < c_{{\mathrm{W}\mathrm{W}\mathrm{W}}}/\Lambda^2 < 2.0 $ TeV$^{-2}$. The additional hadronic activity, as well as the efficiencies for gap activity vetos, are studied in a signal-enriched region. Generally reasonable agreement is found between the data and the quantum chromodynamics predictions with the HERWIG++ parton shower and hadronization model, while the PYTHIA model predictions are typically above the observed measurements. |
| References | ||||
| 1 | ATLAS Collaboration | Observation of a new particle in the search for the standard model Higgs boson with the ATLAS detector at the LHC | PLB 716 (2012) 1 | 1207.7214 |
| 2 | CMS Collaboration | Observation of a new boson at a mass of 125 GeV with the CMS experiment at the LHC | PLB 716 (2012) 30 | CMS-HIG-12-028 1207.7235 |
| 3 | CMS Collaboration | Observation of a new boson with mass near 125 GeV in pp collisions at $ \sqrt{s} = $ 7 and 8 TeV | JHEP 06 (2013) 081 | CMS-HIG-12-036 1303.4571 |
| 4 | G.-C. Cho et al. | Weak boson fusion production of supersymmetric particles at the CERN LHC | PRD 73 (2006) 054002 | hep-ph/0601063 |
| 5 | J. D. Bjorken | Rapidity gaps and jets as a new physics signature in very high-energy hadron hadron collisions | PRD 47 (1993) 101 | |
| 6 | F. Schissler and D. Zeppenfeld | Parton shower effects on W and Z production via vector boson fusion at NLO QCD | JHEP 04 (2013) 057 | 1302.2884 |
| 7 | K. Hagiwara, S. Ishihara, R. Szalapski, and D. Zeppenfeld | Low-energy effects of new interactions in the electroweak boson sector | PRD 48 (1993) 2182 | |
| 8 | C. Degrande et al. | Effective field theory: A modern approach to anomalous couplings | Annals Phys. 335 (2013) 21 | 1205.4231 |
| 9 | CMS Collaboration | Measurement of electroweak production of a W boson and two forward jets in proton-proton collisions at $ \sqrt{s}= $ 8 TeV | JHEP 11 (2016) 147 | CMS-SMP-13-012 1607.06975 |
| 10 | ATLAS Collaboration | Measurements of electroweak $ Wjj $ production and constraints on anomalous gauge couplings with the ATLAS detector | EPJC 77 (2017) 474 | 1703.04362 |
| 11 | CMS Collaboration | Measurement of the hadronic activity in events with a Z and two jets and extraction of the cross section for the electroweak production of a Z with two jets in pp collisions at $ \sqrt{s} = $ 7 TeV | JHEP 10 (2013) 062 | CMS-FSQ-12-019 1305.7389 |
| 12 | CMS Collaboration | Measurement of electroweak production of two jets in association with a Z boson in proton-proton collisions at $ \sqrt{s}= $ 8 TeV | EPJC 75 (2015) 66 | CMS-FSQ-12-035 1410.3153 |
| 13 | ATLAS Collaboration | Measurement of the electroweak production of dijets in association with a Z boson and distributions sensitive to vector boson fusion in proton-proton collisions at $ \sqrt{s} = $ 8 TeV using the ATLAS detector | JHEP 04 (2014) 031 | 1401.7610 |
| 14 | ATLAS Collaboration | Measurement of the cross-section for electroweak production of dijets in association with a Z boson in pp collisions at $ \sqrt {s} = $ 13 TeV with the ATLAS detector | PLB 775 (2017) 206 | 1709.10264 |
| 15 | CMS Collaboration | Electroweak production of two jets in association with a Z boson in proton-proton collisions at $ \sqrt{s}= $ 13 TeV | EPJC 78 (2018) 589 | CMS-SMP-16-018 1712.09814 |
| 16 | CMS Collaboration | Description and performance of track and primary-vertex reconstruction with the CMS tracker | JINST 9 (2014) P10009 | CMS-TRK-11-001 1405.6569 |
| 17 | CMS Collaboration | Performance of electron reconstruction and selection with the CMS detector in proton-proton collisions at $ \sqrt{s} = $ 8 TeV | JINST 10 (2015) P06005 | CMS-EGM-13-001 1502.02701 |
| 18 | CMS Collaboration | Performance of the CMS muon detector and muon reconstruction with proton-proton collisions at $ \sqrt{s}= $ 13 TeV | JINST 13 (2018) P06015 | CMS-MUO-16-001 1804.04528 |
| 19 | CMS Collaboration | The CMS trigger system | JINST 12 (2017) P01020 | CMS-TRG-12-001 1609.02366 |
| 20 | CMS Collaboration | The CMS experiment at the CERN LHC | JINST 3 (2008) S08004 | CMS-00-001 |
| 21 | J. Alwall et al. | The automated computation of tree-level and next-to-leading order differential cross sections, and their matching to parton shower simulations | JHEP 07 (2014) 079 | 1405.0301 |
| 22 | T. Sjostrand et al. | An introduction to PYTHIA 8.2 | CPC 191 (2015) 159 | 1410.3012 |
| 23 | NNPDF Collaboration | Unbiased global determination of parton distributions and their uncertainties at NNLO and at LO | NPB 855 (2012) 153 | 1107.2652 |
| 24 | CMS Collaboration | Event generator tunes obtained from underlying event and multiparton scattering measurements | EPJC 76 (2016) 155 | CMS-GEN-14-001 1512.00815 |
| 25 | K. Arnold et al. | VBFNLO: A parton level Monte Carlo for processes with electroweak bosons | CPC 180 (2009) 1661 | 0811.4559 |
| 26 | J. Baglio et al. | VBFNLO: a parton level Monte Carlo for processes with electroweak bosons --- manual for version 2.7.0 | 1107.4038 | |
| 27 | K. Arnold et al. | Release Note --- VBFNLO-2.6.0 | 1207.4975 | |
| 28 | M. Bahr et al. | Herwig++ physics and manual | EPJC 58 (2008) 639 | 0803.0883 |
| 29 | M. H. Seymour and A. Siodmok | Constraining MPI models using $ \sigma_{\rm eff} $ and recent Tevatron and LHC Underlying Event data | JHEP 10 (2013) 113 | 1307.5015 |
| 30 | R. Frederix and S. Frixione | Merging meets matching in MC@NLO | JHEP 12 (2012) 061 | 1209.6215 |
| 31 | M. L. Mangano, M. Moretti, F. Piccinini, and M. Treccani | Matching matrix elements and shower evolution for top-quark production in hadronic collisions | JHEP 01 (2007) 013 | hep-ph/0611129 |
| 32 | J. Alwall et al. | Comparative study of various algorithms for the merging of parton showers and matrix elements in hadronic collisions | EPJC 53 (2008) 473 | 0706.2569 |
| 33 | K. Melnikov and F. Petriello | Electroweak gauge boson production at hadron colliders through $ O(\alpha_S^2) $ | PRD 74 (2006) 114017 | hep-ph/0609070 |
| 34 | P. Nason | A new method for combining NLO QCD with shower Monte Carlo algorithms | JHEP 11 (2004) 040 | hep-ph/0409146 |
| 35 | S. Frixione, P. Nason, and C. Oleari | Matching NLO QCD computations with parton shower simulations: the POWHEG method | JHEP 11 (2007) 070 | 0709.2092 |
| 36 | S. Alioli, P. Nason, C. Oleari, and E. Re | A general framework for implementing NLO calculations in shower Monte Carlo programs: the POWHEG BOX | JHEP 06 (2010) 043 | 1002.2581 |
| 37 | N. Kidonakis | Differential and total cross sections for top pair and single top production | in Proceedings of the XX International Workshop on Deep-Inelastic Scattering and Related Subjects Bonn, Germany | 1205.3453 |
| 38 | M. Czakon, P. Fiedler, and A. Mitov | Total top quark pair production cross section at hadron colliders through O($ \alpha_S^4 $) | PRL 110 (2013) 252004 | 1303.6254 |
| 39 | S. Alioli, P. Nason, C. Oleari, and E. Re | NLO single-top production matched with shower in POWHEG: $ \it $ s- and $ \it $ t-channel contributions | JHEP 09 (2009) 111 | 0907.4076 |
| 40 | E. Re | Single-top $ \it $ Wt-channel production matched with parton showers using the POWHEG method | EPJC 71 (2011) 1547 | 1009.2450 |
| 41 | N. Kidonakis | Top quark production | 1311.0283 | |
| 42 | J. M. Campbell and R. K. Ellis | MCFM for the Tevatron and the LHC | NPB Proc. Suppl. 205-206 (2010) 10 | 1007.3492 |
| 43 | GEANT4 Collaboration | GEANT4--A simulation toolkit | NIMA 506 (2003) 250 | |
| 44 | J. Allison et al. | GEANT4 developments and applications | IEEE Trans. Nucl. Sci. 53 (2006) 270 | |
| 45 | CMS Collaboration | Particle-flow reconstruction and global event description with the CMS detector | JINST 12 (2017) P10003 | CMS-PRF-14-001 1706.04965 |
| 46 | M. Cacciari, G. P. Salam, and G. Soyez | The anti-$ {k_{\mathrm{T}}} $ jet clustering algorithm | JHEP 04 (2008) 063 | 0802.1189 |
| 47 | M. Cacciari, G. P. Salam, and G. Soyez | FastJet user manual | EPJC 72 (2012) 1896 | 1111.6097 |
| 48 | CMS Collaboration | Performance of CMS muon reconstruction in pp collision events at $ \sqrt{s} = $ 7 TeV | JINST 7 (2012) P10002 | CMS-MUO-10-004 1206.4071 |
| 49 | M. Cacciari and G. P. Salam | Pileup subtraction using jet areas | PLB 659 (2008) 119 | 0707.1378 |
| 50 | CMS Collaboration | Performance of missing energy reconstruction in 13 TeV pp collision data using the CMS detector | CMS-PAS-JME-16-004 | CMS-PAS-JME-16-004 |
| 51 | M. Cacciari and G. P. Salam | Dispelling the $ N^{3} $ myth for the $ k_{\mathrm{T}} $ jet-finder | PLB 641 (2006) 57 | hep-ph/0512210 |
| 52 | CMS Collaboration | Determination of jet energy calibration and transverse momentum resolution in CMS | JINST 6 (2011) P11002 | CMS-JME-10-011 1107.4277 |
| 53 | CMS Collaboration | Jet algorithms performance in 13 TeV data | CMS-PAS-JME-16-003 | CMS-PAS-JME-16-003 |
| 54 | CMS Collaboration | Pileup jet identification | CDS | |
| 55 | CMS Collaboration | Performance of quark/gluon discrimination using pp collision data at $ \sqrt{s} = $ 8 TeV | CMS-PAS-JME-13-002 | CMS-PAS-JME-13-002 |
| 56 | CMS Collaboration | Identification of heavy-flavour jets with the CMS detector in pp collisions at 13 TeV | JINST 13 (2018) P05011 | CMS-BTV-16-002 1712.07158 |
| 57 | H. Voss, A. Hocker, J. Stelzer, and F. Tegenfeldt | TMVA, the toolkit for multivariate data analysis with ROOT | in XIth International Workshop on Advanced Computing and Analysis Techniques in Physics Research (ACAT), p. 40 2007 | physics/0703039 |
| 58 | The ATLAS Collaboration, The CMS Collaboration, The LHC Higgs Combination Group | Procedure for the LHC Higgs boson search combination in Summer 2011 | CMS-NOTE-2011-005 | |
| 59 | G. Cowan, K. Cranmer, E. Gross, and O. Vitells | Asymptotic formulae for likelihood-based tests of new physics | EPJC 71 (2011) 1554 | 1007.1727 |
| 60 | CMS Collaboration | CMS Luminosity Measurements for the 2016 Data Taking Period | CMS-PAS-LUM-17-001 | CMS-PAS-LUM-17-001 |
| 61 | CMS Collaboration | Measurements of Inclusive W and Z Cross Sections in pp Collisions at $ \sqrt{s}= $ 7 TeV | JHEP 01 (2011) 080 | CMS-EWK-10-002 1012.2466 |
| 62 | CMS Collaboration | Measurement of the inelastic proton-proton cross section at $ \sqrt{s}= $ 13 TeV | JHEP 07 (2018) 161 | CMS-FSQ-15-005 1802.02613 |
| 63 | R. J. Barlow and C. Beeston | Fitting using finite Monte Carlo samples | CPC 77 (1993) 219 | |
| 64 | C. Degrande et al. | Studies of vector boson scattering and triboson production with DELPHES parametrized fast simulation for Snowmass 2013 | 1309.7452 | |
| 65 | Particle Data Group, K. Nakamura et al. | Review of particle physics | JPG 37 (2010) 075021 | |
| 66 | The LEP Electroweak Working Group | Electroweak measurements in electron-positron collisions at W-boson-pair energies at LEP | PR 532 (2013) 119 | 1302.3415 |
| 67 | CDF Collaboration | Measurement of the $ WZ $ Cross Section and Triple Gauge Couplings in $ p \bar p $ Collisions at $ \sqrt{s} = $ 1.96 TeV | PRD 86 (2012) 031104 | 1202.6629 |
| 68 | D0 Collaboration | Limits on anomalous trilinear gauge boson couplings from $ WW $, $ WZ $ and $ W\gamma $ production in $ p\bar{p} $ collisions at $ \sqrt{s}= $ 1.96 TeV | PLB 718 (2012) 451 | 1208.5458 |
| 69 | ATLAS Collaboration | Measurement of $ \mathrm{WW/WZ} \to \ell \nu \mathrm{q q'} $ production with the hadronically decaying boson reconstructed as one or two jets in pp collisions at $ \sqrt{s} = $ 8 TeV with ATLAS, and constraints on anomalous gauge couplings | EPJC 77 (2017) 563 | 1706.01702 |
| 70 | ATLAS Collaboration | Measurements of $ \mathrm{W}^{\pm}\mathrm{Z} $ production cross sections in pp collisions at $ \sqrt{s} = $ 8 TeV with the ATLAS detector and limits on anomalous gauge boson self-couplings | PRD 93 (2016) 092004 | 1603.02151 |
| 71 | CMS Collaboration | Search for anomalous couplings in boosted $ \mathrm{WW/WZ} \to \ell \nu \mathrm{q \overline{q}} $ production in proton-proton collisions at $ \sqrt{s} = $ 8 TeV | PLB 772 (2017) 21 | CMS-SMP-13-008 1703.06095 |
| 72 | CMS Collaboration | Measurement of the WZ production cross section in pp collisions at $ \sqrt{s} = $ 7 and 8 TeV and search for anomalous triple gauge couplings at $ \sqrt{s} = $ 8 TeV | EPJC 77 (2017) 236 | CMS-SMP-14-014 1609.05721 |
| 73 | CMS Collaboration | Precise determination of the mass of the Higgs boson and tests of compatibility of its couplings with the standard model predictions using proton collisions at 7 and 8 TeV | EPJC 75 (2015) 212 | CMS-HIG-14-009 1412.8662 |
| 74 | K. Hagiwara, R. D. Peccei, and D. Zeppenfeld | Probing the weak boson sector in $ \mathrm{e^{+} e^{-} \to W^{+} W^{-}} $ | NPB 282 (1987) 253 | |
| 75 | CMS Collaboration | Tracking and primary vertex results in first 7 TeV collisions | CMS-PAS-TRK-10-005 | |
| 76 | CMS Collaboration | Commissioning of TrackJets in pp collisions at $ \sqrt{s} = $ 7 TeV | CMS-PAS-JME-10-006 | |
| 77 | CMS Collaboration | Performance of jet reconstruction with charged tracks only | CMS-PAS-JME-08-001 | |
|
|
Compact Muon Solenoid LHC, CERN |
|

|

|

|

|

|