

Compact Muon Solenoid
LHC, CERN
| CMS-SMP-19-010 ; CERN-EP-2020-250 | ||
| Measurements of the differential cross sections of the production of Z$+$jets and $\gamma +$jets and of Z boson emission collinear with a jet in pp collisions at $\sqrt{s} = $ 13 TeV | ||
| CMS Collaboration | ||
| 3 February 2021 | ||
| JHEP 05 (2021) 285 | ||
| Abstract: Measurements of the differential cross sections of Z$+$jets and $\gamma +$jets production, and their ratio, are presented as a function of the boson transverse momentum. Measurements are also presented of the angular distribution between the Z boson and the closest jet. The analysis is based on pp collisions at a center-of-mass energy of 13 TeV corresponding to an integrated luminosity of 35.9 fb$^{-1}$ recorded by the CMS experiment at the LHC. The results, corrected for detector effects, are compared with various theoretical predictions. In general, the predictions at higher orders in perturbation theory show better agreement with the measurements. This work provides the first measurement of the ratio of the differential cross sections of Z$+$jets and $\gamma +$jets production at 13 TeV, as well as the first direct measurement of Z bosons emitted collinearly with a jet. | ||
| Links: e-print arXiv:2102.02238 [hep-ex] (PDF) ; CDS record ; inSPIRE record ; CADI line (restricted) ; | ||
| Figures | |
png pdf |
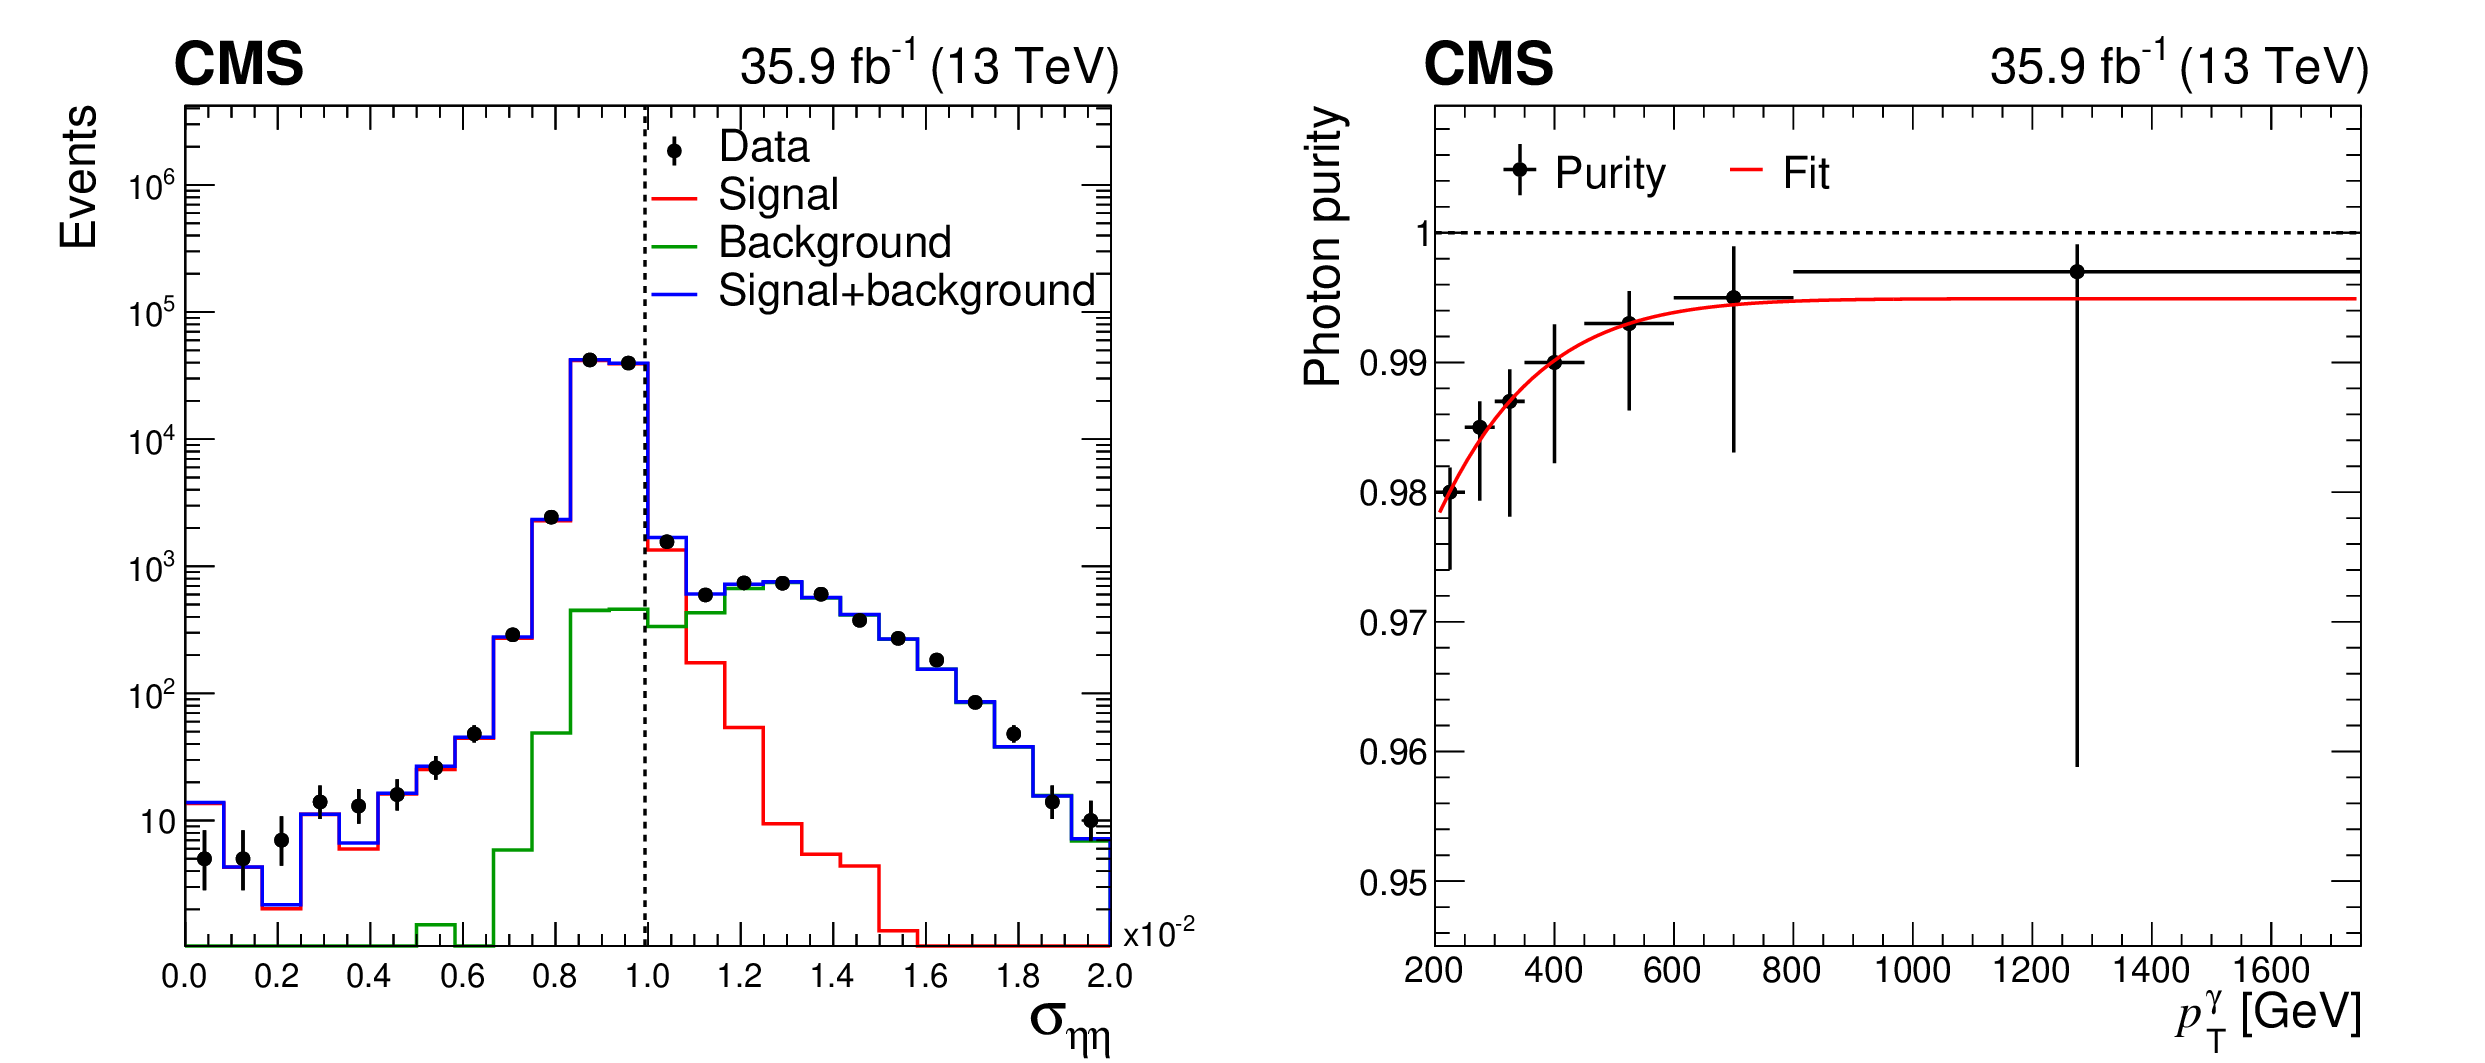
Figure 1:
A fit to the ${\sigma _{\eta \eta}}$ distribution using signal and background templates to extract a value for the purity in the photon ${p_{\mathrm {T}}}$ bin of 300-350 GeV. The signal region is to the left of the vertical dashed line (left). Purity as a function of photon ${p_{\mathrm {T}}}$, as extracted from a fit to the ${\sigma _{\eta \eta}}$ distribution in each ${p_{\mathrm {T}}}$ bin. The error bars show the total statistical and systematic uncertainty and the solid line is the fit to the data points (right). |
png pdf |
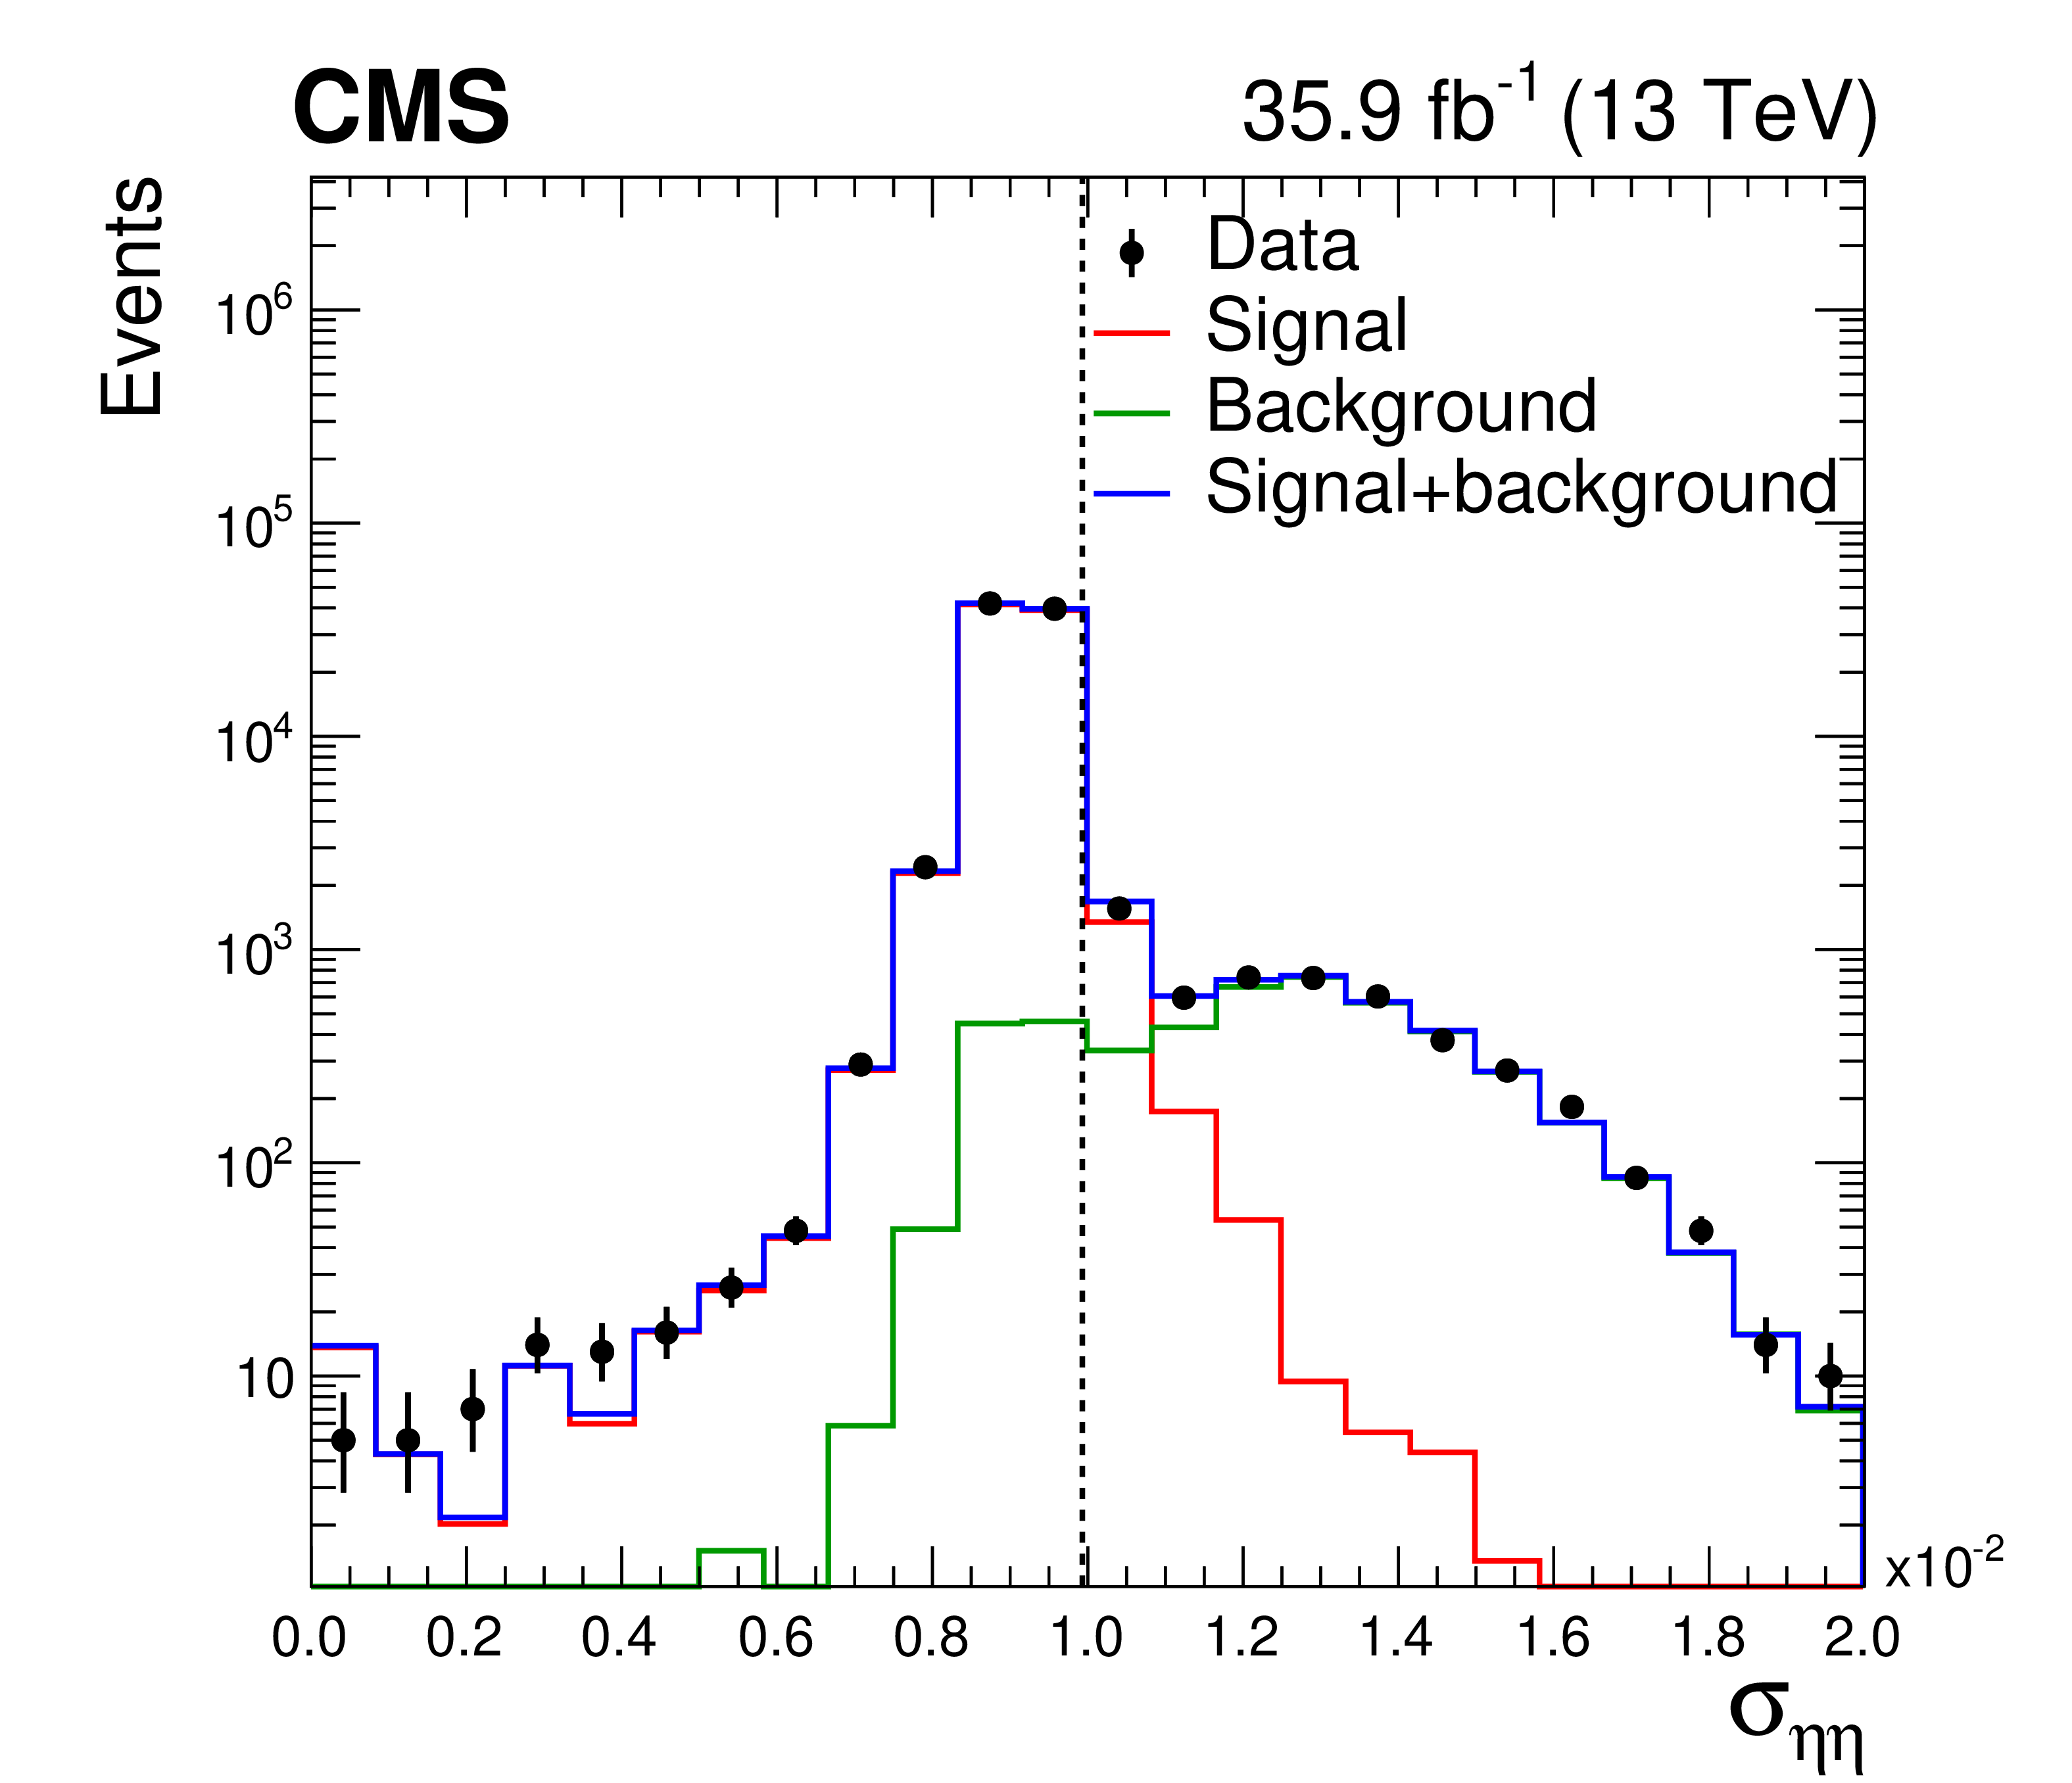
Figure 1-a:
A fit to the ${\sigma _{\eta \eta}}$ distribution using signal and background templates to extract a value for the purity in the photon ${p_{\mathrm {T}}}$ bin of 300-350 GeV. The signal region is to the left of the vertical dashed line. |

png pdf |
Figure 1-b:
Purity as a function of photon ${p_{\mathrm {T}}}$, as extracted from a fit to the ${\sigma _{\eta \eta}}$ distribution in each ${p_{\mathrm {T}}}$ bin. The error bars show the total statistical and systematic uncertainty and the solid line is the fit to the data points. |
png pdf |
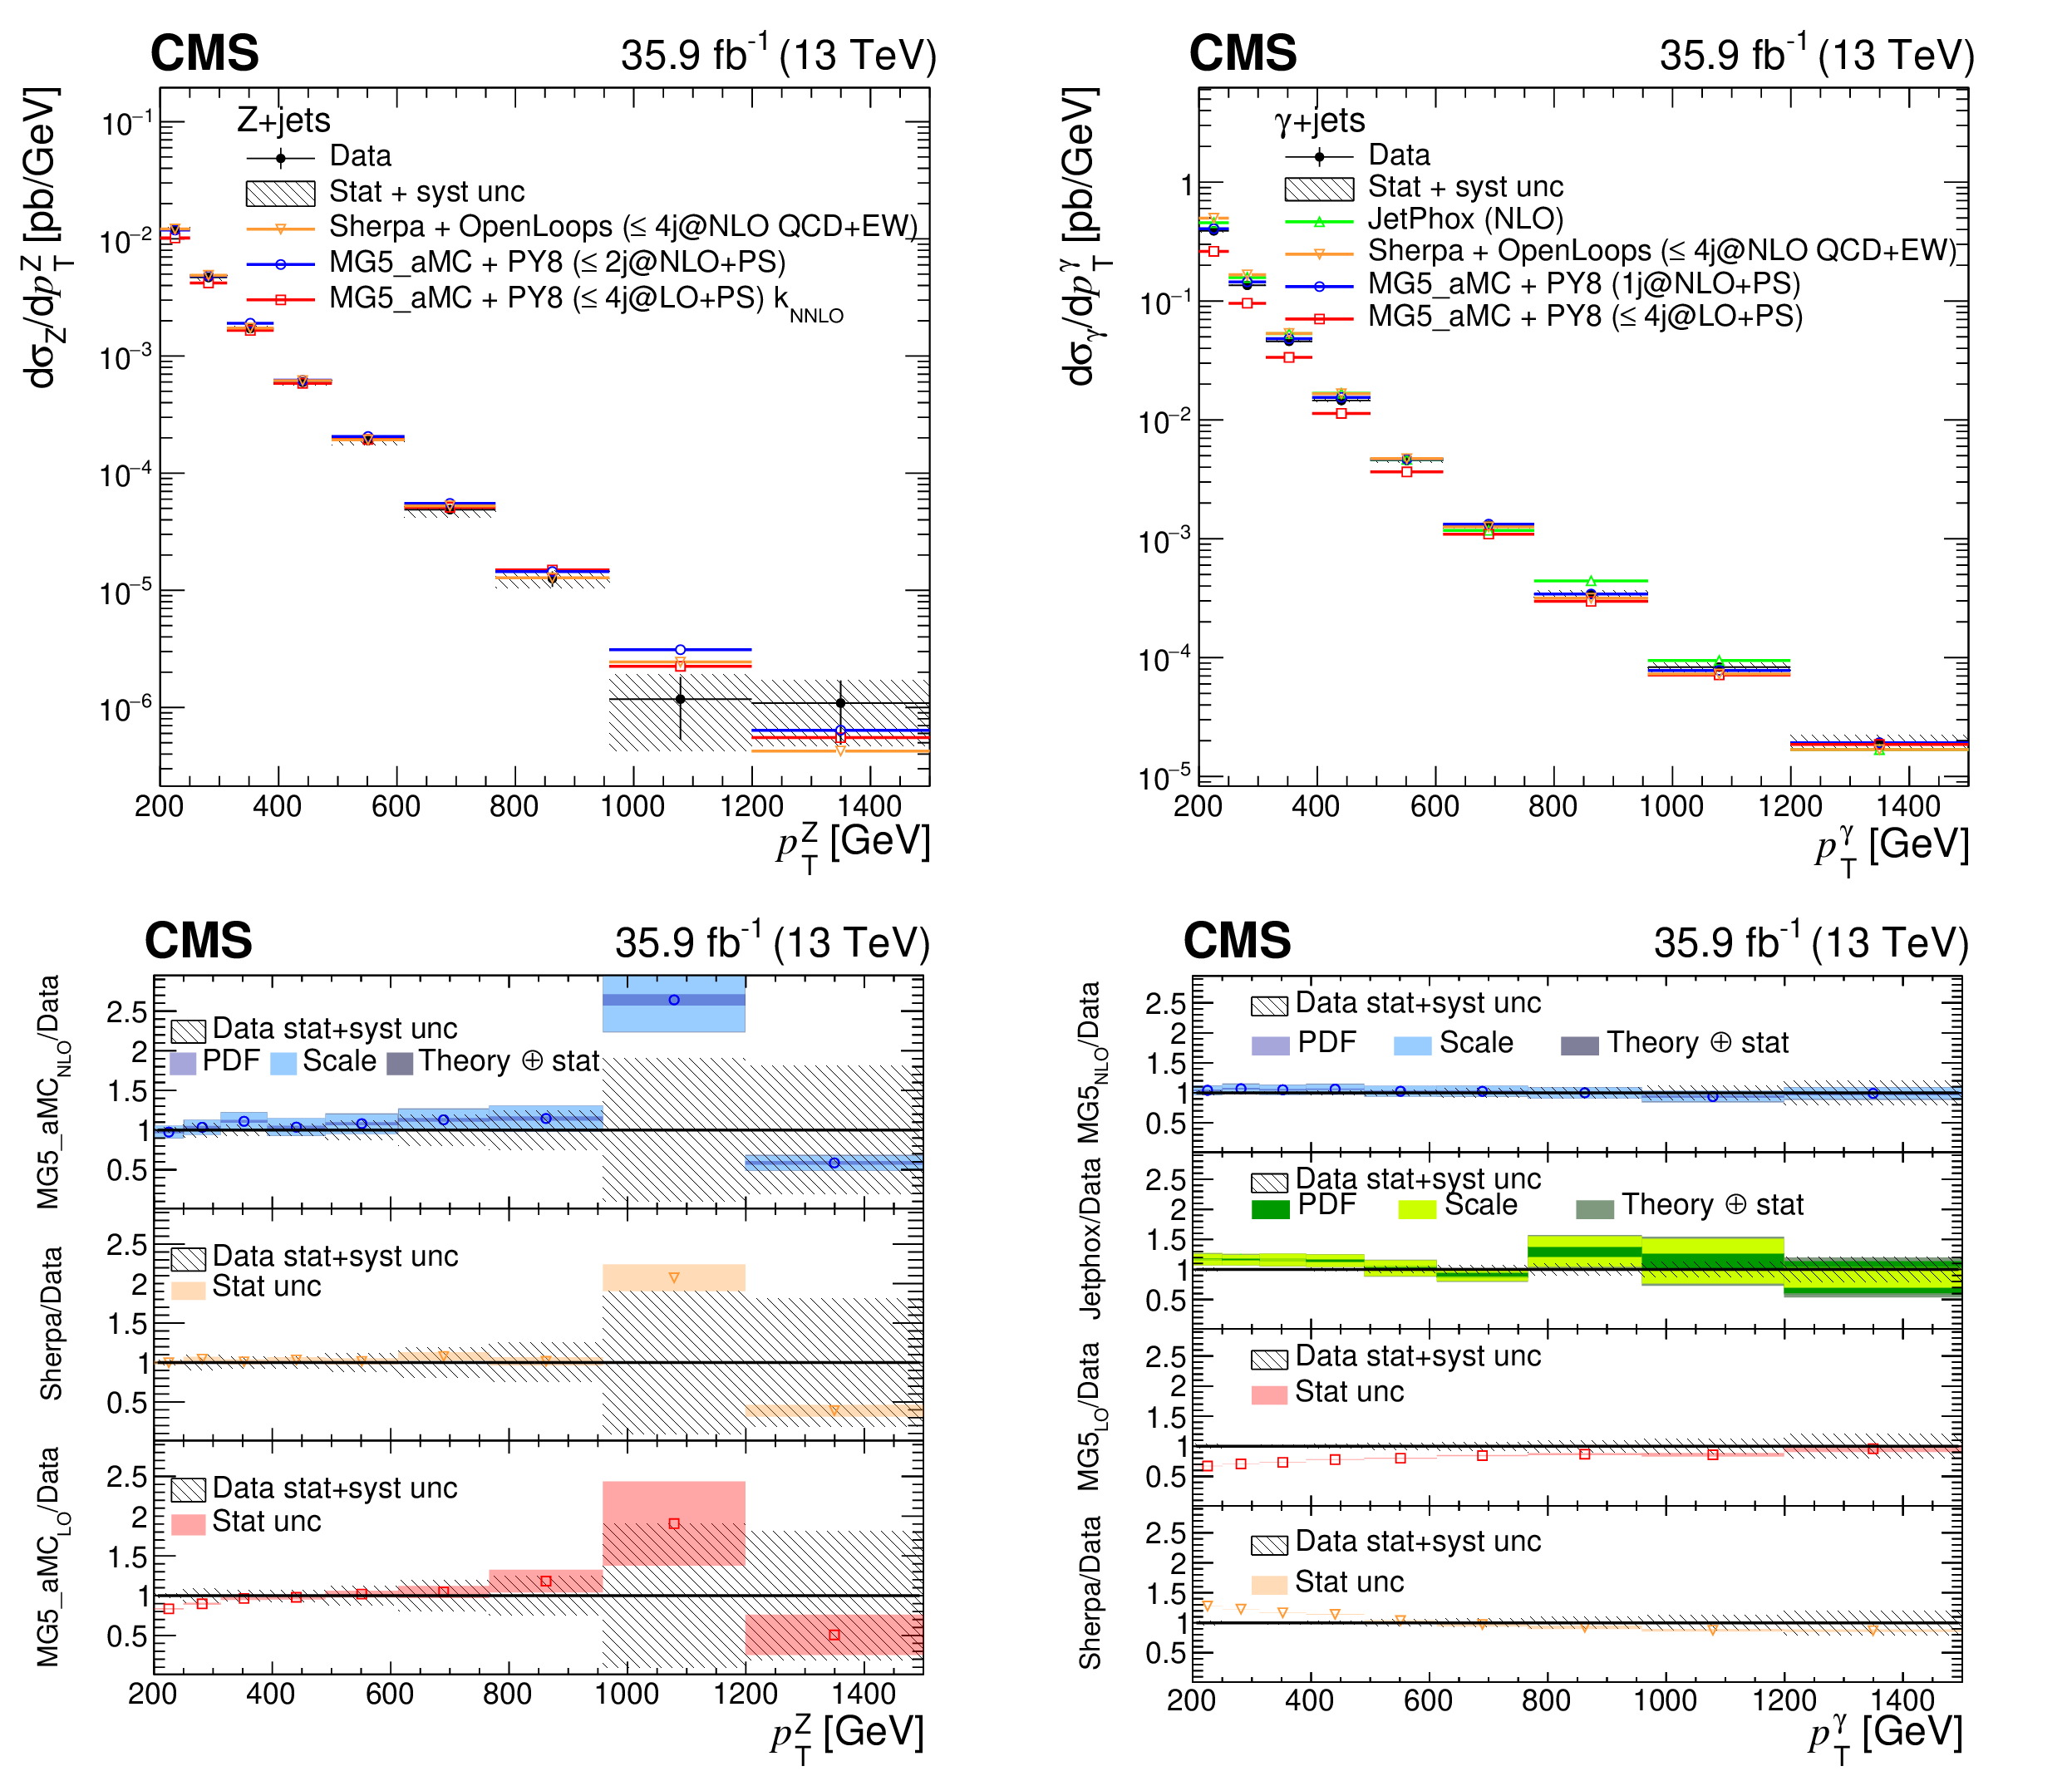
Figure 2:
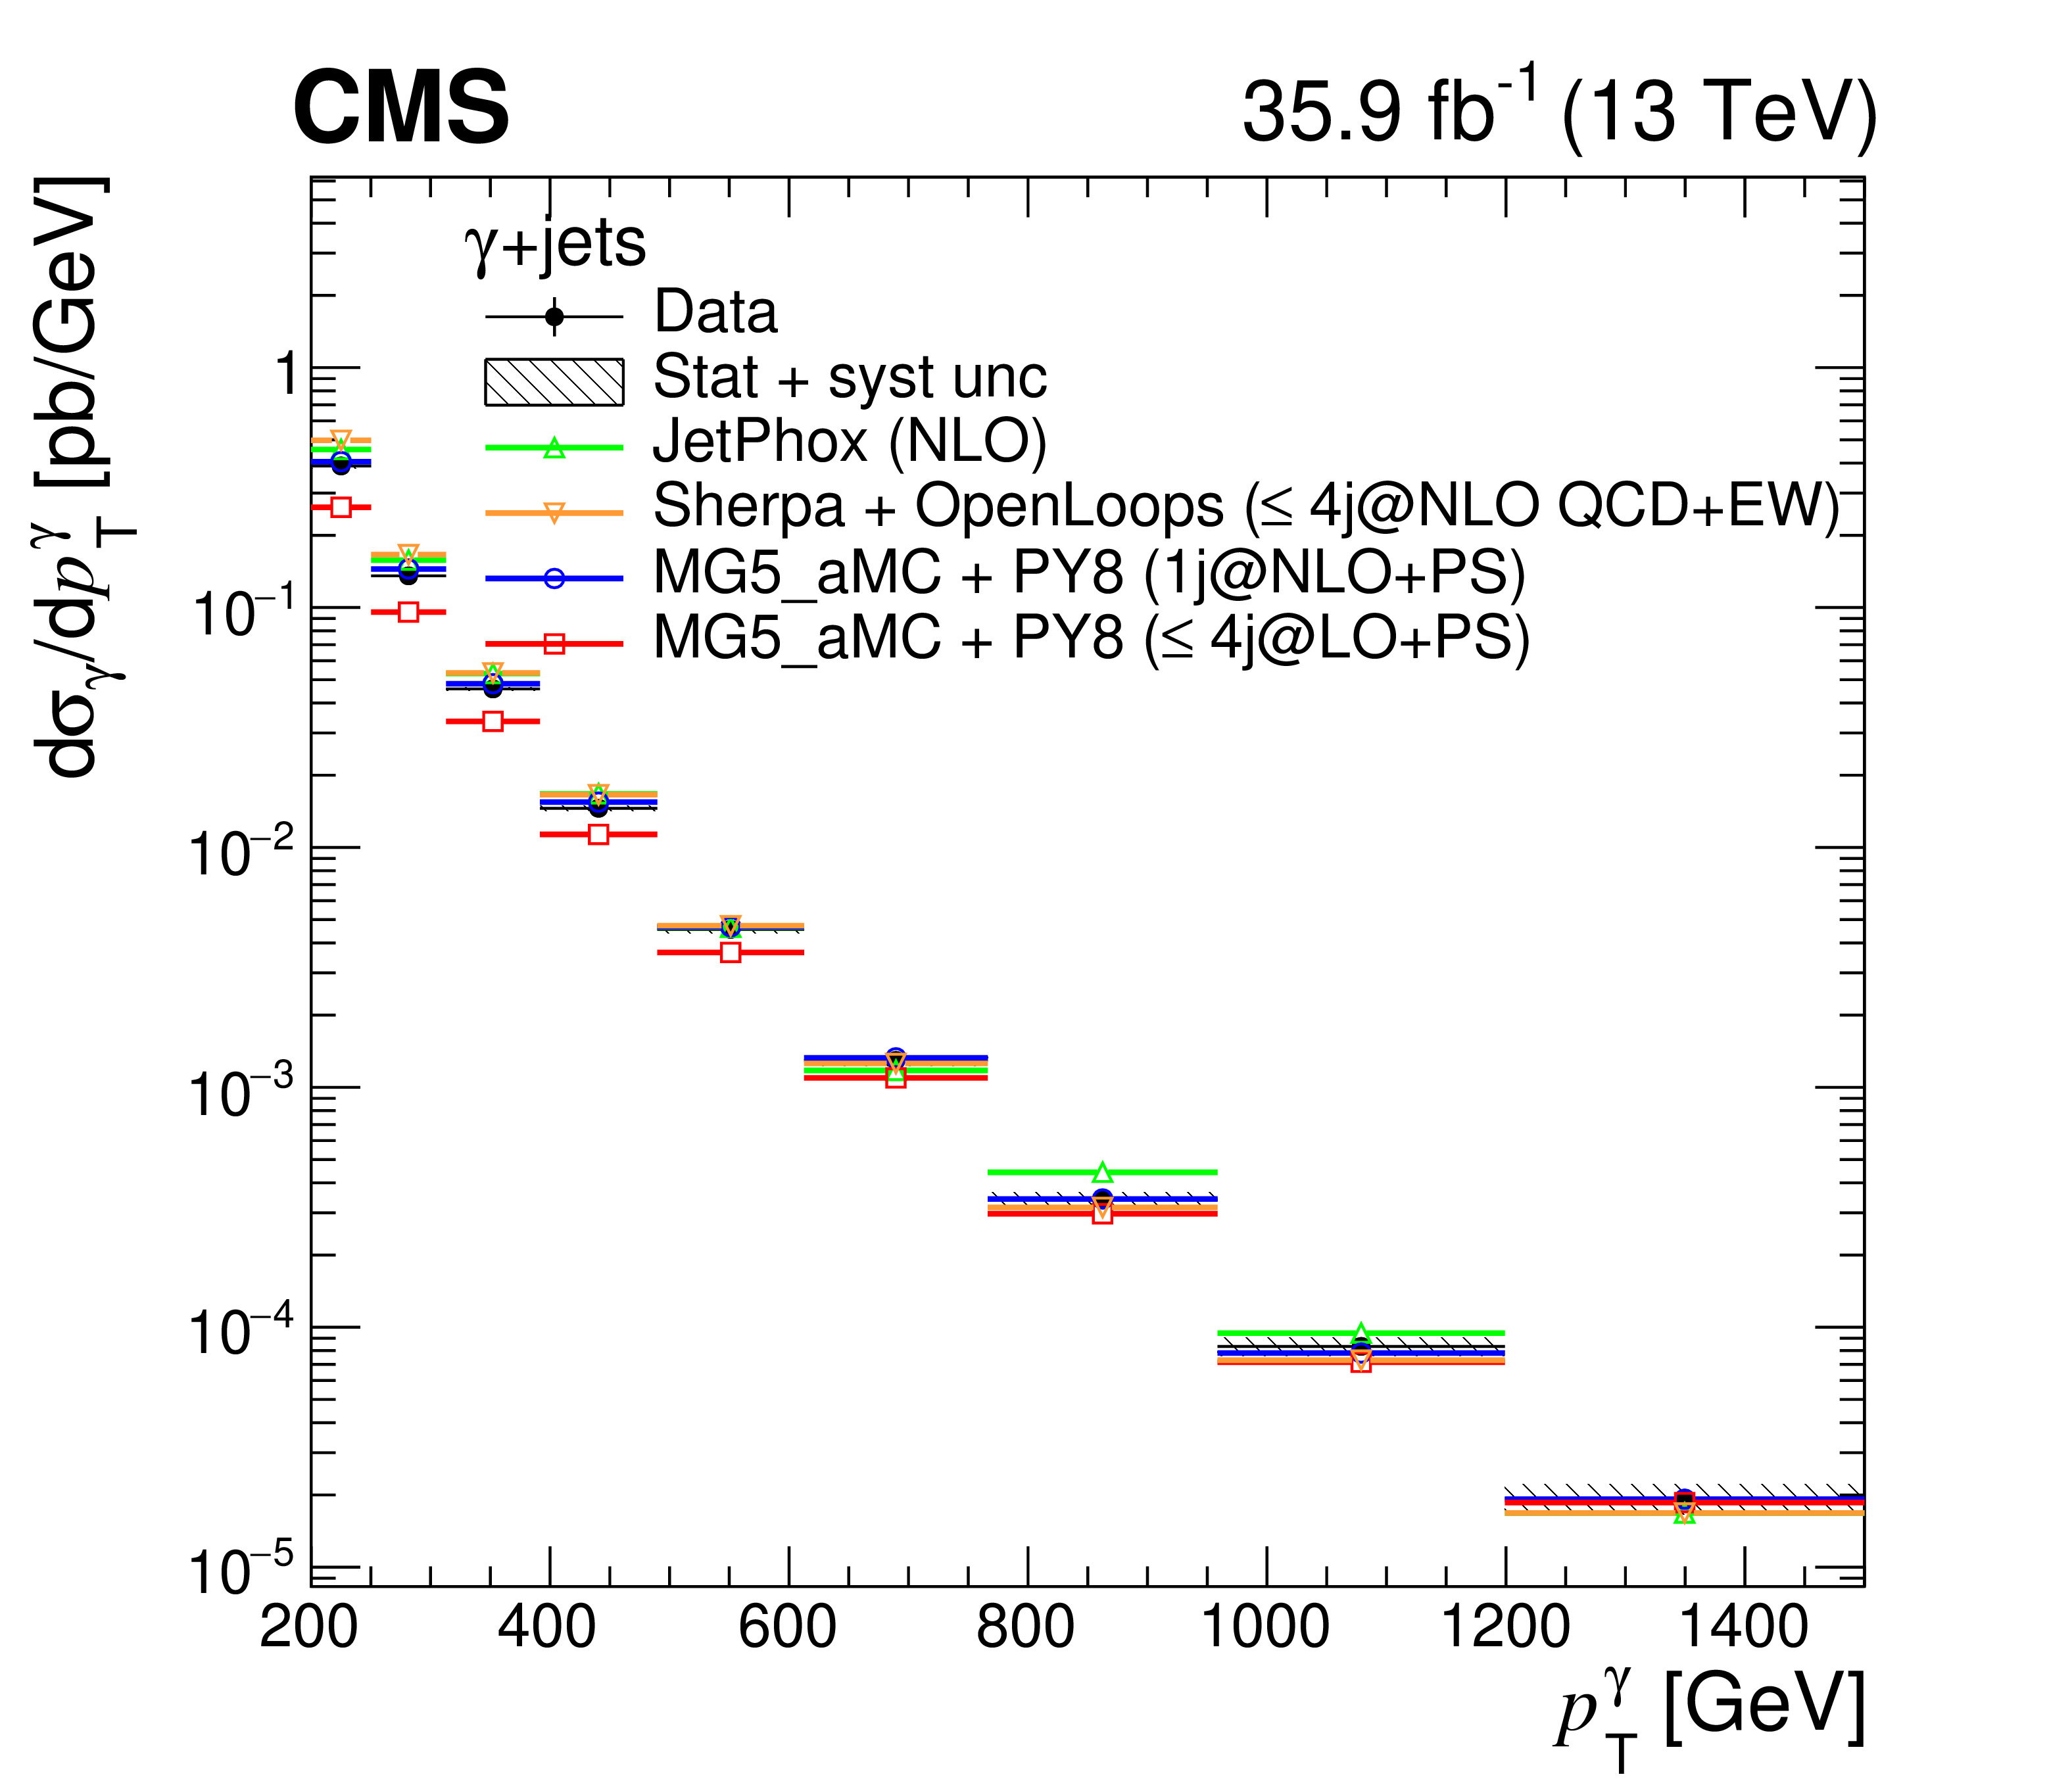
Measured differential cross sections as a function of the boson ${p_{\mathrm {T}}}$ for Z$+$jets (left) and $\gamma +$jets (right) and their comparisons with several theoretical predictions. The LO MadGraph 5_aMC@NLO prediction for Z$+$jets has been normalized to the NNLO cross section (denoted by k$_{\textrm {NNLO}}$). The vertical bars in the upper panels represent the statistical uncertainty in the measurement and the hatched band in the lower and upper panels is the sum in quadrature of the statistical and systematic uncertainty components in the measurement. The lower panels show the ratios of the theoretical predictions to the unfolded data. The shaded band in the LO MadGraph 5_aMC@NLO and SHERPA + OpenLoops calculations shows the statistical uncertainty. The dark (light) shaded band on the NLO prediction from MadGraph 5_aMC@NLO and the JetPhox prediction represents the PDF (scale) uncertainties, whereas the statistical uncertainties are barely visible. |
png pdf |
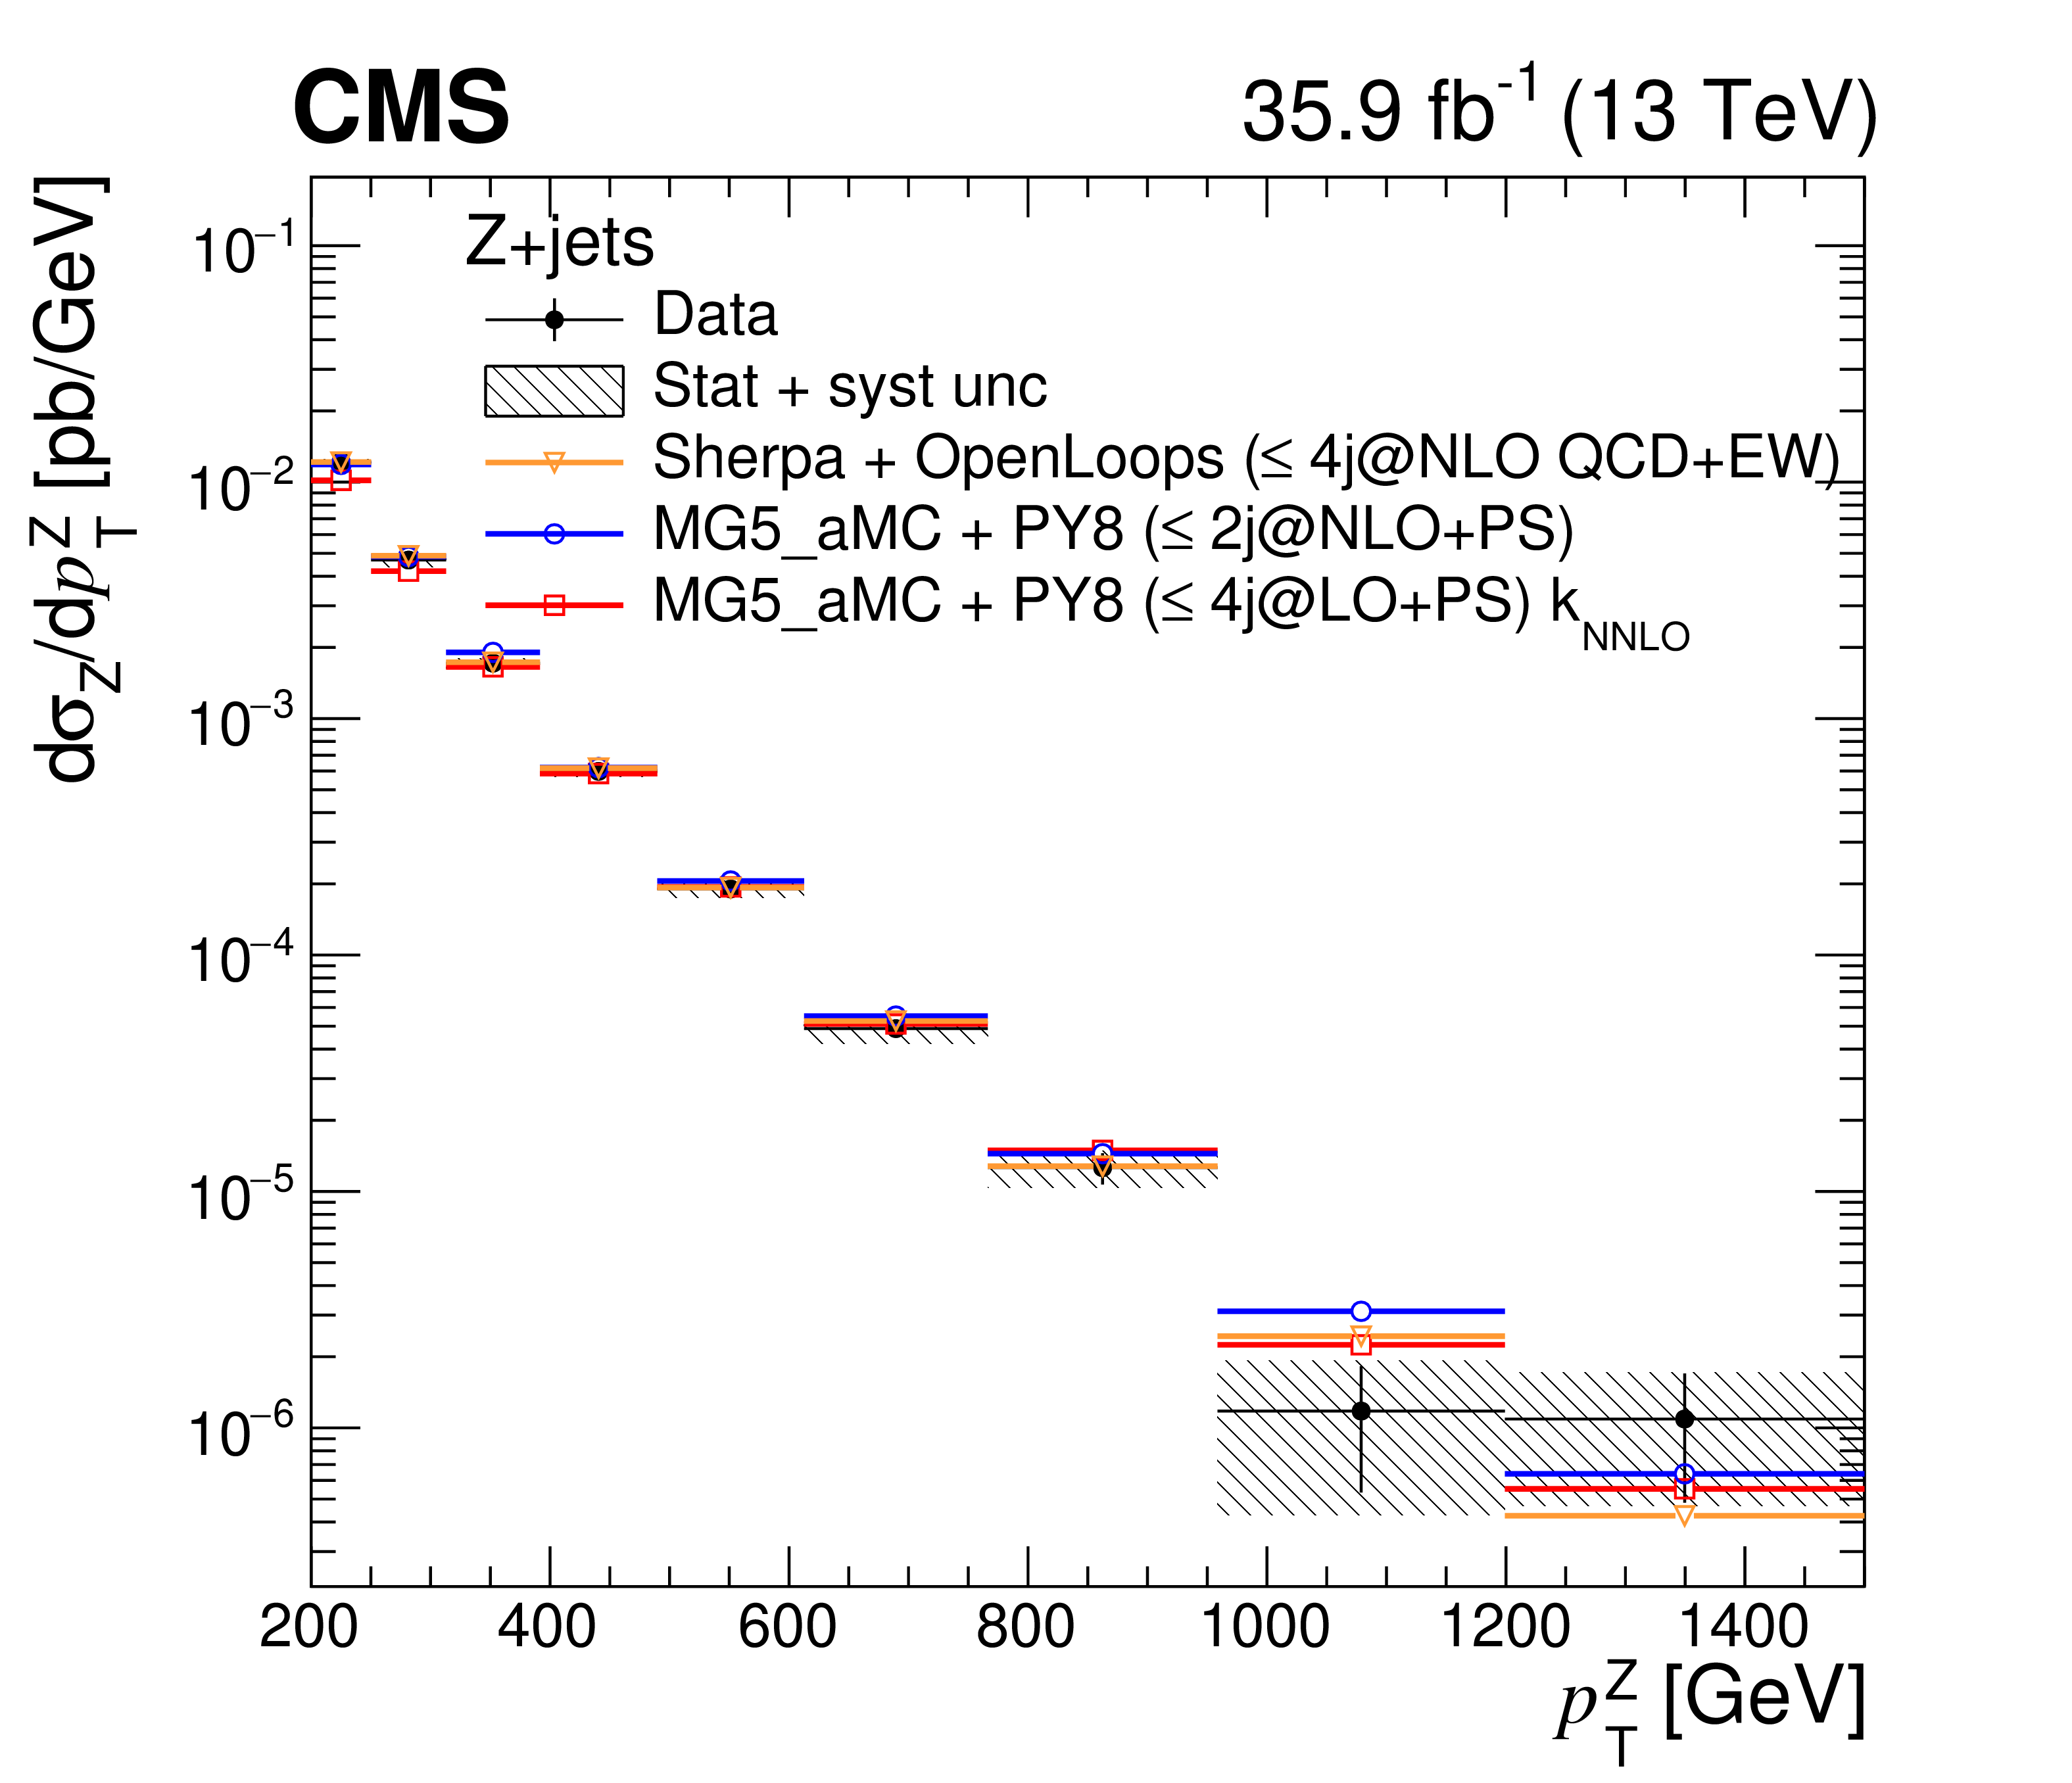
Figure 2-a:
Measured differential cross section as a function of the boson ${p_{\mathrm {T}}}$ for Z$+$jets and comparisons with several theoretical predictions. The LO MadGraph 5_aMC@NLO prediction for Z$+$jets has been normalized to the NNLO cross section (denoted by k$_{\textrm {NNLO}}$). The vertical bars represent the statistical uncertainty in the measurement and the hatched band is the sum in quadrature of the statistical and systematic uncertainty components in the measurement. |
png pdf |
Figure 2-b:
Measured differential cross section as a function of the boson ${p_{\mathrm {T}}}$ for $\gamma +$jets |

png pdf |
Figure 2-c:
Measured differential cross section as a function of the boson ${p_{\mathrm {T}}}$ for Z$+$jets and comparisons with several theoretical predictions. The panel shows the ratios of the theoretical predictions to the unfolded data. The dark (light) shaded band on the NLO prediction from MadGraph 5_aMC@NLO and the JetPhox prediction represents the PDF (scale) uncertainties, whereas the statistical uncertainties are barely visible. The hatched band is the sum in quadrature of the statistical and systematic uncertainty components in the measurement. |
png pdf |
Figure 2-d:
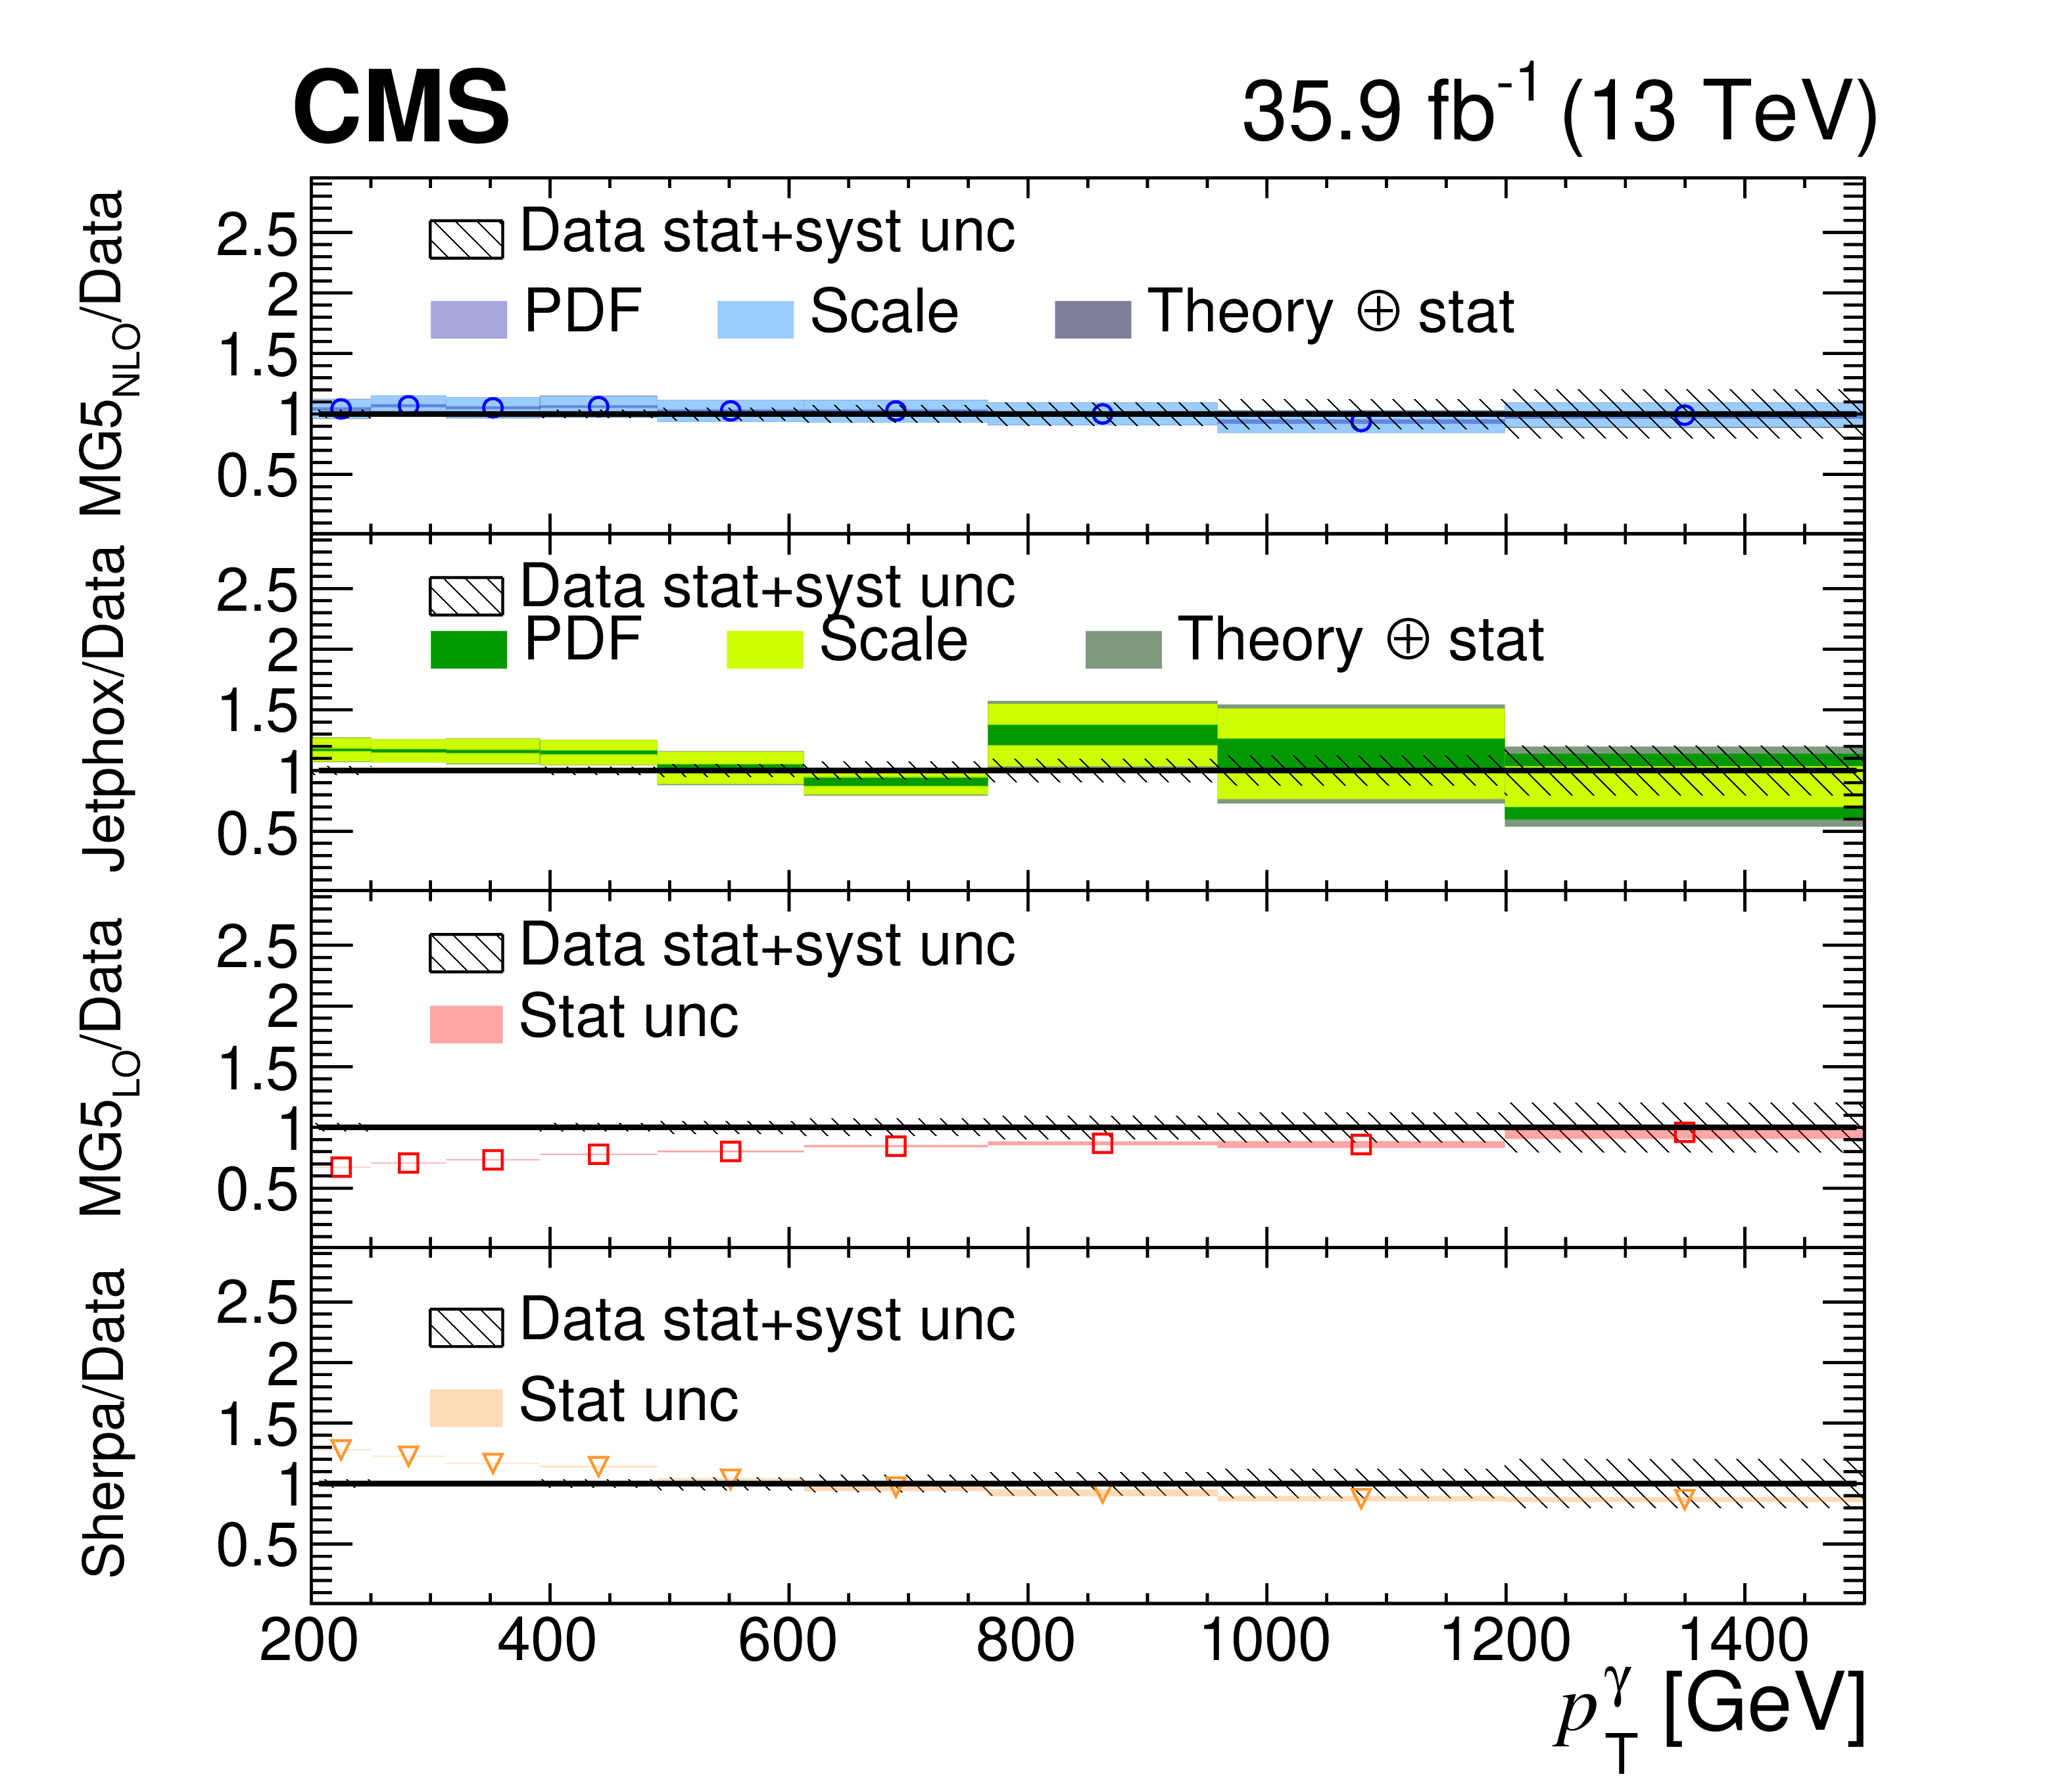
Measured differential cross section as a function of the boson ${p_{\mathrm {T}}}$ for $\gamma +$jets and comparisons with several theoretical predictions. The panel shows the ratios of the theoretical predictions to the unfolded data. The dark (light) shaded band on the NLO prediction from MadGraph 5_aMC@NLO and the JetPhox prediction represents the PDF (scale) uncertainties, whereas the statistical uncertainties are barely visible. The hatched band is the sum in quadrature of the statistical and systematic uncertainty components in the measurement. |
png pdf |
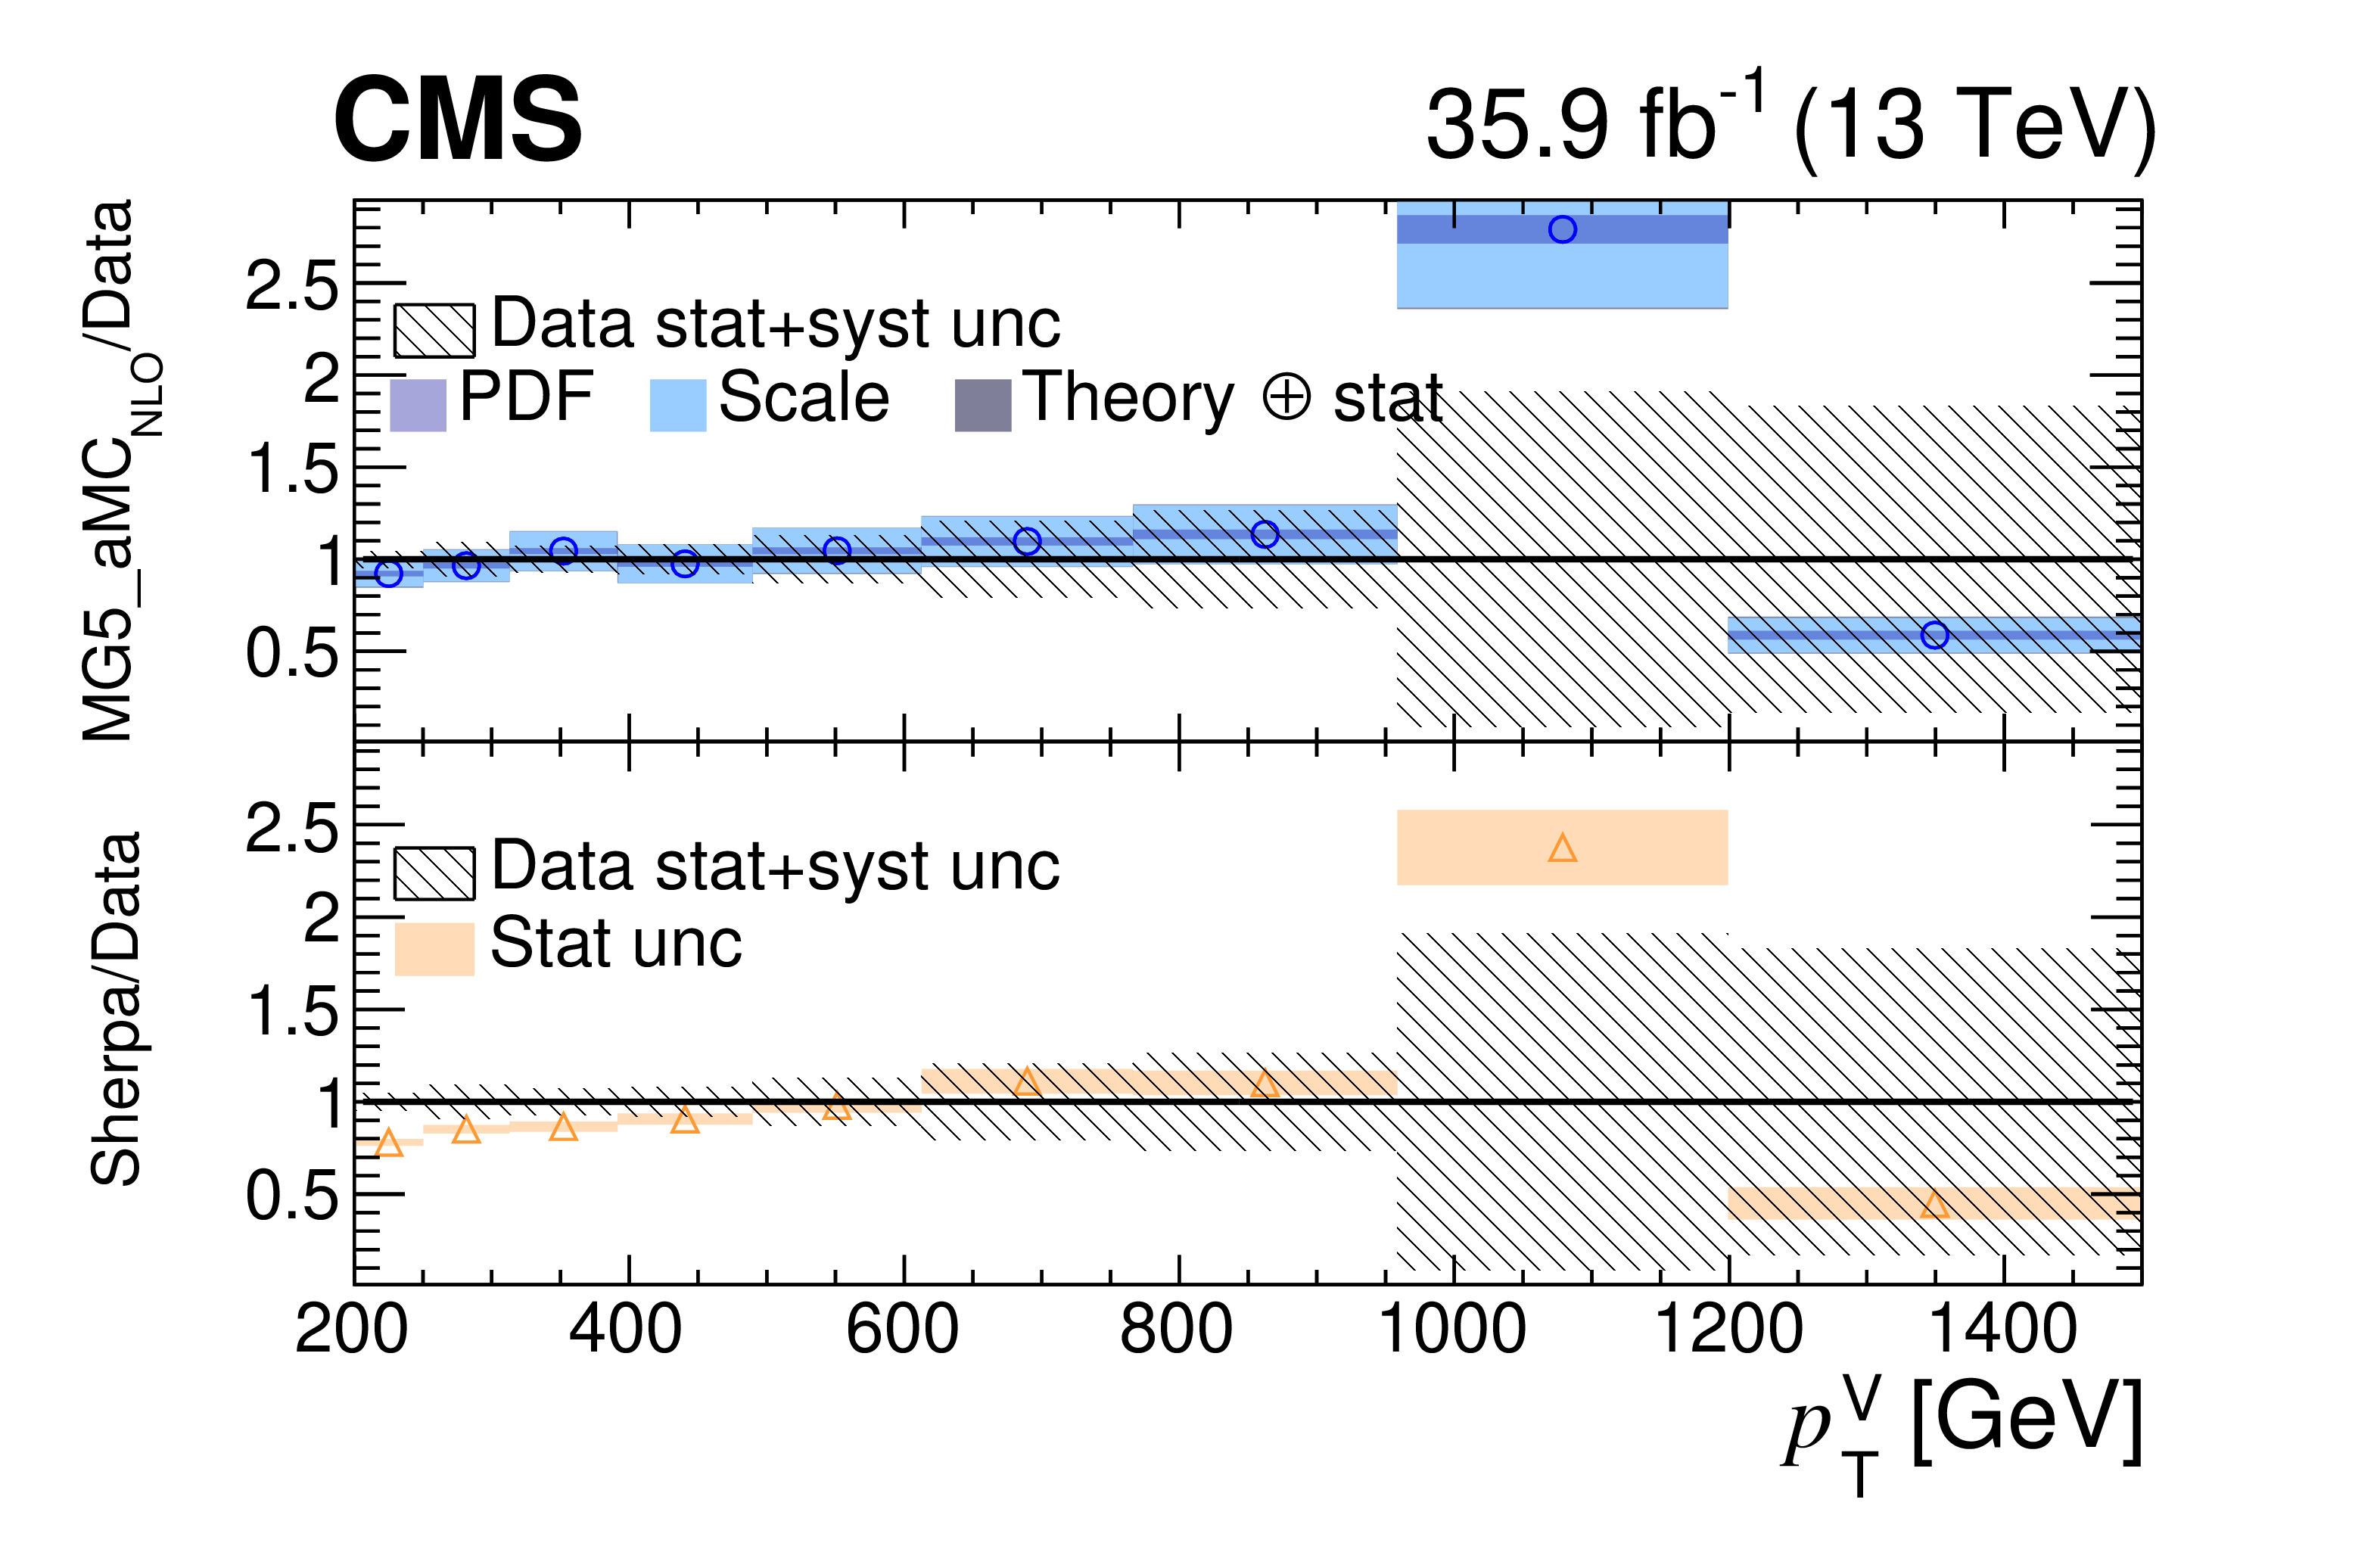
Figure 3:
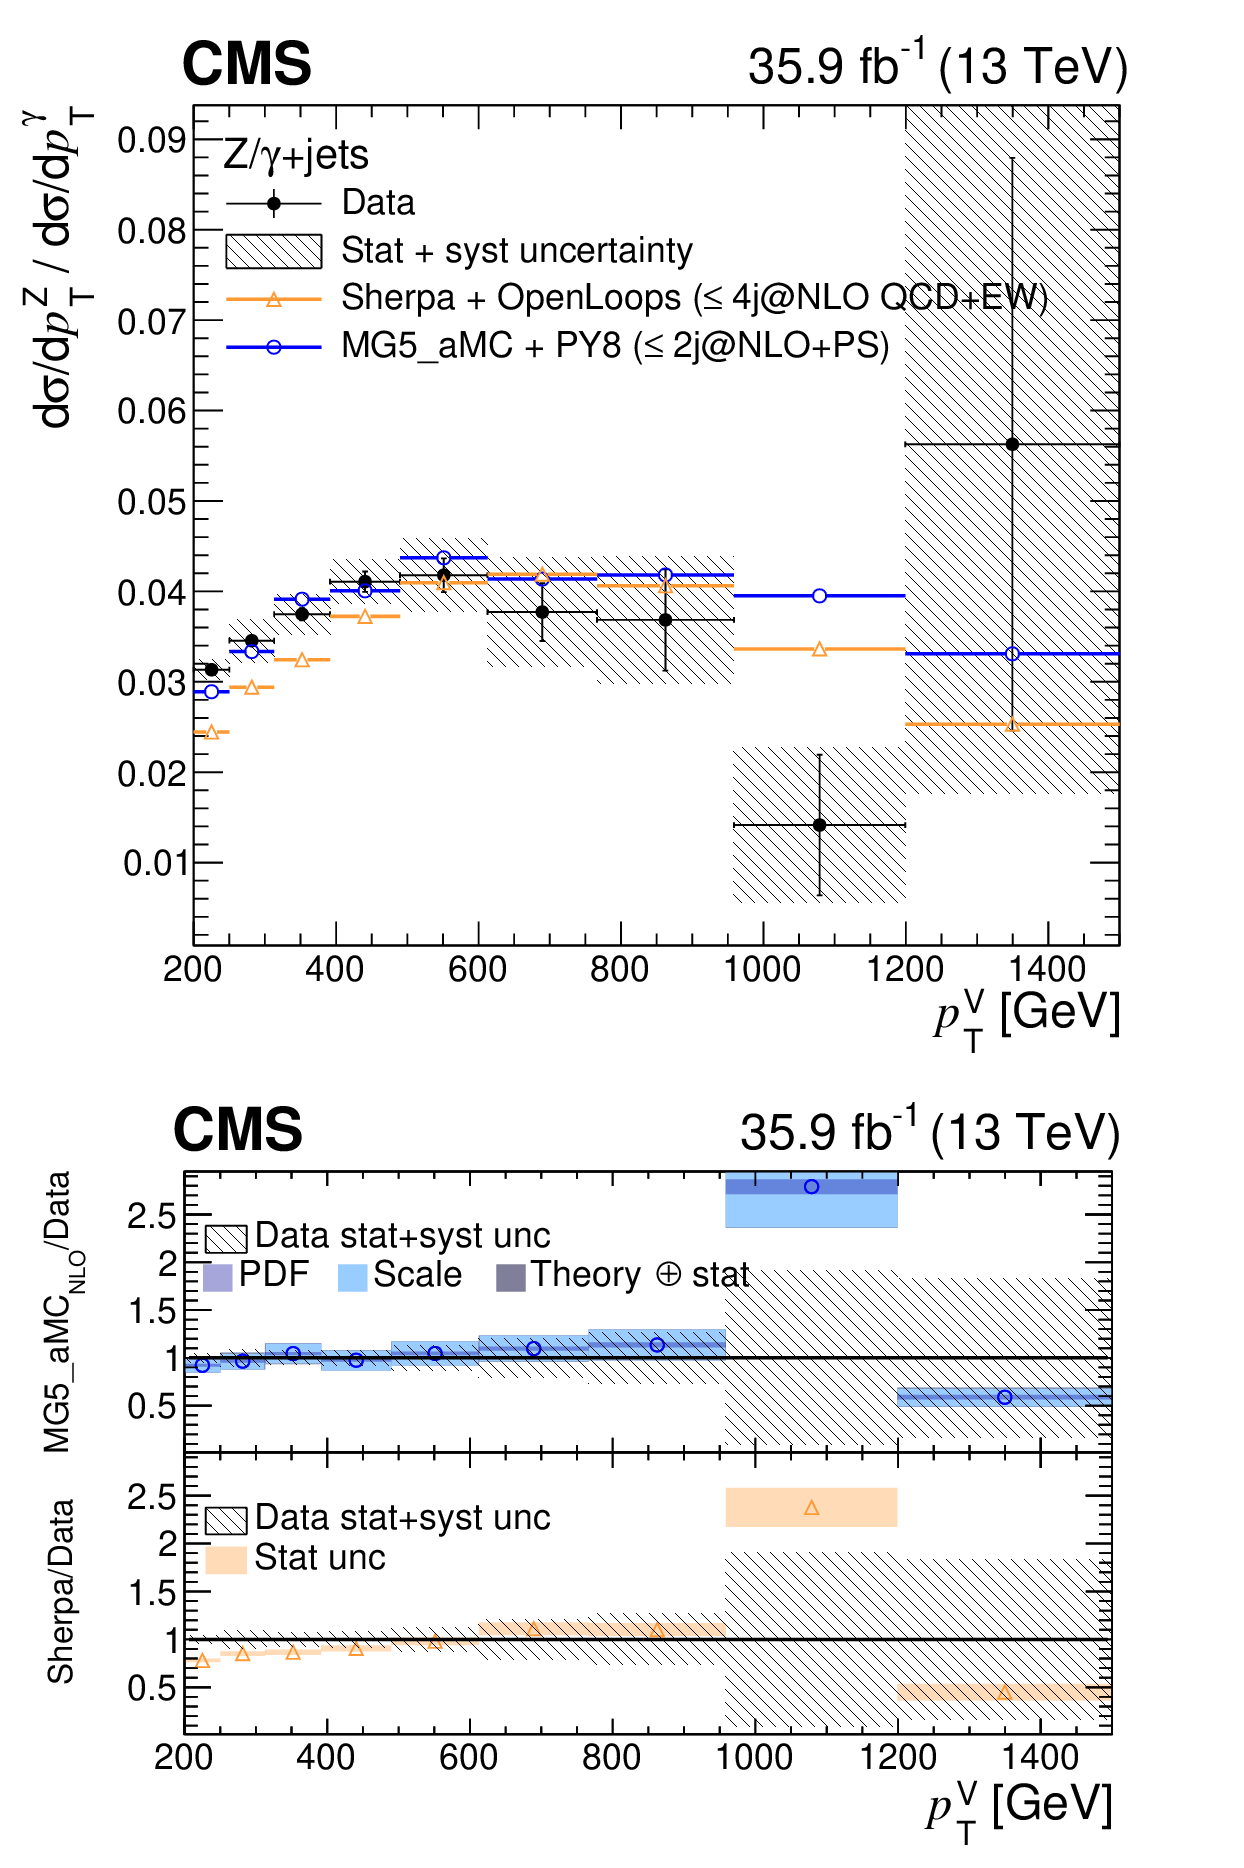
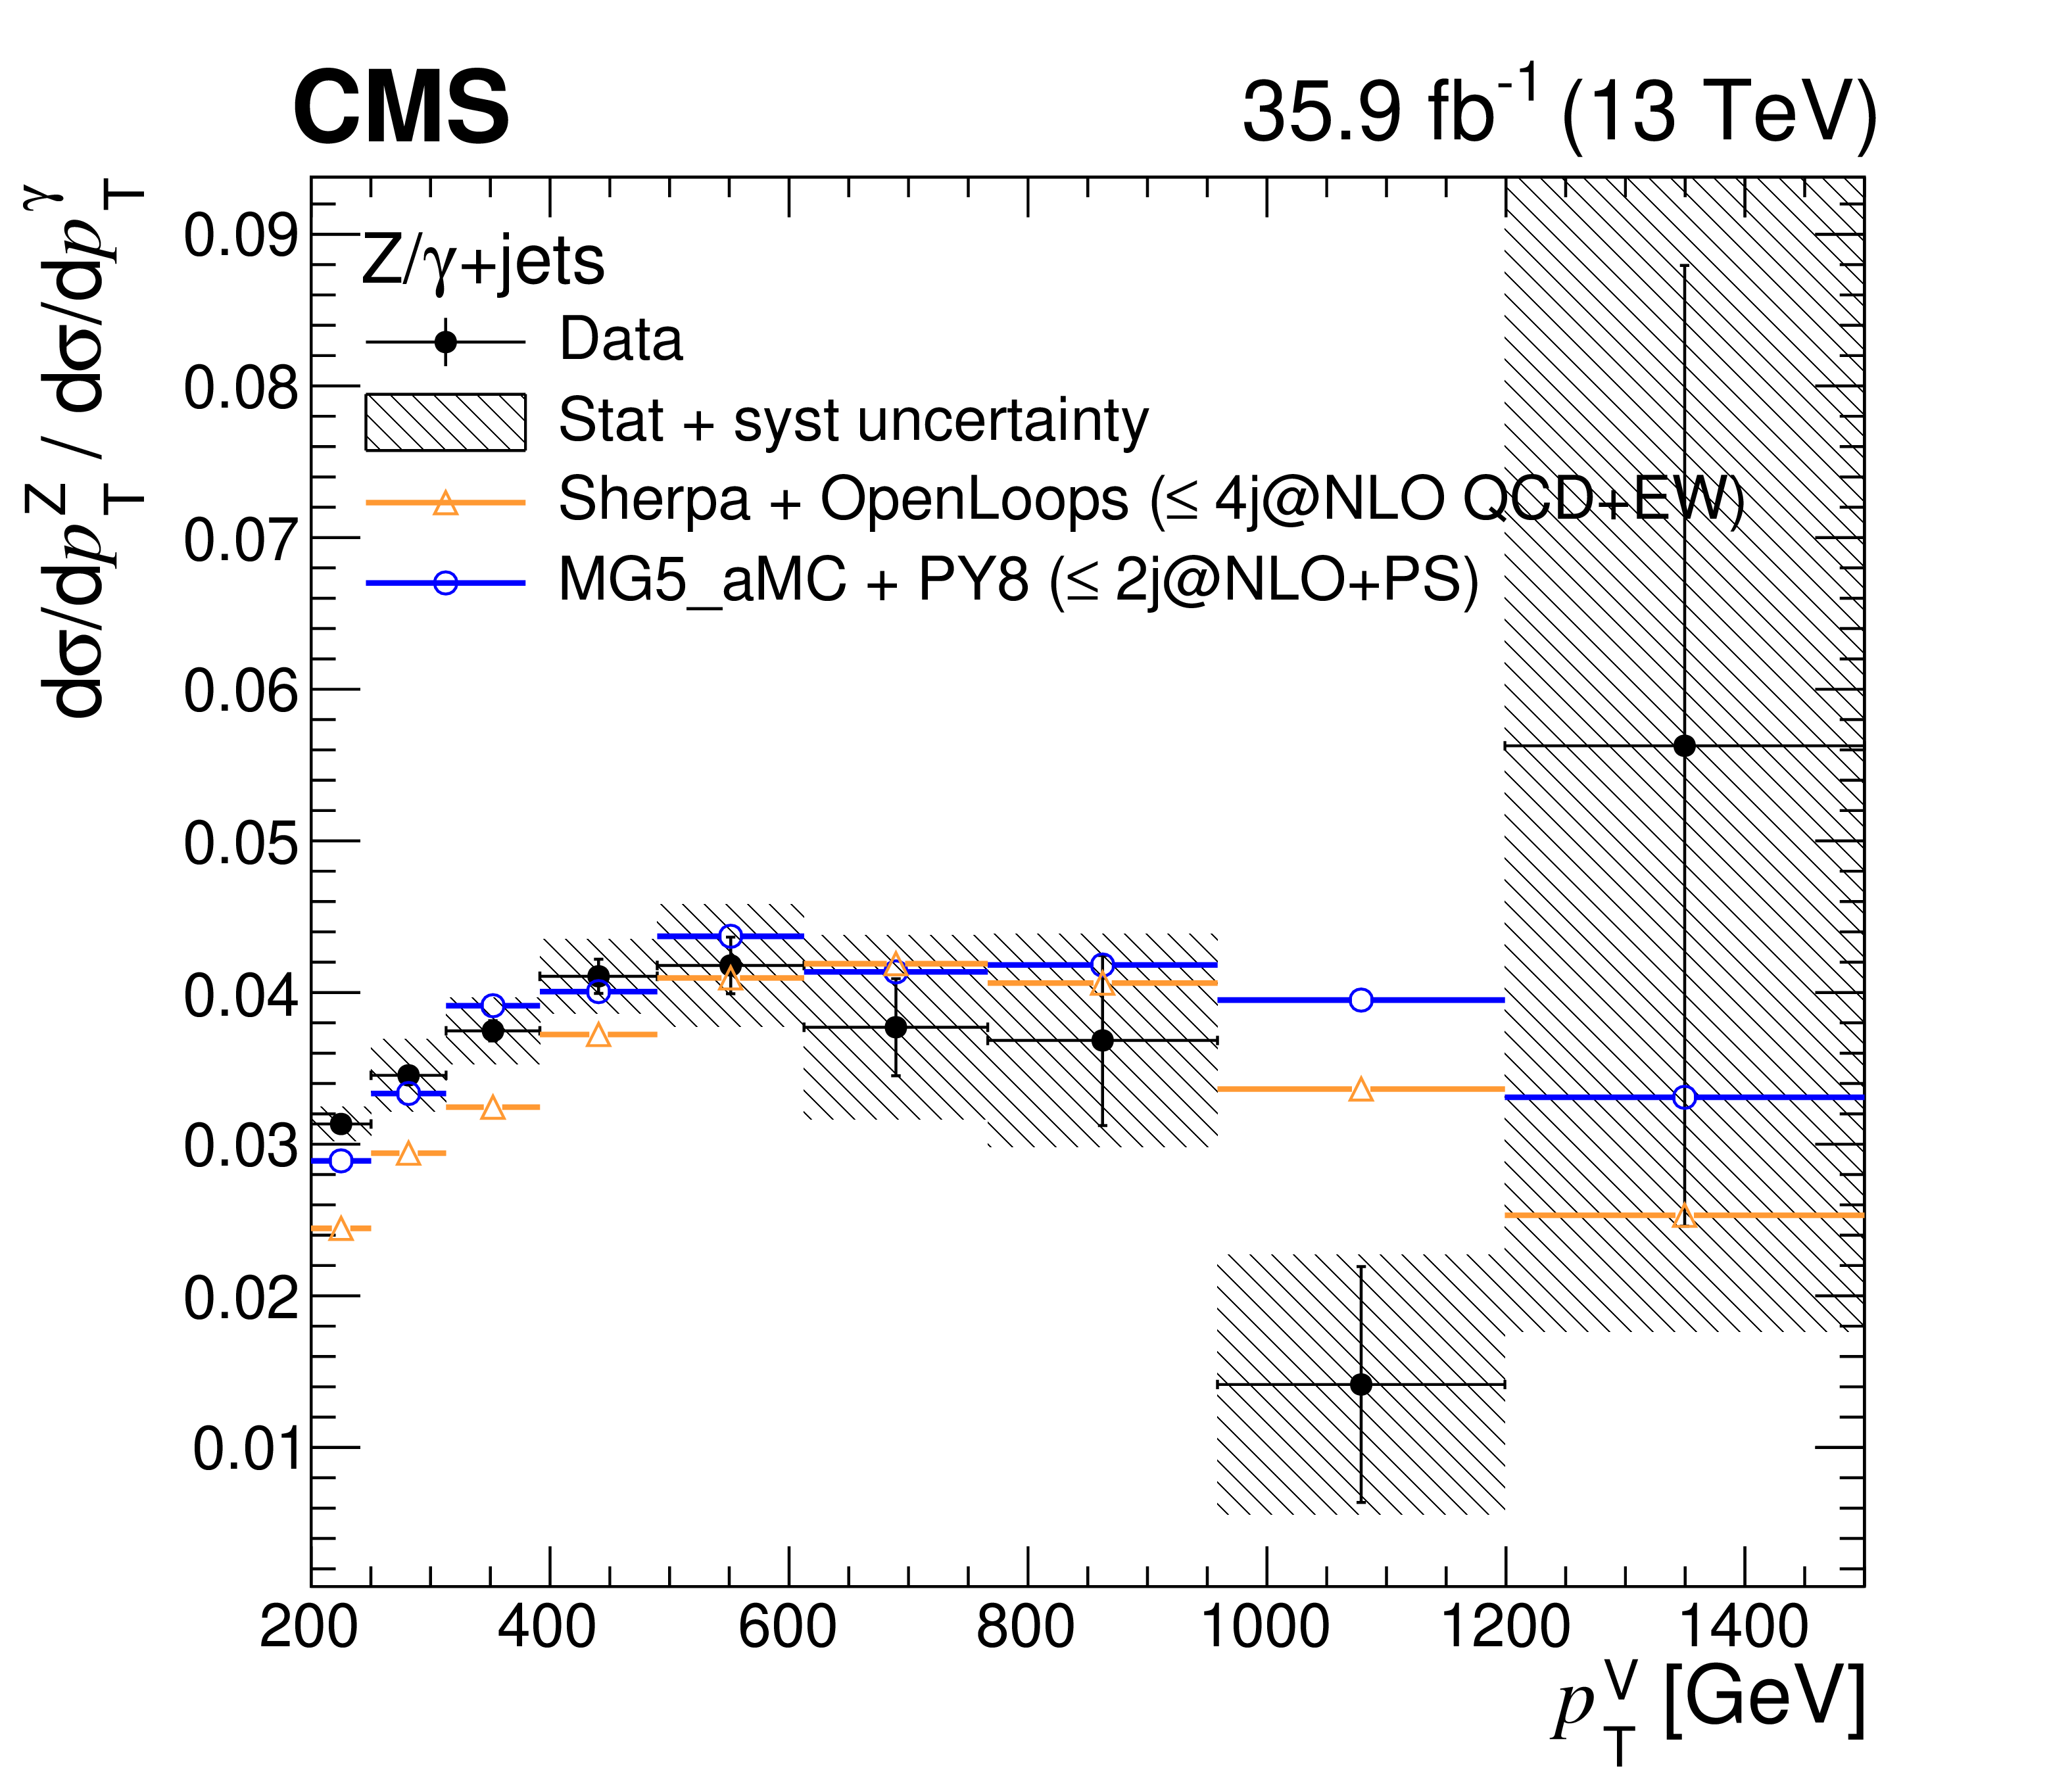
Differential cross section ratio of Z$+$jets to $\gamma +$jets as a function of the vector boson (V) transverse momentum compared with the theoretical prediction from MadGraph 5_aMC@NLO and SHERPA + OpenLoops. Only vector bosons produced centrally, with $ {| y |} < $ 1.4, in association with one or more jets are considered. The lower panel shows the ratio of the theoretical prediction to the unfolded data. The vertical bars in the upper panel represent the statistical uncertainty in the measurement and the hatched band in the lower and upper panels is the sum in quadrature of the statistical and systematic uncertainty components in the measurement. The dark (light) shaded band on the NLO prediction from MadGraph 5_aMC@NLO represents the PDF (scale) uncertainties, which are treated as uncorrelated between Z$+$jets and $\gamma +$jets, whereas the statistical uncertainties are barely visible. The shaded band on the SHERPA + OpenLoops calculation is the statistical uncertainty. |
png pdf |
Figure 3-a:
Differential cross section ratio of Z$+$jets to $\gamma +$jets as a function of the vector boson (V) transverse momentum compared with the theoretical prediction from MadGraph 5_aMC@NLO and SHERPA + OpenLoops. Only vector bosons produced centrally, with $ {| y |} < $ 1.4, in association with one or more jets are considered. The vertical bars represent the statistical uncertainty in the measurement. The hatched band is the sum in quadrature of the statistical and systematic uncertainty components in the measurement. |
png pdf |
Figure 3-b:
Differential cross section ratio of Z$+$jets to $\gamma +$jets as a function of the vector boson (V) transverse momentum compared with the theoretical prediction from MadGraph 5_aMC@NLO and SHERPA + OpenLoops. Only vector bosons produced centrally, with $ {| y |} < $ 1.4, in association with one or more jets are considered. The panel shows the ratio of the theoretical prediction to the unfolded data. The hatched band is the sum in quadrature of the statistical and systematic uncertainty components in the measurement. The dark (light) shaded band on the NLO prediction from MadGraph 5_aMC@NLO represents the PDF (scale) uncertainties, which are treated as uncorrelated between Z$+$jets and $\gamma +$jets, whereas the statistical uncertainties are barely visible. The shaded band on the SHERPA + OpenLoops calculation is the statistical uncertainty. |
png pdf |
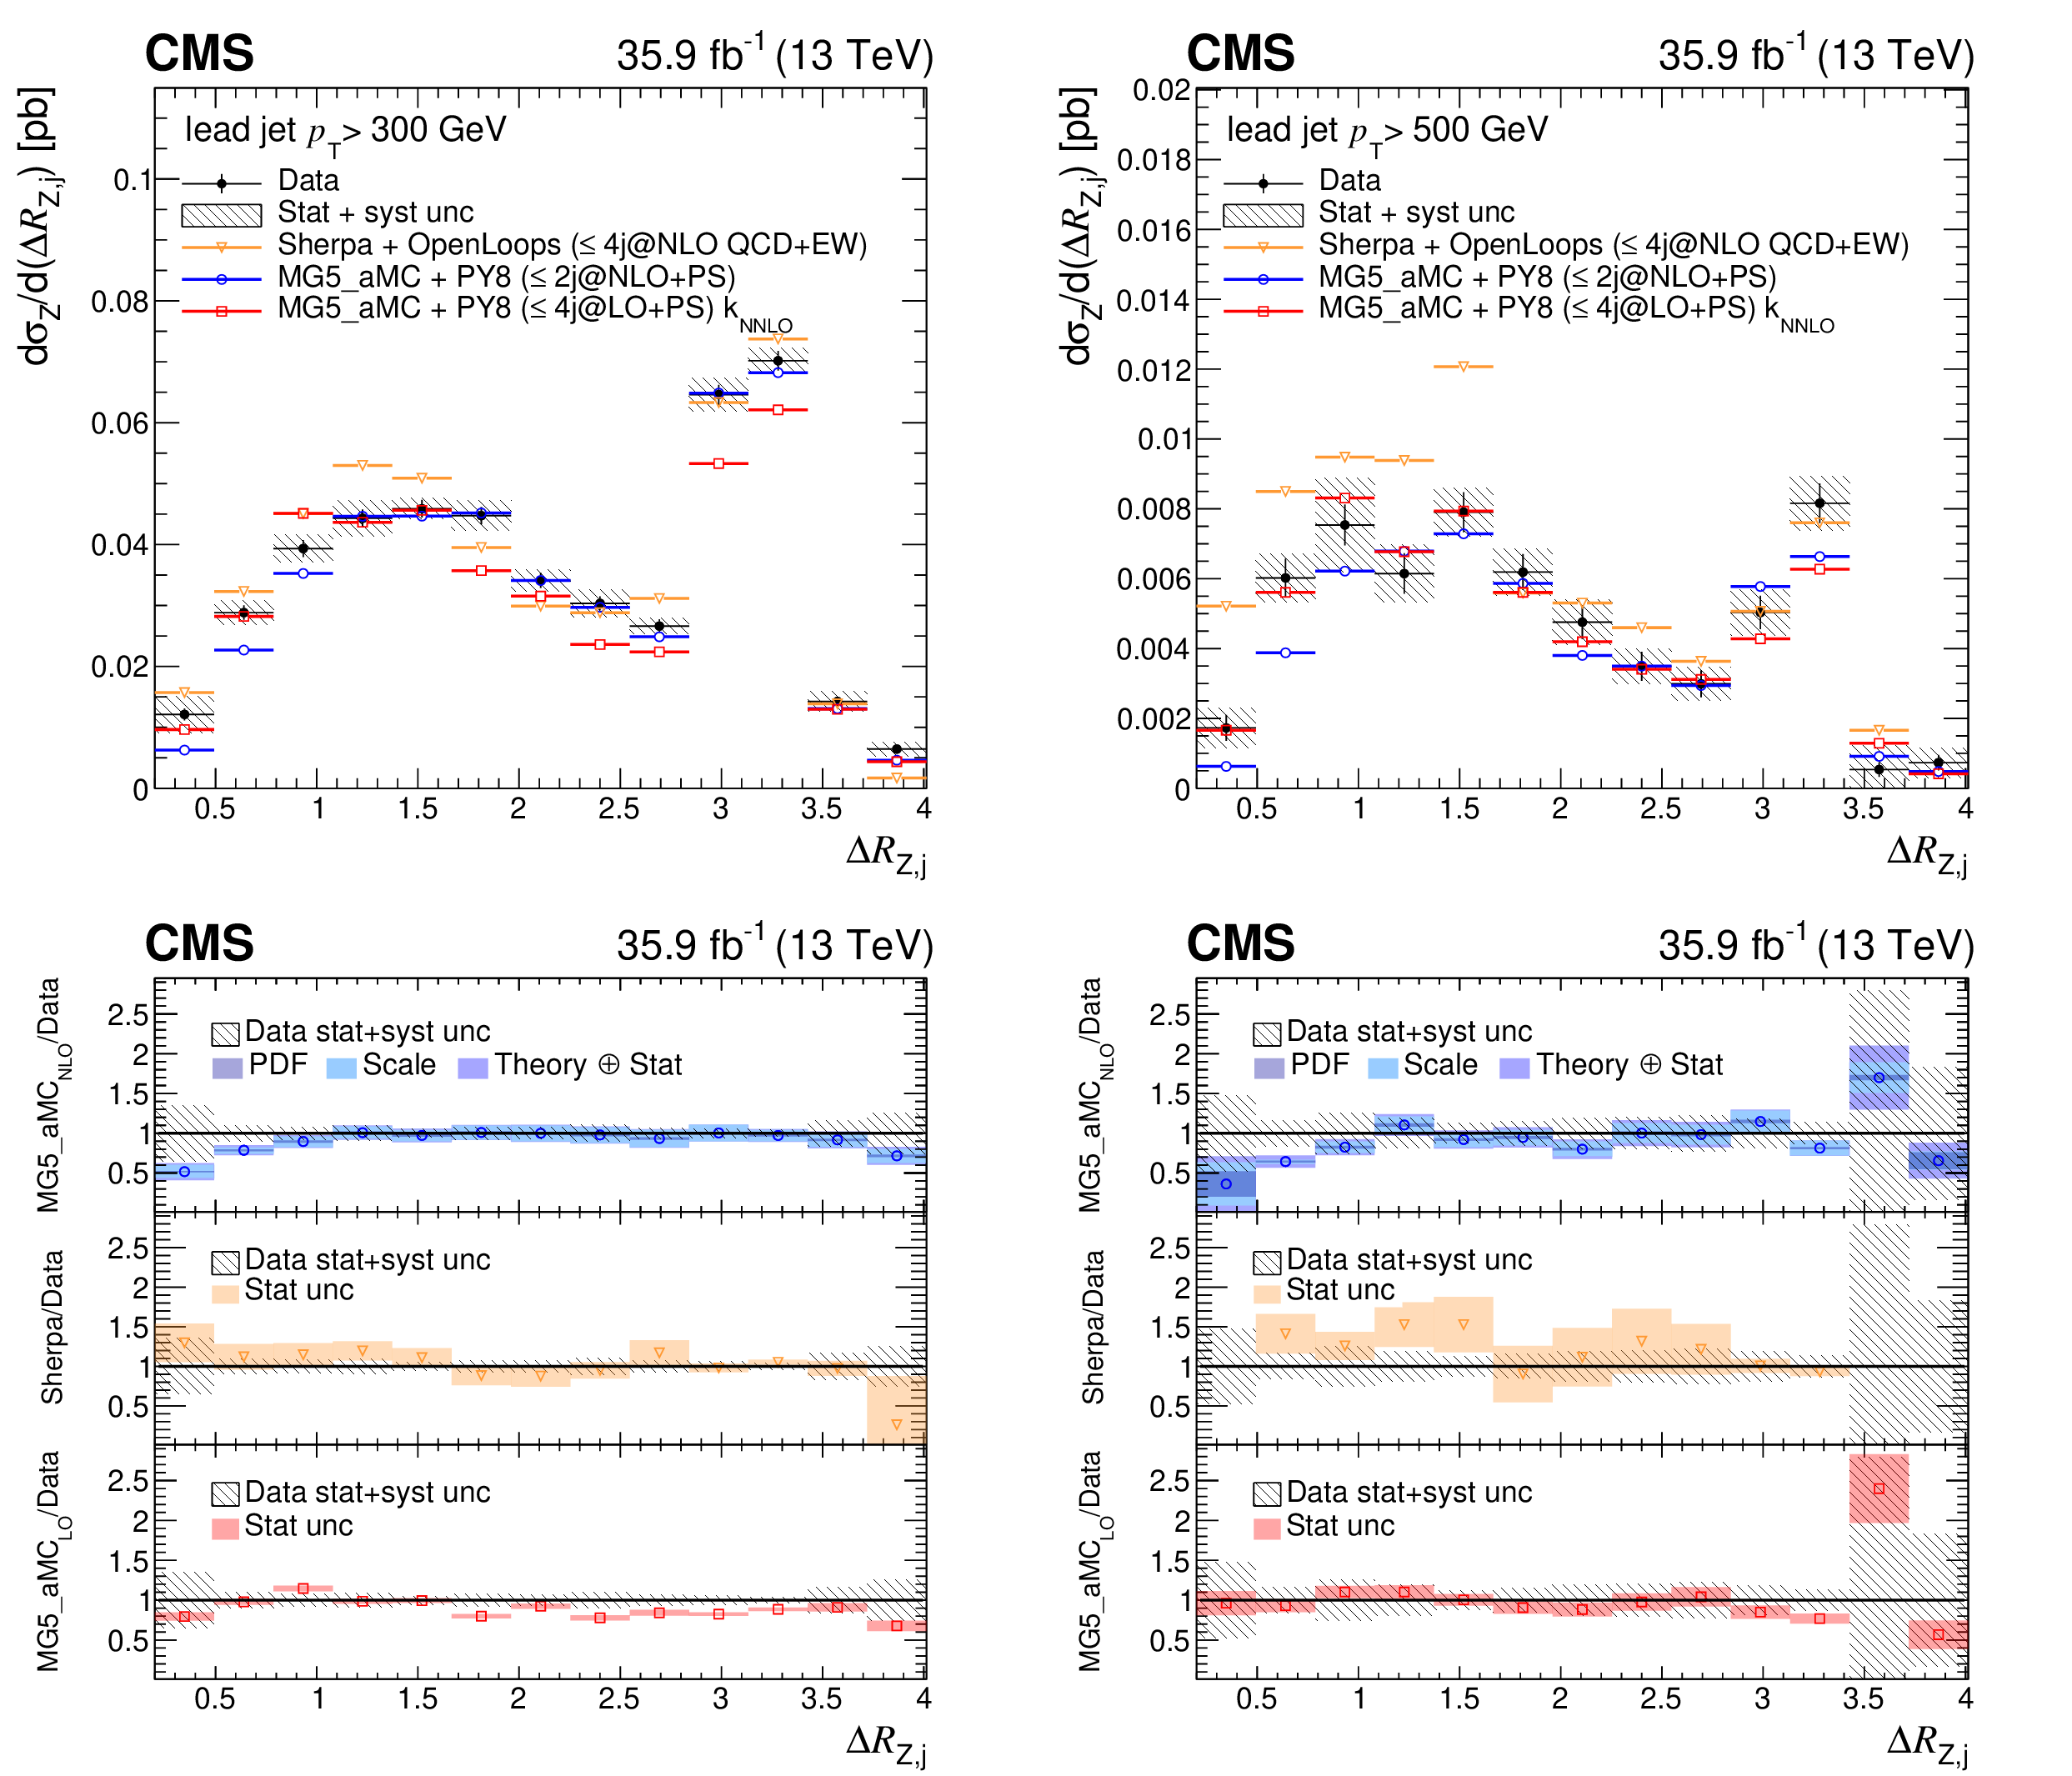
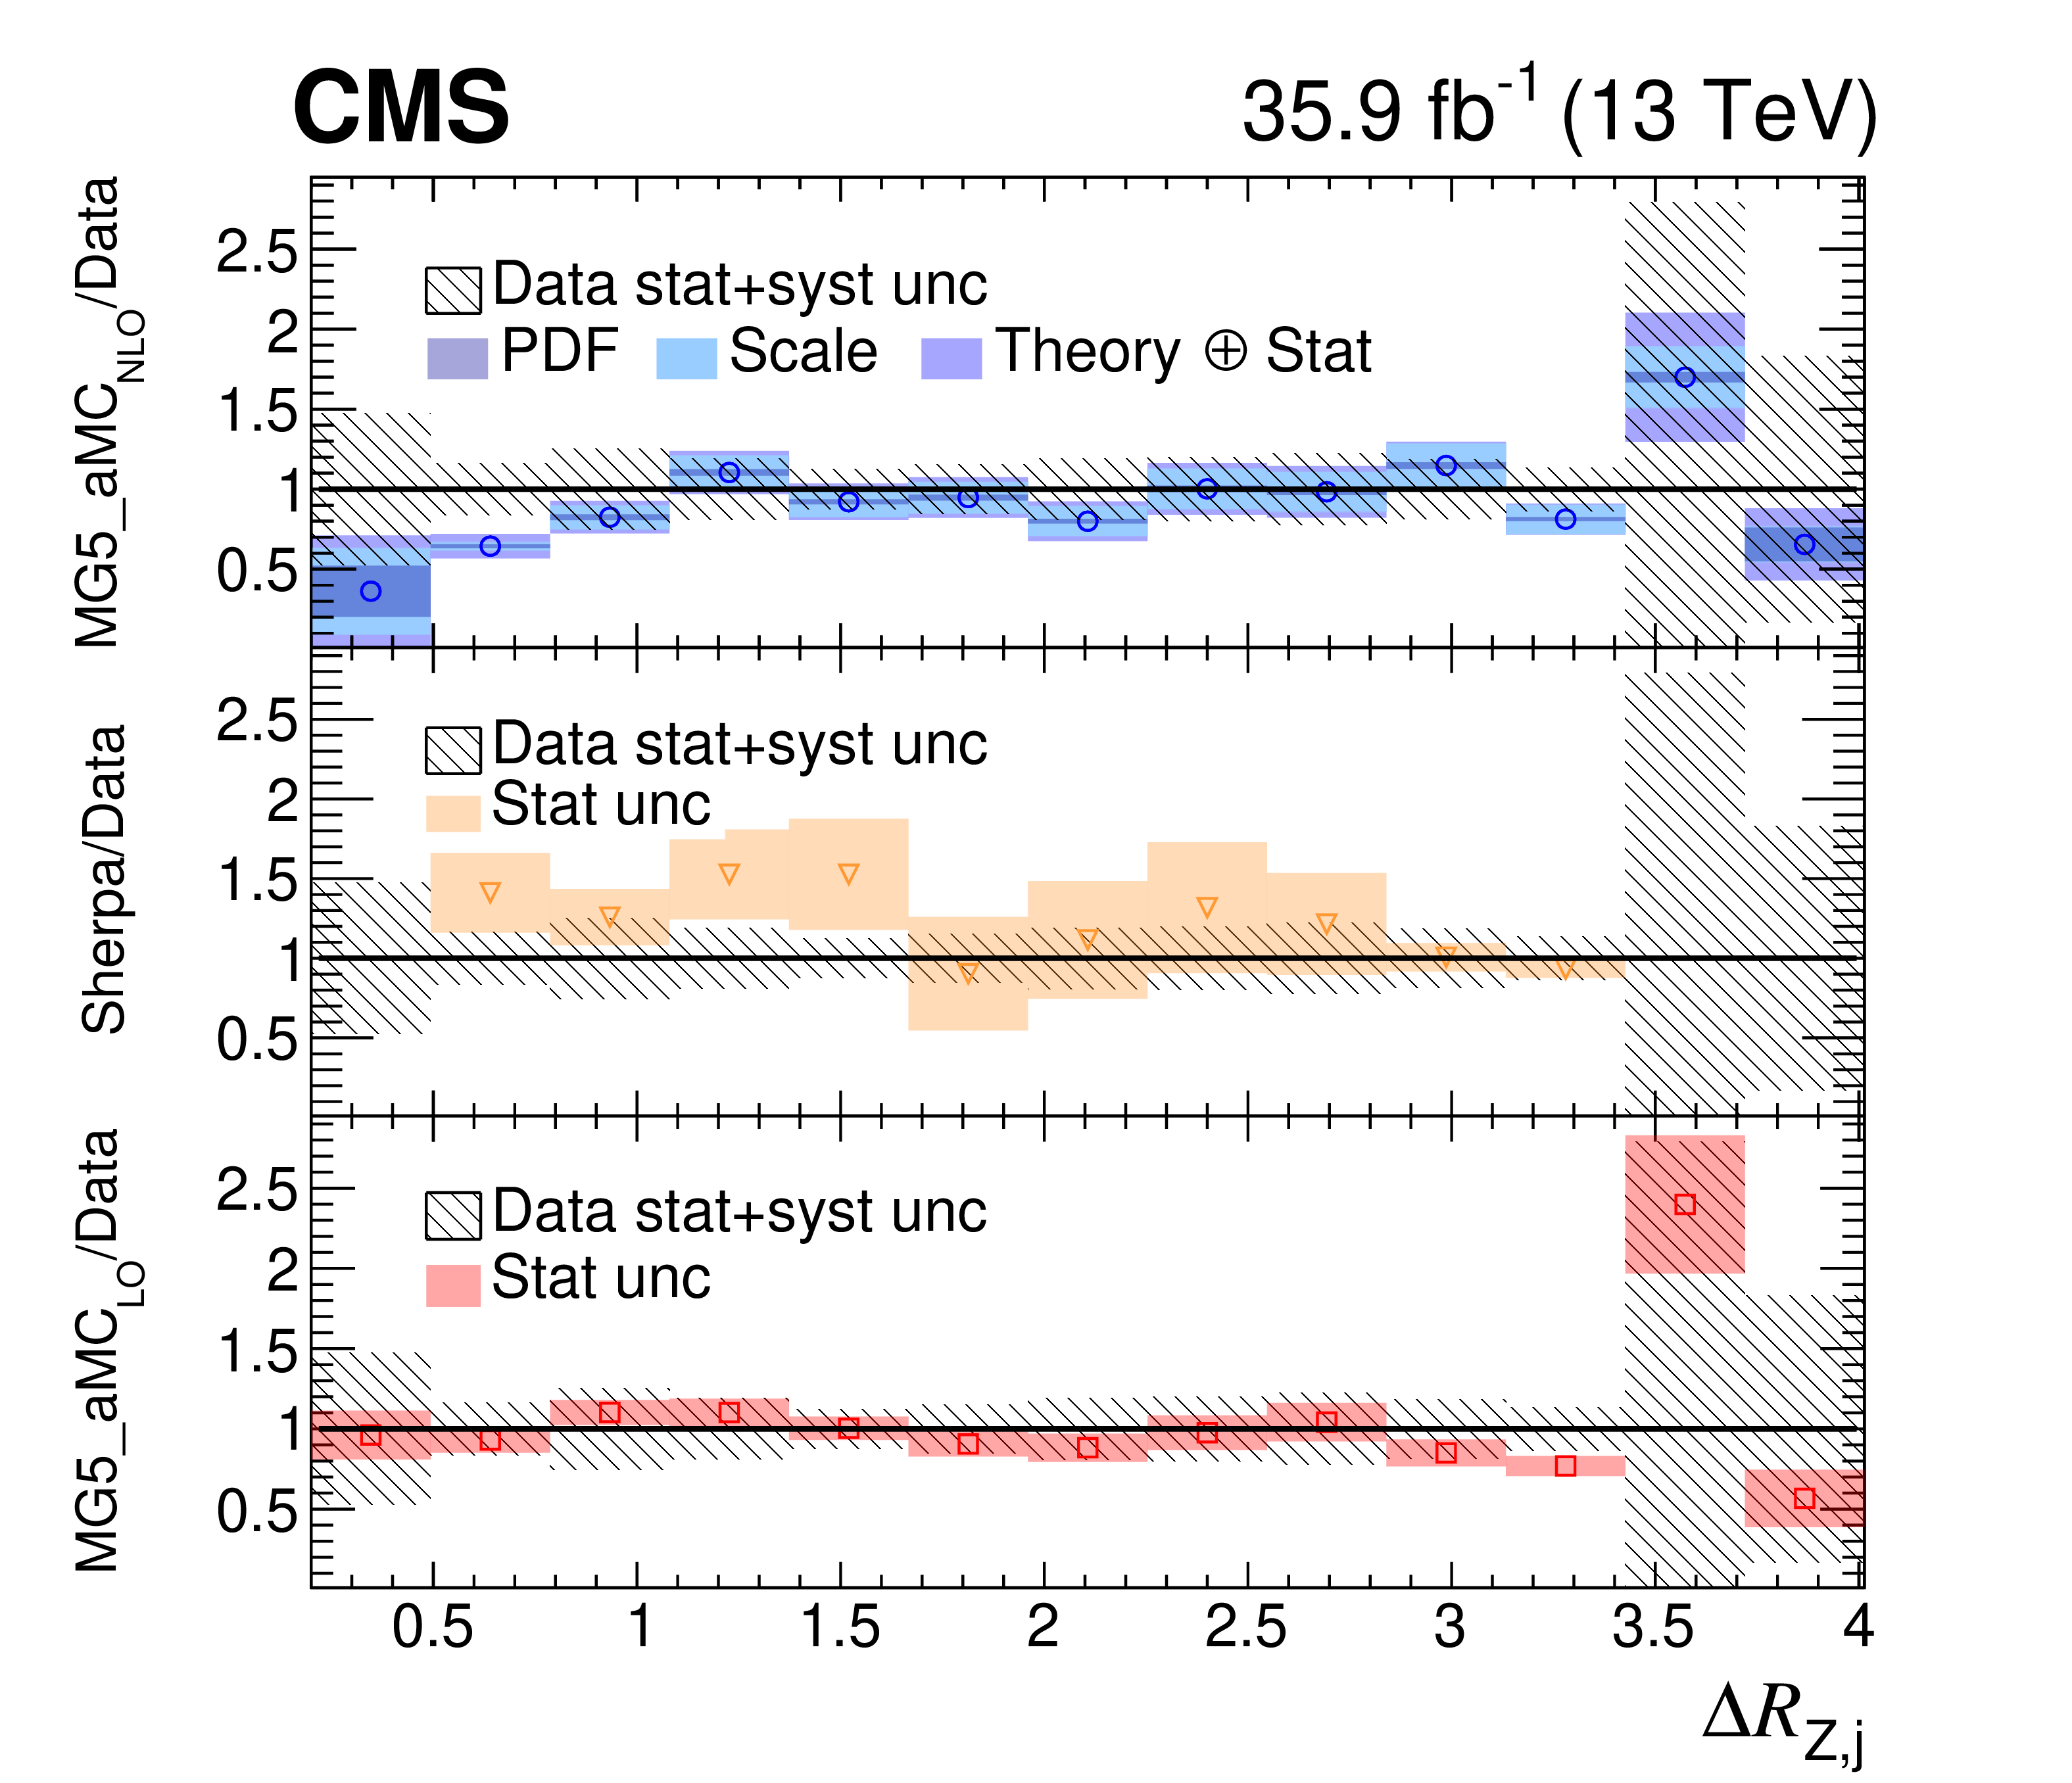
Figure 4:
Measured differential cross section of Z$+$jets as a function of the angular separation between the Z boson and the closest jet, compared with theoretical predictions from MadGraph 5_aMC@NLO and SHERPA + OpenLoops, where the leading jet ${p_{\mathrm {T}}}$ is above 300 (left) and 500 (right) GeV. The vertical bars in the upper panel represent the statistical uncertainty in the measurement and the hatched band in the lower and upper panels is the sum in quadrature of the statistical and systematic uncertainty components in the measurement. The lower panels show the ratio of the theoretical predictions to the unfolded data. The shaded band on the LO MadGraph 5_aMC@NLO and SHERPA + OpenLoops calculations is the statistical uncertainty. The dark (light) shaded band on the NLO prediction from MadGraph 5_aMC@NLO represents the PDF (scale) uncertainties. |

png pdf |
Figure 4-a:
Measured differential cross section of Z$+$jets as a function of the angular separation between the Z boson and the closest jet, compared with theoretical predictions from MadGraph 5_aMC@NLO and SHERPA + OpenLoops, where the leading jet ${p_{\mathrm {T}}}$ is above 300 GeV. The vertical bars represent the statistical uncertainty in the measurement. The hatched band is the sum in quadrature of the statistical and systematic uncertainty components in the measurement. |
png pdf |
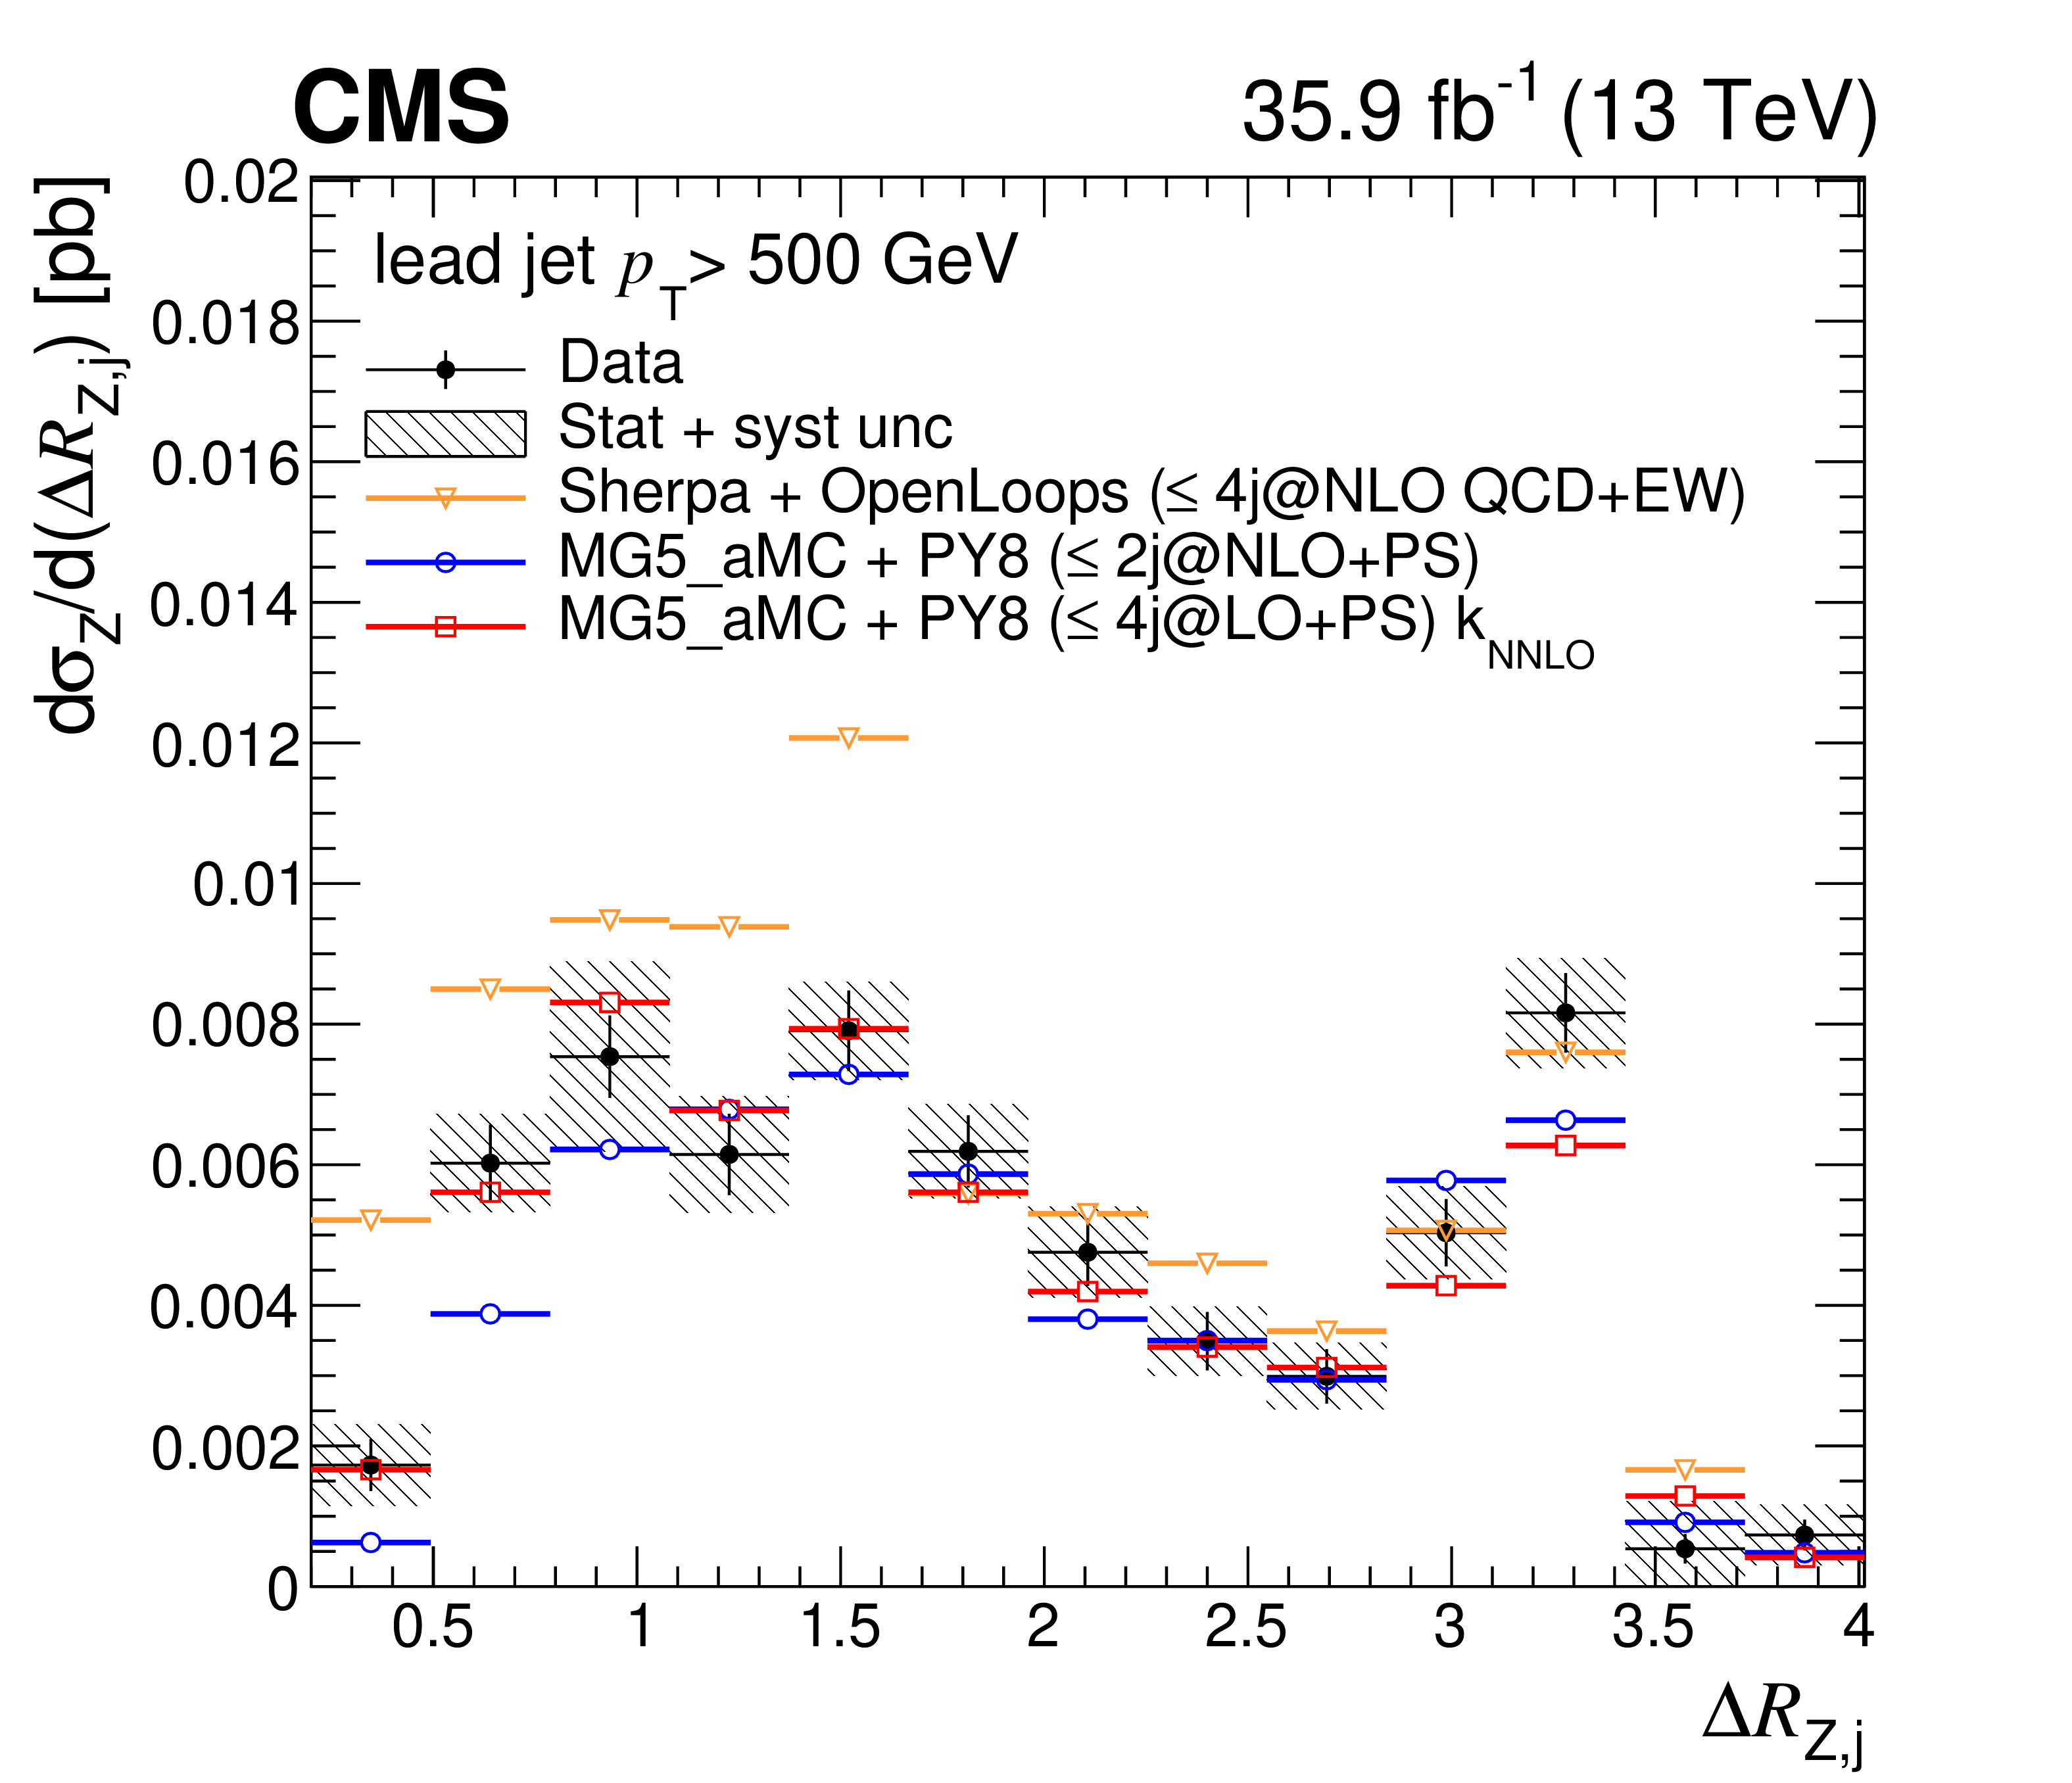
Figure 4-b:
Measured differential cross section of Z$+$jets as a function of the angular separation between the Z boson and the closest jet, compared with theoretical predictions from MadGraph 5_aMC@NLO and SHERPA + OpenLoops, where the leading jet ${p_{\mathrm {T}}}$ is above 300 GeV. The vertical bars represent the statistical uncertainty in the measurement. The hatched band is the sum in quadrature of the statistical and systematic uncertainty components in the measurement. |
png pdf |
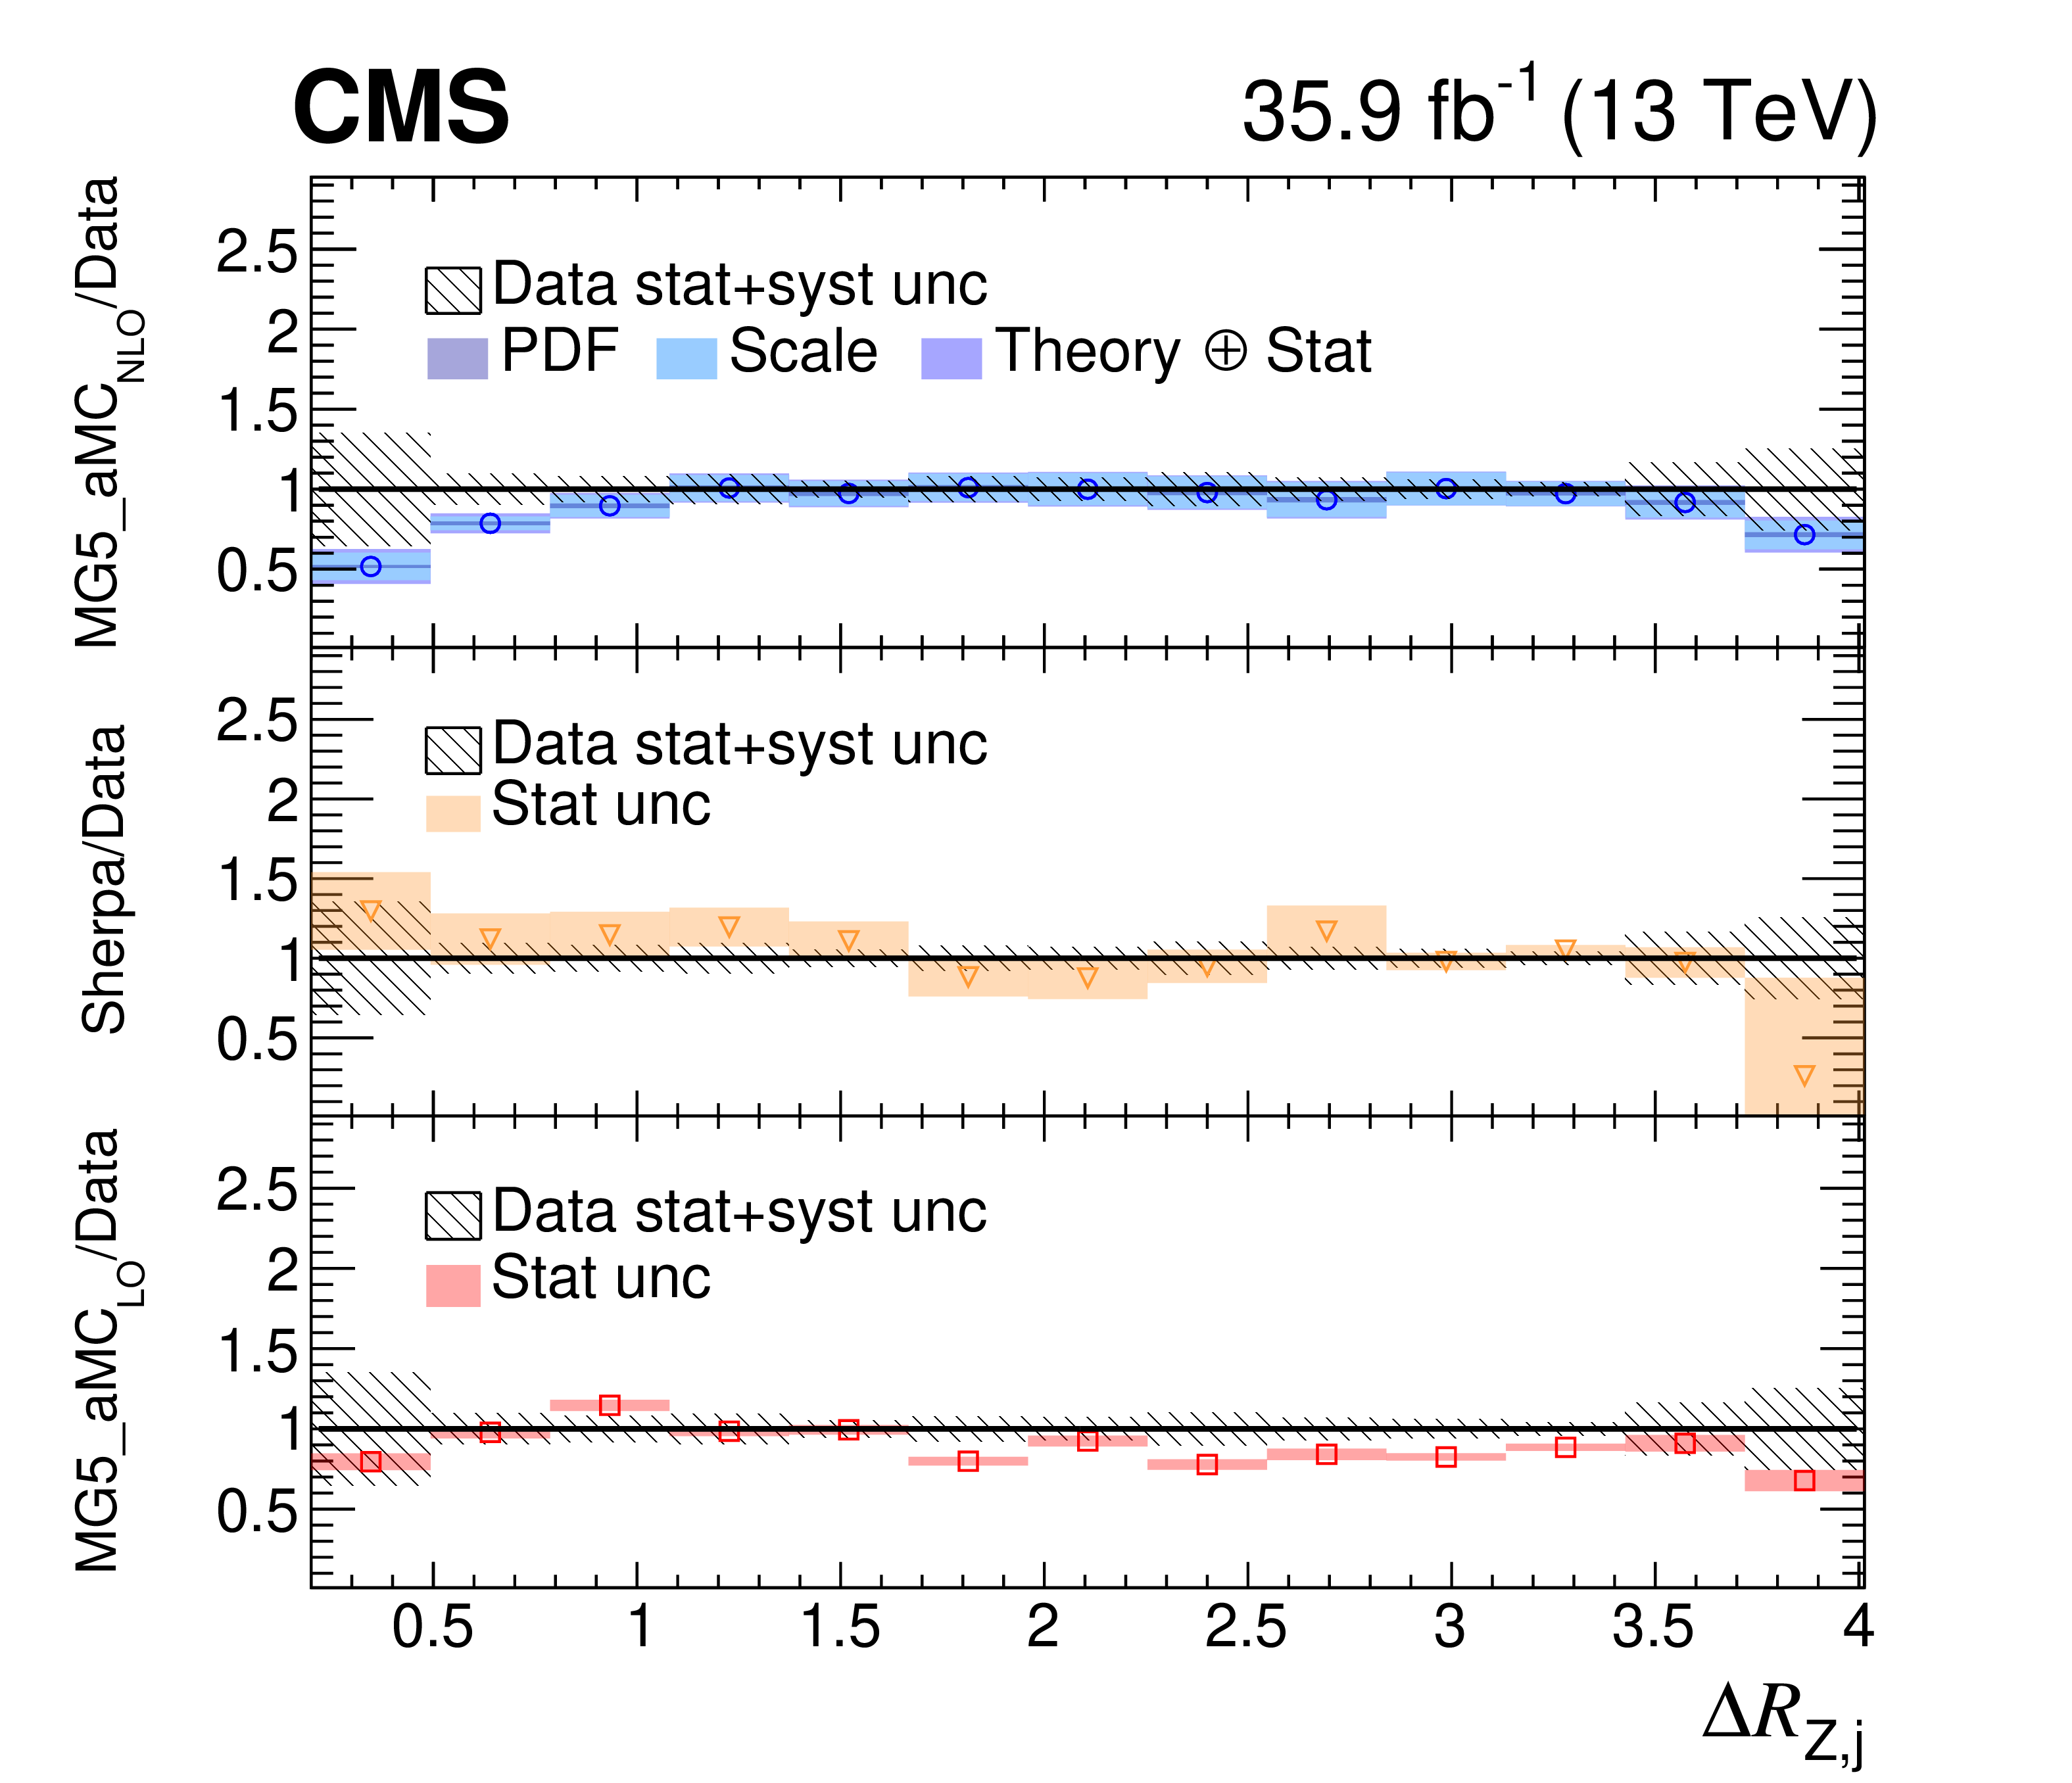
Figure 4-c:
Measured differential cross section of Z$+$jets as a function of the angular separation between the Z boson and the closest jet, compared with theoretical predictions from MadGraph 5_aMC@NLO and SHERPA + OpenLoops, where the leading jet ${p_{\mathrm {T}}}$ is above 300 GeV. The panel shows the ratio of the theoretical predictions to the unfolded data. The hatched band is the sum in quadrature of the statistical and systematic uncertainty components in the measurement. The shaded band on the LO MadGraph 5_aMC@NLO and SHERPA + OpenLoops calculations is the statistical uncertainty. The dark (light) shaded band on the NLO prediction from MadGraph 5_aMC@NLO represents the PDF (scale) uncertainties. |
png pdf |
Figure 4-d:
Measured differential cross section of Z$+$jets as a function of the angular separation between the Z boson and the closest jet, compared with theoretical predictions from MadGraph 5_aMC@NLO and SHERPA + OpenLoops, where the leading jet ${p_{\mathrm {T}}}$ is above 300 GeV. The panel shows the ratio of the theoretical predictions to the unfolded data. The hatched band is the sum in quadrature of the statistical and systematic uncertainty components in the measurement. The shaded band on the LO MadGraph 5_aMC@NLO and SHERPA + OpenLoops calculations is the statistical uncertainty. The dark (light) shaded band on the NLO prediction from MadGraph 5_aMC@NLO represents the PDF (scale) uncertainties. |
| Tables | |
png pdf |
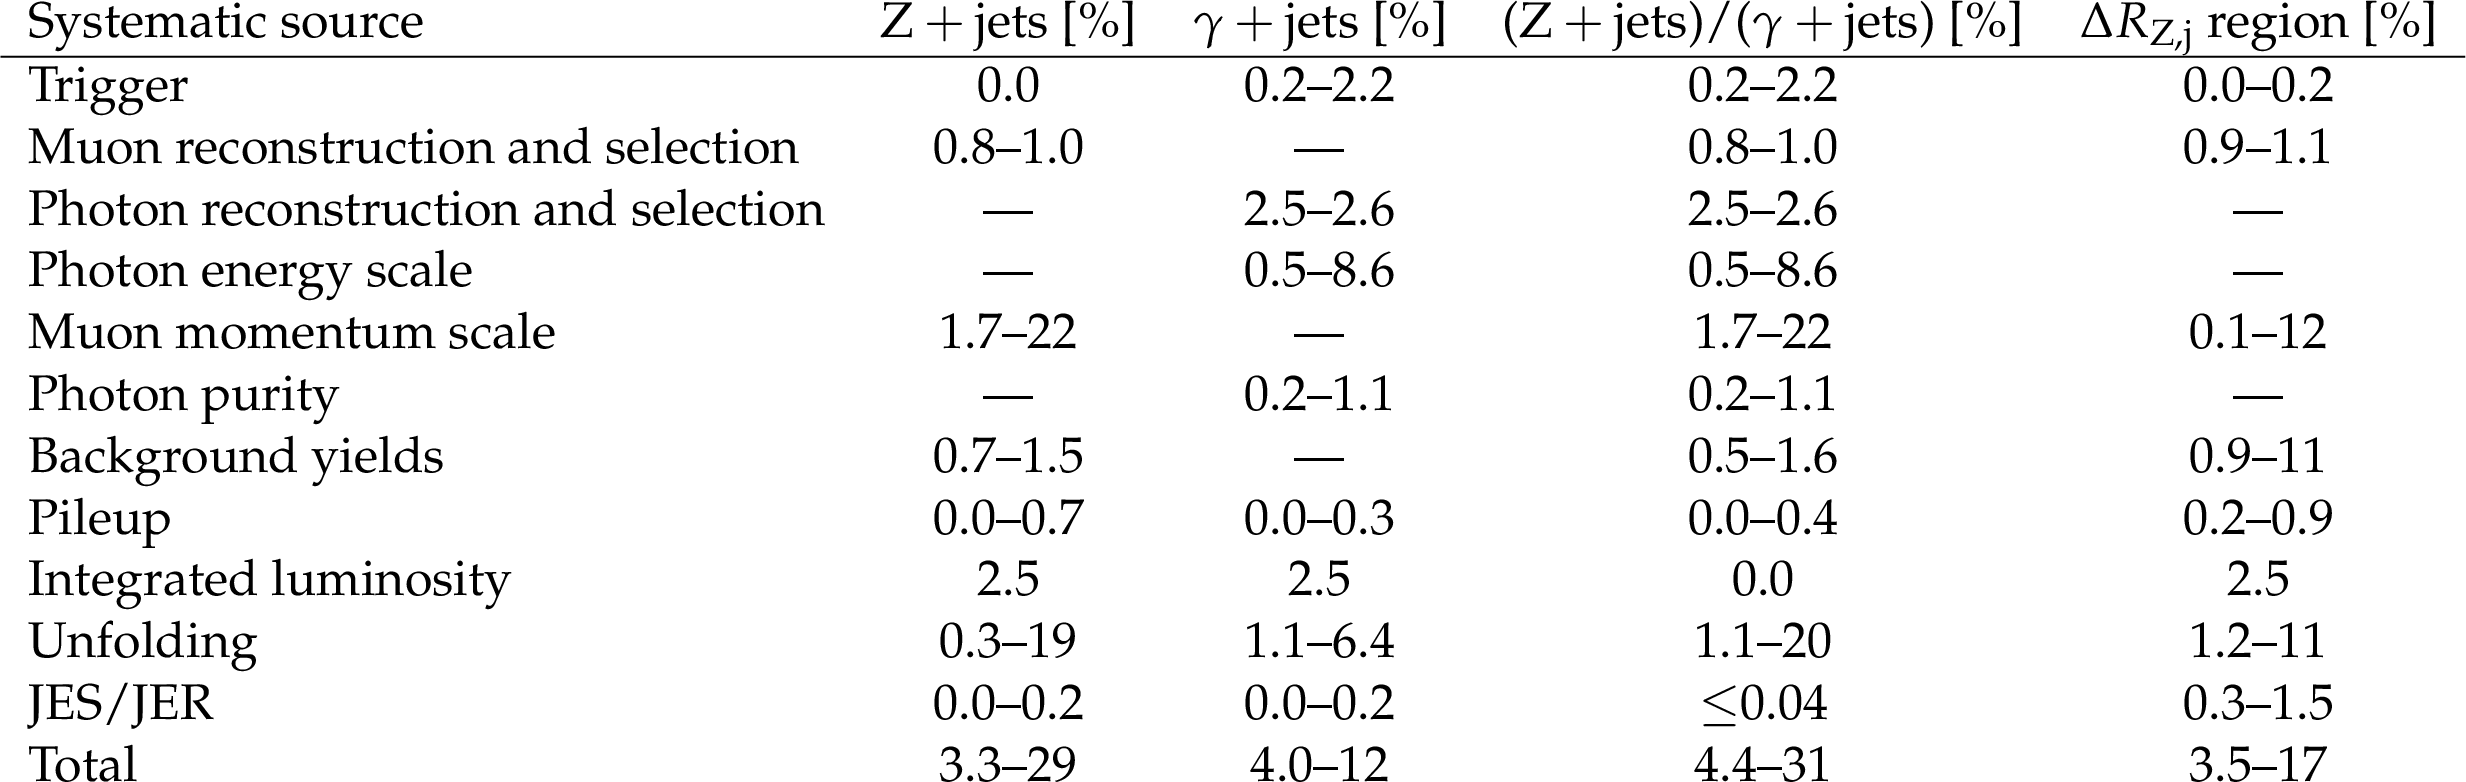
Table 1:
The contributions to the uncertainty in the differential cross section measurements for the Z$+$jets and $\gamma +$jets processes, the Z/$\gamma$ ratio, and the ${{{\Delta R}}_{\mathrm{Z},\text {j}}}$ region. The uncertainties are expressed in percent, and a range represents the minimum and maximum effect observed. |
| Summary |
|
This paper presents measurements of standard model processes that probe regions of phase space characterized by the production of Z$+$jets and $\gamma +$jets at large boson transverse momentum (${p_{\mathrm{T}}}$), and of a Z boson in association with at least one very high ${p_{\mathrm{T}}}$ jet. The measurements utilize data recorded with the CMS detector in pp collisions at $\sqrt{s}$ = 13 TeV at the LHC that correspond to an integrated luminosity of 35.9 fb$^{-1}$. Comparisons are made between the unfolded data and several theory predictions. The Z$+$jets and $\gamma +$jets cross sections as a function of boson ${p_{\mathrm{T}}}$ are presented for ${p_{\mathrm{T}}}$ above 200 GeV and compared with predictions from (i) the leading-order (LO) and next-to-leading-order (NLO) calculations from MadGraph5+MCatNLO, and (ii) the NLO quantum chromodynamics and electroweak (QCD+EW) calculation from SHERPA + OpenLoops . In addition, the $\gamma +$jets measurement is compared with NLO JetPhox predictions. The data are consistent with theory for both the $\gamma$ and Z boson final states, although in some regions of phase space a few tens of percent deviations are observed. In general, the perturbative NLO corrections exhibit a better agreement with the measurements. This is the first measurement at 13 TeV of the ratio of cross sections for Z$+$jets to $\gamma +$jets as a function of boson ${p_{\mathrm{T}}}$. This ratio is compared with the NLO calculation from MadGraph5+MCatNLO and the NLO QCD+EW prediction from SHERPA + OpenLoops ; and it probes the region up to 1.5 TeV in boson ${p_{\mathrm{T}}}$. The data are generally in agreement with theory within the uncertainties over the full range of boson ${p_{\mathrm{T}}}$. This ratio provides an important theoretical input for the estimation, based on the $\gamma +$jets process, of the ${\mathrm{Z}\to\mathrm{\nu\bar{nu}}} $ background relevant in searches for new physics. The measurement of the emission of a Z boson collinear to a jet represents the first explicit study of this topology at the LHC. It is accessed through the production of a Z boson in association with at least one high-${p_{\mathrm{T}}}$ jet ($ > $300 or $ > $500 GeV), and the differential cross section is measured as a function of the angular separation between the Z boson and the closest jet (${{{\Delta R} }_{\mathrm{Z},\text{j}}} $). The unfolded data are compared with the LO and NLO calculations from MadGraph5+MCatNLO, and the NLO QCD+EW prediction from SHERPA + OpenLoops . The NLO {MadGraph} shows agreement over most of the measured distribution, but underpredicts it for the ${{{\Delta R} }_{\mathrm{Z},\text{j}}} $ region below 0.8, which is dominated by events with the emission of a Z boson in close proximity to a jet. The prediction from SHERPA is also generally consistent with the measurement. The measurements presented in this paper will become increasingly important in current and future runs of the LHC, where the higher $\sqrt{s}$ and larger integrated luminosity will push the LHC program into new territory, necessitating an understanding of standard model processes in regions of previously unexplored phase space. |
| References | ||||
| 1 | A. Gehrmann-De Ridder et al. | Precise QCD predictions for the production of a Z boson in association with a hadronic jet | PRL 117 (2016) 022001 | 1507.02850 |
| 2 | R. Boughezal et al. | Z-boson production in association with a jet at next-to-next-to-leading order in perturbative QCD | PRL 116 (2016) 152001 | 1512.01291 |
| 3 | L. Carminati et al. | Sensitivity of the LHC isolated-gamma+jet data to the parton distribution functions of the proton | EPL 101 (2013) 61002 | 1212.5511 |
| 4 | R. Boughezal, A. Guffanti, F. Petriello, and M. Ubiali | The impact of the LHC Z-boson transverse momentum data on PDF determinations | JHEP 07 (2017) 130 | 1705.00343 |
| 5 | CMS Collaboration | Search for new physics in final states with an energetic jet or a hadronically decaying $ W $ or $ Z $ boson and transverse momentum imbalance at $ \sqrt{s}=$ 13 TeV | PRD 97 (2018) 092005 | CMS-EXO-16-048 1712.02345 |
| 6 | W. J. Stirling and E. Vryonidou | Electroweak corrections and Bloch-Nordsieck violations in 2-to-2 processes at the LHC | JHEP 04 (2013) 155 | 1212.6537 |
| 7 | A. Denner, S. Dittmaier, T. Kasprzik, and A. M$\ddot\rm u$ck | Electroweak corrections to W + jet hadroproduction including leptonic W-boson decays | JHEP 08 (2009) 075 | 0906.1656 |
| 8 | A. Denner, S. Dittmaier, T. Kasprzik, and A. M$\ddot\rm u$ck | Electroweak corrections to dilepton + jet production at hadron colliders | JHEP 06 (2011) 069 | 1103.0914 |
| 9 | A. Denner, S. Dittmaier, T. Kasprzik, and A. M$\ddot\rm u$ck | Electroweak corrections to monojet production at the LHC | EPJC 73 (2013) 2297 | 1211.5078 |
| 10 | A. Denner, L. Hofer, A. Scharf, and S. Uccirati | Electroweak corrections to lepton pair production in association with two hard jets at the LHC | JHEP 01 (2015) 094 | 1411.0916 |
| 11 | S. Kallweit et al. | NLO QCD+EW predictions for V+jets including off-shell vector-boson decays and multijet merging | JHEP 04 (2016) 021 | 1511.08692 |
| 12 | J. M. Lindert et al. | Precise predictions for V+jets dark matter backgrounds | EPJC 77 (2017) 829 | 1705.04664 |
| 13 | M. Schönherr et al. | NLO QCD+EW for V+jets | in Proceedings of the 4th Large Hadron Collider Physics Conference (LHCP 2016), p. 58 2016 | 1609.01445 |
| 14 | R. Frederix et al. | The automation of next-to-leading order electroweak calculations | JHEP 07 (2018) 185 | 1804.10017 |
| 15 | CMS Collaboration | Comparison of the Z/$ \gamma^{*} $ + jets to $ \gamma $ + jets cross sections in pp collisions at $ \sqrt{s}= $ 8 TeV | JHEP 10 (2015) 128 | CMS-SMP-14-005 1505.06520 |
| 16 | U. Baur | Weak boson emission in hadron collider processes | PRD 75 (2007) 013005 | hep-ph/0611241 |
| 17 | J. R. Christiansen and T. Sjöstrand | Weak gauge boson radiation in parton showers | JHEP 04 (2014) 115 | 1401.5238 |
| 18 | F. Krauss, P. Petrov, M. Schönherr, and M. Spannowsky | Measuring collinear W emissions inside jets | PRD 89 (2014) 114006 | 1403.4788 |
| 19 | ATLAS Collaboration | Measurement of W boson angular distributions in events with high transverse momentum jets at $ \sqrt{s}= $ 8 TeV using the ATLAS detector | PLB 765 (2017) 132 | 1609.07045 |
| 20 | CMS Collaboration | Measurement of the differential cross sections for the associated production of a W boson and jets in proton-proton collisions at $ \sqrt{s}= $ 13 TeV | PRD 96 (2017) 072005 | CMS-SMP-16-005 1707.05979 |
| 21 | CMS Collaboration | The CMS trigger system | JINST 12 (2017) P01020 | CMS-TRG-12-001 1609.02366 |
| 22 | CMS Collaboration | The CMS experiment at the CERN LHC | JINST 3 (2008) S08004 | CMS-00-001 |
| 23 | J. Alwall et al. | The automated computation of tree-level and next-to-leading order differential cross sections, and their matching to parton shower simulations | JHEP 07 (2014) 079 | 1405.0301 |
| 24 | T. Sjöstrand et al. | An introduction to PYTHIA 8.2 | CPC 191 (2015) 159 | 1410.3012 |
| 25 | R. Frederix and S. Frixione | Merging meets matching in MC@NLO | JHEP 12 (2012) 061 | 1209.6215 |
| 26 | K. Melnikov and F. Petriello | Electroweak gauge boson production at hadron colliders through O($ \alpha(s)^{2} $) | PRD 74 (2006) 114017 | hep-ph/0609070 |
| 27 | J. Alwall et al. | Comparative study of various algorithms for the merging of parton showers and matrix elements in hadronic collisions | EPJC 53 (2008) 473 | 0706.2569 |
| 28 | S. Catani, M. Fontannaz, J. P. Guillet, and E. Pilon | Cross-section of isolated prompt photons in hadron-hadron collisions | JHEP 05 (2002) 028 | hep-ph/0204023 |
| 29 | P. Aurenche et al. | A new critical study of photon production in hadronic collisions | PRD 73 (2006) 094007 | hep-ph/0602133 |
| 30 | Z. Belghobsi et al. | Photon-jet correlations and constraints on fragmentation functions | PRD 79 (2009) 114024 | 0903.4834 |
| 31 | L. Bourhis, M. Fontannaz, and J. P. Guillet | Quark and gluon fragmentation functions into photons | EPJC 2 (1998) 529 | hep-ph/9704447 |
| 32 | E. Bothmann et al. | Event generation with Sherpa 2.2 | SciPost Phys. 7 (2019) 034 | 1905.09127 |
| 33 | T. Gleisberg and S. Hoeche | Comix, a new matrix element generator | JHEP 12 (2008) 039 | 0808.3674 |
| 34 | F. Buccioni et al. | Openloops 2 | EPJC 79 (2019) 866 | 1907.13071 |
| 35 | S. Schumann and F. Krauss | A parton shower algorithm based on Catani-Seymour dipole factorisation | JHEP 03 (2008) 038 | 0709.1027 |
| 36 | S. Hoeche, F. Krauss, M. Schönherr, and F. Siegert | A critical appraisal of NLO+PS matching methods | JHEP 09 (2012) 049 | 1111.1220 |
| 37 | S. Frixione and B. R. Webber | Matching NLO QCD computations and parton shower simulations | JHEP 06 (2002) 029 | hep-ph/0204244 |
| 38 | N. Kidonakis | Differential and total cross sections for top pair and single top production | in 20th International Workshop on Deep-Inelastic Scattering and Related Subjects, p. 40 2012 | 1205.3453 |
| 39 | M. Czakon, P. Fiedler, and A. Mitov | Total top-quark pair-production cross section at hadron colliders through O($ \alpha_{s}^{4} $) | PRL 110 (2013) 252004 | 1303.6254 |
| 40 | P. Nason | A new method for combining NLO QCD with shower Monte Carlo algorithms | JHEP 11 (2004) 040 | hep-ph/0409146 |
| 41 | S. Frixione, P. Nason, and C. Oleari | Matching NLO QCD computations with parton shower simulations: the POWHEG method | JHEP 11 (2007) 070 | 0709.2092 |
| 42 | S. Alioli, P. Nason, C. Oleari, and E. Re | A general framework for implementing NLO calculations in shower Monte Carlo programs: the POWHEG BOX | JHEP 06 (2010) 043 | 1002.2581 |
| 43 | E. Re | Single-top Wt-channel production matched with parton showers using the POWHEG method | EPJC 71 (2011) 1547 | 1009.2450 |
| 44 | NNPDF Collaboration | Parton distributions for the LHC Run 2 | JHEP 04 (2015) 040 | 1410.8849 |
| 45 | CMS Collaboration | Event generator tunes obtained from underlying event and multiparton scattering measurements | EPJC 76 (2016) 155 | CMS-GEN-14-001 1512.00815 |
| 46 | GEANT4 Collaboration | GEANT4: A simulation toolkit | NIMA 506 (2003) 250 | |
| 47 | R. D. Ball et al. | Parton distributions with LHC data | NPB 867 (2013) 244 | 1207.1303 |
| 48 | CMS Collaboration | Particle-flow reconstruction and global event description with the CMS detector | JINST 12 (2017) P10003 | CMS-PRF-14-001 1706.04965 |
| 49 | CMS Collaboration | Performance of photon reconstruction and identification with the CMS detector in proton-proton collisions at $ \sqrt{s} = $ 8 TeV | JINST 10 (2015) P08010 | CMS-EGM-14-001 1502.02702 |
| 50 | CMS Collaboration | Electron and photon reconstruction and identification with the CMS experiment at the CERN LHC | (12, 2020) | CMS-EGM-17-001 2012.06888 |
| 51 | M. Cacciari, G. P. Salam, and G. Soyez | The anti-$ {k_{\mathrm{T}}} $ jet clustering algorithm | JHEP 04 (2008) 063 | 0802.1189 |
| 52 | M. Cacciari, G. P. Salam, and G. Soyez | FastJet user manual | EPJC 72 (2012) 1896 | 1111.6097 |
| 53 | M. Cacciari and G. P. Salam | Pileup subtraction using jet areas | PLB 659 (2008) 119 | 0707.1378 |
| 54 | CMS Collaboration | Determination of jet energy calibration and transverse momentum resolution in CMS | JINST 6 (2011) P11002 | CMS-JME-10-011 1107.4277 |
| 55 | CMS Collaboration | Jet energy scale and resolution in the CMS experiment in pp collisions at 8 TeV | JINST 12 (2017) P02014 | CMS-JME-13-004 1607.03663 |
| 56 | CMS Collaboration | Performance of the CMS muon detector and muon reconstruction with proton-proton collisions at $ \sqrt{s} = $ 13 TeV | JINST 13 (2018) P06015 | CMS-MUO-16-001 1804.04528 |
| 57 | R. J. Barlow and C. Beeston | Fitting using finite Monte Carlo samples | CPC 77 (1993) 90005 | |
| 58 | S. Schmitt | TUnfold: an algorithm for correcting migration effects in high energy physics | JINST 7 (2012) T10003 | 1205.6201 |
| 59 | A. N. Tikhonov | Solution of incorrectly formulated problems and the regularization method | Soviet Math. Dokl. 4 (1963) 1035 | |
| 60 | P. C. Hansen | The L-curve and its use in the numerical treatment of inverse problems | in Computational Inverse Problems in Electrocardiology, ed. P. Johnston, Advances in Computational Bioengineering, p. 119 WIT Press | |
| 61 | CMS Collaboration | Measurement of the inclusive W and Z production cross sections in pp collisions at $ \sqrt{s}= $ 7 TeV | JHEP 10 (2011) 132 | CMS-EWK-10-005 1107.4789 |
| 62 | CMS Collaboration | CMS luminosity measurements for the 2016 data taking period | CMS-PAS-LUM-17-001 | CMS-PAS-LUM-17-001 |
|
|
Compact Muon Solenoid LHC, CERN |
|

|

|

|

|

|