

Compact Muon Solenoid
LHC, CERN
| CMS-SMP-21-006 ; CERN-EP-2022-144 | ||
| Measurements of jet multiplicity and jet transverse momentum in multijet events in proton-proton collisions at $ \sqrt{s}= $ 13 TeV | ||
| CMS Collaboration | ||
| 24 October 2022 | ||
| Eur. Phys. J. C 83 (2023) 742 | ||
| Abstract: Multijet events at large transverse momentum ($ p_{\mathrm{T}} $) are measured at $ \sqrt{s}= $ 13 TeV using data recorded with the CMS detector at the LHC, corresponding to an integrated luminosity of 36.3 fb$^{-1}$. The multiplicity of jets with $ p_{\mathrm{T}} > $ 50 GeV that are produced in association with a high-$ p_{\mathrm{T}} $ dijet system is measured in various ranges of the $ p_{\mathrm{T}} $ of the jet with the highest transverse momentum and as a function of the azimuthal angle difference $ \Delta\phi_{1,2} $ between the two highest $ p_{\mathrm{T}} $ jets in the dijet system. The differential production cross sections are measured as a function of the transverse momenta of the four highest $ p_{\mathrm{T}} $ jets. The measurements are compared with leading and next-to-leading order matrix element calculations supplemented with simulations of parton shower, hadronization, and multiparton interactions. In addition, the measurements are compared with next-to-leading order matrix element calculations combined with transverse-momentum dependent parton densities and transverse-momentum dependent parton shower. | ||
| Links: e-print arXiv:2210.13557 [hep-ex] (PDF) ; CDS record ; inSPIRE record ; HepData record ; CADI line (restricted) ; | ||
| Figures | |
png pdf |
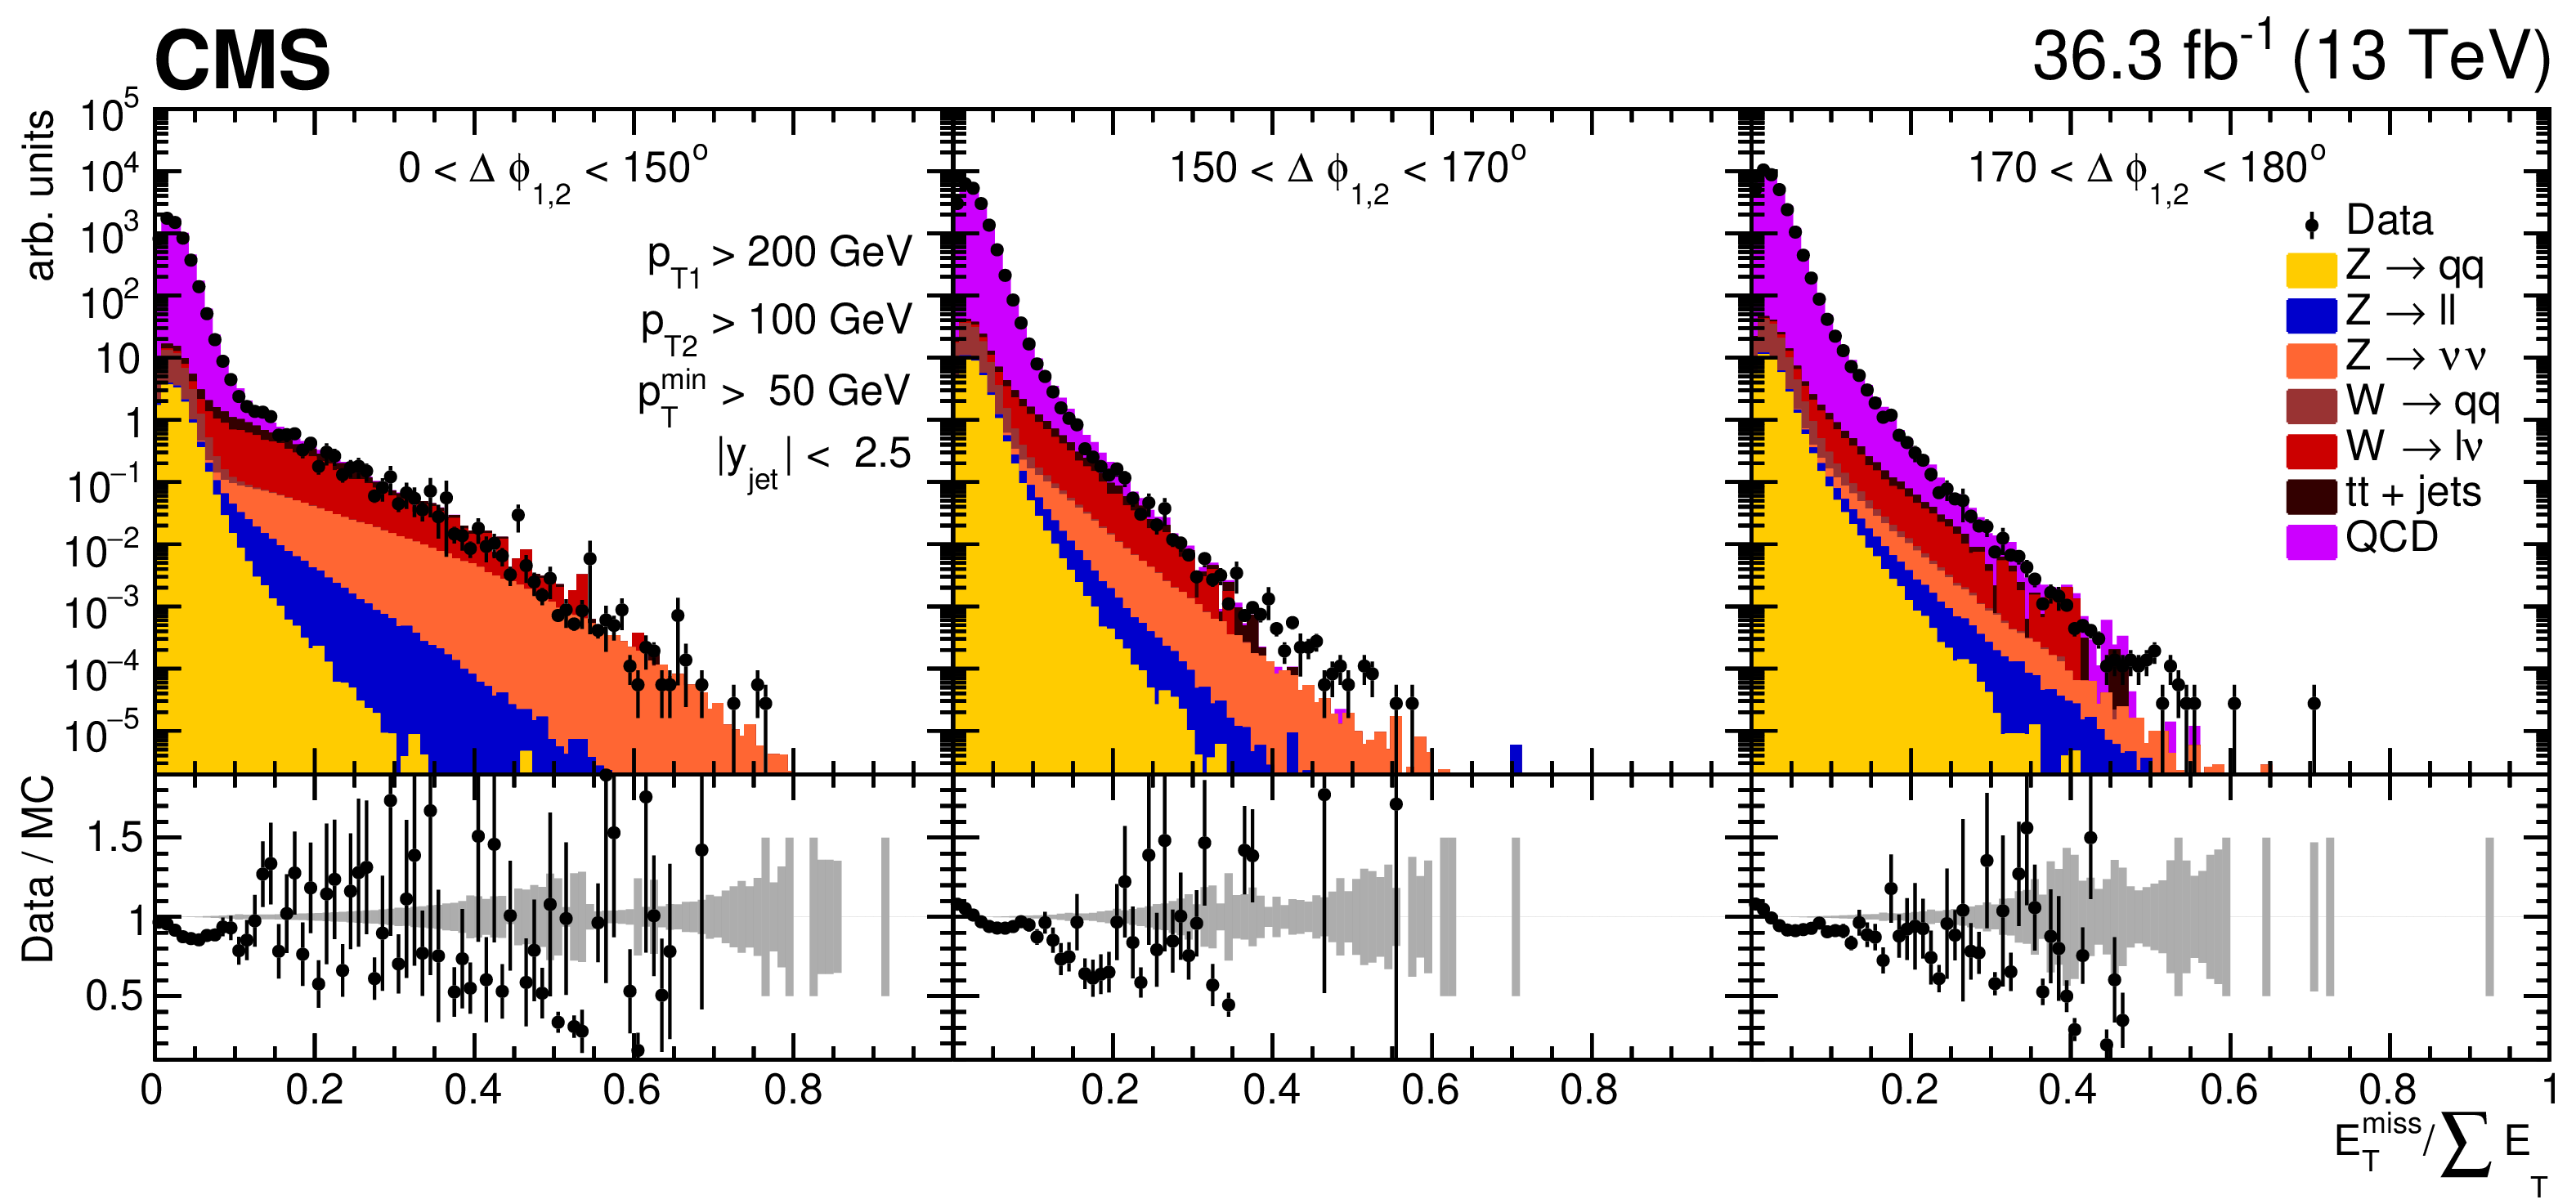
Figure 1:
Distribution of $ E_{\mathrm{T}}^{\text{miss}}/\sum{E_{\mathrm{T}}} $ for data and simulated jet production for three regions of $ \Delta\phi_{1,2} $. Shown are the contributions from QCD, $ \mathrm{W}/\mathrm{Z} $ and $ {\mathrm{t}\overline{\mathrm{t}}} $ events. The main contributions of events with large $ E_{\mathrm{T}}^{\text{miss}} $ in the final state come from processes like $ \mathrm{Z} \to \nu \overline{\nu} $ and $ \mathrm{W} \to \ell\nu $. The data (MC prediction) statistical uncertainty is shown as a vertical line (grey shaded bar in the ratio). |
png pdf |
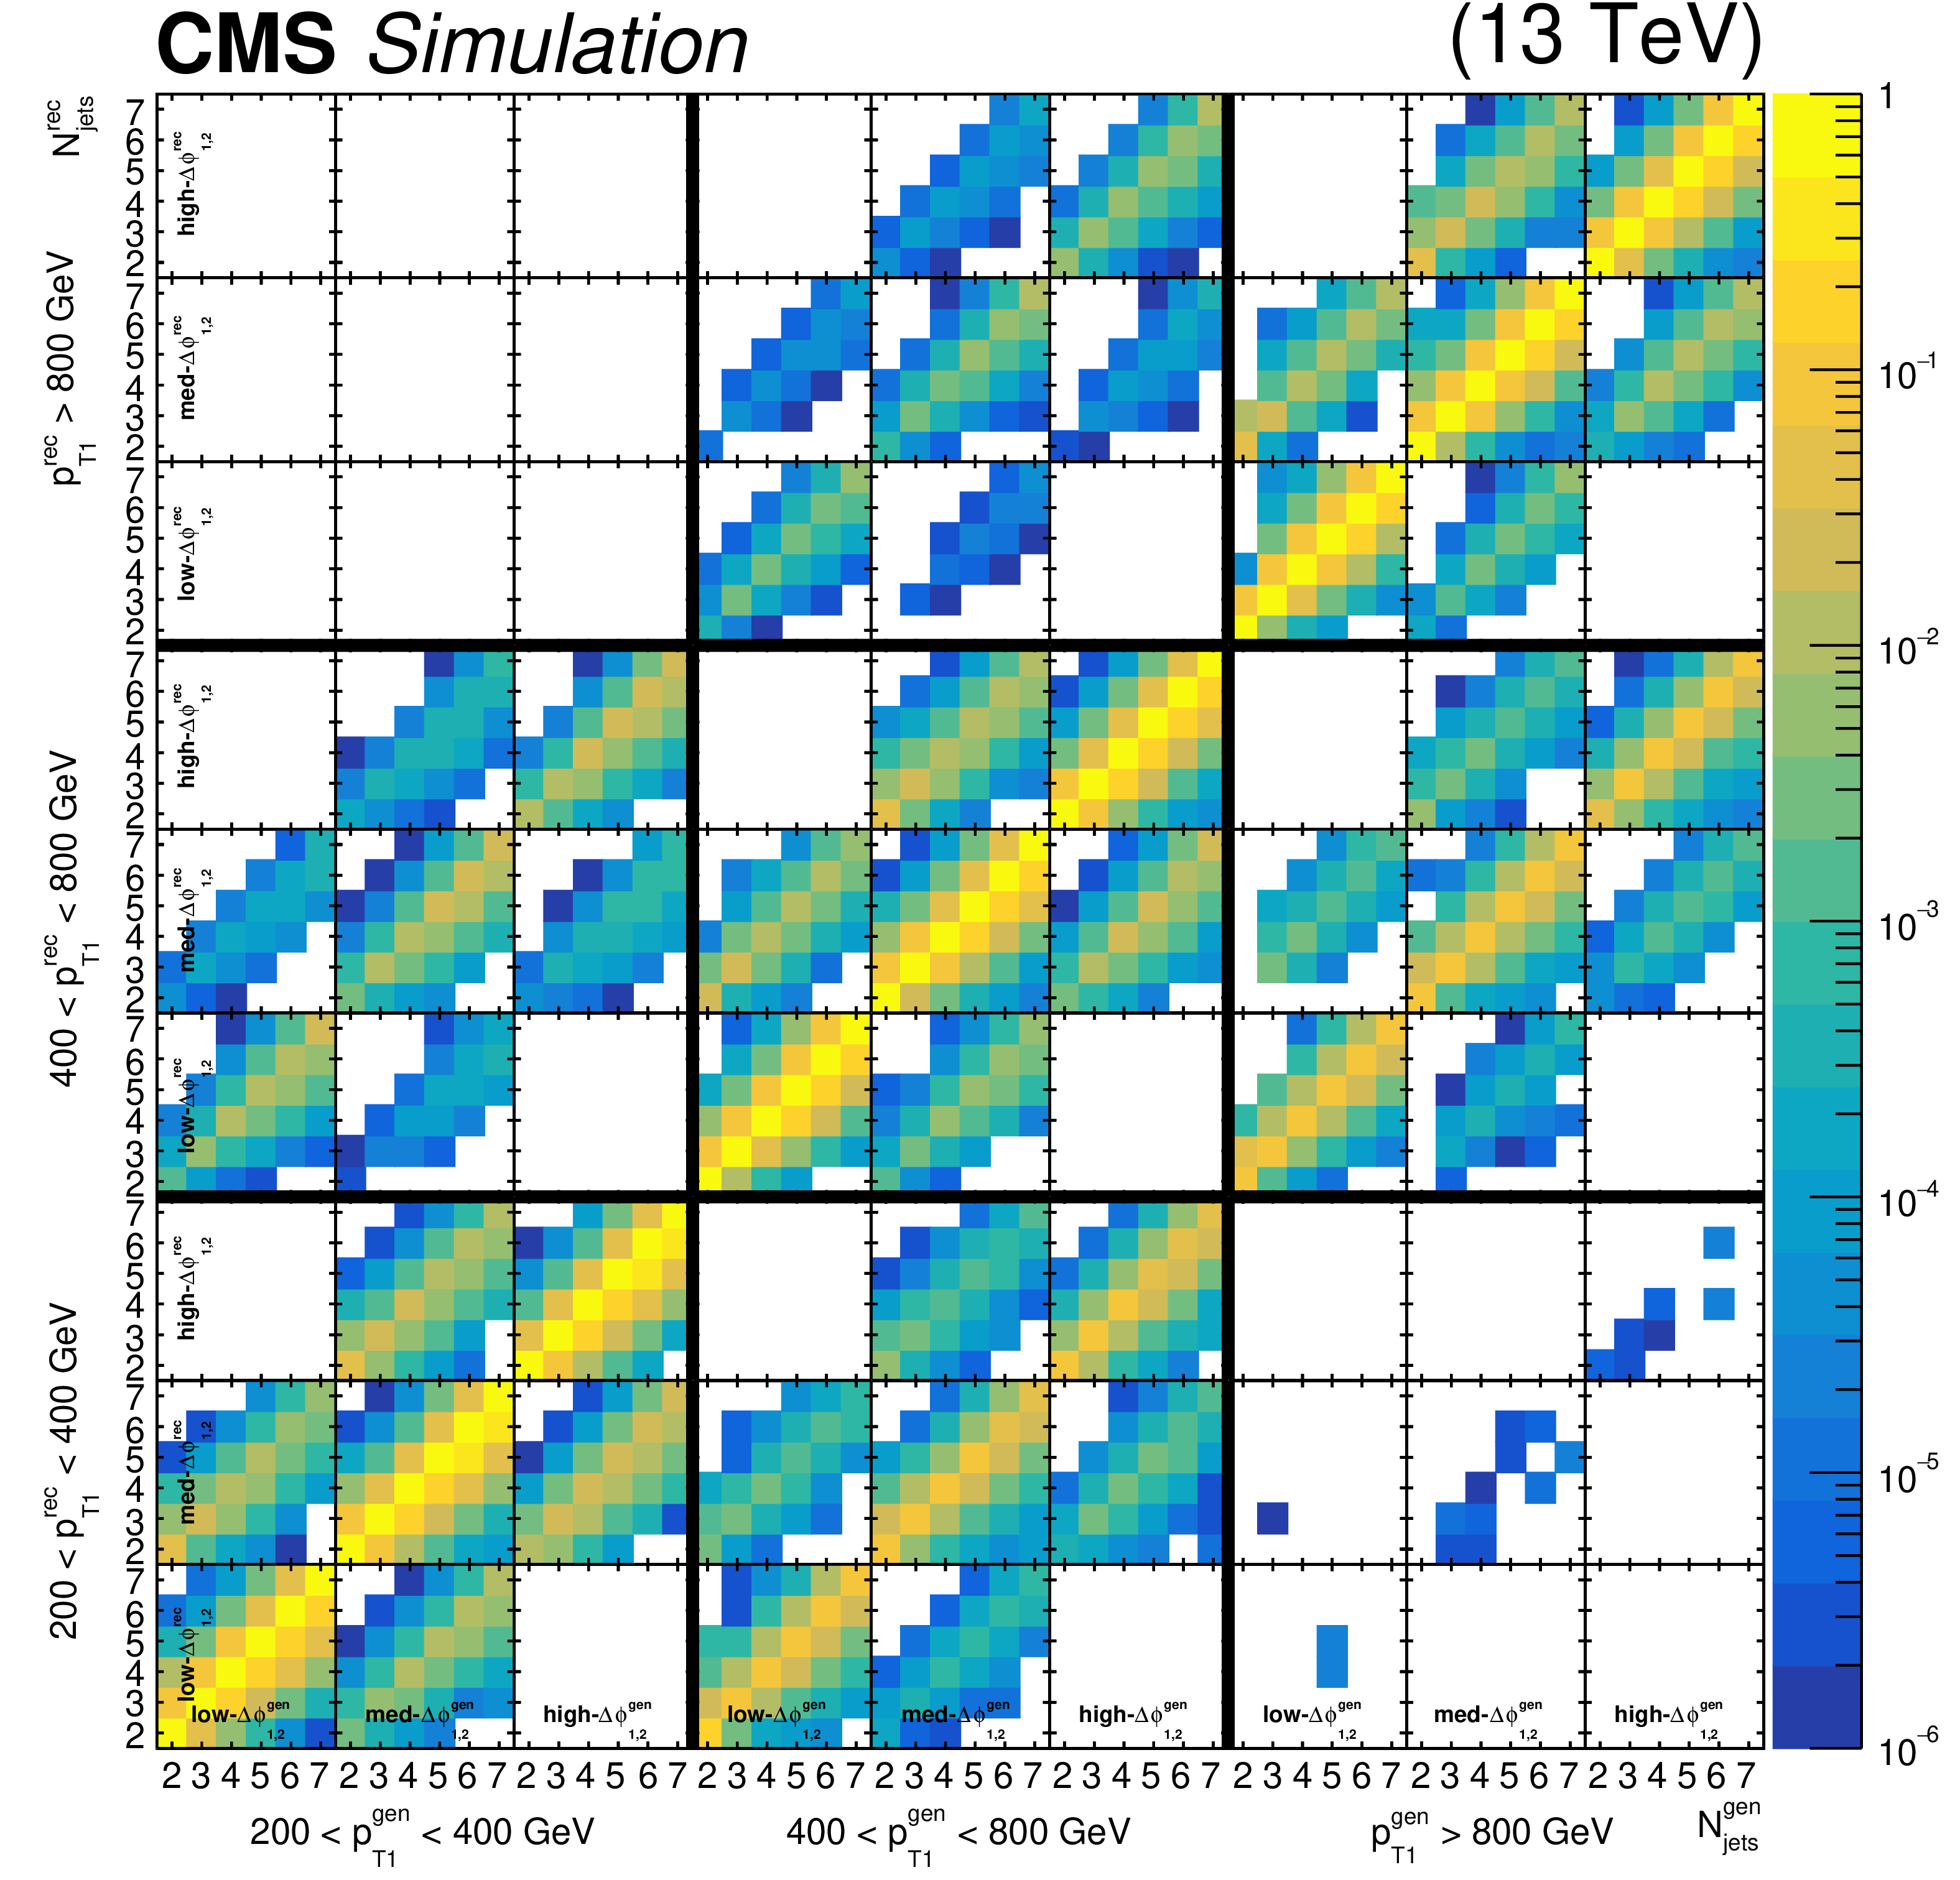
Figure 2:
Probability matrix (condition number: 3.0) for the jet multiplicity distribution constructed with the MADGRAPH+PY8 sample. The global 3$ \times $3 sectors (separated by the thick black lines) correspond to the $ p_{\mathrm{T1}} $ bins, indicated by the labels in the x (lower) and y (left) axes; the smaller 3$ \times $3 structures correspond to the $ \Delta\phi_{1,2} $ bins, indicated in the leftmost row and lowest column, the x(y) axis of these $ \Delta\phi_{1,2} $ cells corresponds to the jet multiplicity at particle (detector) level. The z axis covers a range from 10$^{-6} $ to 1 indicating the probability of migrations from the particle-level bin to the corresponding detector-level bin. |
png pdf |
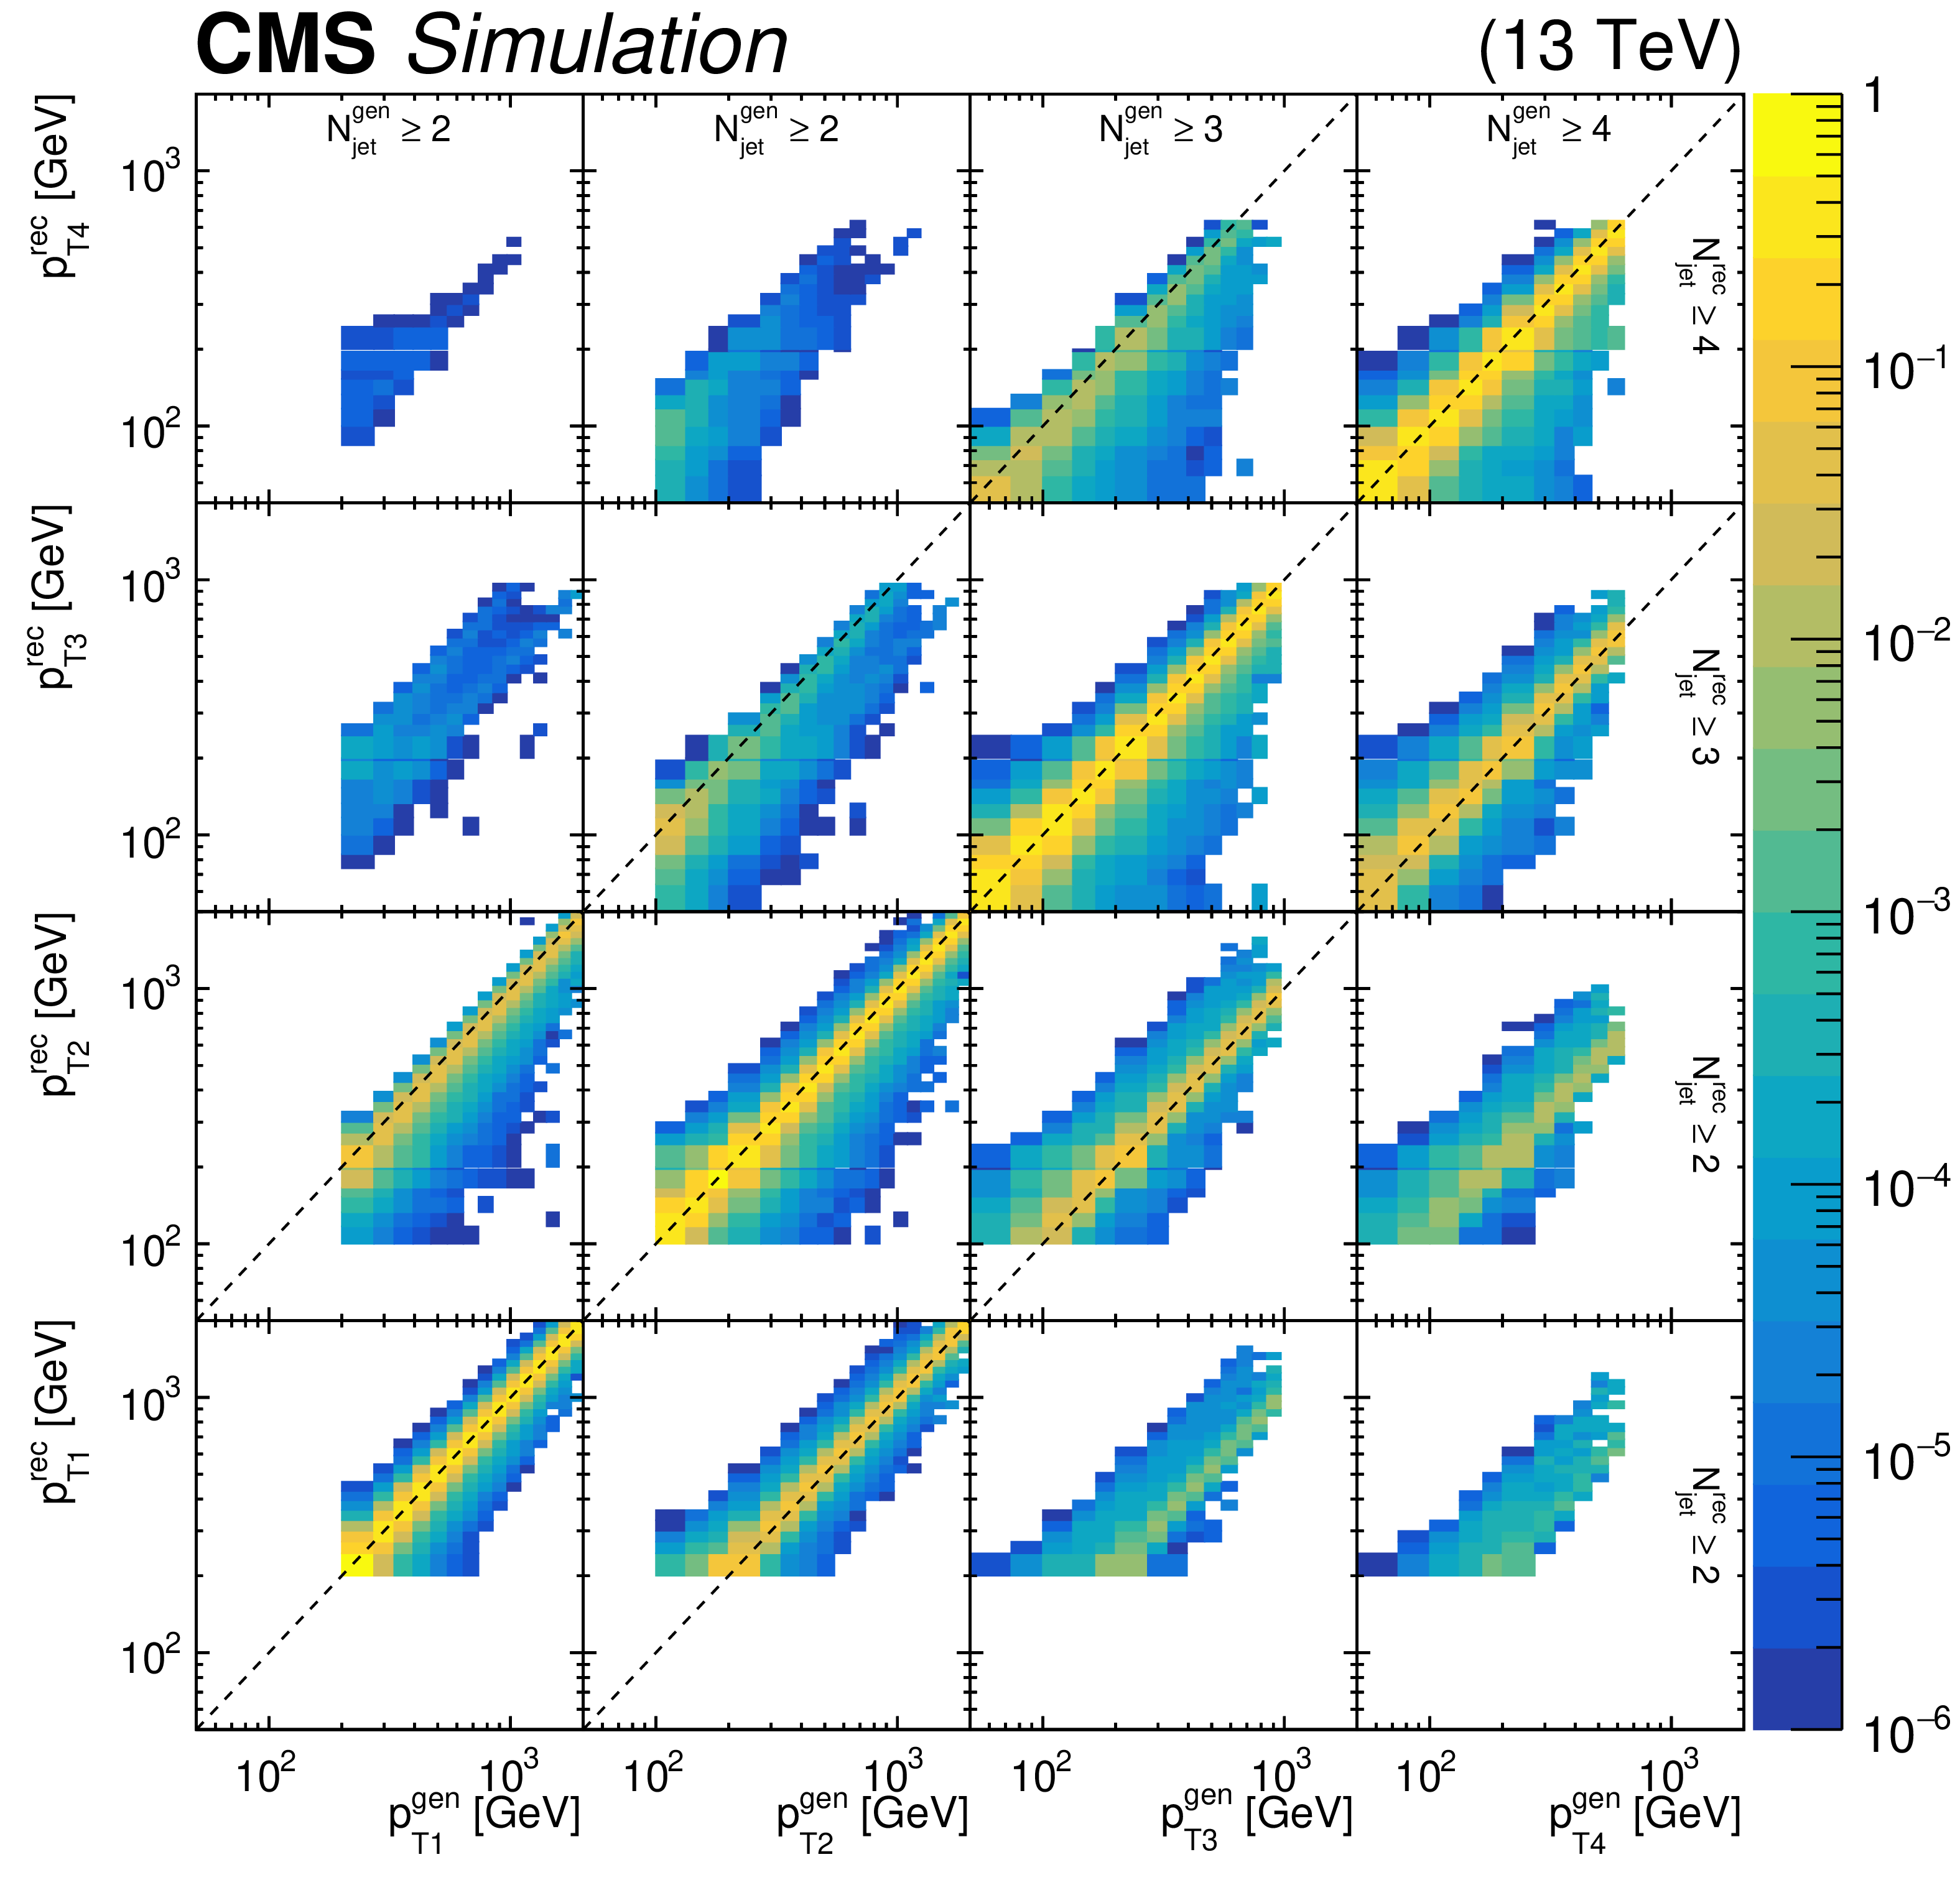
Figure 3:
Probability matrix (condition number: 4.9) for the $ p_{\mathrm{T}} $ of the four leading jets constructed with the MADGRAPH+PY8 sample. The global 4$ \times $4 sectors correspond to the $ p_{\mathrm{T}} $ distributions each of the first four jets, the x axis corresponds to the particle (gen) level and y axis corresponds to the detector (rec) level. The z axis covers a range from 10$^{-6} $ to 1 indicating the probability of migrations from the particle-level bin to the corresponding detector-level bin. |
png pdf |
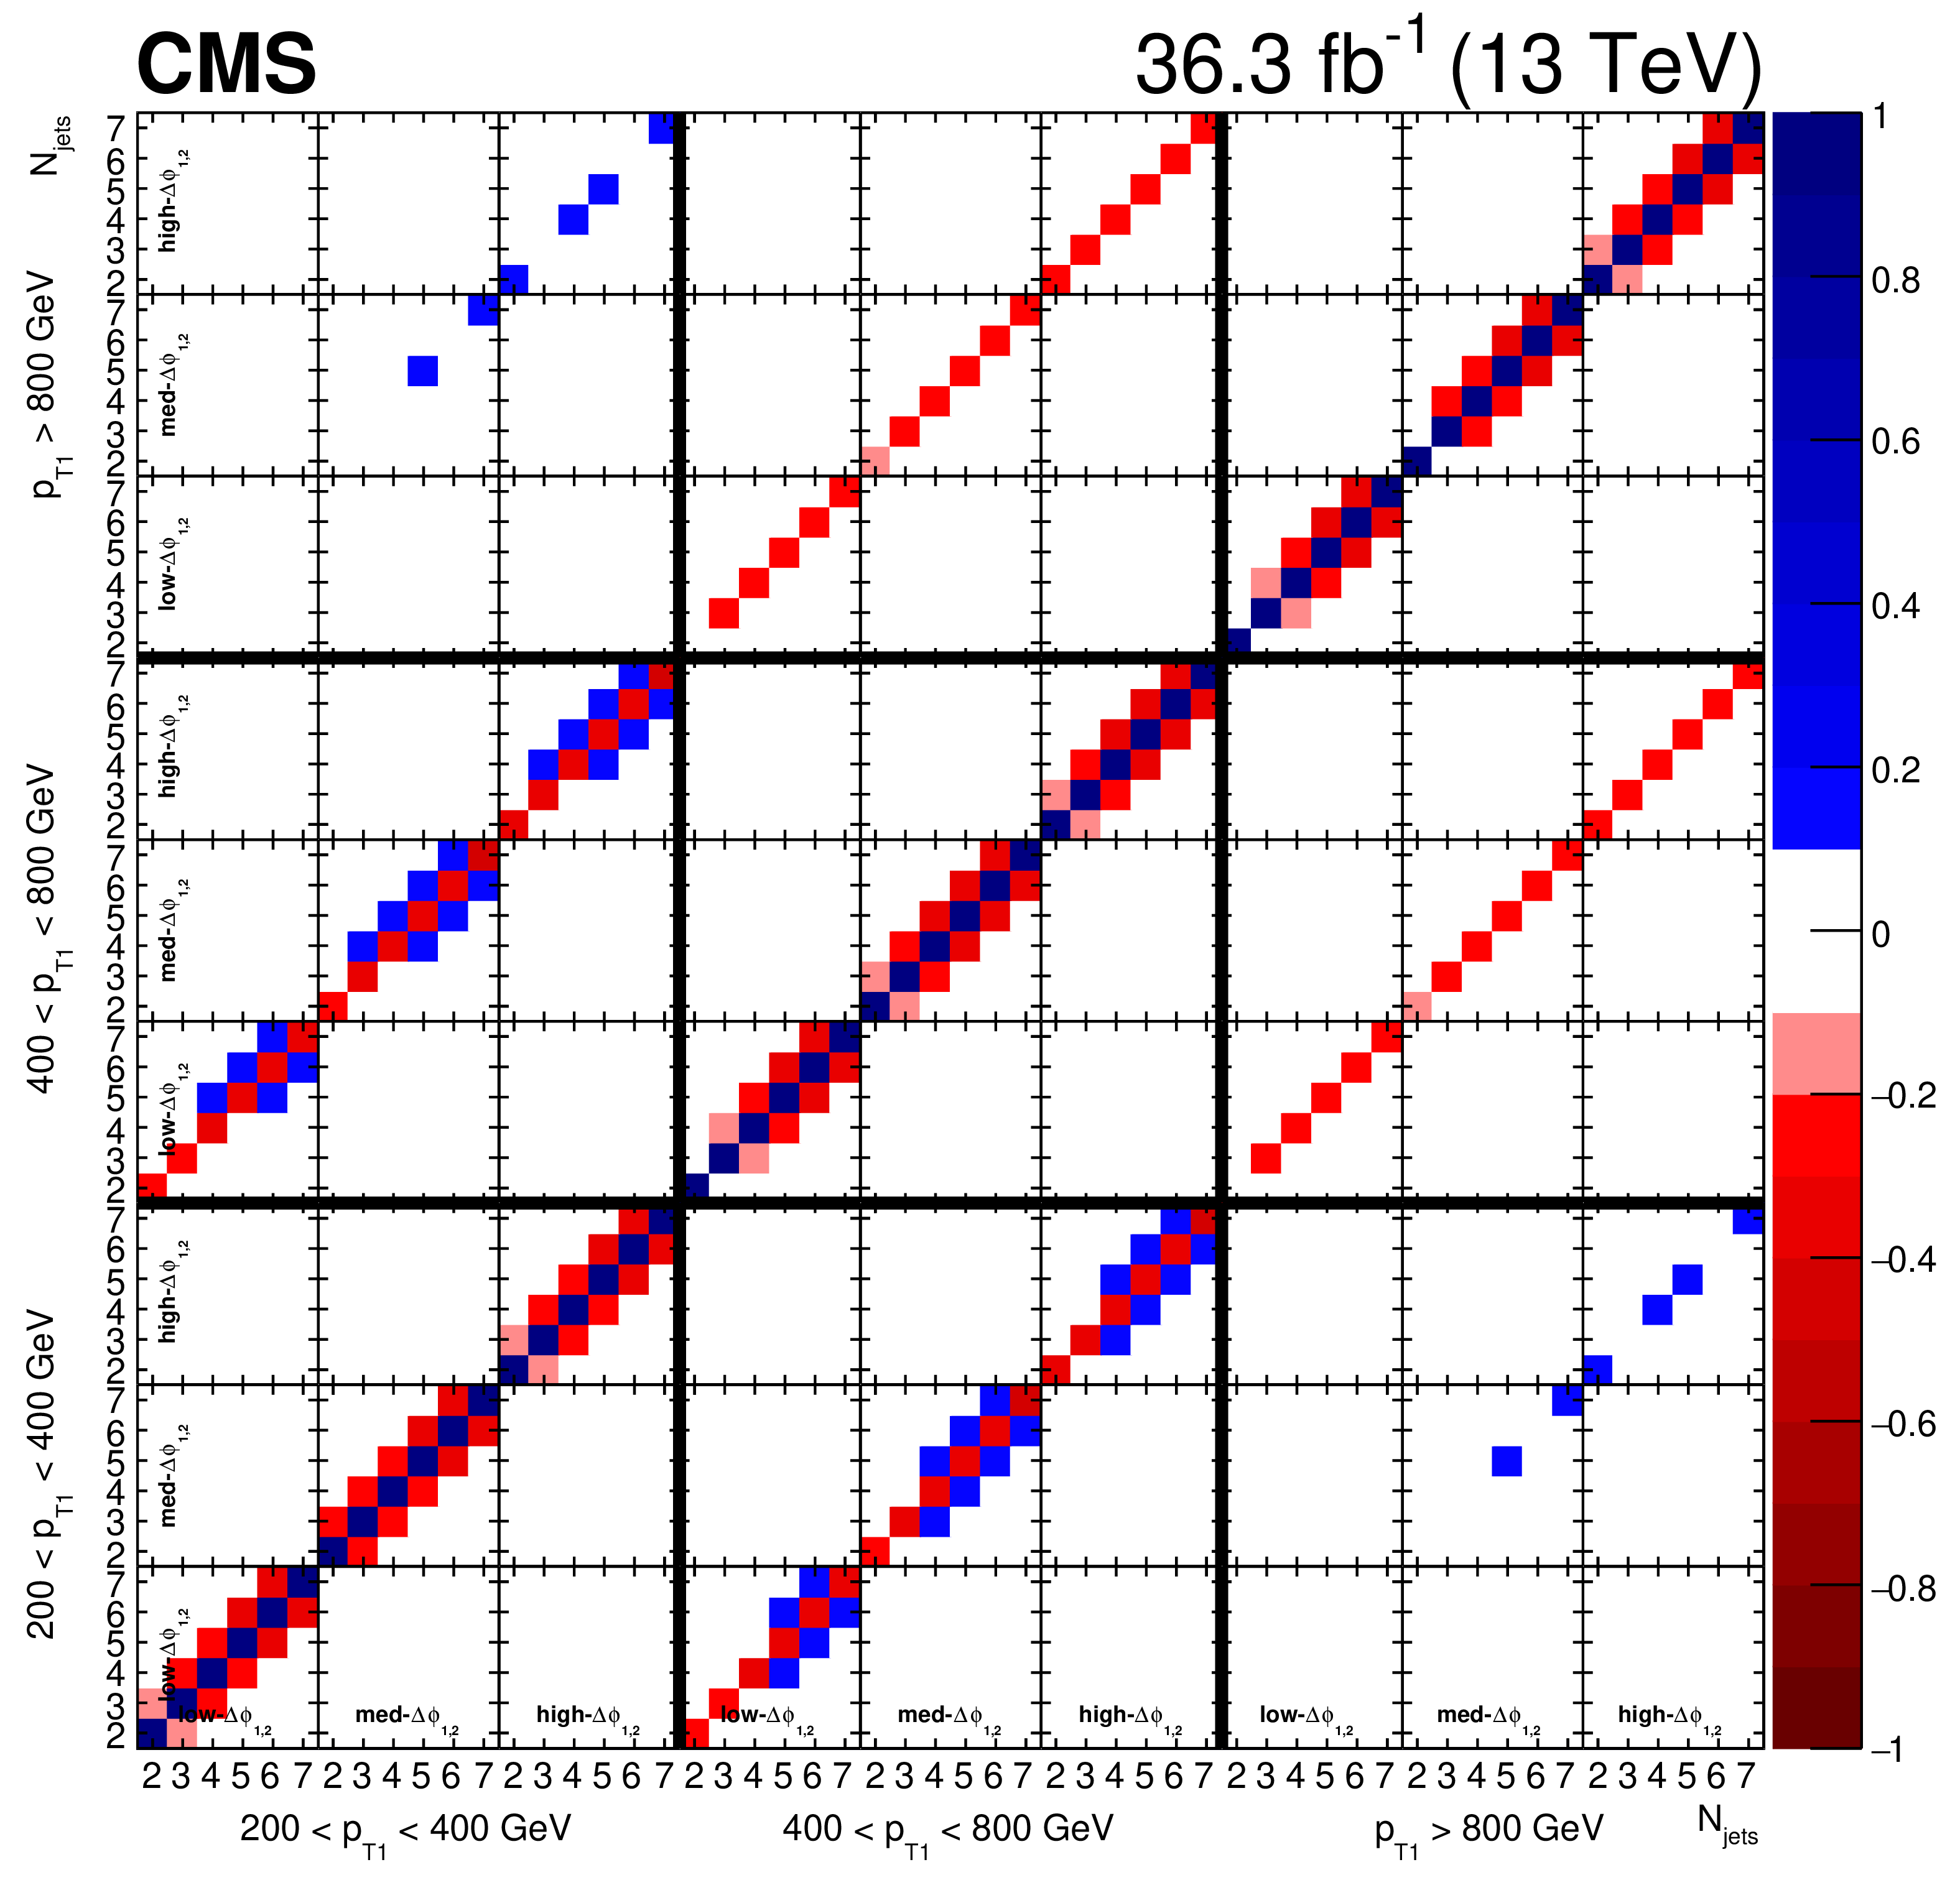
Figure 4:
Correlation matrix at the particle-level for the jet multiplicity distribution. It contains contributions from the data and from the limited-size MADGRAPH+PY8 sample. The global 3$ \times $3 sectors (separated by the thick black lines) correspond to the $ p_{\mathrm{T1}} $ bins, indicated by the labels next to the x (lower) and y (left) axes; the smaller 3$ \times $3 structures correspond to the $ \Delta\phi_{1,2} $ bins, indicated in the leftmost row and lowest column, the x and y axes correspond to the jet multiplicity. The z axis covers a range from-1 to 1 indicating the correlations in blue shades and anticorrelations in red shades, the values between-0.1 and 0.1 are represented in white. |

png pdf |
Figure 5:
Correlation matrix for the particle-level $ p_{\mathrm{T}} $ of the four leading jets. It contains contributions from the data and from the limited-size MADGRAPH+PY8 sample. Here each one of the 4$ \times $4 sectors corresponds to one of the $ p_{\mathrm{T}} $ spectra measured, indicated by the x and y axis labels. The z axis covers a range from-1 to 1 indicating the correlations in blue shades and anticorrelations in red shades, the values between-0.1 and 0.1 are represented in white. |
png pdf |
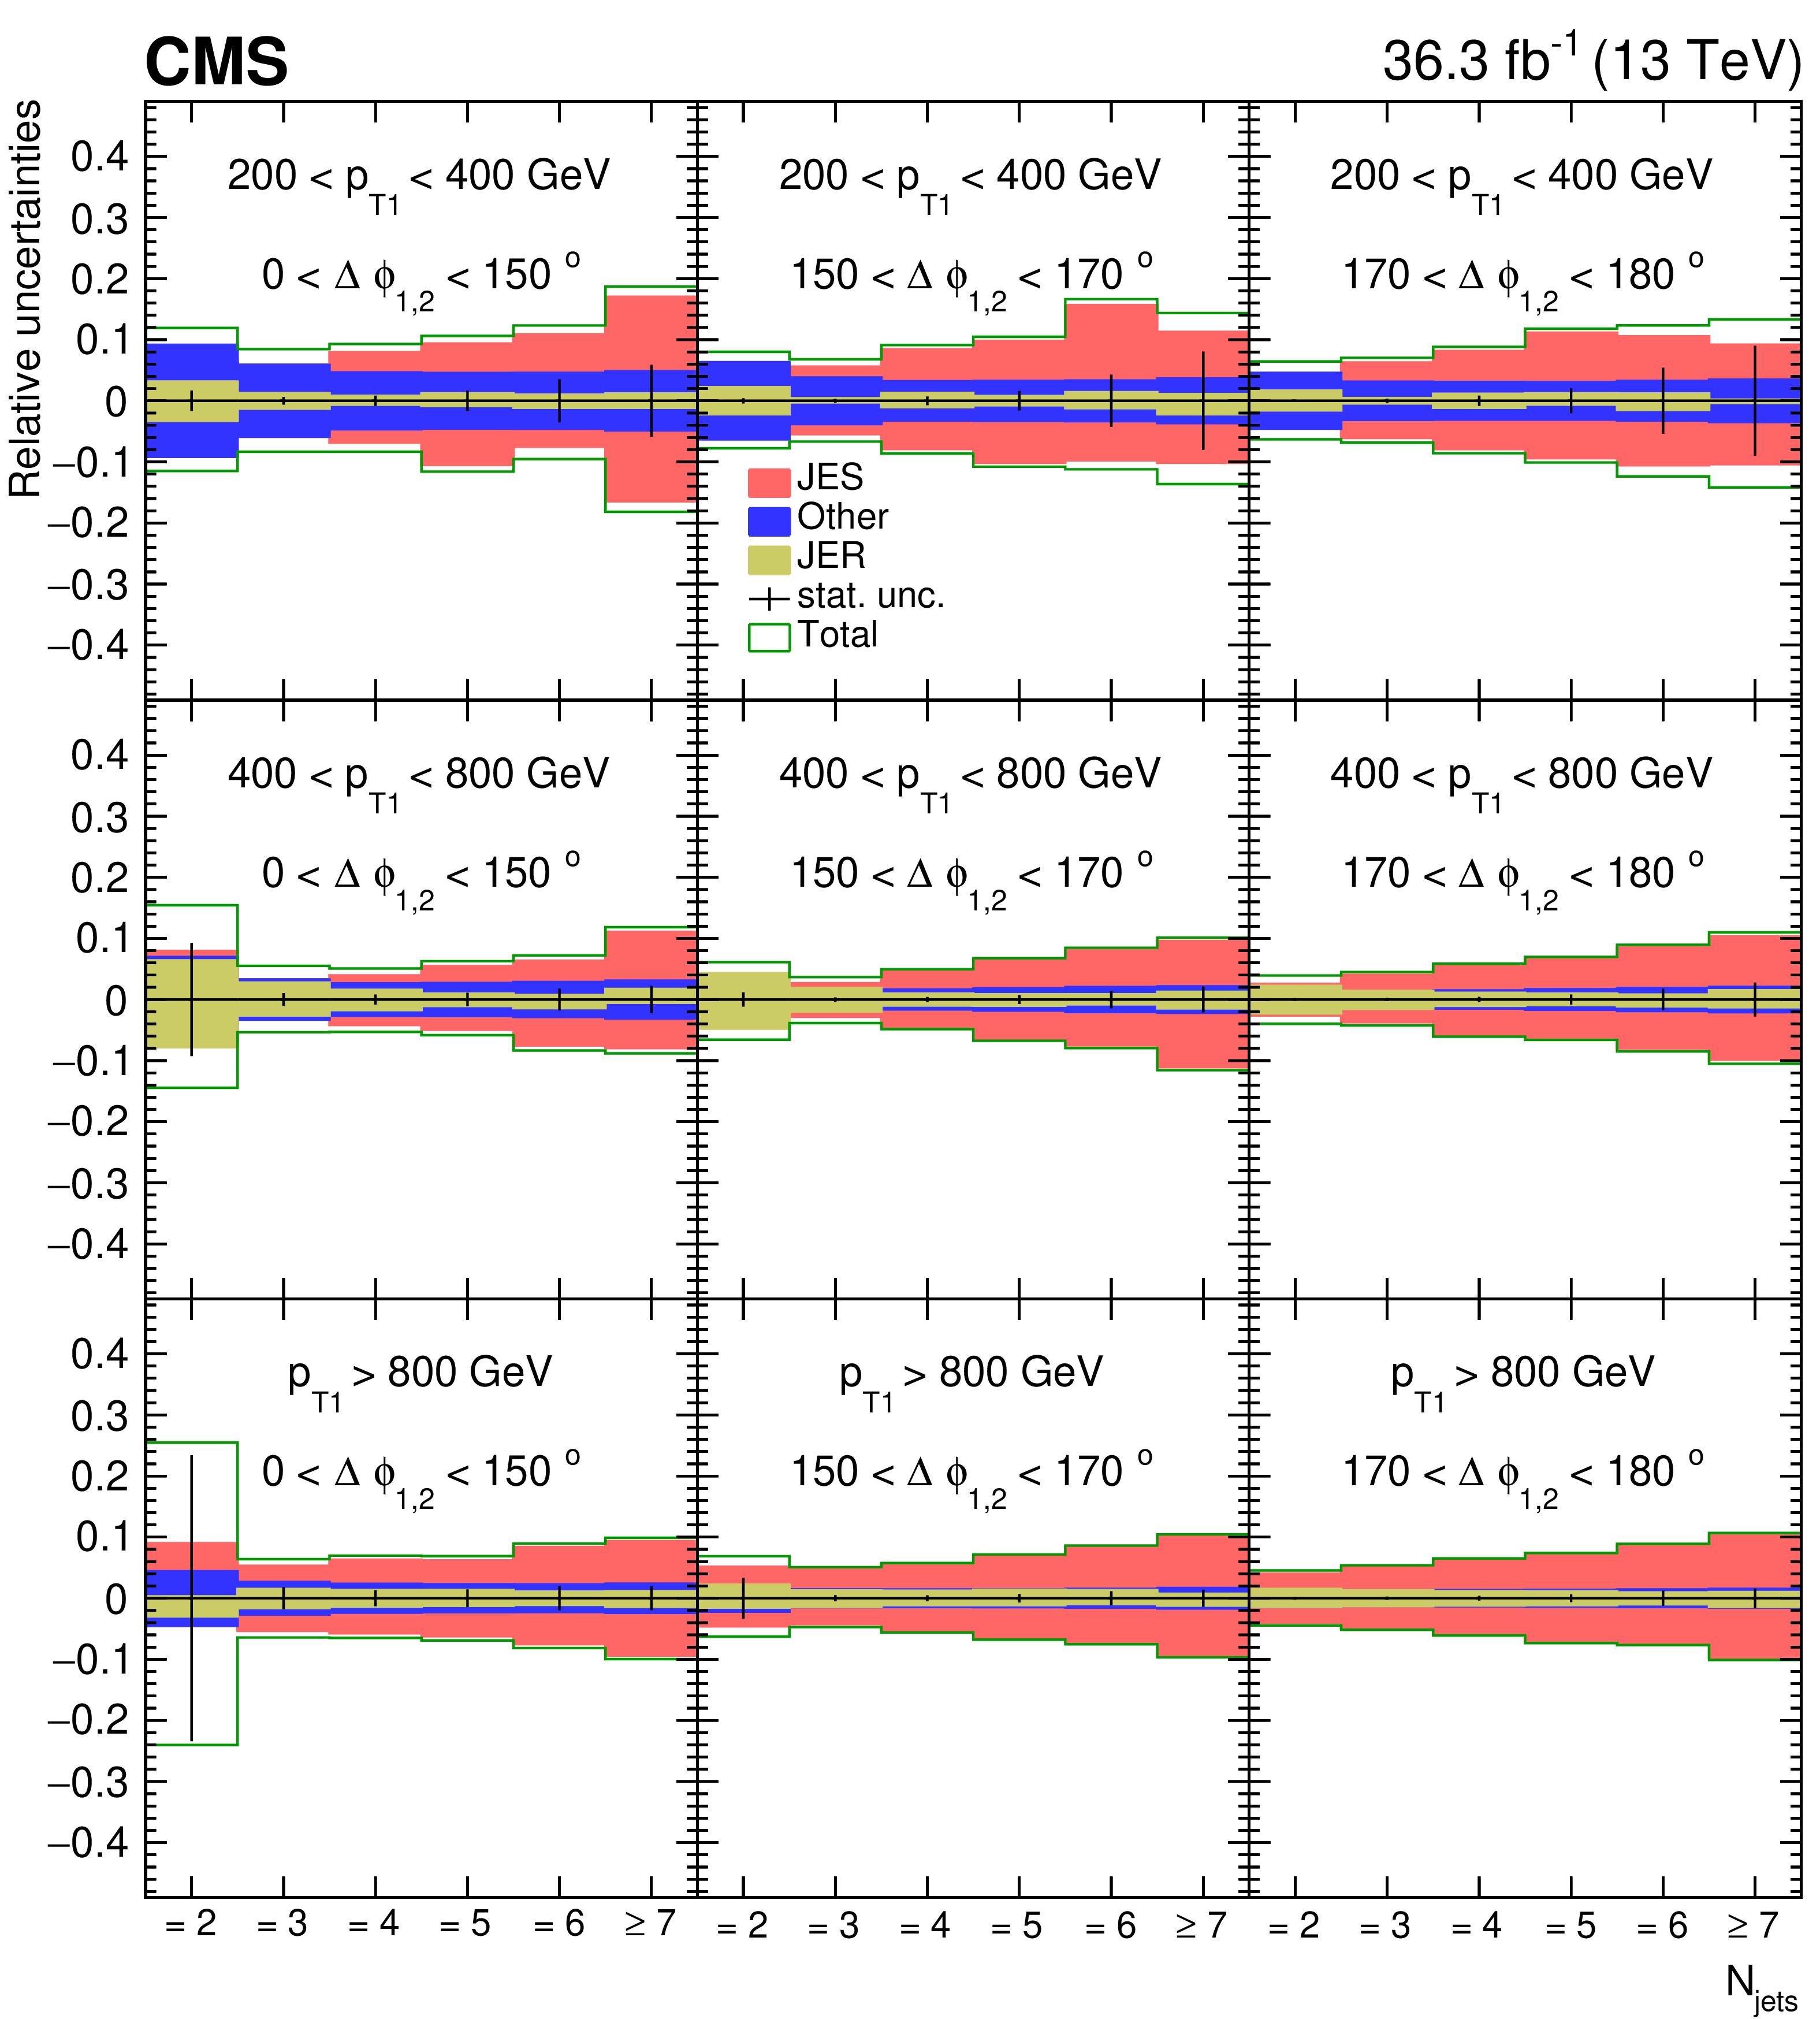
Figure 6:
Relative uncertainties for JES, JER, ``Other'' and total statistical uncertainty for the jet multiplicity distribution in bins of $ p_{\mathrm{T1}} $ and $ \Delta\phi_{1,2} $. Here ``Other'' indicates luminosity, pileup, prefiring, and model uncertainty. |
png pdf |
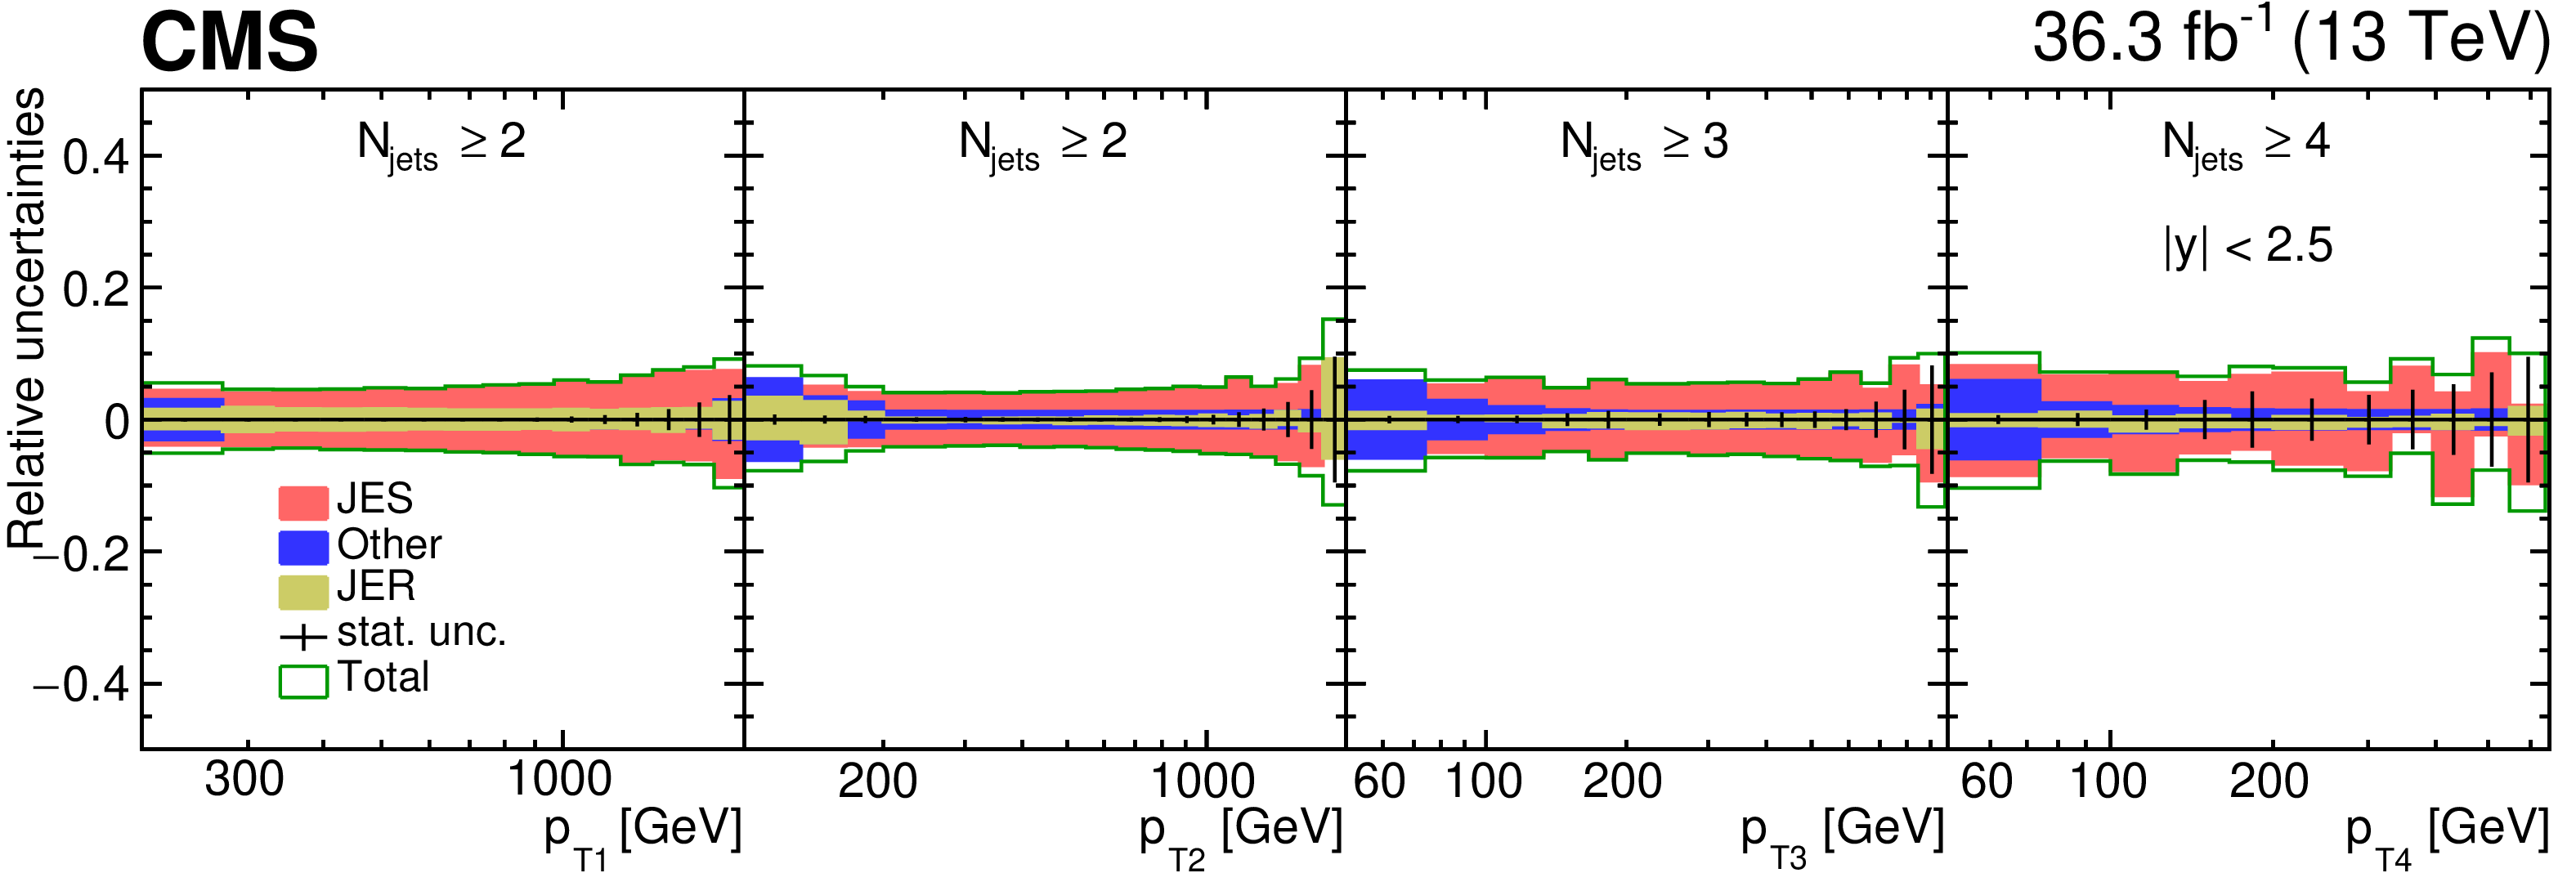
Figure 7:
Relative uncertainties for JES, JER, ``Other'' and total statistical uncertainty for the $ p_{\mathrm{T}} $ distributions of the four leading jets. Here ``Other'' indicates luminosity, pileup, prefiring, and model uncertainty. |
png pdf |
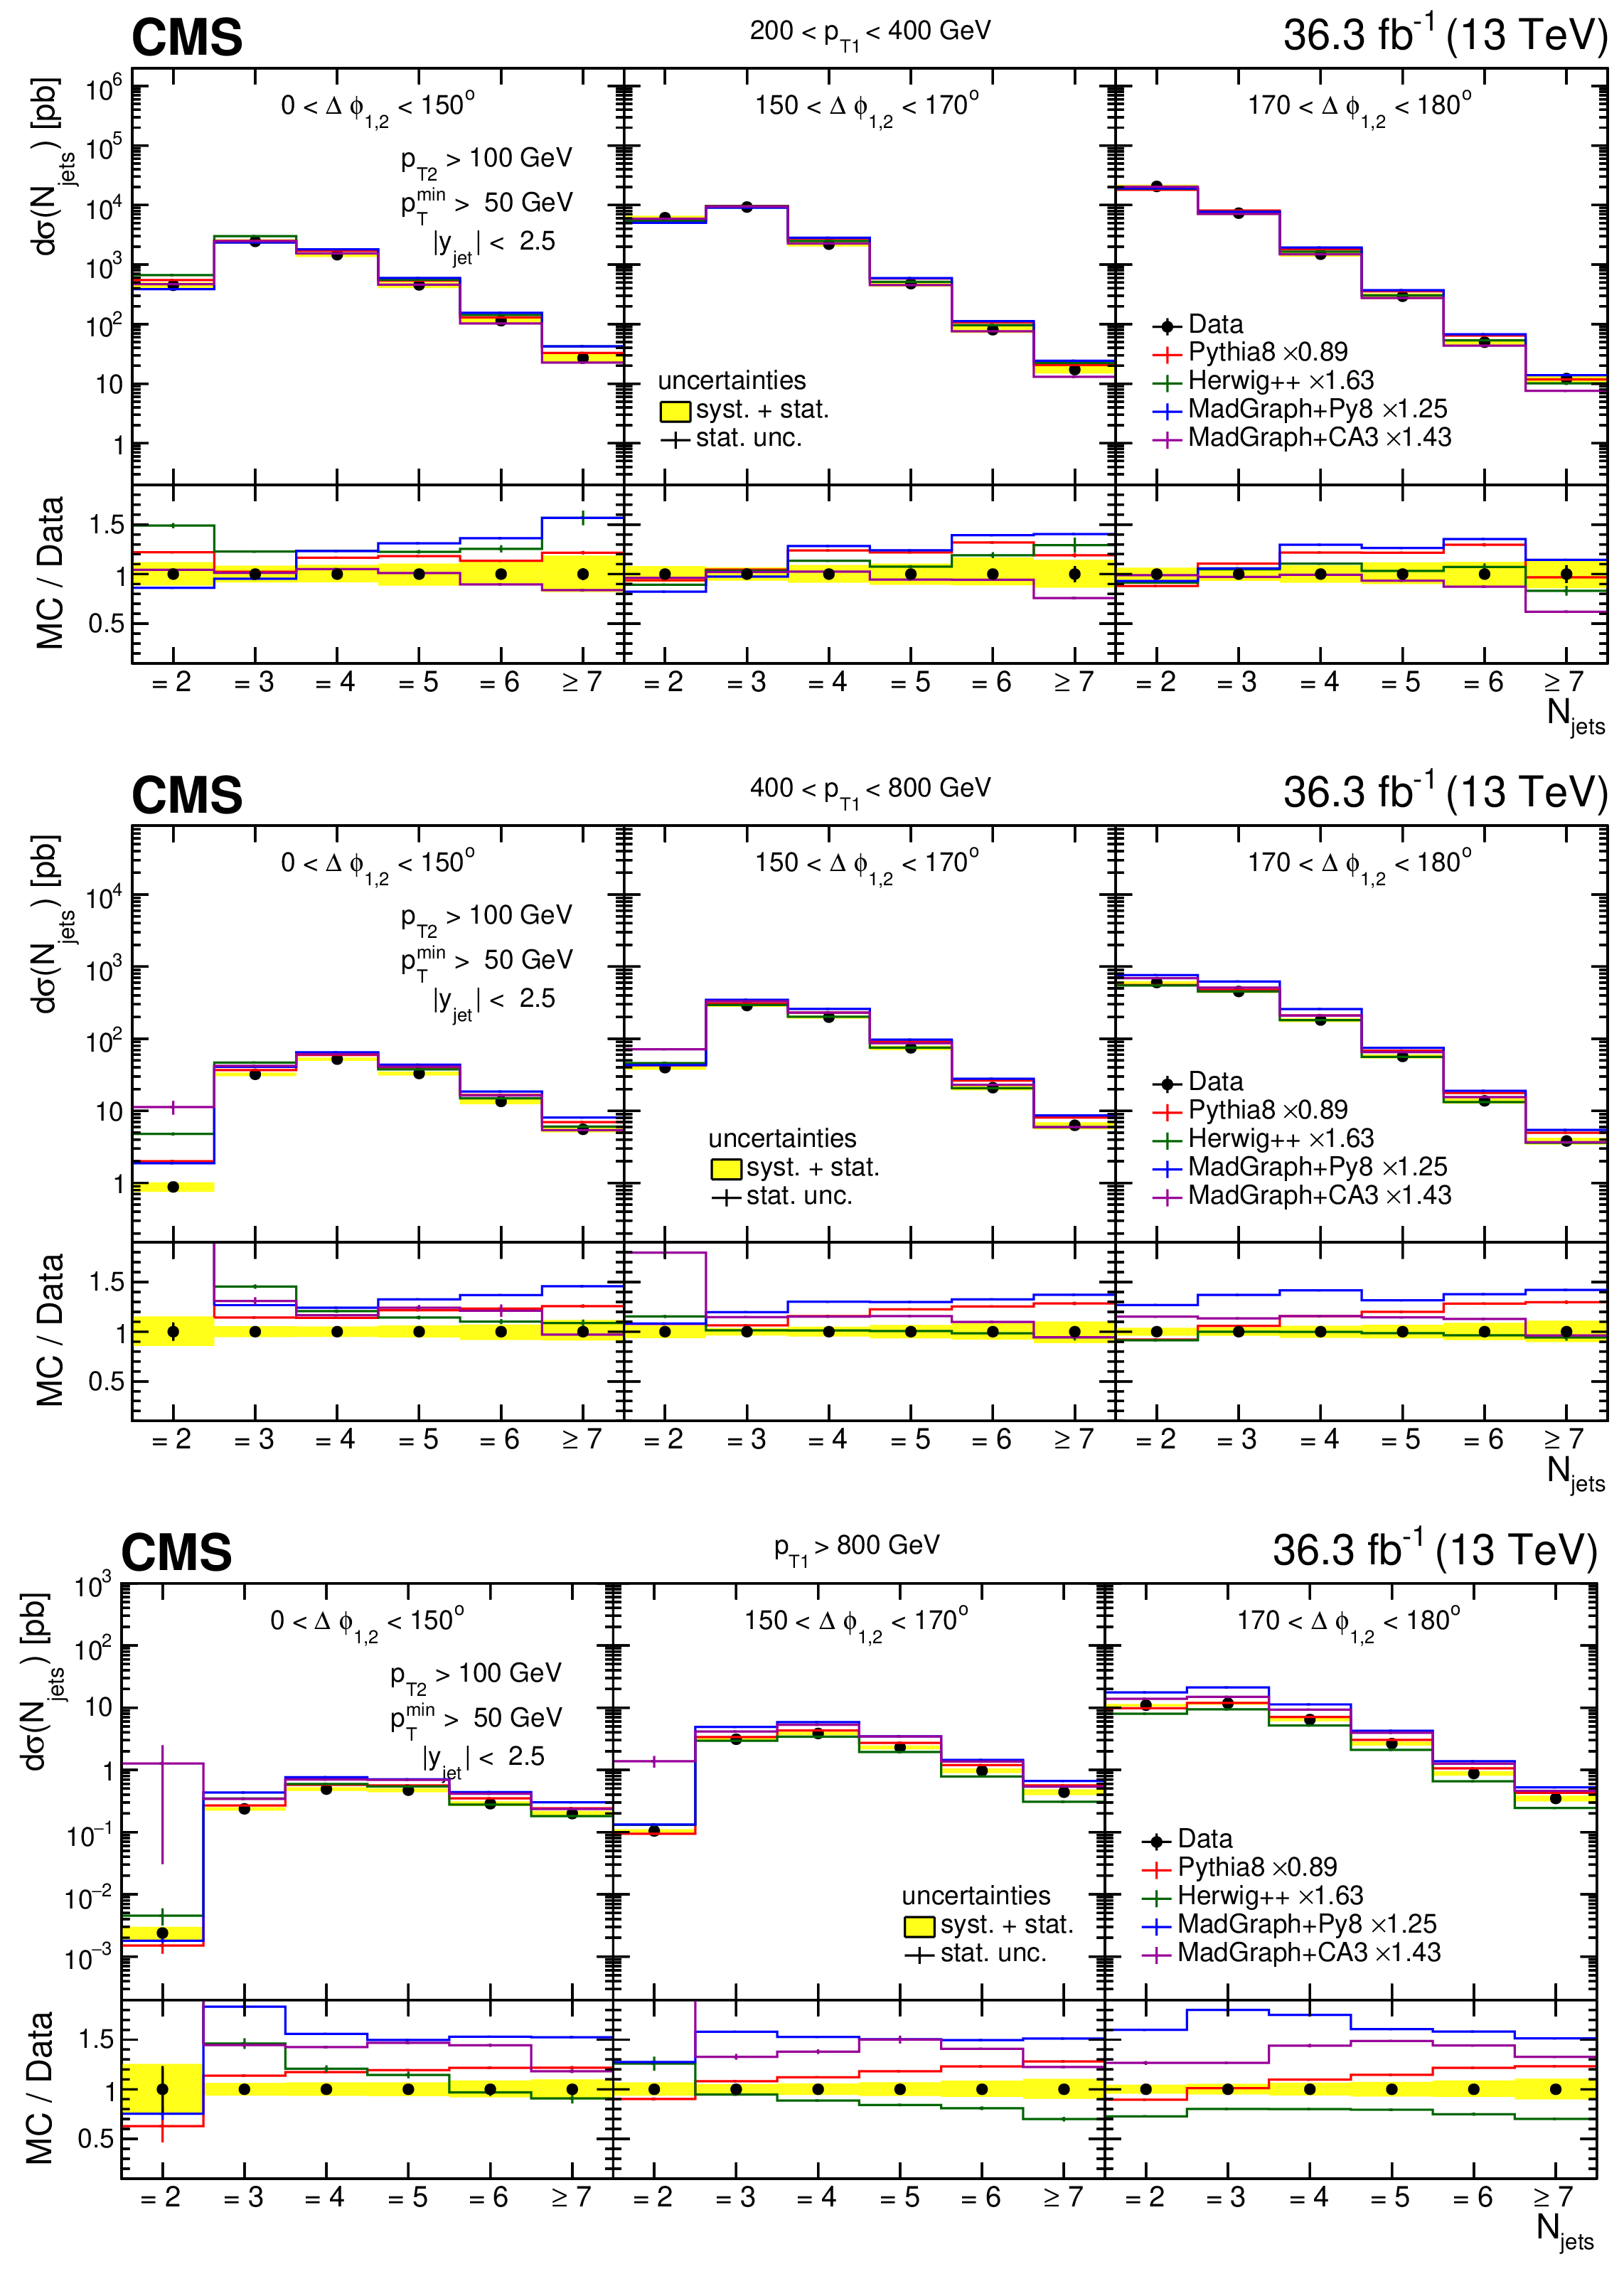
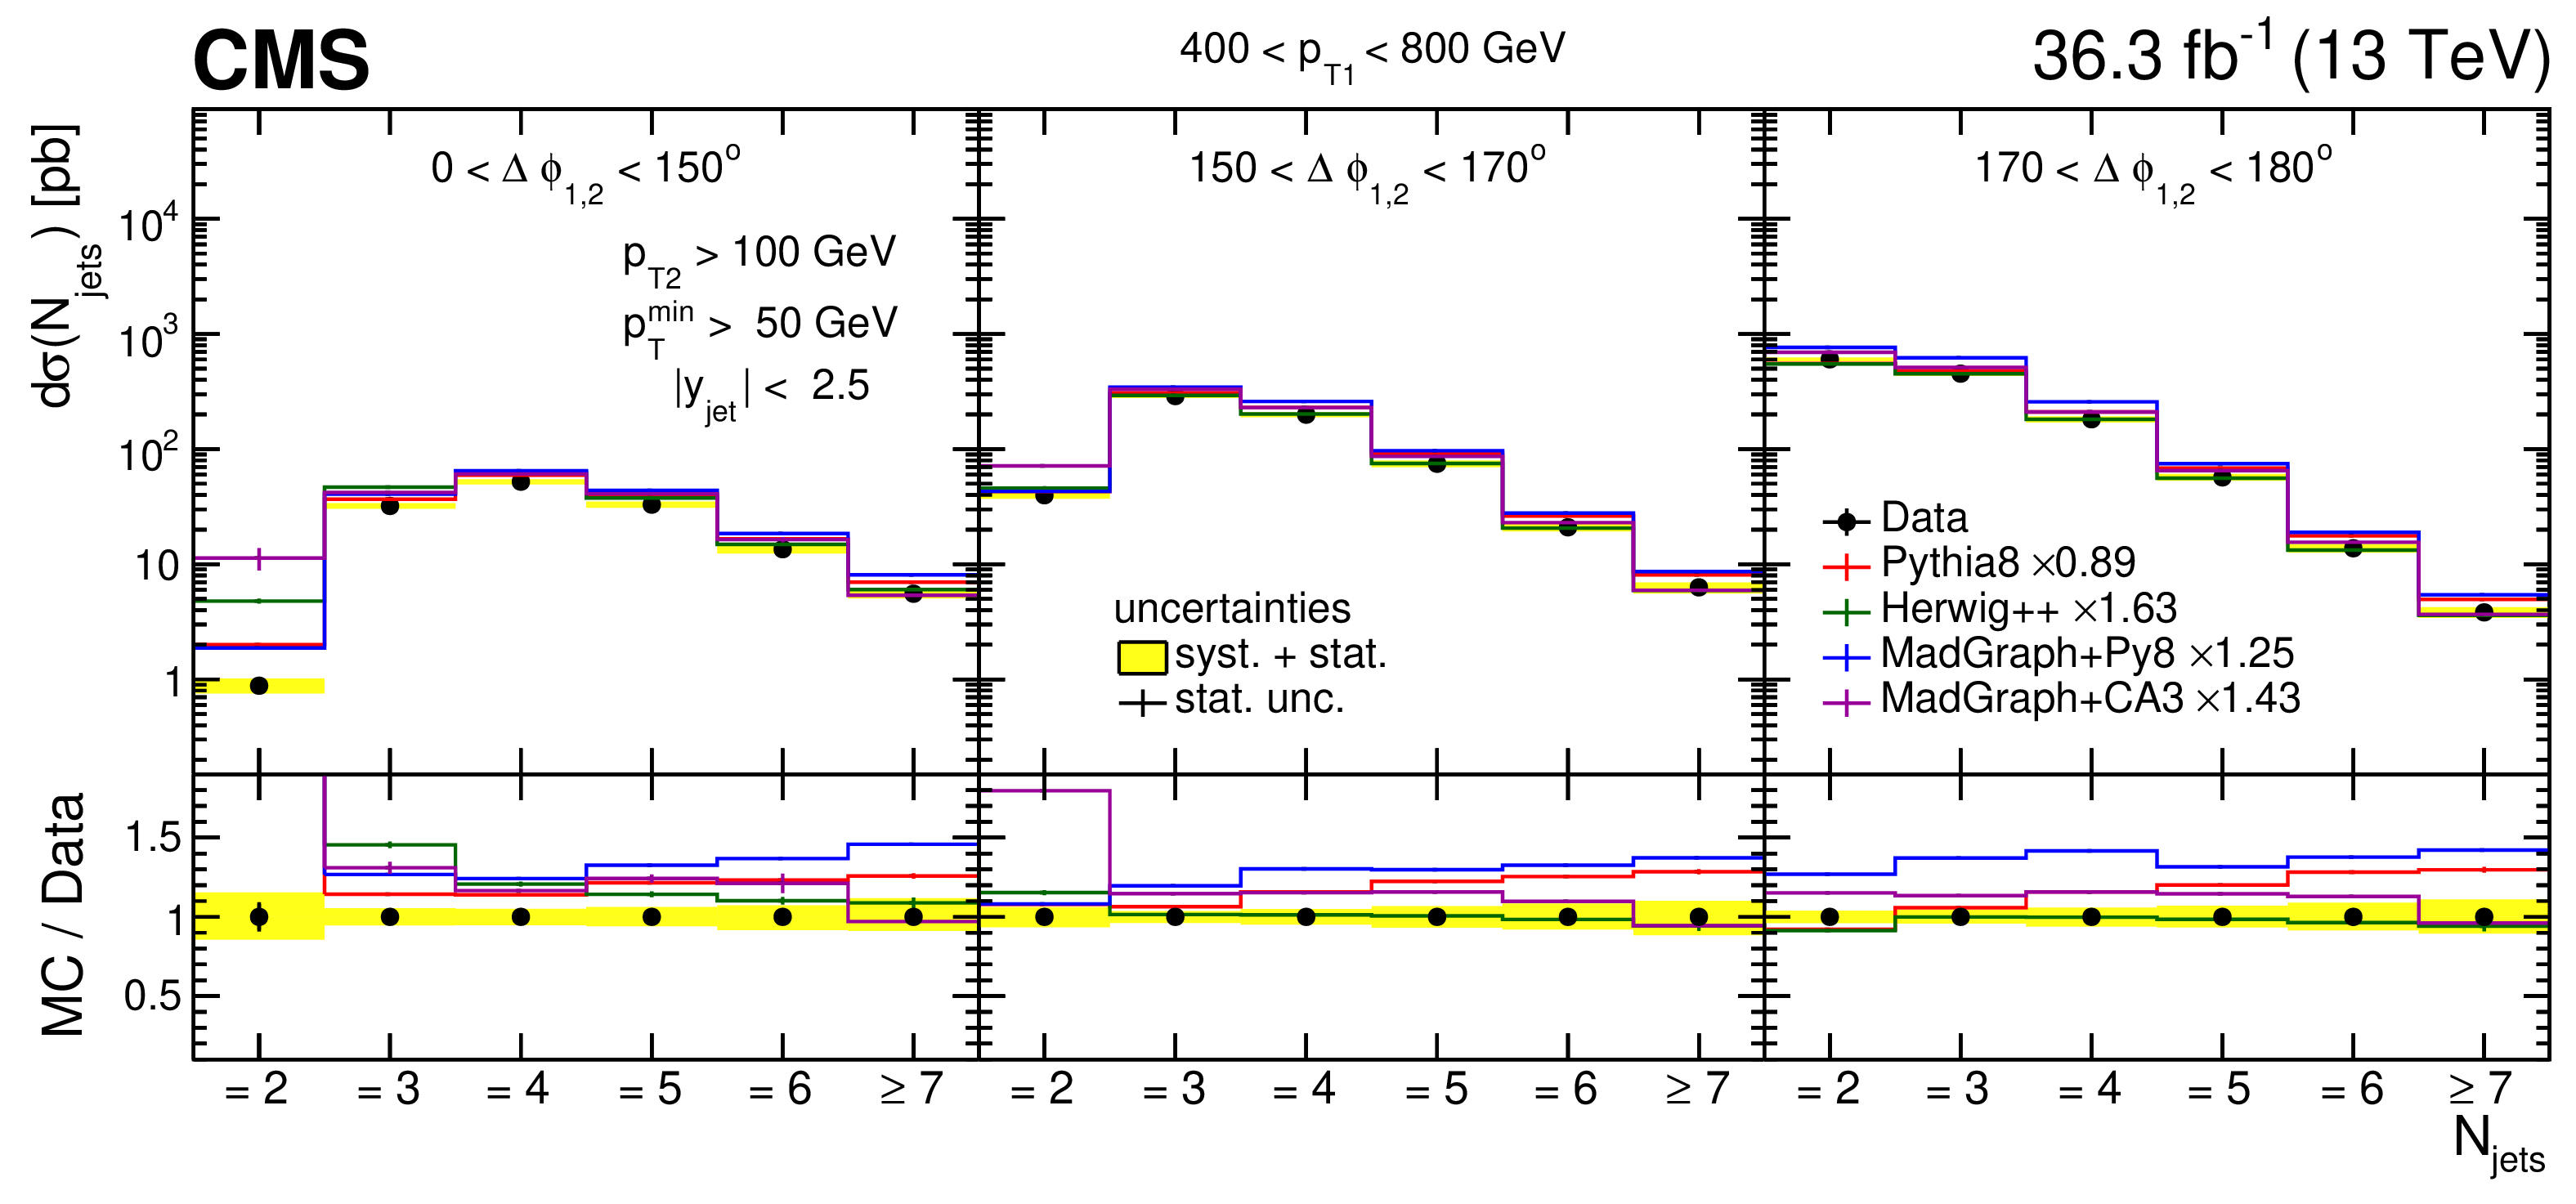
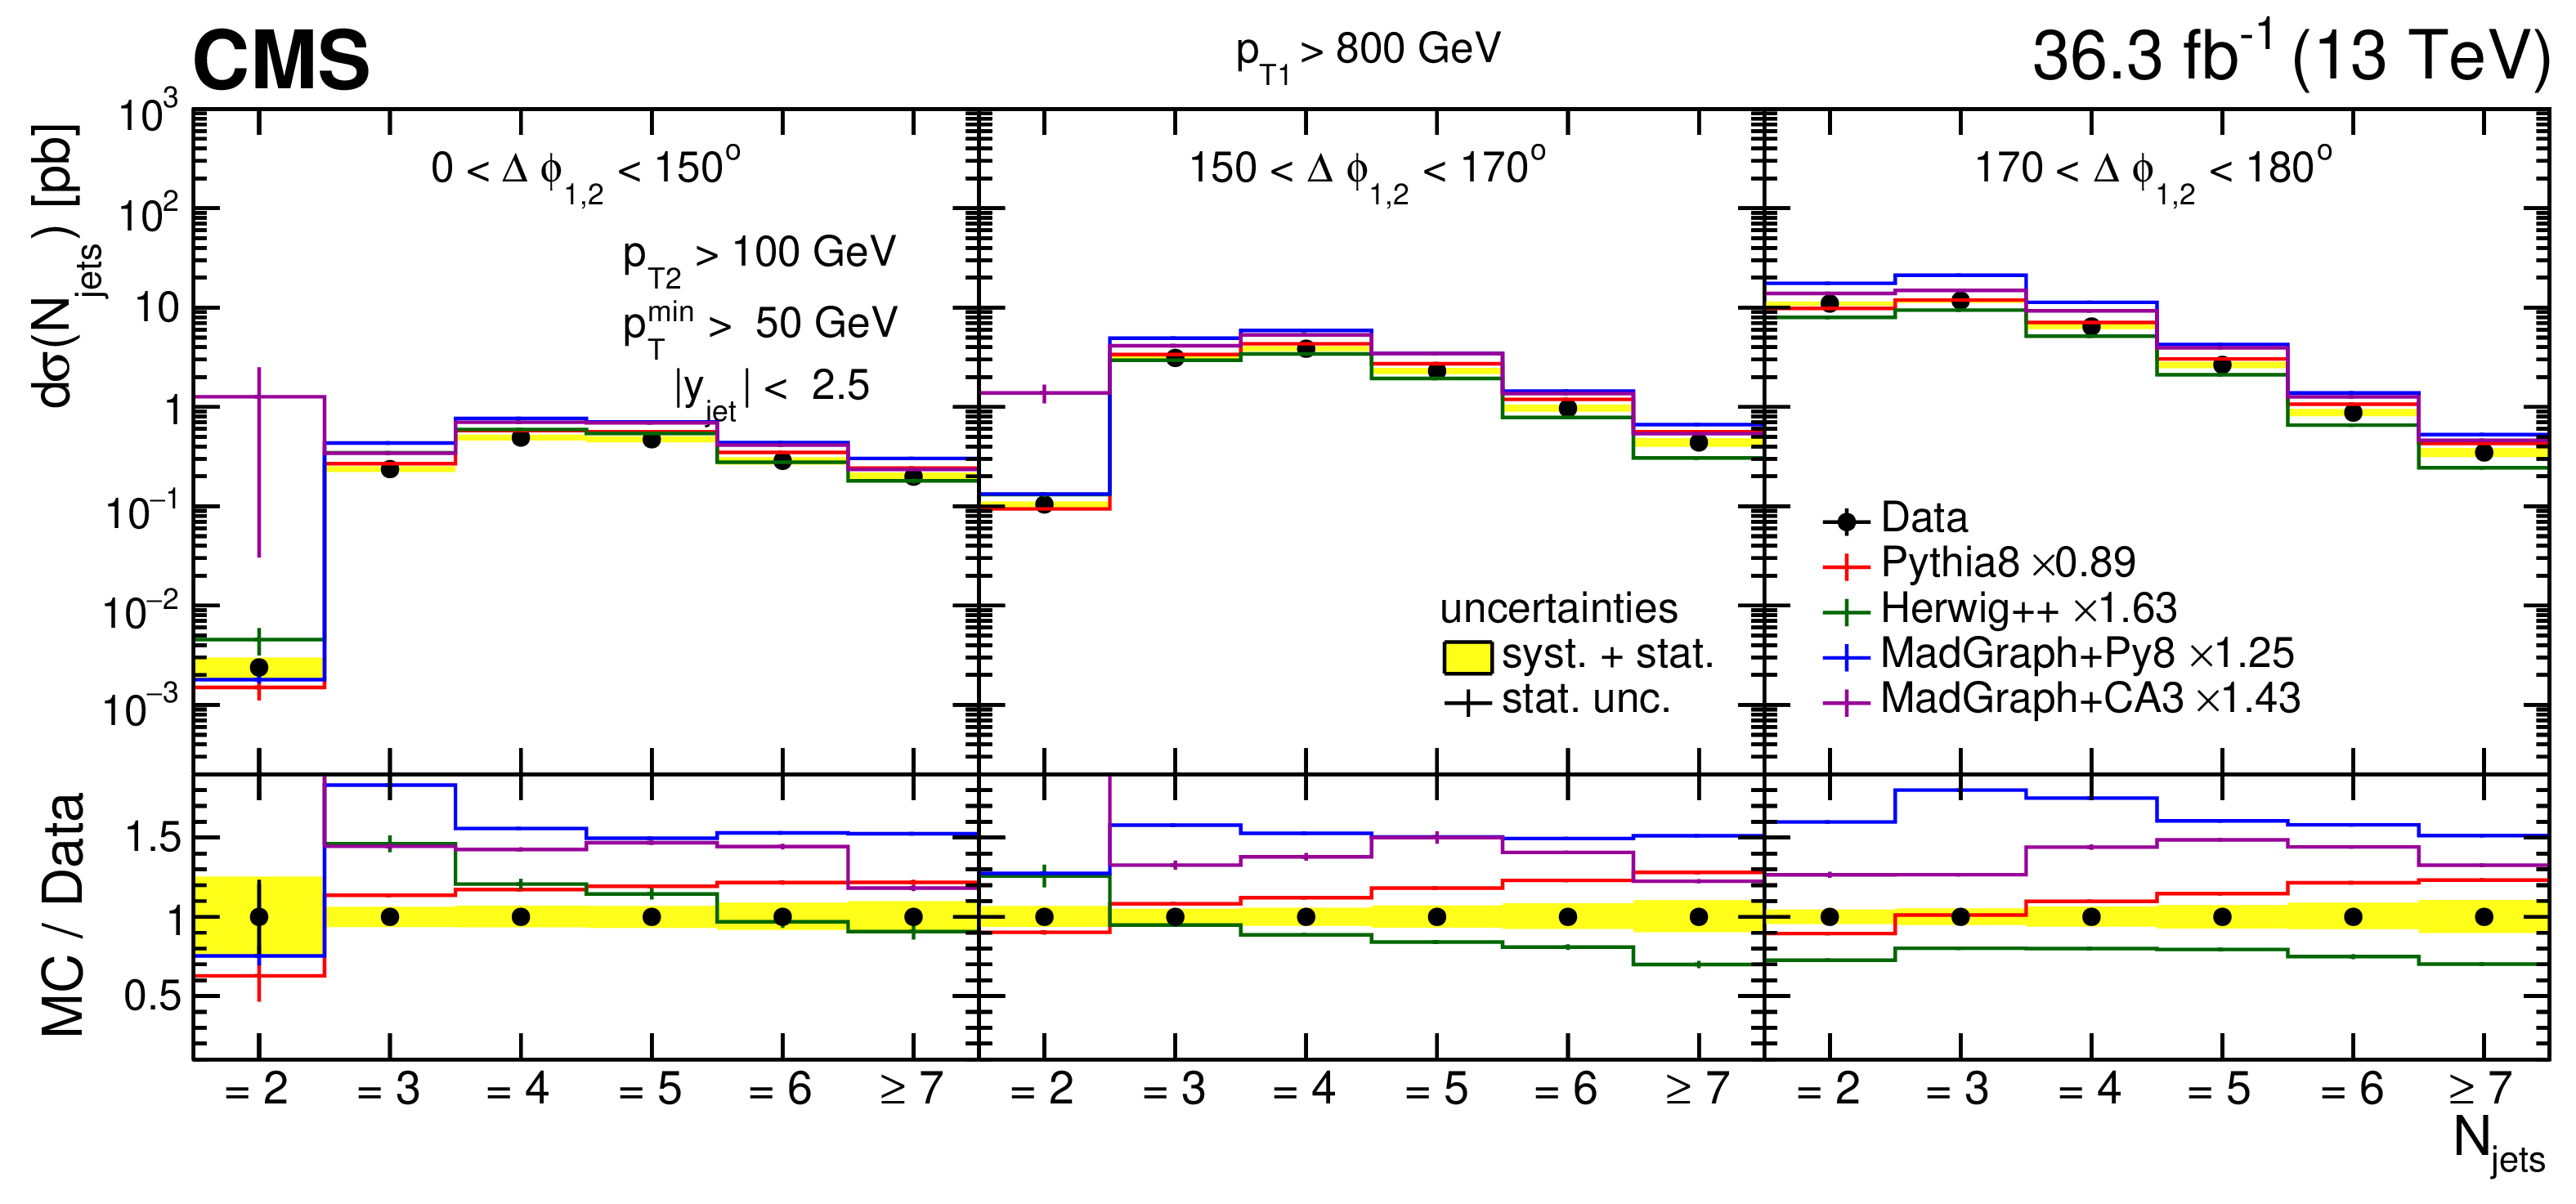
Figure 8:
Differential cross section as a function of the exclusive jet multiplicity (inclusive for 7 jets) in bins of $ p_{\mathrm{T1}} $ and $ \Delta\phi_{1,2} $. The data are compared with LO predictions of PYTHIA 8, HERWIG++, MADGRAPH+PY8 and MADGRAPH+CA3. The predictions are normalized to the measured dijet cross section using the scaling factors shown in the legend. The vertical error bars correspond to the statistical uncertainty, the yellow band shows the total experimental uncertainty. |
png pdf |
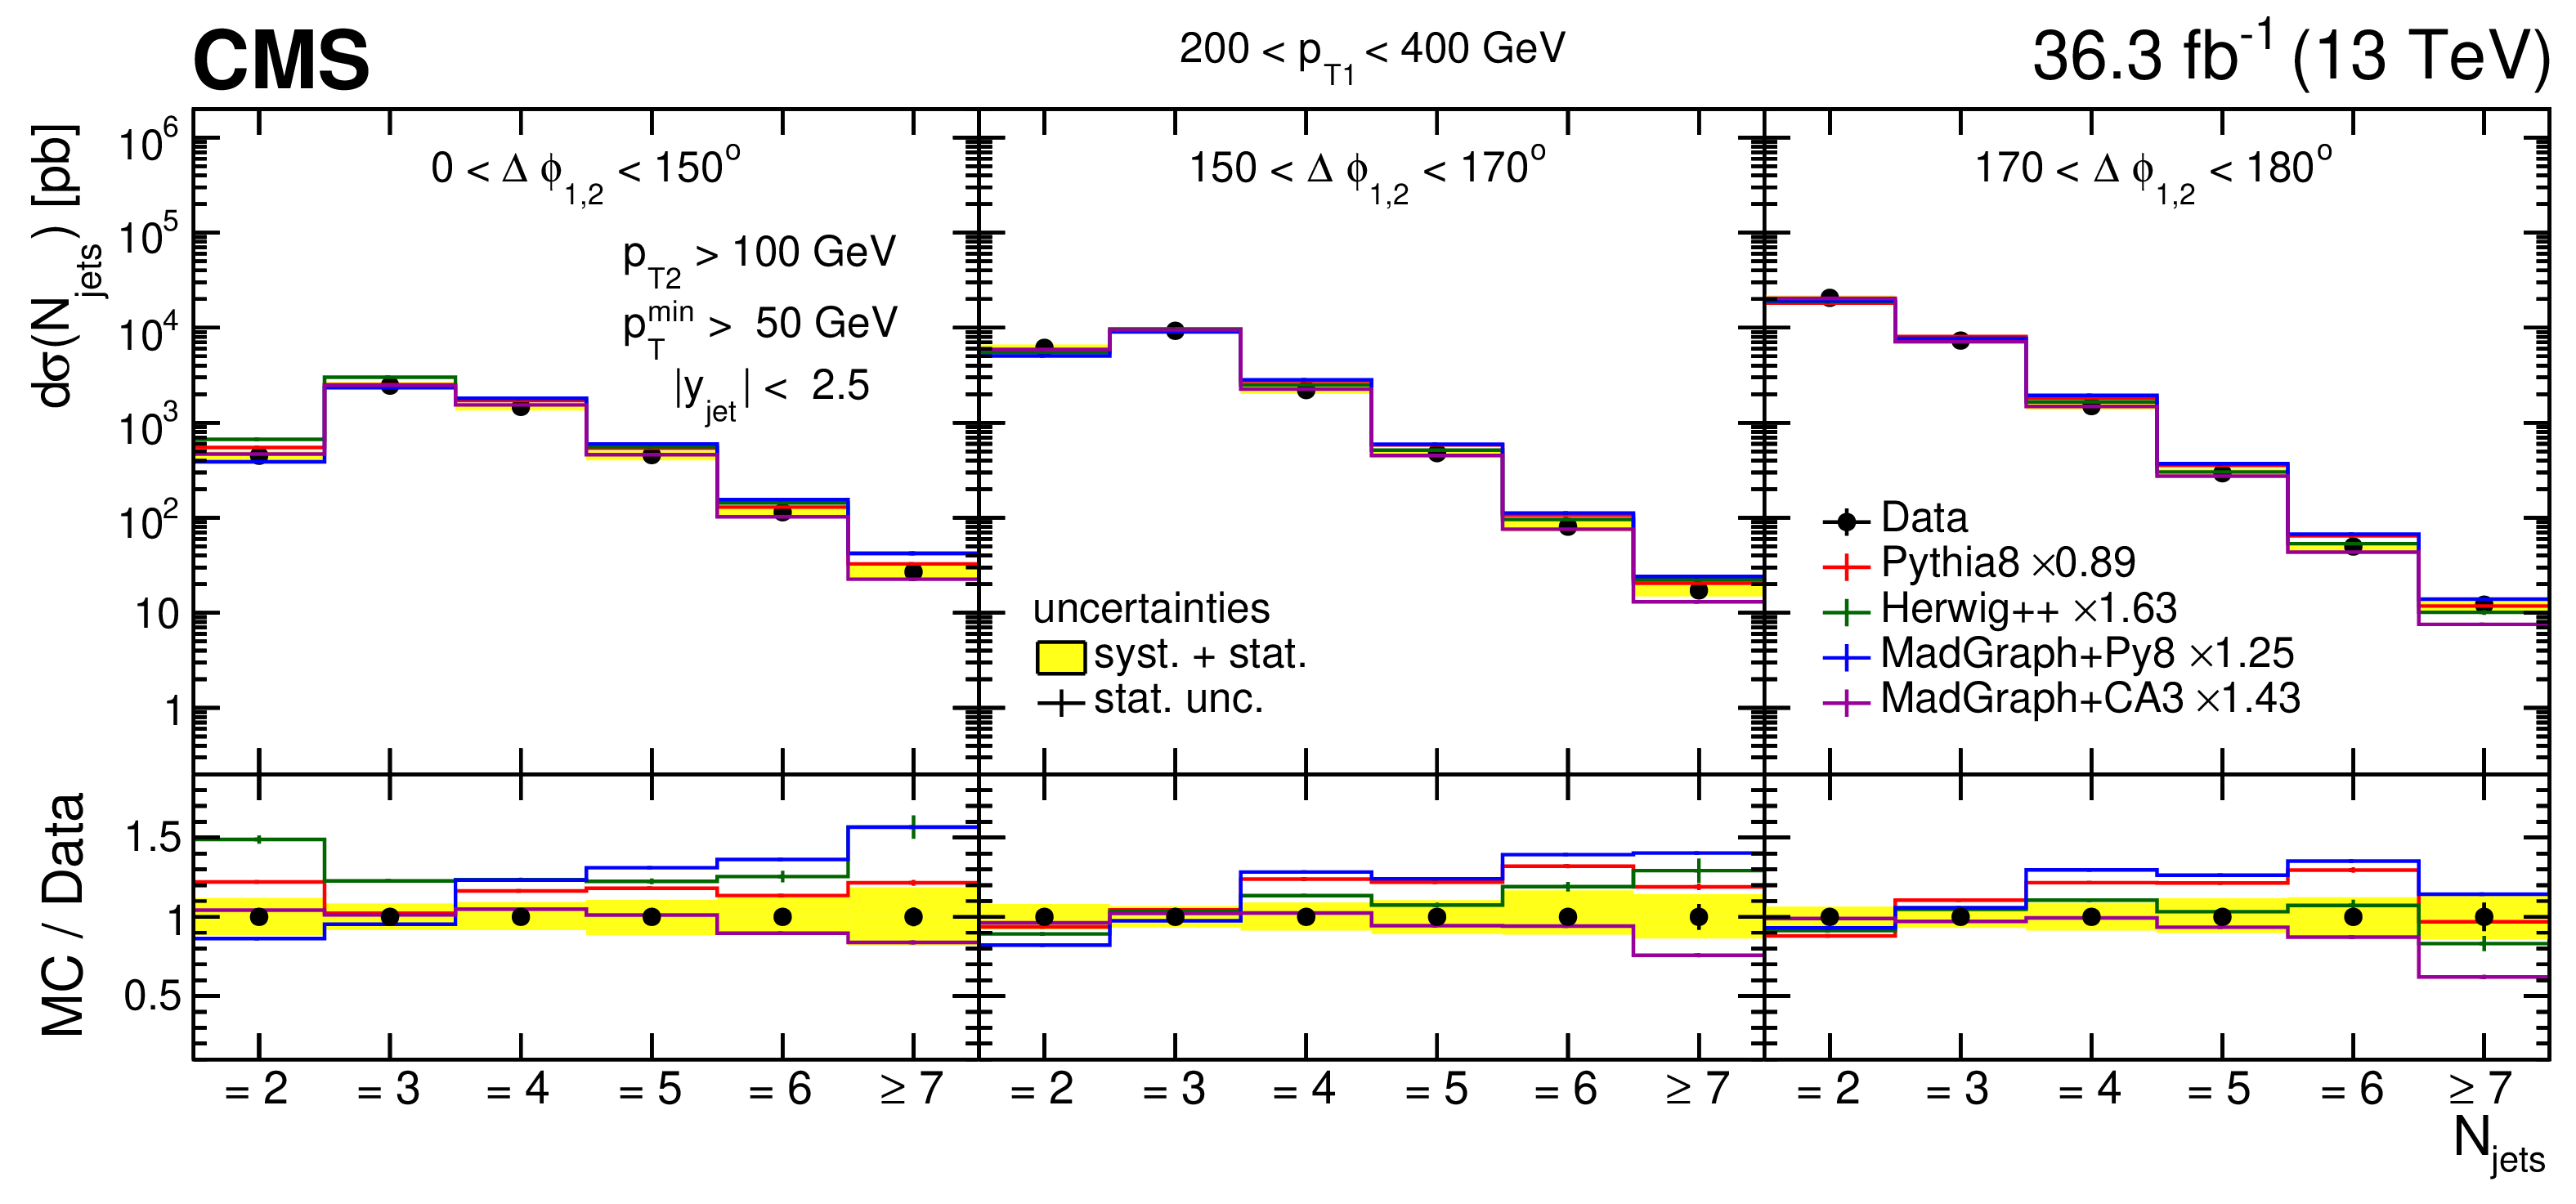
Figure 8-a:
Differential cross section as a function of the exclusive jet multiplicity (inclusive for 7 jets) for 200 $ < p_{\mathrm{T1}} < $ 400 GeV and 0 $ < \Delta\phi_{1,2} < $ 150$^{\text{o}}$ (left), 150 $ < \Delta\phi_{1,2} < $ 170$^{\text{o}}$ (middle), 170 $ < \Delta\phi_{1,2} < $ 180$^{\text{o}}$ (right). The data are compared with LO predictions of PYTHIA 8, HERWIG++, MADGRAPH+PY8 and MADGRAPH+CA3. The predictions are normalized to the measured dijet cross section using the scaling factors shown in the legend. The vertical error bars correspond to the statistical uncertainty, the yellow band shows the total experimental uncertainty. |
png pdf |
Figure 8-b:
Differential cross section as a function of the exclusive jet multiplicity (inclusive for 7 jets) for 400 $ < p_{\mathrm{T1}} < $ 800 GeV and 0 $ < \Delta\phi_{1,2} < $ 150$^{\text{o}}$ (left), 150 $ < \Delta\phi_{1,2} < $ 170$^{\text{o}}$ (middle), 170 $ < \Delta\phi_{1,2} < $ 180$^{\text{o}}$ (right). The data are compared with LO predictions of PYTHIA 8, HERWIG++, MADGRAPH+PY8 and MADGRAPH+CA3. The predictions are normalized to the measured dijet cross section using the scaling factors shown in the legend. The vertical error bars correspond to the statistical uncertainty, the yellow band shows the total experimental uncertainty. |
png pdf |
Figure 8-c:
Differential cross section as a function of the exclusive jet multiplicity (inclusive for 7 jets) for $ p_{\mathrm{T1}} > $ 800 GeV and 0 $ < \Delta\phi_{1,2} < $ 150$^{\text{o}}$ (left), 150 $ < \Delta\phi_{1,2} < $ 170$^{\text{o}}$ (middle), 170 $ < \Delta\phi_{1,2} < $ 180$^{\text{o}}$ (right). The data are compared with LO predictions of PYTHIA 8, HERWIG++, MADGRAPH+PY8 and MADGRAPH+CA3. The predictions are normalized to the measured dijet cross section using the scaling factors shown in the legend. The vertical error bars correspond to the statistical uncertainty, the yellow band shows the total experimental uncertainty. |

png pdf |
Figure 9:
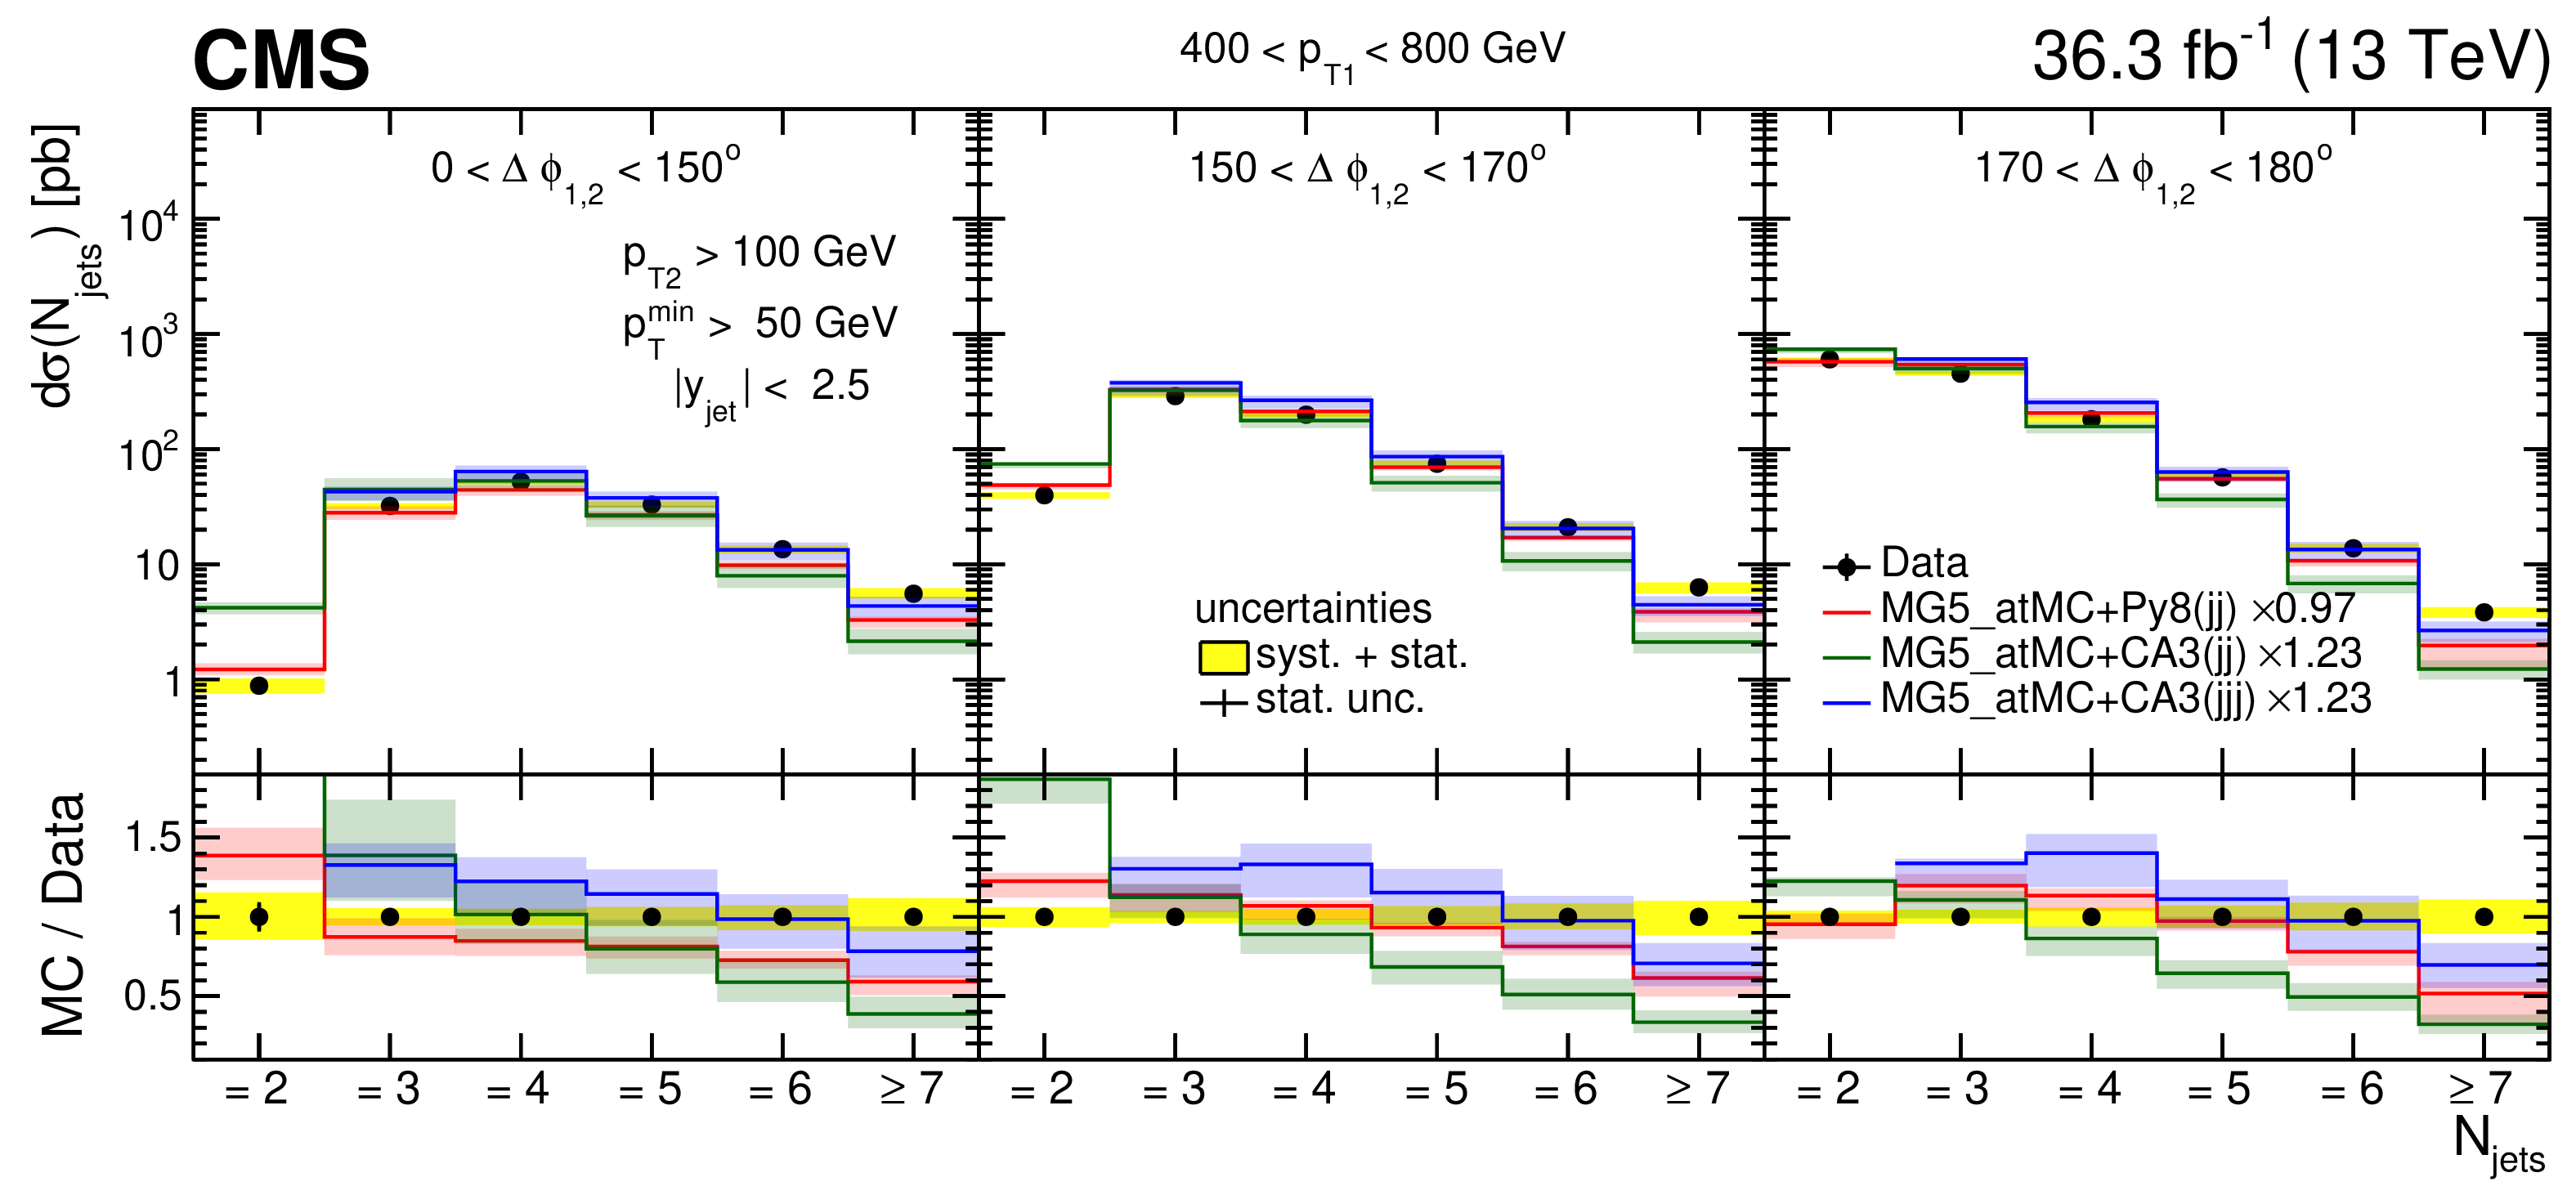
Differential cross section as a function of the exclusive jet multiplicity (inclusive for 7 jets) in bins of $ p_{\mathrm{T1}} $ and $ \Delta\phi_{1,2} $. The data are compared with NLO dijet predictions MG5_aMC+Py8 (jj) and MG5_aMC+CA3 (jj) as well as the NLO three-jet prediction of MG5_aMC+CA3 (jjj). The vertical error bars correspond to the statistical uncertainty, the yellow band shows the total experimental uncertainty. The shaded bands show the uncertainty from a variation of the renormalization and factorization scales. The predictions are normalized to the measured inclusive dijet cross section using the scaling factors shown in the legend. |

png pdf |
Figure 9-a:
Differential cross section as a function of the exclusive jet multiplicity (inclusive for 7 jets) for 200 $ < p_{\mathrm{T1}} < $ 400 GeV and 0 $ < \Delta\phi_{1,2} < $ 150$^{\text{o}}$ (left), 150 $ < \Delta\phi_{1,2} < $ 170$^{\text{o}}$ (middle), 170 $ < \Delta\phi_{1,2} < $ 180$^{\text{o}}$ (right). The data are compared with NLO dijet predictions MG5_aMC+Py8 (jj) and MG5_aMC+CA3 (jj) as well as the NLO three-jet prediction of MG5_aMC+CA3 (jjj). The vertical error bars correspond to the statistical uncertainty, the yellow band shows the total experimental uncertainty. The shaded bands show the uncertainty from a variation of the renormalization and factorization scales. The predictions are normalized to the measured inclusive dijet cross section using the scaling factors shown in the legend. |
png pdf |
Figure 9-b:
Differential cross section as a function of the exclusive jet multiplicity (inclusive for 7 jets) for 400 $ < p_{\mathrm{T1}} < $ 800 GeV and 0 $ < \Delta\phi_{1,2} < $ 150$^{\text{o}}$ (left), 150 $ < \Delta\phi_{1,2} < $ 170$^{\text{o}}$ (middle), 170 $ < \Delta\phi_{1,2} < $ 180$^{\text{o}}$ (right). The data are compared with NLO dijet predictions MG5_aMC+Py8 (jj) and MG5_aMC+CA3 (jj) as well as the NLO three-jet prediction of MG5_aMC+CA3 (jjj). The vertical error bars correspond to the statistical uncertainty, the yellow band shows the total experimental uncertainty. The shaded bands show the uncertainty from a variation of the renormalization and factorization scales. The predictions are normalized to the measured inclusive dijet cross section using the scaling factors shown in the legend. |

png pdf |
Figure 9-c:
Differential cross section as a function of the exclusive jet multiplicity (inclusive for 7 jets) for $ p_{\mathrm{T1}} > $ 800 GeV and 0 $ < \Delta\phi_{1,2} < $ 150$^{\text{o}}$ (left), 150 $ < \Delta\phi_{1,2} < $ 170$^{\text{o}}$ (middle), 170 $ < \Delta\phi_{1,2} < $ 180$^{\text{o}}$ (right). The data are compared with NLO dijet predictions MG5_aMC+Py8 (jj) and MG5_aMC+CA3 (jj) as well as the NLO three-jet prediction of MG5_aMC+CA3 (jjj). The vertical error bars correspond to the statistical uncertainty, the yellow band shows the total experimental uncertainty. The shaded bands show the uncertainty from a variation of the renormalization and factorization scales. The predictions are normalized to the measured inclusive dijet cross section using the scaling factors shown in the legend. |
png pdf |
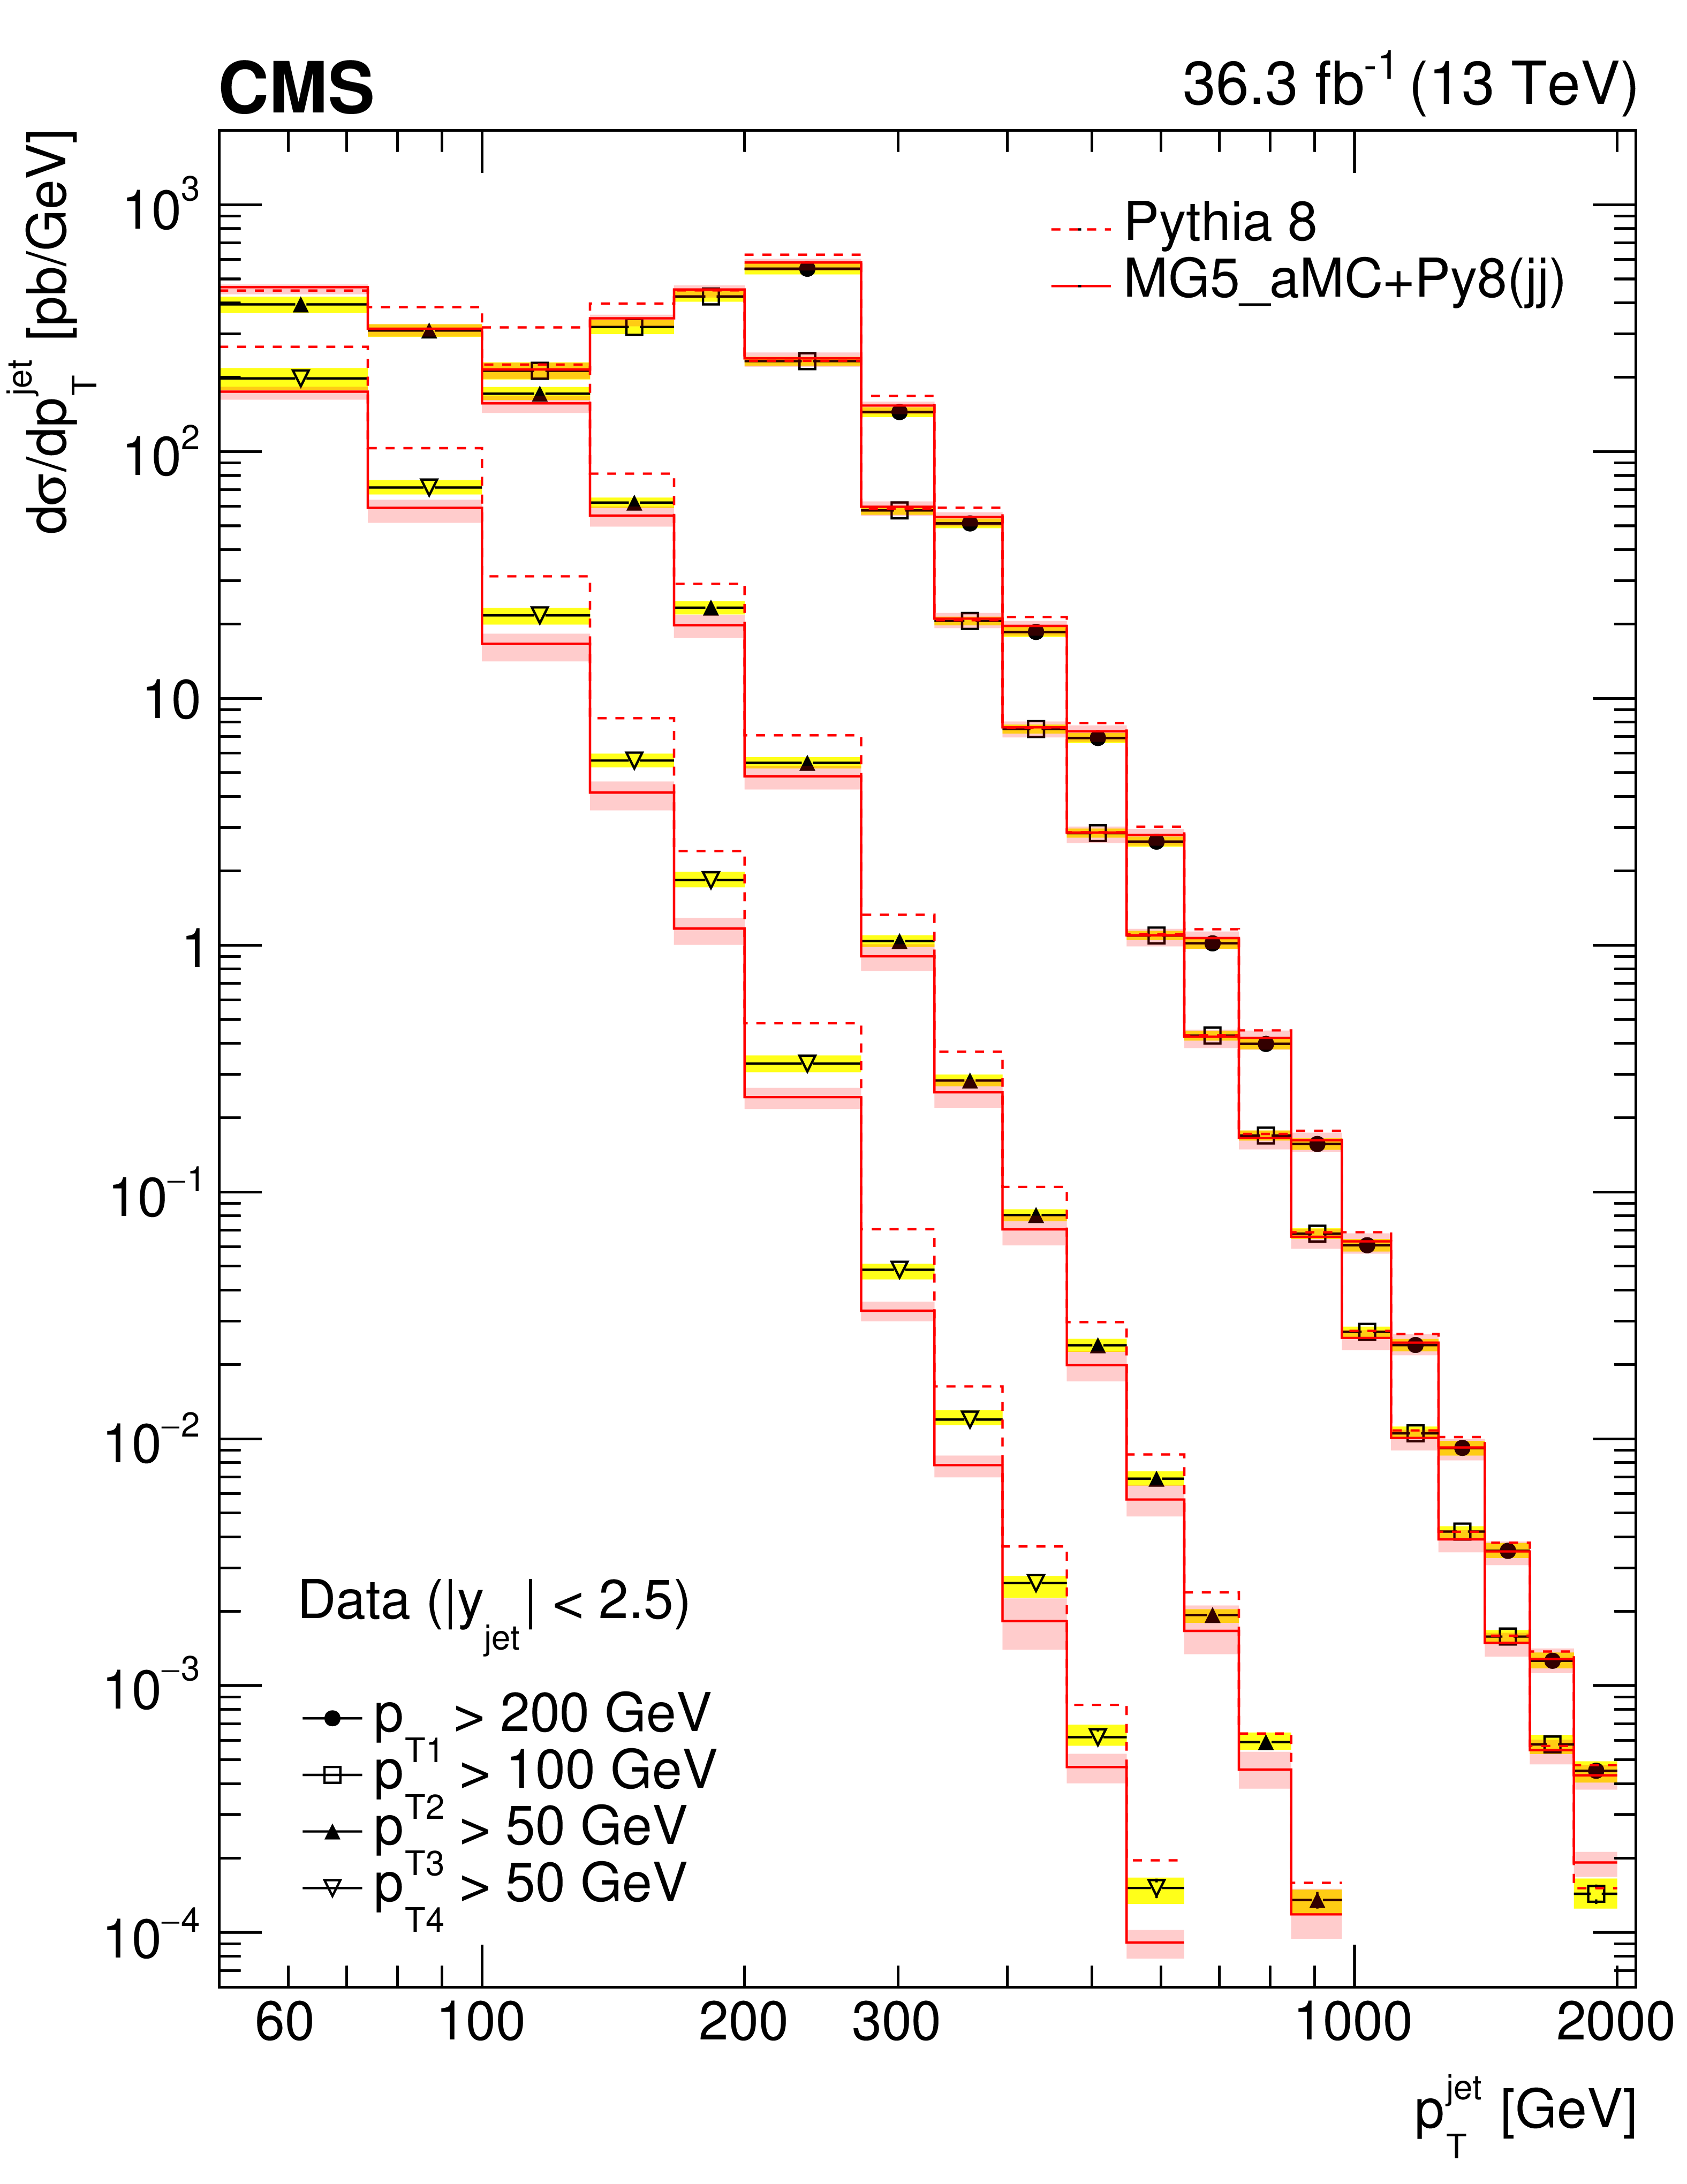
Figure 10:
Transverse momenta of the four leading jets, with the yellow band representing the total experimental uncertainty. The data are compared with LO (PYTHIA 8) and NLO (MG5_aMC+Py8 ) predictions. The red band in the NLO prediction represents the renormalization and factorization scale uncertainty. |

png pdf |
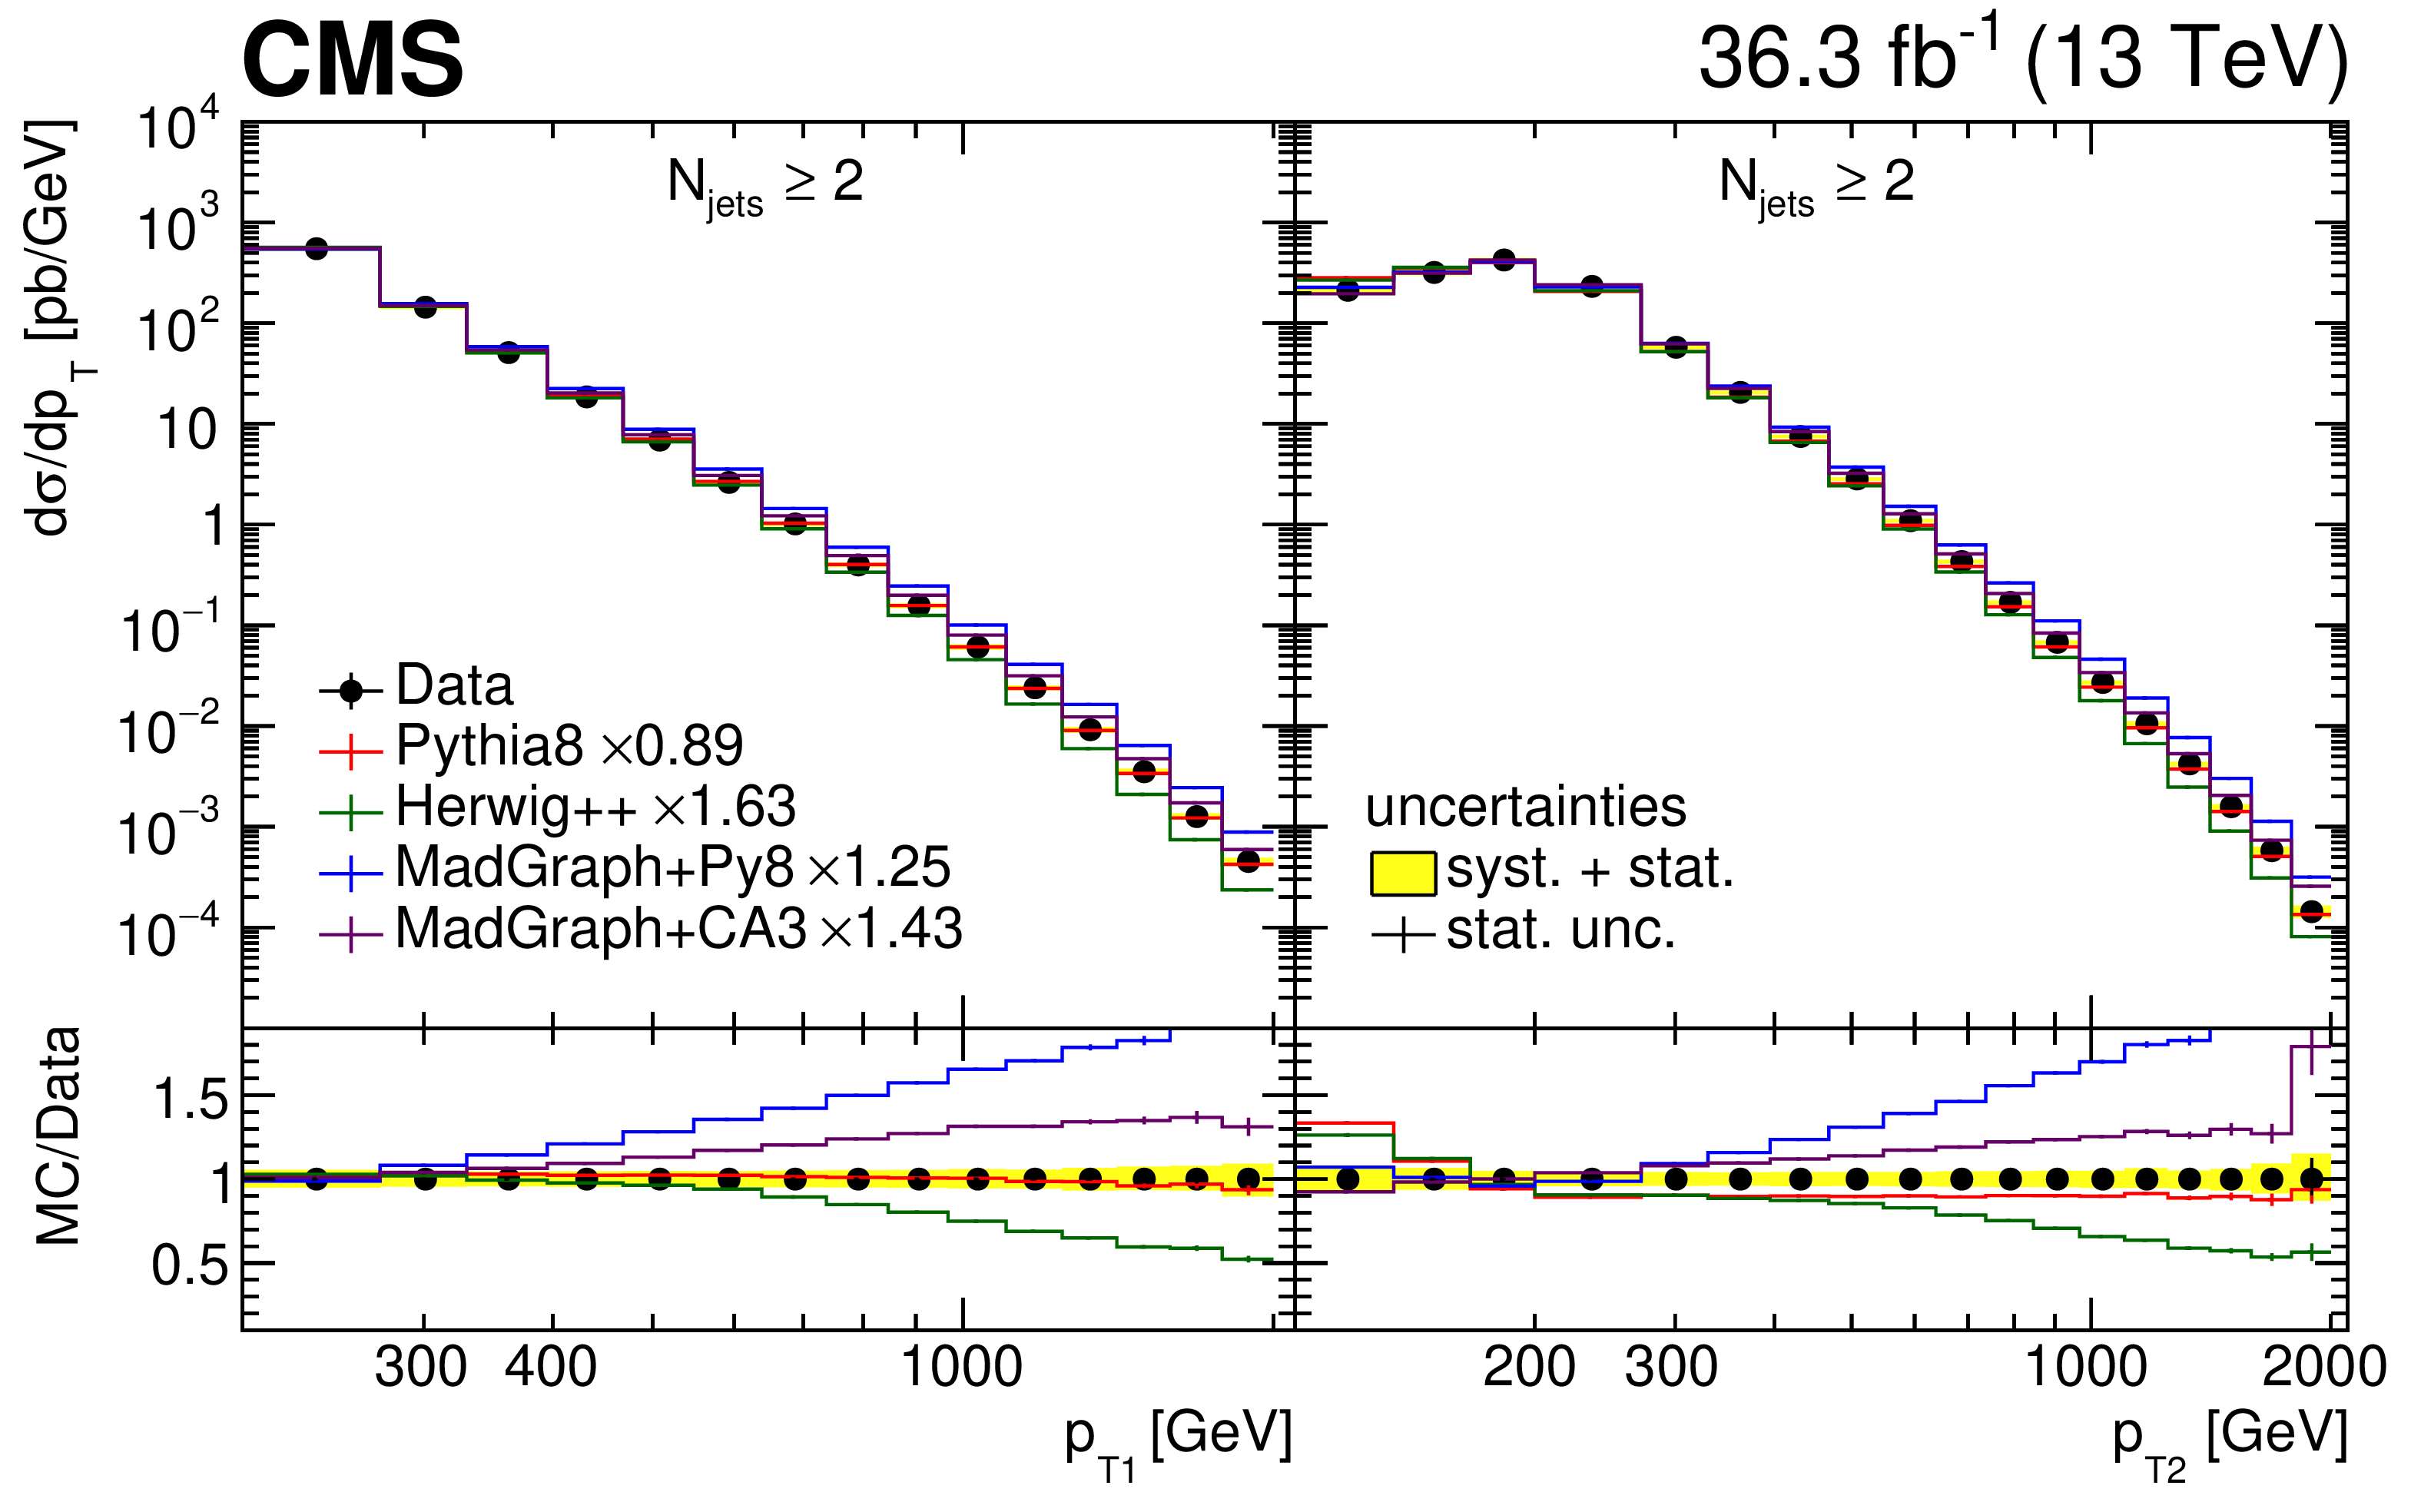
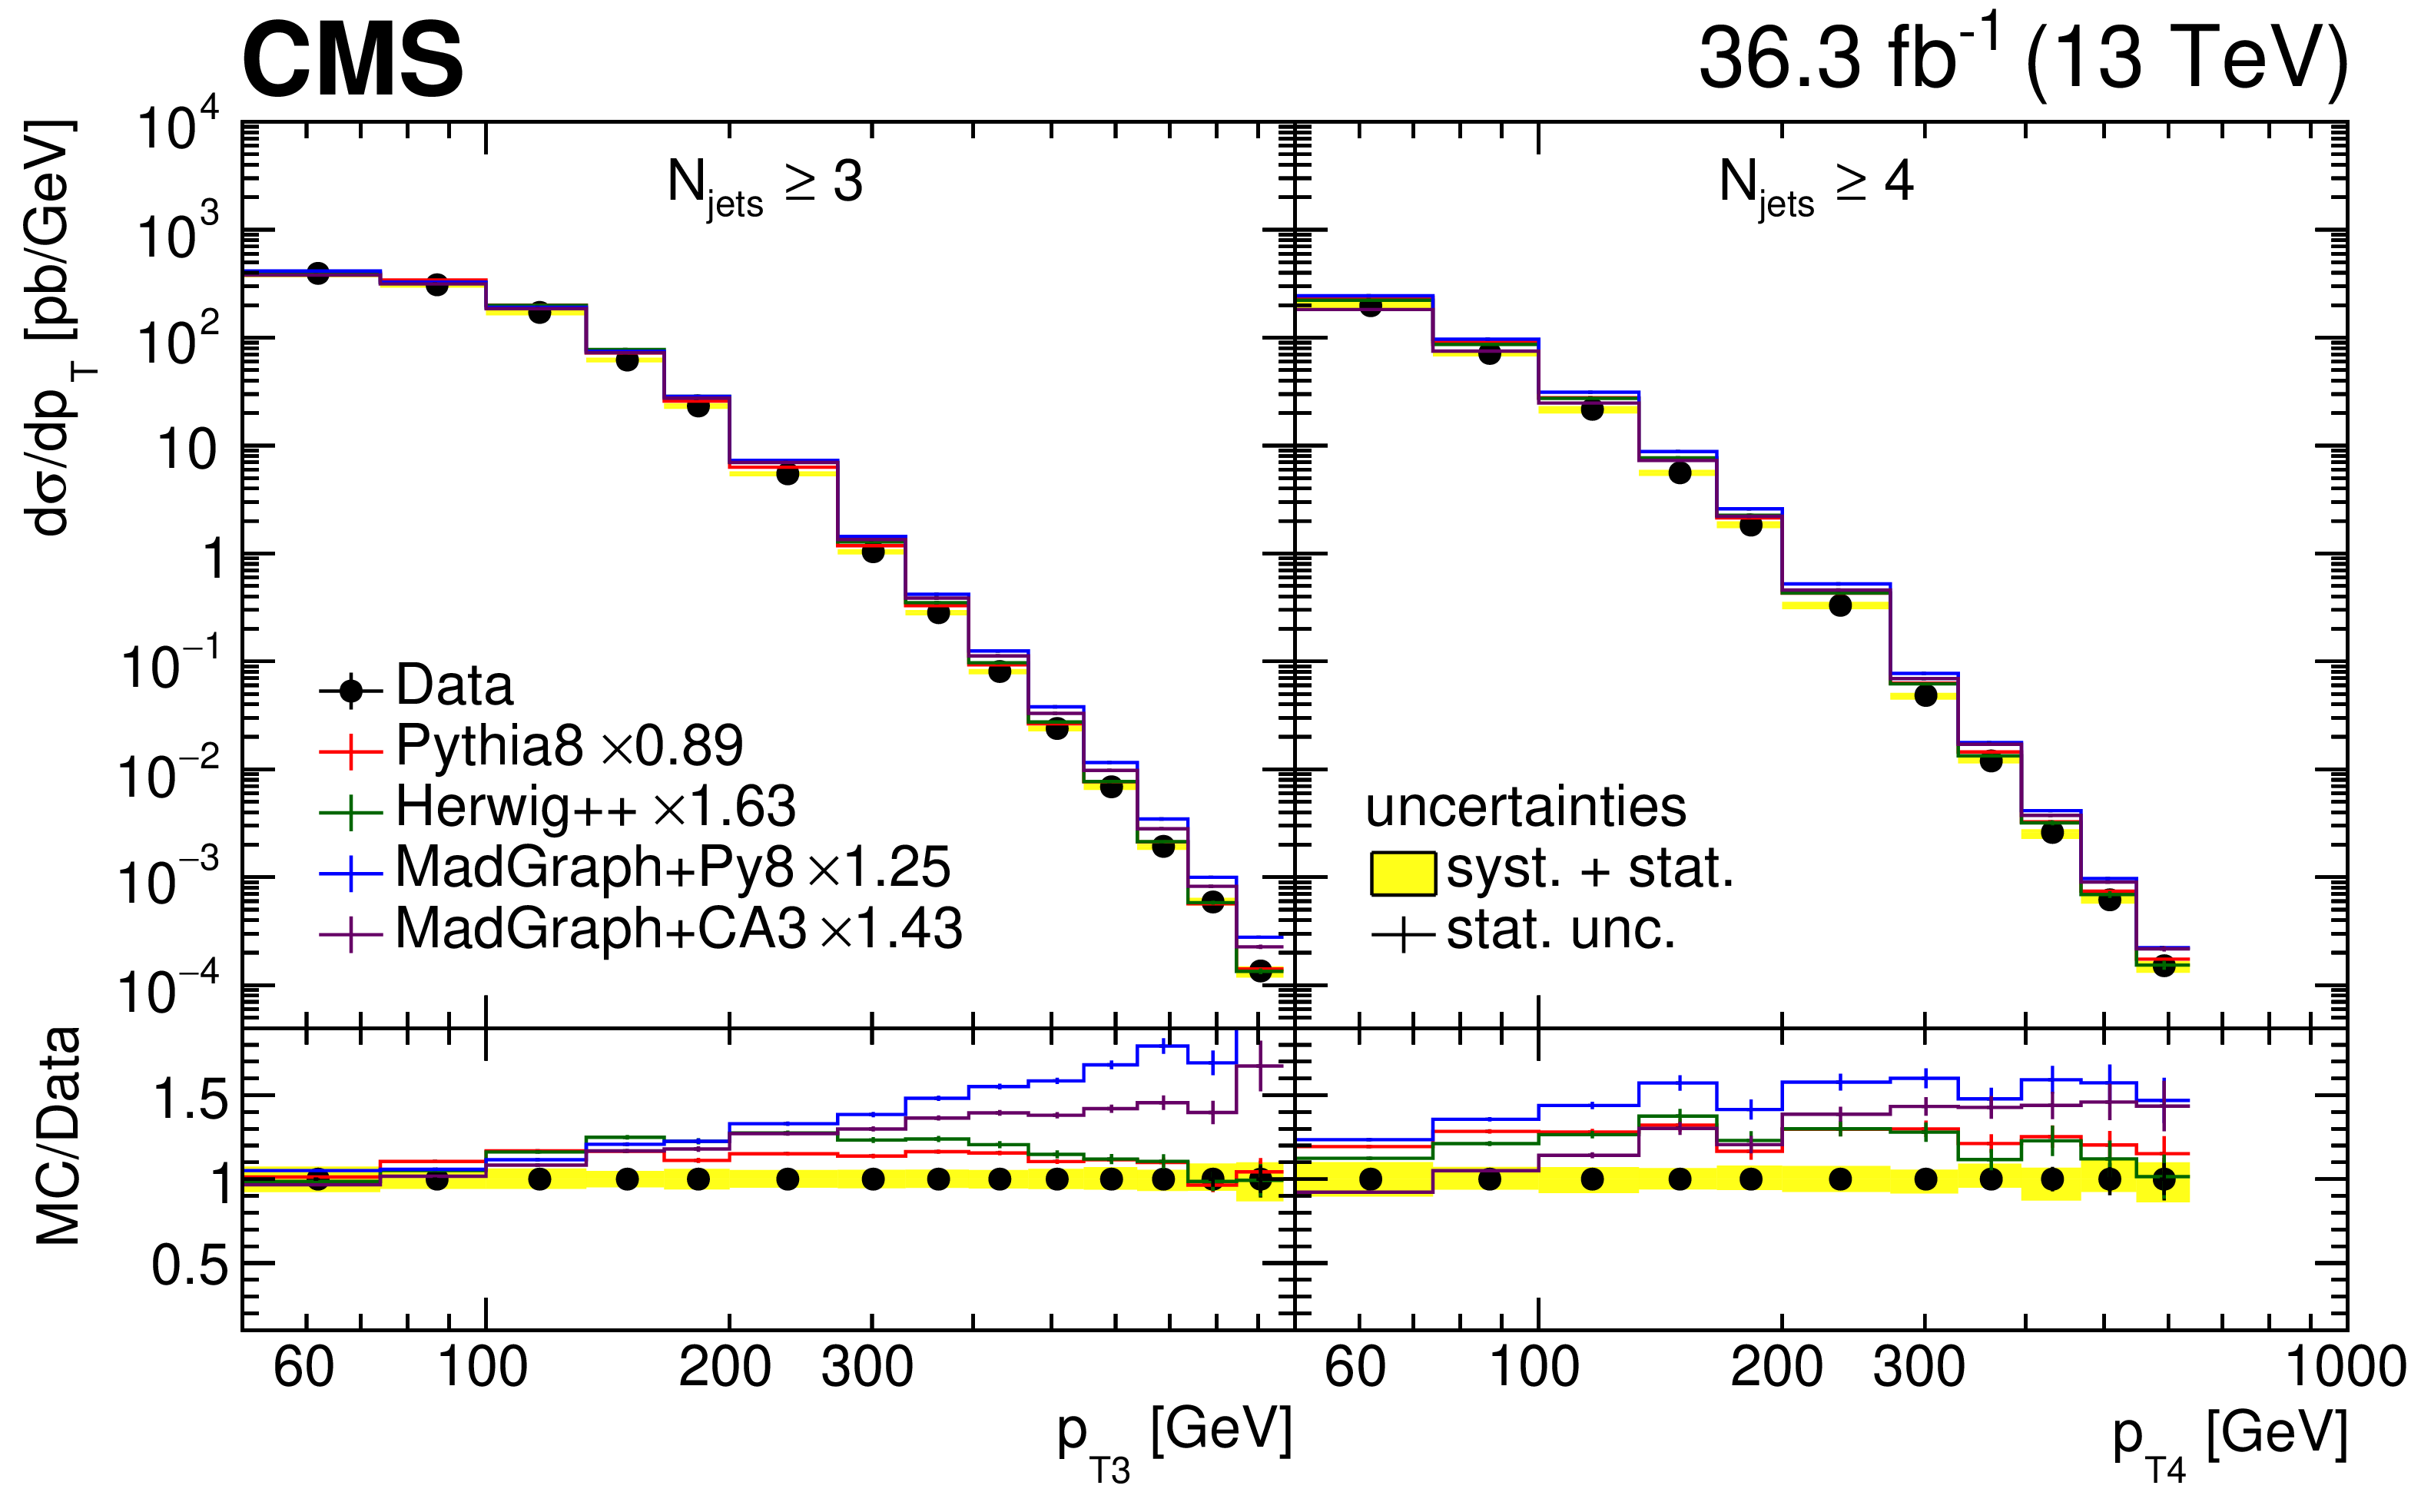
Figure 11:
Transverse momentum distributions of the four leading jets. The transverse momentum of the leading and subleading (third and fourth leading) $ p_{\mathrm{T}} $ jets from left to right is shown in the upper (lower) figure. The data are compared with LO predictions of PYTHIA 8, HERWIG++, MADGRAPH+PY8 and MADGRAPH+CA3. The predictions are normalized to the measured dijet cross section using the scaling factors shown in the legend. The vertical error bars correspond to the statistical uncertainty, the yellow band shows the total experimental uncertainty. |
png pdf |
Figure 11-a:
The transverse momentum of the leading (left) and subleading (right) leading $ p_{\mathrm{T}} $ jets is shown. The data are compared with LO predictions of PYTHIA 8, HERWIG++, MADGRAPH+PY8 and MADGRAPH+CA3. The predictions are normalized to the measured dijet cross section using the scaling factors shown in the legend. The vertical error bars correspond to the statistical uncertainty, the yellow band shows the total experimental uncertainty. |
png pdf |
Figure 11-b:
The transverse momentum of the third (left) and fourth (right) leading $ p_{\mathrm{T}} $ jets is shown. The data are compared with LO predictions of PYTHIA 8, HERWIG++, MADGRAPH+PY8 and MADGRAPH+CA3. The predictions are normalized to the measured dijet cross section using the scaling factors shown in the legend. The vertical error bars correspond to the statistical uncertainty, the yellow band shows the total experimental uncertainty. |

png pdf |
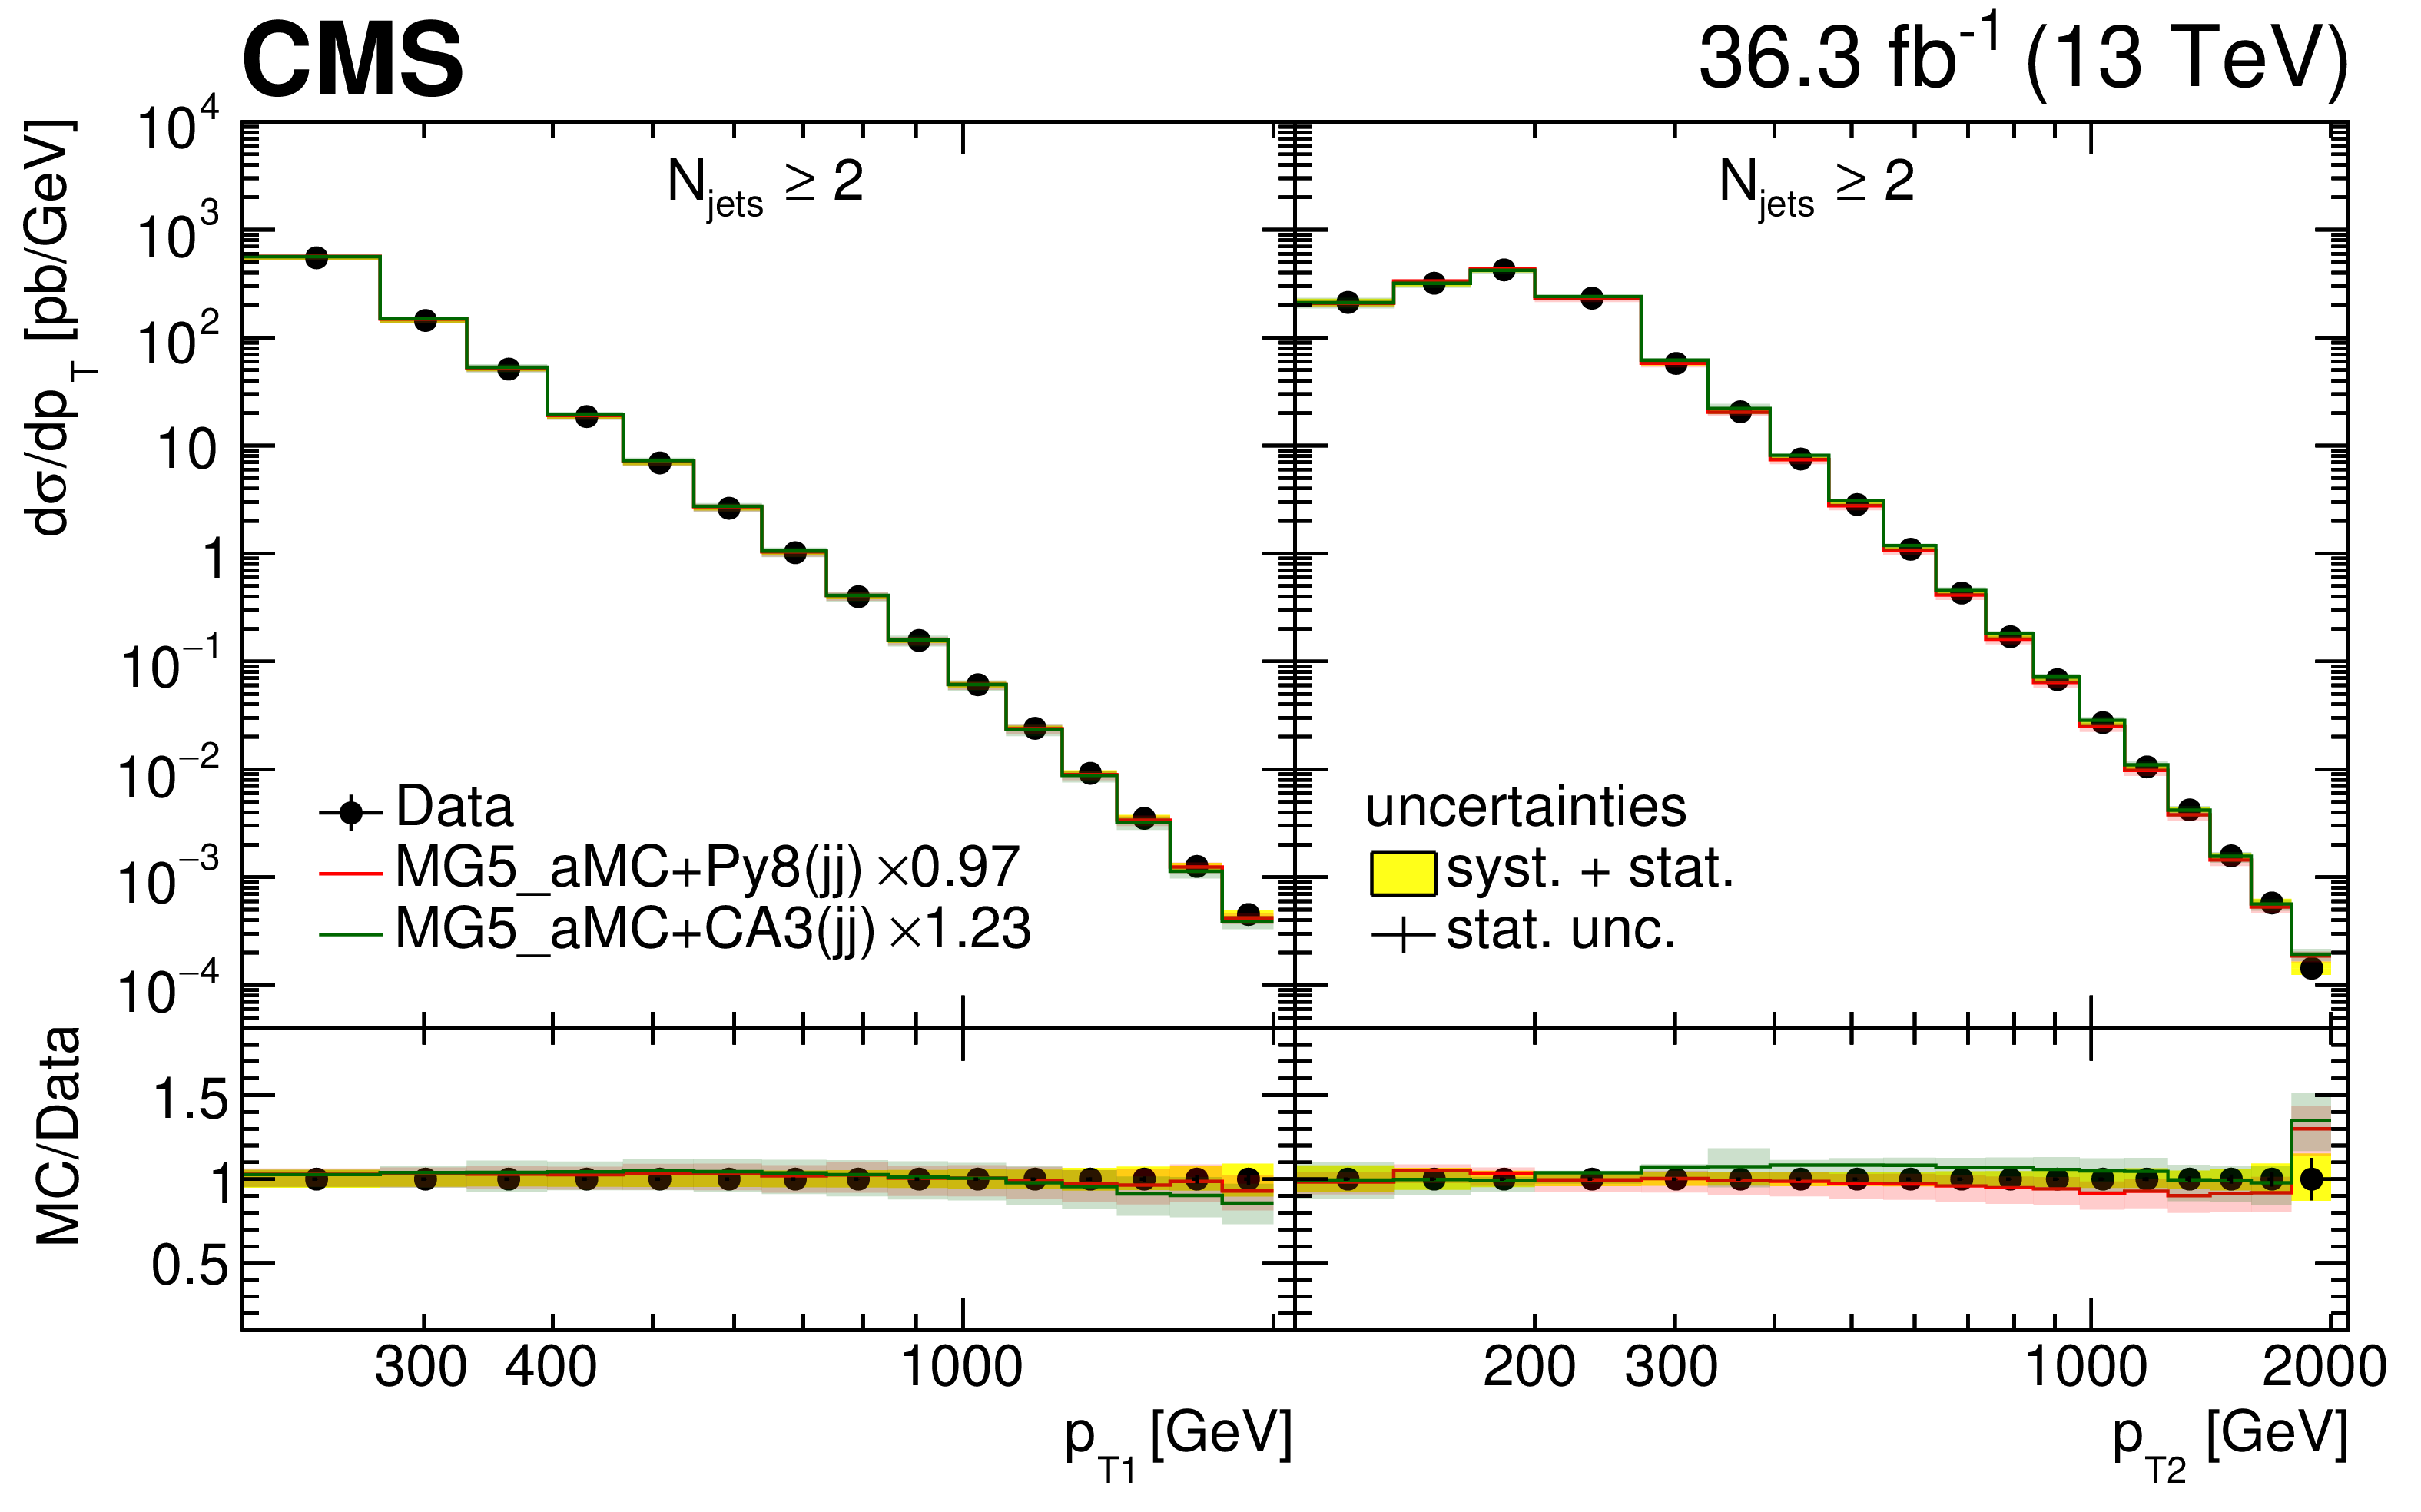
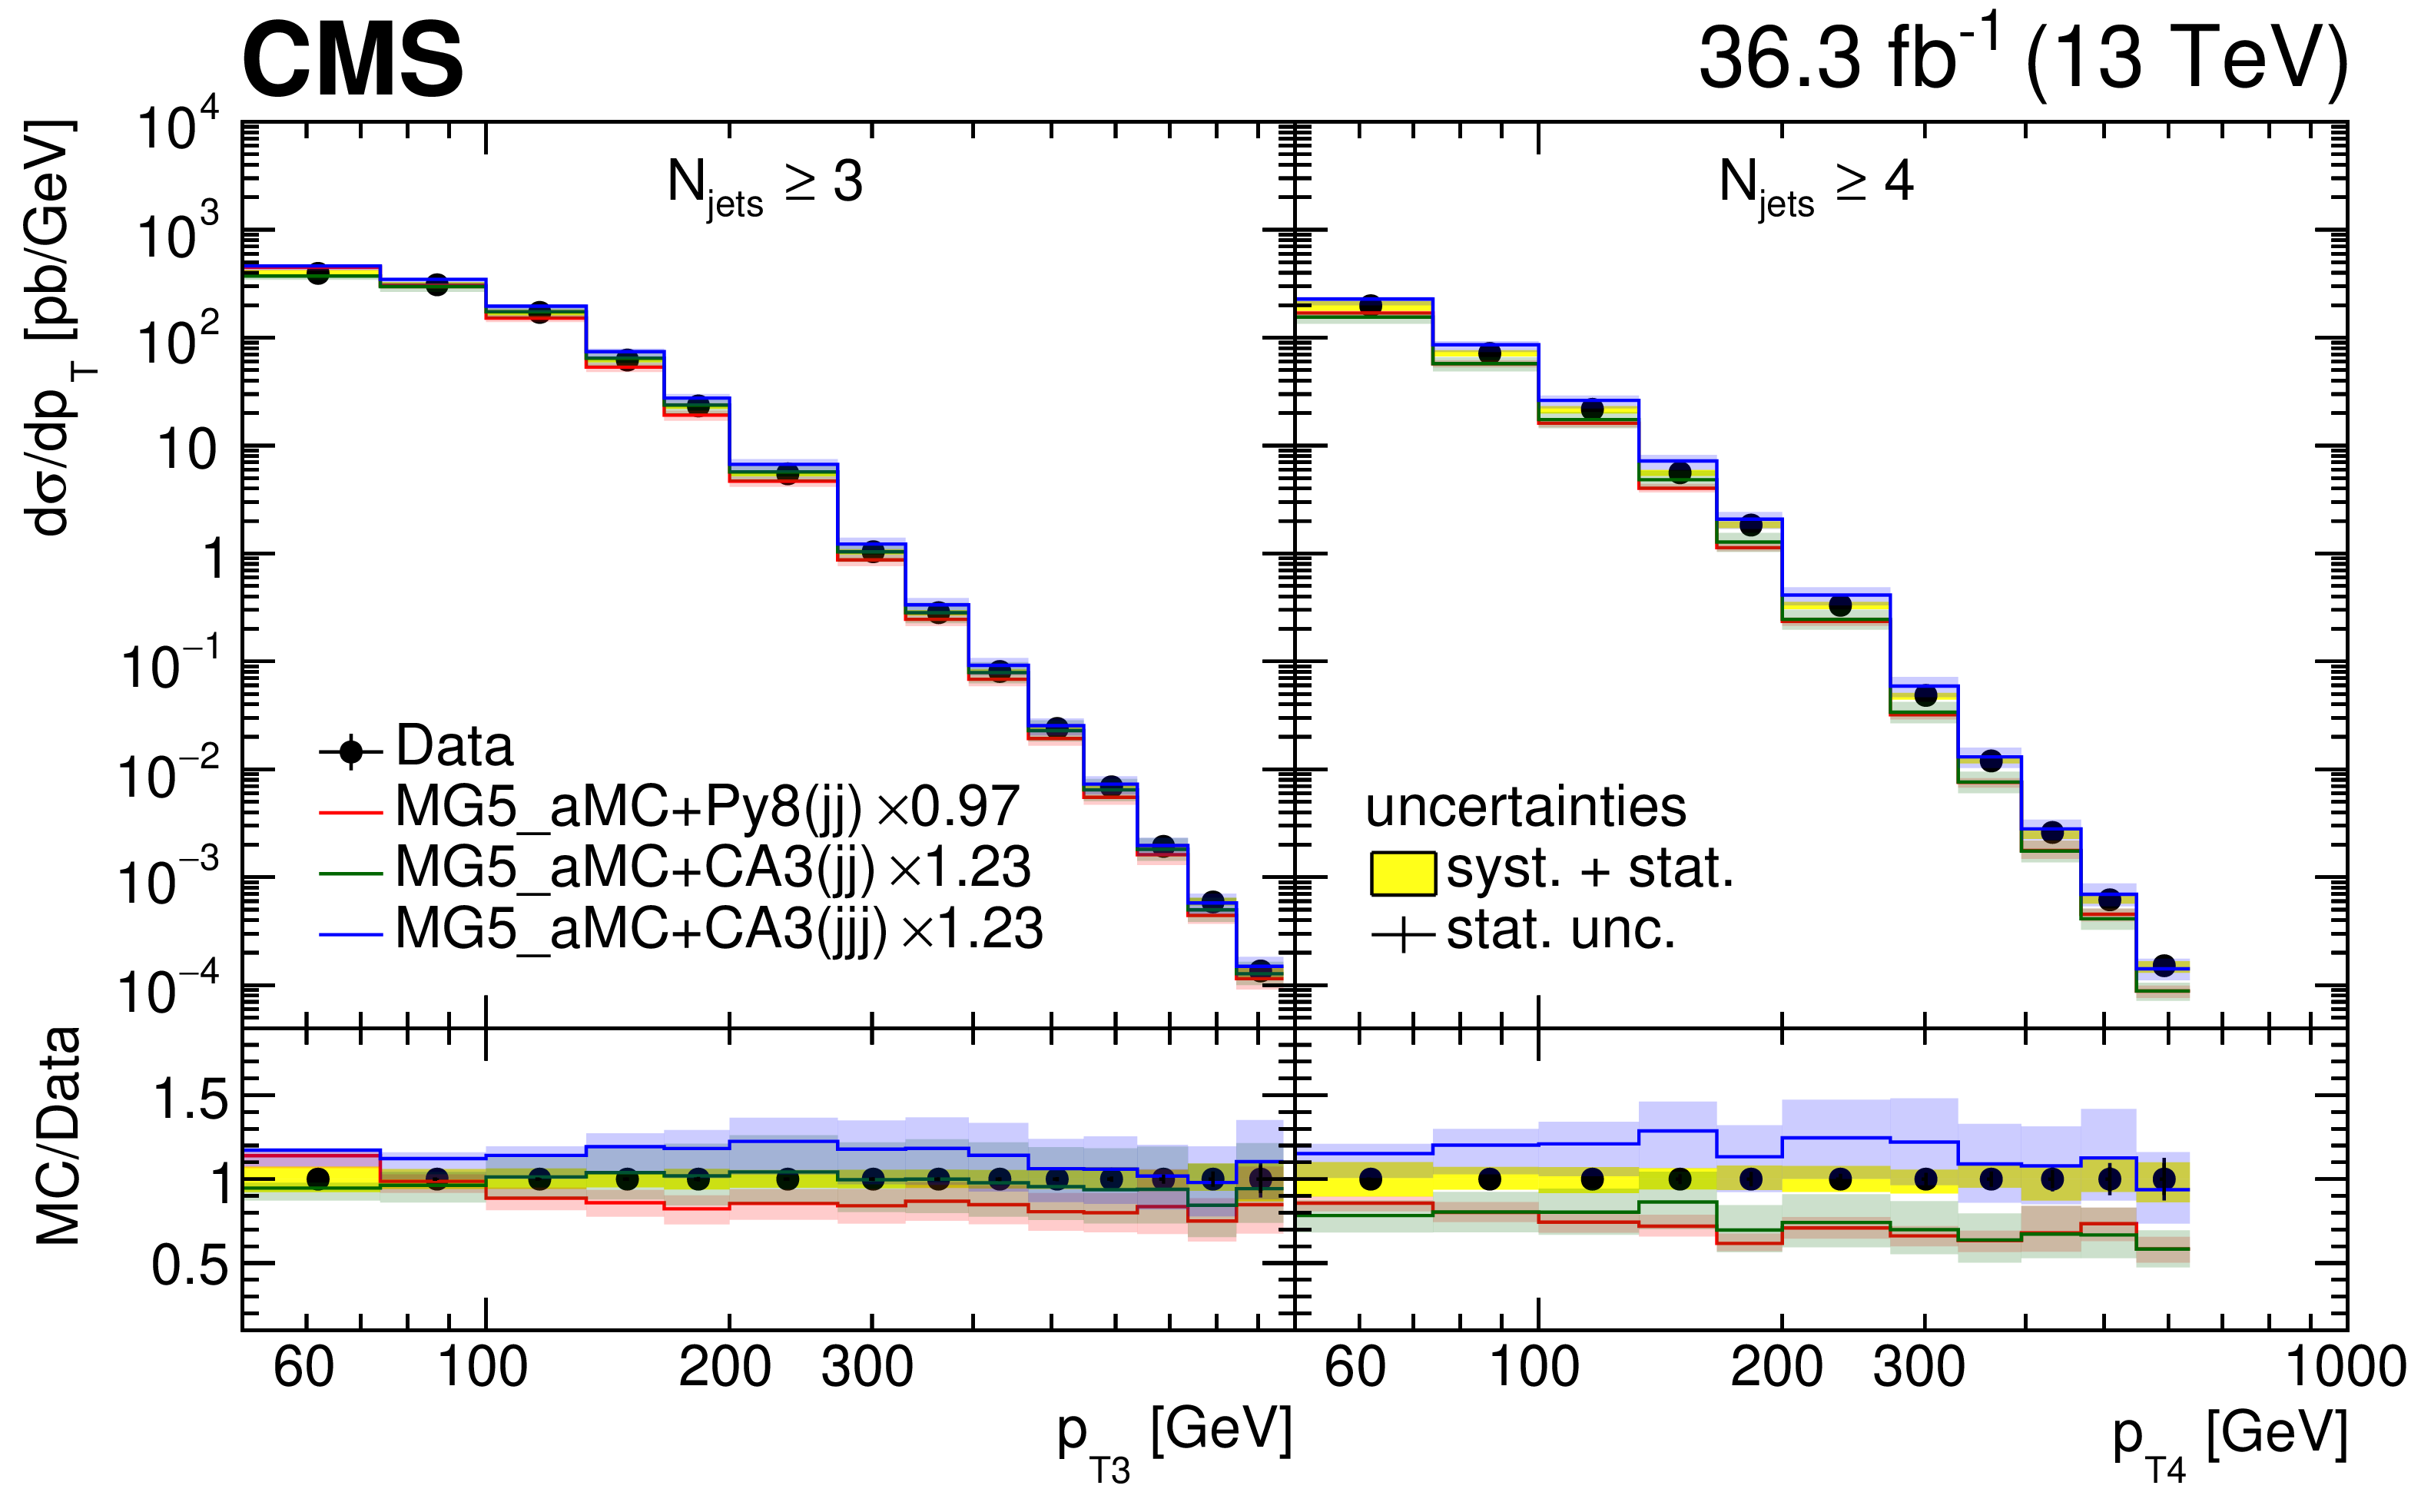
Figure 12:
Transverse momentum distributions of the four leading jets. The transverse momentum of the leading and subleading (third and fourth leading) $ p_{\mathrm{T}} $ jets from left to right is shown in the upper (lower) figure. The data are compared with NLO predictions MG5_aMC+Py8 (jj) and MG5_aMC+CA3 (jj) as well as the NLO three-jet prediction of MG5_aMC+CA3 (jjj). The vertical error bars correspond to the statistical uncertainty, and the yellow band to total uncertainty of the measurement. The bands show the uncertainty from a variation of the renormalization and factorization scales. The predictions are normalized to the measured dijet cross section using the scaling factors shown in the legend. |
png pdf |
Figure 12-a:
he transverse momentum of the leading (left) and subleading (right) leading $ p_{\mathrm{T}} $ jets is shown. The data are compared with NLO predictions MG5_aMC+Py8 (jj) and MG5_aMC+CA3 (jj) as well as the NLO three-jet prediction of MG5_aMC+CA3 (jjj). The vertical error bars correspond to the statistical uncertainty, and the yellow band to total uncertainty of the measurement. The bands show the uncertainty from a variation of the renormalization and factorization scales. The predictions are normalized to the measured dijet cross section using the scaling factors shown in the legend. |
png pdf |
Figure 12-b:
The transverse momentum of the third (left) and fourth (right) leading $ p_{\mathrm{T}} $ jets is shown. The data are compared with NLO predictions MG5_aMC+Py8 (jj) and MG5_aMC+CA3 (jj) as well as the NLO three-jet prediction of MG5_aMC+CA3 (jjj). The vertical error bars correspond to the statistical uncertainty, and the yellow band to total uncertainty of the measurement. The bands show the uncertainty from a variation of the renormalization and factorization scales. The predictions are normalized to the measured dijet cross section using the scaling factors shown in the legend. |
| Tables | |

png pdf |
Table 1:
Description of the simulated samples used in the analysis. |
png pdf |
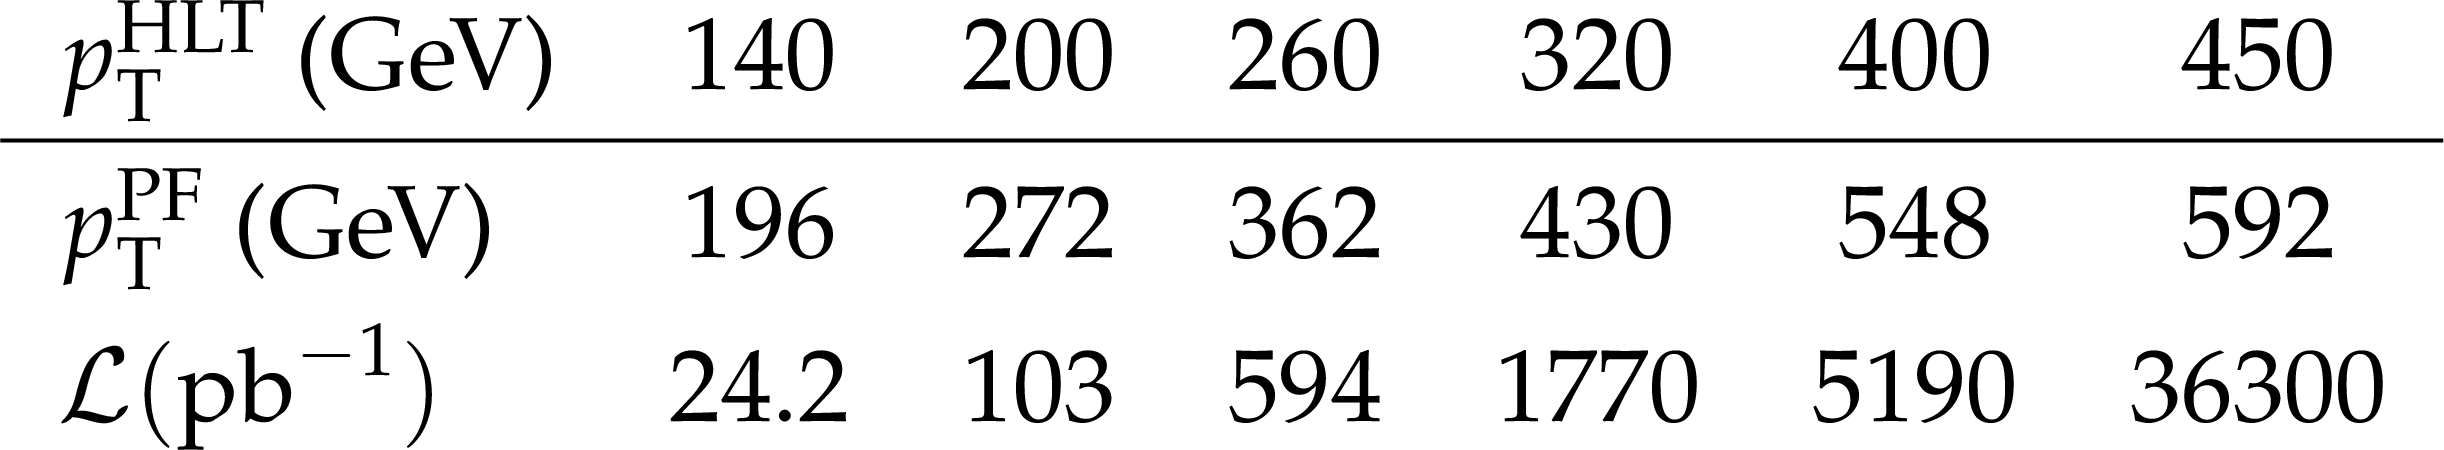
Table 2:
The integrated luminosity for each trigger sample considered in this analysis with the $ p_{\mathrm{T}} $ thresholds for HLT (PF) reconstruction. |
| Summary |
| A study of multijet events has been performed in proton-proton collisions at a center-of-mass energy of 13 TeV using data collected with the CMS detector corresponding to an integrated luminosity of 36.3 fb$^{-1}$. The measurements are performed by selecting a dijet system containing a jet with $ p_{\mathrm{T}} > $ 200 GeV and a subleading jet with $ p_{\mathrm{T}} > $ 100 GeV within $ |y| < $ 2.5. For the first time, the jet multiplicity in bins of the leading jet $ p_{\mathrm{T}} $ and the azimuthal angle difference between the two leading jets, $ \Delta\phi_{1,2} $, is measured. The jet multiplicity distributions show that even in the back-to-back region of the dijet system, up to seven jets are measurable. The differential production cross sections are measured for the highest $ p_{\mathrm{T}} $ jets up to the TeV scale. The measurement of the differential cross section as a function of the jet $ p_{\mathrm{T}} $ for the four highest $ p_{\mathrm{T}} $ jets is an important reference for standard model multijet cross section calculations, and especially for the simulations including parton showers for higher jet multiplicity. The measured multiplicity distribution of jets with $ p_{\mathrm{T}} > $ 50 GeV and $ |y| < $ 2.5 is not well described by the leading order MADGRAPH+PYTHIA 8 simulation. However, in the back-to-back region HERWIG++ and MADGRAPH+CASCADE3 provide a better description of the shape of the jet multiplicity. The measured differential cross section as a function of the transverse momentum of the four leading $ p_{\mathrm{T}} $ jets is not described by any of the LO predictions either in normalization or in shape. However, MADGRAPH+CASCADE3 describes the shape of the distribution better than MADGRAPH+PYTHIA 8. The predictions using dijet NLO matrix elements, MG5_AMC+PYTHIA 8(jj) and MG5_AMC+CASCADE3(jj) describe the lower multiplicity regions, as well as the transverse momenta of the leading jets, reasonably well. The three-jet NLO calculation MG5_AMC+CASCADE3(jjj) describes very well the cross section of the third and fourth jets. The measurements presented here provide stringent tests of theoretical predictions in the perturbative high-$ p_{\mathrm{T}} $ and high-jet multiplicity regions. Although the higher jet multiplicities are not described with either parton shower approach, it is interesting that the lower jet multiplicity cross section is described satisfactorily with NLO dijet calculations supplemented with PB -TMDs and TMD parton shower with fewer tunable parameters than in the case with conventional parton showers. The measured observables and its statistical correlations are provided in HEPData [41] as tabulated results. |
| References | ||||
| 1 | A. Bermudez Martinez et al. | Collinear and TMD parton densities from fits to precision DIS measurements in the parton branching method | PRD 99 (2019) 074008 | 1804.11152 |
| 2 | F. Hautmann et al. | Soft-gluon resolution scale in QCD evolution equations | PLB 772 (2017) 446 | 1704.01757 |
| 3 | F. Hautmann et al. | Collinear and TMD quark and gluon densities from parton branching solution of QCD evolution equations | JHEP 01 (2018) 070 | 1708.03279 |
| 4 | J. Alwall et al. | The automated computation of tree-level and next-to-leading order differential cross sections, and their matching to parton shower simulations | JHEP 07 (2014) 079 | 1405.0301 |
| 5 | S. Baranov et al. | CASCADE3 A Monte Carlo event generator based on TMDs | EPJC 81 (2021) 425 | 2101.10221 |
| 6 | D0 Collaboration | Measurement of dijet azimuthal decorrelations at central rapidities in $ \mathrm{p}\overline{\mathrm{p}} $ collisions at $ \sqrt{s}=$ 1.96 TeV | PRL 94 (2005) 221801 | hep-ex/0409040 |
| 7 | D0 Collaboration | Measurement of the combined rapidity and $ p_{\mathrm{T}} $ dependence of dijet azimuthal decorrelations in $ \mathrm{p}\overline{\mathrm{p}} $ collisions at $ \sqrt{s}=$ 1.96 TeV | PLB 721 (2013) 212 | 1212.1842 |
| 8 | ATLAS Collaboration | Measurement of dijet azimuthal decorrelations in pp collisions at $ \sqrt{s}=$ 7 TeV | PRL 106 (2011) 172002 | 1102.2696 |
| 9 | CMS Collaboration | Dijet azimuthal decorrelations in pp collisions at $ \sqrt{s}=$ 7 TeV | PRL 106 (2011) 122003 | CMS-QCD-10-026 1101.5029 |
| 10 | CMS Collaboration | Measurement of dijet azimuthal decorrelation in pp collisions at $ \sqrt{s}=$ 8 TeV | EPJC 76 (2016) 536 | CMS-SMP-14-015 1602.04384 |
| 11 | CMS Collaboration | Azimuthal correlations for inclusive 2-jet, 3-jet, and 4-jet events in pp collisions at $ \sqrt{s}= $ 13 TeV | EPJC 78 (2018) 566 | CMS-SMP-16-014 1712.05471 |
| 12 | CMS Collaboration | Azimuthal separation in nearly back-to-back jet topologies in inclusive 2- and 3-jet events in pp collisions at $ \sqrt{s}= $ 13 TeV | EPJC 79 (2019) 773 | CMS-SMP-17-009 1902.04374 |
| 13 | CMS Collaboration | Performance of the CMS Level-1 trigger in proton-proton collisions at $ \sqrt{s} = $ 13 TeV | JINST 15 (2020) P10017 | CMS-TRG-17-001 2006.10165 |
| 14 | CMS Collaboration | The CMS trigger system | JINST 12 (2017) P01020 | CMS-TRG-12-001 1609.02366 |
| 15 | CMS Collaboration | Particle-flow reconstruction and global event description with the CMS detector | JINST 12 (2017) P10003 | CMS-PRF-14-001 1706.04965 |
| 16 | CMS Collaboration | Technical proposal for the Phase-II upgrade of the Compact Muon Solenoid | CMS Technical Proposal CERN-LHCC-2015-010, CMS-TDR-15-02, 2015 CDS |
|
| 17 | M. Cacciari, G. P. Salam, and G. Soyez | The anti-$ k_{\mathrm{T}} $ jet clustering algorithm | JHEP 04 (2008) 063 | 0802.1189 |
| 18 | M. Cacciari, G. P. Salam, and G. Soyez | FastJet user manual | EPJC 72 (2012) 1896 | 1111.6097 |
| 19 | CMS Collaboration | Pileup Removal Algorithms | CMS Physics Analysis Summary, 2014 CMS-PAS-JME-14-001 |
CMS-PAS-JME-14-001 |
| 20 | CMS Collaboration | Jet energy scale and resolution in the CMS experiment in pp collisions at 8 TeV | JINST 12 (2017) P02014 | CMS-JME-13-004 1607.03663 |
| 21 | CMS Collaboration | Performance of missing transverse momentum reconstruction in proton-proton collisions at $ \sqrt{s} = $ 13 TeV using the CMS detector | JINST 14 (2019) P07004 | CMS-JME-17-001 1903.06078 |
| 22 | CMS Collaboration | The CMS experiment at the CERN LHC | JINST 3 (2008) S08004 | |
| 23 | T. Sjöstrand et al. | An introduction to PYTHIA 8.2 | Comput. Phys. Commun. 191 (2015) 159 | 1410.3012 |
| 24 | CMS Collaboration | Event generator tunes obtained from underlying event and multiparton scattering measurements | EPJC 76 (2016) 155 | CMS-GEN-14-001 1512.00815 |
| 25 | NNPDF Collaboration | Unbiased global determination of parton distributions and their uncertainties at NNLO and at LO | NPB 855 (2012) 153 | 1107.2652 |
| 26 | M. Bahr et al. | Herwig++ physics and manual | EPJC 58 (2008) 639 | 0803.0883 |
| 27 | J. Pumplin et al. | New generation of parton distributions with uncertainties from global QCD analysis | JHEP 07 (2002) 012 | hep-ph/0201195 |
| 28 | J. Alwall et al. | Comparative study of various algorithms for the merging of parton showers and matrix elements in hadronic collisions | EPJC 53 (2008) 473 | 0706.2569 |
| 29 | A. Bermudez Martinez , F. Hautmann, and M. L. Mangano | TMD evolution and multi-jet merging | PLB 822 (2021) 136700 | 2107.01224 |
| 30 | T. Sjöstrand, S. Mrenna, and P. Skands | PYTHIA 6.4 physics and manual | JHEP 05 (2006) 026 | hep-ph/0603175 |
| 31 | NNPDF Collaboration | Parton distributions for the LHC Run II | JHEP 04 (2015) 040 | 1410.8849 |
| 32 | G. Corcella et al. | HERWIG 6: An event generator for hadron emission reactions with interfering gluons (including supersymmetric processes) | JHEP 01 (2001) 010 | hep-ph/0011363 |
| 33 | S. Frixione, P. Nason, and B. R. Webber | Matching NLO QCD and parton showers in heavy flavor production | JHEP 08 (2003) 007 | hep-ph/0305252 |
| 34 | S. Frixione and B. R. Webber | Matching NLO QCD computations and parton shower simulations | JHEP 06 (2002) 029 | hep-ph/0204244 |
| 35 | GEANT4 Collaboration | GEANT 4 -- a simulation toolkit | NIM A 506 (2003) 250 | |
| 36 | CMS Collaboration | Measurement and QCD analysis of double-differential inclusive jet cross sections in proton-proton collisions at $ \sqrt{s} $ = 13 TeV | JHEP 02 (2022) 142 | CMS-SMP-20-011 2111.10431 |
| 37 | CMS Collaboration | Jet algorithms performance in 13 TeV data | CMS Physics Analysis Summary , CERN, Geneva, 2017 CMS-PAS-JME-16-003 |
CMS-PAS-JME-16-003 |
| 38 | S. Schmitt | TUnfold: an algorithm for correcting migration effects in high energy physics | JINST 7 (2012) T10003 | 1205.6201 |
| 39 | CMS Collaboration | Precision luminosity measurement in proton-proton collisions at $ \sqrt{s} = $ 13 TeV in 2015 and 2016 at CMS | EPJC 81 (2021) 800 | CMS-LUM-17-003 2104.01927 |
| 40 | CMS Collaboration | Measurement of the inelastic proton-proton cross section at $ \sqrt{s}= $ 13 TeV | JHEP 07 (2018) 161 | CMS-FSQ-15-005 1802.02613 |
| 41 | CMS Collaboration | HEPData record for this analysis | link | |
|
|
Compact Muon Solenoid LHC, CERN |
|

|

|

|

|

|