

Compact Muon Solenoid
LHC, CERN
| CMS-SMP-20-011 ; CERN-EP-2021-221 | ||
| Measurement and QCD analysis of double-differential inclusive jet cross sections in proton-proton collisions at $ \sqrt{s} = $ 13 TeV | ||
| CMS Collaboration | ||
| 19 November 2021 | ||
| JHEP 02 (2022) 142 [Addendum] | ||
| Abstract: A measurement of the inclusive jet production in proton-proton collisions at the LHC at $ \sqrt{s}= $ 13 TeV is presented. The double-differential cross sections are measured as a function of the jet transverse momentum $ p_{\mathrm{T}} $ and the absolute jet rapidity $ |y| $. The anti-$ k_{\mathrm{T}} $ clustering algorithm is used with distance parameter of 0.4 (0.7) in a phase space region with jet $ p_{\mathrm{T}} $ from 97 GeV up to 3.1 TeV and $ |y| < $ 2.0. Data collected with the CMS detector are used, corresponding to an integrated luminosity of 36.3 fb$ ^{-1} $ (33.5 fb$ ^{-1} $). The measurement is used in a comprehensive QCD analysis at next-to-next-to-leading order, which results in significant improvement in the accuracy of the parton distributions in the proton. Simultaneously, the value of the strong coupling constant at the Z boson mass is extracted as $ \alpha_\mathrm{S}(m_\mathrm{Z})= $ 0.1170 $ \pm $ 0.0019. For the first time, these data are used in a standard model effective field theory analysis at next-to-leading order, where parton distributions and the QCD parameters are extracted simultaneously with imposed constraints on the Wilson coefficient $ c_1 $ of 4-quark contact interactions.Note added: in the Addendum to this paper JHEP 12 (2022) 035, available as Appendix B in this document, an improved value of $ \alpha_\mathrm{S}(m_\mathrm{Z}) = $ 0.1166 $ \pm $ 0.0017 has been extracted. This result supersedes the number in the above abstract of the original publication, JHEP 02 (2022) 142. | ||
| Links: e-print arXiv:2111.10431 [hep-ex] (PDF) ; CDS record ; inSPIRE record ; HepData record ; Physics Briefing ; CADI line (restricted) ; | ||
| Figures | |
png pdf |
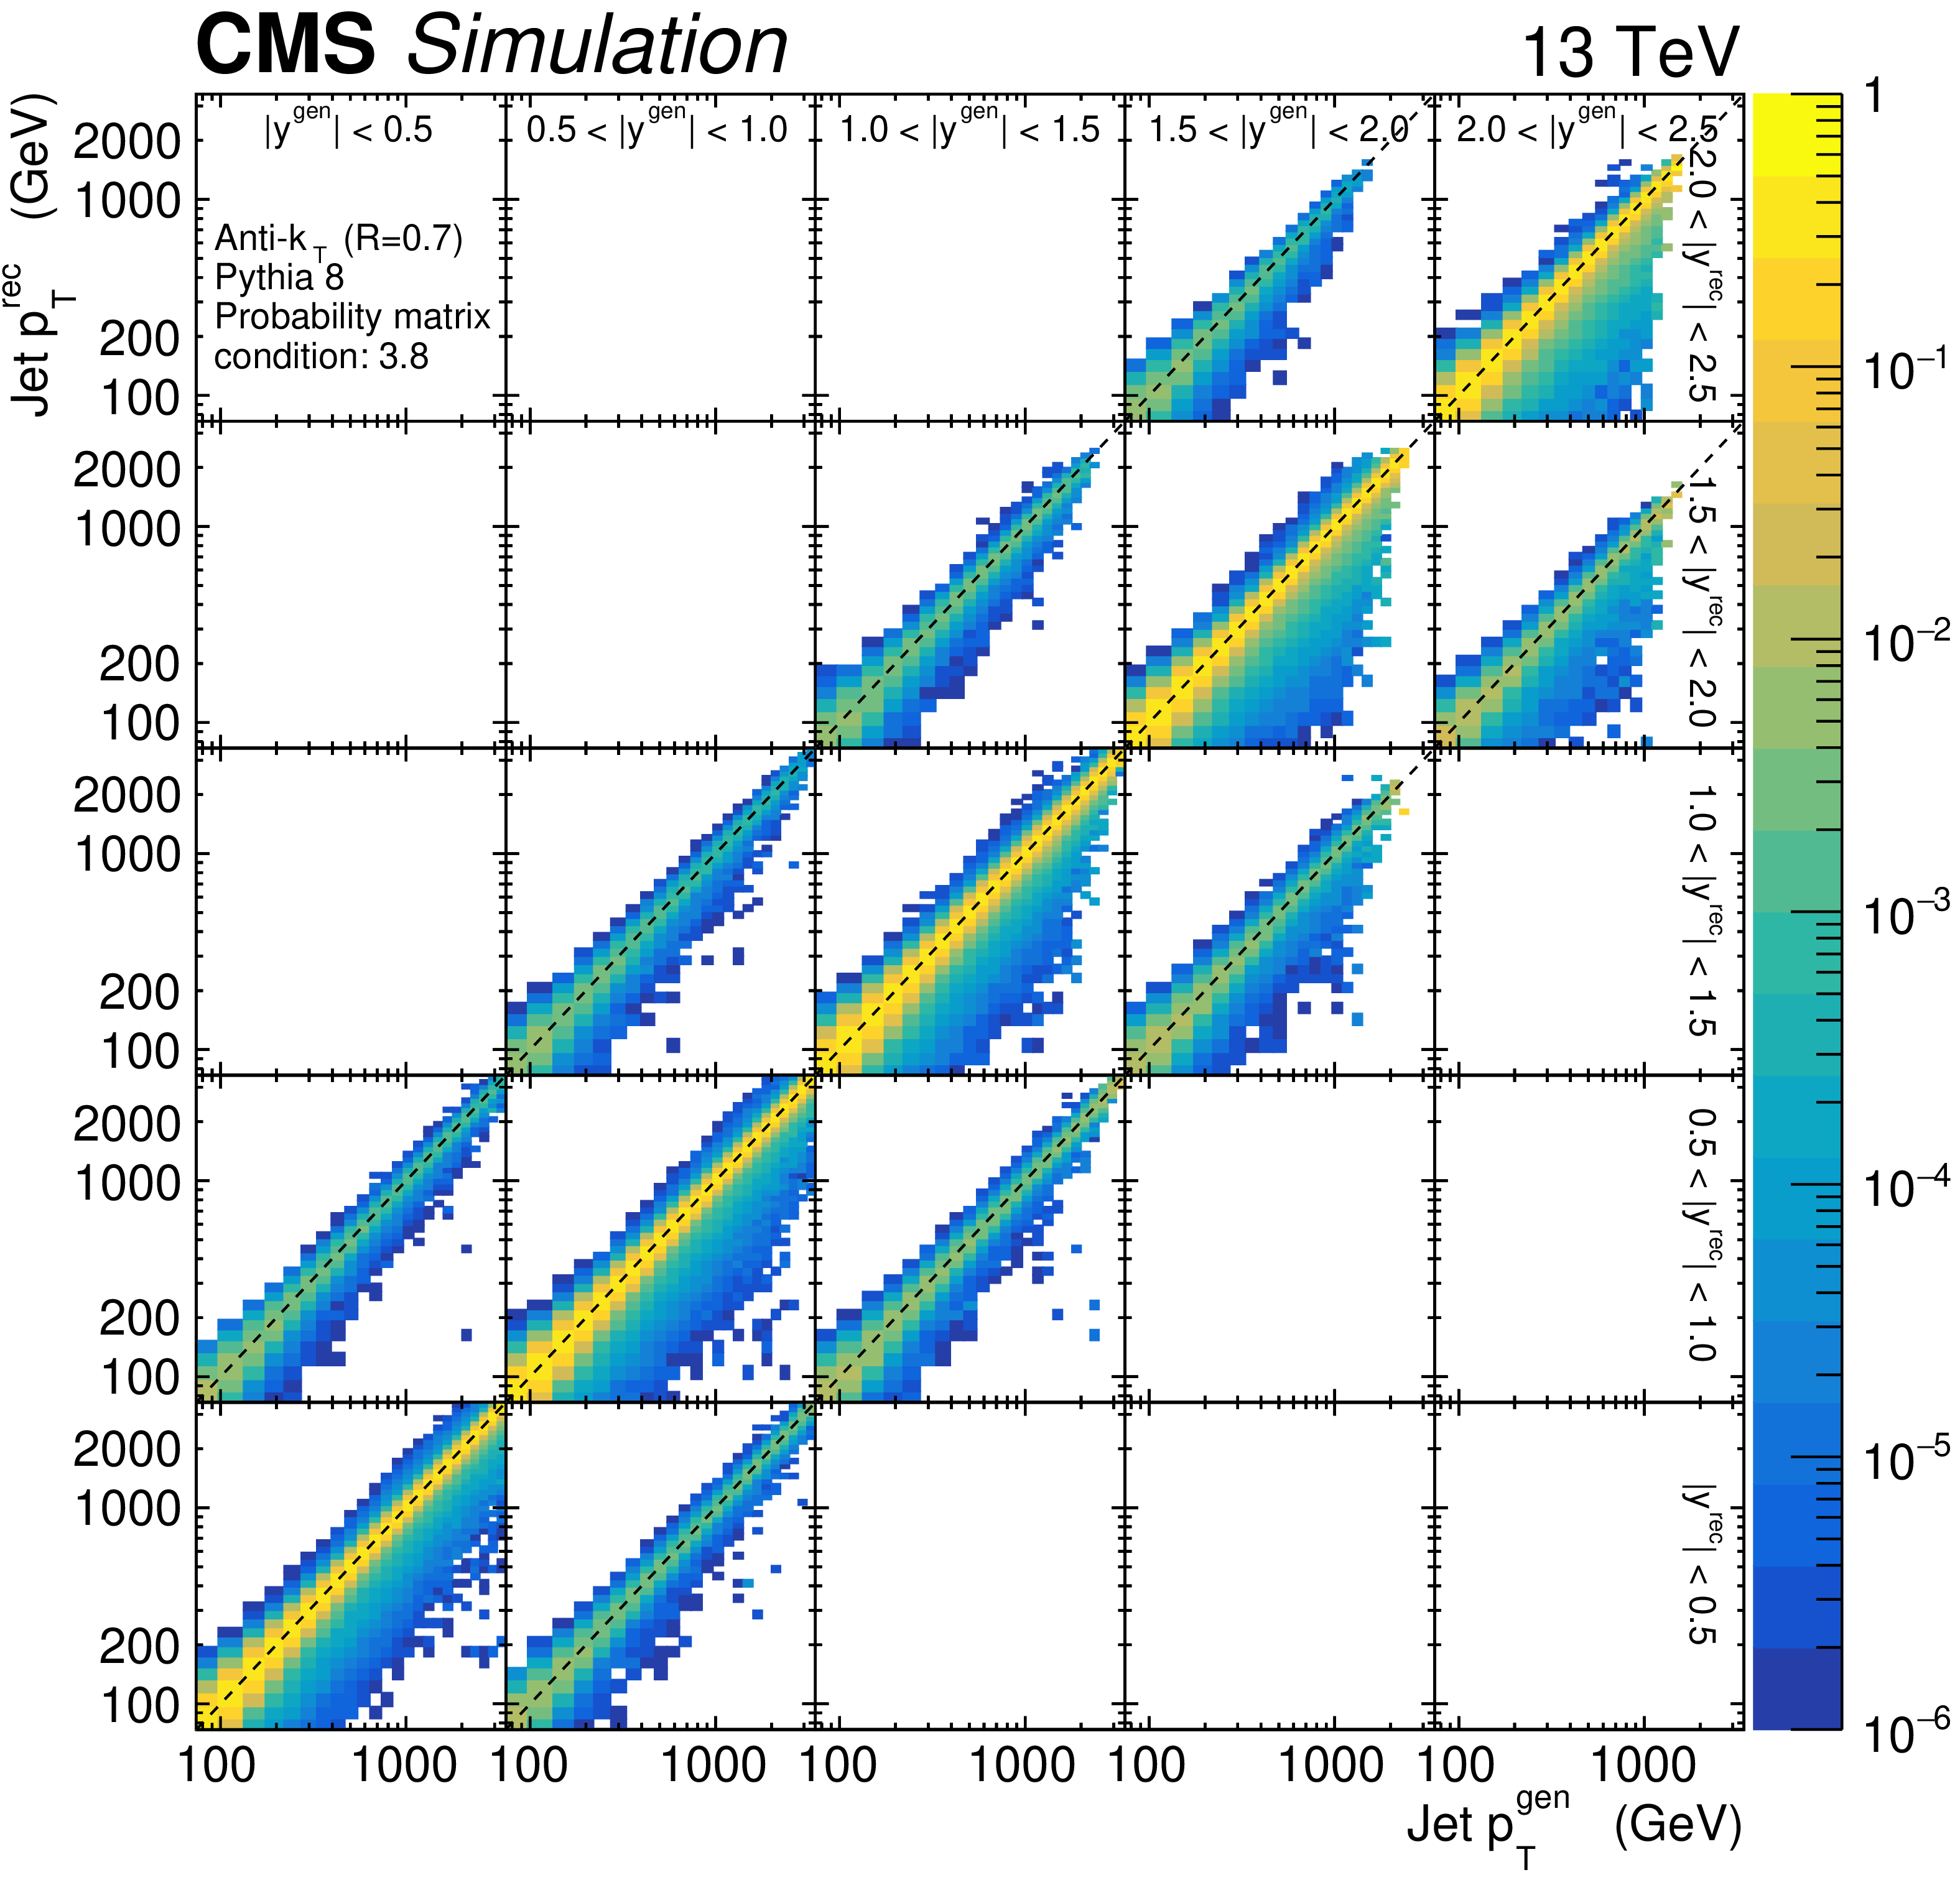
Figure 1:
The probability matrix, estimated with a simulated sample based on PYTHIA 8, for jets clustered using the anti-$ k_{\mathrm{T}} $ algorithm with $ R = $ 0.7. The horizontal (vertical) axis corresponds to jets at the particle (detector) level. The global 5 $ \times $ 5 structure corresponds to the bins of rapidity $ y $ of the jets, indicated by the labels in the uppermost row and rightmost column; the horizontal and vertical axes of each cell correspond to the transverse momentum $ p_{\mathrm{T}} $ of the jets. The colour range covers a range from $ 10^{-6} $ to 1 and the rows are normalised to unity, indicating the probability for a particle-level jet generated with values of $ p_{\mathrm{T}}^\text{gen} $ and $ |y|^\text{gen} $ to be reconstructed at the detector level with values of $ p_{\mathrm{T}}^\text{rec} $ and $ |y|^\text{rec} $. Migrations outside of the phase space are not included; migrations across rapidity bins only occur among adjacent rapidity bins. The dashed lines indicate the diagonal bins in each rapidity cell. |
png pdf |
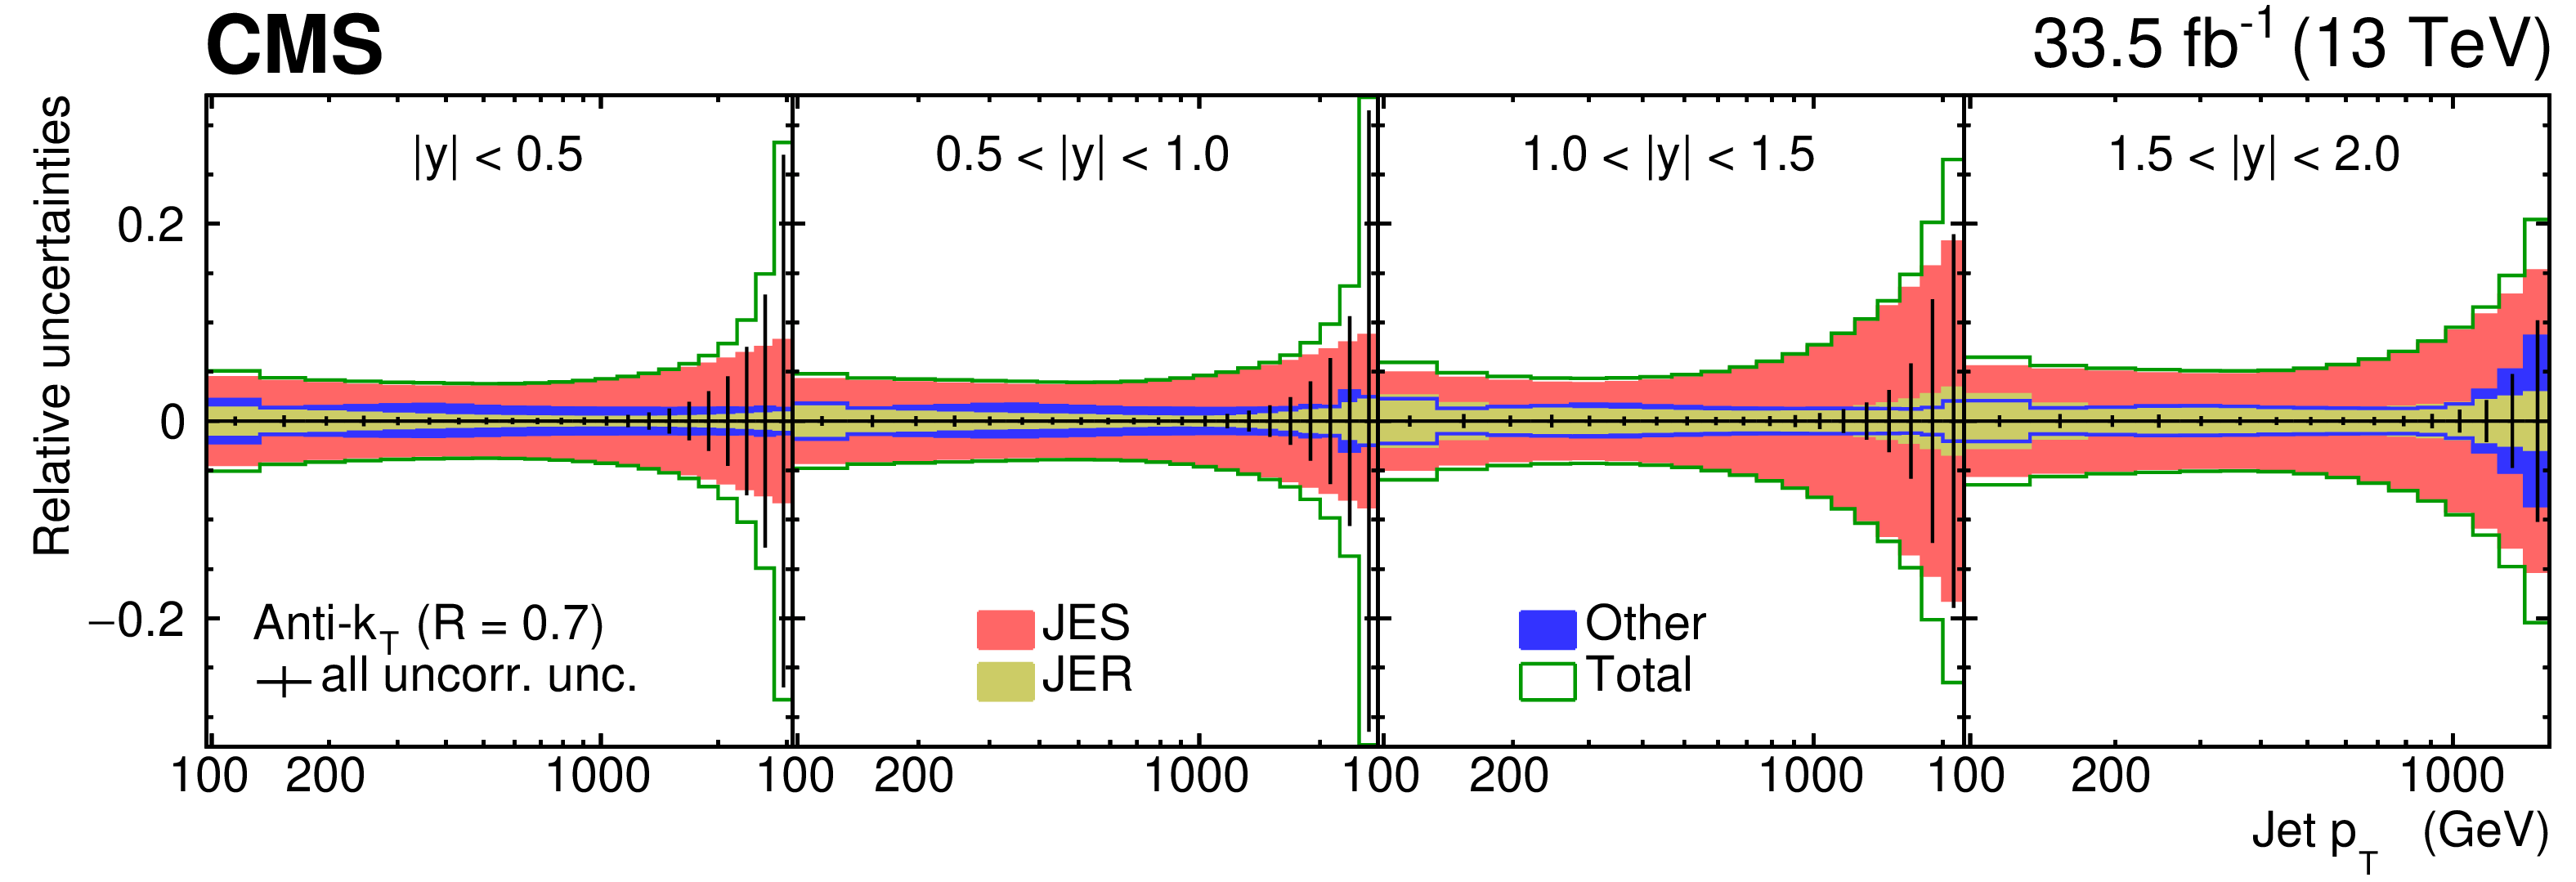
Figure 2:
Relative uncertainties in the double-differential cross section, as functions of jet transverse momentum ($ x $ axis) and rapidity (cells), for jets clustered using the anti-$ k_{\mathrm{T}} $ algorithm with $ R = $ 0.7. The systematic uncertainties are shown in different, noncumulative colour bands: the red bands correspond to JES uncertainties, the yellow bands to the JER uncertainties, and the blue bands to all other sources, including the integrated luminosity uncertainty, the model uncertainty, uncertainties in the migrations in and out of the phase space, and uncertainties in various inefficiencies and backgrounds. The vertical error bars include the statistical uncertainties from the data and from the PYTHIA 8 simulated sample used for the unfolding, as well as the binwise systematic uncertainties, all summed in quadrature. The total uncertainty, shown in green, includes all systematic and statistical uncertainties summed in quadrature. |
png pdf |
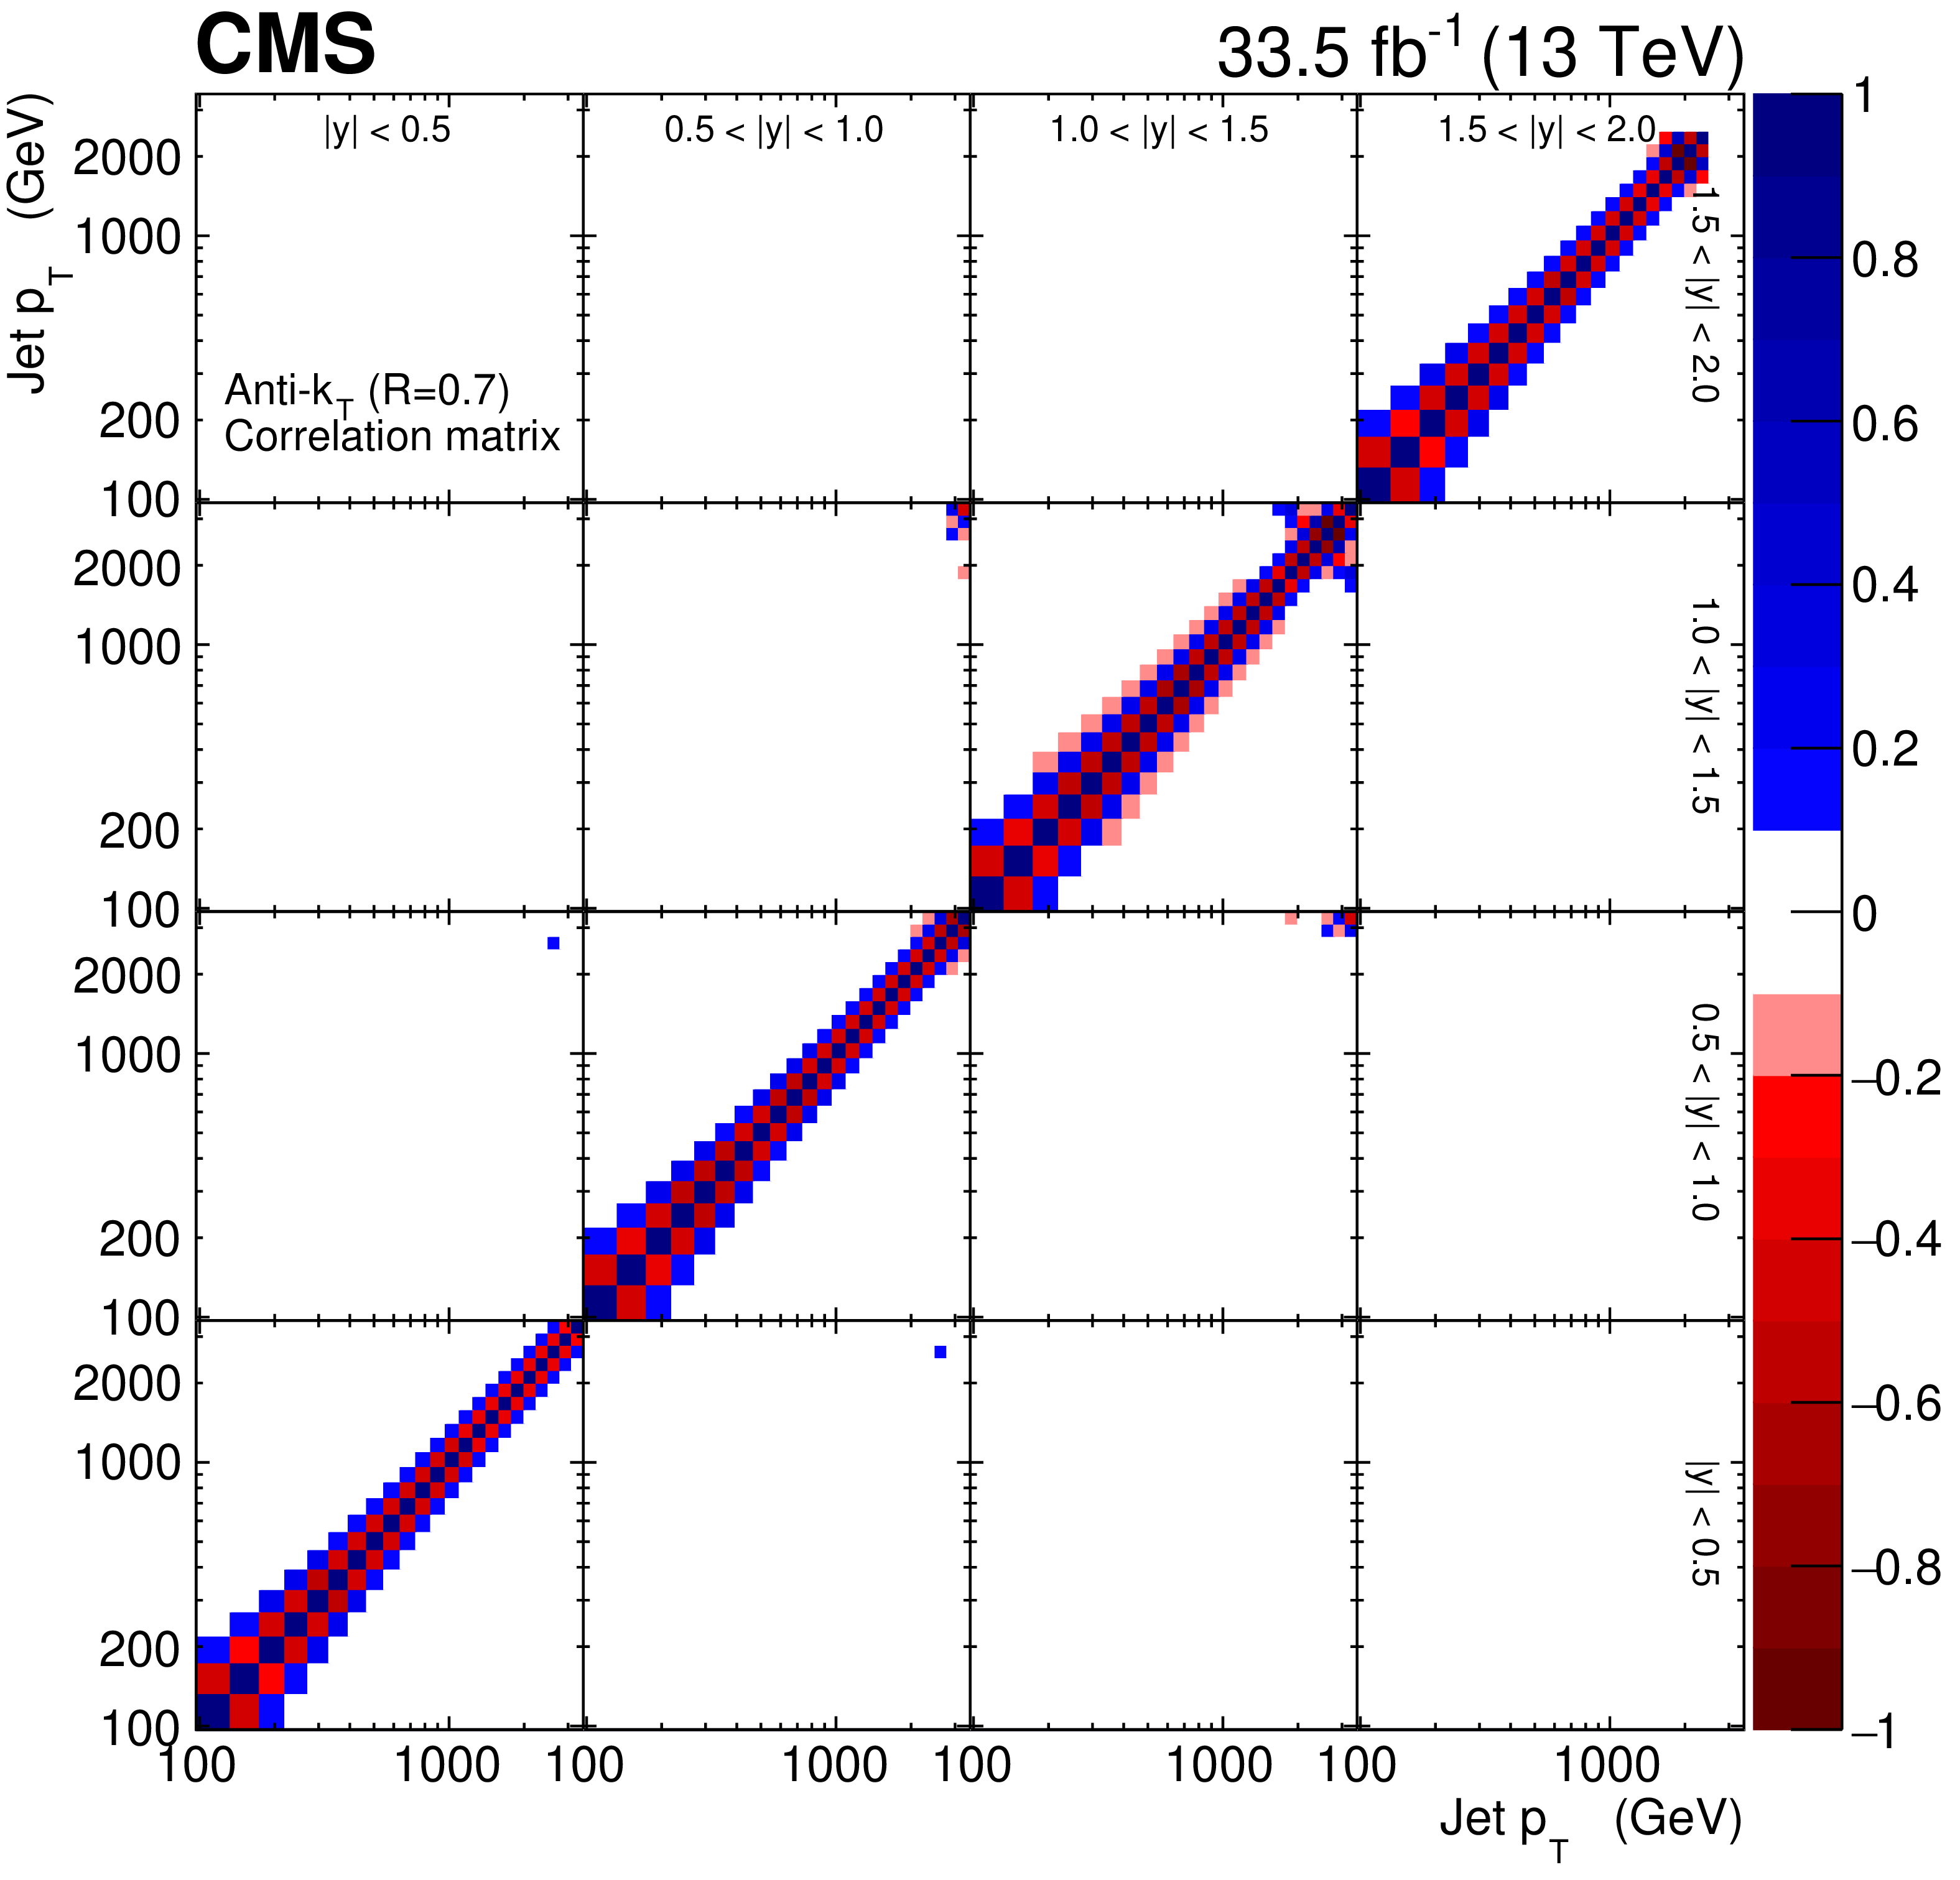
Figure 3:
The correlation matrix at the particle level, for jets clustered using the anti-$ k_{\mathrm{T}} $ algorithm with $ R = $ 0.7. It contains contributions from the data and from the PYTHIA 8 sample used to perform the unfolding. The global 4 $ \times $ 4 structure corresponds to the bins of rapidity $ y $ of the jets, indicated by the labels in the uppermost row and rightmost column; the horizontal and vertical axes of each cell correspond to the transverse momentum $ p_{\mathrm{T}} $ of the jets. The colour range covers a range from-1 to 1 and indicates correlations in blue shades and anti-correlations in red shades, except for values between-0.1 and 0.1. Correlations across rapidity bins reach significant values mostly at the edges of the $ p_{\mathrm{T}} $ range. |
png pdf |
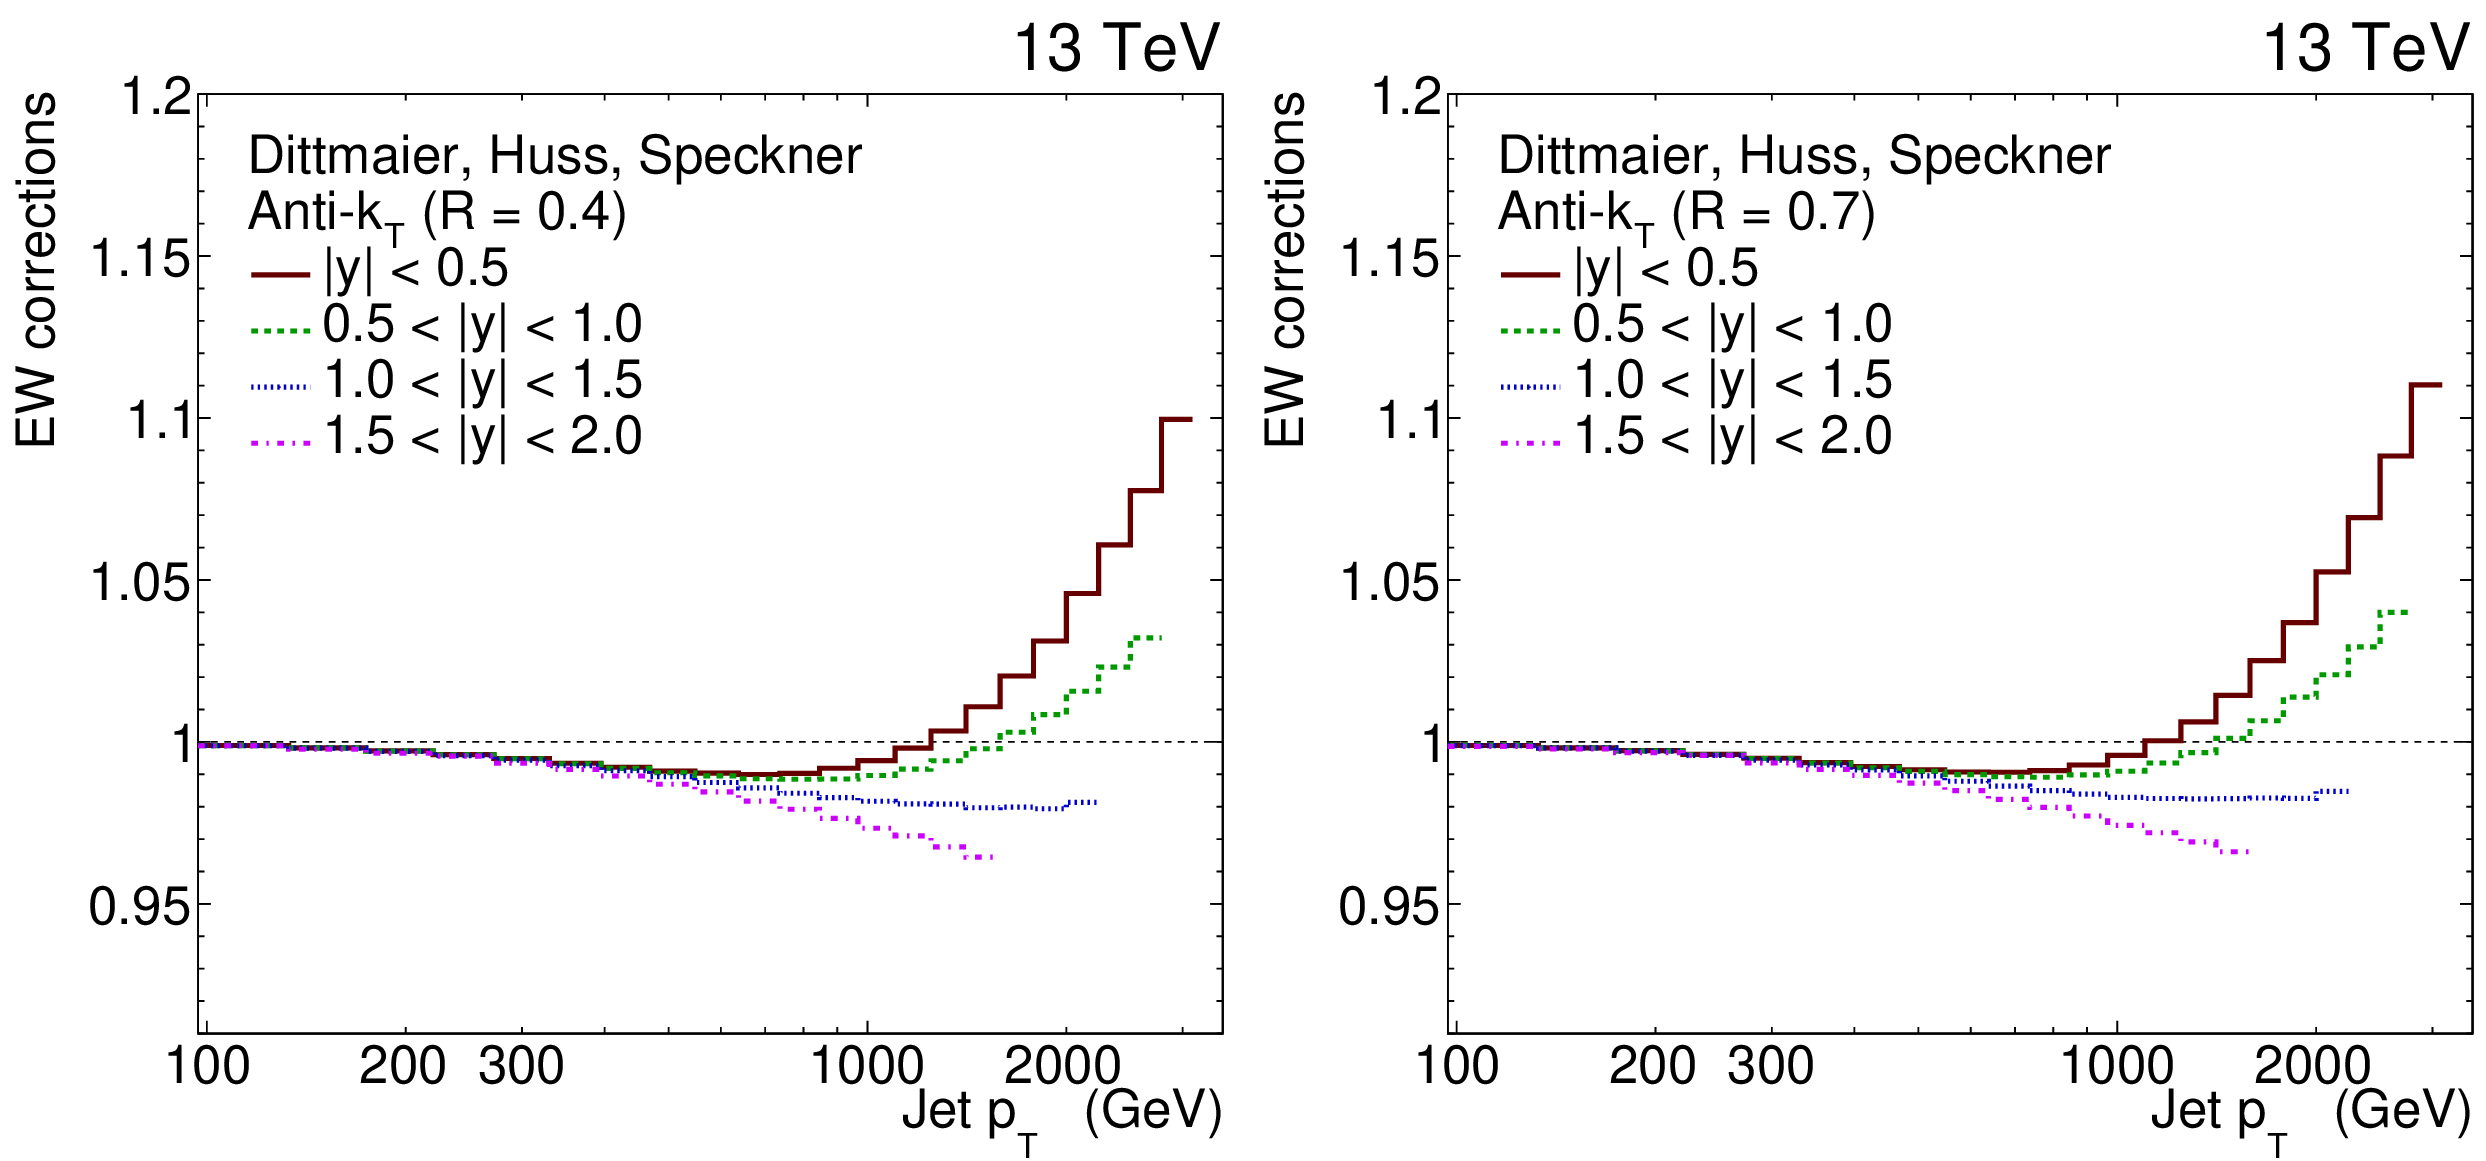
Figure 4:
The EW corrections for inclusive jet cross sections, as reported in Ref. [62]. The values for jets clustered using the anti-$ k_{\mathrm{T}} $ algorithm with $ R= $ 0.4 (0.7) are shown on the left (right); each curve corresponds to a rapidity bin. |

png pdf |
Figure 4-a:
The EW corrections for inclusive jet cross sections, as reported in Ref. [62]. The values for jets clustered using the anti-$ k_{\mathrm{T}} $ algorithm with $ R= $ 0.4 are shown; each curve corresponds to a rapidity bin. |

png pdf |
Figure 4-b:
The EW corrections for inclusive jet cross sections, as reported in Ref. [62]. The values for jets clustered using the anti-$ k_{\mathrm{T}} $ algorithm with $ R= $ 0.7 are shown; each curve corresponds to a rapidity bin. |

png pdf |
Figure 5:
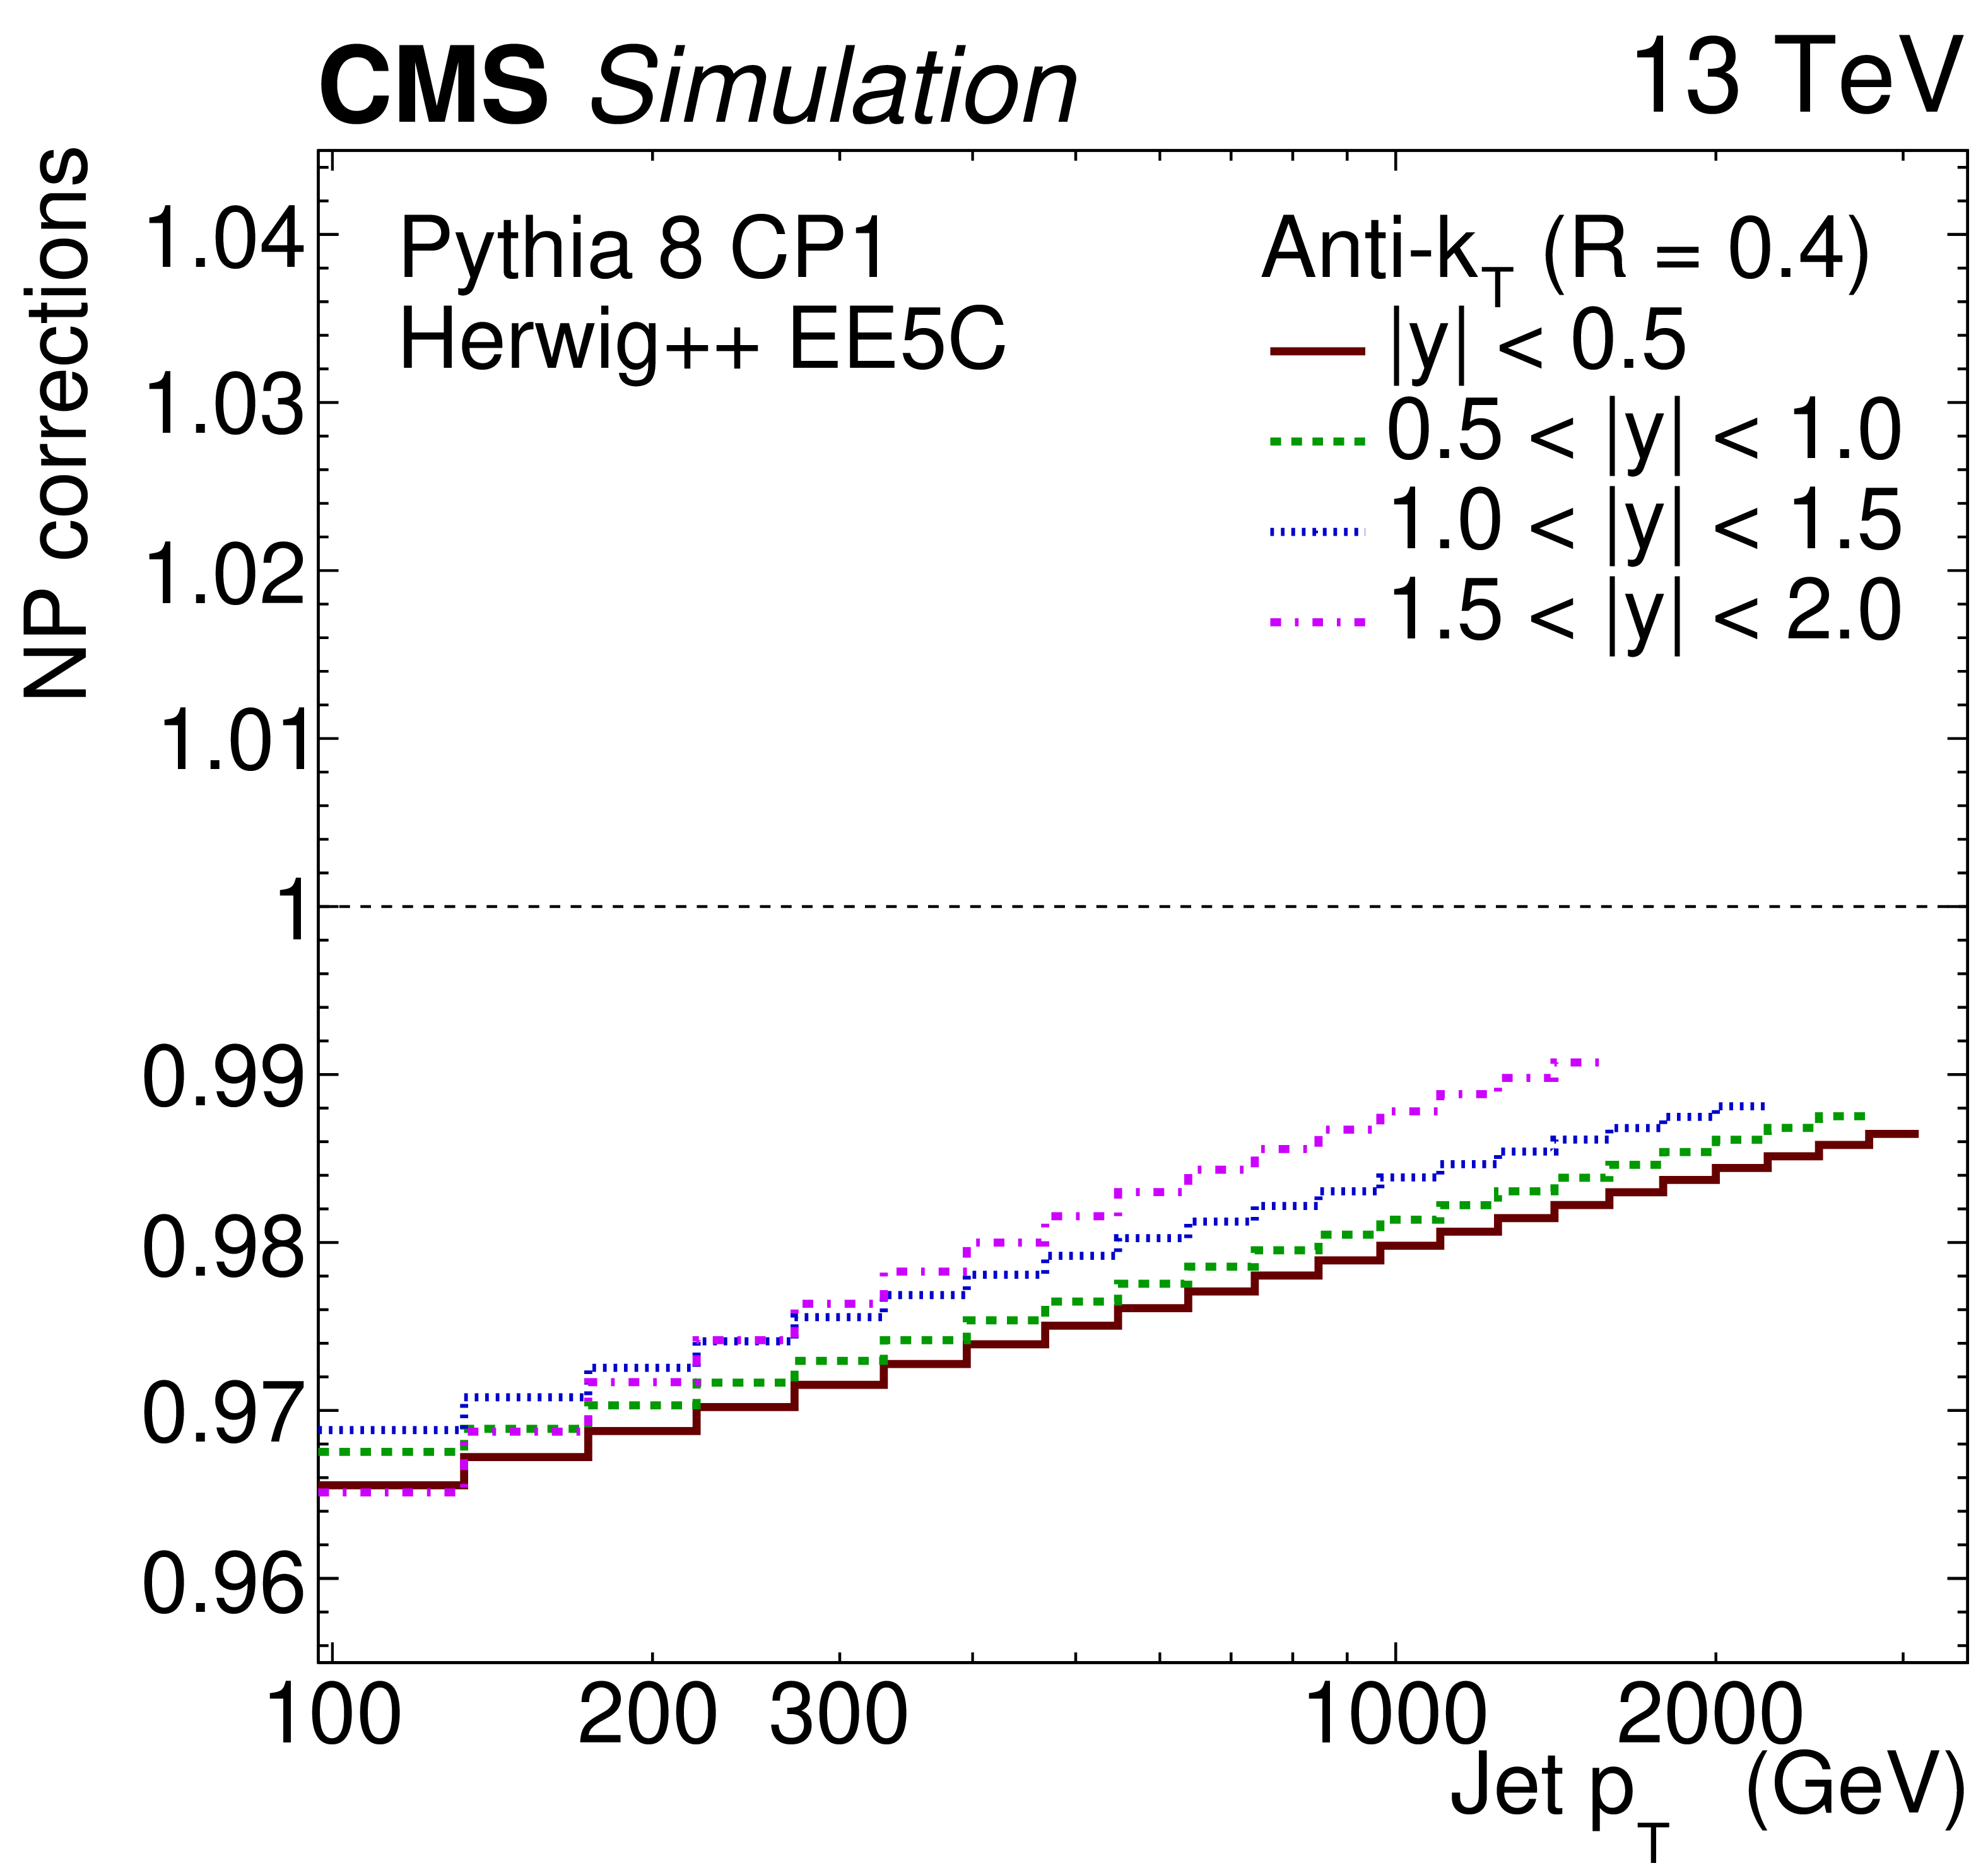
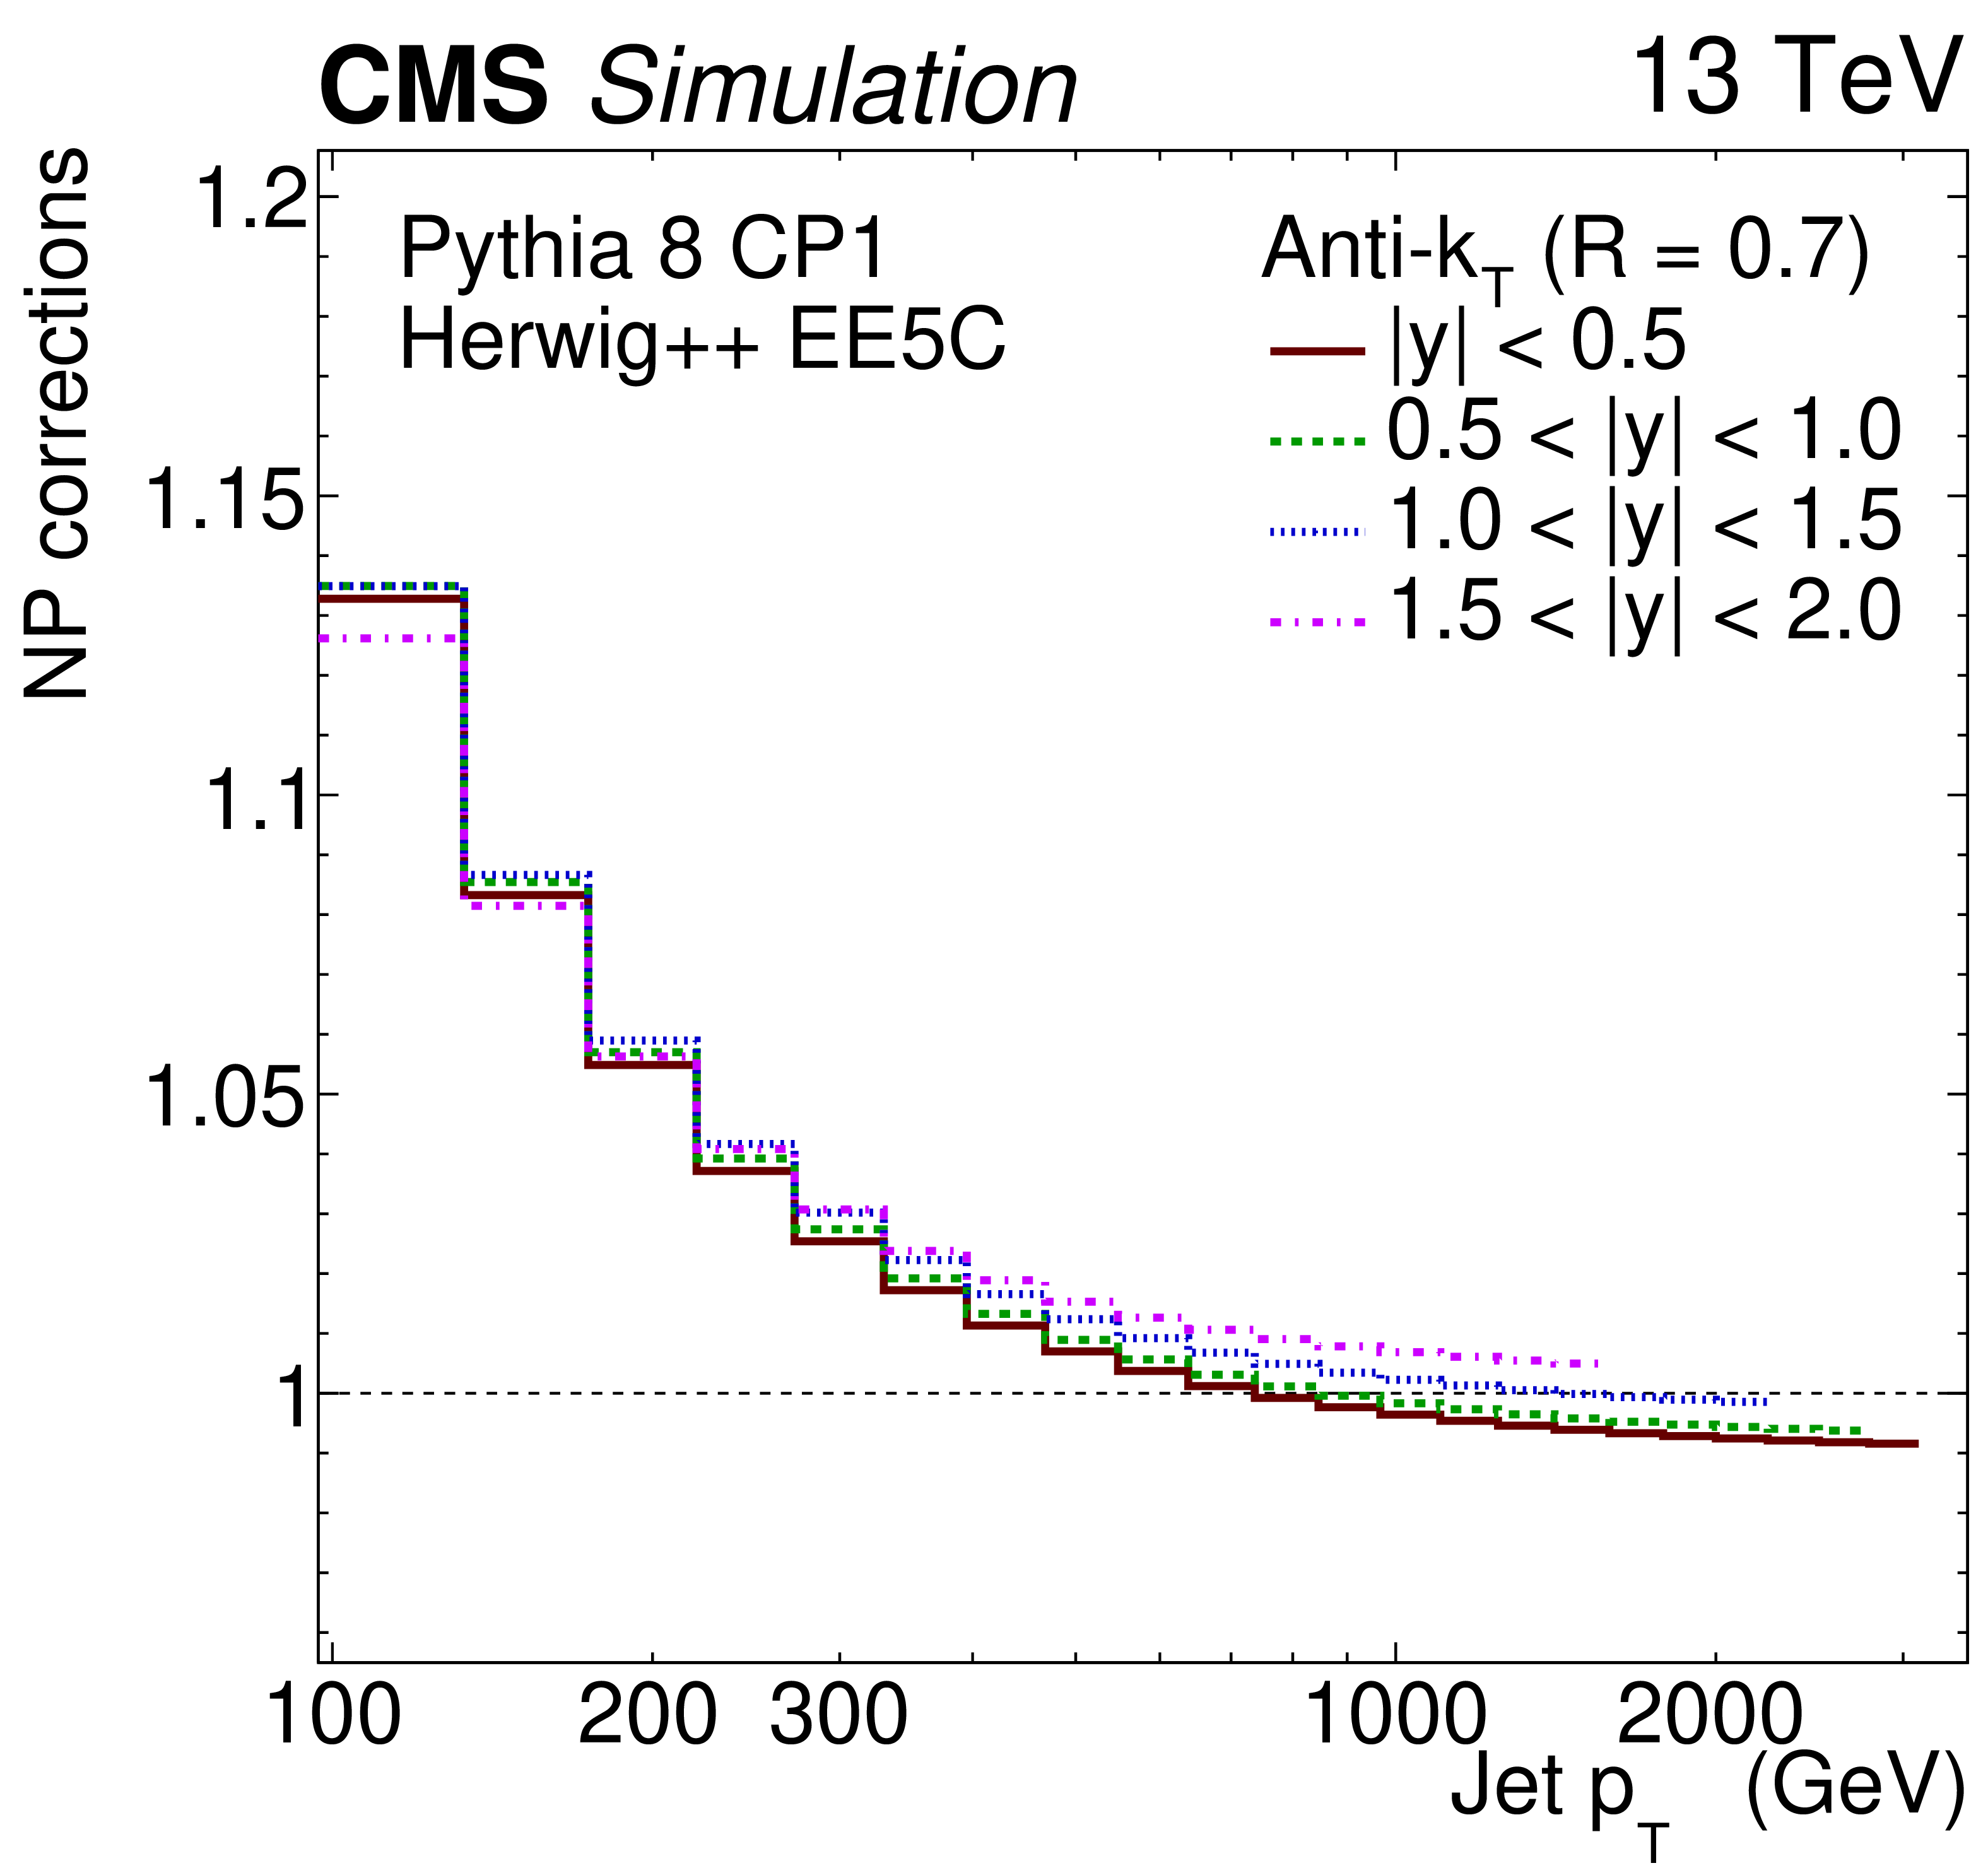
The values for NP corrections for inclusive jet cross sections. The values for jets with $ R= $ 0.4 (0.7) are shown on the left (right); each curve corresponds to a rapidity bin. The values correspond to the average of the corrections obtained with PYTHIA 8 and with HERWIG++. |
png pdf |
Figure 5-a:
The values for NP corrections for inclusive jet cross sections. The values for jets with $ R= $ 0.4 are shown; each curve corresponds to a rapidity bin. The values correspond to the average of the corrections obtained with PYTHIA 8 and with HERWIG++. |
png pdf |
Figure 5-b:
The values for NP corrections for inclusive jet cross sections. The values for jets with $ R= $ 0.7 are shown; each curve corresponds to a rapidity bin. The values correspond to the average of the corrections obtained with PYTHIA 8 and with HERWIG++. |
png pdf |
Figure 6:
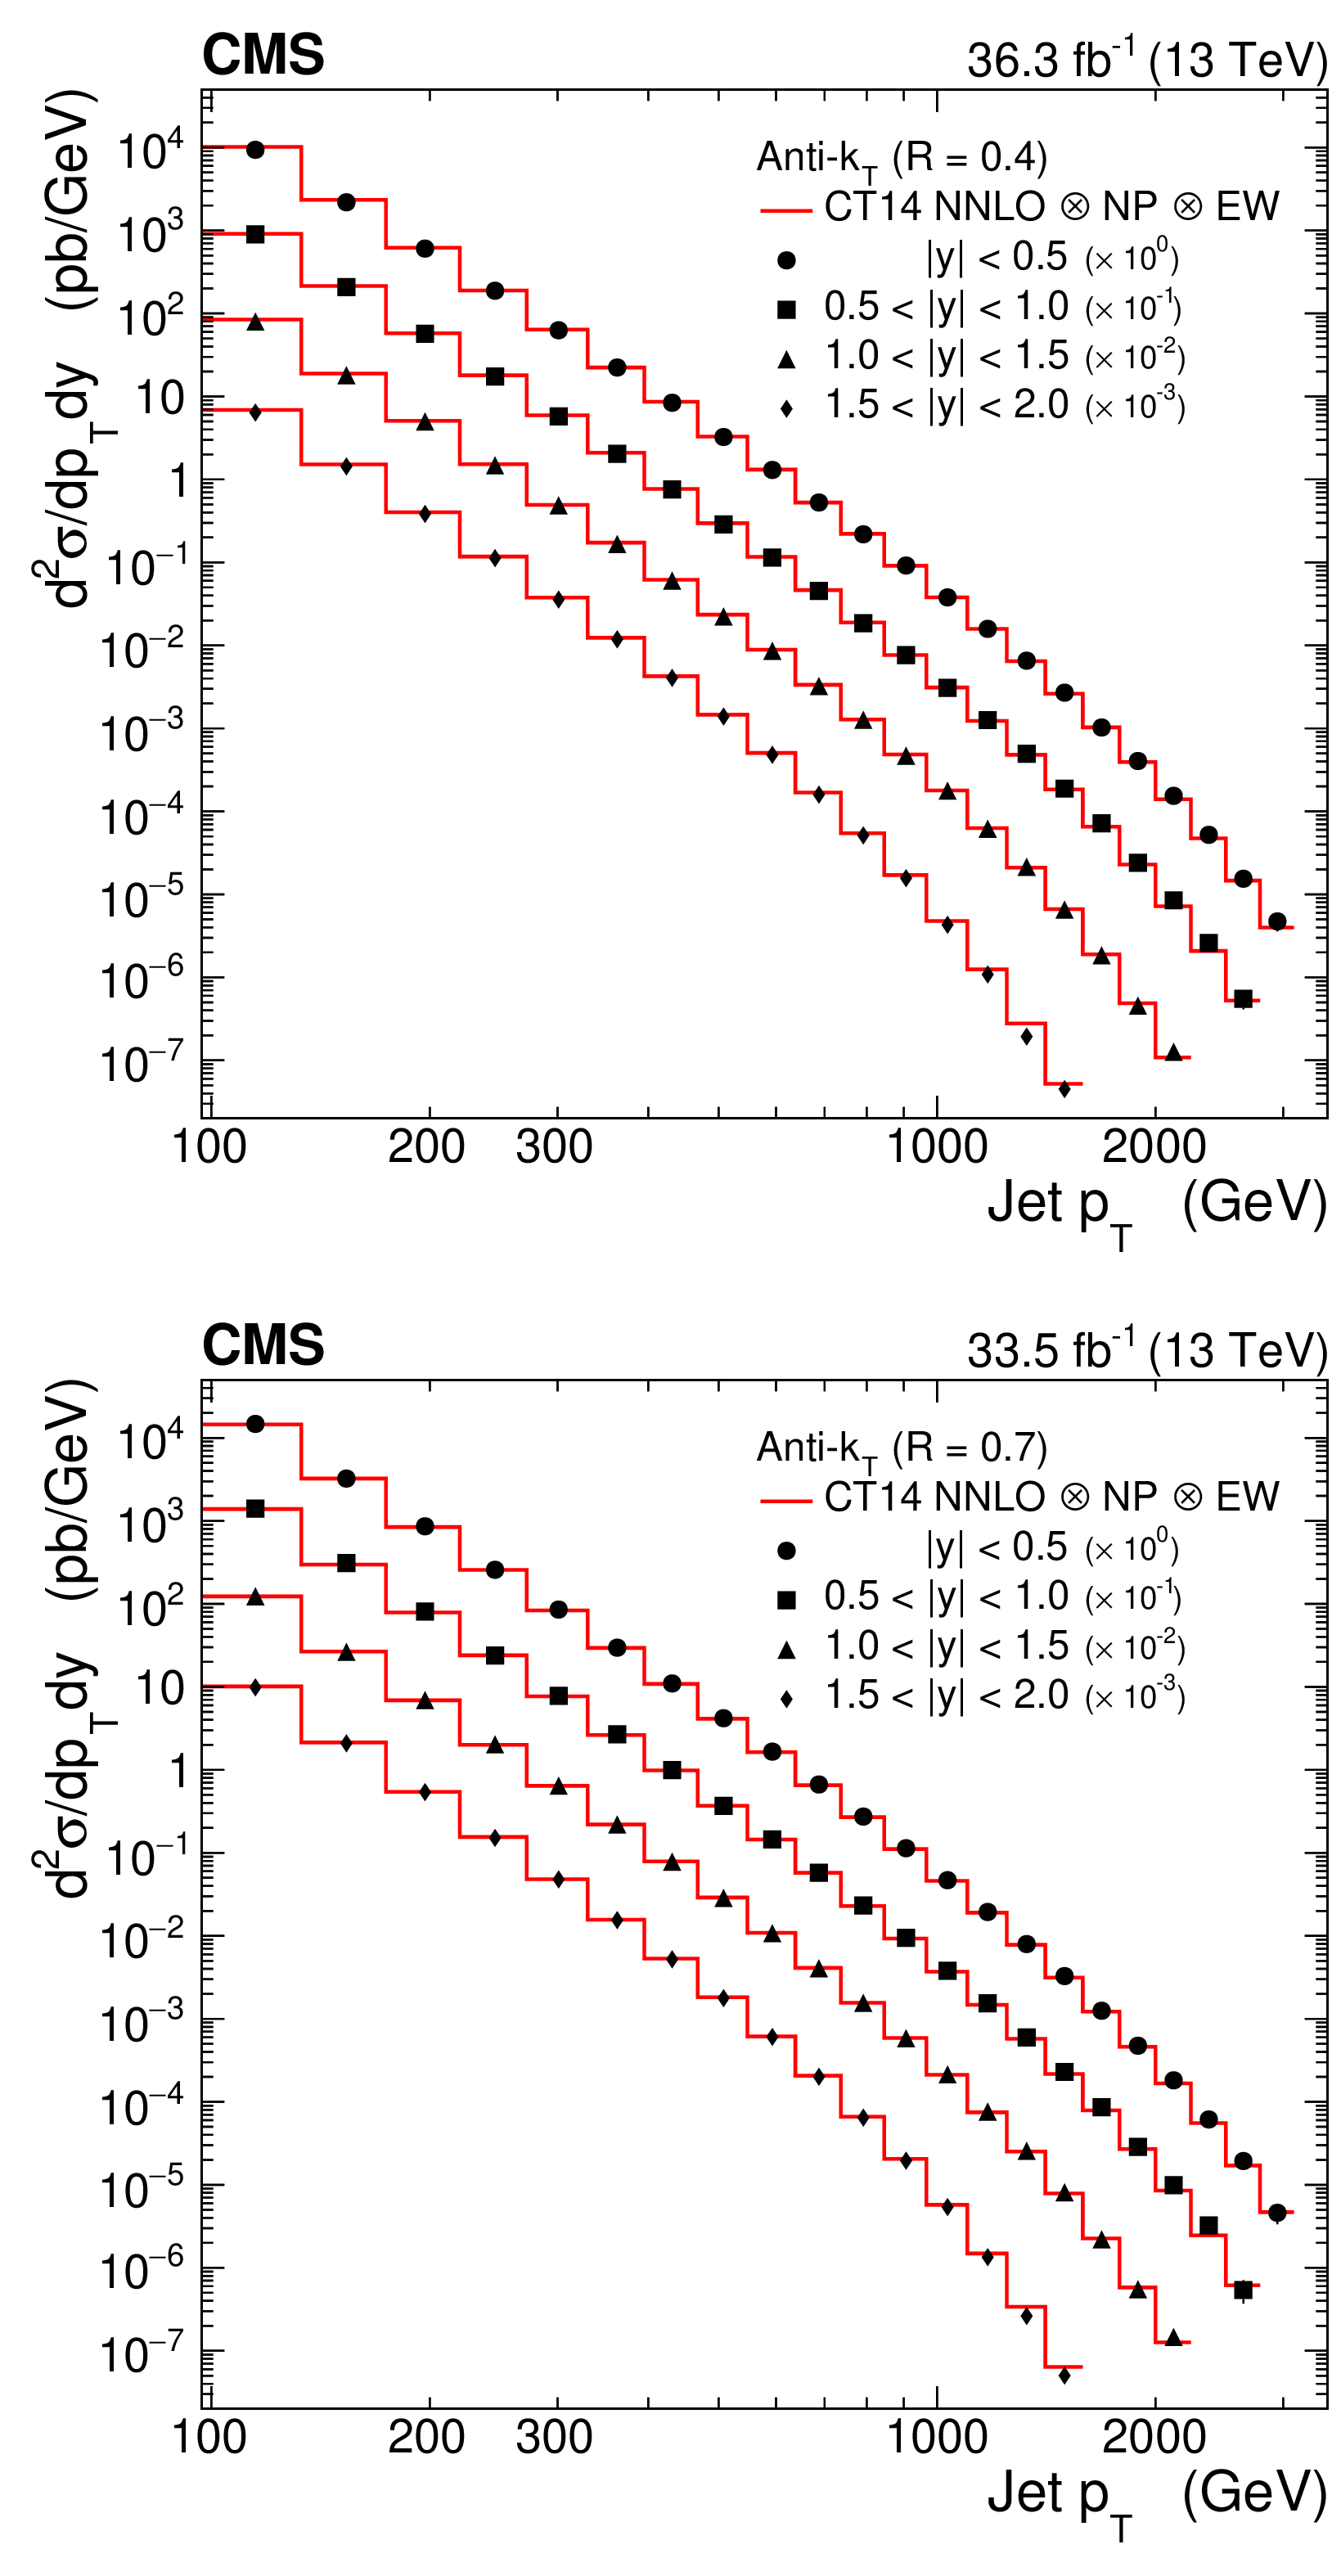
The inclusive jet production cross sections as a function of the jet transverse momentum $ p_{\mathrm{T}} $ measured in intervals of the absolute rapidity $ |y| $. The cross section obtained for jets clustered using the anti-$ k_{\mathrm{T}} $ algorithm with $ R= $ 0.4 (0.7) is shown on the upper (lower) plot. The results in different $ |y| $ intervals are scaled by a constant factor for presentation purpose. The data in different $ |y| $ intervals are shown by markers of different style. The statistical uncertainties are too small to be visible; the systematic uncertainties are not shown. The measurements are compared with fixed-order NNLO QCD predictions (solid line) using CT14nnlo PDF and corrected for EW and NP effects. |

png pdf |
Figure 6-a:
The inclusive jet production cross sections as a function of the jet transverse momentum $ p_{\mathrm{T}} $ measured in intervals of the absolute rapidity $ |y| $. The cross section obtained for jets clustered using the anti-$ k_{\mathrm{T}} $ algorithm with $ R= $ 0.4 is shown. The results in different $ |y| $ intervals are scaled by a constant factor for presentation purpose. The data in different $ |y| $ intervals are shown by markers of different style. The statistical uncertainties are too small to be visible; the systematic uncertainties are not shown. The measurements are compared with fixed-order NNLO QCD predictions (solid line) using CT14nnlo PDF and corrected for EW and NP effects. |

png pdf |
Figure 6-b:
The inclusive jet production cross sections as a function of the jet transverse momentum $ p_{\mathrm{T}} $ measured in intervals of the absolute rapidity $ |y| $. The cross section obtained for jets clustered using the anti-$ k_{\mathrm{T}} $ algorithm with $ R= $ 0.7 is shown. The results in different $ |y| $ intervals are scaled by a constant factor for presentation purpose. The data in different $ |y| $ intervals are shown by markers of different style. The statistical uncertainties are too small to be visible; the systematic uncertainties are not shown. The measurements are compared with fixed-order NNLO QCD predictions (solid line) using CT14nnlo PDF and corrected for EW and NP effects. |
png pdf |
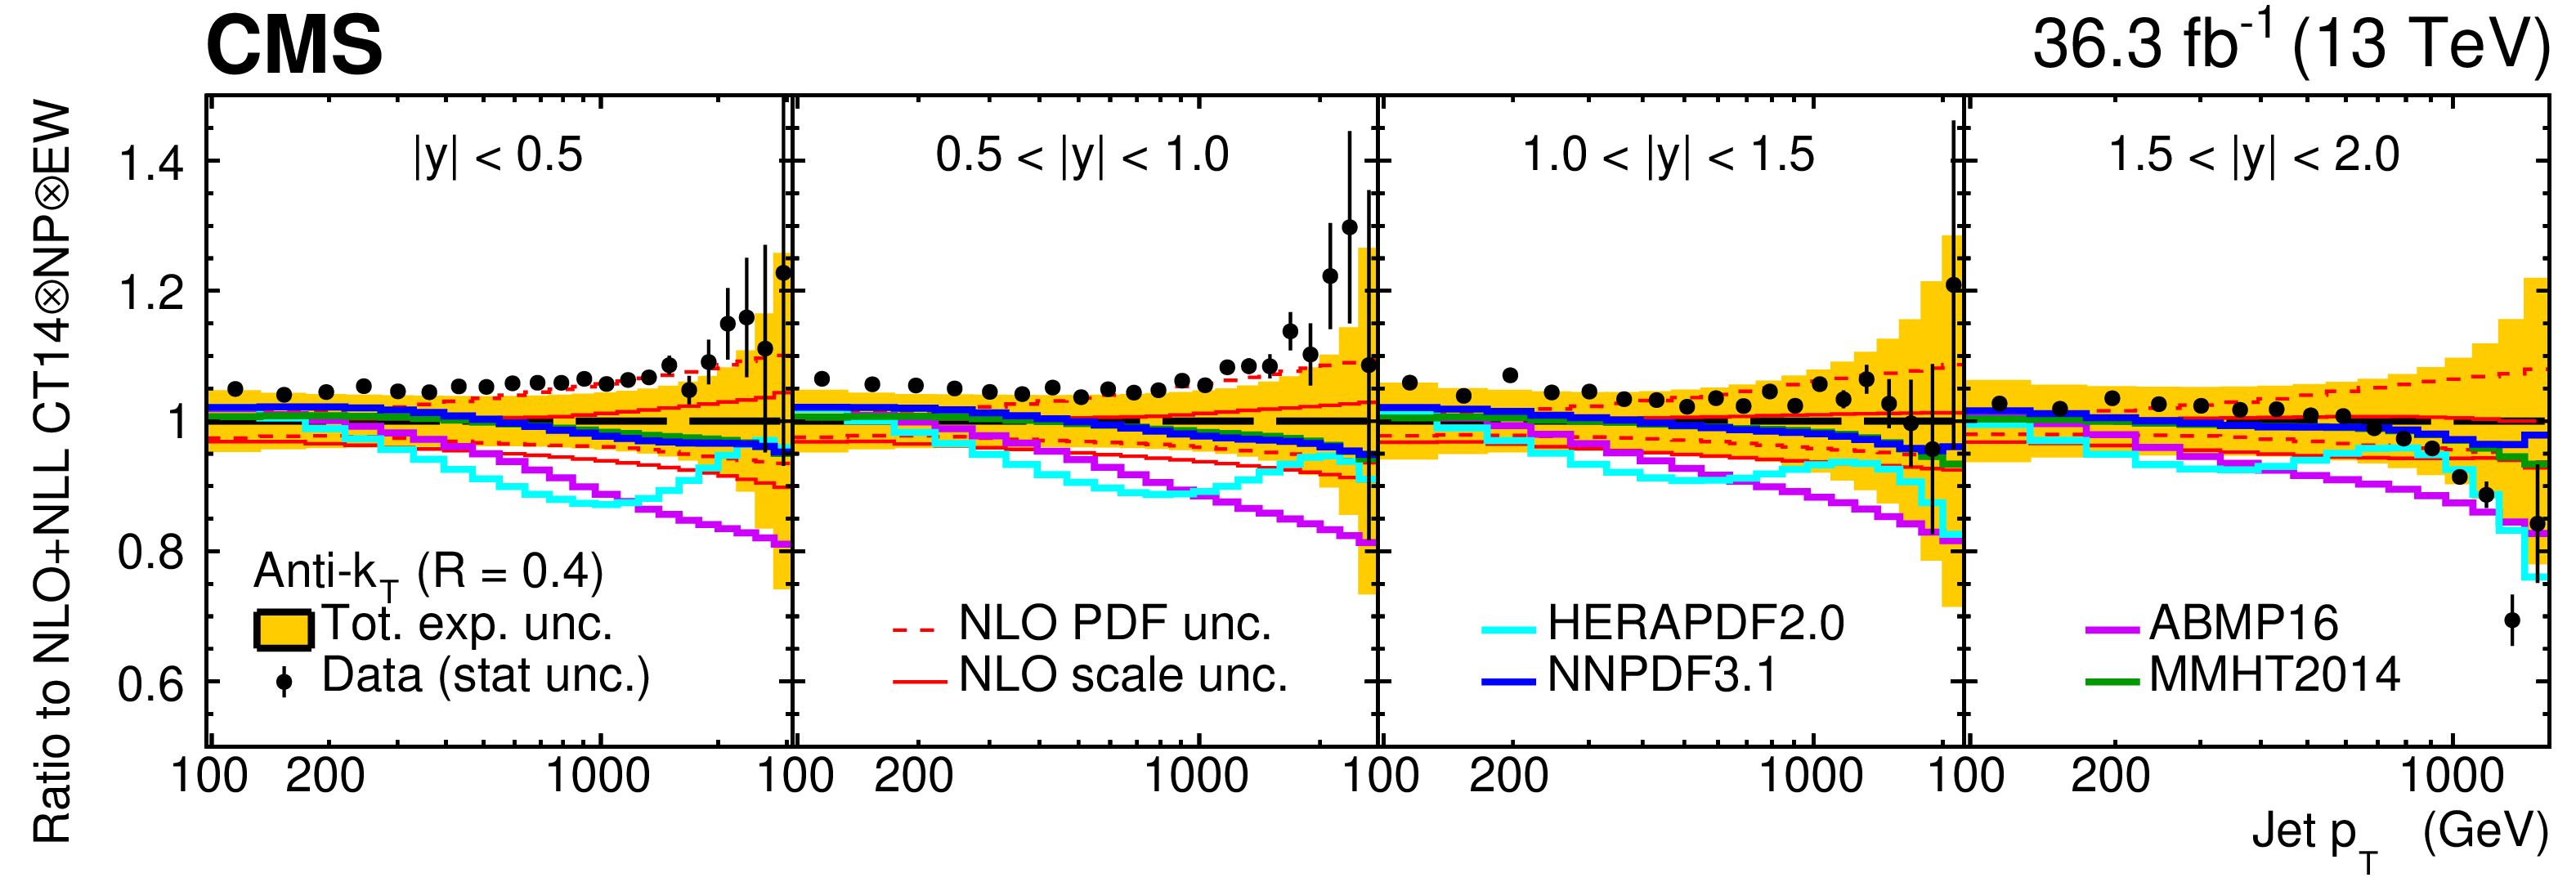
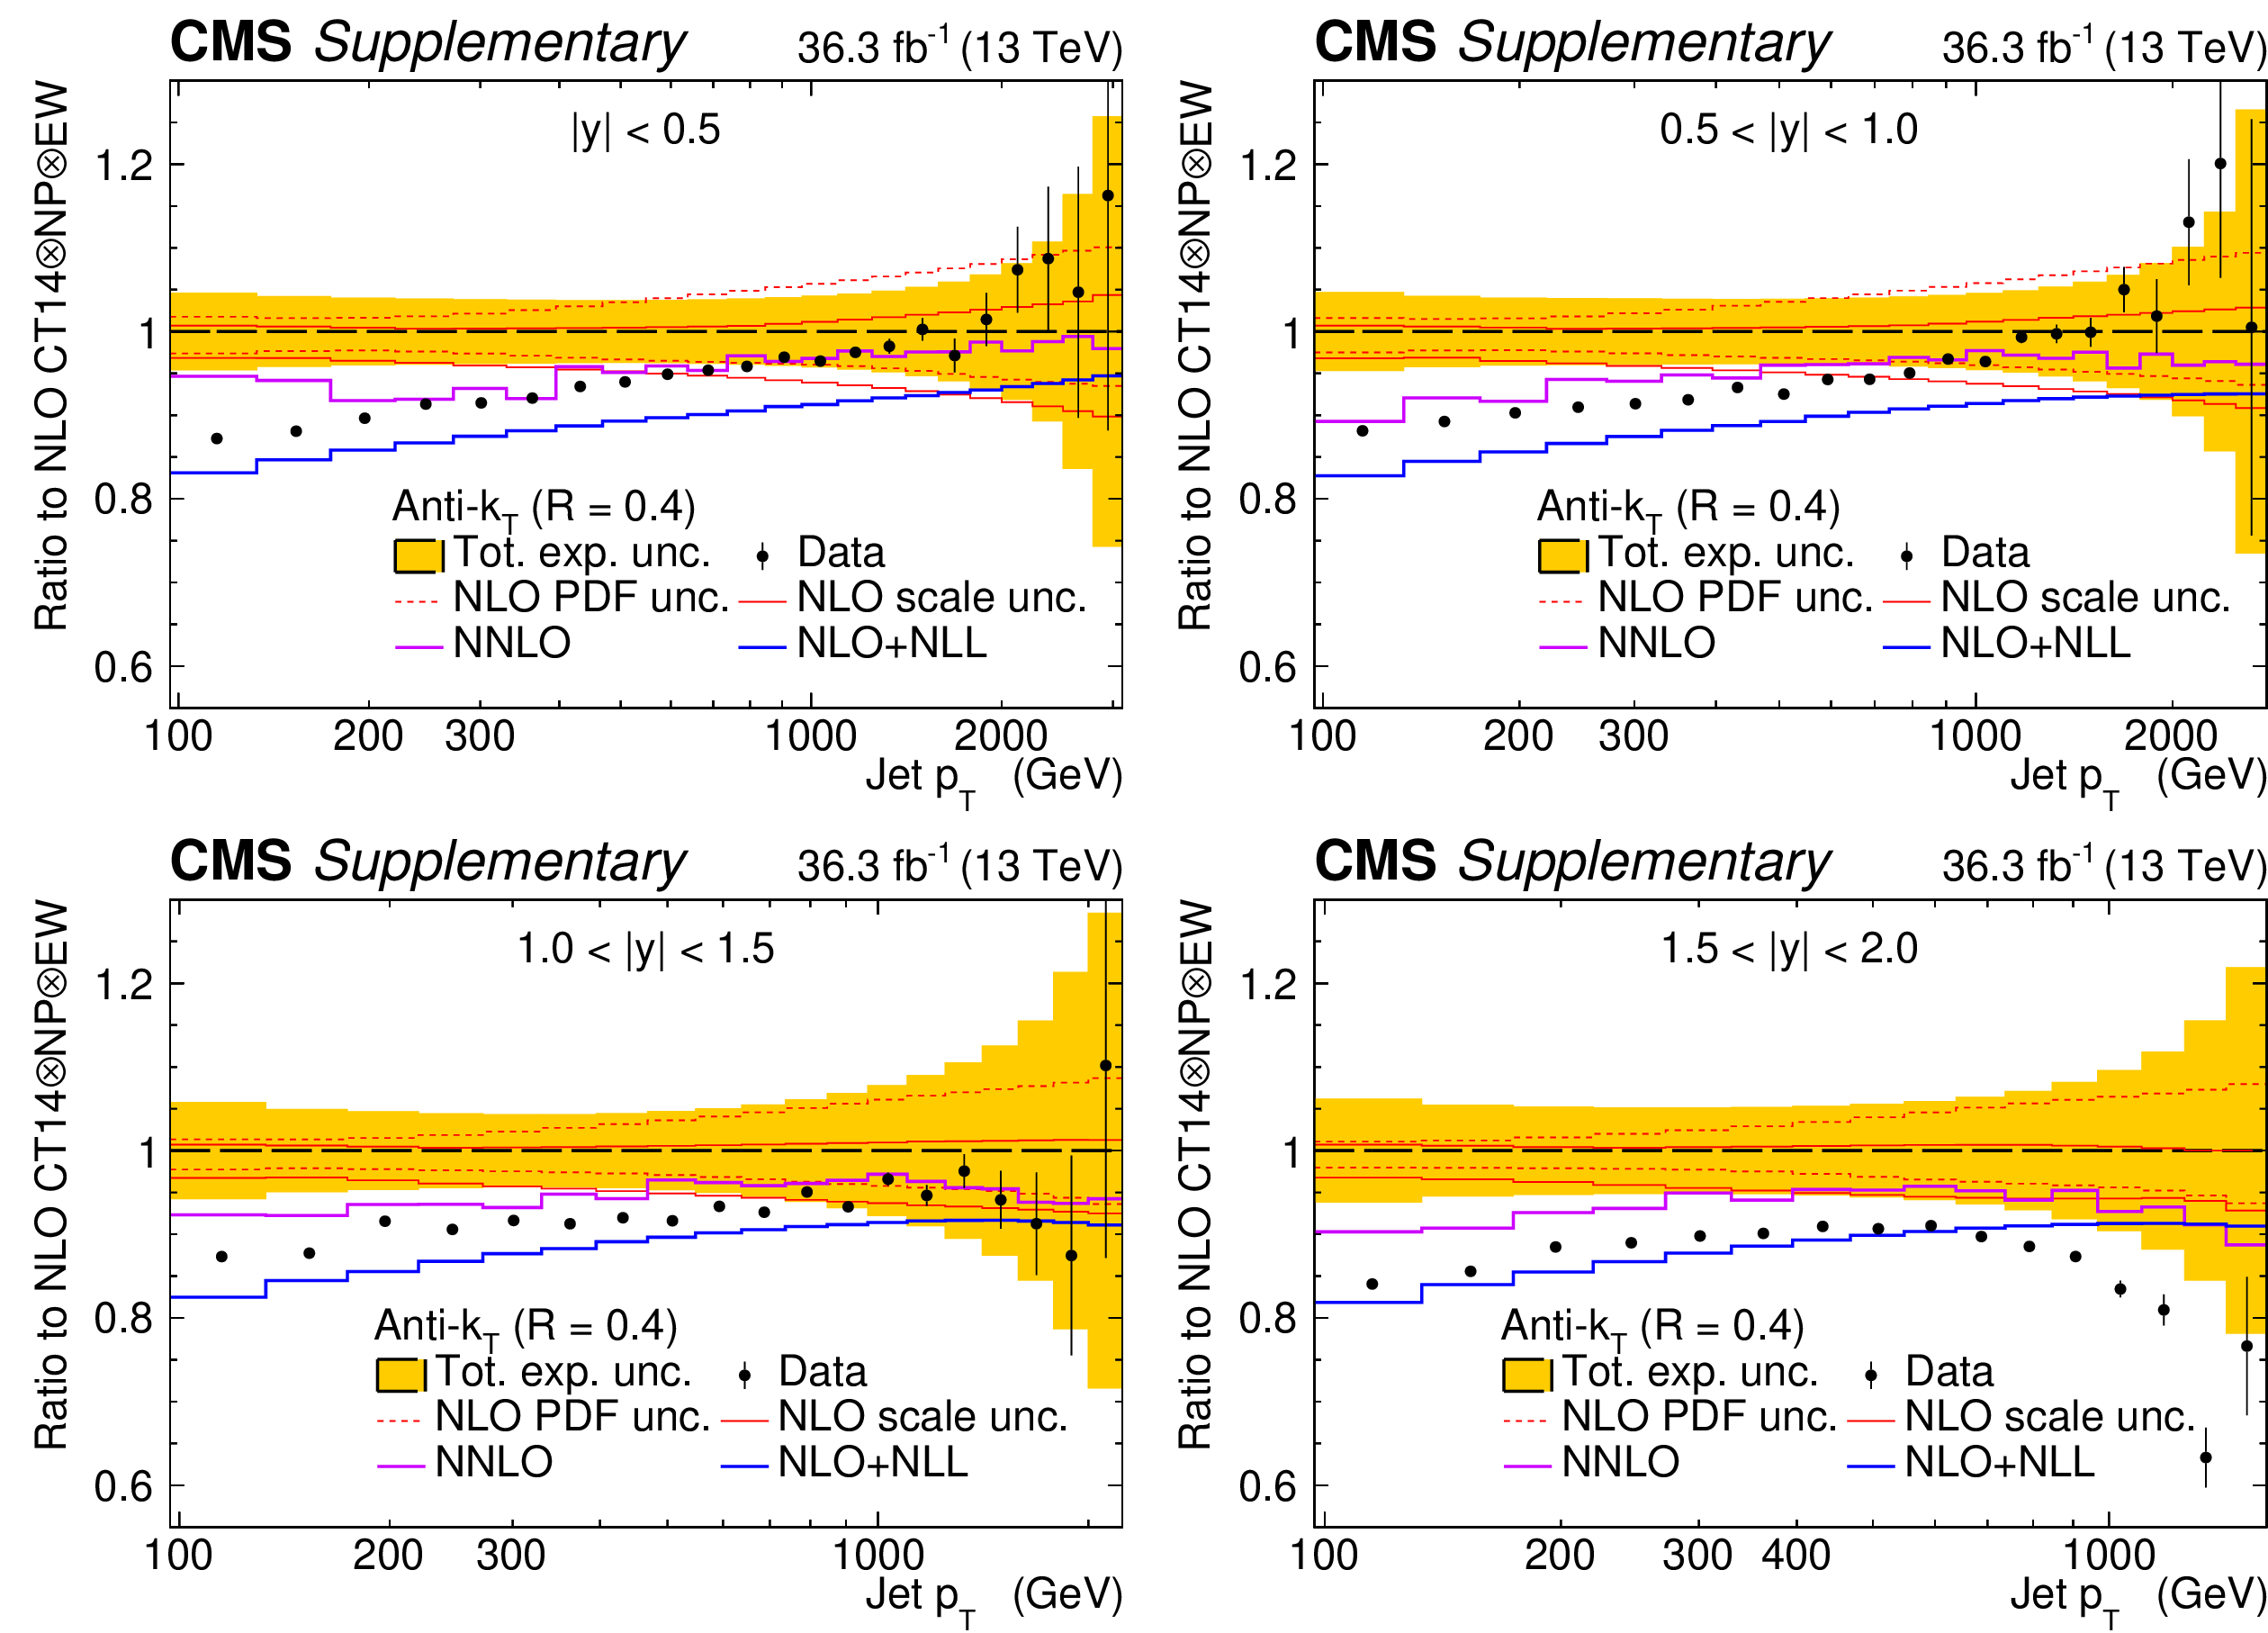
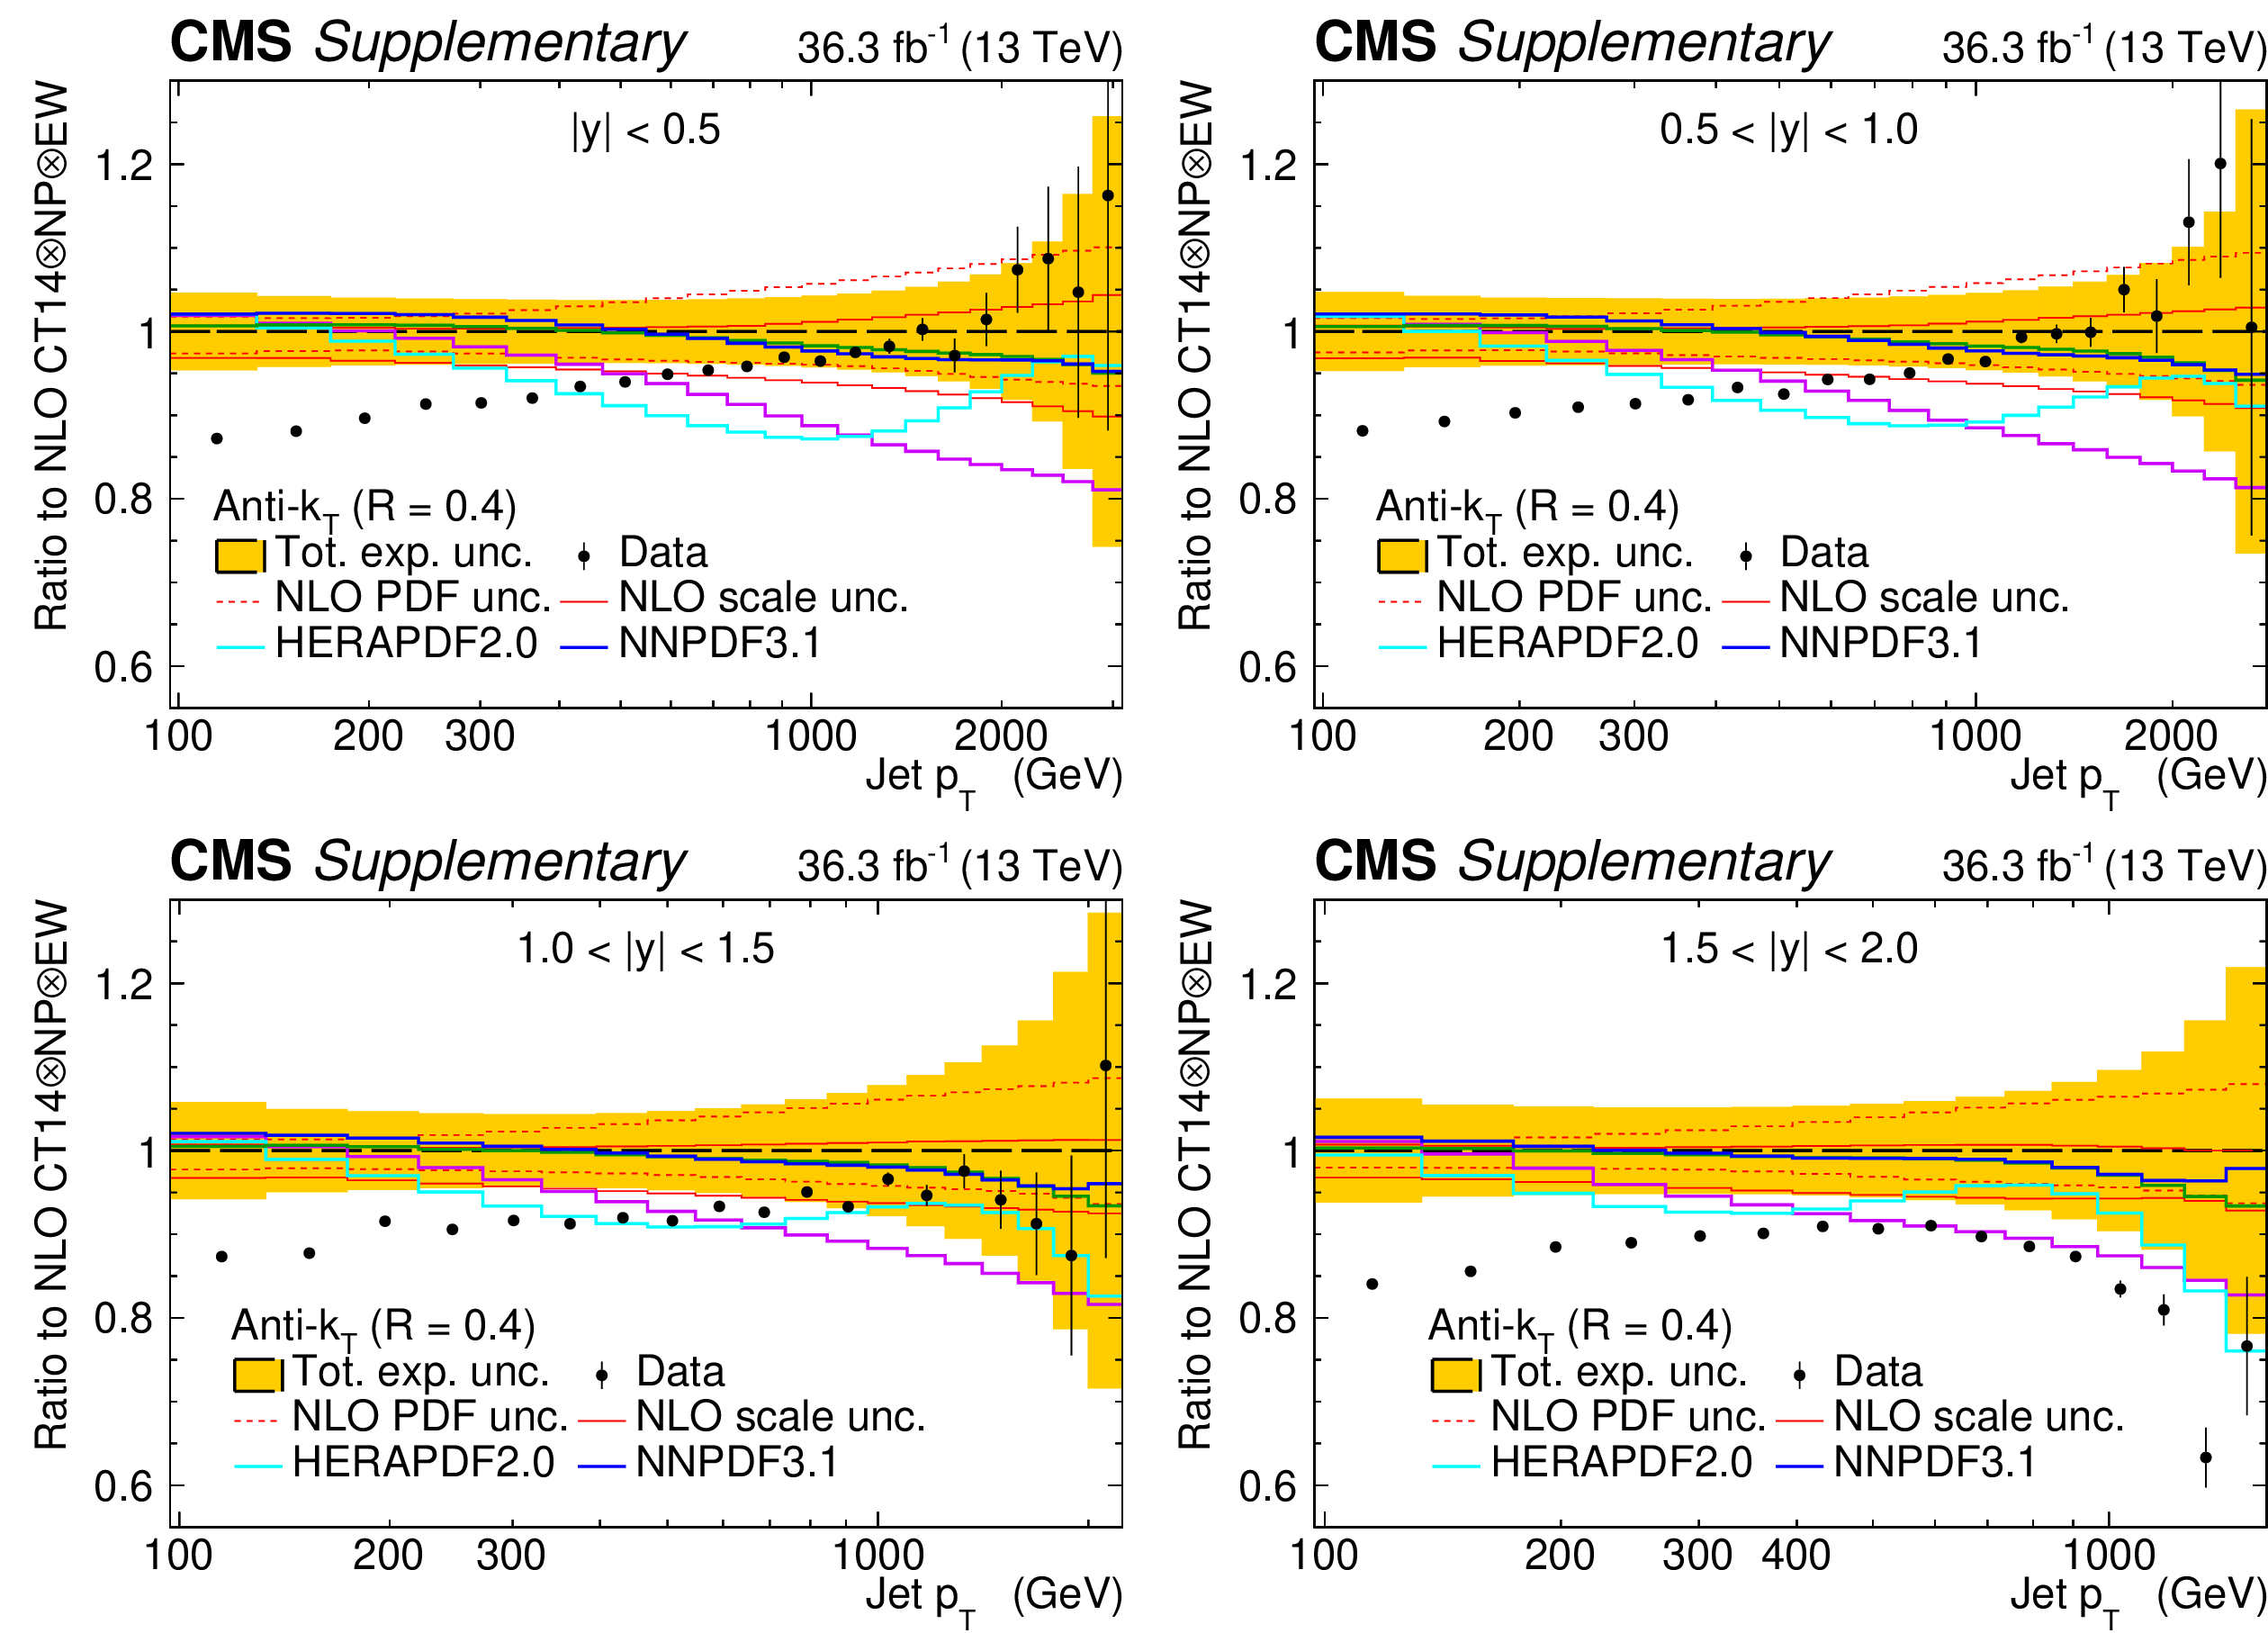
Figure 7:
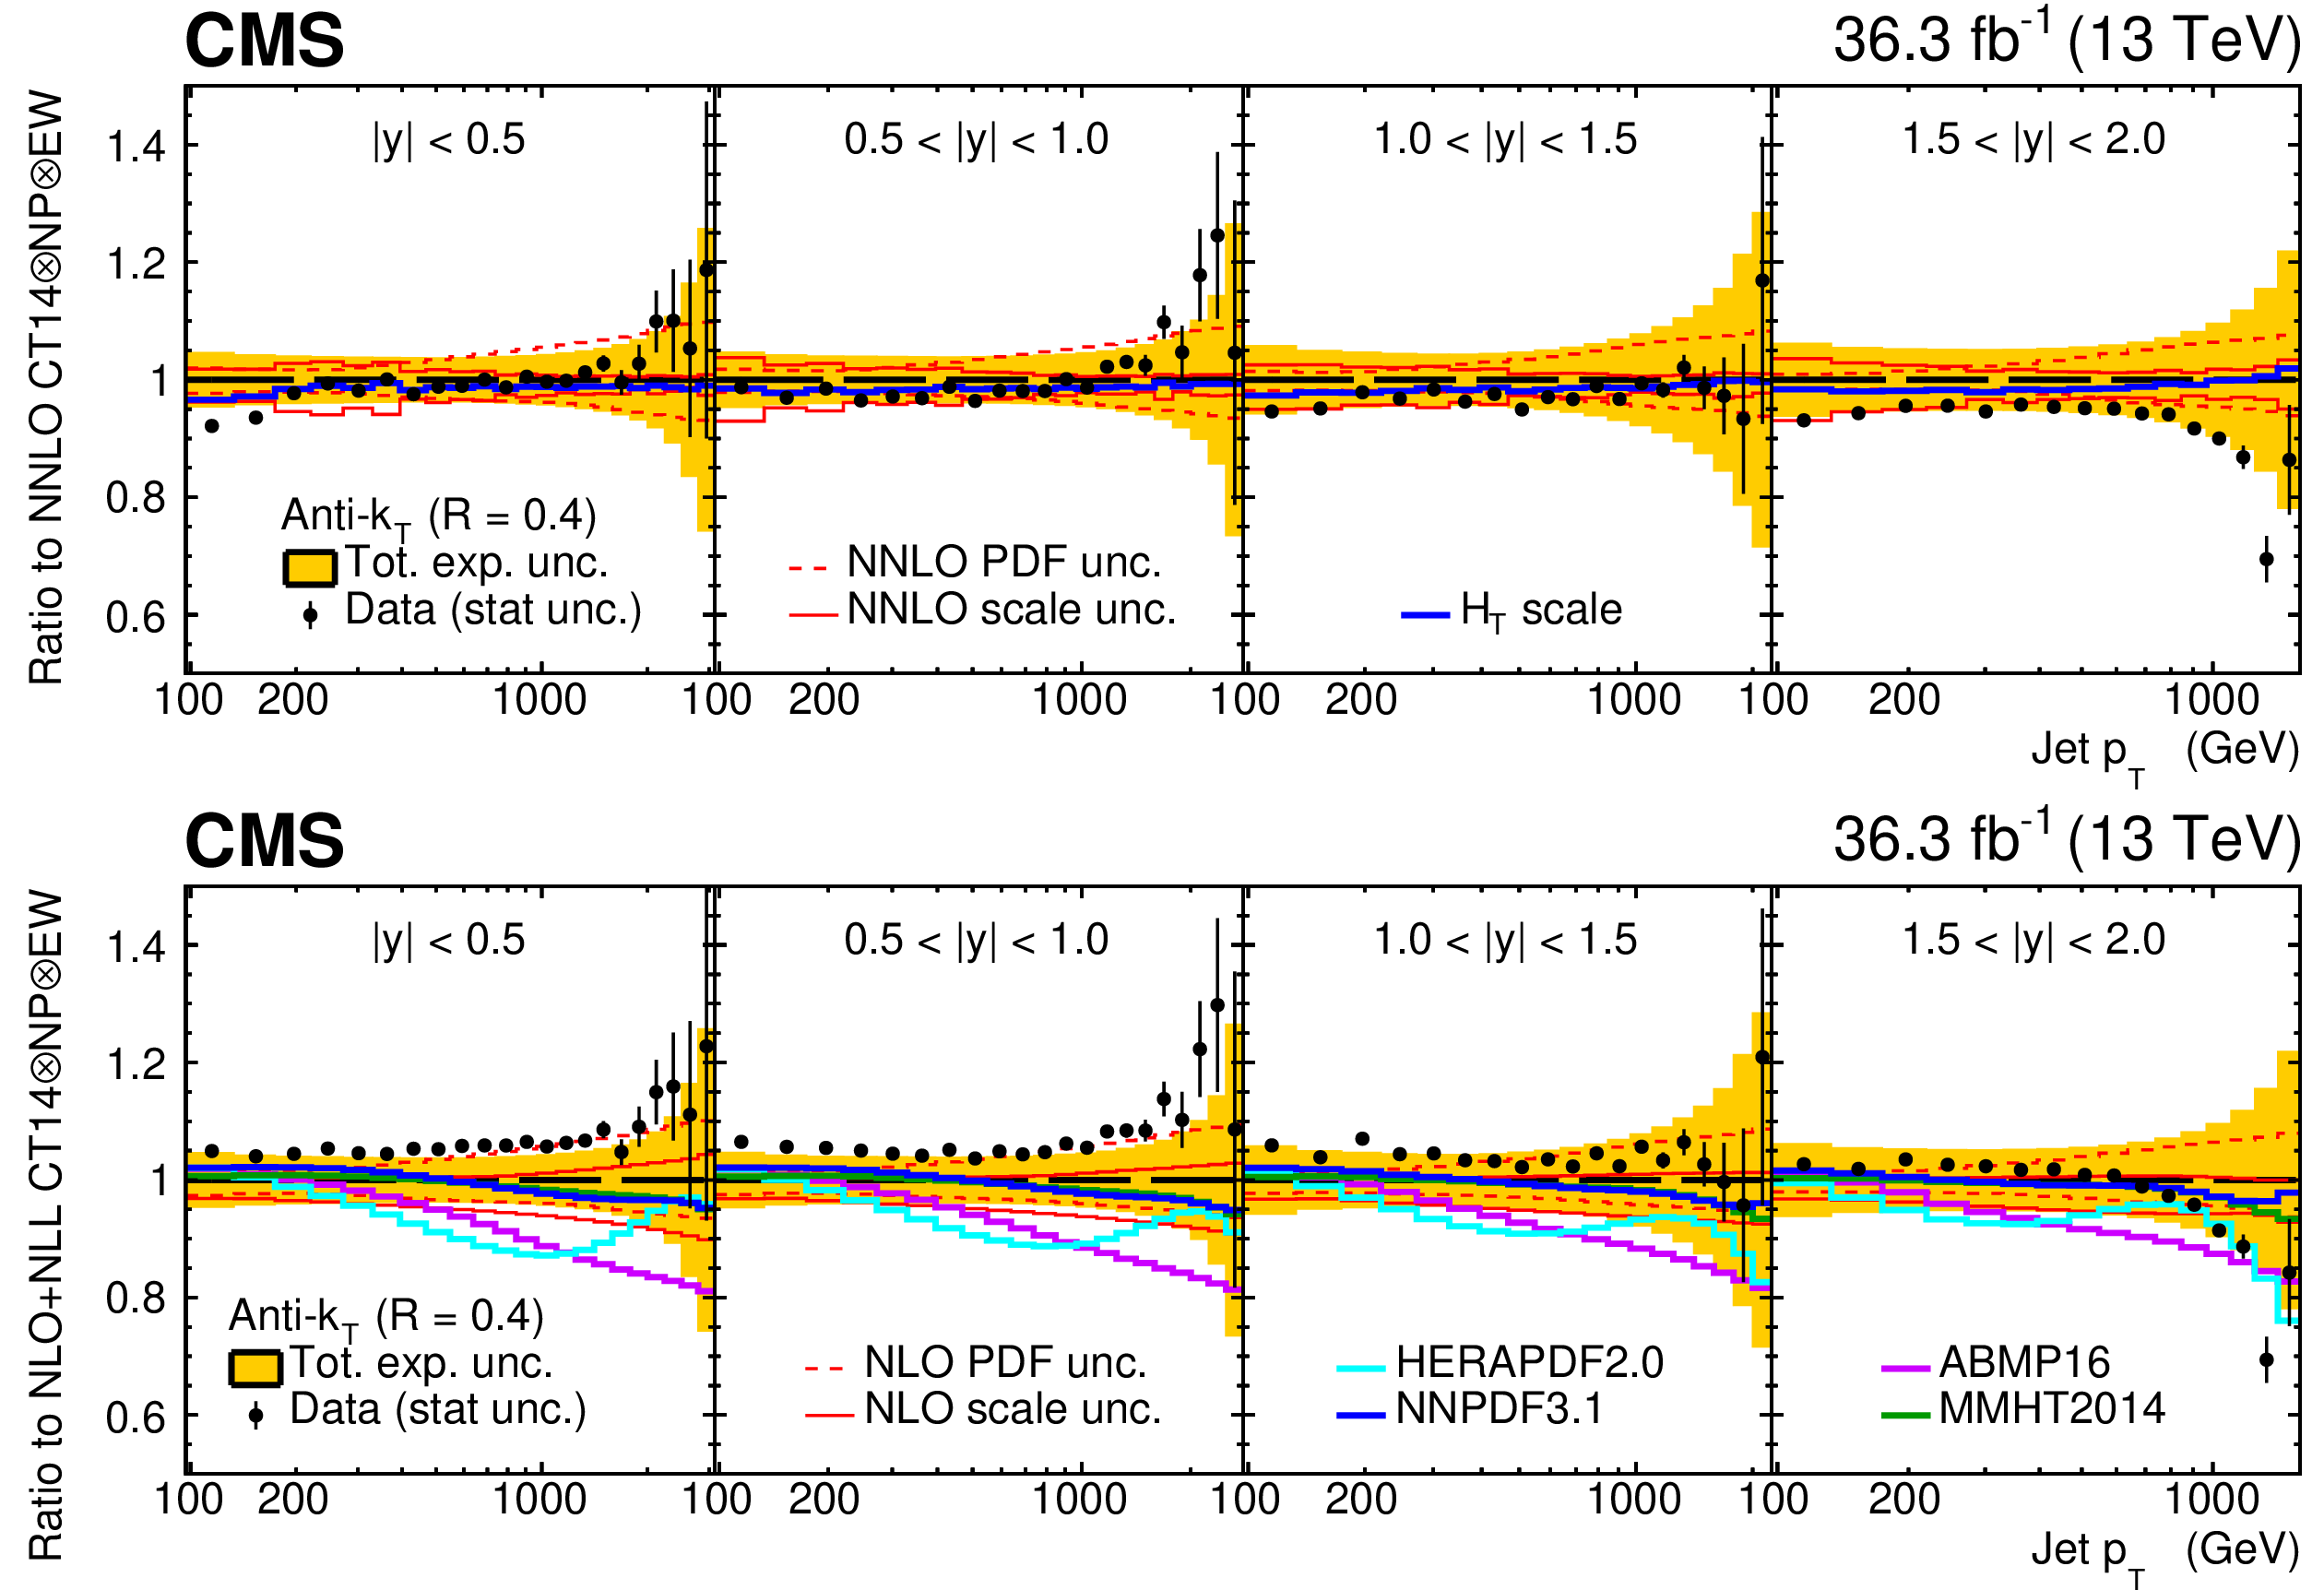
The double-differential cross section of inclusive jet production, as a function of $ p_{\mathrm{T}} $ and $ |y| $, for jets clustered using the anti-$ k_{\mathrm{T}} $ algorithm with $ R= $ 0.4, presented as ratios to the QCD predictions. The data points are shown by filled circles, with statistic uncertainties shown by vertical error bars, while the total experimental uncertainty is centred at one and is presented by the orange band. In the upper panel, the data are divided by the NNLO prediction, corrected for NP and EW effects, using CT14nnlo PDF and with renormalisation and factorisation scales jet $ p_{\mathrm{T}} $ and, alternatively $ H_{\mathrm{T}} $ (blue solid line). In the lower panel, the data are shown as ratio to NLO+NLL prediction, calculated with CT14nlo PDF, and corrected for NP and EW effects. The scale (PDF) uncertainties are shown by red solid (dashed) lines. NLO+NLL predictions obtained with alternative PDF sets are displayed in different colours as a ratio to the central prediction using CT14nlo. |

png pdf |
Figure 7-a:
The double-differential cross section of inclusive jet production, as a function of $ p_{\mathrm{T}} $ and $ |y| $, for jets clustered using the anti-$ k_{\mathrm{T}} $ algorithm with $ R= $ 0.4, presented as ratios to the QCD predictions. The data points are shown by filled circles, with statistic uncertainties shown by vertical error bars, while the total experimental uncertainty is centred at one and is presented by the orange band. The data are divided by the NNLO prediction, corrected for NP and EW effects, using CT14nnlo PDF and with renormalisation and factorisation scales jet $ p_{\mathrm{T}} $ and, alternatively $ H_{\mathrm{T}} $ (blue solid line). |
png pdf |
Figure 7-b:
The double-differential cross section of inclusive jet production, as a function of $ p_{\mathrm{T}} $ and $ |y| $, for jets clustered using the anti-$ k_{\mathrm{T}} $ algorithm with $ R= $ 0.4, presented as ratios to the QCD predictions. The data points are shown by filled circles, with statistic uncertainties shown by vertical error bars, while the total experimental uncertainty is centred at one and is presented by the orange band. The data are shown as ratio to NLO+NLL prediction, calculated with CT14nlo PDF, and corrected for NP and EW effects. The scale (PDF) uncertainties are shown by red solid (dashed) lines. NLO+NLL predictions obtained with alternative PDF sets are displayed in different colours as a ratio to the central prediction using CT14nlo. |
png pdf |
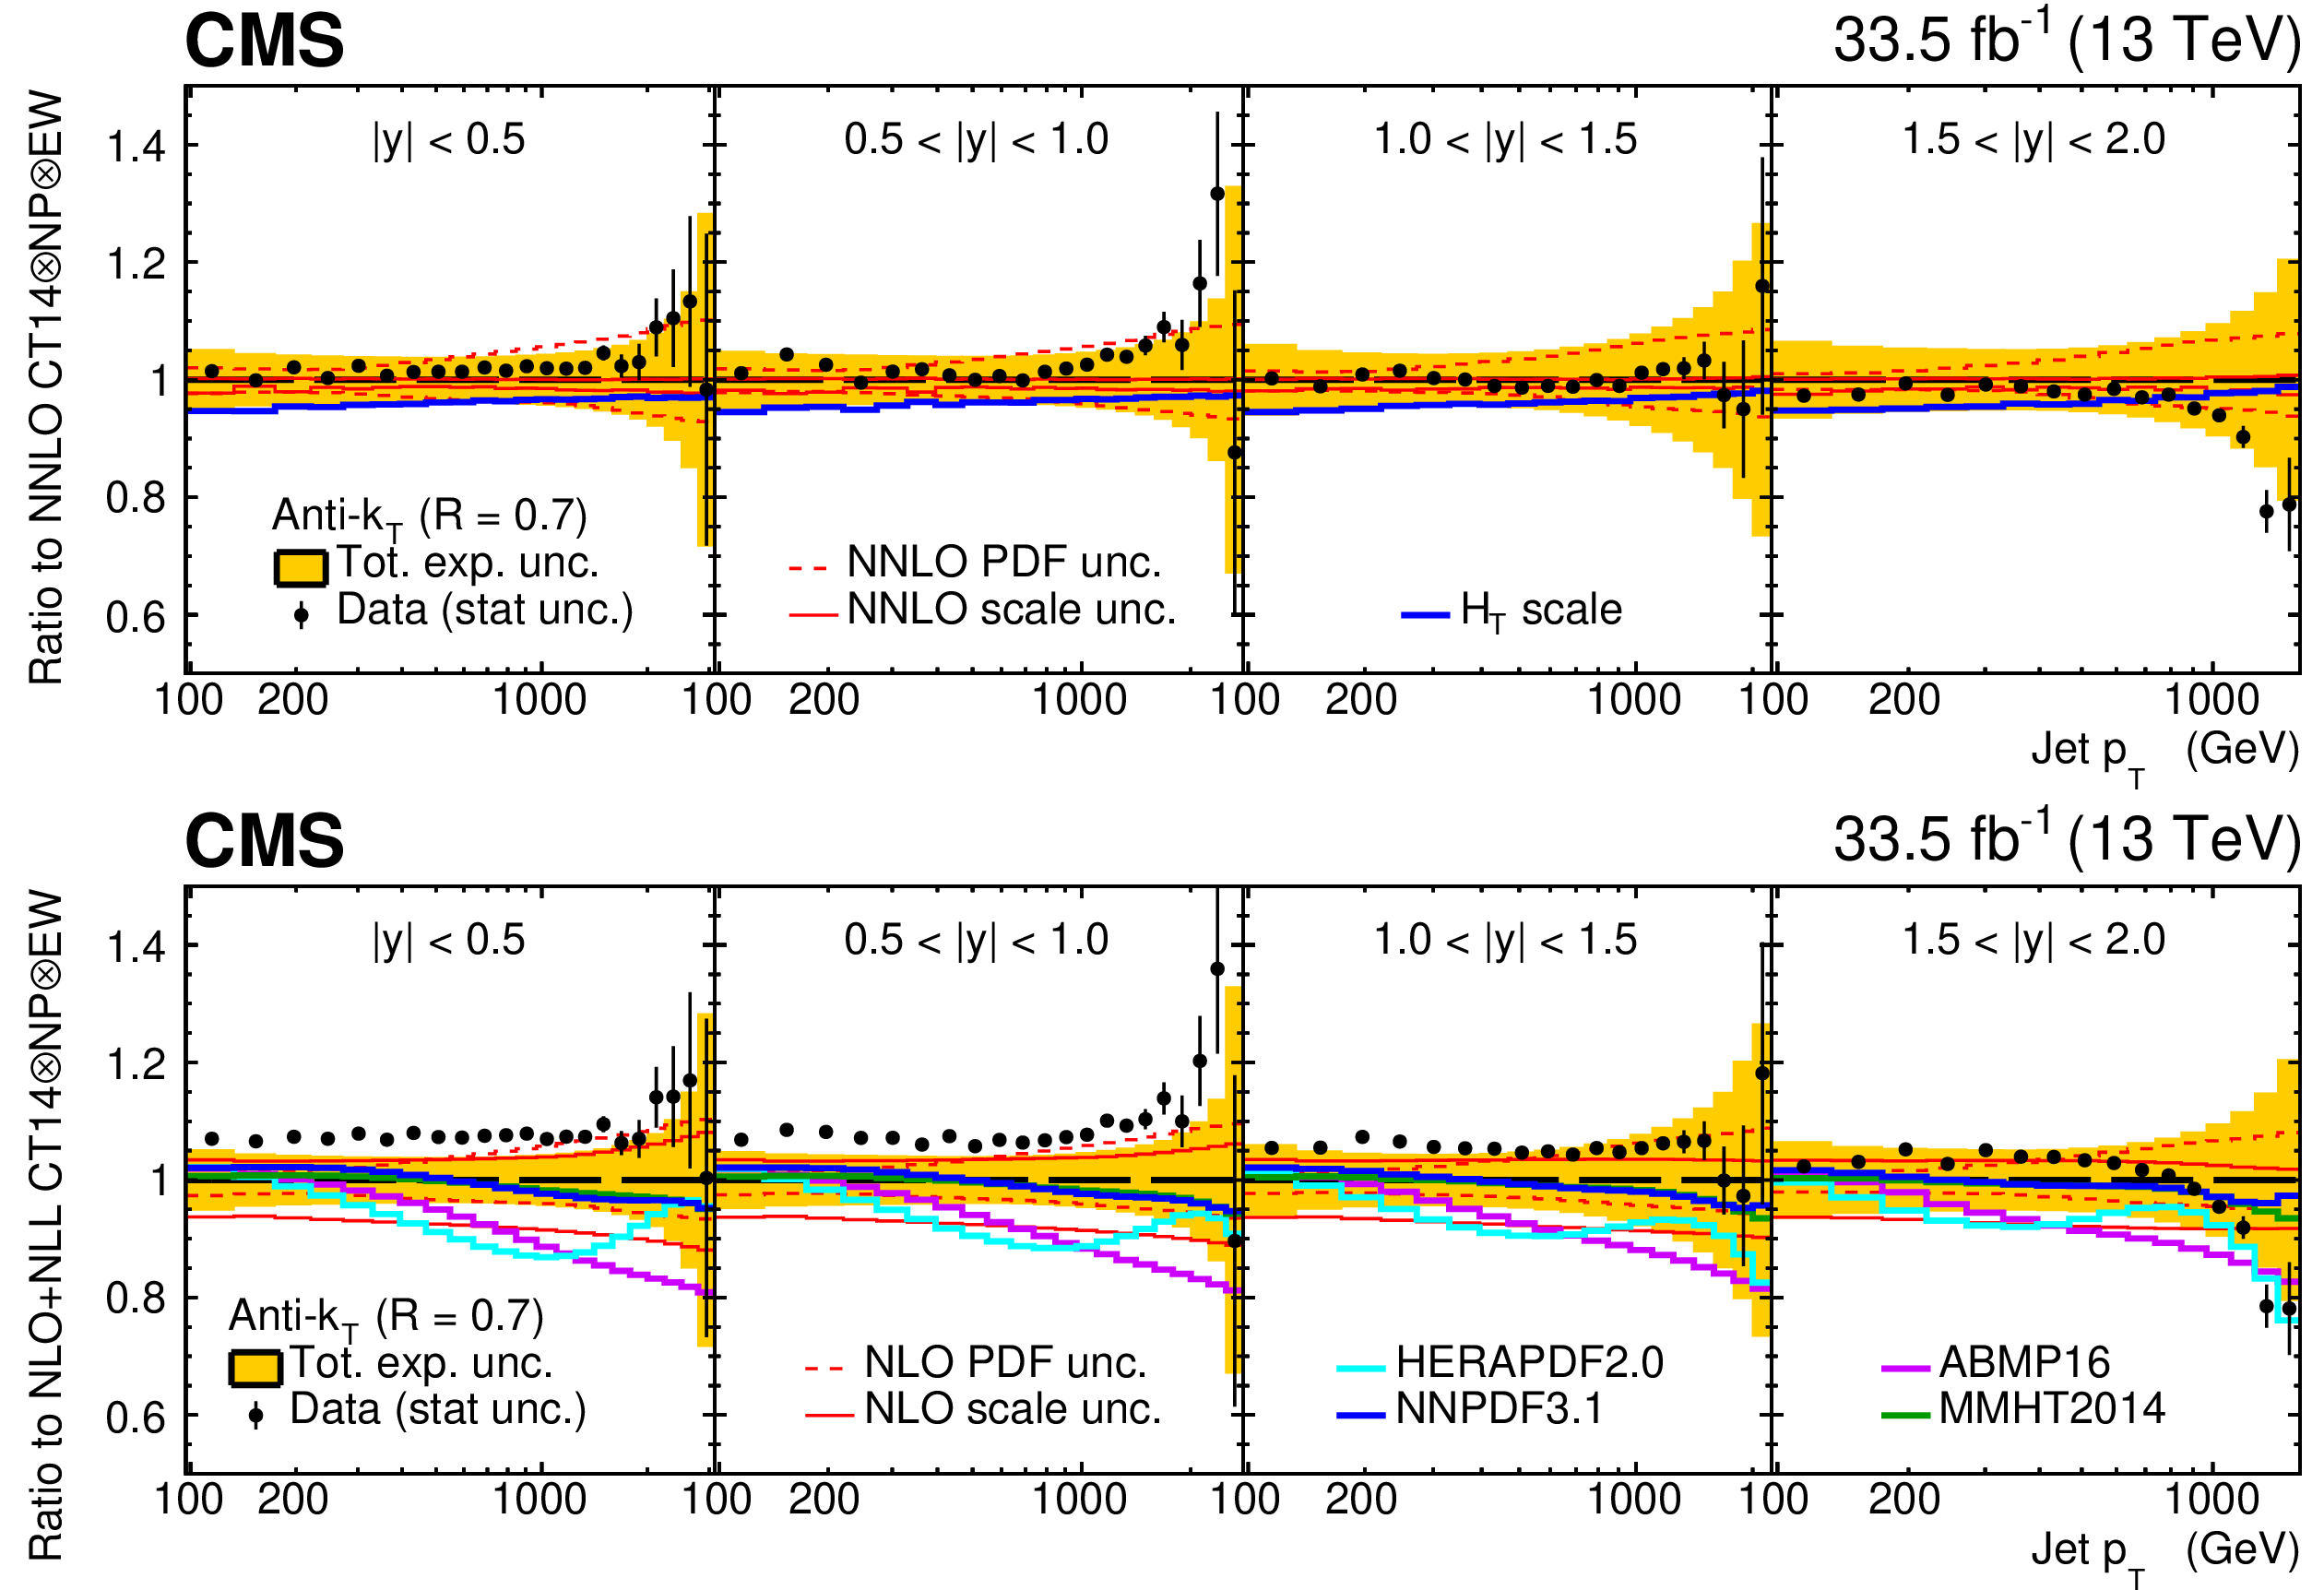
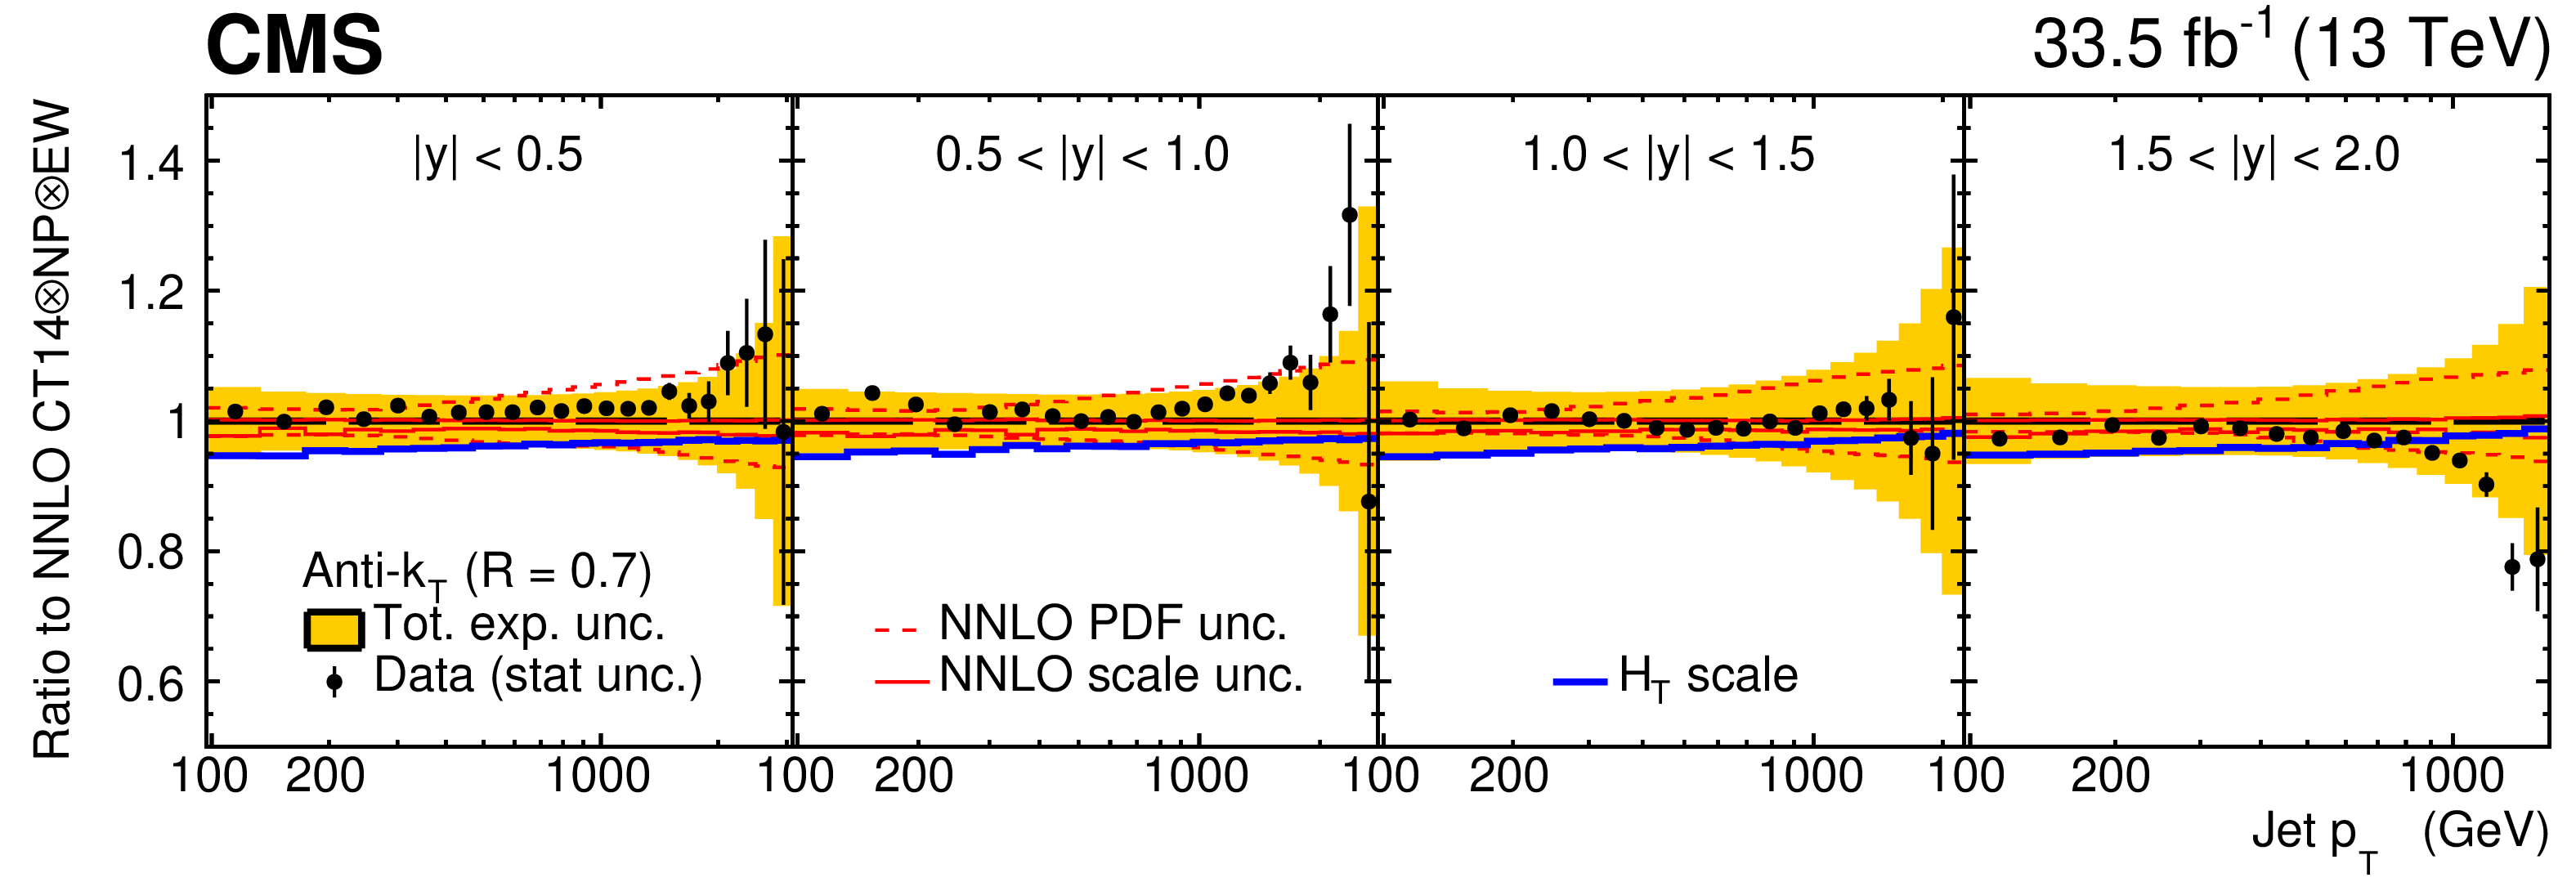
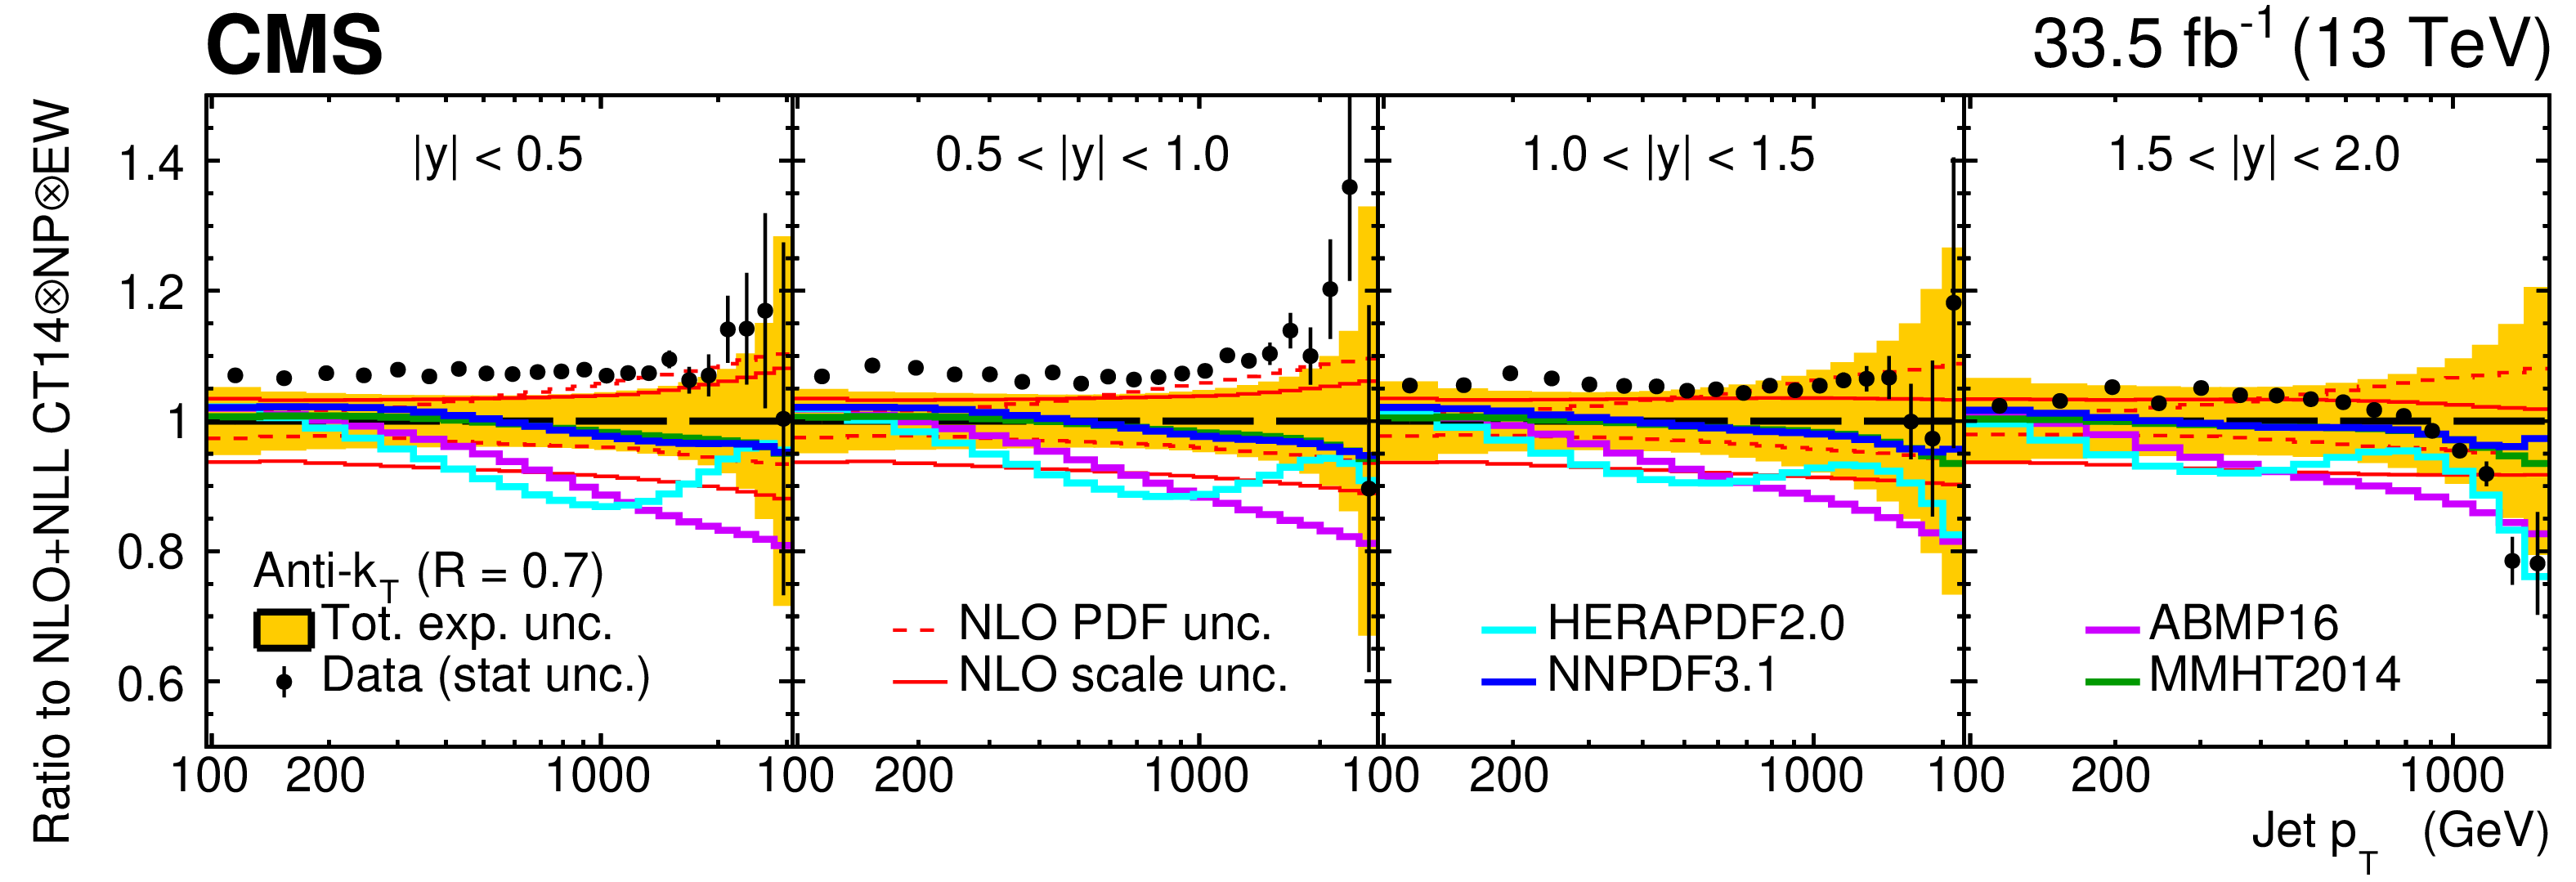
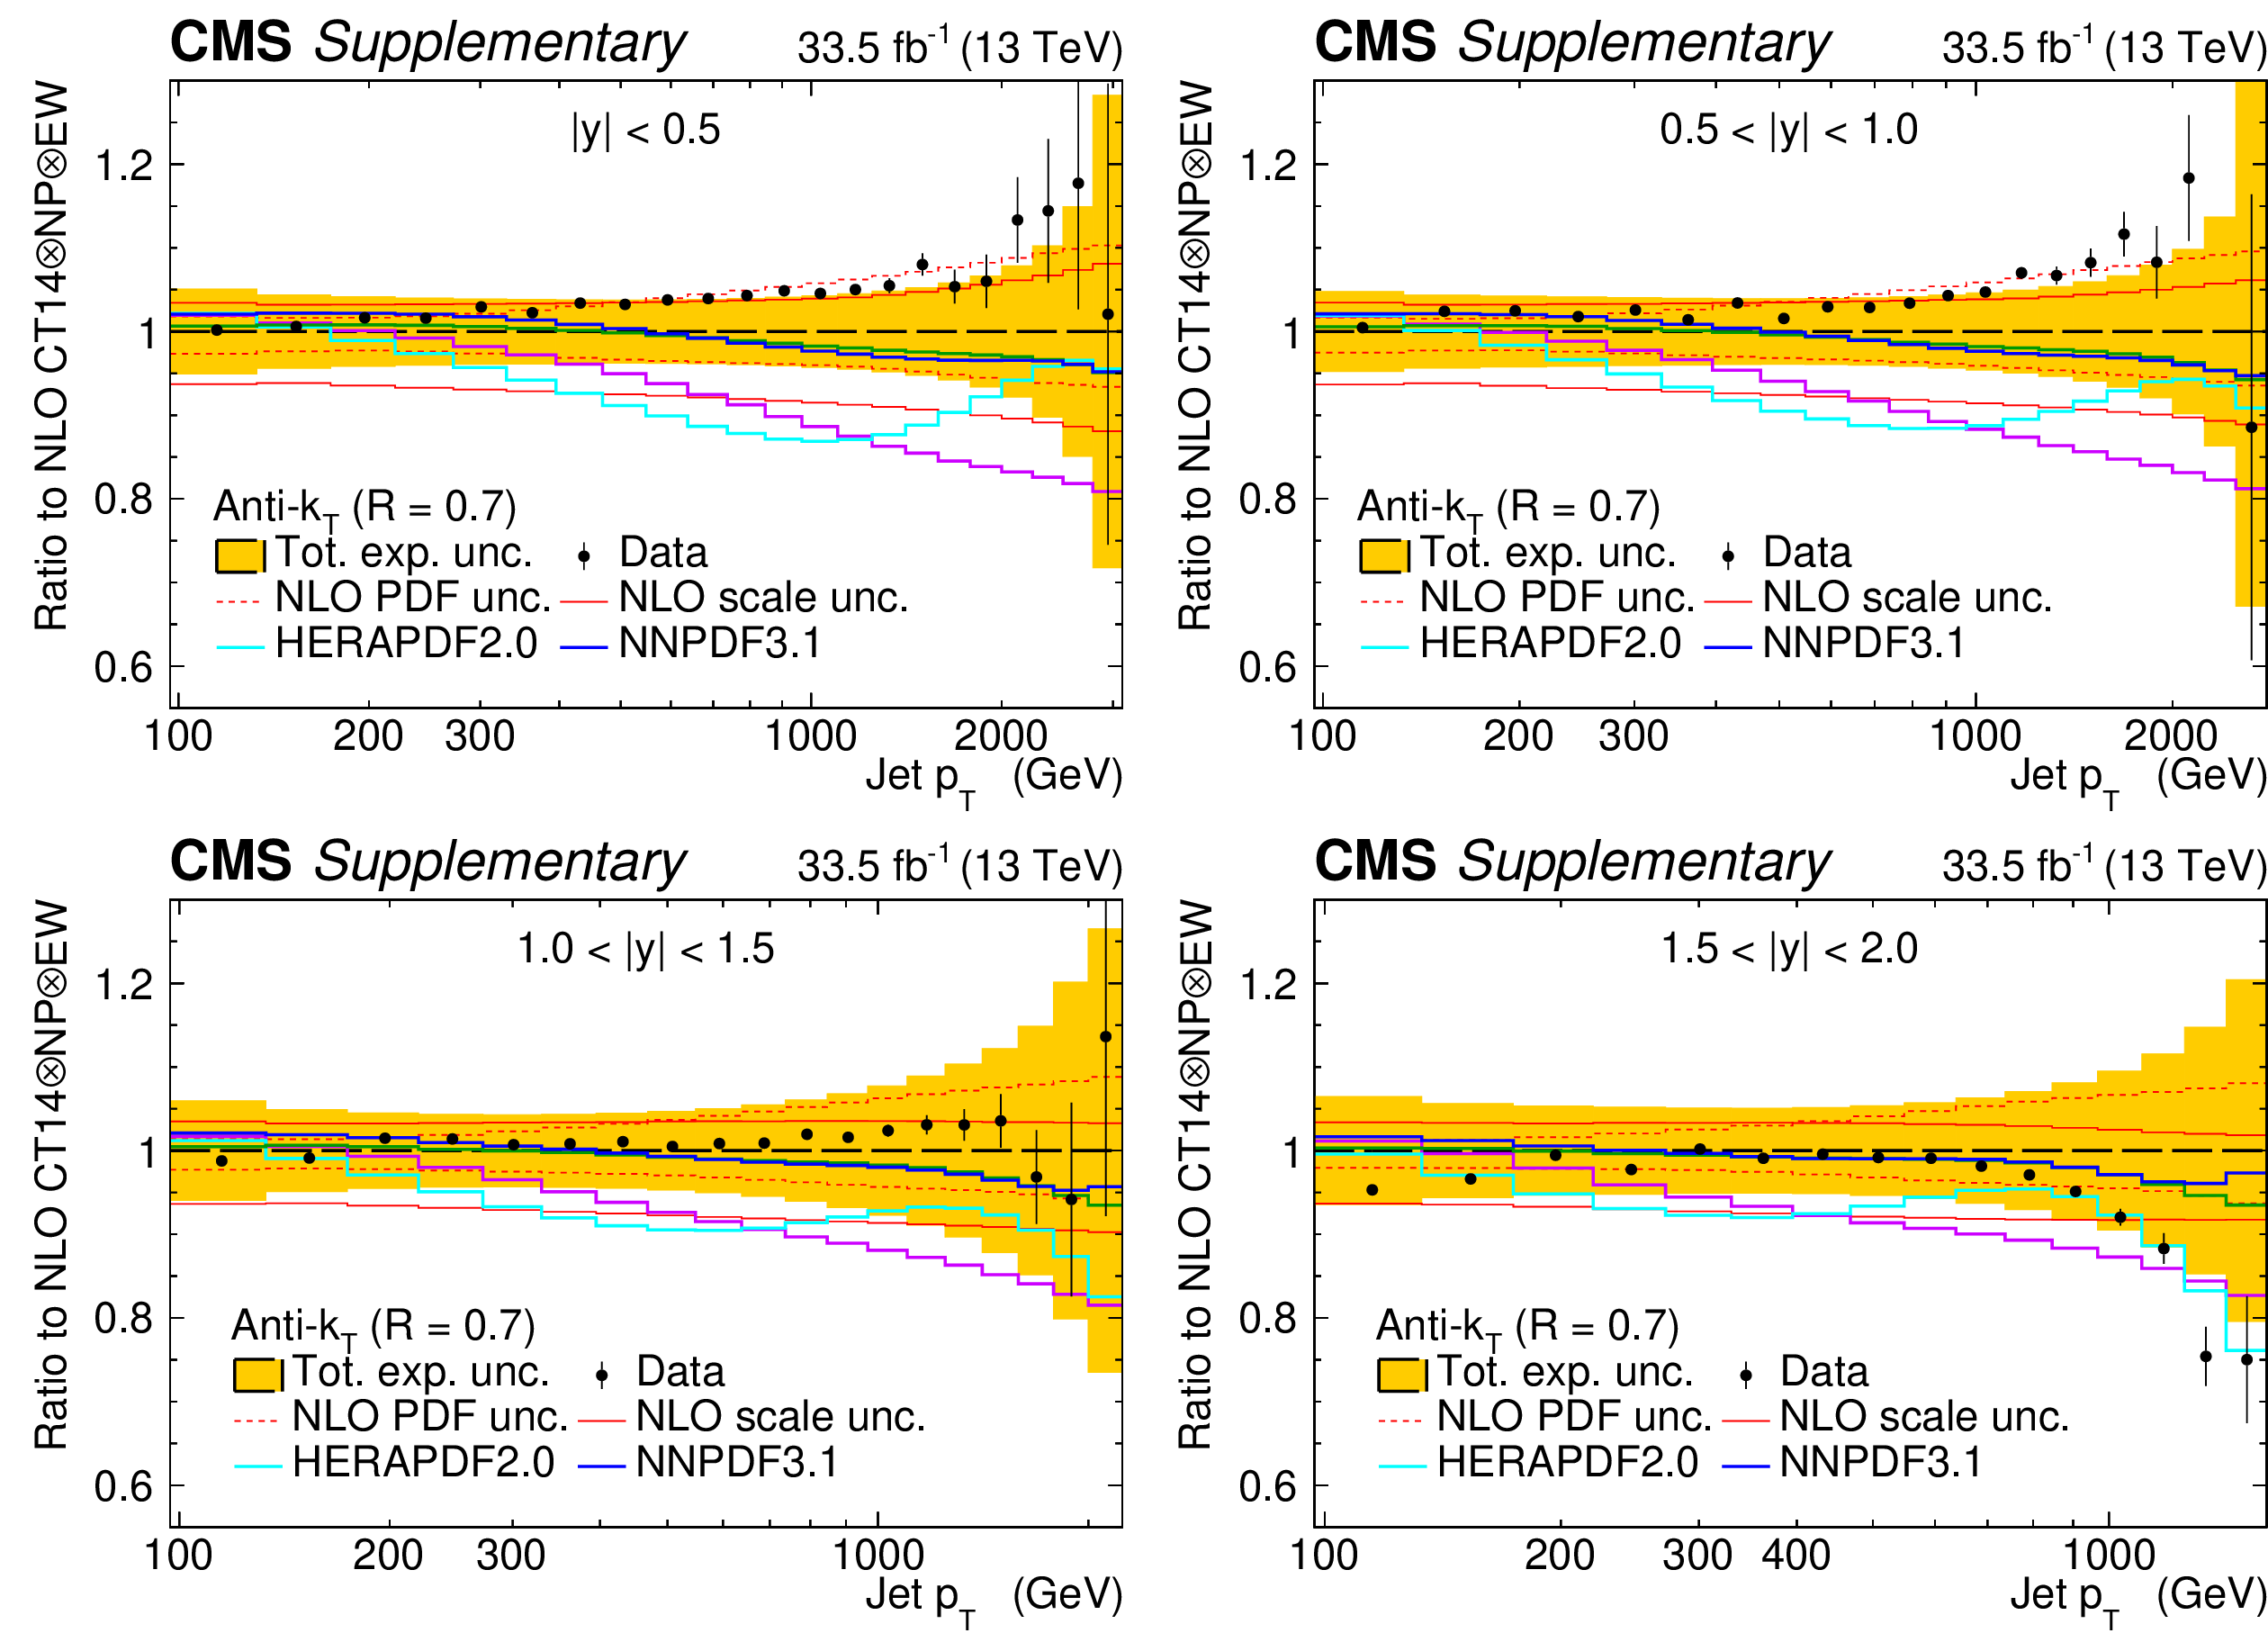
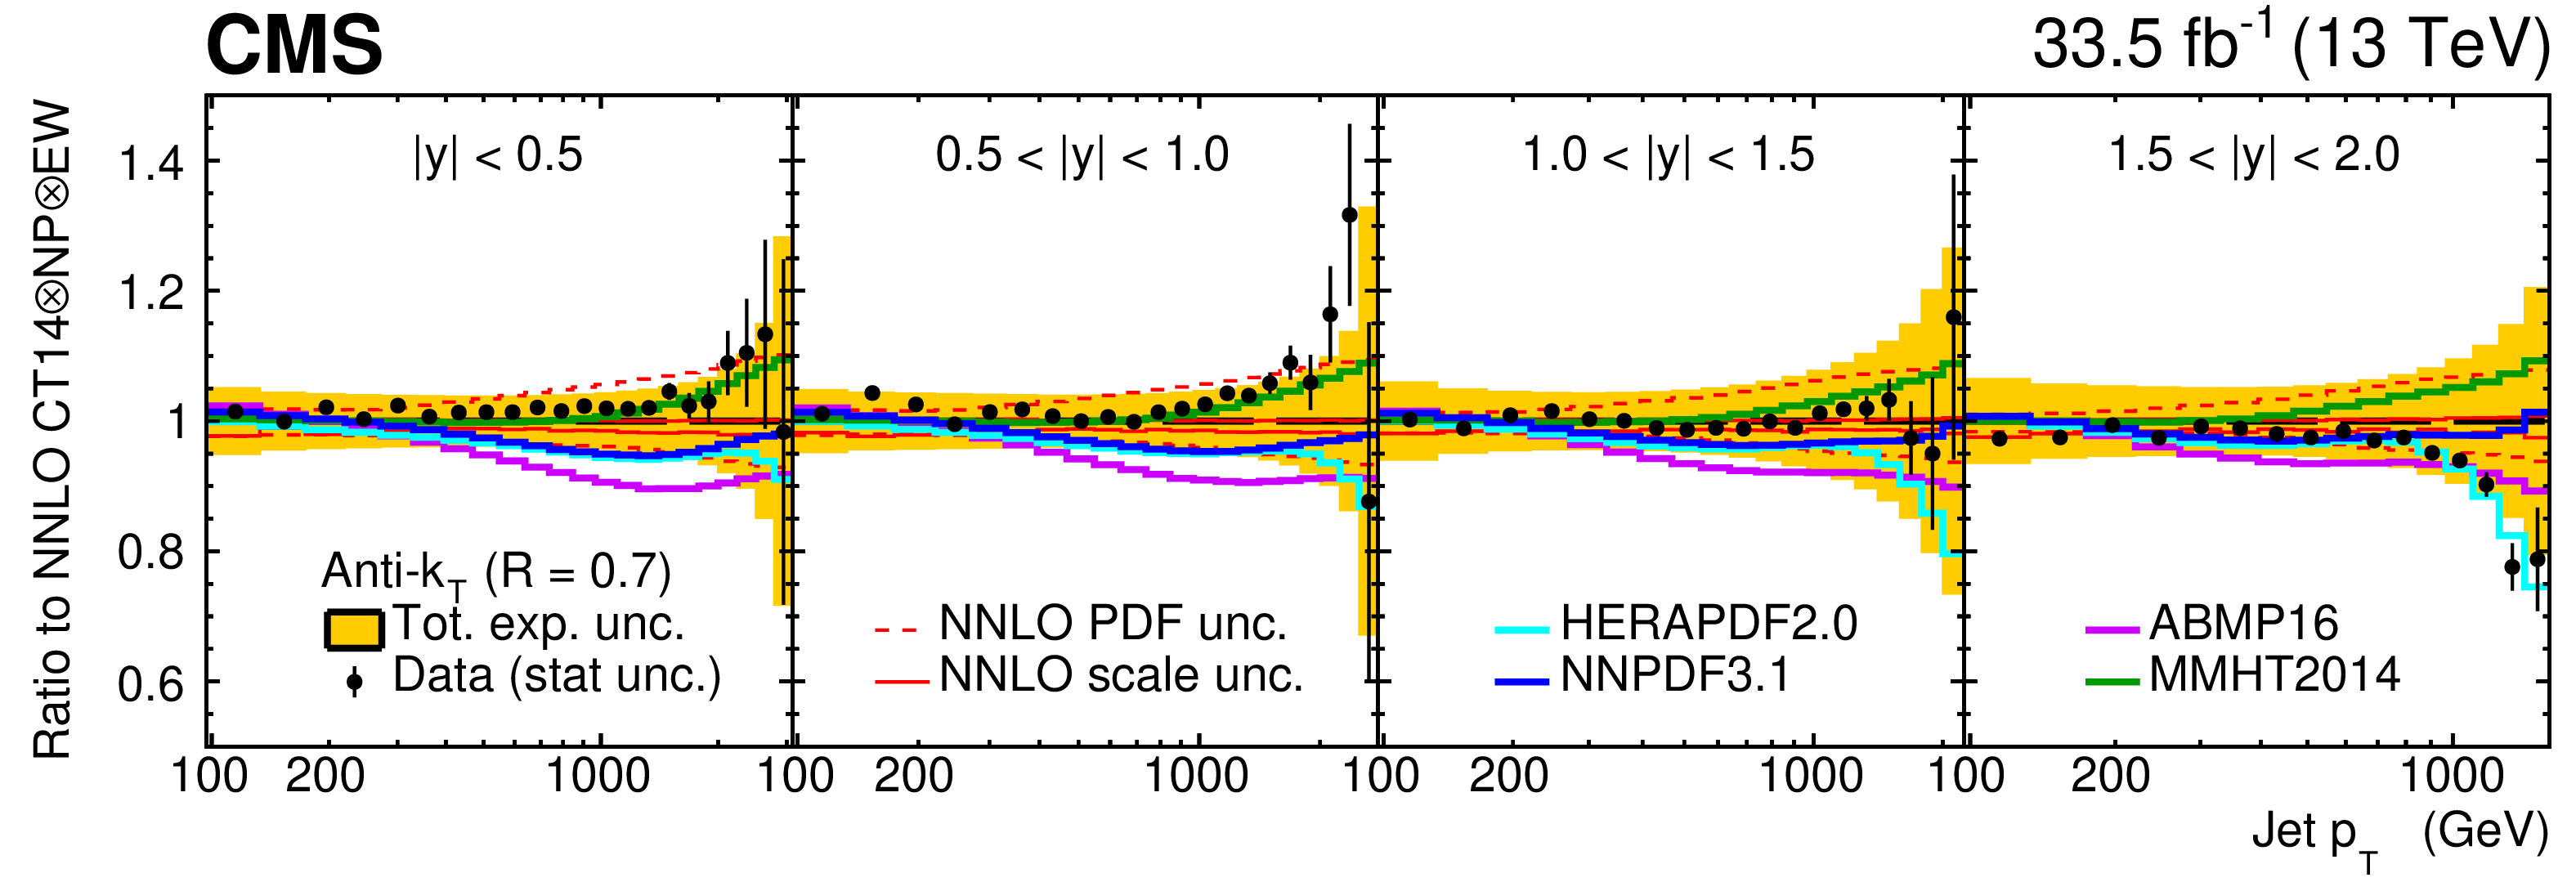
Figure 8:
The double-differential cross section of inclusive jet production, as a function of $ p_{\mathrm{T}} $ and $ |y| $, for jets clustered using the anti-$ k_{\mathrm{T}} $ algorithm with $ R= $ 0.7, presented as ratios to the QCD predictions. The notations are identical to those of Fig. 7. |
png pdf |
Figure 8-a:
The double-differential cross section of inclusive jet production, as a function of $ p_{\mathrm{T}} $ and $ |y| $, for jets clustered using the anti-$ k_{\mathrm{T}} $ algorithm with $ R= $ 0.7, presented as ratios to the QCD predictions. The notations are identical to those of Fig. 7-a. |
png pdf |
Figure 8-b:
The double-differential cross section of inclusive jet production, as a function of $ p_{\mathrm{T}} $ and $ |y| $, for jets clustered using the anti-$ k_{\mathrm{T}} $ algorithm with $ R= $ 0.7, presented as ratios to the QCD predictions. The notations are identical to those of Fig. 7-b. |
png pdf |
Figure 9:
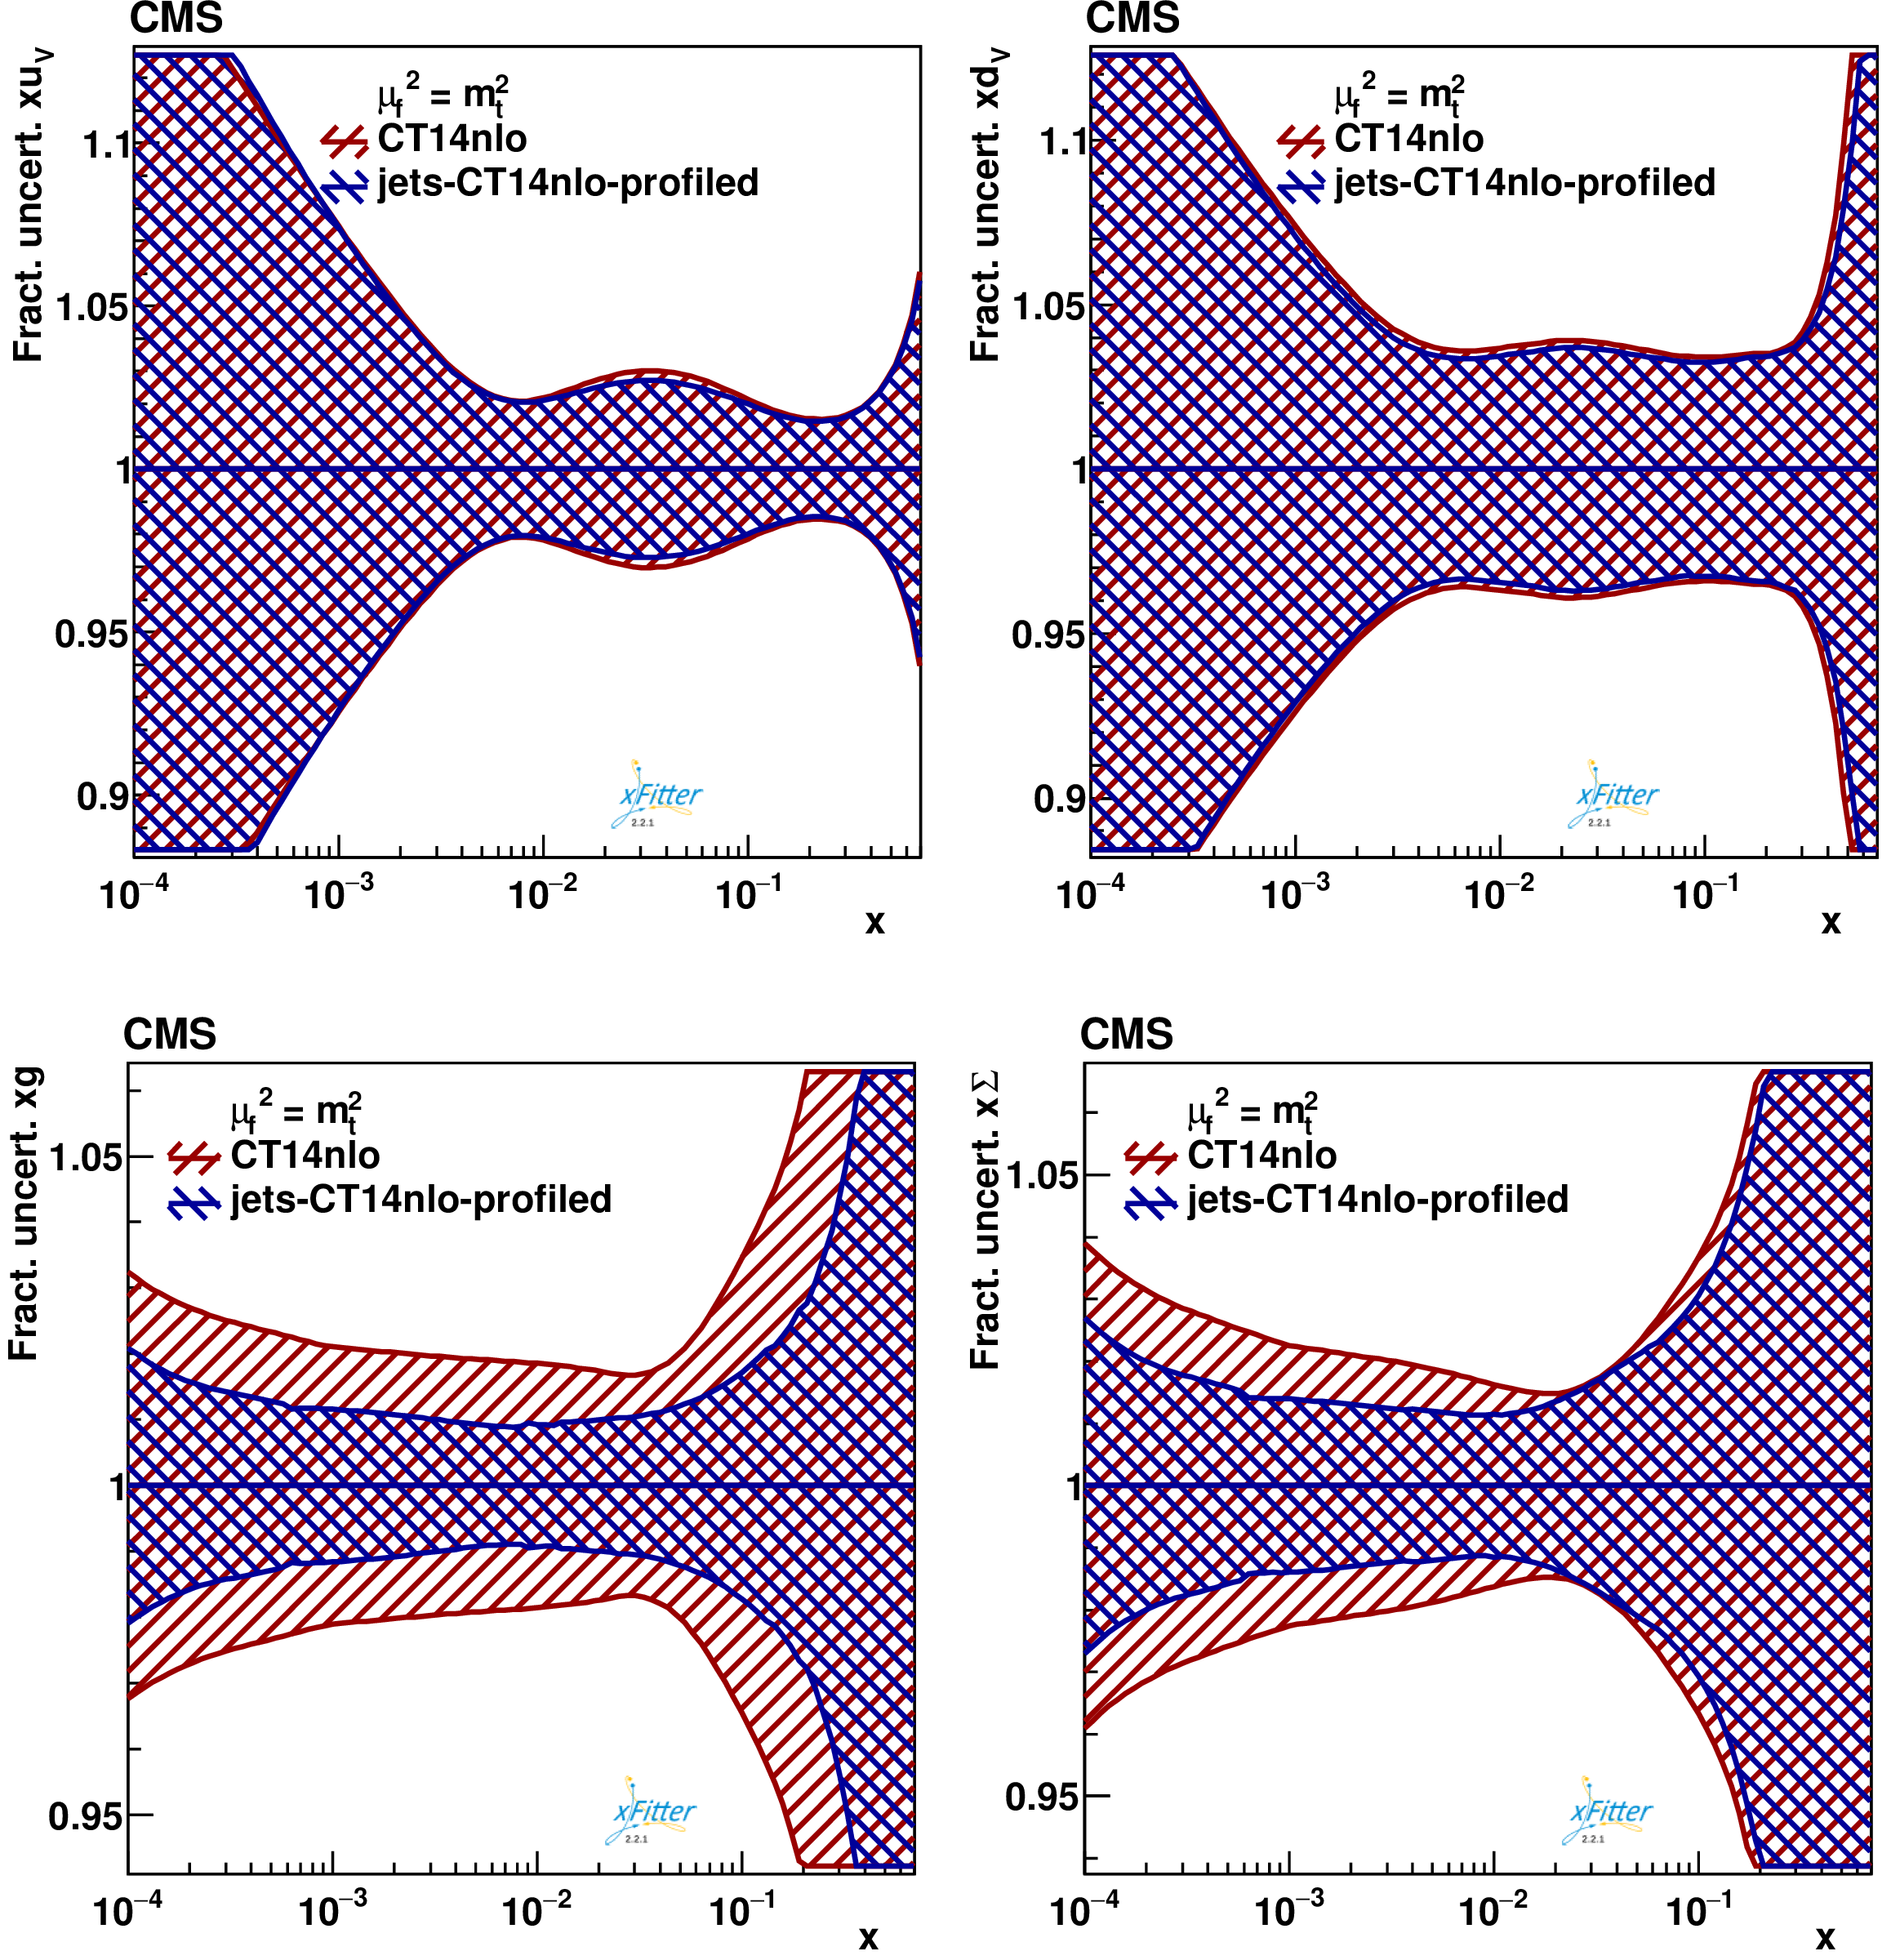
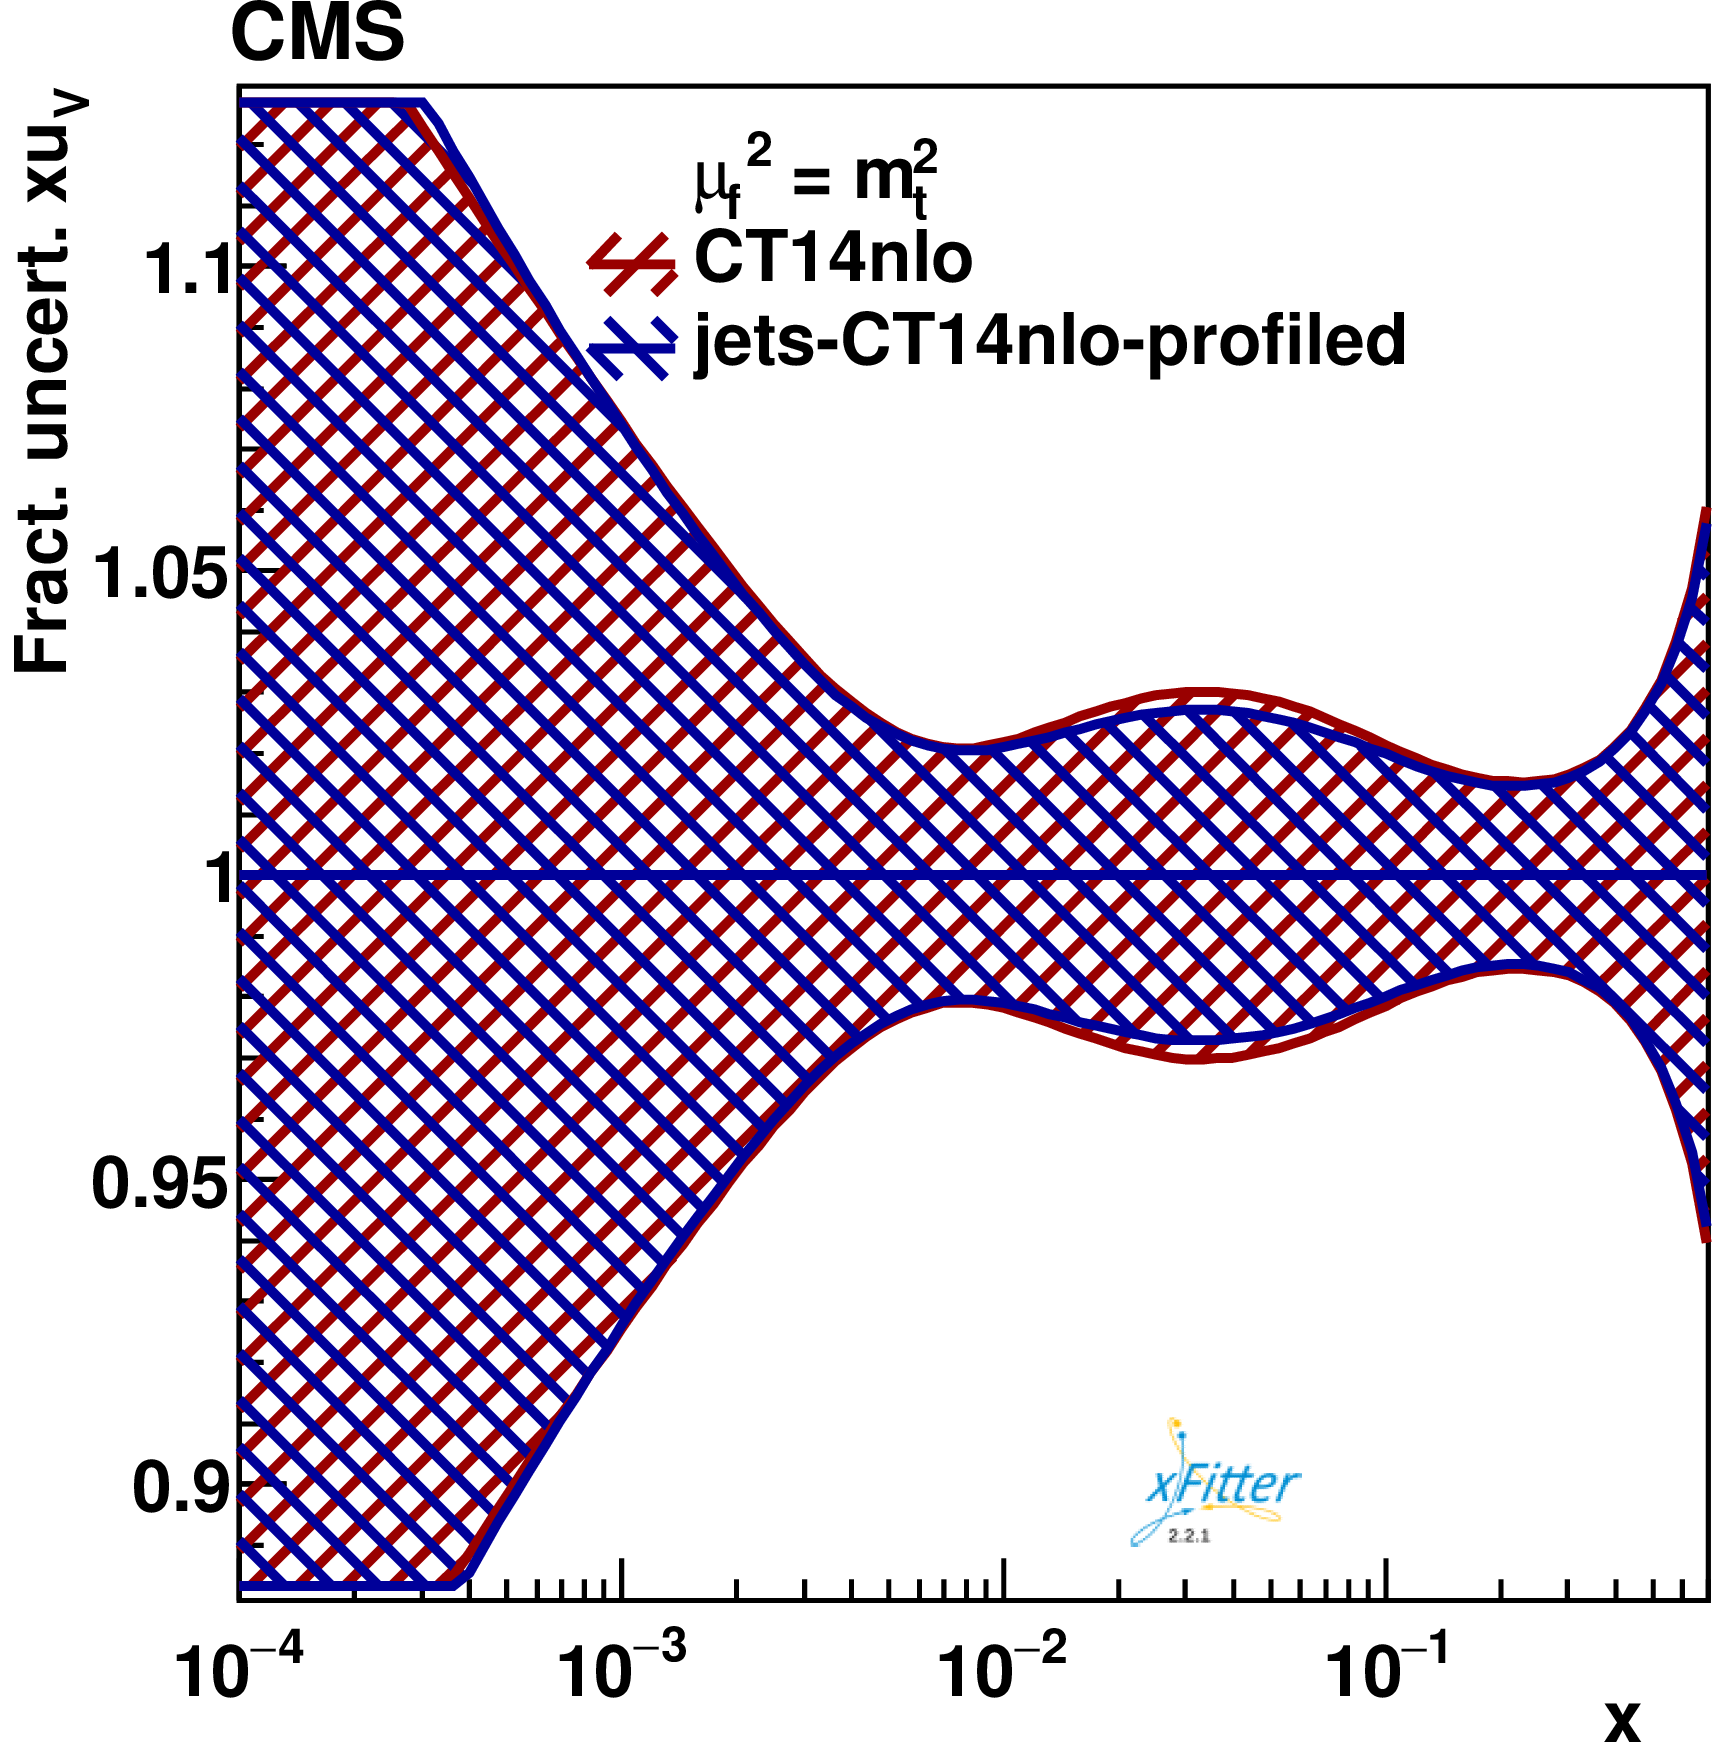
Fractional uncertainties in the u-valence (upper left), d-valence (upper right), gluon (lower left), and the sea quark (lower right) distributions, shown as a function of $ x $ for the scale $ \mu_\mathrm{f}=m_\mathrm{t} $. The profiling is performed using CT14nlo PDF at NLO, by using CMS inclusive jet cross section at $ \sqrt{s}= $ 13 TeV, implying the theoretical prediction for these data at NLO+NLL. The original uncertainty is shown in red, while the profiled result is shown in blue. |
png pdf |
Figure 9-a:
Fractional uncertainties in the u-valence distribution, shown as a function of $ x $ for the scale $ \mu_\mathrm{f}=m_\mathrm{t} $. The profiling is performed using CT14nlo PDF at NLO, by using CMS inclusive jet cross section at $ \sqrt{s}= $ 13 TeV, implying the theoretical prediction for these data at NLO+NLL. The original uncertainty is shown in red, while the profiled result is shown in blue. |

png pdf |
Figure 9-b:
Fractional uncertainties in the d-valence distribution, shown as a function of $ x $ for the scale $ \mu_\mathrm{f}=m_\mathrm{t} $. The profiling is performed using CT14nlo PDF at NLO, by using CMS inclusive jet cross section at $ \sqrt{s}= $ 13 TeV, implying the theoretical prediction for these data at NLO+NLL. The original uncertainty is shown in red, while the profiled result is shown in blue. |
png pdf |
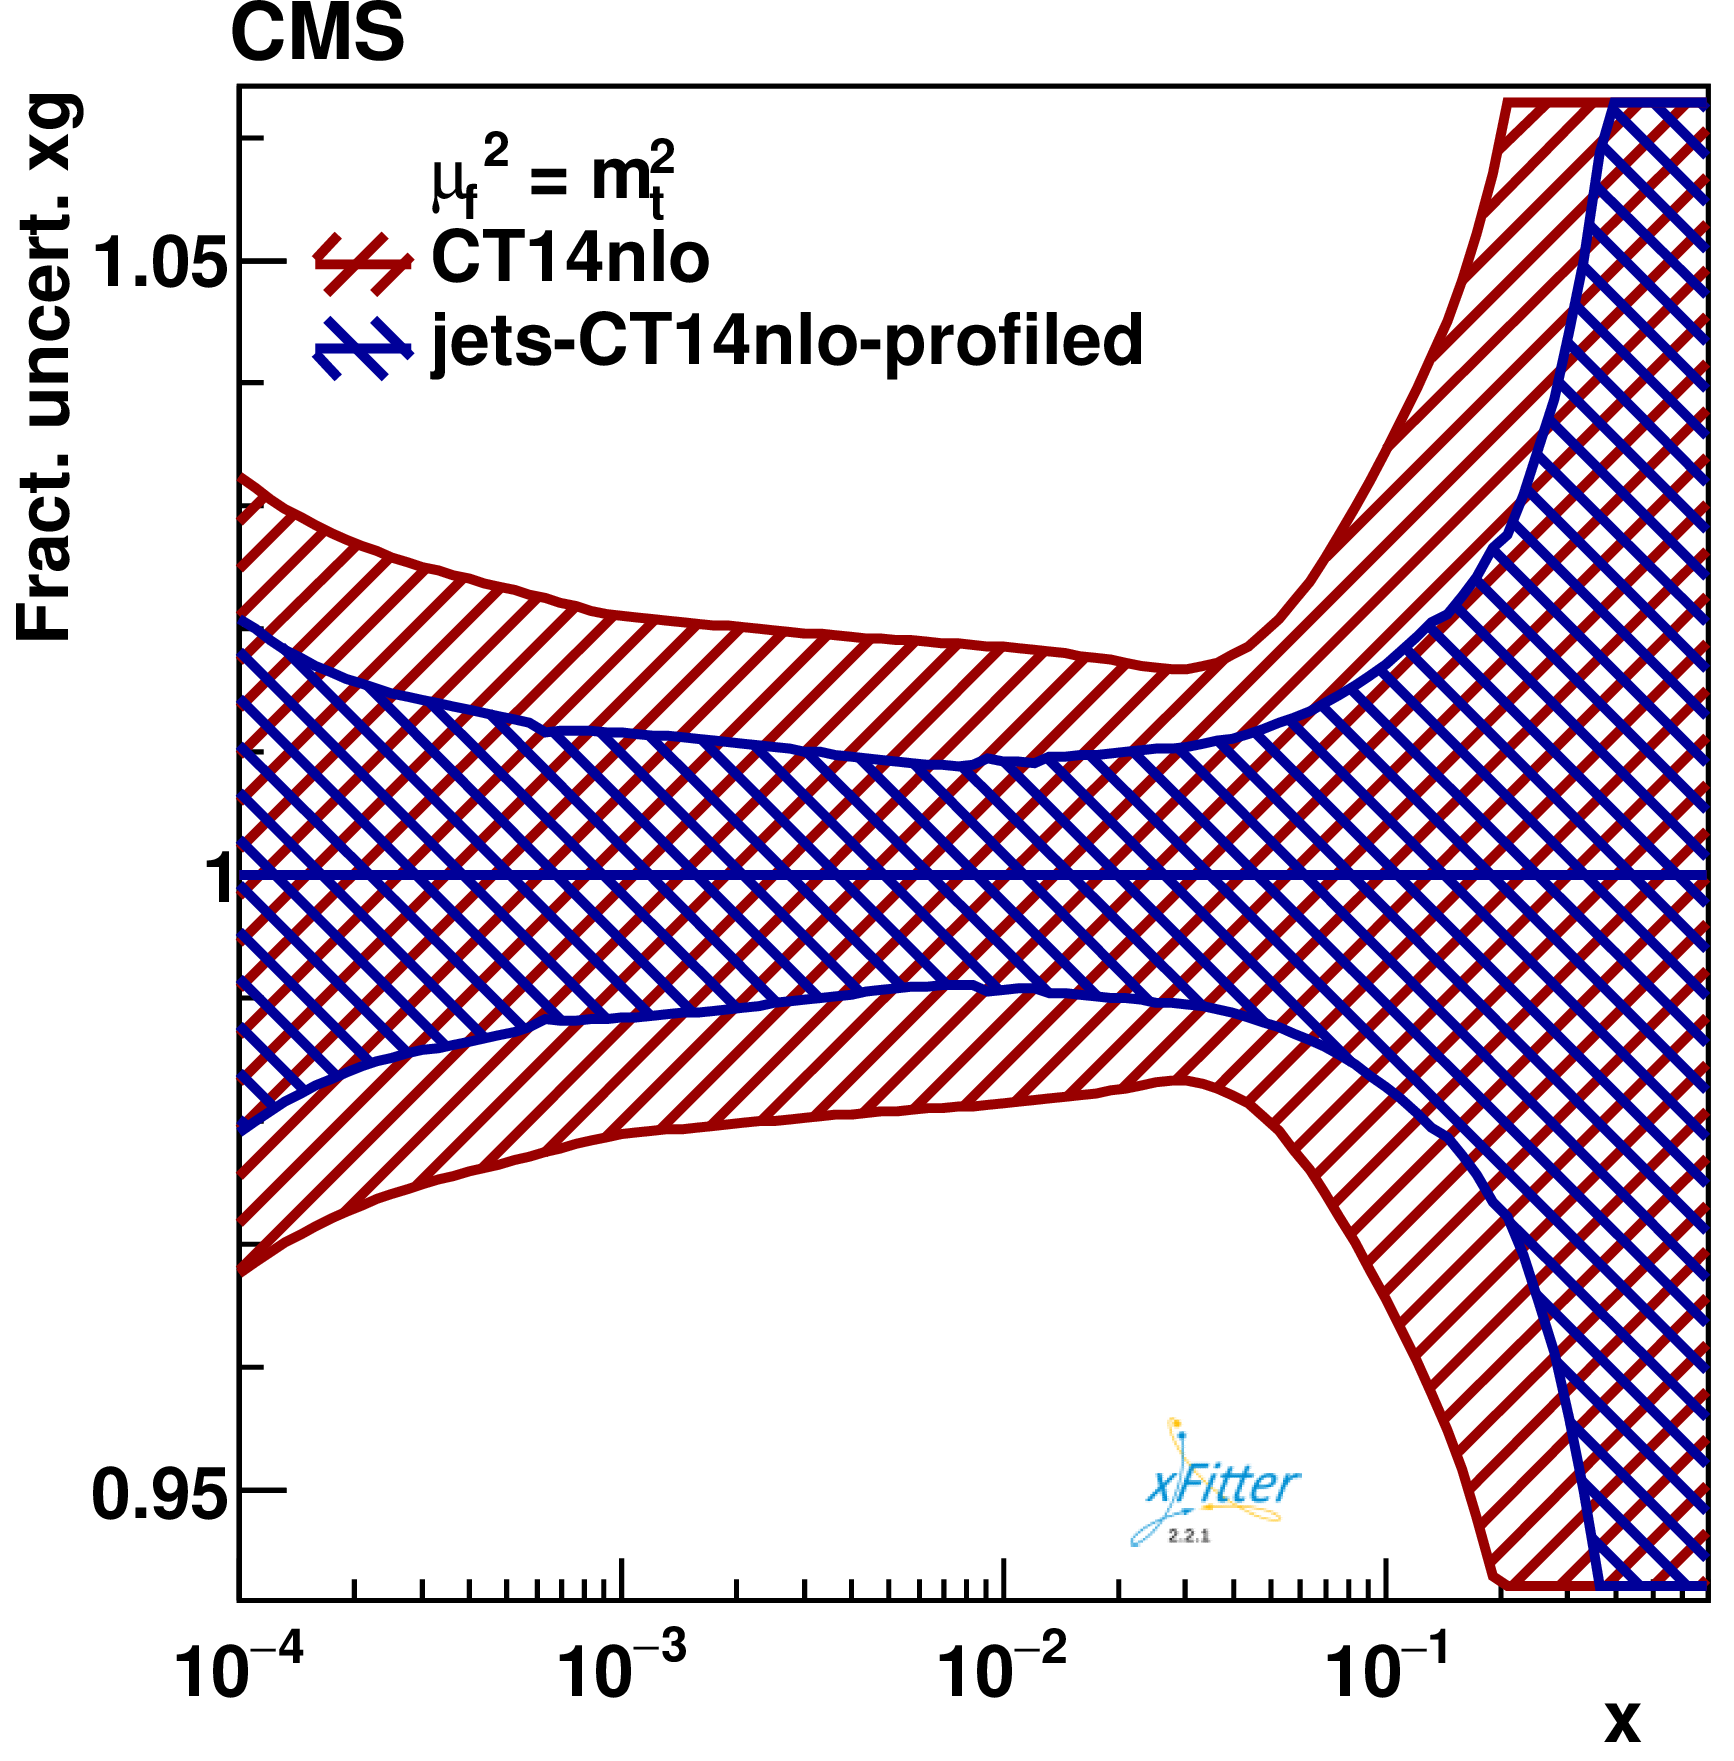
Figure 9-c:
Fractional uncertainties in the gluon distribution, shown as a function of $ x $ for the scale $ \mu_\mathrm{f}=m_\mathrm{t} $. The profiling is performed using CT14nlo PDF at NLO, by using CMS inclusive jet cross section at $ \sqrt{s}= $ 13 TeV, implying the theoretical prediction for these data at NLO+NLL. The original uncertainty is shown in red, while the profiled result is shown in blue. |
png pdf |
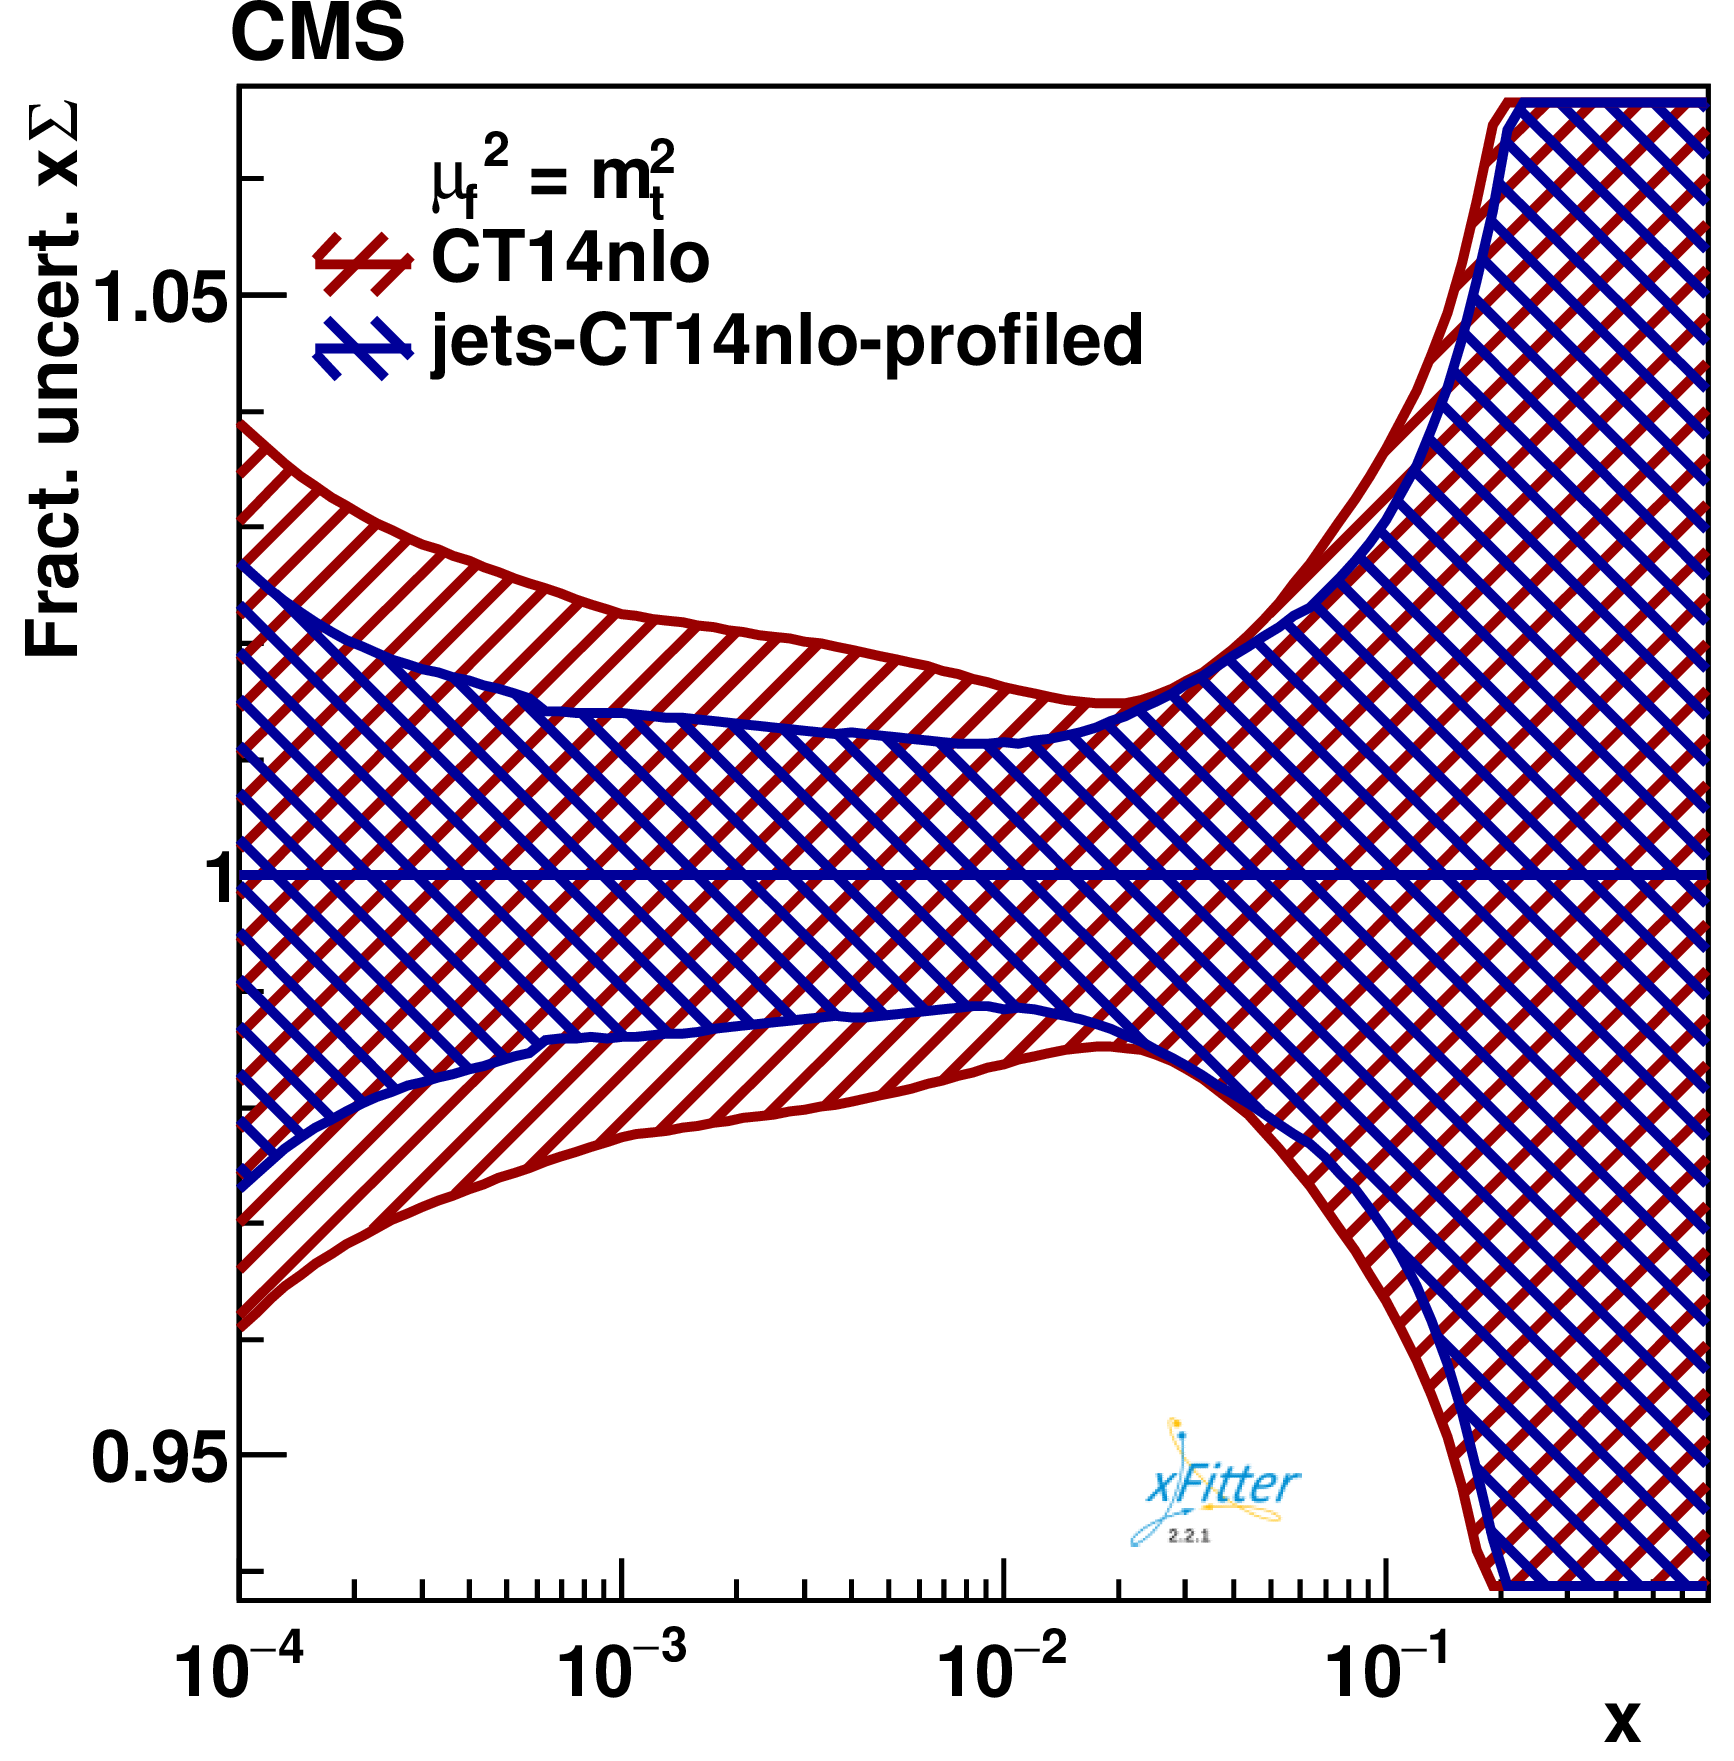
Figure 9-d:
Fractional uncertainties in the sea quark distribution, shown as a function of $ x $ for the scale $ \mu_\mathrm{f}=m_\mathrm{t} $. The profiling is performed using CT14nlo PDF at NLO, by using CMS inclusive jet cross section at $ \sqrt{s}= $ 13 TeV, implying the theoretical prediction for these data at NLO+NLL. The original uncertainty is shown in red, while the profiled result is shown in blue. |

png pdf |
Figure 10:
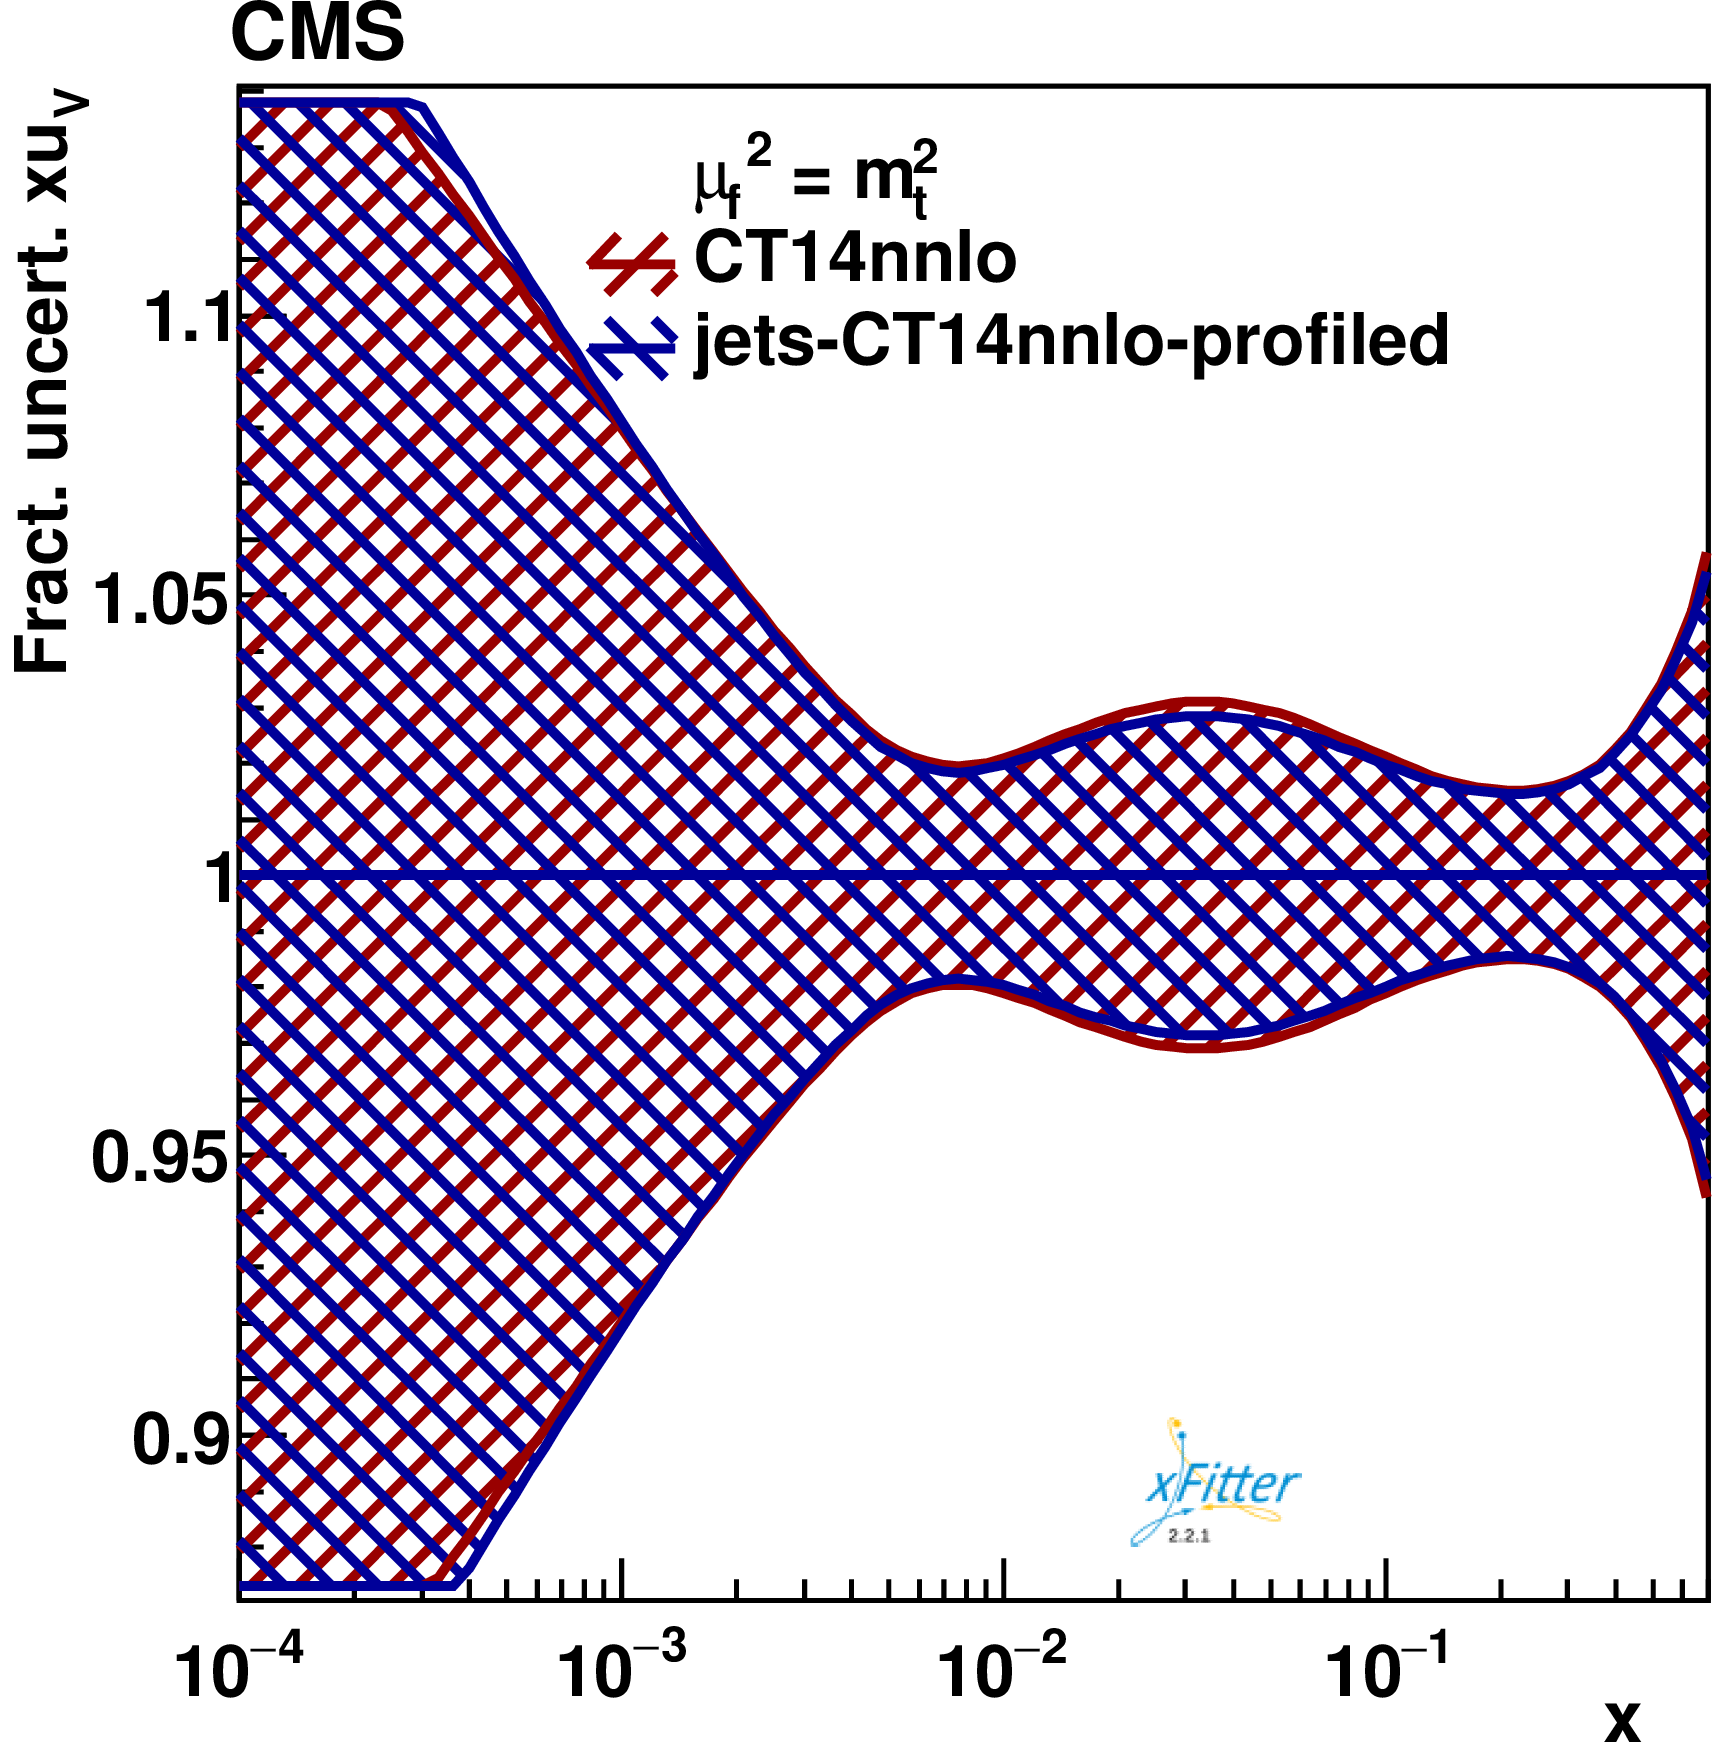
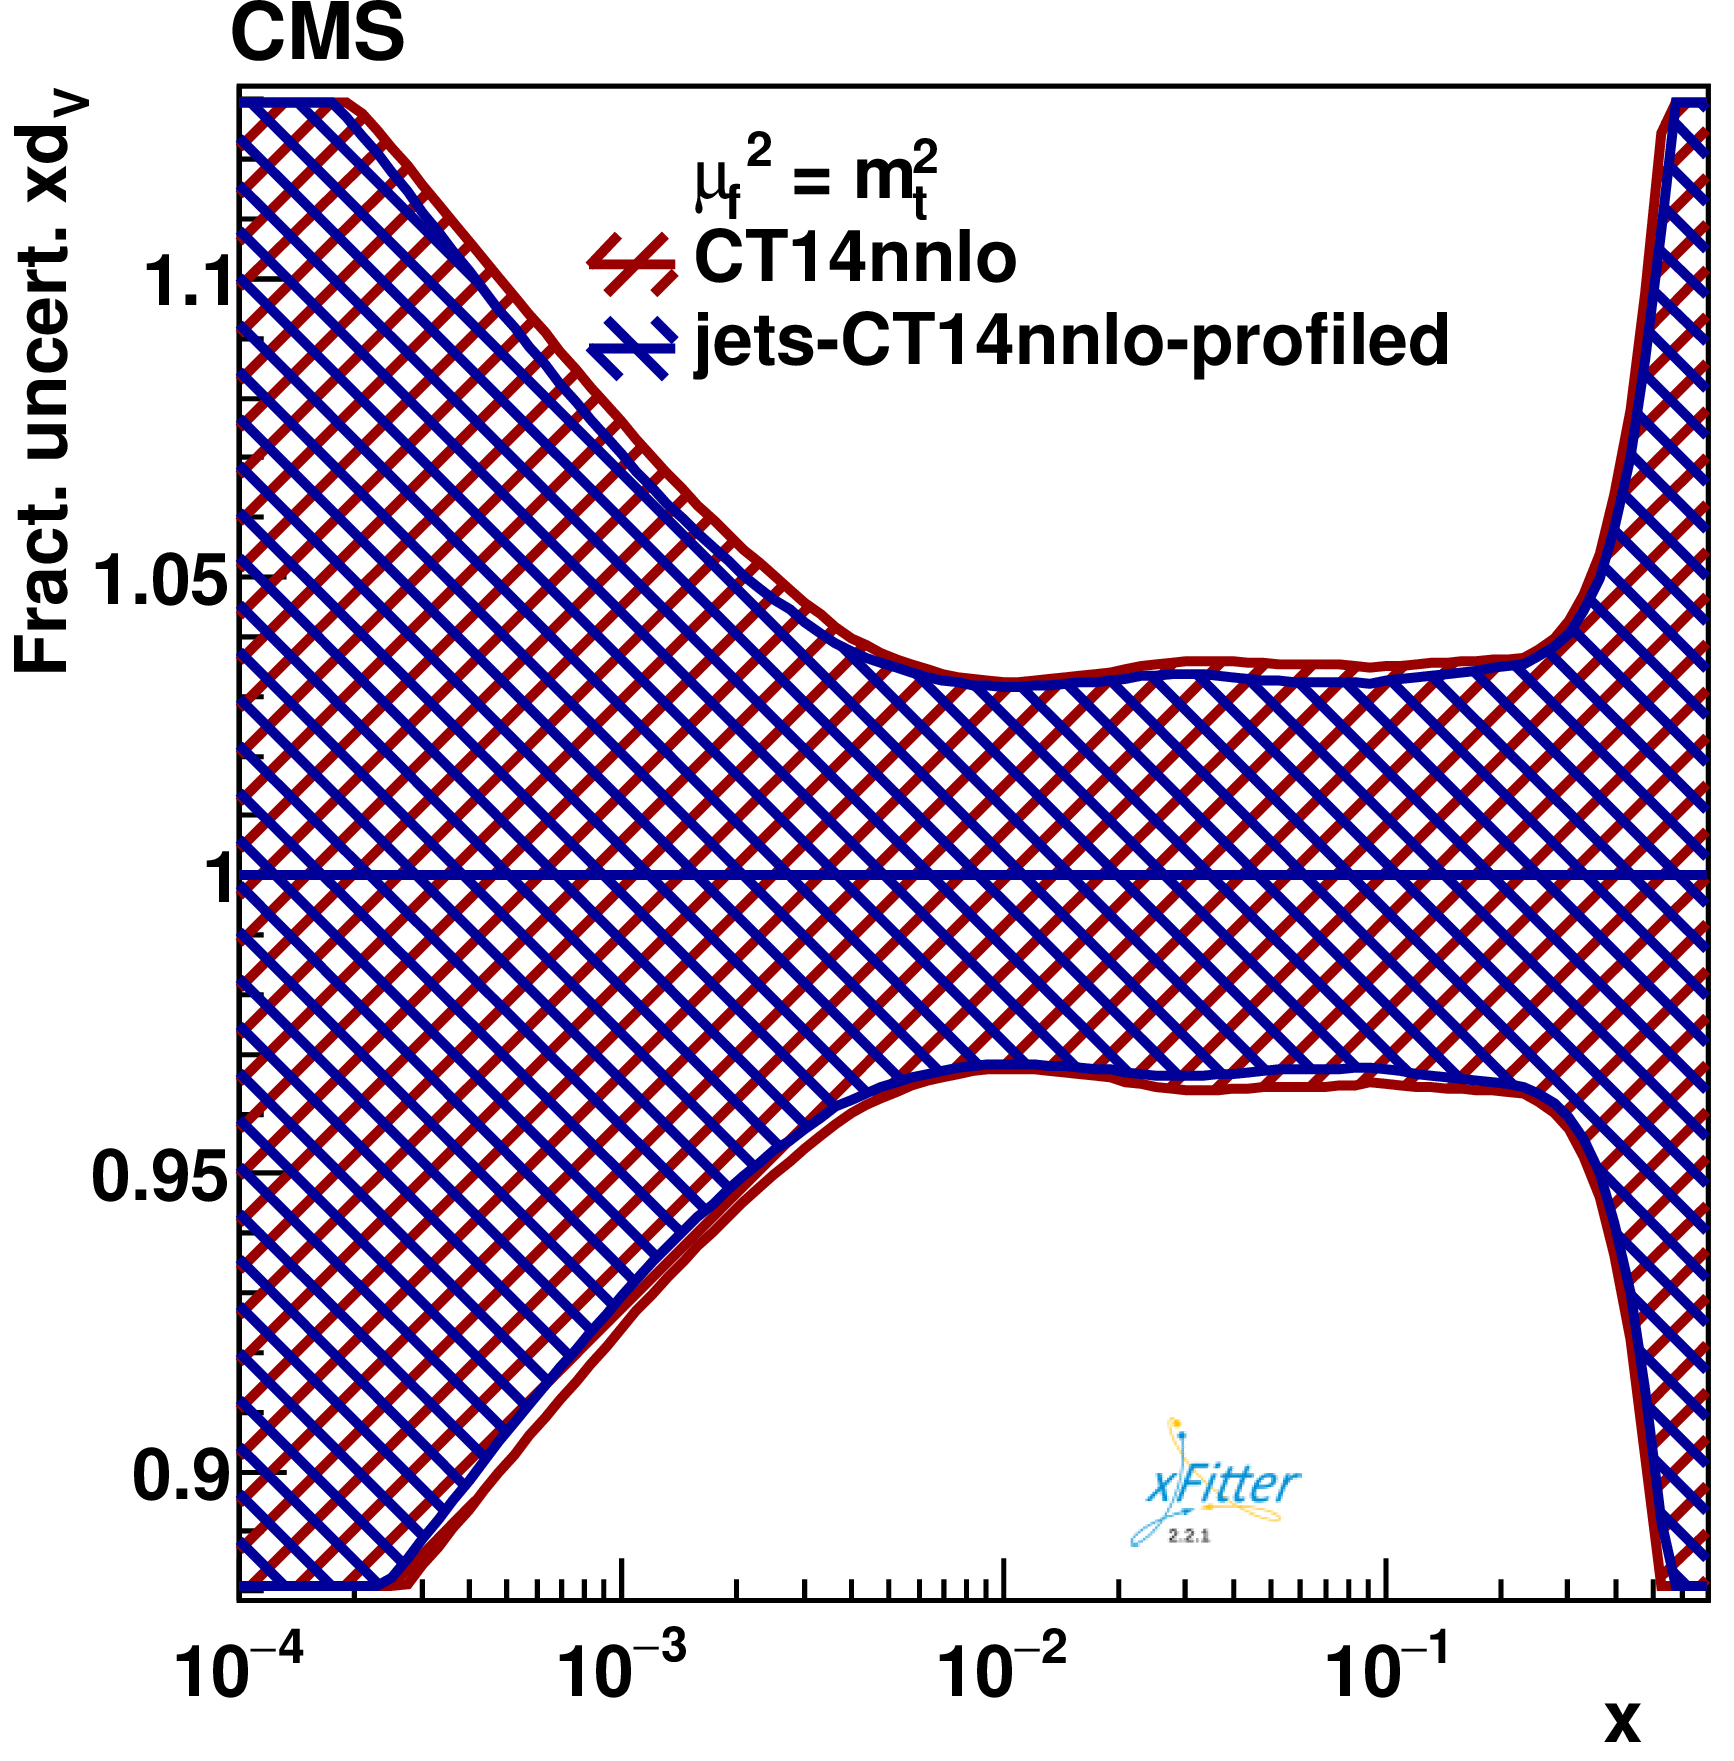
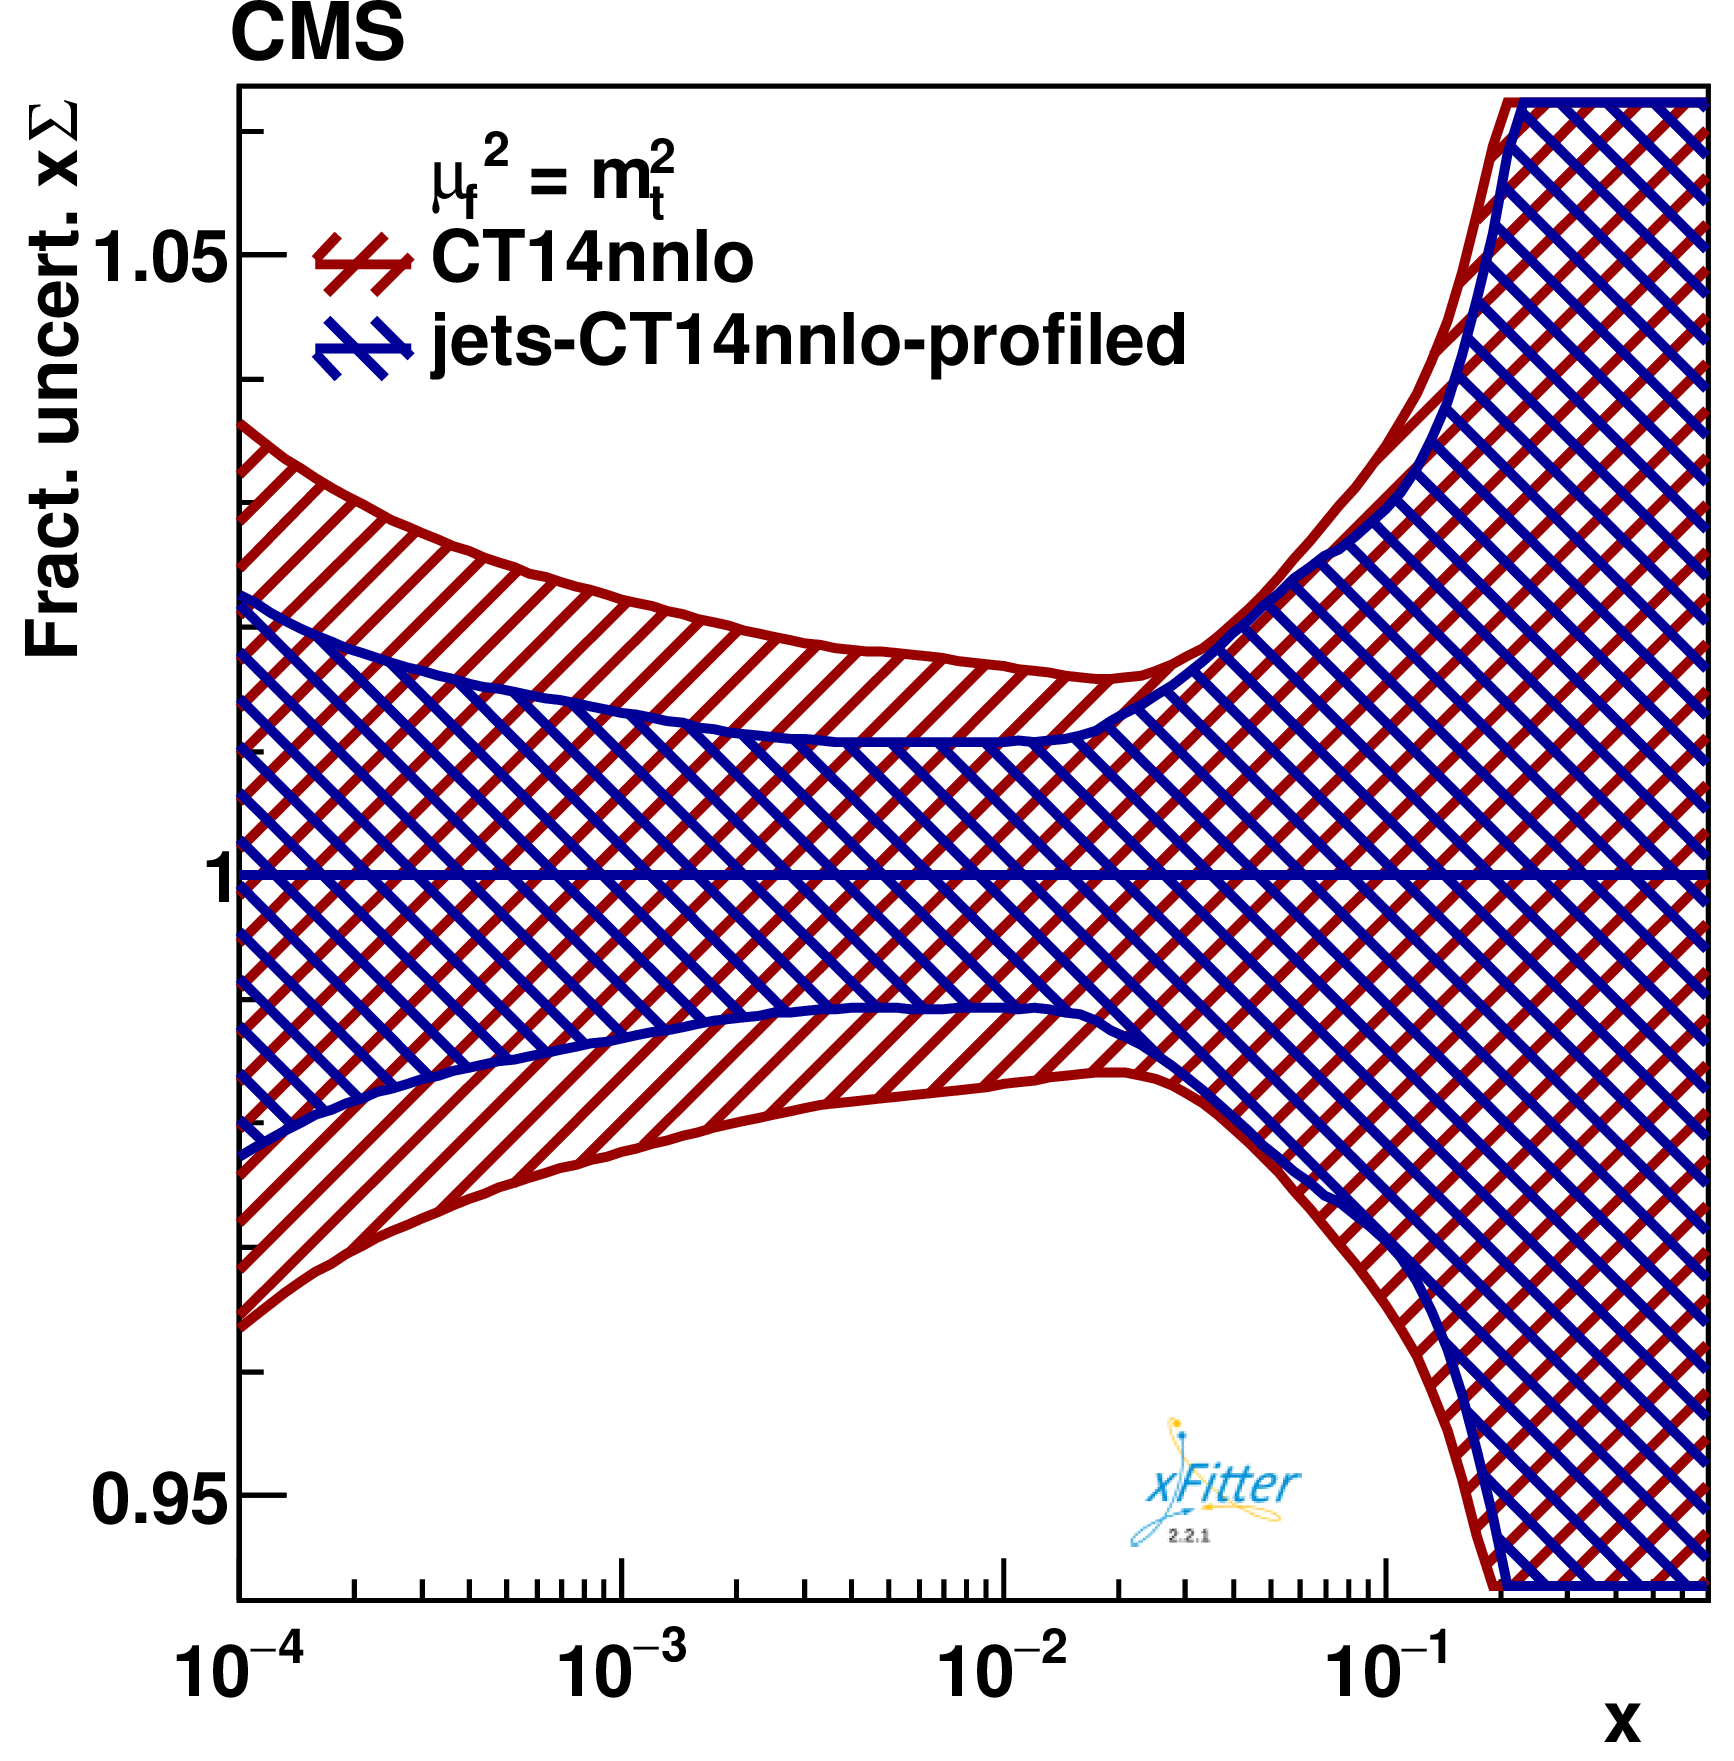
Fractional uncertainties in the u-valence (upper left), d-valence (upper right), gluon (lower left), and the sea quark (lower right) distributions, shown as functions of $ x $ for the scale $ \mu_\mathrm{f}=m_\mathrm{t} $. The profiling is performed using CT14nnlo PDF at NNLO, by using the CMS inclusive jet cross section at $ \sqrt{s}= $ 13 TeV, implying the theoretical prediction for these data at NNLO. The original uncertainty is shown in red, while the profiled result is shown in blue. |
png pdf |
Figure 10-a:
Fractional uncertainties in the u-valence distribution, shown as functions of $ x $ for the scale $ \mu_\mathrm{f}=m_\mathrm{t} $. The profiling is performed using CT14nnlo PDF at NNLO, by using the CMS inclusive jet cross section at $ \sqrt{s}= $ 13 TeV, implying the theoretical prediction for these data at NNLO. The original uncertainty is shown in red, while the profiled result is shown in blue. |
png pdf |
Figure 10-b:
Fractional uncertainties in the d-valence distribution, shown as functions of $ x $ for the scale $ \mu_\mathrm{f}=m_\mathrm{t} $. The profiling is performed using CT14nnlo PDF at NNLO, by using the CMS inclusive jet cross section at $ \sqrt{s}= $ 13 TeV, implying the theoretical prediction for these data at NNLO. The original uncertainty is shown in red, while the profiled result is shown in blue. |

png pdf |
Figure 10-c:
Fractional uncertainties in the gluon distribution, shown as functions of $ x $ for the scale $ \mu_\mathrm{f}=m_\mathrm{t} $. The profiling is performed using CT14nnlo PDF at NNLO, by using the CMS inclusive jet cross section at $ \sqrt{s}= $ 13 TeV, implying the theoretical prediction for these data at NNLO. The original uncertainty is shown in red, while the profiled result is shown in blue. |
png pdf |
Figure 10-d:
Fractional uncertainties in the sea quark distribution, shown as functions of $ x $ for the scale $ \mu_\mathrm{f}=m_\mathrm{t} $. The profiling is performed using CT14nnlo PDF at NNLO, by using the CMS inclusive jet cross section at $ \sqrt{s}= $ 13 TeV, implying the theoretical prediction for these data at NNLO. The original uncertainty is shown in red, while the profiled result is shown in blue. |
png pdf |
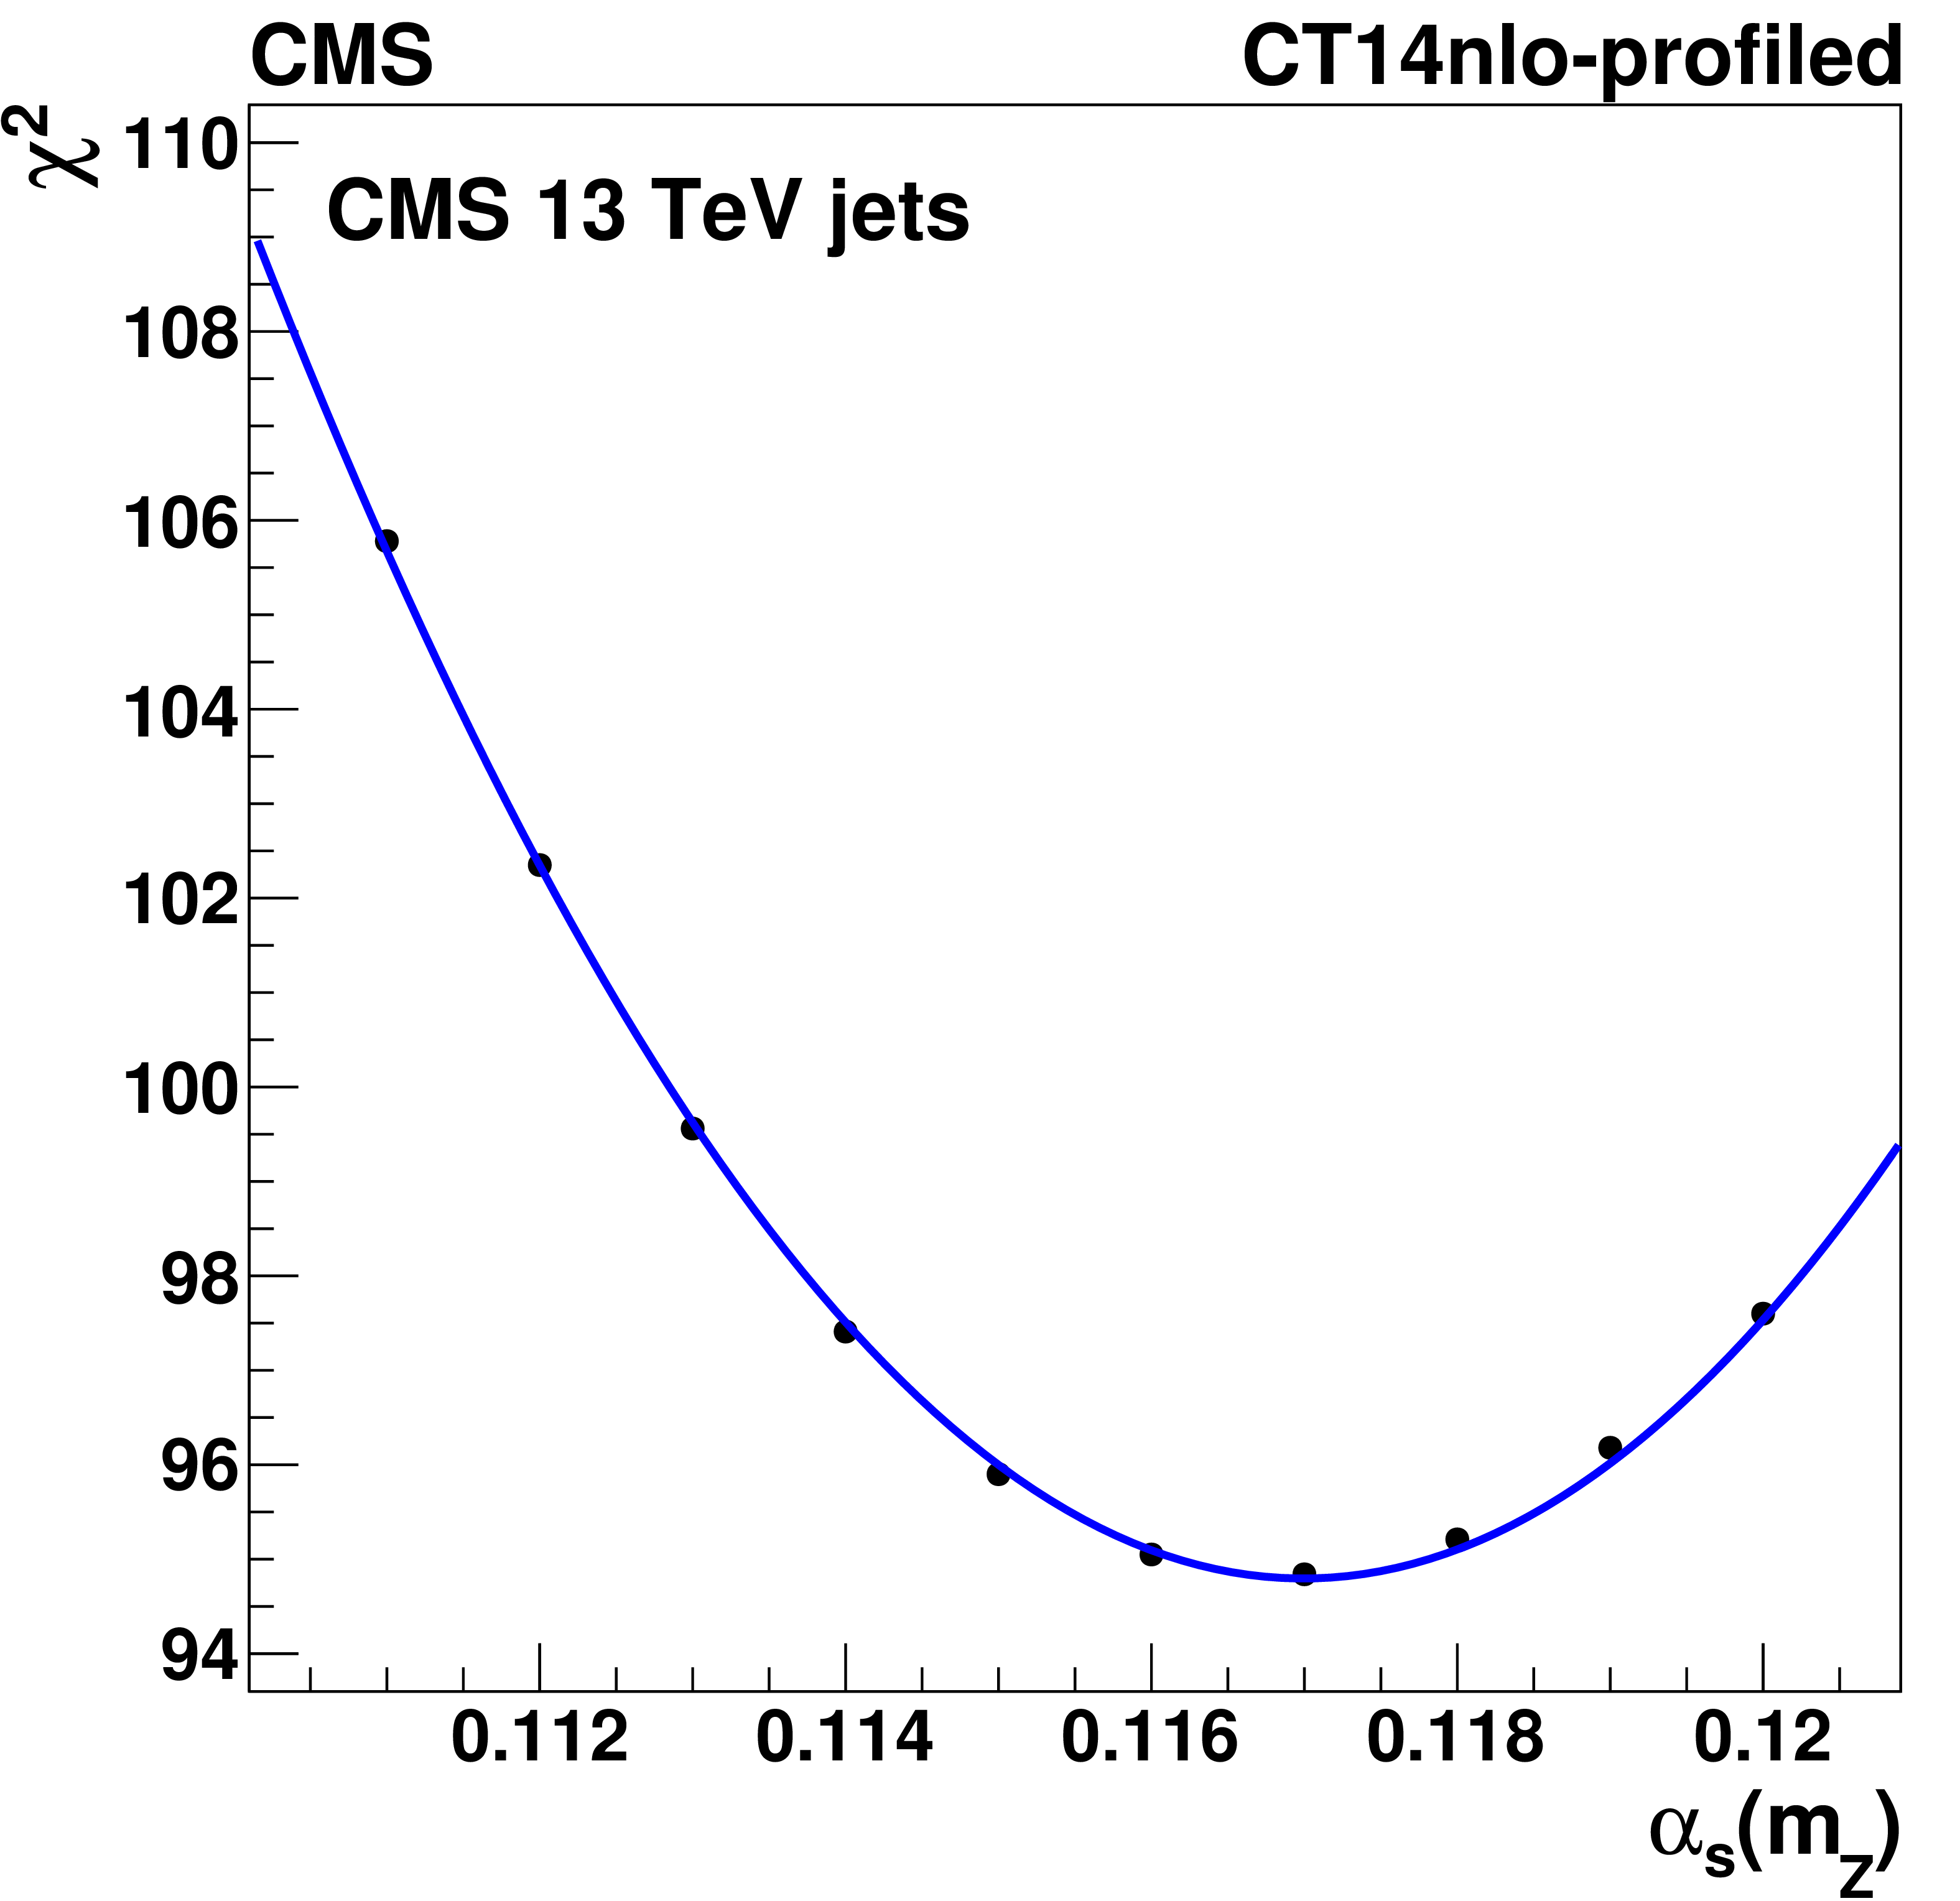
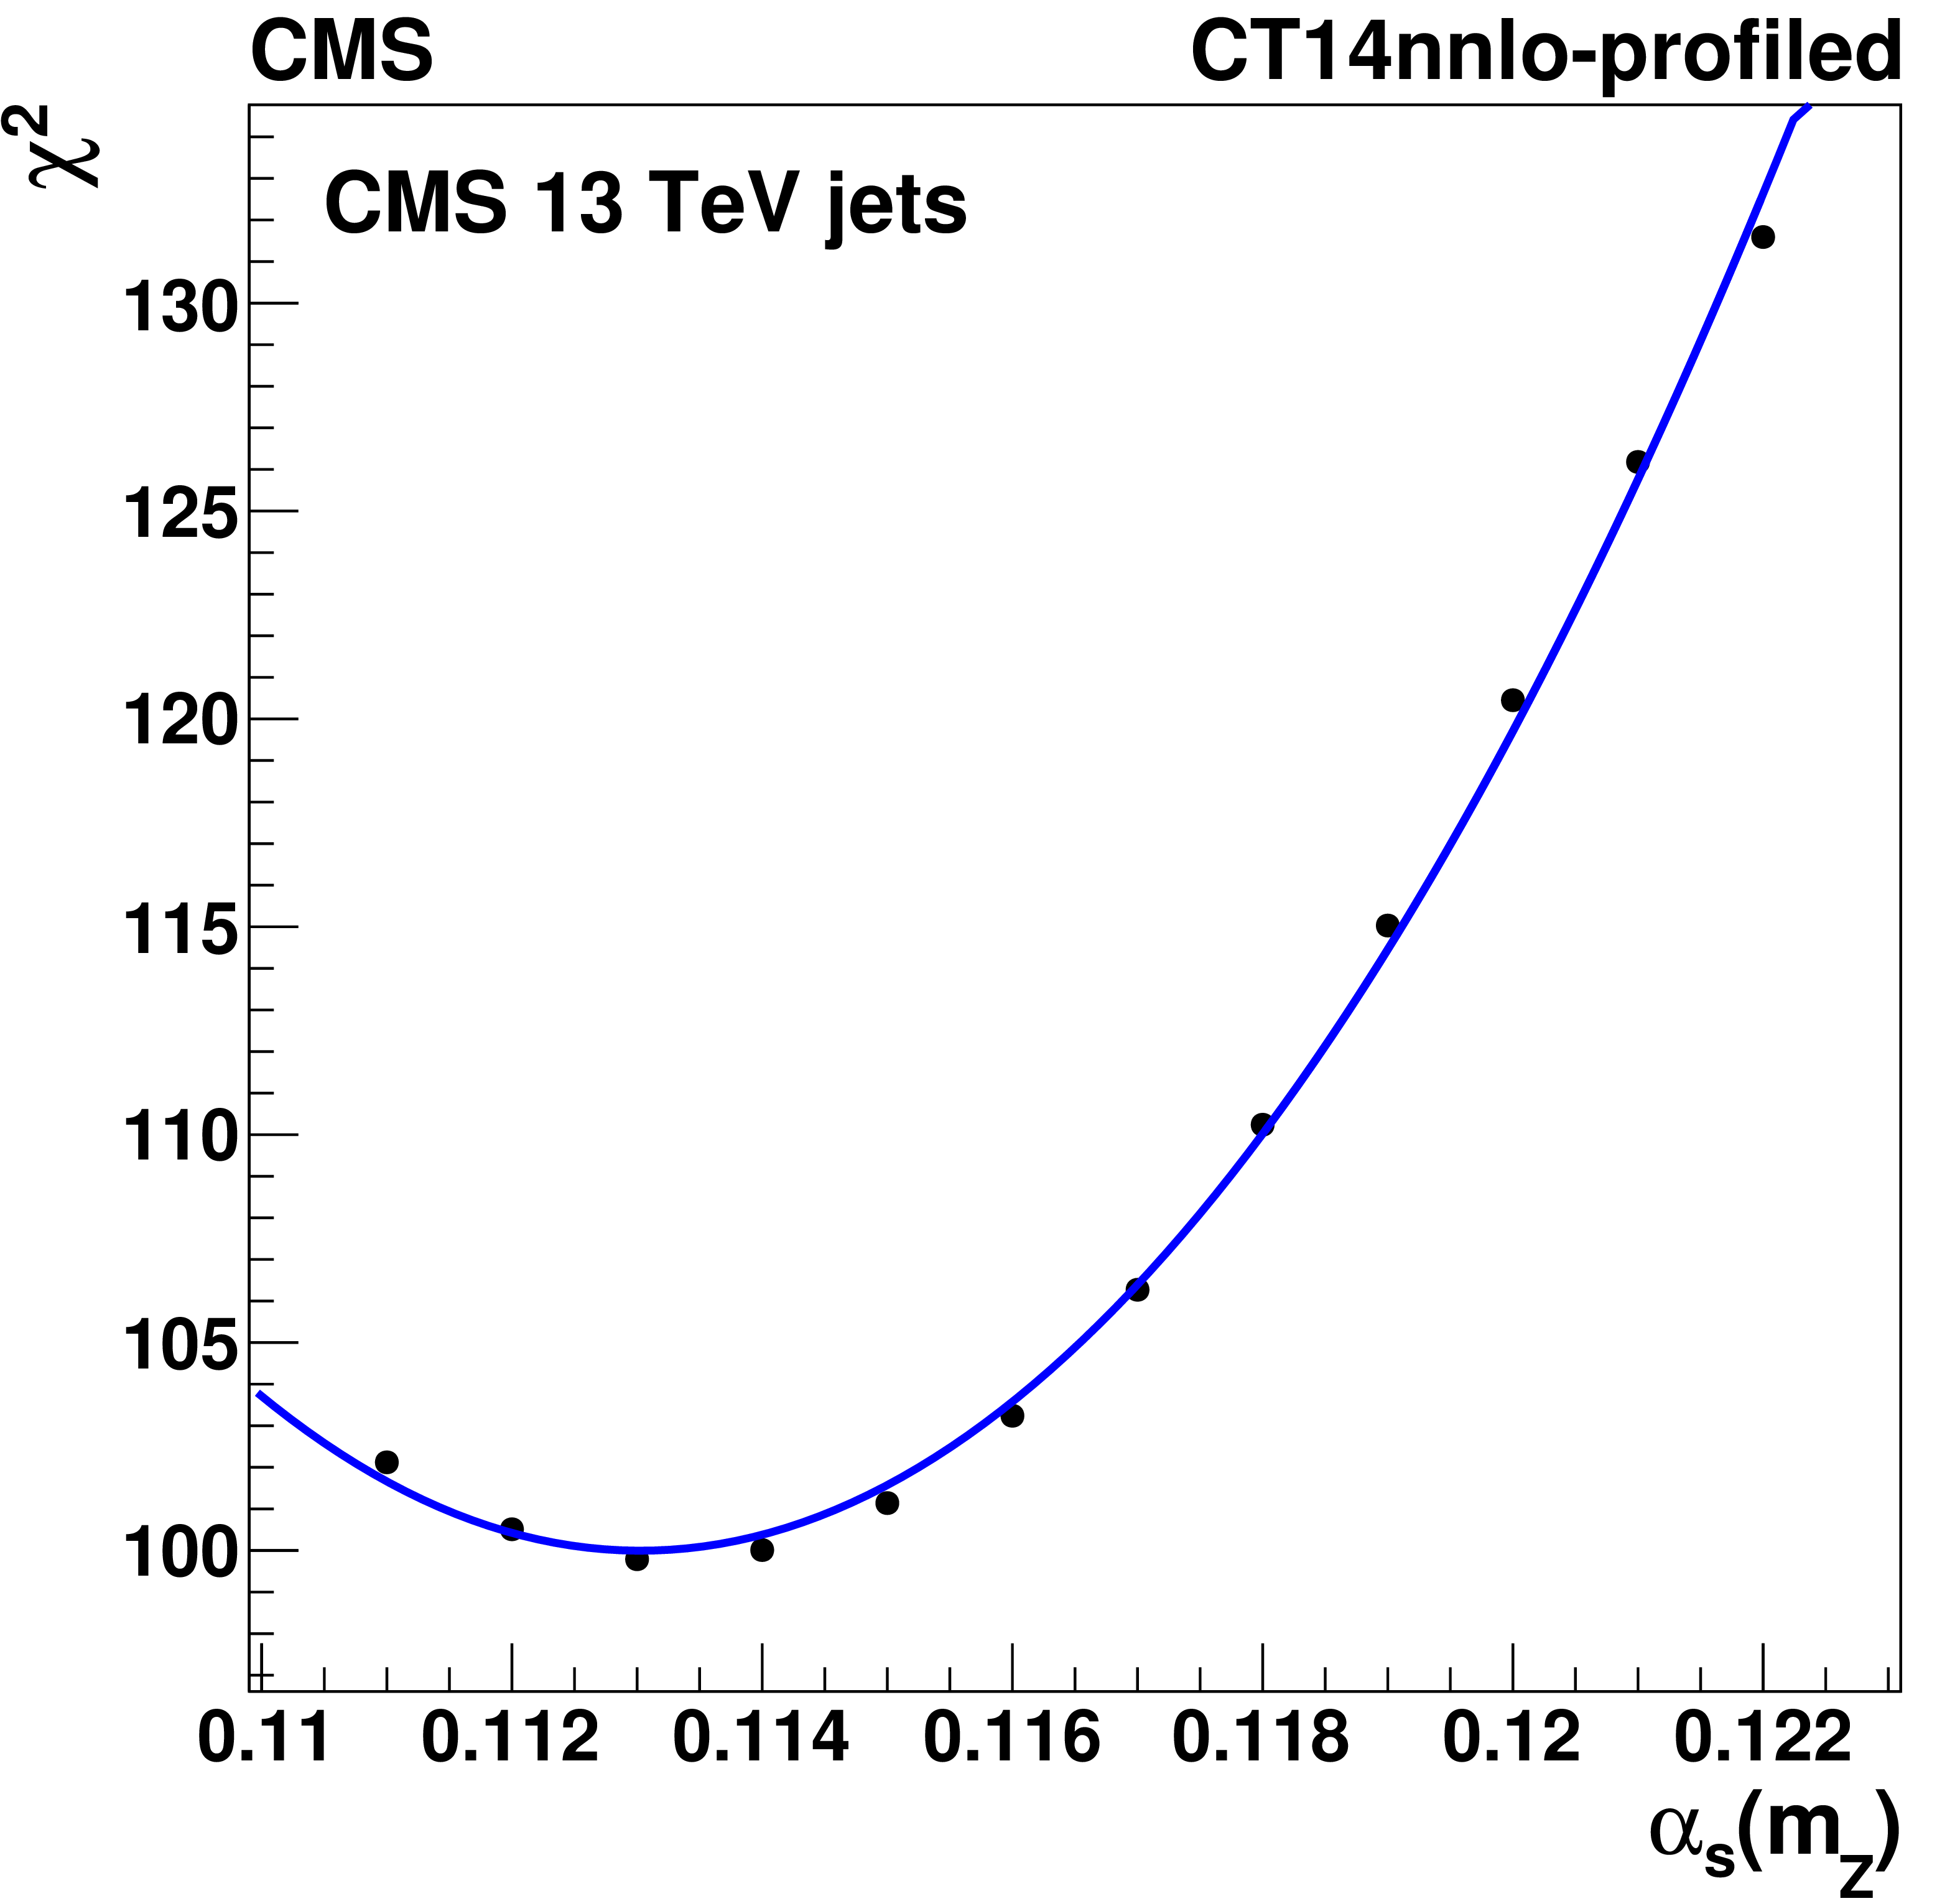
Figure 11:
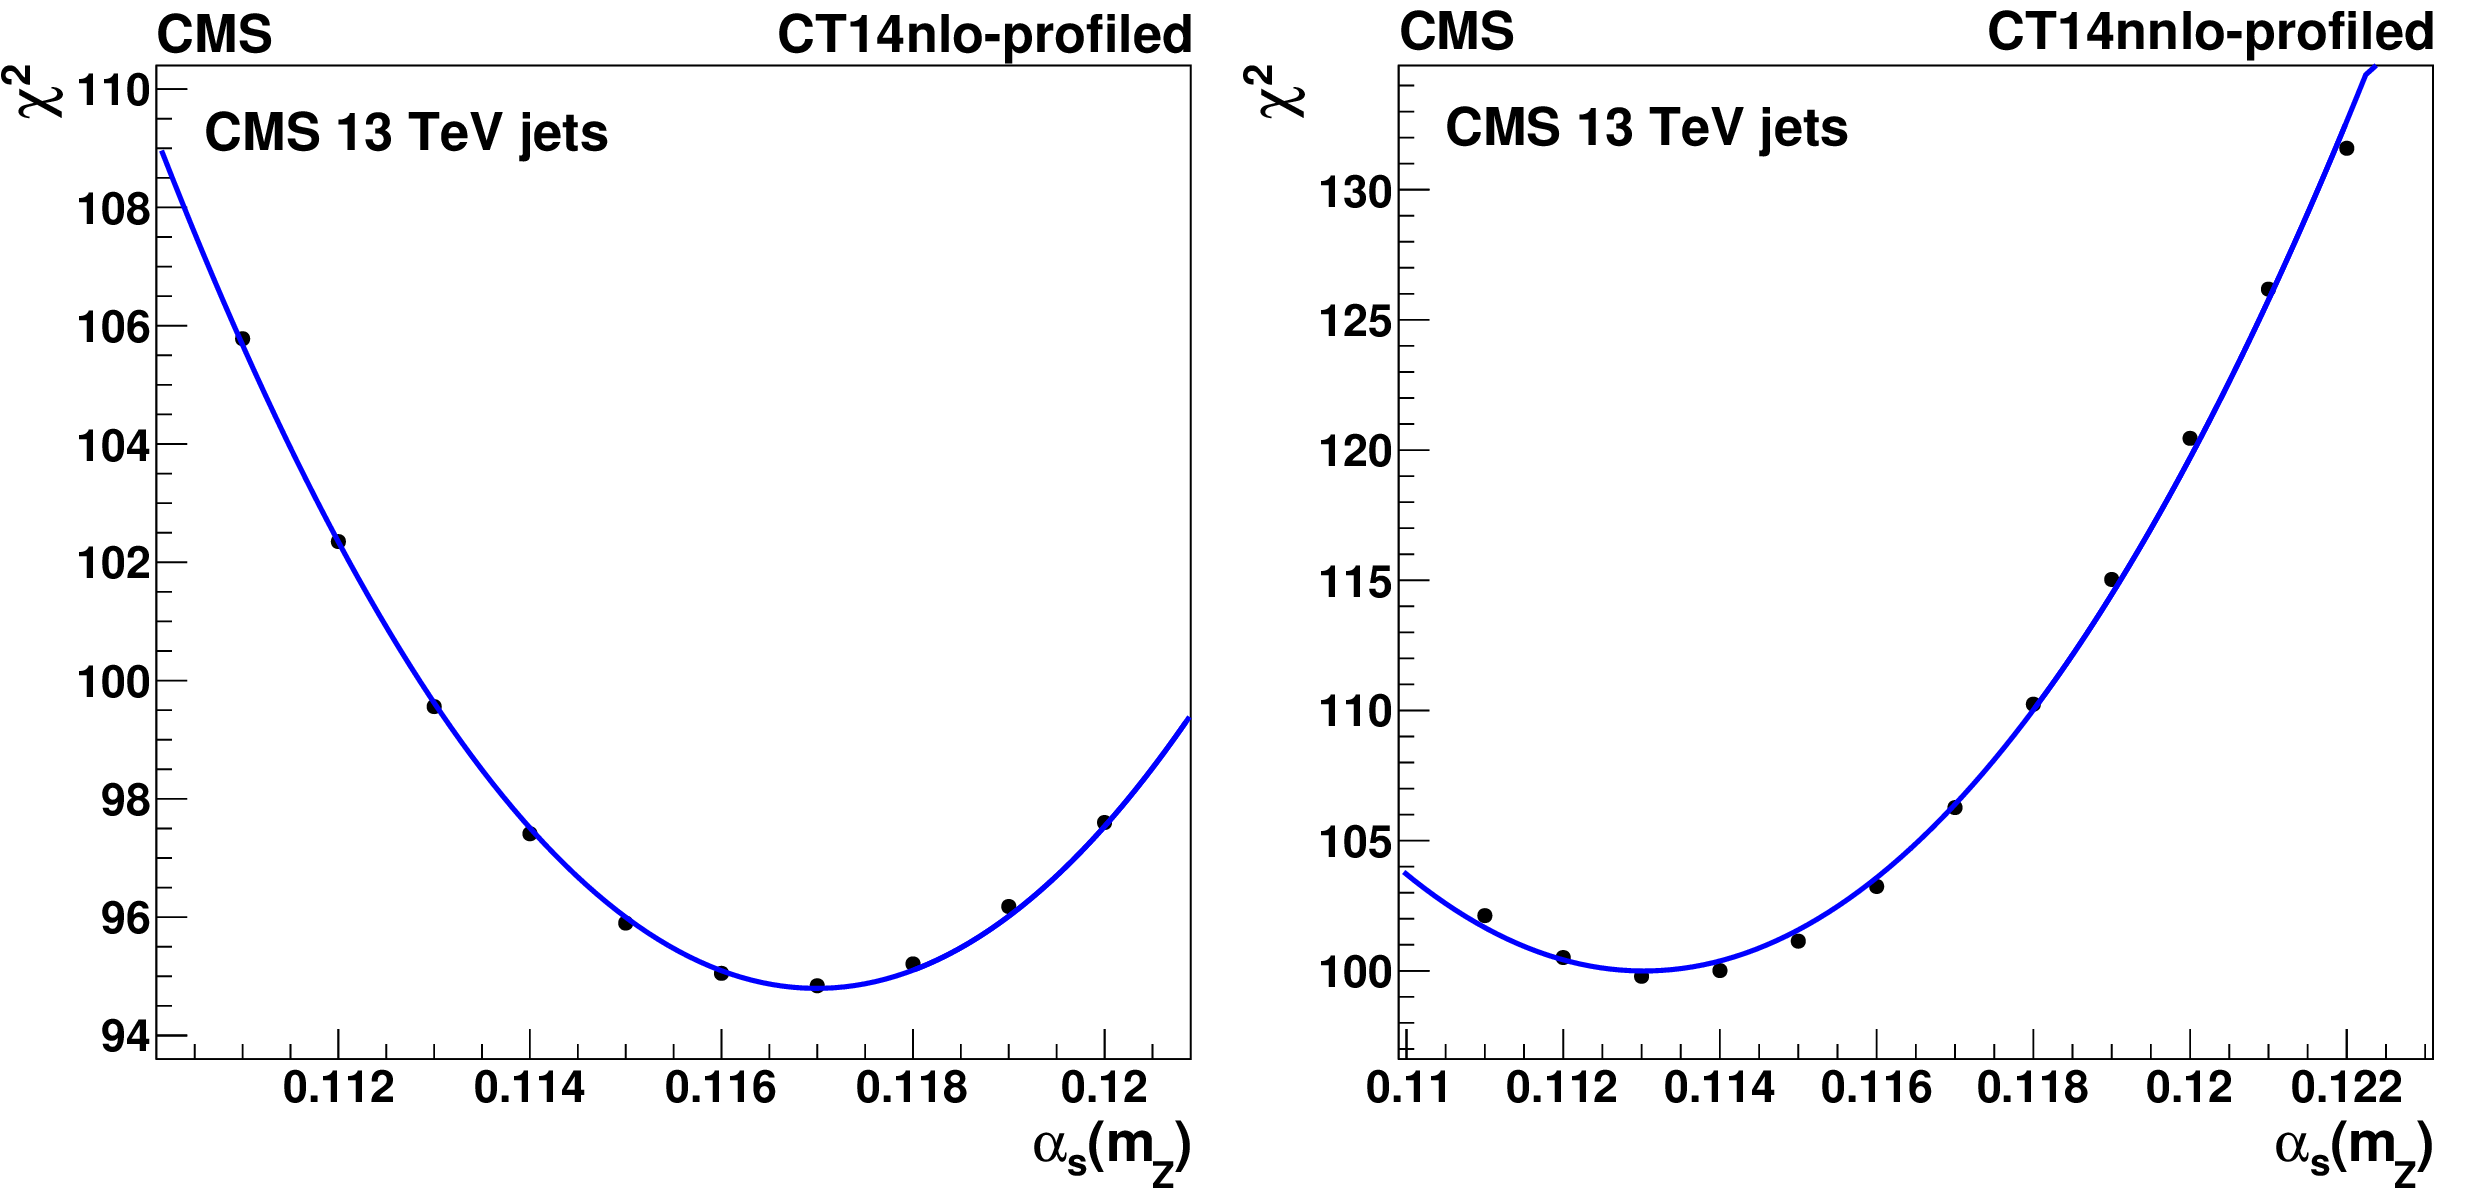
The $ \chi^2 $ obtained in profiling of CT14 PDF $ \alpha_\mathrm{S}(m_\mathrm{Z}) $ series using the CMS inclusive jet cross section at $ \sqrt{s}= $ 13 TeV at NLO (left) and NNLO (right). |
png pdf |
Figure 11-a:
The $ \chi^2 $ obtained in profiling of CT14 PDF $ \alpha_\mathrm{S}(m_\mathrm{Z}) $ series using the CMS inclusive jet cross section at $ \sqrt{s}= $ 13 TeV at NLO. |
png pdf |
Figure 11-b:
The $ \chi^2 $ obtained in profiling of CT14 PDF $ \alpha_\mathrm{S}(m_\mathrm{Z}) $ series using the CMS inclusive jet cross section at $ \sqrt{s}= $ 13 TeV at NNLO. |
png pdf |
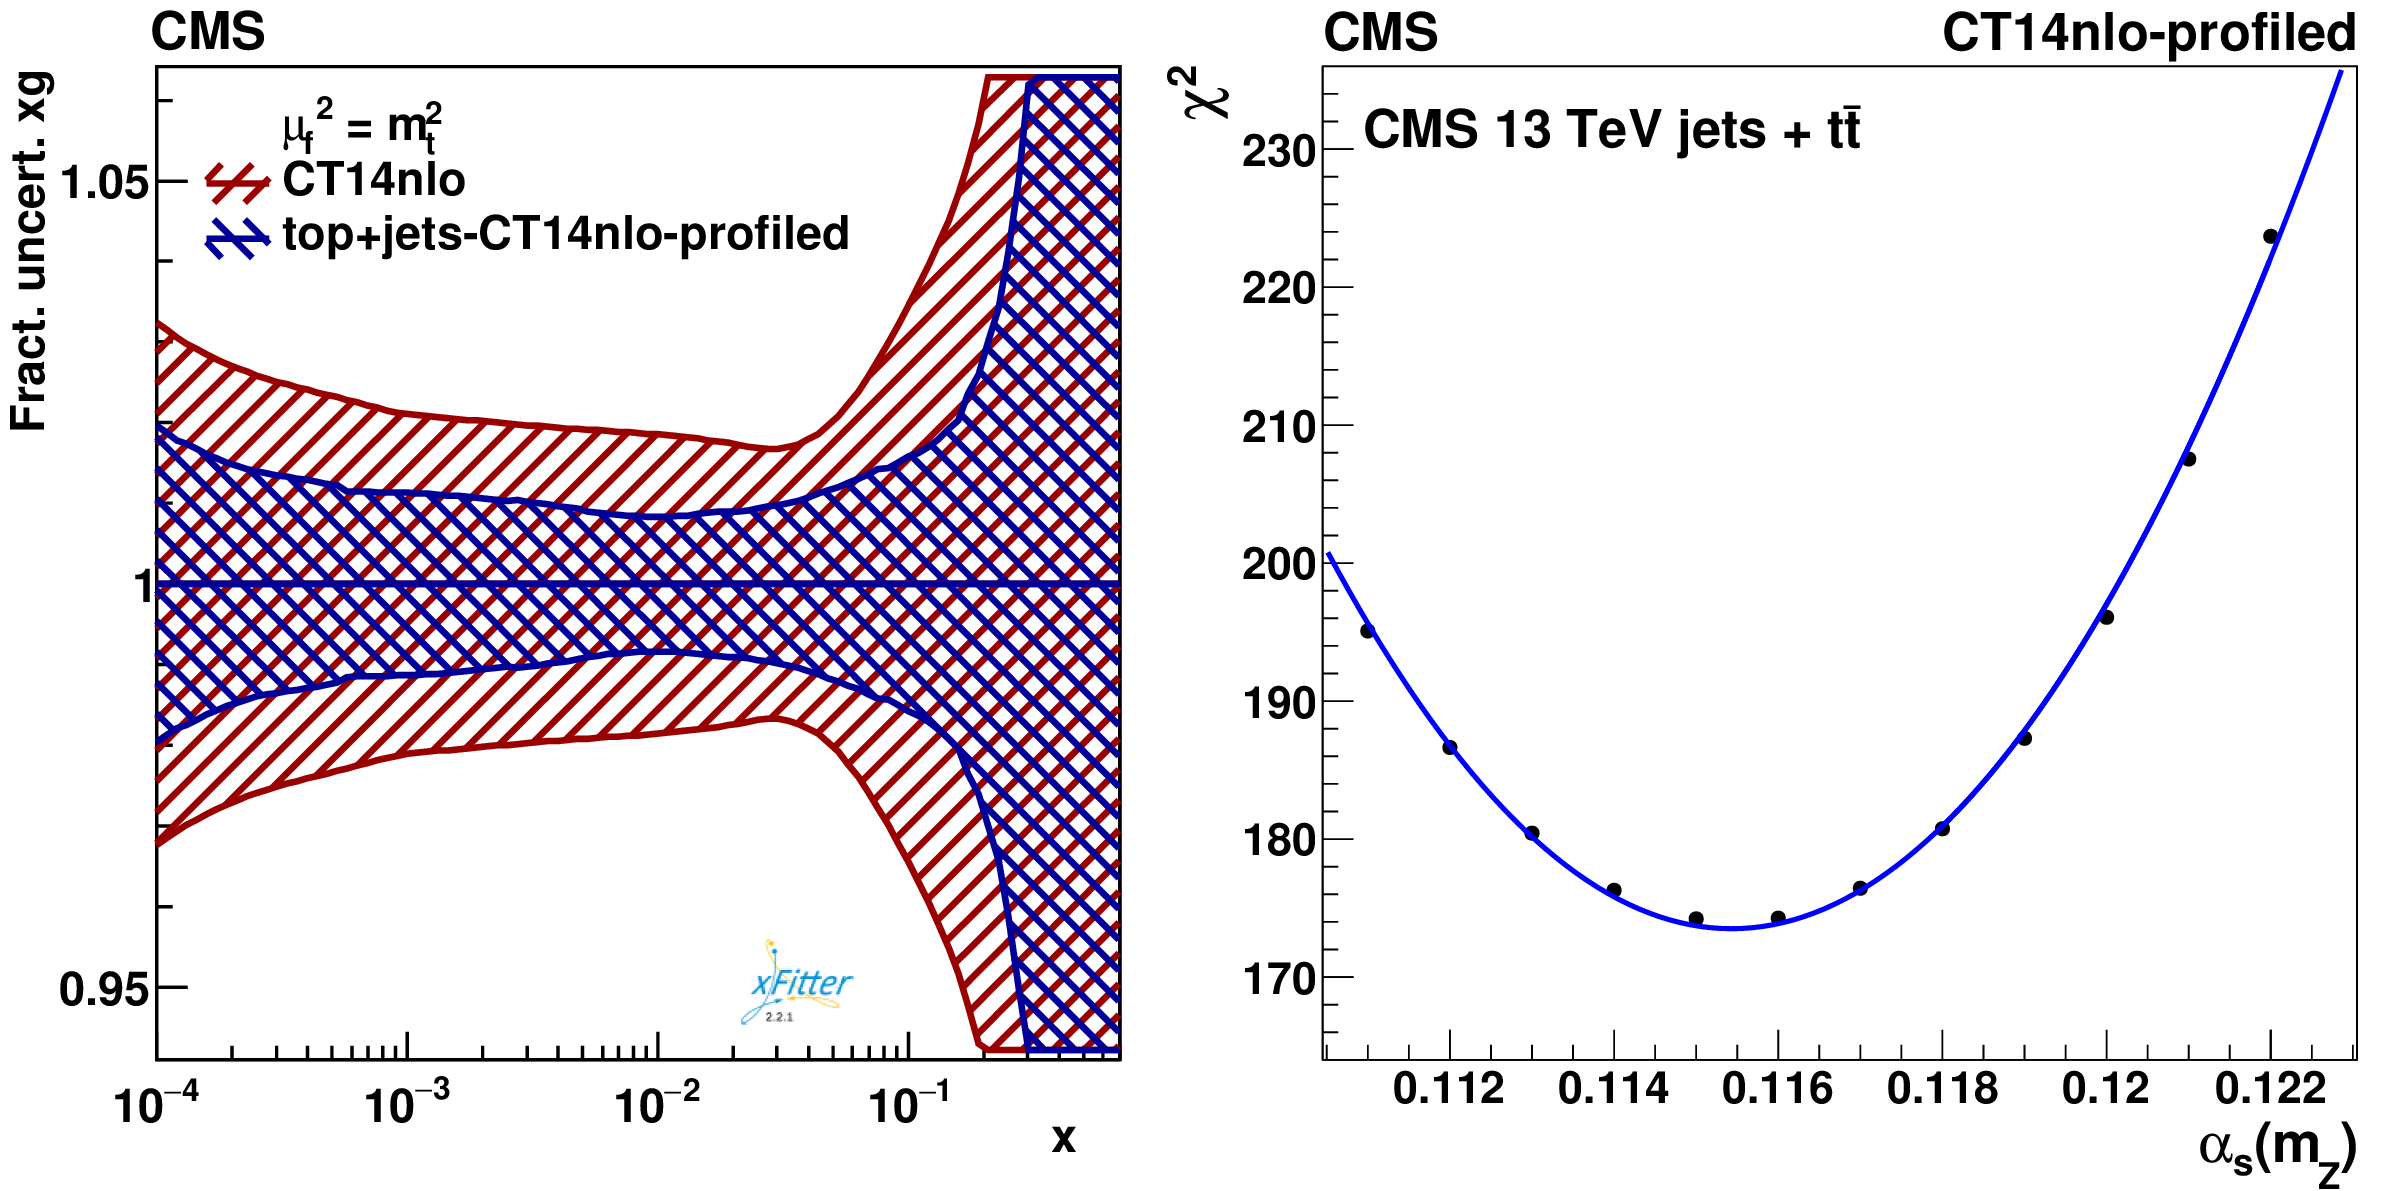
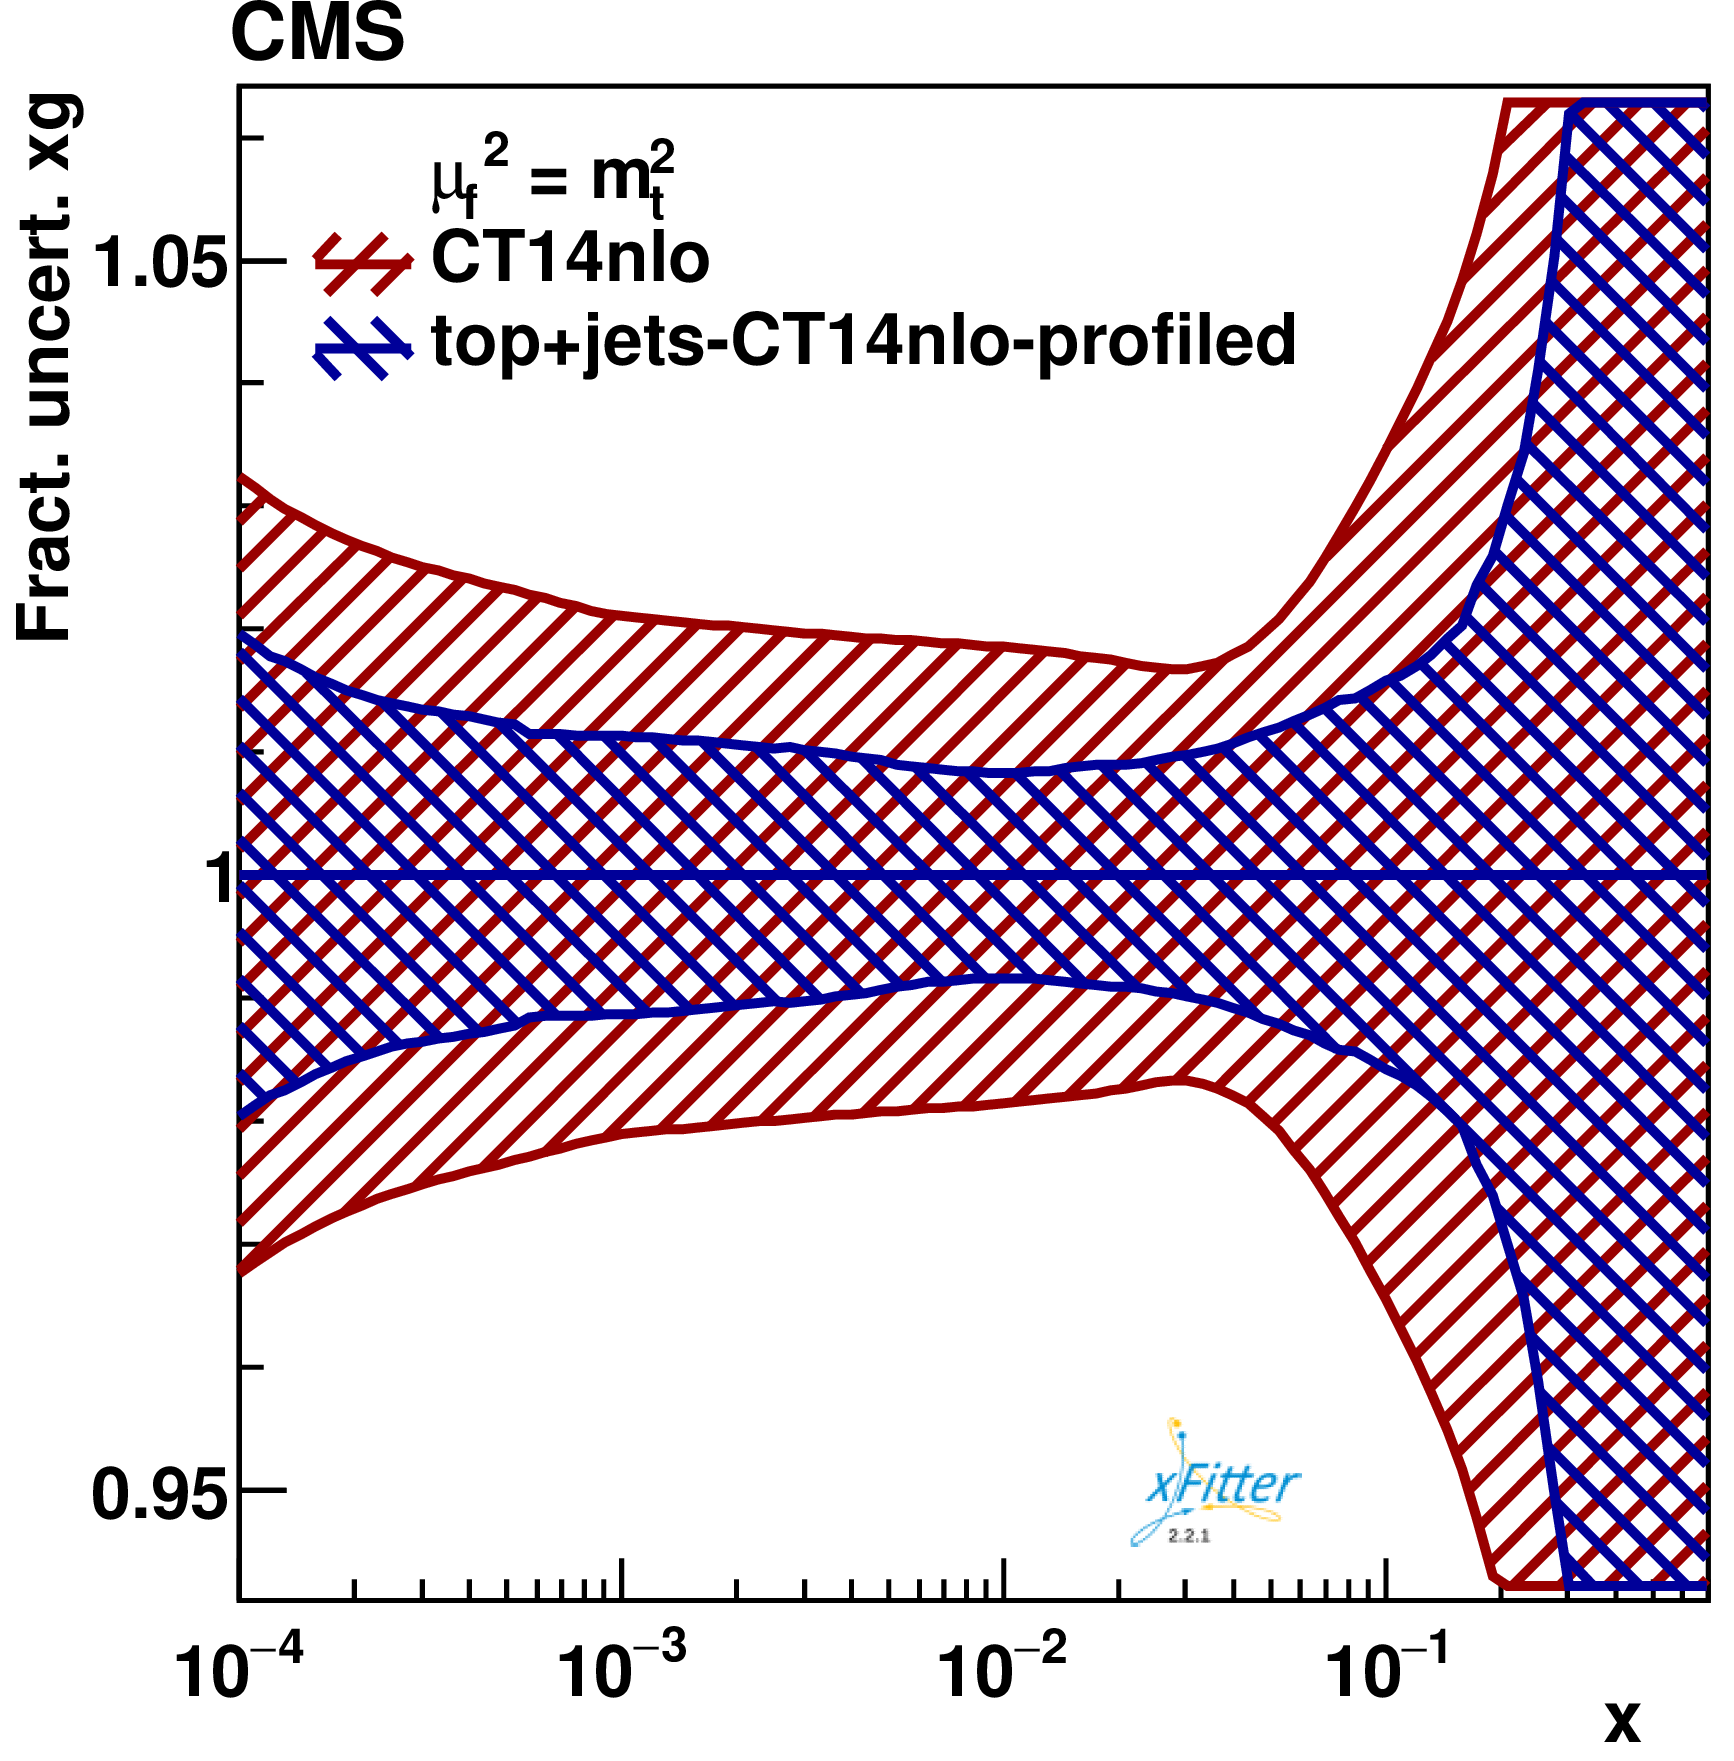
Figure 12:
Fractional uncertainty in the gluon distribution (left), shown as a function of $ x $ for the scale $ \mu_\mathrm{f}=m_\mathrm{t} $. The profiling is performed using CT14nlo PDF at NLO, by using the CMS inclusive jet and the triple-differential $ \mathrm{t} \overline{\mathrm{t}} $ cross sections at $ \sqrt{s}= $ 13 TeV. The original (profiled) uncertainty is shown in red (blue). The $ \chi^2 $ (right) obtained in profiling of CT14 PDF $ \alpha_\mathrm{S}(m_\mathrm{Z}) $ series using the same data as in (left). |
png pdf |
Figure 12-a:
Fractional uncertainty in the gluon distribution, shown as a function of $ x $ for the scale $ \mu_\mathrm{f}=m_\mathrm{t} $. The profiling is performed using CT14nlo PDF at NLO, by using the CMS inclusive jet and the triple-differential $ \mathrm{t} \overline{\mathrm{t}} $ cross sections at $ \sqrt{s}= $ 13 TeV. The original (profiled) uncertainty is shown in red (blue). |

png pdf |
Figure 12-b:
The $ \chi^2 $ obtained in profiling of CT14 PDF $ \alpha_\mathrm{S}(m_\mathrm{Z}) $ series using the same data as in Fig. 12-a. |
png pdf |
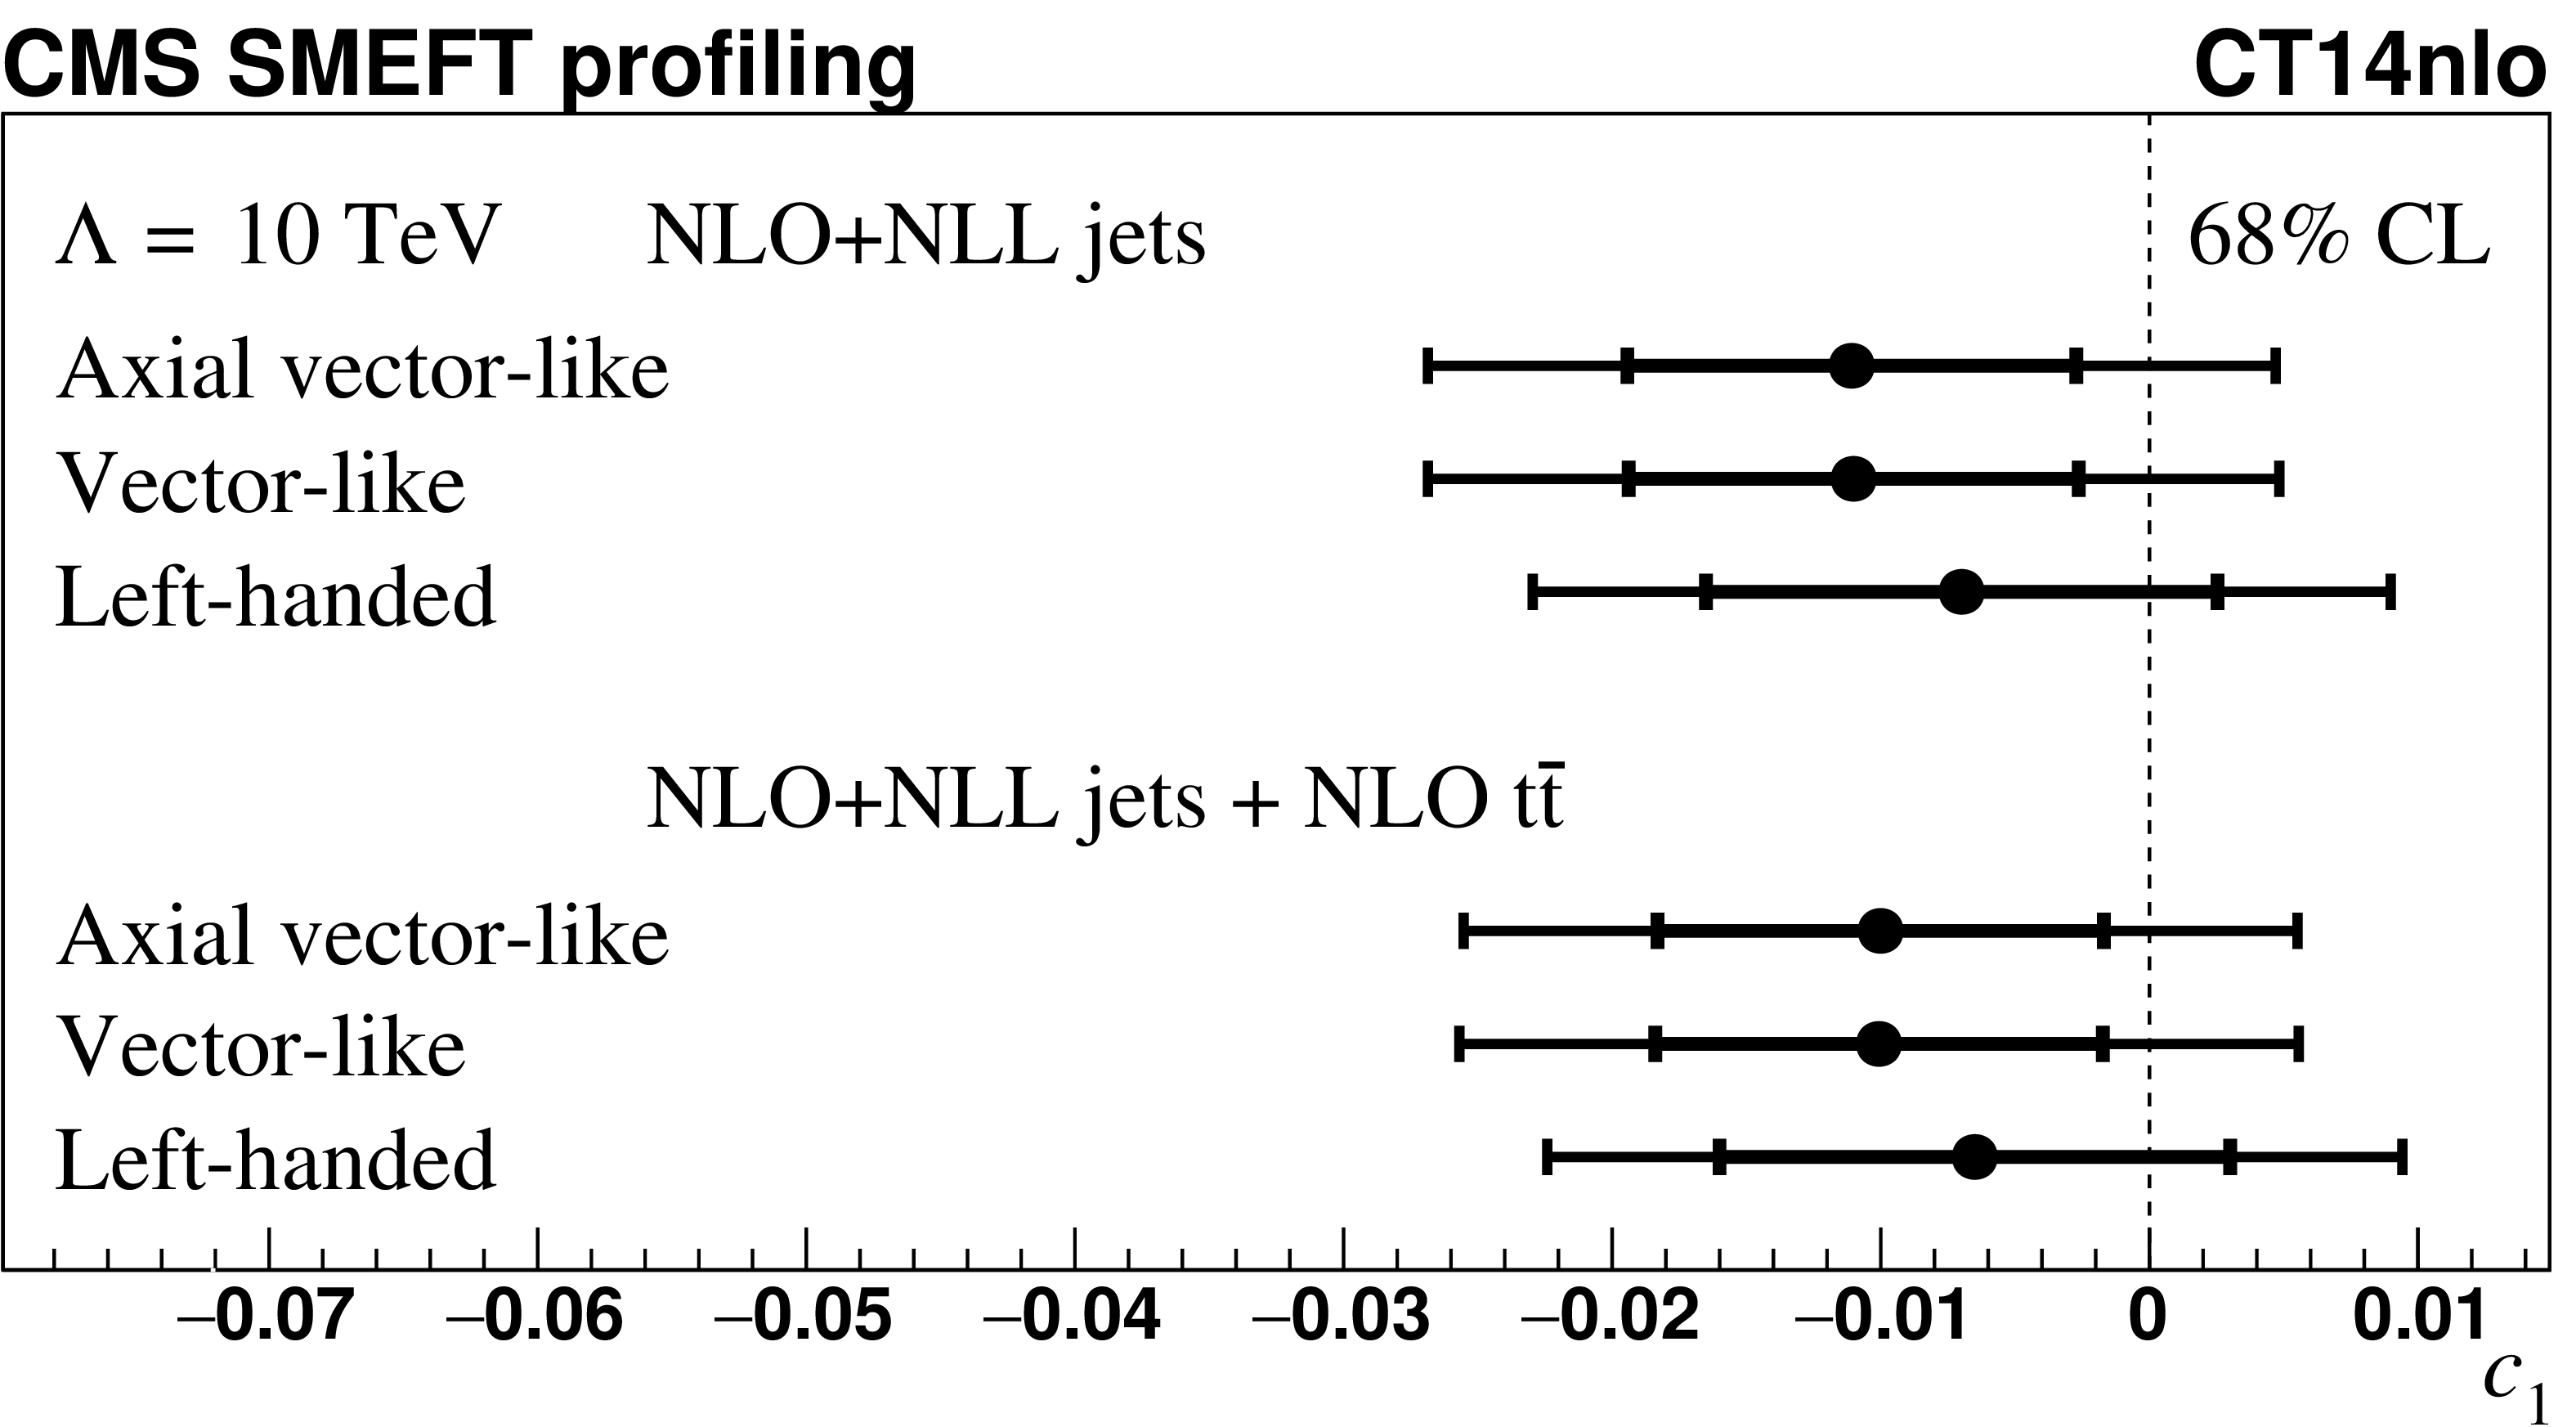
Figure 13:
The profiled Wilson coefficient $ c_1 $ for the contact interaction models, assuming the left-handed, vector-like, and axial vector-like scenarios, as obtained in the profiling analysis using NLO+NLL calculation for the jet production and the CT14nlo PDF set. The value of $ \Lambda = $ 10 TeV is assumed. The results are obtained using the CMS measurements of inclusive jet cross section and of normalised triple-differential $ \mathrm{t} \overline{\mathrm{t}} $ cross section at $ \sqrt{s}= $ 13 TeV. The inner error bar shows the PDF uncertainty at 68% CL, while the outer error bar represents the total uncertainty, obtained from the PDF and scale uncertainties, added in quadrature. |
png pdf |
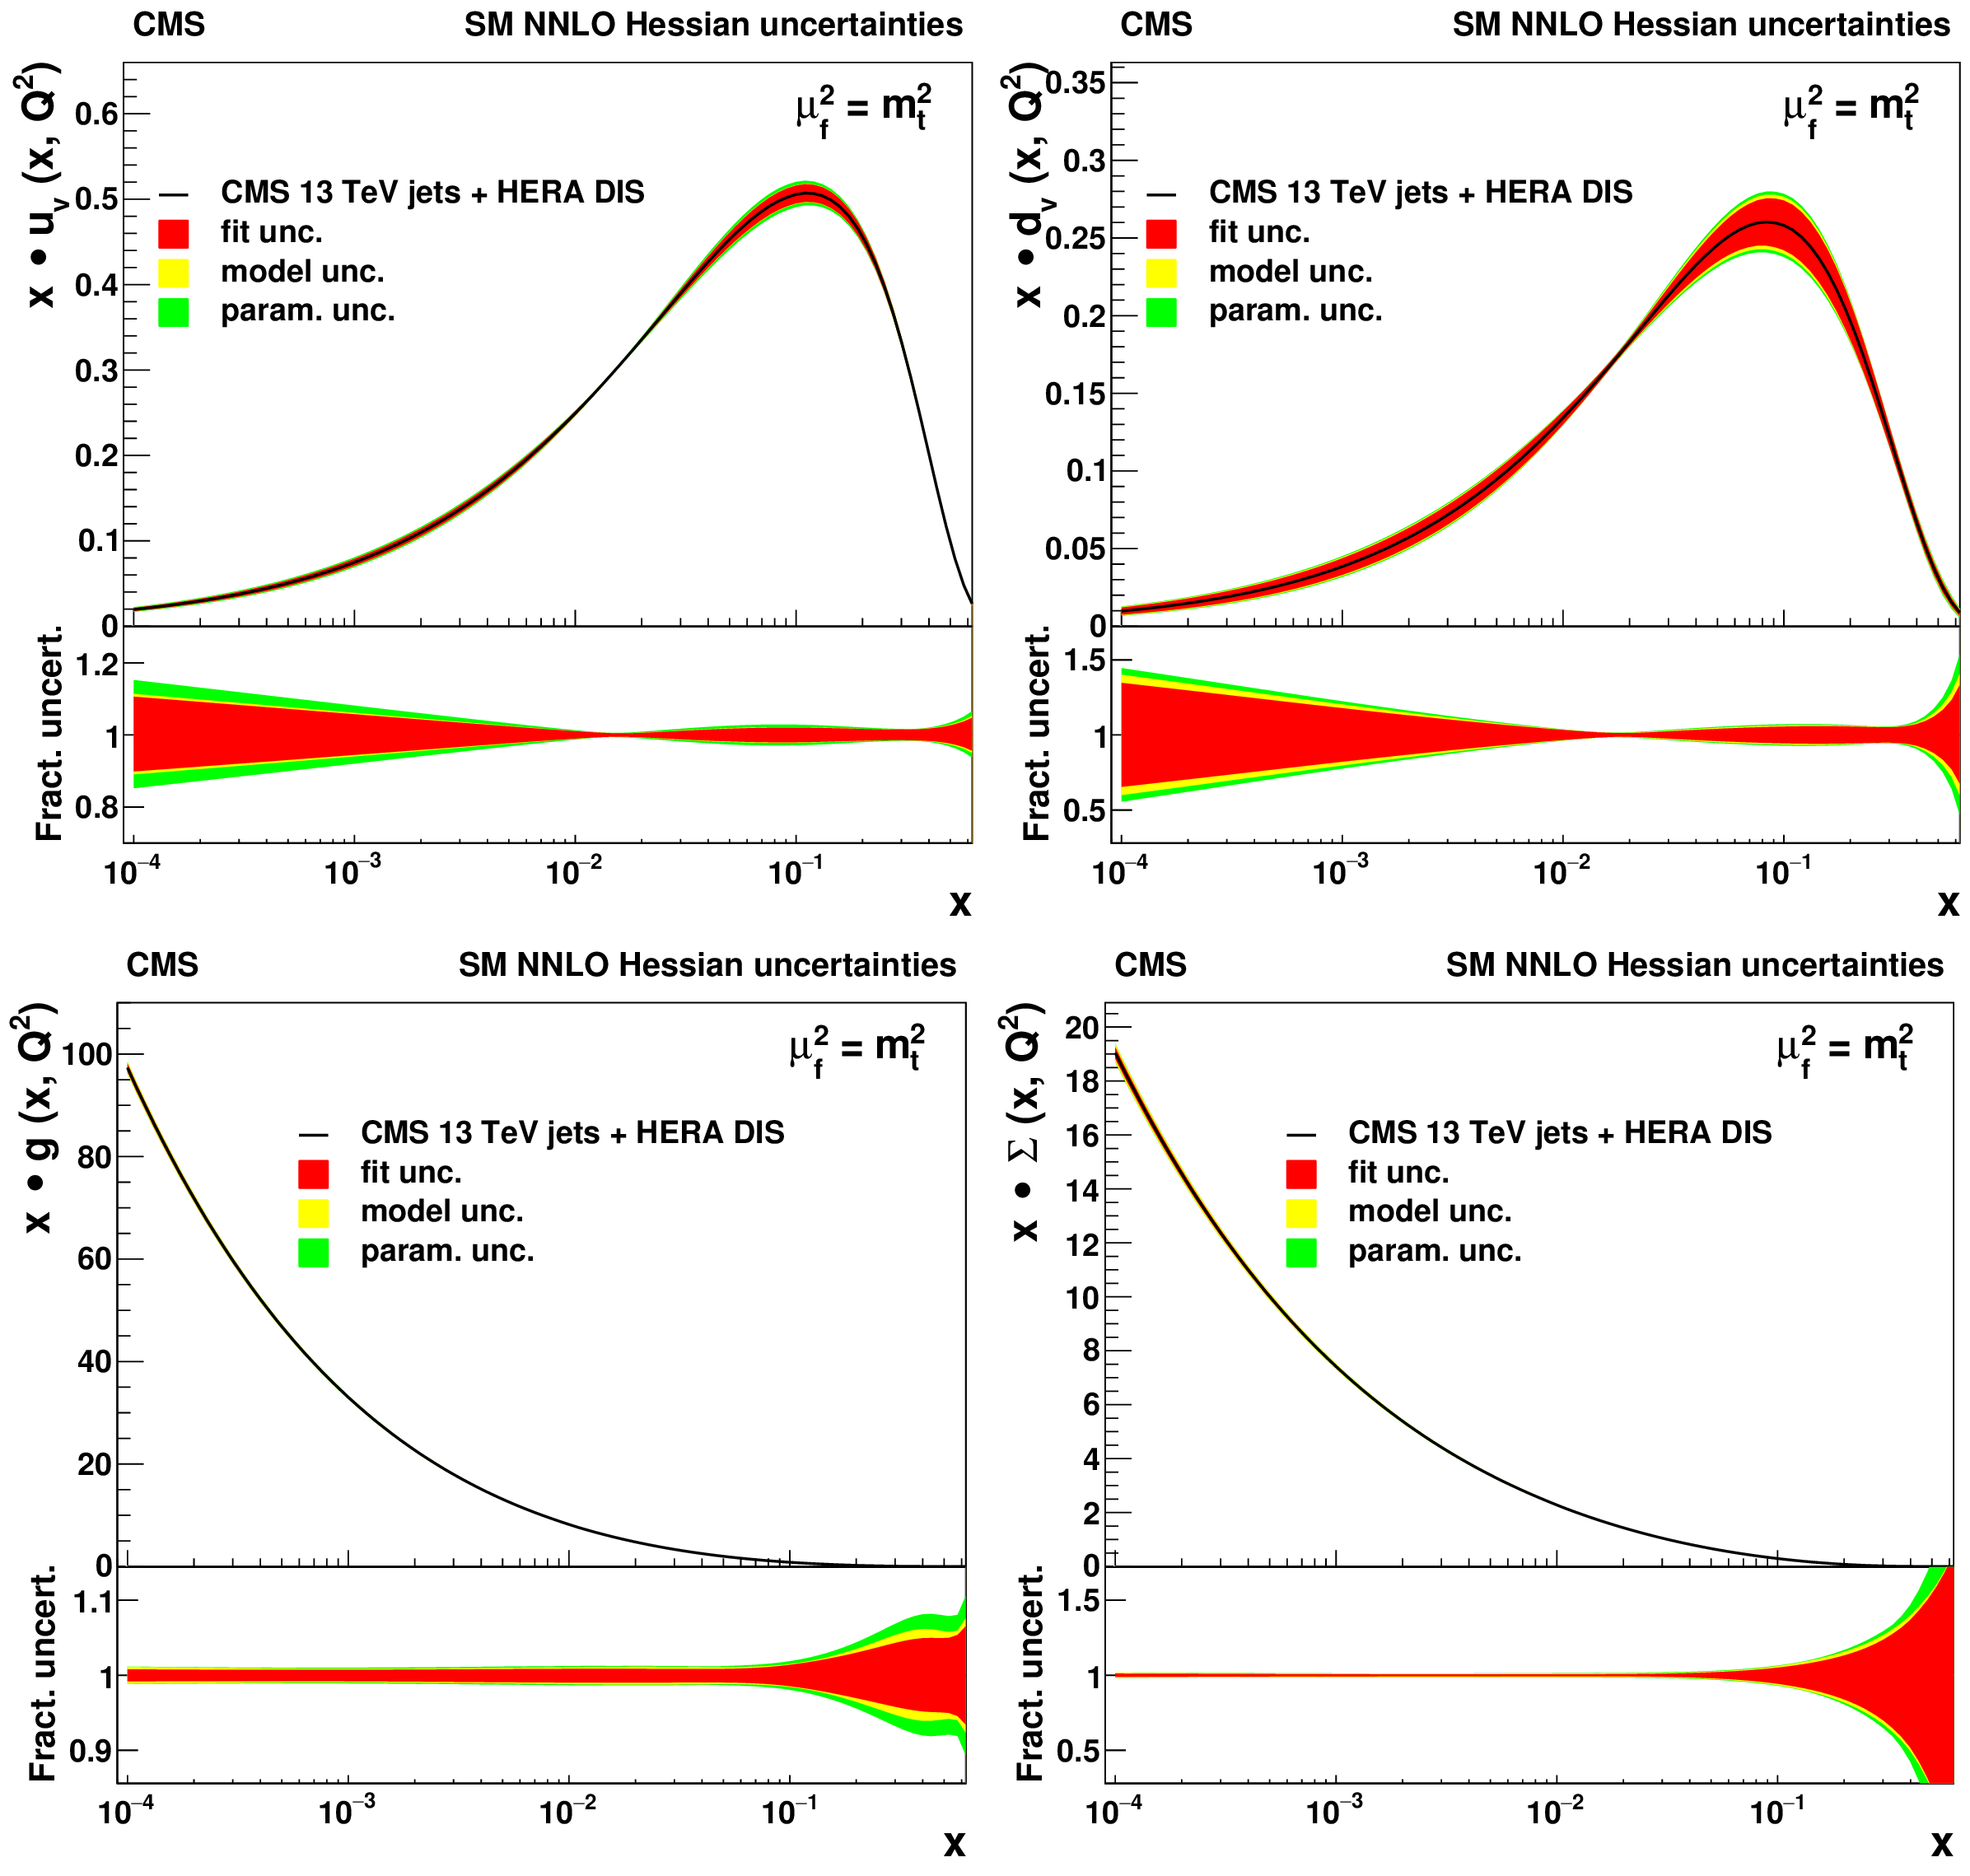
Figure 14:
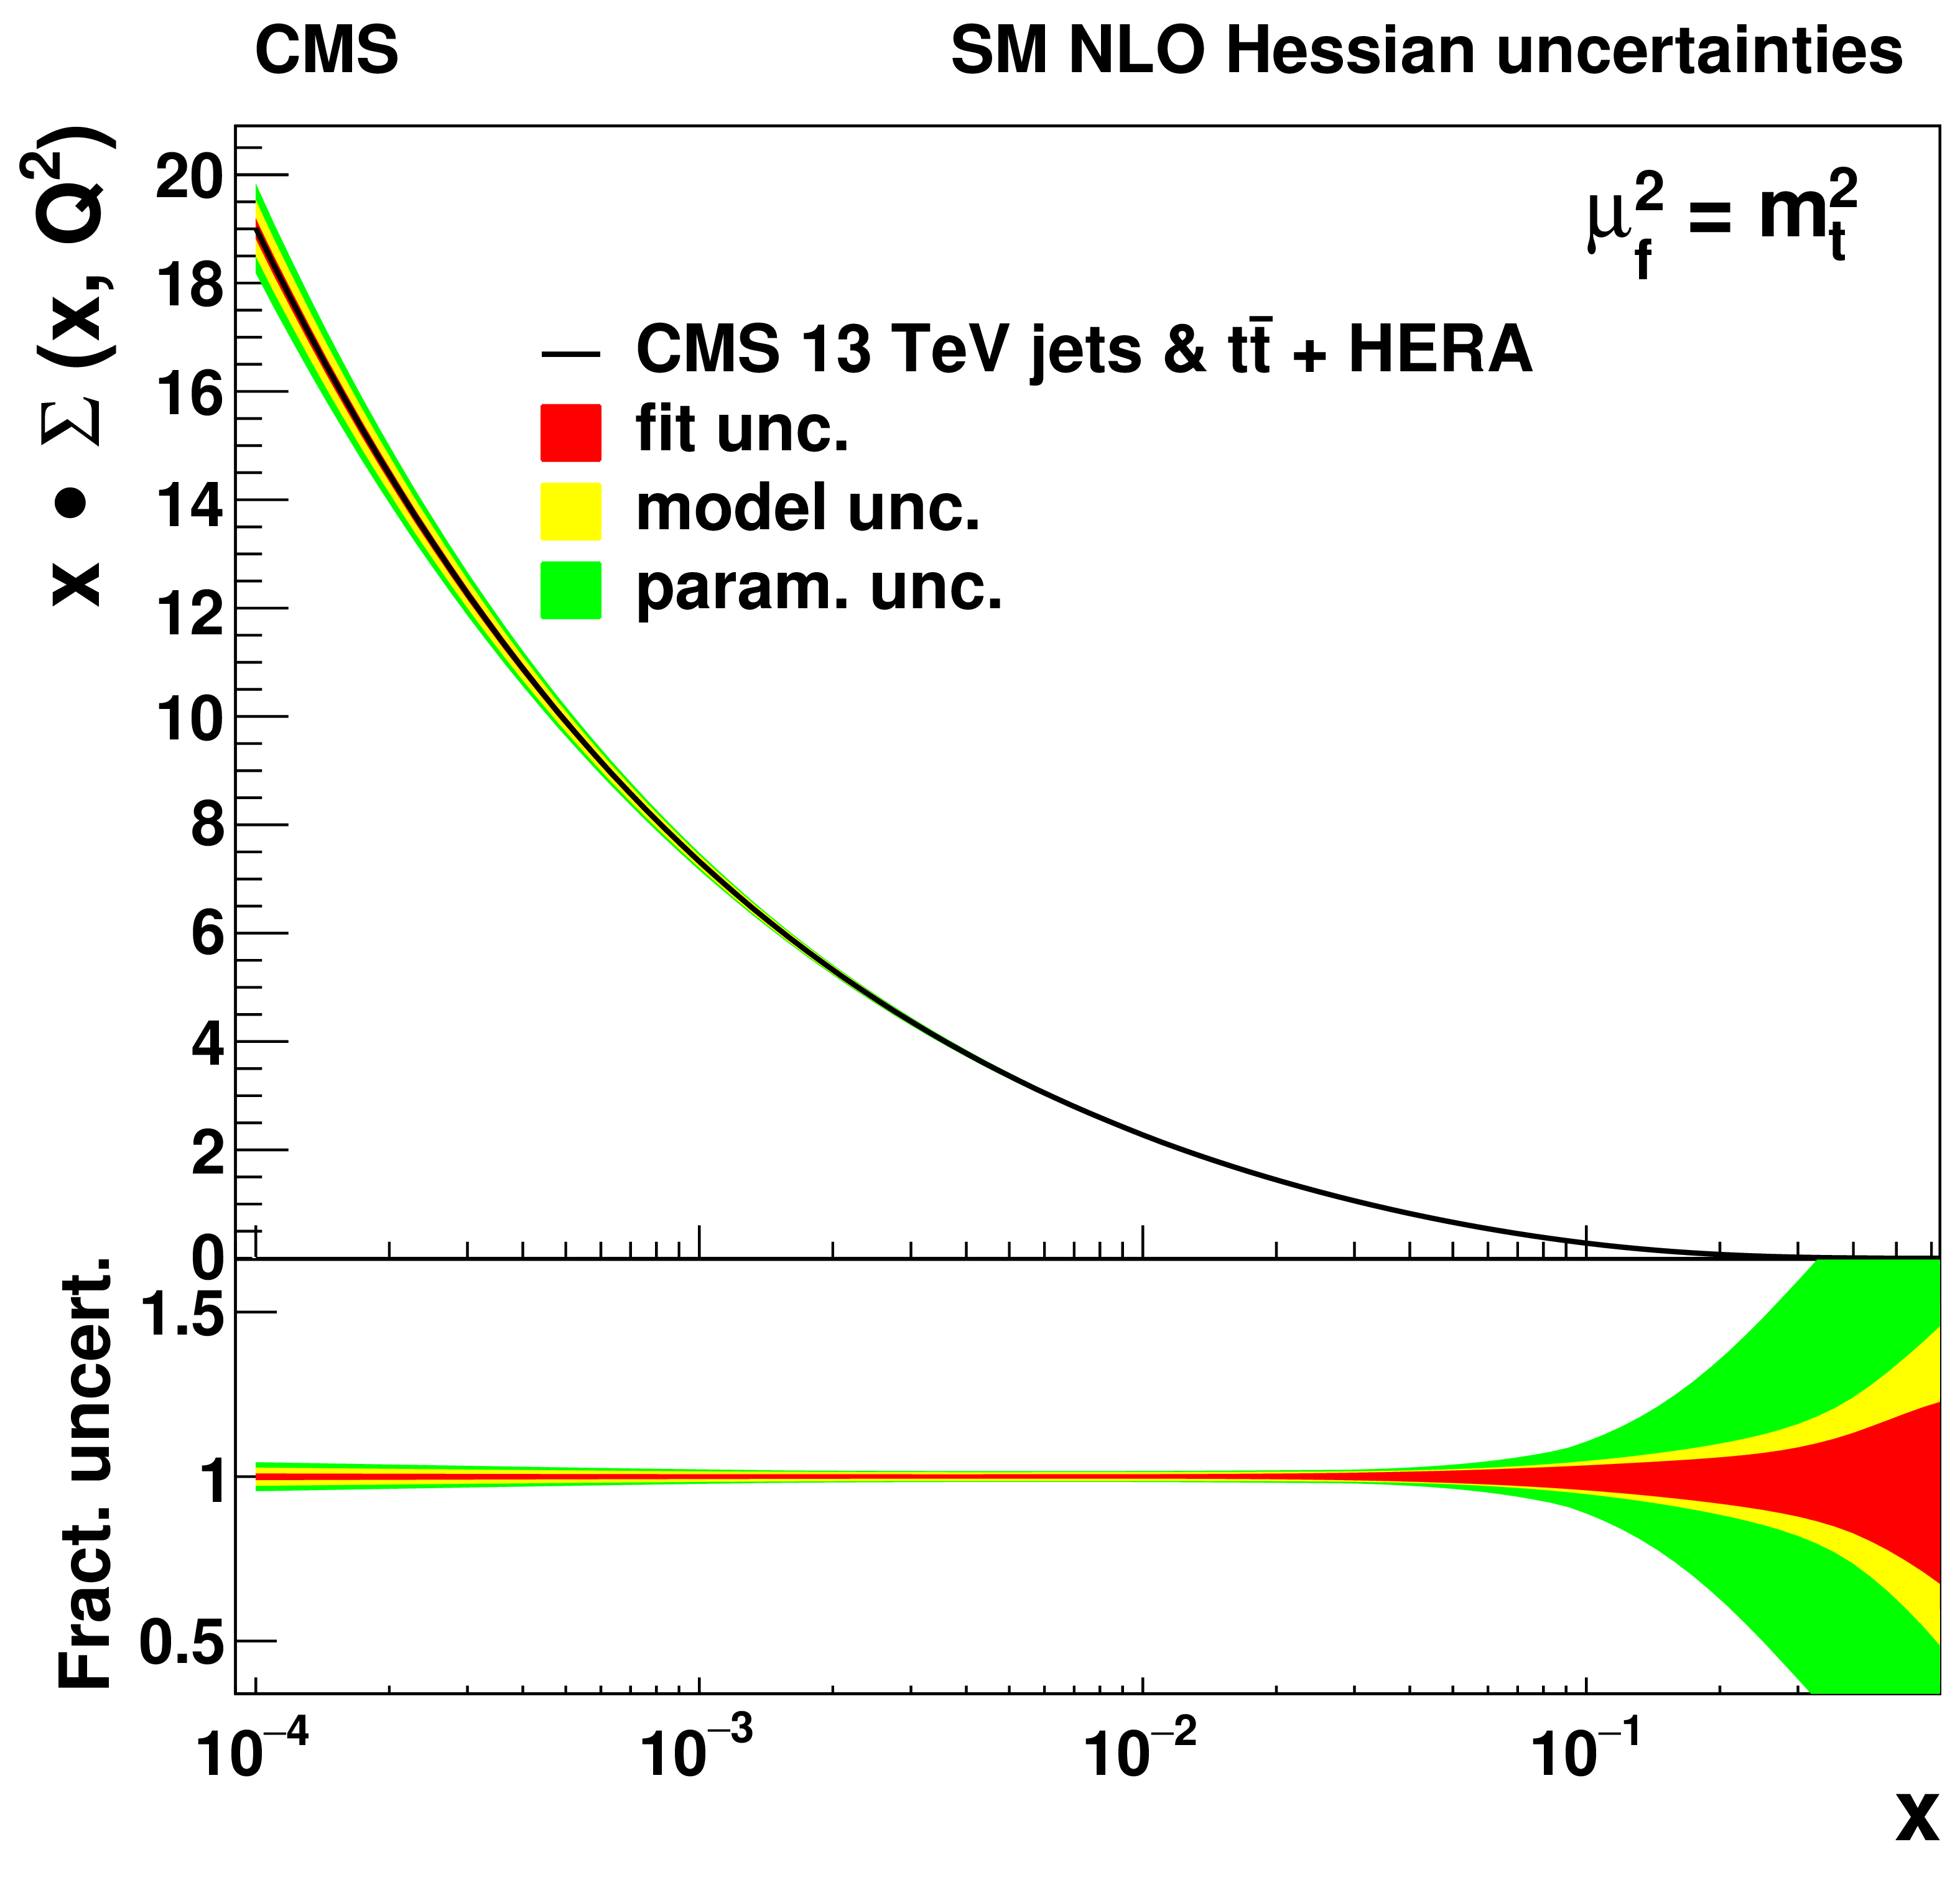
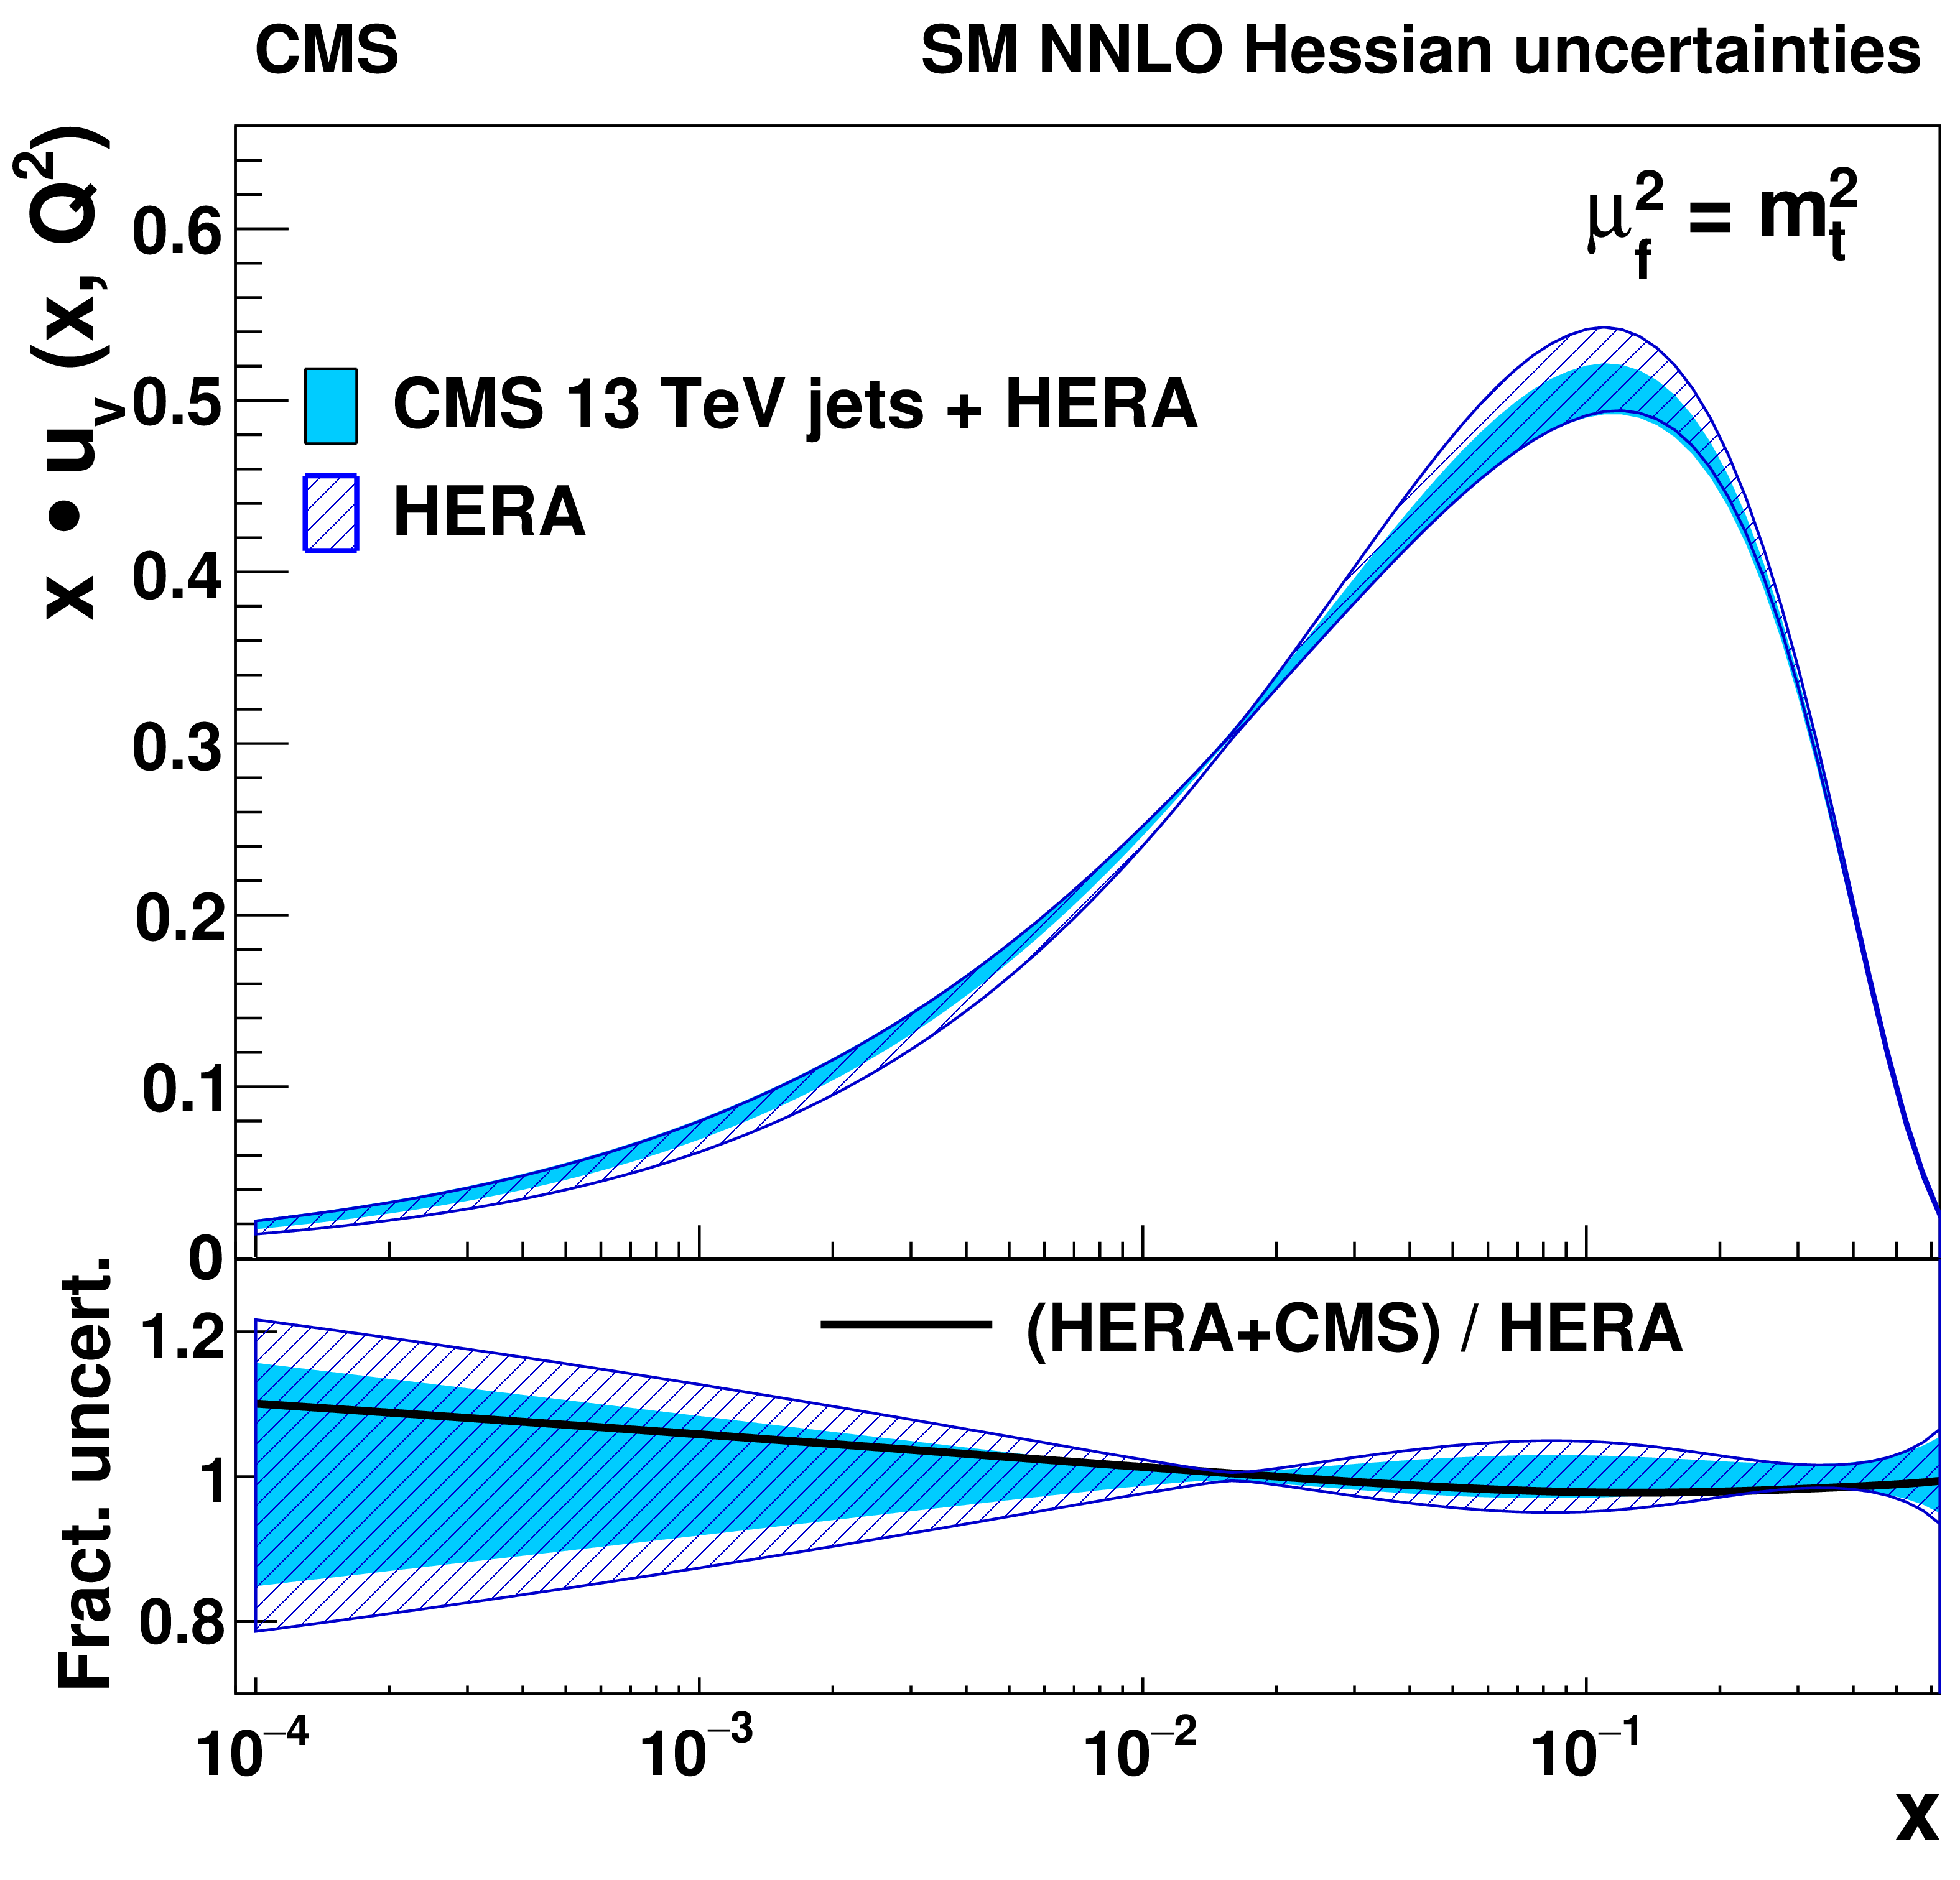
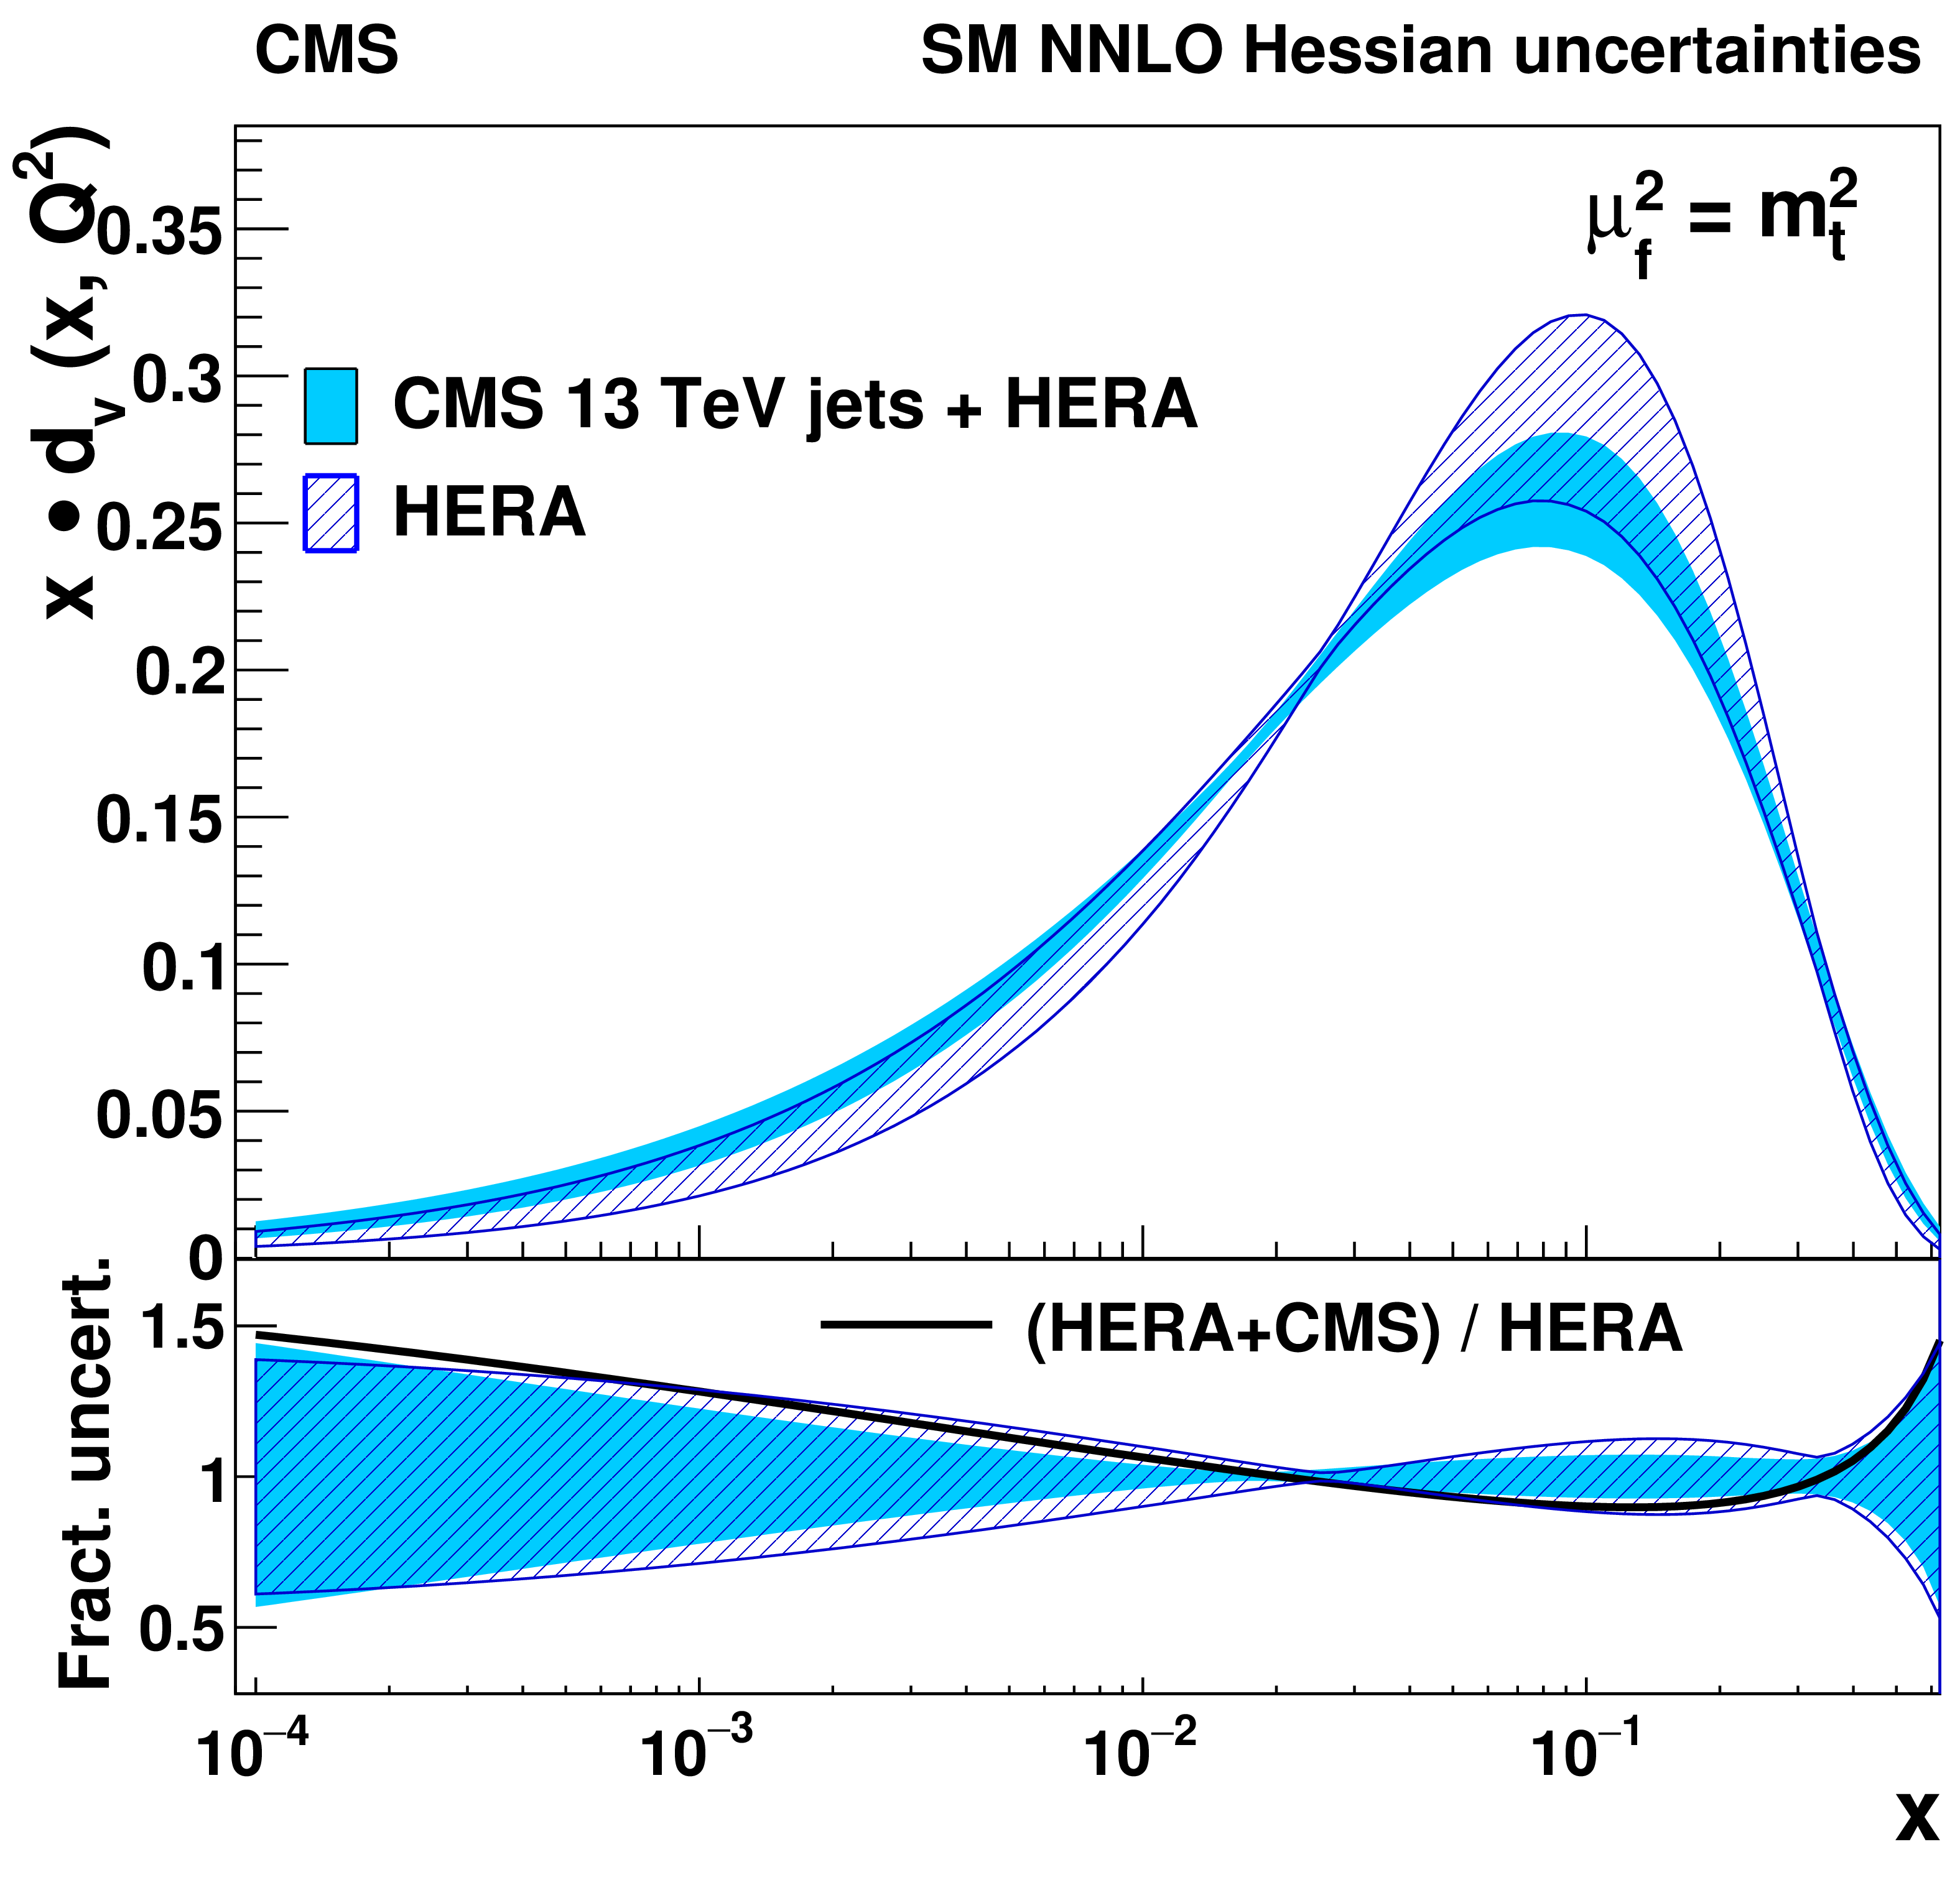
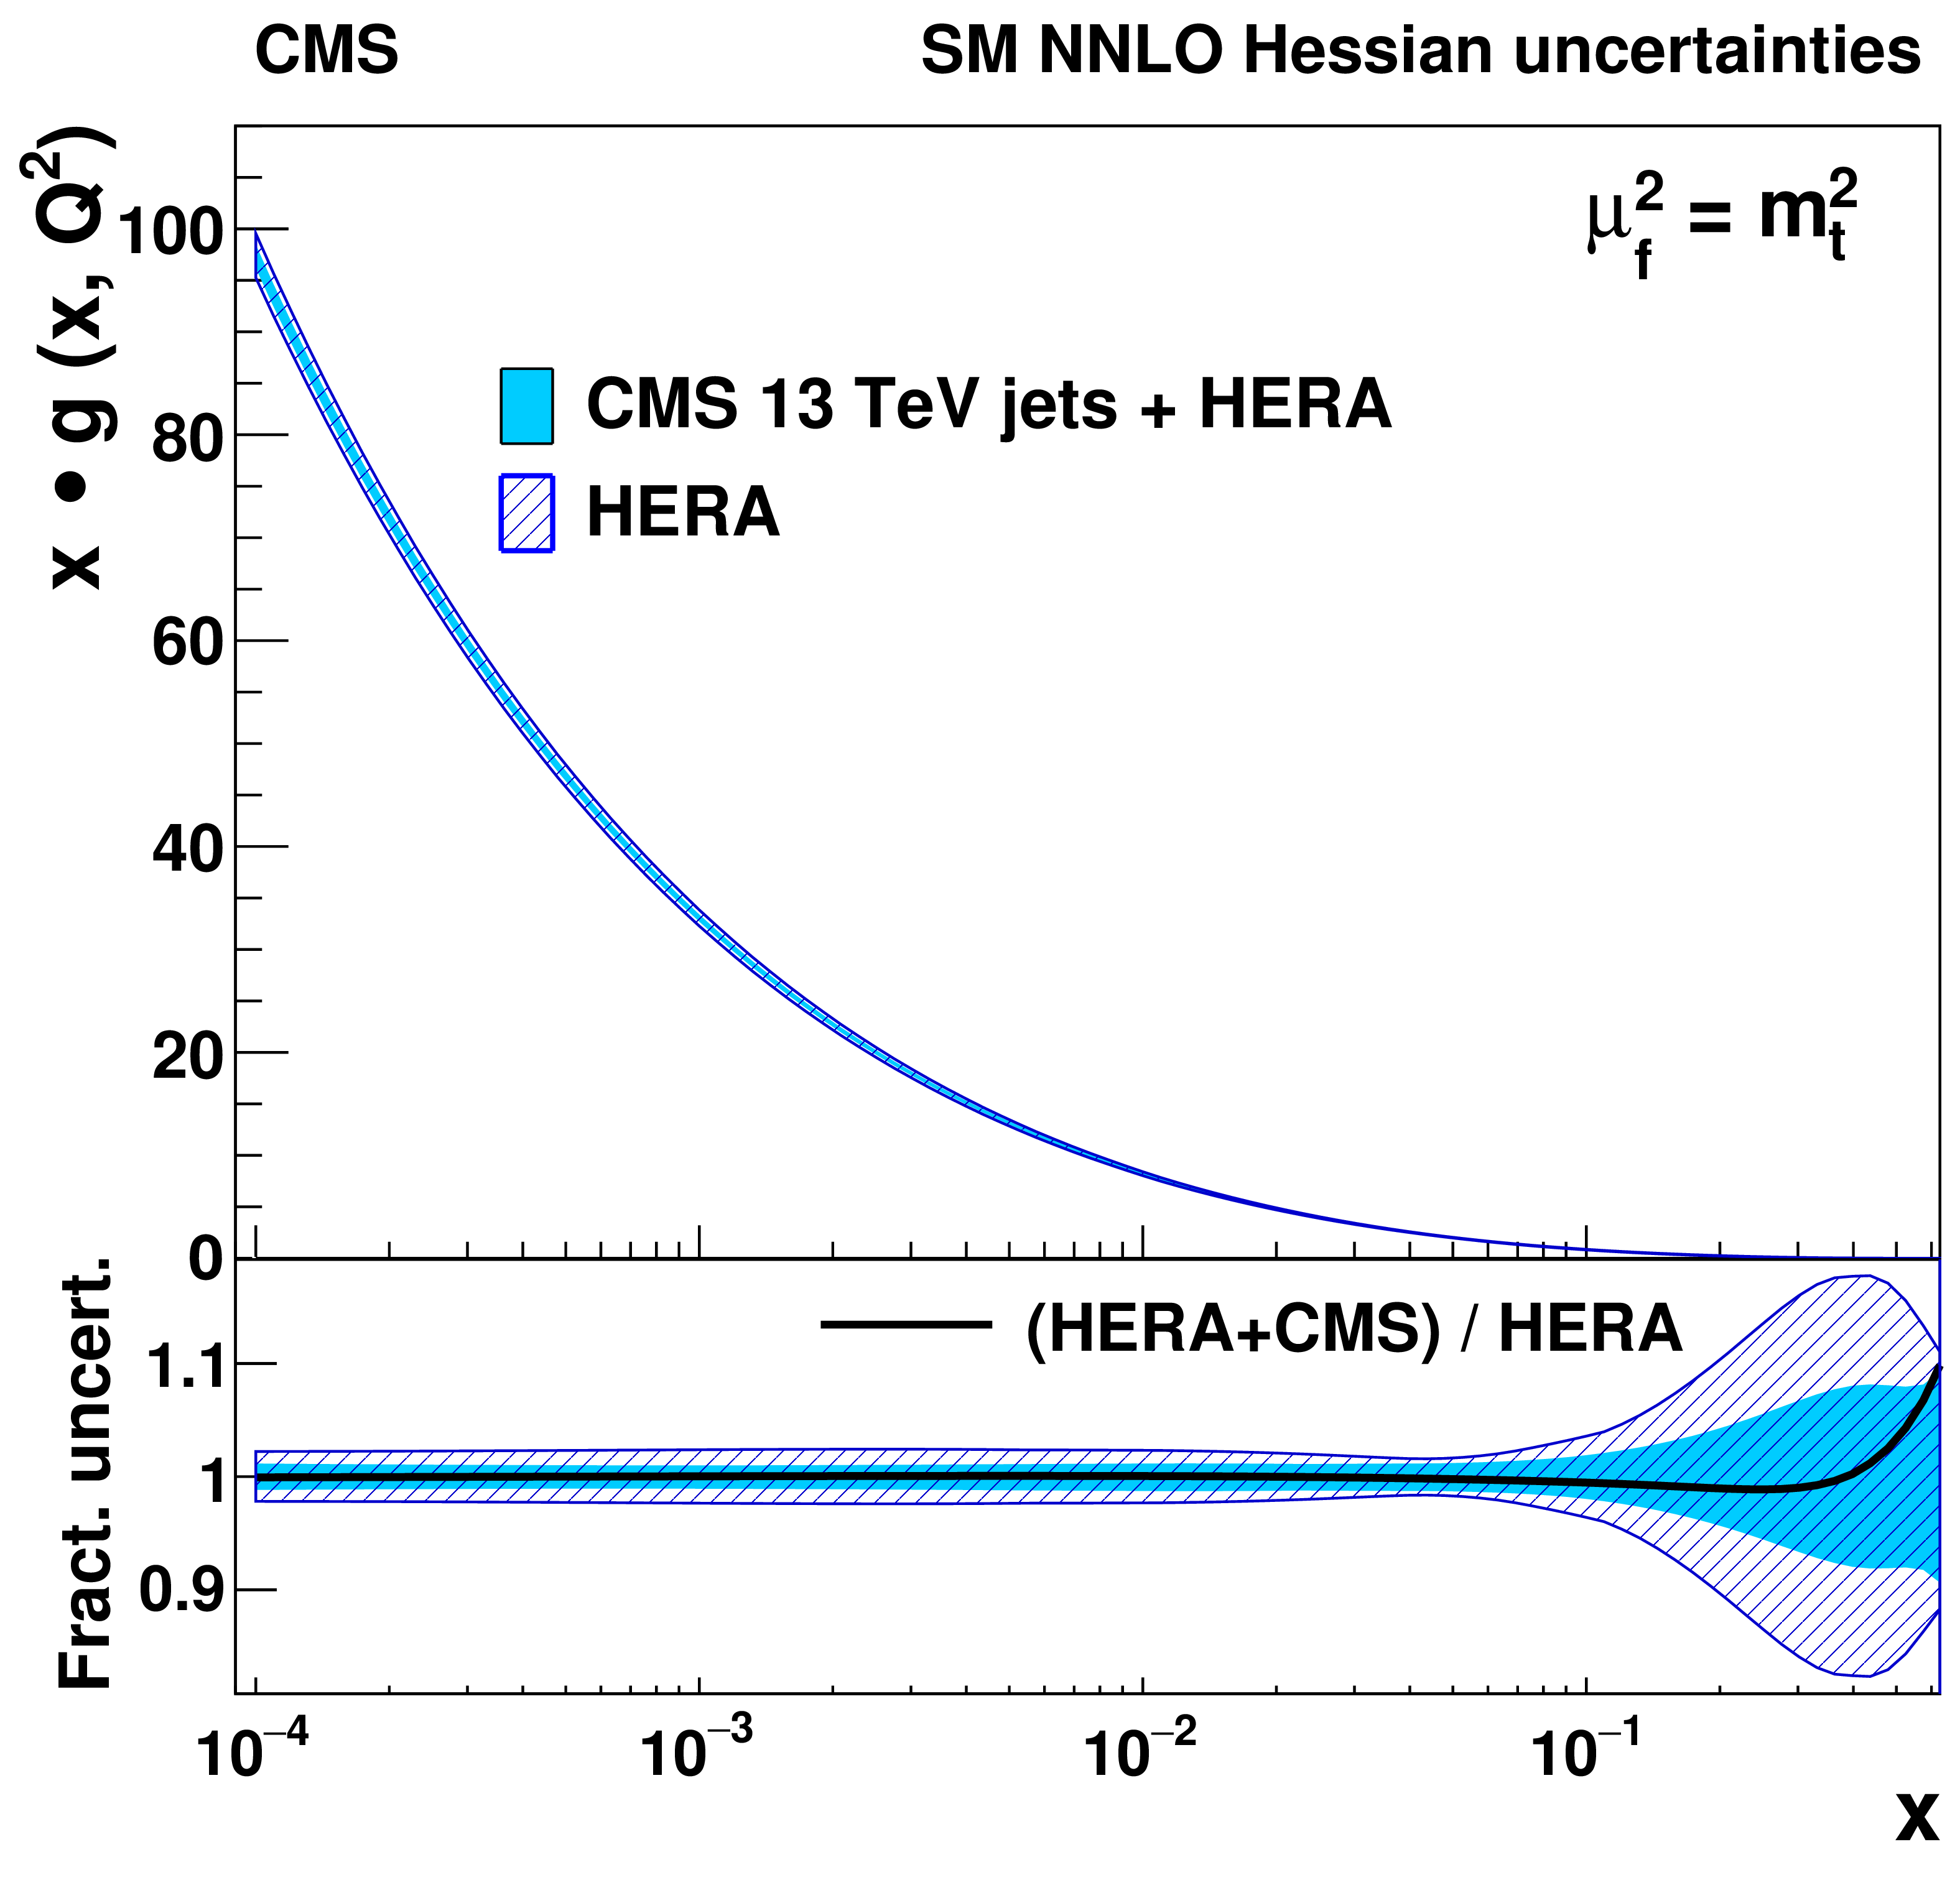
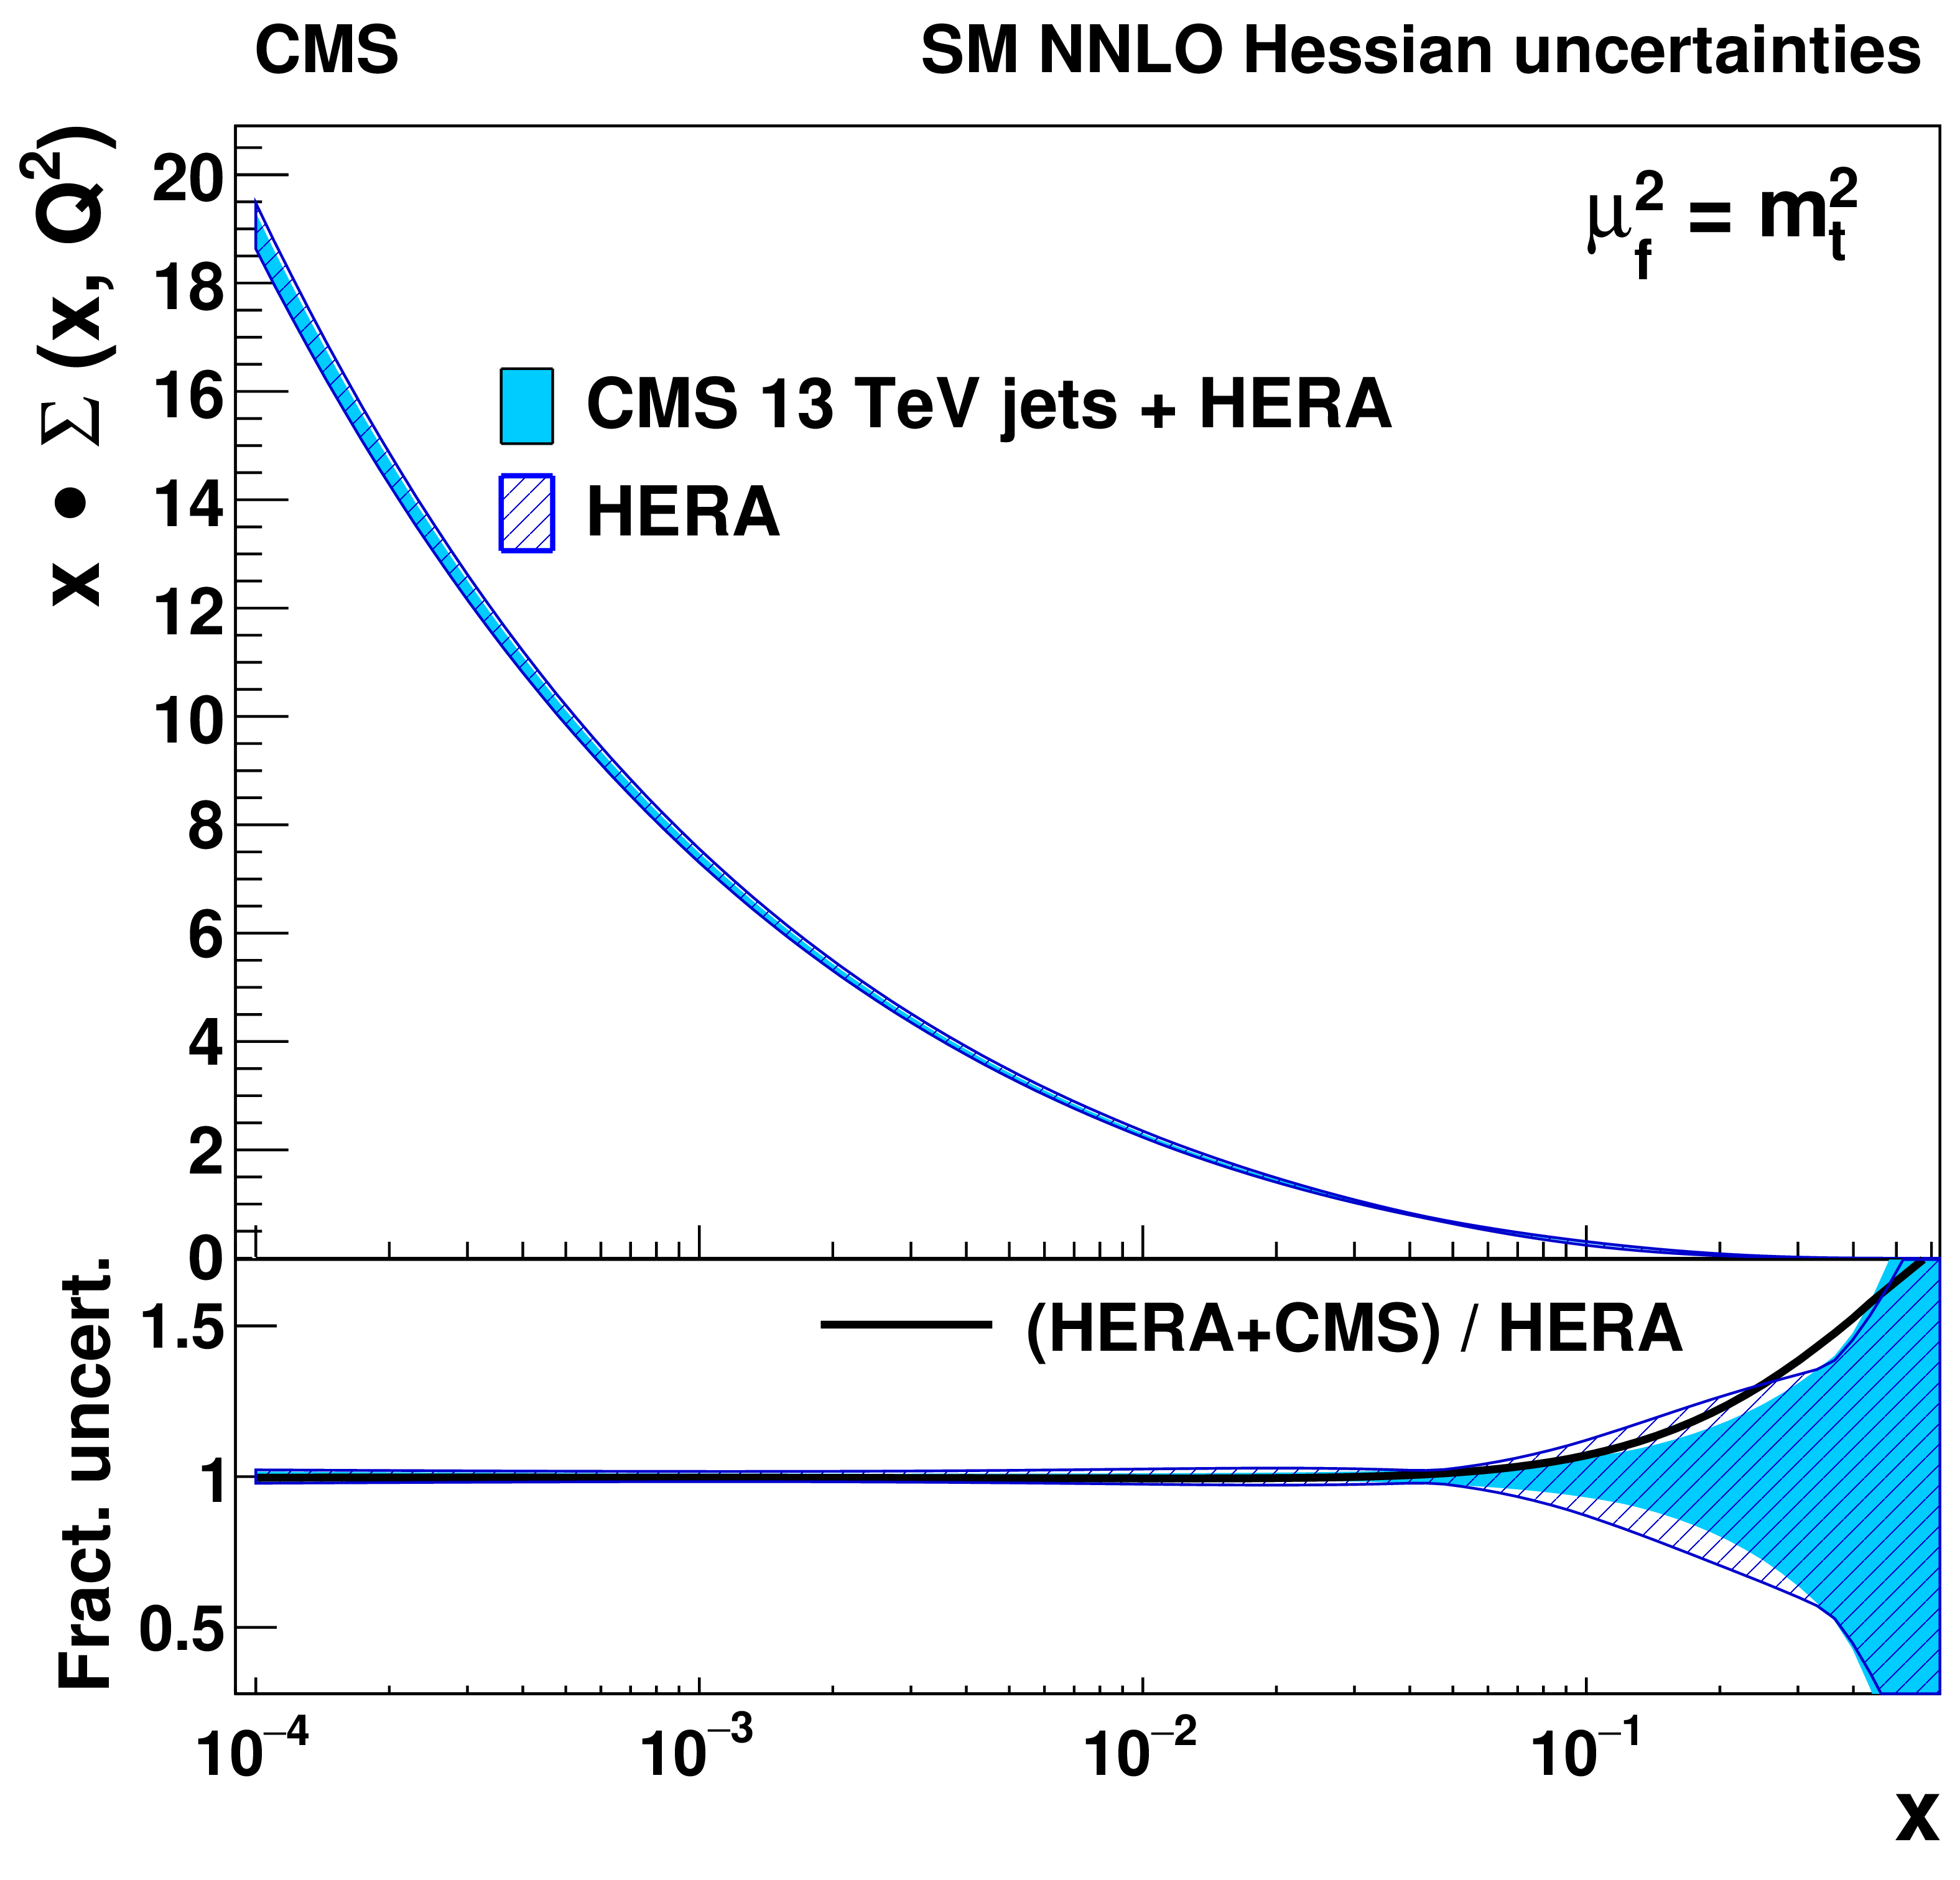
The u-valence (upper left), d-valence (upper right), gluon (lower left), and sea quark (lower right) distributions, shown as a function of $ x $ at the scale $ \mu_\mathrm{f}=m_t^2 $, resulting from the NNLO fit using HERA DIS together with the CMS inclusive jet cross section at $ \sqrt{s}= $ 13 TeV. Contributions of fit, model, and parameterisation uncertainties for each PDF are shown. In the lower panels, the relative uncertainty contributions are presented. |
png pdf |
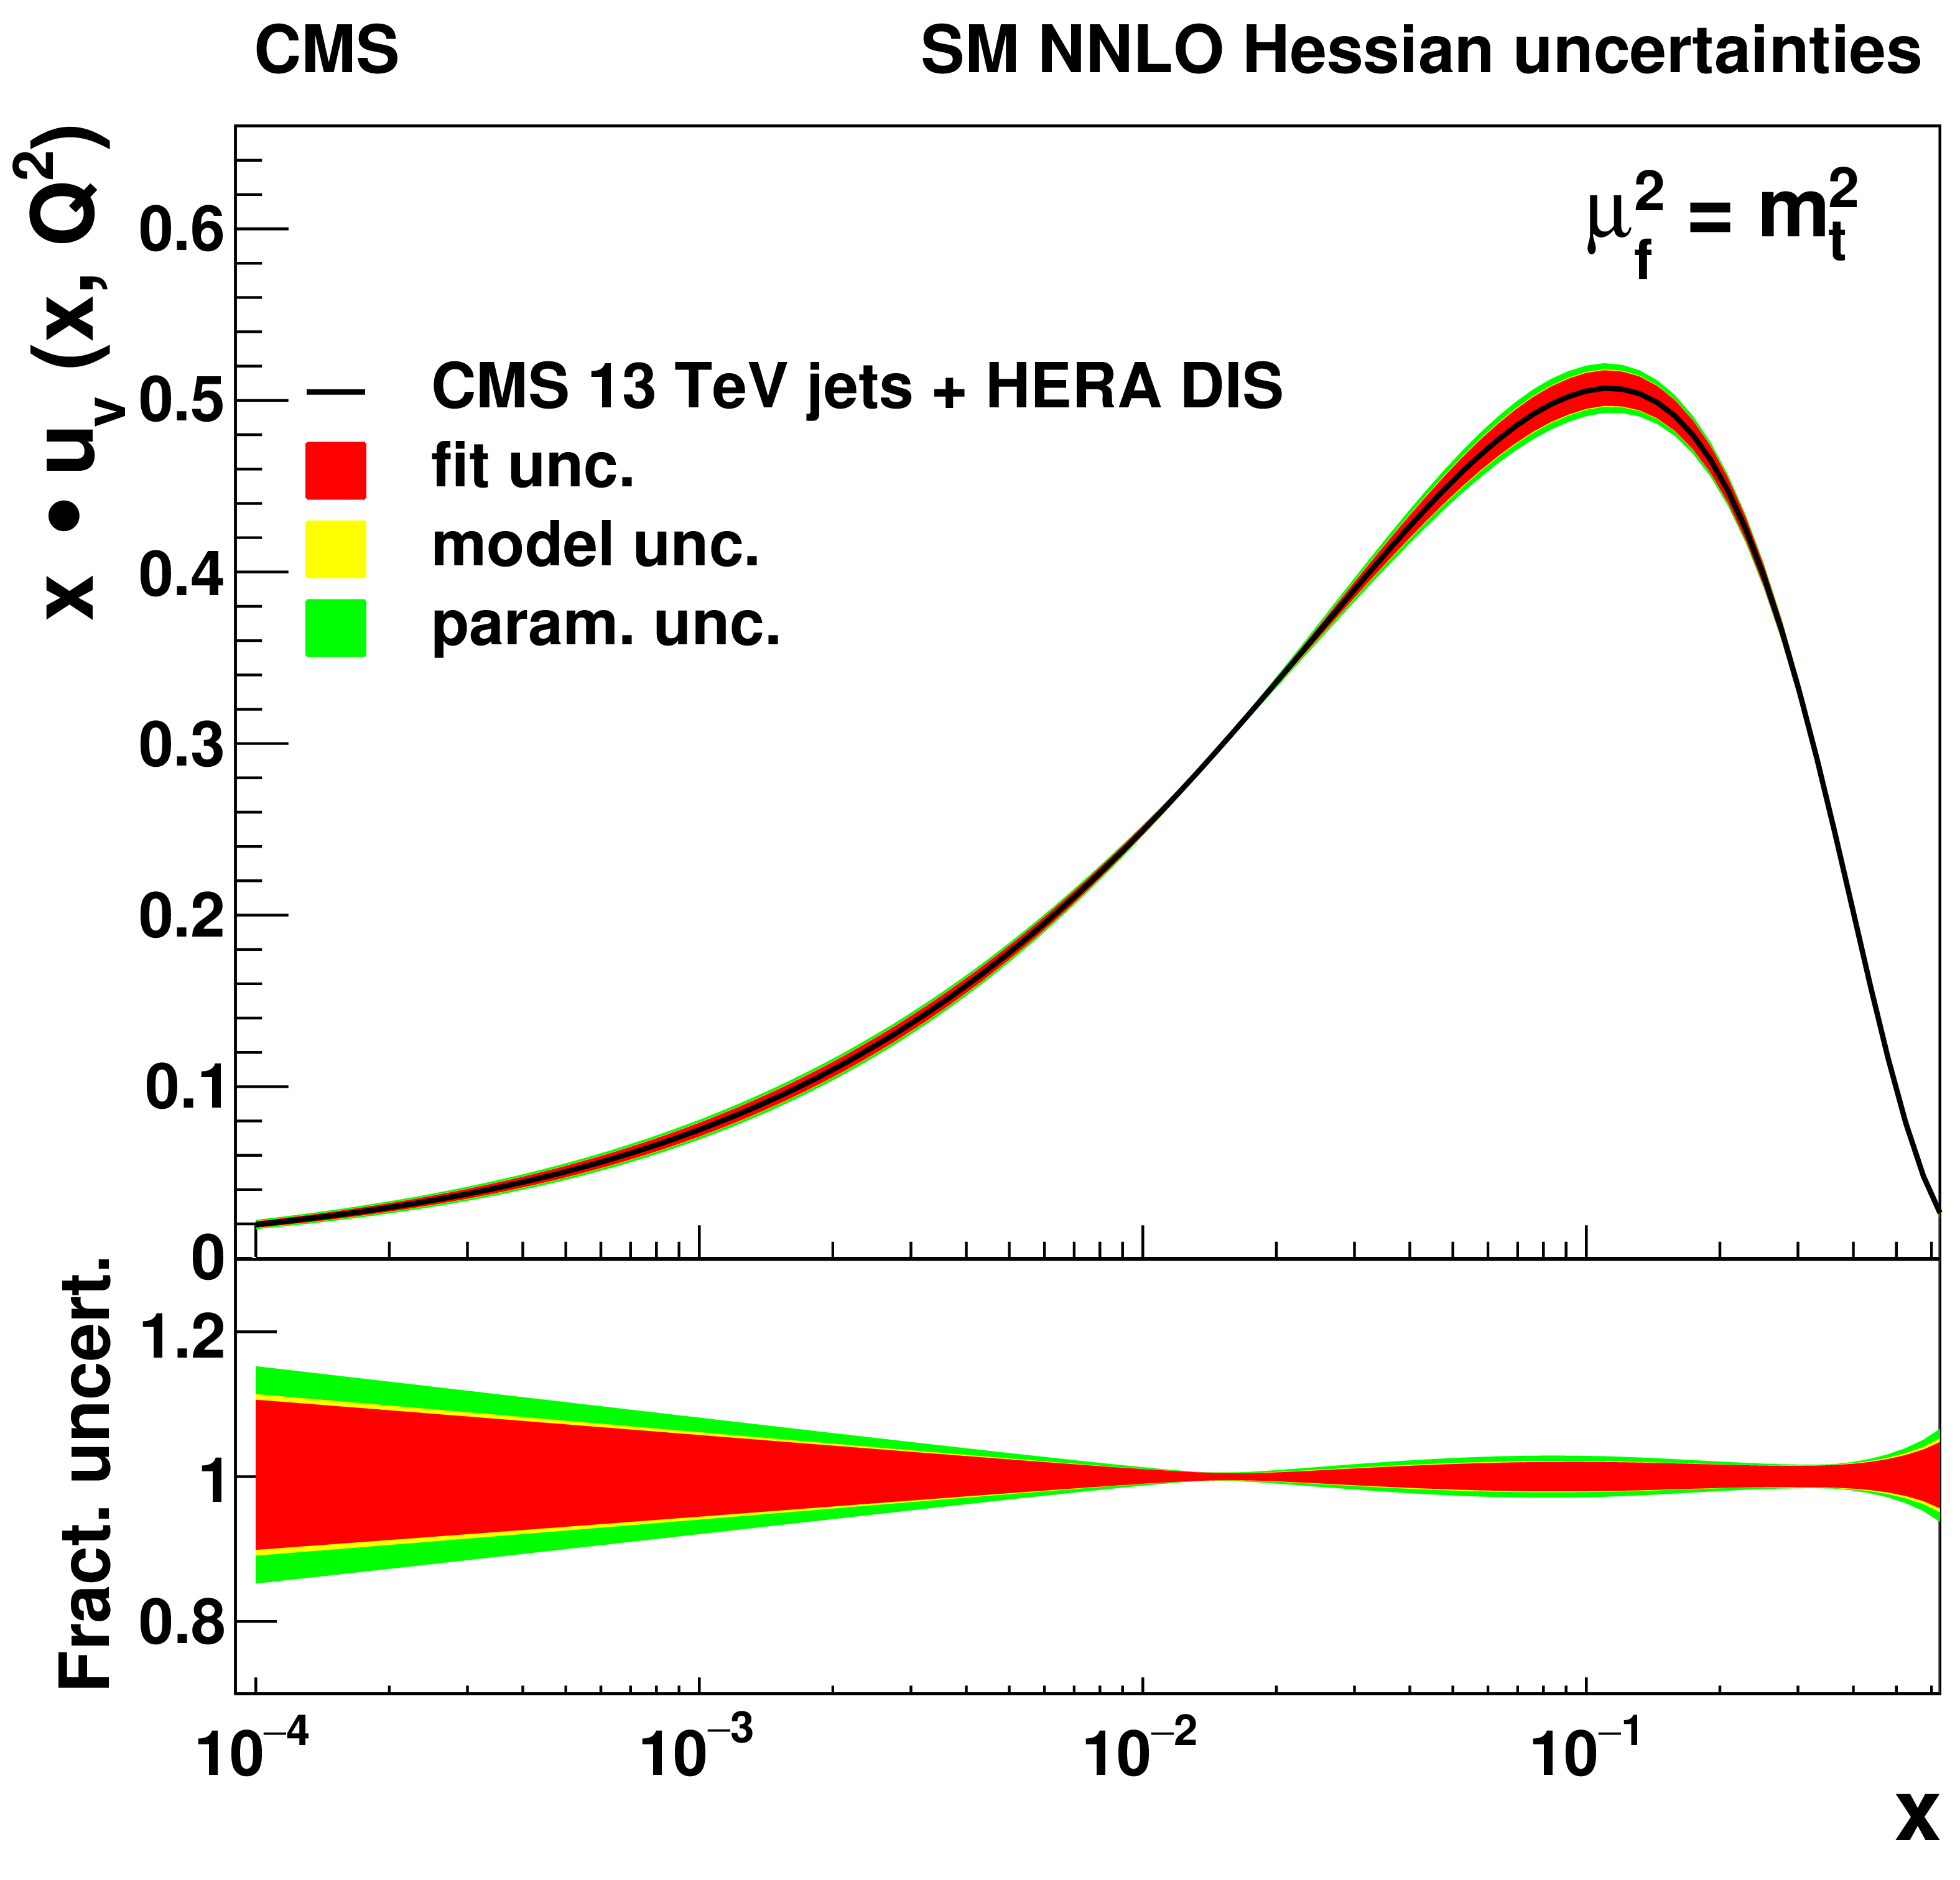
Figure 14-a:
The u-valence distribution, shown as a function of $ x $ at the scale $ \mu_\mathrm{f}=m_t^2 $, resulting from the NNLO fit using HERA DIS together with the CMS inclusive jet cross section at $ \sqrt{s}= $ 13 TeV. Contributions of fit, model, and parameterisation uncertainties for each PDF are shown. In the lower panel, the relative uncertainty contributions are presented. |
png pdf |
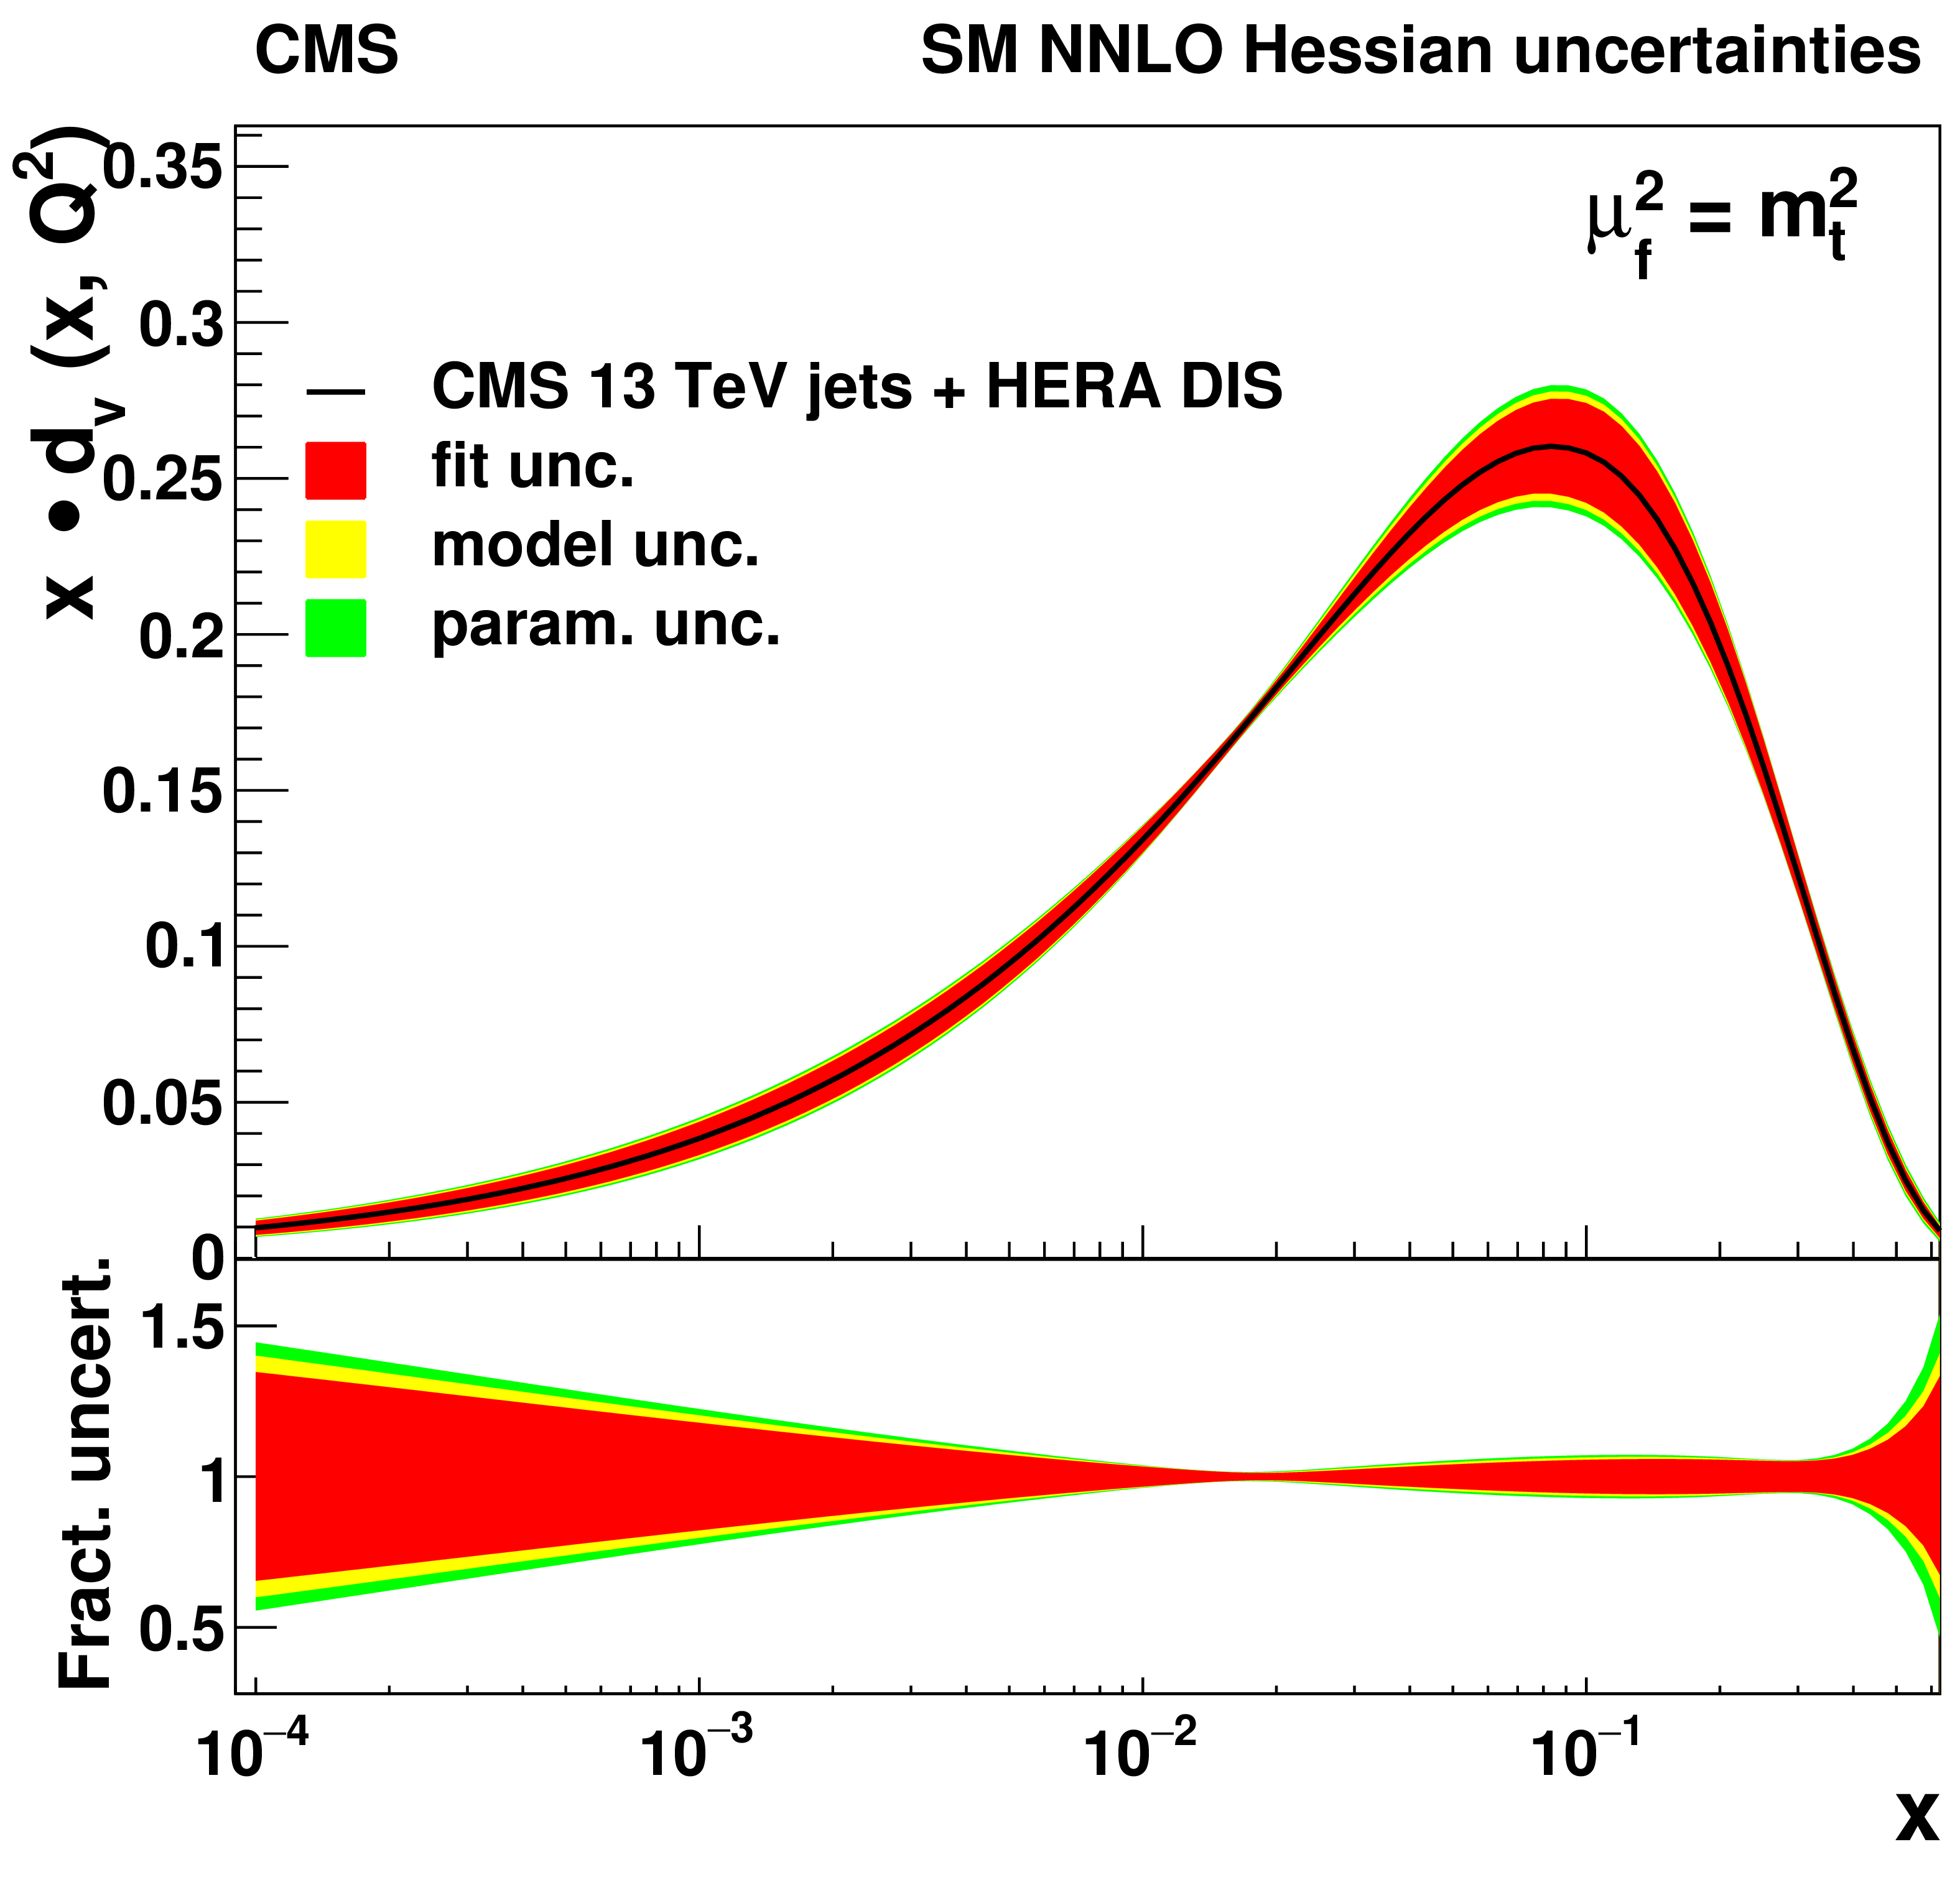
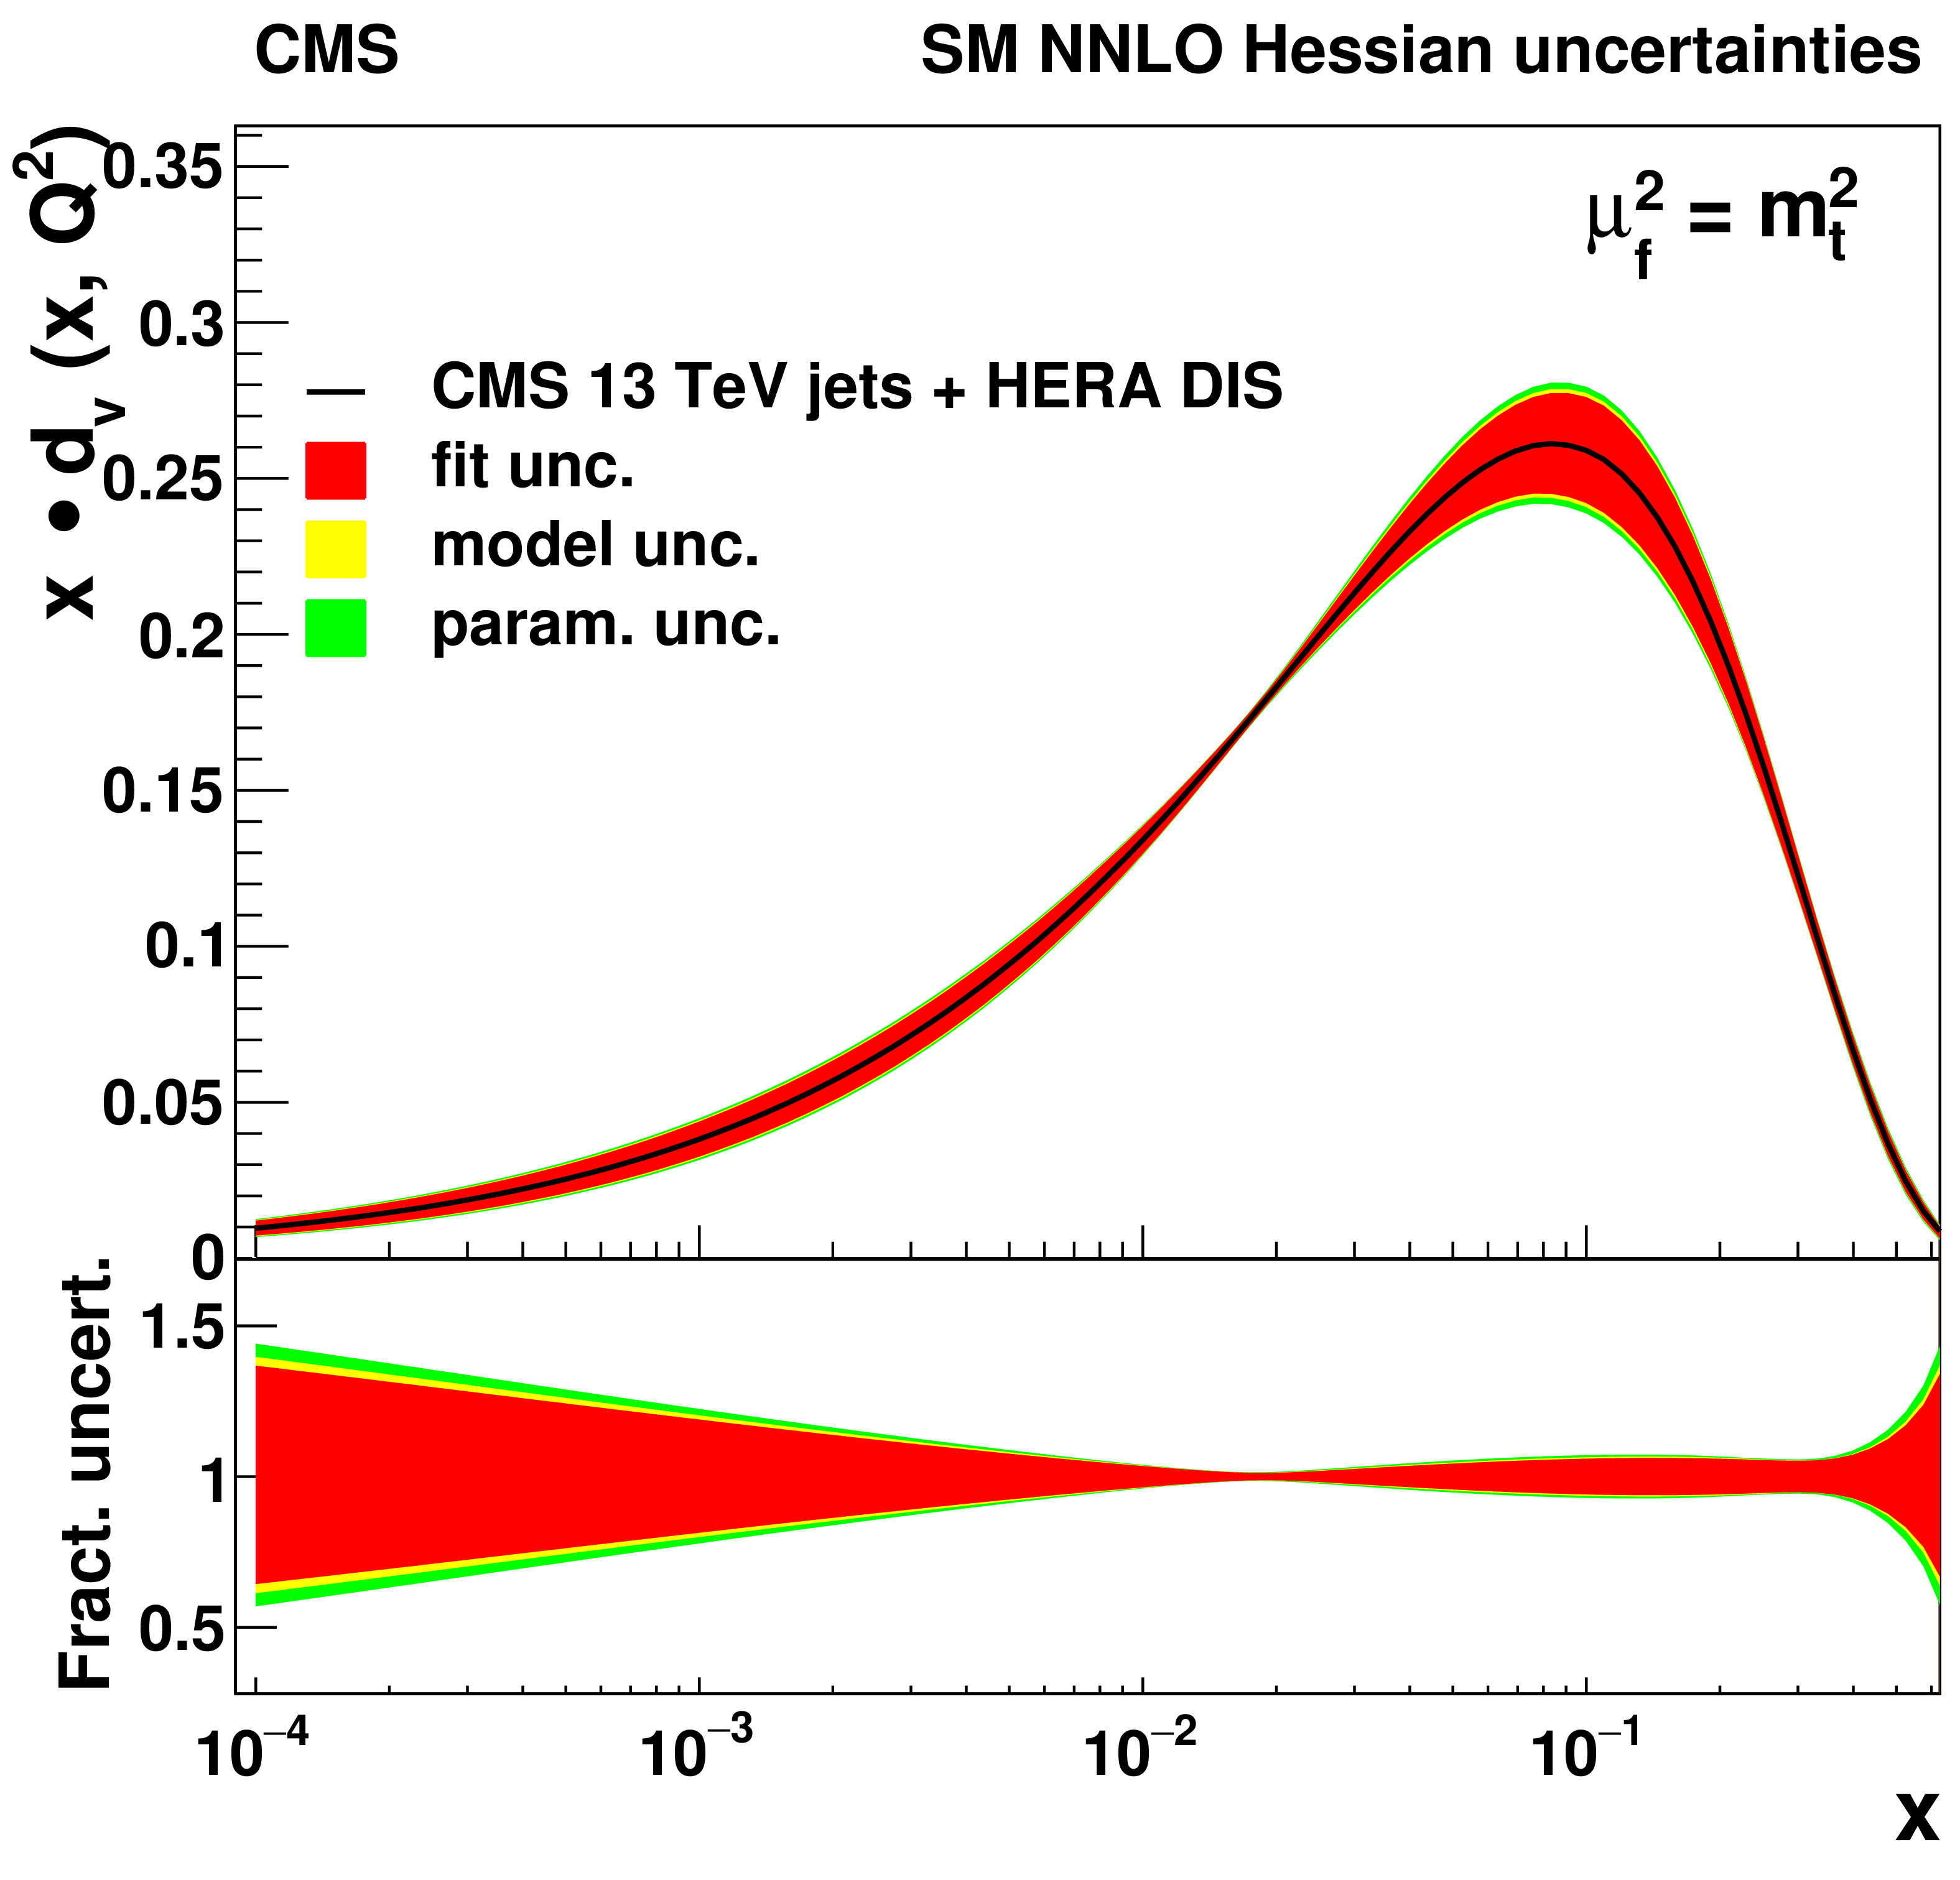
Figure 14-b:
The d-valence distribution, shown as a function of $ x $ at the scale $ \mu_\mathrm{f}=m_t^2 $, resulting from the NNLO fit using HERA DIS together with the CMS inclusive jet cross section at $ \sqrt{s}= $ 13 TeV. Contributions of fit, model, and parameterisation uncertainties for each PDF are shown. In the lower panel, the relative uncertainty contributions are presented. |
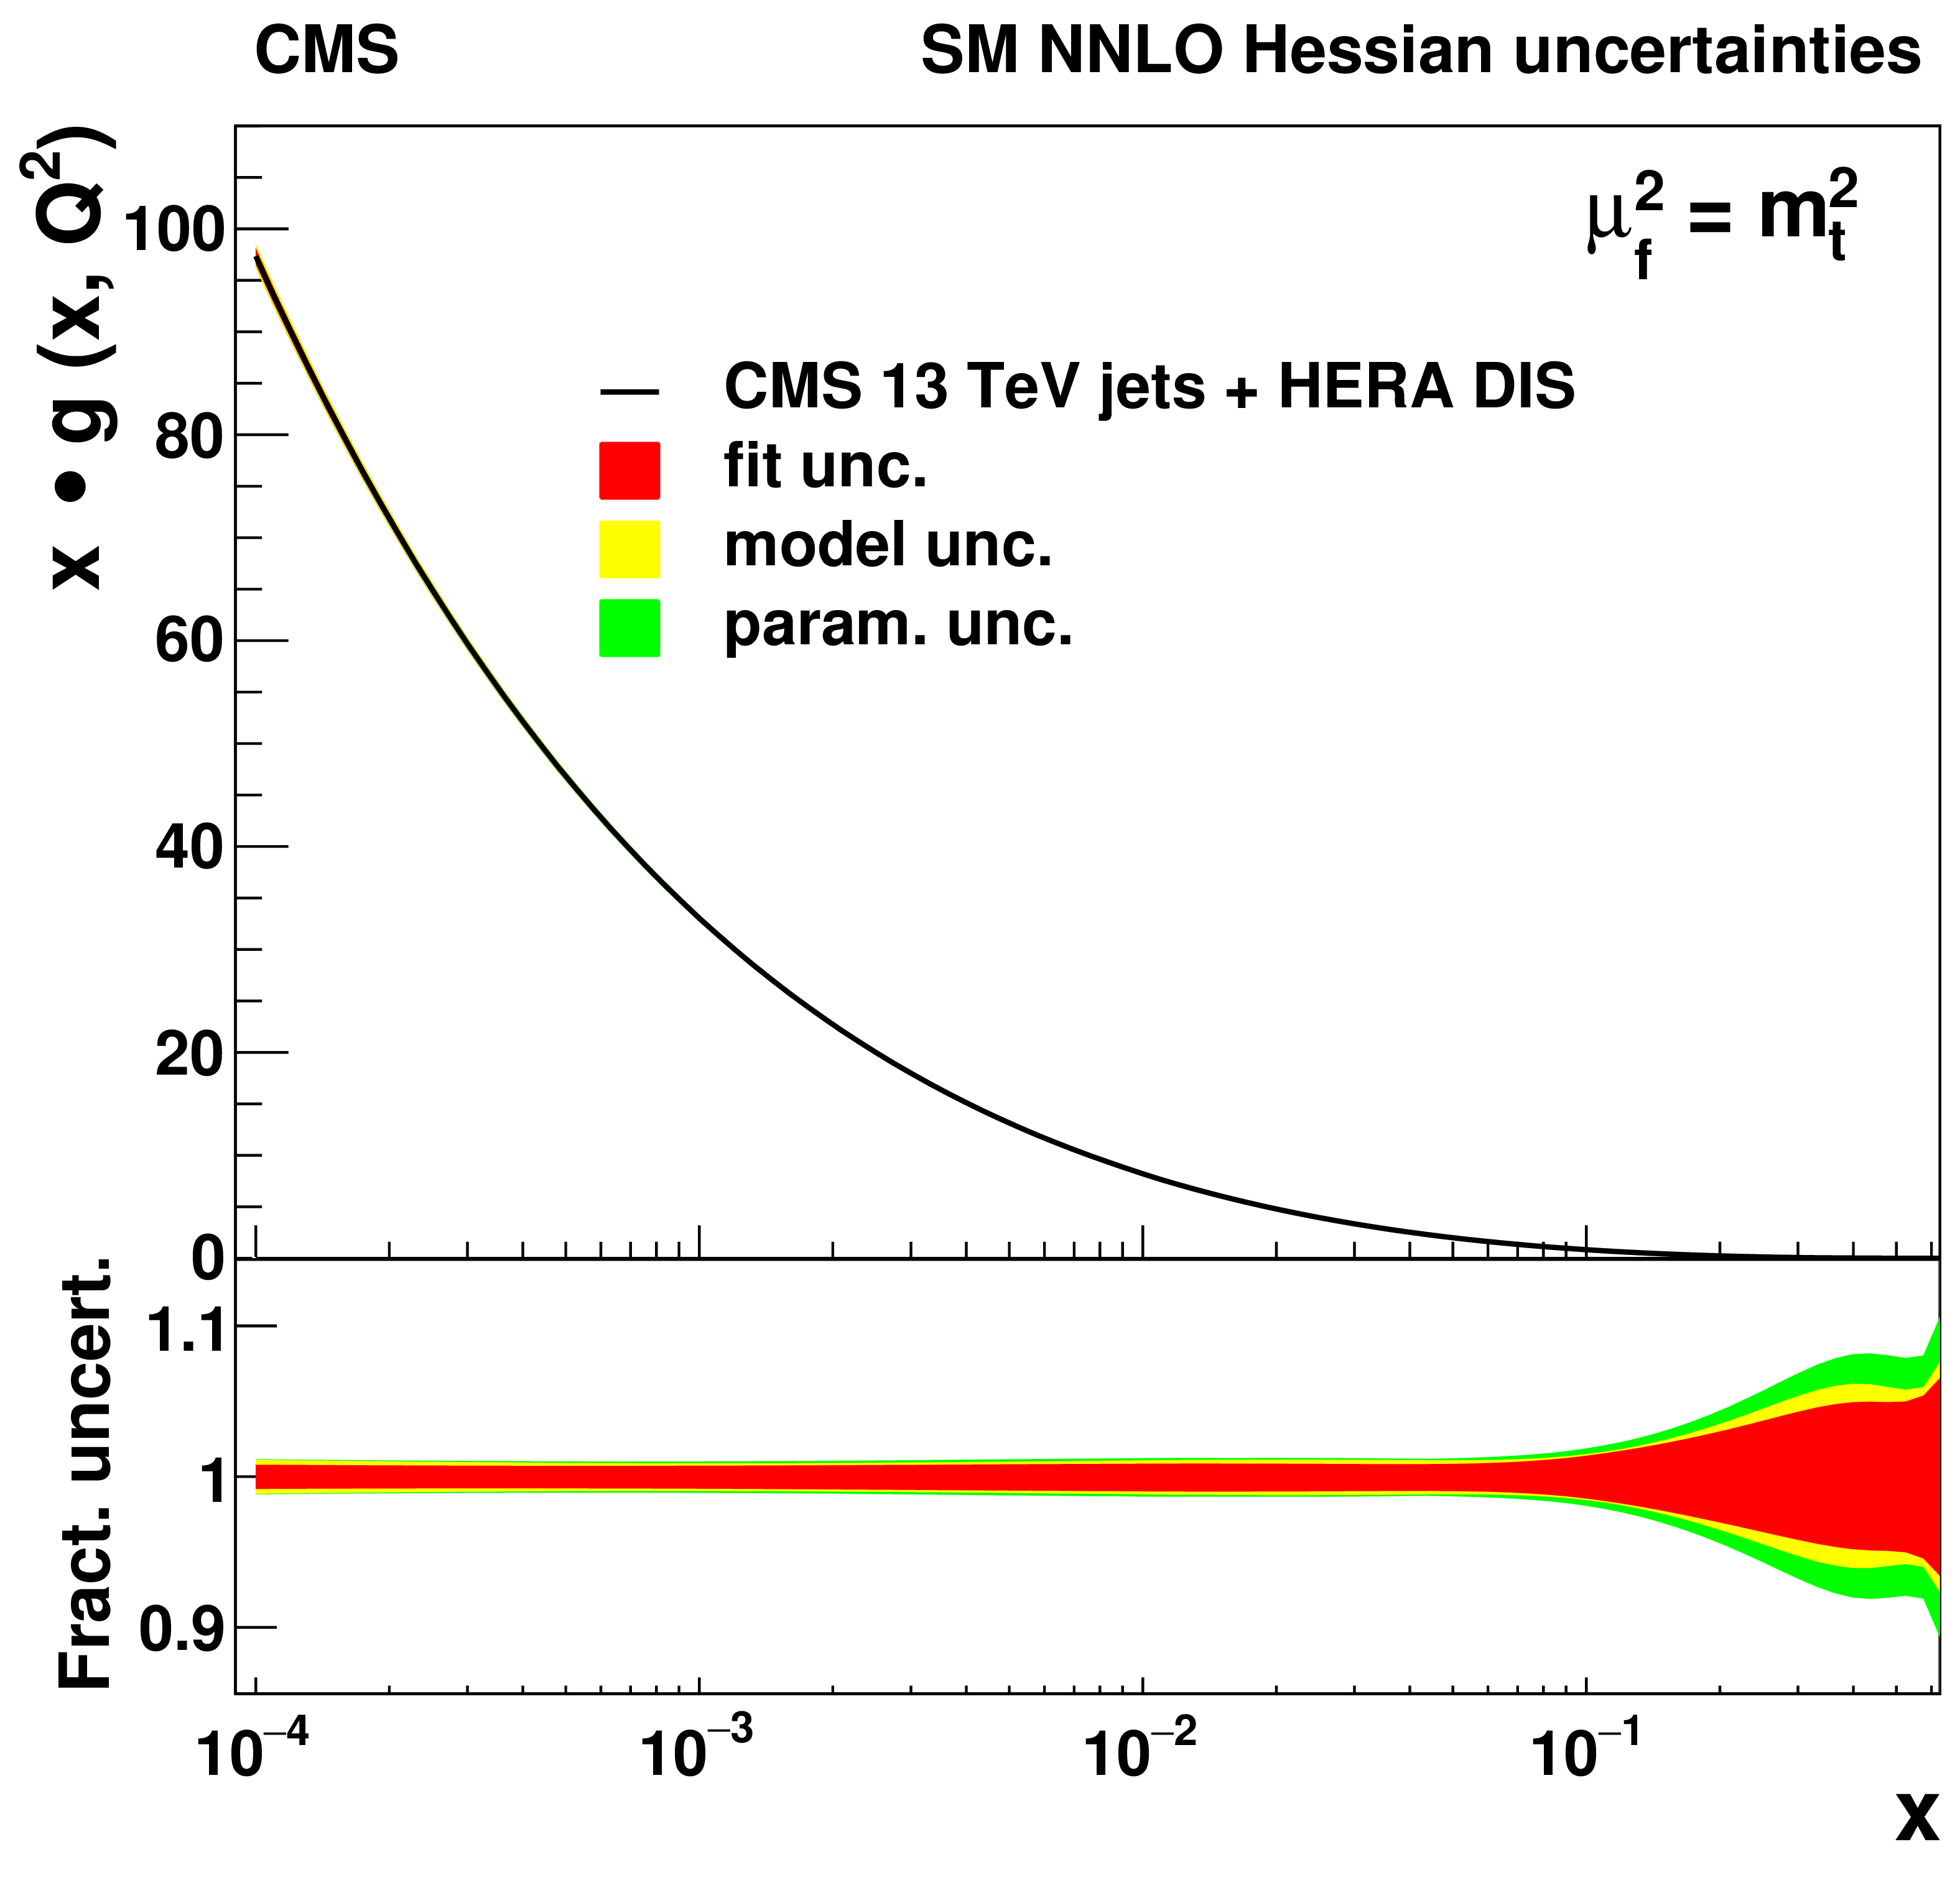
png pdf |
Figure 14-c:
The gluon distribution, shown as a function of $ x $ at the scale $ \mu_\mathrm{f}=m_t^2 $, resulting from the NNLO fit using HERA DIS together with the CMS inclusive jet cross section at $ \sqrt{s}= $ 13 TeV. Contributions of fit, model, and parameterisation uncertainties for each PDF are shown. In the lower panel, the relative uncertainty contributions are presented. |

png pdf |
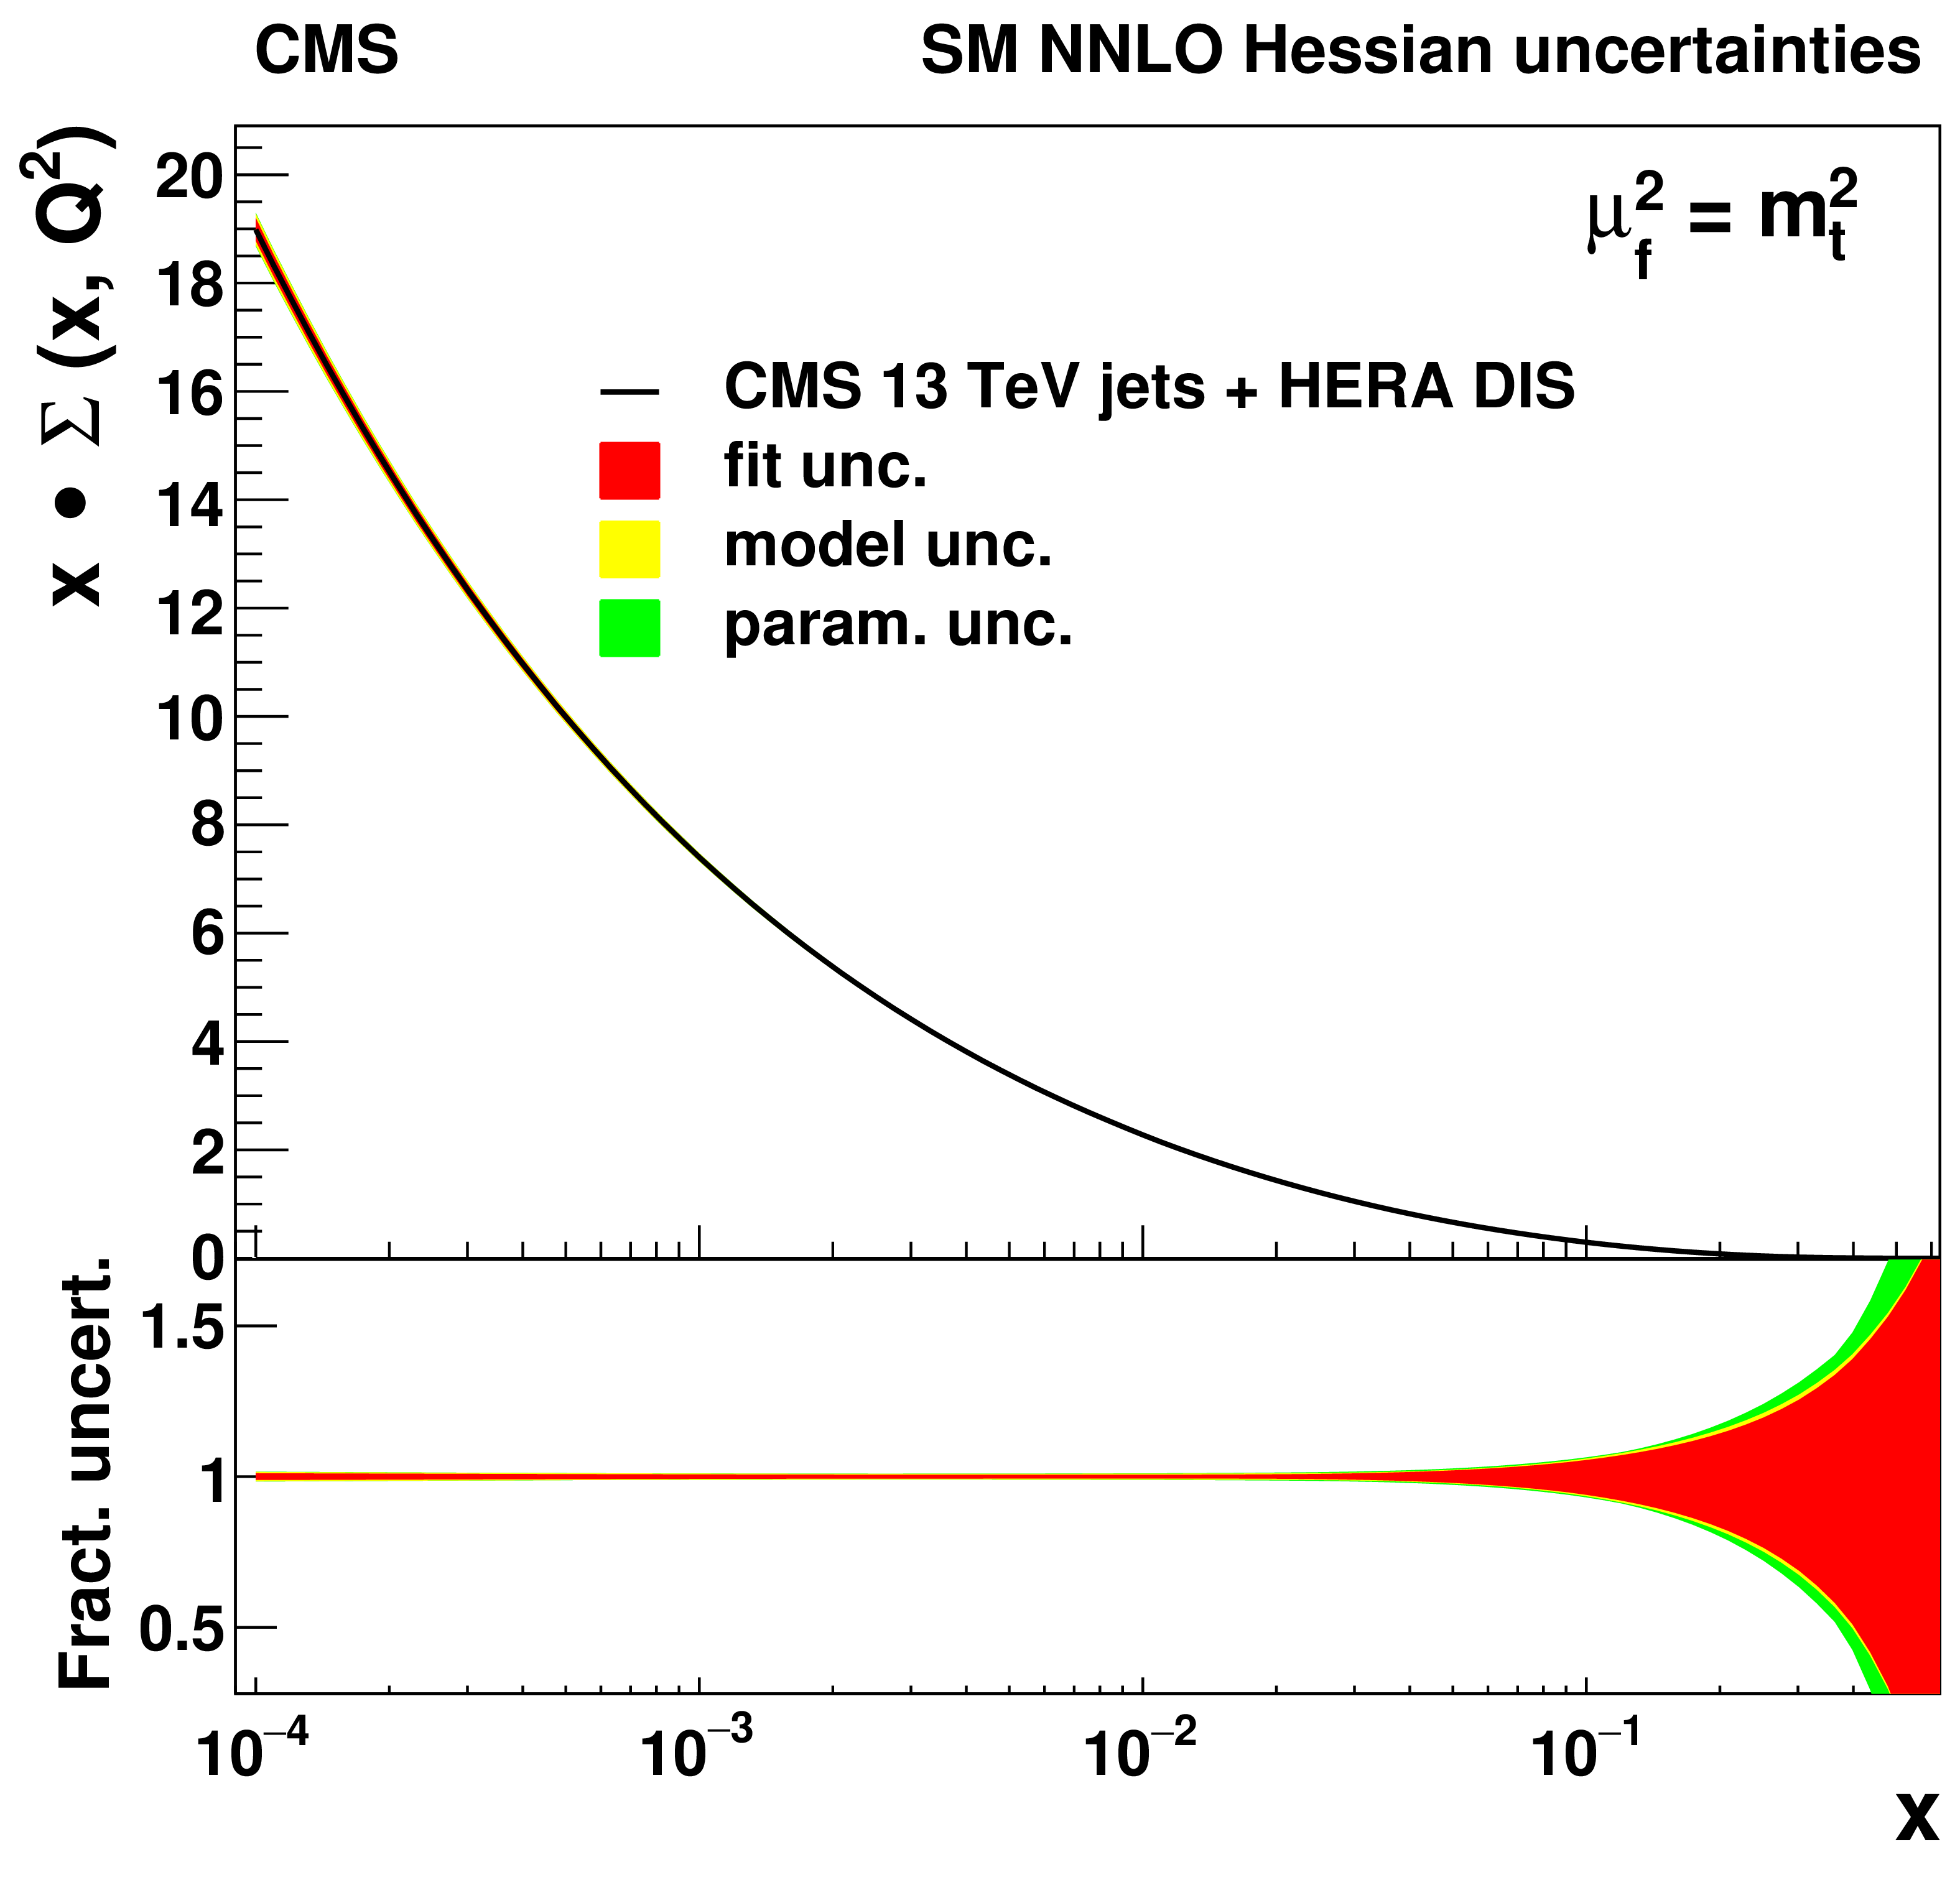
Figure 14-d:
The sea quark distribution, shown as a function of $ x $ at the scale $ \mu_\mathrm{f}=m_t^2 $, resulting from the NNLO fit using HERA DIS together with the CMS inclusive jet cross section at $ \sqrt{s}= $ 13 TeV. Contributions of fit, model, and parameterisation uncertainties for each PDF are shown. In the lower panel, the relative uncertainty contributions are presented. |
png pdf |
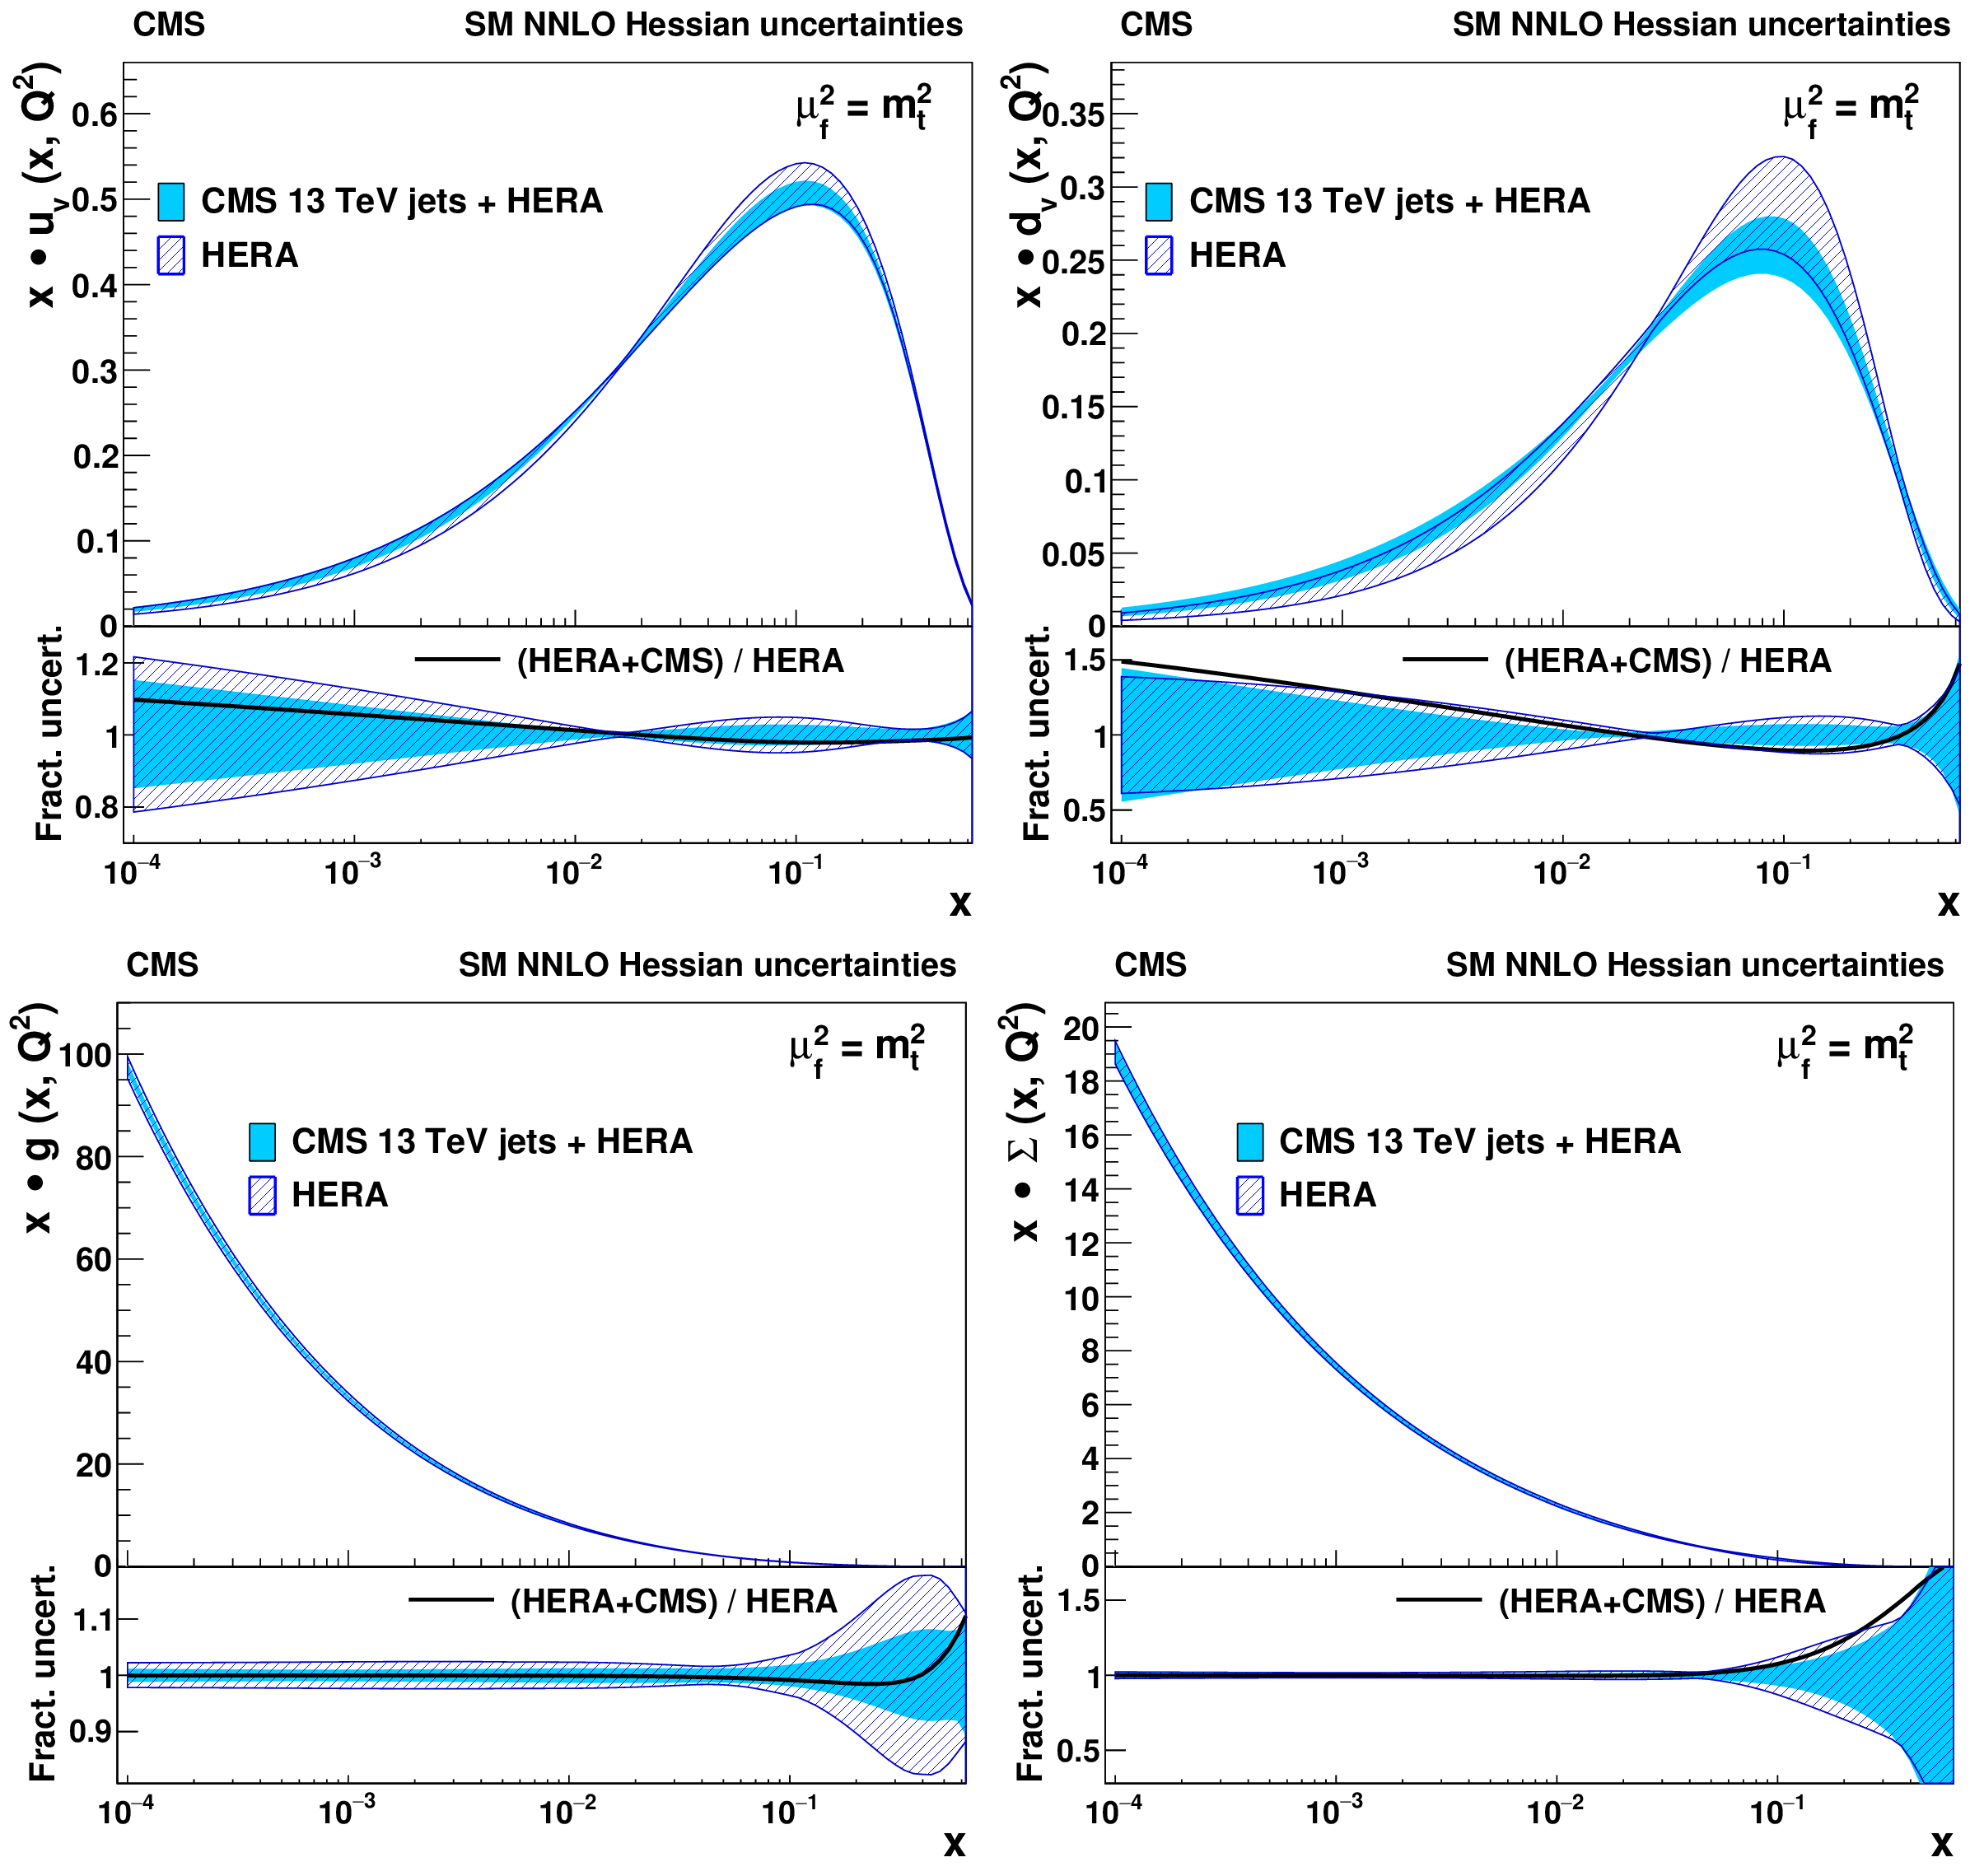
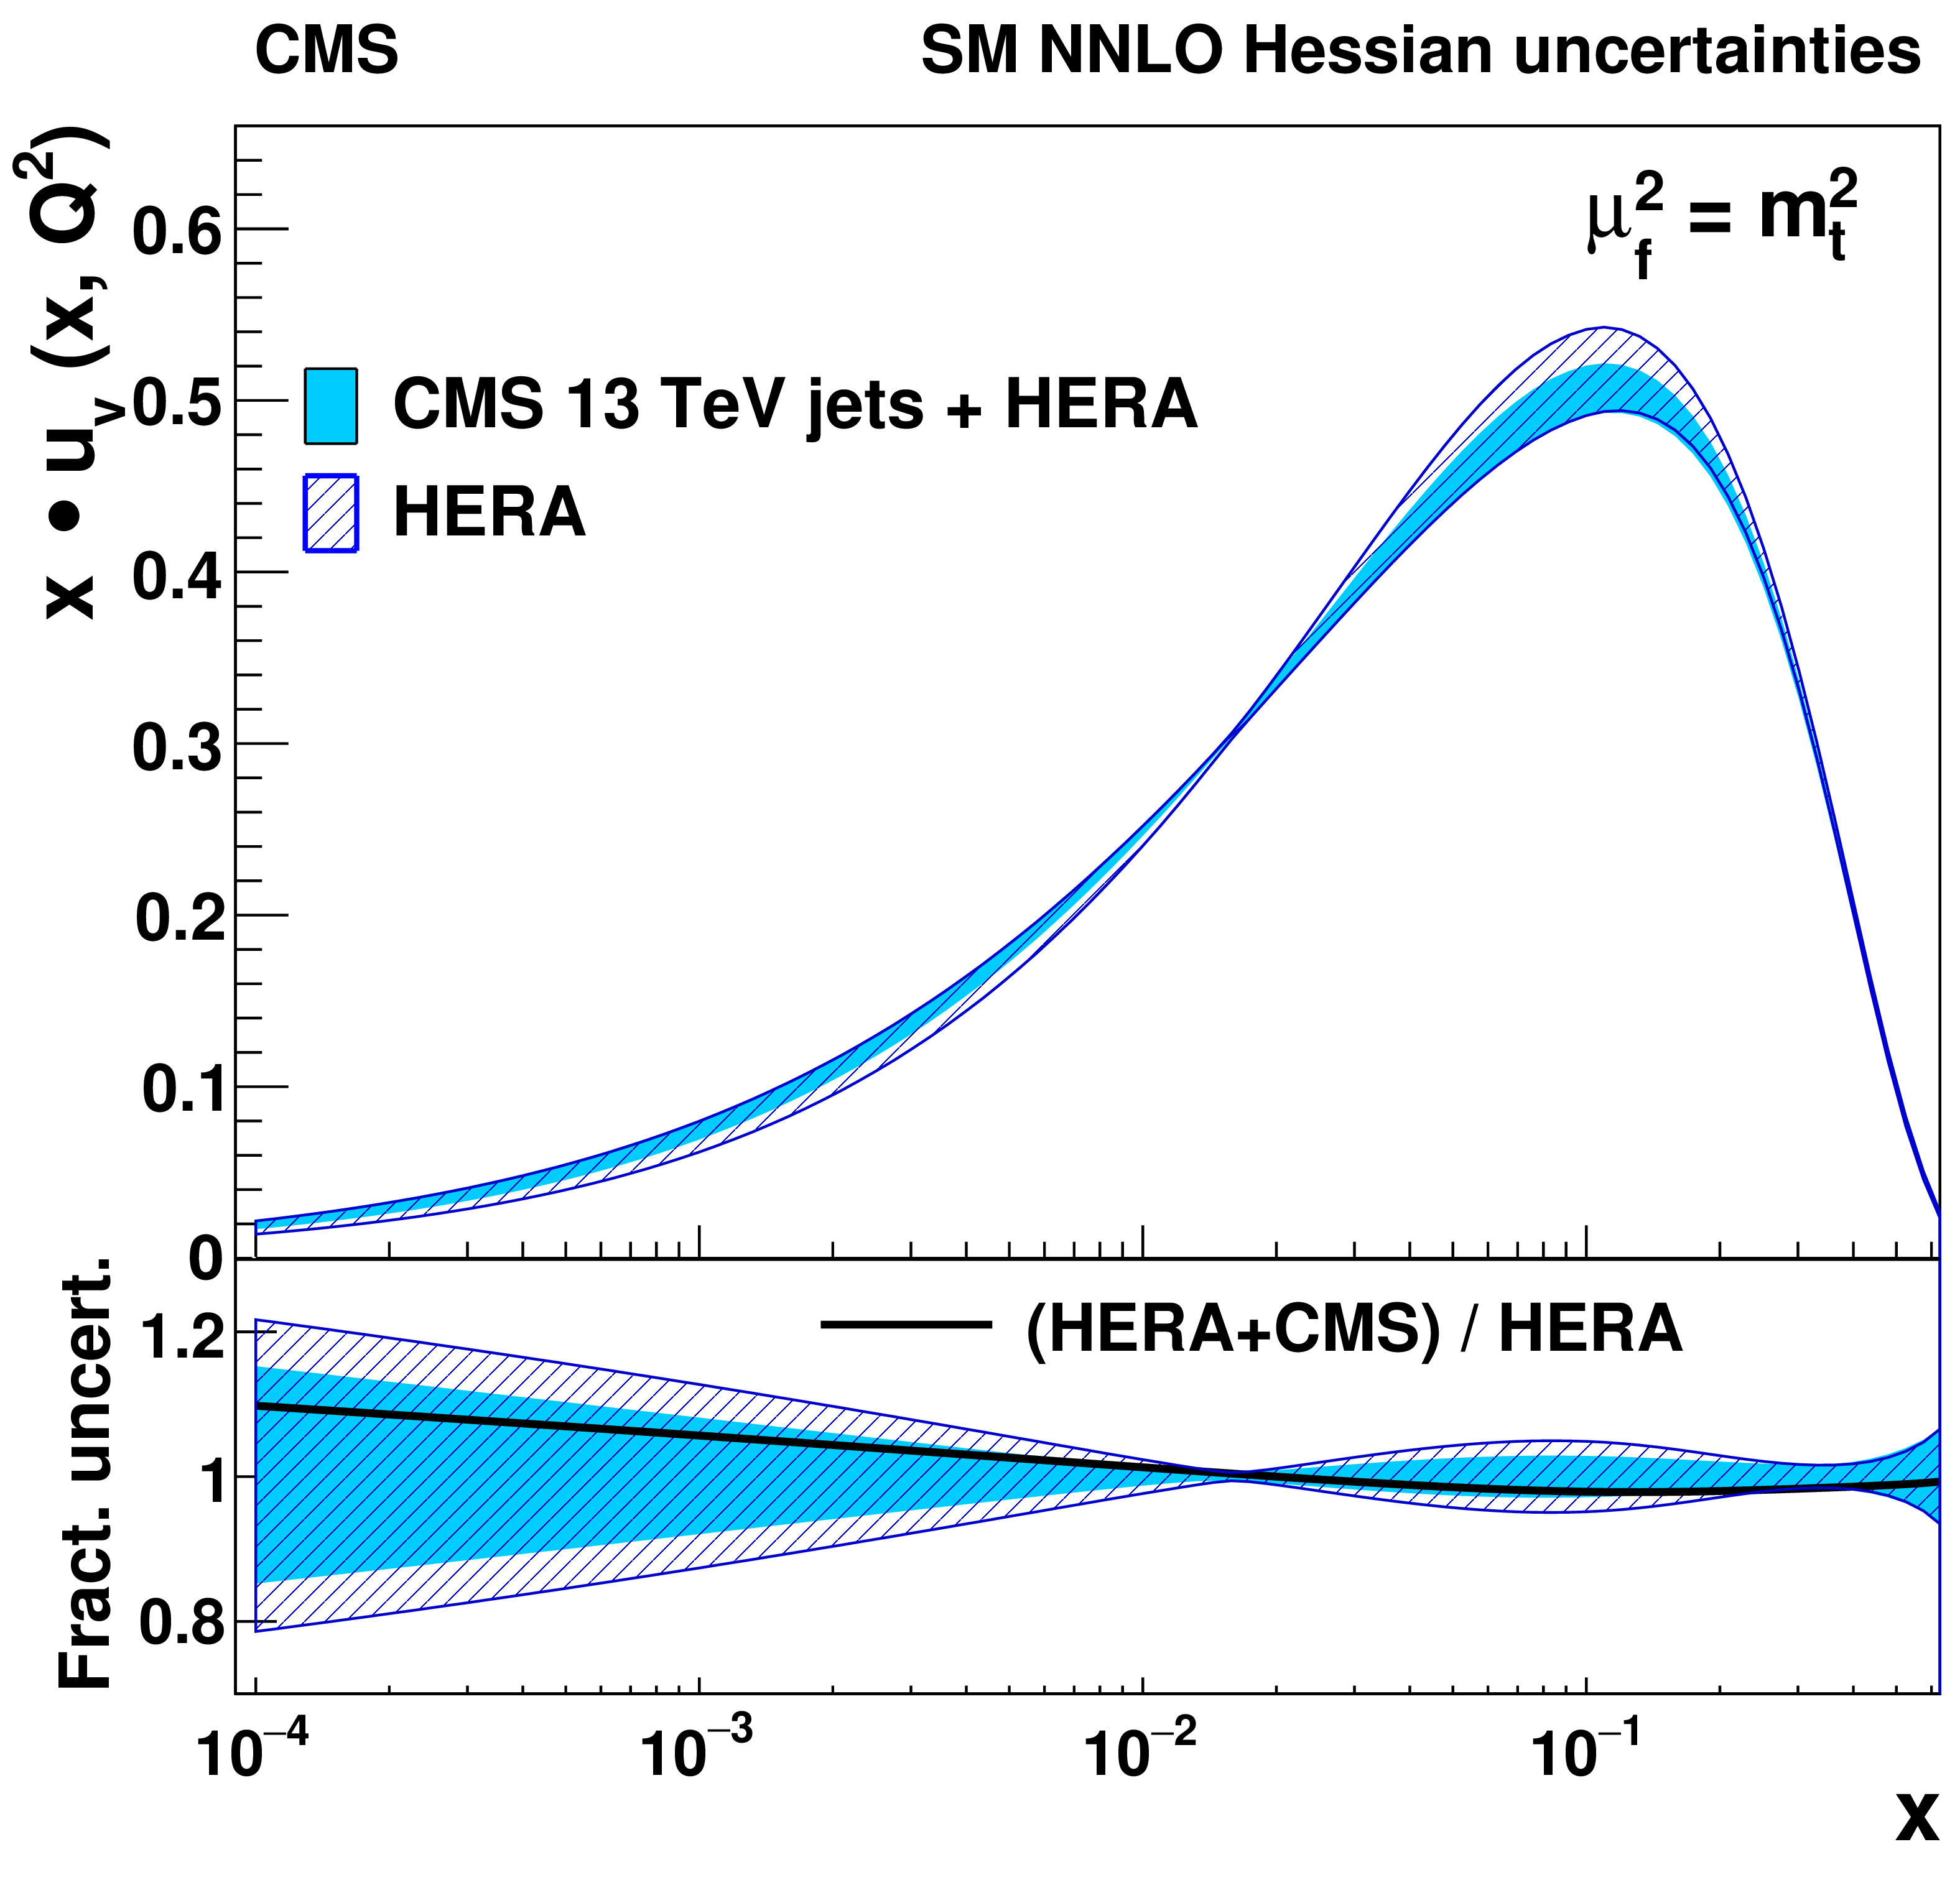
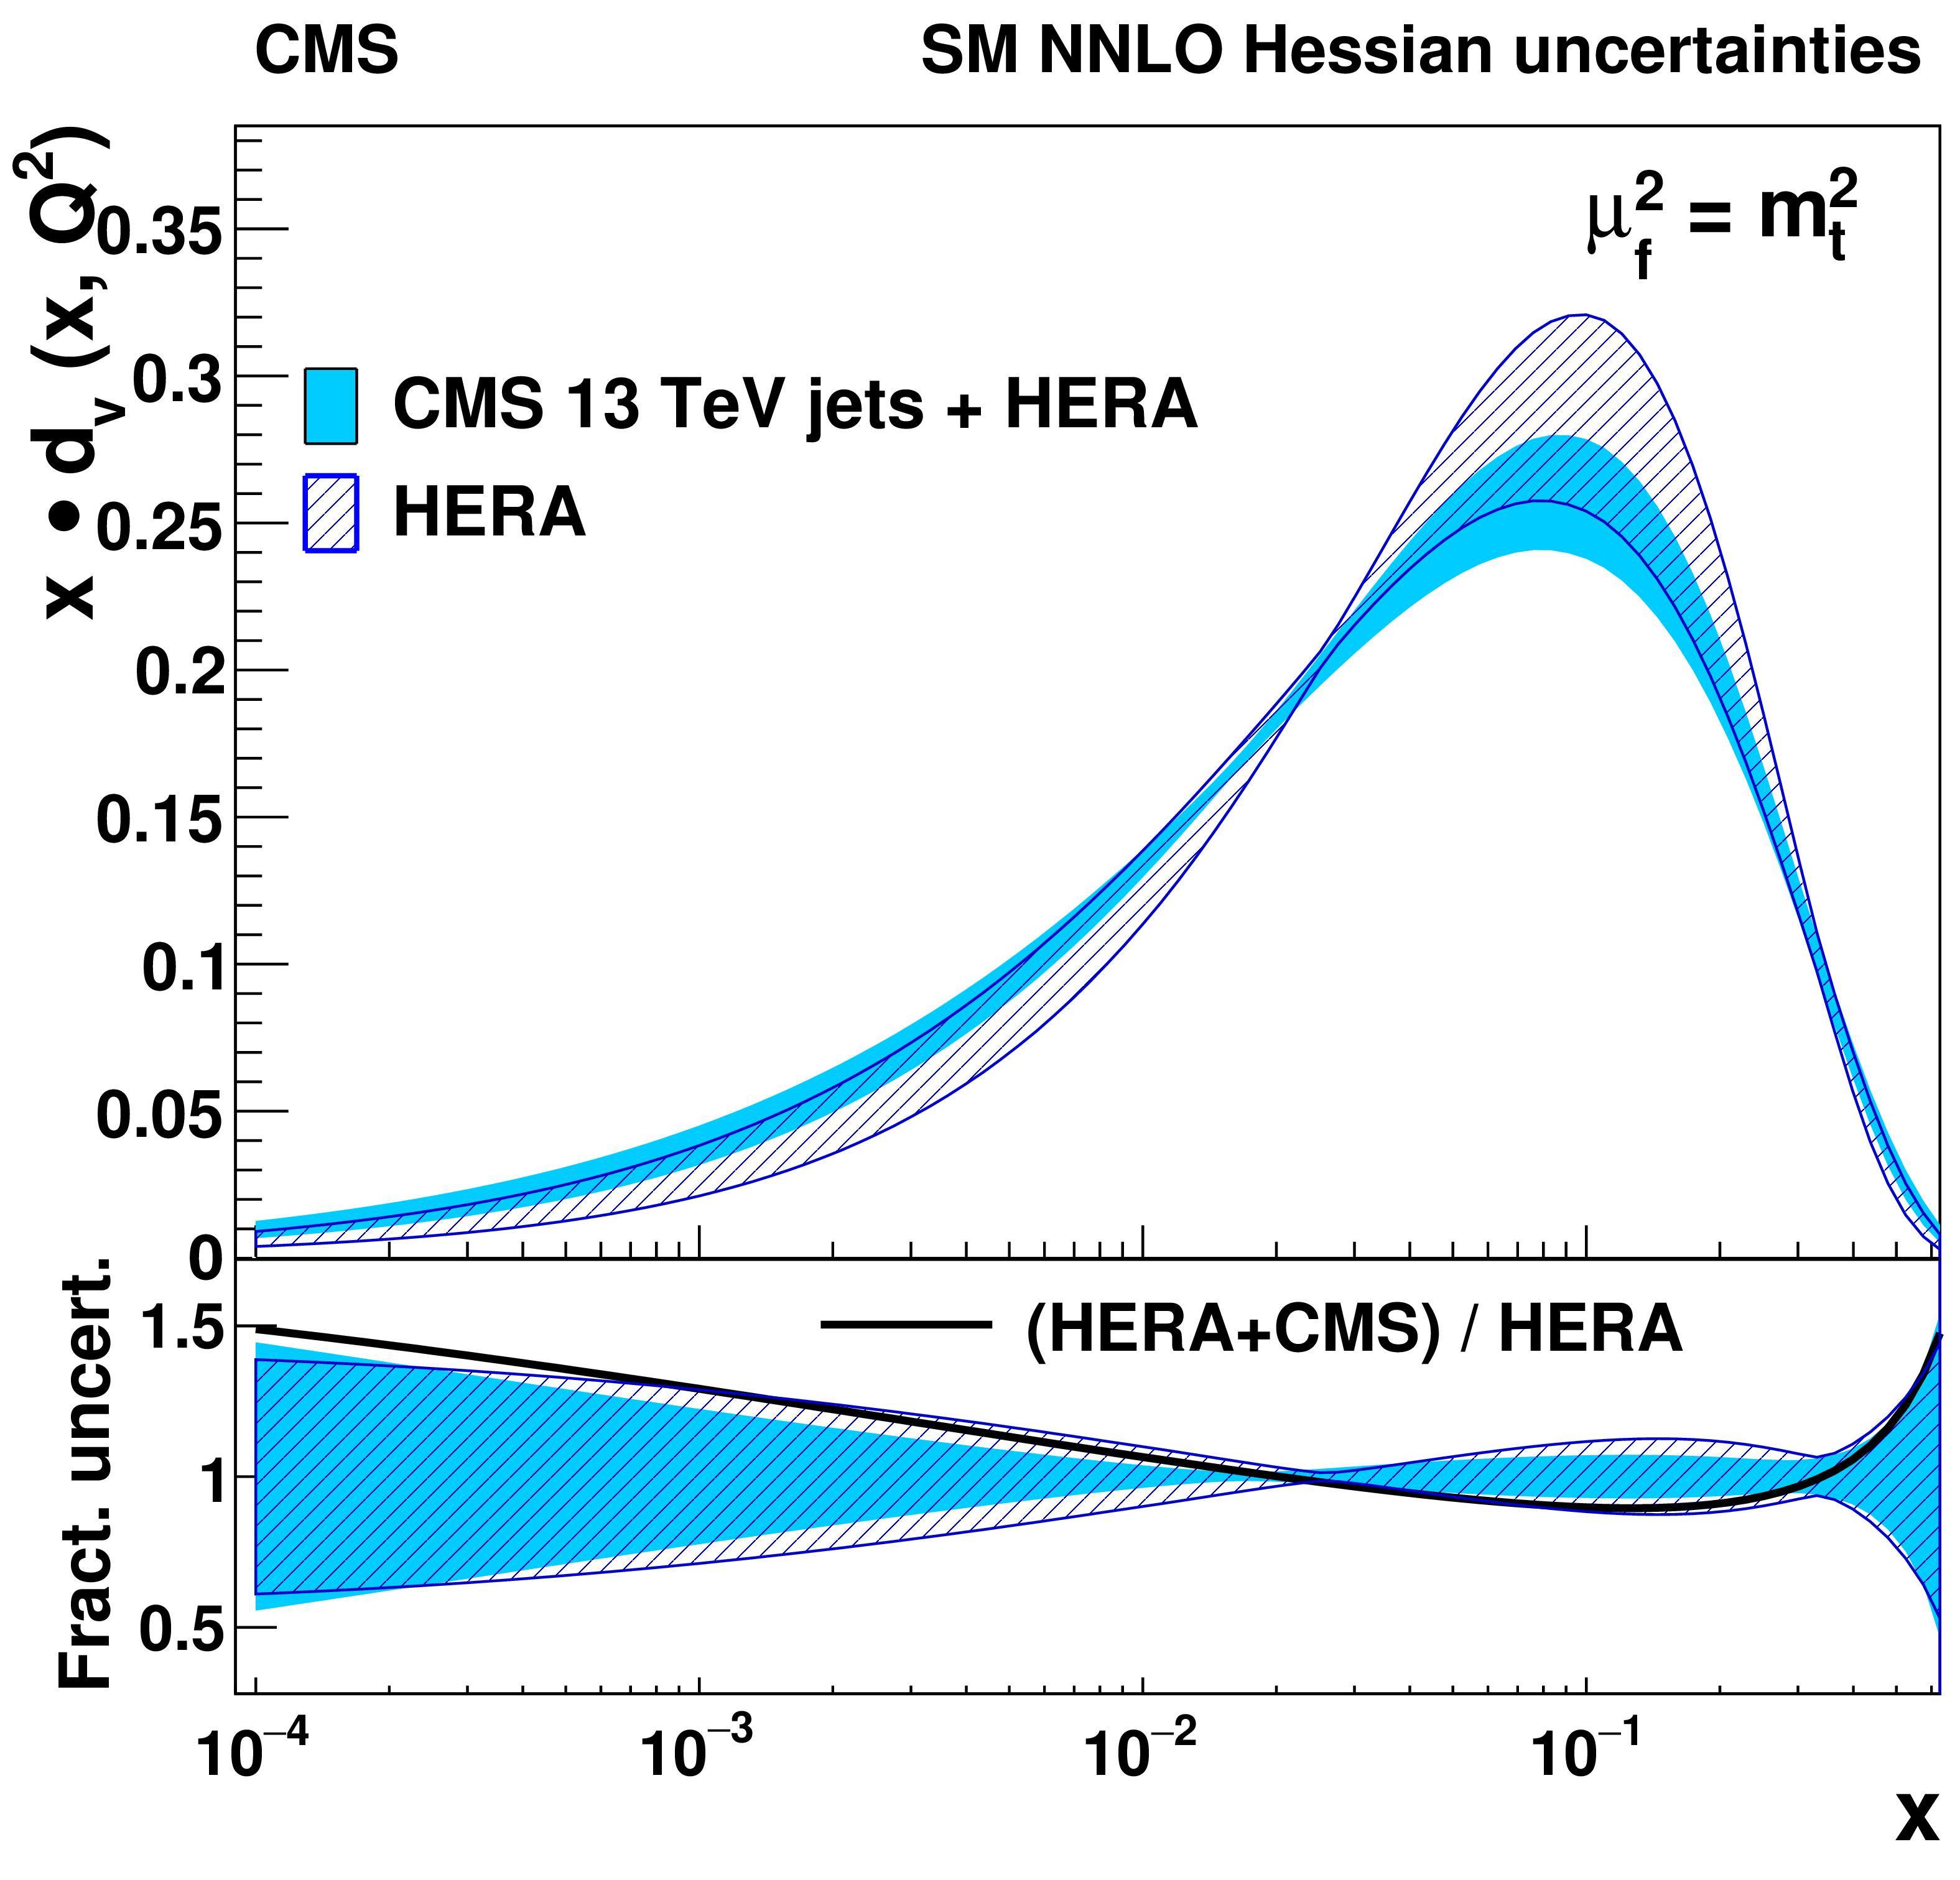
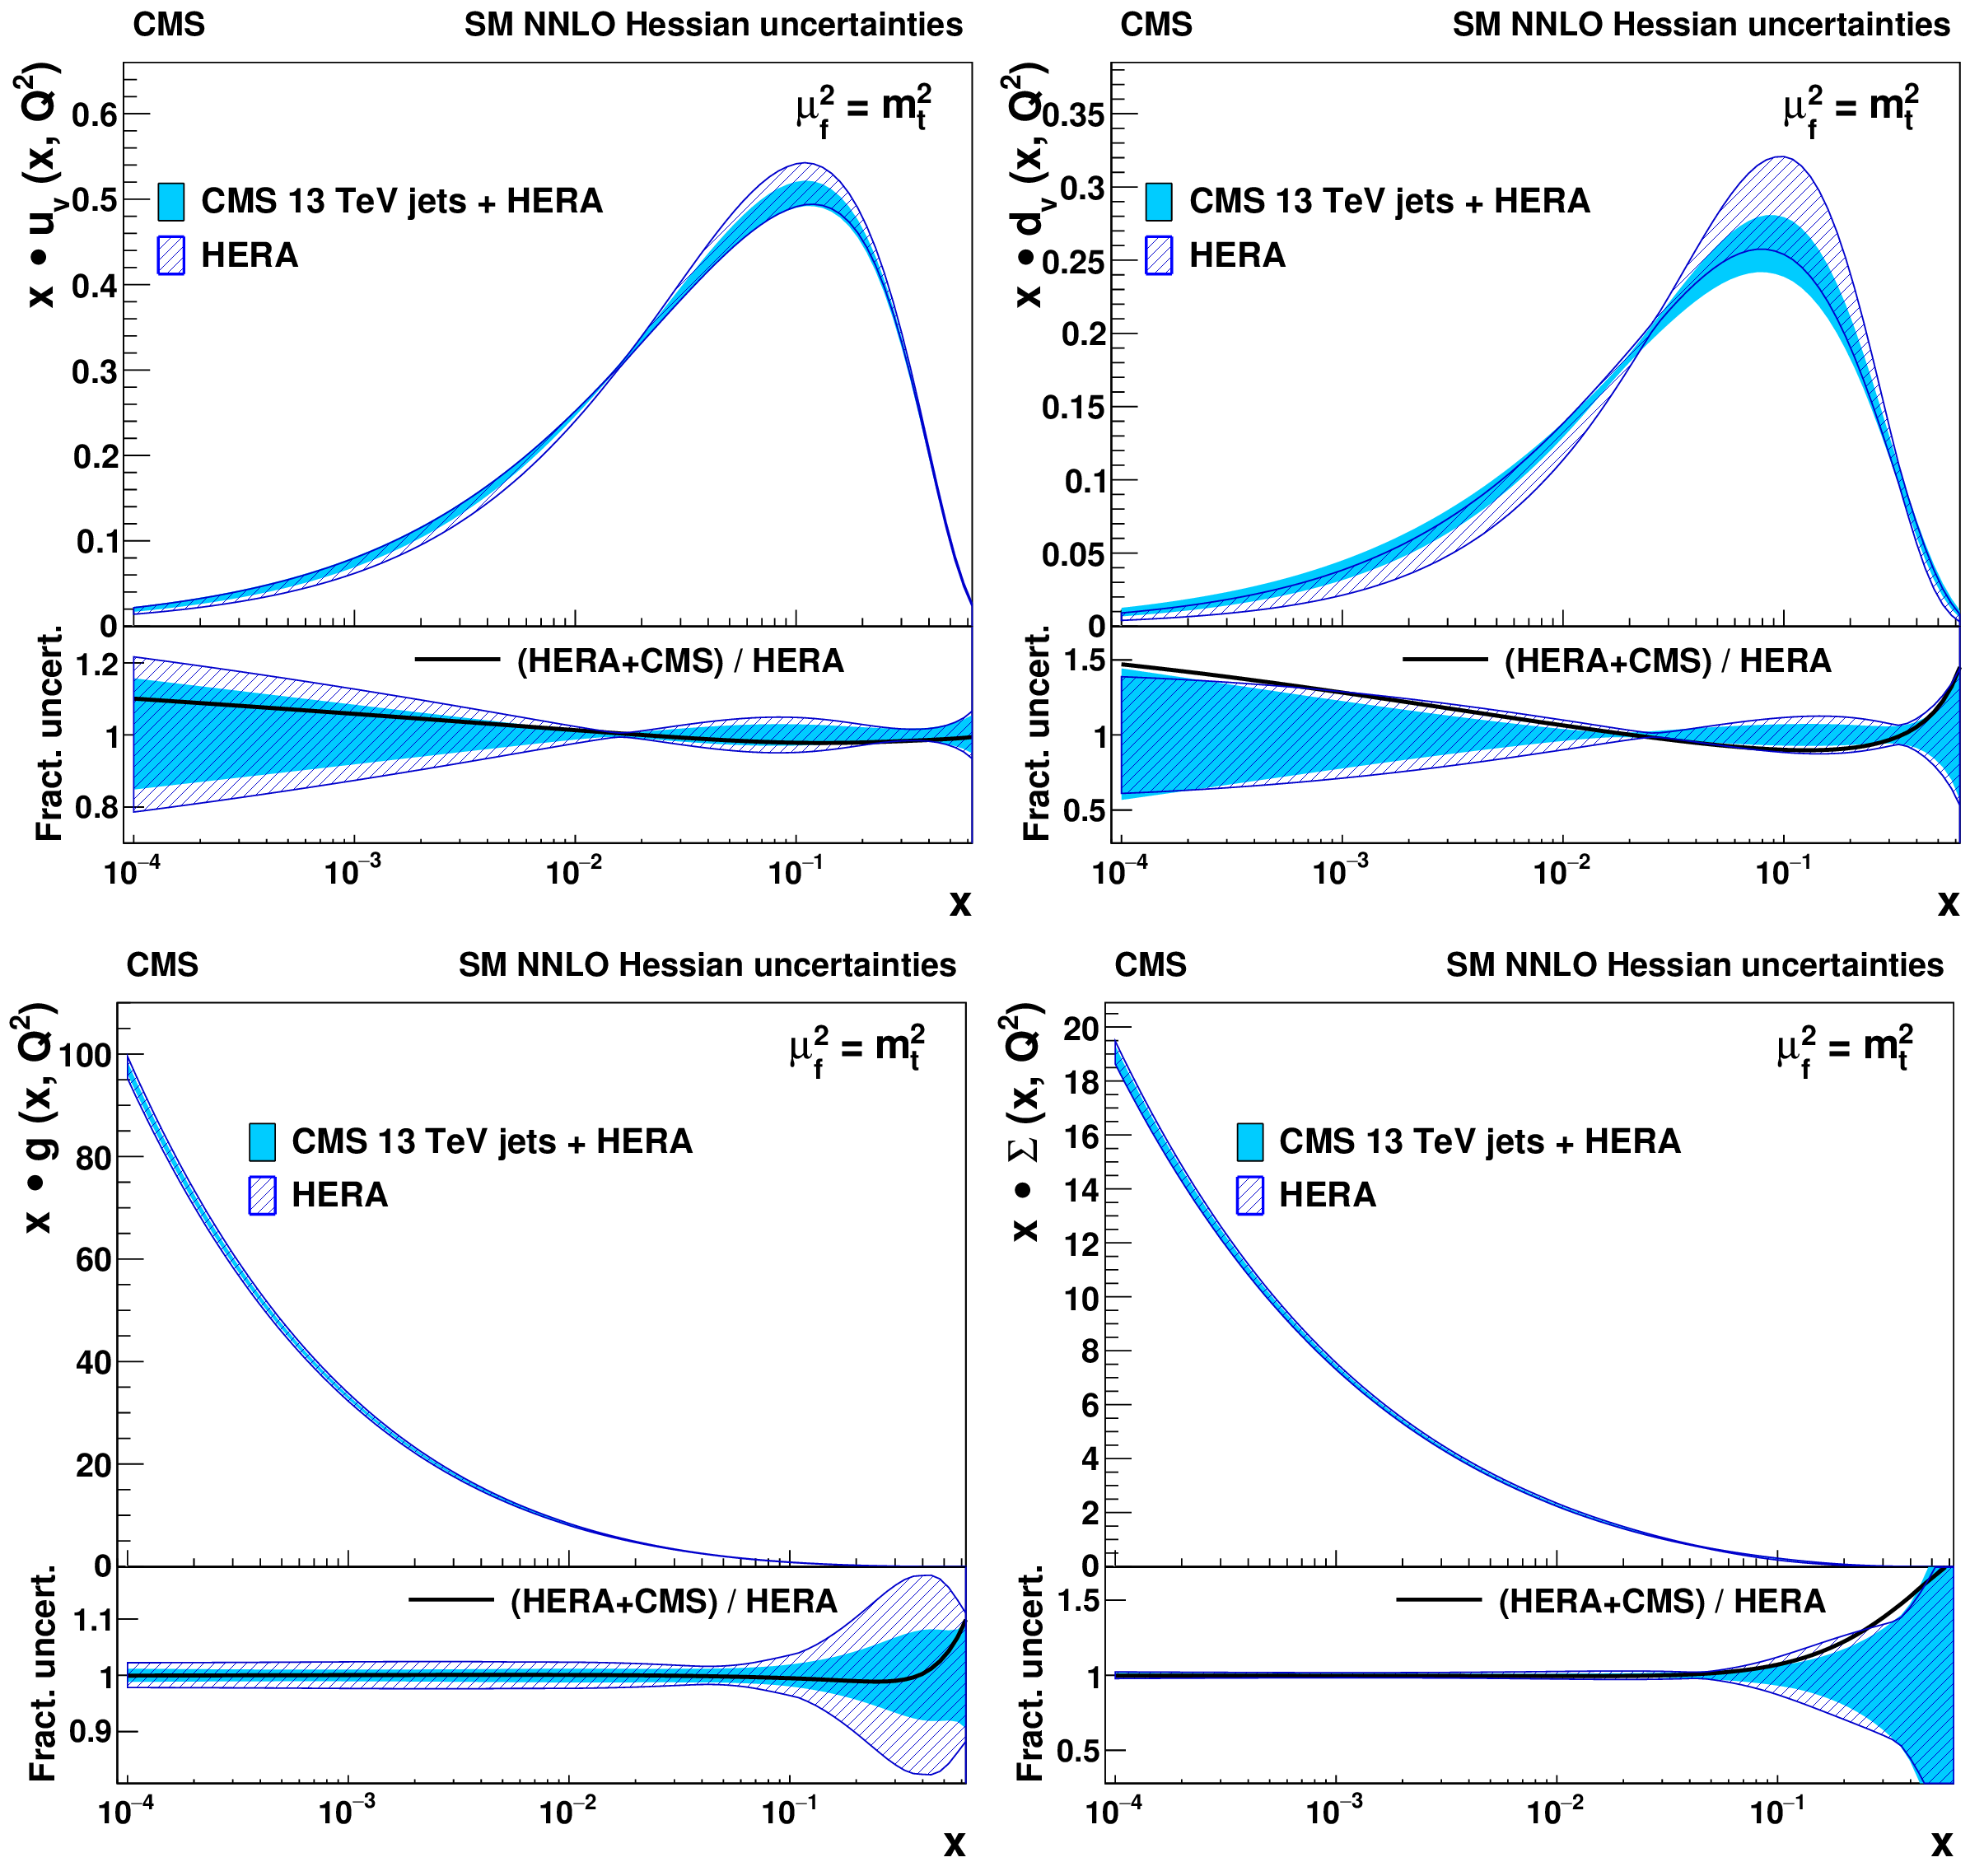
Figure 15:
The u-valence (upper left), d-valence (upper right), gluon (lower left), and sea quark (lower right) distributions, shown as a function of $ x $ at the scale $ \mu_\mathrm{f}=m_t^2 $. The filled (hatched) band represents the results of the NNLO fit using HERA DIS and the CMS inclusive jet cross section at $ \sqrt{s}= $ 13 TeV (using the HERA DIS data only). The PDFs are shown with their total uncertainty. In the lower panels, the comparison of the relative PDF uncertainties is shown for each distribution. The dashed line corresponds to the ratio of the central PDF values of the two variants of the fit. |
png pdf |
Figure 15-a:
The u-valence distribution, shown as a function of $ x $ at the scale $ \mu_\mathrm{f}=m_t^2 $. The filled (hatched) band represents the results of the NNLO fit using HERA DIS and the CMS inclusive jet cross section at $ \sqrt{s}= $ 13 TeV (using the HERA DIS data only). The PDFs are shown with their total uncertainty. In the lower panel, the comparison of the relative PDF uncertainties is shown for each distribution. The dashed line corresponds to the ratio of the central PDF values of the two variants of the fit. |
png pdf |
Figure 15-b:
The d-valence distribution, shown as a function of $ x $ at the scale $ \mu_\mathrm{f}=m_t^2 $. The filled (hatched) band represents the results of the NNLO fit using HERA DIS and the CMS inclusive jet cross section at $ \sqrt{s}= $ 13 TeV (using the HERA DIS data only). The PDFs are shown with their total uncertainty. In the lower panel, the comparison of the relative PDF uncertainties is shown for each distribution. The dashed line corresponds to the ratio of the central PDF values of the two variants of the fit. |

png pdf |
Figure 15-c:
The gluon distribution, shown as a function of $ x $ at the scale $ \mu_\mathrm{f}=m_t^2 $. The filled (hatched) band represents the results of the NNLO fit using HERA DIS and the CMS inclusive jet cross section at $ \sqrt{s}= $ 13 TeV (using the HERA DIS data only). The PDFs are shown with their total uncertainty. In the lower panel, the comparison of the relative PDF uncertainties is shown for each distribution. The dashed line corresponds to the ratio of the central PDF values of the two variants of the fit. |

png pdf |
Figure 15-d:
The sea quark distribution, shown as a function of $ x $ at the scale $ \mu_\mathrm{f}=m_t^2 $. The filled (hatched) band represents the results of the NNLO fit using HERA DIS and the CMS inclusive jet cross section at $ \sqrt{s}= $ 13 TeV (using the HERA DIS data only). The PDFs are shown with their total uncertainty. In the lower panel, the comparison of the relative PDF uncertainties is shown for each distribution. The dashed line corresponds to the ratio of the central PDF values of the two variants of the fit. |
png pdf |
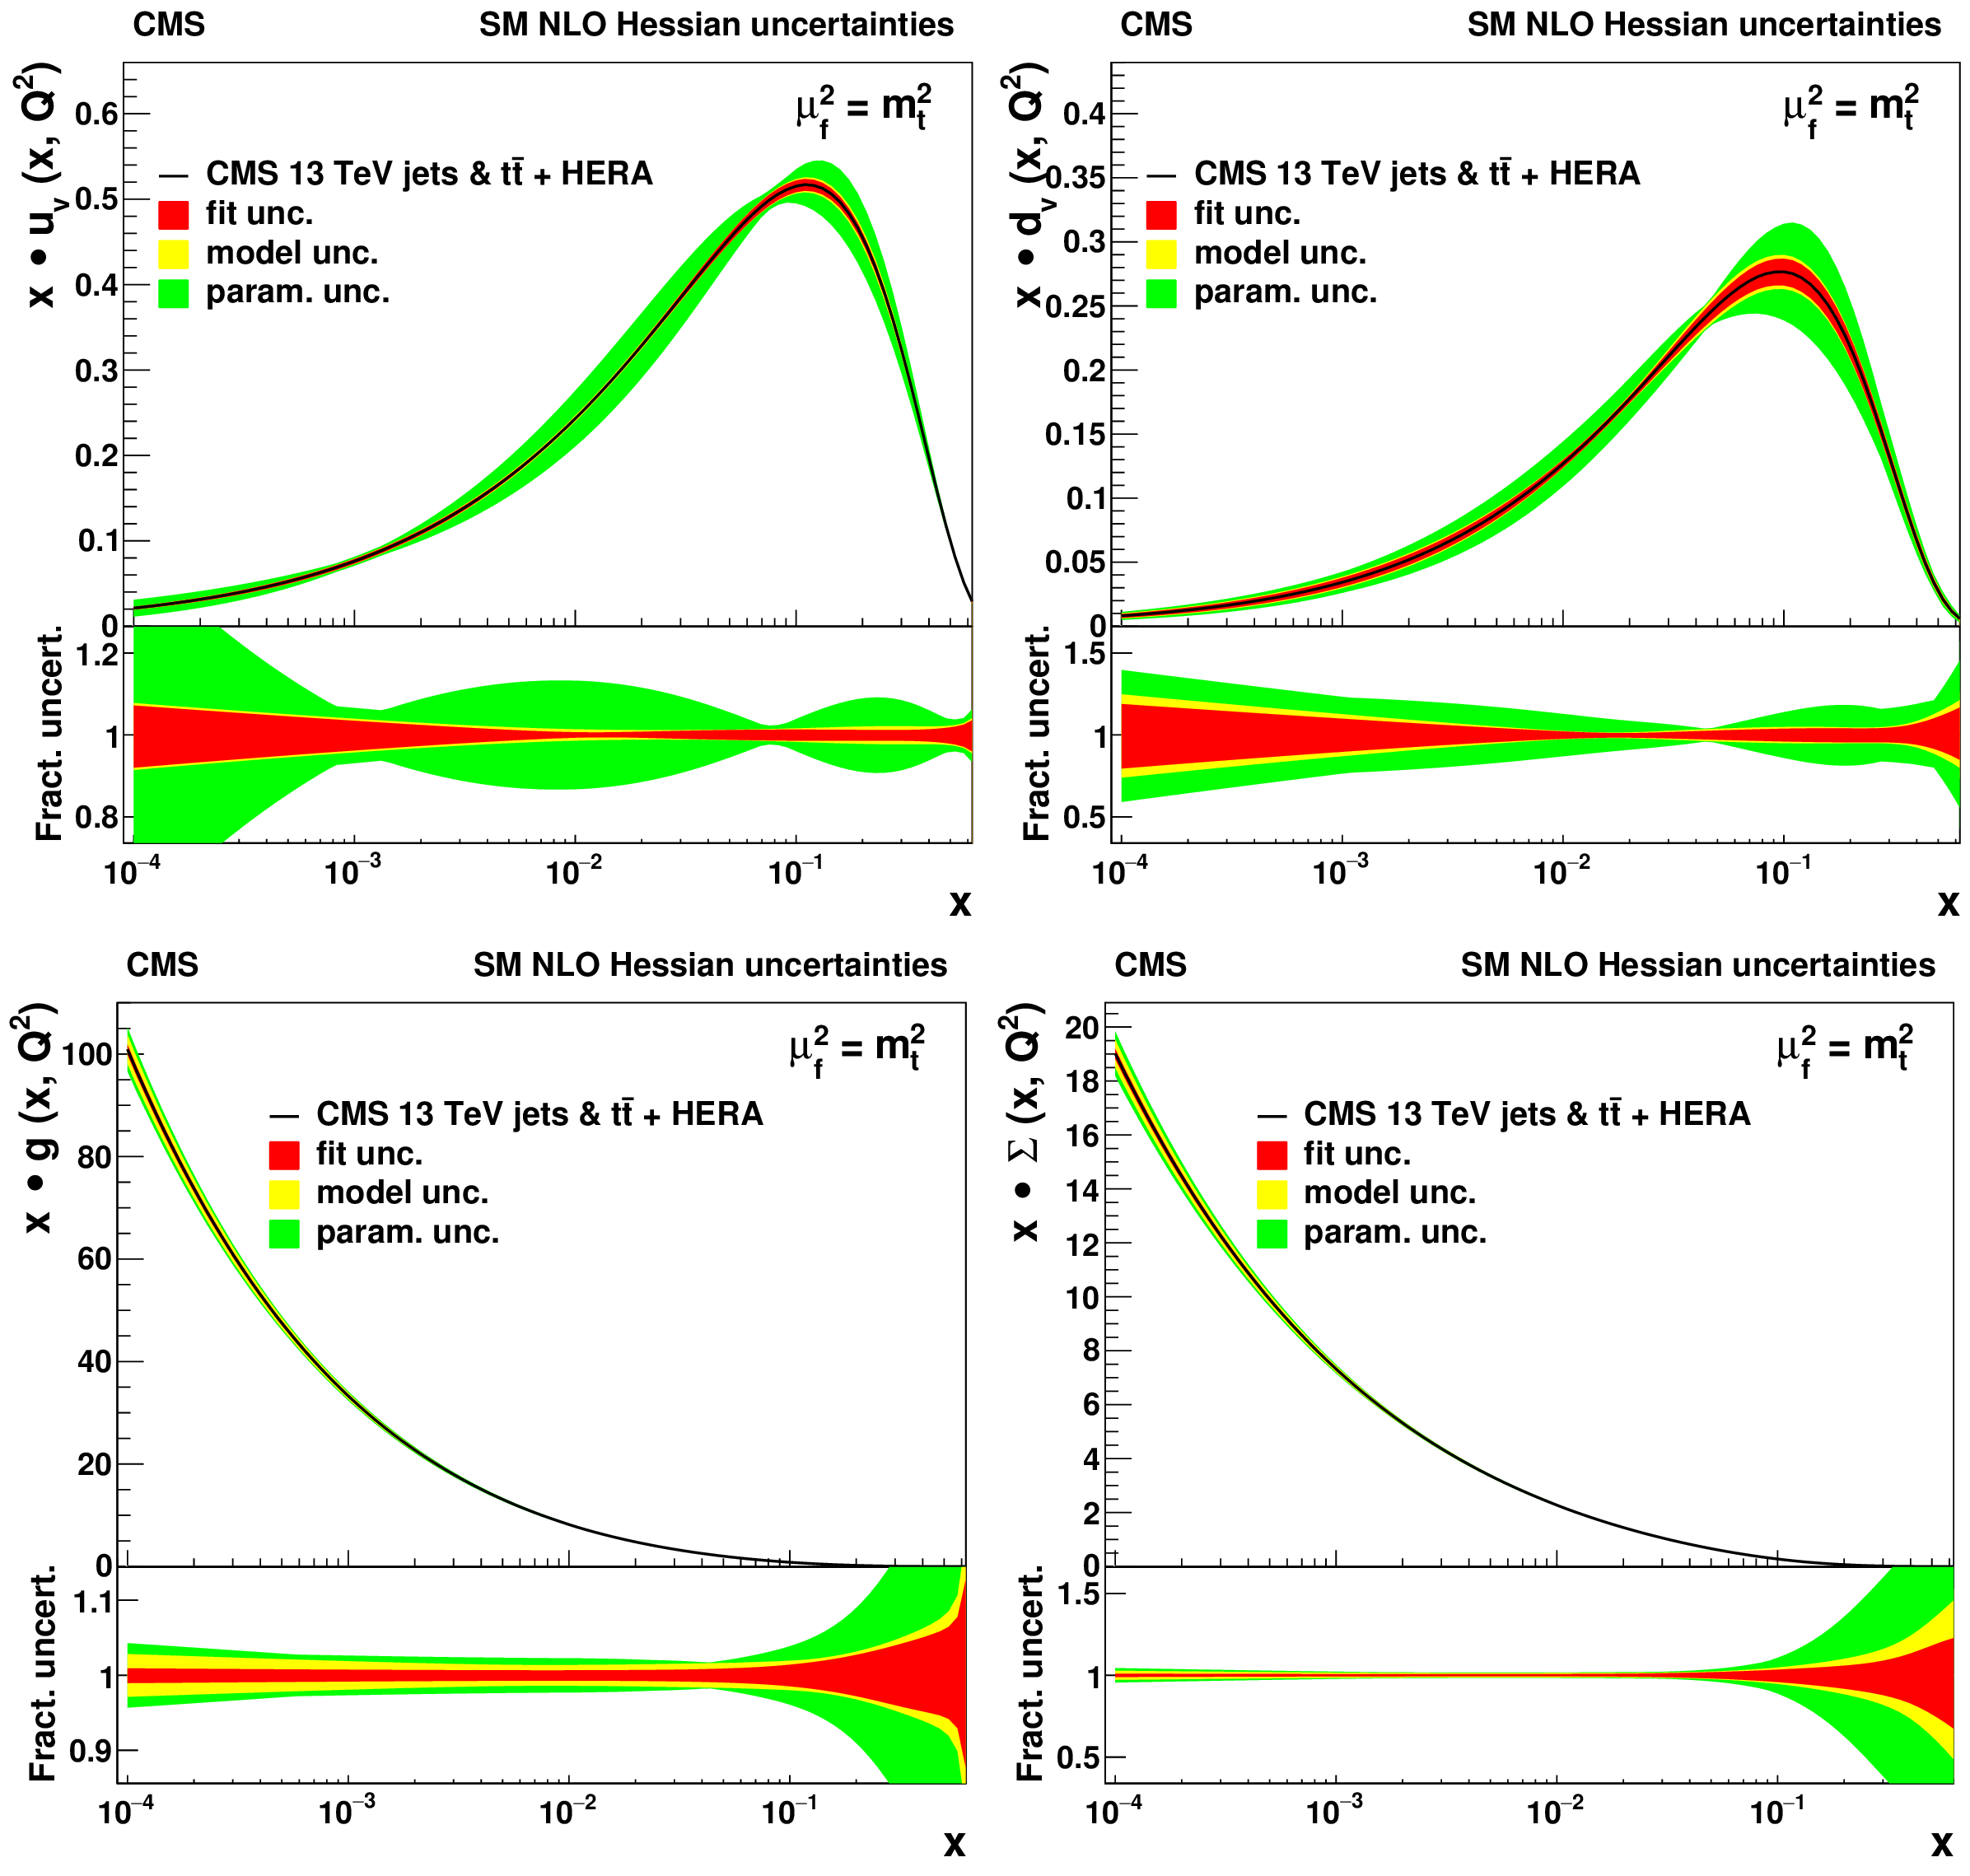
Figure 16:
The u-valence (upper left), d-valence (upper right), gluon (lower left), and sea quark (lower right) distributions, shown as functions of $ x $ at the scale $ \mu_\mathrm{f}=m_\mathrm{t}^2 $, resulting from the SM fit using HERA DIS together with the CMS inclusive jet cross section and the normalised triple-differential cross section of $ \mathrm{t} \overline{\mathrm{t}} $ production at $ \sqrt{s}= $ 13 TeV. Contributions of fit, model, and parameterisation uncertainties for each PDF are shown. In the lower panels, the relative uncertainty contributions are presented. |
png pdf |
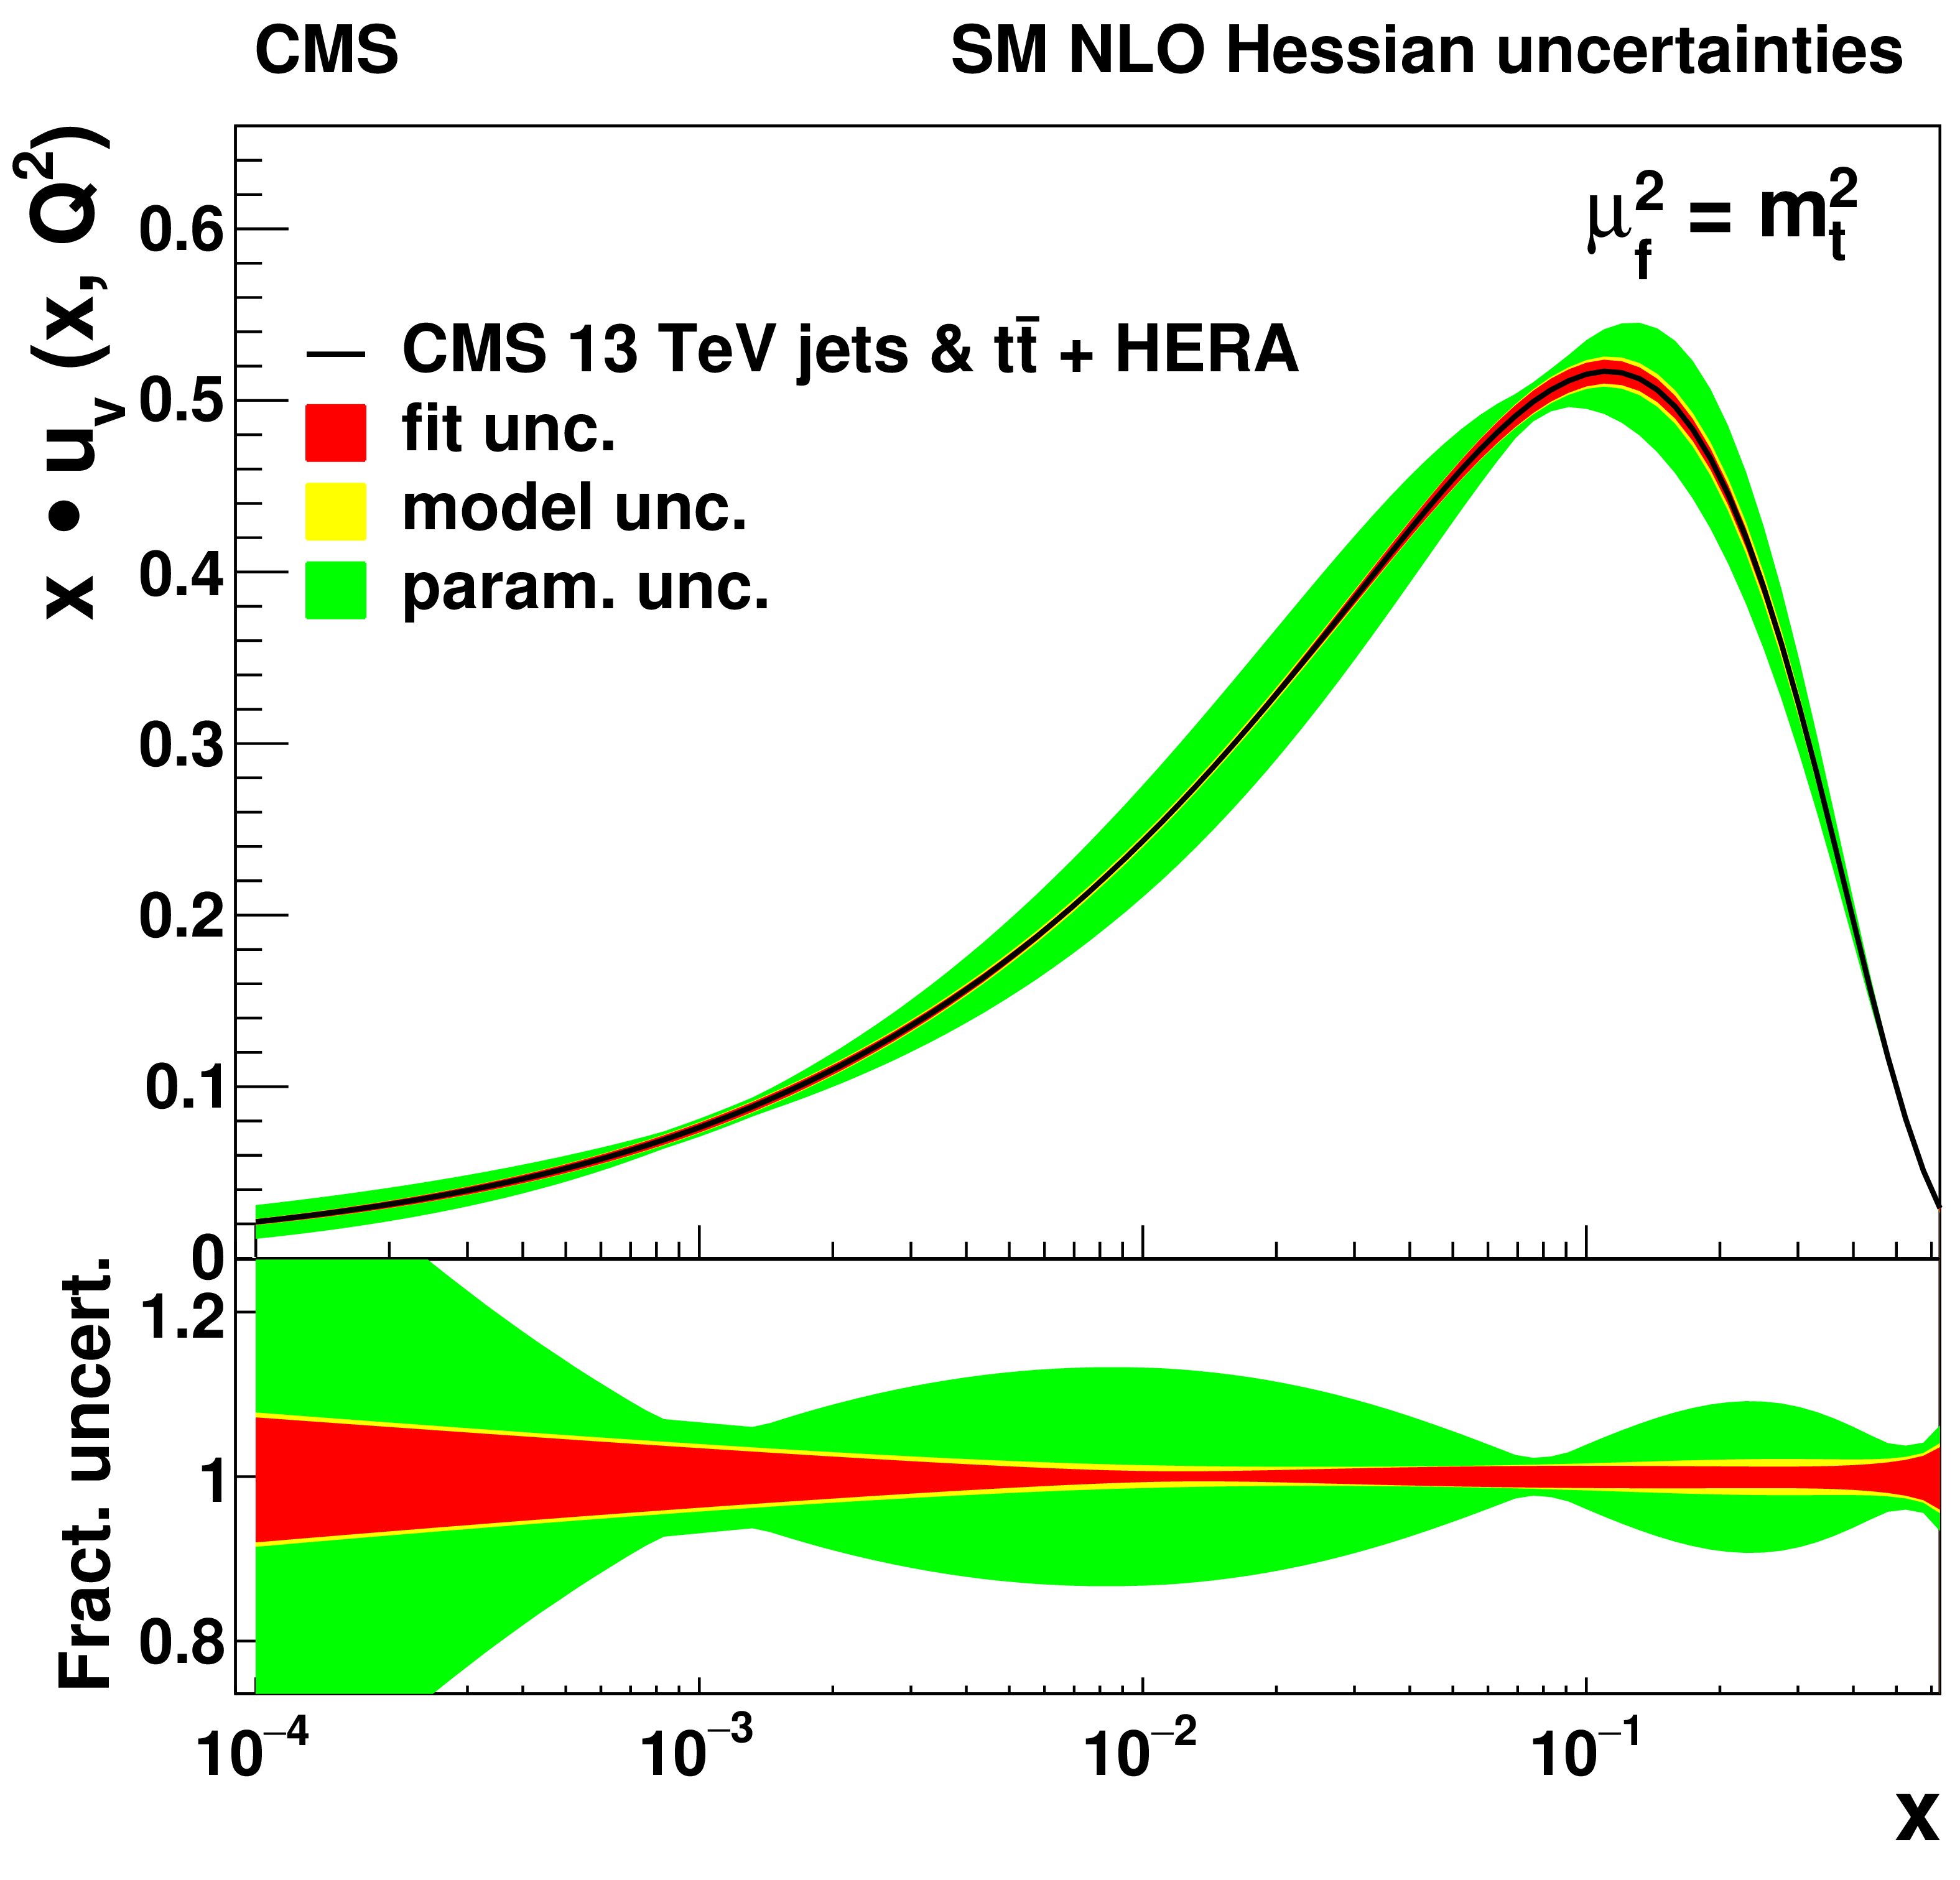
Figure 16-a:
The u-valence distribution, shown as functions of $ x $ at the scale $ \mu_\mathrm{f}=m_\mathrm{t}^2 $, resulting from the SM fit using HERA DIS together with the CMS inclusive jet cross section and the normalised triple-differential cross section of $ \mathrm{t} \overline{\mathrm{t}} $ production at $ \sqrt{s}= $ 13 TeV. Contributions of fit, model, and parameterisation uncertainties for each PDF are shown. In the lower panel, the relative uncertainty contributions are presented. |
png pdf |
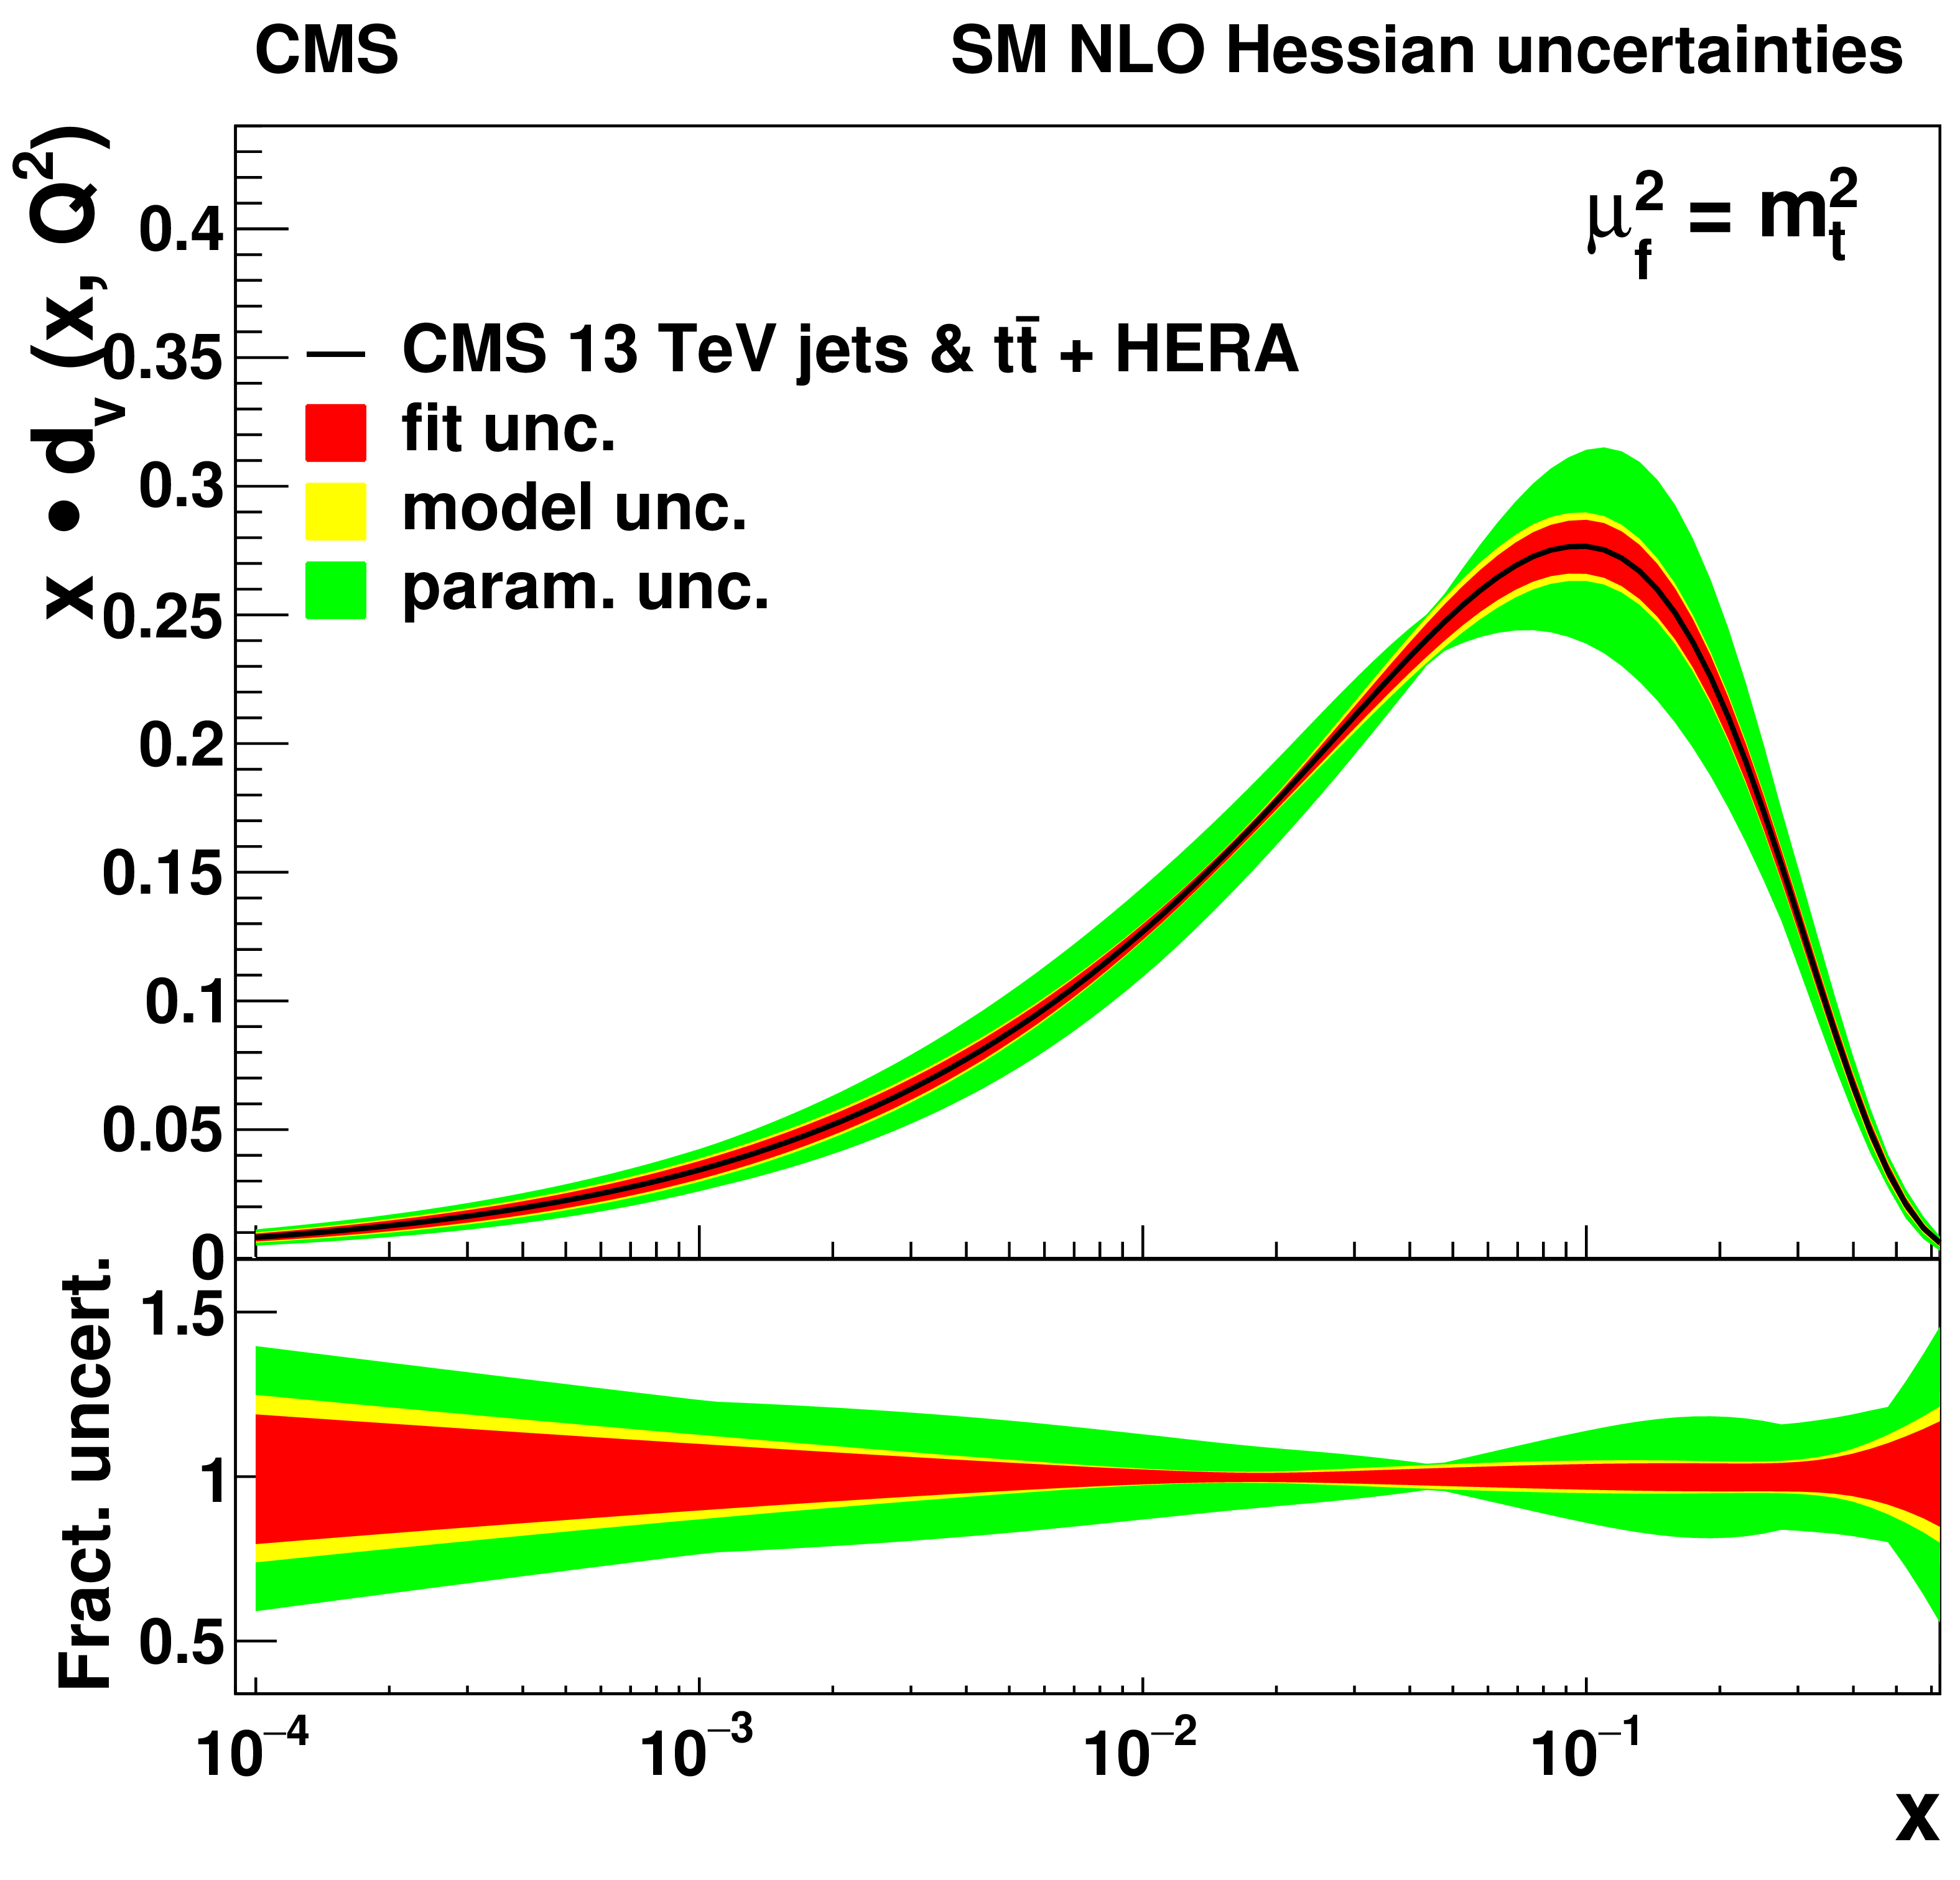
Figure 16-b:
The d-valence distribution, shown as functions of $ x $ at the scale $ \mu_\mathrm{f}=m_\mathrm{t}^2 $, resulting from the SM fit using HERA DIS together with the CMS inclusive jet cross section and the normalised triple-differential cross section of $ \mathrm{t} \overline{\mathrm{t}} $ production at $ \sqrt{s}= $ 13 TeV. Contributions of fit, model, and parameterisation uncertainties for each PDF are shown. In the lower panel, the relative uncertainty contributions are presented. |
png pdf |
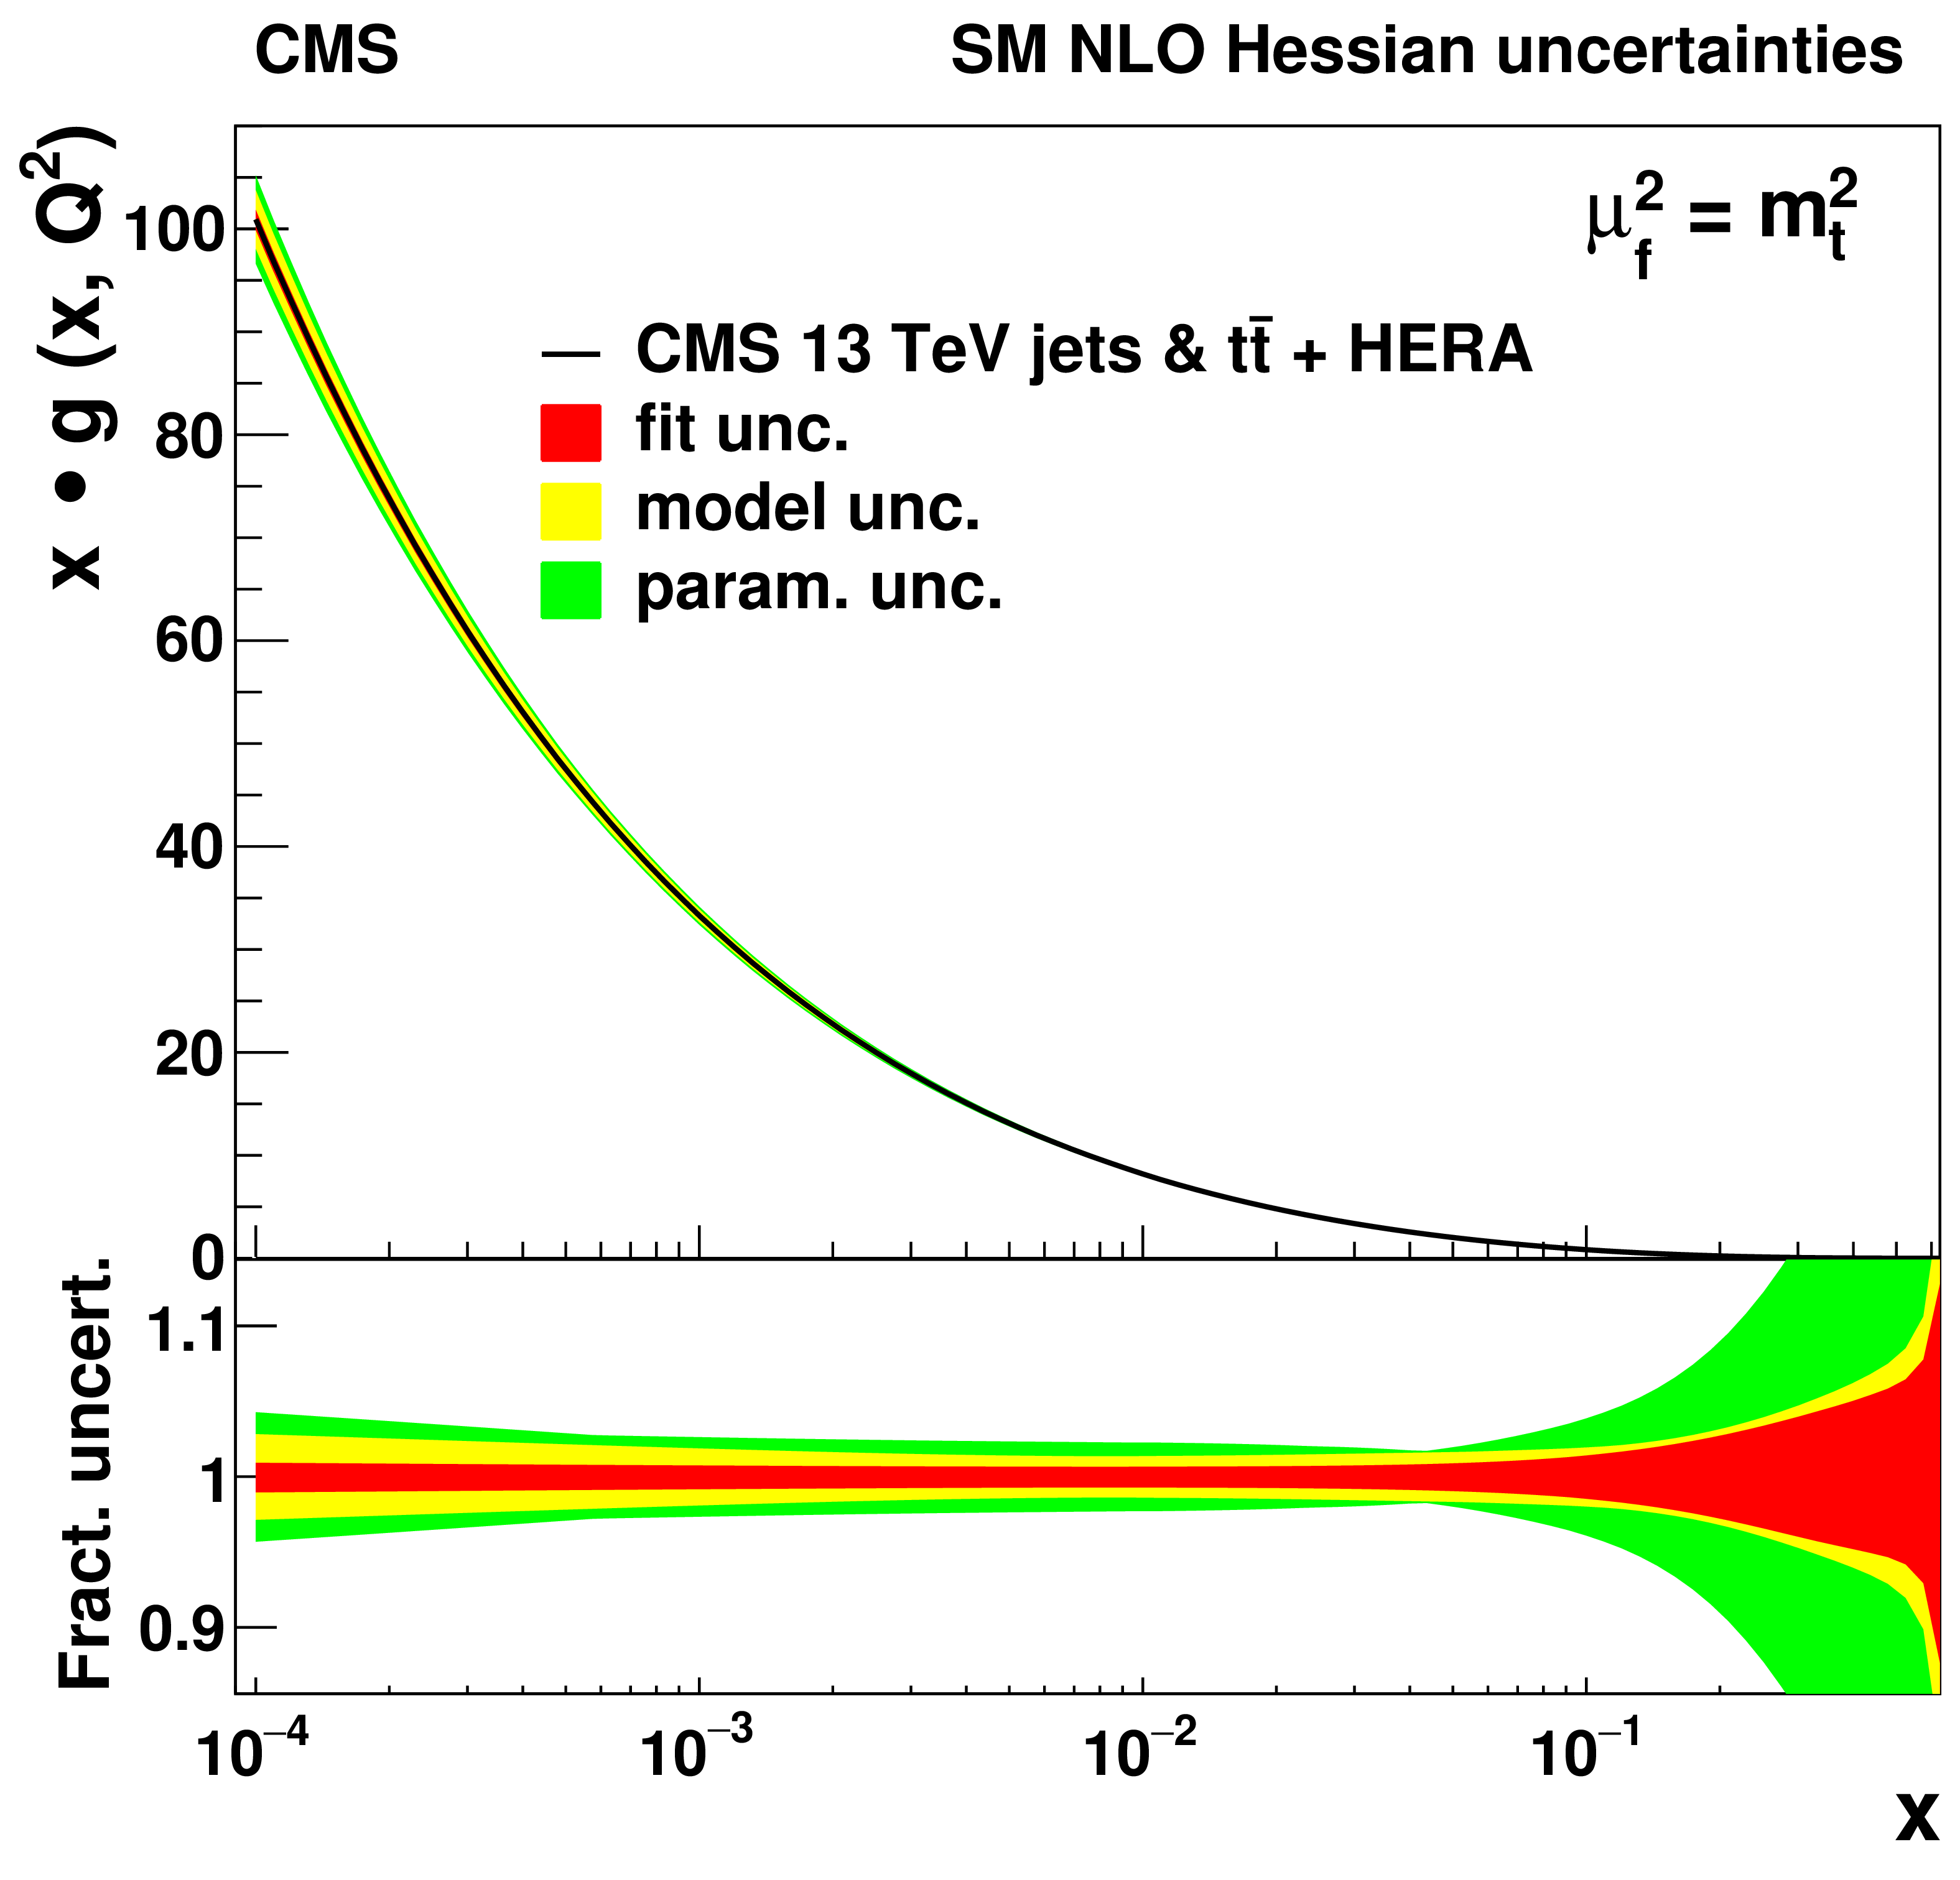
Figure 16-c:
The gluon distribution, shown as functions of $ x $ at the scale $ \mu_\mathrm{f}=m_\mathrm{t}^2 $, resulting from the SM fit using HERA DIS together with the CMS inclusive jet cross section and the normalised triple-differential cross section of $ \mathrm{t} \overline{\mathrm{t}} $ production at $ \sqrt{s}= $ 13 TeV. Contributions of fit, model, and parameterisation uncertainties for each PDF are shown. In the lower panel, the relative uncertainty contributions are presented. |
png pdf |
Figure 16-d:
The sea quark distribution, shown as functions of $ x $ at the scale $ \mu_\mathrm{f}=m_\mathrm{t}^2 $, resulting from the SM fit using HERA DIS together with the CMS inclusive jet cross section and the normalised triple-differential cross section of $ \mathrm{t} \overline{\mathrm{t}} $ production at $ \sqrt{s}= $ 13 TeV. Contributions of fit, model, and parameterisation uncertainties for each PDF are shown. In the lower panel, the relative uncertainty contributions are presented. |
png pdf |
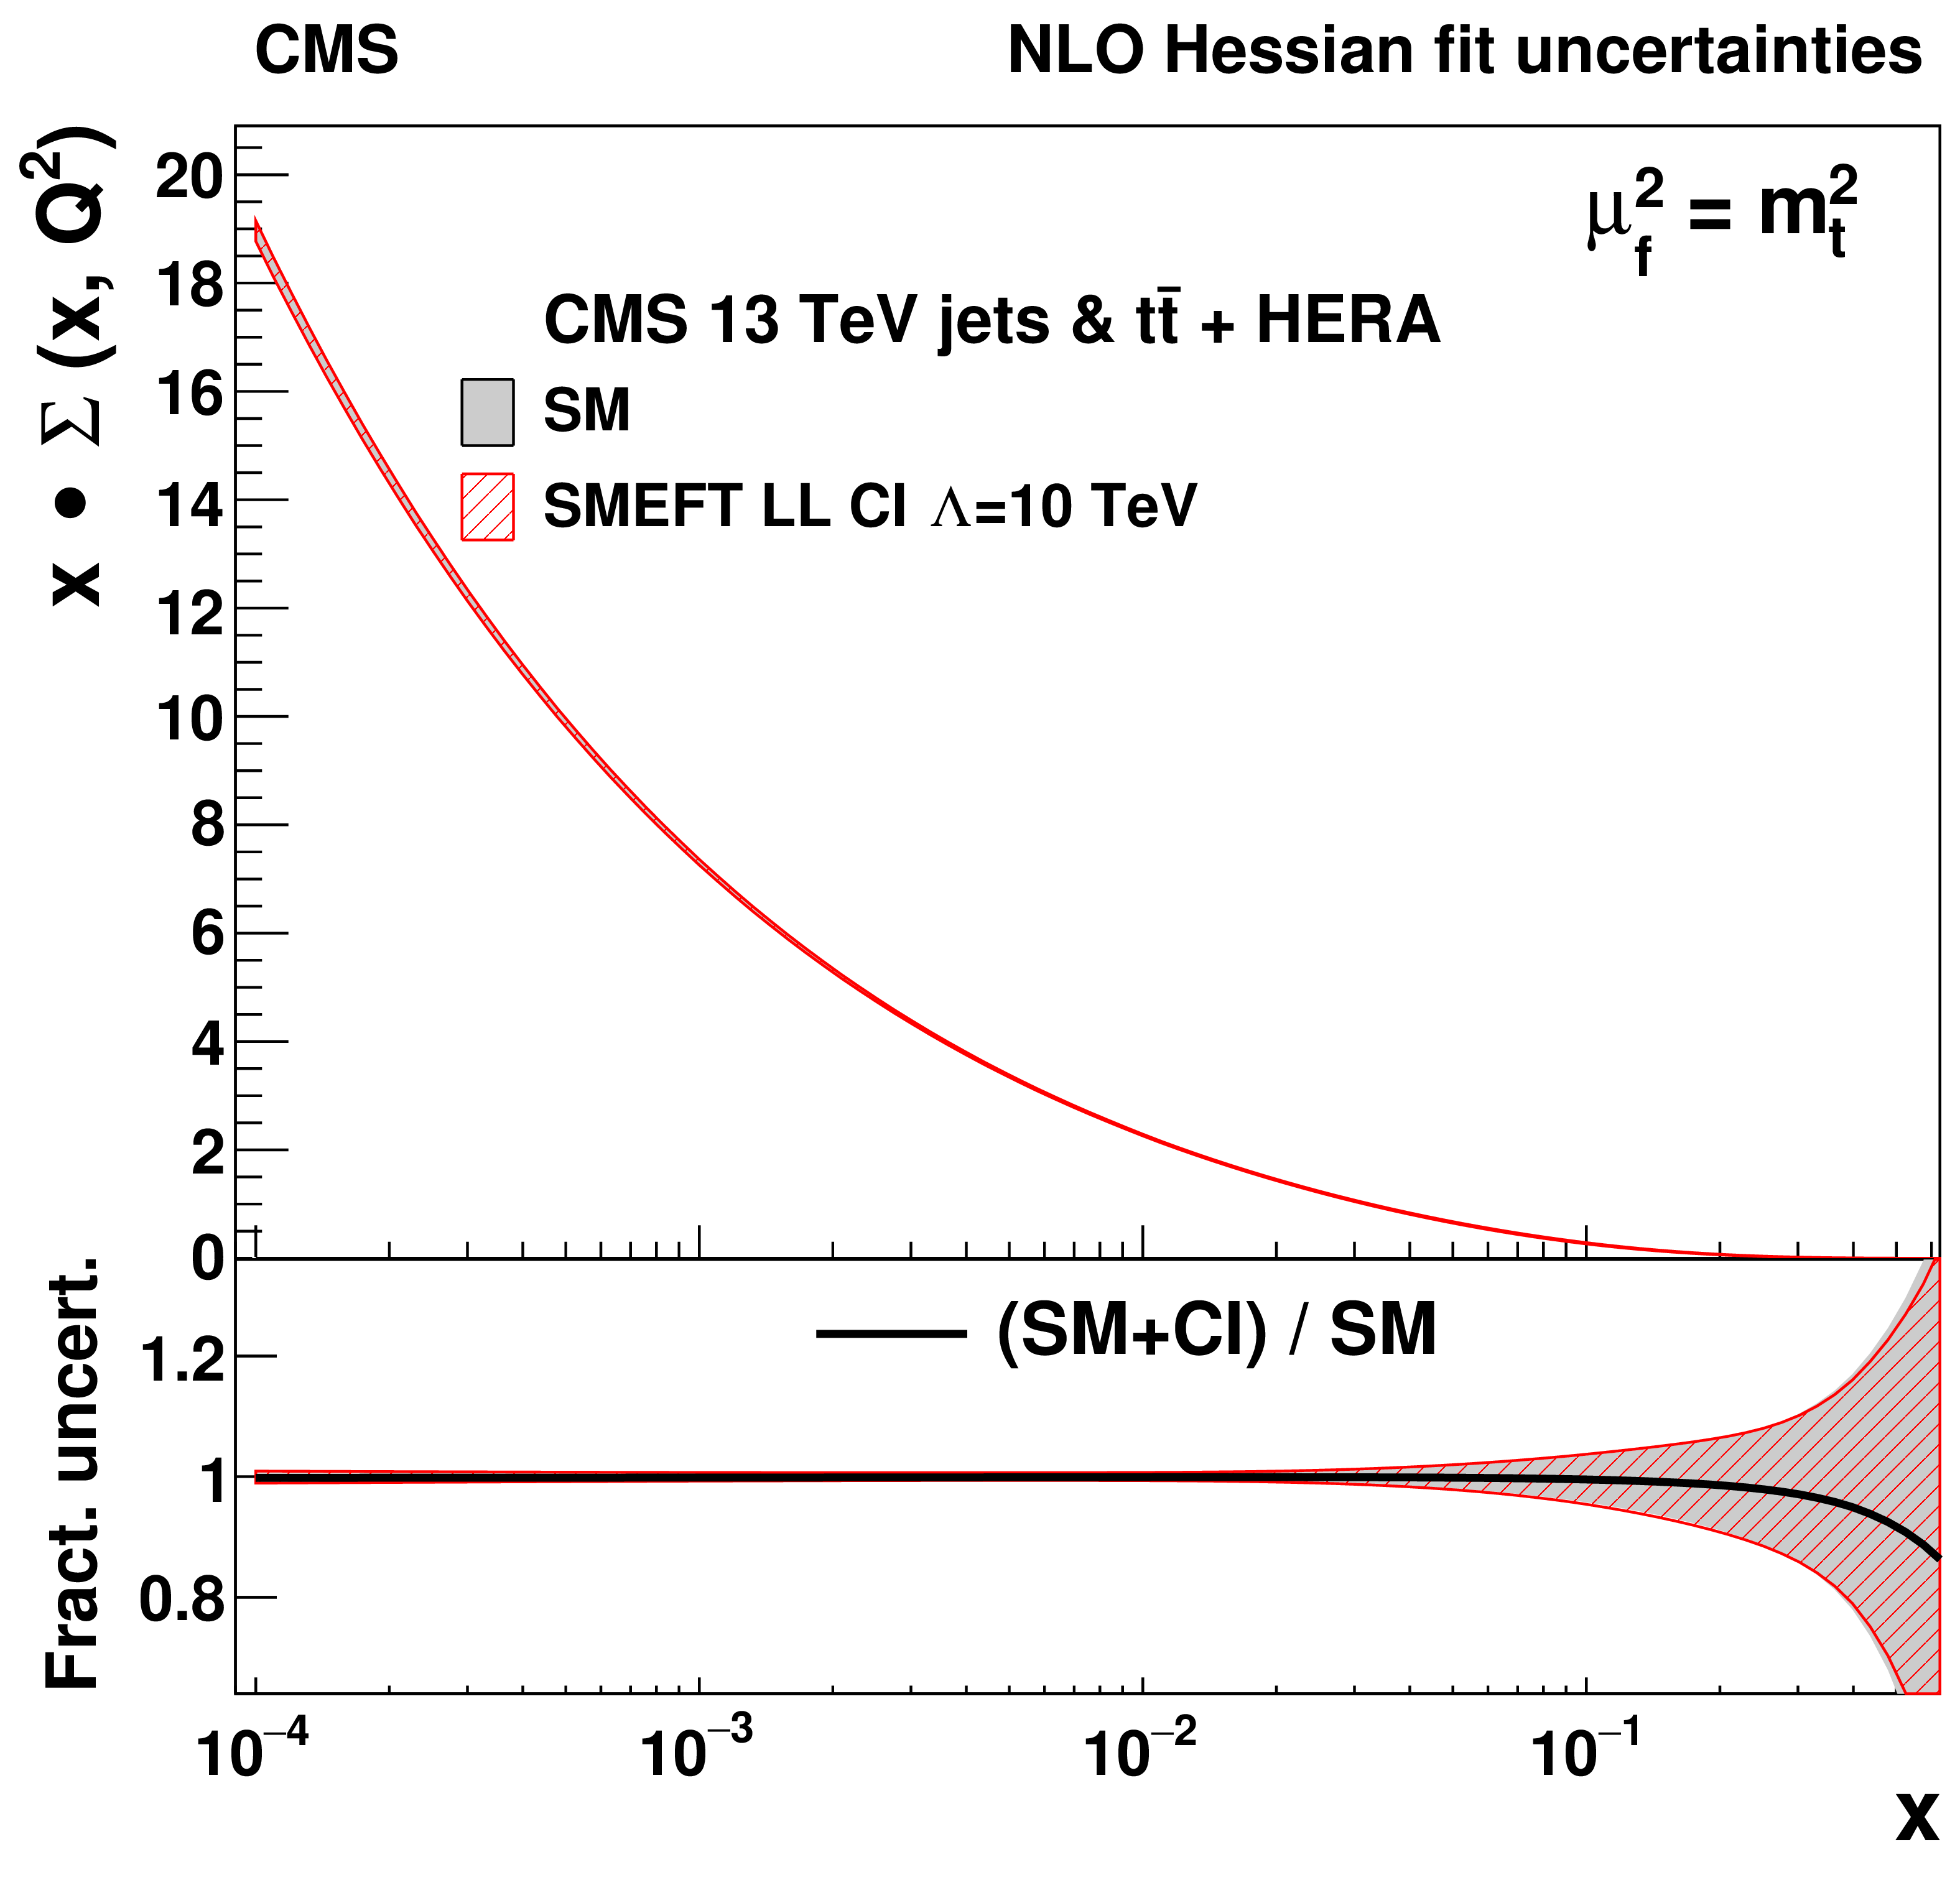
Figure 17:
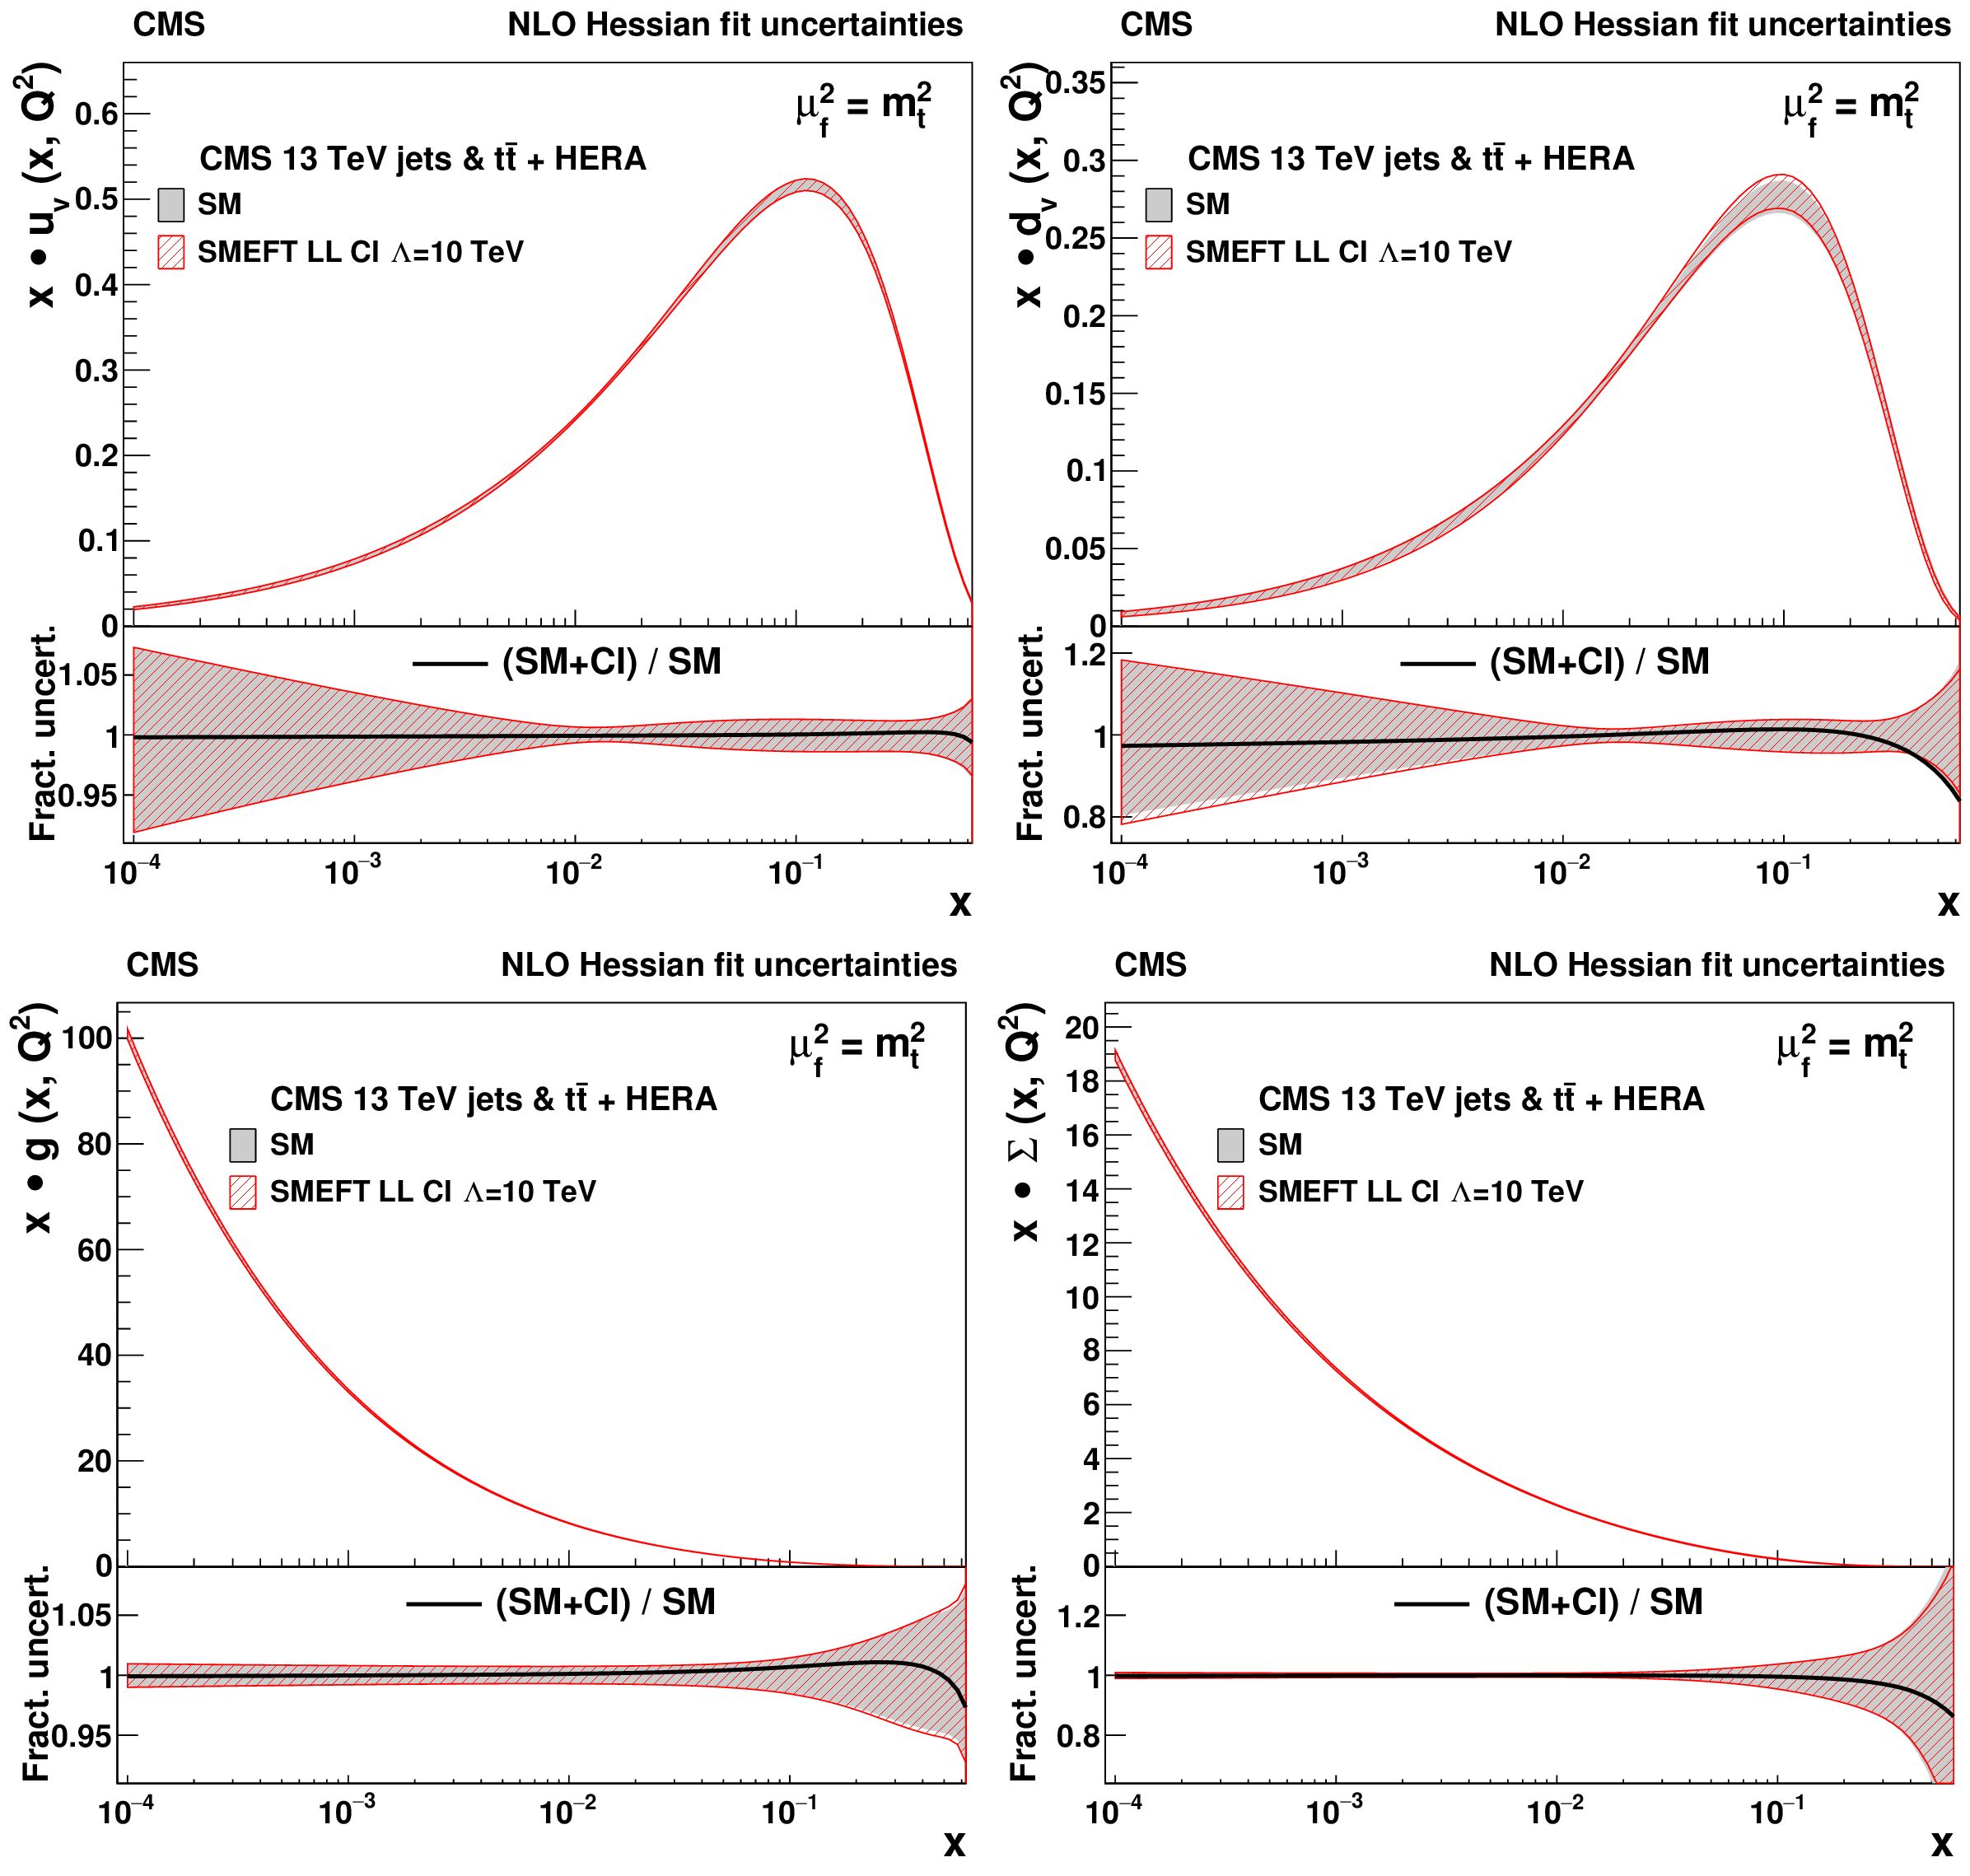
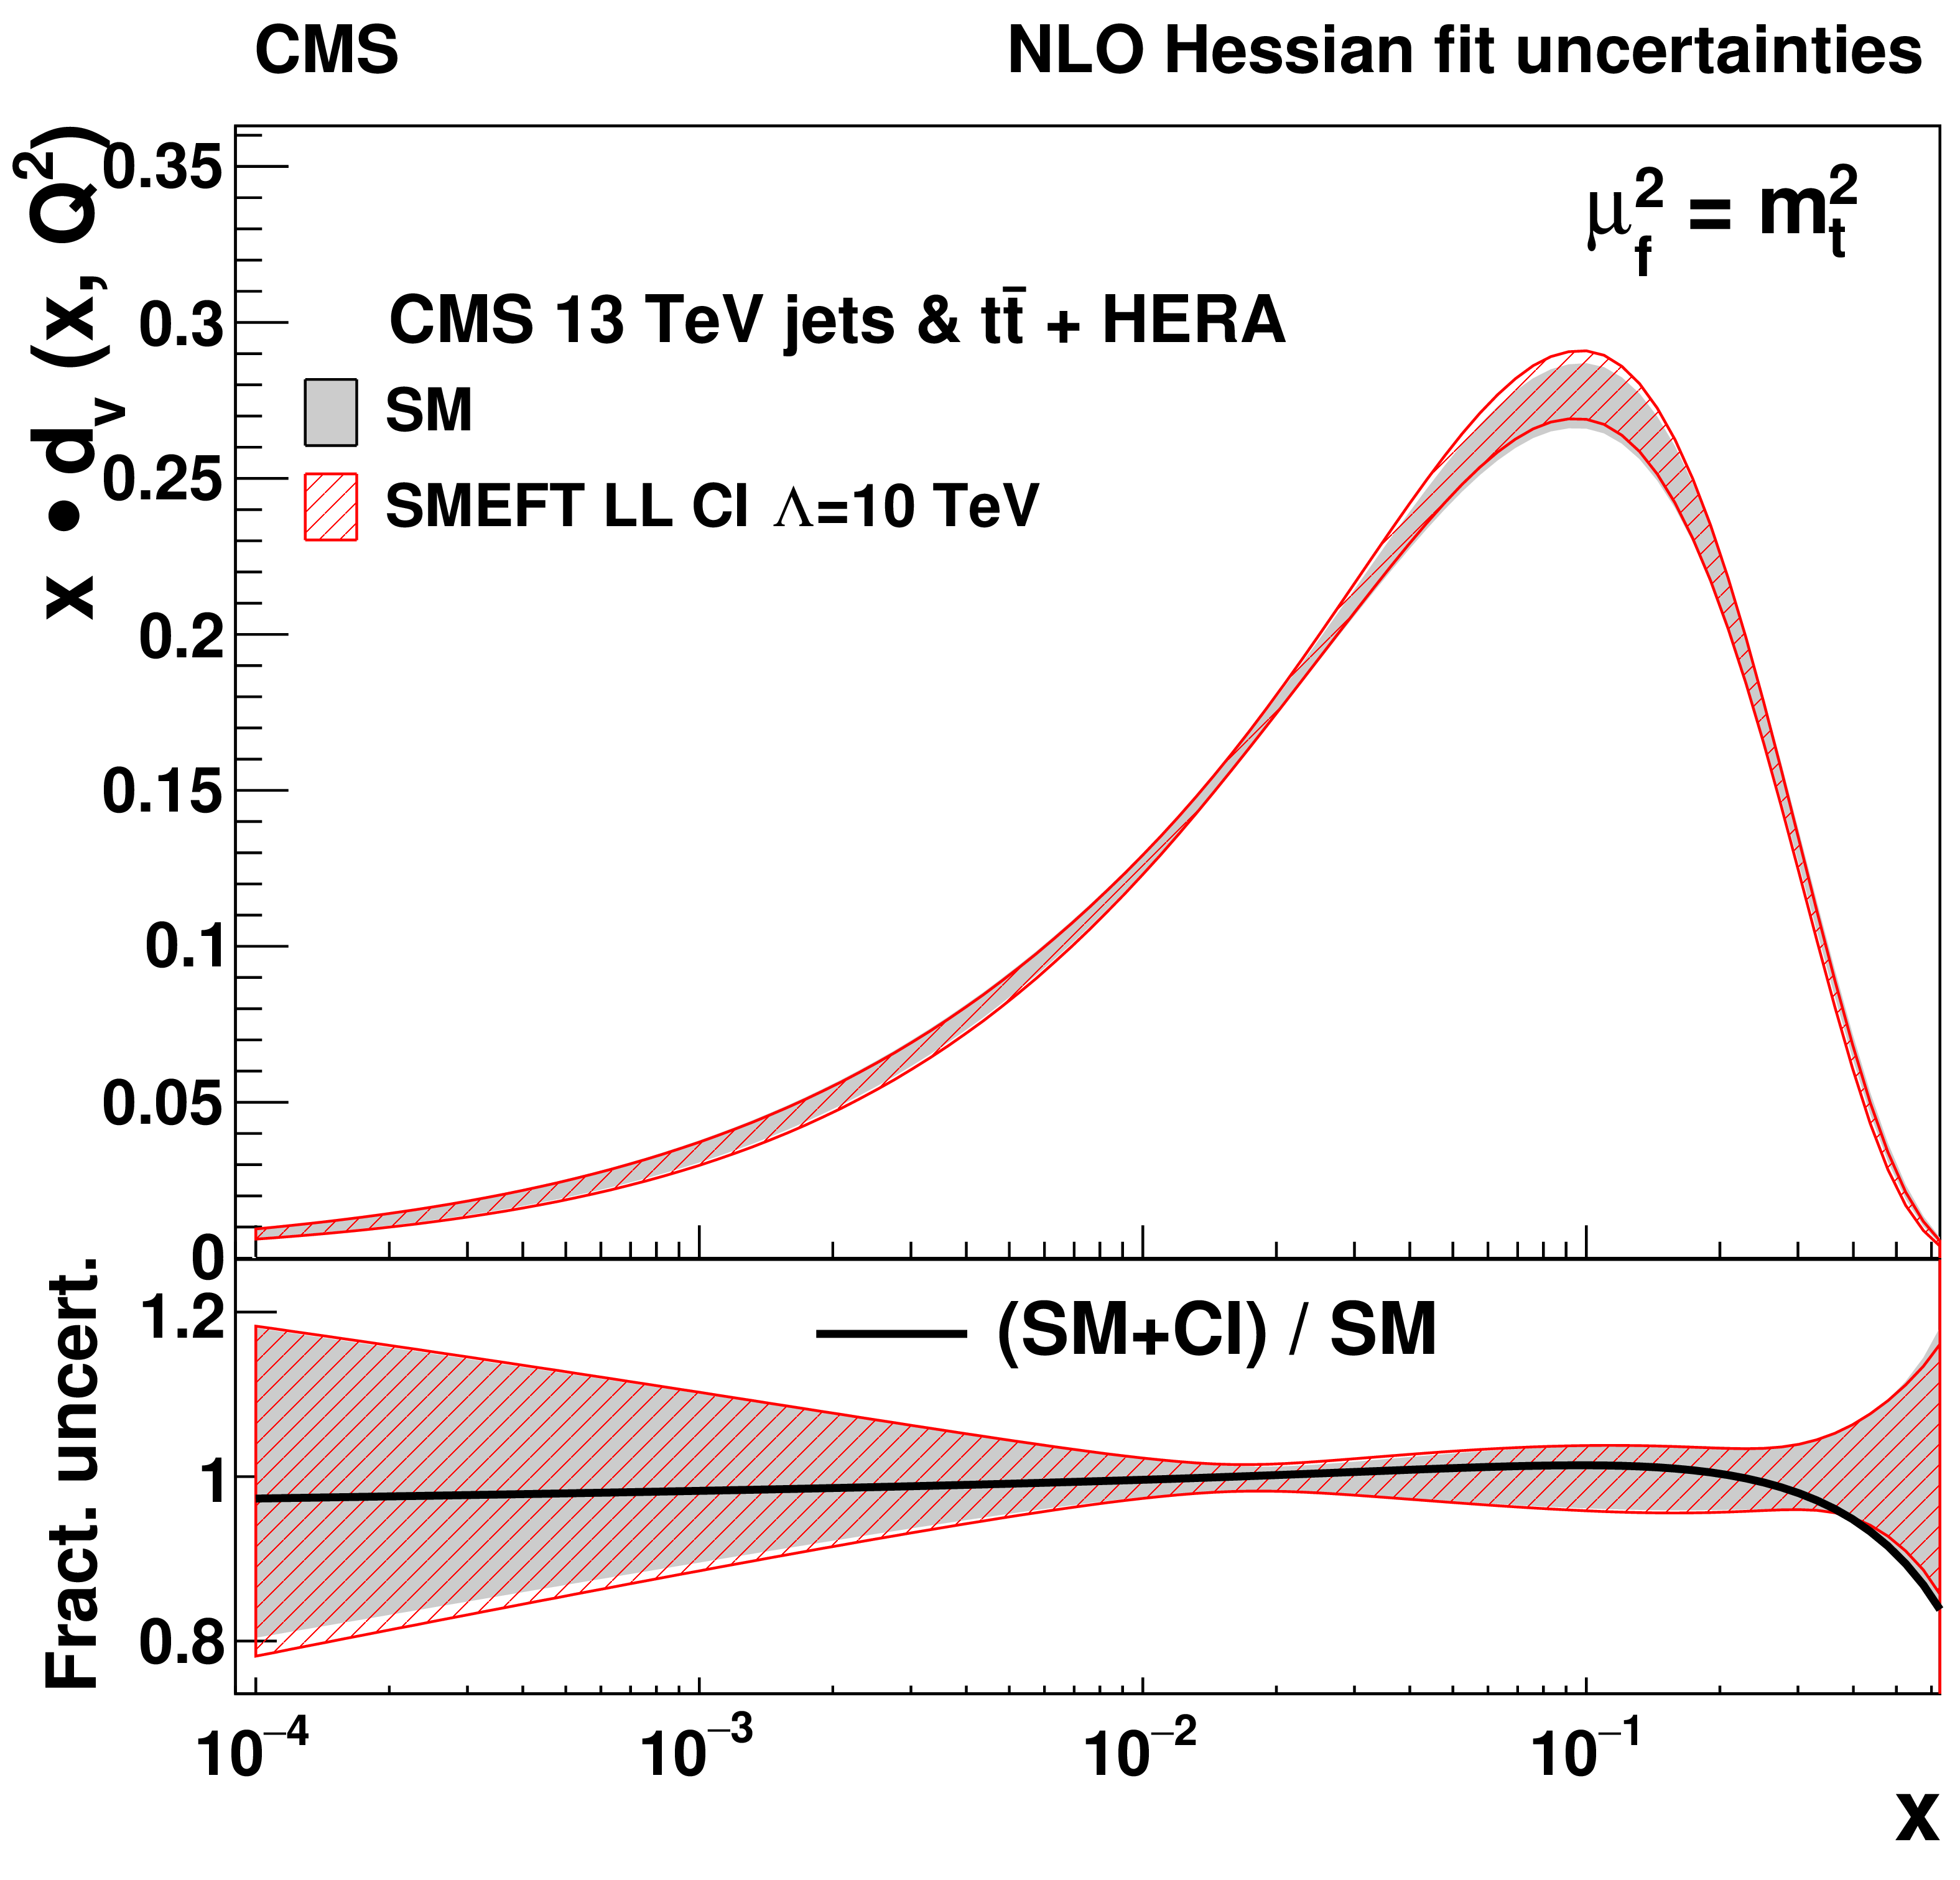
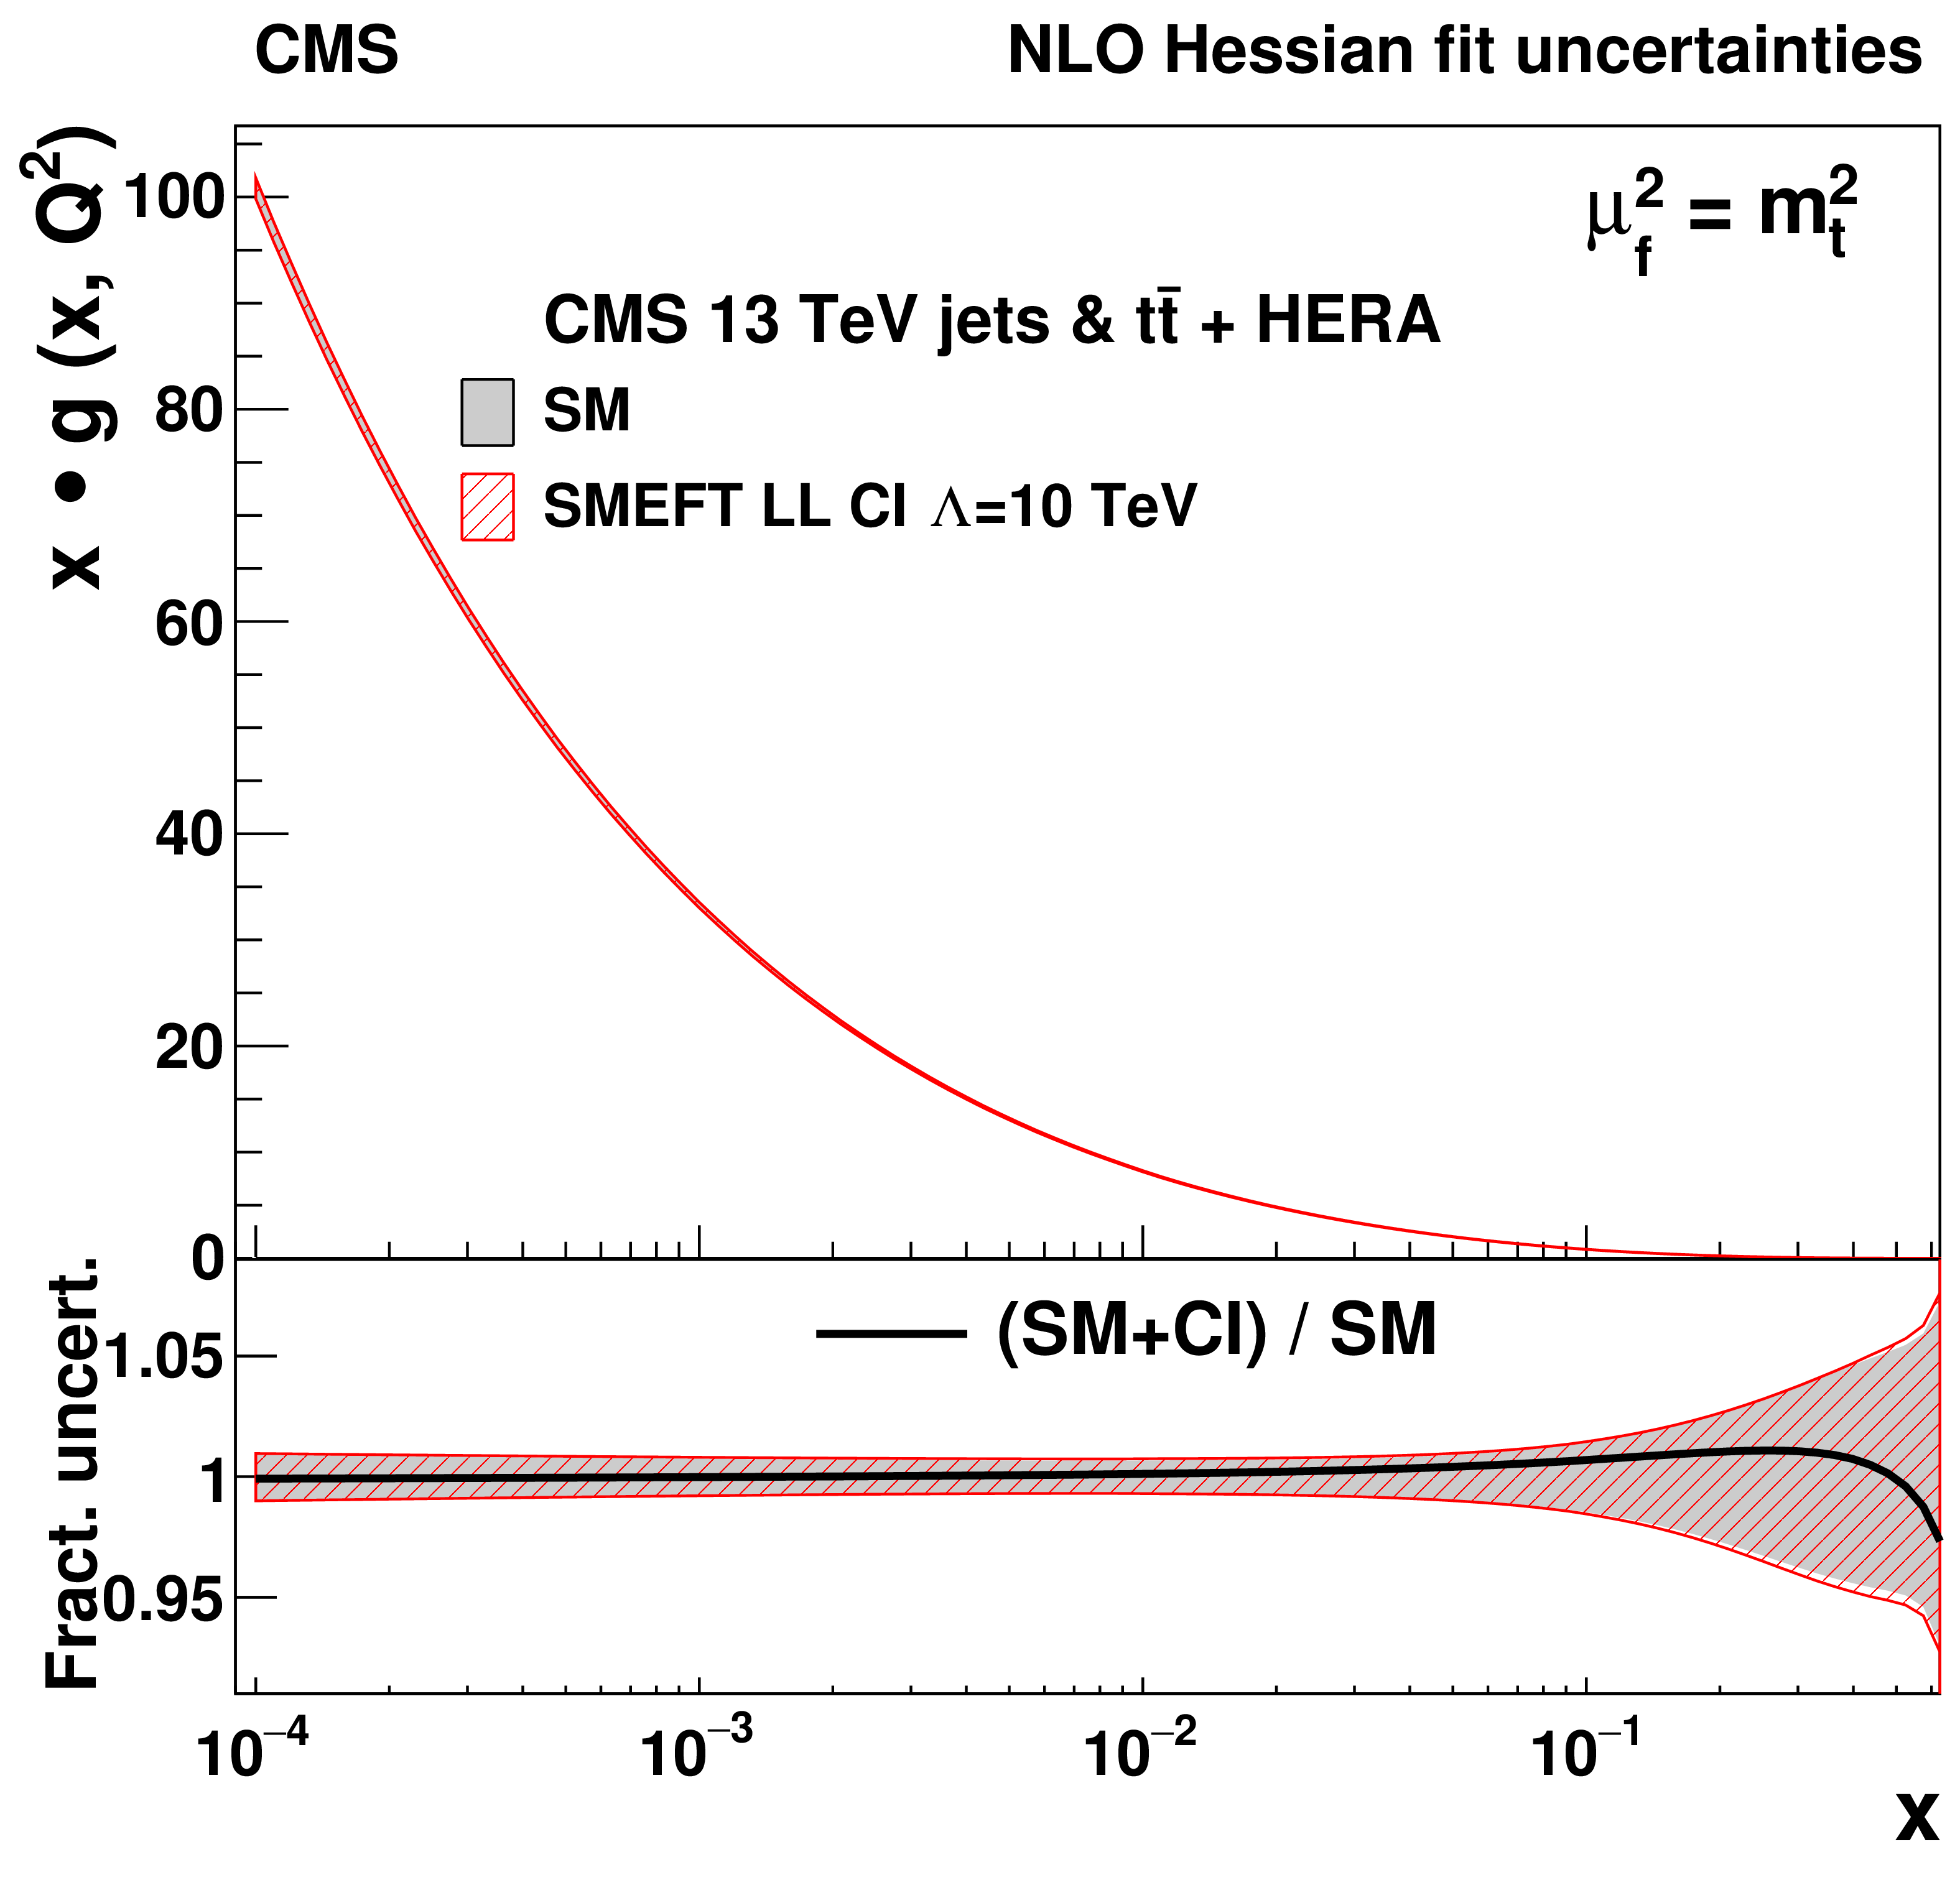
The u-valence (upper left), d-valence (upper right), gluon (lower left), and sea quark (lower right) distributions, shown as functions of $ x $ at the scale $ \mu_\mathrm{f}^2=m_\mathrm{t}^2 $, resulting from the fits with and without the CI terms. The SMEFT fit is performed with the left-handed CI model with $ \Lambda= $ 10 TeV. |

png pdf |
Figure 17-a:
The u-valence distribution, shown as functions of $ x $ at the scale $ \mu_\mathrm{f}^2=m_\mathrm{t}^2 $, resulting from the fits with and without the CI terms. The SMEFT fit is performed with the left-handed CI model with $ \Lambda= $ 10 TeV. |
png pdf |
Figure 17-b:
The d-valence distribution, shown as functions of $ x $ at the scale $ \mu_\mathrm{f}^2=m_\mathrm{t}^2 $, resulting from the fits with and without the CI terms. The SMEFT fit is performed with the left-handed CI model with $ \Lambda= $ 10 TeV. |
png pdf |
Figure 17-c:
The gluon distribution, shown as functions of $ x $ at the scale $ \mu_\mathrm{f}^2=m_\mathrm{t}^2 $, resulting from the fits with and without the CI terms. The SMEFT fit is performed with the left-handed CI model with $ \Lambda= $ 10 TeV. |
png pdf |
Figure 17-d:
The sea quark distribution, shown as functions of $ x $ at the scale $ \mu_\mathrm{f}^2=m_\mathrm{t}^2 $, resulting from the fits with and without the CI terms. The SMEFT fit is performed with the left-handed CI model with $ \Lambda= $ 10 TeV. |
png pdf |
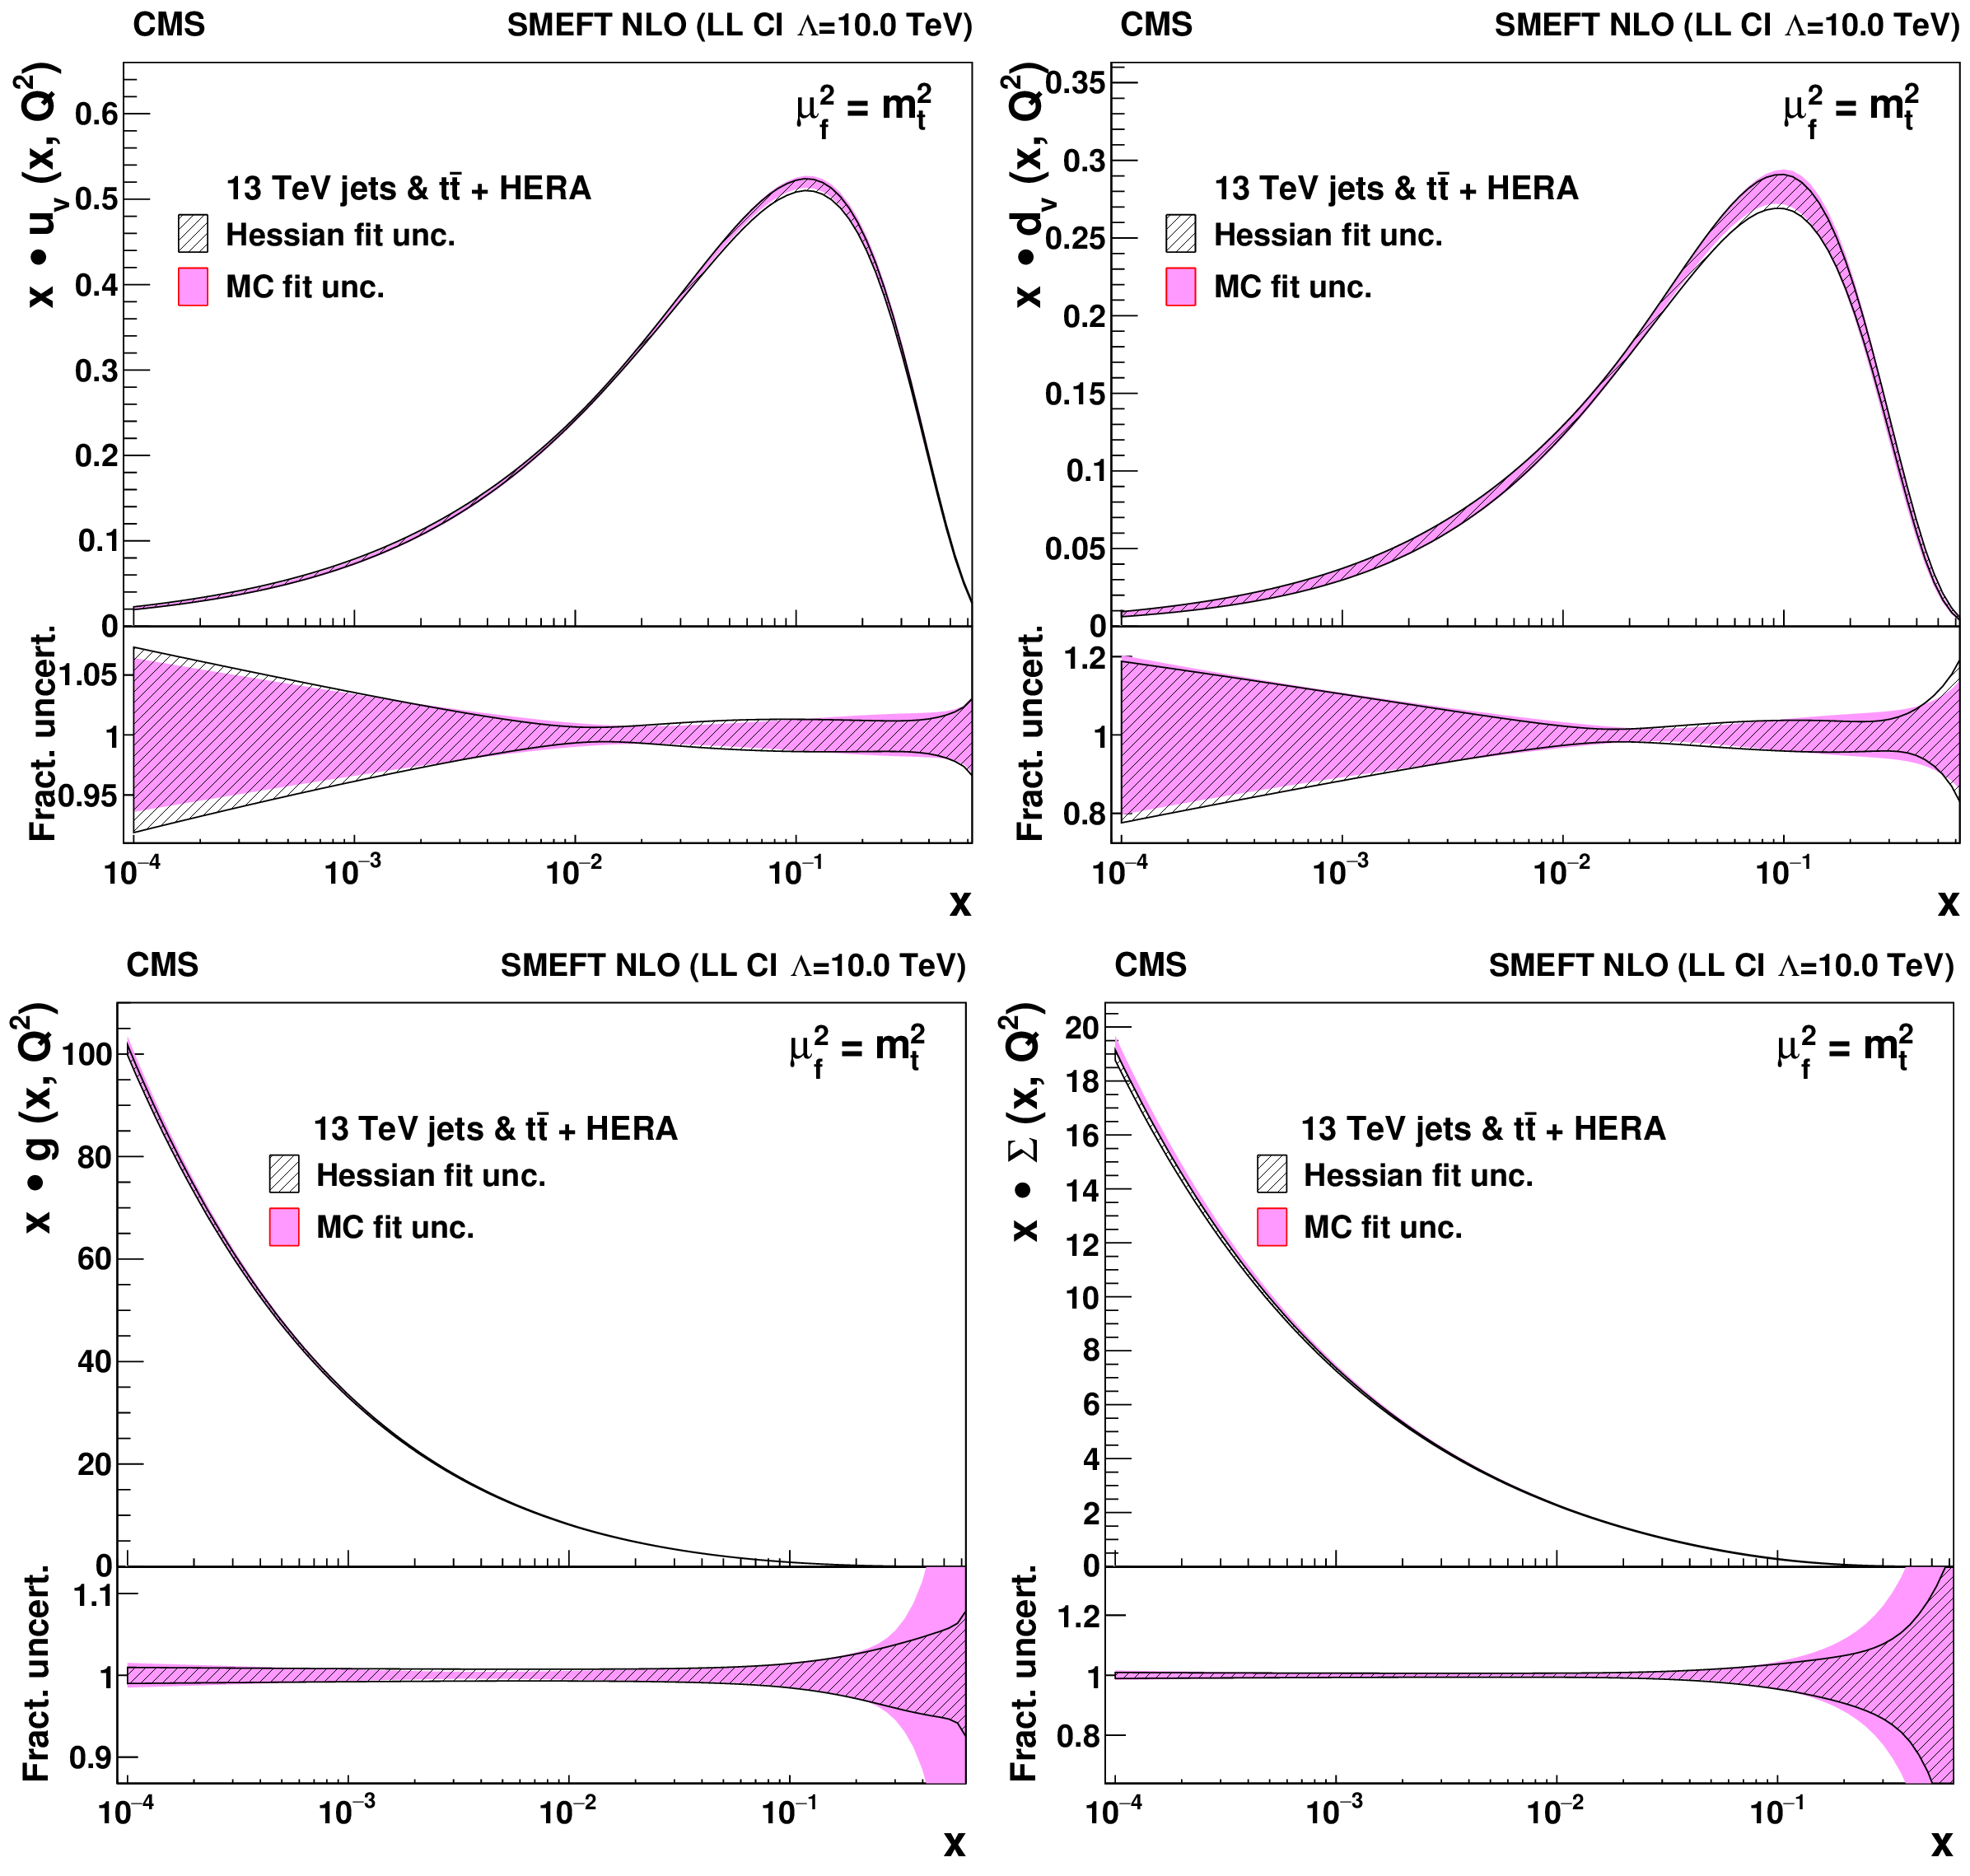
Figure 18:
The u-valence (upper left), d-valence (upper right), gluon (lower left), and sea quark (lower right) distributions, shown as a function of $ x $ at the scale $ \mu_\mathrm{f}^2=m_\mathrm{t}^2 $, resulting from the SMEFT fit with the left-handed CI model with $ \Lambda= $ 10 TeV. The PDFs are shown with the fit uncertainties obtained by the Hessian (solid blue) and Monte Carlo (solid red) methods. |
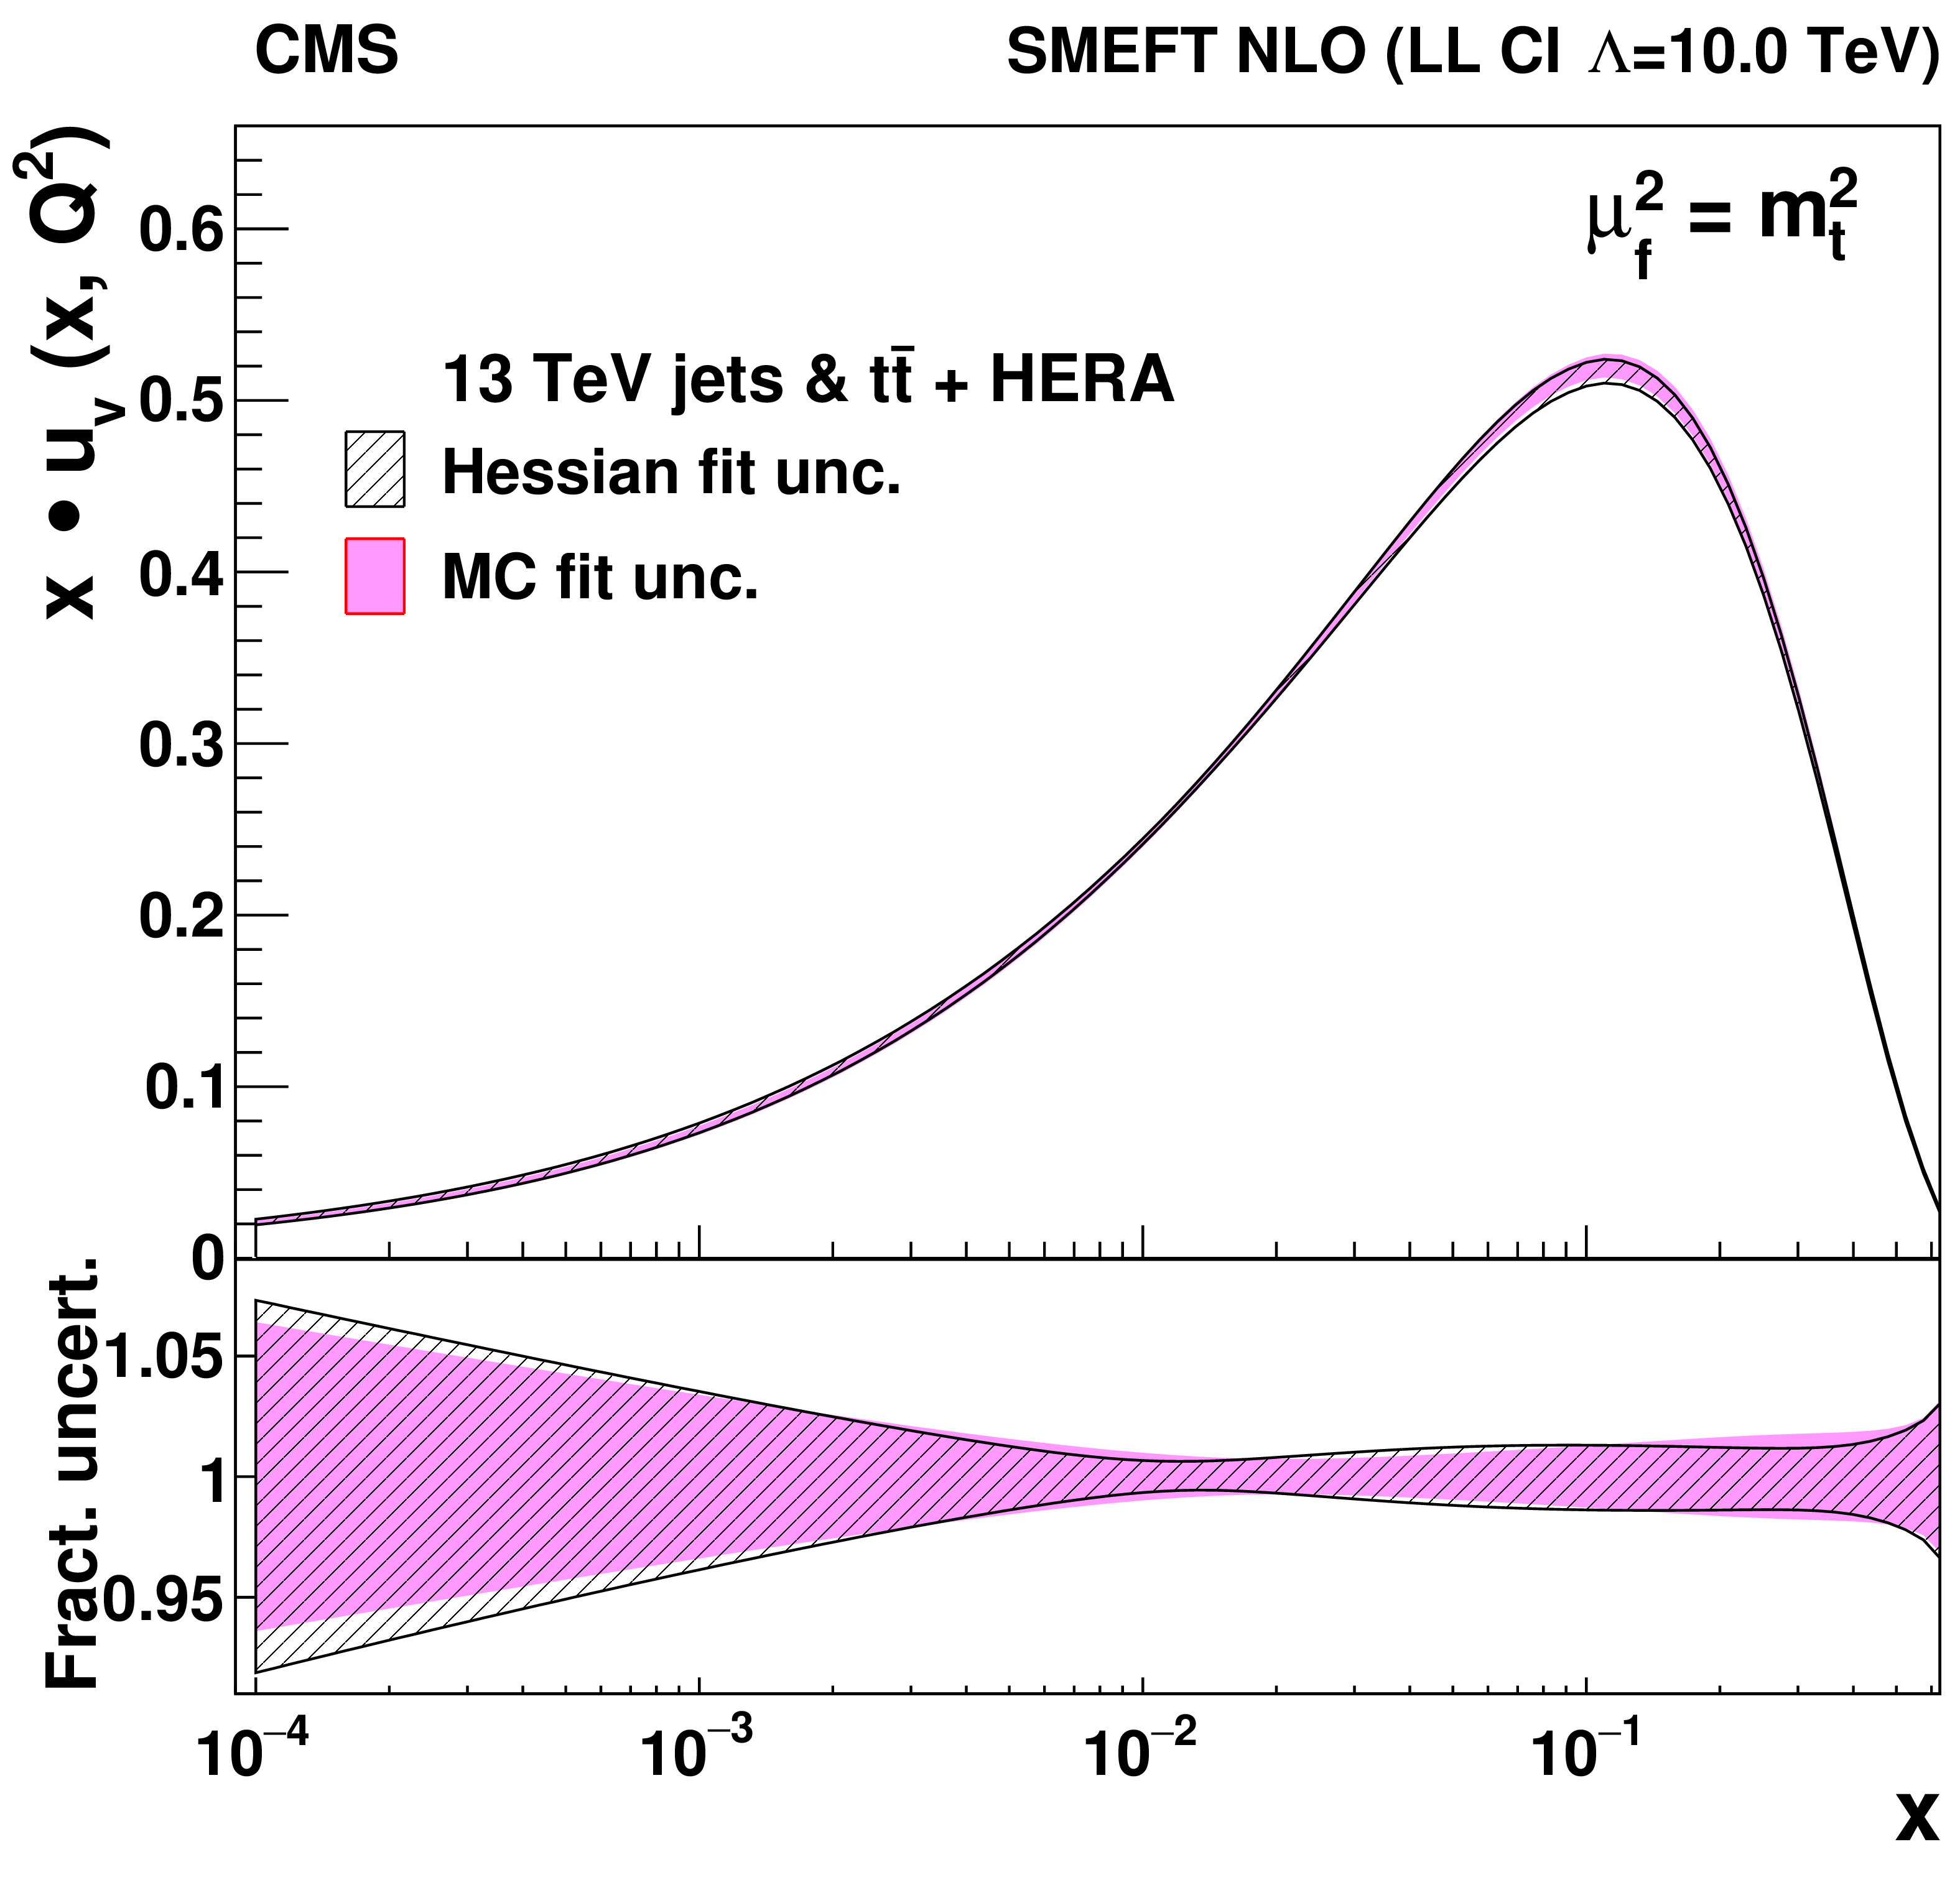
png pdf |
Figure 18-a:
The u-valence distribution, shown as a function of $ x $ at the scale $ \mu_\mathrm{f}^2=m_\mathrm{t}^2 $, resulting from the SMEFT fit with the left-handed CI model with $ \Lambda= $ 10 TeV. The PDFs are shown with the fit uncertainties obtained by the Hessian (solid blue) and Monte Carlo (solid red) methods. |
png pdf |
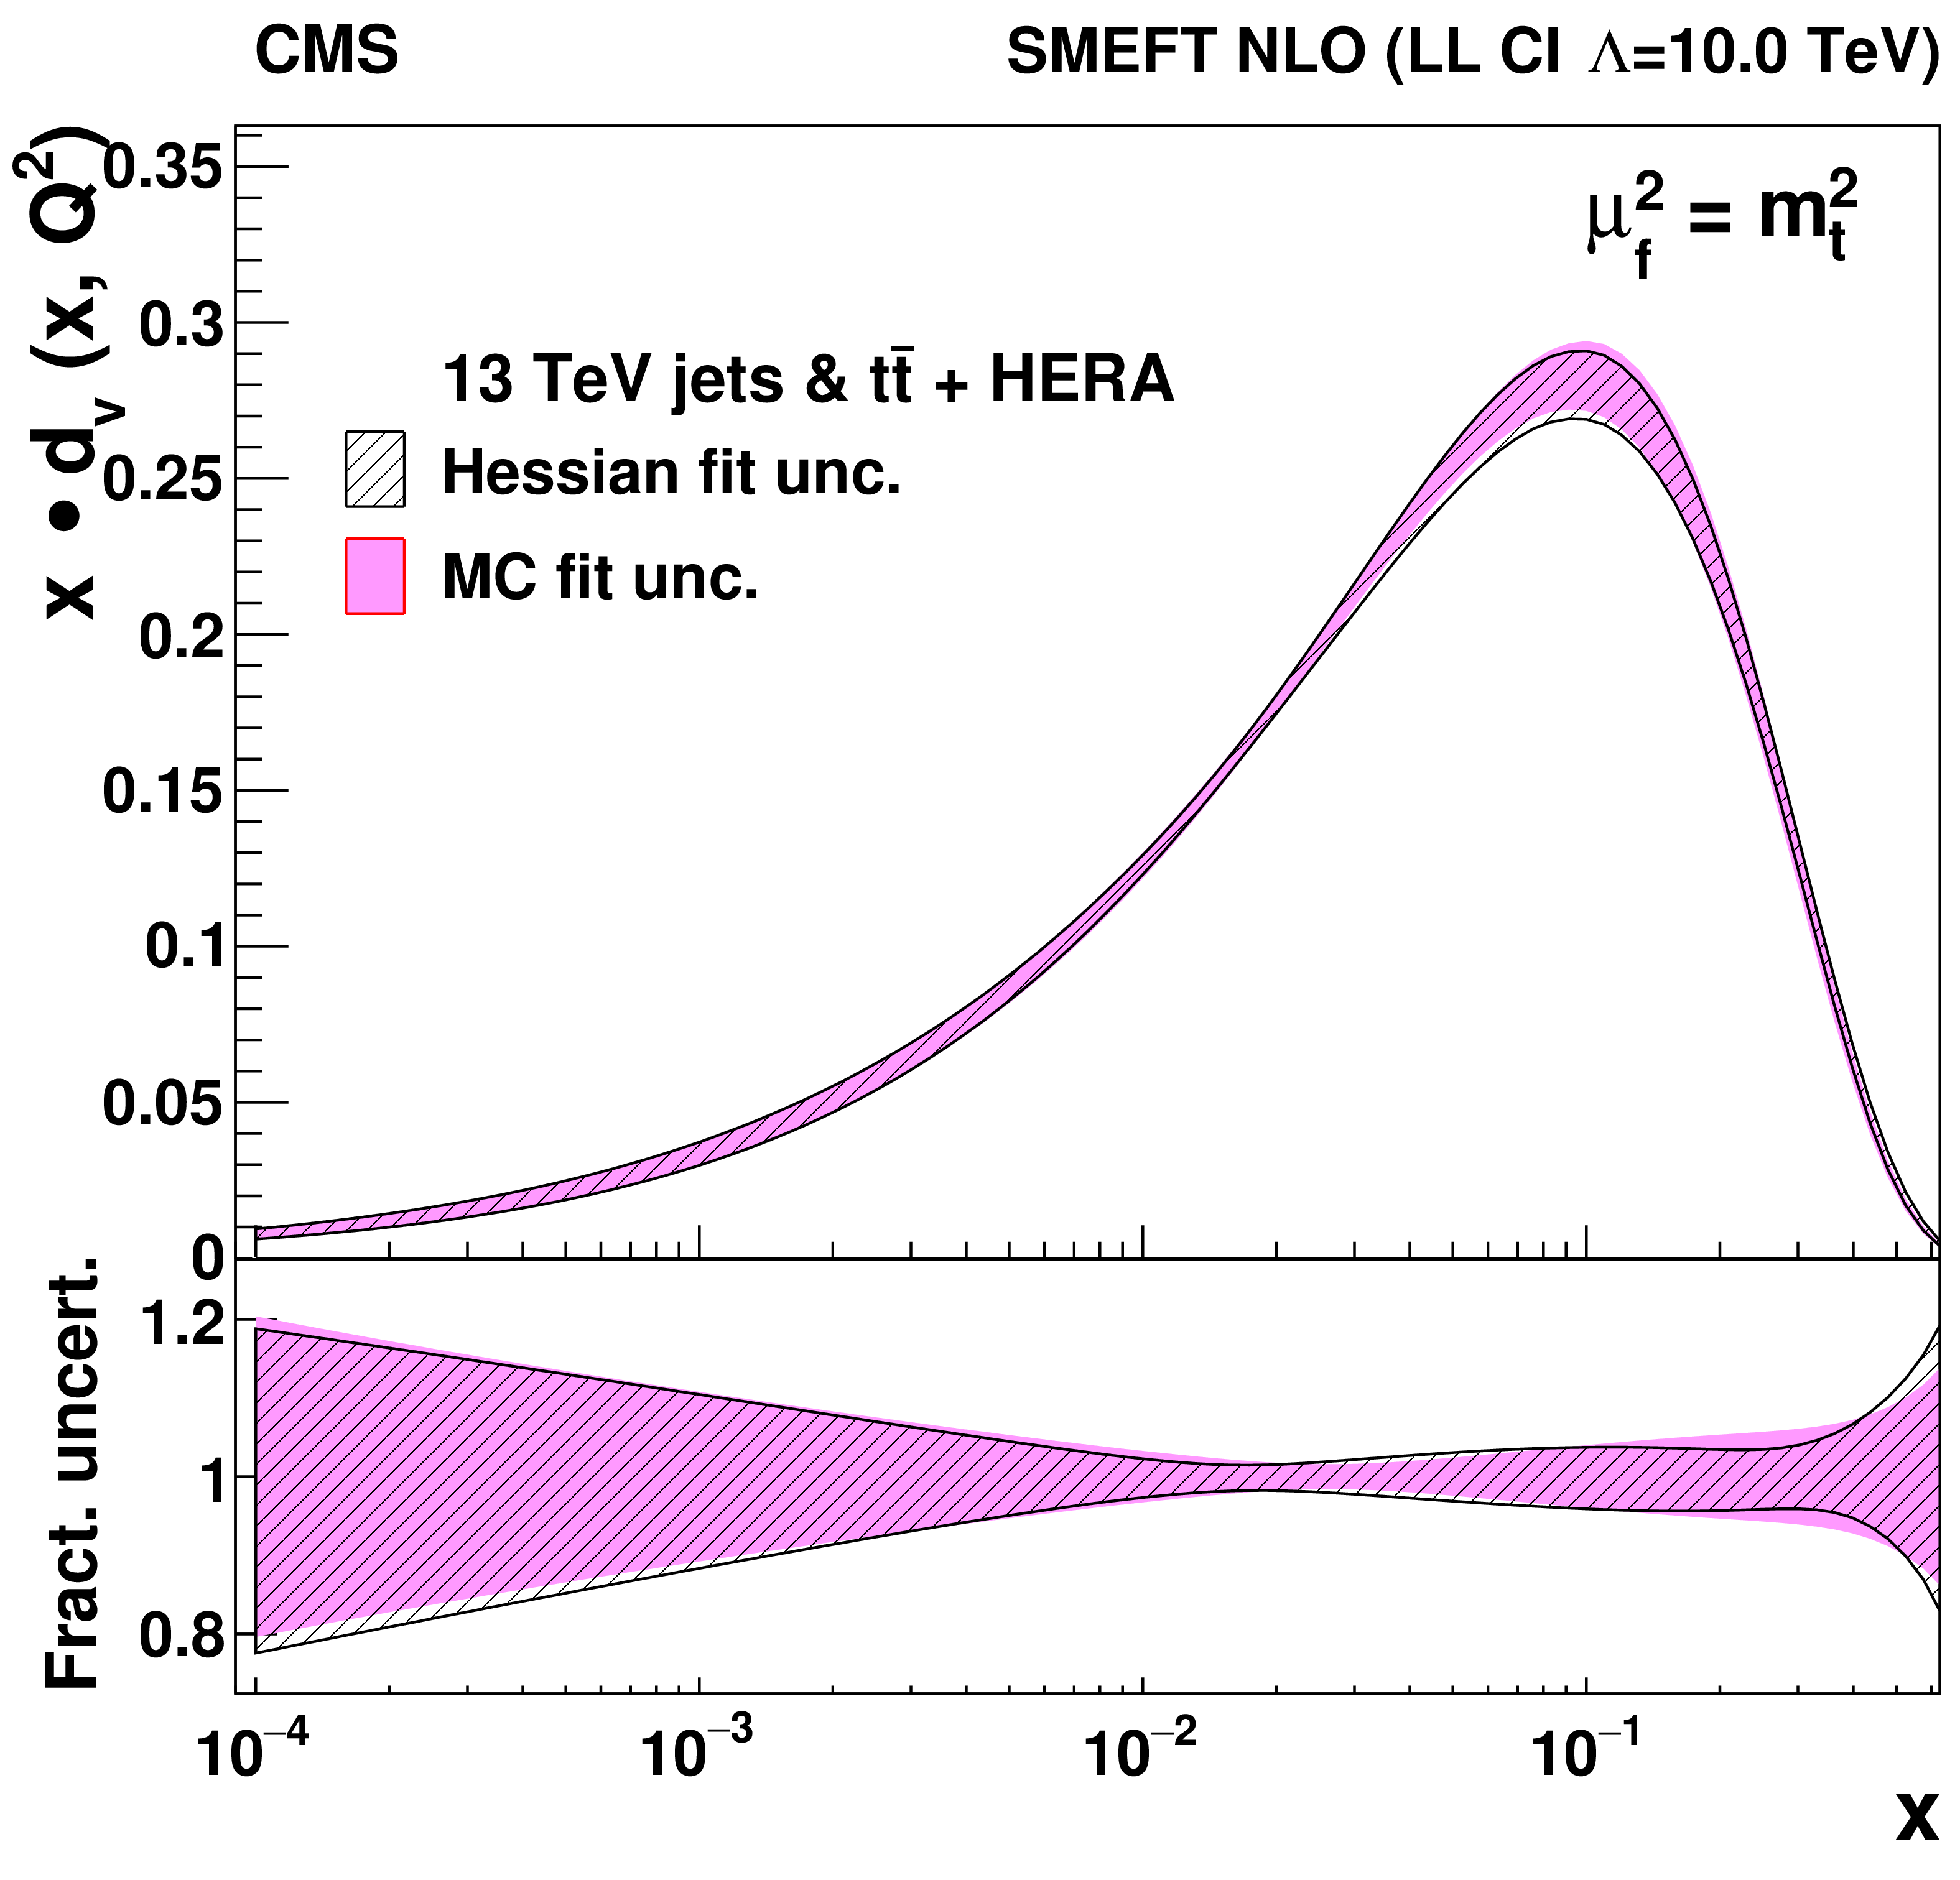
Figure 18-b:
The d-valence distribution, shown as a function of $ x $ at the scale $ \mu_\mathrm{f}^2=m_\mathrm{t}^2 $, resulting from the SMEFT fit with the left-handed CI model with $ \Lambda= $ 10 TeV. The PDFs are shown with the fit uncertainties obtained by the Hessian (solid blue) and Monte Carlo (solid red) methods. |
png pdf |
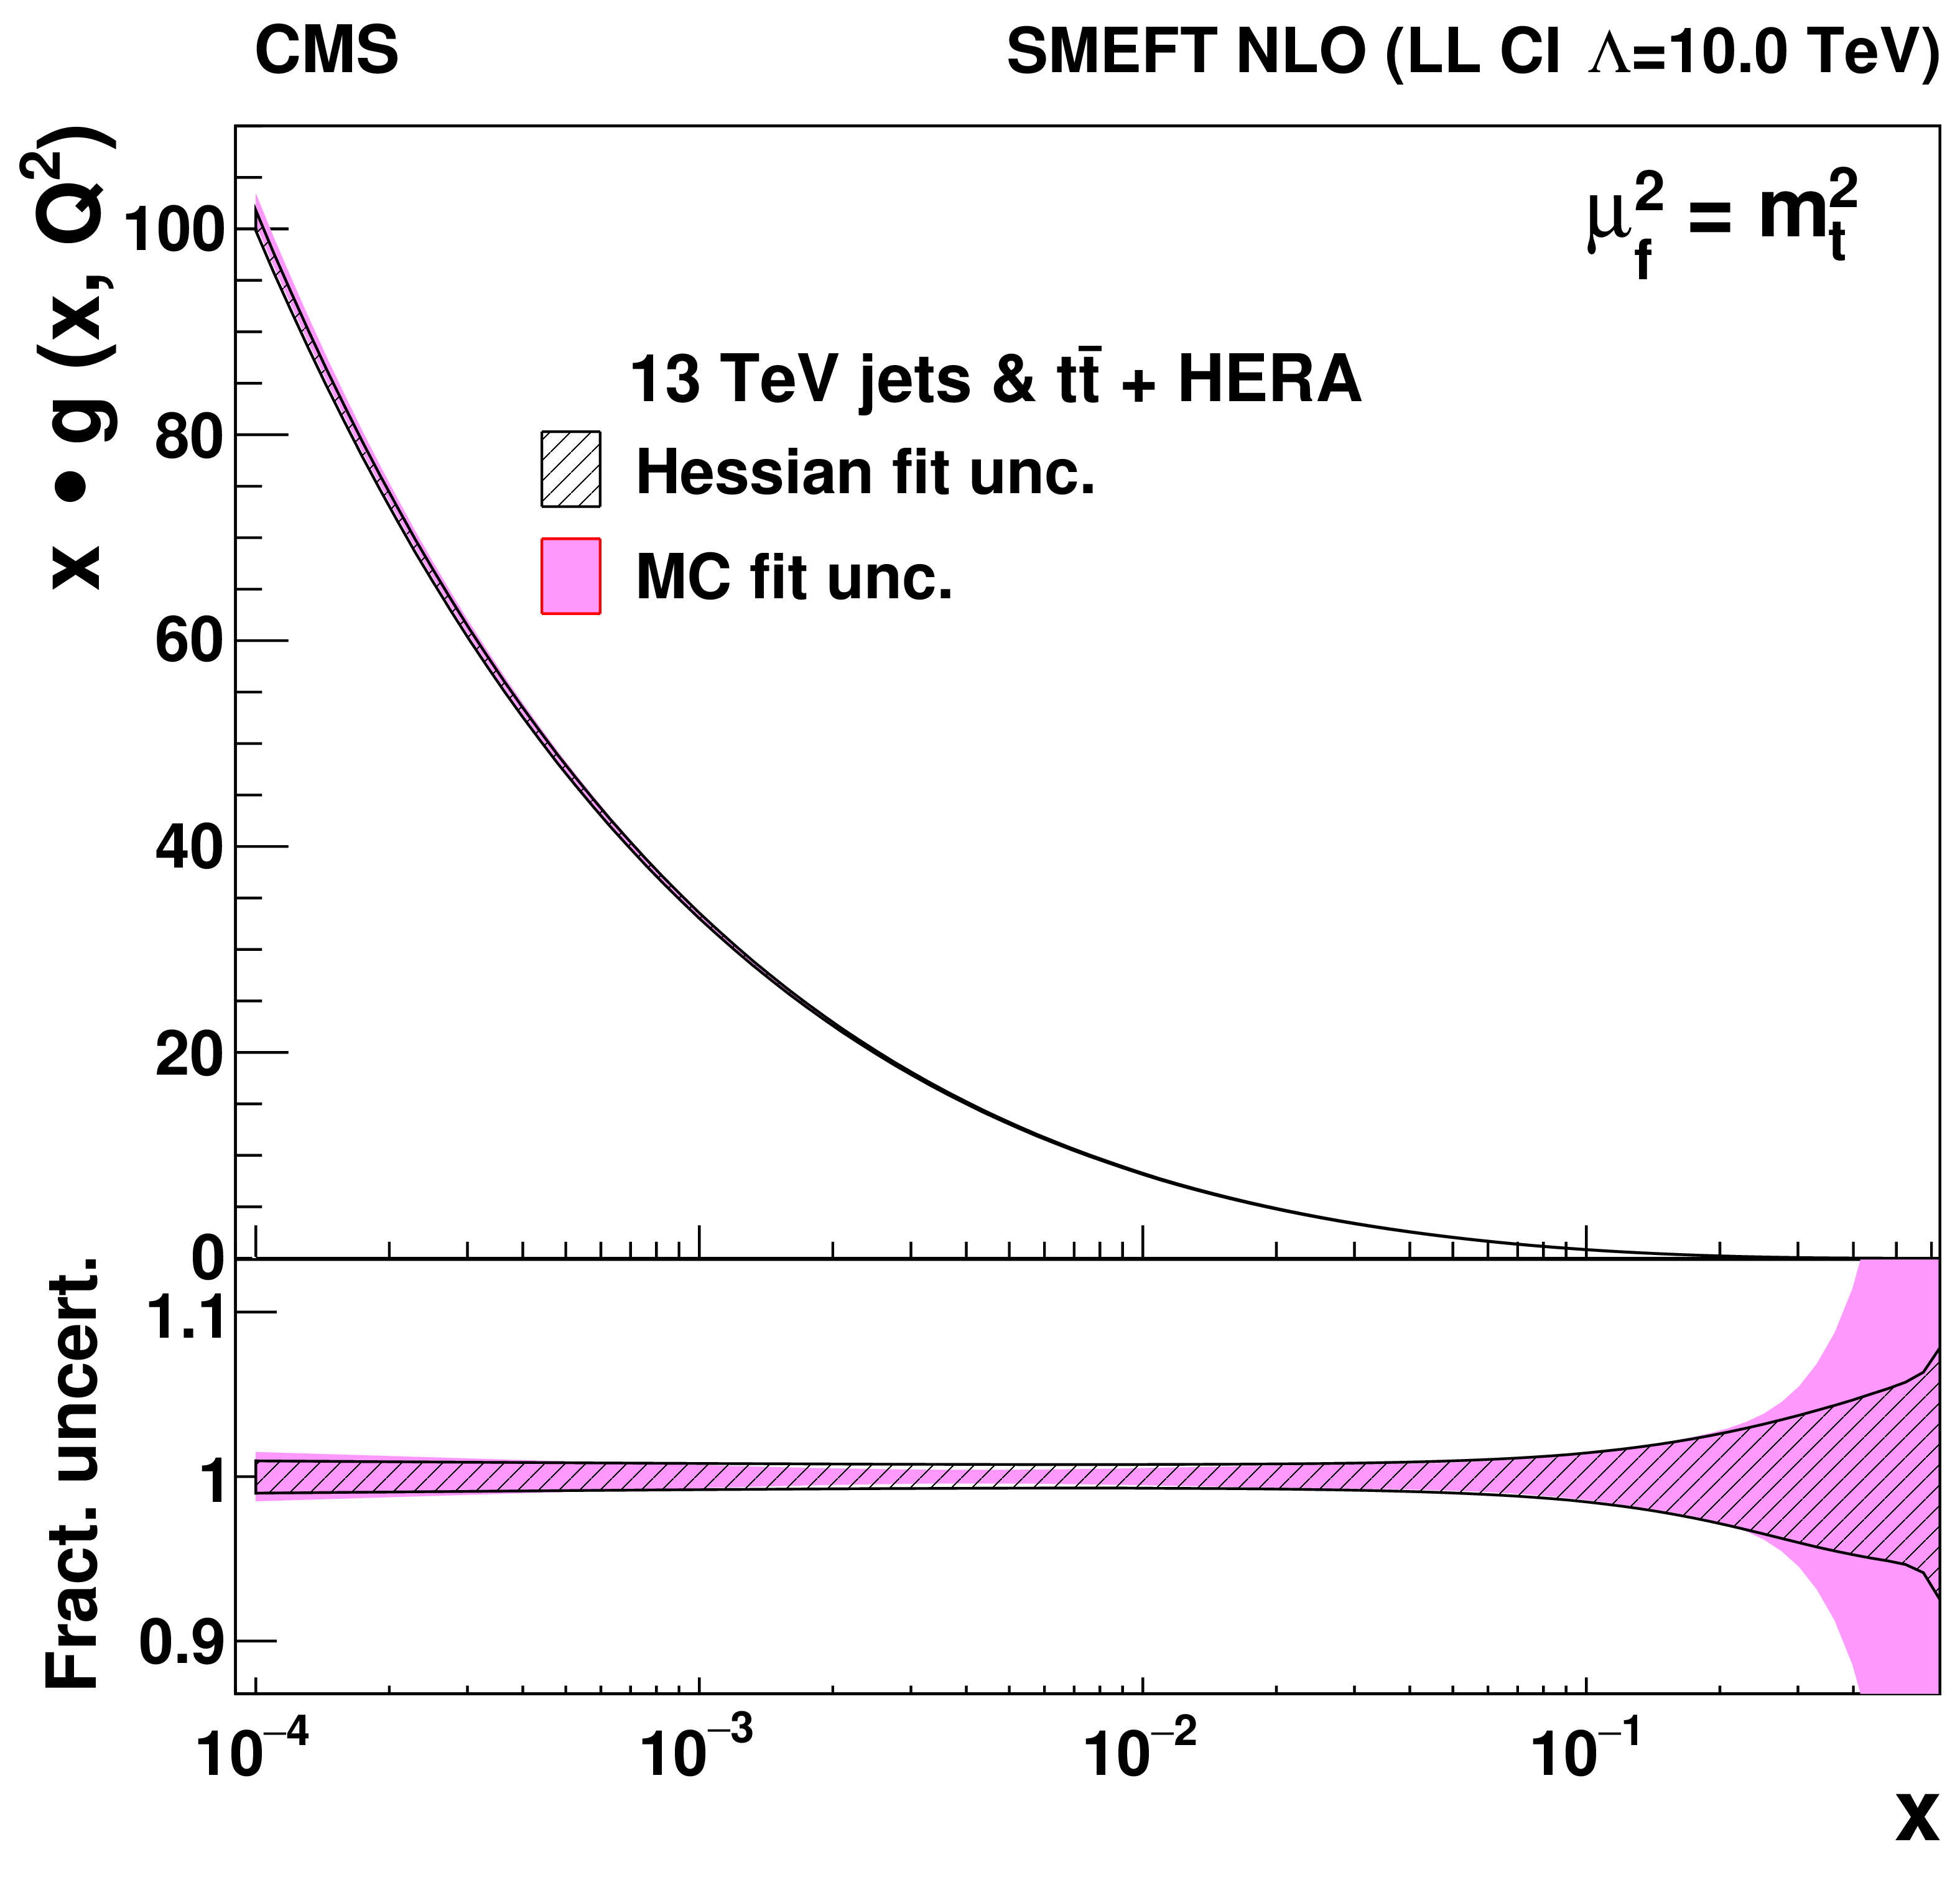
Figure 18-c:
The gluon distribution, shown as a function of $ x $ at the scale $ \mu_\mathrm{f}^2=m_\mathrm{t}^2 $, resulting from the SMEFT fit with the left-handed CI model with $ \Lambda= $ 10 TeV. The PDFs are shown with the fit uncertainties obtained by the Hessian (solid blue) and Monte Carlo (solid red) methods. |
png pdf |
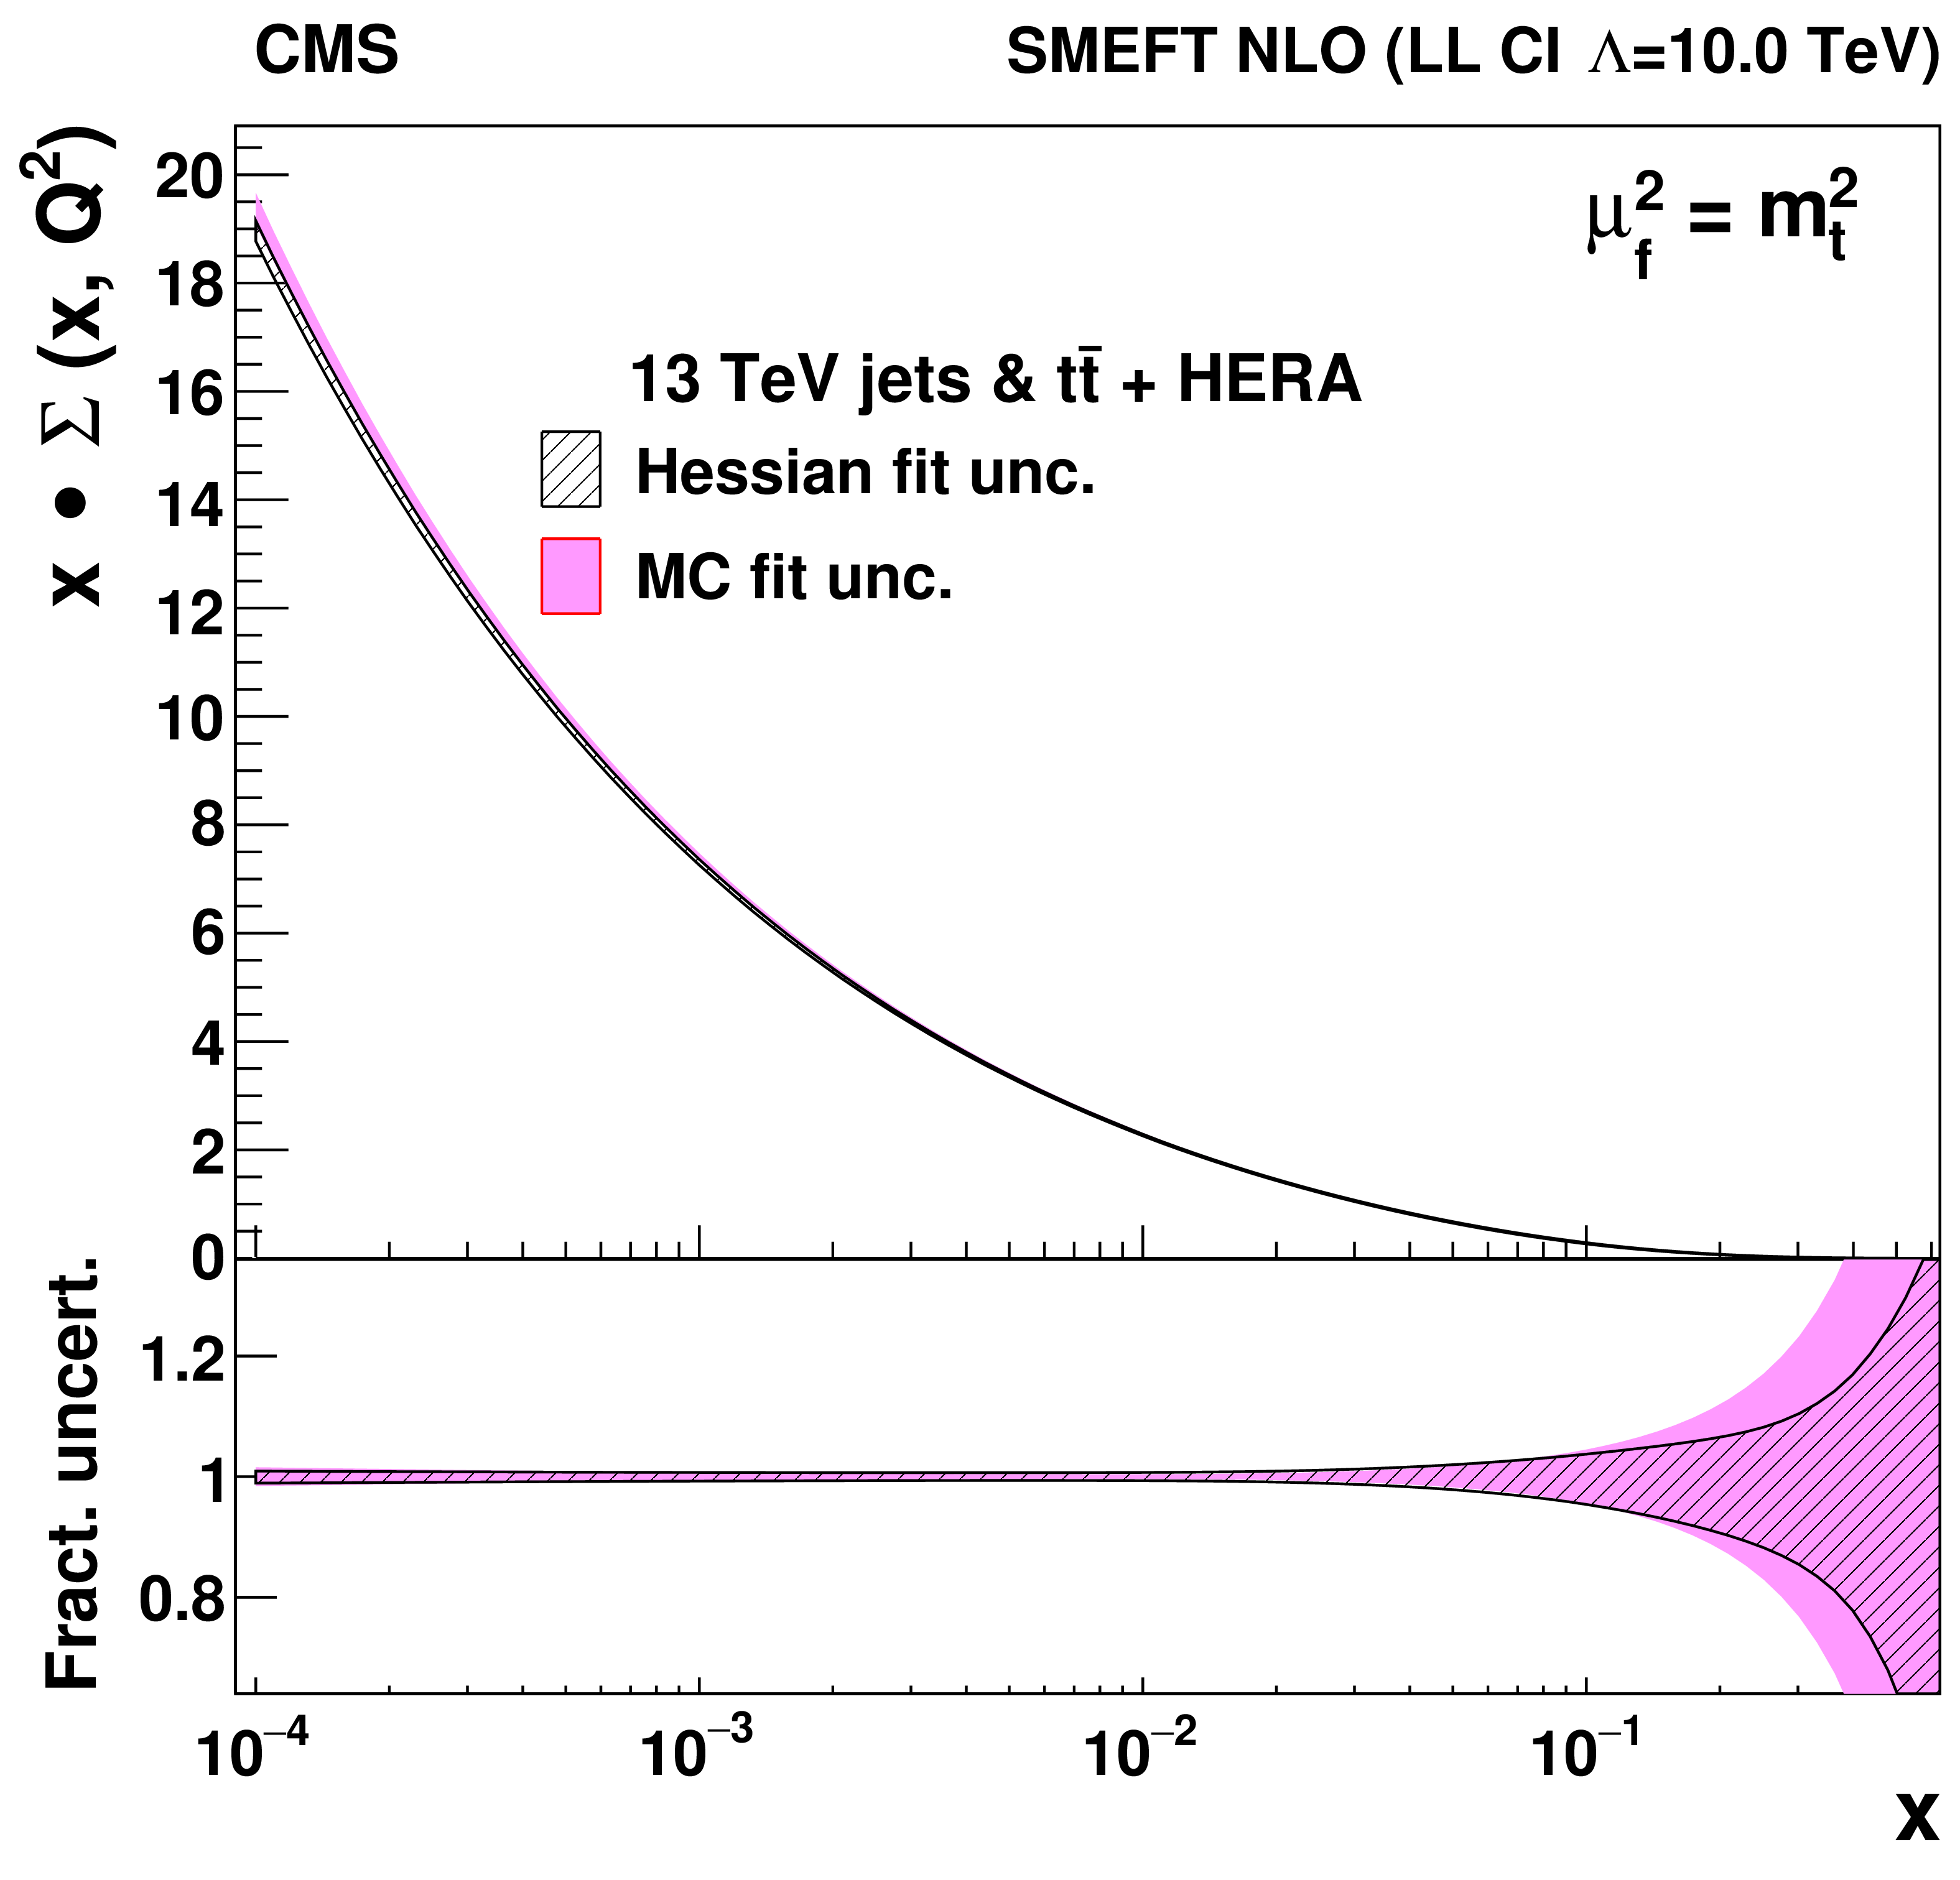
Figure 18-d:
The sea quark distribution, shown as a function of $ x $ at the scale $ \mu_\mathrm{f}^2=m_\mathrm{t}^2 $, resulting from the SMEFT fit with the left-handed CI model with $ \Lambda= $ 10 TeV. The PDFs are shown with the fit uncertainties obtained by the Hessian (solid blue) and Monte Carlo (solid red) methods. |
png pdf |
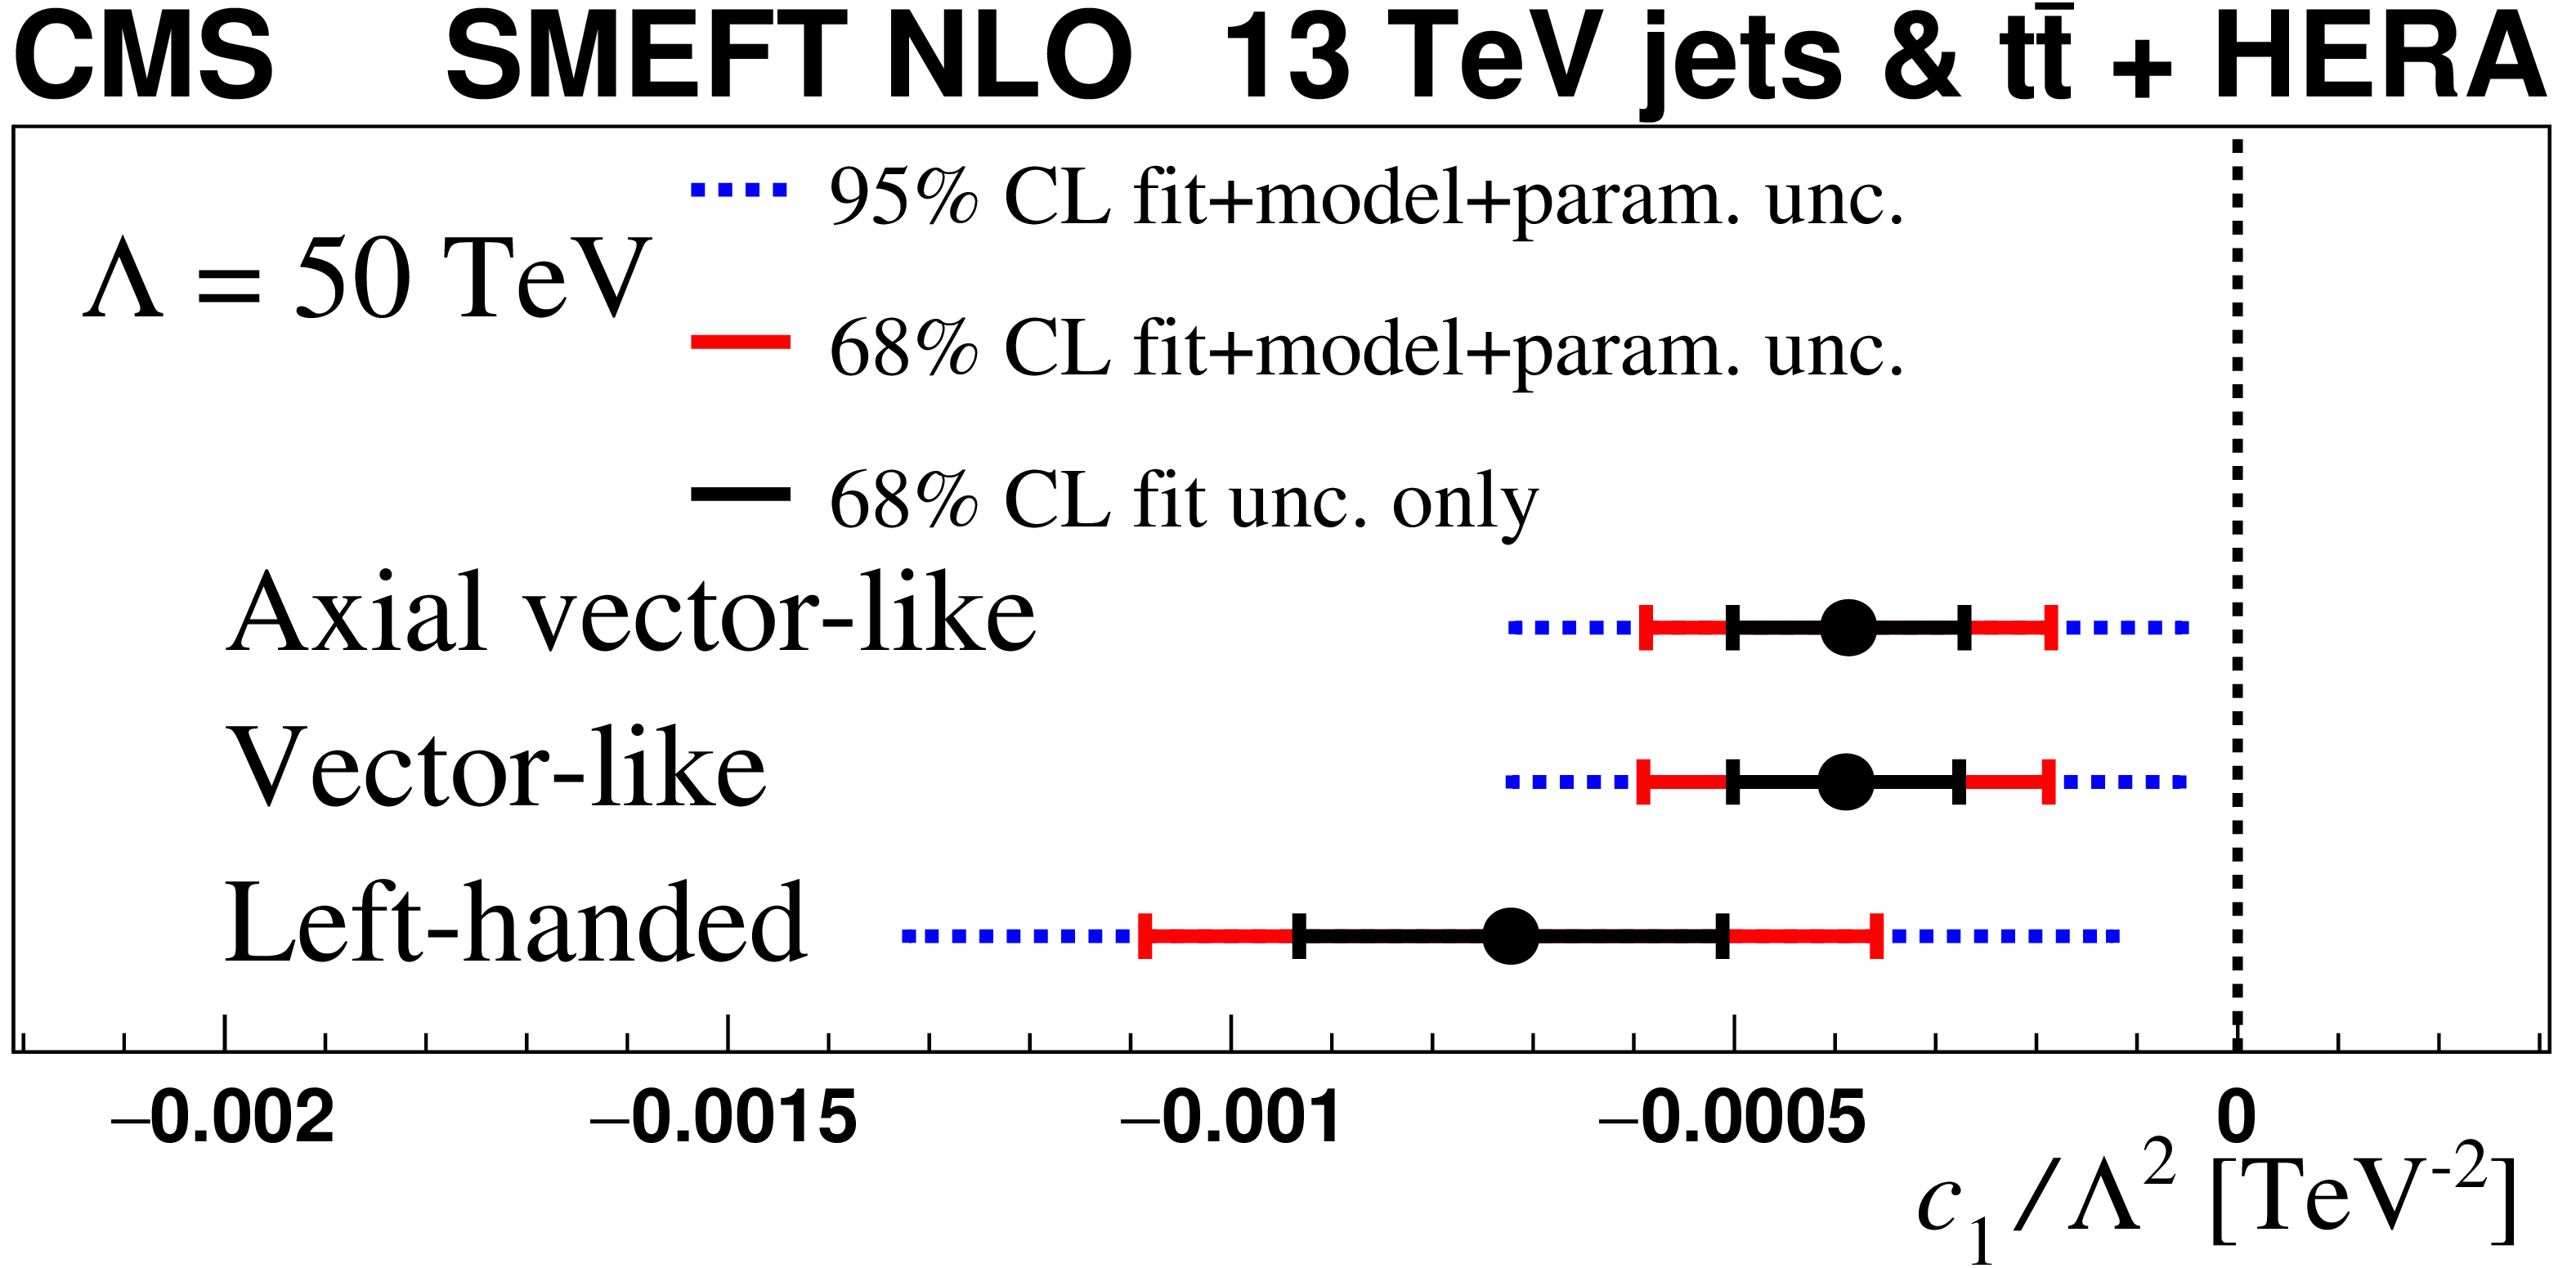
Figure 19:
The Wilson coefficients $ c_1 $ obtained in the SMEFT analysis at NLO, divided by $ \Lambda^2 $, for $ \Lambda= $ 50 TeV. The solid (dashed) lines represent the total uncertainty at 68 (95)% CL. The inner (outer) error bars show the fit (total) uncertainty at 68% CL. |
png pdf |
Figure A1:
Cross sections of inclusive jet production for distance parameter $ R= $ 0.4 as a function of transverse momentum of the individual jet in bins of absolute rapidity $ |y| $, compared to the theoretical predictions at NLO, NLO+NLL, and NNLO. All results are normalised to the prediction at NLO. The measurement (solid symbols) is presented with the statistical uncertainties (vertical error bars), while the systematic uncertainty is represented by a yellow filled band, centered at 1. The NLO (black dashed line) and NLO+NLL (blue solid line) predictions are obtained using CT14nlo PDF. The PDF (dotted red line) and scale (solid red line) uncertainties are shown for the NLO prediction. The NNLO calculation (purple solid line) is obtained using CT14nnlo PDF. |
png pdf |
Figure A2:
Cross sections of inclusive jet production for distance parameter $ R= $ 0.4 as a function of transverse momentum of the individual jet in bins of absolute rapidity $ |y| $, compared to the theoretical predictions at NLO using different PDFs (lines of different colors). All results are normalised to the prediction at NLO obtained using CT14nlo PDF (black dashed line). The measurement (solid symbols) is presented with the statistical uncertainties (vertical error bars), while the systematic uncertainty is represented by a yellow filled band, centered at 1. |

png pdf |
Figure A3:
Same as Fig. A1 for the distance parameter $ R= $ 0.7. |
png pdf |
Figure A4:
Same as Fig. A2 for the distance parameter $ R= $ 0.7. |
png pdf |
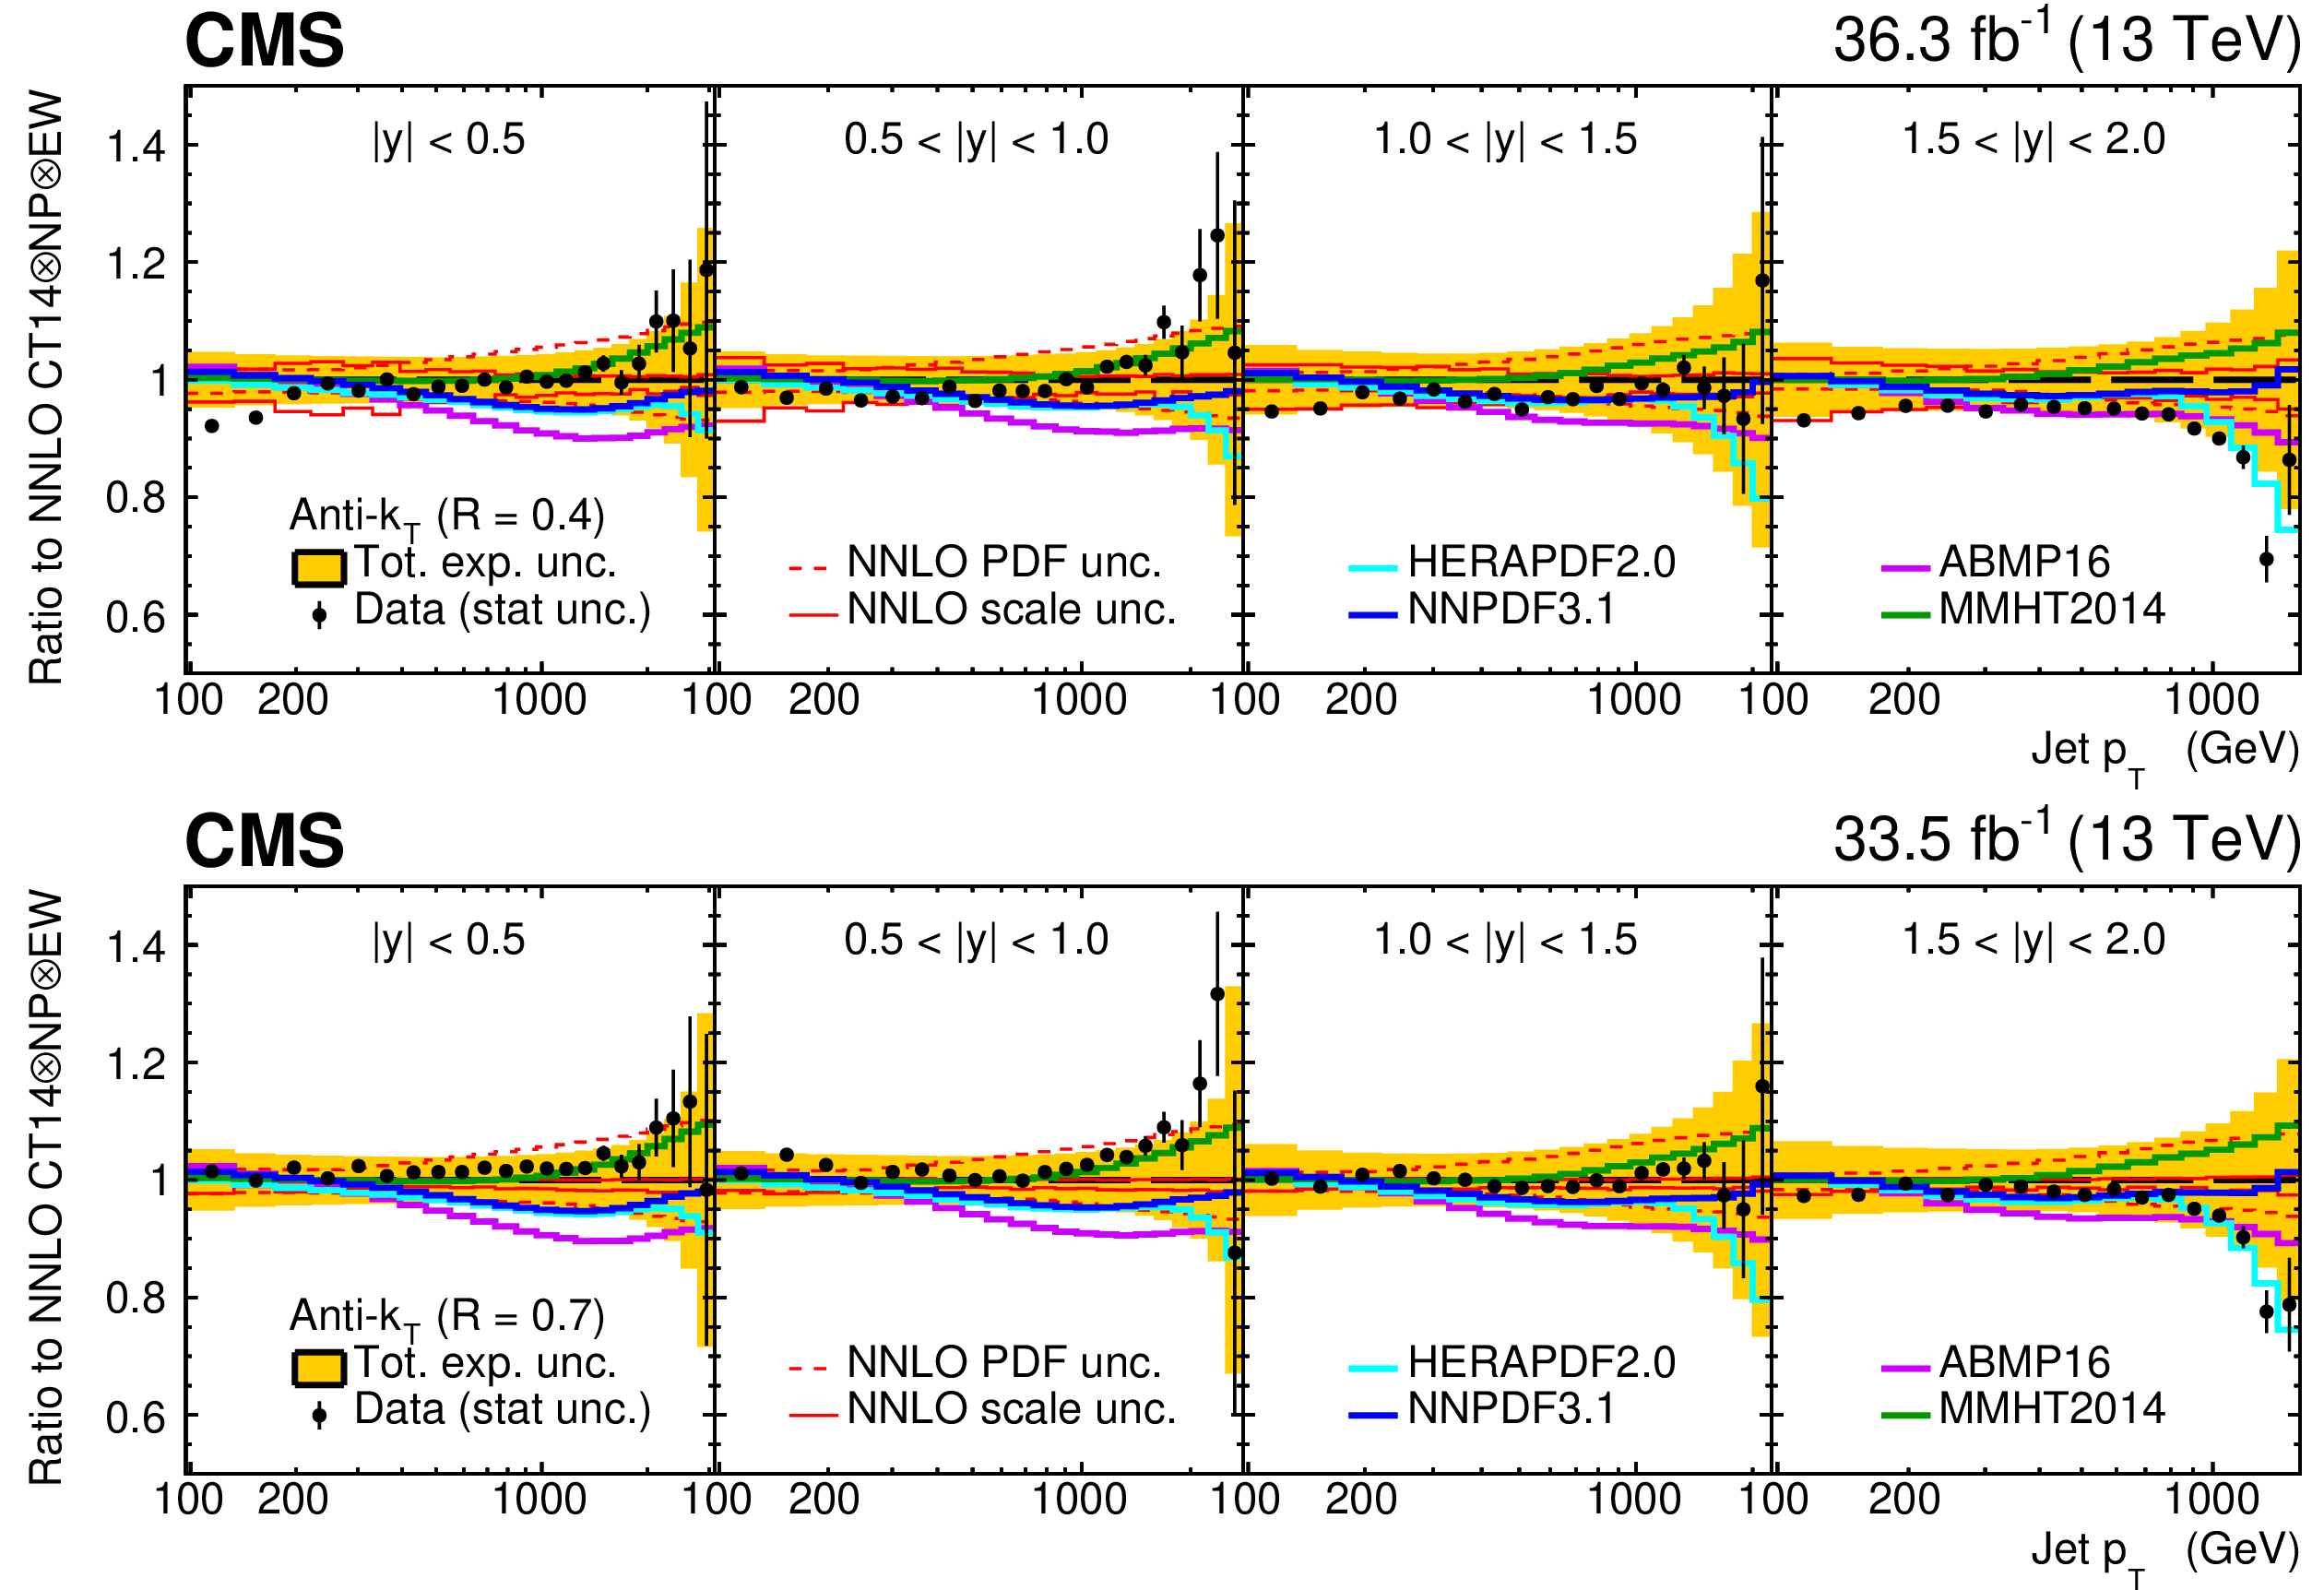
Figure B1:
The double-differential cross section of inclusive jet production, as a function of $ p_{\mathrm{T}} $ and $ |y| $, for jets clustered using the anti-$ k_{\mathrm{T}} $ algorithm with $ R= $ 0.4 (upper panel) and $ R= $ 0.7 (lower panel), presented as ratios to the QCD predictions. The data points are shown by filled circles, with statistical uncertainties shown by vertical error bars, while the total experimental uncertainty is centred at one and is presented by the orange band. The data are divided by the NNLO prediction corrected for NP and EW effects, using CT14nnlo PDF and choosing jet $ p_{\mathrm{T}} $ as renormalisation and factorisation scale. NNLO predictions obtained with alternative PDF sets are displayed in different colours as a ratio to the central prediction using CT14nnlo. |
png pdf |
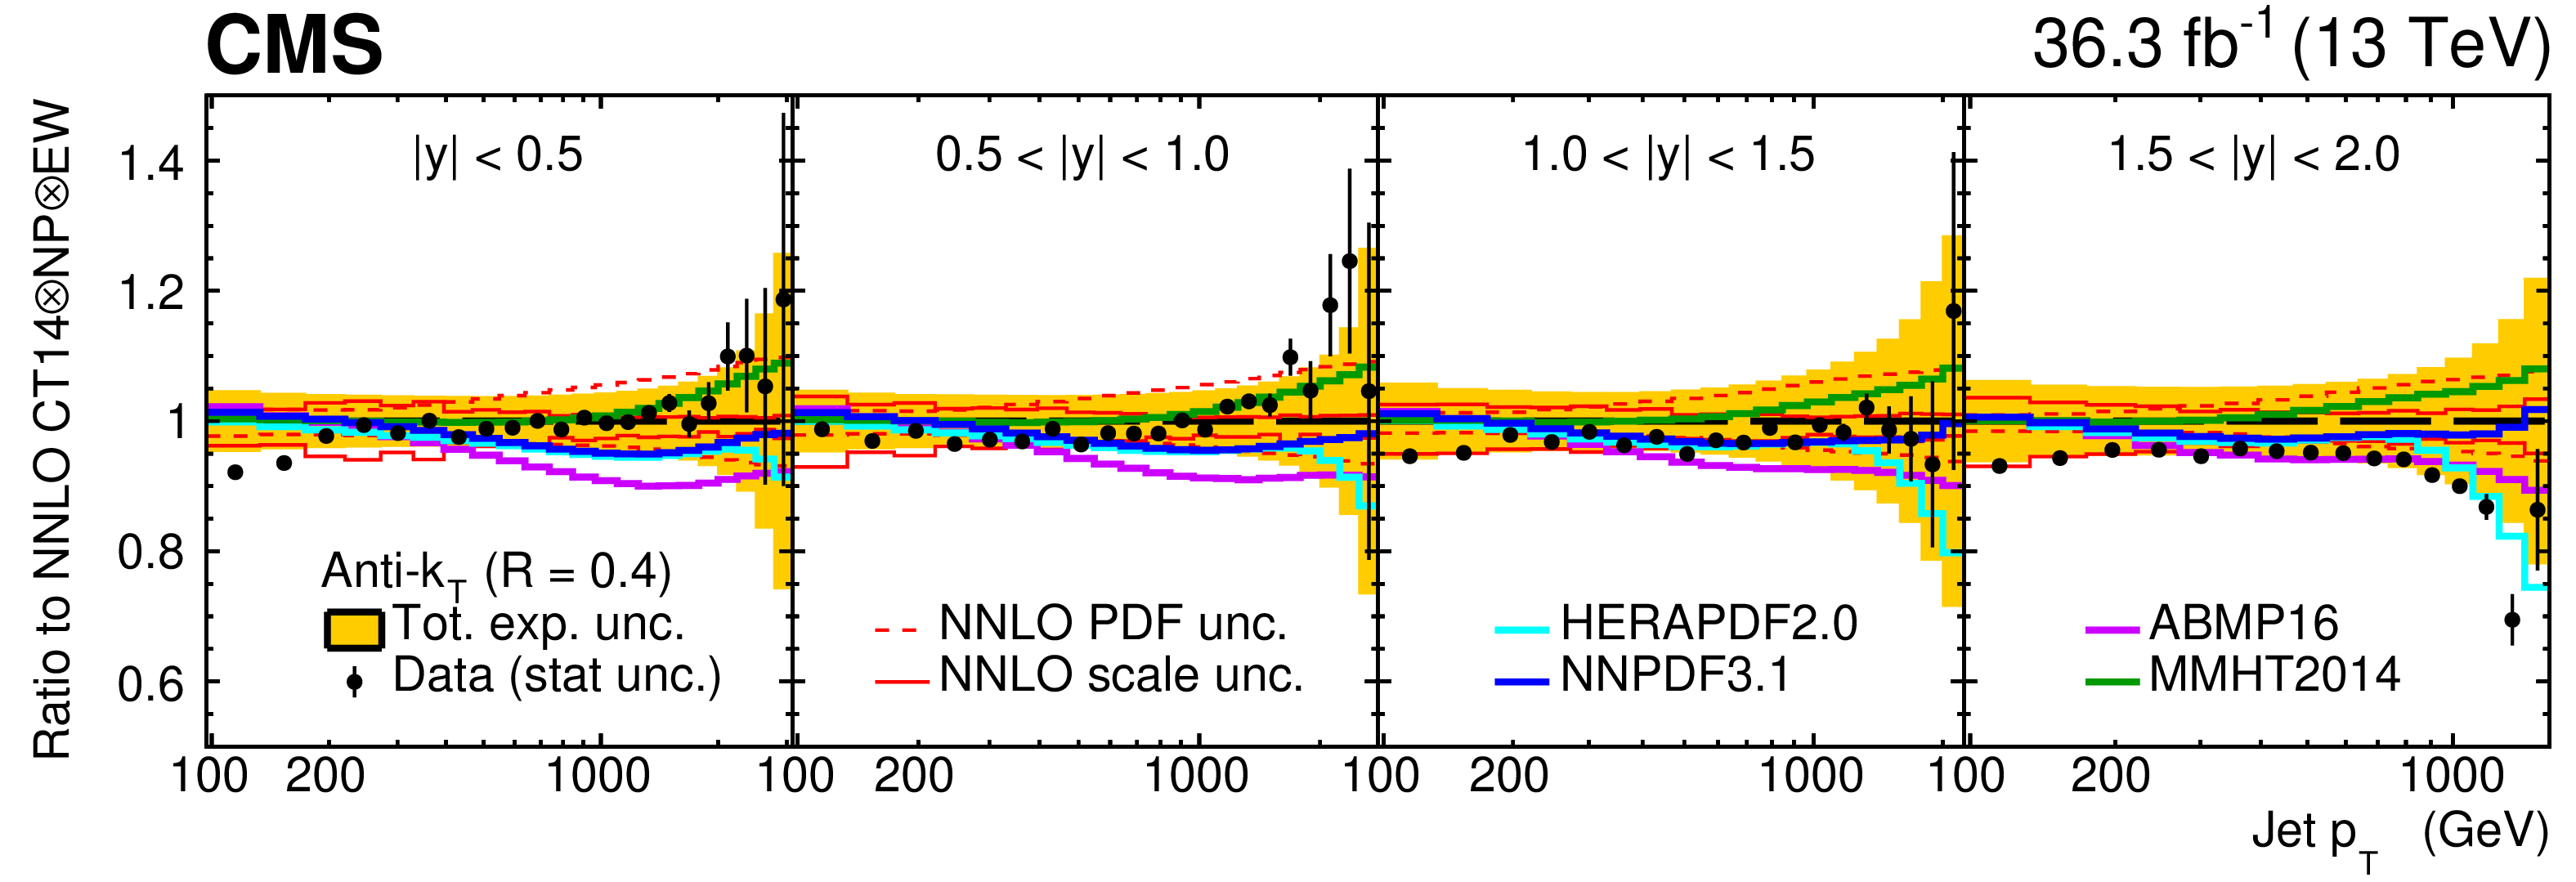
Figure B1-a:
The double-differential cross section of inclusive jet production, as a function of $ p_{\mathrm{T}} $ and $ |y| $, for jets clustered using the anti-$ k_{\mathrm{T}} $ algorithm with $ R= $ 0.4, presented as ratios to the QCD predictions. The data points are shown by filled circles, with statistical uncertainties shown by vertical error bars, while the total experimental uncertainty is centred at one and is presented by the orange band. The data are divided by the NNLO prediction corrected for NP and EW effects, using CT14nnlo PDF and choosing jet $ p_{\mathrm{T}} $ as renormalisation and factorisation scale. NNLO predictions obtained with alternative PDF sets are displayed in different colours as a ratio to the central prediction using CT14nnlo. |
png pdf |
Figure B1-b:
The double-differential cross section of inclusive jet production, as a function of $ p_{\mathrm{T}} $ and $ |y| $, for jets clustered using the anti-$ k_{\mathrm{T}} $ algorithm with $ R= $ 0.7, presented as ratios to the QCD predictions. The data points are shown by filled circles, with statistical uncertainties shown by vertical error bars, while the total experimental uncertainty is centred at one and is presented by the orange band. The data are divided by the NNLO prediction corrected for NP and EW effects, using CT14nnlo PDF and choosing jet $ p_{\mathrm{T}} $ as renormalisation and factorisation scale. NNLO predictions obtained with alternative PDF sets are displayed in different colours as a ratio to the central prediction using CT14nnlo. |

png pdf |
Figure B2:
The u-valence (upper left), d-valence (upper right), gluon (lower left), and sea quark (lower right) distributions shown as a function of $ x $ at the scale $ \mu_\mathrm{f}=m_\mathrm{t} $, resulting from the NNLO fit using HERA DIS data together with the CMS inclusive jet cross section at $ \sqrt{s}= $ 13 TeV. The prediction for the inclusive jet cross section is obtained using NNLO interpolation grids. Contributions of the fit, model, and parametrisation uncertainties for each PDF are shown. In the lower panels, the relative uncertainty contributions are presented. |

png pdf |
Figure B2-a:
The u-valence distribution shown as a function of $ x $ at the scale $ \mu_\mathrm{f}=m_\mathrm{t} $, resulting from the NNLO fit using HERA DIS data together with the CMS inclusive jet cross section at $ \sqrt{s}= $ 13 TeV. The prediction for the inclusive jet cross section is obtained using NNLO interpolation grids. Contributions of the fit, model, and parametrisation uncertainties for each PDF are shown. In the lower panel, the relative uncertainty contributions are presented. |
png pdf |
Figure B2-b:
The d-valence distribution shown as a function of $ x $ at the scale $ \mu_\mathrm{f}=m_\mathrm{t} $, resulting from the NNLO fit using HERA DIS data together with the CMS inclusive jet cross section at $ \sqrt{s}= $ 13 TeV. The prediction for the inclusive jet cross section is obtained using NNLO interpolation grids. Contributions of the fit, model, and parametrisation uncertainties for each PDF are shown. In the lower panel, the relative uncertainty contributions are presented. |

png pdf |
Figure B2-c:
The gluon distribution shown as a function of $ x $ at the scale $ \mu_\mathrm{f}=m_\mathrm{t} $, resulting from the NNLO fit using HERA DIS data together with the CMS inclusive jet cross section at $ \sqrt{s}= $ 13 TeV. The prediction for the inclusive jet cross section is obtained using NNLO interpolation grids. Contributions of the fit, model, and parametrisation uncertainties for each PDF are shown. In the lower panel, the relative uncertainty contributions are presented. |
png pdf |
Figure B2-d:
The sea quark distribution shown as a function of $ x $ at the scale $ \mu_\mathrm{f}=m_\mathrm{t} $, resulting from the NNLO fit using HERA DIS data together with the CMS inclusive jet cross section at $ \sqrt{s}= $ 13 TeV. The prediction for the inclusive jet cross section is obtained using NNLO interpolation grids. Contributions of the fit, model, and parametrisation uncertainties for each PDF are shown. In the lower panel, the relative uncertainty contributions are presented. |
png pdf |
Figure B3:
The u-valence (upper left), d-valence (upper right), gluon (lower left), and sea quark (lower right) distributions shown as a function of $ x $ at the scale $ \mu_\mathrm{f}=m_\mathrm{t} $. The filled (hatched) band represents the results of the NNLO fit using HERA DIS and the CMS inclusive jet cross section at $ \sqrt{s}= $ 13 TeV (using the HERA DIS data only). The PDFs are shown with their total uncertainty. The prediction for the inclusive jet cross section is obtained using NNLO interpolation grids. In the lower panels, the comparison of the relative PDF uncertainties is shown for each distribution. The line corresponds to the ratio of the central PDF values of the two variants of the fit. |
png pdf |
Figure B3-a:
The u-valence distribution shown as a function of $ x $ at the scale $ \mu_\mathrm{f}=m_\mathrm{t} $. The filled (hatched) band represents the results of the NNLO fit using HERA DIS and the CMS inclusive jet cross section at $ \sqrt{s}= $ 13 TeV (using the HERA DIS data only). The PDFs are shown with their total uncertainty. The prediction for the inclusive jet cross section is obtained using NNLO interpolation grids. In the lower panel, the comparison of the relative PDF uncertainties is shown for each distribution. The line corresponds to the ratio of the central PDF values of the two variants of the fit. |
png pdf |
Figure B3-b:
The d-valence distribution shown as a function of $ x $ at the scale $ \mu_\mathrm{f}=m_\mathrm{t} $. The filled (hatched) band represents the results of the NNLO fit using HERA DIS and the CMS inclusive jet cross section at $ \sqrt{s}= $ 13 TeV (using the HERA DIS data only). The PDFs are shown with their total uncertainty. The prediction for the inclusive jet cross section is obtained using NNLO interpolation grids. In the lower panel, the comparison of the relative PDF uncertainties is shown for each distribution. The line corresponds to the ratio of the central PDF values of the two variants of the fit. |
png pdf |
Figure B3-c:
The gluon distribution shown as a function of $ x $ at the scale $ \mu_\mathrm{f}=m_\mathrm{t} $. The filled (hatched) band represents the results of the NNLO fit using HERA DIS and the CMS inclusive jet cross section at $ \sqrt{s}= $ 13 TeV (using the HERA DIS data only). The PDFs are shown with their total uncertainty. The prediction for the inclusive jet cross section is obtained using NNLO interpolation grids. In the lower panel, the comparison of the relative PDF uncertainties is shown for each distribution. The line corresponds to the ratio of the central PDF values of the two variants of the fit. |
png pdf |
Figure B3-d:
The sea quark distribution shown as a function of $ x $ at the scale $ \mu_\mathrm{f}=m_\mathrm{t} $. The filled (hatched) band represents the results of the NNLO fit using HERA DIS and the CMS inclusive jet cross section at $ \sqrt{s}= $ 13 TeV (using the HERA DIS data only). The PDFs are shown with their total uncertainty. The prediction for the inclusive jet cross section is obtained using NNLO interpolation grids. In the lower panel, the comparison of the relative PDF uncertainties is shown for each distribution. The line corresponds to the ratio of the central PDF values of the two variants of the fit. |
| Tables | |

png pdf |
Table 1:
Recent measurements of inclusive jet production, performed by the ATLAS and CMS Collaborations at different $ \sqrt{s} $, with the corresponding integrated luminosities. |
png pdf |
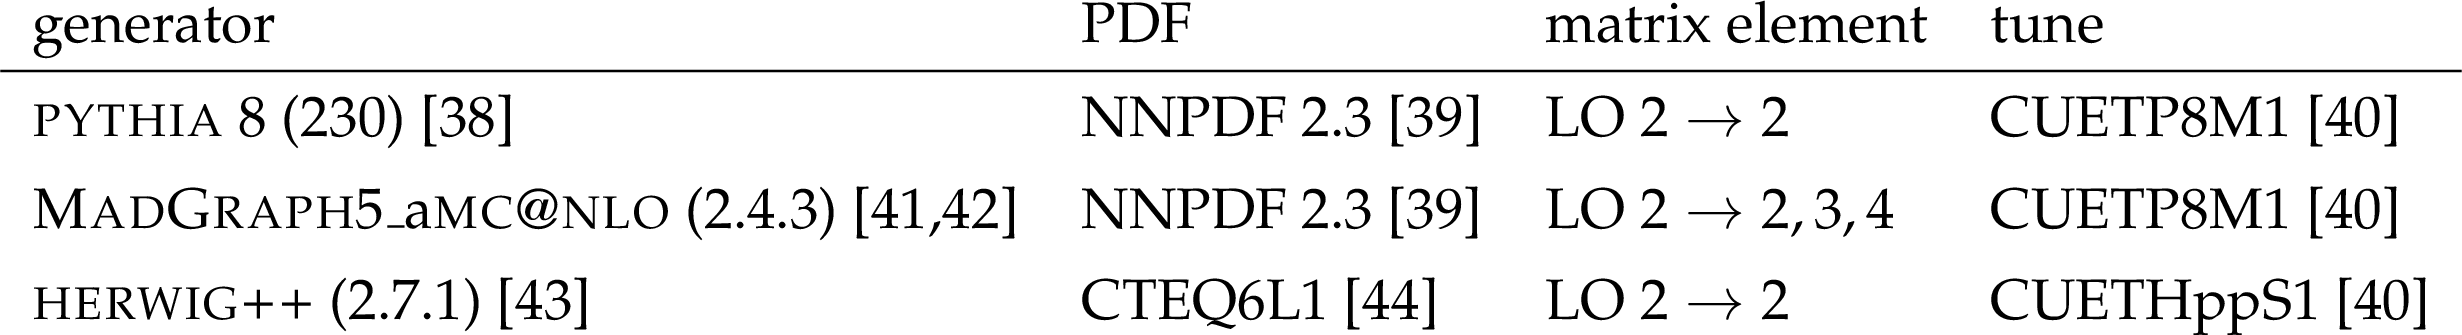
Table 2:
Description of the simulations used in the analysis. |

png pdf |
Table 3:
The HLT ranges and effective integrated luminosities used in the jet cross section measurement for $ R= $ 0.4. The first (second) row shows the $ p_{\mathrm{T}} $ threshold for the HLT (offline PF) reconstruction; the third row corresponds to the effective luminosity of each trigger $ \mathcal{L} $. |

png pdf |
Table 4:
The HLT ranges and effective integrated luminosities used in the jet cross section measurement for $ R= $ 0.7. The first (second) row shows the $ p_{\mathrm{T}} $ threshold for the HLT (offline PF) reconstruction; the third row corresponds to the effective luminosity of each trigger $ \mathcal{L} $. |
png pdf |
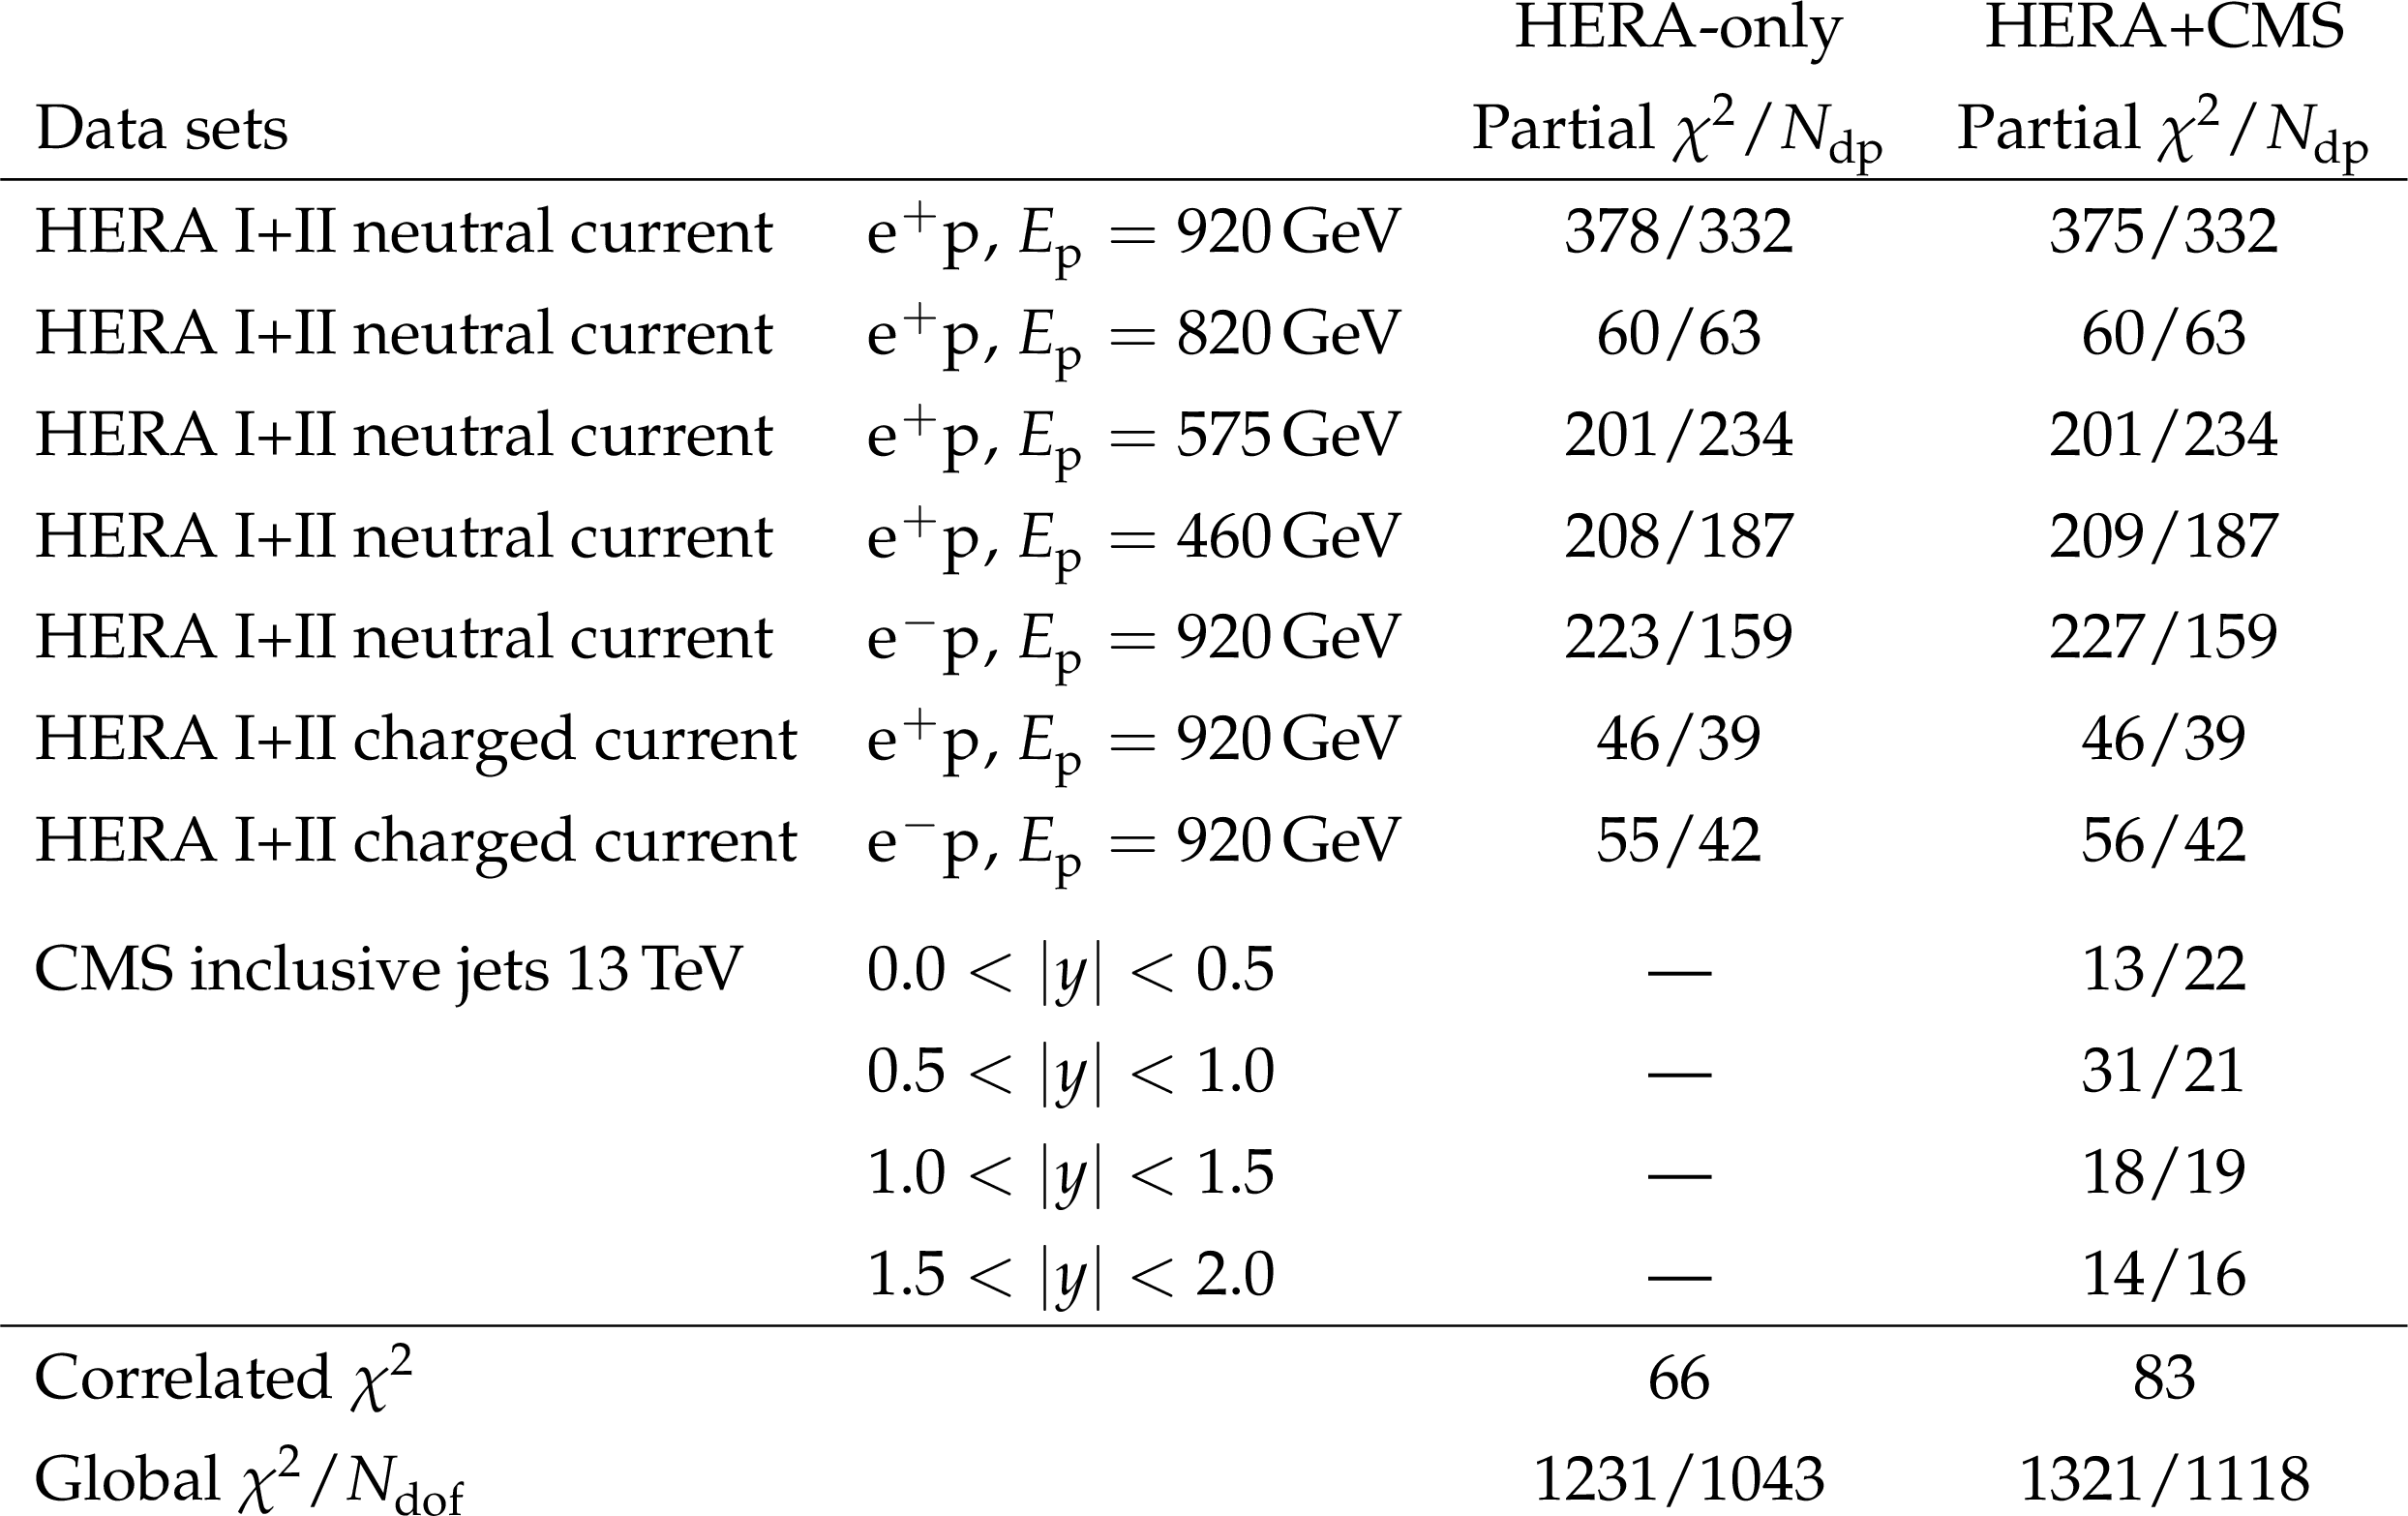
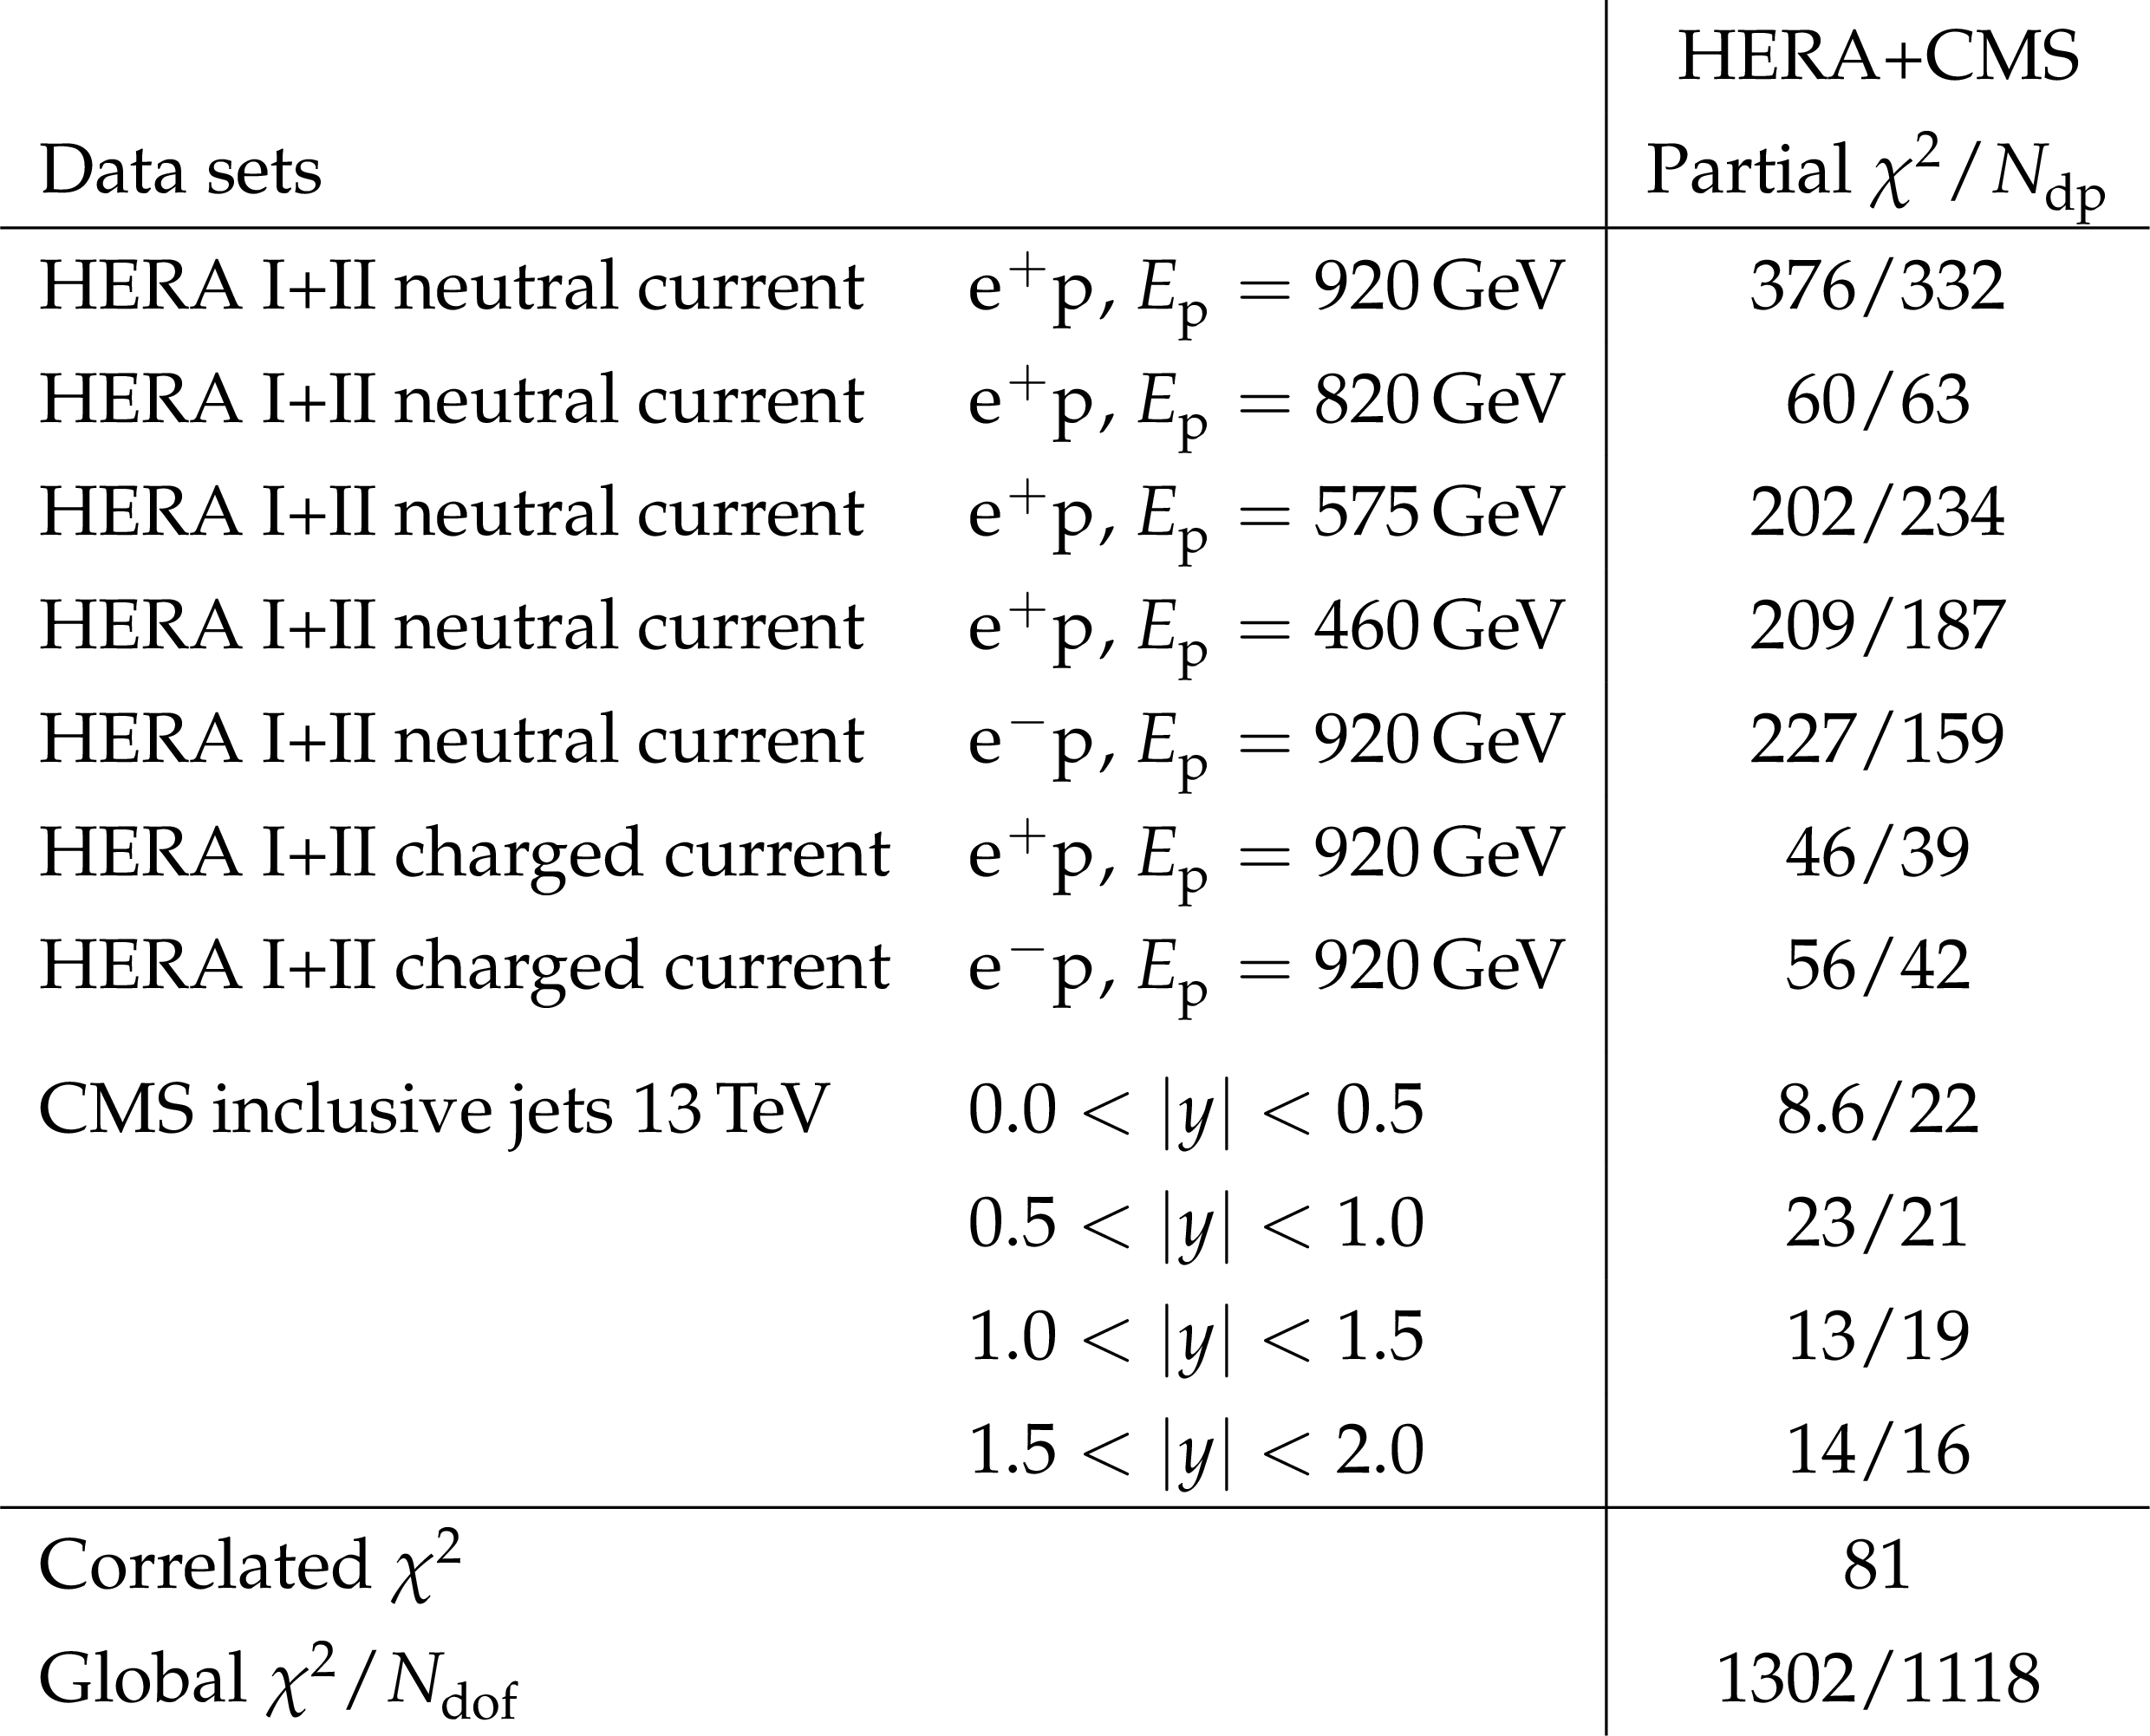
Table 5:
Partial $ \chi^2 $ per number of data points $ N_\mathrm{dp} $ and the global $ \chi^2 $ per degree of freedom, $ N_\mathrm{dof} $, as obtained in the QCD analysis at NNLO of HERA+CMS jet data and HERA-only data. In the DIS data, the proton beam energy is given as $ E_\mathrm{p} $ and the electron energy is 27.5 GeV. |
png pdf |
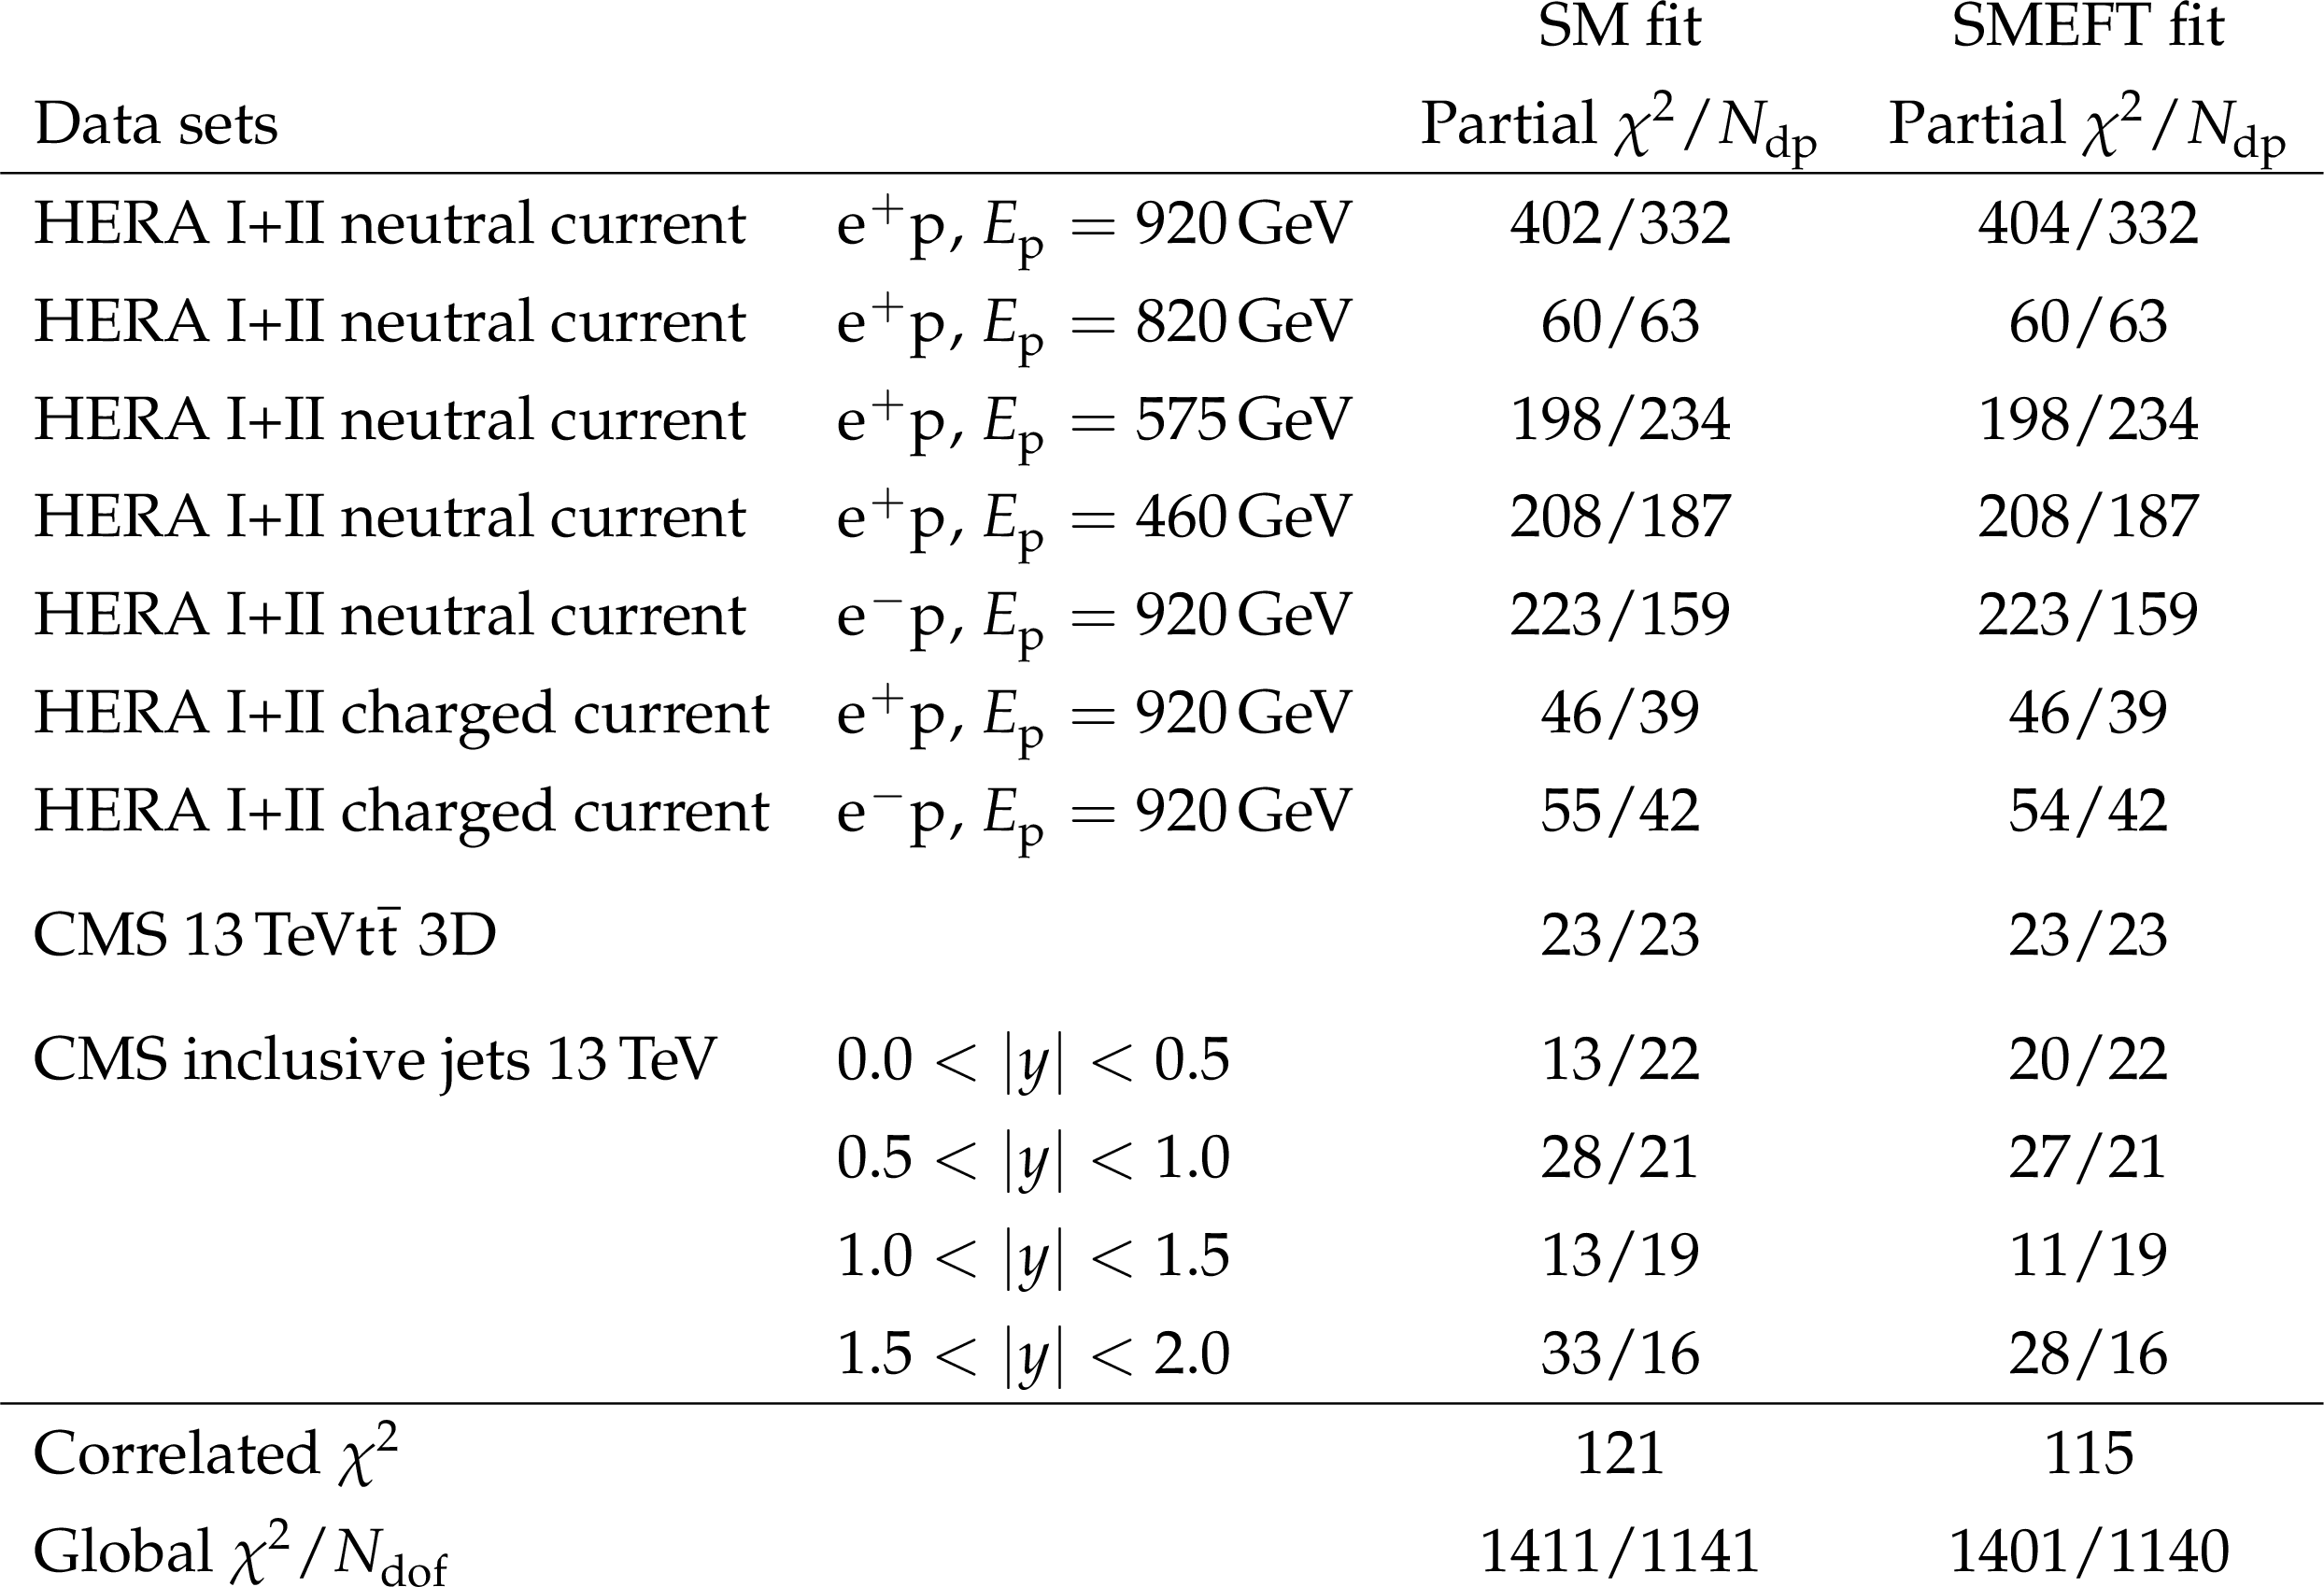
Table 6:
Partial $ \chi^2 $ per number of data points $ N_\mathrm{dp} $ and the global $ \chi^2 $ per degree of freedom, $ N_\mathrm{dof} $, as obtained in the QCD analysis of HERA DIS data and the CMS measurements of inclusive jet production and the normalised triple-differential $ \mathrm{t} \overline{\mathrm{t}} $ production at $ \sqrt{s}= $ 13 TeV, obtained in SM and SMEFT analyses. |
png pdf |
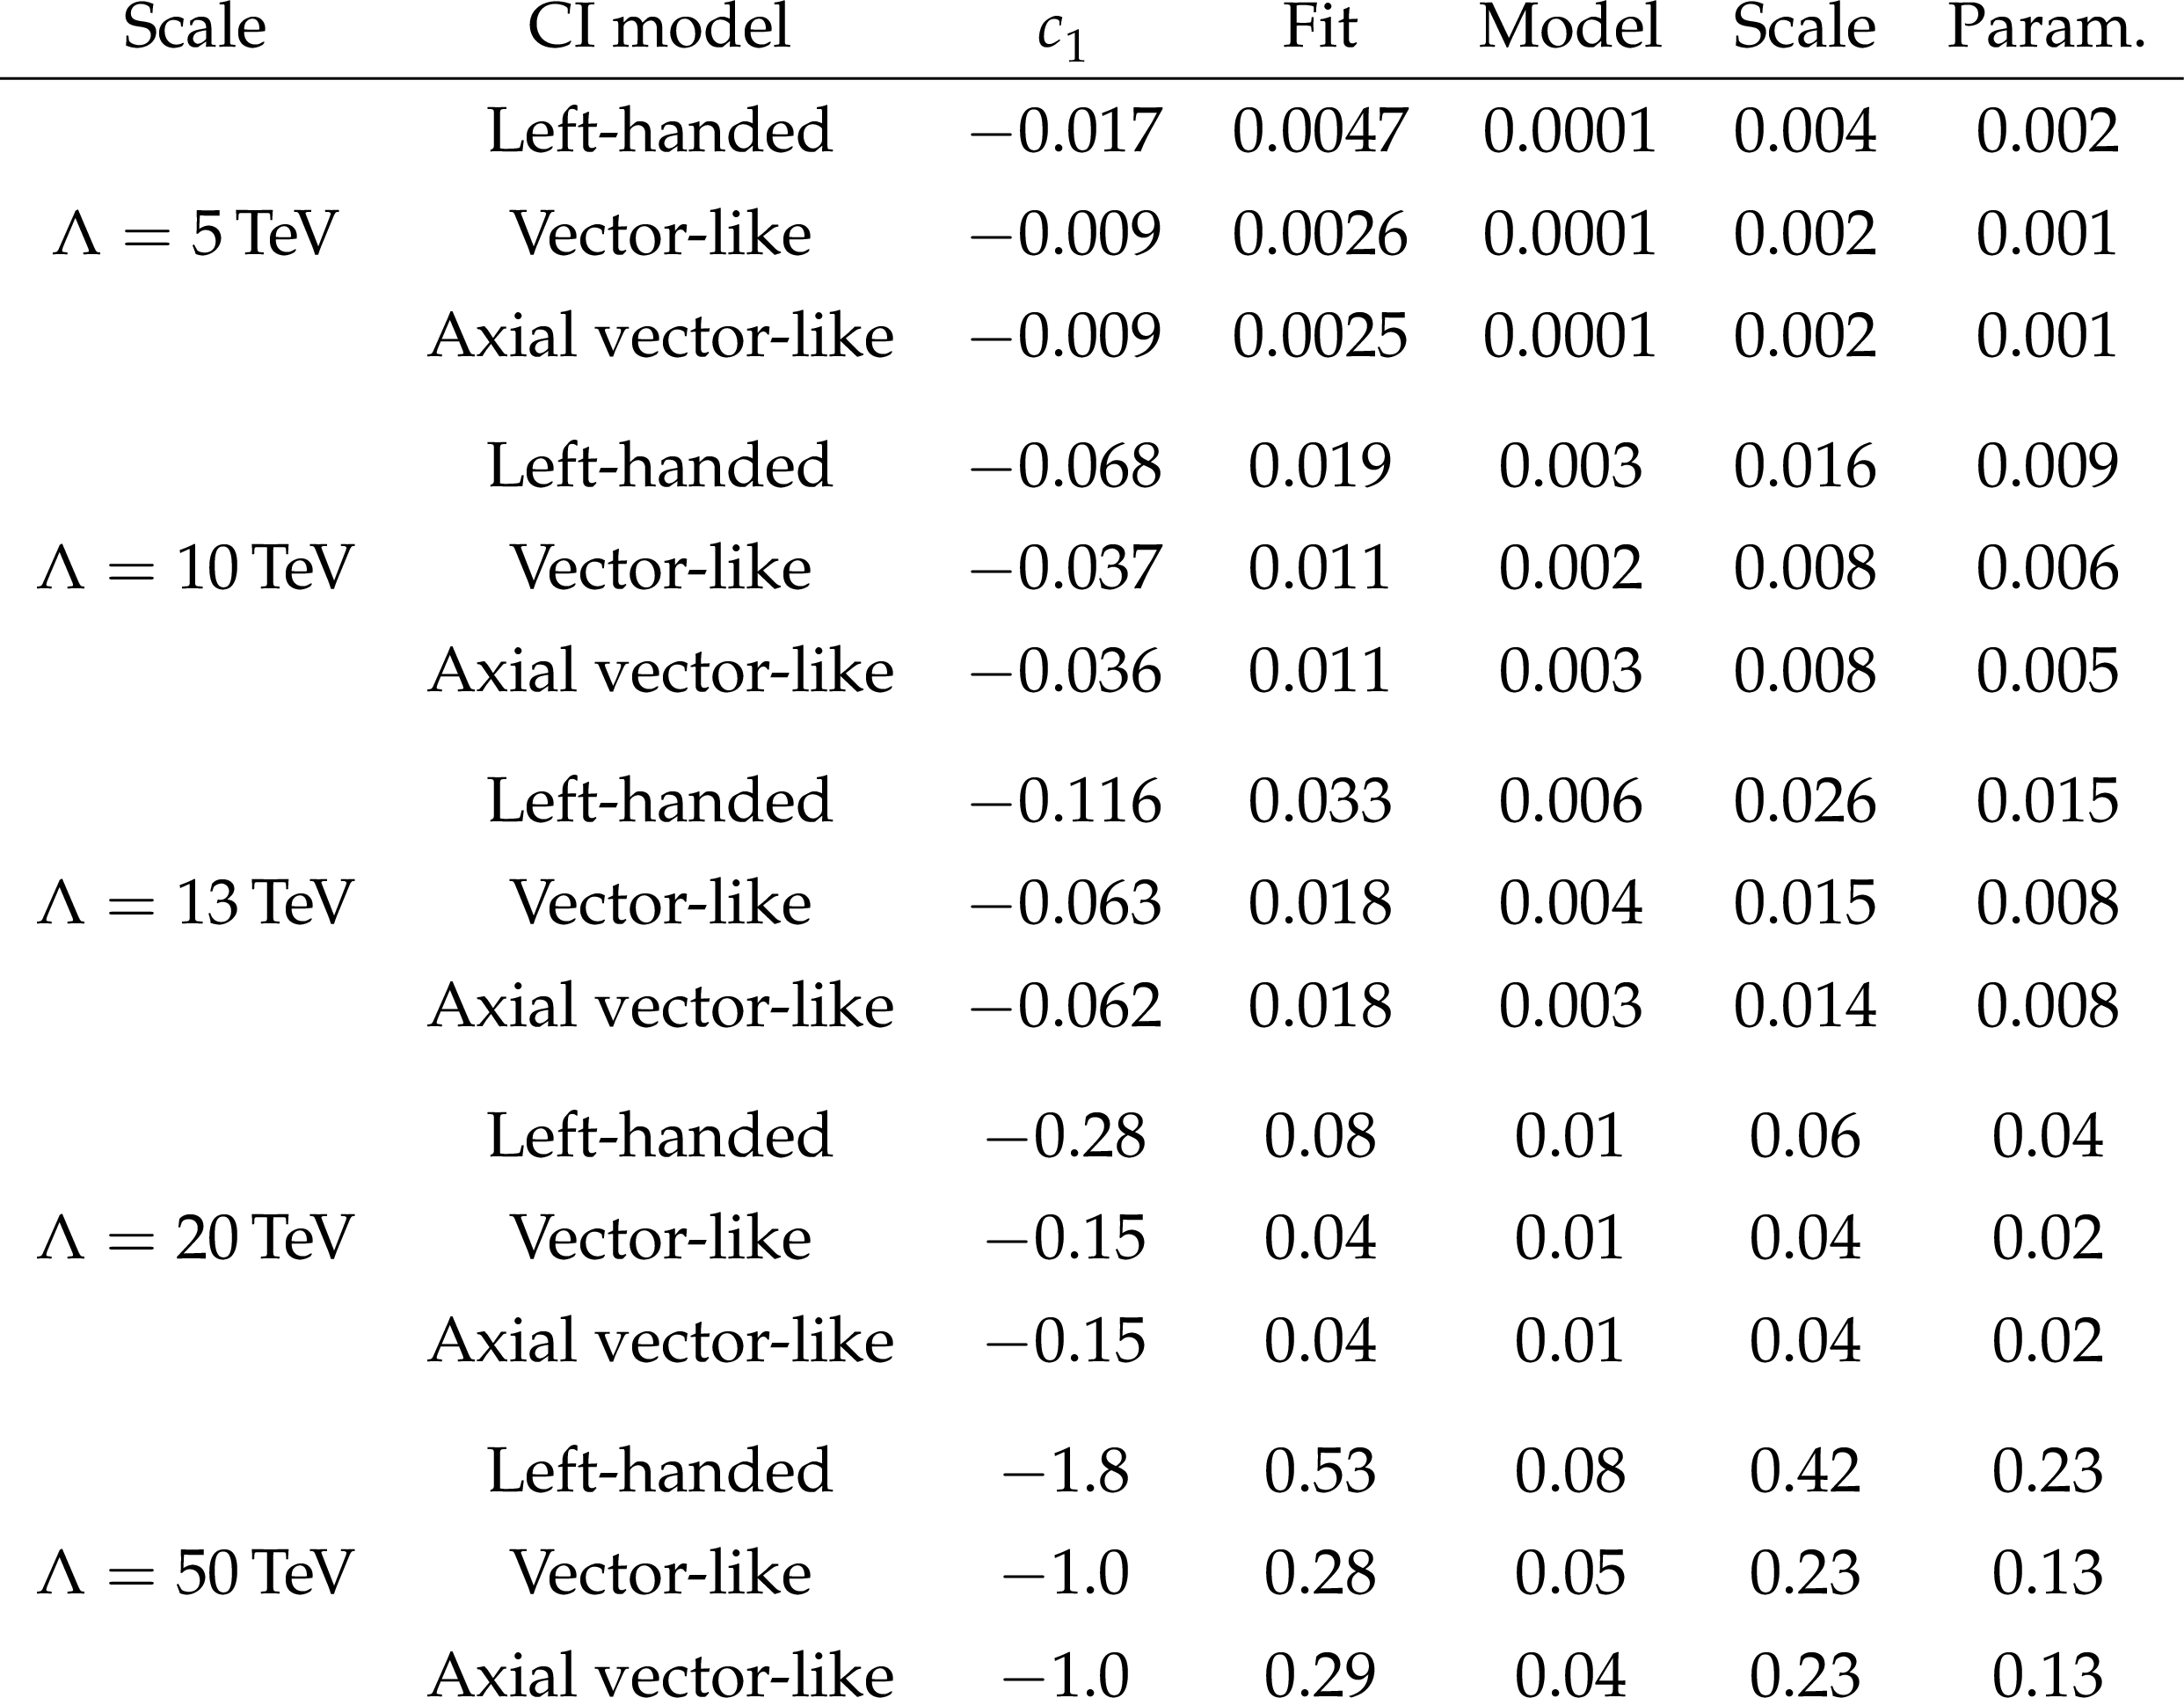
Table 7:
The values and uncertainties of the fitted Wilson coefficients $ c_1 $ for various scales $ \Lambda $. The fit uncertainties are obtained by using the Hessian method. |
png pdf |
Table B1:
Partial $ \chi^2 $ per number of data points, $ N_\mathrm{dp} $, and the global $ \chi^2 $ per degree of freedom, $ N_\mathrm{dof} $, as obtained in the QCD analysis at NNLO of HERA+CMS jet data, using NNLO interpolation grids for the 13 TeV inclusive jet cross section. In the DIS data, the proton beam energy is given as $ E_\mathrm{p} $ and the electron energy is 27.5 GeV. |
| Summary |
| In this paper, the measurement of the double-differential inclusive jet cross sections in proton-proton collisions at $ \sqrt{s}= $ 13 TeV is presented as a function of the jet transverse momentum $ p_{\mathrm{T}} $ and the jet rapidity $ |y| $ for jets reconstructed using the anti-$ k_{\mathrm{T}} $ clustering algorithm with a distance parameter $ R $ of 0.4 and 0.7. The phase space covers jet $ p_{\mathrm{T}} $ from 97 GeV up to 3.1 TeV and jet rapidity up to $ |y|= $ 2.0. The measured jet cross sections are compared with predictions of perturbative quantum chromodynamics (pQCD) at next-to-next-to-leading order (NNLO) and next-to-leading order (NLO) with the next-to-leading-logarithmic (NLL) resummation correction, using various sets of parton distribution functions (PDFs). A strong impact of the measurement on determination of the parton distributions is observed, expressed by significant differences among the theoretical predictions using different PDF sets, and by large corresponding uncertainties. To investigate the impact of the measurements on the PDFs and the strong coupling constant $ \alpha_\mathrm{S} $, a QCD analysis is performed, where the jet production cross section with $ R= $ 0.7 is used together with the HERA measurements of deep inelastic scattering. Significant improvement of the accuracy of the PDFs by using the present measurement in the QCD analysis is demonstrated in a profiling analysis using the CT14 PDF set and in the full PDF fit. The value of the strong coupling constant at the Z boson mass is extracted in a QCD analysis at NNLO using the inclusive jet cross sections in proton-proton collisions for the first time, and results in $ \alpha_\mathrm{S}(m_\mathrm{Z})= $ 0.1170 $ \pm $ 0.0014 (fit) $ \pm $ 0.0007 (model) $ \pm $ 0.0008 (scale) $ \pm $ 0.0001 (parametrisation). The QCD analysis is also performed at NLO, where the CMS measurement of the normalised triple-differential top quark-antiquark production cross section at $ \sqrt{s}= $ 13 TeV is used in addition. In this analysis, the PDFs, the values of the strong coupling constant, and of the top quark pole mass $ m_\mathrm{t}^{\text{pole}} $ are extracted simultaneously with $ \alpha_\mathrm{S}(m_\mathrm{Z}) = $ 0.1188 $ \pm $ 0.0017 (fit) $ \pm $ 0.0004 (model) $ \pm $ 0.0025 (scale) $ \pm $ 0.0001 (parameterisation), dominated by the scale uncertainty, and $ m_\mathrm{t}^{\text{pole}} = $ 170.4 $ \pm $ 0.6 (fit) $ \pm $ 0.1 (model) $ \pm $ 0.1 (scale) $ \pm $ 0.1 (parameterisation) GeV. The resulting values of $ \alpha_\mathrm{S}(m_\mathrm{Z}) $ agree with the world average and the previous CMS results using the jet measurements. The value of $ m_\mathrm{t}^{\text{pole}} $ agrees well with the result of the previous CMS analysis using the triple-differential cross section of the top quark-antiquark pair production. Although the inclusive jet production is not directly sensitive to $ m_\mathrm{t}^{\text{pole}} $, the resulting value is improved by the additional constraint on the gluon distribution and on $ \alpha_\mathrm{S}(m_\mathrm{Z}) $ provided by the jet measurements. Furthermore, an alternative QCD analysis is performed with the same data, where the standard model Lagrangian is modified by the introduction of effective terms related to 4-quark contact interactions. In the analysis, the Wilson coefficients for the contact interactions are extracted for different values assumed for the scale $ \Lambda $ of the new interaction. The results are translated into a 95% confidence level exclusion limit for the left-handed model with constructive interference, corresponding to $ \Lambda > $ 24 TeV. These results are compatible with the standard model and the previous limits obtained at the LHC using jet production. The advantage of the present approach is the simultaneous extraction of PDFs, thereby mitigating possible bias in the interpretation of the measurements in terms of physics beyond the standard model. Tabulated results are provided in the HEPData record for this analysis [94]. |
| References | ||||
| 1 | ATLAS Collaboration | Measurement of inclusive jet and dijet cross sections in proton-proton collisions at 7 TeV centre-of-mass energy with the ATLAS detector | EPJC 71 (2011) 1512 | 1009.5908 |
| 2 | ATLAS Collaboration | Measurement of inclusive jet and dijet production in pp collisions at $ \sqrt{s}= $ 7 TeV using the ATLAS detector | PRD 86 (2012) 014022 | 1112.6297 |
| 3 | CMS Collaboration | Measurement of the inclusive jet cross section in pp collisions at $ \sqrt{s}= $ 7 TeV | PRL 107 (2011) 132001 | CMS-QCD-10-011 1106.0208 |
| 4 | CMS Collaboration | Measurement of the double-differential inclusive jet cross section in proton-proton collisions at $ \sqrt{s} = $ 13 TeV | EPJC 76 (2016) 451 | CMS-SMP-15-007 1605.04436 |
| 5 | ATLAS Collaboration | Measurement of the inclusive jet cross section in pp collisions at $ \sqrt{s}= $ 2.76 TeV and comparison to the inclusive jet cross section at $ \sqrt{s}= $ 7 TeV using the ATLAS detector | EPJC 73 (2013) 2509 | 1304.4739 |
| 6 | CMS Collaboration | Measurement of the inclusive jet cross section in pp collisions at $ \sqrt{s} = $ 2.76 TeV | EPJC 76 (2016) 265 | CMS-SMP-14-017 1512.06212 |
| 7 | ATLAS Collaboration | Measurement of the inclusive jet cross-section in proton-proton collisions at $ \sqrt{s}= $ 7 TeV using 4.5 fb$ ^{-1} $ of data with the ATLAS detector | JHEP 02 (2015) 153 | 1410.8857 |
| 8 | CMS Collaboration | Measurements of differential jet cross sections in proton-proton collisions at $ \sqrt{s}= $ 7 TeV with the CMS detector | PRD 87 (2013) 112002 | CMS-QCD-11-004 1212.6660 |
| 9 | CMS Collaboration | Measurement of the ratio of inclusive jet cross sections using the anti-$ k_{\mathrm{T}} $ algorithm with radius parameters $ R= $ 0.5 and 0.7 in pp collisions at $ \sqrt{s} = $ 7 TeV | PRD 90 (2014) 072006 | CMS-SMP-13-002 1406.0324 |
| 10 | ATLAS Collaboration | Measurement of the inclusive jet cross-sections in proton-proton collisions at $ \sqrt{s}= $ 8 TeV with the ATLAS detector | JHEP 09 (2017) 020 | 1706.03192 |
| 11 | CMS Collaboration | Measurement and QCD analysis of double-differential inclusive jet cross sections in pp collisions at $ \sqrt{s}= $ 8 TeV and cross section ratios to 2.76 and 7 TeV | JHEP 03 (2017) 156 | CMS-SMP-14-001 1609.05331 |
| 12 | ATLAS Collaboration | Measurement of inclusive jet and dijet cross-sections in proton-proton collisions at $ \sqrt{s}= $ 13 TeV with the ATLAS detector | JHEP 05 (2018) 195 | 1711.02692 |
| 13 | X. Liu, S.-O. Moch, and F. Ringer | Phenomenology of single-inclusive jet production with jet radius and threshold resummation | PRD 97 (2018) 056026 | 1801.07284 |
| 14 | J. Currie, E. W. N. Glover, and J. Pires | Next-to-next-to leading order QCD predictions for single jet inclusive production at the LHC | PRL 118 (2017) 072002 | 1611.01460 |
| 15 | J. Currie et al. | Infrared sensitivity of single jet inclusive production at hadron colliders | JHEP 10 (2018) 155 | 1807.03692 |
| 16 | CMS Collaboration | Constraints on parton distribution functions and extraction of the strong coupling constant from the inclusive jet cross section in pp collisions at $ \sqrt{s} = $ 7 TeV | EPJC 75 (2015) 288 | CMS-SMP-12-028 1410.6765 |
| 17 | M. Cacciari, G. P. Salam, and G. Soyez | The anti-$ k_{\mathrm{T}} $ jet clustering algorithm | JHEP 04 (2008) 063 | 0802.1189 |
| 18 | M. Cacciari, G. P. Salam, and G. Soyez | FASTJET user manual | EPJC 72 (2012) 1896 | 1111.6097 |
| 19 | M. Dasgupta, L. Magnea, and G. P. Salam | Non-perturbative QCD effects in jets at hadron colliders | JHEP 02 (2008) 055 | 0712.3014 |
| 20 | CMS Collaboration | Dependence of inclusive jet production on the anti-$ k_{\mathrm{T}} $ distance parameter in pp collisions at $ \sqrt{s} = $ 13 TeV | JHEP 12 (2020) 082 | CMS-SMP-19-003 2005.05159 |
| 21 | H1 and ZEUS Collaborations | Combination of measurements of inclusive deep inelastic $ \mathrm{e}^{\pm} \mathrm{p} $ scattering cross sections and QCD analysis of HERA data | EPJC 75 (2015) 580 | 1506.06042 |
| 22 | CMS Collaboration | Measurement of $ \mathrm{t} \overline{\mathrm{t}} $ normalised multi-differential cross sections in pp collisions at $ \sqrt{s}= $ 13 TeV, and simultaneous determination of the strong coupling strength, top quark pole mass, and parton distribution functions | EPJC 80 (2020) 658 | CMS-TOP-18-004 1904.05237 |
| 23 | J. Gao, C. S. Li, and C. P. Yuan | NLO QCD corrections to dijet production via quark contact interactions | JHEP 07 (2012) 037 | 1204.4773 |
| 24 | J. Gao | CIJET: A program for computation of jet cross sections induced by quark contact interactions at hadron colliders | Comput. Phys. Commun. 184 (2013) 2362 | 1301.7263 |
| 25 | CMS Collaboration | Search for contact interactions using the inclusive jet $ p_{\mathrm{T}} $ spectrum in pp collisions at $ \sqrt{s} = $ 7 TeV | PRD 87 (2013) 052017 | CMS-EXO-11-010 1301.5023 |
| 26 | CMS Collaboration | Search for quark compositeness in dijet angular distributions from pp collisions at $ \sqrt{s} = $ 7 TeV | JHEP 05 (2012) 055 | CMS-EXO-11-017 1202.5535 |
| 27 | CMS Collaboration | Search for quark contact interactions and extra spatial dimensions using dijet angular distributions in proton-proton collisions at $ \sqrt{s} = $ 8 TeV | PLB 746 (2015) 79 | CMS-EXO-12-050 1411.2646 |
| 28 | CMS Collaboration | Search for new physics with dijet angular distributions in proton-proton collisions at $ \sqrt{s} = $ 13 TeV | JHEP 07 (2017) 013 | CMS-EXO-15-009 1703.09986 |
| 29 | CMS Collaboration | Particle-flow reconstruction and global event description with the CMS detector | JINST 12 (2017) P10003 | CMS-PRF-14-001 1706.04965 |
| 30 | CMS Collaboration | Jet energy scale and resolution in the CMS experiment in pp collisions at 8 TeV | JINST 12 (2017) P02014 | CMS-JME-13-004 1607.03663 |
| 31 | CMS Collaboration | Jet algorithms performance in 13 TeV data | CMS Physics Analysis Summary, 2017 link |
CMS-PAS-JME-16-003 |
| 32 | CMS Collaboration | Performance of missing transverse momentum reconstruction in proton-proton collisions at $ \sqrt{s} = $ 13 TeV using the CMS detector | JINST 14 (2019) P07004 | CMS-JME-17-001 1903.06078 |
| 33 | CMS Collaboration | The CMS trigger system | JINST 12 (2017) P01020 | CMS-TRG-12-001 1609.02366 |
| 34 | CMS Collaboration | Performance of the CMS level-1 trigger in proton-proton collisions at $ \sqrt{s} = $ 13 TeV | JINST 15 (2020) P10017 | CMS-TRG-17-001 2006.10165 |
| 35 | CMS Collaboration | The CMS experiment at the CERN LHC | JINST 3 (2008) S08004 | |
| 36 | CMS Collaboration | Precision luminosity measurement in proton-proton collisions at $ \sqrt{s} = $ 13 TeV in 2015 and 2016 at CMS | EPJC 81 (2021) 800 | CMS-LUM-17-003 2104.01927 |
| 37 | GEANT4 Collaboration | GEANT 4---a simulation toolkit | NIM A 506 (2003) 250 | |
| 38 | T. Sjöstrand et al. | An introduction to PYTHIA 8.2 | Comput. Phys. Commun. 191 (2015) 159 | 1410.3012 |
| 39 | R. D. Ball et al. | Parton distributions with LHC data | NPB 867 (2013) 244 | 1207.1303 |
| 40 | CMS Collaboration | Event generator tunes obtained from underlying event and multiparton scattering measurements | EPJC 76 (2016) 155 | CMS-GEN-14-001 1512.00815 |
| 41 | J. Alwall et al. | MADGRAPH 5: going beyond | JHEP 06 (2011) 128 | 1106.0522 |
| 42 | J. Alwall et al. | The automated computation of tree-level and next-to-leading order differential cross sections, and their matching to parton shower simulations | JHEP 07 (2014) 079 | 1405.0301 |
| 43 | M. Bahr et al. | HERWIG++ physics and manual | EPJC 58 (2008) 639 | 0803.0883 |
| 44 | J. Pumplin et al. | New generation of parton distributions with uncertainties from global QCD analysis | JHEP 07 (2002) 012 | hep-ph/0201195 |
| 45 | P. L. S. Connor and R. Žlebcík | Step: a tool to perform tests of smoothness on differential distributions based on Chebyshev polynomials of the first kind | Submitted to SciPost Physics, 2021 | 2111.09968 |
| 46 | M. Oreglia | A study of the reactions $ \psi\prime \to \gamma \gamma {\mathrm{J}/\psi} $ | PhD thesis, Stanford University, . SLAC Report SLAC-R-236, 1980 | |
| 47 | E. Gaiser | Charmonium spectroscopy from radiative decays of the $ {\mathrm{J}/\psi} $ and $ \psi\prime $ | PhD thesis, Stanford University. SLAC Report SLAC-R-255, 1983 | |
| 48 | M. Cacciari and G. P. Salam | Pileup subtraction using jet areas | PLB 659 (2008) 119 | 0707.1378 |
| 49 | S. Schmitt | TUNFOLD, an algorithm for correcting migration effects in high energy physics | JINST 7 (2012) T10003 | 1205.6201 |
| 50 | Z. Nagy | Three jet cross-sections in hadron-hadron collisions at next-to-leading order | PRL 88 (2002) 122003 | hep-ph/0110315 |
| 51 | Z. Nagy | Next-to-leading order calculation of three jet observables in hadron-hadron collision | PRD 68 (2003) 094002 | hep-ph/0307268 |
| 52 | T. Gehrmann et al. | Jet cross sections and transverse momentum distributions with NNLOJET | PoS RADCOR 074, 2018 link |
1801.06415 |
| 53 | D. Britzger, K. Rabbertz, F. Stober, and M. Wobisch | New features in version 2 of the FASTNLO project | fastNLO Collaboration, in 20th International Workshop on Deep-Inelastic Scattering and Related Subjects, 2012 link |
1208.3641 |
| 54 | M. Cacciari et al. | Single-jet inclusive cross section and its definition | PRD 100 (2019) 114015 | 1906.11850 |
| 55 | M. Dasgupta, F. A. Dreyer, G. P. Salam, and G. Soyez | Inclusive jet spectrum for small-radius jets | JHEP 06 (2016) 057 | 1602.01110 |
| 56 | J. Bellm et al. | Jet cross sections at the LHC and the quest for higher precision | EPJC 80 (2020) 93 | 1903.12563 |
| 57 | S. Dulat et al. | New parton distribution functions from a global analysis of quantum chromodynamics | PRD 93 (2016) 033006 | 1506.07443 |
| 58 | NNPDF Collaboration | Parton distributions from high-precision collider data | EPJC 77 (2017) 663 | 1706.00428 |
| 59 | L. A. Harland-Lang, A. D. Martin, P. Motylinski, and R. S. Thorne | Parton distributions in the LHC era: MMHT 2014 PDFs | EPJC 75 (2015) 204 | 1412.3989 |
| 60 | S. Alekhin, J. Blümlein, S. Moch, and R. Placakyte | Parton distribution functions, $ \alpha_\mathrm{S} $, and heavy-quark masses for LHC run II | PRD 96 (2017) 014011 | 1701.05838 |
| 61 | J. Gao et al. | MEKS: a program for computation of inclusive jet cross sections at hadron colliders | Comput. Phys. Commun. 184 (2013) 1626 | 1207.0513 |
| 62 | S. Dittmaier, A. Huss, and C. Speckner | Weak radiative corrections to dijet production at hadron colliders | JHEP 11 (2012) 095 | 1210.0438 |
| 63 | J. M. Campbell and R. K. Ellis | An update on vector boson pair production at hadron colliders | PRD 60 (1999) 113006 | hep-ph/9905386 |
| 64 | J. M. Campbell, R. K. Ellis, and W. T. Giele | A multi-threaded version of MCFM | EPJC 75 (2015) 246 | 1503.06182 |
| 65 | J. M. Campbell, R. K. Ellis, and C. Williams | Vector boson pair production at the LHC | JHEP 07 (2011) 018 | 1105.0020 |
| 66 | CMS Collaboration | Extraction and validation of a new set of CMS PYTHIA 8 tunes from underlying-event measurements | EPJC 80 (2020) 4 | CMS-GEN-17-001 1903.12179 |
| 67 | S. Alekhin et al. | HERAFitter, open source QCD fit project | EPJC 75 (2015) 304 | 1410.4412 |
| 68 | V. Bertone, M. Botje, D. Britzger et al. | XFITTER 2.0.0: An open source QCD fit framework | PoS DIS 203, 2018 link |
1709.01151 |
| 69 | xFitter Developers' Team | xFitter | link | |
| 70 | V. N. Gribov and L. N. Lipatov | Deep inelastic $ \mathrm{e} \mathrm{p} $ scattering in perturbation theory | Sov. J. Nucl. Phys. 15 (1972) 438 | |
| 71 | G. Altarelli and G. Parisi | Asymptotic freedom in parton language | NPB 126 (1977) 298 | |
| 72 | G. Curci, W. Furmanski, and R. Petronzio | Evolution of parton densities beyond leading order: The non-singlet case | NPB 175 (1980) 27 | |
| 73 | W. Furmanski and R. Petronzio | Singlet parton densities beyond leading order | PLB 97 (1980) 437 | |
| 74 | S. Moch, J. A. M. Vermaseren, and A. Vogt | The three-loop splitting functions in QCD: The nonsinglet case | NPB 688 (2004) 101 | hep-ph/0403192 |
| 75 | A. Vogt, S. Moch, and J. A. M. Vermaseren | The three-loop splitting functions in QCD: The singlet case | NPB 691 (2004) 129 | hep-ph/0404111 |
| 76 | M. Botje | QCDNUM: Fast QCD evolution and convolution | Comput. Phys. Commun. 182 (2011) 490 | 1005.1481 |
| 77 | E. Eichten, K. D. Lane, and M. E. Peskin | New tests for quark and lepton substructure | PRL 50 (1983) 811 | |
| 78 | P. Langacker | The physics of heavy $ \mathrm{Z}^{'} $ gauge bosons | Rev. Mod. Phys. 81 (2009) 1199 | 0801.1345 |
| 79 | H1 and ZEUS Collaborations | Combined measurement and QCD analysis of the inclusive $ \mathrm{e}^{\pm} \mathrm{p} $ scattering cross sections at HERA | JHEP 01 (2010) 109 | 0911.0884 |
| 80 | R. S. Thorne and R. G. Roberts | An ordered analysis of heavy flavor production in deep inelastic scattering | PRD 57 (1998) 6871 | hep-ph/9709442 |
| 81 | R. S. Thorne | A variable-flavor number scheme for NNLO | PRD 73 (2006) 054019 | hep-ph/0601245 |
| 82 | R. S. Thorne | Effect of changes of variable flavor number scheme on parton distribution functions and predicted cross sections | PRD 86 (2012) 074017 | 1201.6180 |
| 83 | J. Pumplin et al. | Uncertainties of predictions from parton distribution functions. II. The Hessian method | PRD 65 (2001) 014013 | hep-ph/0101032 |
| 84 | W. T. Giele and S. Keller | Implications of hadron collider observables on parton distribution function uncertainties | PRD 58 (1998) 094023 | hep-ph/9803393 |
| 85 | W. T. Giele, S. A. Keller, and D. A. Kosower | Parton distribution function uncertainties | hep-ph/0104052 | |
| 86 | H. Paukkunen and P. Zurita | PDF reweighting in the Hessian matrix approach | JHEP 12 (2014) 100 | 1402.6623 |
| 87 | C. Schmidt, J. Pumplin, C. P. Yuan, and P. Yuan | Updating and optimizing error parton distribution function sets in the Hessian approach | PRD 98 (2018) 094005 | 1806.07950 |
| 88 | HERAFitter developers' Team | QCD analysis of W- and Z-boson production at Tevatron | EPJC 75 (2015) 458 | 1503.05221 |
| 89 | R. Abdul Khalek et al. | Towards ultimate parton distributions at the high-luminosity LHC | EPJC 78 (2018) 962 | 1810.03639 |
| 90 | Particle Data Group, P. A. Zyla et al. | Review of particle physics | Prog. Theor. Exp. Phys. 2020 (2020) 083C01 | |
| 91 | H1 Collaboration | Determination of the strong coupling constant $ \alpha_\mathrm{S}(m_\mathrm{Z}) $ in next-to-next-to-leading order QCD using H1 jet cross section measurements | EPJC 77 (2017) 791 | 1709.07251 |
| 92 | CMS Collaboration | Measurement of the $ \mathrm{t} \overline{\mathrm{t}} $ production cross section, the top quark mass, and the strong coupling constant using dilepton events in pp collisions at $ \sqrt{s} = $ 13 TeV | EPJC 79 (2019) 368 | CMS-TOP-17-001 1812.10505 |
| 93 | ATLAS Collaboration | Search for new phenomena in dijet events using 37 fb$ ^{-1} $ of pp collision data collected at $ \sqrt{s} = $ 13 TeV with the ATLAS detector | PRD 96 (2017) 052004 | 1703.09127 |
| 94 | CMS Collaboration | HEPData record for this analysis | link | |
| 95 | D. Britzger et al. | NNLO interpolation grids for jet production at the LHC | 2207.13735 | |
| 96 | X. Chen et al. | NNLO QCD corrections in full colour for jet production observables at the LHC | JHEP 09 (2022) 025 | 2204.10173 |
|
|
Compact Muon Solenoid LHC, CERN |
|

|

|

|

|

|