

Compact Muon Solenoid
LHC, CERN
| CMS-SUS-17-001 ; CERN-EP-2017-252 | ||
| Search for top squarks and dark matter particles in opposite-charge dilepton final states at $\sqrt{s} = $ 13 TeV | ||
| CMS Collaboration | ||
| 2 November 2017 | ||
| Phys. Rev. D 97 (2018) 032009 | ||
| Abstract: A search for new physics is presented in final states with two oppositely charged leptons (electrons or muons), jets identified as originating from b quarks, and missing transverse momentum ($ p_{\mathrm{T}}^{\text miss} $). The search uses proton-proton collision data at $\sqrt{s} = $ 13 TeV amounting to 35.9 fb$^{-1}$ of integrated luminosity collected using the CMS detector in 2016. Hypothetical signal events are efficiently separated from the dominant $ \mathrm{t\bar{t}} $ background with requirements on $ p_{\mathrm{T}}^{\text miss} $ and transverse mass variables. No significant deviation is observed from the expected background. Exclusion limits are set in the context of simplified supersymmetric models with pair-produced top squarks. For top squarks, decaying exclusively to a top quark and a neutralino, exclusion limits are placed at 95% confidence level on the mass of the lightest top squark up to 800 GeV and on the lightest neutralino up to 360 GeV. These results, combined with searches in the single-lepton and all-jet final states, raise the exclusion limits up to 1050 GeV for the lightest top squark and up to 500 GeV for the lightest neutralino. For top squarks undergoing a cascade decay through charginos and sleptons, the mass limits reach up to 1300 GeV for top squarks and up to 800 GeV for the lightest neutralino. The results are also interpreted in a simplified model with a dark matter (DM) particle coupled to the top quark through a scalar or pseudoscalar mediator. For light DM, mediator masses up to 100 (50) GeV are excluded for scalar (pseudoscalar) mediators. The result for the scalar mediator achieves some of the most stringent limits to date in this model. | ||
| Links: e-print arXiv:1711.00752 [hep-ex] (PDF) ; CDS record ; inSPIRE record ; HepData record ; CADI line (restricted) ; | ||
| Figures & Tables | Summary | Additional Figures & Tables | References | CMS Publications |
|---|
|
Additional information on efficiencies needed for reinterpretation of
these results are available here. Additional technical material for CMS speakers can be found here. |
| Figures | |
png pdf |
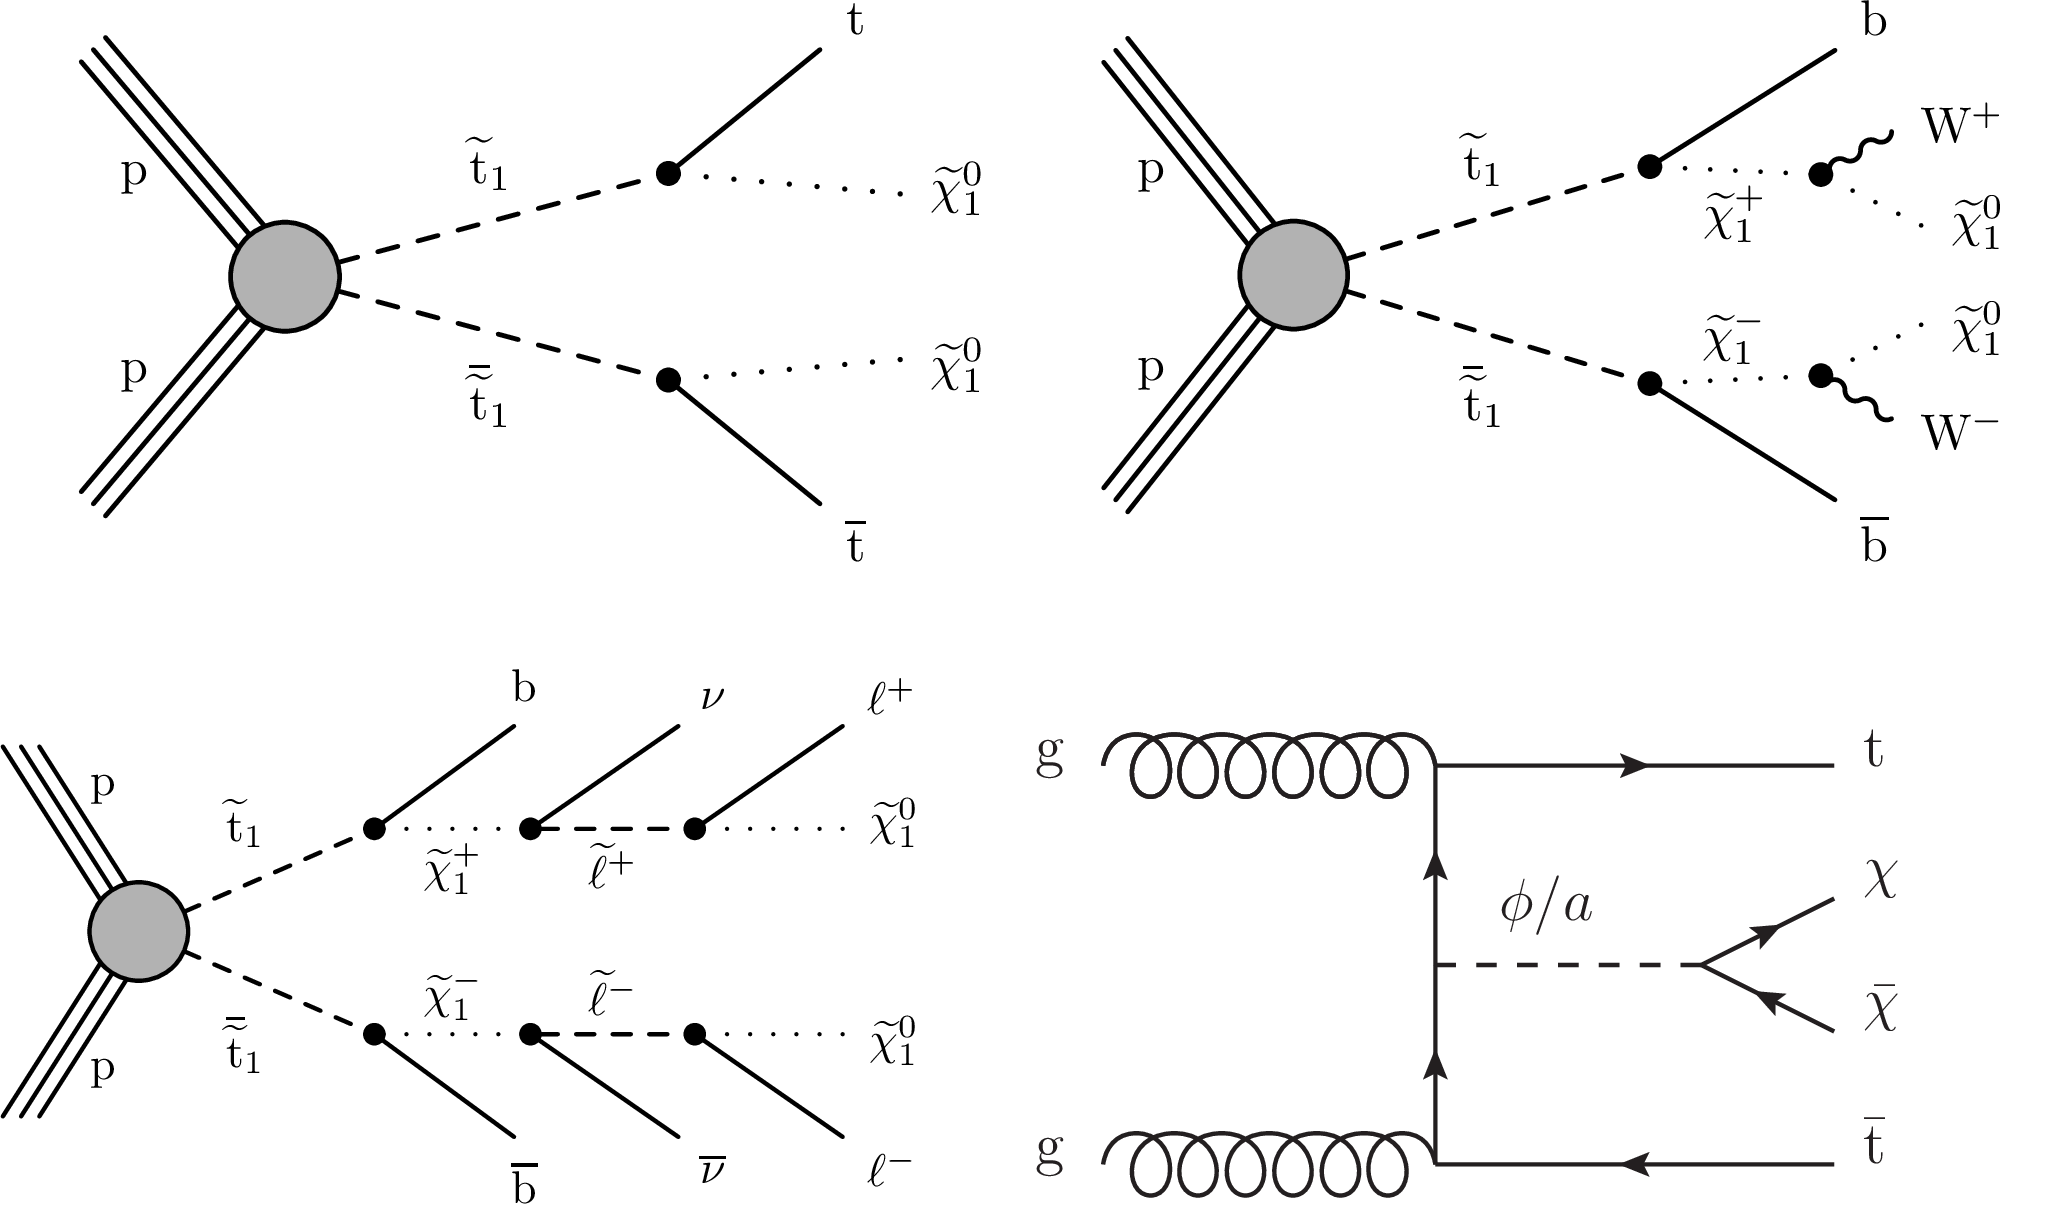
Figure 1:
Diagrams for simplified SUSY models and for direct DM production: strong production of top squark pairs $\tilde{\mathrm{t}}_{1} \overline{\tilde{\mathrm{t}}} _{1}$, where each top squark decays to a top quark and a $\tilde{\chi}^0_1$ (T2tt model, upper left), or where each top squark decays into a b quark and an intermediate $\tilde{\chi}^{\pm}_1$ that further decays into a W boson and a $\tilde{\chi}^0_1 $ (T2bW model, upper right), or to a neutrino and an intermediate slepton $\nu \tilde{\ell}^{\pm}$ that yield $\nu \tilde{\chi}^0_1 $ and an $\ell ^\pm $ from the virtual slepton decay (T8bb$\ell\ell\nu\nu$ model, lower left). Direct DM production through scalar or pseudoscalar mediators in association with top quarks is shown at the lower right. |
png pdf |
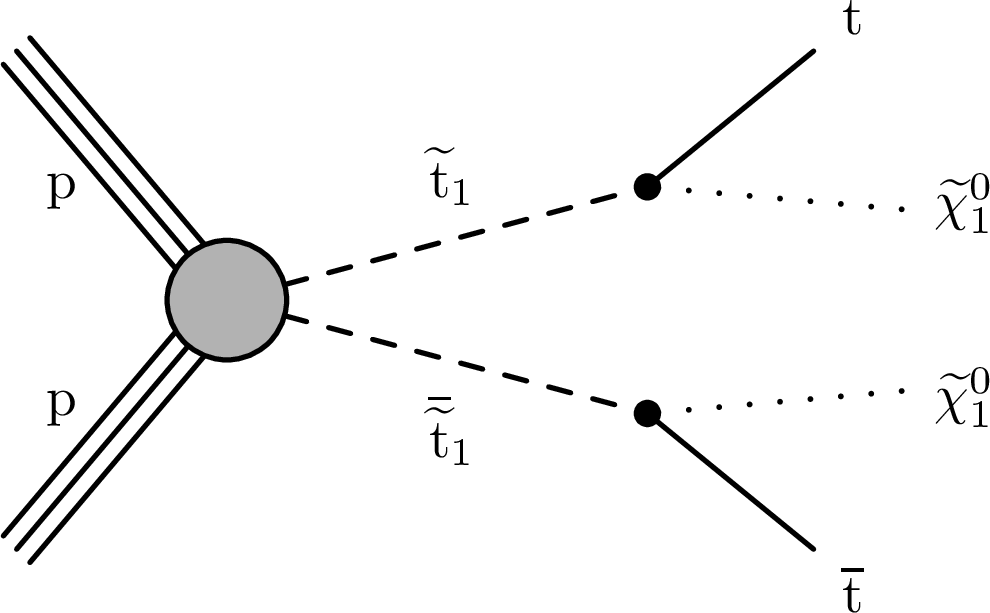
Figure 1-a:
Diagram for a simplified SUSY model of direct DM production: strong production of top squark pairs $\tilde{\mathrm{t}}_{1} \overline{\tilde{\mathrm{t}}} _{1}$, where each top squark decays to a top quark and a $\tilde{\chi}^0_1$ (T2tt model). |

png pdf |
Figure 1-b:
Diagram for a simplified SUSY model of direct DM production: strong production of top squark pairs $\tilde{\mathrm{t}}_{1} \overline{\tilde{\mathrm{t}}} _{1}$, where each top squark decays into a b quark and an intermediate $\tilde{\chi}^{\pm}_1$ that further decays into a W boson and a $\tilde{\chi}^0_1 $ (T2bW model). |
png pdf |
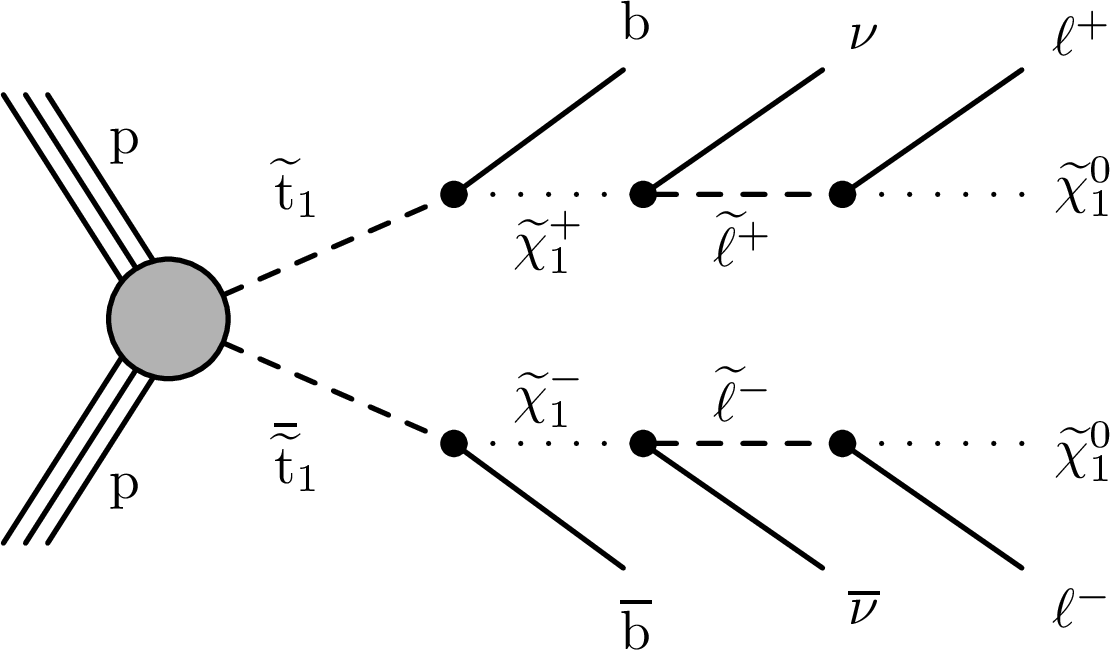
Figure 1-c:
Diagram for a simplified SUSY model of direct DM production: strong production of top squark pairs $\tilde{\mathrm{t}}_{1} \overline{\tilde{\mathrm{t}}} _{1}$, where each top squark decays into a b quark and an intermediate $\tilde{\chi}^{\pm}_1$ that further decays into a neutrino and an intermediate slepton $\nu \tilde{\ell}^{\pm}$ that yield $\nu \tilde{\chi}^0_1 $ and an $\ell ^\pm $ from the virtual slepton decay (T8bb$\ell\ell\nu\nu$ model). |
png pdf |
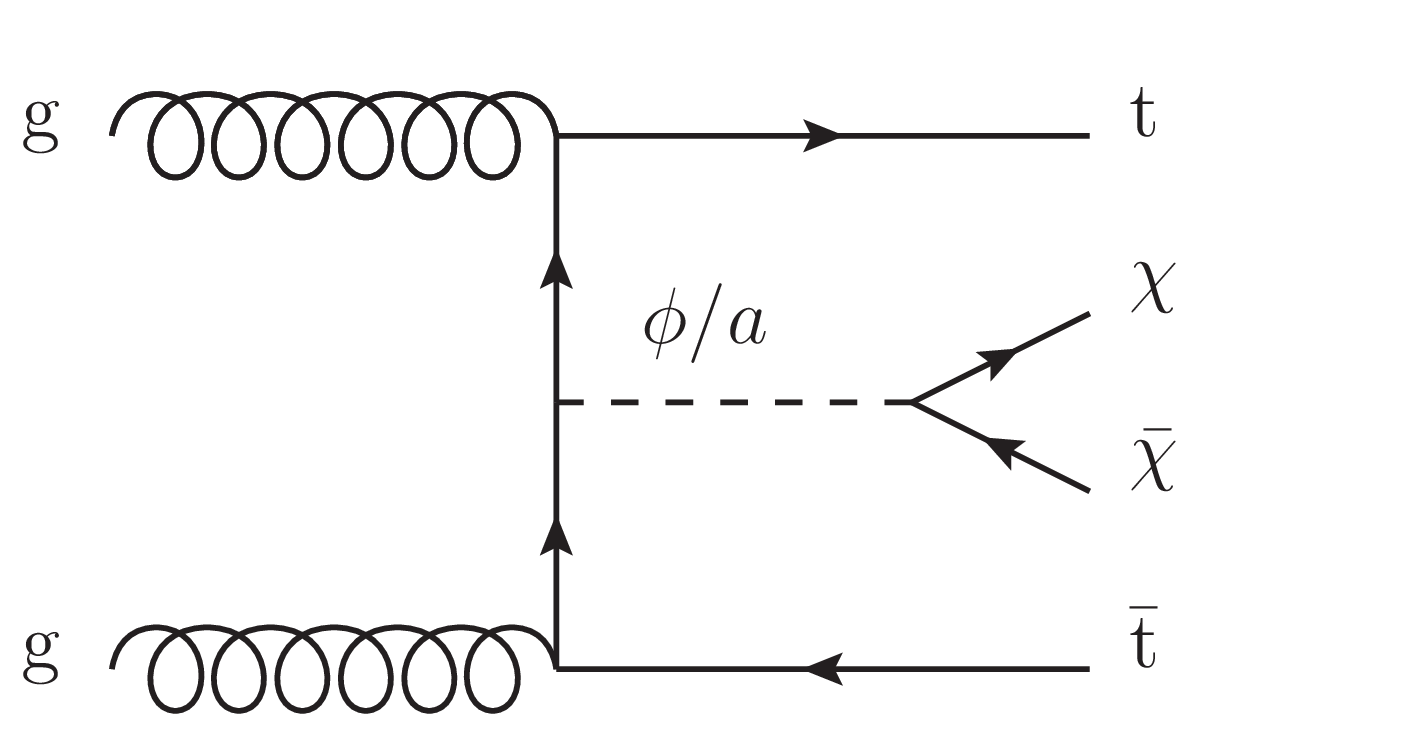
Figure 1-d:
Diagram for a simplified SUSY model of direct DM production: direct DM production through scalar or pseudoscalar mediators in association with top quarks. |
png pdf |
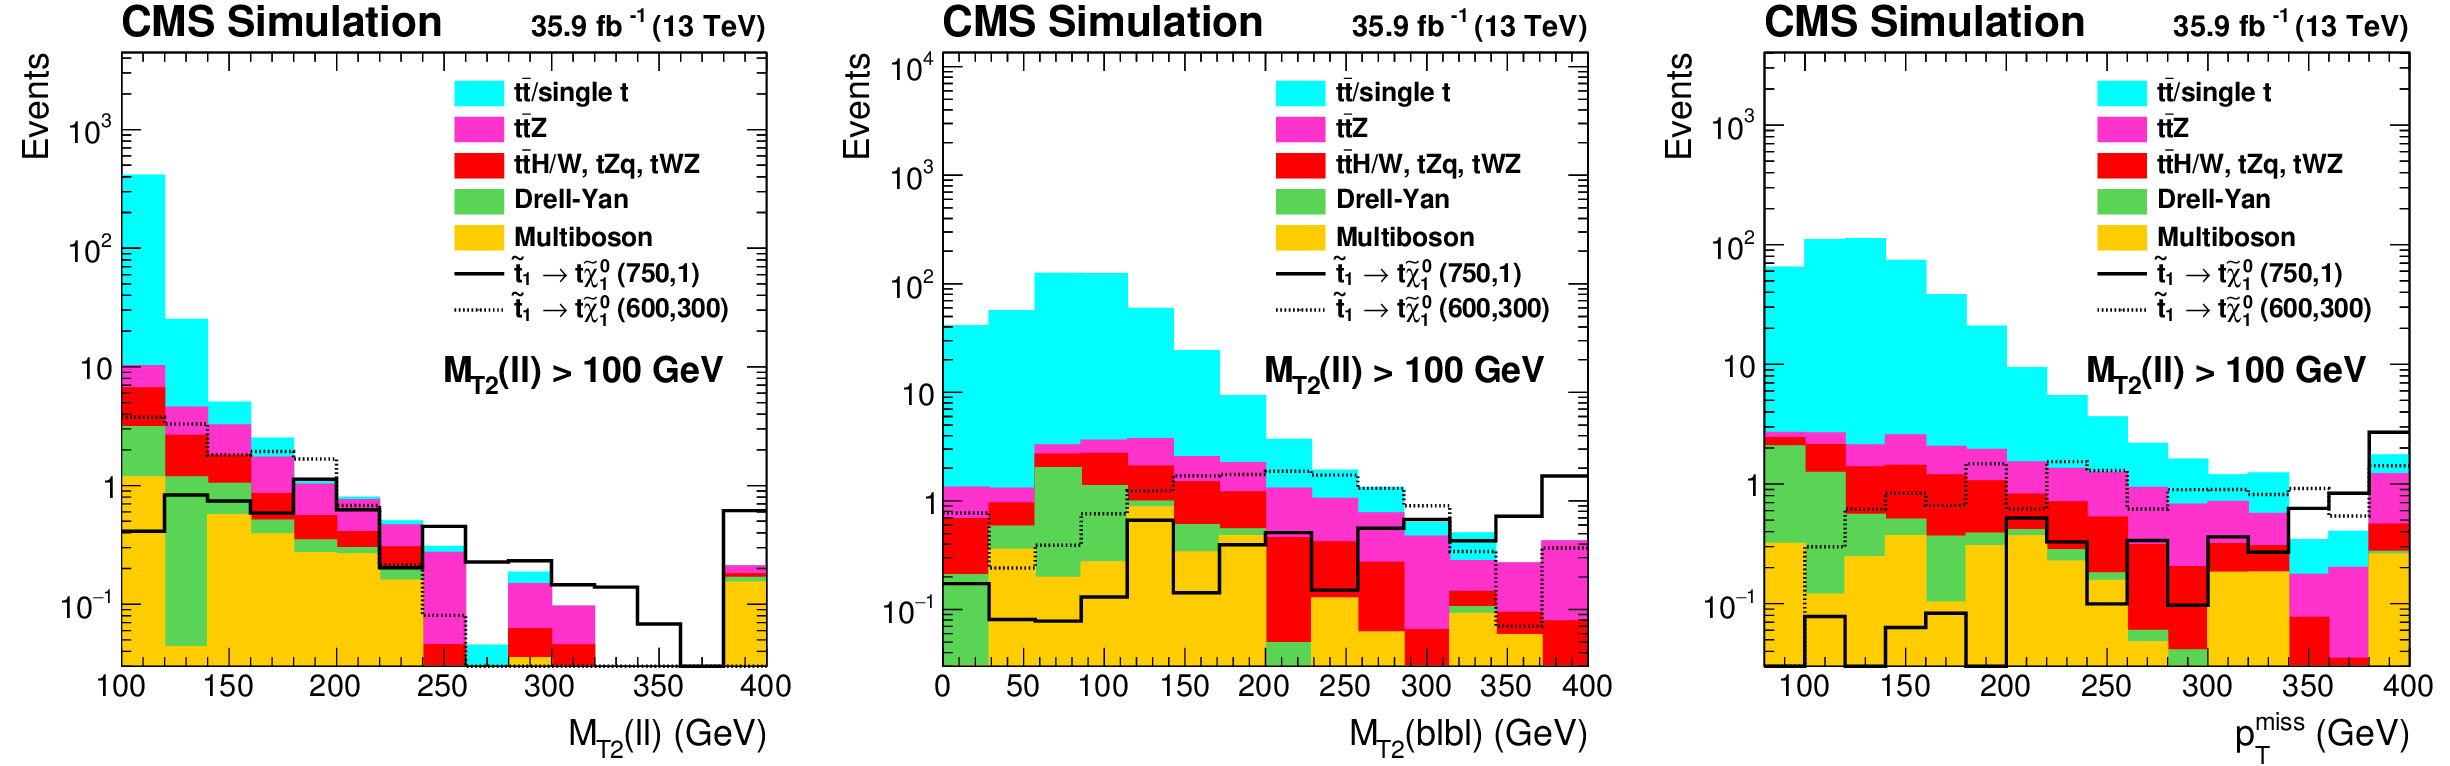
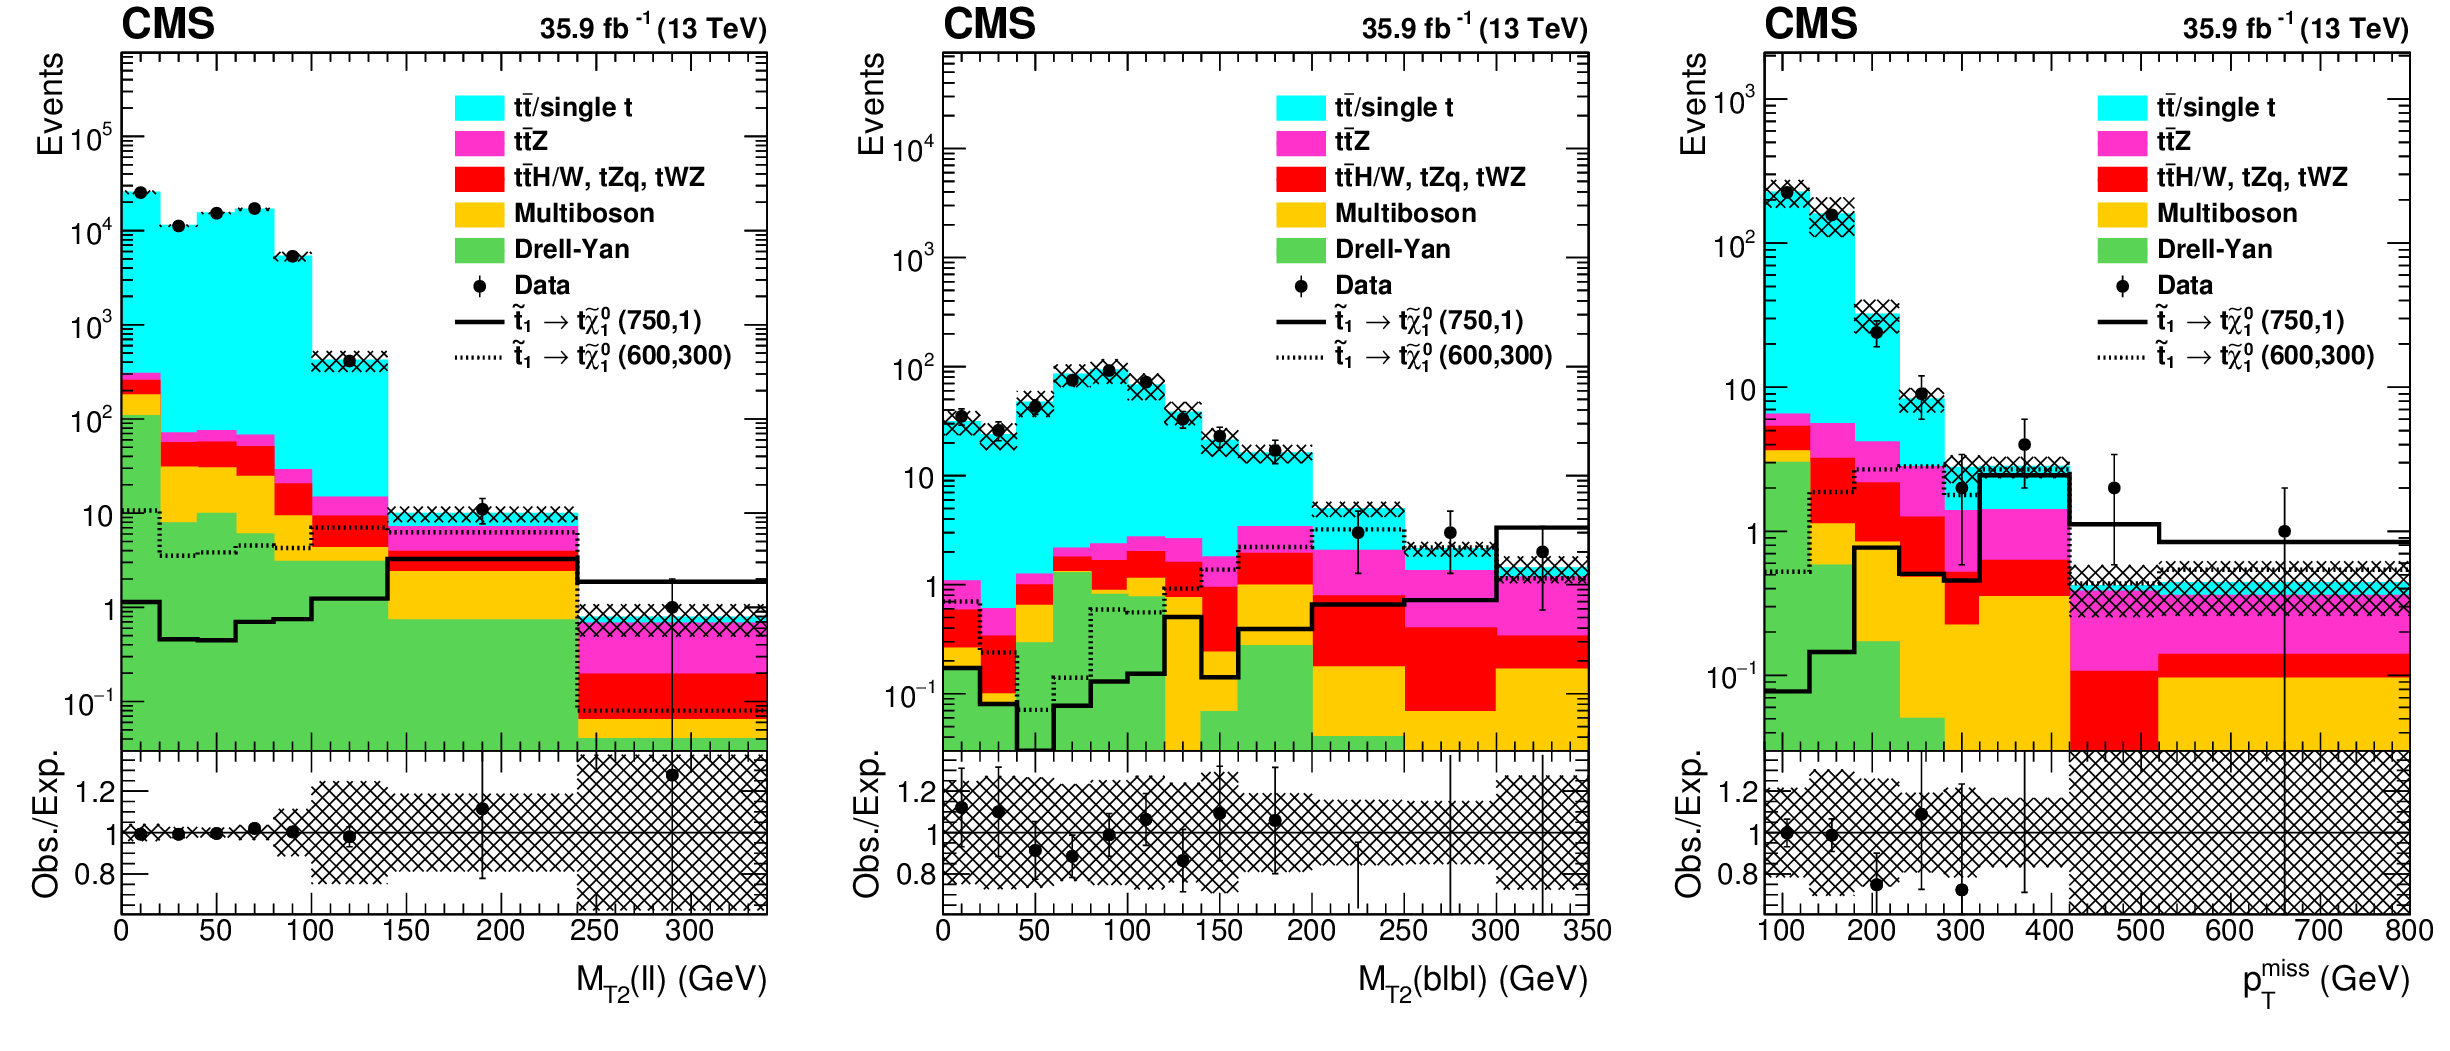
Figure 2:
Distributions of ${M_{\text {T2}}(\ell \ell)} $ (left), $ {M_{\text {T2}}(\mathrm{b} \ell \mathrm{b} \ell)}$ (center), and ${{p_{\mathrm {T}}} ^\text {miss}}$ (right) in simulation after preselection and requiring $ {M_{\text {T2}}(\ell \ell)} > $ 100 GeV. A T2tt signal is shown with masses $m_{\tilde{\mathrm{t}}} = $ 750 GeV and $m_{\tilde{\chi}^0_1} = $ 1 GeV, as well as a more compressed signal with $m_{\tilde{\mathrm{t}}} = $ 600 GeV and $m_{\tilde{\chi}^0_1} = $ 300 GeV. |
png pdf root |
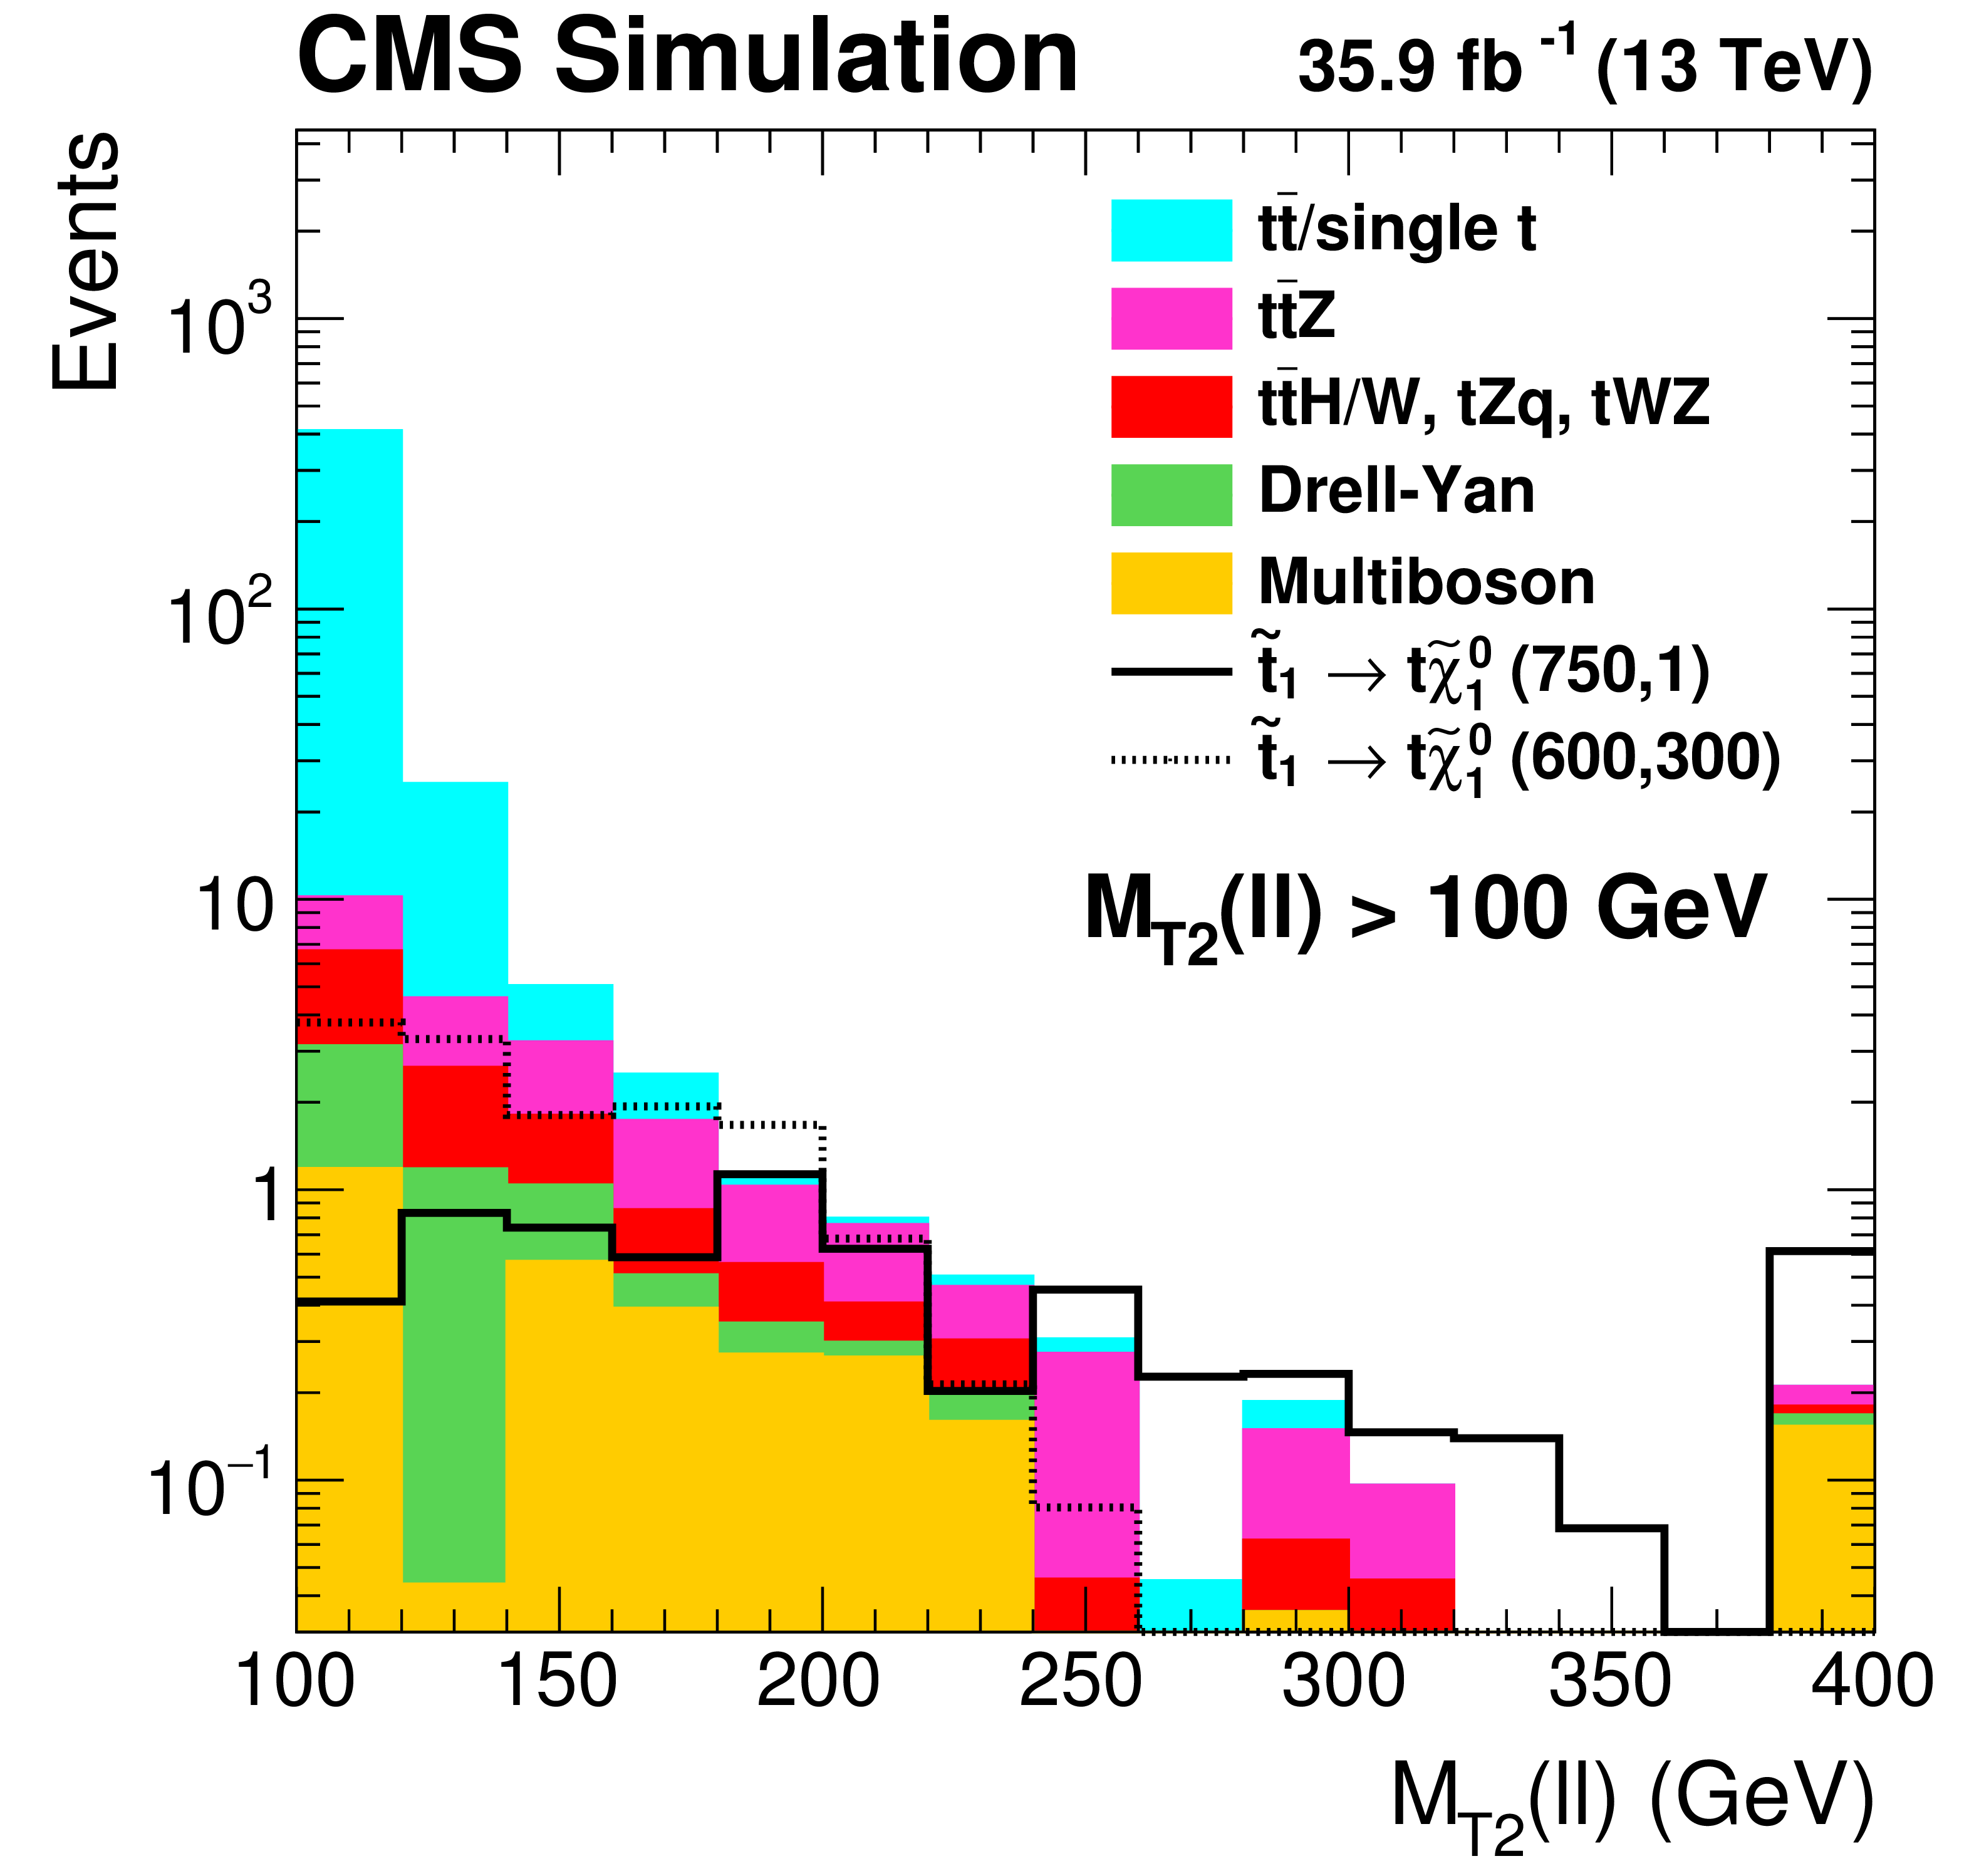
Figure 2-a:
Distribution of ${M_{\text {T2}}(\ell \ell)} $ in simulation after preselection and requiring $ {M_{\text {T2}}(\ell \ell)} > $ 100 GeV. A T2tt signal is shown with masses $m_{\tilde{\mathrm{t}}} = $ 750 GeV and $m_{\tilde{\chi}^0_1} = $ 1 GeV, as well as a more compressed signal with $m_{\tilde{\mathrm{t}}} = $ 600 GeV and $m_{\tilde{\chi}^0_1} = $ 300 GeV. |
png pdf root |
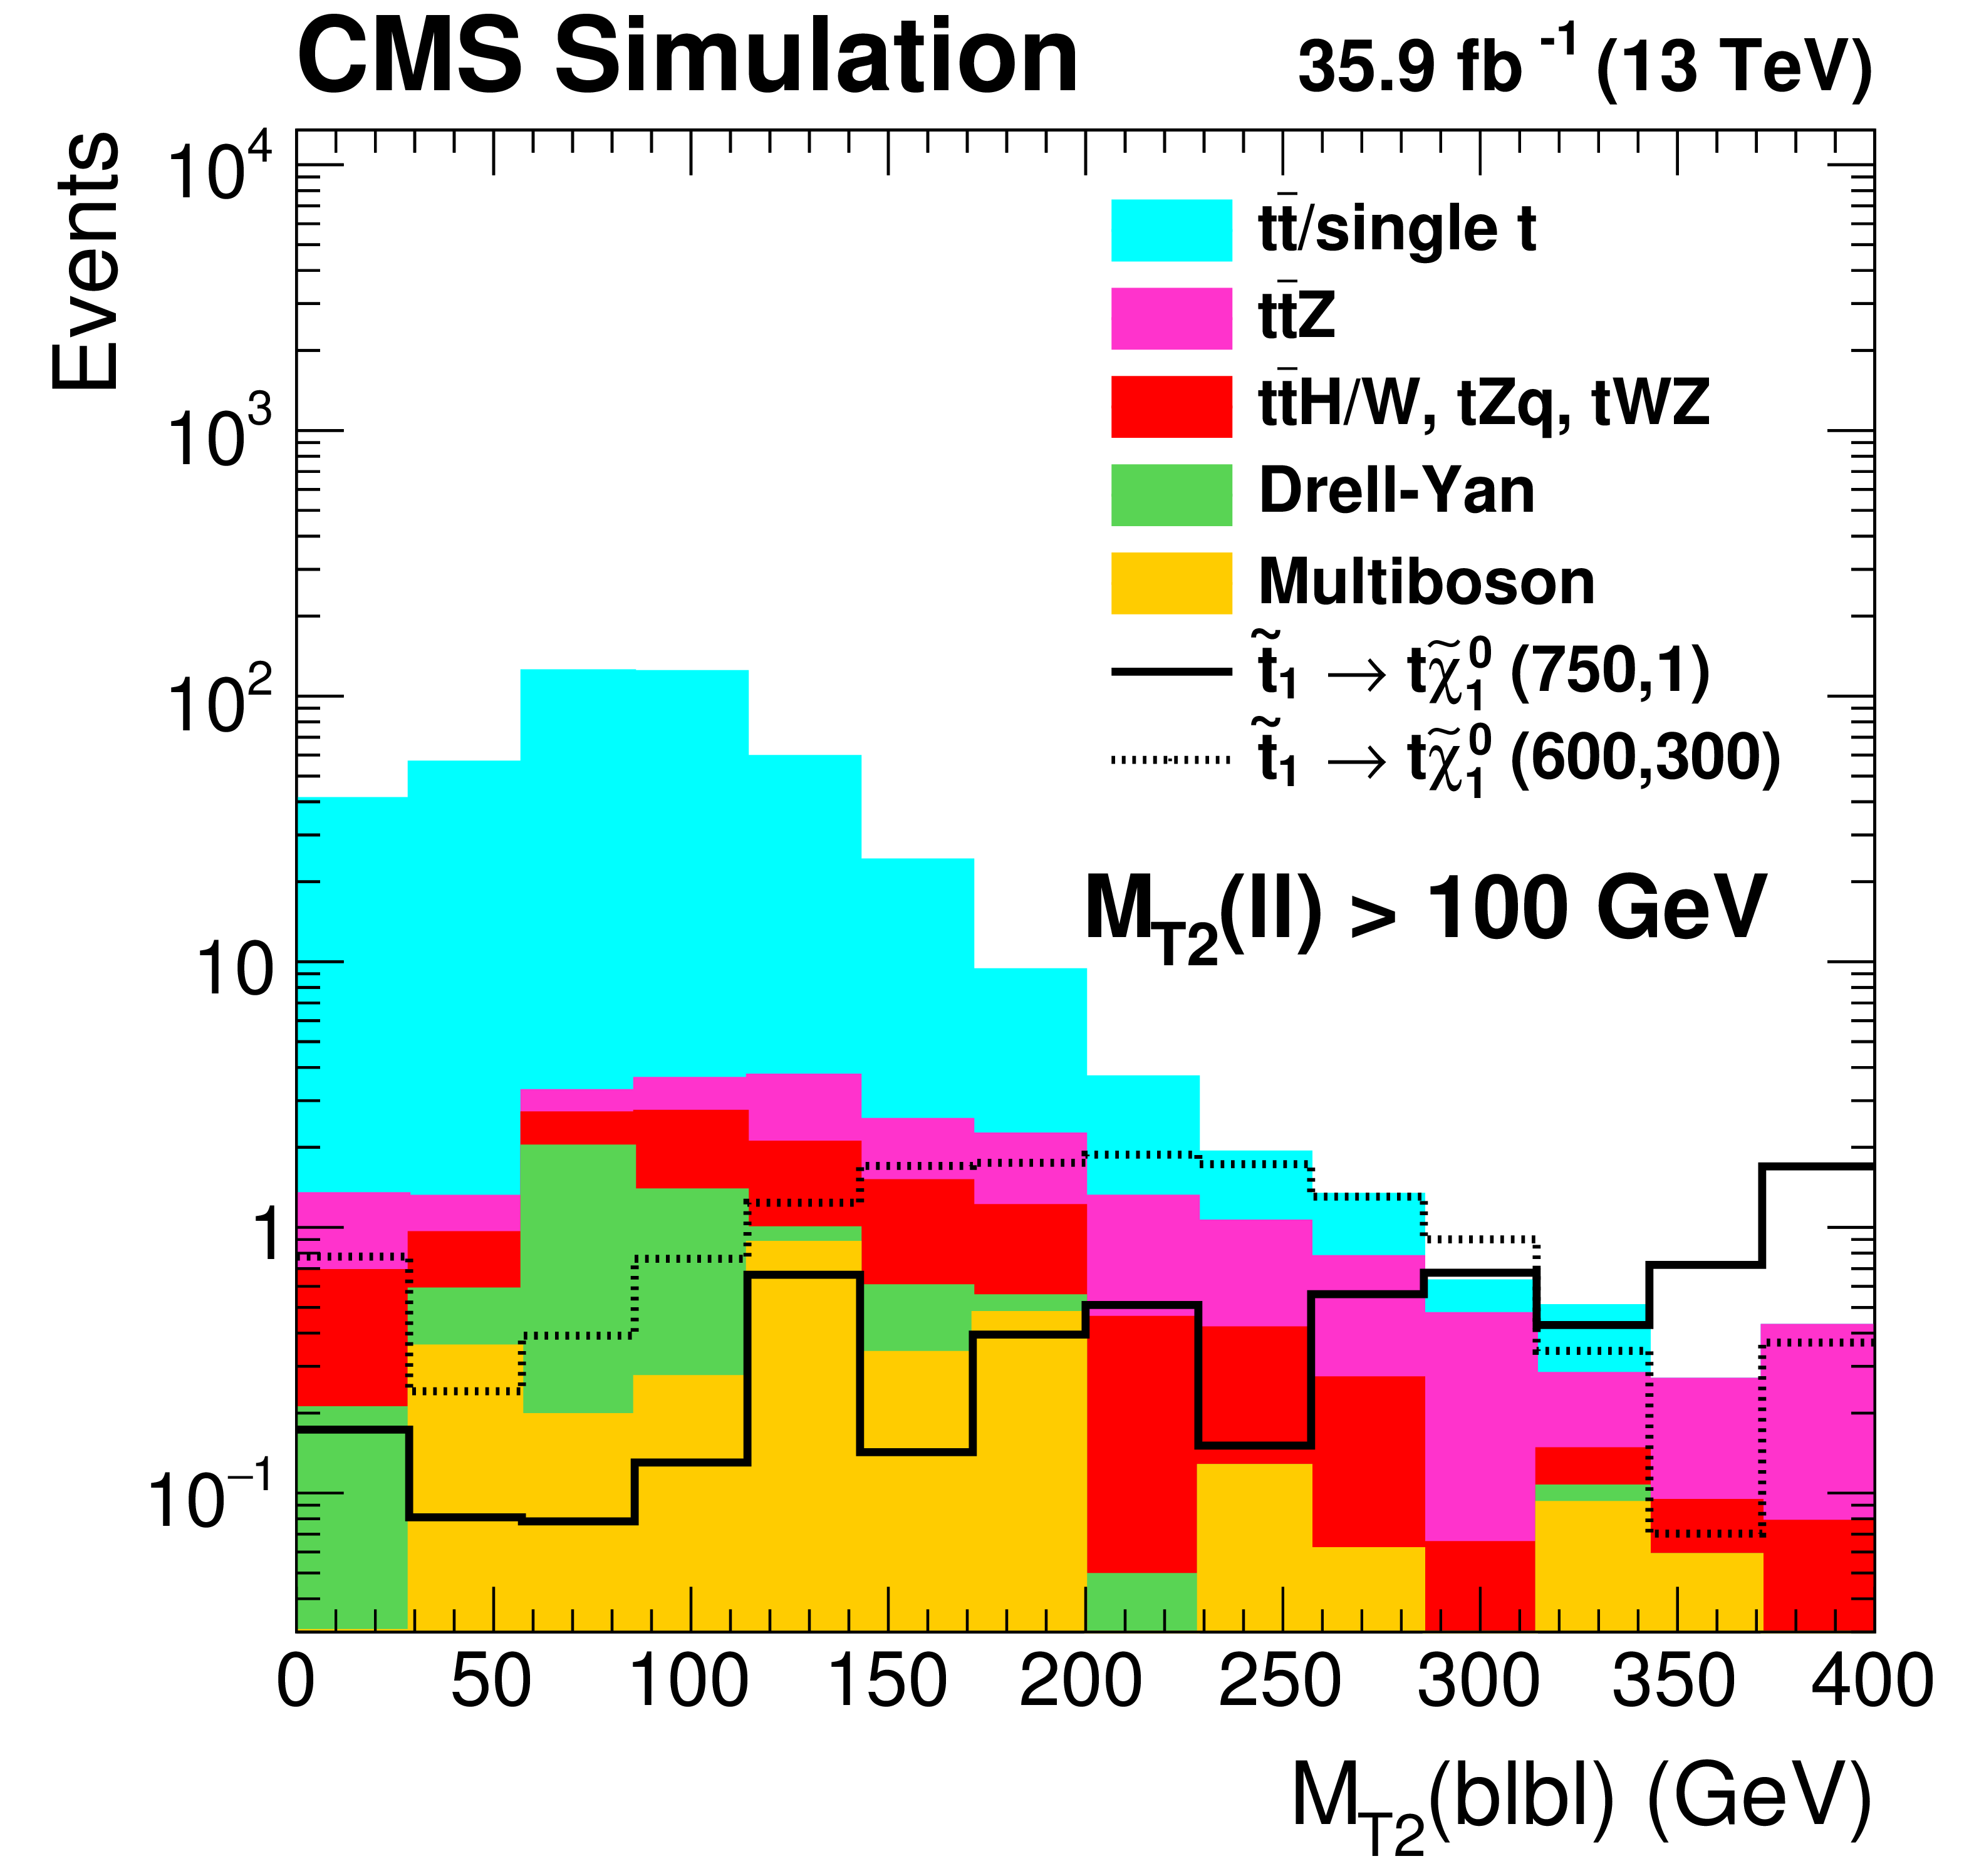
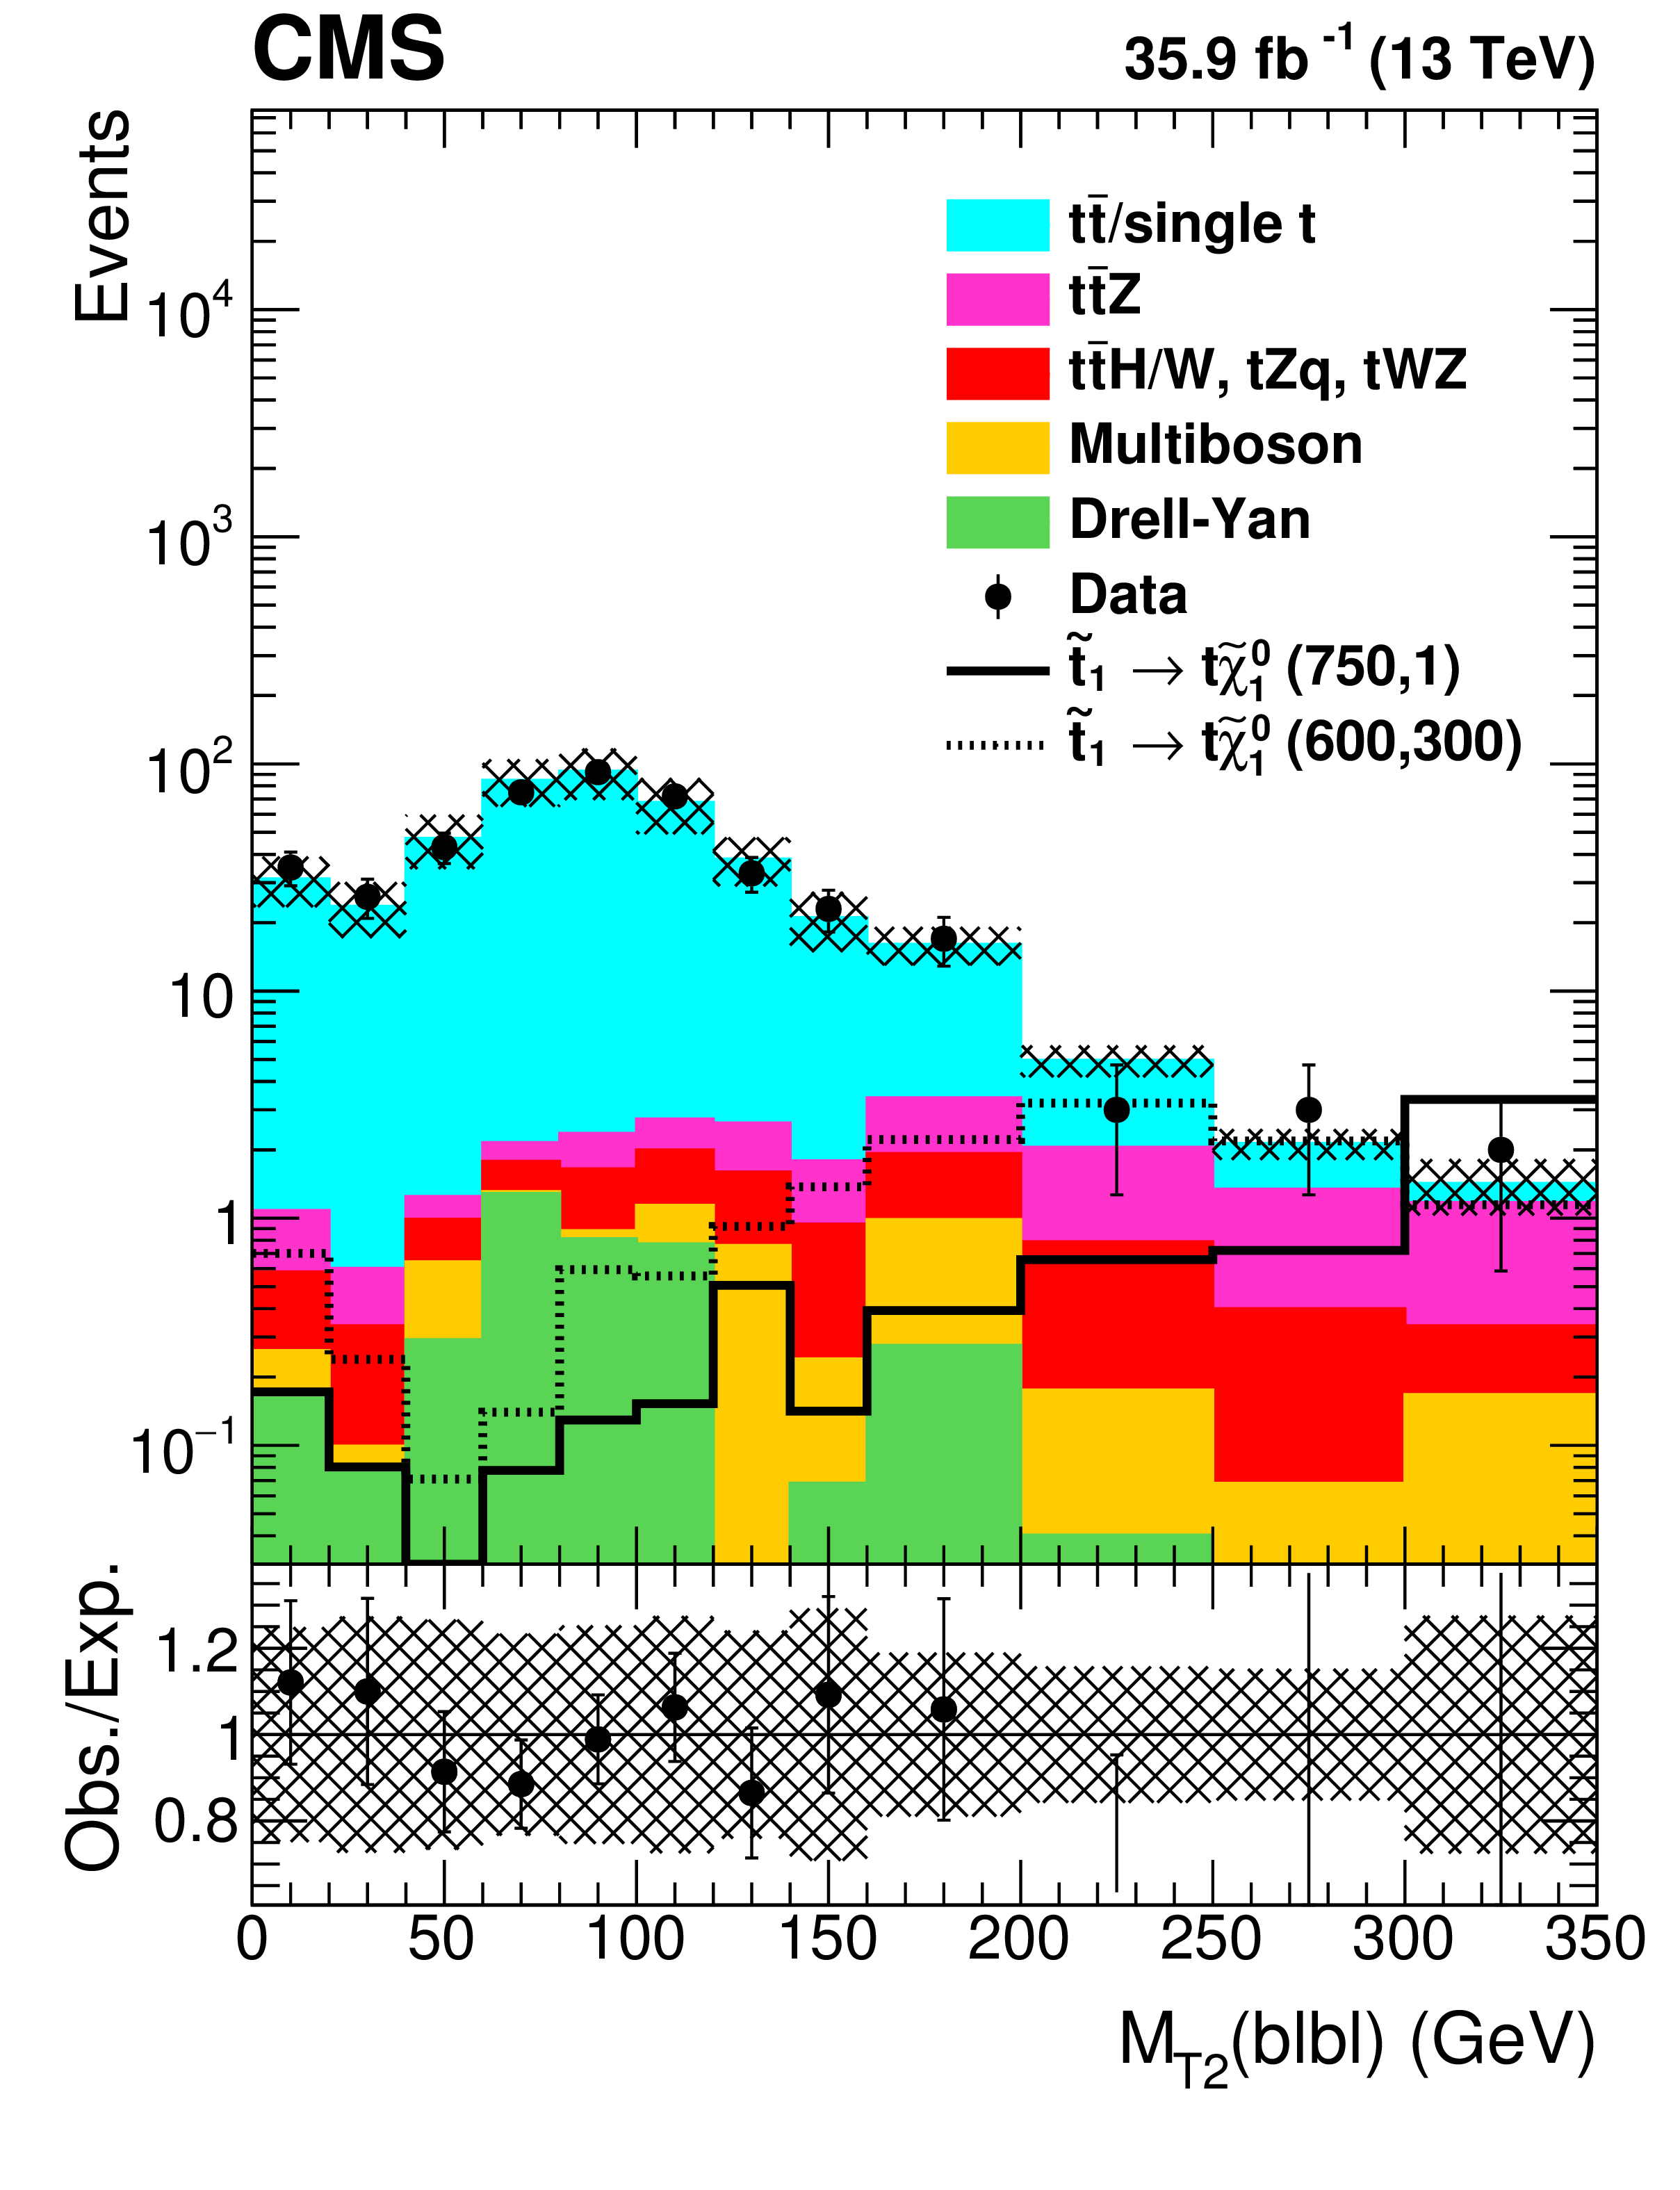
Figure 2-b:
Distribution of $ {M_{\text {T2}}(\mathrm{b} \ell \mathrm{b} \ell)}$ in simulation after preselection and requiring $ {M_{\text {T2}}(\ell \ell)} > $ 100 GeV. A T2tt signal is shown with masses $m_{\tilde{\mathrm{t}}} = $ 750 GeV and $m_{\tilde{\chi}^0_1} = $ 1 GeV, as well as a more compressed signal with $m_{\tilde{\mathrm{t}}} = $ 600 GeV and $m_{\tilde{\chi}^0_1} = $ 300 GeV. |
png pdf root |
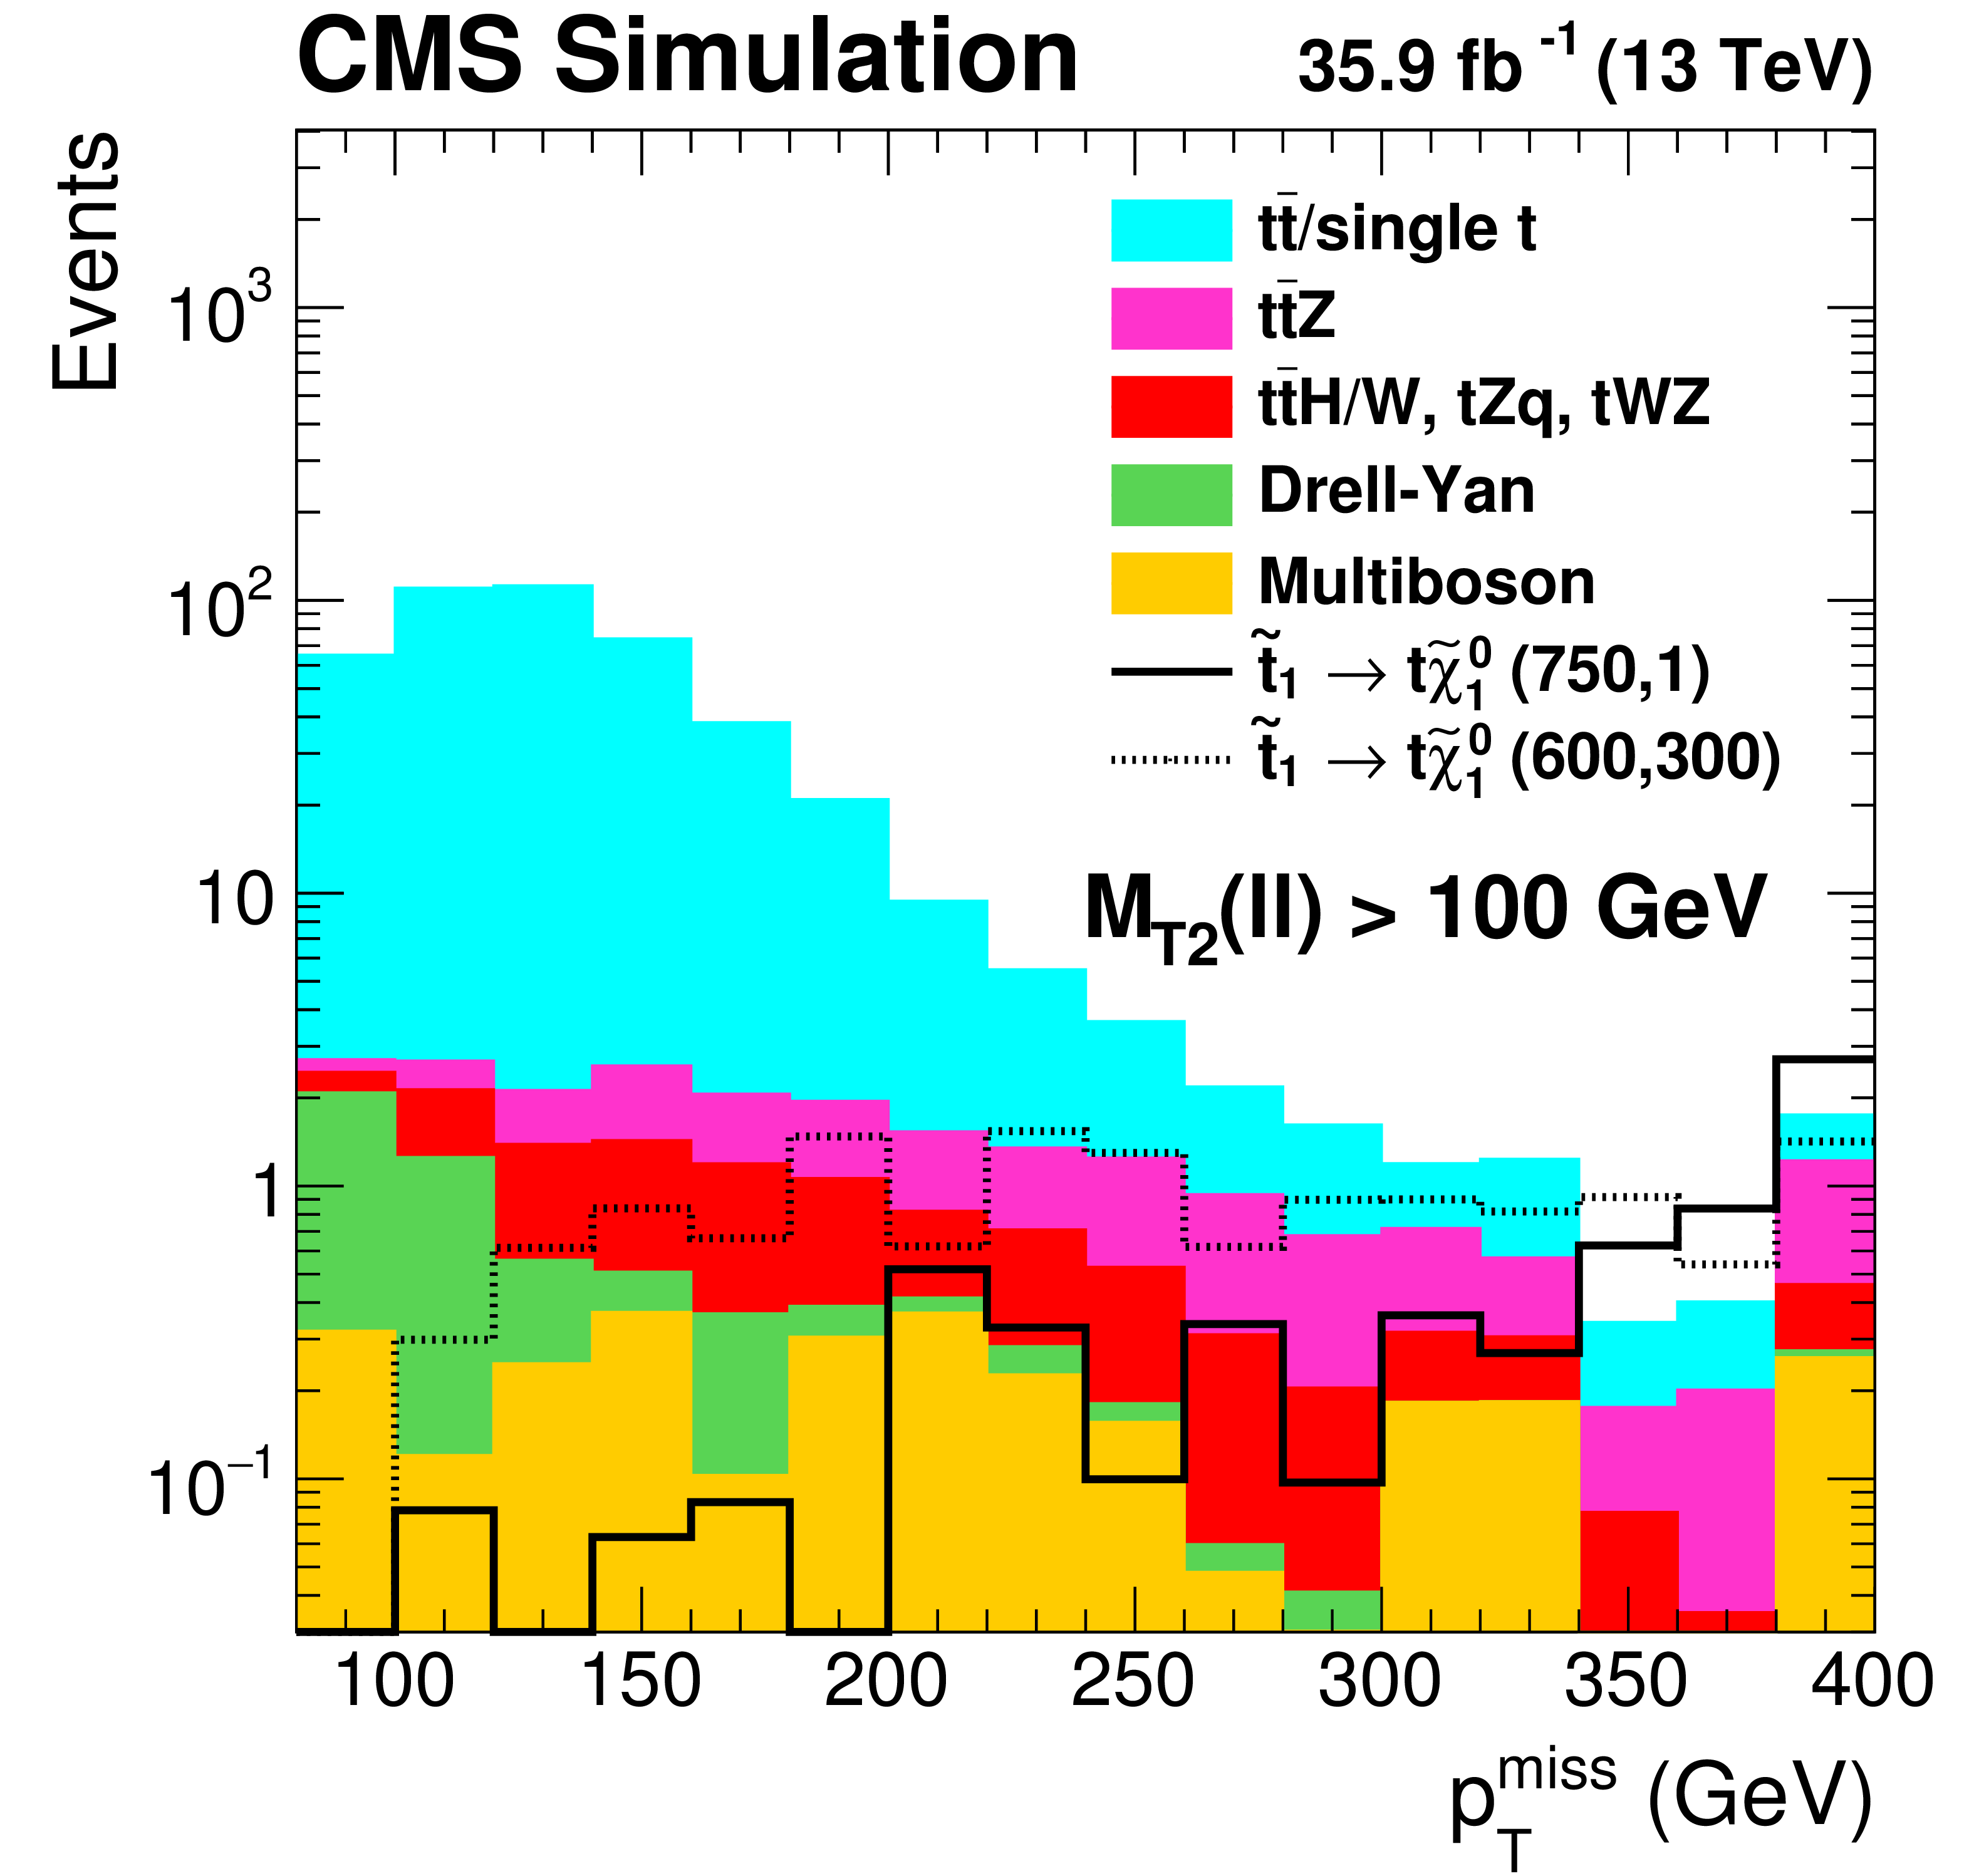
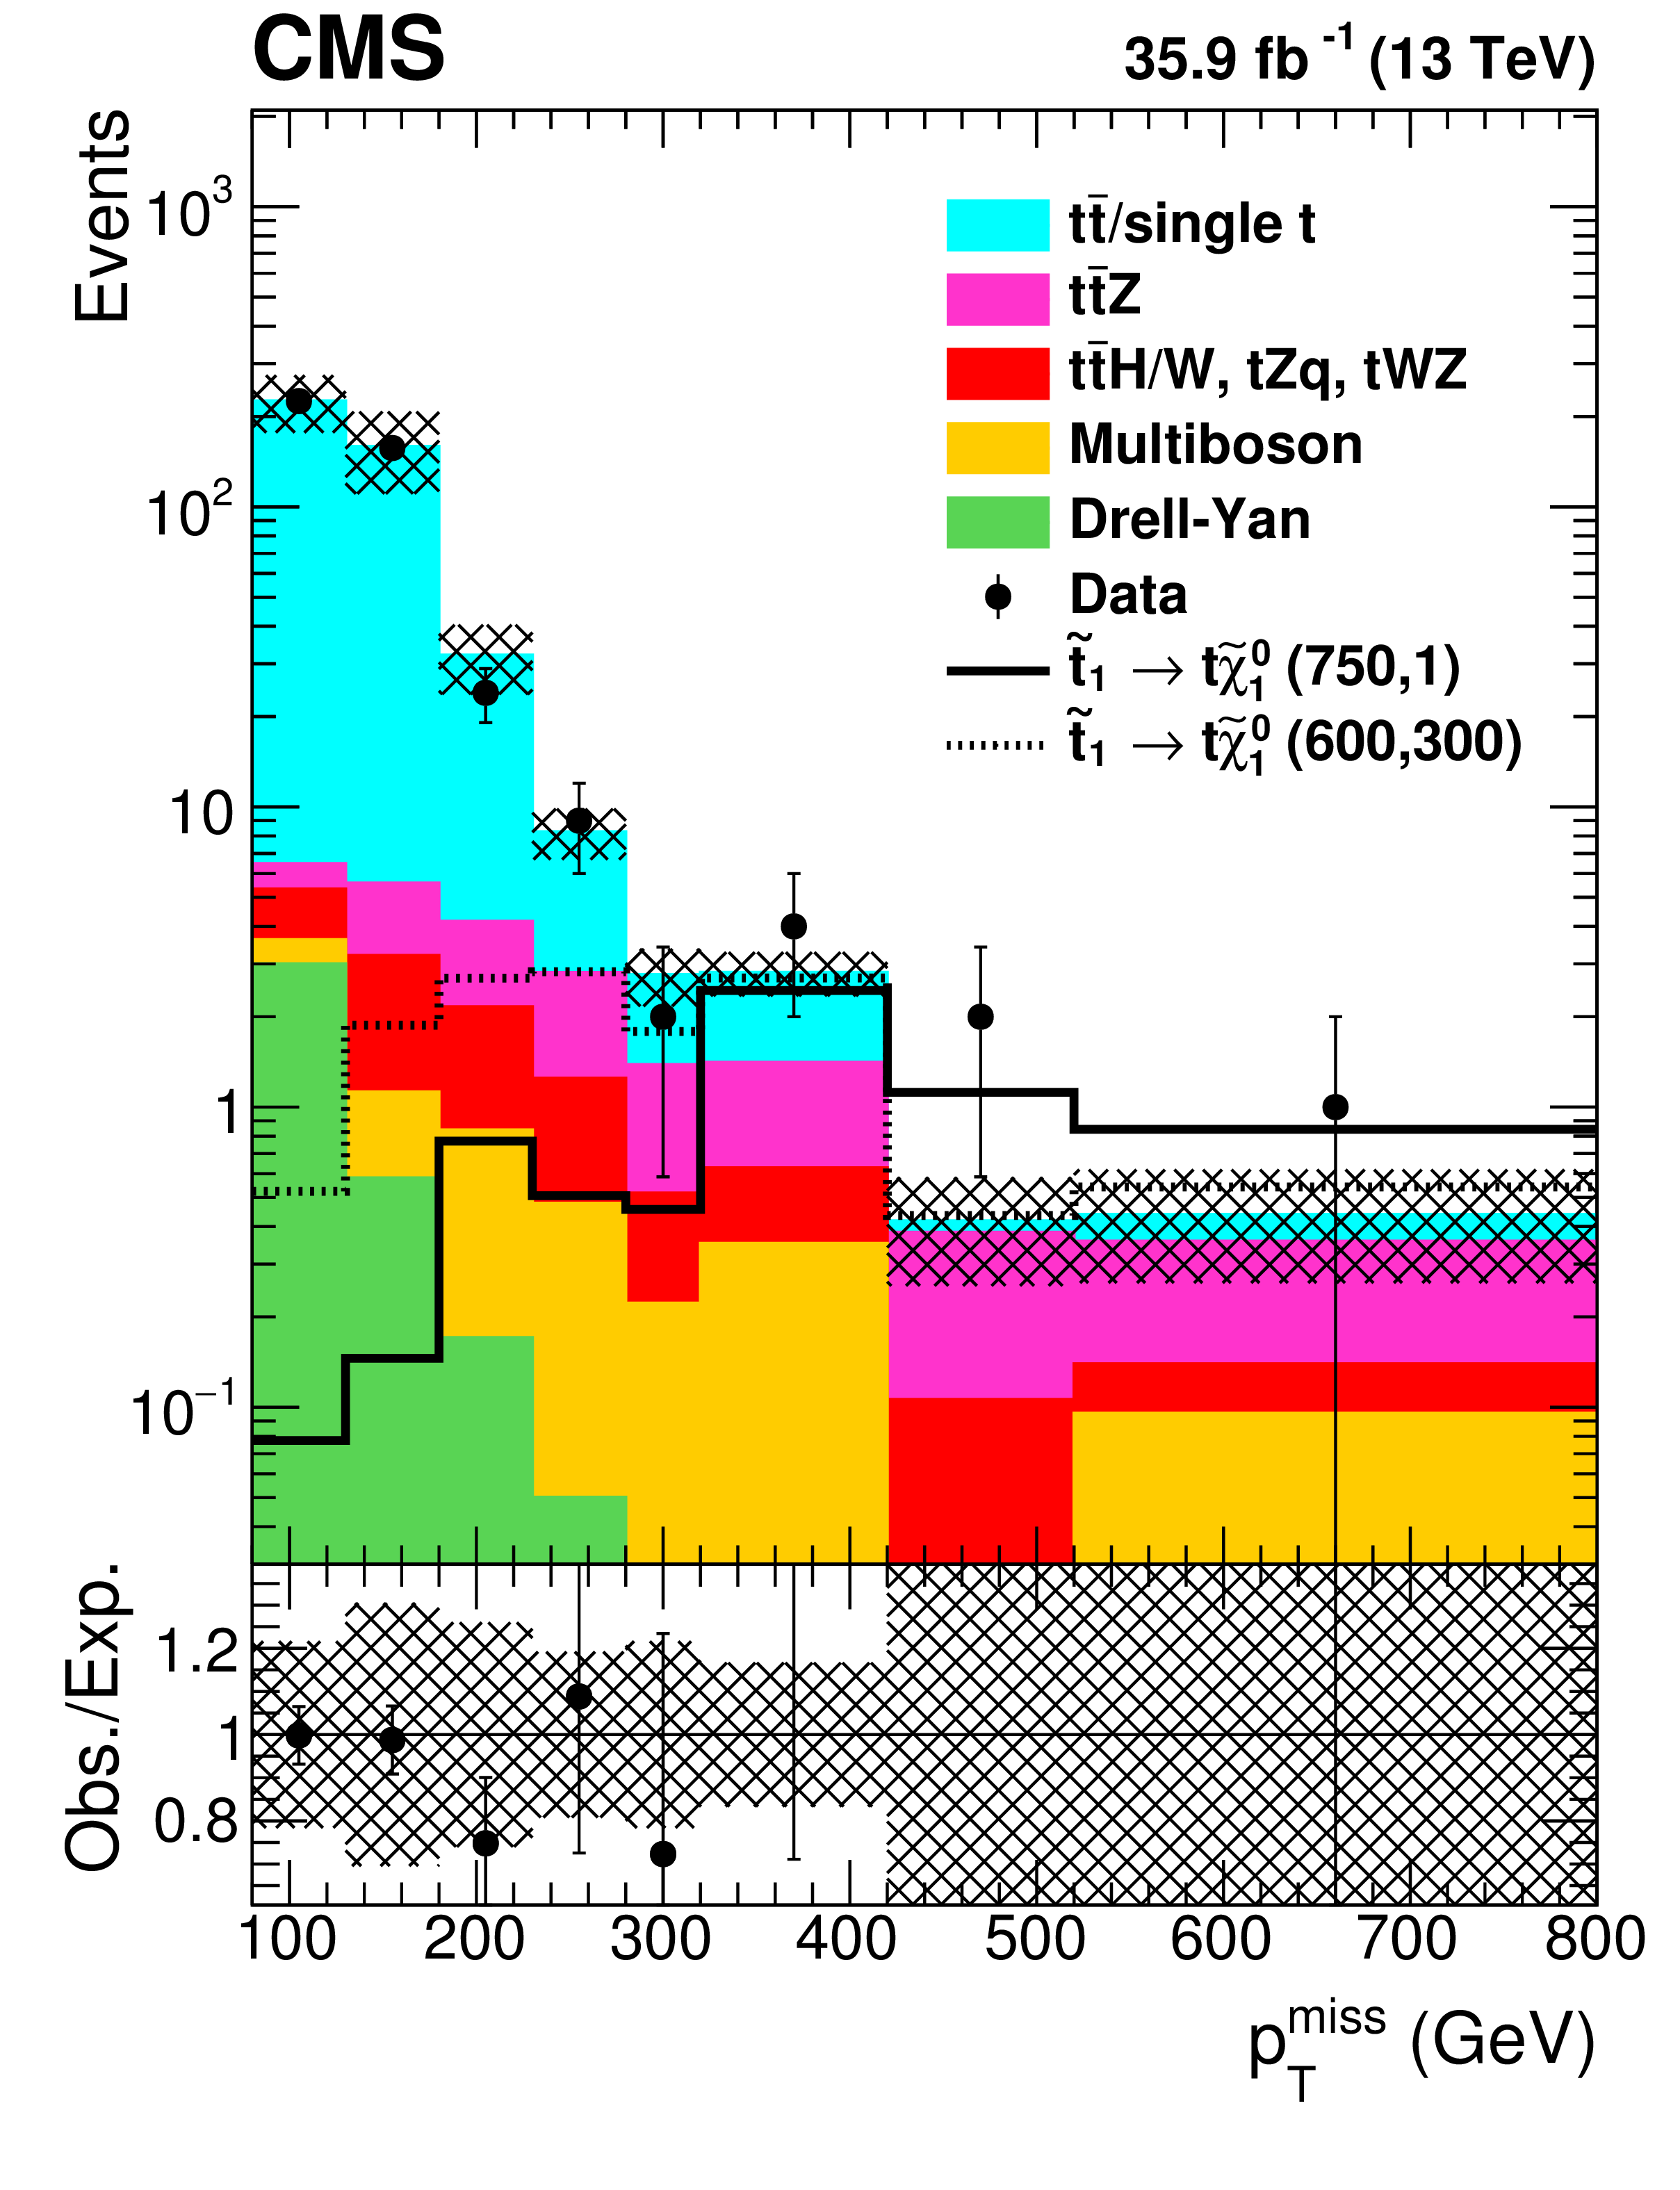
Figure 2-c:
Distribution of ${{p_{\mathrm {T}}} ^\text {miss}}$ in simulation after preselection and requiring $ {M_{\text {T2}}(\ell \ell)} > $ 100 GeV. A T2tt signal is shown with masses $m_{\tilde{\mathrm{t}}} = $ 750 GeV and $m_{\tilde{\chi}^0_1} = $ 1 GeV, as well as a more compressed signal with $m_{\tilde{\mathrm{t}}} = $ 600 GeV and $m_{\tilde{\chi}^0_1} = $ 300 GeV. |

png pdf |
Figure 3:
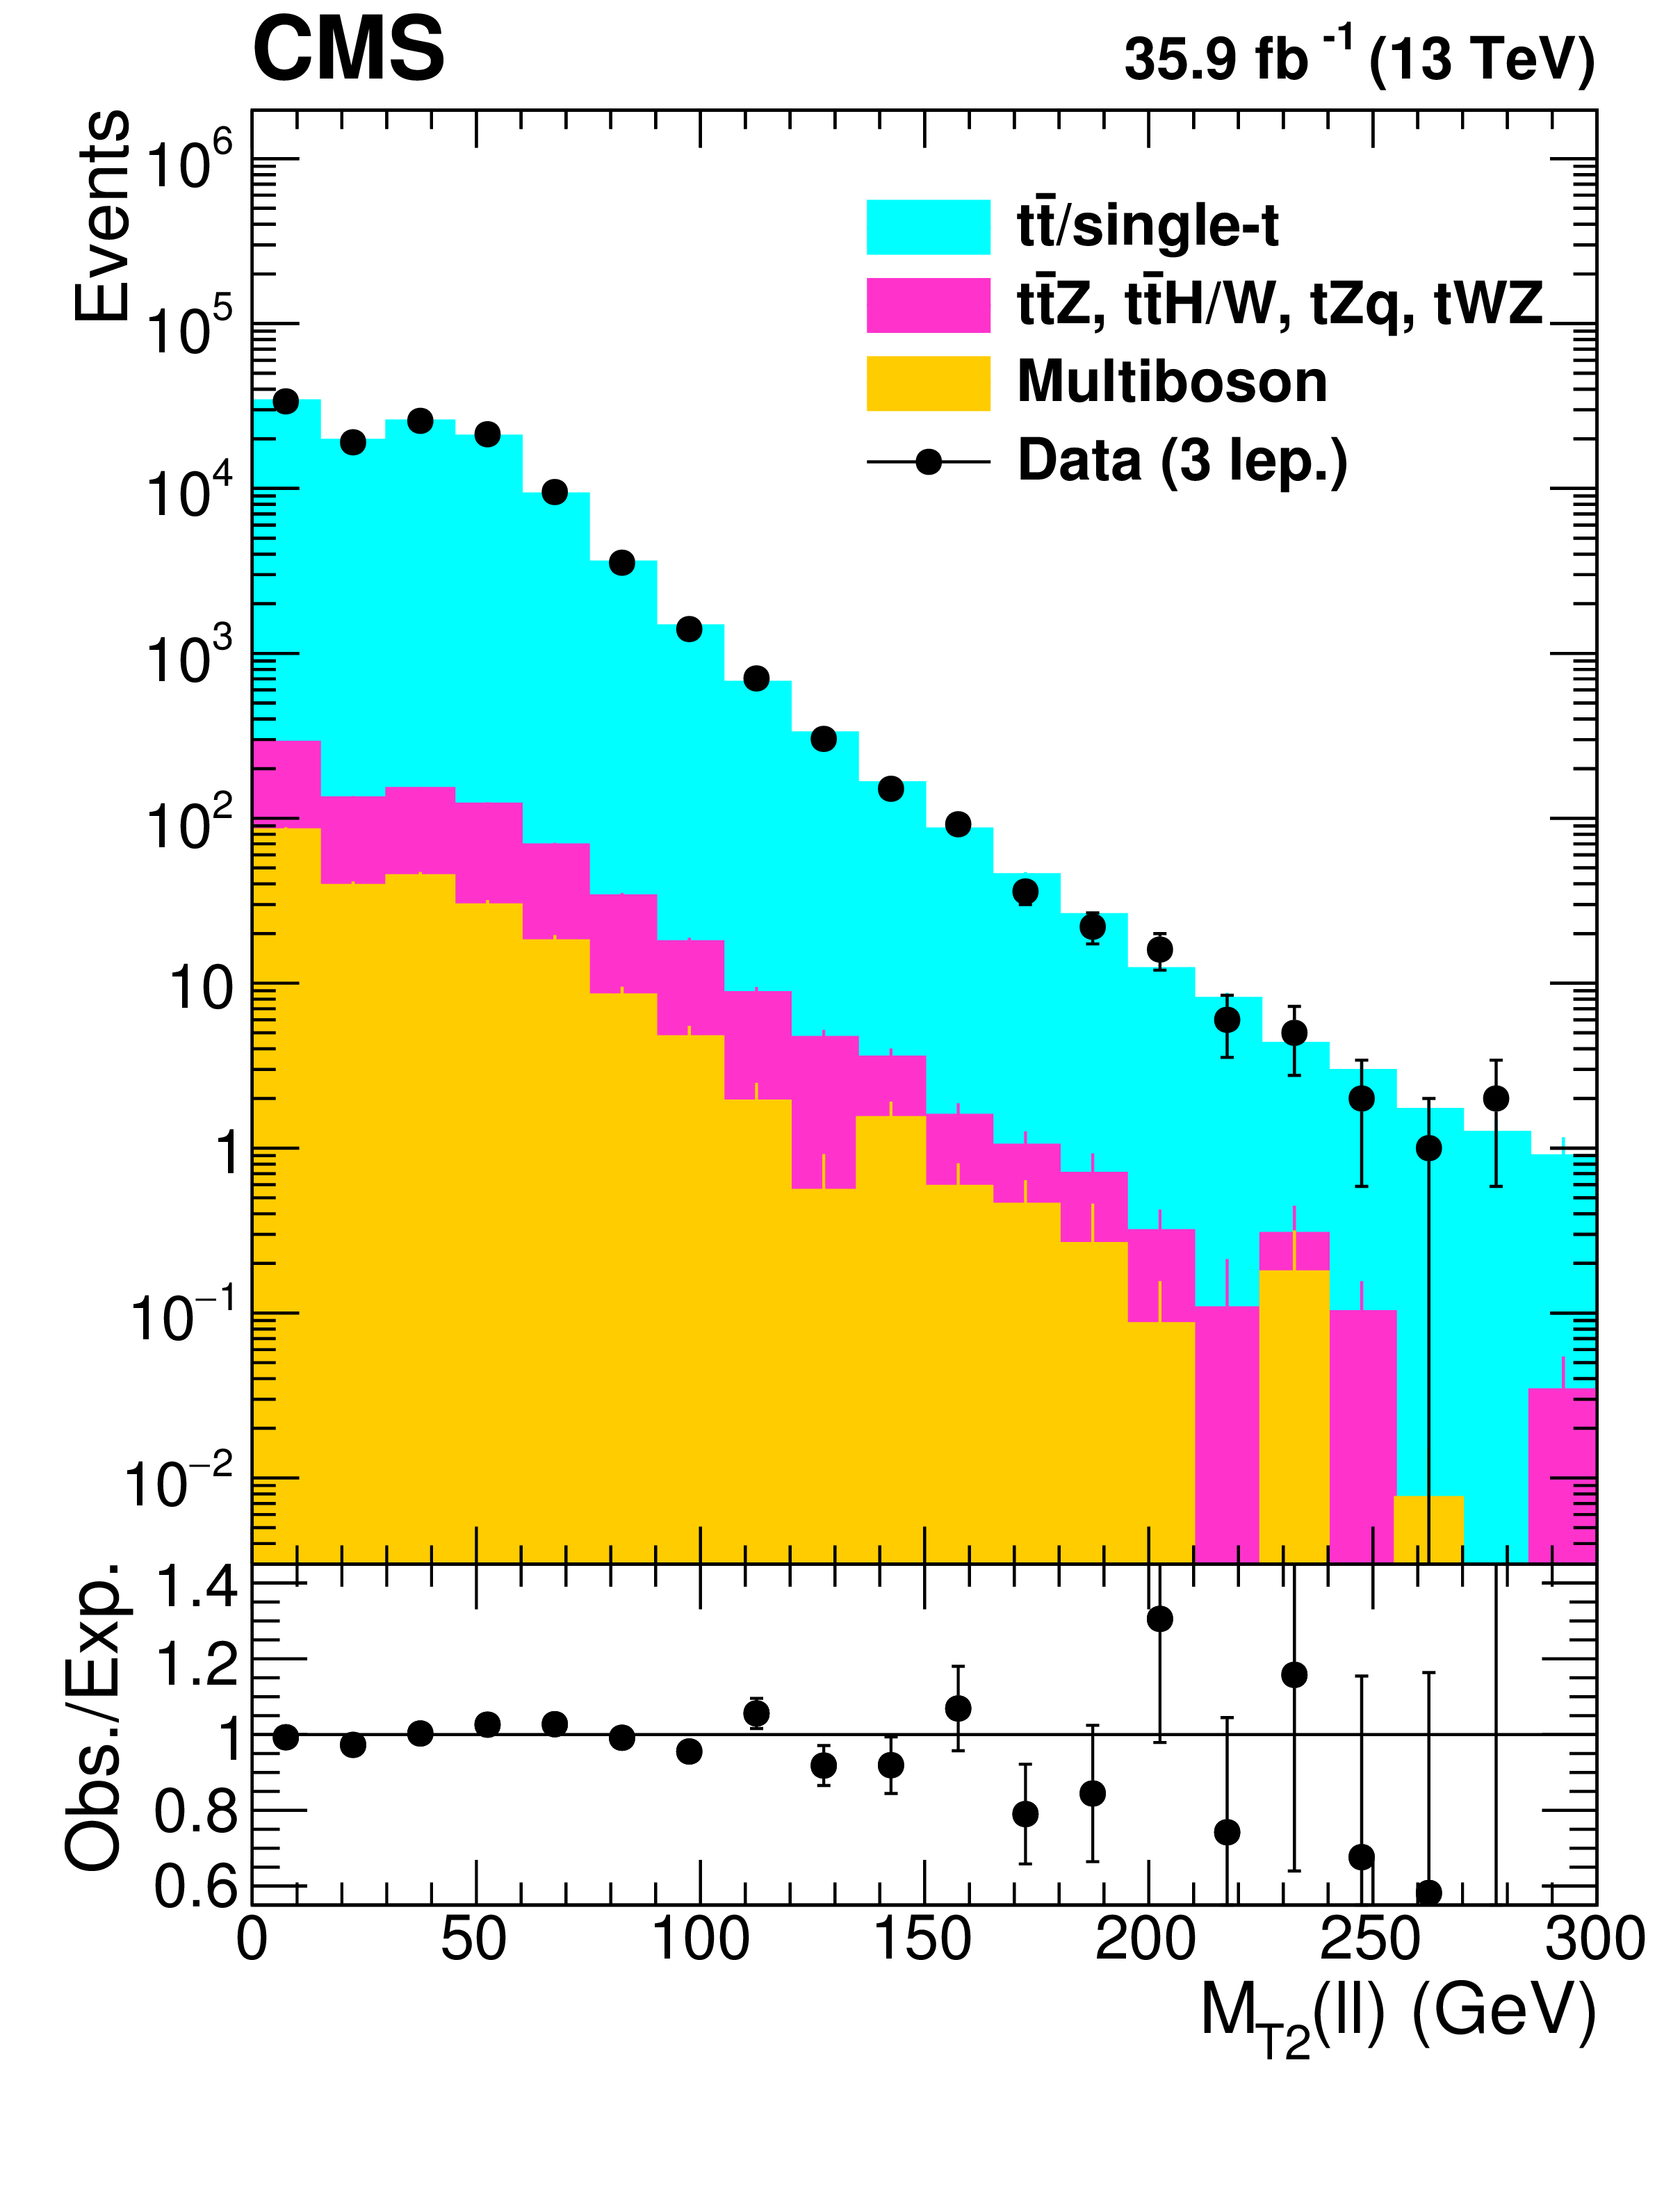
Left : distribution of ${M_{\text {T2}}(\ell \ell)}$ in a control region enriched in ${\mathrm{t} {}\mathrm{\bar{t}}} $ events and defined by $ {N_\text {jets}} \geq $ 2, $ {N_\text {b jets}} \geq $ 1, and $ {{p_{\mathrm {T}}} ^\text {miss}} < $ 80 GeV. The hatched band shows the uncertainties from experimental effects, as described in Section 7. Right : distribution of ${M_{\text {T2}}(\ell \ell)}$ after swapping an isolated lepton with an additional non-isolated lepton, as described in the text. For both plots, simulated yields are normalized to data using the yields in the $ {M_{\text {T2}}(\ell \ell)} < $ 100 GeV region. |
png pdf root |
Figure 3-a:
Distribution of ${M_{\text {T2}}(\ell \ell)}$ in a control region enriched in ${\mathrm{t} {}\mathrm{\bar{t}}} $ events and defined by $ {N_\text {jets}} \geq $ 2, $ {N_\text {b jets}} \geq $ 1, and $ {{p_{\mathrm {T}}} ^\text {miss}} < $ 80 GeV. The hatched band shows the uncertainties from experimental effects, as described in Section 7. Simulated yields are normalized to data using the yields in the $ {M_{\text {T2}}(\ell \ell)} < $ 100 GeV region. |
png pdf |
Figure 3-b:
Distribution of ${M_{\text {T2}}(\ell \ell)}$ after swapping an isolated lepton with an additional non-isolated lepton, as described in the text. Simulated yields are normalized to data using the yields in the $ {M_{\text {T2}}(\ell \ell)} < $ 100 GeV region. |
png pdf |
Figure 4:
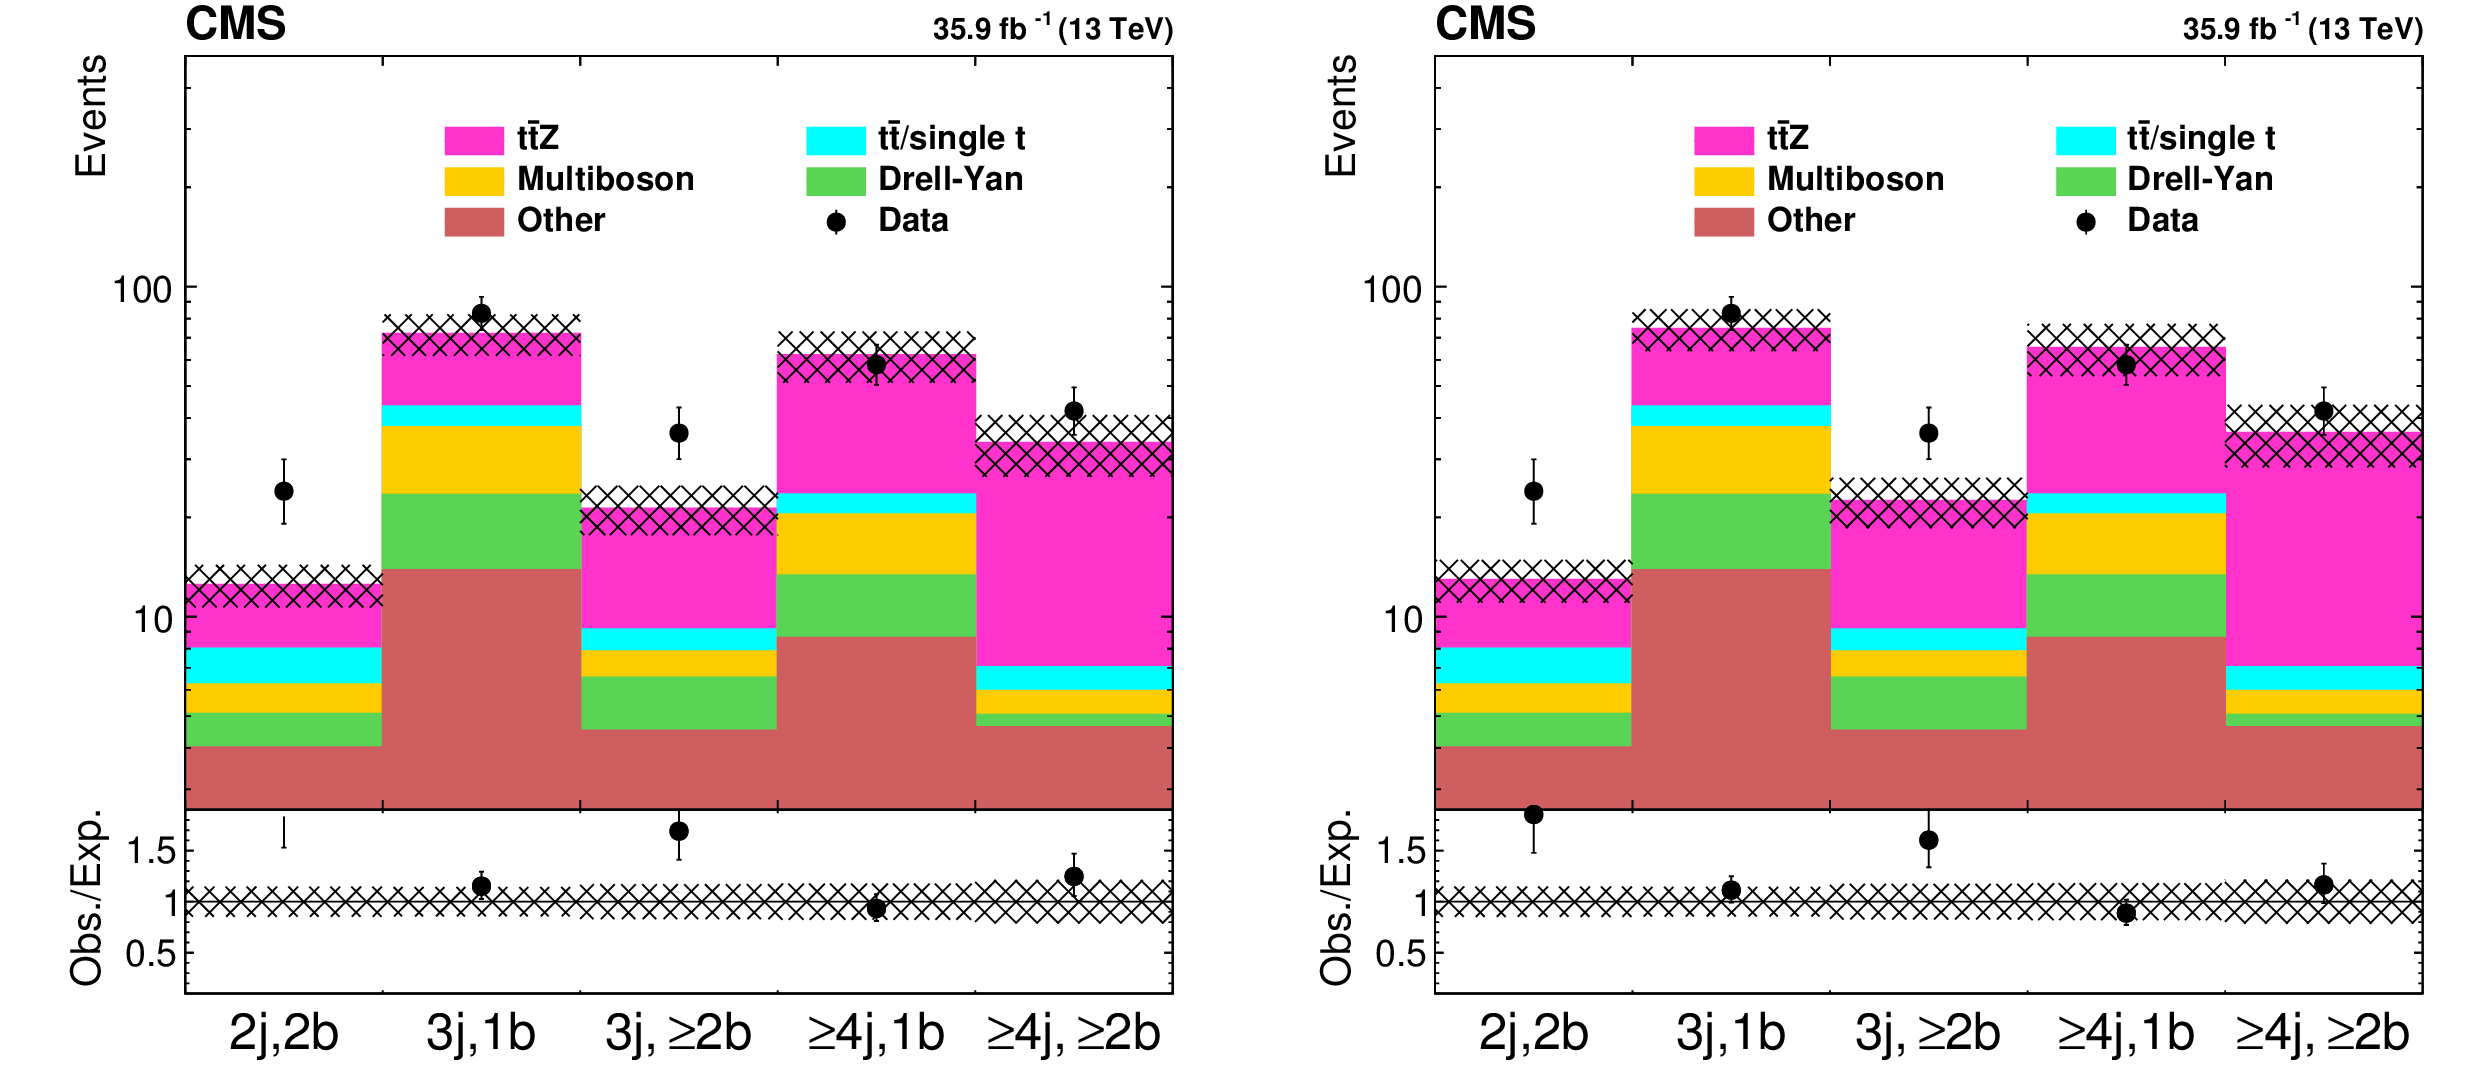
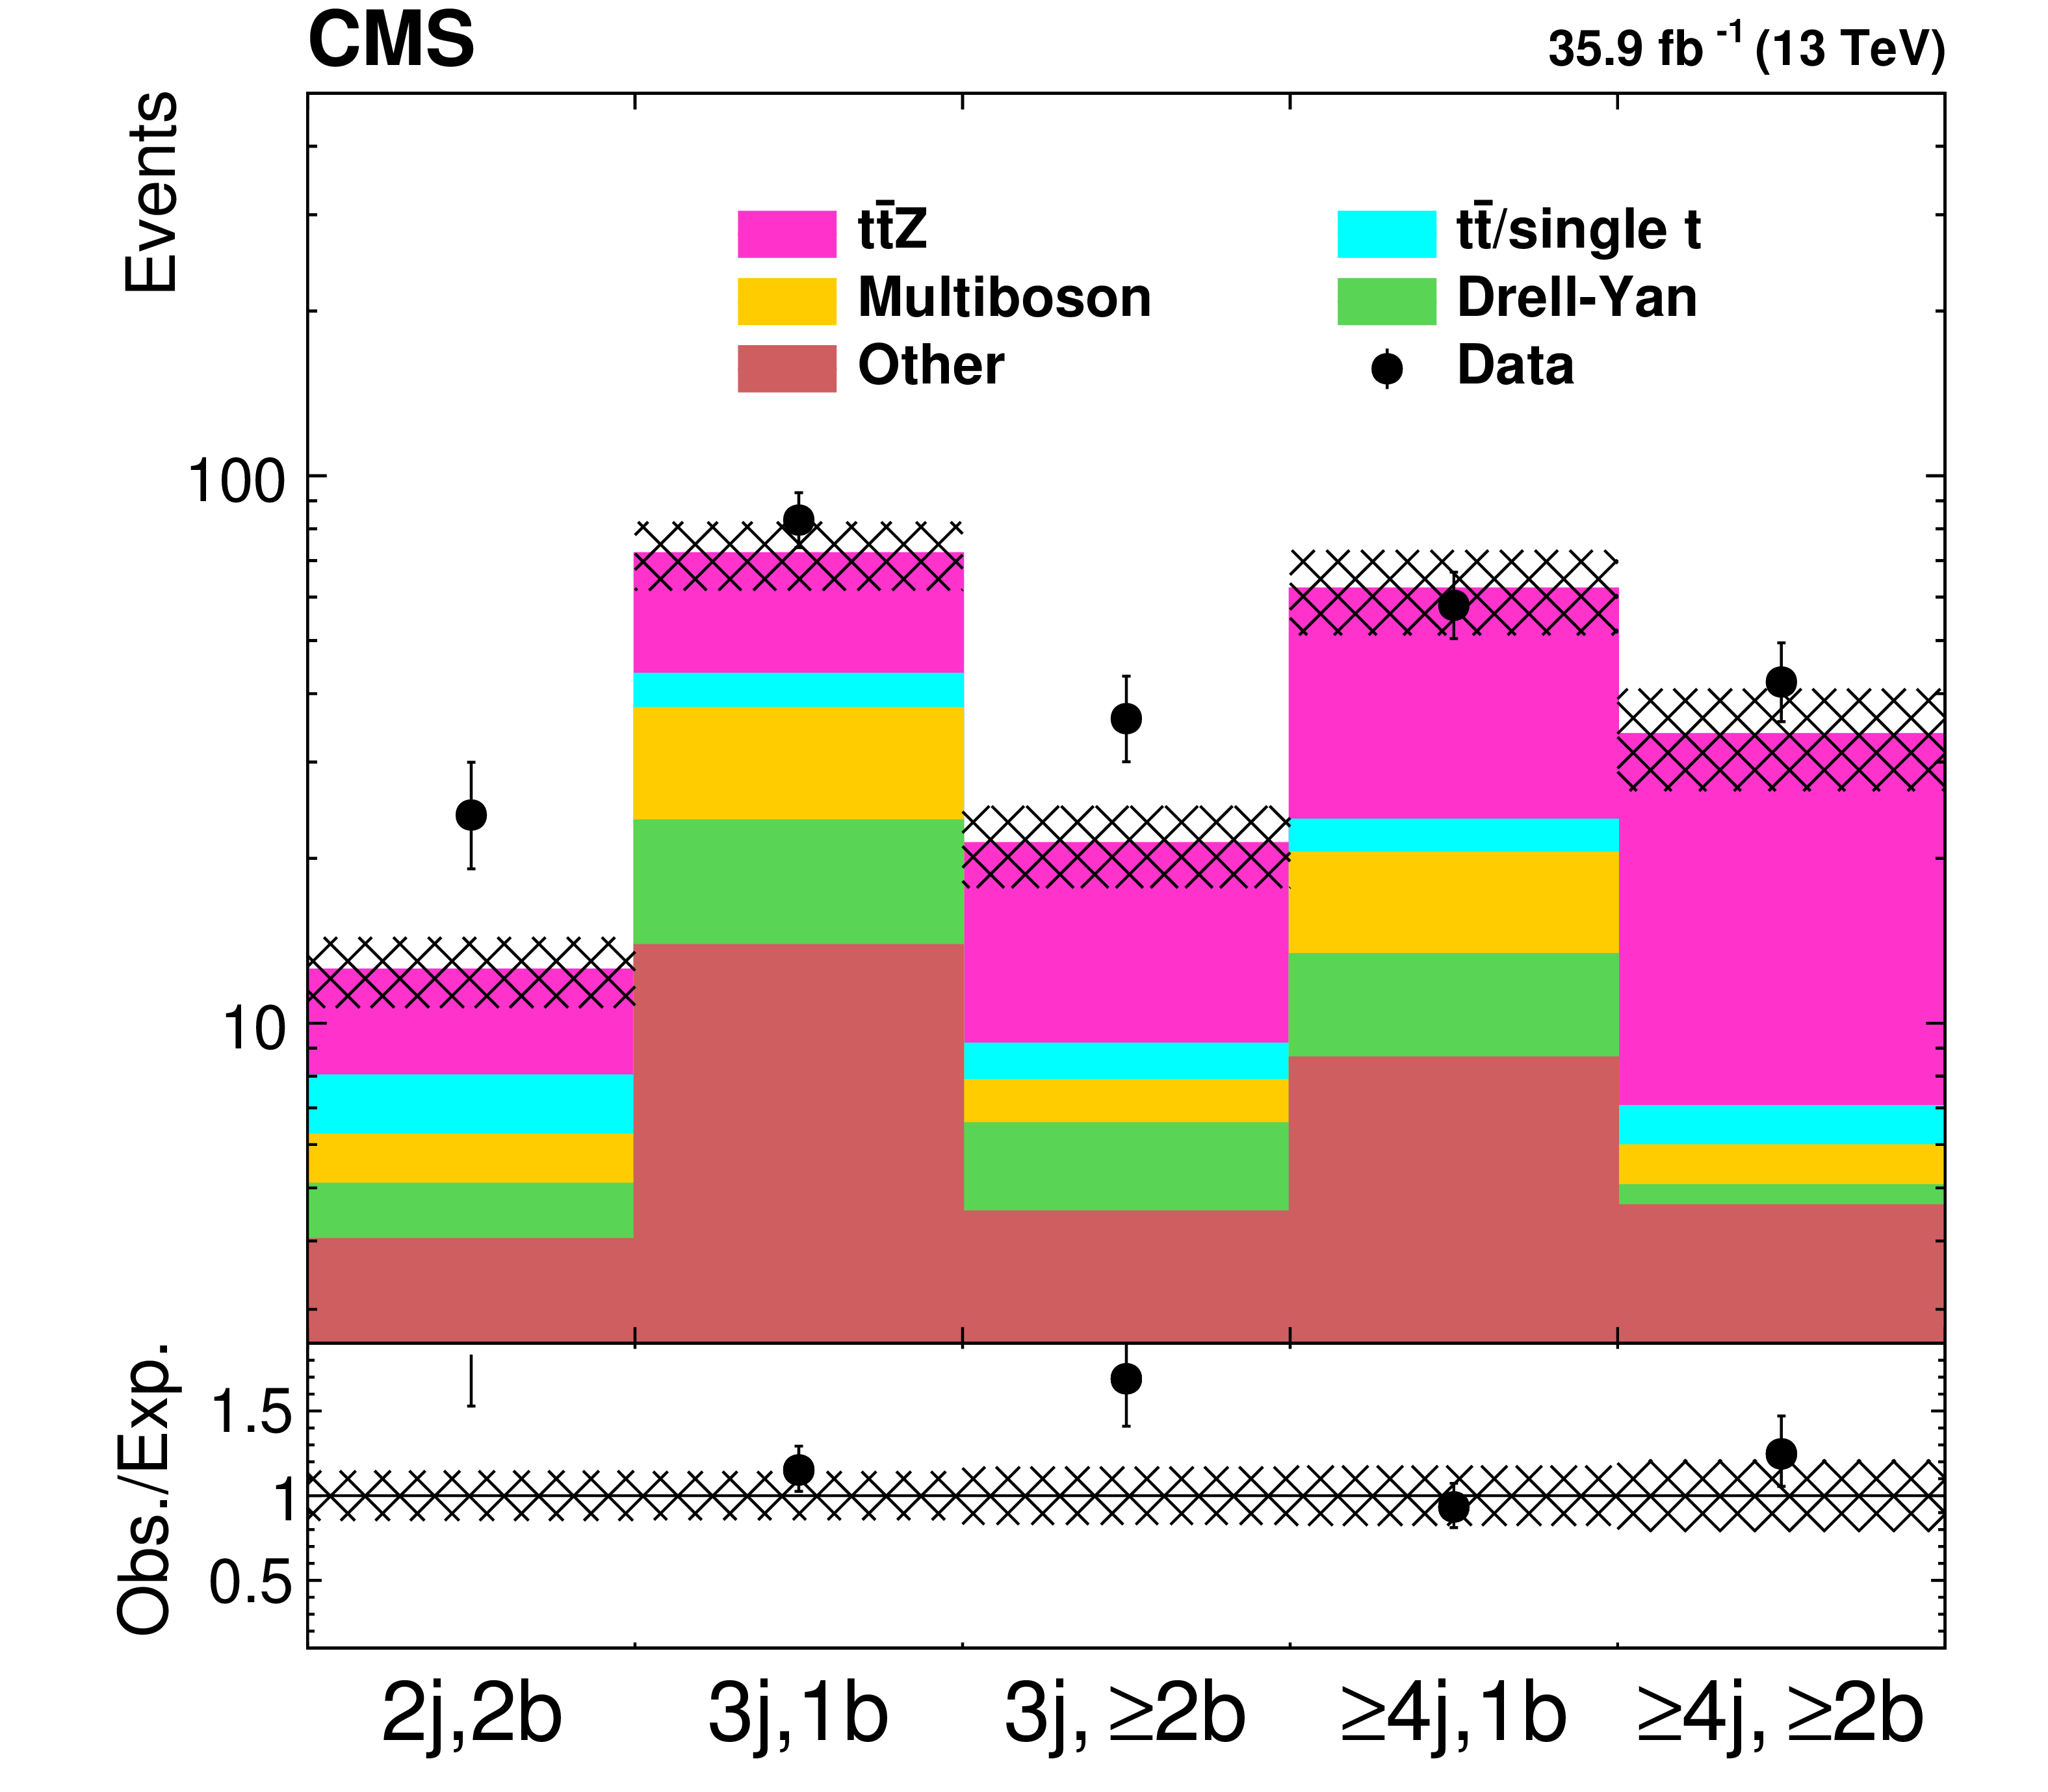
Expected and observed yields in the five ${{\mathrm{t} {}\mathrm{\bar{t}}} \mathrm{Z}}$ control regions, which are defined by different requirements on the number of reconstructed jets and b jets, before (left) and after the fit (right). The hatched band contains all uncertainties discussed in the text. |
png pdf root |
Figure 4-a:
Expected and observed yields in the five ${{\mathrm{t} {}\mathrm{\bar{t}}} \mathrm{Z}}$ control regions, which are defined by different requirements on the number of reconstructed jets and b jets, before the fit. The hatched band contains all uncertainties discussed in the text. |

png pdf root |
Figure 4-b:
Expected and observed yields in the five ${{\mathrm{t} {}\mathrm{\bar{t}}} \mathrm{Z}}$ control regions, which are defined by different requirements on the number of reconstructed jets and b jets, after the fit. The hatched band contains all uncertainties discussed in the text. |
png pdf |
Figure 5:
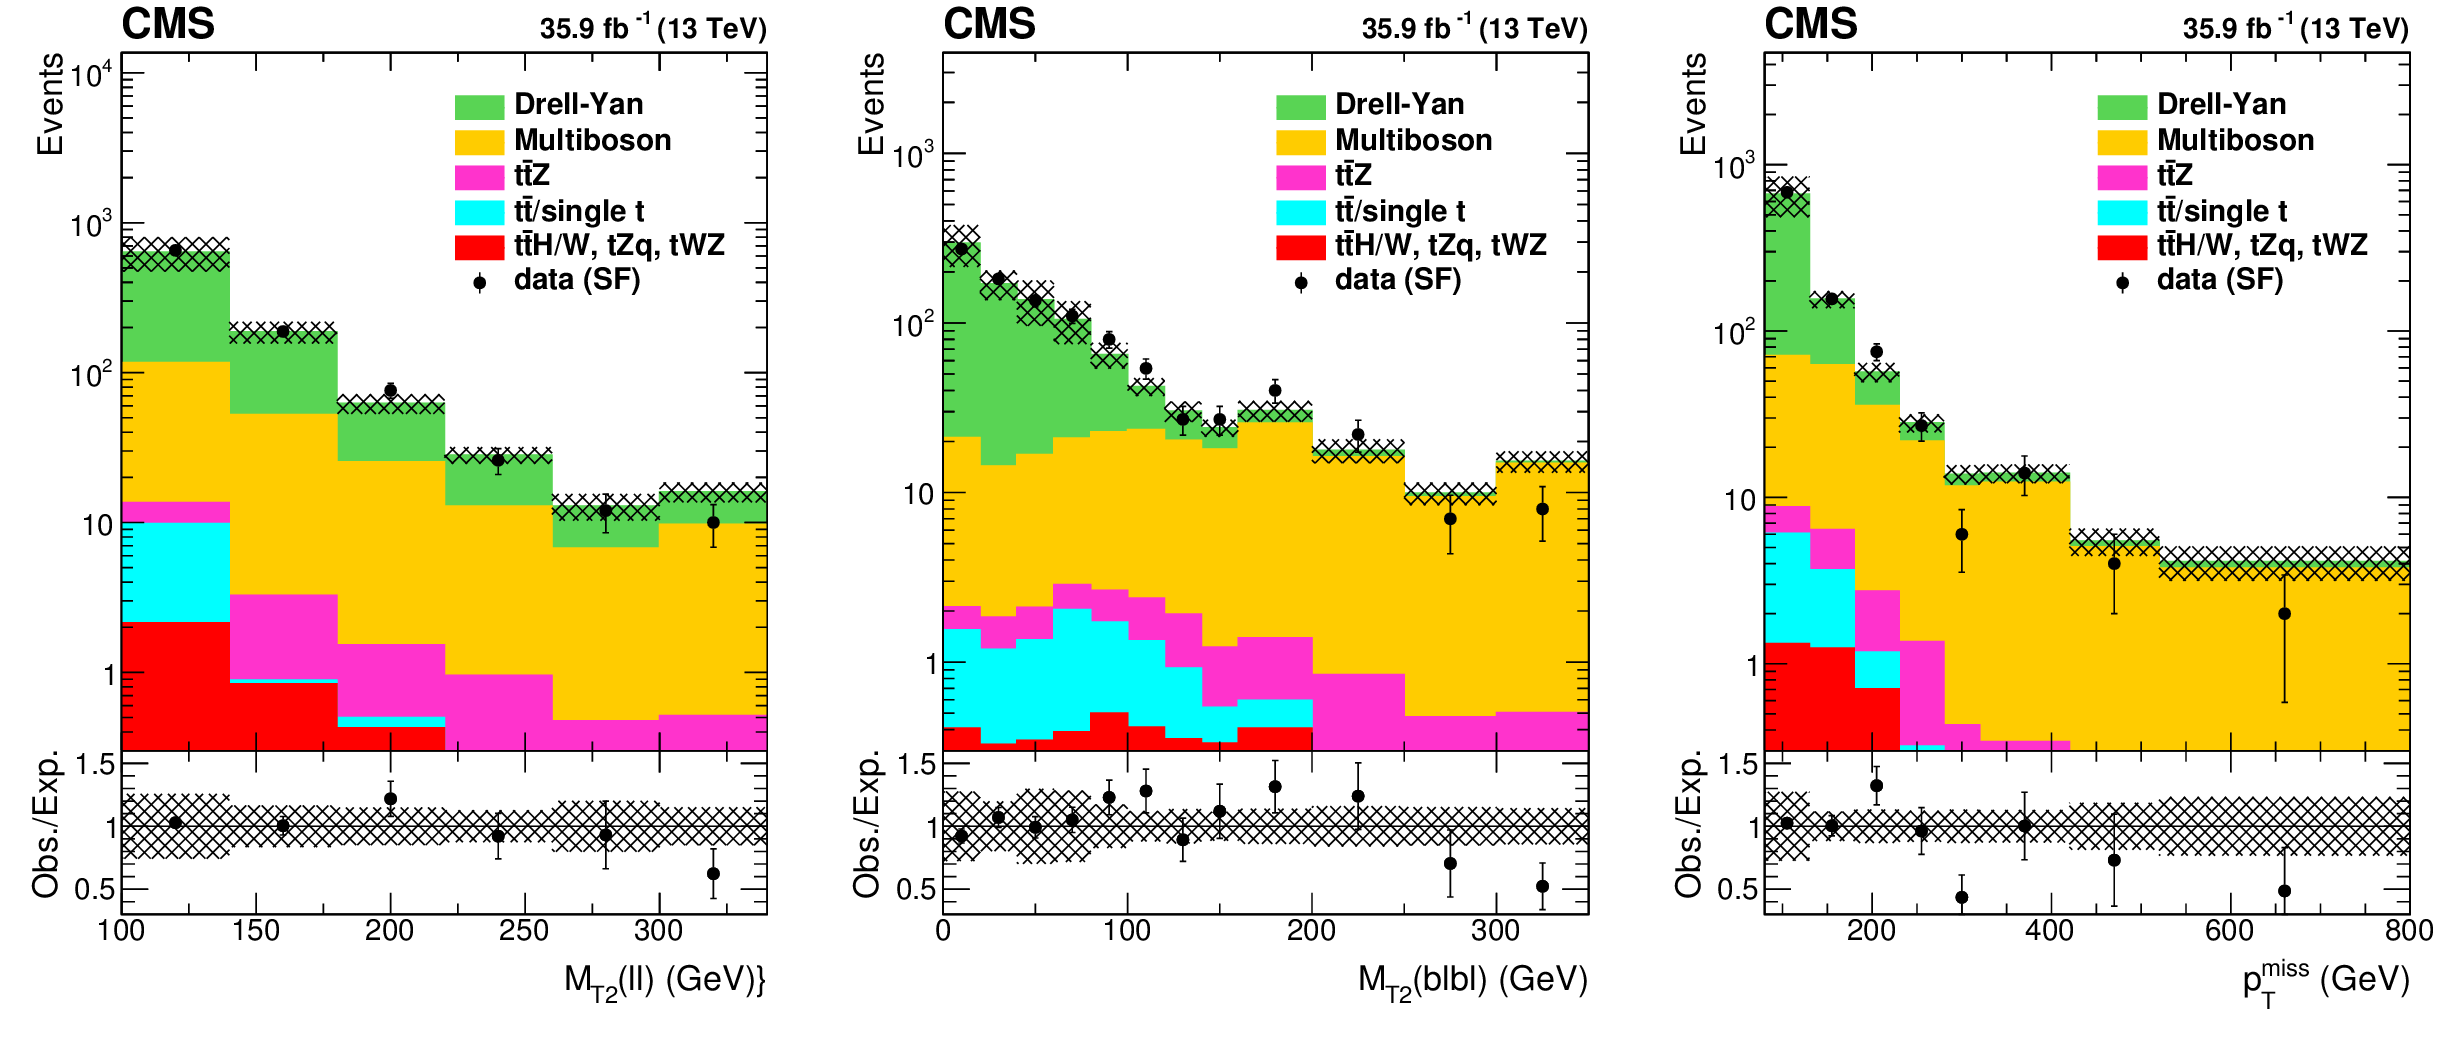
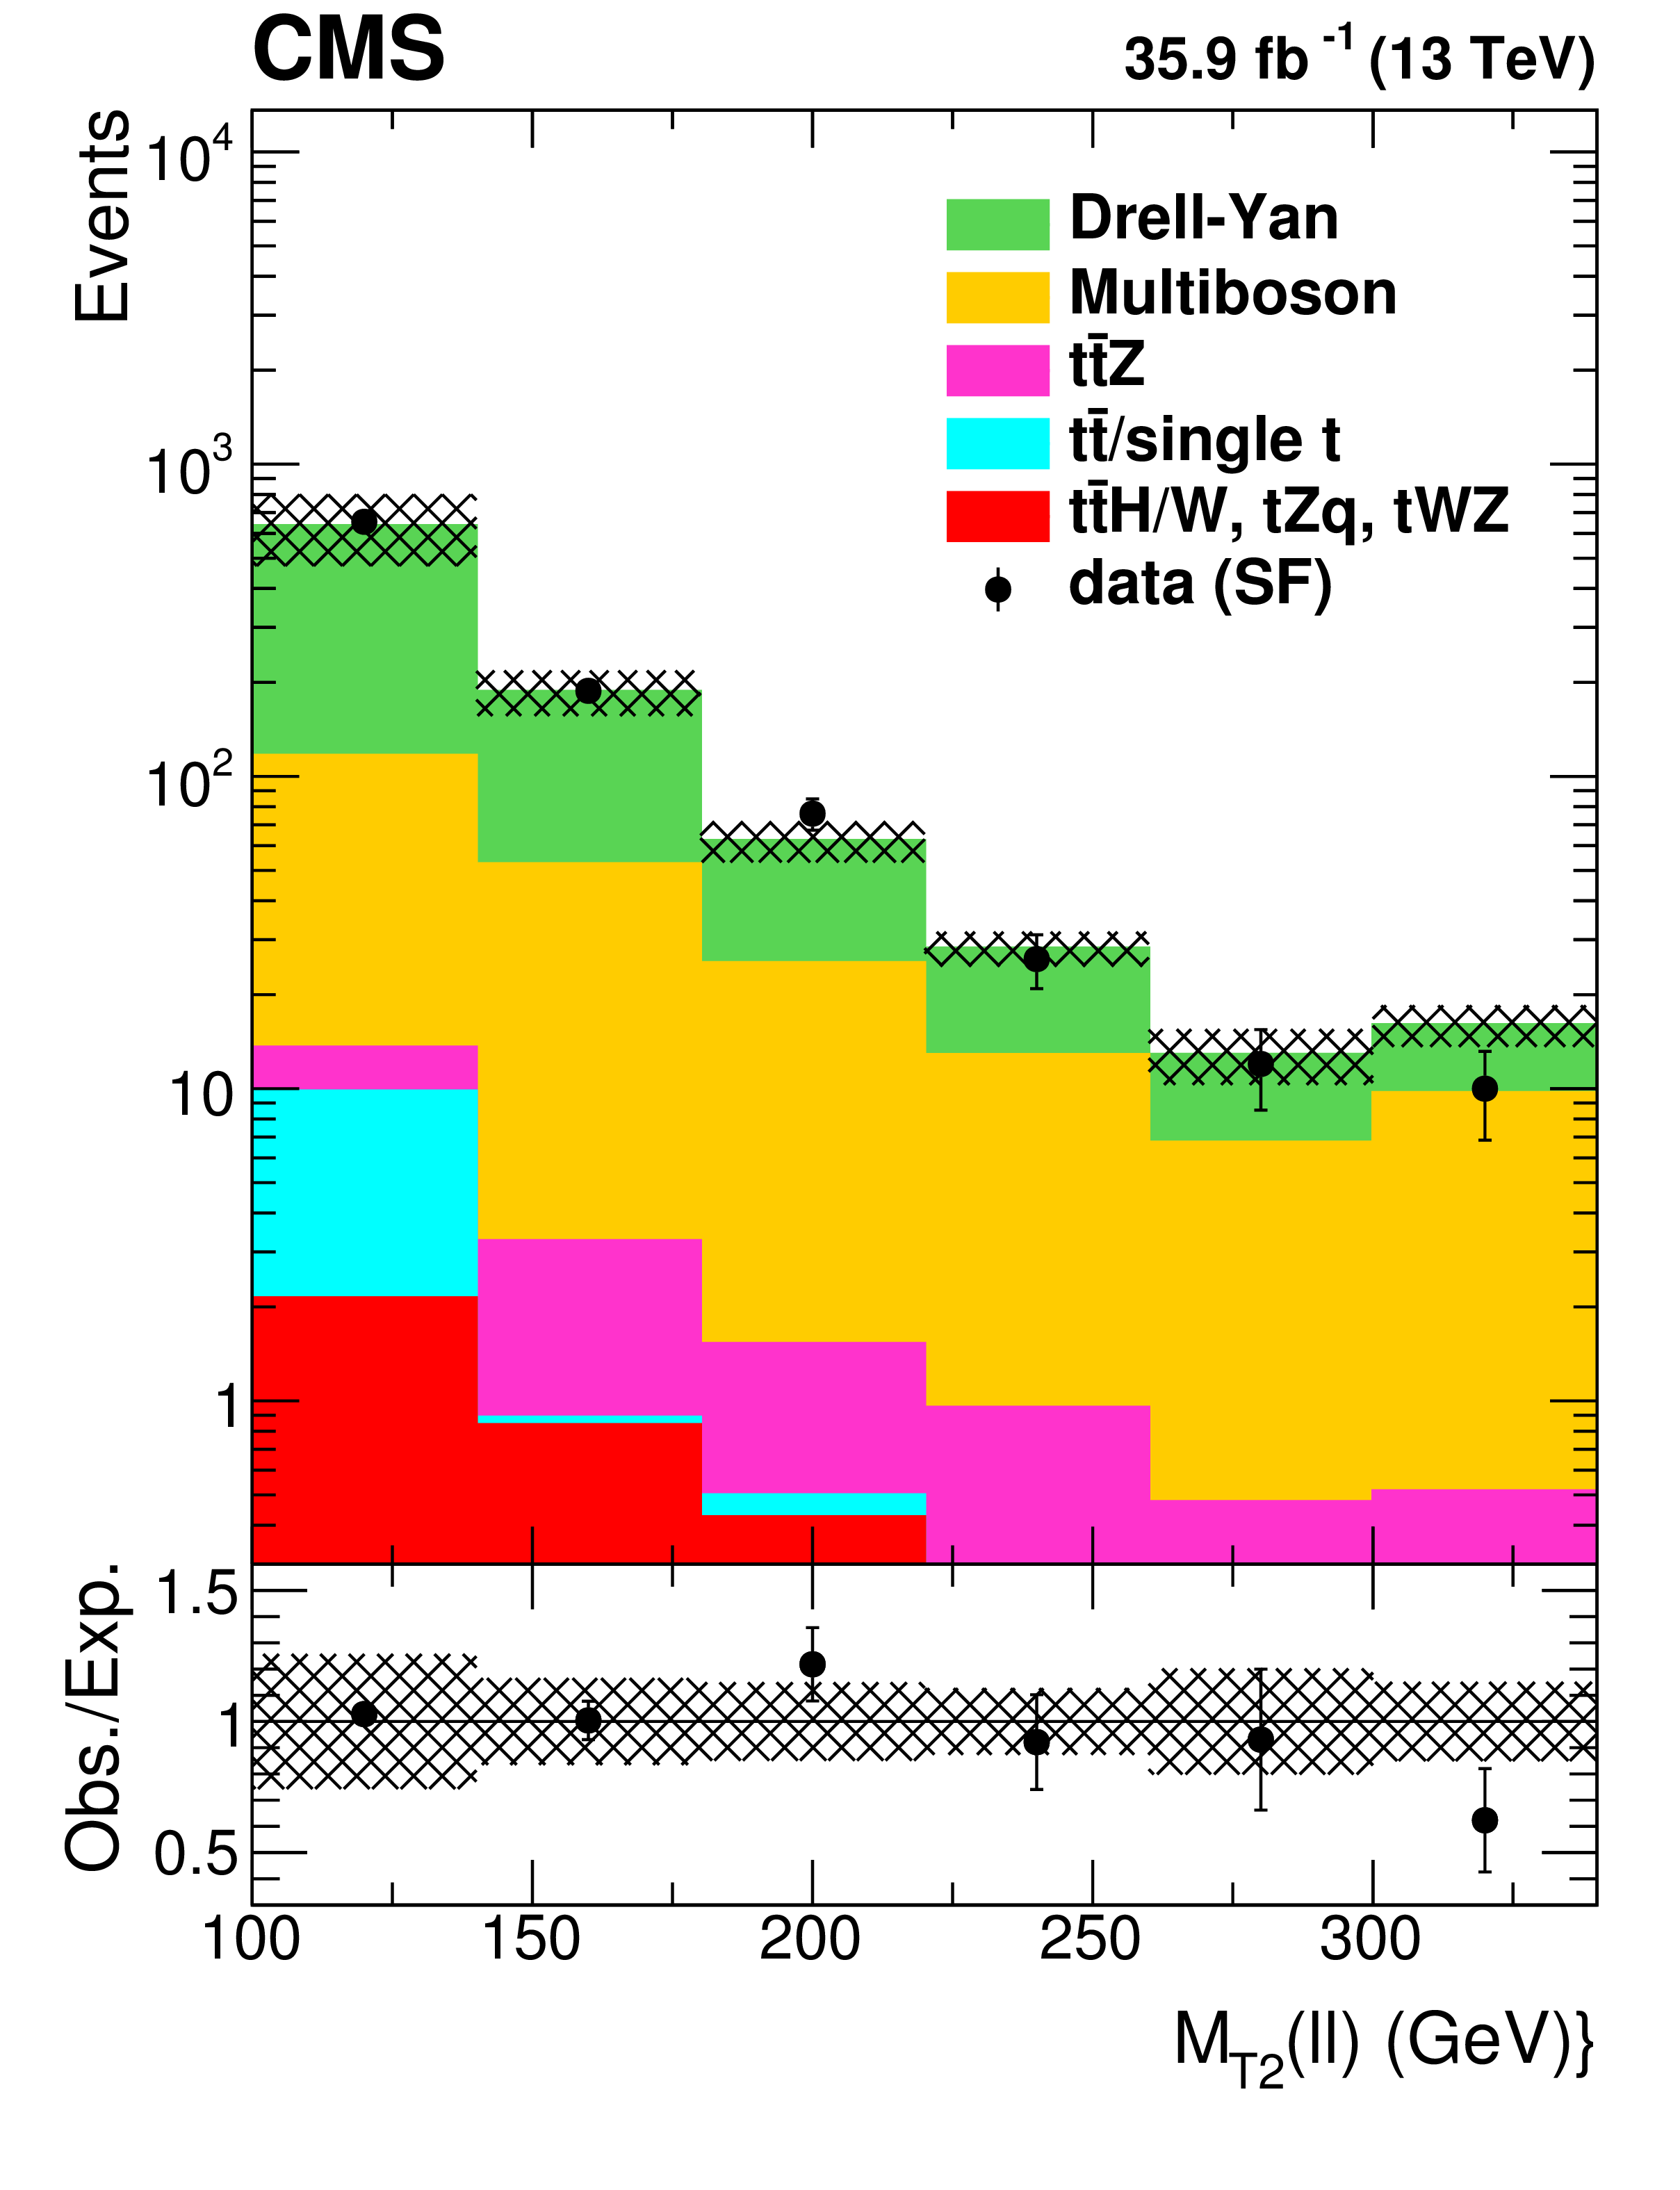
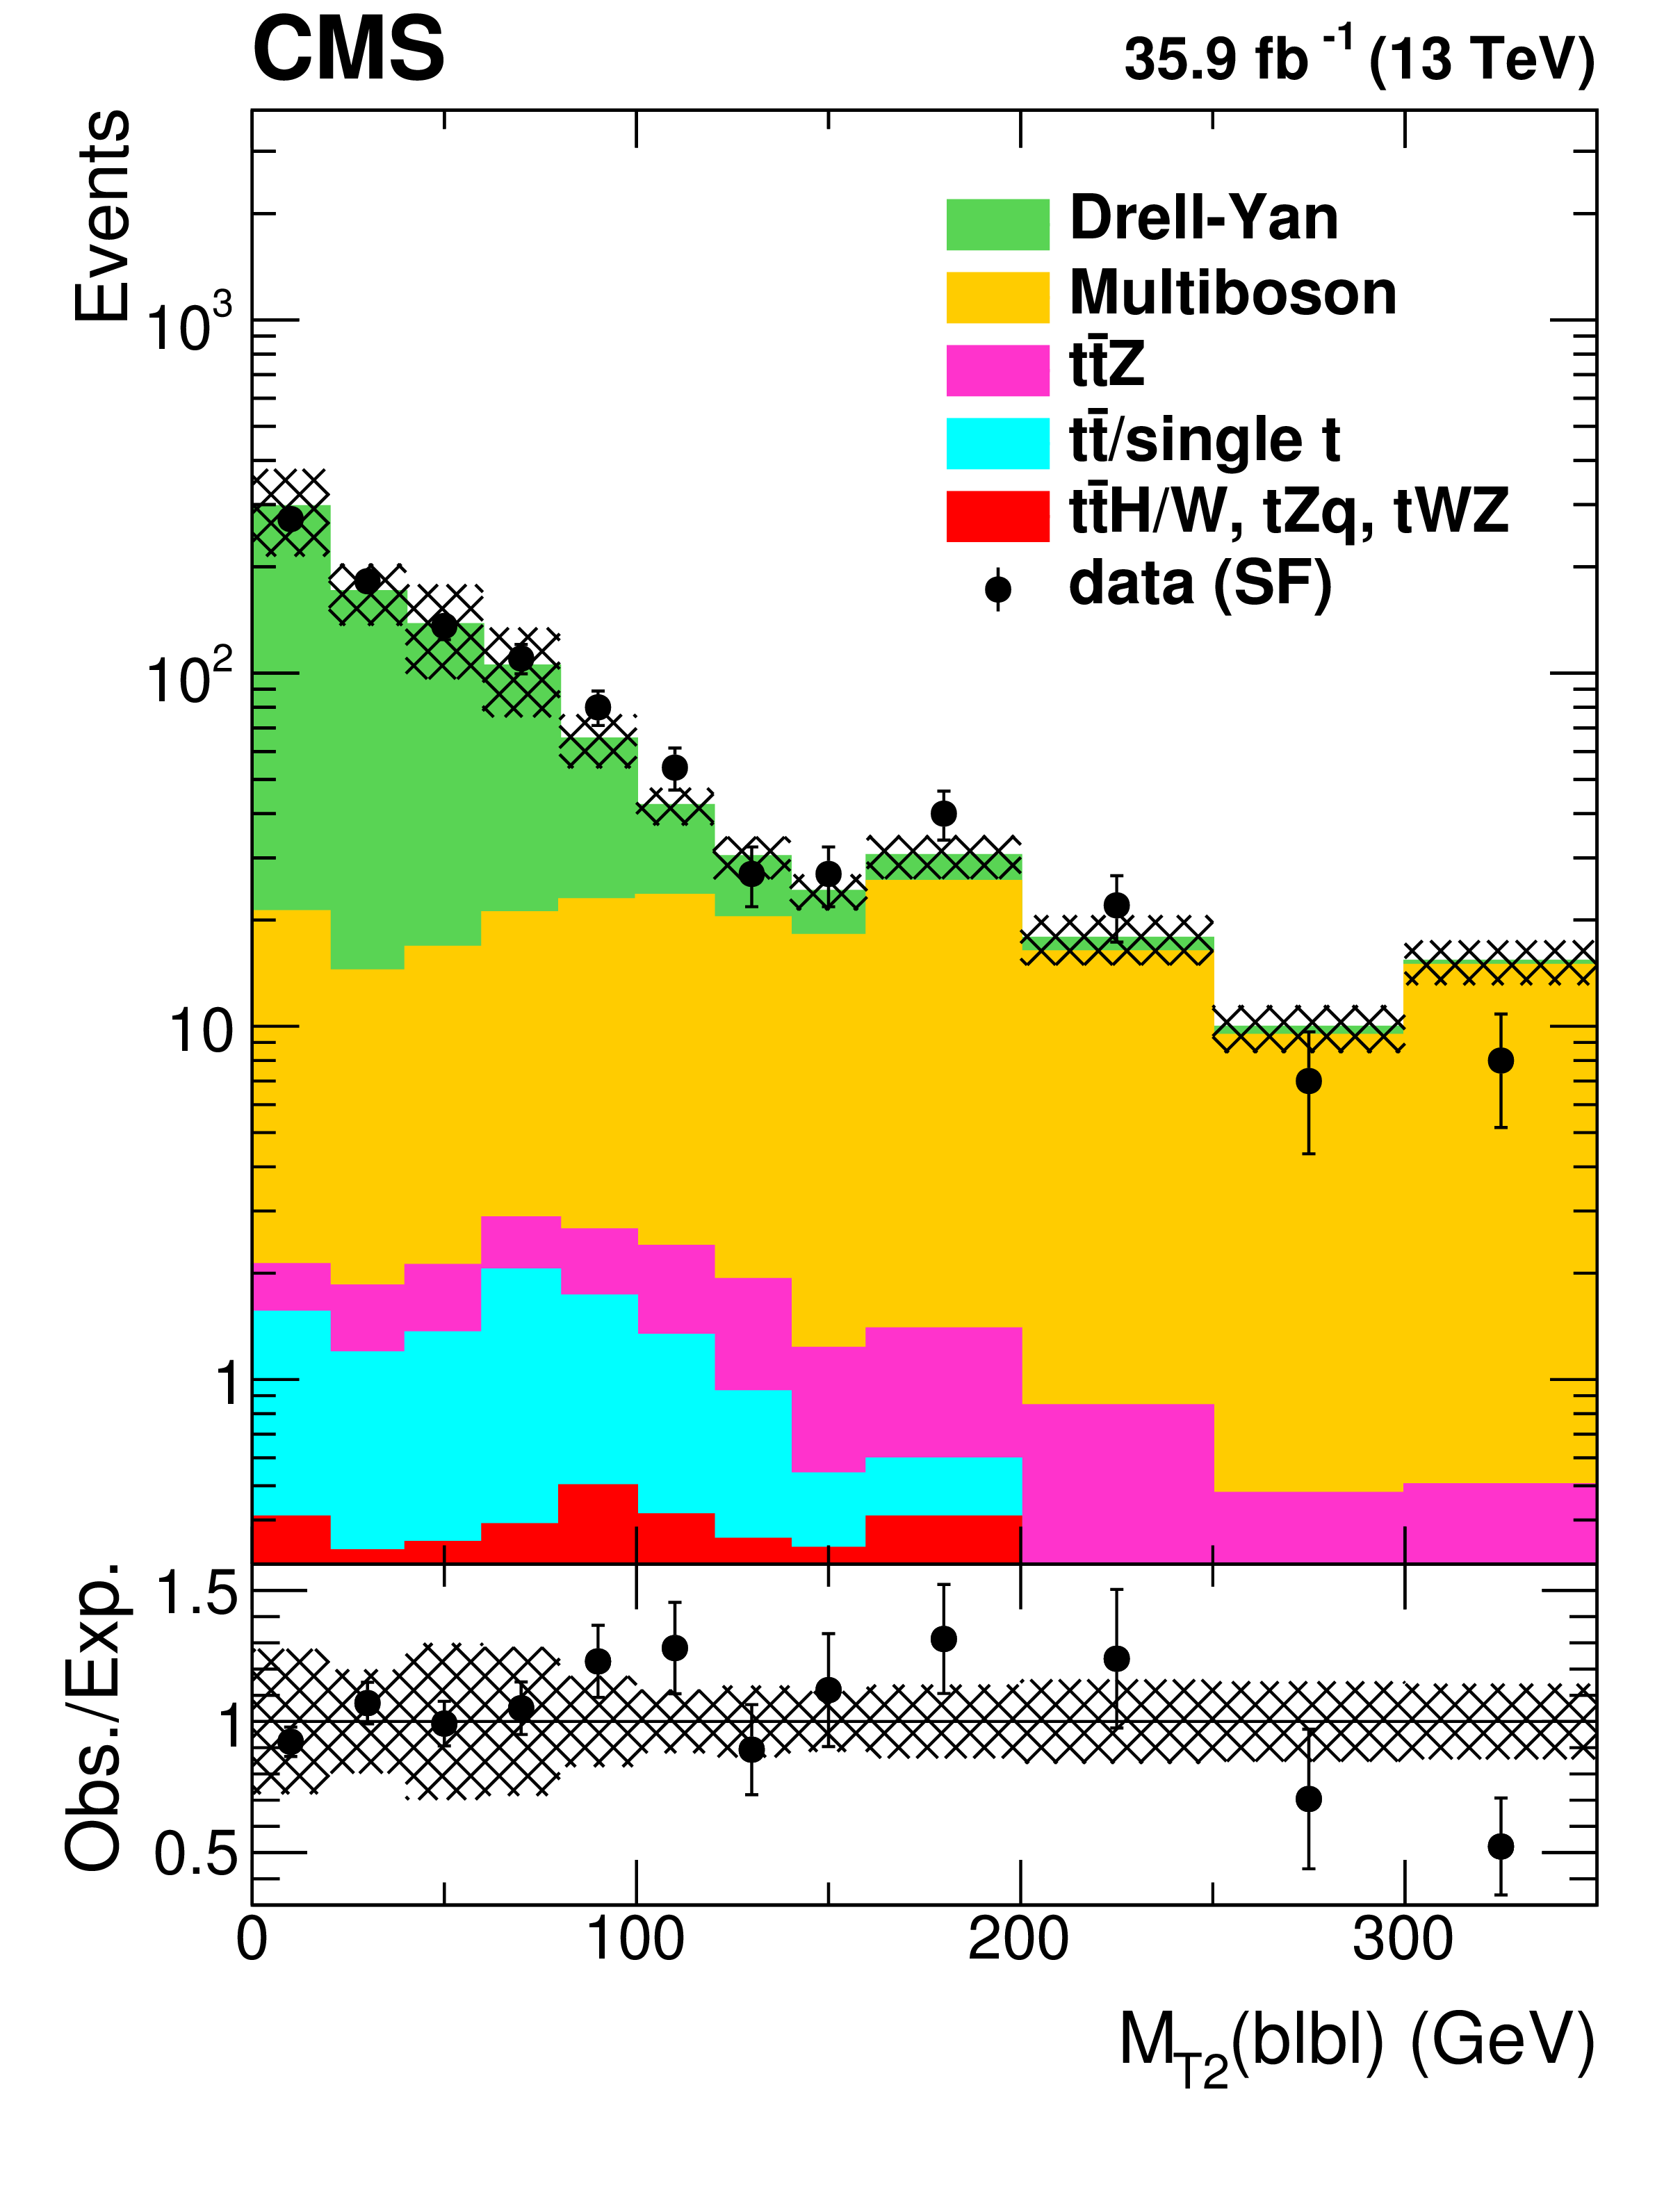
Distributions of ${M_{\text {T2}}(\ell \ell)}$ (left), ${M_{\text {T2}}(\mathrm{b} \ell \mathrm{b} \ell)}$ (center), and ${{p_{\mathrm {T}}} ^\text {miss}}$ (right) for same-flavor (SF) events falling within the Z boson mass window ($ | m(\ell \ell)-m_{\mathrm{Z}} | < $ 15 GeV), with at least two jets and $ {N_\text {b jets}} = $ 0, $ {{p_{\mathrm {T}}} ^\text {miss}} > $ 80 GeV, and $ {M_{\text {T2}}(\ell \ell)} > $ 100 GeV. The hatched band shows the uncertainties from experimental effects, as described in Section 7. |
png pdf root |
Figure 5-a:
Distribution of ${M_{\text {T2}}(\ell \ell)}$ for same-flavor (SF) events falling within the Z boson mass window ($ | m(\ell \ell)-m_{\mathrm{Z}} | < $ 15 GeV), with at least two jets and $ {N_\text {b jets}} = $ 0, $ {{p_{\mathrm {T}}} ^\text {miss}} > $ 80 GeV, and $ {M_{\text {T2}}(\ell \ell)} > $ 100 GeV. The hatched band shows the uncertainties from experimental effects, as described in Section 7. |
png pdf root |
Figure 5-b:
Distribution of ${M_{\text {T2}}(\mathrm{b} \ell \mathrm{b} \ell)}$ for same-flavor (SF) events falling within the Z boson mass window ($ | m(\ell \ell)-m_{\mathrm{Z}} | < $ 15 GeV), with at least two jets and $ {N_\text {b jets}} = $ 0, $ {{p_{\mathrm {T}}} ^\text {miss}} > $ 80 GeV, and $ {M_{\text {T2}}(\ell \ell)} > $ 100 GeV. The hatched band shows the uncertainties from experimental effects, as described in Section 7. |

png pdf root |
Figure 5-c:
Distribution of ${{p_{\mathrm {T}}} ^\text {miss}}$ for same-flavor (SF) events falling within the Z boson mass window ($ | m(\ell \ell)-m_{\mathrm{Z}} | < $ 15 GeV), with at least two jets and $ {N_\text {b jets}} = $ 0, $ {{p_{\mathrm {T}}} ^\text {miss}} > $ 80 GeV, and $ {M_{\text {T2}}(\ell \ell)} > $ 100 GeV. The hatched band shows the uncertainties from experimental effects, as described in Section 7. |
png pdf root |
Figure 6:
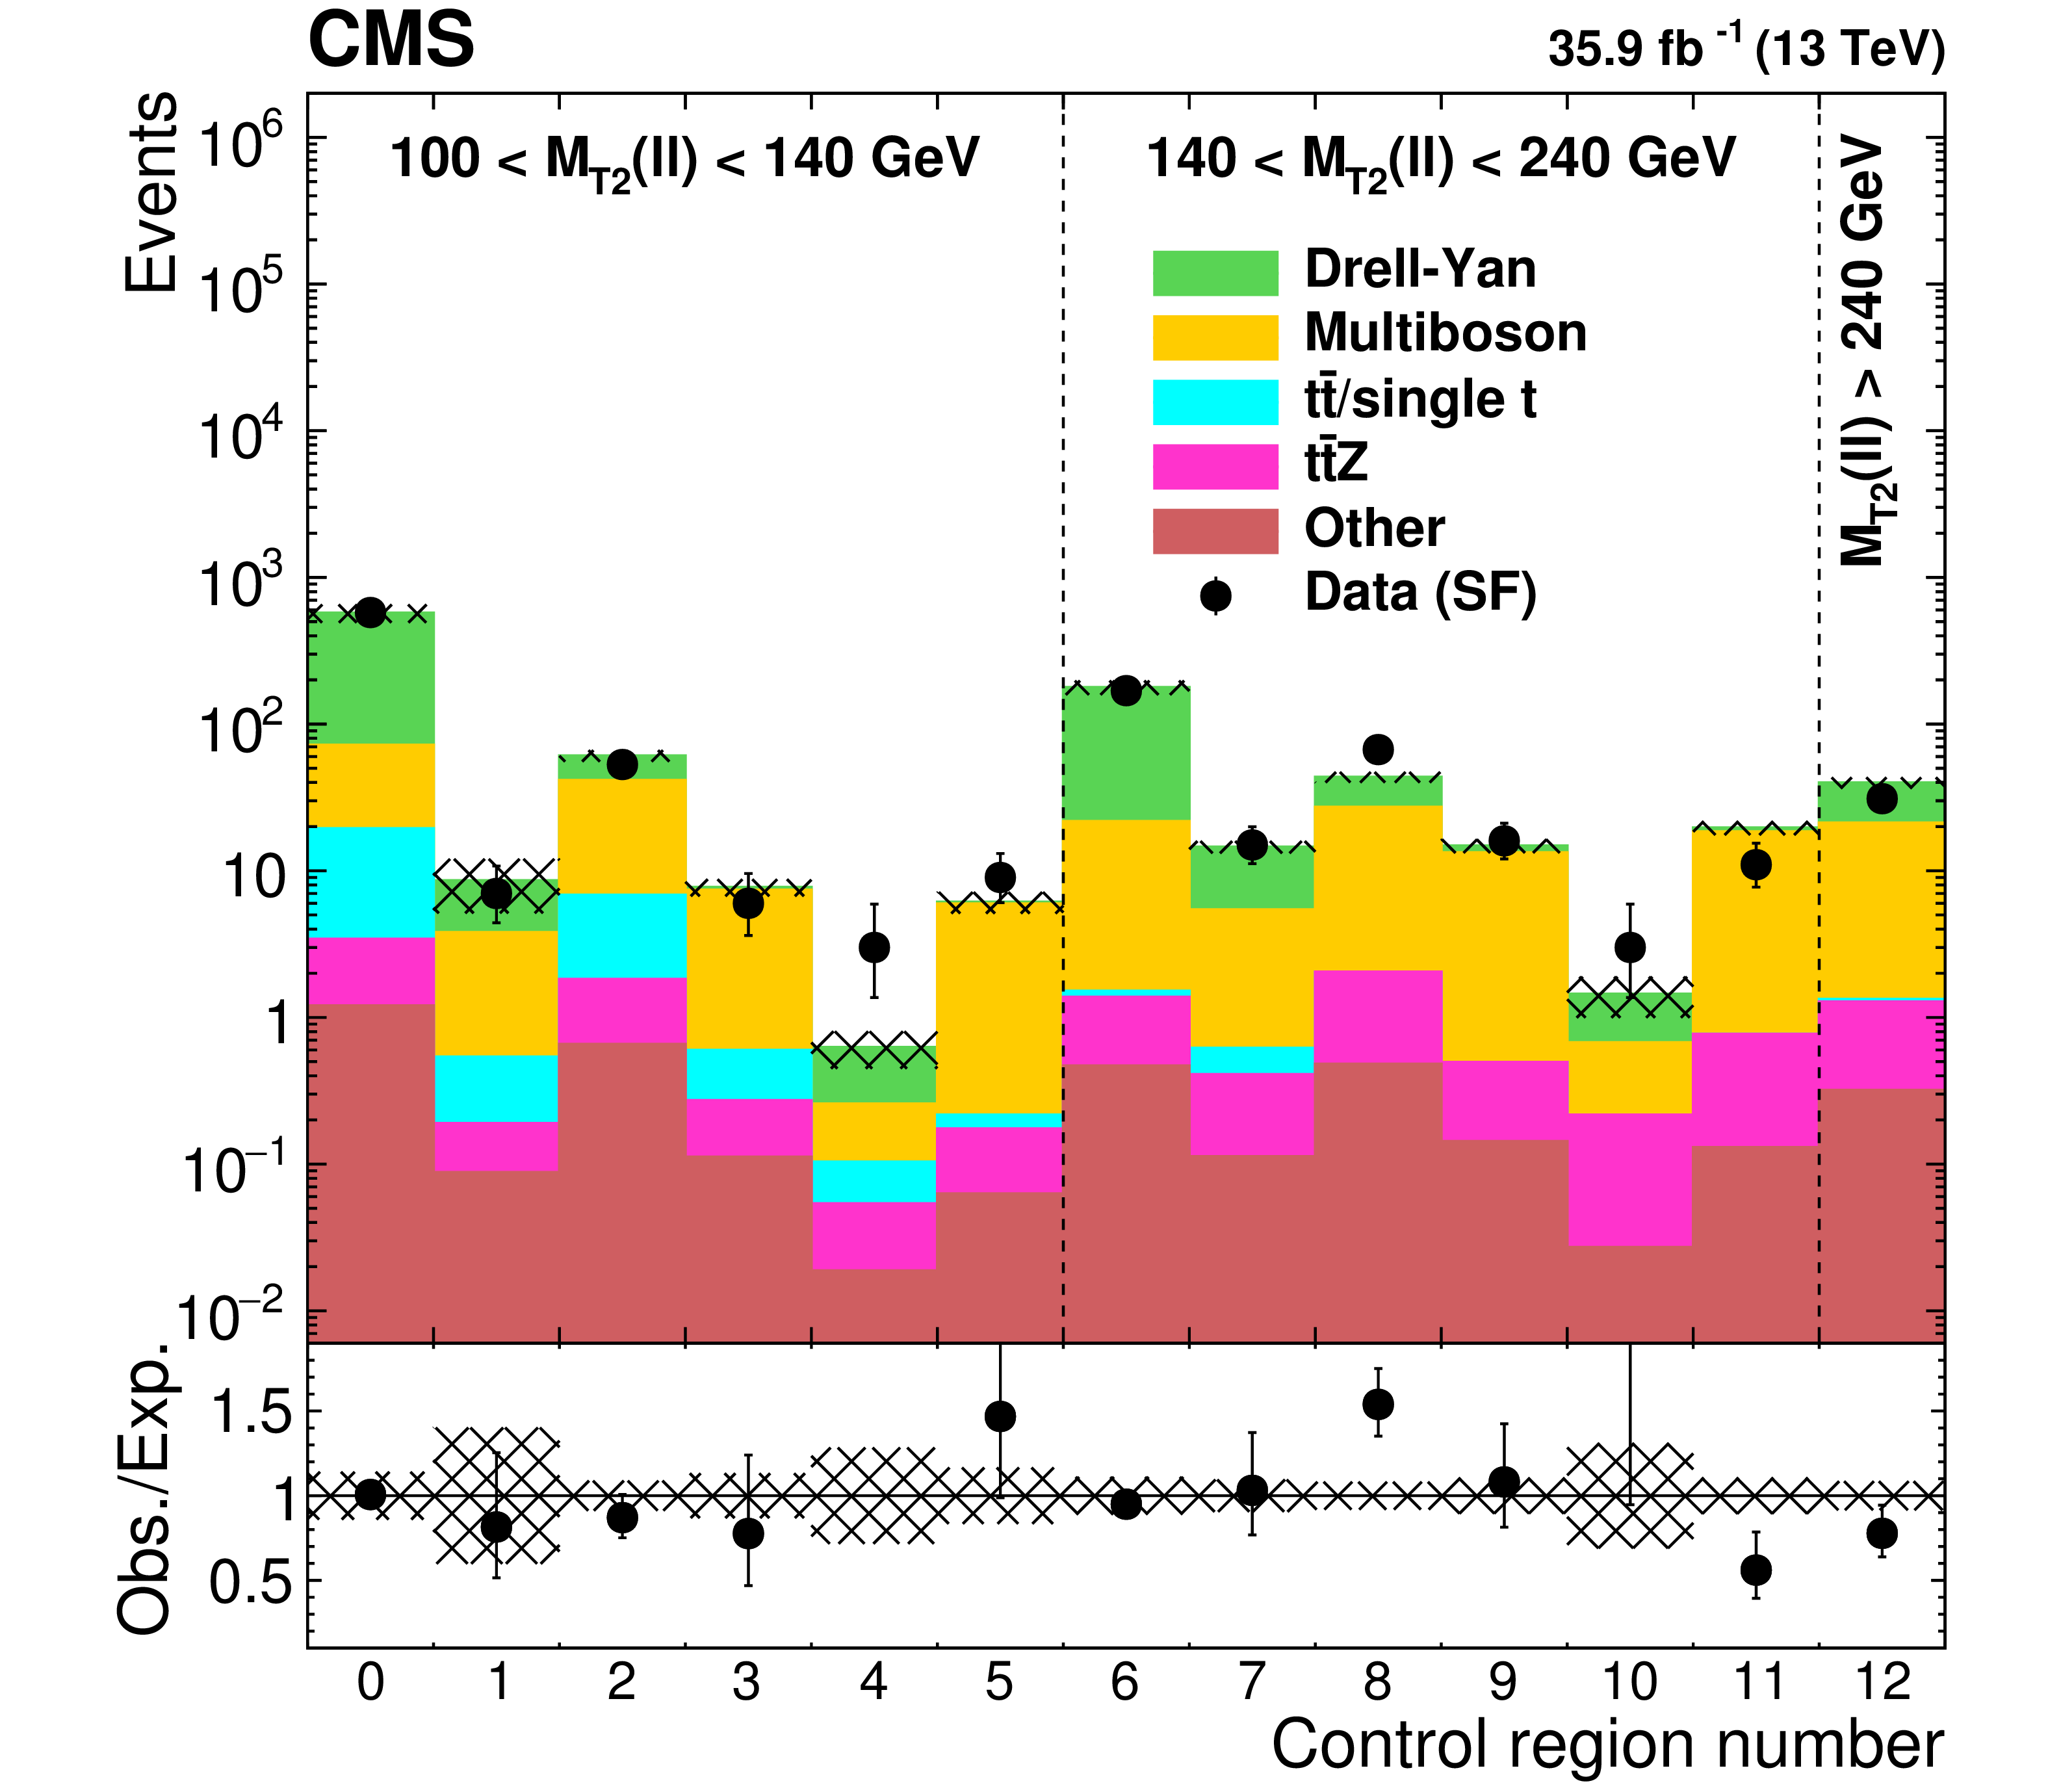
Event yields in the 13 Drell-Yan and multiboson control regions for events with same-flavor (SF) leptons falling within the Z boson mass window ($ | m(\ell \ell)-m_{\mathrm{Z}} | < $ 15 GeV) and $ {N_\text {b jets}} = $ 0, after renormalizing with the scale factors obtained from the fit procedure described in the text. The hatched band shows the uncertainties from the fit including the uncertainties from the experimental effects, as described in Section 7. |
png pdf |
Figure 7:
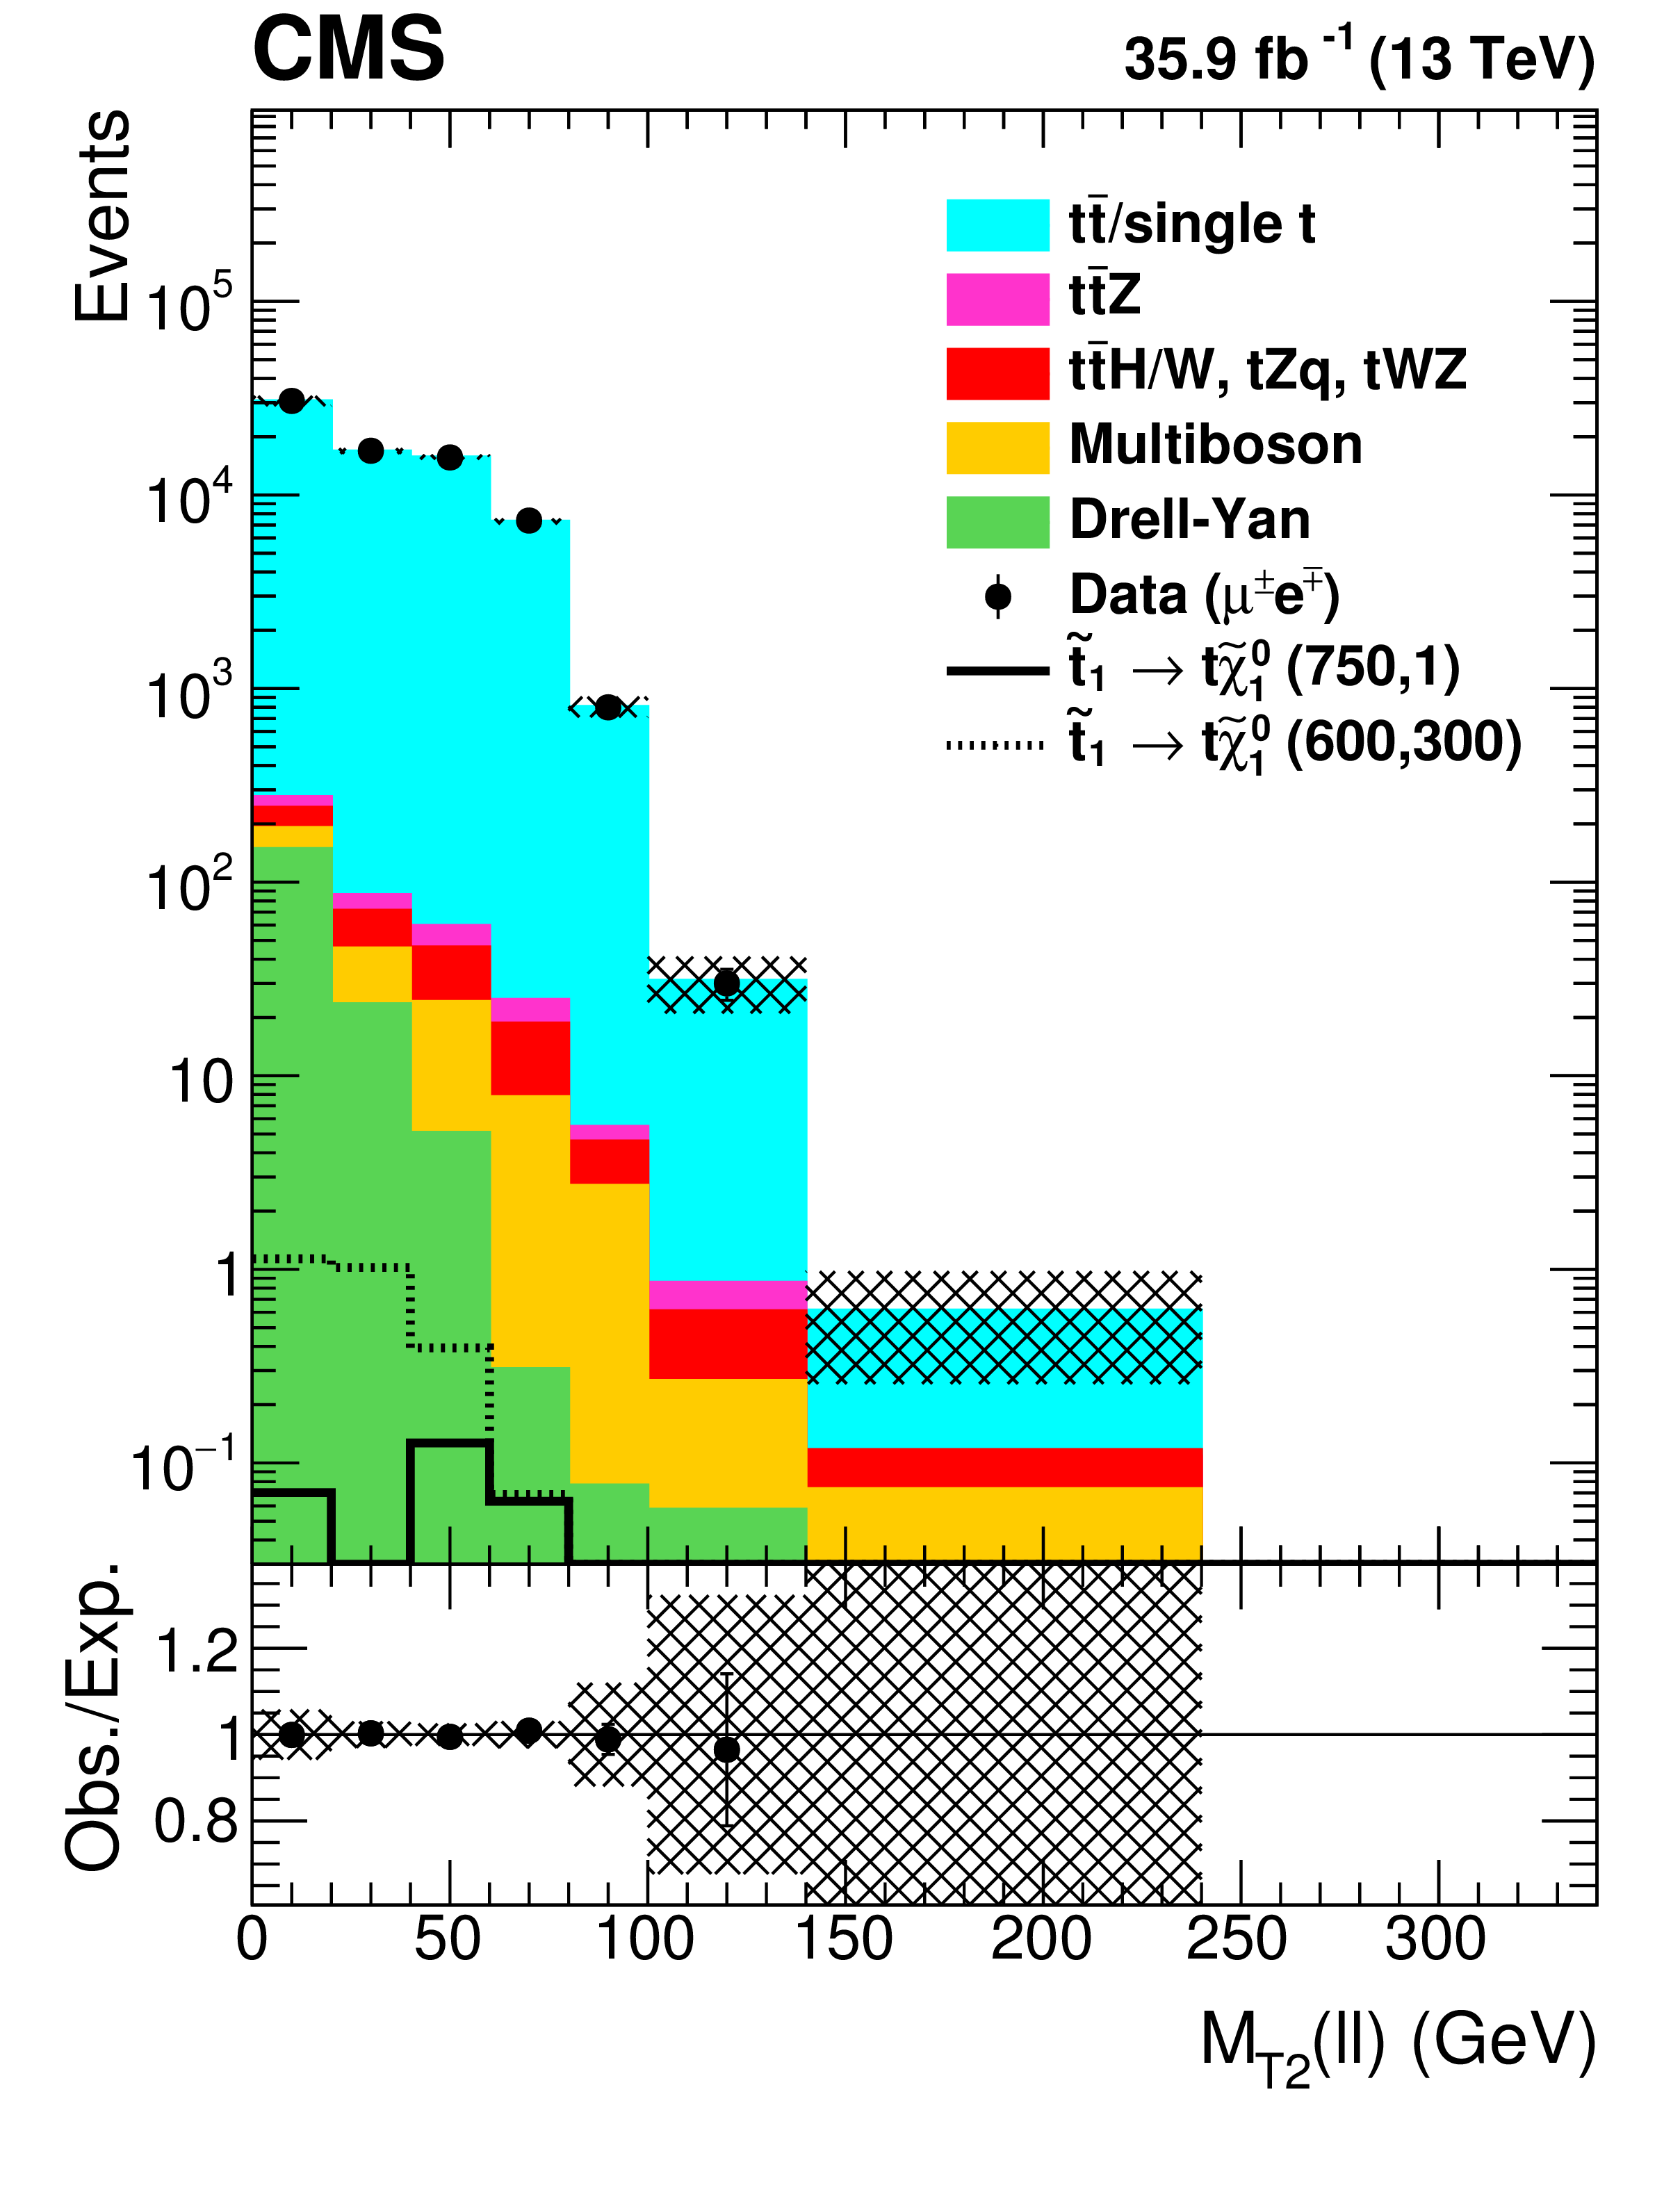
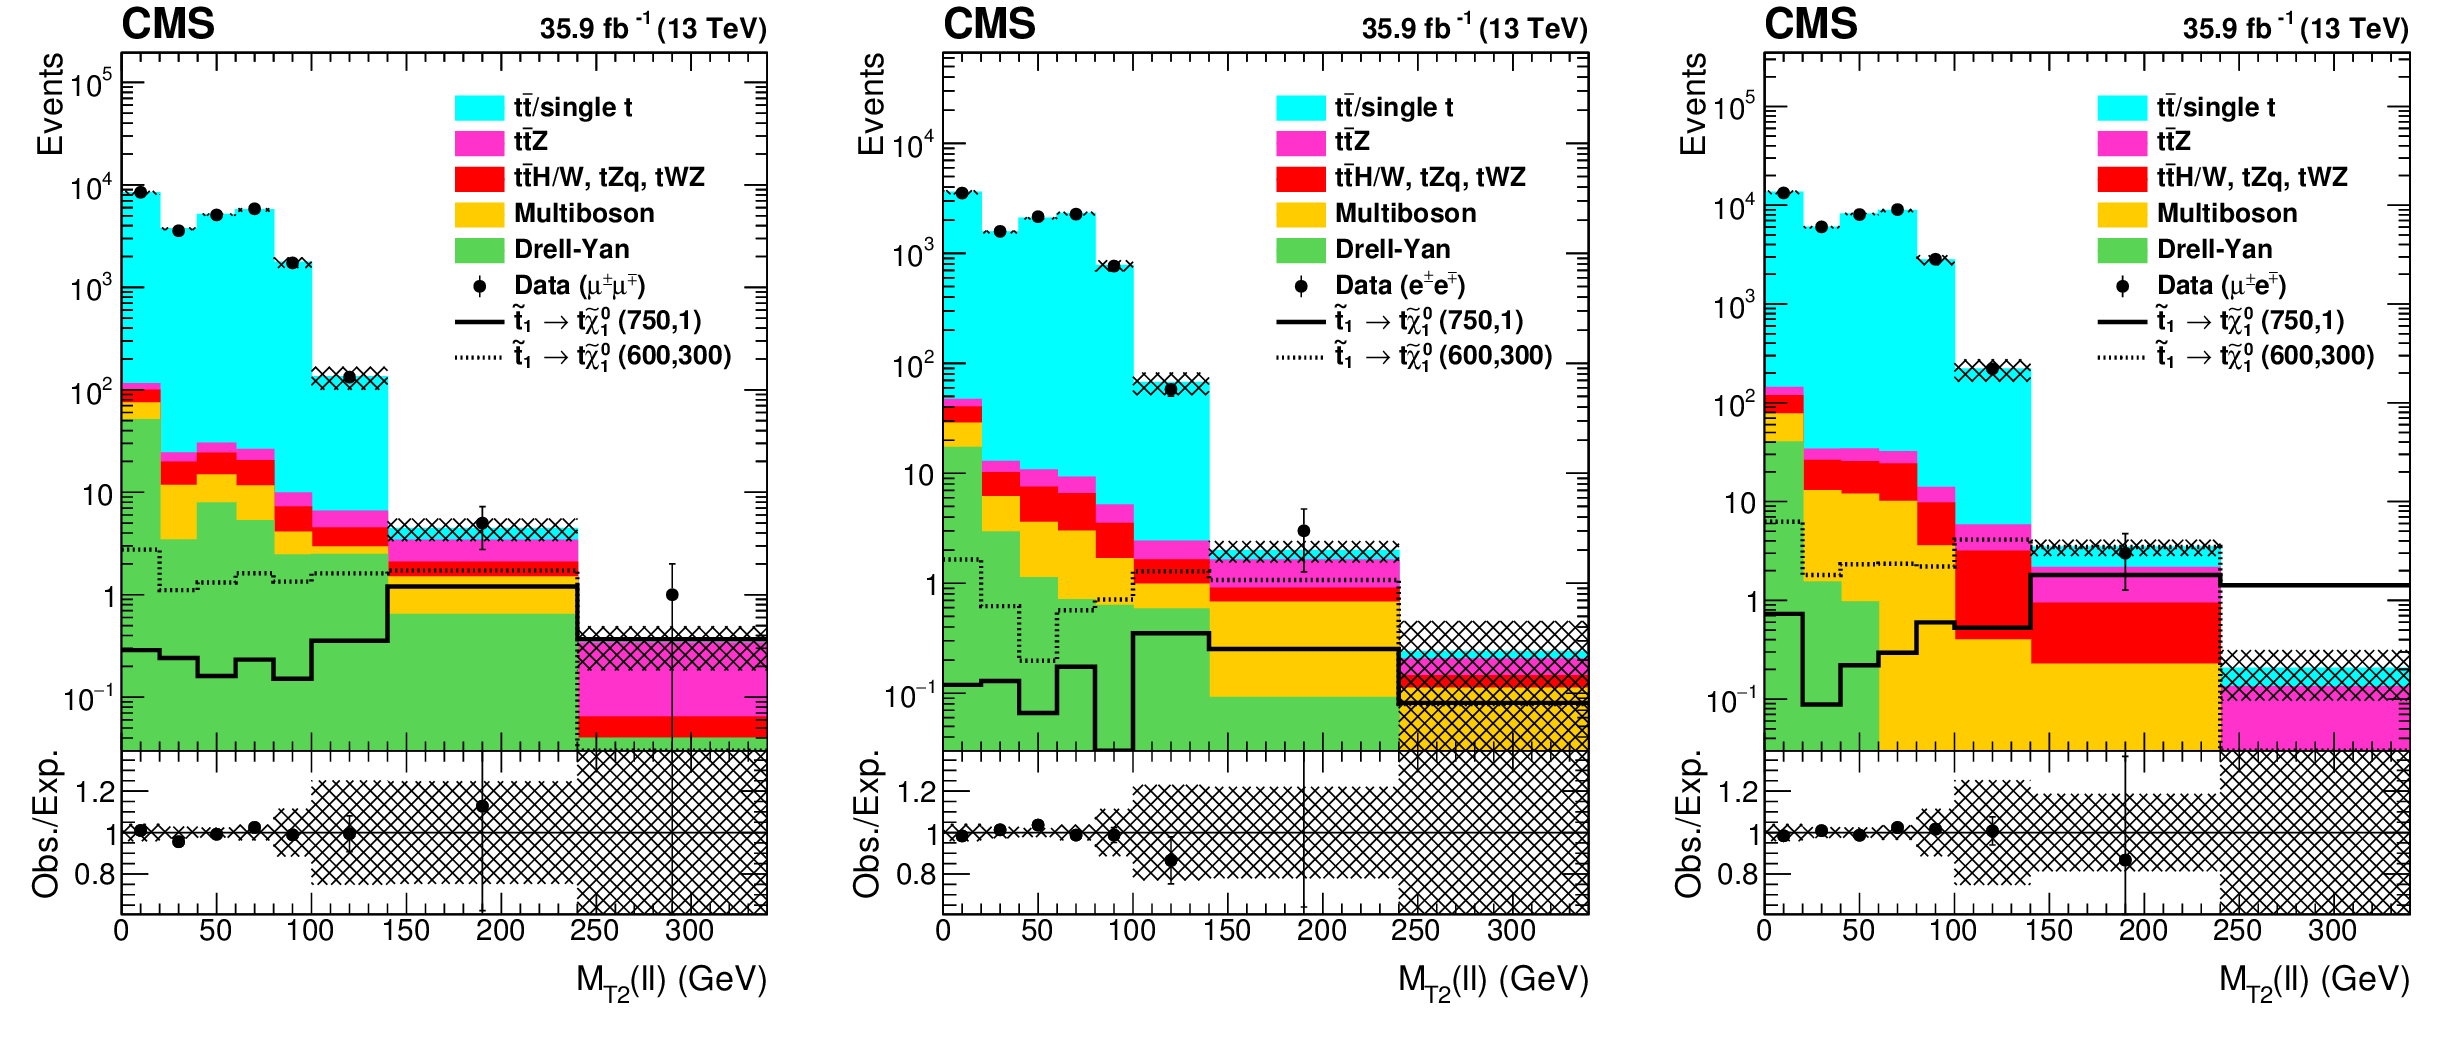
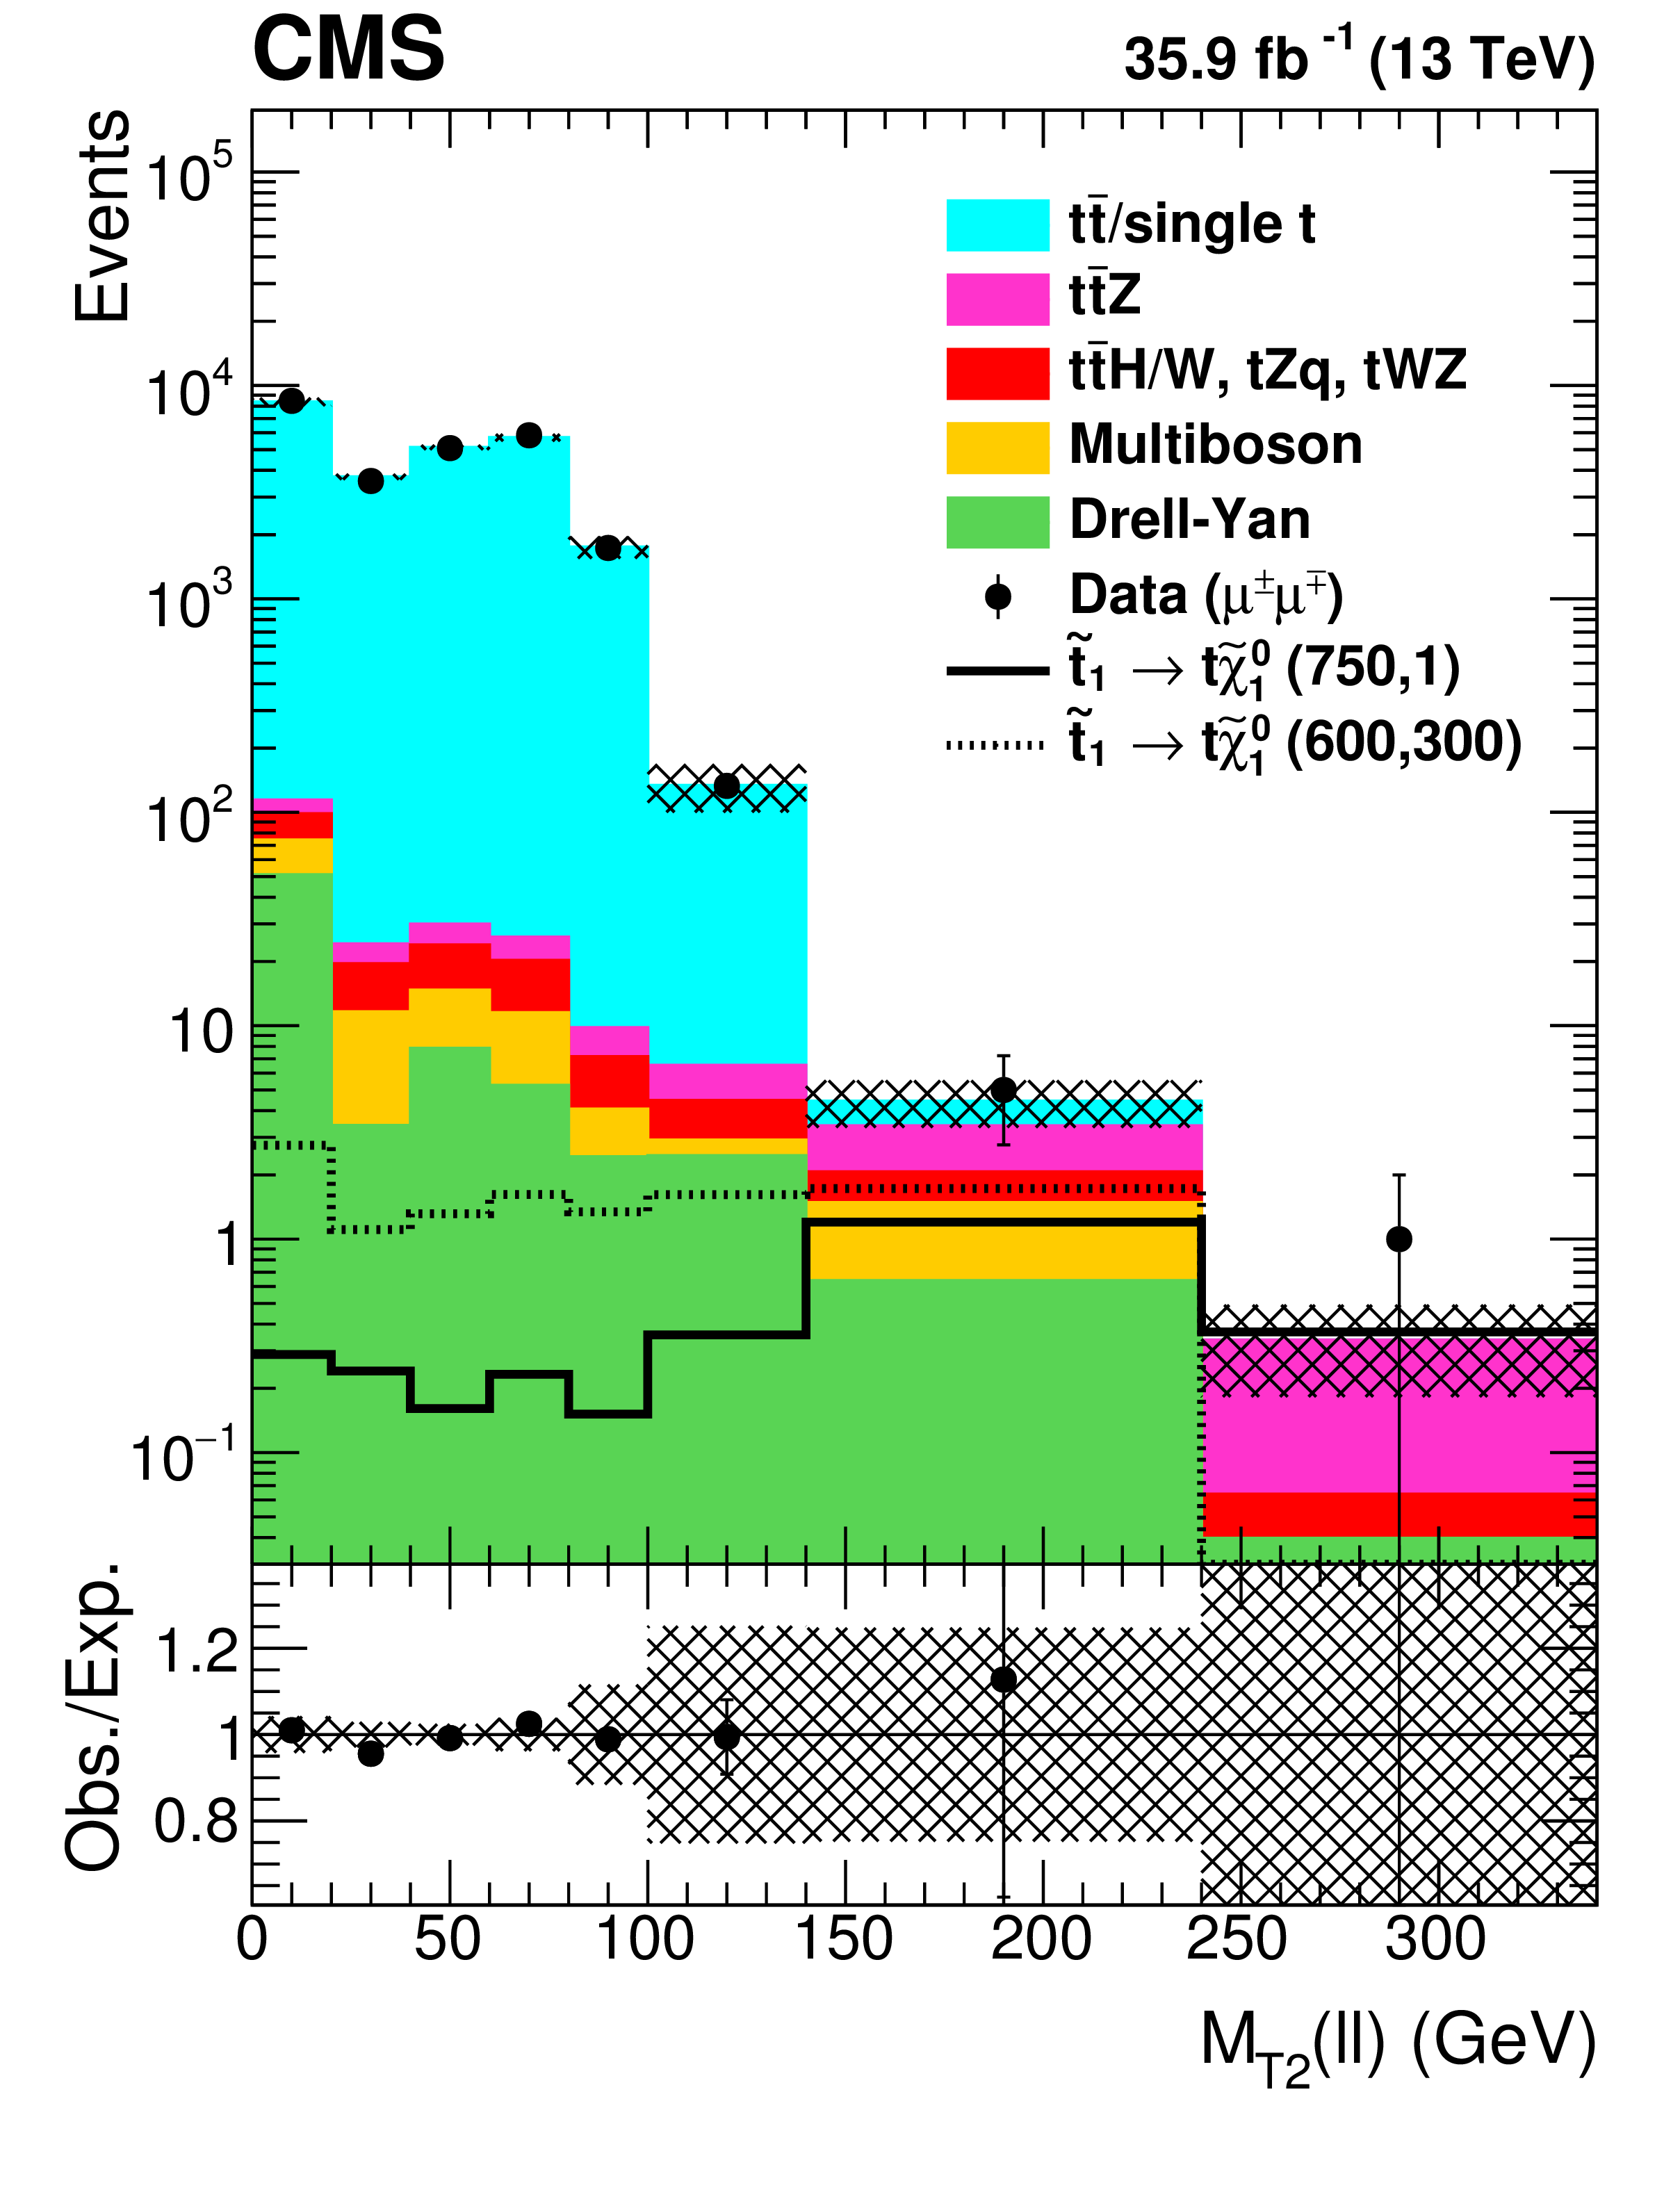
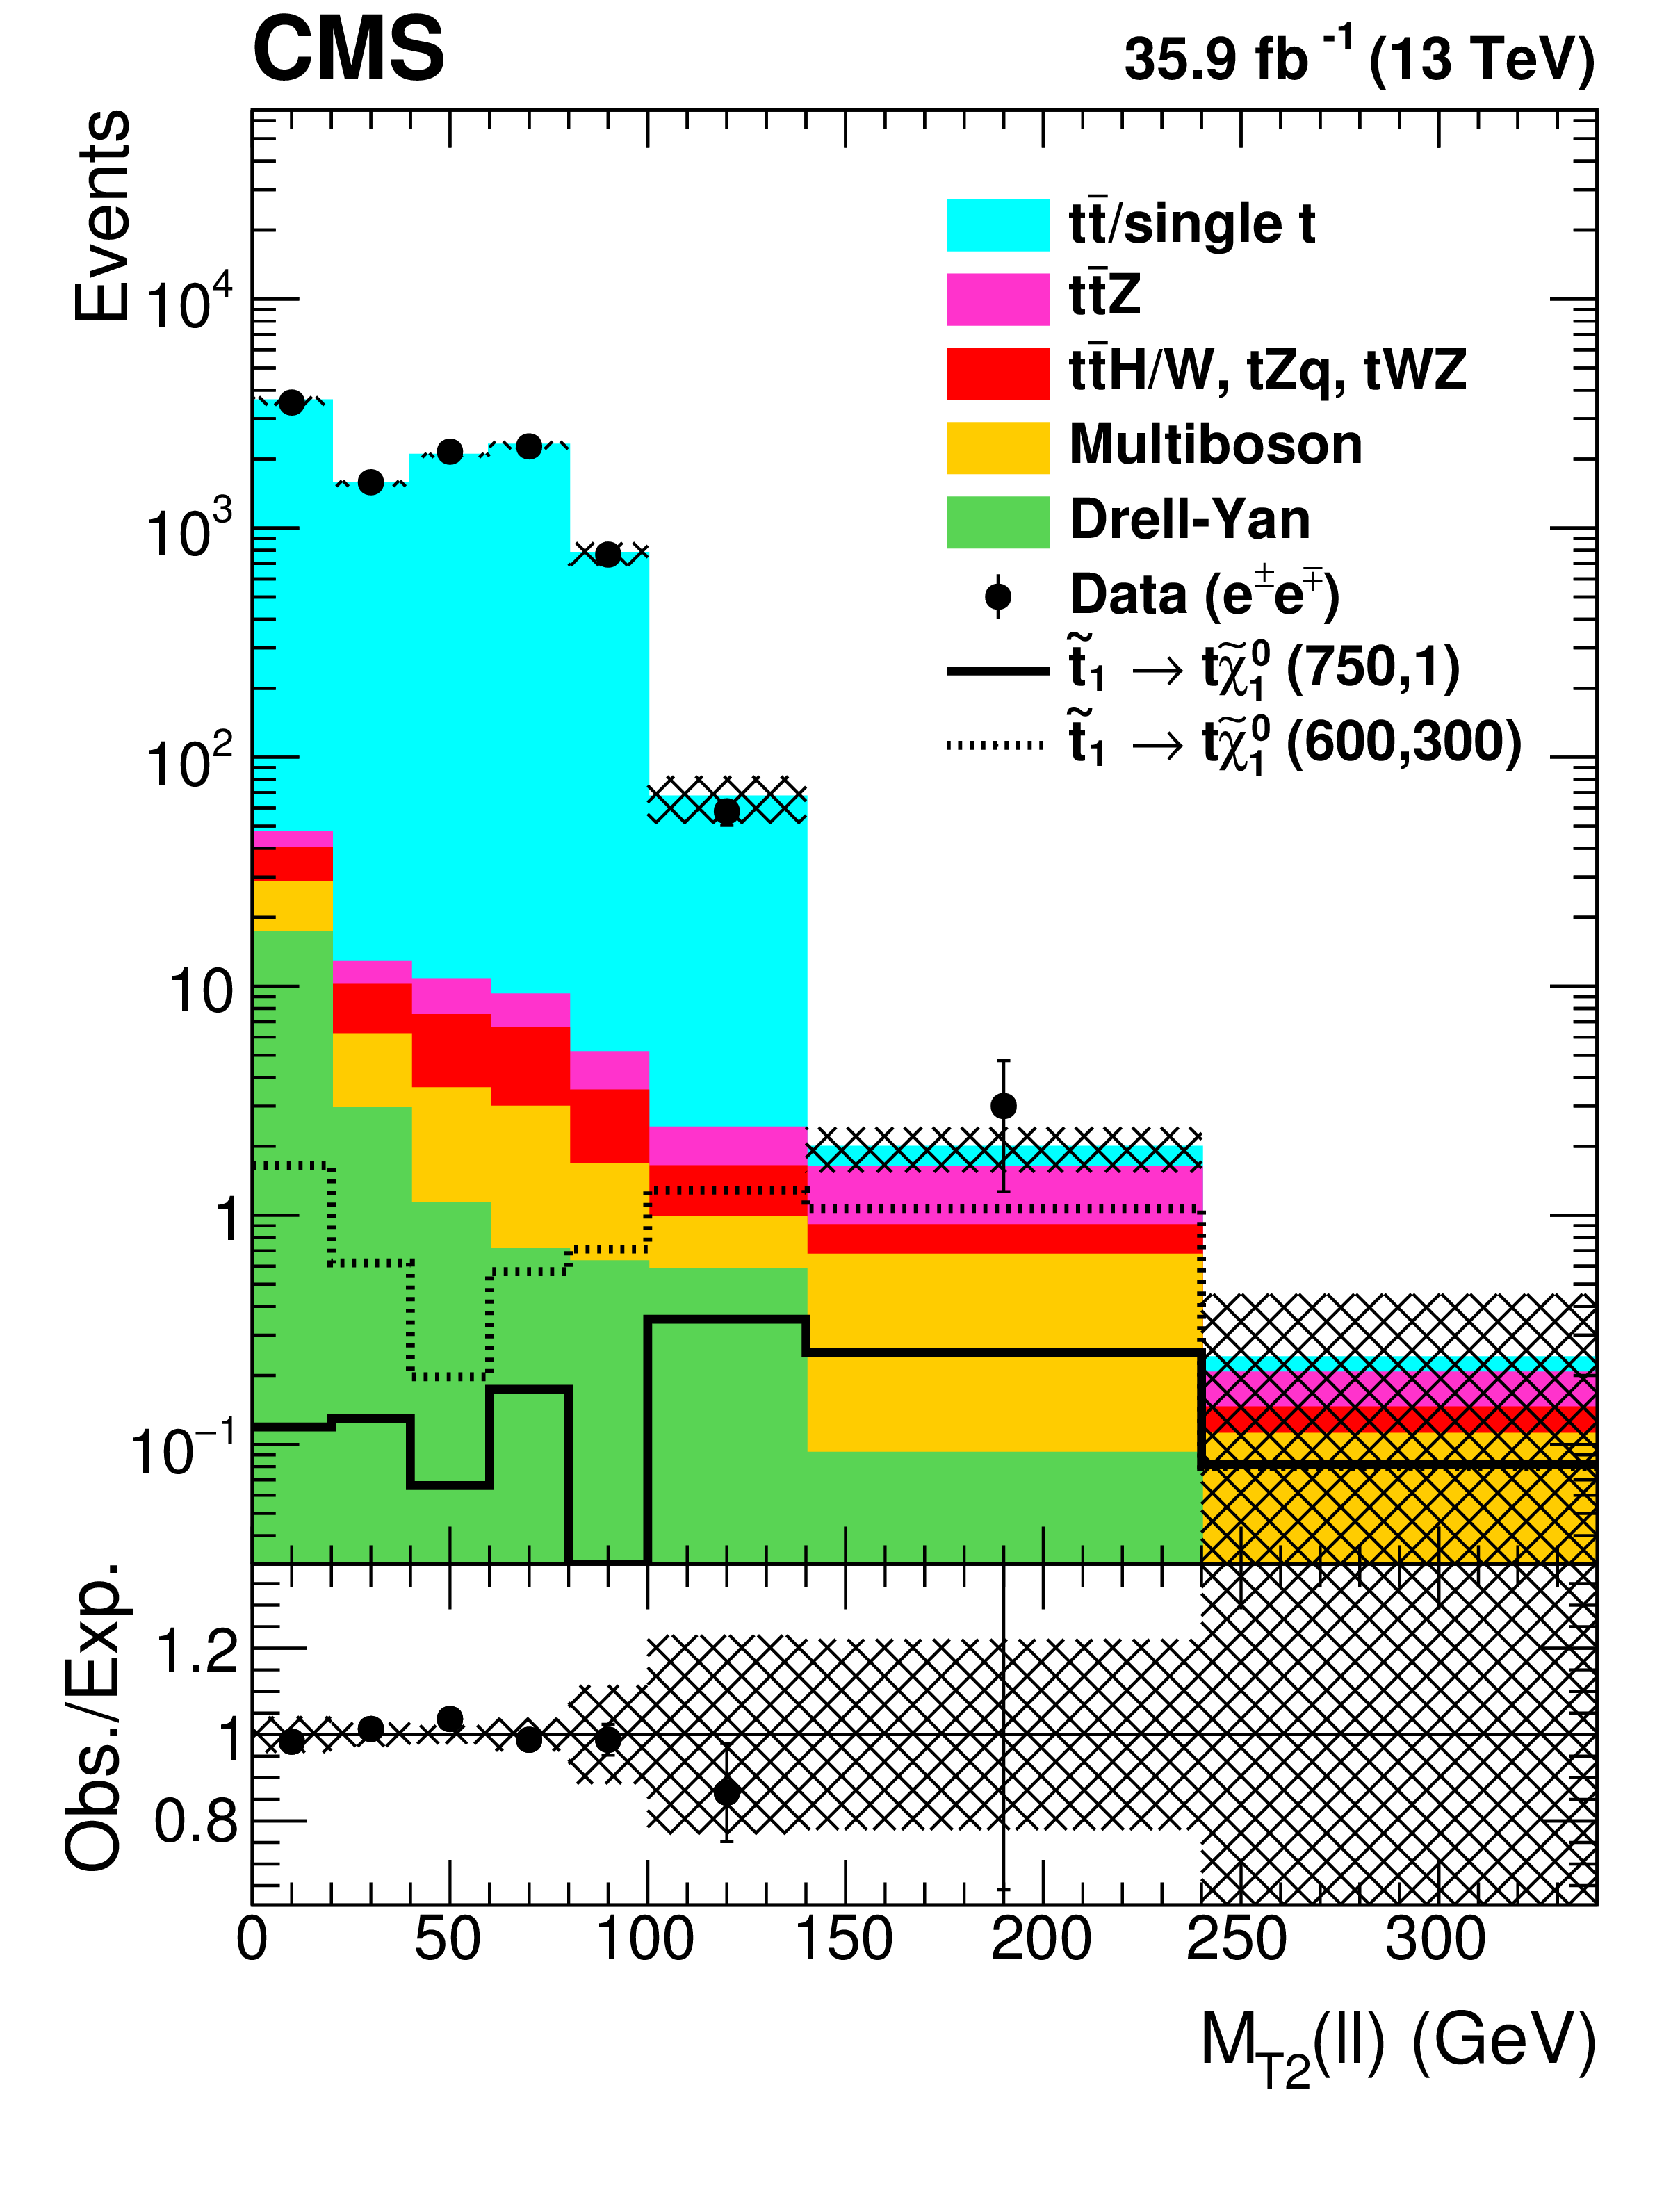
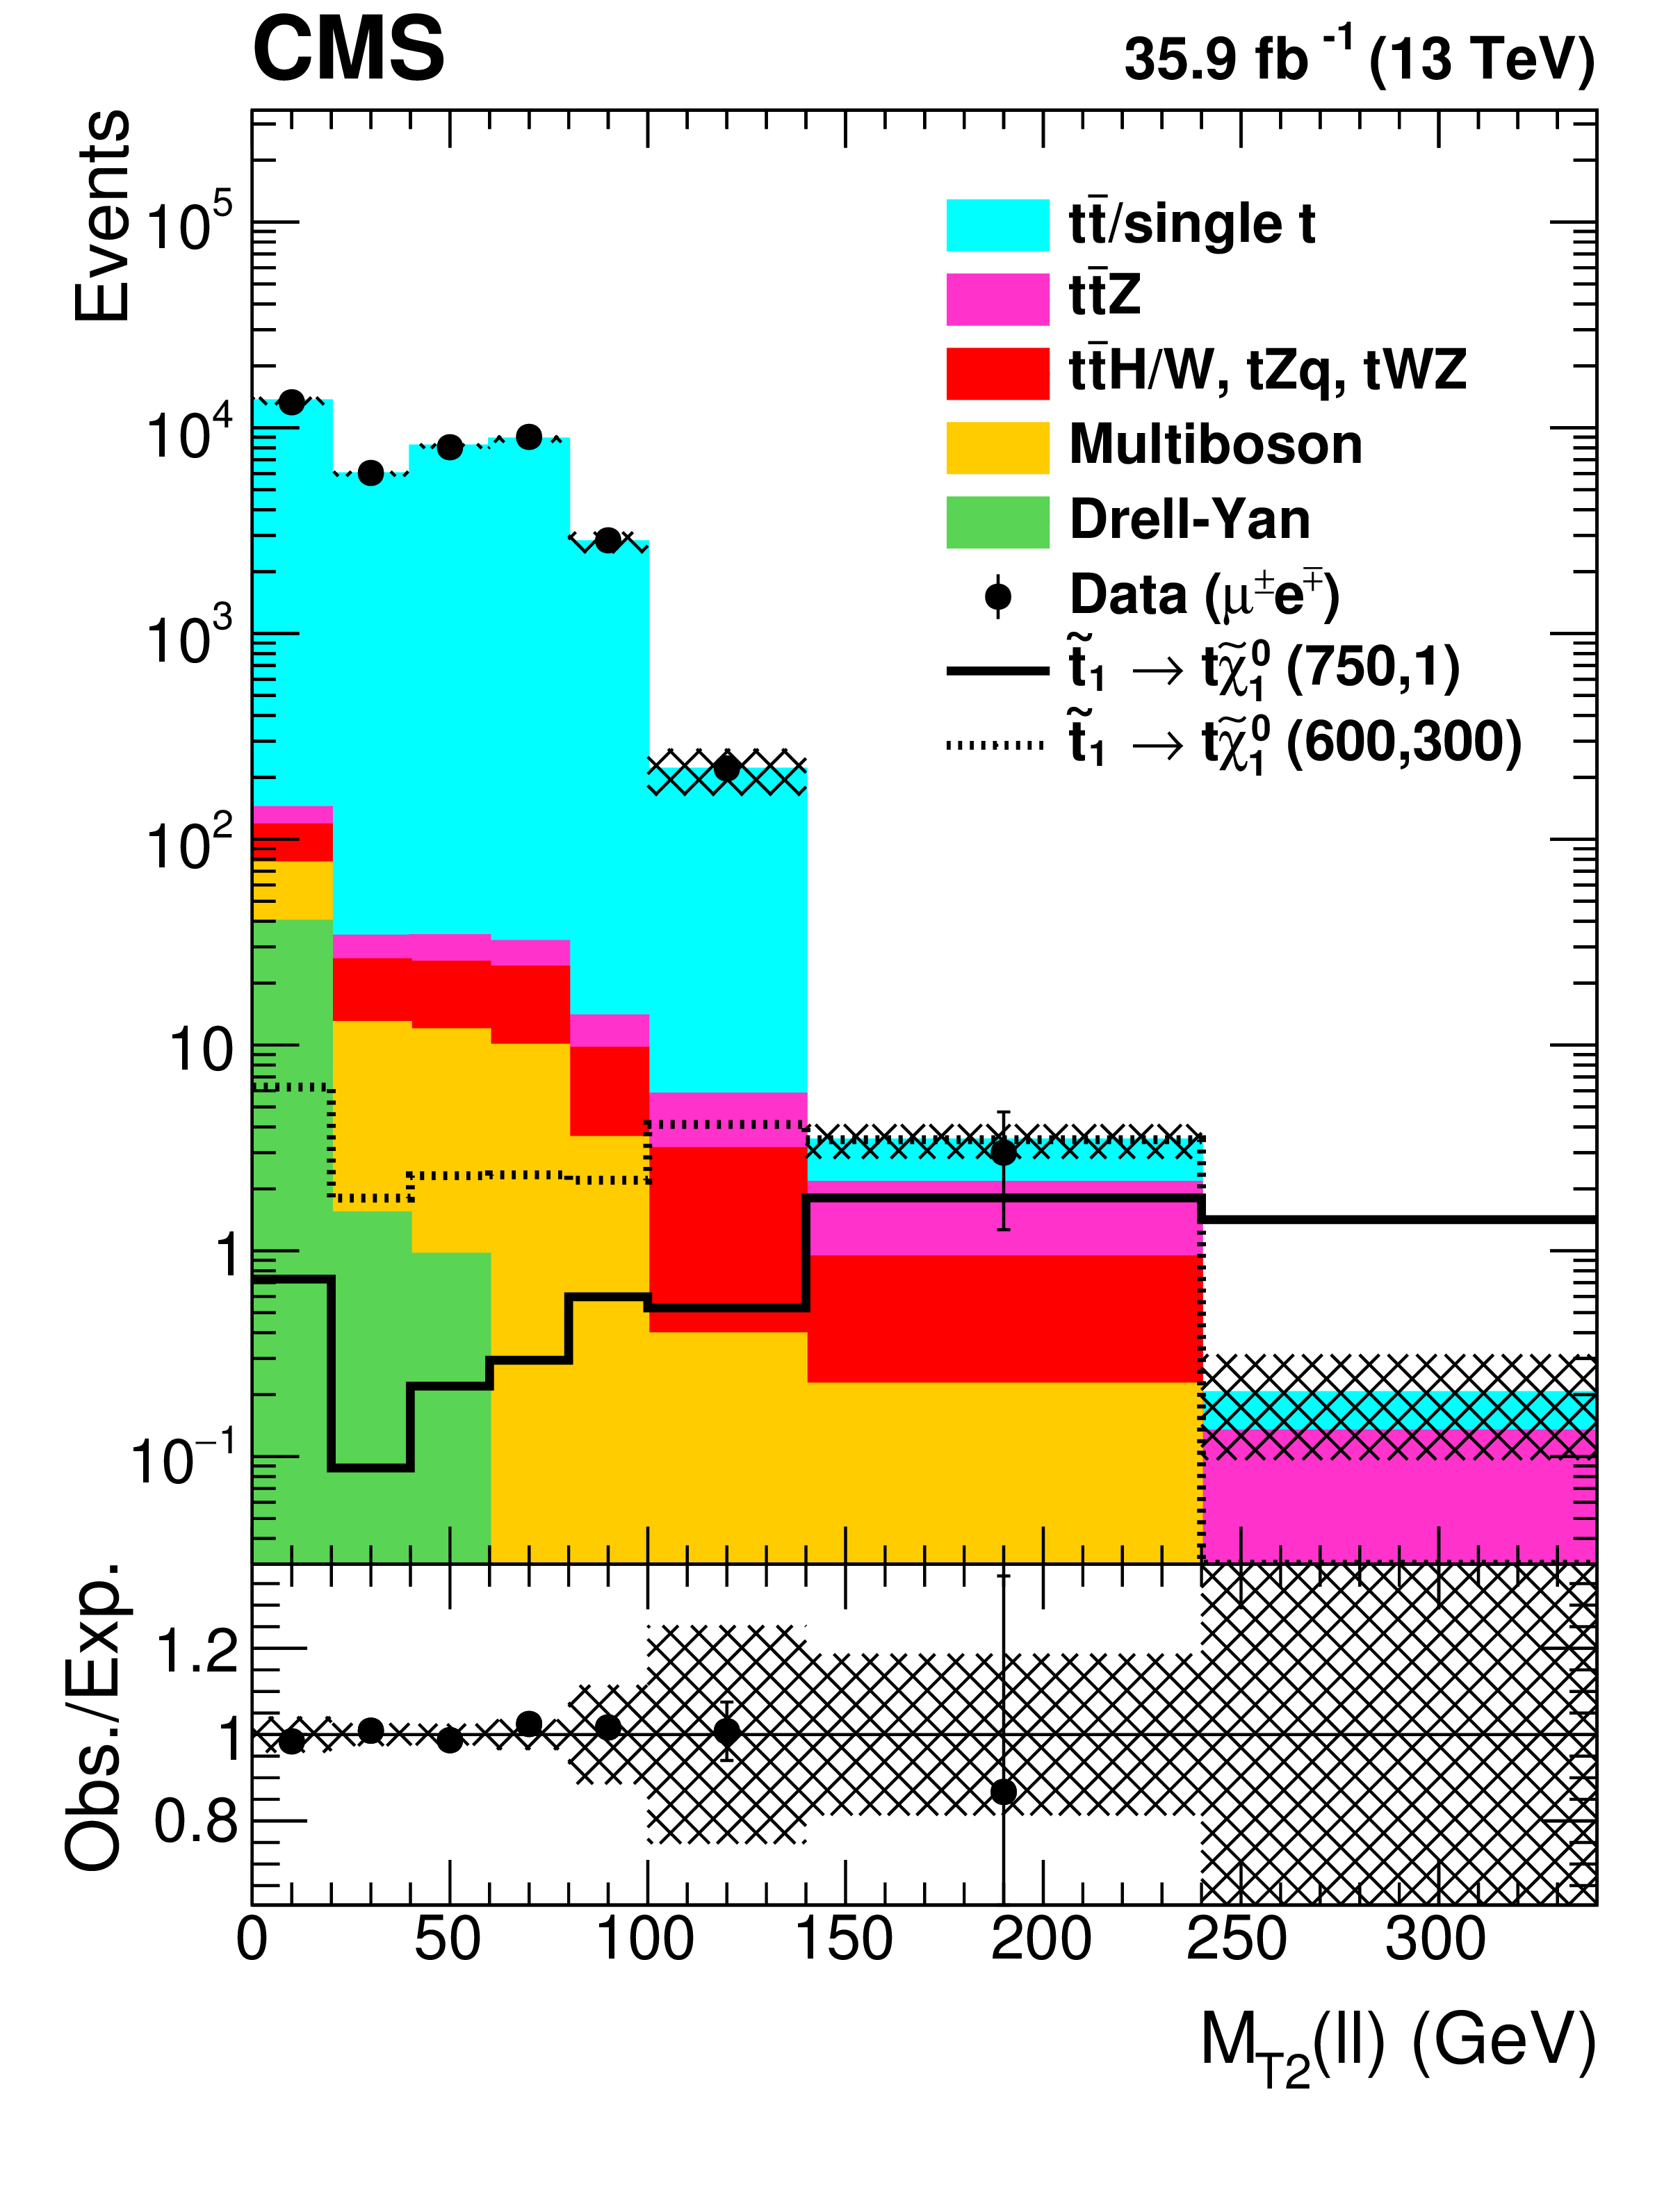
Distributions of $ {M_{\text {T2}}(\ell \ell)} $ for observed events in the $\mu \mu $ (left), $\mathrm{e} \mathrm{e} $ (middle), and $\mathrm{e} \mu $ (right) channels compared to the predicted SM backgrounds for the selection defined in Table 1. The hatched band shows the uncertainties discussed in the text. |
png pdf root |
Figure 7-a:
Distribution of $ {M_{\text {T2}}(\ell \ell)} $ for observed events in the $\mu \mu $ channel compared to the predicted SM backgrounds for the selection defined in Table 1. The hatched band shows the uncertainties discussed in the text. |
png pdf root |
Figure 7-b:
Distribution of $ {M_{\text {T2}}(\ell \ell)} $ for observed events in the $\mathrm{e} \mathrm{e} $ channel compared to the predicted SM backgrounds for the selection defined in Table 1. The hatched band shows the uncertainties discussed in the text. |
png pdf root |
Figure 7-c:
Distribution of $ {M_{\text {T2}}(\ell \ell)} $ for observed events in the $\mathrm{e} \mu $ channel compared to the predicted SM backgrounds for the selection defined in Table 1. The hatched band shows the uncertainties discussed in the text. |
png pdf |
Figure 8:
Distributions of ${M_{\text {T2}}(\ell \ell)}$ (left), ${M_{\text {T2}}(\mathrm{b} \ell \mathrm{b} \ell)}$ (middle), and ${{p_{\mathrm {T}}} ^\text {miss}}$ (right) for all lepton flavors for the selection defined in Table 1. Additionally, $ {M_{\text {T2}}(\ell \ell)} > $ 100 GeV is required for the ${M_{\text {T2}}(\mathrm{b} \ell \mathrm{b} \ell)}$ and ${{p_{\mathrm {T}}} ^\text {miss}}$ distributions. The hatched band shows the uncertainties discussed in the text. |

png pdf root |
Figure 8-a:
Distribution of ${M_{\text {T2}}(\ell \ell)}$ for all lepton flavors for the selection defined in Table 1. Additionally, $ {M_{\text {T2}}(\ell \ell)} > $ 100 GeV is required for the ${M_{\text {T2}}(\mathrm{b} \ell \mathrm{b} \ell)}$ and ${{p_{\mathrm {T}}} ^\text {miss}}$ distributions. The hatched band shows the uncertainties discussed in the text. |
png pdf root |
Figure 8-b:
Distribution of ${M_{\text {T2}}(\mathrm{b} \ell \mathrm{b} \ell)}$ for all lepton flavors for the selection defined in Table 1. Additionally, $ {M_{\text {T2}}(\ell \ell)} > $ 100 GeV is required for the ${M_{\text {T2}}(\mathrm{b} \ell \mathrm{b} \ell)}$ and ${{p_{\mathrm {T}}} ^\text {miss}}$ distributions. The hatched band shows the uncertainties discussed in the text. |
png pdf root |
Figure 8-c:
Distribution of ${{p_{\mathrm {T}}} ^\text {miss}}$ for all lepton flavors for the selection defined in Table 1. Additionally, $ {M_{\text {T2}}(\ell \ell)} > $ 100 GeV is required for the ${M_{\text {T2}}(\mathrm{b} \ell \mathrm{b} \ell)}$ and ${{p_{\mathrm {T}}} ^\text {miss}}$ distributions. The hatched band shows the uncertainties discussed in the text. |
png pdf |
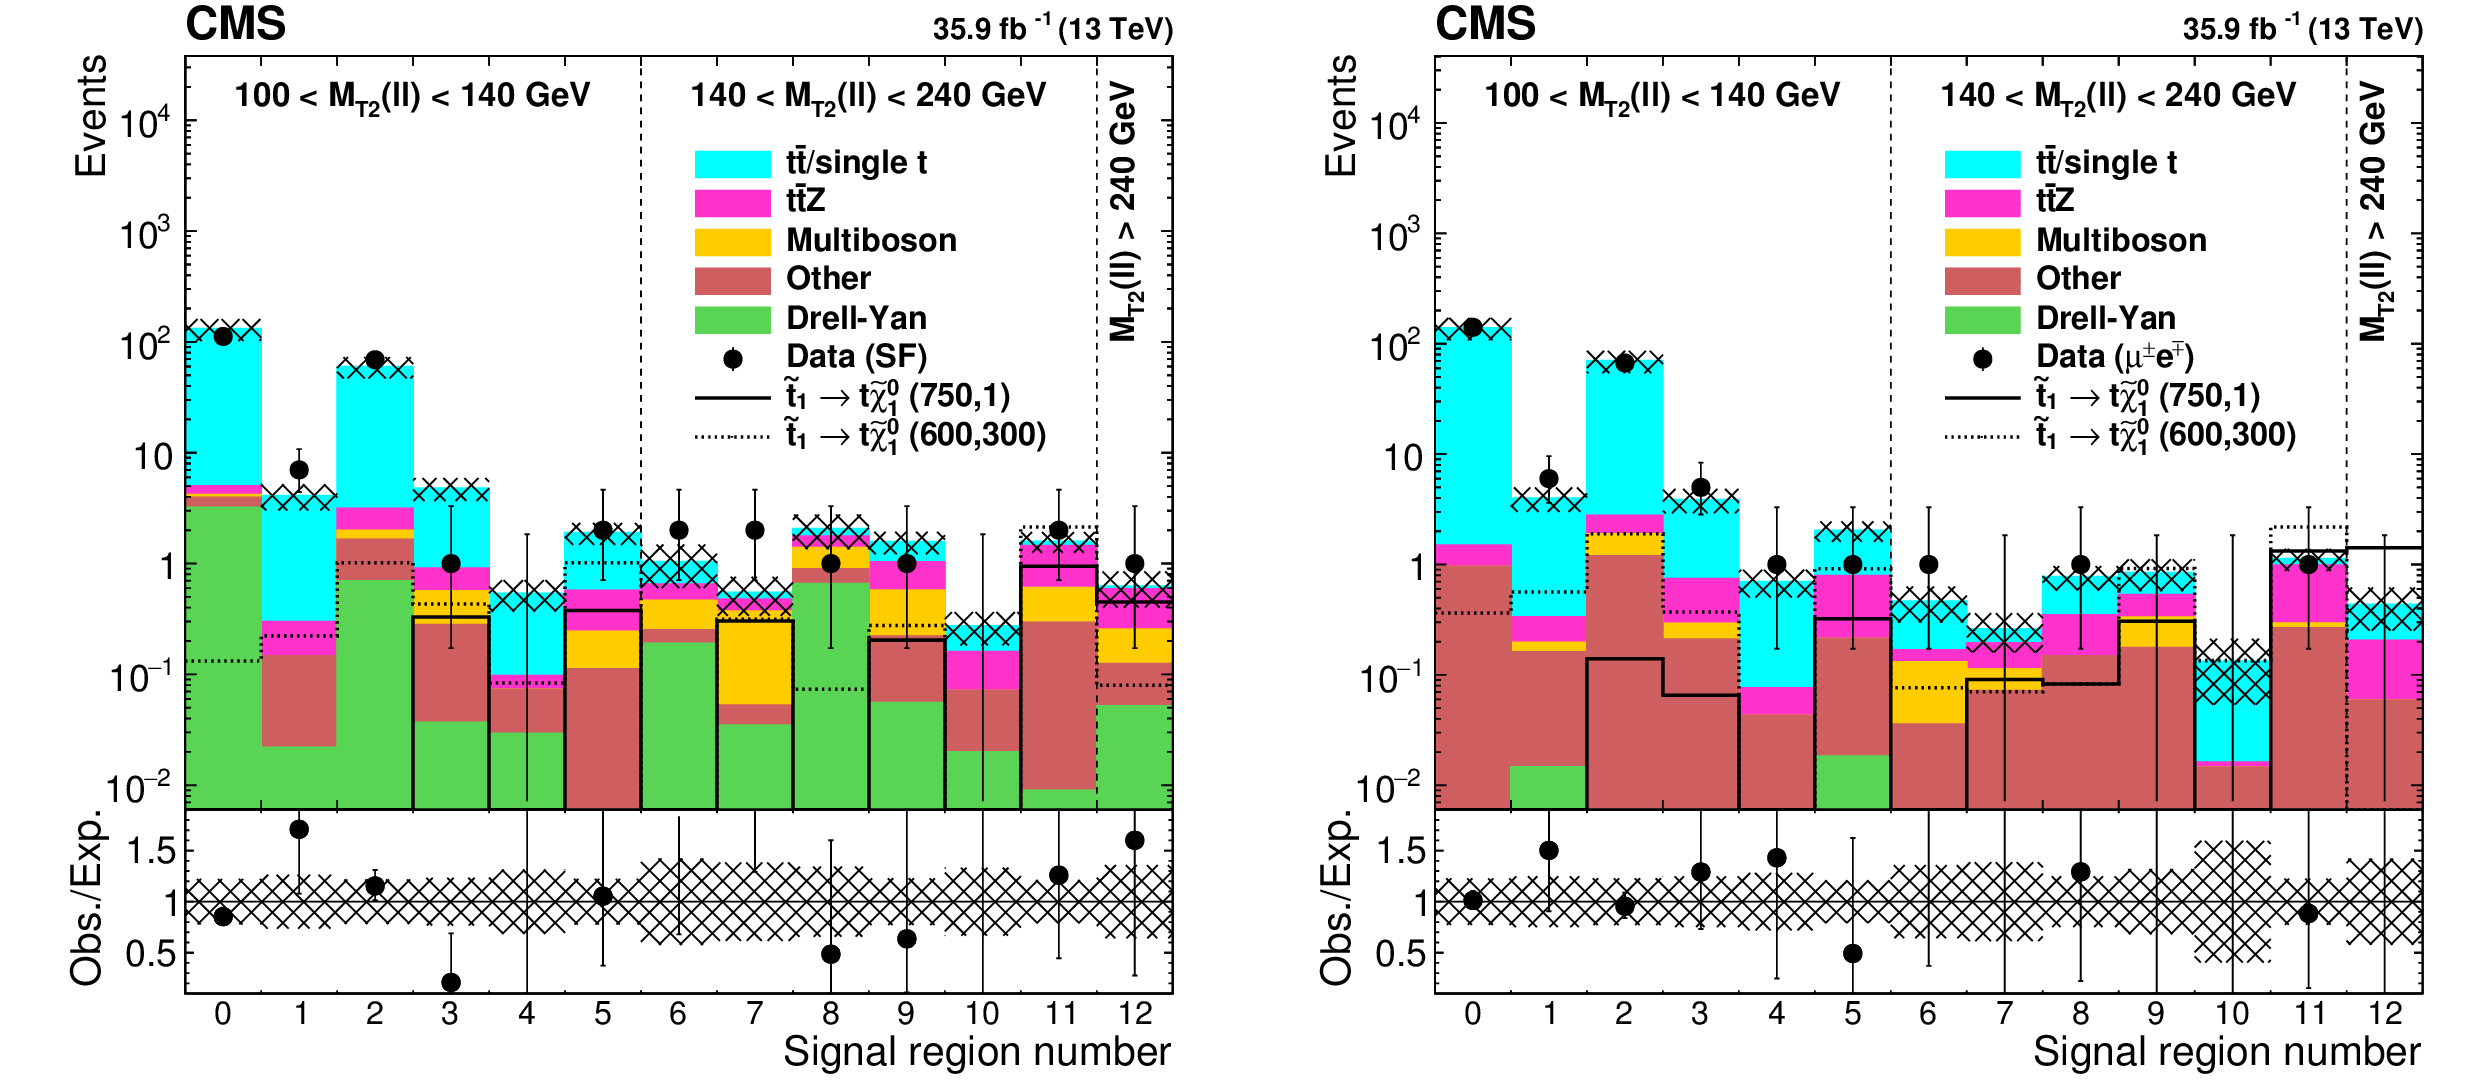
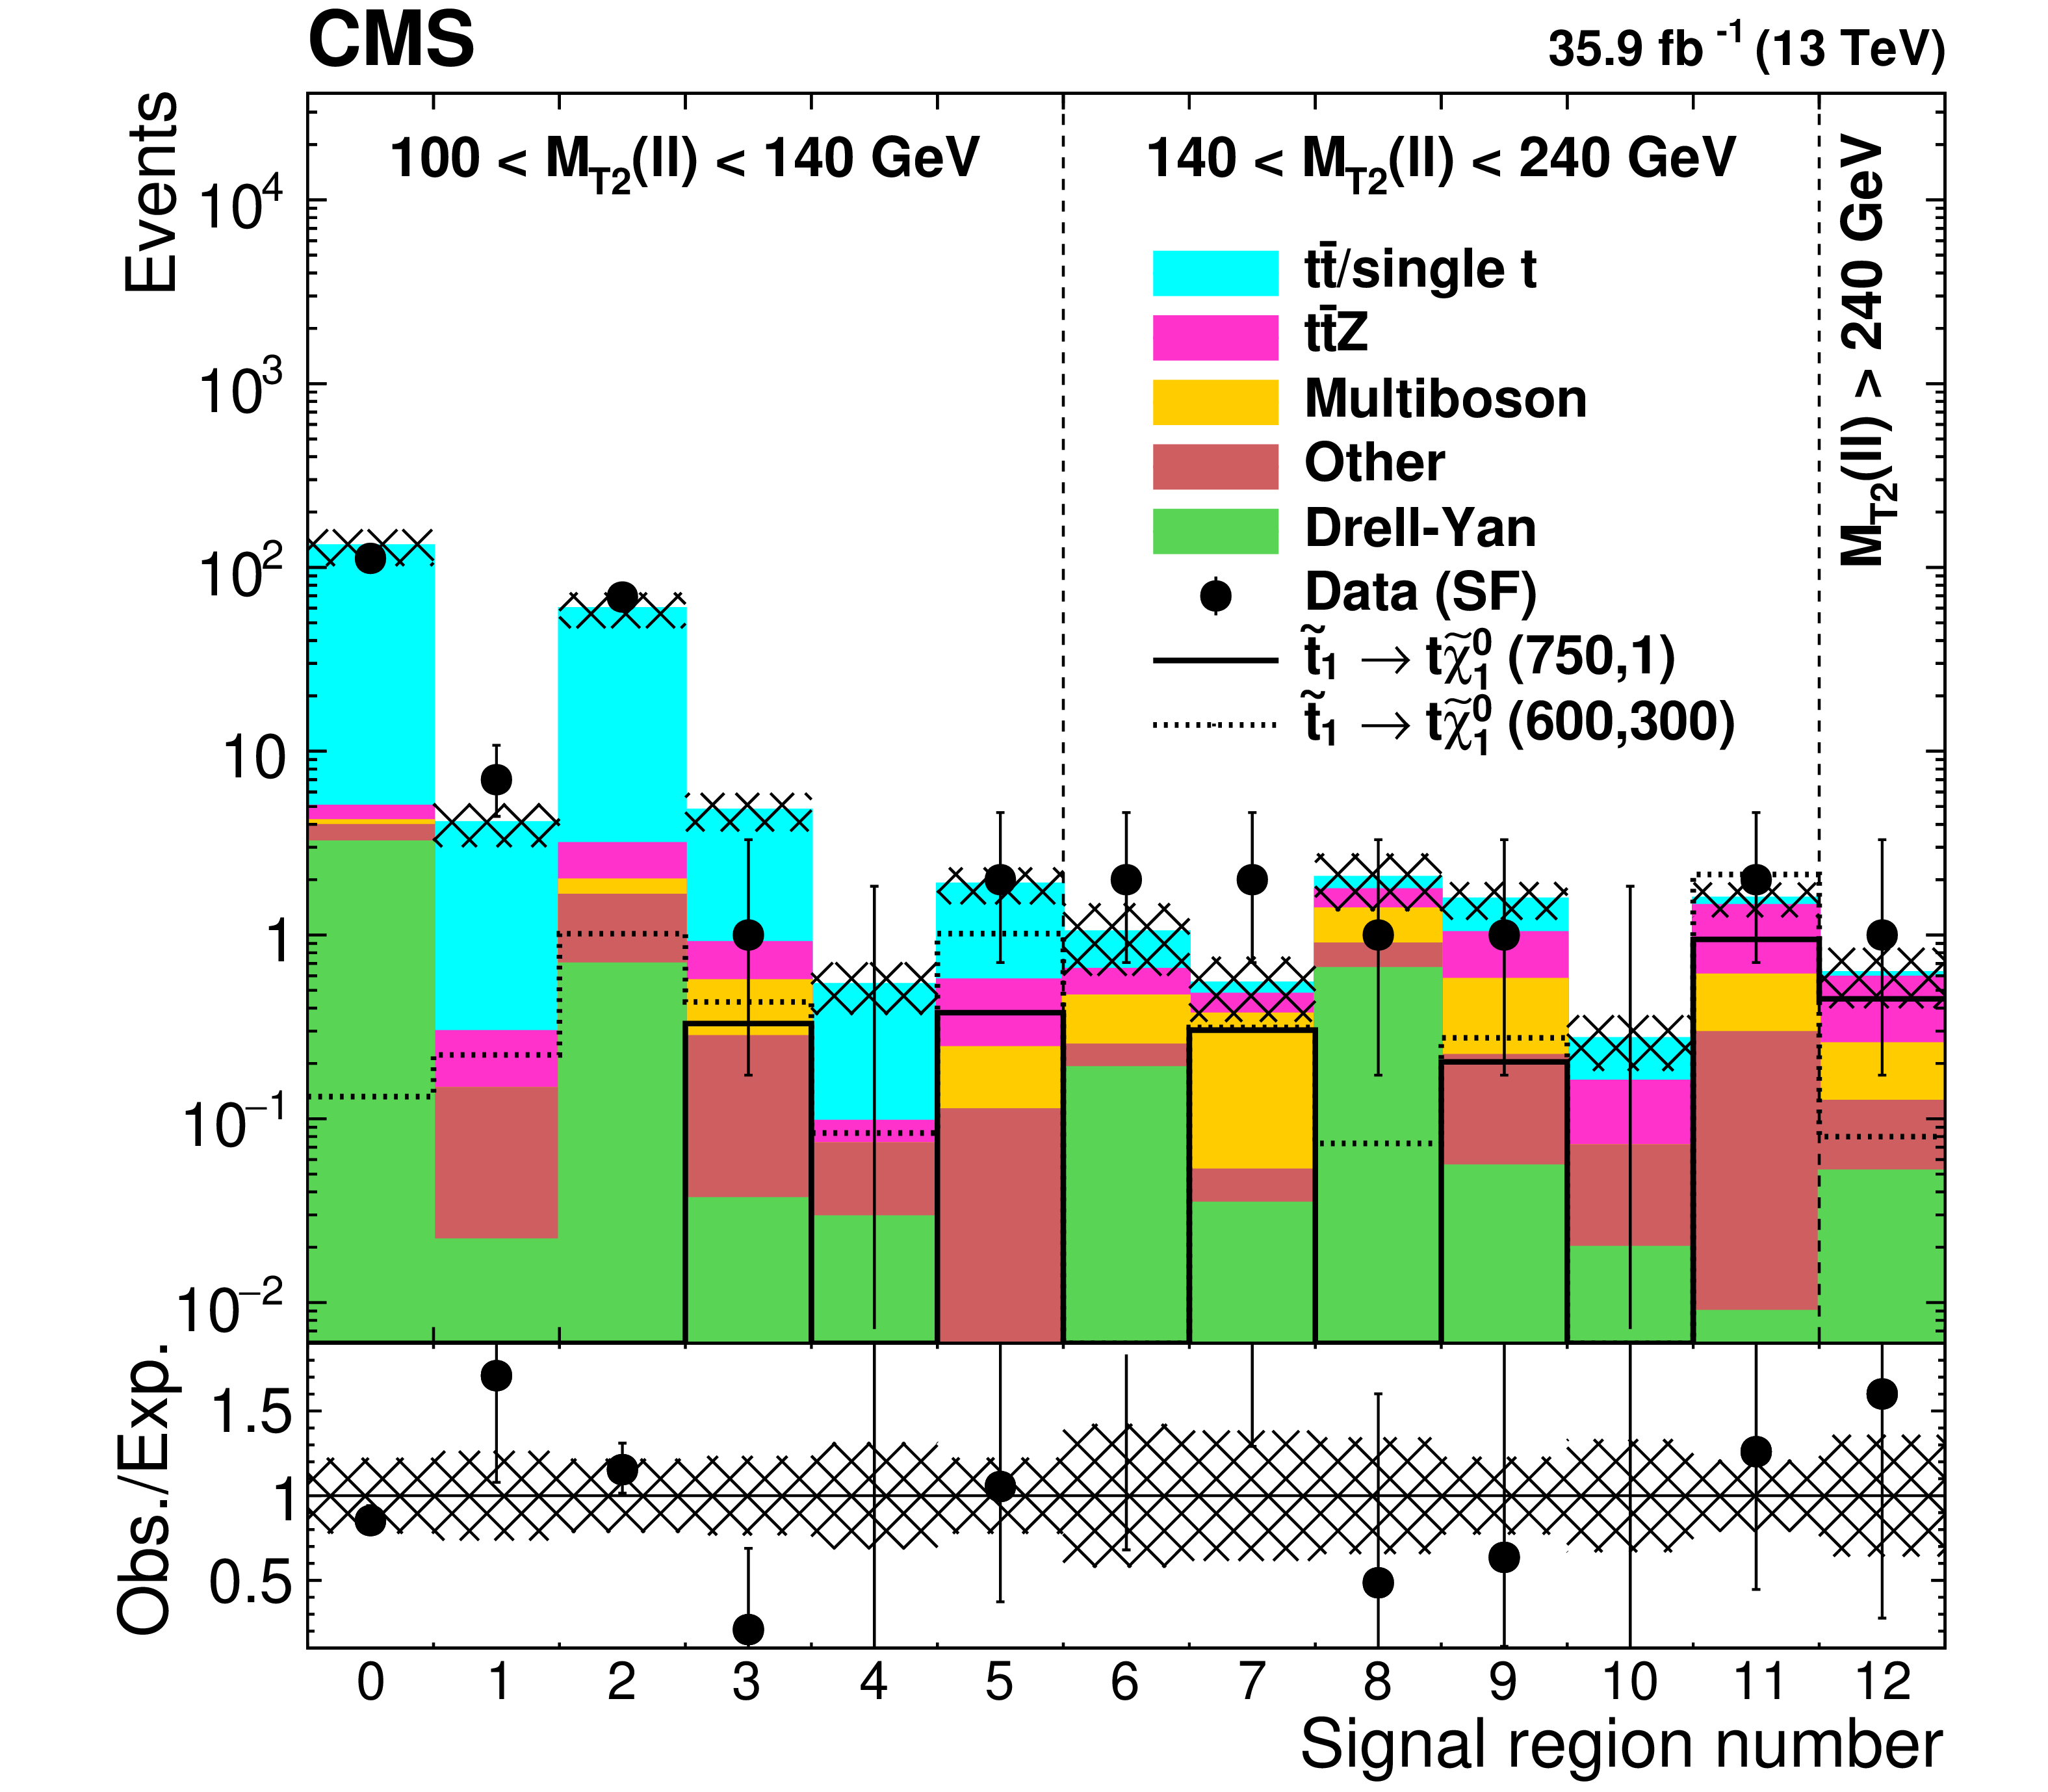
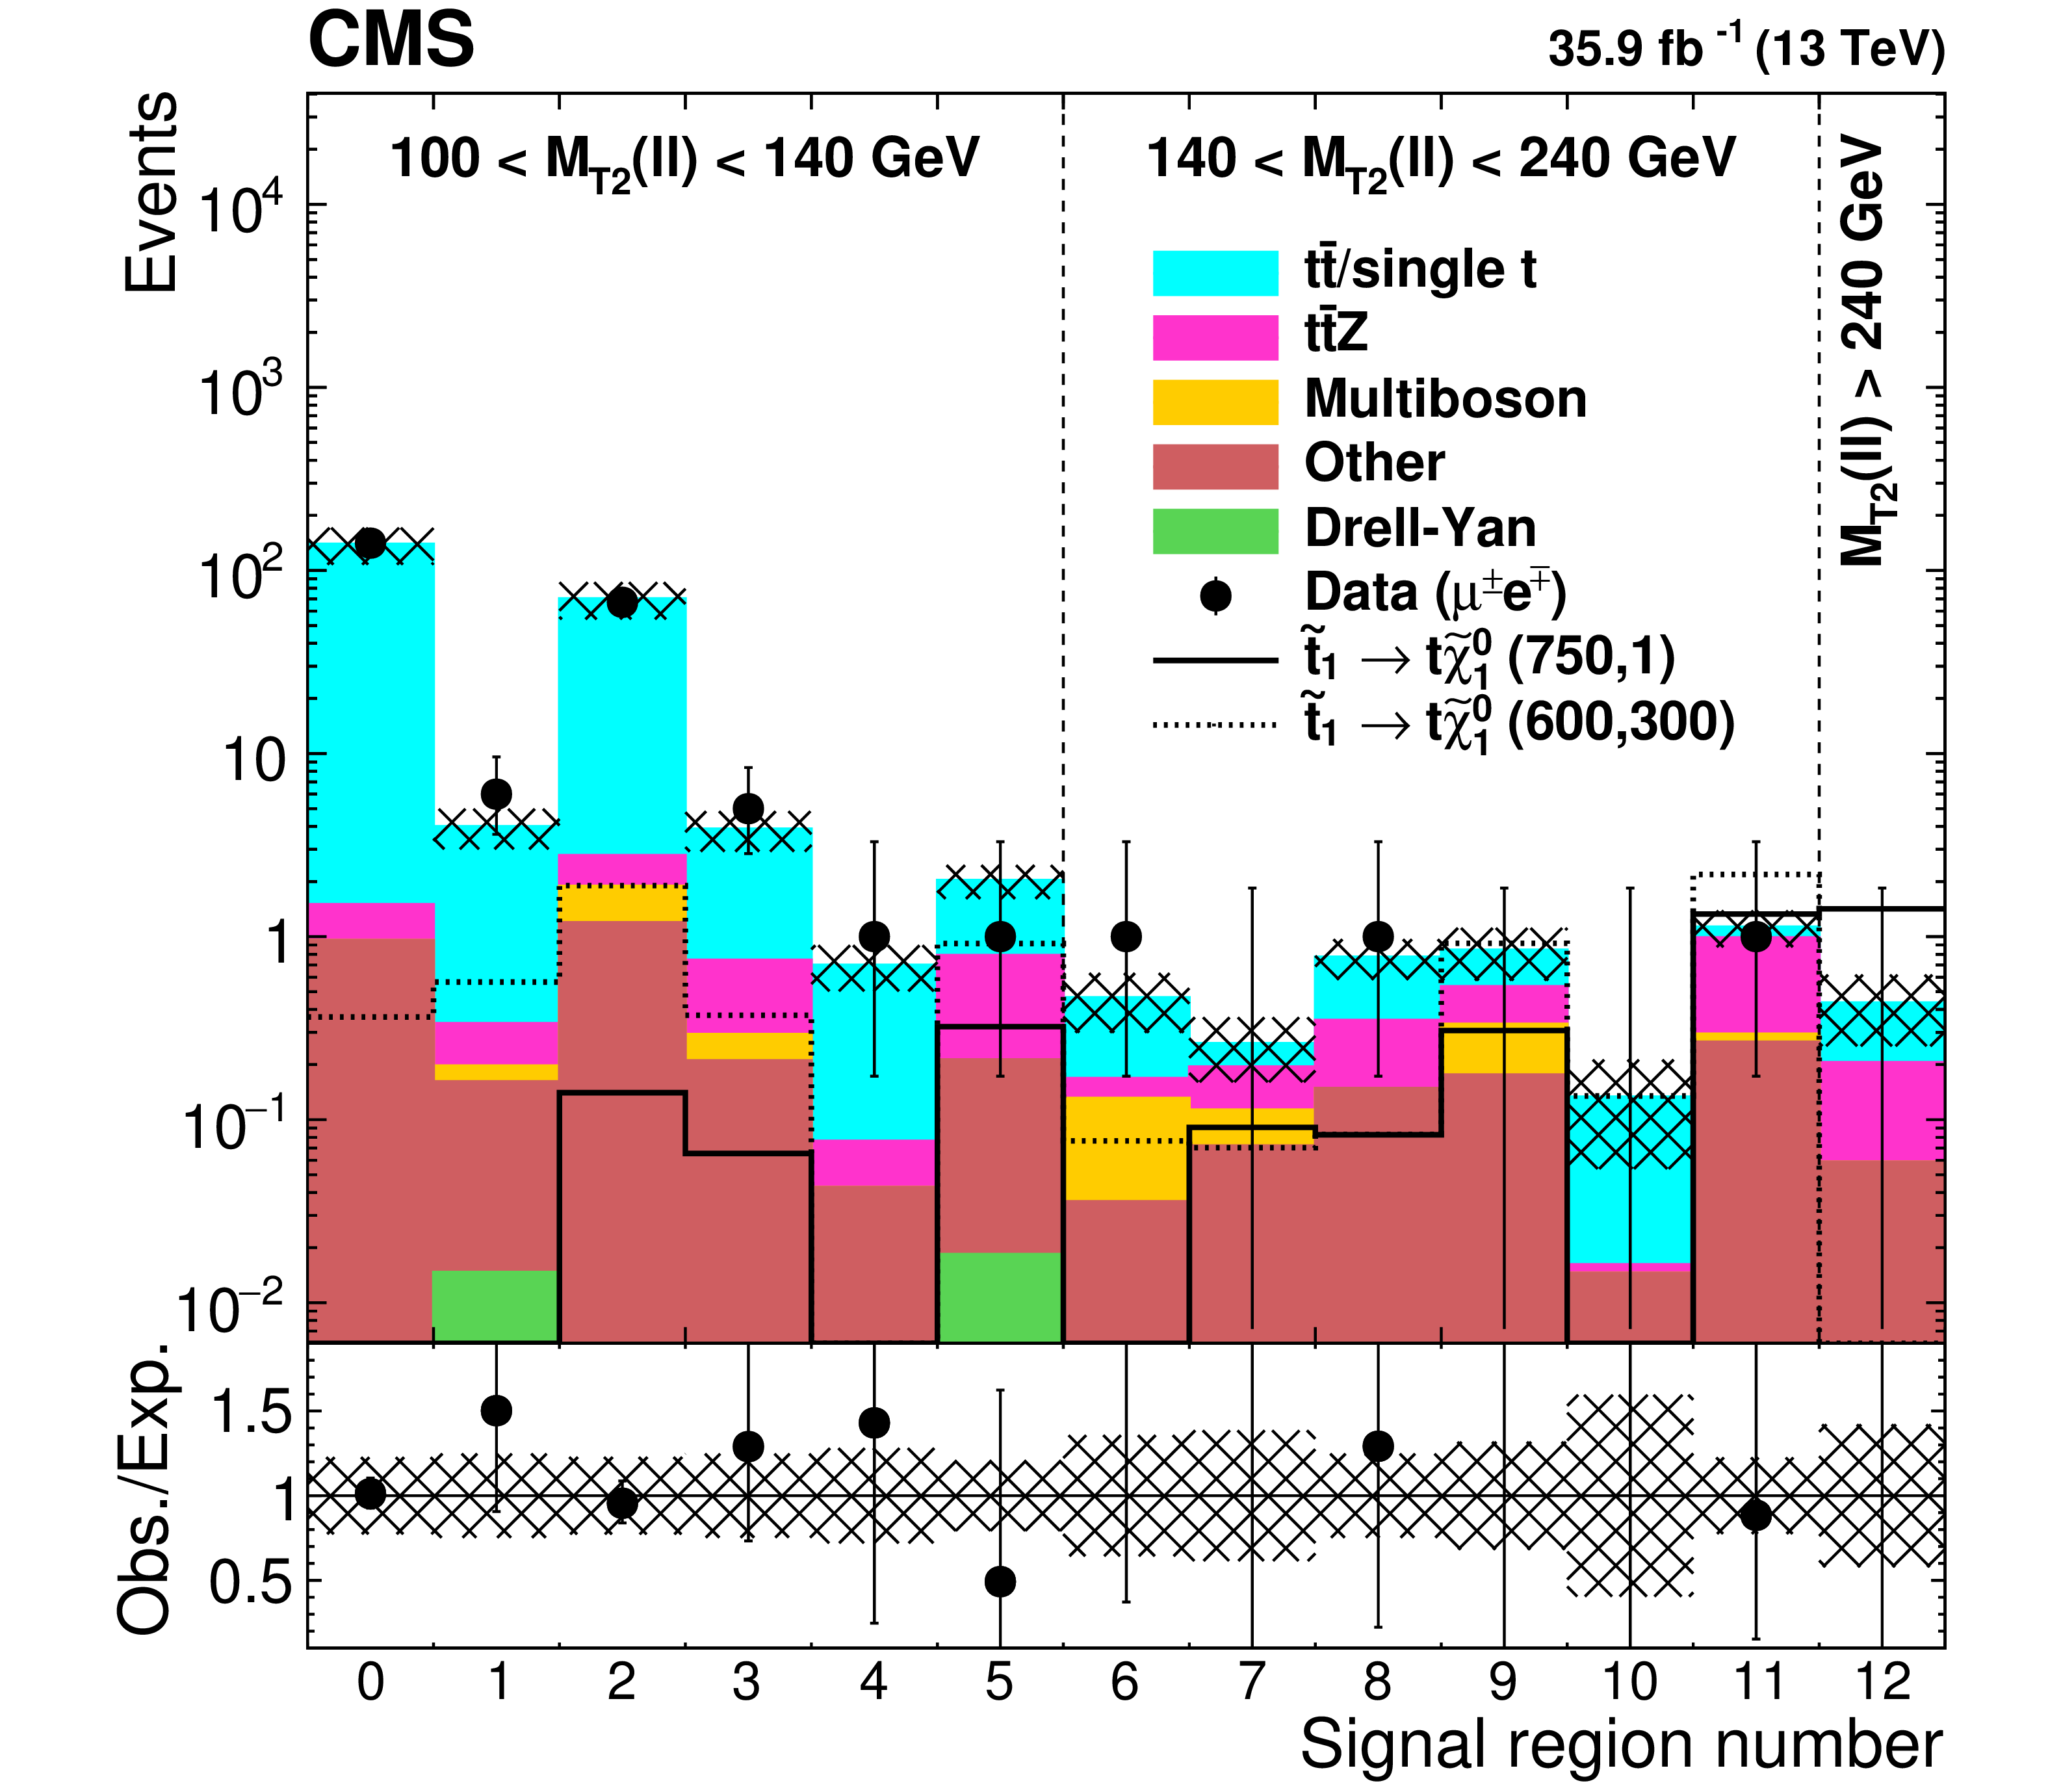
Figure 9:
Predicted backgrounds and observed yields in the $\mathrm{e} \mathrm{e} $ and $\mu \mu $ search regions (left) and the $\mathrm{e} \mu $ search regions (right). The hatched band shows the uncertainties discussed in the text. |
png pdf root |
Figure 9-a:
Predicted backgrounds and observed yields in the $\mathrm{e} \mathrm{e} $ and $\mu \mu $ search regions. The hatched band shows the uncertainties discussed in the text. |
png pdf root |
Figure 9-b:
Predicted backgrounds and observed yields in the $\mathrm{e} \mu $ search region. The hatched band shows the uncertainties discussed in the text. |
png pdf root |
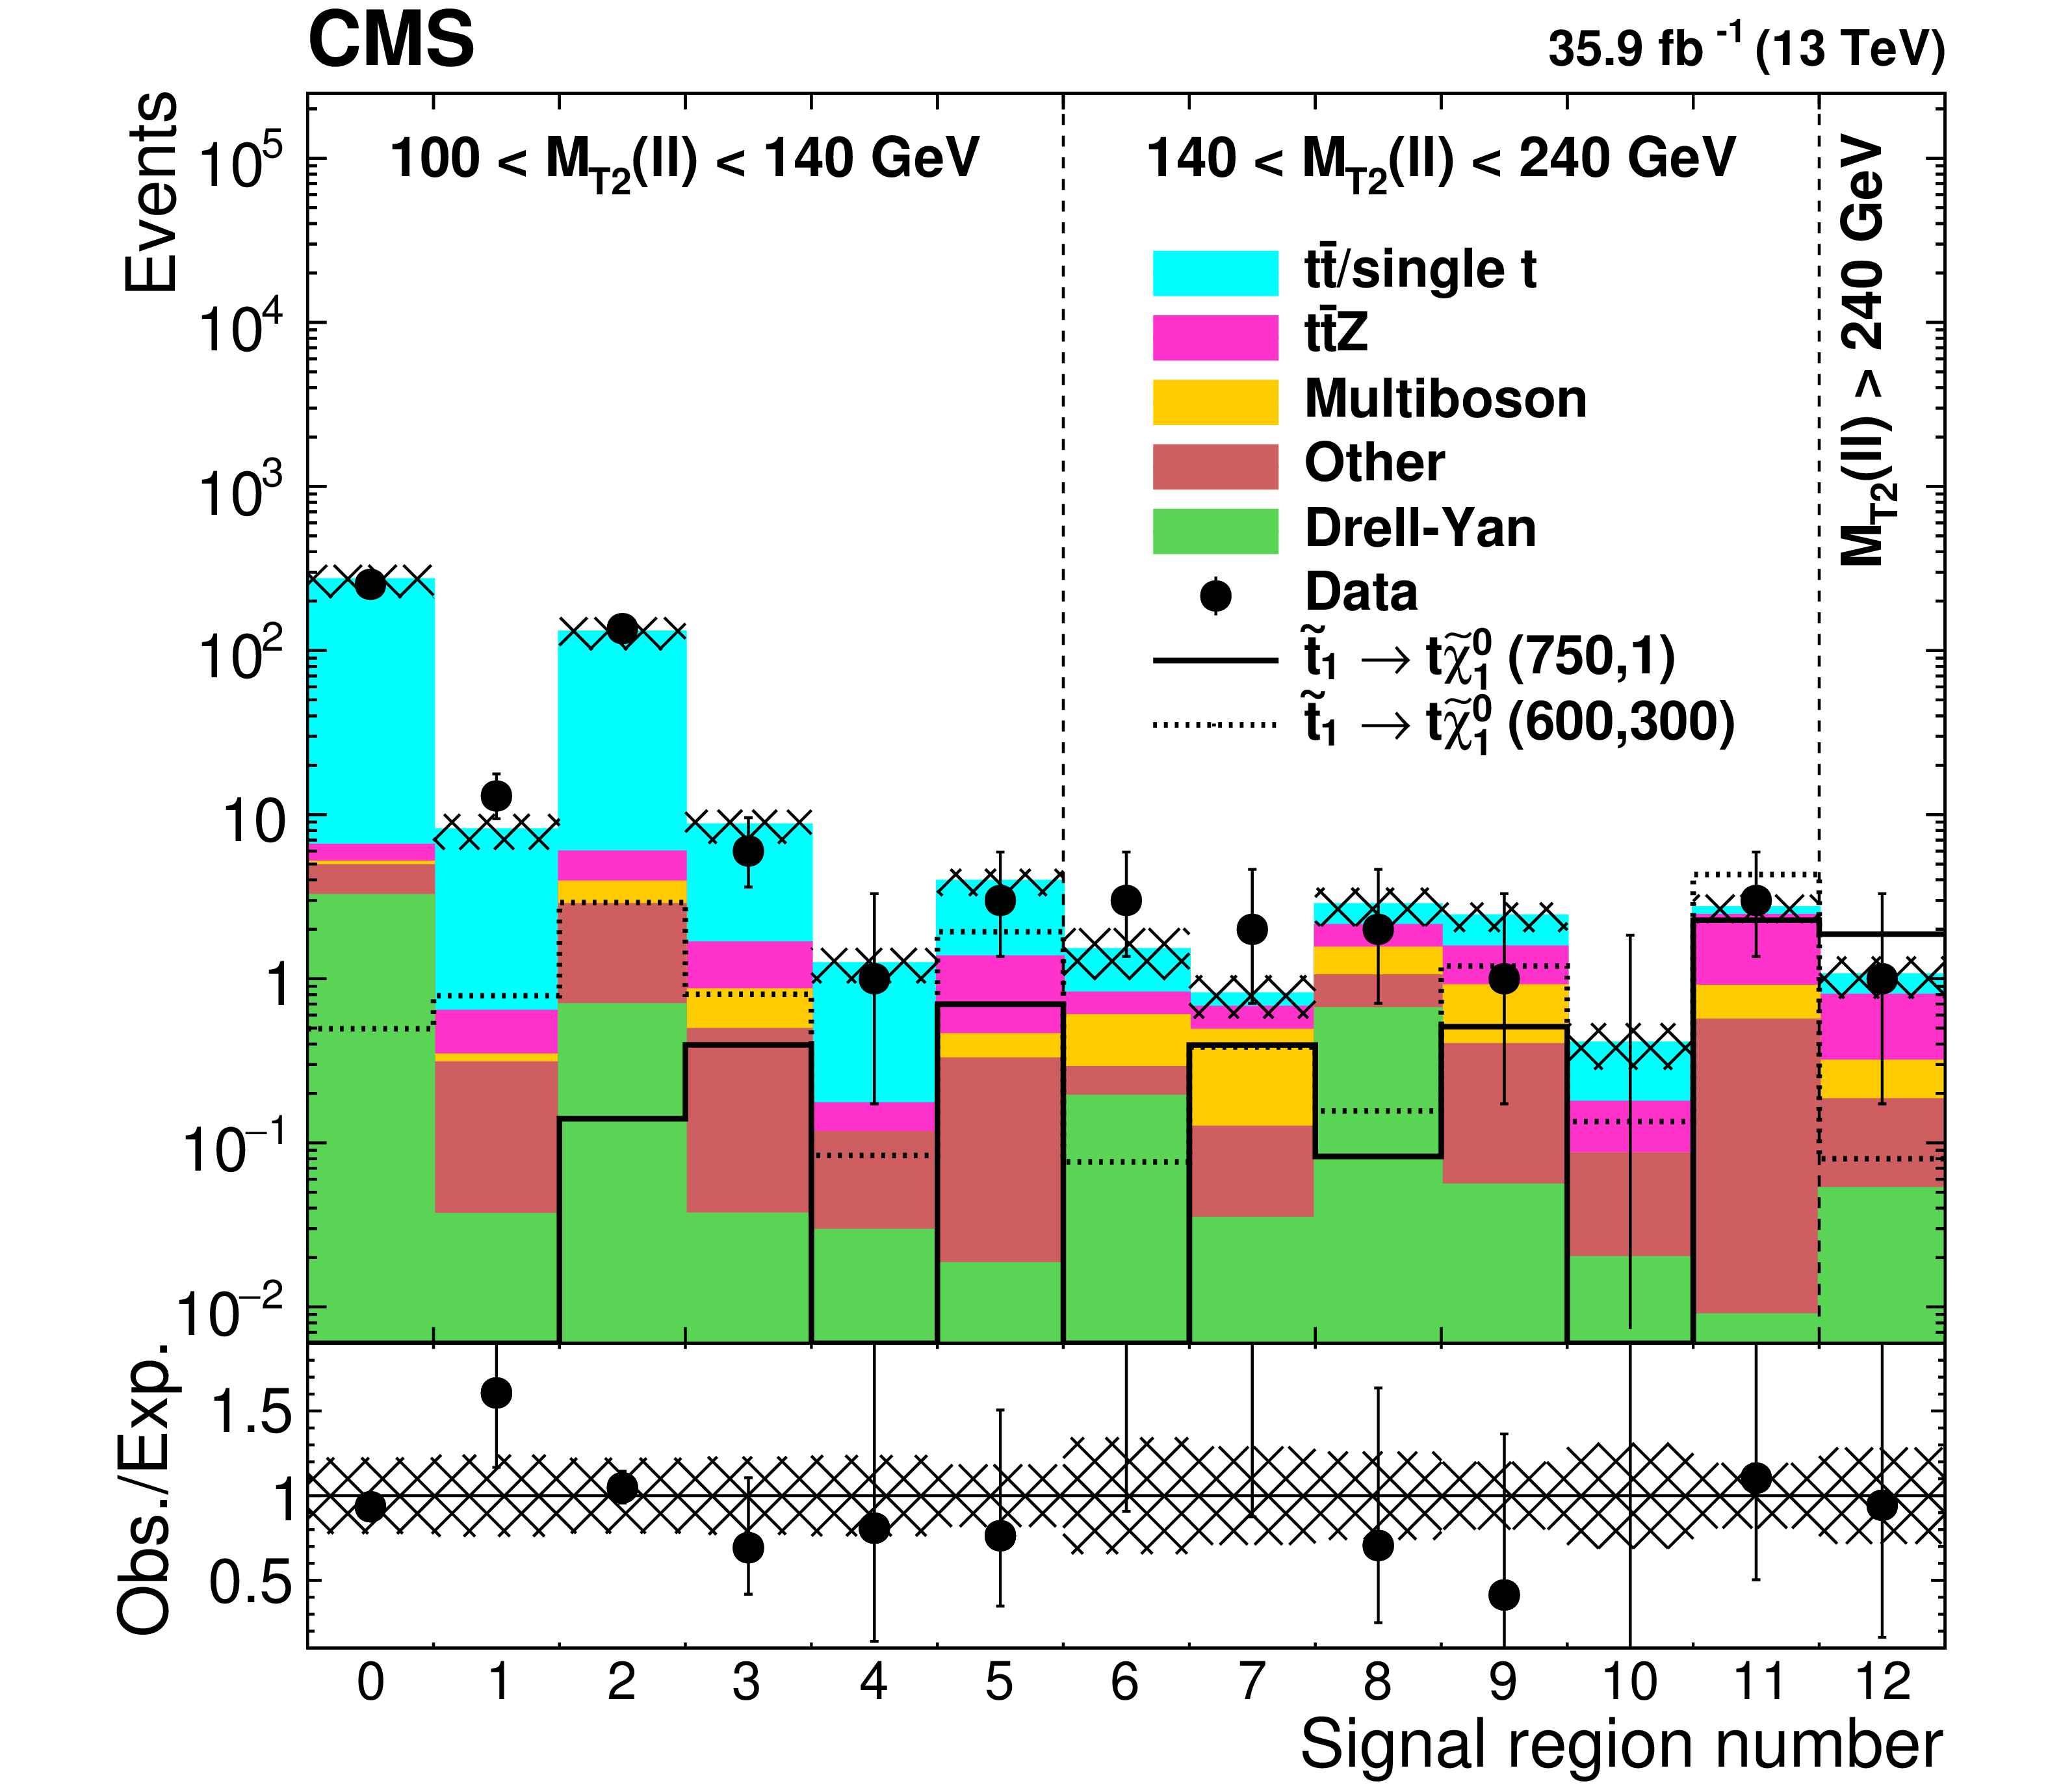
Figure 10:
Predicted backgrounds and observed yields in the $\mathrm{e} \mathrm{e} $, $\mu \mu $, and $\mathrm{e} \mu $ search regions combined. The hatched band shows the uncertainties discussed in the text. |
png pdf |
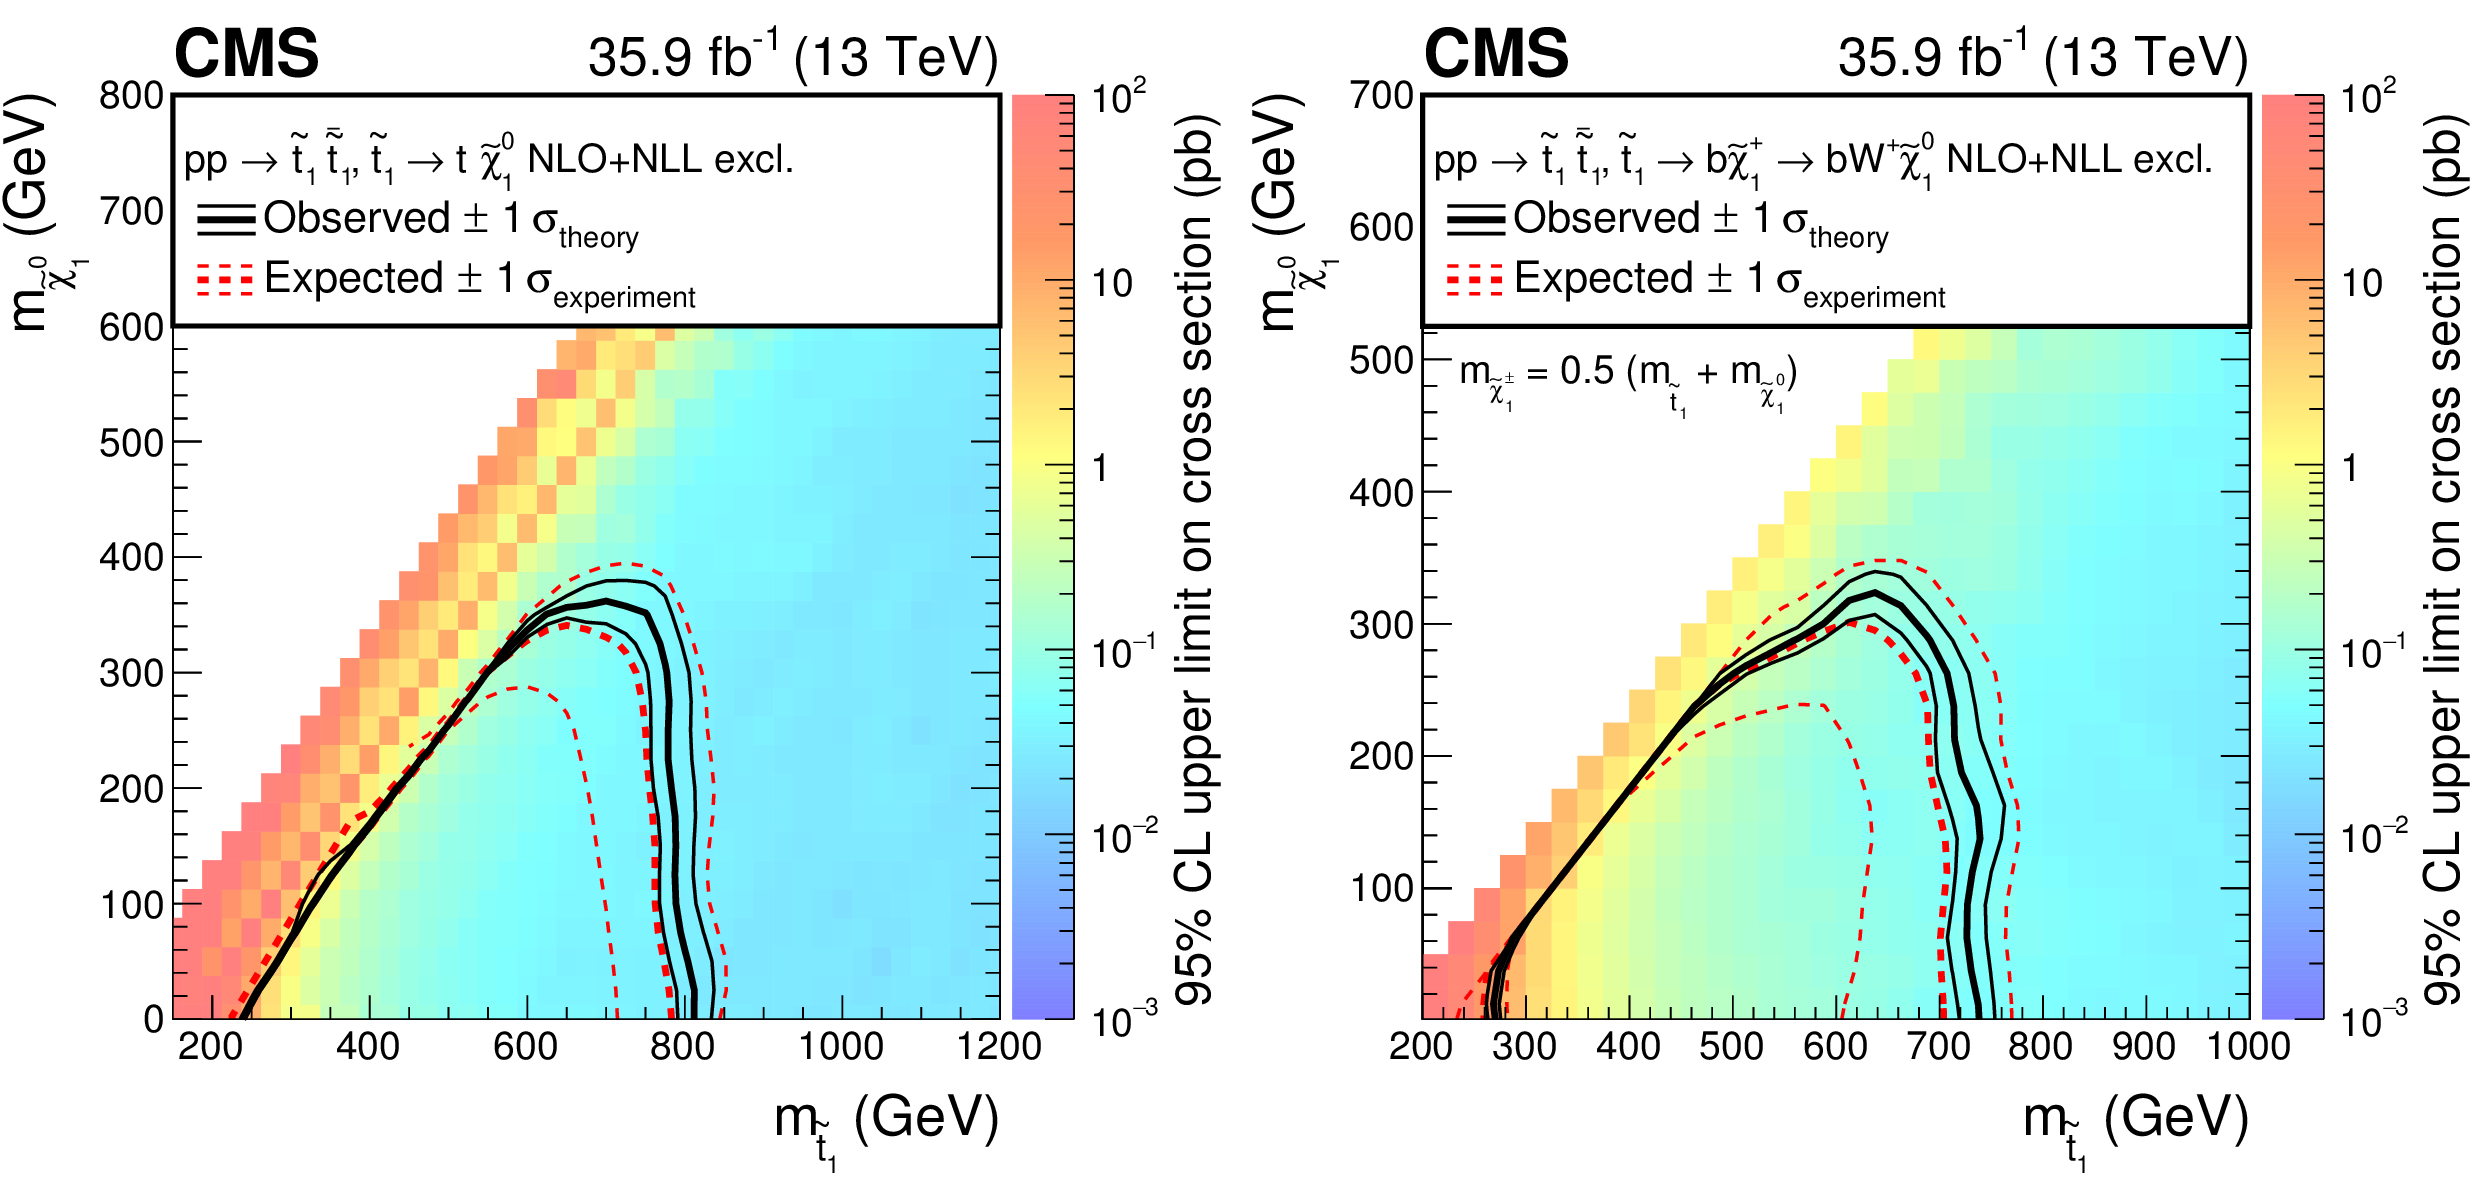
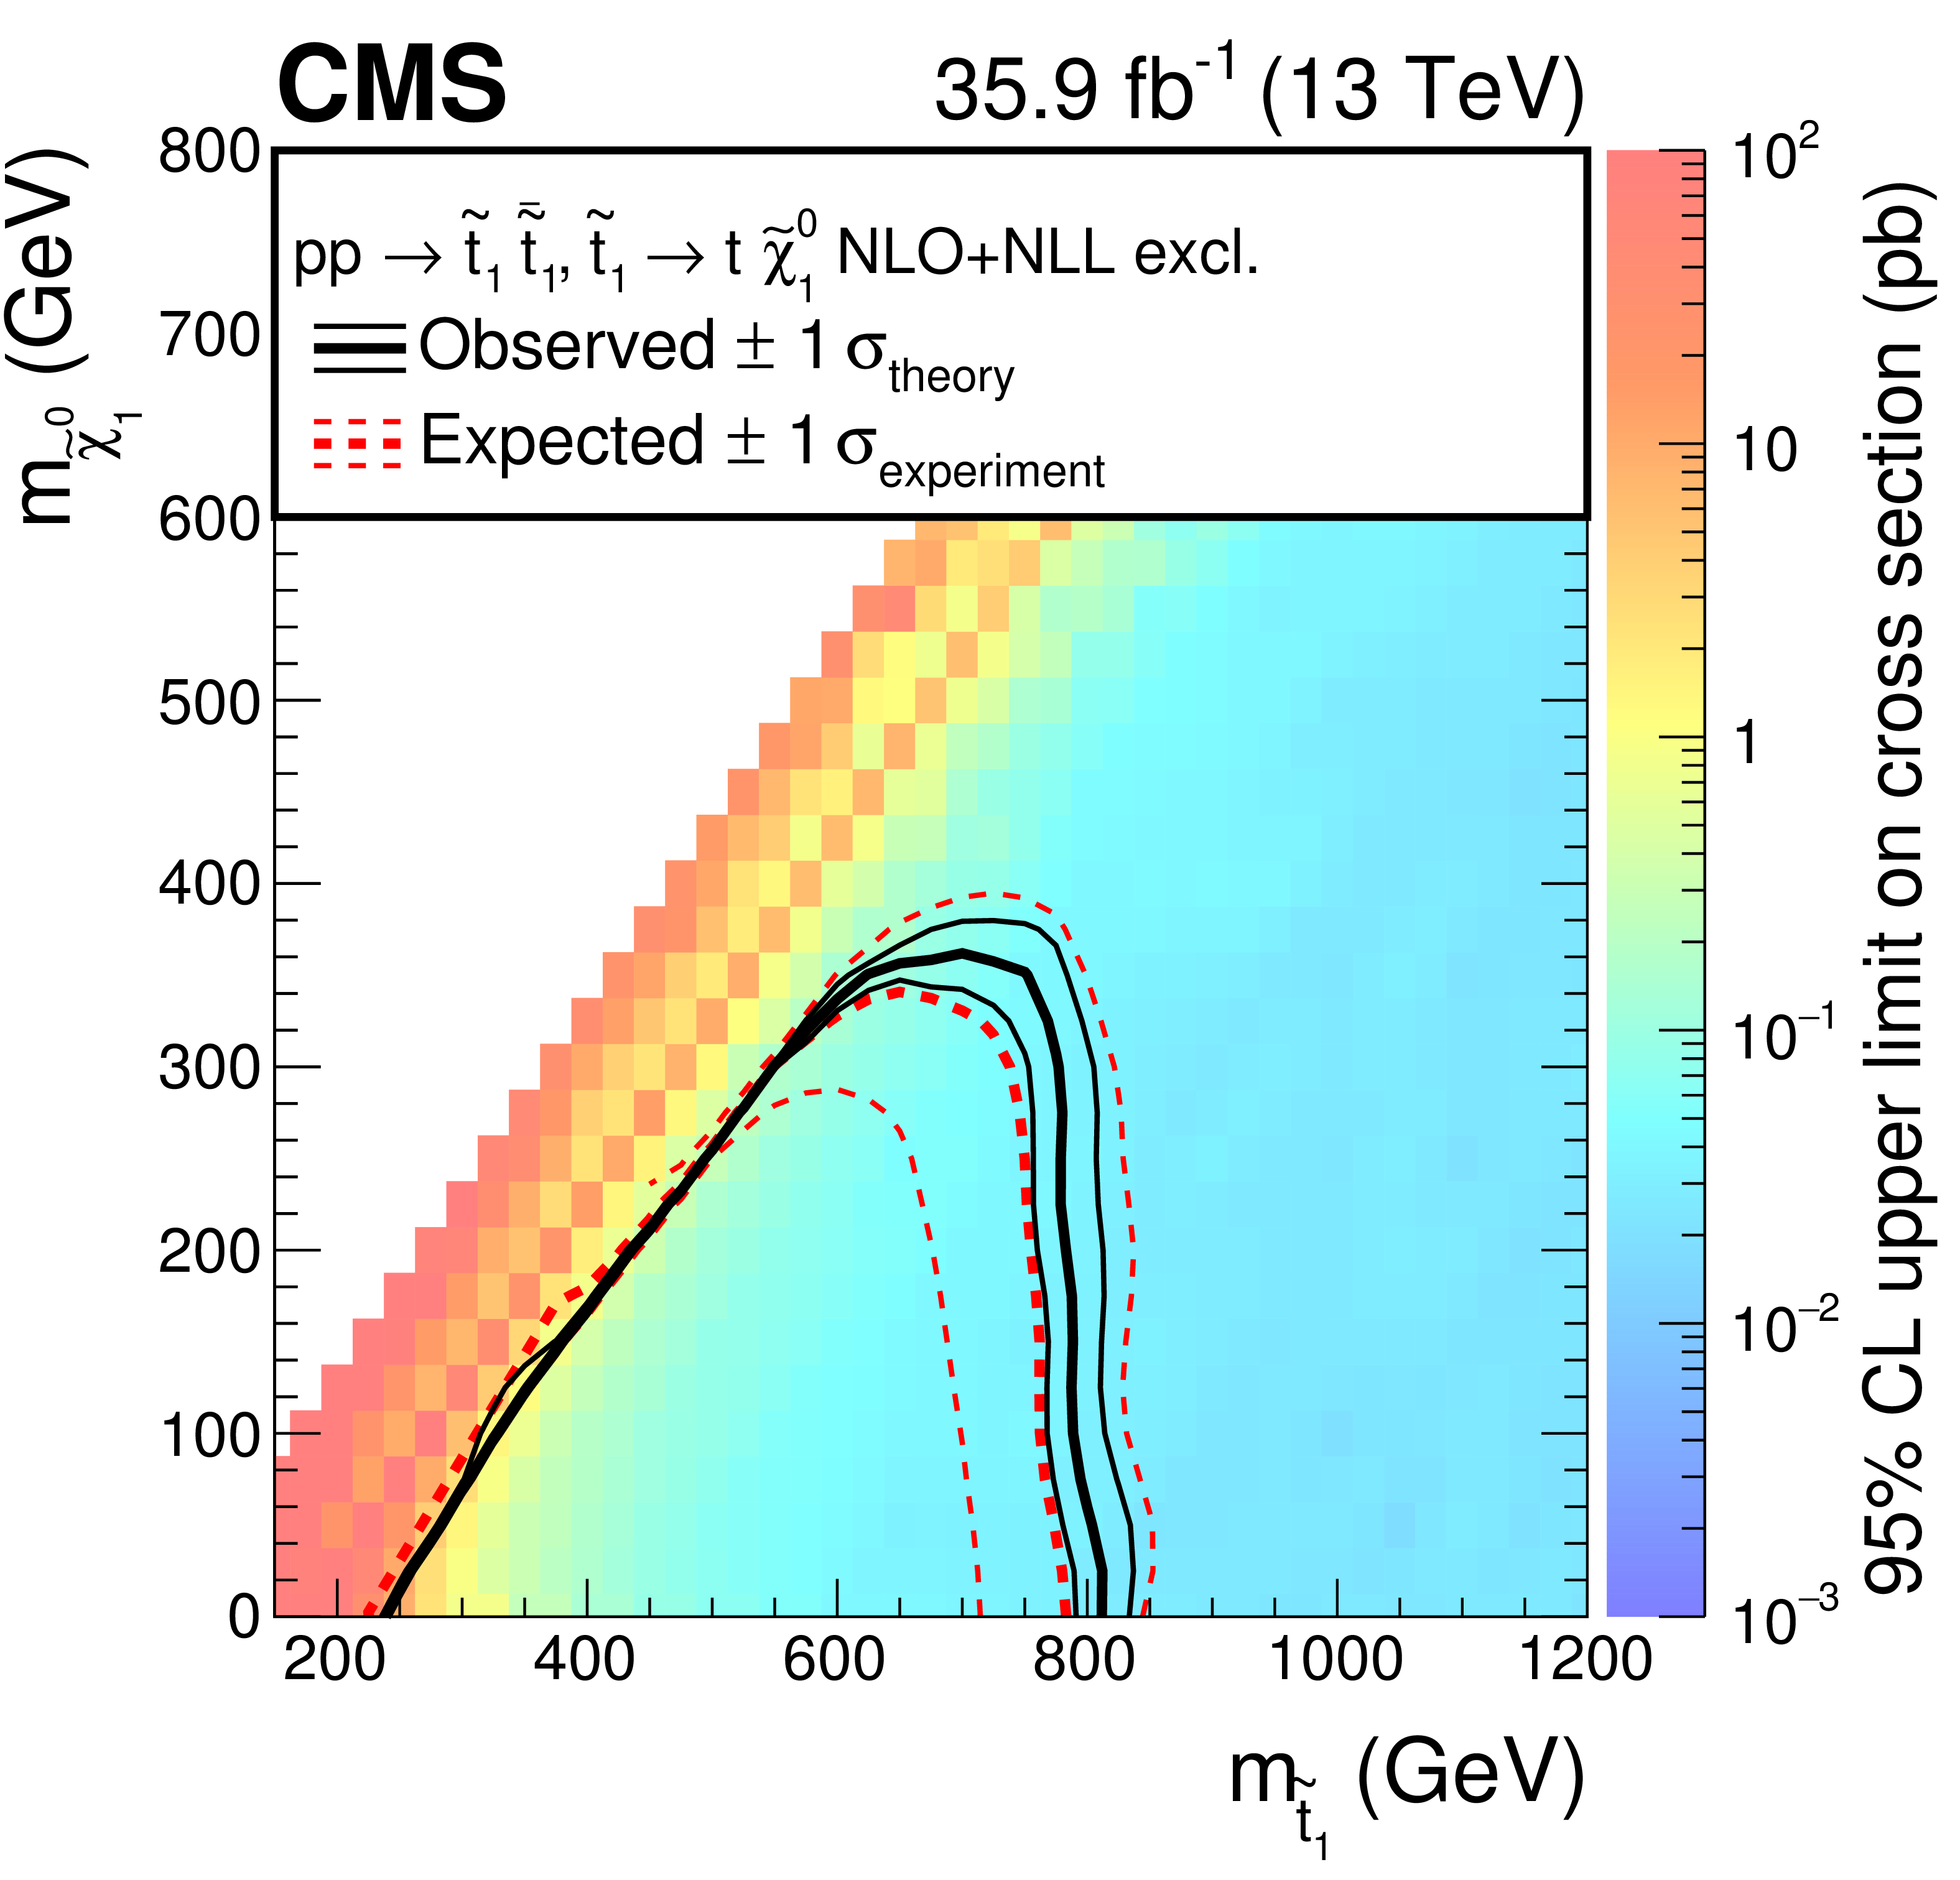
Figure 11:
Expected and observed limits for the T2tt model with $\tilde{\mathrm{t}}_{1} \to \mathrm{t} \tilde{\chi}^0_1 $ decays (left) and for the T2bW model with $\tilde{\mathrm{t}}_{1} \to \mathrm{b} \tilde{ \chi }^{+}_{1} \to \mathrm{b} \mathrm{W^{+}} \tilde{\chi}^0_1 $ decays (right) in the $m_{\tilde{\mathrm{t}}_{1}}$-$m_{\tilde{\chi}^0_1}$ mass plane. The color indicates the 95% CL upper limit on the cross section times the square of the branching fraction at each point in the plane. The area below the thick black curve represents the observed exclusion region at 95% CL assuming 100% branching fraction, while the dashed red lines indicate the expected limits at 95% CL and the region containing 68% of the distribution of limits expected under the background-only hypothesis. The thin black lines show the effect of the theoretical uncertainties in the signal cross section. |
png pdf root |
Figure 11-a:
Expected and observed limits for the T2tt model with $\tilde{\mathrm{t}}_{1} \to \mathrm{t} \tilde{\chi}^0_1 $ decays in the $m_{\tilde{\mathrm{t}}_{1}}$-$m_{\tilde{\chi}^0_1}$ mass plane. The color indicates the 95% CL upper limit on the cross section times the square of the branching fraction at each point in the plane. The area below the thick black curve represents the observed exclusion region at 95% CL assuming 100% branching fraction, while the dashed red lines indicate the expected limits at 95% CL and the region containing 68% of the distribution of limits expected under the background-only hypothesis. The thin black lines show the effect of the theoretical uncertainties in the signal cross section. |

png pdf root |
Figure 11-b:
Expected and observed limits for the T2bW model with $\tilde{\mathrm{t}}_{1} \to \mathrm{b} \tilde{ \chi }^{+}_{1} \to \mathrm{b} \mathrm{W^{+}} \tilde{\chi}^0_1 $ decays in the $m_{\tilde{\mathrm{t}}_{1}}$-$m_{\tilde{\chi}^0_1}$ mass plane. The color indicates the 95% CL upper limit on the cross section times the square of the branching fraction at each point in the plane. The area below the thick black curve represents the observed exclusion region at 95% CL assuming 100% branching fraction, while the dashed red lines indicate the expected limits at 95% CL and the region containing 68% of the distribution of limits expected under the background-only hypothesis. The thin black lines show the effect of the theoretical uncertainties in the signal cross section. |

png pdf |
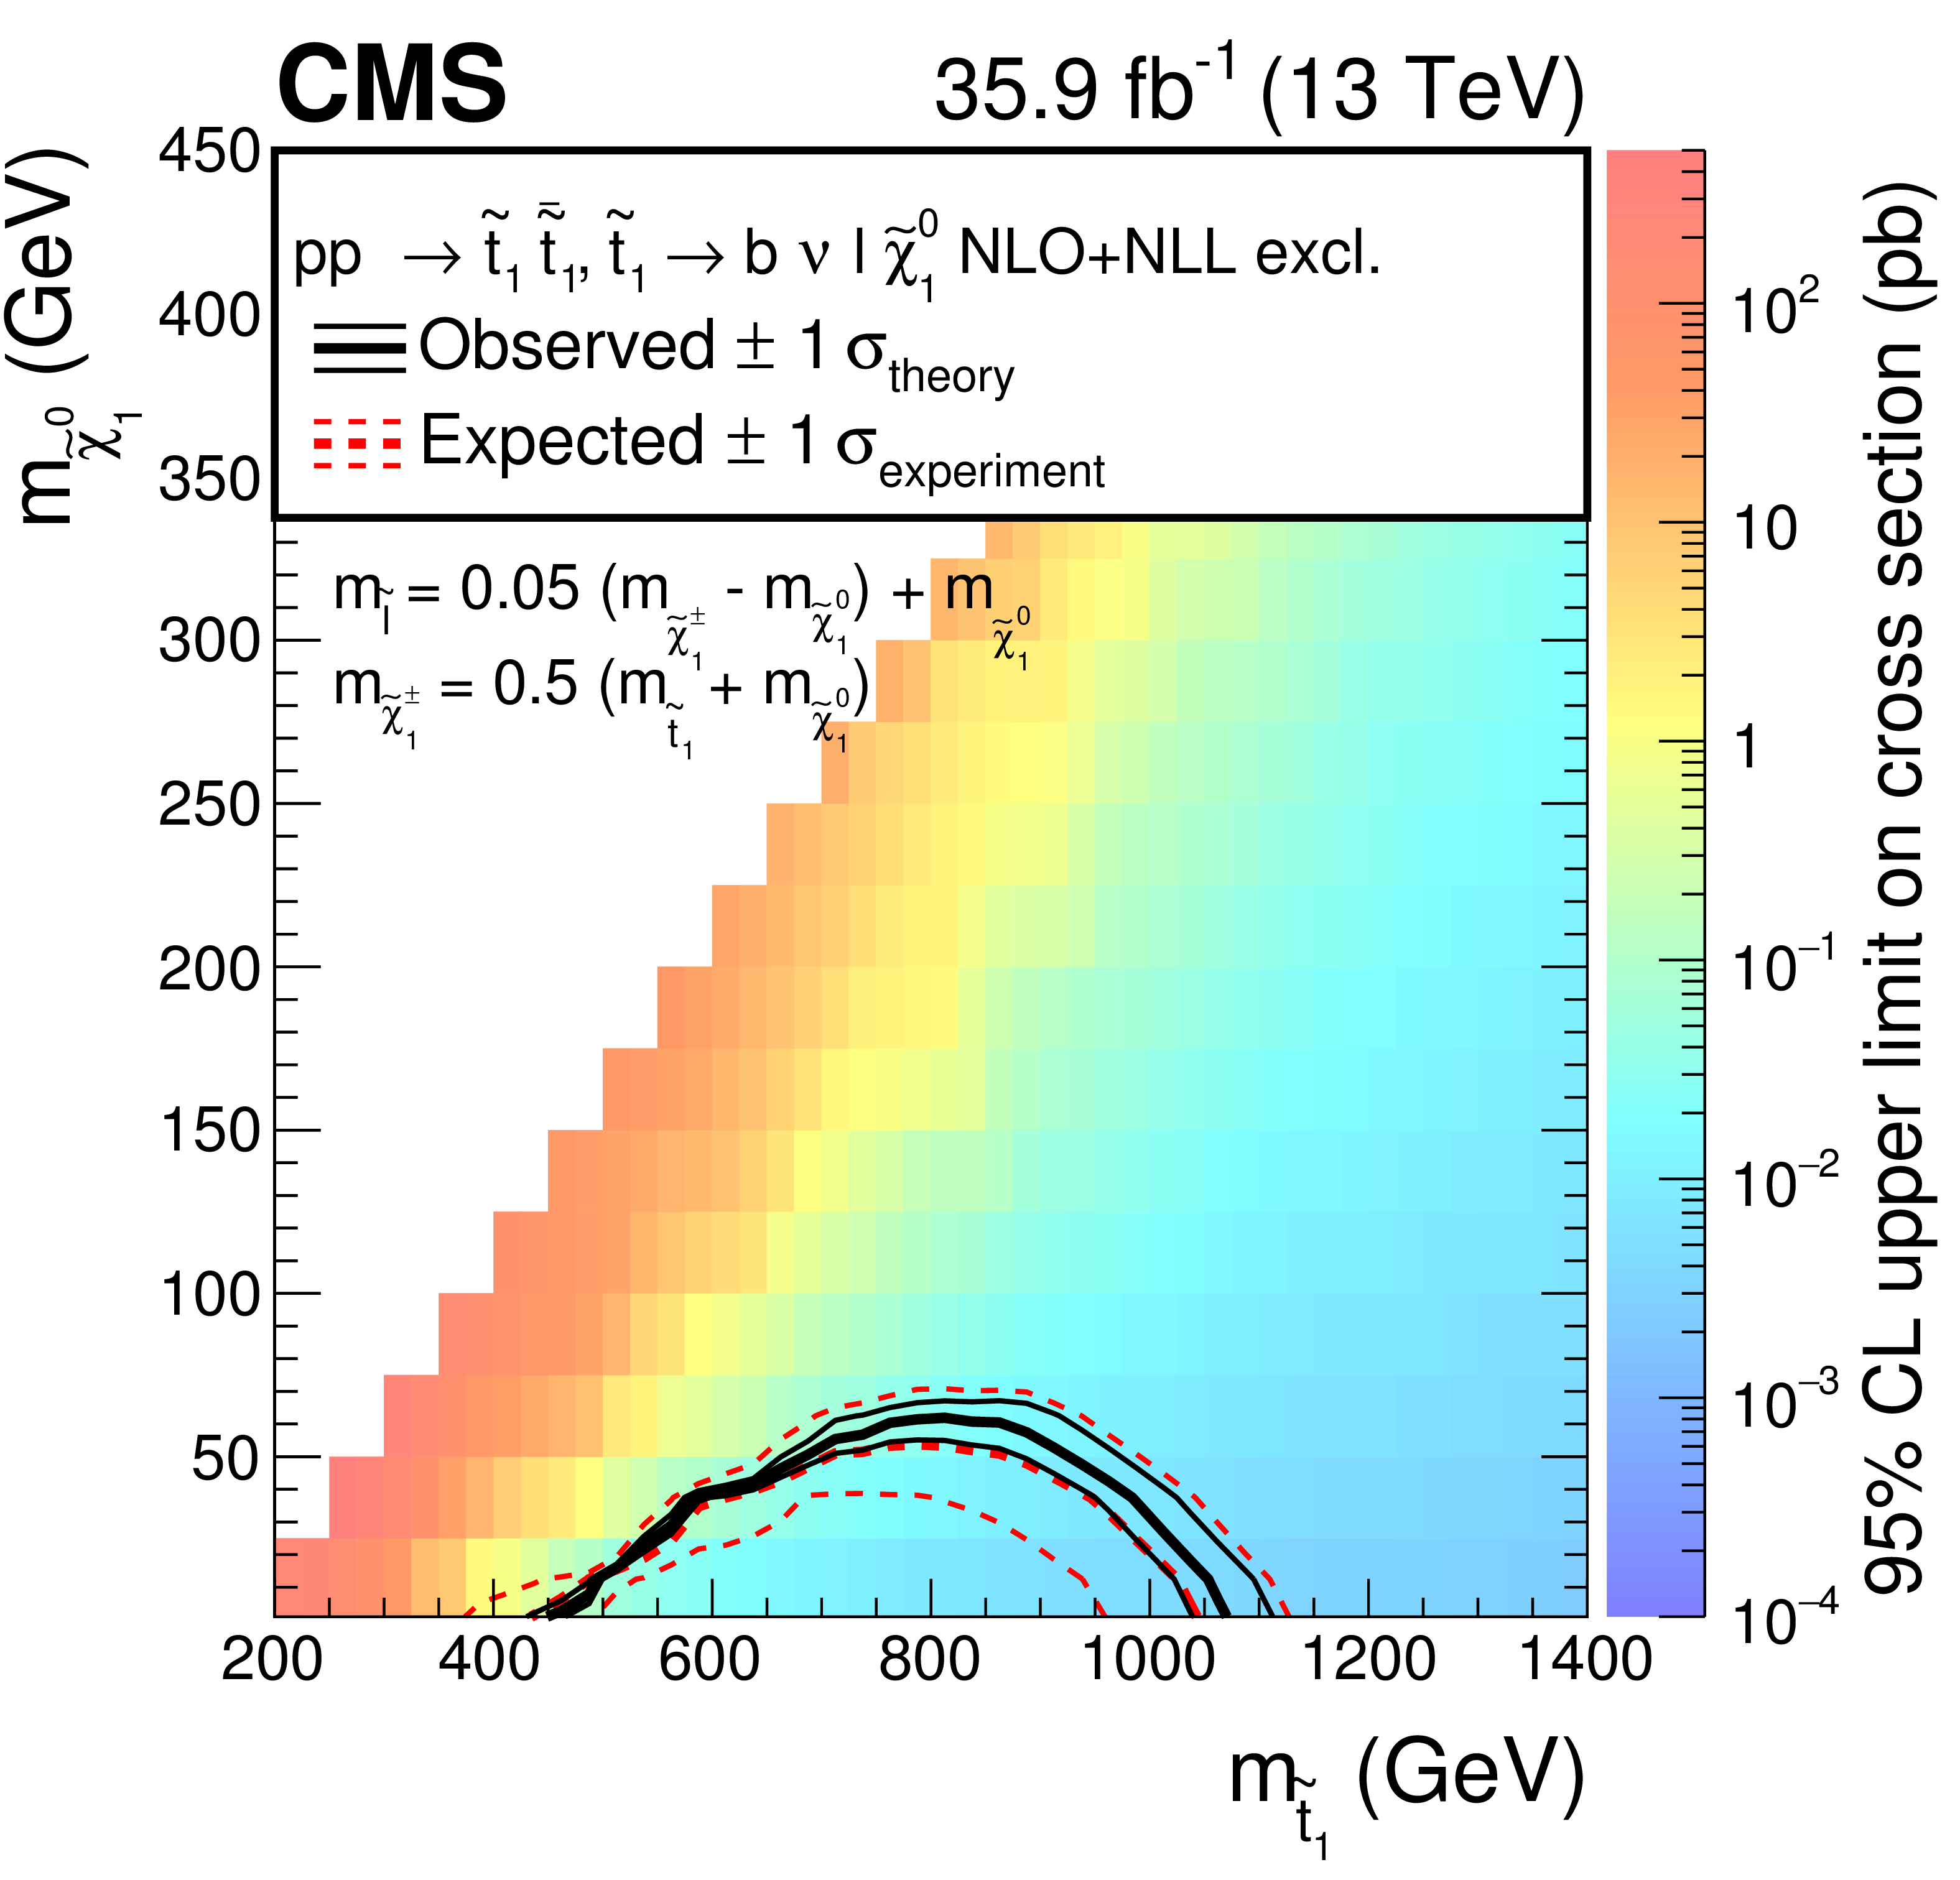
Figure 12:
Expected and observed limits for the T8bb$\ell\ell\nu\nu$ model with $\tilde{\mathrm{t}}_{1} \to \mathrm{b} \tilde{ \chi }^{+}_{1} \to \mathrm{b} \nu \tilde{\ell} \to \mathrm{b} \nu \ell \tilde{\chi}^0_1 $ decays in the $m_{\tilde{\mathrm{t}}_{1}}$-$m_{\tilde{\chi}^0_1}$ mass plane for three different mass configurations defined by $m_{\tilde{\ell}} = x + (m_{\tilde{ \chi }^{+}_{1}} - m_{\tilde{\chi}^0_1}) + m_{\tilde{\chi}^0_1}$ with $x=$ 0.05 (upper left), $x=$ 0.5 (upper right), and $x=$ 0.95 (lower). The description of curves is the same as in the caption of Fig. 11. |
png pdf root |
Figure 12-a:
Expected and observed limits for the T8bb$\ell\ell\nu\nu$ model with $\tilde{\mathrm{t}}_{1} \to \mathrm{b} \tilde{ \chi }^{+}_{1} \to \mathrm{b} \nu \tilde{\ell} \to \mathrm{b} \nu \ell \tilde{\chi}^0_1 $ decays in the $m_{\tilde{\mathrm{t}}_{1}}$-$m_{\tilde{\chi}^0_1}$ mass plane for three different mass configurations defined by $m_{\tilde{\ell}} = x + (m_{\tilde{ \chi }^{+}_{1}} - m_{\tilde{\chi}^0_1}) + m_{\tilde{\chi}^0_1}$ with $x=$ 0.05. The description of curves is the same as in the caption of Fig. 11. |
png pdf root |
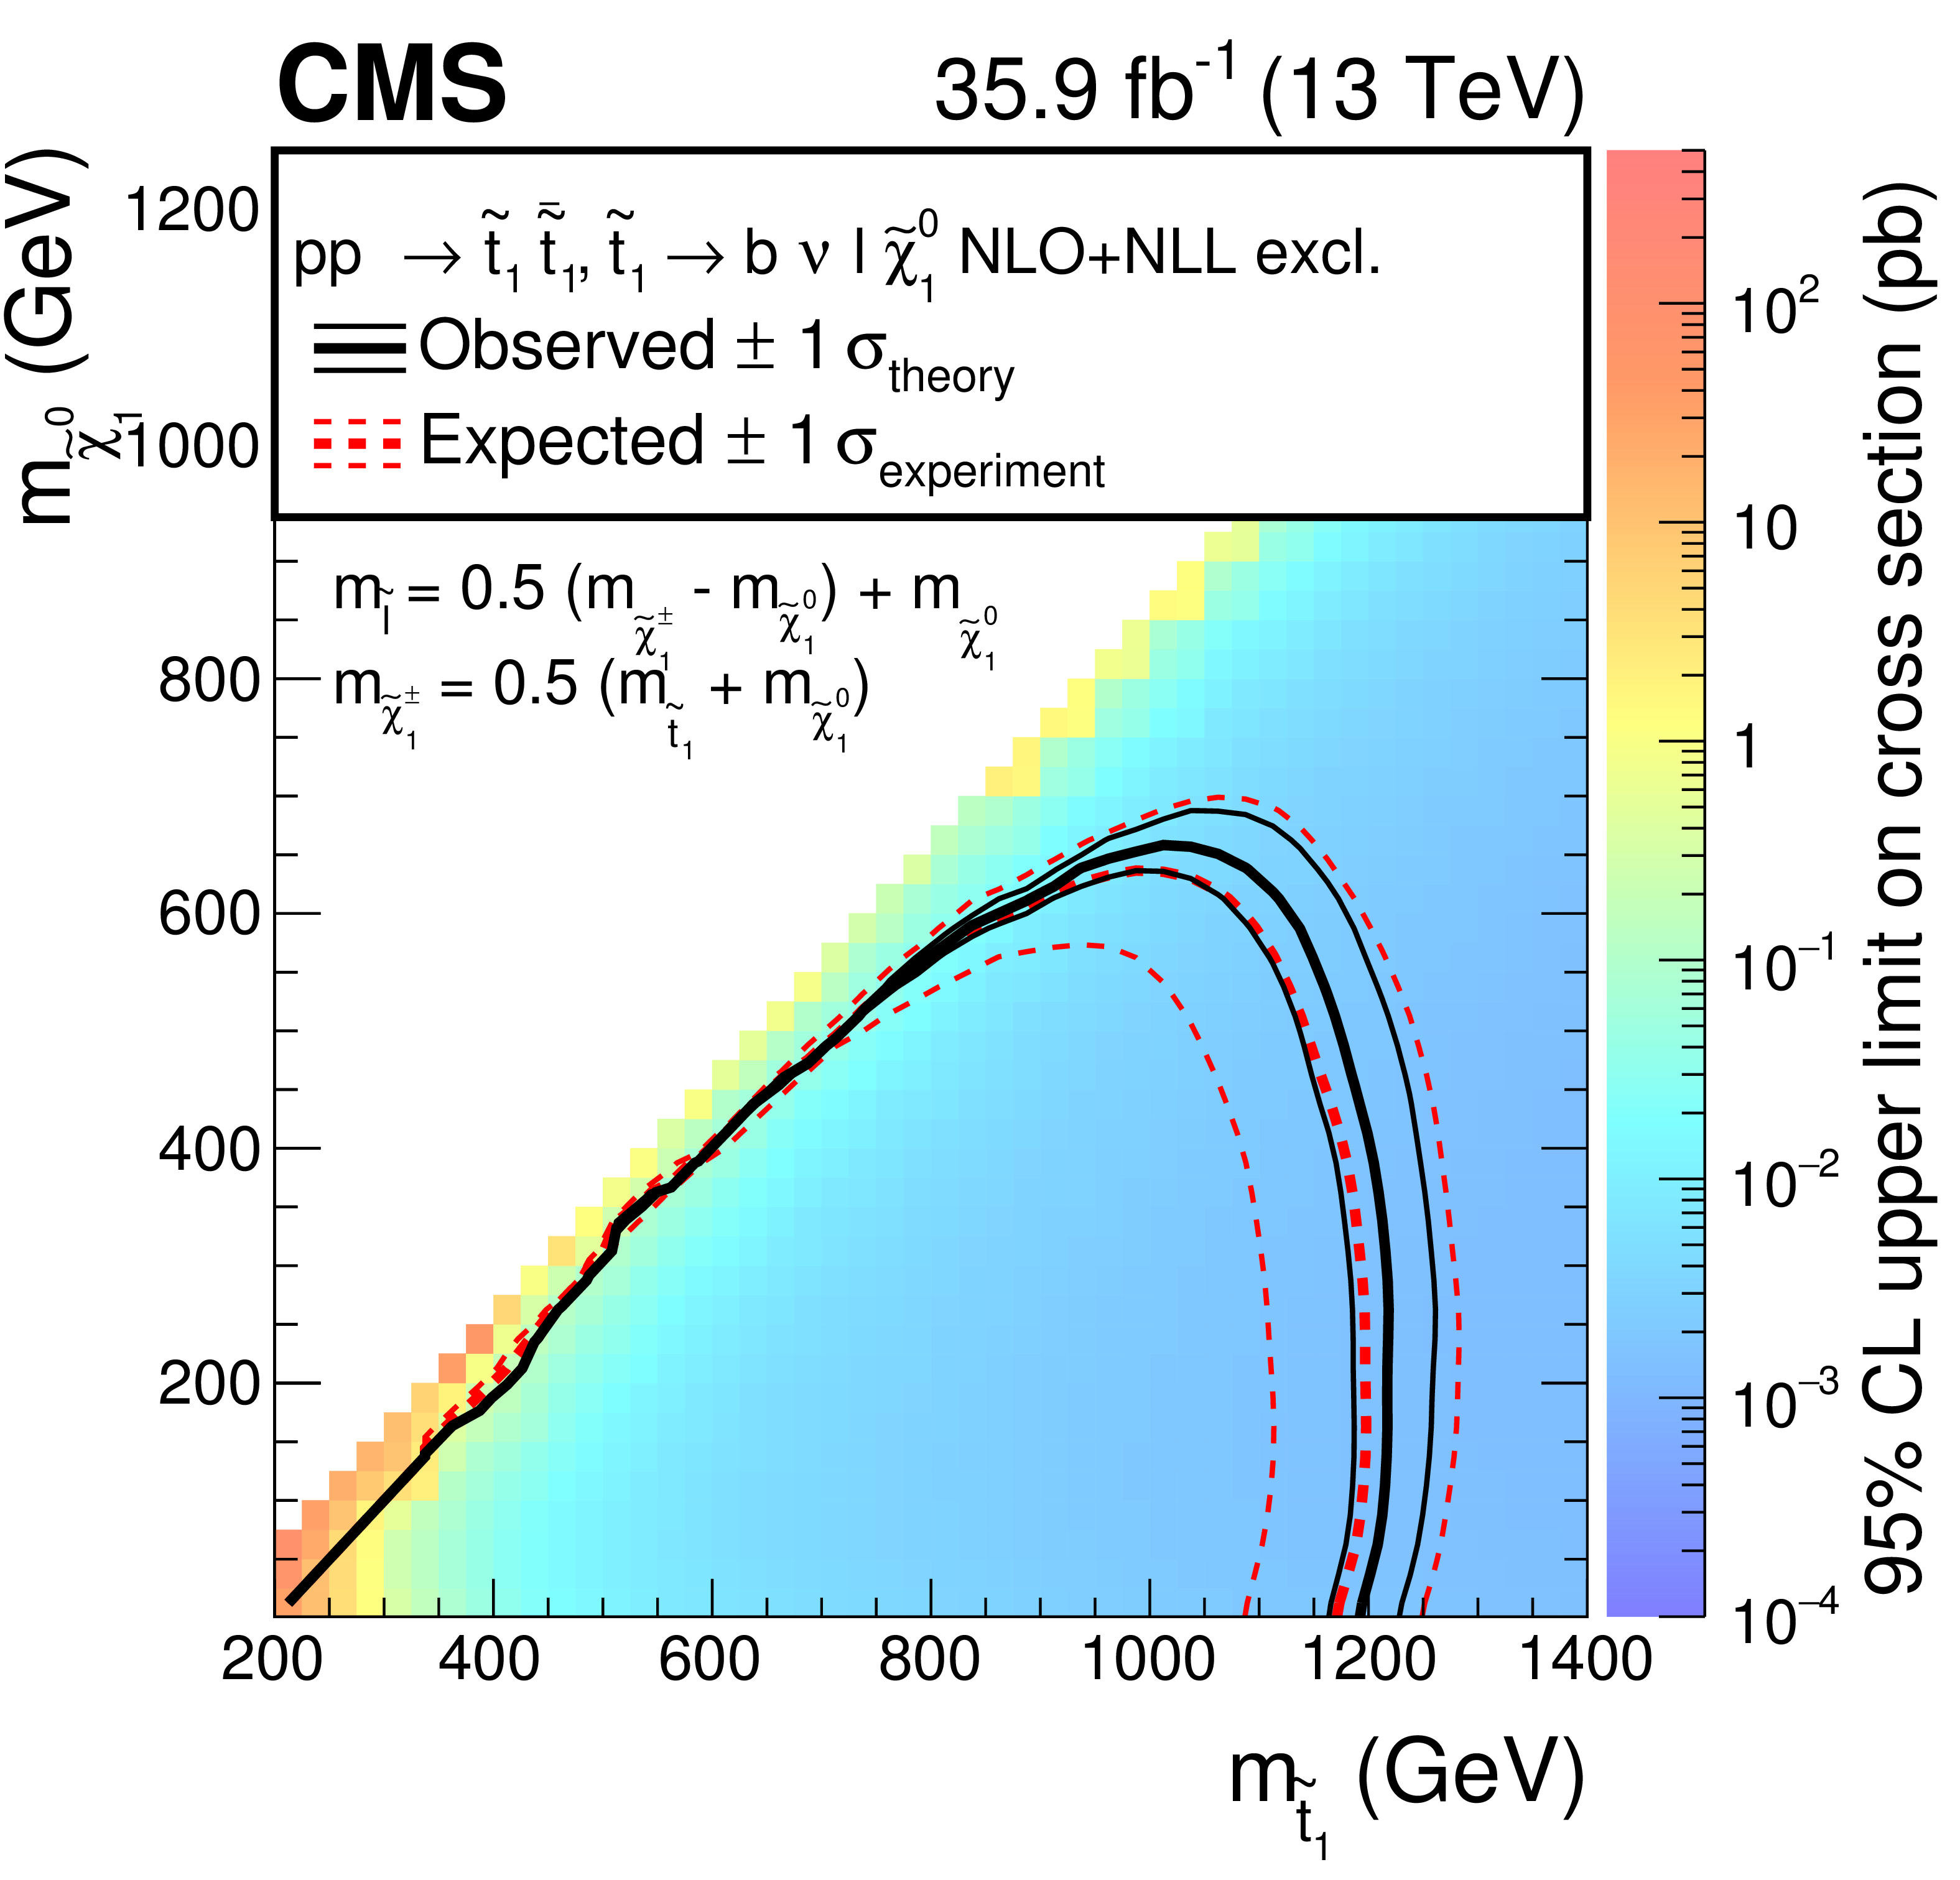
Figure 12-b:
Expected and observed limits for the T8bb$\ell\ell\nu\nu$ model with $\tilde{\mathrm{t}}_{1} \to \mathrm{b} \tilde{ \chi }^{+}_{1} \to \mathrm{b} \nu \tilde{\ell} \to \mathrm{b} \nu \ell \tilde{\chi}^0_1 $ decays in the $m_{\tilde{\mathrm{t}}_{1}}$-$m_{\tilde{\chi}^0_1}$ mass plane for three different mass configurations defined by $m_{\tilde{\ell}} = x + (m_{\tilde{ \chi }^{+}_{1}} - m_{\tilde{\chi}^0_1}) + m_{\tilde{\chi}^0_1}$ with $x=$ 0.5. The description of curves is the same as in the caption of Fig. 11. |
png pdf root |
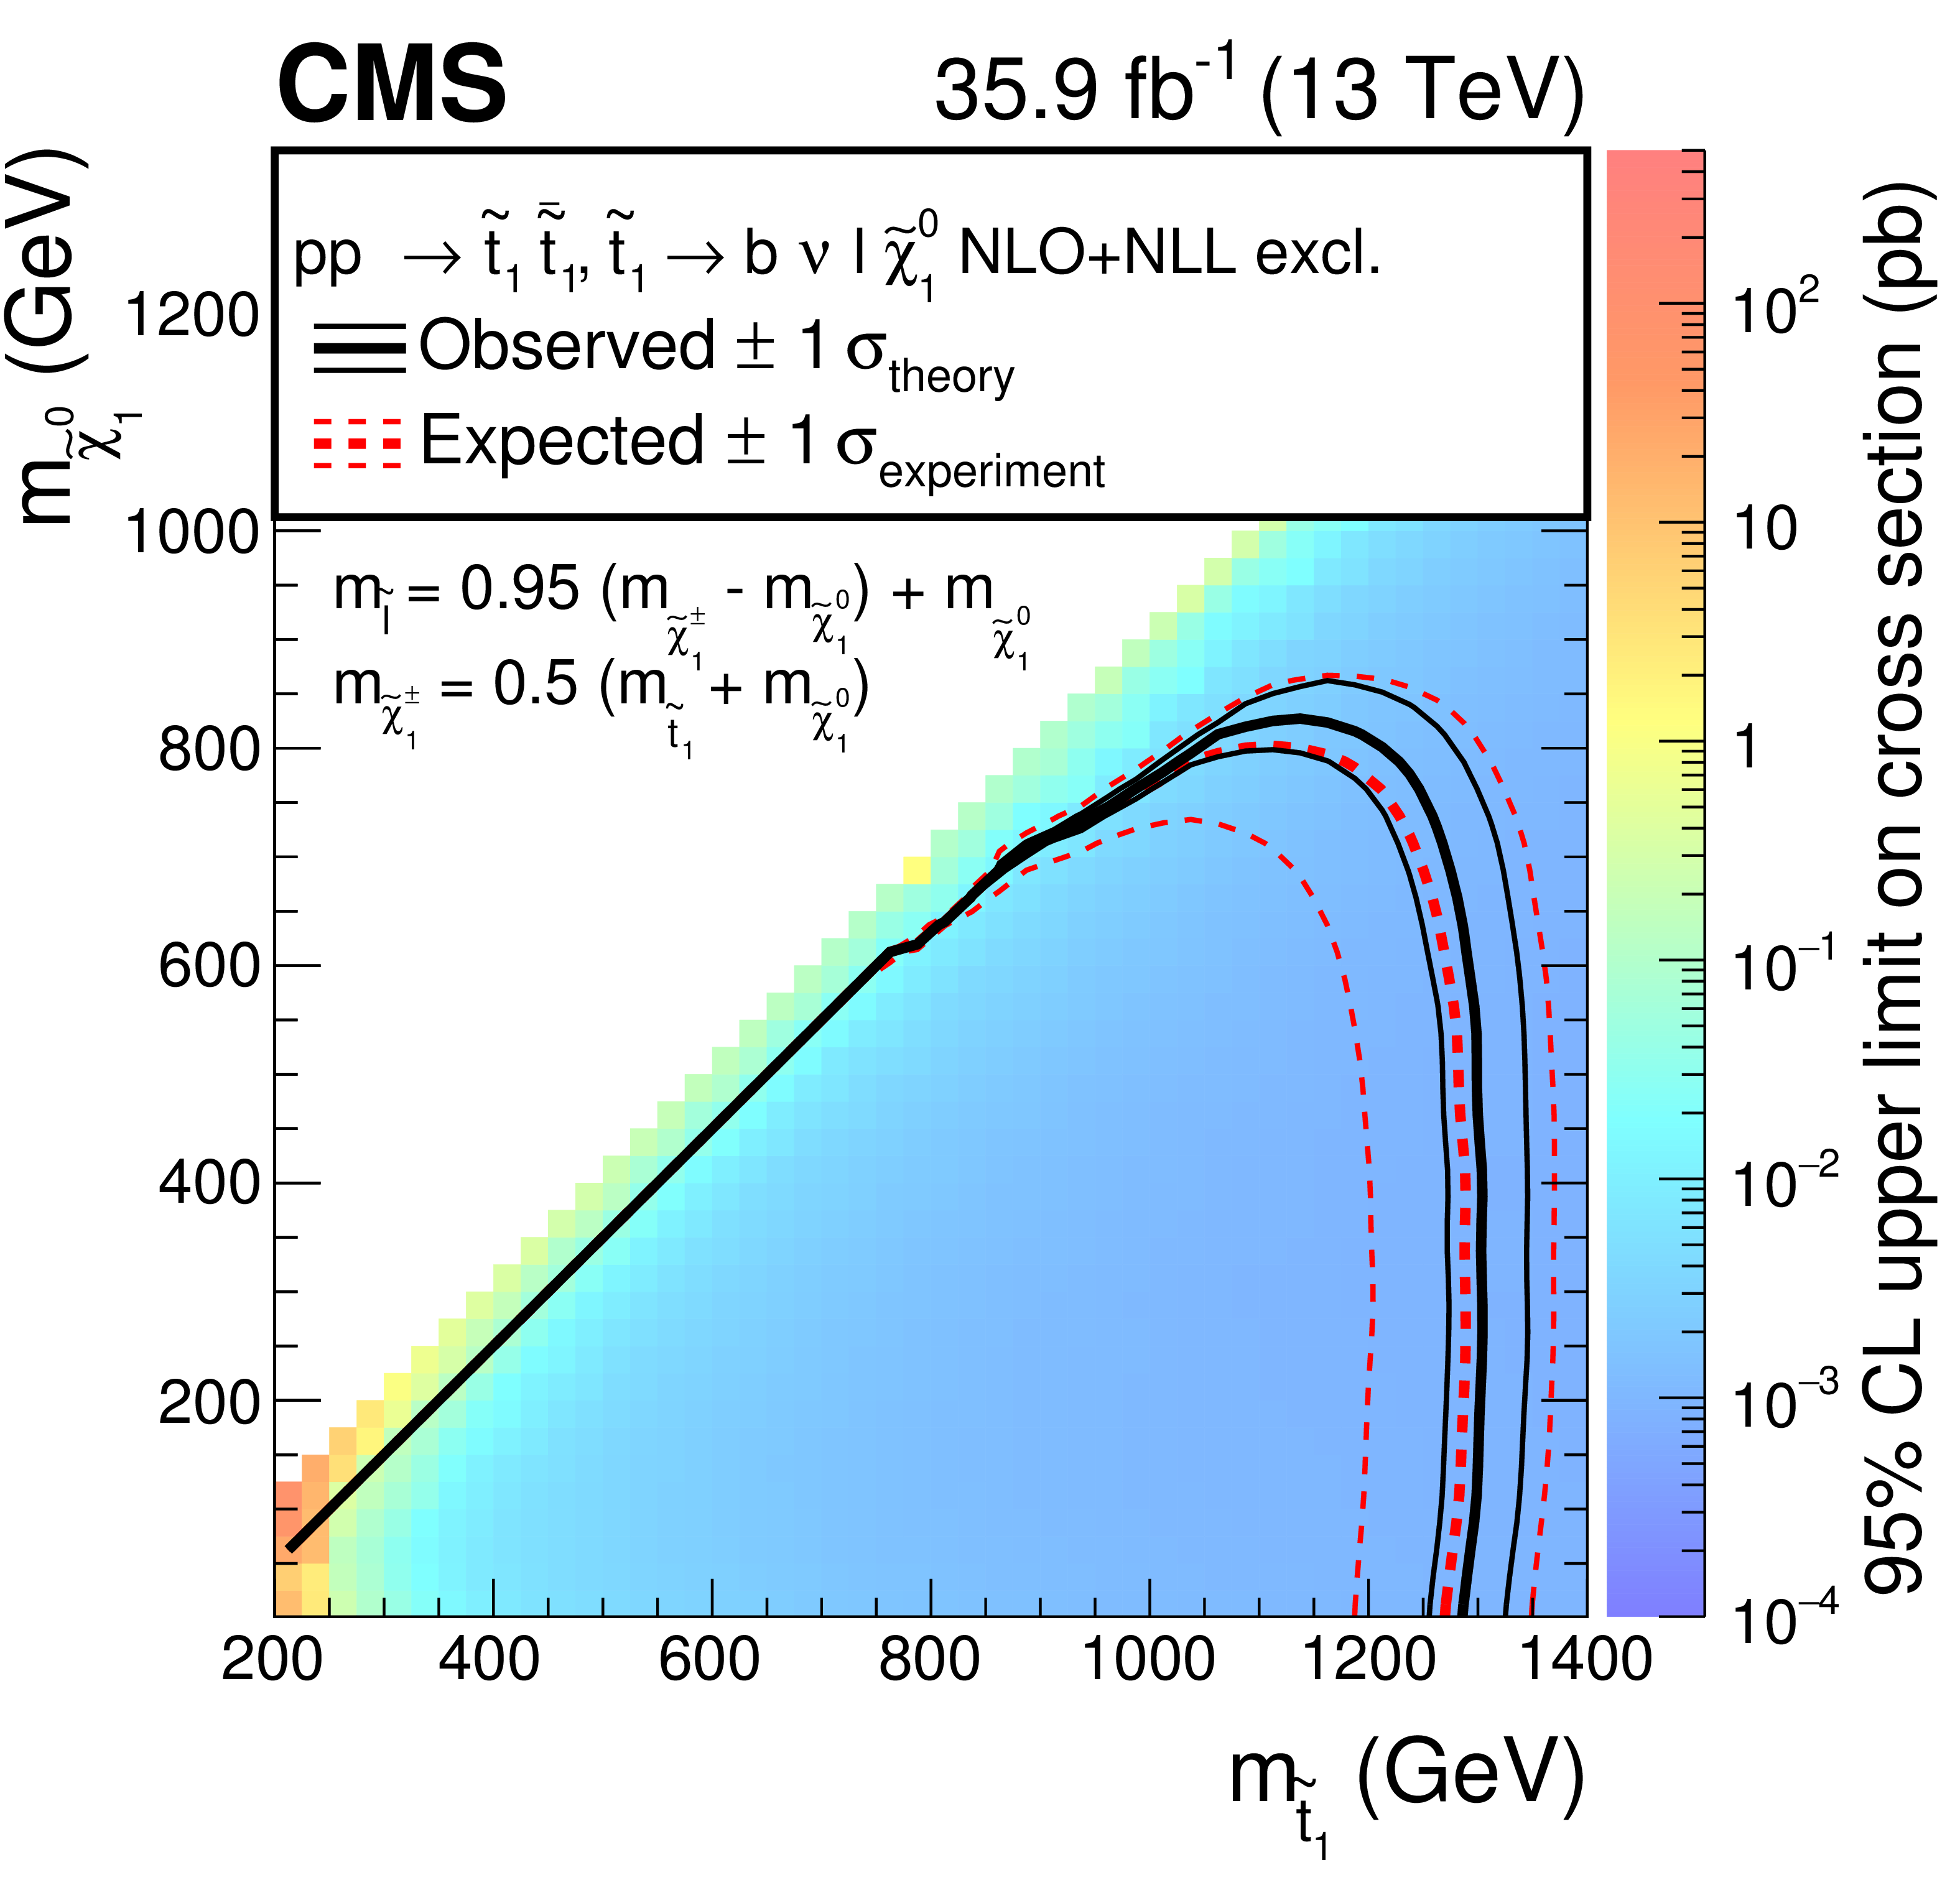
Figure 12-c:
Expected and observed limits for the T8bb$\ell\ell\nu\nu$ model with $\tilde{\mathrm{t}}_{1} \to \mathrm{b} \tilde{ \chi }^{+}_{1} \to \mathrm{b} \nu \tilde{\ell} \to \mathrm{b} \nu \ell \tilde{\chi}^0_1 $ decays in the $m_{\tilde{\mathrm{t}}_{1}}$-$m_{\tilde{\chi}^0_1}$ mass plane for three different mass configurations defined by $m_{\tilde{\ell}} = x + (m_{\tilde{ \chi }^{+}_{1}} - m_{\tilde{\chi}^0_1}) + m_{\tilde{\chi}^0_1}$ with $x=$ 0.95. The description of curves is the same as in the caption of Fig. 11. |

png pdf |
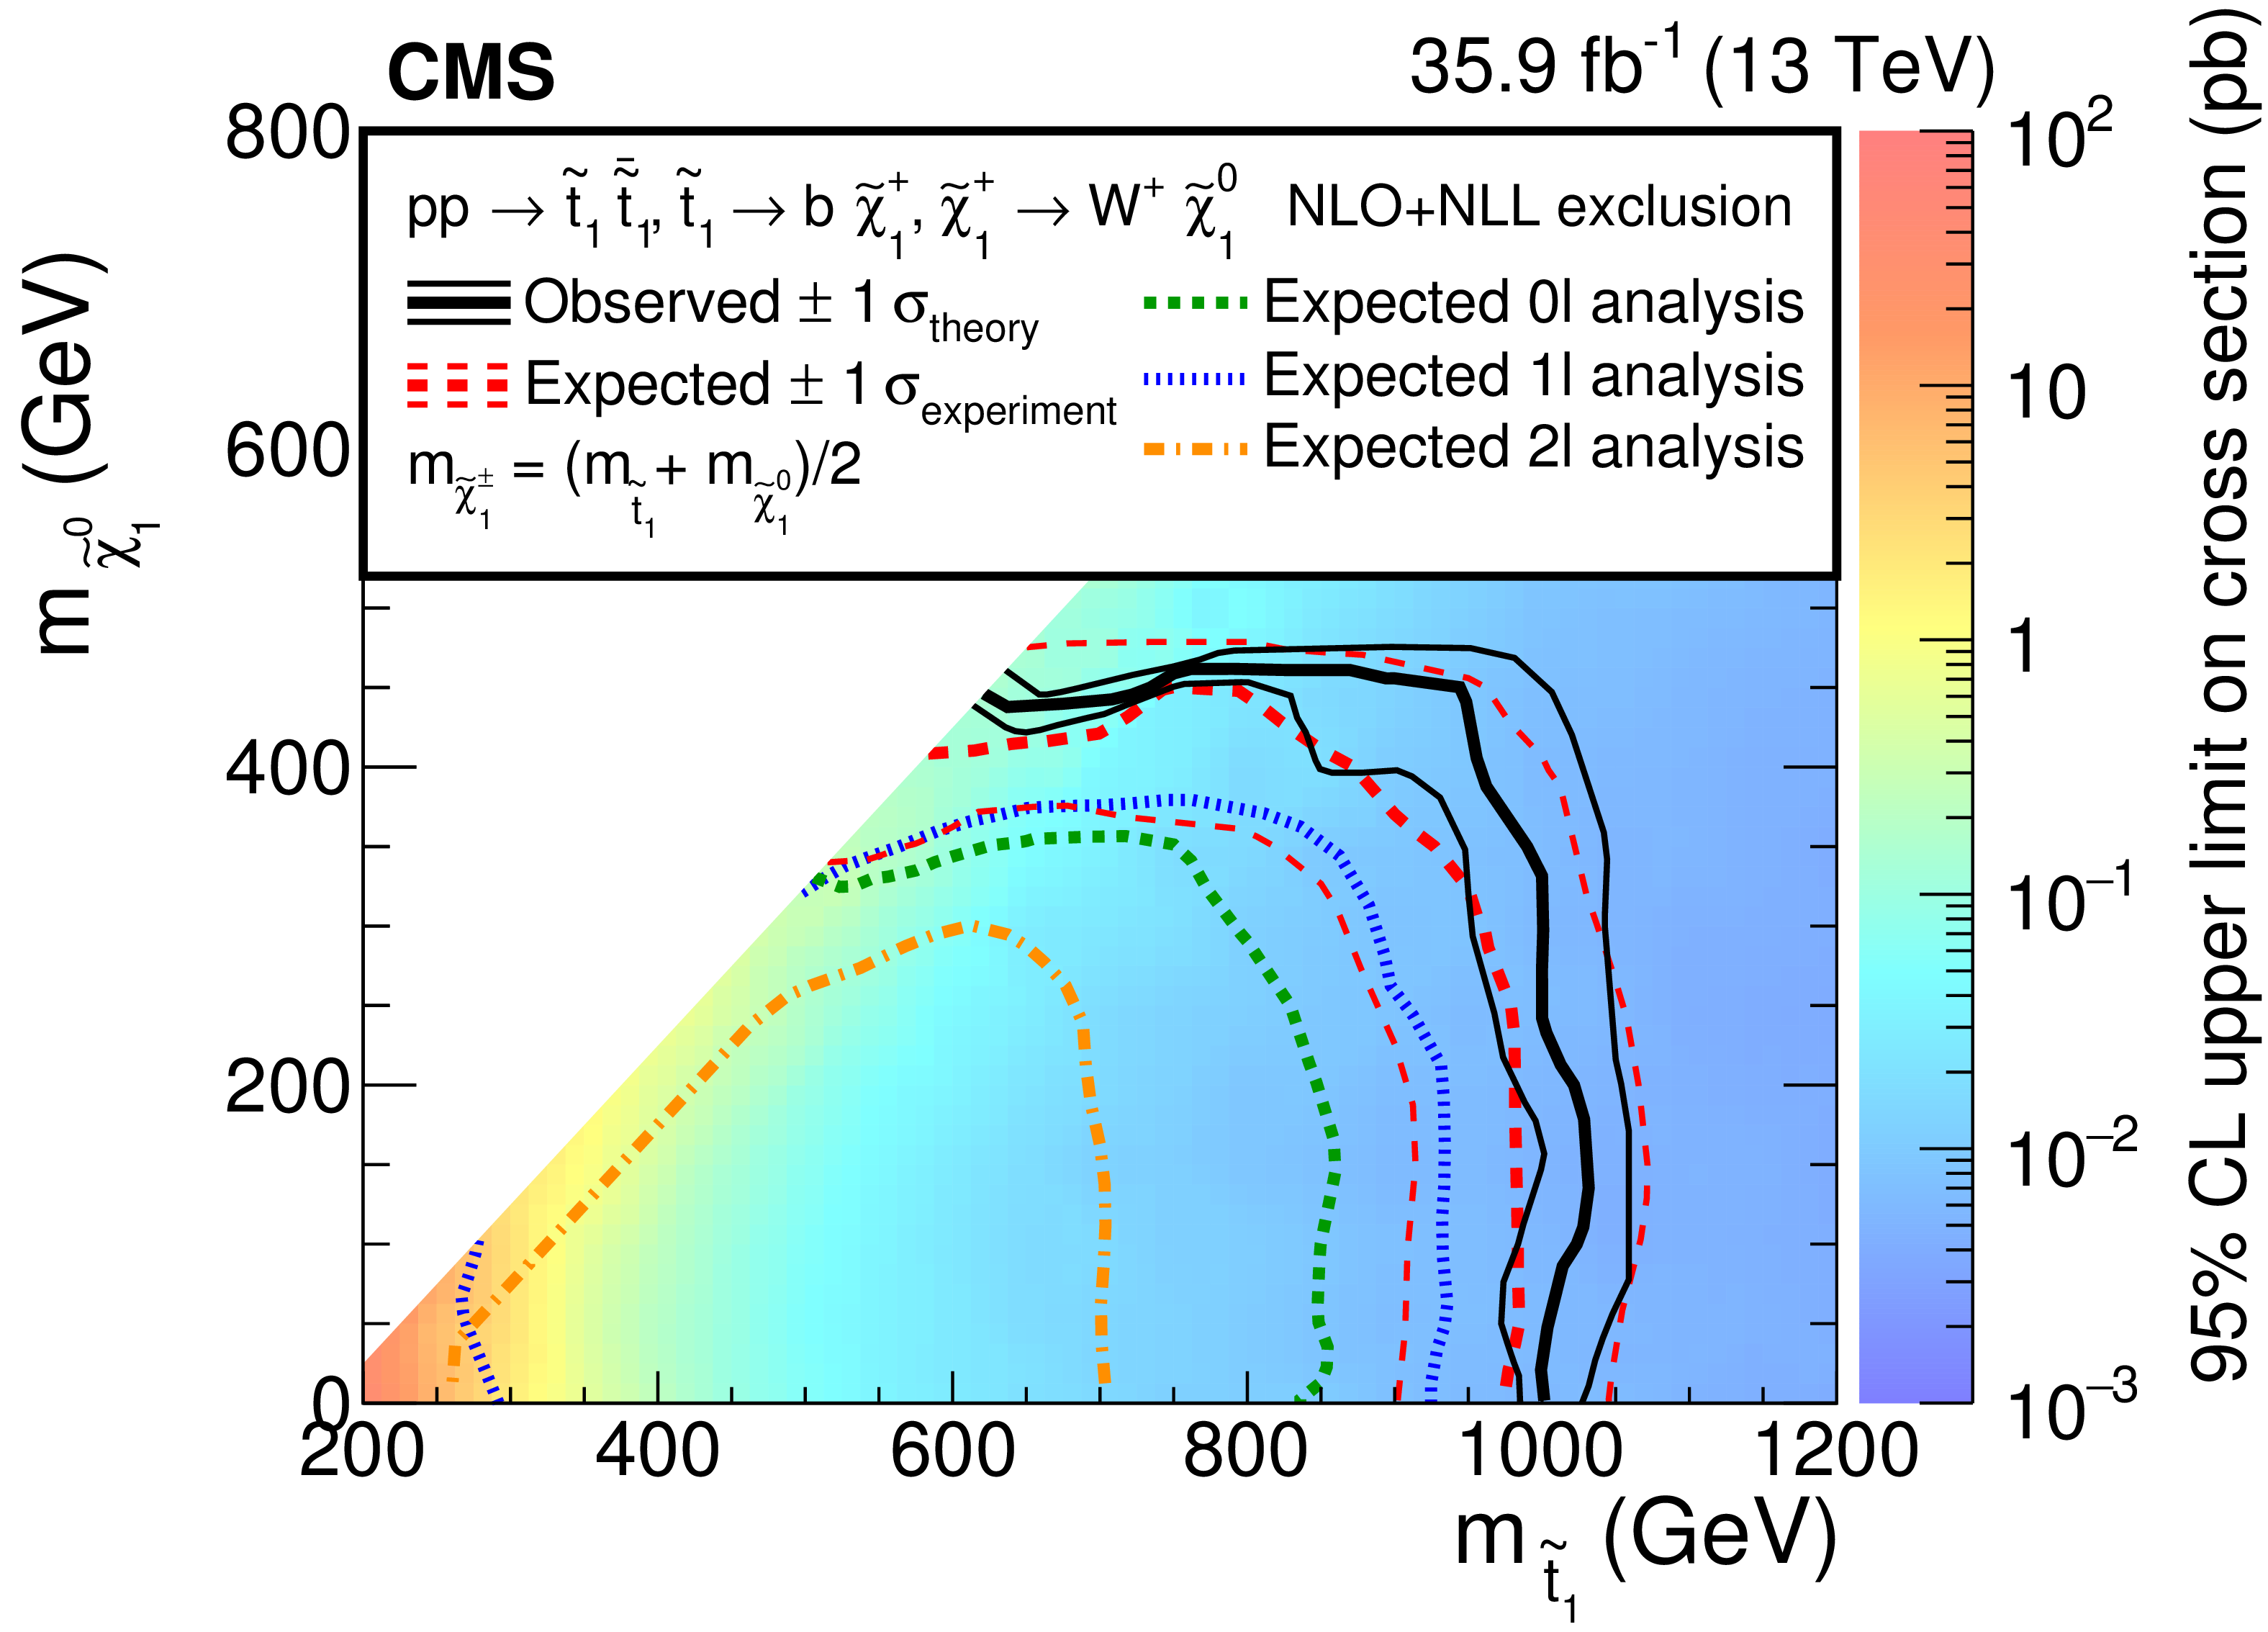
Figure 13:
Expected and observed limits for the T2tt model with $\tilde{\mathrm{t}}_{1} \to \mathrm{t} \tilde{\chi}^0_1 $ decays in the $m_{\tilde{\mathrm{t}}_{1}}$-$m_{\tilde{\chi}^0_1}$ mass plane combining the dilepton final state with the single-lepton [19] and the all-hadronic [20] final states as described in the text. The color indicates the 95% CL upper limit on the cross section times the square of the branching fraction at each point in the plane. The area below the thick black curve represents the observed exclusion region at 95% CL assuming 100% branching fraction, while the dashed red lines indicate the expected limits at 95% CL and the region containing 68% of the distribution of limits expected under the background-only hypothesis. The thin black lines show the effect of the theoretical uncertainties in the signal cross section. The green short-dashed, blue dotted, and long-short-dashed orange curves show the expected individual limits for the all-hadronic, single-lepton, and dilepton analyses, respectively. The whited out area on the diagonal corresponds to configurations where the mass difference between $\tilde{\mathrm{t}}_{1}$ and $\tilde{\chi}^0_1$ is very close to the top quark mass. In this region the signal acceptance strongly depends on the $\tilde{\chi}^0_1$ mass and is therefore hard to model. |
png pdf |
Figure 14:
Expected and observed limits for the T2bW model with $\tilde{\mathrm{t}}_{1} \to \mathrm{b} \tilde{ \chi }^{+}_{1} \to \mathrm{b} \mathrm{W^{+}} \tilde{\chi}^0_1 $ decays in the $m_{\tilde{\mathrm{t}}_{1}}$-$m_{\tilde{\chi}^0_1}$ mass plane combining the dilepton final state with the all-hadronic [20] and the single-lepton [19] final states as described in the text. The mass of the chargino is chosen to be $(m_{\tilde{\mathrm{t}}_{1}} + m_{\tilde{\chi}^0_1})/2$. The description of curves is the same as in the caption of Fig. 13. |
png pdf |
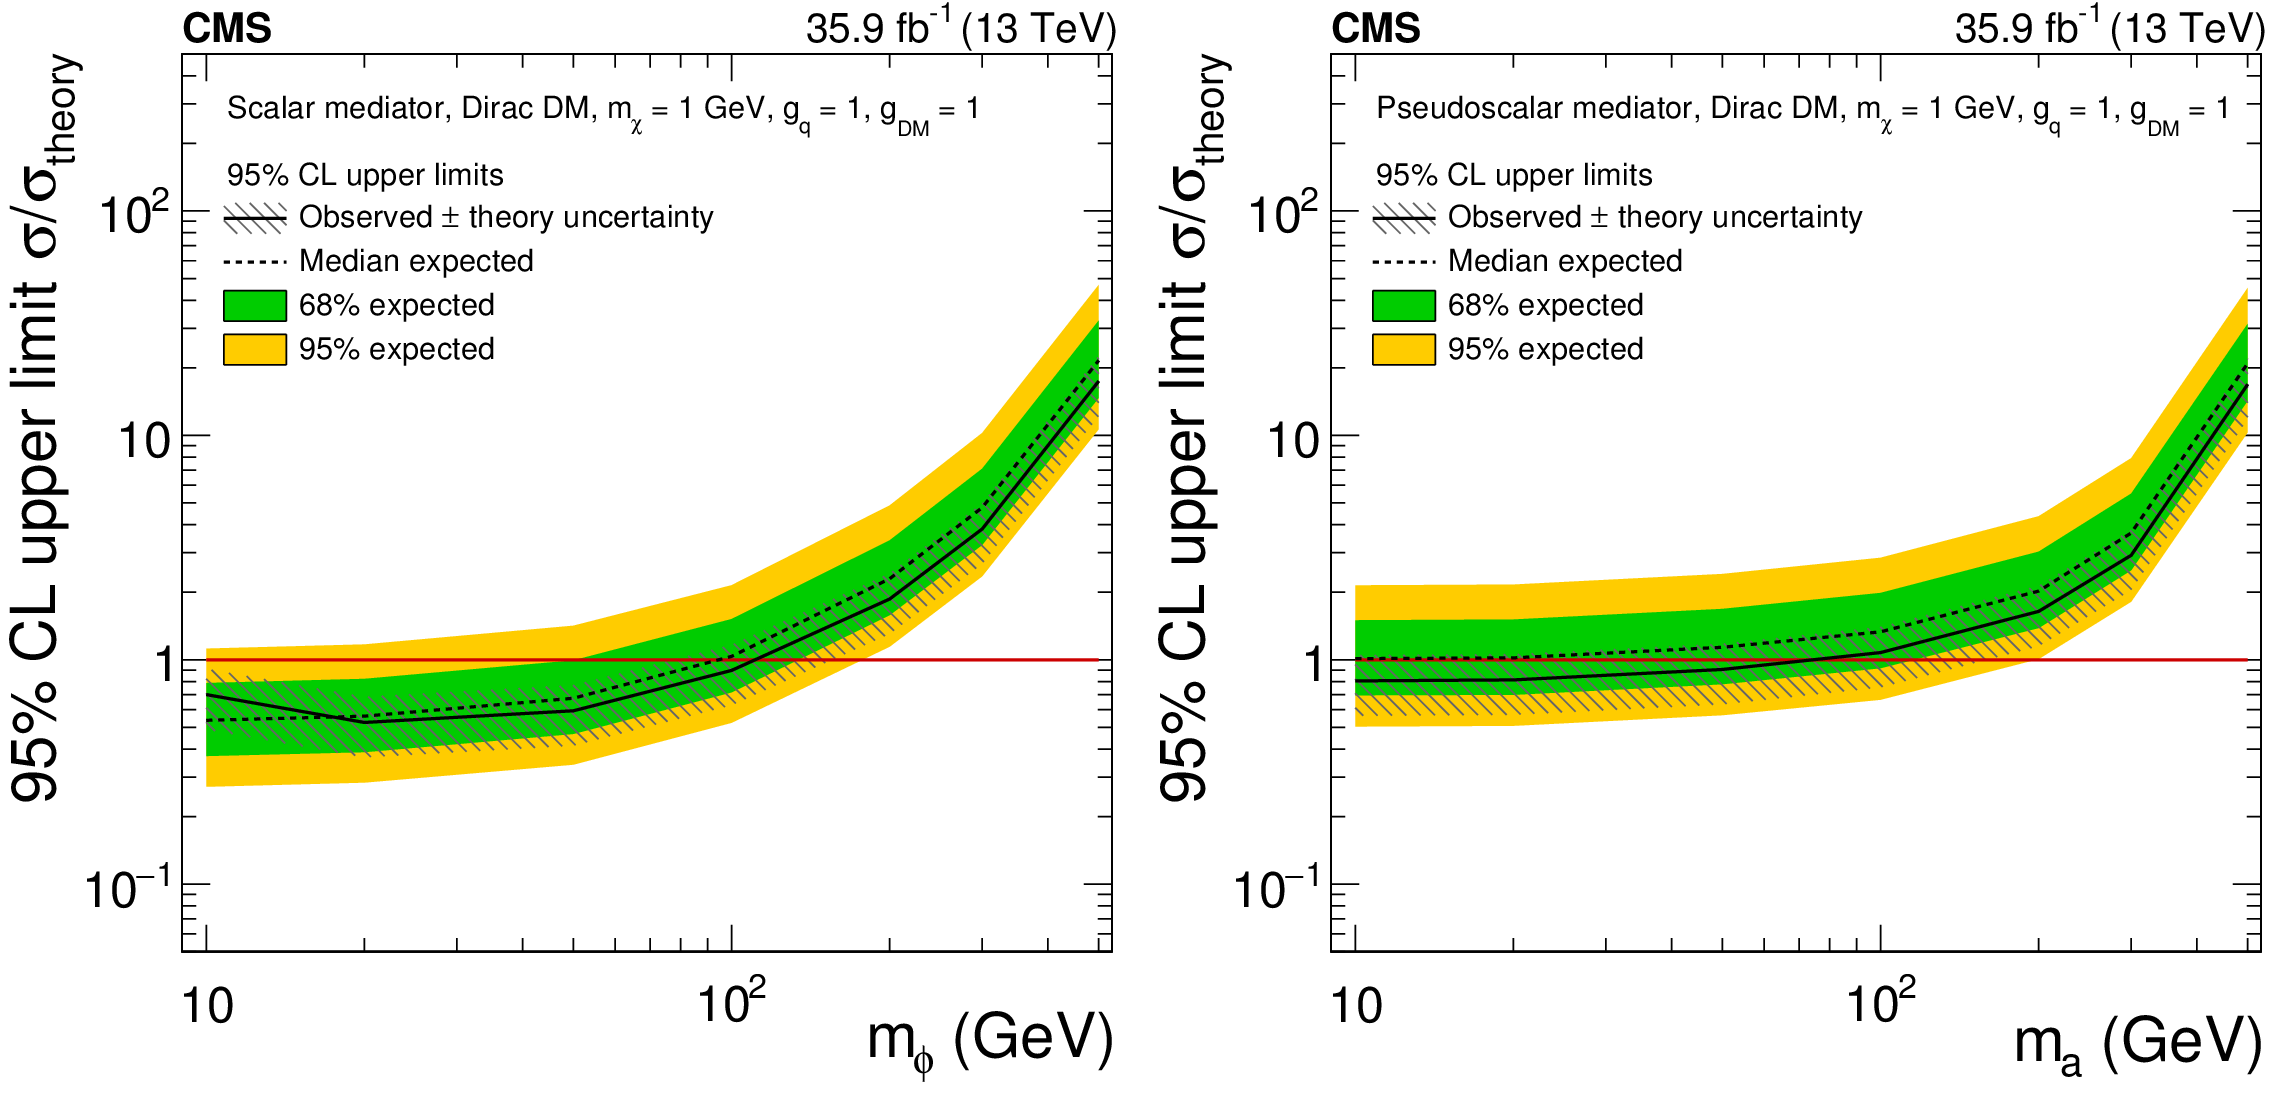
Figure 15:
The 95% CL expected (dashed line) and observed limits (solid line) on $\mu =\sigma /\sigma _{\text {theory}}$ for a fermionic DM particle with $m_{\chi} = $ 1 GeV assuming different scalar (left) and pseudoscalar (right) mediator masses. The green and yellow bands represent the regions containing 68 and 95%, respectively, of the distribution of limits expected under the background-only hypothesis. The horizontal red line indicates $\mu =$ 1. The mediator couplings are set to $g_{\mathrm{q}}=g_\mathrm {DM}=$ 1. The gray hashed band around the observed limit corresponds to a 30% theory uncertainty in the inclusive signal cross section. |
png pdf |
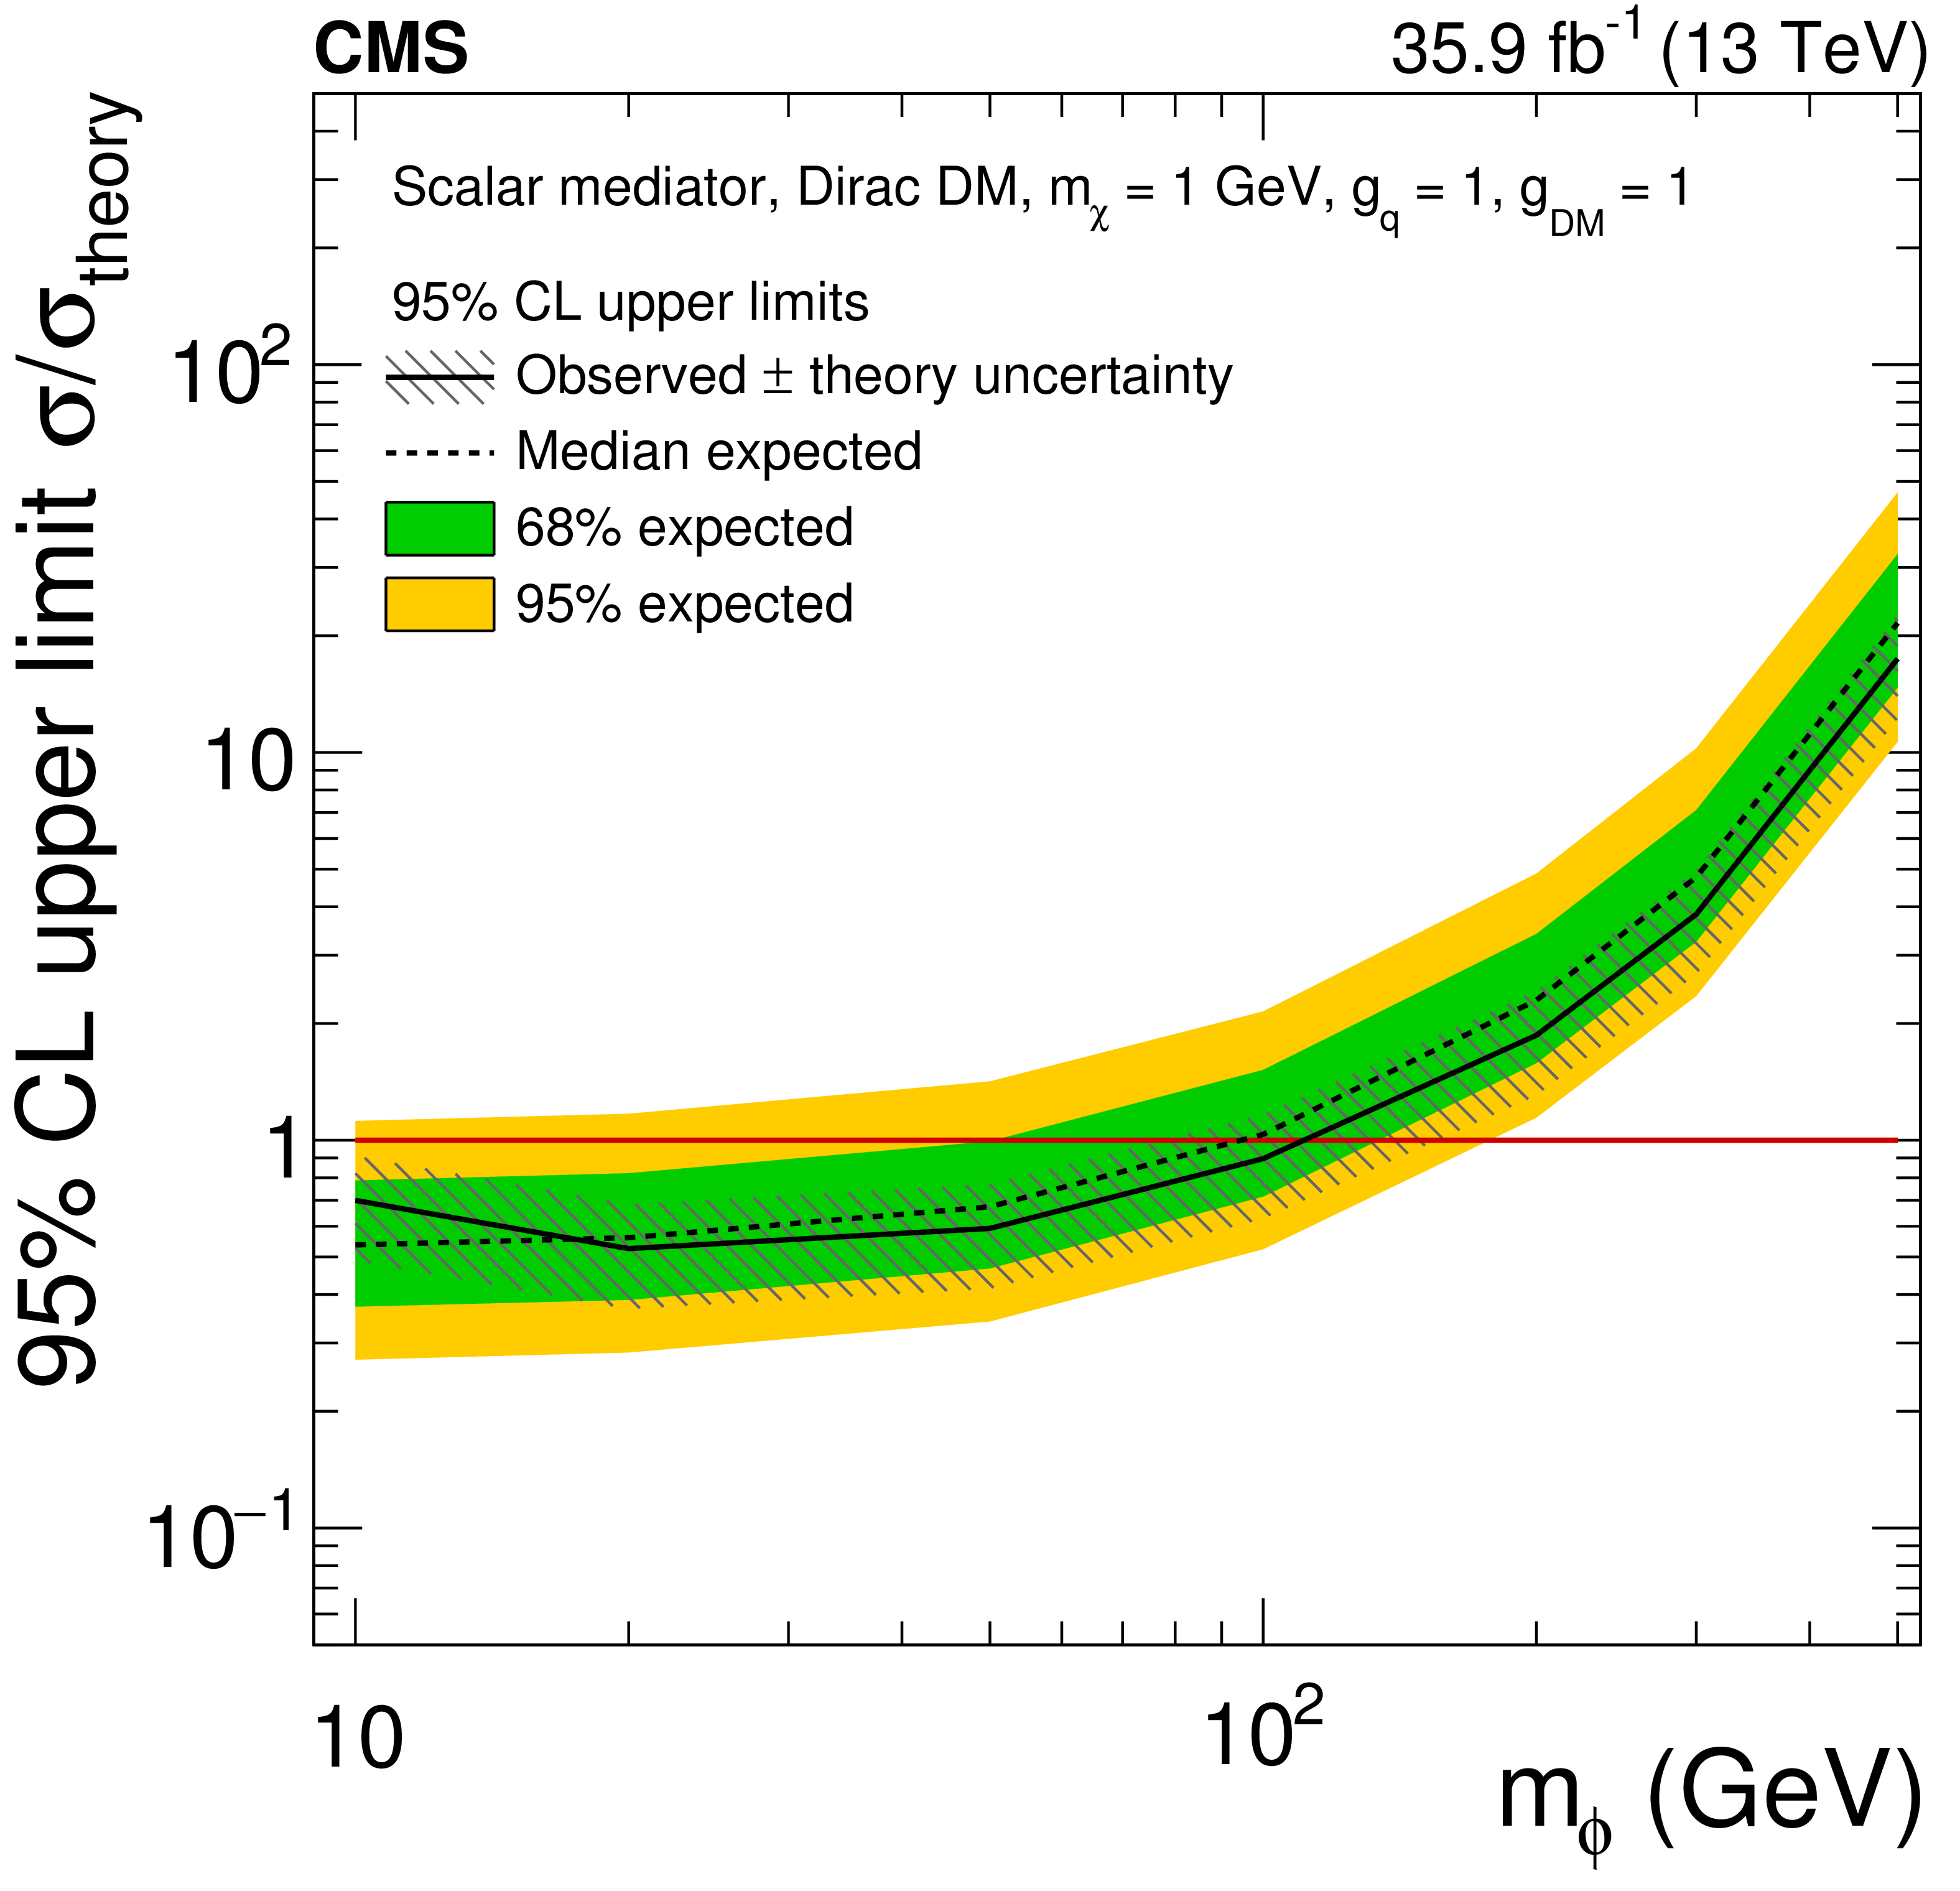
Figure 15-a:
The 95% CL expected (dashed line) and observed limits (solid line) on $\mu =\sigma /\sigma _{\text {theory}}$ for a fermionic DM particle with $m_{\chi} = $ 1 GeV assuming different scalar mediator masses. The green and yellow bands represent the regions containing 68 and 95%, respectively, of the distribution of limits expected under the background-only hypothesis. The horizontal red line indicates $\mu =$ 1. The mediator couplings are set to $g_{\mathrm{q}}=g_\mathrm {DM}=$ 1. The gray hashed band around the observed limit corresponds to a 30% theory uncertainty in the inclusive signal cross section. |
png pdf |
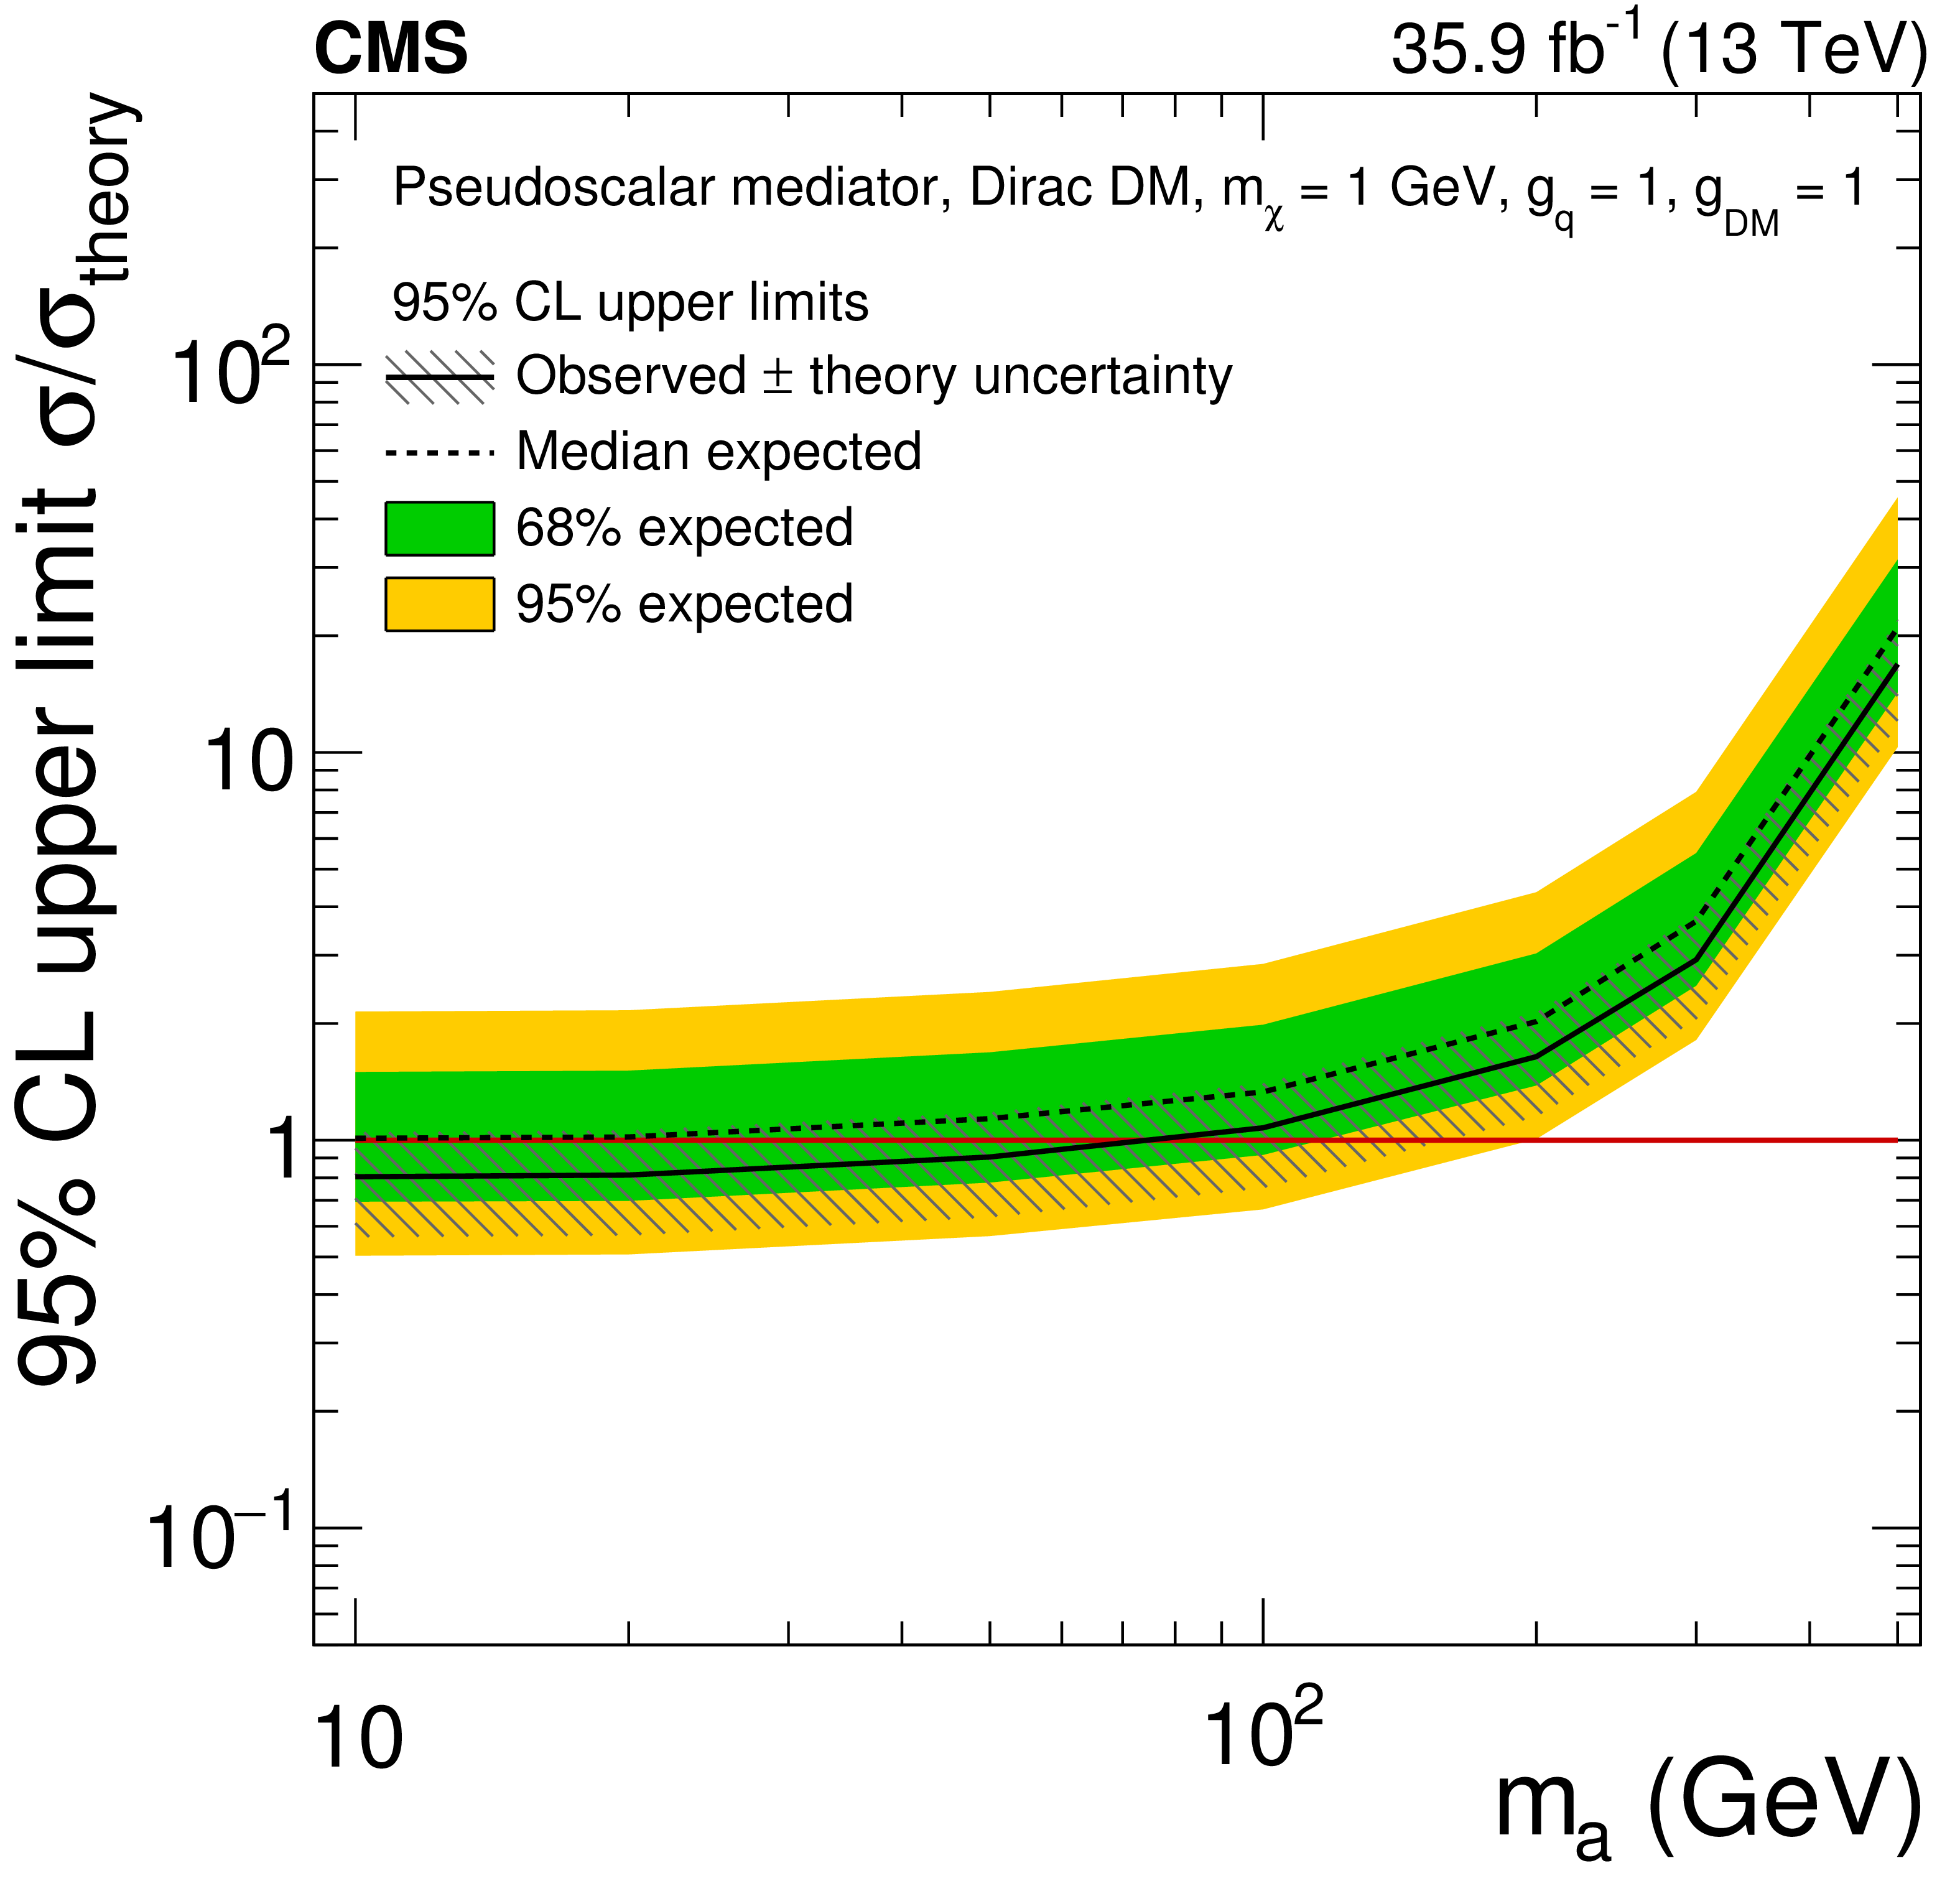
Figure 15-b:
The 95% CL expected (dashed line) and observed limits (solid line) on $\mu =\sigma /\sigma _{\text {theory}}$ for a fermionic DM particle with $m_{\chi} = $ 1 GeV assuming different pseudoscalar mediator masses. The green and yellow bands represent the regions containing 68 and 95%, respectively, of the distribution of limits expected under the background-only hypothesis. The horizontal red line indicates $\mu =$ 1. The mediator couplings are set to $g_{\mathrm{q}}=g_\mathrm {DM}=$ 1. The gray hashed band around the observed limit corresponds to a 30% theory uncertainty in the inclusive signal cross section. |
| Tables | |
png pdf |
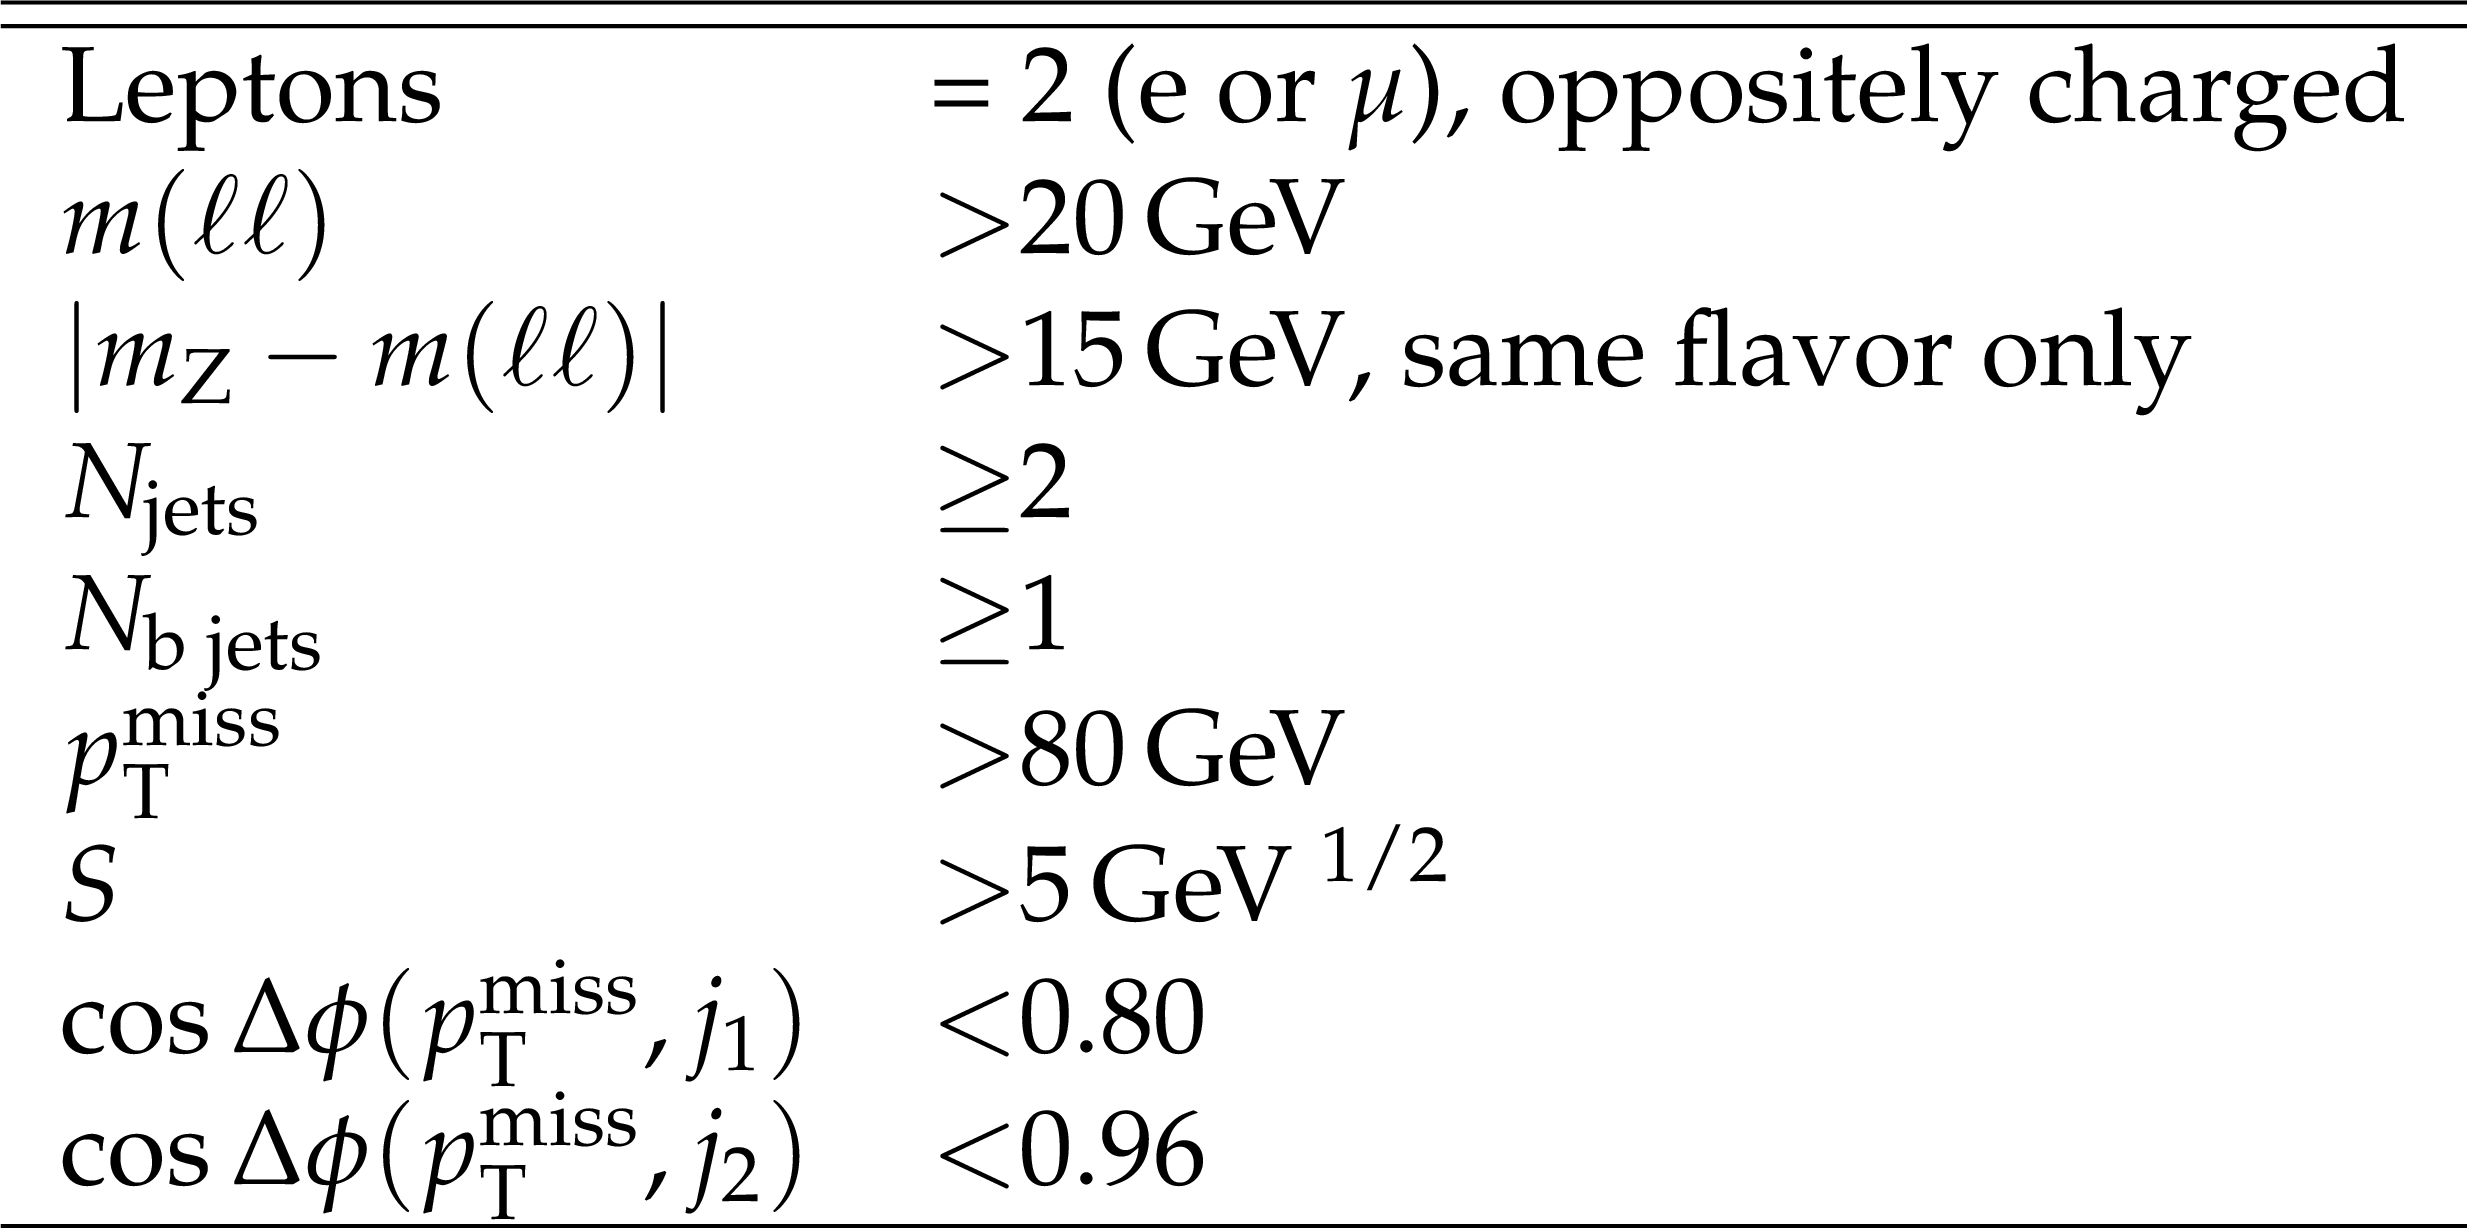
Table 1:
Overview of the preselection requirements. |

png pdf |
Table 2:
Definition of the signal regions. The regions are further split into different- and same-flavor regions. |

png pdf |
Table 3:
Relative systematic uncertainties in the background yields in the signal regions. Where given, ranges represent the minimal and maximal changes in yield across all signal regions. |

png pdf |
Table 4:
Total expected background and event yields in data in each of the signal regions for same-flavor ($\mathrm{e^{+}} \mathrm{e^{-}} /\mu^{+} \mu^{-} $), different-flavor ($\mathrm{e^{\pm}} \mu^{\mp} $), and all channels combined with all the systematic uncertainties included as described in Section 7. |
png pdf |
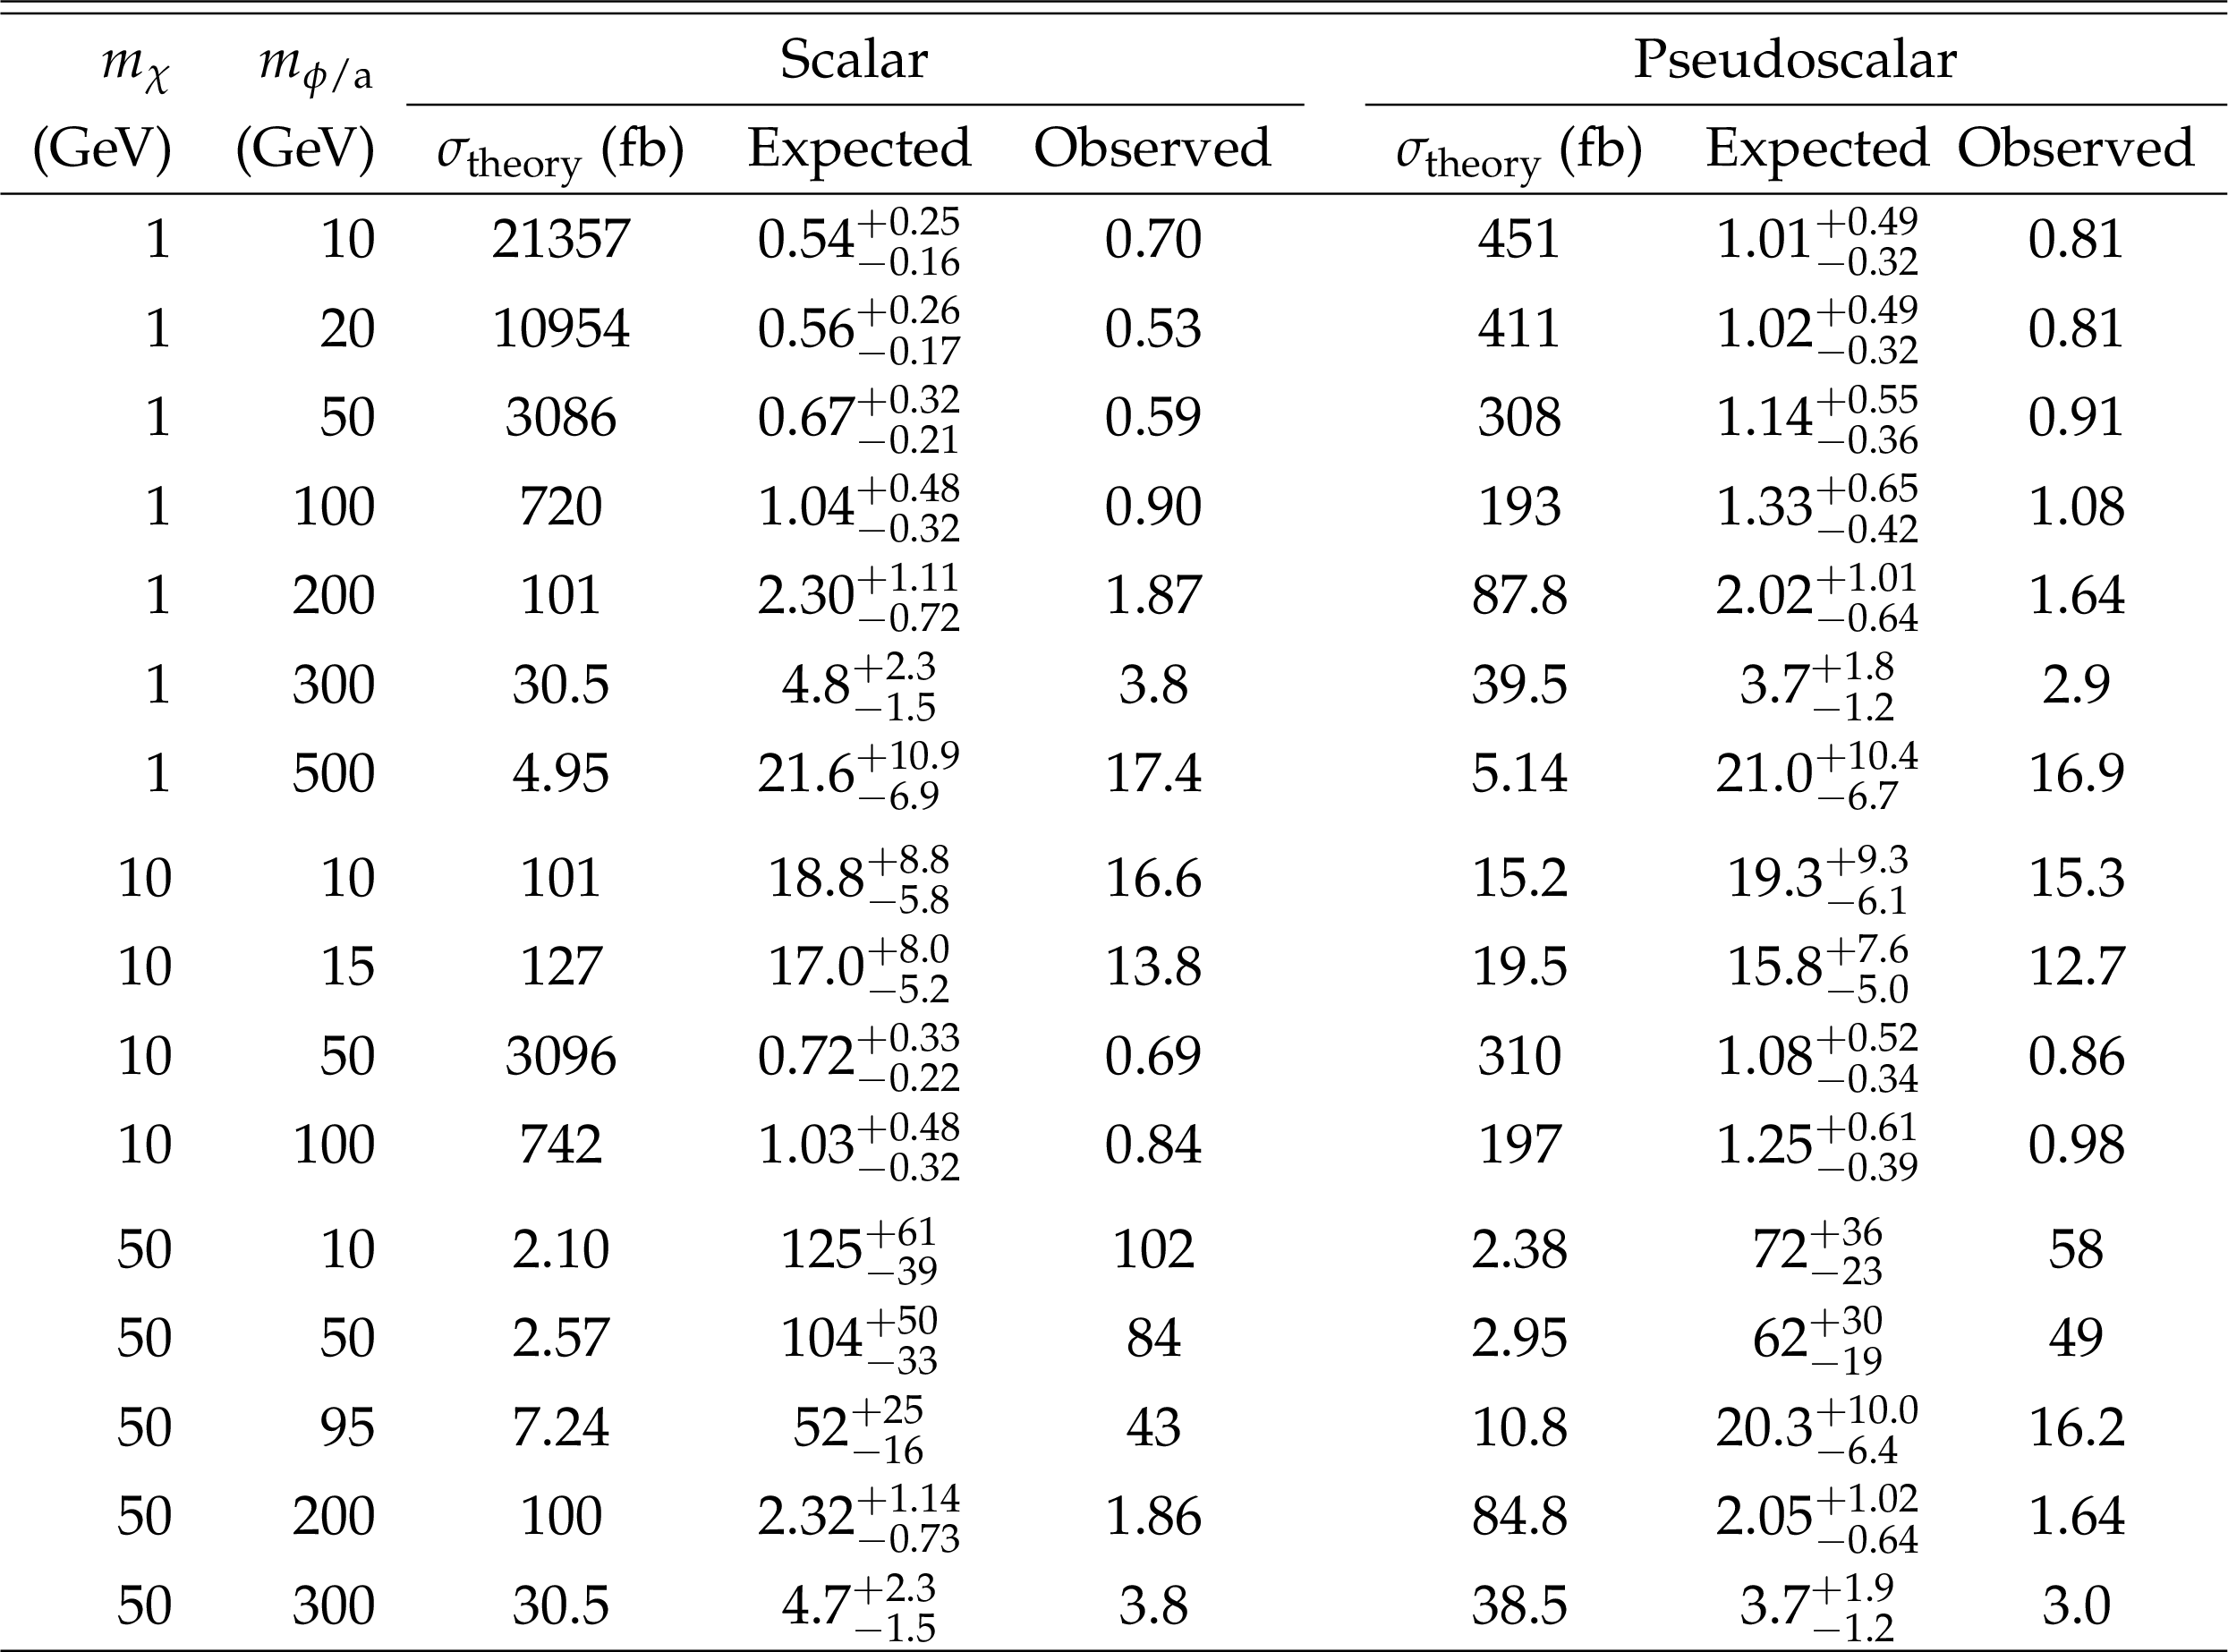
Table 5:
Ratios $\mu =\sigma /\sigma _{\text {theory}}$ of the 95% CL expected and observed limits to simplified model expectations for different DM particle masses and mediator masses and for scalar ($\phi $) and pseudoscalar ($\mathrm {a}$) mediators under the assumption $g_{\mathrm{q}}=g_\mathrm {DM}=$ 1. The uncertainties reflect the 68% band of the expected limits. |
png pdf |
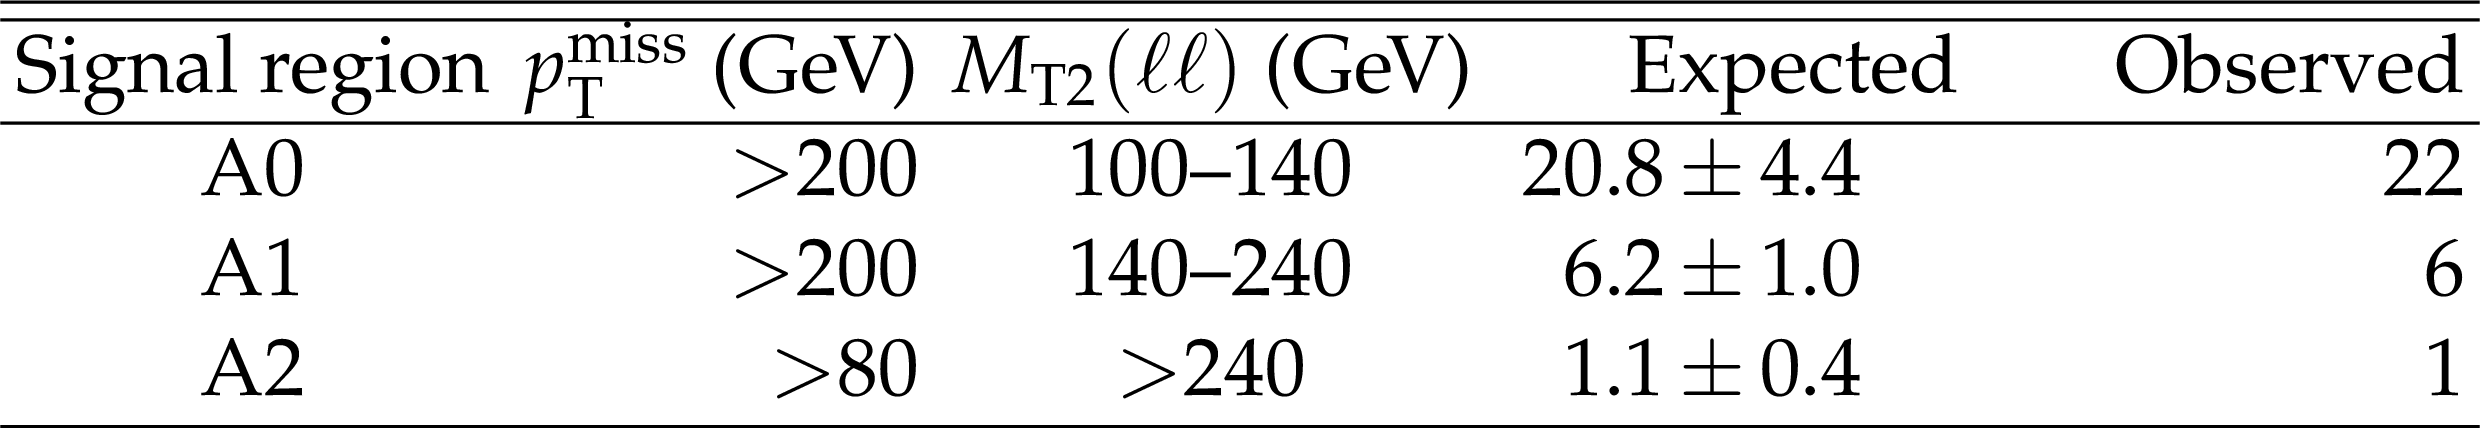
Table 6:
Expected and observed event yields, summed over all lepton flavors, in the aggregate signal regions defined by the selection requirements in the table. |

png pdf |
Table 7:
Covariance (top) and correlation matrix (bottom) for the background prediction in the aggregate signal regions described in Table 6. |
| Summary |
|
A search was presented for top squark pair production and dark matter in final states with two leptons, b jets, and large missing transverse momentum in data corresponding to an integrated luminosity of 35.9 fb$^{-1}$ in pp collisions collected at a center-of-mass energy of 13 TeV in the CMS detector at the LHC. An efficient background reduction using dedicated kinematic variables was achieved, suppressing by several orders of magnitude the large background from standard model dilepton $ \mathrm{ t \bar{t} } $ events. With no evidence observed for a deviation from the expected background from the standard model, results were interpreted in several simplified models for supersymmetric top squark pair production as well as through the production of a spin-0 dark matter mediator in association with a $ \mathrm{ t \bar{t} } $ pair. In the T2tt model with $\tilde{ \mathrm{t} }_{1} \to \mathrm{t}\tilde{ \chi }^{0}_{1}$ decays, $\tilde{ \mathrm{t} }_{1}$ masses $<$800 GeV and $\tilde{ \chi }^{0}_{1}$ masses $<$360 GeV are excluded. In the T2bW model with $\tilde{ \mathrm{t} }_{1} \to \mathrm{b}\tilde{ \chi }^{+}_{1} \to \mathrm{b}\mathrm{W}^{+}\tilde{ \chi }^{0}_{1}$ decays, $\tilde{ \mathrm{t} }_{1}$ masses $<$750 GeV and $\tilde{ \chi }^{0}_{1}$ masses $<$320 GeV are excluded, assuming the chargino mass to be the mean of the $\tilde{ \mathrm{t} }_{1}$ and the $\tilde{ \chi }^{0}_{1}$ masses. In the newly considered T8bb$\ell\ell\nu\nu$ model with decays $\tilde{ \mathrm{t} }_{1} \to \mathrm{b}\tilde{ \chi }^{+}_{1} \to \mathrm{b}\nu\tilde{\ell} \to \mathrm{b}\nu\ell\tilde{ \chi }^{0}_{1}$, and therefore 100% branching to dilepton final states, the sensitivity depends on the intermediate particle masses. With the chargino mass again taken as the mean of the $\tilde{ \mathrm{t} }_{1}$ and the $\tilde{ \chi }^{0}_{1}$ masses, the strongest exclusion is obtained if the slepton mass is close to the chargino mass. In this case, excluded masses reach up to 1.3 TeV for $\tilde{ \mathrm{t} }_{1}$ and 800 GeV for $\tilde{ \chi }^{0}_{1}$. The T2tt and T2bW results were combined with complementary searches in the all-jet and single-lepton channels, providing exclusions in the T2tt model of $\tilde{ \mathrm{t} }_{1}$ mass $<$1050 GeV for a massless $\tilde{ \chi }^{0}_{1}$, and a $\tilde{ \chi }^{0}_{1}$ mass of $<$500 GeV for a $\tilde{ \mathrm{t} }_{1}$ mass of 900 GeV. In the same way, the T2bW model is excluded for $\tilde{ \mathrm{t} }_{1}$ mass $<$1000 GeV for a massless $\tilde{ \chi }^{0}_{1}$, and a $\tilde{ \chi }^{0}_{1}$ mass of $<$450 GeV for a $\tilde{ \mathrm{t} }_{1}$ mass of 900 GeV. The combination extends the sensitivity by $\approx$50 GeV in the masses of both $\tilde{ \mathrm{t} }_{1}$ and $\tilde{ \chi }^{0}_{1}$ in the T2bW model, and by similar values in the T2tt model, when the difference between these masses is $\approx$200 GeV. Aggregate search regions were presented that can be used to reinterpret the results in a wider range of theoretical models of new physics that give rise to the chosen final state. In addition, the results were interpreted in a simplified model with a dark matter candidate particle coupled to the top quark via a scalar or a pseudoscalar mediator. Within the assumptions of the model, a scalar mediator with a mass up to 100 GeV and a pseudoscalar mediator with a mass up to 50 GeV are excluded for a dark matter candidate mass of 1 GeV. The result for the scalar mediator achieves some of the most stringent limits to date in this model. |
| Additional Figures | |
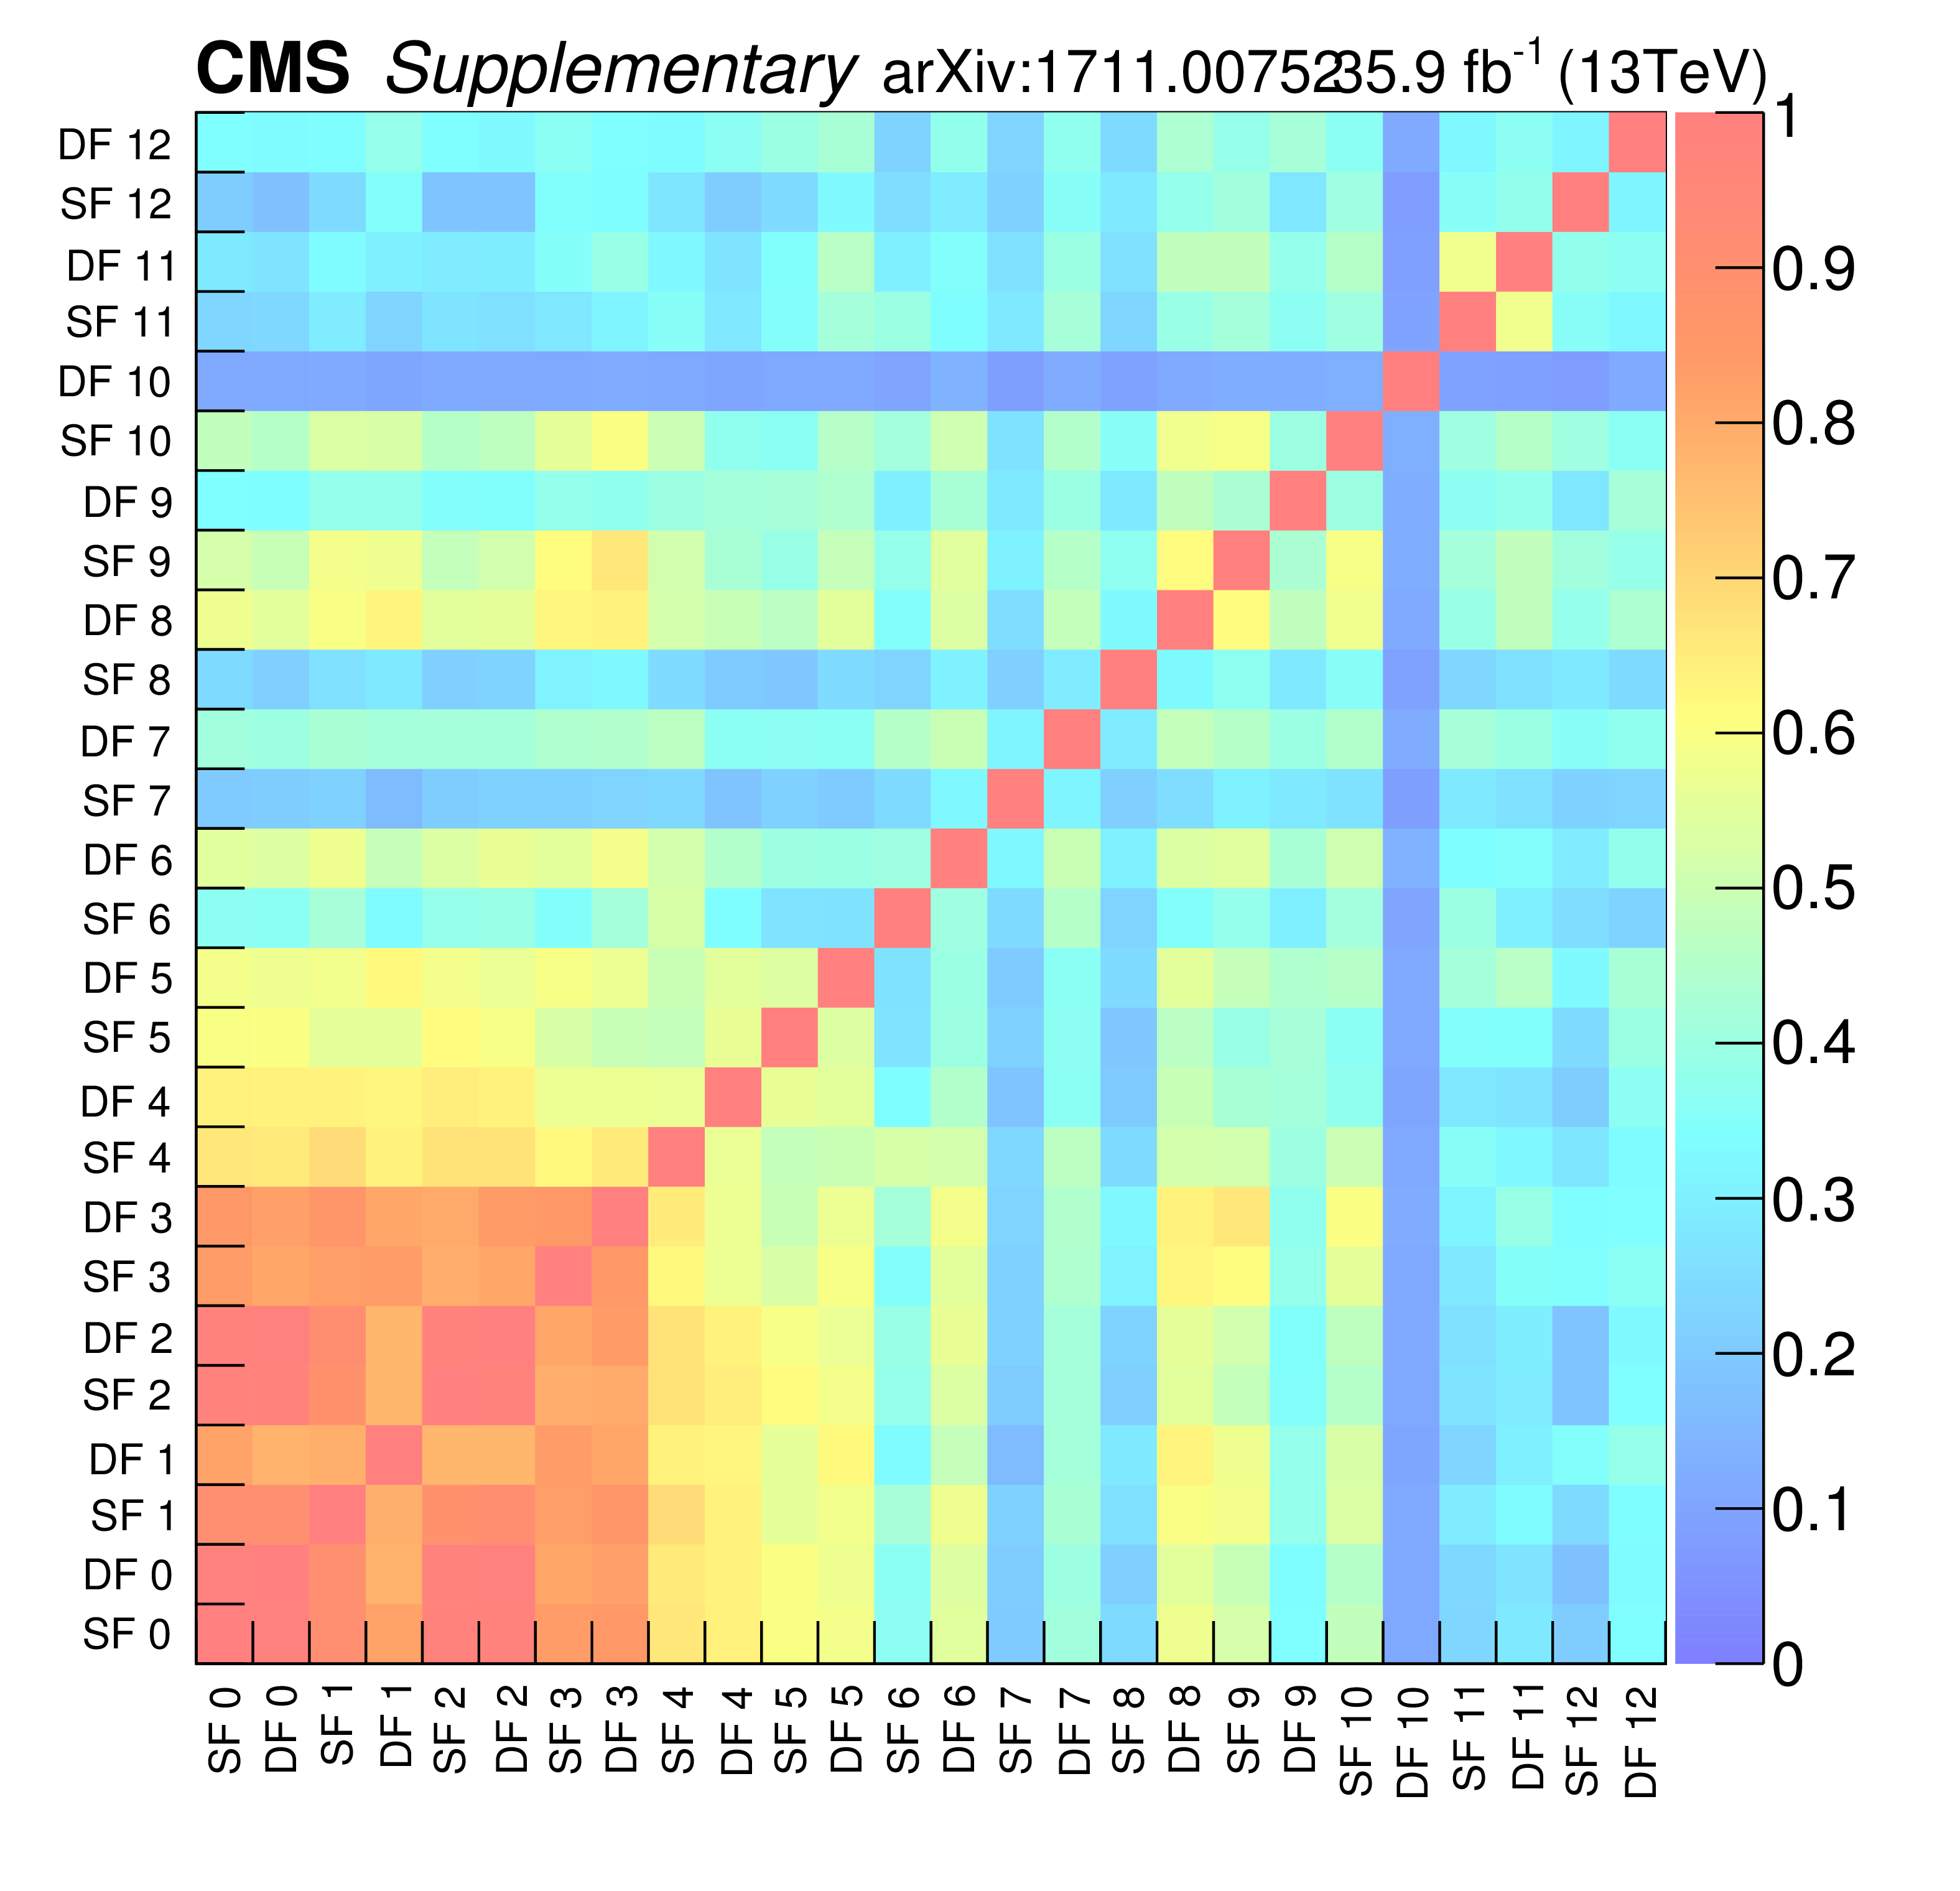
png pdf root |
Additional Figure 1:
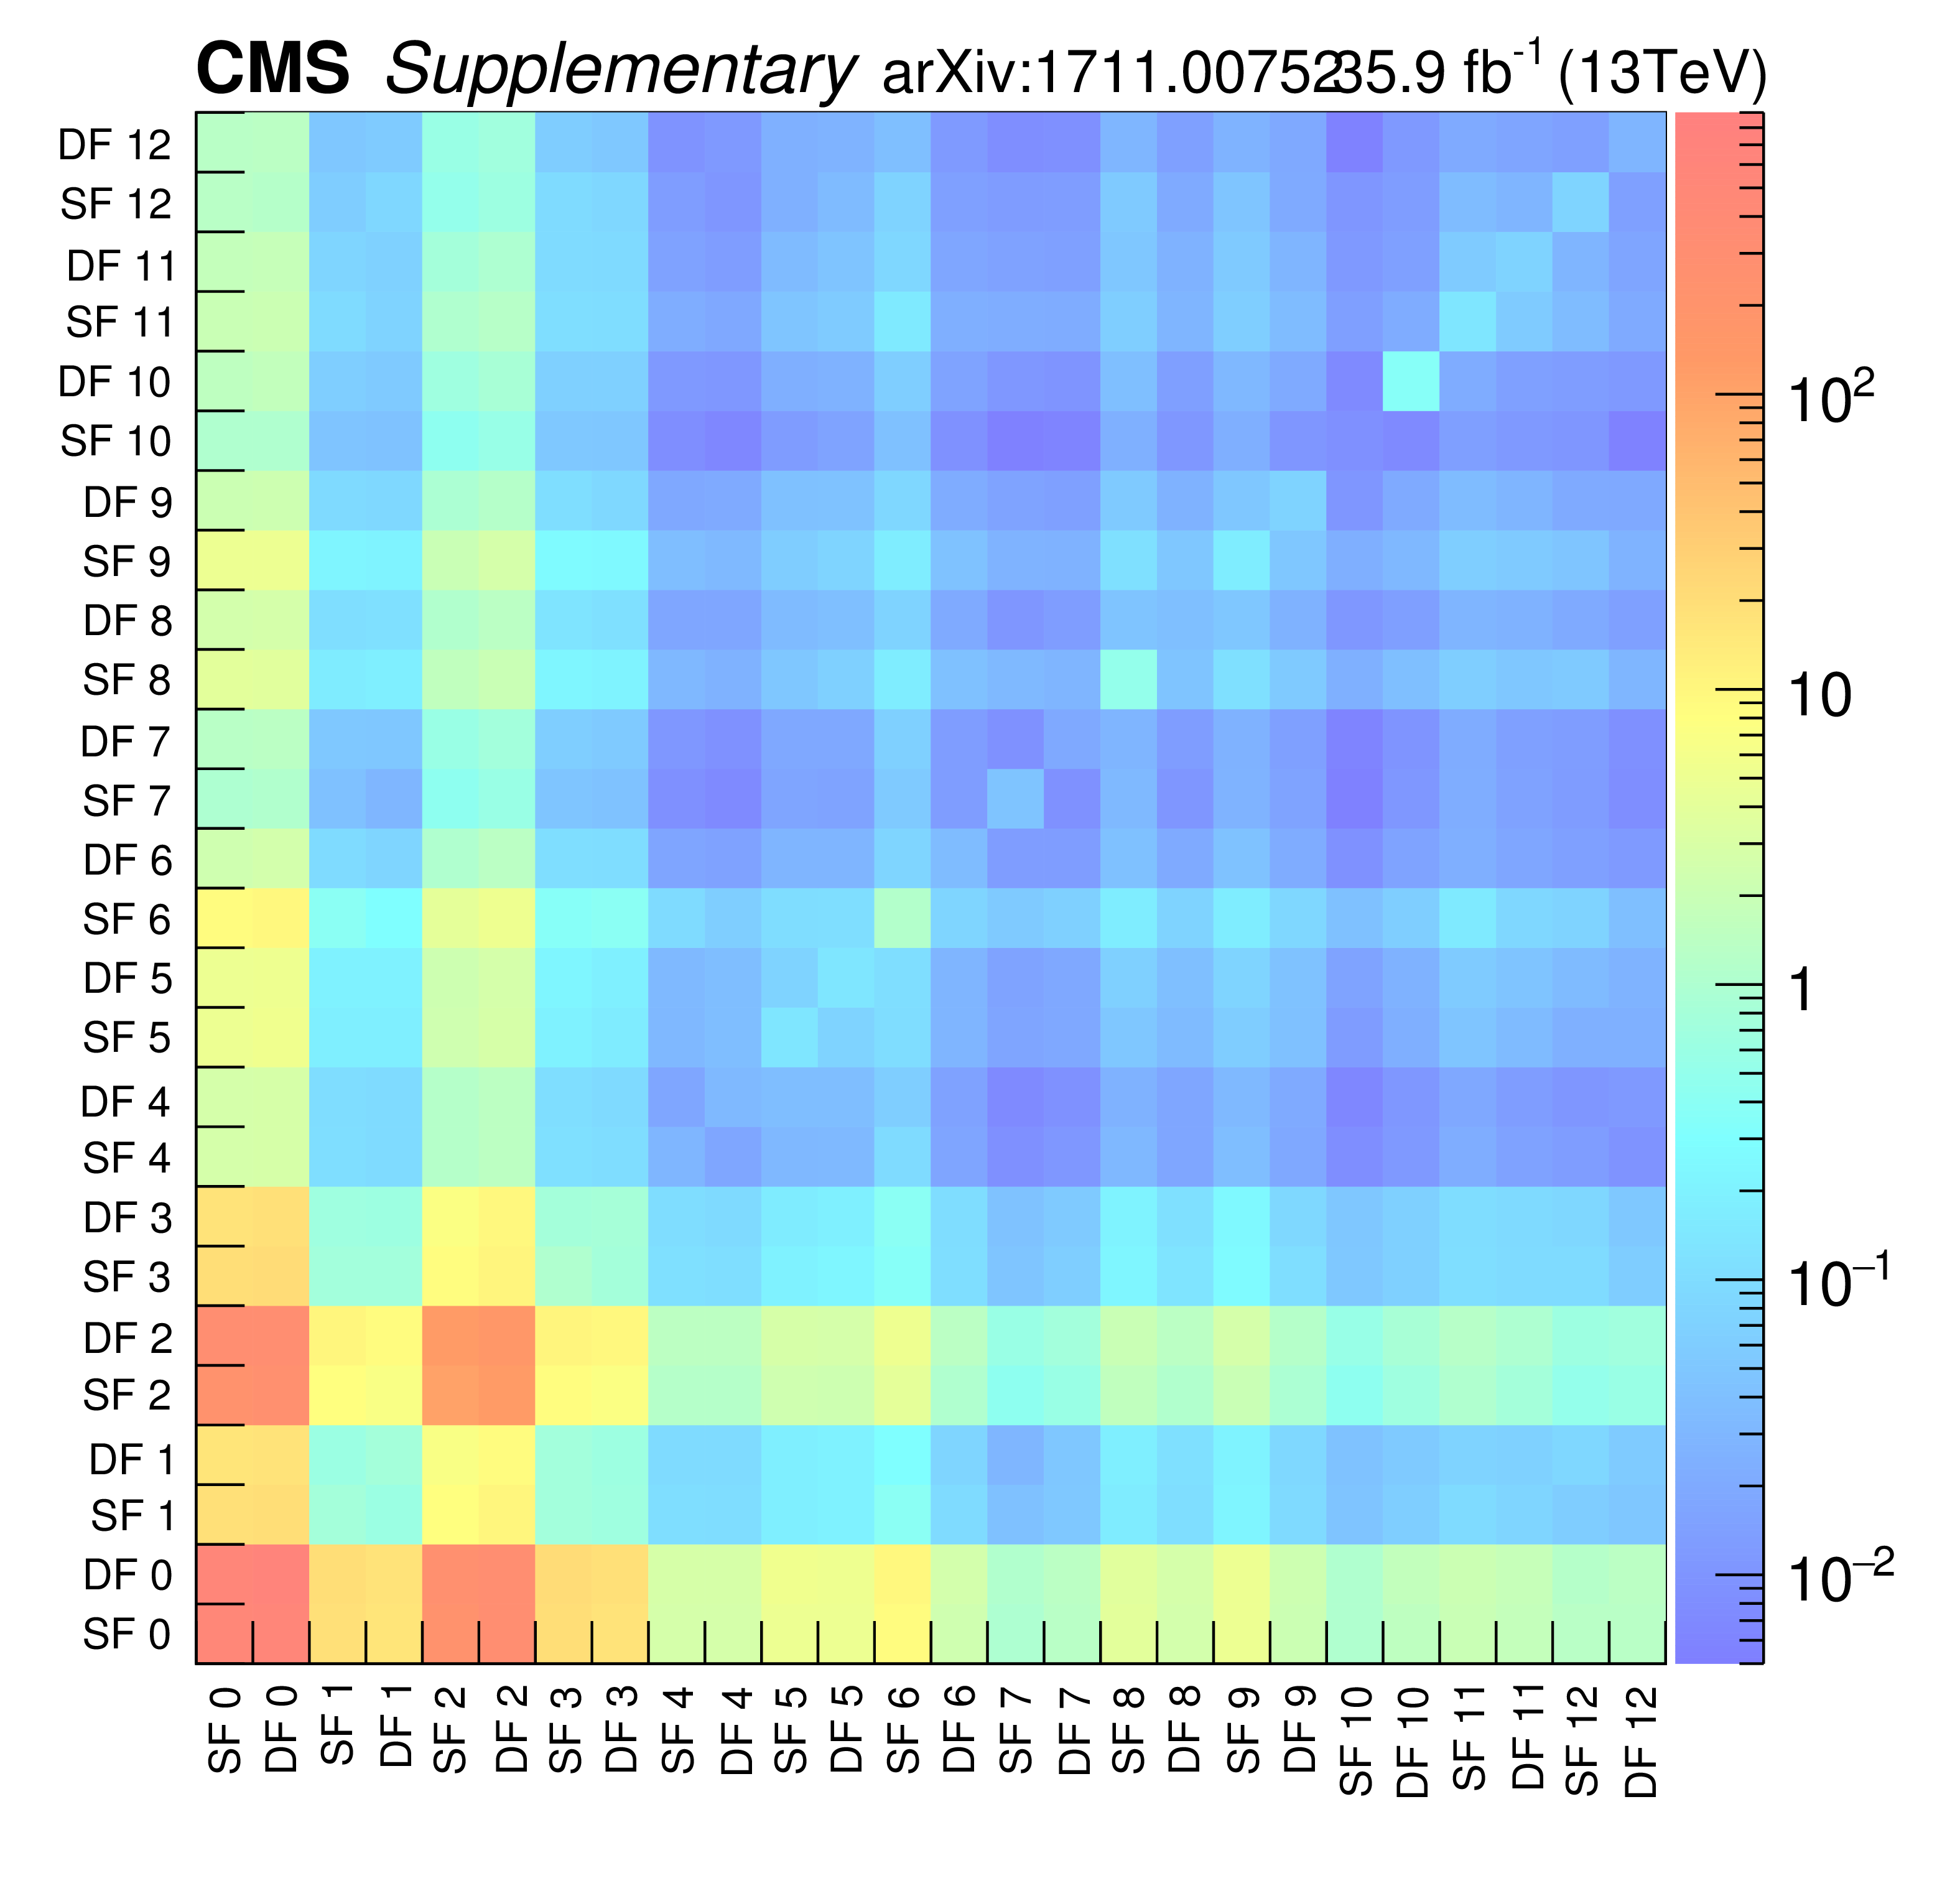
Correlation matrix of the 13 signal regions, split into same-flavor (SF) and different-flavor (DF) regions. |
png pdf root |
Additional Figure 2:
Covariance matrix of the 13 signal regions, split into same-flavor (SF) and different-flavor (DF) regions. |

png pdf root |
Additional Figure 3:
Expected and observed limits for the T2tt model with $\tilde{\mathrm{t}}_{1} \to \mathrm{t} \tilde{\chi}^0_1 $ decays in the $m_{\tilde{\mathrm{t}}_{1}}$-$m_{\tilde{\chi}^0_1}$ mass plane, using aggregate signal regions. The color indicates the 95% CL upper limit on the cross section times the square of the branching fraction at each point in the plane. The area below the thick black curve represents the observed exclusion region at 95% CL assuming 100% branching fraction, while the dashed red lines indicate the expected limits at 95% CL and the region containing 68% of the distribution of limits expected under the background-only hypothesis. The thin black lines show the effect of the theoretical uncertainties in the signal cross section. |
| Additional Tables | |

png pdf |
Additional Table 1:
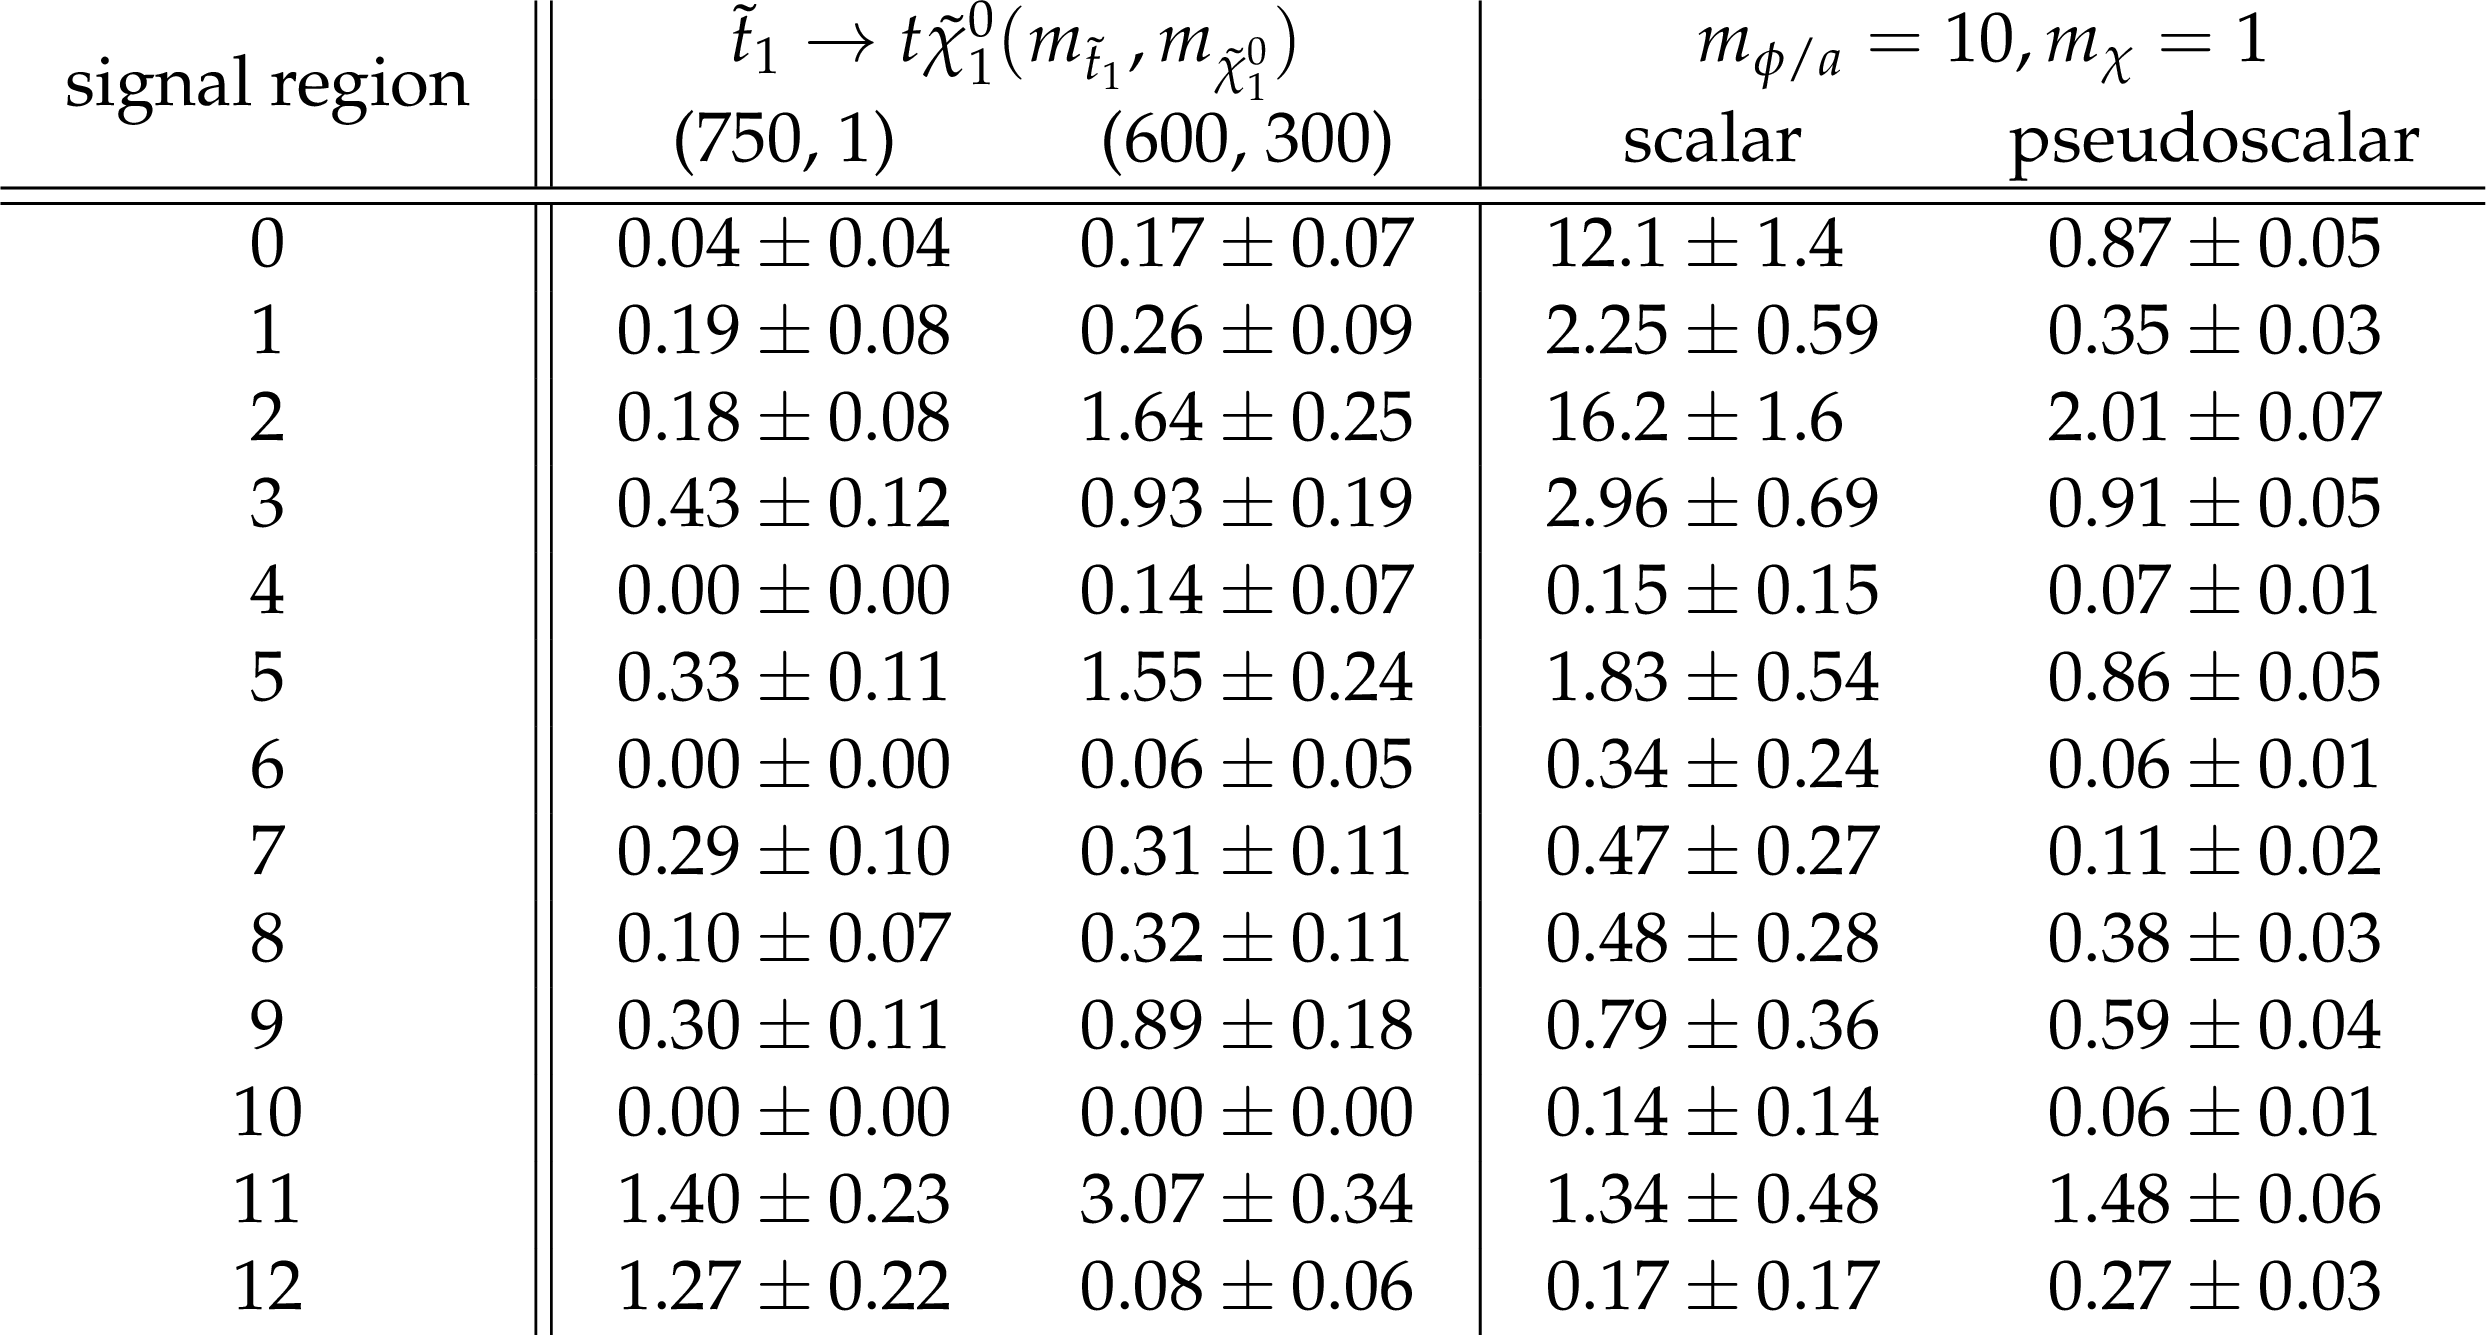
Cutflow table for two different configurations of T2tt SUSY signal models (left) and DM signal models (right). Numbers are normalized to an integrated luminosity of 35.9 fb$^{-1}$ and shown for T2tt signals with top squark masses of 750 (600) GeV and LSP masses of 1 (300) GeV, and scalar (pseudoscalar) mediator mass of 10 GeV and DM particle mass of 1 GeV. |
png pdf |
Additional Table 2:
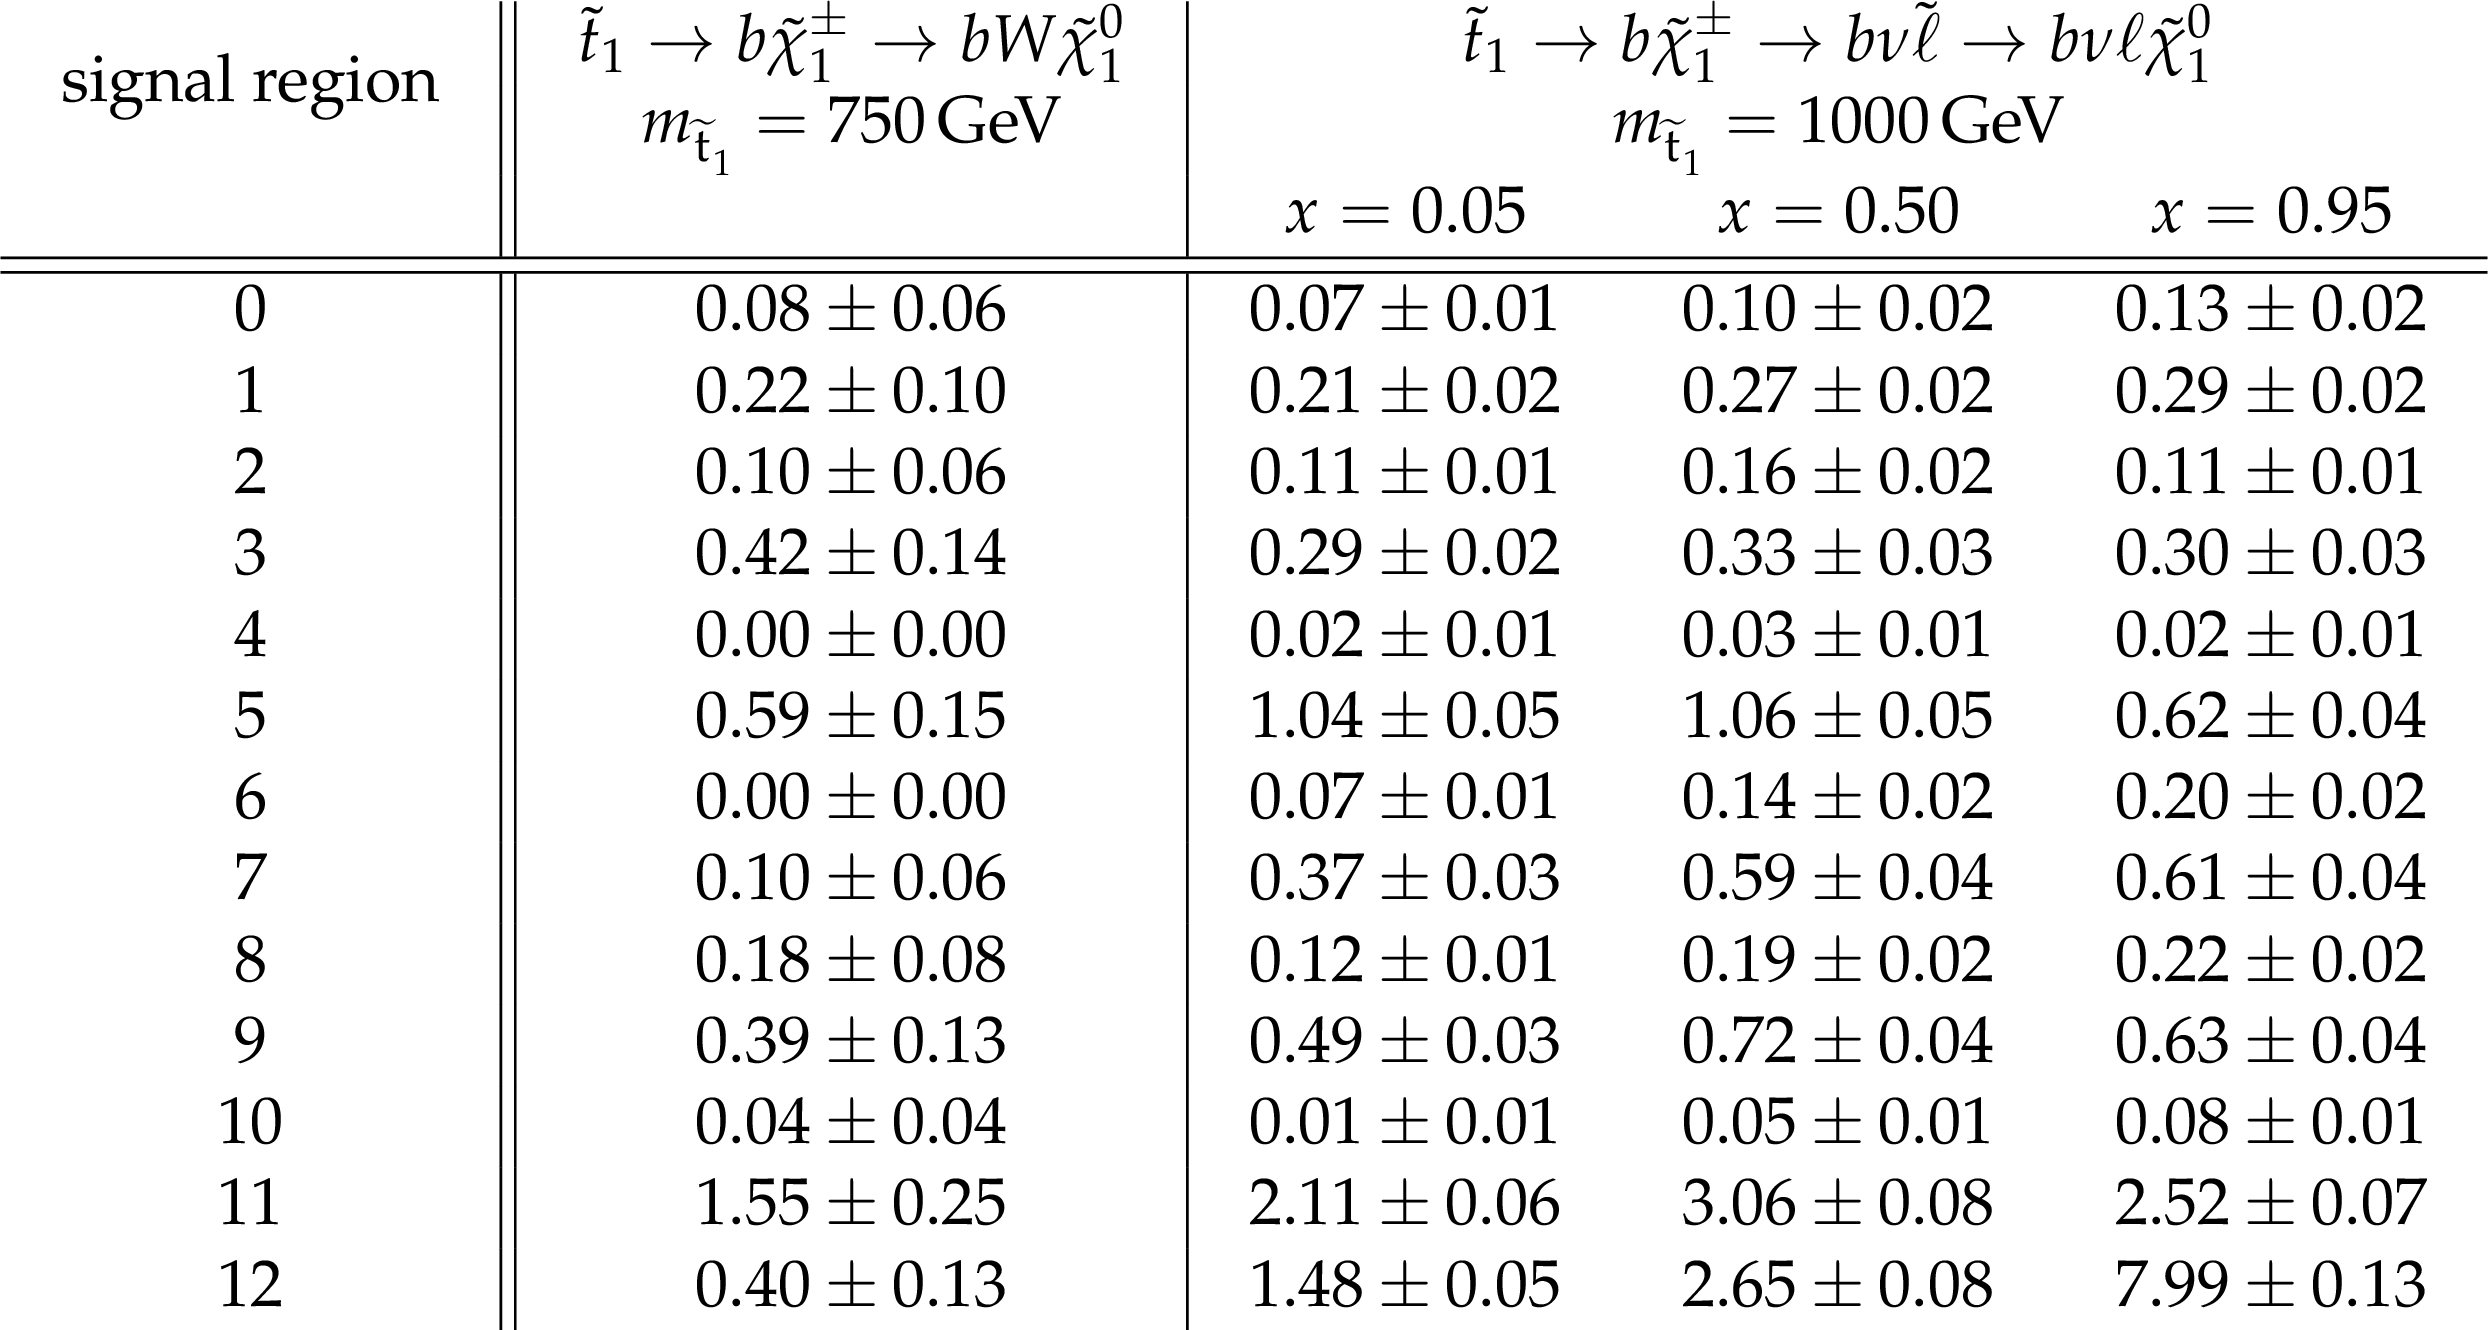
Total expected signal and statistical uncertainties for the signal benchmark points in the same-flavor regions, normalized to an integrated luminosity of 35.9 fb$^{-1}$. All mass parameters are given in GeV. |

png pdf |
Additional Table 3:
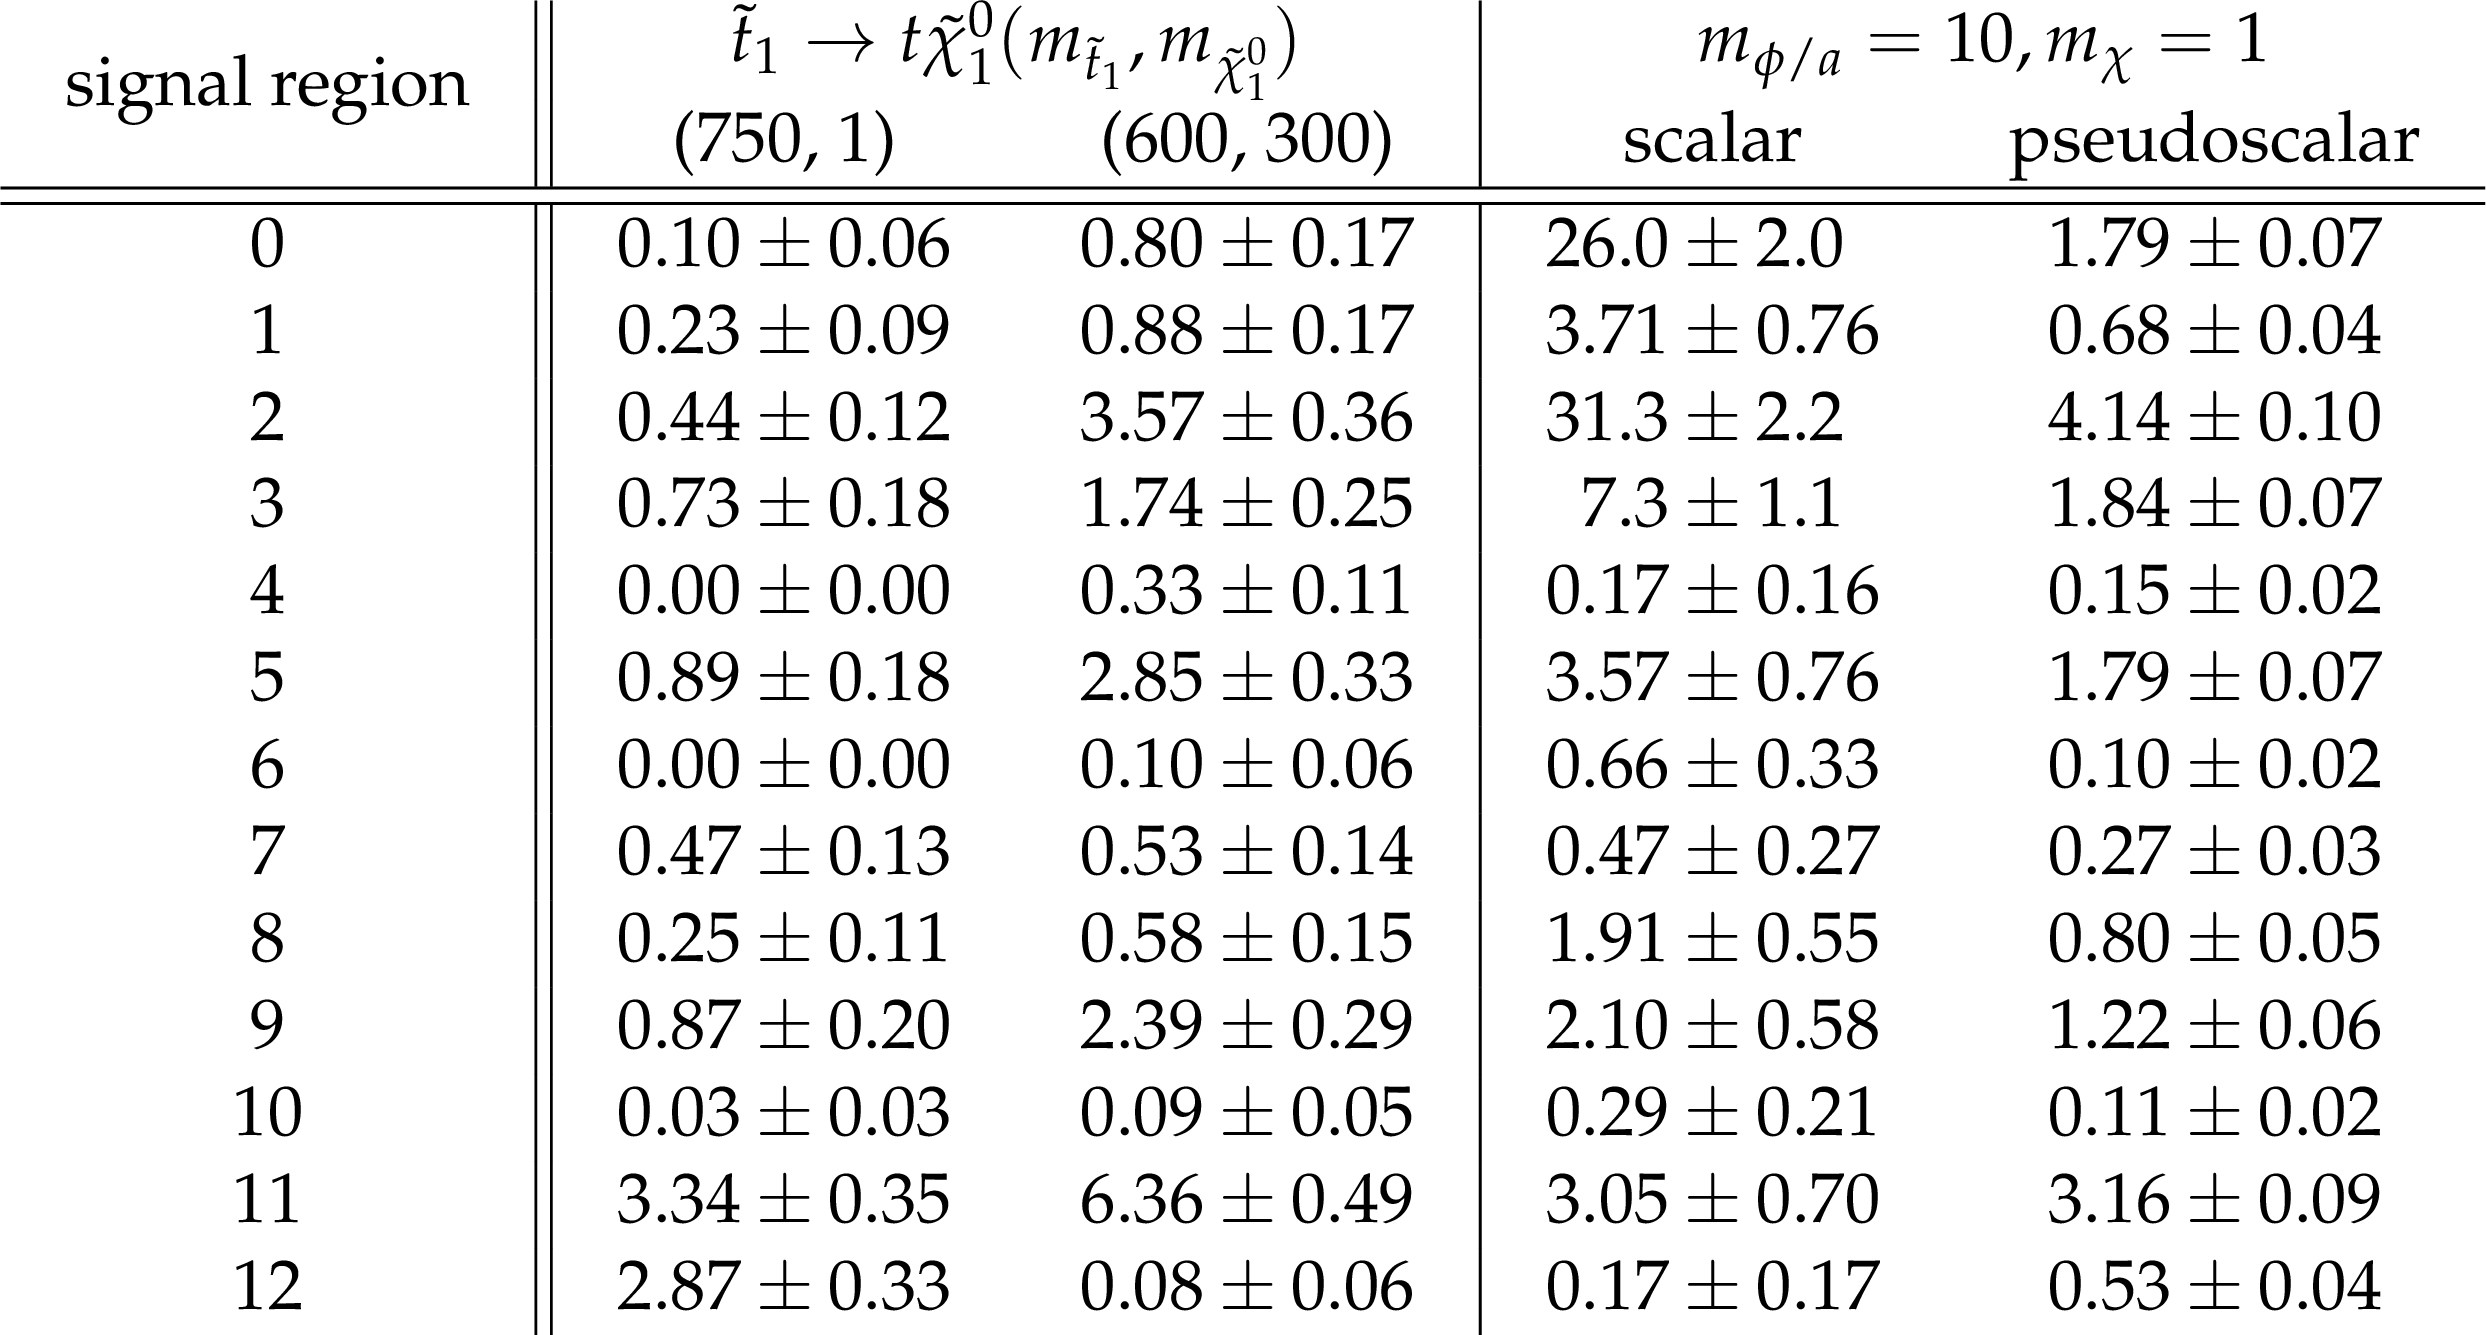
Total expected signal and statistical uncertainties for the signal benchmark points in the different-flavor regions, normalized to an integrated luminosity of 35.9 fb$^{-1}$. All mass parameters are given in GeV. |
png pdf |
Additional Table 4:
Total expected signal and statistical uncertainties for the signal benchmark points in the combined same-flavor and different-flavor regions, normalized to an integrated luminosity of 35.9 fb$^{-1}$. All mass parameters are given in GeV. |
png pdf |
Additional Table 5:
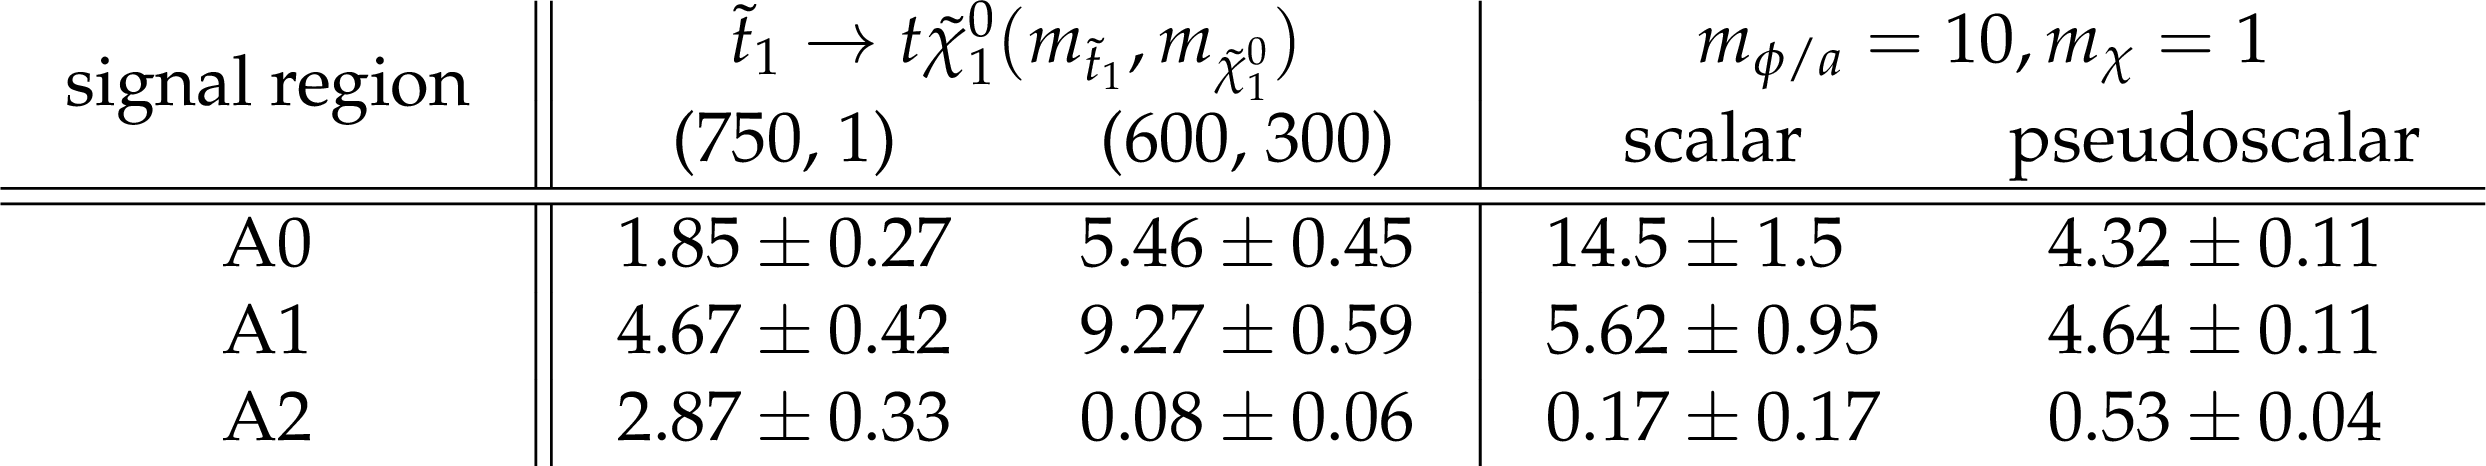
Total expected signal and statistical uncertainties for the signal benchmark points in the aggregate signal regions, normalized to an integrated luminosity of 35.9 fb$^{-1}$. All mass parameters are given in GeV. |
png pdf |
Additional Table 6:
Total expected signal and statistical uncertainties for additional signal benchmark points in the same-flavor regions, normalized to an integrated luminosity of 35.9 fb$^{-1}$. The chargino mass is always assumed as $m_{\tilde{\chi}^{+} _1} = (m_{\tilde{\mathrm{t}}_{1}} + m_{\tilde{\chi}^{0} _1})/2$, and the neutralino mass is set to $m_{\tilde{\chi}^{0} _1} = $ 1 GeV for all benchmark points. |
png pdf |
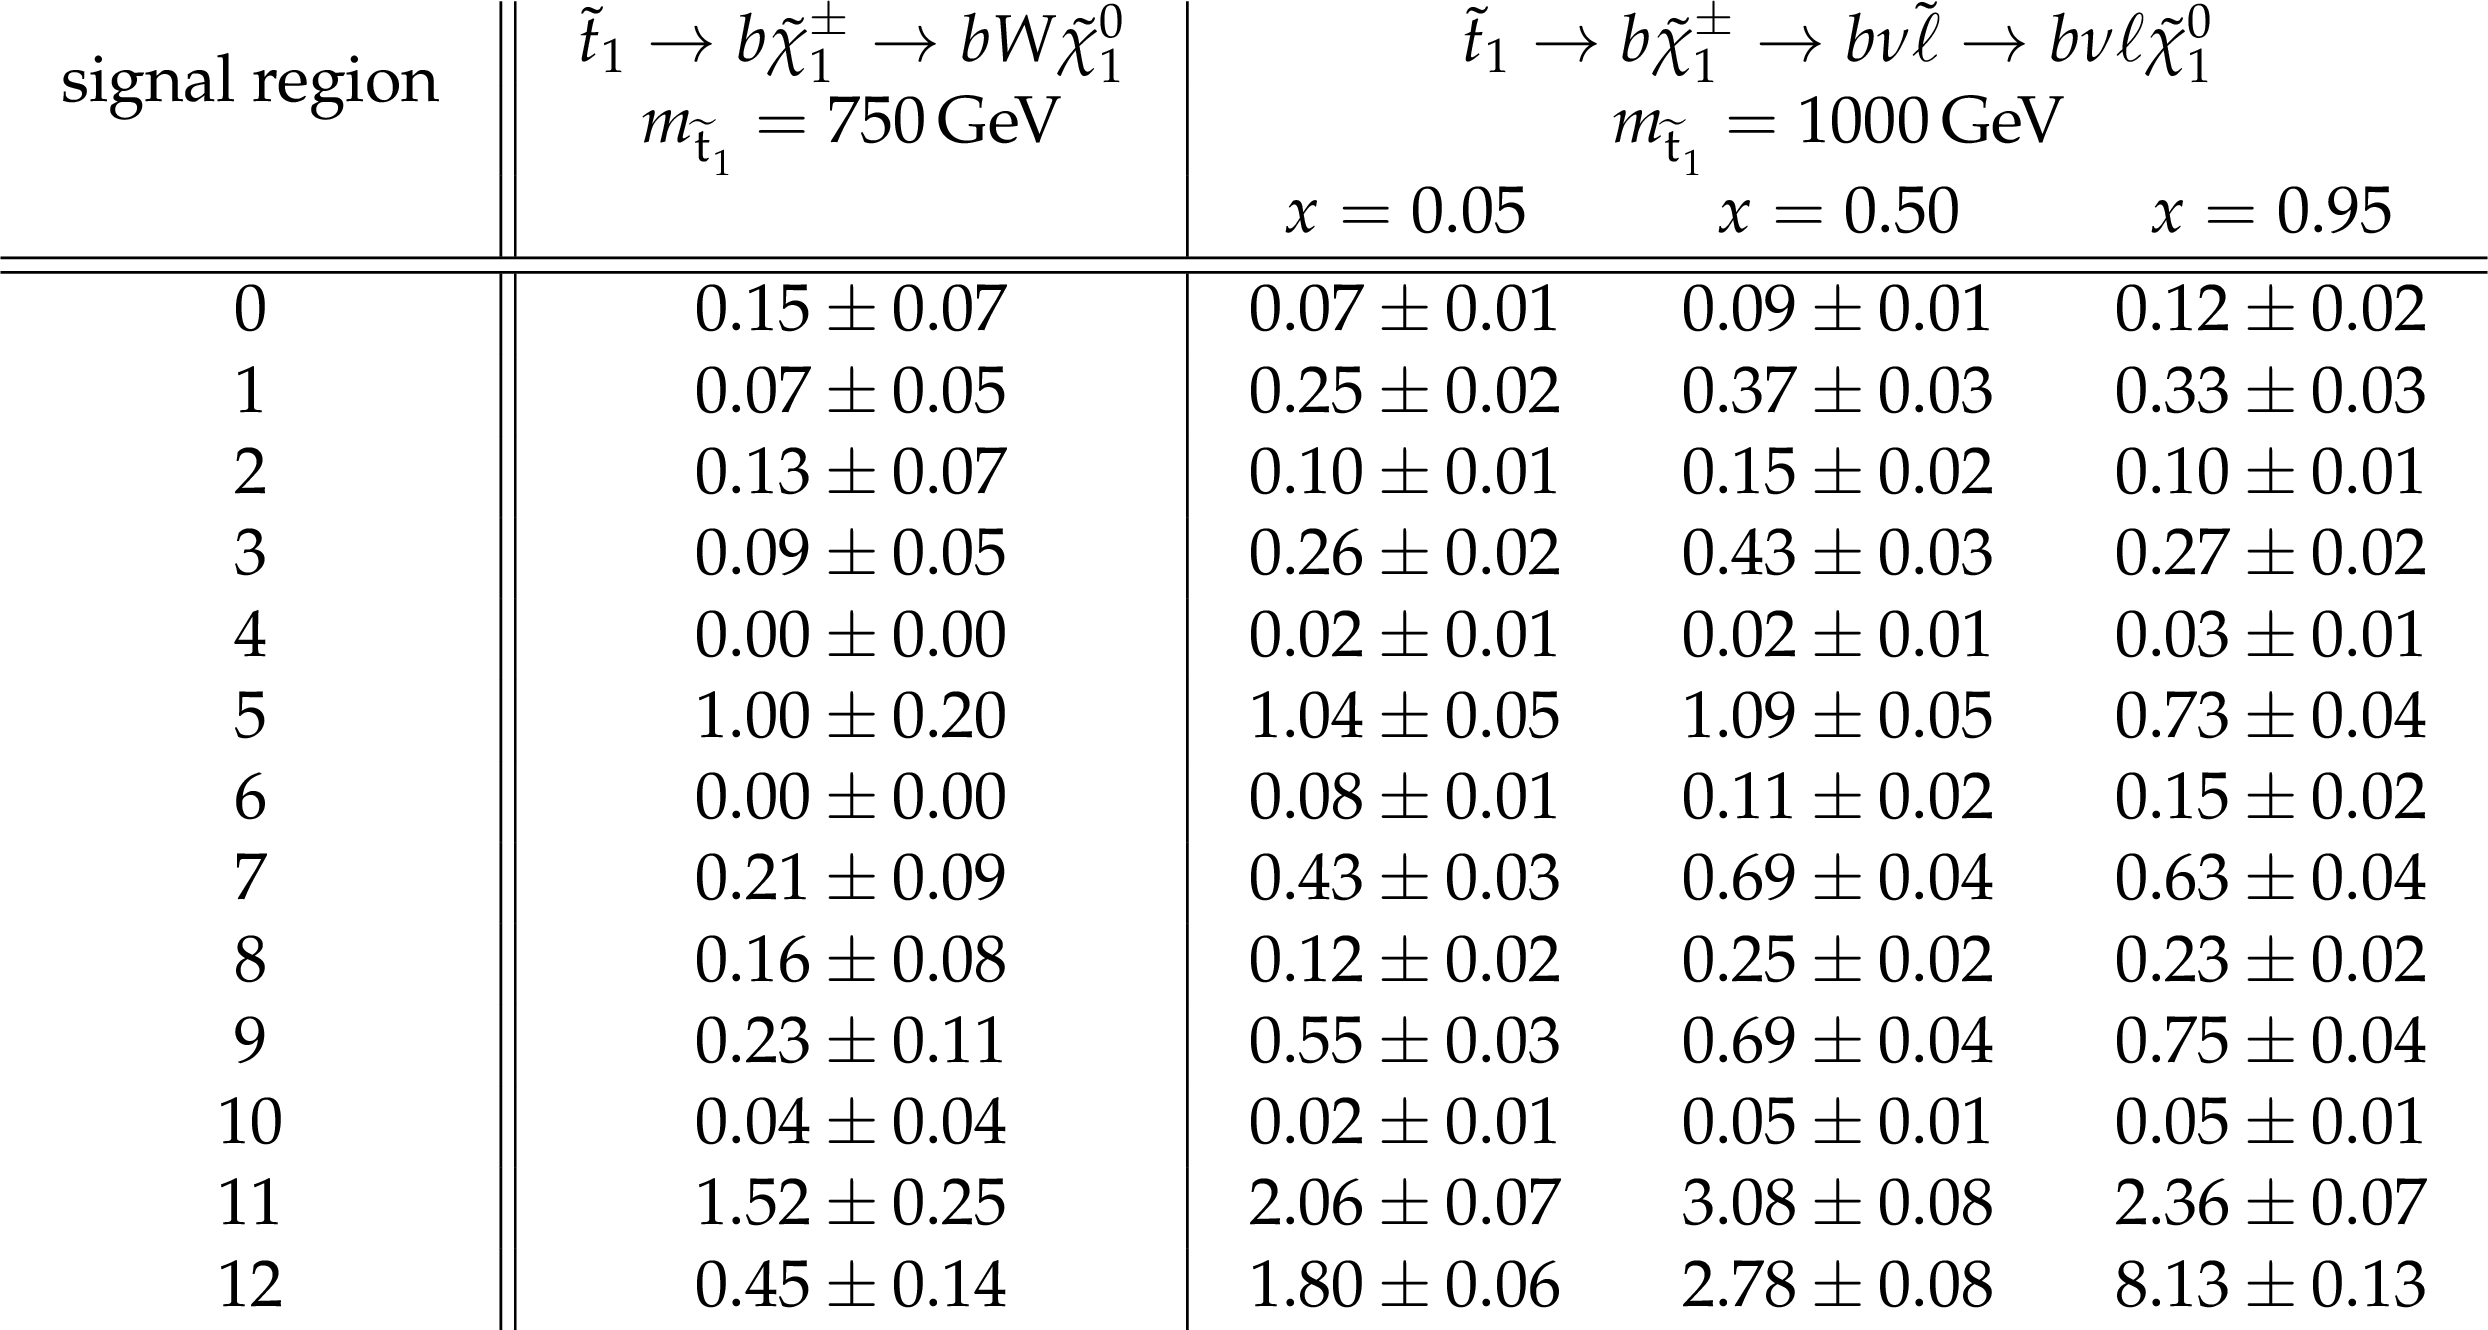
Additional Table 7:
Total expected signal and statistical uncertainties for additional signal benchmark points in the different-flavor regions, normalized to an integrated luminosity of 35.9 fb$^{-1}$. The chargino mass is always assumed as $m_{\tilde{\chi}^{+} _1} = (m_{\tilde{\mathrm{t}}_{1}} + m_{\tilde{\chi}^{0} _1})/2$, and the neutralino mass is set to $m_{\tilde{\chi}^{0} _1} = $ 1 GeV for all benchmark points. |
png pdf |
Additional Table 8:
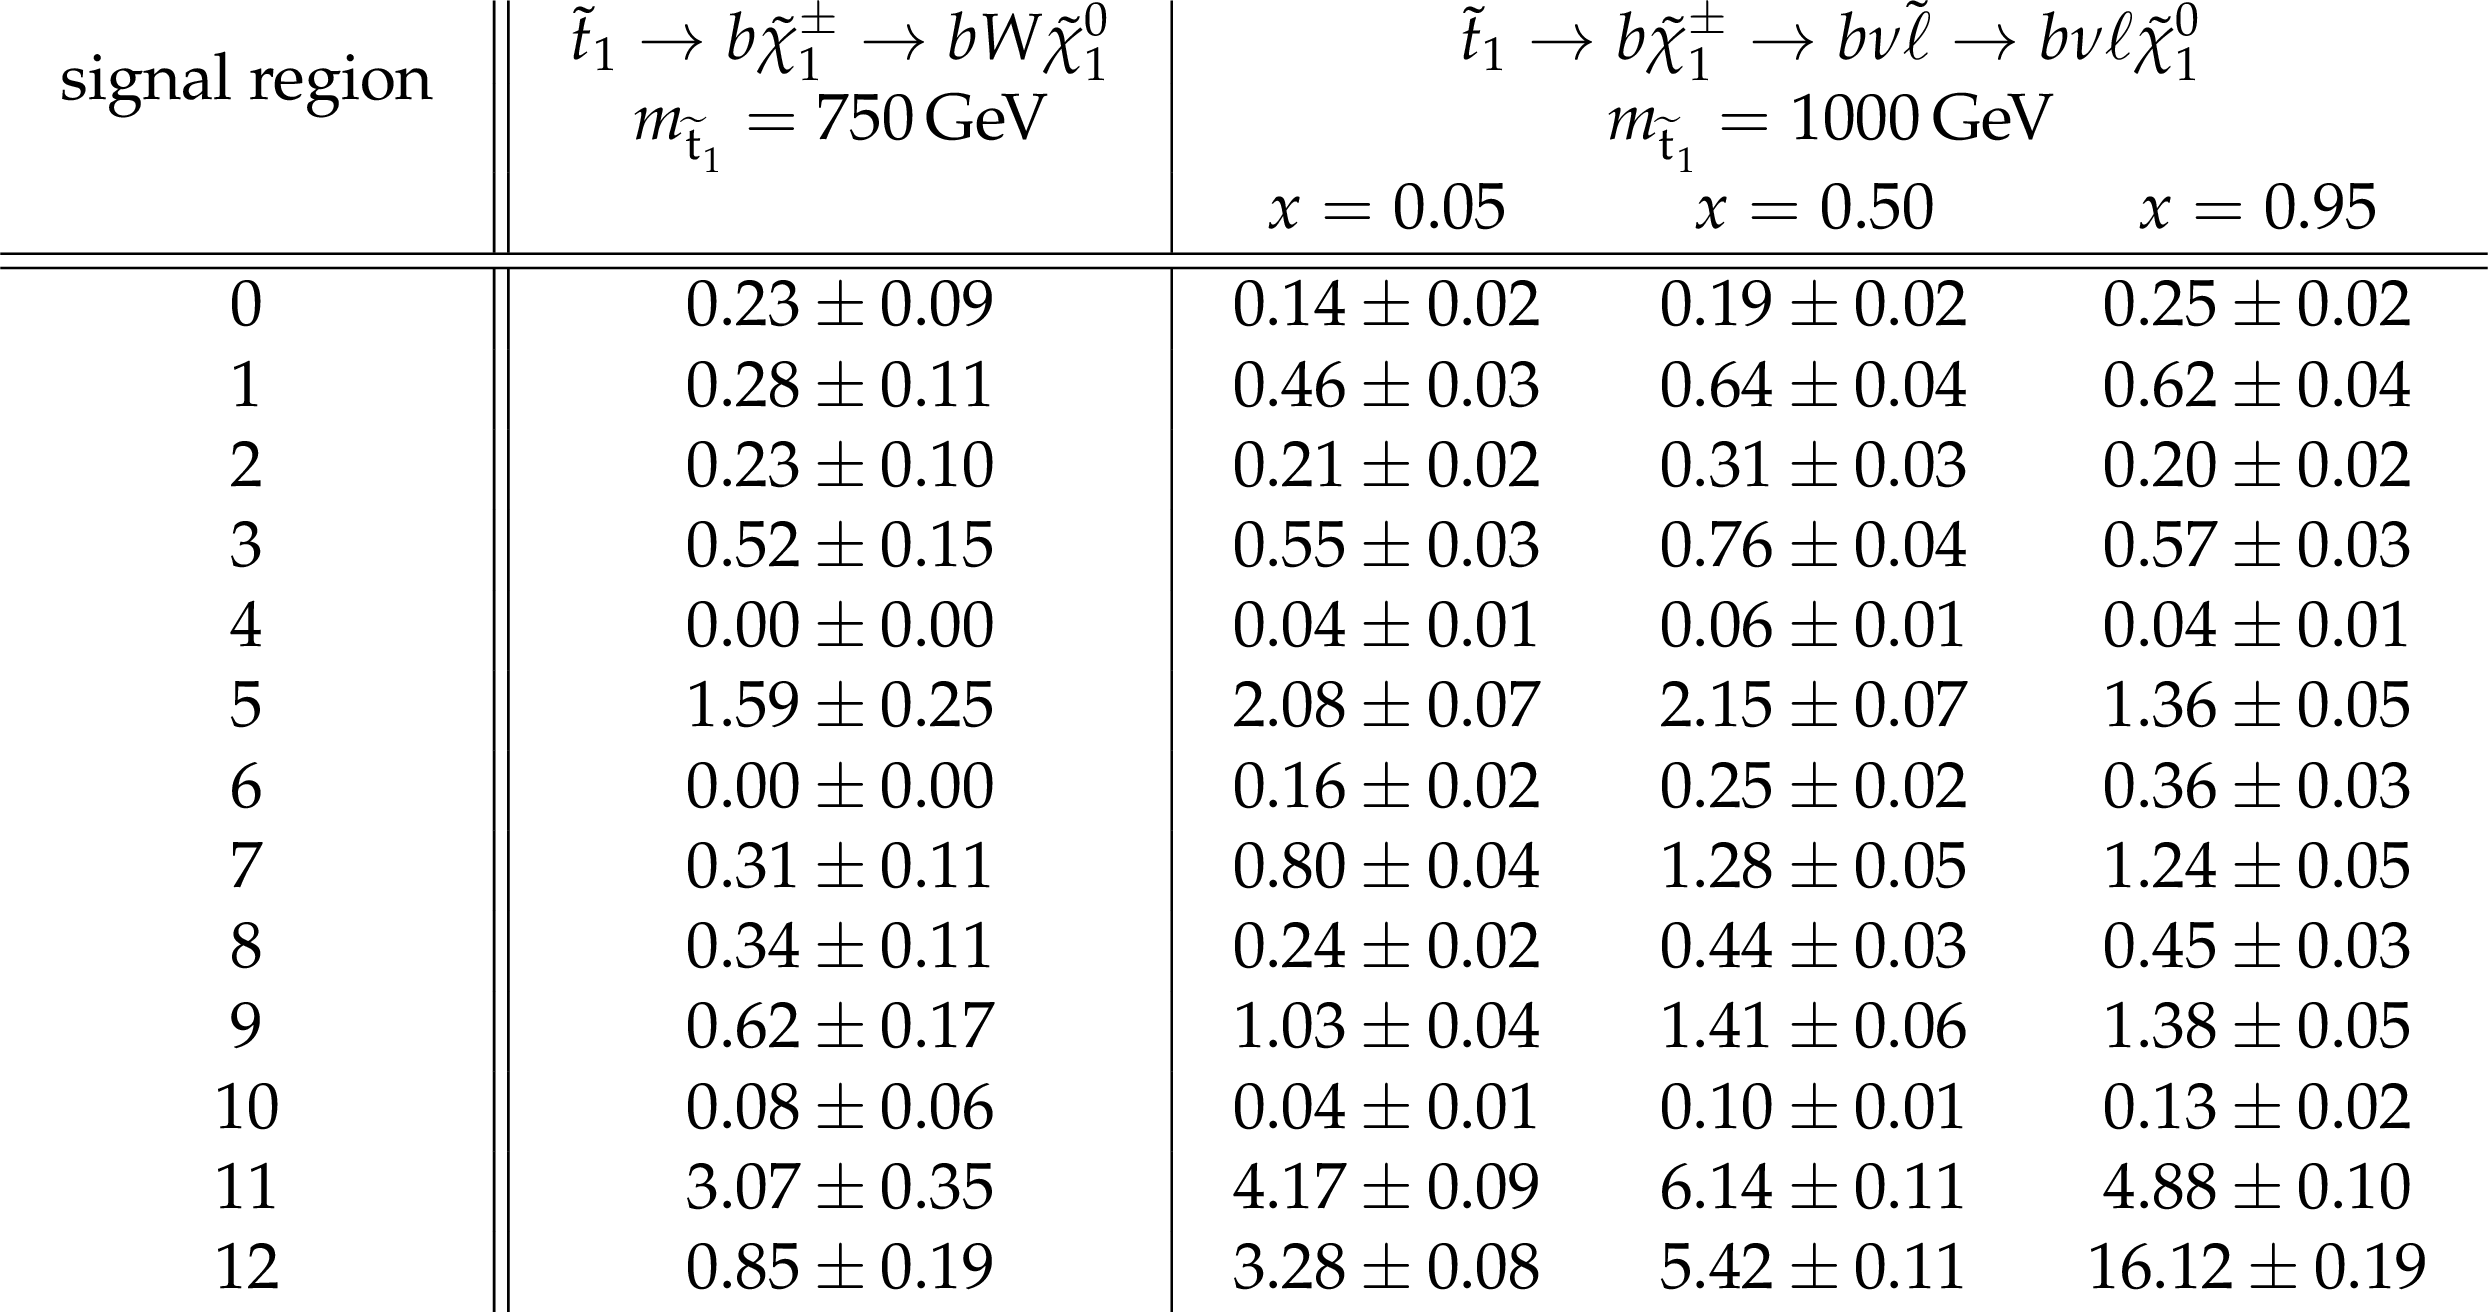
Total expected signal and statistical uncertainties for additional signal benchmark points in the same-flavor and different-flavor regions combined, normalized to an integrated luminosity of 35.9 fb$^{-1}$. The chargino mass is always assumed as $m_{\tilde{\chi}^{+} _1} = (m_{\tilde{\mathrm{t}}_{1}} + m_{\tilde{\chi}^{0} _1})/2$, and the neutralino mass is set to $m_{\tilde{\chi}^{0} _1} = $ 1 GeV for all benchmark points. |
png pdf |
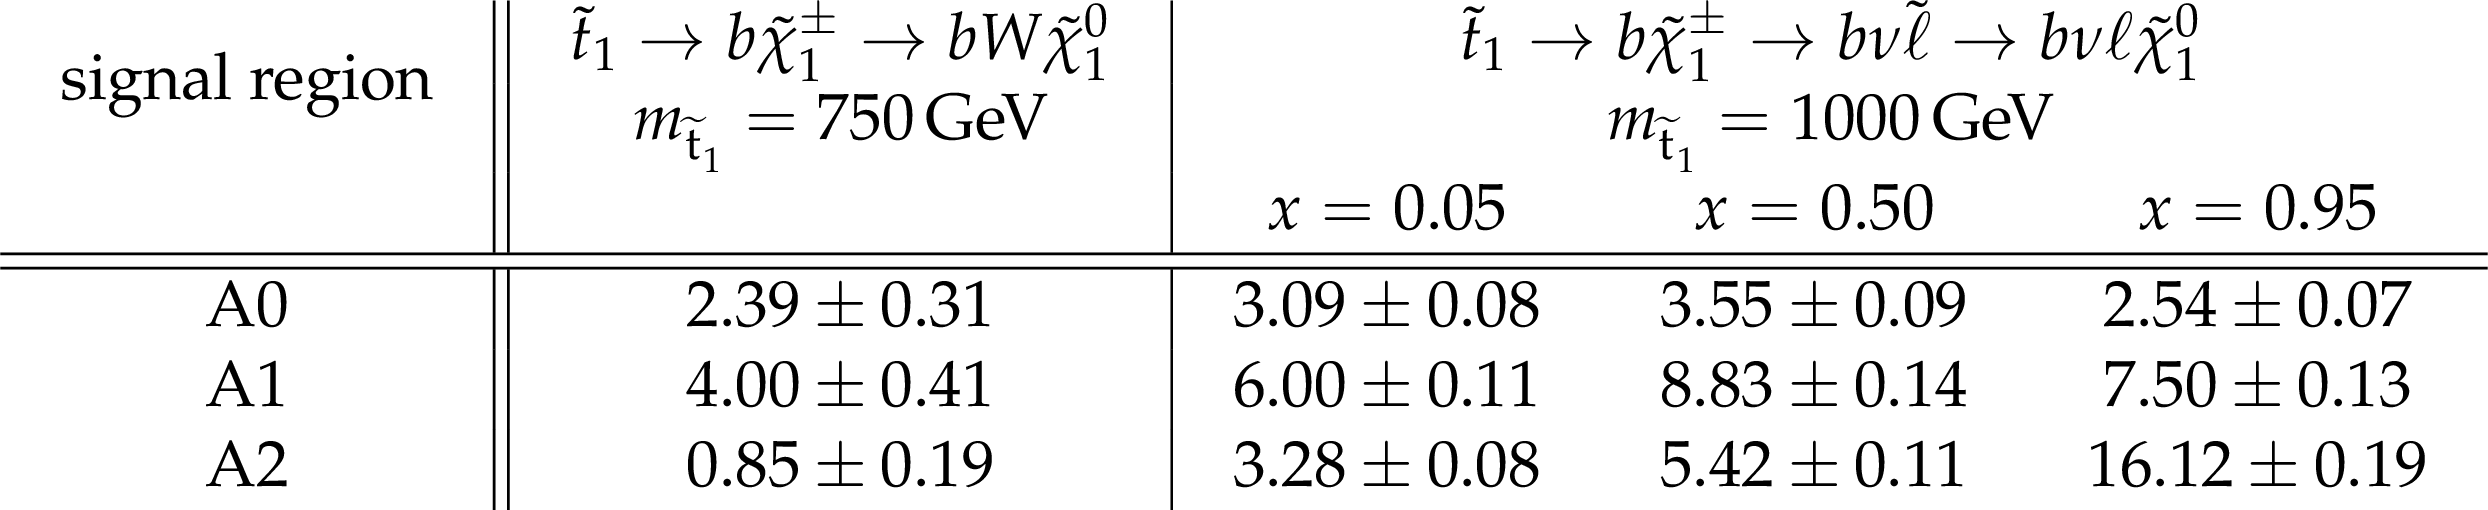
Additional Table 9:
Total expected signal and statistical uncertainties for additional signal benchmark points in the aggregate signal regions, normalized to an integrated luminosity of 35.9 fb$^{-1}$. The chargino mass is always assumed as $m_{\tilde{\chi}^{+} _1} = (m_{\tilde{\mathrm{t}}_{1}} + m_{\tilde{\chi}^{0} _1})/2$, and the neutralino mass is set to $m_{\tilde{\chi}^{0} _1} = $ 1 GeV for all benchmark points. |
|
UFO Model for ttbar+DM Pseudoscalar mediator UFO Model for ttbar+DM Scalar mediator Example LHE Header File for DM model |
| References | ||||
| 1 | E. Witten | Dynamical breaking of supersymmetry | NPB 188 (1981) 513 | |
| 2 | S. Dimopoulos and H. Georgi | Softly broken supersymmetry and SU(5) | NPB 193 (1981) 150 | |
| 3 | P. Ramond | Dual theory for free fermions | PRD 3 (1971) 2415 | |
| 4 | Y. A. Gol'fand and E. P. Likhtman | Extension of the algebra of Poincar$ \'e $ group generators and violation of P invariance | JEPTL 13 (1971)323 | |
| 5 | A. Neveu and J. H. Schwarz | Factorizable dual model of pions | NPB 31 (1971) 86 | |
| 6 | D. V. Volkov and V. P. Akulov | Possible universal neutrino interaction | JEPTL 16 (1972)438 | |
| 7 | J. Wess and B. Zumino | A lagrangian model invariant under supergauge transformations | PLB 49 (1974) 52 | |
| 8 | J. Wess and B. Zumino | Supergauge transformations in four dimensions | NPB 70 (1974) 39 | |
| 9 | P. Fayet | Supergauge invariant extension of the Higgs mechanism and a model for the electron and its neutrino | NPB 90 (1975) 104 | |
| 10 | H. P. Nilles | Supersymmetry, supergravity and particle physics | Phys. Rep. 110 (1984) 1 | |
| 11 | G. R. Farrar and P. Fayet | Phenomenology of the production, decay, and detection of new hadronic states associated with supersymmetry | PLB 76 (1978) 575 | |
| 12 | M. Papucci, J. T. Ruderman, and A. Weiler | Natural SUSY endures | JHEP 09 (2012) 035 | 1110.6926 |
| 13 | J. Smith, W. L. van Neerven, and J. A. M. Vermaseren | The transverse mass and width of the $ W $ boson | PRL 50 (1983) 1738 | |
| 14 | C. G. Lester and D. J. Summers | Measuring masses of semiinvisibly decaying particles pair produced at hadron colliders | PLB 463 (1999) 99 | hep-ph/9906349 |
| 15 | J. Alwall, P. Schuster, and N. Toro | Simplified models for a first characterization of new physics at the LHC | PRD 79 (2009) 075020 | 0810.3921 |
| 16 | J. Alwall, M.-P. Le, M. Lisanti, and J. G. Wacker | Model-independent jets plus missing energy searches | PRD 79 (2009) 015005 | 0809.3264 |
| 17 | LHC New Physics Working Group Collaboration | Simplified models for LHC new physics searches | JPG 39 (2012) 105005 | 1105.2838 |
| 18 | CMS Collaboration | Interpretation of searches for supersymmetry with simplified models | PRD 88 (2013) 052017 | CMS-SUS-11-016 1301.2175 |
| 19 | CMS Collaboration | Search for top squark pair production in pp collisions at $ \sqrt{s} = $ 13 TeV using single lepton events | JHEP 10 (2017) 019 | CMS-SUS-16-051 1706.04402 |
| 20 | CMS Collaboration | Search for direct production of supersymmetric partners of the top quark in the all-jets final state in proton-proton collisions at $ \sqrt{s} = $ 13 TeV | JHEP 10 (2017) 005 | CMS-SUS-16-049 1707.03316 |
| 21 | CMS Collaboration | Search for top-squark pair production in the single-lepton final state in pp collisions at $ \sqrt{s} = $ 8 TeV | EPJC 73 (2013) 2677 | CMS-SUS-13-011 1308.1586 |
| 22 | CMS Collaboration | Search for direct pair production of scalar top quarks in the single- and dilepton channels in proton-proton collisions at $ \sqrt{s} = $ 8 TeV | JHEP 07 (2016) 027 | CMS-SUS-14-015 1602.03169 |
| 23 | CMS Collaboration | Searches for pair production of third-generation squarks in $ \sqrt{s}= $ 13 TeV pp collisions | EPJC 77 (2017) 327 | CMS-SUS-16-008 1612.03877 |
| 24 | ATLAS Collaboration | Search for direct top squark pair production in final states with two leptons in $ \sqrt{s} = 13 TeV pp $ collisions with the ATLAS detector | 1708.03247 | |
| 25 | ATLAS Collaboration | ATLAS Run 1 searches for direct pair production of third-generation squarks at the Large Hadron Collider | EPJC 75 (2015) 510 | 1506.08616 |
| 26 | ATLAS Collaboration | Search for top squark pair production in final states with one isolated lepton, jets, and missing transverse momentum in $ \sqrt s = $ 8 TeV pp collisions with the ATLAS detector | JHEP 11 (2014) 118 | 1407.0583 |
| 27 | ATLAS Collaboration | Search for direct top-squark pair production in final states with two leptons in pp collisions at $ \sqrt{s} = $ 8 TeV with the ATLAS detector | JHEP 06 (2014) 124 | 1403.4853 |
| 28 | ATLAS Collaboration | Search for top squarks in final states with one isolated lepton, jets, and missing transverse momentum in $ \sqrt{s}= $ 13 TeV pp collisions with the ATLAS detector | PRD 94 (2016) 052009 | 1606.03903 |
| 29 | T. Lin, E. W. Kolb, and L.-T. Wang | Probing dark matter couplings to top and bottom quarks at the LHC | PRD 88 (2013) 063510 | 1303.6638 |
| 30 | M. R. Buckley, D. Feld, and D. Goncalves | Scalar Simplified Models for Dark Matter | PRD 91 (2015) 015017 | 1410.6497 |
| 31 | U. Haisch and E. Re | Simplified dark matter top-quark interactions at the LHC | JHEP 06 (2015) 078 | 1503.00691 |
| 32 | C. Arina et al. | A comprehensive approach to dark matter studies: exploration of simplified top-philic models | JHEP 11 (2016) 111 | 1605.09242 |
| 33 | D. Abercrombie et al. | Dark matter benchmark models for early LHC Run-2 searches: Report of the ATLAS/CMS dark matter forum | 1507.00966 | |
| 34 | G. D'Ambrosio, G. F. Giudice, G. Isidori, and A. Strumia | Minimal flavor violation: an effective field theory approach | NP 645 (2002) 155 | hep-ph/0207036 |
| 35 | G. Isidori and D. M. Straub | Minimal flavour violation and beyond | EPJC 72 (2012) 2103 | 1202.0464 |
| 36 | ATLAS Collaboration | Search for dark matter in events with heavy quarks and missing transverse momentum in pp collisions with the ATLAS detector | EPJC 75 (2015) 92 | 1410.4031 |
| 37 | CMS Collaboration | Search for the production of dark matter in association with top-quark pairs in the single-lepton final state in proton-proton collisions at $ \sqrt{s} = $ 8 TeV | JHEP 06 (2015) 121 | CMS-B2G-14-004 1504.03198 |
| 38 | CMS Collaboration | Search for dark matter produced in association with heavy-flavor quark pairs in proton-proton collisions at $ \sqrt{s}= $ 13 TeV | EPJC 77 (2017) 845 | CMS-EXO-16-005 1706.02581 |
| 39 | CMS Collaboration | Search for dark matter produced with an energetic jet or a hadronically decaying W or Z boson at $ \sqrt{s}= $ 13 TeV | JHEP 07 (2017) 014 | CMS-EXO-16-037 1703.01651 |
| 40 | ATLAS Collaboration | Search for dark matter produced in association with bottom or top quarks in $ \sqrt{s} = $ 13 TeV pp collisions with the ATLAS detector | 1710.11412 | |
| 41 | CMS Collaboration | The CMS experiment at the CERN LHC | JINST 3 (2008) S08004 | CMS-00-001 |
| 42 | S. Alioli et al. | NLO single-top production matched with shower in POWHEG: $ s $- and $ t $-channel contributions | JHEP 09 (2009) 111 | 0907.4076 |
| 43 | S. Alioli et al. | A general framework for implementing NLO calculations in shower Monte Carlo programs: the POWHEG BOX | JHEP 06 (2010) 043 | 1002.2581 |
| 44 | M. Czakon and A. Mitov | Top++: a program for the calculation of the top-pair cross-section at hadron colliders | CPC 185 (2014) 2930 | 1112.5675 |
| 45 | M. Aliev et al. | HATHOR: HAdronic Top and Heavy quarks crOss section calculatoR | CPC 182 (2011) 1034 | 1007.1327 |
| 46 | M. Beneke, P. Falgari, S. Klein, and C. Schwinn | Hadronic top-quark pair production with NNLL threshold resummation | NPB 855 (2012) 695 | 1109.1536 |
| 47 | M. Czakon and A. Mitov | NNLO corrections to top pair production at hadron colliders: the all-fermionic scattering channels | JHEP 12 (2012) 054 | 1207.0236 |
| 48 | M. Czakon and A. Mitov | NNLO corrections to top pair production at hadron colliders: the quark-gluon reaction | JHEP 01 (2013) 080 | 1210.6832 |
| 49 | M. Czakon, P. Fiedler, and A. Mitov | Total top-quark pair-production cross section at hadron colliders through $ O(\alpha_S^4) $ | PRL 110 (2013) 252004 | 1303.6254 |
| 50 | P. Kant et al. | HatHor for single top-quark production: Updated predictions and uncertainty estimates for single top-quark production in hadronic collisions | CPC 191 (2015) 74 | 1406.4403 |
| 51 | E. Re | Single-top $ Wt $-channel production matched with parton showers using the POWHEG method | EPJC 71 (2011) 1547 | 1009.2450 |
| 52 | J. Alwall et al. | The automated computation of tree-level and next-to-leading order differential cross sections, and their matching to parton shower simulations | JHEP 07 (2014) 079 | 1405.0301 |
| 53 | R. Gavin, Y. Li, F. Petriello, and S. Quackenbush | FEWZ 2.0: A code for hadronic Z production at next-to-next-to-leading order | CPC 182 (2011) 2388 | 1011.3540 |
| 54 | M. V. Garzelli, A. Kardos, C. G. Papadopoulos, and Z. Trocsanyi | $ {\rm t\bar{t}W^{\pm}} $ and $ {\rm t\bar{t}Z} $ hadroproduction at NLO accuracy in QCD with parton shower and hadronization effects | JHEP 11 (2012) 056 | 1208.2665 |
| 55 | T. Sjostrand et al. | An introduction to PYTHIA 8.2 | CPC 191 (2015) 159 | 1410.3012 |
| 56 | P. Skands, S. Carrazza, and J. Rojo | Tuning PYTHIA 8.1: the Monash 2013 tune | EPJC 74 (2014) 3024 | 1404.5630 |
| 57 | CMS Collaboration | Event generator tunes obtained from underlying event and multiparton scattering measurements | EPJC 76 (2016) 155 | CMS-GEN-14-001 1512.00815 |
| 58 | NNPDF Collaboration | Parton distributions for the LHC Run II | JHEP 04 (2015) 040 | 1410.8849 |
| 59 | GEANT4 Collaboration | GEANT4---a simulation toolkit | NIMA 506 (2003) 250 | |
| 60 | C. Borschensky et al. | Squark and gluino production cross sections in pp collisions at $ \sqrt{s} = $ 13, 14, 33 and 100 TeV | EPJC 74 (2014) 3174 | 1407.5066 |
| 61 | S. Abdullin et al. | The fast simulation of the CMS detector at LHC | J. Phys. Conf. Ser. 331 (2011) 032049 | |
| 62 | CMS Collaboration | Particle-flow reconstruction and global event description with the CMS detector | JINST 12 (2017) P10003 | CMS-PRF-14-001 1706.04965 |
| 63 | CMS Collaboration | Performance of electron reconstruction and selection with the CMS detector in proton-proton collisions at $ \sqrt{s}= $ 8 TeV | JINST 10 (2015) P06005 | CMS-EGM-13-001 1502.02701 |
| 64 | CMS Collaboration | Performance of CMS muon reconstruction in pp collision events at $ \sqrt{s}= $ 7 TeV | JINST 7 (2012) P10002 | CMS-MUO-10-004 1206.4071 |
| 65 | M. Cacciari, G. P. Salam, and G. Soyez | The anti-$ k_t $ jet clustering algorithm | JHEP 04 (2008) 063 | 0802.1189 |
| 66 | M. Cacciari, G. P. Salam, and G. Soyez | FastJet user manual | EPJC 72 (2012) 1896 | 1111.6097 |
| 67 | CMS Collaboration | Jet energy scale and resolution in the CMS experiment in pp collisions at 8 TeV | JINST 12 (2017) P02014 | CMS-JME-13-004 1607.03663 |
| 68 | CMS Collaboration | Performance of the CMS missing transverse momentum reconstruction in pp data at $ \sqrt{s} = $ 8 TeV | JINST 10 (2015) P02006 | CMS-JME-13-003 1411.0511 |
| 69 | CMS Collaboration | Identification of heavy-flavour jets with the CMS detector in pp collisions at 13 TeV | Submitted to \it JINST | CMS-BTV-16-002 1712.07158 |
| 70 | M. Burns, K. Kong, K. T. Matchev, and M. Park | Using subsystem $ M_{T2} $ for complete mass determinations in decay chains with missing energy at hadron colliders | JHEP 03 (2009) 143 | 0810.5576 |
| 71 | H.-C. Cheng and Z. Han | Minimal kinematic constraints and $ m_{T2} $ | JHEP 12 (2008) 063 | 0810.5178 |
| 72 | CMS Collaboration | CMS luminosity measurement for the 2016 data taking period | CMS-PAS-LUM-17-001 | CMS-PAS-LUM-17-001 |
| 73 | J. Butterworth et al. | PDF4LHC recommendations for LHC Run II | JPG 43 (2016) 023001 | 1510.03865 |
| 74 | CMS Collaboration | Measurement of the differential cross section for top quark pair production in pp collisions at $ \sqrt{s} = $ 8 TeV | EPJC 75 (2015) 542 | CMS-TOP-12-028 1505.04480 |
| 75 | CMS Collaboration | Measurement of differential cross sections for top quark pair production using the lepton+jets final state in proton-proton collisions at 13 TeV | PRD 95 (2017) 092001 | CMS-TOP-16-008 1610.04191 |
| 76 | S. Catani, D. de Florian, M. Grazzini, and P. Nason | Soft gluon resummation for Higgs boson production at hadron colliders | JHEP 07 (2003) 028 | hep-ph/0306211 |
| 77 | M. Cacciari et al. | The $ \mathrm{t\bar{t}} $ cross-section at 1.8 TeV and 1.96 TeV: a study of the systematics due to parton densities and scale dependence | JHEP 04 (2004) 068 | hep-ph/0303085 |
| 78 | G. Cowan, K. Cranmer, E. Gross, and O. Vitells | Asymptotic formulae for likelihood-based tests of new physics | EPJC 71 (2011) 1554 | 1007.1727 |
| 79 | T. Junk | Confidence level computation for combining searches with small statistics | Nucl. Instr. Meth. A 434 (1999) 435 | hep-ex/9902006 |
| 80 | A. L. Read | Presentation of search results: the $ CL_s $ technique | in Durham IPPP Workshop: Advanced Statistical Techniques in Particle Physics, p. 2693 Durham, UK, March, 2002 [JPG 28 (2002) 2693] | |
| 81 | G. Belanger, R. M. Godbole, L. Hartgring, and I. Niessen | Top polarization in stop production at the LHC | JHEP 05 (2013) 167 | 1212.3526 |
| 82 | CMS Collaboration | Simplified likelihood for the re-interpretation of public CMS results | CDS | |
|
|
Compact Muon Solenoid LHC, CERN |
|

|

|

|

|

|