

Compact Muon Solenoid
LHC, CERN
| CMS-SUS-16-049 ; CERN-EP-2017-129 | ||
| Search for direct production of supersymmetric partners of the top quark in the all-jets final state in proton-proton collisions at $ \sqrt{s} = $ 13 TeV | ||
| CMS Collaboration | ||
| 10 July 2017 | ||
| J. High Energy Phys. 10 (2017) 005 | ||
| Abstract: A search for direct production of top squark pairs in events with jets and large transverse momentum imbalance is presented. The data are based on proton-proton collisions at a center-of-mass energy of 13 TeV, collected in 2016 at the CERN LHC, and correspond to an integrated luminosity of 35.9 fb$^{-1}$. The search considers a variety of $R$-parity conserving supersymmetric models, including ones for which the top squark and neutralino masses are nearly degenerate. Specialized jet reconstruction tools are developed to exploit the unique characteristics of the signal topologies. With no significant excess of events observed above the standard model expectations, upper limits are set on the direct top squark pair production cross section in the context of simplified supersymmetric models for various decay hypotheses. Models with larger differences in mass between the top squark and neutralino are probed for masses up to 1040 and 500 GeV, respectively, whereas models with a more compressed mass hierarchy are probed up to 660 and 610 GeV, respectively. The smallest mass difference probed is for masses near to 550 and 540 GeV, respectively. | ||
| Links: e-print arXiv:1707.03316 [hep-ex] (PDF) ; CDS record ; inSPIRE record ; CADI line (restricted) ; | ||
| Figures & Tables | Summary | Additional Figures & Tables | References | CMS Publications |
|---|
| Additional information on efficiencies needed for reinterpretation of these results are available here. Additional technical material can be found here |
| Figures | |
png pdf |
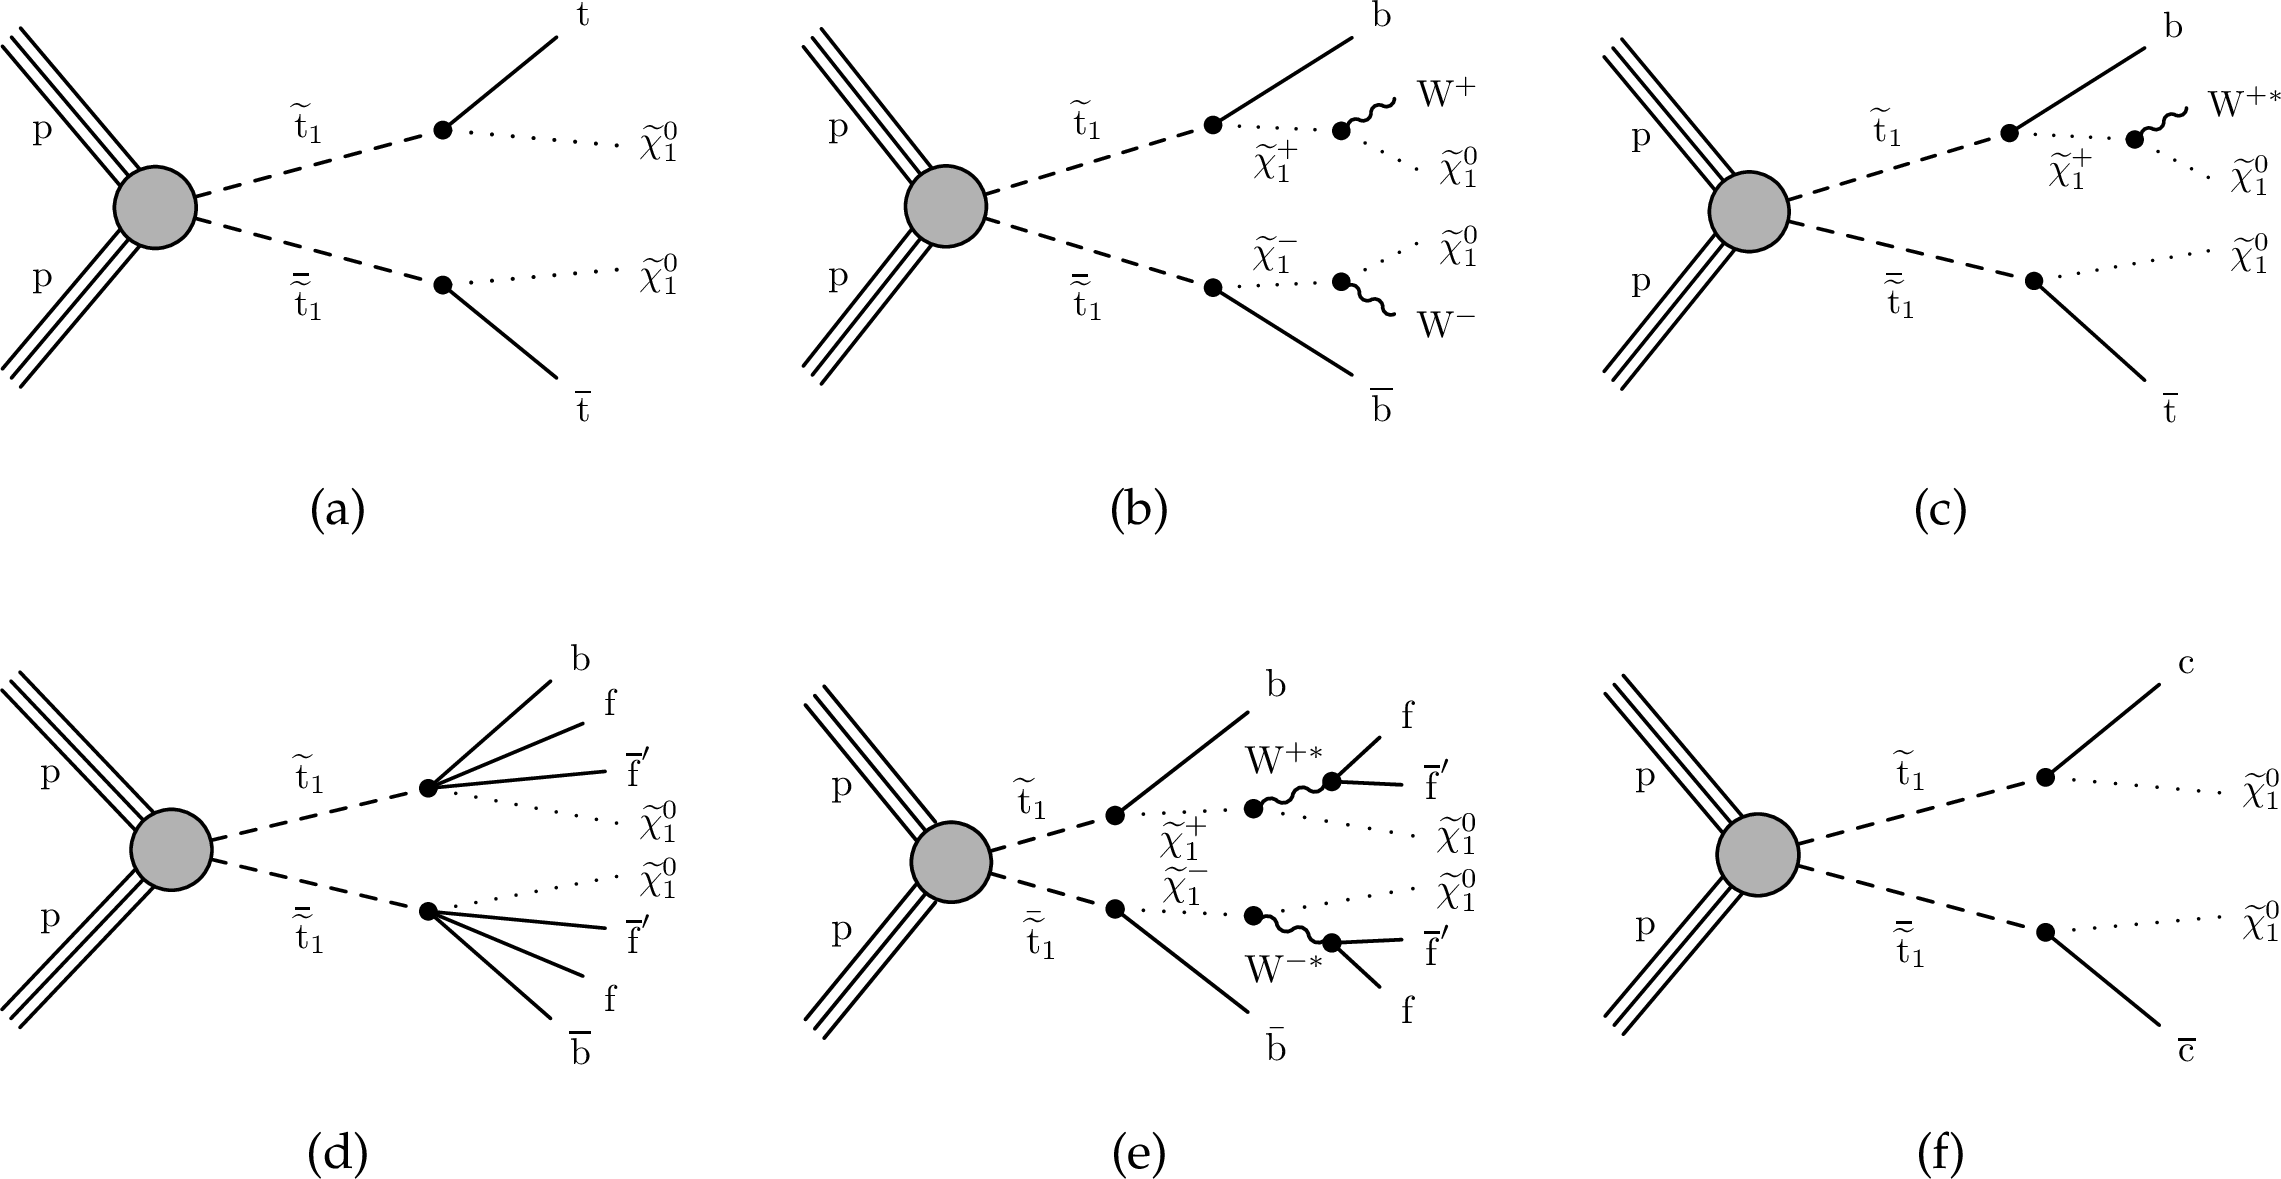
Figure 1:
Diagrams for the decay modes of pair-produced top squarks studied in this analysis. The decay cascades are denoted: (a) T2tt, (b) T2bW, (c) T2tb, (d) T2ttC, (e) T2bWC, and (f) T2cc. An asterisk indicates that the particle may be produced off-shell. |

png pdf |
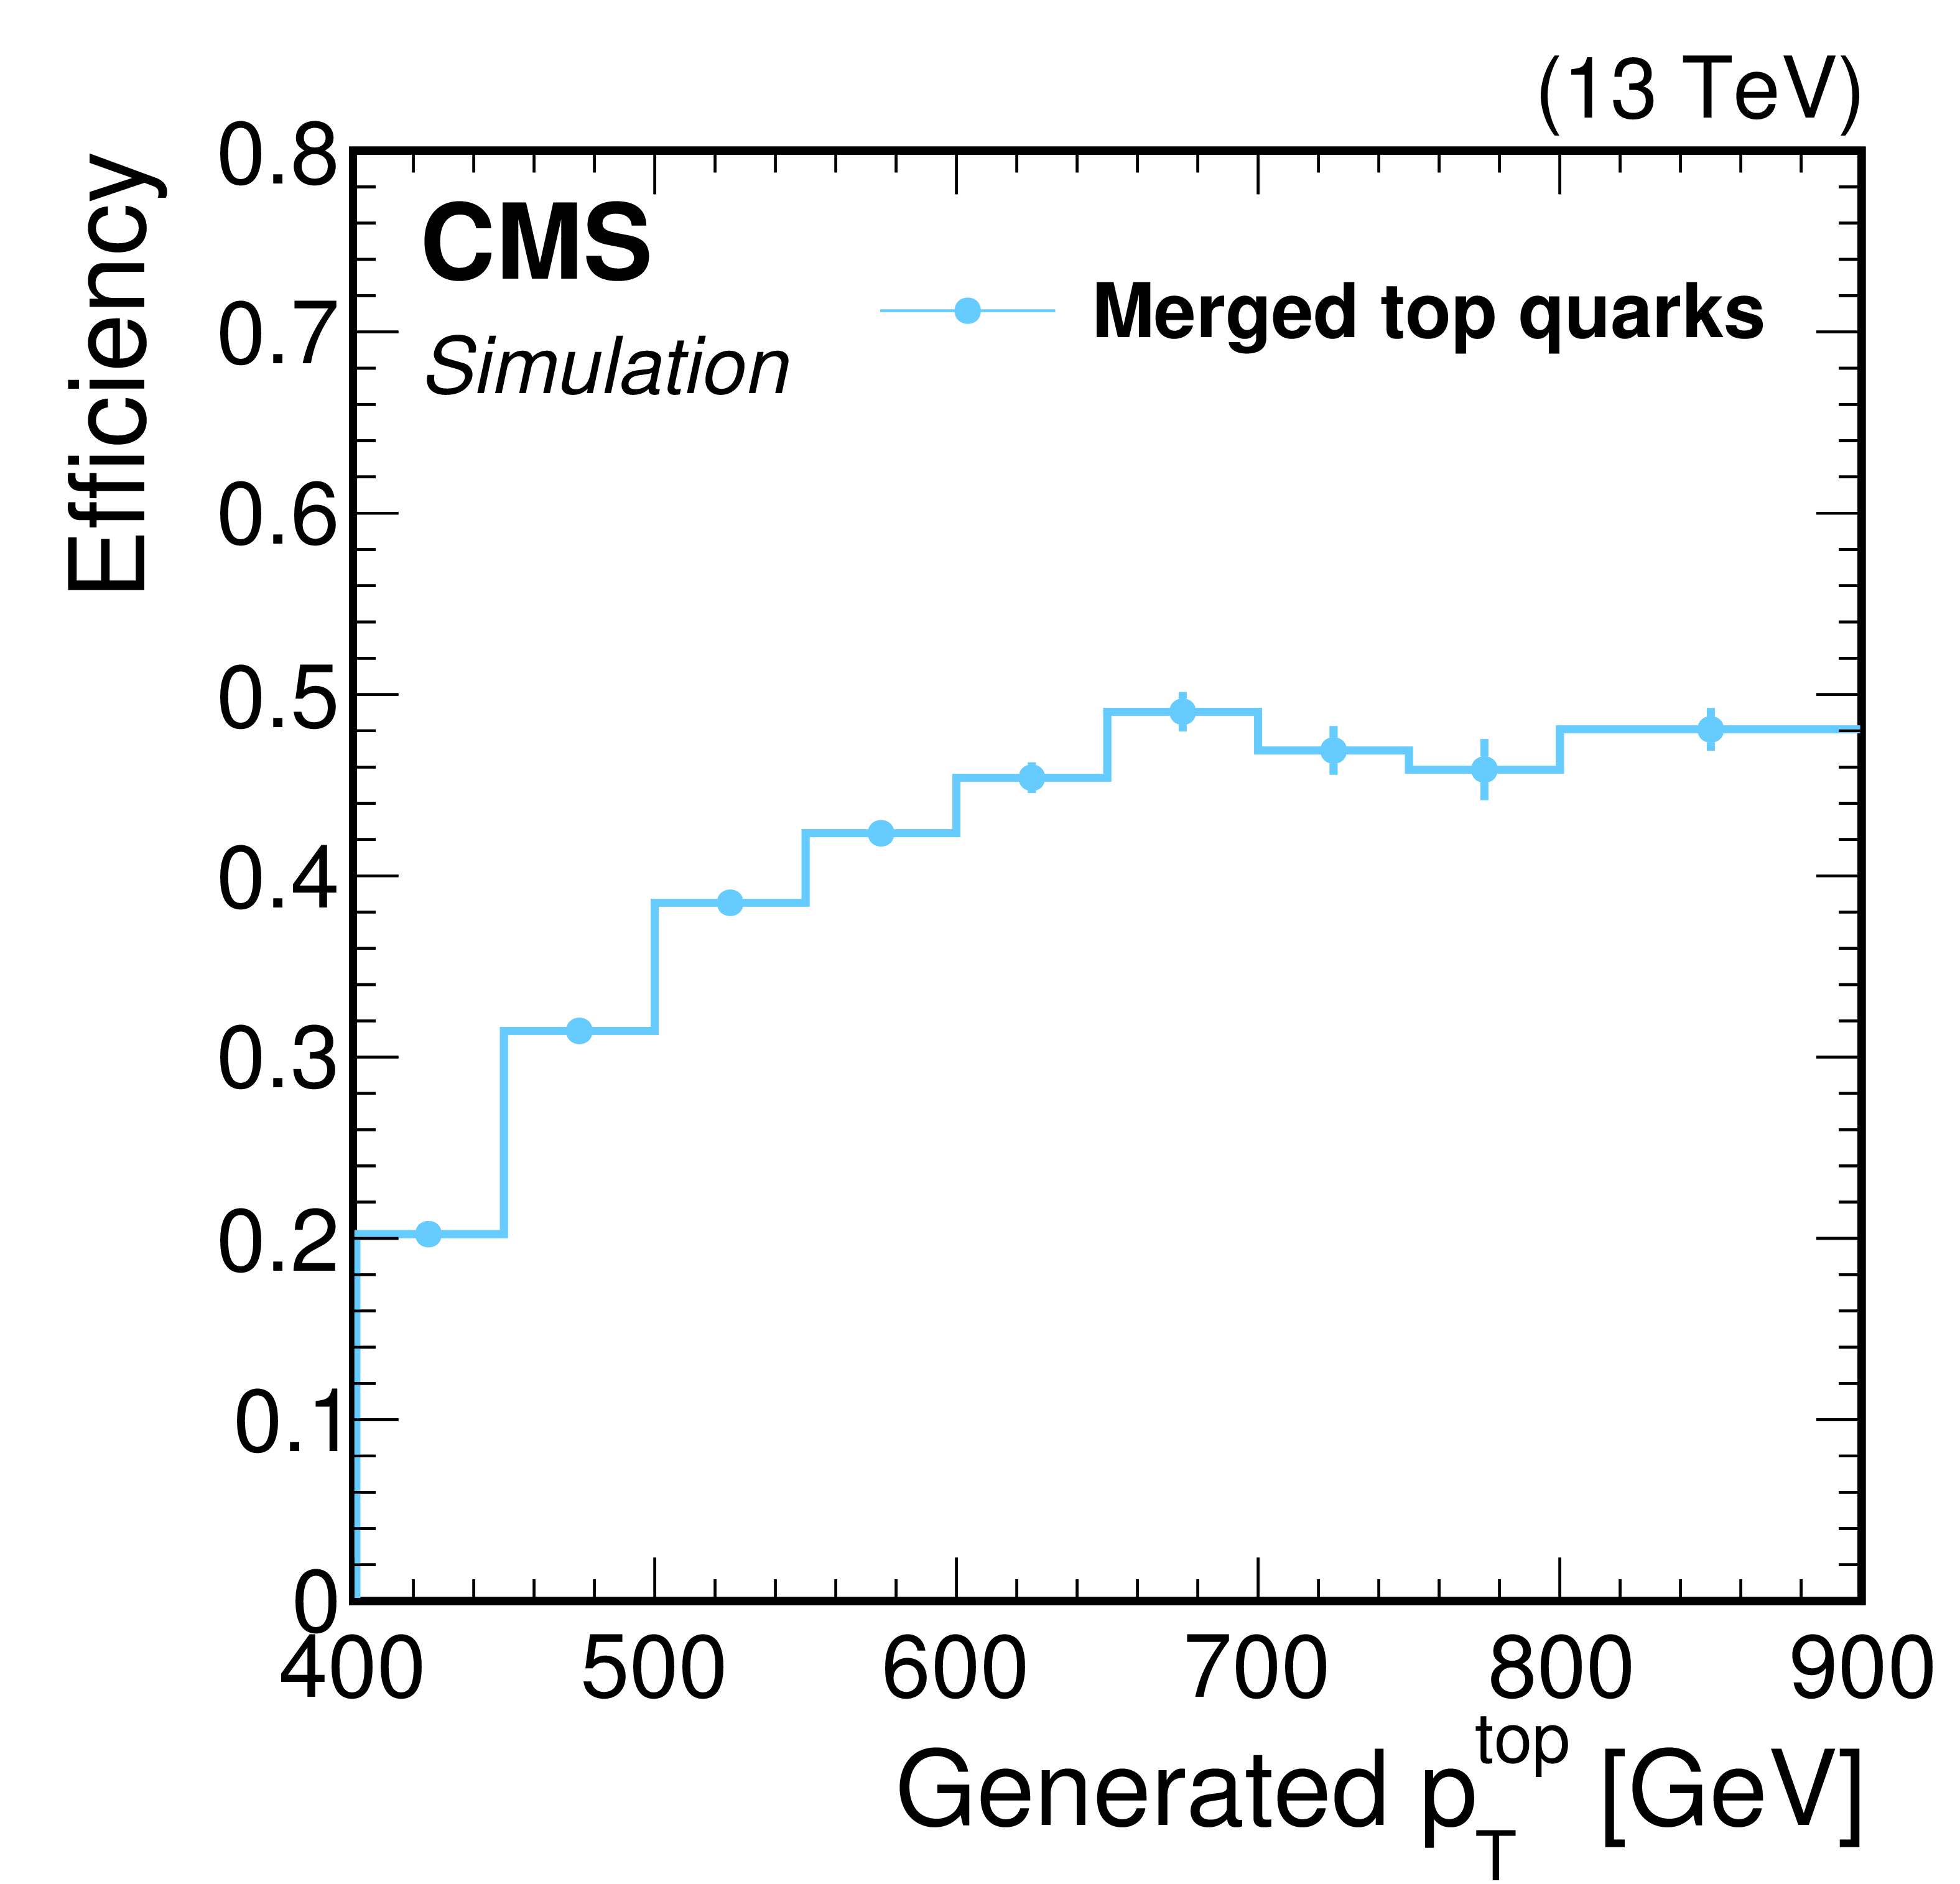
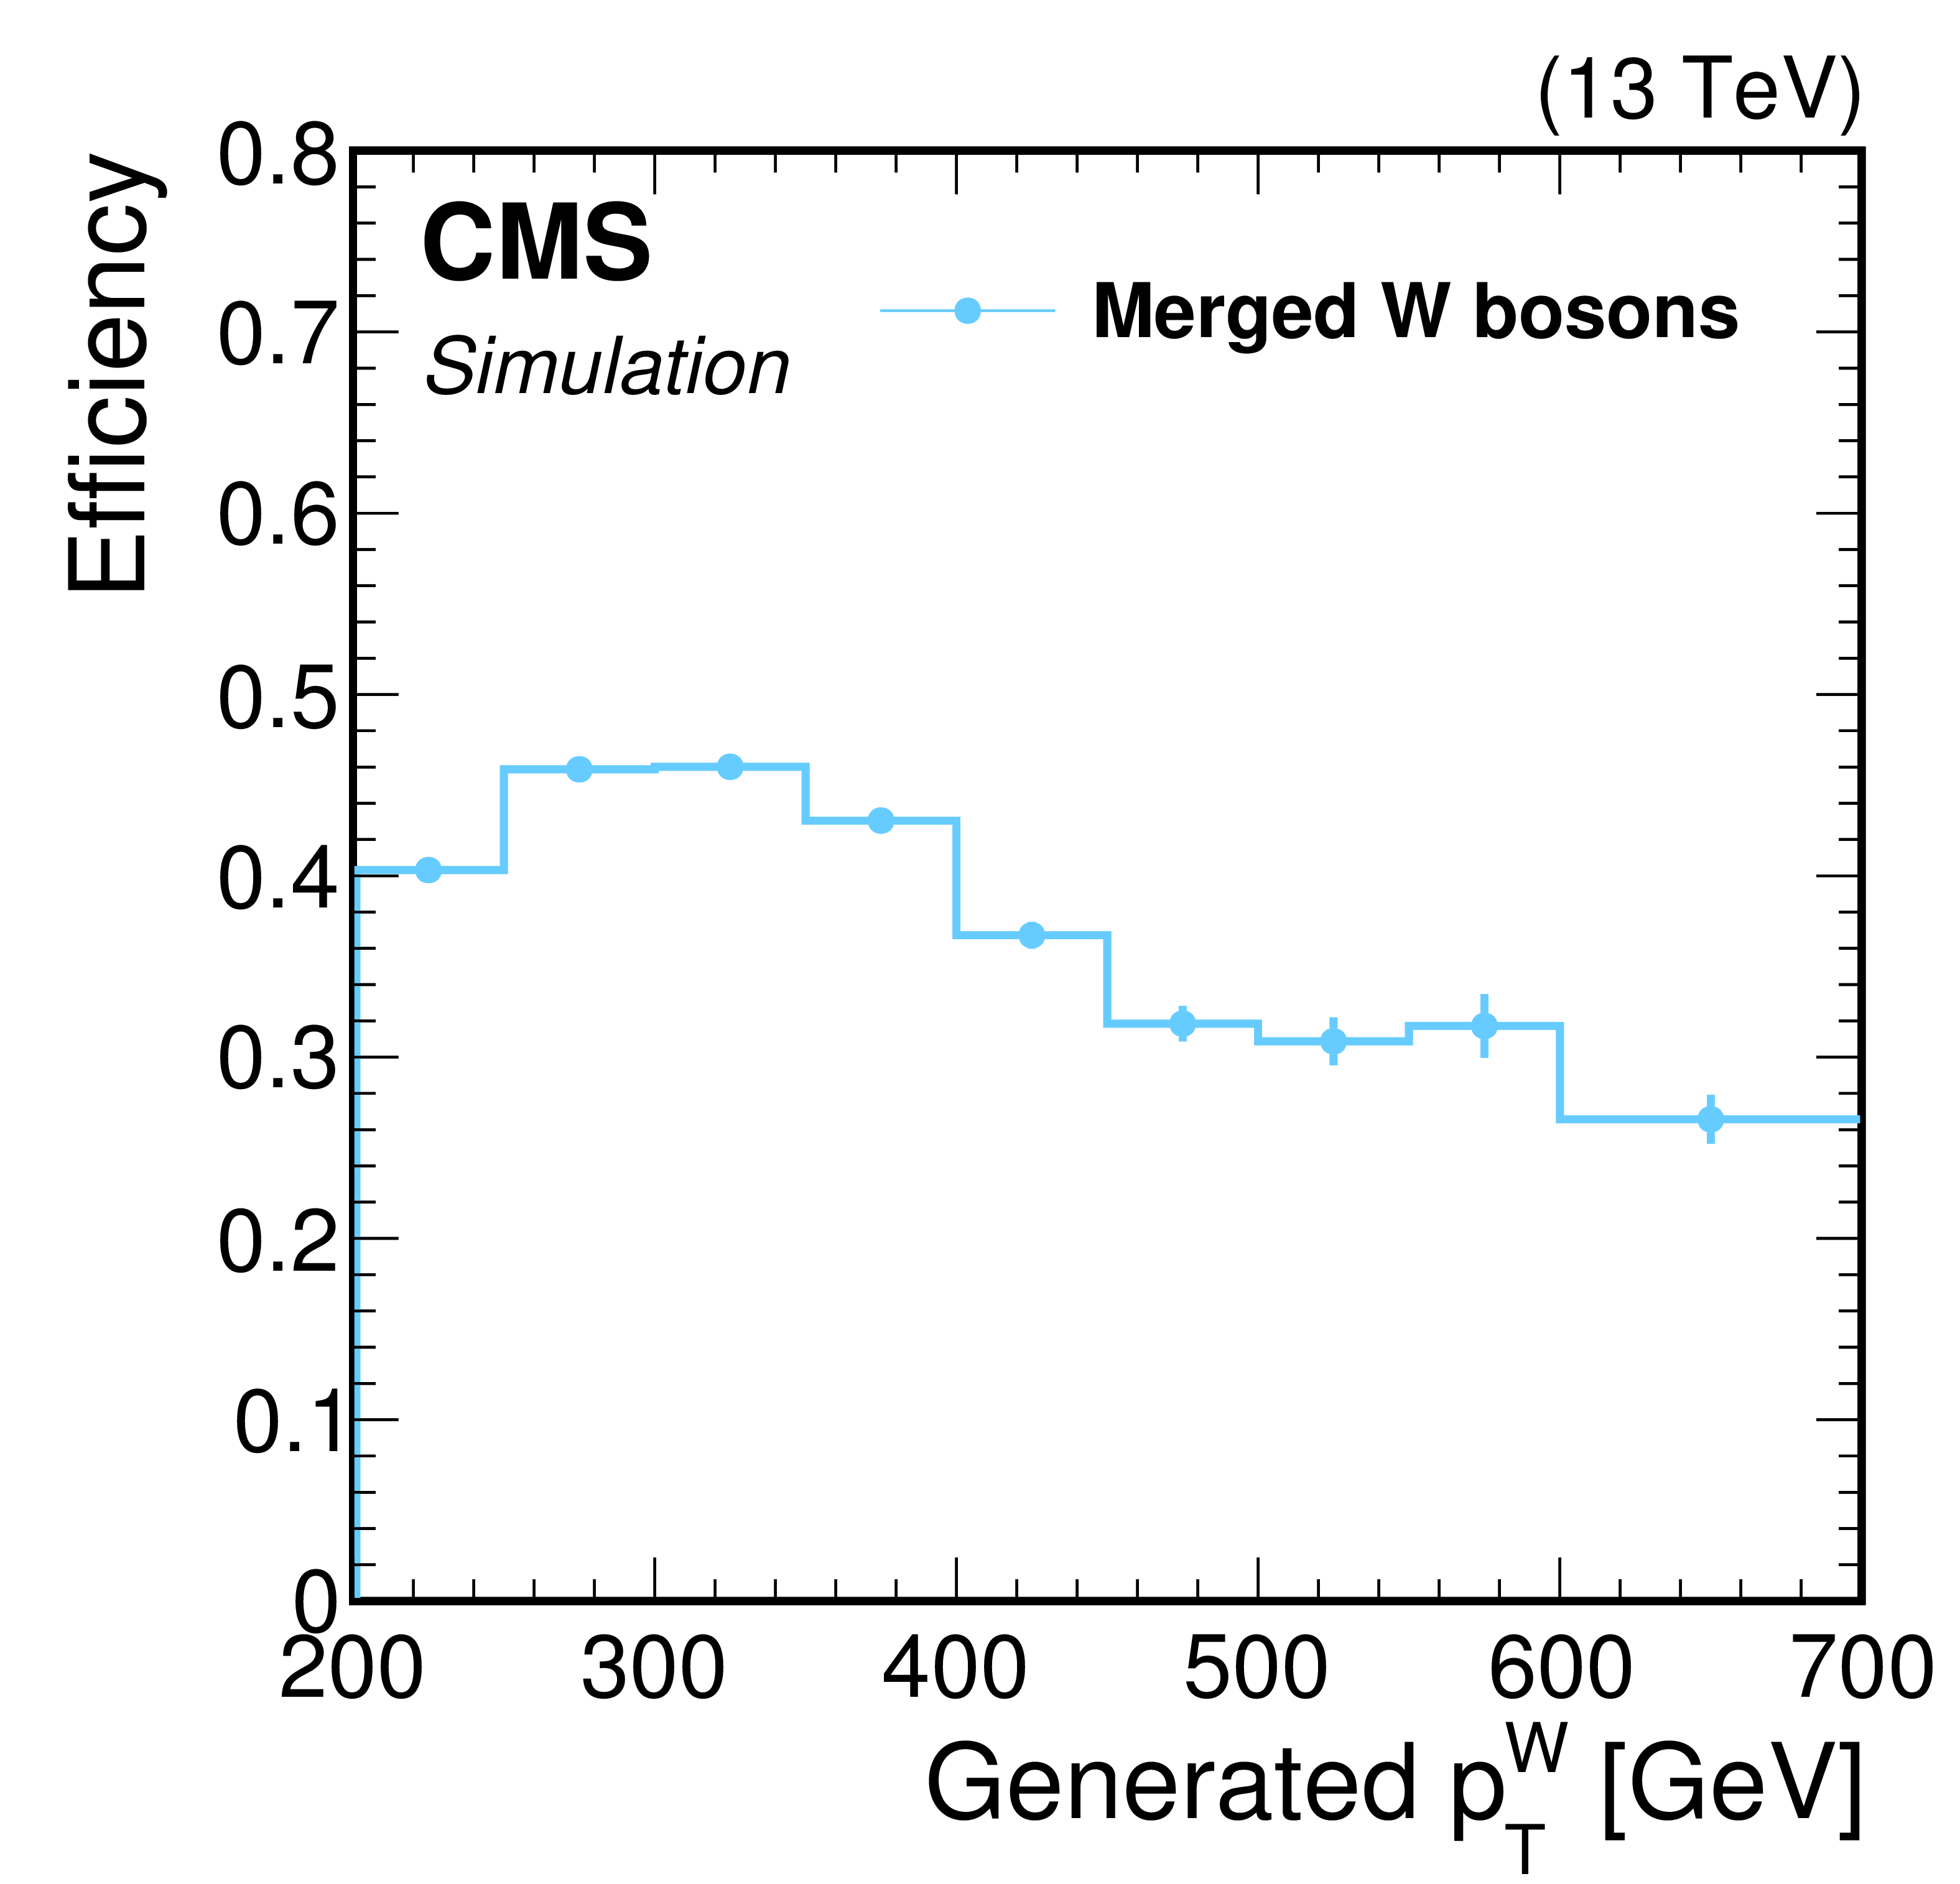
Figure 2:
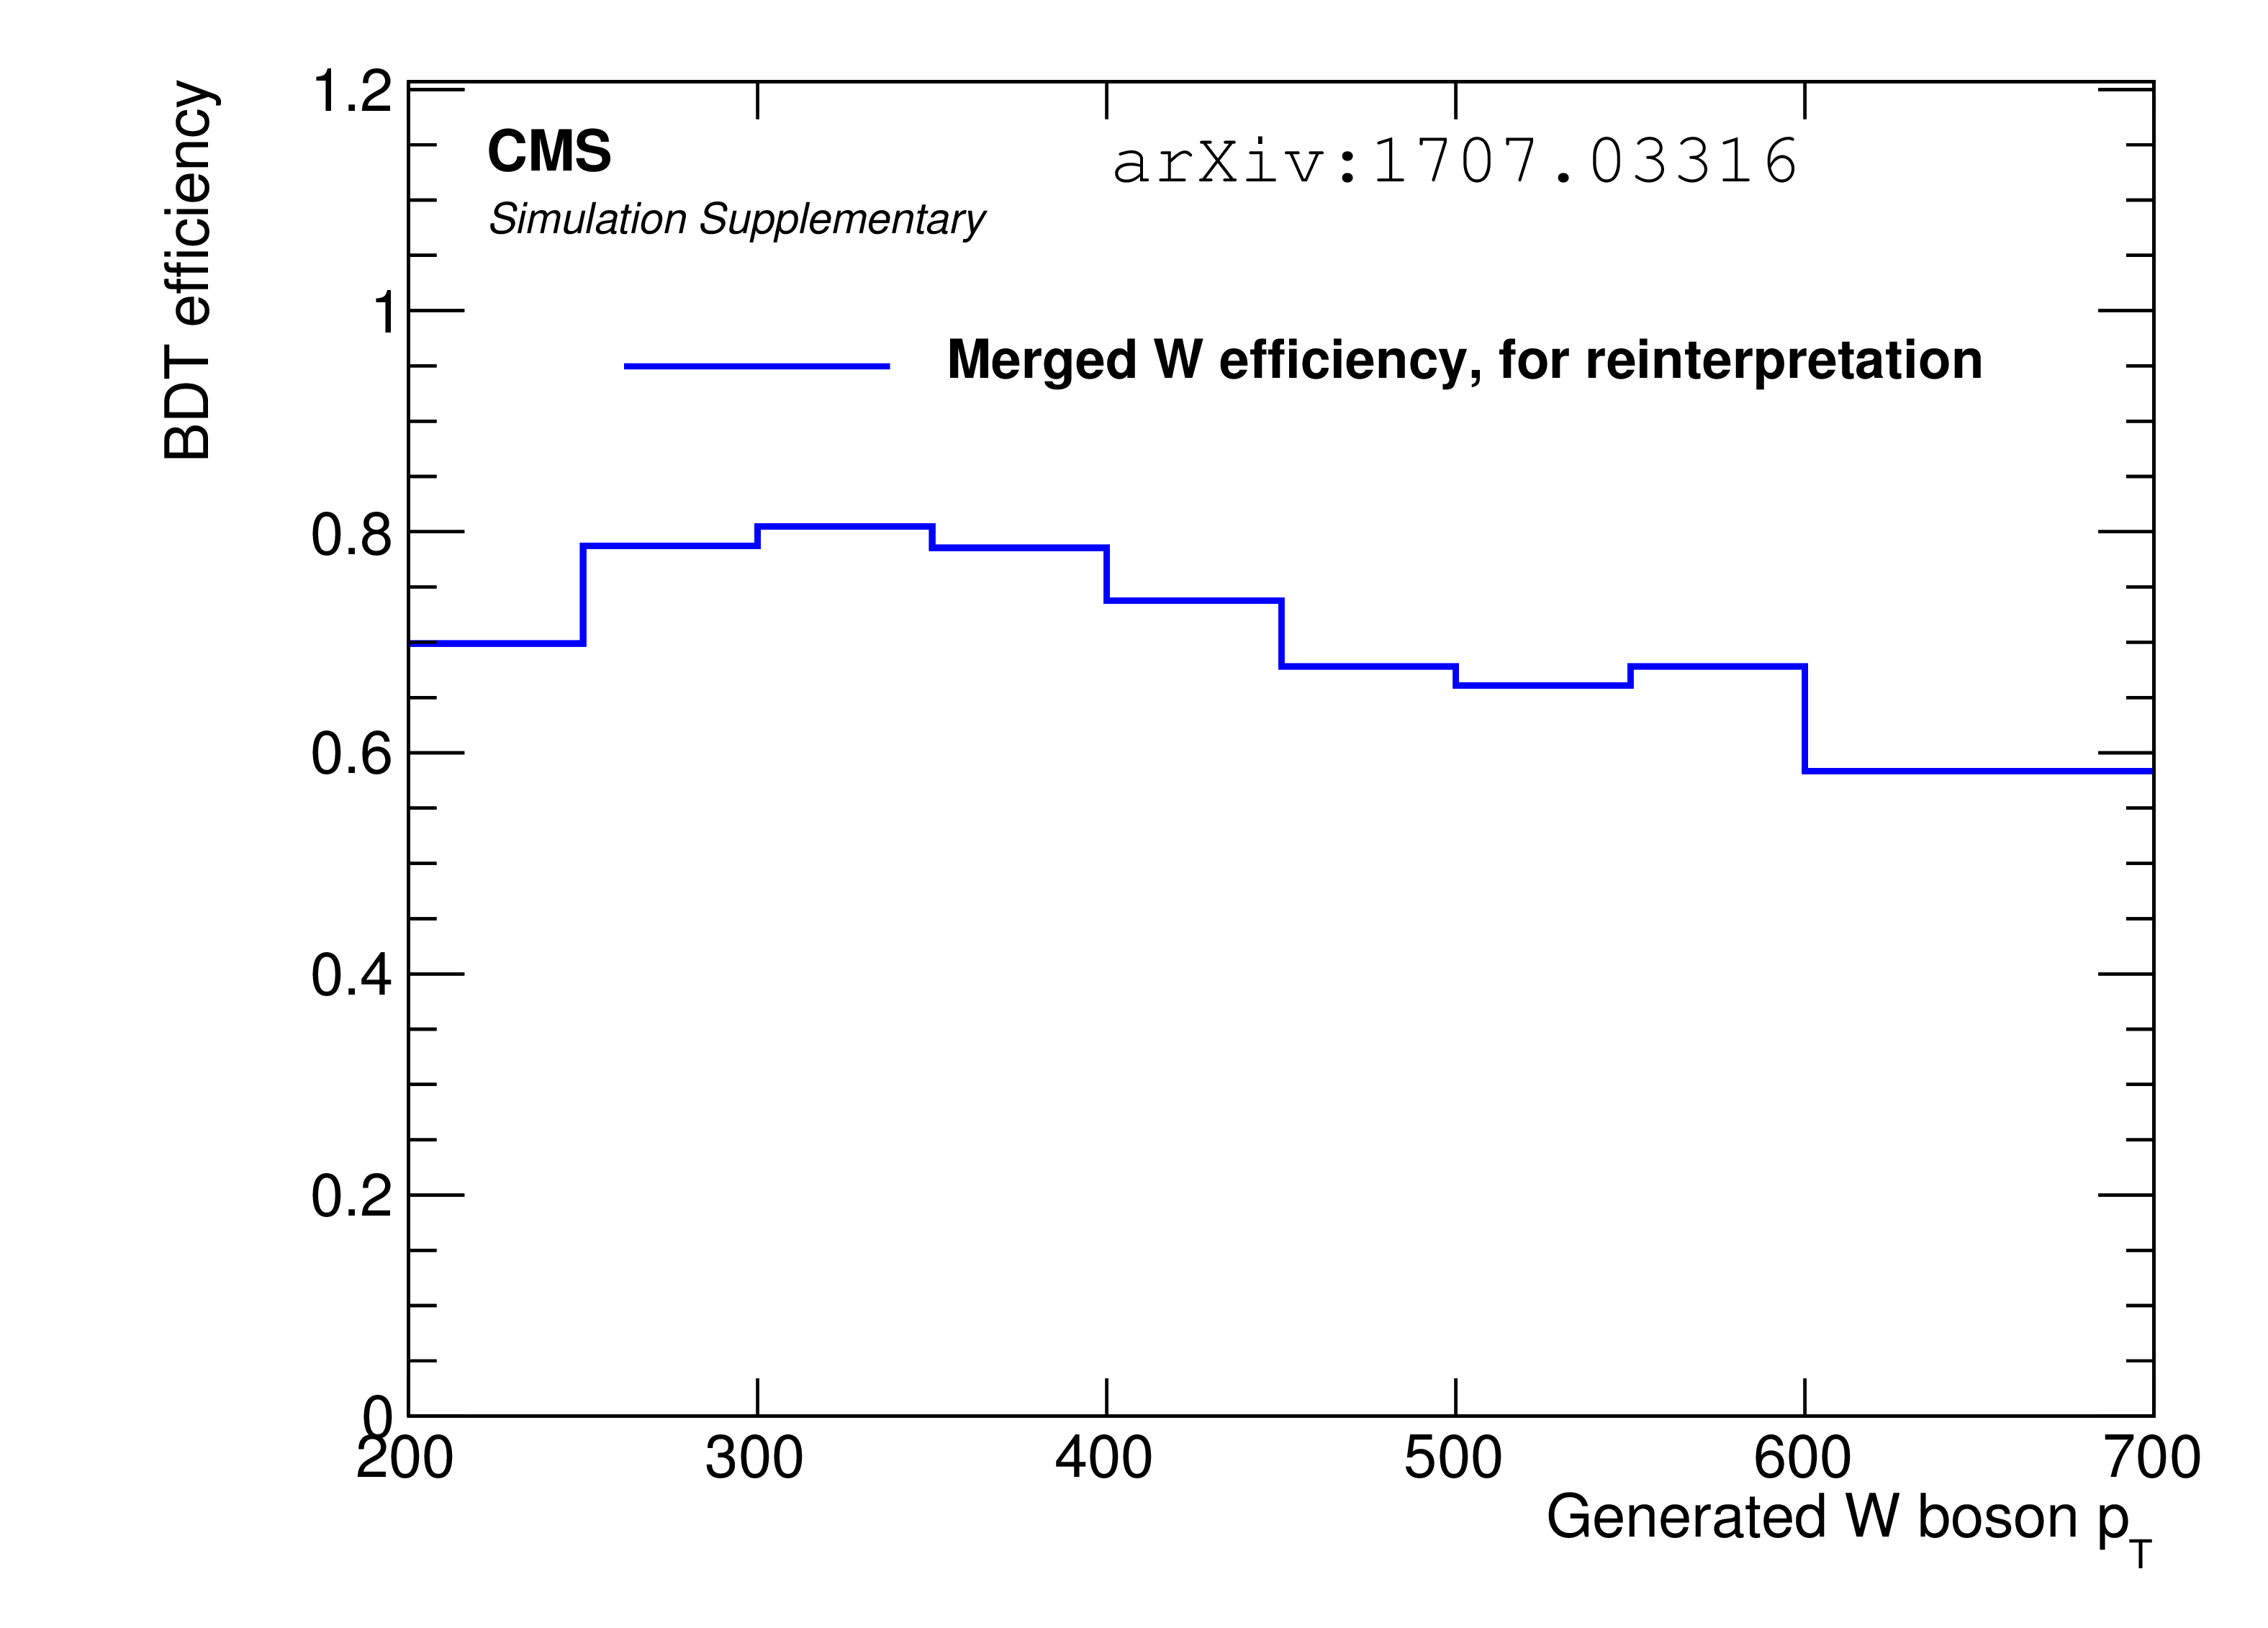
Efficiencies in MC simulation for identifying the quark decays of top quarks (left), and W bosons (right), as a function of the $ {p_{\mathrm {T}}} $ of the generated top quarks or W bosons to which they were matched. |
png pdf |
Figure 2-a:
Efficiencies in MC simulation for identifying the quark decays of top quarks, as a function of the $ {p_{\mathrm {T}}} $ of the generated top quarks or W bosons to which they were matched. |
png pdf |
Figure 2-b:
Efficiencies in MC simulation for identifying the quark decays of W bosons, as a function of the $ {p_{\mathrm {T}}} $ of the generated top quarks or W bosons to which they were matched. |
png pdf |
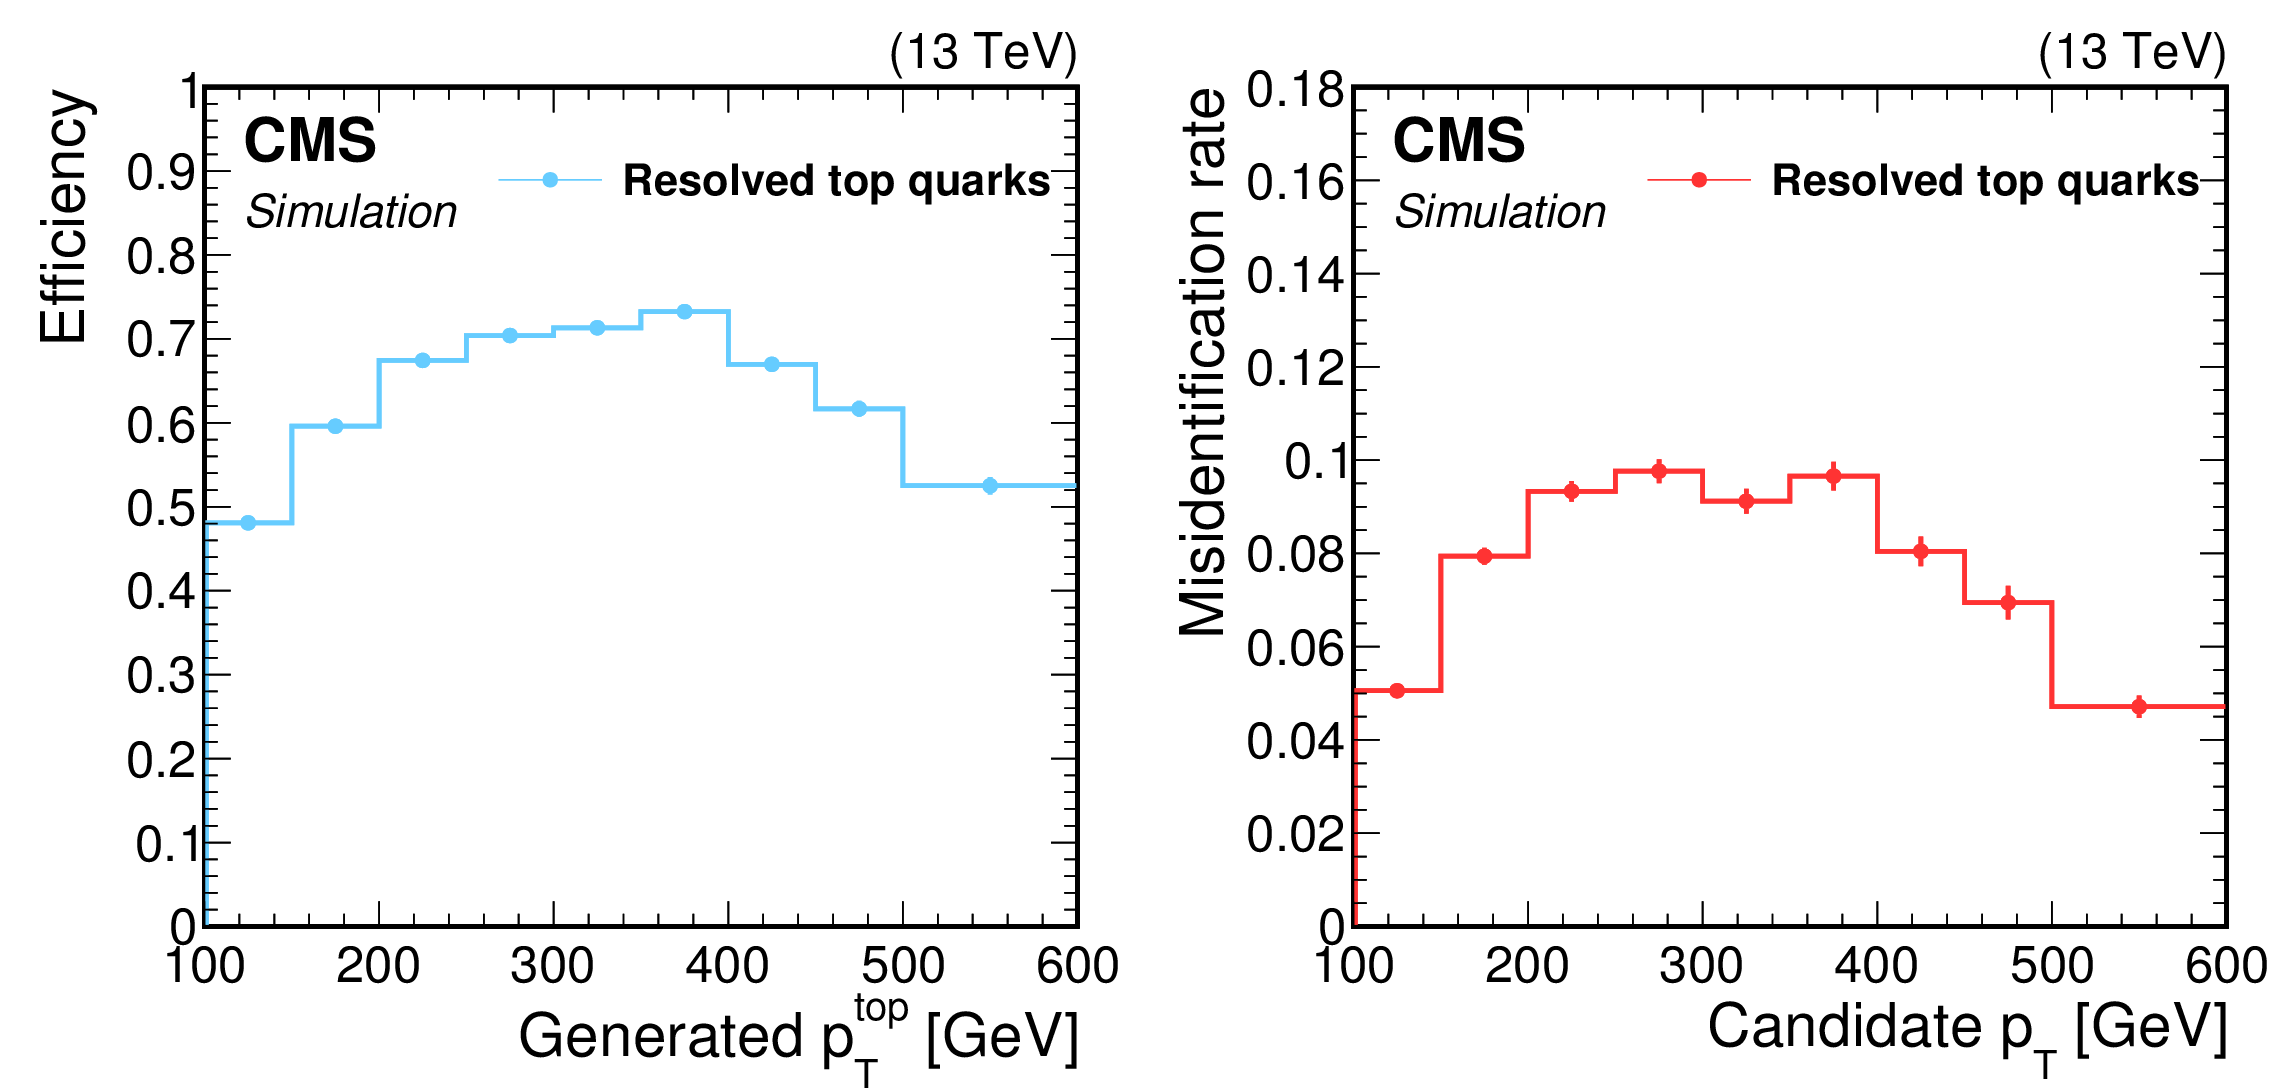
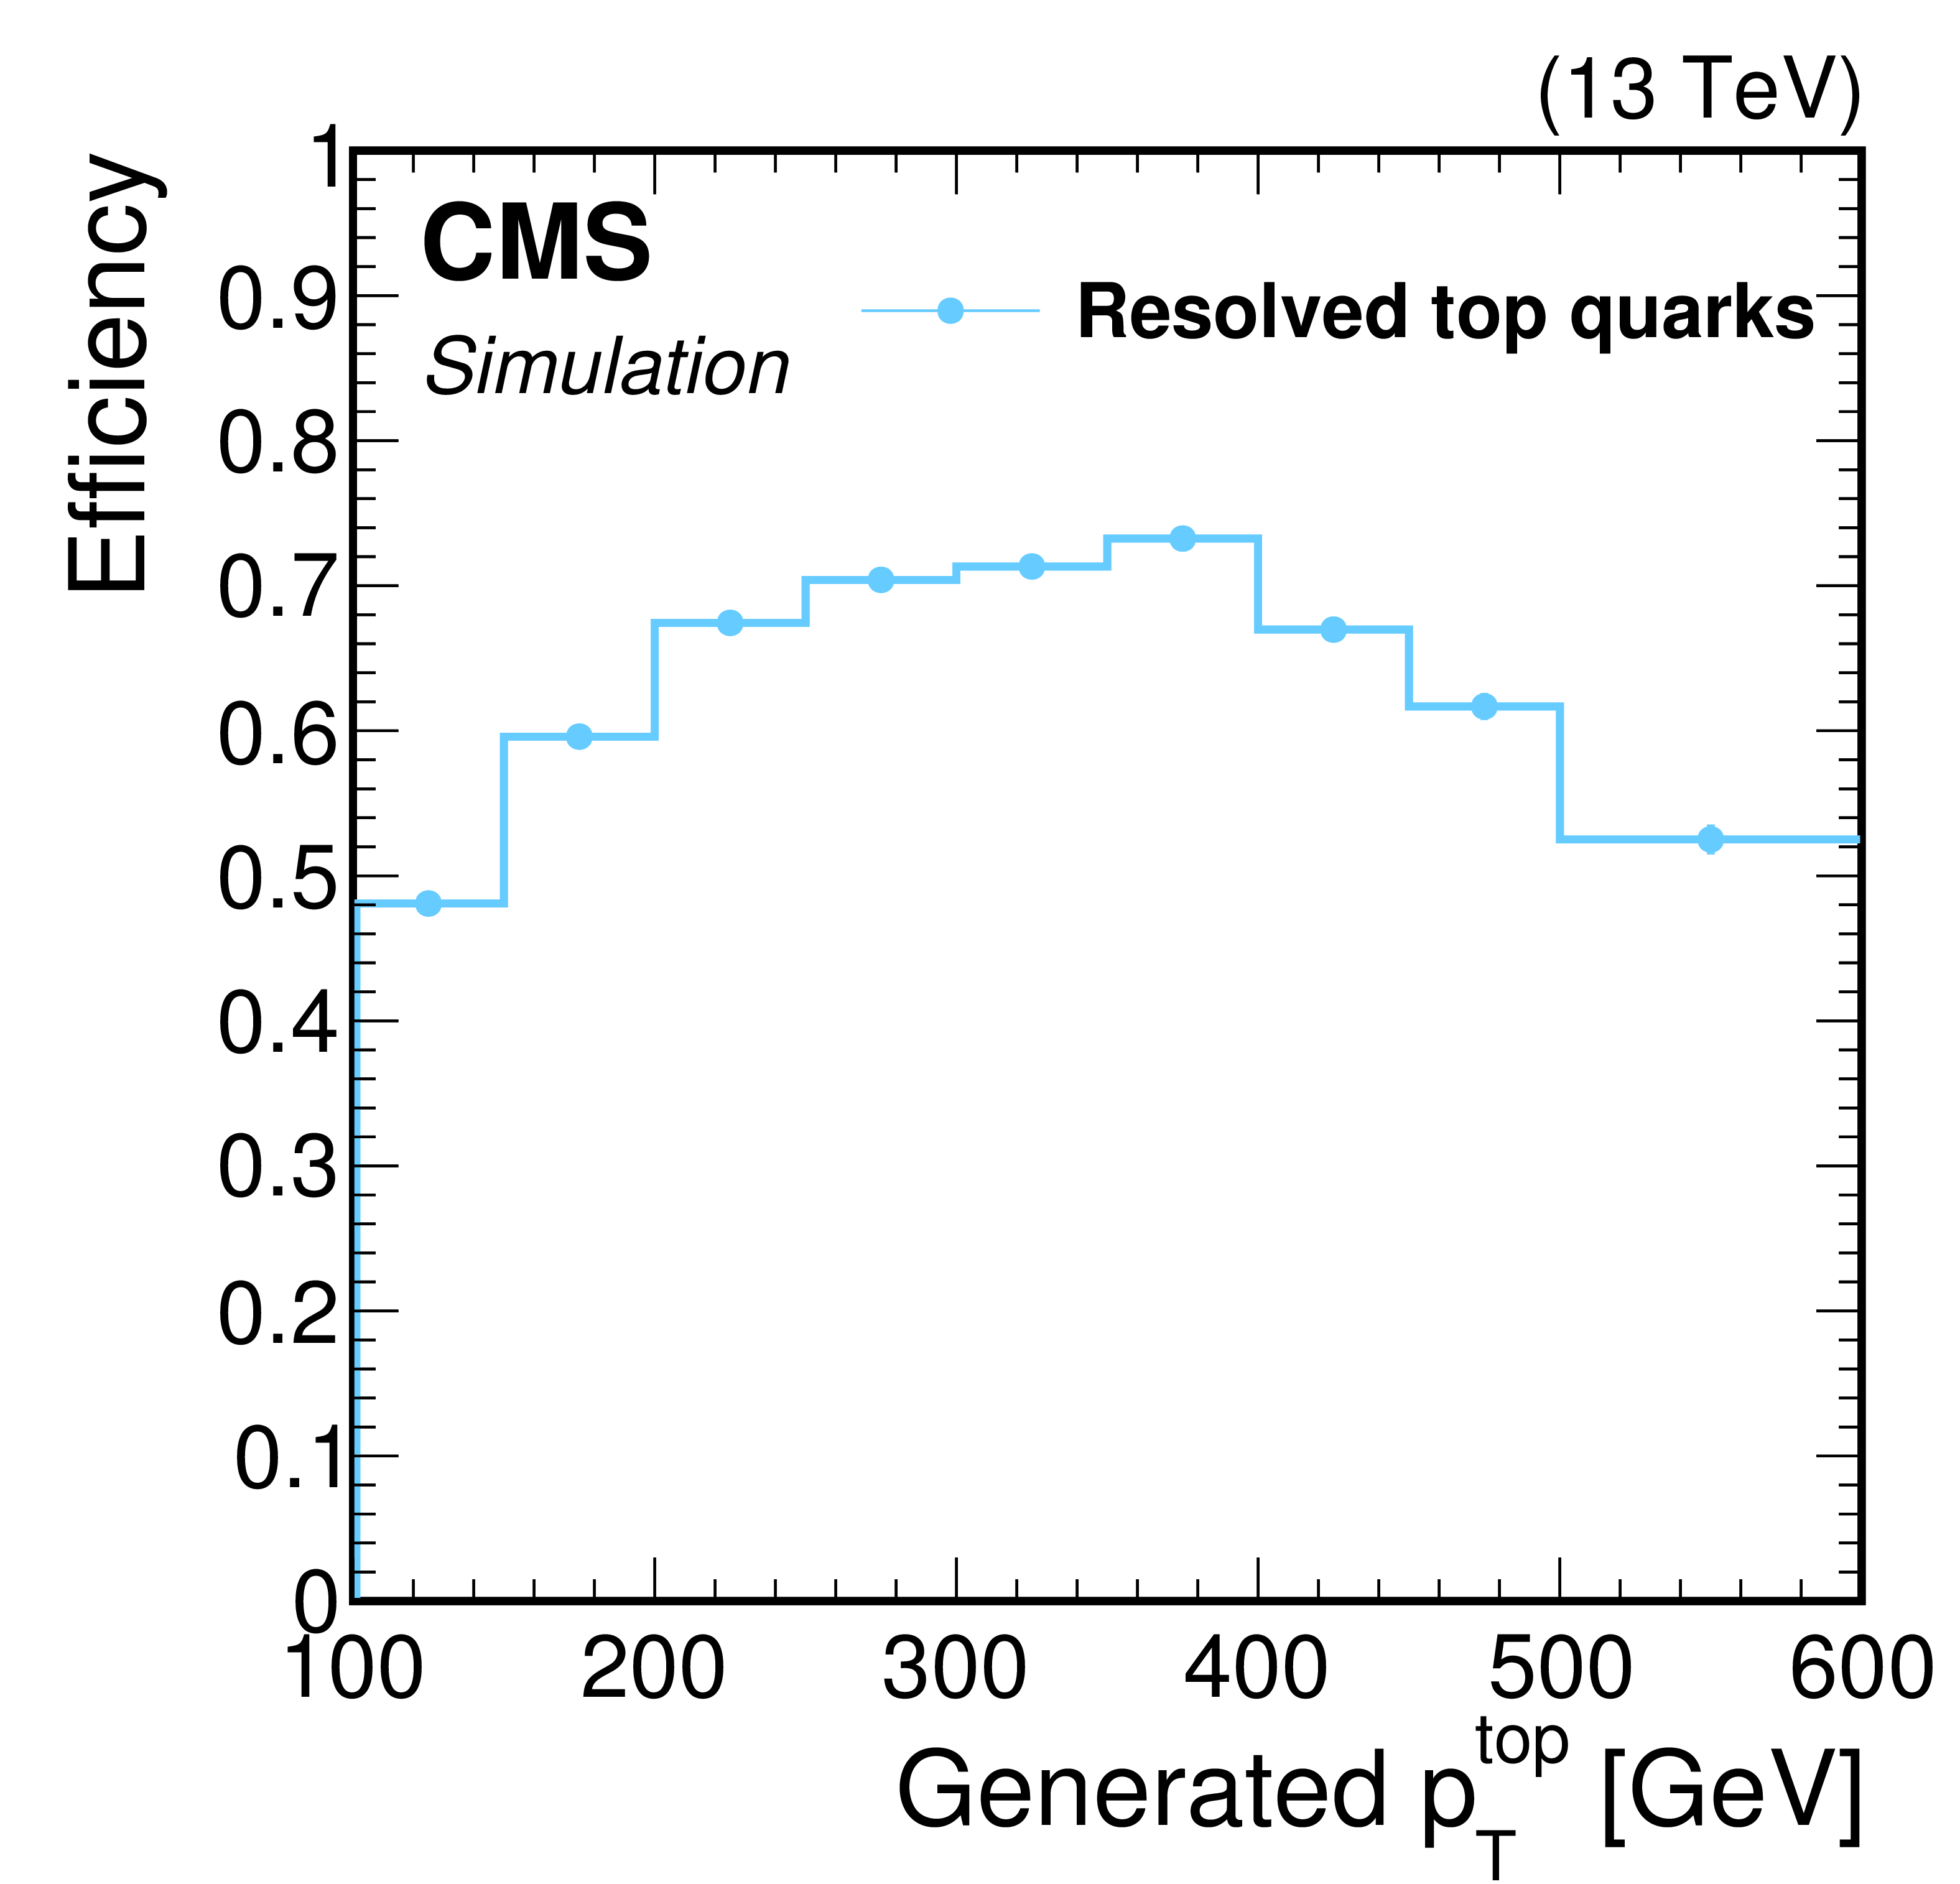
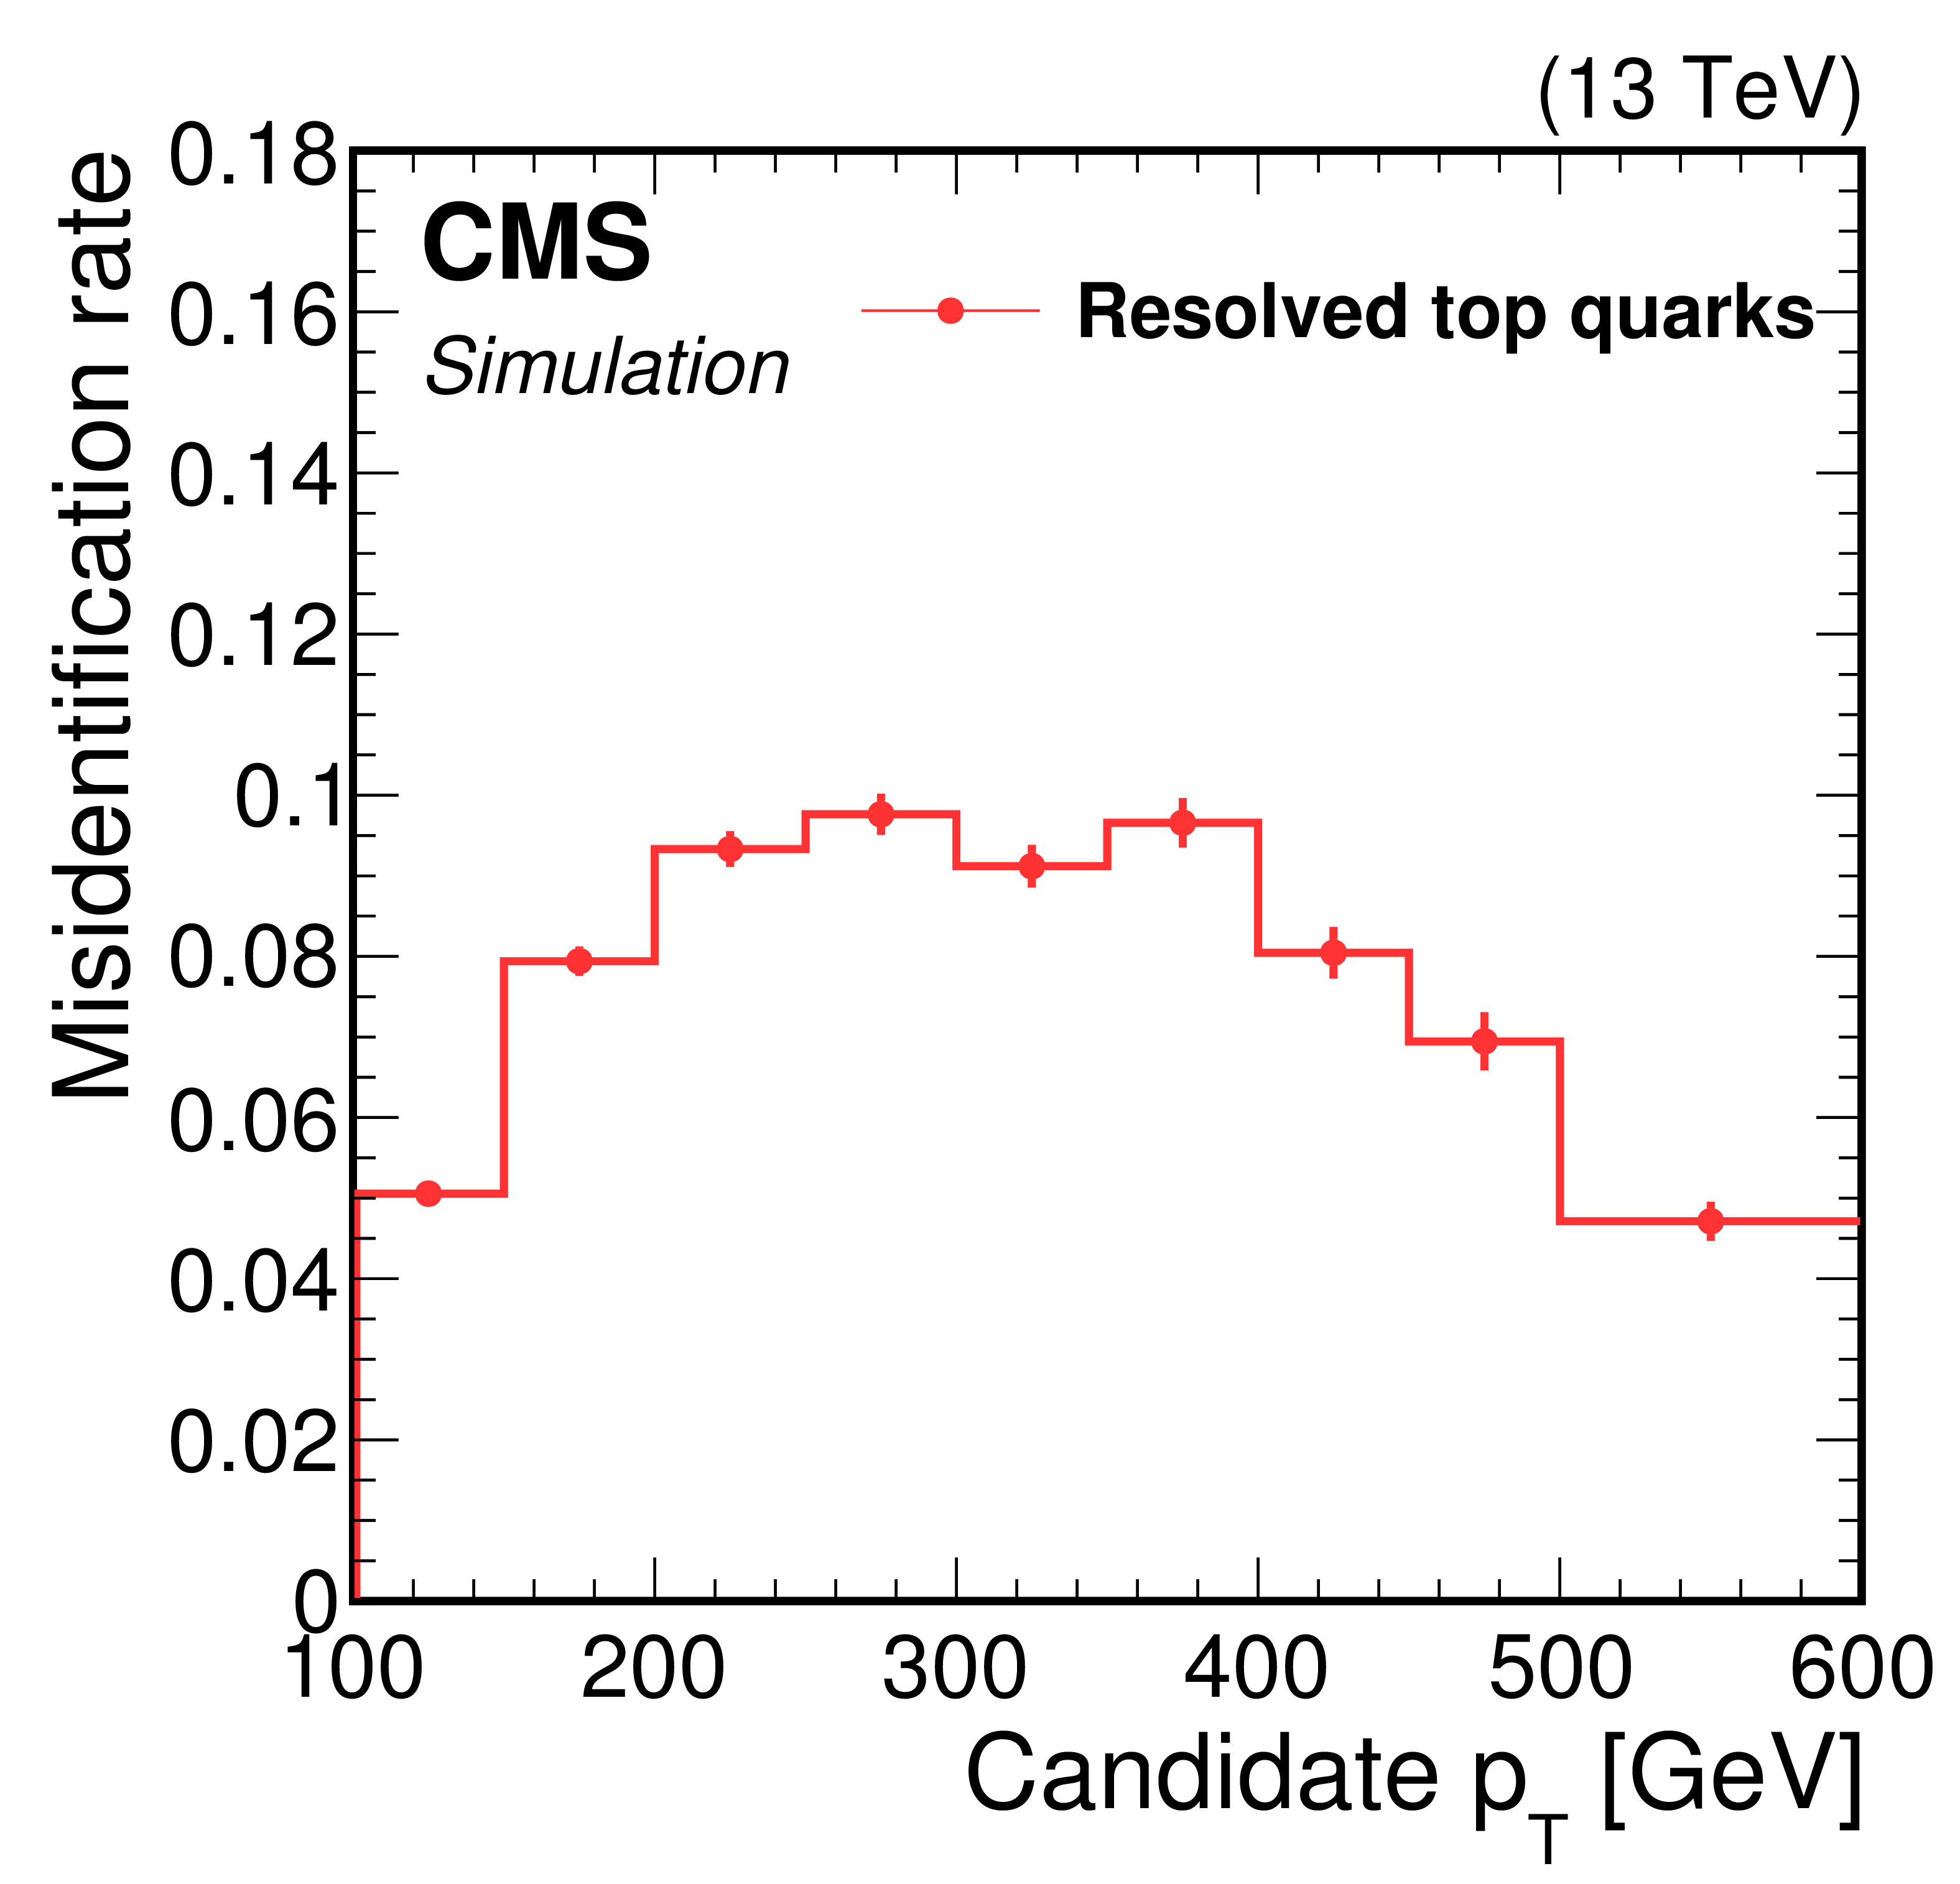
Figure 3:
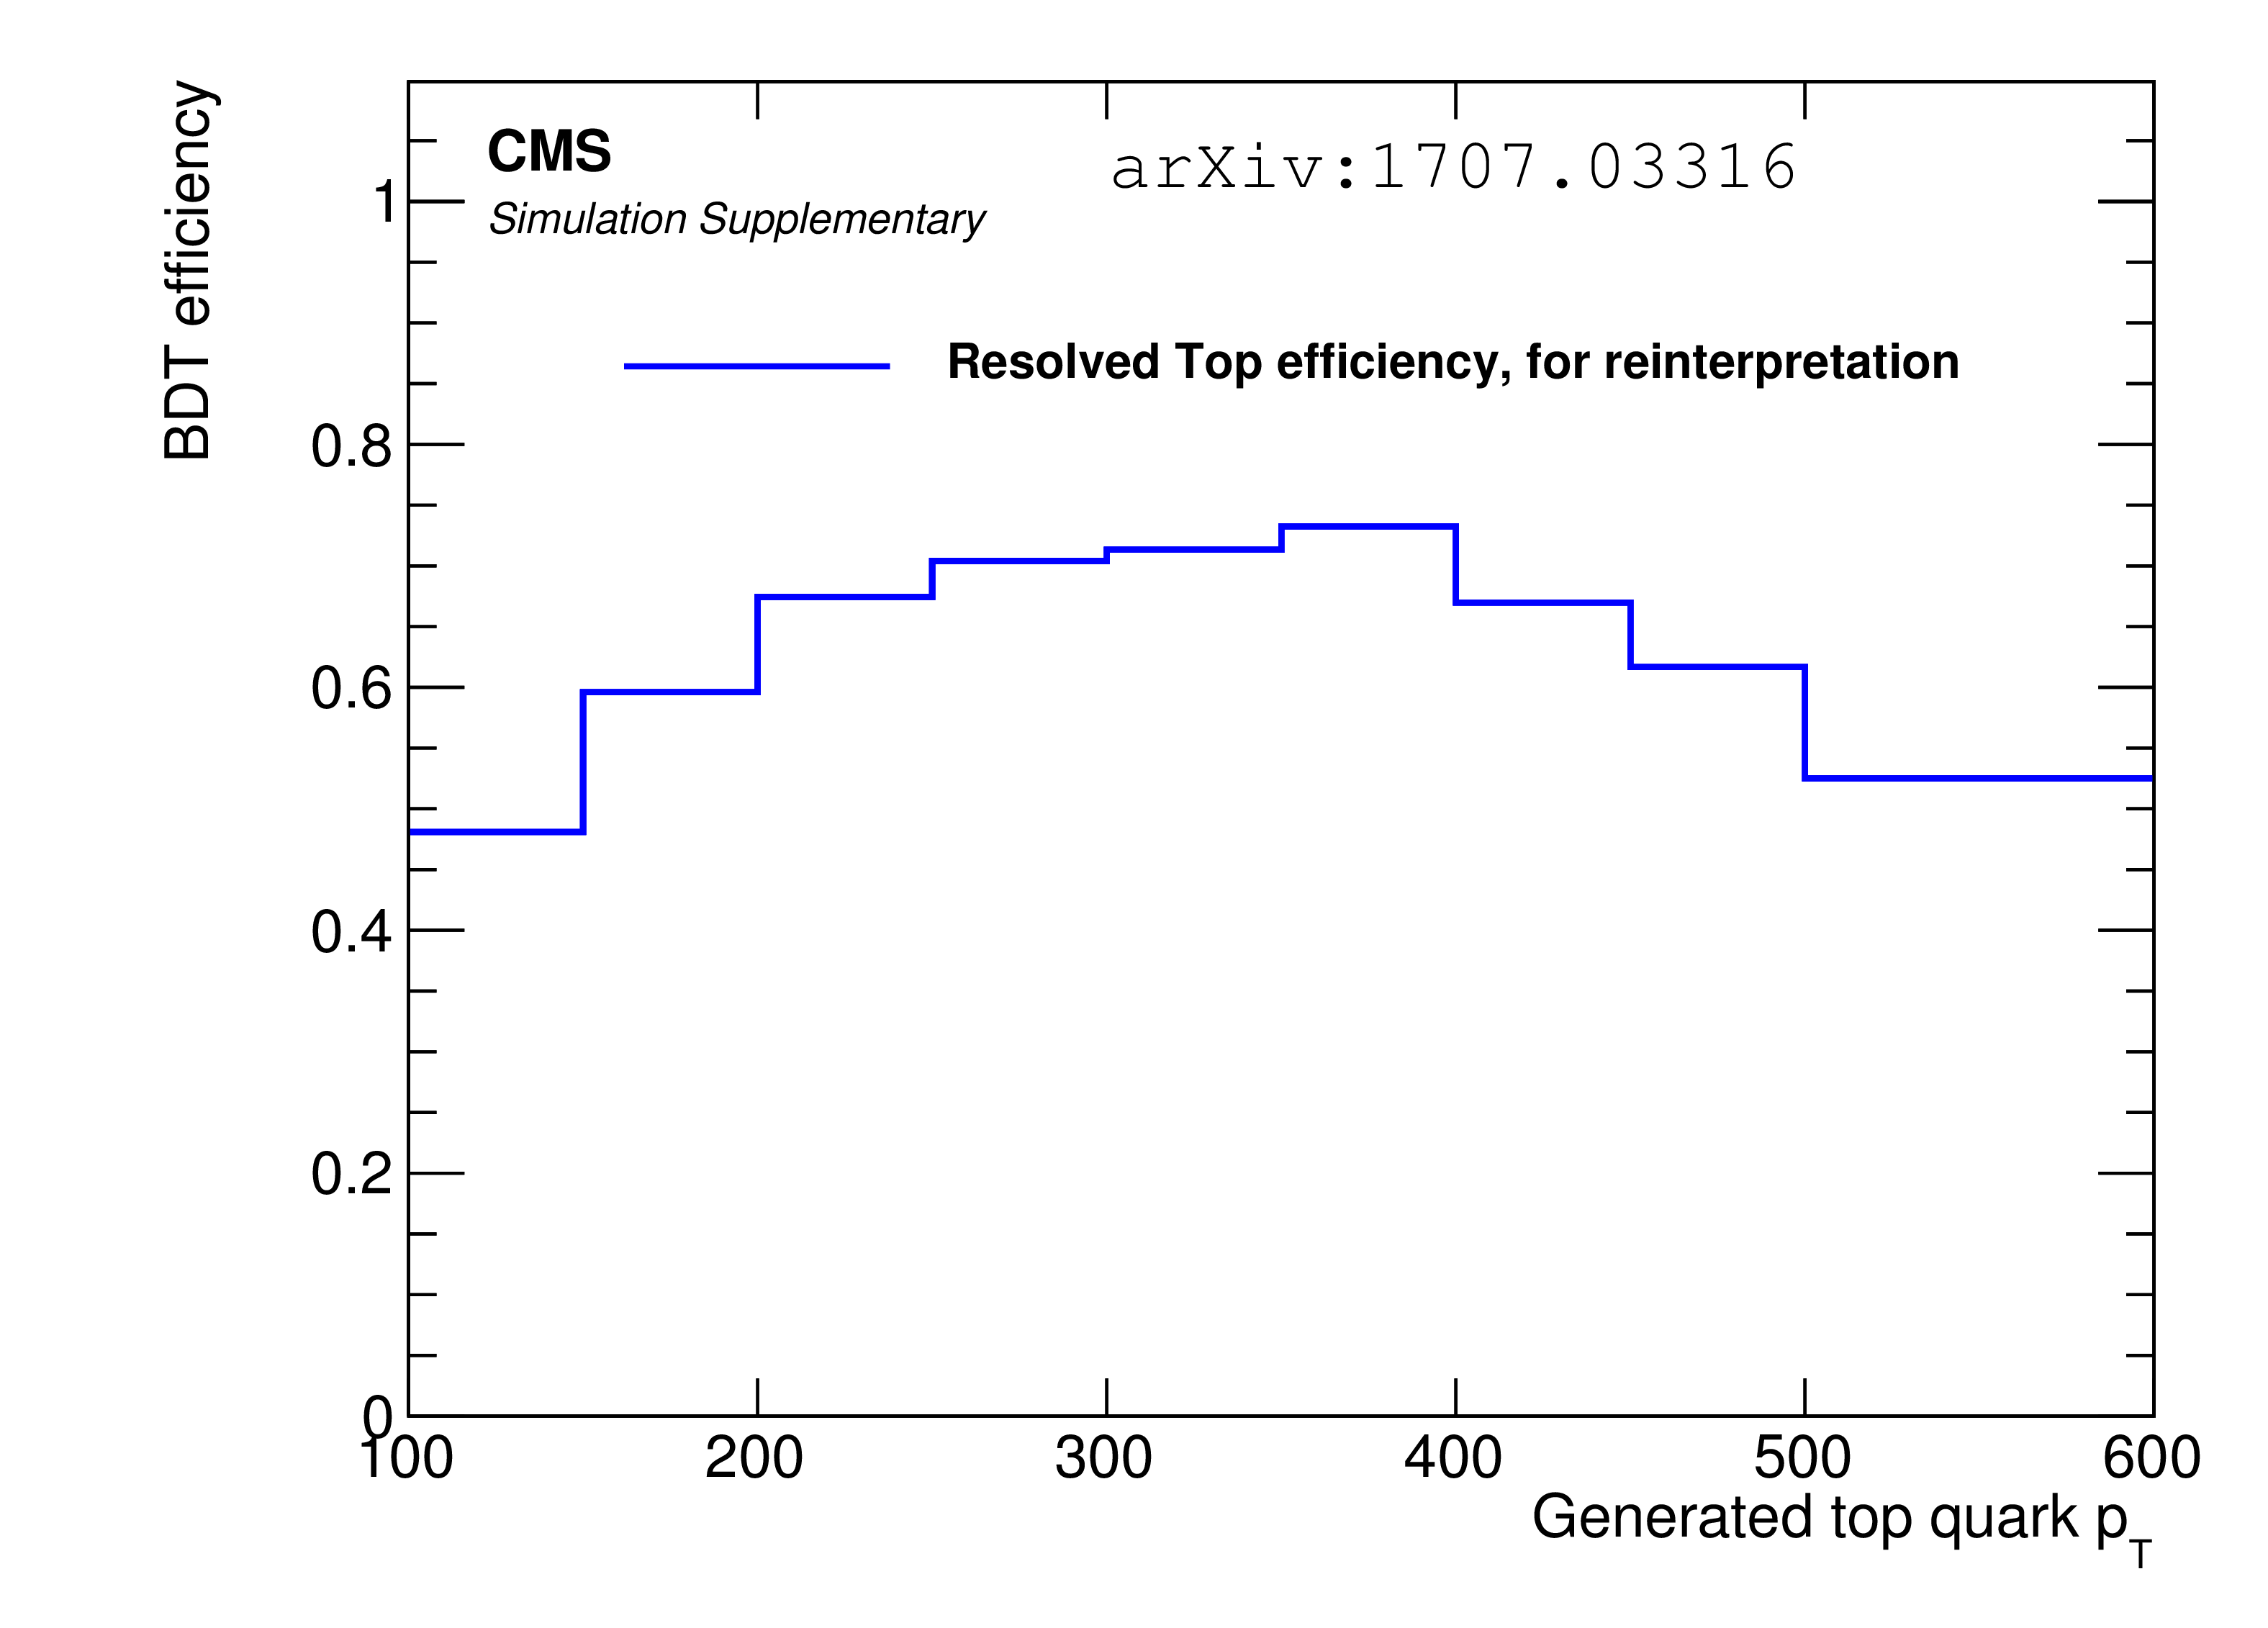
Left: Efficiency in MC simulation to identify resolved top quark decays as a function of the $ {p_{\mathrm {T}}} $ of the generated top quark. Right: Misidentification rate in MC simulation as a function of the $ {p_{\mathrm {T}}} $ of resolved top quarks, in a sample dominated by the QCD multijet process. |
png pdf |
Figure 3-a:
Efficiency in MC simulation to identify resolved top quark decays as a function of the $ {p_{\mathrm {T}}} $ of the generated top quark. |
png pdf |
Figure 3-b:
Misidentification rate in MC simulation as a function of the $ {p_{\mathrm {T}}} $ of resolved top quarks, in a sample dominated by the QCD multijet process. |

png pdf |
Figure 4:
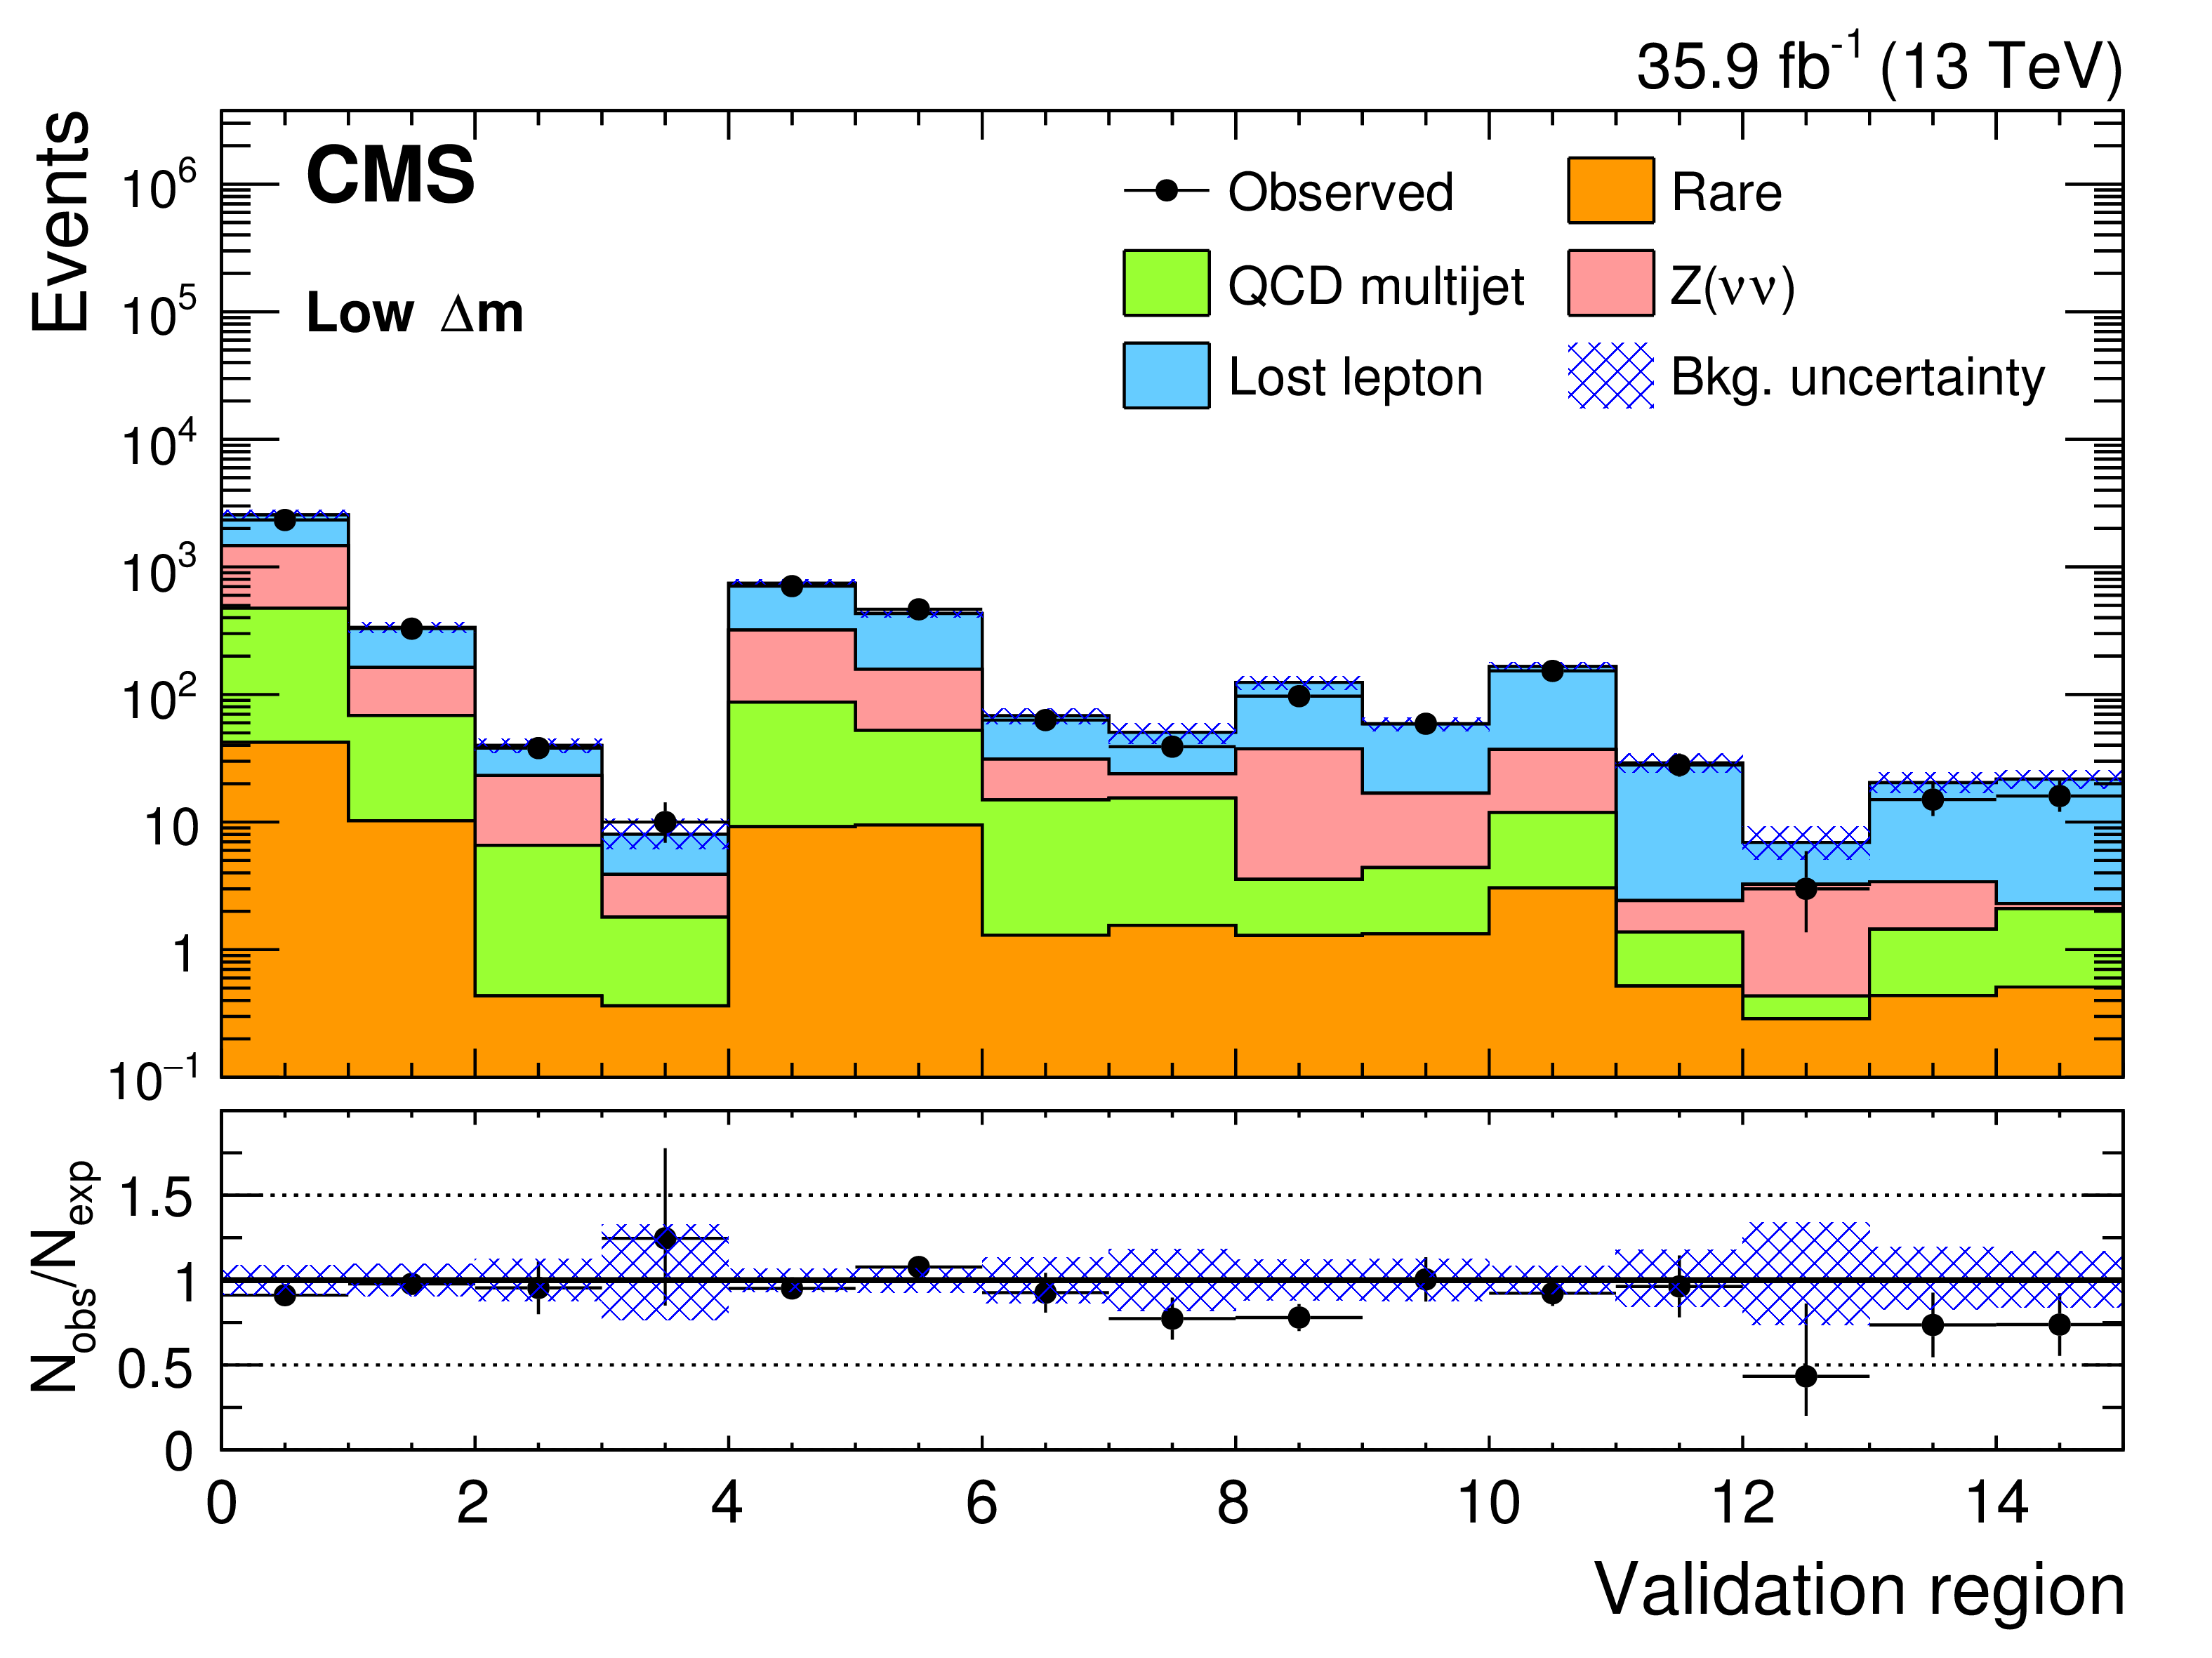
Observed data and SM background predictions in the low-$ { {p_{\mathrm {T}}} ^\text {miss}}$ validation sample for the low $ {\Delta m} $ (left) and high $ {\Delta m} $ (right) selections. Ratios of the observed to SM predicted event counts derived from control regions are shown in the lower panel of each plot. The shaded blue band represents the statistical uncertainty combined with the systematic uncertainty resulting from the top quark and W boson tagging correction factors on the background prediction. |
png pdf |
Figure 4-a:
Observed data and SM background predictions in the low-$ { {p_{\mathrm {T}}} ^\text {miss}}$ validation sample for the low $ {\Delta m} $ selection. Ratios of the observed to SM predicted event counts derived from control regions are shown in the lower panel. The shaded blue band represents the statistical uncertainty combined with the systematic uncertainty resulting from the top quark and W boson tagging correction factors on the background prediction. |

png pdf |
Figure 4-b:
Observed data and SM background predictions in the low-$ { {p_{\mathrm {T}}} ^\text {miss}}$ validation sample for the high $ {\Delta m} $ selection. Ratios of the observed to SM predicted event counts derived from control regions are shown in the lower panel. The shaded blue band represents the statistical uncertainty combined with the systematic uncertainty resulting from the top quark and W boson tagging correction factors on the background prediction. |
png pdf |
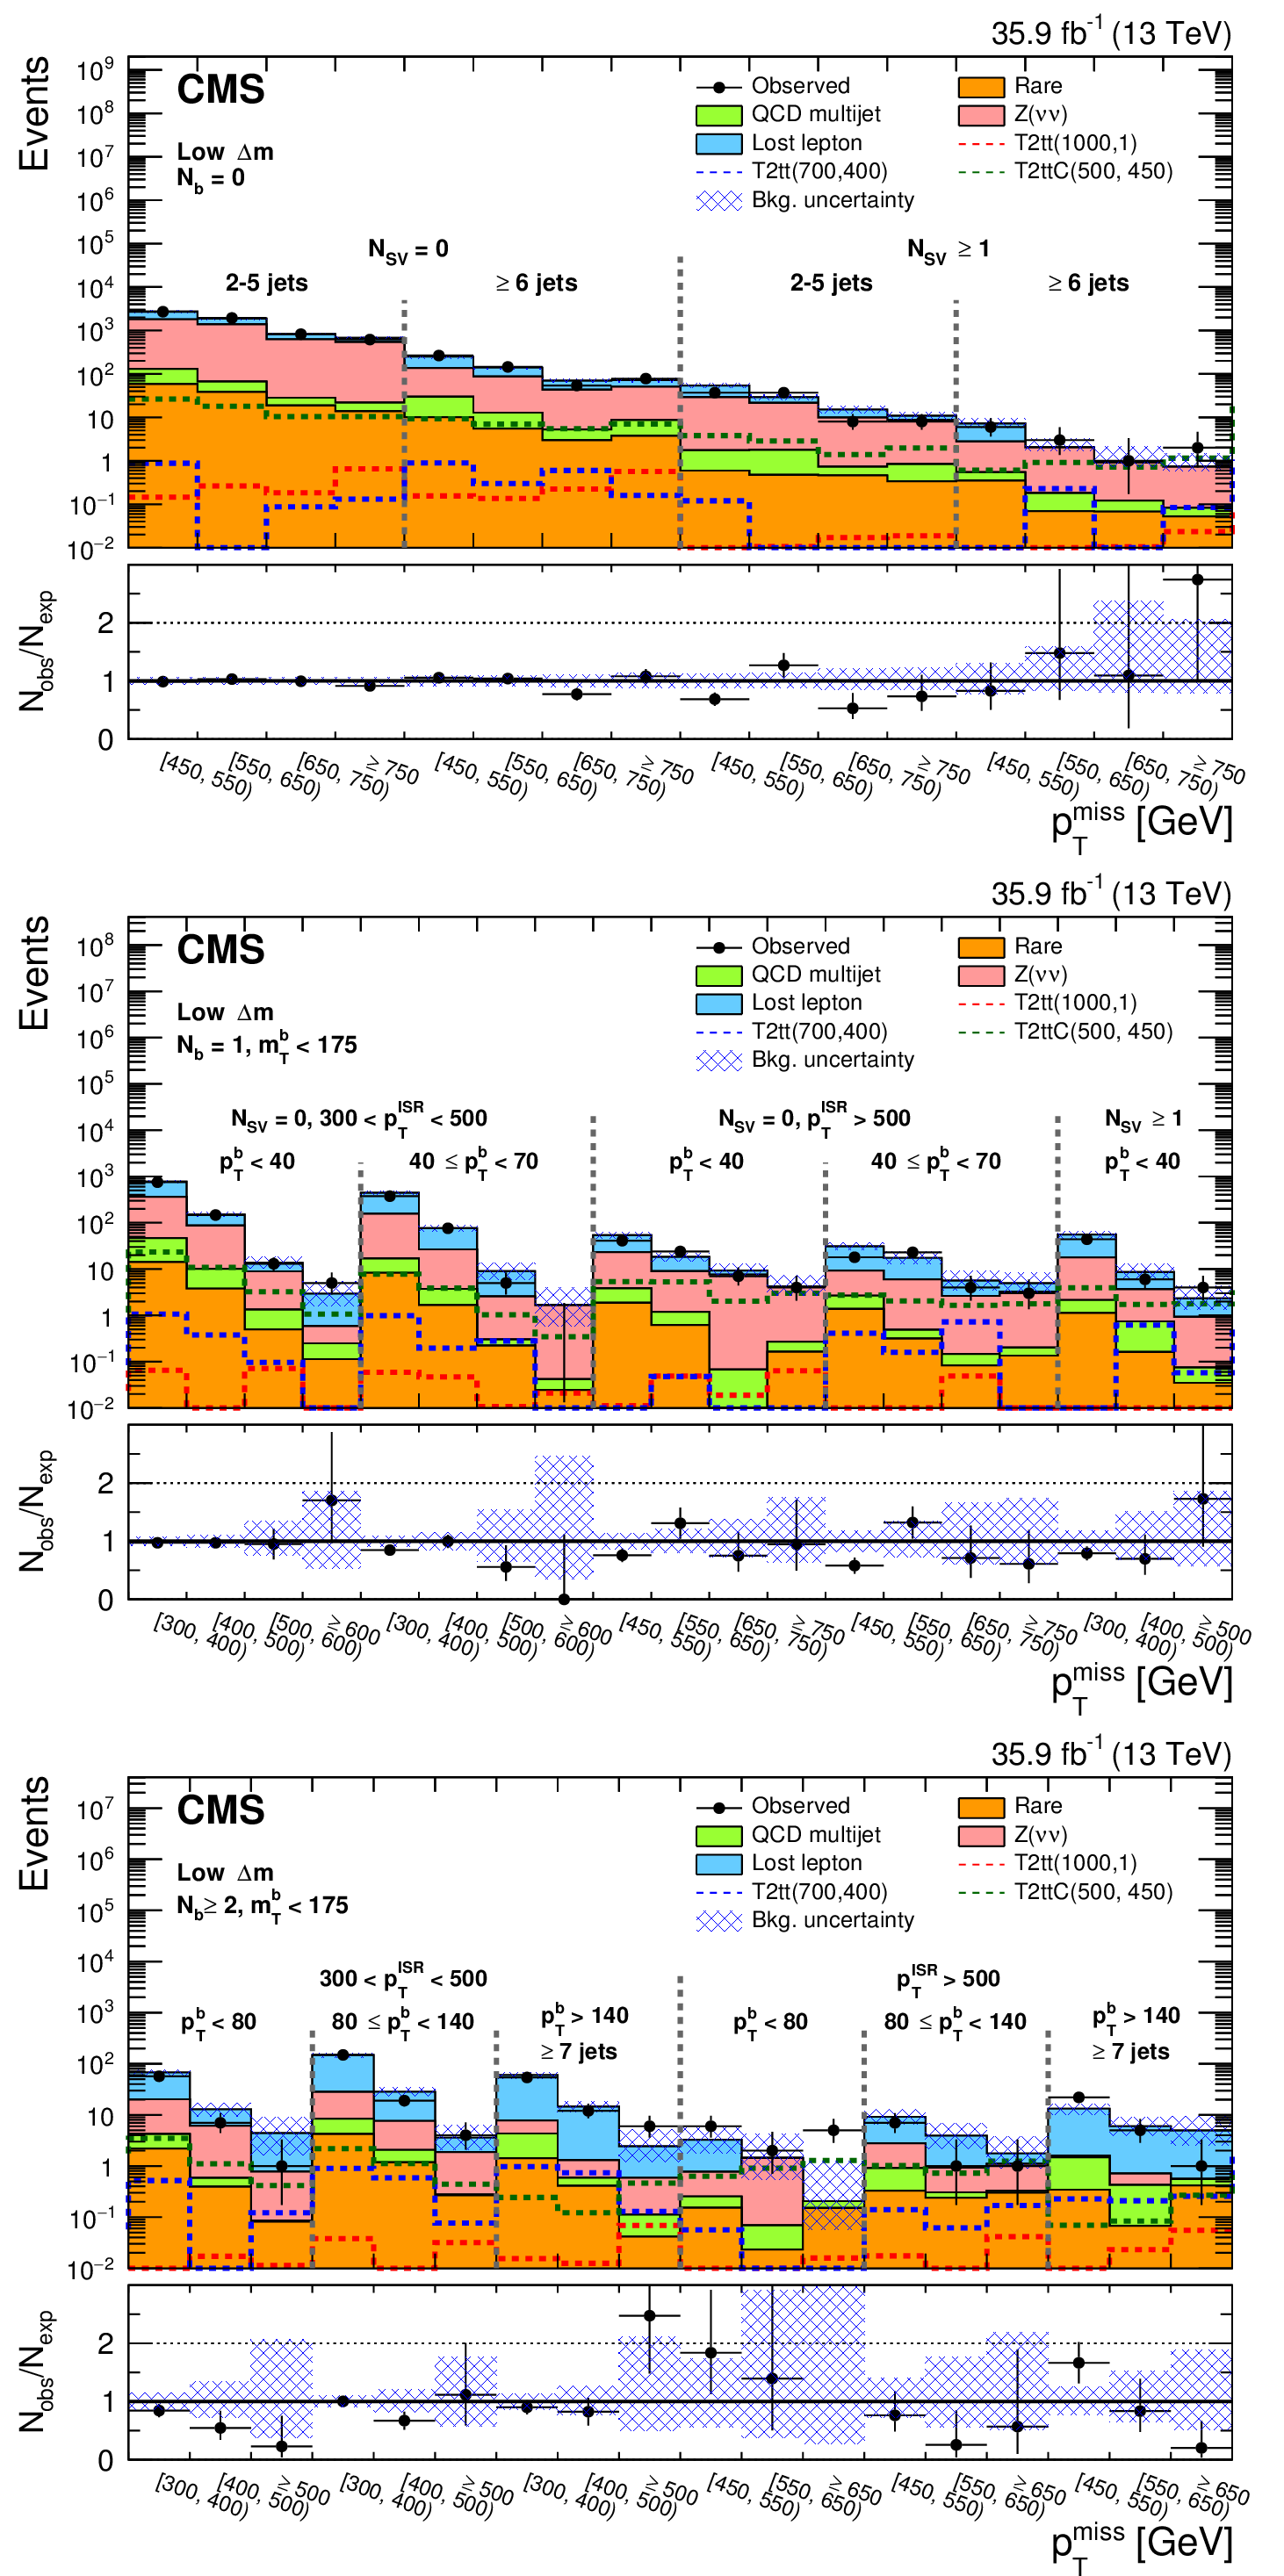
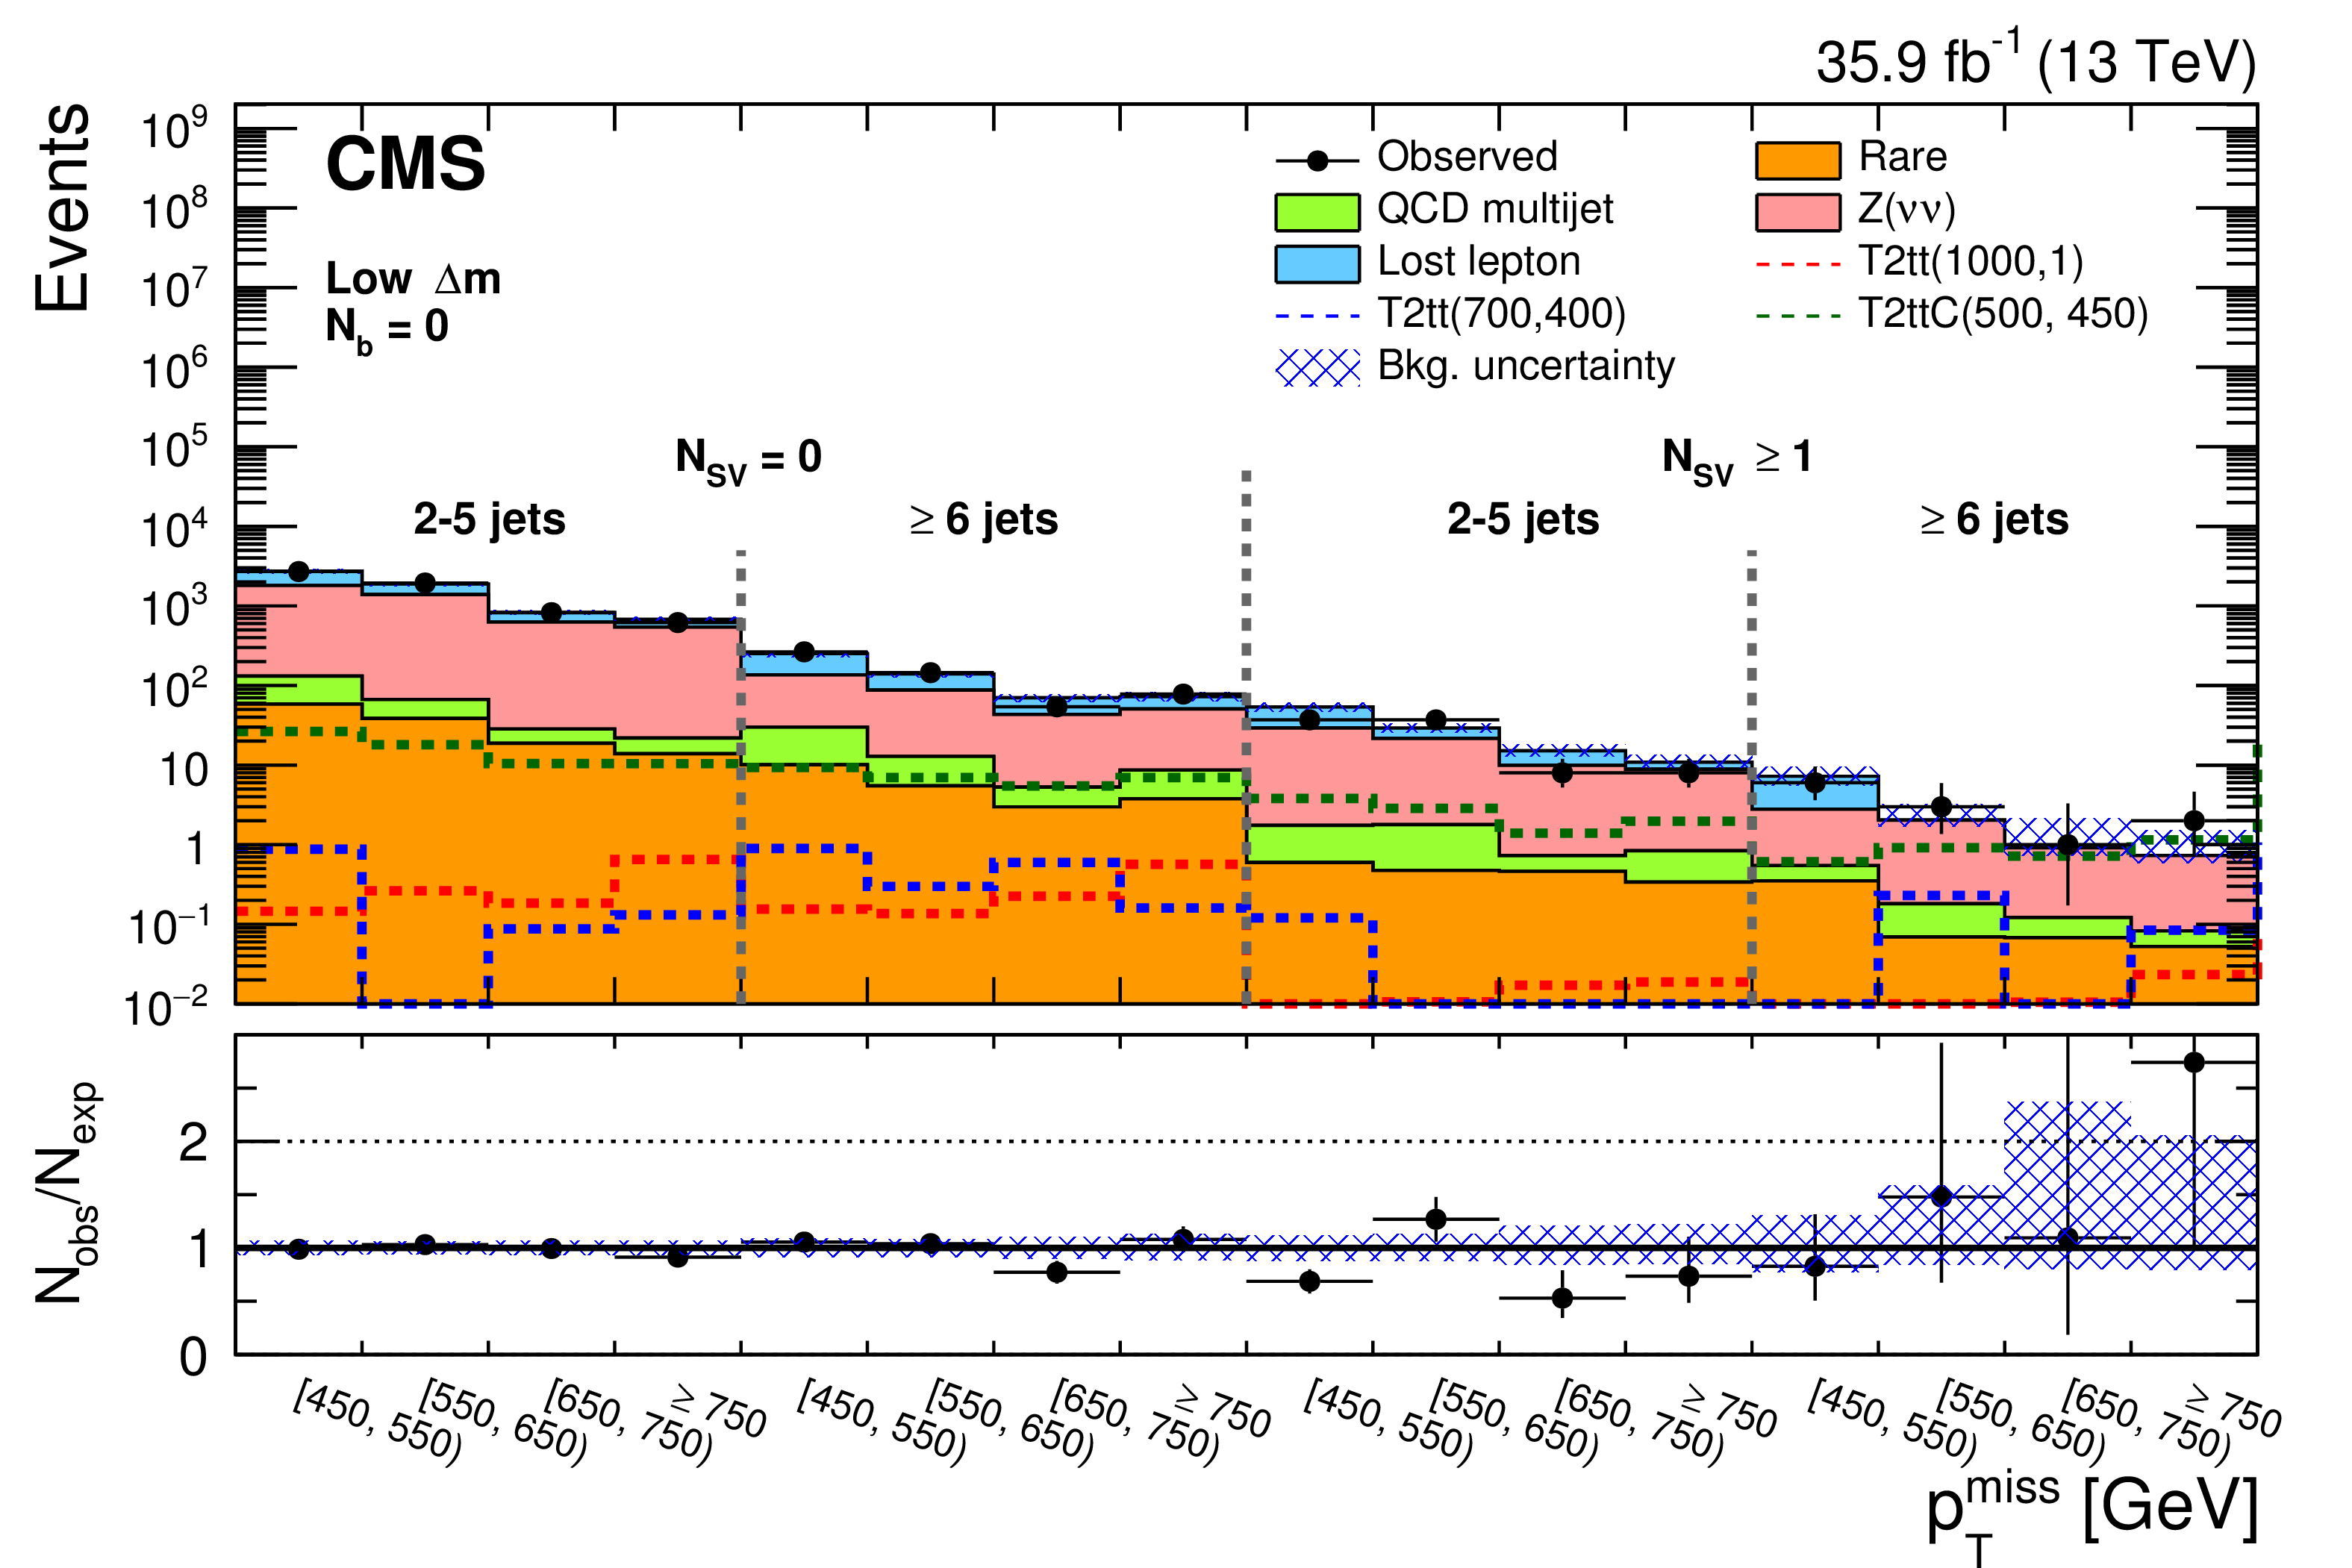
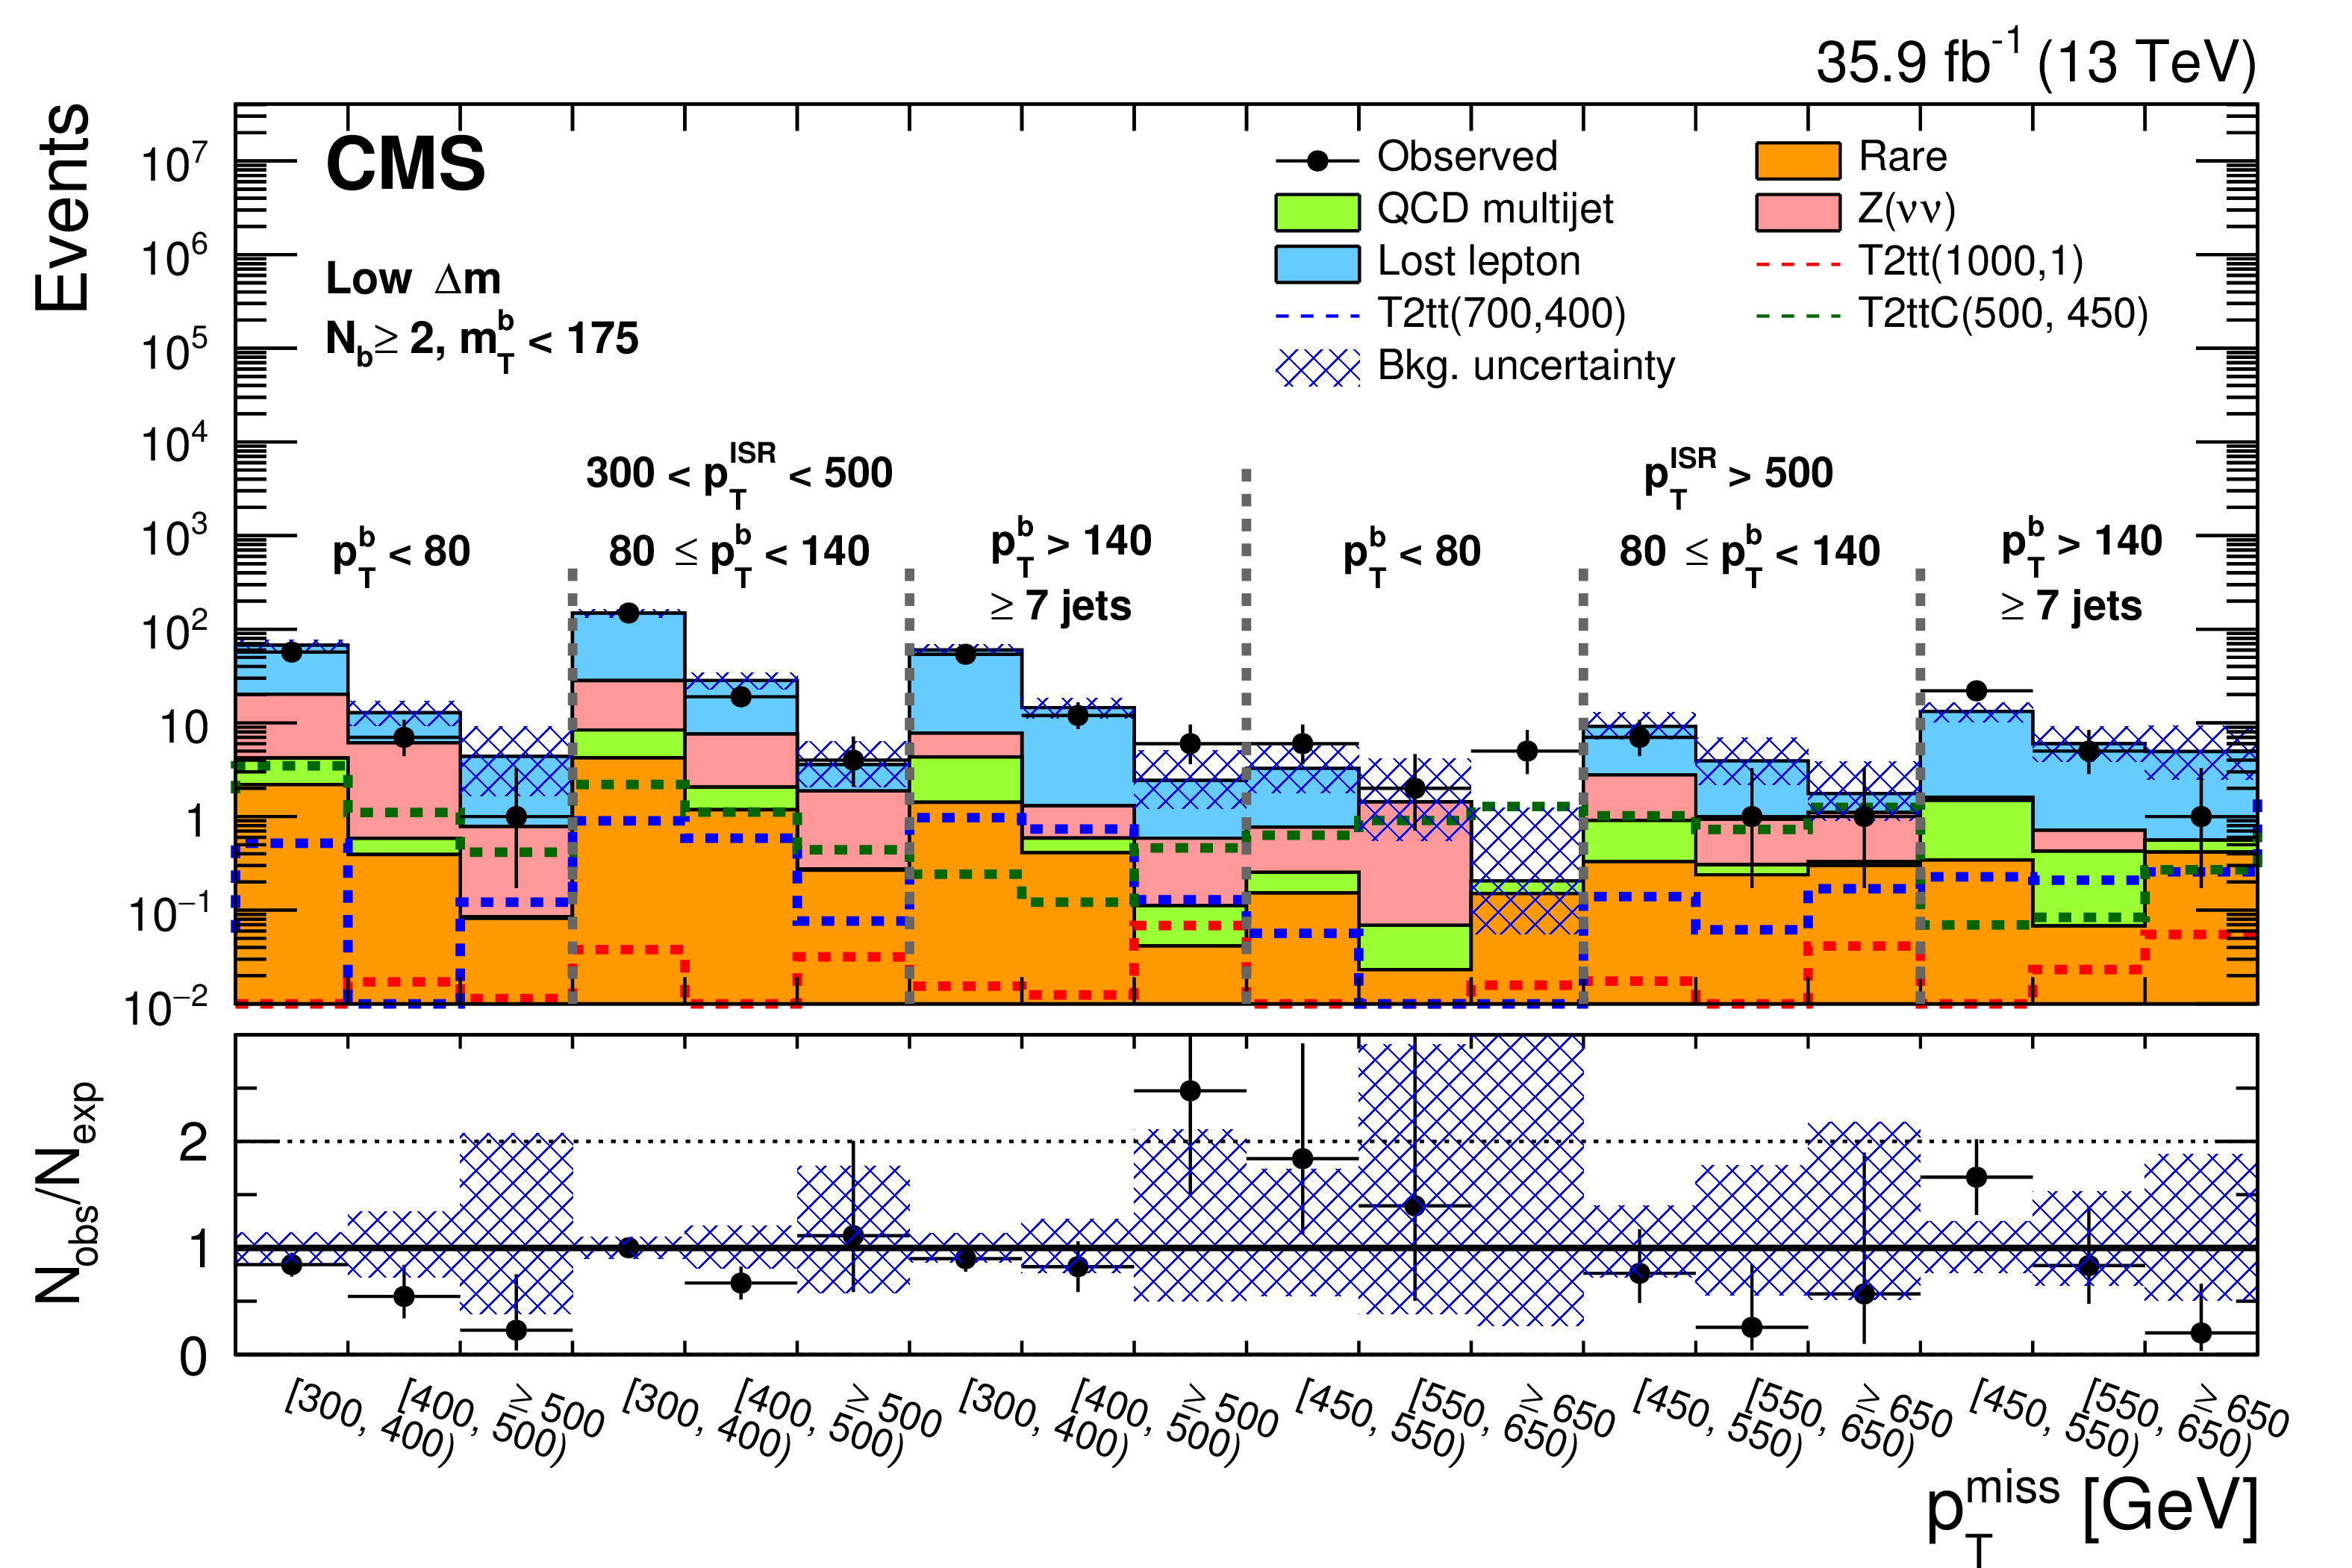
Figure 5:
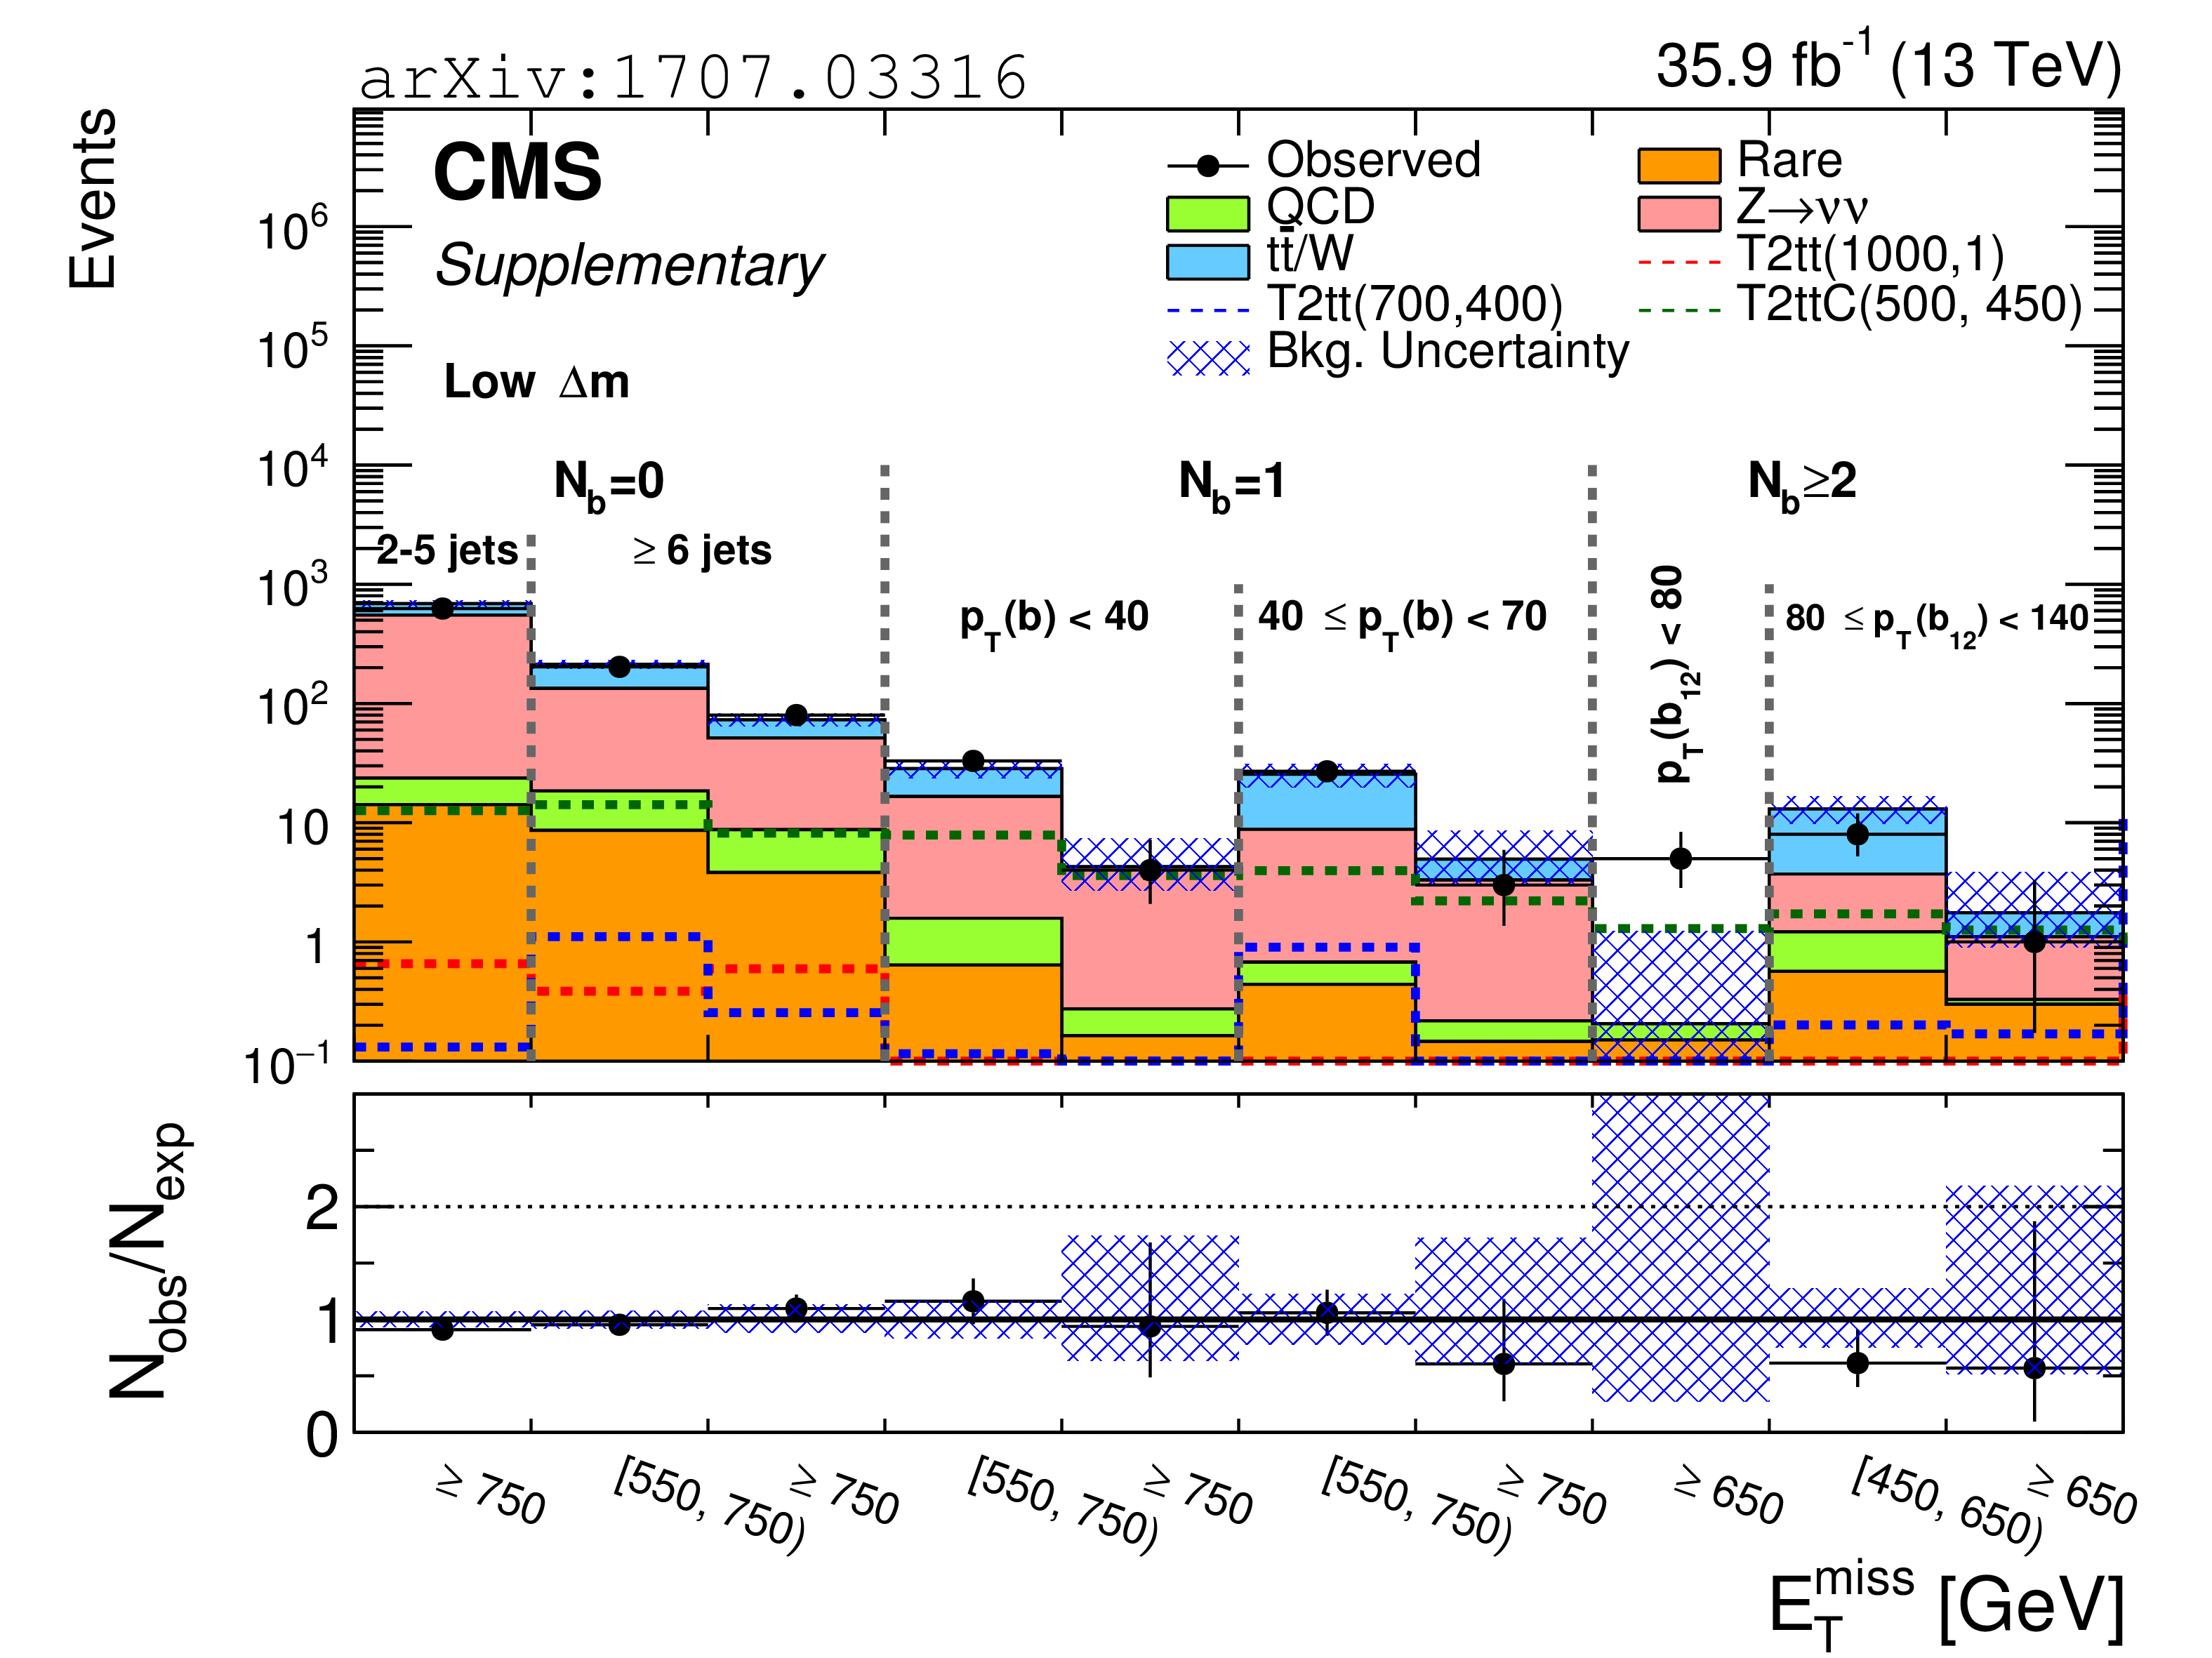
Observed data events and SM background predictions for the low $ {\Delta m} $ search regions with $N_{\mathrm{ b } }=$ 0 (top), $N_{\mathrm{ b } }=$ 1 (middle), and $N_{\mathrm{ b } }\geq $ 2 (bottom). Ratios of the observed to SM predicted event counts are shown in the lower panel of each plot. The shaded blue band represents the combined statistical and systematic uncertainties on the SM predictions. The one SR for which the result is not visible in the lower panel is discussed in the text. Units are GeV. |
png pdf |
Figure 5-a:
Observed data events and SM background predictions for the low $ {\Delta m} $ search regions with $N_{\mathrm{ b } }=$ 0. Ratios of the observed to SM predicted event counts are shown in the lower panel of each plot. The shaded blue band represents the combined statistical and systematic uncertainties on the SM predictions. The one SR for which the result is not visible in the lower panel is discussed in the text. Units are GeV. |

png pdf |
Figure 5-b:
Observed data events and SM background predictions for the low $ {\Delta m} $ search regions with $N_{\mathrm{ b } }=$ 1. Ratios of the observed to SM predicted event counts are shown in the lower panel of each plot. The shaded blue band represents the combined statistical and systematic uncertainties on the SM predictions. The one SR for which the result is not visible in the lower panel is discussed in the text. Units are GeV. |
png pdf |
Figure 5-c:
Observed data events and SM background predictions for the low $ {\Delta m} $ search regions with $N_{\mathrm{ b } }\geq $ 2. Ratios of the observed to SM predicted event counts are shown in the lower panel of each plot. The shaded blue band represents the combined statistical and systematic uncertainties on the SM predictions. The one SR for which the result is not visible in the lower panel is discussed in the text. Units are GeV. |

png pdf |
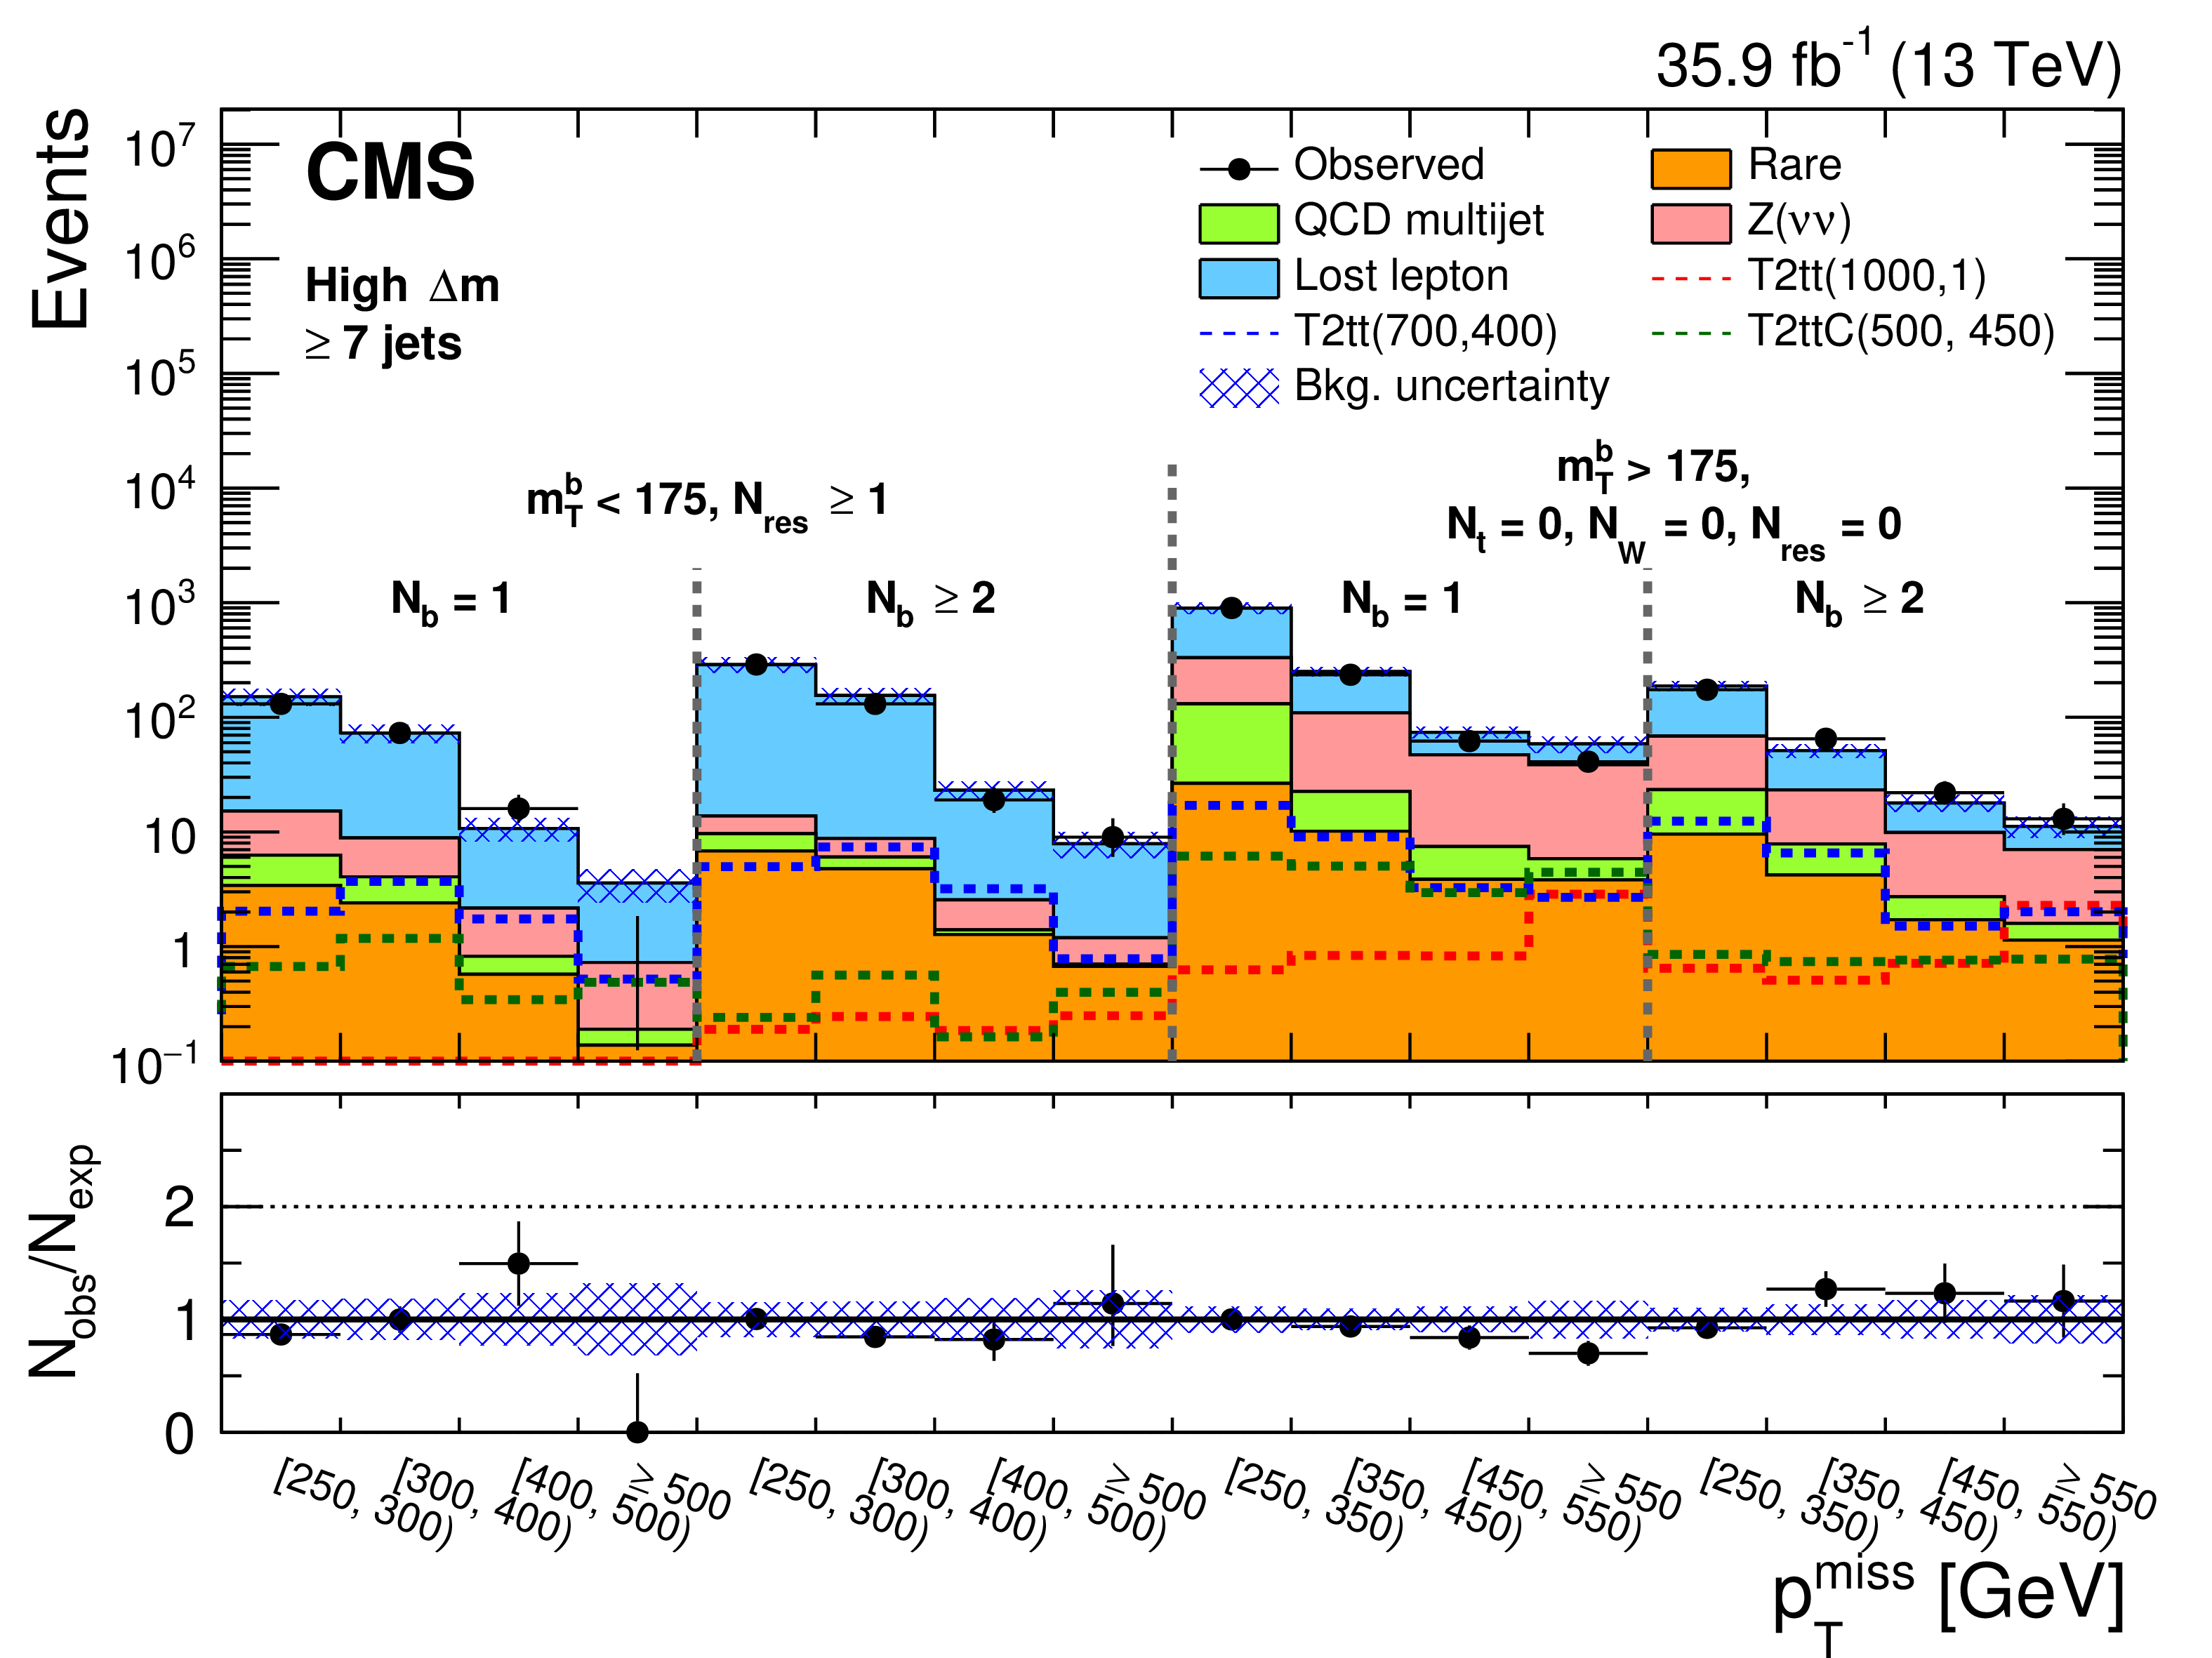
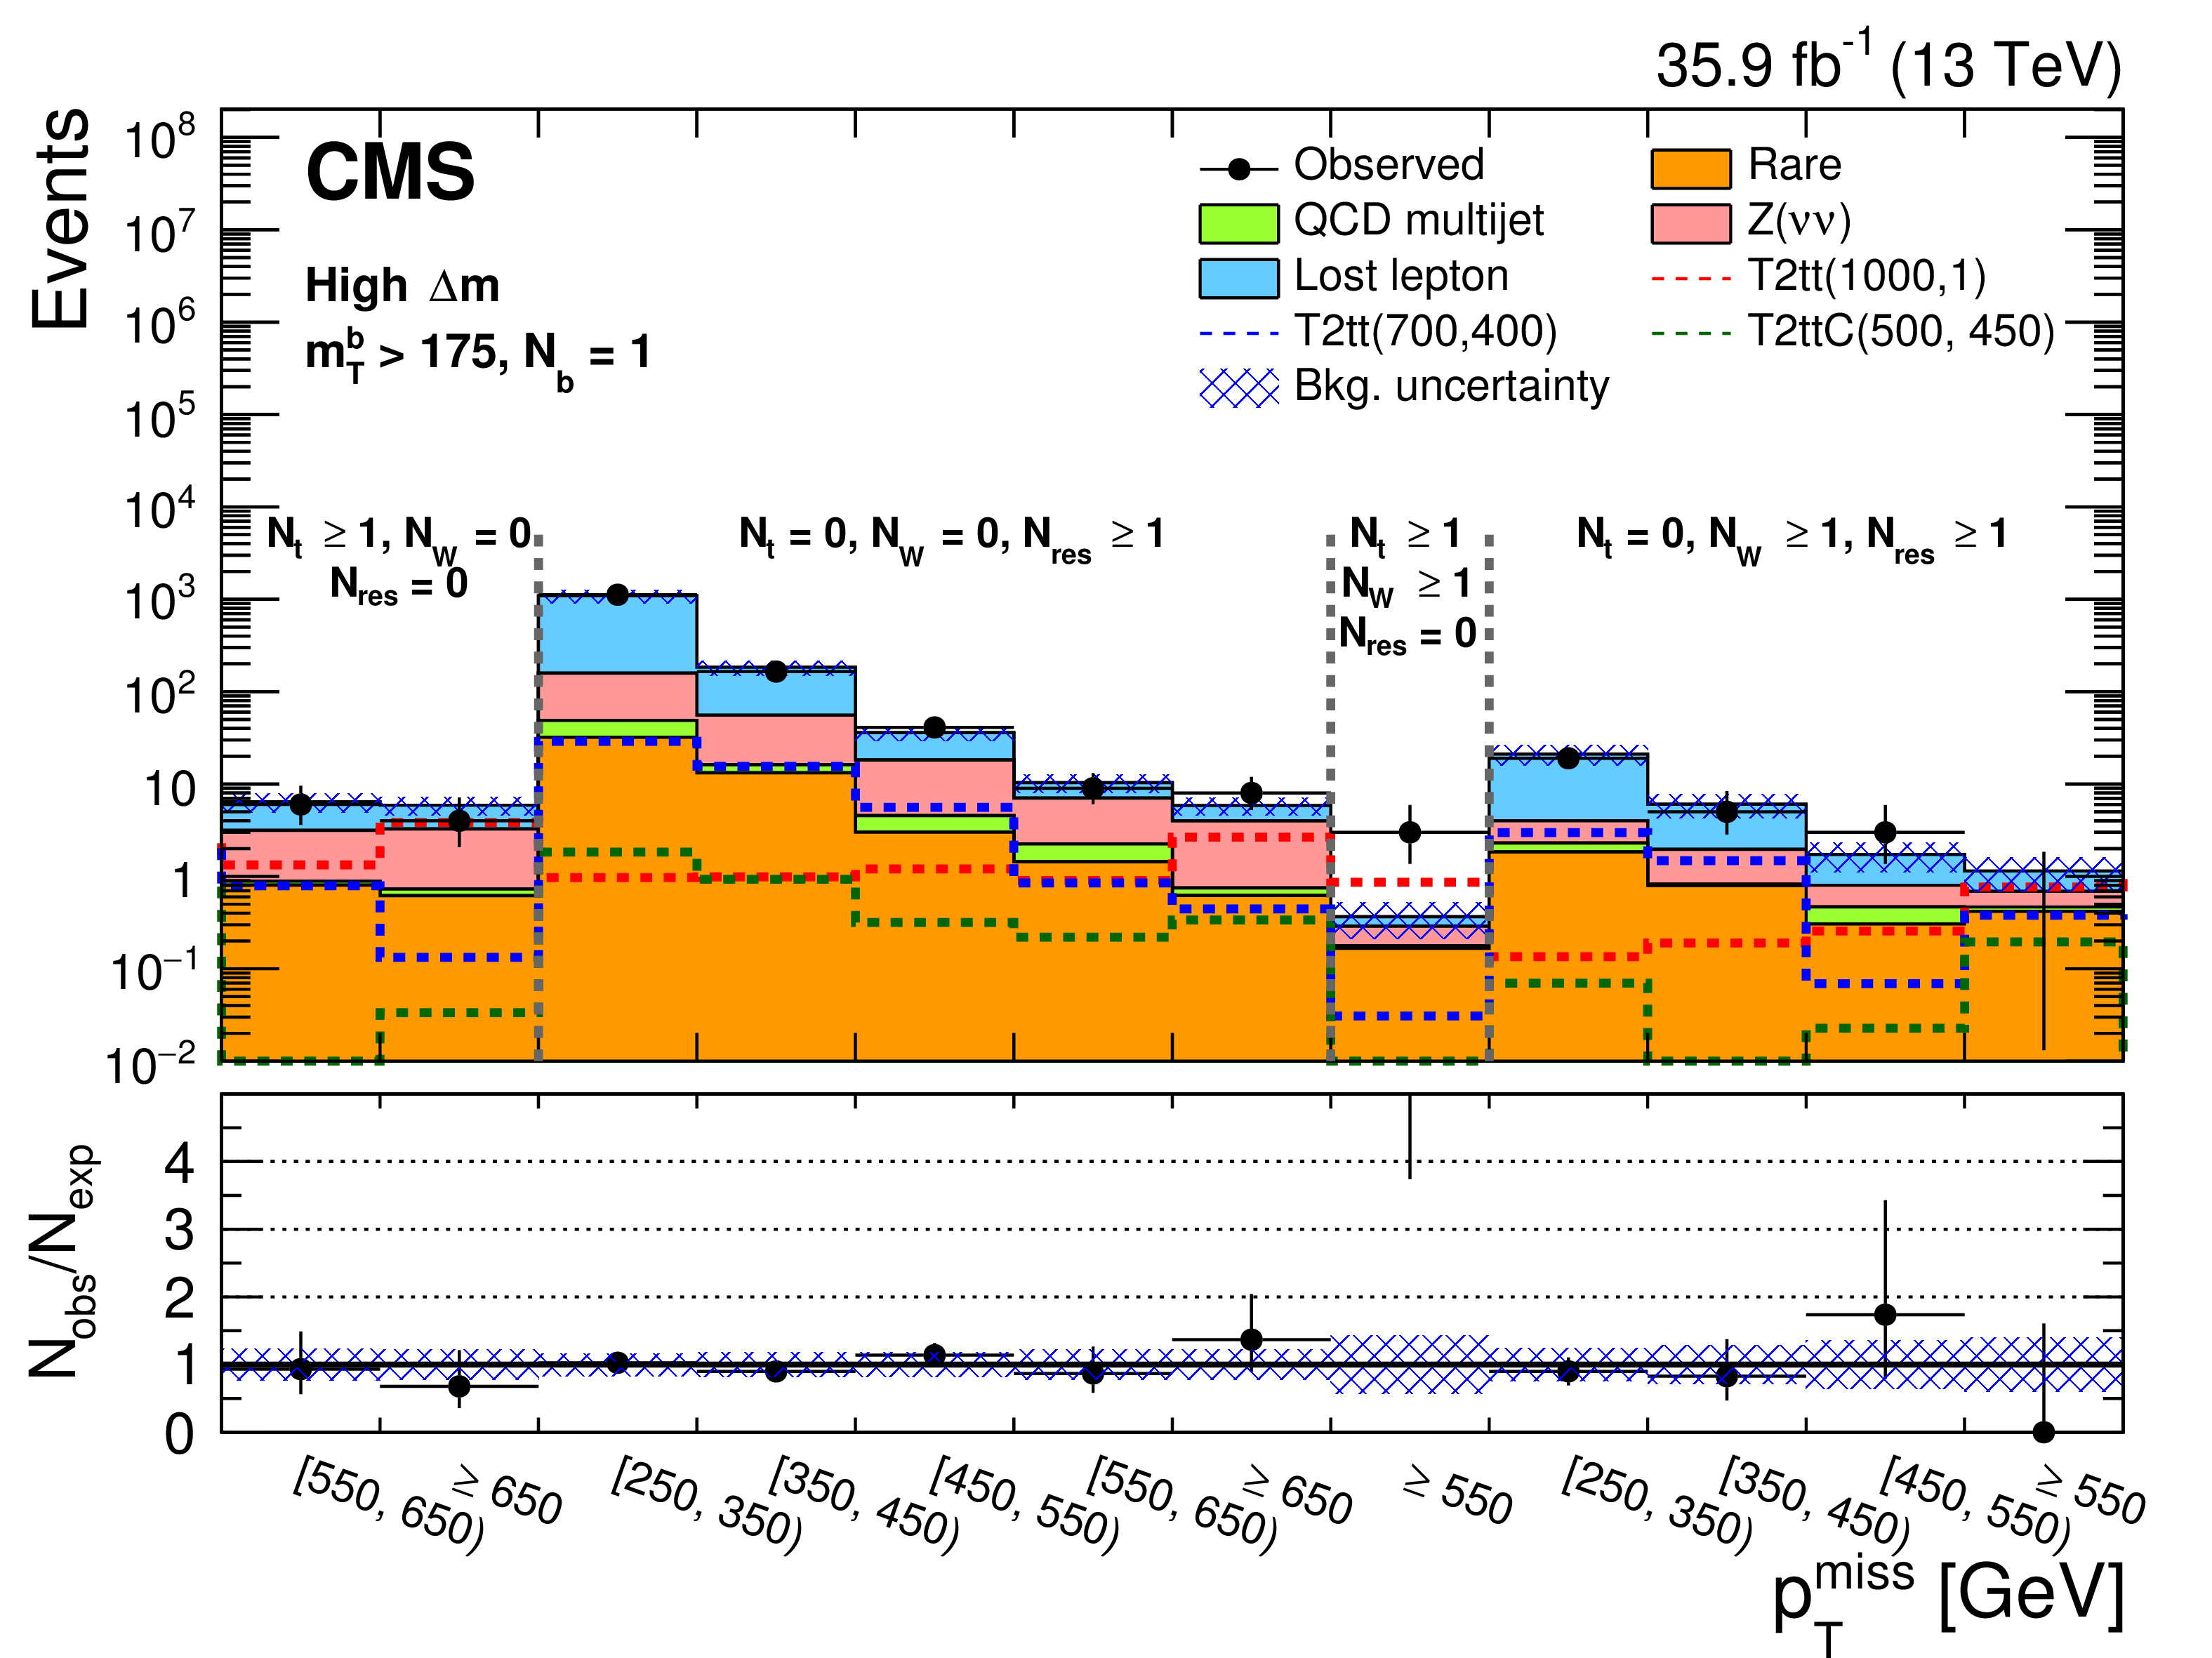
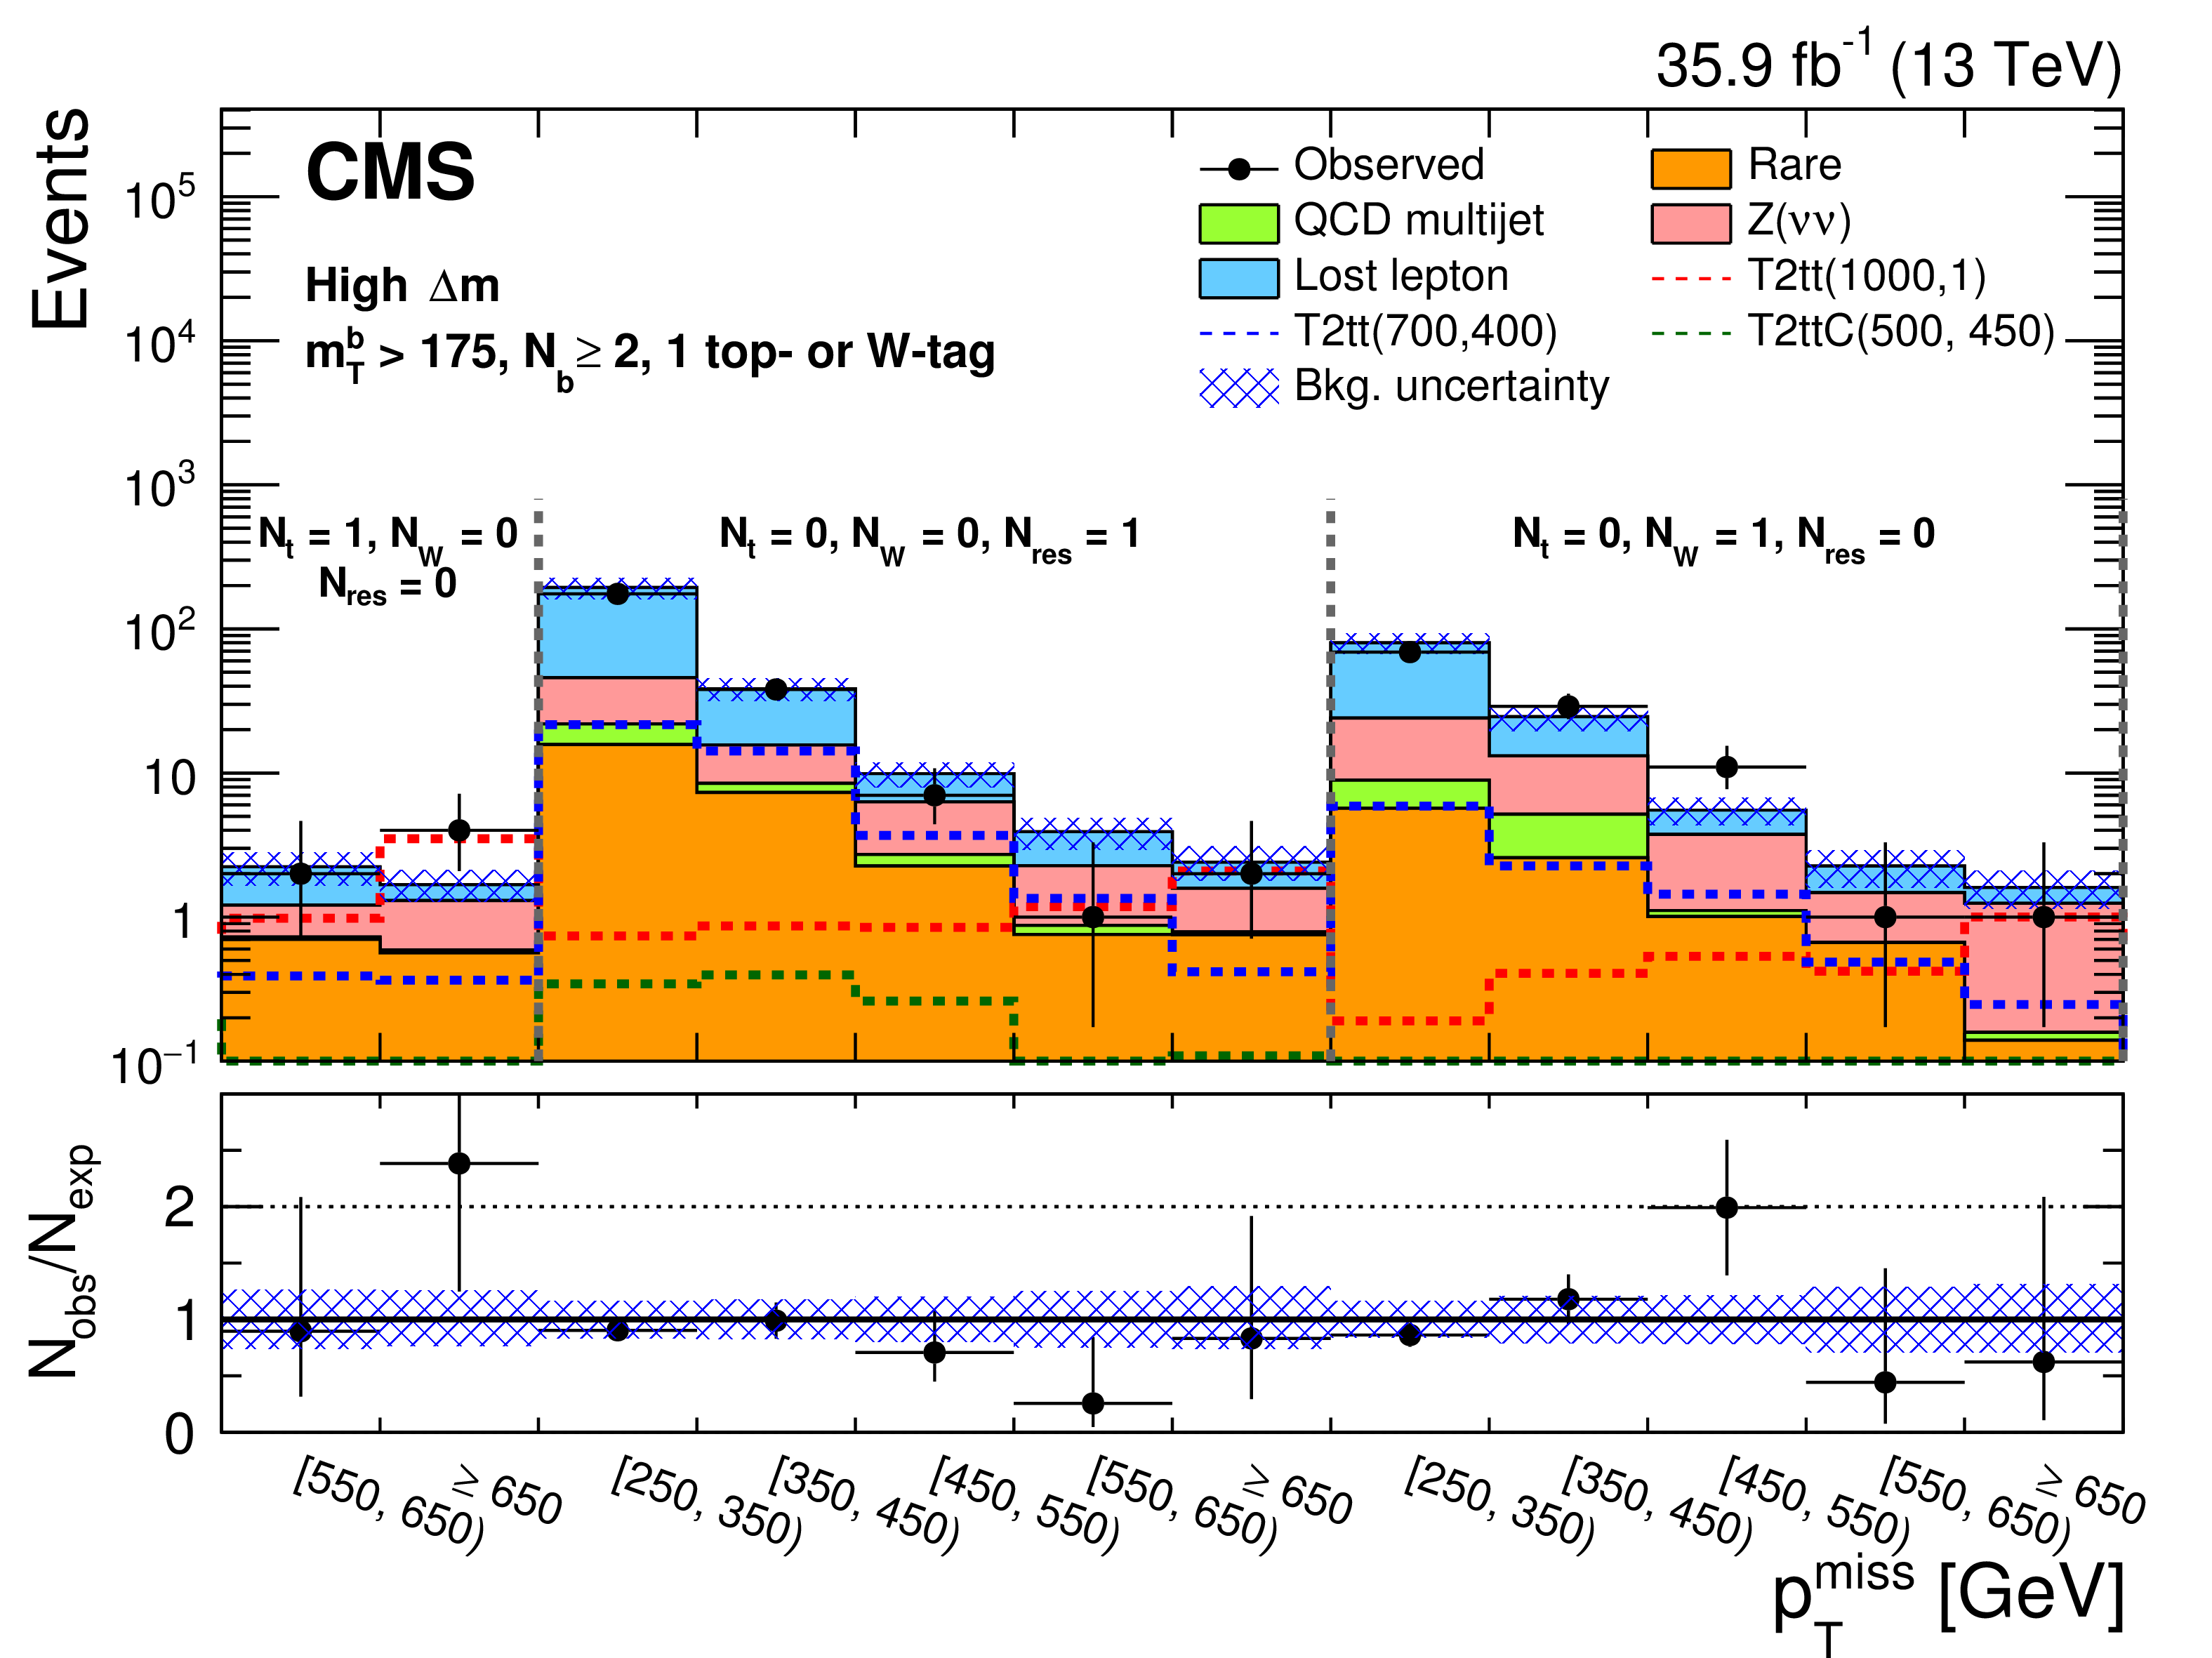
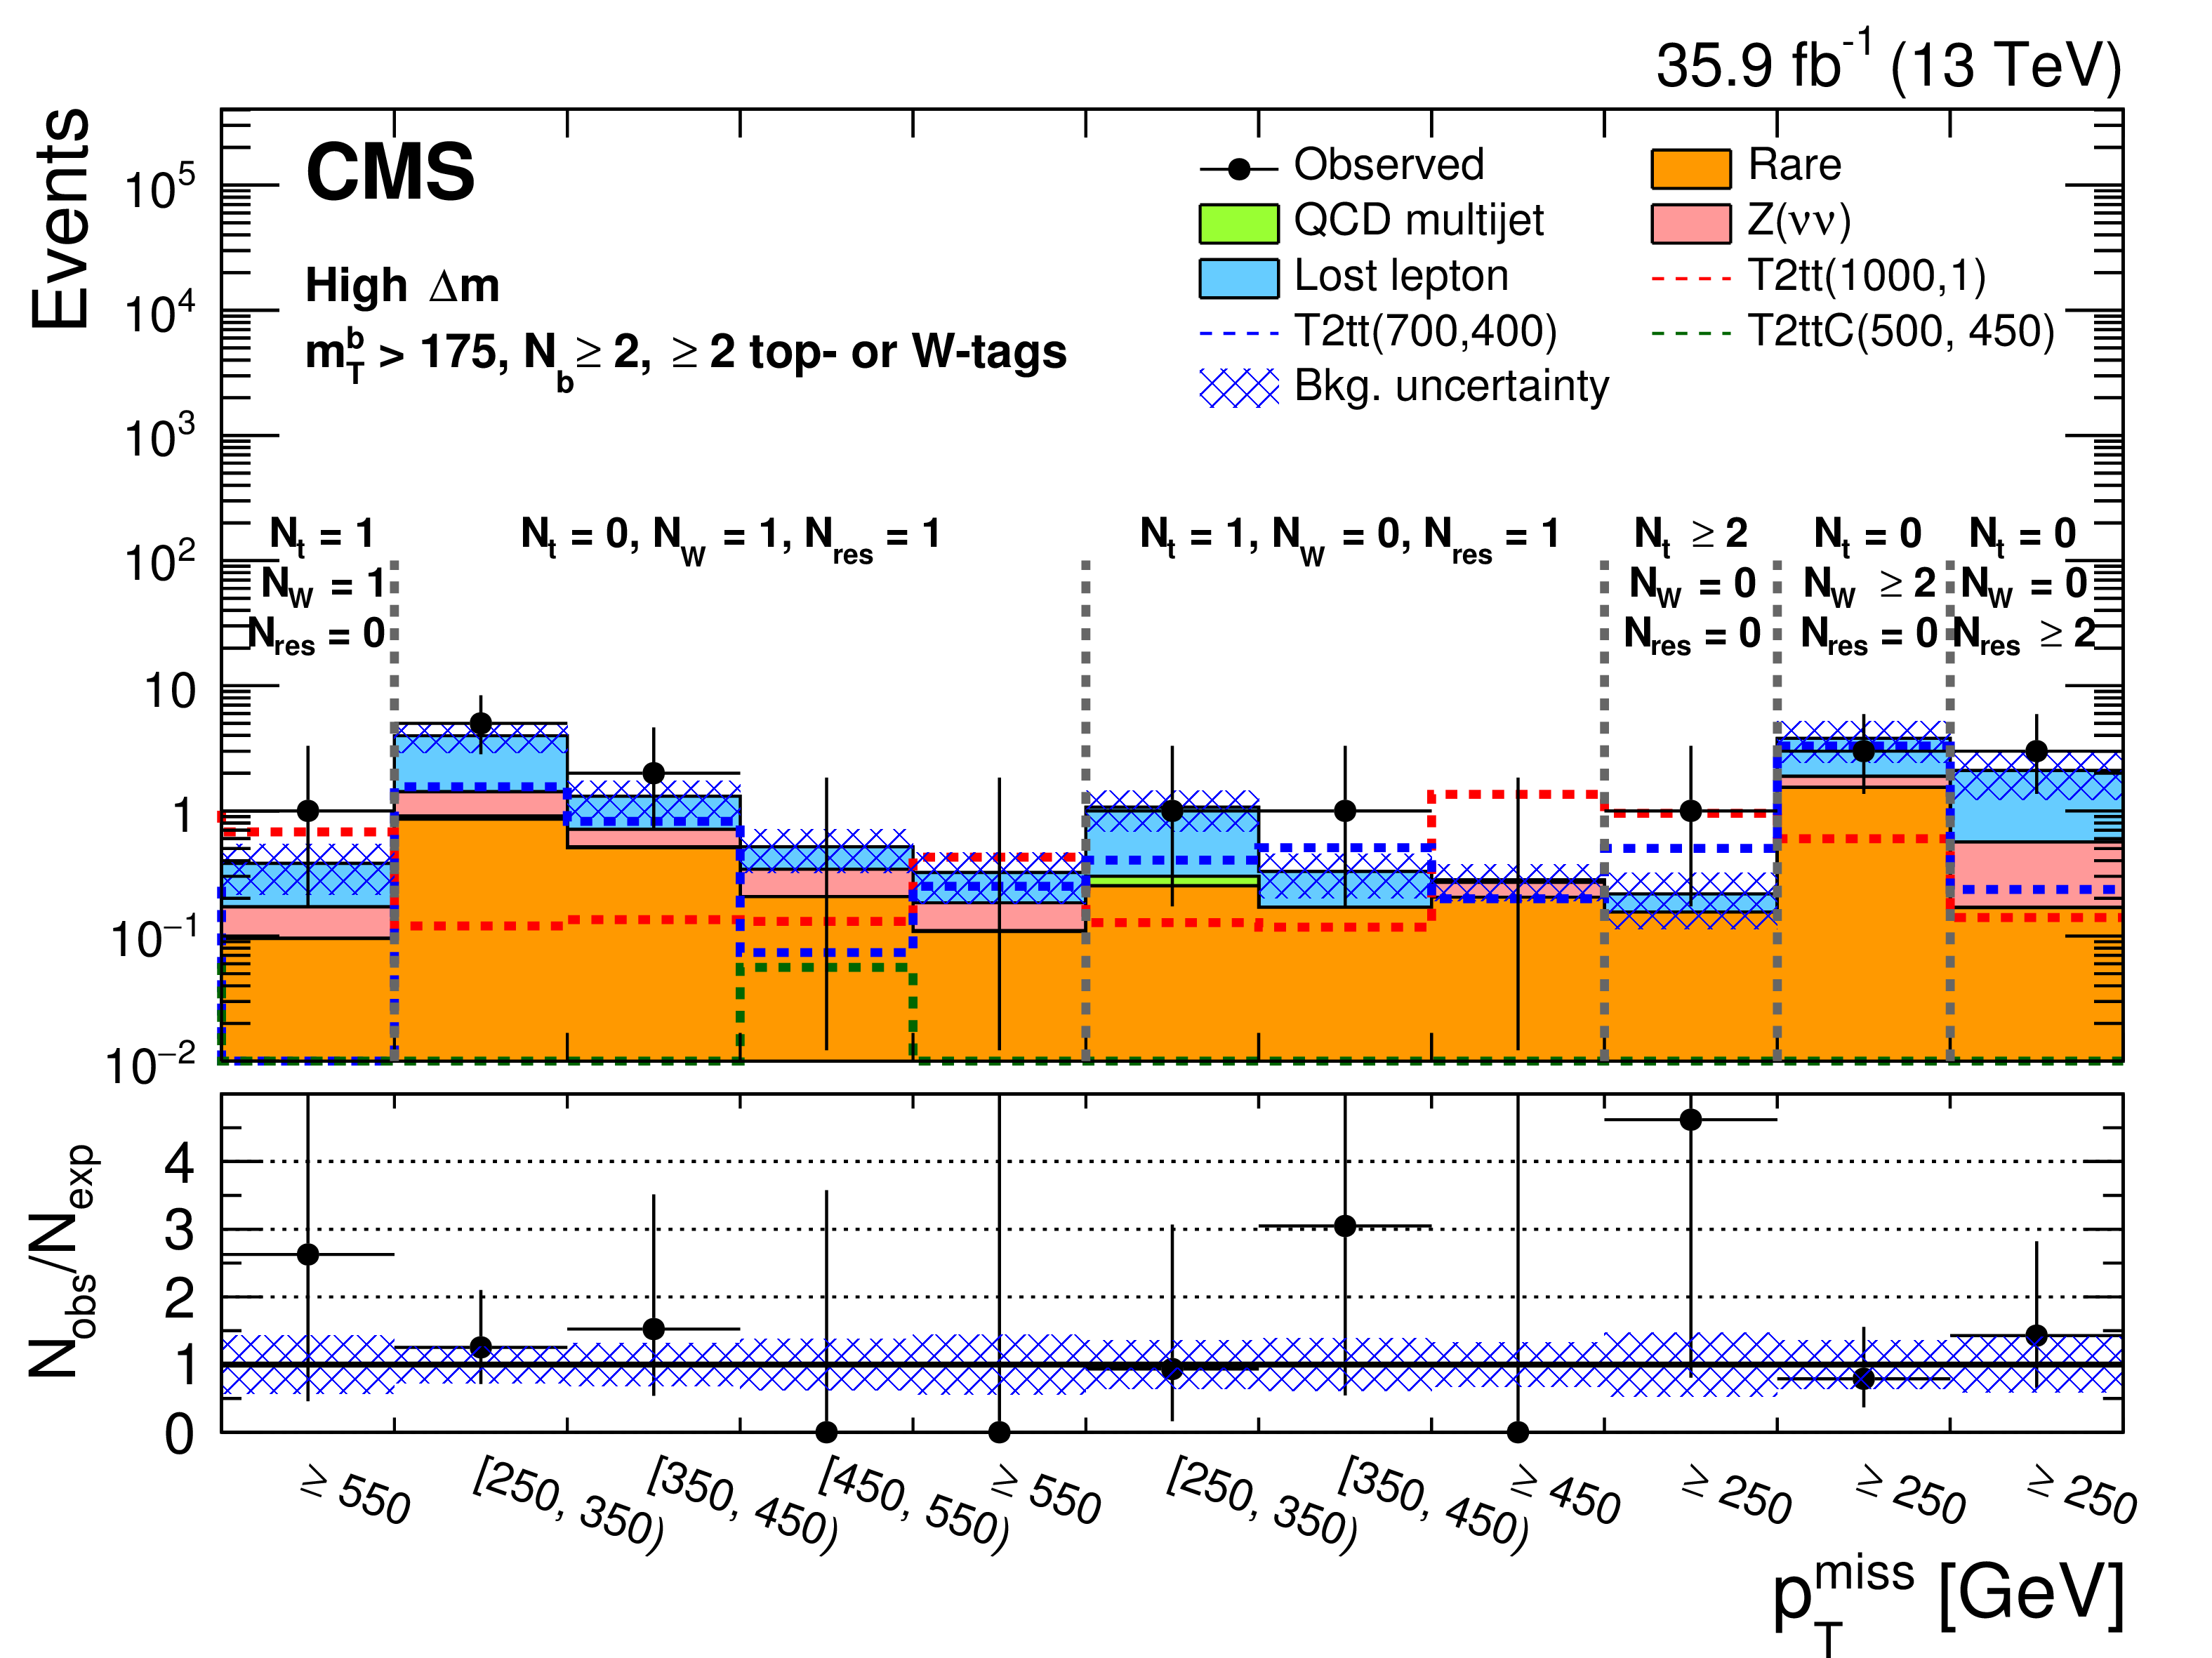
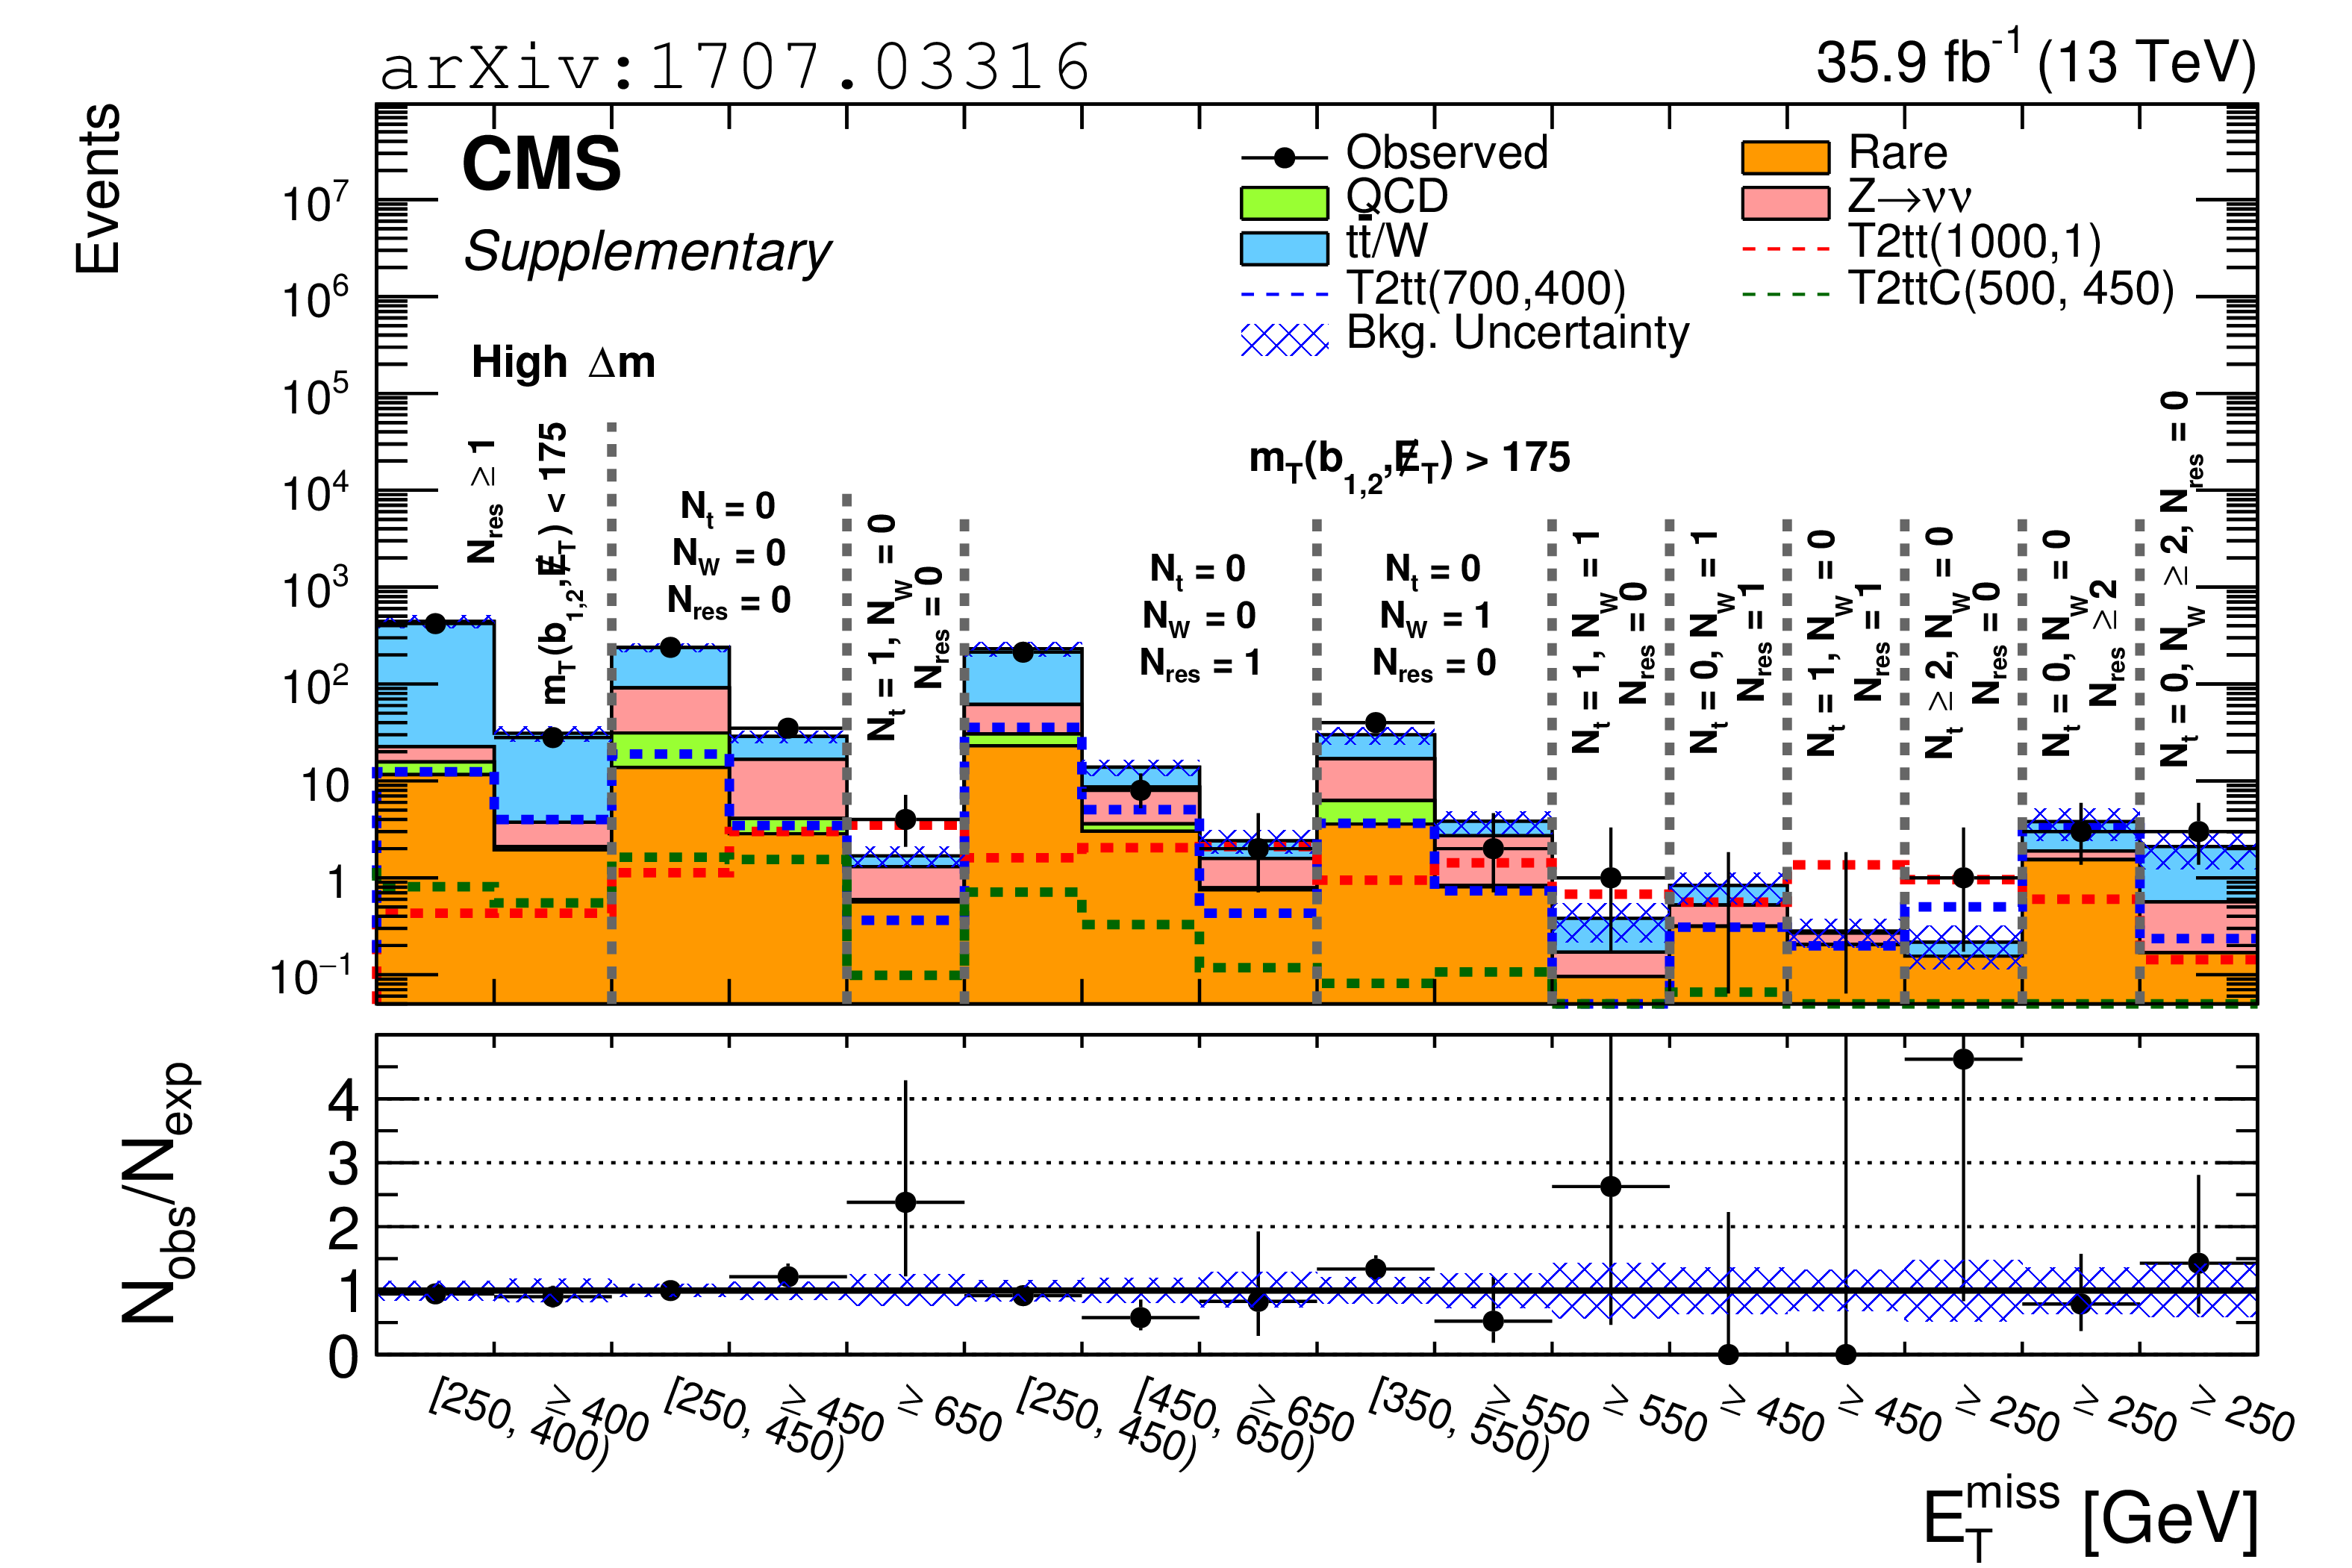
Figure 6:
Observed data events and SM background predictions for the high $ {\Delta m} $ search regions. Details of the selection applied is displayed on each plot. Ratios of the observed to SM predicted event counts are shown in the lower panel of each plot. The shaded blue band represents the statistical and systematic uncertainty on the prediction. The one SR for which the result is not visible in the lower panel is discussed in the text. Units are GeV. |
png pdf |
Figure 6-a:
Observed data events and SM background predictions for one the high $ {\Delta m} $ search regions. Details of the selection applied is displayed on the plot. Ratios of the observed to SM predicted event counts are shown in the lower panel. The shaded blue band represents the statistical and systematic uncertainty on the prediction. Units are GeV. |
png pdf |
Figure 6-b:
Observed data events and SM background predictions for one the high $ {\Delta m} $ search regions. Details of the selection applied is displayed on the plot. Ratios of the observed to SM predicted event counts are shown in the lower panel. The shaded blue band represents the statistical and systematic uncertainty on the prediction. Units are GeV. |
png pdf |
Figure 6-c:
Observed data events and SM background predictions for one the high $ {\Delta m} $ search regions. Details of the selection applied is displayed on the plot. Ratios of the observed to SM predicted event counts are shown in the lower panel. The shaded blue band represents the statistical and systematic uncertainty on the prediction. Units are GeV. |
png pdf |
Figure 6-d:
Observed data events and SM background predictions for one the high $ {\Delta m} $ search regions. Details of the selection applied is displayed on the plot. Ratios of the observed to SM predicted event counts are shown in the lower panel. The shaded blue band represents the statistical and systematic uncertainty on the prediction. Units are GeV. |
png pdf root |
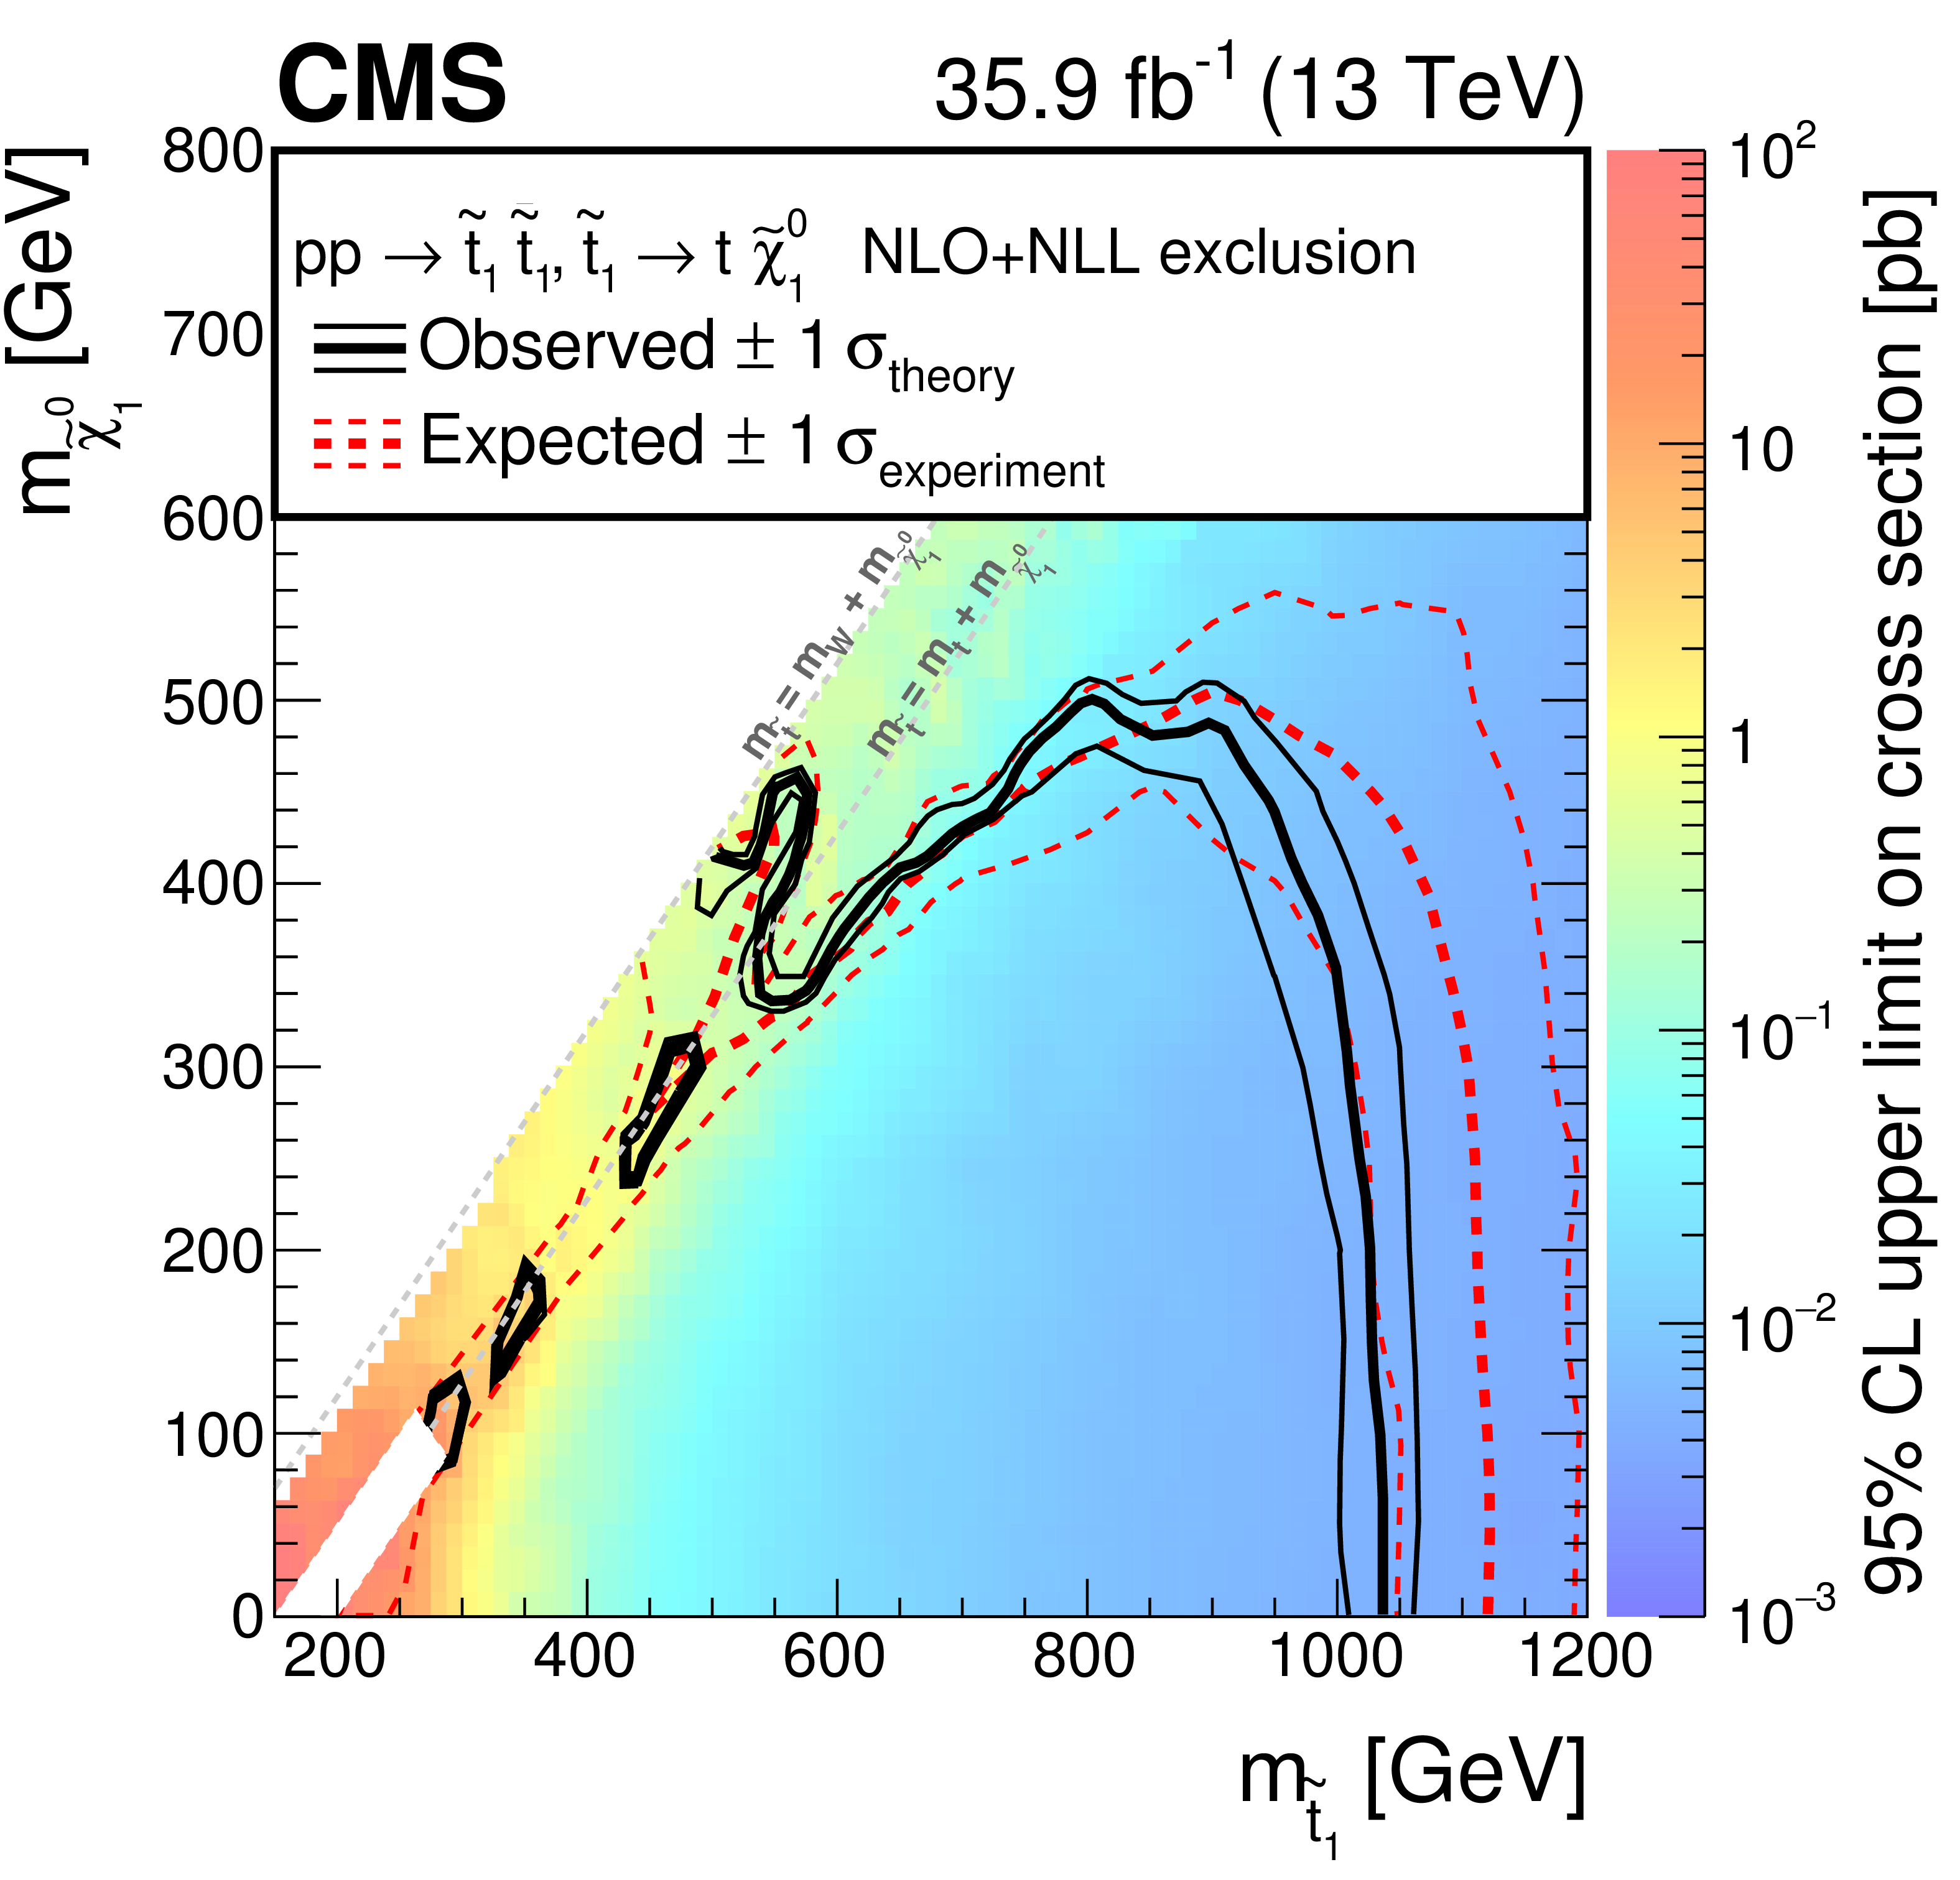
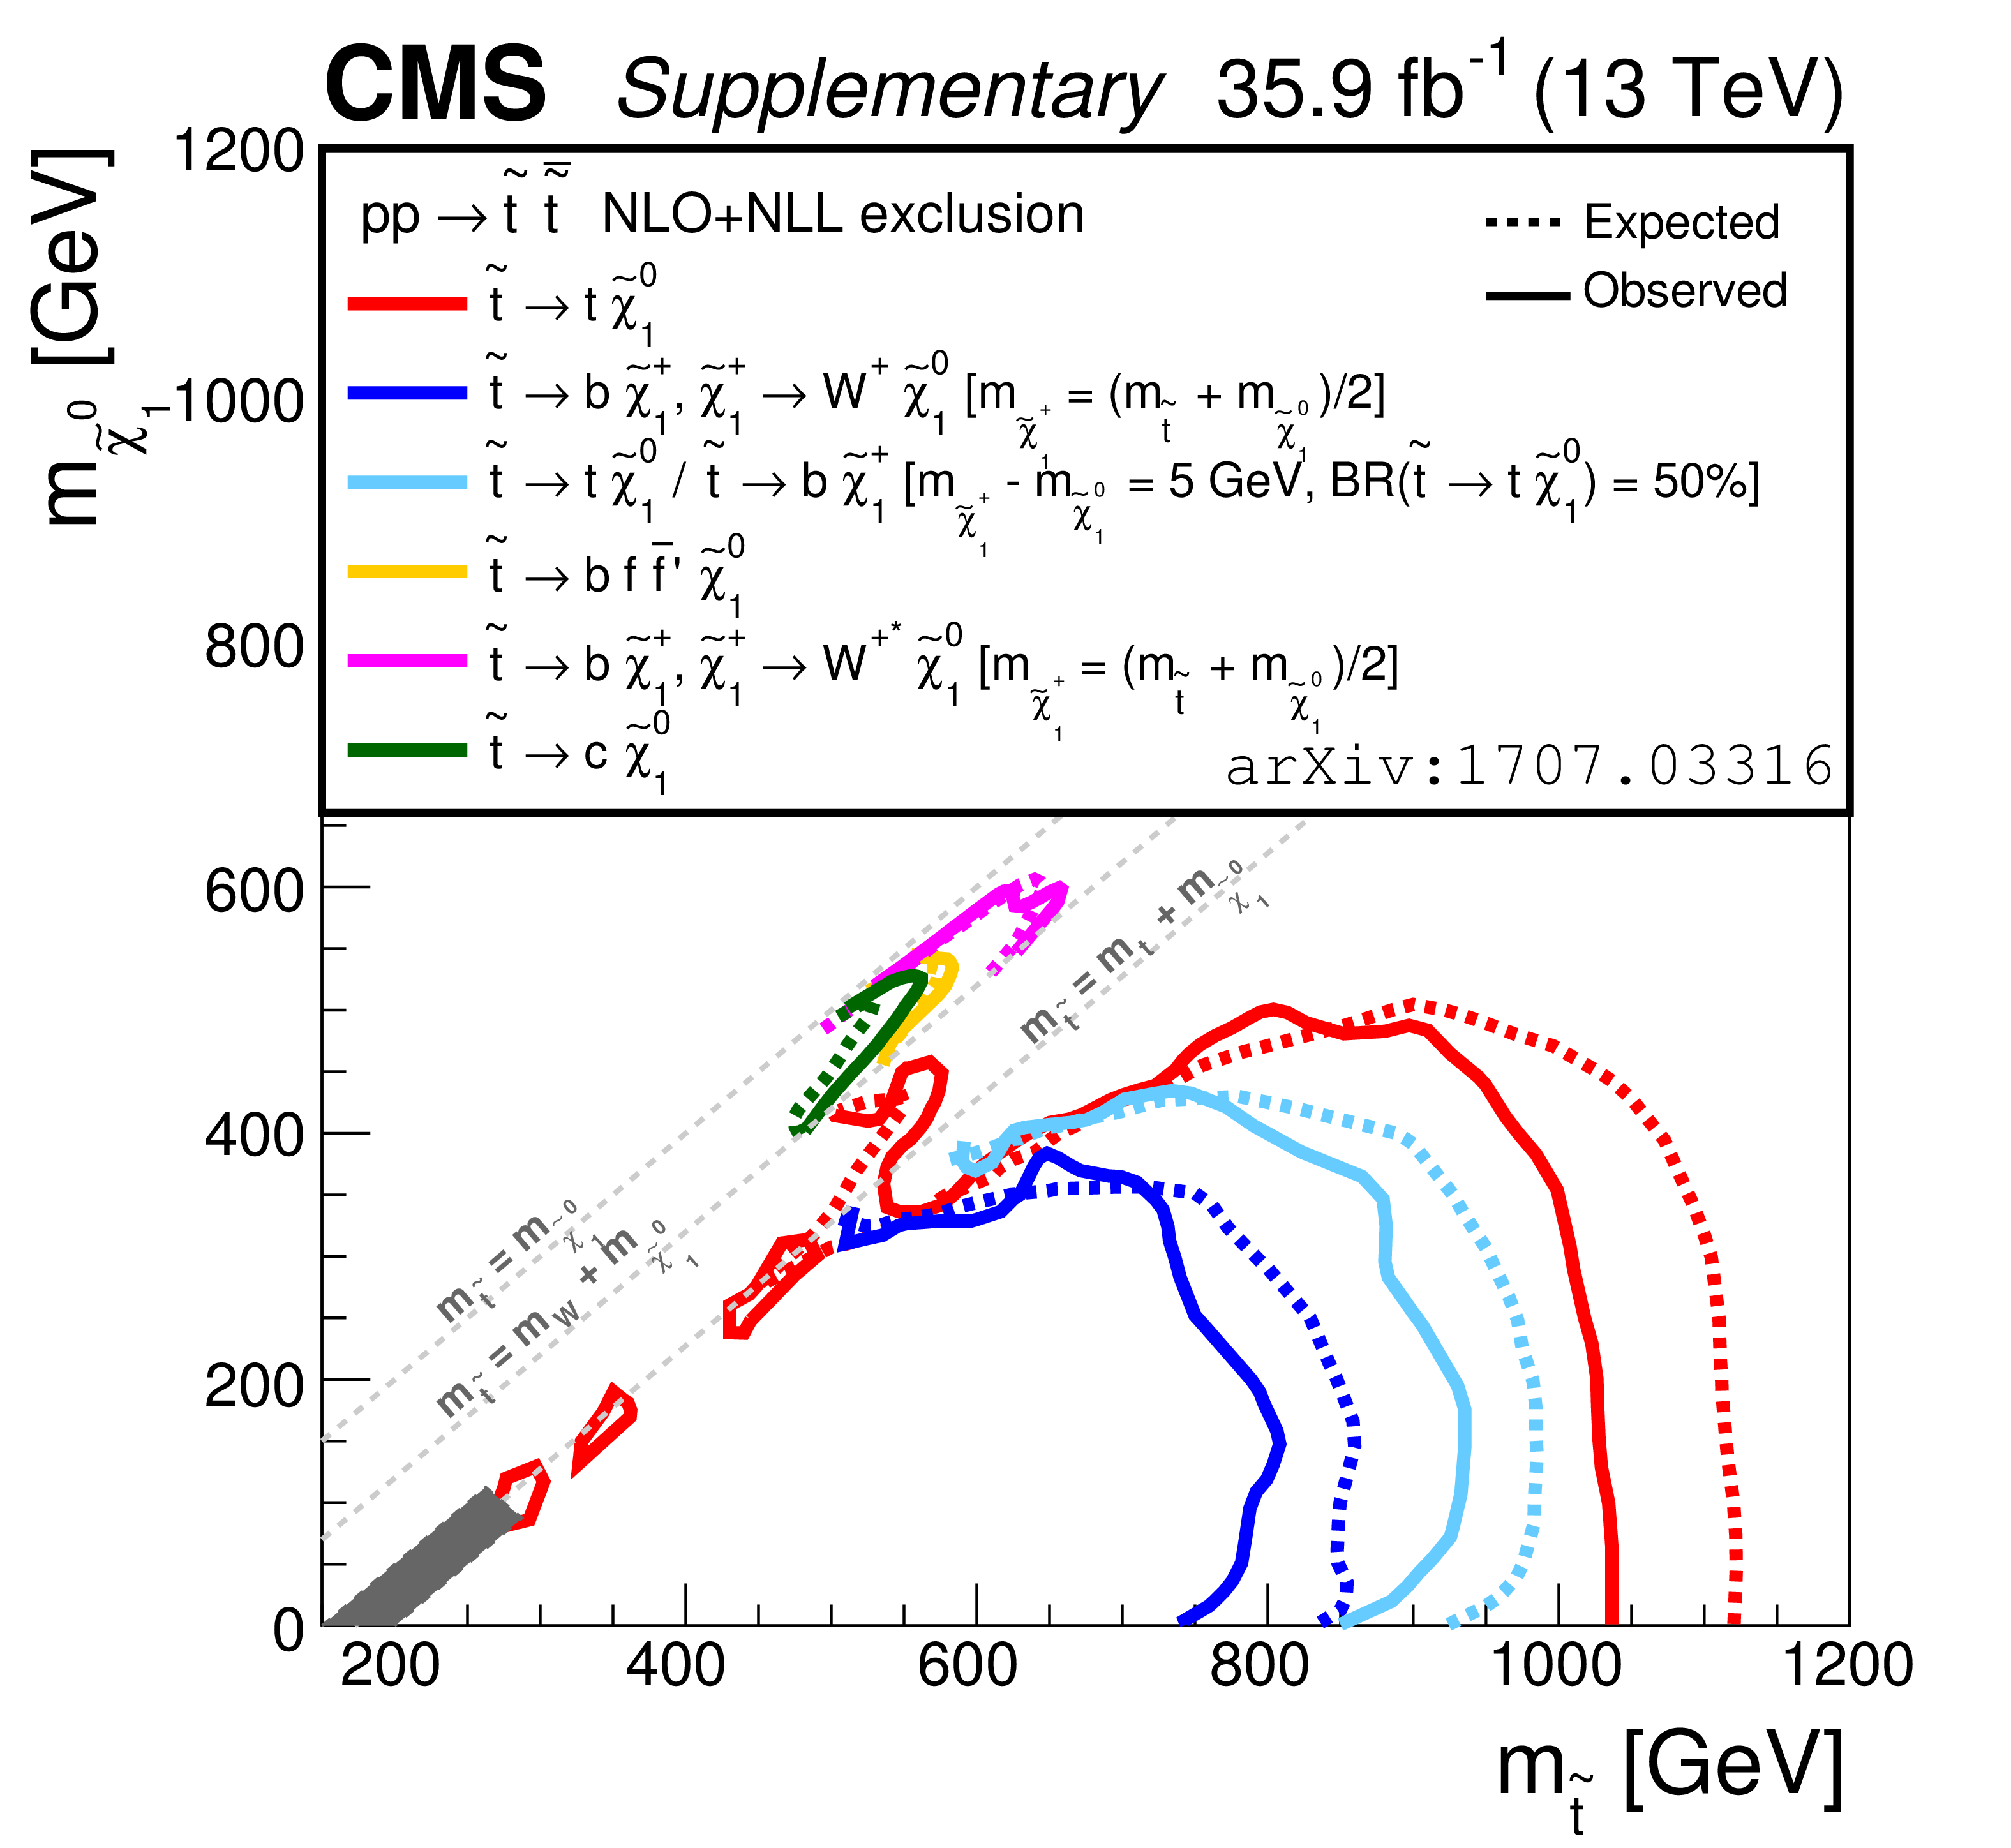
Figure 7:
Exclusion limits at 95% CL for top squark pair production followed by the decay $\tilde{ \mathrm{ t } } _{1}\to \mathrm{ t } \tilde{\chi}^0_1 $ (T2tt), in the mass plane $m_{\tilde{\chi}^0_1 }$ versus $m_{\tilde{ \mathrm{ t } } _{1}}$. The areas to the left and below the solid black curves represent the observed exclusion and the $\pm $1 standard deviation contours for the NLO+NLL cross section calculations and their uncertainties [63]. The dashed red curves represent the corresponding expectation at 95% CL and $\pm $1 standard deviation contours for the associated experimental uncertainties. The "islands" represent regions that are not excluded by this search. The diagonal area where $ {\Delta m} $ is very close to the top quark mass, corresponding to a very light $ \tilde{\chi}^0_1 $, is left blank because the final states, which are similar to the SM ${\mathrm{ t } {}\mathrm{ \bar{t} } }$ background, have acceptance that varies strongly with $ \tilde{\chi}^0_1 $ mass, making it very difficult to model the signal acceptance in this region. |

png pdf root |
Figure 8:
Exclusion limits at 95% CL for top squark pair production followed by the decay $\tilde{ \mathrm{ t } } _{1}\to \mathrm{ b } \tilde{\chi}^{\pm}_1 \to \mathrm{ b } \mathrm{ W } ^{\pm } \tilde{\chi}^0_1 $ (T2bW), in the mass plane $m_{\tilde{\chi}^0_1 }$ versus $m_{\tilde{ \mathrm{ t } } _{1}}$. The areas to the left and below the solid black curves represent the observed exclusion and the $\pm $1 standard deviation contours for the NLO+NLL cross section calculations and their uncertainties [63]. The dashed red curves represent the corresponding expectation at 95% CL and $\pm $1 standard deviation contours for the associated experimental uncertainties. In the lower left corner of the diagram, where $ {\Delta m} $ is close to the top quark mass, the sensitivity of the search is significantly reduced due to the fact that the $\tilde{ \mathrm{ t } } _{1}$ decay products are soft and often escape detection. |
png pdf root |
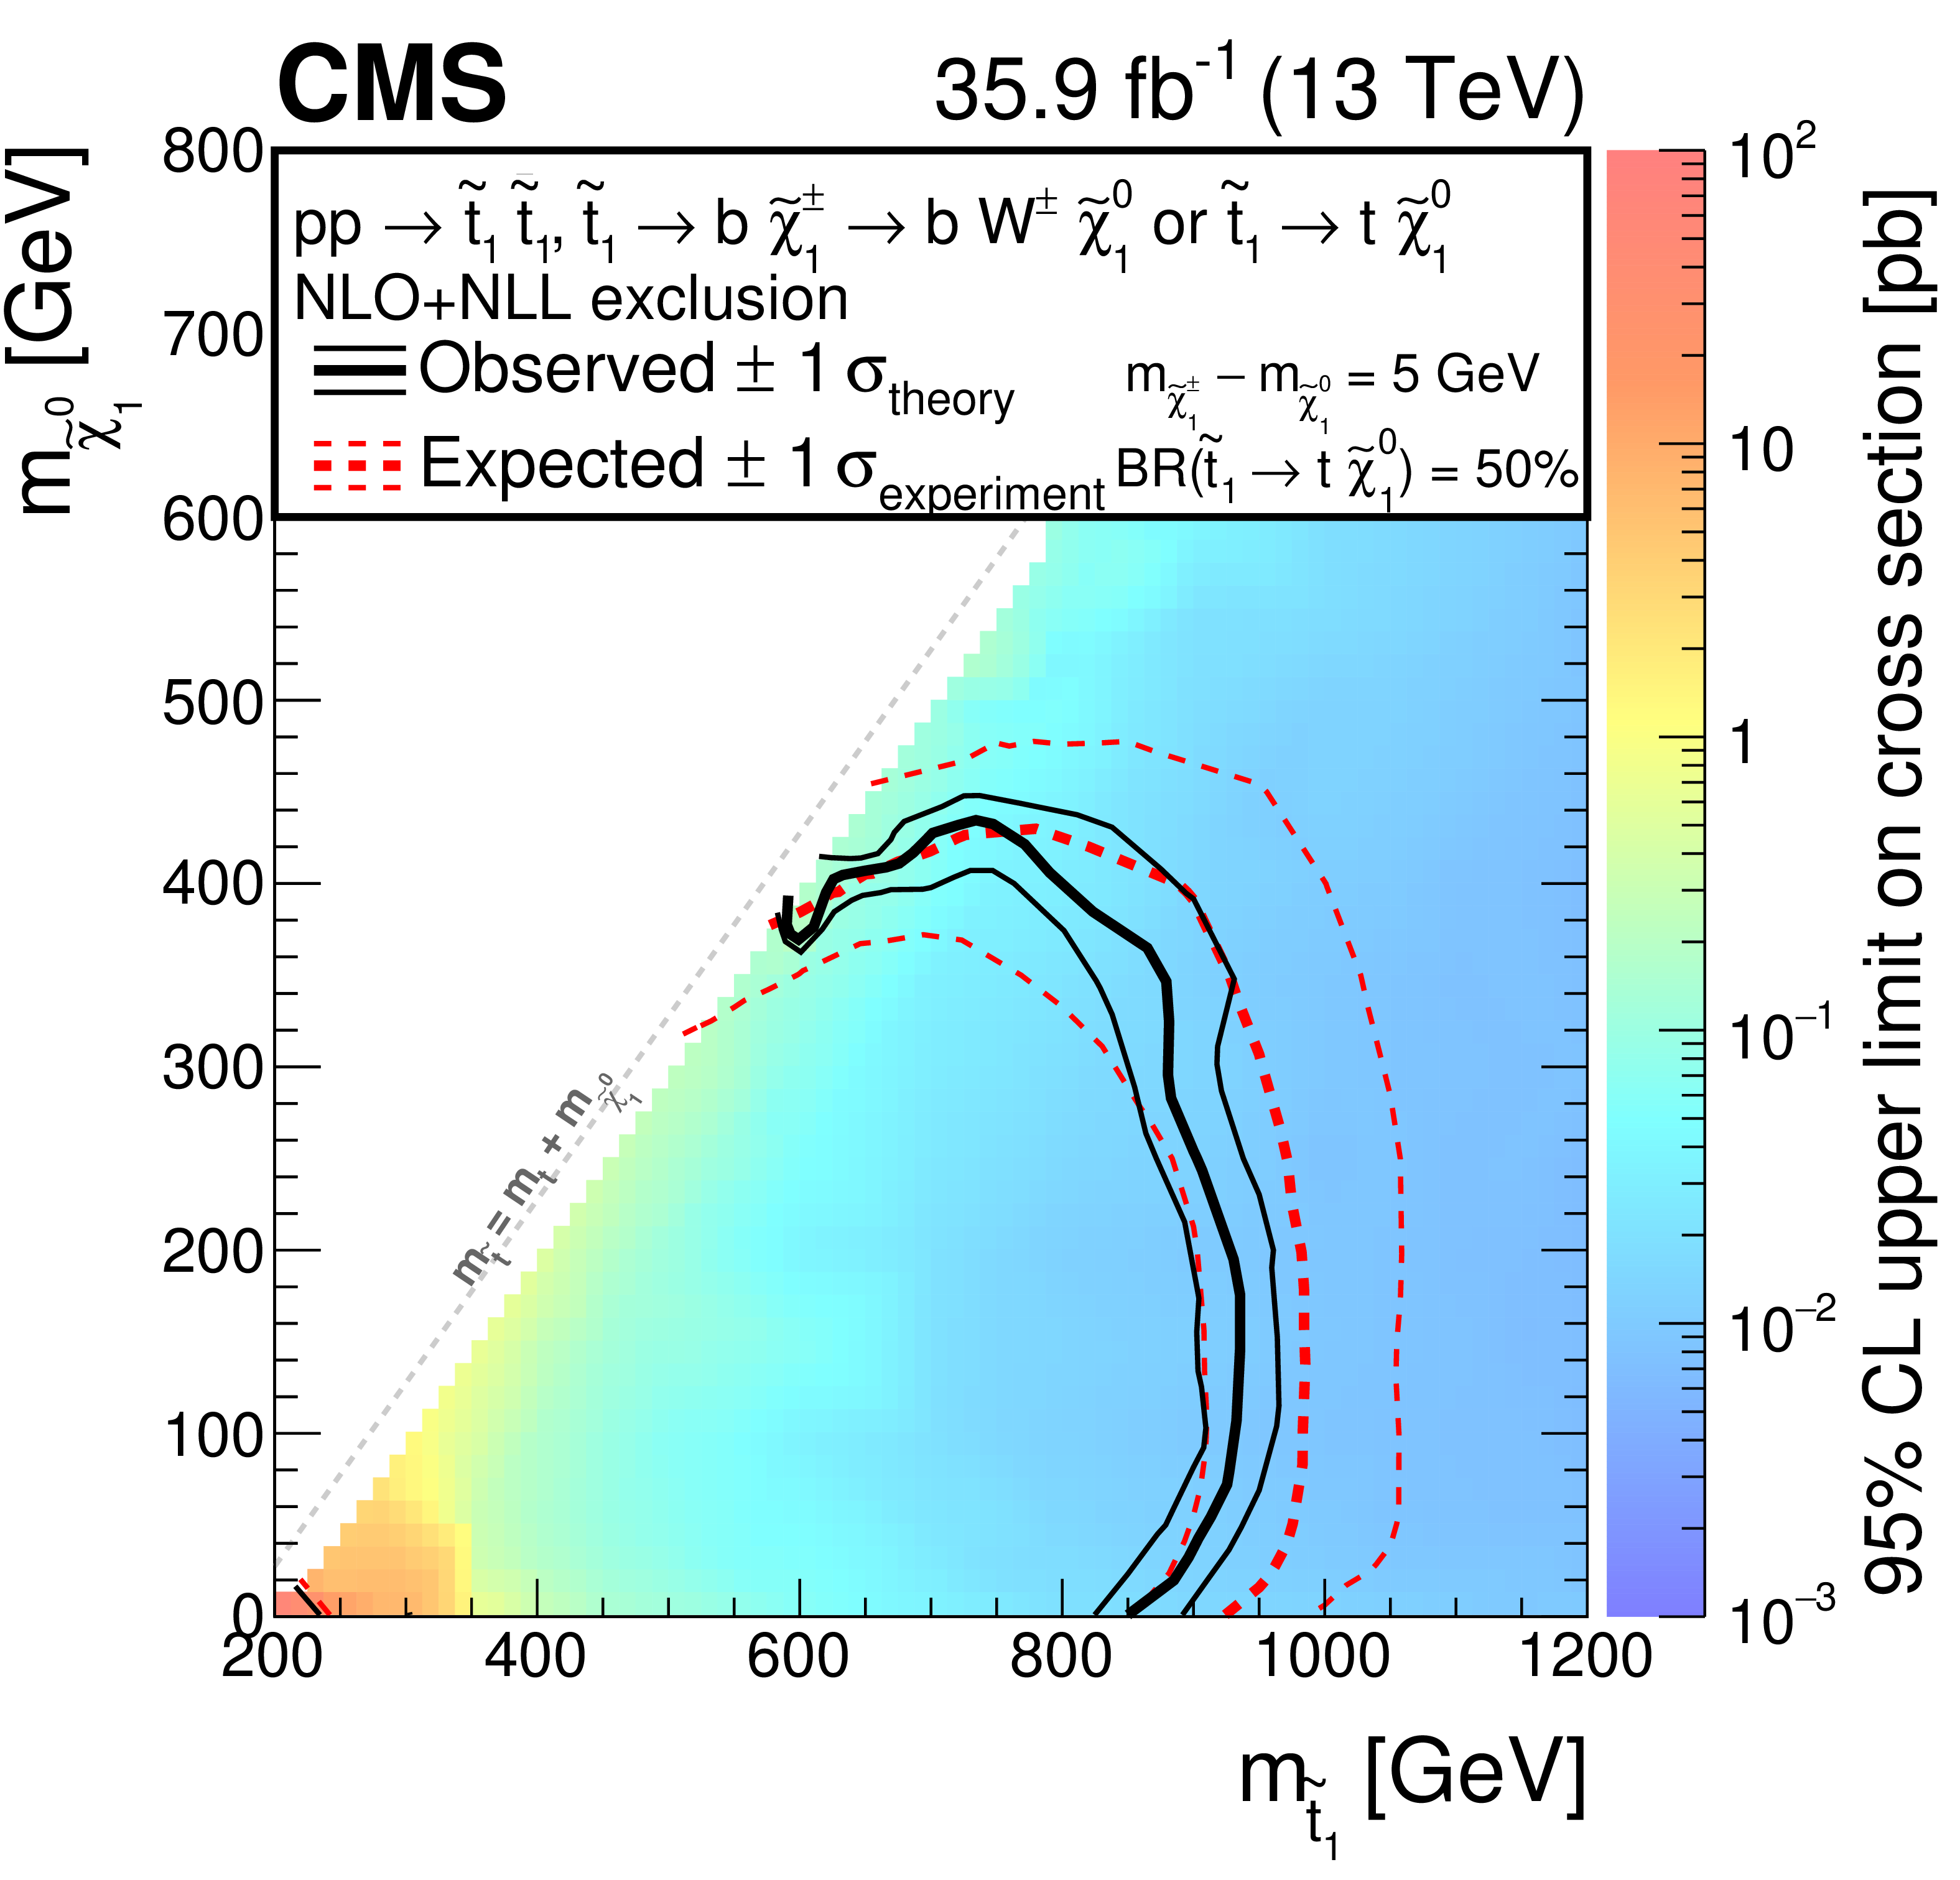
Figure 9:
Exclusion limits at 95% CL for top squark pair production followed by the mixed decay $\mathrm{ p } \mathrm{ p } \to \tilde{ \mathrm{ t } } _{1}\overline{\tilde{\mathrm{t}}} _{1}\to \mathrm{ \bar{t} } \tilde{\chi}^0_1 \mathrm{ b } \tilde{\chi}^{+}_{1} $ (T2tb) decay scenario, in the mass plane $m_{\tilde{\chi}^0_1 }$ versus $m_{\tilde{ \mathrm{ t } } _{1}}$. In T2tb an assumption of a compressed mass spectrum in which the mass of $ \tilde{\chi}^{\pm}_1 $ is only 5 GeV greater than that of $ \tilde{\chi}^0_1 $, is considered. The areas to the left and below the solid black curves represent the observed exclusion and the $\pm $1 standard deviation contours for the NLO+NLL cross section calculations and their uncertainties [63]. The dashed red curves represent the corresponding expectation at 95% CL and $\pm $1 standard deviation contours for the associated experimental uncertainties. In the lower left corner of the diagram, where $ {\Delta m} $ is close to the top quark mass, the sensitivity of the search is significantly reduced due to the fact that the $\tilde{ \mathrm{ t } } _{1}$ decay products are soft and often escape detection. |
png pdf root |
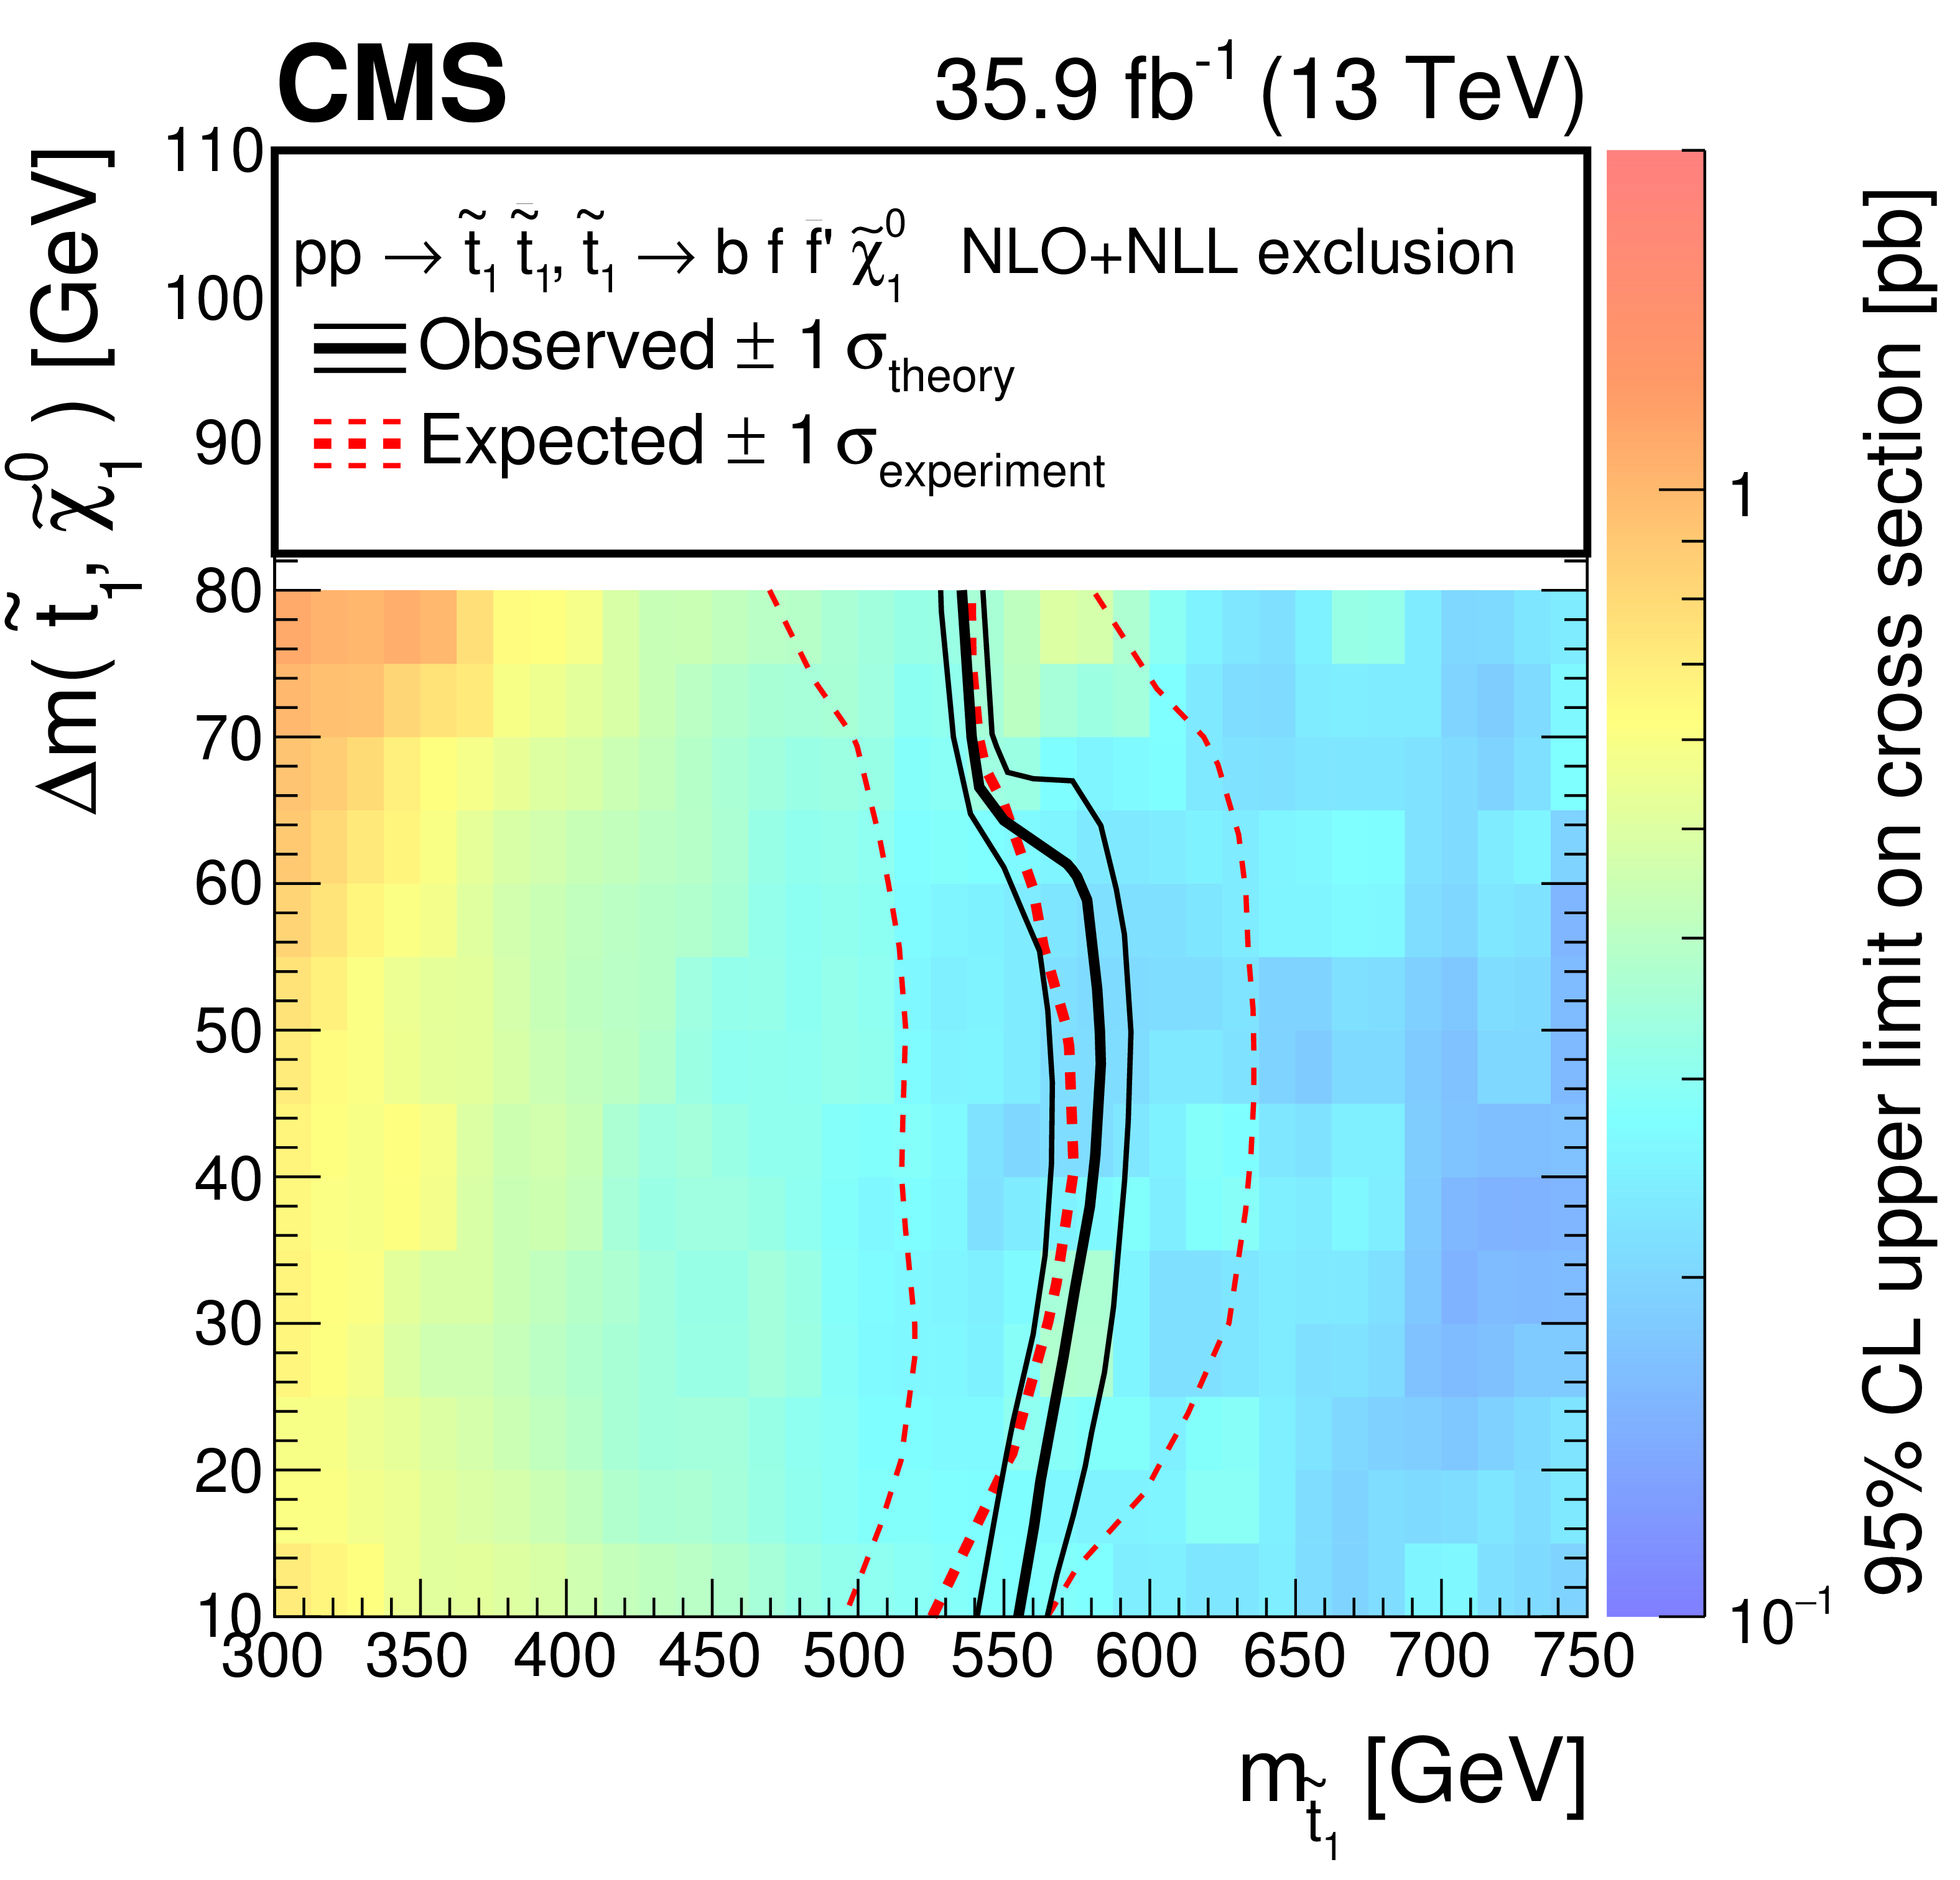
Figure 10:
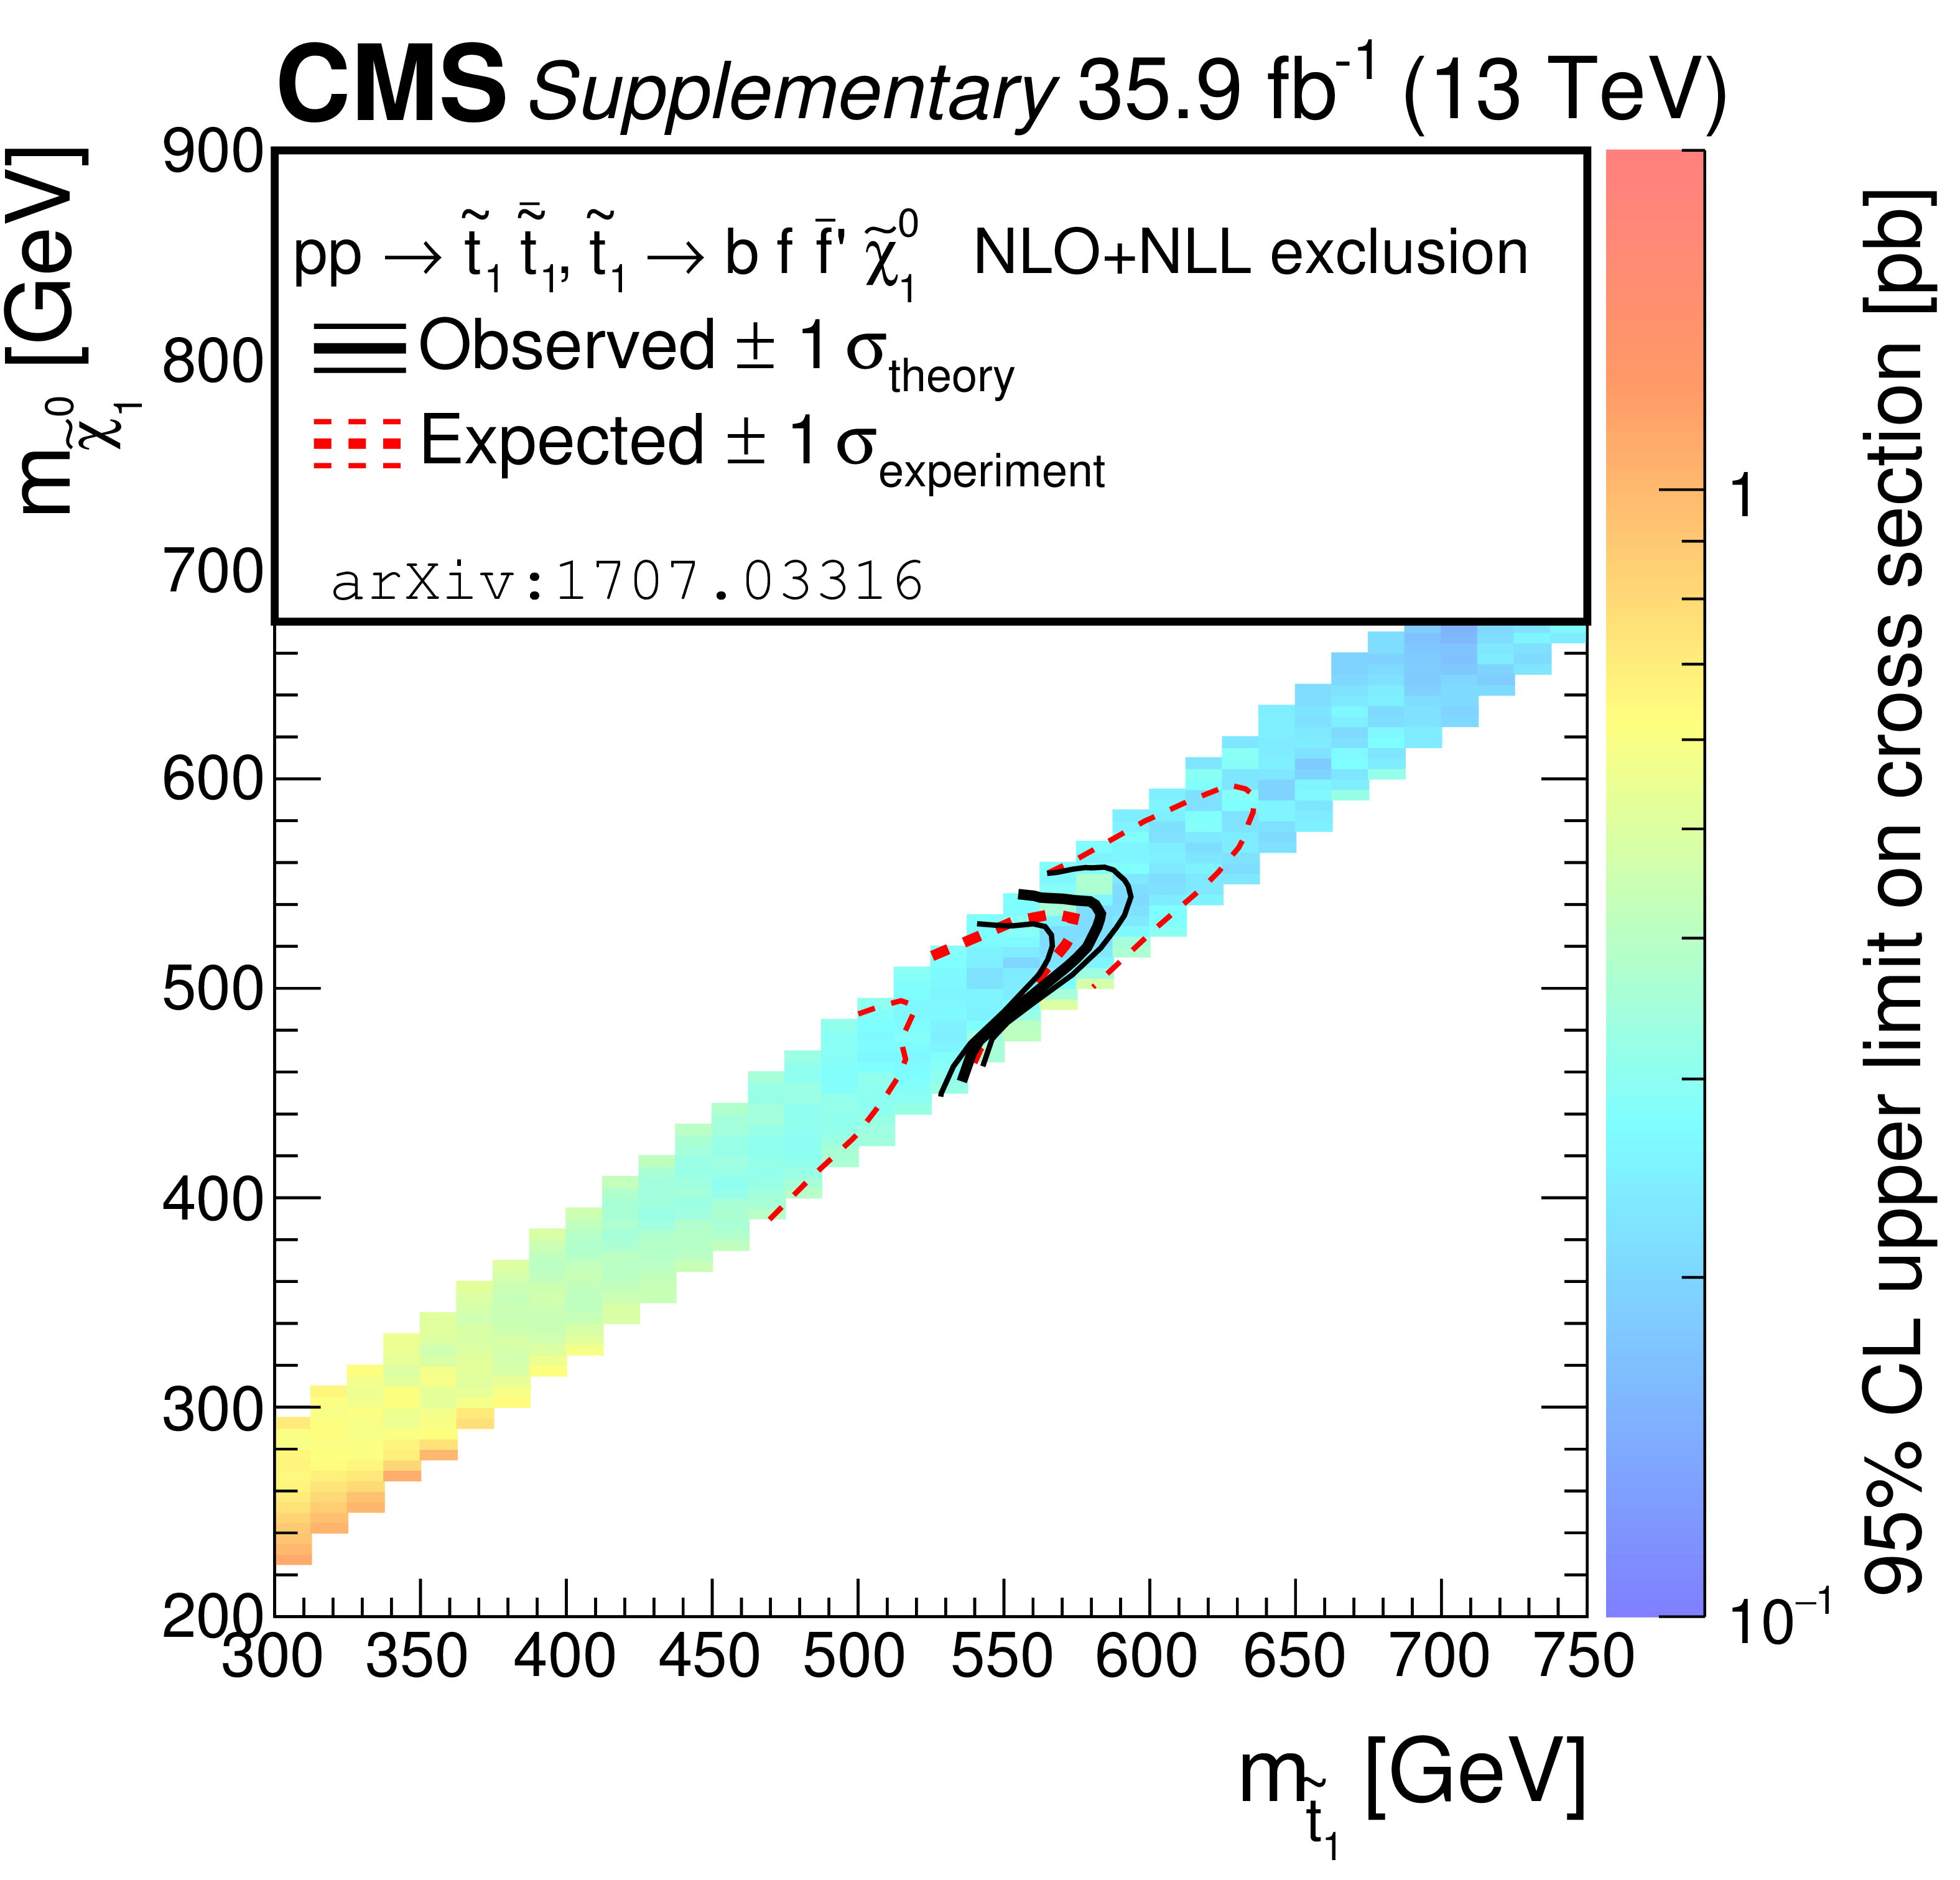
Exclusion limits at 95% CL for top squark pair production followed by the four-body decay $\tilde{ \mathrm{ t } } _{1} \to \mathrm{ b } \mathrm {f} \bar{\mathrm {f'}} \tilde{\chi}^0_1 $ (T2ttC) in the mass plane $ {\Delta m}(\tilde{ \mathrm{ t } } _{1},\tilde{\chi}^0_1)$ versus $m_{\tilde{ \mathrm{ t } } _{1}}$. The areas to the left and below the solid black curves represent the observed exclusion and the $\pm $1 standard deviation contours for the NLO+NLL cross section calculations and their uncertainties [63]. The dashed red curves represent the corresponding expectation at 95% CL and $\pm $1 standard deviation contours for the associated experimental uncertainties. |
png pdf root |
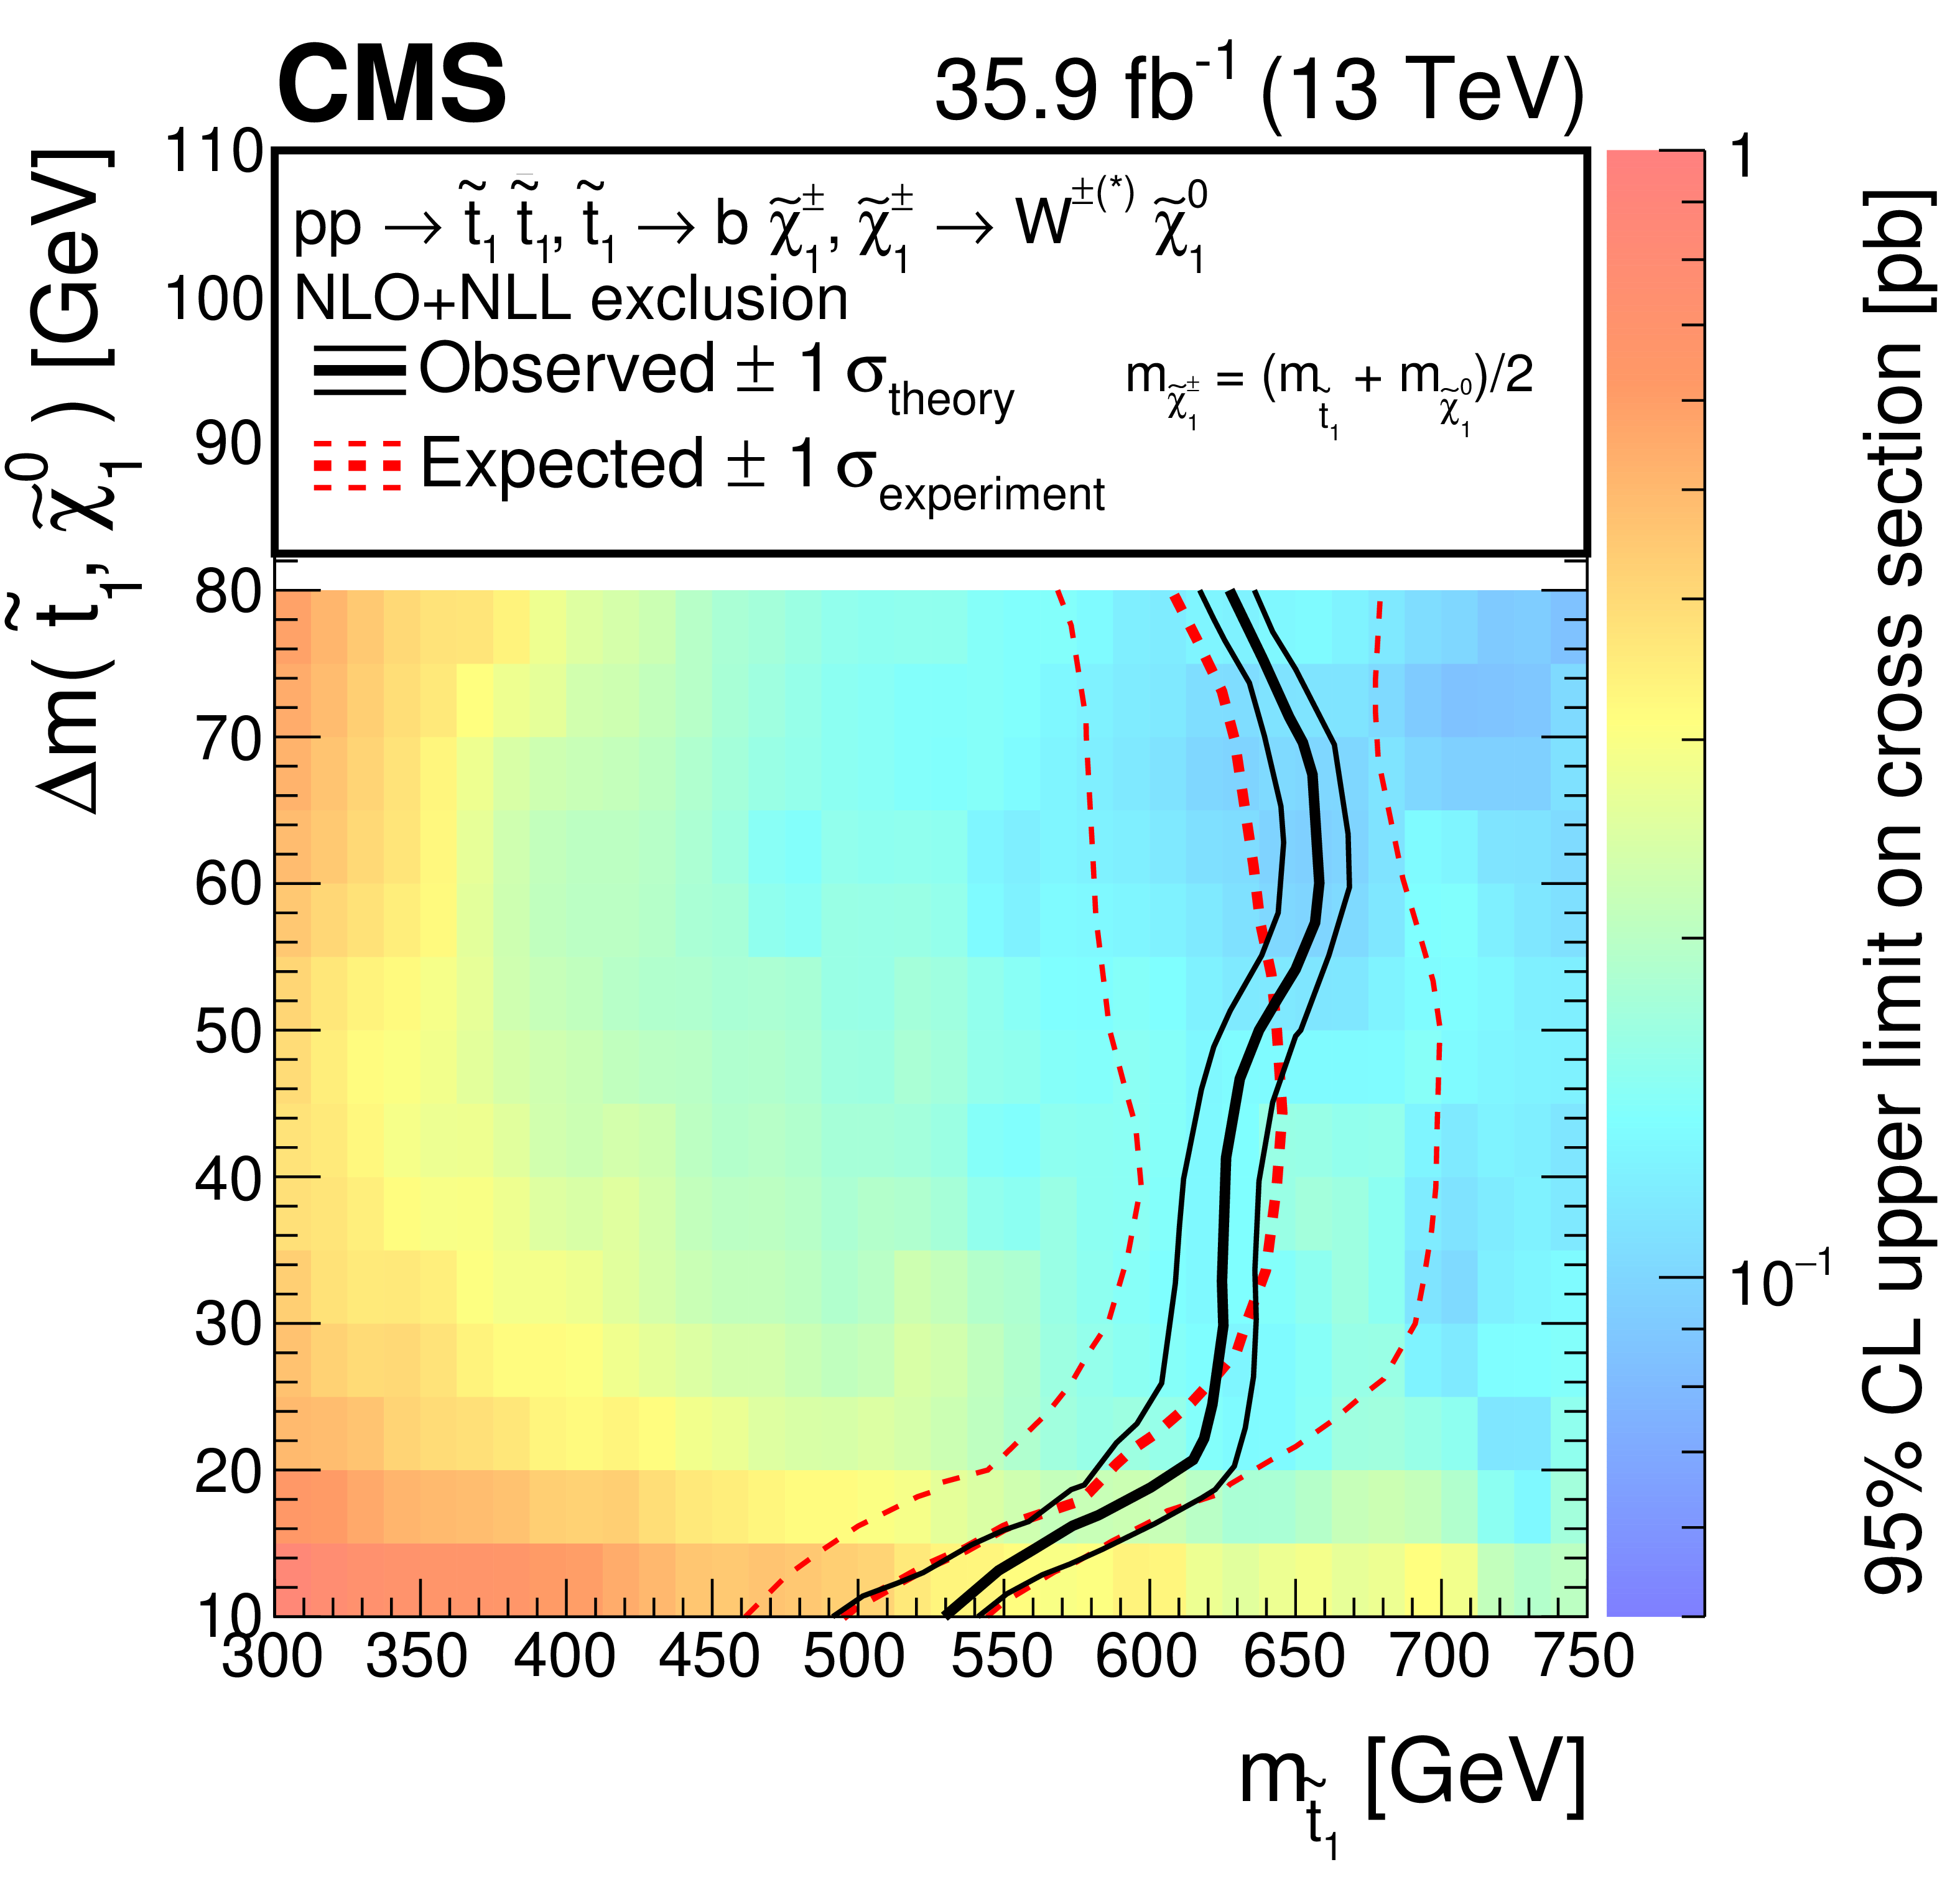
Figure 11:
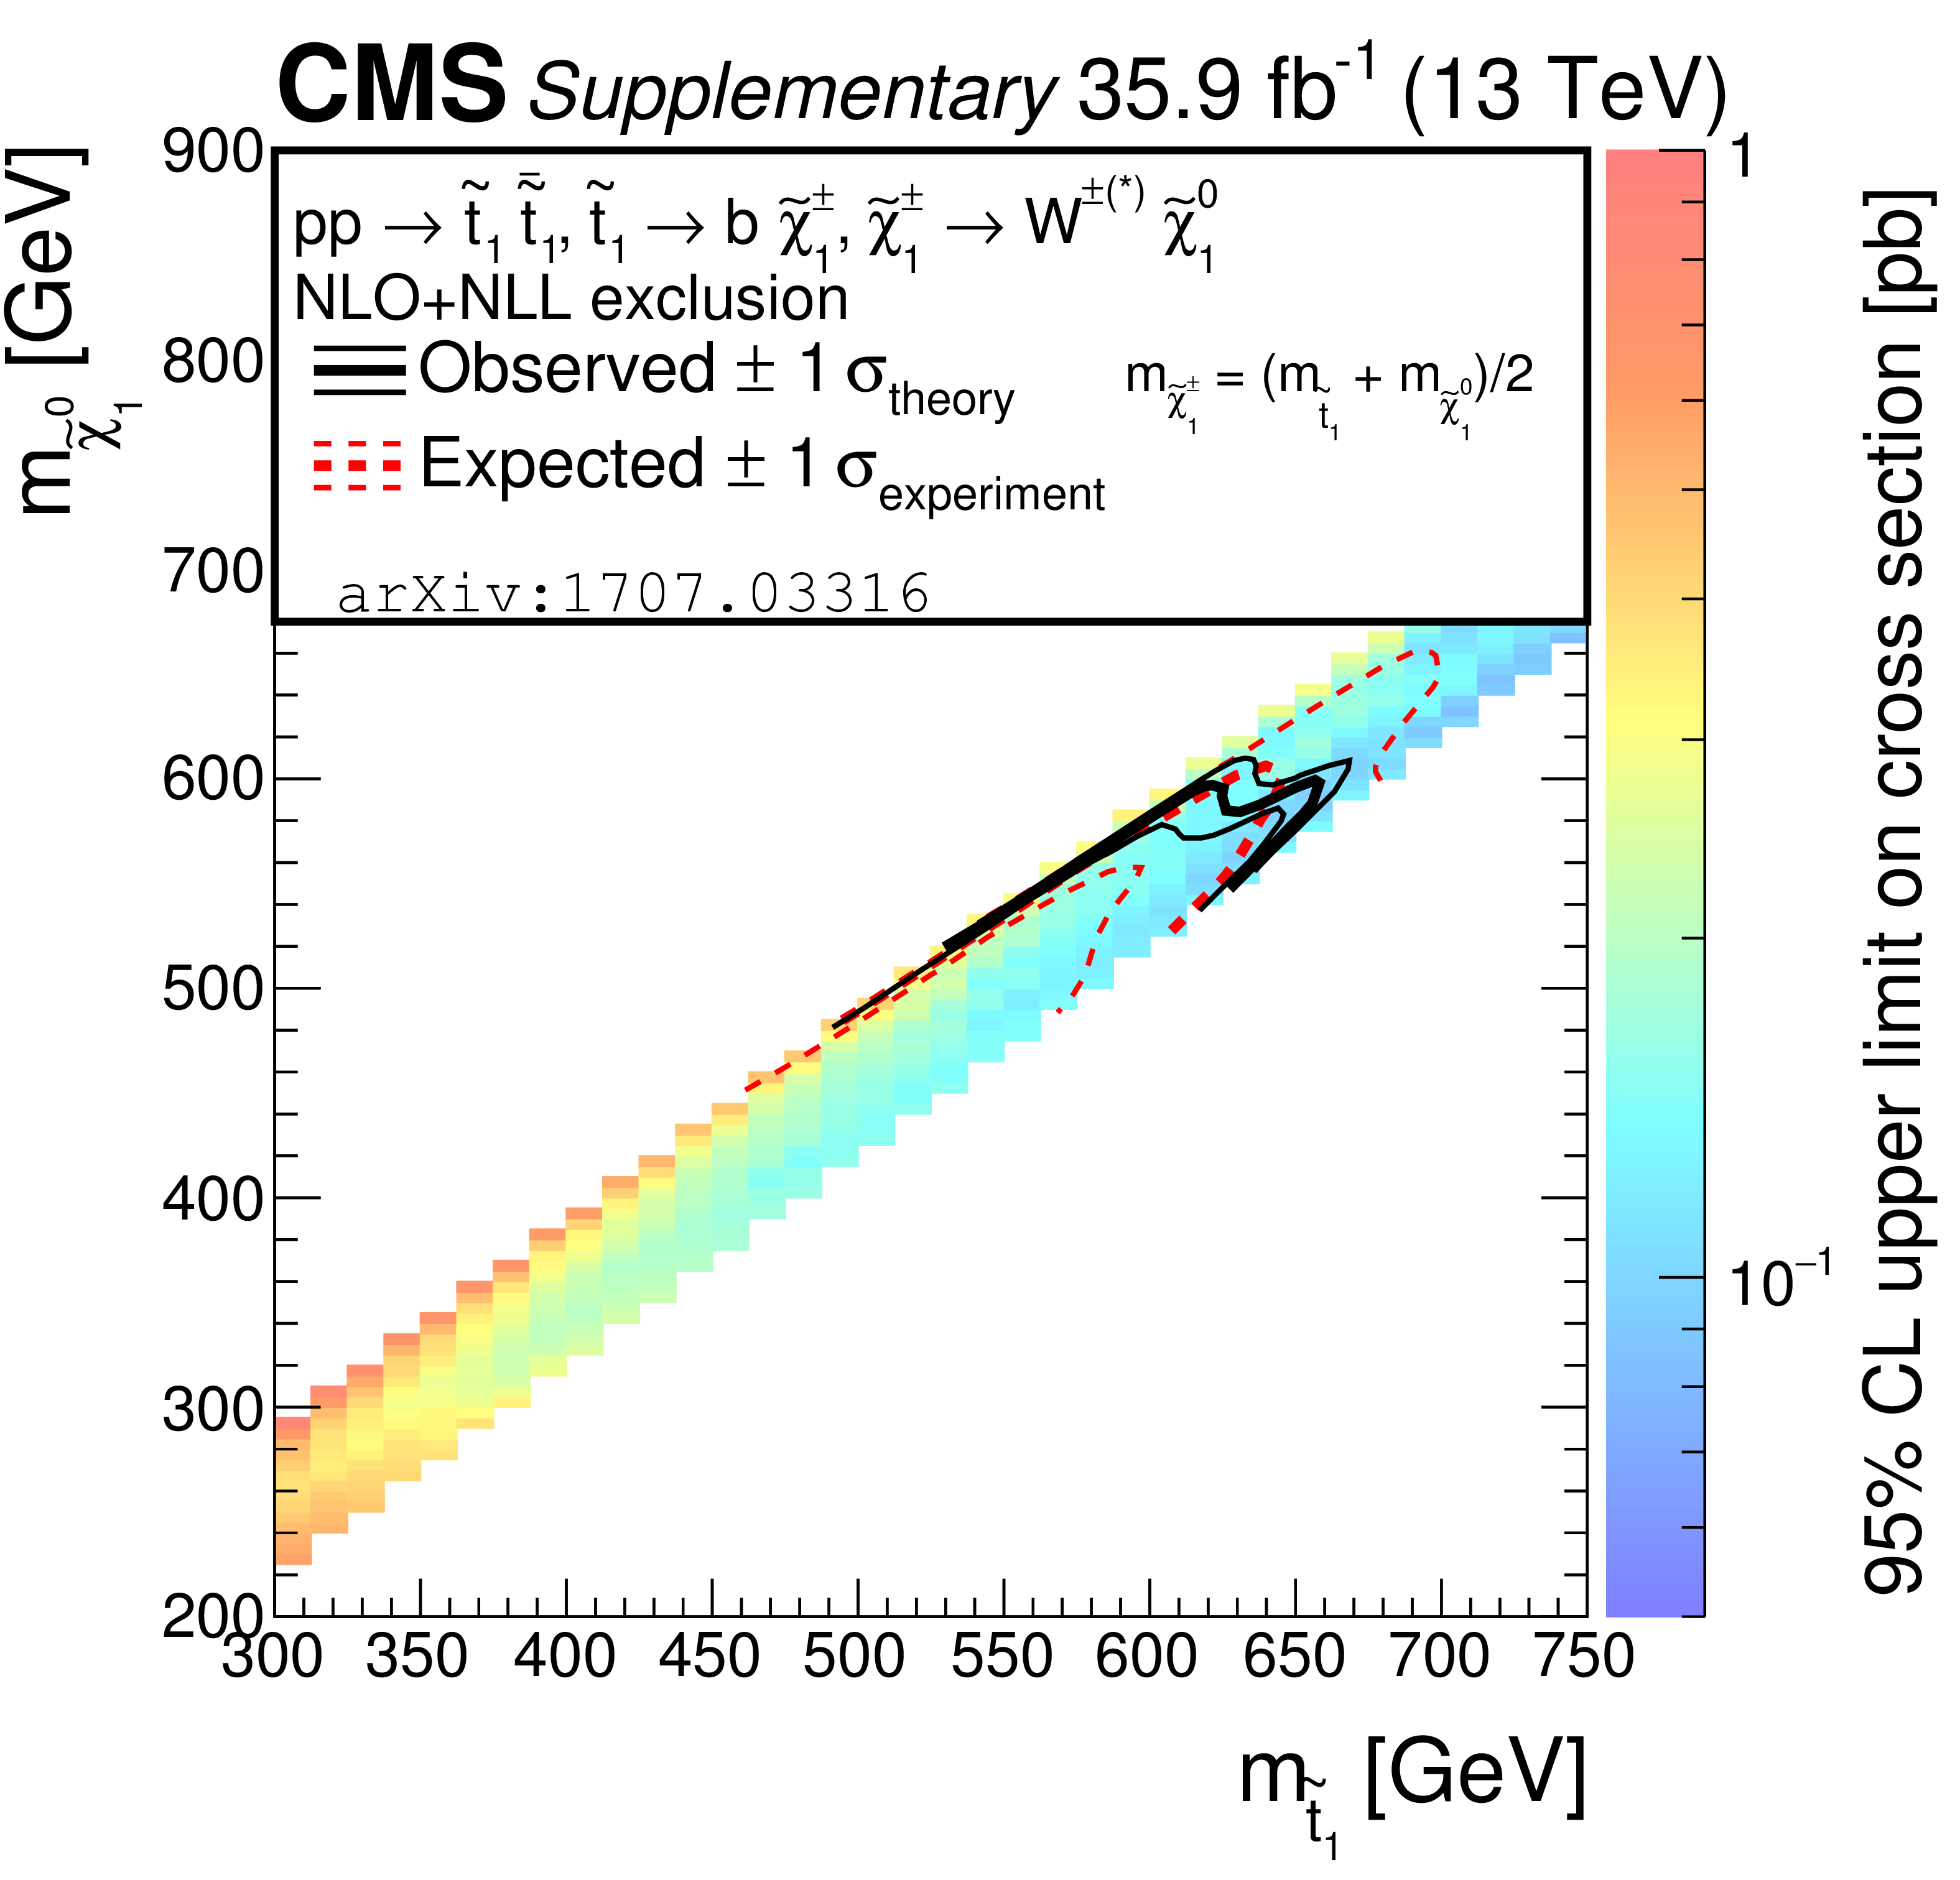
Exclusion limits at 95% CL for top squark pair production followed by the decay $\tilde{ \mathrm{ t } } _{1}\to \mathrm{ b } \tilde{\chi}^{\pm}_1 \to \mathrm{ b } \mathrm {f} \bar{\mathrm {f'}} \tilde{\chi}^0_1 $ (T2bWC) in the mass plane $ {\Delta m}(\tilde{ \mathrm{ t } } _{1},\tilde{\chi}^0_1)$ versus $m_{\tilde{ \mathrm{ t } } _{1}}$. The areas to the left and below the solid black curves represent the observed exclusion and the $\pm $1 standard deviation contours for the NLO+NLL cross section calculations and their uncertainties [63]. The dashed red curves represent the corresponding expectation at 95% CL and $\pm $1 standard deviation contours for the associated experimental uncertainties. |

png pdf root |
Figure 12:
Exclusion limits at 95% CL for top squark pair production followed by the decay $\tilde{ \mathrm{ t } } _{1}\to \mathrm{c} \tilde{\chi}^0_1 $ (T2cc) in the mass plane $ {\Delta m}(\tilde{ \mathrm{ t } } _{1},\tilde{\chi}^0_1)$ versus $m_{\tilde{ \mathrm{ t } } _{1}}$. The areas to the left and below the solid black curves represent the observed exclusion and the $\pm $1 standard deviation contours for the NLO+NLL cross section calculations and their uncertainties [63]. The dashed red curves represent the corresponding expectation at 95% CL and $\pm $1 standard deviation contours for the associated experimental uncertainties. |
| Tables | |
png pdf |
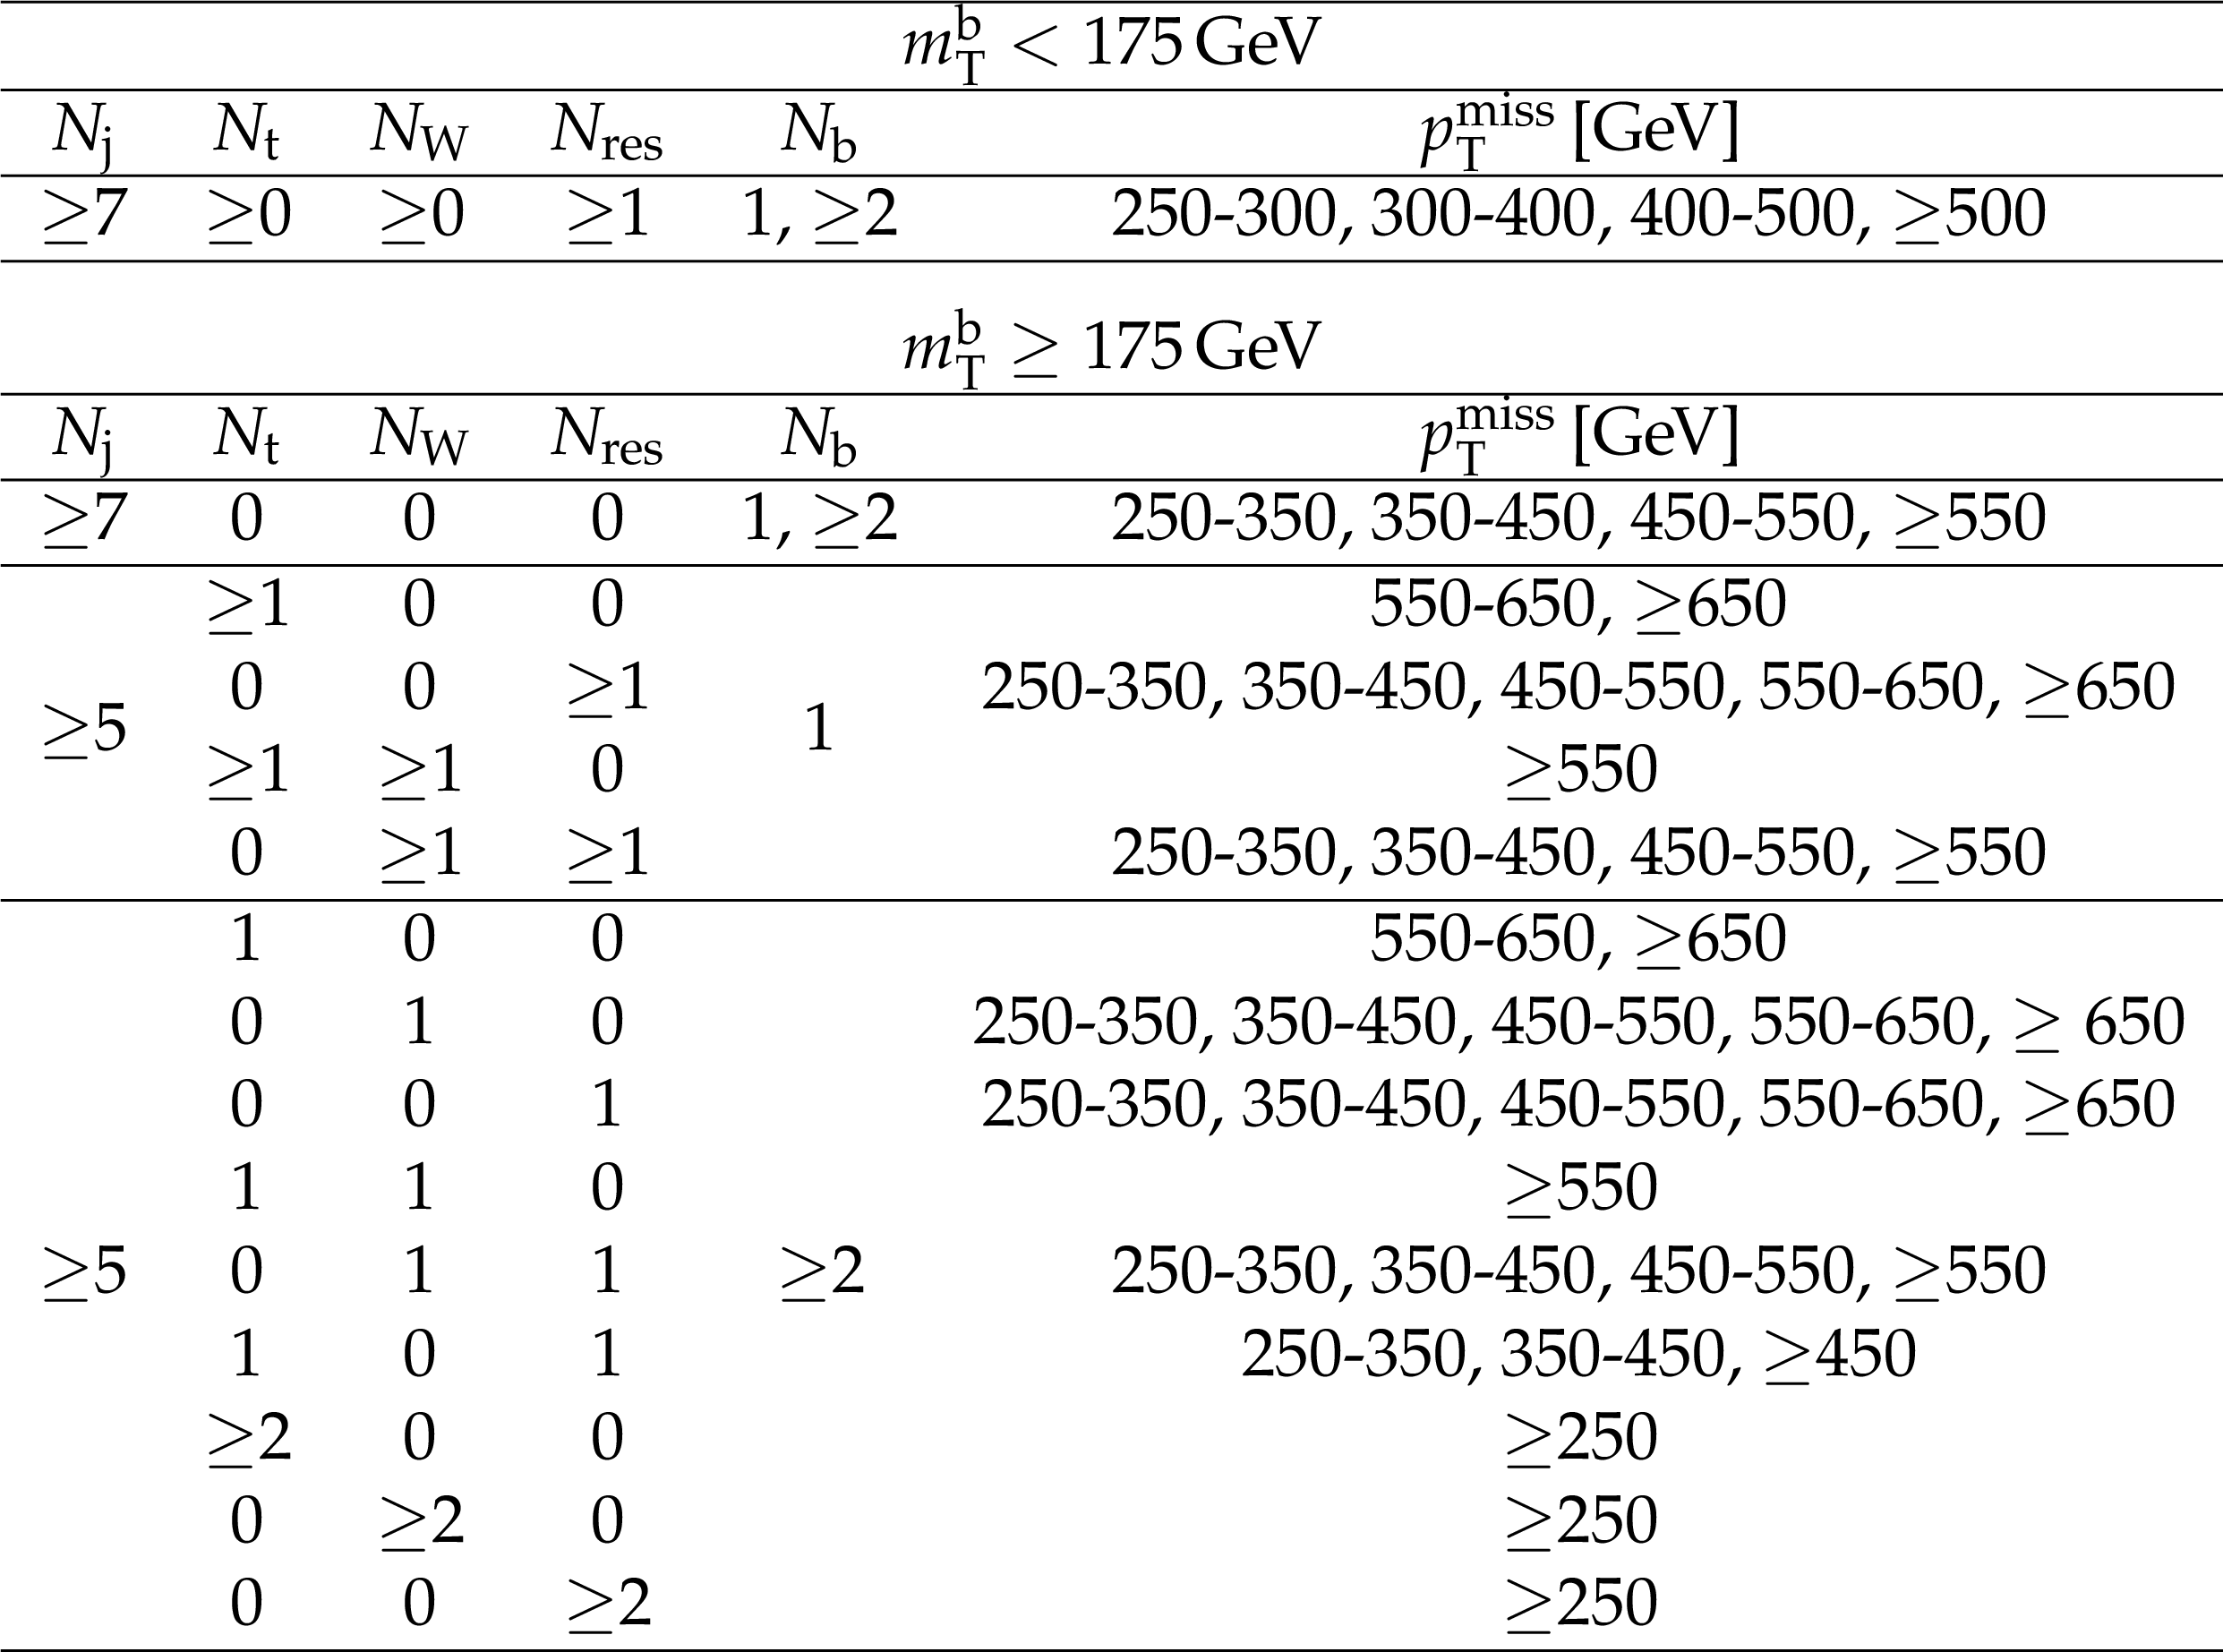
Table 1:
Summary of the 51 non-overlapping search regions that mainly target high $ {\Delta m} $ signal. The high $ {\Delta m} $ baseline selection is $N_{\text {j}}\geq $ 5, $ { {p_{\mathrm {T}}} ^\text {miss}} \geq $ 250 GeV, no leptons, $N_{\mathrm{ b } }\geq $ 1, and $\Delta \phi _{1234}\geq $ 0.5. |
png pdf |
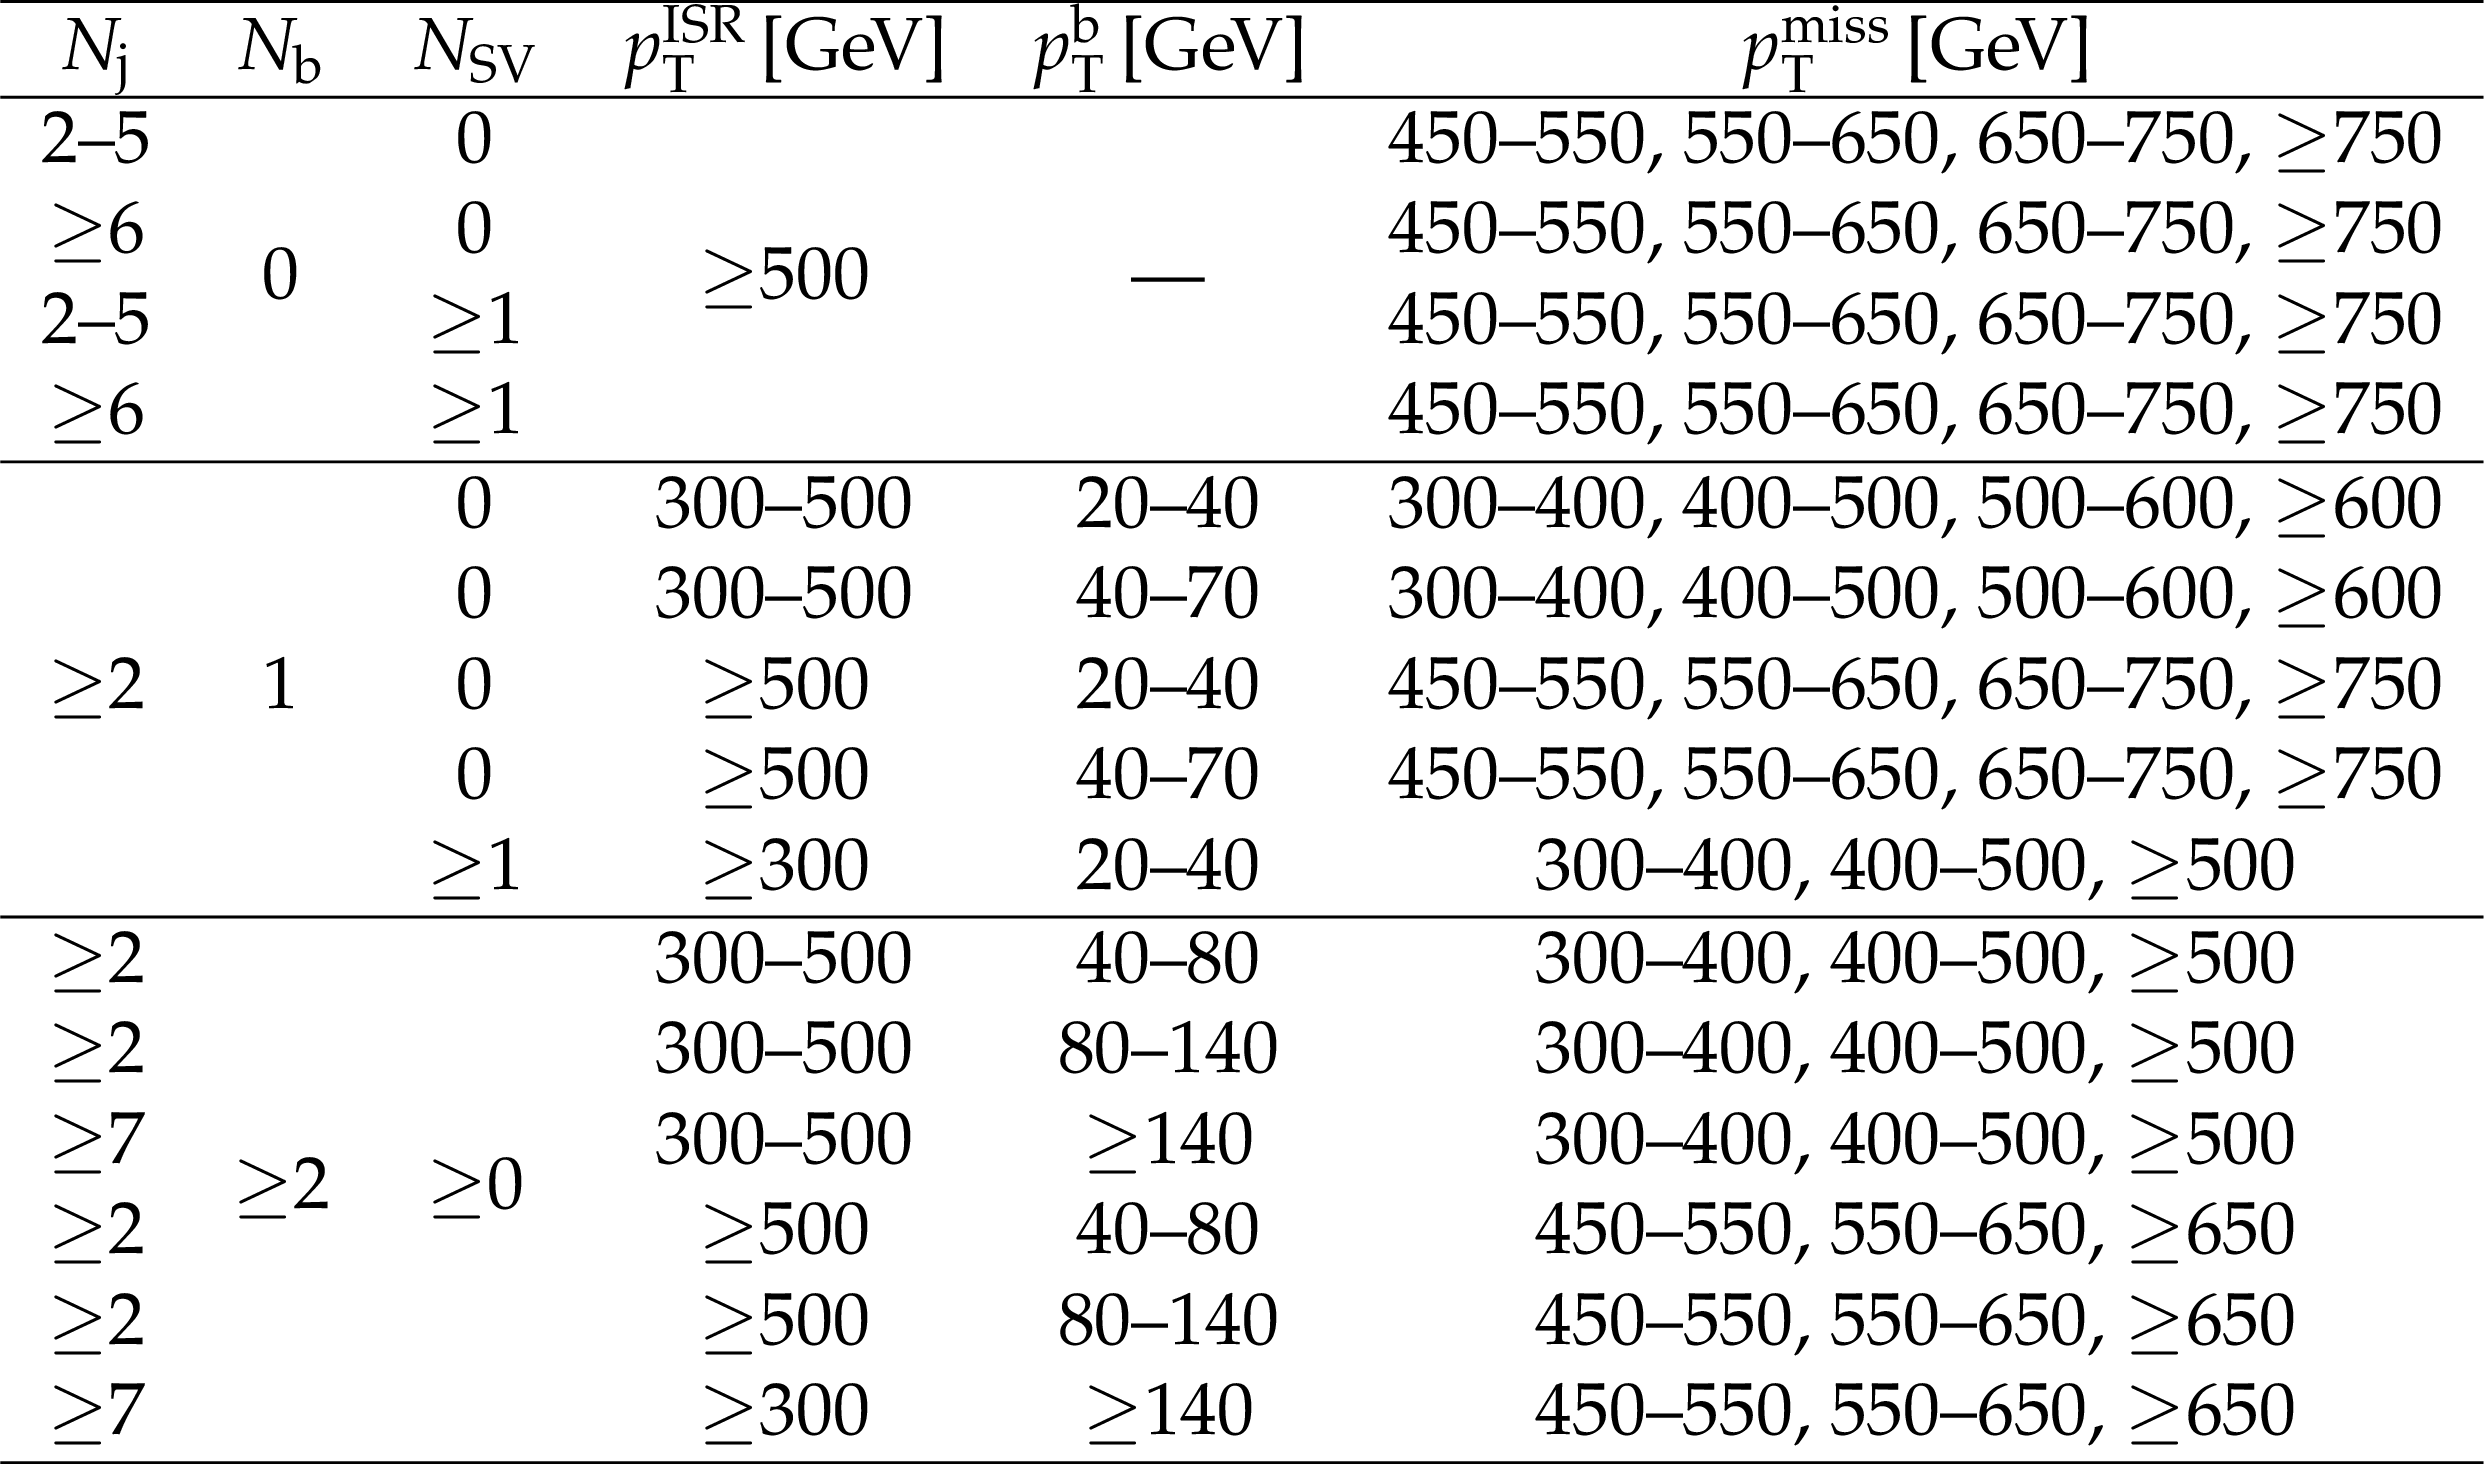
Table 2:
Summary of the 53 non-overlapping search regions that mainly target low $ {\Delta m} $ signal. The low $ {\Delta m} $ baseline selection is $N_{\text {j}}\geq $ 2, $ { {p_{\mathrm {T}}} ^\text {miss}} \geq $ 250 GeV, no leptons, $N_{\mathrm{ t } }=N_{\mathrm{ W } }=N_{\text {res}}= $ 0, $m_{\mathrm {T}}^{\mathrm {b}}< $ 175 GeV (when applicable), $ {| \Delta \phi (\mathrm {j}_1, {\vec{p}_{\mathrm {T}}^{\,\text {miss}}}) | } \geq $ 0.5, ${| \Delta \phi (\mathrm {j}_{2,3}, {\vec{p}_{\mathrm {T}}^{\,\text {miss}}}) | } \geq $ 0.15, and an ISR jet with $p_{\mathrm {T}}^{\mathrm {ISR}}\geq $ 300 GeV, $ {| \eta | } \leq $ 2.4, $ {| \Delta \phi (j_{\text {ISR}}, {\vec{p}_{\mathrm {T}}^{\,\text {miss}}}) | } \geq $ 2, and $ {S_{E_{\mathrm {T}}} } \geq $10 $\sqrt{} $GeV. |
png pdf |
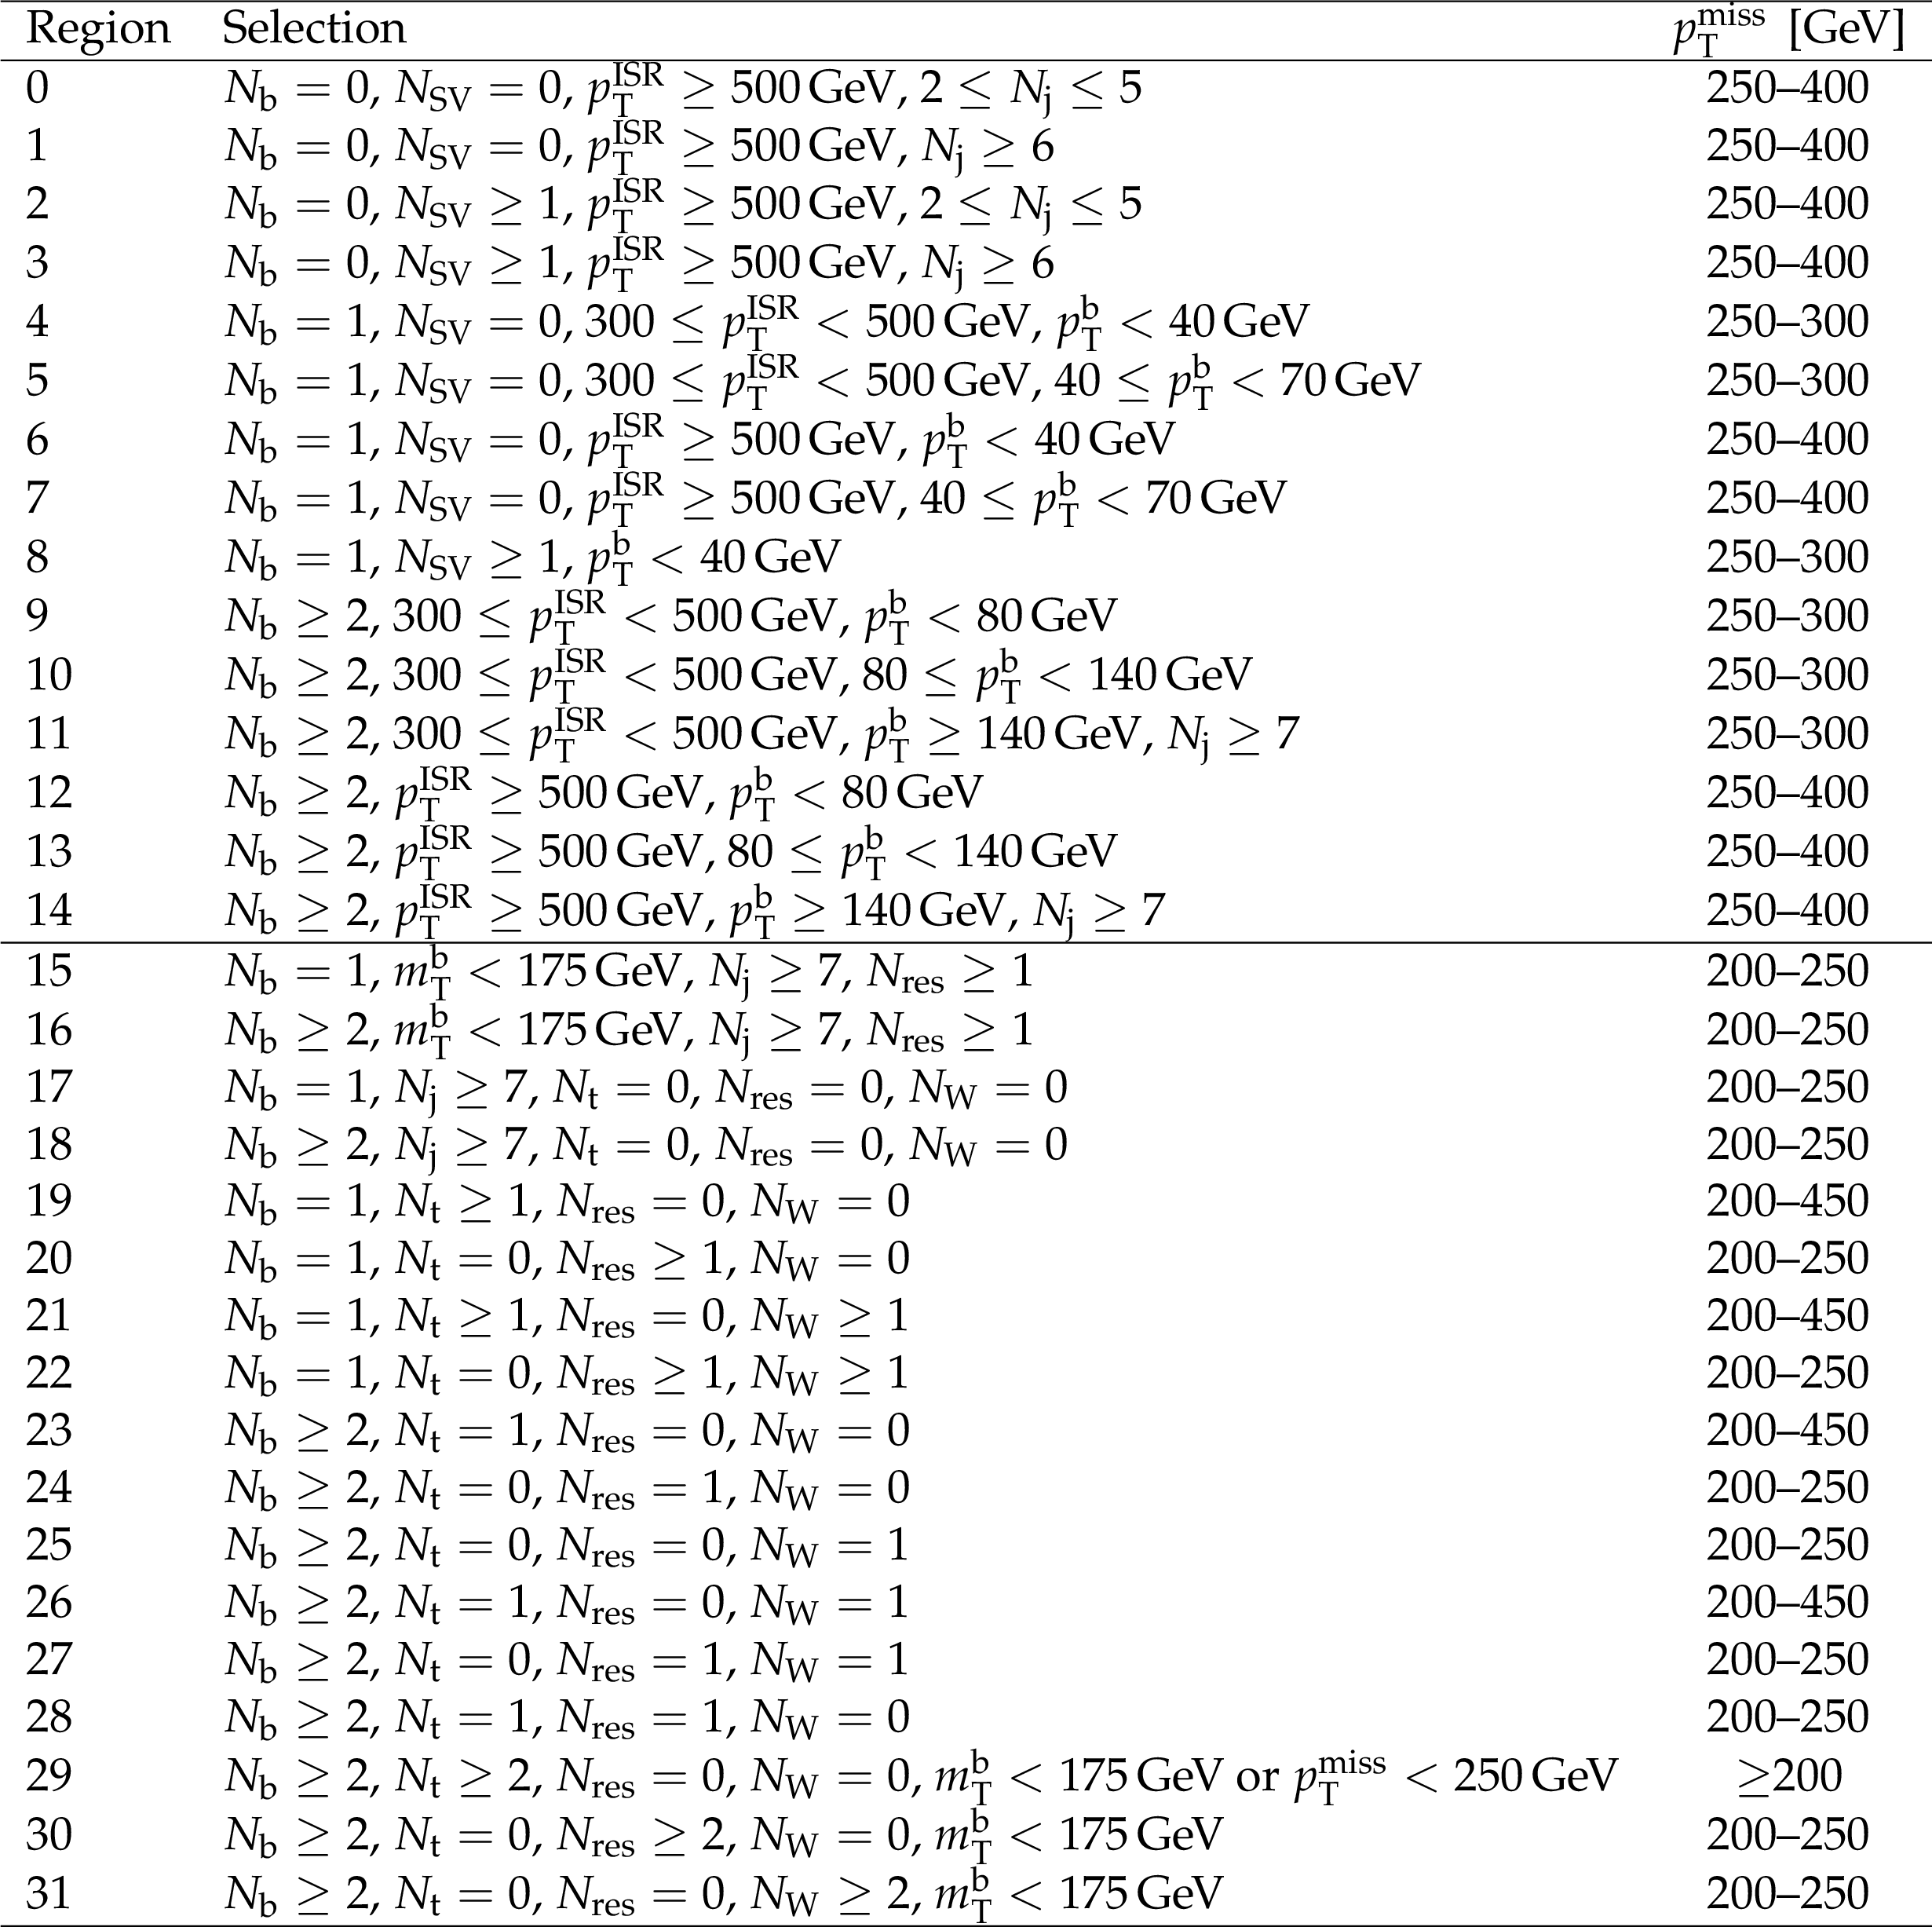
Table 3:
Summary of the validation region selections. The top part of the table (rows 0-14) corresponds to regions for the low $ {\Delta m} $ selections, whereas the bottom part (rows 15-31) corresponds to regions for the high $ {\Delta m} $ selections. |
png pdf |
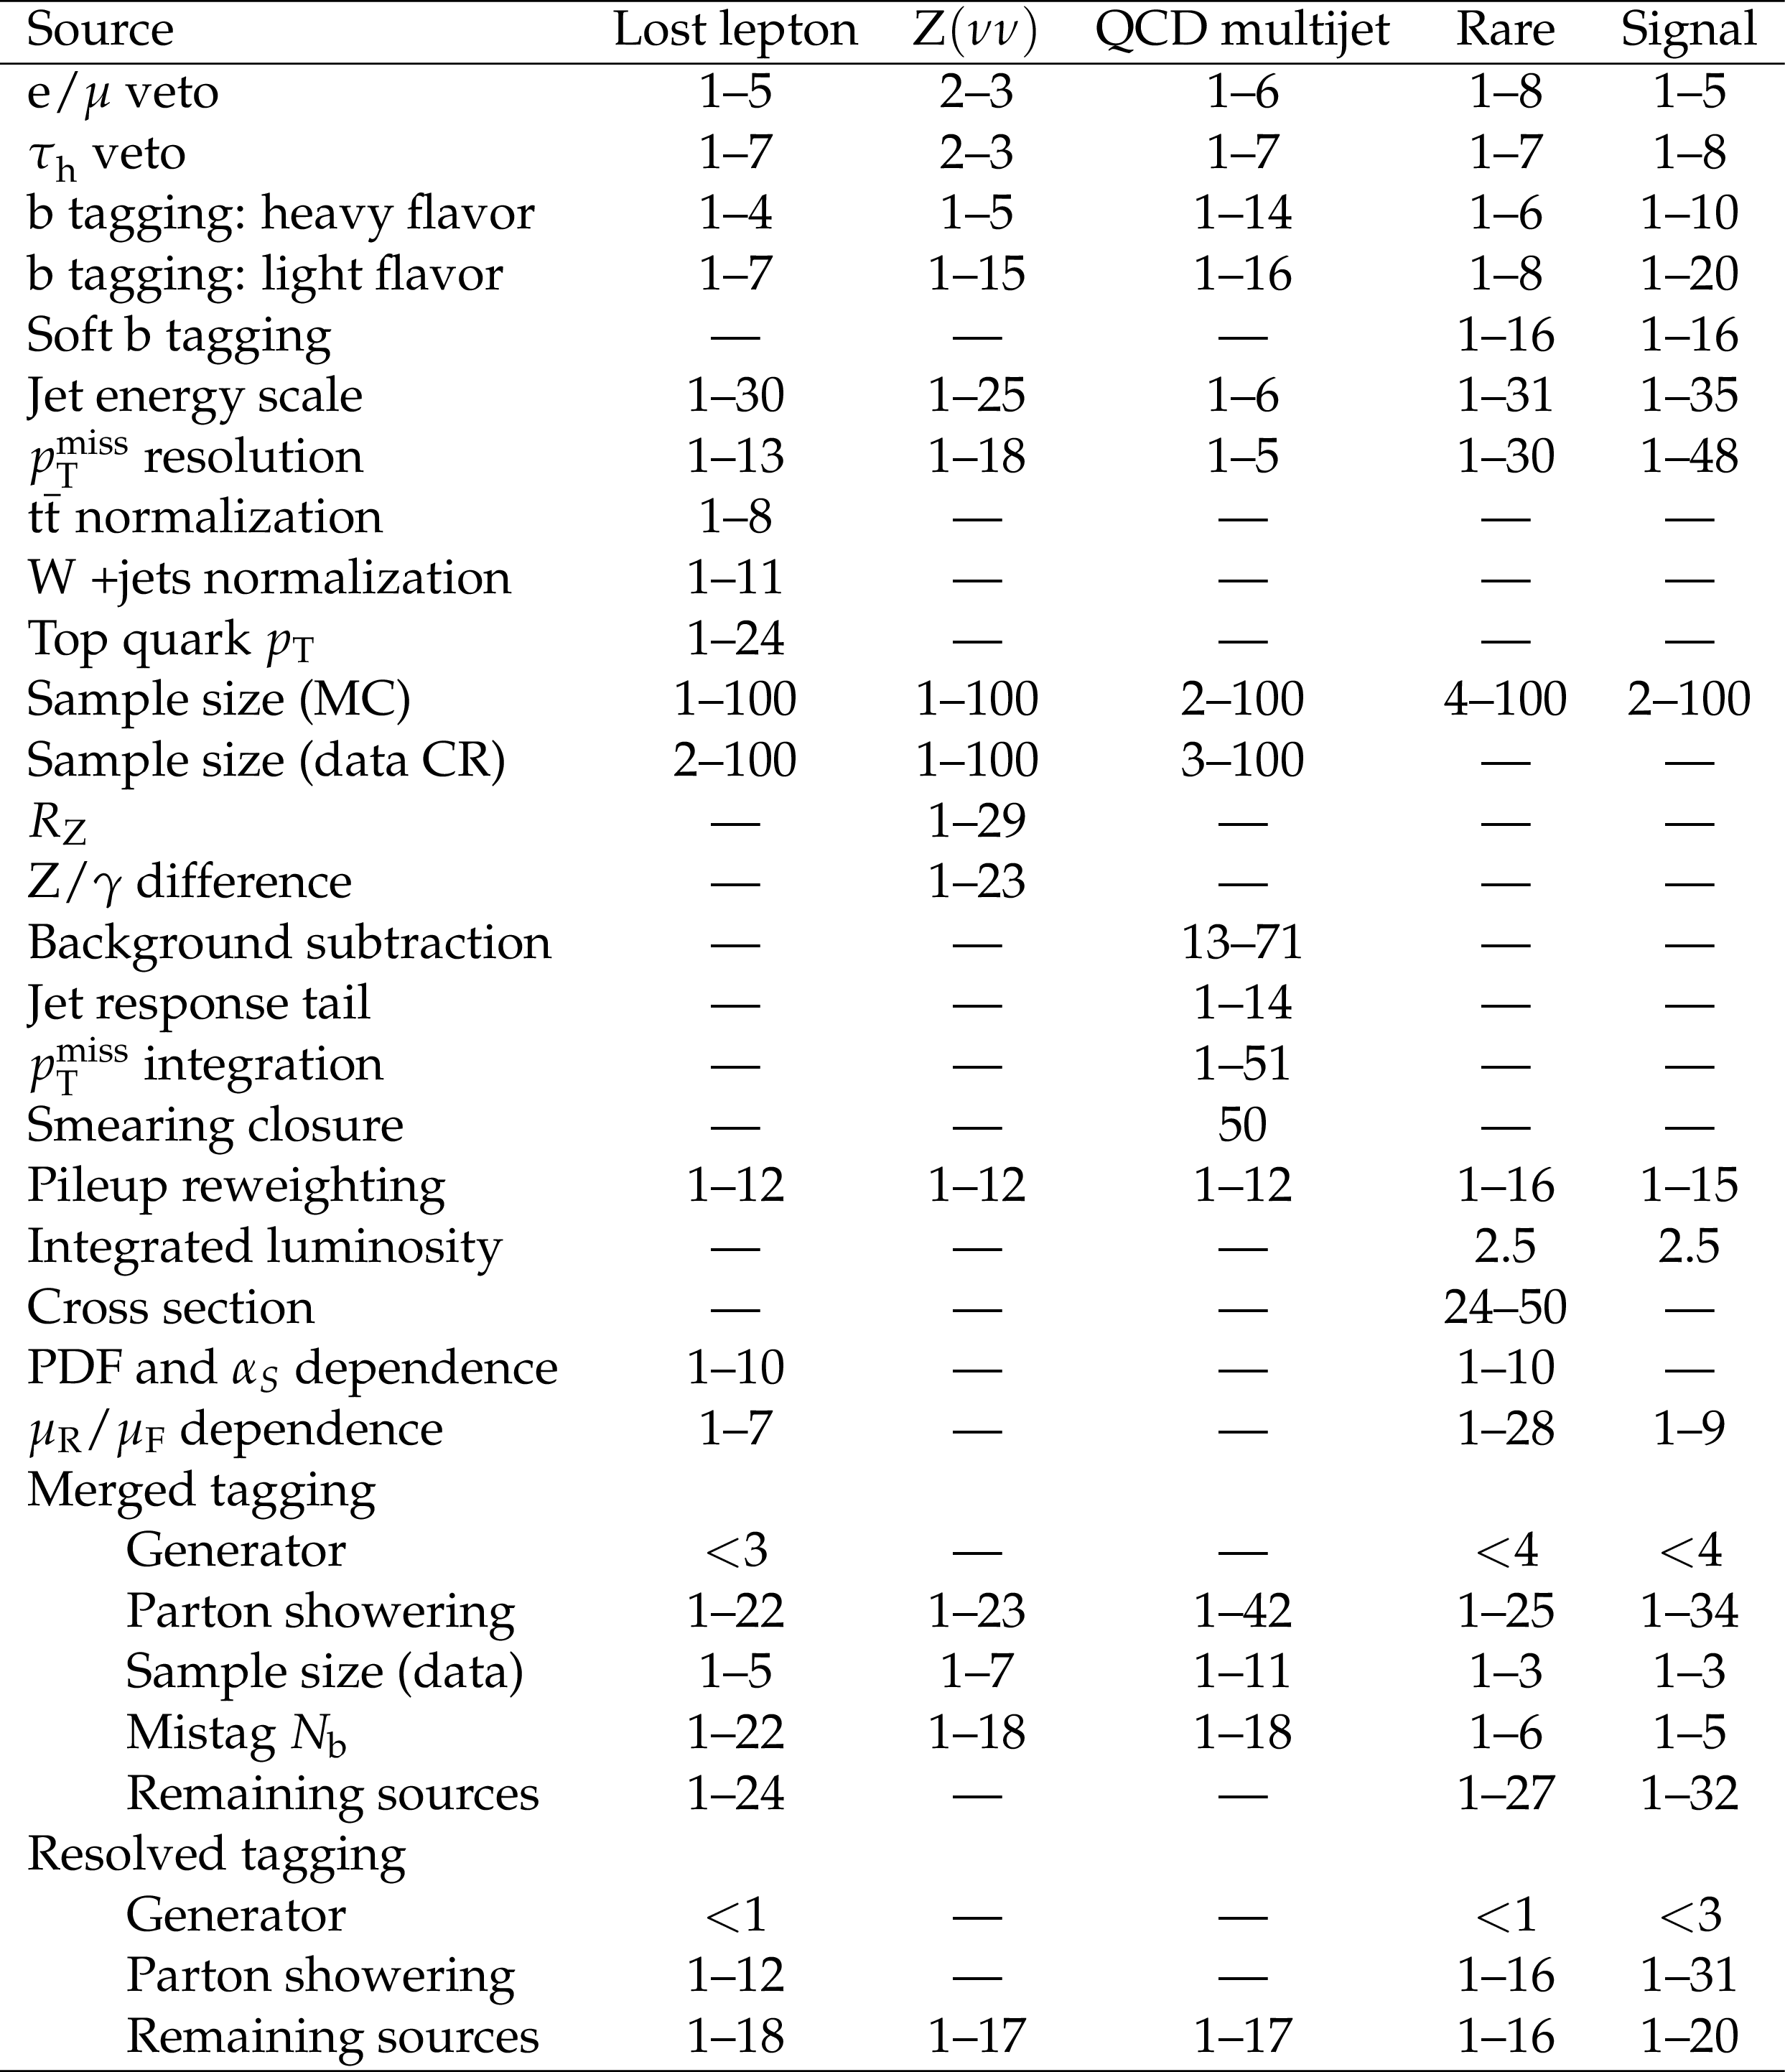
Table 4:
Range of systematic uncertainties [%] in the prediction across the different search regions. "Rare" column includes diboson and ${{\mathrm{ t } {}\mathrm{ \bar{t} } } \mathrm{Z}} $ processes. "Signal" column shows the range of systematic uncertainties representative of the full set of models shown in Fig. xxxxx. |
png pdf |
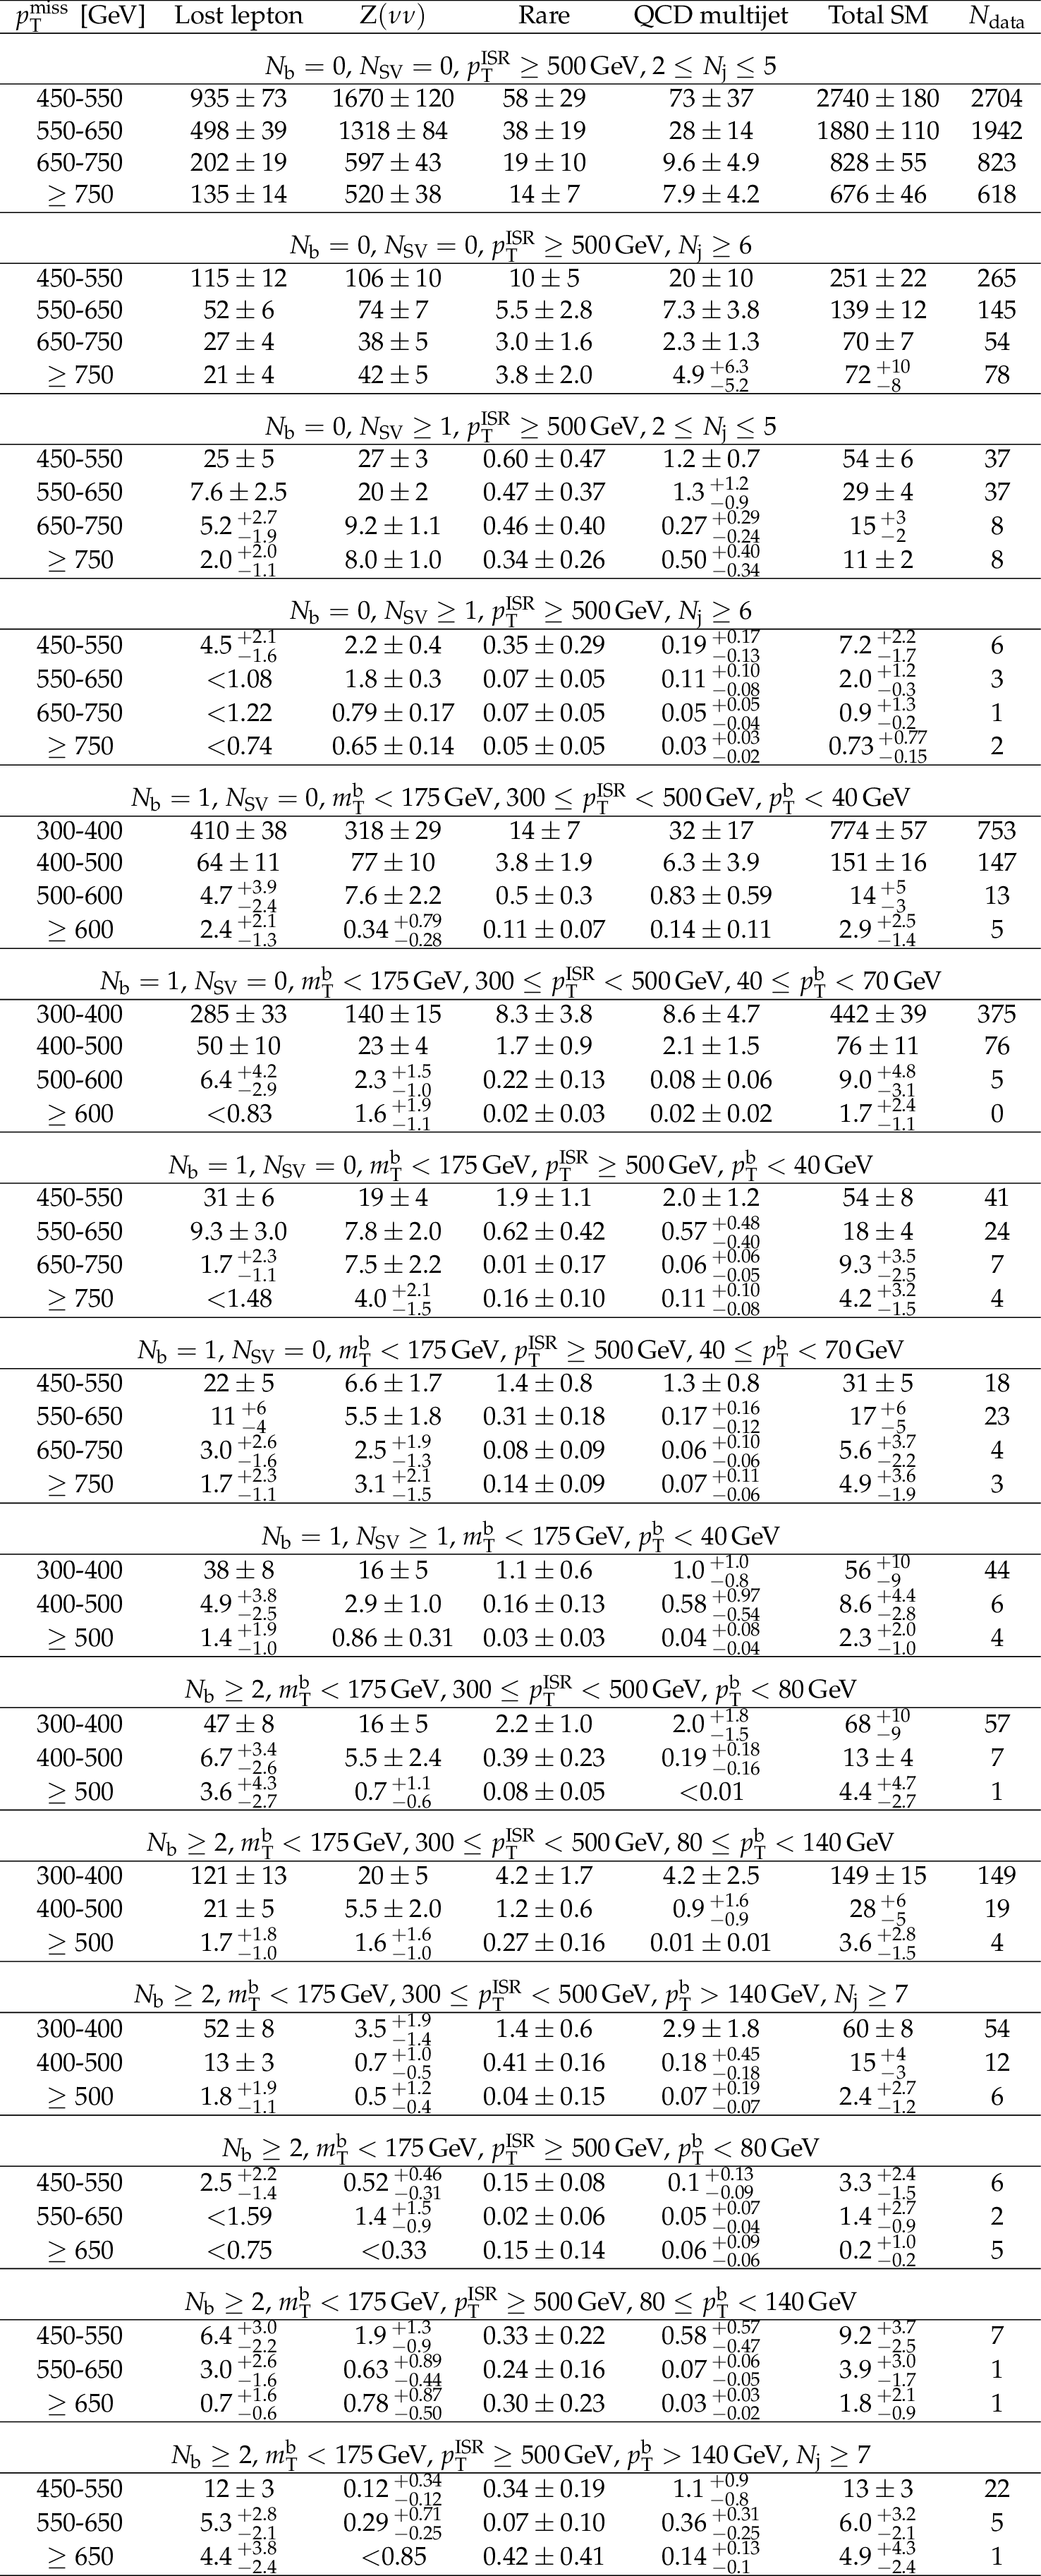
Table 5:
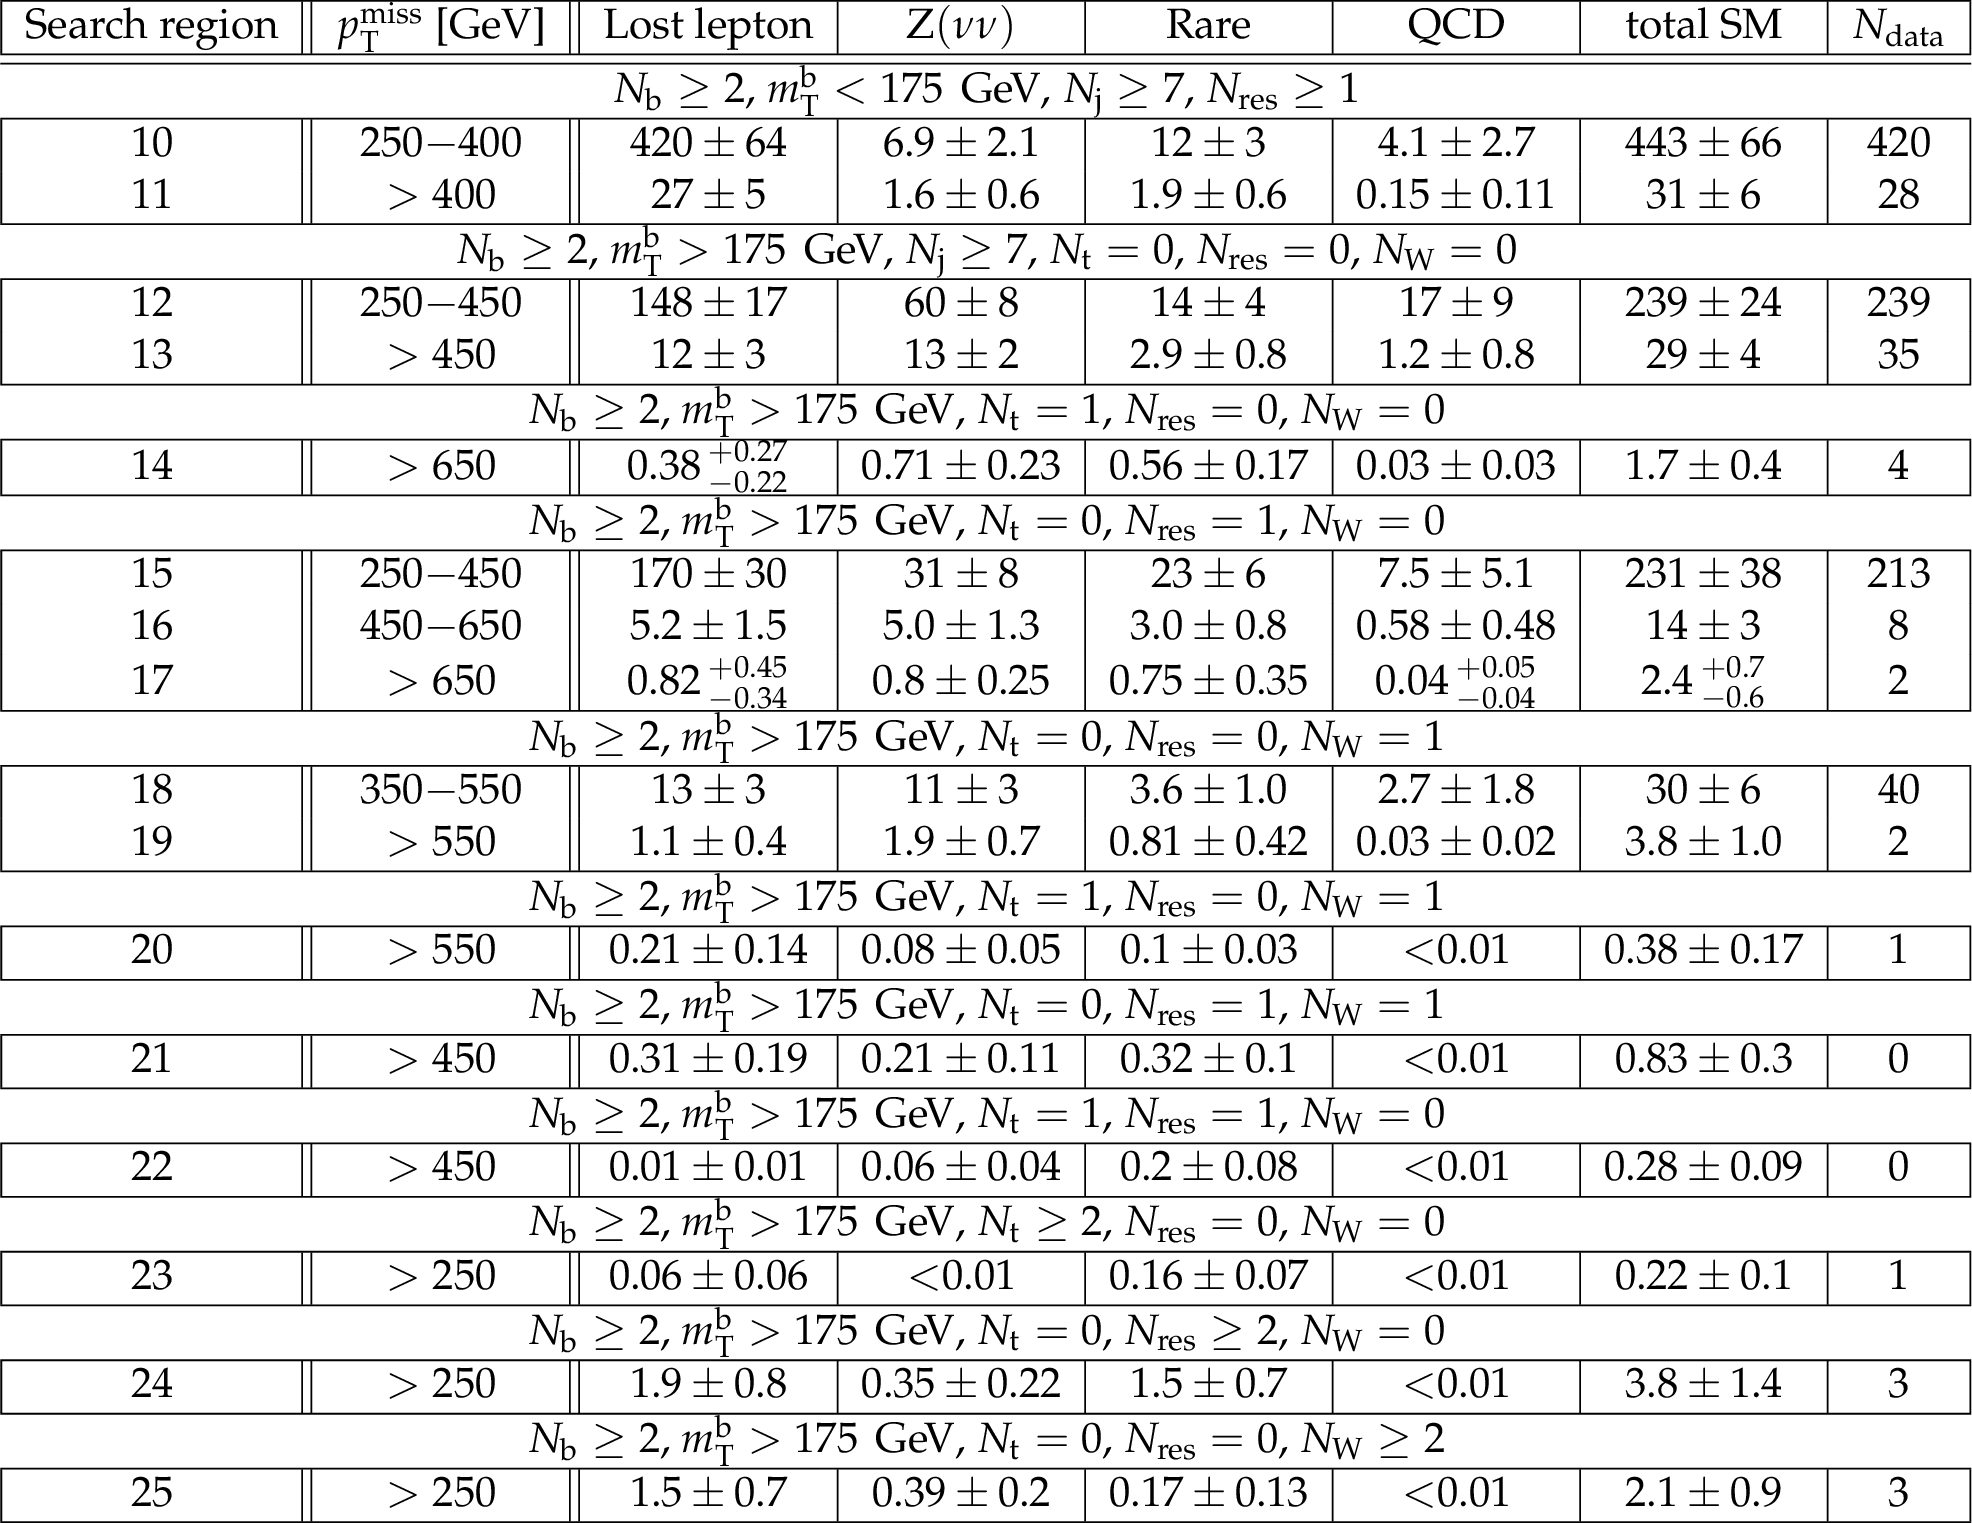
Predicted background yields and the observation in different search regions for the low $ {\Delta m} $ analysis. The total uncertainty is given for each background prediction. |
png pdf |
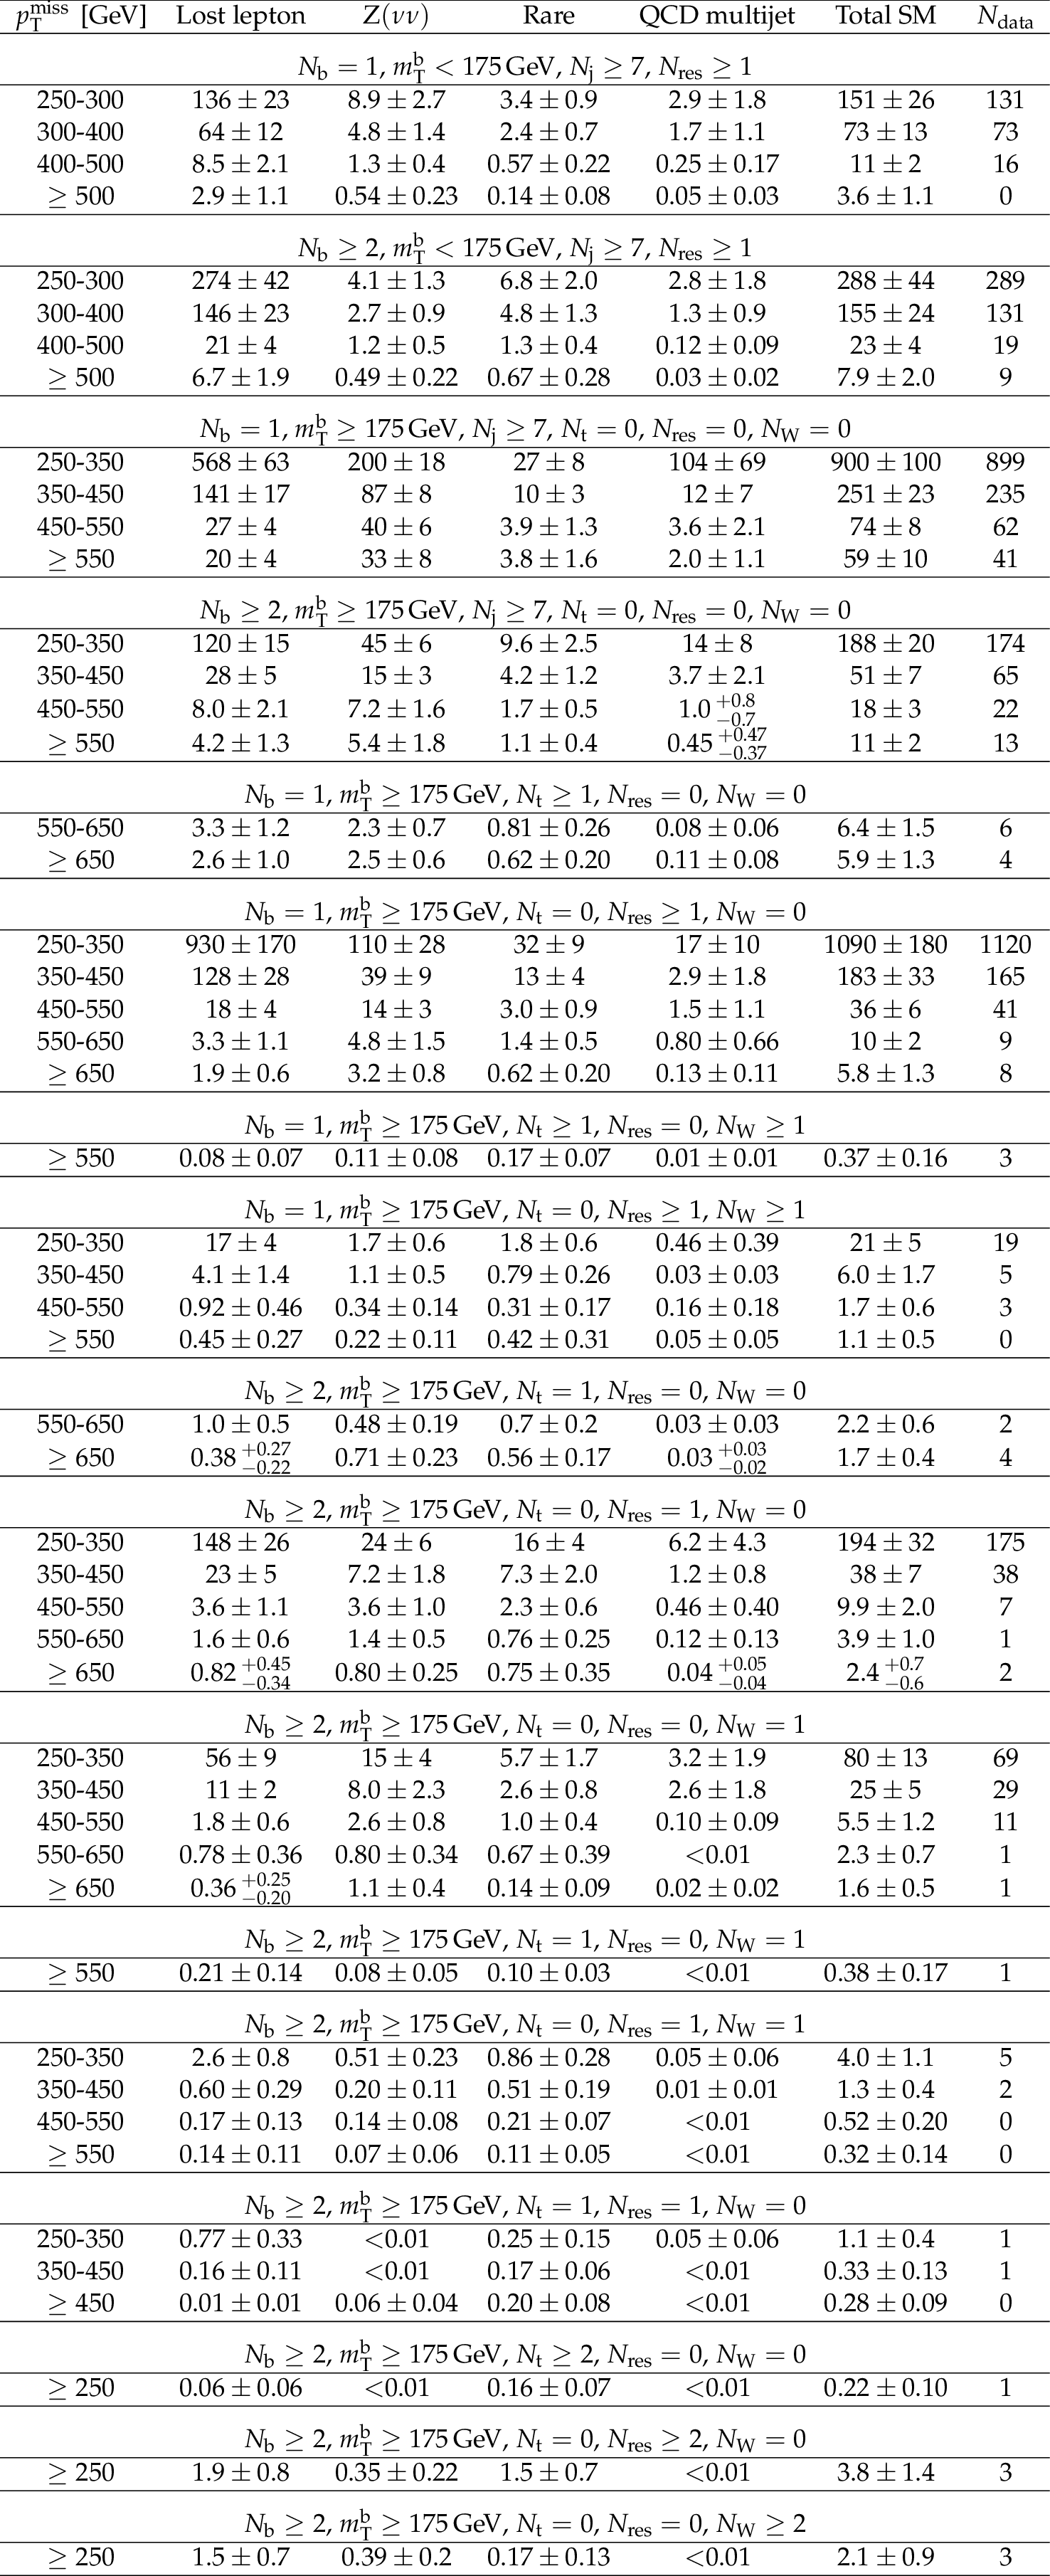
Table 6:
Predicted background yields and the observation in different search regions for the high $ {\Delta m} $ analysis. The total uncertainty is given for each background prediction. |
| Summary |
|
A search is presented for direct top squark pair production in the all-jets final states based upon data collected with the CMS detector in pp collisions at a center-of-mass energy of 13 TeV, corresponding to an integrated luminosity of 35.9 fb$^{-1}$. The search is optimized for discovery through a variety of signatures. No significant excess of events is observed beyond the expected contribution from SM processes, and exclusion limits are set at a 95% confidence level in the context of simplified models [46,47,48] of direct top squark pair production. In the parameter space of large mass differences between the $\tilde{ \mathrm{ t } }_{1}$ and $\tilde{\chi}^0_1$ that permit the $\tilde{ \mathrm{ t } }_{1}$ to decay to an on-shell top quark and a neutralino, top squark masses up to 1040 GeV and $\tilde{\chi}^0_1$ masses up to 500 GeV are excluded. Alternatively, when the top squark decays to a bottom quark and a $\tilde{\chi}^{\pm}_1$, $\tilde{ \mathrm{ t } }_{1}$ masses up to 800 GeV and $\tilde{\chi}^0_1$ masses up to 360 GeV are excluded. Finally, for possibilities in which the branching fractions for these two top squark decay modes equal 50%, including the assumption of a compressed mass spectrum with the mass of the $ \tilde{\chi}^{\pm}_1 $ only 5 GeV greater than that of $ \tilde{\chi}^0_1 $, top squark masses up to 940 GeV and $\tilde{\chi}^0_1$ masses up to 440 GeV are excluded. In the regions of parameter space where the mass difference between the $\tilde{ \mathrm{ t } }_{1}$ and $\tilde{\chi}^0_1$ is smaller than the mass of the W boson, we consider four-body decays of top squarks in which top squark masses up to 580 GeV are excluded for a neutralino mass of 540 GeV. An additional decay that is relevant in this parameter space is one in which the top squark decays to a bottom quark and a $\tilde{\chi}^{\pm}_1$, that then decays to a virtual W boson and a $ \tilde{\chi}^0_1 $. Here, top squark masses up to 660 GeV are excluded for a neutralino mass of 610 GeV. Finally, we consider decays through a flavor changing neutral current process where the $\tilde{ \mathrm{ t } }_{1}$ decays to a c quark and a $ \tilde{\chi}^0_1 $. In this case, $\tilde{ \mathrm{ t } }_{1}$ and $ \tilde{\chi}^0_1 $ masses up to 560 GeV and up to 520 GeV, respectively, are excluded. In summary, we present a search that takes advantage of a large new set of data collected by the CMS experiment in 2016, as well as a variety of new methods that yield exclusion limits for a wide array of top squark decay modes in planes of $m_{\tilde{\chi}^0_1}$ versus $m_{\tilde{ \mathrm{ t } }_{1}}$ and $m_{\tilde{ \mathrm{ t } }_{1}} - m_{\tilde{\chi}^0_1}$ versus $m_{\tilde{ \mathrm{ t } }_{1}}$ that extend significantly beyond those obtained in previous searches. |
| Additional Figures | |
png pdf |
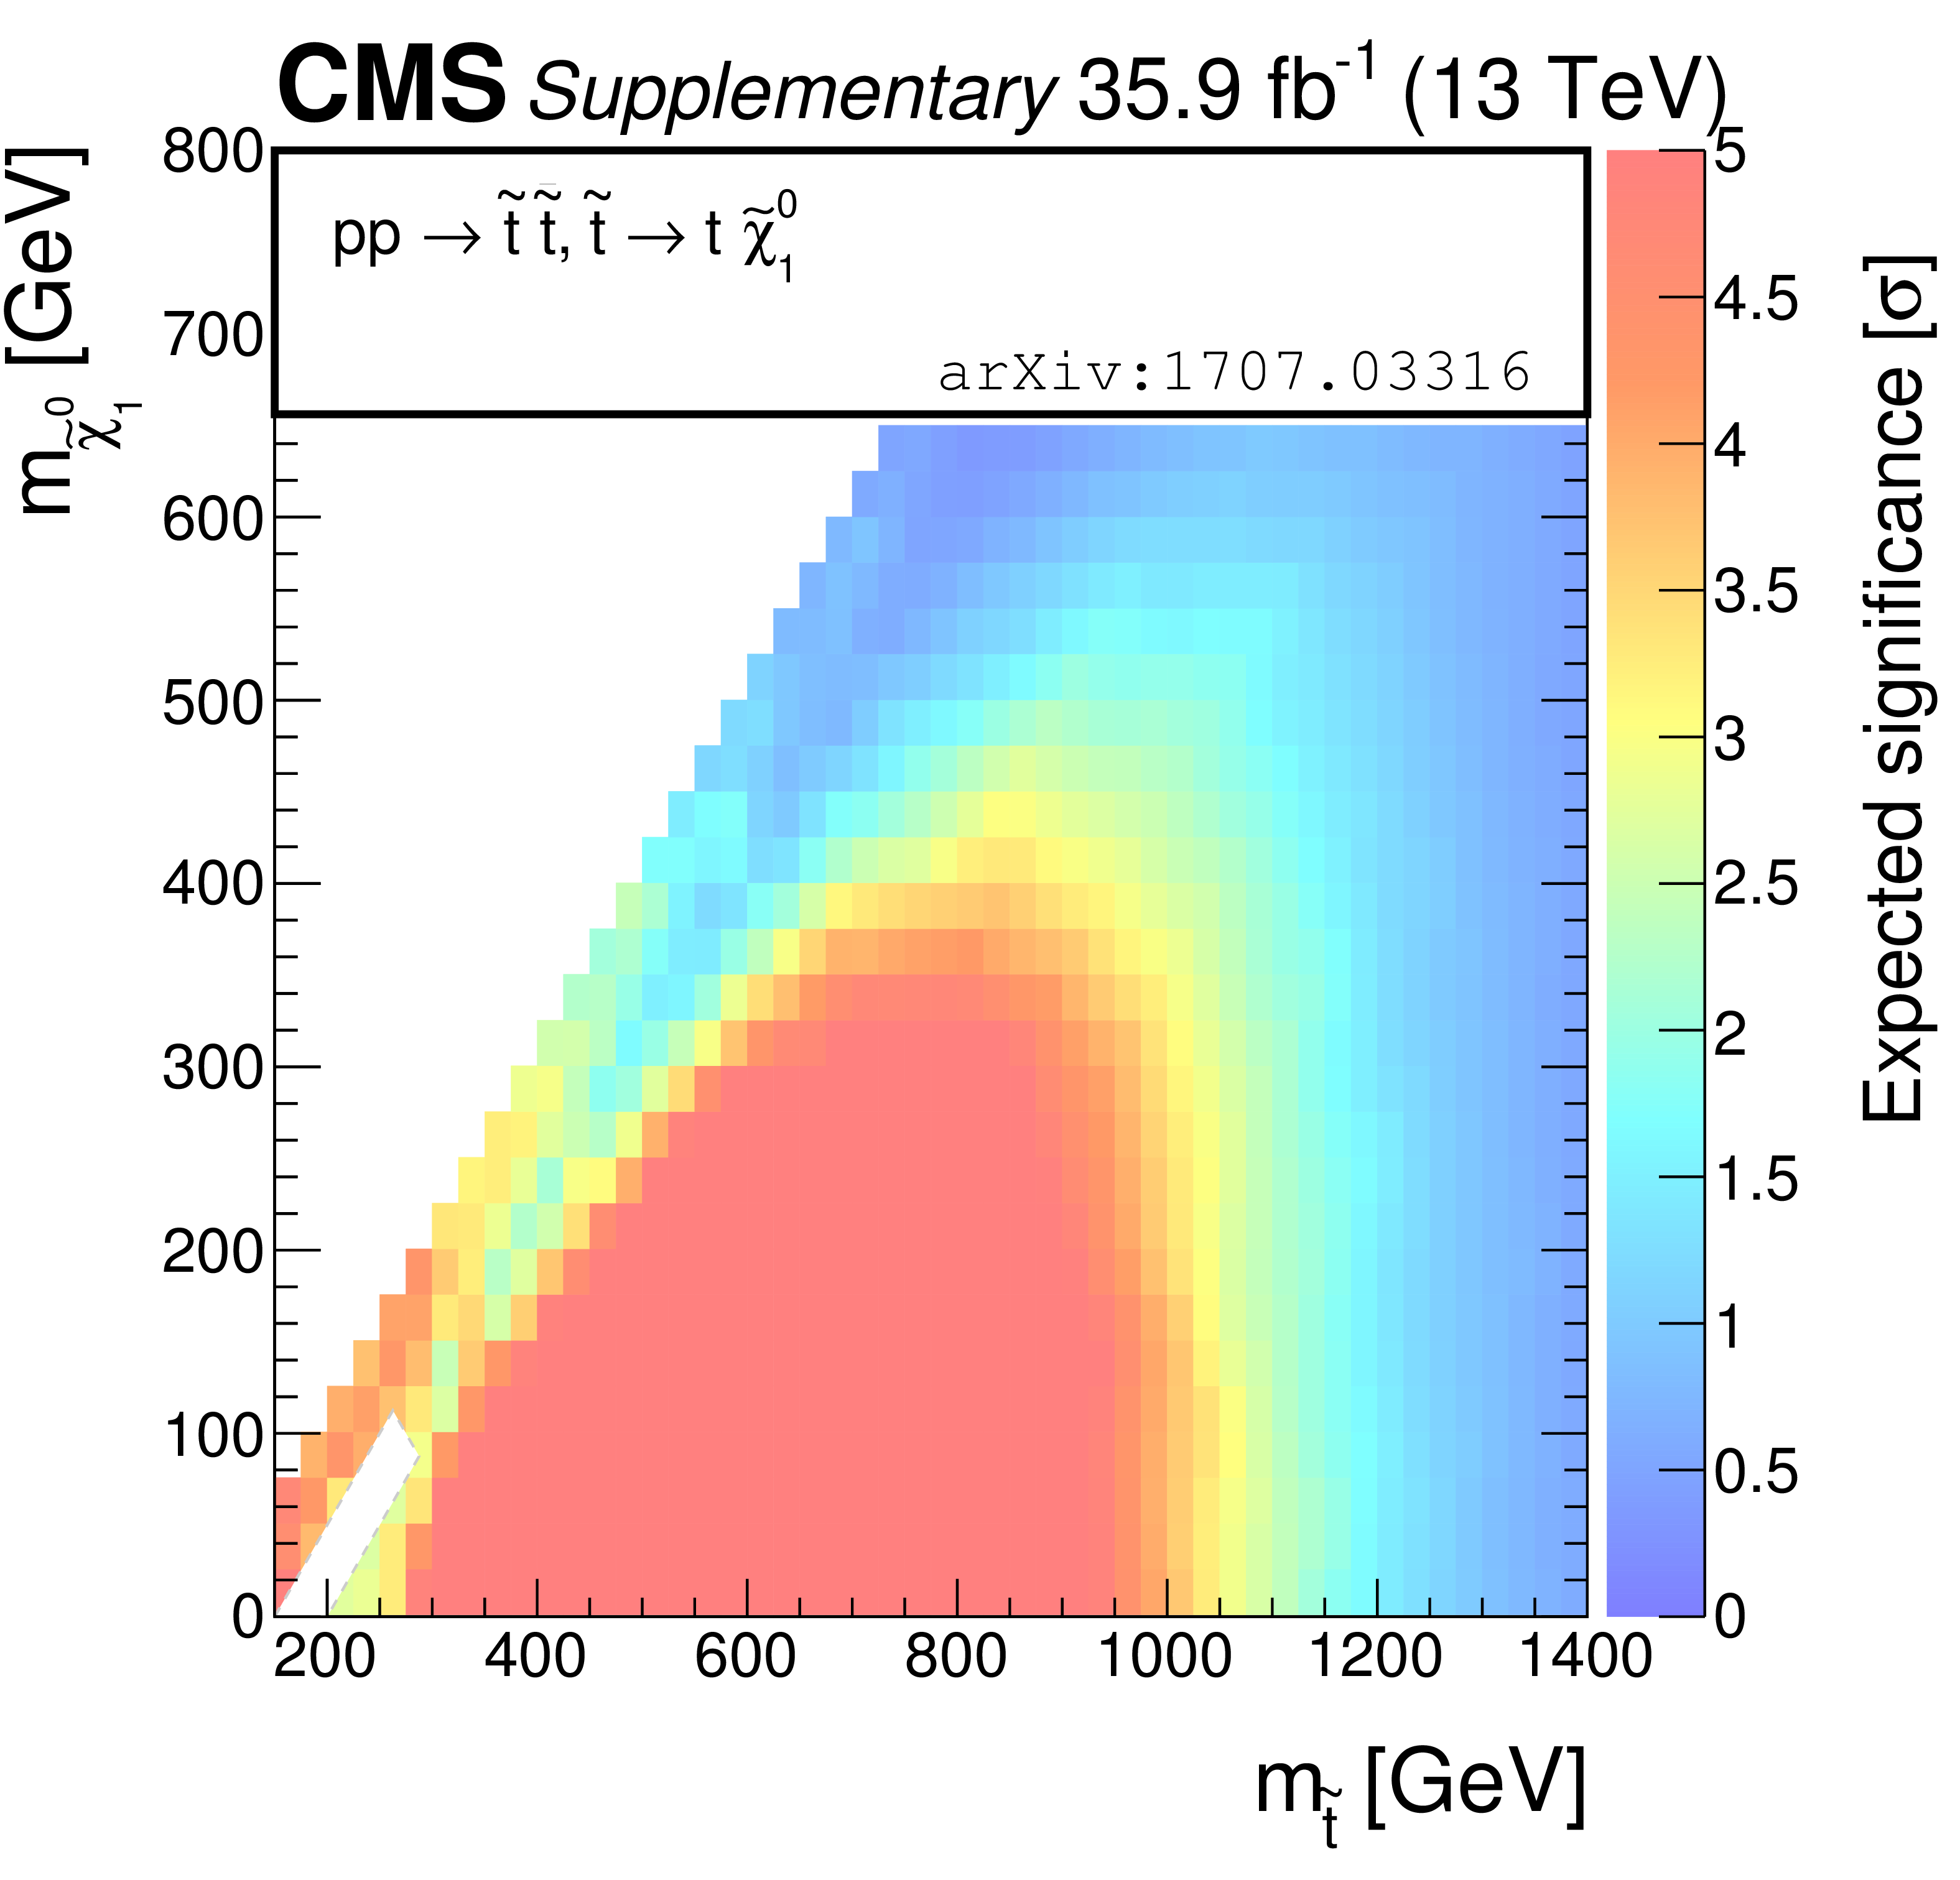
Additional Figure 1:
Expected significances for simplified models of top squark pair production in the pure $\tilde{ \mathrm{ t } } _{1}\to \mathrm{ t } \tilde{\chi}^0_1 $ ("T2tt") decay scenario. |

png pdf |
Additional Figure 2:
Observed significances for simplified models of top squark pair production in the pure $\tilde{ \mathrm{ t } } _{1}\to \mathrm{ t } \tilde{\chi}^0_1 $ ("T2tt") decay scenario. |
png pdf |
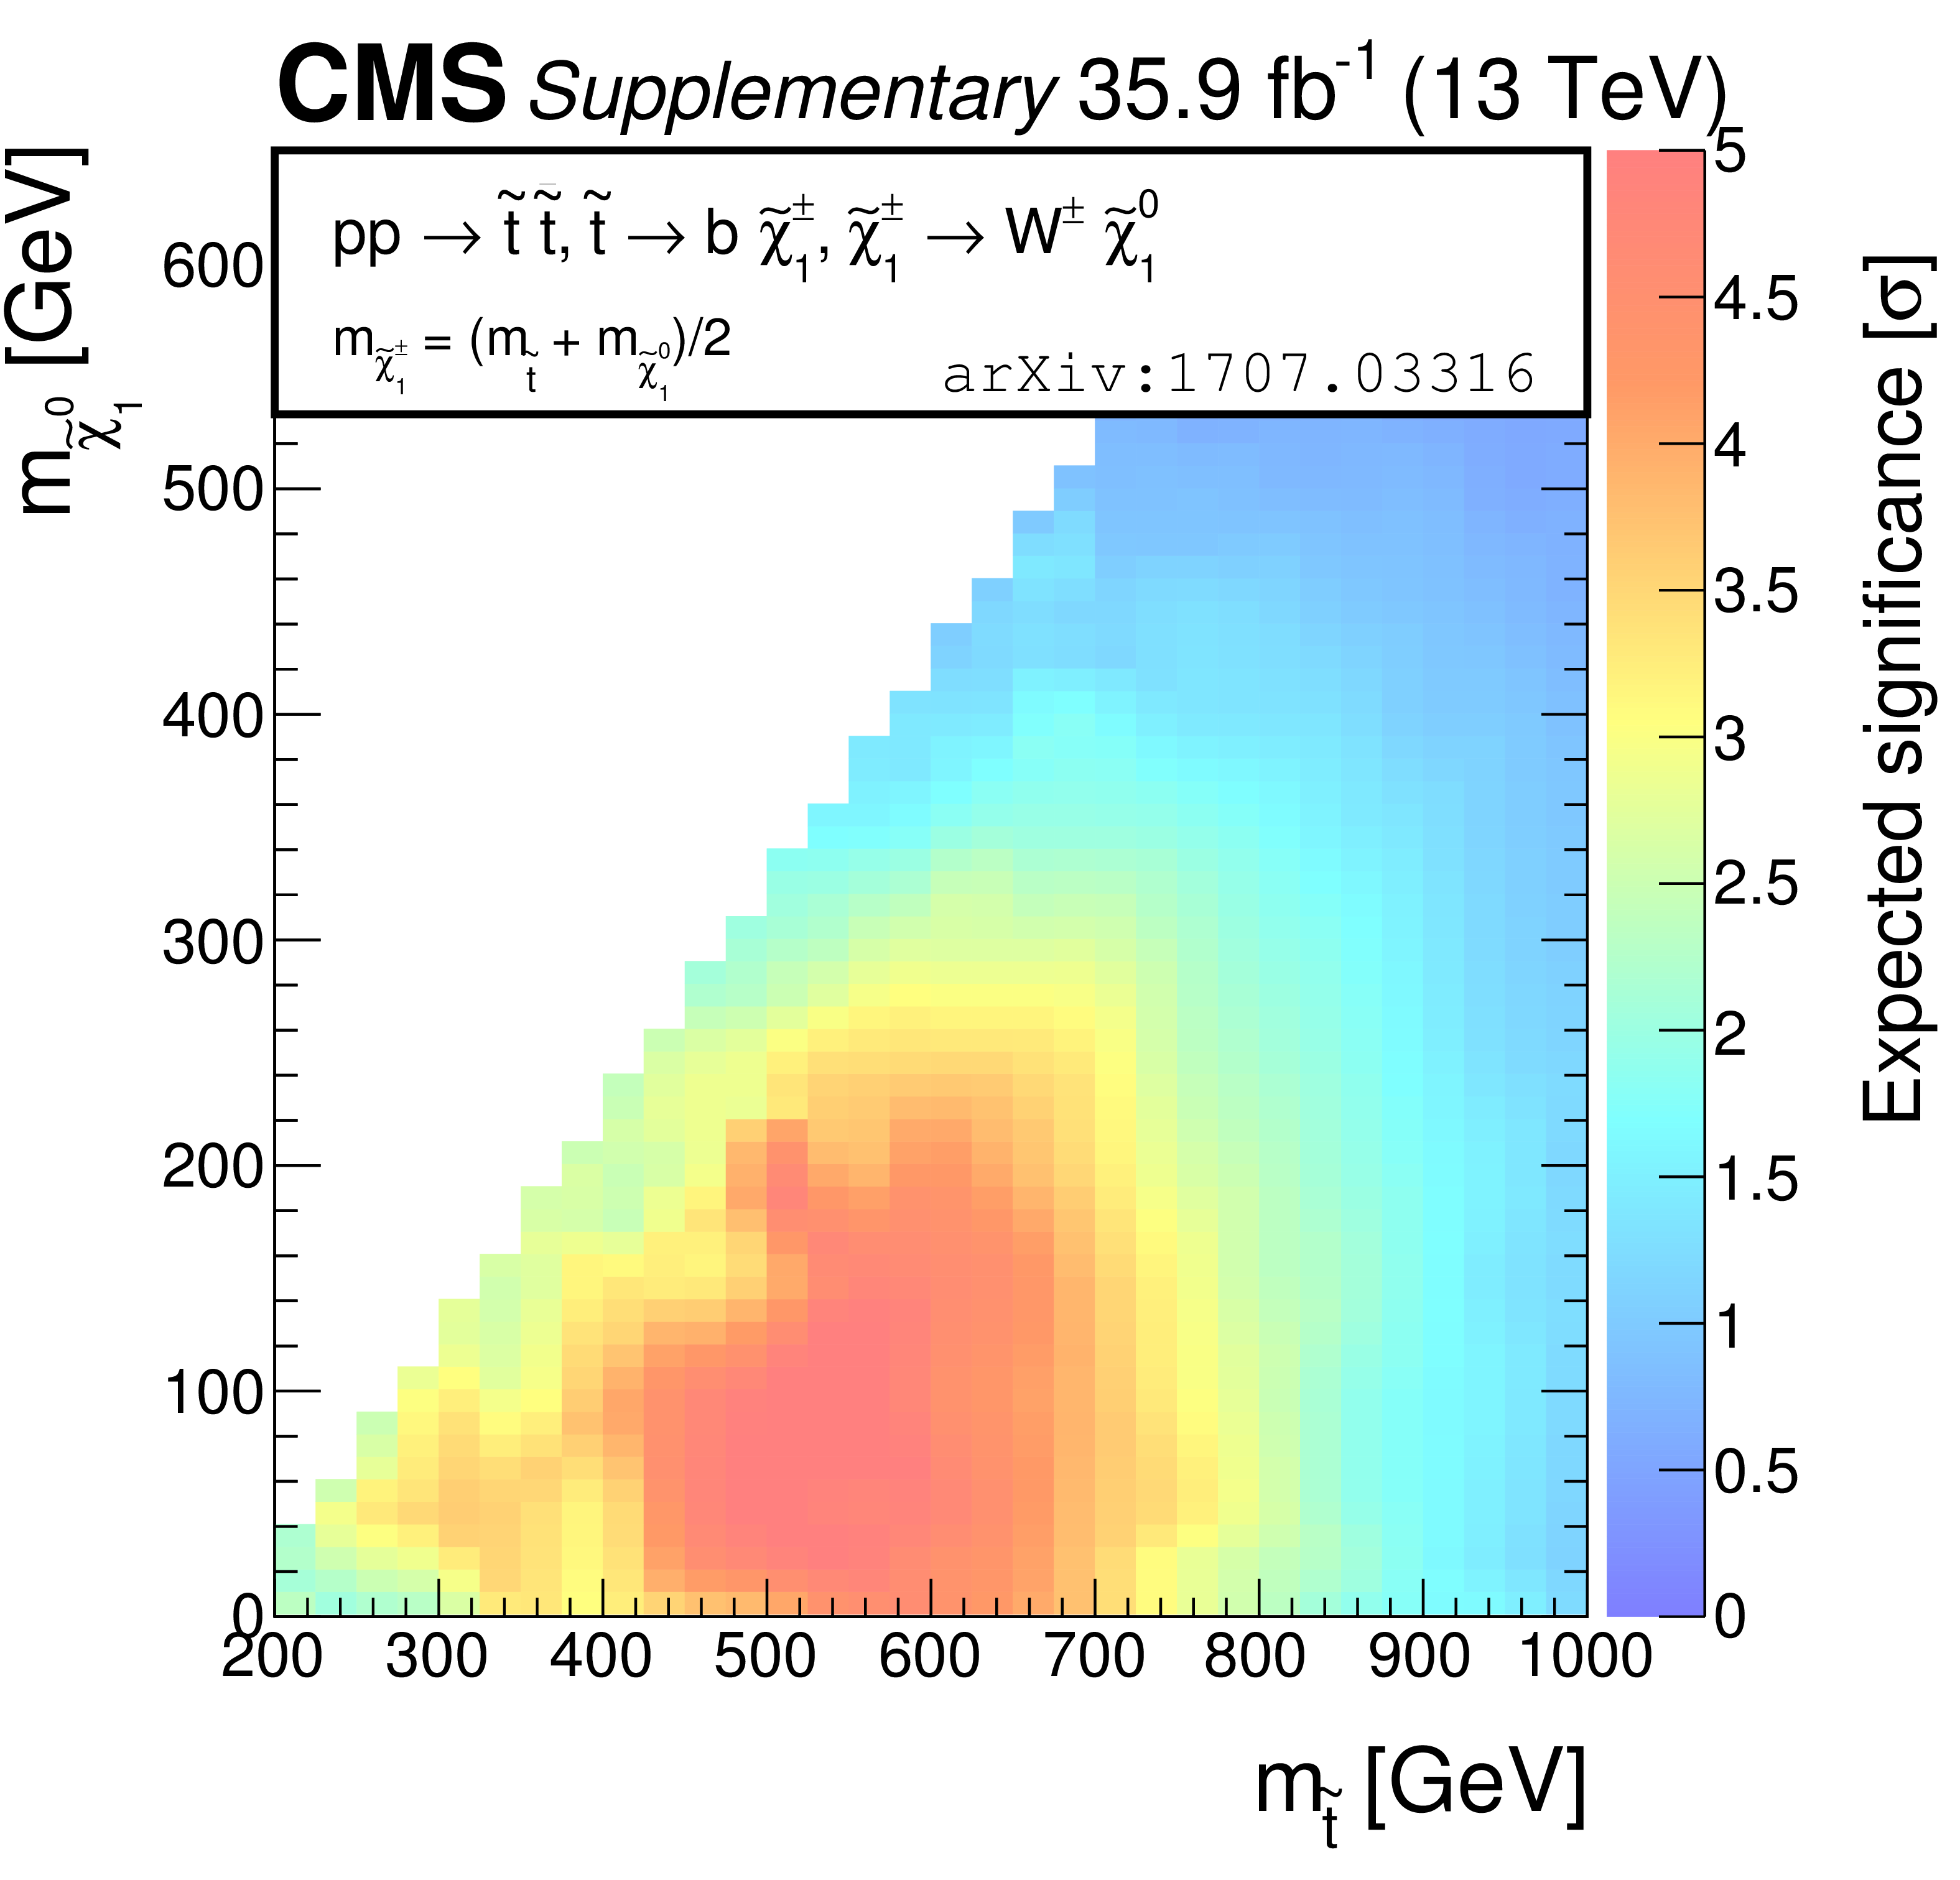
Additional Figure 3:
Expected significances for simplified models of top squark pair production in the pure $\tilde{ \mathrm{ t } } _{1}\to \mathrm{ b } \tilde{\chi}^{\pm}_1 \rightarrow \mathrm{ b } {\mathrm {W}}^{\pm } \tilde{\chi}^0_1 $ ("T2bW'') decay scenario. |
png pdf |
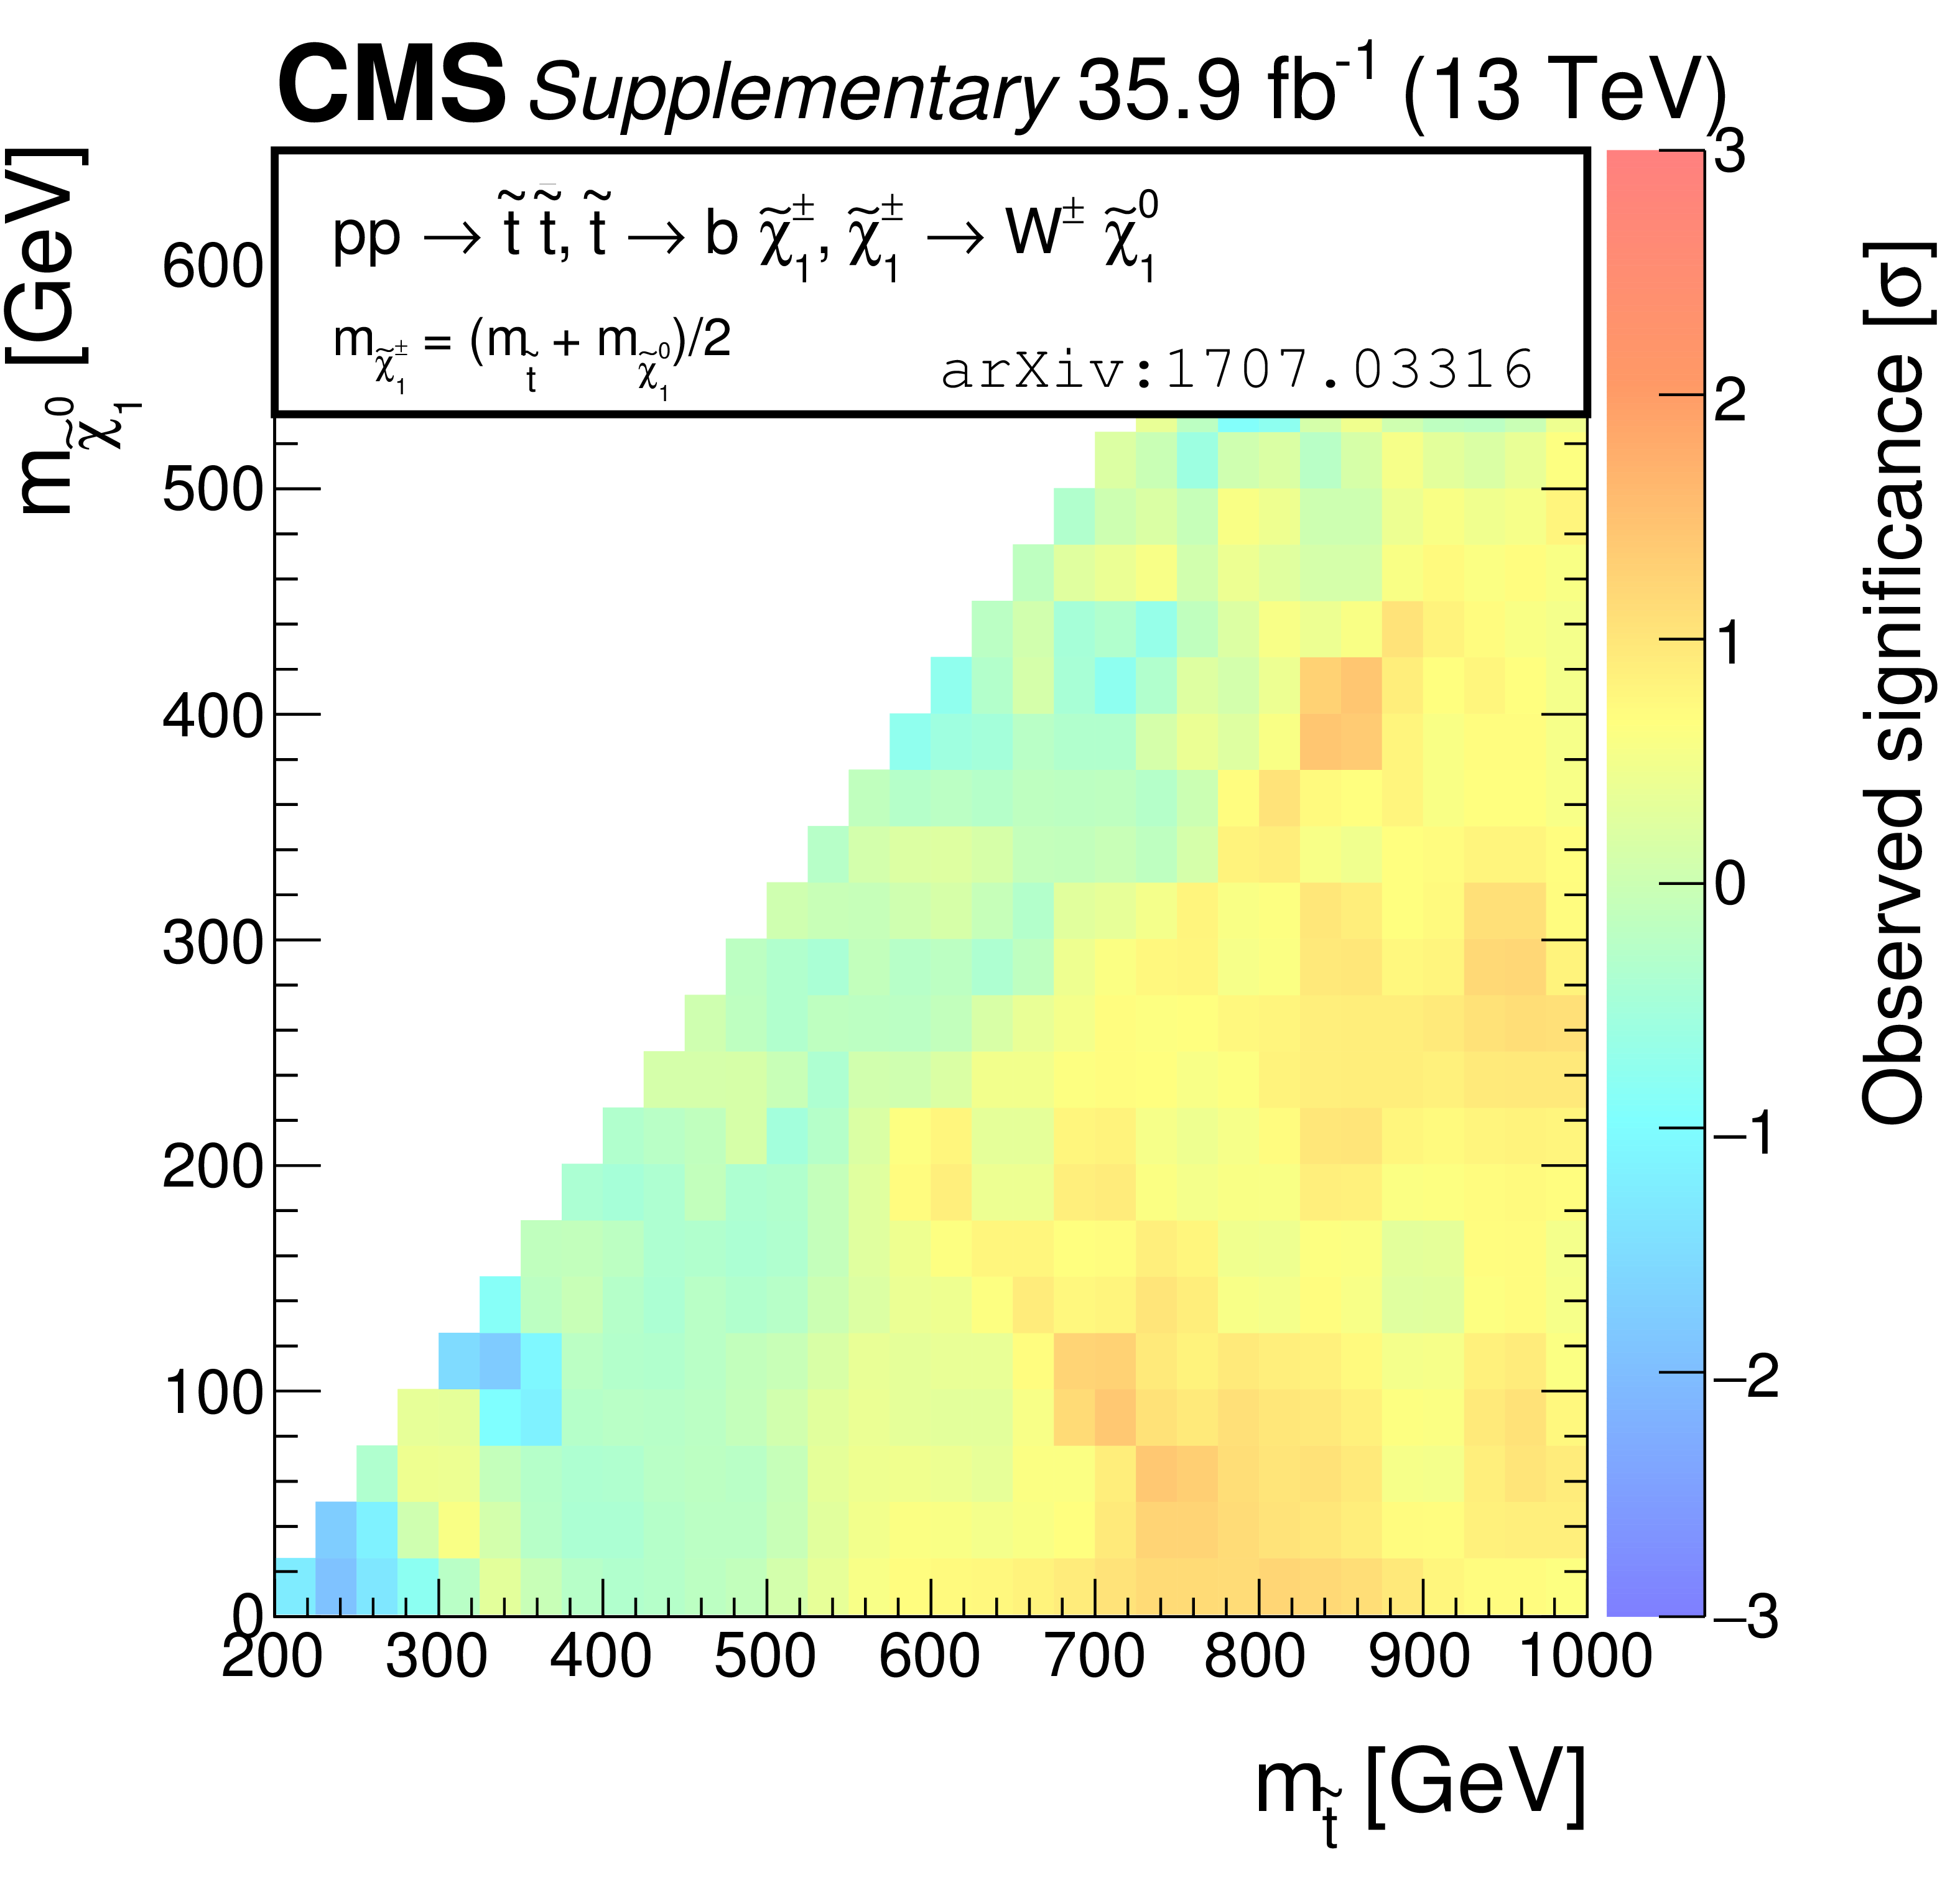
Additional Figure 4:
Observed significances for simplified models of top squark pair production in the pure $\tilde{ \mathrm{ t } } _{1}\to \mathrm{ b } \tilde{\chi}^{\pm}_1 \rightarrow \mathrm{ b } {\mathrm {W}}^{\pm } \tilde{\chi}^0_1 $ ("T2bW'') decay scenario. |
png pdf |
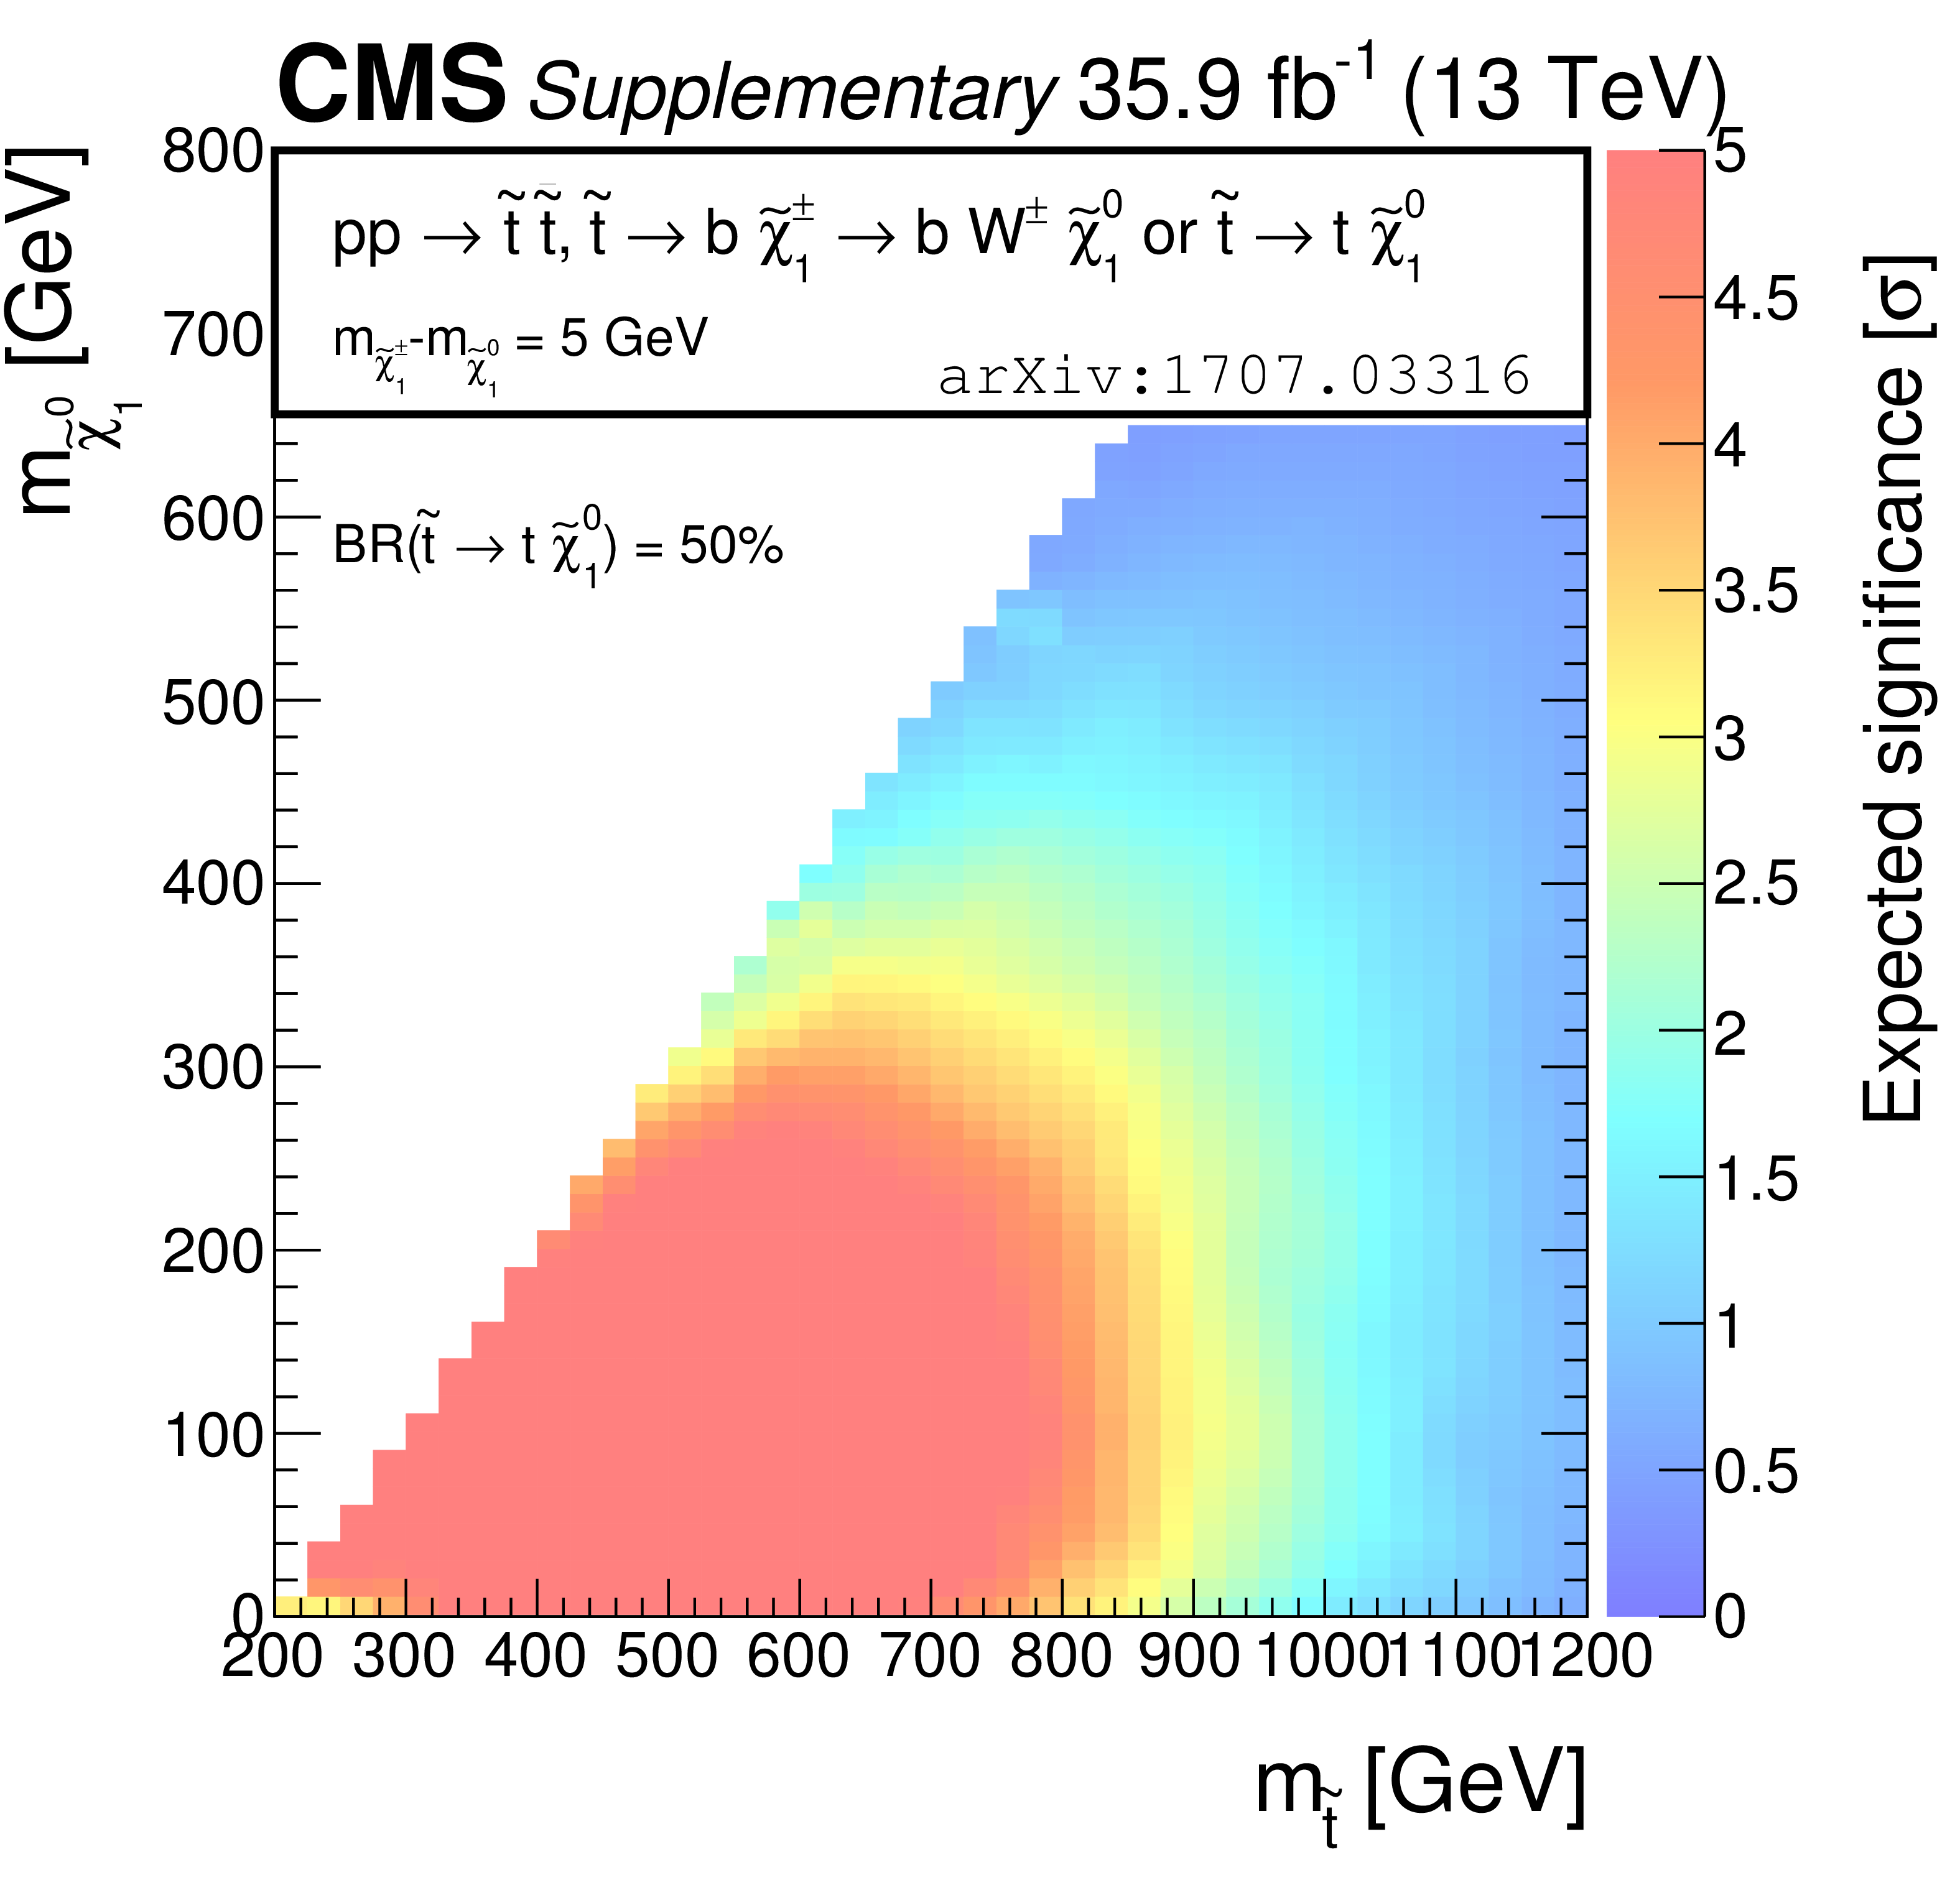
Additional Figure 5:
Expected significances for simplified models of top squark pair production in the $\mathrm{ p } \mathrm{ p } \rightarrow \tilde{ \mathrm{ t } } _{1}\overline{\tilde{\mathrm{t}}} _{1}\rightarrow \mathrm{ \bar{t} } \tilde{\chi}^0_1 \mathrm{ b } \tilde{\chi}^{+}_{1} $ ("T2tb'') decay scenario, under the assumption of a compressed mass spectrum in which the mass of $ \tilde{\chi}^{\pm}_1 $ is only 5 GeV greater than that of $ \tilde{\chi}^0_1 $. |
png pdf |
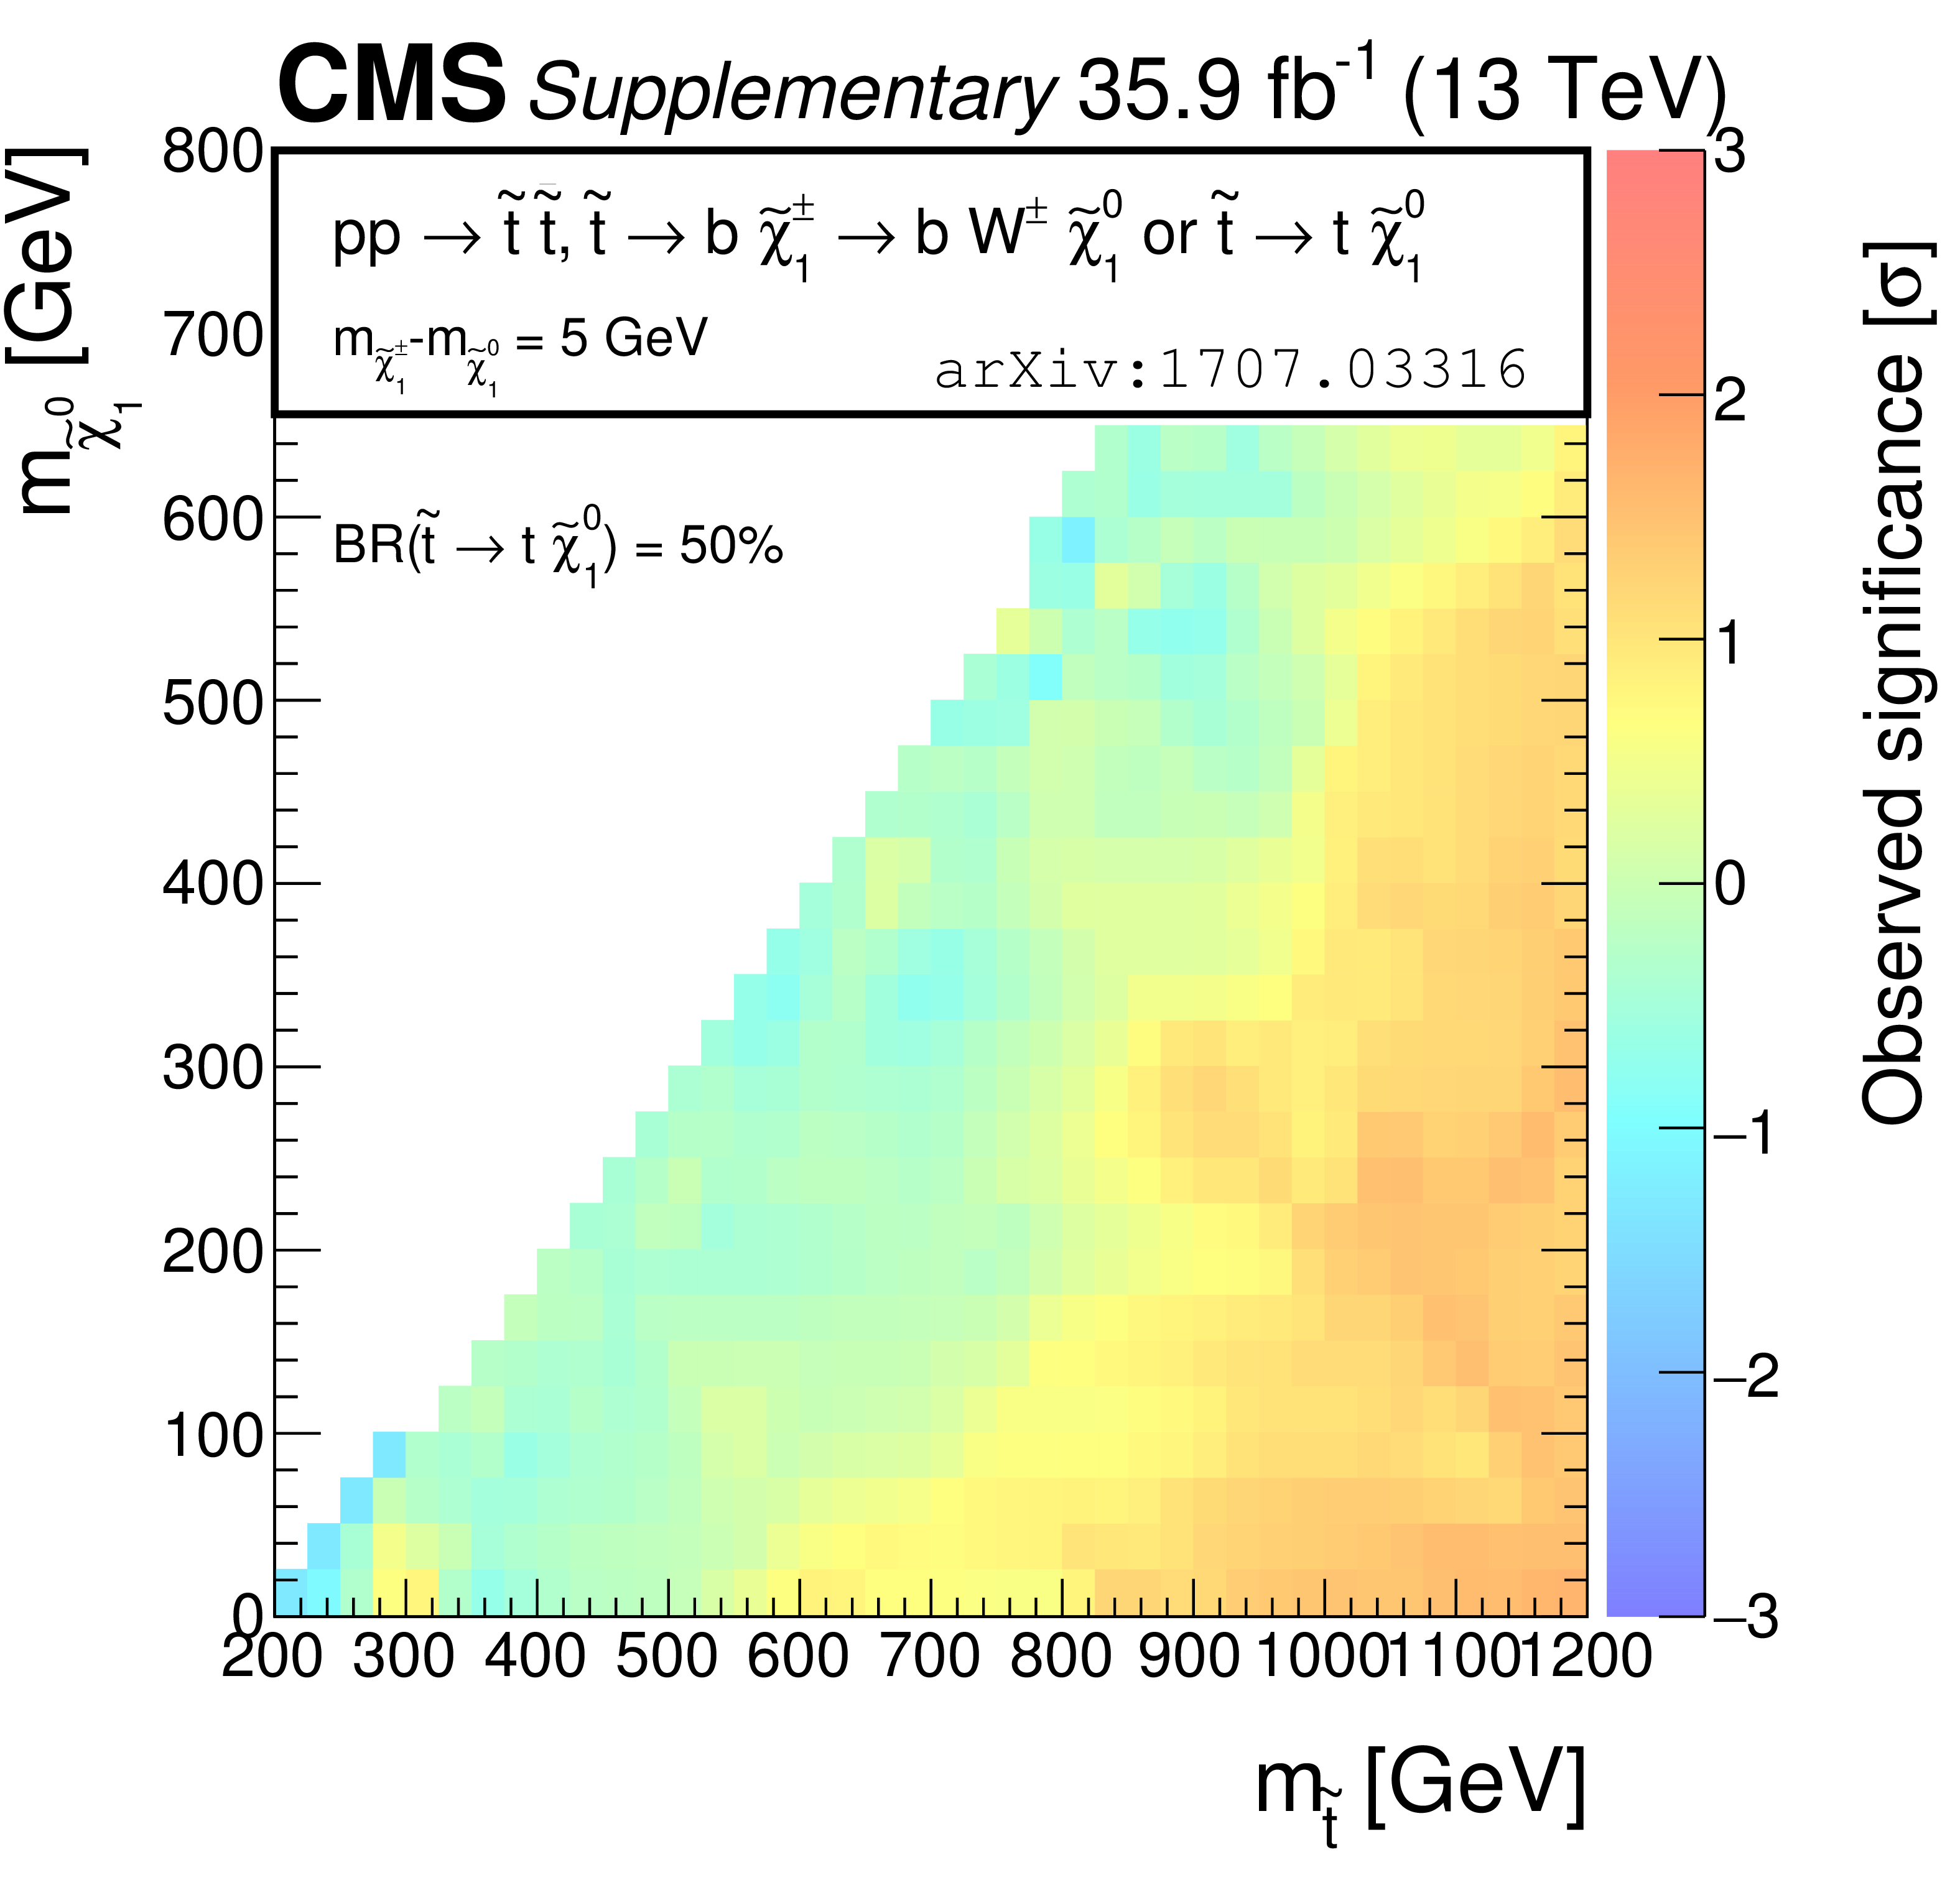
Additional Figure 6:
Observed significances for simplified models of top squark pair production in the $\mathrm{ p } \mathrm{ p } \rightarrow \tilde{ \mathrm{ t } } _{1}\overline{\tilde{\mathrm{t}}} _{1}\rightarrow \mathrm{ \bar{t} } \tilde{\chi}^0_1 \mathrm{ b } \tilde{\chi}^{+}_{1} $ ("T2tb'') decay scenario, under the assumption of a compressed mass spectrum in which the mass of $ \tilde{\chi}^{\pm}_1 $ is only 5 GeV greater than that of $ \tilde{\chi}^0_1 $. |
png pdf |
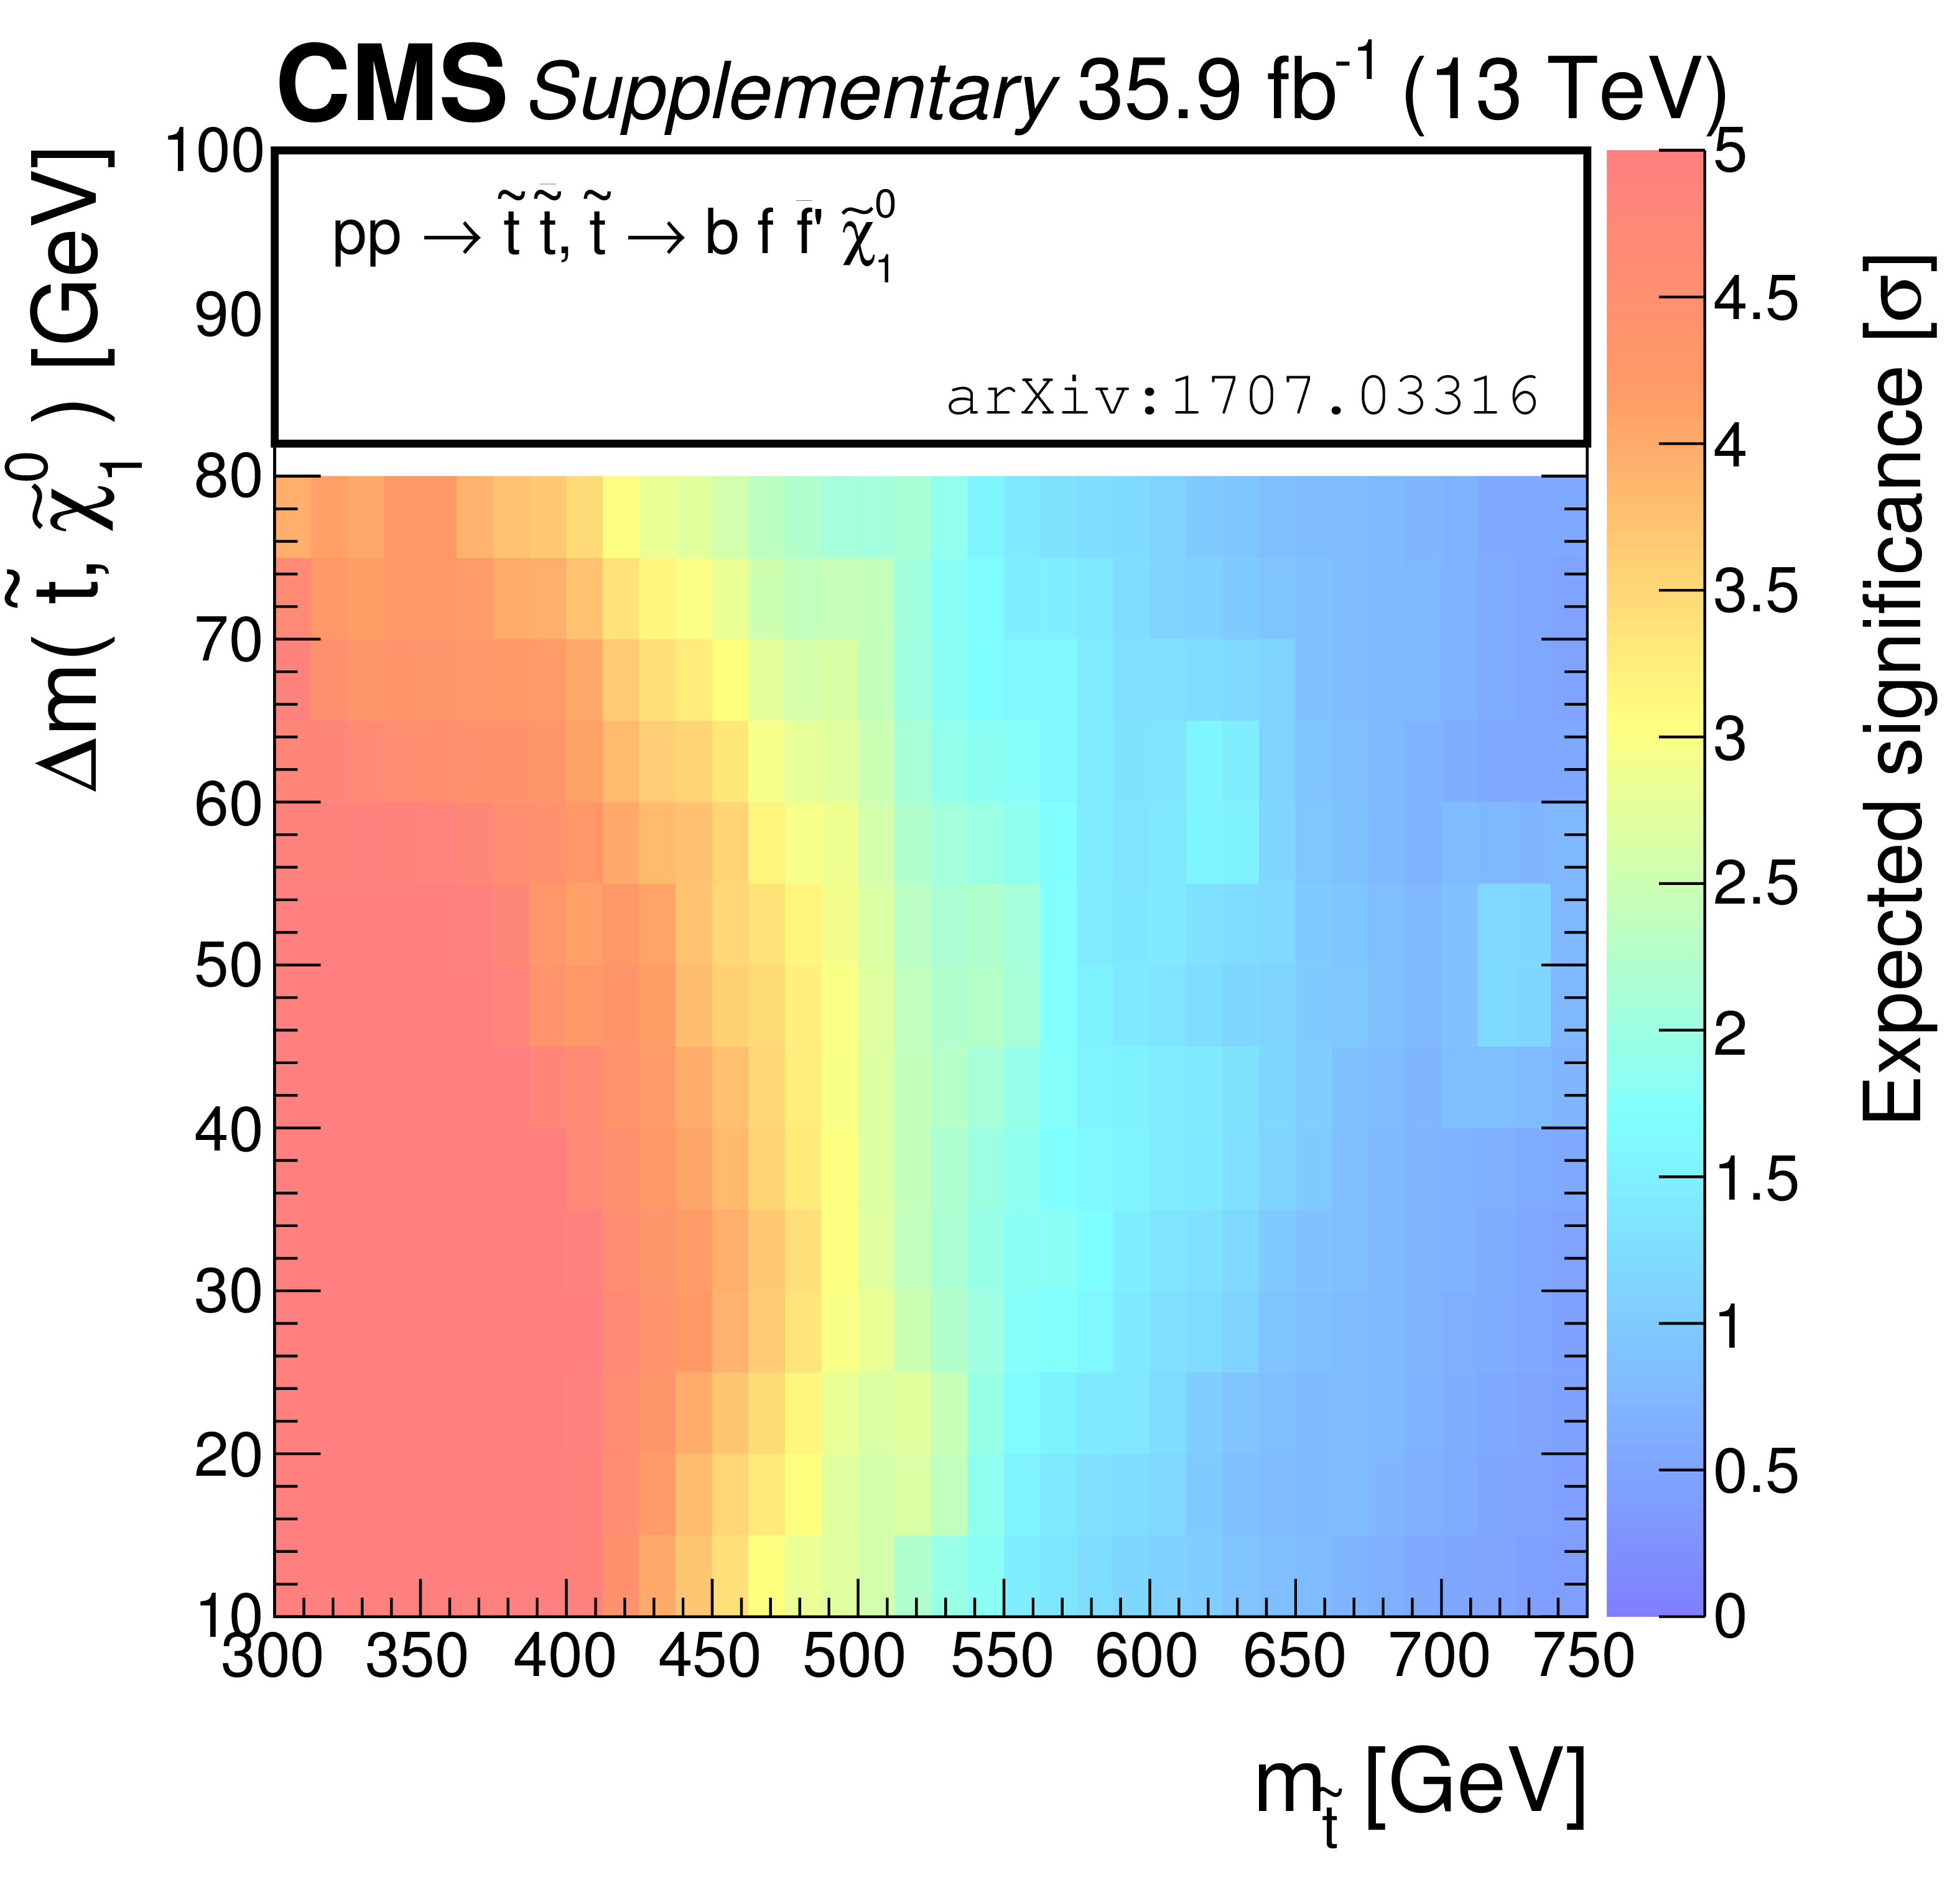
Additional Figure 7:
Expected significances for simplified models of top squark pair production in the $\tilde{ \mathrm{ t } } _{1} \to \mathrm{ b } \mathrm {f} \bar{\mathrm {f'}} \tilde{\chi}^0_1 $ ("T2ttC'') four-body decay scenario. |

png pdf |
Additional Figure 8:
Observed significances for simplified models of top squark pair production in the $\tilde{ \mathrm{ t } } _{1} \to \mathrm{ b } \mathrm {f} \bar{\mathrm {f'}} \tilde{\chi}^0_1 $ ("T2ttC'') four-body decay scenario. |
png pdf |
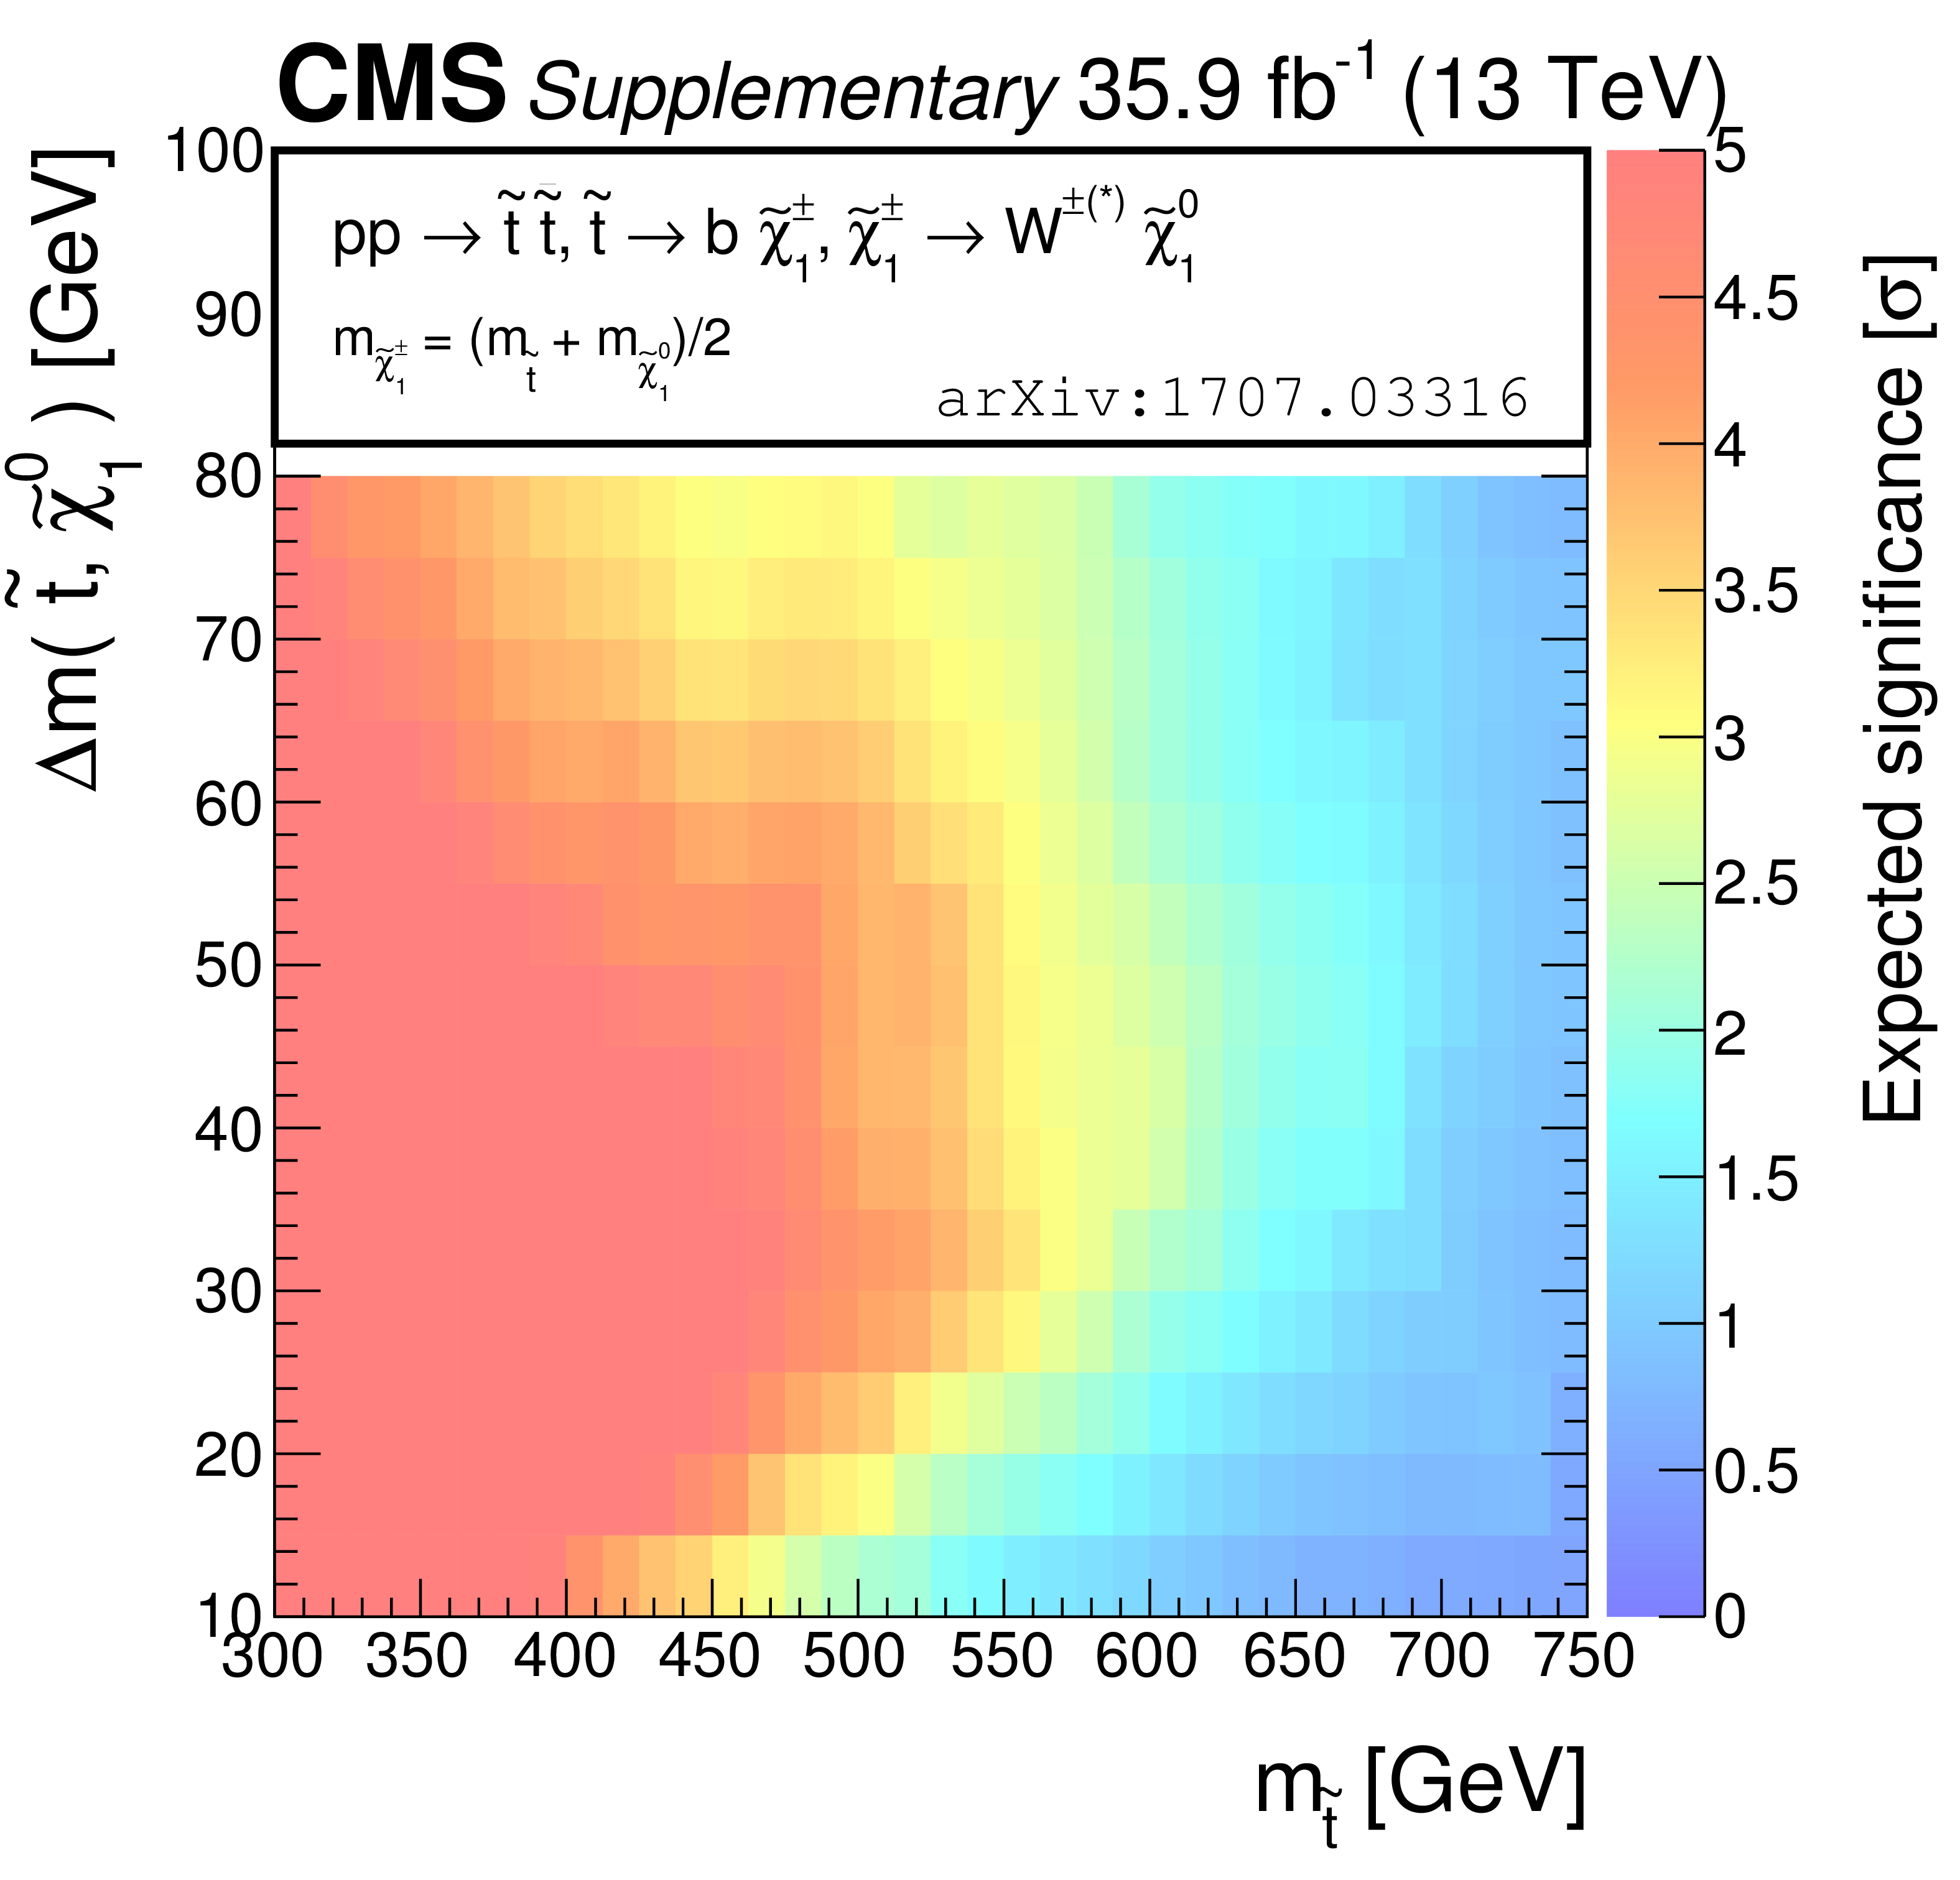
Additional Figure 9:
Expected significances for simplified models of top squark pair production in the $\tilde{ \mathrm{ t } } _{1}\to \mathrm{ b } \tilde{\chi}^{\pm}_1 \to \mathrm{ b } \mathrm {f} \bar{\mathrm {f'}} \tilde{\chi}^0_1 $ ("T2bWC") four-body decay scenario. |
png pdf |
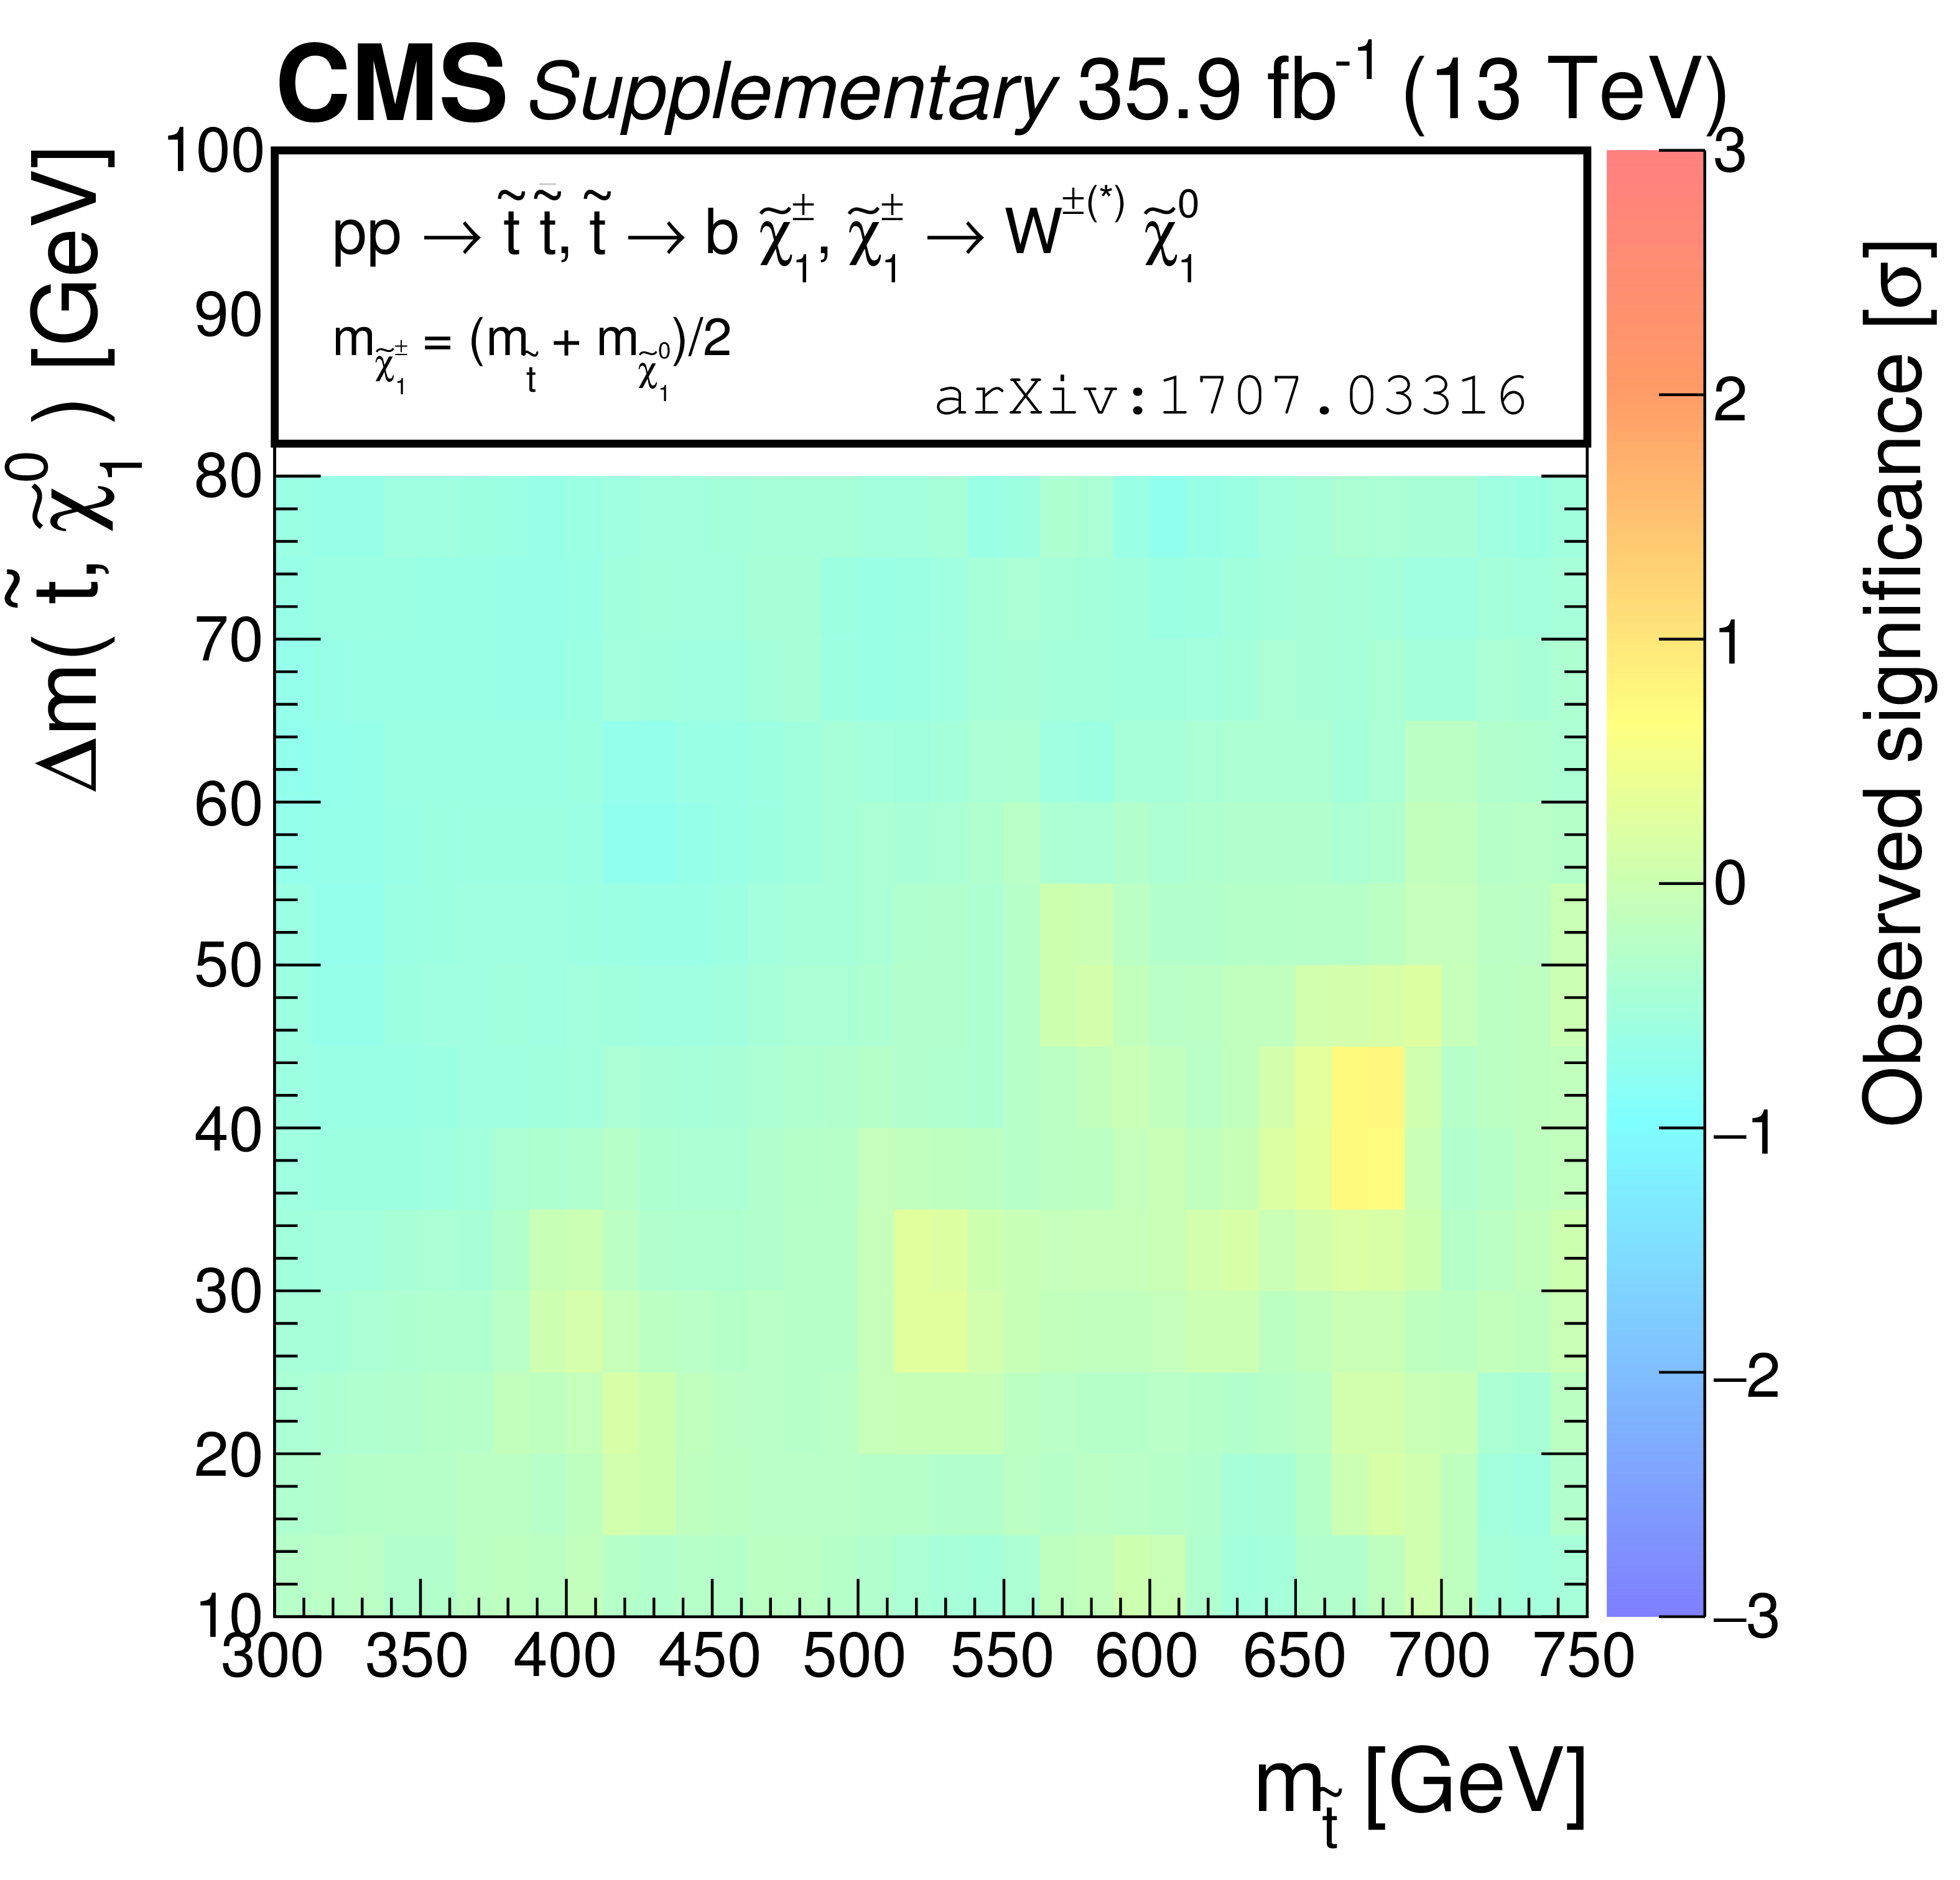
Additional Figure 10:
Observed significances for simplified models of top squark pair production in the $\tilde{ \mathrm{ t } } _{1}\to \mathrm{ b } \tilde{\chi}^{\pm}_1 \to \mathrm{ b } \mathrm {f} \bar{\mathrm {f'}} \tilde{\chi}^0_1 $ ("T2bWC") four-body decay scenario. |
png pdf |
Additional Figure 11:
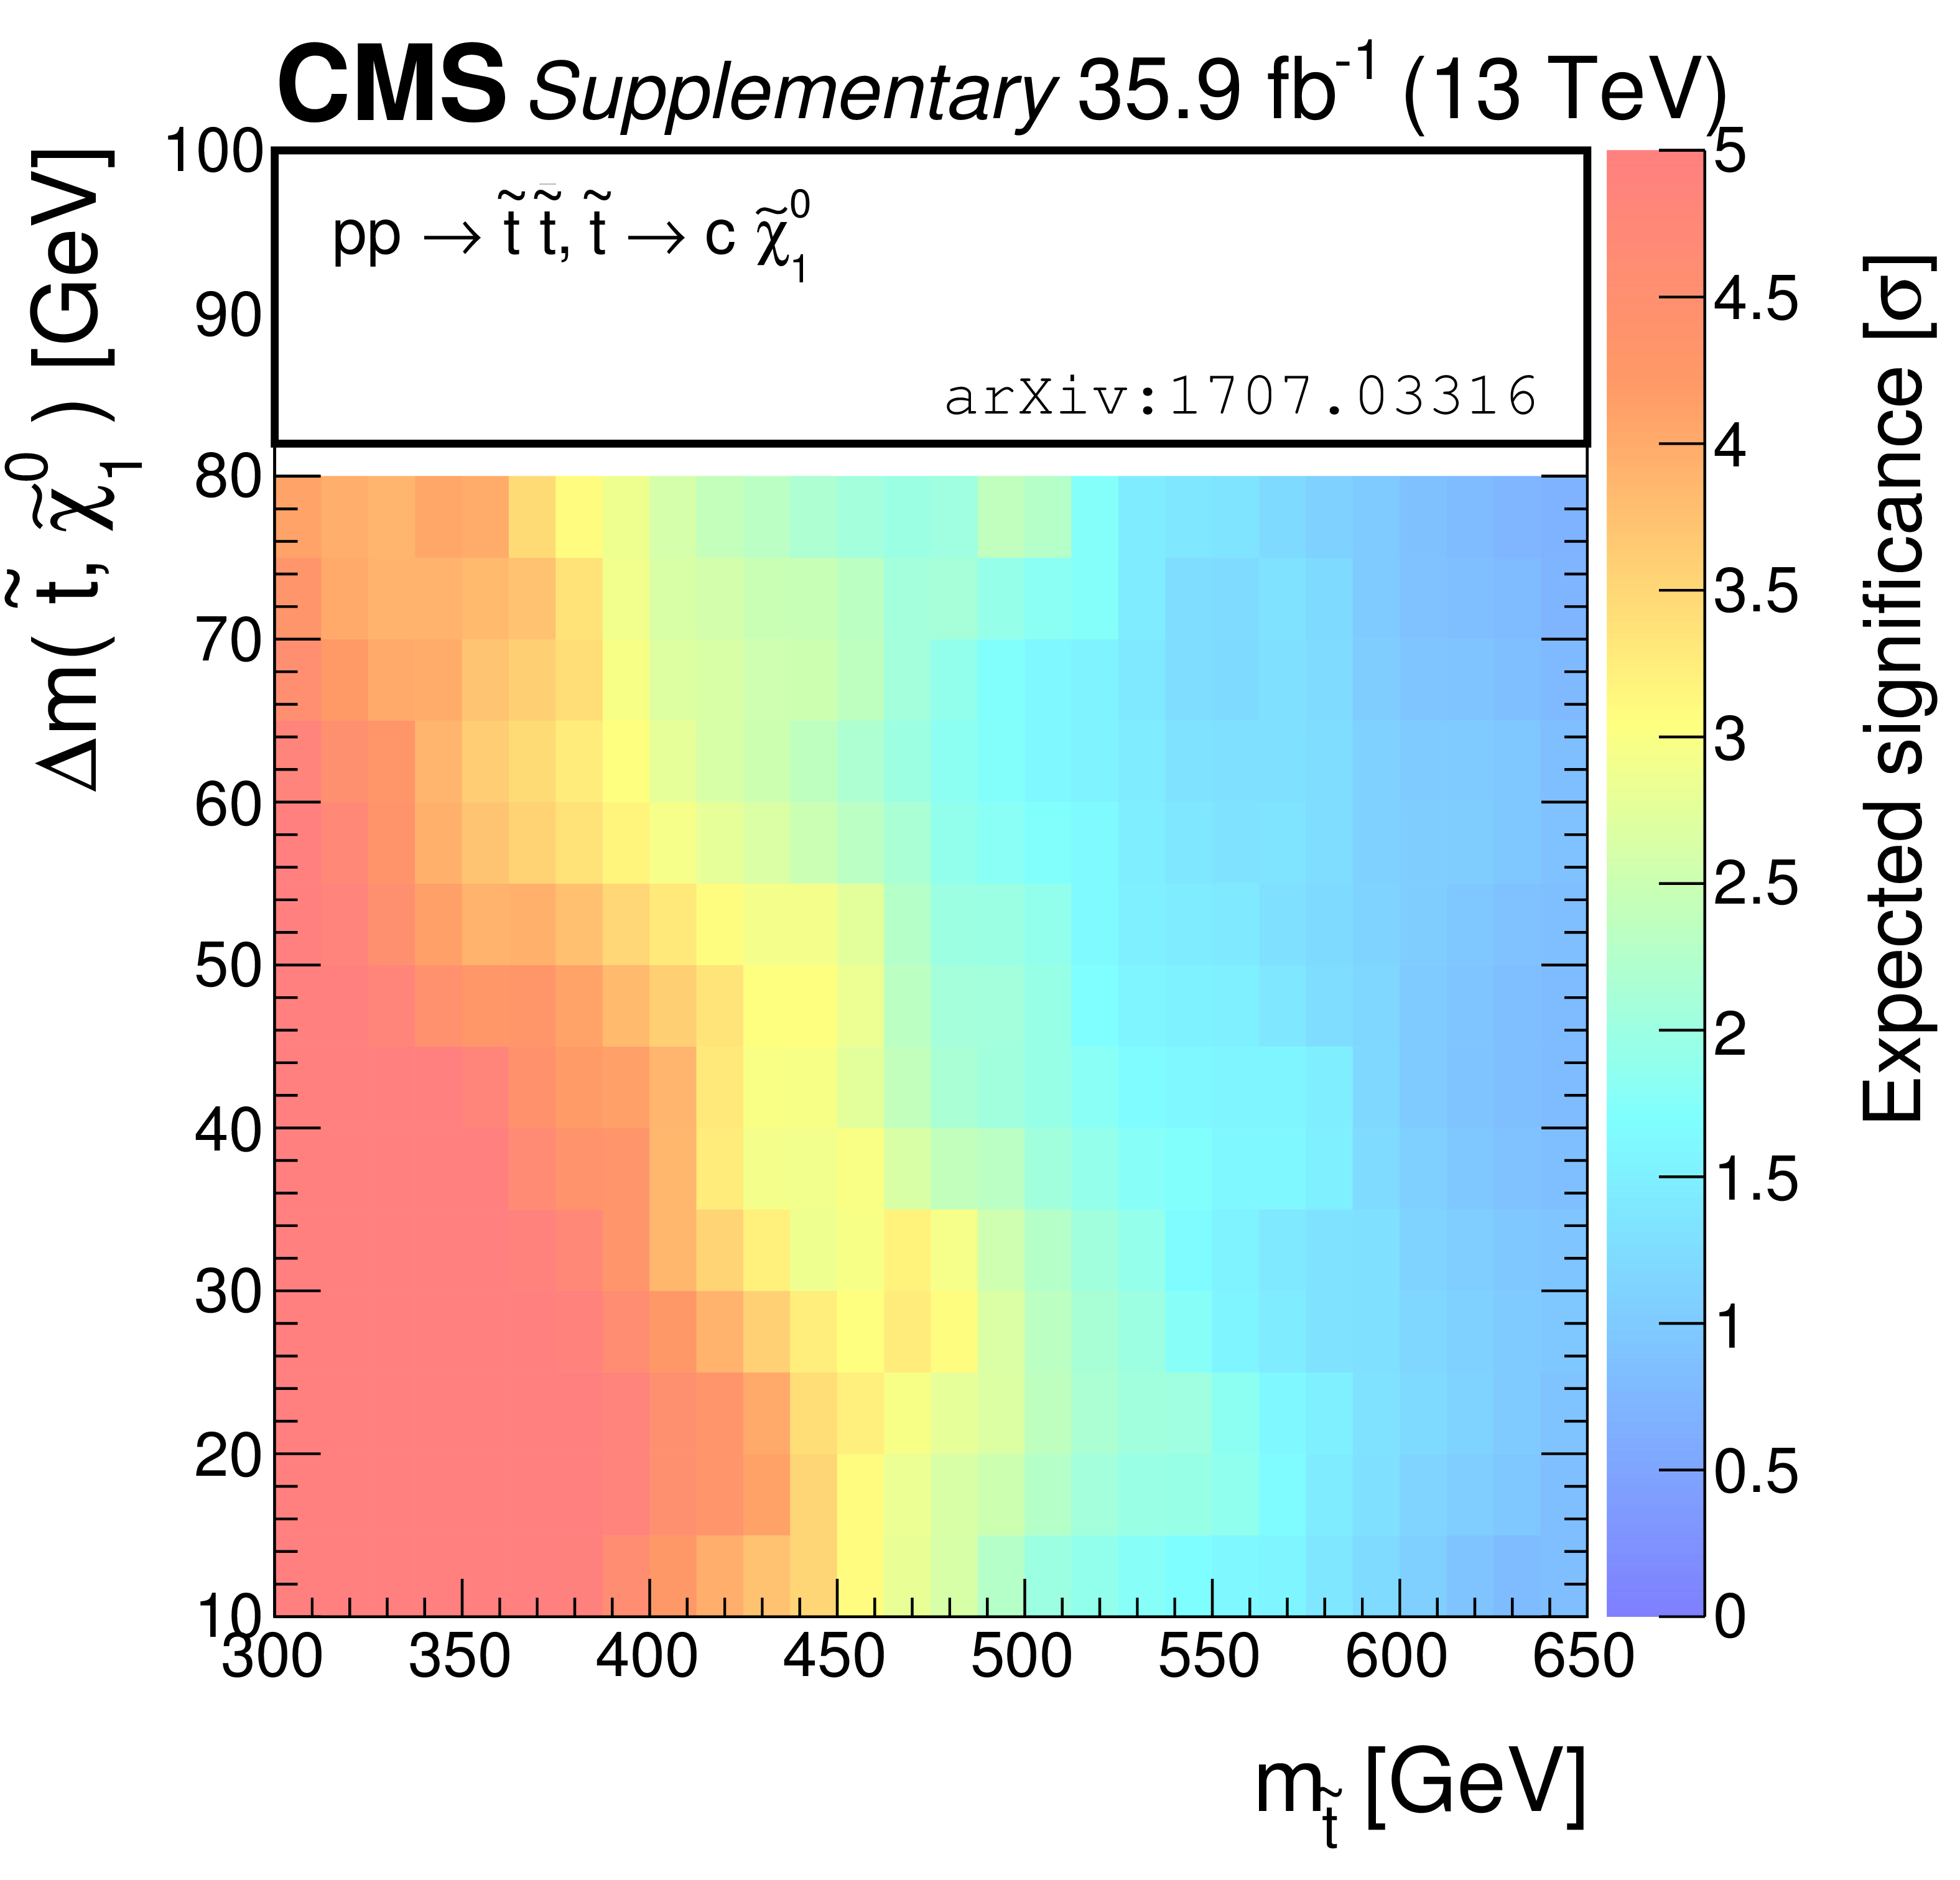
Expected significances for simplified models of top squark pair production in the $\tilde{ \mathrm{ t } } _{1}\to \mathrm{c} \tilde{\chi}^0_1 $ ("T2cc") decay scenario. |
png pdf |
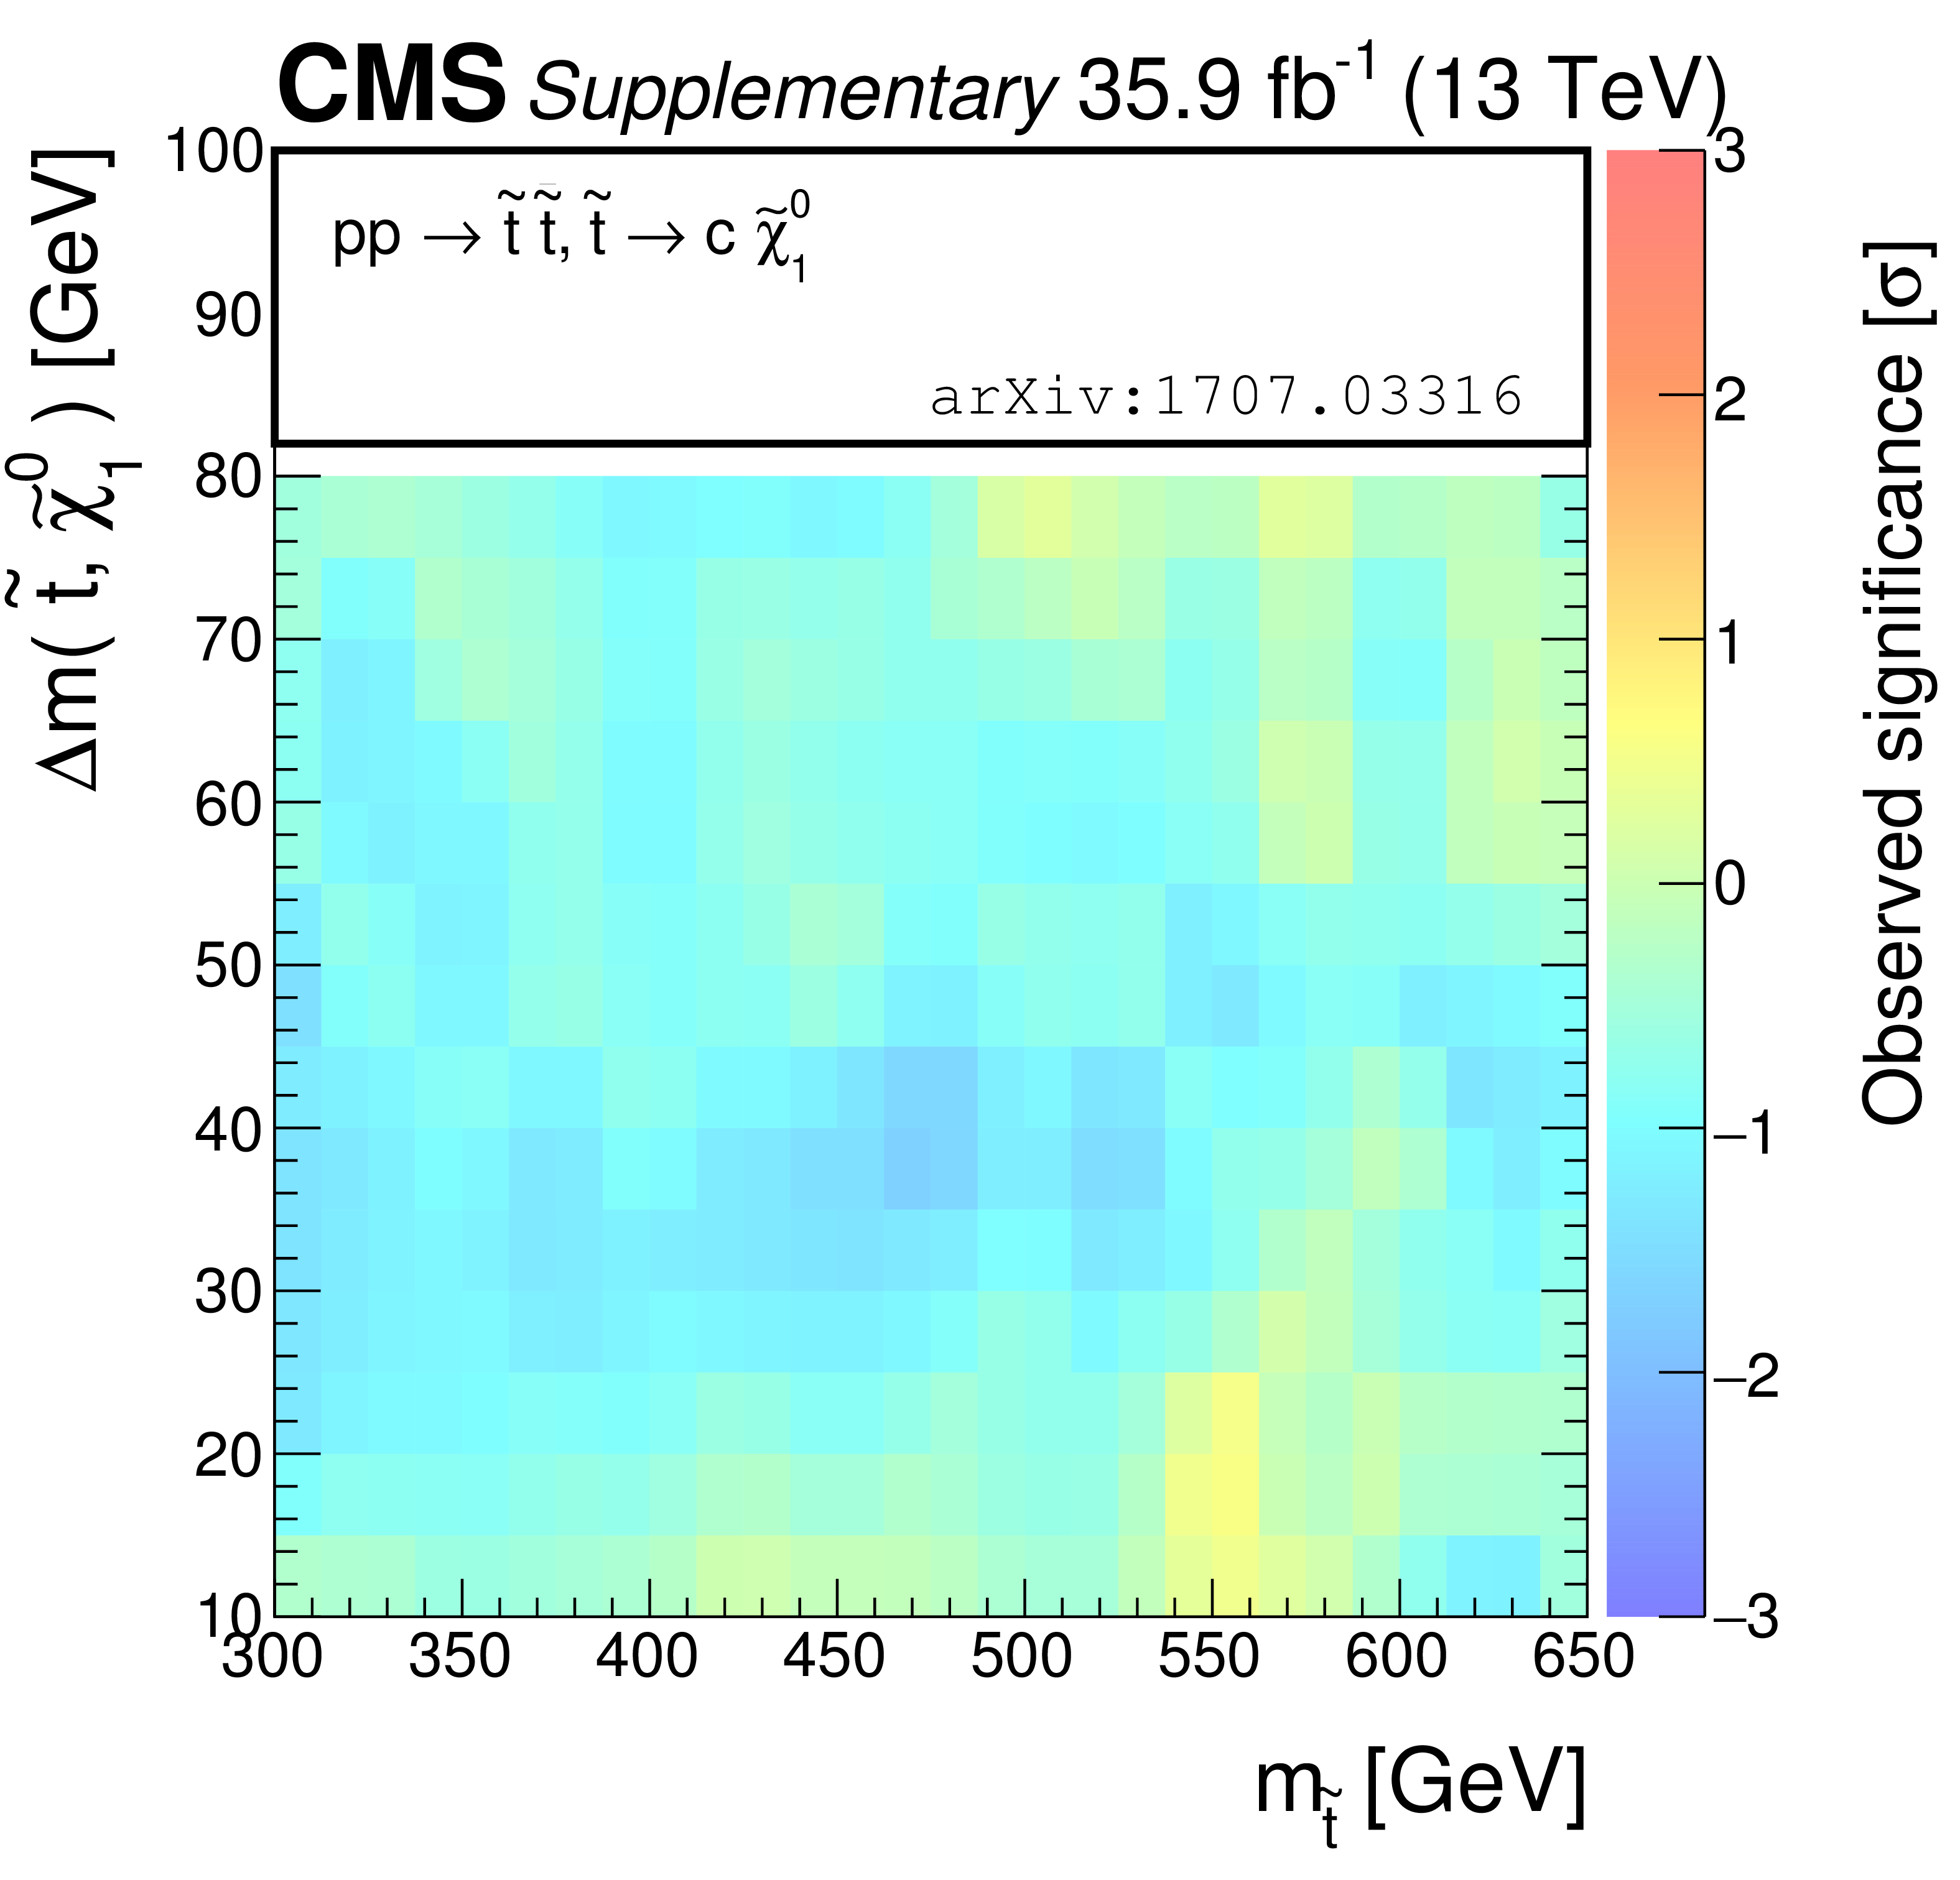
Additional Figure 12:
Observed significances for simplified models of top squark pair production in the $\tilde{ \mathrm{ t } } _{1}\to \mathrm{c} \tilde{\chi}^0_1 $ ("T2cc") decay scenario. |
png pdf |
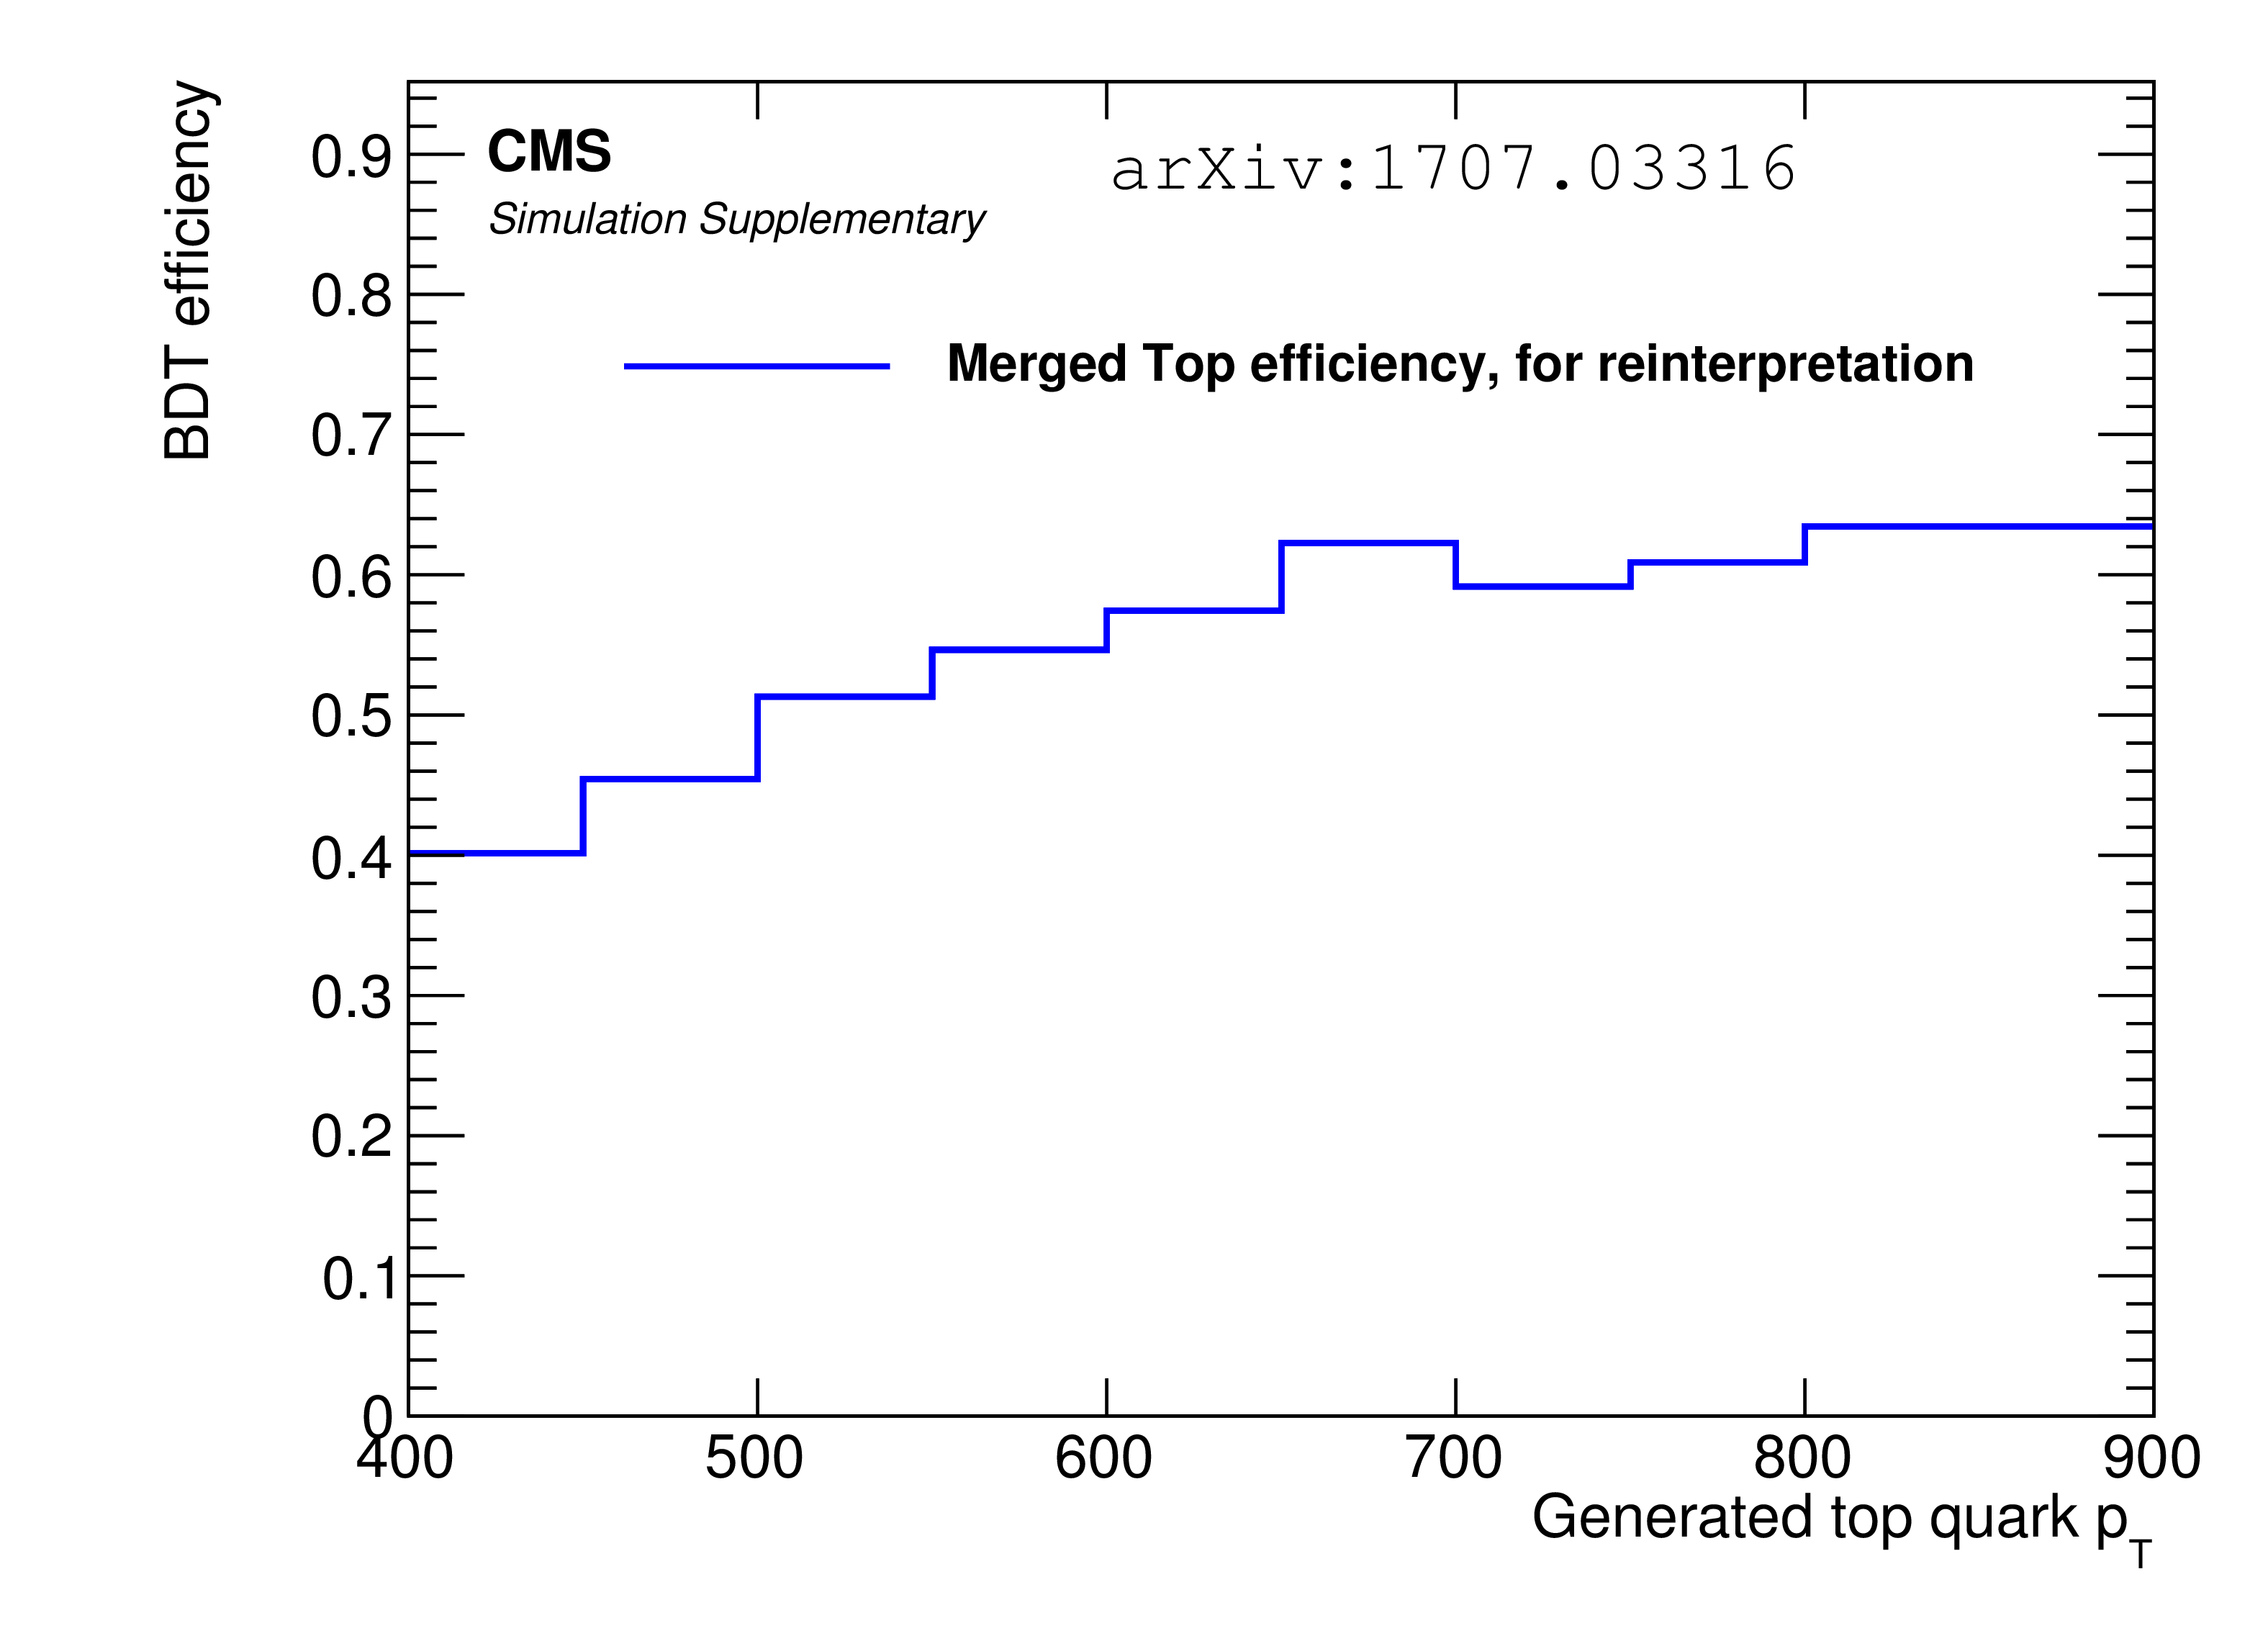
Additional Figure 13:
BDT efficiency of merged top tagging for reinterpretation objects. See reinterpretation material. |
png pdf |
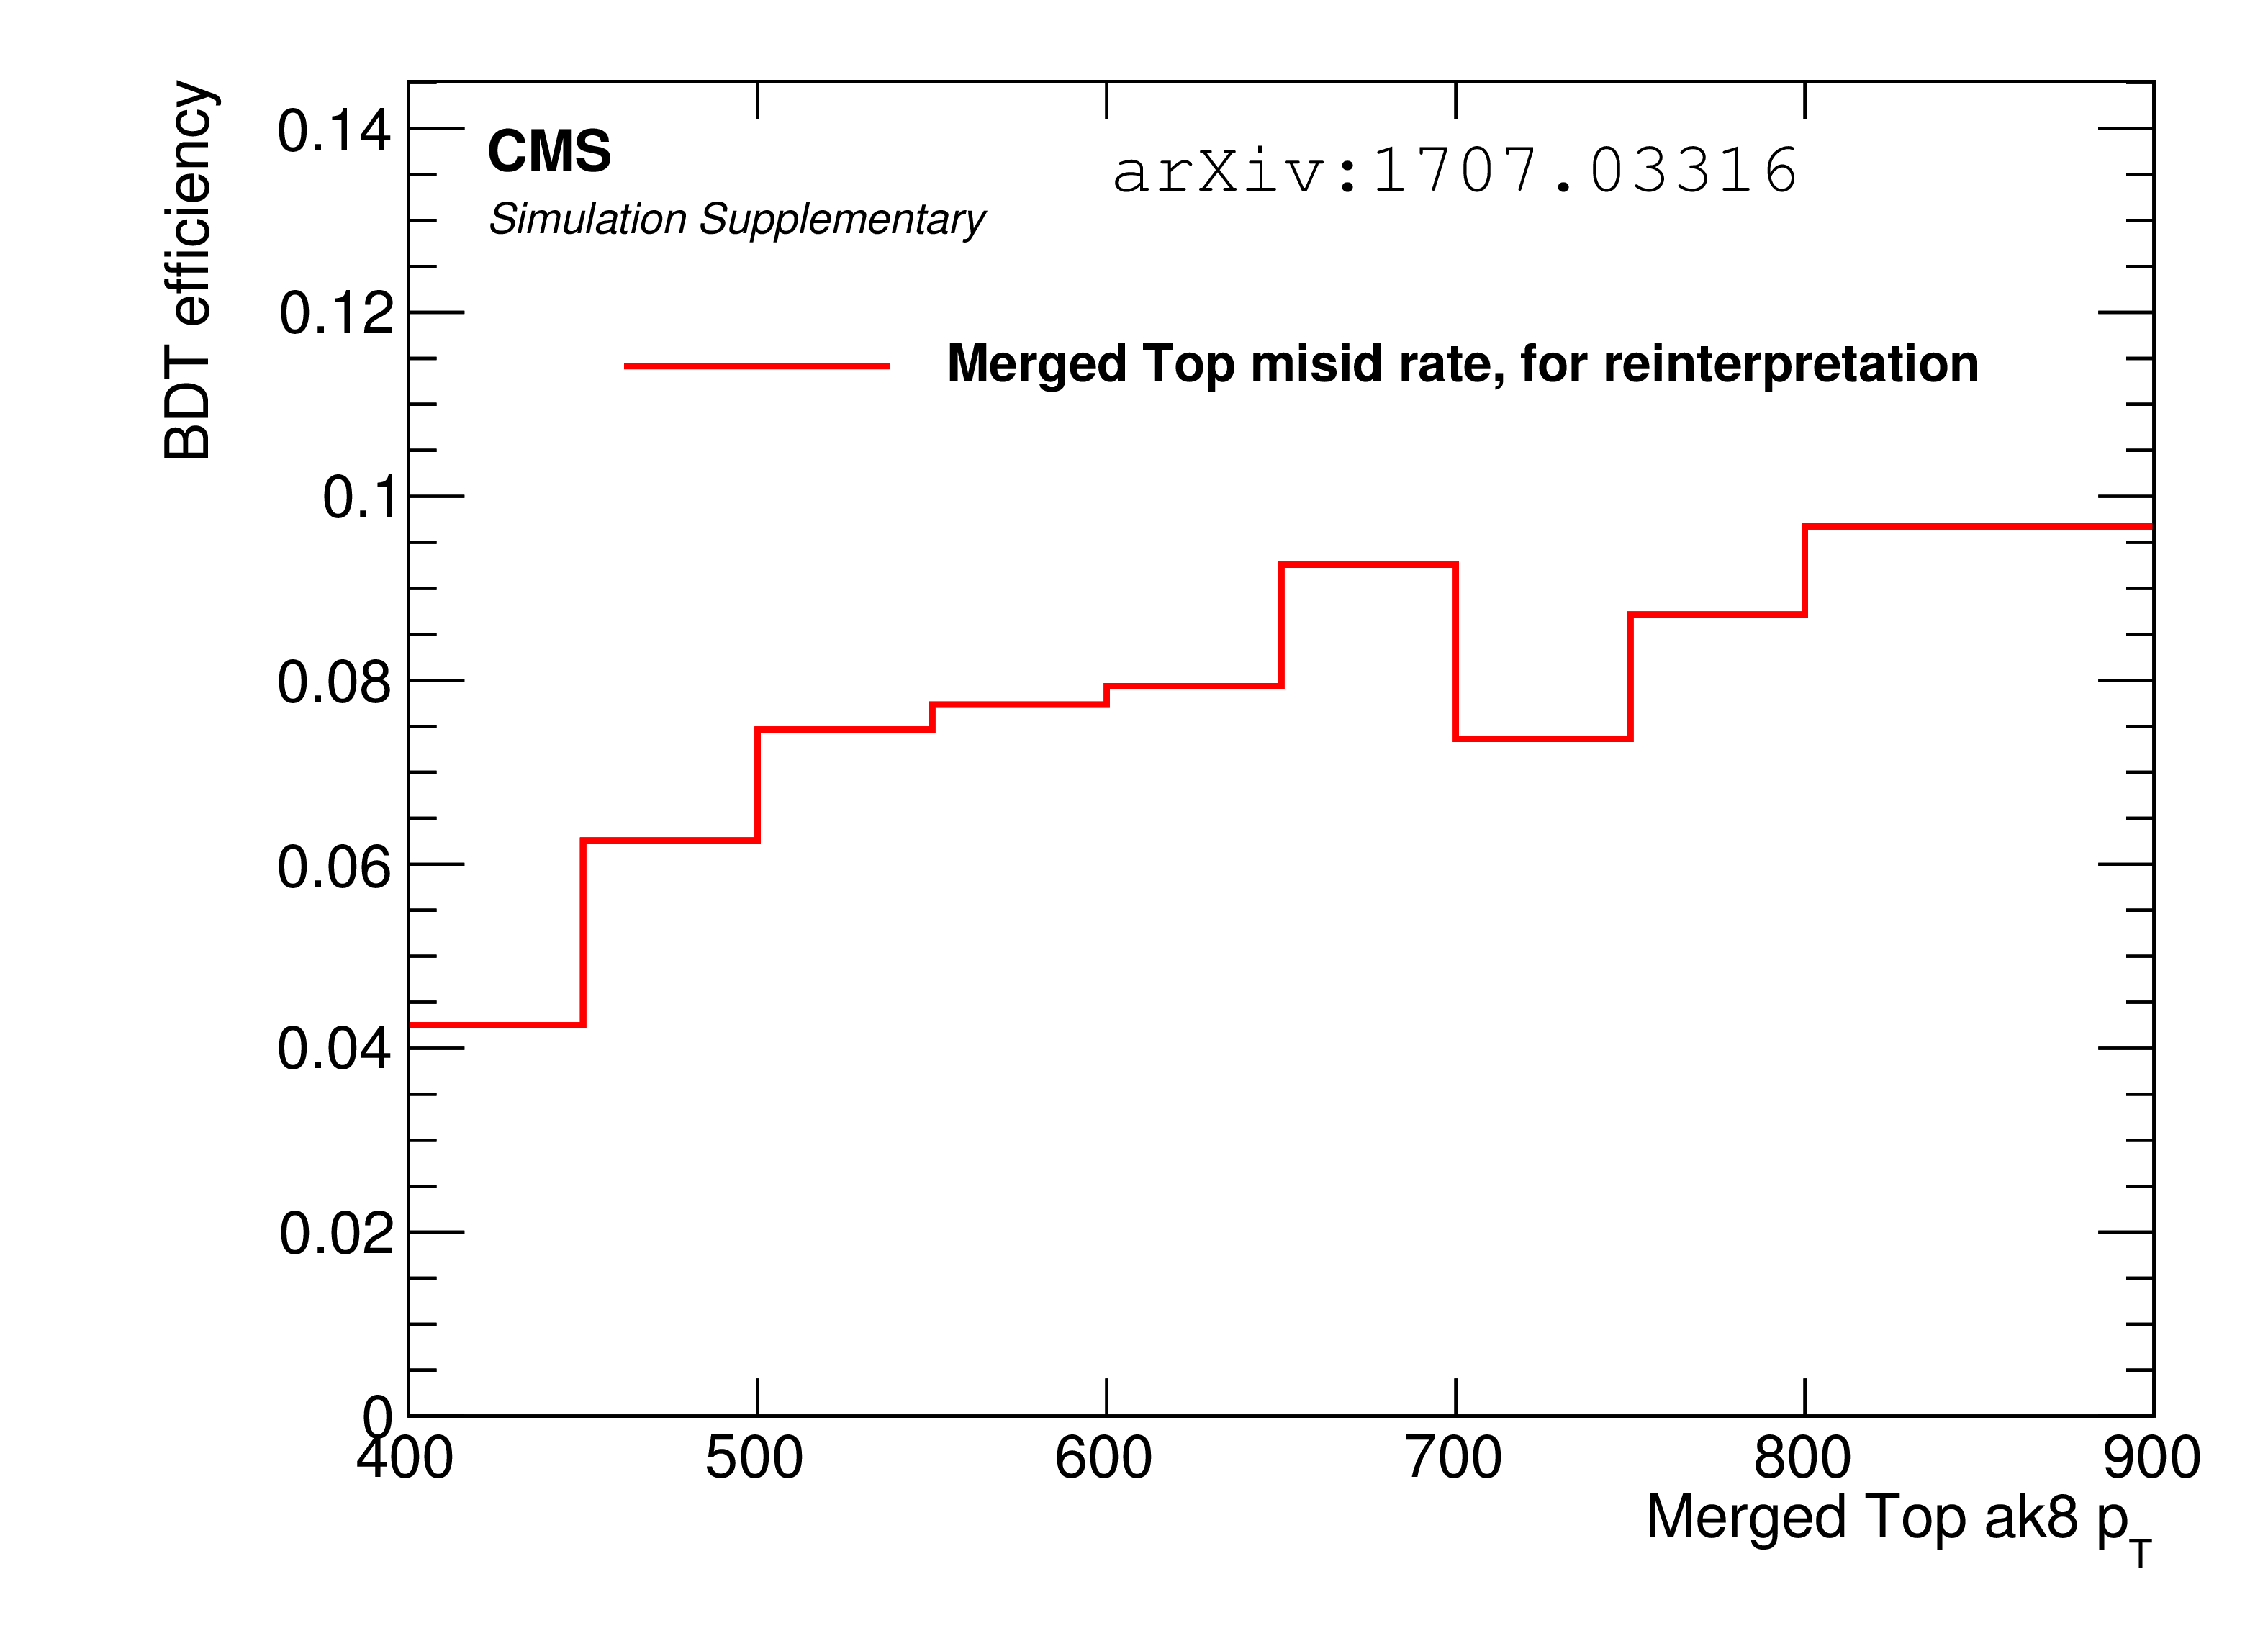
Additional Figure 14:
BDT efficiency of merged top misidentification rate for reinterpretation objects. See reinterpretation material. |
png pdf |
Additional Figure 15:
BDT efficiency of merged W tagging for reinterpretation objects. See reinterpretation material. |
png pdf |
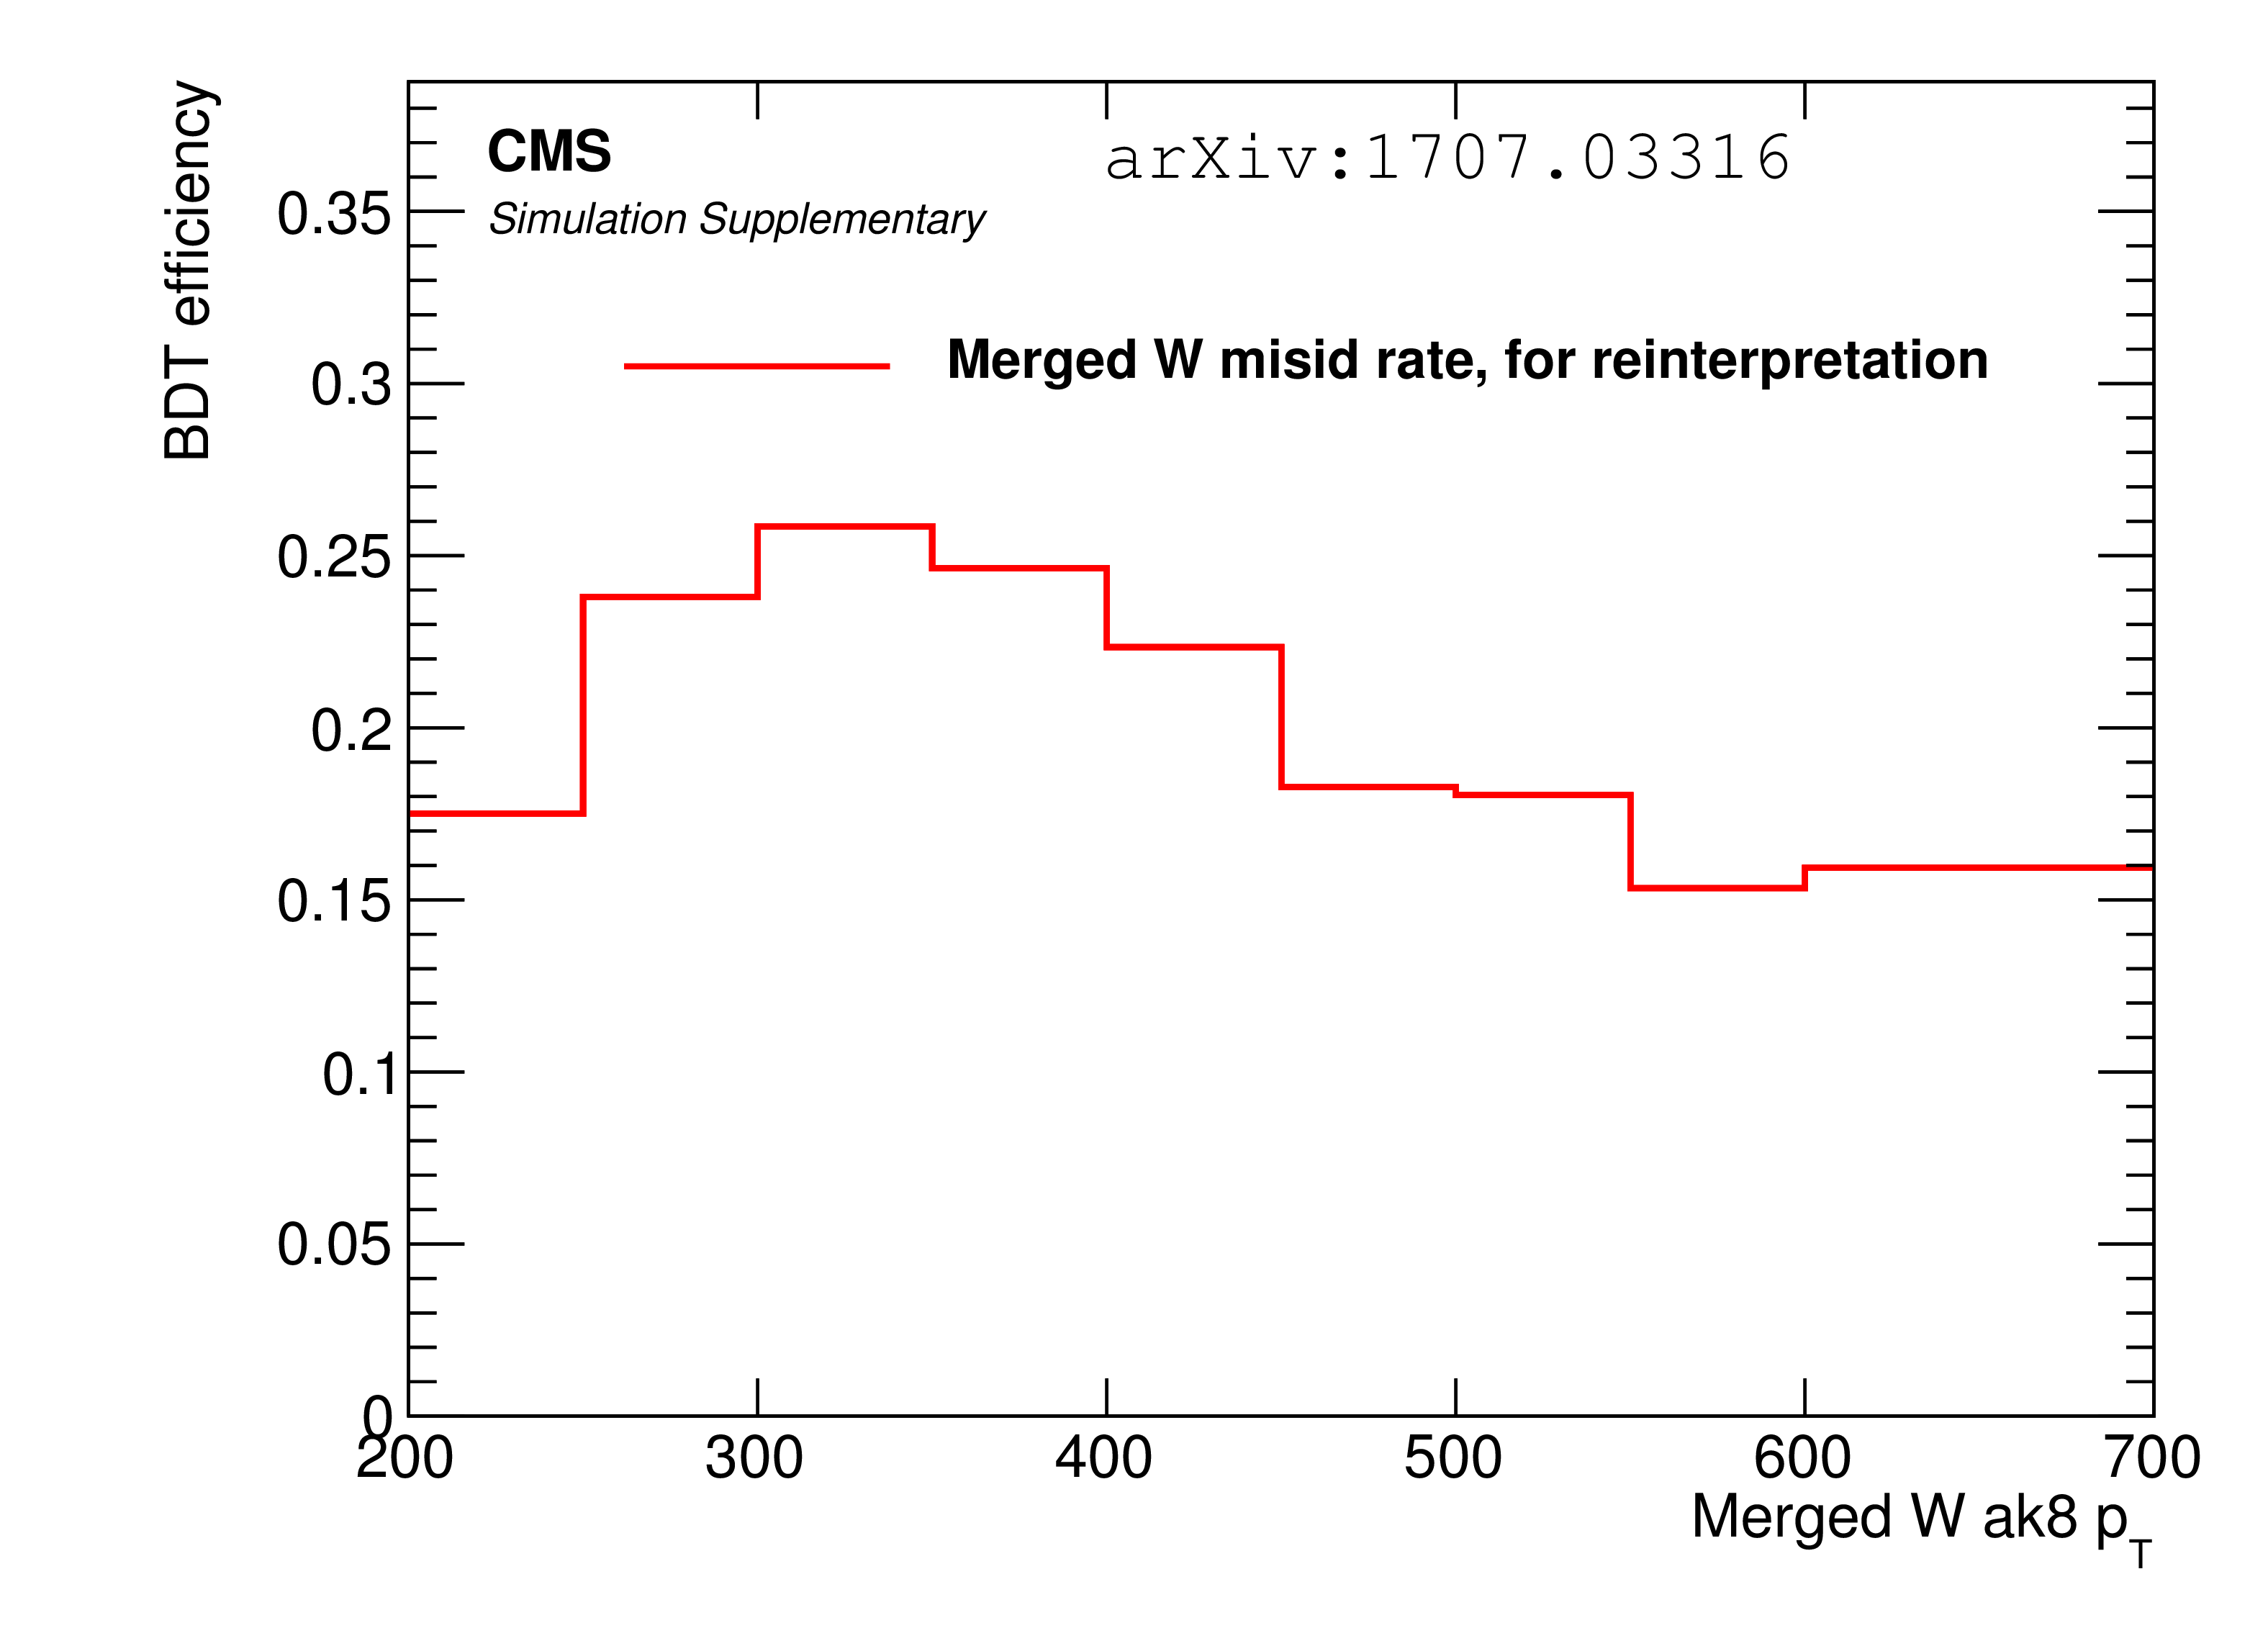
Additional Figure 16:
BDT efficiency of merged W misidentification rate for reinterpretation objects. See reinterpretation material. |
png pdf |
Additional Figure 17:
BDT efficiency of resolved top tagging for reinterpretation objects. See reinterpretation material. |

png pdf |
Additional Figure 18:
BDT efficiency of resolved top misidentification rate for reinterpretation objects. See reinterpretation material. |
png pdf |
Additional Figure 19:
Observed events and SM estimates for the super search regions defined for the low $ {\Delta m} $ category. The ratios of the observed data to the SM prediction derived from control regions (black points, with error bars corresponding to the data statistical uncertainty) are shown in the ratio plots. The shaded blue band represents the statistical and systematic uncertainty on the background prediction. The units of $ { {p_{\mathrm {T}}} ^{\mathrm {b}}}$ and $m_{\mathrm {T}}^{\mathrm {b}}$ are GeV, where applicable. |
png pdf |
Additional Figure 20:
Observed events and SM estimates for the super search regions defined for the high $ {\Delta m} $ category. The ratios of the observed data to the SM prediction derived from control regions (black points, with error bars corresponding to the data statistical uncertainty) are shown in the ratio plots. The shaded blue band represents the statistical and systematic uncertainty on the background prediction. The units of $ { {p_{\mathrm {T}}} ^{\mathrm {b}}}$ and $m_{\mathrm {T}}^{\mathrm {b}}$ are GeV, where applicable. |
png pdf root |
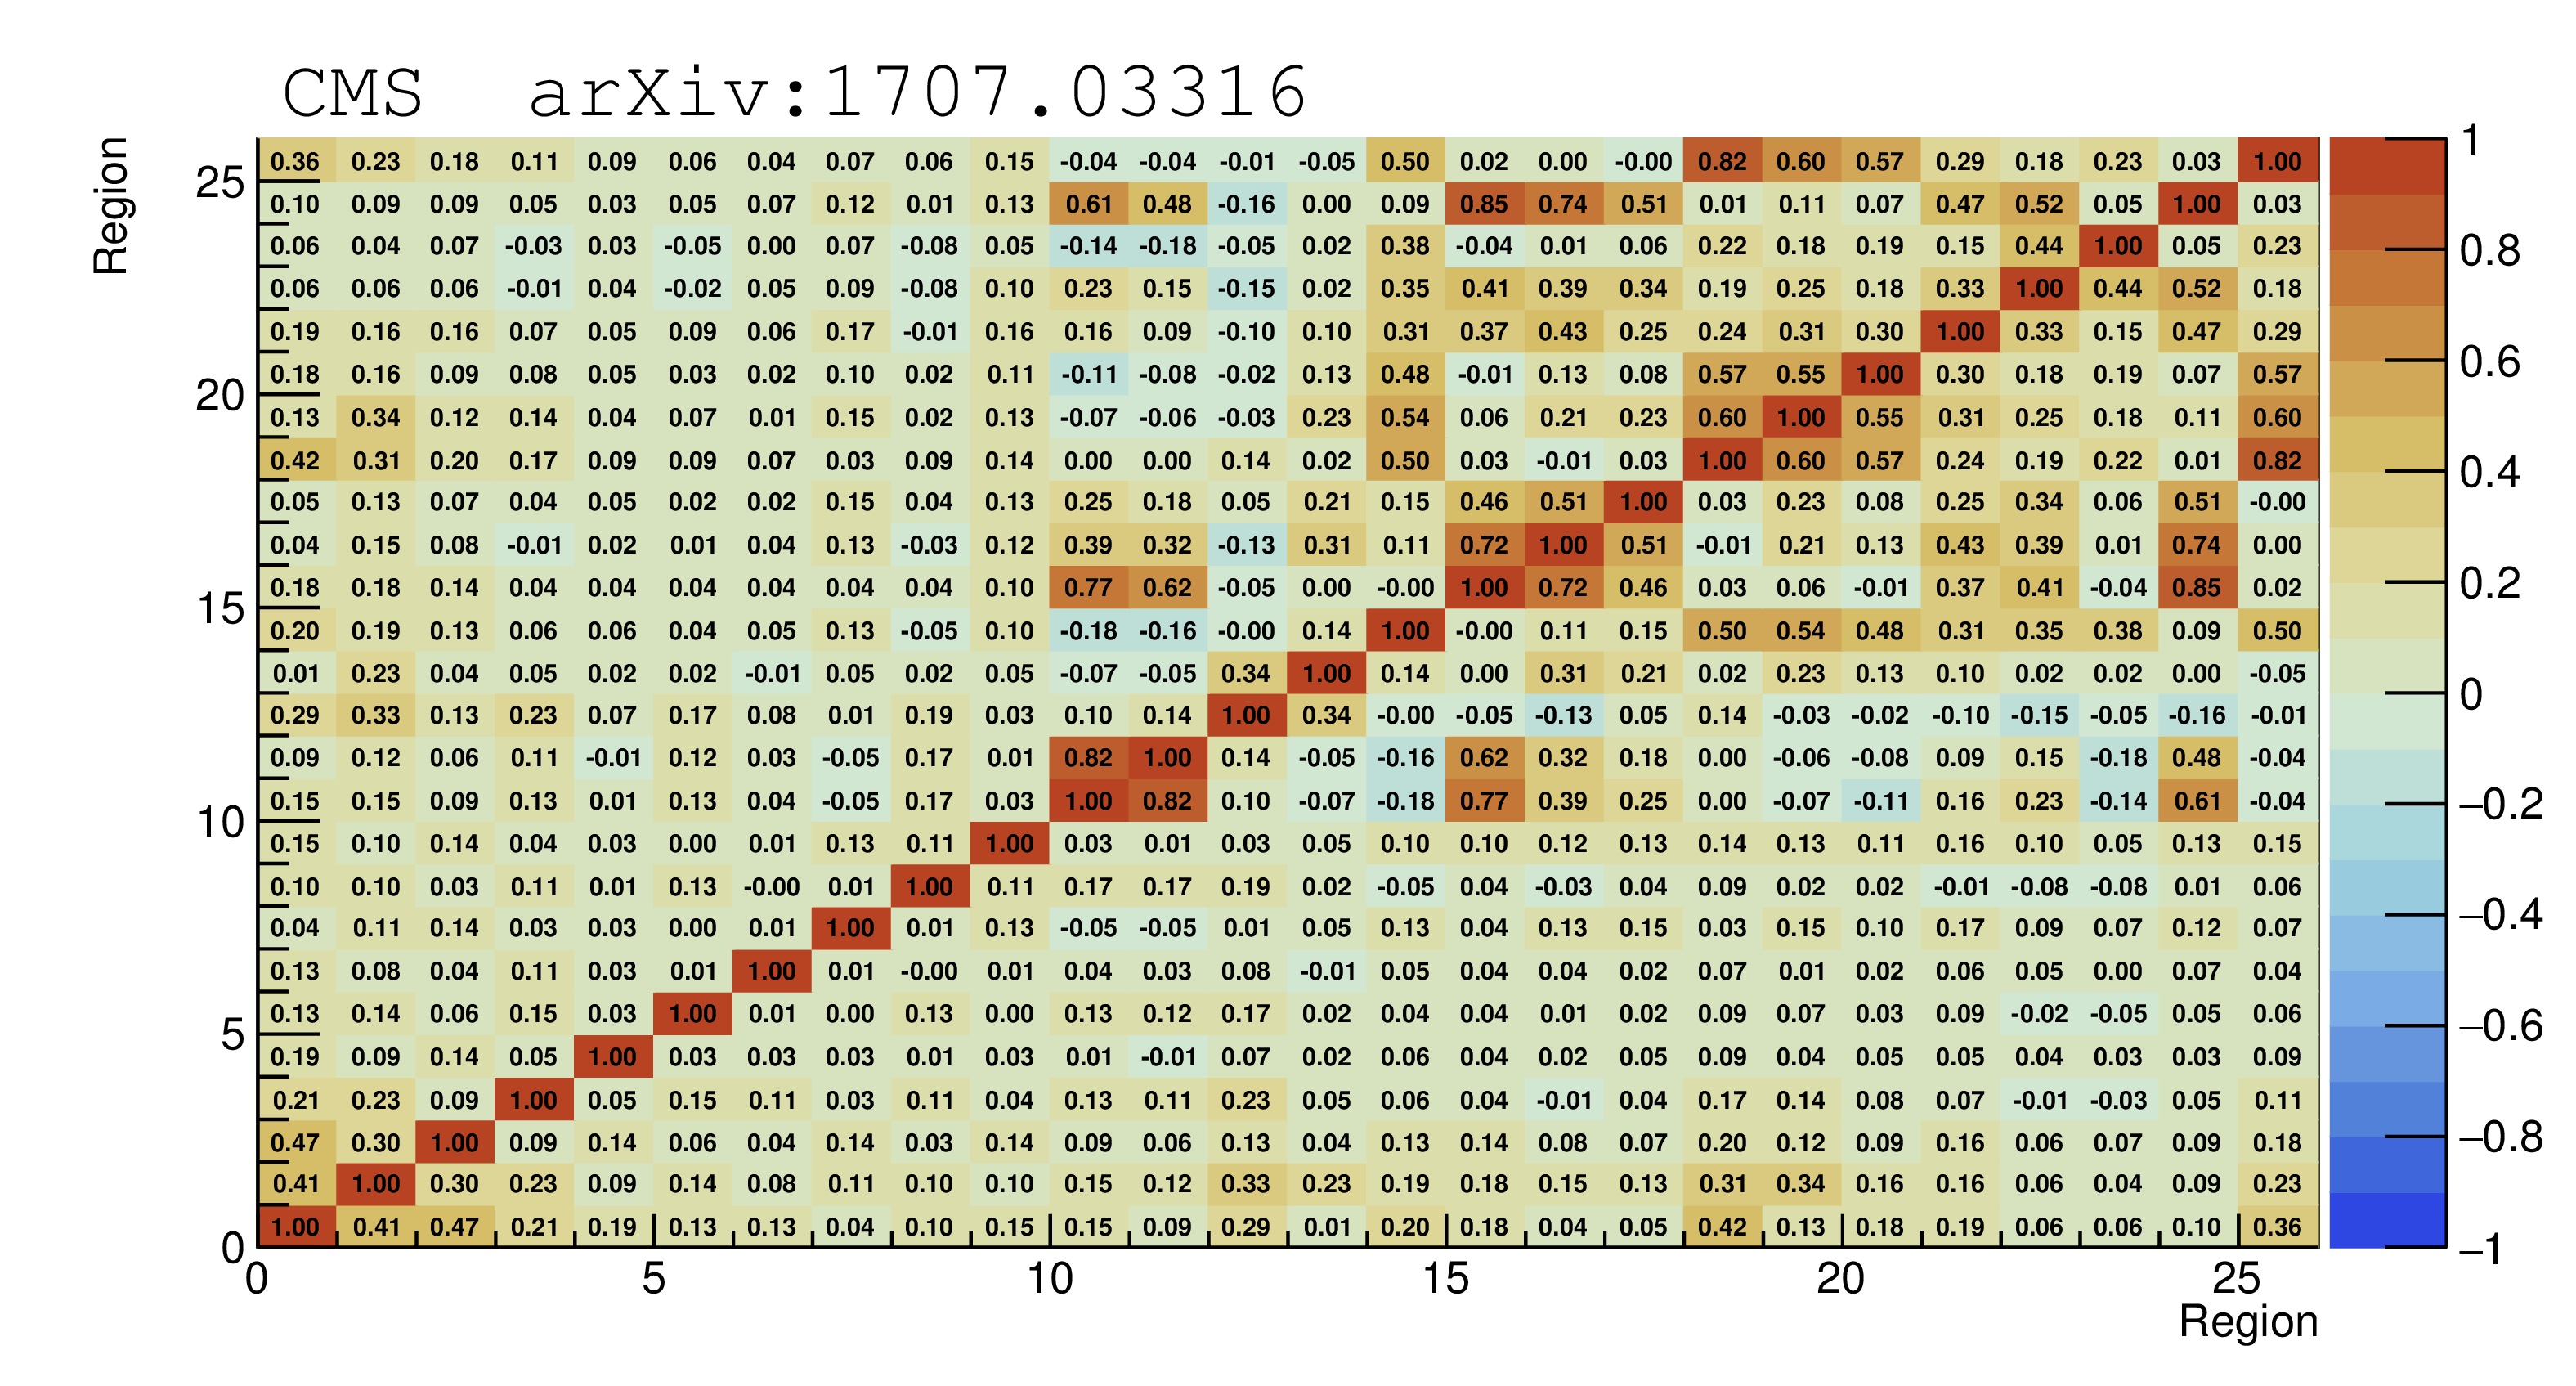
Additional Figure 21:
Correlation matrix of the background estimates between the 26 super search regions. |
png pdf root |
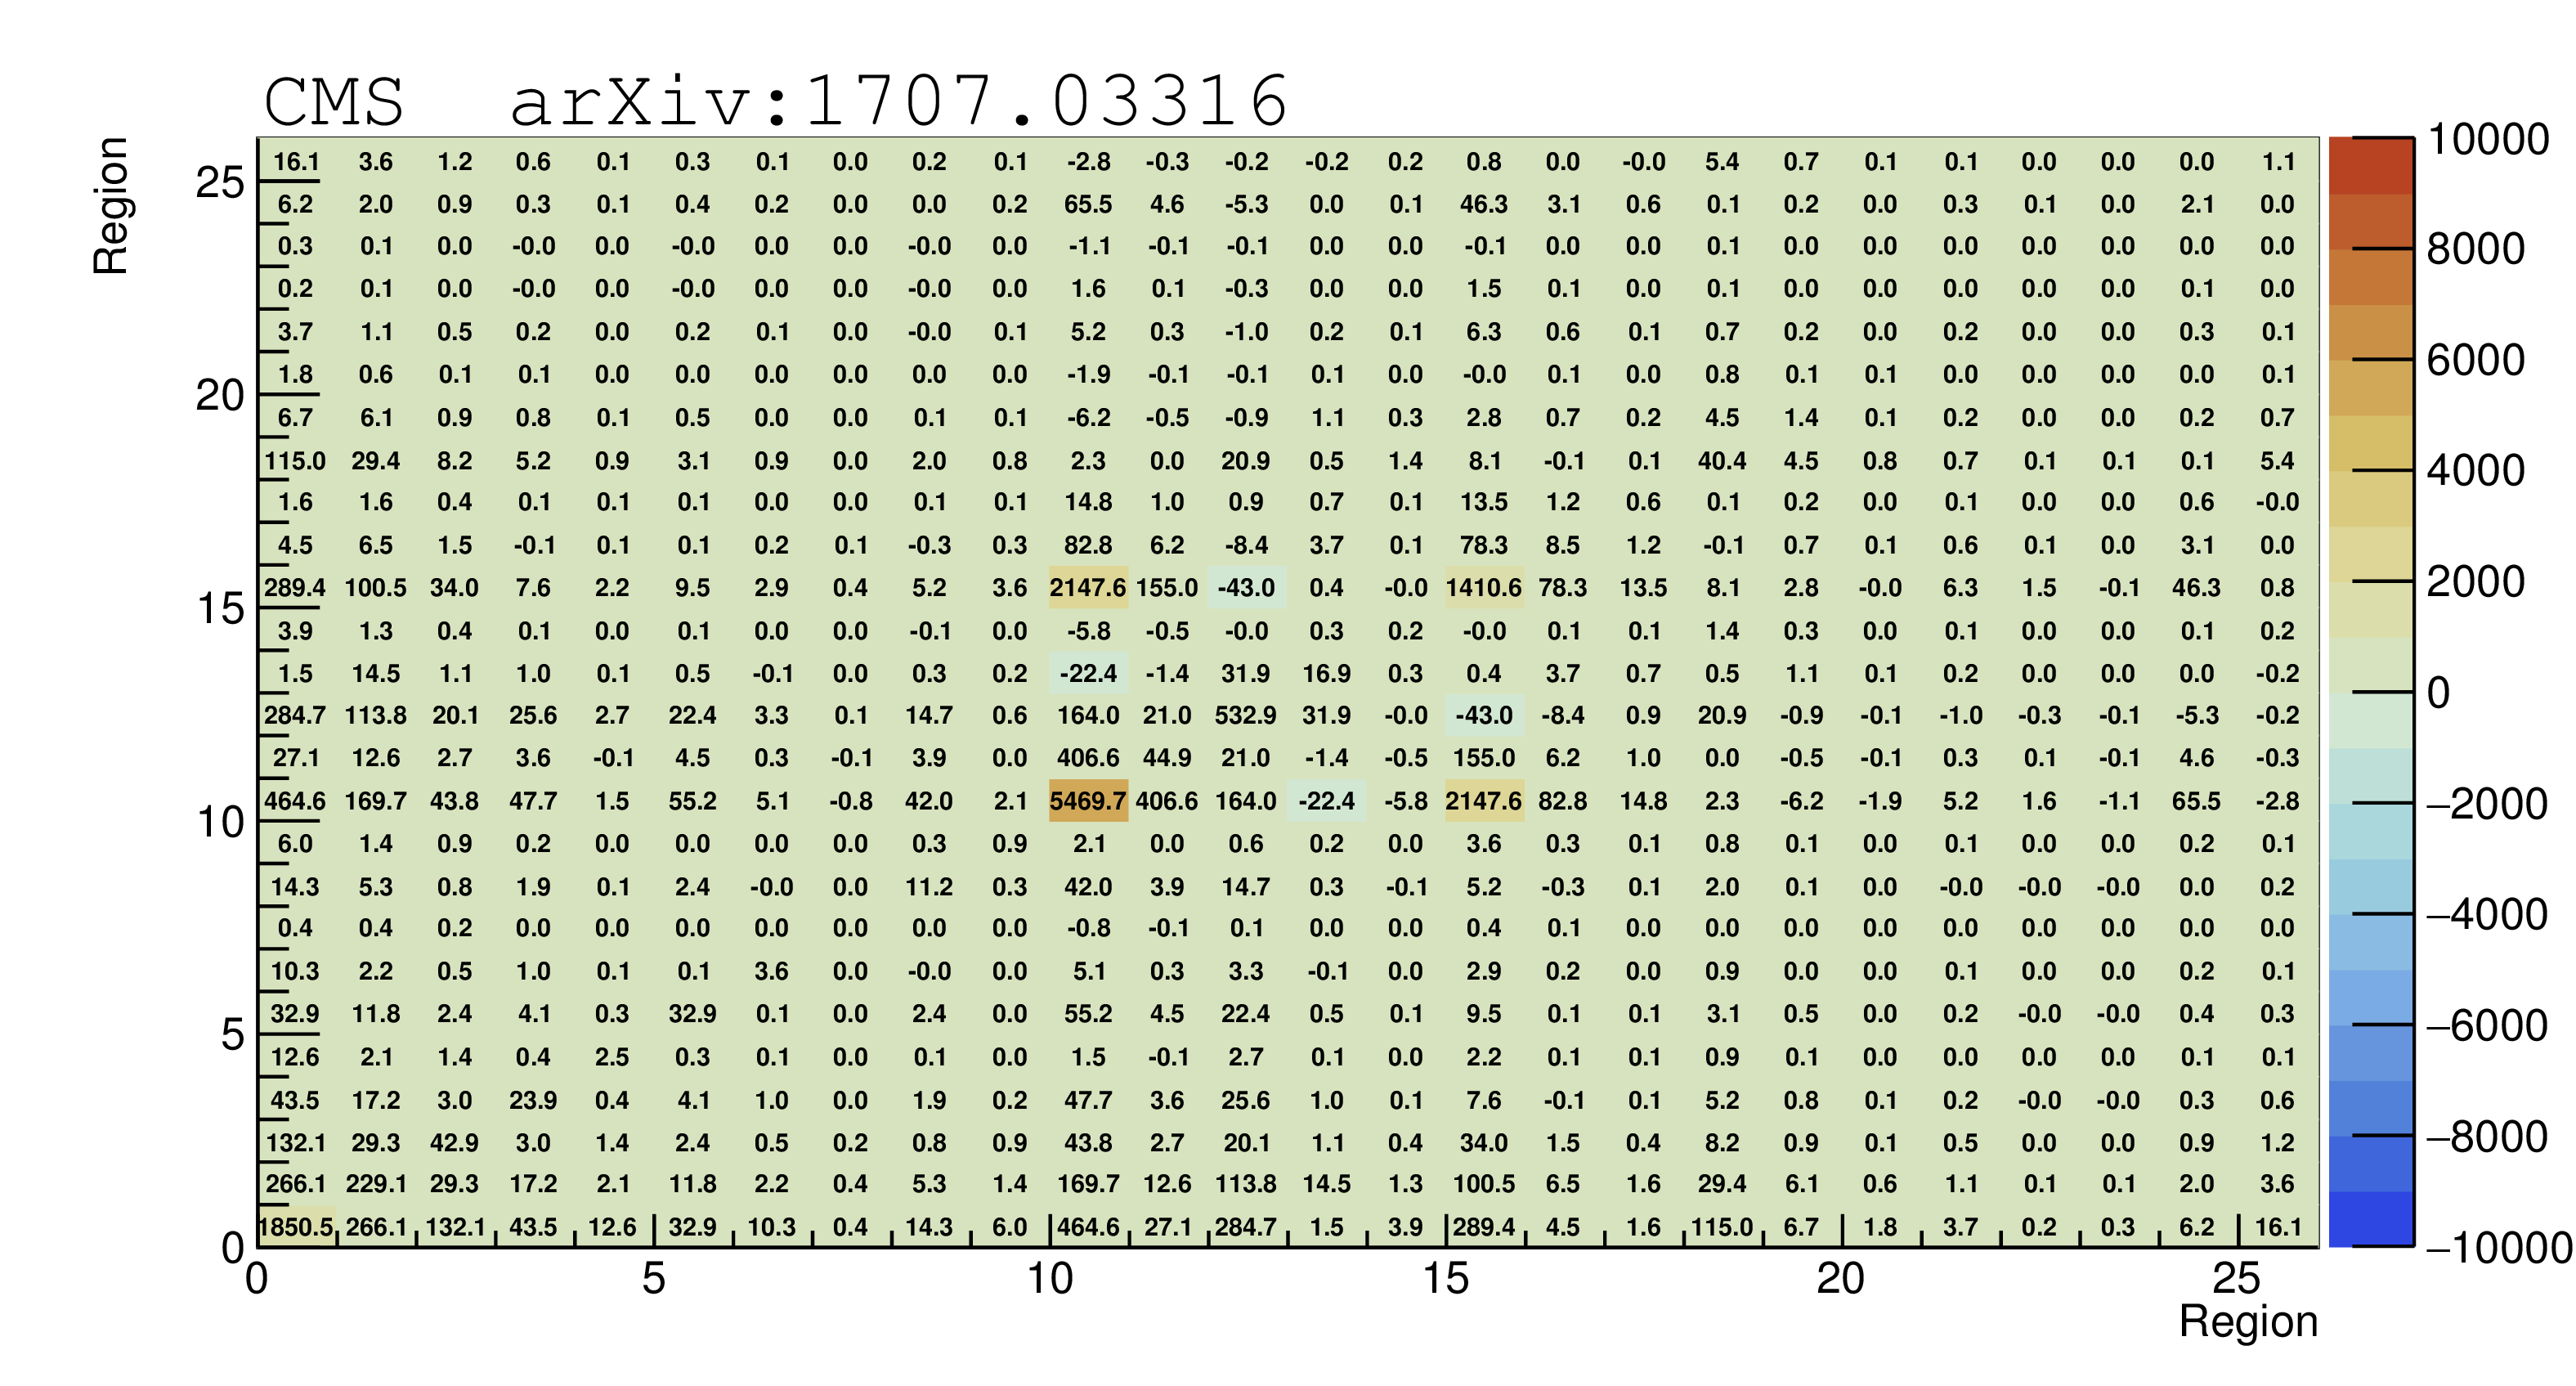
Additional Figure 22:
Covariance matrix of the background estimates between the 26 super search regions. |
png pdf |
Additional Figure 23:
Summary of the limits obtained in the search. |
png pdf |
Additional Figure 24:
Cross section limits and exclusion region for the T2ttC model in the top squark vs. LSP mass plane. |
png pdf |
Additional Figure 25:
Cross section limits and exclusion region for the T2bWC model in the top squark vs. LSP mass plane. |

png pdf |
Additional Figure 26:
Cross section limits and exclusion region for the T2cc model in the top squark vs. LSP mass plane. |
| Additional Tables | |
png pdf |
Additional Table 1:
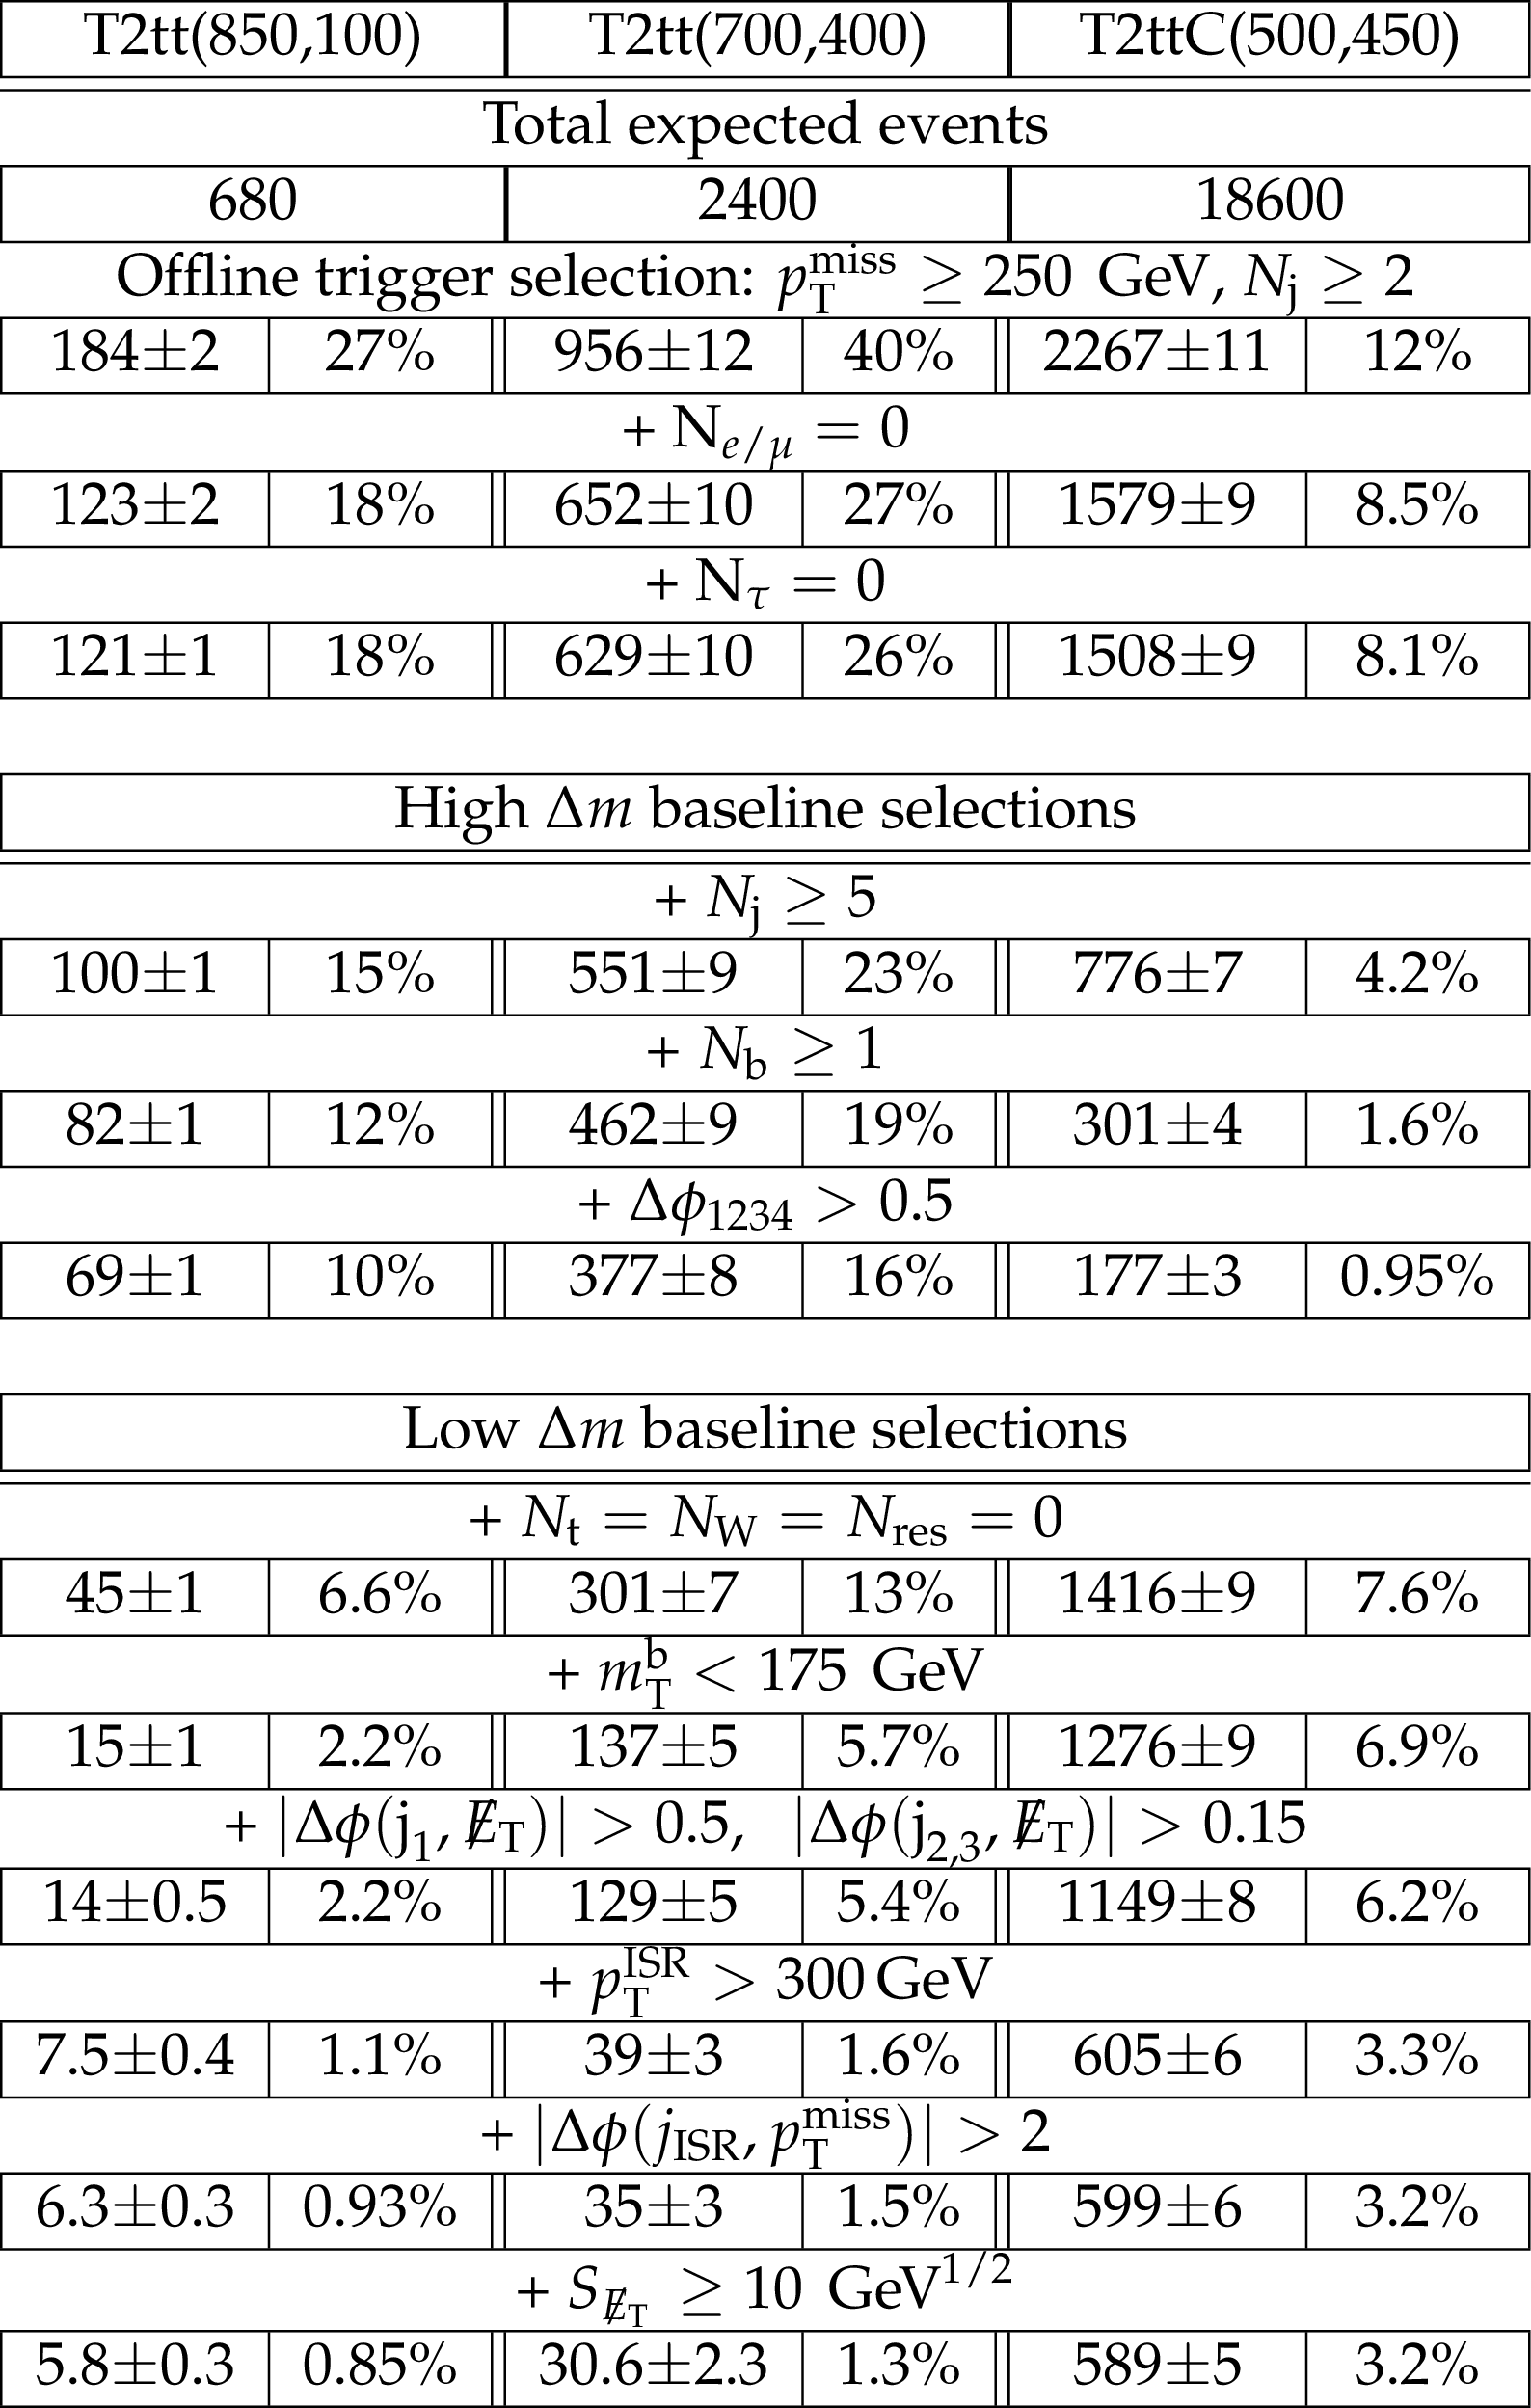
Event yields from simulation, followed by the total selection efficiency with respect to the first row, after applying the sequential selections composing the low and high $ {\Delta m} $ baseline selections. The offline trigger selection is firstly applied, followed by the lepton vetoes. Next, the high $ {\Delta m} $ baseline selections are applied sequentially starting after the lepton vetoes. Finally, the low $ {\Delta m} $ baseline selections are applied sequentially but starting again just after the lepton vetoes. The expected yields of three signal benchmark points are included. The numbers are normalized to an integrated luminosity of 35.9 fb$^{-1}$ and the uncertainties correspond to statistical uncertainty from the MC samples. |
png pdf |
Additional Table 2:
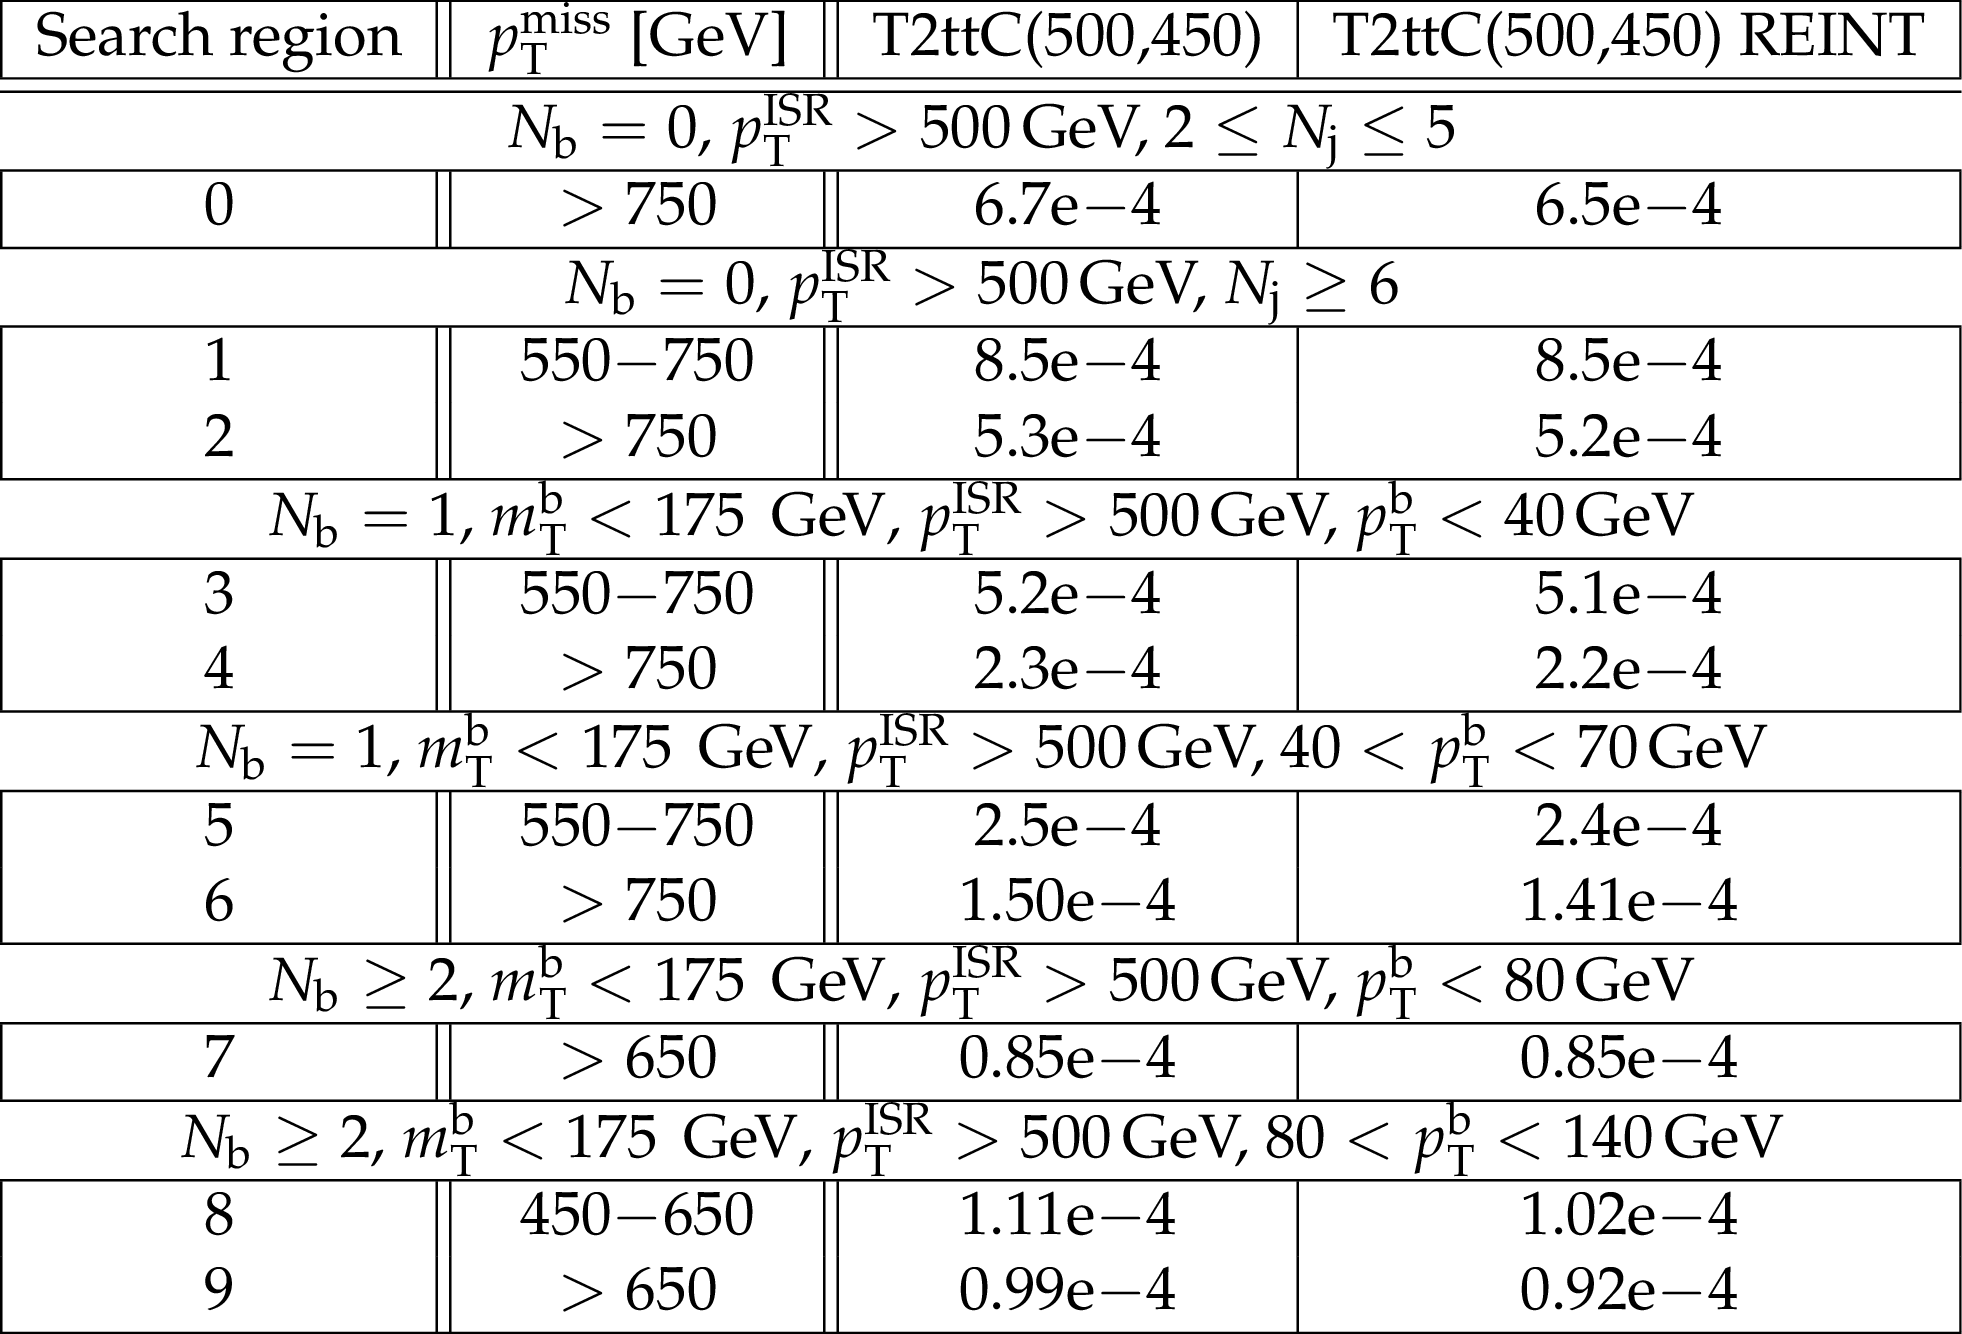
Predicted acceptance times efficiency in the super search regions of the low $ {\Delta m} $ category for the T2ttC(500,450) signal benchmark point. The first column corresponds to the top and W objects used in the analysis; the second corresponds to the simplified top and W objects defined in the reinterpretation material. |
png pdf |
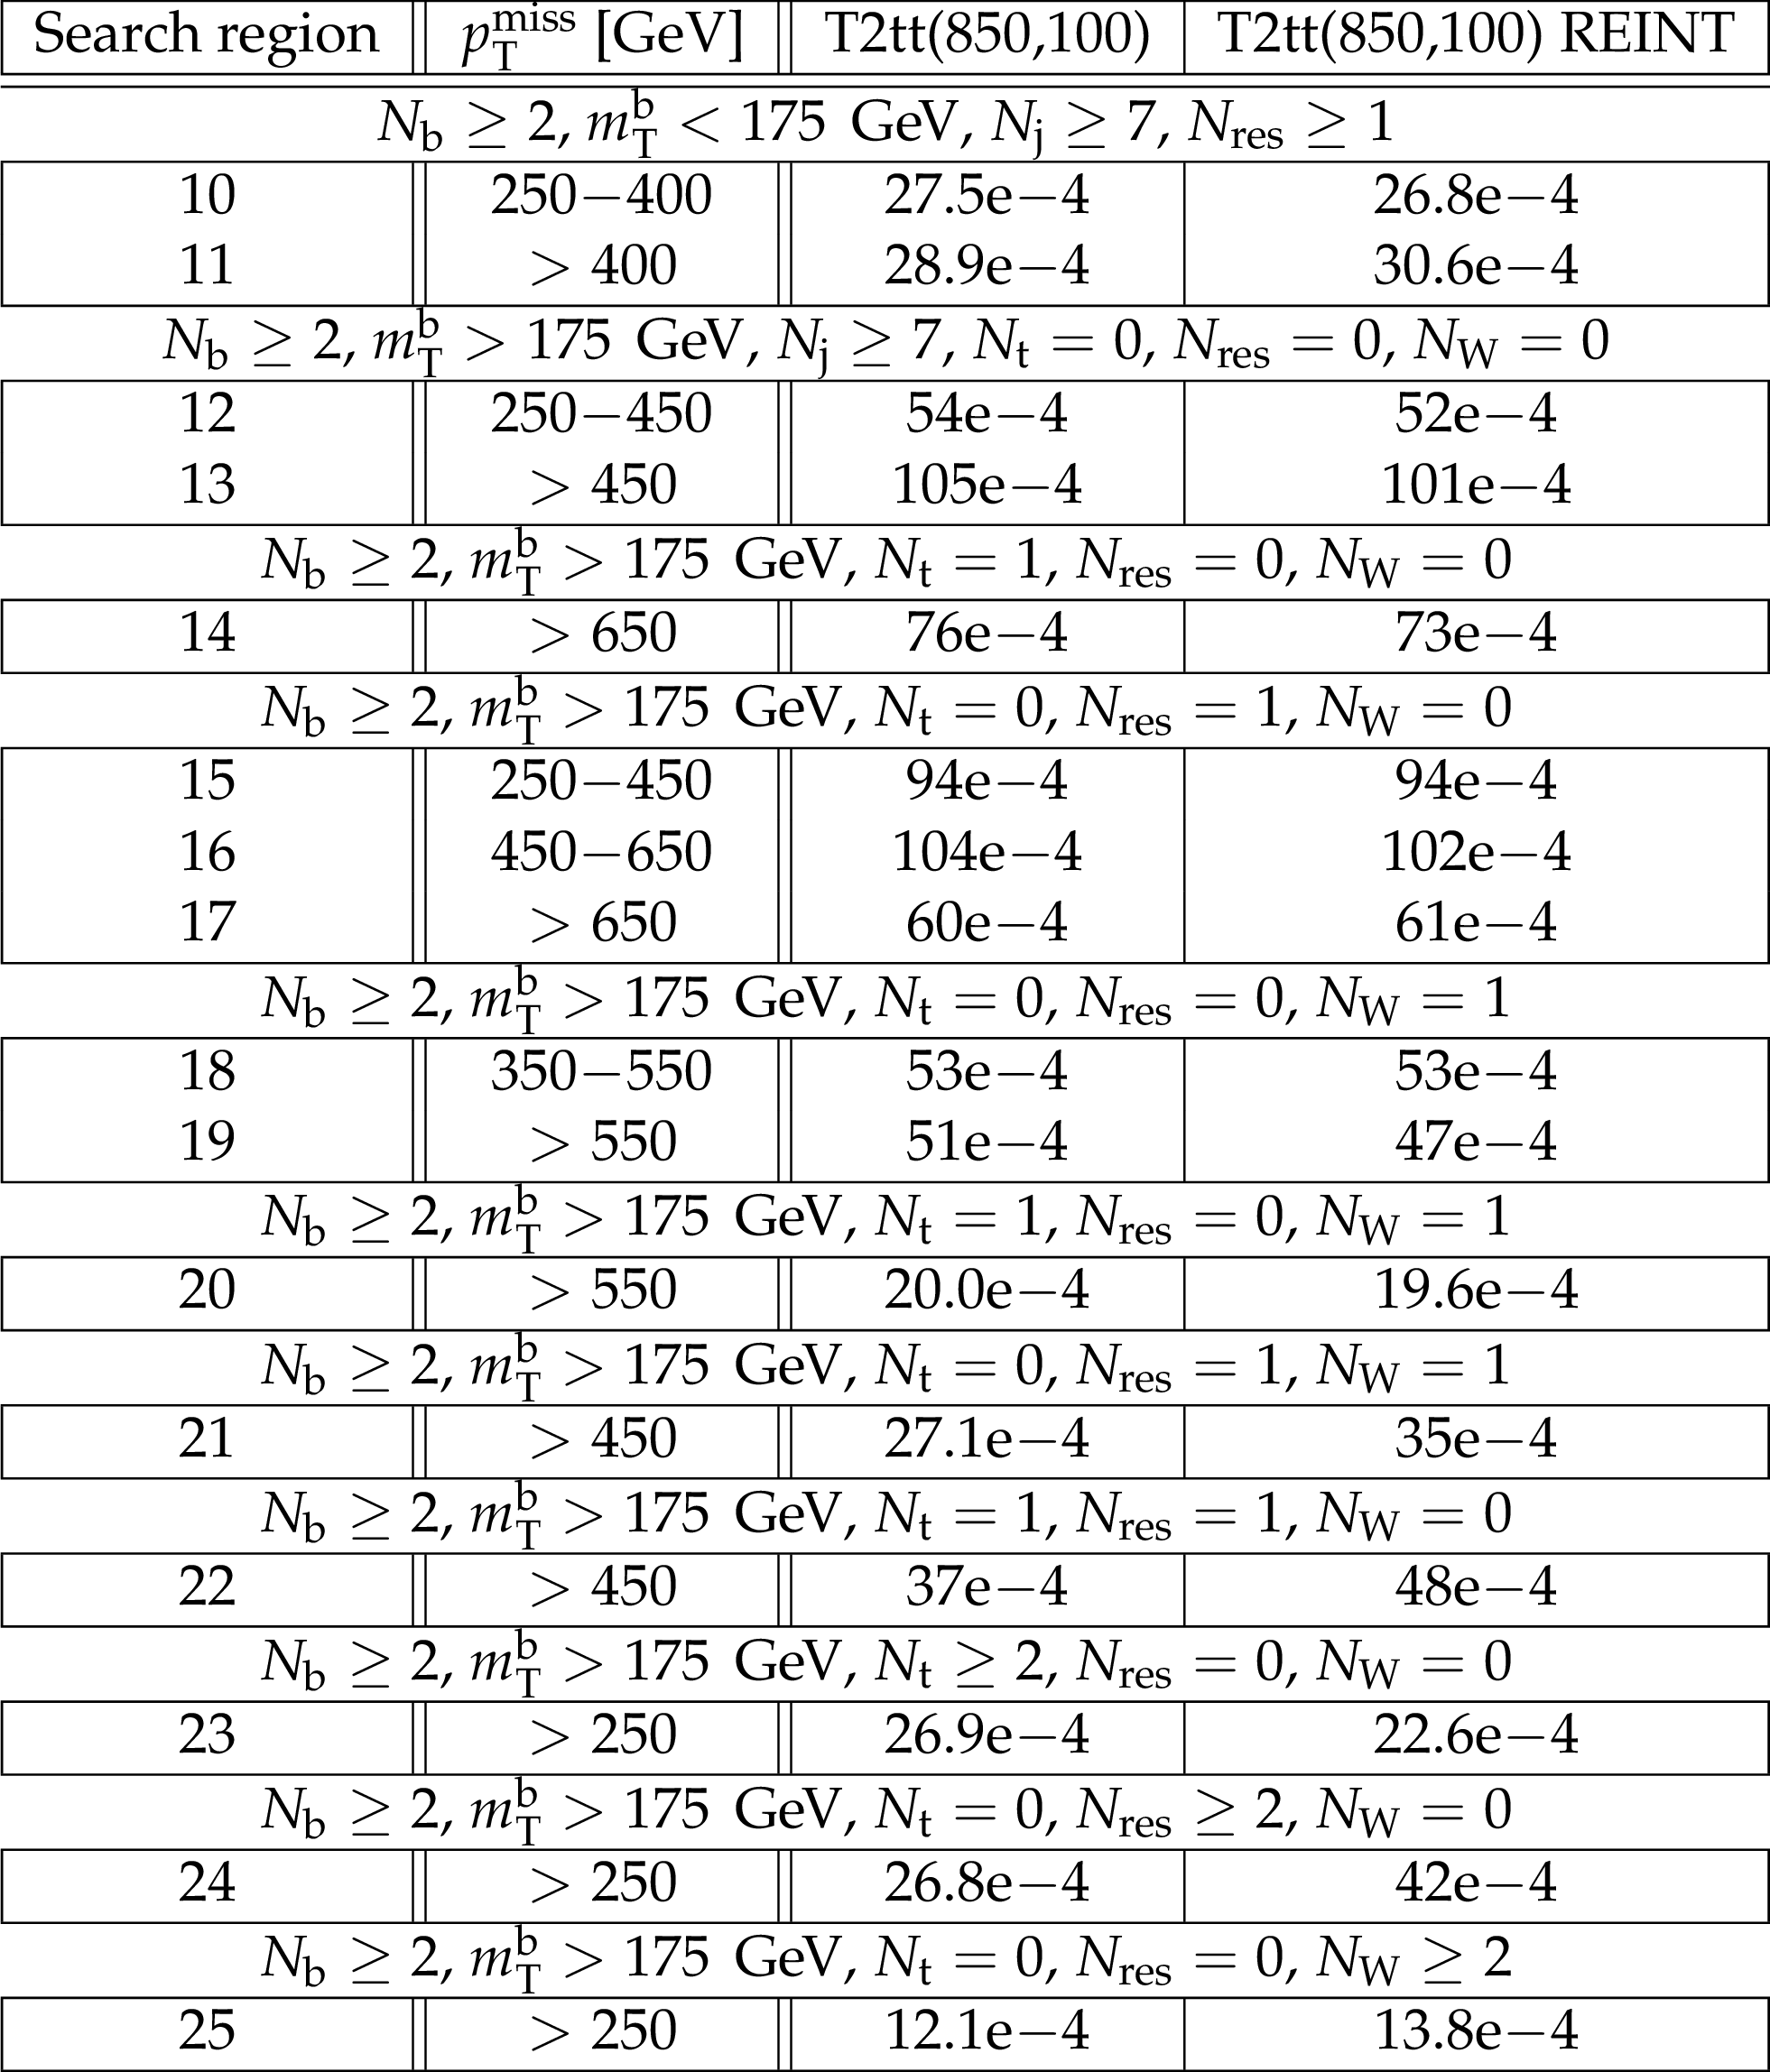
Additional Table 3:
Predicted acceptance times efficiency in the super search regions of the high $ {\Delta m} $ category for the T2tt(850,100) signal benchmark point. The first column corresponds to the top and W objects used in the analysis; the second corresponds to the simplified top and W objects defined in the reinterpretation material. |
png pdf |
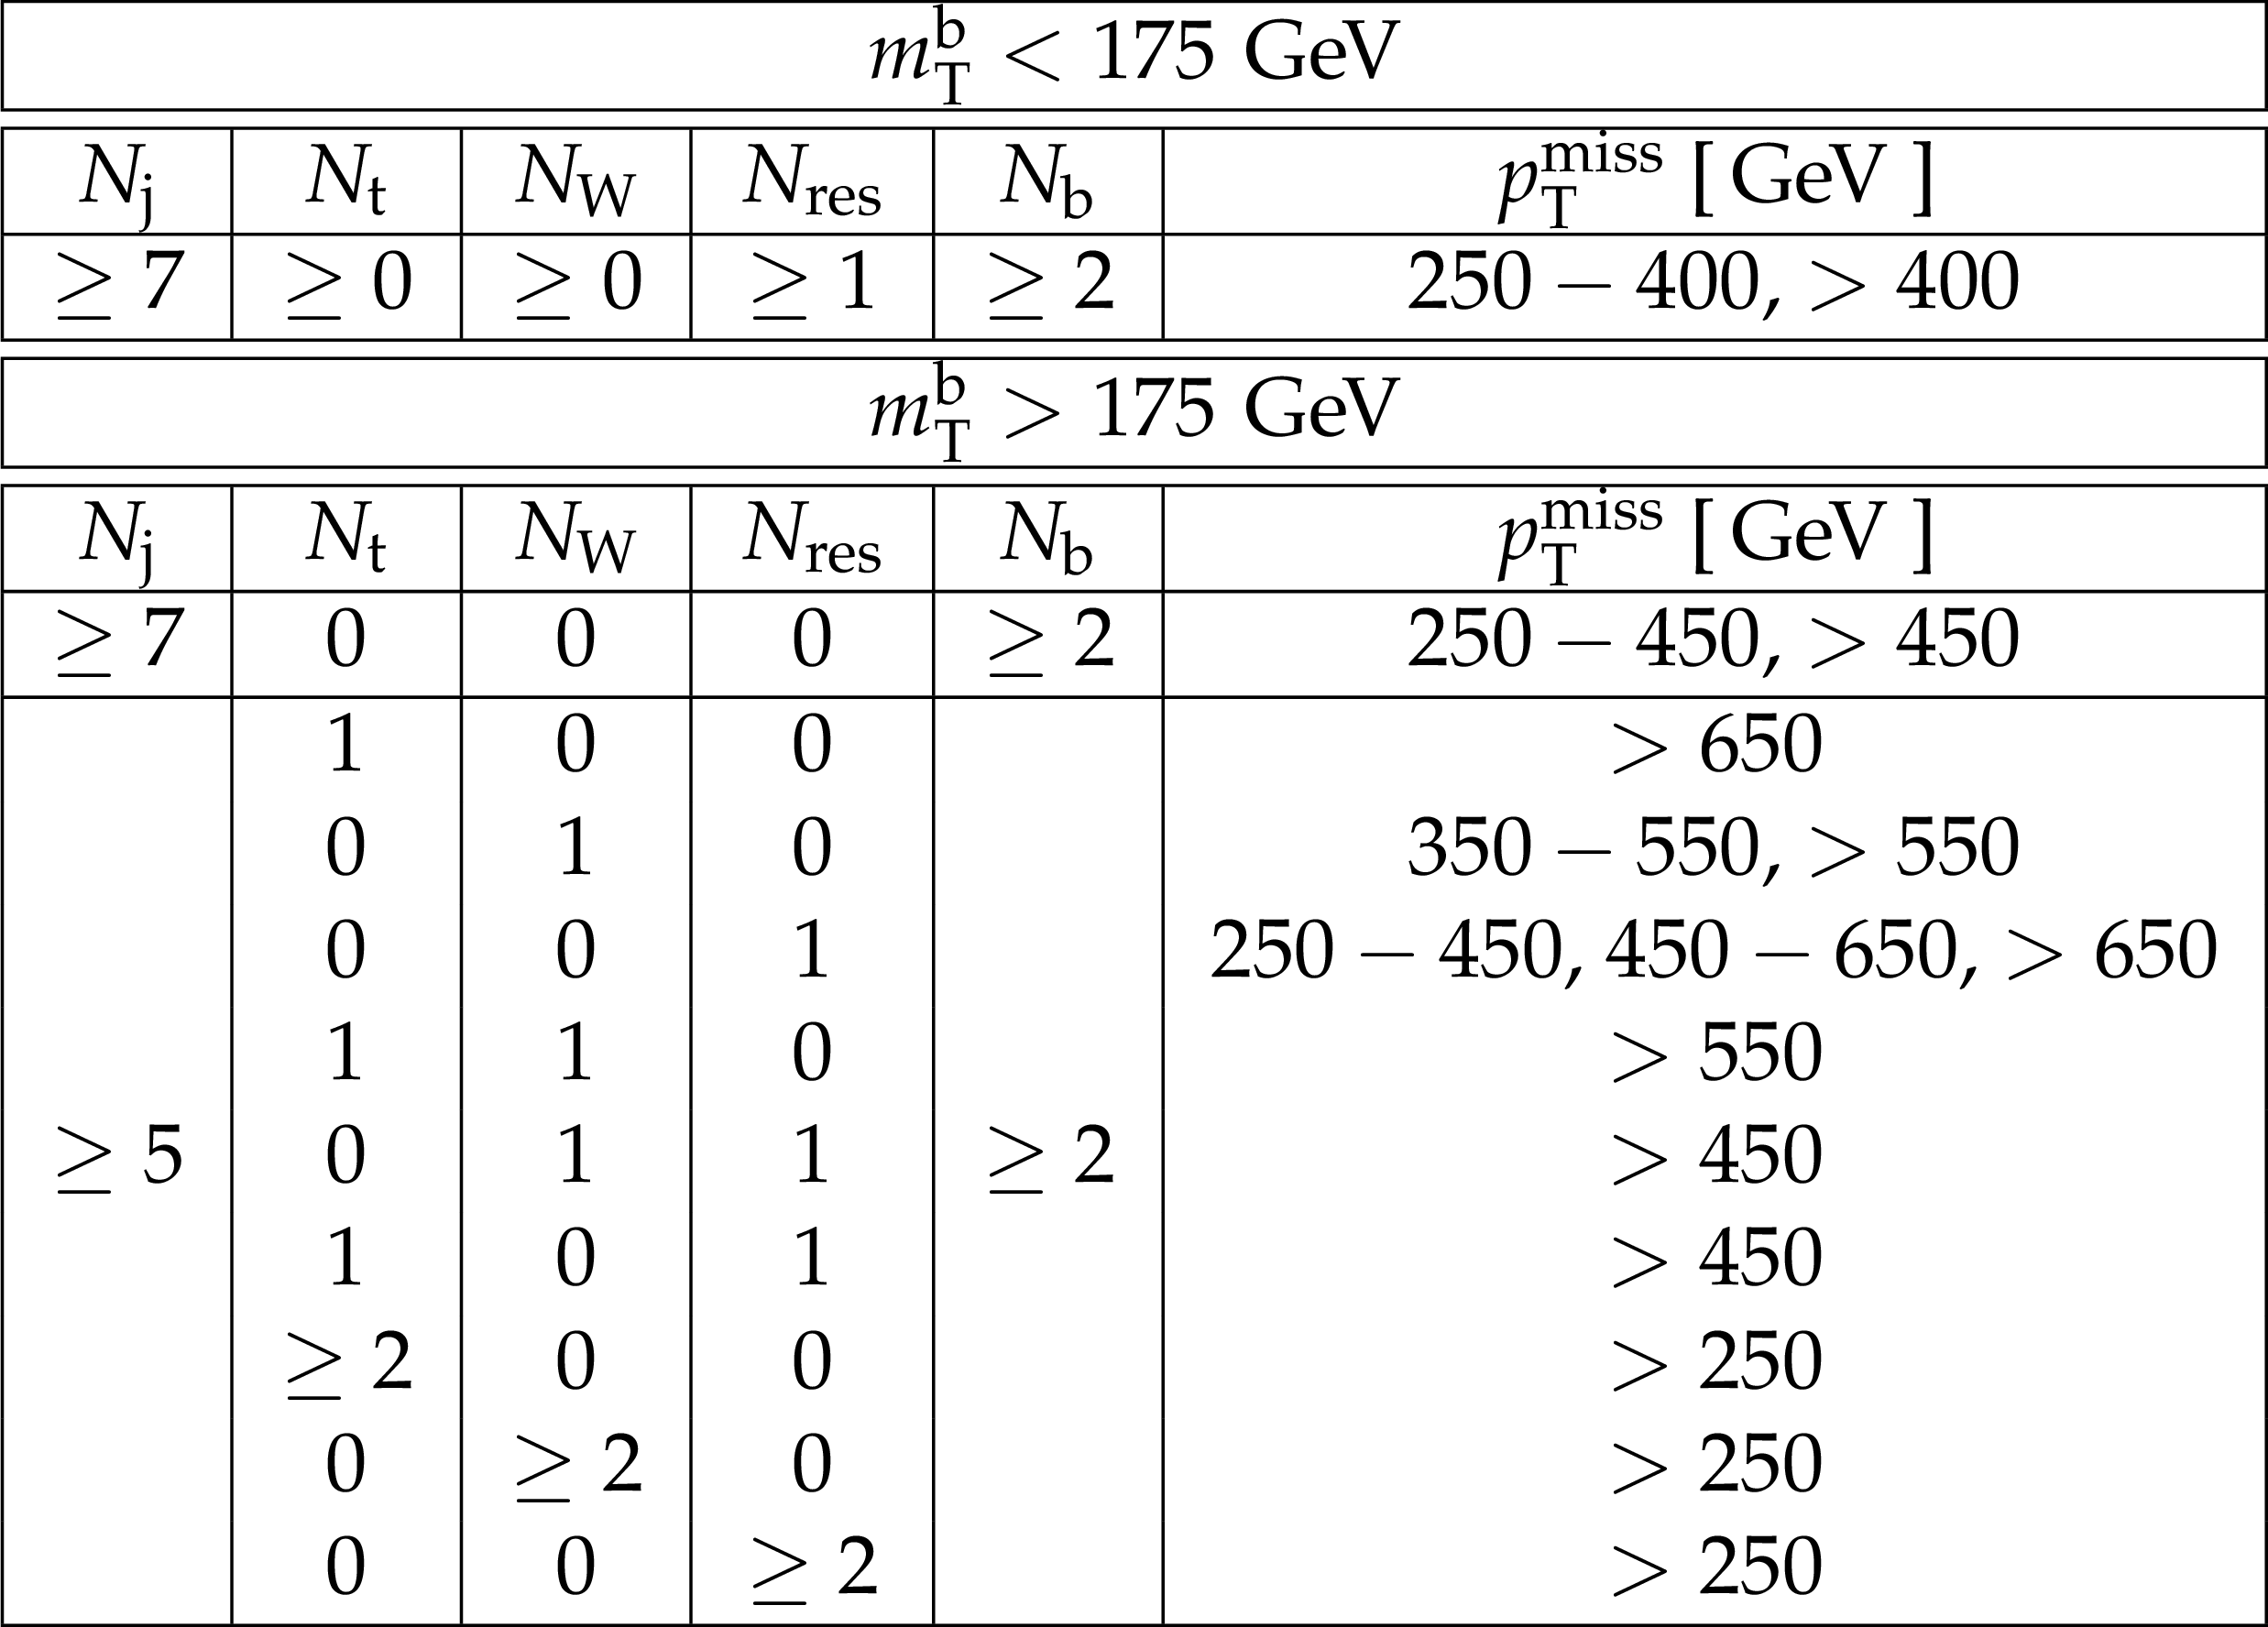
Additional Table 4:
Summary of the 10 disjoint super search regions in the low $ {\Delta m} $ category. The low $ {\Delta m} $ baseline selection is $N_{\text {j}}\geq 2$, $ { {p_{\mathrm {T}}} ^\text {miss}} >250 GeV $, zero leptons, $N_{\mathrm{ t } }=N_{ {\mathrm {W}}}=N_{\text {res}}=0$, $N_{\mathrm{ b } }\geq 0$, $m_{\mathrm {T}}^{\mathrm {b}}<175 GeV $ (when applicable), $|\Delta \phi (\text {j}_1, {E_{\mathrm {T}}})|>0.5, |\Delta \phi (\text {j}_{2,3}, {E_{\mathrm {T}}})| > 0.15$, $ {p_{\mathrm {T}}} (\text {ISR}) > 300$ GeV, $ |\eta (\text {ISR})| < 2.4$, $|\Delta \phi (j_{\text {ISR}}, { {p_{\mathrm {T}}} ^\text {miss}})|>2$, and $ {S_{E_{\mathrm {T}}\hspace {-0.8em}/\kern 0.45em} }> 10 GeV ^{1/2}$. |
png pdf |
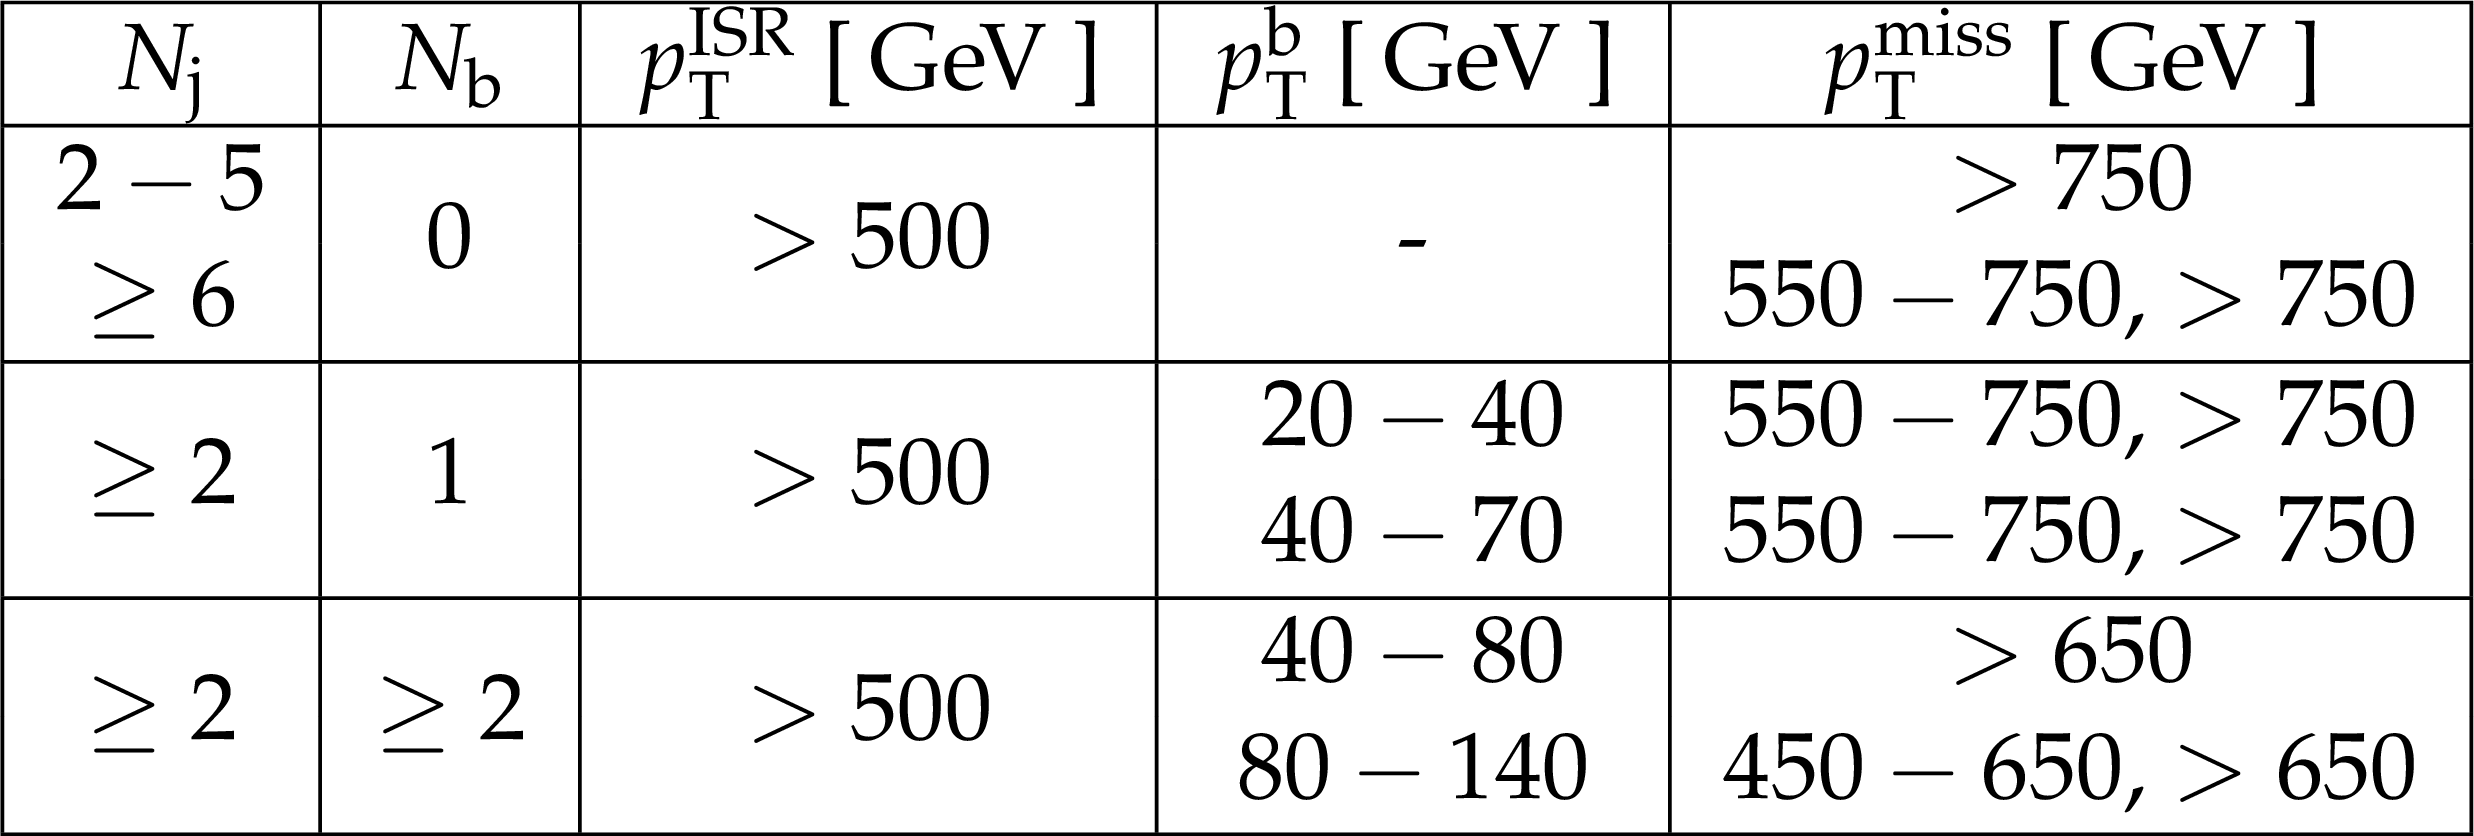
Additional Table 5:
Summary of the 16 disjoint super search regions in the high $ {\Delta m} $ category. The high $ {\Delta m} $ baseline selection is $N_{\text {j}}\geq 5$, $ { {p_{\mathrm {T}}} ^\text {miss}} >250 GeV $, zero leptons, $N_{\mathrm{ b } }\geq 1$, and $\Delta \phi _{1234}>0.5$. |
png pdf |
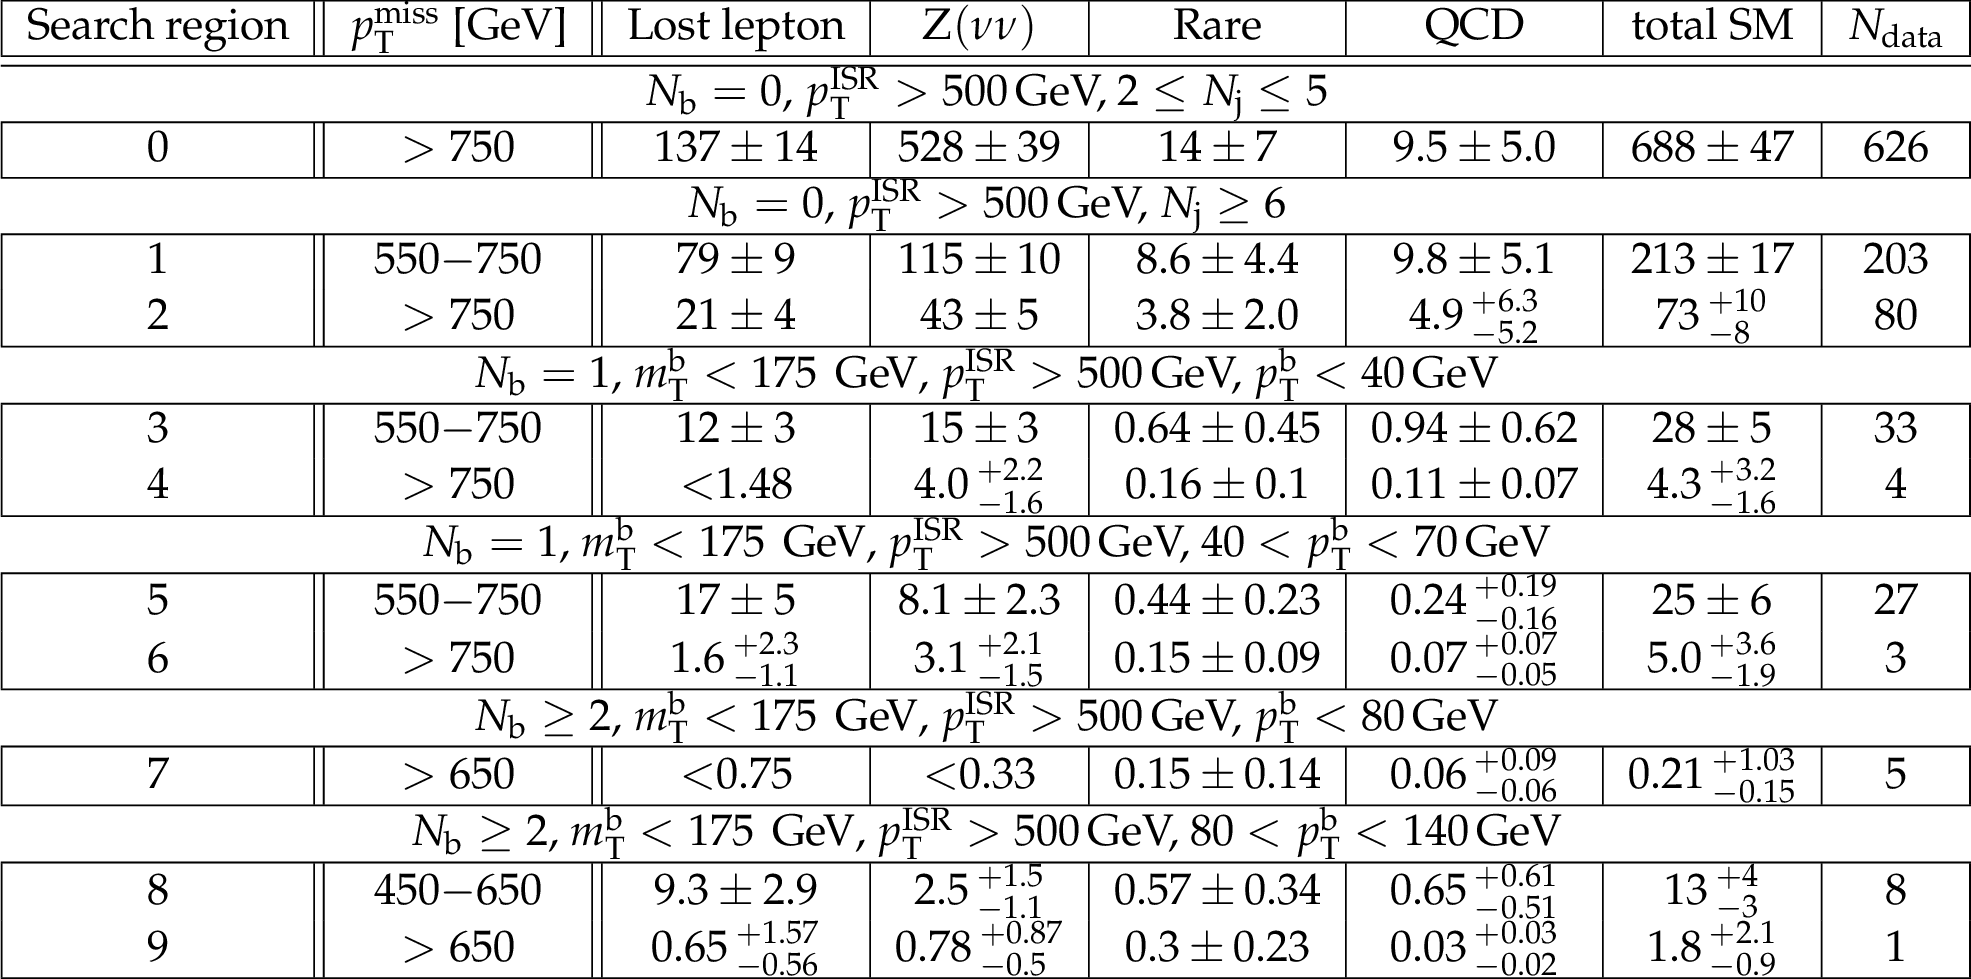
Additional Table 6:
Predicted background yields and the observation in the super search regions of the low $ {\Delta m} $ category. The total uncertainty is given for each background prediction. |
png pdf |
Additional Table 7:
Predicted background yields and the observation in the super search regions of the high $ {\Delta m} $ category. The total uncertainty is given for each background prediction. |
| Additional material and instructions needed for reinterpretation here. |
| References | ||||
| 1 | ATLAS Collaboration | Observation of a new particle in the search for the Standard Model Higgs boson with the ATLAS detector at the LHC | PLB 716 (2012) 1 | 1207.7214 |
| 2 | CMS Collaboration | Observation of a new boson at a mass of 125 GeV with the CMS experiment at the LHC | PLB 716 (2012) 30 | CMS-HIG-12-028 1207.7235 |
| 3 | CMS Collaboration | Observation of a new boson with mass near 125 GeV in $ \mathrm{ p }\mathrm{ p } $ collisions at $ \sqrt{s} = $ 7 and 8 TeV | JHEP 06 (2013) 081 | CMS-HIG-12-036 1303.4571 |
| 4 | ATLAS Collaboration | Measurement of the Higgs boson mass from the $ \textrm{H}\rightarrow \gamma\gamma $ and $ \textrm{H} \rightarrow \textrm{ZZ}^{*} \rightarrow 4\ell $ channels with the ATLAS detector using 25 fb$ ^{-1} $ of $ \mathrm{ p }\mathrm{ p } $ collision data | PRD 90 (2014) 052004 | 1406.3827 |
| 5 | CMS Collaboration | Precise determination of the mass of the Higgs boson and tests of compatibility of its couplings with the standard model predictions using proton collisions at 7 and 8 TeV | EPJC 75 (2015) 212 | CMS-HIG-14-009 1412.8662 |
| 6 | ATLAS and CMS Collaborations | Combined measurement of the Higgs boson mass in pp collisions at $ \sqrt{s}=$ 7 and 8 TeV with the ATLAS and CMS experiments | PRL 114 (2015) 191803 | 1503.07589 |
| 7 | G. 't Hooft | Naturalness, chiral symmetry, and spontaneous chiral symmetry breaking | NATO Sci. Ser. B 59 (1980) 135 | |
| 8 | E. Witten | Dynamical breaking of supersymmetry | Nucl. Phys. B 188 (1981) 513 | |
| 9 | M. Dine, W. Fischler, and M. Srednicki | Supersymmetric technicolor | Nucl. Phys. B 189 (1981) 575 | |
| 10 | S. Dimopoulos and S. Raby | Supercolor | Nucl. Phys. B 192 (1981) 353 | |
| 11 | S. Dimopoulos and H. Georgi | Softly broken supersymmetry and SU(5) | Nucl. Phys. B 193 (1981) 150 | |
| 12 | R. K. Kaul and P. Majumdar | Cancellation of quadratically divergent mass corrections in globally supersymmetric spontaneously broken gauge theories | Nucl. Phys. B 199 (1982) 36 | |
| 13 | F. Zwicky | Die Rotverschiebung von extragalaktischen Nebeln | Helv. Phys. Acta 6 (1933) 110 | |
| 14 | V. C. Rubin and J. Ford, W. Kent | Rotation of the Andromeda nebula from a spectroscopic survey of emission regions | Astrophys. J. 159 (1970) 379 | |
| 15 | Particle Data Group | Review of particle physics | CPC 40 (2016) 100001 | |
| 16 | R. Barbieri and G. F. Giudice | Upper bounds on supersymmetric particle masses | Nucl. Phys. B 306 (1988) 63 | |
| 17 | B. de Carlos and J. A. Casas | One loop analysis of the electroweak breaking in supersymmetric models and the fine tuning problem | PLB 309 (1993) 320 | hep-ph/9303291 |
| 18 | S. Dimopoulos and G. F. Giudice | Naturalness constraints in supersymmetric theories with nonuniversal soft terms | PLB 357 (1995) 573 | hep-ph/9507282 |
| 19 | R. Barbieri, G. R. Dvali, and L. J. Hall | Predictions from a U(2) flavor symmetry in supersymmetric theories | PLB 377 (1996) 76 | hep-ph/9512388 |
| 20 | J. L. Feng | Naturalness and the status of supersymmetry | Ann. Rev. Nucl. Part. Sci. 63 (2013) 351 | 1302.6587 |
| 21 | L. Evans and P. Bryant (editors) | LHC Machine | JINST 3 (2008) S08001 | |
| 22 | J. Wess and B. Zumino | Supergauge transformations in four-dimensions | Nucl. Phys. B 70 (1974) 39 | |
| 23 | G. R. Farrar and P. Fayet | Phenomenology of the production, decay, and detection of new hadronic states associated with supersymmetry | PLB 76 (1978) 575 | |
| 24 | J. L. Feng | Dark matter candidates from particle physics and methods of detection | Ann. Rev. Astron. Astrophys. 48 (2010) 495 | 1003.0904 |
| 25 | ATLAS Collaboration | Search for a supersymmetric partner to the top quark in final states with jets and missing transverse momentum at $ \sqrt{s}=$ 7 TeV with the ATLAS detector | PRL 109 (2012) 211802 | 1208.1447 |
| 26 | ATLAS Collaboration | Search for direct top squark pair production in final states with one isolated lepton, jets, and missing transverse momentum in $ \sqrt{s}=$ 7 TeV $ \mathrm{ p }\mathrm{ p } $ collisions using 4.7 fb$^{-1} $ of ATLAS data | PRL 109 (2012) 211803 | 1208.2590 |
| 27 | ATLAS Collaboration | Search for a heavy top-quark partner in final states with two leptons with the ATLAS detector at the LHC | JHEP 11 (2012) 094 | 1209.4186 |
| 28 | ATLAS Collaboration | Search for direct top-squark pair production in final states with two leptons in $ \mathrm{ p }\mathrm{ p } $ collisions at $ \sqrt{s}=$ 8 TeV with the ATLAS detector | JHEP 06 (2014) 124 | 1403.4853 |
| 29 | ATLAS Collaboration | Search for direct third-generation squark pair production in final states with missing transverse momentum and two b-jets in $ \sqrt{s}=$ 8 TeV $ \mathrm{ p }\mathrm{ p } $ collisions with the ATLAS detector | JHEP 10 (2013) 189 | 1308.2631 |
| 30 | ATLAS Collaboration | Measurement of spin correlation in top-antitop quark events and search for top squark pair production in pp collisions at $ \sqrt{s}=$ 8 TeV using the ATLAS detector | PRL 114 (2015) 142001 | 1412.4742 |
| 31 | ATLAS Collaboration | Search for pair-produced third-generation squarks decaying via charm quarks or in compressed supersymmetric scenarios in $ \mathrm{ p }\mathrm{ p } $ collisions at $ \sqrt{s}=$ 8 TeV with the ATLAS detector | PRD 90 (2014) 052008 | 1407.0608 |
| 32 | ATLAS Collaboration | ATLAS Run 1 searches for direct pair production of third-generation squarks at the Large Hadron Collider | EPJC 75 (2015) 510 | 1506.08616 |
| 33 | CMS Collaboration | Search for top-squark pair production in the single-lepton final state in $ \mathrm{ p }\mathrm{ p } $ collisions at $ \sqrt{s} = $ 8 TeV | EPJC 73 (2013) 2677 | CMS-SUS-13-011 1308.1586 |
| 34 | CMS Collaboration | Search for supersymmetry in hadronic final states with missing transverse energy using the variables $ \alpha_\mathrm{T} $ and b-quark multiplicity in pp~collisions at $ \sqrt{s} = $ 8 TeV | EPJC 73 (2013) 2568 | CMS-SUS-12-028 1303.2985 |
| 35 | CMS Collaboration | Search for supersymmetry using razor variables in events with b-tagged jets in $ \mathrm{ p }\mathrm{ p } $ collisions at $ \sqrt{s} = $ 8 TeV | PRD 91 (2015) 052018 | CMS-SUS-13-004 1502.00300 |
| 36 | CMS Collaboration | Searches for third-generation squark production in fully hadronic final states in proton-proton collisions at $ \sqrt{s} = $ 8 TeV | JHEP 06 (2015) 116 | CMS-SUS-14-001 1503.08037 |
| 37 | CMS Collaboration | Search for direct pair production of supersymmetric top quarks decaying to all-hadronic final states in $ \mathrm{ p }\mathrm{ p } $ collisions at $ \sqrt{s} = $ 8 TeV | EPJC 76 (2016) 460 | CMS-SUS-13-023 1603.00765 |
| 38 | ATLAS Collaboration | Search for top squarks in final states with one isolated lepton, jets, and missing transverse momentum in $ \sqrt{s}=$ 13 TeV $ \mathrm{ p }\mathrm{ p } $ collisions with the ATLAS detector | PRD 94 (2016) 052009 | 1606.03903 |
| 39 | CMS Collaboration | Search for new physics with the M$ _{T2} $ variable in all-jets final states produced in $ \mathrm{ p }\mathrm{ p } $ collisions at $ \sqrt{s}=$ 13 TeV | JHEP 10 (2016) 006 | CMS-SUS-15-003 1603.04053 |
| 40 | CMS Collaboration | Inclusive search for supersymmetry using razor variables in $ \mathrm{ p }\mathrm{ p } $ collisions at $ \sqrt{s} = $ 13 TeV | PRD 95 (2017) 012003 | CMS-SUS-15-004 1609.07658 |
| 41 | CMS Collaboration | A search for new phenomena in pp collisions at $ \sqrt{s} = $ 13 TeV in final states with missing transverse momentum and at least one jet using the $ \alpha _{\mathrm {T}} $ variable | EPJC 77 (2017) 294 | CMS-SUS-15-005 1611.00338 |
| 42 | CMS Collaboration | Searches for pair production of third-generation squarks in $ \sqrt{s} = $ 13 TeV pp collisions | EPJC 77 (2017) 327 | CMS-SUS-16-008 1612.03877 |
| 43 | ATLAS Collaboration | Search for direct top squark pair production in events with a Higgs or $ Z $ boson, and missing transverse momentum in $ \sqrt{s}=$ 13 TeV $ pp $ collisions with the ATLAS detector | Submitted to JHEP | 1706.03986 |
| 44 | CMS Collaboration | Search for supersymmetry in multijet events with missing transverse momentum in proton-proton collisions at 13 TeV | Submitted to PRD | CMS-SUS-16-033 1704.07781 |
| 45 | CMS Collaboration | Search for new phenomena with the $ M_{\text{T}2} $ variable in the all-hadronic final state produced in proton-proton collisions at $ \sqrt{s} = $ 13 TeV | Submitted to EPJC | CMS-SUS-16-036 1705.04650 |
| 46 | J. Alwall, P. Schuster, and N. Toro | Simplified models for a first characterization of new physics at the LHC | PRD 79 (2009) 075020 | 0810.3921 |
| 47 | J. Alwall, M.-P. Le, M. Lisanti, and J. G. Wacker | Model-independent jets plus missing energy searches | PRD 79 (2009) 015005 | 0809.3264 |
| 48 | D. A. LHC New Physics Working Group et al. | Simplified models for LHC new physics searches | JPG 39 (2012) 105005 | 1105.2838 |
| 49 | C. Balazs, M. Carena, and C. E. M. Wagner | Dark matter, light stops, and electroweak baryogenesis | PRD 70 (2004) 015007 | hep-ph/0403224 |
| 50 | CMS Collaboration | The CMS experiment at the CERN LHC | JINST 3 (2008) S08004 | CMS-00-001 |
| 51 | J. Alwall et al. | The automated computation of tree-level and next-to-leading order differential cross sections, and their matching to parton shower simulations | JHEP 07 (2014) 079 | 1405.0301 |
| 52 | NNPDF Collaboration | Parton distributions for the LHC Run II | JHEP 04 (2015) 040 | 1410.8849 |
| 53 | P. Nason | A new method for combining NLO QCD with shower Monte Carlo algorithms | JHEP 11 (2004) 040 | hep-ph/0409146 |
| 54 | S. Frixione, P. Nason, and C. Oleari | Matching NLO QCD computations with Parton Shower simulations: the POWHEG method | JHEP 11 (2007) 070 | 0709.2092 |
| 55 | S. Alioli, P. Nason, C. Oleari, and E. Re | A general framework for implementing NLO calculations in shower Monte Carlo programs: the POWHEG BOX | JHEP 06 (2010) 043 | 1002.2581 |
| 56 | E. Re | Single-top Wt-channel production matched with parton showers using the POWHEG method | EPJC 71 (2011) 1547 | 1009.2450 |
| 57 | P. Nason and G. Zanderighi | $ \mathrm{ W }^+ \mathrm{ W }^- $, $ \mathrm{ W }\mathrm{ Z } $ and $ \mathrm{ Z }\mathrm{ Z } $ production in the POWHEG-BOX-V2 | EPJC 74 (2014) 2702 | 1311.1365 |
| 58 | T. Sjostrand, S. Mrenna, and P. Skands | A brief introduction to PYTHIA 8.1 | CPC 178 (2008) 852 | 0710.3820 |
| 59 | J. Alwall et al. | Comparative study of various algorithms for the merging of parton showers and matrix elements in hadronic collisions | EPJC 53 (2008) 473 | 0706.2569 |
| 60 | R. Frederix and S. Frixione | Merging meets matching in MC@NLO | JHEP 12 (2012) 061 | 1209.6215 |
| 61 | J. M. Campbell, R. K. Ellis, P. Nason, and E. Re | Top-pair production and decay at NLO matched with parton showers | JHEP 04 (2015) 114 | 1412.1828 |
| 62 | M. Bahr et al. | Herwig++ physics and manual | EPJC 58 (2008) 639 | 0803.0883 |
| 63 | C. Borschensky et al. | Squark and gluino production cross sections in pp~ collisions at $ \sqrt{s} = $ 13, 14, 33 and 100 TeV | EPJC 74 (2014) 3174 | 1407.5066 |
| 64 | M. Czakon and A. Mitov | Top++: A program for the calculation of the top-pair cross-section at hadron colliders | CPC 185 (2014) 2930 | 1112.5675 |
| 65 | Y. Li and F. Petriello | Combining QCD and electroweak corrections to dilepton production in FEWZ | PRD 86 (2012) 094034 | 1208.5967 |
| 66 | P. Kant et al. | HatHor for single top-quark production: Updated predictions and uncertainty estimates for single top-quark production in hadronic collisions | CPC 191 (2015) 74 | 1406.4403 |
| 67 | N. Kidonakis | NNLL threshold resummation for top-pair and single-top production | Phys. Part. Nucl. 45 (2014) 714 | 1210.7813 |
| 68 | CMS Collaboration | Measurement of the $ \mathrm{t}\overline{{\mathrm{t}}} $ production cross section in the all-jets final state in $ \mathrm{ p }\mathrm{ p } $ collisions at $ \sqrt{s}=$ 8 TeV | EPJC 76 (2016) 128 | CMS-TOP-14-018 1509.06076 |
| 69 | GEANT4 Collaboration | GEANT4---a simulation toolkit | NIMA 506 (2003) 250 | |
| 70 | S. Abdullin et al. | The fast simulation of the CMS detector at LHC | J. Phys. Conf. Ser. 331 (2011) 032049 | |
| 71 | CMS Collaboration | Particle-flow reconstruction and global event description with the CMS detector | Submitted to JINST | CMS-PRF-14-001 1706.04965 |
| 72 | M. Cacciari, G. P. Salam, and G. Soyez | The anti-$ k_t $ jet clustering algorithm | JHEP 04 (2008) 063 | 0802.1189 |
| 73 | M. Cacciari, G. P. Salam, and G. Soyez | FastJet user manual | EPJC 72 (2012) 1896 | 1111.6097 |
| 74 | M. Cacciari and G. P. Salam | Pileup subtraction using jet areas | PLB 659 (2008) 119 | 0707.1378 |
| 75 | CMS Collaboration | Study of pileup removal algorithms for jets | CMS-PAS-JME-14-001 | CMS-PAS-JME-14-001 |
| 76 | CMS Collaboration | Jet energy scale and resolution in the CMS experiment in $ \mathrm{ p }\mathrm{ p } $ collisions at 8 TeV | JINST 12 (2017) P02014 | CMS-JME-13-004 1607.03663 |
| 77 | CMS Collaboration | Identification of b-quark jets with the CMS experiment | JINST 8 (2013) P04013 | CMS-BTV-12-001 1211.4462 |
| 78 | CMS Collaboration | Identification of b quark jets at the CMS Experiment in the LHC Run 2 | CMS-PAS-BTV-15-001 | CMS-PAS-BTV-15-001 |
| 79 | CMS Collaboration | Performance of electron reconstruction and selection with the cms detector in proton-proton collisions at $ \sqrt{s} = $ 8 TeV | JINST 10 (2015) P06005 | CMS-EGM-13-001 1502.02701 |
| 80 | CMS Collaboration | Performance of CMS muon reconstruction in $ \mathrm{ p }\mathrm{ p } collision $ events at $ \sqrt{s} = $ 7 TeV | JINST 7 (2012) P10002 | CMS-MUO-10-004 1206.4071 |
| 81 | K. Rehermann and B. Tweedie | Efficient identification of boosted semileptonic top quarks at the LHC | JHEP 03 (2011) 059 | 1007.2221 |
| 82 | CMS Collaboration | Performance of photon reconstruction and identification with the CMS detector in proton-proton collisions at $ \sqrt{s} = $ 8 TeV | JINST 10 (2015) P08010 | CMS-EGM-14-001 1502.02702 |
| 83 | B. P. Roe et al. | Boosted decision trees, an alternative to artificial neural networks | NIMA 543 (2005) 577 | physics/0408124 |
| 84 | J. Shelton | Jet substructure | in Proceedings, Theoretical Advanced Study Institute in Elementary Particle Physics: Searching for New Physics at Small and Large Scales (TASI 2012) Boulder | 1302.0260 |
| 85 | Y. L. Dokshitzer, G. D. Leder, S. Moretti, and B. R. Webber | Better jet clustering algorithms | JHEP 08 (1997) 001 | hep-ph/9707323 |
| 86 | M. Dasgupta, A. Fregoso, S. Marzani, and G. P. Salam | Towards an understanding of jet substructure | JHEP 09 (2013) 029 | 1307.0007 |
| 87 | A. J. Larkoski, S. Marzani, G. Soyez, and J. Thaler | Soft drop | JHEP 05 (2014) 146 | 1402.2657 |
| 88 | J. Thaler and K. Van Tilburg | Maximizing boosted top identification by minimizing N-subjettiness | JHEP 02 (2012) 093 | 1108.2701 |
| 89 | CMS Collaboration | Performance of quark/gluon discrimination in 8 TeV pp data | CMS-PAS-JME-13-002 | CMS-PAS-JME-13-002 |
| 90 | H. Voss, A. Hocker, J. Stelzer, and F. Tegenfeldt | TMVA, the toolkit for multivariate data analysis with ROOT | in XIth International Workshop on Advanced Computing and Analysis Techniques in Physics Research (ACAT) 2007 | physics/0703039 |
| 91 | CMS Collaboration | Jet algorithms performance in 13 TeV data | CMS-PAS-JME-16-003 | CMS-PAS-JME-16-003 |
| 92 | CMS Collaboration | Identification of c-quark jets at the CMS experiment | CMS-PAS-BTV-16-001 | CMS-PAS-BTV-16-001 |
| 93 | CMS Collaboration | Measurement of $ \text{B}\overline{\text{B}} $ angular correlations based on secondary vertex reconstruction at $ \sqrt{s} = $ 7 TeV | JHEP 03 (2011) 136 | CMS-BPH-10-010 1102.3194 |
| 94 | B. Efron | The Jackknife, The Bootstrap, and Other Resampling Plans | volume 38 of CBMS-NSF Regional Conference Series in Applied Mathematics SIAM, Philadelphia, 1982 ISBN 978-0-898711-79-0 | |
| 95 | CMS Collaboration | Observation of top quark pairs produced in association with a vector boson in $ \mathrm{ p }\mathrm{ p } $ collisions at $ \sqrt{s}=$ 8 TeV | JHEP 01 (2016) 096 | CMS-TOP-14-021 1510.01131 |
| 96 | ATLAS Collaboration | Measurement of the $ ZZ $ production cross section in proton-proton collisions at $ \sqrt s = $ 8 TeV using the $ ZZ\to\ell^{-}\ell^{+}\ell^{\prime -}\ell^{\prime +} $ and $ ZZ\to\ell^{-}\ell^{+}\nu\bar{\nu} $ channels with the ATLAS detector | JHEP 01 (2017) 099 | 1610.07585 |
| 97 | CMS Collaboration | Measurement of the WZ production cross section in $ \mathrm{ p }\mathrm{ p } $ collisions at $ \sqrt{s}=$ 13 TeV | PLB 766 (2017) 268 | CMS-SMP-16-002 1607.06943 |
| 98 | S. Catani, D. de Florian, M. Grazzini, and P. Nason | Soft gluon resummation for Higgs boson production at hadron colliders | JHEP 07 (2003) 028 | hep-ph/0306211 |
| 99 | M. Cacciari et al. | The $ \mathrm{ t \bar{t} } $ cross-section at 1.8 TeV and 1.96 TeV: a study of the systematics due to parton densities and scale dependence | JHEP 04 (2004) 068 | hep-ph/0303085 |
| 100 | CMS Collaboration | CMS luminosity measurements for the 2016 data taking period | CMS-PAS-LUM-17-001 | CMS-PAS-LUM-17-001 |
| 101 | T. Junk | Confidence level computation for combining searches with small statistics | NIMA 434 (1999) 435 | hep-ex/9902006 |
| 102 | A. L. Read | Presentation of search results: The $ CL_s $ technique | JPG 28 (2002) 2693 | |
| 103 | ATLAS and CMS Collaborations | Procedure for the LHC Higgs boson search combination in summer 2011 | ATL-PHYS-PUB-2011-011, CMS NOTE-2011/005 | |
| 104 | G. Cowan, K. Cranmer, E. Gross, and O. Vitells | Asymptotic formulae for likelihood-based tests of new physics | EPJC 71 (2011) 1554 | 1007.1727 |
| 105 | R. Grober, M. M. Mohlleitner, E. Popenda, and A. Wlotzka | Light stop decays: implications for LHC searches | EPJC 75 (2015) 420 | 1408.4662 |
|
|
Compact Muon Solenoid LHC, CERN |
|

|

|

|

|

|