

Compact Muon Solenoid
LHC, CERN
| CMS-SUS-17-004 ; CERN-EP-2017-283 | ||
| Combined search for electroweak production of charginos and neutralinos in proton-proton collisions at $\sqrt{s} = $ 13 TeV | ||
| CMS Collaboration | ||
| 11 January 2018 | ||
| JHEP 03 (2018) 160 | ||
| Abstract: A statistical combination of several searches for the electroweak production of charginos and neutralinos is presented. All searches use proton-proton collision data at $\sqrt{s} = $ 13 TeV, recorded with the CMS detector at the LHC in 2016 and corresponding to an integrated luminosity of 35.9 fb$^{-1}$. In addition to the combination of previous searches, a targeted analysis requiring three or more charged leptons (electrons or muons) is presented, focusing on the challenging scenario in which the difference in mass between the two least massive neutralinos is approximately equal to the mass of the Z boson. The results are interpreted in simplified models of chargino-neutralino or neutralino pair production. For chargino-neutralino production, in the case when the lightest neutralino is massless, the combination yields an observed (expected) limit at the 95% confidence level on the chargino mass of up to 650 (570) GeV, improving upon the individual analysis limits by up to 40 GeV. If the mass difference between the two least massive neutralinos is approximately equal to the mass of the Z boson in the chargino-neutralino model, the targeted search requiring three or more leptons obtains observed and expected exclusion limits of around 225 GeV on the second neutralino mass and 125 GeV on the lightest neutralino mass, improving the observed limit by about 60 GeV in both masses compared to the previous CMS result. In the neutralino pair production model, the combined observed (expected) exclusion limit on the neutralino mass extends up to 650-750 (550-750) GeV, depending on the branching fraction assumed. This extends the observed exclusion achieved in the individual analyses by up to 200 GeV. The combined result additionally excludes some intermediate gaps in the mass coverage of the individual analyses. | ||
| Links: e-print arXiv:1801.03957 [hep-ex] (PDF) ; CDS record ; inSPIRE record ; CADI line (restricted) ; | ||
| Figures & Tables | Summary | Additional Figures | References | CMS Publications |
|---|
|
Additional information on efficiencies needed for reinterpretation of these results are available here.
Additional technical material for CMS speakers can be found here |
| Figures | |
png pdf |
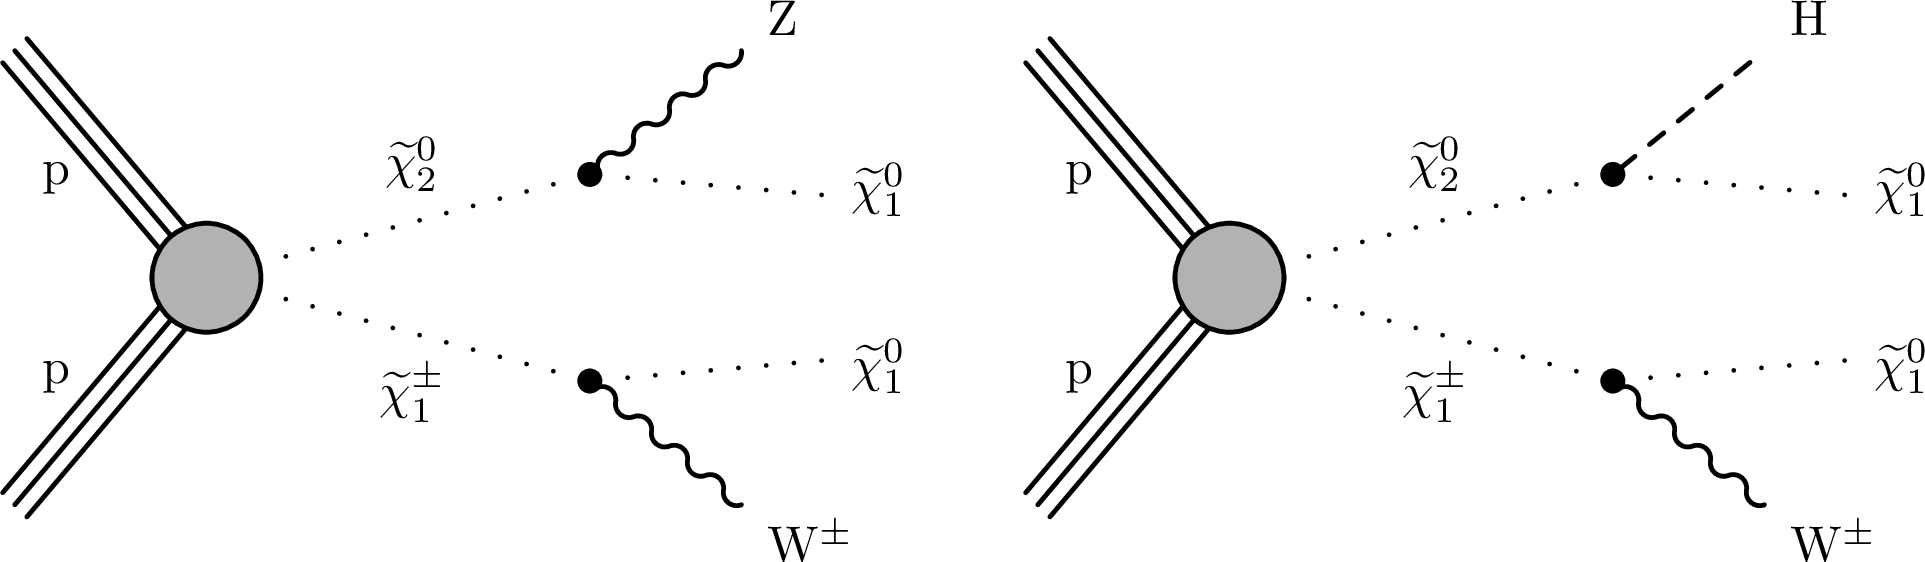
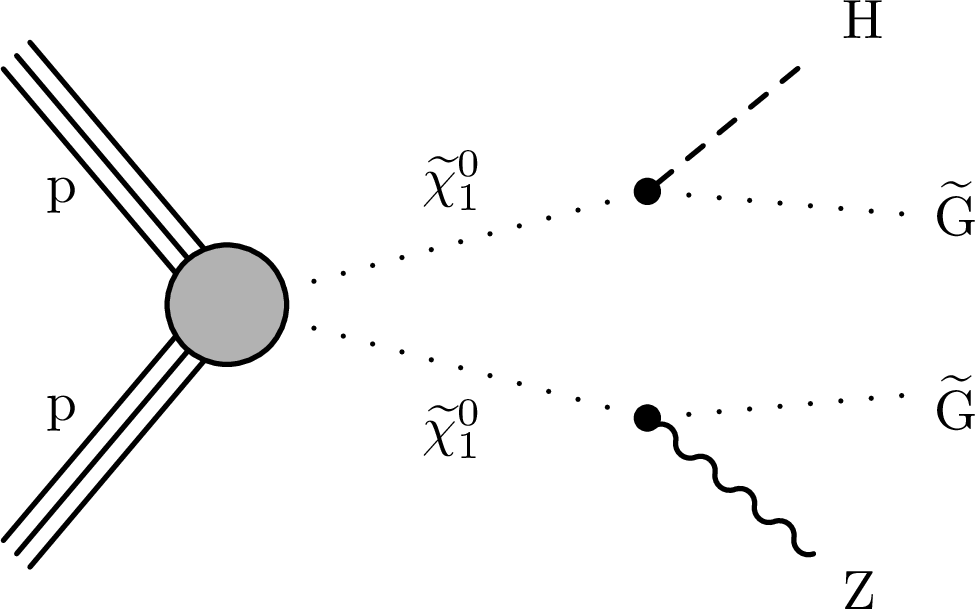
Figure 1:
Production of $ \tilde{\chi}^{\pm}_{1} \tilde{\chi}^0_2 $ with the $ \tilde{\chi}^{\pm}_{1} $ decaying to a W boson and the LSP, $ \tilde{\chi}^0_1 $, and the $ \tilde{\chi}^0_2 $ decaying to either (left) a Z boson and the $ \tilde{\chi}^0_1 $ or (right) a H boson and the $ \tilde{\chi}^0_1 $. |

png pdf |
Figure 1-a:
Production of $ \tilde{\chi}^{\pm}_{1} \tilde{\chi}^0_2 $ with the $ \tilde{\chi}^{\pm}_{1} $ decaying to a W boson and the LSP, $ \tilde{\chi}^0_1 $, and the $ \tilde{\chi}^0_2 $ decaying to a Z boson and the $ \tilde{\chi}^0_1 $. |
png pdf |
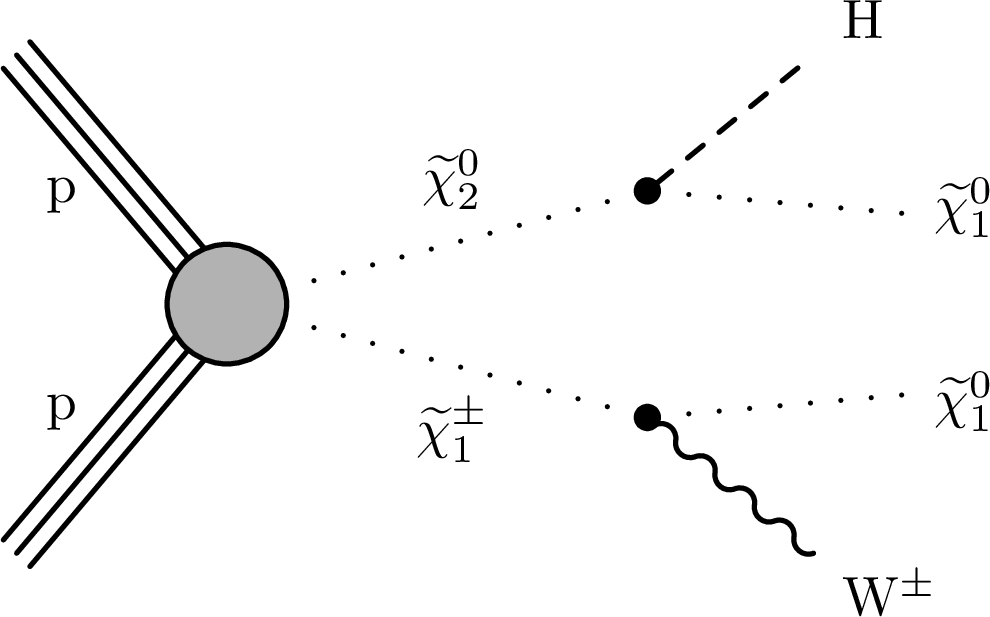
Figure 1-b:
Production of $ \tilde{\chi}^{\pm}_{1} \tilde{\chi}^0_2 $ with the $ \tilde{\chi}^{\pm}_{1} $ decaying to a W boson and the LSP, $ \tilde{\chi}^0_1 $, and the $ \tilde{\chi}^0_2 $ decaying to a H boson and the $ \tilde{\chi}^0_1 $. |
png pdf |
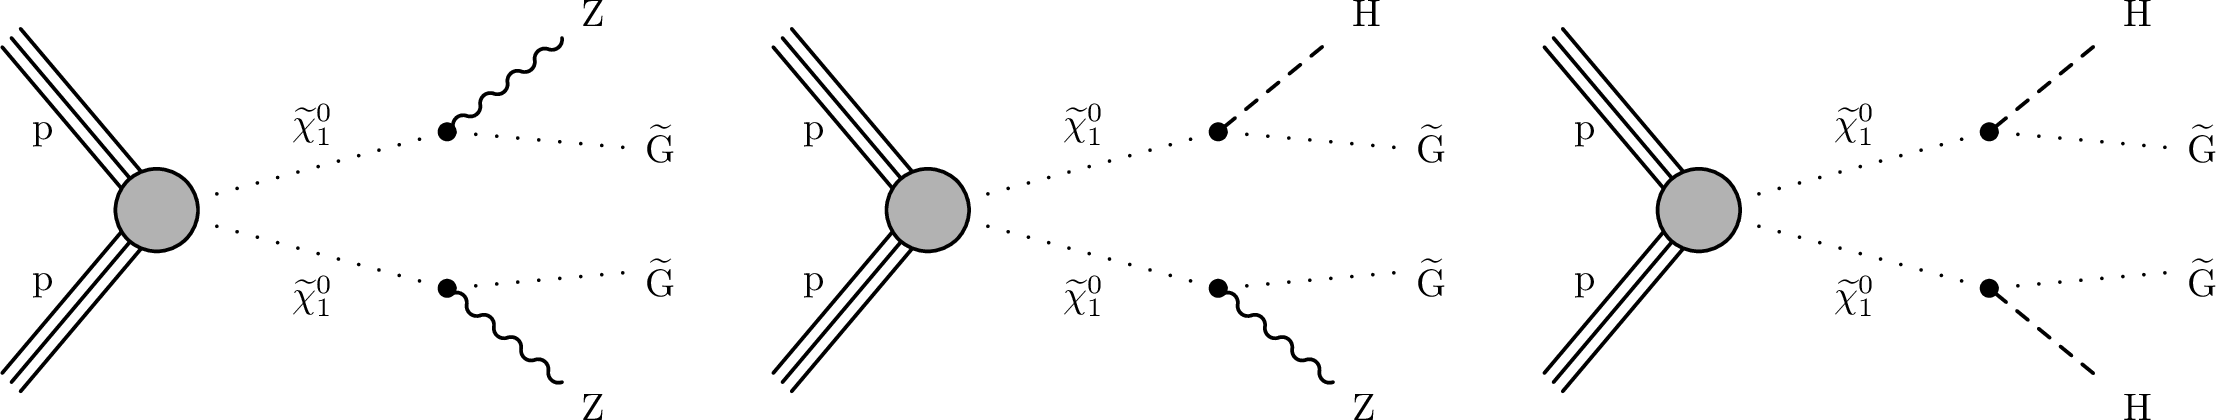
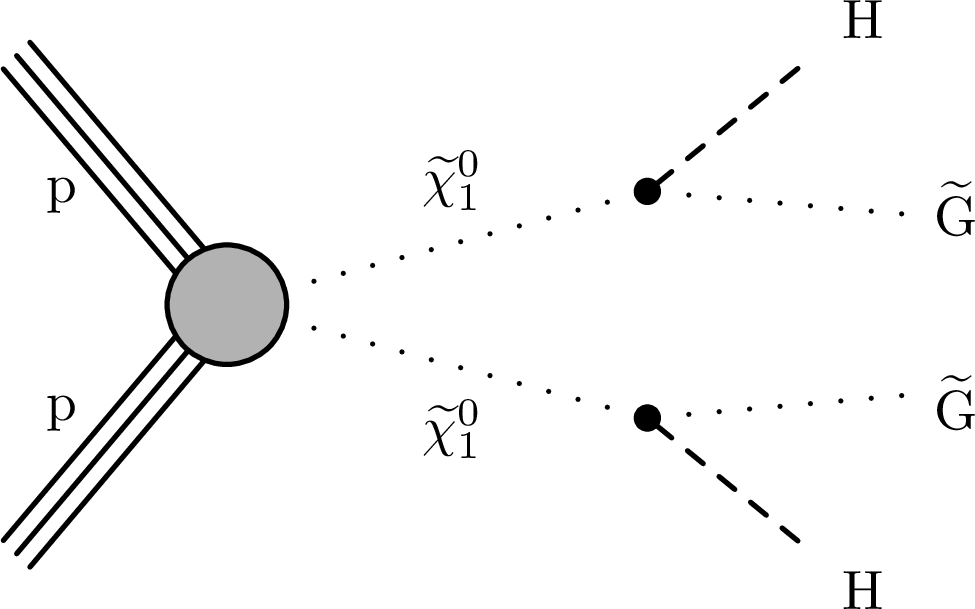
Figure 2:
A GMSB model with $ \tilde{\chi}^0_1 \tilde{\chi}^0_1 $ pair production. The two $ \tilde{\chi}^0_1 $ particles decay into the $ \tilde{G} $ LSP and (left) both to Z bosons, (center) a Z and a H boson, or (right) both to H bosons. |
png pdf |
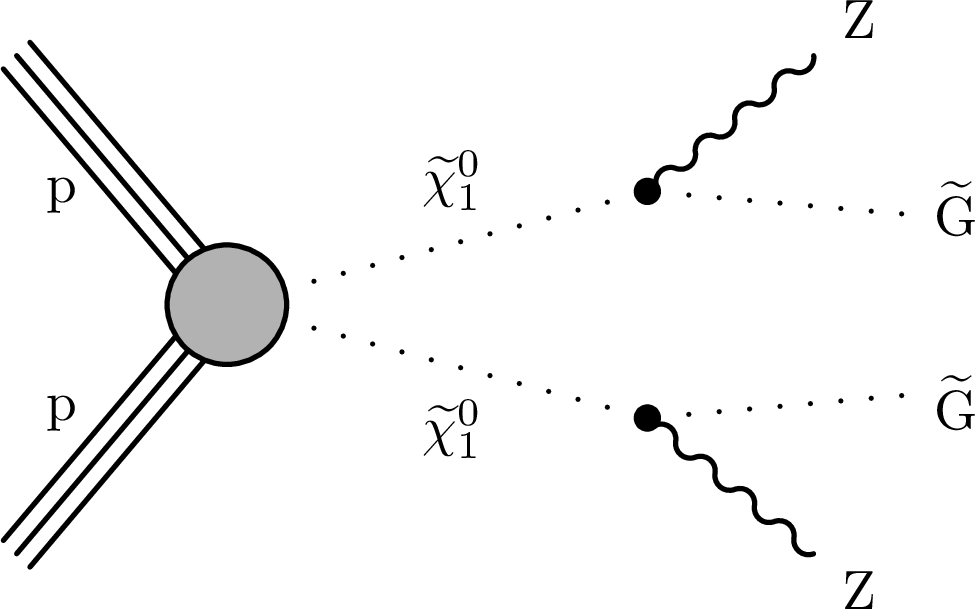
Figure 2-a:
A GMSB model with $ \tilde{\chi}^0_1 \tilde{\chi}^0_1 $ pair production. The two $ \tilde{\chi}^0_1 $ particles decay into the $ \tilde{G} $ LSP and both to Z bosons. |
png pdf |
Figure 2-b:
A GMSB model with $ \tilde{\chi}^0_1 \tilde{\chi}^0_1 $ pair production. The two $ \tilde{\chi}^0_1 $ particles decay into the $ \tilde{G} $ LSP and to a Z and a H boson. |
png pdf |
Figure 2-c:
A GMSB model with $ \tilde{\chi}^0_1 \tilde{\chi}^0_1 $ pair production. The two $ \tilde{\chi}^0_1 $ particles decay into the $ \tilde{G} $ LSP and both to H bosons. |
png pdf |
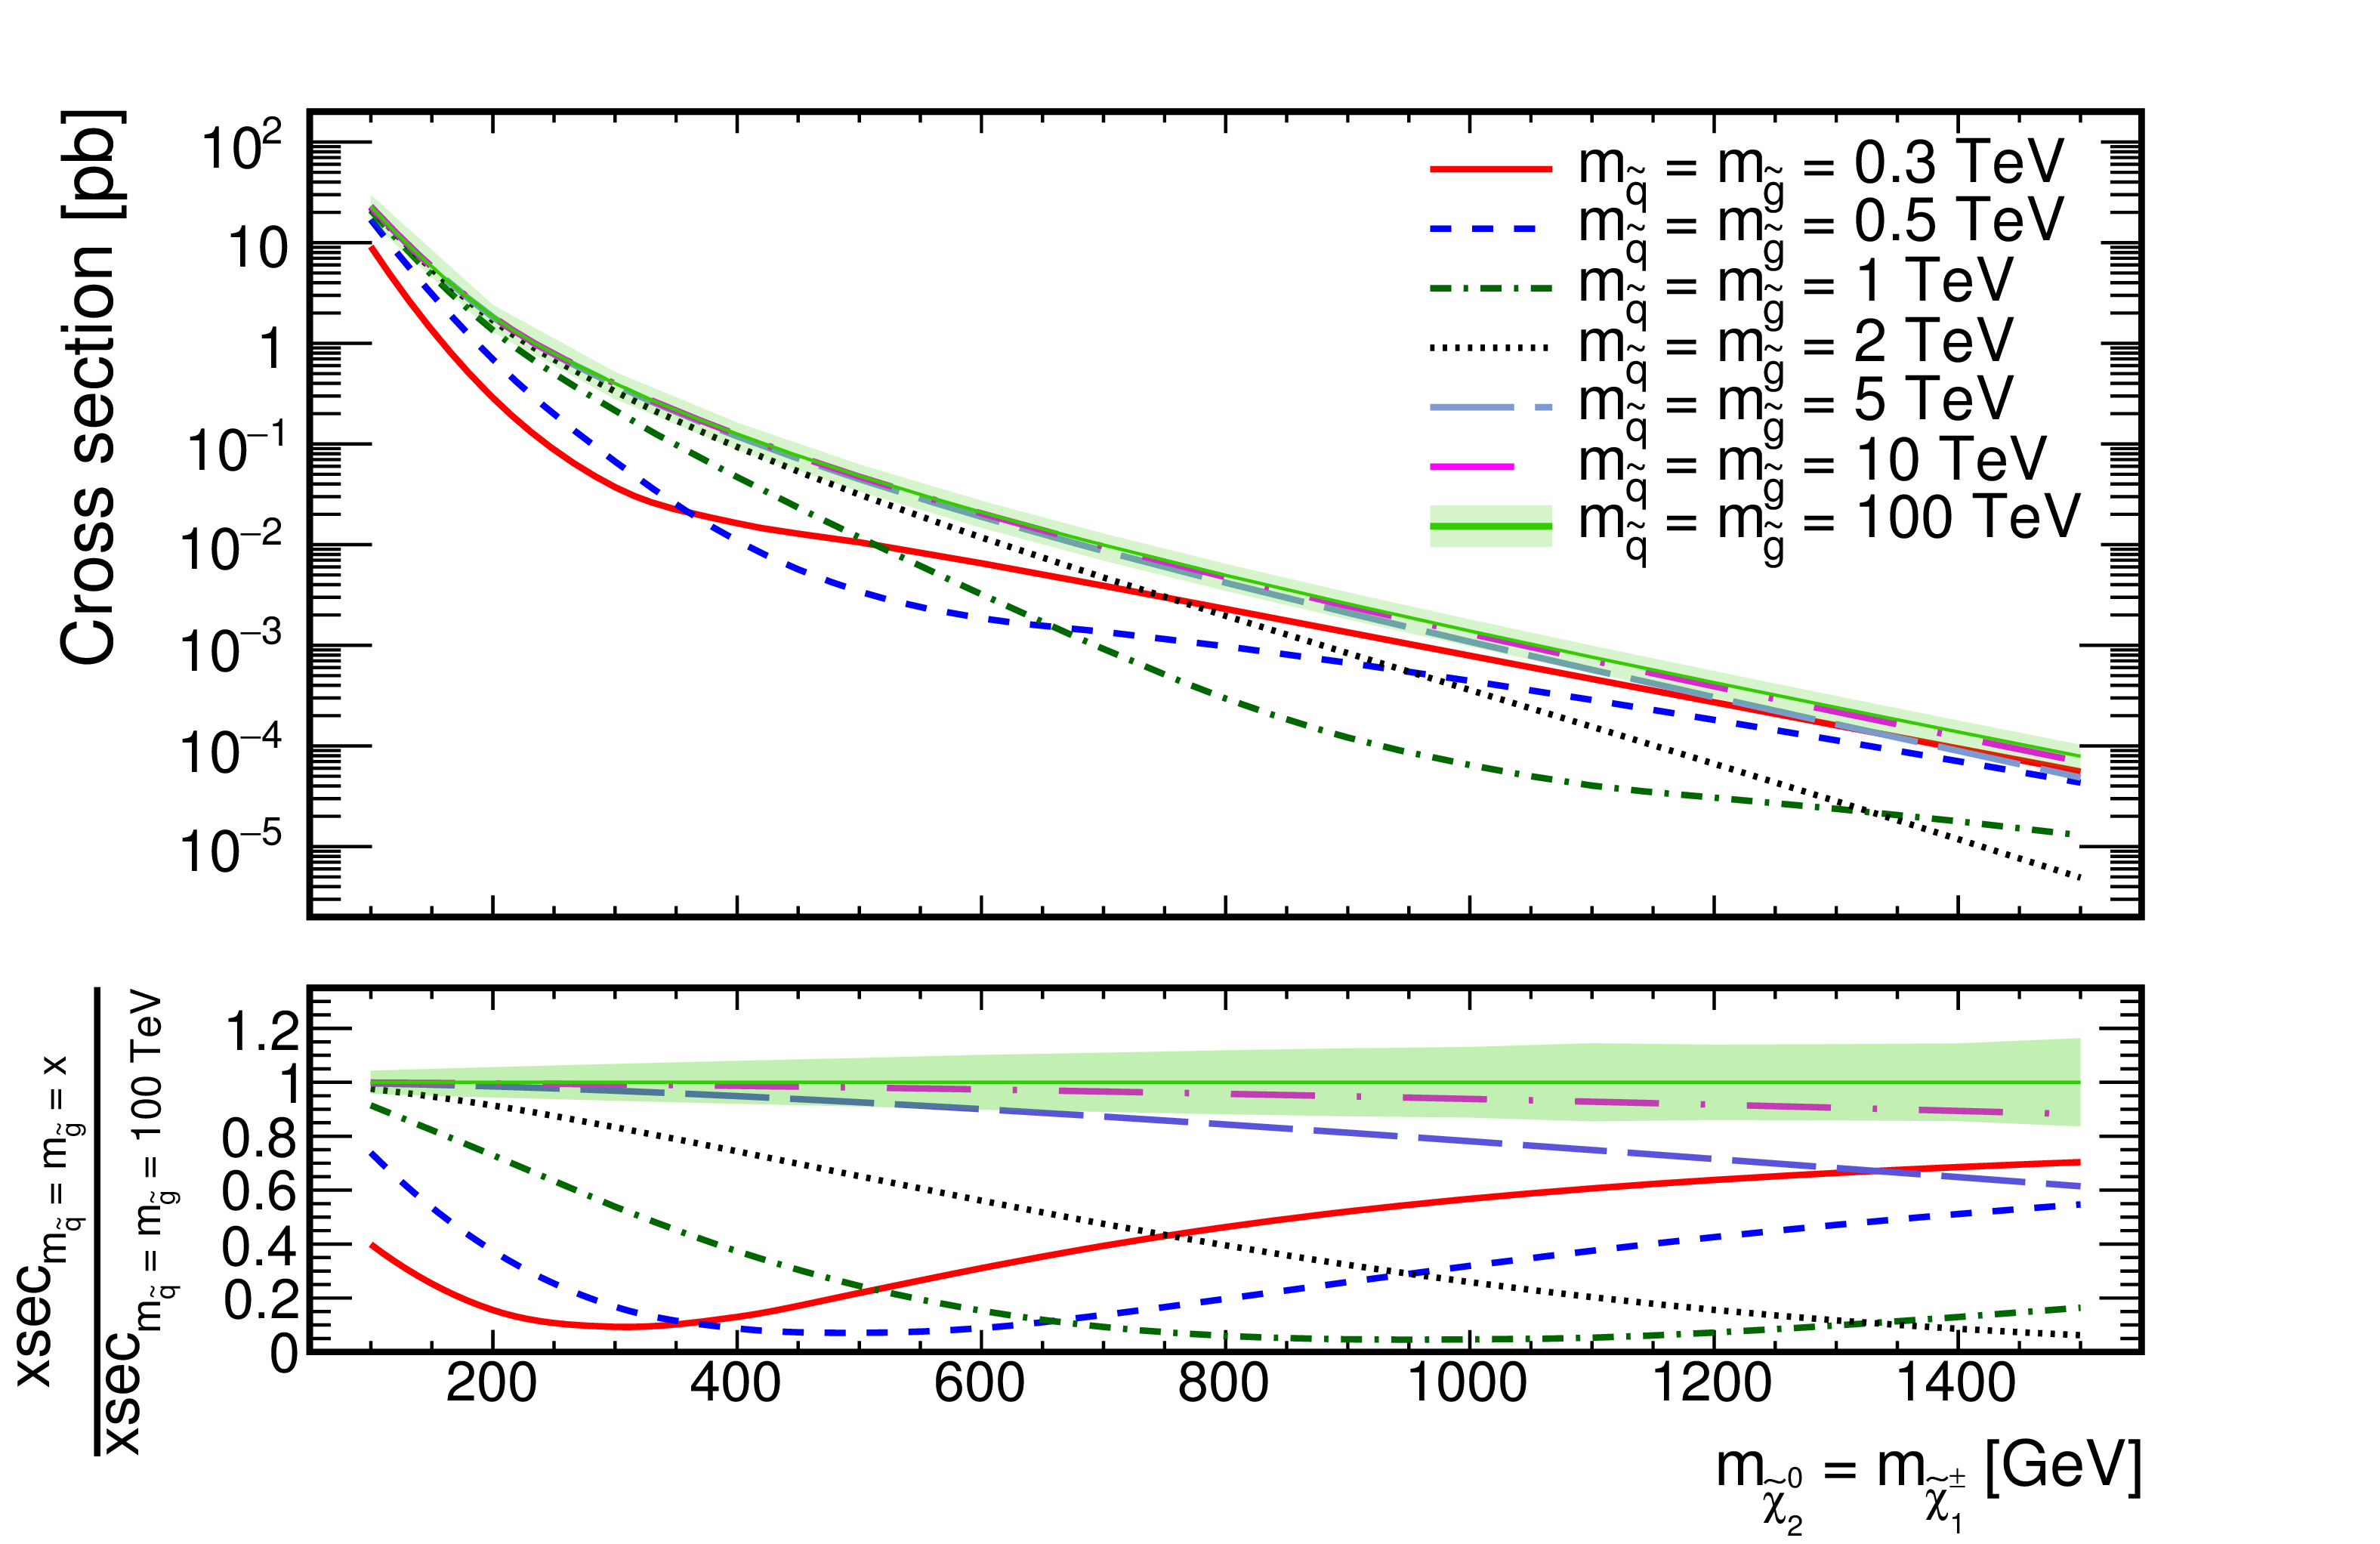
Figure 3:
Cross section for $ \tilde{\chi}^{\pm}_{1} \tilde{\chi}^0_2 $ production at $\sqrt {s} = $ 13 TeV versus the wino mass, calculated to NLO accuracy in QCD with Resummino [56]. The $ \tilde{\chi}^{\pm}_{1} $ and $ \tilde{\chi}^0_2 $ are assumed to be mass-degenerate winos. The various curves show different assumptions on the masses of the squarks and gluinos, as described in the legend. The green band shows the theoretical uncertainty in the cross section calculation, from the variation of renormalization and factorization scales as well as parton density functions, for the 100 TeV squark and gluino mass assumption. |
png pdf |
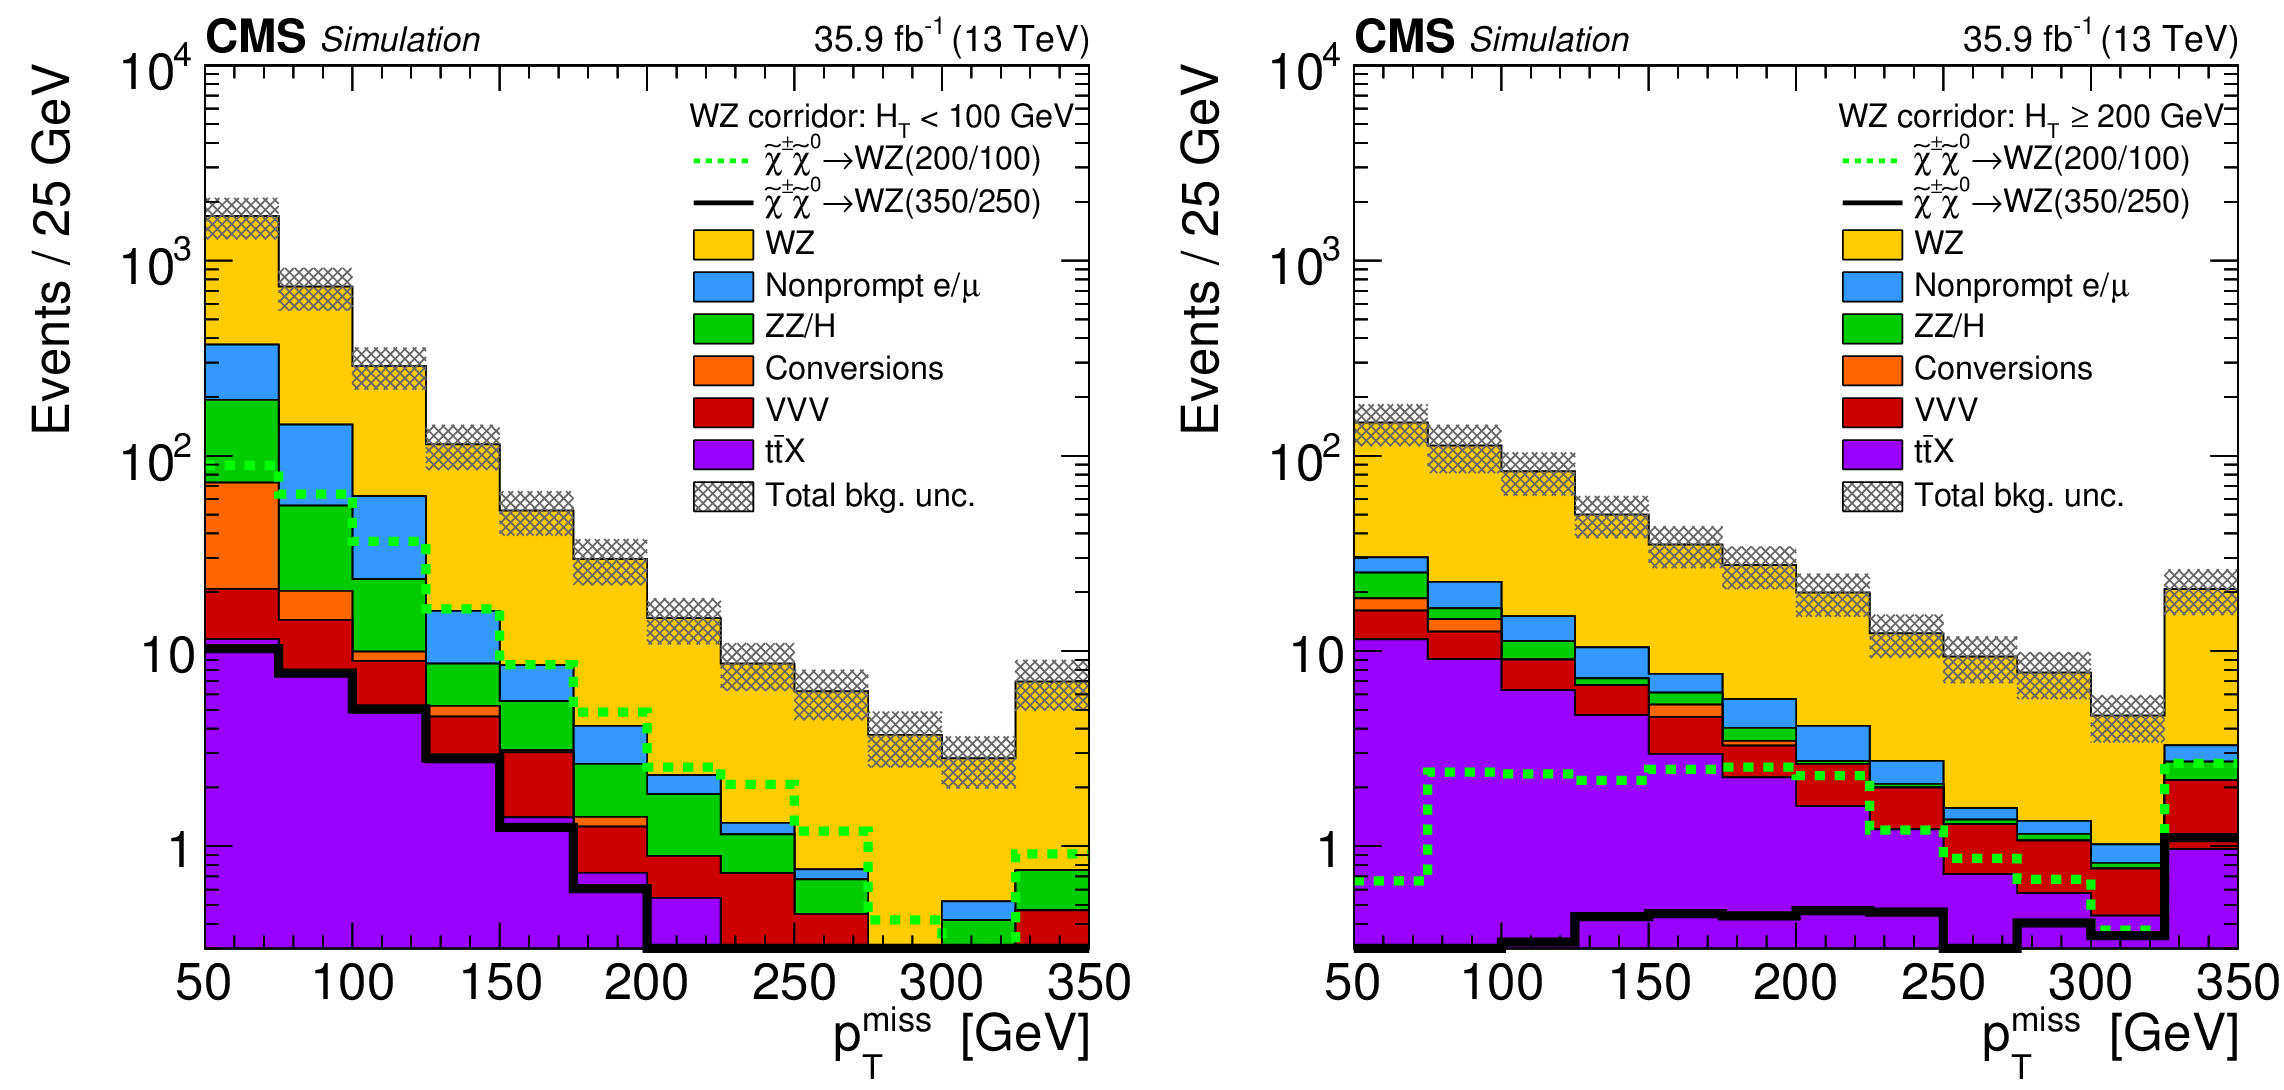
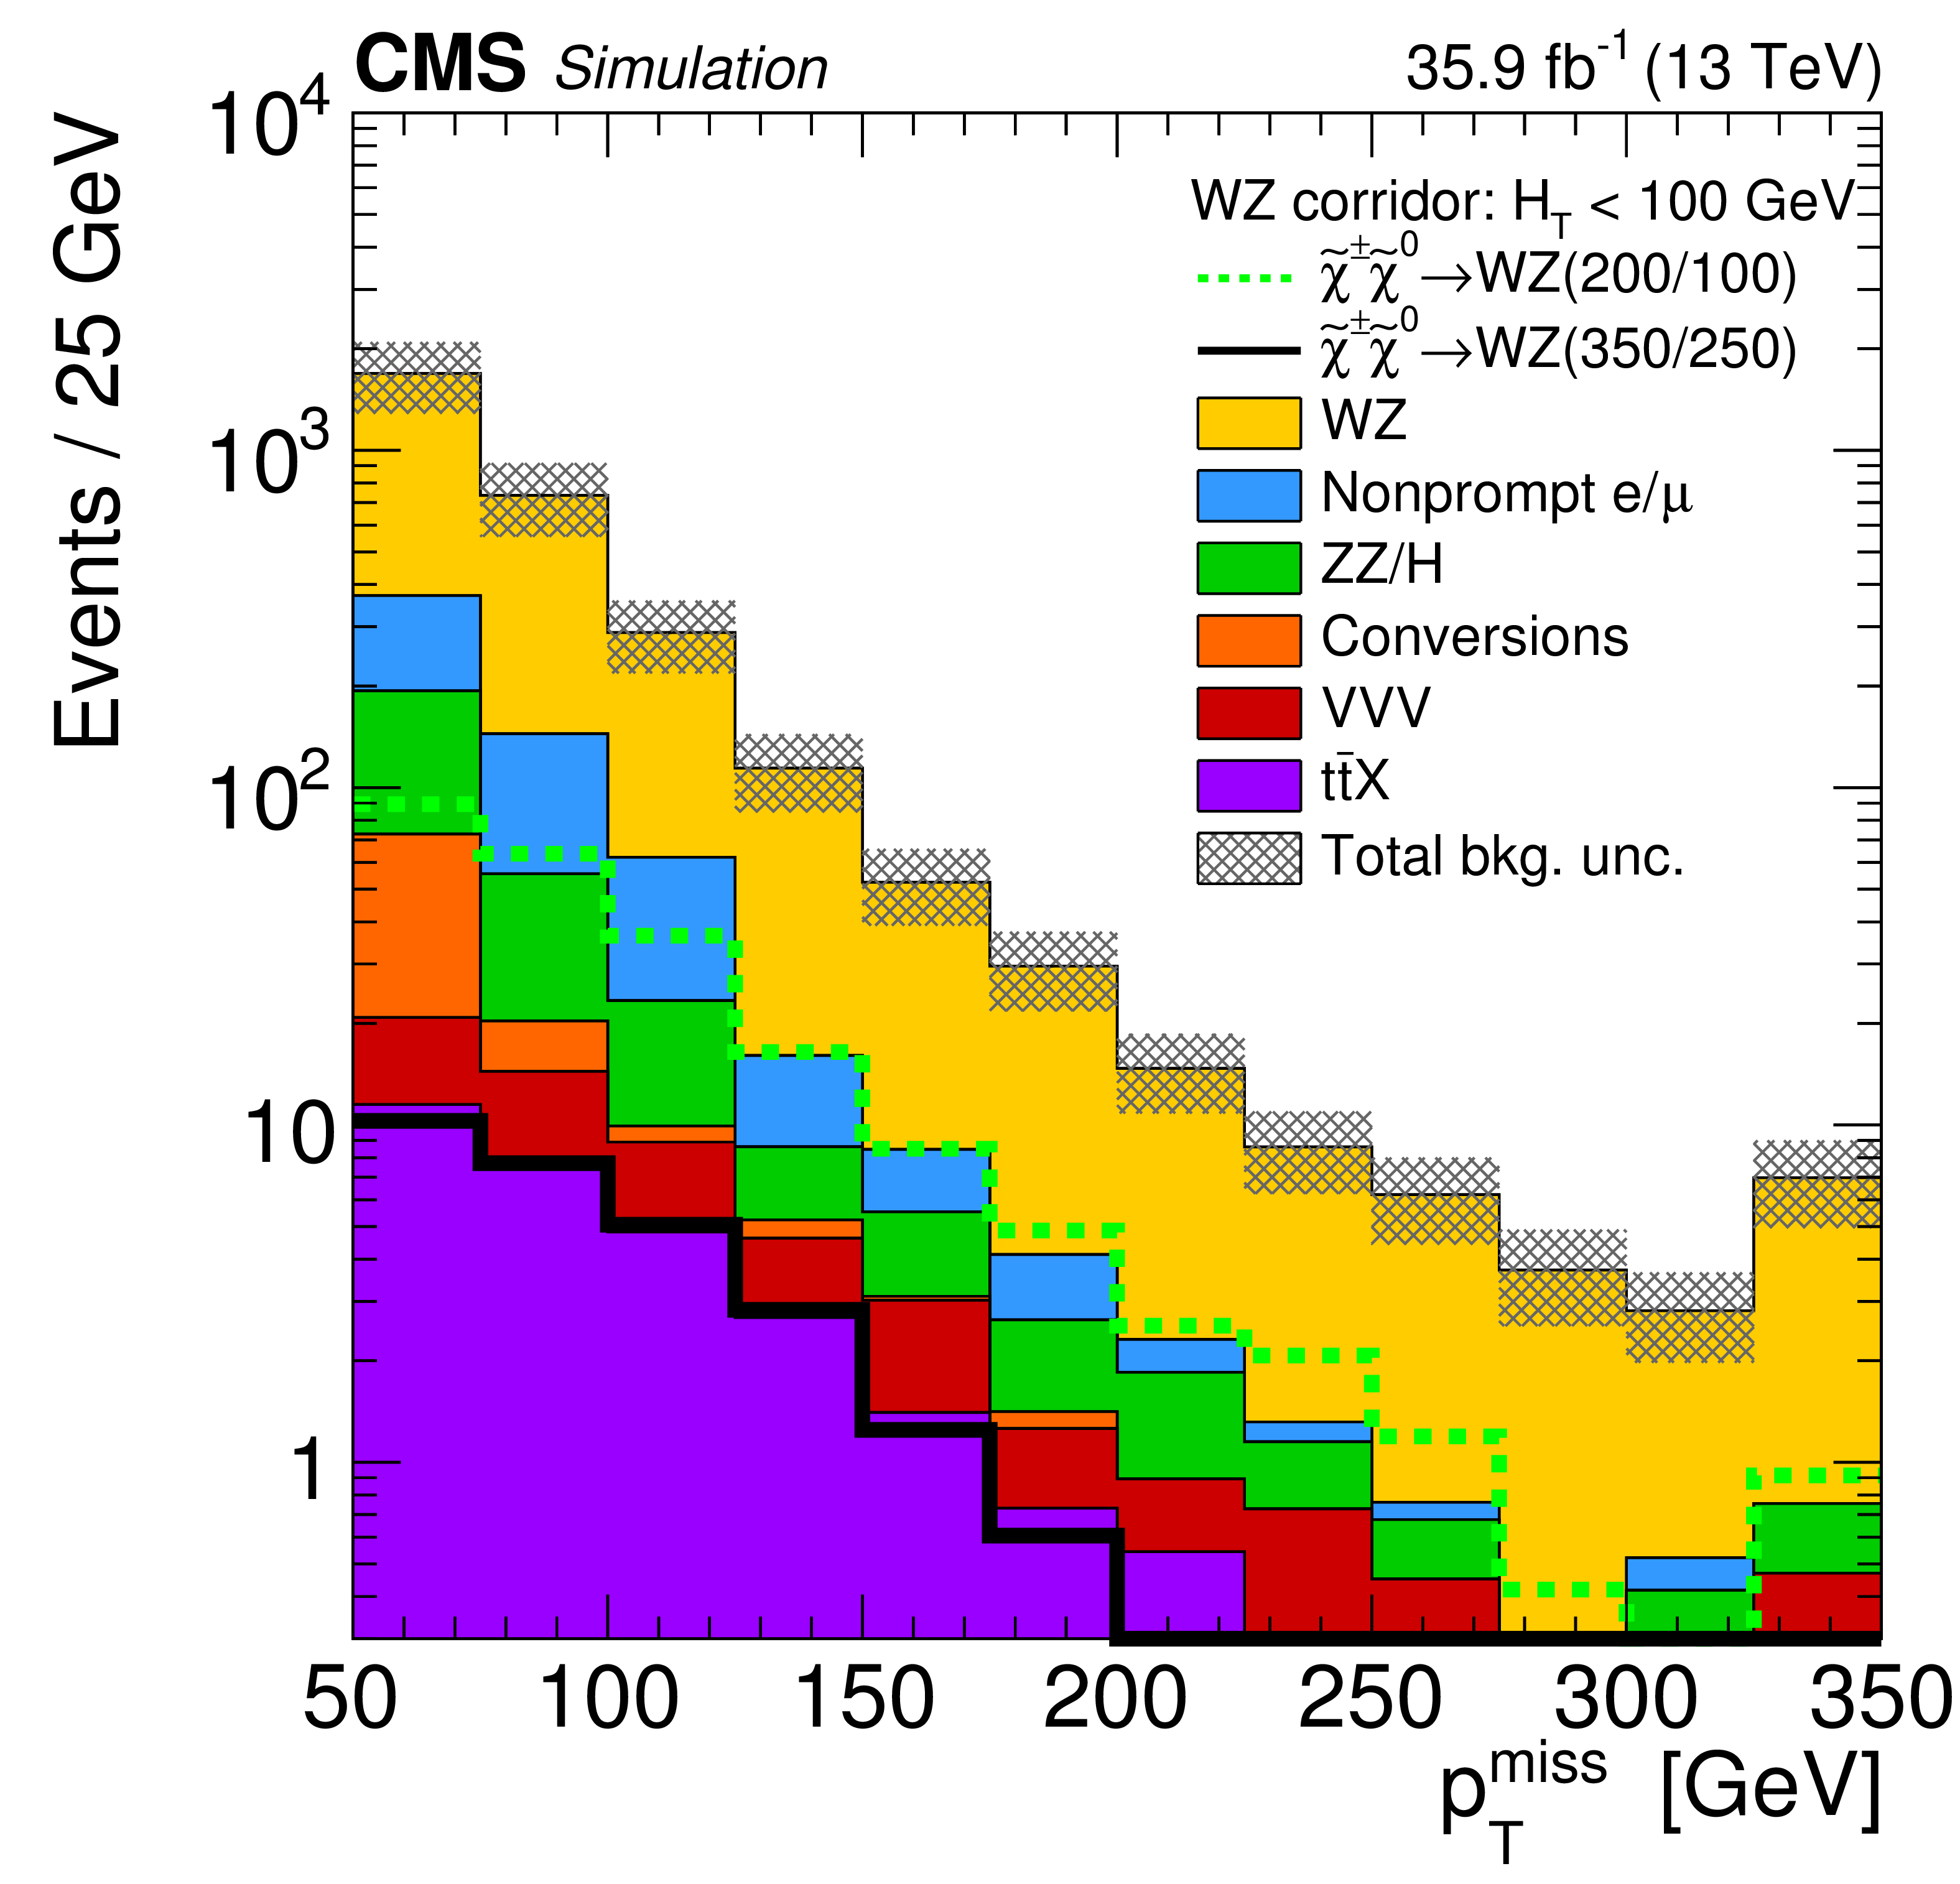
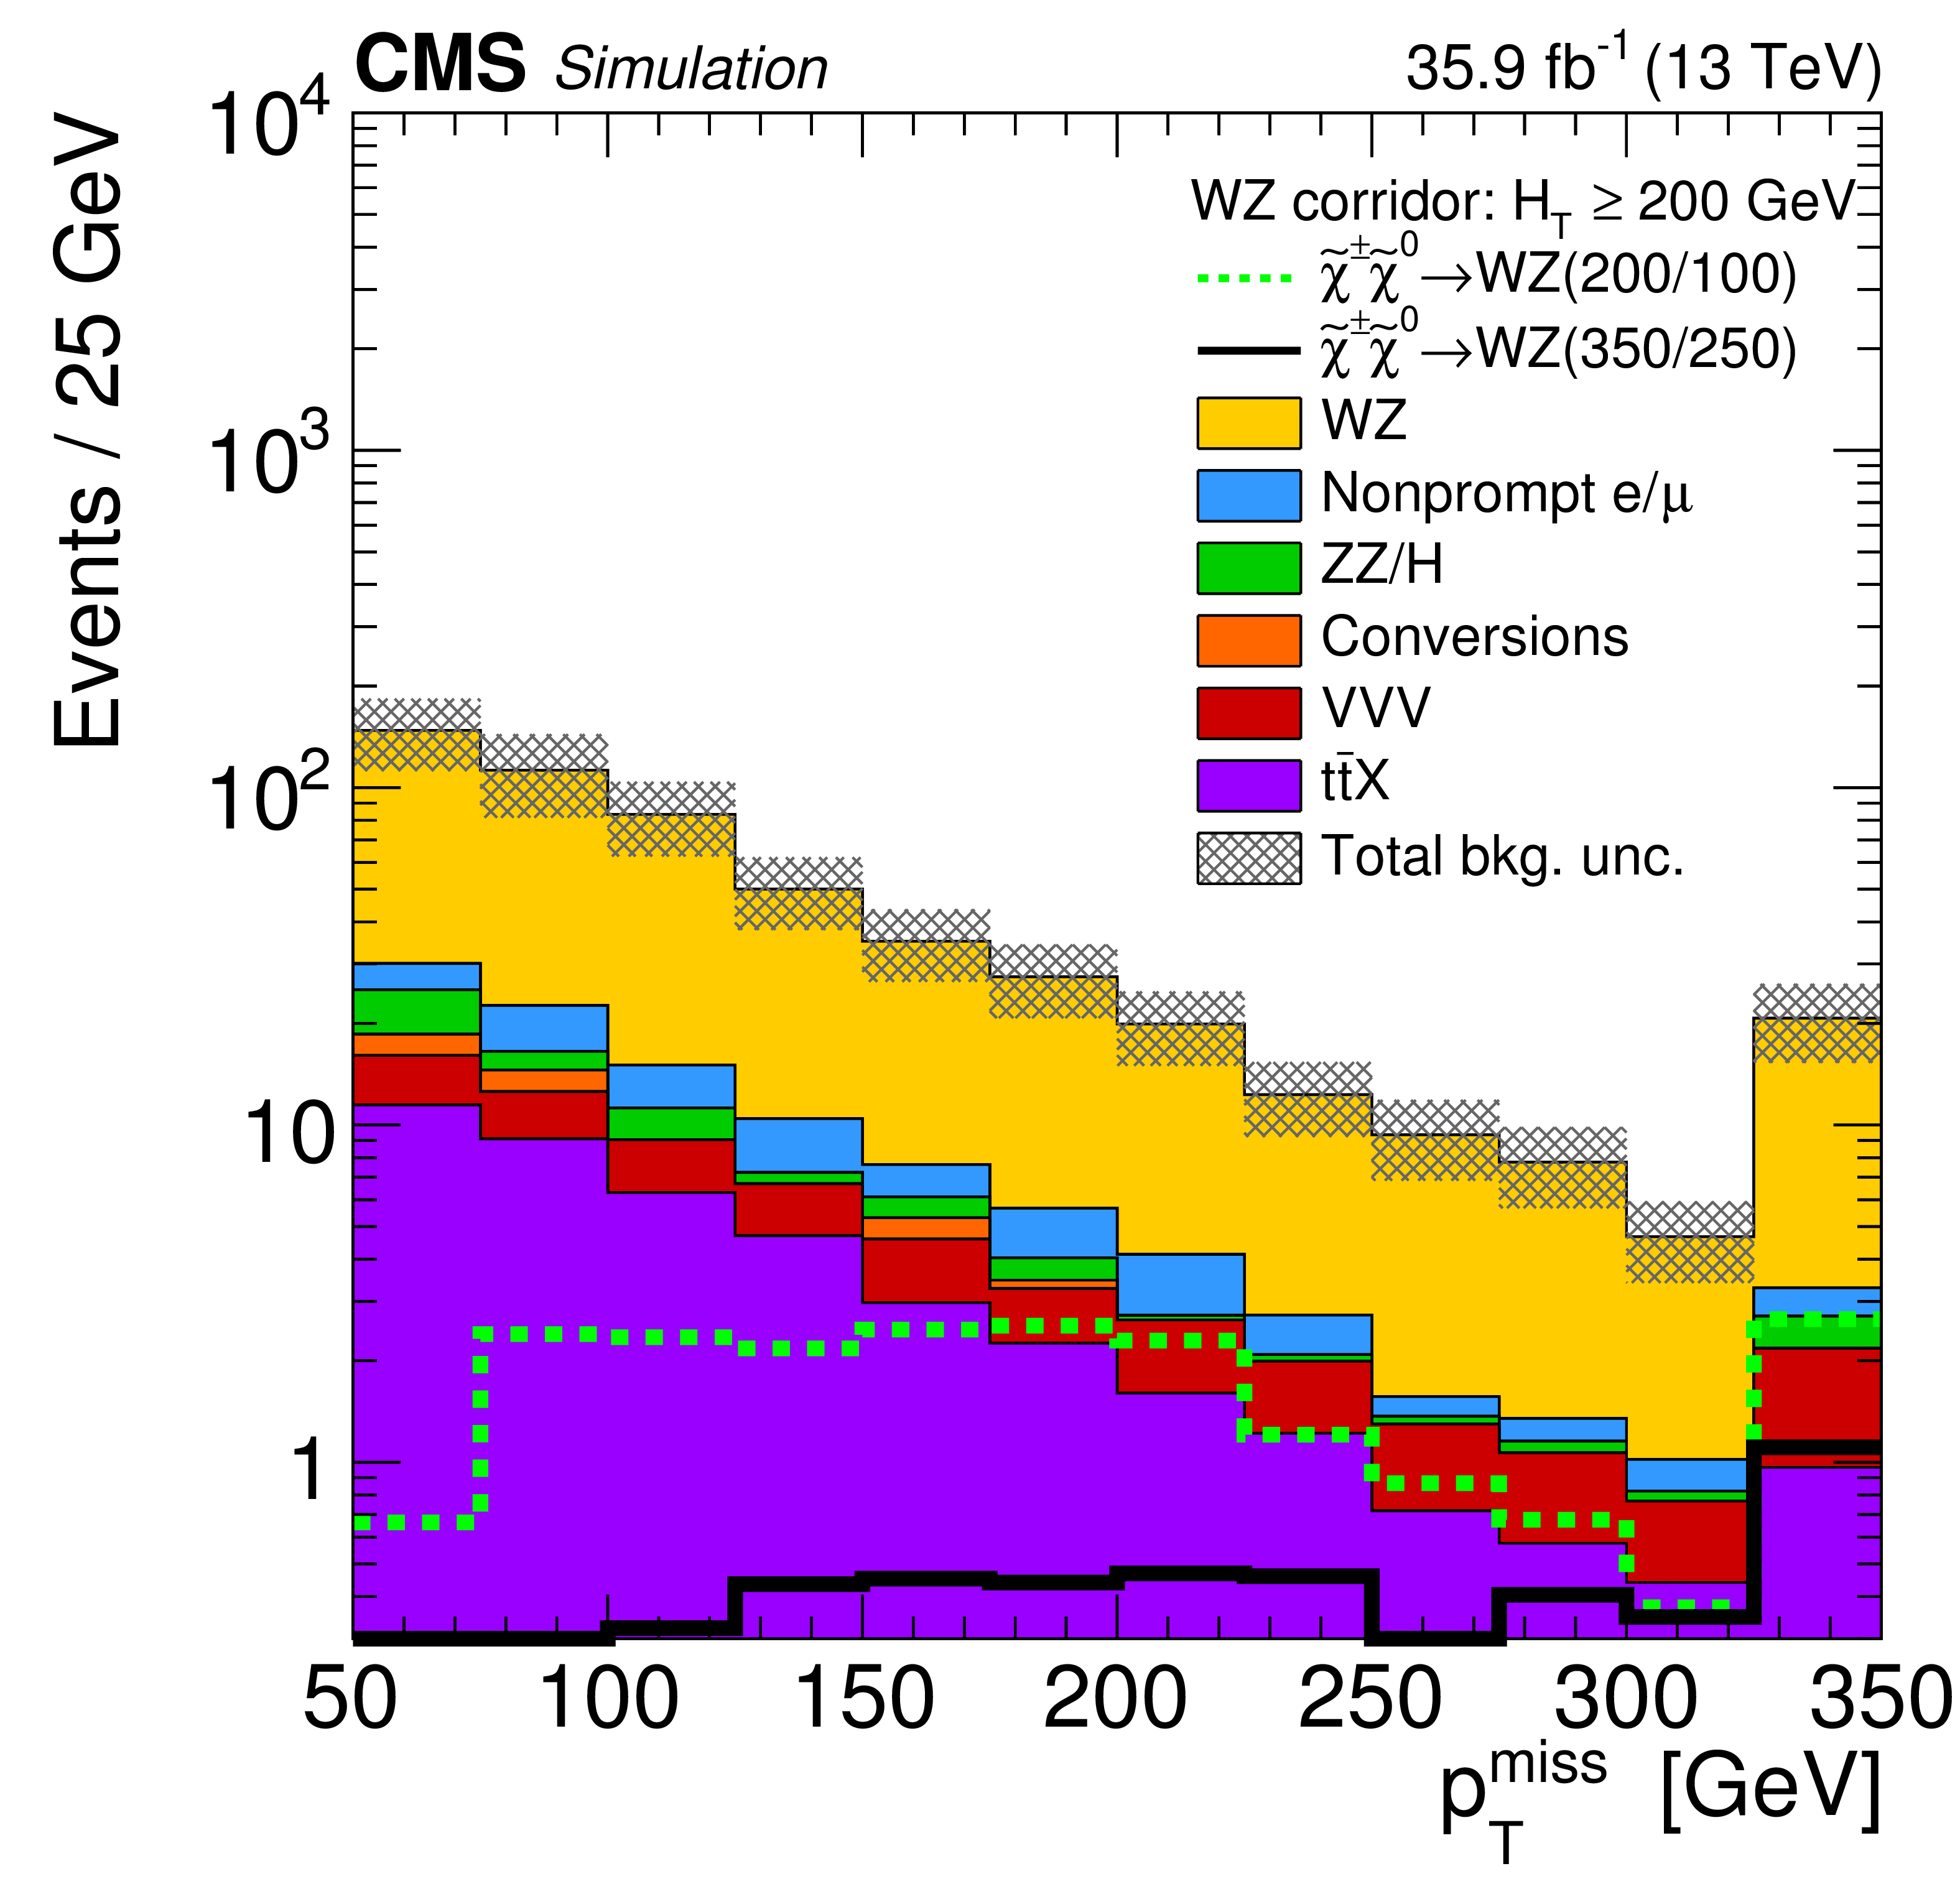
Figure 4:
Distributions of $ {{p_{\mathrm {T}}} ^\text {miss}} $ for two representative signal points in the WZ corridor as well as the expected SM background for $ {H_{\mathrm {T}}} < $ 100 (left) and $ > $ 200 GeV (right). For larger values of $ {H_{\mathrm {T}}} $ the shape difference between signal and background becomes more pronounced due to the presence of $ \tilde{\chi}^0_1 $ LSPs with large Lorentz boost. |
png pdf |
Figure 4-a:
Distribution of $ {{p_{\mathrm {T}}} ^\text {miss}} $ for two representative signal points in the WZ corridor as well as the expected SM background for $ {H_{\mathrm {T}}} < $ 100 GeV. For larger values of $ {H_{\mathrm {T}}} $ the shape difference between signal and background becomes more pronounced due to the presence of $ \tilde{\chi}^0_1 $ LSPs with large Lorentz boost. |
png pdf |
Figure 4-b:
Distribution of $ {{p_{\mathrm {T}}} ^\text {miss}} $ for two representative signal points in the WZ corridor as well as the expected SM background for $ {H_{\mathrm {T}}} > $ 200 GeV. For larger values of $ {H_{\mathrm {T}}} $ the shape difference between signal and background becomes more pronounced due to the presence of $ \tilde{\chi}^0_1 $ LSPs with large Lorentz boost. |

png pdf |
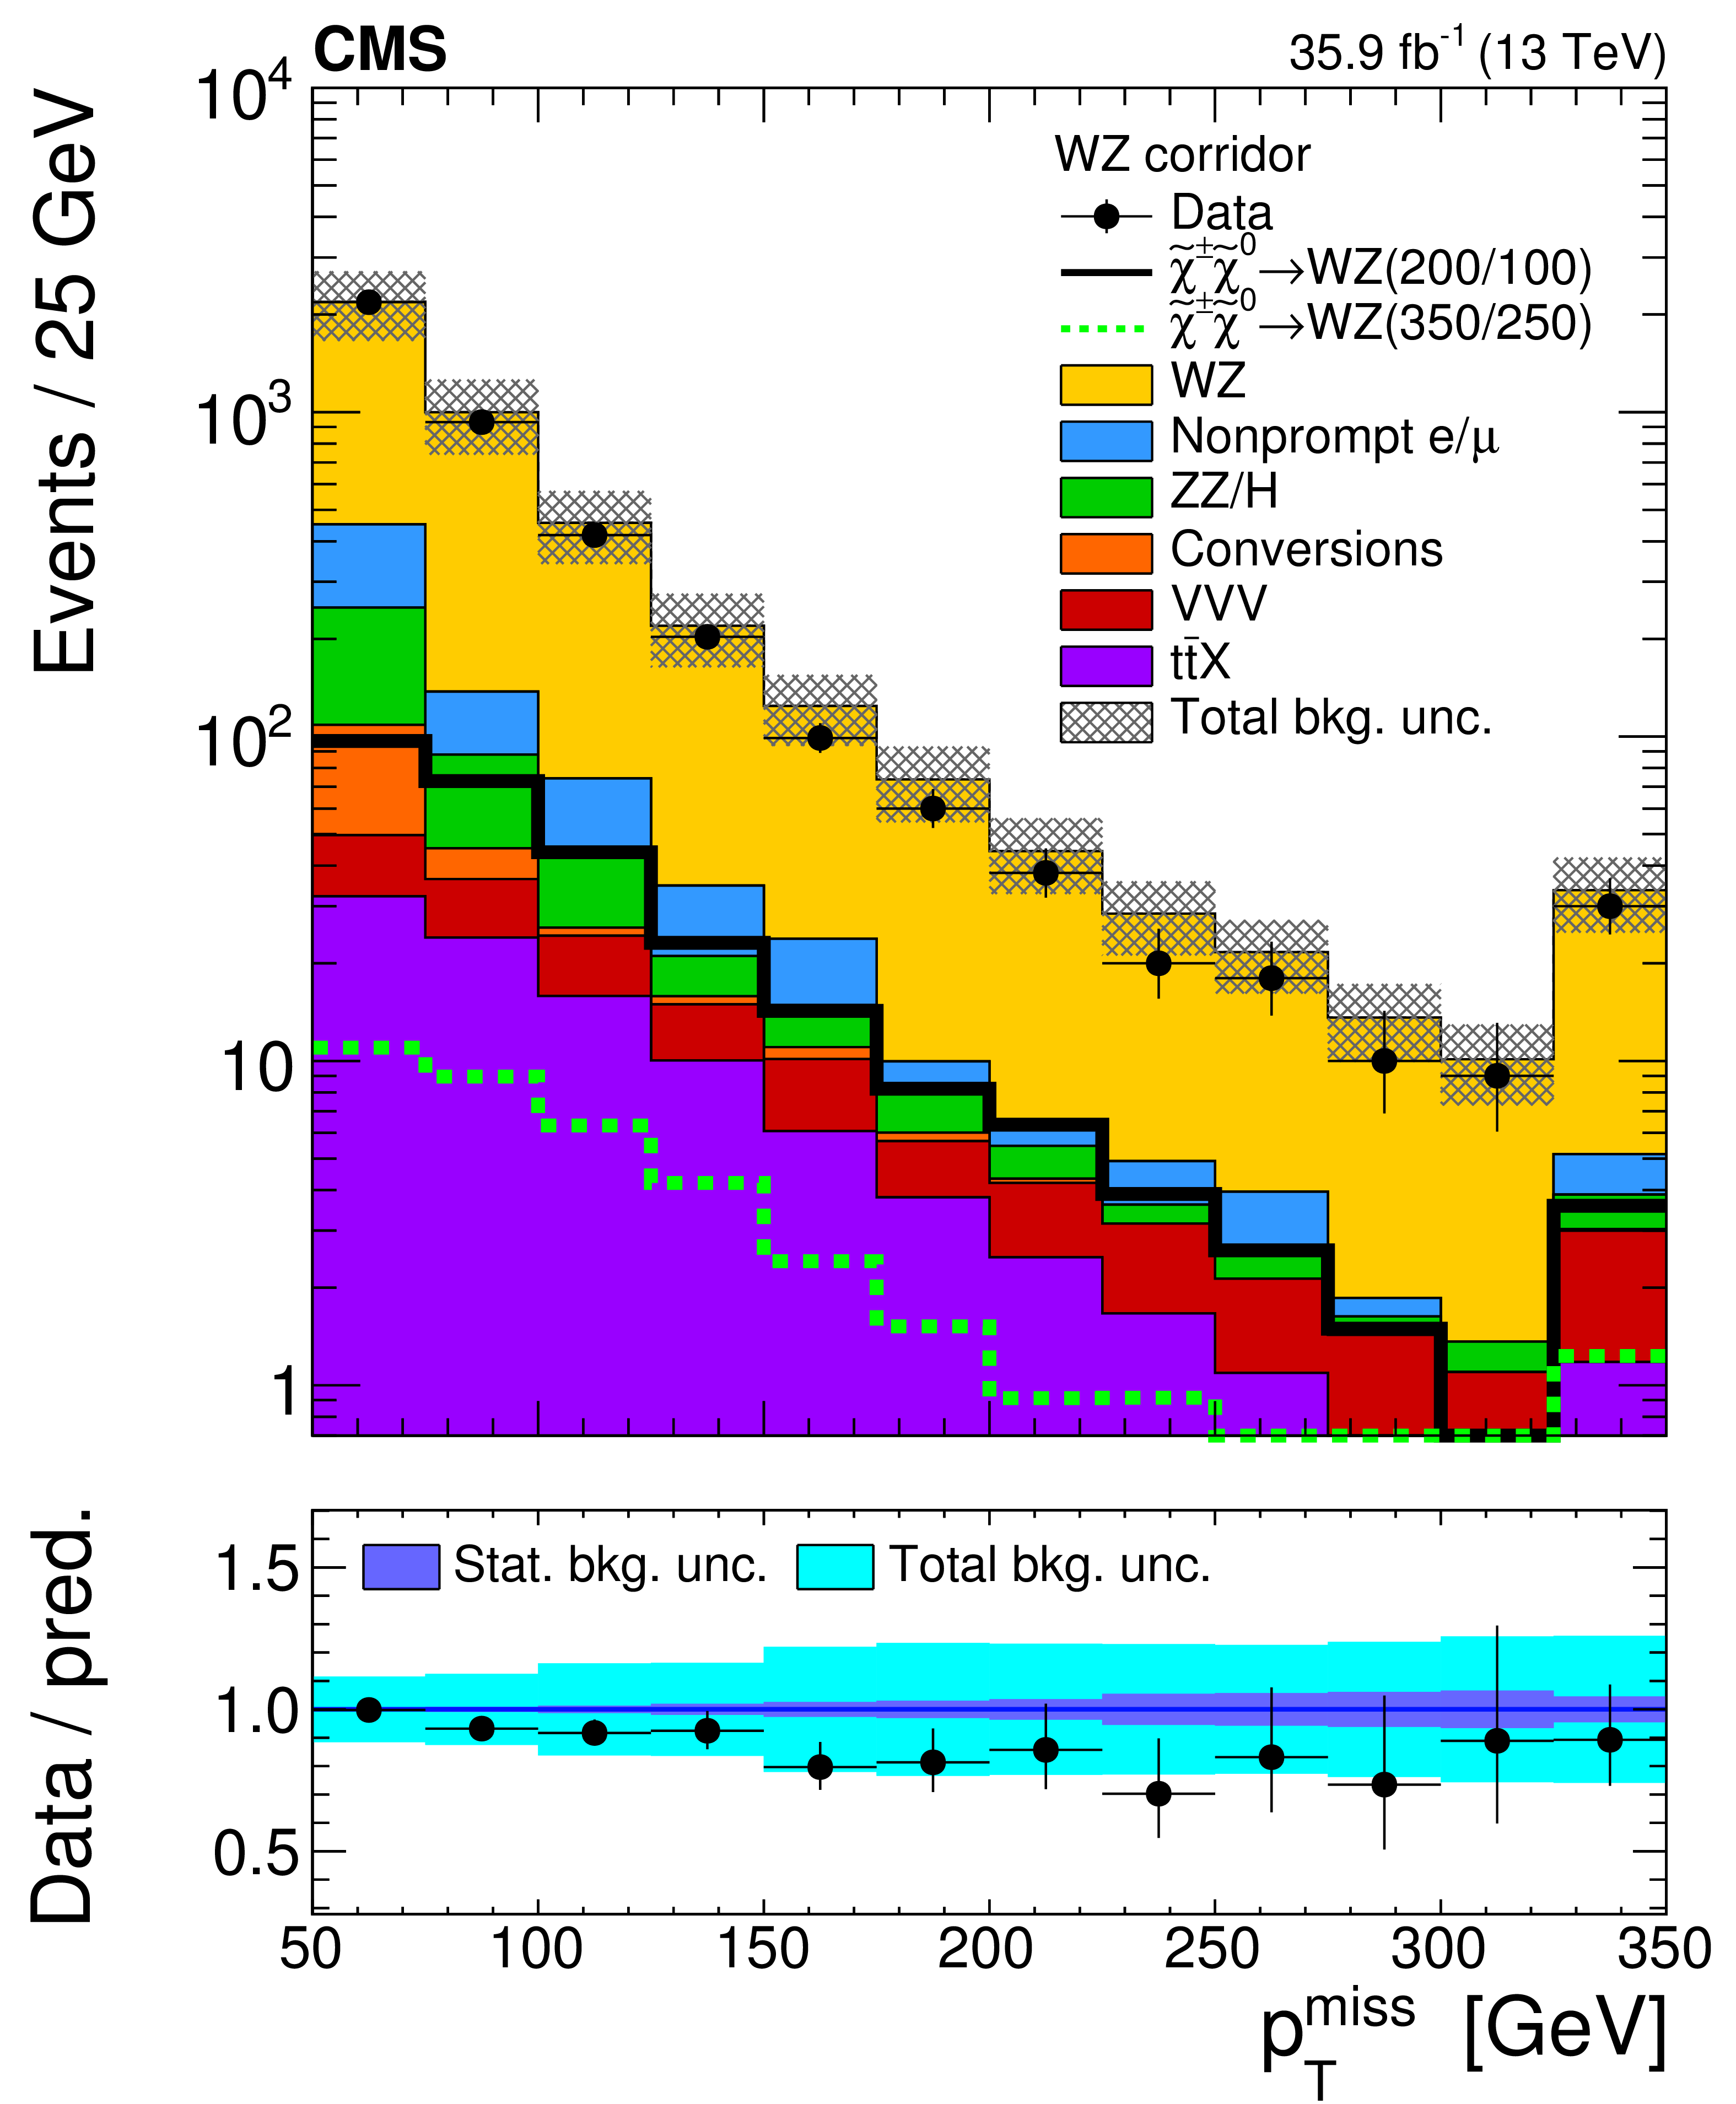
Figure 5:
Distributions of the transverse mass of the third lepton with respect to $ {{p_{\mathrm {T}}} ^\text {miss}} $ (upper left), the $ {{p_{\mathrm {T}}} ^\text {miss}} $ (upper right), the $ {m_{\ell \ell}} $ of the OSSF pair (lower left), and the $ {H_{\mathrm {T}}} $ (lower right). Distributions for two signal mass points in the WZ corridor are overlaid for illustration. The bottom panel shows the ratio of observed data to predicted yields. The dark purple band shows the statistical uncertainty in the background prediction, while the light blue band shows the total uncertainty. |

png pdf |
Figure 5-a:
Distribution of the transverse mass of the third lepton with respect to $ {{p_{\mathrm {T}}} ^\text {miss}} $. Distributions for two signal mass points in the WZ corridor are overlaid for illustration. The bottom panel shows the ratio of observed data to predicted yields. The dark purple band shows the statistical uncertainty in the background prediction, while the light blue band shows the total uncertainty. |
png pdf |
Figure 5-b:
Distribution of the $ {{p_{\mathrm {T}}} ^\text {miss}} $. Distributions for two signal mass points in the WZ corridor are overlaid for illustration. The bottom panel shows the ratio of observed data to predicted yields. The dark purple band shows the statistical uncertainty in the background prediction, while the light blue band shows the total uncertainty. |

png pdf |
Figure 5-c:
Distribution of the $ {m_{\ell \ell}} $ of the OSSF pair. Distributions for two signal mass points in the WZ corridor are overlaid for illustration. The bottom panel shows the ratio of observed data to predicted yields. The dark purple band shows the statistical uncertainty in the background prediction, while the light blue band shows the total uncertainty. |

png pdf |
Figure 5-d:
Distribution of the $ {H_{\mathrm {T}}} $. Distributions for two signal mass points in the WZ corridor are overlaid for illustration. The bottom panel shows the ratio of observed data to predicted yields. The dark purple band shows the statistical uncertainty in the background prediction, while the light blue band shows the total uncertainty. |
png pdf |
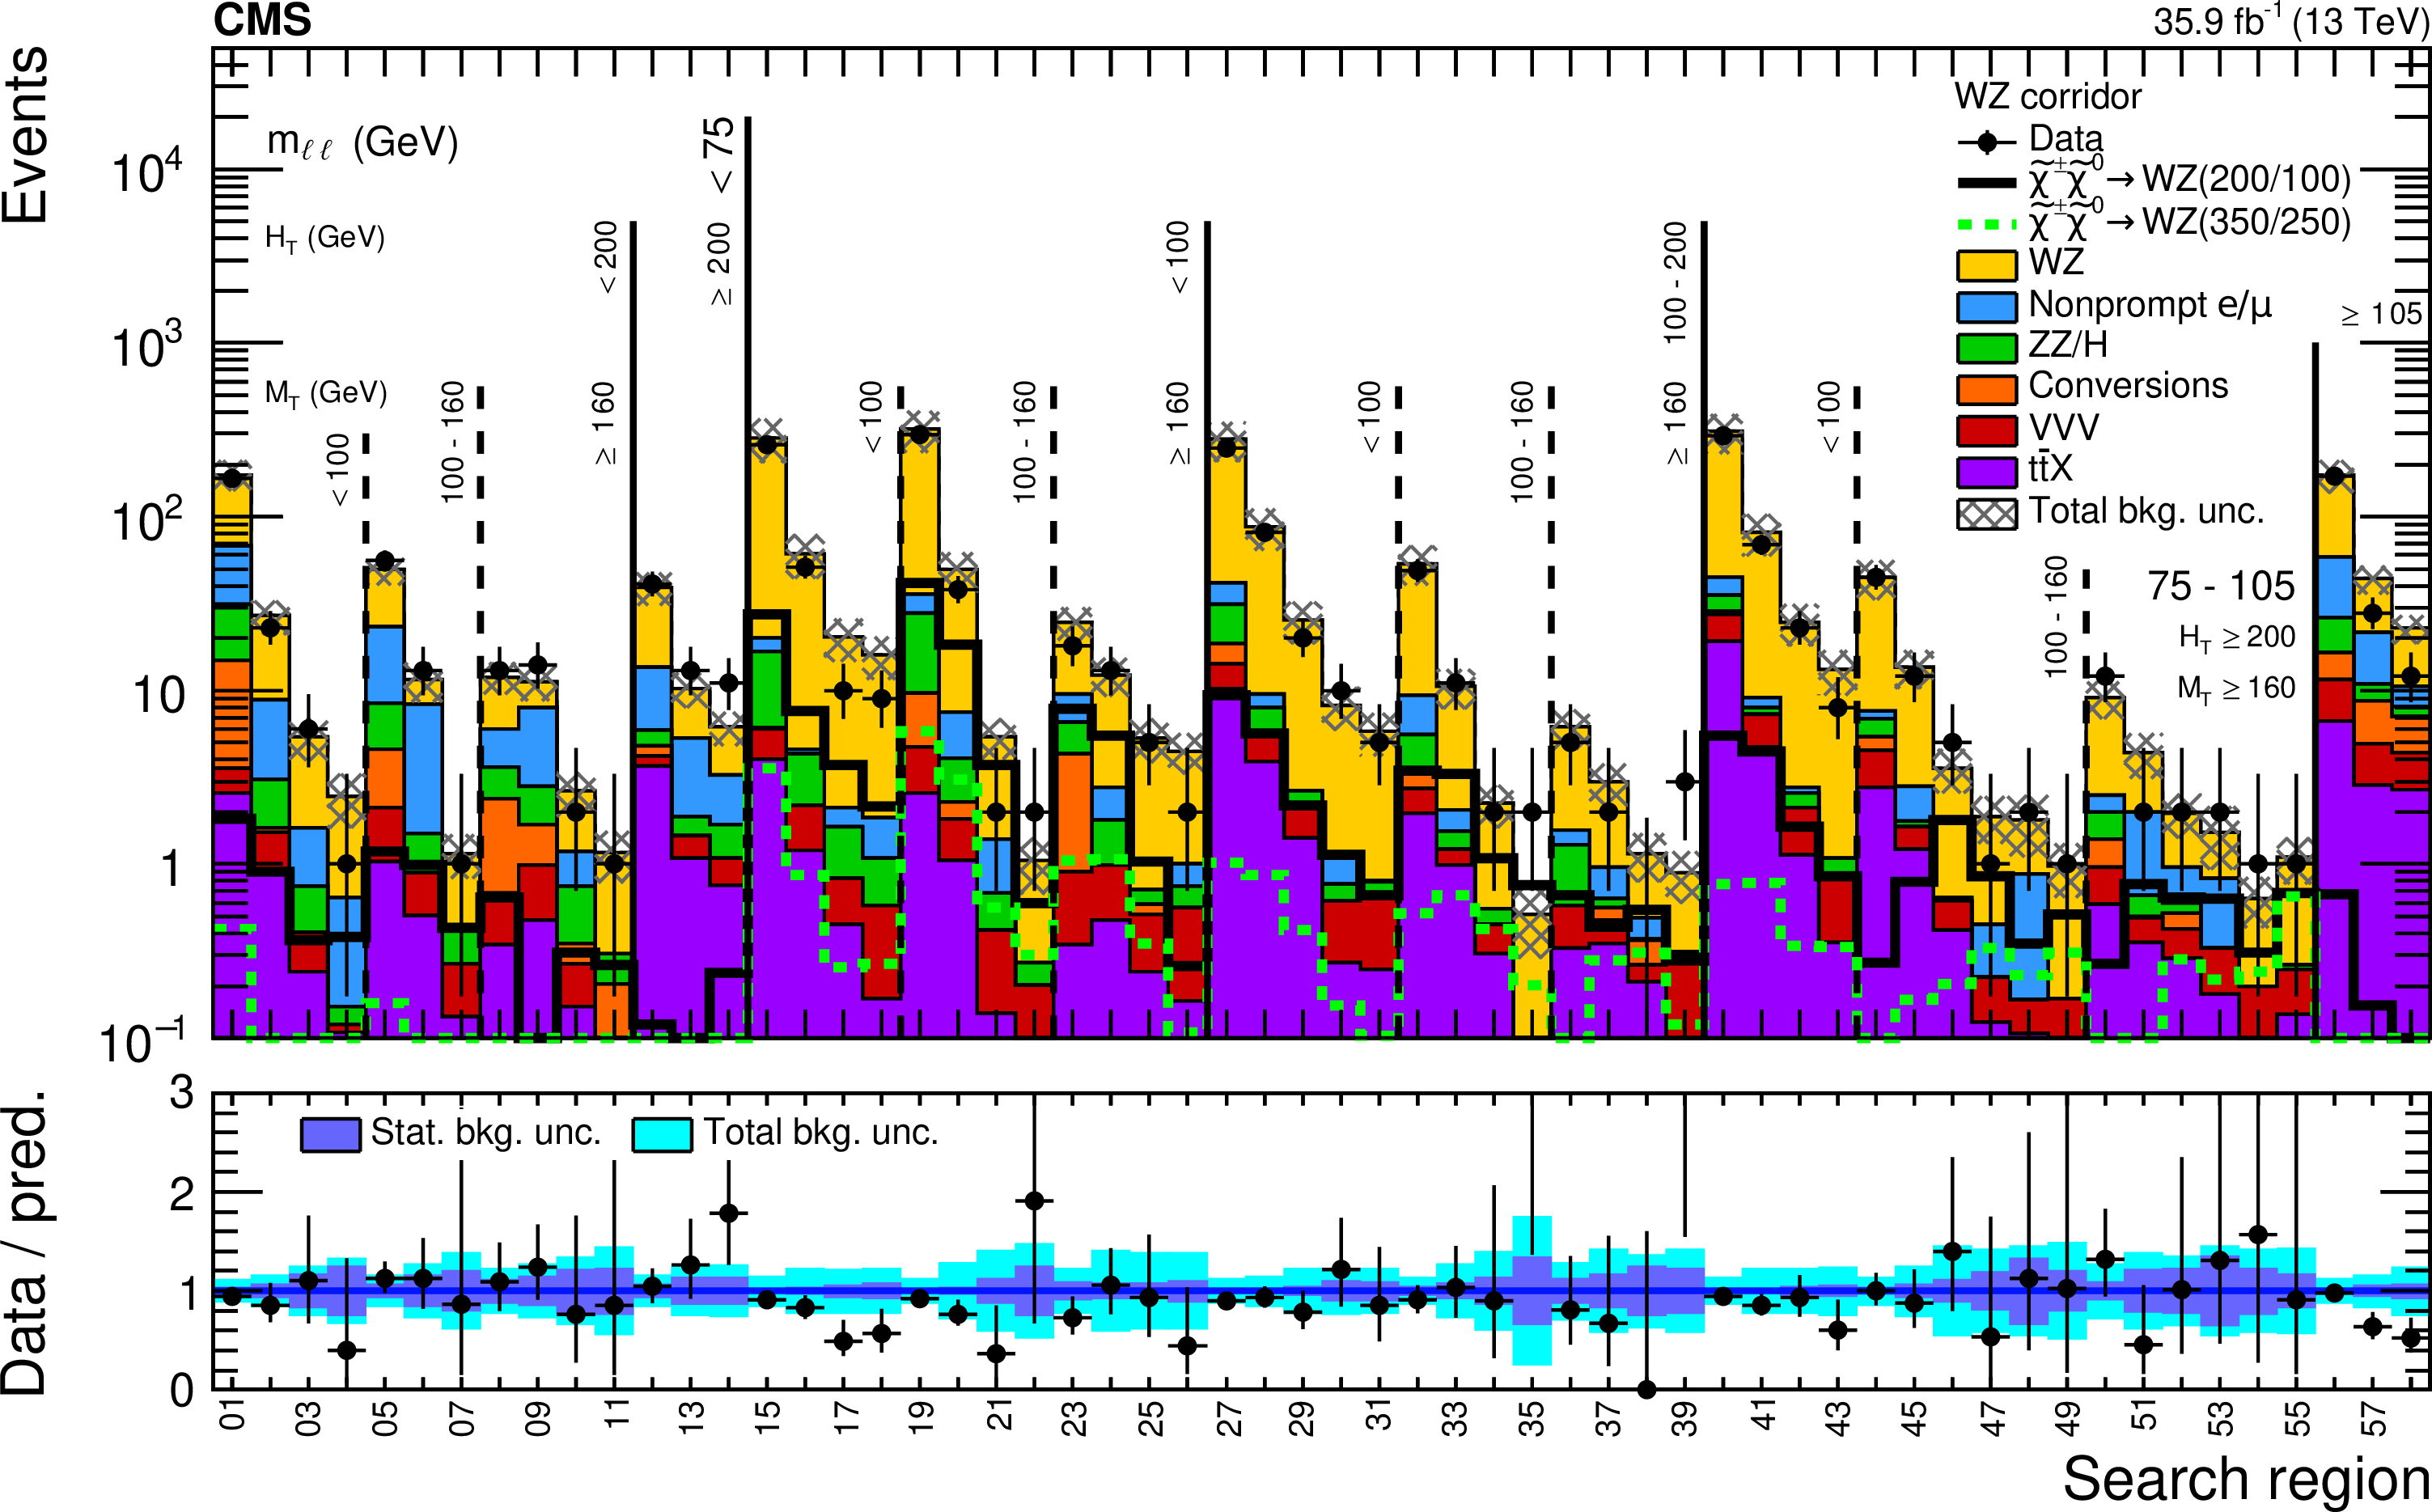
Figure 6:
Expected and observed yield comparison in the search regions. Two example signal mass points along the WZ corridor are overlaid for illustration. The bottom panel shows the ratio of observed data to predicted yields. The dark purple band shows the statistical uncertainty in the background prediction, while the light blue band shows the total uncertainty. |

png pdf root |
Figure 7:
The 95% confidence level upper limit on the production cross section in the plane of $ {m_{\tilde{\chi}^{\pm}_{1} }} $ and $ {m_{\tilde{\chi}^0_1 }} $ for the model of $ {\tilde{\chi}^{\pm}_{1} \tilde{\chi}^0_2 } $ production with the WZ topology, using only the search requiring three or more leptons as described in Section 6. The thick solid black (dashed red) curve represents the observed (expected) exclusion contour assuming the theory cross sections. The area below each curve is the excluded region. The thin dashed red lines indicate the $ \pm $1$ \sigma _{\text {experiment}}$ uncertainty. The thin black lines show the effect of the theoretical uncertainties (${\pm}$1$\sigma _{\text {theory}}$) on the signal cross section. The color scale shows the observed limit at 95% CL on the signal production cross section. |
png pdf |
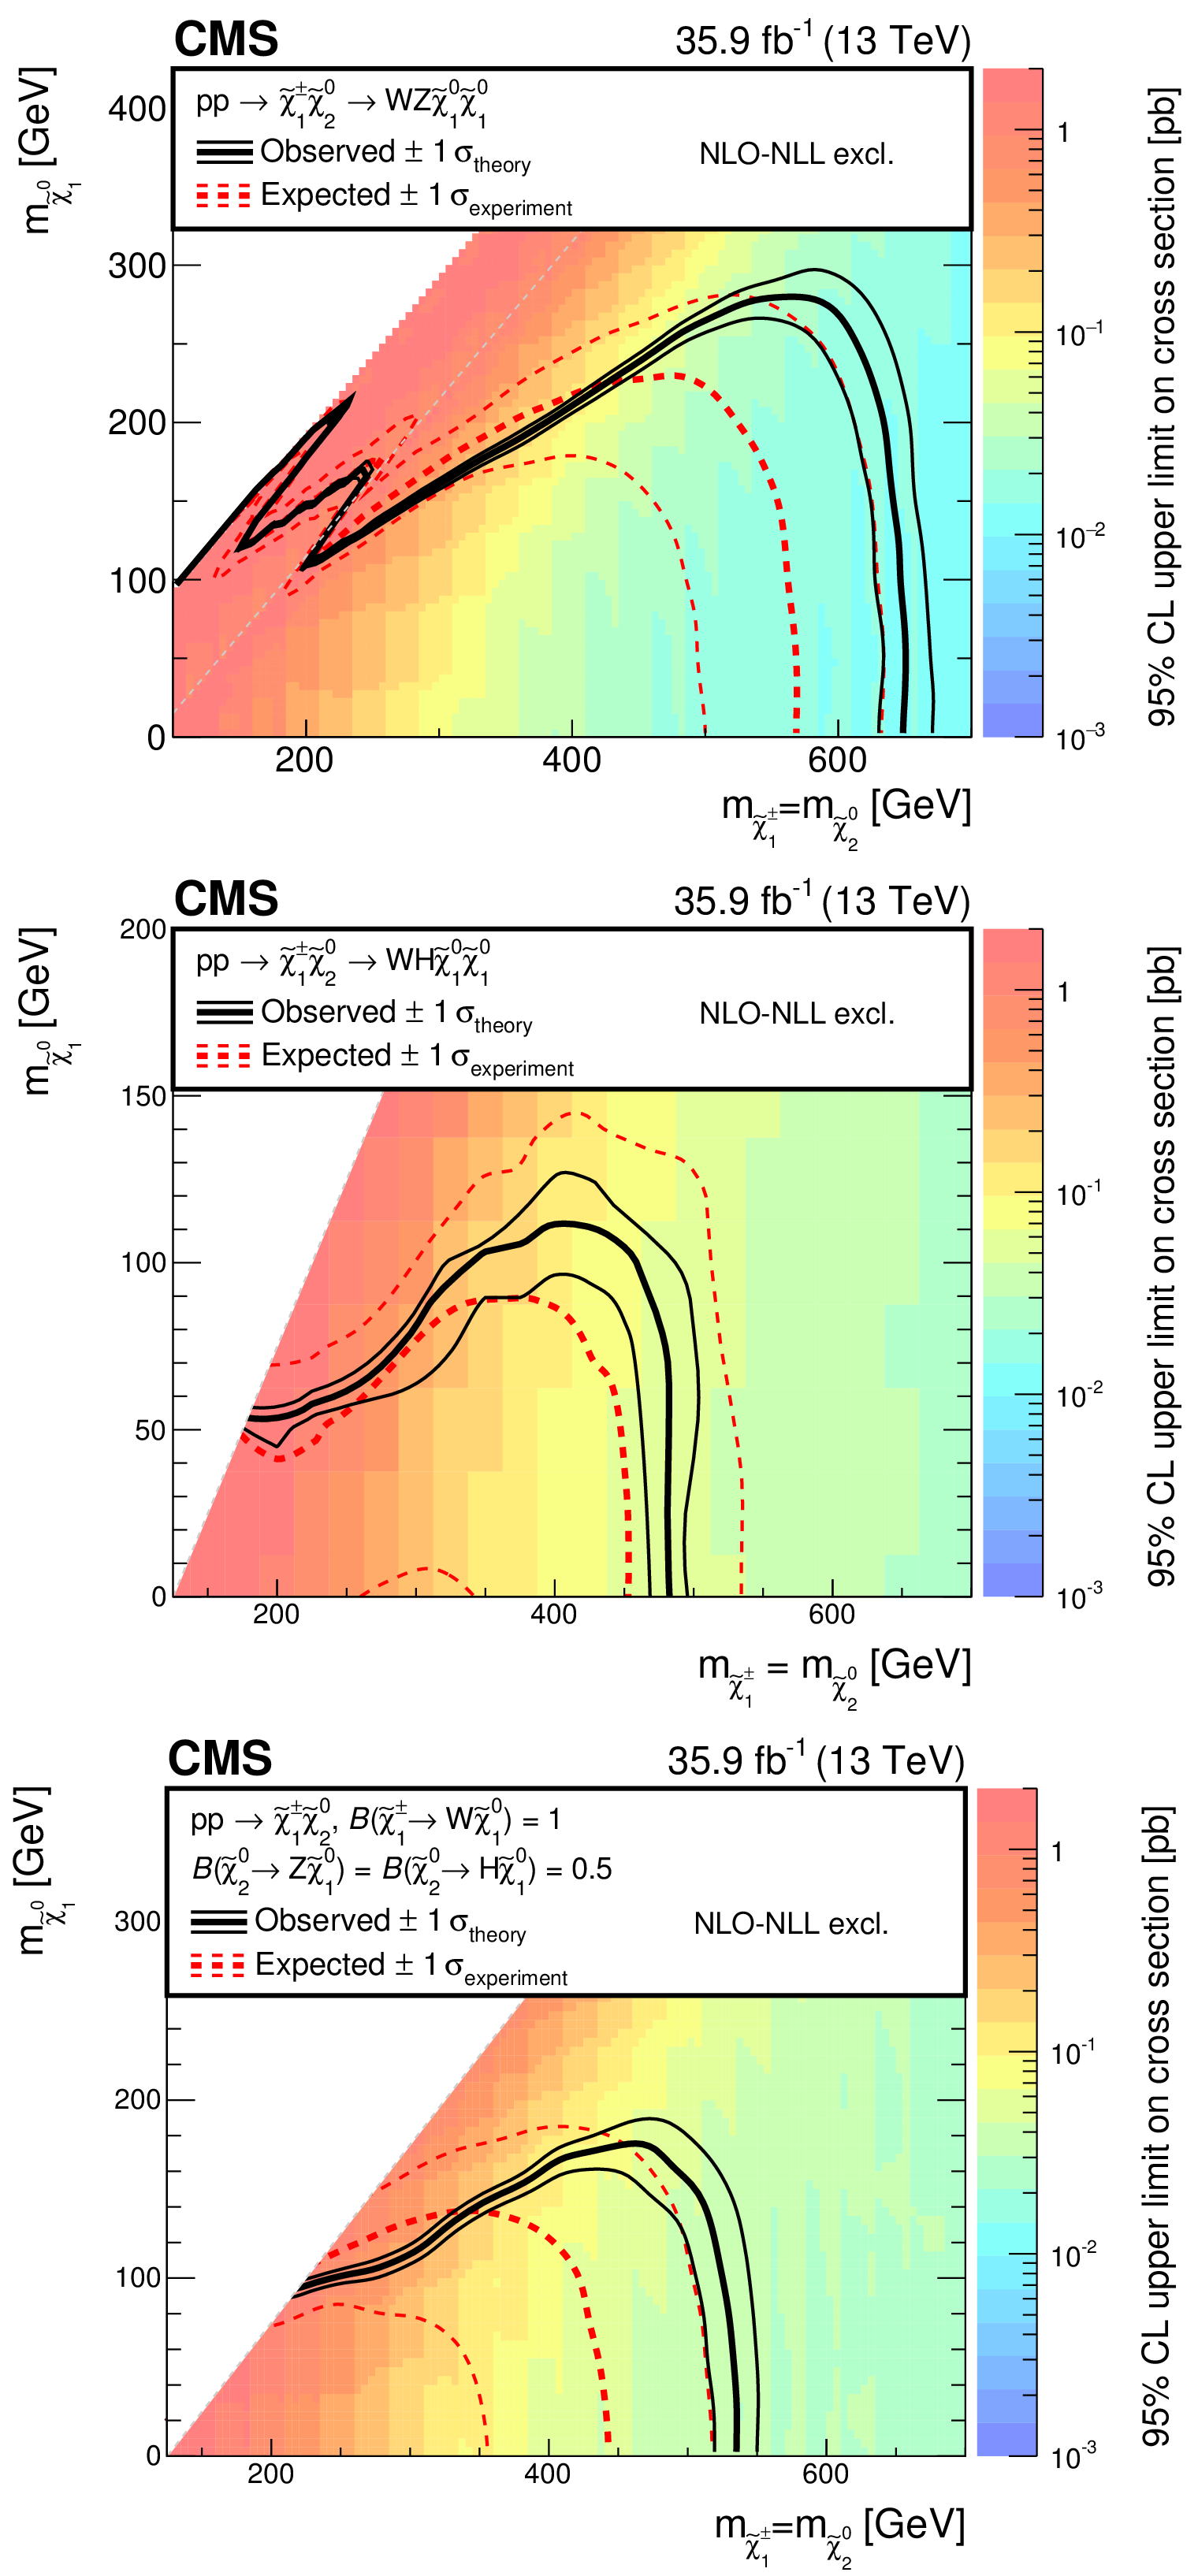
Figure 8:
The 95% CL upper limits on the production cross sections in the plane of $ {m_{\tilde{\chi}^{\pm}_{1} }} $ and $ {m_{\tilde{\chi}^0_1 }} $ for the models of $ {\tilde{\chi}^{\pm}_{1} \tilde{\chi}^0_2 } $ production with (upper) the WZ topology, (middle) the WH topology, or (lower) the mixed topology with 50% branching fraction to each of WZ and WH. The thick solid black (dashed red) curve represents the observed (expected) exclusion contour assuming the theory cross sections. The area below each curve is the excluded region. The thin dashed red lines indicate the $ \pm $1$ \sigma _{\text {experiment}}$ uncertainty. The thin black lines show the effect of the theoretical uncertainties ($ \pm $1$ \sigma _{\text {theory}}$) on the signal cross section. The color scale shows the observed limit at 95% CL on the signal production cross section. |
png pdf root |
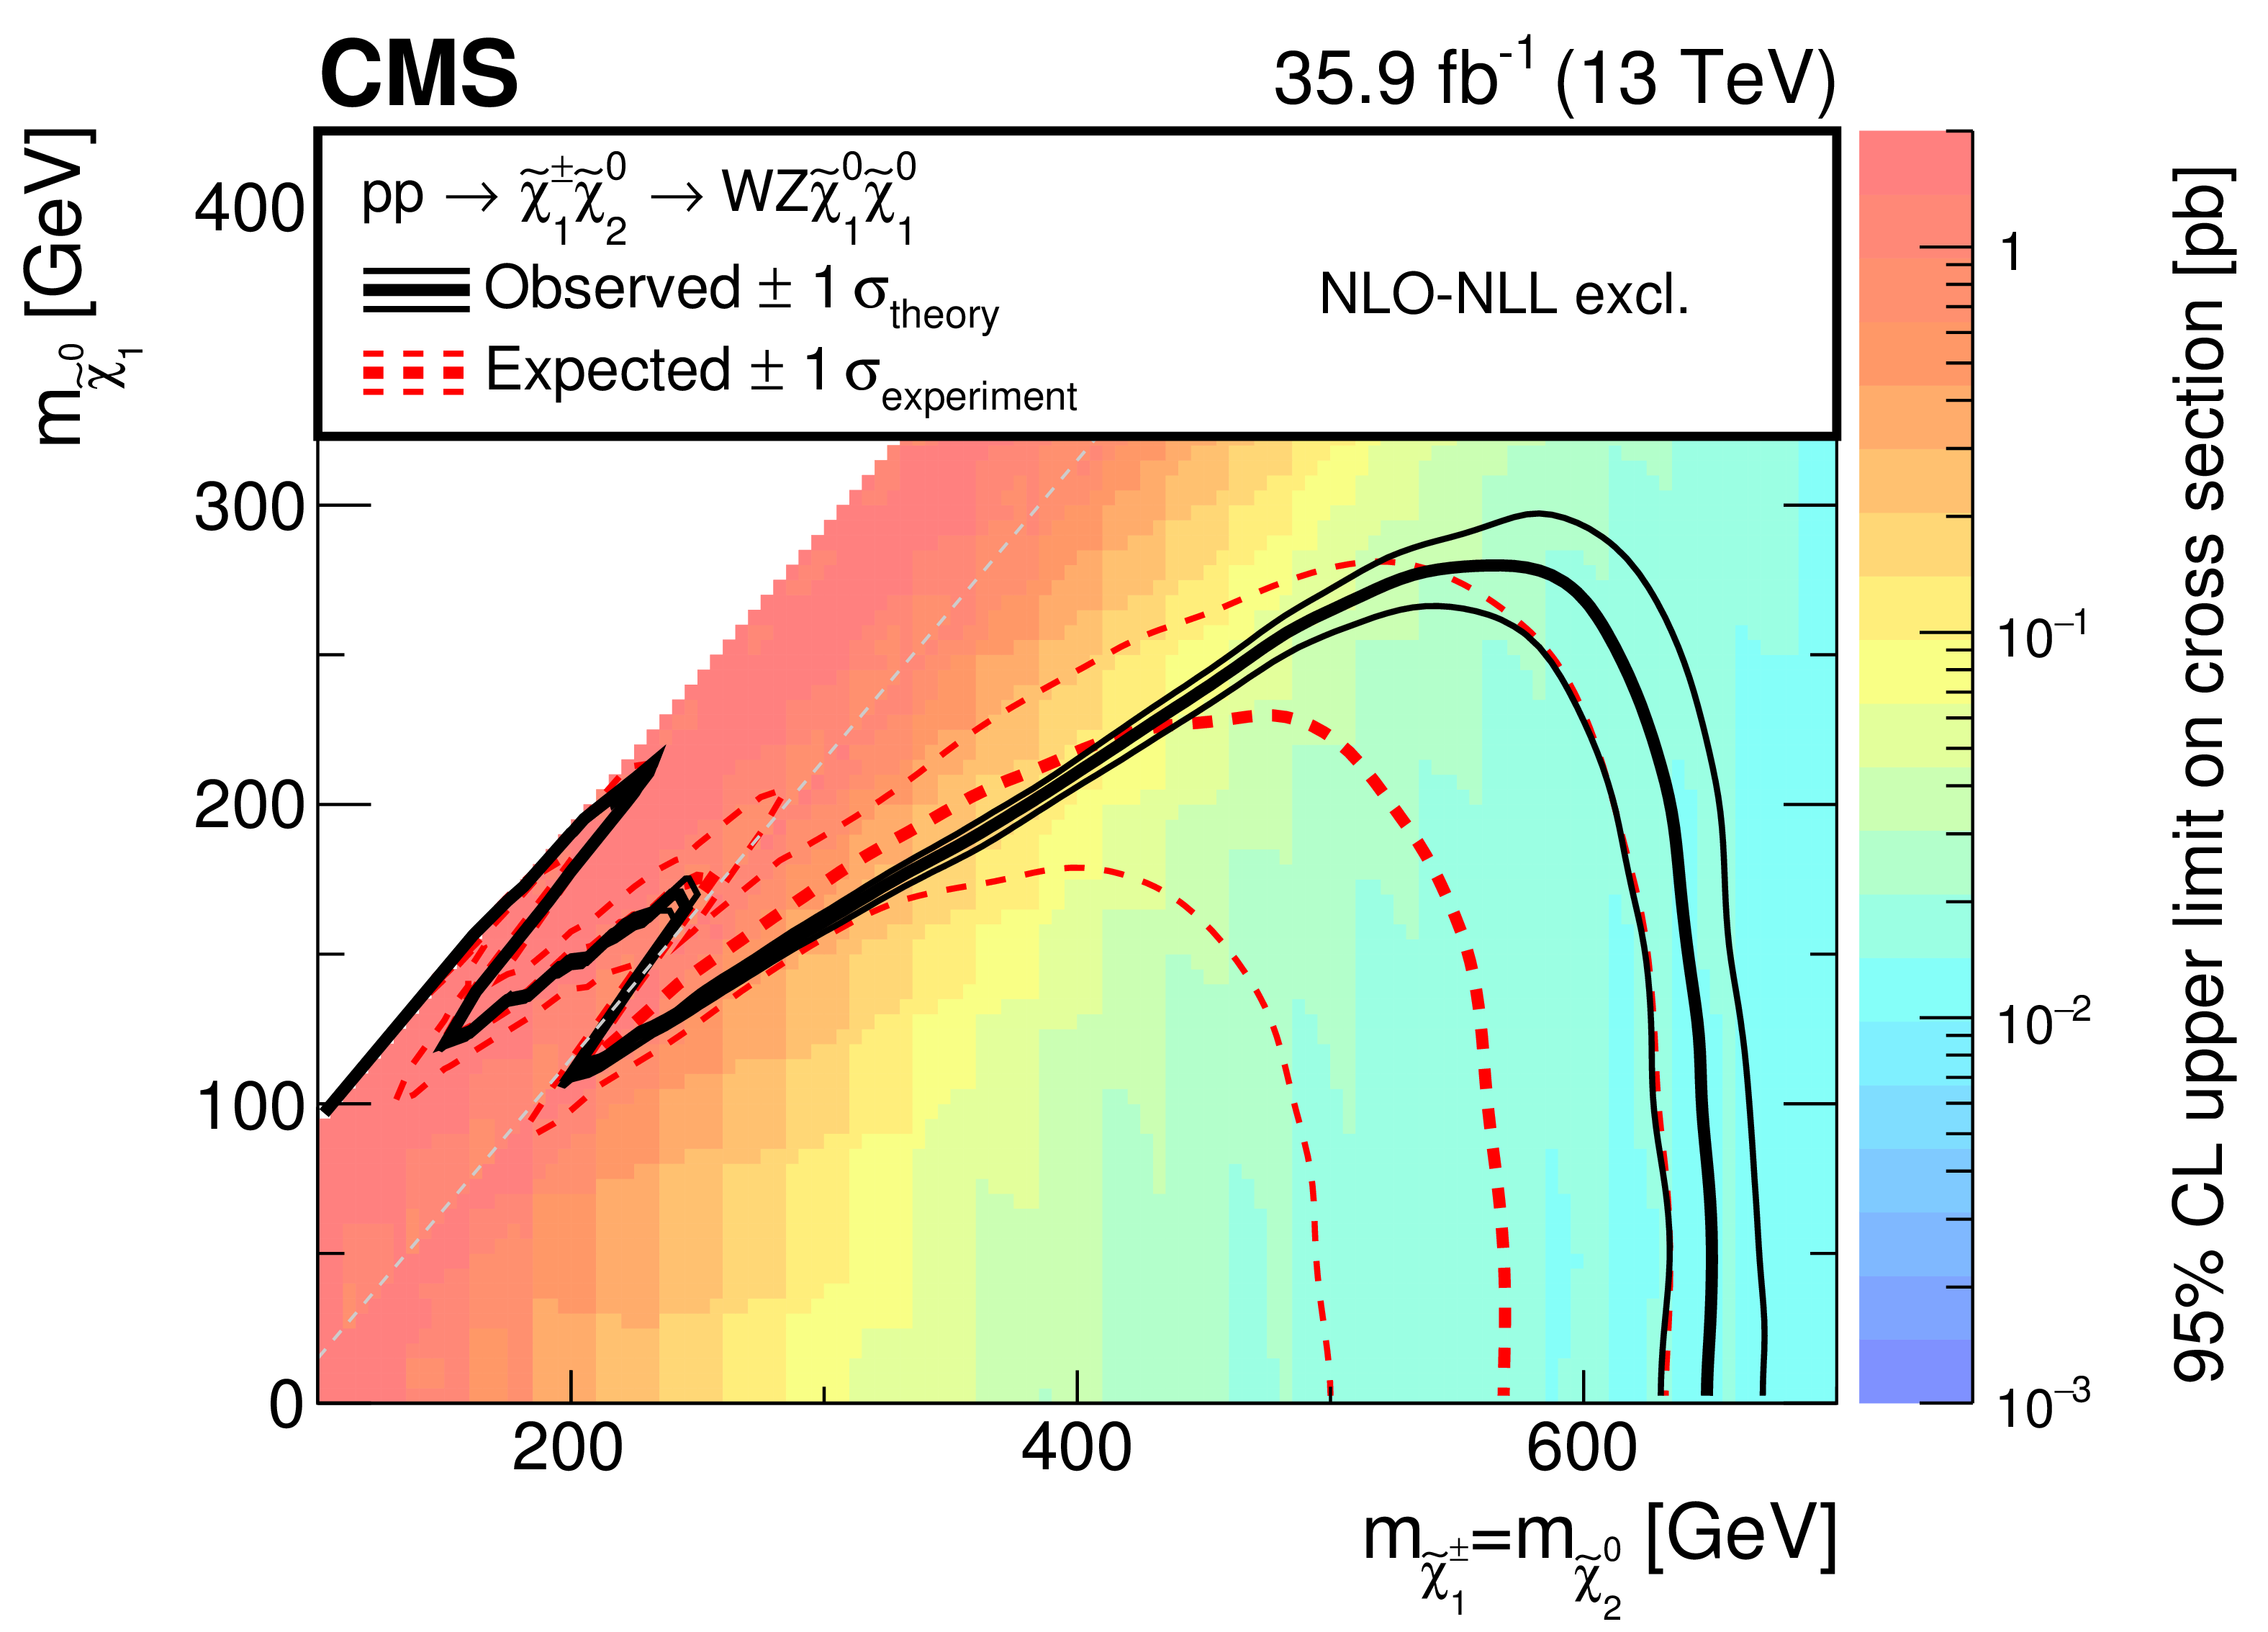
Figure 8-a:
The 95% CL upper limits on the production cross sections in the plane of $ {m_{\tilde{\chi}^{\pm}_{1} }} $ and $ {m_{\tilde{\chi}^0_1 }} $ for the models of $ {\tilde{\chi}^{\pm}_{1} \tilde{\chi}^0_2 } $ production with the WZ topology. The thick solid black (dashed red) curve represents the observed (expected) exclusion contour assuming the theory cross sections. The area below each curve is the excluded region. The thin dashed red lines indicate the $ \pm $1$ \sigma _{\text {experiment}}$ uncertainty. The thin black lines show the effect of the theoretical uncertainties ($ \pm $1$ \sigma _{\text {theory}}$) on the signal cross section. The color scale shows the observed limit at 95% CL on the signal production cross section. |
png pdf root |
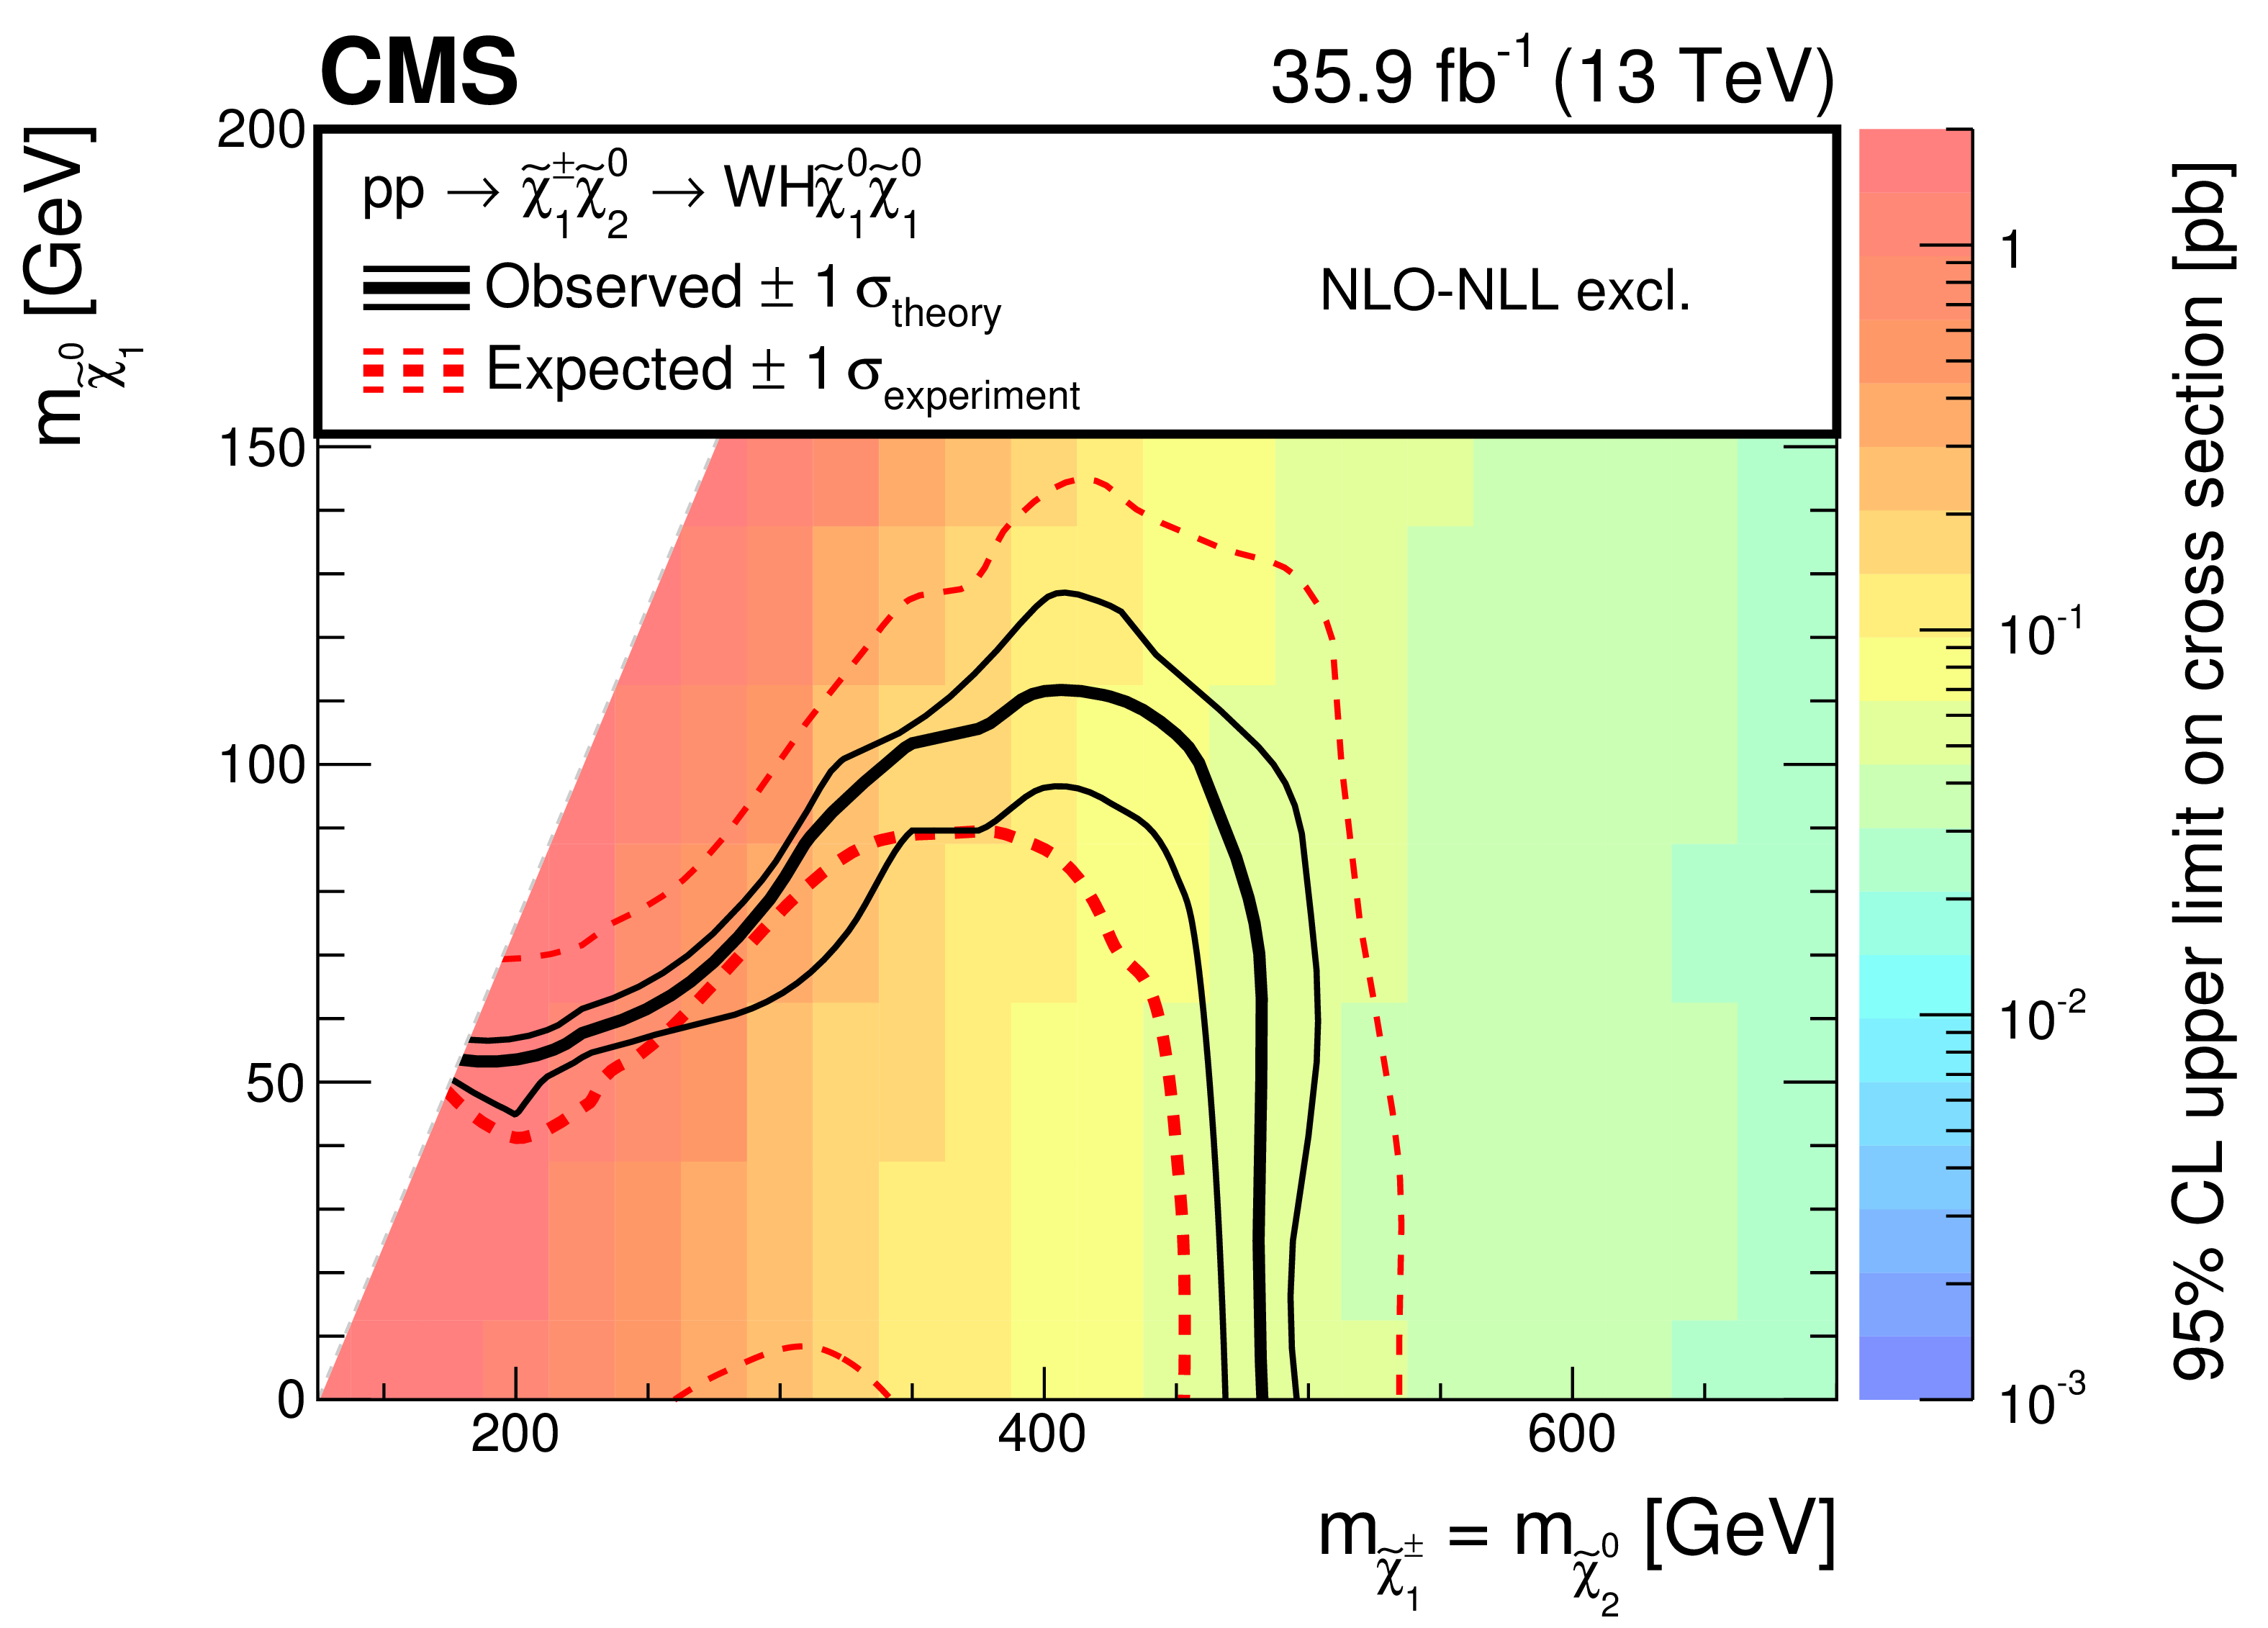
Figure 8-b:
The 95% CL upper limits on the production cross sections in the plane of $ {m_{\tilde{\chi}^{\pm}_{1} }} $ and $ {m_{\tilde{\chi}^0_1 }} $ for the models of $ {\tilde{\chi}^{\pm}_{1} \tilde{\chi}^0_2 } $ production with the WH topology. The thick solid black (dashed red) curve represents the observed (expected) exclusion contour assuming the theory cross sections. The area below each curve is the excluded region. The thin dashed red lines indicate the $ \pm $1$ \sigma _{\text {experiment}}$ uncertainty. The thin black lines show the effect of the theoretical uncertainties ($ \pm $1$ \sigma _{\text {theory}}$) on the signal cross section. The color scale shows the observed limit at 95% CL on the signal production cross section. |
png pdf root |
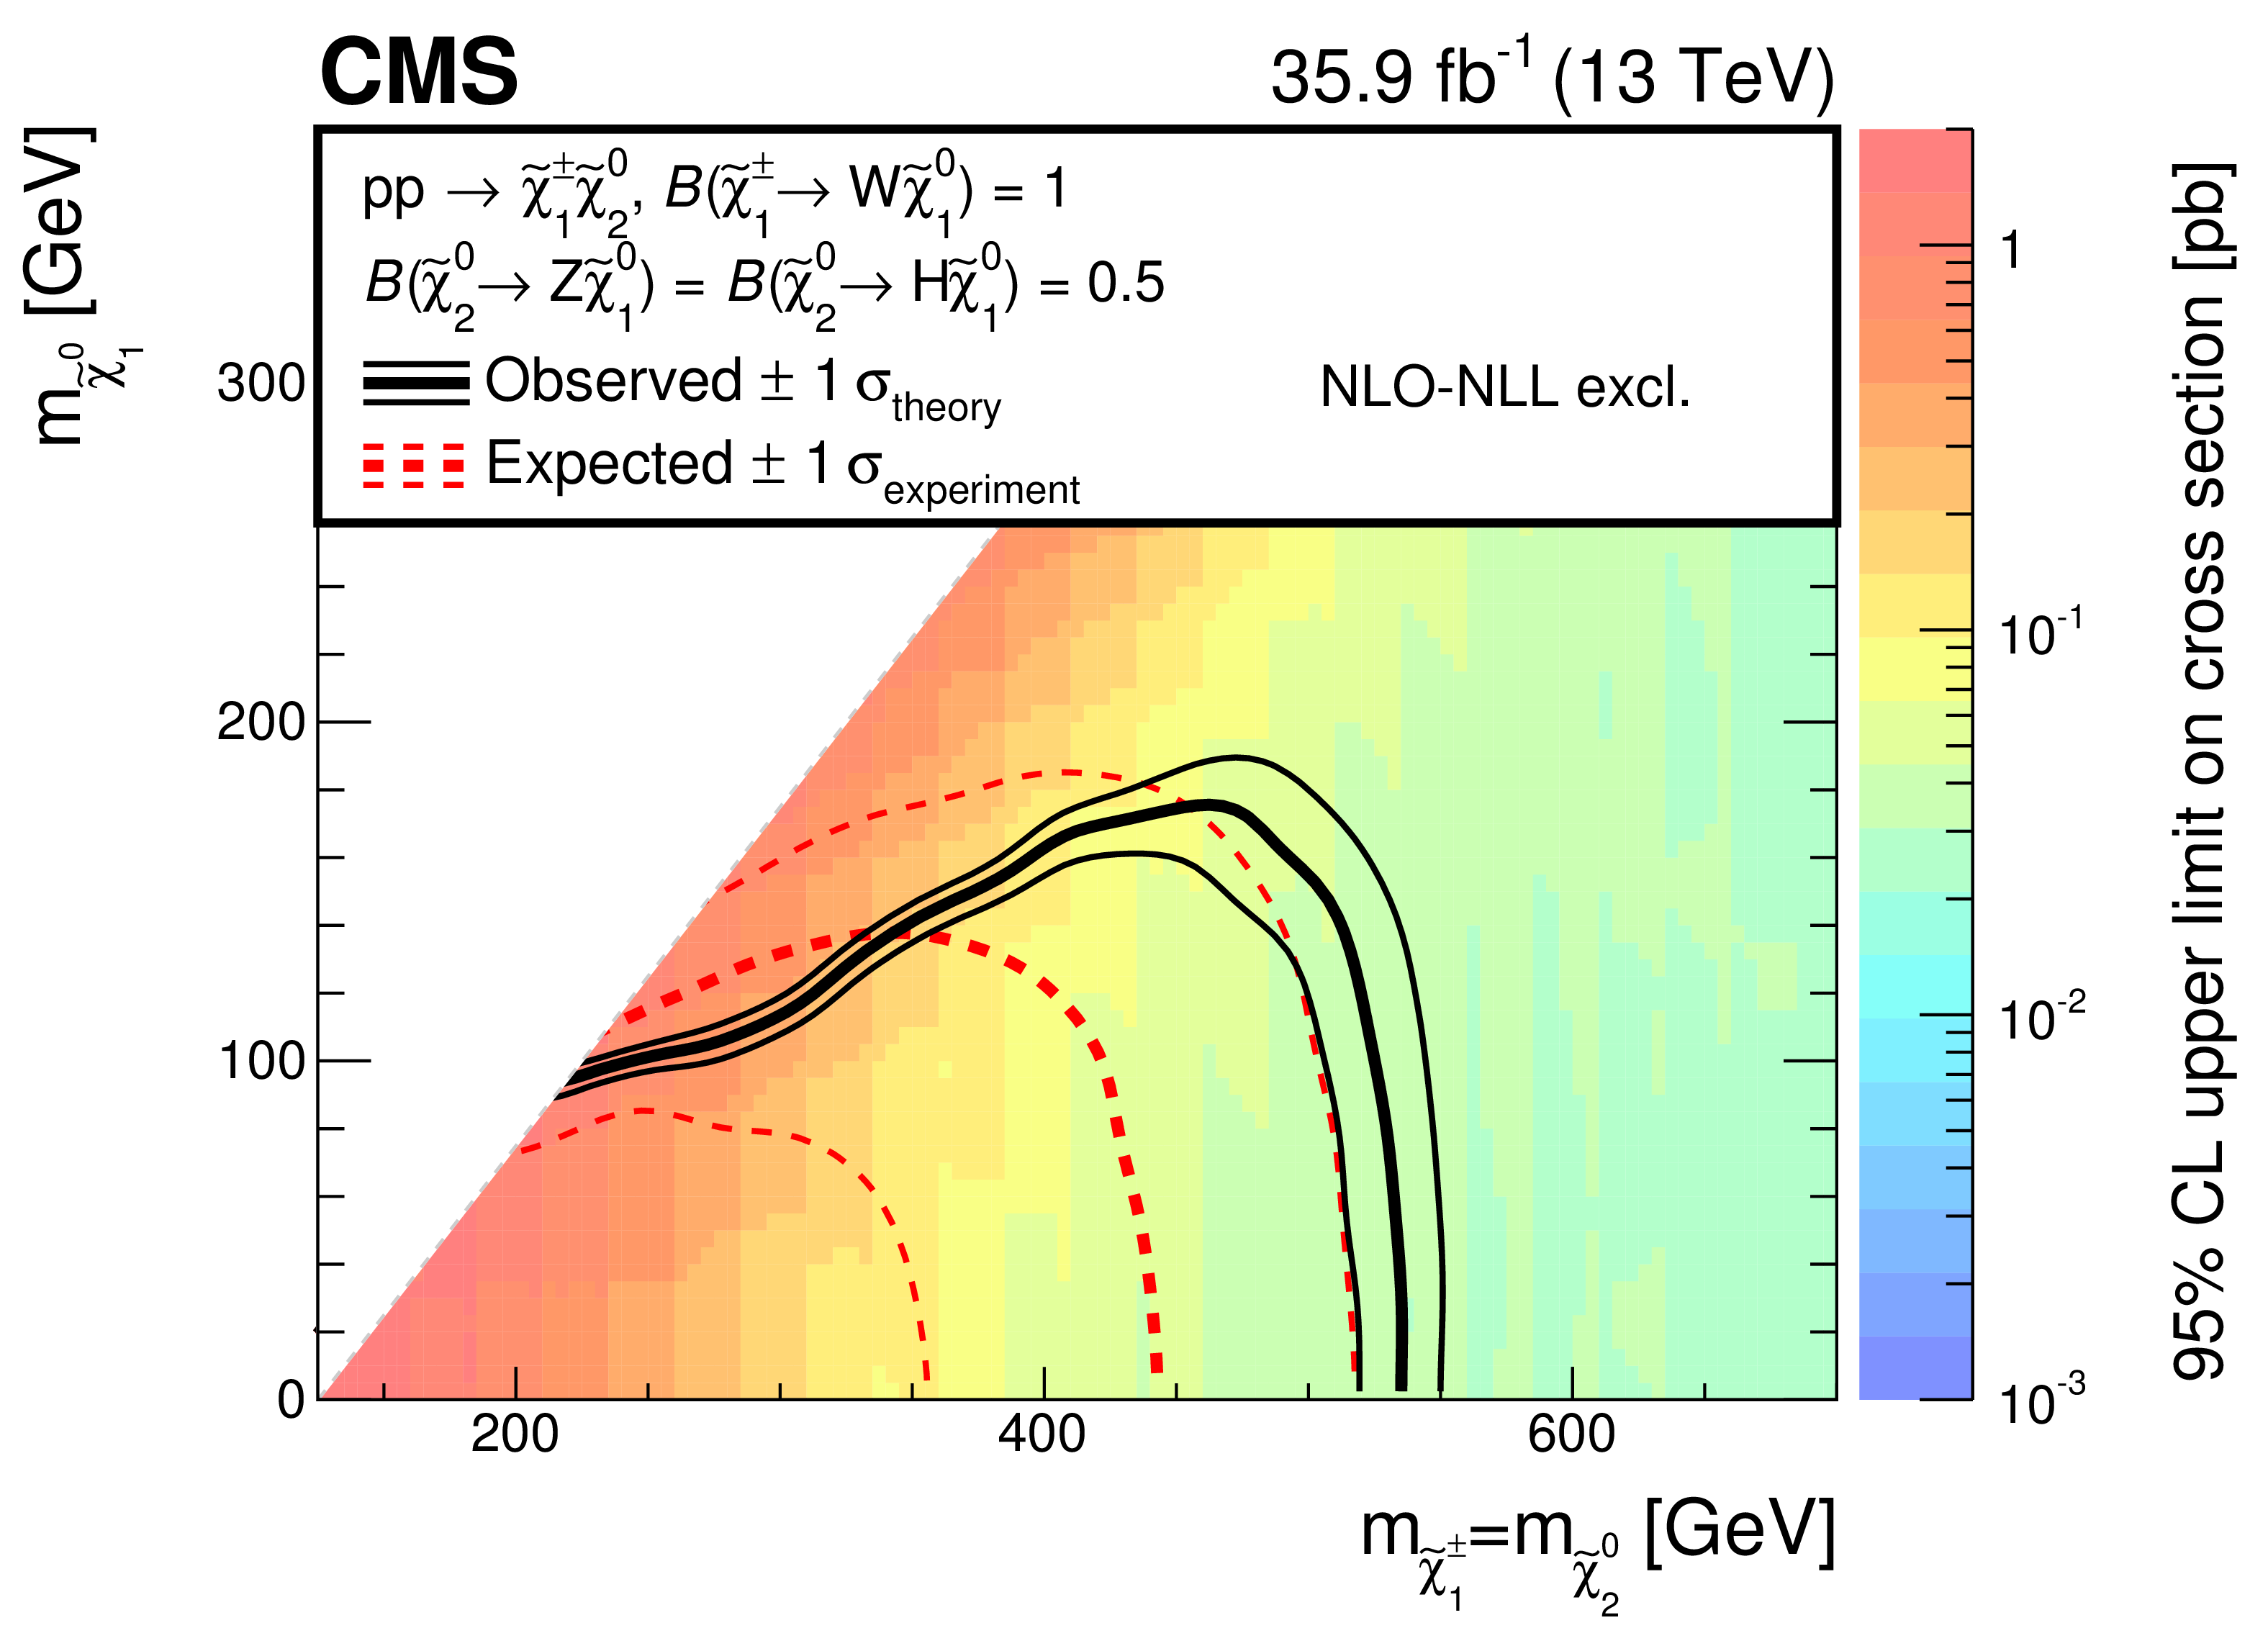
Figure 8-c:
The 95% CL upper limits on the production cross sections in the plane of $ {m_{\tilde{\chi}^{\pm}_{1} }} $ and $ {m_{\tilde{\chi}^0_1 }} $ for the models of $ {\tilde{\chi}^{\pm}_{1} \tilde{\chi}^0_2 } $ production with the mixed topology with 50% branching fraction to each of WZ and WH. The thick solid black (dashed red) curve represents the observed (expected) exclusion contour assuming the theory cross sections. The area below each curve is the excluded region. The thin dashed red lines indicate the $ \pm $1$ \sigma _{\text {experiment}}$ uncertainty. The thin black lines show the effect of the theoretical uncertainties ($ \pm $1$ \sigma _{\text {theory}}$) on the signal cross section. The color scale shows the observed limit at 95% CL on the signal production cross section. |
png pdf |
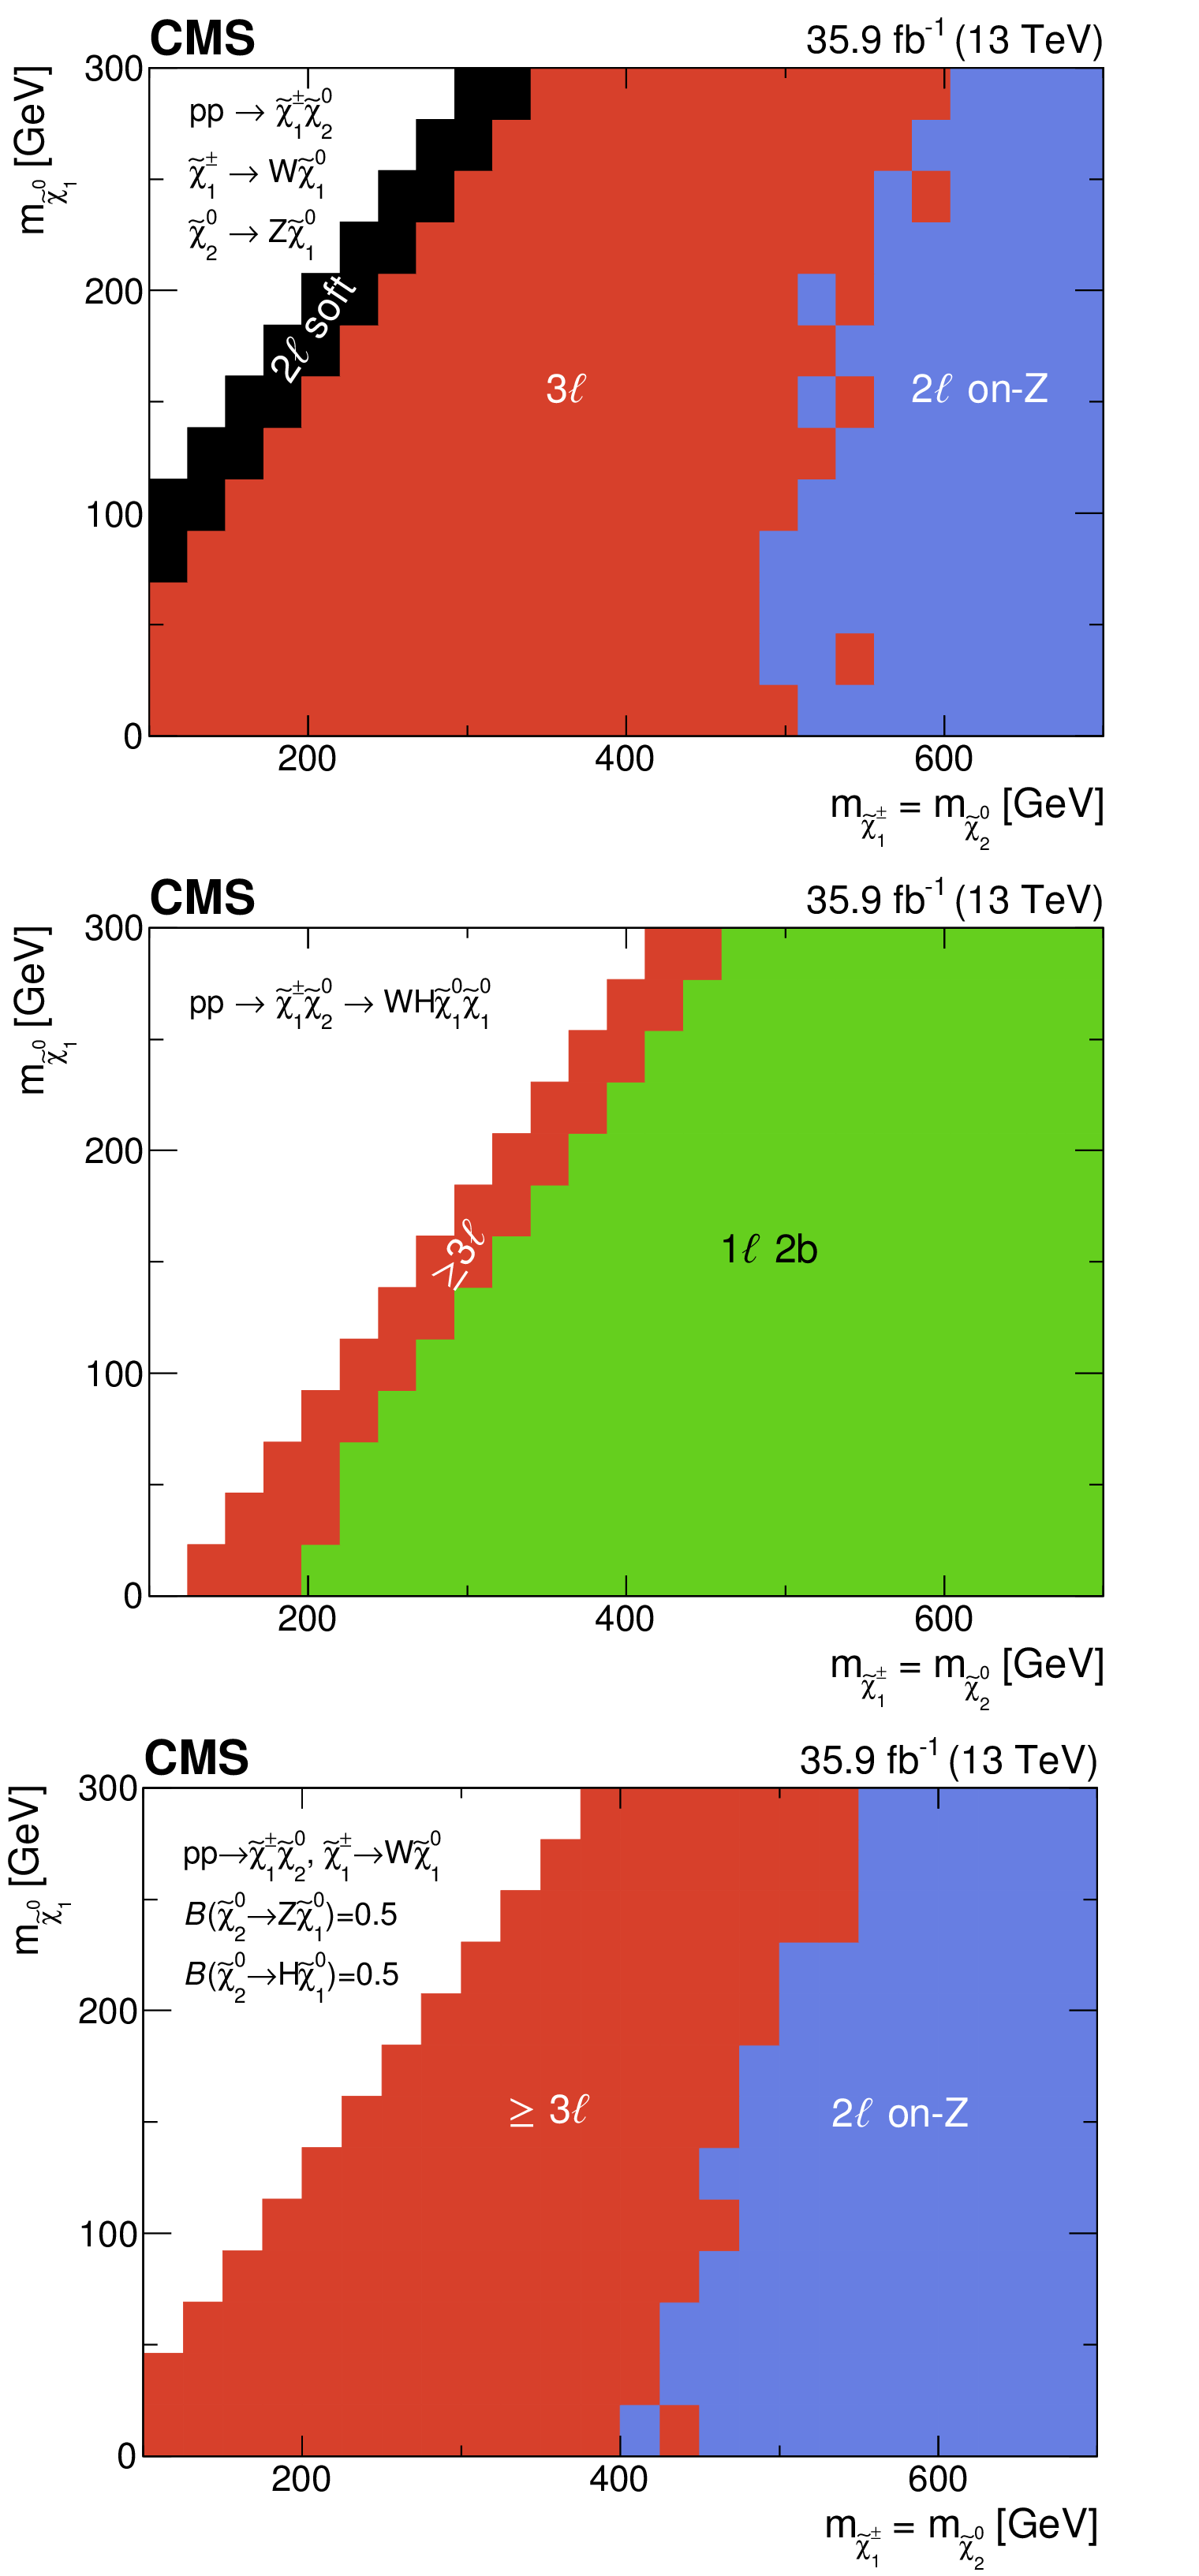
Figure 9:
The analysis with the best expected exclusion limit at each point in the plane of $ {m_{\tilde{\chi}^{\pm}_{1} }} $ and $ {m_{\tilde{\chi}^0_1 }} $ for the models of $ {\tilde{\chi}^{\pm}_{1} \tilde{\chi}^0_2 } $ production with (upper) the WZ topology, (middle) the WH topology, and (lower) the mixed topology 50% branching fraction to each of WZ and WH. |

png pdf |
Figure 9-a:
The analysis with the best expected exclusion limit at each point in the plane of $ {m_{\tilde{\chi}^{\pm}_{1} }} $ and $ {m_{\tilde{\chi}^0_1 }} $ for the models of $ {\tilde{\chi}^{\pm}_{1} \tilde{\chi}^0_2 } $ production with the WZ topology. |
png pdf |
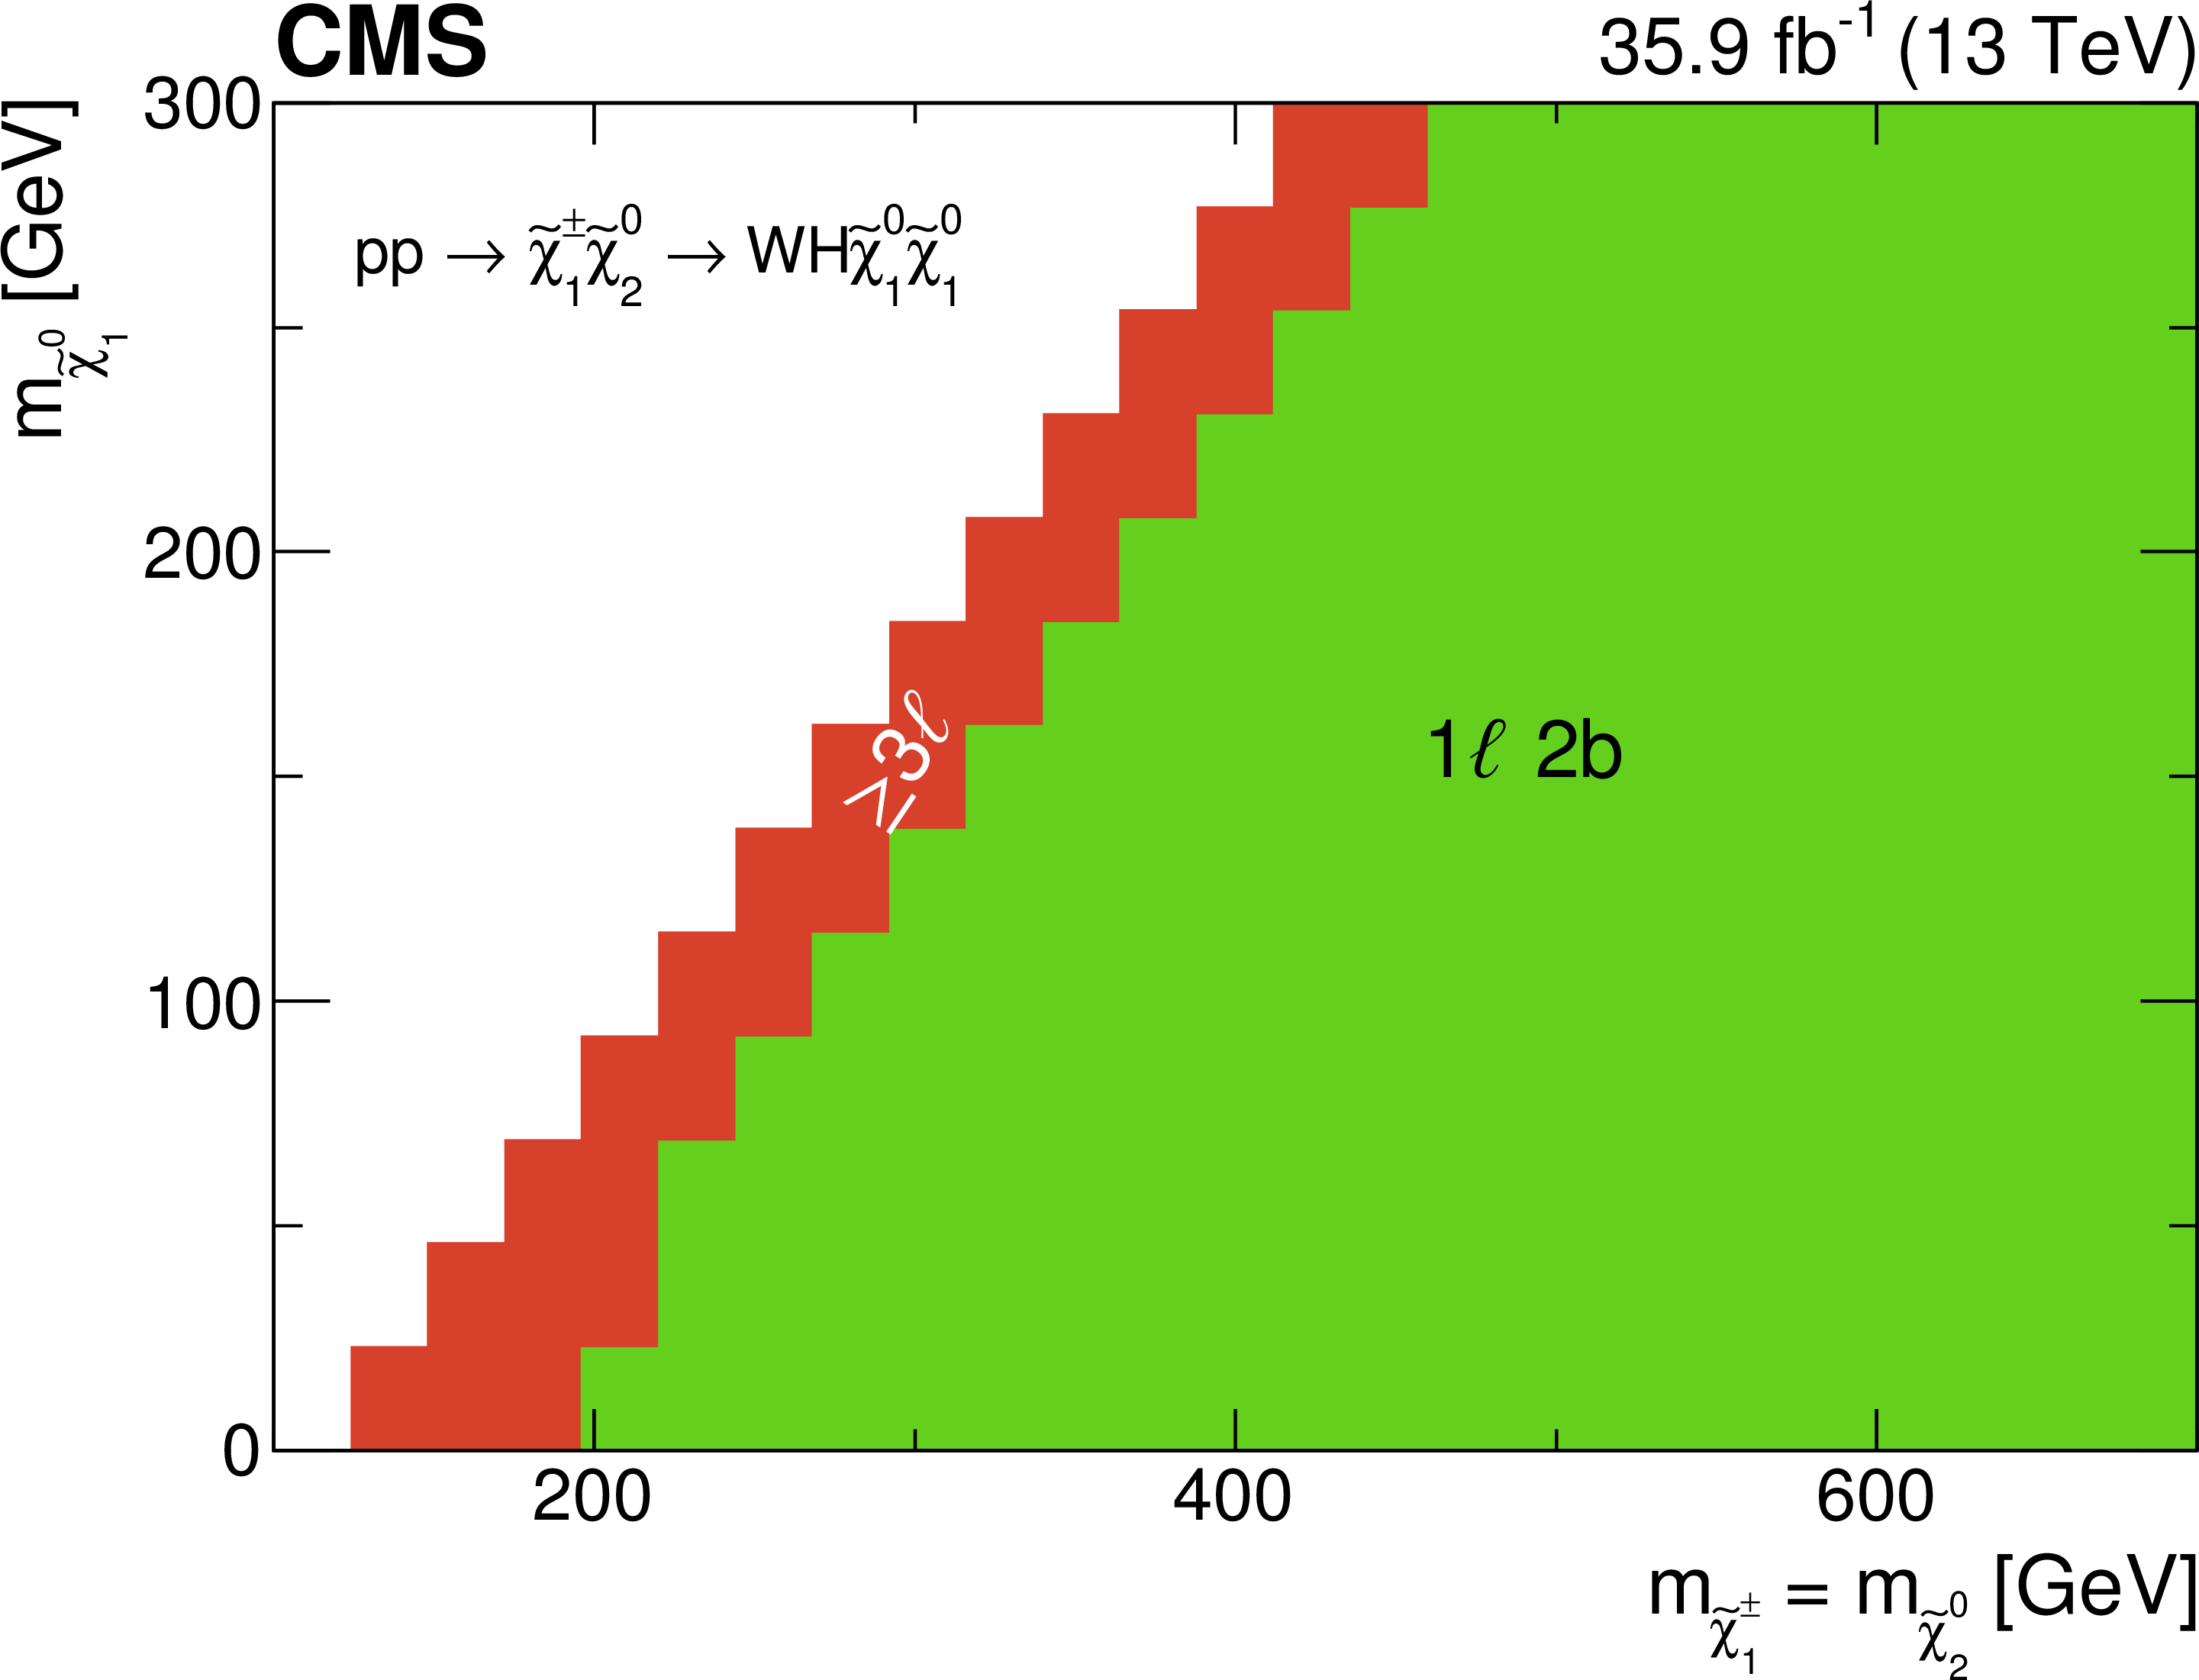
Figure 9-b:
The analysis with the best expected exclusion limit at each point in the plane of $ {m_{\tilde{\chi}^{\pm}_{1} }} $ and $ {m_{\tilde{\chi}^0_1 }} $ for the models of $ {\tilde{\chi}^{\pm}_{1} \tilde{\chi}^0_2 } $ production with the WH topology. Figure 9-c |

png pdf |
Figure 9-c:
The analysis with the best expected exclusion limit at each point in the plane of $ {m_{\tilde{\chi}^{\pm}_{1} }} $ and $ {m_{\tilde{\chi}^0_1 }} $ for the models of $ {\tilde{\chi}^{\pm}_{1} \tilde{\chi}^0_2 } $ production with (upper) the WZ topology, (middle) the WH topology, and (lower) the mixed topology 50% branching fraction to each of WZ and WH. |

png pdf |
Figure 10:
Exclusion contours at 95% CL in the plane of $ {m_{\tilde{\chi}^{\pm}_{1} }} $ and $ {m_{\tilde{\chi}^0_1 }} $ for the models of $ {\tilde{\chi}^{\pm}_{1} \tilde{\chi}^0_2 } $ production (left) for the individual analyses and (right) for the combination of analyses. The decay modes assumed for each contour are given in the legends. |

png pdf |
Figure 10-a:
Exclusion contours at 95% CL in the plane of $ {m_{\tilde{\chi}^{\pm}_{1} }} $ and $ {m_{\tilde{\chi}^0_1 }} $ for the models of $ {\tilde{\chi}^{\pm}_{1} \tilde{\chi}^0_2 } $ production for the individual analyses. The decay modes assumed for each contour are given in the legends. |
png pdf |
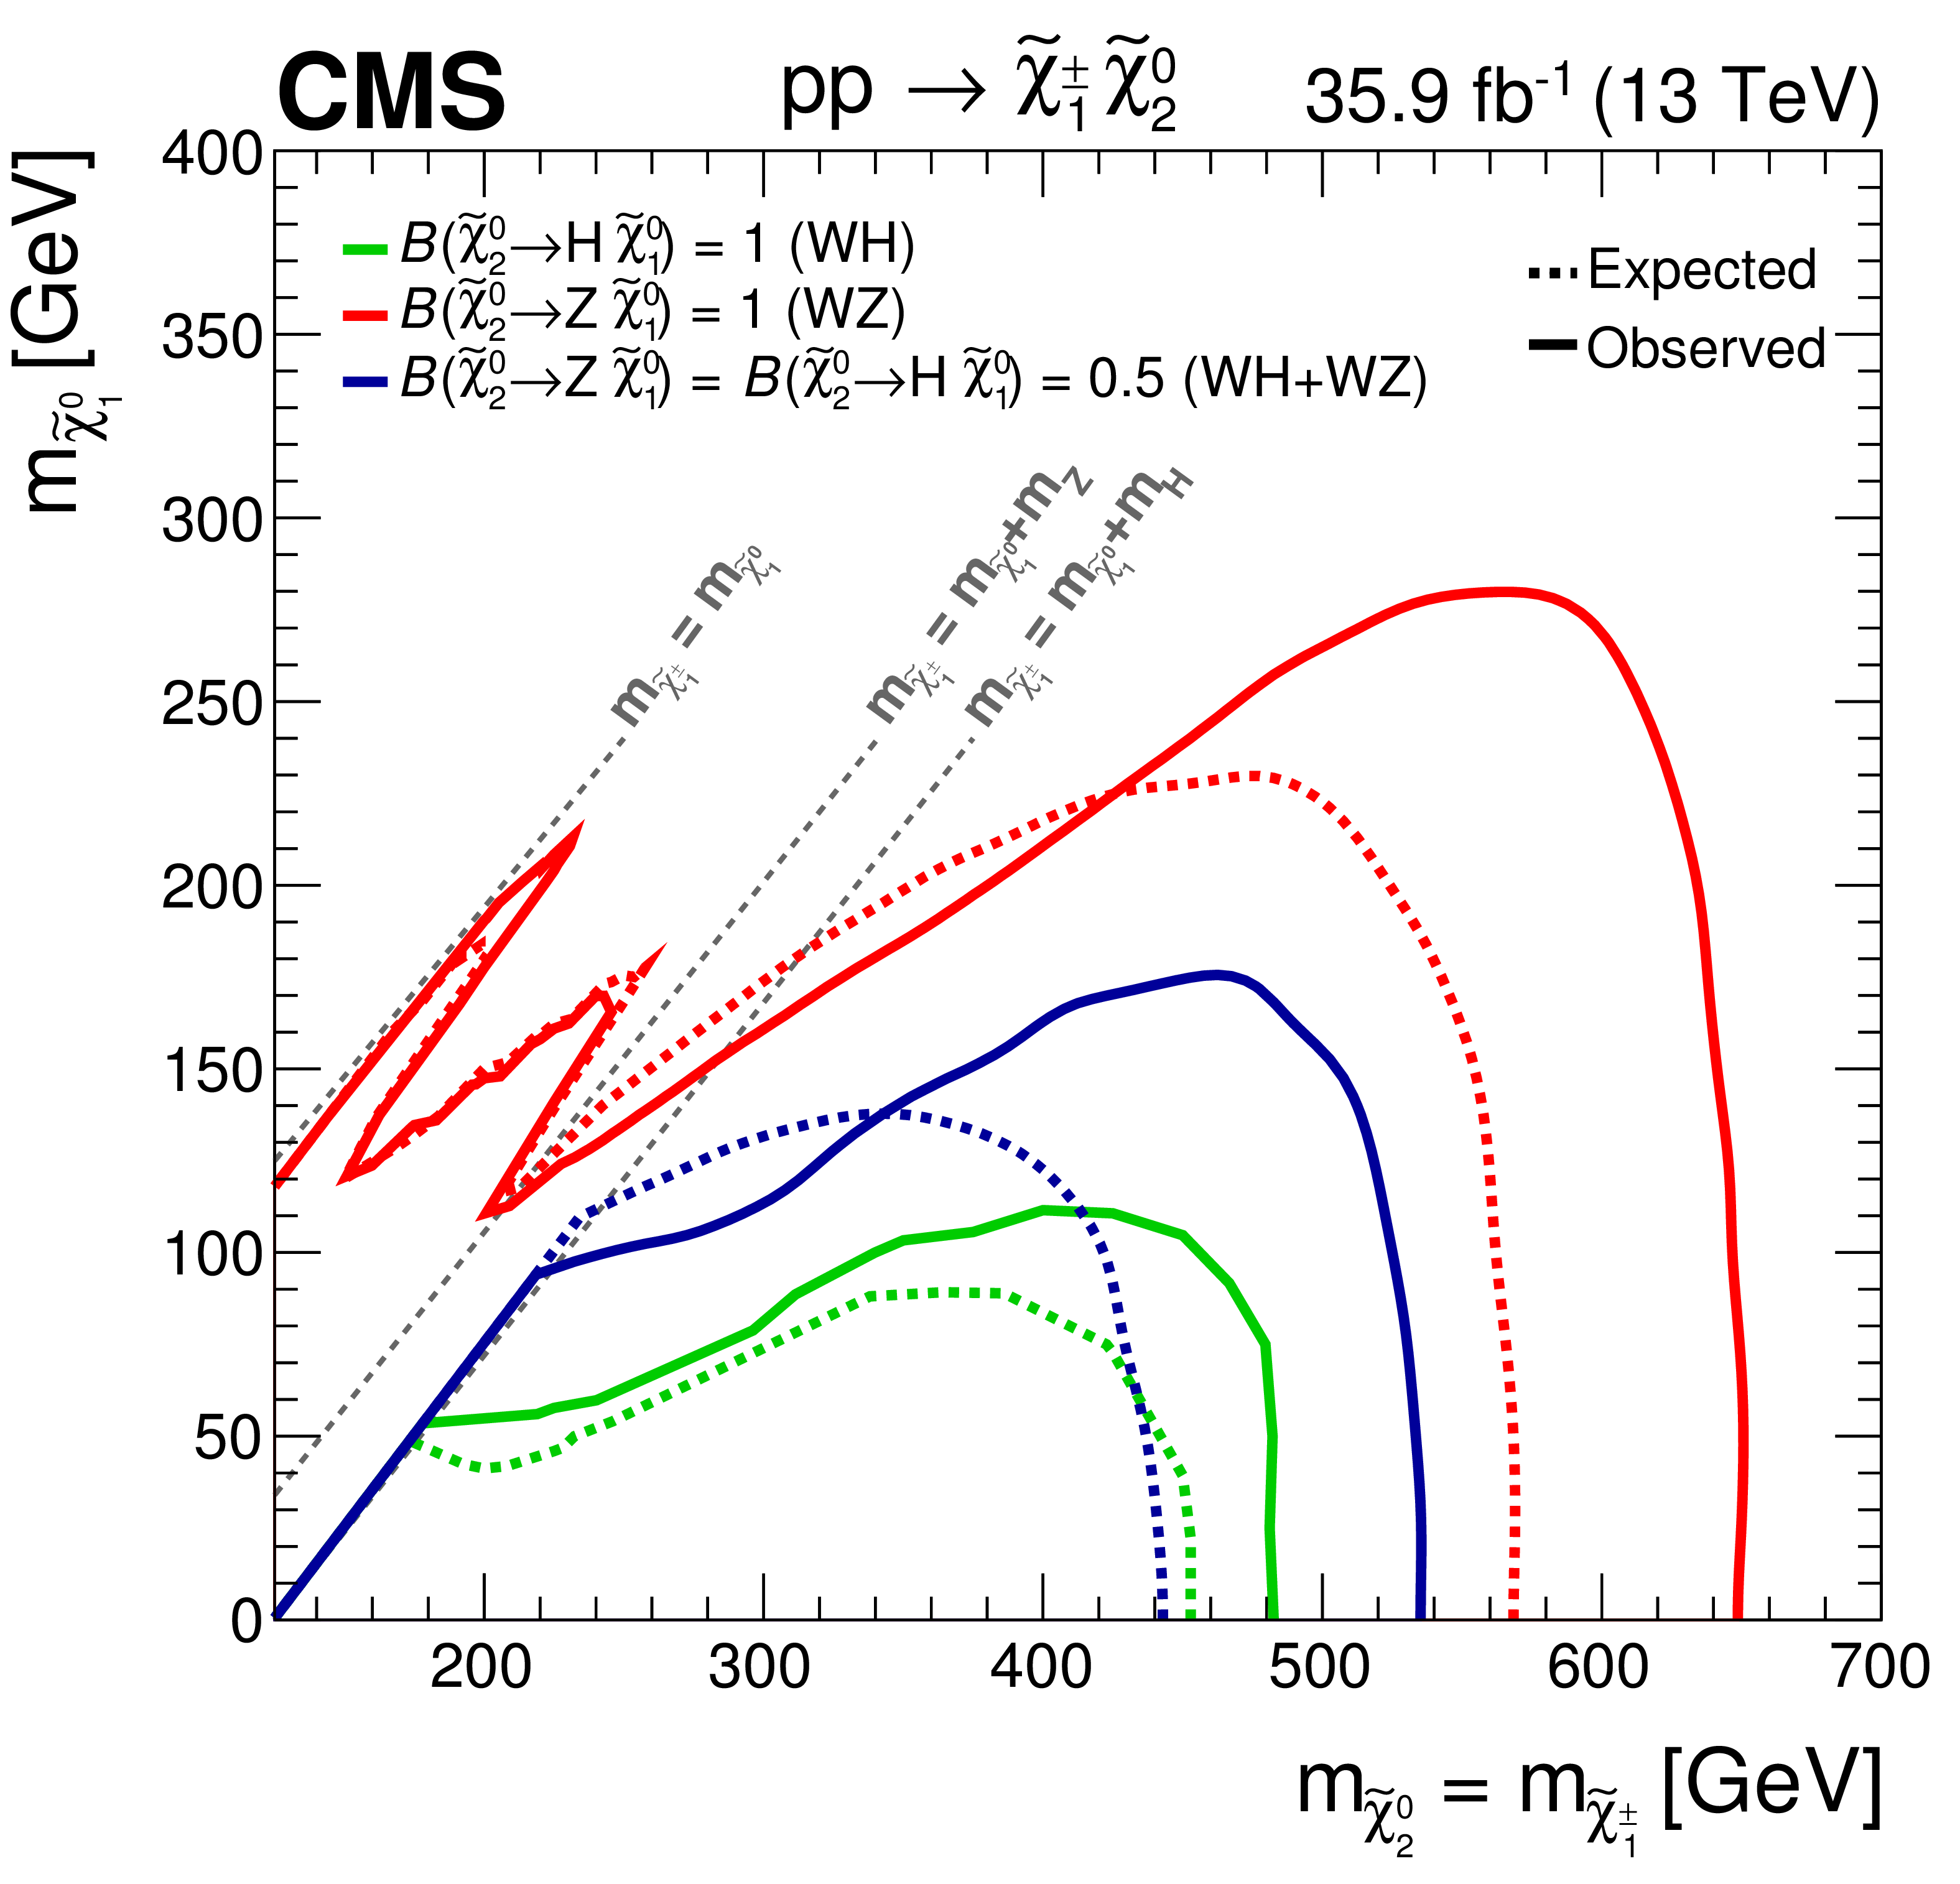
Figure 10-b:
Exclusion contours at 95% CL in the plane of $ {m_{\tilde{\chi}^{\pm}_{1} }} $ and $ {m_{\tilde{\chi}^0_1 }} $ for the models of $ {\tilde{\chi}^{\pm}_{1} \tilde{\chi}^0_2 } $ production for the combination of analyses. The decay modes assumed for each contour are given in the legends. |
png pdf root |
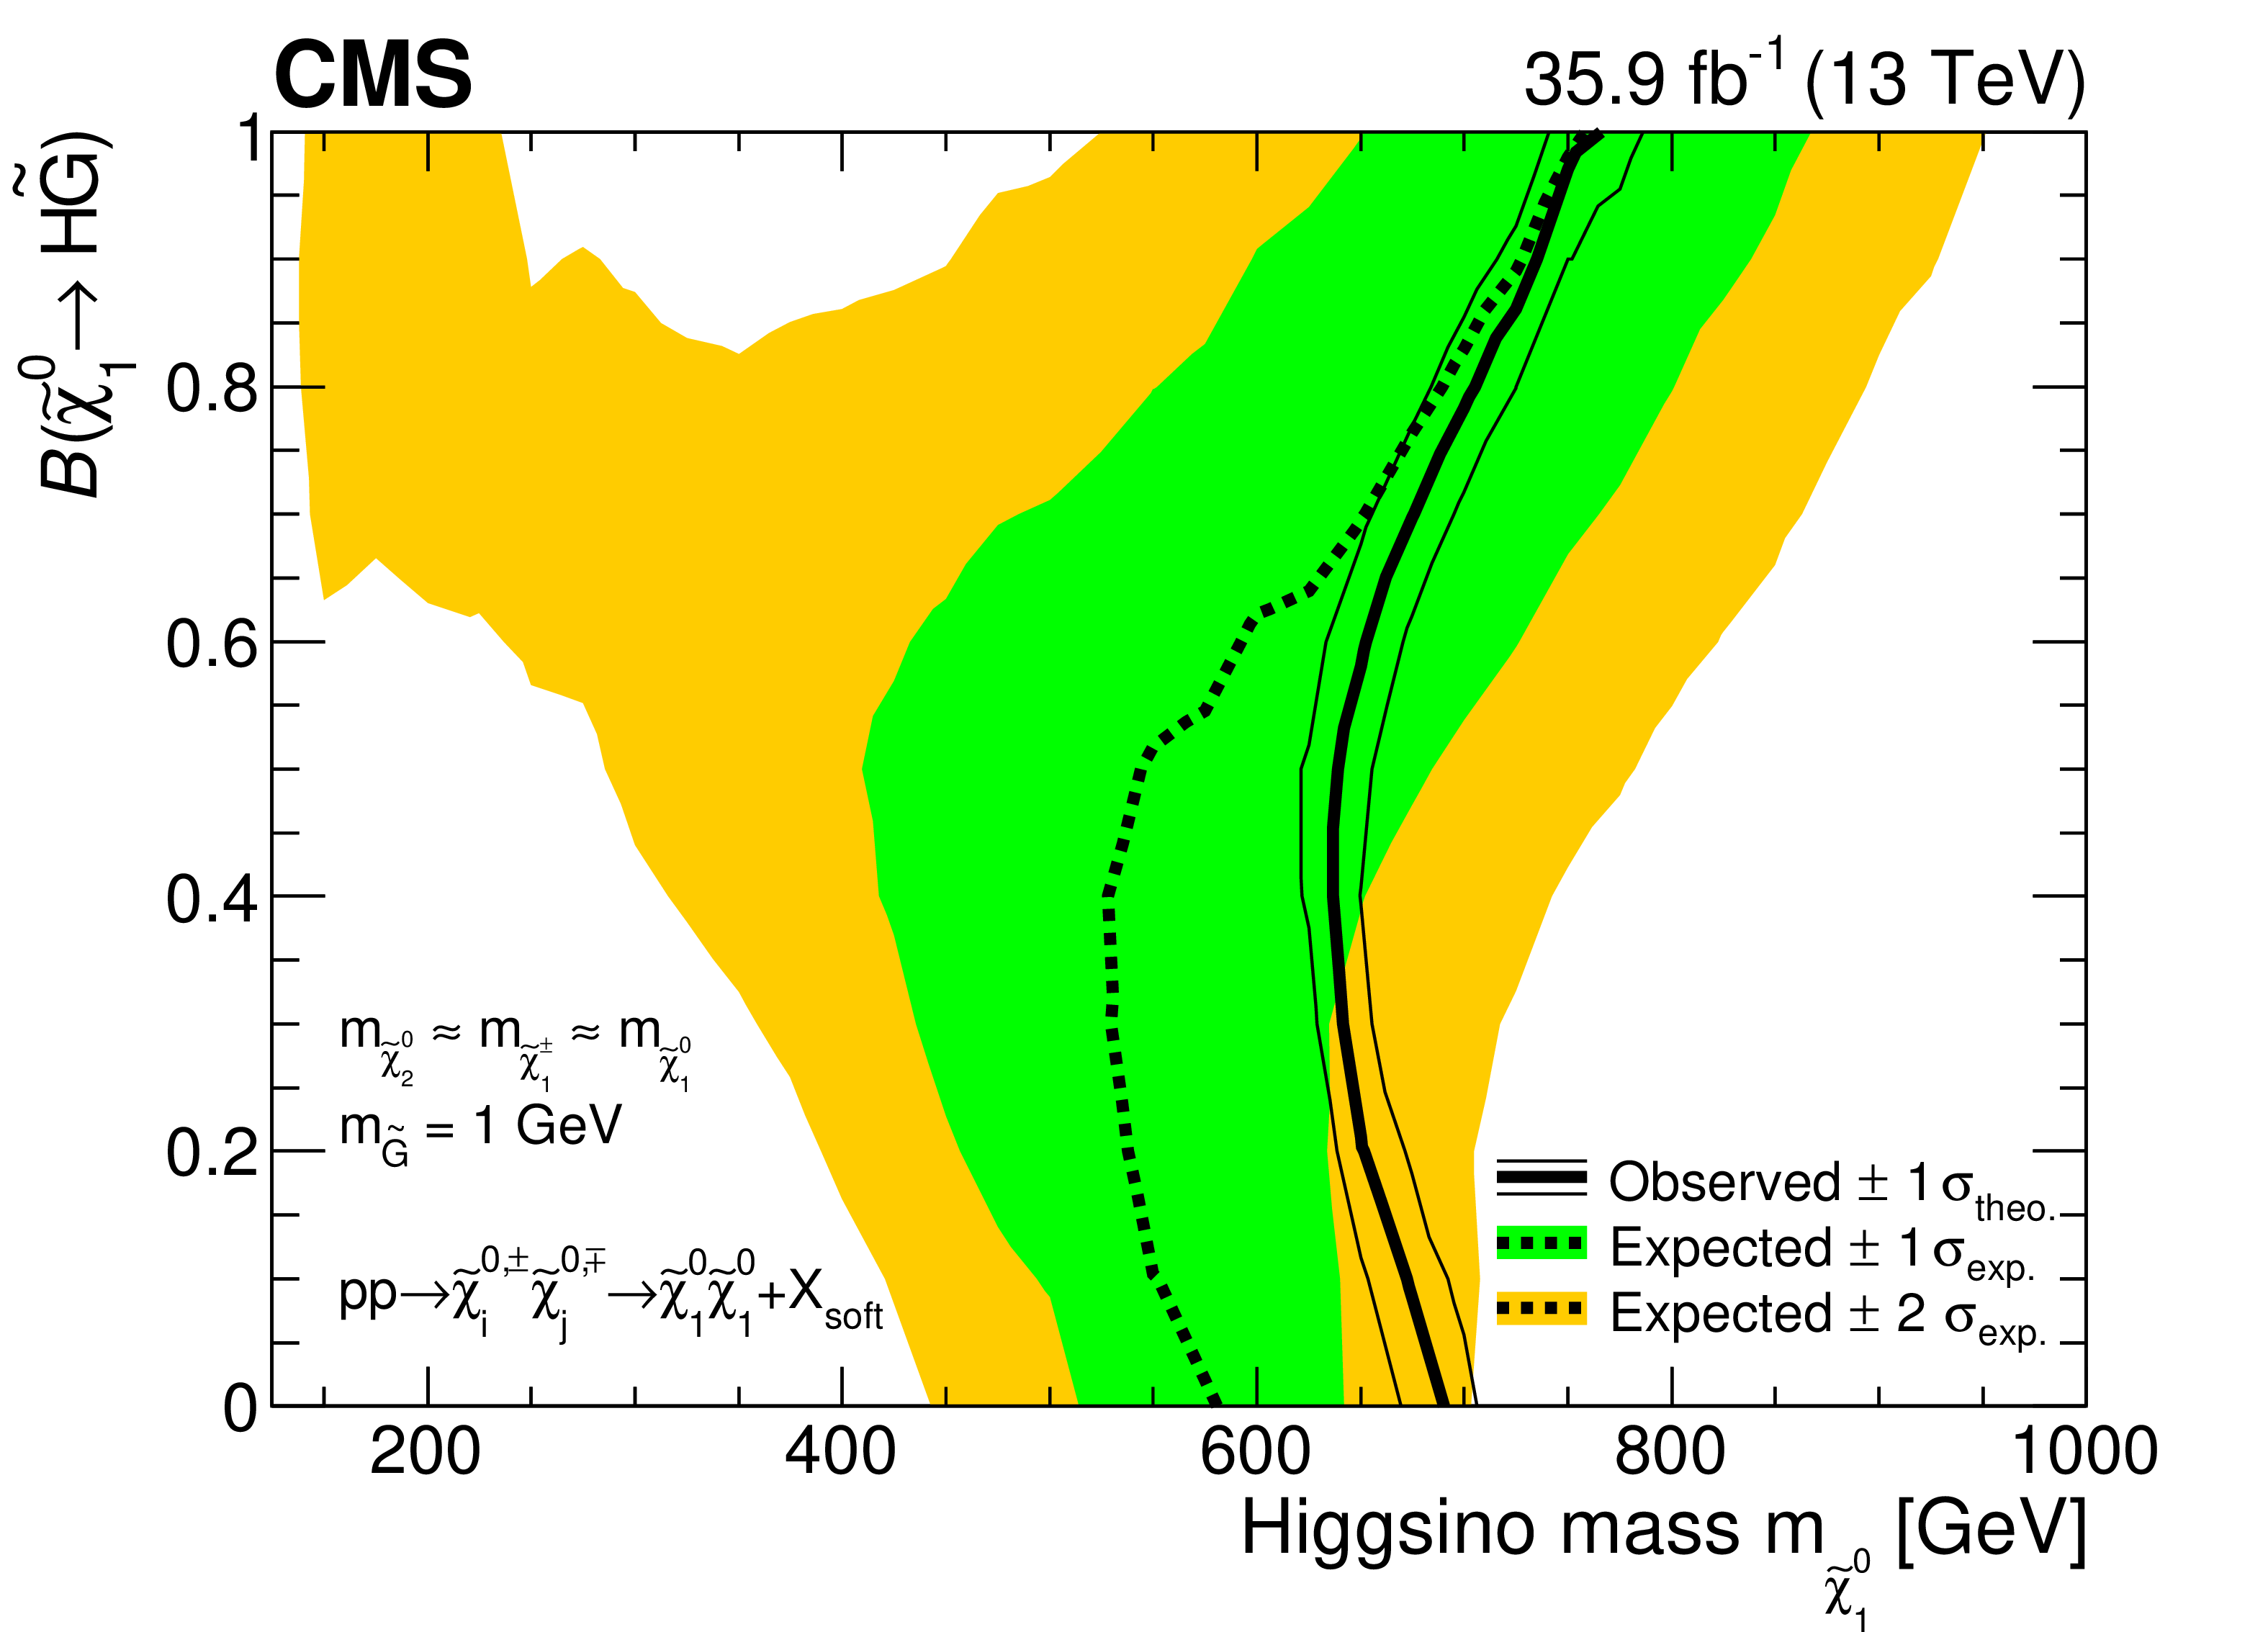
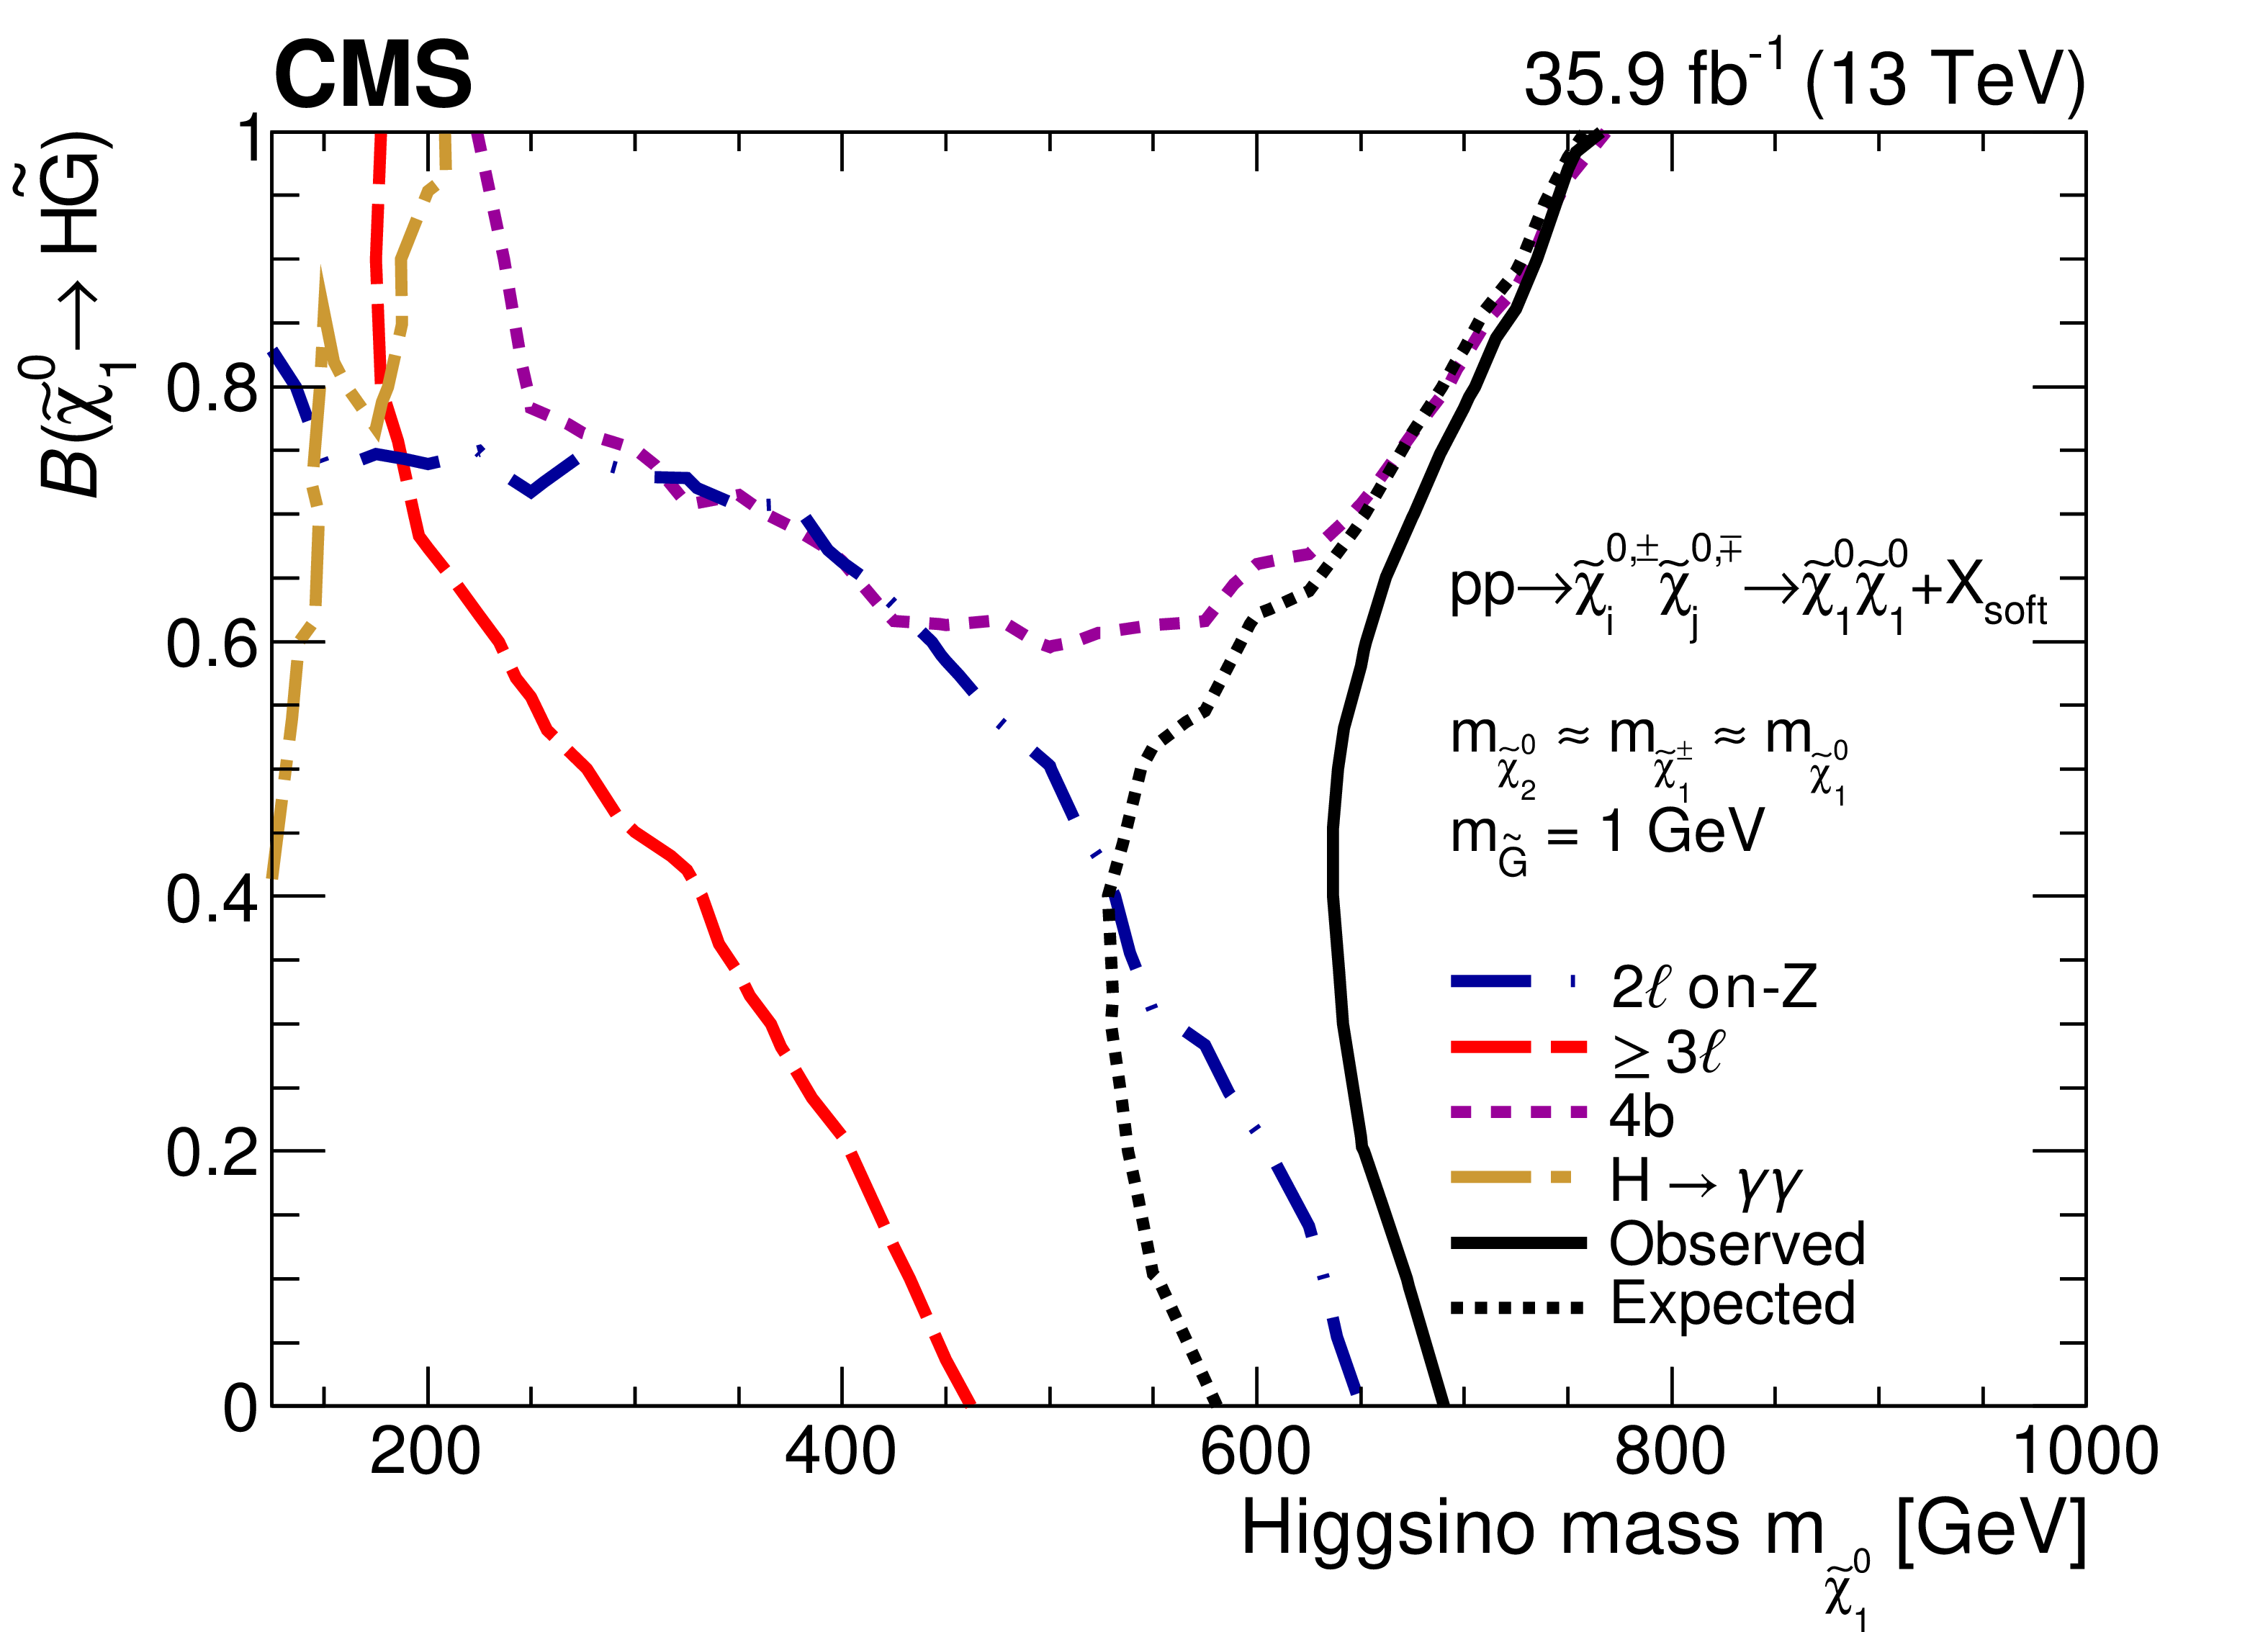
Figure 11:
Combined exclusion contours at the 95% CL in the plane of $ {m_{\tilde{\chi}^0_1 }} $ and $ {\mathcal {B}(\tilde{\chi}^0_1 \to {\mathrm {H}} \tilde{G})} $ for the model of $ {\tilde{\chi}^0_1 \tilde{\chi}^0_1 } $ production. The area to the left of or below the solid (dashed) black curve represents the observed (expected) exclusion region. The green and yellow bands indicate the $\pm $1 and 2$\sigma $ uncertainties in the expected limit. The thin black lines show the effect of the theoretical uncertainties (${\pm}$1$\sigma _{\text {theory}}$) on the signal cross section. |
png pdf root |
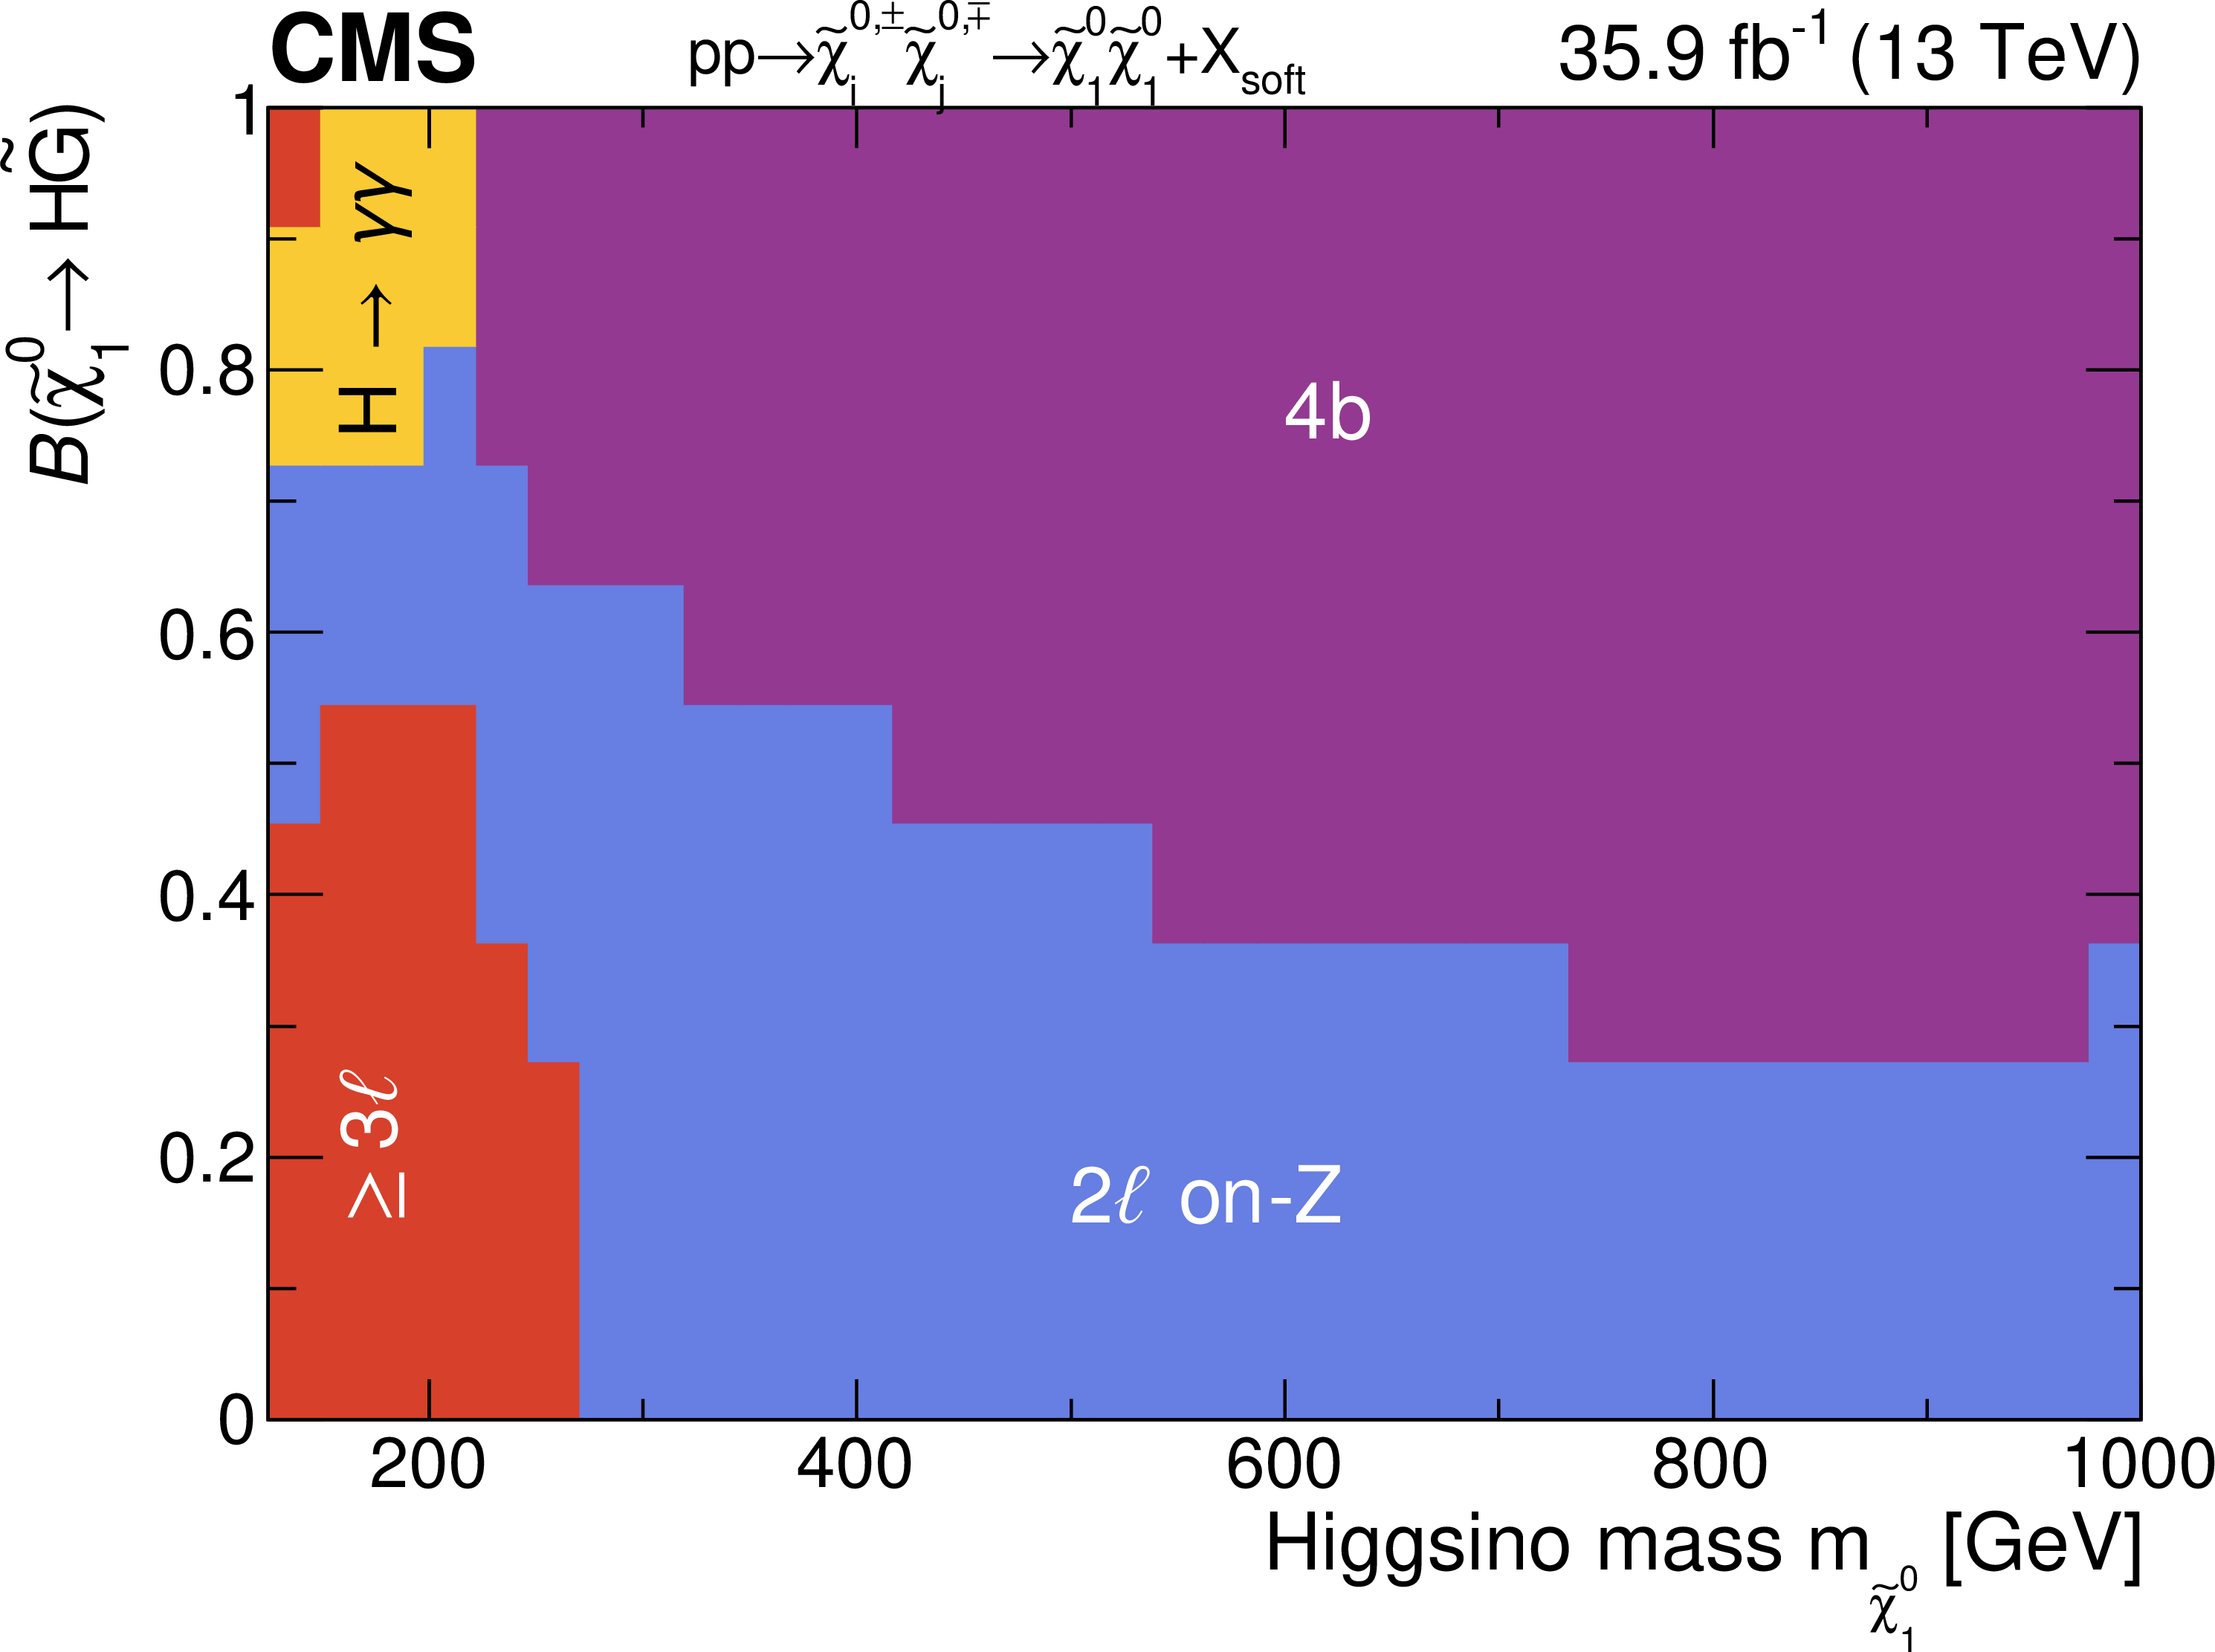
Figure 12:
Observed exclusion contours at the 95% CL in the plane of $ {m_{\tilde{\chi}^0_1 }} $ and $ {\mathcal {B}(\tilde{\chi}^0_1 \to {\mathrm {H}} \tilde{G})} $ for the model of $ {\tilde{\chi}^0_1 \tilde{\chi}^0_1 } $ production for each individual analysis compared with the combination. For the 4 b contour, the region above is excluded, while for all others, the region to the left is excluded. The 4 b search drives the exclusion at large values of $ {\mathcal {B}(\tilde{\chi}^0_1 \to {\mathrm {H}} \tilde{G})} $ while the on- Z dilepton and multilepton searches are competing at lower values of $ {\mathcal {B}(\tilde{\chi}^0_1 \to {\mathrm {H}} \tilde{G})} $. |
png pdf |
Figure 13:
The analysis with the best expected exclusion limit at each point in the plane of $ {m_{\tilde{\chi}^0_1 }} $ and $ {\mathcal {B}(\tilde{\chi}^0_1 \to {\mathrm {H}} \tilde{G})} $ for the model of $ {\tilde{\chi}^0_1 \tilde{\chi}^0_1 } $ production. |
png pdf |
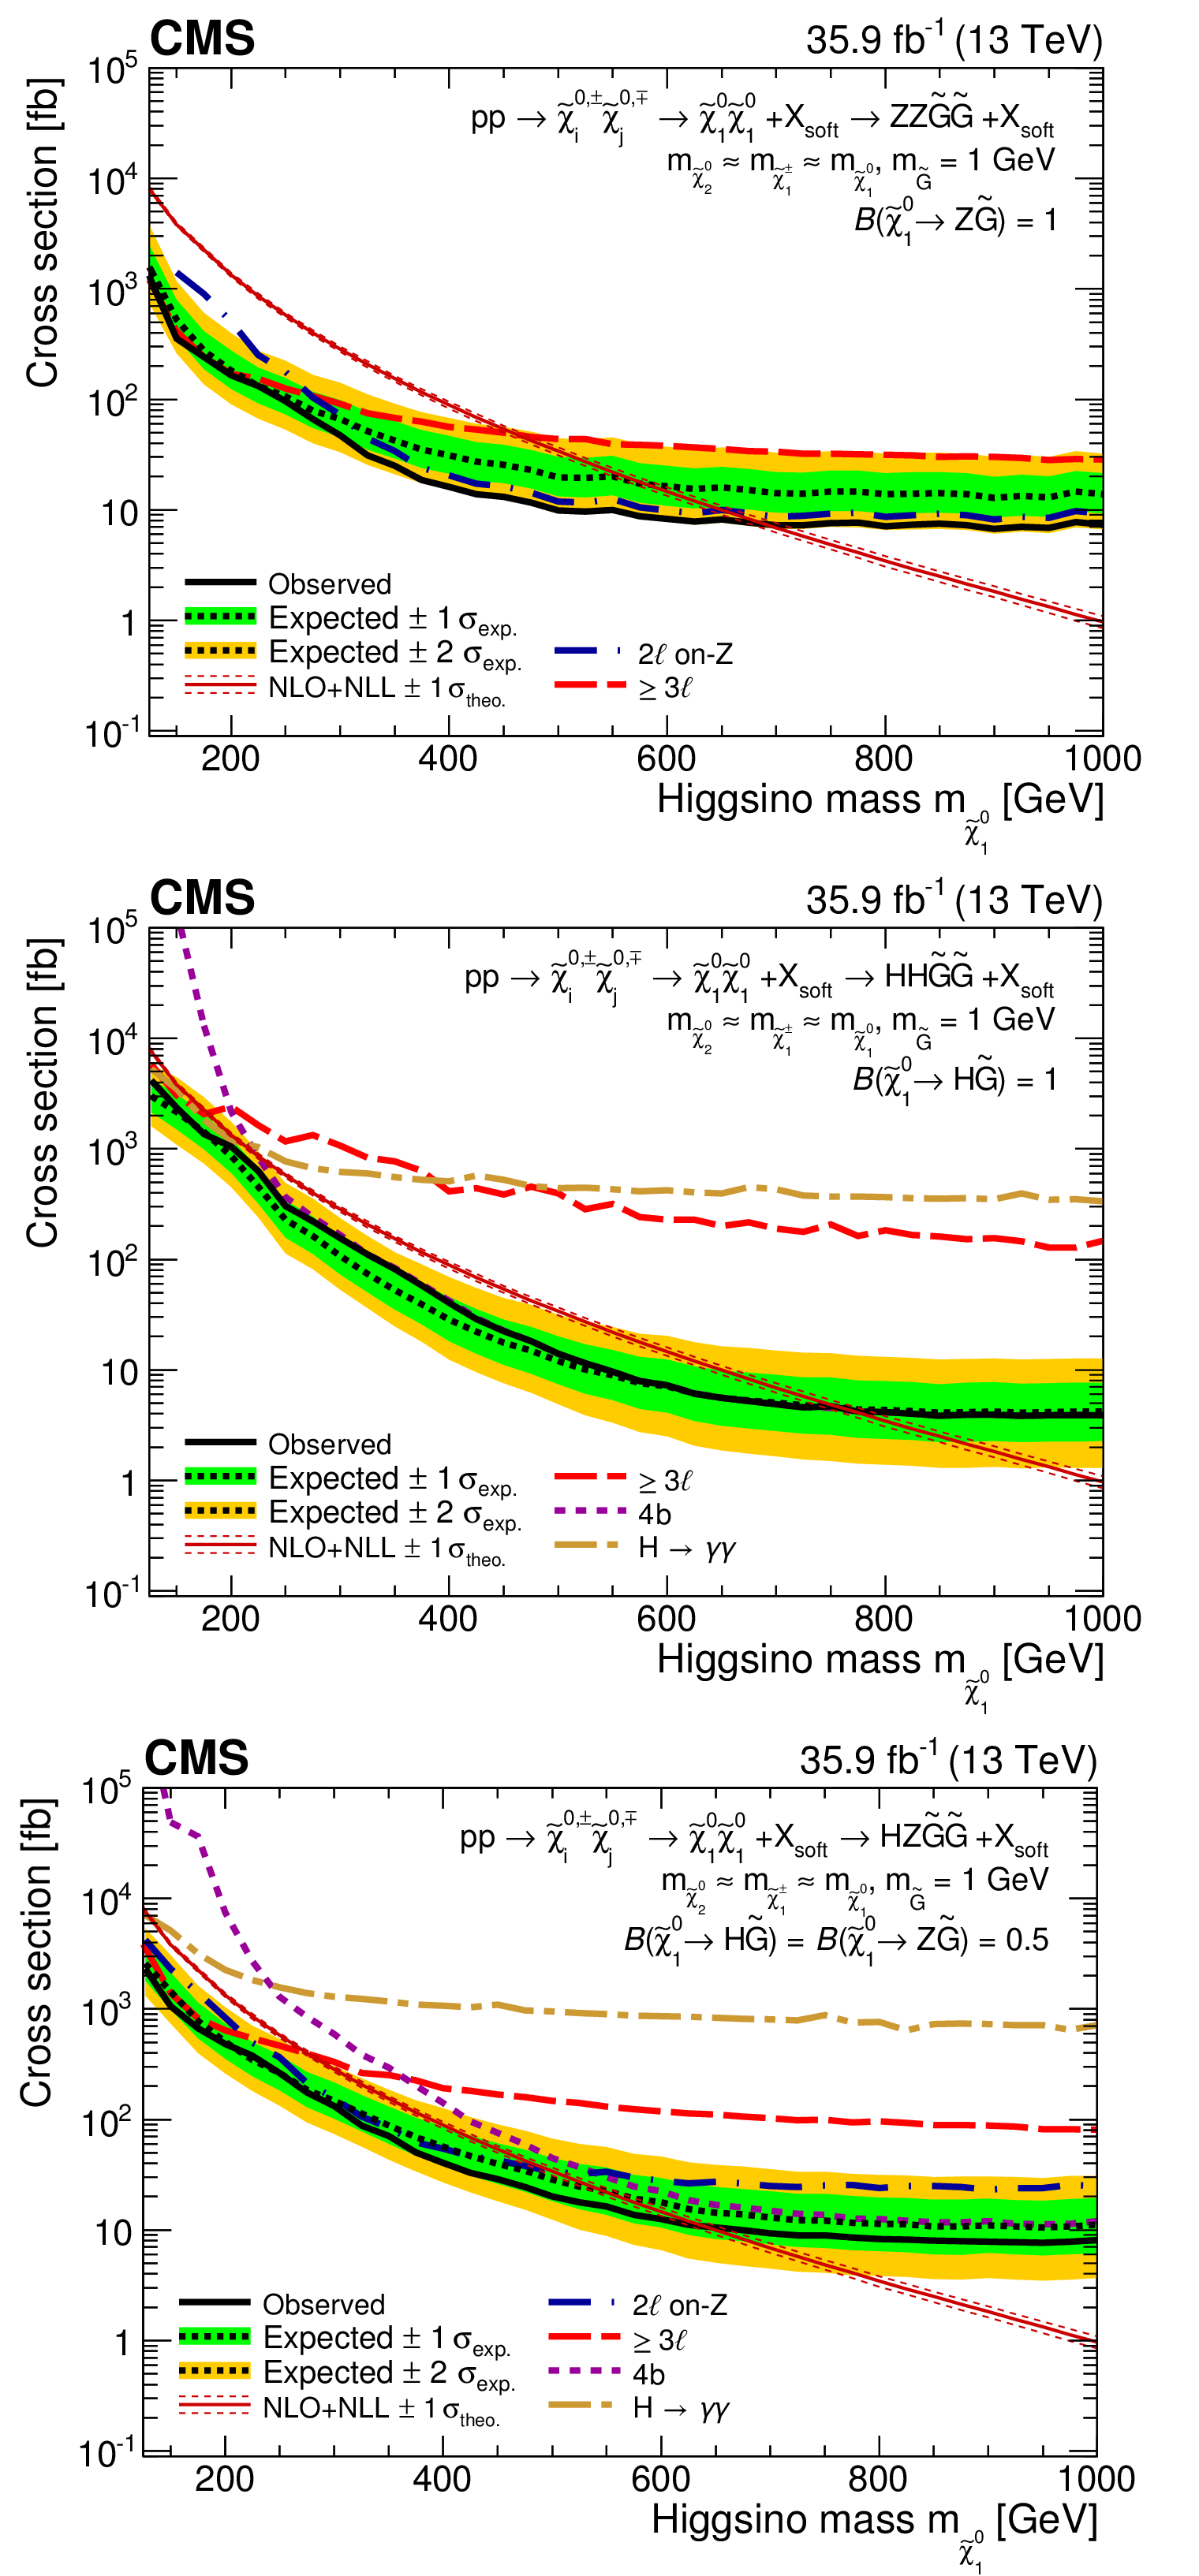
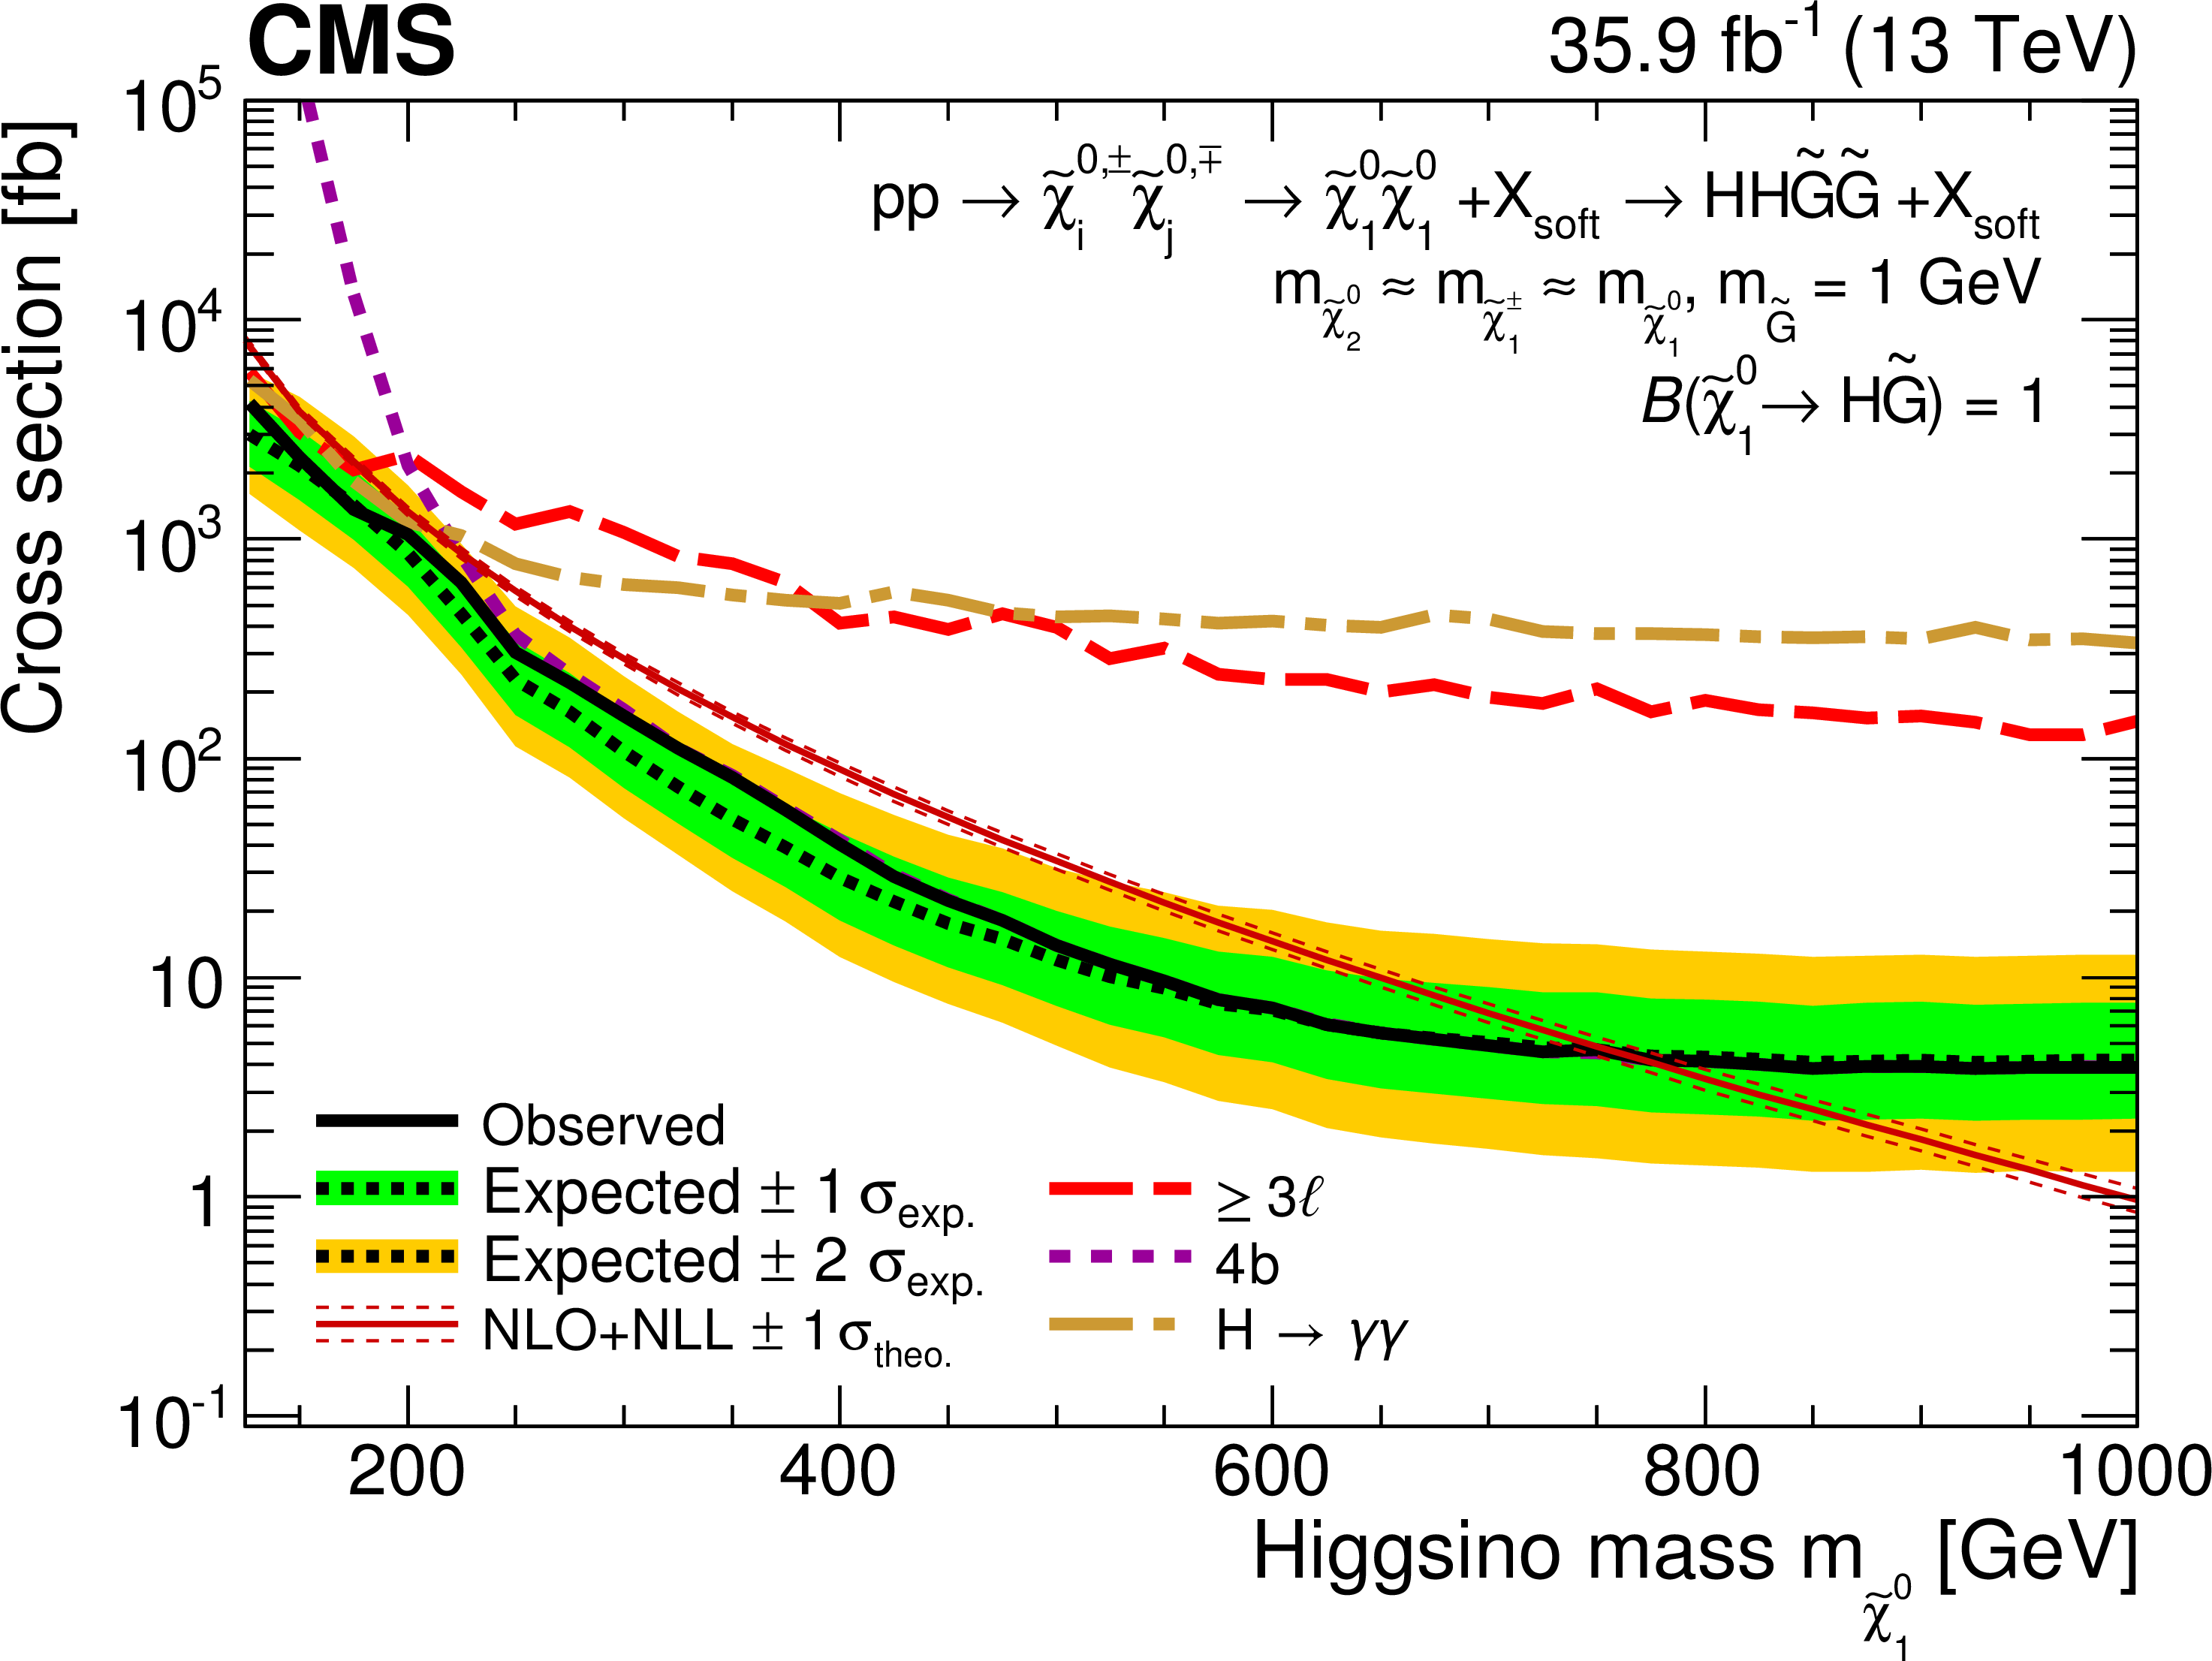
Figure 14:
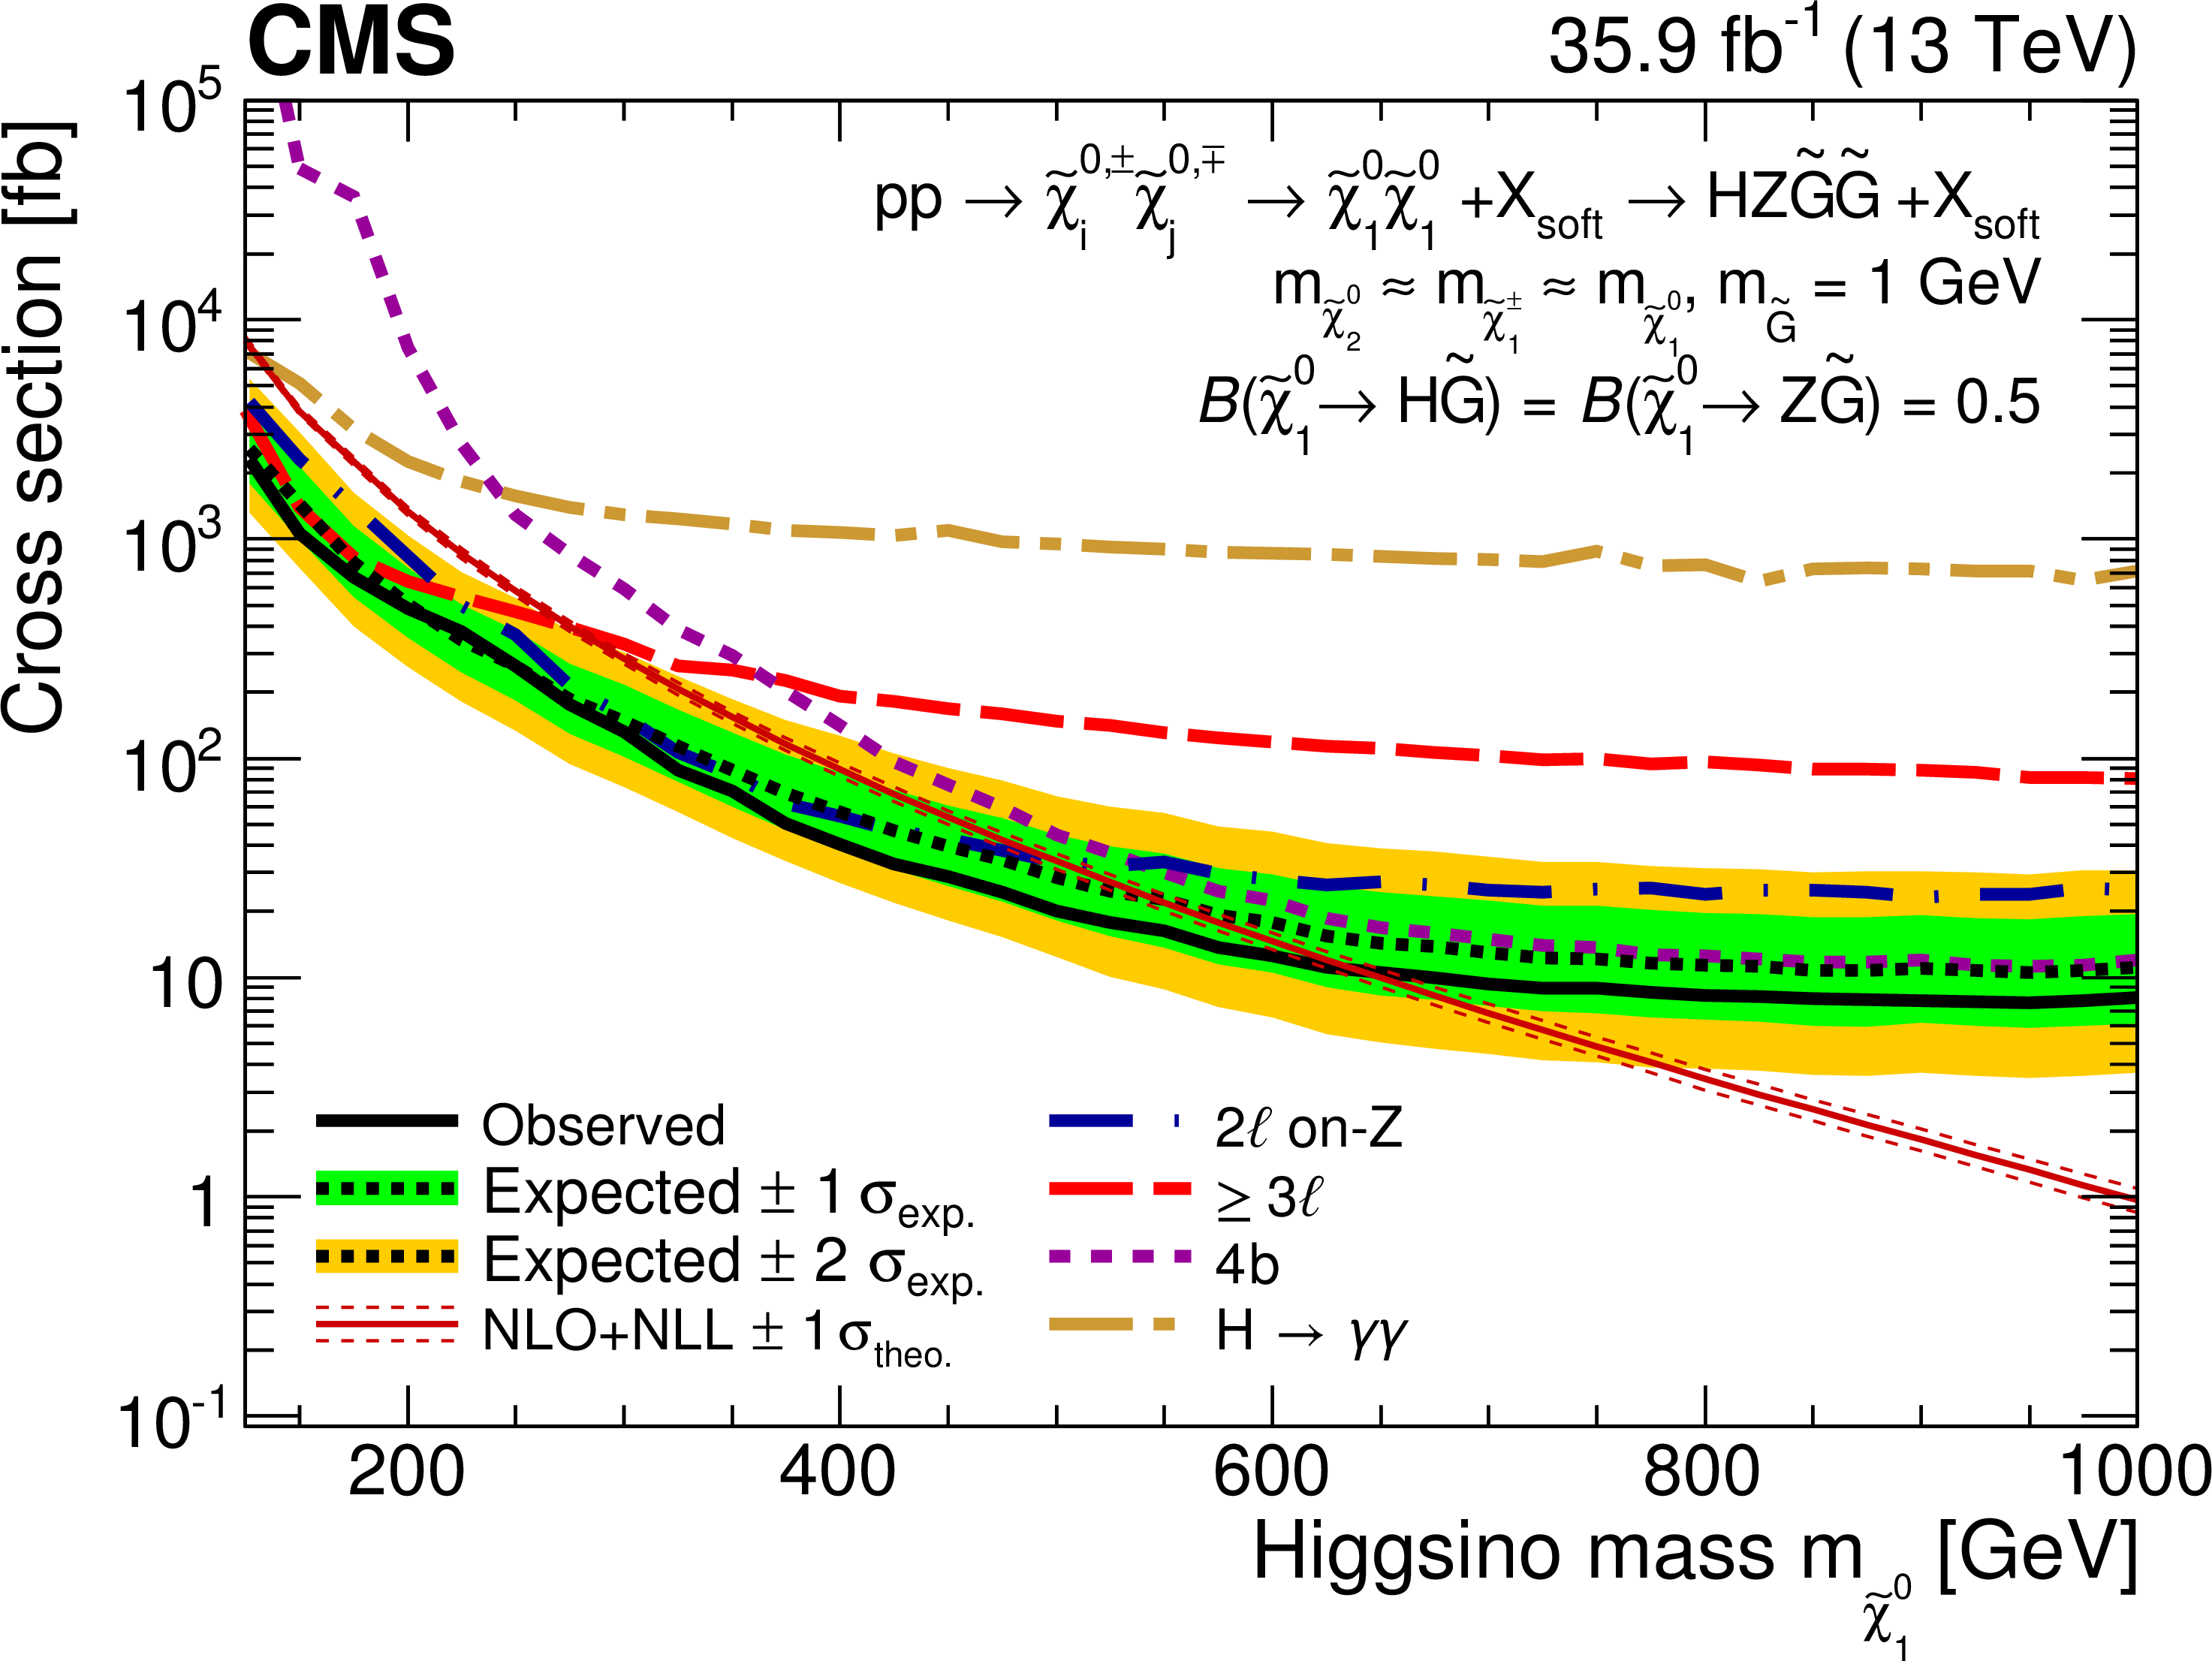
The 95% CL upper limits on the production cross sections as a function of $ {m_{\tilde{\chi}^0_1 }} $ for the model of $ {\tilde{\chi}^0_1 \tilde{\chi}^0_1 } $ production with three choices of $ {\mathcal {B}(\tilde{\chi}^0_1 \to {\mathrm {H}} \tilde{G})} $ : (upper) 0%, yielding the ZZ topology, (middle) 100%, yielding the ZH topology, and (lower) 50%, yielding the ZH mixed topology. The solid black line represents the observed exclusion. The dashed black line represents the expected exclusion, while the green and yellow bands indicate the $\pm $1 and 2$\sigma $ uncertainties in the expected limit. The red line shows the theoretical cross section with its uncertainty. The other lines in each plot show the observed exclusion for individual analyses. |

png pdf root |
Figure 14-a:
The 95% CL upper limits on the production cross sections as a function of $ {m_{\tilde{\chi}^0_1 }} $ for the model of $ {\tilde{\chi}^0_1 \tilde{\chi}^0_1 } $ production with the 0% choice of $ {\mathcal {B}(\tilde{\chi}^0_1 \to {\mathrm {H}} \tilde{G})} $, yielding the ZZ topology. The solid black line represents the observed exclusion. The dashed black line represents the expected exclusion, while the green and yellow bands indicate the $\pm $1 and 2$\sigma $ uncertainties in the expected limit. The red line shows the theoretical cross section with its uncertainty. The other lines in each plot show the observed exclusion for individual analyses. |
png pdf root |
Figure 14-b:
The 95% CL upper limits on the production cross sections as a function of $ {m_{\tilde{\chi}^0_1 }} $ for the model of $ {\tilde{\chi}^0_1 \tilde{\chi}^0_1 } $ production with the 100% choice of $ {\mathcal {B}(\tilde{\chi}^0_1 \to {\mathrm {H}} \tilde{G})} $, yielding the ZH topology. The solid black line represents the observed exclusion. The dashed black line represents the expected exclusion, while the green and yellow bands indicate the $\pm $1 and 2$\sigma $ uncertainties in the expected limit. The red line shows the theoretical cross section with its uncertainty. The other lines in each plot show the observed exclusion for individual analyses. |
png pdf root |
Figure 14-c:
The 95% CL upper limits on the production cross sections as a function of $ {m_{\tilde{\chi}^0_1 }} $ for the model of $ {\tilde{\chi}^0_1 \tilde{\chi}^0_1 } $ production with the 50% choice of $ {\mathcal {B}(\tilde{\chi}^0_1 \to {\mathrm {H}} \tilde{G})} $, yielding the ZH mixed topology. The solid black line represents the observed exclusion. The dashed black line represents the expected exclusion, while the green and yellow bands indicate the $\pm $1 and 2$\sigma $ uncertainties in the expected limit. The red line shows the theoretical cross section with its uncertainty. The other lines in each plot show the observed exclusion for individual analyses. |
| Tables | |
png pdf |
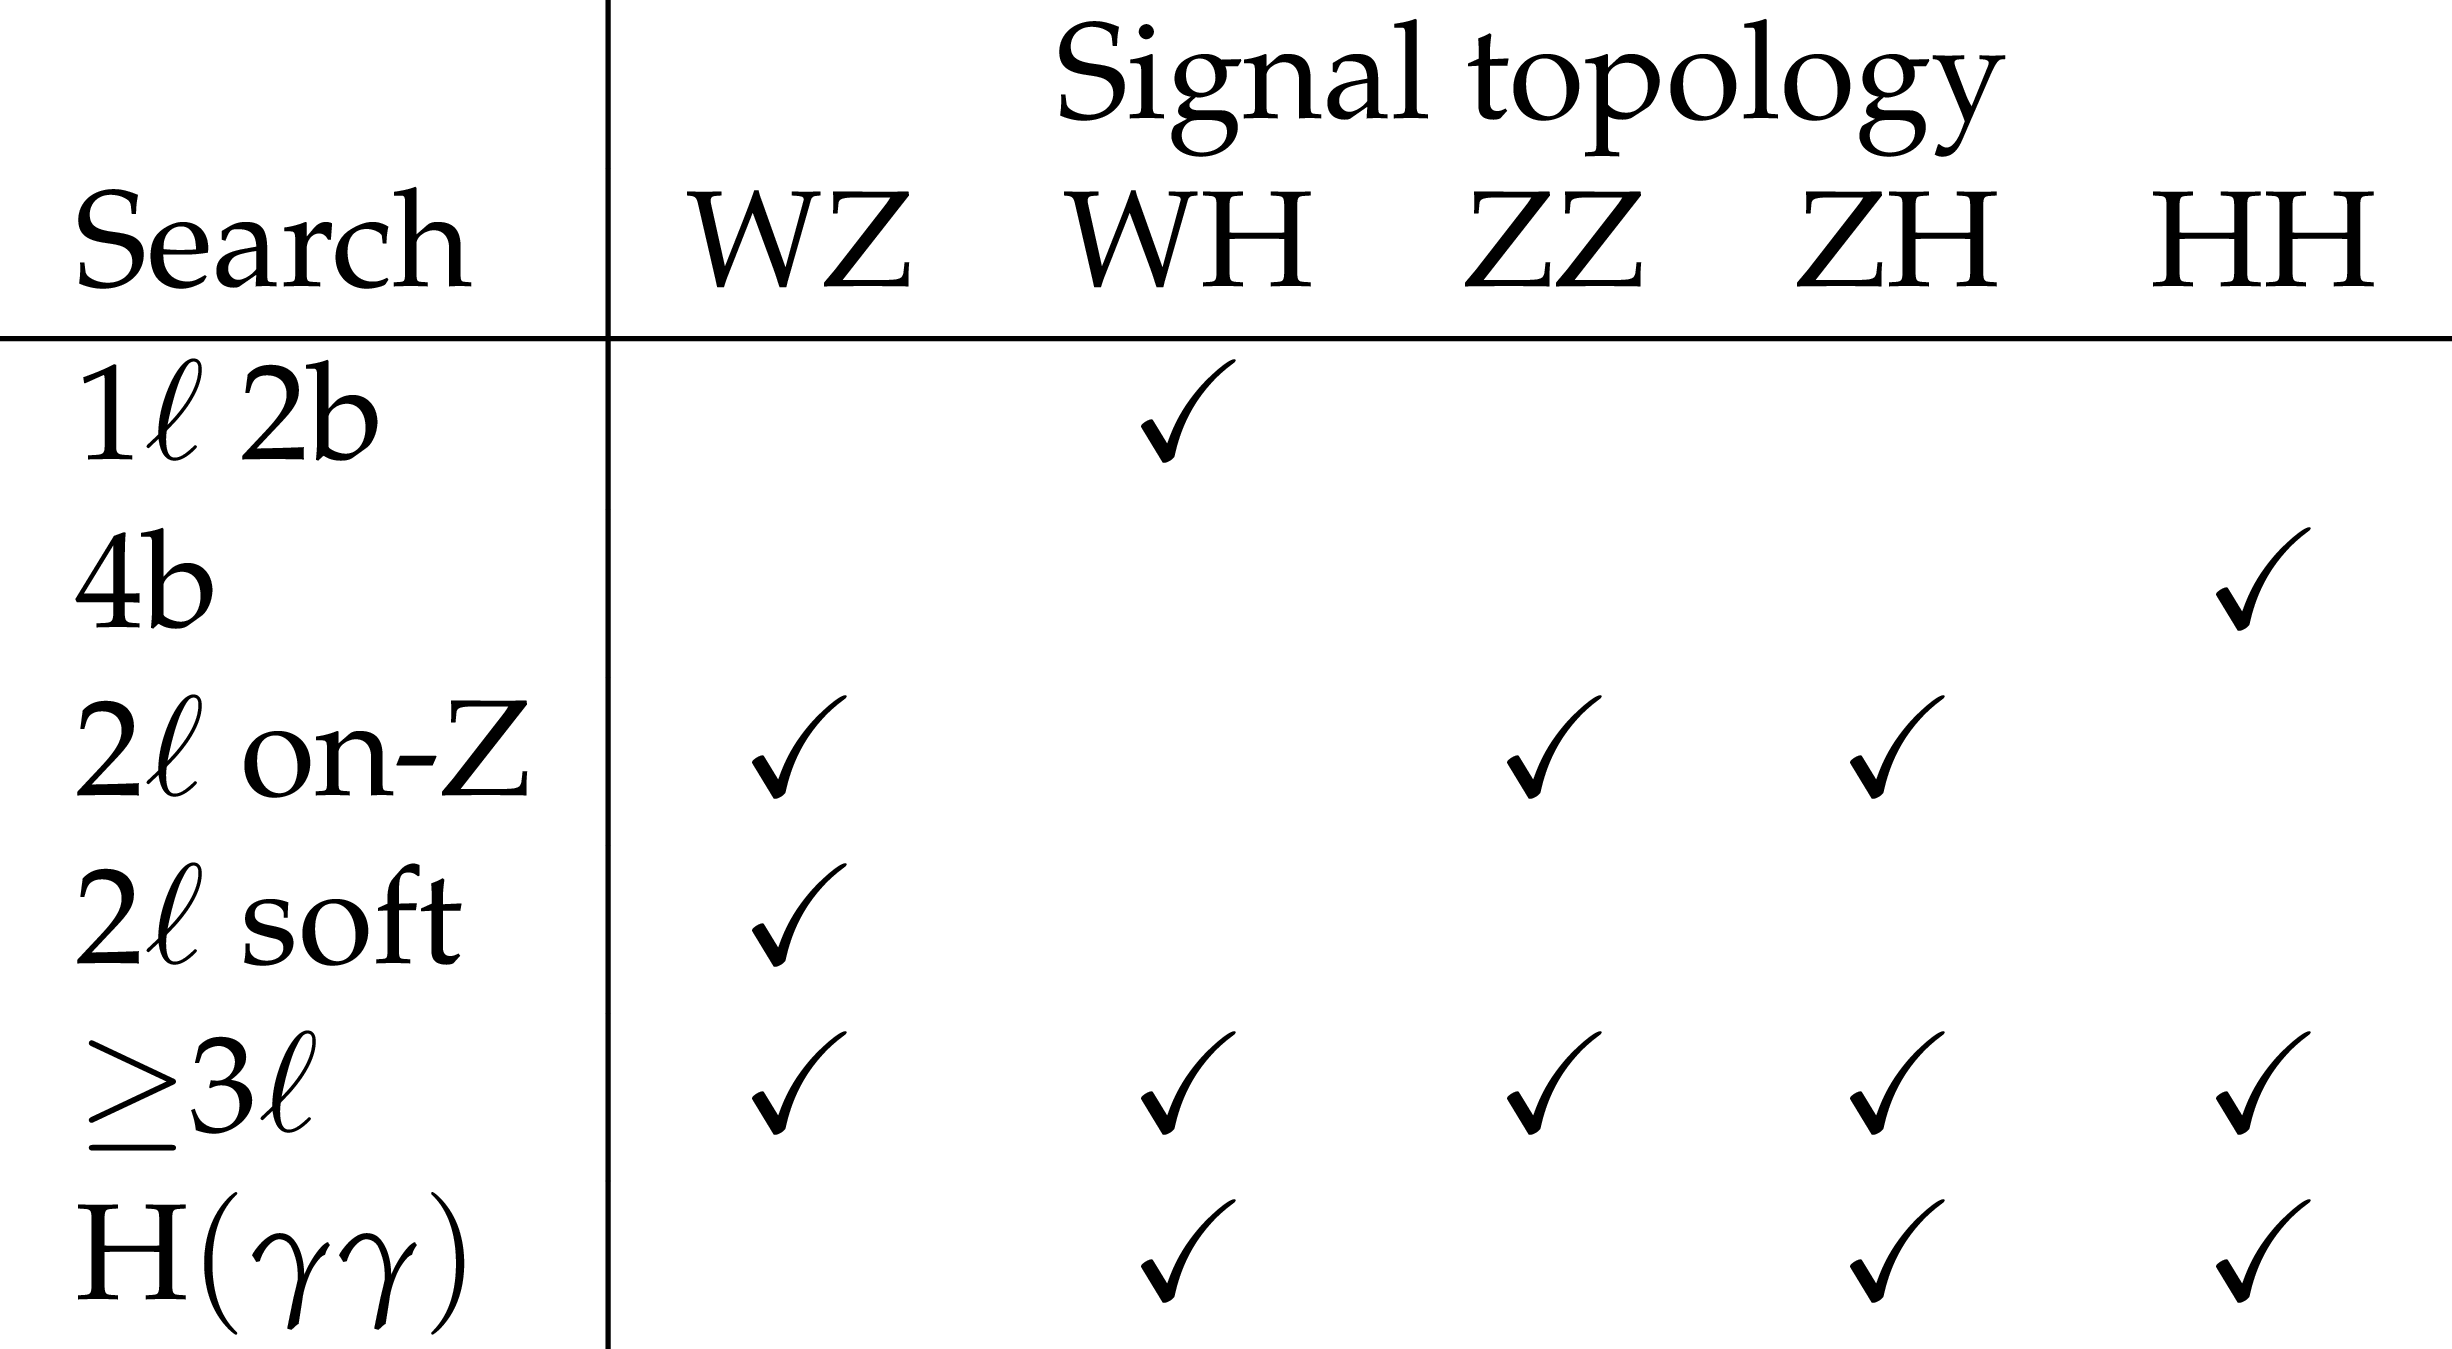
Table 1:
Summary of all experimental searches considered in the combination (rows), and the signal topologies for which each search is used in the combined results (columns). The searches are described in Sections 5.1 through 5.6 and Section 6. The ${\geq}$3$\ell $ search described in Section 5.5 is used for all signal topologies except for WZ, where the reoptimized search strategy from Section 6 is employed instead. |
png pdf |
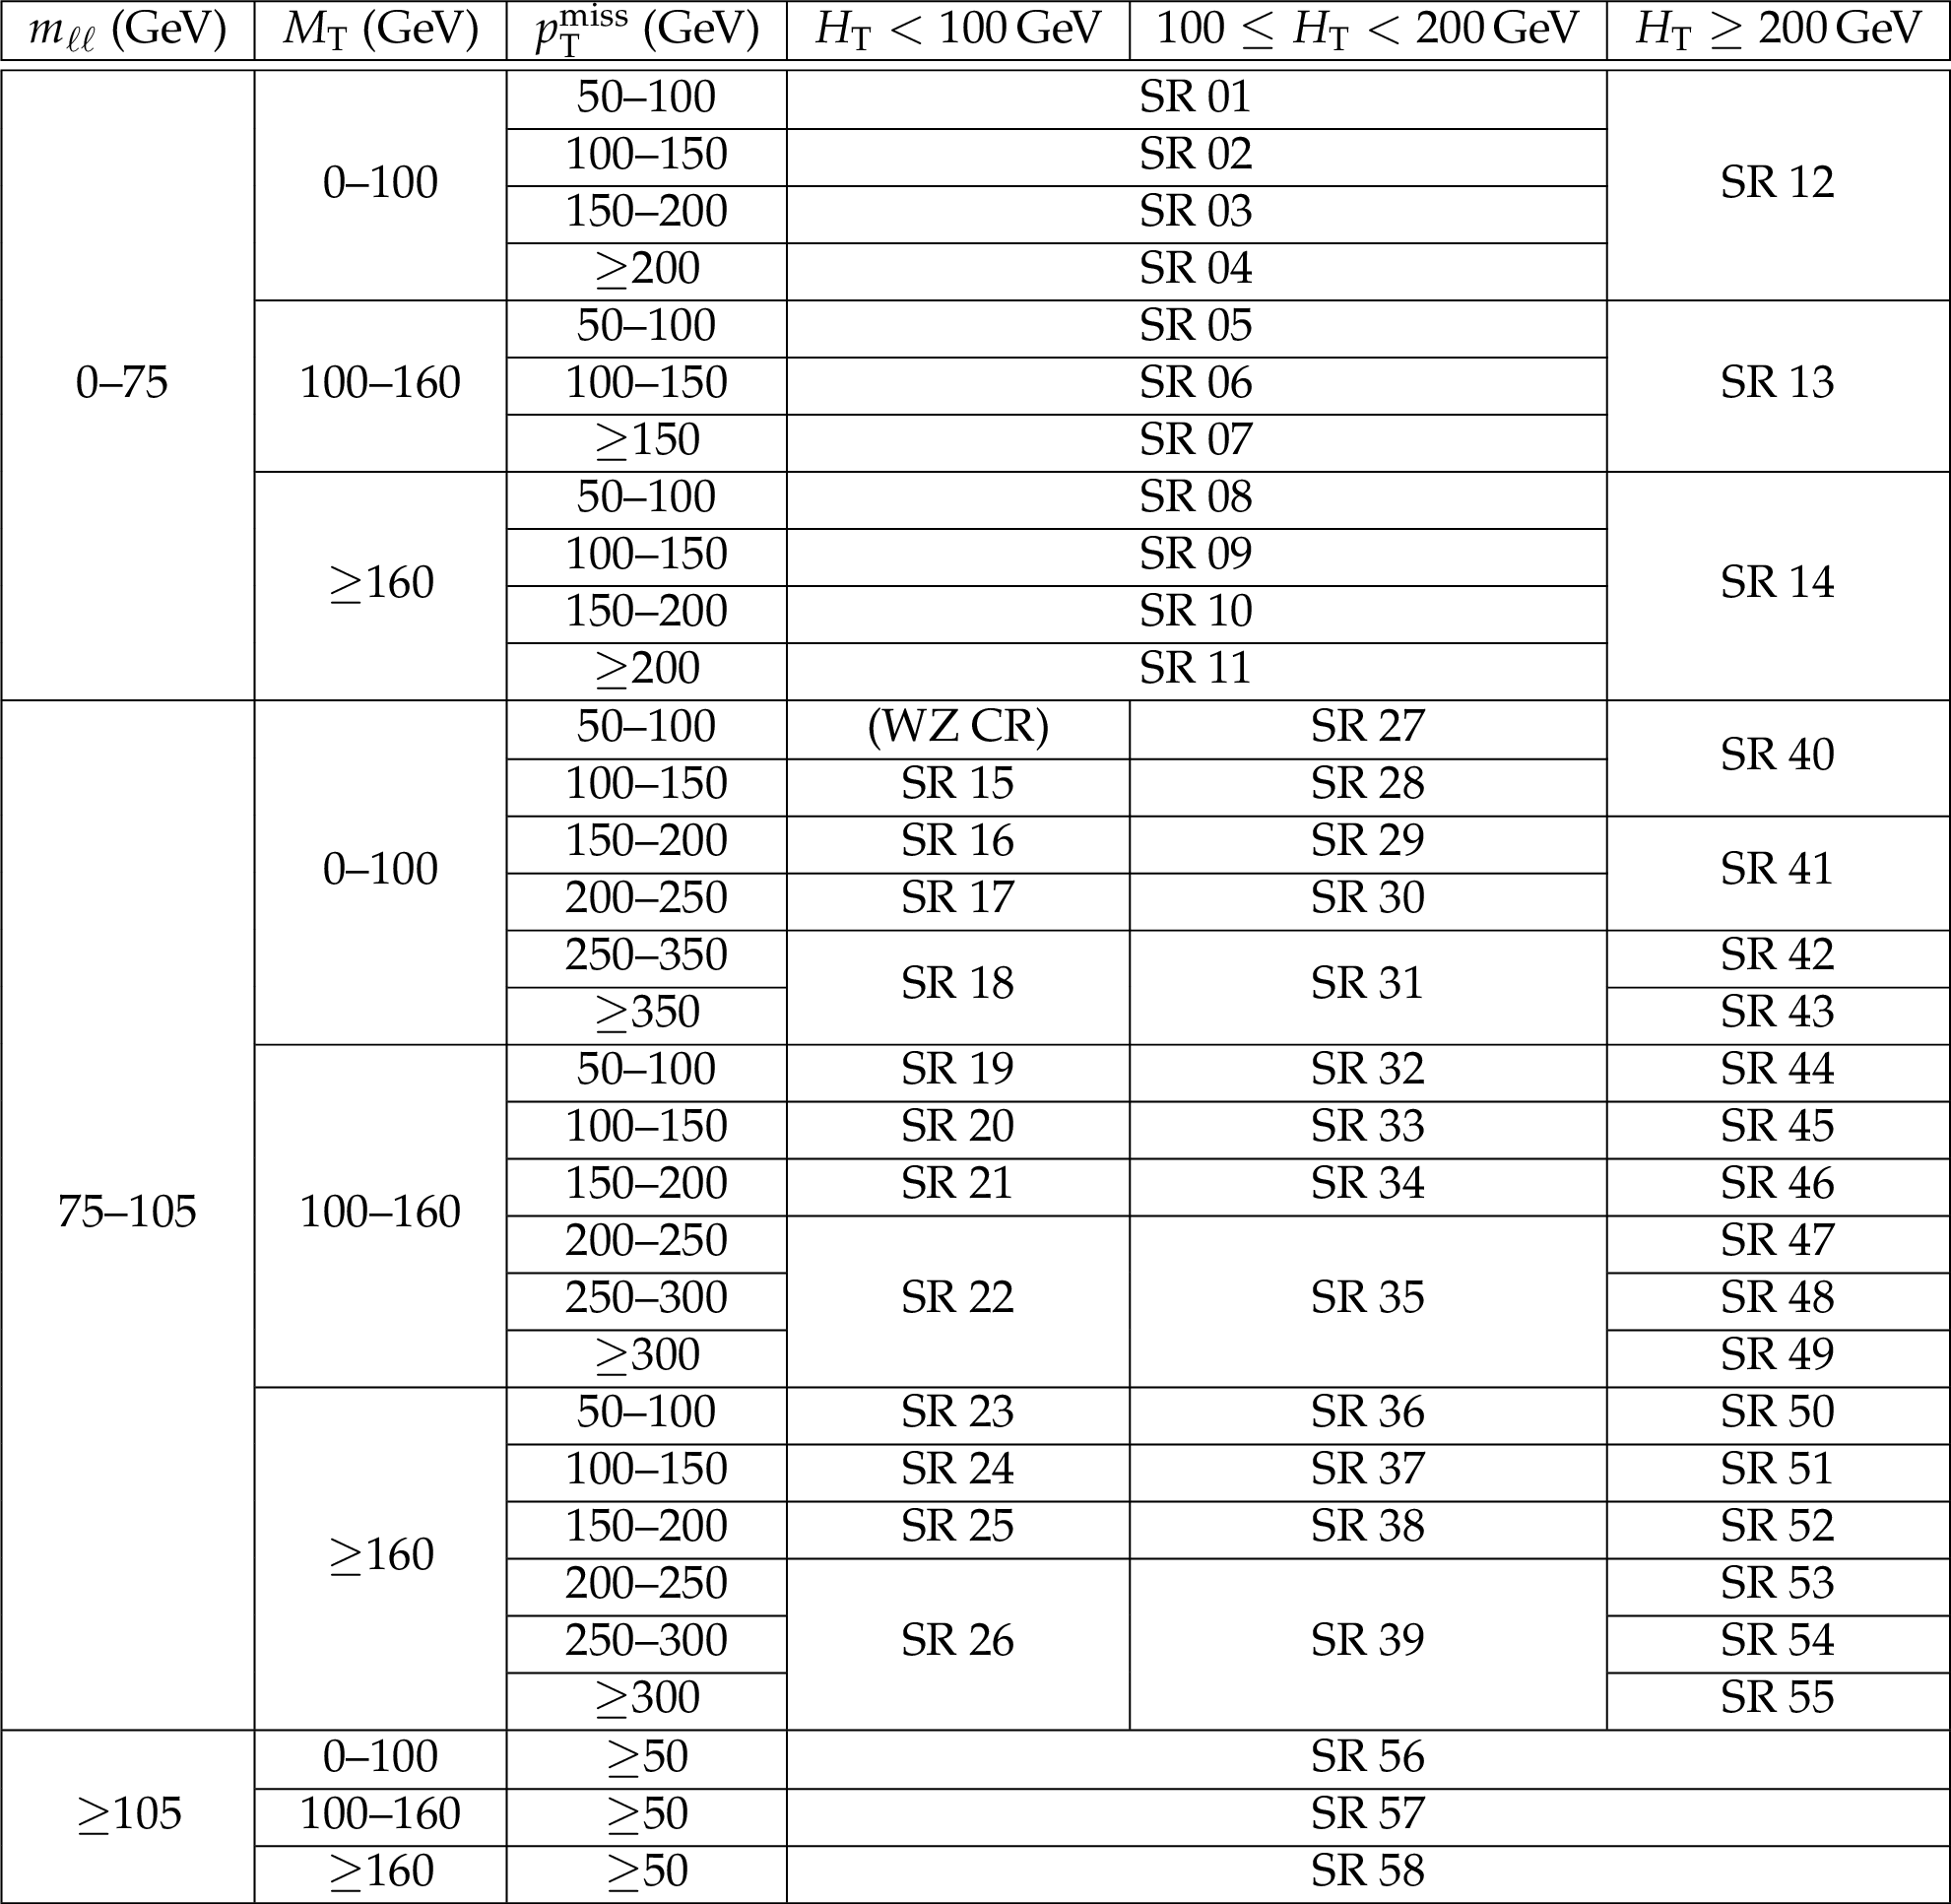
Table 2:
Definition of the search regions (SRs) optimized for the WZ corridor in the WZ signal topology. Events must have three leptons ( e, ${{\mu}}$) forming at least one OSSF pair and they are categorized in $ {m_{\ell \ell}} $, $ {M_\text {T}} $, $ {{p_{\mathrm {T}}} ^\text {miss}} $ and $ {H_{\mathrm {T}}} $. Where ranges of values are given, the lower bound is inclusive while the upper bound is exclusive, e.g., $75 \leq {m_{\ell \ell}} < $ 105 GeV. |
png pdf |
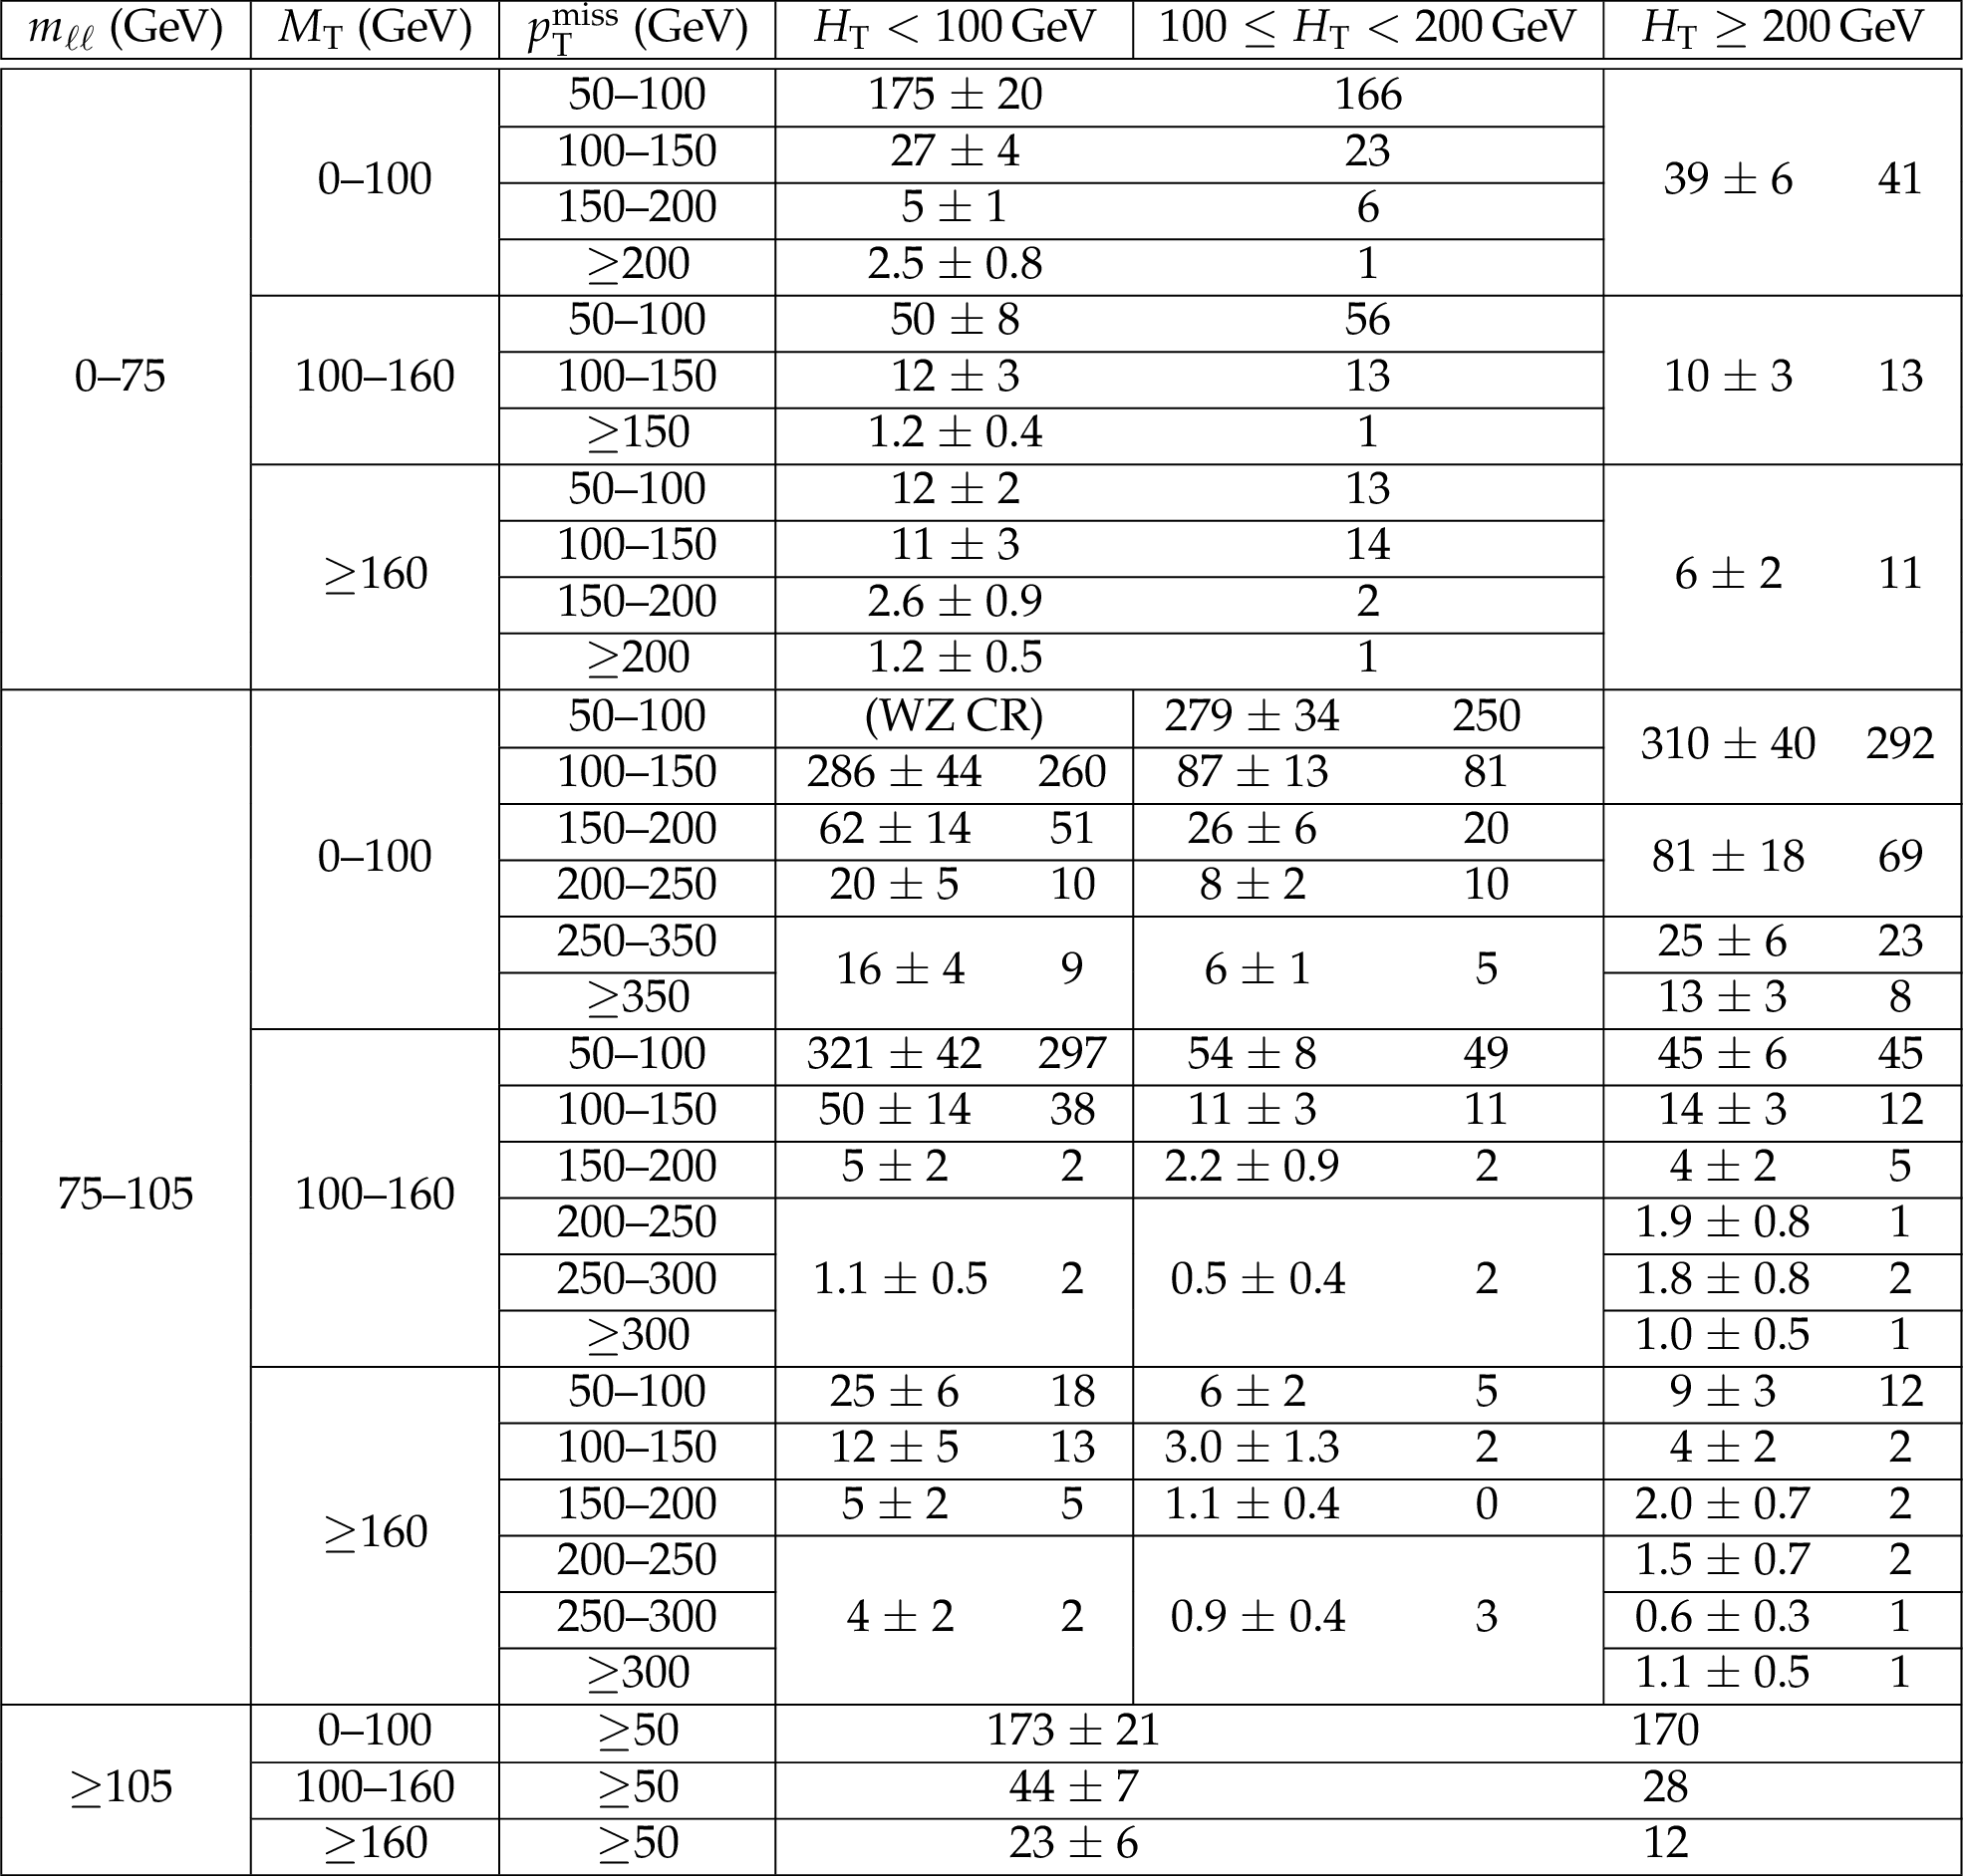
Table 3:
Expected and observed event yields in the search regions. For each bin, the first number corresponds to the expected yield and its total uncertainty while the second number gives the observation. Where ranges of values are given for the selections, the lower bound is inclusive while the upper bound is exclusive, e.g., 75 $ \leq {m_{\ell \ell}} < $ 105 GeV. |
| Summary |
|
A number of searches for the electroweak production of charginos and neutralinos predicted in supersymmetry (SUSY) have been performed in different final states. All searches considered here use proton-proton collision data at $\sqrt{s} = $ 13 TeV, recorded with the CMS detector at the LHC and corresponding to an integrated luminosity of 35.9 fb$^{-1}$. No significant deviations from the standard model expectations have been observed. A targeted search requiring three or more charged leptons (electrons or muons) has been presented, focusing on chargino-neutralino production where the difference in mass between $\tilde{\chi}^0_2$ and $\tilde{\chi}^0_1$ is approximately equal to the mass of the Z boson, and no significant deviations from the standard model predictions are observed. This search is interpreted in a simplified model scenario of SUSY chargino-neutralino ($\tilde{\chi}^{\pm}_1\tilde{\chi}^0_2 $) production with decays $\tilde{\chi}^{\pm}_1\to\mathrm{W}^{\pm}\tilde{\chi}^0_1$ and $\tilde{\chi}^0_2 \to\mathrm{Z}\tilde{\chi}^0_1$, where $\tilde{\chi}^0_1$ is the lightest SUSY particle (LSP). In the targeted phase space, the expected and observed 95% confidence level exclusion limits extend to 225 GeV in the mass of $ \tilde{\chi}^0_2 $ and 125 GeV in the mass of $ \tilde{\chi}^0_1 $, improving the observed limits from the previous publication by up to 60 GeV [38]. A statistical combination of several searches is performed and interpreted in the context of simplified models of either chargino-neutralino production, or neutralino pair production in a gauge-mediated SUSY breaking (GMSB) scenario. For a massless LSP $ \tilde{\chi}^0_1 $ in the chargino-neutralino model, the combined result gives an observed (expected) limit in the $ \tilde{\chi}^{\pm}_1 $ mass of about 650 (570) GeV for the WZ topology, 480 (455) GeV for the WH topology, and 535 (440) GeV for the mixed topology. Compared to the results of individual analyses, the combination improves the observed exclusion limit by up to 40 GeV in the masses of $ \tilde{\chi}^{\pm}_1 $ and $ \tilde{\chi}^0_2 $ in the chargino-neutralino model. The combination also excludes intermediate mass values that were not excluded by individual analyses, including $ \tilde{\chi}^{\pm}_1 $ masses between 180 and 240 GeV in the WH topology. In the GMSB neutralino pair model, the combined result gives an observed (expected) limit in the $ \tilde{\chi}^0_1 $ mass of 650-750 (550-750) GeV. The combined result improves the observed limit by up to 200 GeV in the mass of $ \tilde{\chi}^0_1 $ in the GMSB neutralino pair model, depending on the branching fractions for the SUSY particle decays. These results represent the most stringent constraints to date for all models considered. |
| Additional Figures | |

png pdf root |
Additional Figure 1:
Exclusion contours at the 95% CL for the model of neutralino-neutralino production for events obtained in the 2$\ell $ on-Z analysis. |

png pdf root |
Additional Figure 2:
Exclusion contours at the 95% CL for the model of neutralino-neutralino production for events obtained in the $\geq $3$\ell $ analysis. |
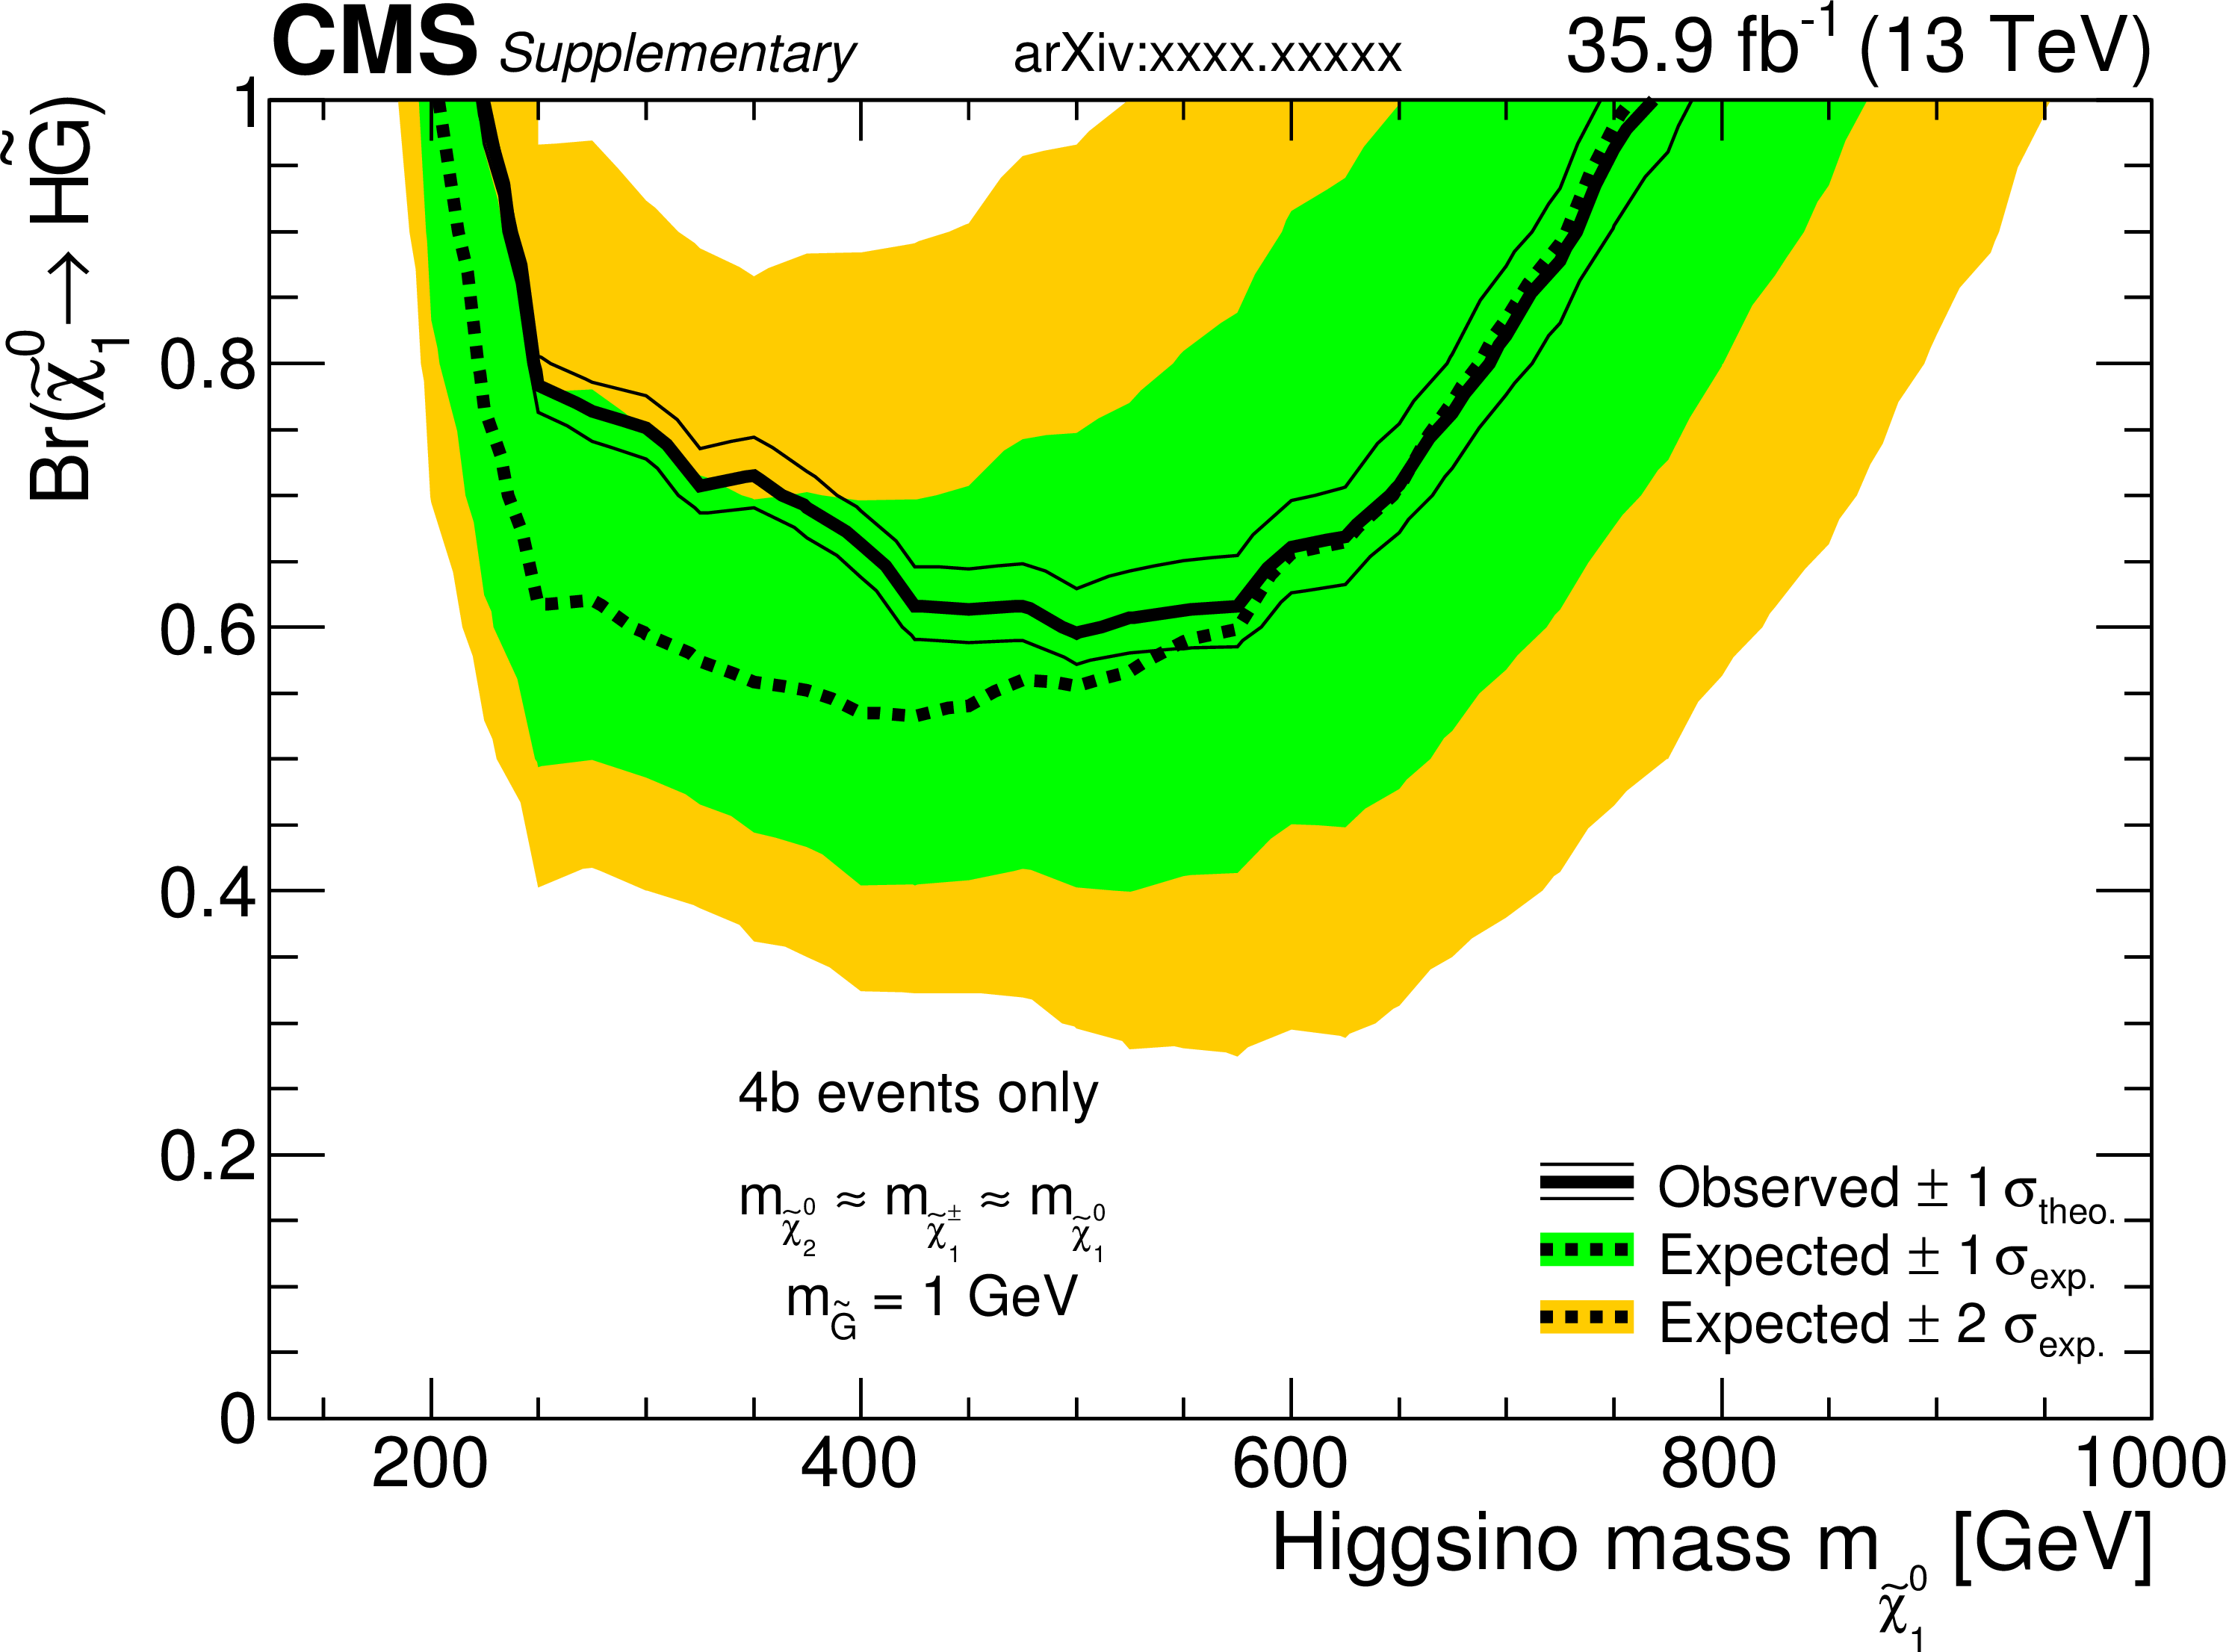
png pdf root |
Additional Figure 3:
Exclusion contours at the 95% CL for the model of neutralino-neutralino production for events obtained in the 4b analysis. |
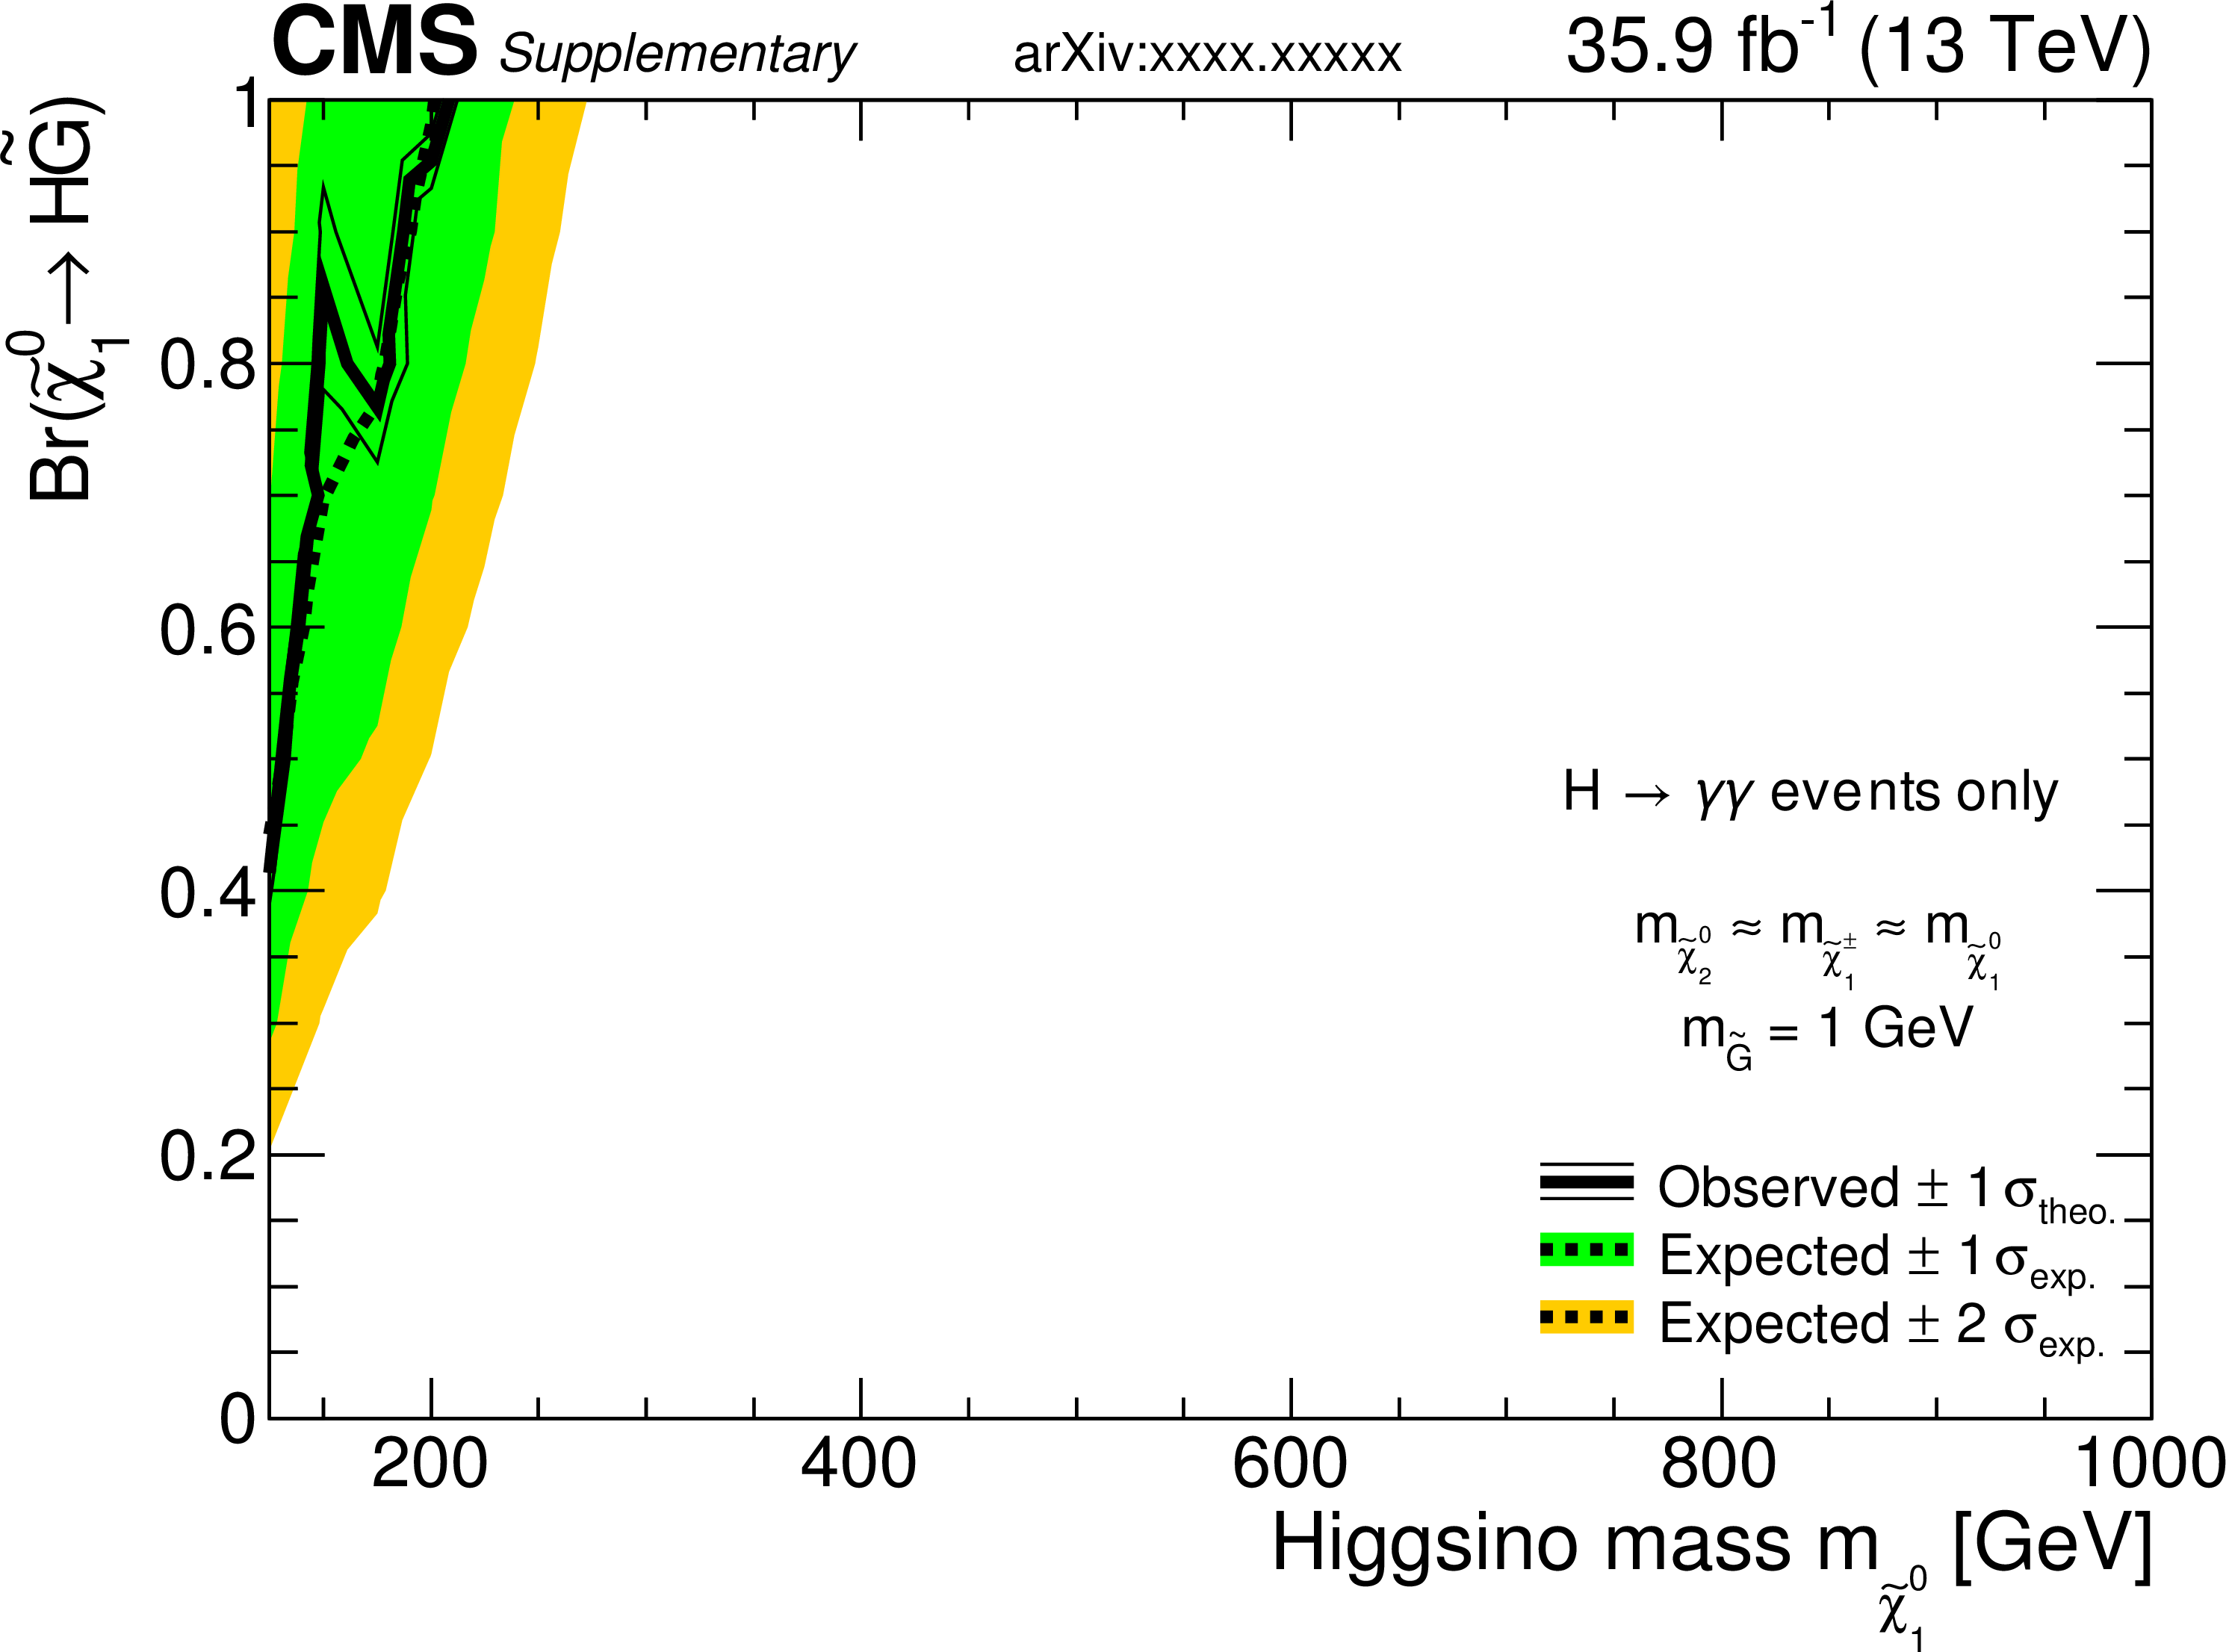
png pdf root |
Additional Figure 4:
Exclusion contours at the 95% CL for the model of neutralino-neutralino production for events obtained in the $\mathrm {H}\rightarrow \gamma \gamma $ analysis. |
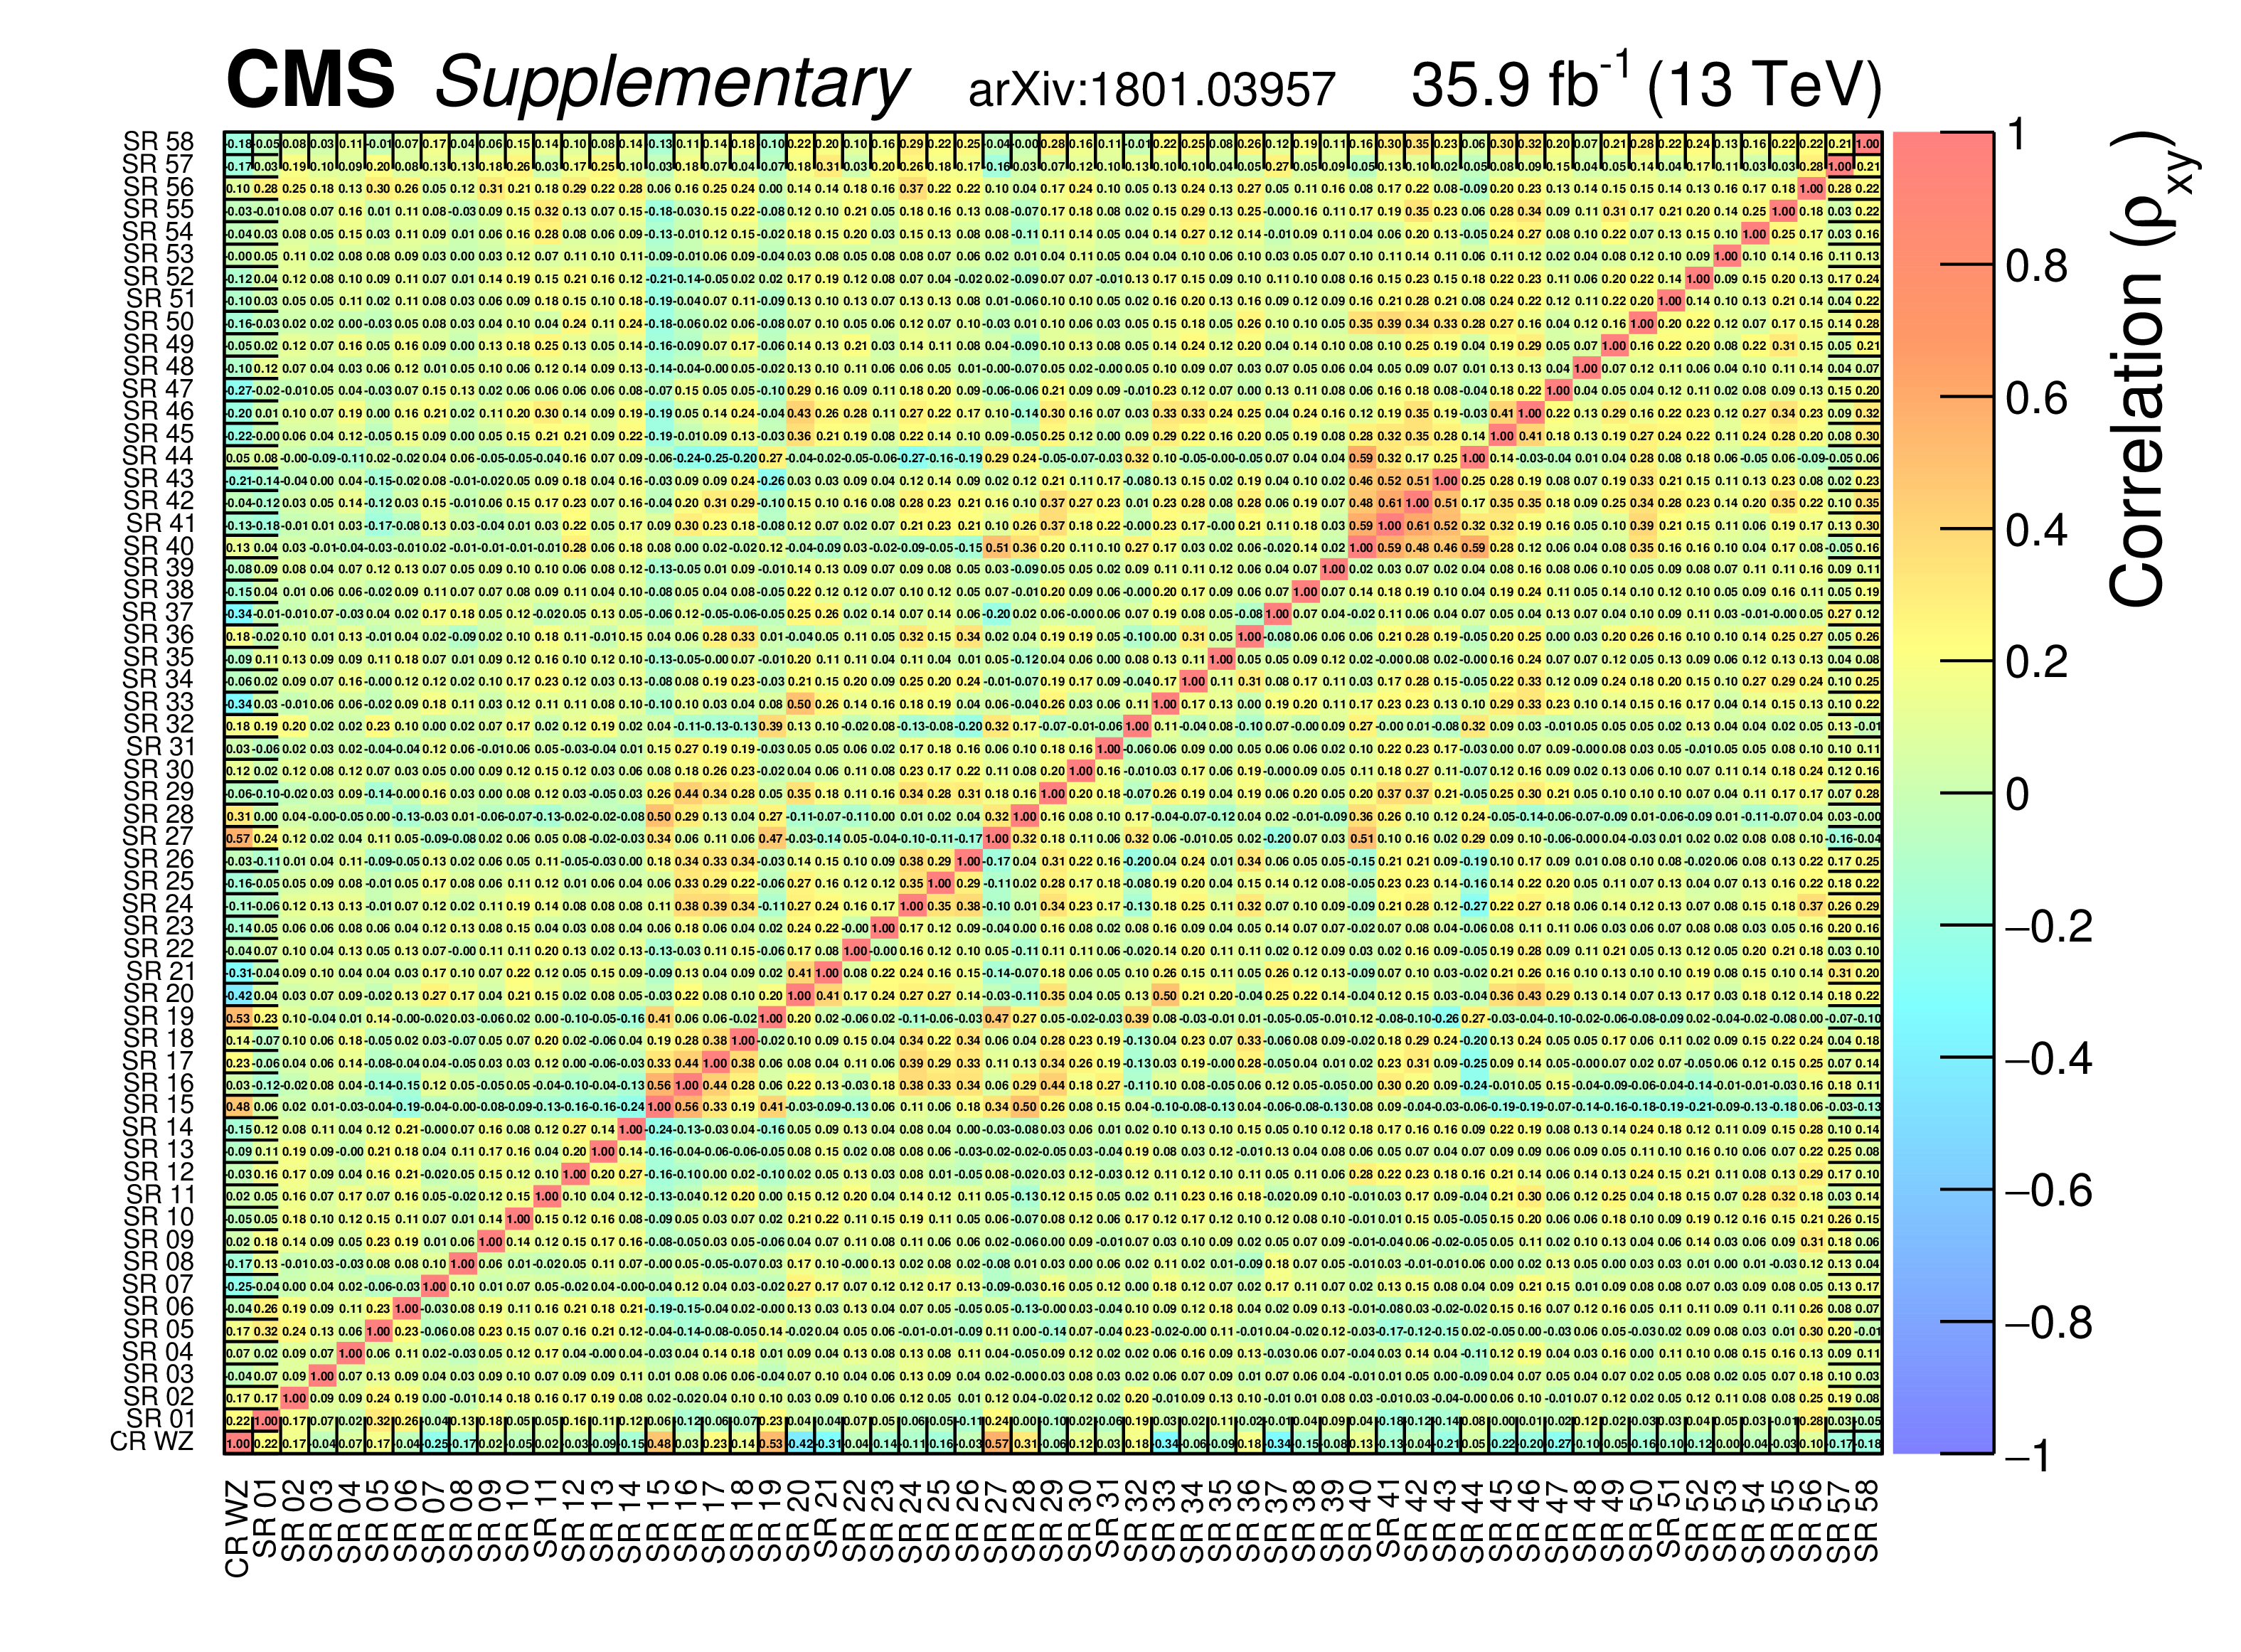
png pdf root |
Additional Figure 5:
The correlation matrix for the background predictions in the 3 lepton SRs. |
| References | ||||
| 1 | P. Ramond | Dual theory for free fermions | PRD 3 (1971) 2415 | |
| 2 | Y. A. Gol'fand and E. P. Likhtman | Extension of the algebra of Poincar$ \'e $ group generators and violation of P invariance | JEPTL 13 (1971)323 | |
| 3 | A. Neveu and J. H. Schwarz | Factorizable dual model of pions | NPB 31 (1971) 86 | |
| 4 | D. V. Volkov and V. P. Akulov | Possible universal neutrino interaction | JEPTL 16 (1972)438 | |
| 5 | J. Wess and B. Zumino | A lagrangian model invariant under supergauge transformations | PLB 49 (1974) 52 | |
| 6 | J. Wess and B. Zumino | Supergauge transformations in four dimensions | NPB 70 (1974) 39 | |
| 7 | P. Fayet | Supergauge invariant extension of the Higgs mechanism and a model for the electron and its neutrino | NPB 90 (1975) 104 | |
| 8 | H. P. Nilles | Supersymmetry, supergravity and particle physics | Phys. Rep. 110 (1984) 1 | |
| 9 | S. Dimopoulos and G. F. Giudice | Naturalness constraints in supersymmetric theories with nonuniversal soft terms | PLB 357 (1995) 573 | hep-ph/9507282 |
| 10 | R. Barbieri and D. Pappadopulo | S-particles at their naturalness limits | JHEP 10 (2009) 061 | 0906.4546 |
| 11 | M. Papucci, J. T. Ruderman, and A. Weiler | Natural SUSY endures | JHEP 09 (2012) 035 | 1110.6926 |
| 12 | A. J. Buras, J. R. Ellis, M. K. Gaillard, and D. V. Nanopoulos | Aspects of the grand unification of strong, weak and electromagnetic interactions | NPB 135 (1978) 66 | |
| 13 | H. E. Haber and G. L. Kane | The search for supersymmetry: Probing physics beyond the standard model | PR 117 (1985) 75 | |
| 14 | G. R. Farrar and P. Fayet | Phenomenology of the production, decay, and detection of new hadronic states associated with supersymmetry | PLB 76 (1978) 575 | |
| 15 | H. Goldberg | Constraint on the photino mass from cosmology | PRL 50 (1983) 1419, .[Erratum: \DOI10.1103/PhysRevLett.103.099905] | |
| 16 | J. R. Ellis et al. | Supersymmetric relics from the big bang | NPB 238 (1984) 453 | |
| 17 | Joint LEP2 SUSY Working Group, the ALEPH, DELPHI, L3 and OPAL Collaborations | LEP2 SUSY | link | |
| 18 | ATLAS Collaboration | Search for electroweak production of supersymmetric states in scenarios with compressed mass spectra at $ \sqrt{s}= $ 13 TeV with the ATLAS detector | Submitted to PRD | 1712.08119 |
| 19 | ATLAS Collaboration | Search for the electroweak production of supersymmetric particles in $ \sqrt{s}= $ 8 TeV pp collisions with the ATLAS detector | PRD 93 (2016) 052002 | 1509.07152 |
| 20 | ATLAS Collaboration | Search for photonic signatures of gauge-mediated supersymmetry in 8 TeV pp collisions with the ATLAS detector | PRD 92 (2015) 072001 | 1507.05493 |
| 21 | ATLAS Collaboration | Search for metastable heavy charged particles with large ionisation energy loss in pp collisions at $ \sqrt{s} = $ 8 TeV using the ATLAS experiment | EPJC 75 (2015) 407 | 1506.05332 |
| 22 | ATLAS Collaboration | Search for direct pair production of a chargino and a neutralino decaying to the 125 GeV Higgs boson in $ \sqrt{s} = $ 8 TeV pp collisions with the ATLAS detector | EPJC 75 (2015) 208 | 1501.07110 |
| 23 | ATLAS Collaboration | Searches for heavy long-lived charged particles with the ATLAS detector in proton-proton collisions at $ \sqrt{s} = $ 8 TeV | JHEP 01 (2015) 068 | 1411.6795 |
| 24 | ATLAS Collaboration | Search for nonpointing and delayed photons in the diphoton and missing transverse momentum final state in 8 TeV pp collisions at the LHC using the ATLAS detector | PRD 90 (2014) 112005 | 1409.5542 |
| 25 | ATLAS Collaboration | Search for the direct production of charginos, neutralinos and staus in final states with at least two hadronically decaying taus and missing transverse momentum in pp collisions at $ \sqrt{s} = $ 8 TeV with the ATLAS detector | JHEP 10 (2014) 096 | 1407.0350 |
| 26 | ATLAS Collaboration | Search for supersymmetry in events with four or more leptons in $ \sqrt{s} = $ 8 TeV pp collisions with the ATLAS detector | PRD 90 (2014) 052001 | 1405.5086 |
| 27 | ATLAS Collaboration | Search for direct production of charginos, neutralinos and sleptons in final states with two leptons and missing transverse momentum in pp collisions at $ \sqrt{s} = $ 8 TeV with the ATLAS detector | JHEP 05 (2014) 071 | 1403.5294 |
| 28 | ATLAS Collaboration | Search for direct production of charginos and neutralinos in events with three leptons and missing transverse momentum in $ \sqrt{s} = $ 8 TeV pp collisions with the ATLAS detector | JHEP 04 (2014) 169 | 1402.7029 |
| 29 | ATLAS Collaboration | Search for charginos nearly mass degenerate with the lightest neutralino based on a disappearing-track signature in pp collisions at $ \sqrt{s} = $ 8 TeV with the ATLAS detector | PRD 88 (2013) 112006 | 1310.3675 |
| 30 | CMS Collaboration | Searches for electroweak production of charginos, neutralinos, and sleptons decaying to leptons and W, Z, and Higgs bosons in pp collisions at 8 TeV | EPJC 74 (2014) 3036 | CMS-SUS-13-006 1405.7570 |
| 31 | CMS Collaboration | Searches for electroweak neutralino and chargino production in channels with Higgs, Z, and W bosons in pp collisions at 8 TeV | PRD 90 (2014) 092007 | CMS-SUS-14-002 1409.3168 |
| 32 | CMS Collaboration | Search for supersymmetry in electroweak production with photons and large missing transverse energy in pp collisions at $ \sqrt{s} = $ 8 TeV | PLB 759 (2016) 479 | CMS-SUS-14-016 1602.08772 |
| 33 | CMS Collaboration | Search for supersymmetry in events with soft leptons, low jet multiplicity, and missing transverse energy in proton-proton collisions at $ \sqrt{s} = $ 8 TeV | PLB 759 (2016) 9 | CMS-SUS-14-021 1512.08002 |
| 34 | CMS Collaboration | Search for supersymmetry in events with a photon, a lepton, and missing transverse momentum in pp collisions at $ \sqrt{s} = $ 8 TeV | PLB 757 (2016) 6 | CMS-SUS-14-013 1508.01218 |
| 35 | CMS Collaboration | Search for electroweak production of charginos in final states with two $ \tau $ leptons in pp collisions at $ \sqrt{s} = $ 8 TeV | JHEP 04 (2017) 018 | CMS-SUS-14-022 1610.04870 |
| 36 | CMS Collaboration | Searches for long-lived charged particles in pp collisions at $ \sqrt{s} = $ 7 and 8 TeV | JHEP 07 (2013) 122 | CMS-EXO-12-026 1305.0491 |
| 37 | CMS Collaboration | Search for disappearing tracks in proton-proton collisions at $ \sqrt{s} = $ 8 TeV | JHEP 01 (2015) 96 | CMS-EXO-12-034 1411.6006 |
| 38 | CMS Collaboration | Search for electroweak production of charginos and neutralinos in multilepton final states in proton-proton collisions at $ \sqrt{s}= $ 13 TeV | Submitted to JHEP | CMS-SUS-16-039 1709.05406 |
| 39 | CMS Collaboration | Search for new physics in events with two low momentum opposite-sign leptons and missing transverse energy at $ \sqrt{s}= $ 13 TeV | Submitted to PLB | CMS-SUS-16-048 1801.01846 |
| 40 | CMS Collaboration | Search for supersymmetry with Higgs boson to diphoton decays using the razor variables at $ \sqrt{s}= $ 13 TeV | Submitted to PLB | CMS-SUS-16-045 1709.00384 |
| 41 | CMS Collaboration | Search for higgsino pair production in pp collisions at $ \sqrt{s} = 13 \mathrm{TeV} $ in final states with large missing transverse momentum and two Higgs bosons decaying via $ \mathrm{H} \to\mathrm{b}\overline{\mathrm{b}} $ | Submitted to PRD | CMS-SUS-16-044 1709.04896 |
| 42 | CMS Collaboration | Search for new phenomena in final states with two opposite-charge, same-flavor leptons, jets, and missing transverse momentum in pp collisions at $ \sqrt{s}= $ 13 TeV | Submitted to JHEP | CMS-SUS-16-034 1709.08908 |
| 43 | CMS Collaboration | Search for electroweak production of charginos and neutralinos in WH events in proton-proton collisions at $ \sqrt{s}= $ 13 TeV | JHEP 11 (2017) 029 | CMS-SUS-16-043 1706.09933 |
| 44 | J. Alwall, P. Schuster, and N. Toro | Simplified models for a first characterization of new physics at the LHC | PRD 79 (2009) 075020 | 0810.3921 |
| 45 | J. Alwall, M.-P. Le, M. Lisanti, and J. G. Wacker | Model-independent jets plus missing energy searches | PRD 79 (2009) 015005 | 0809.3264 |
| 46 | D. Alves et al. | Simplified models for LHC new physics searches | JPG 39 (2012) 105005 | 1105.2838 |
| 47 | CMS Collaboration | Interpretation of searches for supersymmetry with simplified models | PRD 88 (2013) 052017 | CMS-SUS-11-016 1301.2175 |
| 48 | ATLAS and CMS Collaborations | Measurements of the Higgs boson production and decay rates and constraints on its couplings from a combined ATLAS and CMS analysis of the LHC pp collision data at $ \sqrt{s}= $ 7 and 8 TeV | JHEP 08 (2016) 045 | 1606.02266 |
| 49 | S. P. Martin | A supersymmetry primer | in Perspectives on Supersymmetry II, G. L. Kane, ed., p. 1 World Scientific, 2010 Adv. Ser. Direct. High Energy Phys., vol. 21 | hep-ph/9709356 |
| 50 | K. T. Matchev and S. D. Thomas | Higgs and Z boson signatures of supersymmetry | PRD 62 (2000) 077702 | hep-ph/9908482 |
| 51 | P. Meade, M. Reece, and D. Shih | Prompt decays of general neutralino NLSPs at the Tevatron | JHEP 05 (2010) 105 | 0911.4130 |
| 52 | J. T. Ruderman and D. Shih | General neutralino NLSPs at the early LHC | JHEP 08 (2012) 159 | 1103.6083 |
| 53 | P. Z. Skands et al. | SUSY Les Houches accord: interfacing SUSY spectrum calculators, decay packages, and event generators | JHEP 07 (2004) 036 | hep-ph/0311123 |
| 54 | W. Beenakker et al. | Production of charginos, neutralinos, and sleptons at hadron colliders | PRL 83 (1999) 3780 | hep-ph/9906298 |
| 55 | B. Fuks, M. Klasen, D. R. Lamprea, and M. Rothering | Gaugino production in proton-proton collisions at a center-of-mass energy of 8 TeV | JHEP 10 (2012) 081 | 1207.2159 |
| 56 | B. Fuks, M. Klasen, D. R. Lamprea, and M. Rothering | Precision predictions for electroweak superpartner production at hadron colliders with $ \sc $ Resummino | EPJC 73 (2013) 2480 | 1304.0790 |
| 57 | G. Bozzi, B. Fuks, and M. Klasen | Joint resummation for slepton pair production at hadron colliders | NPB 794 (2008) 46 | 0709.3057 |
| 58 | G. Bozzi, B. Fuks, and M. Klasen | Threshold resummation for slepton-pair production at hadron colliders | NPB 777 (2007) 157 | hep-ph/0701202 |
| 59 | G. Bozzi, B. Fuks, and M. Klasen | Transverse-momentum resummation for slepton-pair production at the CERN LHC | PRD 74 (2006) 015001 | hep-ph/0603074 |
| 60 | CMS Collaboration | The CMS experiment at the CERN LHC | JINST 3 (2008) S08004 | CMS-00-001 |
| 61 | CMS Collaboration | Particle-flow reconstruction and global event description with the CMS detector | JINST 12 (2017) P10003 | CMS-PRF-14-001 1706.04965 |
| 62 | M. Cacciari, G. P. Salam, and G. Soyez | The anti-$ k_t $ jet clustering algorithm | JHEP 04 (2008) 063 | 0802.1189 |
| 63 | M. Cacciari, G. P. Salam, and G. Soyez | FastJet user manual | EPJC 72 (2012) 1896 | 1111.6097 |
| 64 | CMS Collaboration | Performance of the CMS missing transverse momentum reconstruction in pp data at $ \sqrt{s} = $ 8 TeV | JINST 10 (2015) P02006 | CMS-JME-13-003 1411.0511 |
| 65 | CMS Collaboration | Performance of electron reconstruction and selection with the cms detector in proton-proton collisions at $ \sqrt{s} = $ 8 TeV | JINST 10 (2015) P06005 | CMS-EGM-13-001 1502.02701 |
| 66 | CMS Collaboration | Performance of CMS muon reconstruction in pp collision events at $ \sqrt{s}= $ 7 TeV | JINST 7 (2012) P10002 | CMS-MUO-10-004 1206.4071 |
| 67 | CMS Collaboration | Reconstruction and identification of $ \tau $ lepton decays to hadrons and $ \nu_\tau $ at CMS | JINST 11 (2016) P01019 | CMS-TAU-14-001 1510.07488 |
| 68 | CMS Collaboration | Identification of heavy-flavour jets with the CMS detector in pp collisions at 13 TeV | Submitted to \it JINST | CMS-BTV-16-002 1712.07158 |
| 69 | D. Guest et al. | Jet flavor classification in high-energy physics with deep neural networks | PRD 94 (2016) 112002 | 1607.08633 |
| 70 | J. Alwall et al. | The automated computation of tree-level and next-to-leading order differential cross sections, and their matching to parton shower simulations | JHEP 07 (2014) 079 | 1405.0301 |
| 71 | T. Melia, P. Nason, R. Rontsch, and G. Zanderighi | W$ ^+ $W$ ^- $, WZ and ZZ production in the POWHEG BOX | JHEP 11 (2011) 078 | 1107.5051 |
| 72 | P. Nason and G. Zanderighi | $ \mathrm{W}^+ \mathrm{W}^- $, $ \mathrm{W} \mathrm{Z} $ and $ \mathrm{Z} \mathrm{Z} $ production in the POWHEG-BOX-V2 | EPJC 74 (2014) 2702 | 1311.1365 |
| 73 | NNPDF Collaboration | Parton distributions for the LHC Run II | JHEP 04 (2015) 040 | 1410.8849 |
| 74 | T. Sjostrand, S. Mrenna, and P. Z. Skands | A brief introduction to PYTHIA 8.1 | CPC 178 (2008) 852 | 0710.3820 |
| 75 | CMS Collaboration | Event generator tunes obtained from underlying event and multiparton scattering measurements | EPJC 76 (2016) 155 | CMS-GEN-14-001 1512.00815 |
| 76 | J. Alwall et al. | Comparative study of various algorithms for the merging of parton showers and matrix elements in hadronic collisions | EPJC 53 (2008) 473 | 0706.2569 |
| 77 | R. Frederix and S. Frixione | Merging meets matching in MC@NLO | JHEP 12 (2012) 061 | 1209.6215 |
| 78 | S. Alioli, P. Nason, C. Oleari, and E. Re | NLO single-top production matched with shower in POWHEG: $ s $- and $ t $-channel contributions | JHEP 09 (2009) 111 | 0907.4076 |
| 79 | E. Re | Single-top $ Wt $-channel production matched with parton showers using the POWHEG method | EPJC 71 (2011) 1547 | 1009.2450 |
| 80 | R. Gavin, Y. Li, F. Petriello, and S. Quackenbush | FEWZ 2.0: A code for hadronic Z production at next-to-next-to-leading order | CPC 182 (2011) 2388 | 1011.3540 |
| 81 | R. Gavin, Y. Li, F. Petriello, and S. Quackenbush | W physics at the LHC with FEWZ 2.1 | CPC 184 (2013) 208 | 1201.5896 |
| 82 | M. Czakon and A. Mitov | Top++: a program for the calculation of the top-pair cross-section at hadron colliders | CPC 185 (2014) 2930 | 1112.5675 |
| 83 | C. Borschensky et al. | Squark and gluino production cross sections in pp collisions at $ \sqrt{s} = $ 13, 14, 33 and 100 TeV | EPJC 74 (2014) 3174 | 1407.5066 |
| 84 | CMS Collaboration | Search for top-squark pair production in the single-lepton final state in pp collisions at $ \sqrt{s} = $ 8 TeV | EPJC 73 (2013) 2677 | CMS-SUS-13-011 1308.1586 |
| 85 | \GEANTfour Collaboration | $ GEANT4 -- a $ simulation toolkit | NIMA 506 (2003) 250 | |
| 86 | S. Abdullin et al. | The fast simulation of the CMS detector at LHC | J. Phys. Conf. Ser. 331 (2011) 032049 | |
| 87 | CMS Collaboration | Inclusive search for supersymmetry using the razor variables in pp collisions at $ \sqrt{s} = $ 7 TeV | PRL 111 (2013) 081802 | CMS-SUS-11-024 1212.6961 |
| 88 | CMS Collaboration | Search for supersymmetry with razor variables in pp collisions at $ \sqrt{s} = $ 7 TeV | PRD 90 (2014) 112001 | CMS-SUS-12-005 1405.3961 |
| 89 | CMS Collaboration | Search for new physics in same-sign dilepton events in proton-proton collisions at $ \sqrt{s} = $ 13 TeV | EPJC 76 (2016) 439 | CMS-SUS-15-008 1605.03171 |
| 90 | T. Junk | Confidence level computation for combining searches with small statistics | NIMA 434 (1999) 435 | hep-ex/9902006 |
| 91 | A. L. Read | Presentation of search results: the $ CL_s $ technique | in Durham IPPP Workshop: Advanced Statistical Techniques in Particle Physics, p. 2693 Durham, UK, March, 2002 [JPG 28 (2002) 2693] | |
| 92 | G. Cowan, K. Cranmer, E. Gross, and O. Vitells | Asymptotic formulae for likelihood-based tests of new physics | EPJC 71 (2011) 1554 | 1007.1727 |
| 93 | ATLAS and CMS Collaborations | Procedure for the LHC Higgs boson search combination in summer 2011 | CMS-NOTE-2011-005 | |
|
|
Compact Muon Solenoid LHC, CERN |
|

|

|

|

|

|