

Compact Muon Solenoid
LHC, CERN
| CMS-SUS-17-005 ; CERN-EP-2018-079 | ||
| Search for top squarks decaying via four-body or chargino-mediated modes in single-lepton final states in proton-proton collisions at $\sqrt{s} = $ 13 TeV | ||
| CMS Collaboration | ||
| 15 May 2018 | ||
| JHEP 09 (2018) 065 | ||
| Abstract: A search for the pair production of the lightest supersymmetric partner of the top quark ($ {\tilde{\mathrm{t}}_{1}} $) is presented. The search focuses on a compressed scenario where the mass difference between the top squark and the lightest supersymmetric particle, often considered to be the lightest neutralino ($ \tilde{\chi}^0_1 $), is smaller than the mass of the W boson. The proton-proton collision data were recorded by the CMS experiment at a centre-of-mass energy of 13 TeV, and correspond to an integrated luminosity of 35.9 fb$^{-1}$. In this search, two decay modes of the top squark are considered: a four-body decay into a bottom quark, two additional fermions, and a $ \tilde{\chi}^0_1 $; and a decay via an intermediate chargino. Events are selected using the presence of a high-momentum jet, significant missing transverse momentum, and a low transverse momentum electron or muon. Two analysis techniques are used, targeting different decay modes of the $ {\tilde{\mathrm{t}}_{1}} $: a sequential selection and a multivariate technique. No evidence for the production of top squarks is found, and mass limits at 95% confidence level are set that reach up to 560 GeV, depending on the $m( {\tilde{\mathrm{t}}_{1}} ) - m(\tilde{\chi}^0_1)$ mass difference and the decay mode. | ||
| Links: e-print arXiv:1805.05784 [hep-ex] (PDF) ; CDS record ; inSPIRE record ; CADI line (restricted) ; | ||
| Figures & Tables | Summary | Additional Figures & Tables | References | CMS Publications |
|---|
|
Additional information on efficiencies needed for reinterpretation of these results are available here. Additional technical material can be found here |
| Figures | |

png pdf |
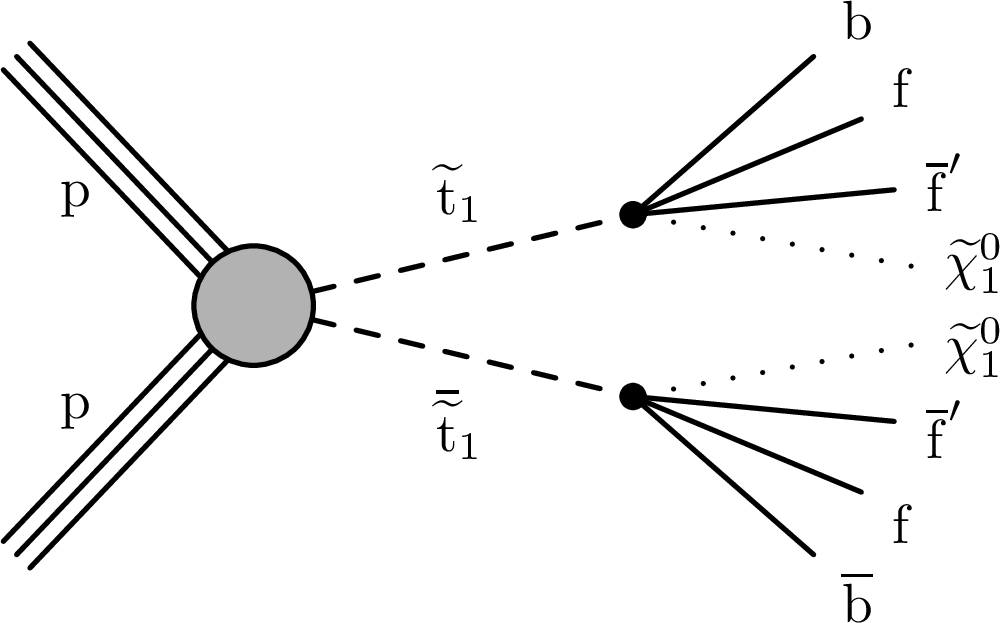
Figure 1:
Top squark pair production at the LHC with four-body (left) or chargino-mediated (right) decays. |
png pdf |
Figure 1-a:
Top squark pair production at the LHC with four-body (left) or chargino-mediated (right) decays. |

png pdf |
Figure 1-b:
Top squark pair production at the LHC with four-body (left) or chargino-mediated (right) decays. |

png pdf |
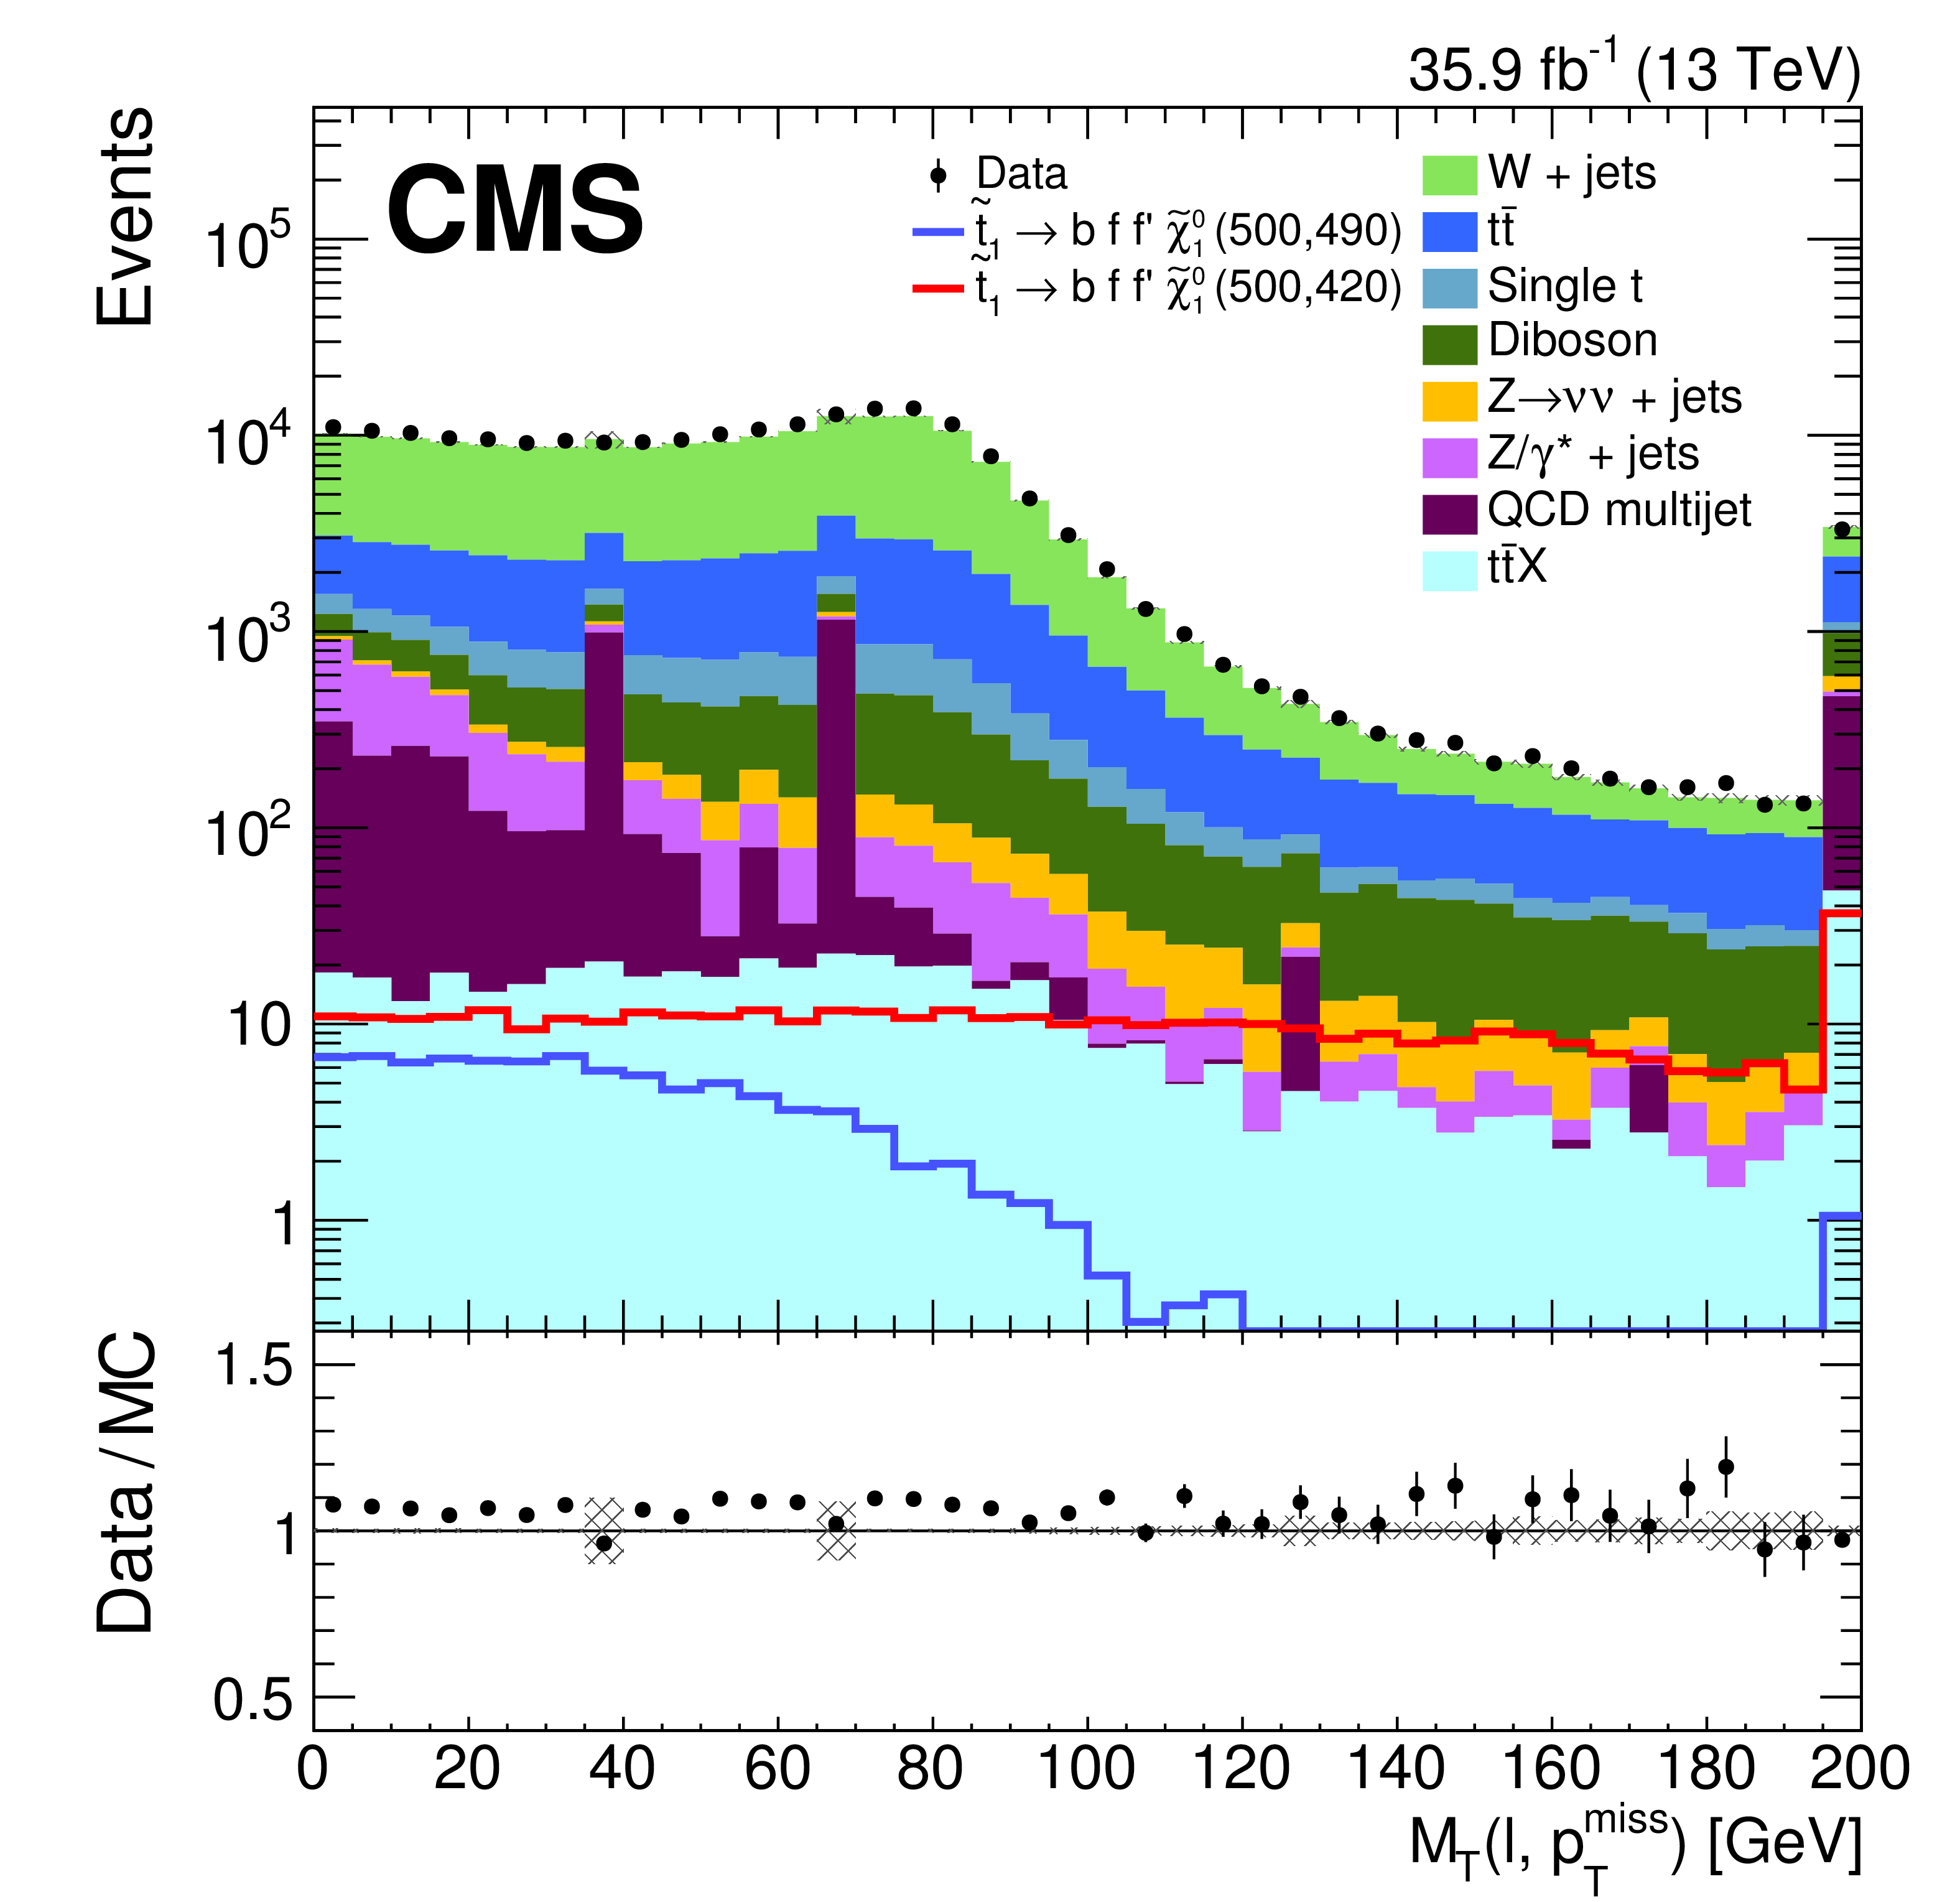
Figure 2:
Distributions of lepton $ {p_{\mathrm {T}}} $ (left) and $ {M_{\mathrm {T}}} $ (right) at the preselection level in data and simulation. The lower panels show the ratio of data to the sum of the SM backgrounds where the dark shaded bands indicate the statistical uncertainties of the simulation. The distributions of two signal points of the four-body decay are also represented, while not being added to the background: ${({m}({\tilde{\mathrm {t}}} _{1}}), {m}({\tilde{\chi}^{0}_{1}})) = $ (500,490) and (500,420) GeV. The background distributions are obtained directly from simulation, and are normalized to an integrated luminosity of 35.9 fb$^{-1}$. The last bin in each plot includes events beyond 200 GeV. |

png pdf root |
Figure 2-a:
Distribution of lepton $ {p_{\mathrm {T}}} $ at the preselection level in data and simulation. The lower panel shows the ratio of data to the sum of the SM backgrounds where the dark shaded bands indicate the statistical uncertainties of the simulation. The distributions of two signal points of the four-body decay are also represented, while not being added to the background: ${({m}({\tilde{\mathrm {t}}} _{1}}), {m}({\tilde{\chi}^{0}_{1}})) = $ (500,490) and (500,420) GeV. The background distributions are obtained directly from simulation, and are normalized to an integrated luminosity of 35.9 fb$^{-1}$. The last bin in each plot includes events beyond 200 GeV. |
png pdf root |
Figure 2-b:
Distribution of $ {M_{\mathrm {T}}} $ at the preselection level in data and simulation. The lower panel shows the ratio of data to the sum of the SM backgrounds where the dark shaded bands indicate the statistical uncertainties of the simulation. The distributions of two signal points of the four-body decay are also represented, while not being added to the background: ${({m}({\tilde{\mathrm {t}}} _{1}}), {m}({\tilde{\chi}^{0}_{1}})) = $ (500,490) and (500,420) GeV. The background distributions are obtained directly from simulation, and are normalized to an integrated luminosity of 35.9 fb$^{-1}$. The last bin in each plot includes events beyond 200 GeV. |
png pdf |
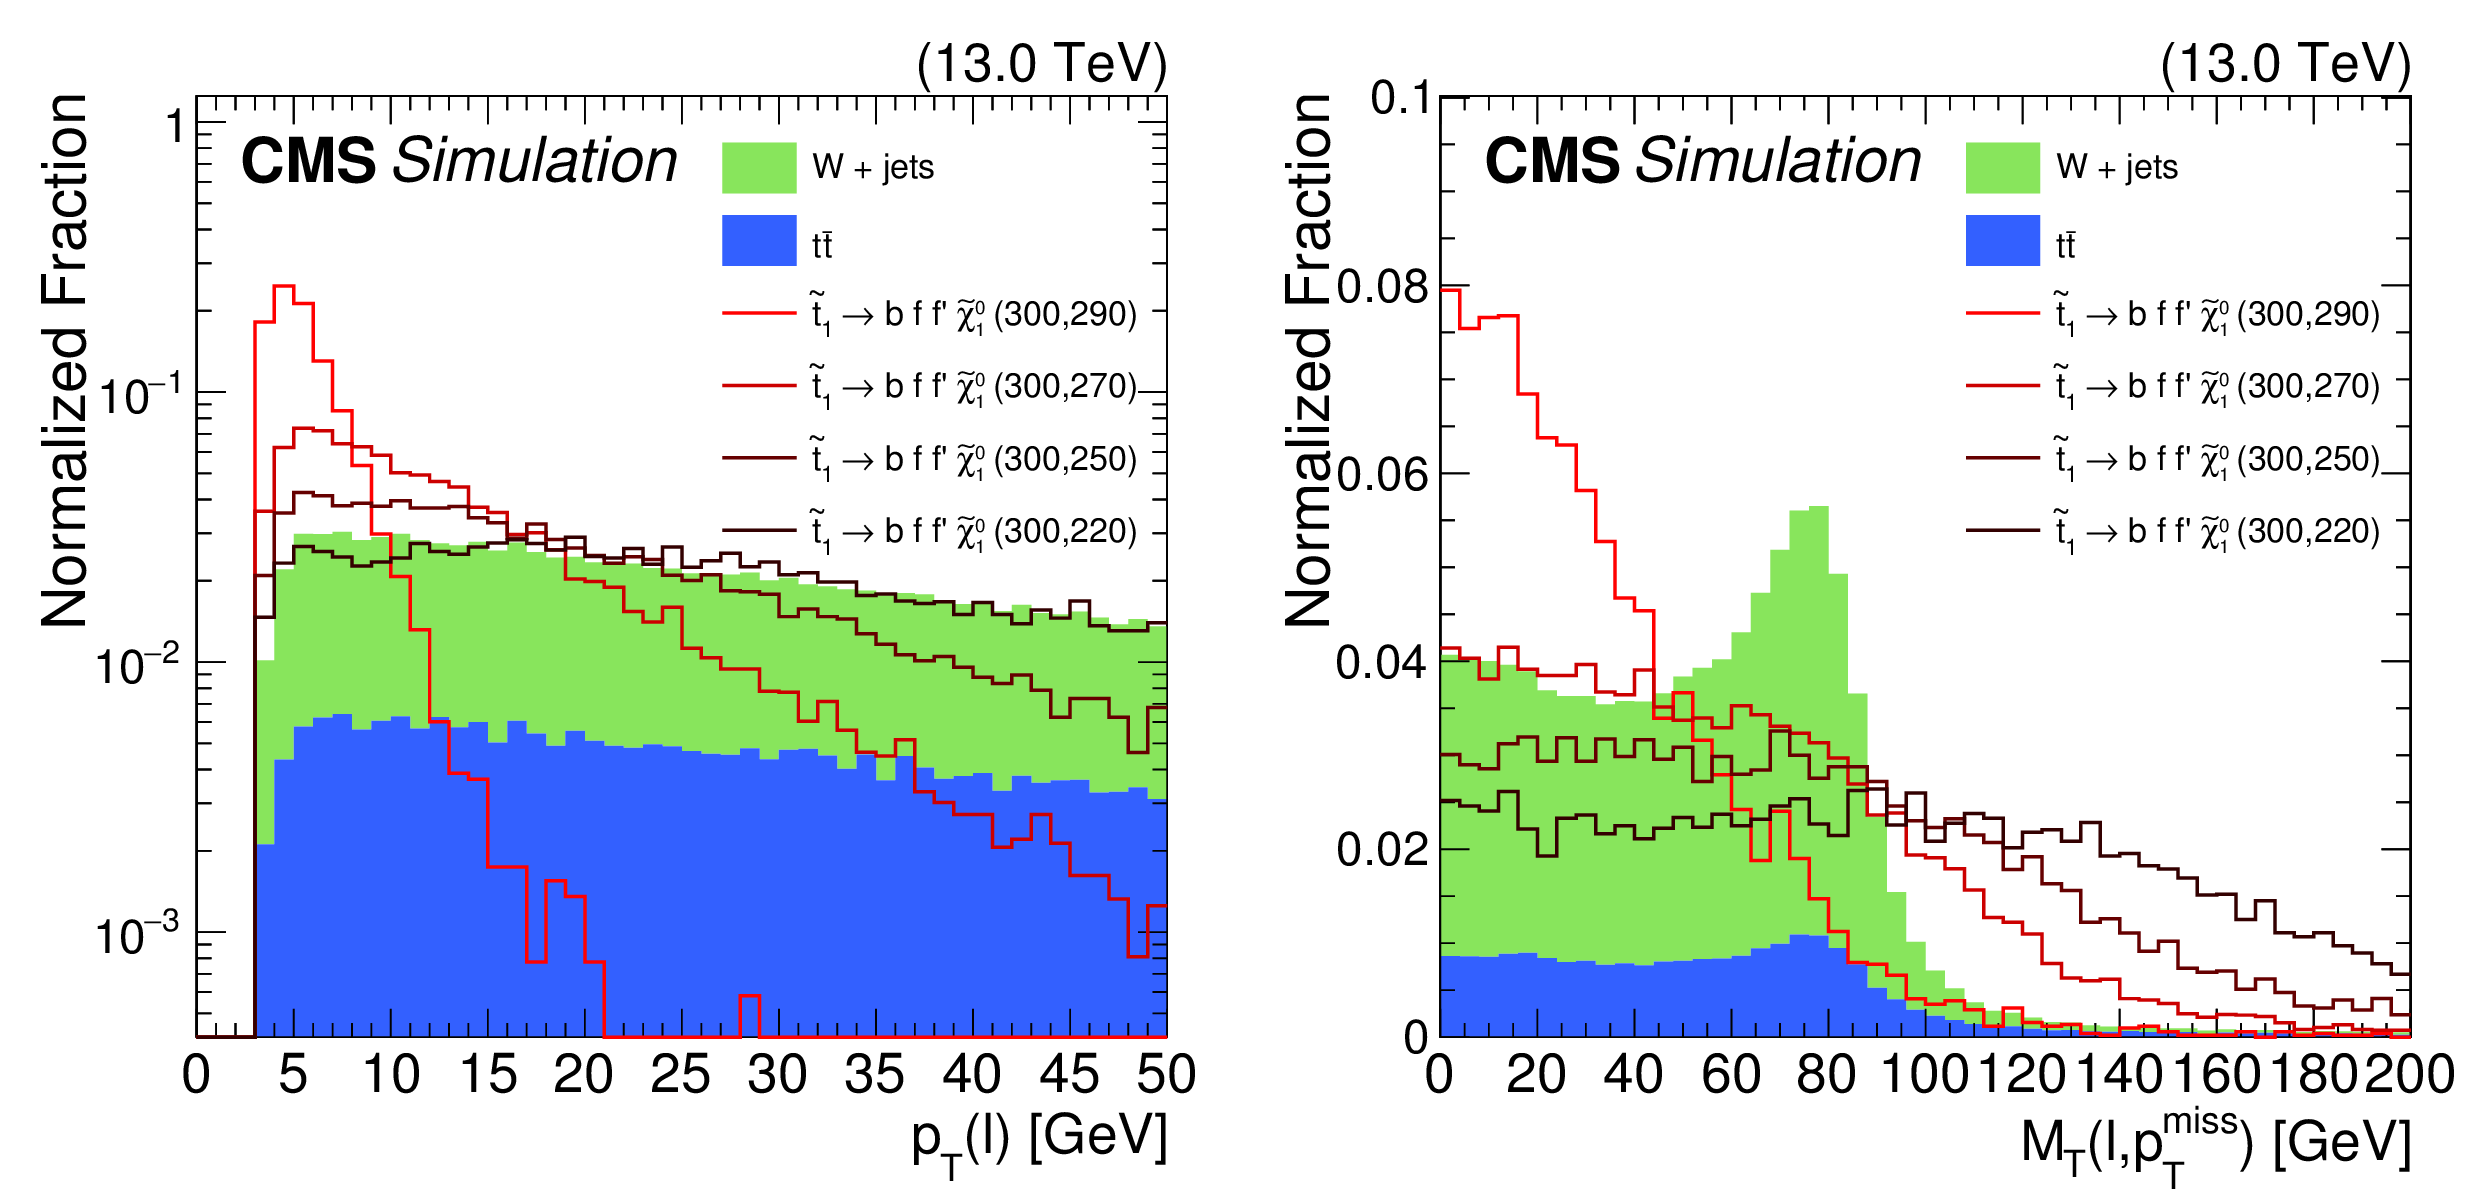
Figure 3:
Simulated distributions of ${{p_{\mathrm {T}}} (\ell)}$ (left) and $ {M_{\mathrm {T}}} $ (right) at the preselection level for signal samples with different ${\Delta {m}}$, and W+jets and $ {{\mathrm {t}\overline {\mathrm {t}}}} $ background events. The area of each signal distribution, and the total background contribution, are normalized to unit area. |
png pdf |
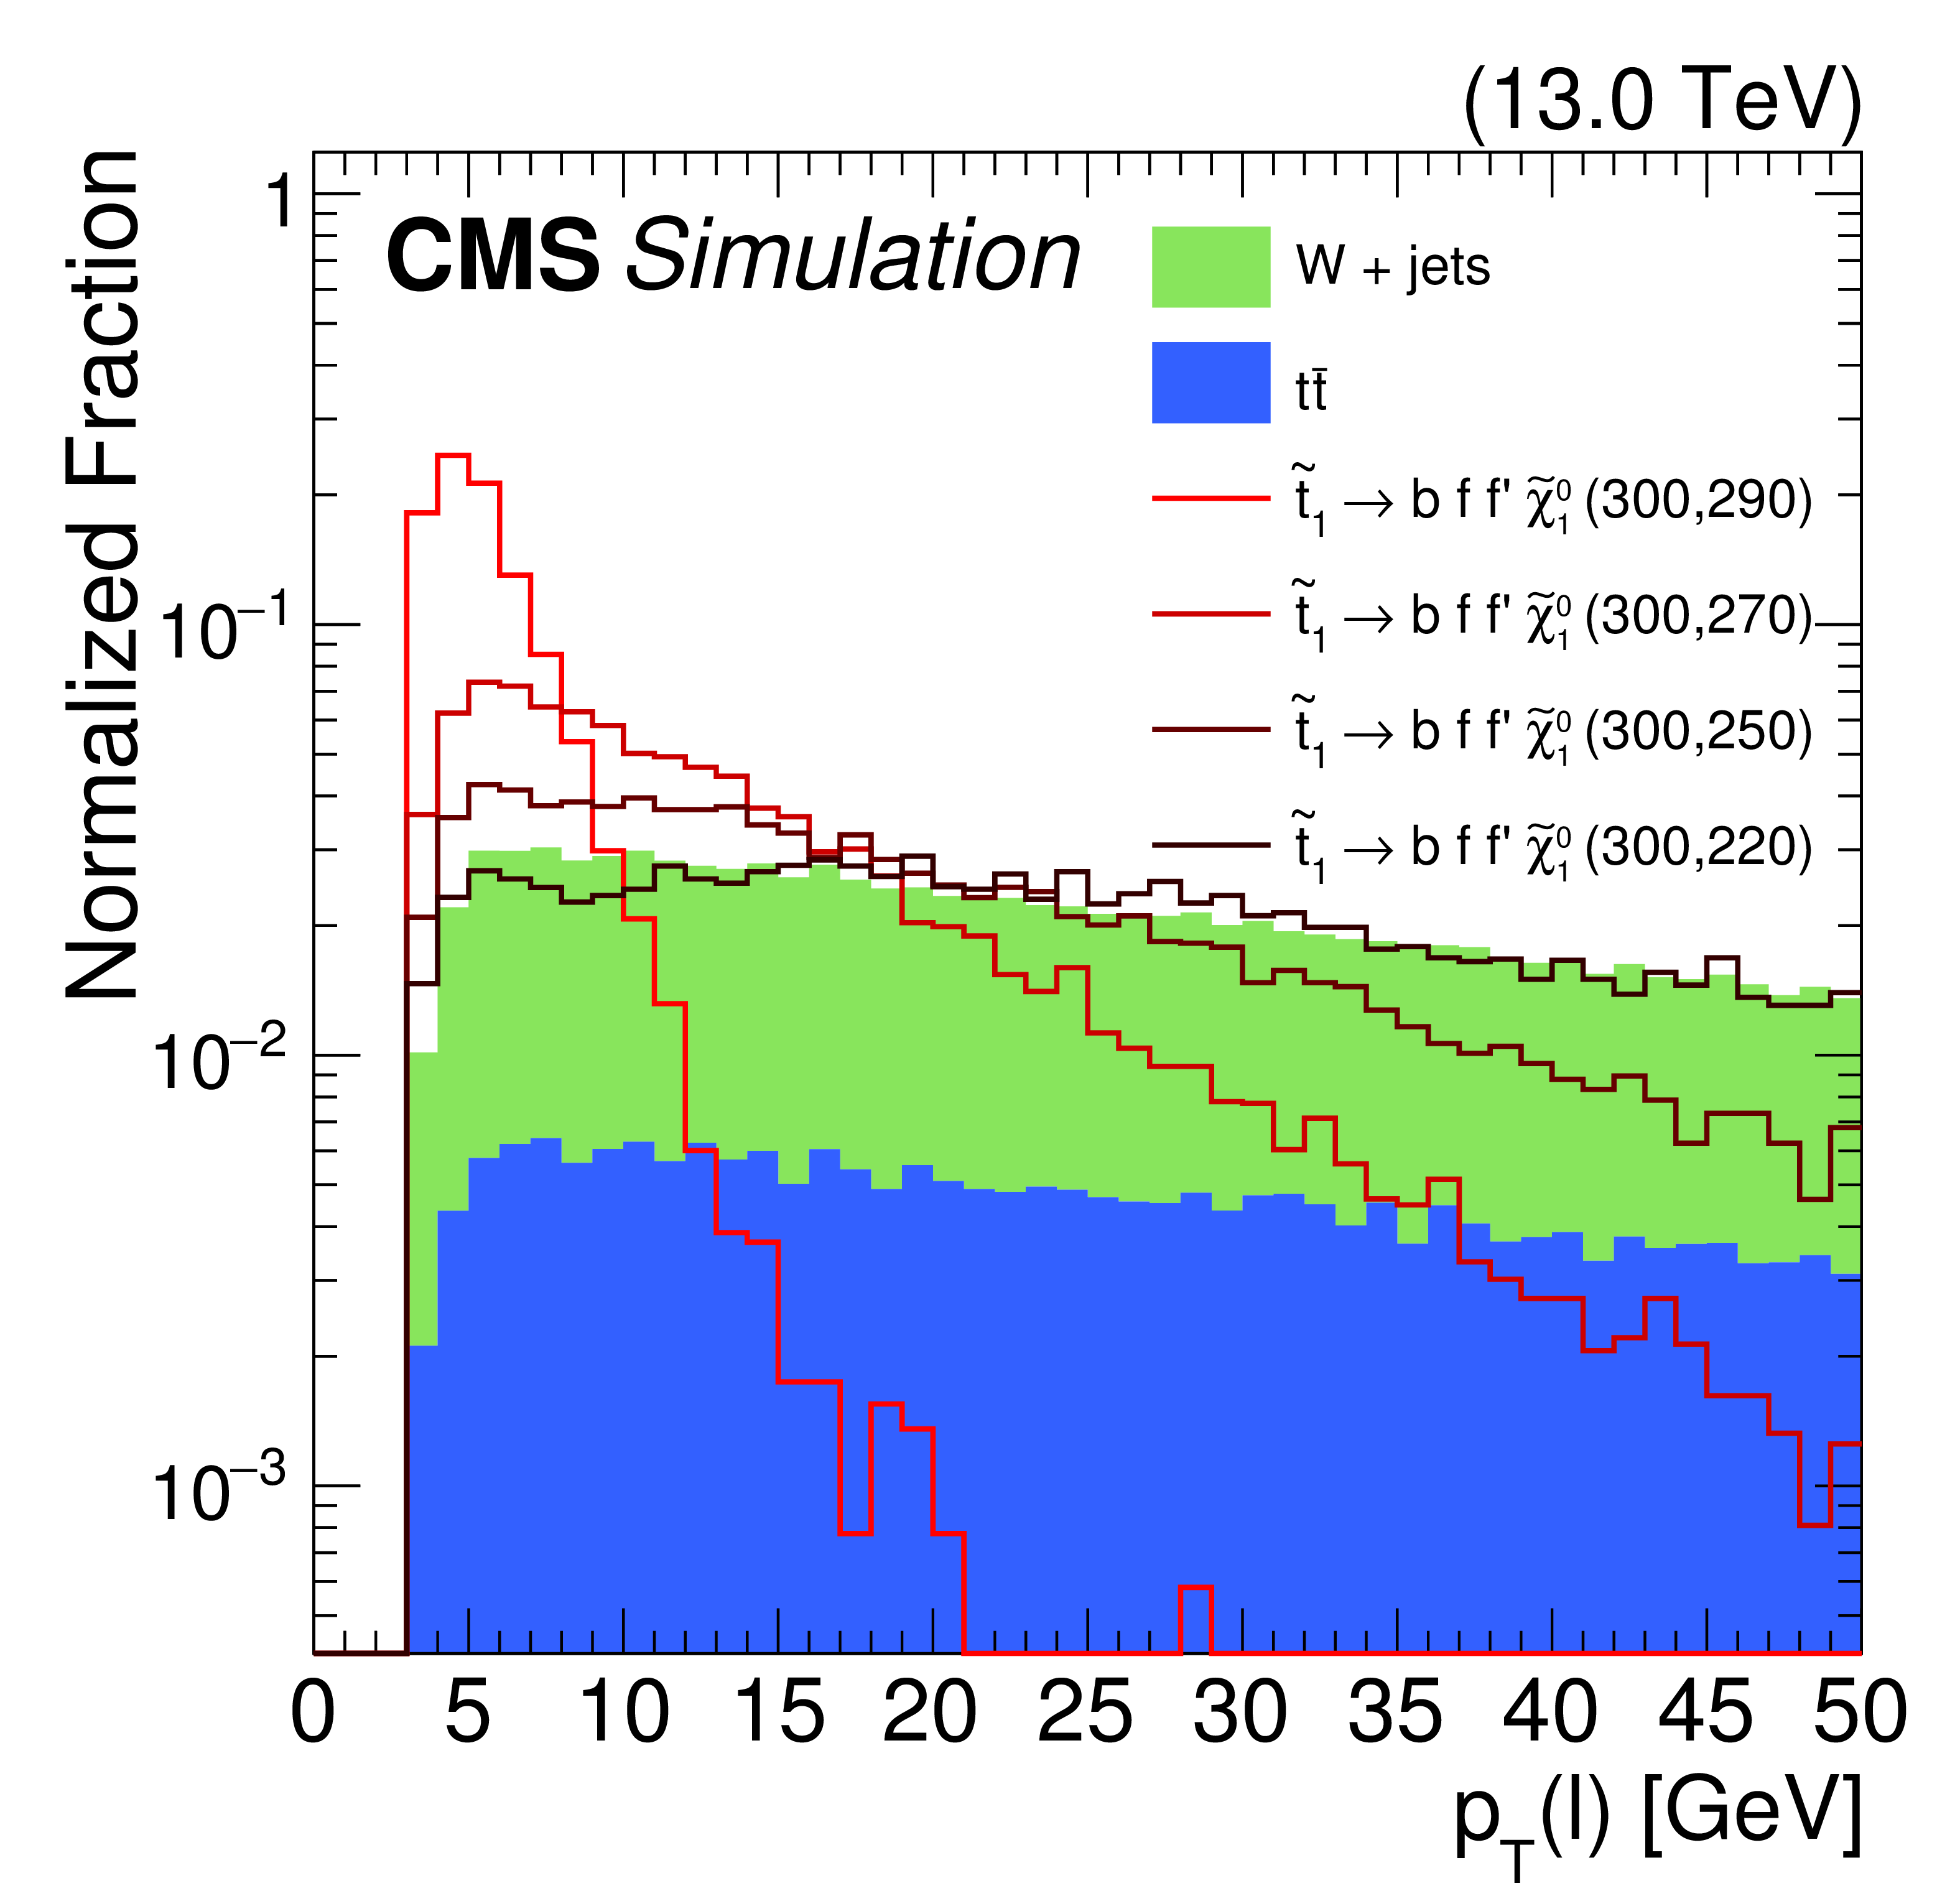
Figure 3-a:
Simulated distribution of ${{p_{\mathrm {T}}} (\ell)}$ at the preselection level for signal samples with different ${\Delta {m}}$, and W+jets and $ {{\mathrm {t}\overline {\mathrm {t}}}} $ background events. The area of the signal distribution and the total background contribution are normalized to unit area. |

png pdf |
Figure 3-b:
Simulated distribution of $ {M_{\mathrm {T}}} $ at the preselection level for signal samples with different ${\Delta {m}}$, and W+jets and $ {{\mathrm {t}\overline {\mathrm {t}}}} $ background events. The area of the signal distribution and the total background contribution are normalized to unit area. |
png pdf |
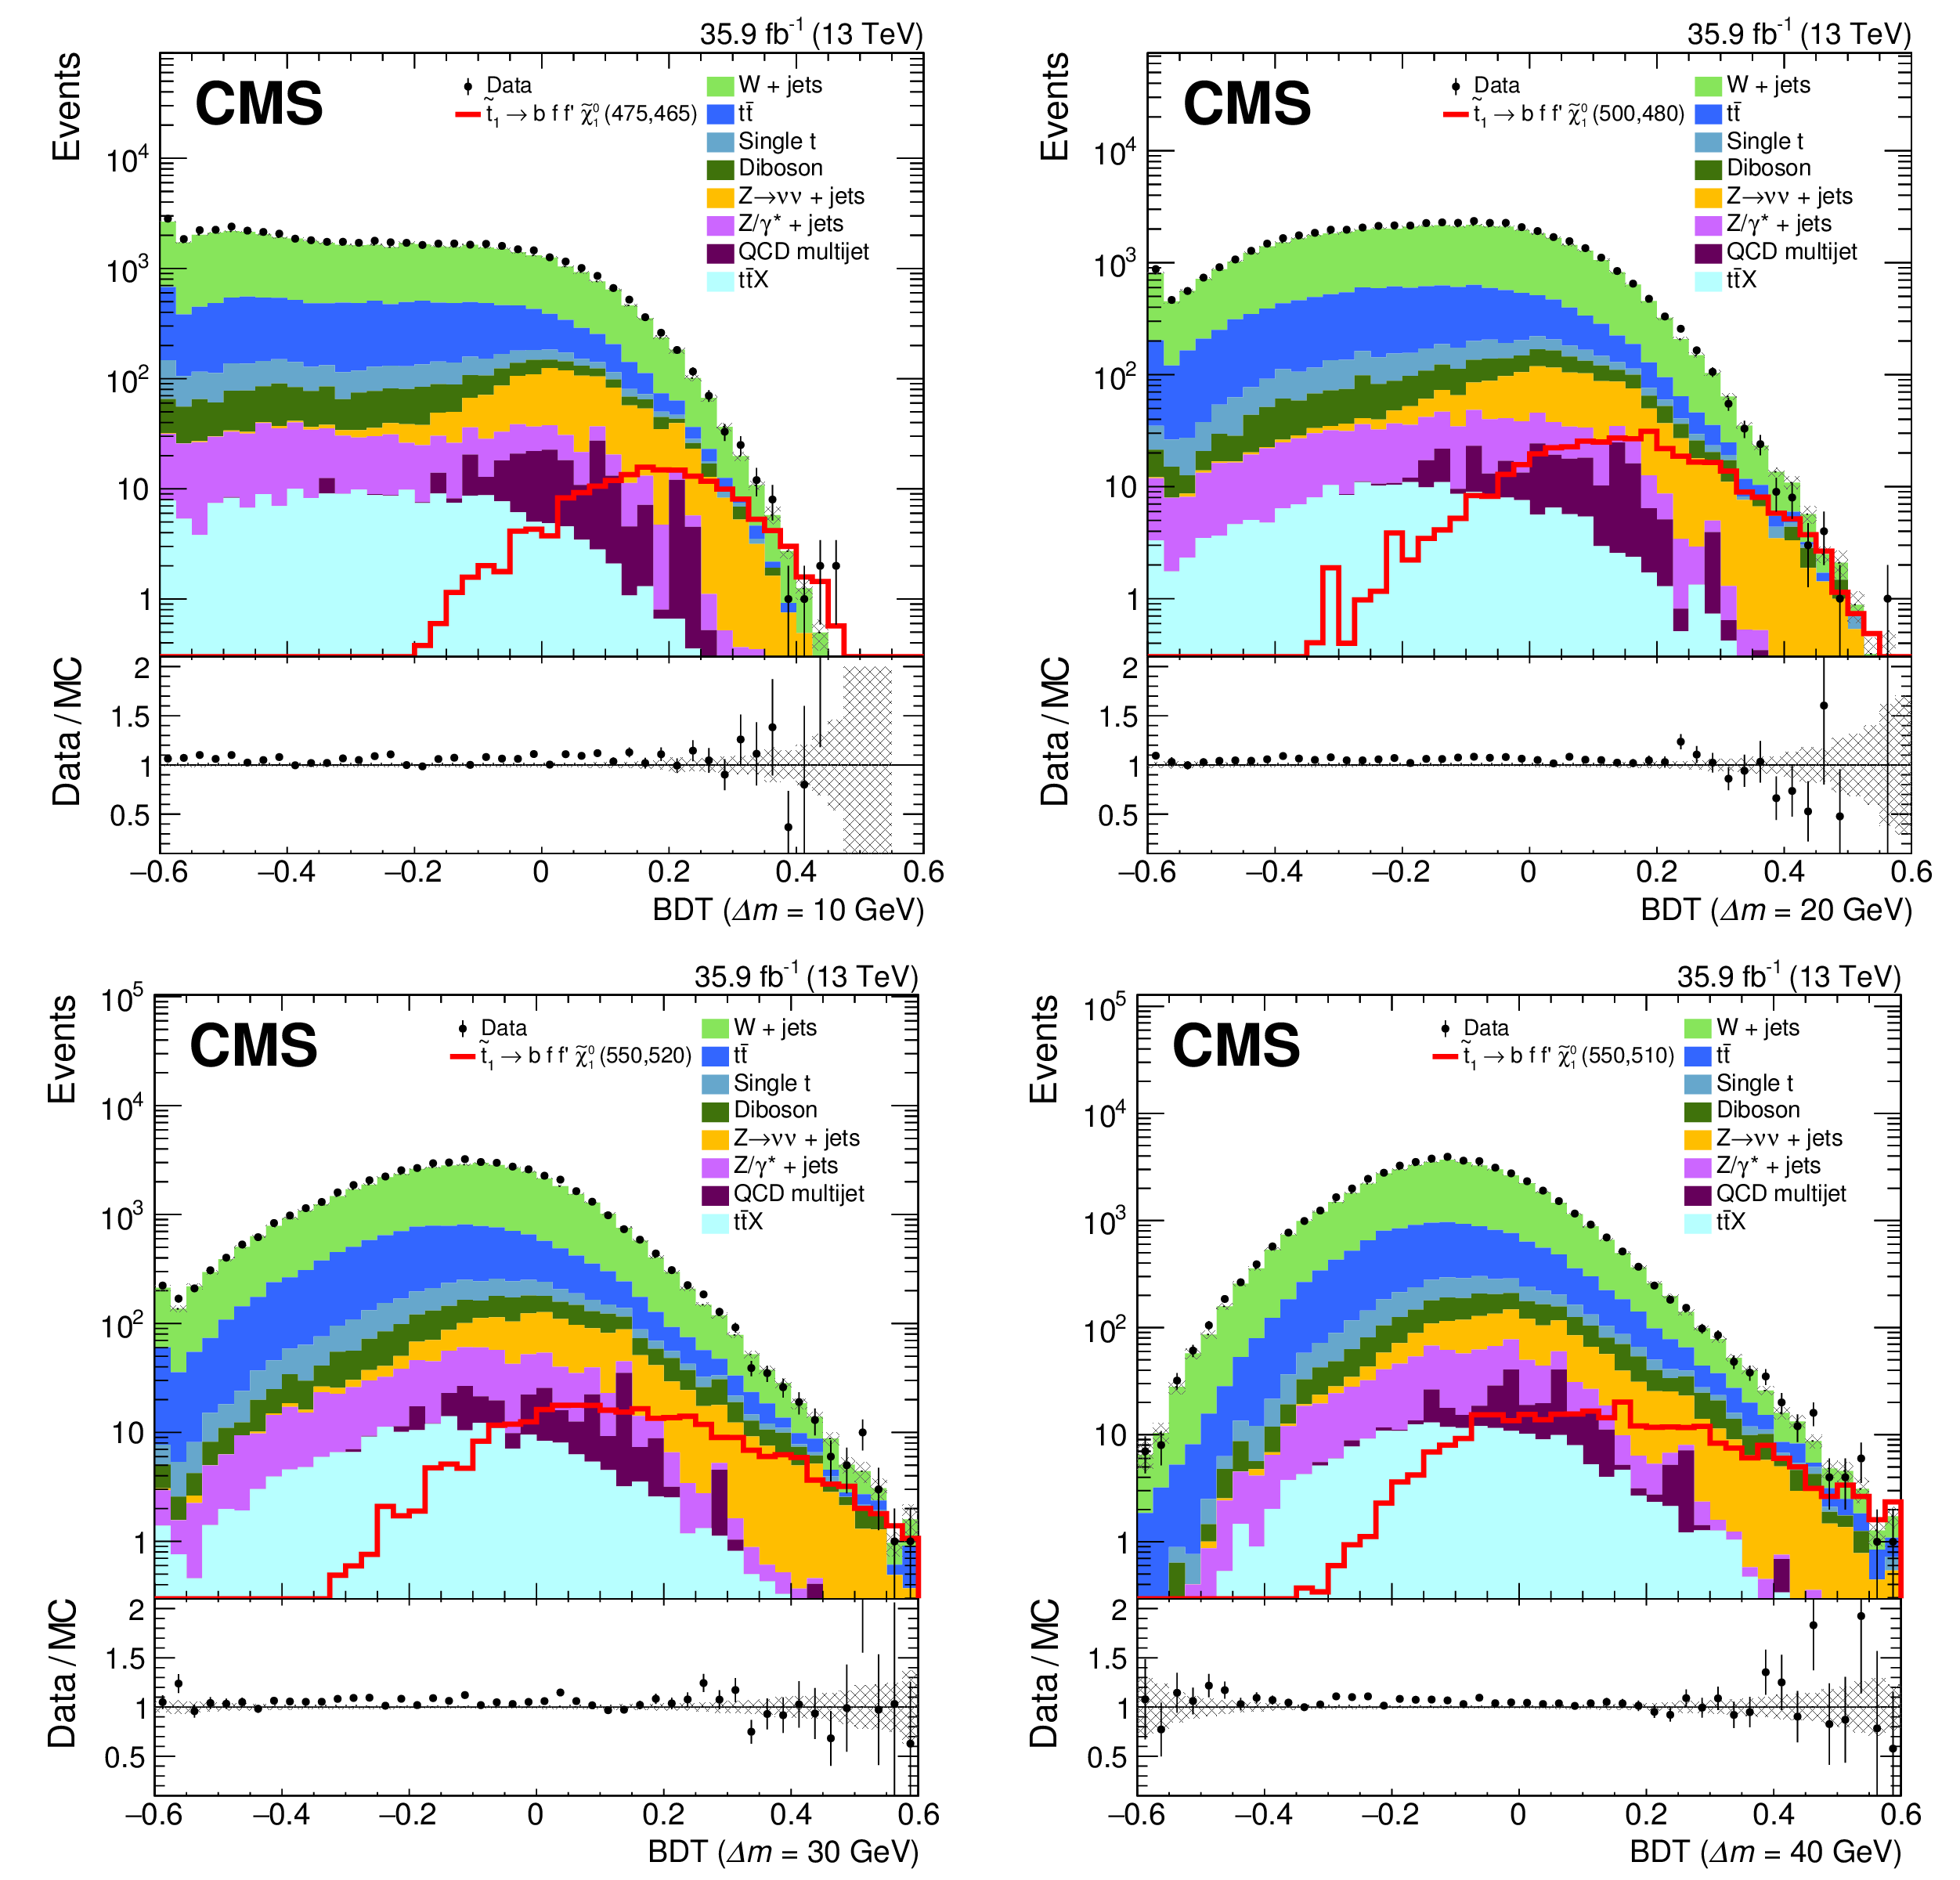
Figure 4:
Distributions of the BDT output at the preselection level in data and simulation in 10 GeV steps of $ {\Delta {m}} $ from 10 (top-left) to 40 GeV (bottom-right). For each case, a representative ${({m}({\tilde{\mathrm {t}}} _{1}}), {m}({\tilde{\chi}^{0}_{1}}))$ signal point is also shown, but is not added to the SM background. The shaded area on the Data/MC ratio represents the statistical uncertainty of the simulated background. |

png pdf |
Figure 4-a:
Distribution of the BDT output at the preselection level in data and simulation for $ {\Delta {m}} = $ 10 GeV. A representative ${({m}({\tilde{\mathrm {t}}} _{1}}), {m}({\tilde{\chi}^{0}_{1}}))$ signal point is also shown, but is not added to the SM background. The shaded area on the Data/MC ratio represents the statistical uncertainty of the simulated background. |

png pdf |
Figure 4-b:
Distribution of the BDT output at the preselection level in data and simulation for $ {\Delta {m}} = $ 20 GeV. A representative ${({m}({\tilde{\mathrm {t}}} _{1}}), {m}({\tilde{\chi}^{0}_{1}}))$ signal point is also shown, but is not added to the SM background. The shaded area on the Data/MC ratio represents the statistical uncertainty of the simulated background. |

png pdf |
Figure 4-c:
Distribution of the BDT output at the preselection level in data and simulation for $ {\Delta {m}} = $ 30 GeV. A representative ${({m}({\tilde{\mathrm {t}}} _{1}}), {m}({\tilde{\chi}^{0}_{1}}))$ signal point is also shown, but is not added to the SM background. The shaded area on the Data/MC ratio represents the statistical uncertainty of the simulated background. |
png pdf |
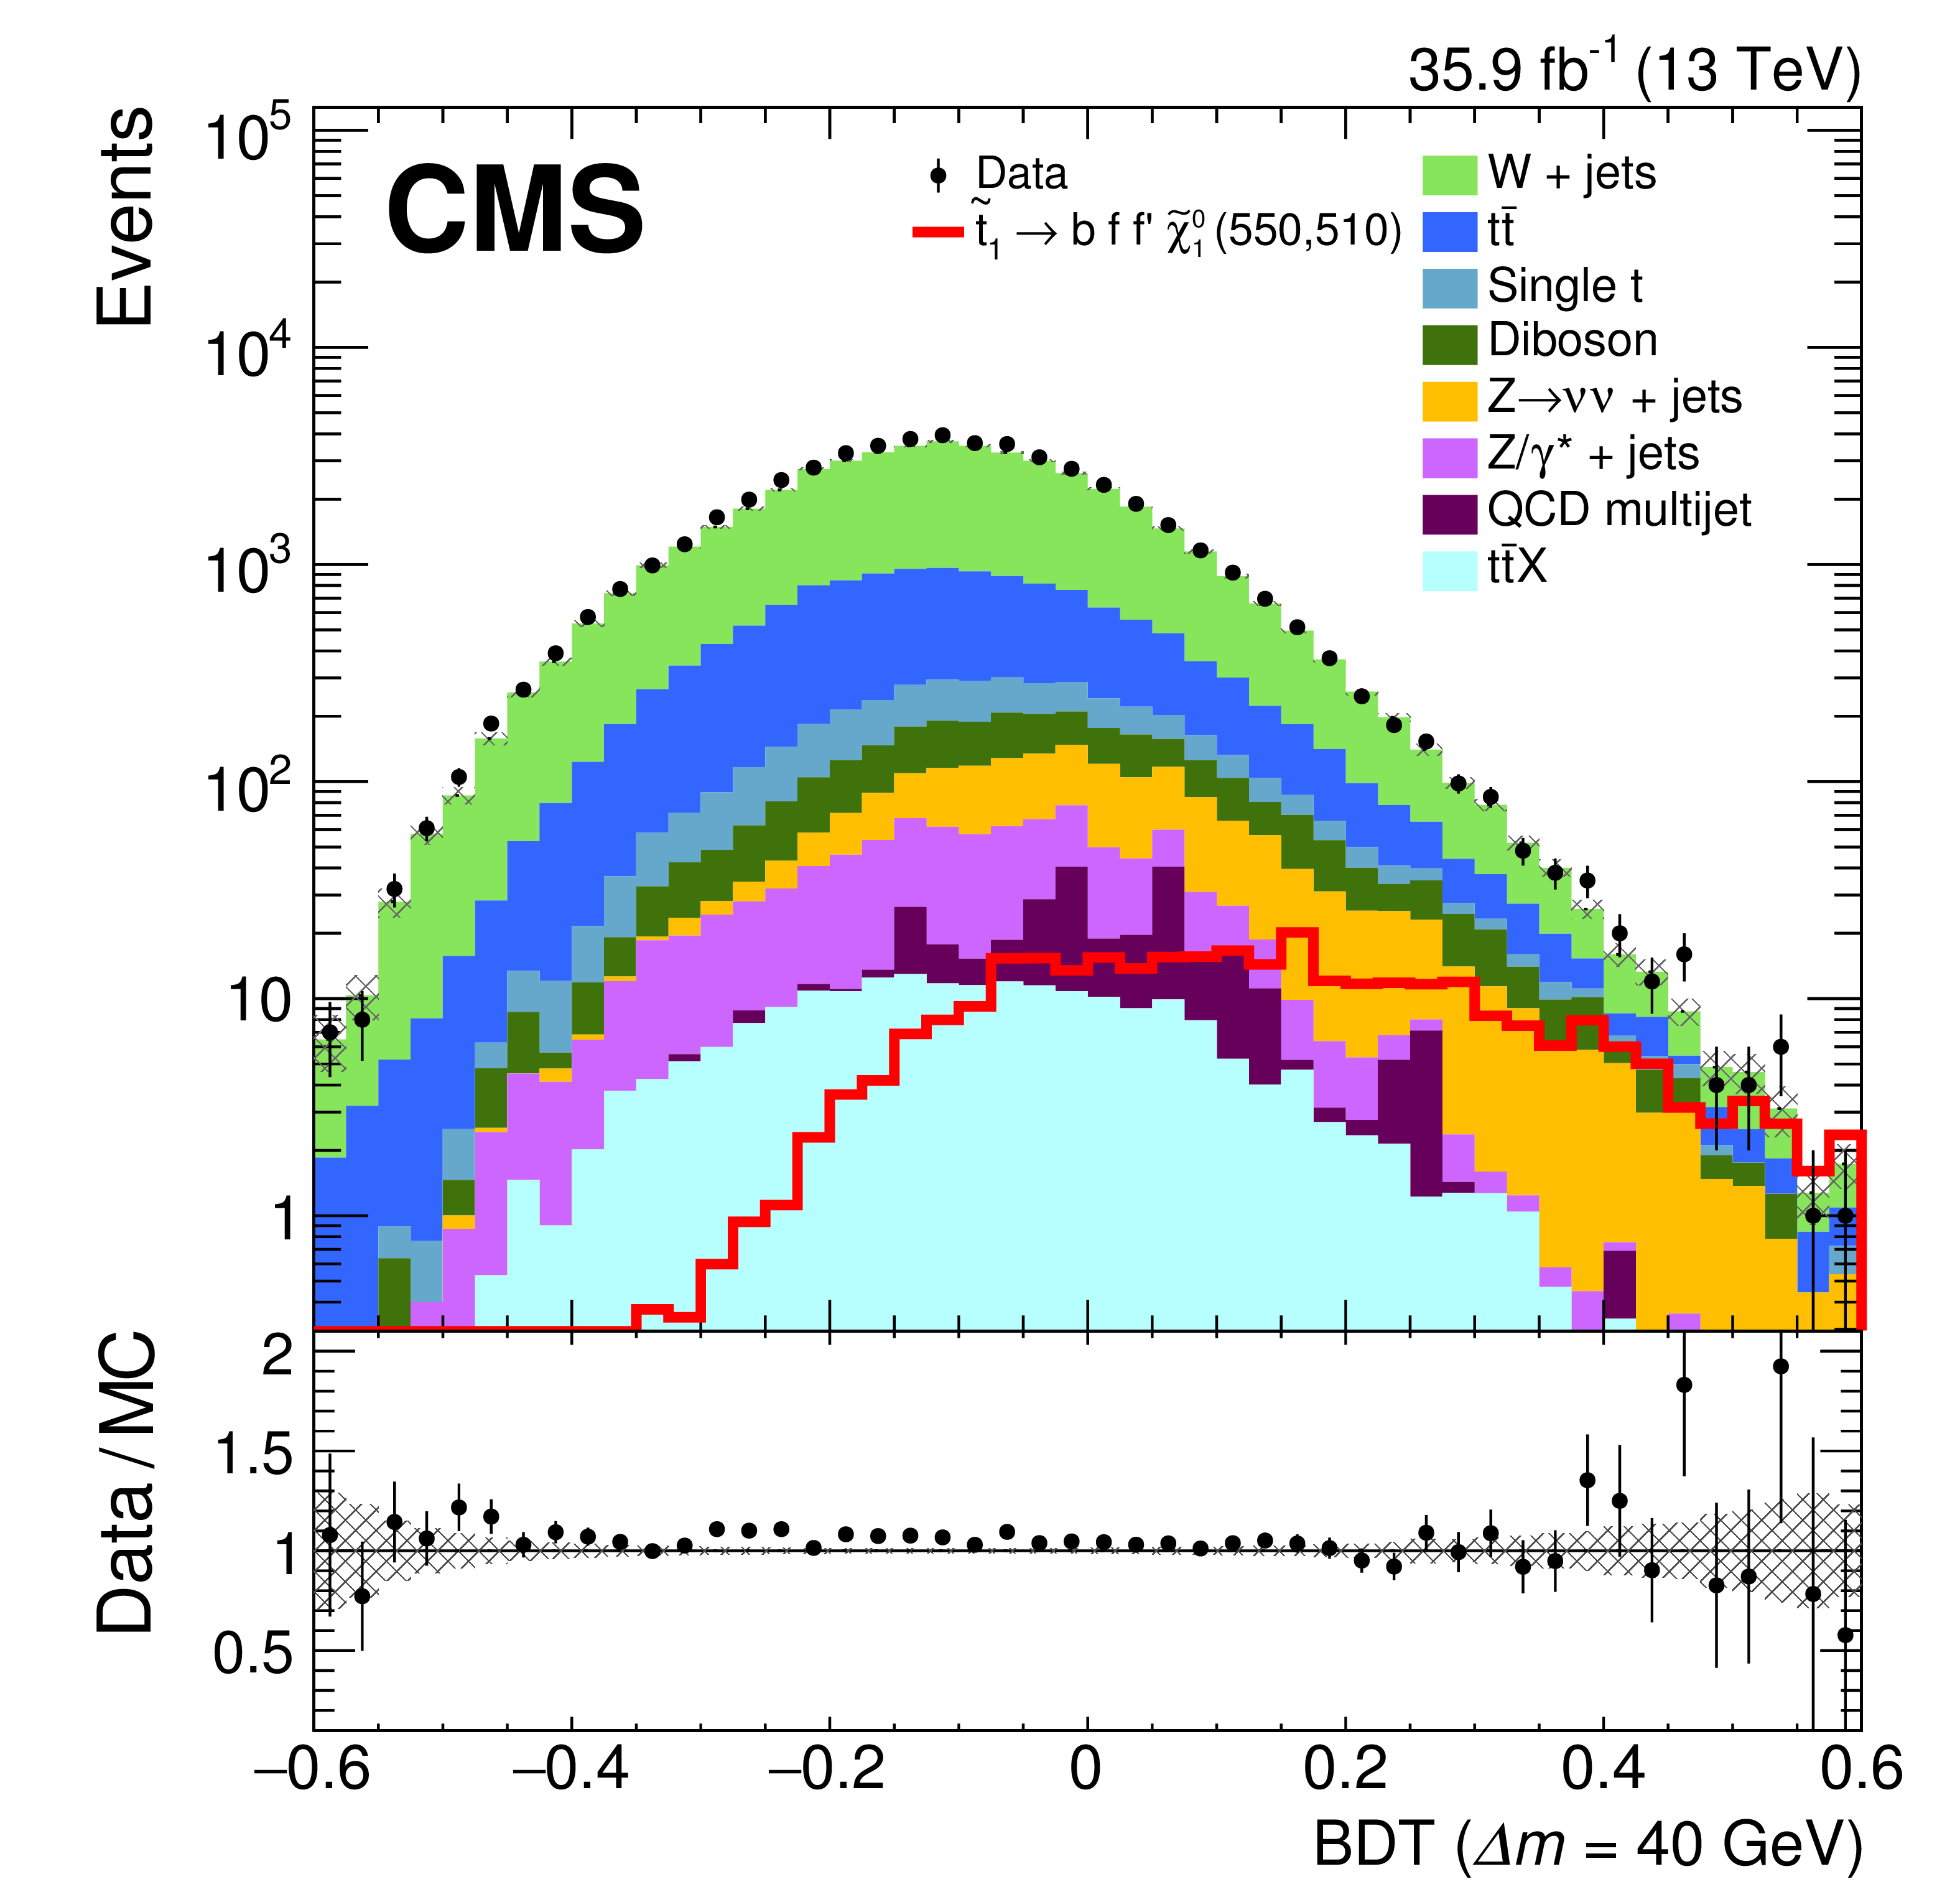
Figure 4-d:
Distribution of the BDT output at the preselection level in data and simulation for $ {\Delta {m}} = $ 40 GeV. A representative ${({m}({\tilde{\mathrm {t}}} _{1}}), {m}({\tilde{\chi}^{0}_{1}}))$ signal point is also shown, but is not added to the SM background. The shaded area on the Data/MC ratio represents the statistical uncertainty of the simulated background. |
png pdf |
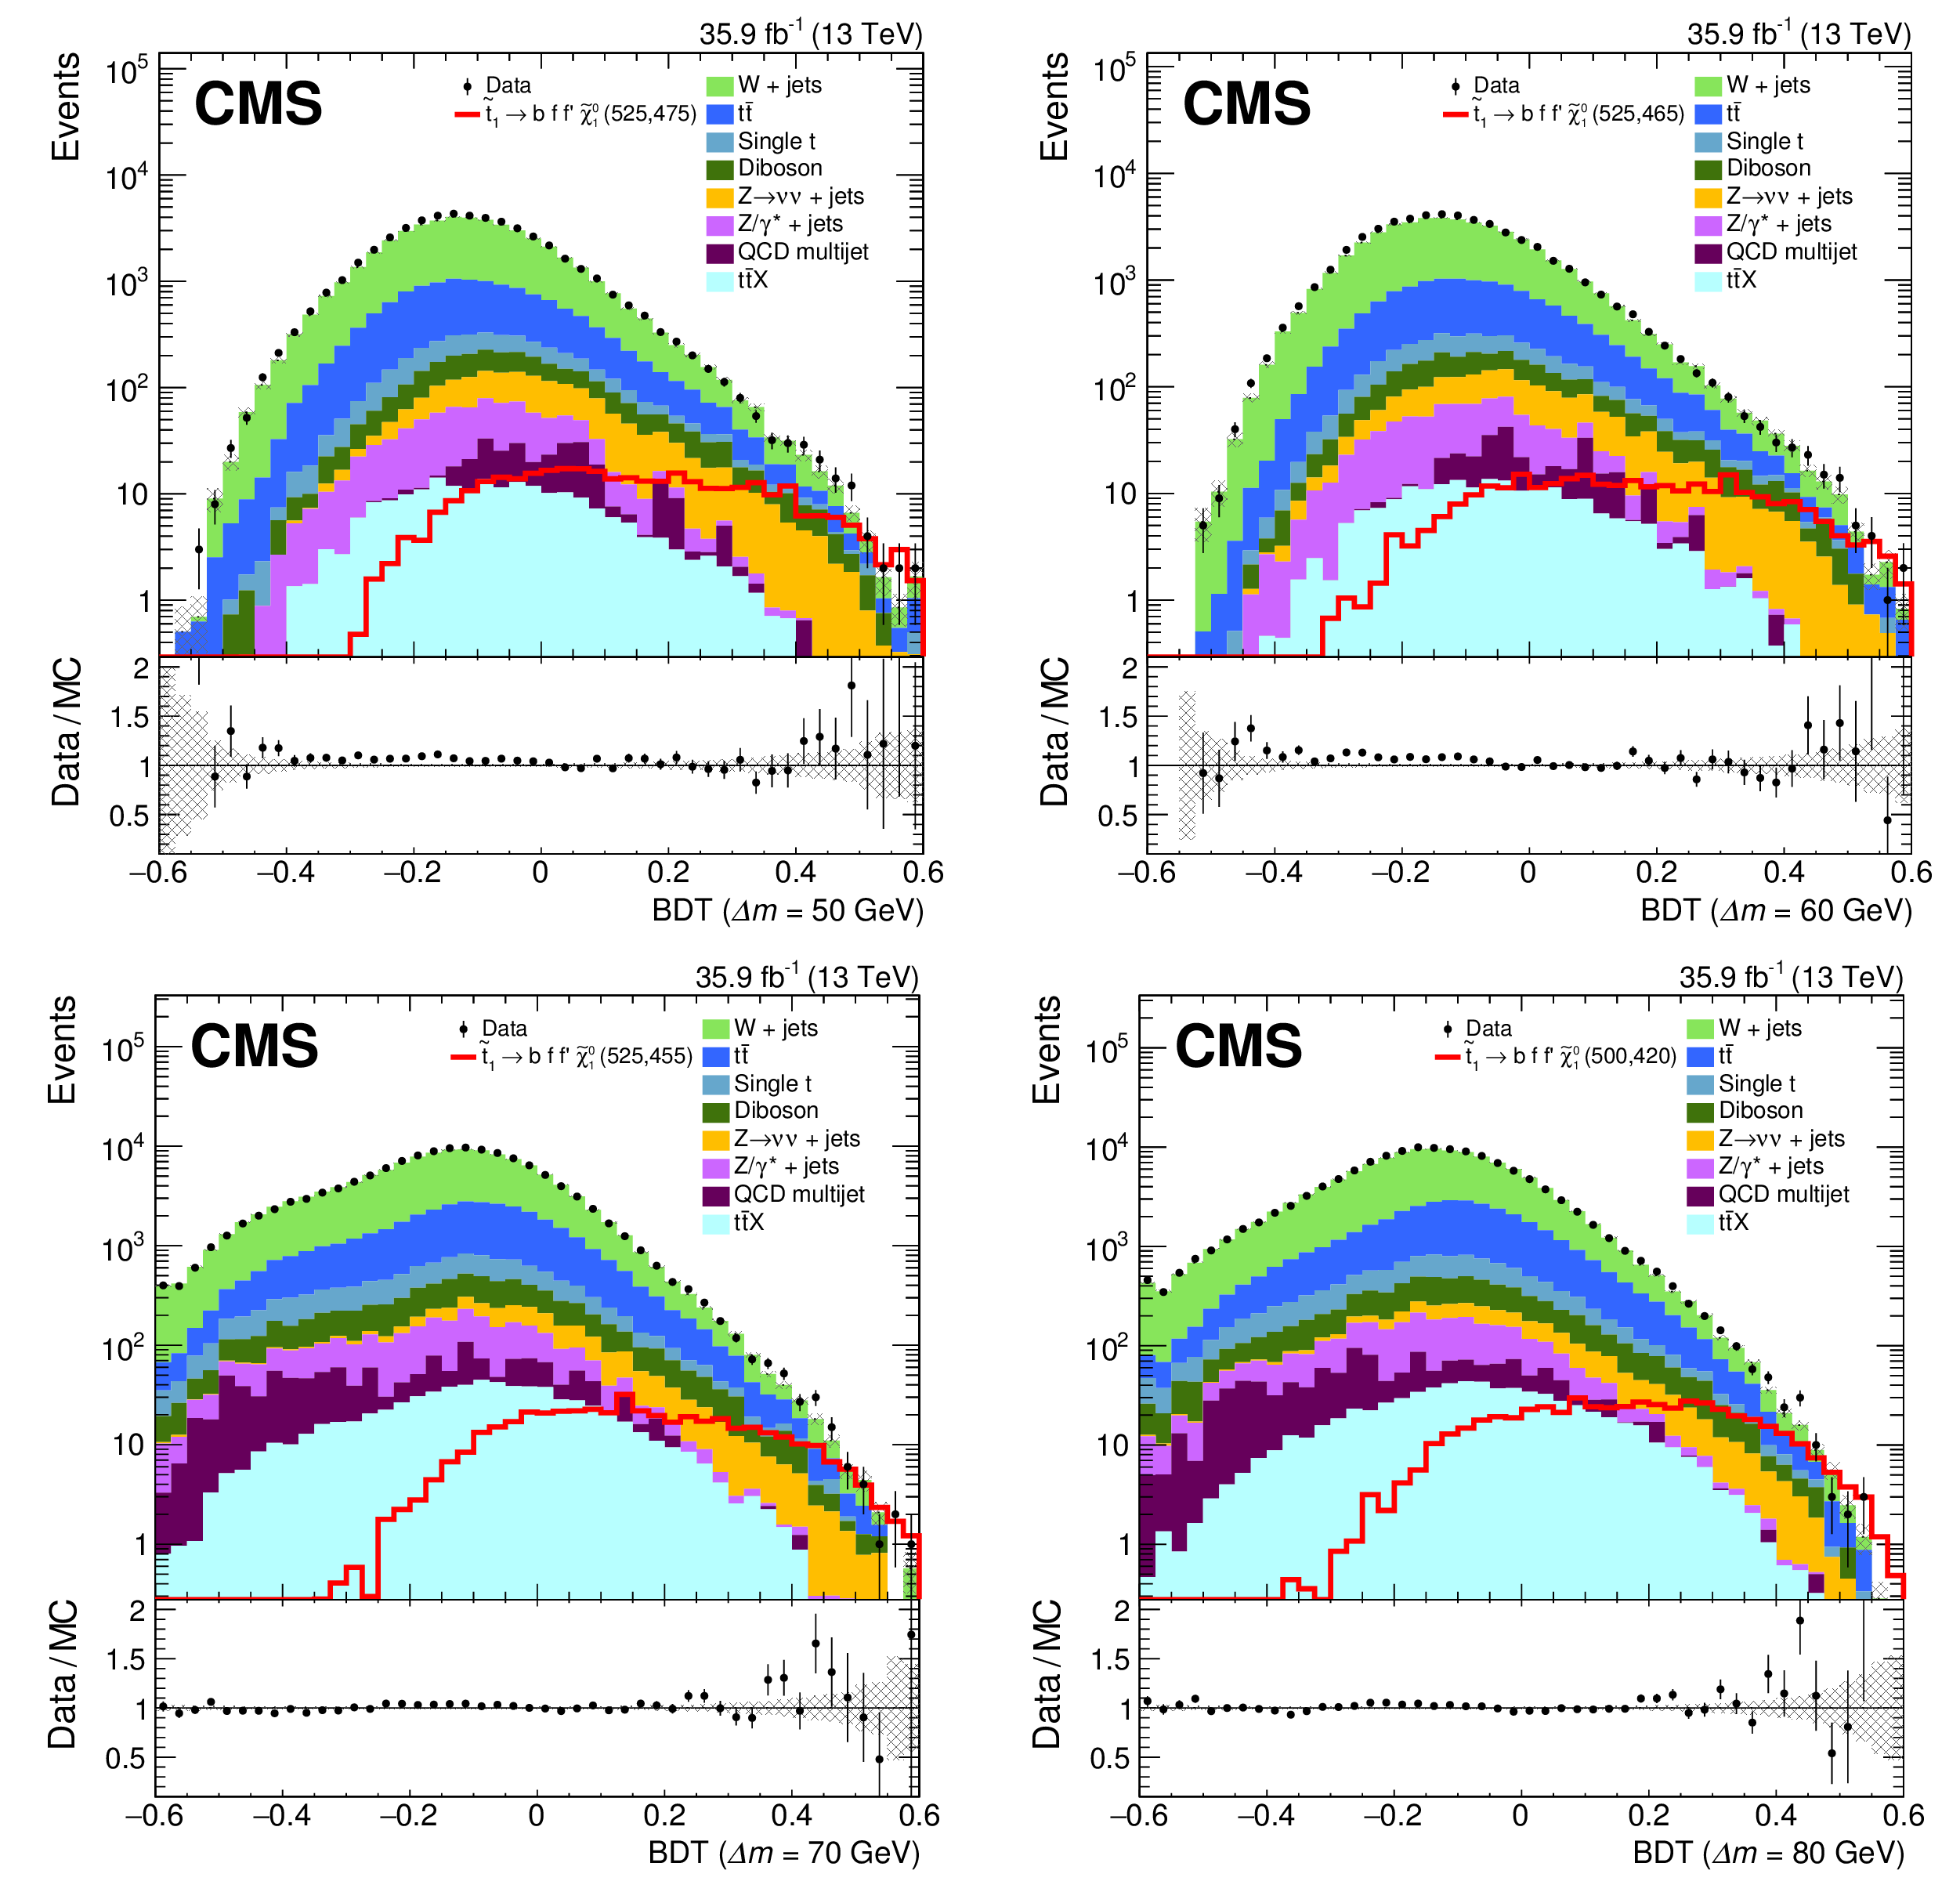
Figure 5:
Distributions of the BDT output at the preselection level in data and simulation in 10 GeV steps of $ {\Delta {m}} $ from 50 (top-left) to 80 GeV (bottom-right). For each case, a representative ${({m}({\tilde{\mathrm {t}}} _{1}}), {m}({\tilde{\chi}^{0}_{1}}))$ signal point is also shown, but is not added to the SM background. The shaded area on the Data/MC ratio represents the statistical uncertainty of the simulated background. |

png pdf |
Figure 5-a:
Distribution of the BDT output at the preselection level in data and simulation for $ {\Delta {m}} = $ 50 GeV. For each case, a representative ${({m}({\tilde{\mathrm {t}}} _{1}}), {m}({\tilde{\chi}^{0}_{1}}))$ signal point is also shown, but is not added to the SM background. The shaded area on the Data/MC ratio represents the statistical uncertainty of the simulated background. |
png pdf |
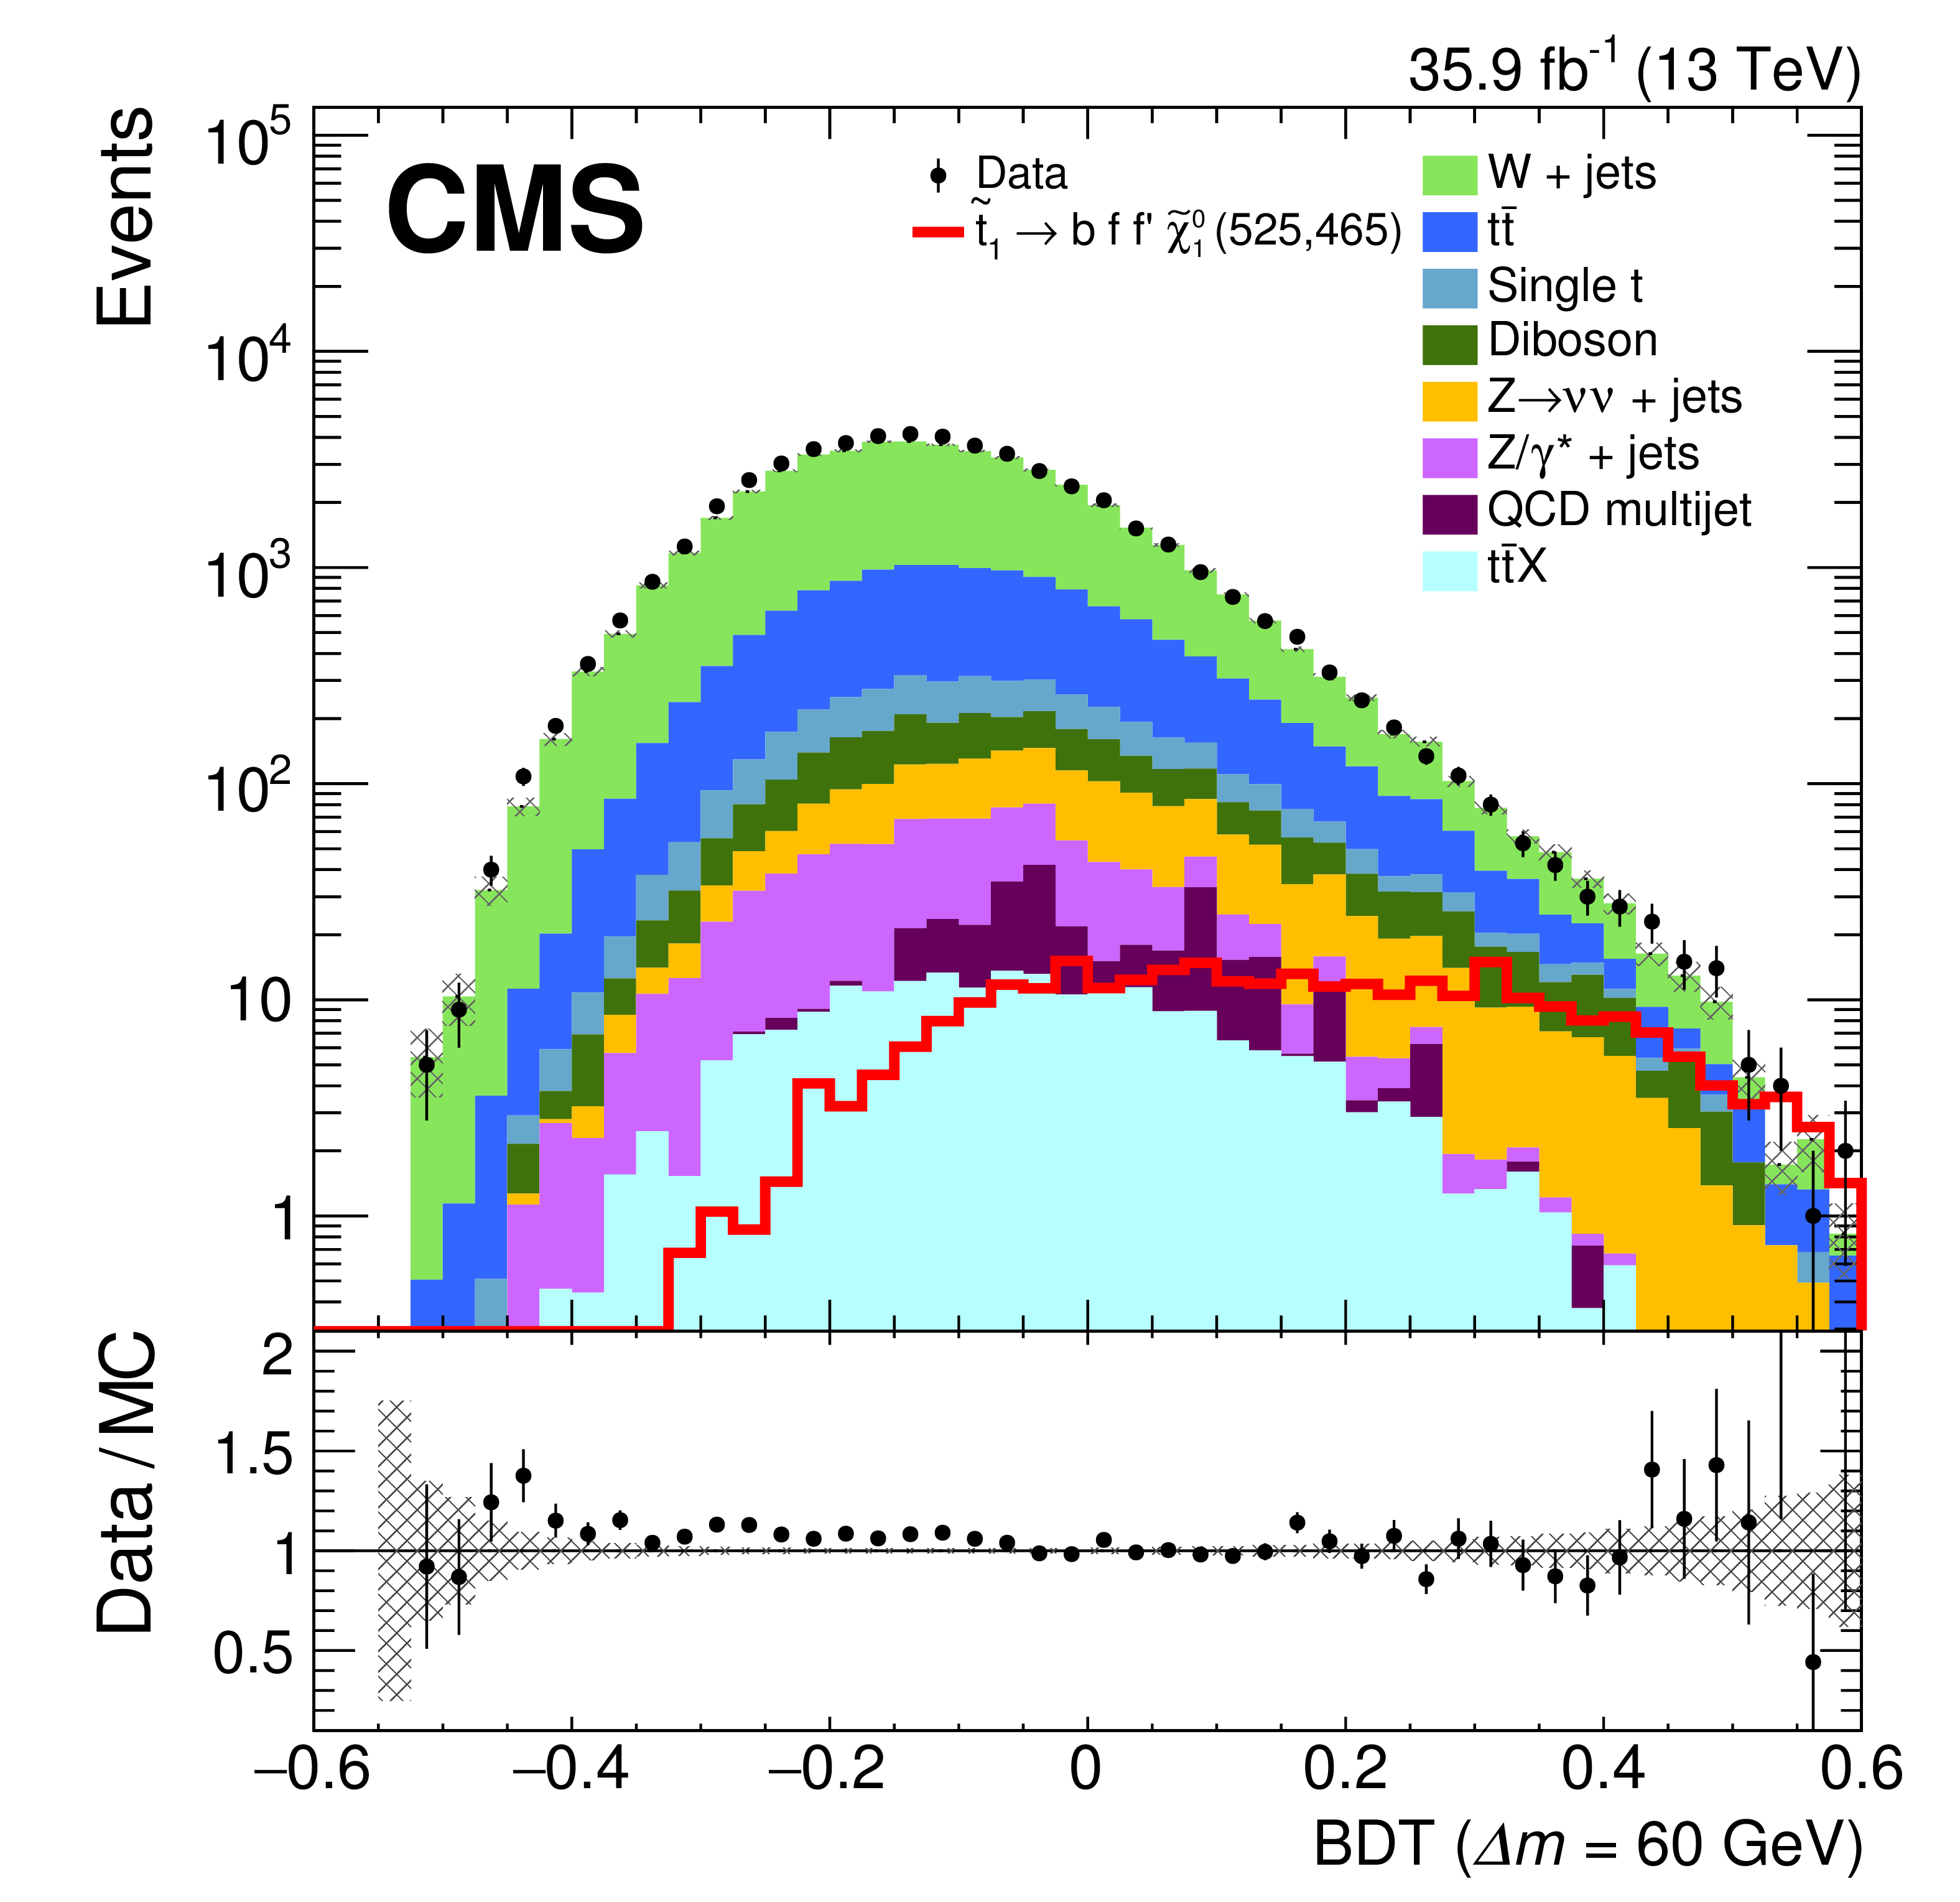
Figure 5-b:
Distribution of the BDT output at the preselection level in data and simulation for $ {\Delta {m}} = $ 60 GeV. For each case, a representative ${({m}({\tilde{\mathrm {t}}} _{1}}), {m}({\tilde{\chi}^{0}_{1}}))$ signal point is also shown, but is not added to the SM background. The shaded area on the Data/MC ratio represents the statistical uncertainty of the simulated background. |

png pdf |
Figure 5-c:
Distribution of the BDT output at the preselection level in data and simulation for $ {\Delta {m}} = $ 70 GeV. For each case, a representative ${({m}({\tilde{\mathrm {t}}} _{1}}), {m}({\tilde{\chi}^{0}_{1}}))$ signal point is also shown, but is not added to the SM background. The shaded area on the Data/MC ratio represents the statistical uncertainty of the simulated background. |

png pdf |
Figure 5-d:
Distribution of the BDT output at the preselection level in data and simulation for $ {\Delta {m}} = $ 80 GeV. For each case, a representative ${({m}({\tilde{\mathrm {t}}} _{1}}), {m}({\tilde{\chi}^{0}_{1}}))$ signal point is also shown, but is not added to the SM background. The shaded area on the Data/MC ratio represents the statistical uncertainty of the simulated background. |
png pdf root |
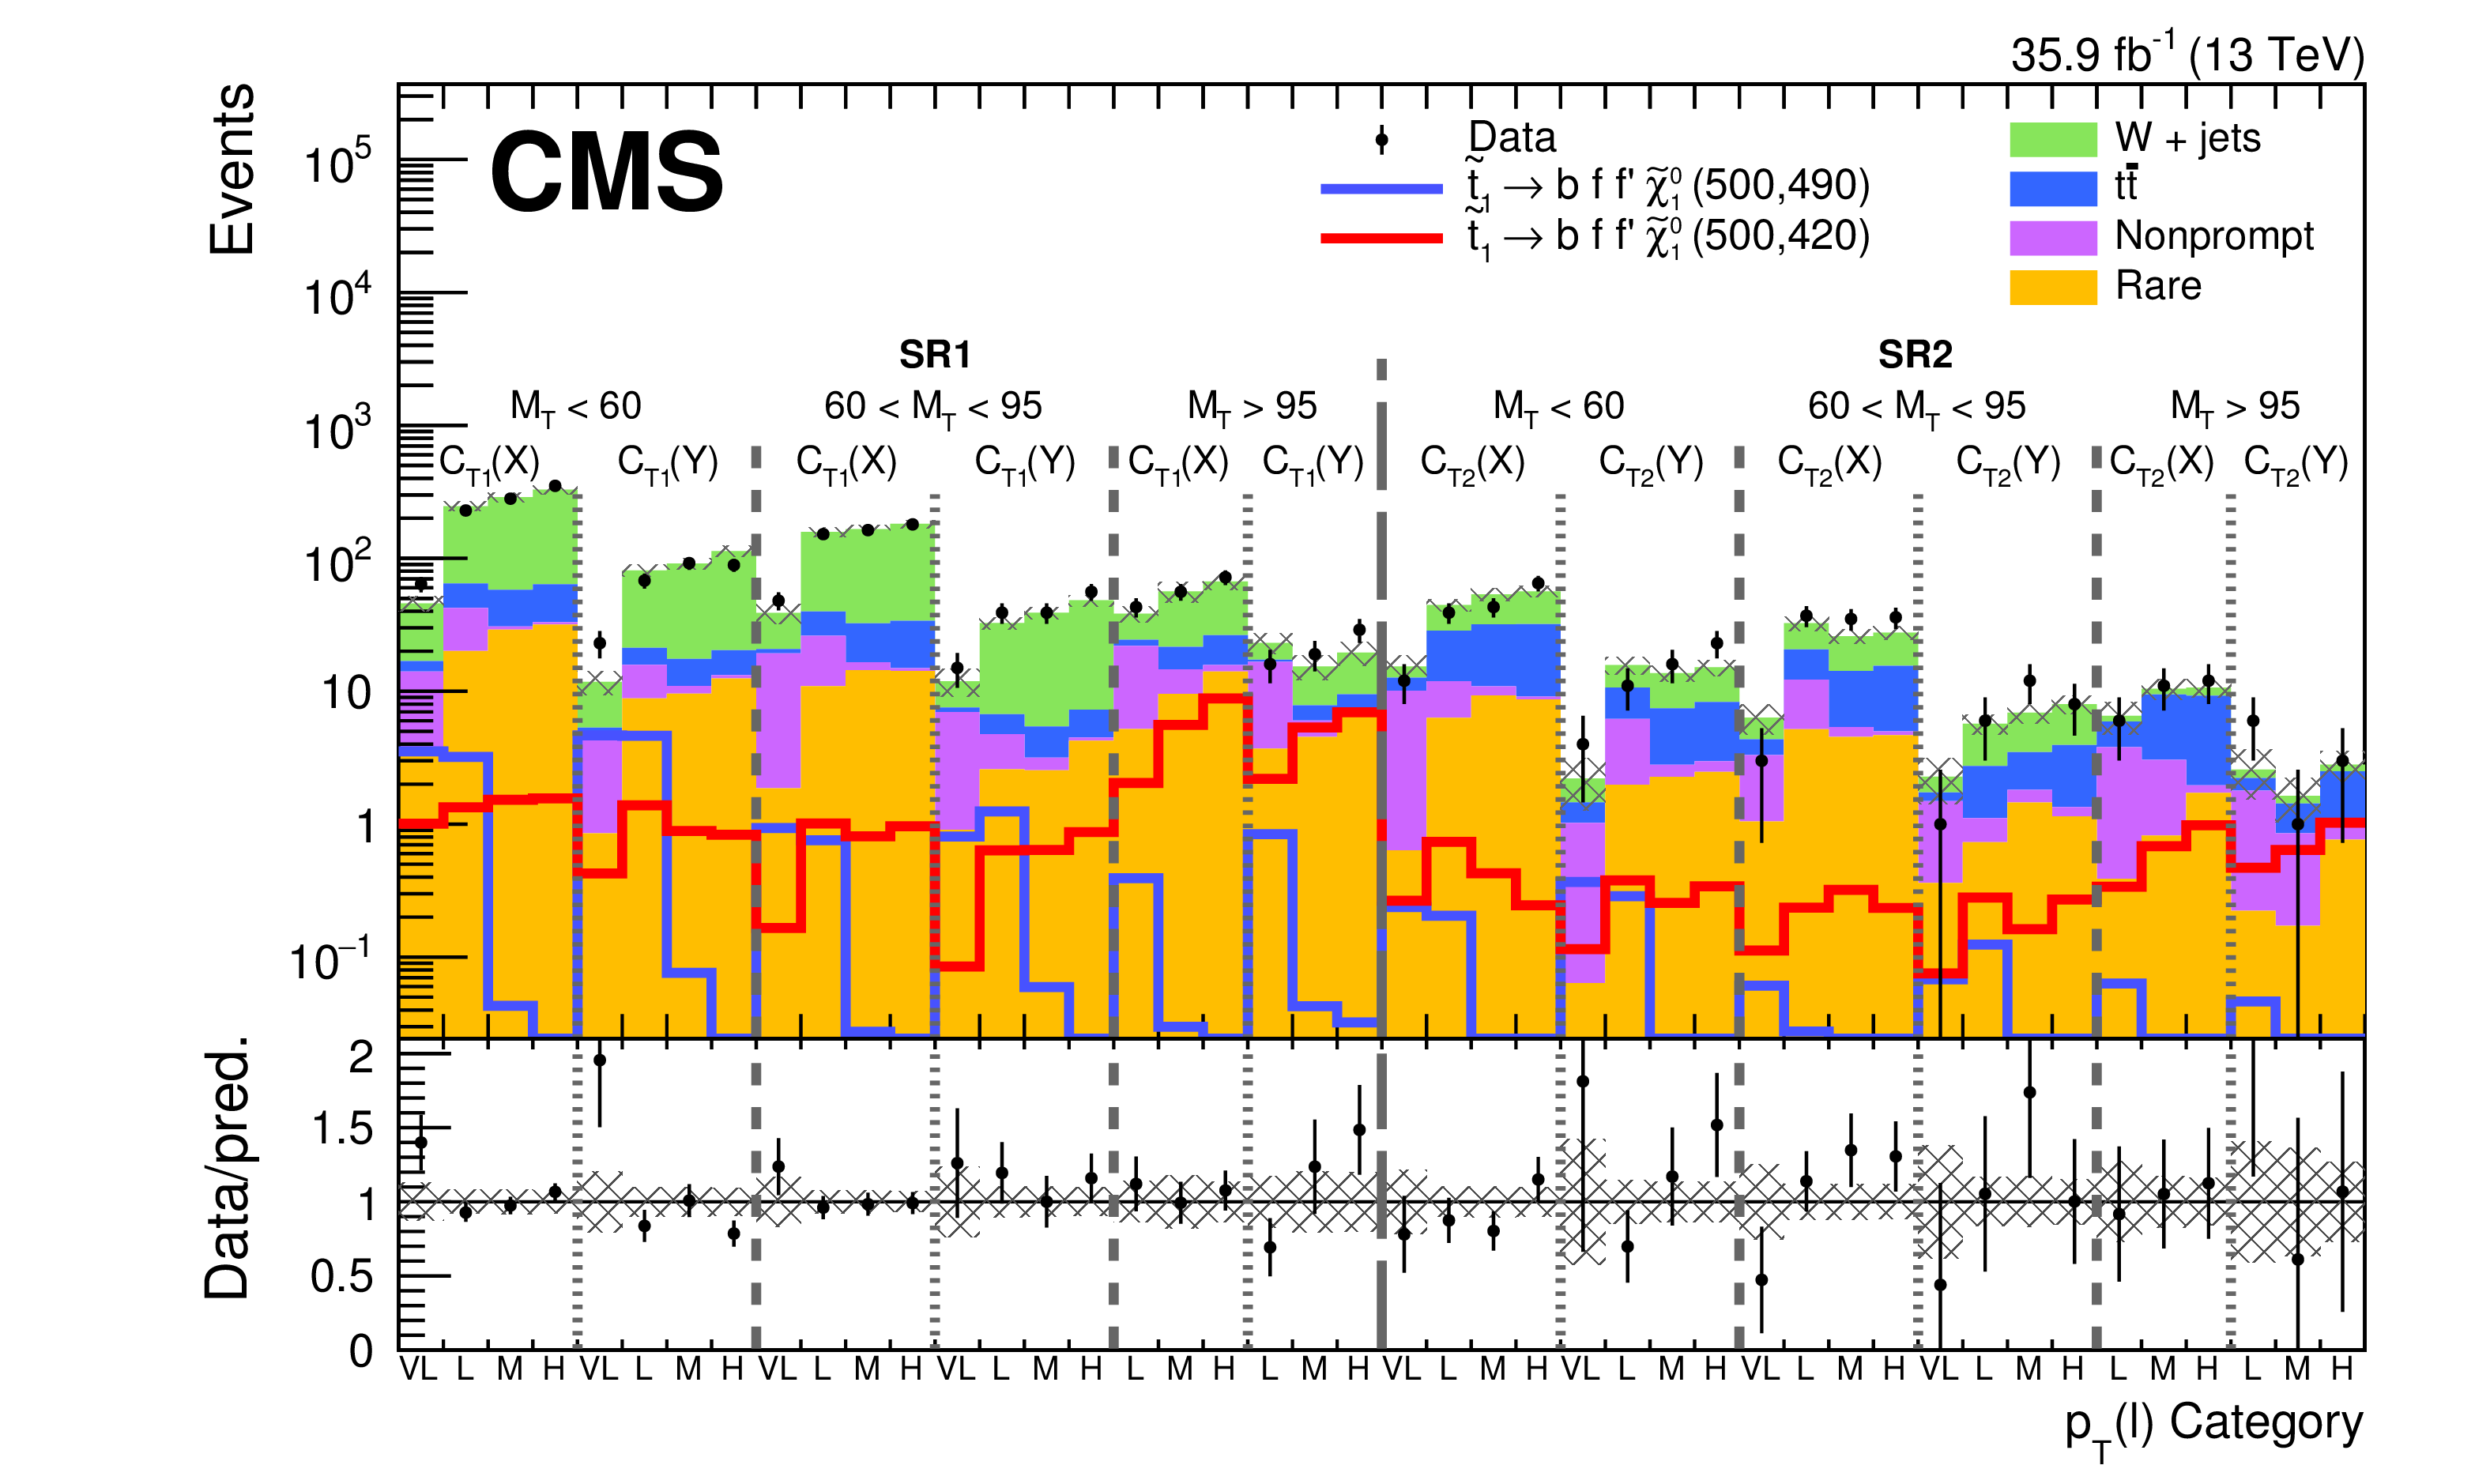
Figure 6:
The CC approach: summary of observed and expected background yields in all SRs as defined in Table yyyyy. The vertical bars and the shaded areas represent the statistical uncertainty of the data and the total uncertainty in the prediction, respectively. The lower panel shows the ratio of data to prediction. |

png pdf |
Figure 7:
Exclusion limit at 95% CL for the four-body decay of the top squark as a function of $m({\tilde{\mathrm {t}}} _{1})$ and $ {\Delta {m}} $ for the CC (upper) and MVA (lower) approaches. The colour shading corresponds to the observed limit on the cross section. The solid black (dashed red) lines represent the observed (expected) limits, derived using the expected top squark pair production cross section. The thick lines represent the central values and the thin lines the variations due to the theoretical or experimental uncertainties. |

png pdf root |
Figure 7-a:
Exclusion limit at 95% CL for the four-body decay of the top squark as a function of $m({\tilde{\mathrm {t}}} _{1})$ and $ {\Delta {m}} $ for the CC approach. The colour shading corresponds to the observed limit on the cross section. The solid black (dashed red) lines represent the observed (expected) limits, derived using the expected top squark pair production cross section. The thick lines represent the central values and the thin lines the variations due to the theoretical or experimental uncertainties. |
png pdf root |
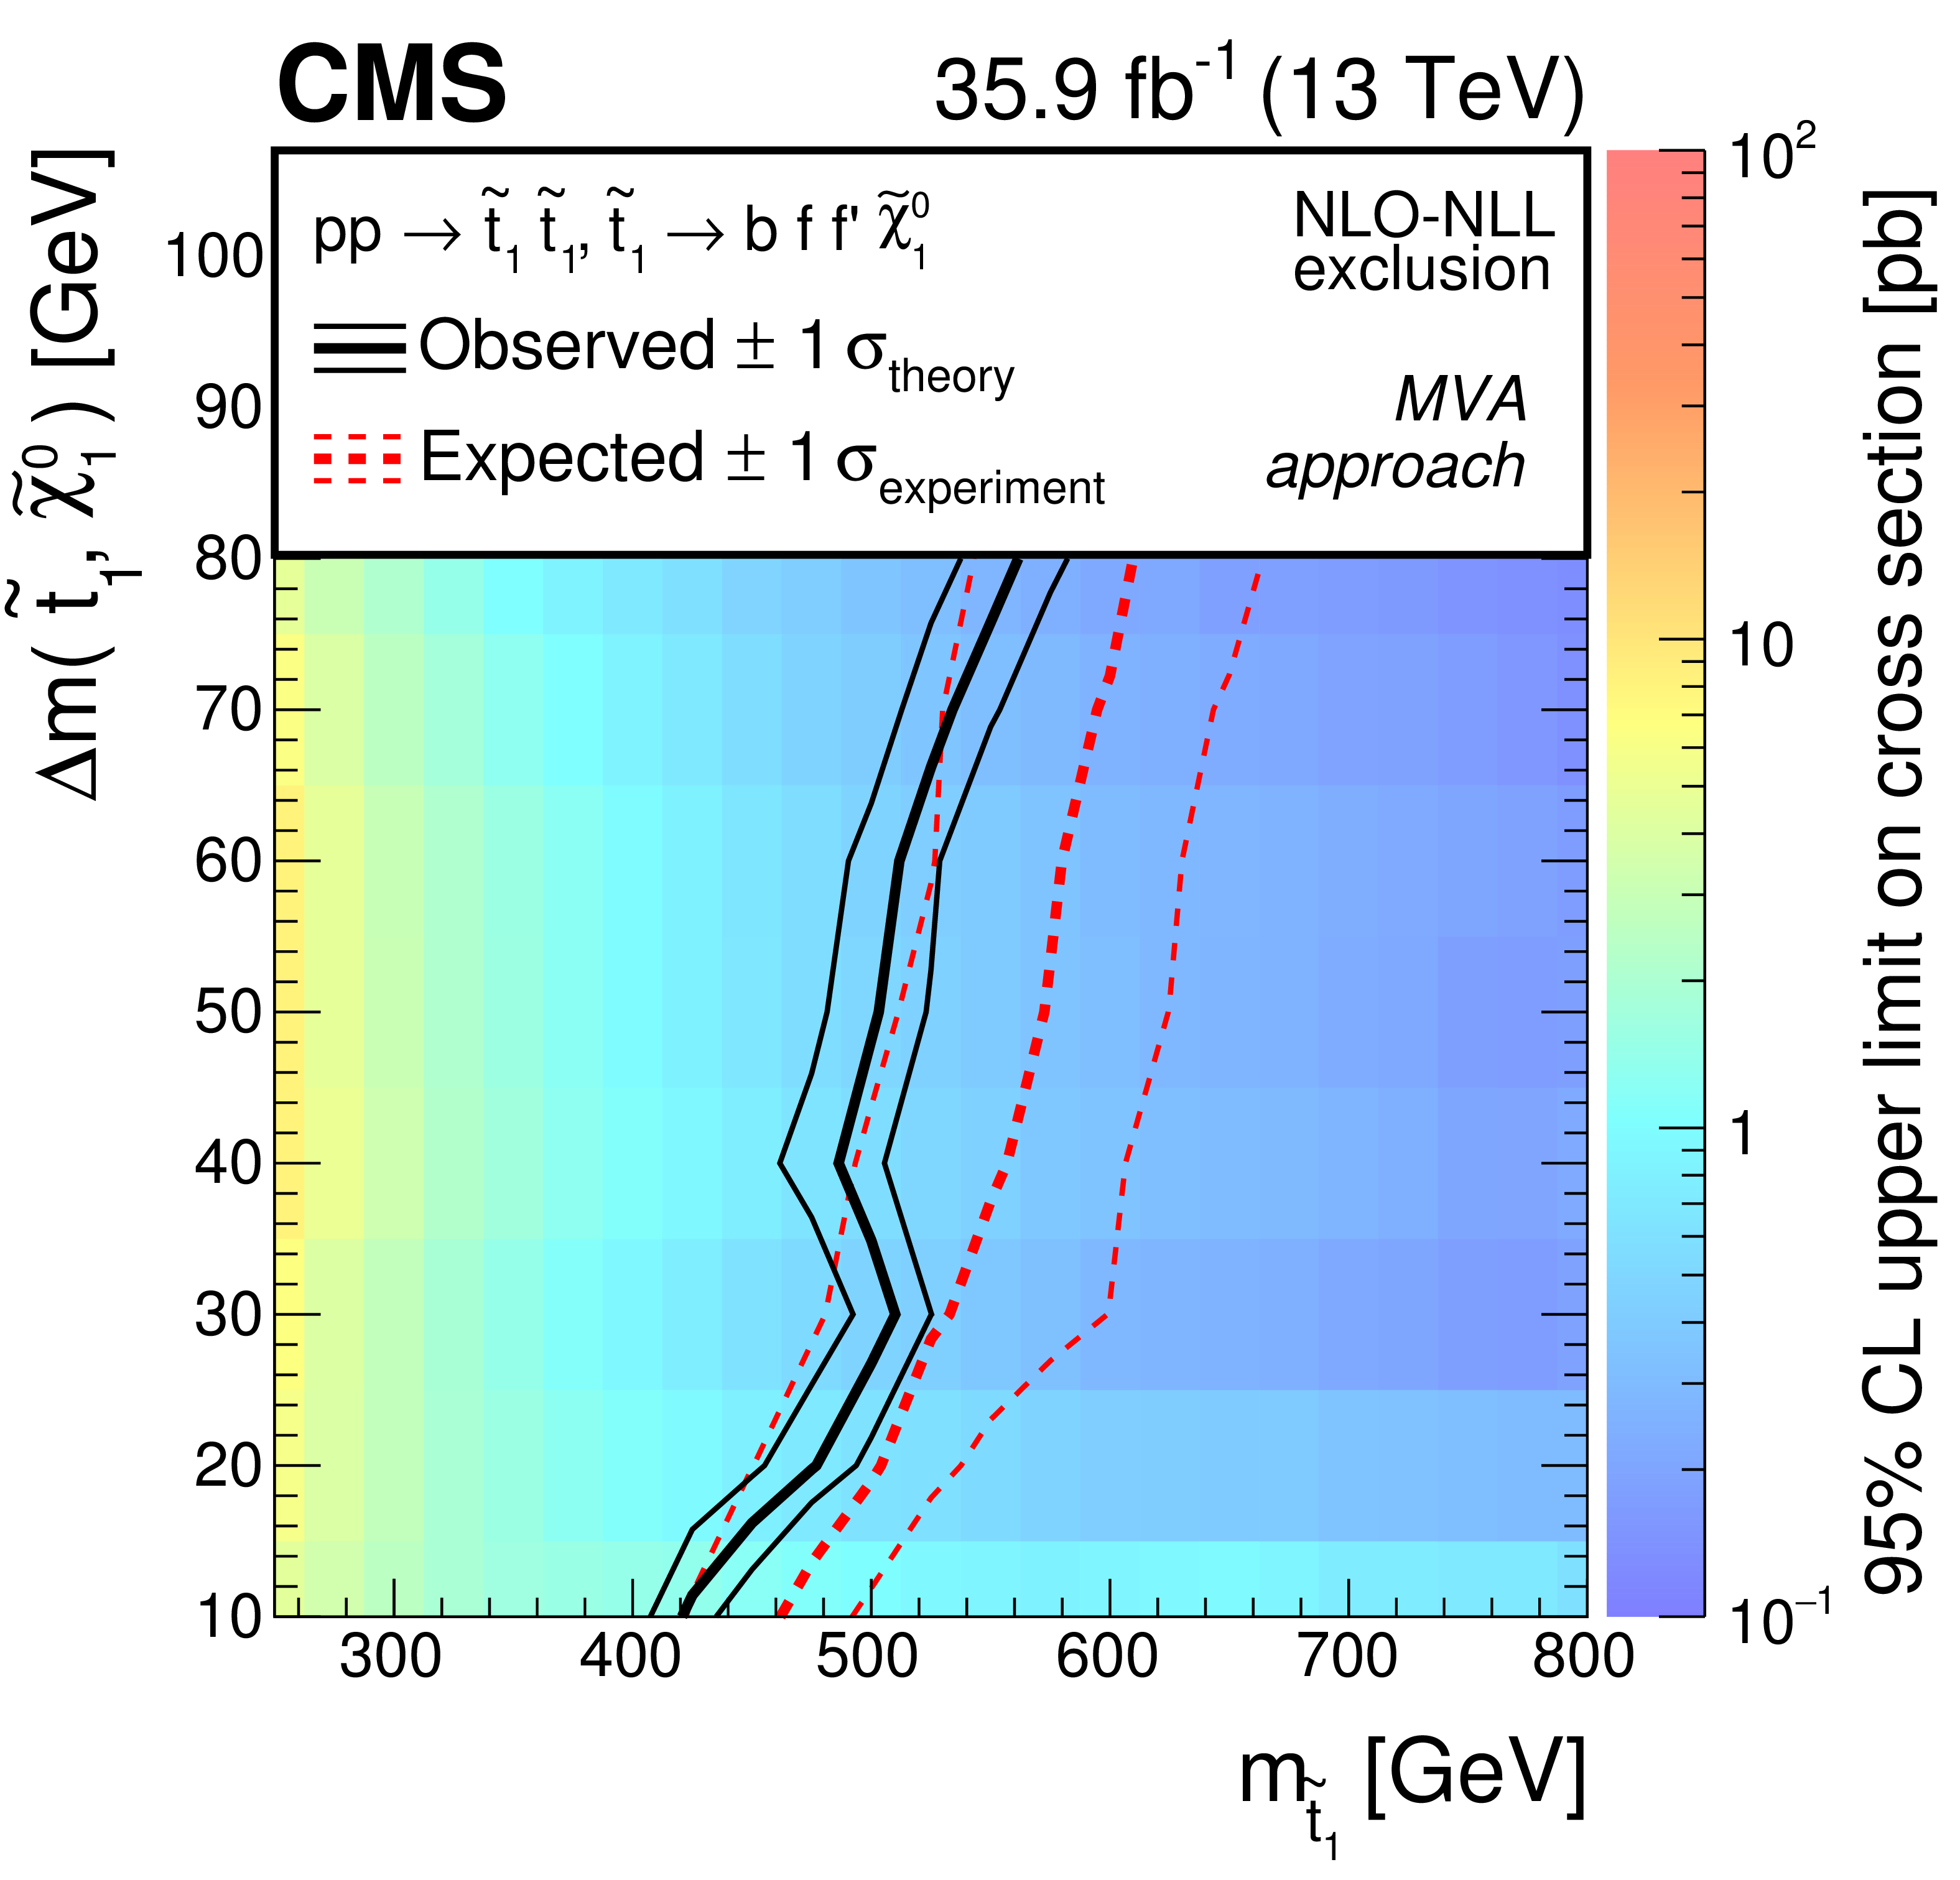
Figure 7-b:
Exclusion limit at 95% CL for the four-body decay of the top squark as a function of $m({\tilde{\mathrm {t}}} _{1})$ and $ {\Delta {m}} $ for the MVA approach. The colour shading corresponds to the observed limit on the cross section. The solid black (dashed red) lines represent the observed (expected) limits, derived using the expected top squark pair production cross section. The thick lines represent the central values and the thin lines the variations due to the theoretical or experimental uncertainties. |

png pdf root |
Figure 8:
Exclusion limit at 95% CL for the chargino-mediated decay of the top squark as a function of $m({\tilde{\mathrm {t}}} _{1})$ and $ {\Delta {m}} $ for the CC search. The colour shading corresponds to the observed limit on the cross section. The solid black (dashed red) lines represent the observed (expected) limits, derived using the expected top squark pair production cross section. The thick lines represent the central values and the thin lines the variations due to the theoretical (experimental) uncertainties. |
png pdf |
Figure 9:
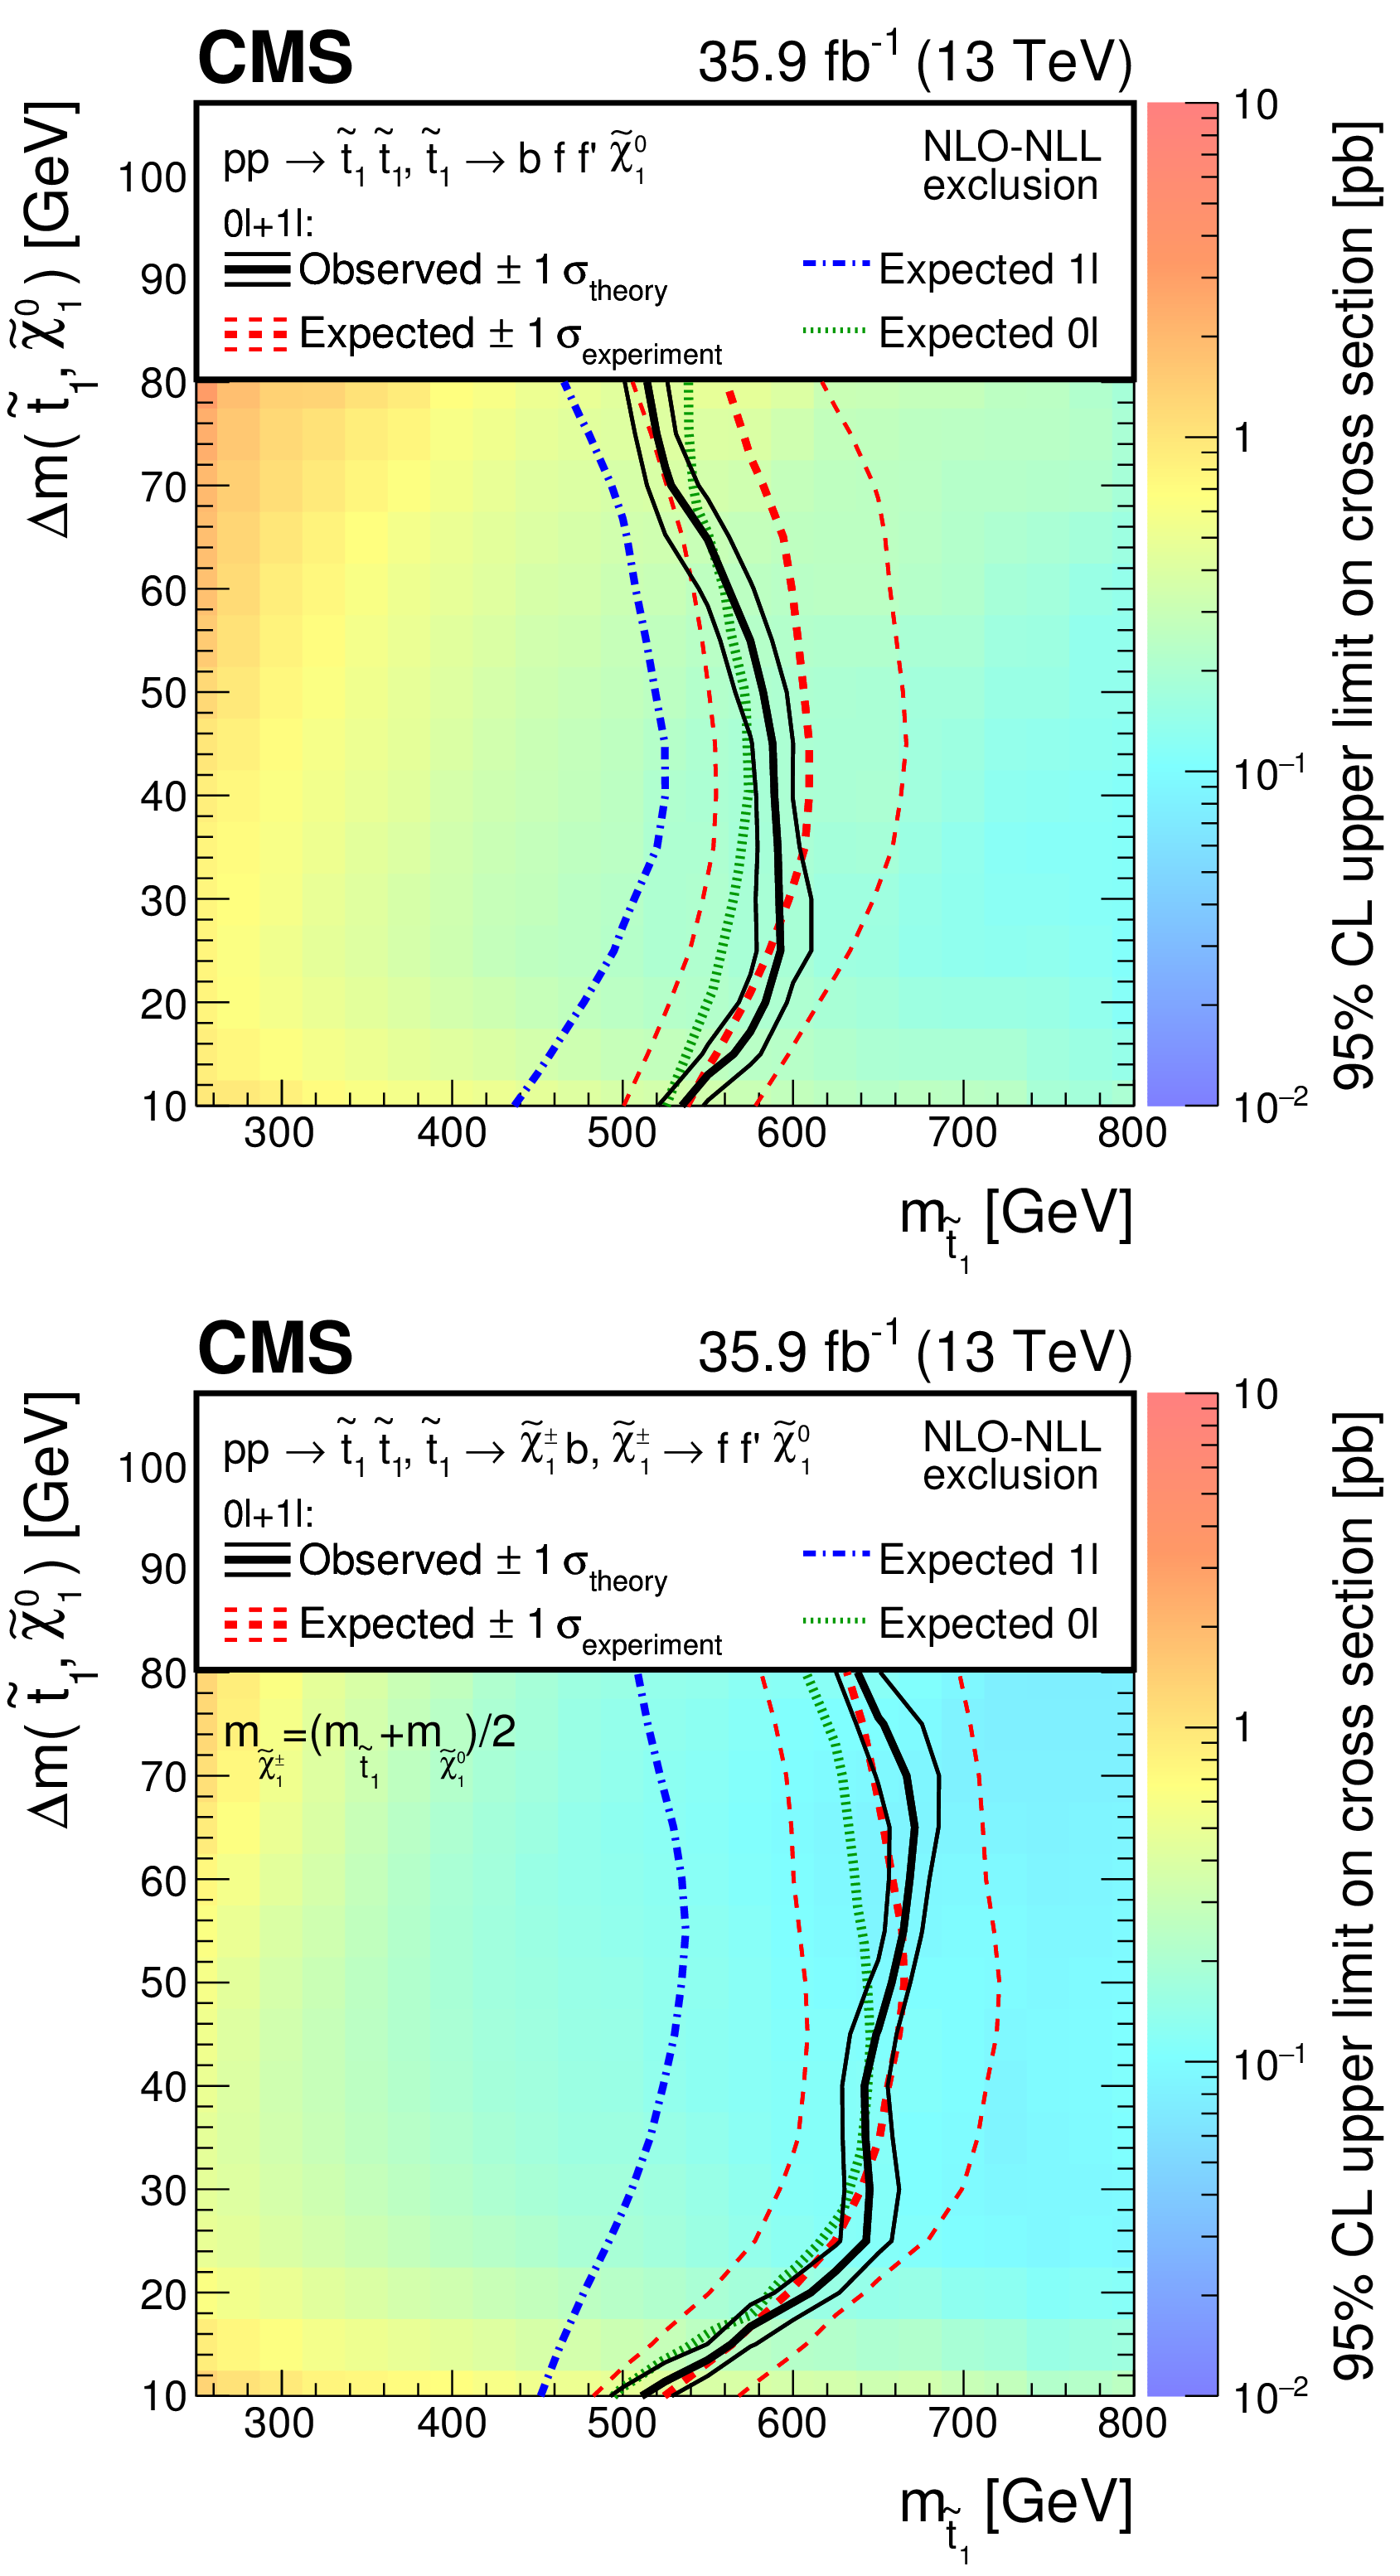
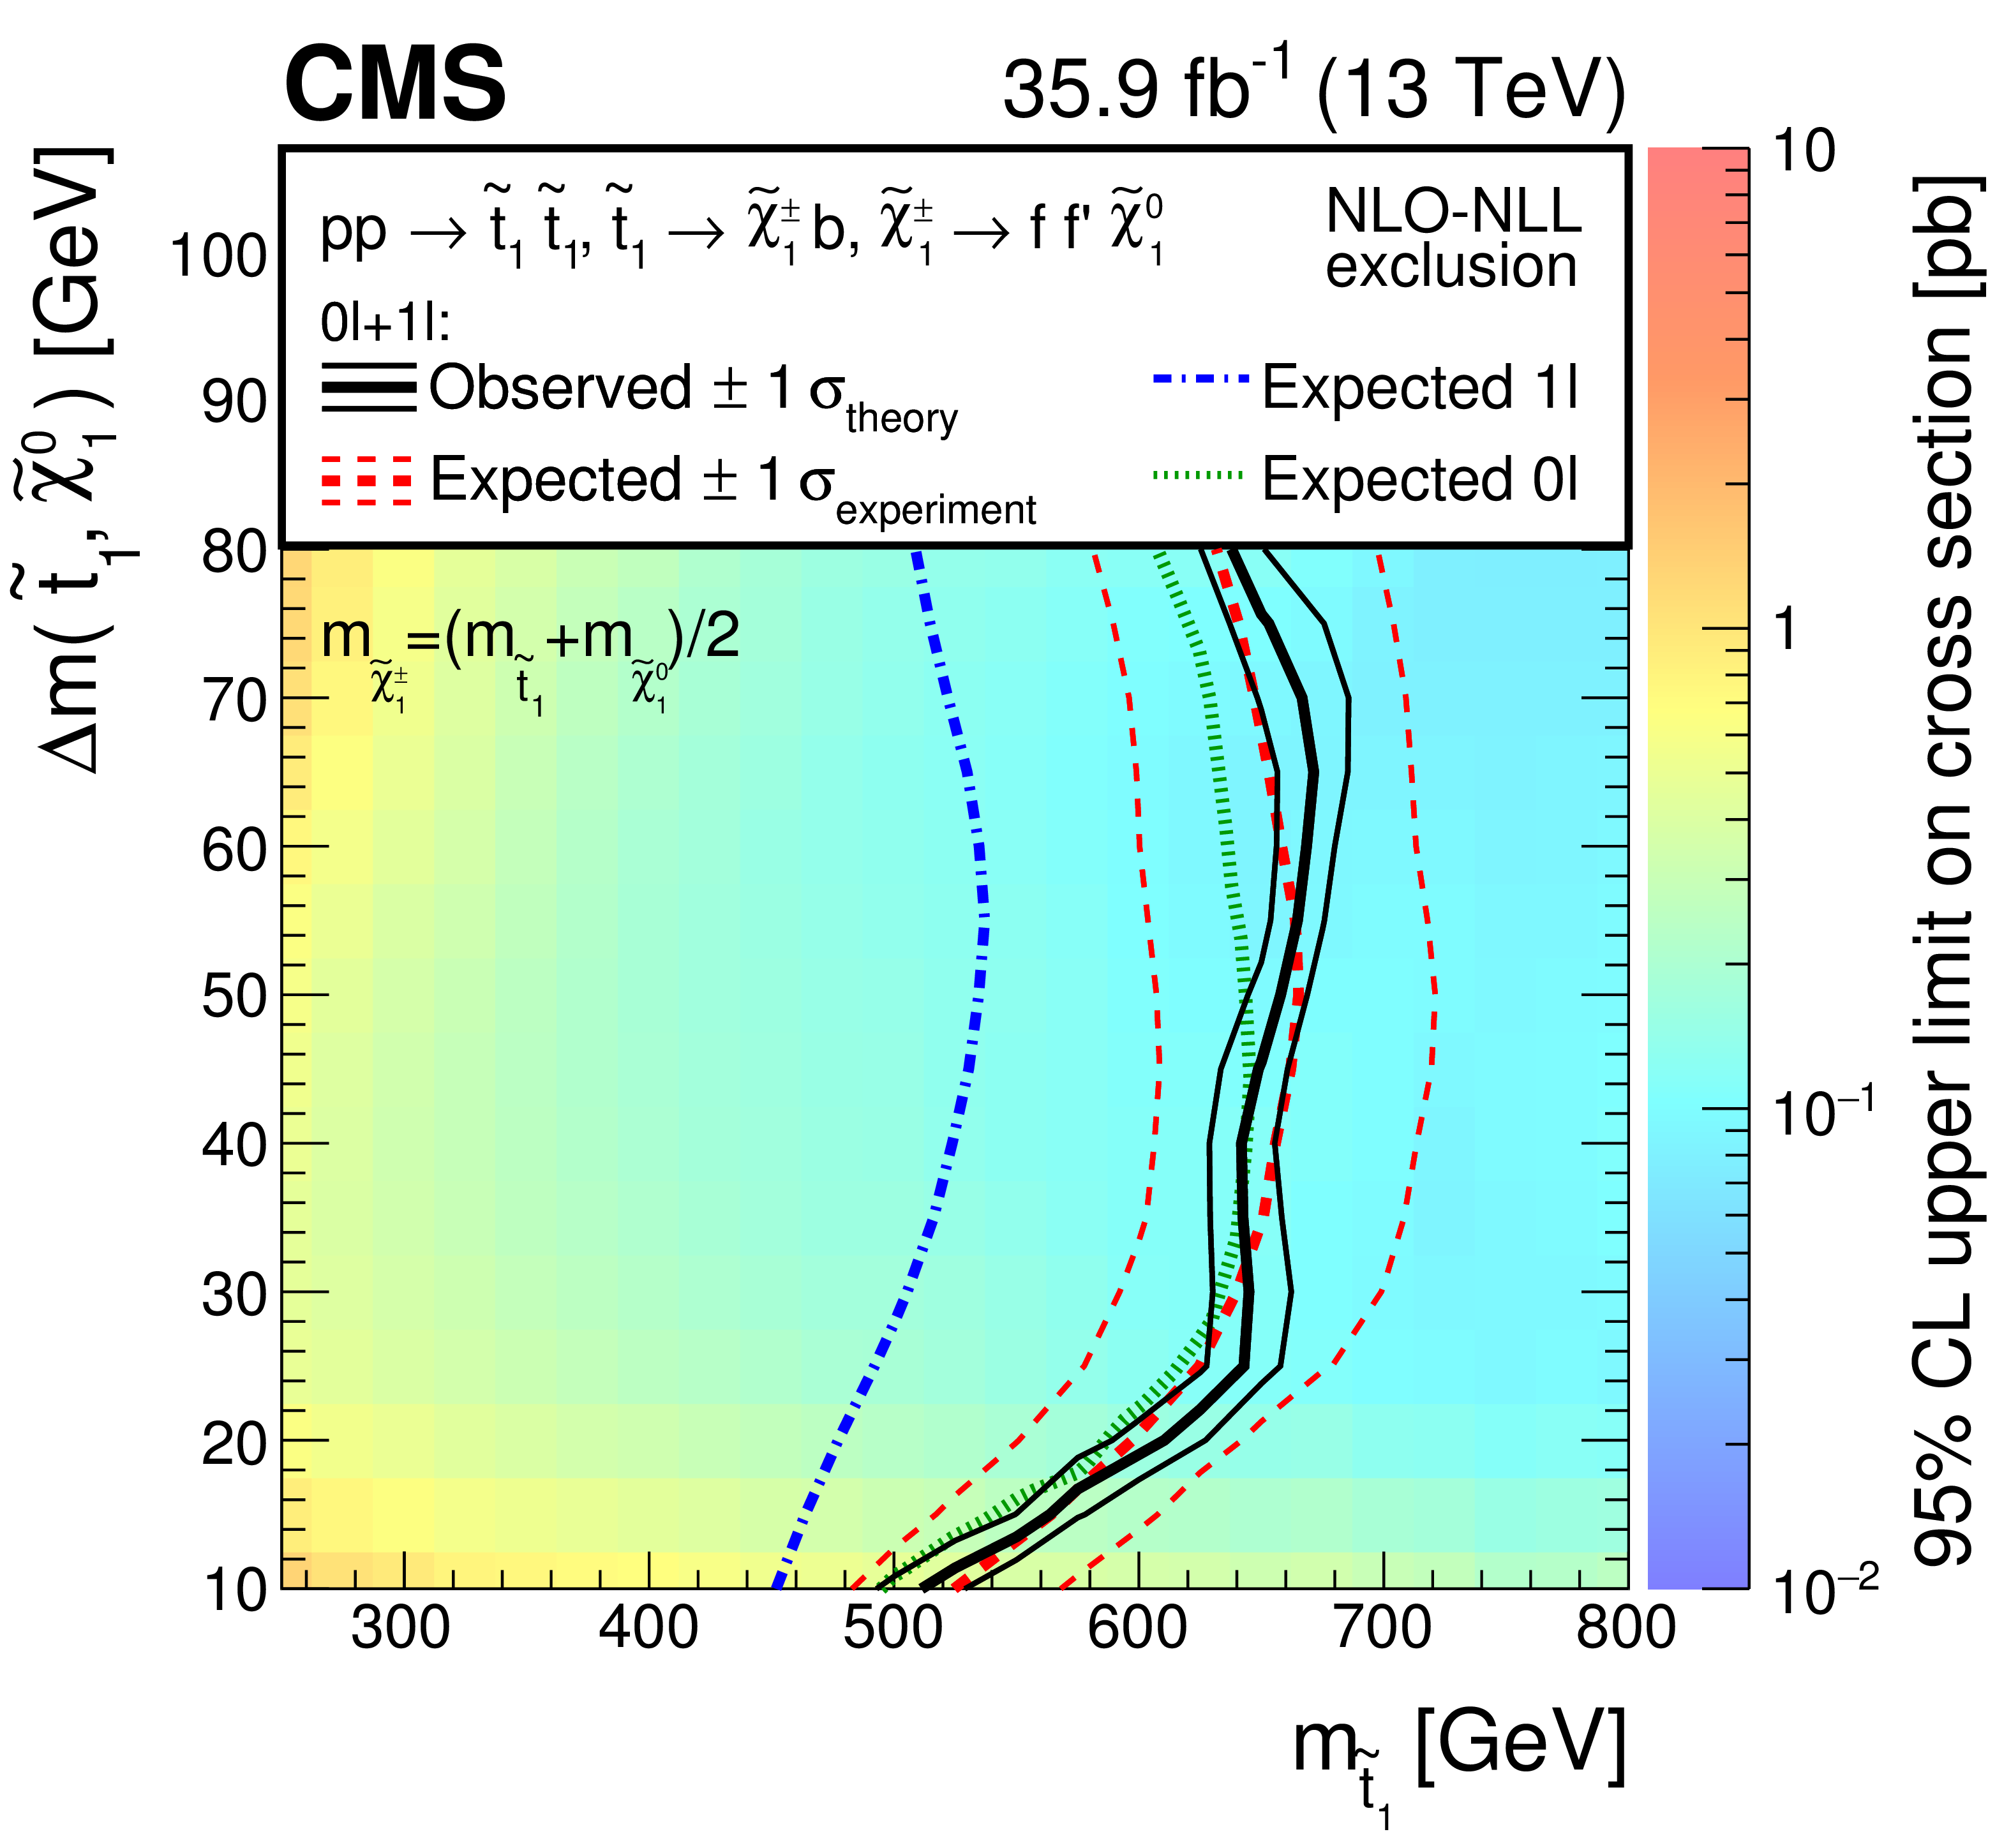
Combined limits at 95% CL between the CC single-lepton (1$ \ell $) and all-hadronic (0$ \ell $) [19] searches for the four-body decay (upper) and the chargino-mediated decay (lower) of the top squark in the $m({\tilde{\mathrm {t}}} _{1})$-$\Delta m({\tilde{\mathrm {t}}} _{1}, {\tilde{\chi}^{0}_{1}})$ plane. The correlations between the two searches have been taken into account. The colour shading corresponds to the observed limit on the cross section. The solid black (dashed red) lines show the observed (expected) mass limits, derived using the expected top squark pair production cross section. The thick lines represent the central values and the thin lines the variations due to the theoretical (experimental) uncertainties. The dot-dashed blue and dotted green lines show the individual expected mass limits for the 1$ \ell $ and 0$ \ell $ searches, respectively. |
png pdf root |
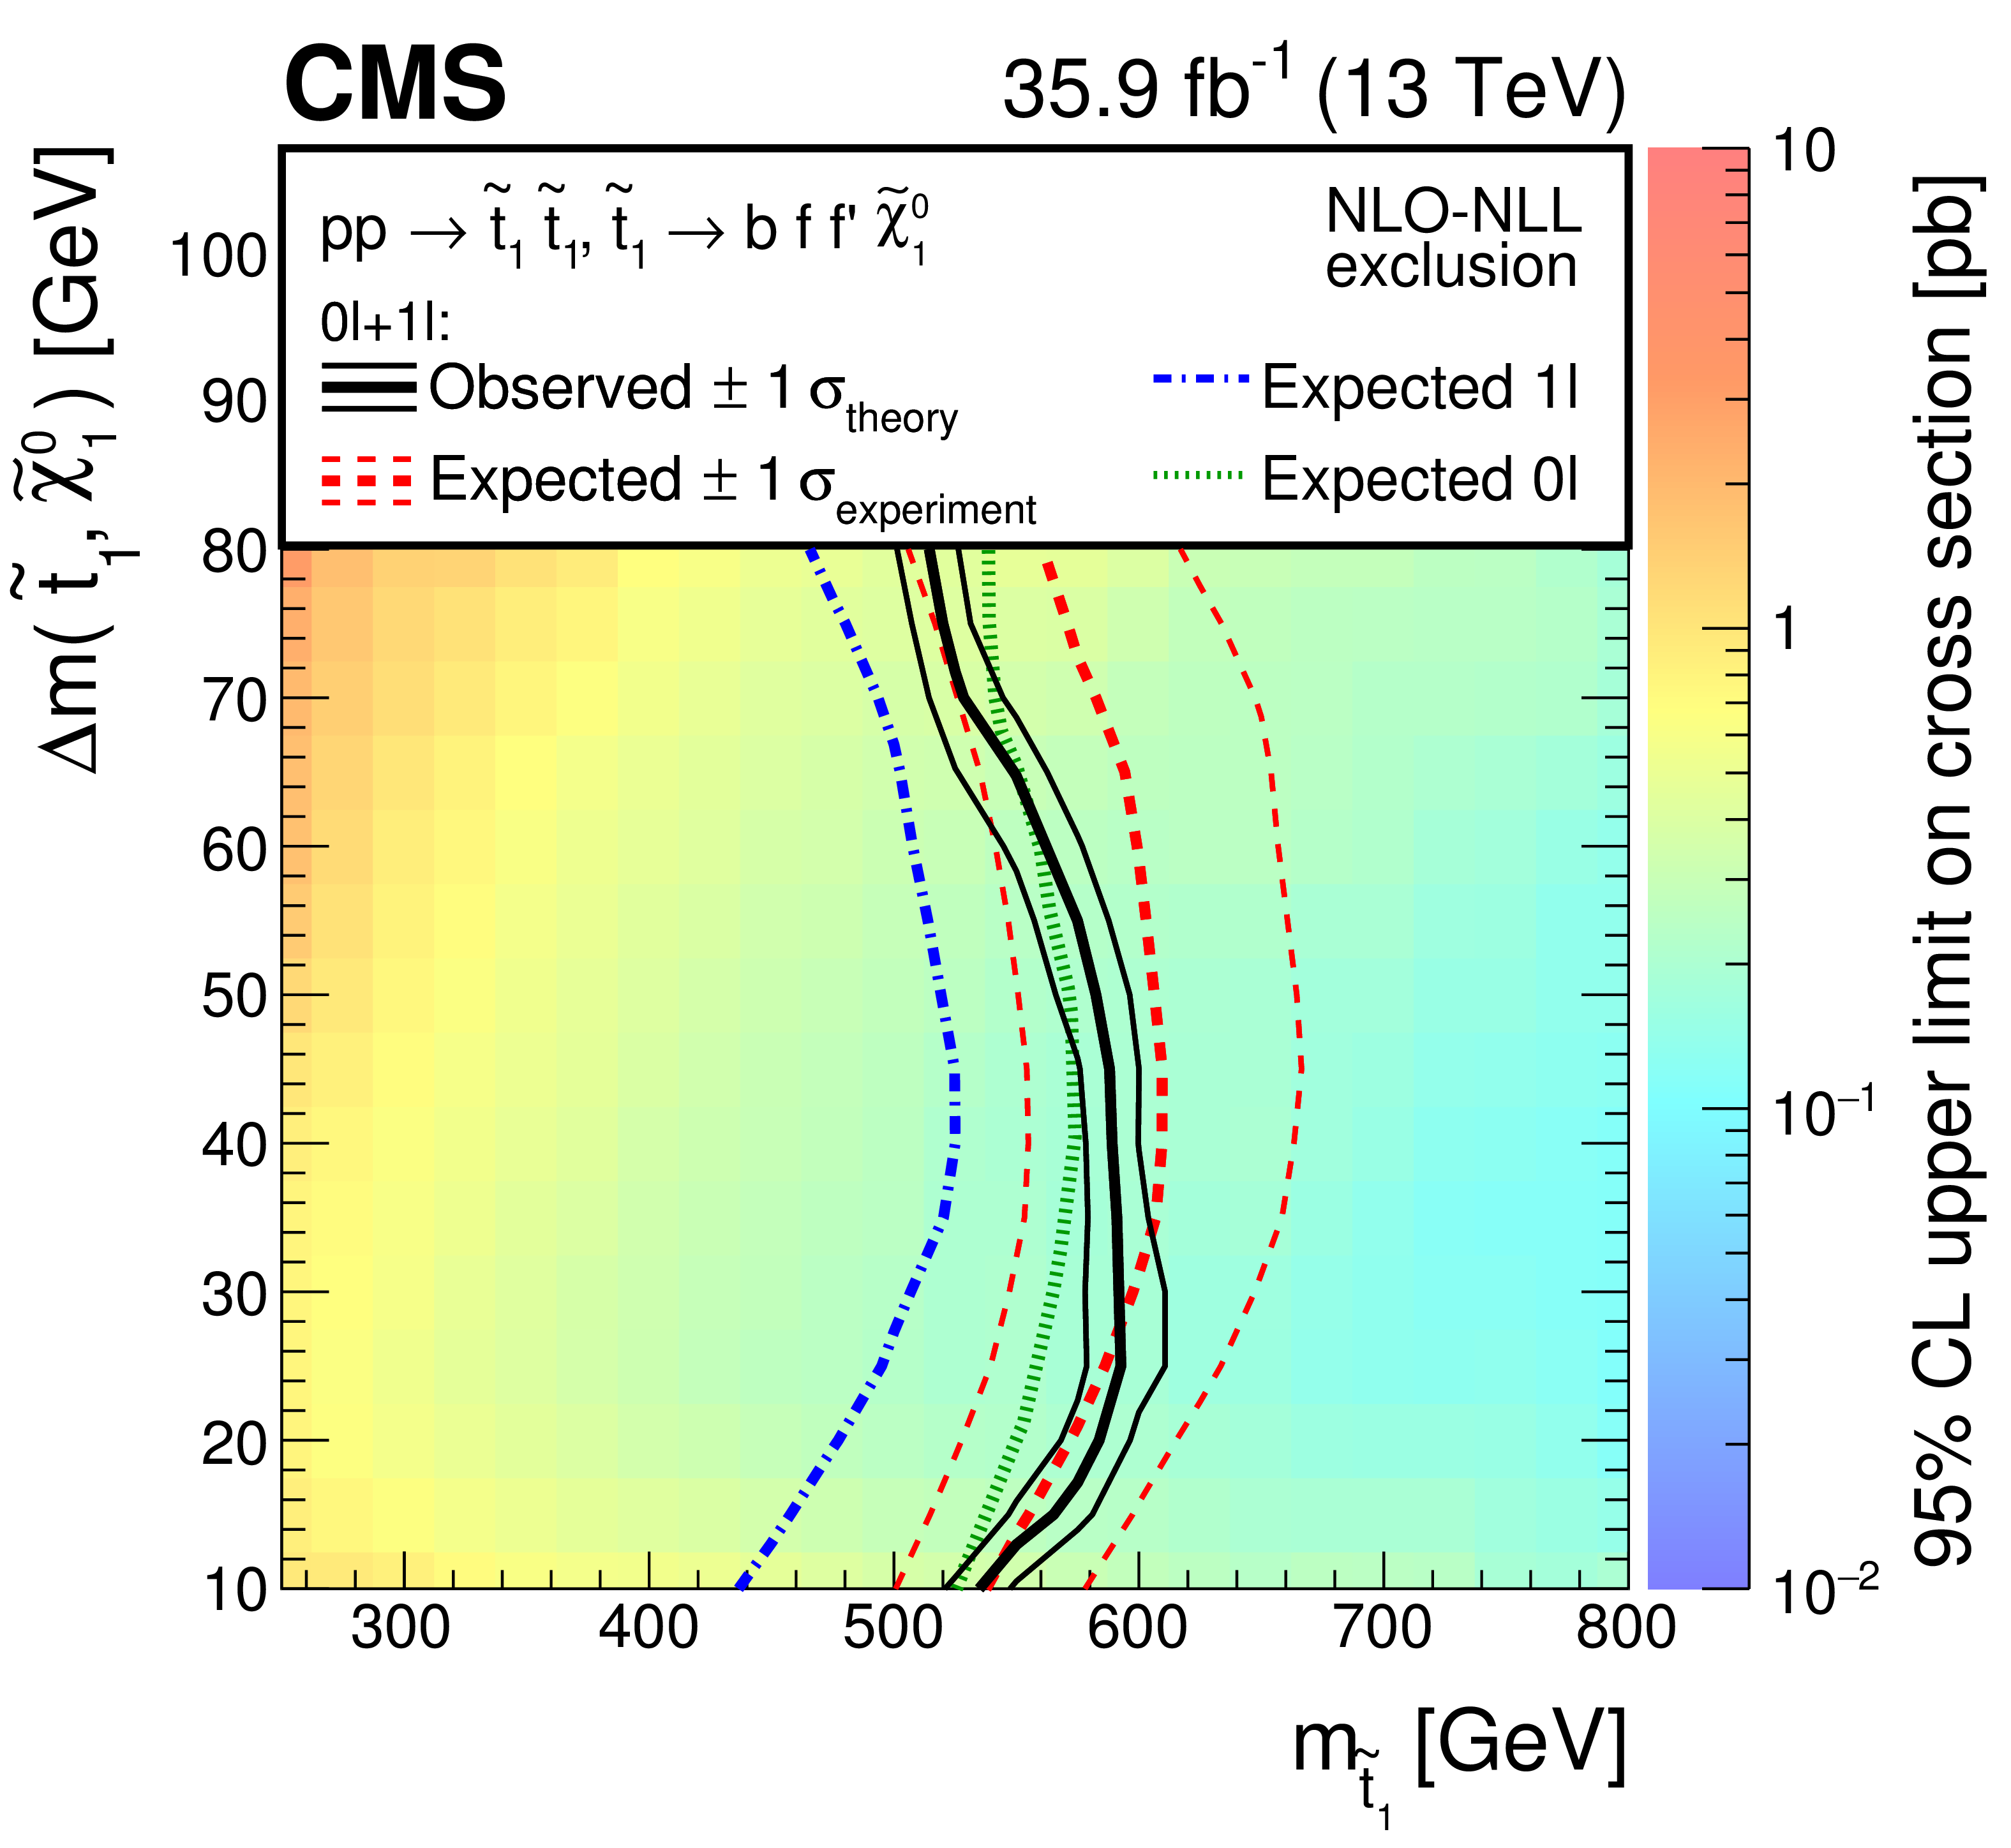
Figure 9-a:
Combined limits at 95% CL between the CC single-lepton (1$ \ell $) and all-hadronic (0$ \ell $) [19] searches for the four-body decay of the top squark in the $m({\tilde{\mathrm {t}}} _{1})$-$\Delta m({\tilde{\mathrm {t}}} _{1}, {\tilde{\chi}^{0}_{1}})$ plane. The correlation with the other search has been taken into account. The colour shading corresponds to the observed limit on the cross section. The solid black (dashed red) lines show the observed (expected) mass limits, derived using the expected top squark pair production cross section. The thick lines represent the central values and the thin lines the variations due to the theoretical (experimental) uncertainties. The dot-dashed blue and dotted green lines show the individual expected mass limits for the 1$ \ell $ and 0$ \ell $ searches, respectively. |
png pdf root |
Figure 9-b:
Combined limits at 95% CL between the CC single-lepton (1$ \ell $) and all-hadronic (0$ \ell $) [19] searches the chargino-mediated decay of the top squark in the $m({\tilde{\mathrm {t}}} _{1})$-$\Delta m({\tilde{\mathrm {t}}} _{1}, {\tilde{\chi}^{0}_{1}})$ plane. The correlation with the other search has been taken into account. The colour shading corresponds to the observed limit on the cross section. The solid black (dashed red) lines show the observed (expected) mass limits, derived using the expected top squark pair production cross section. The thick lines represent the central values and the thin lines the variations due to the theoretical (experimental) uncertainties. The dot-dashed blue and dotted green lines show the individual expected mass limits for the 1$ \ell $ and 0$ \ell $ searches, respectively. |
| Tables | |

png pdf |
Table 1:
The CC search: definition of SRs. The subregions of SRs are denoted by tags in parentheses, as described in the text: VL, L, M, and H refer to the four bins in lepton $ {p_{\mathrm {T}}} $, and X and Y to the $ {C_{\mathrm {T}}} $ ranges specified in the table. The corresponding control regions (CR) use the same selection with the exception of the lepton $ {p_{\mathrm {T}}} $ as shown in the table. For jets, the attributes "soft'' and "hard'' refer to the $ {p_{\mathrm {T}}} $ ranges 30-60 GeV and $ > $60 GeV, respectively. |
png pdf |
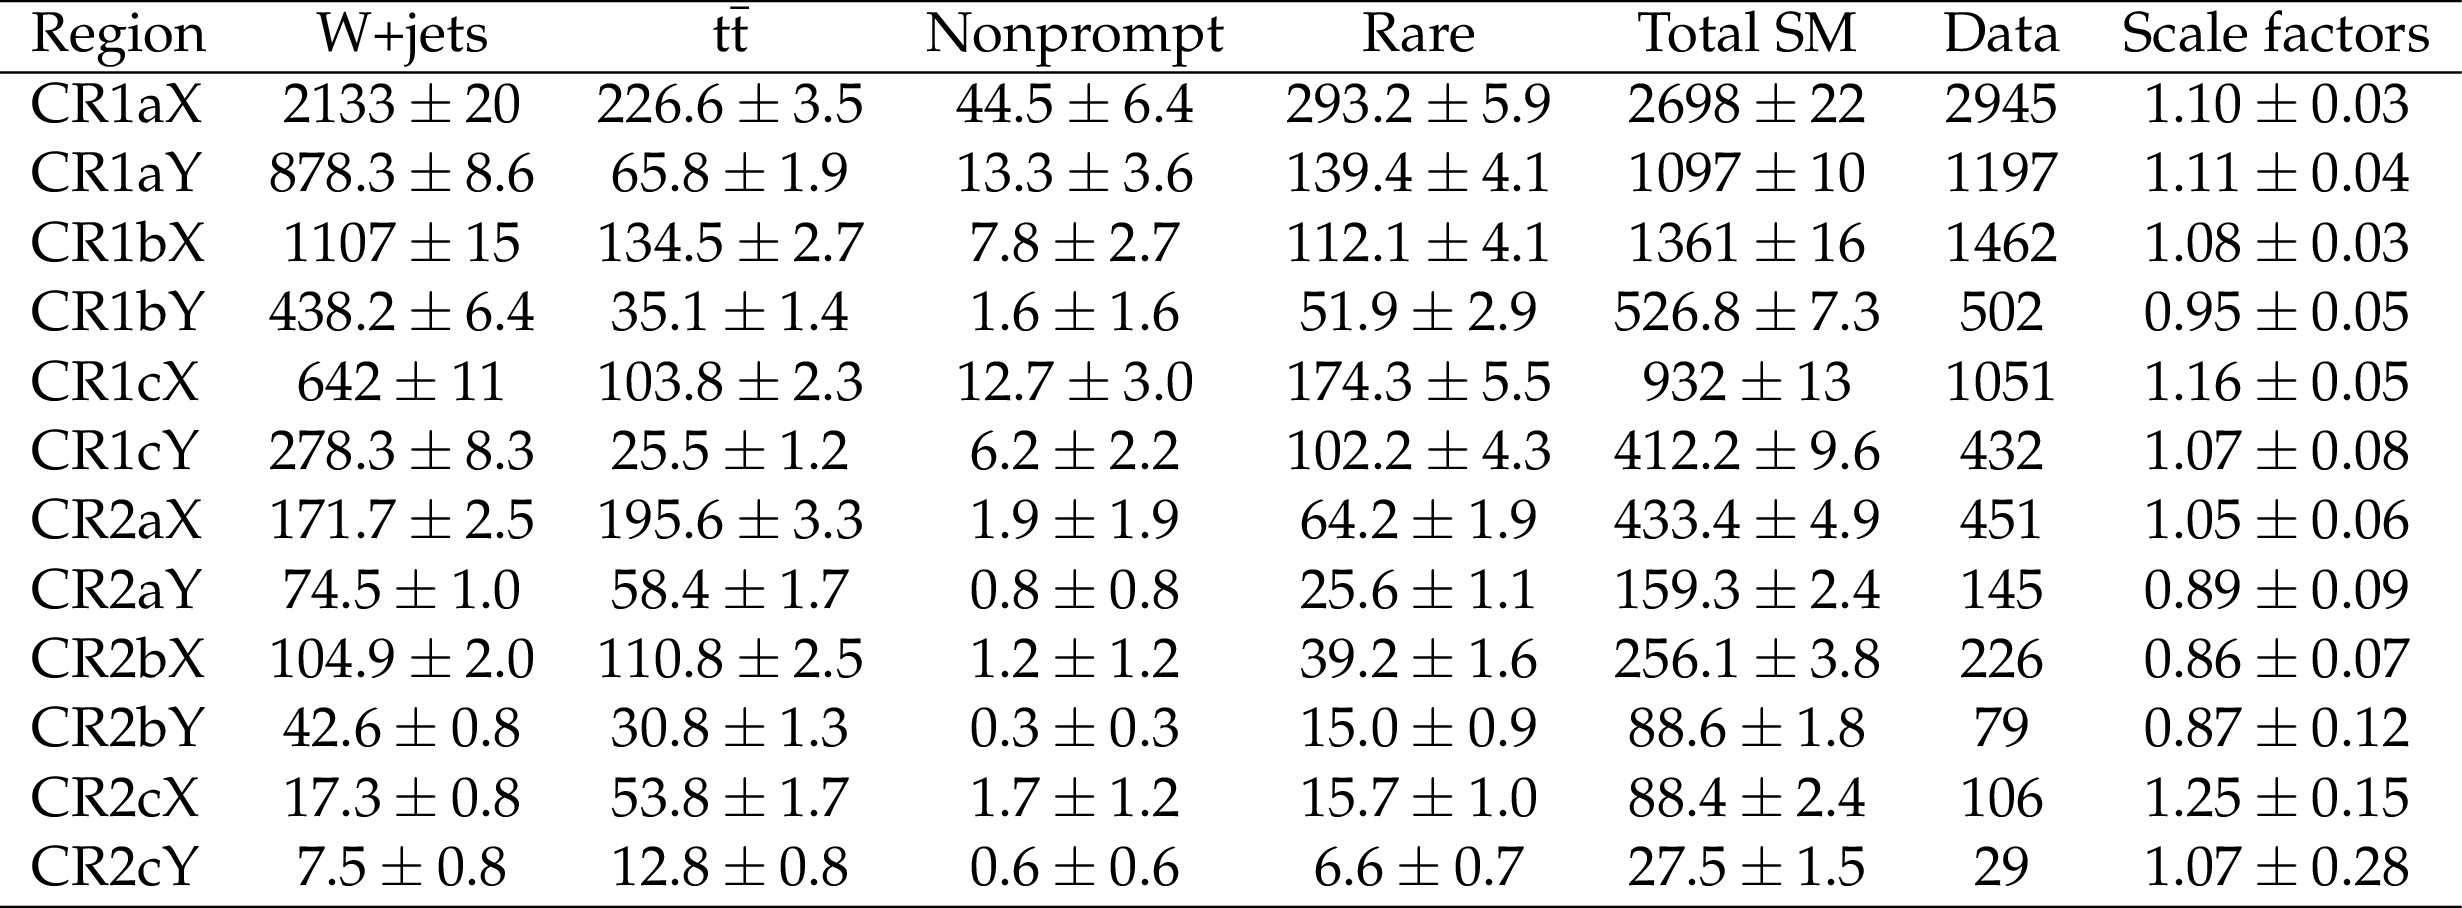
Table 2:
The CC search: observed yields and simulated background contributions to CRs normalized to an integrated luminosity of 35.9 fb$^{-1}$. The nonprompt contributions are estimated from data. The last column shows the scale factors used for the normalization of the W+jets and $ {{\mathrm {t}\overline {\mathrm {t}}}} $ samples. Only statistical uncertainties are reported. |
png pdf |
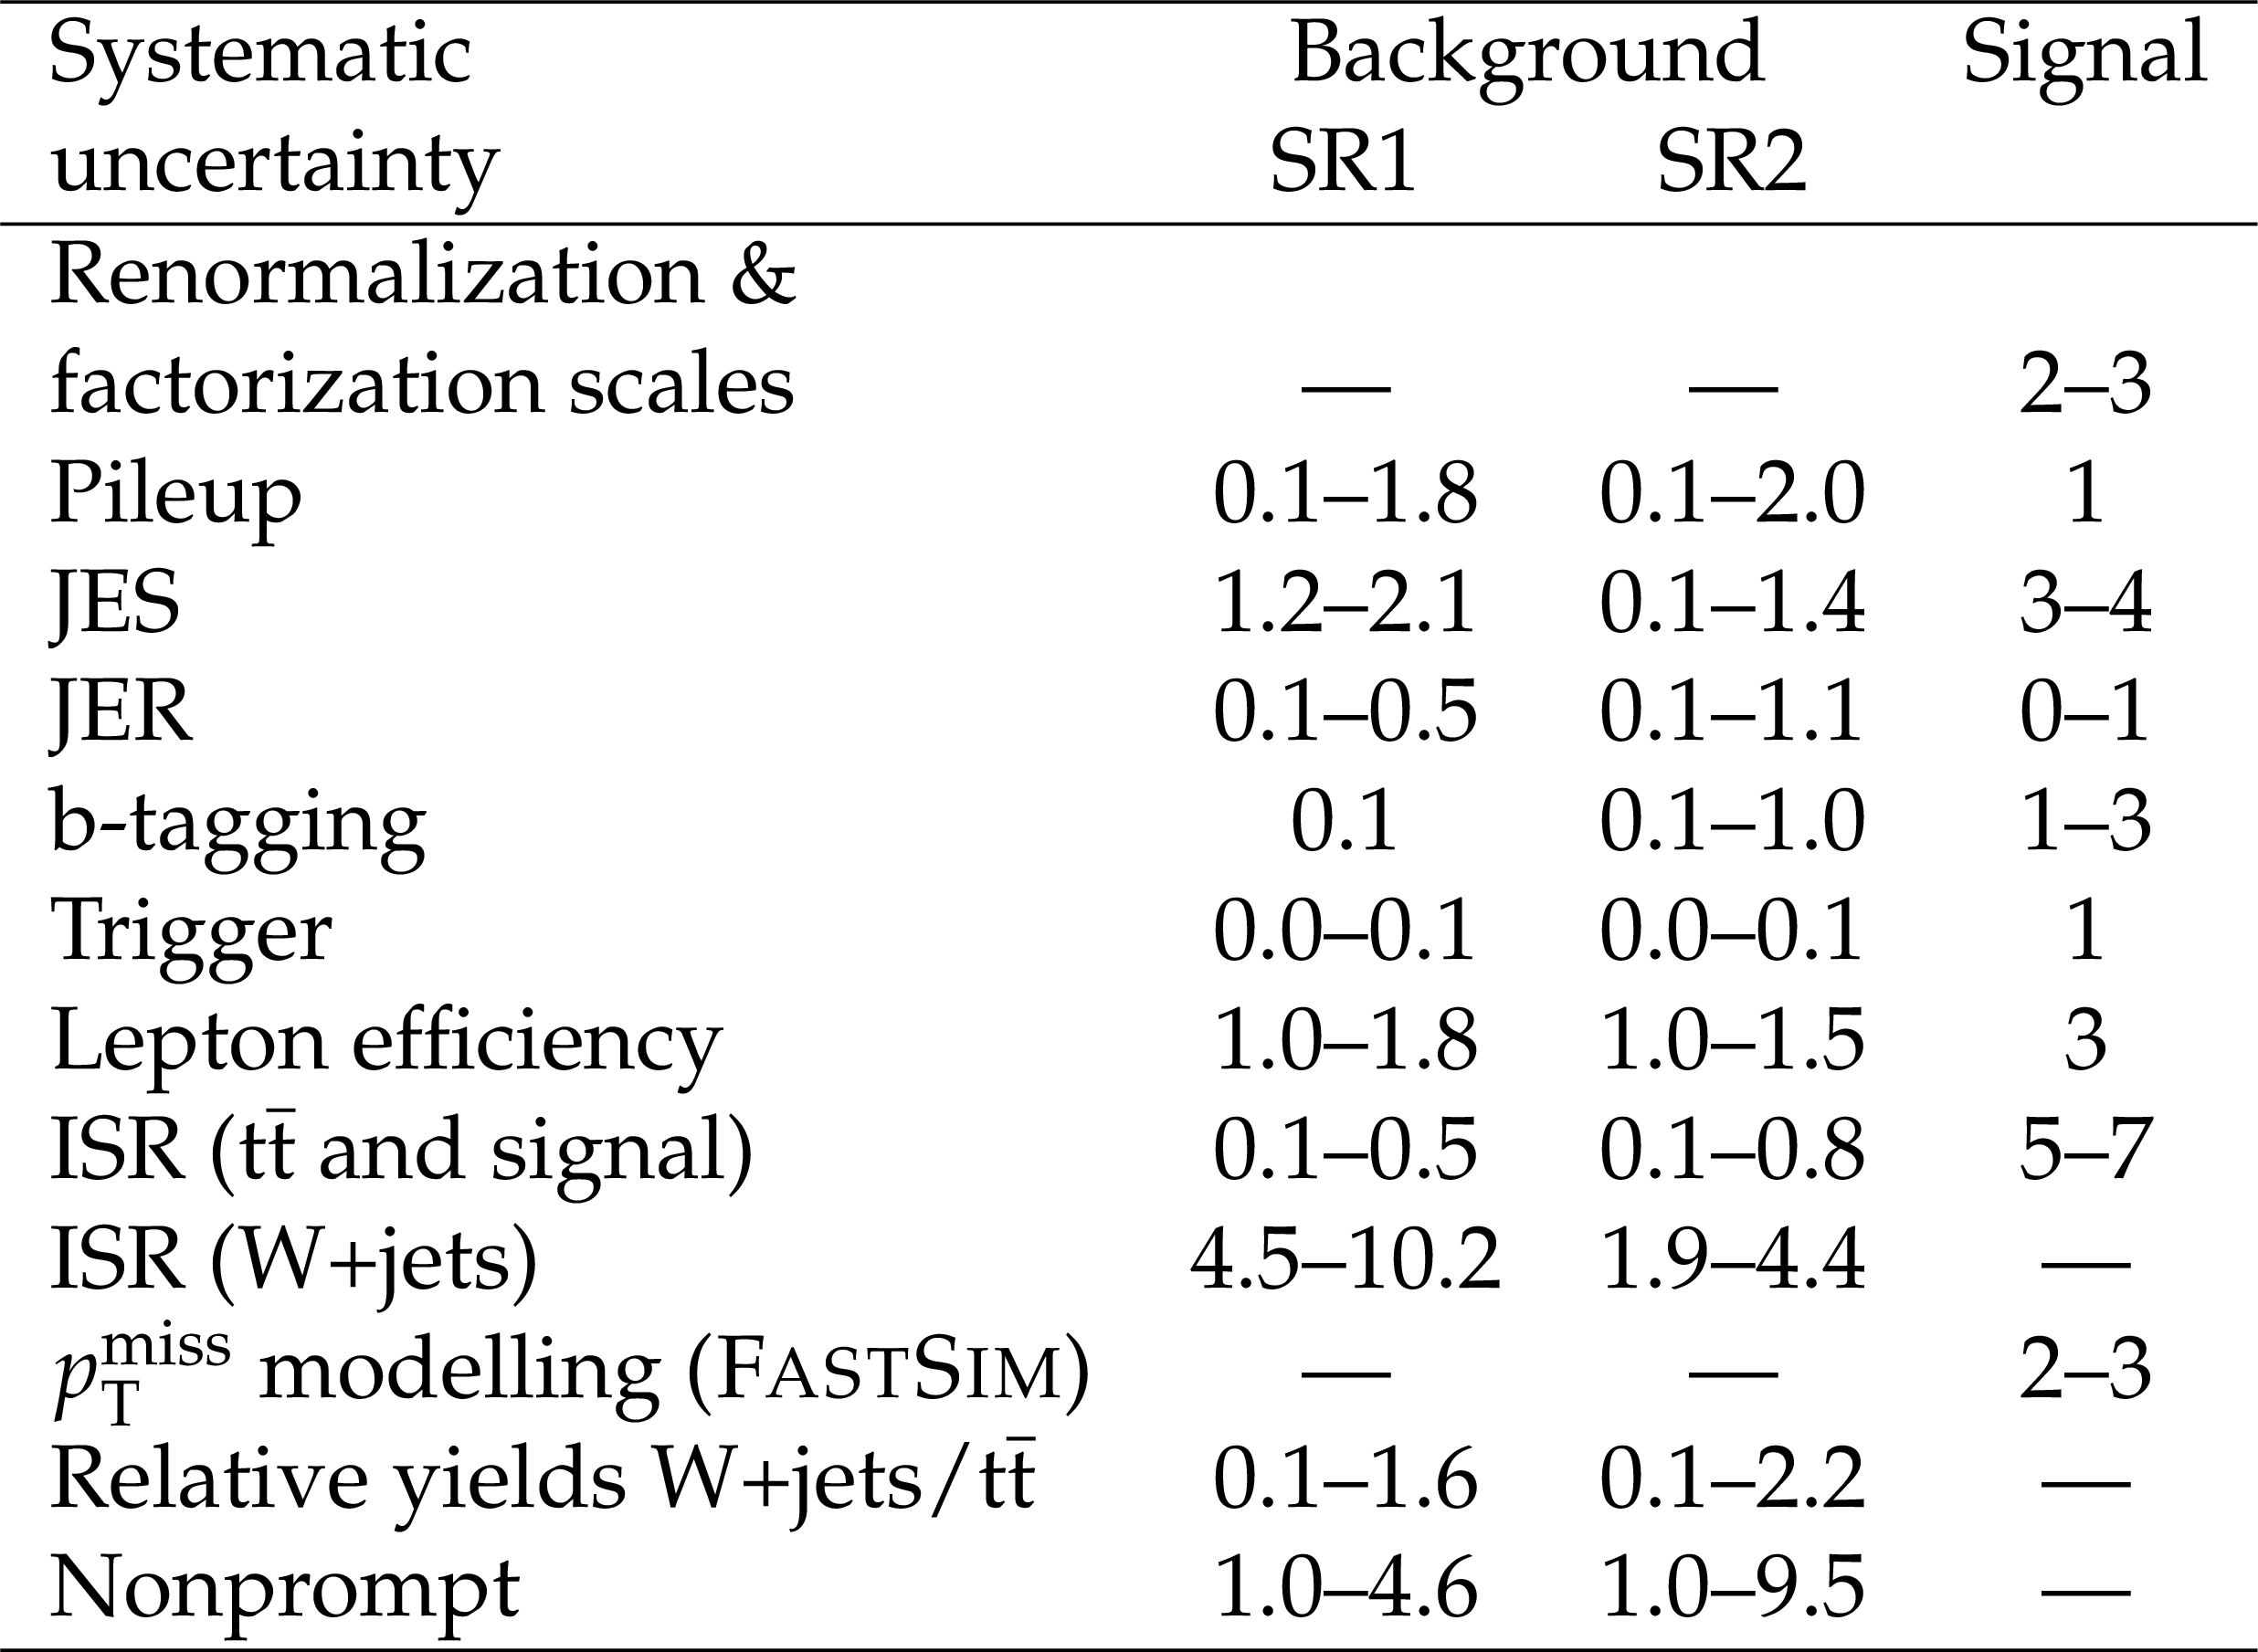
Table 3:
The CC search: typical ranges for relative systematic uncertainties (in%) on the total background prediction and signal prediction in the main SRs. The "--'' means that a certain source of uncertainty is not applicable. |
png pdf |
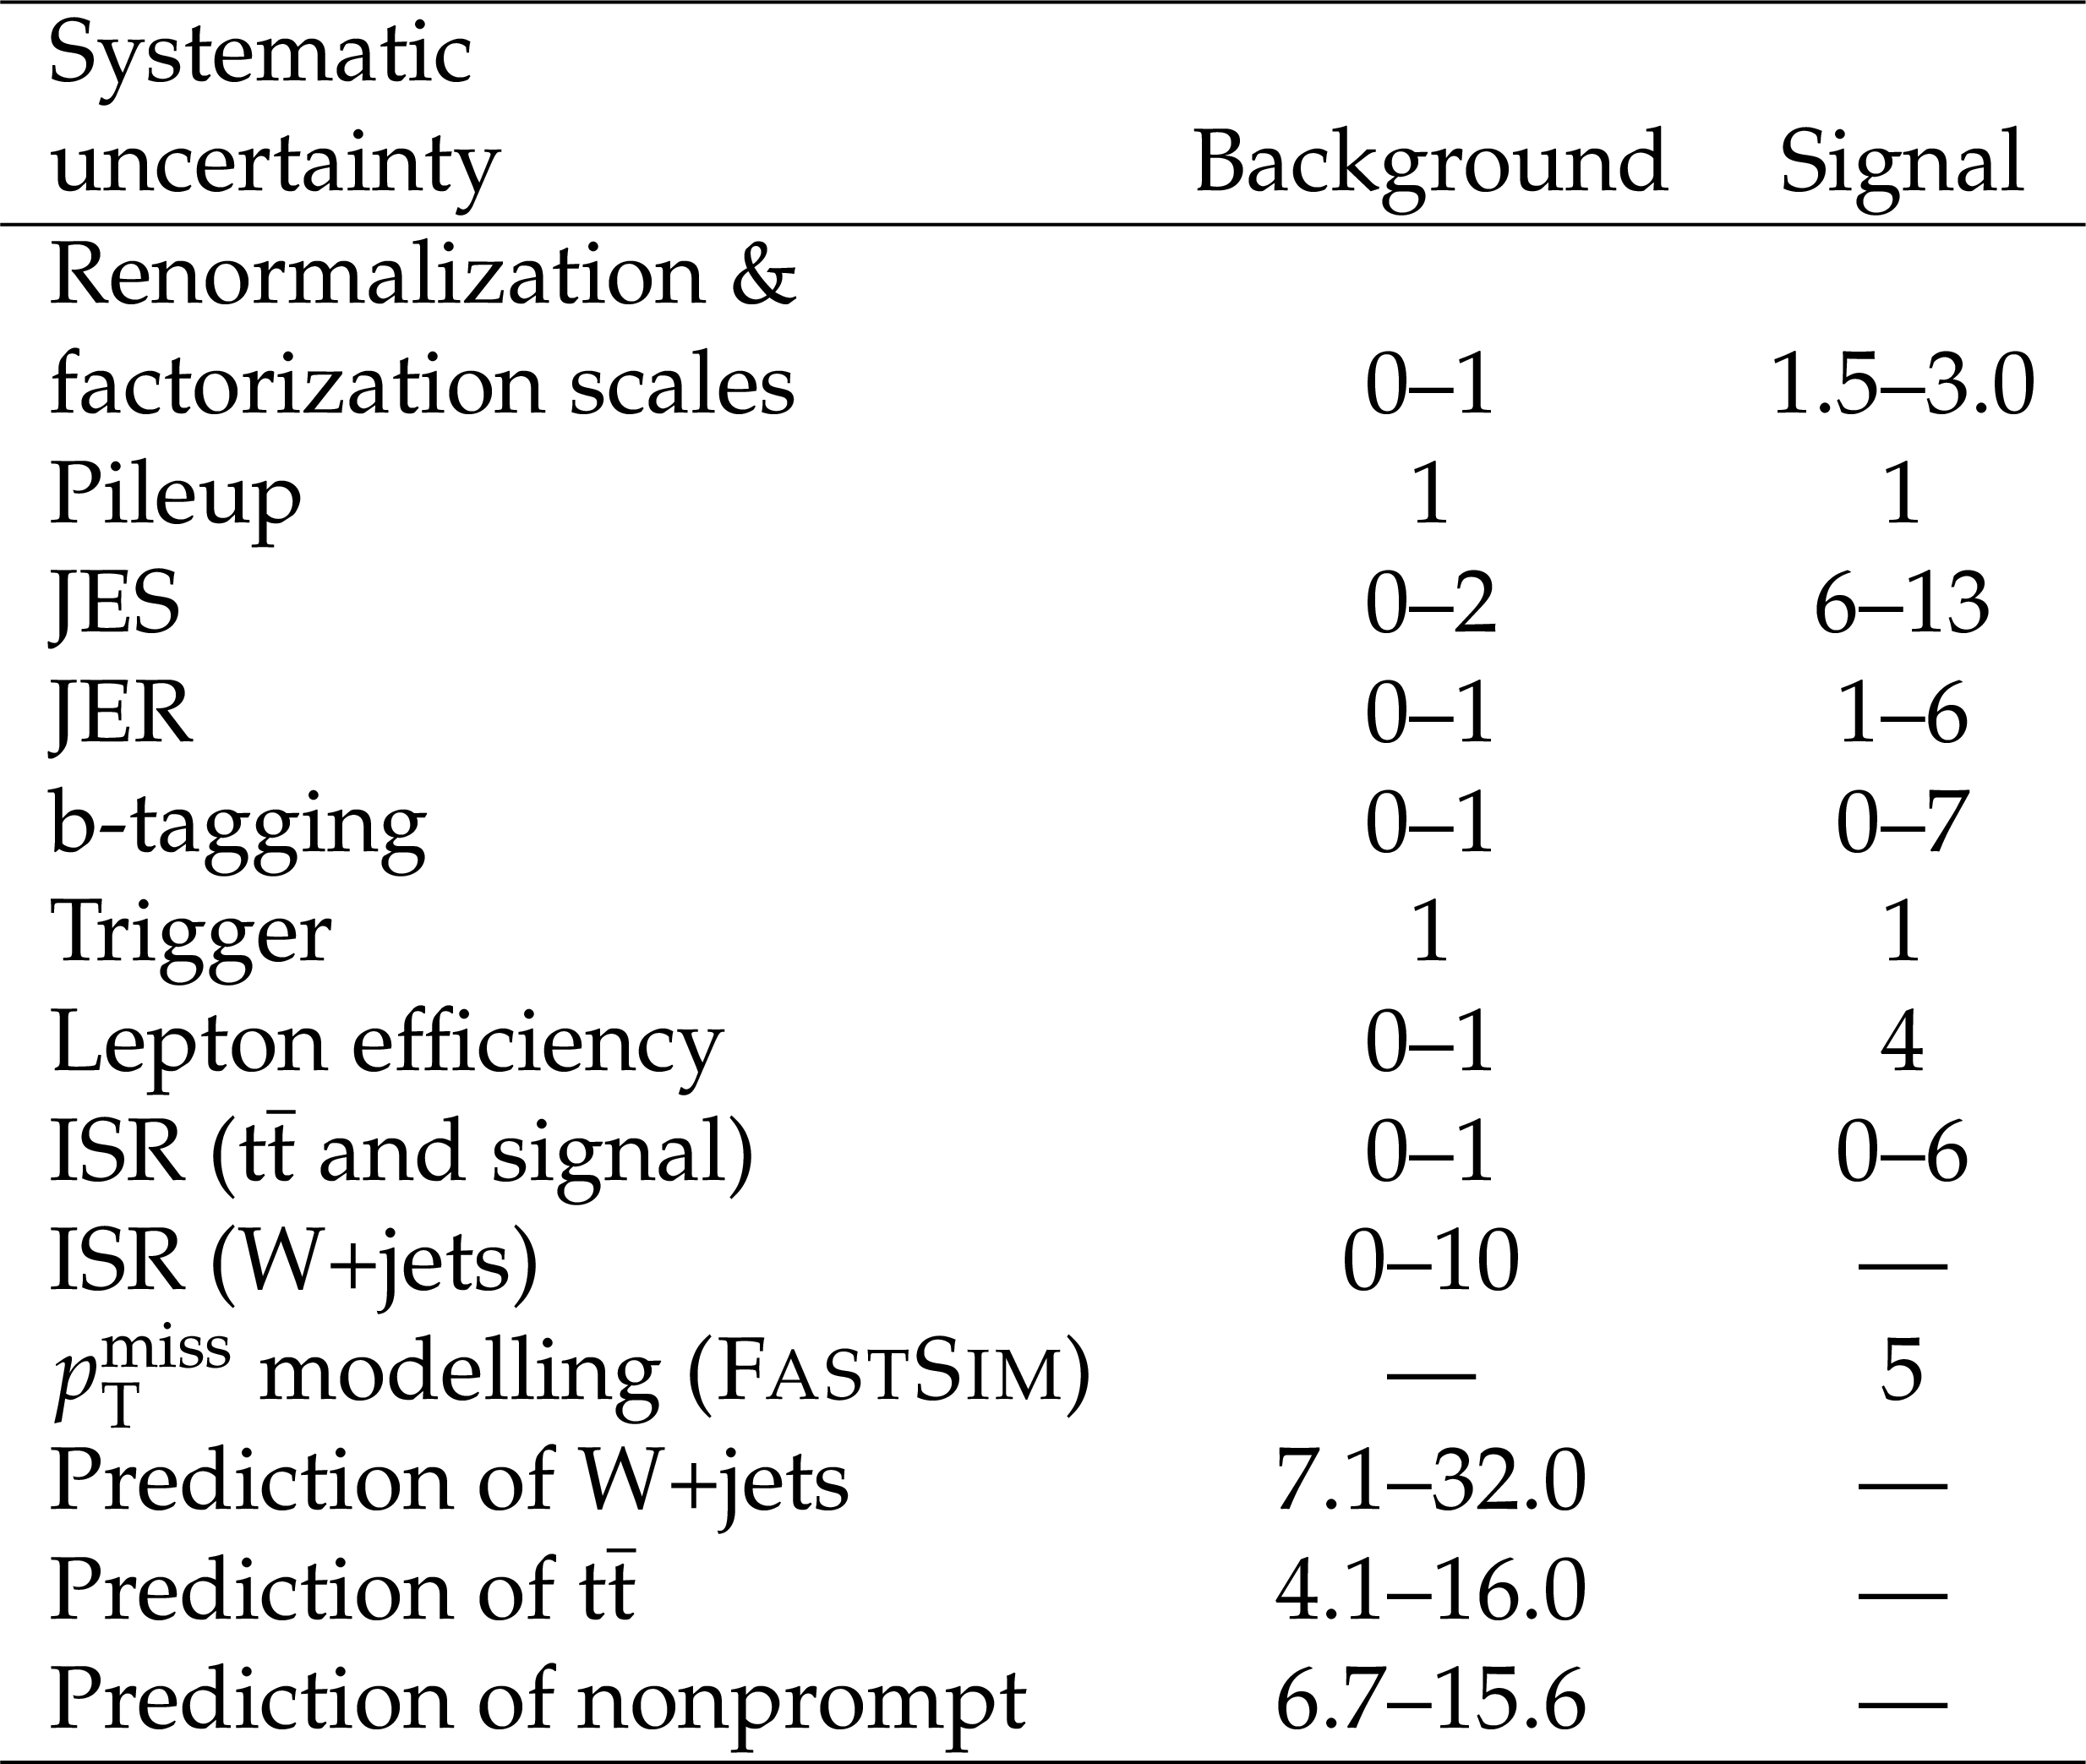
Table 4:
The MVA search: relative systematic uncertainties (in%) on the total background and signal prediction. The "--'' means that a certain source of uncertainty is not applicable. In the case of the background, the uncertainties are on the total background. Systematic uncertainties on the data-driven prediction of the W+jets, $ {{\mathrm {t}\overline {\mathrm {t}}}} $, and nonprompt lepton backgrounds are reported. |
png pdf |
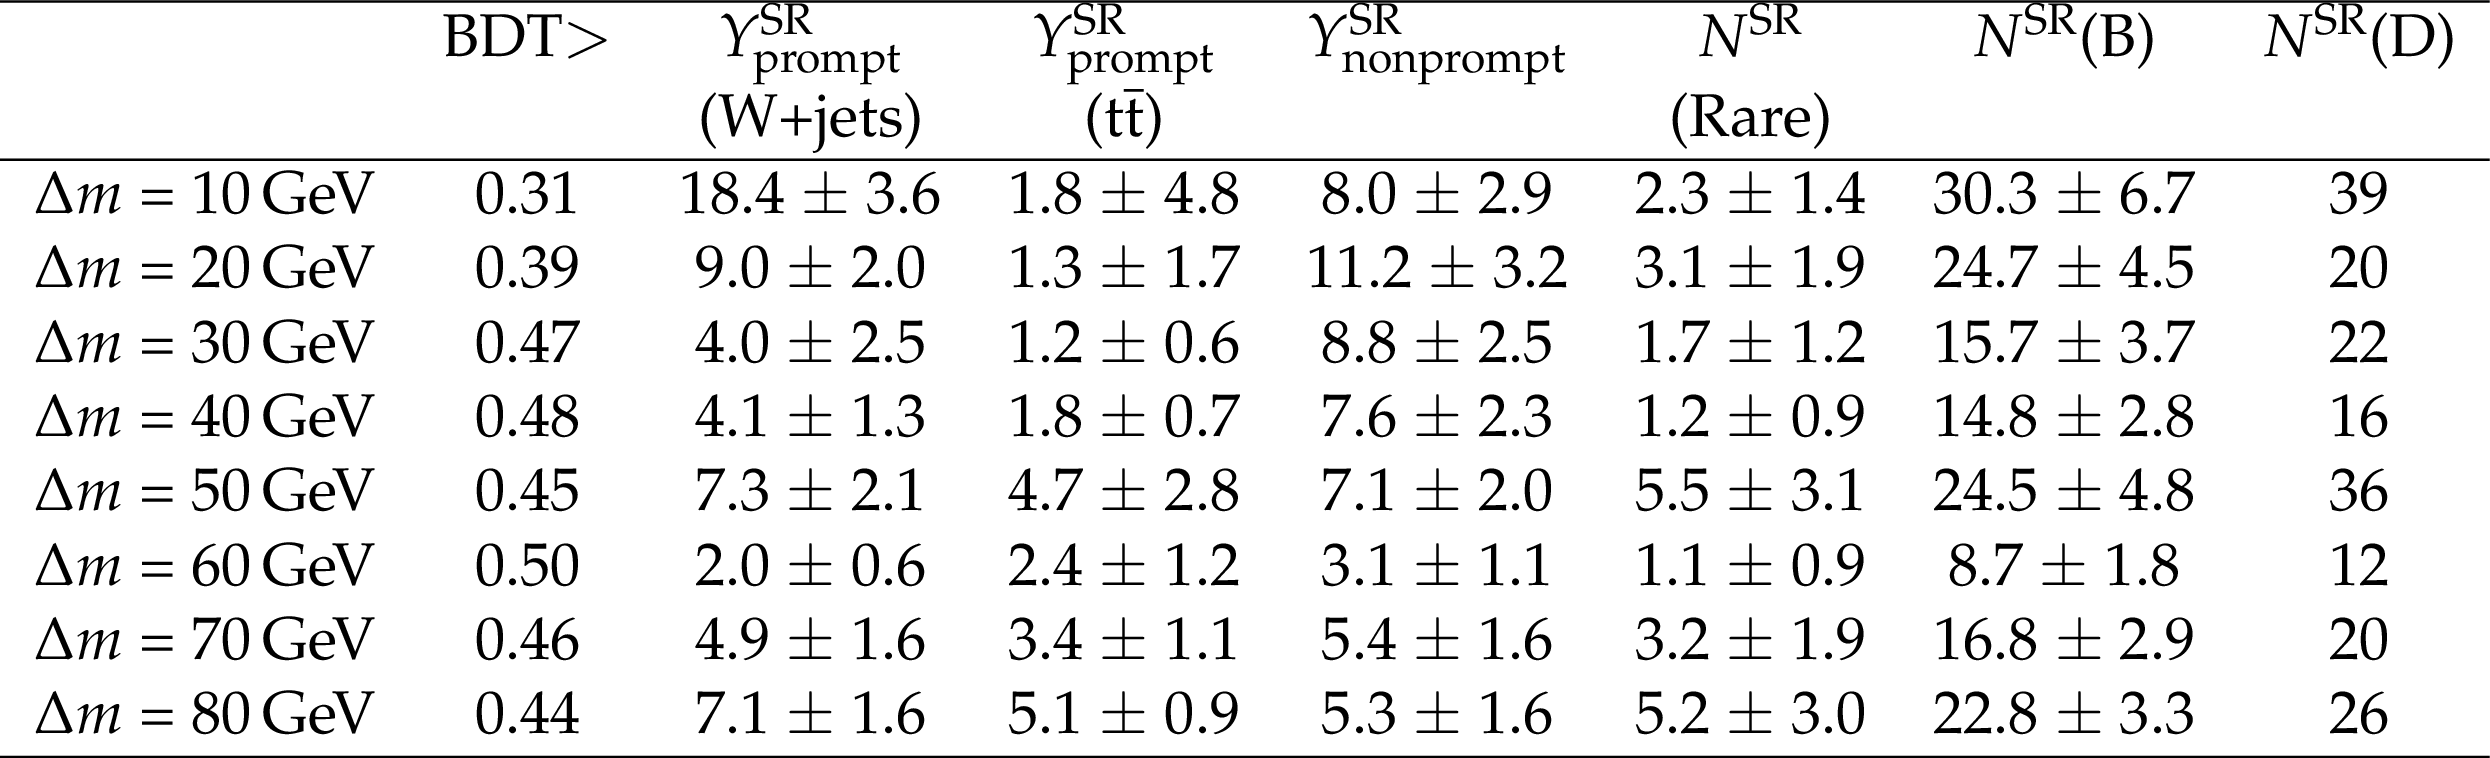
Table 5:
The MVA search: prediction of the W+jets, $ {{\mathrm {t}\overline {\mathrm {t}}}} $, nonprompt lepton, and other backgrounds in the eight SRs defined by the threshold on the BDT output reported in the second column. The prediction of the first three processes is based on data, while that of $N^{SR}(\text {Rare})$, i.e. rare backgrounds, is based on simulation. The uncertainties are the quadrature sum of the statistical uncertainties, the systematic uncertainties of Table xxxxx, and for the backgrounds predicted from simulation, the cross section uncertainties. The number of total expected background ($N^{SR}\text {(B)}$) and observed data ($N^{SR}\text {(D)}$) events in each SR are also reported. |
| Summary |
|
A search for direct top squark pair production is performed in a compressed scenario where the mass difference $ {\Delta {m}} $ between the lightest top squark and the lightest supersymmetric particle (LSP), taken to be the lightest neutralino $ \tilde{\chi}^0_1 $, does not exceed the W boson mass. Two decay modes of the top squark are targeted: the four-body prompt decay to $\mathrm{b} \mathrm{f} \overline{\mathrm{f}}^{\,\prime} \tilde{\chi}^0_1$, and the chargino-mediated decay to $\mathrm{b} \tilde{\chi}^{+}_{1}$ with a subsequent decay $\tilde{\chi}^{+}_{1} \to \mathrm{f} \overline{\mathrm{f}}^{\,\prime} \tilde{\chi}^0_1$. Results are based on proton-proton collision data at $\sqrt{s} = $ 13 TeV, recorded with the CMS detector in 2016 and corresponding to an integrated luminosity of 35.9 fb$^{-1}$. Selected events are required to have a single lepton (electron or muon), and significant missing transverse momentum ($ p_{\mathrm{T}}^{\text{miss}} $). Because of the small mass difference between the top squark and the LSP, the decay products of the top squark are expected to have low $ {p_{\mathrm{T}}} $. Events where the presence of a jet from initial-state radiation leads to a boost of the top squark pair and sizeable $ p_{\mathrm{T}}^{\text{miss}} $ are selected. Two search strategies are pursued. In the sequential selection approach (CC), signal regions are defined based on discriminating variables, particularly the transverse mass of the lepton-$ p_{\mathrm{T}}^{\text{miss}} $ system and the lepton momentum. In another approach, a multivariate analysis (MVA) is employed that uses both kinematic and topological variables and is specifically trained for different $ {\Delta {m}} $ regions of the four-body decay mode. In both approaches, the dominant contributions to the signal regions from standard model processes (W+jets, $\mathrm{t\bar{t}}$, and events with misidentified leptons) are estimated from control regions in data. Data are found to be compatible with the predicted standard model backgrounds. The results are used to set limits at 95% confidence level on the production cross section as a function of the $ {\tilde{\mathrm{t}}_{1}} $ and $ \tilde{\chi}^0_1 $ masses, within the context of simplified models. Assuming 100% branching fraction in the decay channel under consideration and the top squark pair production cross section computed at NLO+NLL precision [40,41,42,43,44,45,46], these limits are converted into mass limits. Both search strategies are applied to the four-body decay mode. For this decay mode, the MVA search excludes top squark masses up to 420 and 560 GeV at ${\Delta {m}} = $ 10 and 80 GeV, respectively. There is less sensitivity at lower $ {\Delta {m}} $ due to the smaller available phase space, where the very soft kinematics of the decay products lead to a lower acceptance. The limits obtained in the CC approach are comparable with the MVA approach for ${\Delta {m}} = $ 30 GeV. The CC approach also covers the chargino-mediated decays, where the chargino mass is taken as the average of the top squark and the neutralino masses, probing $ {\tilde{\mathrm{t}}_{1}} $ masses up to 540 GeV for ${\Delta {m}} \approx $ 40 GeV. The results of the CC search have been combined with a search for top squark pair production in the fully hadronic channel [19]. The combined mass limits reach up to 590 and 670 GeV for four-body and chargino-mediated decays, respectively. The reach of the $ {\Delta {m}} $ dependent MVA search in the four-body decay mode is noteworthy, as the exclusion limit goes beyond that of the combined result at high ${\Delta {m}}$. The results summarized in this paper represent the most stringent limits to date on the top squark pair production cross section for mass differences between the top squark and the lightest neutralino below the W boson mass, and for decays proceeding through the four-body or the chargino-mediated modes. |
| Additional Figures | |
png pdf root |
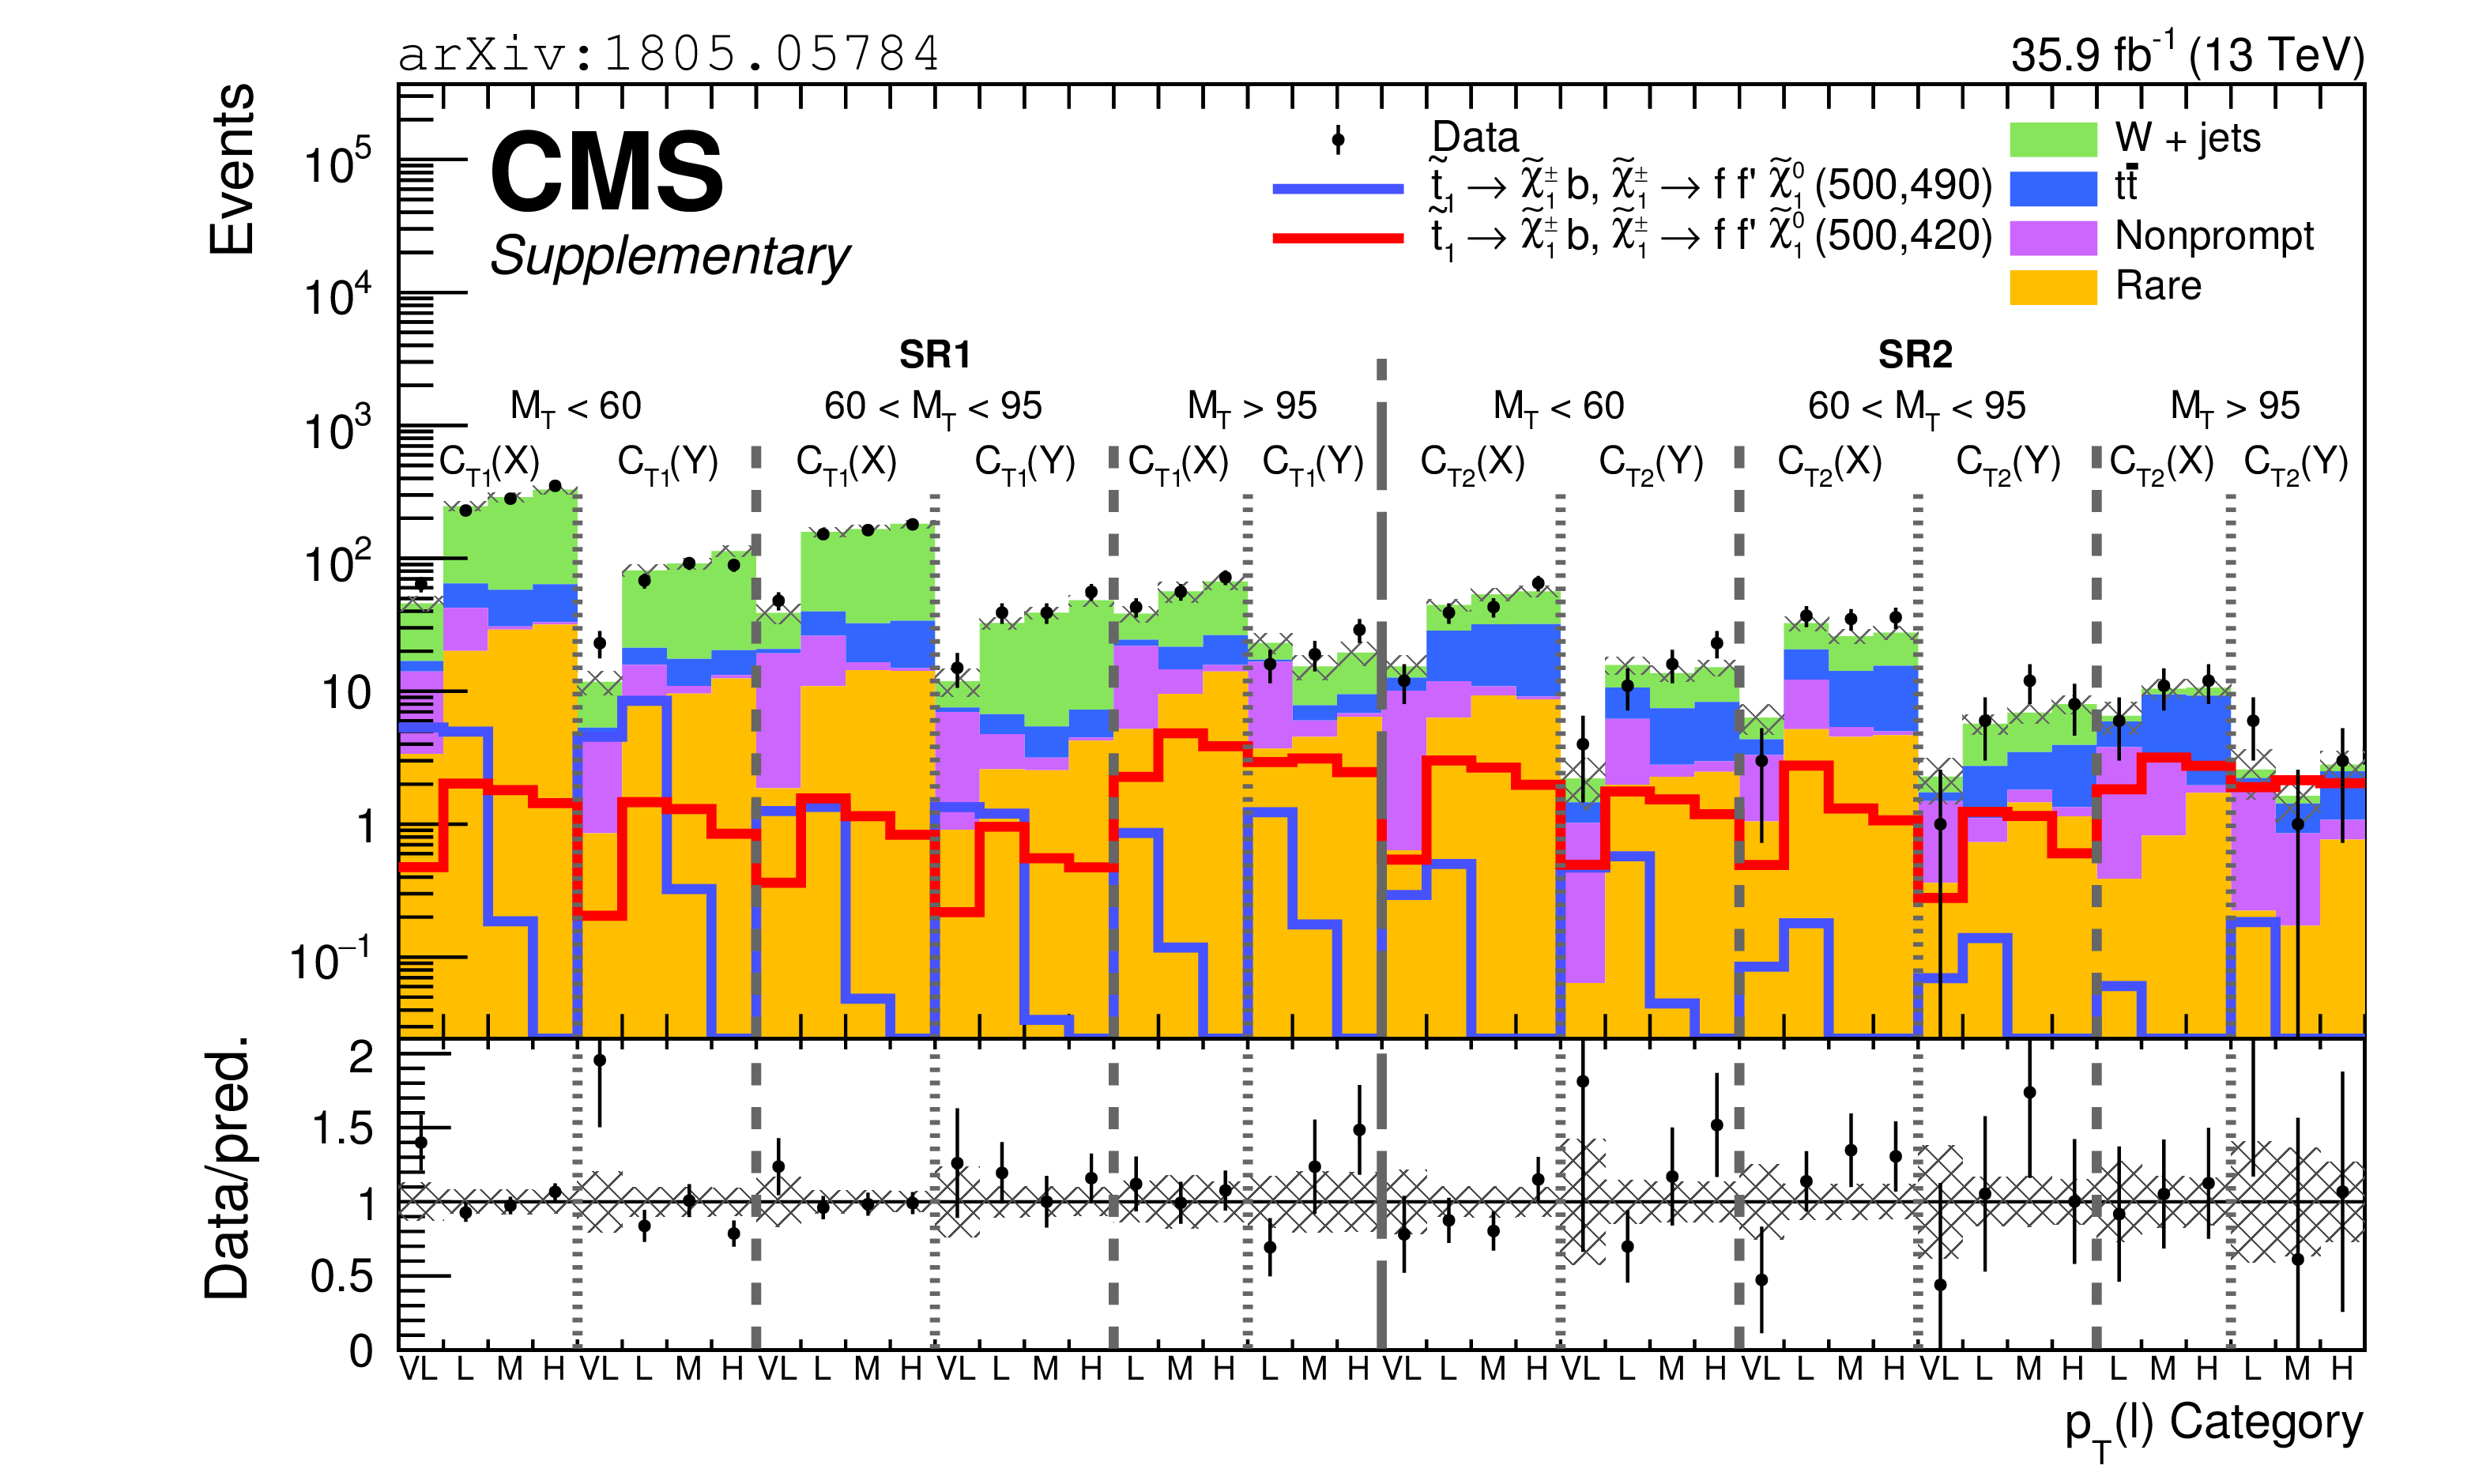
Additional Figure 1:
The CC approach. Summary of observed and expected background yields in all SRs as defined in Table 1 of the paper. The ranges for $M_{\mathrm {T}}$ are given in units of GeV. The vertical bars and the shaded areas represent the statistical uncertainty of the data and the total uncertainty in the prediction, respectively. The lower panel shows the ratio of data to prediction. |
png pdf root |
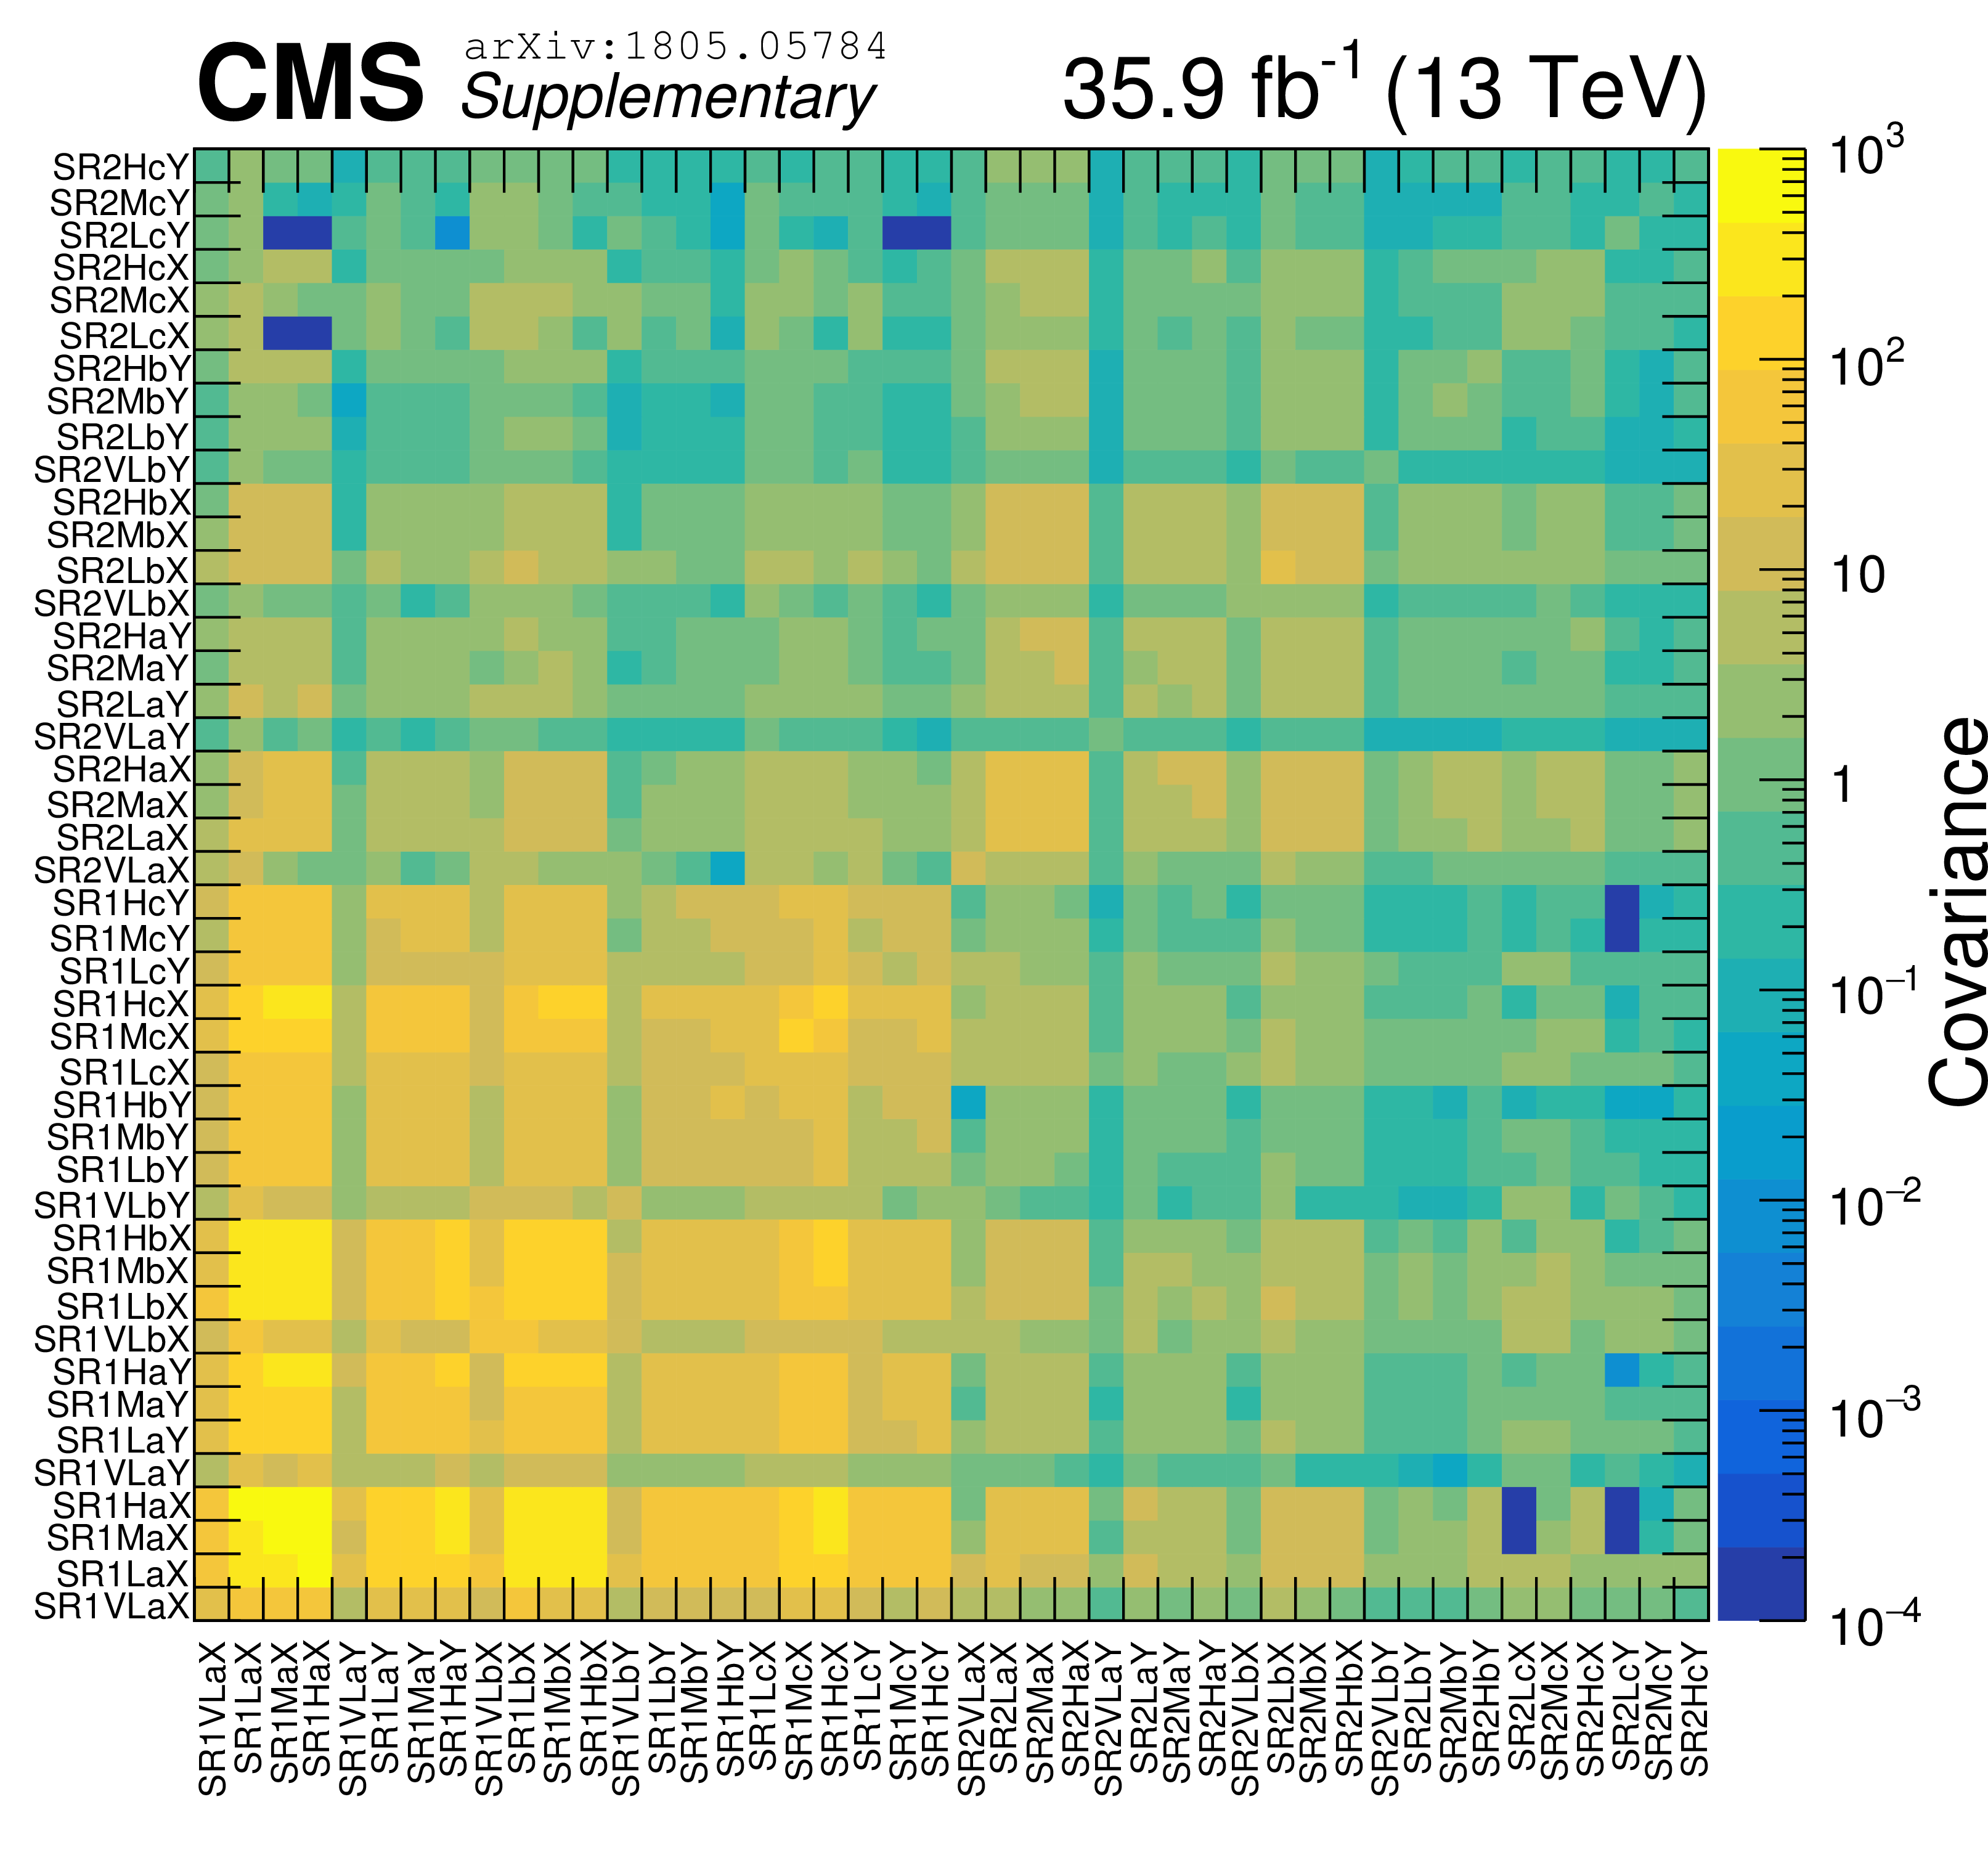
Additional Figure 2:
The CC approach. Covariance matrix of the background estimates between signal regions. An electronic version of this figure is available. |
png pdf root |
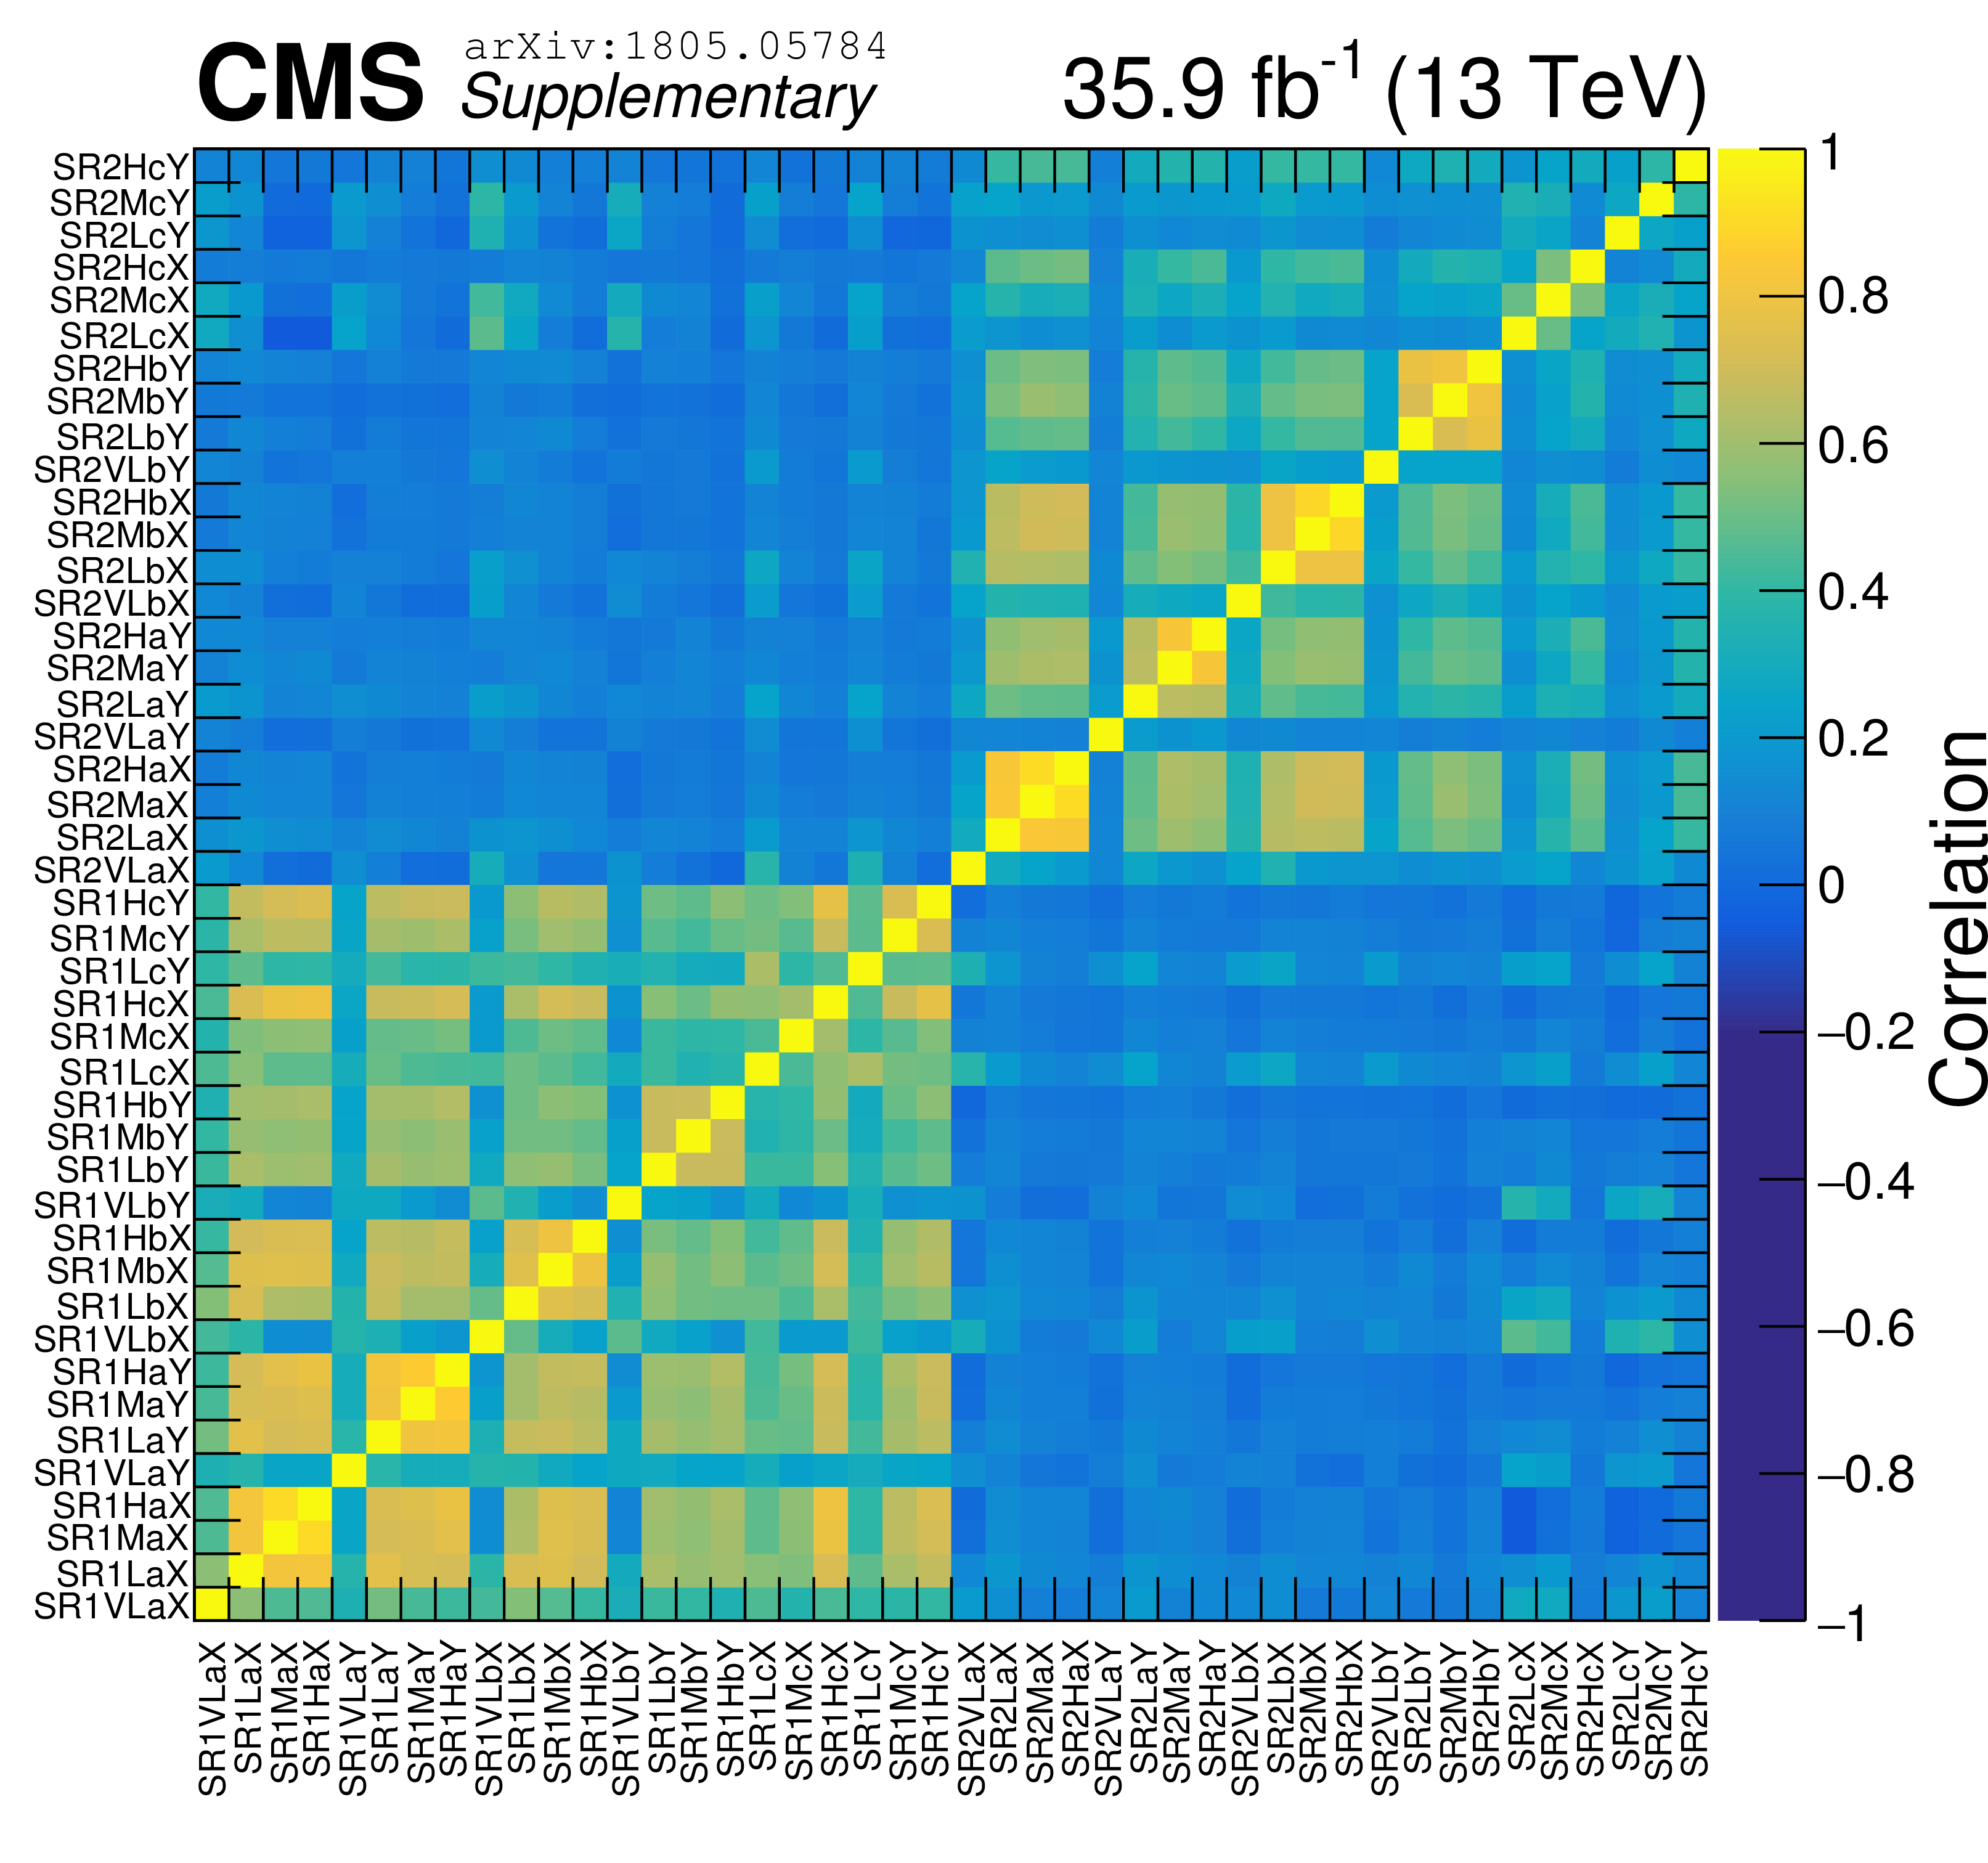
Additional Figure 3:
The CC approach. Correlation matrix of the background estimates between signal regions. An electronic version of this figure is available. |
png pdf root |
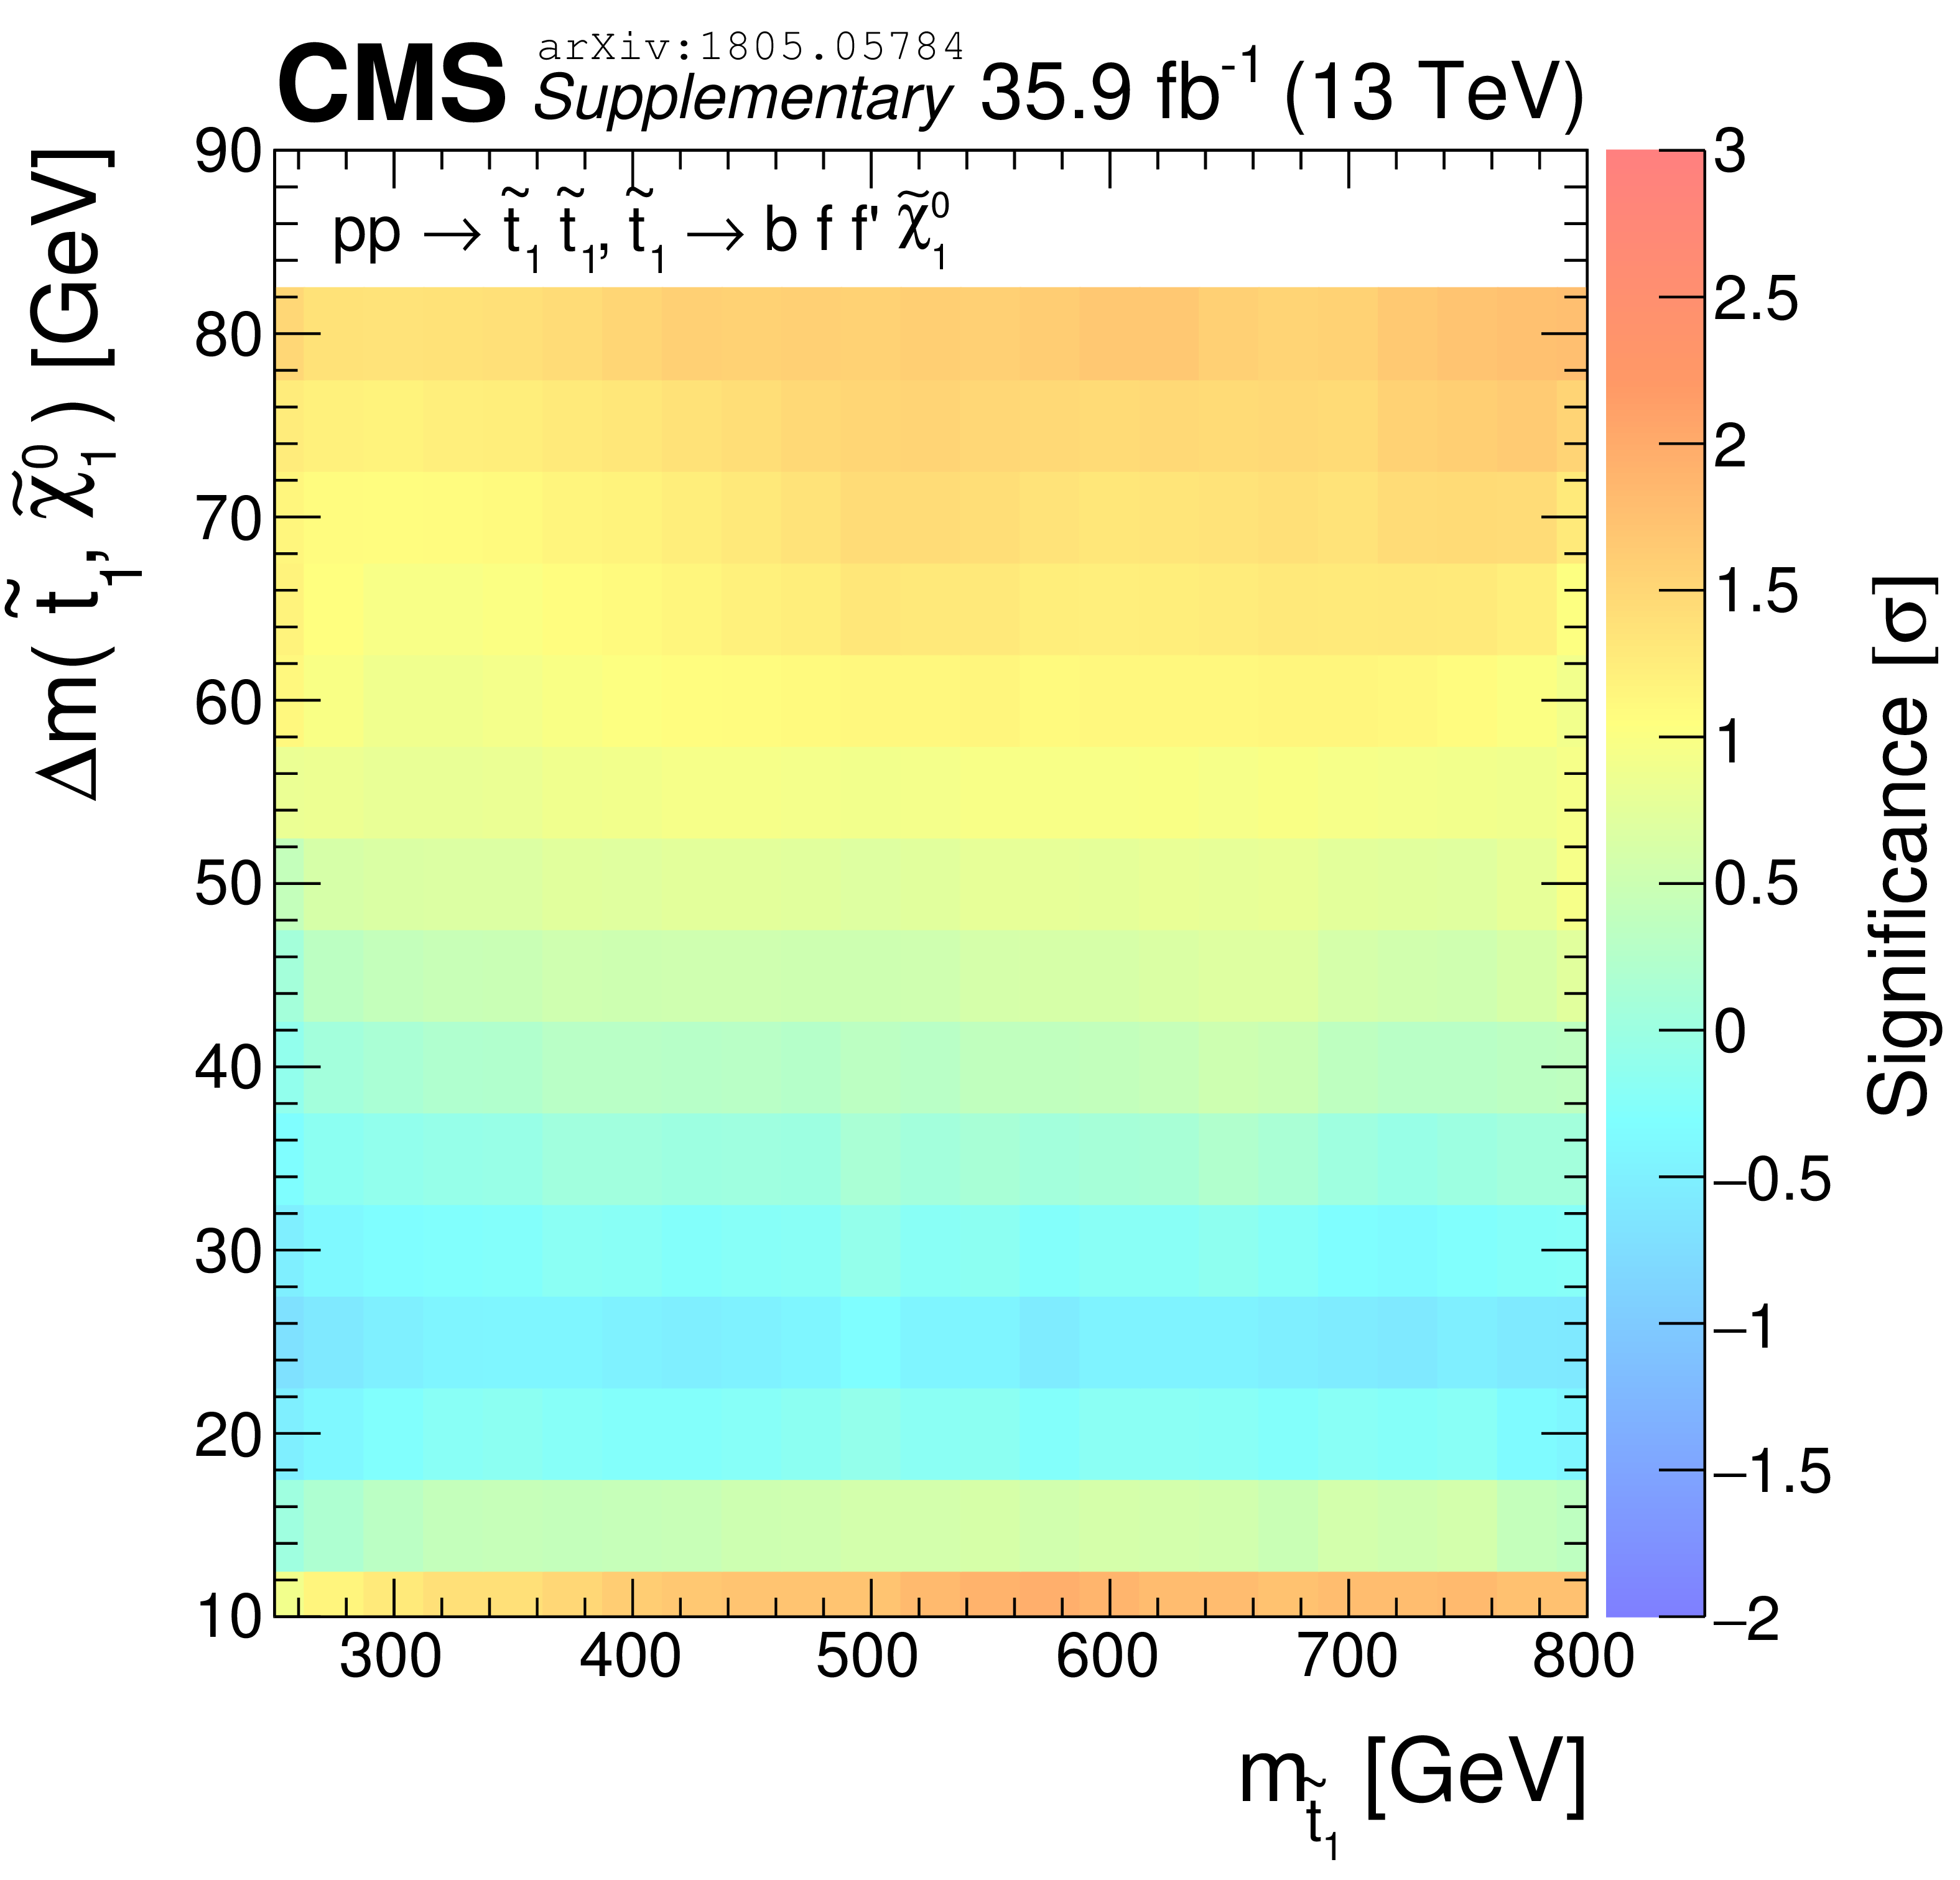
Additional Figure 4:
Observed significance for the four-body decay of the top squark in the CC approach. |
png pdf root |
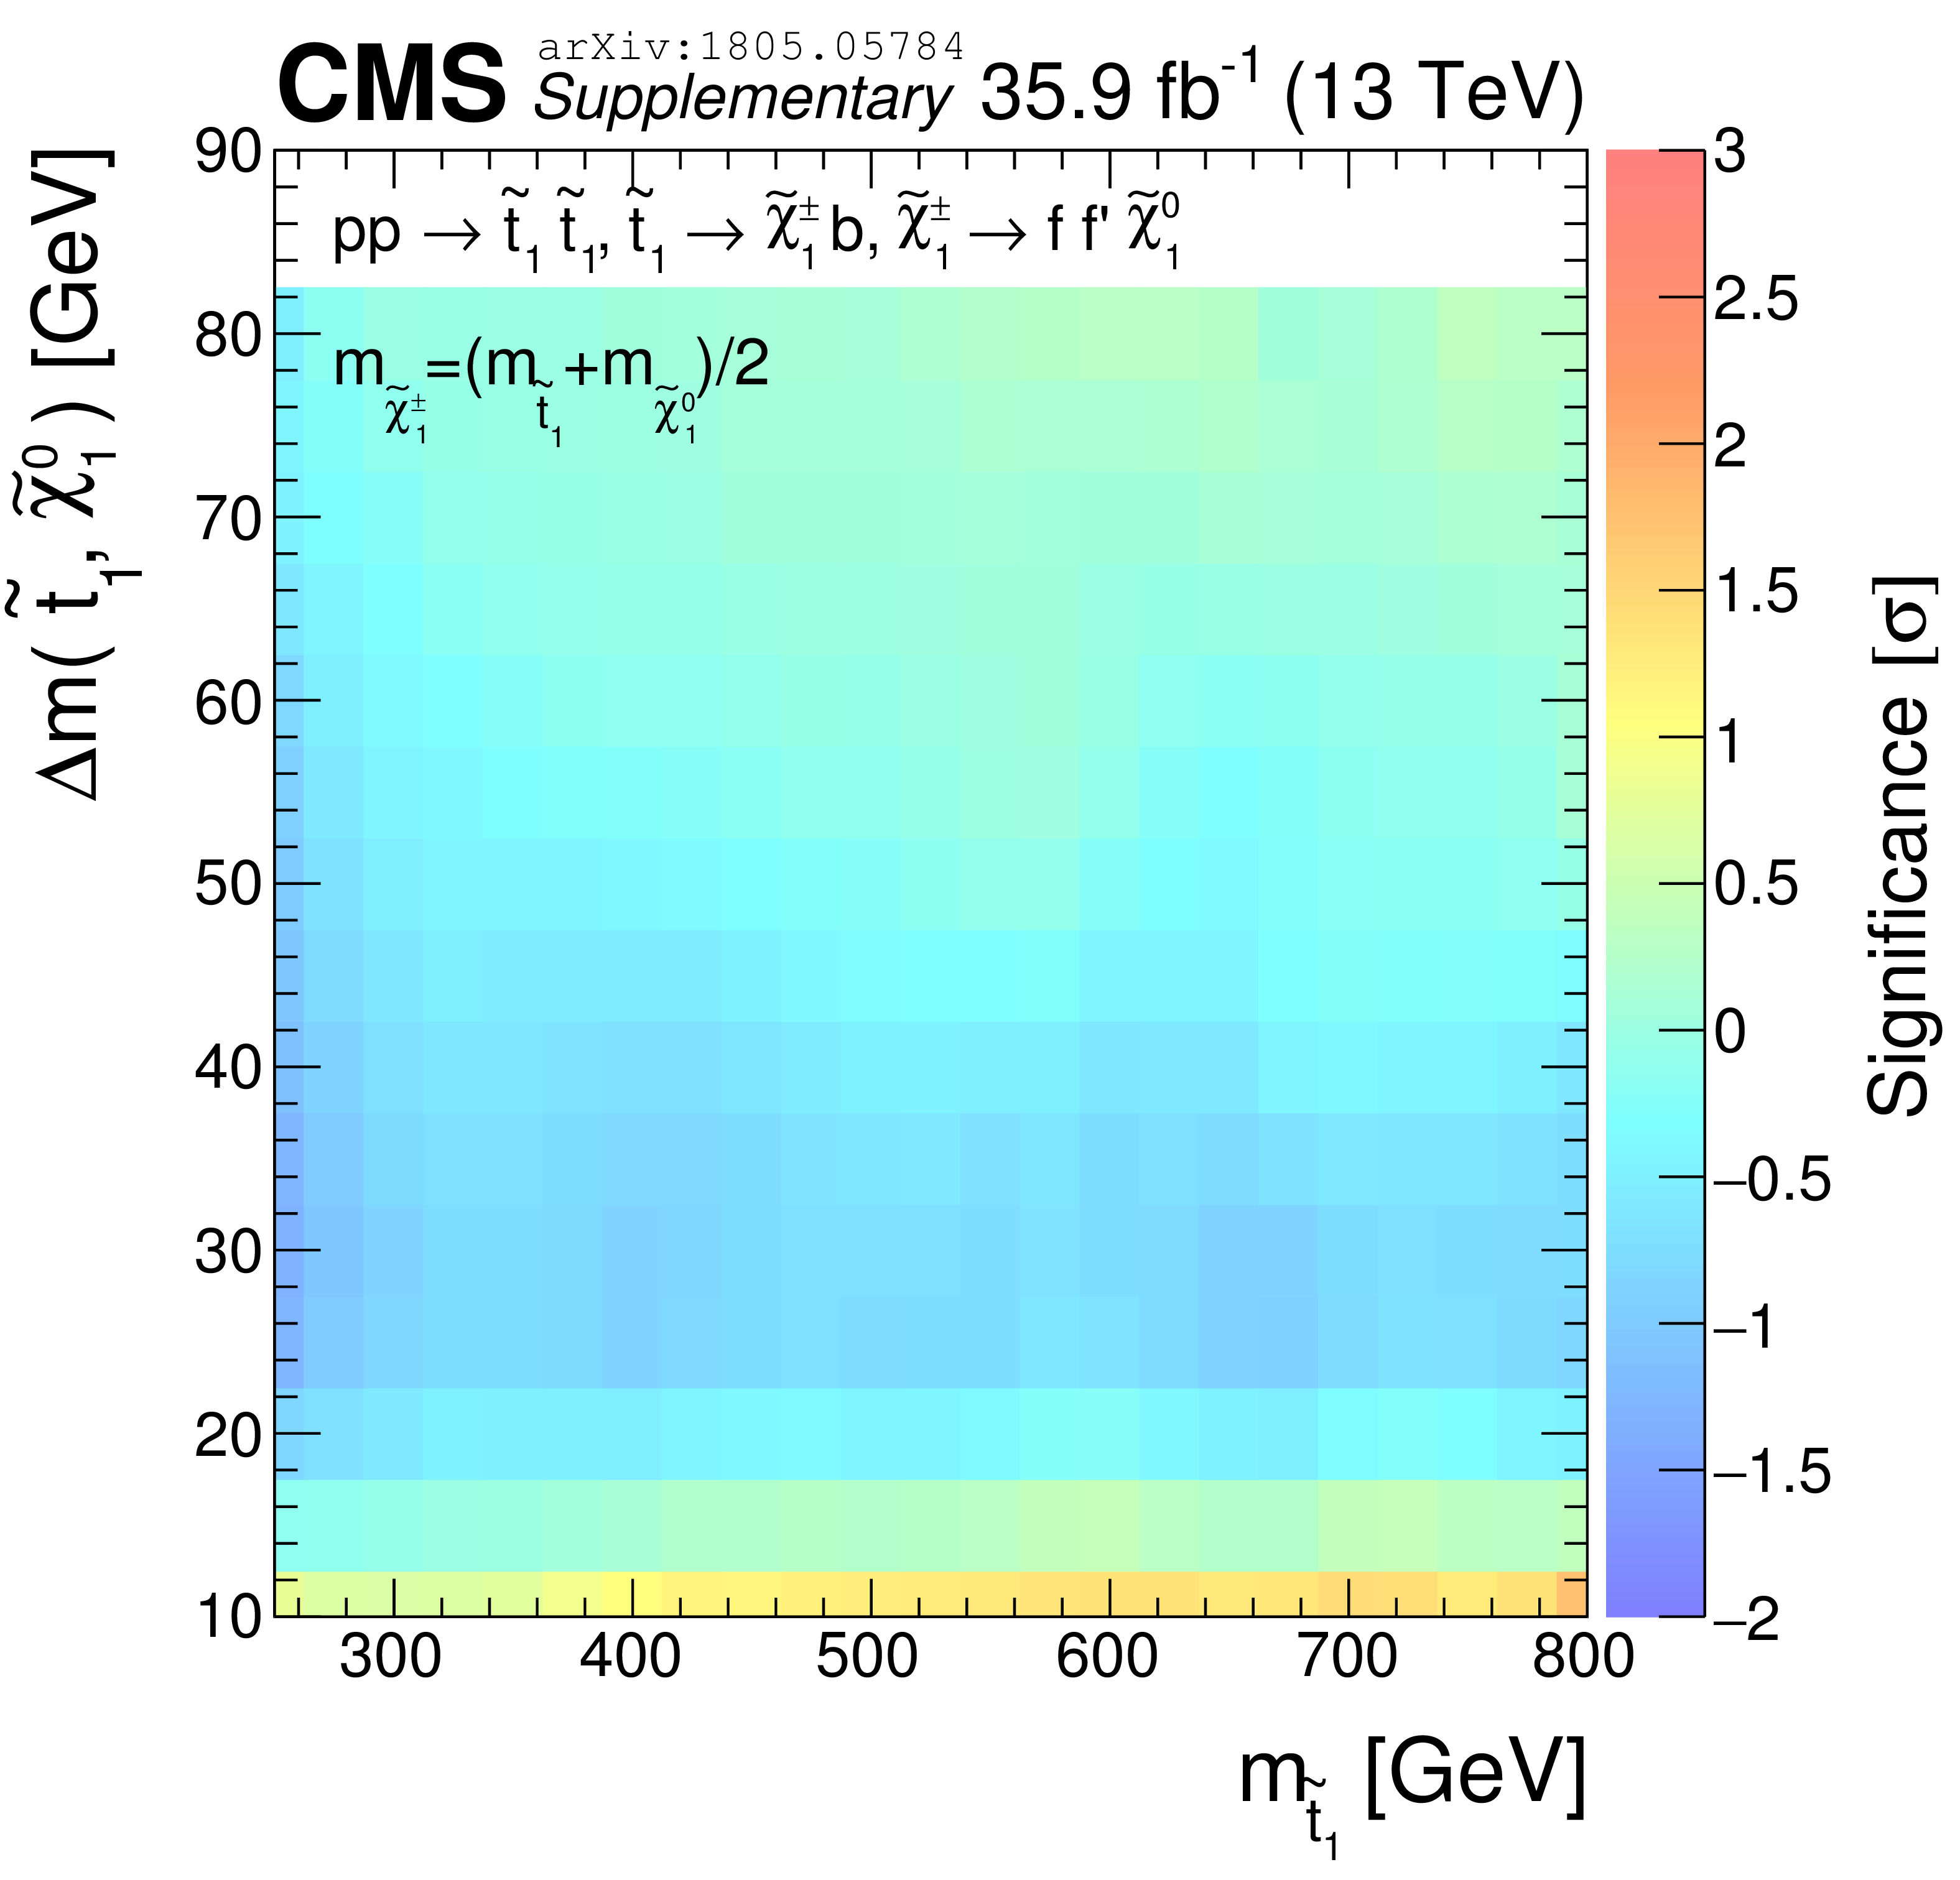
Additional Figure 5:
Observed significance for the chargino-mediated decay of the top squark in the CC approach. |
png pdf root |
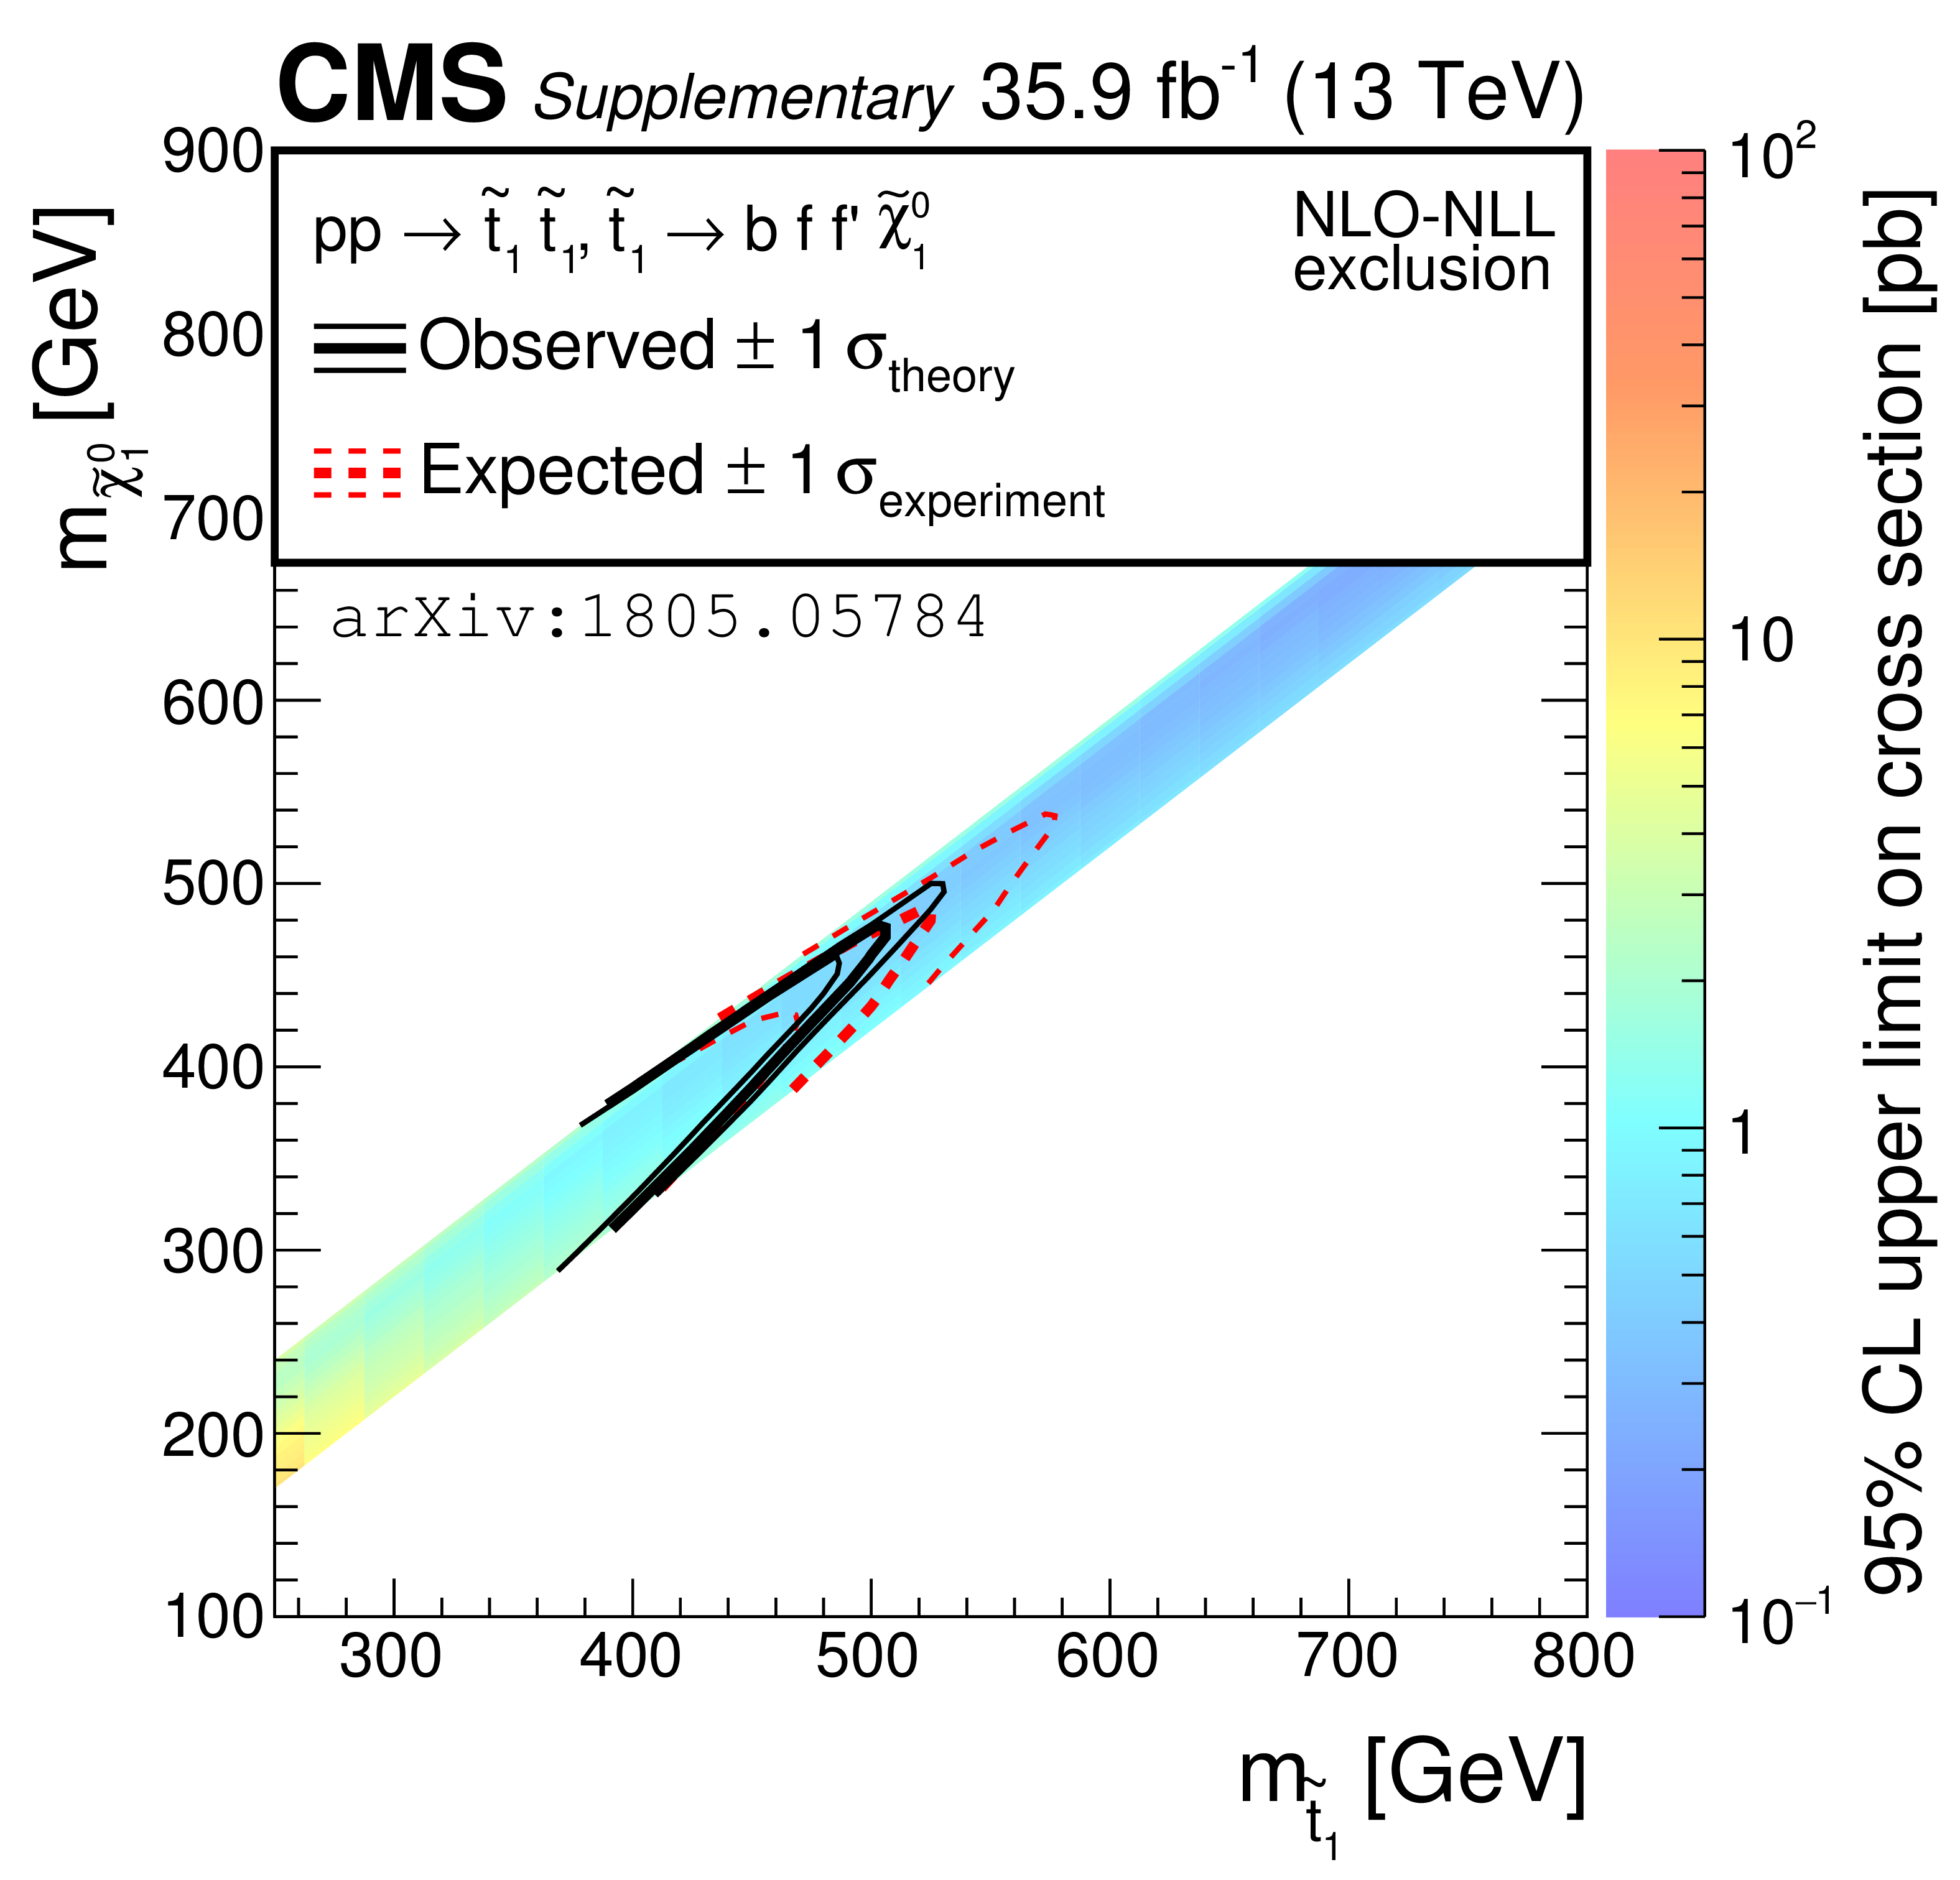
Additional Figure 6:
The CC approach. Limits at 95% CL for the four-body decay of the top squark in the $ \tilde{\mathrm {t}} _{1}$-$ {\tilde{\chi}^{0}_{1}} $ mass plane. |
png pdf root |
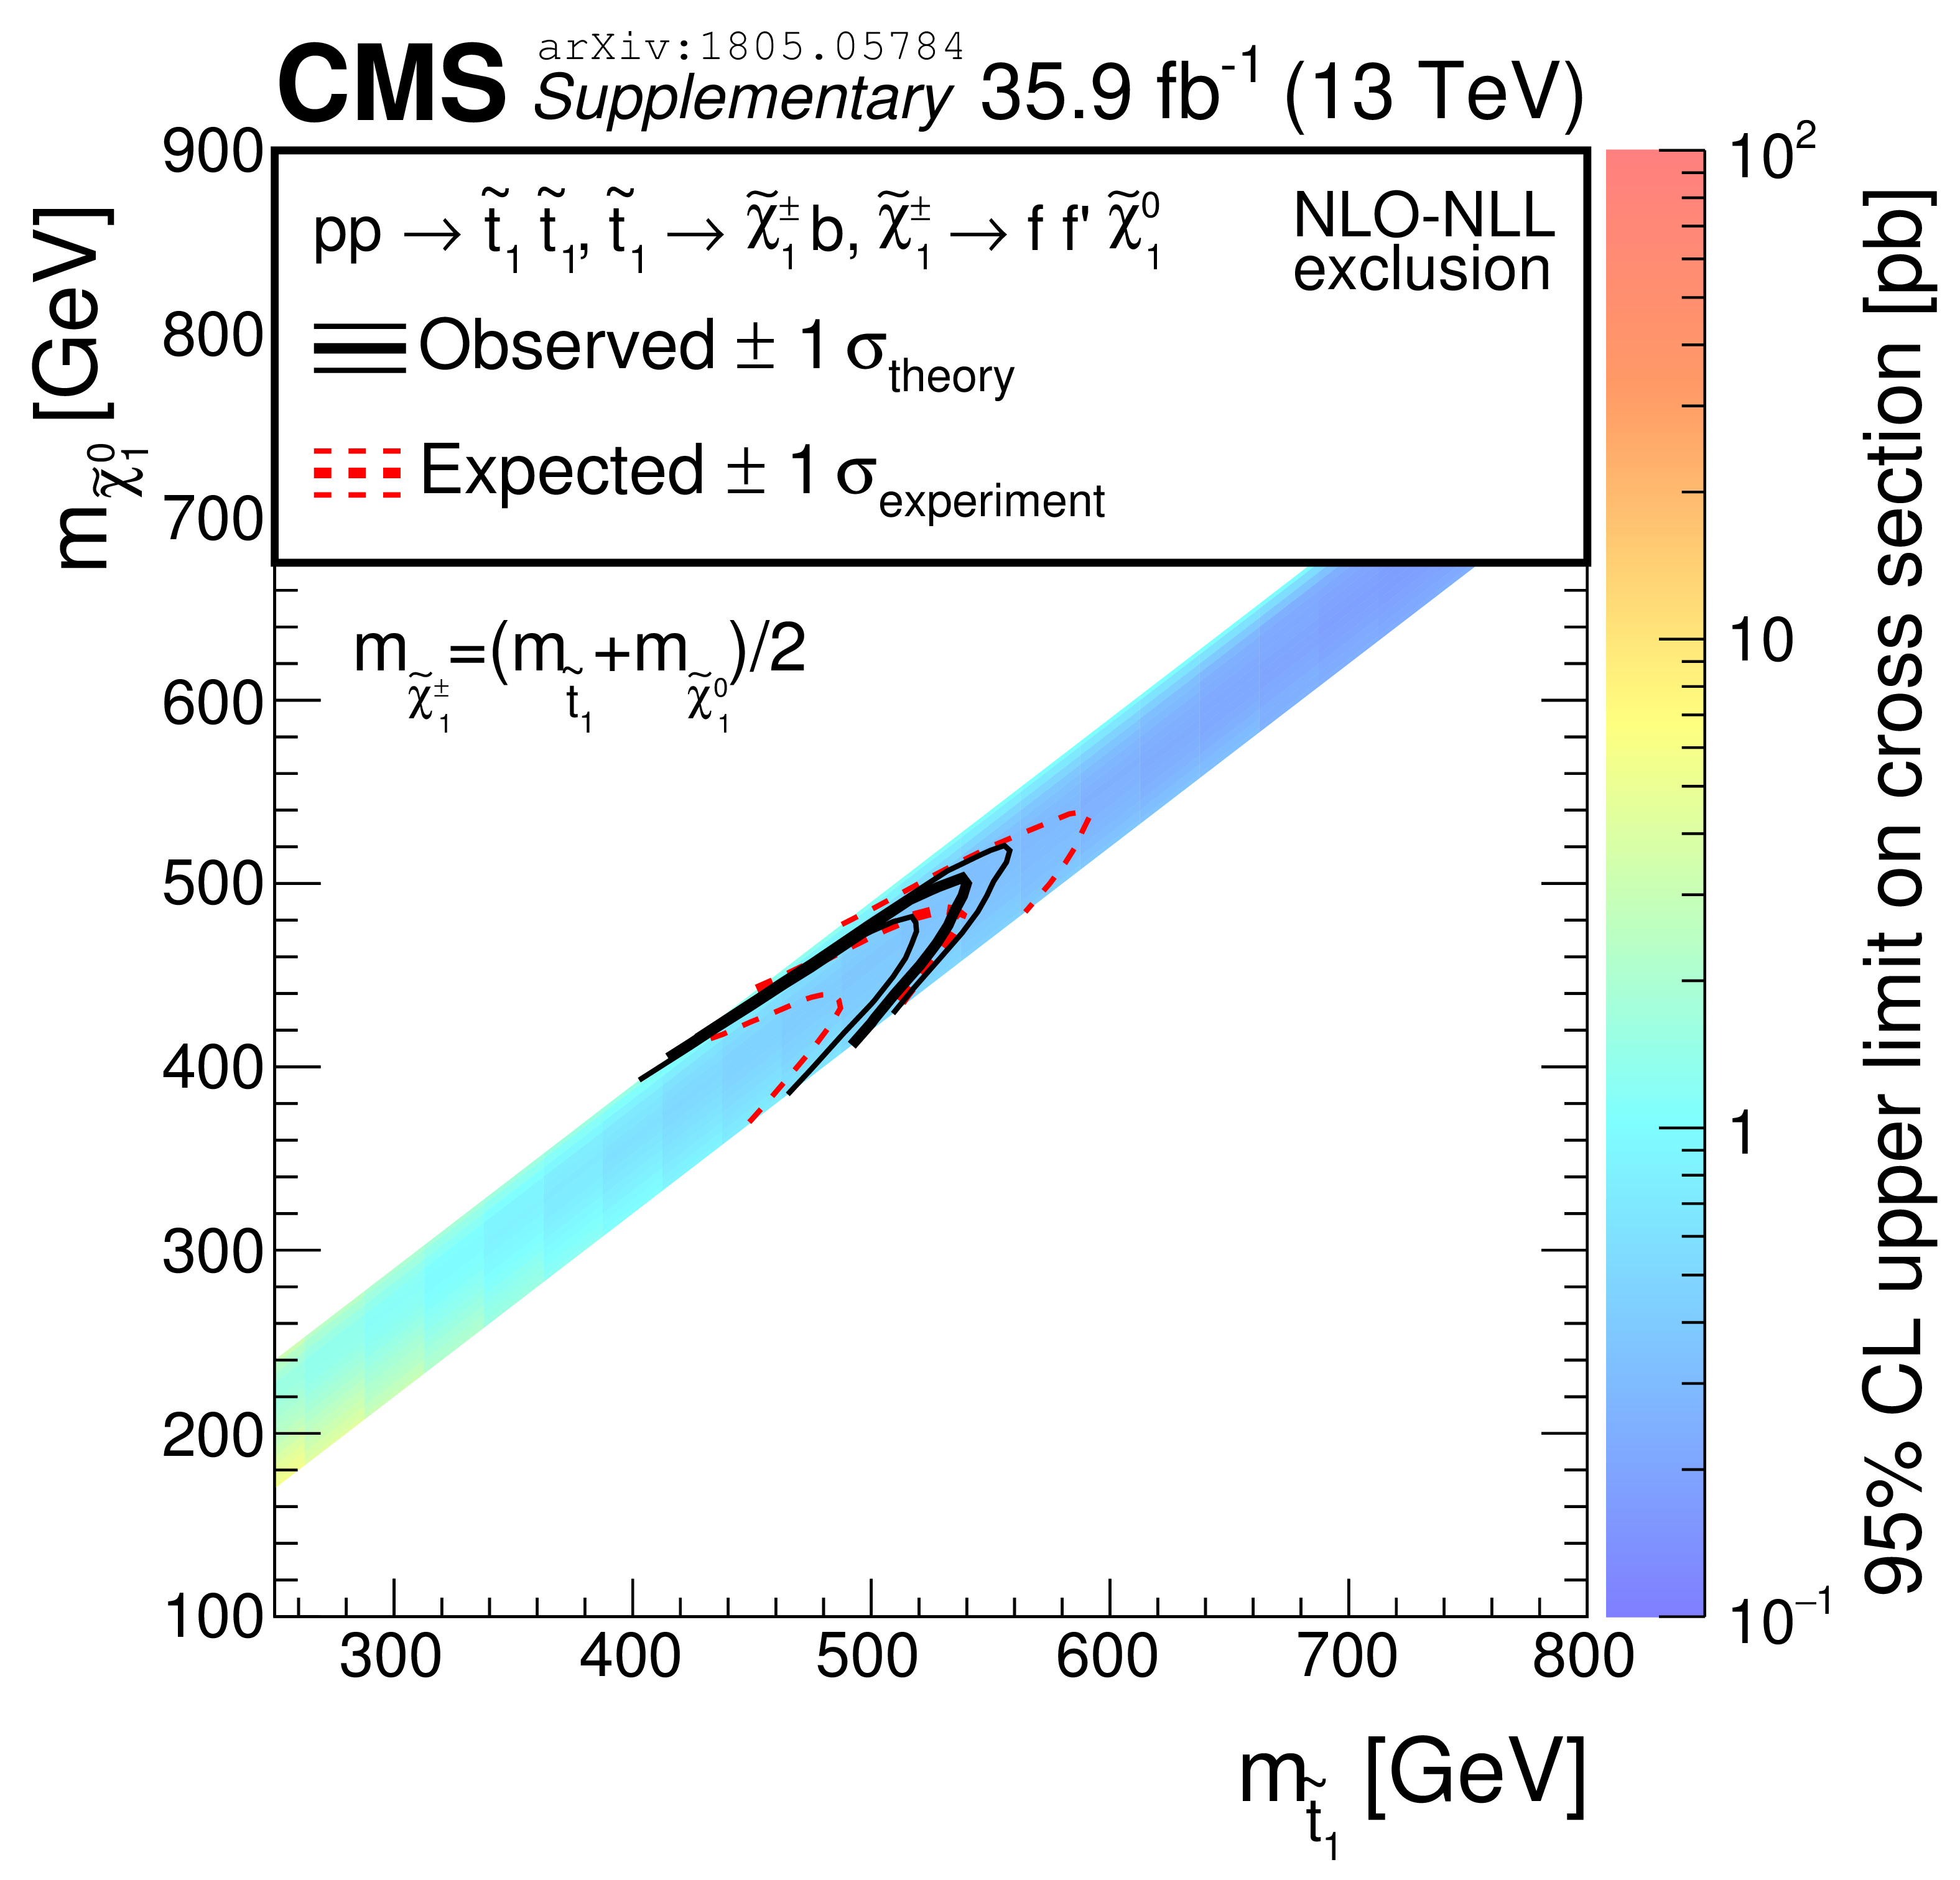
Additional Figure 7:
The CC approach. Limits at 95% CL for the chargino-mediated decay of the top squark in the $ {\tilde{\mathrm {t}}} _{1}$-$ {\tilde{\chi}^{0}_{1}} $ mass plane. |

png pdf |
Additional Figure 8:
The MVA approach. Total efficiency of the selection (preselection and threshold applied on the BDT output) as function of $m_{{\tilde{\mathrm {t}}} _{1}}$ and $\Delta m$ for the four-body decay scenario (see Figure 1). |
| Additional Tables | |

png pdf |
Additional Table 1:
Summary of expected background and observed data yields in the CC signal regions. The uncertainties on the background prediction include the statistical and systematic sources. |
png pdf |
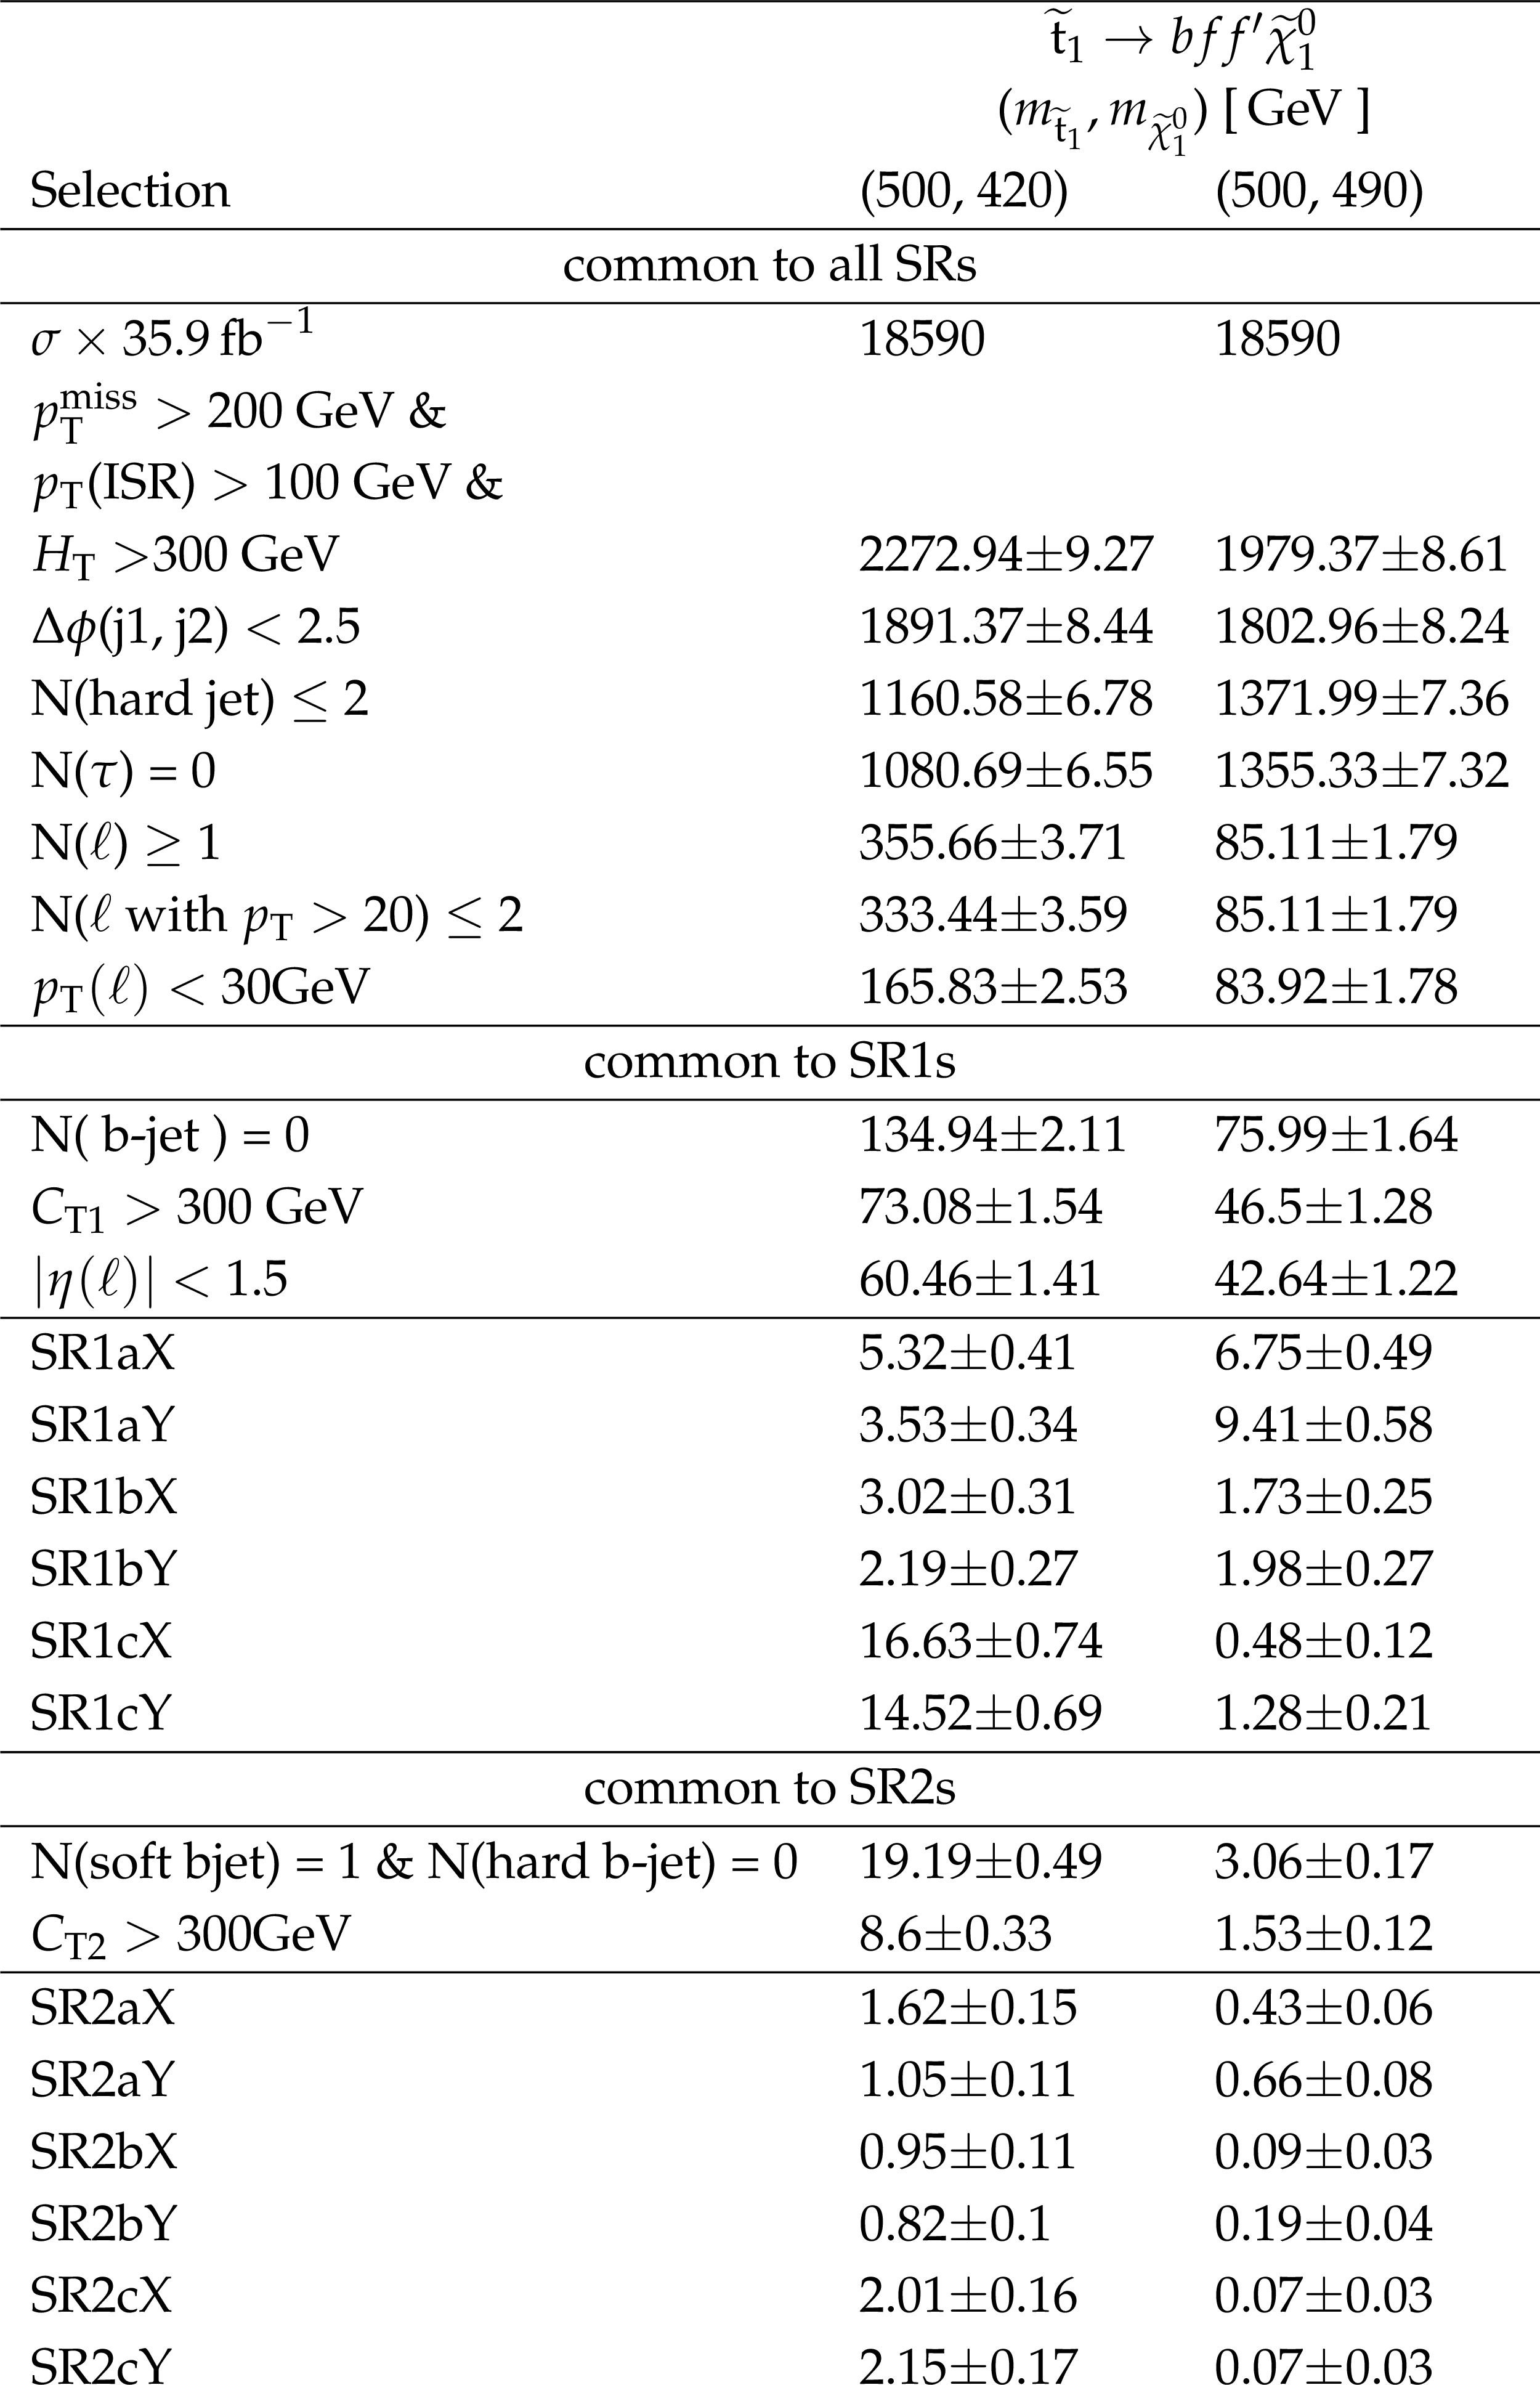
Additional Table 2:
The CC approach. Cut flow table for selection of signal regions with two signal points from the four-body decay. The values are normalized to an integrated luminosity of 35.9 fb$^{-1}$. |
png pdf |
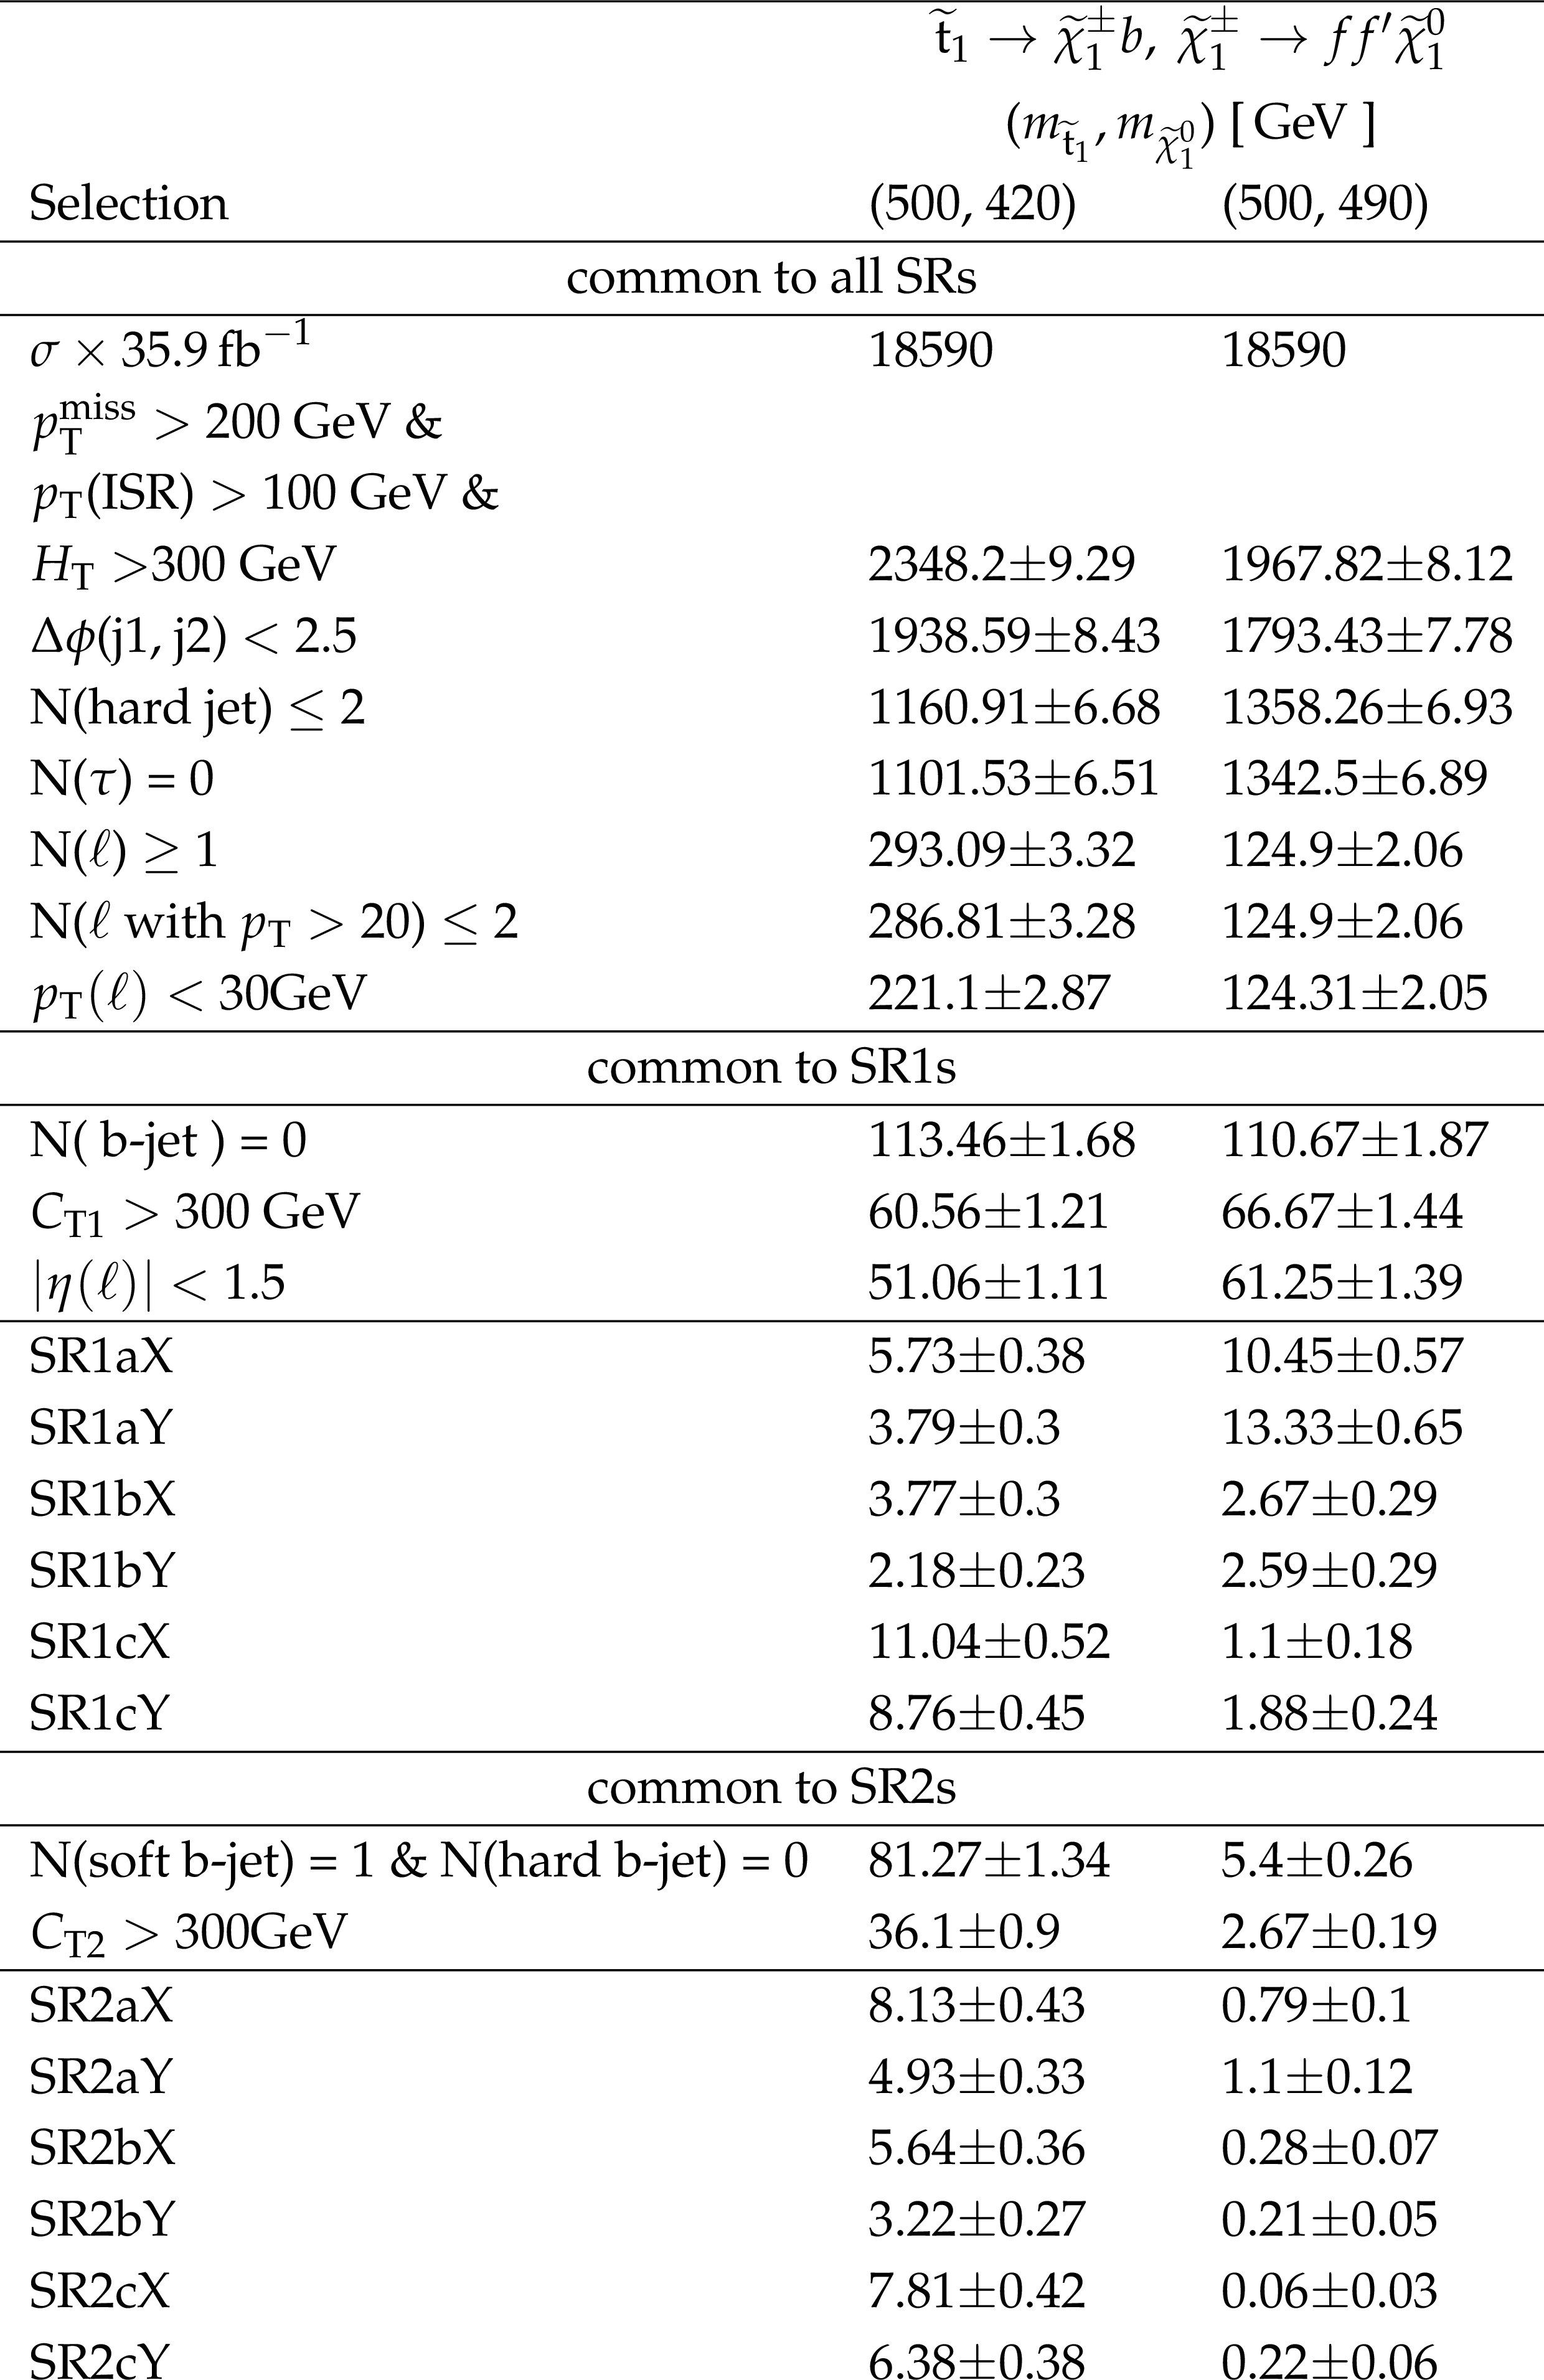
Additional Table 3:
The CC approach. Cut flow table for selection of signal regions with two signal points from the chargino-mediated scenario. The values are normalized to an integrated luminosity of 35.9 fb$^{-1}$. |
|
The efficiency maps of the simplified models in the CC signal region are provided in the following ROOT files: - Four-body decay of the top squark (T2tt): CCAccpEffMap_T2tt - Chargino-mediated decay of the top squark (T2bW): CCAccpEffMap_T2bW |
| References | ||||
| 1 | S. P. Martin | A supersymmetry primer | Adv. Ser. Direct. High Energy Phys. 18 (1998) 1 | hep-ph/9709356 |
| 2 | J. Wess and B. Zumino | Supergauge transformations in four dimensions | NPB 70 (1974) 39 | |
| 3 | H. P. Nilles | Supersymmetry, supergravity and particle physics | Phys. Reports 110 (1984) 1 | |
| 4 | H. E. Haber and G. L. Kane | The search for supersymmetry: Probing physics beyond the standard model | Phys. Reports 117 (1985) 75 | |
| 5 | R. Barbieri, S. Ferrara, and C. A. Savoy | Gauge models with spontaneously broken local supersymmetry | PLB 119 (1982) 343 | |
| 6 | S. Dawson, E. Eichten, and C. Quigg | Search for supersymmetric particles in hadron-hadron collisions | PRD 31 (1985) 1581 | |
| 7 | G. R. Farrar and P. Fayet | Phenomenology of the production, decay, and detection of new hadronic states associated with supersymmetry | PLB 76 (1978) 575 | |
| 8 | E. Witten | Dynamical breaking of supersymmetry | NPB 188 (1981) 513 | |
| 9 | S. Dimopoulos and H. Georgi | Softly broken supersymmetry and SU(5) | NPB 193 (1981) 150 | |
| 10 | ATLAS Collaboration | Observation of a new particle in the search for the standard model Higgs boson with the ATLAS detector at the LHC | PLB 716 (2012) 1 | 1207.7214 |
| 11 | CMS Collaboration | Observation of a new boson at a mass of 125 GeV with the CMS experiment at the LHC | PLB 716 (2012) 30 | CMS-HIG-12-028 1207.7235 |
| 12 | CMS Collaboration | Observation of a new boson with mass near 125 GeV in pp collisions at $ \sqrt{s} = $ 7 and 8 TeV | JHEP 06 (2013) 081 | CMS-HIG-12-036 1303.4571 |
| 13 | C. Bal\'azs, M. Carena, and C. E. M. Wagner | Dark matter, light stops and electroweak baryogenesis | PRD 70 (2004) 015007 | hep-ph/0403224 |
| 14 | T. Cohen et al. | Susy simplified models at 14, 33, and 100 TeV proton colliders | JHEP 04 (2014) 117 | 1311.6480 |
| 15 | CMS Collaboration | Search for supersymmetry in events with soft leptons, low jet multiplicity, and missing transverse energy in proton proton collisions at $ \sqrt{s} = $ 8 TeV | PLB 759 (2016) 9 | CMS-SUS-14-021 1512.08002 |
| 16 | ATLAS Collaboration | Search for top squark pair production in final states with one isolated lepton, jets, and missing transverse momentum in $ \sqrt{s} = 8 TeV {\mathrm{p}}{\mathrm{p}} $ collisions with the ATLAS detector | JHEP 11 (2014) 118 | 1407.0583 |
| 17 | ATLAS Collaboration | Search for top-squark pair production in final states with one lepton, jets, and missing transverse momentum using 36 fb$ ^{-1} $ of $ \sqrt{s}= $ 13 TeV pp collision data with the atlas detector | Submitted to JHEP | 1711.11520 |
| 18 | ATLAS Collaboration | Search for dark matter and other new phenomena in events with an energetic jet and large missing transverse momentum using the ATLAS detector | JHEP 01 (2018) 126 | 1711.03301 |
| 19 | CMS Collaboration | Search for direct production of supersymmetric partners of the top quark in the all-jets final state in proton-proton collisions at $ \sqrt{s} = $ 13 TeV | JHEP 10 (2017) 005 | CMS-SUS-16-049 1707.03316 |
| 20 | ATLAS Collaboration | Search for direct top squark pair production in final states with two leptons in $ \sqrt{s} = 13 TeV pp $ collisions with the atlas detector | EPJC 77 (2017) 898 | 1708.03247 |
| 21 | CMS Collaboration | Search for new physics in events with two soft oppositely charged leptons and missing transverse momentum in proton-proton collisions at $ \sqrt{s}= $ 13 TeV | Submitted to PLB | CMS-SUS-16-048 1801.01846 |
| 22 | CMS Collaboration | The CMS experiment at the CERN LHC | JINST 3 (2008) S08004 | CMS-00-001 |
| 23 | CMS Collaboration | Particle-flow reconstruction and global event description with the CMS detector | JINST 12 (2017) P10003 | CMS-PRF-14-001 1706.04965 |
| 24 | M. Cacciari, G. P. Salam, and G. Soyez | The anti-$ {k_{\mathrm{T}}} $ jet clustering algorithm | JHEP 04 (2008) 063 | 0802.1189 |
| 25 | M. Cacciari, G. P. Salam, and G. Soyez | FastJet user manual | EPJC 72 (2012) 1896 | 1111.6097 |
| 26 | CMS Collaboration | Performance of electron reconstruction and selection with the CMS detector in proton-proton collisions at $ \sqrt{s} = $ 8 TeV | JINST 10 (2015) P06005 | CMS-EGM-13-001 1502.02701 |
| 27 | CMS Collaboration | Performance of CMS muon reconstruction in $ {\mathrm{p}}{\mathrm{p}} $ collision events at $ \sqrt{s} = $ 7 TeV | JINST 7 (2012) P10002 | CMS-MUO-10-004 1206.4071 |
| 28 | CMS Collaboration | Reconstruction and identification of $ \tau $ lepton decays to hadrons and $ \nu_{\tau} $ at CMS | JINST 11 (2016) P01019 | CMS-TAU-14-001 1510.07488 |
| 29 | CMS Collaboration | Jet energy scale and resolution in the CMS experiment in pp collisions at 8 TeV | JINST 12 (2017) P02014 | CMS-JME-13-004 1607.03663 |
| 30 | CMS Collaboration | Identification of b-quark jets with the CMS experiment | JINST 8 (2013) P04013 | CMS-BTV-12-001 1211.4462 |
| 31 | CMS Collaboration | Identification of heavy-flavour jets with the CMS detector in pp collisions at 13 TeV | JINST 13 (2018) P05011 | CMS-BTV-16-002 1712.07158 |
| 32 | J. Alwall et al. | The automated computation of tree-level and next-to-leading order differential cross sections, and their matching to parton shower simulations | JHEP 07 (2014) 079 | 1405.0301 |
| 33 | S. Alioli, P. Nason, C. Oleari, and E. Re | NLO single-top production matched with shower in POWHEG: $ s $- and $ t $-channel contributions | JHEP 09 (2009) 111 | 0907.4076 |
| 34 | E. Re | Single-top Wt-channel production matched with parton showers using the POWHEG method | EPJC 71 (2011) 1547 | 1009.2450 |
| 35 | NNPDF Collaboration | Parton distributions for the LHC Run II | JHEP 04 (2015) 040 | 1410.8849 |
| 36 | T. Sjostrand, S. Mrenna, and P. Z. Skands | PYTHIA 6.4 physics and manual | JHEP 05 (2006) 026 | hep-ph/0603175 |
| 37 | T. Sjostrand, S. Mrenna, and P. Z. Skands | A brief introduction to PYTHIA 8.1 | CPC 178 (2008) 852 | 0710.3820 |
| 38 | CMS Collaboration | Event generator tunes obtained from underlying event and multiparton scattering measurements | EPJC 76 (2016) 155 | CMS-GEN-14-001 1512.00815 |
| 39 | GEANT4 Collaboration | $ GEANT4--a $ simulation toolkit | NIMA 506 (2003) 250 | |
| 40 | W. Beenakker, R. Hopker, and M. Spira | PROSPINO: A program for the production of supersymmetric particles in next-to-leading order QCD | hep-ph/9611232 | |
| 41 | C. Borschensky et al. | Squark and gluino production cross sections in pp collisions at $ \sqrt{s} = $ 13, 14, 33 and 100 TeV | EPJC 74 (2014) 3174 | 1407.5066 |
| 42 | W. Beenakker, R. Hopker, M. Spira, and P. M. Zerwas | Squark and gluino production at hadron colliders | NPB 492 (1997) 51 | hep-ph/9610490 |
| 43 | A. Kulesza and L. Motyka | Threshold resummation for squark-antisquark and gluino-pair production at the LHC | PRL 102 (2009) 111802 | hep-ph/0807.2405 |
| 44 | A. Kulesza and L. Motyka | Soft gluon resummation for the production of gluino-gluino and squark-antisquark pairs at the LHC | PRD 80 (2009) 095004 | hep-ph/0905.4749 |
| 45 | W. Beenakker et al. | Soft-gluon resummation for squark and gluino hadroproduction | JHEP 12 (2009) 41 | hep-ph/0909.4418 |
| 46 | W. Beenakker et al. | Squark and gluino production | Int. J. Mod. Phys. A 26 (2011) 2637 | hep-ph/1105.1110 |
| 47 | CMS Collaboration | The fast simulation of the CMS detector at LHC | J. Phys. Conf. Ser. 331 (2011) 032049 | |
| 48 | CMS Collaboration | CMS Luminosity Measurements for the 2016 Data Taking Period | CMS-PAS-LUM-17-001 | CMS-PAS-LUM-17-001 |
| 49 | CMS Collaboration | Measurement of the inelastic proton-proton cross section at $ \sqrt{s}= $ 13 TeV | Submitted to JHEP | CMS-FSQ-15-005 1802.02613 |
| 50 | CMS Collaboration | Search for supersymmetry in multijet events with missing transverse momentum in proton-proton collisions at 13 TeV | PRD 96 (2017) 032003 | CMS-SUS-16-033 1704.07781 |
| 51 | CMS Collaboration | Search for electroweak production of charginos and neutralinos in wh events in proton-proton collisions at $ \sqrt{s} = $ 13 TeV | JHEP 11 (2017) 029 | CMS-SUS-16-043 1706.09933 |
| 52 | L. Rokach and O. Maimon | Data mining with decision trees: theory and applications | World Scientific Pub Co Inc., 2008 ISBN 978-981-277-171-1 | |
| 53 | A. Hoecker et al. | TMVA: Toolkit for multivariate data analysis | PoS ACAT (2007) 040 | physics/0703039 |
| 54 | G. Cowan, K. Cranmer, E. Gross, and O. Vitells | Asymptotic formulae for likelihood-based tests of new physics | EPJC 71 (2011) 1554 | 1007.1727 |
| 55 | T. Junk | Confidence level computation for combining searches with small statistics | NIMA 434 (1999) 435 | hep-ex/9902006 |
| 56 | A. L. Read | Presentation of search results: the $ CL_s $ technique | JPG 28 (2002) 2693 | |
| 57 | ATLAS and CMS Collaborations, LHC Higgs Combination Group | Procedure for the LHC Higgs boson search combination in summer 2011 | ATL-PHYS-PUB/2011-11, CMS NOTE 2011/005, CERN | |
|
|
Compact Muon Solenoid LHC, CERN |
|

|

|

|

|

|