

Compact Muon Solenoid
LHC, CERN
| CMS-TOP-16-007 ; CERN-EP-2017-120 | ||
| Measurement of normalized differential $\mathrm{ t \bar{t} }$ cross sections in the dilepton channel from pp collisions at $ \sqrt{s} = $ 13 TeV | ||
| CMS Collaboration | ||
| 25 August 2017 | ||
| JHEP 04 (2018) 060 | ||
| Abstract: Normalized differential cross sections for top quark pair production are measured in the dilepton ($\mathrm{ e }^{+}\mathrm{ e }^{-}$, $\mu^{+}\mu^{-}$, and $\mu^{\mp}\mathrm{ e }^{\pm}$) decay channels in proton-proton collisions at a center-of-mass energy of 13 TeV. The measurements are performed with data corresponding to an integrated luminosity of 2.1 fb$^{-1}$ using the CMS detector at the LHC. The cross sections are measured differentially as a function of the kinematic properties of the leptons, jets from bottom quark hadronization, top quarks, and top quark pairs at the particle and parton levels. The results are compared to several Monte Carlo generators that implement calculations up to next-to-leading order in perturbative quantum chromodynamics interfaced with parton showering, and also to fixed-order theoretical calculations of top quark pair production up to next-to-next-to-leading order. | ||
| Links: e-print arXiv:1708.07638 [hep-ex] (PDF) ; CDS record ; inSPIRE record ; HepData record ; CADI line (restricted) ; | ||
| Figures | |
png pdf |
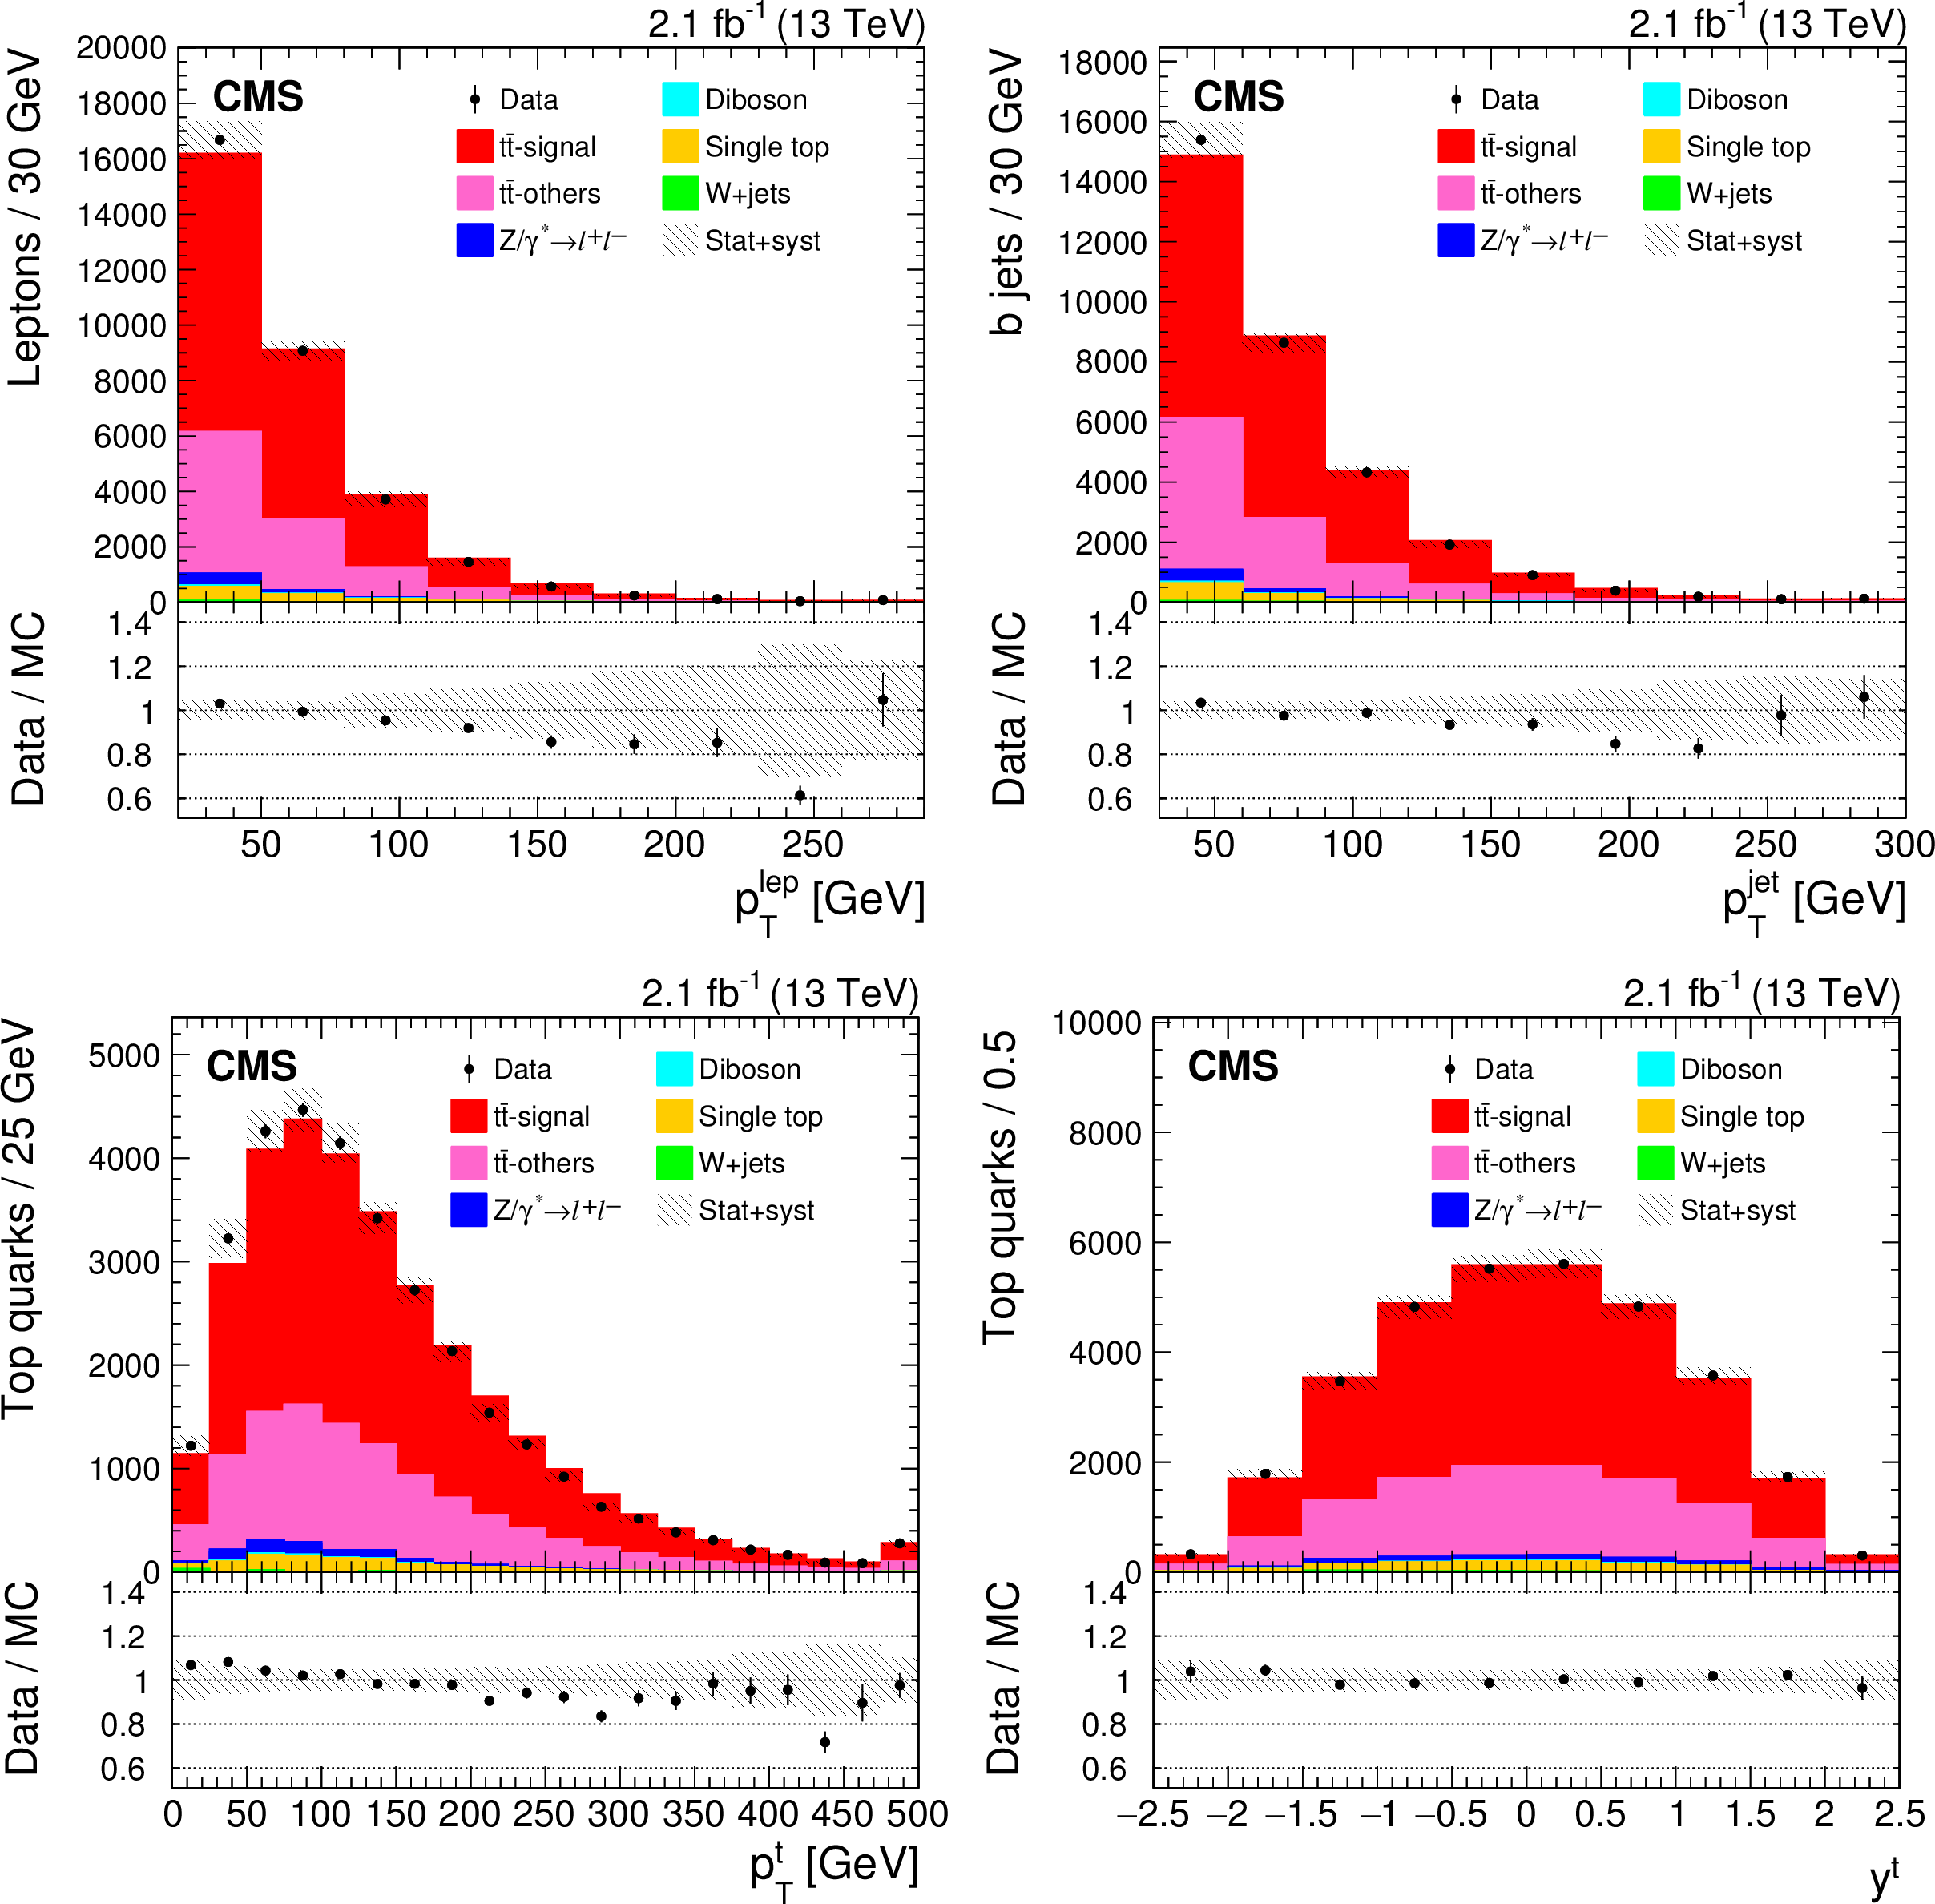
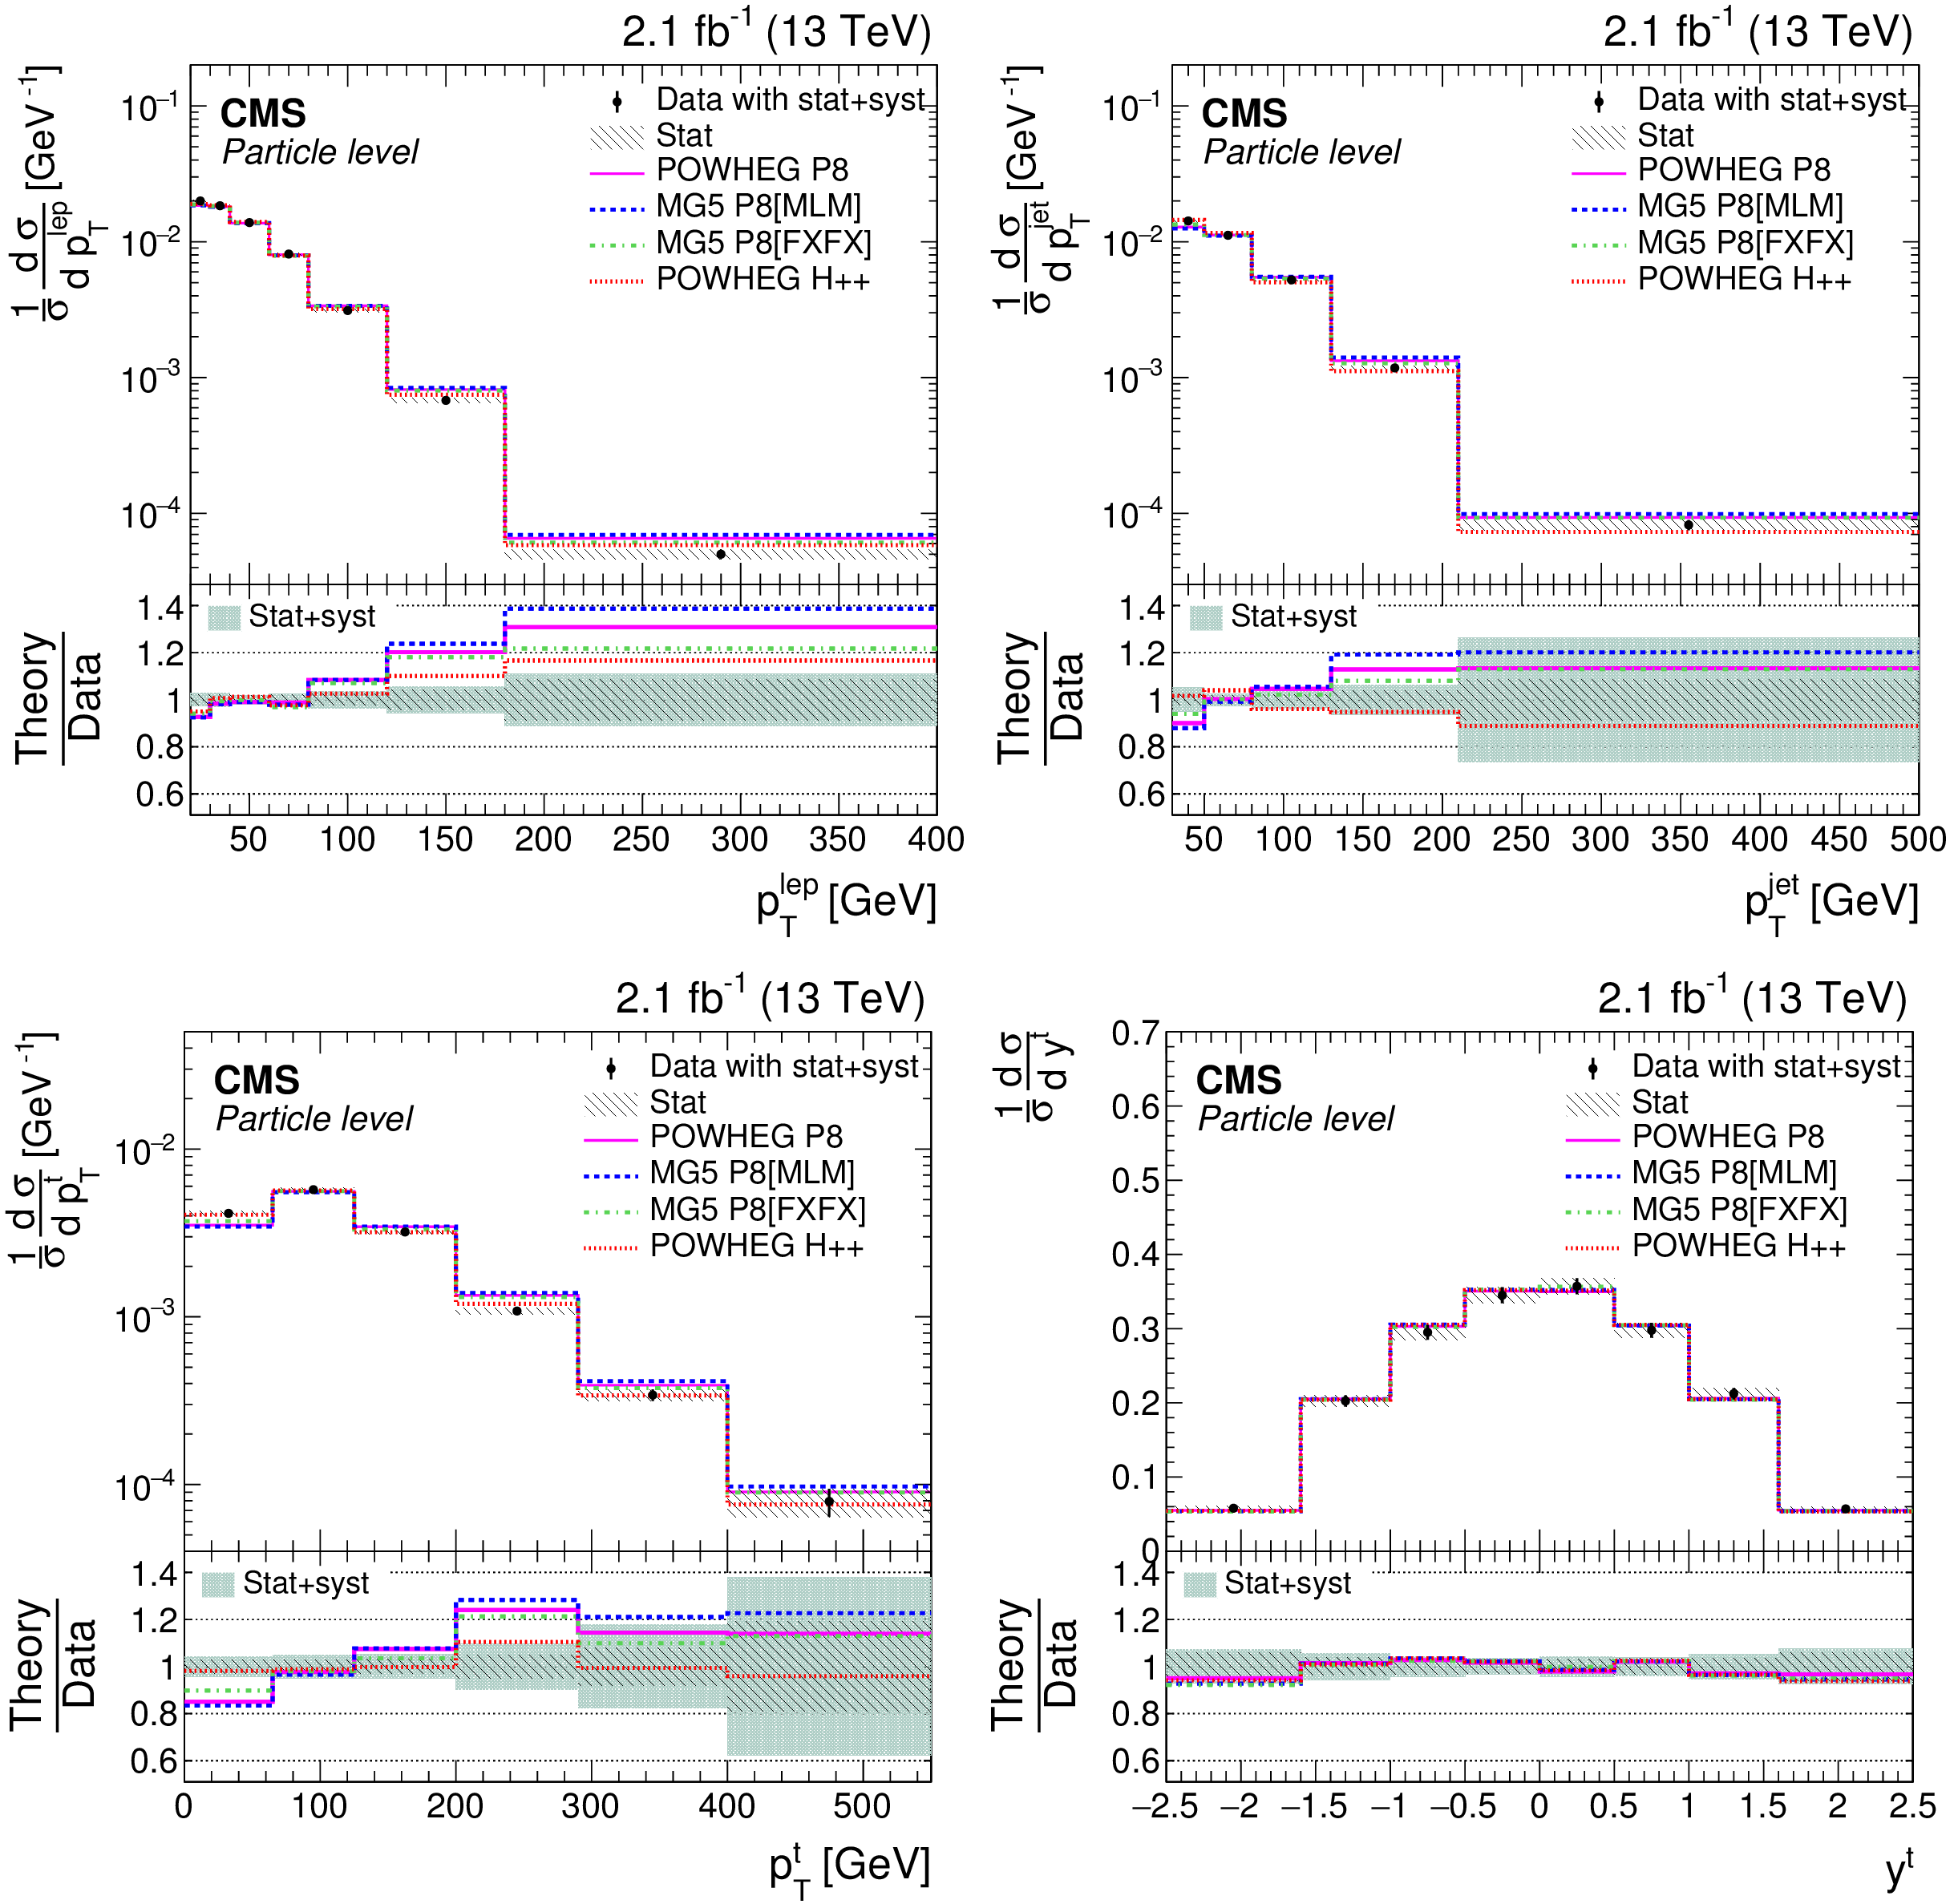
Figure 1:
Reconstructed $ { {p_{\mathrm {T}}} ^{{ \rm lep}}} $ (upper left), $ { {p_{\mathrm {T}}} ^{{ \rm jet}}} $ (upper right), $ { {p_{\mathrm {T}}} ^{\rm t}} $ (lower left), and $ {y^{\rm t}} $ (lower right) distributions from data (points) and from MC simulation (shaded histograms). The signal definition for particle level is considered to distinguish $ {\mathrm{ t } {}\mathrm{ \bar{t} } } $-signal and $ {\mathrm{ t } {}\mathrm{ \bar{t} } } $-others. All corrections described in the text are applied to the simulation. The last bin includes the overflow events. The uncertainties shown by the vertical bars on the data points are statistical only while the hatched band shows the combined statistical and systematic uncertainties added in quadrature. The lower panels display the ratios of the data to the MC prediction. |
png pdf |
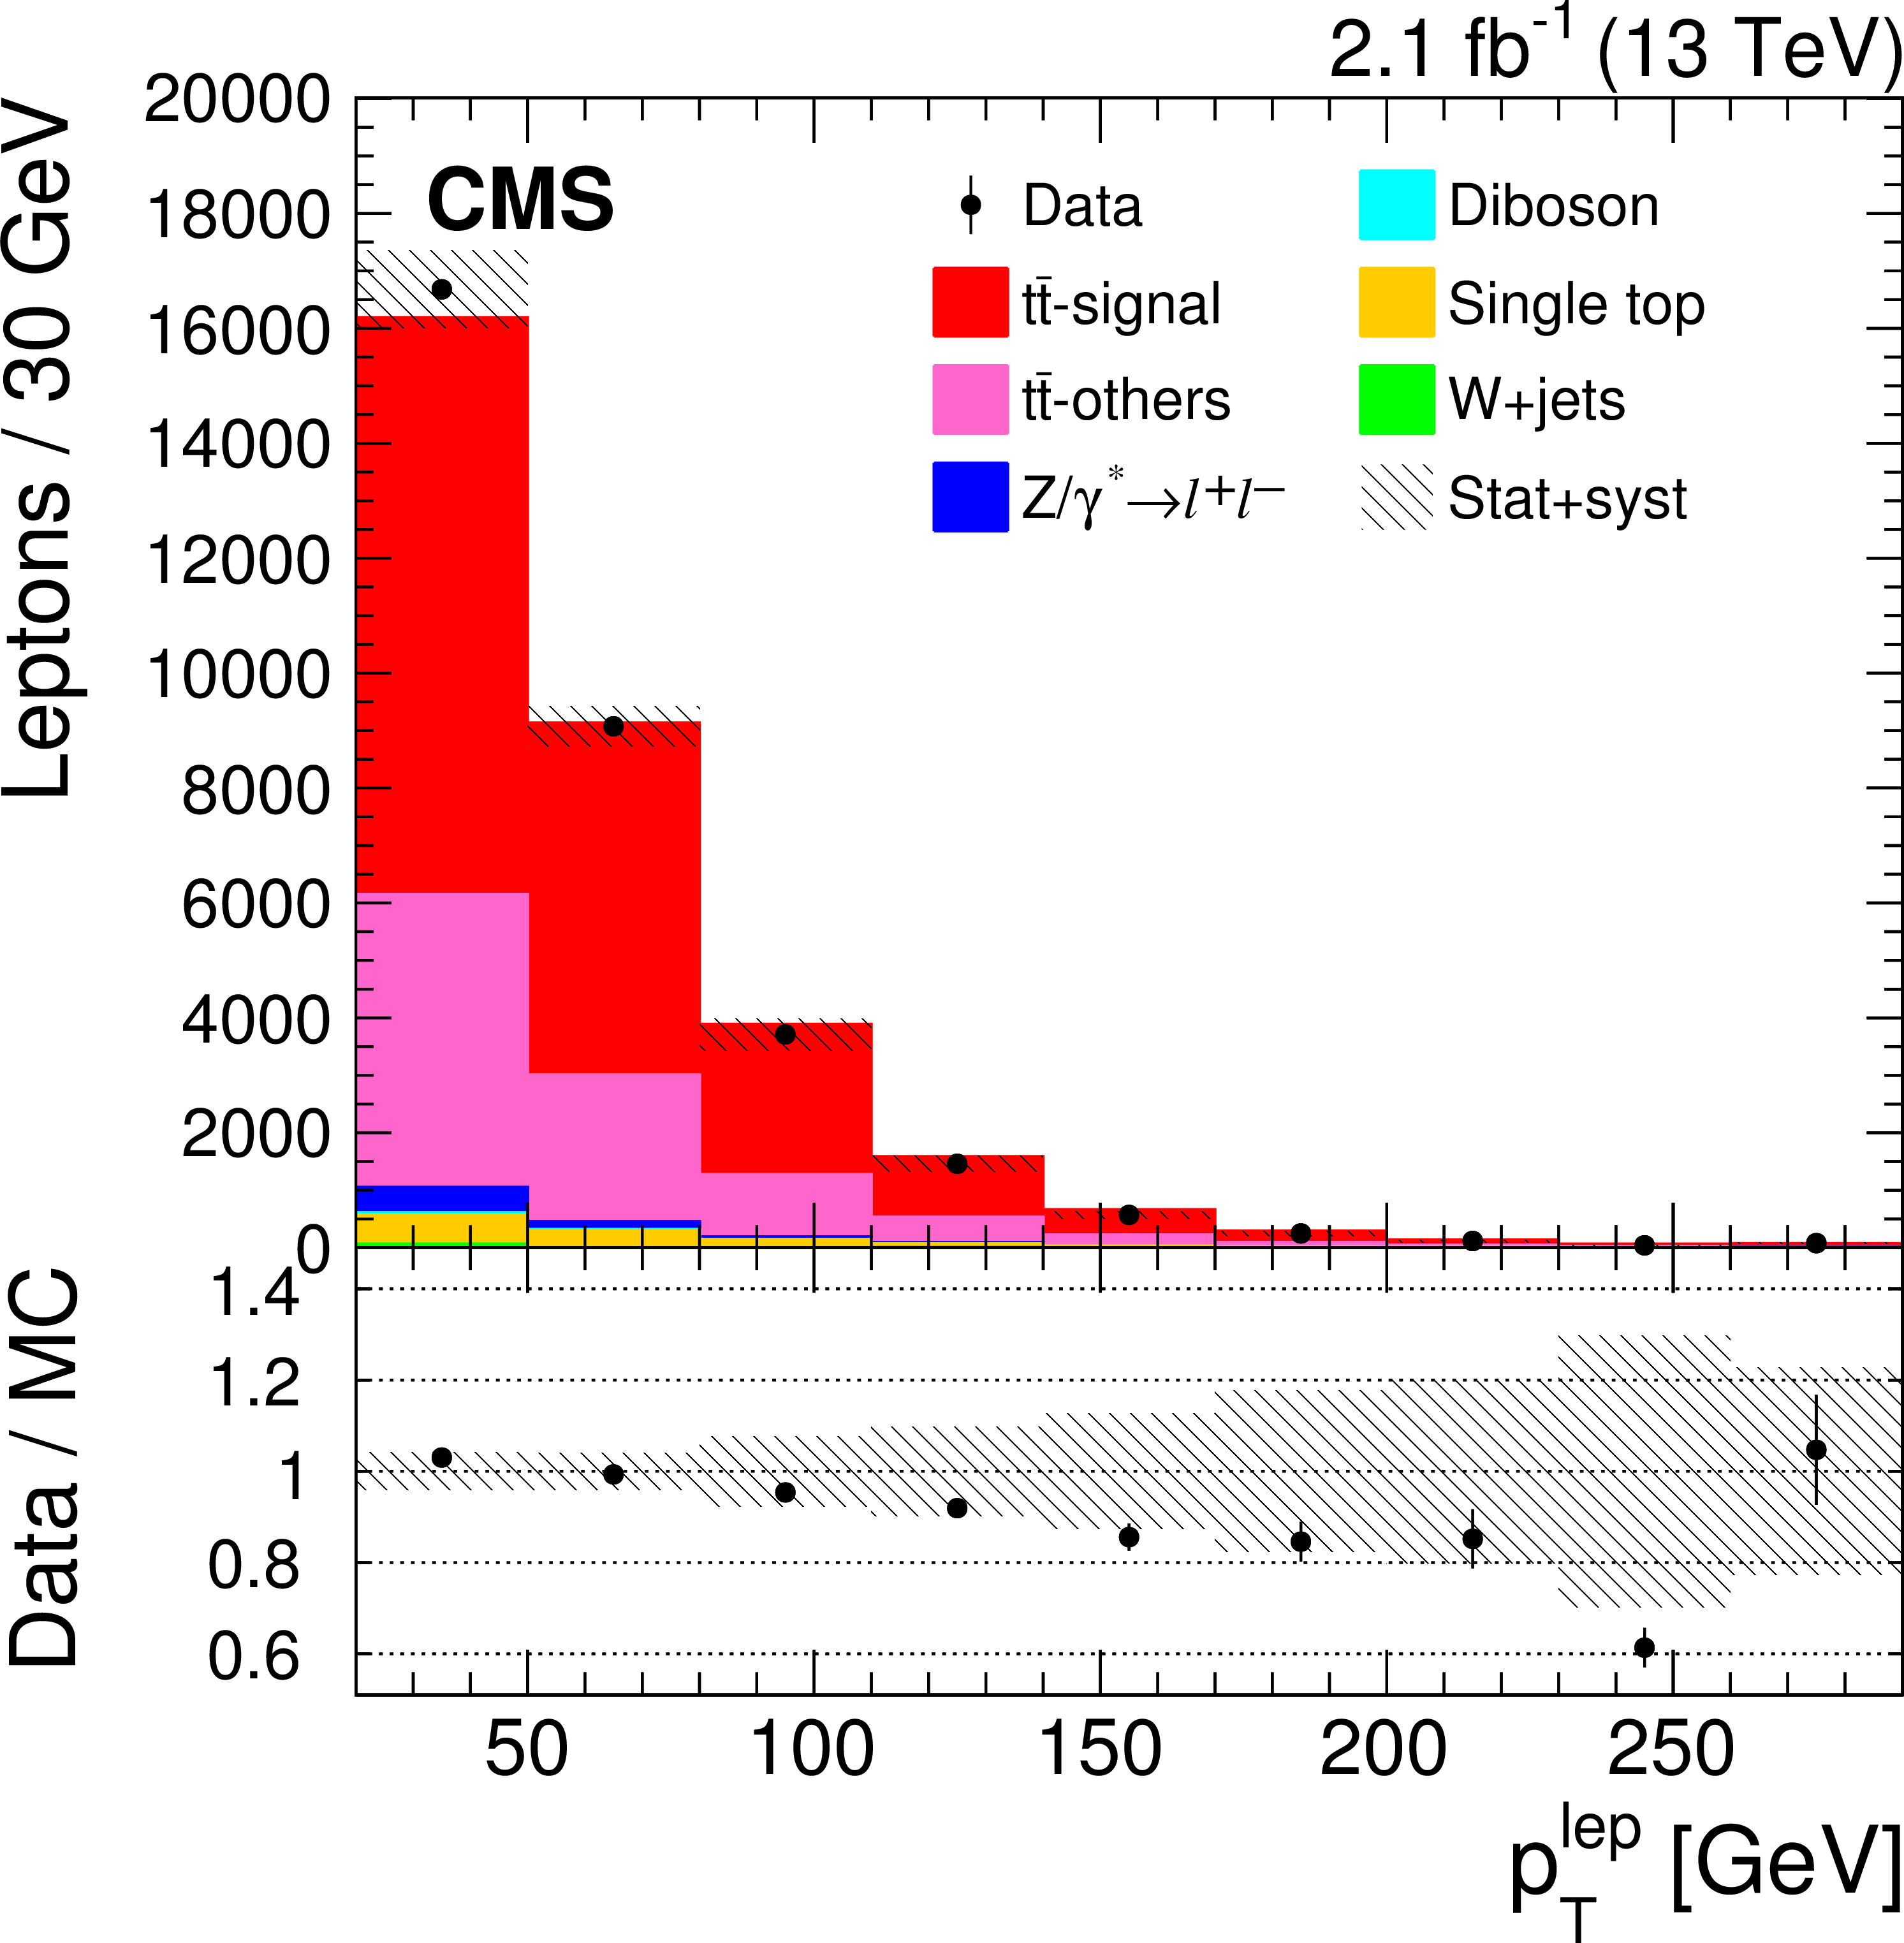
Figure 1-a:
Reconstructed $ { {p_{\mathrm {T}}} ^{{ \rm lep}}} $ distribution from data (points) and from MC simulation (shaded histograms). The signal definition for particle level is considered to distinguish $ {\mathrm{ t } {}\mathrm{ \bar{t} } } $-signal and $ {\mathrm{ t } {}\mathrm{ \bar{t} } } $-others. All corrections described in the text are applied to the simulation. The last bin includes the overflow events. The uncertainties shown by the vertical bars on the data points are statistical only while the hatched band shows the combined statistical and systematic uncertainties added in quadrature. The lower panel displays the ratios of the data to the MC prediction. |
png pdf |
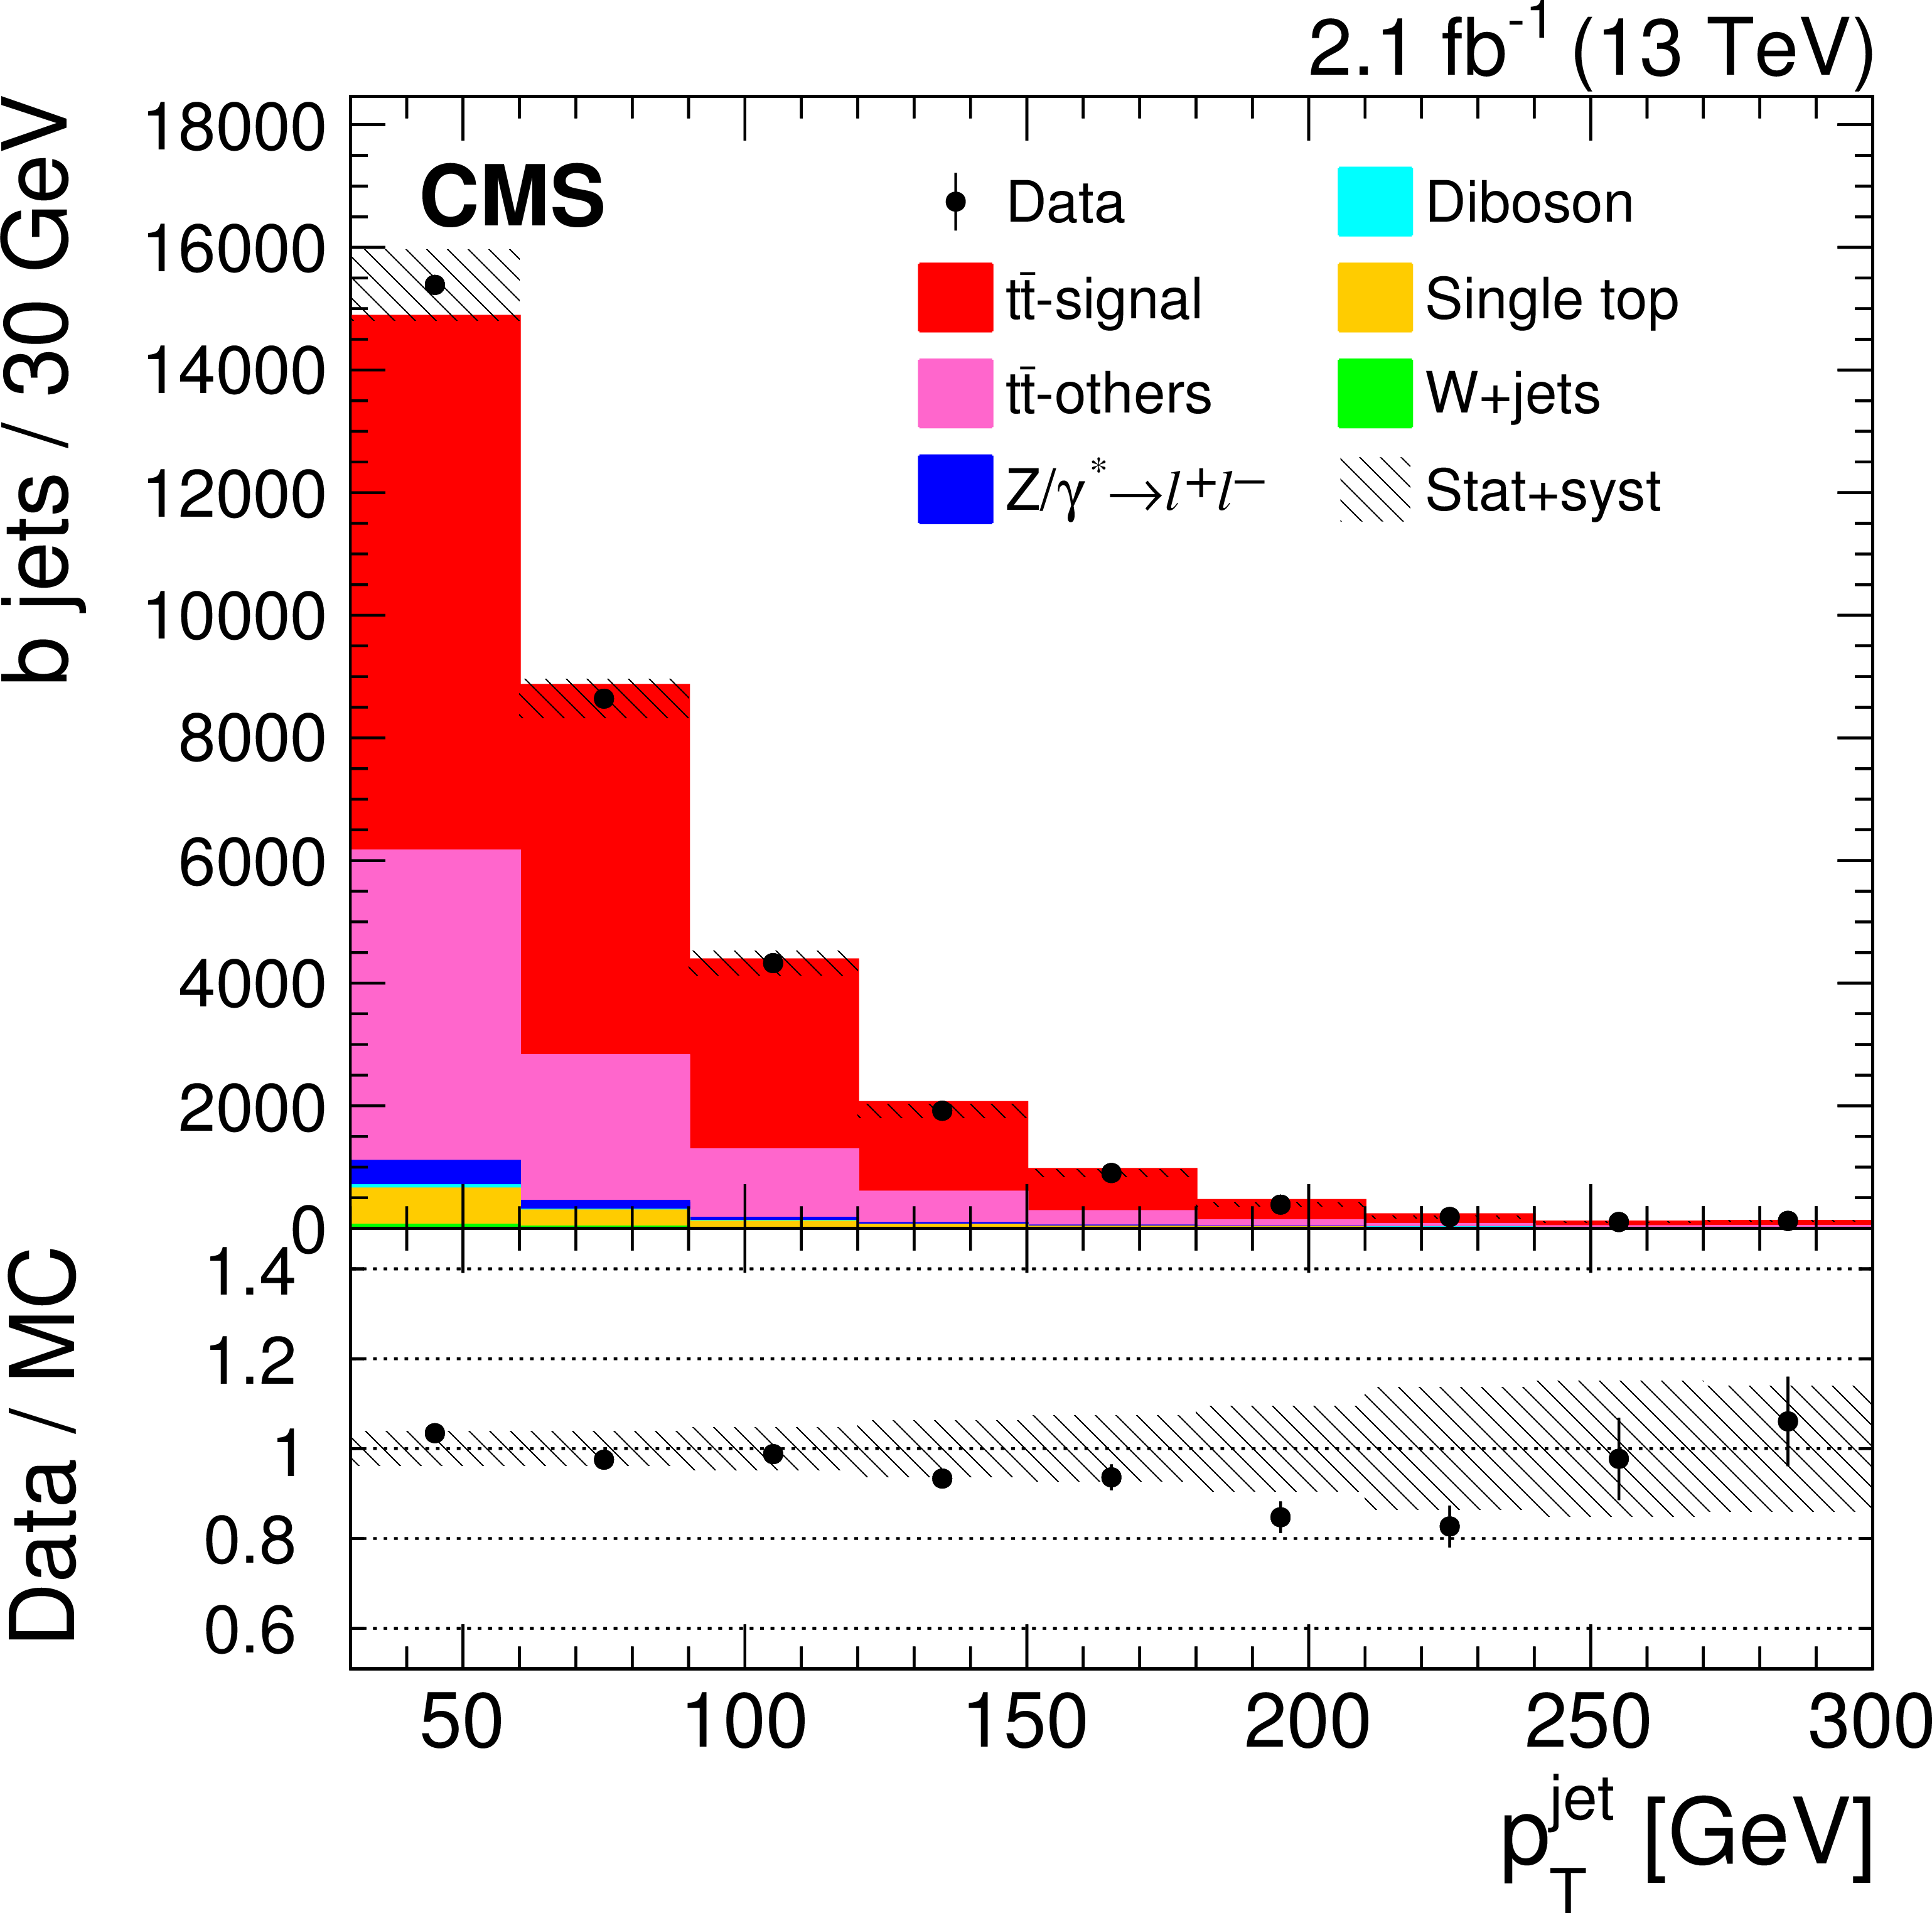
Figure 1-b:
Reconstructed $ { {p_{\mathrm {T}}} ^{{ \rm jet}}} $ distribution from data (points) and from MC simulation (shaded histograms). The signal definition for particle level is considered to distinguish $ {\mathrm{ t } {}\mathrm{ \bar{t} } } $-signal and $ {\mathrm{ t } {}\mathrm{ \bar{t} } } $-others. All corrections described in the text are applied to the simulation. The last bin includes the overflow events. The uncertainties shown by the vertical bars on the data points are statistical only while the hatched band shows the combined statistical and systematic uncertainties added in quadrature. The lower panel displays the ratios of the data to the MC prediction. |
png pdf |
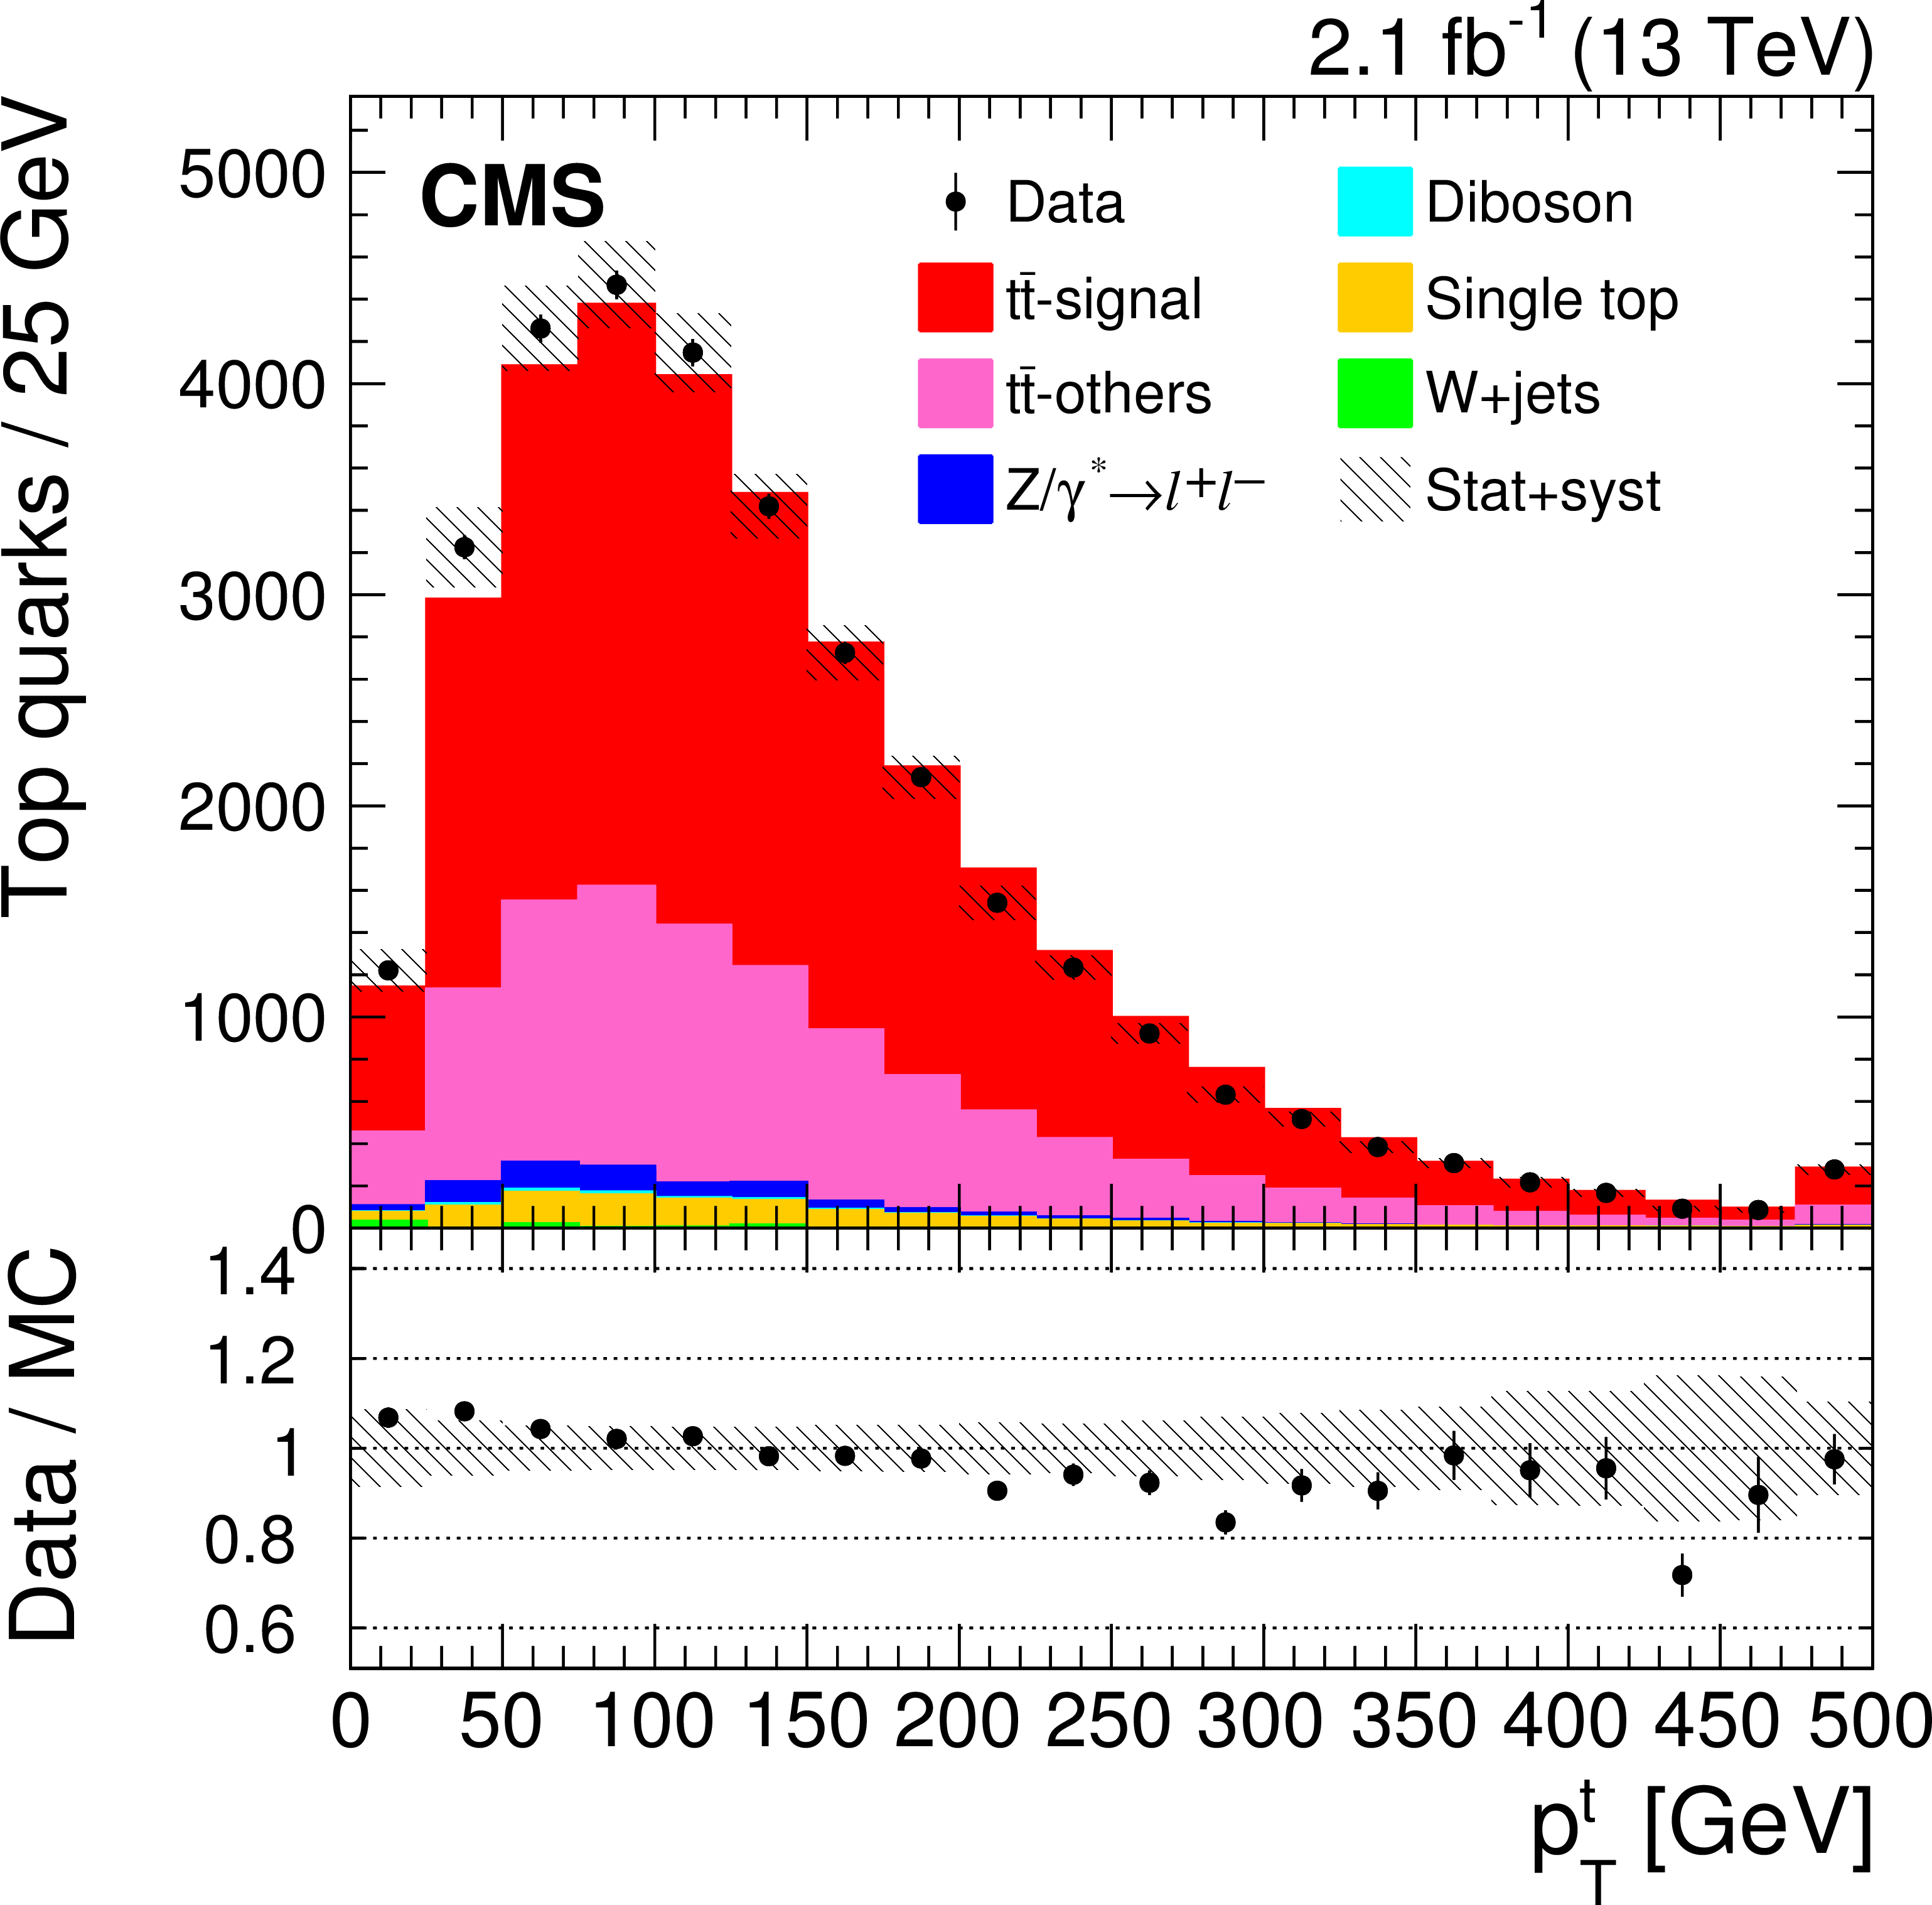
Figure 1-c:
Reconstructed $ { {p_{\mathrm {T}}} ^{\rm t}} $ distribution from data (points) and from MC simulation (shaded histograms). The signal definition for particle level is considered to distinguish $ {\mathrm{ t } {}\mathrm{ \bar{t} } } $-signal and $ {\mathrm{ t } {}\mathrm{ \bar{t} } } $-others. All corrections described in the text are applied to the simulation. The last bin includes the overflow events. The uncertainties shown by the vertical bars on the data points are statistical only while the hatched band shows the combined statistical and systematic uncertainties added in quadrature. The lower panel displays the ratios of the data to the MC prediction. |
png pdf |
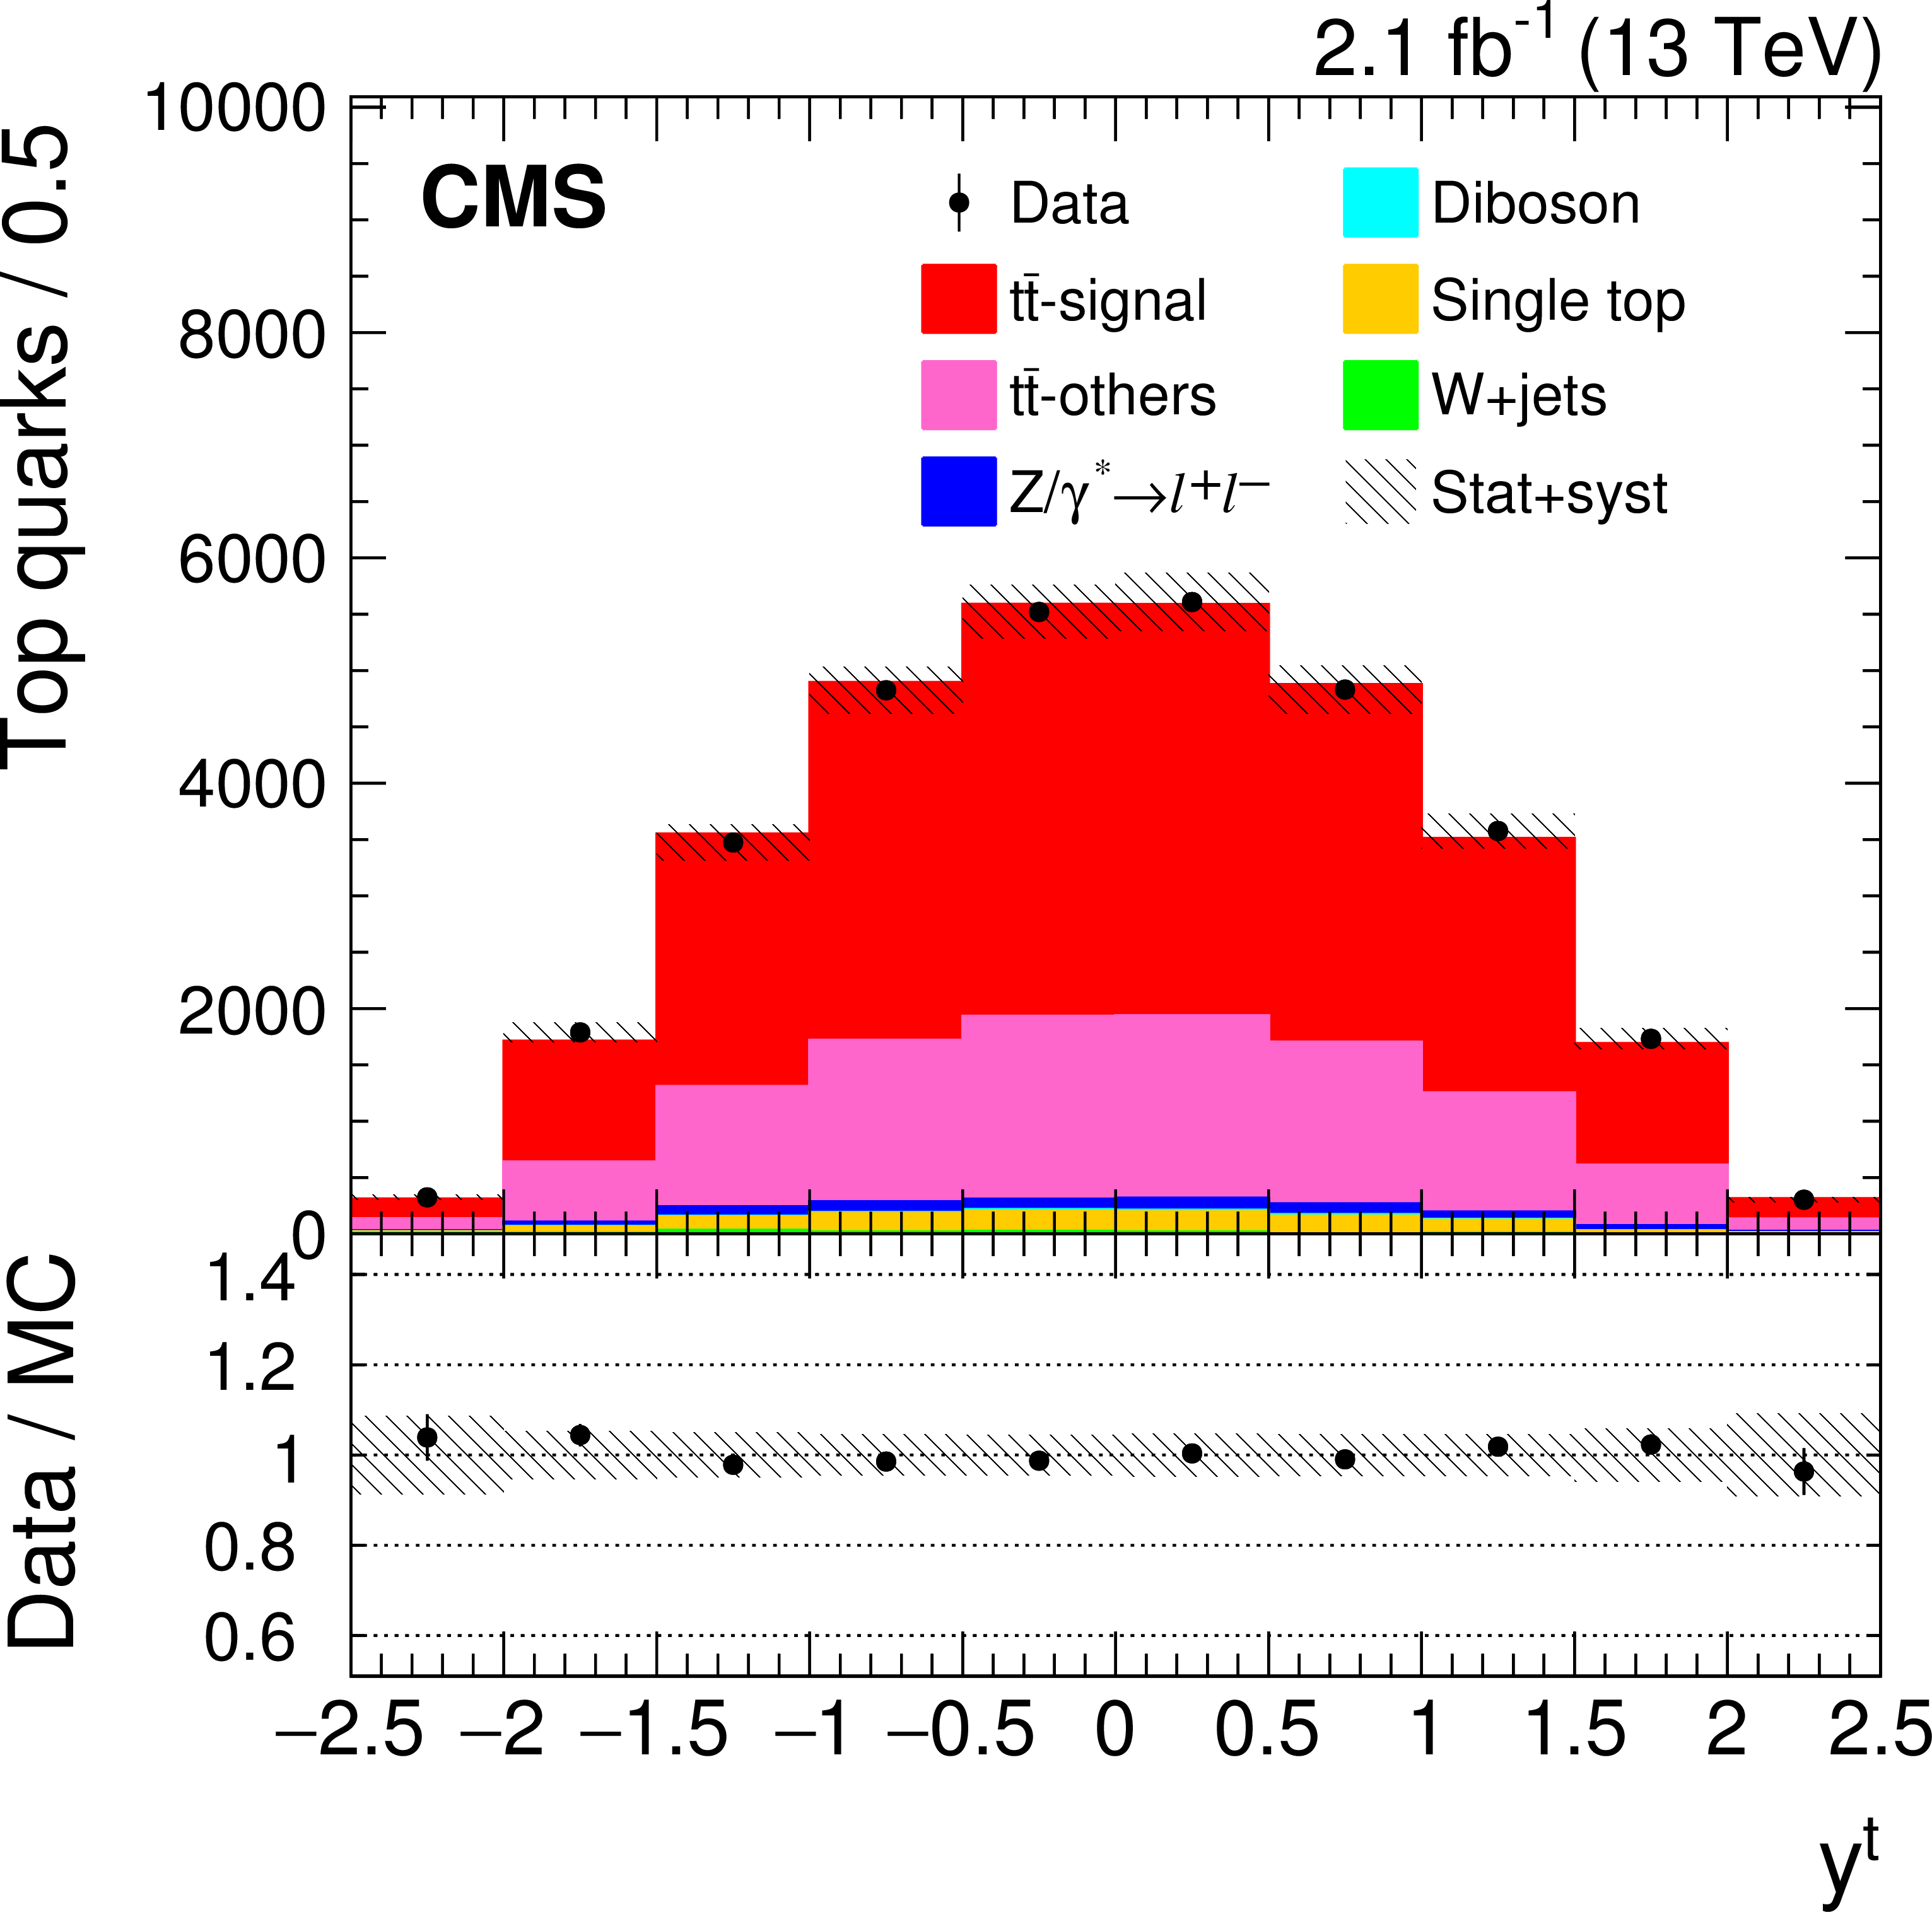
Figure 1-d:
Reconstructed $ {y^{\rm t}} $ distribution from data (points) and from MC simulation (shaded histograms). The signal definition for particle level is considered to distinguish $ {\mathrm{ t } {}\mathrm{ \bar{t} } } $-signal and $ {\mathrm{ t } {}\mathrm{ \bar{t} } } $-others. All corrections described in the text are applied to the simulation. The last bin includes the overflow events. The uncertainties shown by the vertical bars on the data points are statistical only while the hatched band shows the combined statistical and systematic uncertainties added in quadrature. The lower panel displays the ratios of the data to the MC prediction. |

png pdf |
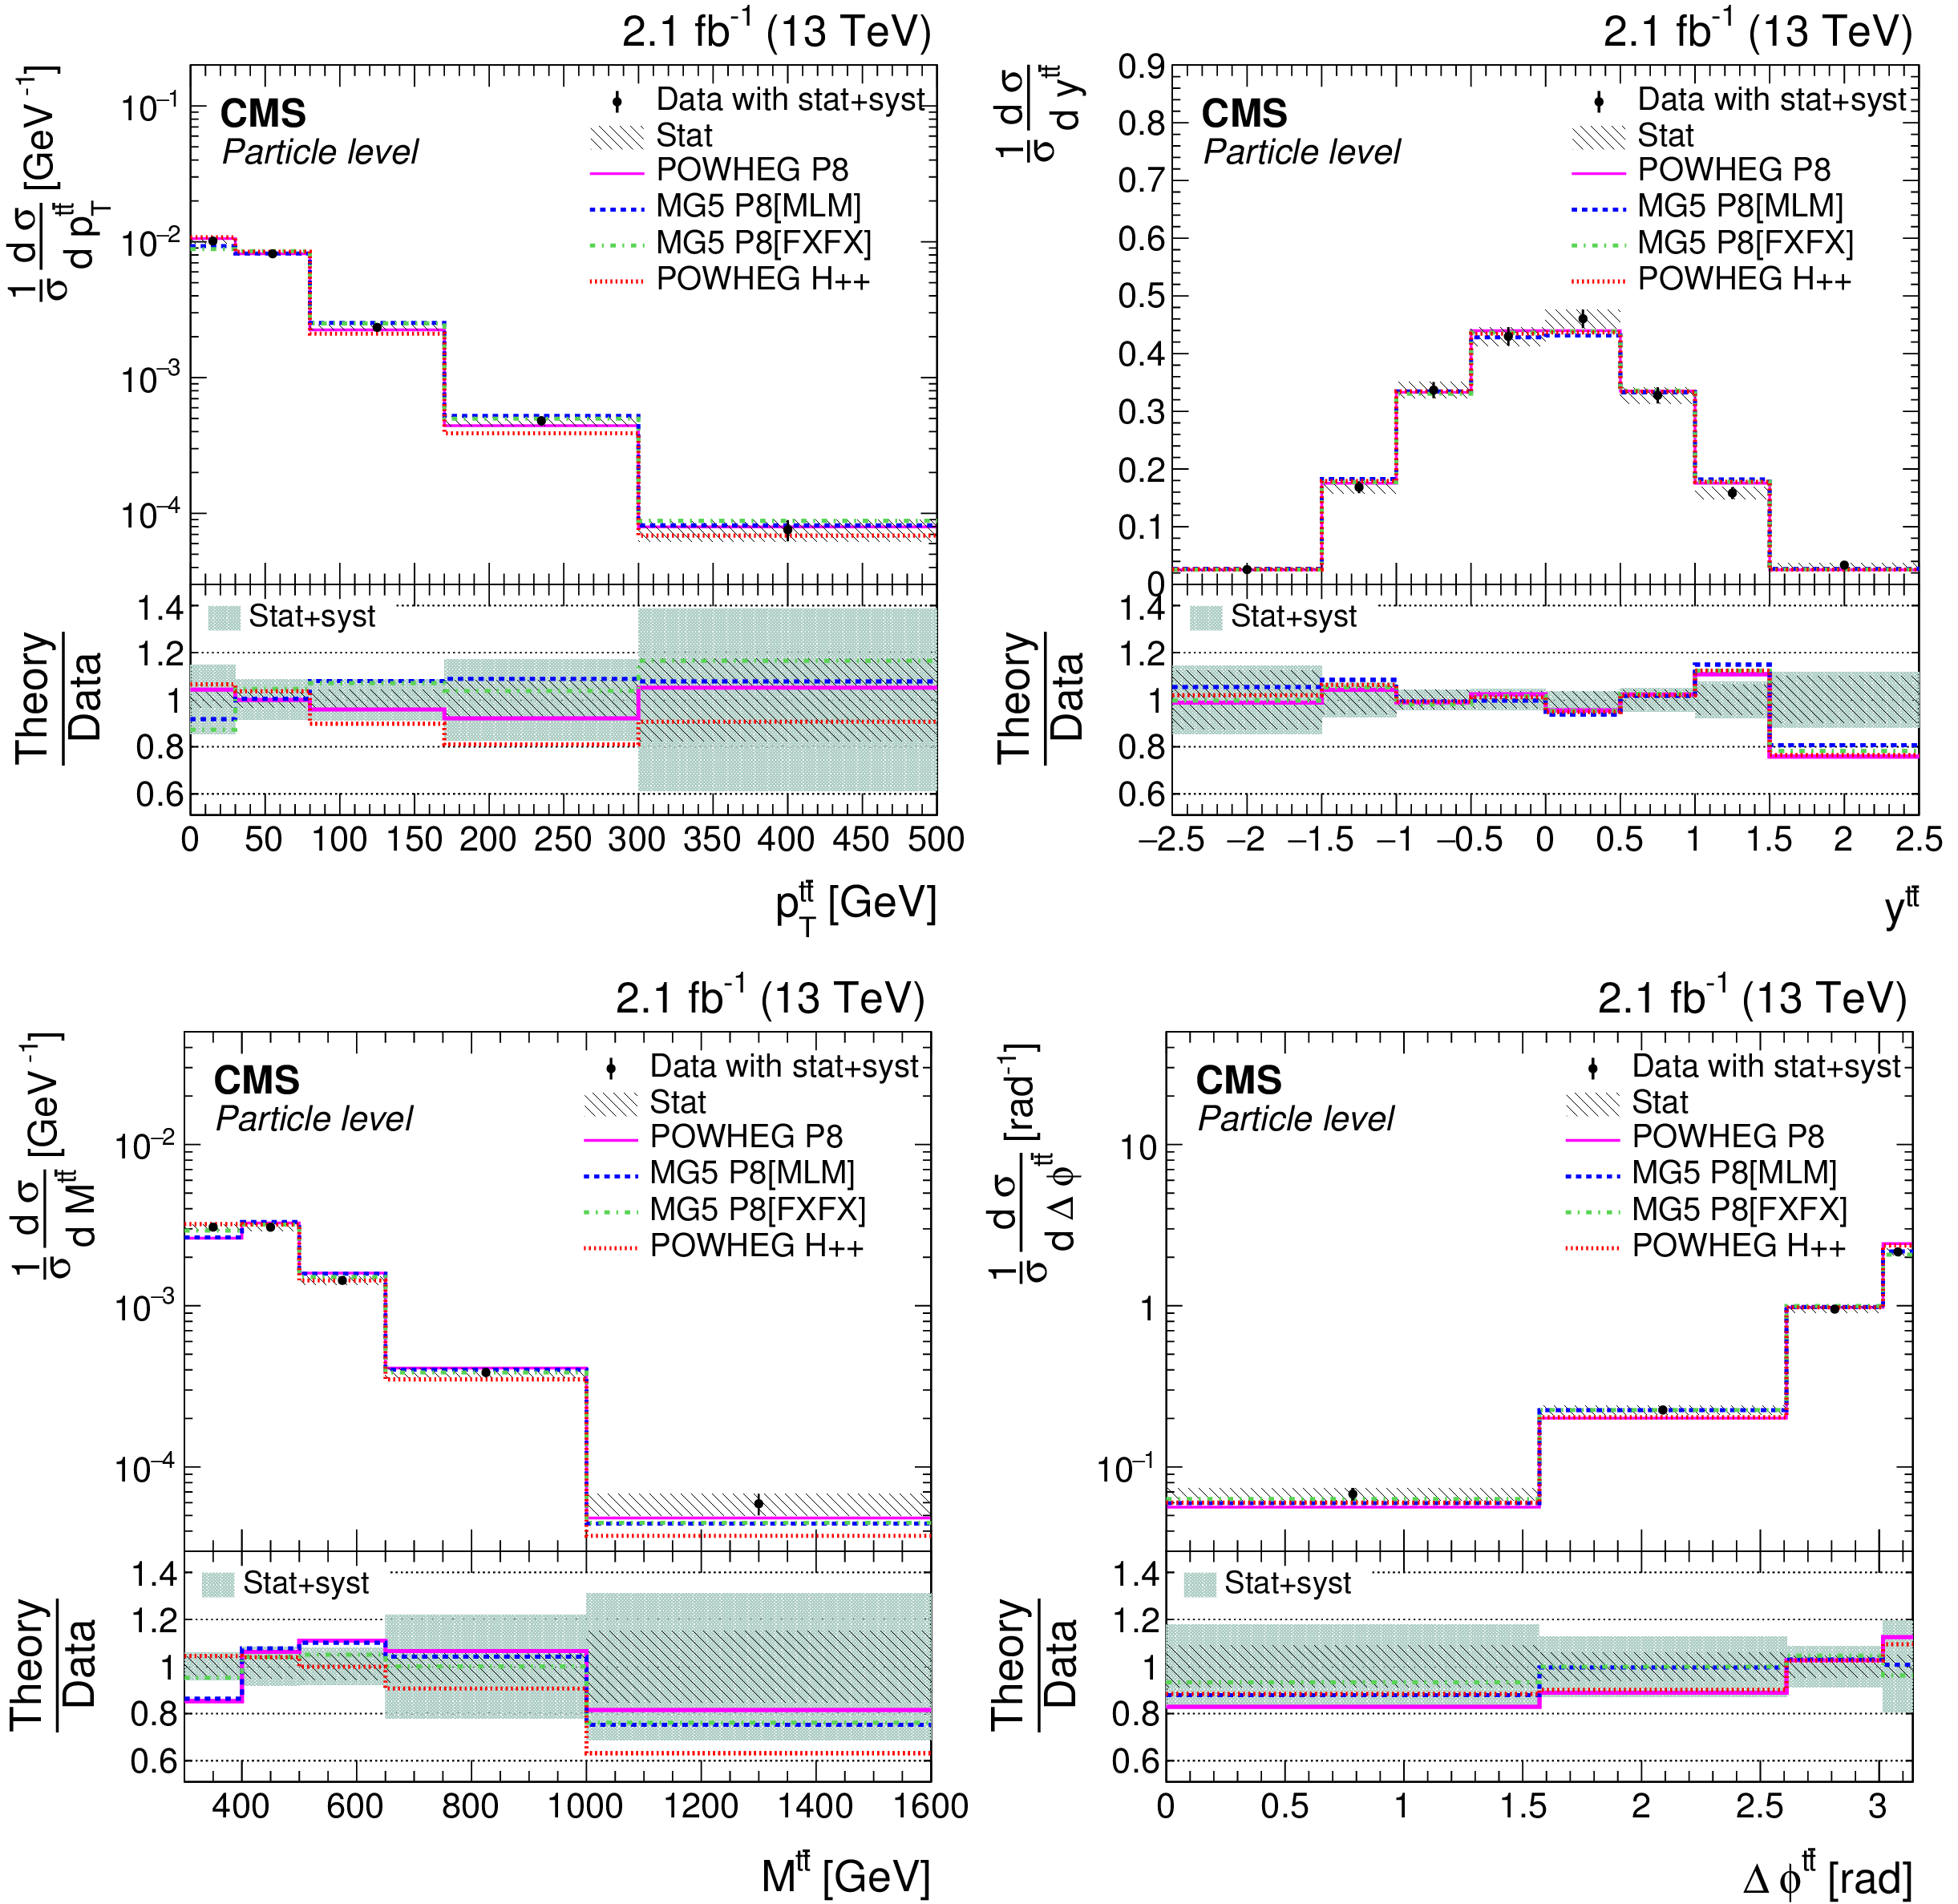
Figure 2:
Reconstructed $ {p_{\mathrm {T}}^{{{\mathrm{ t } {}\mathrm{ \bar{t} } } }}} $ (upper left), $ {y^{{\mathrm{ t } {}\mathrm{ \bar{t} } } }} $ (upper right), $ {M^{{\mathrm{ t } {}\mathrm{ \bar{t} } } }} $ (lower left), and $ {\Delta \phi ^{{\mathrm{ t } {}\mathrm{ \bar{t} } } }} $ (lower right) distributions from data (points) and from MC simulation (shaded histograms). The signal definition for particle level is considered to distinguish $ {\mathrm{ t } {}\mathrm{ \bar{t} } } $-signal and $ {\mathrm{ t } {}\mathrm{ \bar{t} } } $-others. All corrections described in the text are applied to the simulation. The last bin includes the overflow events. The uncertainties shown by the vertical bars on the data points are statistical only only while the hatched band shows the combined statistical and systematic uncertainties added in quadrature. The lower panels display the ratios of the data to the MC prediction. |
png pdf |
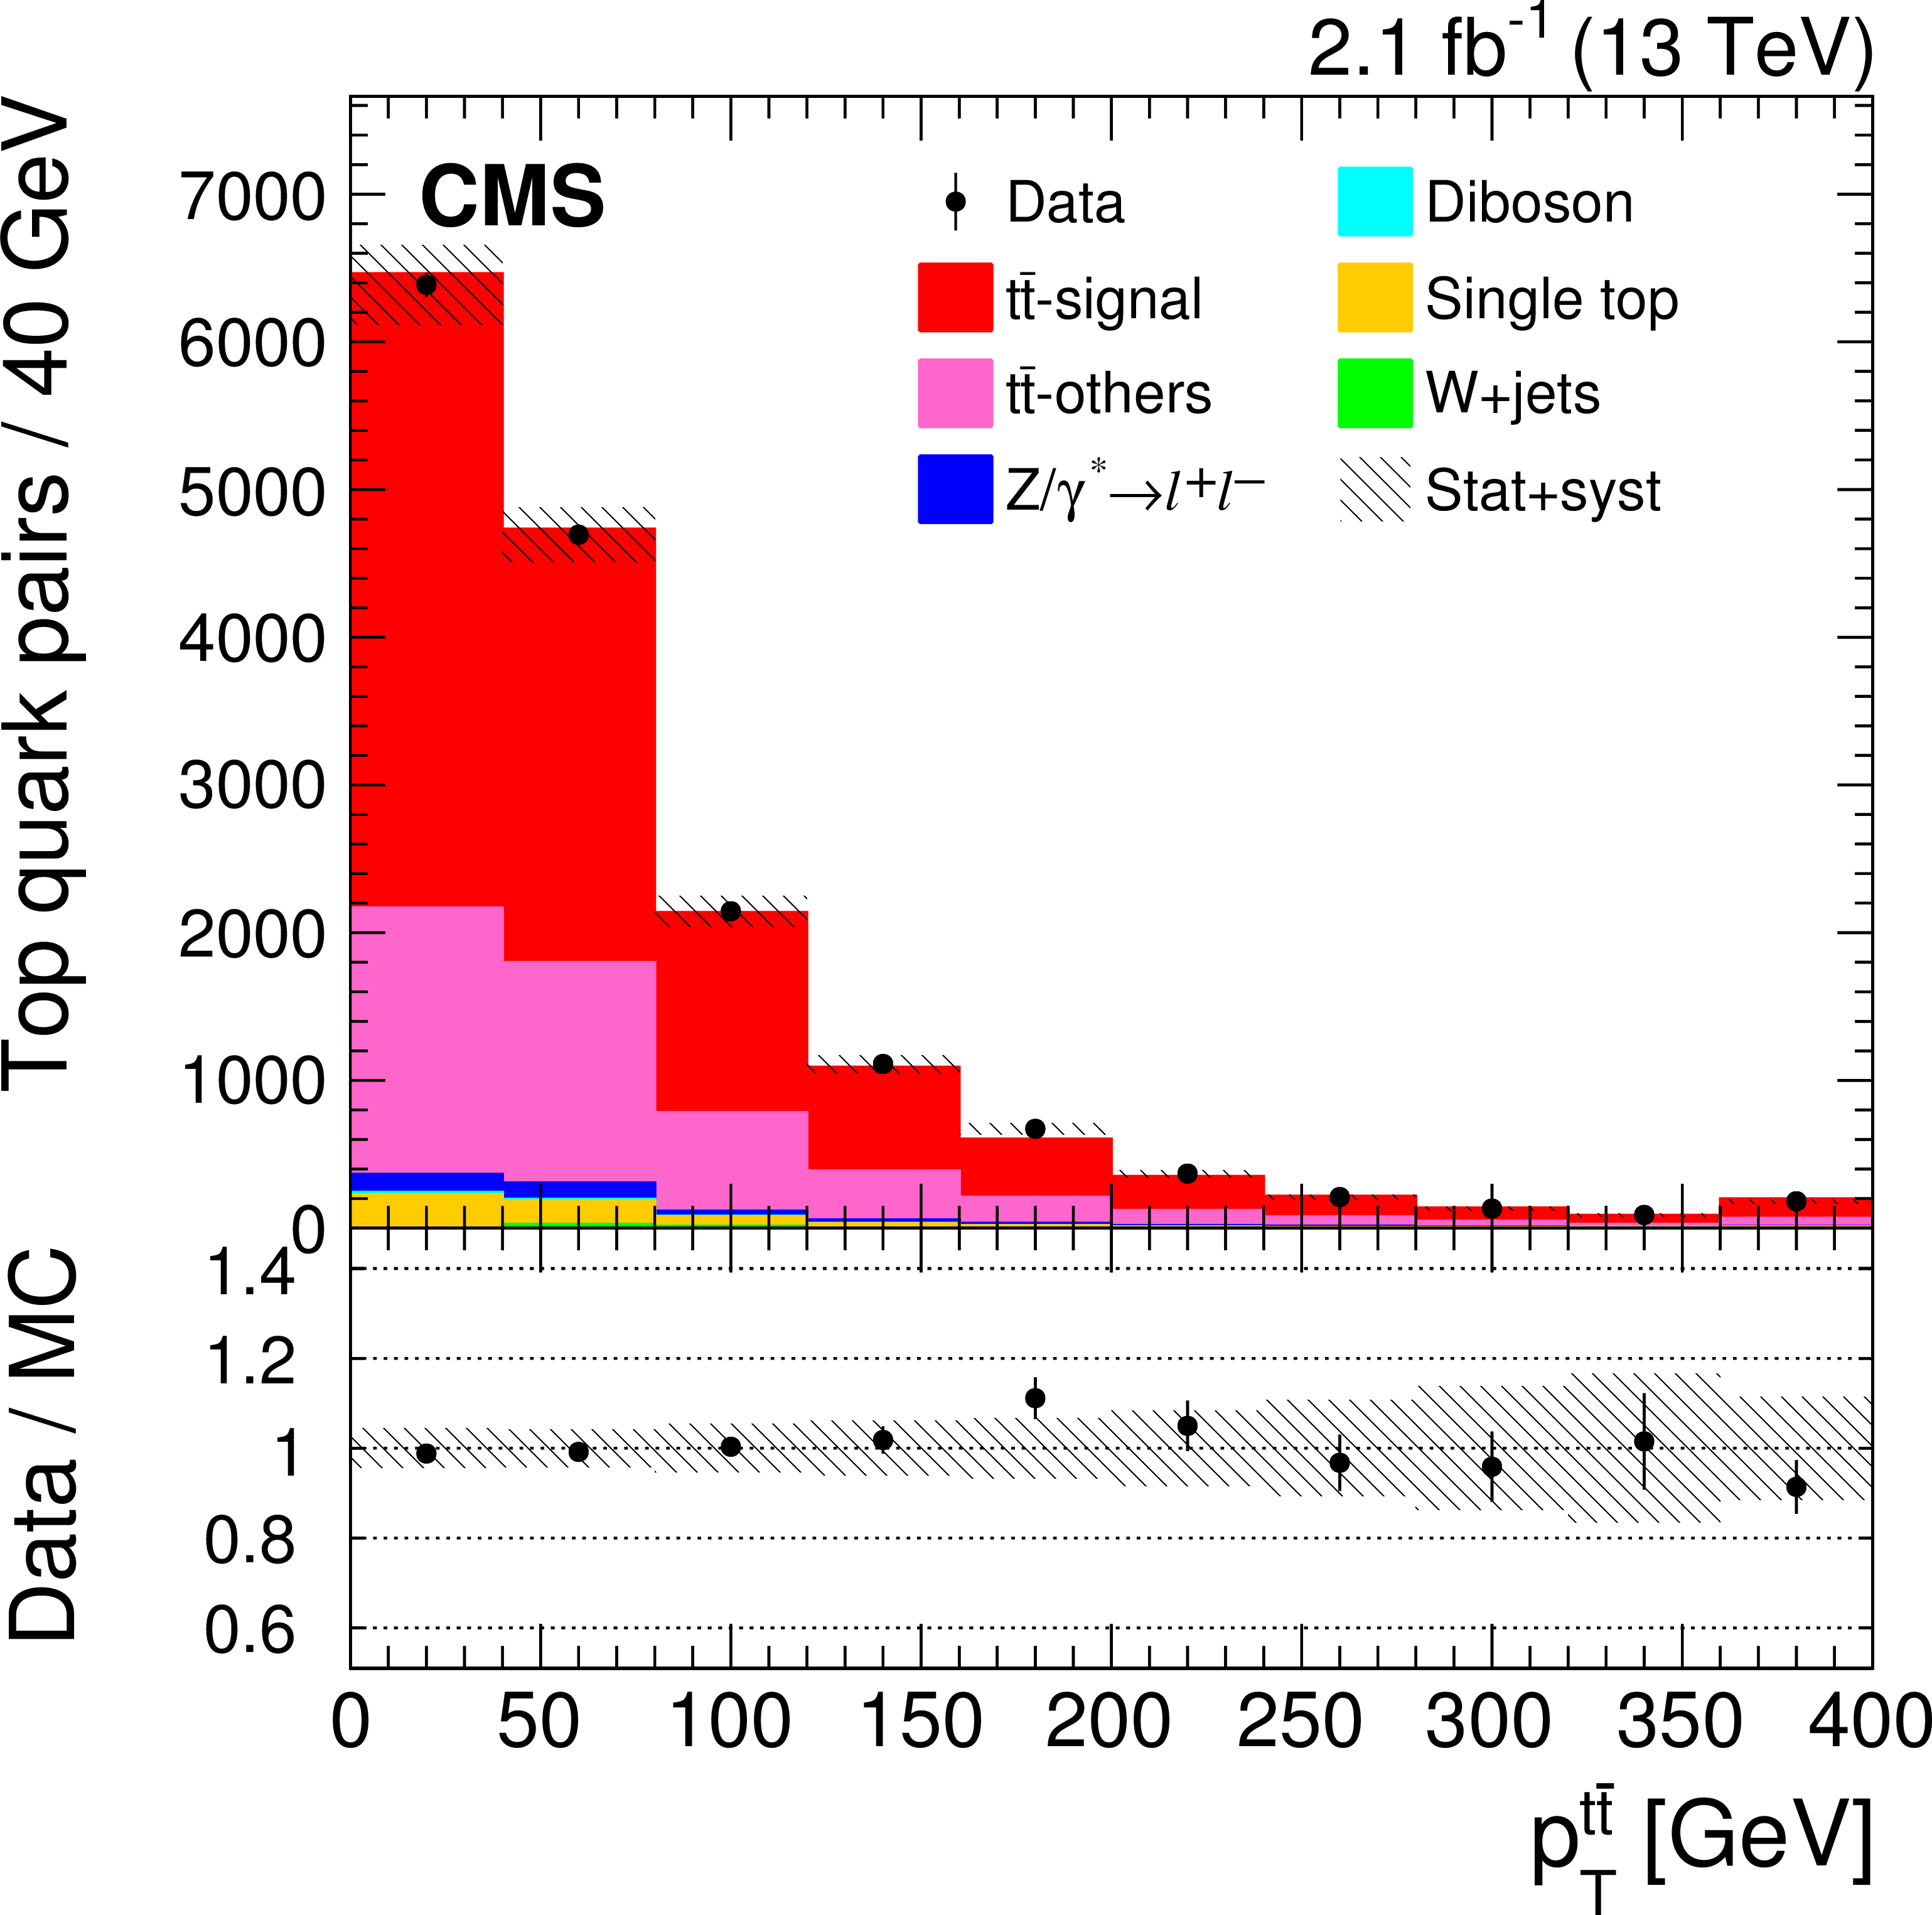
Figure 2-a:
Reconstructed $ {p_{\mathrm {T}}^{{{\mathrm{ t } {}\mathrm{ \bar{t} } } }}} $ distribution from data (points) and from MC simulation (shaded histograms). The signal definition for particle level is considered to distinguish $ {\mathrm{ t } {}\mathrm{ \bar{t} } } $-signal and $ {\mathrm{ t } {}\mathrm{ \bar{t} } } $-others. All corrections described in the text are applied to the simulation. The last bin includes the overflow events. The uncertainties shown by the vertical bars on the data points are statistical only only while the hatched band shows the combined statistical and systematic uncertainties added in quadrature. The lower panel displays the ratios of the data to the MC prediction. |

png pdf |
Figure 2-b:
Reconstructed $ {y^{{\mathrm{ t } {}\mathrm{ \bar{t} } } }} $ distribution from data (points) and from MC simulation (shaded histograms). The signal definition for particle level is considered to distinguish $ {\mathrm{ t } {}\mathrm{ \bar{t} } } $-signal and $ {\mathrm{ t } {}\mathrm{ \bar{t} } } $-others. All corrections described in the text are applied to the simulation. The last bin includes the overflow events. The uncertainties shown by the vertical bars on the data points are statistical only only while the hatched band shows the combined statistical and systematic uncertainties added in quadrature. The lower panel displays the ratios of the data to the MC prediction. |
png pdf |
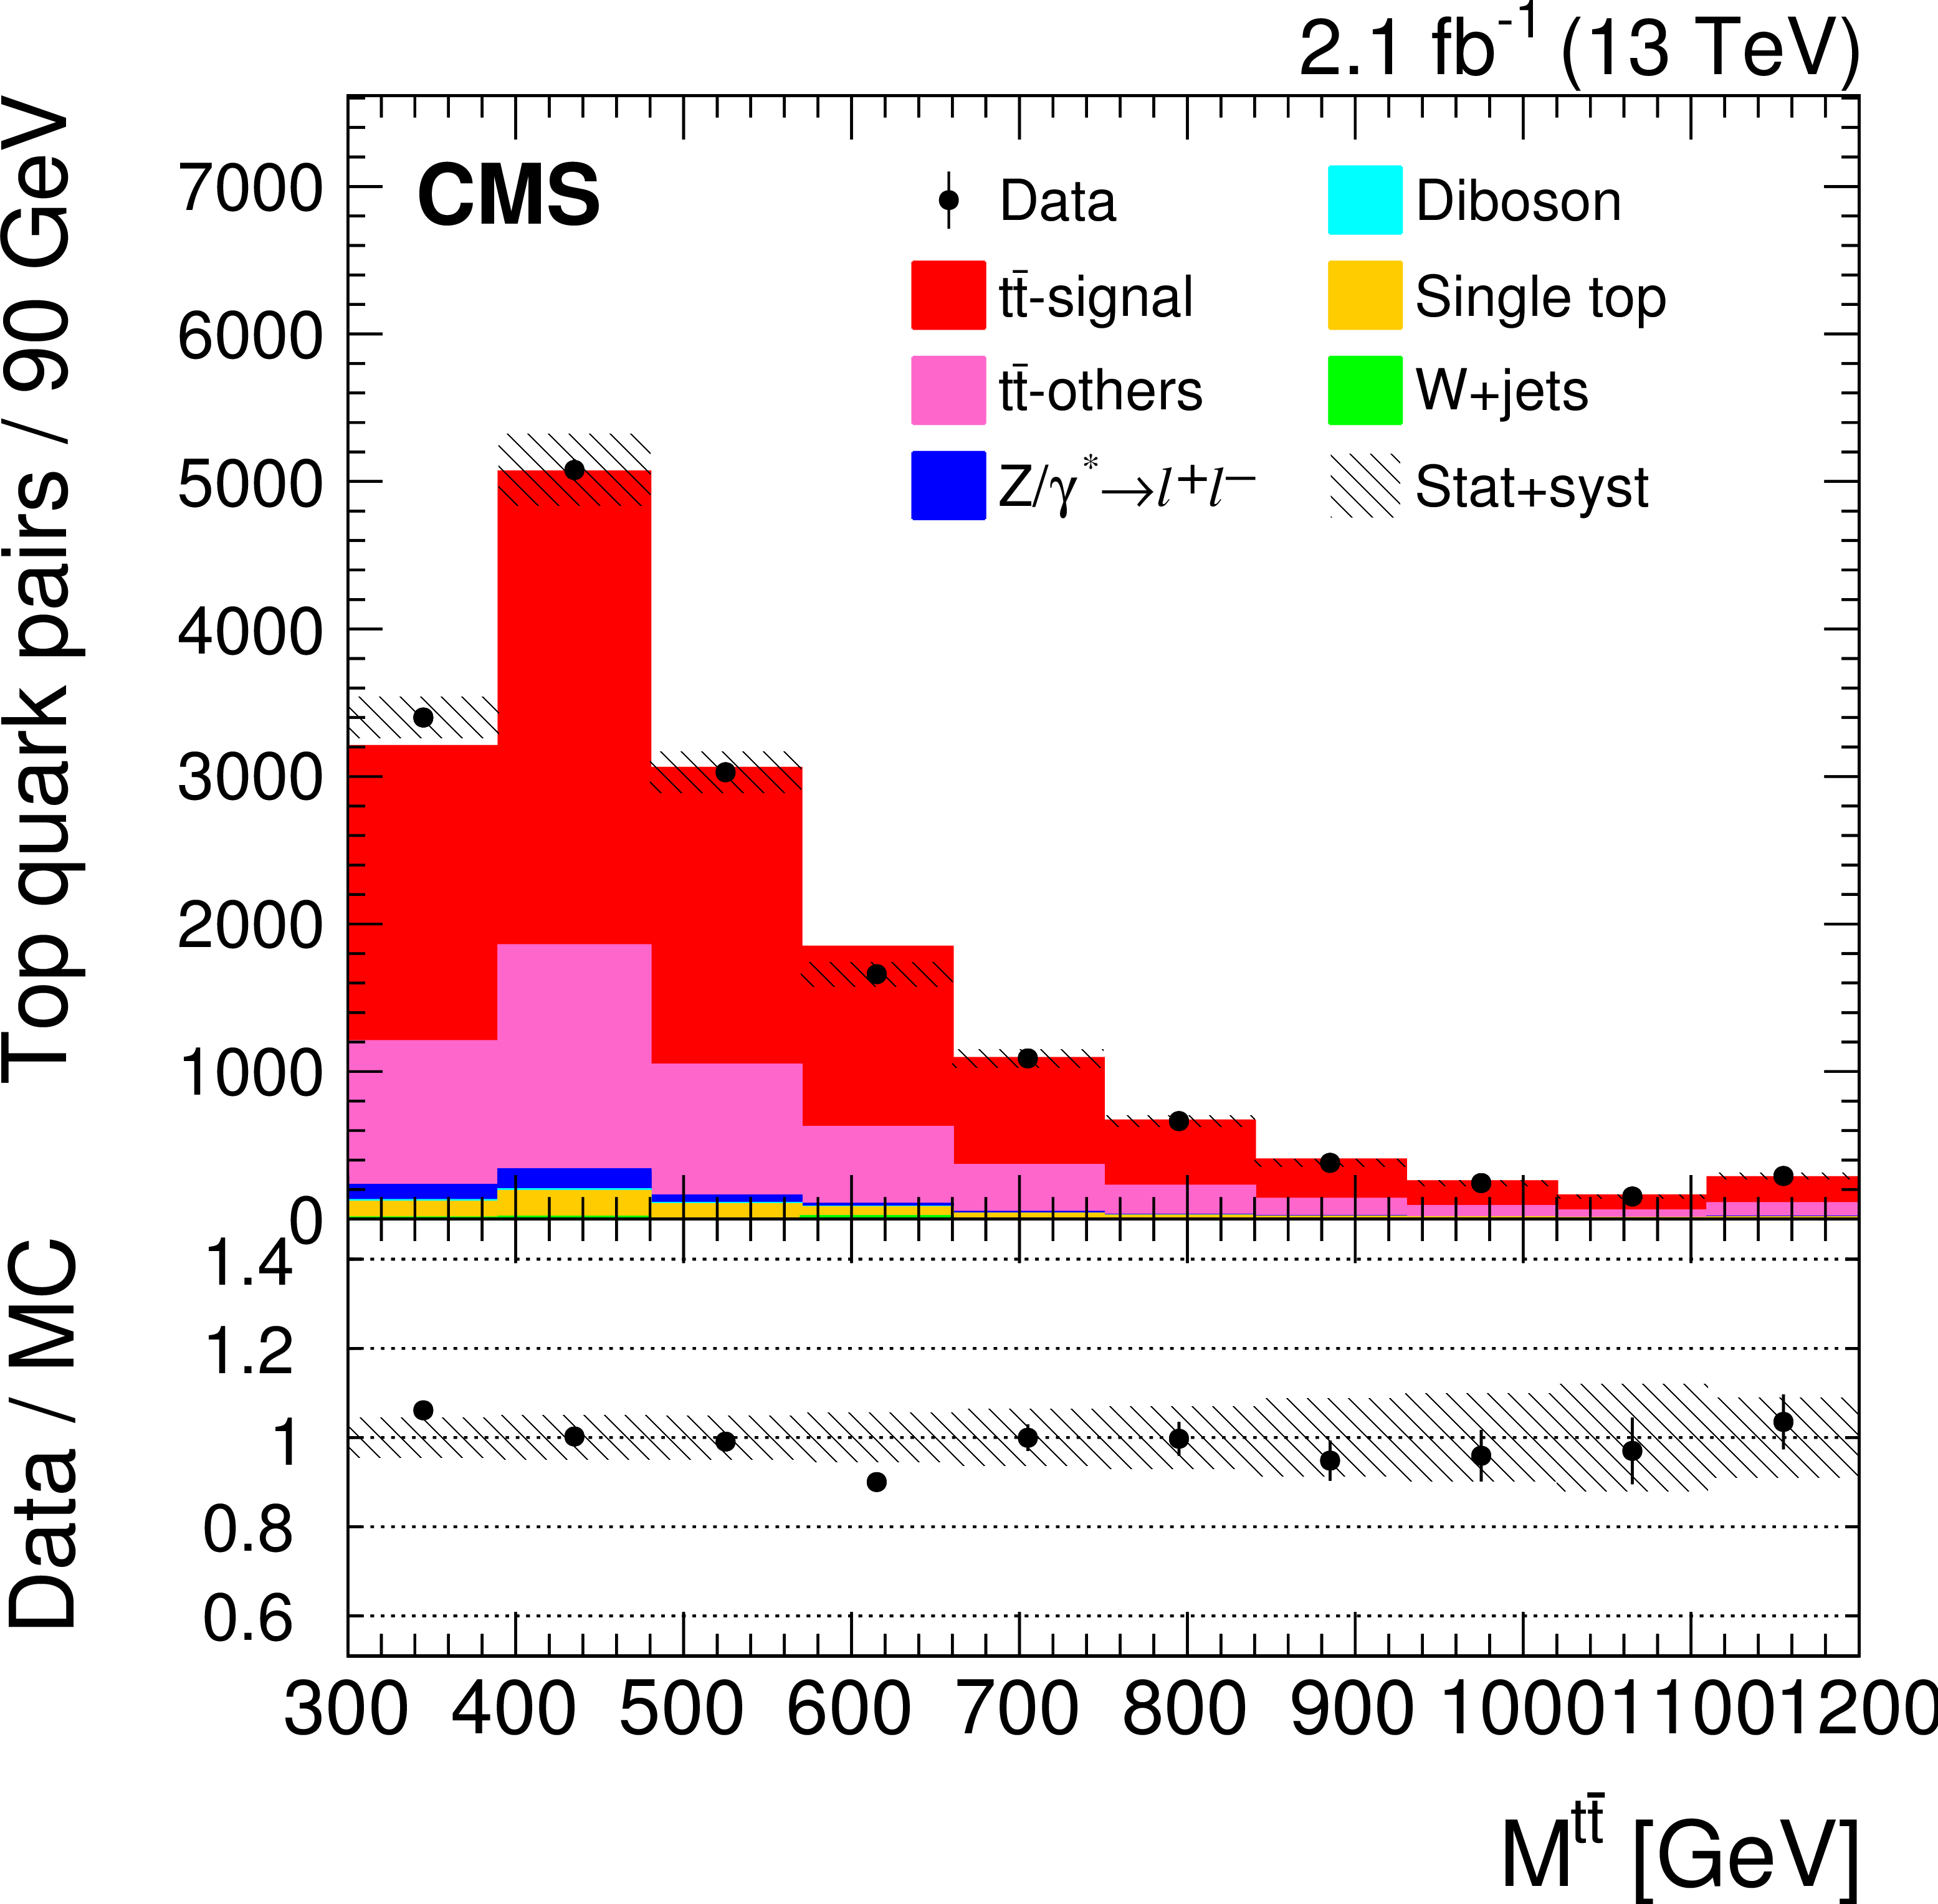
Figure 2-c:
Reconstructed $ {M^{{\mathrm{ t } {}\mathrm{ \bar{t} } } }} $ distribution from data (points) and from MC simulation (shaded histograms). The signal definition for particle level is considered to distinguish $ {\mathrm{ t } {}\mathrm{ \bar{t} } } $-signal and $ {\mathrm{ t } {}\mathrm{ \bar{t} } } $-others. All corrections described in the text are applied to the simulation. The last bin includes the overflow events. The uncertainties shown by the vertical bars on the data points are statistical only only while the hatched band shows the combined statistical and systematic uncertainties added in quadrature. The lower panel displays the ratios of the data to the MC prediction. |
png pdf |
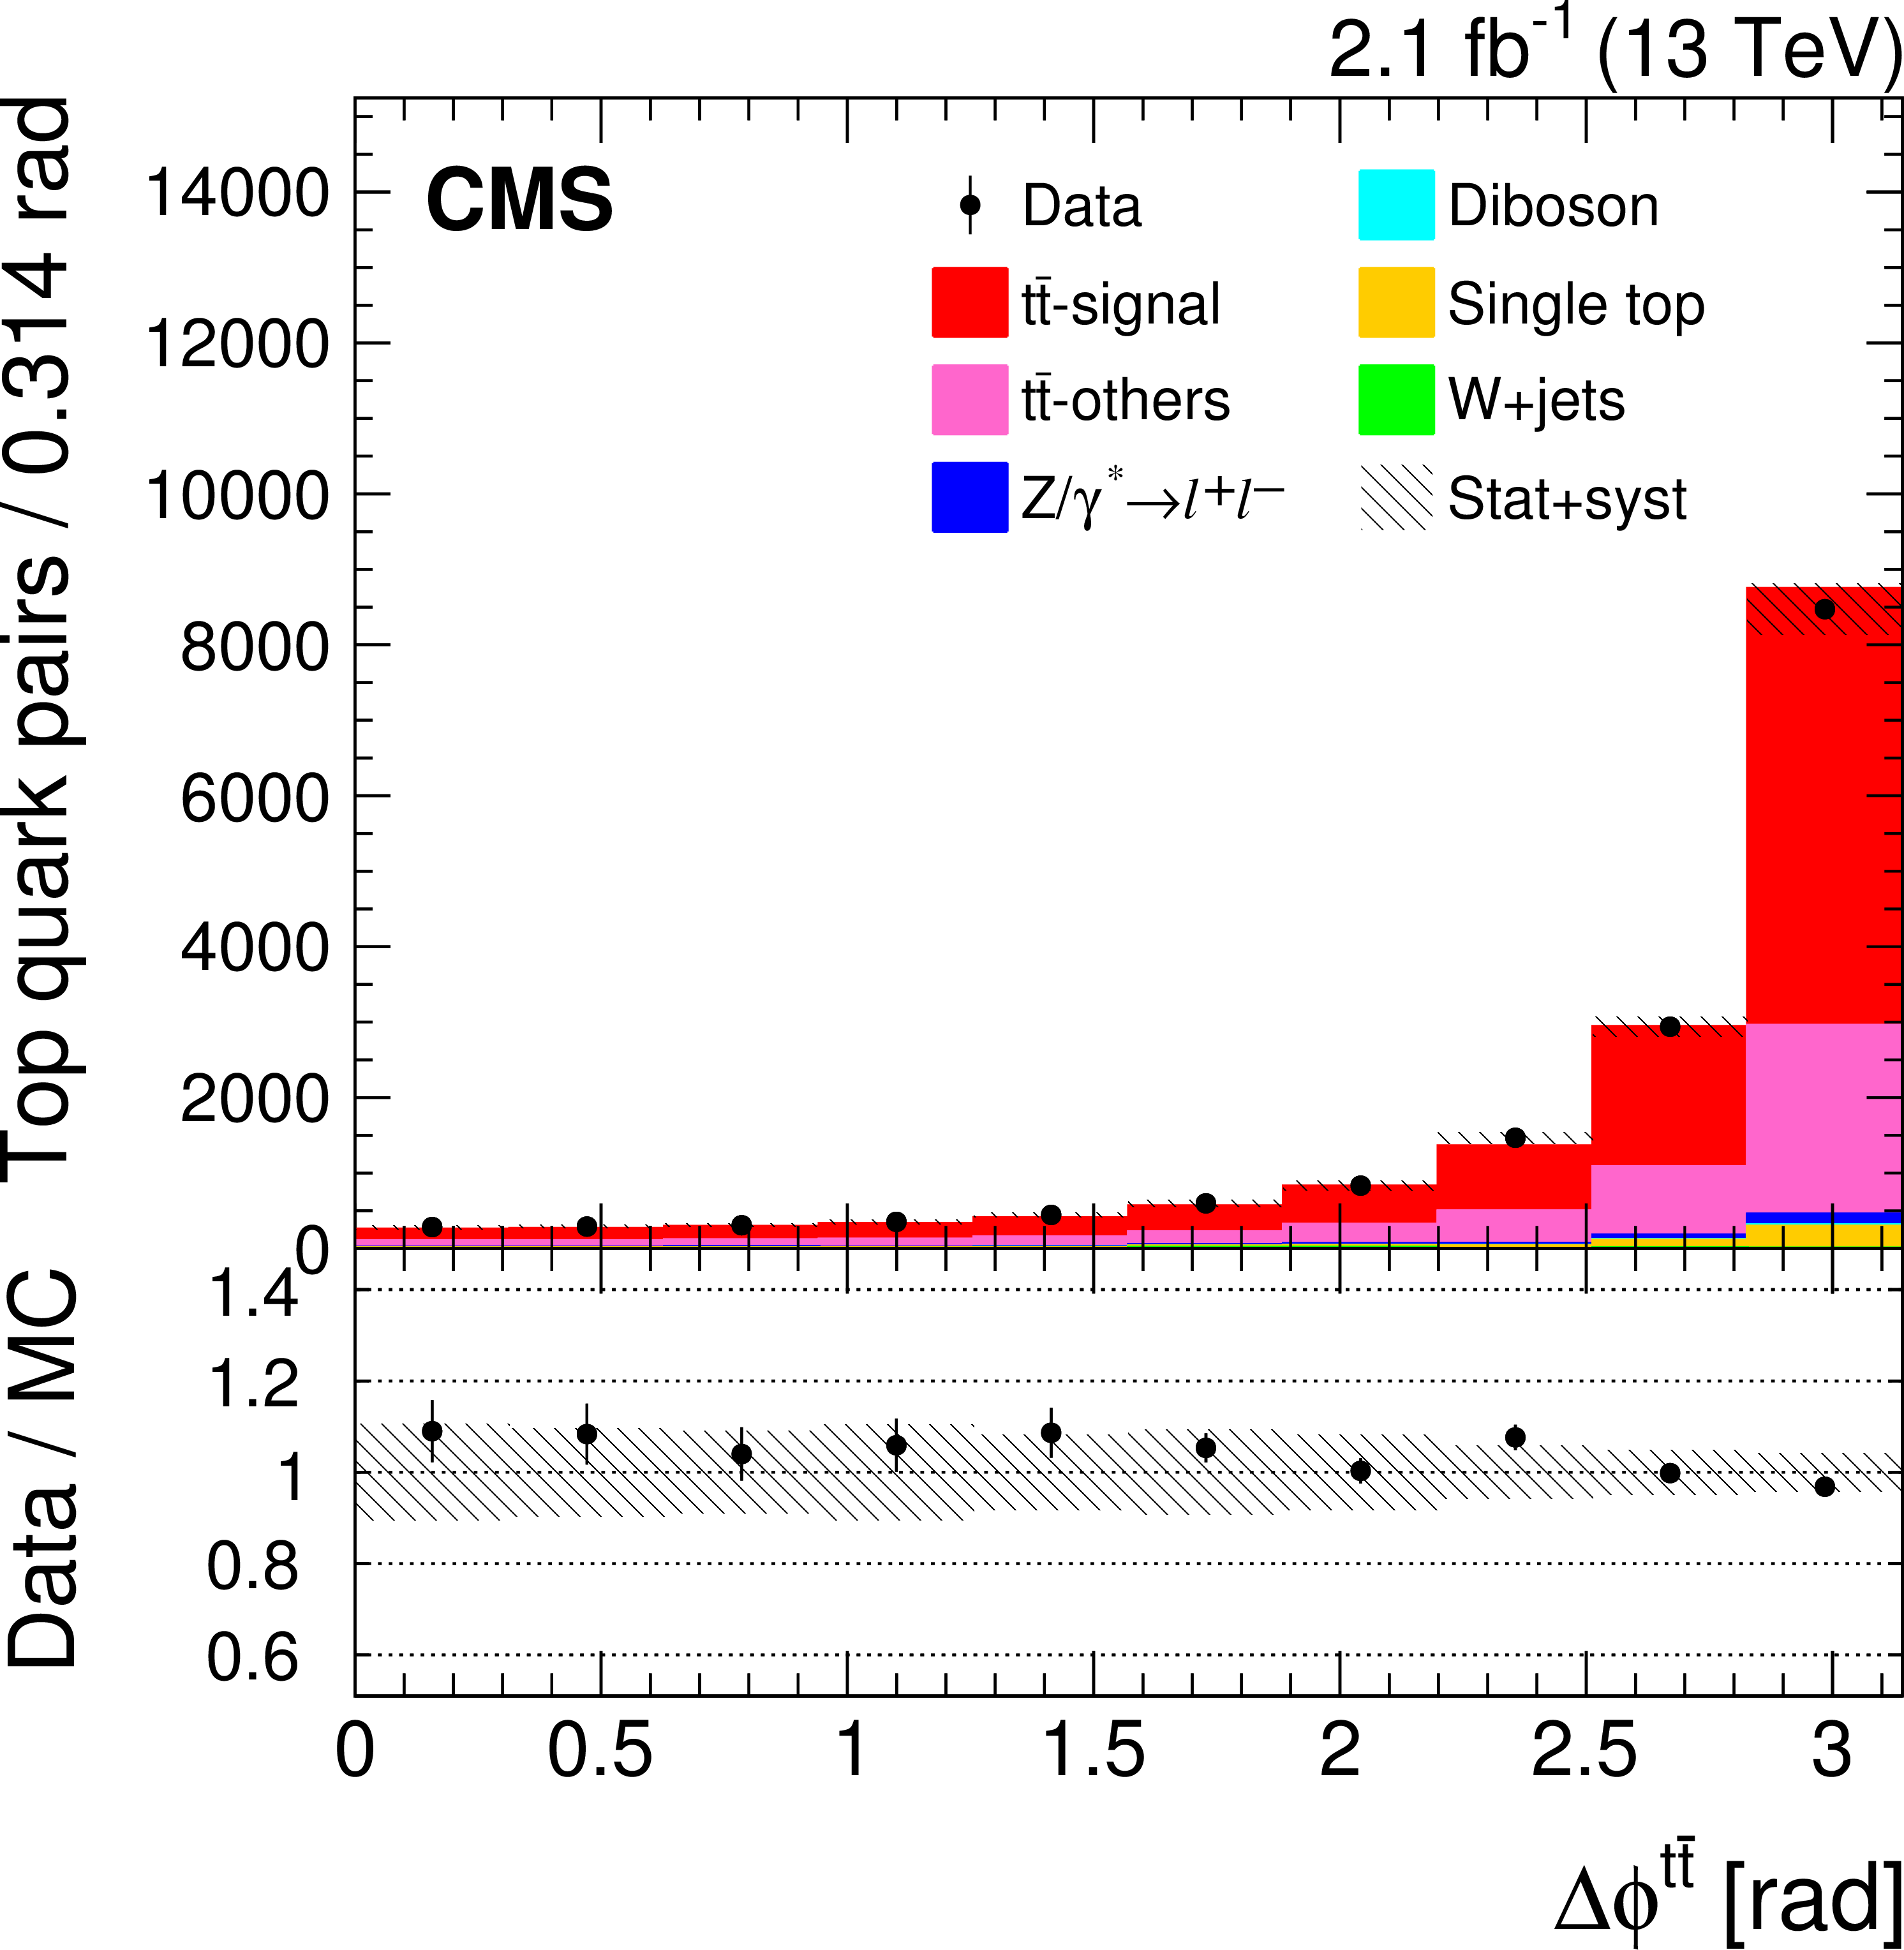
Figure 2-d:
Reconstructed $ {\Delta \phi ^{{\mathrm{ t } {}\mathrm{ \bar{t} } } }} $ distribution from data (points) and from MC simulation (shaded histograms). The signal definition for particle level is considered to distinguish $ {\mathrm{ t } {}\mathrm{ \bar{t} } } $-signal and $ {\mathrm{ t } {}\mathrm{ \bar{t} } } $-others. All corrections described in the text are applied to the simulation. The last bin includes the overflow events. The uncertainties shown by the vertical bars on the data points are statistical only only while the hatched band shows the combined statistical and systematic uncertainties added in quadrature. The lower panel displays the ratios of the data to the MC prediction. |
png pdf |
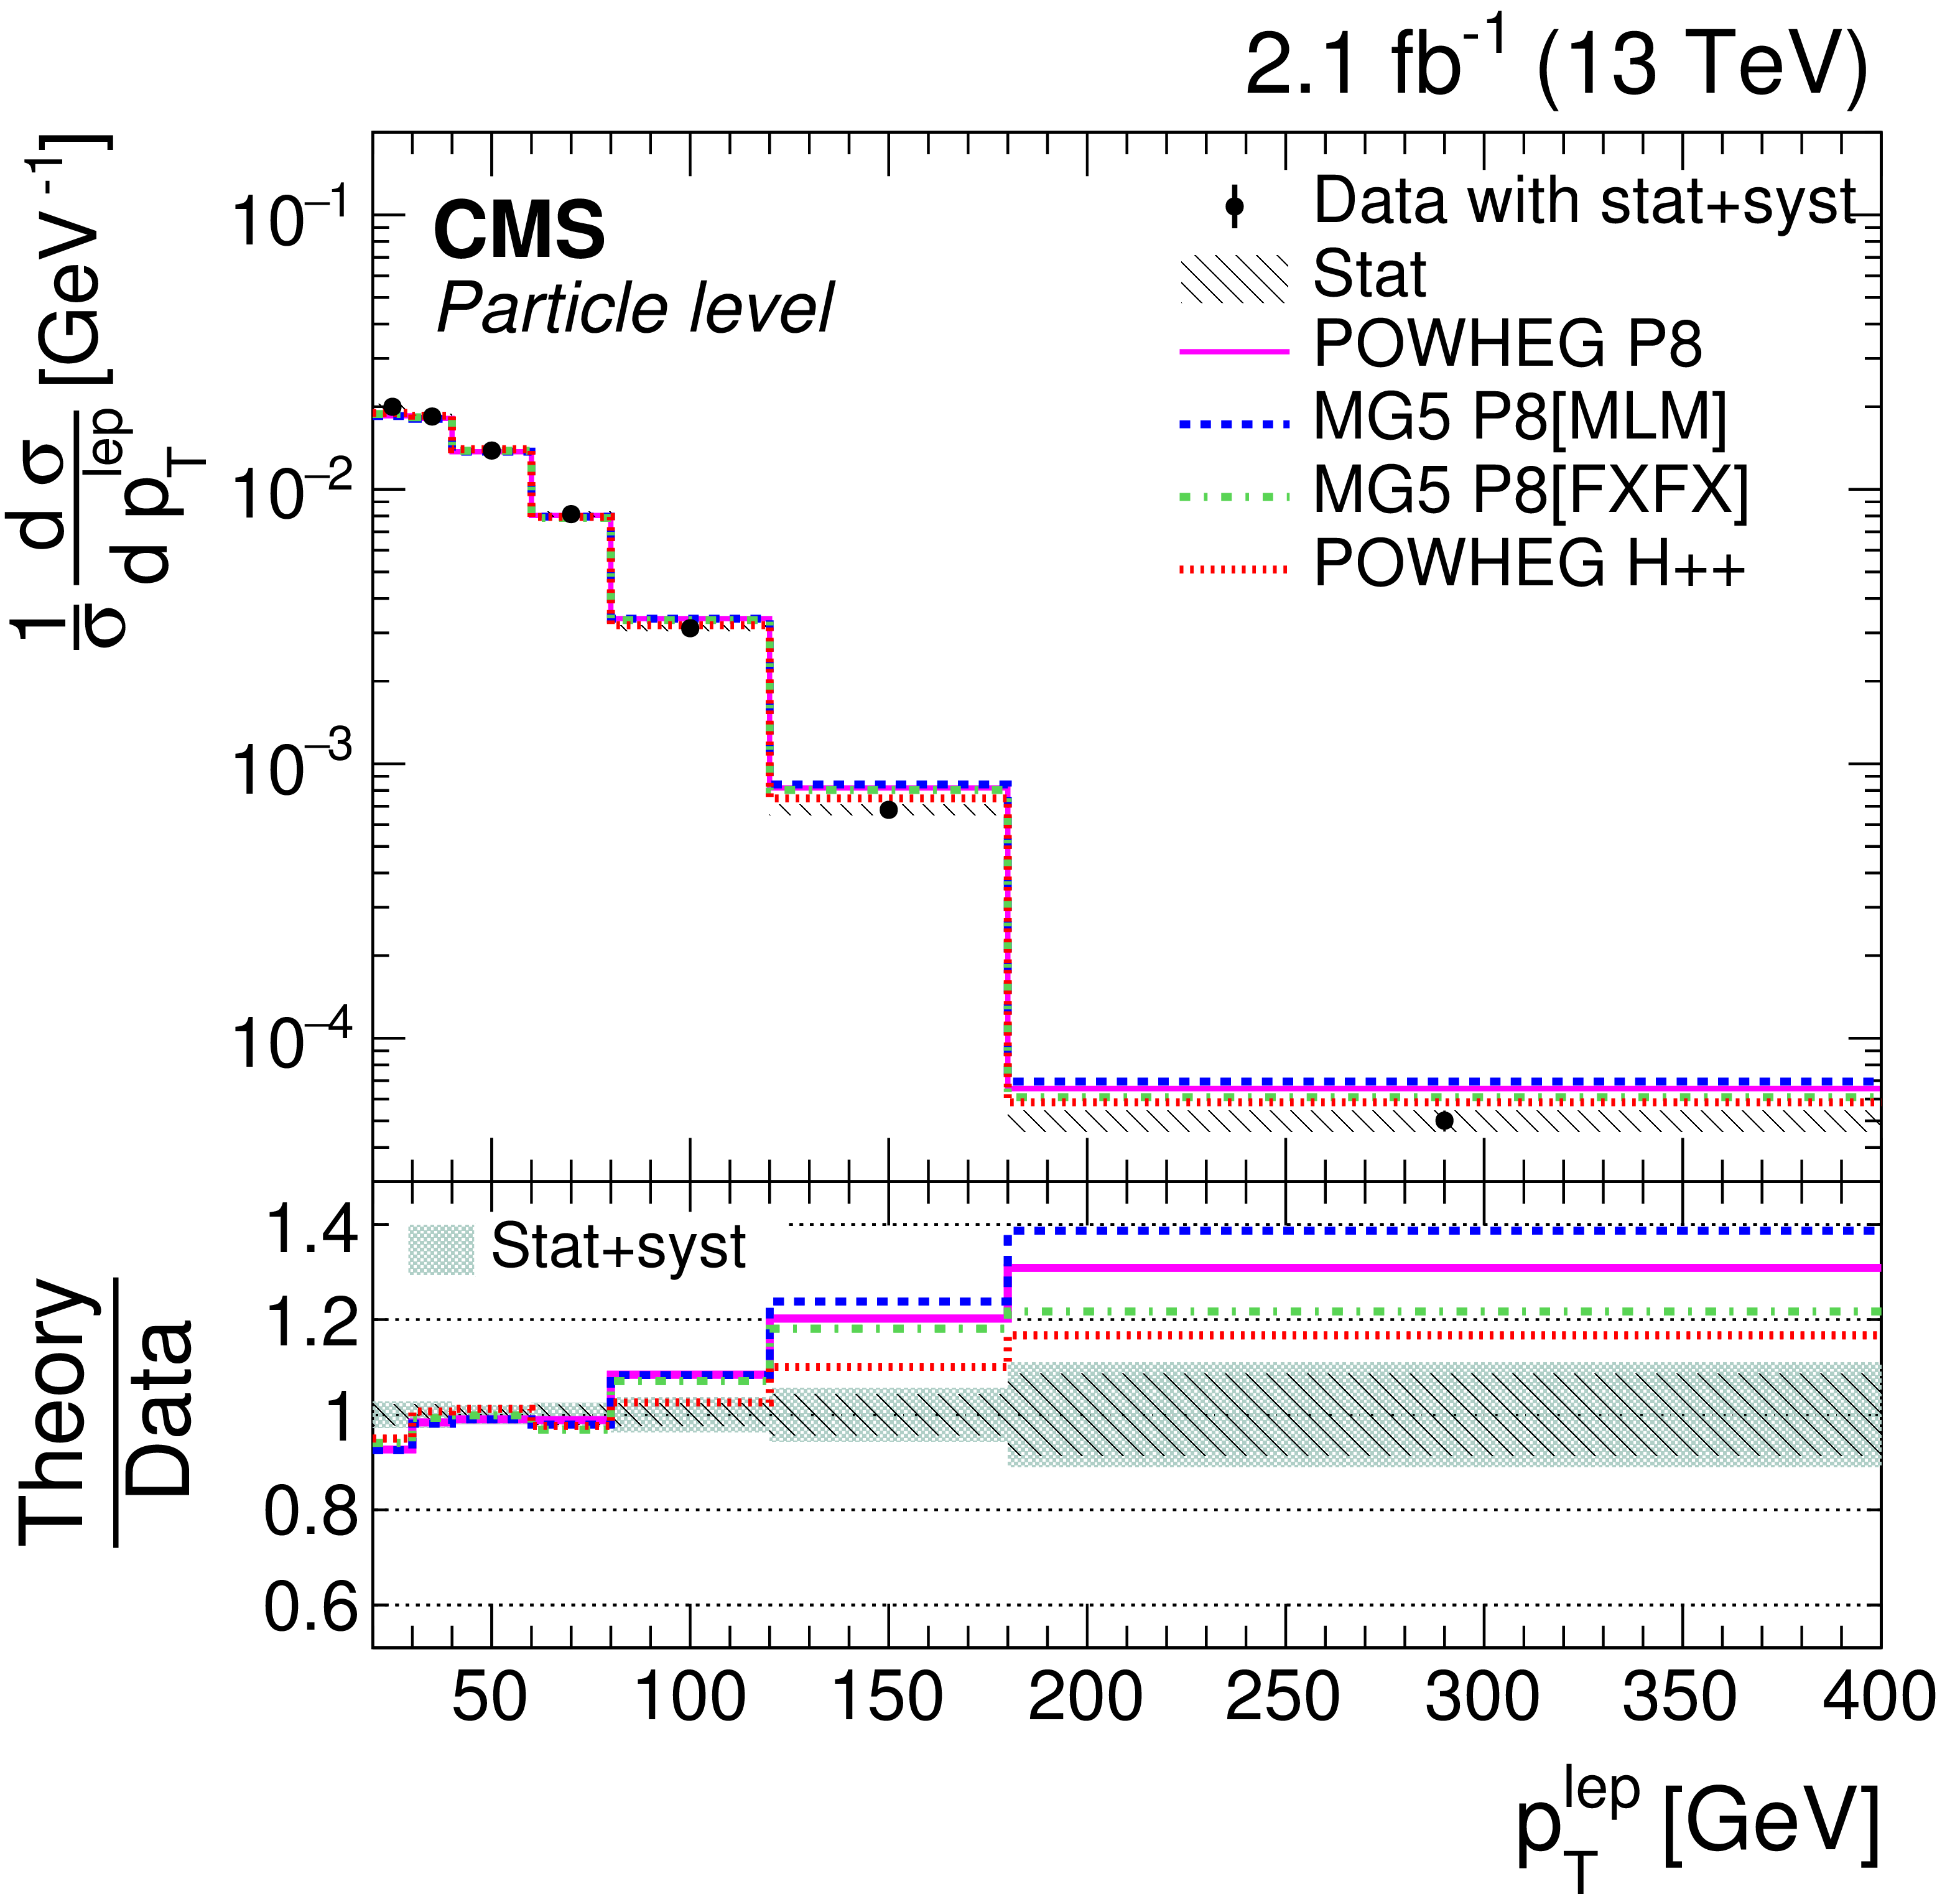
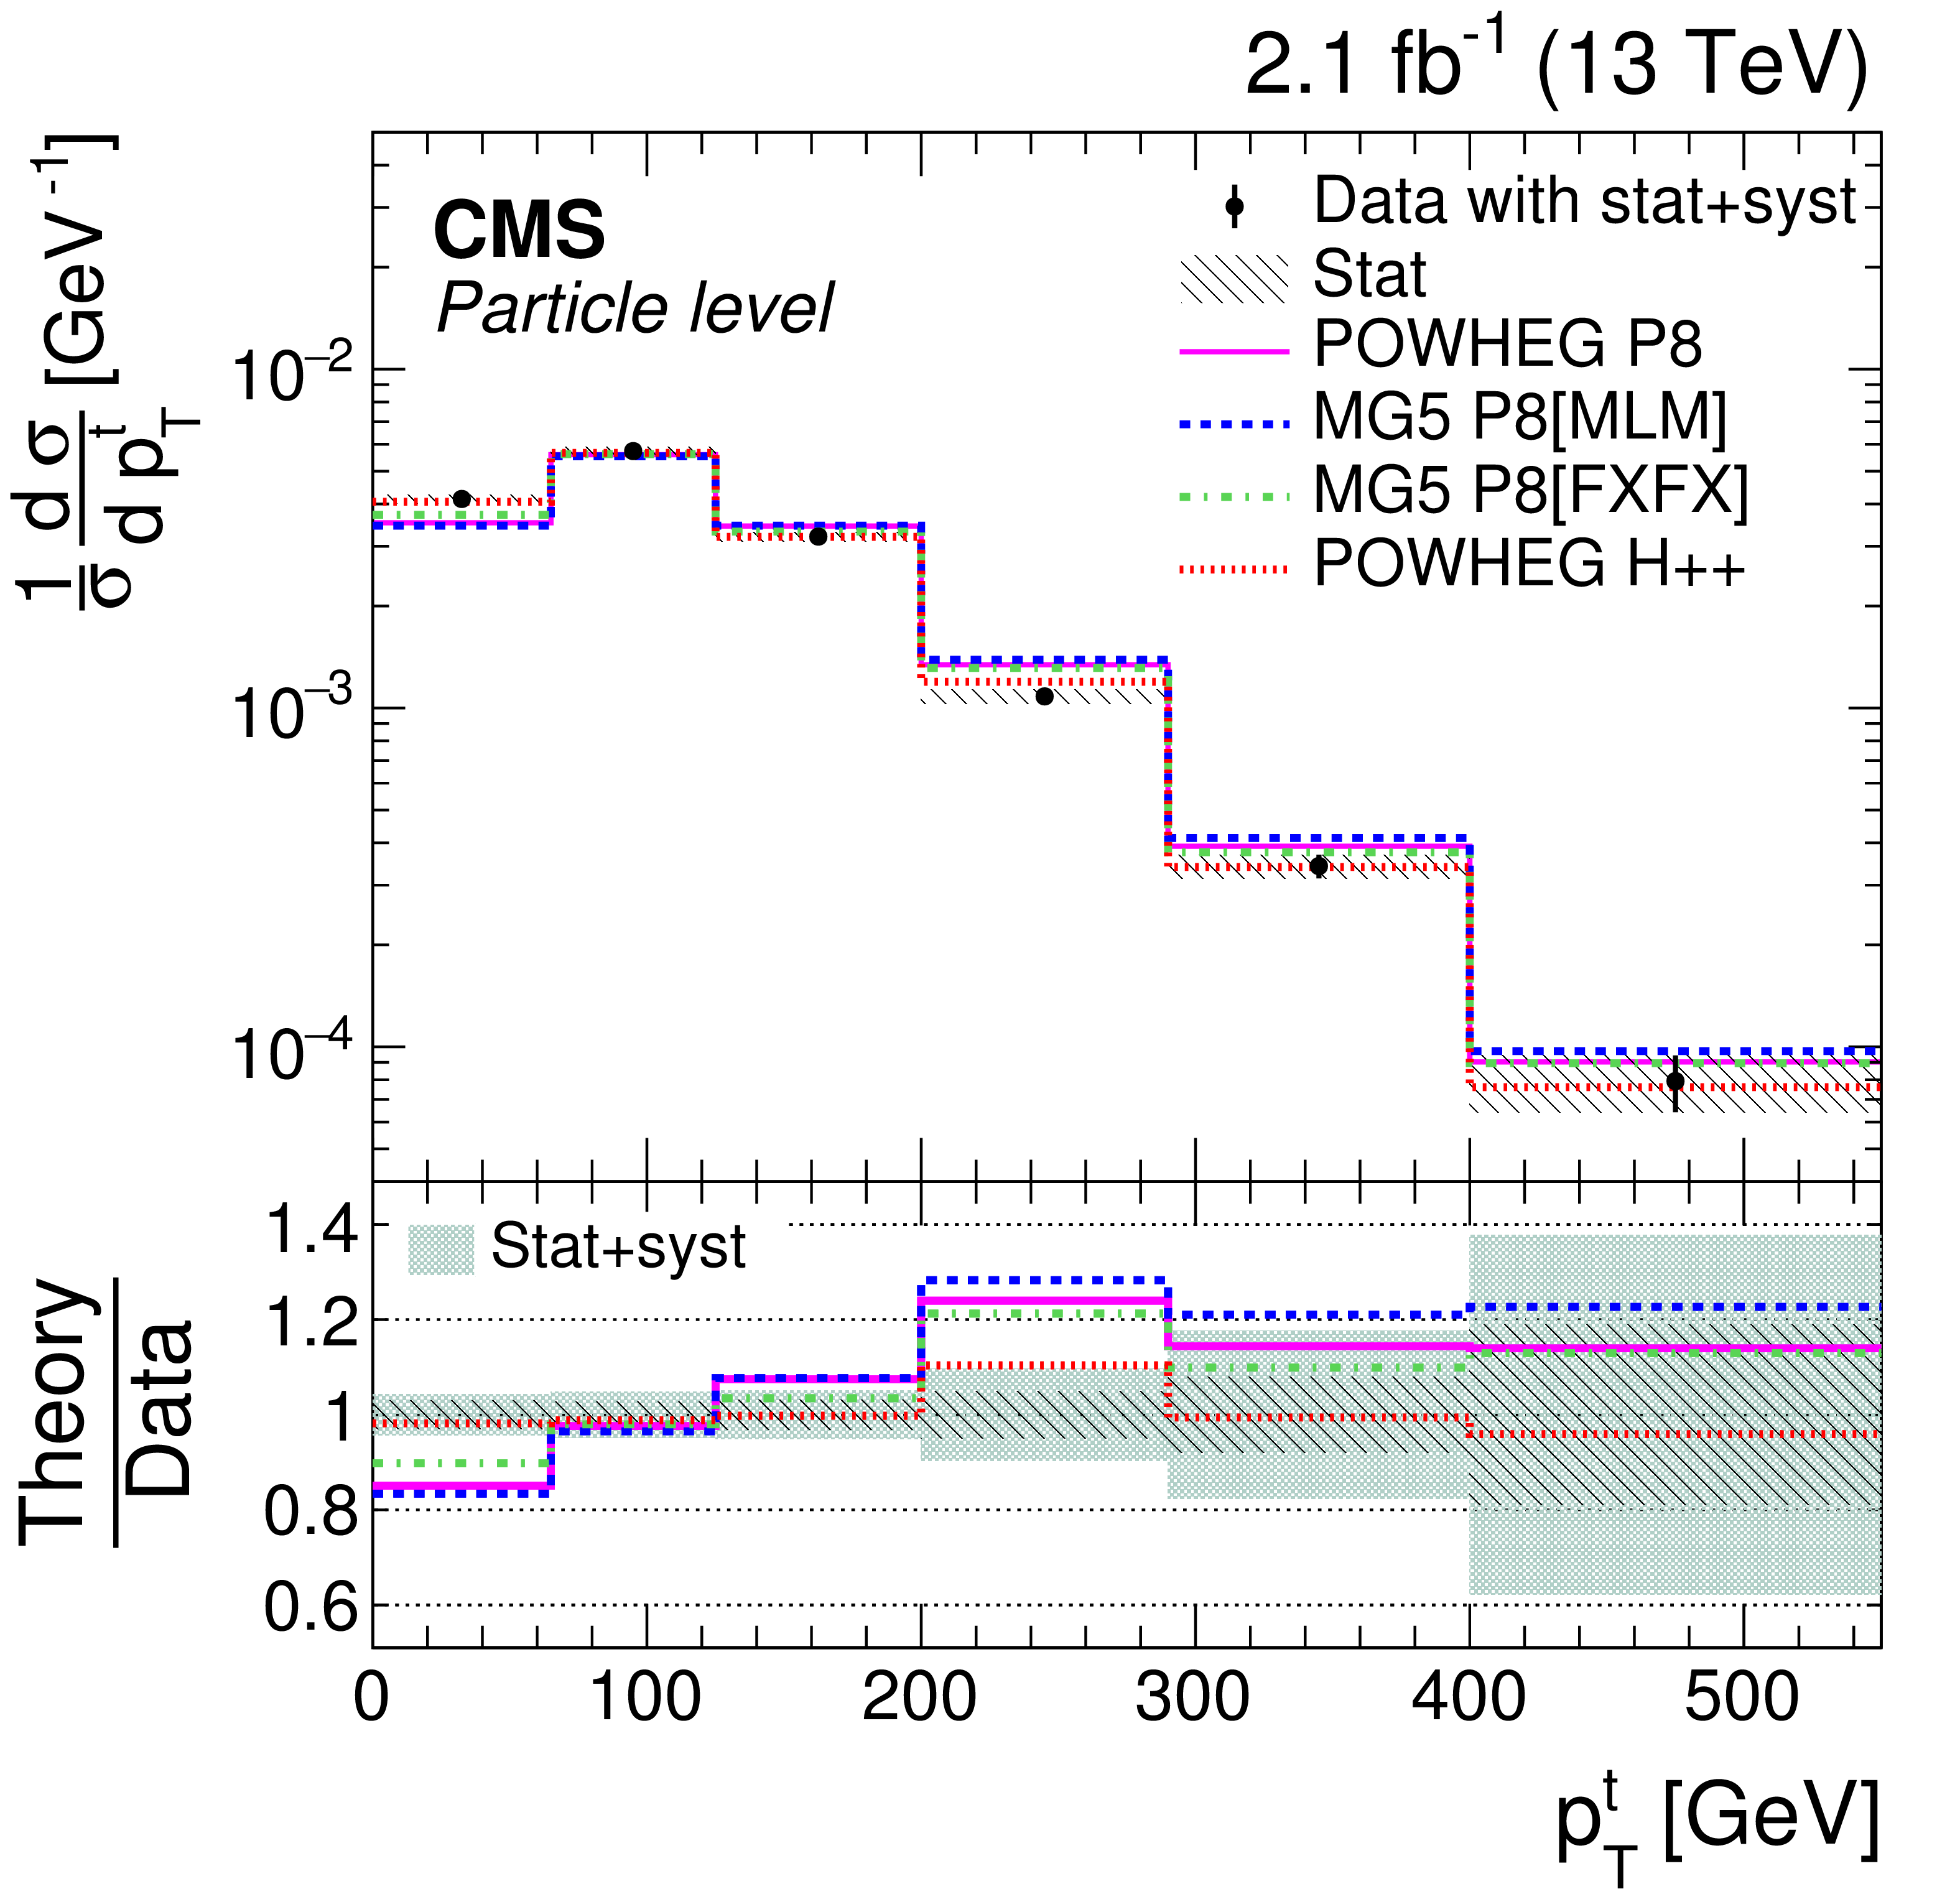
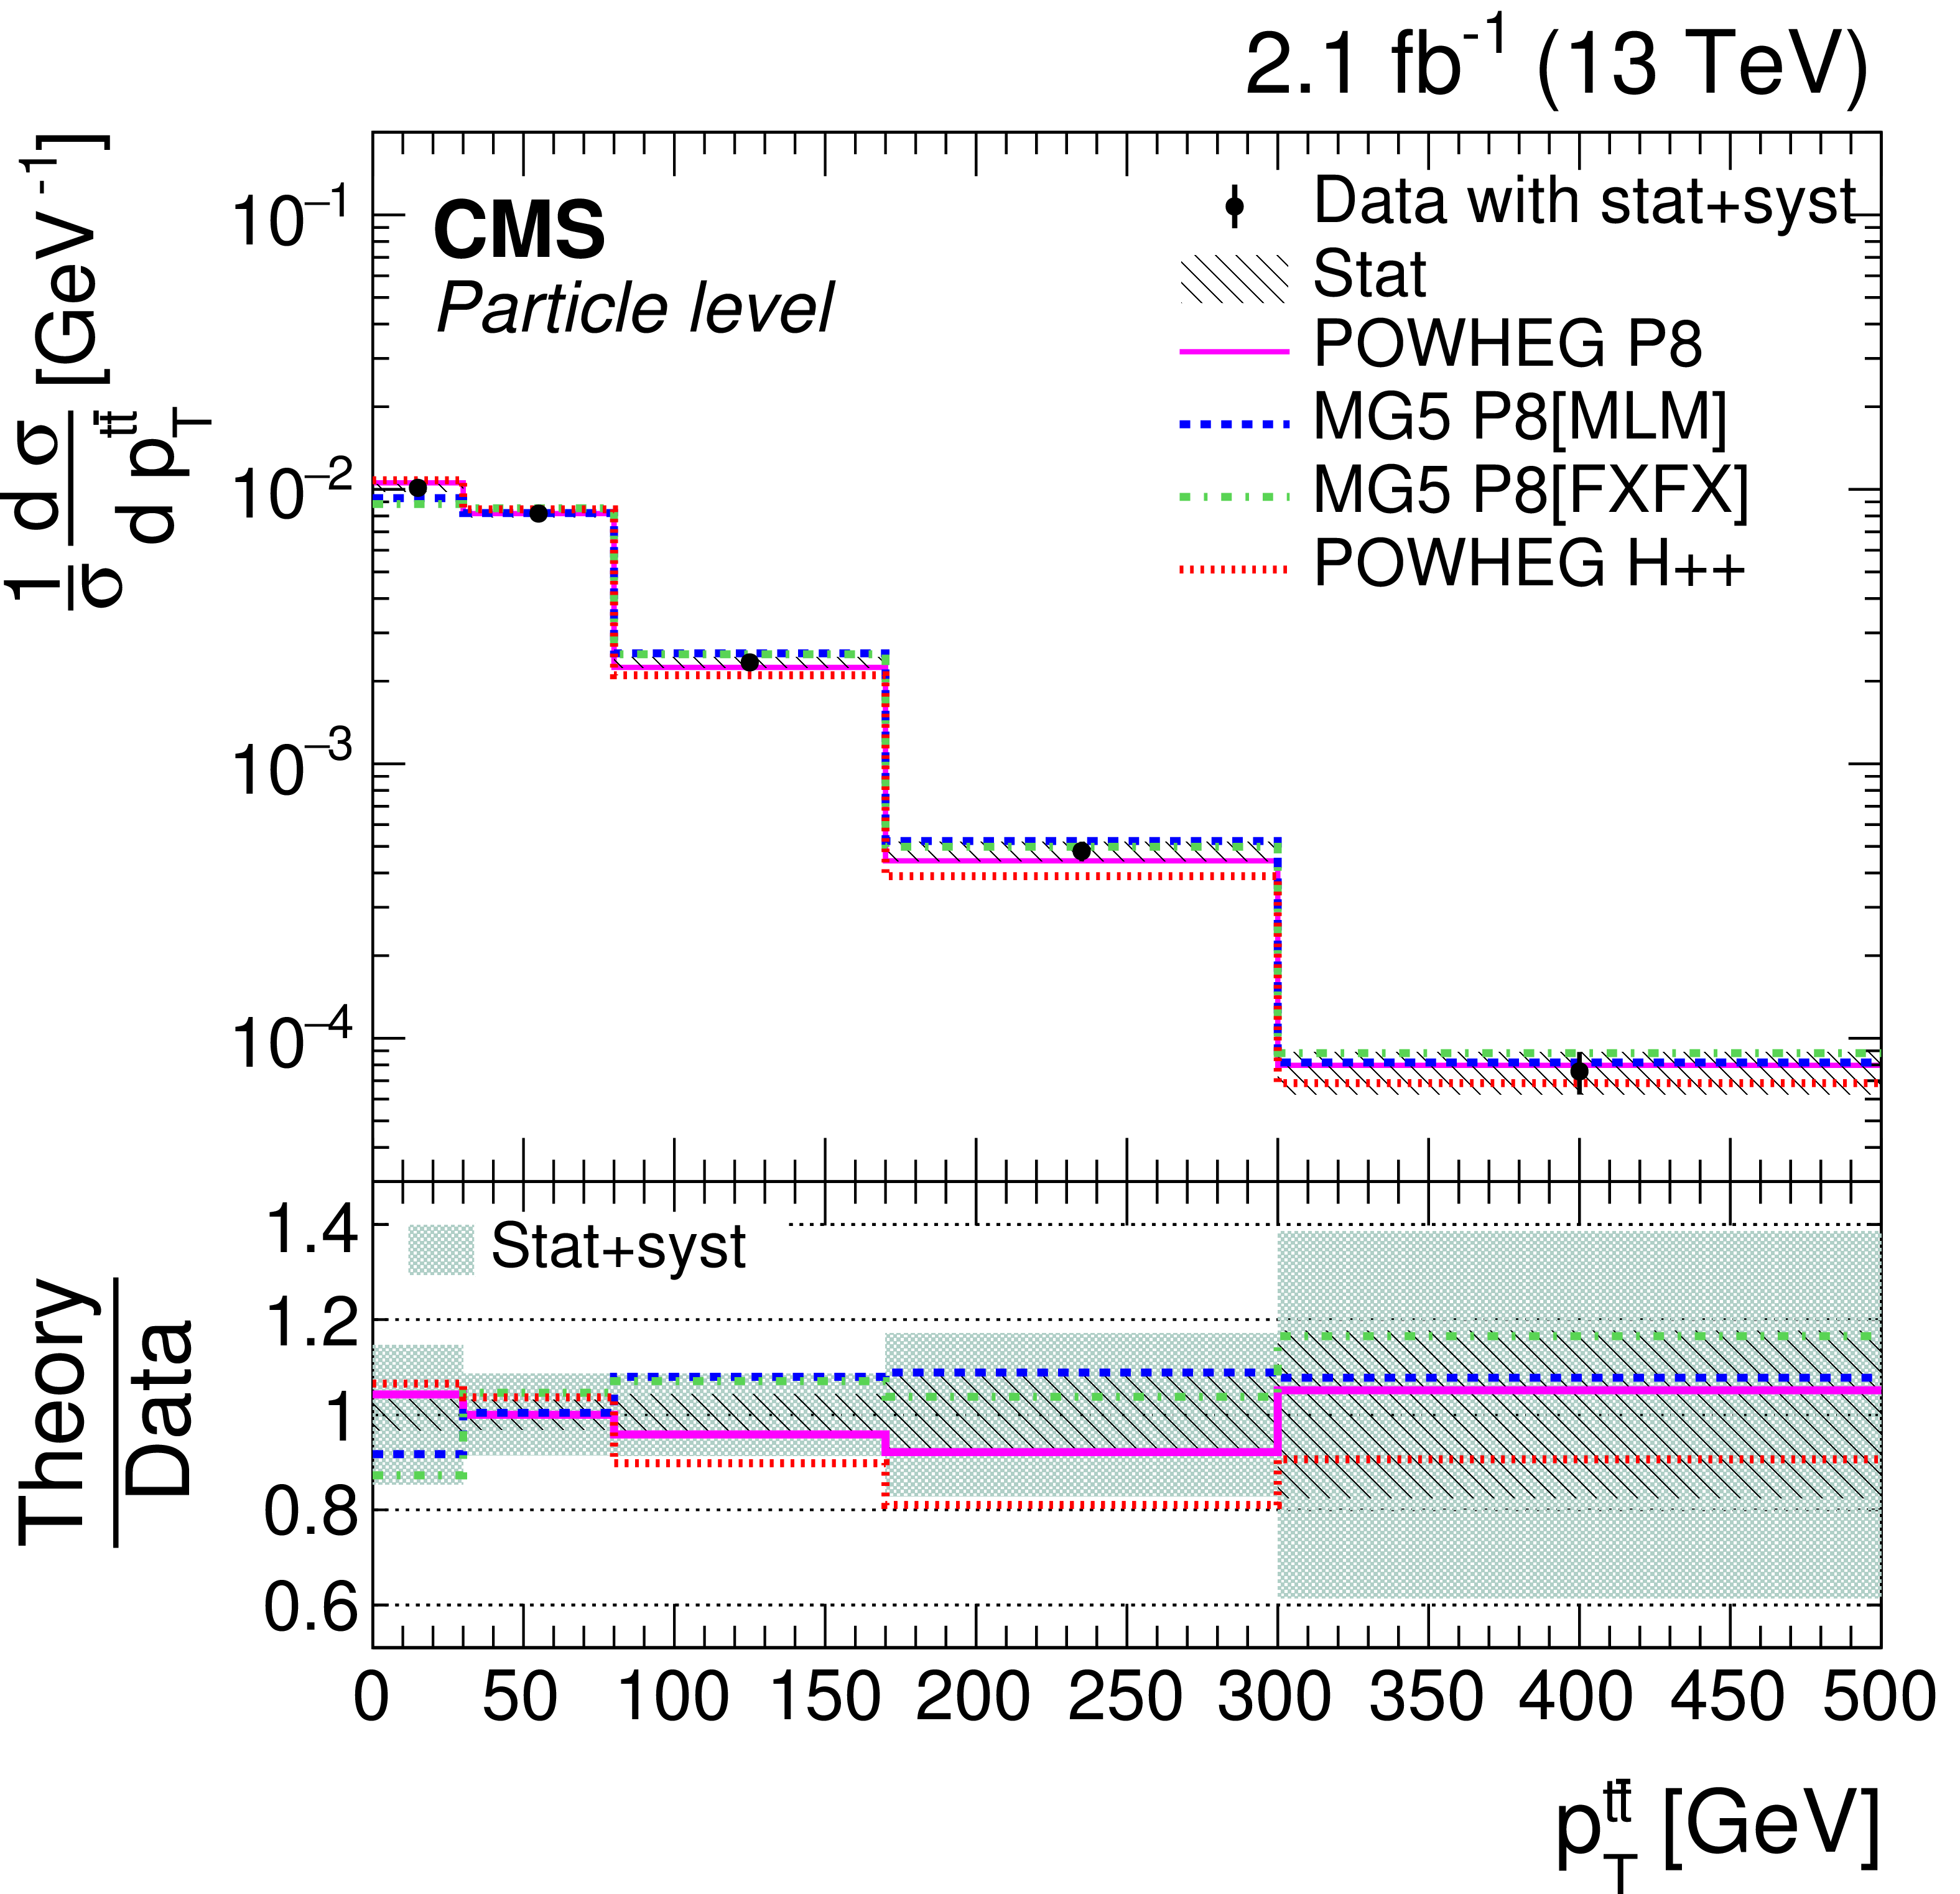
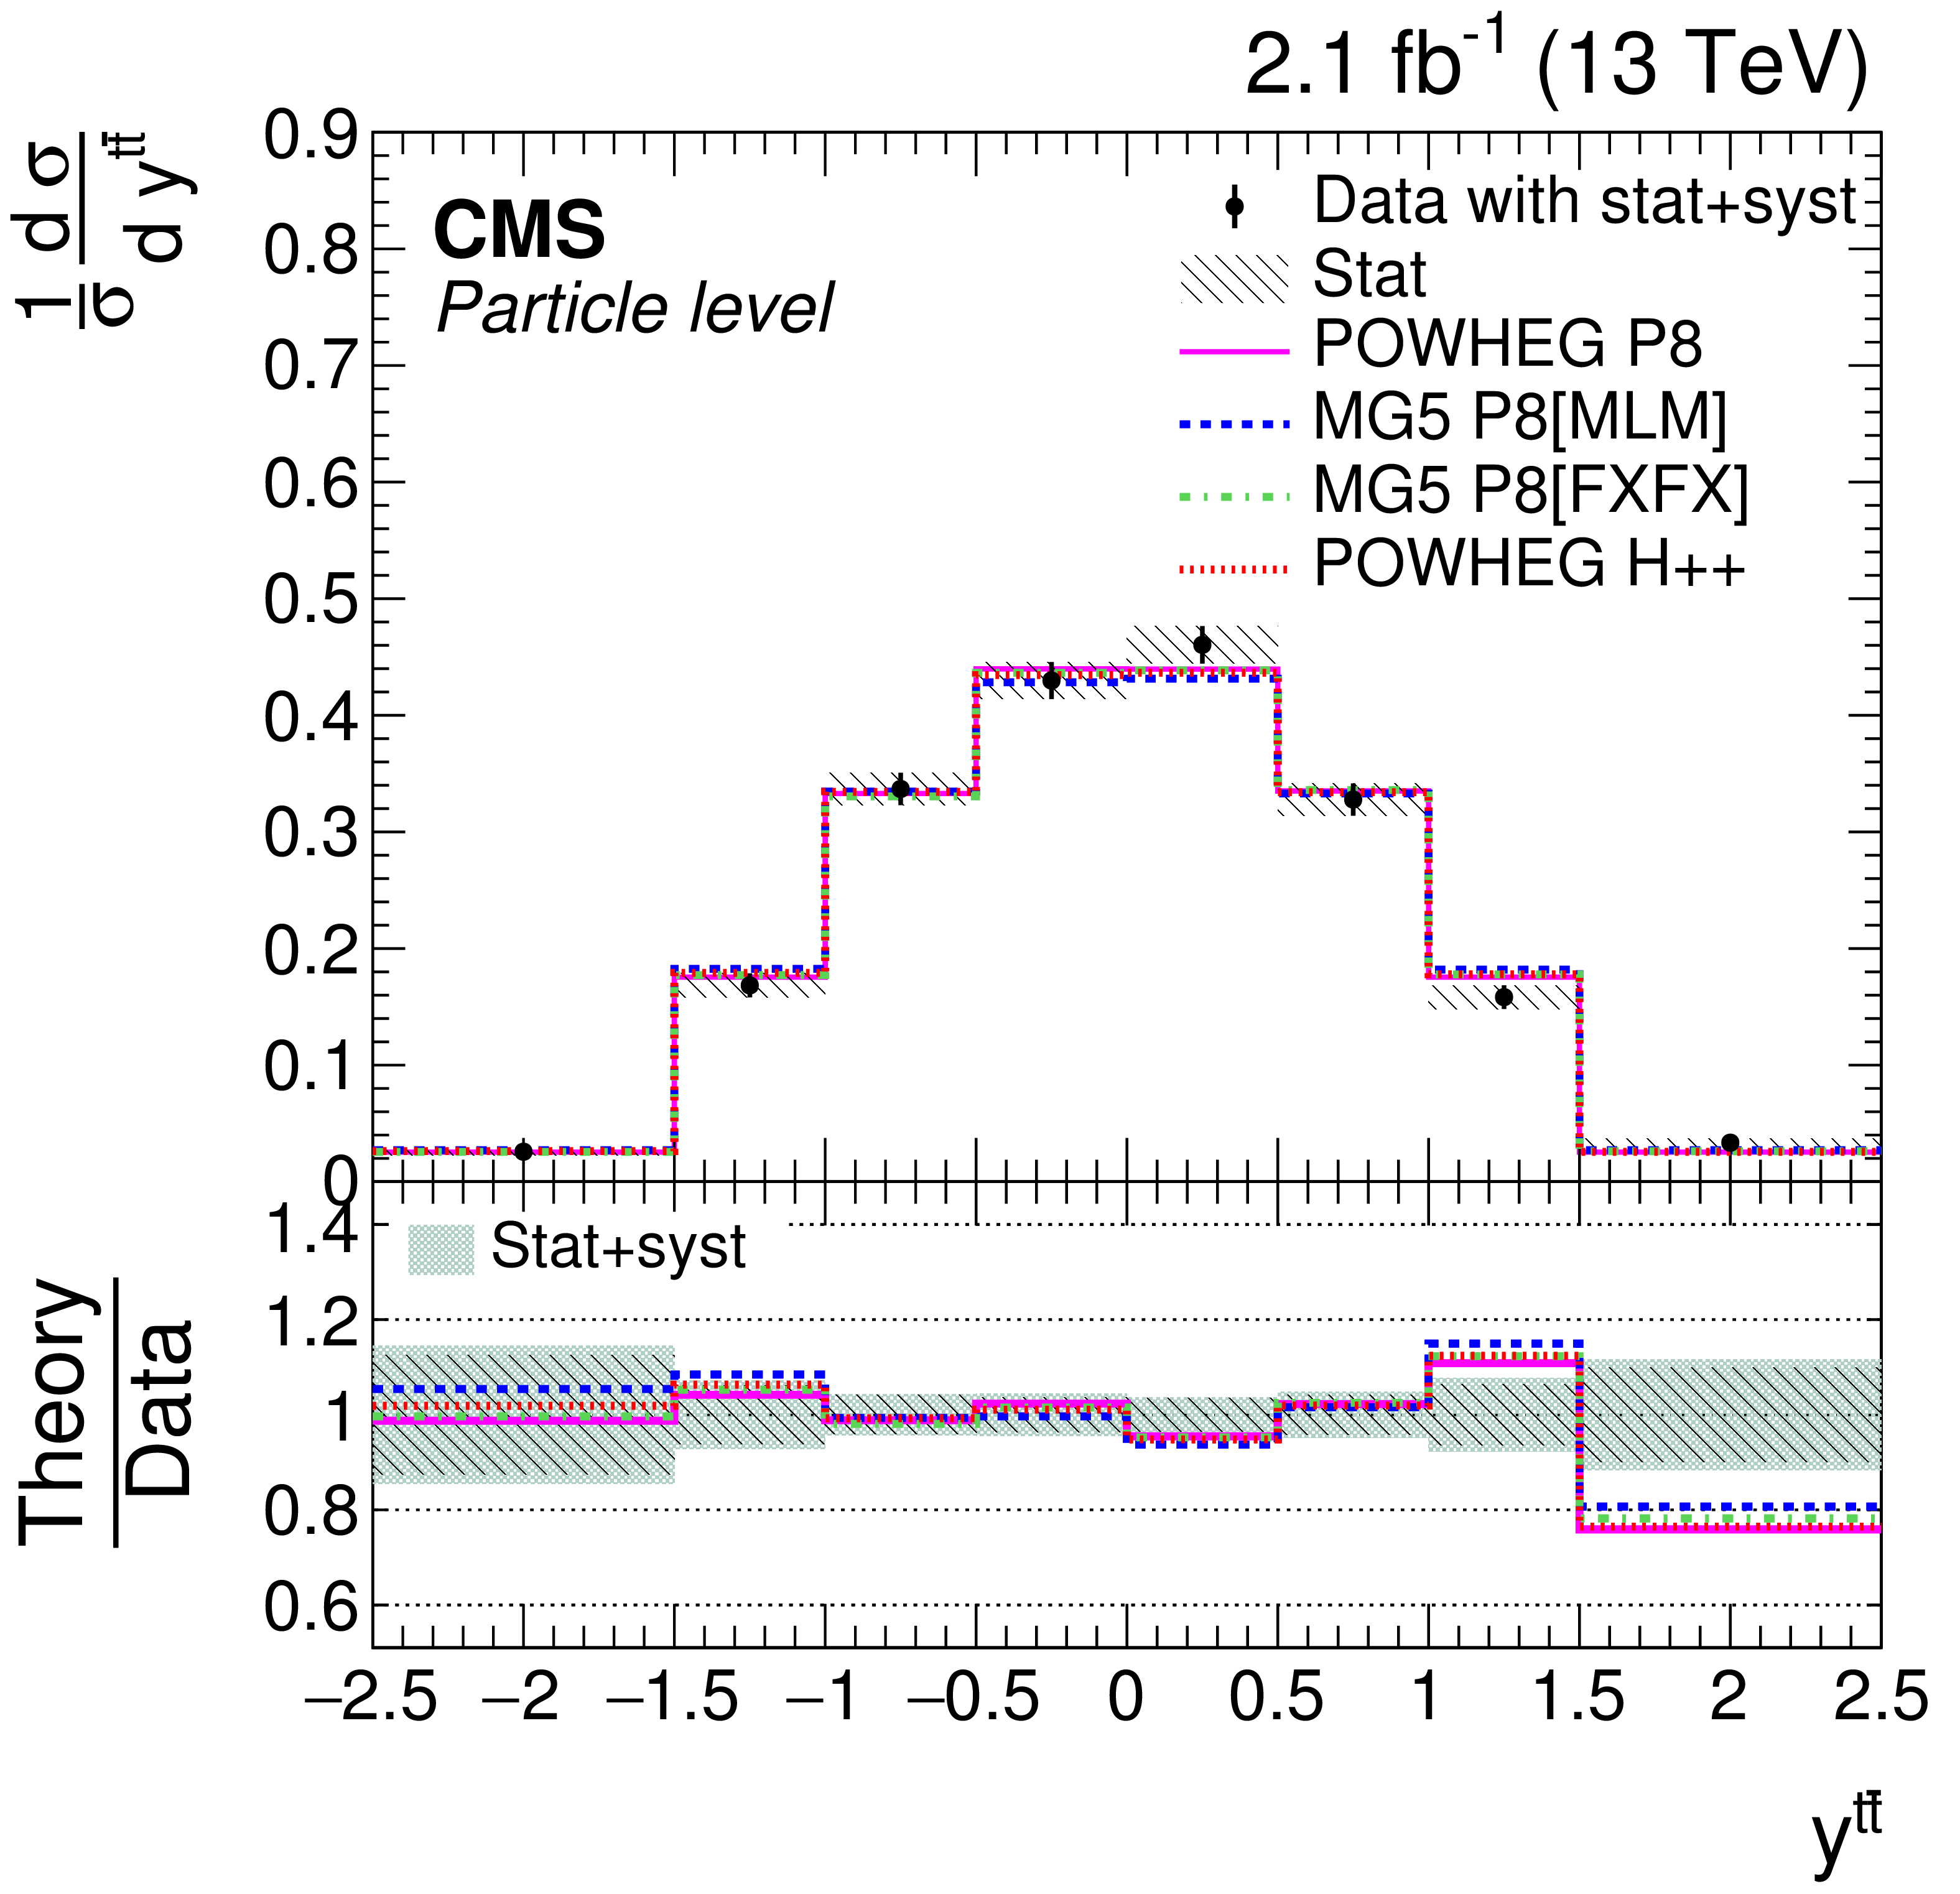
Figure 3:
Normalized differential $ {\mathrm{ t } {}\mathrm{ \bar{t} } } $ cross sections as a function of lepton (upper left), jet (upper right), and top quark $ {p_{\mathrm {T}}} $ (lower left) and top quark rapidity (lower right), measured at the particle level in the visible phase space and combining the distributions for top quarks and antiquarks. The measured data are compared to different standard model predictions from POWHEG+PYTHIA 8 (POWHEG P8), MG5_aMC@NLO+PYTHIA 8[MLM] (MG5 P8 [MLM]), MG5_aMC@NLO+PYTHIA 8[FXFX] (MG5 P8 [FXFX]), and POWHEG+HERWIG++ (POWHEG H++). The vertical bars on the data points indicate the total (combined statistical and systematic) uncertainties while the hatched band shows the statistical uncertainty. The lower panel gives the ratio of the theoretical predictions to the data. The light-shaded band displays the combined statistical and systematic uncertainties added in quadrature. |
png pdf |
Figure 3-a:
Normalized differential $ {\mathrm{ t } {}\mathrm{ \bar{t} } } $ cross sections as a function of lepton $ {p_{\mathrm {T}}} $, measured at the particle level in the visible phase space and combining the distributions for top quarks and antiquarks. The measured data are compared to different standard model predictions from POWHEG+PYTHIA 8 (POWHEG P8), MG5_aMC@NLO+PYTHIA 8[MLM] (MG5 P8 [MLM]), MG5_aMC@NLO+PYTHIA 8[FXFX] (MG5 P8 [FXFX]), and POWHEG+HERWIG++ (POWHEG H++). The vertical bars on the data points indicate the total (combined statistical and systematic) uncertainties while the hatched band shows the statistical uncertainty. The lower panel gives the ratio of the theoretical predictions to the data. The light-shaded band displays the combined statistical and systematic uncertainties added in quadrature. |

png pdf |
Figure 3-b:
Normalized differential $ {\mathrm{ t } {}\mathrm{ \bar{t} } } $ cross sections as a function of jet $ {p_{\mathrm {T}}} $, measured at the particle level in the visible phase space and combining the distributions for top quarks and antiquarks. The measured data are compared to different standard model predictions from POWHEG+PYTHIA 8 (POWHEG P8), MG5_aMC@NLO+PYTHIA 8[MLM] (MG5 P8 [MLM]), MG5_aMC@NLO+PYTHIA 8[FXFX] (MG5 P8 [FXFX]), and POWHEG+HERWIG++ (POWHEG H++). The vertical bars on the data points indicate the total (combined statistical and systematic) uncertainties while the hatched band shows the statistical uncertainty. The lower panel gives the ratio of the theoretical predictions to the data. The light-shaded band displays the combined statistical and systematic uncertainties added in quadrature. |
png pdf |
Figure 3-c:
Normalized differential $ {\mathrm{ t } {}\mathrm{ \bar{t} } } $ cross sections as a function of top quark $ {p_{\mathrm {T}}} $, measured at the particle level in the visible phase space and combining the distributions for top quarks and antiquarks. The measured data are compared to different standard model predictions from POWHEG+PYTHIA 8 (POWHEG P8), MG5_aMC@NLO+PYTHIA 8[MLM] (MG5 P8 [MLM]), MG5_aMC@NLO+PYTHIA 8[FXFX] (MG5 P8 [FXFX]), and POWHEG+HERWIG++ (POWHEG H++). The vertical bars on the data points indicate the total (combined statistical and systematic) uncertainties while the hatched band shows the statistical uncertainty. The lower panel gives the ratio of the theoretical predictions to the data. The light-shaded band displays the combined statistical and systematic uncertainties added in quadrature. |

png pdf |
Figure 3-d:
Normalized differential $ {\mathrm{ t } {}\mathrm{ \bar{t} } } $ cross sections as a function of top quark $ rapidity, measured at the particle level in the visible phase space and combining the distributions for top quarks and antiquarks. The measured data are compared to different standard model predictions from POWHEG+PYTHIA 8 (POWHEG P8), MG5_aMC@NLO+PYTHIA 8[MLM] (MG5 P8 [MLM]), MG5_aMC@NLO+PYTHIA 8[FXFX] (MG5 P8 [FXFX]), and POWHEG+HERWIG++ (POWHEG H++). The vertical bars on the data points indicate the total (combined statistical and systematic) uncertainties while the hatched band shows the statistical uncertainty. The lower panel gives the ratio of the theoretical predictions to the data. The light-shaded band displays the combined statistical and systematic uncertainties added in quadrature. |
png pdf |
Figure 4:
Normalized differential $ {\mathrm{ t } {}\mathrm{ \bar{t} } } $ cross sections as a function of $ {p_{\mathrm {T}}^{{{\mathrm{ t } {}\mathrm{ \bar{t} } } }}} $ (upper left), $ {y^{{\mathrm{ t } {}\mathrm{ \bar{t} } } }} $ (upper right), $ {M^{{\mathrm{ t } {}\mathrm{ \bar{t} } } }} $ (lower left), and $ {\Delta \phi ^{{\mathrm{ t } {}\mathrm{ \bar{t} } } }} $ (lower right), measured at the particle level in the visible phase space. The measured data are compared to different standard model predictions from POWHEG+PYTHIA 8 (POWHEG P8), MG5_aMC@NLO+PYTHIA 8[MLM] (MG5 P8 [MLM]), MG5_aMC@NLO+PYTHIA 8[FXFX] (MG5 P8 [FXFX]), and POWHEG+HERWIG++ (POWHEG H++). The vertical bars on the data points indicate the total (combined statistical and systematic) uncertainties while the hatched band shows the statistical uncertainty. The lower panel gives the ratio of the theoretical predictions to the data. The light-shaded band displays the combined statistical and systematic uncertainties added in quadrature. |
png pdf |
Figure 4-a:
Normalized differential $ {\mathrm{ t } {}\mathrm{ \bar{t} } } $ cross sections as a function of $ {p_{\mathrm {T}}^{{{\mathrm{ t } {}\mathrm{ \bar{t} } } }}} $, measured at the particle level in the visible phase space. The measured data are compared to different standard model predictions from POWHEG+PYTHIA 8 (POWHEG P8), MG5_aMC@NLO+PYTHIA 8[MLM] (MG5 P8 [MLM]), MG5_aMC@NLO+PYTHIA 8[FXFX] (MG5 P8 [FXFX]), and POWHEG+HERWIG++ (POWHEG H++). The vertical bars on the data points indicate the total (combined statistical and systematic) uncertainties while the hatched band shows the statistical uncertainty. The lower panel gives the ratio of the theoretical predictions to the data. The light-shaded band displays the combined statistical and systematic uncertainties added in quadrature. |
png pdf |
Figure 4-b:
Normalized differential $ {\mathrm{ t } {}\mathrm{ \bar{t} } } $ cross sections as a function of $ {y^{{\mathrm{ t } {}\mathrm{ \bar{t} } } }} $, measured at the particle level in the visible phase space. The measured data are compared to different standard model predictions from POWHEG+PYTHIA 8 (POWHEG P8), MG5_aMC@NLO+PYTHIA 8[MLM] (MG5 P8 [MLM]), MG5_aMC@NLO+PYTHIA 8[FXFX] (MG5 P8 [FXFX]), and POWHEG+HERWIG++ (POWHEG H++). The vertical bars on the data points indicate the total (combined statistical and systematic) uncertainties while the hatched band shows the statistical uncertainty. The lower panel gives the ratio of the theoretical predictions to the data. The light-shaded band displays the combined statistical and systematic uncertainties added in quadrature. |

png pdf |
Figure 4-c:
Normalized differential $ {\mathrm{ t } {}\mathrm{ \bar{t} } } $ cross sections as a function of $ {M^{{\mathrm{ t } {}\mathrm{ \bar{t} } } }} $, measured at the particle level in the visible phase space. The measured data are compared to different standard model predictions from POWHEG+PYTHIA 8 (POWHEG P8), MG5_aMC@NLO+PYTHIA 8[MLM] (MG5 P8 [MLM]), MG5_aMC@NLO+PYTHIA 8[FXFX] (MG5 P8 [FXFX]), and POWHEG+HERWIG++ (POWHEG H++). The vertical bars on the data points indicate the total (combined statistical and systematic) uncertainties while the hatched band shows the statistical uncertainty. The lower panel gives the ratio of the theoretical predictions to the data. The light-shaded band displays the combined statistical and systematic uncertainties added in quadrature. |

png pdf |
Figure 4-d:
Normalized differential $ {\mathrm{ t } {}\mathrm{ \bar{t} } } $ cross sections as a function of $ {\Delta \phi ^{{\mathrm{ t } {}\mathrm{ \bar{t} } } }} $, measured at the particle level in the visible phase space. The measured data are compared to different standard model predictions from POWHEG+PYTHIA 8 (POWHEG P8), MG5_aMC@NLO+PYTHIA 8[MLM] (MG5 P8 [MLM]), MG5_aMC@NLO+PYTHIA 8[FXFX] (MG5 P8 [FXFX]), and POWHEG+HERWIG++ (POWHEG H++). The vertical bars on the data points indicate the total (combined statistical and systematic) uncertainties while the hatched band shows the statistical uncertainty. The lower panel gives the ratio of the theoretical predictions to the data. The light-shaded band displays the combined statistical and systematic uncertainties added in quadrature. |
png pdf |
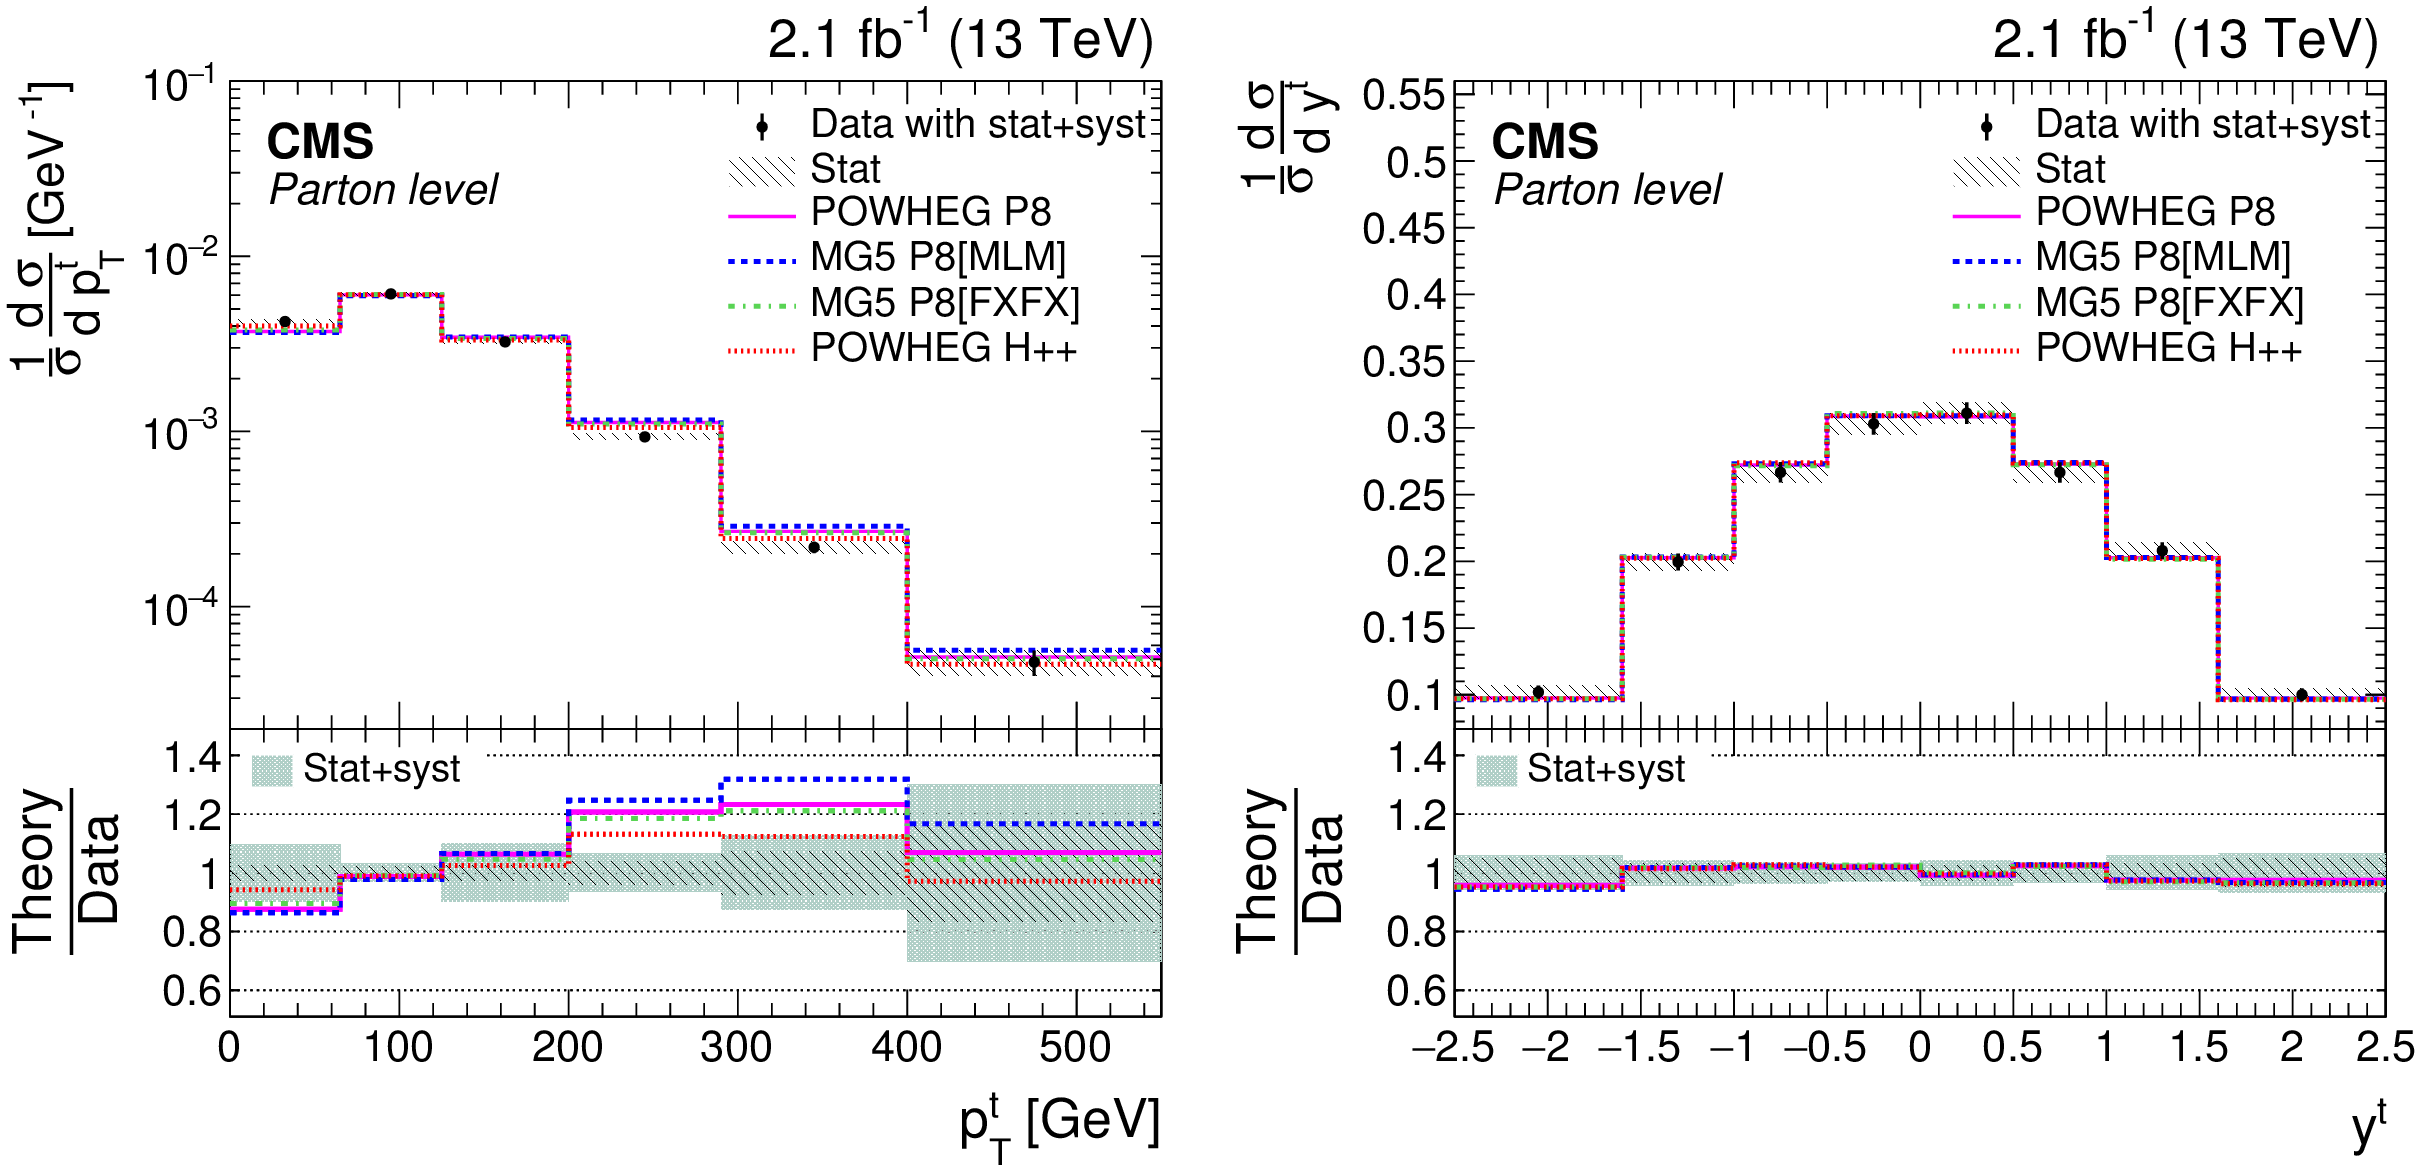
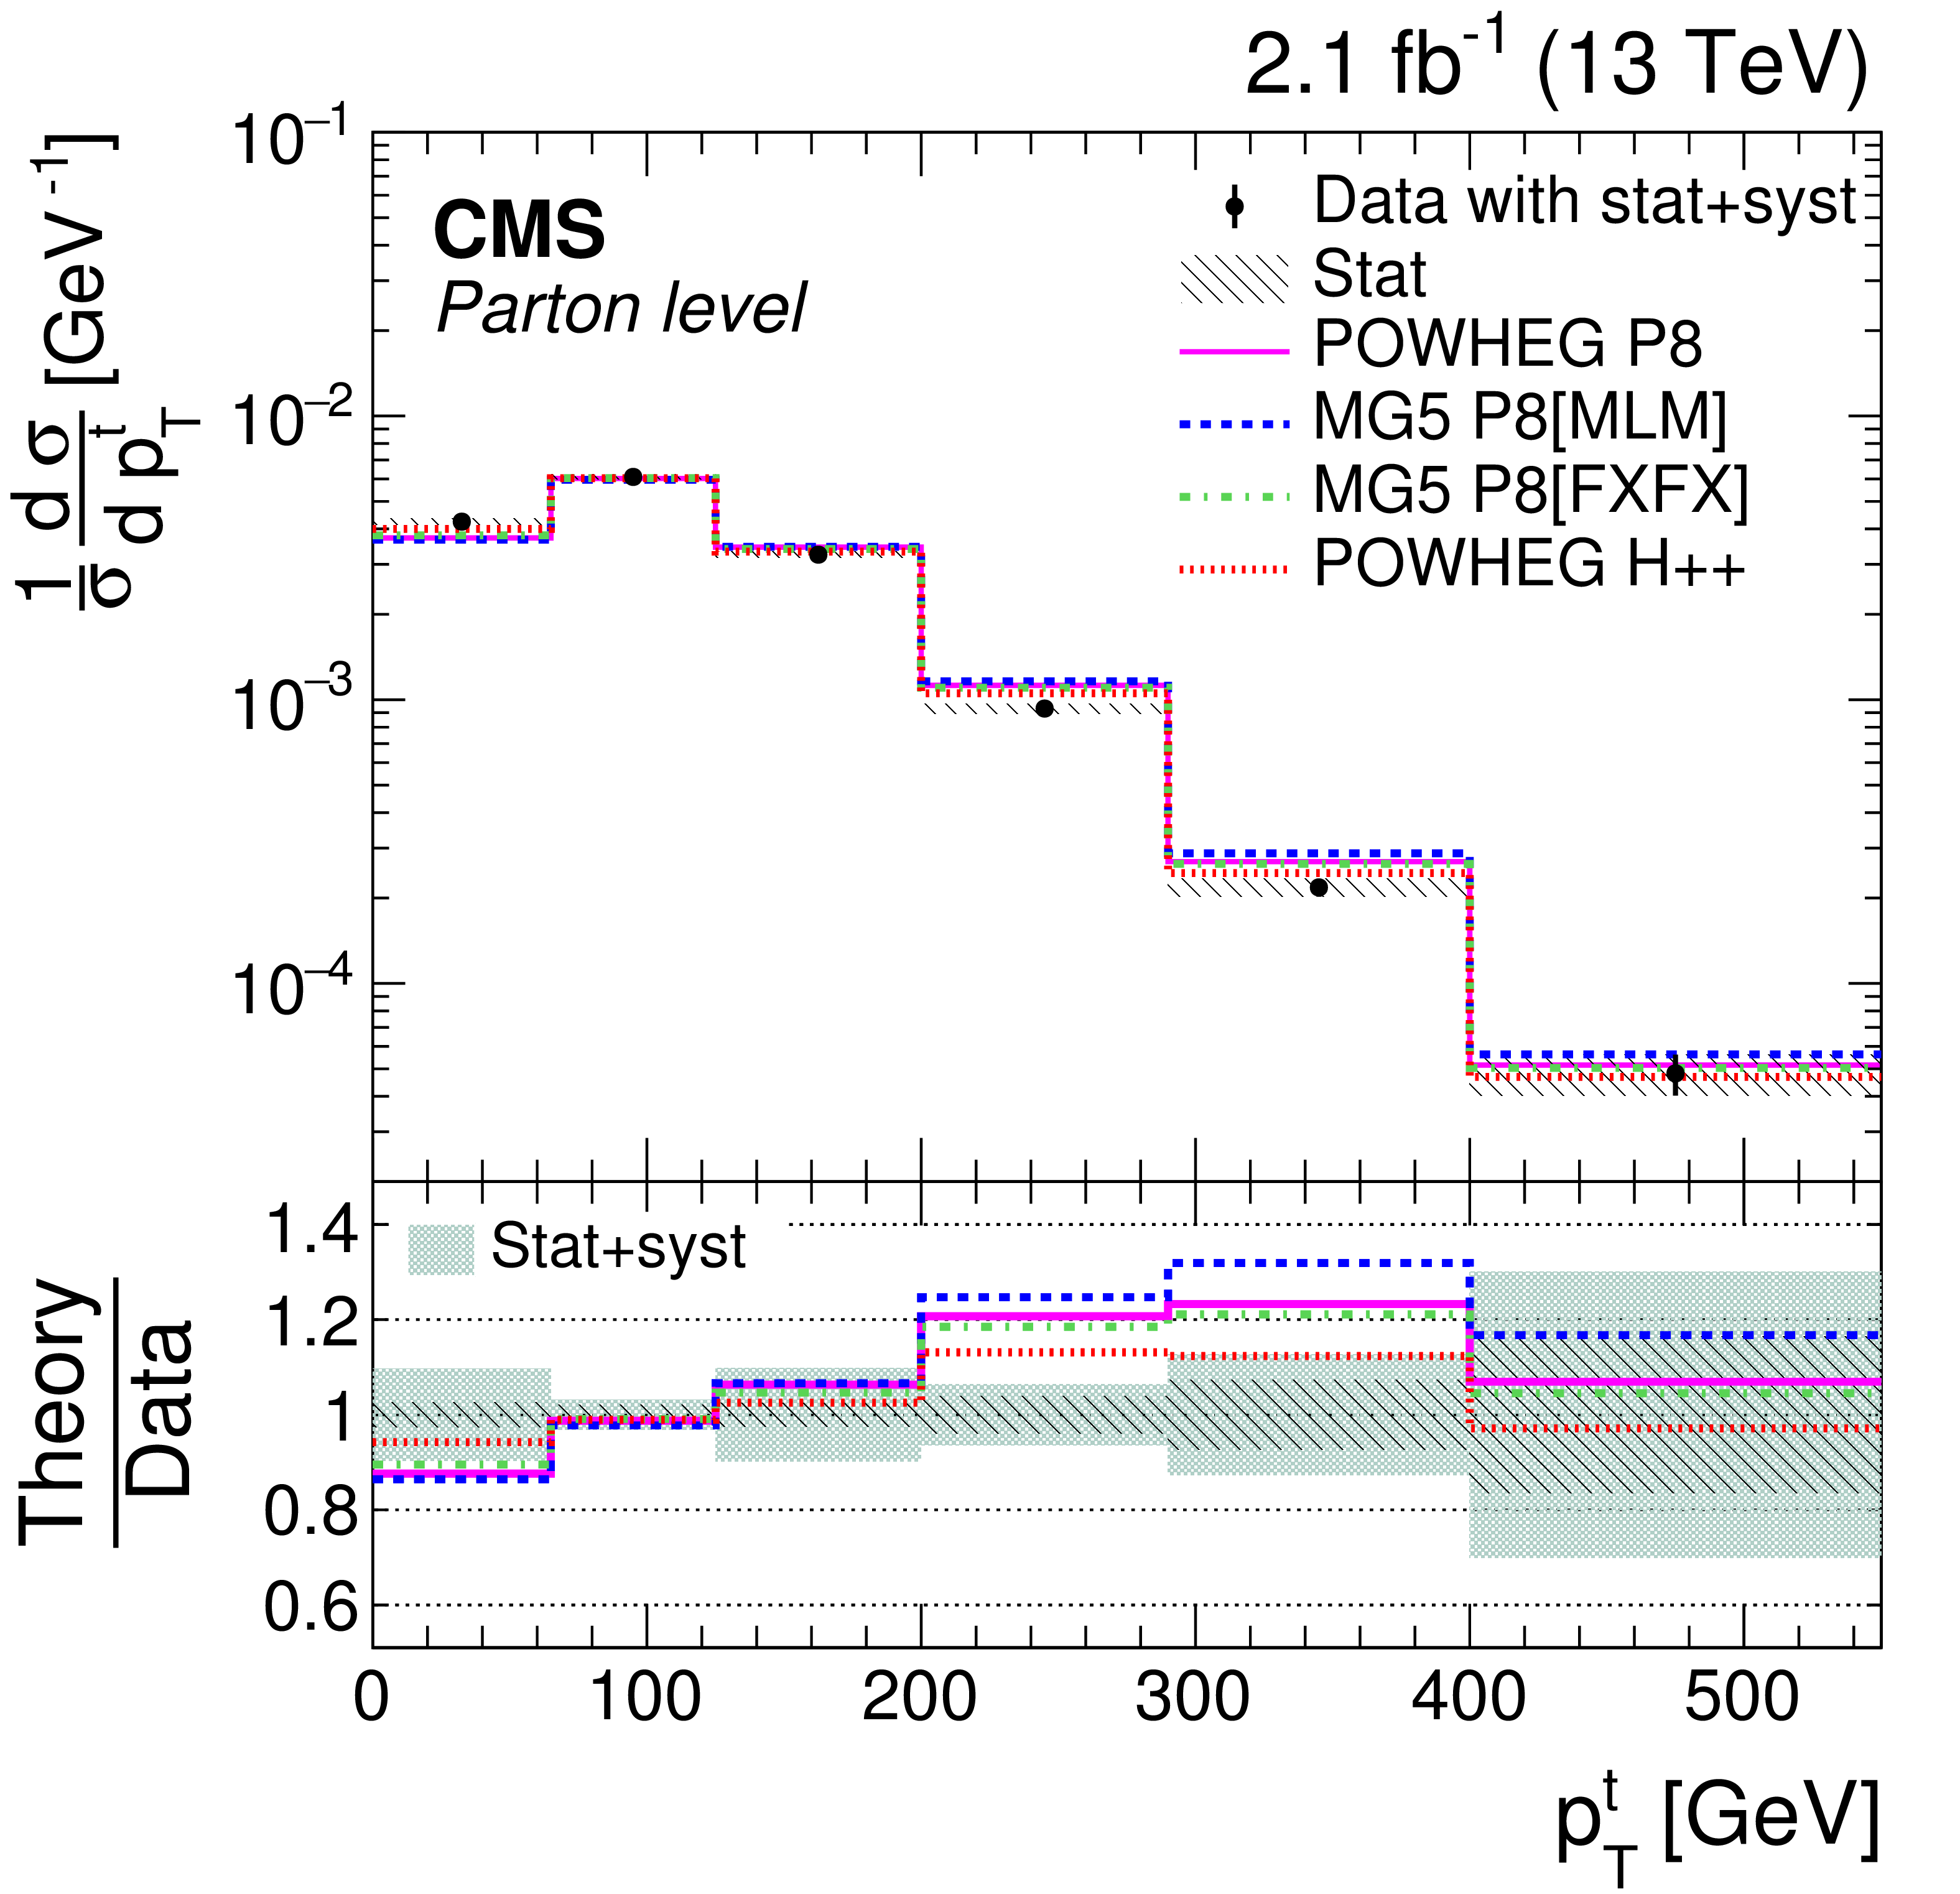
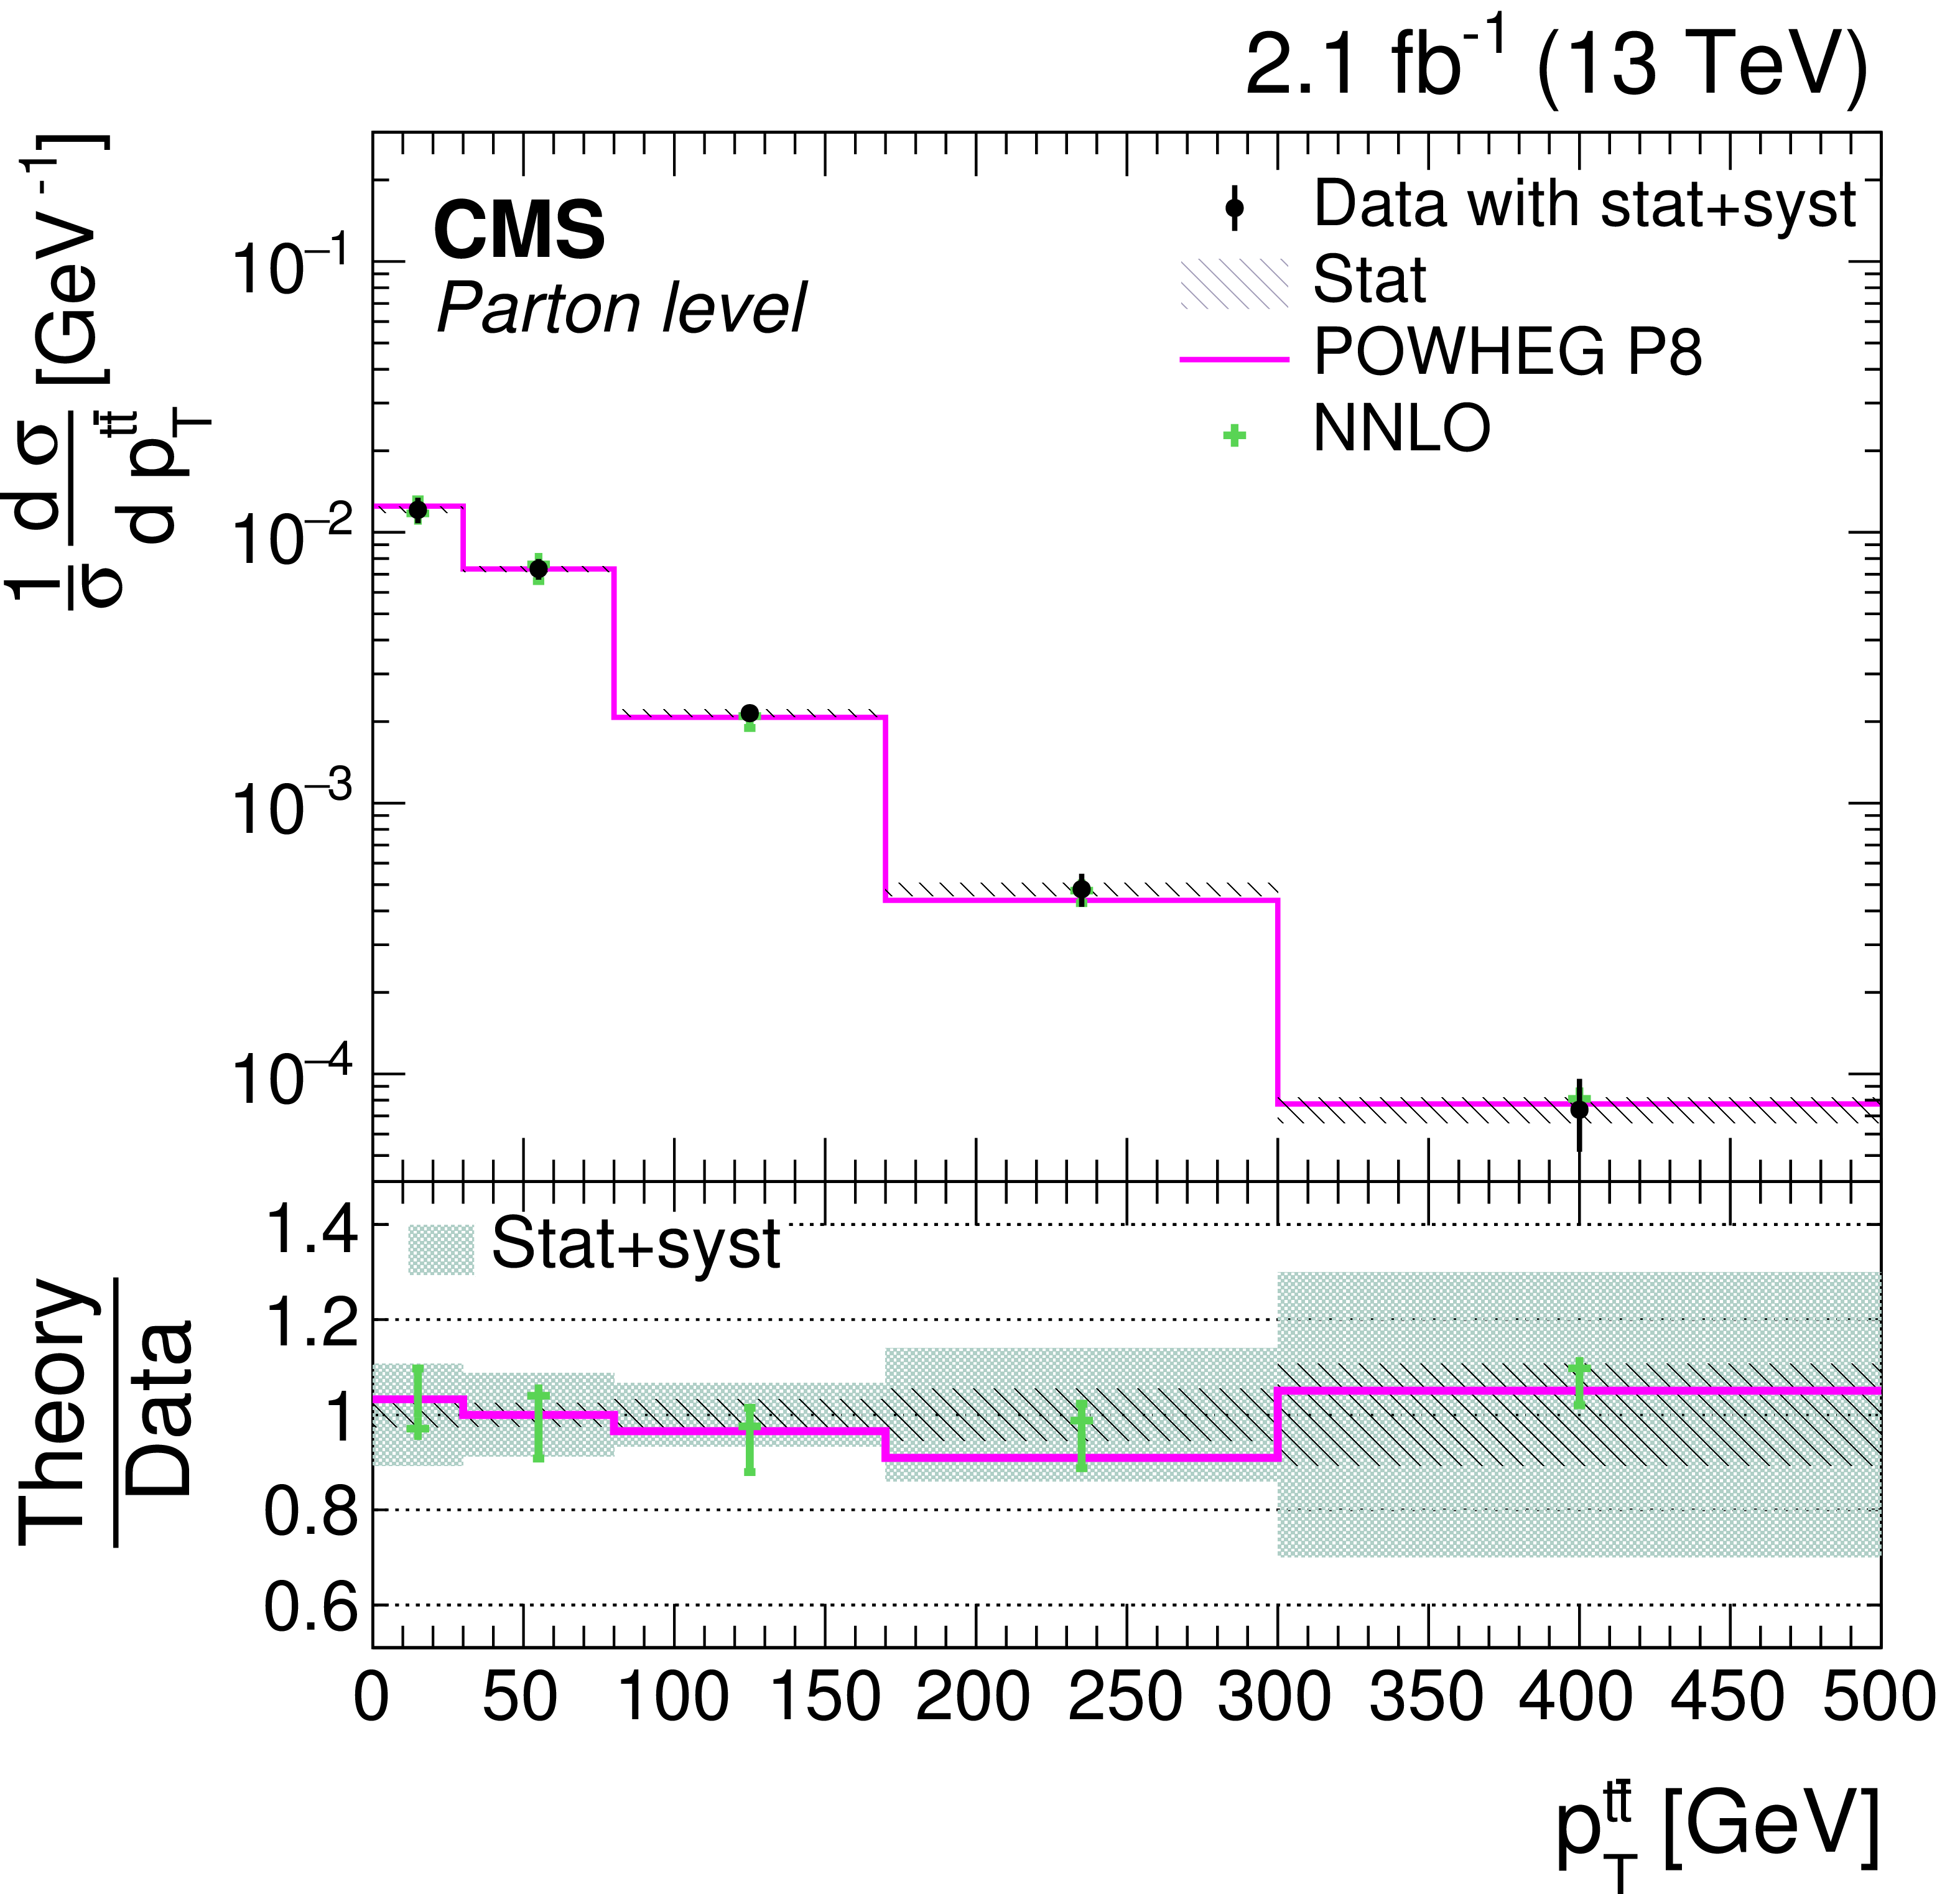
Figure 5:
Normalized differential $ {\mathrm{ t } {}\mathrm{ \bar{t} } } $ cross sections as a function of top quark $ {p_{\mathrm {T}}} $ (left) and top quark rapidity (right), measured at the parton level in the full phase space and combining the distributions for top quarks and antiquarks. The measured data are compared to different standard model predictions from POWHEG+PYTHIA 8 (POWHEG P8), MG5_aMC@NLO+PYTHIA 8[MLM] (MG5 P8 [MLM]), MG5_aMC@NLO+PYTHIA 8[FXFX] (MG5 P8 [FXFX]), and POWHEG+HERWIG++ (POWHEG H++). The vertical bars on the data points indicate the total (combined statistical and systematic) uncertainties while the hatched band shows the statistical uncertainty. The lower panel gives the ratio of the theoretical predictions to the data. The light-shaded band displays the combined statistical and systematic uncertainties added in quadrature. |
png pdf |
Figure 5-a:
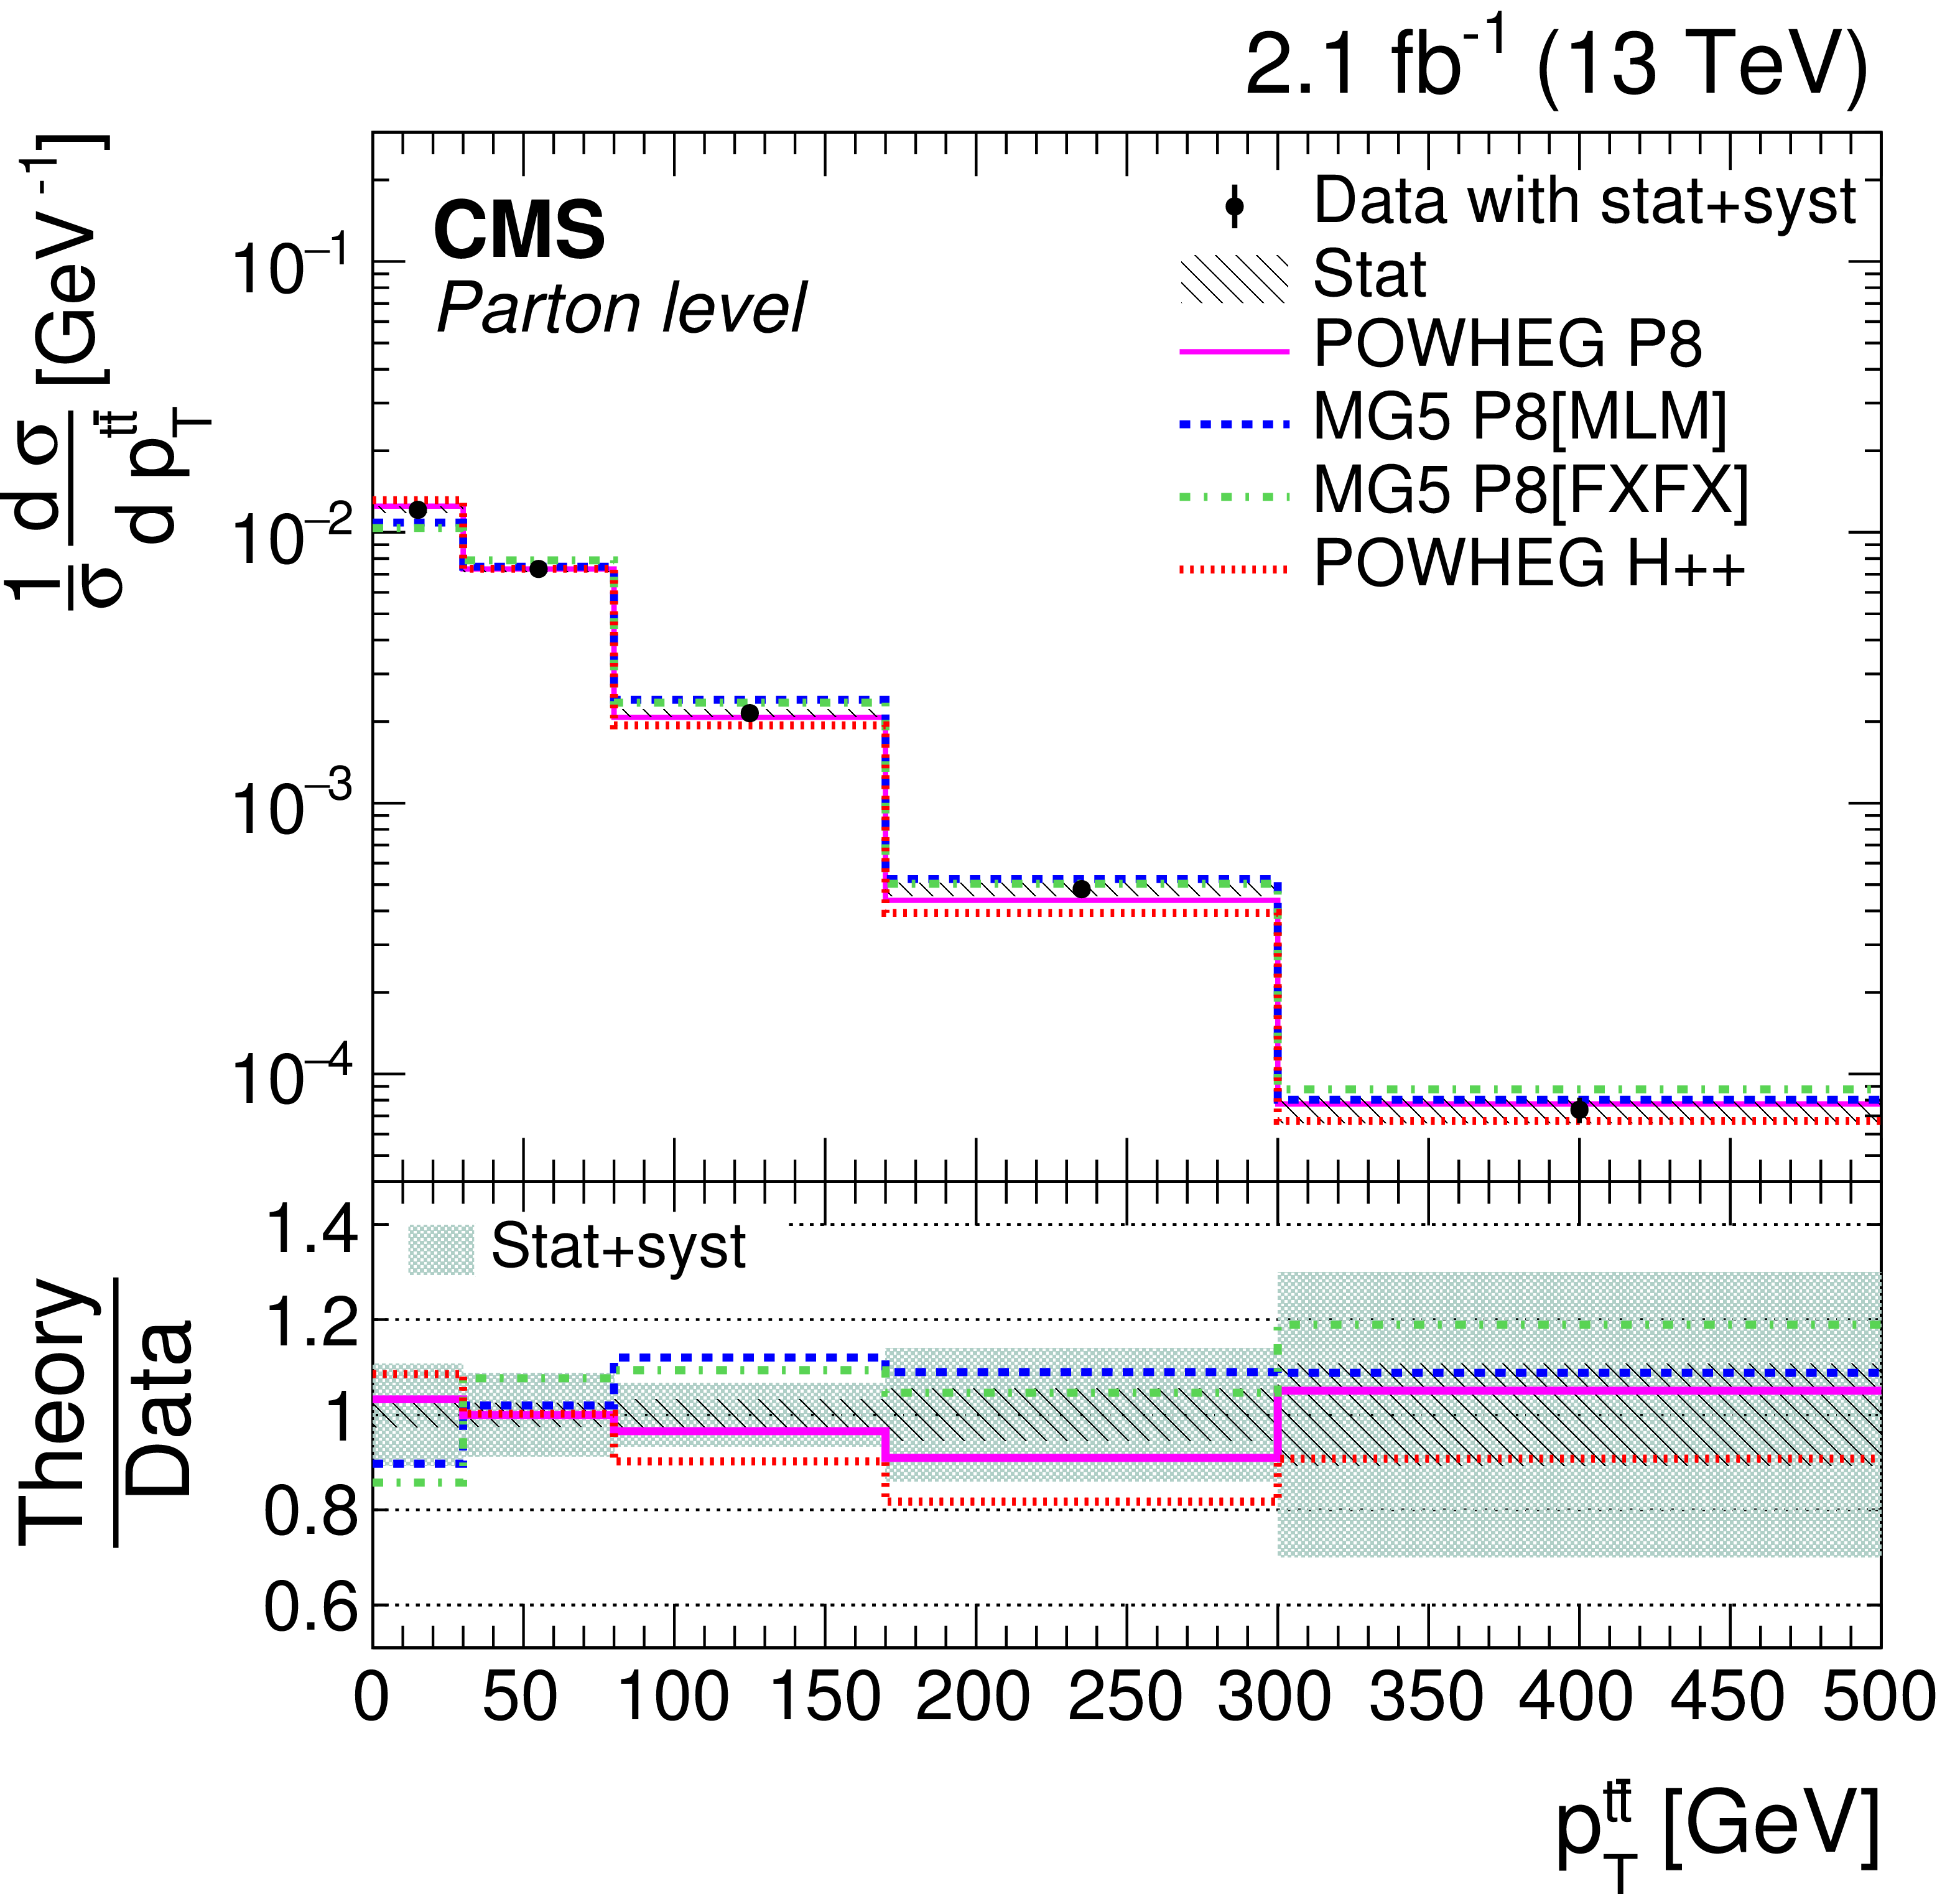
Normalized differential $ {\mathrm{ t } {}\mathrm{ \bar{t} } } $ cross sections as a function of top quark $ {p_{\mathrm {T}}} $, measured at the parton level in the full phase space and combining the distributions for top quarks and antiquarks. The measured data are compared to different standard model predictions from POWHEG+PYTHIA 8 (POWHEG P8), MG5_aMC@NLO+PYTHIA 8[MLM] (MG5 P8 [MLM]), MG5_aMC@NLO+PYTHIA 8[FXFX] (MG5 P8 [FXFX]), and POWHEG+HERWIG++ (POWHEG H++). The vertical bars on the data points indicate the total (combined statistical and systematic) uncertainties while the hatched band shows the statistical uncertainty. The lower panel gives the ratio of the theoretical predictions to the data. The light-shaded band displays the combined statistical and systematic uncertainties added in quadrature. |
png pdf |
Figure 5-b:
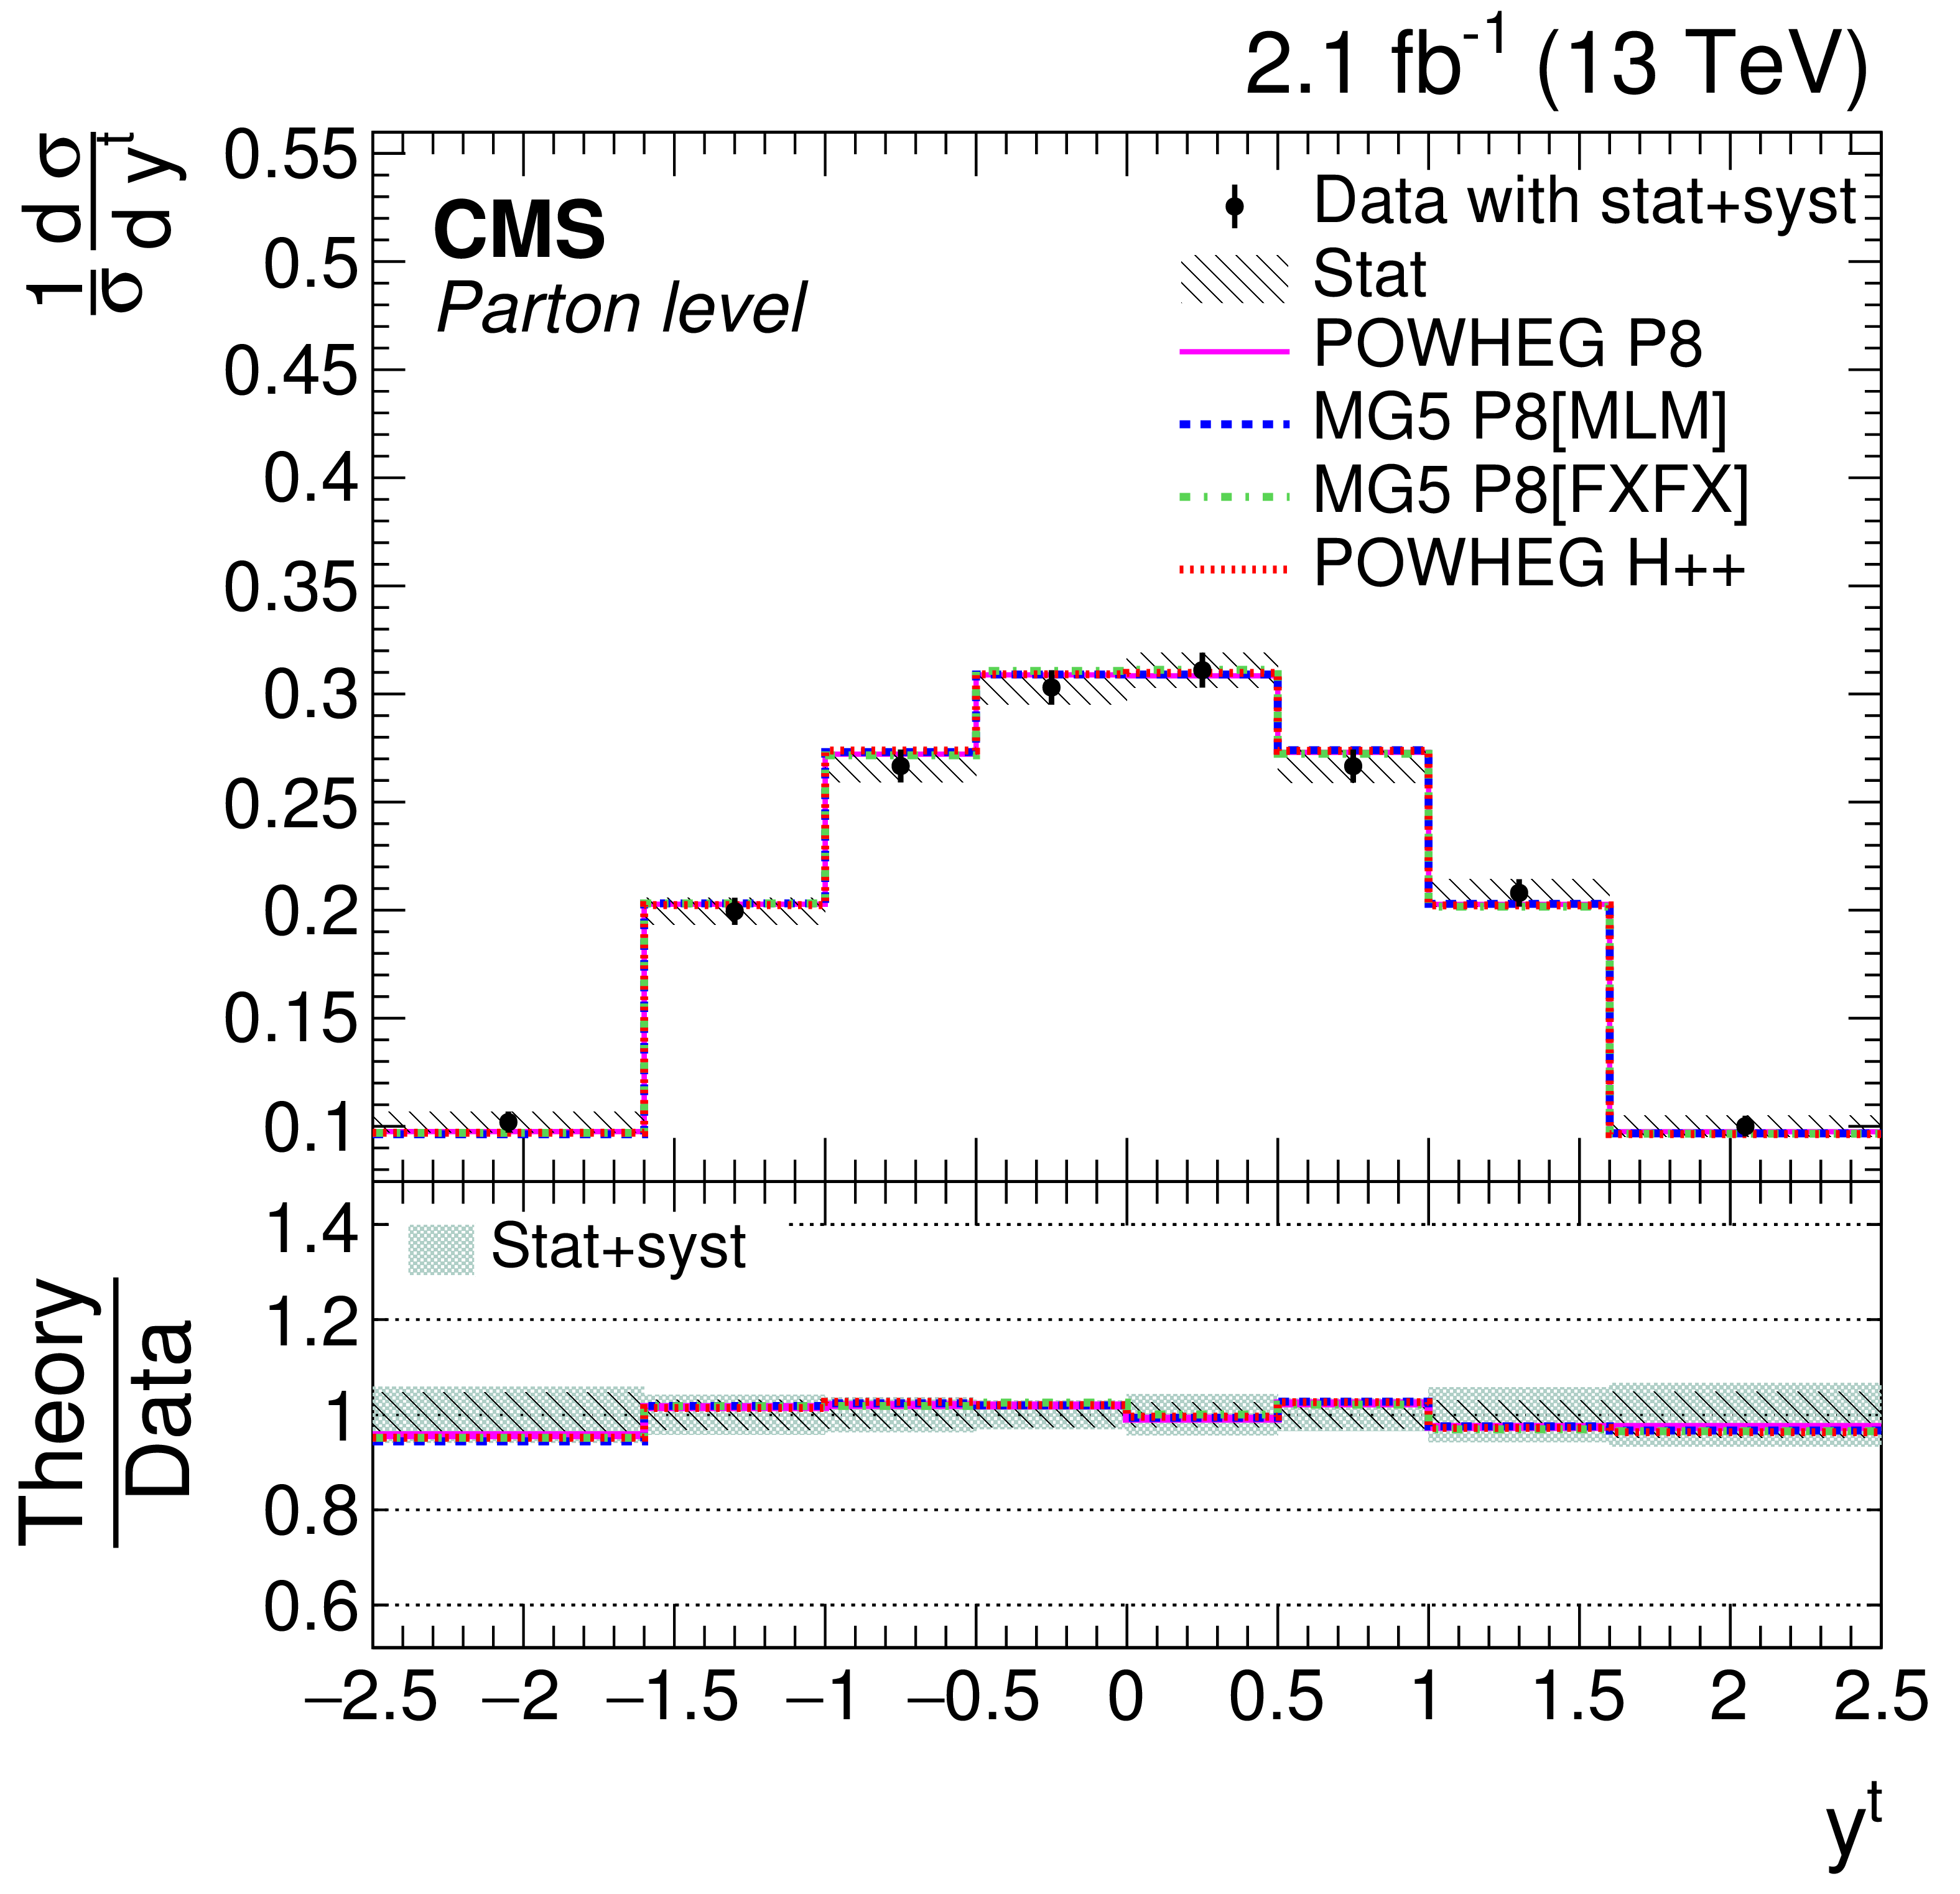
Normalized differential $ {\mathrm{ t } {}\mathrm{ \bar{t} } } $ cross sections as a function of top quark rapidity, measured at the parton level in the full phase space and combining the distributions for top quarks and antiquarks. The measured data are compared to different standard model predictions from POWHEG+PYTHIA 8 (POWHEG P8), MG5_aMC@NLO+PYTHIA 8[MLM] (MG5 P8 [MLM]), MG5_aMC@NLO+PYTHIA 8[FXFX] (MG5 P8 [FXFX]), and POWHEG+HERWIG++ (POWHEG H++). The vertical bars on the data points indicate the total (combined statistical and systematic) uncertainties while the hatched band shows the statistical uncertainty. The lower panel gives the ratio of the theoretical predictions to the data. The light-shaded band displays the combined statistical and systematic uncertainties added in quadrature. |
png pdf |
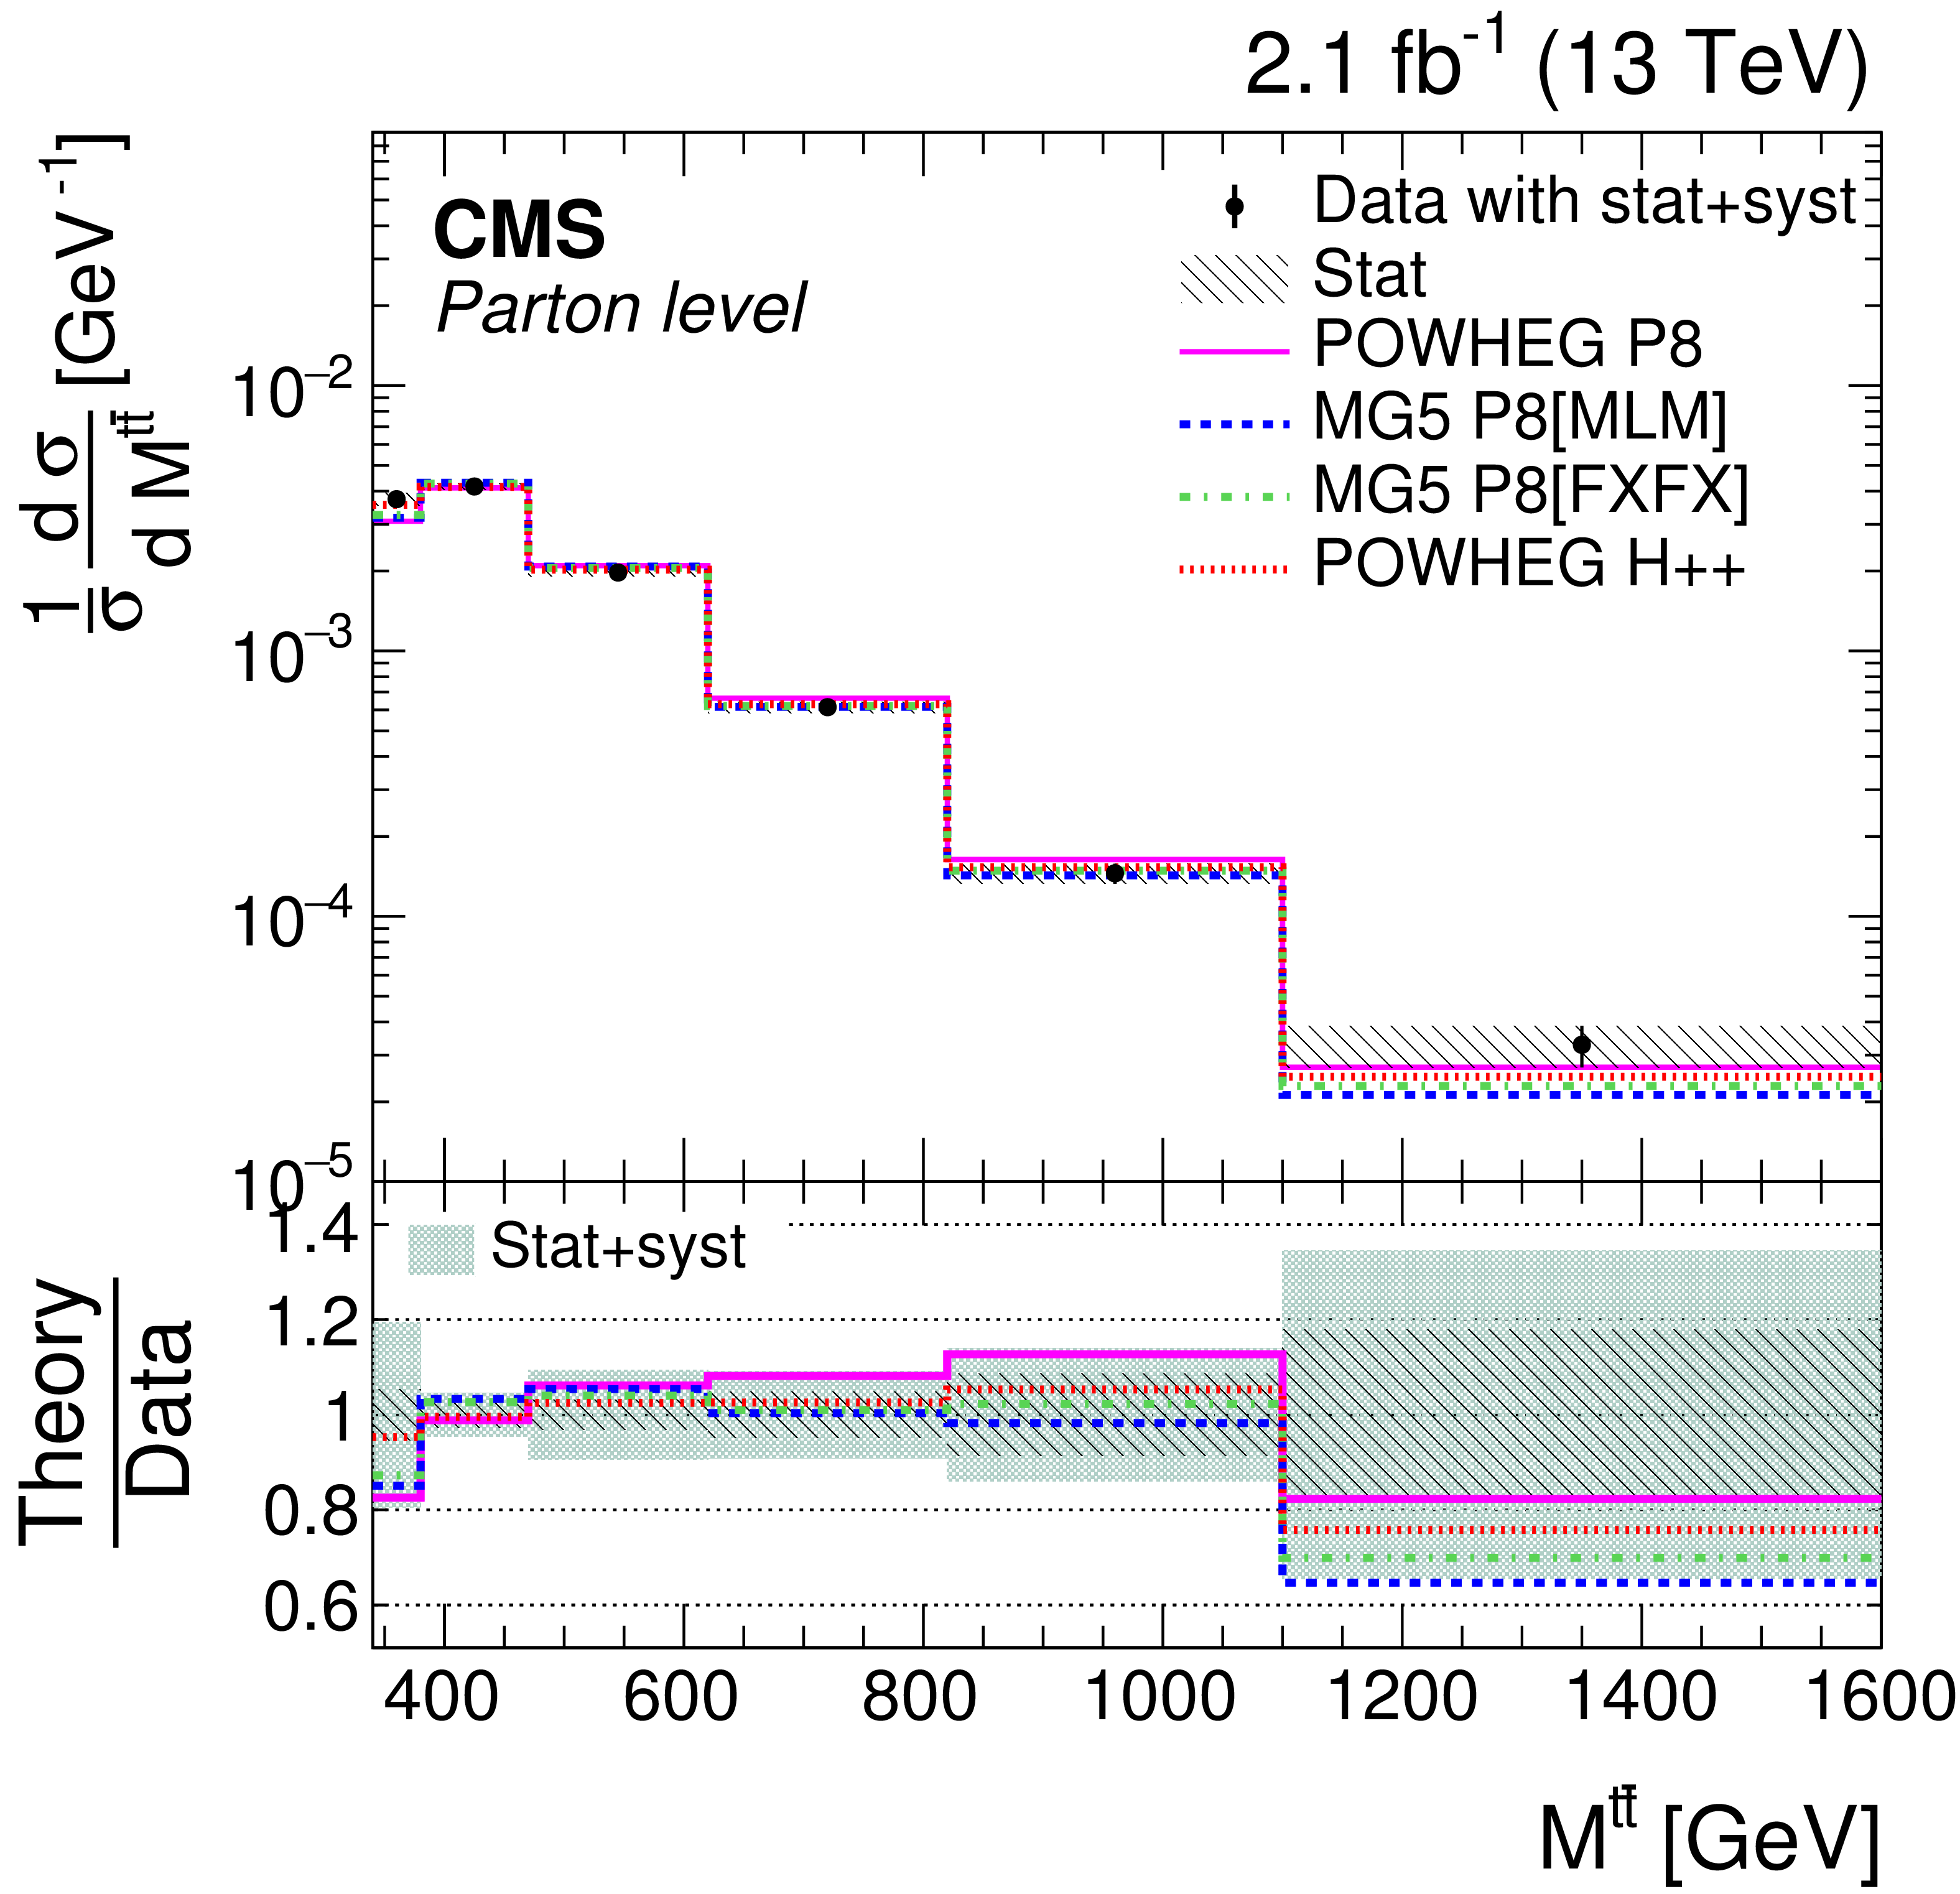
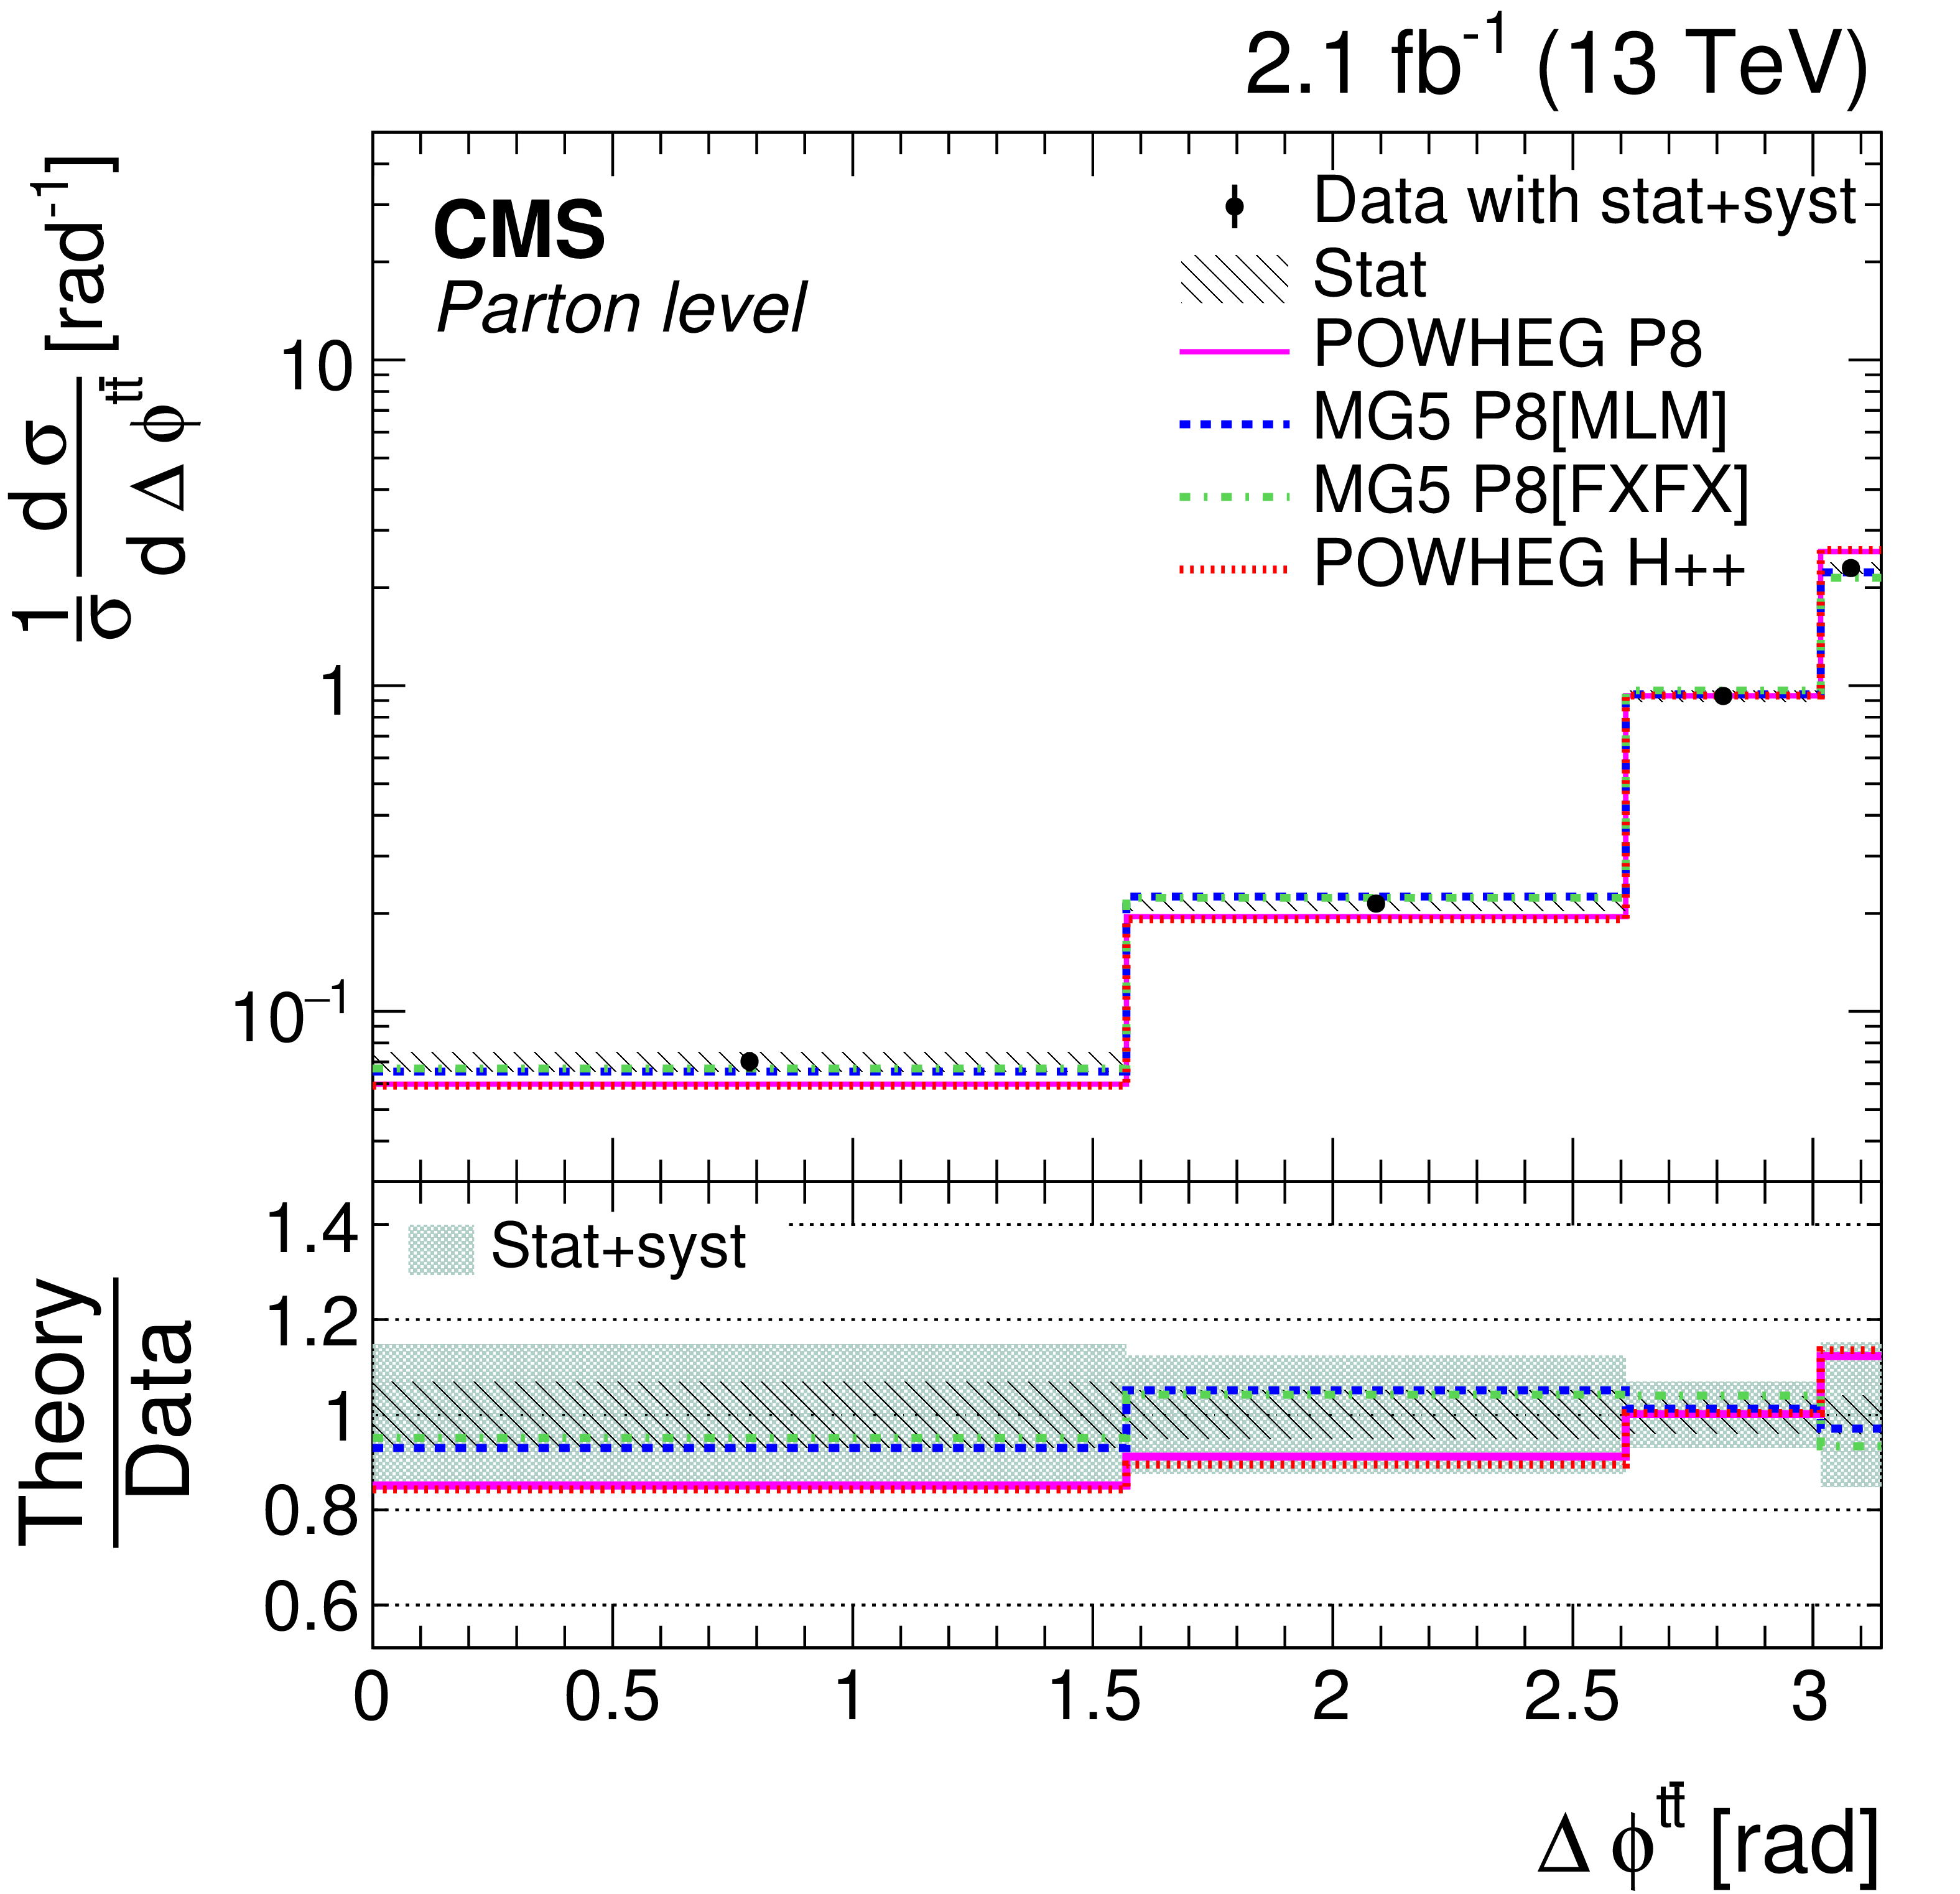
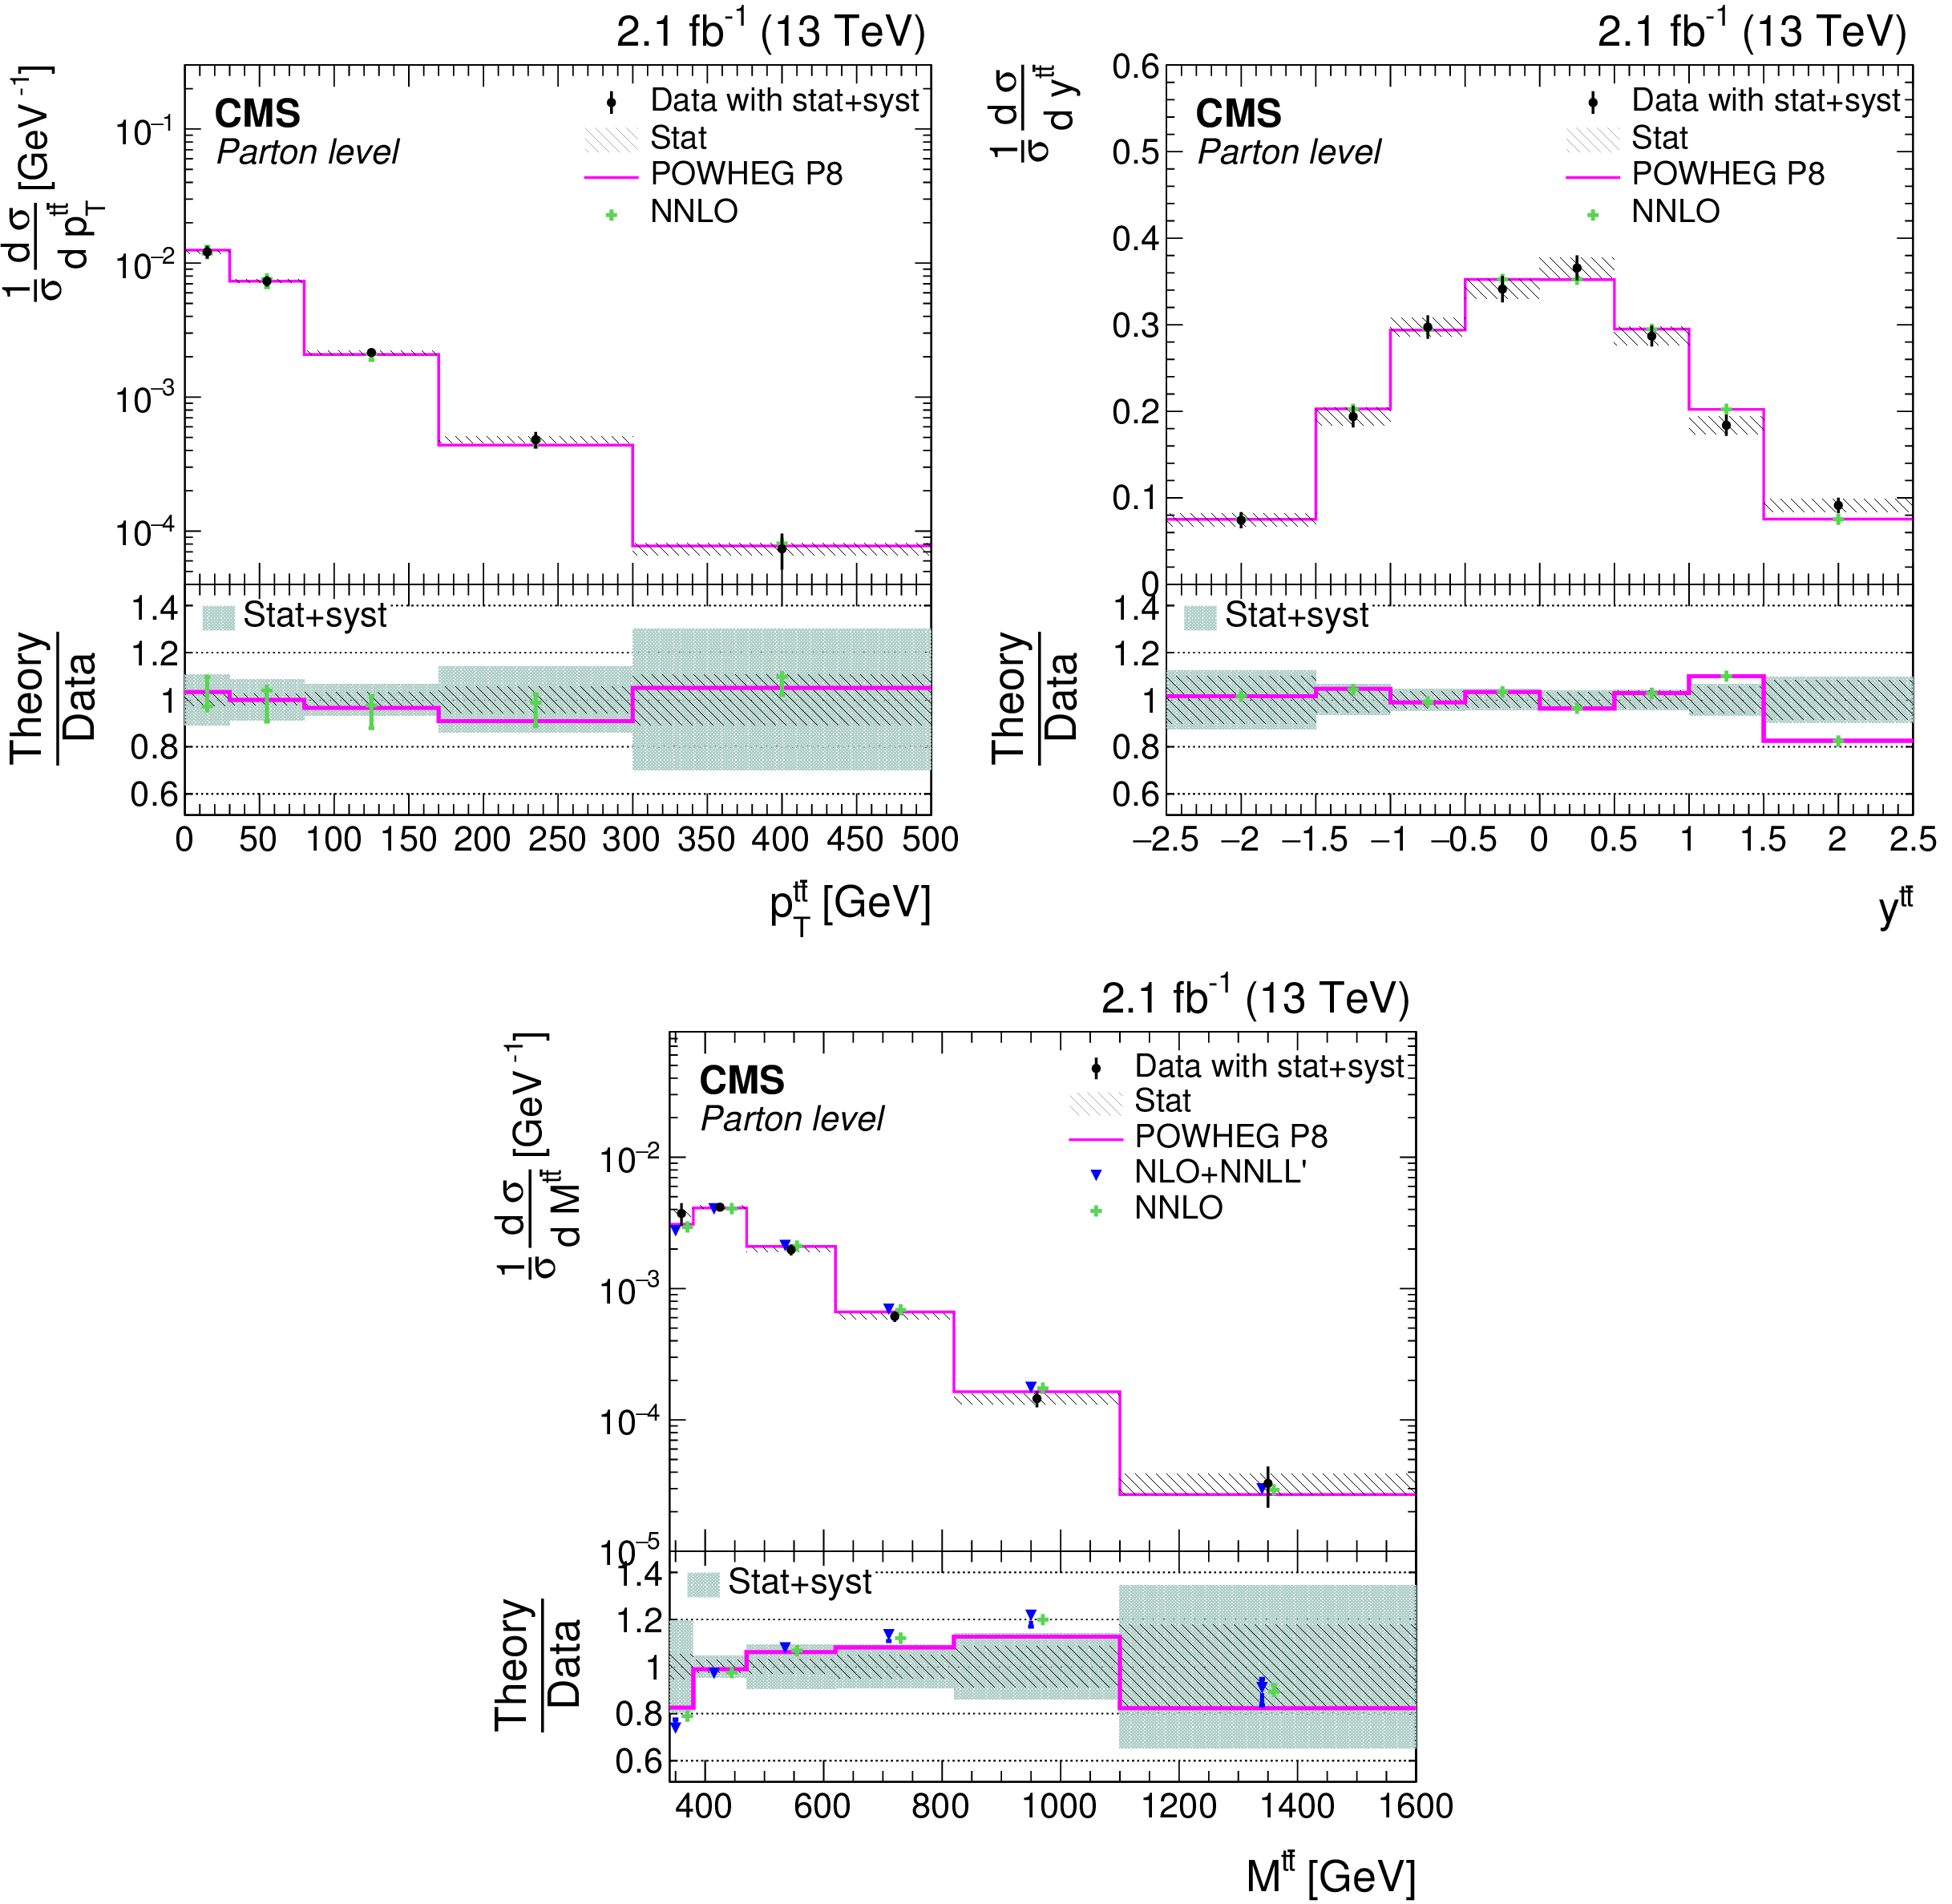
Figure 6:
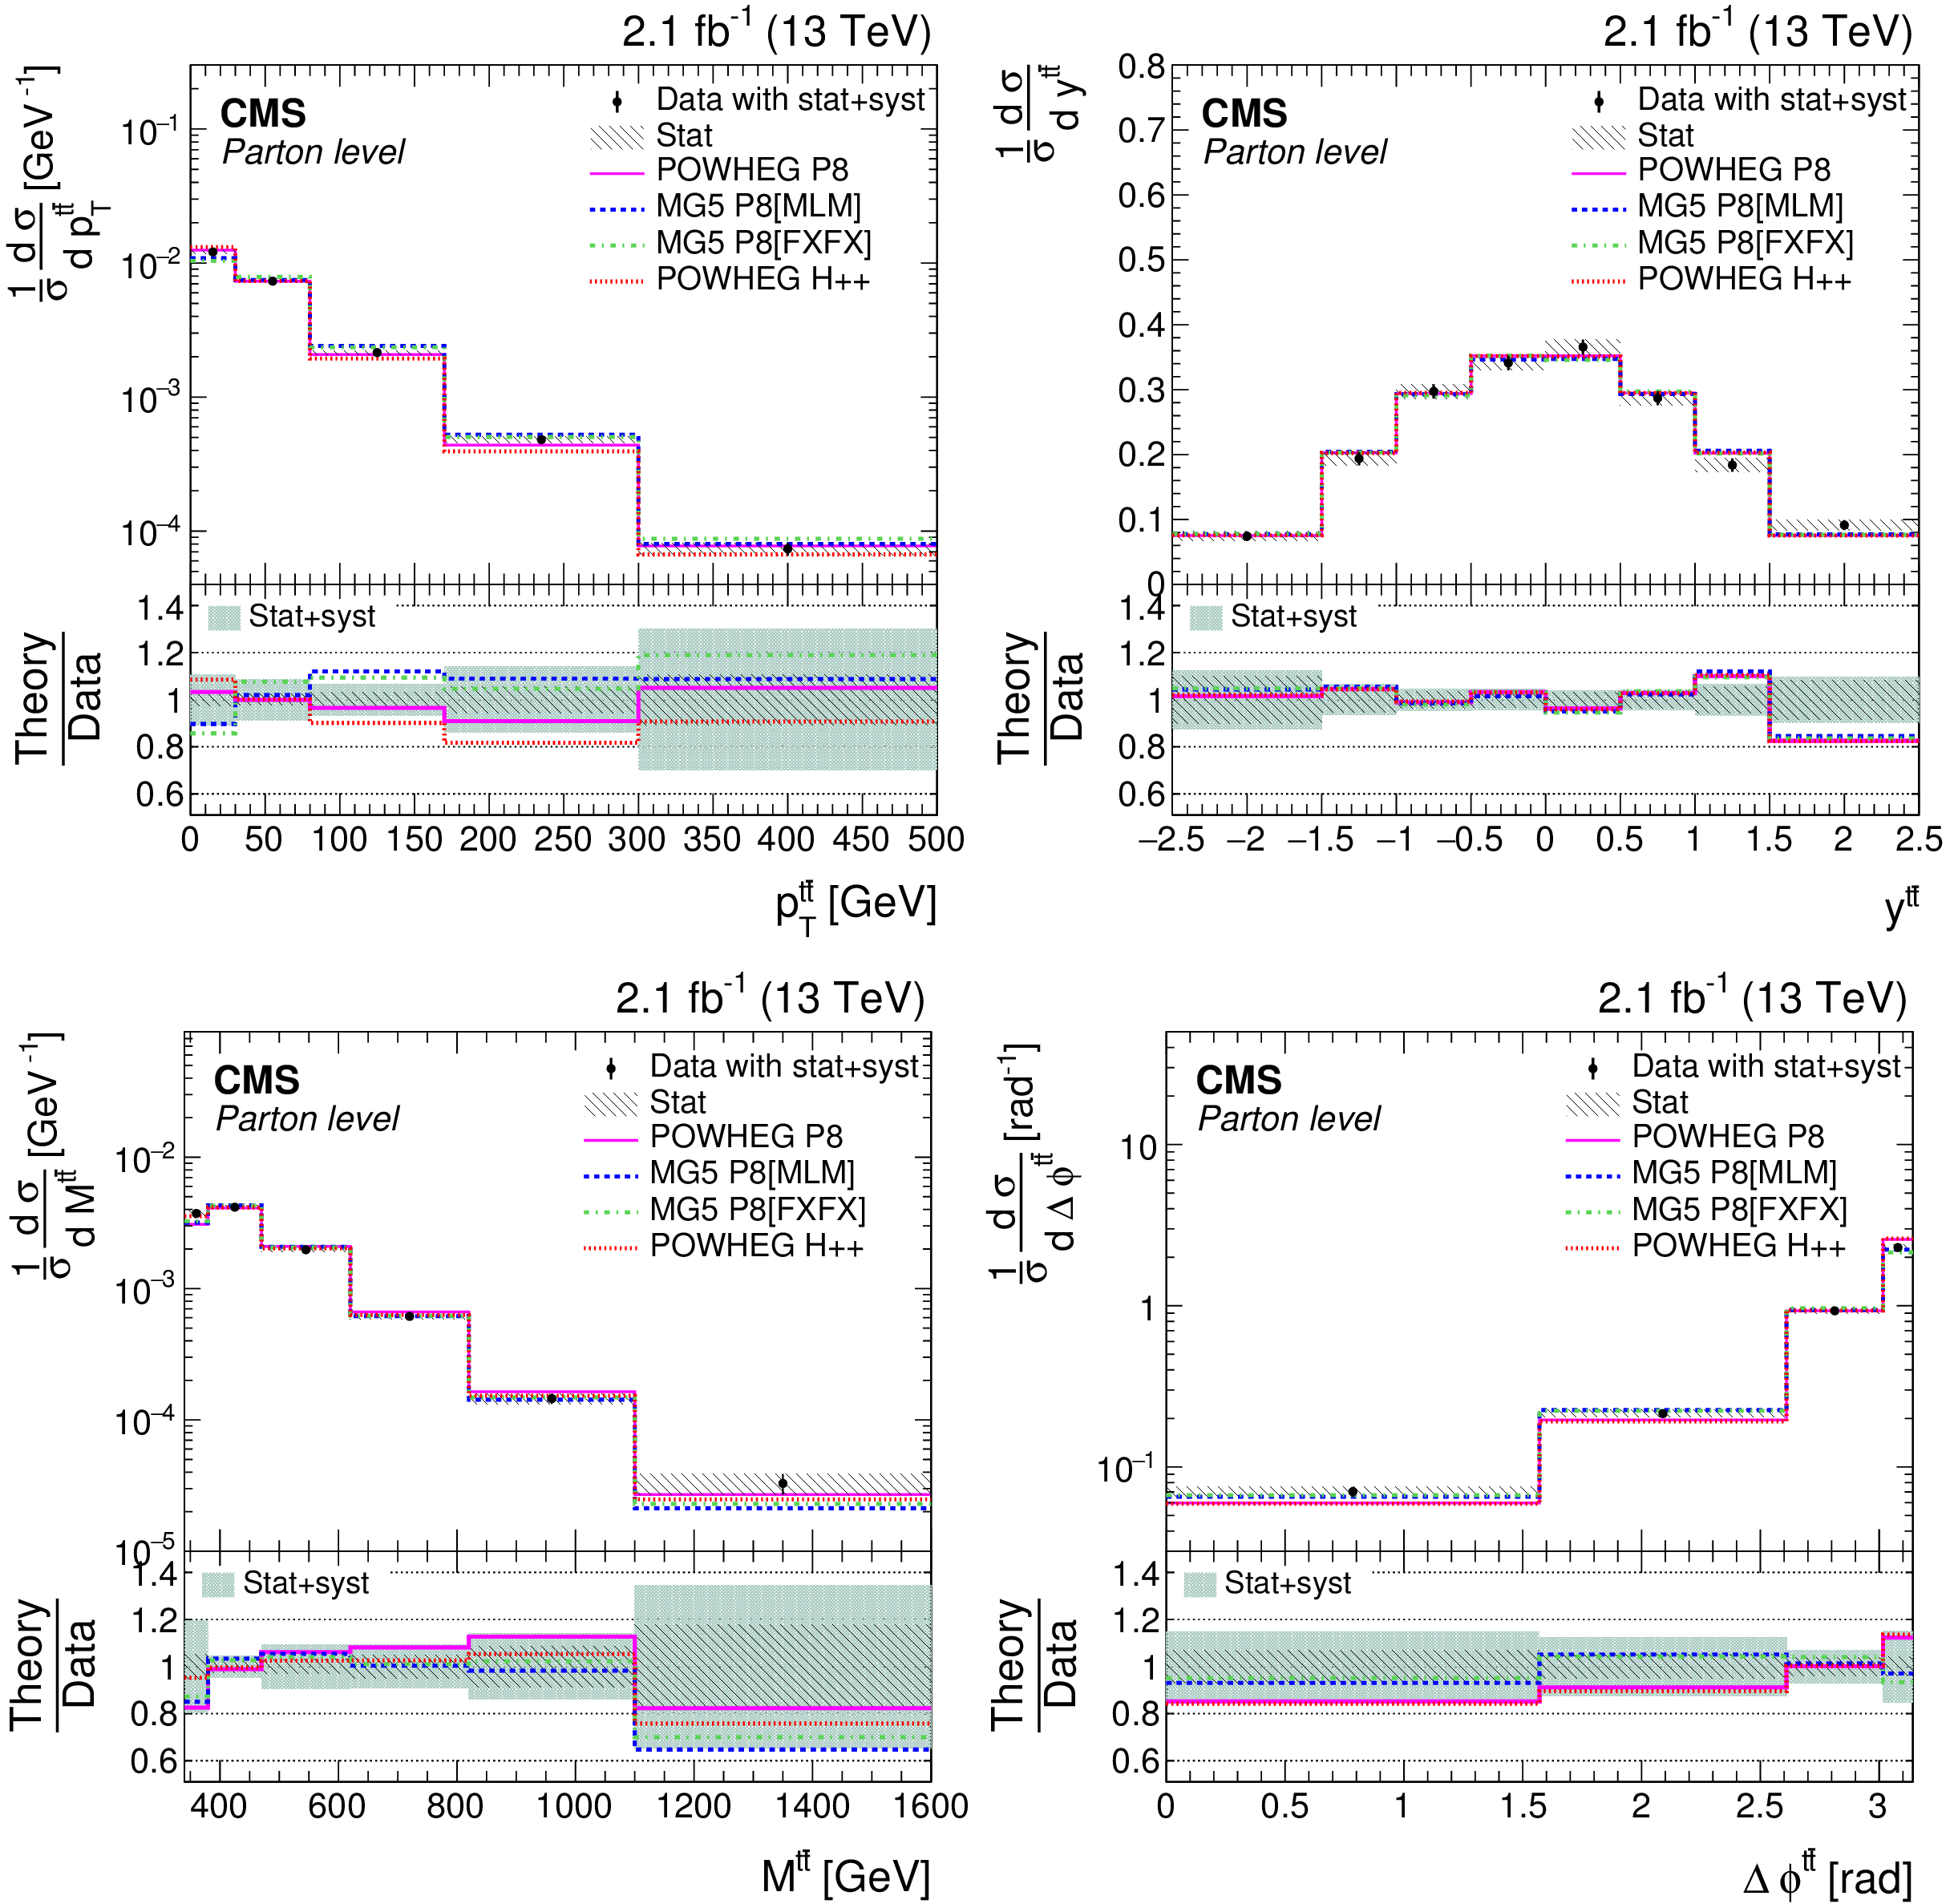
Normalized differential $ {\mathrm{ t } {}\mathrm{ \bar{t} } } $ cross sections as a function of $ {p_{\mathrm {T}}^{{{\mathrm{ t } {}\mathrm{ \bar{t} } } }}} $ (upper left), $ {y^{{\mathrm{ t } {}\mathrm{ \bar{t} } } }} $ (upper right), $ {M^{{\mathrm{ t } {}\mathrm{ \bar{t} } } }} $ (lower left), and $ {\Delta \phi ^{{\mathrm{ t } {}\mathrm{ \bar{t} } } }} $ (lower right), measured at the parton level in the full phase space. The measured data are compared to different standard model predictions from POWHEG+PYTHIA 8 (POWHEG P8), MG5_aMC@NLO+PYTHIA 8[MLM] (MG5 P8 [MLM]), MG5_aMC@NLO+PYTHIA 8[FXFX] (MG5 P8 [FXFX]), and POWHEG+HERWIG++ (POWHEG H++). The vertical bars on the data points indicate the total (combined statistical and systematic) uncertainties while the hatched band shows the statistical uncertainty. The lower panel gives the ratio of the theoretical predictions to the data. The light-shaded band displays the combined statistical and systematic uncertainties added in quadrature. |
png pdf |
Figure 6-a:
Normalized differential $ {\mathrm{ t } {}\mathrm{ \bar{t} } } $ cross sections as a function of $ {p_{\mathrm {T}}^{{{\mathrm{ t } {}\mathrm{ \bar{t} } } }}} $, measured at the parton level in the full phase space. The measured data are compared to different standard model predictions from POWHEG+PYTHIA 8 (POWHEG P8), MG5_aMC@NLO+PYTHIA 8[MLM] (MG5 P8 [MLM]), MG5_aMC@NLO+PYTHIA 8[FXFX] (MG5 P8 [FXFX]), and POWHEG+HERWIG++ (POWHEG H++). The vertical bars on the data points indicate the total (combined statistical and systematic) uncertainties while the hatched band shows the statistical uncertainty. The lower panel gives the ratio of the theoretical predictions to the data. The light-shaded band displays the combined statistical and systematic uncertainties added in quadrature. |
png pdf |
Figure 6-b:
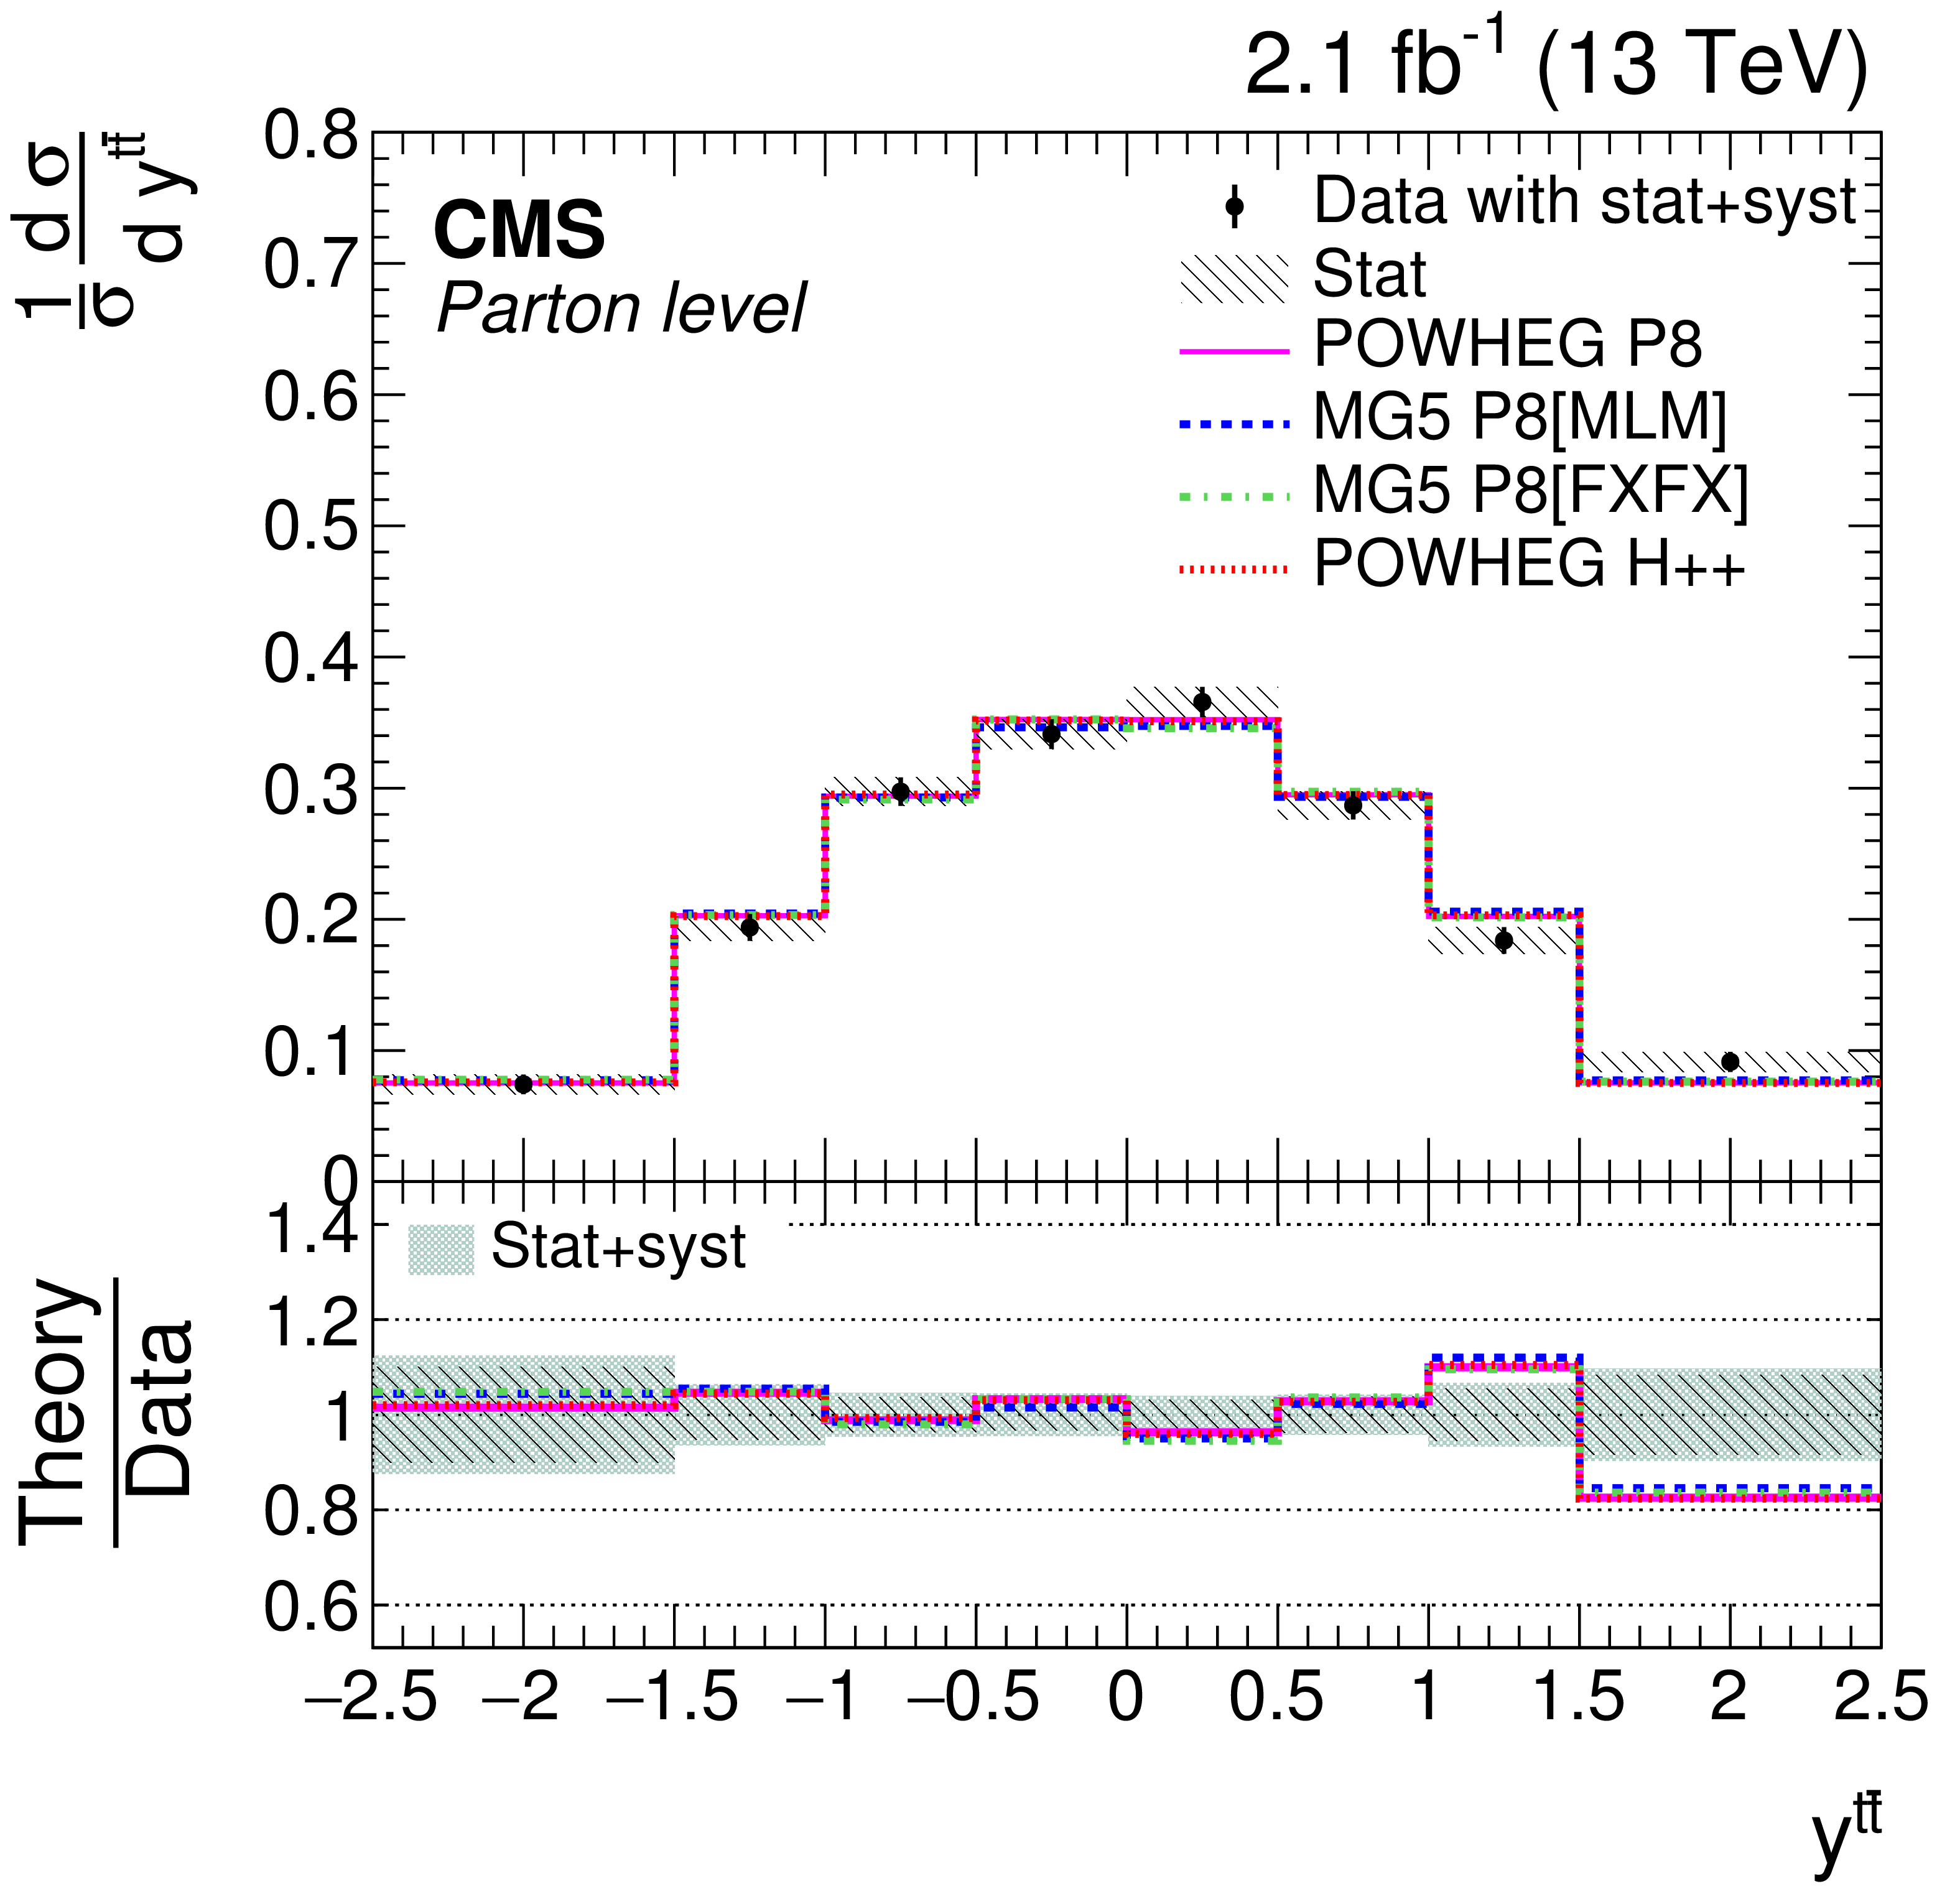
Normalized differential $ {\mathrm{ t } {}\mathrm{ \bar{t} } } $ cross sections as a function of $ {y^{{\mathrm{ t } {}\mathrm{ \bar{t} } } }} $, measured at the parton level in the full phase space. The measured data are compared to different standard model predictions from POWHEG+PYTHIA 8 (POWHEG P8), MG5_aMC@NLO+PYTHIA 8[MLM] (MG5 P8 [MLM]), MG5_aMC@NLO+PYTHIA 8[FXFX] (MG5 P8 [FXFX]), and POWHEG+HERWIG++ (POWHEG H++). The vertical bars on the data points indicate the total (combined statistical and systematic) uncertainties while the hatched band shows the statistical uncertainty. The lower panel gives the ratio of the theoretical predictions to the data. The light-shaded band displays the combined statistical and systematic uncertainties added in quadrature. |
png pdf |
Figure 6-c:
Normalized differential $ {\mathrm{ t } {}\mathrm{ \bar{t} } } $ cross sections as a function of $ {M^{{\mathrm{ t } {}\mathrm{ \bar{t} } } }} $, measured at the parton level in the full phase space. The measured data are compared to different standard model predictions from POWHEG+PYTHIA 8 (POWHEG P8), MG5_aMC@NLO+PYTHIA 8[MLM] (MG5 P8 [MLM]), MG5_aMC@NLO+PYTHIA 8[FXFX] (MG5 P8 [FXFX]), and POWHEG+HERWIG++ (POWHEG H++). The vertical bars on the data points indicate the total (combined statistical and systematic) uncertainties while the hatched band shows the statistical uncertainty. The lower panel gives the ratio of the theoretical predictions to the data. The light-shaded band displays the combined statistical and systematic uncertainties added in quadrature. |
png pdf |
Figure 6-d:
Normalized differential $ {\mathrm{ t } {}\mathrm{ \bar{t} } } $ cross sections as a function of $ {\Delta \phi ^{{\mathrm{ t } {}\mathrm{ \bar{t} } } }} $, measured at the parton level in the full phase space. The measured data are compared to different standard model predictions from POWHEG+PYTHIA 8 (POWHEG P8), MG5_aMC@NLO+PYTHIA 8[MLM] (MG5 P8 [MLM]), MG5_aMC@NLO+PYTHIA 8[FXFX] (MG5 P8 [FXFX]), and POWHEG+HERWIG++ (POWHEG H++). The vertical bars on the data points indicate the total (combined statistical and systematic) uncertainties while the hatched band shows the statistical uncertainty. The lower panel gives the ratio of the theoretical predictions to the data. The light-shaded band displays the combined statistical and systematic uncertainties added in quadrature. |

png pdf |
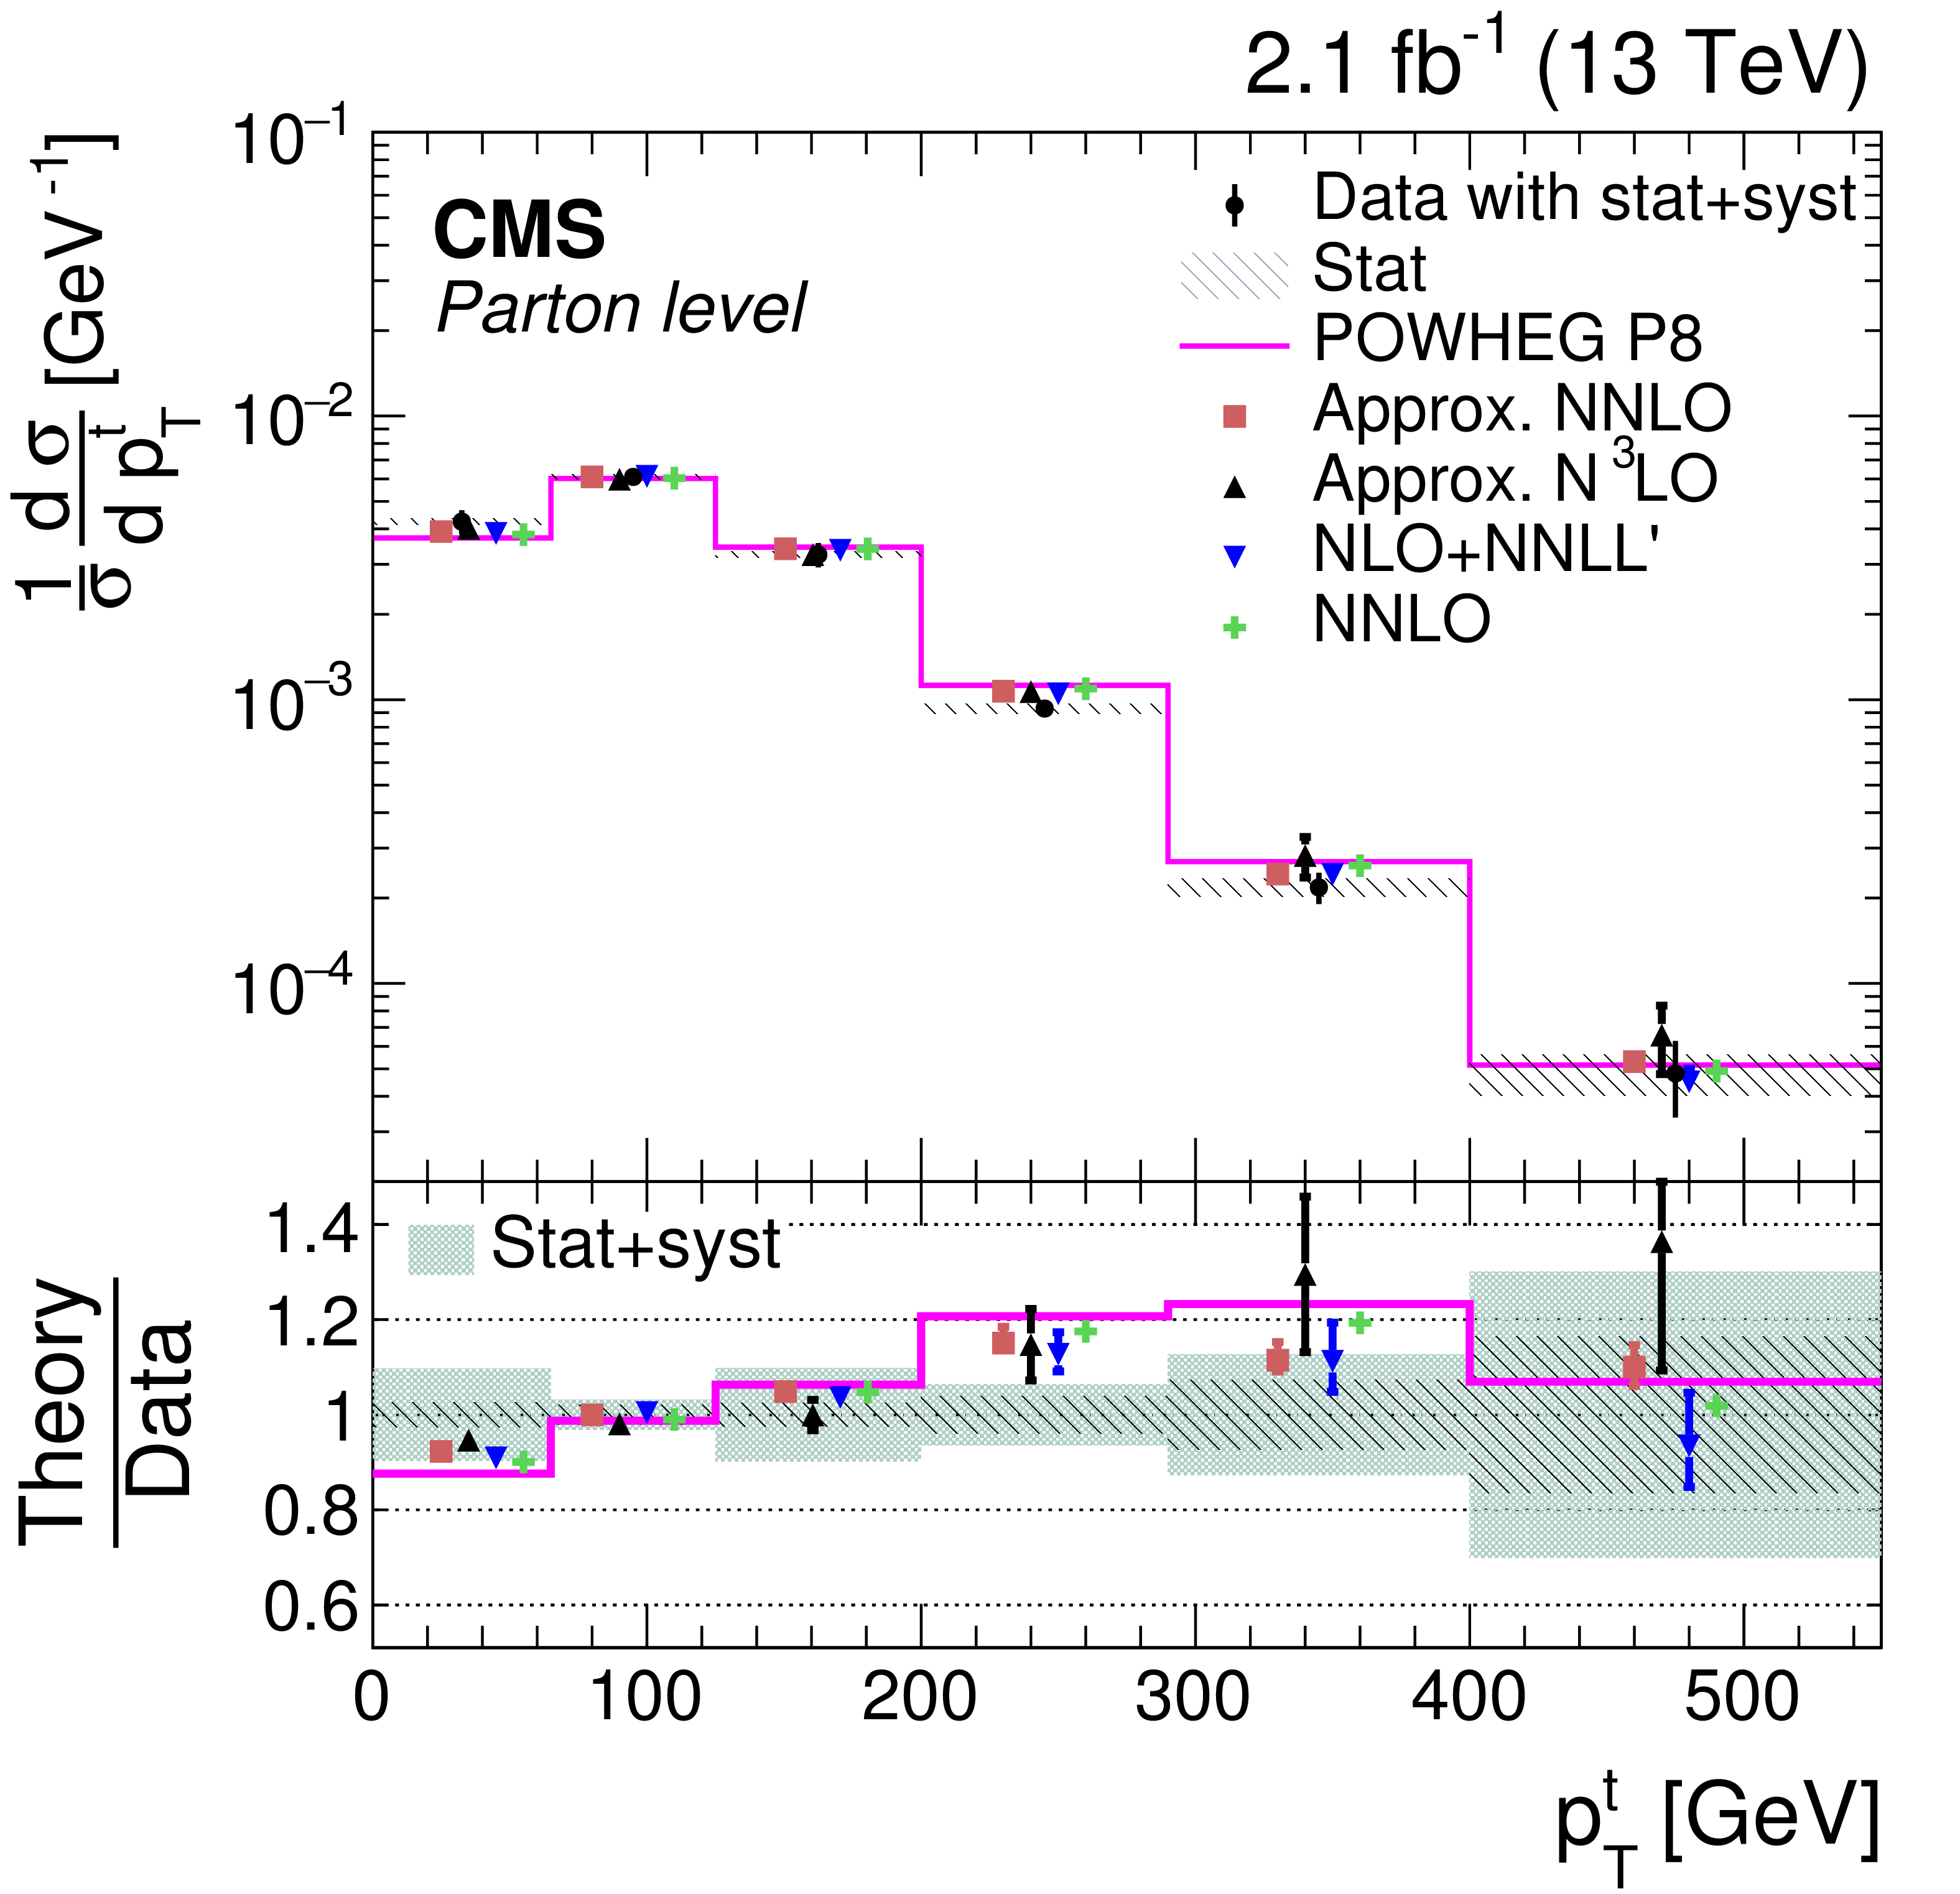
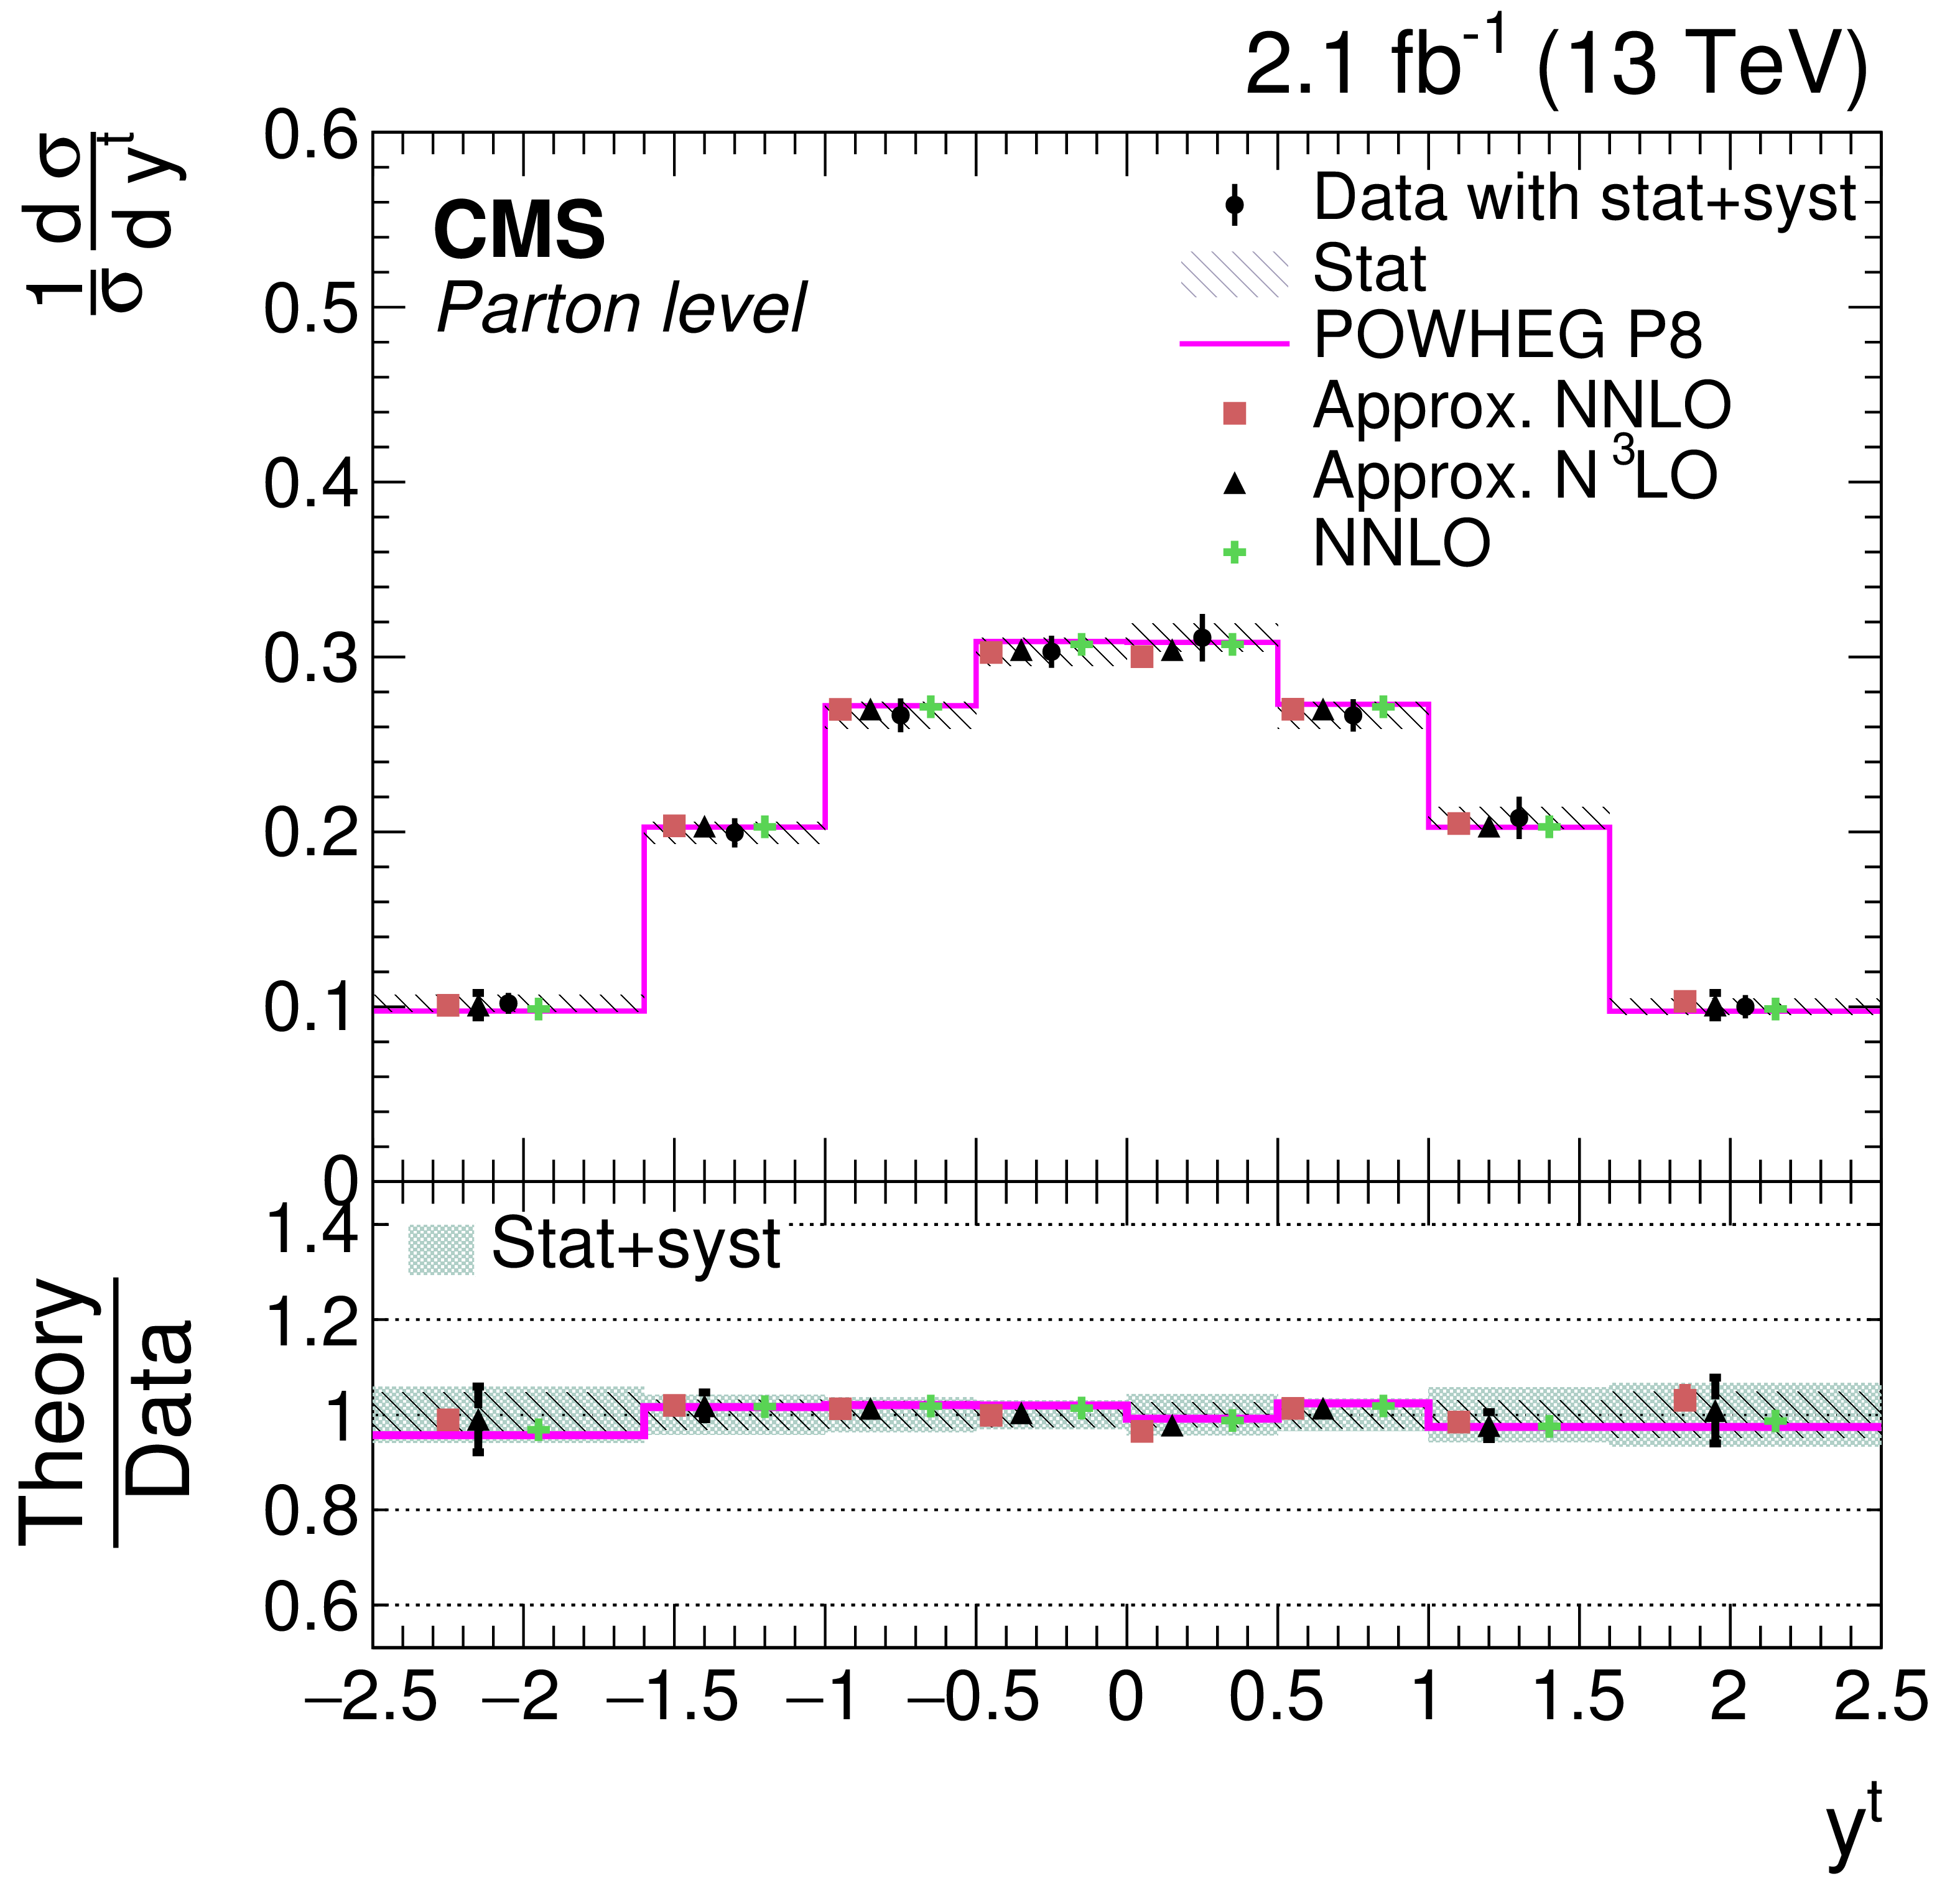
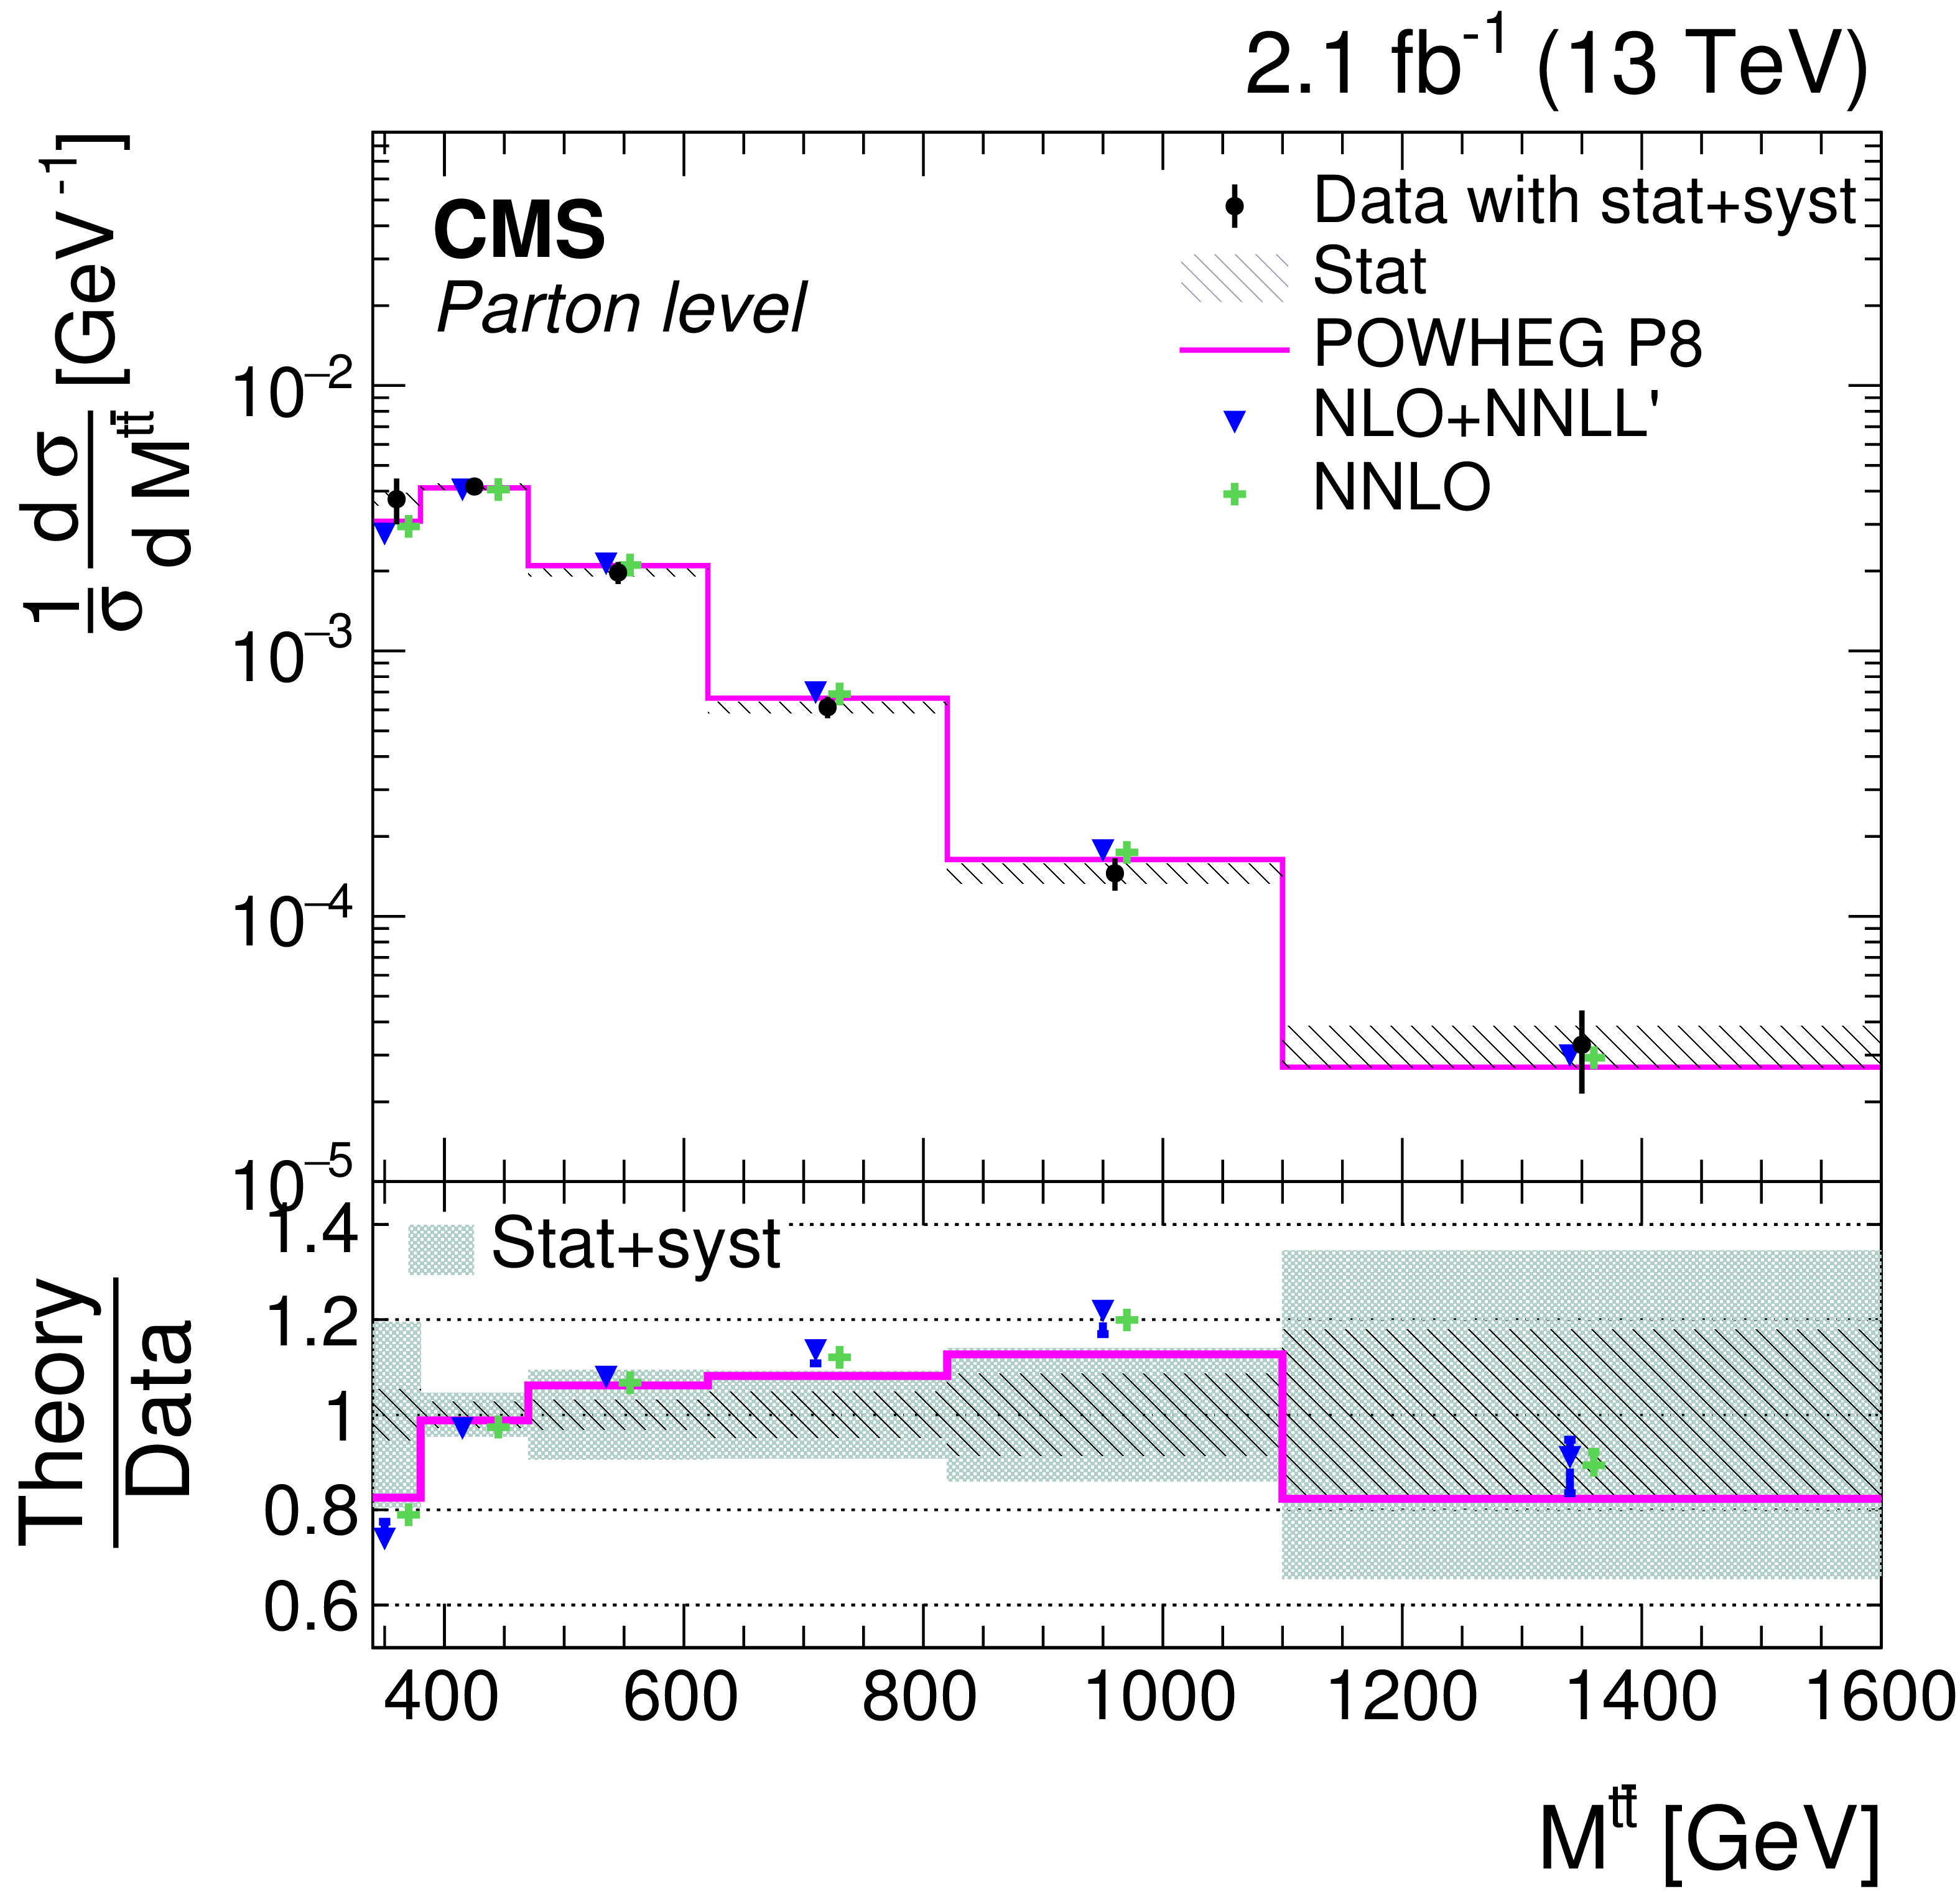
Figure 7:
Normalized differential $ {\mathrm{ t } {}\mathrm{ \bar{t} } } $ cross sections as a function of top quark $ {p_{\mathrm {T}}} $ (left) and top quark rapidity (right), measured at the parton level in the full phase space and combining the distributions for top quarks and antiquarks. The vertical bars on the data points indicate the total (combined statistical and systematic) uncertainties, while the hatched band shows the statistical uncertainty. The measurements are compared to different perturbative QCD calculations of an approximate NNLO [59], an approximate next-to-NNLO (N$^{3}$LO) [60], an improved NLO+NNLL (NLO+NNLL') [62], and a full NNLO [63]. The lower panel gives the ratio of the theoretical predictions to the data. |
png pdf |
Figure 7-a:
Normalized differential $ {\mathrm{ t } {}\mathrm{ \bar{t} } } $ cross sections as a function of top quark $ {p_{\mathrm {T}}} $, measured at the parton level in the full phase space and combining the distributions for top quarks and antiquarks. The vertical bars on the data points indicate the total (combined statistical and systematic) uncertainties, while the hatched band shows the statistical uncertainty. The measurements are compared to different perturbative QCD calculations of an approximate NNLO [59], an approximate next-to-NNLO (N$^{3}$LO) [60], an improved NLO+NNLL (NLO+NNLL') [62], and a full NNLO [63]. The lower panel gives the ratio of the theoretical predictions to the data. |
png pdf |
Figure 7-b:
Normalized differential $ {\mathrm{ t } {}\mathrm{ \bar{t} } } $ cross sections as a function of top quark rapidity, measured at the parton level in the full phase space and combining the distributions for top quarks and antiquarks. The vertical bars on the data points indicate the total (combined statistical and systematic) uncertainties, while the hatched band shows the statistical uncertainty. The measurements are compared to different perturbative QCD calculations of an approximate NNLO [59], an approximate next-to-NNLO (N$^{3}$LO) [60], an improved NLO+NNLL (NLO+NNLL') [62], and a full NNLO [63]. The lower panel gives the ratio of the theoretical predictions to the data. |
png pdf |
Figure 8:
Normalized differential $ {\mathrm{ t } {}\mathrm{ \bar{t} } } $ cross sections as a function of $ {p_{\mathrm {T}}^{{{\mathrm{ t } {}\mathrm{ \bar{t} } } }}} $ (upper left), $ {y^{{\mathrm{ t } {}\mathrm{ \bar{t} } } }} $ (upper right), and $ {M^{{\mathrm{ t } {}\mathrm{ \bar{t} } } }} $ (lower) for the top quarks or antiquarks, measured at parton level in the full phase space. The vertical bars on the data points indicate the total (combined statistical and systematic) uncertainties, while the hatched band shows the statistical uncertainty. The measurements are compared to different perturbative QCD calculations of an improved NLO+NNLL (NLO+NNLL') [62] and a full NNLO [63]. The lower panel gives the ratio of the theoretical predictions to the data. |
png pdf |
Figure 8-a:
Normalized differential $ {\mathrm{ t } {}\mathrm{ \bar{t} } } $ cross sections as a function of $ {p_{\mathrm {T}}^{{{\mathrm{ t } {}\mathrm{ \bar{t} } } }}} $ for the top quarks or antiquarks, measured at parton level in the full phase space. The vertical bars on the data points indicate the total (combined statistical and systematic) uncertainties, while the hatched band shows the statistical uncertainty. The measurements are compared to different perturbative QCD calculations of an improved NLO+NNLL (NLO+NNLL') [62] and a full NNLO [63]. The lower panel gives the ratio of the theoretical predictions to the data. |

png pdf |
Figure 8-b:
Normalized differential $ {\mathrm{ t } {}\mathrm{ \bar{t} } } $ cross sections as a function of $ {y^{{\mathrm{ t } {}\mathrm{ \bar{t} } } }} $ for the top quarks or antiquarks, measured at parton level in the full phase space. The vertical bars on the data points indicate the total (combined statistical and systematic) uncertainties, while the hatched band shows the statistical uncertainty. The measurements are compared to different perturbative QCD calculations of an improved NLO+NNLL (NLO+NNLL') [62] and a full NNLO [63]. The lower panel gives the ratio of the theoretical predictions to the data. |
png pdf |
Figure 8-c:
Normalized differential $ {\mathrm{ t } {}\mathrm{ \bar{t} } } $ cross sections as a function of $ {M^{{\mathrm{ t } {}\mathrm{ \bar{t} } } }} $ for the top quarks or antiquarks, measured at parton level in the full phase space. The vertical bars on the data points indicate the total (combined statistical and systematic) uncertainties, while the hatched band shows the statistical uncertainty. The measurements are compared to different perturbative QCD calculations of an improved NLO+NNLL (NLO+NNLL') [62] and a full NNLO [63]. The lower panel gives the ratio of the theoretical predictions to the data. |
| Tables | |
png pdf |
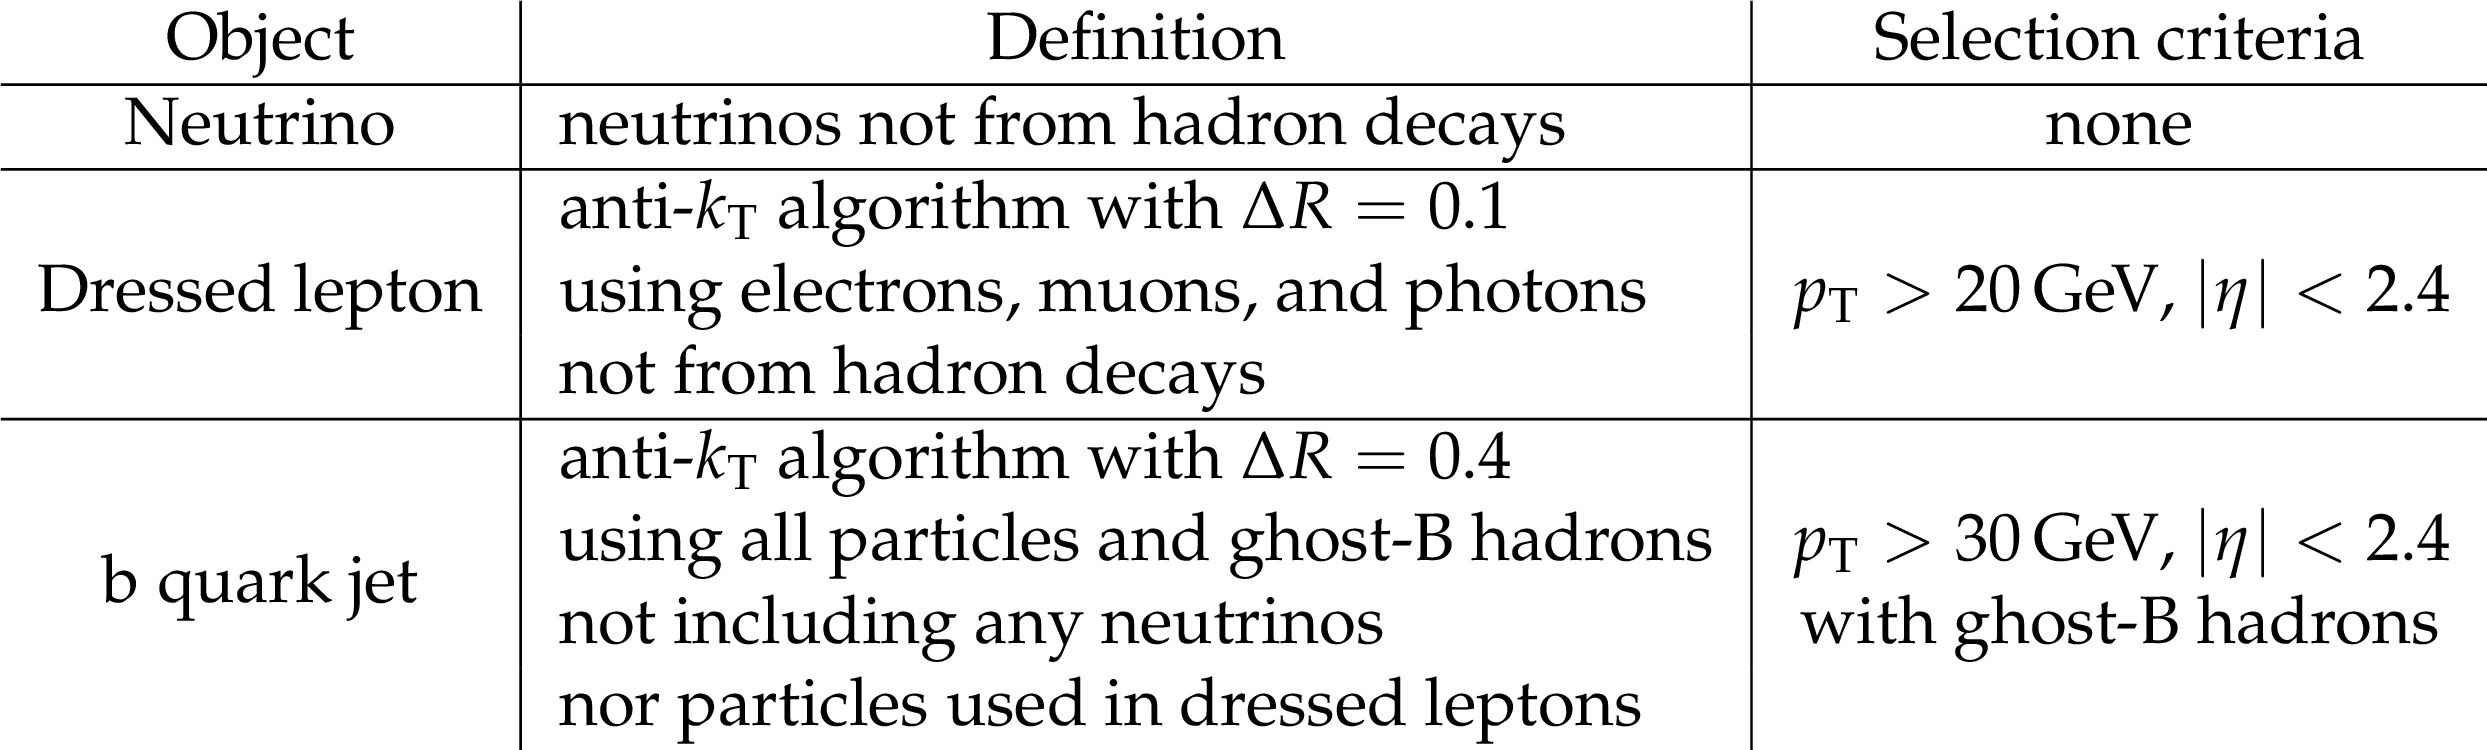
Table 1:
Summary of the object definitions at the particle level. |
png pdf |
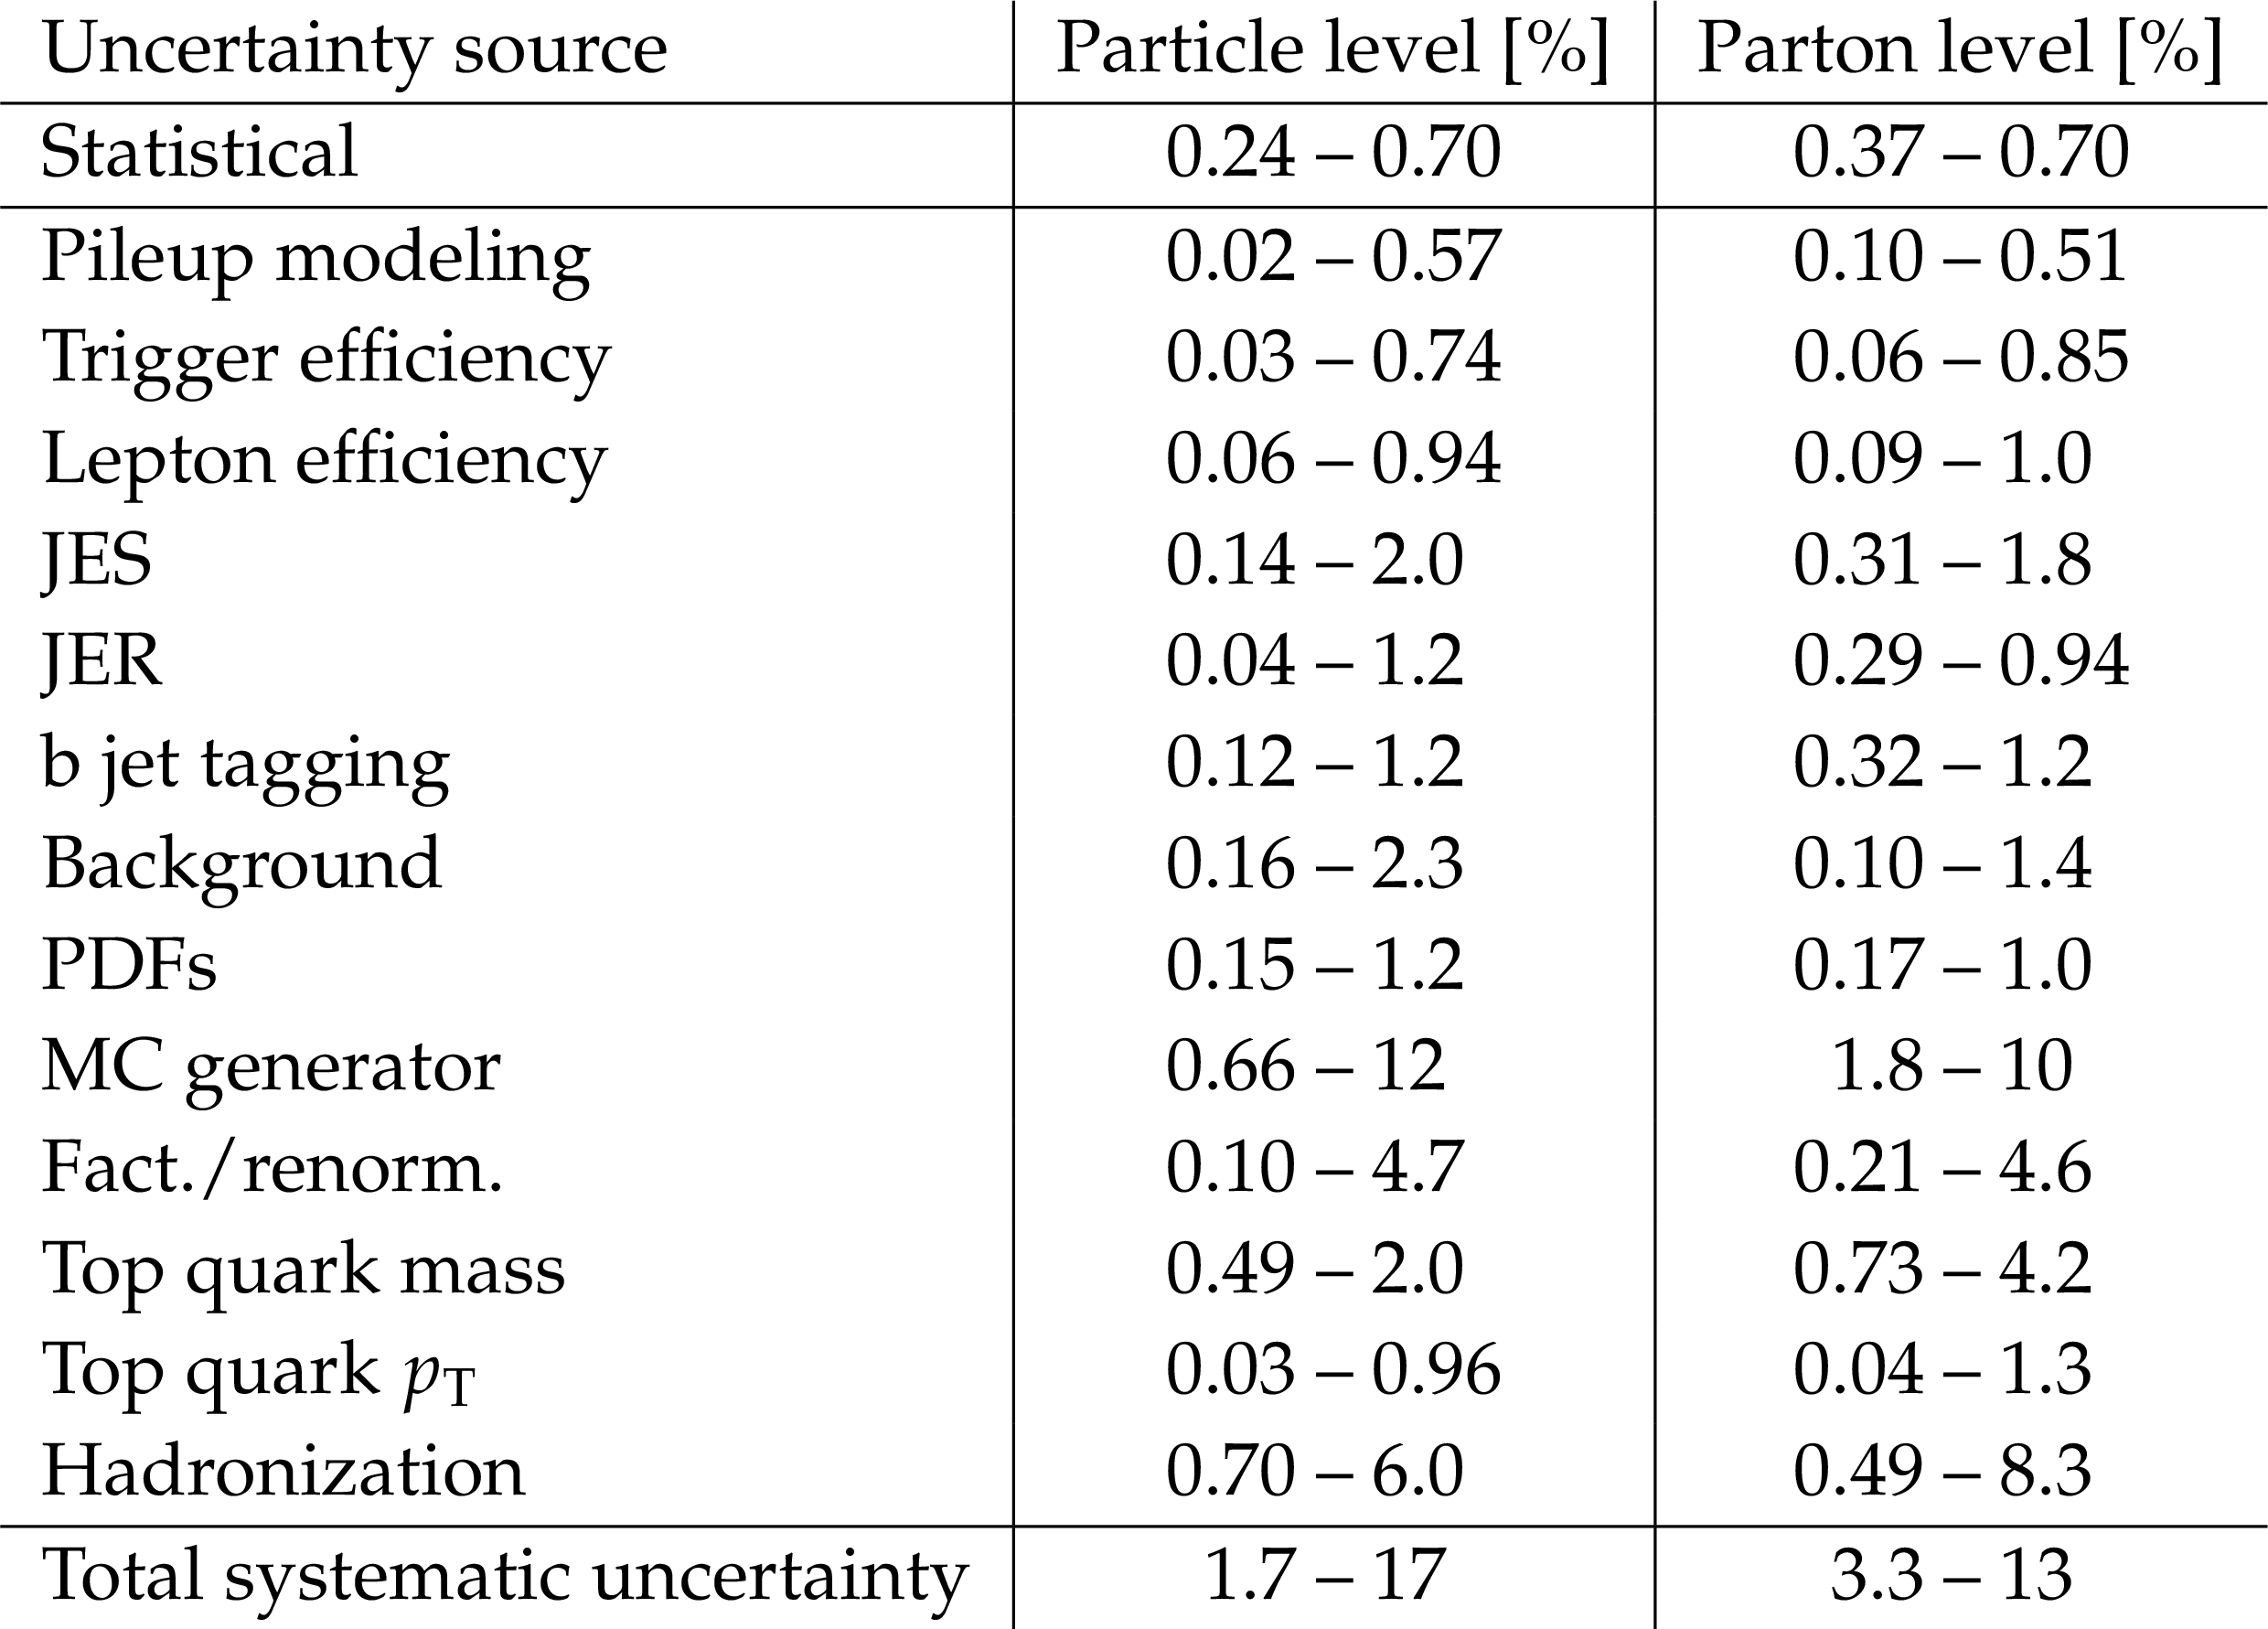
Table 2:
Statistical and systematic uncertainties in the normalized $ {\mathrm{ t } {}\mathrm{ \bar{t} } } $ differential cross sections at particle and parton levels. The uncertainty sources and the corresponding range of the median uncertainty of each distribution are shown in percent. |
png pdf |
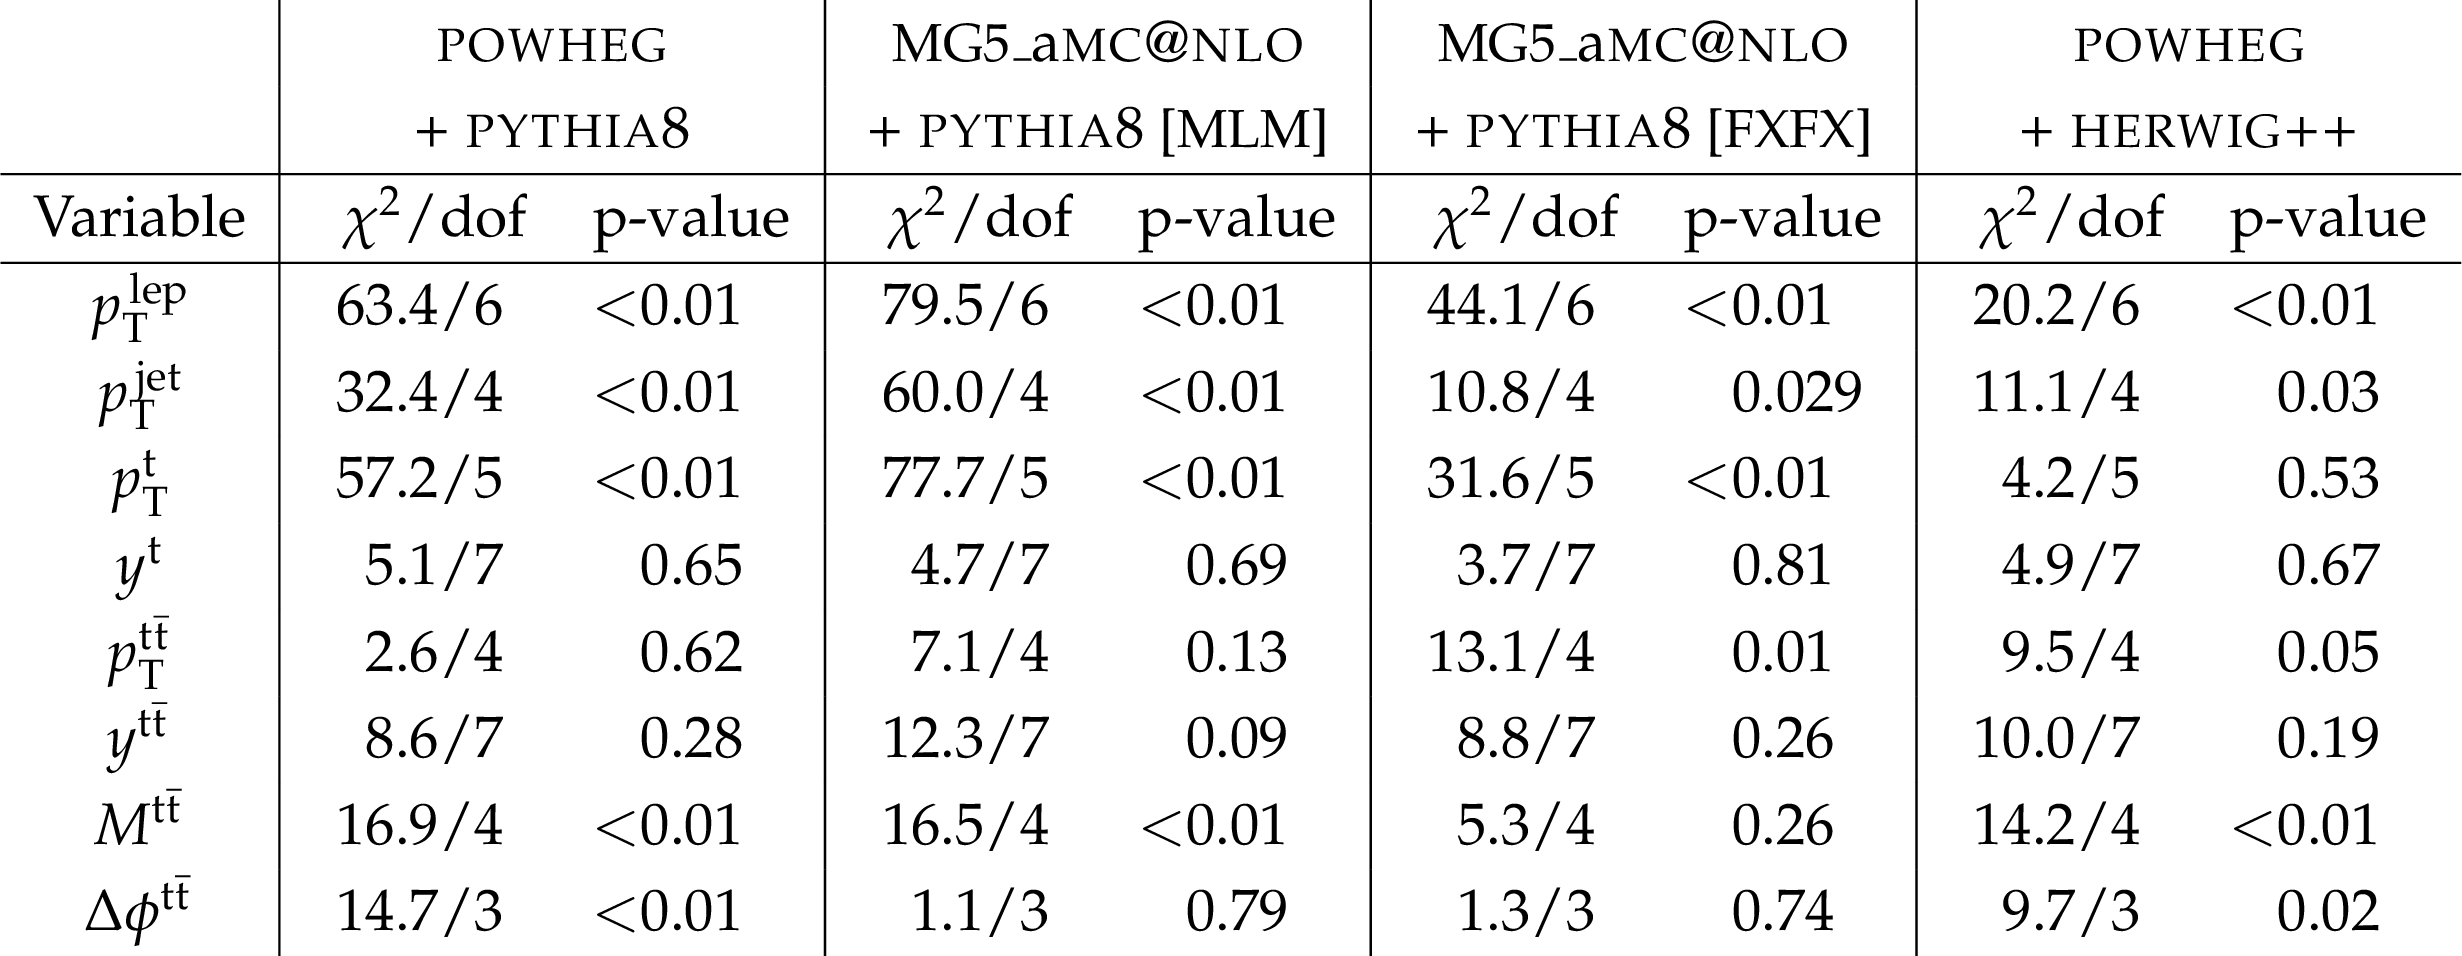
Table 3:
The $\chi ^{2}/$dof and $\rm p$-values for the comparison of the measured normalized $ {\mathrm{ t } {}\mathrm{ \bar{t} } } $ differential cross sections with different model predictions at the particle level for each of the kinematic variables. |
png pdf |
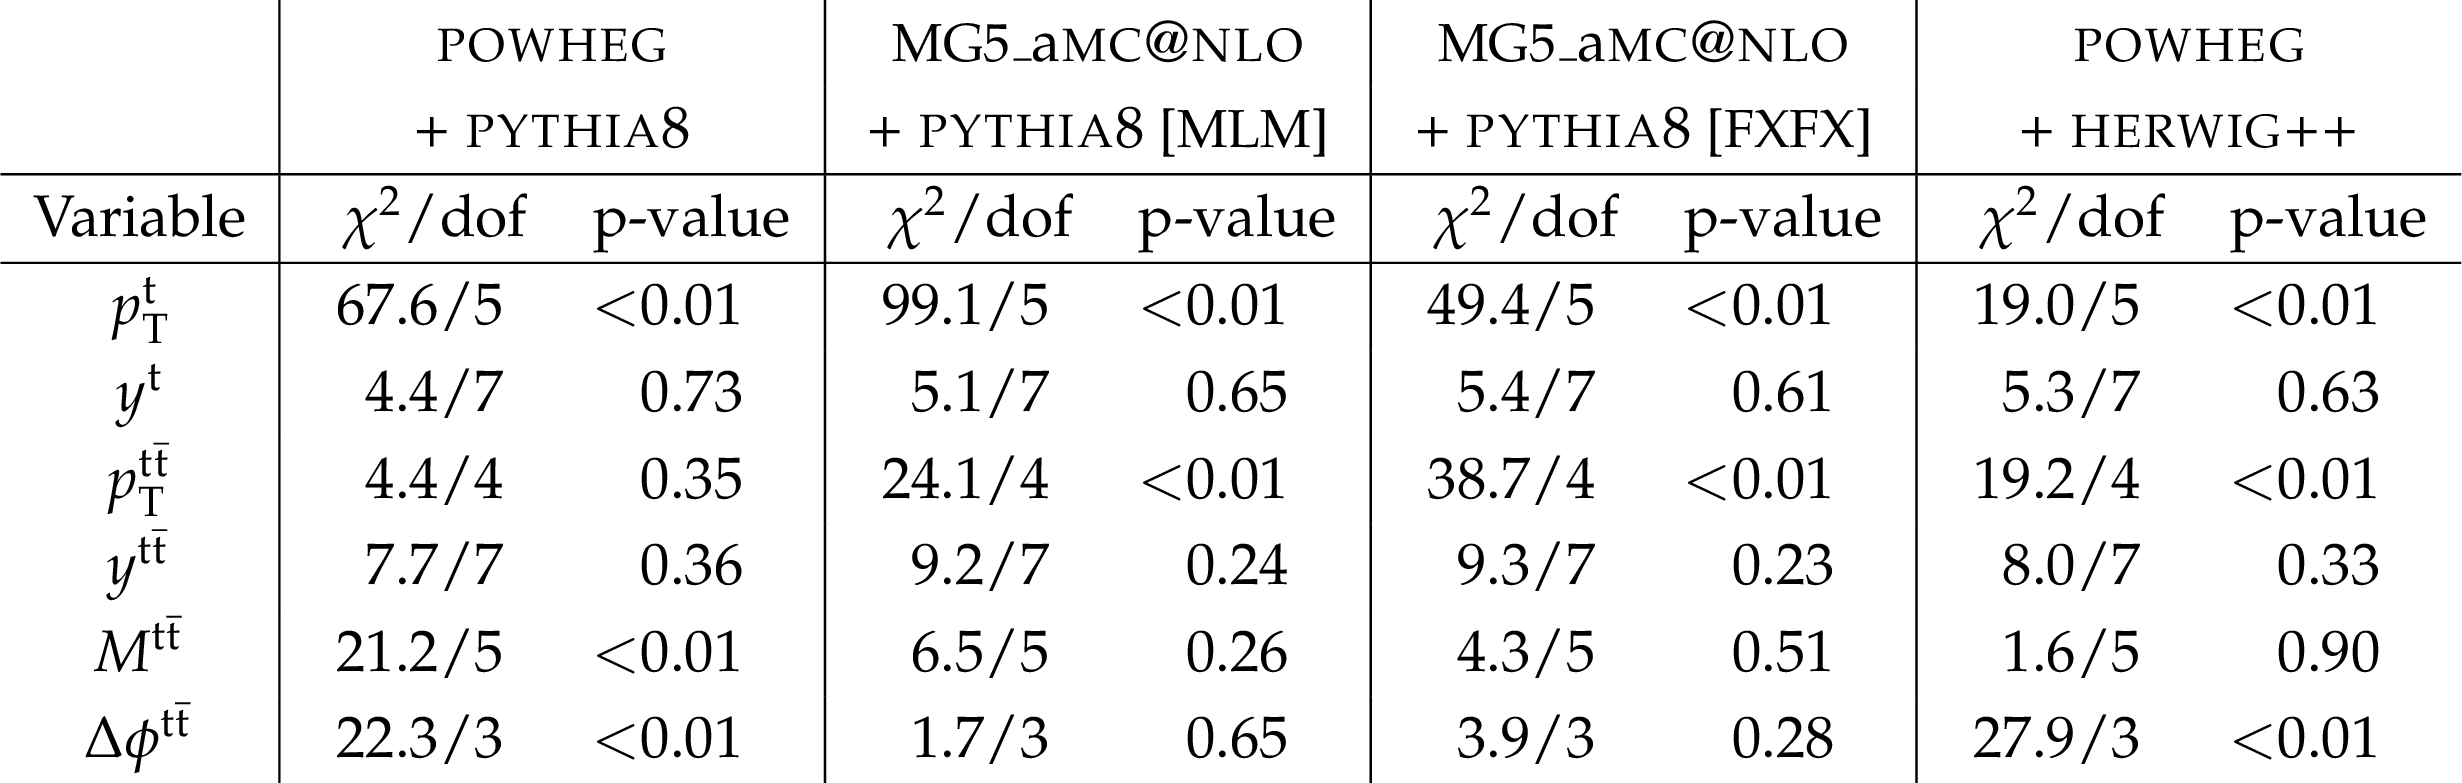
Table 4:
The $\chi ^{2}/$dof and $\rm p$-values for the comparison of the measured normalized $ {\mathrm{ t } {}\mathrm{ \bar{t} } } $ differential cross sections with different model predictions at the parton level for each of the kinematic variables. |
png pdf |
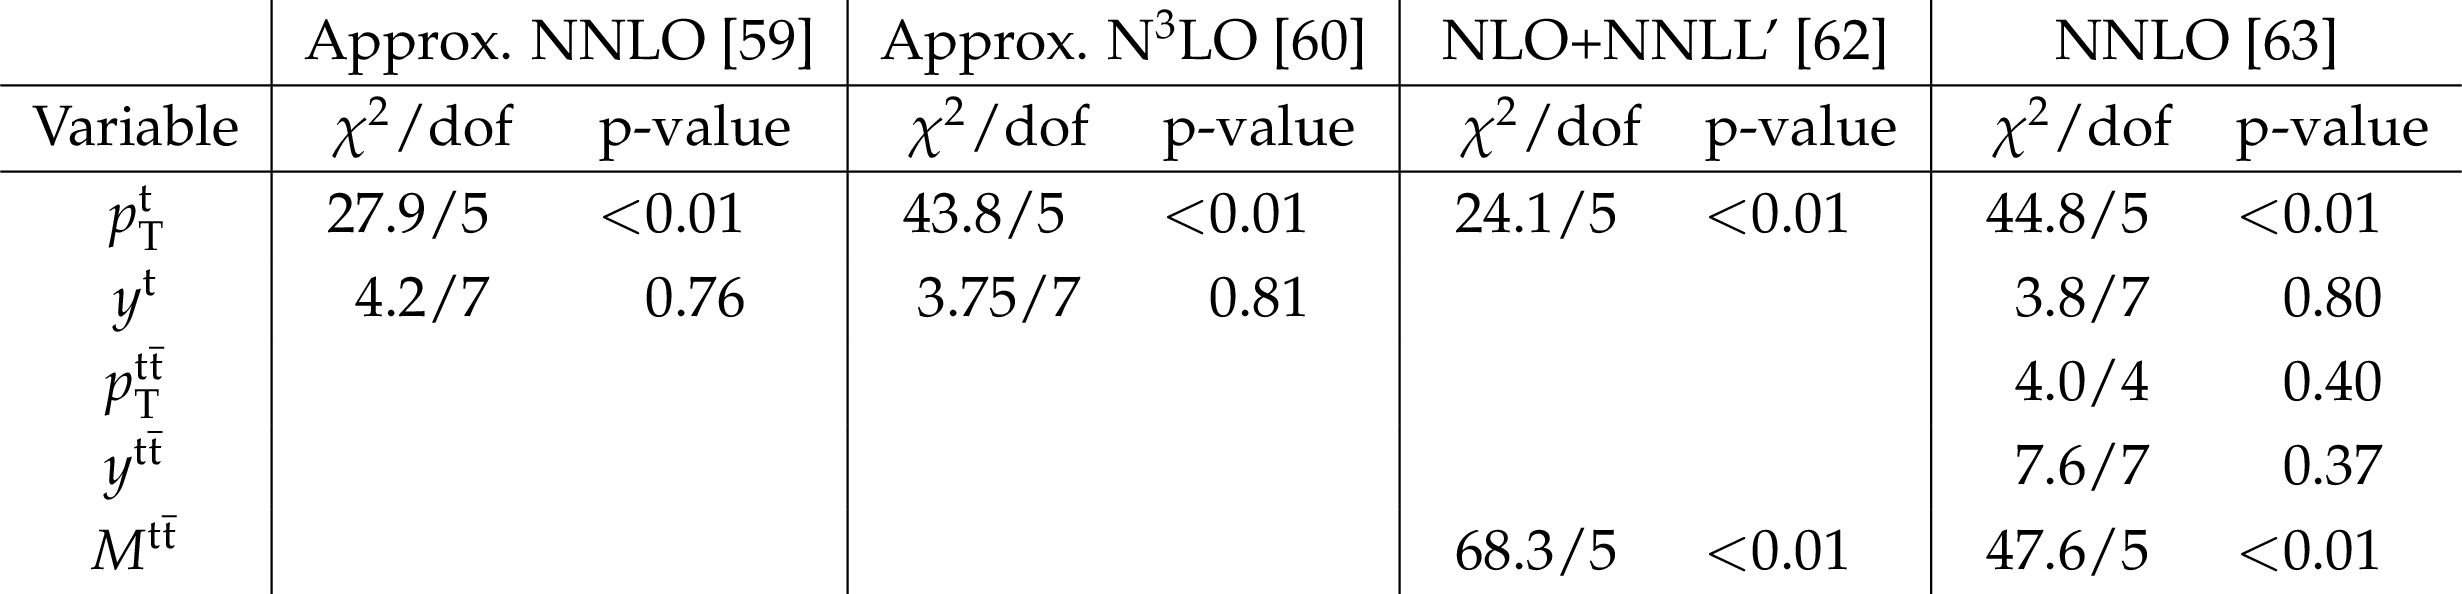
Table 5:
The $\chi ^{2}/$dof and $\rm p$-values for the comparison of the measured normalized $ {\mathrm{ t } {}\mathrm{ \bar{t} } } $ differential cross sections with published perturbative QCD calculations. |
png pdf |
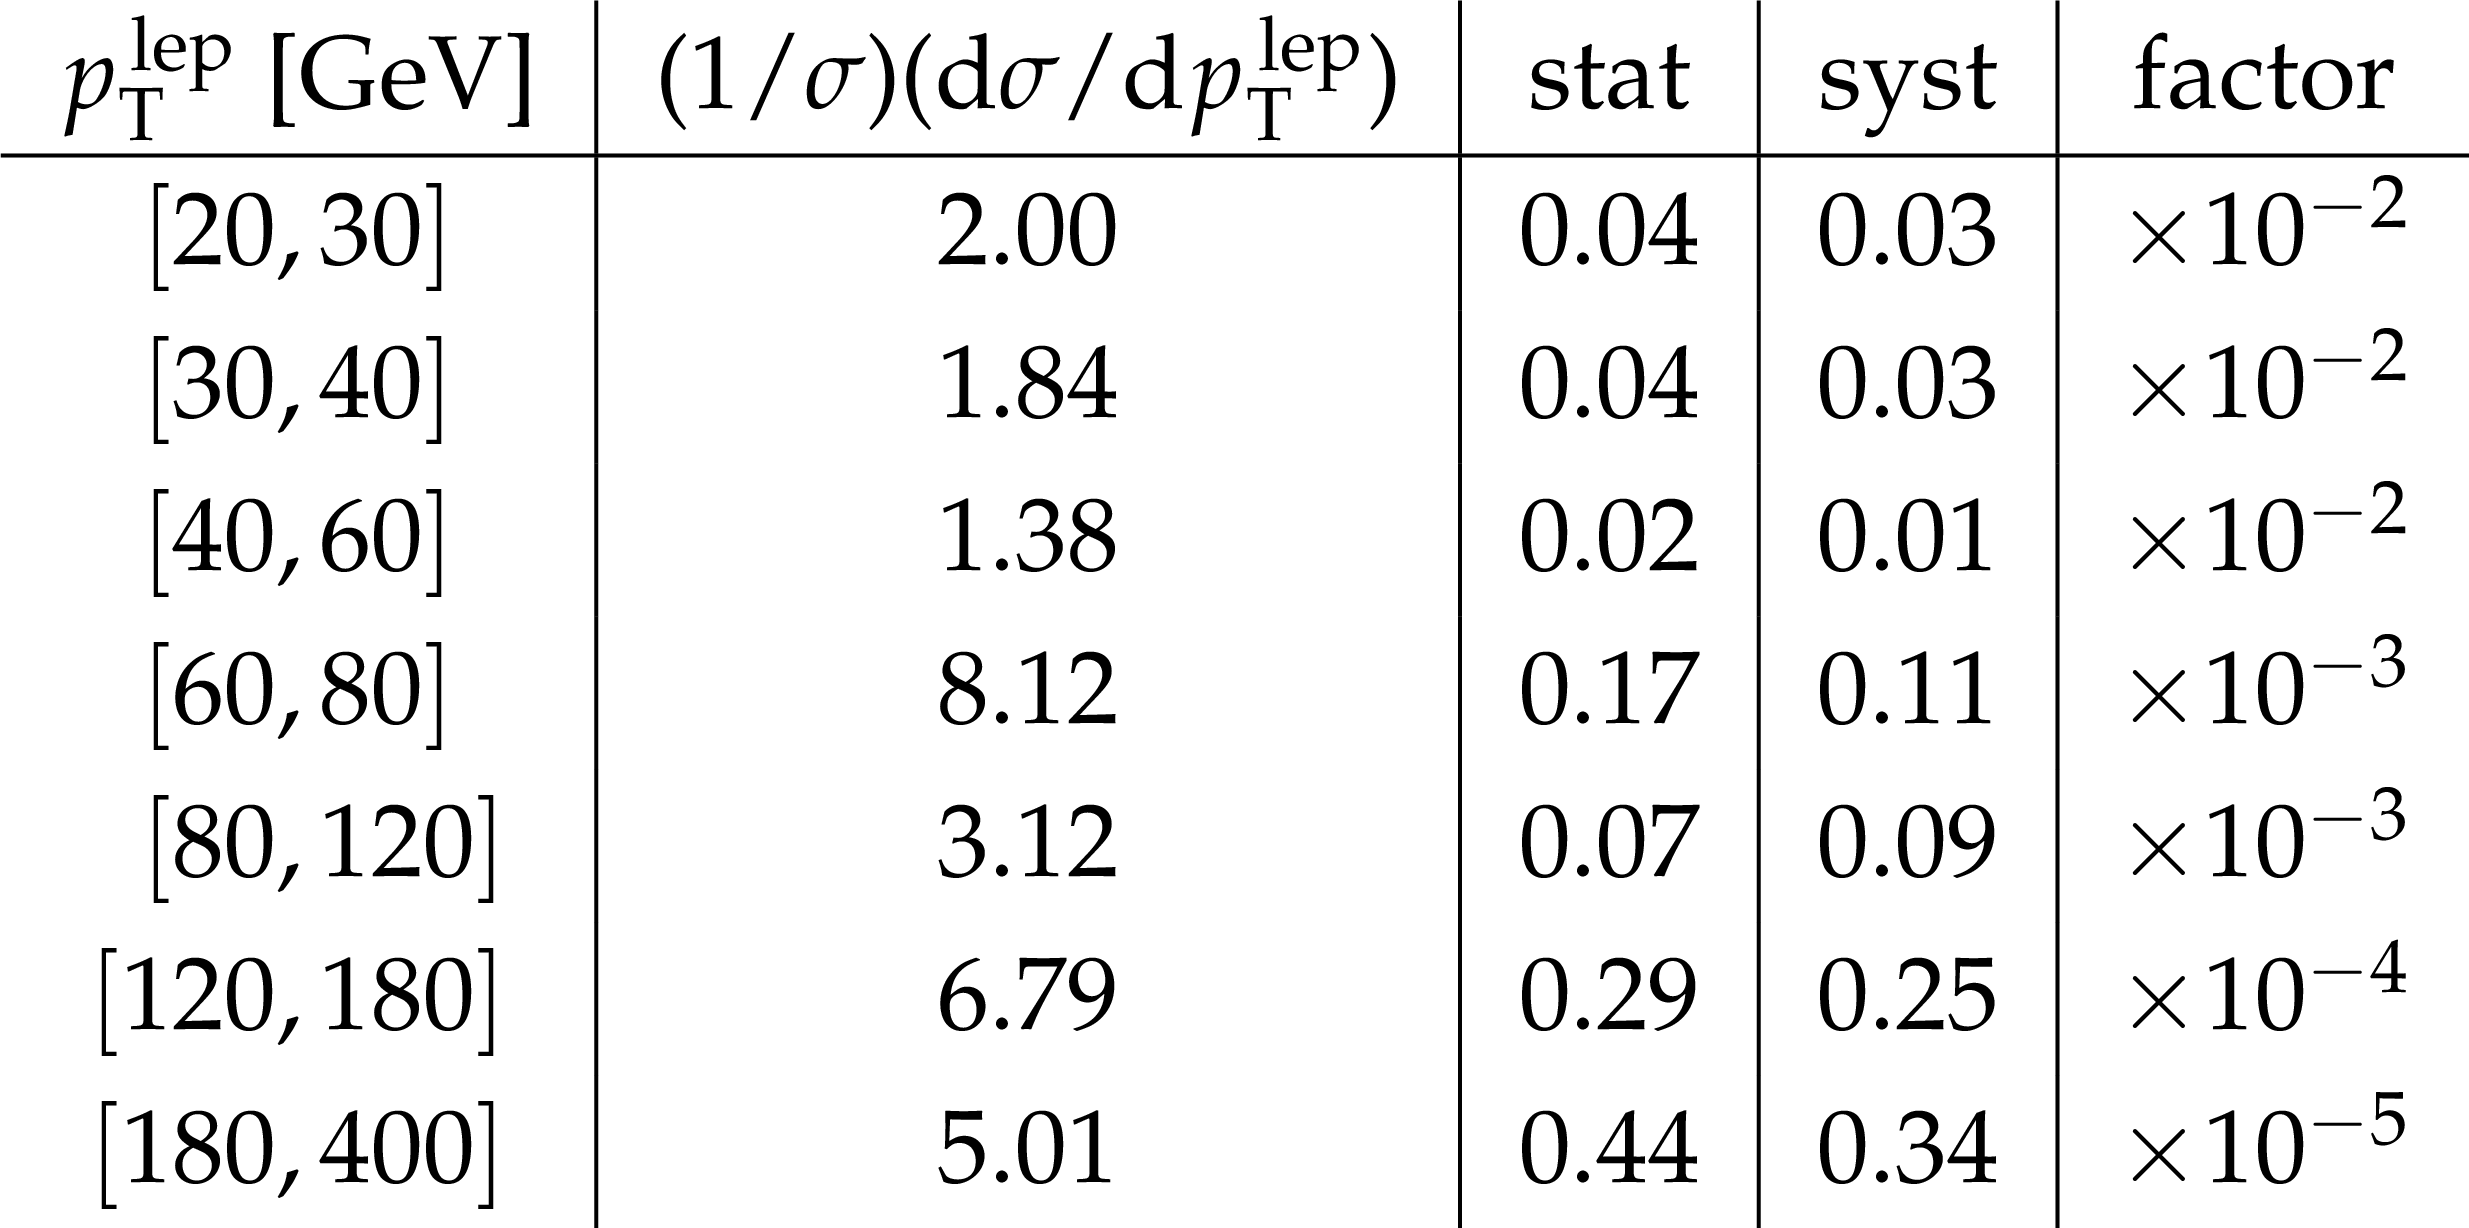
Table 6:
Normalized differential $ {\mathrm{ t } {}\mathrm{ \bar{t} } } $ cross sections with statistical and systematic uncertainties at the particle level as a function of $ { {p_{\mathrm {T}}} ^{{ \rm lep}}} $. The factor given in the last column applies to the values of the normalized cross section and the statistical and systematic uncertainties in that row. |
png pdf |
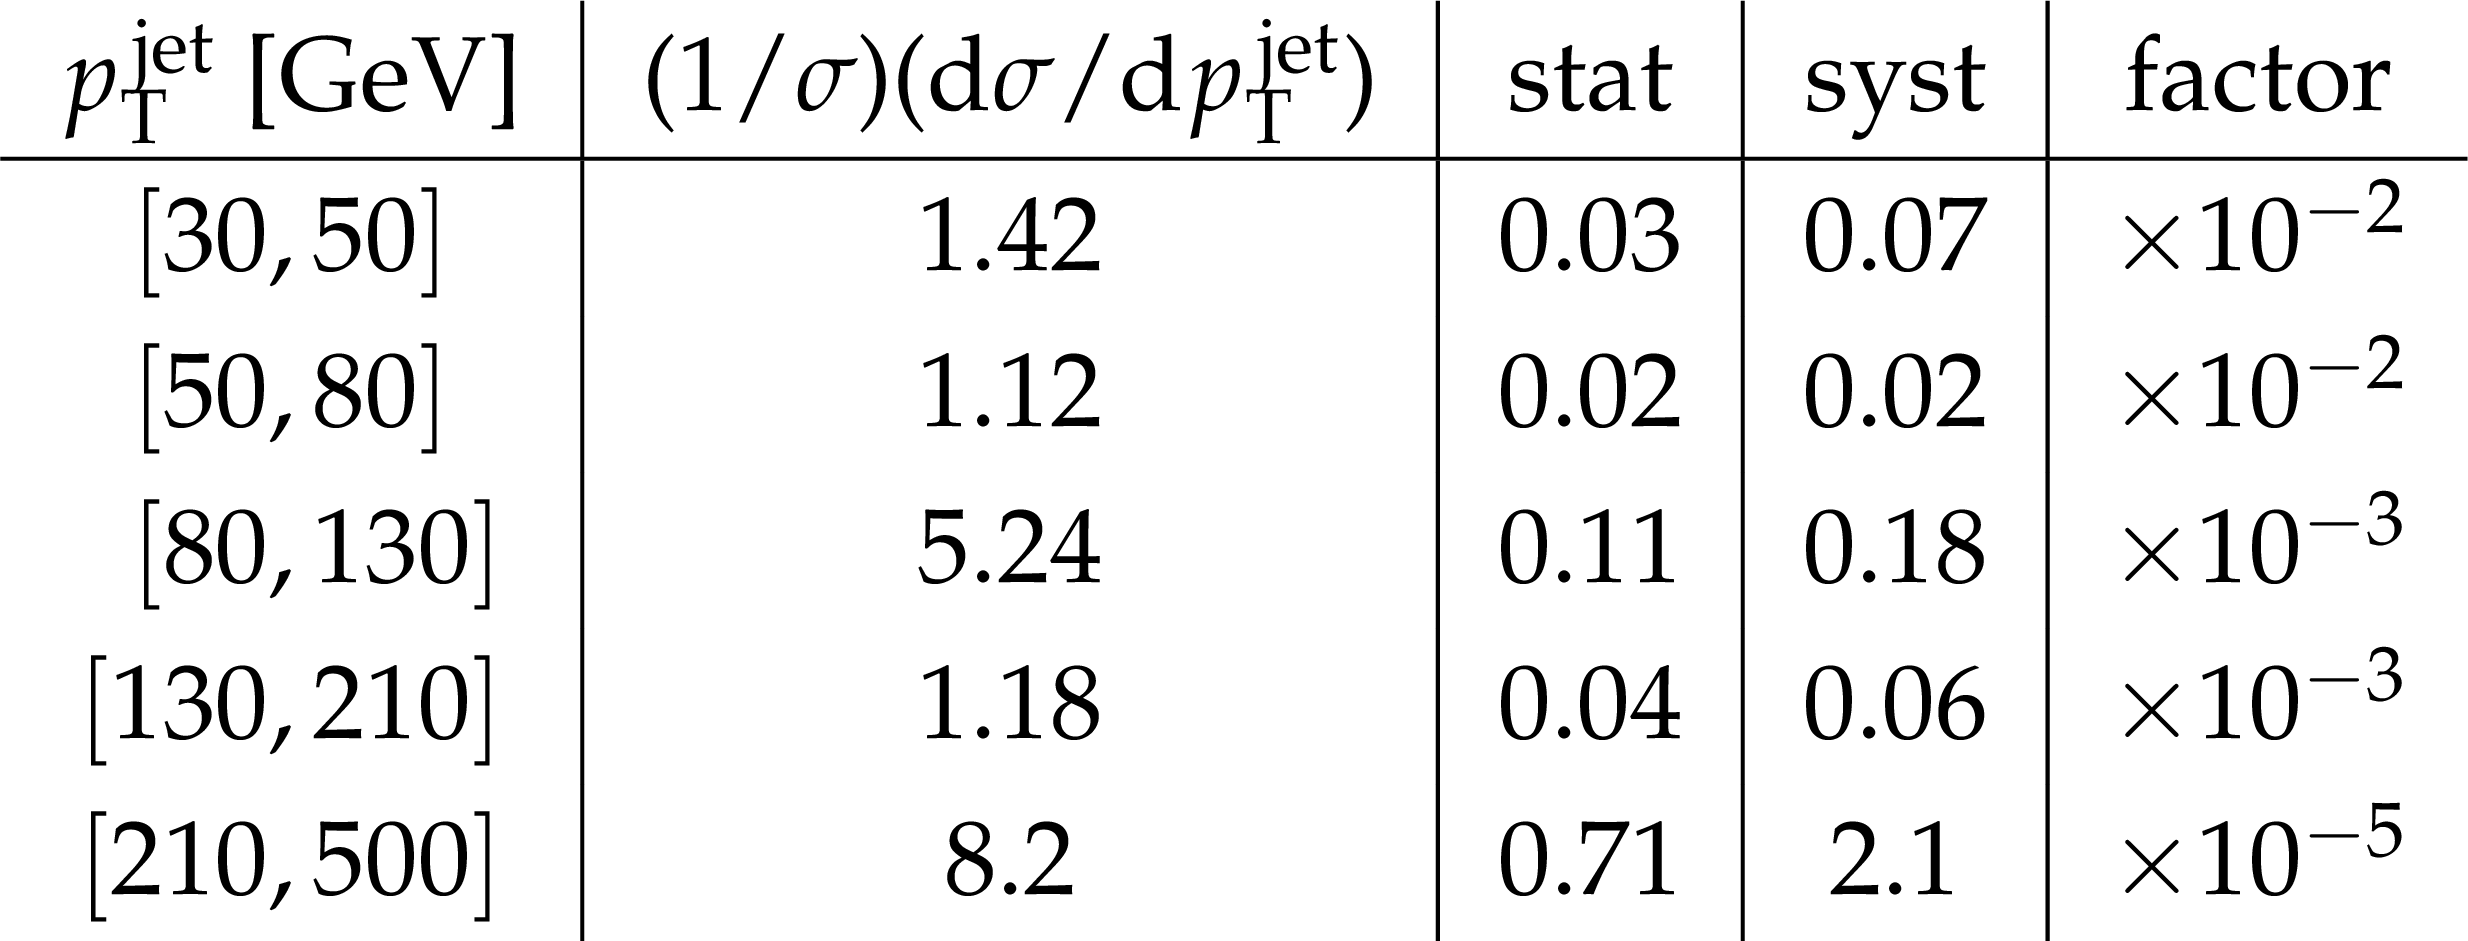
Table 7:
Normalized differential $ {\mathrm{ t } {}\mathrm{ \bar{t} } } $ cross sections with statistical and systematic uncertainties at the particle level as a function of $ { {p_{\mathrm {T}}} ^{{ \rm jet}}} $. The factor given in the last column applies to the values of the normalized cross section and the statistical and systematic uncertainties in that row. |
png pdf |
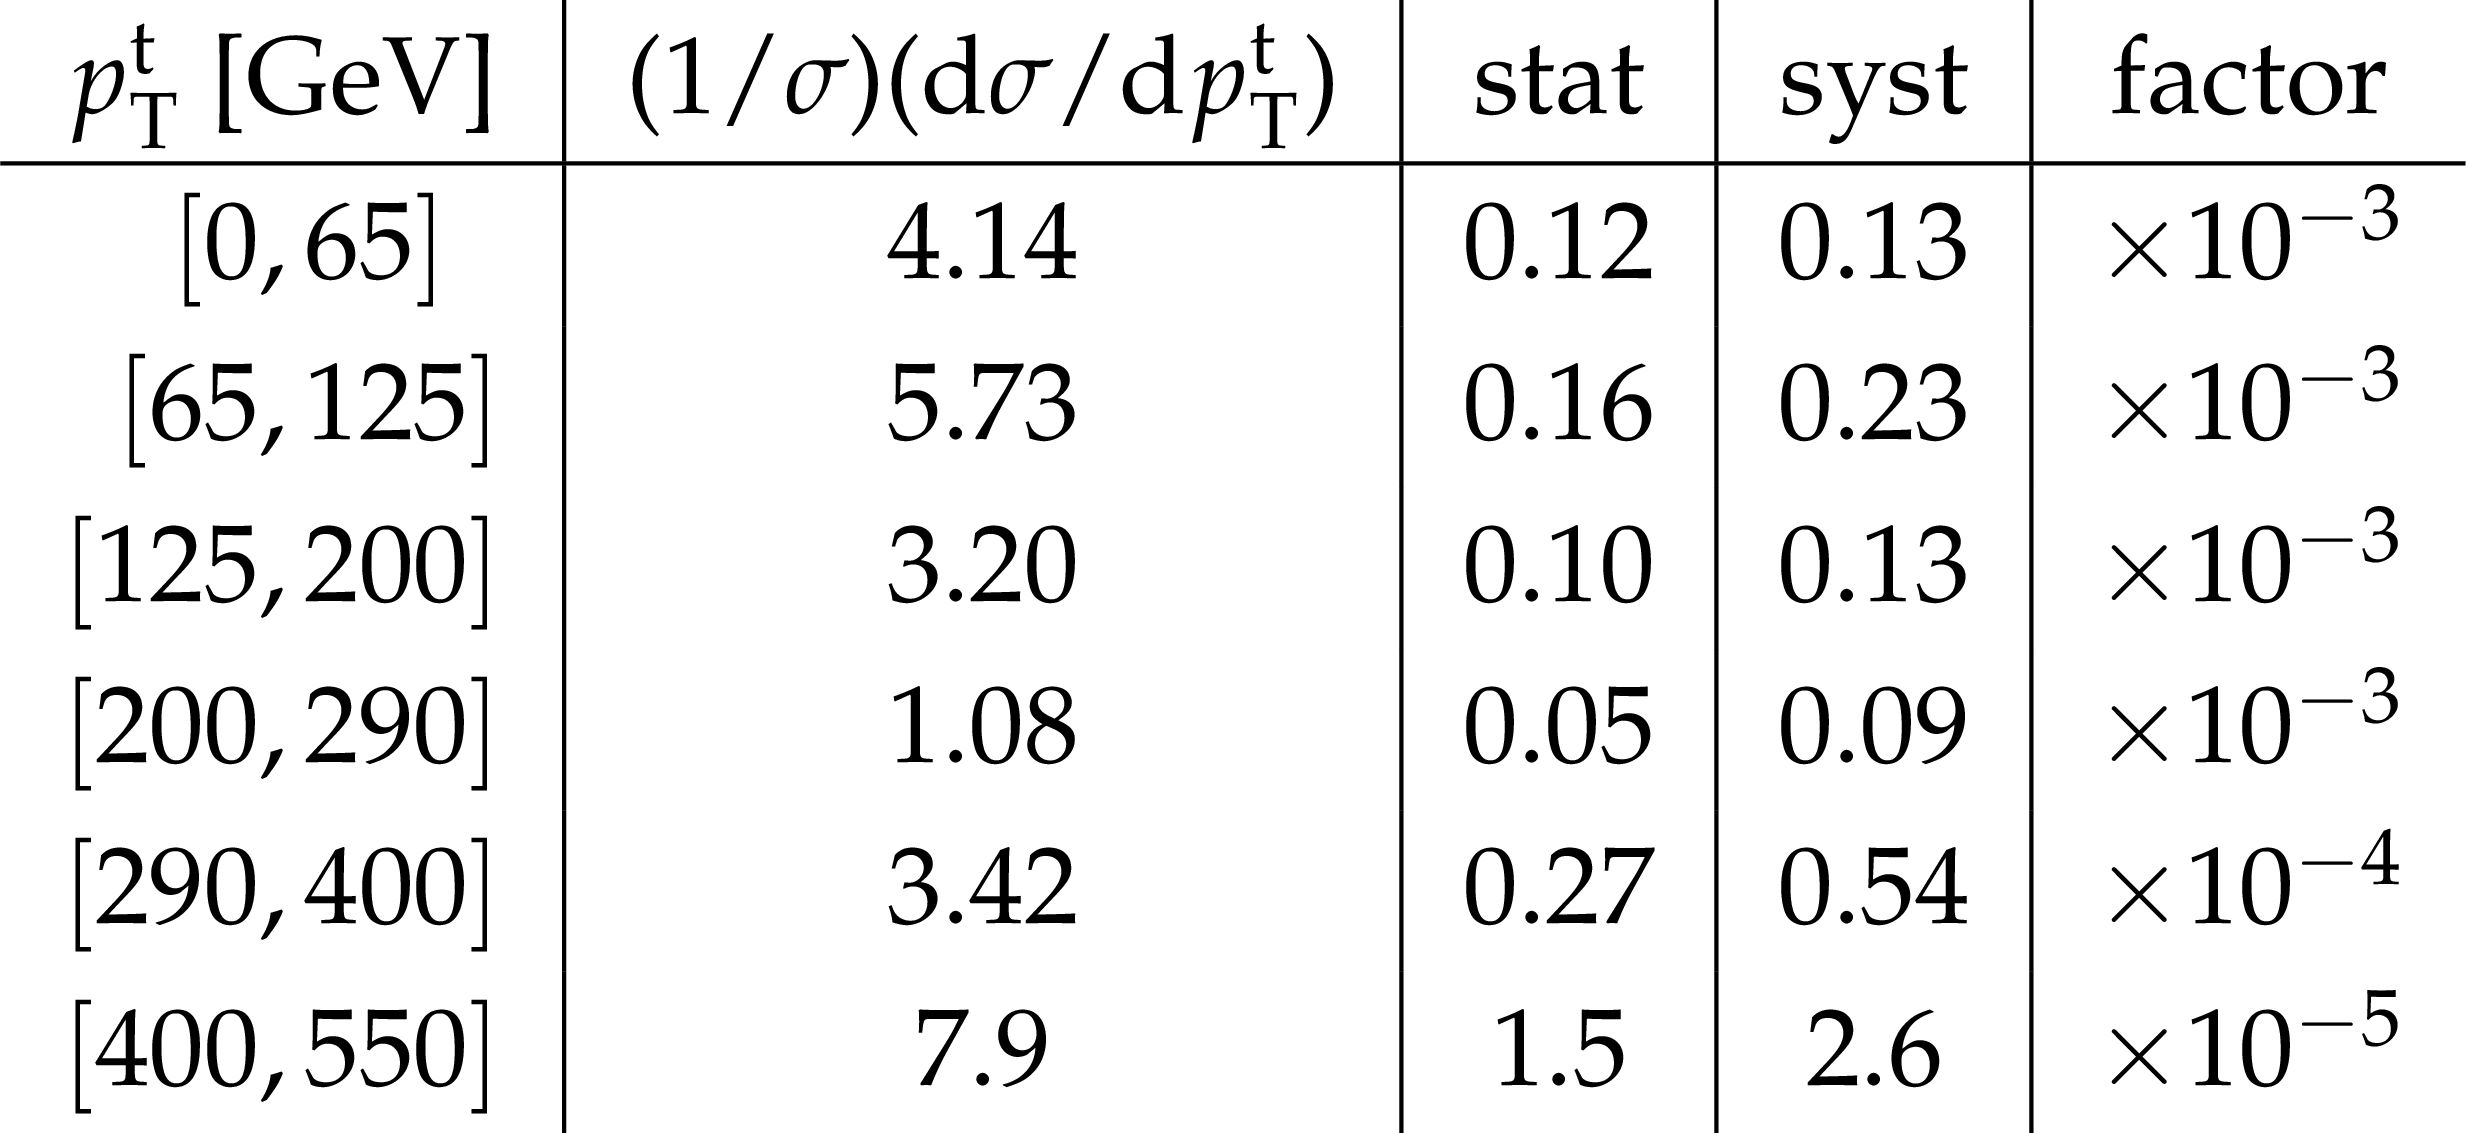
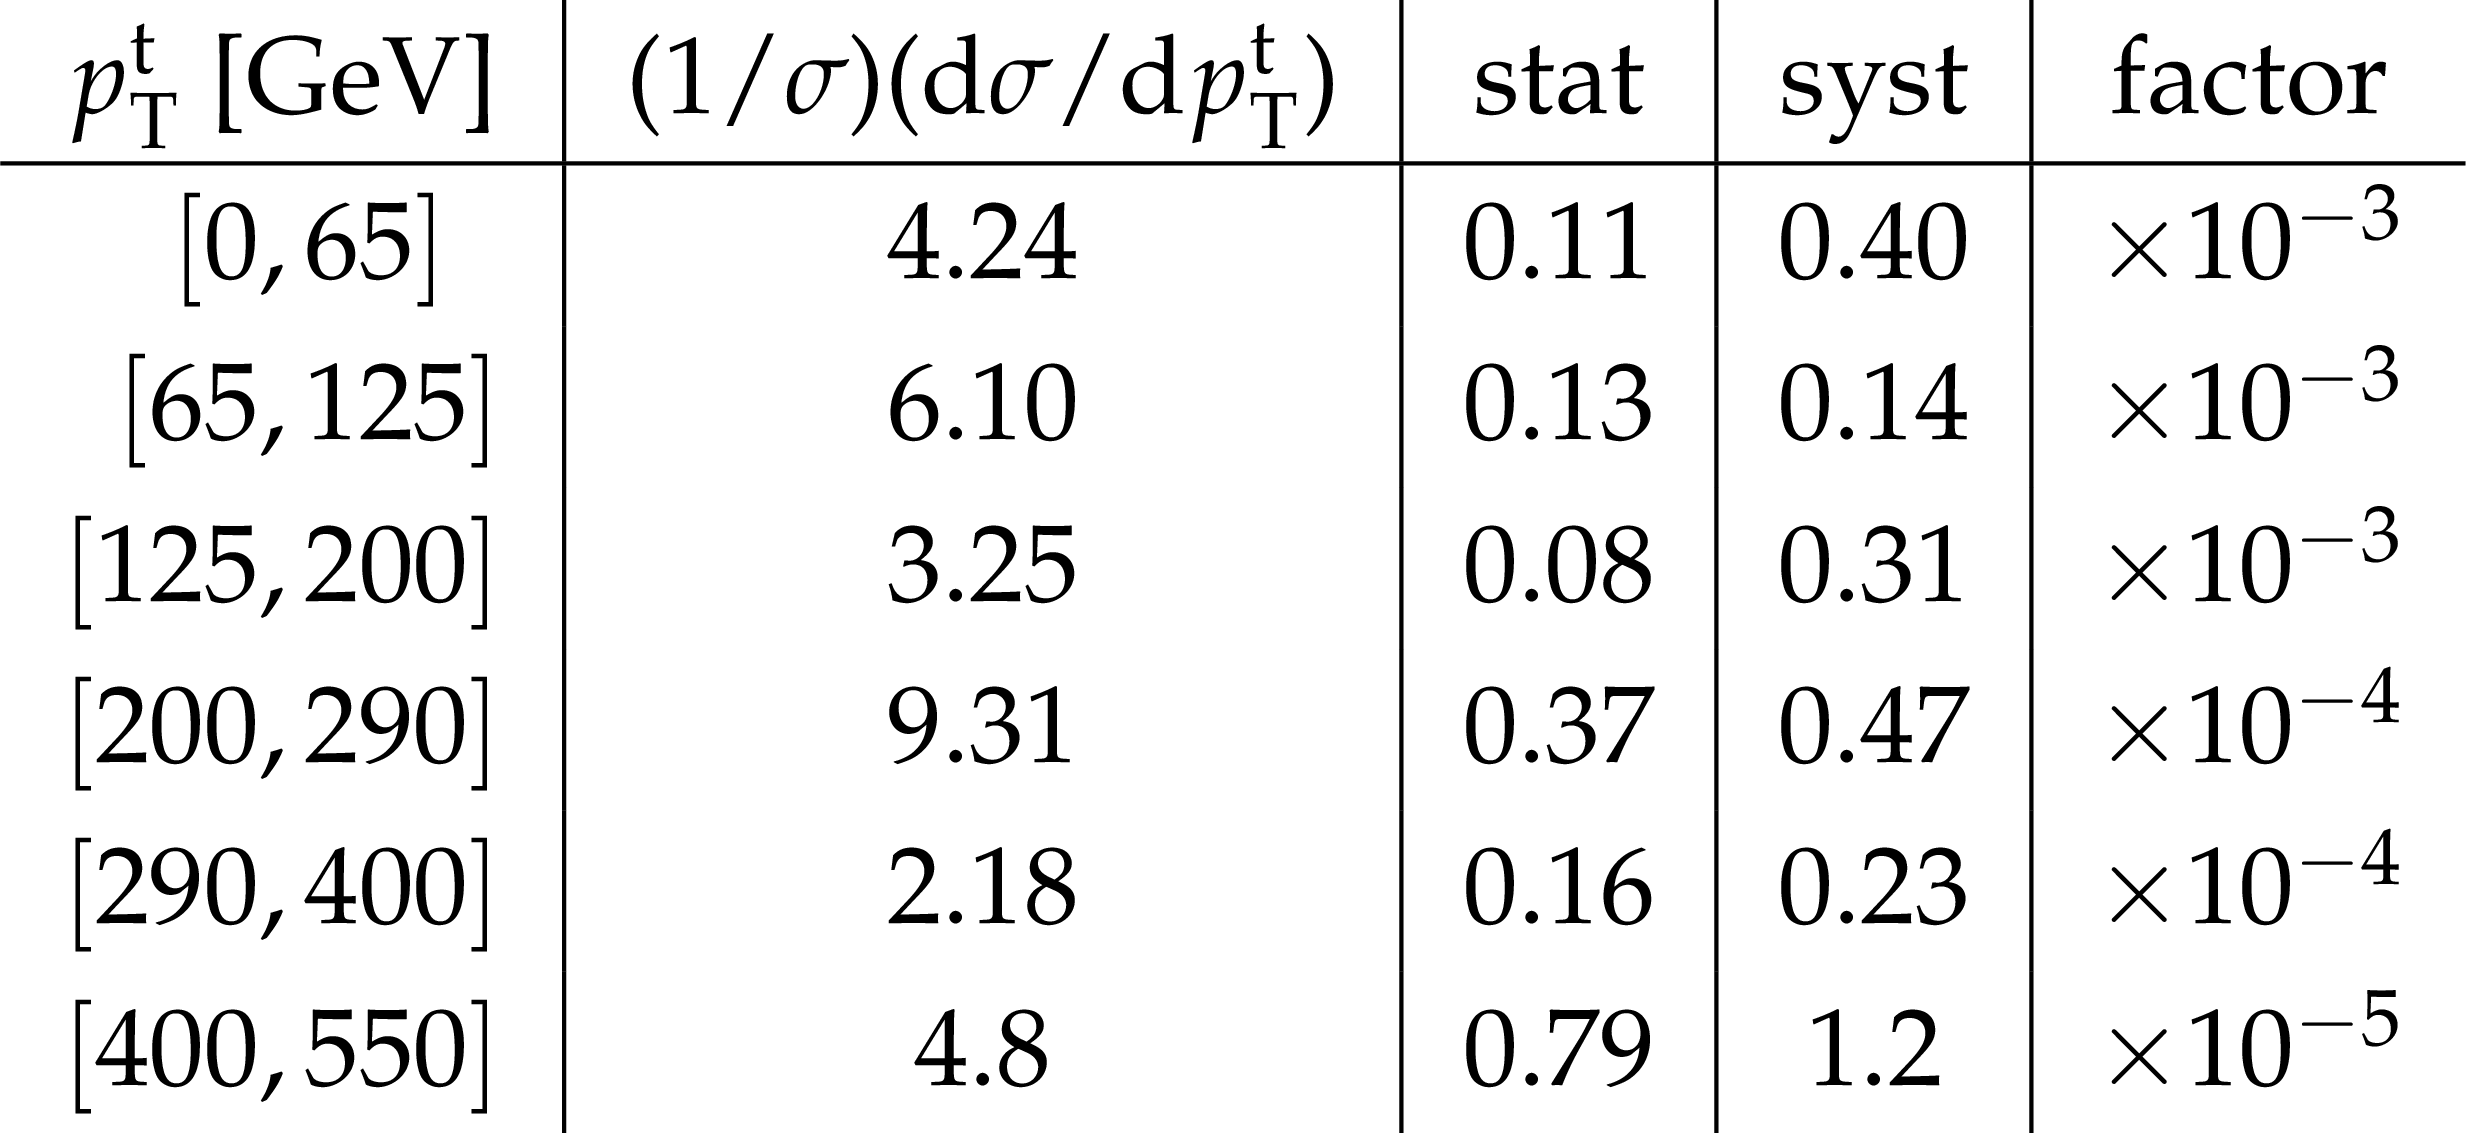
Table 8:
Normalized differential $ {\mathrm{ t } {}\mathrm{ \bar{t} } } $ cross sections with statistical and systematic uncertainties at the particle level as a function of $ { {p_{\mathrm {T}}} ^{\rm t}} $. The factor given in the last column applies to the values of the normalized cross section and the statistical and systematic uncertainties in that row. |

png pdf |
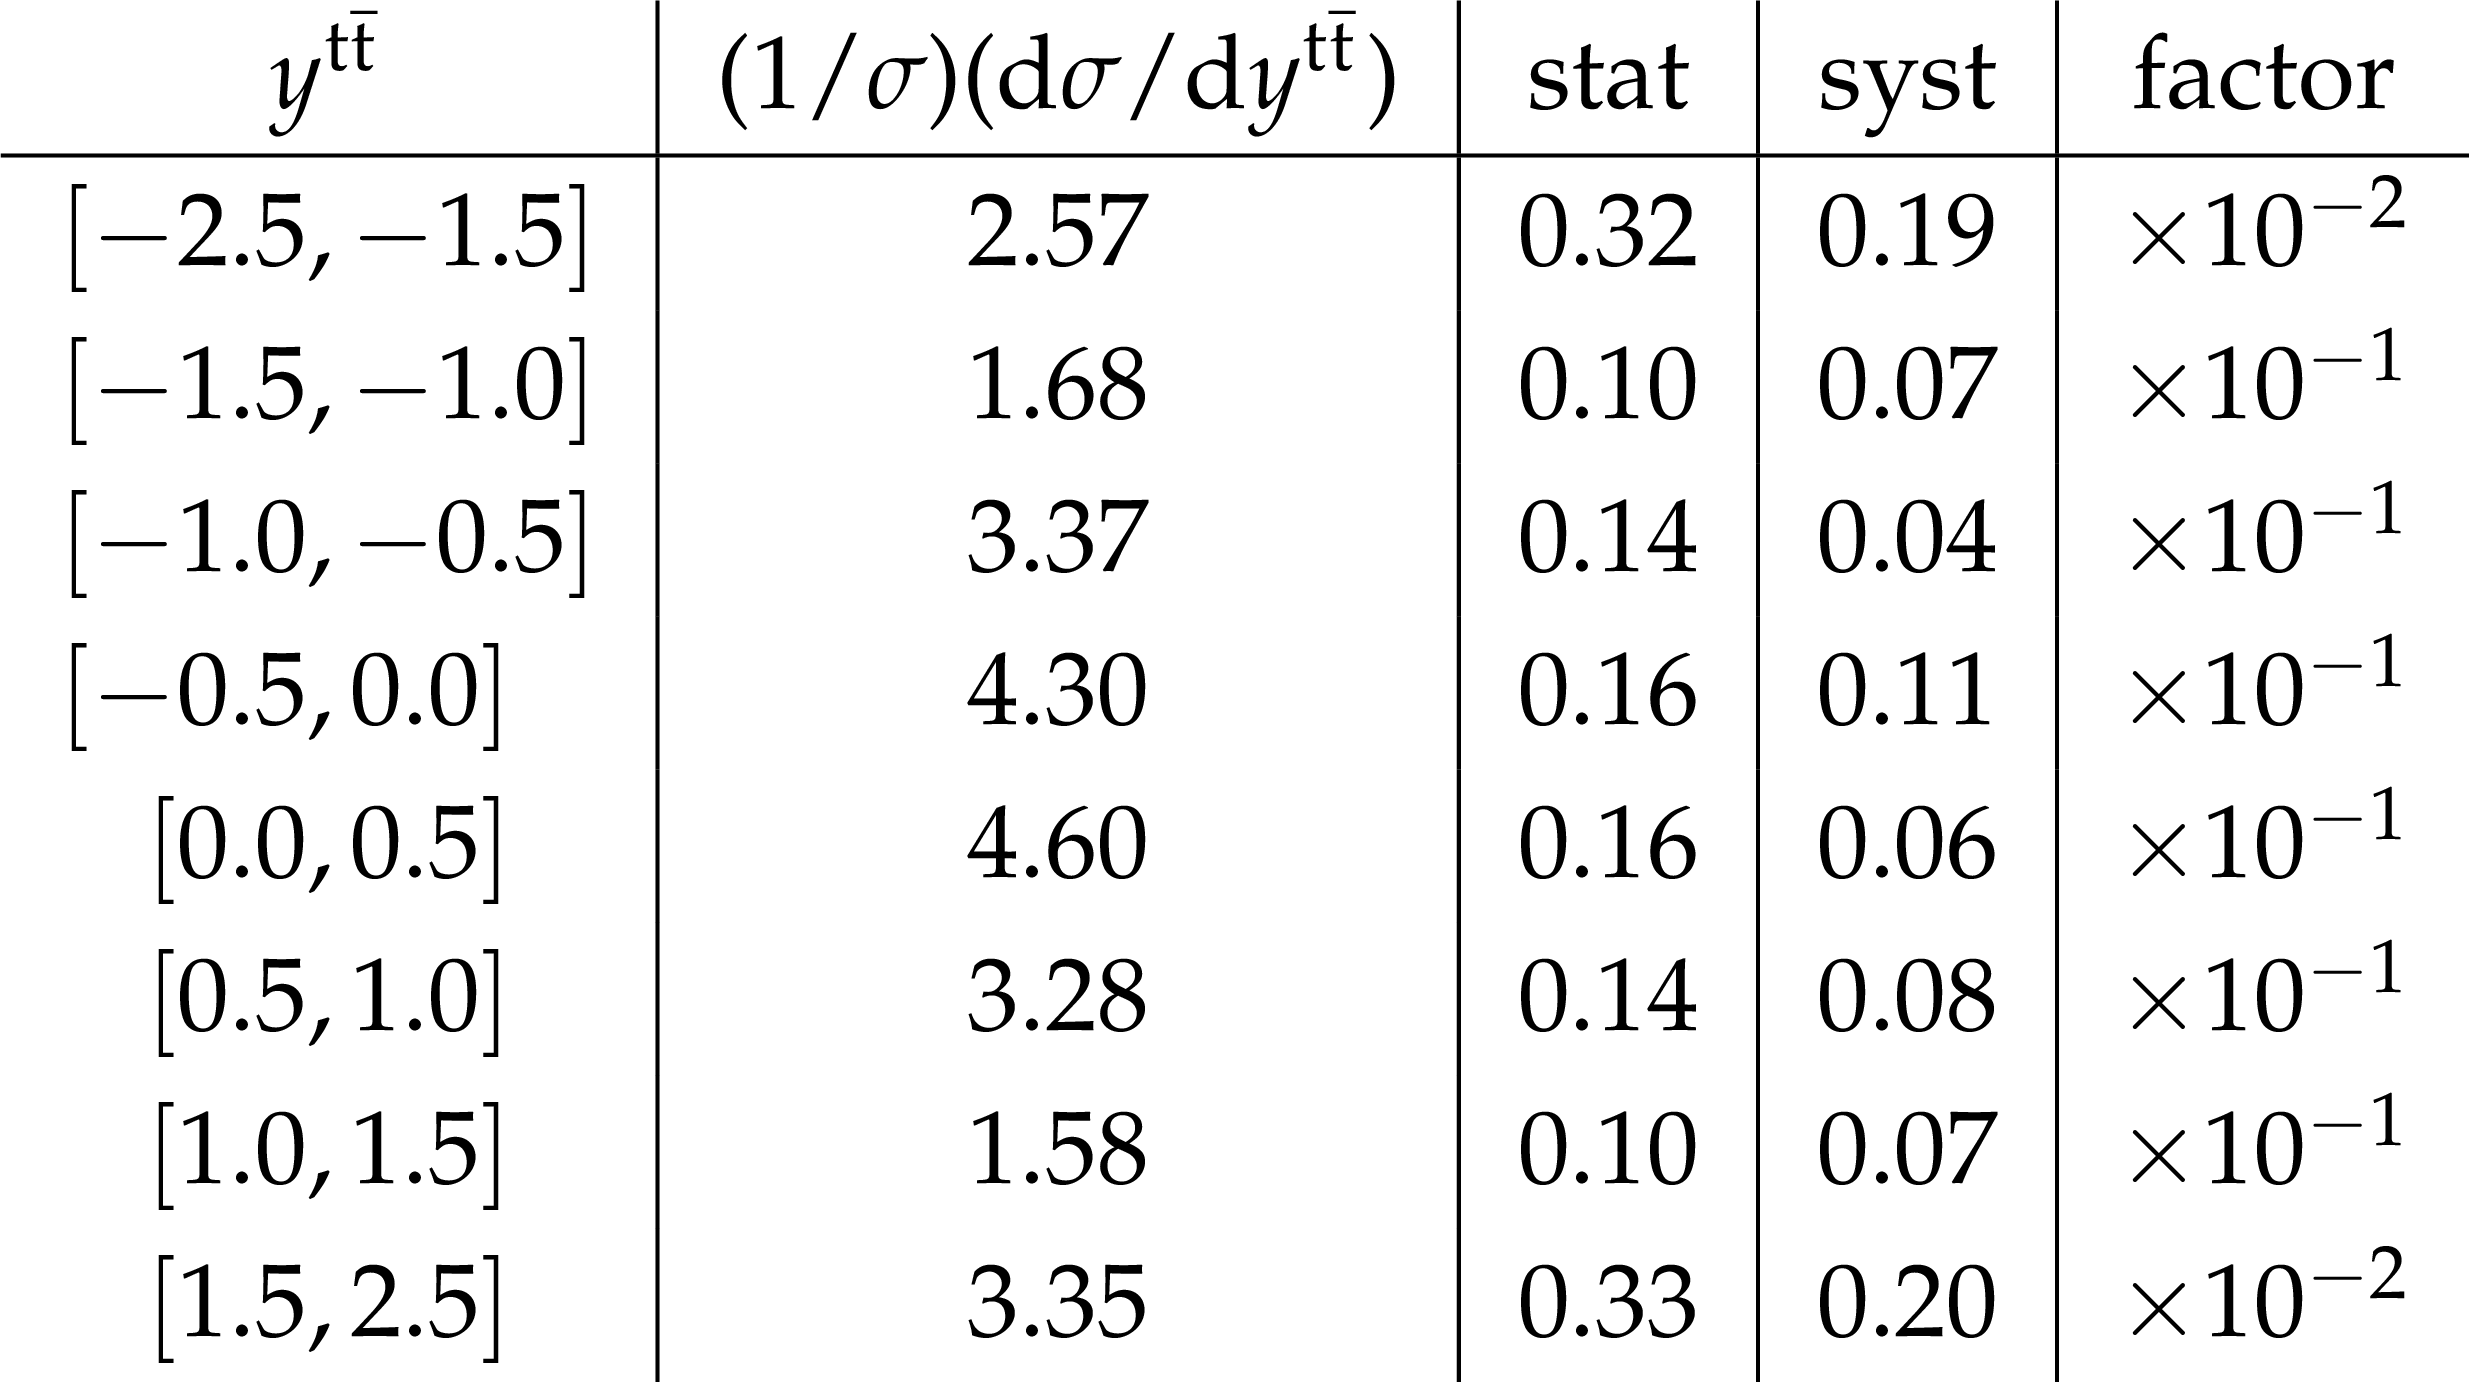
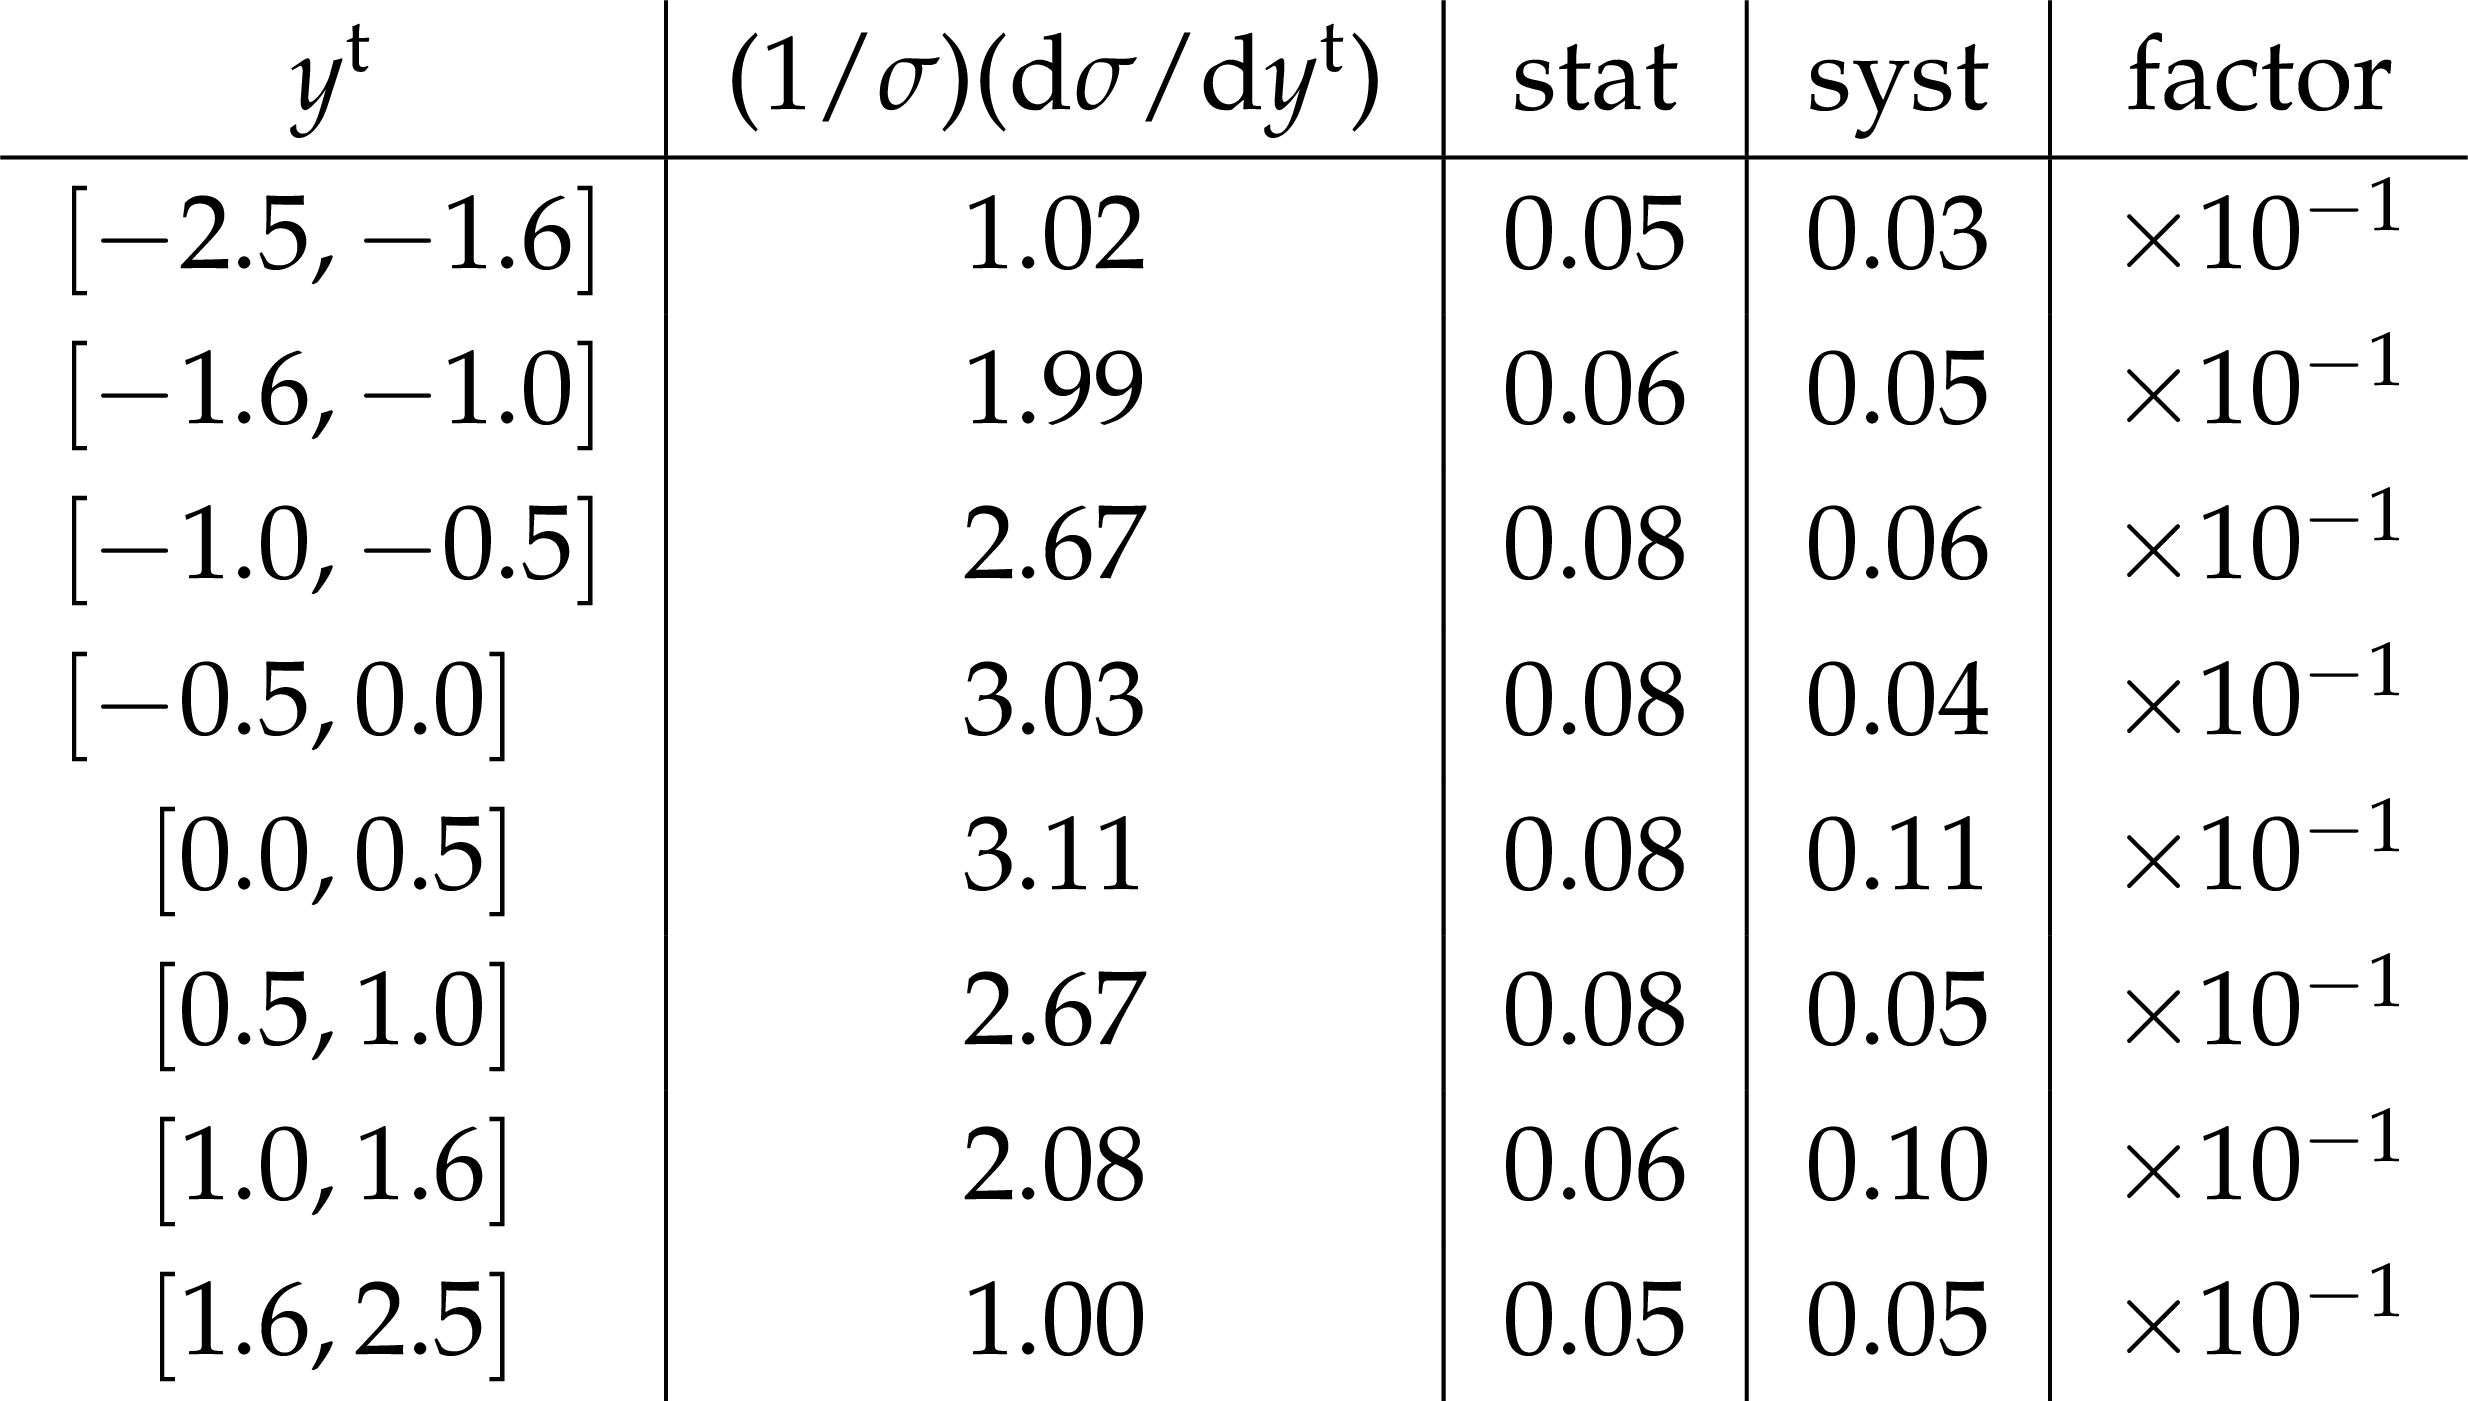
Table 9:
Normalized differential $ {\mathrm{ t } {}\mathrm{ \bar{t} } } $ cross sections with statistical and systematic uncertainties at the particle level as a function of $ {y^{\rm t}} $. The factor given in the last column applies to the values of the normalized cross section and the statistical and systematic uncertainties in that row. |
png pdf |
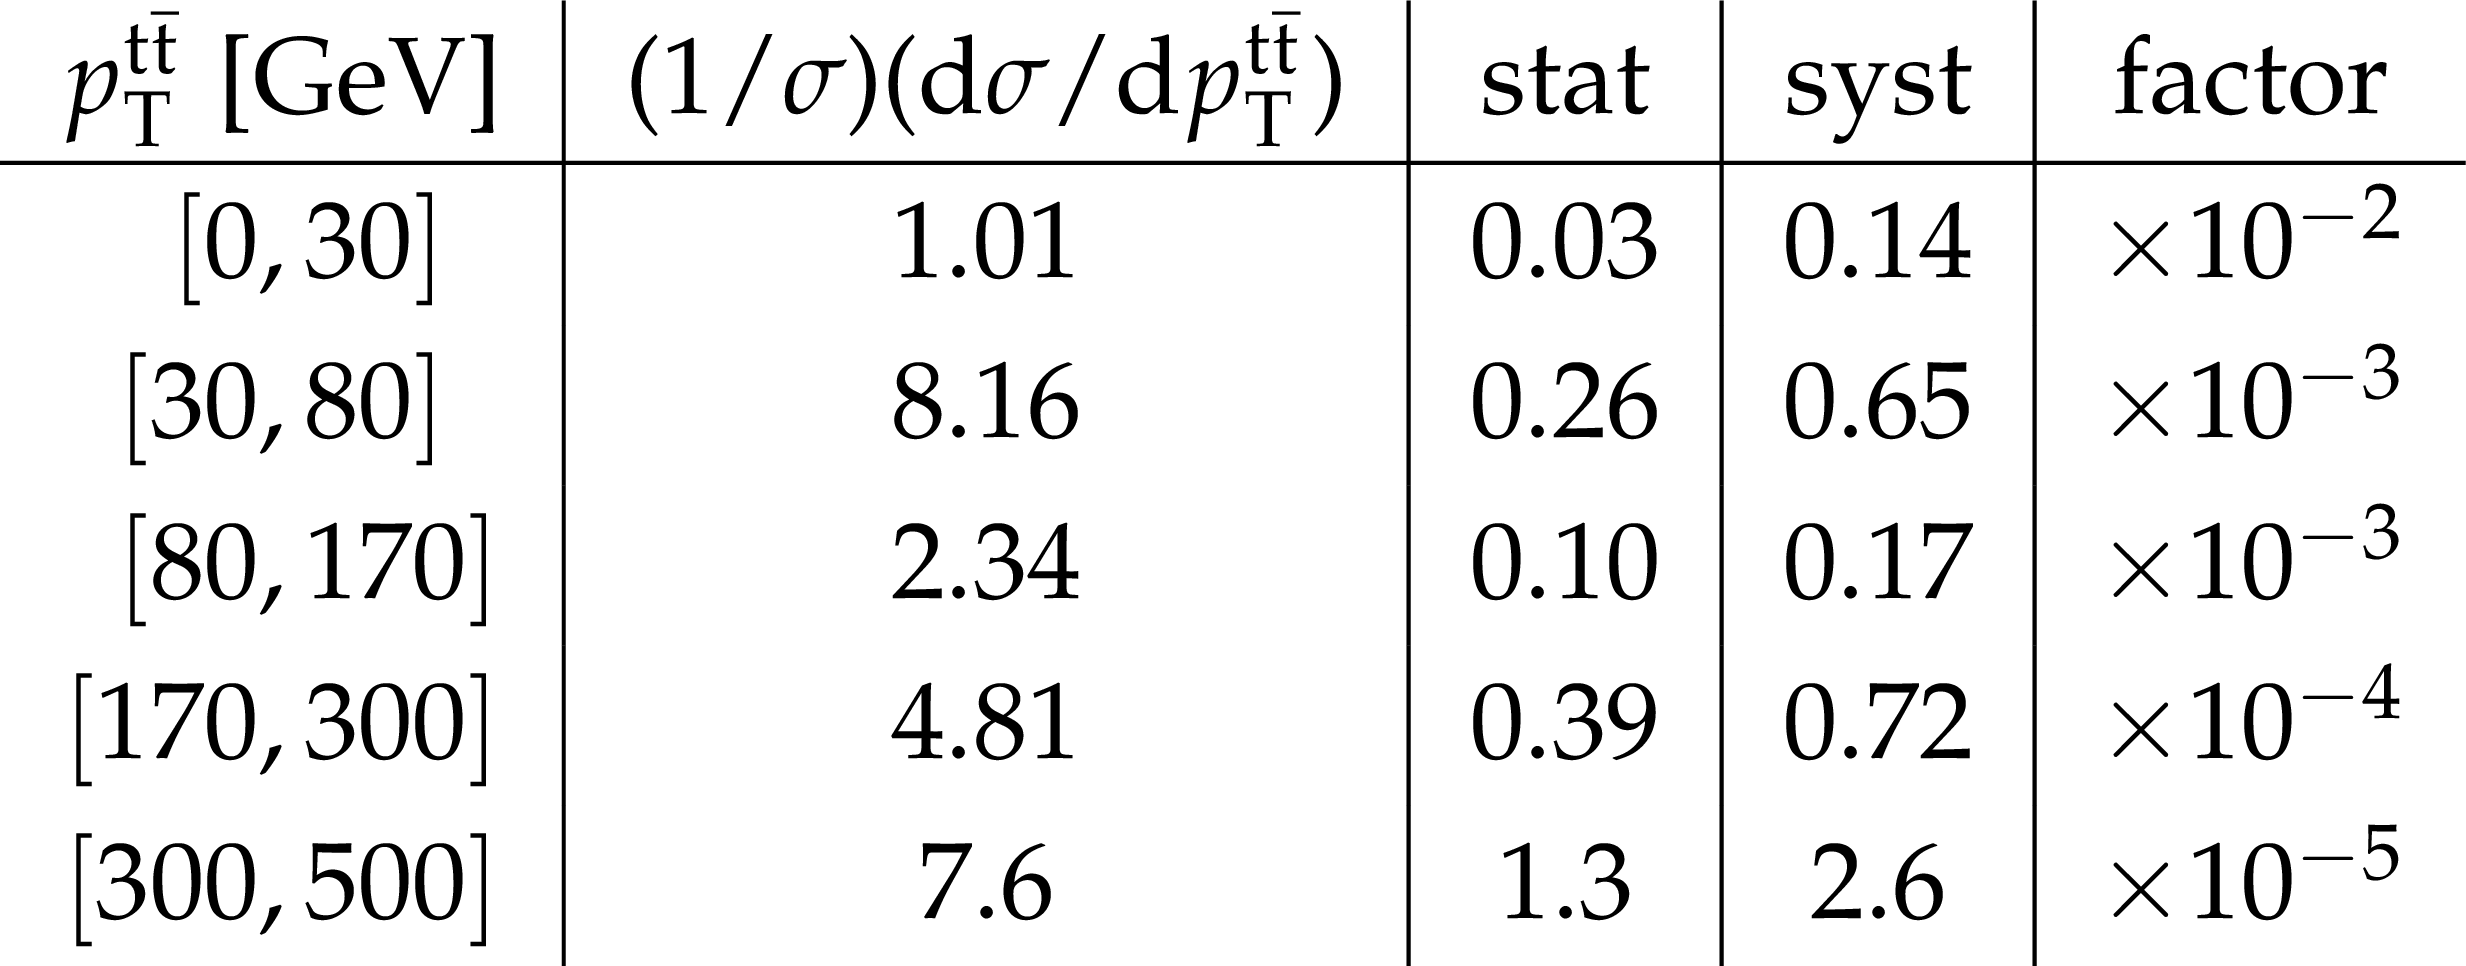
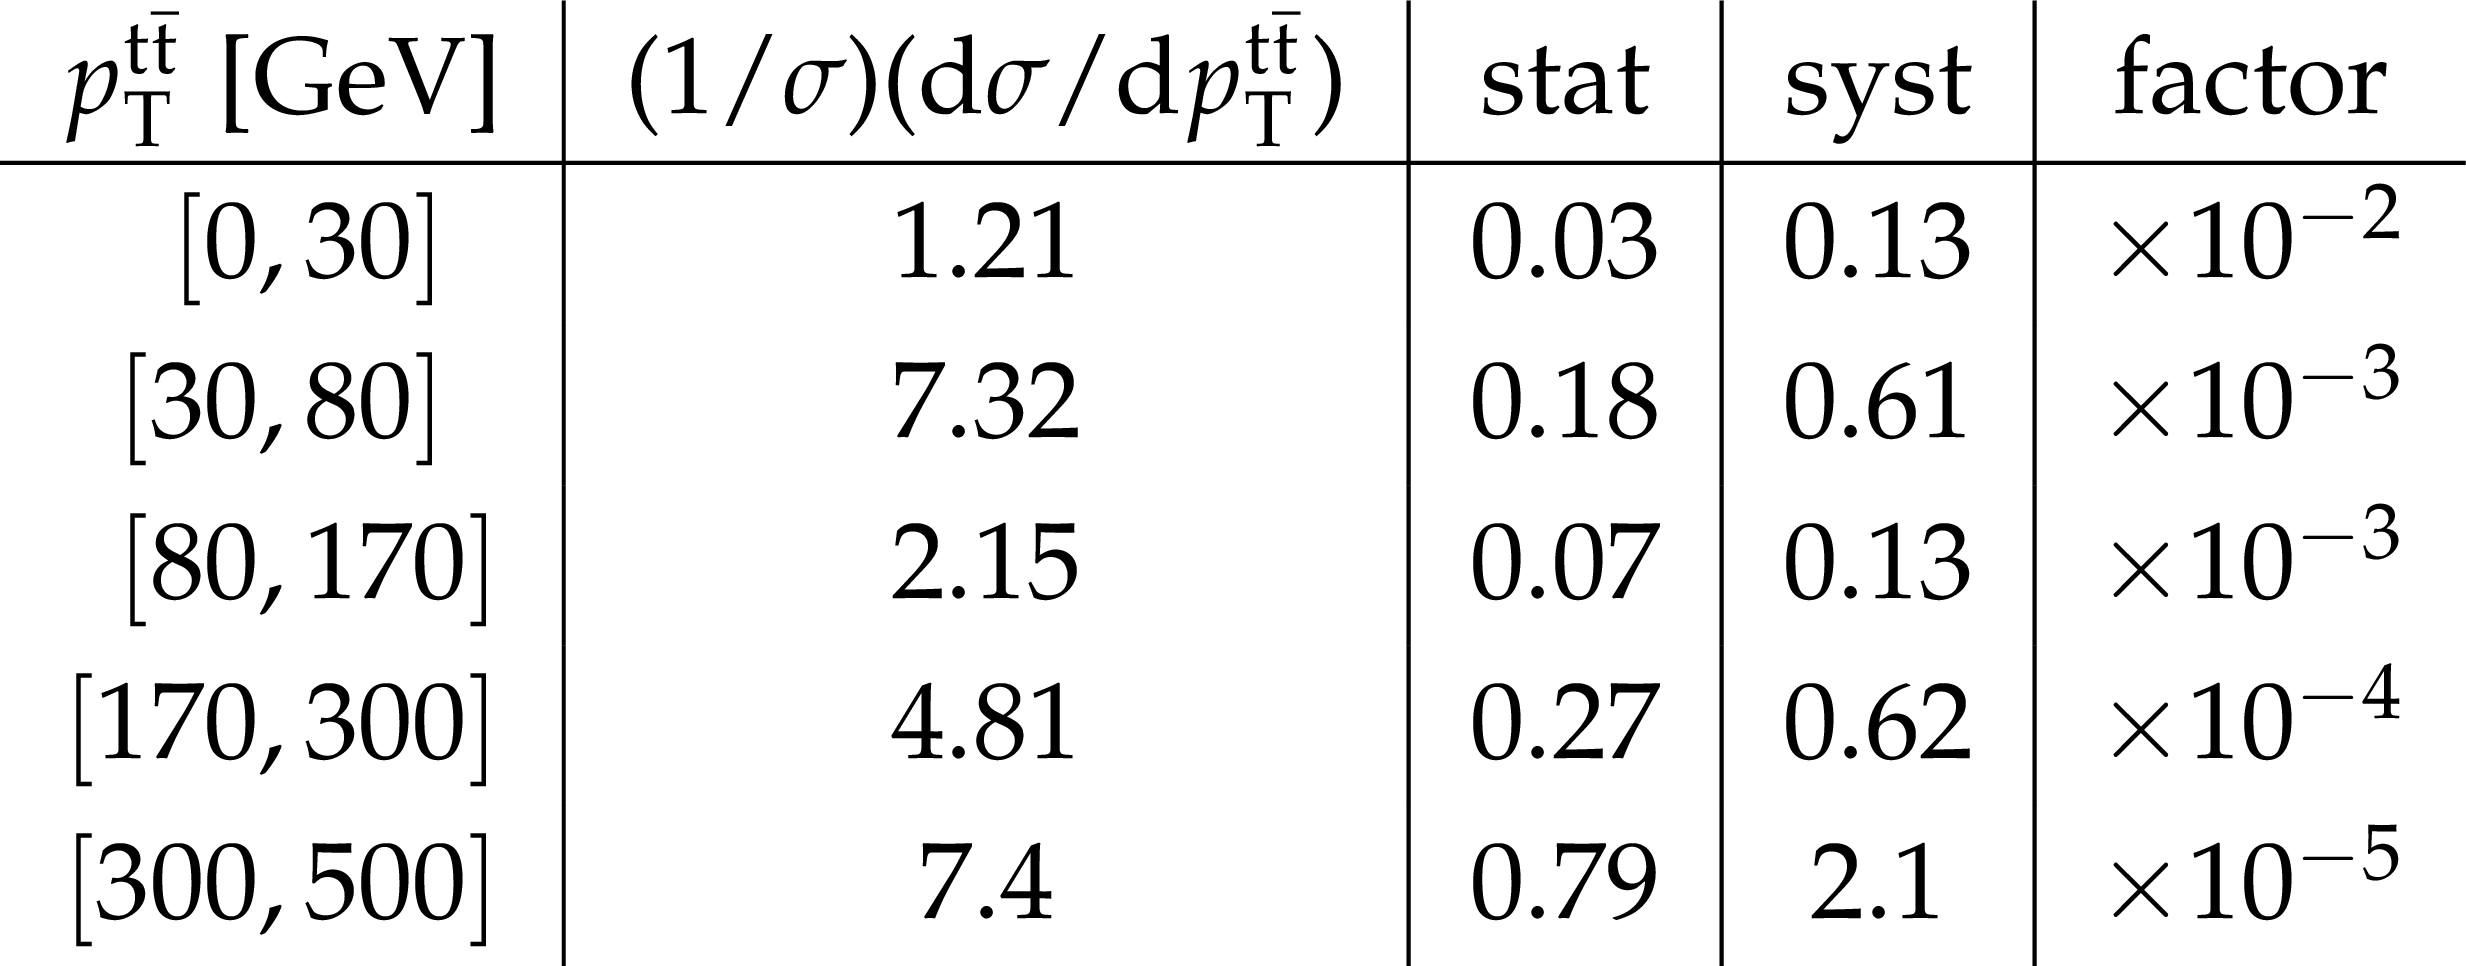
Table 10:
Normalized differential $ {\mathrm{ t } {}\mathrm{ \bar{t} } } $ cross sections with statistical and systematic uncertainties at the particle level as a function of $p_{\rm T}^{{\mathrm{ t } {}\mathrm{ \bar{t} } } }$. The factor given in the last column applies to the values of the normalized cross section and the statistical and systematic uncertainties in that row. |
png pdf |
Table 11:
Normalized differential $ {\mathrm{ t } {}\mathrm{ \bar{t} } } $ cross sections with statistical and systematic uncertainties at the particle level as a function of $ {y^{{\mathrm{ t } {}\mathrm{ \bar{t} } } }} $. The factor given in the last column applies to the values of the normalized cross section and the statistical and systematic uncertainties in that row. |
png pdf |
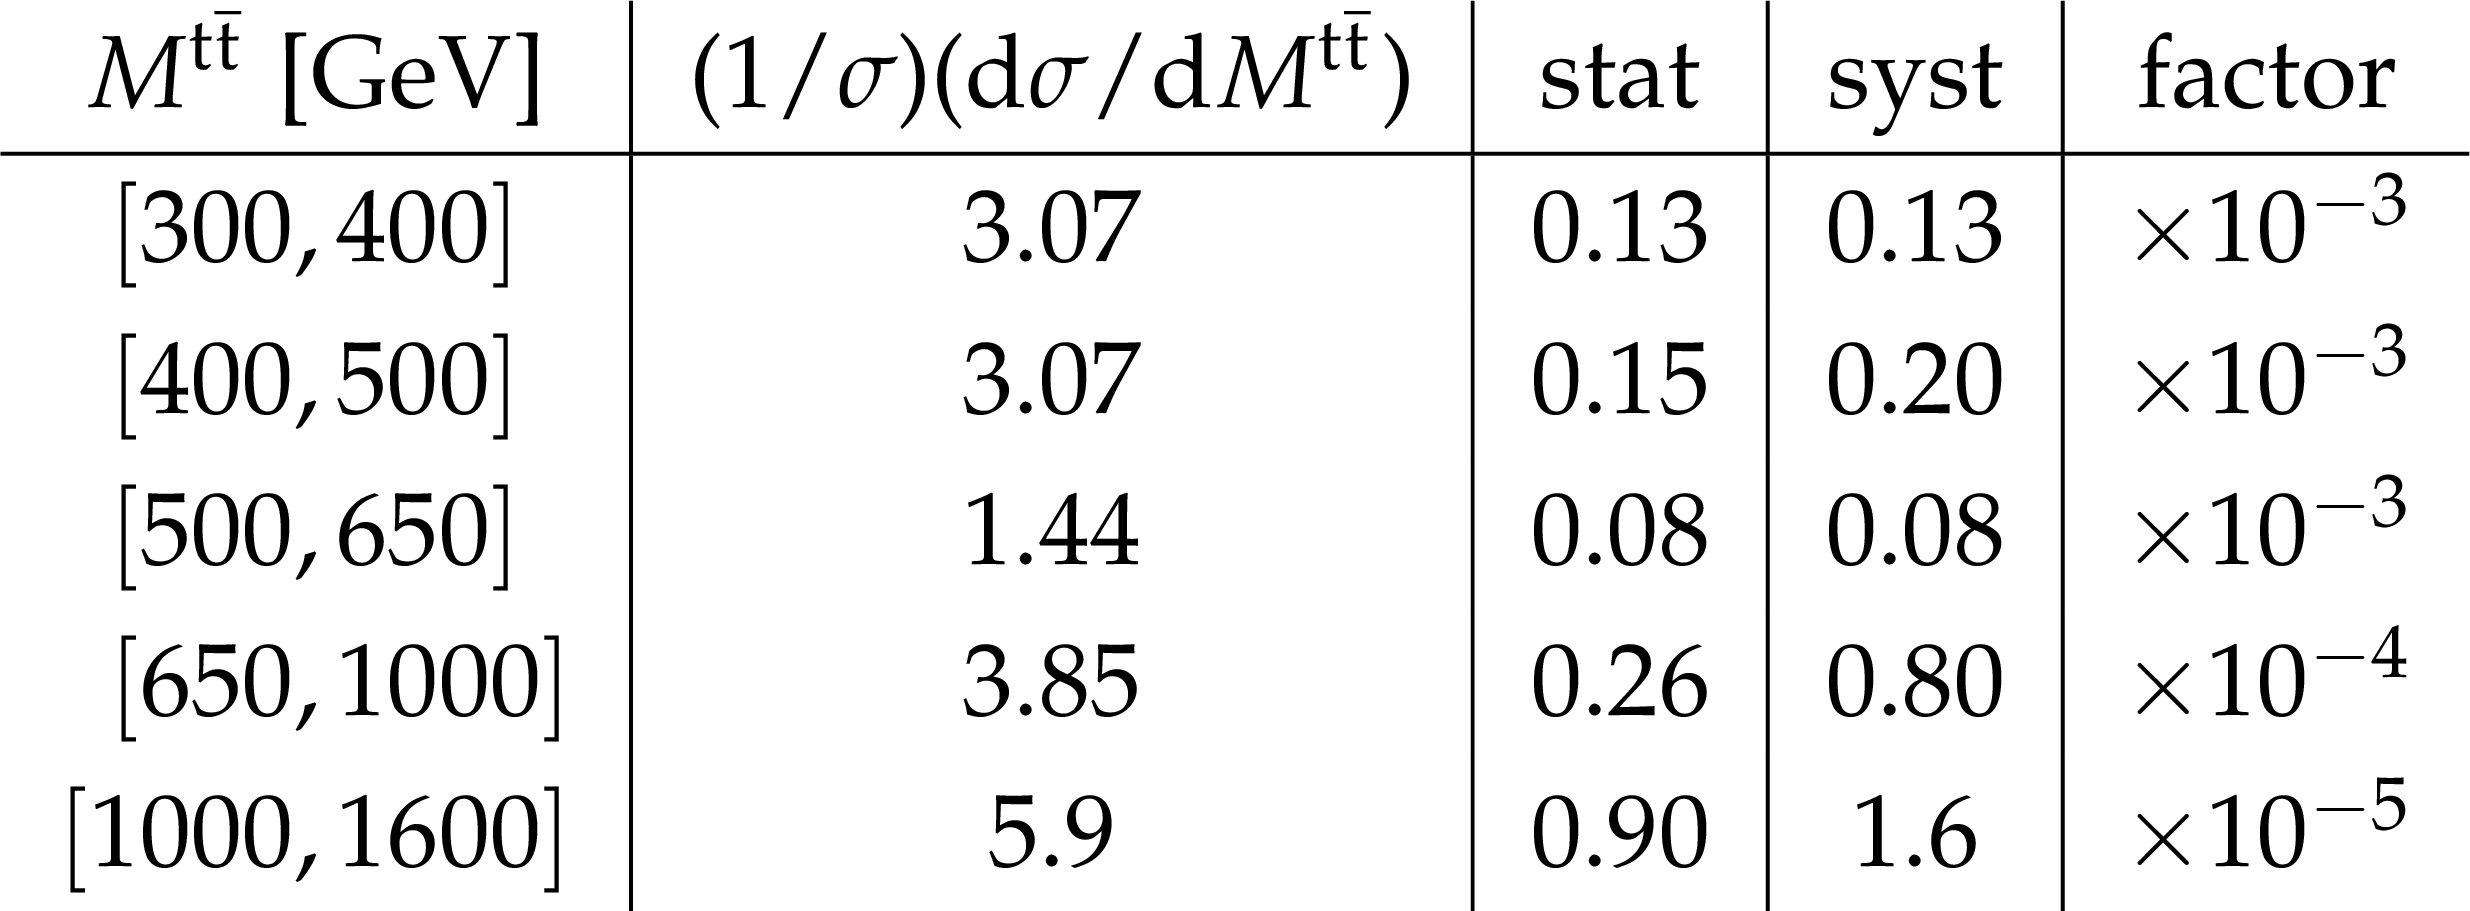
Table 12:
Normalized differential $ {\mathrm{ t } {}\mathrm{ \bar{t} } } $ cross sections with statistical and systematic uncertainties at the particle level as a function of $ {M^{{\mathrm{ t } {}\mathrm{ \bar{t} } } }} $. The factor given in the last column applies to the values of the normalized cross section and the statistical and systematic uncertainties in that row. |

png pdf |
Table 13:
Normalized differential $ {\mathrm{ t } {}\mathrm{ \bar{t} } } $ cross sections with statistical and systematic uncertainties at the particle level as a function of $ {\Delta \phi ^{{\mathrm{ t } {}\mathrm{ \bar{t} } } }} $. The factor given in the last column applies to the values of the normalized cross section and the statistical and systematic uncertainties in that row. |
png pdf |
Table 14:
Normalized differential $ {\mathrm{ t } {}\mathrm{ \bar{t} } } $ cross sections with statistical and systematic uncertainties at the parton level as a function of $p_{\rm T}^{\rm t}$. The factor given in the last column applies to the values of the normalized cross section and the statistical and systematic uncertainties in that row. |
png pdf |
Table 15:
Normalized differential $ {\mathrm{ t } {}\mathrm{ \bar{t} } } $ cross sections with statistical and systematic uncertainties at the parton level as a function of $ {y^{\rm t}} $. The factor given in the last column applies to the values of the normalized cross section and the statistical and systematic uncertainties in that row. |
png pdf |
Table 16:
Normalized differential $ {\mathrm{ t } {}\mathrm{ \bar{t} } } $ cross sections with statistical and systematic uncertainties at the parton level as a function of $p_{\rm T}^{{\mathrm{ t } {}\mathrm{ \bar{t} } } }$. The factor given in the last column applies to the values of the normalized cross section and the statistical and systematic uncertainties in that row. |

png pdf |
Table 17:
Normalized differential $ {\mathrm{ t } {}\mathrm{ \bar{t} } } $ cross sections with statistical and systematic uncertainties at the parton level as a function of $ {y^{{\mathrm{ t } {}\mathrm{ \bar{t} } } }} $. The factor given in the last column applies to the values of the normalized cross section and the statistical and systematic uncertainties in that row. |

png pdf |
Table 18:
Normalized differential $ {\mathrm{ t } {}\mathrm{ \bar{t} } } $ cross sections with statistical and systematic uncertainties at the parton level as a function of $ {M^{{\mathrm{ t } {}\mathrm{ \bar{t} } } }} $. The factor given in the last column applies to the values of the normalized cross section and the statistical and systematic uncertainties in that row. |

png pdf |
Table 19:
Normalized differential $ {\mathrm{ t } {}\mathrm{ \bar{t} } } $ cross sections with statistical and systematic uncertainties at the parton level as a function of $ {\Delta \phi ^{{\mathrm{ t } {}\mathrm{ \bar{t} } } }} $. The factor given in the last column applies to the values of the normalized cross section and the statistical and systematic uncertainties in that row. |
| Summary |
| The normalized differential cross sections for top quark pair production have been presented by the CMS experiment in the dilepton decay channel in pp collisions at $ \sqrt{s} = $ 13 TeV with data corresponding to an integrated luminosity of 2.1 fb$^{-1}$. The differential cross sections are measured as a function of several kinematic variables at particle level in a visible phase space corresponding to the detector acceptance and at parton level in the full phase space. The measurements are compared to the predictions from Monte Carlo simulations and calculations in perturbative quantum chromodynamics. In general, the measurements are in fairly good agreement with predictions. We confirm that the top quark $ p_{\mathrm{T}} $ spectrum in data is softer than the Monte Carlo predictions at both particle and parton levels, as reported by the ATLAS and CMS experiments. The present results are in agreement with the earlier ATLAS and CMS measurements. We also find that the measurements are in better agreement with calculations within quantum chromodynamics up to next-to-next-to-leading-order accuracy at the parton level compared to previous next-to-leading-order predictions. |
| References | ||||
| 1 | M. Czakon, M. L. Mangano, A. Mitov, and J. Rojo | Constraints on the gluon PDF from top quark pair production at hadron colliders | JHEP 07 (2013) 167 | 1303.7215 |
| 2 | CMS Collaboration | Measurement of differential top-quark-pair production cross sections in pp colisions at $ \sqrt{s} = $ 7 TeV | EPJC 73 (2013) 2339 | CMS-TOP-11-013 1211.2220 |
| 3 | ATLAS Collaboration | Differential top-antitop cross-section measurements as a function of observables constructed from final-state particles using pp collisions at $ \sqrt{s} = $ 7 TeV in the ATLAS detector | JHEP 06 (2015) 100 | 1502.05923 |
| 4 | CMS Collaboration | Measurement of the differential cross section for top quark pair production in pp collisions at $ \sqrt{s} = $ 8 TeV | EPJC 75 (2015) 542 | CMS-TOP-12-028 1505.04480 |
| 5 | ATLAS Collaboration | Measurements of top-quark pair differential cross-sections in the lepton+jets channel in $ pp $ collisions at $ \sqrt{s} = $ 8 TeV using the ATLAS detector | EPJC 76 (2016) 538 | 1511.04716 |
| 6 | CMS Collaboration | Measurement of the differential cross sections for top quark pair production as a function of kinematic event variables in pp collisions at $ \sqrt{s} = $ 7 and 8 TeV | PRD 94 (2016) 052006 | CMS-TOP-12-042 1607.00837 |
| 7 | CMS Collaboration | Measurement of the integrated and differential $ t\overline{t} $ production cross sections for high-$ p_{\mathrm{T}} $ top quarks in $ pp $ collisions at $ \sqrt{s} = $ 8 TeV | PRD 94 (2016) 072002 | CMS-TOP-14-012 1605.00116 |
| 8 | CMS Collaboration | Measurement of the $ \mathrm{ t \bar{t} } $ production cross section in the all-jets final state in pp collisions at $ \sqrt{s} = $ 8 TeV | EPJC 76 (2016) 128 | CMS-TOP-14-018 1509.06076 |
| 9 | CMS Collaboration | Measurement of $ \mathrm{ t \bar{t} } $ production with additional jet activity, including $ \mathrm {b} $ quark jets, in the dilepton decay channel using pp collisions at $ \sqrt{s} = $ 8 TeV | EPJC 76 (2016) 379 | CMS-TOP-12-041 1510.03072 |
| 10 | ATLAS Collaboration | Measurement of jet activity in top quark events using the $ e \mu $ final state with two $ b $-tagged jets in $ pp $ collisions at $ \sqrt{s} = $ 8 TeV with the ATLAS detector | JHEP 09 (2016) 074 | 1606.09490 |
| 11 | ATLAS Collaboration | Measurement of top quark pair differential cross-sections in the dilepton channel in $ pp $ collisions at $ \sqrt{s} = $ 7 and 8 TeV with ATLAS | PRD 94 (2016) 092003 | 1607.07281 |
| 12 | CMS Collaboration | Measurement of double-differential cross sections for top quark pair production in pp collisions at $ \sqrt{s} = $ 8 TeV and impact on parton distribution functions | EPJC 77 (2017) 459 | 1703.01630v2 |
| 13 | CMS Collaboration | Measurement of differential cross sections for top quark pair production using the lepton+jets final state in proton-proton collisions at 13 TeV | PRD 95 (2017) 092001 | CMS-TOP-16-008 1610.04191 |
| 14 | ATLAS Collaboration | Measurement of jet activity produced in top-quark events with an electron, a muon and two $ b $-tagged jets in the final state in $ pp $ collisions at $ \sqrt{s} = $ 13 TeV with the ATLAS detector | EPJC 77 (2017) 220 | 1610.09978 |
| 15 | CMS Collaboration | The CMS experiment at the CERN LHC | JINST 3 (2008) S08004 | CMS-00-001 |
| 16 | CMS Collaboration | Particle-flow reconstruction and global event description with the CMS detector | Submitted to JINST | CMS-PRF-14-001 1706.04965 |
| 17 | CMS Collaboration | Missing transverse energy performance of the CMS detector | JINST 6 (2011) P09001 | CMS-JME-10-009 1106.5048 |
| 18 | P. Nason | A new method for combining NLO QCD with shower Monte Carlo algorithms | JHEP 11 (2004) 040 | hep-ph/0409146 |
| 19 | S. Frixione, P. Nason, and C. Oleari | Matching NLO QCD computations with parton shower simulations: the POWHEG method | JHEP 11 (2007) 070 | 0709.2092 |
| 20 | S. Alioli, P. Nason, C. Oleari, and E. Re | A general framework for implementing NLO calculations in shower Monte Carlo programs: the POWHEG BOX | JHEP 06 (2010) 043 | 1002.2581 |
| 21 | J. M. Campbell, R. K. Ellis, P. Nason, and E. Re | Top-pair production and decay at NLO matched with parton showers | JHEP 04 (2015) 114 | 1412.1828 |
| 22 | J. Alwall et al. | The automated computation of tree-level and next-to-leading order differential cross sections, and their matching to parton shower simulations | JHEP 07 (2014) 079 | 1405.0301 |
| 23 | T. Sjostrand, S. Mrenna, and P. Skands | A brief introduction to PYTHIA 8.1 | Comp. Phys. Comm. 178 (2008) 852 | 0710.3820 |
| 24 | P. Skands, S. Carrazza, and J. Rojo | Tuning PYTHIA 8.1: the Monash 2013 tune | EPJC 74 (2014) 3024 | 1404.5630 |
| 25 | R. Frederix and S. Frixione | Merging meets matching in MC@NLO | JHEP 12 (2012) 061 | 1209.6215 |
| 26 | J. Alwall et al. | Comparative study of various algorithms for the merging of parton showers and matrix elements in hadronic collisions | EPJC 53 (2008) 473 | 0706.2569 |
| 27 | M. Bahr et al. | Herwig++ physics and manual | EPJC 58 (2008) 639 | 0803.0883 |
| 28 | M. H. Seymour and A. Siodmok | Constraining MPI models using $ \sigma_{\text{eff}} $ and recent Tevatron and LHC Underlying Event data | JHEP 10 (2013) 113 | 1307.5015 |
| 29 | M. Czakon and A. Mitov | Top++: A program for the calculation of the top-pair cross-section at hadron colliders | CPC 185 (2014) 2930 | 1112.5675 |
| 30 | Y. Li and F. Petriello | Combining QCD and electroweak corrections to dilepton production in FEWZ | PRD 86 (2012) 094034 | 1208.5967 |
| 31 | E. Re | Single-top $ Wt $-channel production matched with parton showers using the POWHEG method | EPJC 71 (2011) 1547 | 1009.2450 |
| 32 | N. Kidonakis | NNLL threshold resummation for top-pair and single-top production | Phys. Part. Nucl. 45 (2014) 714 | 1210.7813 |
| 33 | T. Gehrmann et al. | $ W^{+}W^{-} $ Production at Hadron Colliders in Next to Next to Leading Order QCD | PRL 113 (2014) 212001 | 1408.5243 |
| 34 | J. M. Campbell and R. K. Ellis | MCFM for the Tevatron and the LHC | NPPS 205-206 (2010) 10 | 1007.3492 |
| 35 | J. Allison et al. | GEANT4 developments and applications | IEEE Trans. Nucl. Sci. 53 (2006) 270 | |
| 36 | GEANT4 Collaboration | GEANT4---a simulation toolkit | NIMA 506 (2003) 250 | |
| 37 | CMS Collaboration | Measurement of the $ \mathrm{ t \bar{t} } $ production cross section using events in the $ \mathrm{e}\mu $ final state in pp collisions at $ \sqrt{s} = $ 13 TeV | EPJC 77 (2017) 172 | CMS-TOP-16-005 1611.04040 |
| 38 | CMS Collaboration | Performance of CMS muon reconstruction in pp collision events at $ \sqrt{s} = $ 7 TeV | JINST 7 (2012) P10002 | CMS-MUO-10-004 1206.4071 |
| 39 | CMS Collaboration | Performance of electron reconstruction and selection with the CMS detector in proton-proton collisions at $ \sqrt{s} = $ 8 TeV | JINST 10 (2015) P06005 | CMS-EGM-13-001 1502.02701 |
| 40 | CMS Collaboration | Measurement of the Top Quark Pair Production Cross Section in Proton-Proton Collisions at $ \sqrt{s} = $ 13 TeV | PRL 116 (2016) 052002 | CMS-TOP-15-003 1510.05302 |
| 41 | M. Cacciari, G. P. Salam, and G. Soyez | FastJet user manual | EPJC 72 (2012) 1896 | 1111.6097 |
| 42 | M. Cacciari, G. P. Salam, and G. Soyez | The anti-$ k_t $ jet clustering algorithm | JHEP 04 (2008) 063 | 0802.1189 |
| 43 | CMS Collaboration | Jet energy scale and resolution in the CMS experiment in pp collisions at 8 TeV | JINST 12 (2017) P02014 | CMS-JME-13-004 1607.03663 |
| 44 | CMS Collaboration | Identification of b-quark jets with the CMS experiment | JINST 8 (2013) P04013 | CMS-BTV-12-001 1211.4462 |
| 45 | CMS Collaboration | Identification of b quark jets at the CMS experiment in the LHC Run 2 | CMS-PAS-BTV-15-001 | CMS-PAS-BTV-15-001 |
| 46 | Particle Data Group, C. Patrignani et al. | Review of particle physics | CPC 40 (2016) 100001 | |
| 47 | L. Sonnenschein | Analytical solution of $ t \overline{t} $ dilepton equations | PRD 73 (2006) 054015 | hep-ph/0603011 |
| 48 | R. H. Dalitz and G. R. Goldstein | Analysis of top-antitop production and dilepton decay events and the top quark mass | PLB 287 (1992) 225 | |
| 49 | CMS Collaboration | First measurement of the cross section for top-quark pair production in proton-proton collisions at $ \sqrt{s} = $ 7 TeV | PLB 695 (2011) 424 | CMS-TOP-10-001 1010.5994 |
| 50 | CMS Collaboration | Measurement of the $ \mathrm{ t \bar{t} } $ production cross section and the top quark mass in the dilepton channel in pp collisions at $ \sqrt{s} = $ 7 TeV | JHEP 07 (2011) 049 | CMS-TOP-11-002 1105.5661 |
| 51 | CMS Collaboration | Measurement of the $ \mathrm{ t \bar{t} } $ production cross section in the dilepton channel in pp collisions at $ \sqrt{s} = $ 7 TeV | JHEP 11 (2012) 067 | CMS-TOP-11-005 1208.2671 |
| 52 | G. D'Agostini | A multidimensional unfolding method based on Bayes' theorem | NIMA 362 (1995) 487 | |
| 53 | CMS Collaboration | Determination of jet energy calibration and transverse momentum resolution in CMS | JINST 6 (2011) P11002 | CMS-JME-10-011 1107.4277 |
| 54 | NNPDF Collaboration | Parton distributions for the LHC Run II | JHEP 04 (2015) 040 | 1410.8849 |
| 55 | J. Butterworth et al. | PDF4LHC recommendations for LHC Run II | JPG 43 (2016) 023001 | 1510.03865 |
| 56 | M. Cacciari et al. | The $ t \overline{t} $ cross-section at 1.8 TeV and 1.96 TeV: A study of the systematics due to parton densities and scale dependence | JHEP 04 (2004) 068 | hep-ph/0303085 |
| 57 | S. Catani, D. de Florian, M. Grazzini, and P. Nason | Soft gluon resummation for Higgs boson production at hadron colliders | JHEP 07 (2003) 028 | hep-ph/0306211 |
| 58 | E. Gross and O. Vitells | Trial factors or the look elsewhere effect in high energy physics | EPJC 70 (2010) 525 | 1005.1891 |
| 59 | M. Guzzi, K. Lipka, and S.-O. Moch | Top-quark pair production at hadron colliders: differential cross section and phenomenological applications with DiffTop | JHEP 01 (2015) 082 | 1406.0386 |
| 60 | N. Kidonakis | NNNLO soft-gluon corrections for the top-quark $ p_{\mathrm{T}} $ and rapidity distributions | PRD 91 (2015) 031501 | 1411.2633 |
| 61 | L. A. Harland-Lang, A. D. Martin, P. Motylinski, and R. S. Thorne | Parton distributions in the LHC era: MMHT 2014 PDFs | EPJC 75 (2015) 204 | 1412.3989 |
| 62 | B. D. Pecjak, D. J. Scott, X. Wang, and L. L. Yang | Resummed Differential Cross Sections for Top-Quark Pairs at the LHC | PRL 116 (2016) 202001 | 1601.07020 |
| 63 | M. Czakon, D. Heymes, and A. Mitov | High-Precision Differential Predictions for Top-Quark Pairs at the LHC | PRL 116 (2016) 082003 | 1511.00549 |
|
|
Compact Muon Solenoid LHC, CERN |
|

|

|

|

|

|