

Compact Muon Solenoid
LHC, CERN
| CMS-TOP-17-012 ; CERN-EP-2020-047 | ||
| Measurement of CKM matrix elements in single top quark $t$-channel production in proton-proton collisions at $\sqrt{s} = $ 13 TeV | ||
| CMS Collaboration | ||
| 25 April 2020 | ||
| Phys. Lett. B 808 (2020) 135609 | ||
| Abstract: The first direct, model-independent measurement is presented of the modulus of the Cabibbo-Kobayashi-Maskawa (CKM) matrix elements $|{{V_{\mathrm{t}\mathrm{b}}}}|$, $|{V_{\mathrm{t}\mathrm{d}}}|$, and $|{V_{\mathrm{t}\mathrm{s}}}|$, in final states enriched in single top quark $t$-channel events. The analysis uses proton-proton collision data from the LHC, collected during 2016 by the CMS experiment, at a centre-of-mass energy of 13 TeV, corresponding to an integrated luminosity of 35.9 fb$^{-1}$. Processes directly sensitive to these matrix elements are considered at both the production and decay vertices of the top quark. In the standard model hypothesis of CKM unitarity, a lower limit of $|{V_{\mathrm{t}\mathrm{b}}}| > $ 0.970 is measured at the 95% confidence level. Several theories beyond the standard model are considered, and by releasing all constraints among the involved parameters, the values $|{V_{\mathrm{t}\mathrm{b}}}| = $ 0.988 $\pm$ 0.024, and $|{V_{\mathrm{t}\mathrm{d}}}|^2 +|{V_{\mathrm{t}\mathrm{s}}}|^2 = $ 0.06 $\pm$ 0.06, where the uncertainties include both statistical and systematic components, are measured. | ||
| Links: e-print arXiv:2004.12181 [hep-ex] (PDF) ; CDS record ; inSPIRE record ; HepData record ; CADI line (restricted) ; | ||
| Figures | |
png pdf |
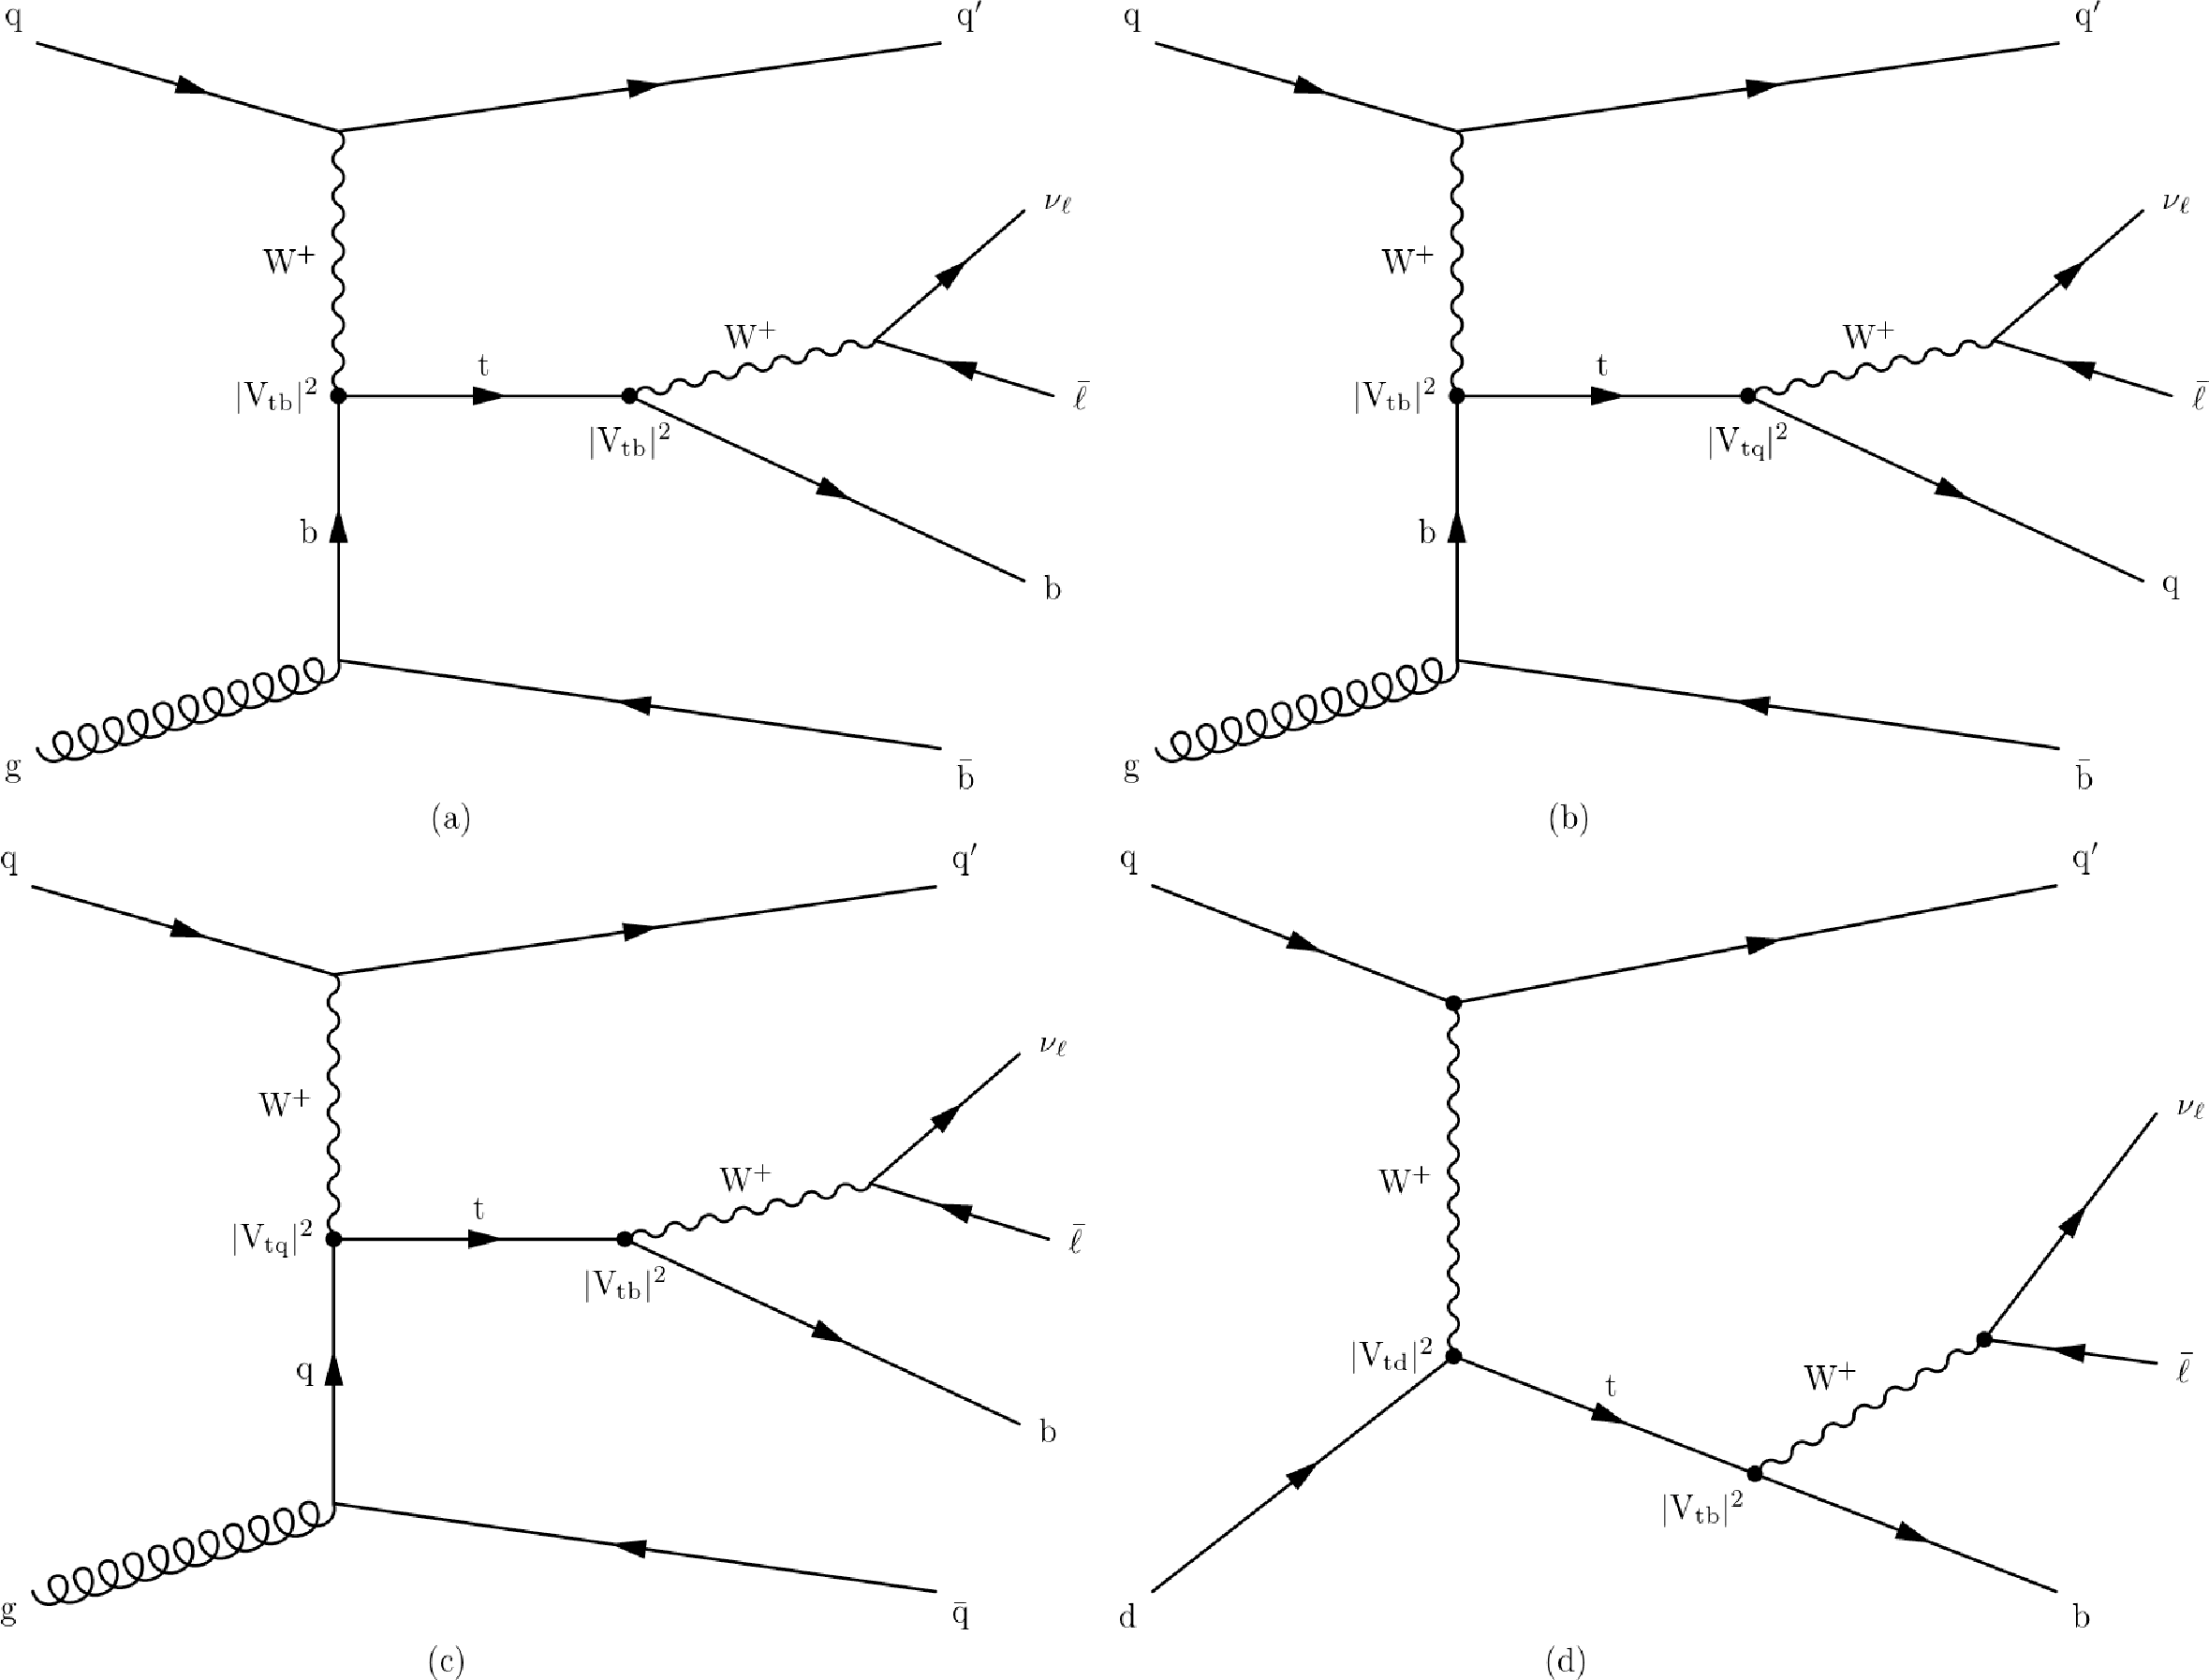
Figure 1:
Leading-order Feynman diagrams for single top quark production via the $t$ channel featuring: (a) a tWb vertex in production and decay, (b) a tWb vertex in production and a tWq in decay, with q being an s or d quark, (c) a tWq vertex in production and a tWb in decay, and (d) a process initiated by a d quark and enhanced due to contributions from these valence quarks. The $\ell $ refers to e or $\mu$ leptons. |
png pdf |
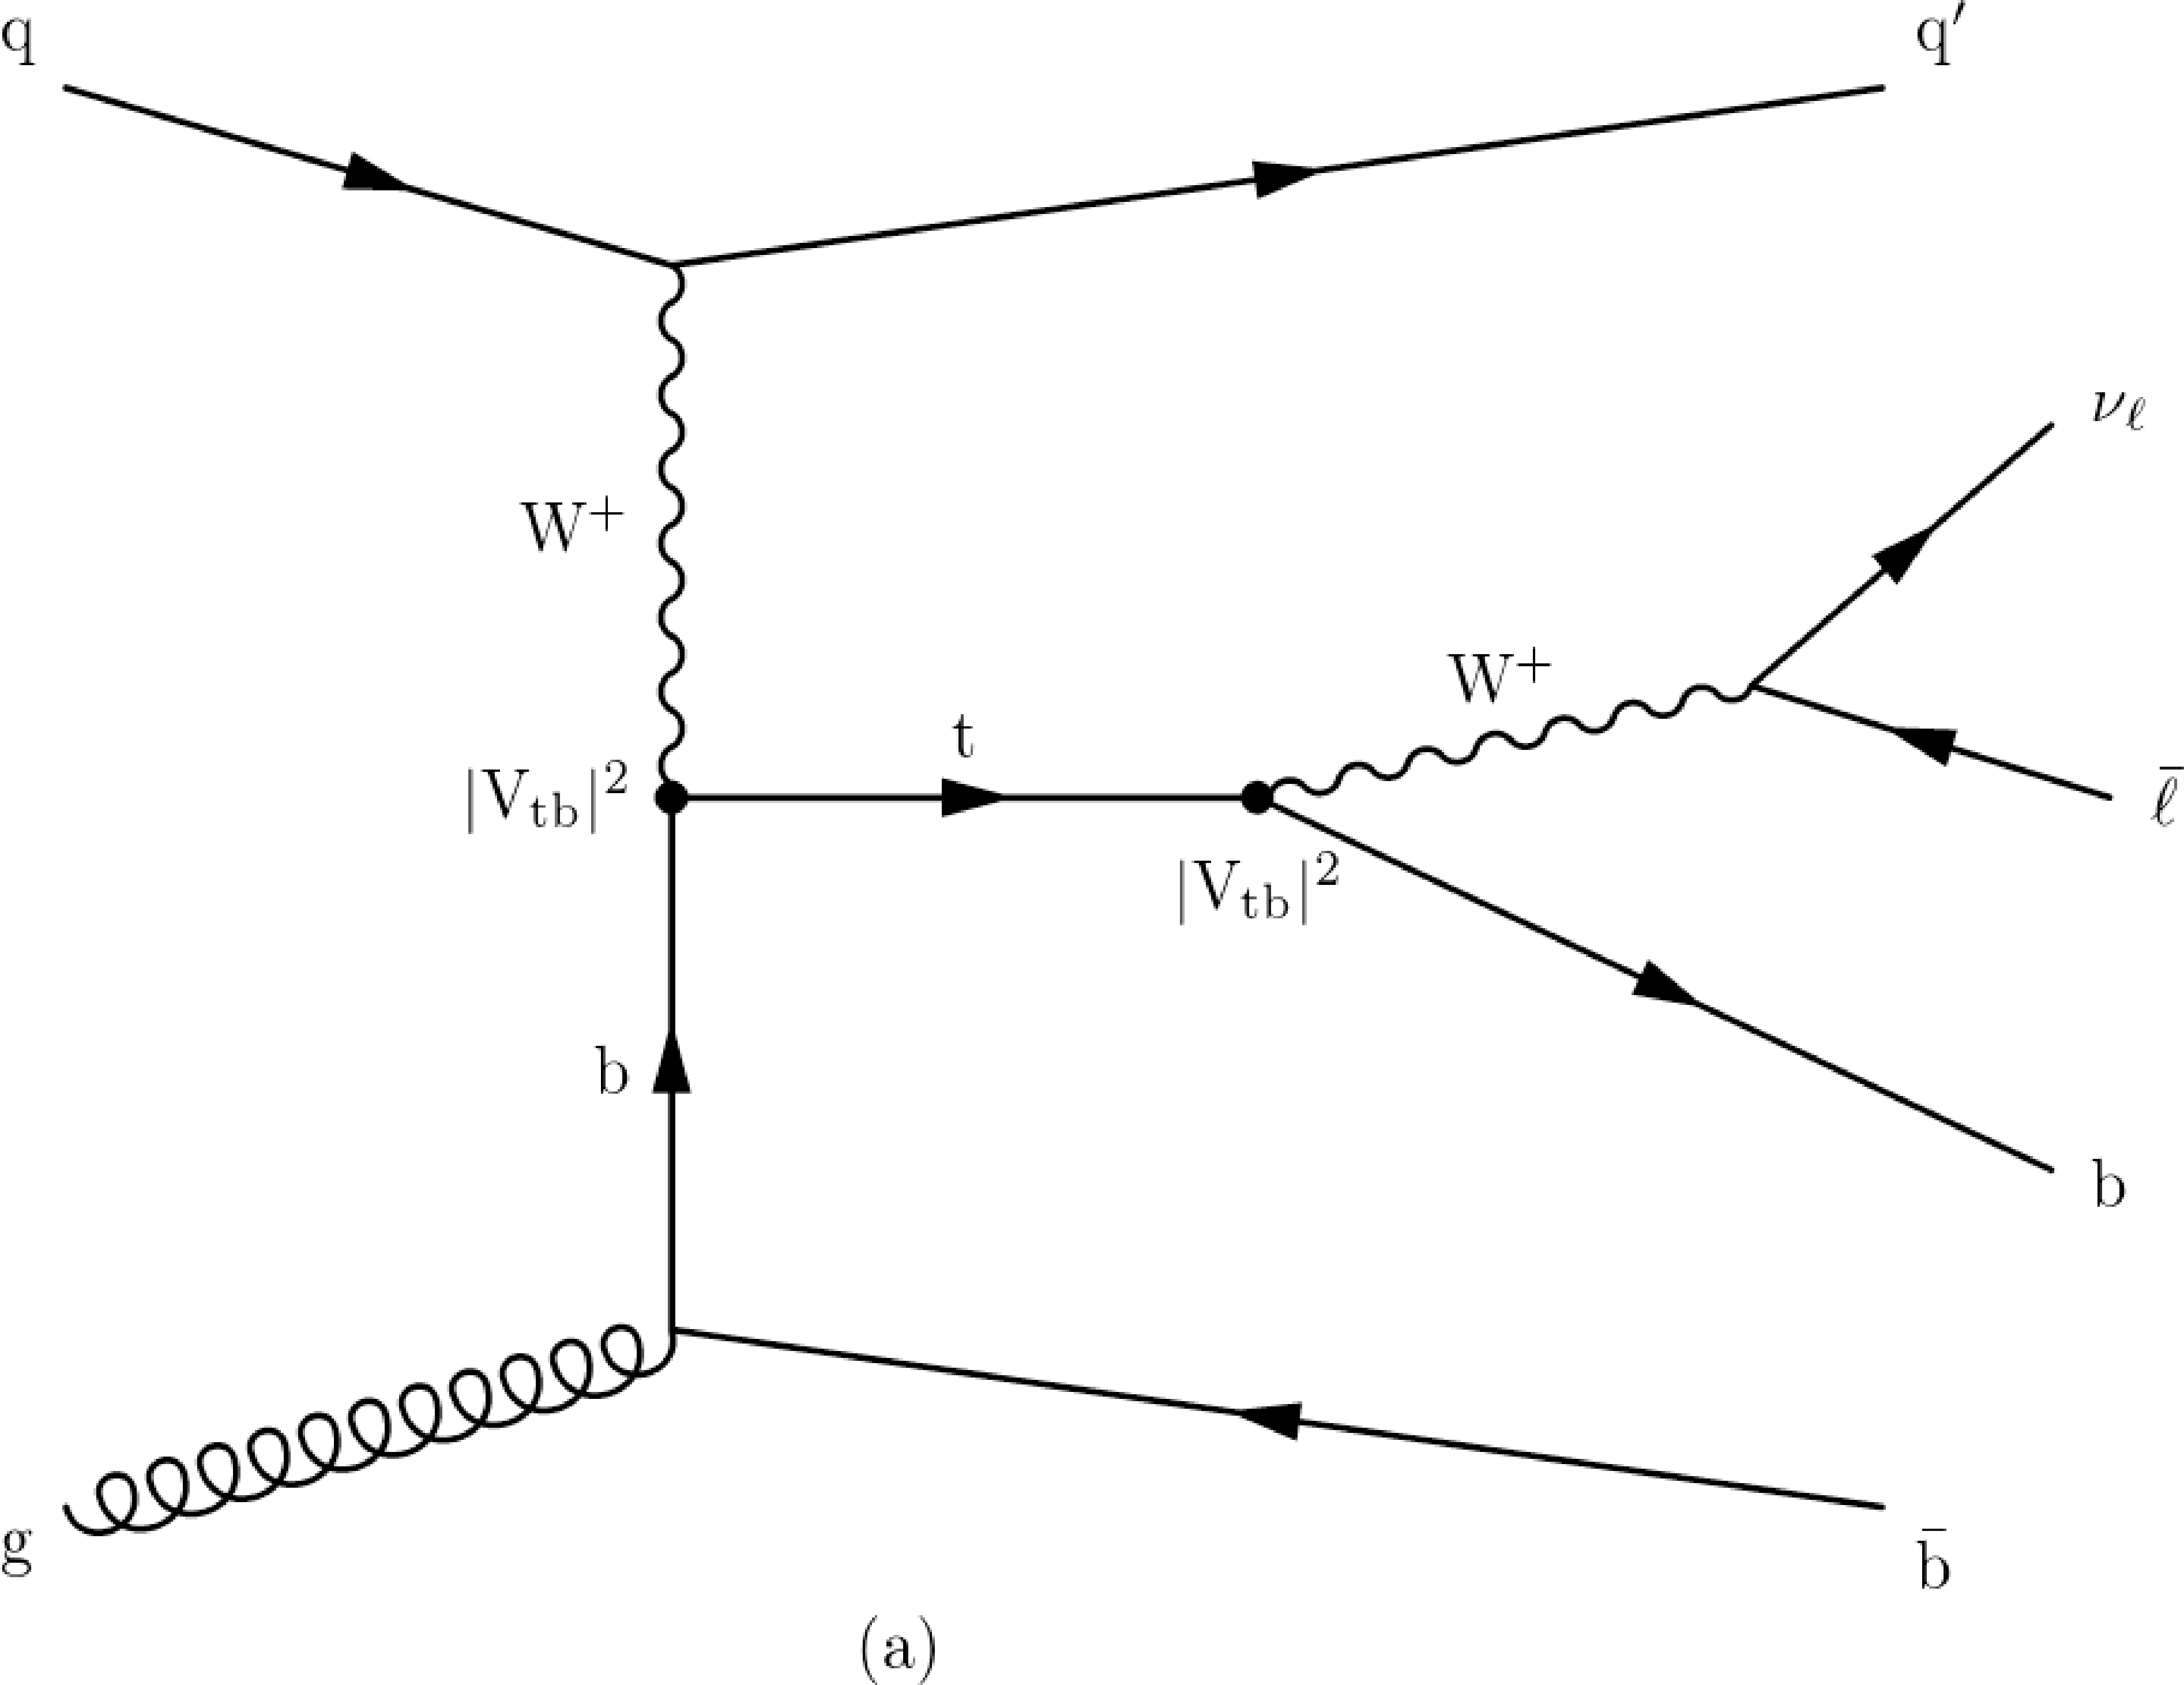
Figure 1-a:
Leading-order Feynman diagram for single top quark production via the $t$ channel featuring: a tWb vertex in production and decay. The $\ell $ refers to e or $\mu$ leptons. |

png pdf |
Figure 1-b:
Leading-order Feynman diagram for single top quark production via the $t$ channel featuring: a tWb vertex in production and a tWq in decay, with q being an s or d quark. The $\ell $ refers to e or $\mu$ leptons. |

png pdf |
Figure 1-c:
Leading-order Feynman diagram for single top quark production via the $t$ channel featuring: a tWq vertex in production and a tWb in decay. The $\ell $ refers to e or $\mu$ leptons. |
png pdf |
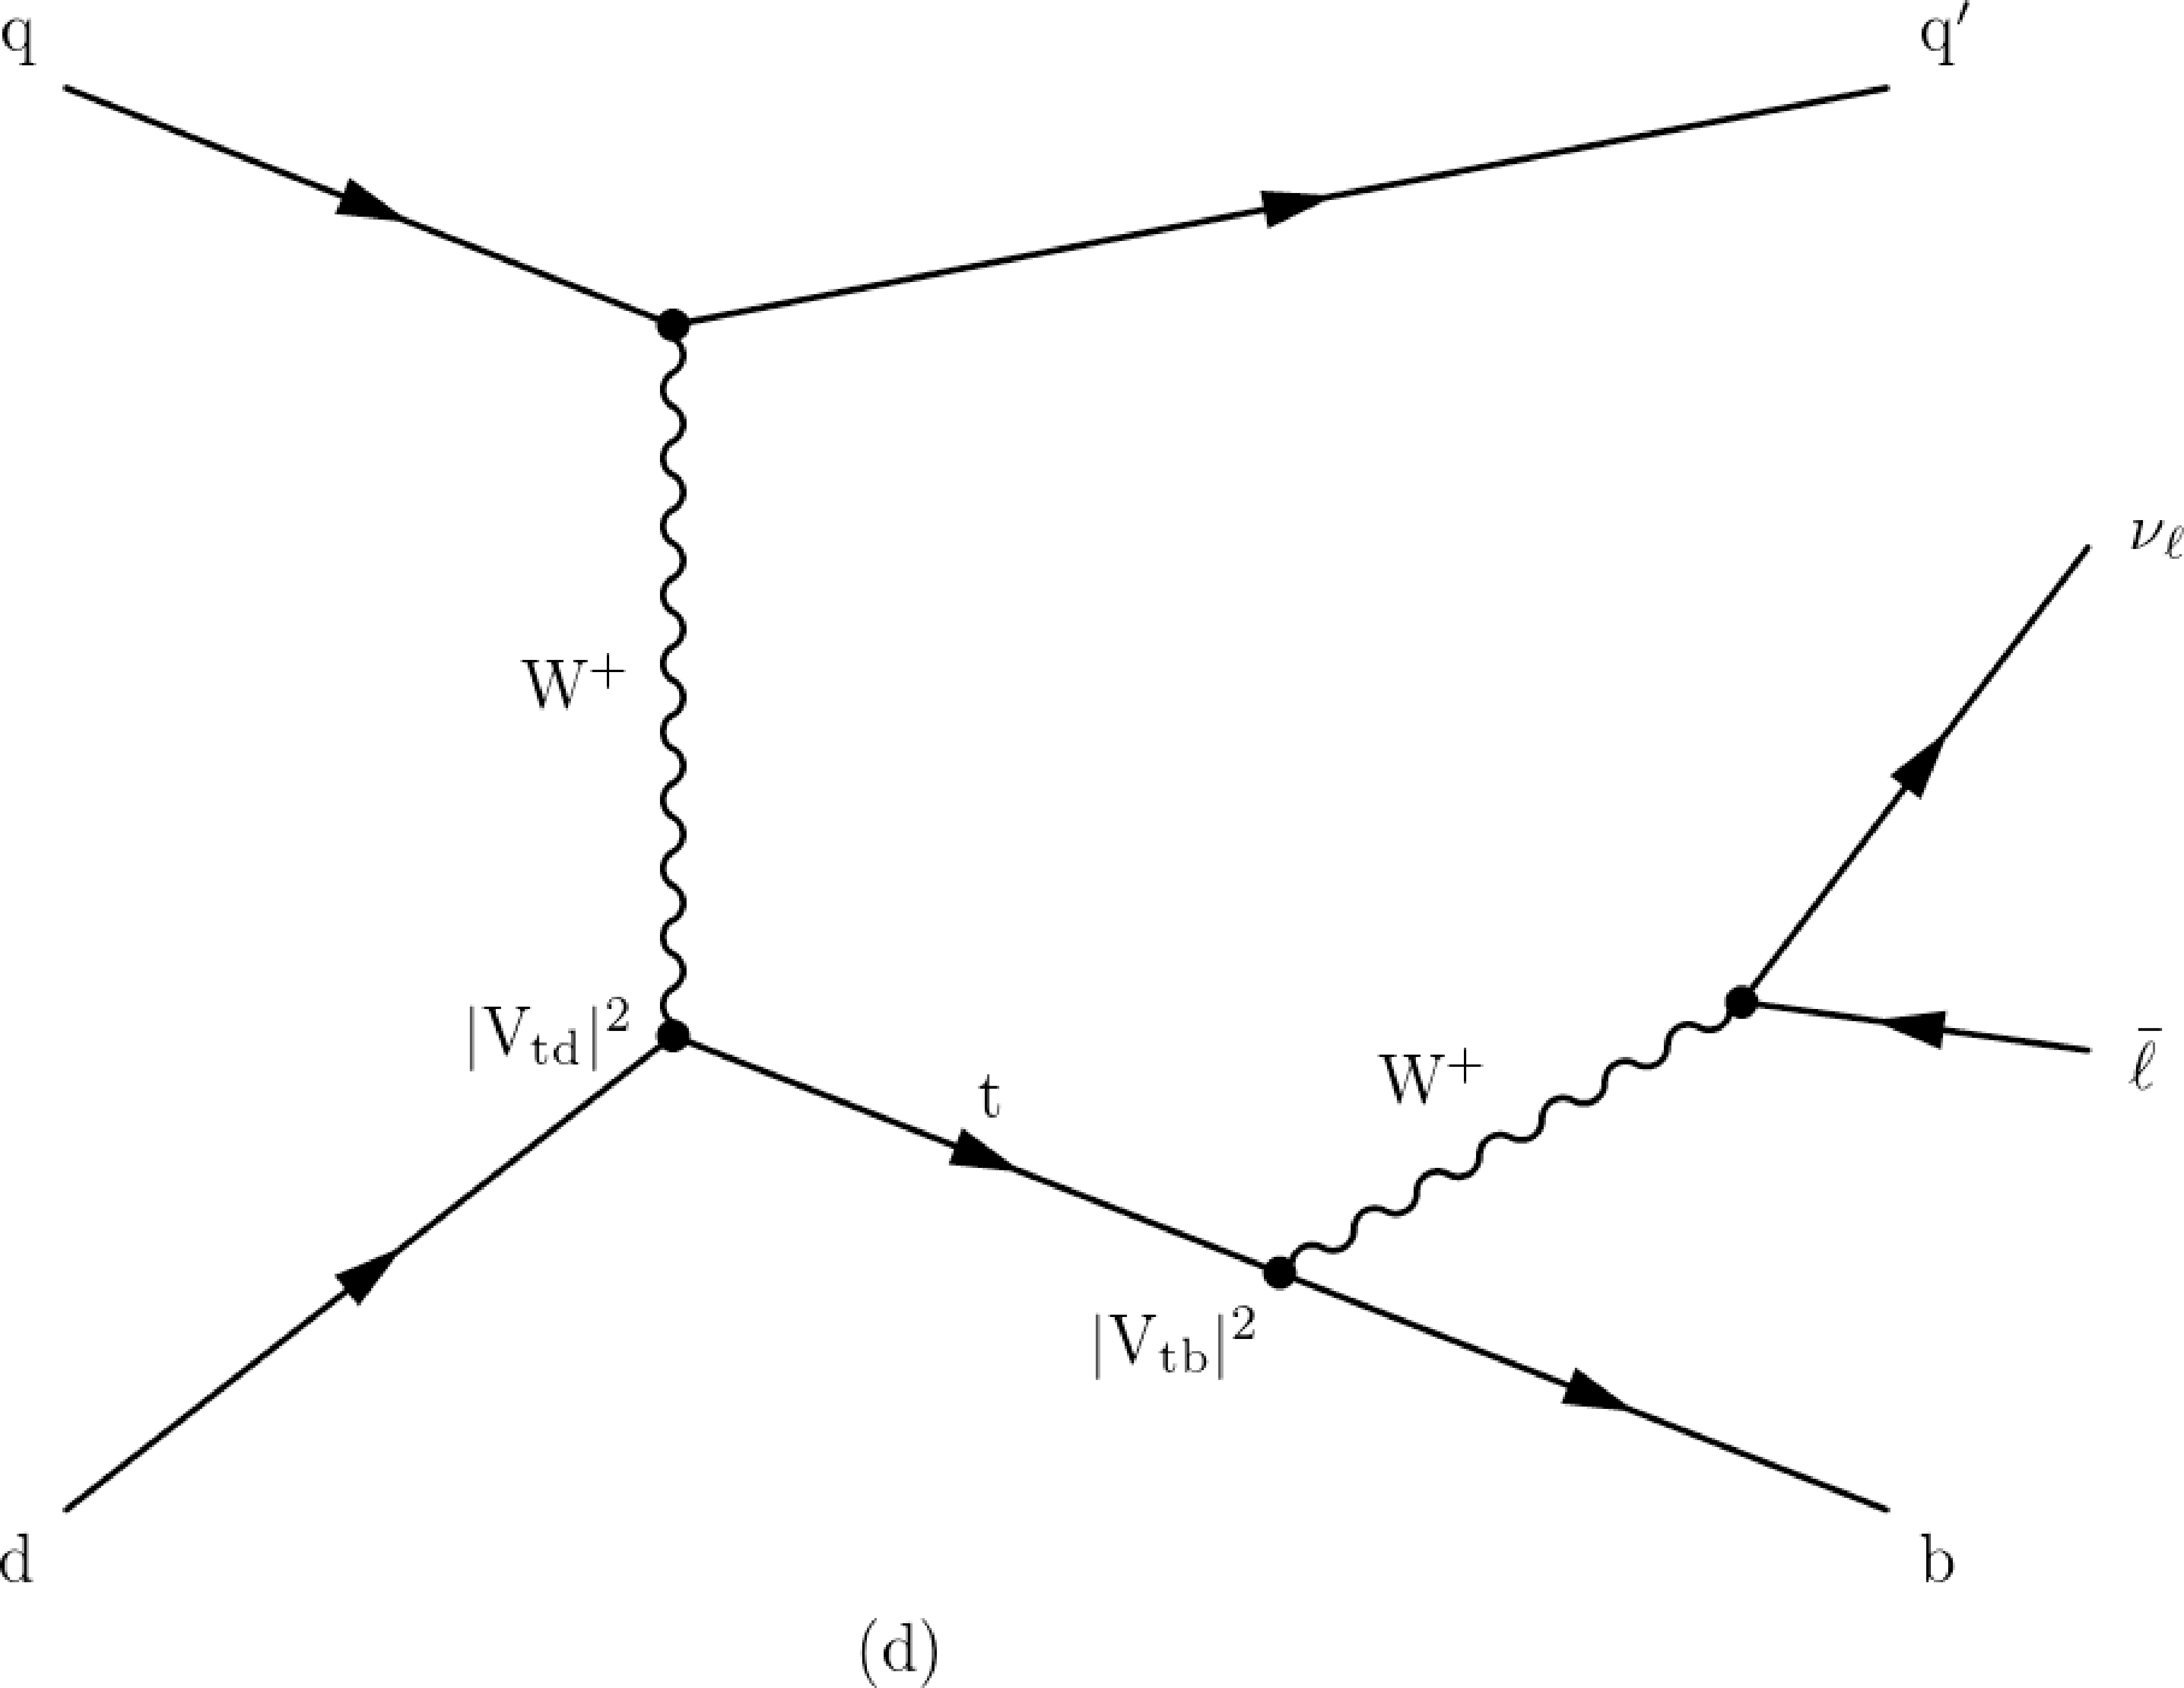
Figure 1-d:
Leading-order Feynman diagram for single top quark production via the $t$ channel featuring: a process initiated by a d quark and enhanced due to contributions from these valence quarks. The $\ell $ refers to e or $\mu$ leptons. |
png pdf |
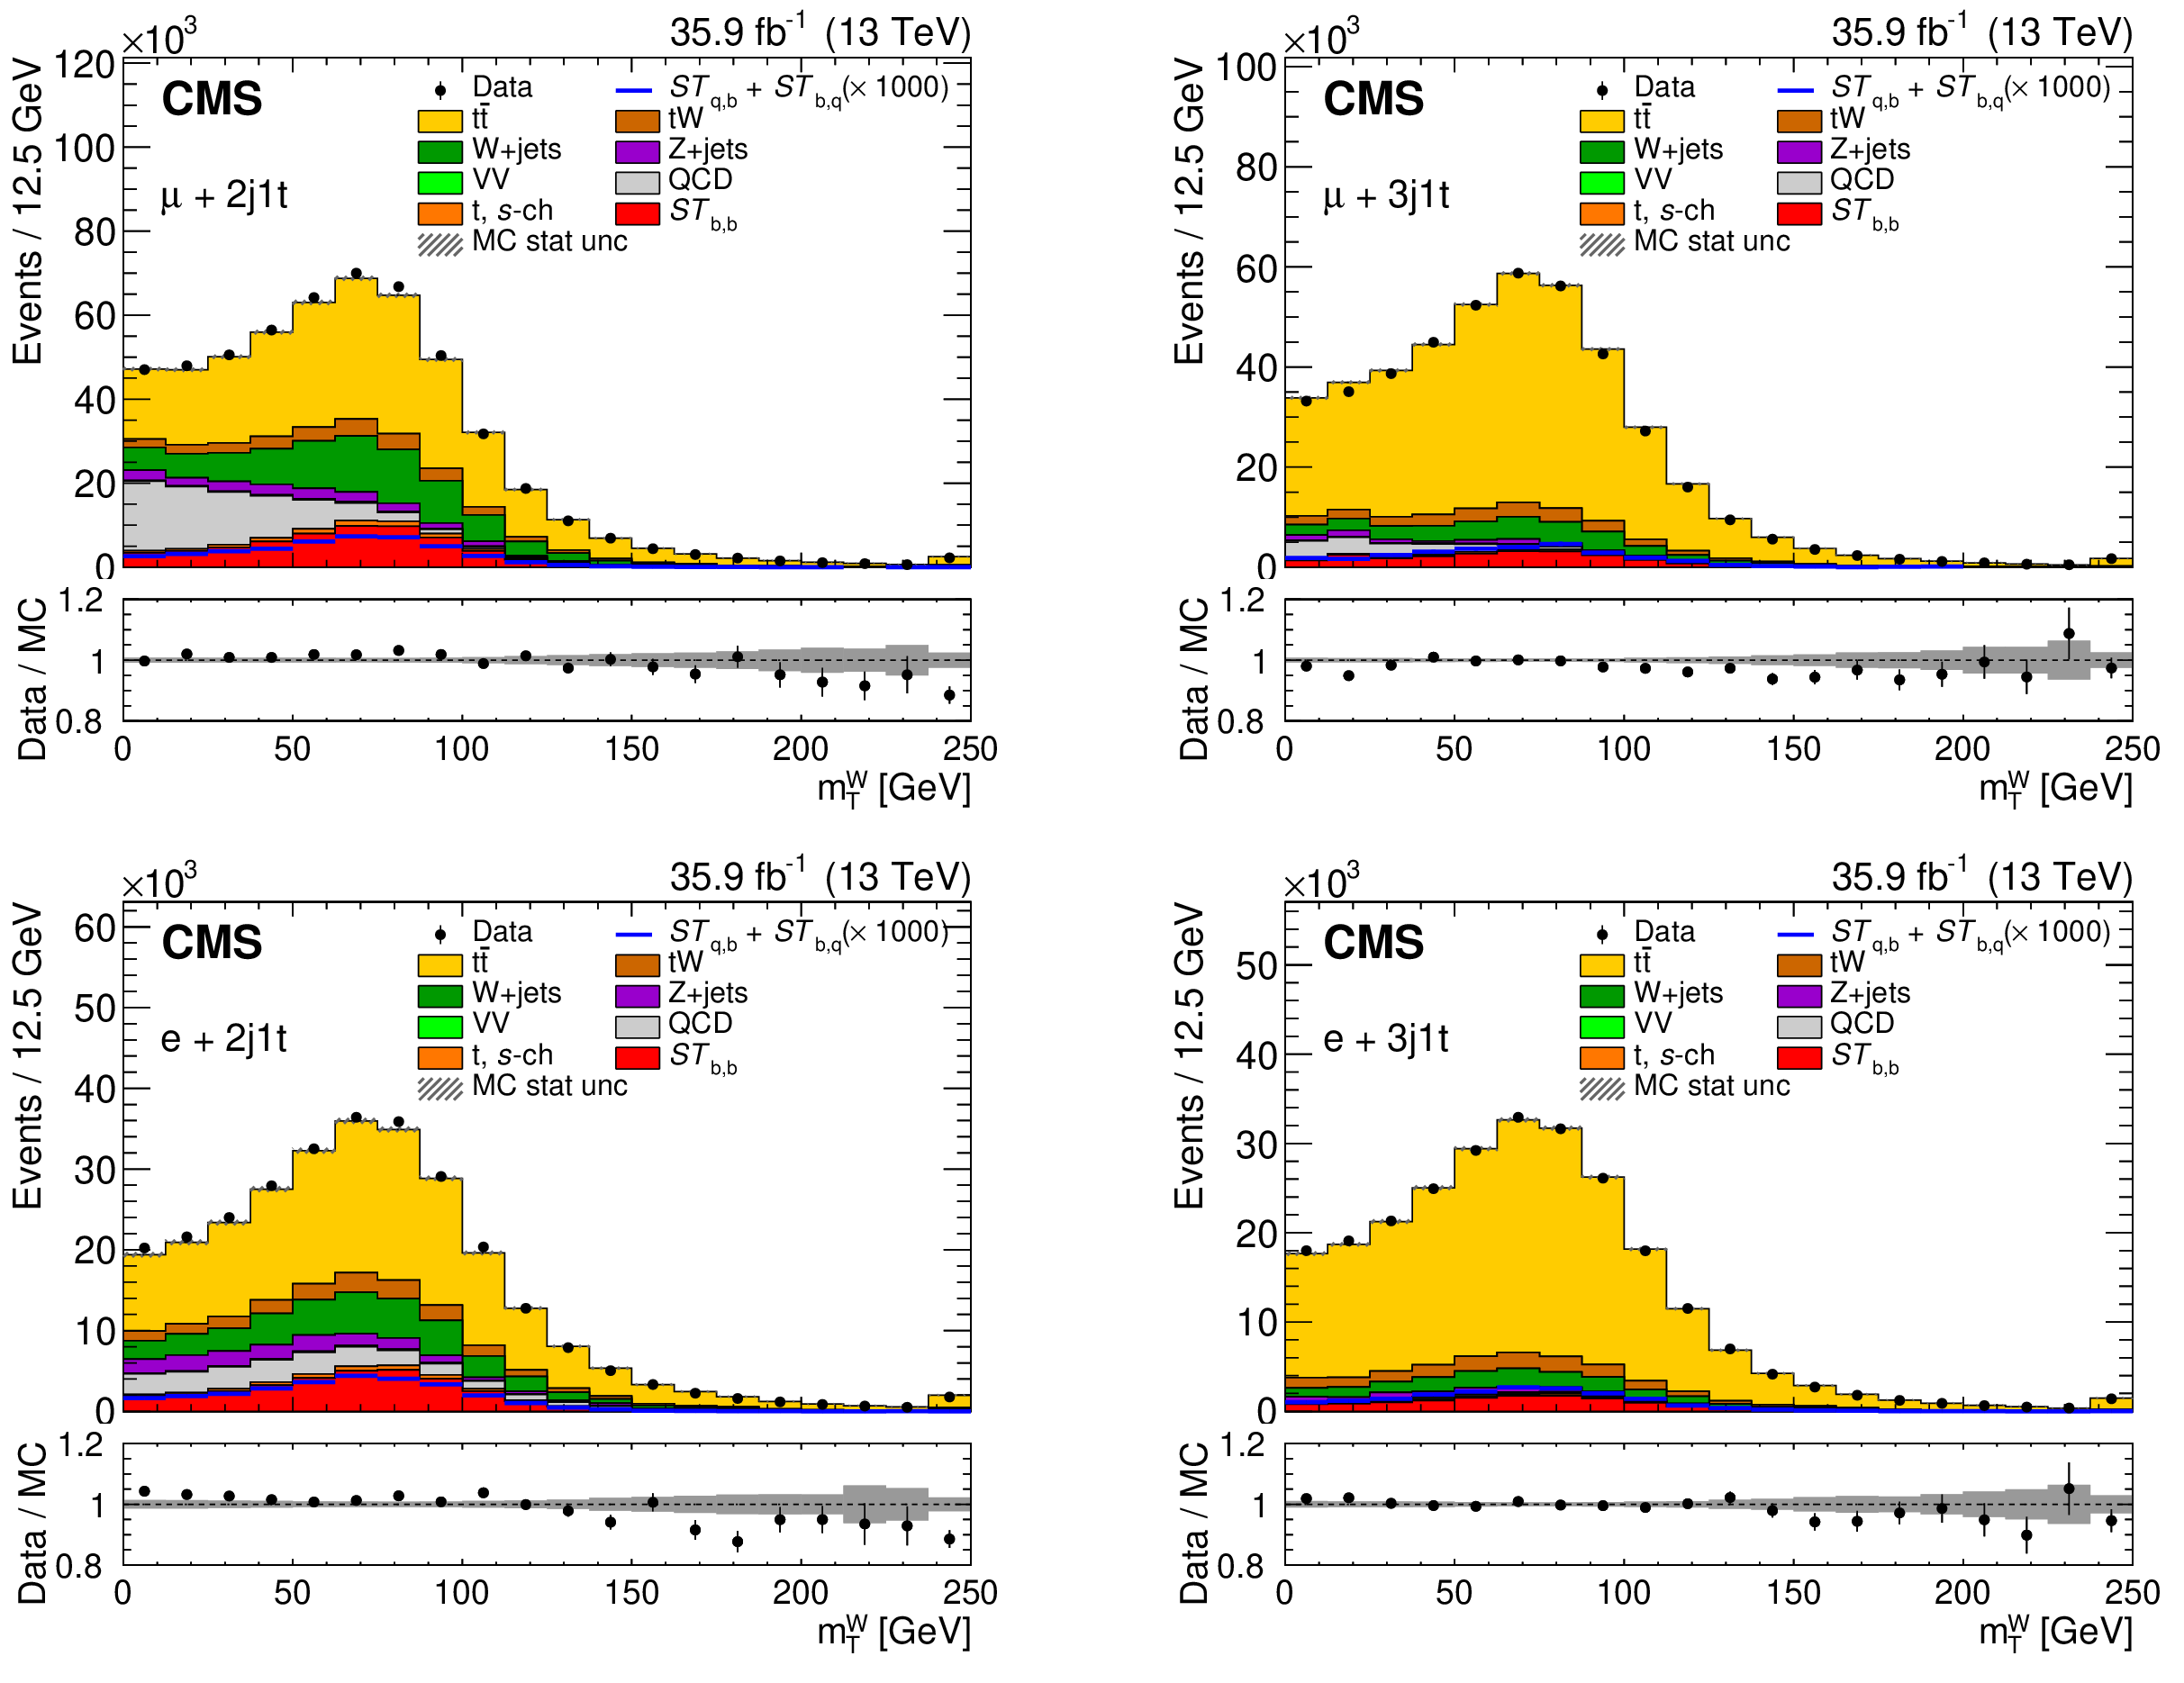
Figure 2:
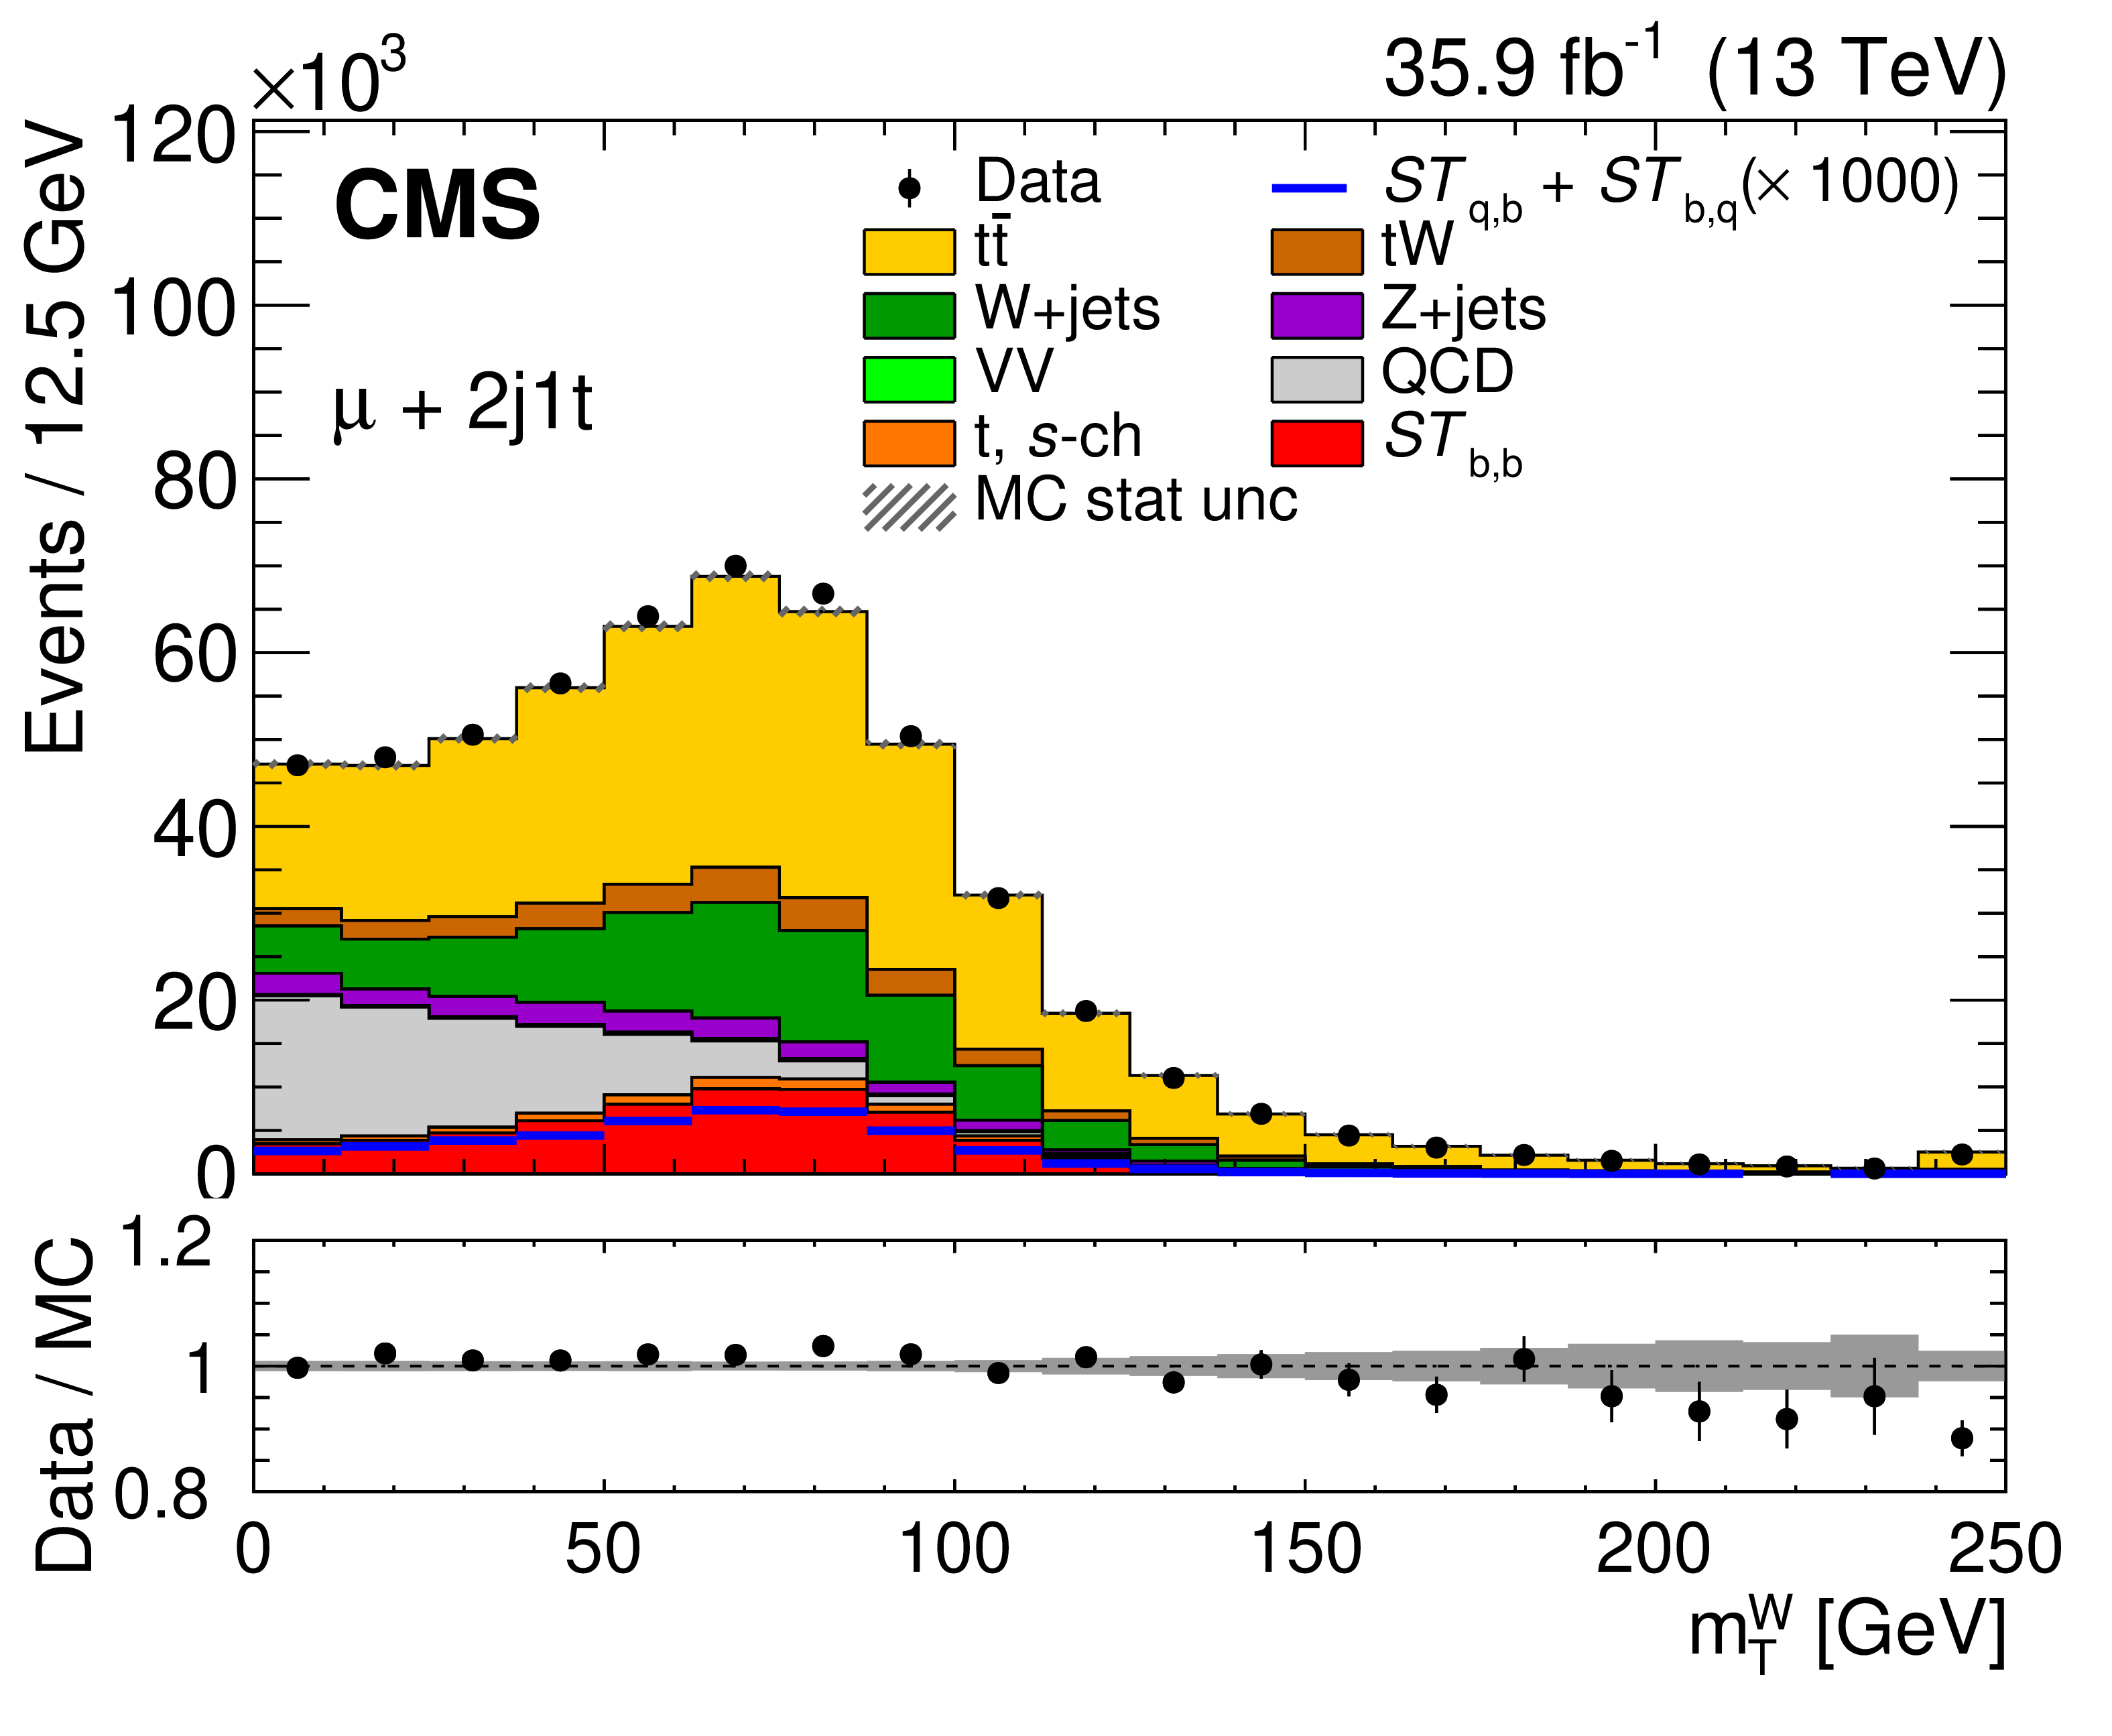
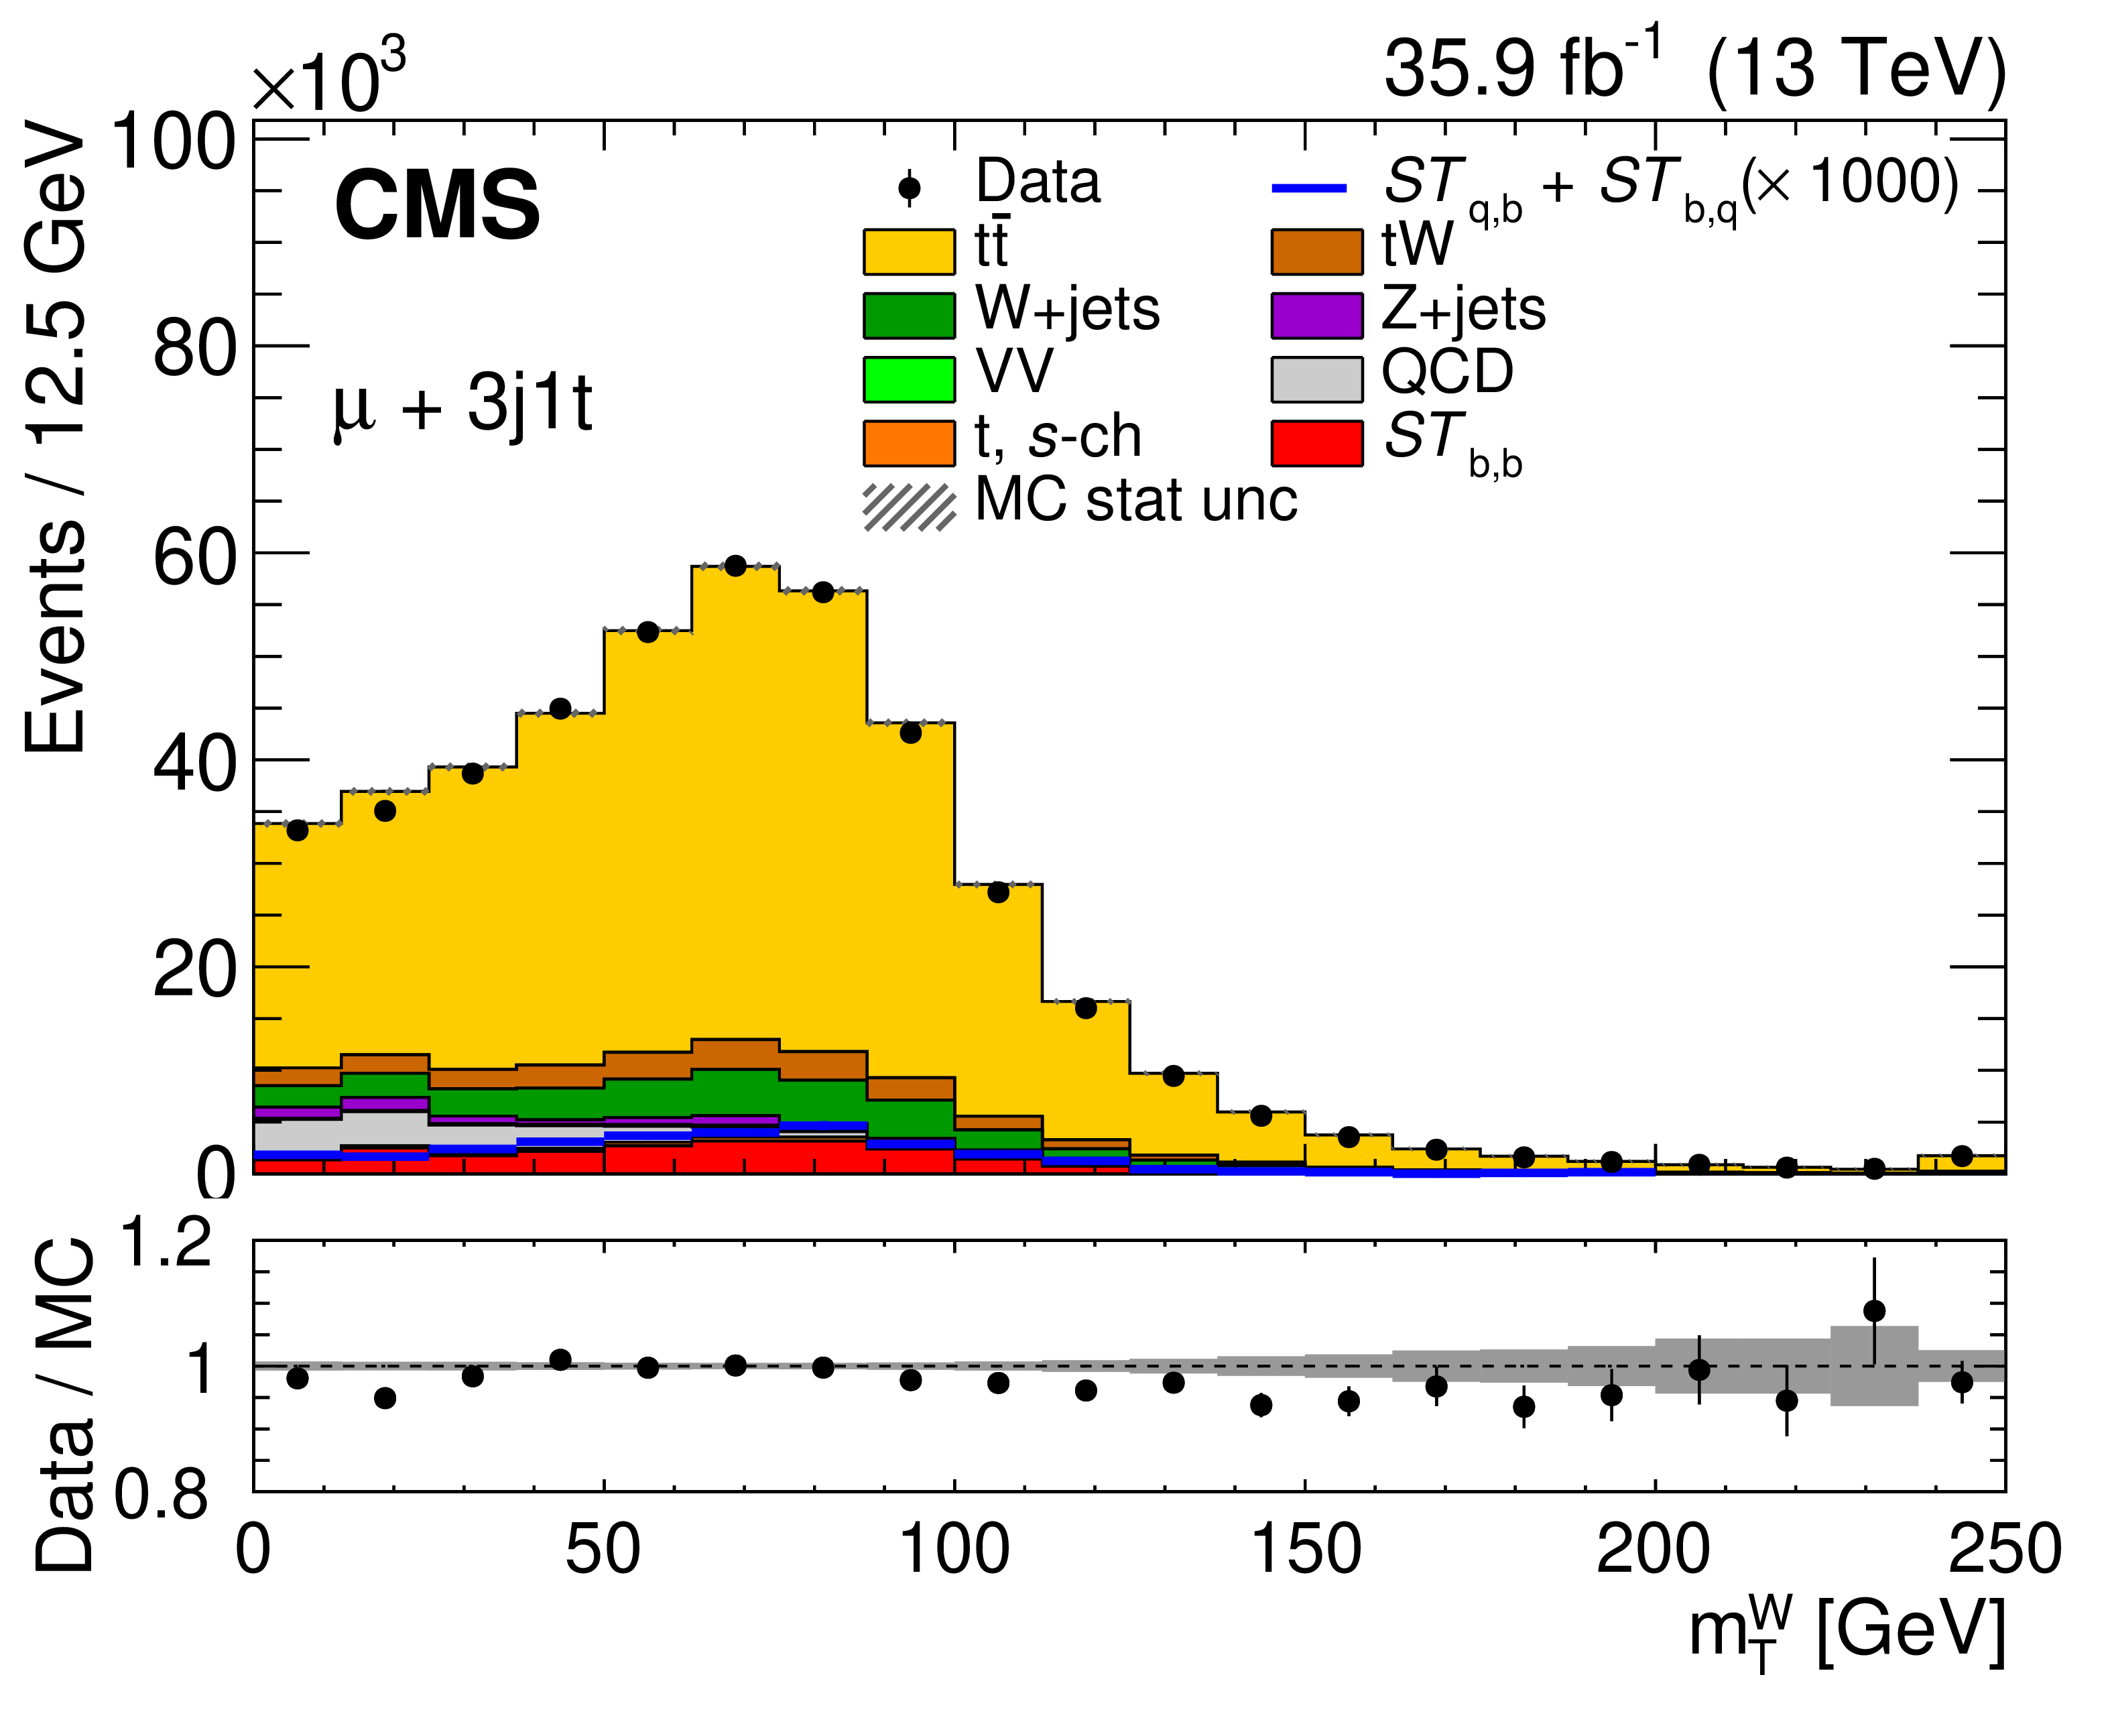
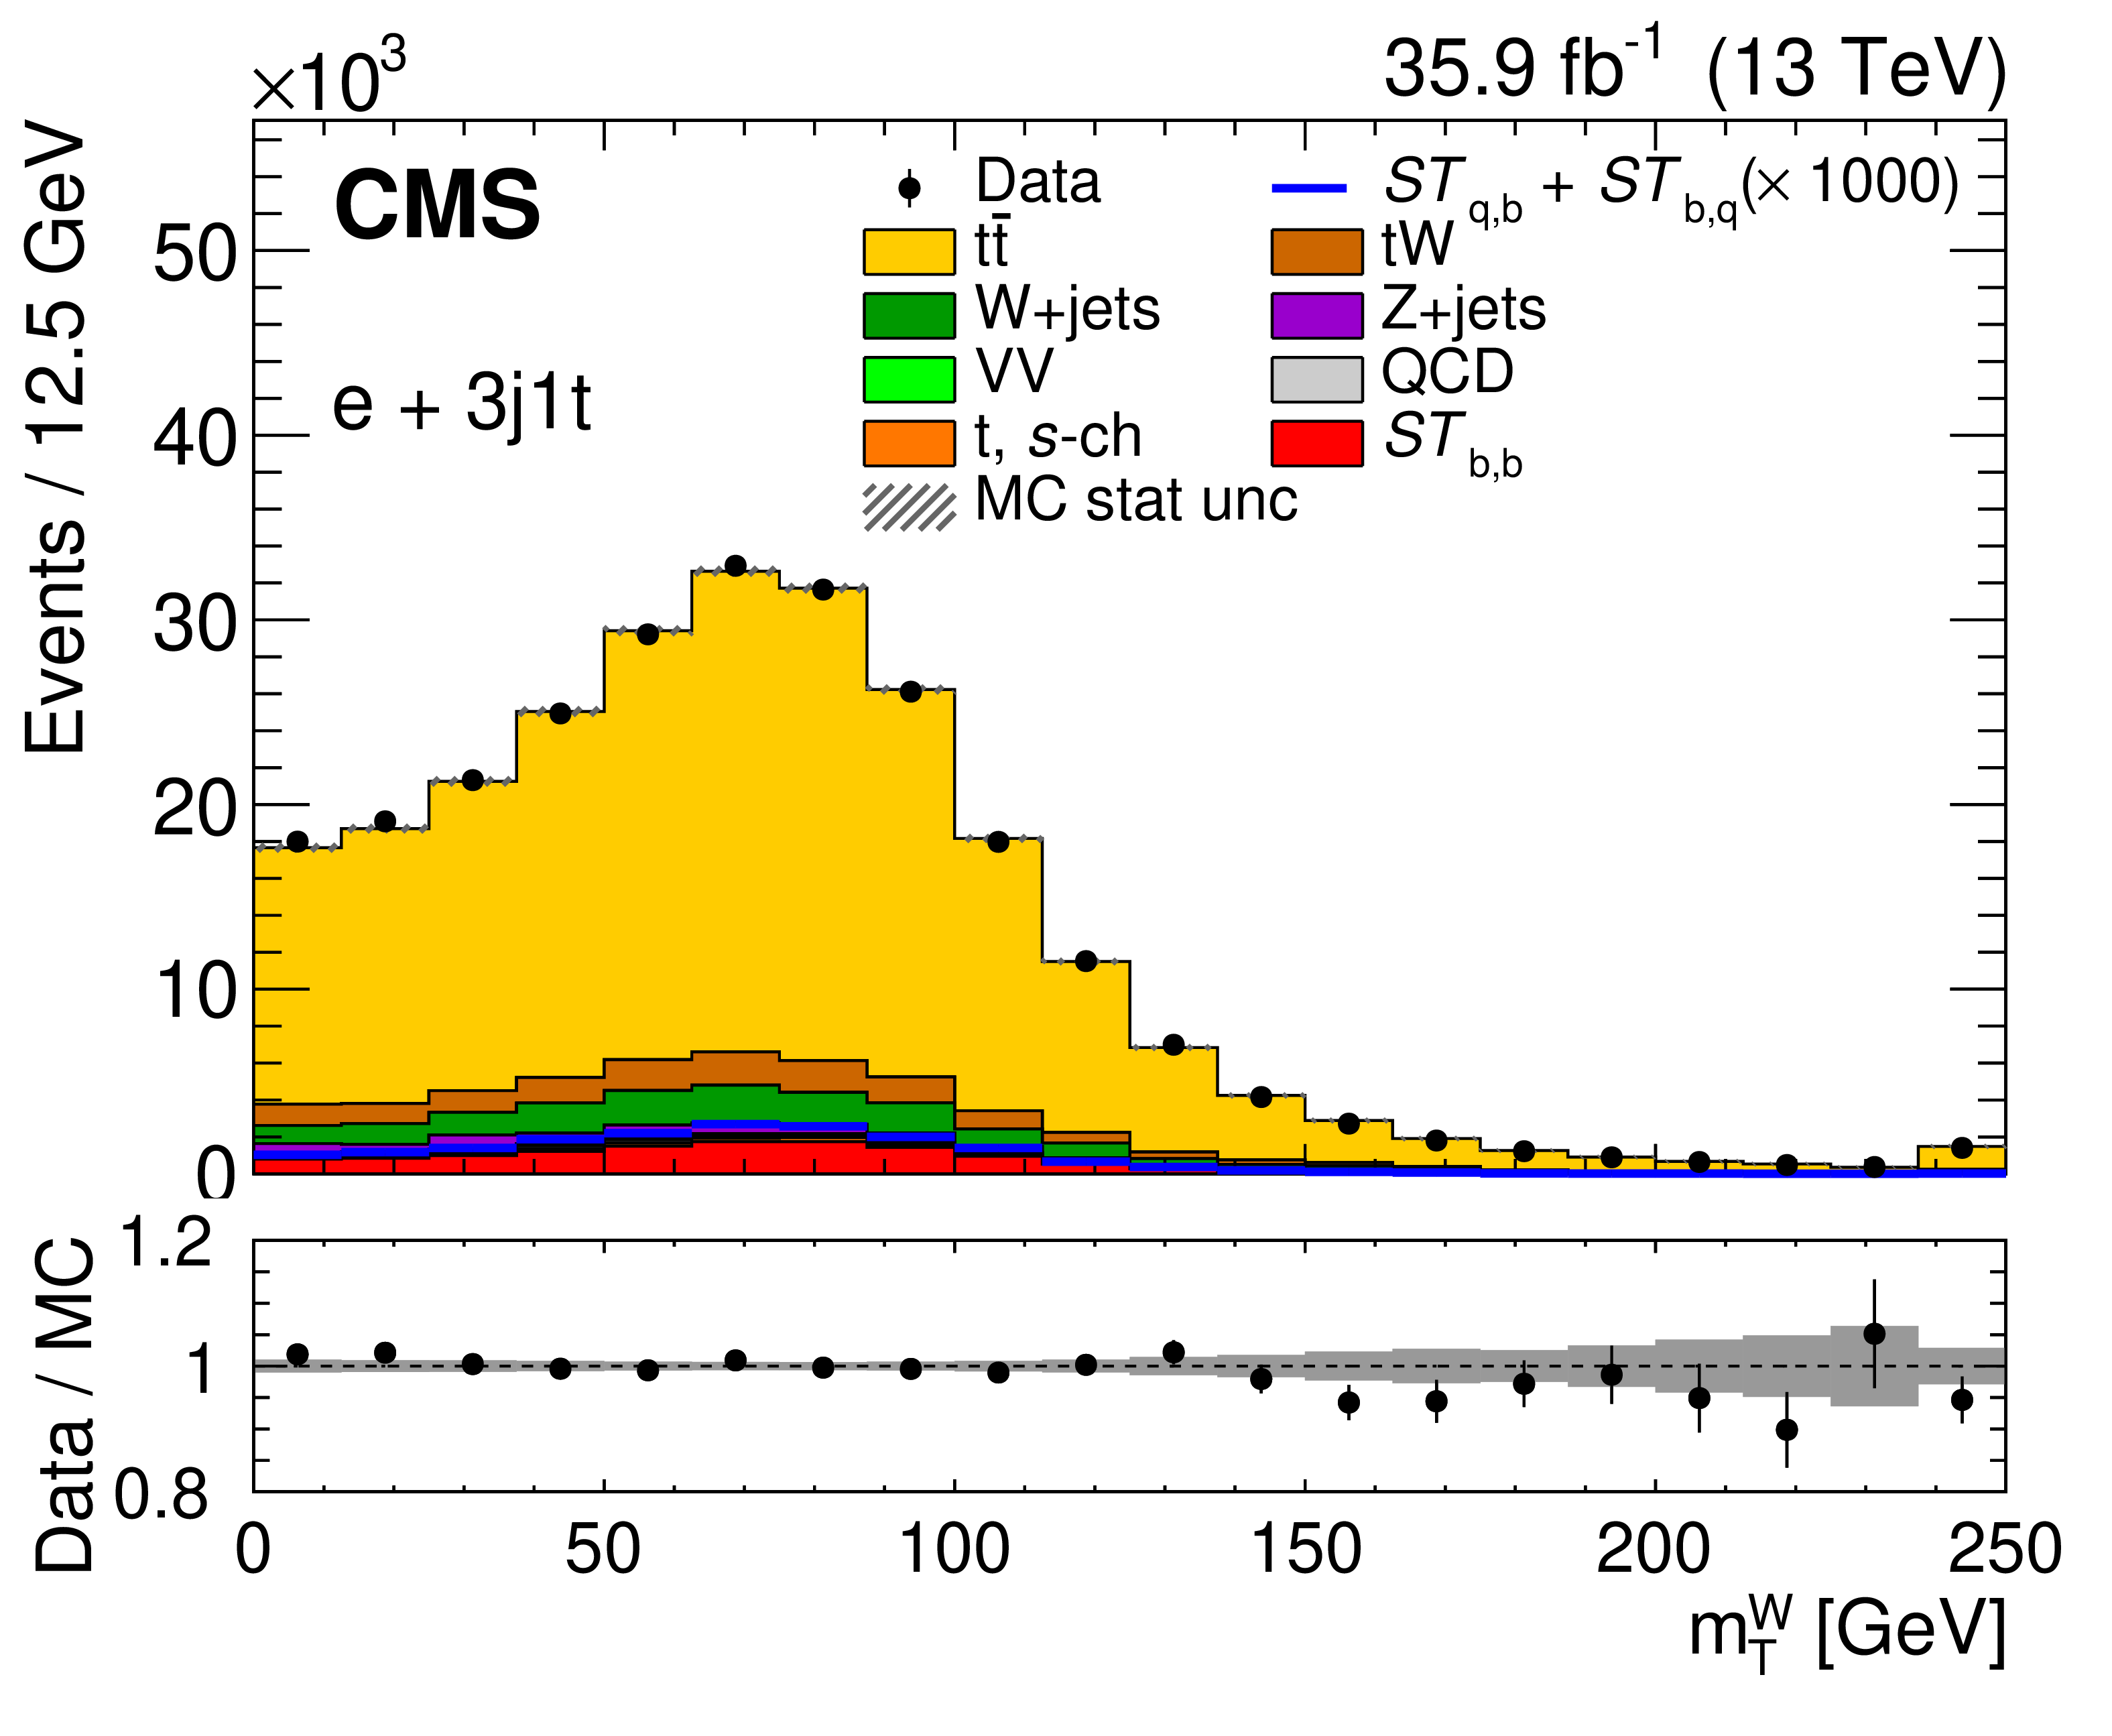
The ${{m_{\mathrm {T}}} ^{\mathrm{W}}}$ distribution from data (points) and simulation (shaded histograms) in the 2j1t (left) and 3j1t (right) categories for the muon (upper) and electron (lower) channels. The vertical lines on the points and the hatched bands show the experimental and MC statistical uncertainties, respectively. The expected distribution from the $ {ST_{\mathrm{q},\mathrm{b}}}+ {ST_{\mathrm{b},\mathrm{q}}}$ processes (multiplied by a factor of 1000) is shown by the solid blue line. The lower panels show the ratio of the data to the MC prediction. |
png pdf |
Figure 2-a:
The ${{m_{\mathrm {T}}} ^{\mathrm{W}}}$ distribution from data (points) and simulation (shaded histograms) in the 2j1t category for the muon channel. The vertical lines on the points and the hatched bands show the experimental and MC statistical uncertainties, respectively. The expected distribution from the $ {ST_{\mathrm{q},\mathrm{b}}}+ {ST_{\mathrm{b},\mathrm{q}}}$ processes (multiplied by a factor of 1000) is shown by the solid blue line. The lower panel shows the ratio of the data to the MC prediction. |
png pdf |
Figure 2-b:
The ${{m_{\mathrm {T}}} ^{\mathrm{W}}}$ distribution from data (points) and simulation (shaded histograms) in the 3j1t category for the muon channel. The vertical lines on the points and the hatched bands show the experimental and MC statistical uncertainties, respectively. The expected distribution from the $ {ST_{\mathrm{q},\mathrm{b}}}+ {ST_{\mathrm{b},\mathrm{q}}}$ processes (multiplied by a factor of 1000) is shown by the solid blue line. The lower panel shows the ratio of the data to the MC prediction. |

png pdf |
Figure 2-c:
The ${{m_{\mathrm {T}}} ^{\mathrm{W}}}$ distribution from data (points) and simulation (shaded histograms) in the 2j1t category for the electron channel. The vertical lines on the points and the hatched bands show the experimental and MC statistical uncertainties, respectively. The expected distribution from the $ {ST_{\mathrm{q},\mathrm{b}}}+ {ST_{\mathrm{b},\mathrm{q}}}$ processes (multiplied by a factor of 1000) is shown by the solid blue line. The lower panel shows the ratio of the data to the MC prediction. |
png pdf |
Figure 2-d:
The ${{m_{\mathrm {T}}} ^{\mathrm{W}}}$ distribution from data (points) and simulation (shaded histograms) in the 3j1t category for the electron channel. The vertical lines on the points and the hatched bands show the experimental and MC statistical uncertainties, respectively. The expected distribution from the $ {ST_{\mathrm{q},\mathrm{b}}}+ {ST_{\mathrm{b},\mathrm{q}}}$ processes (multiplied by a factor of 1000) is shown by the solid blue line. The lower panel shows the ratio of the data to the MC prediction. |

png pdf |
Figure 3:
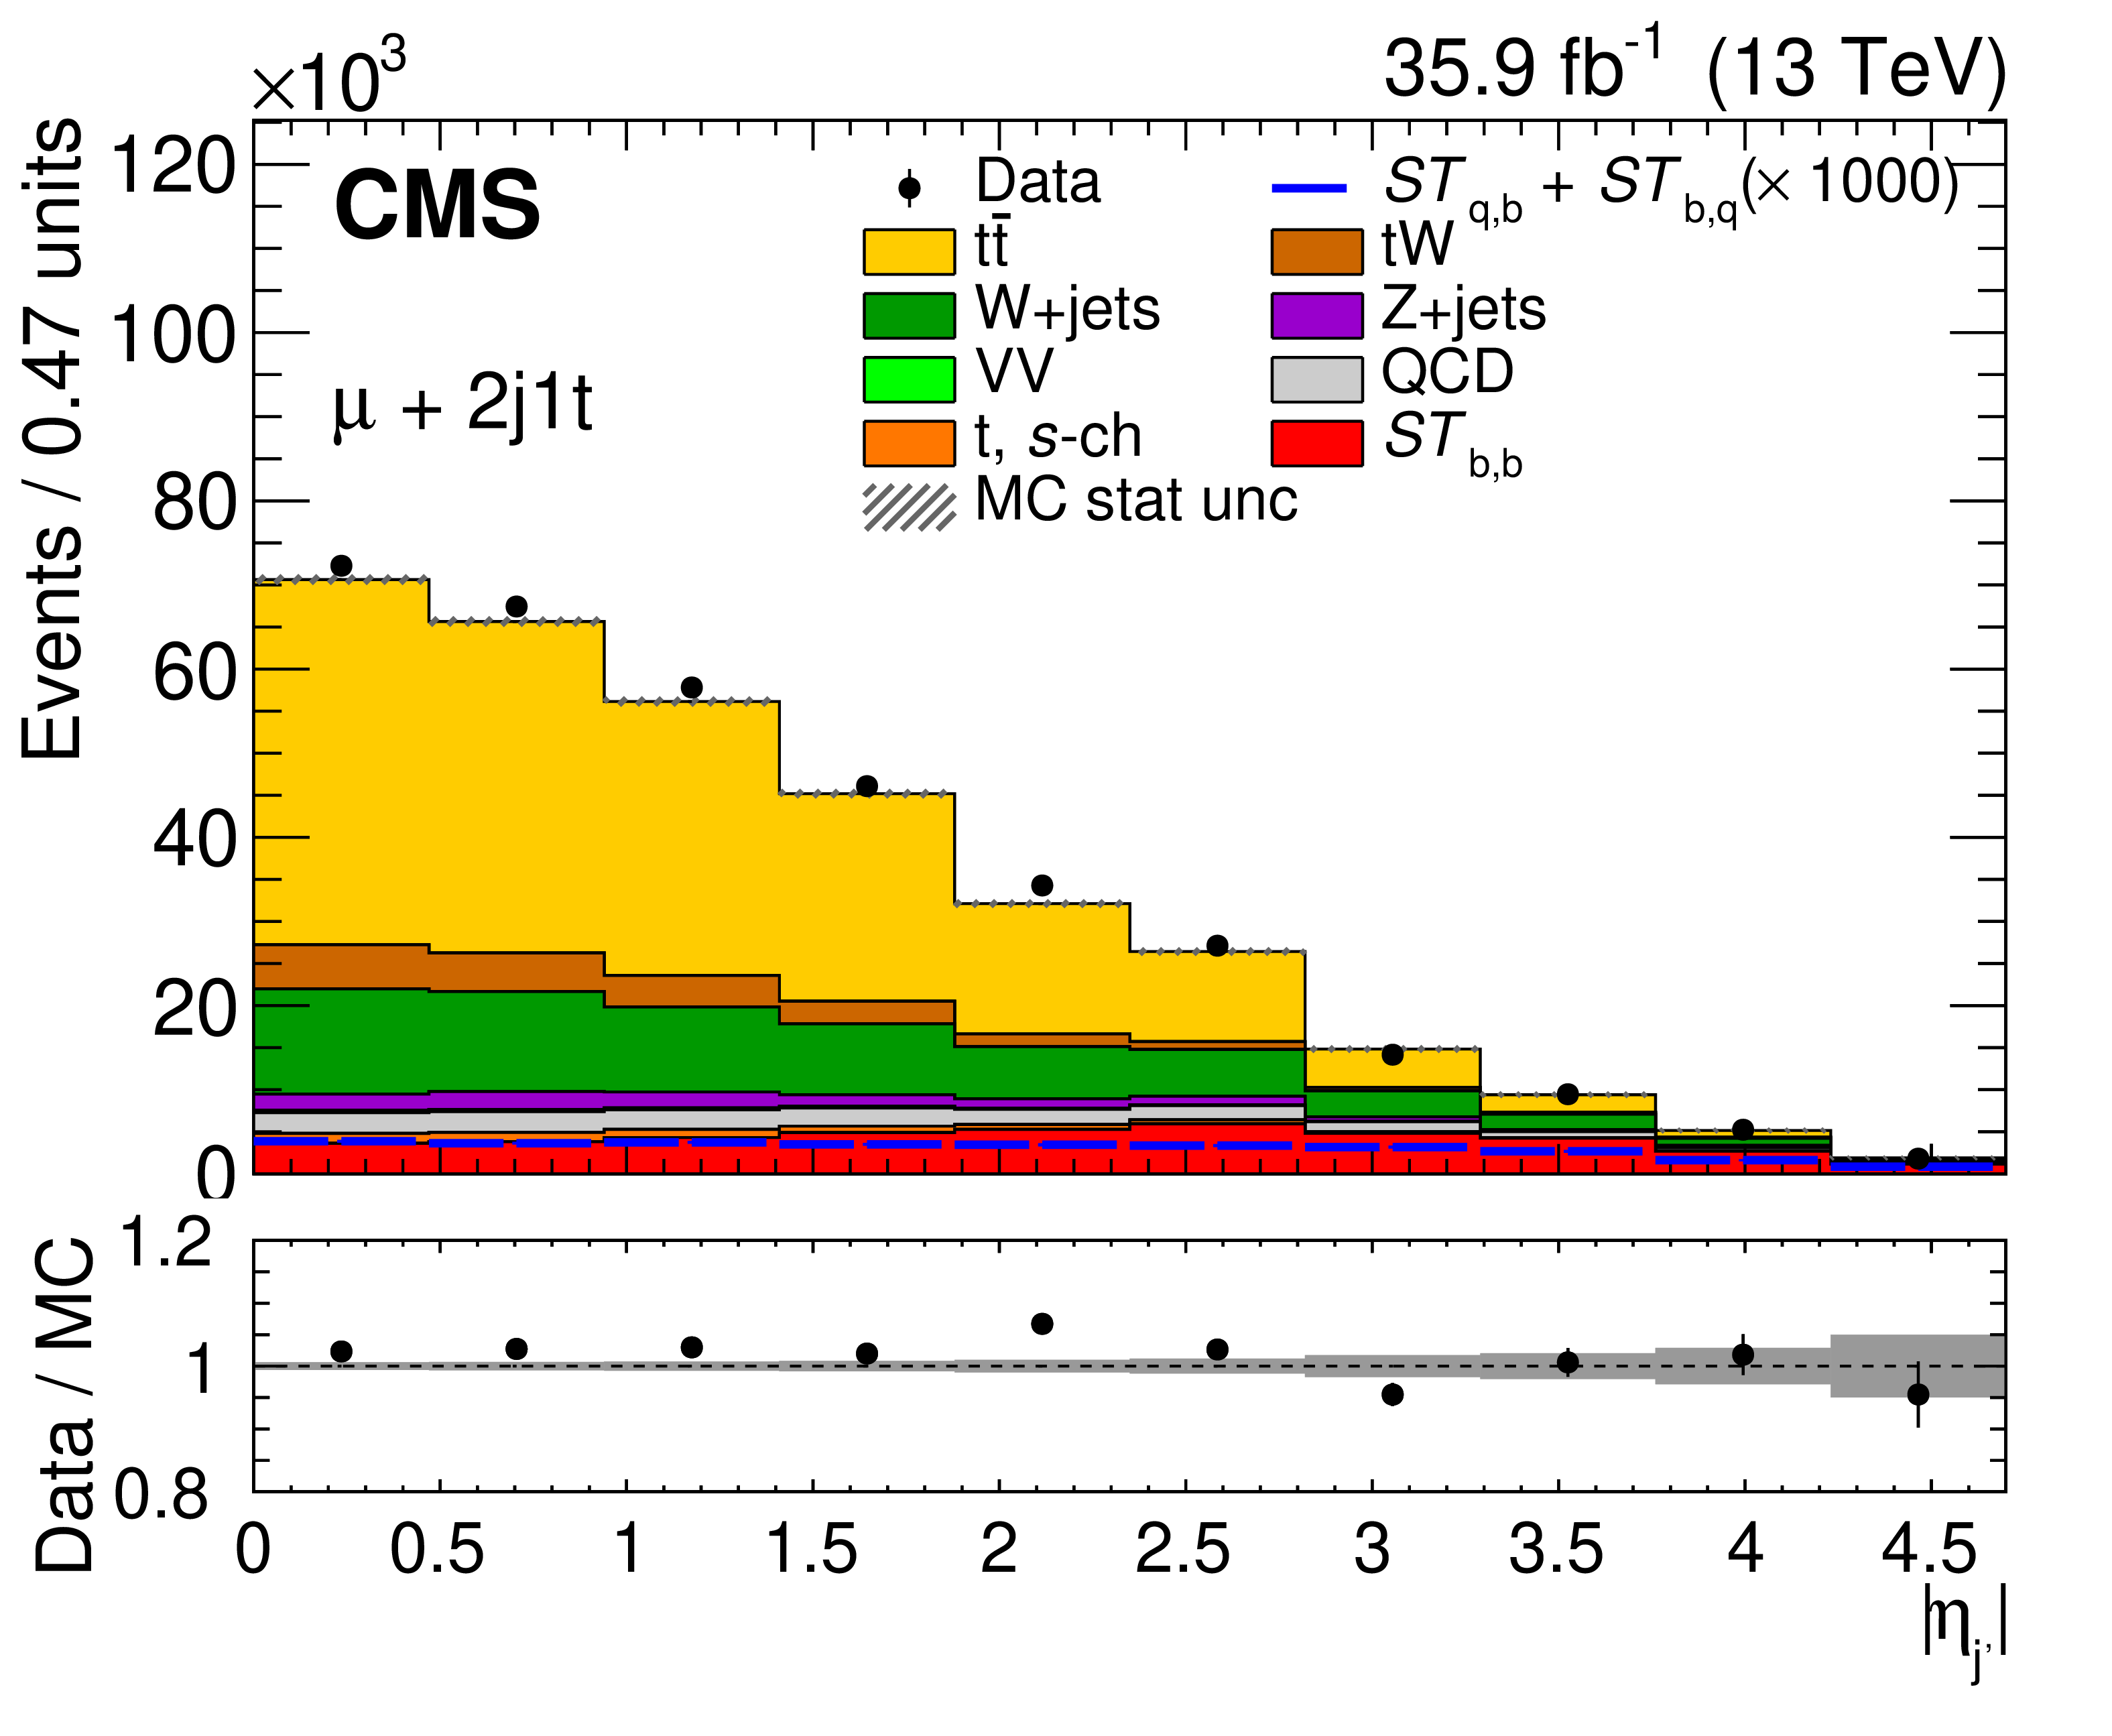
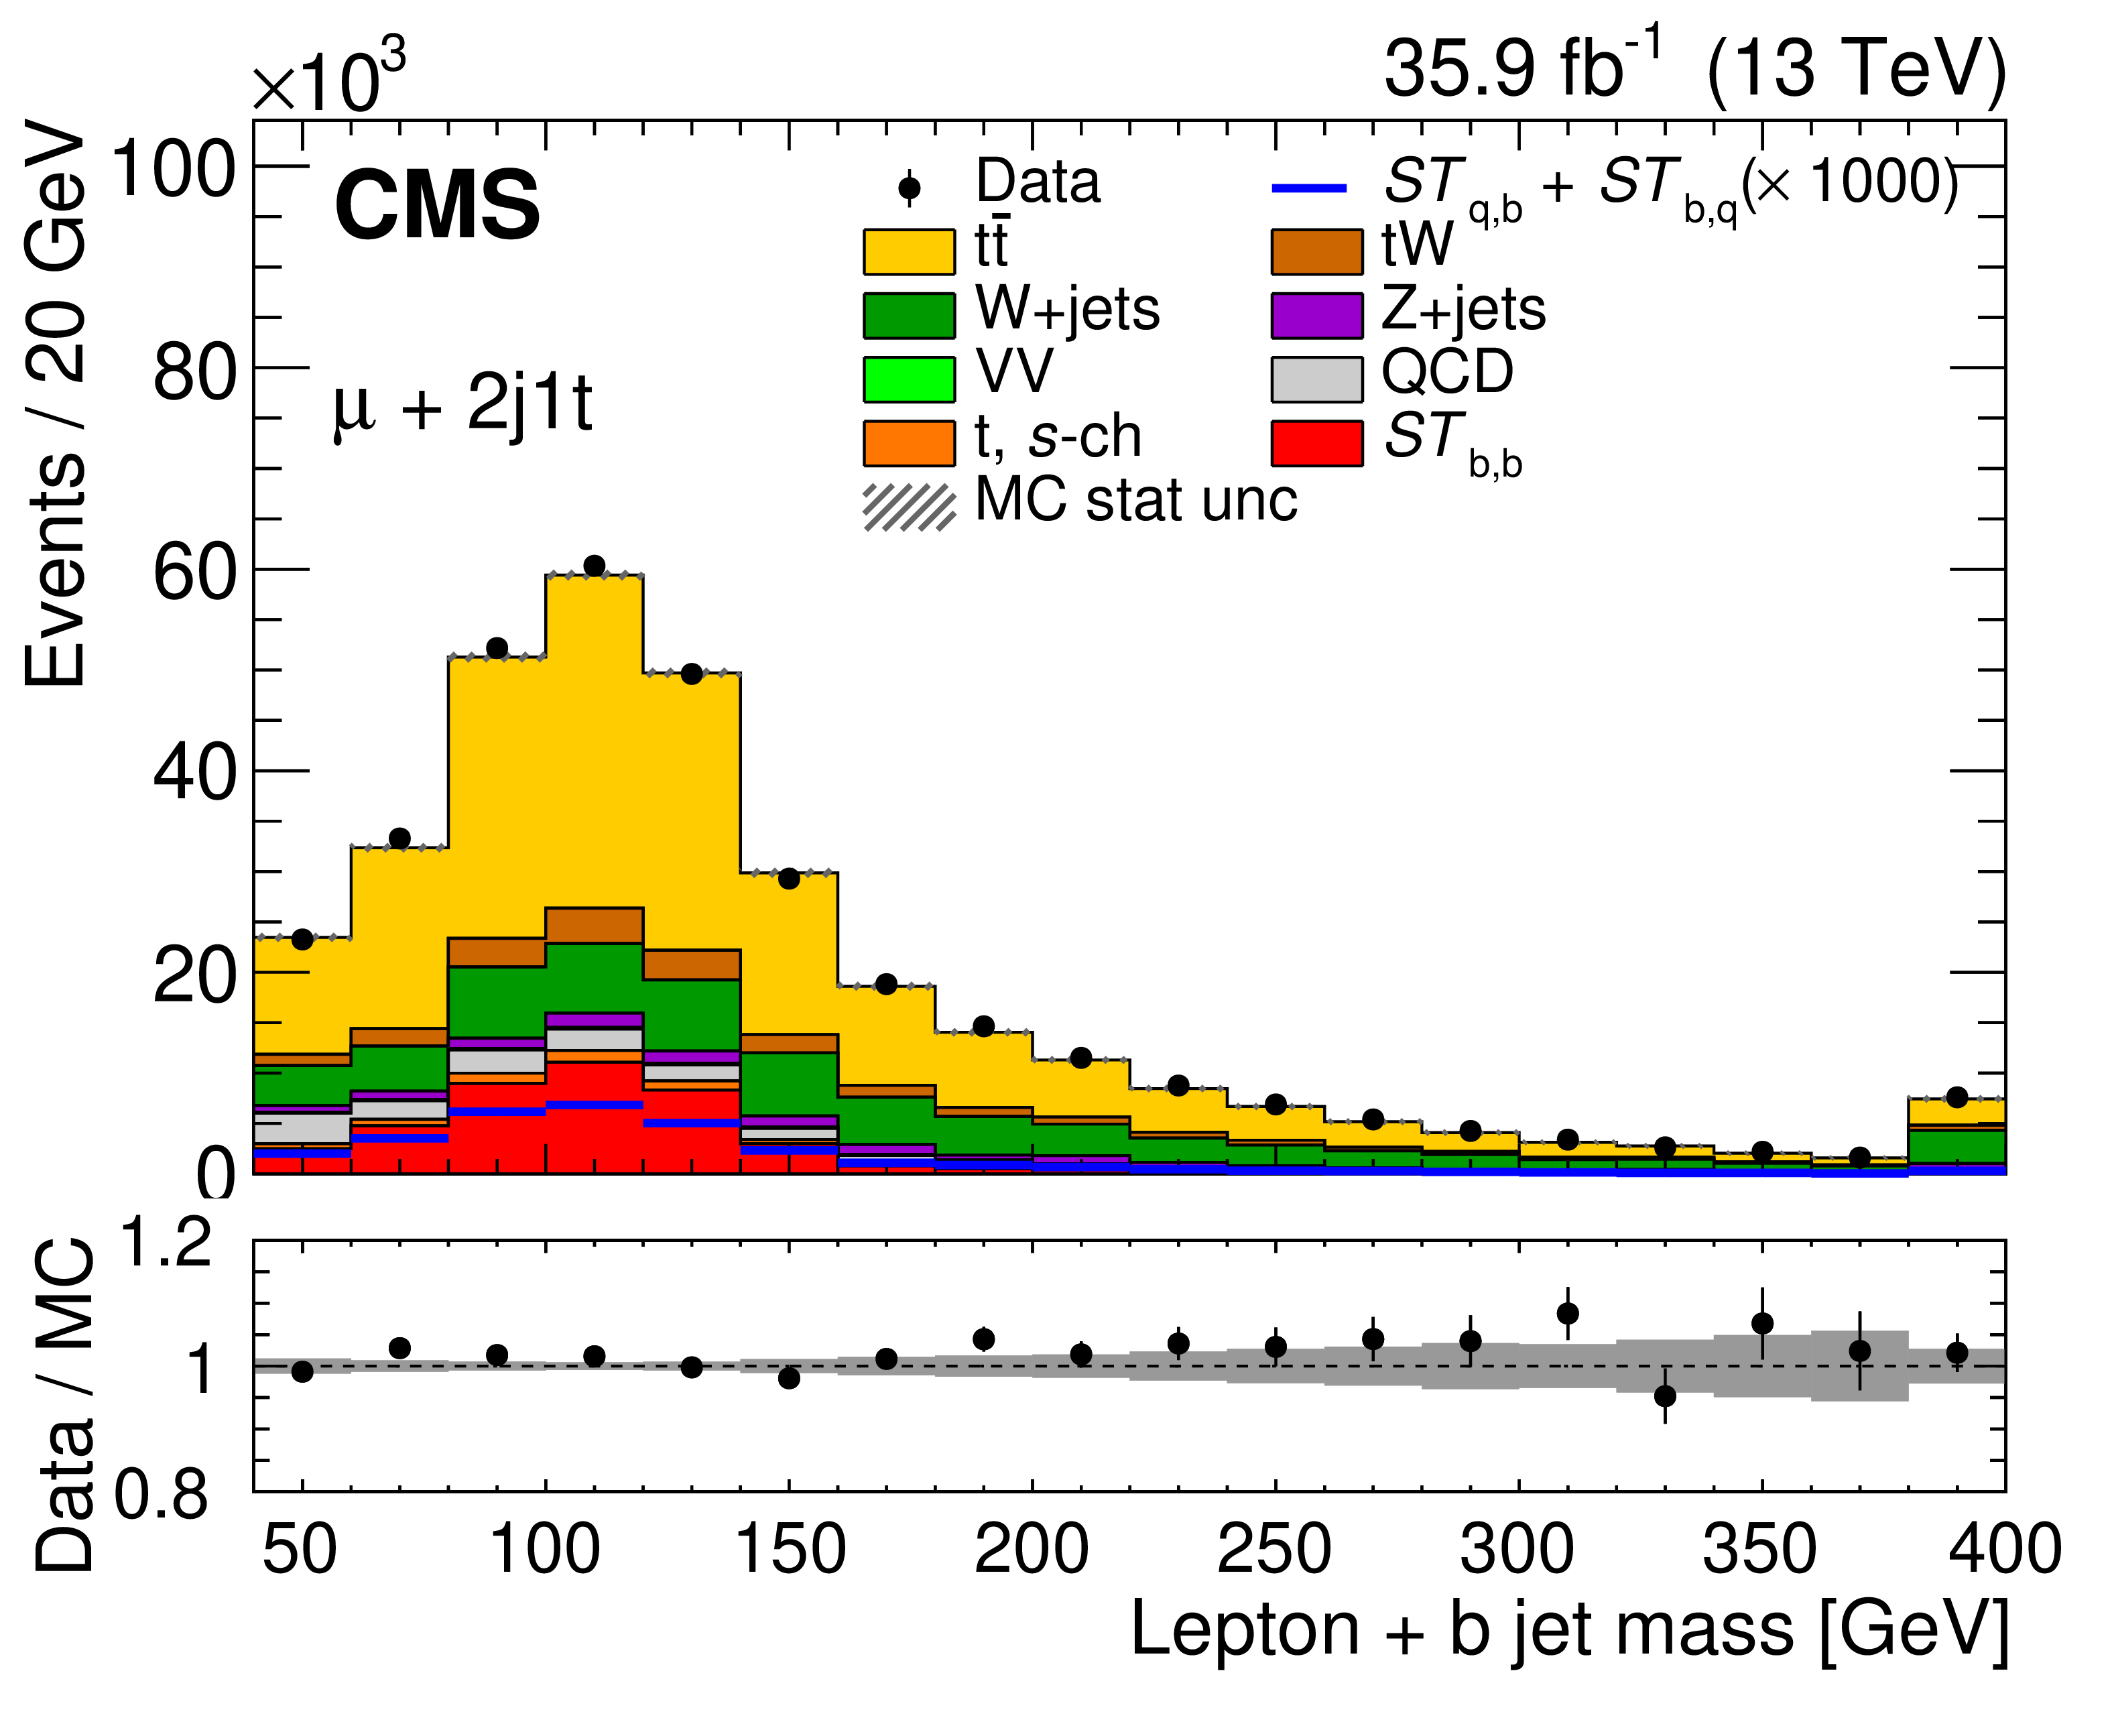
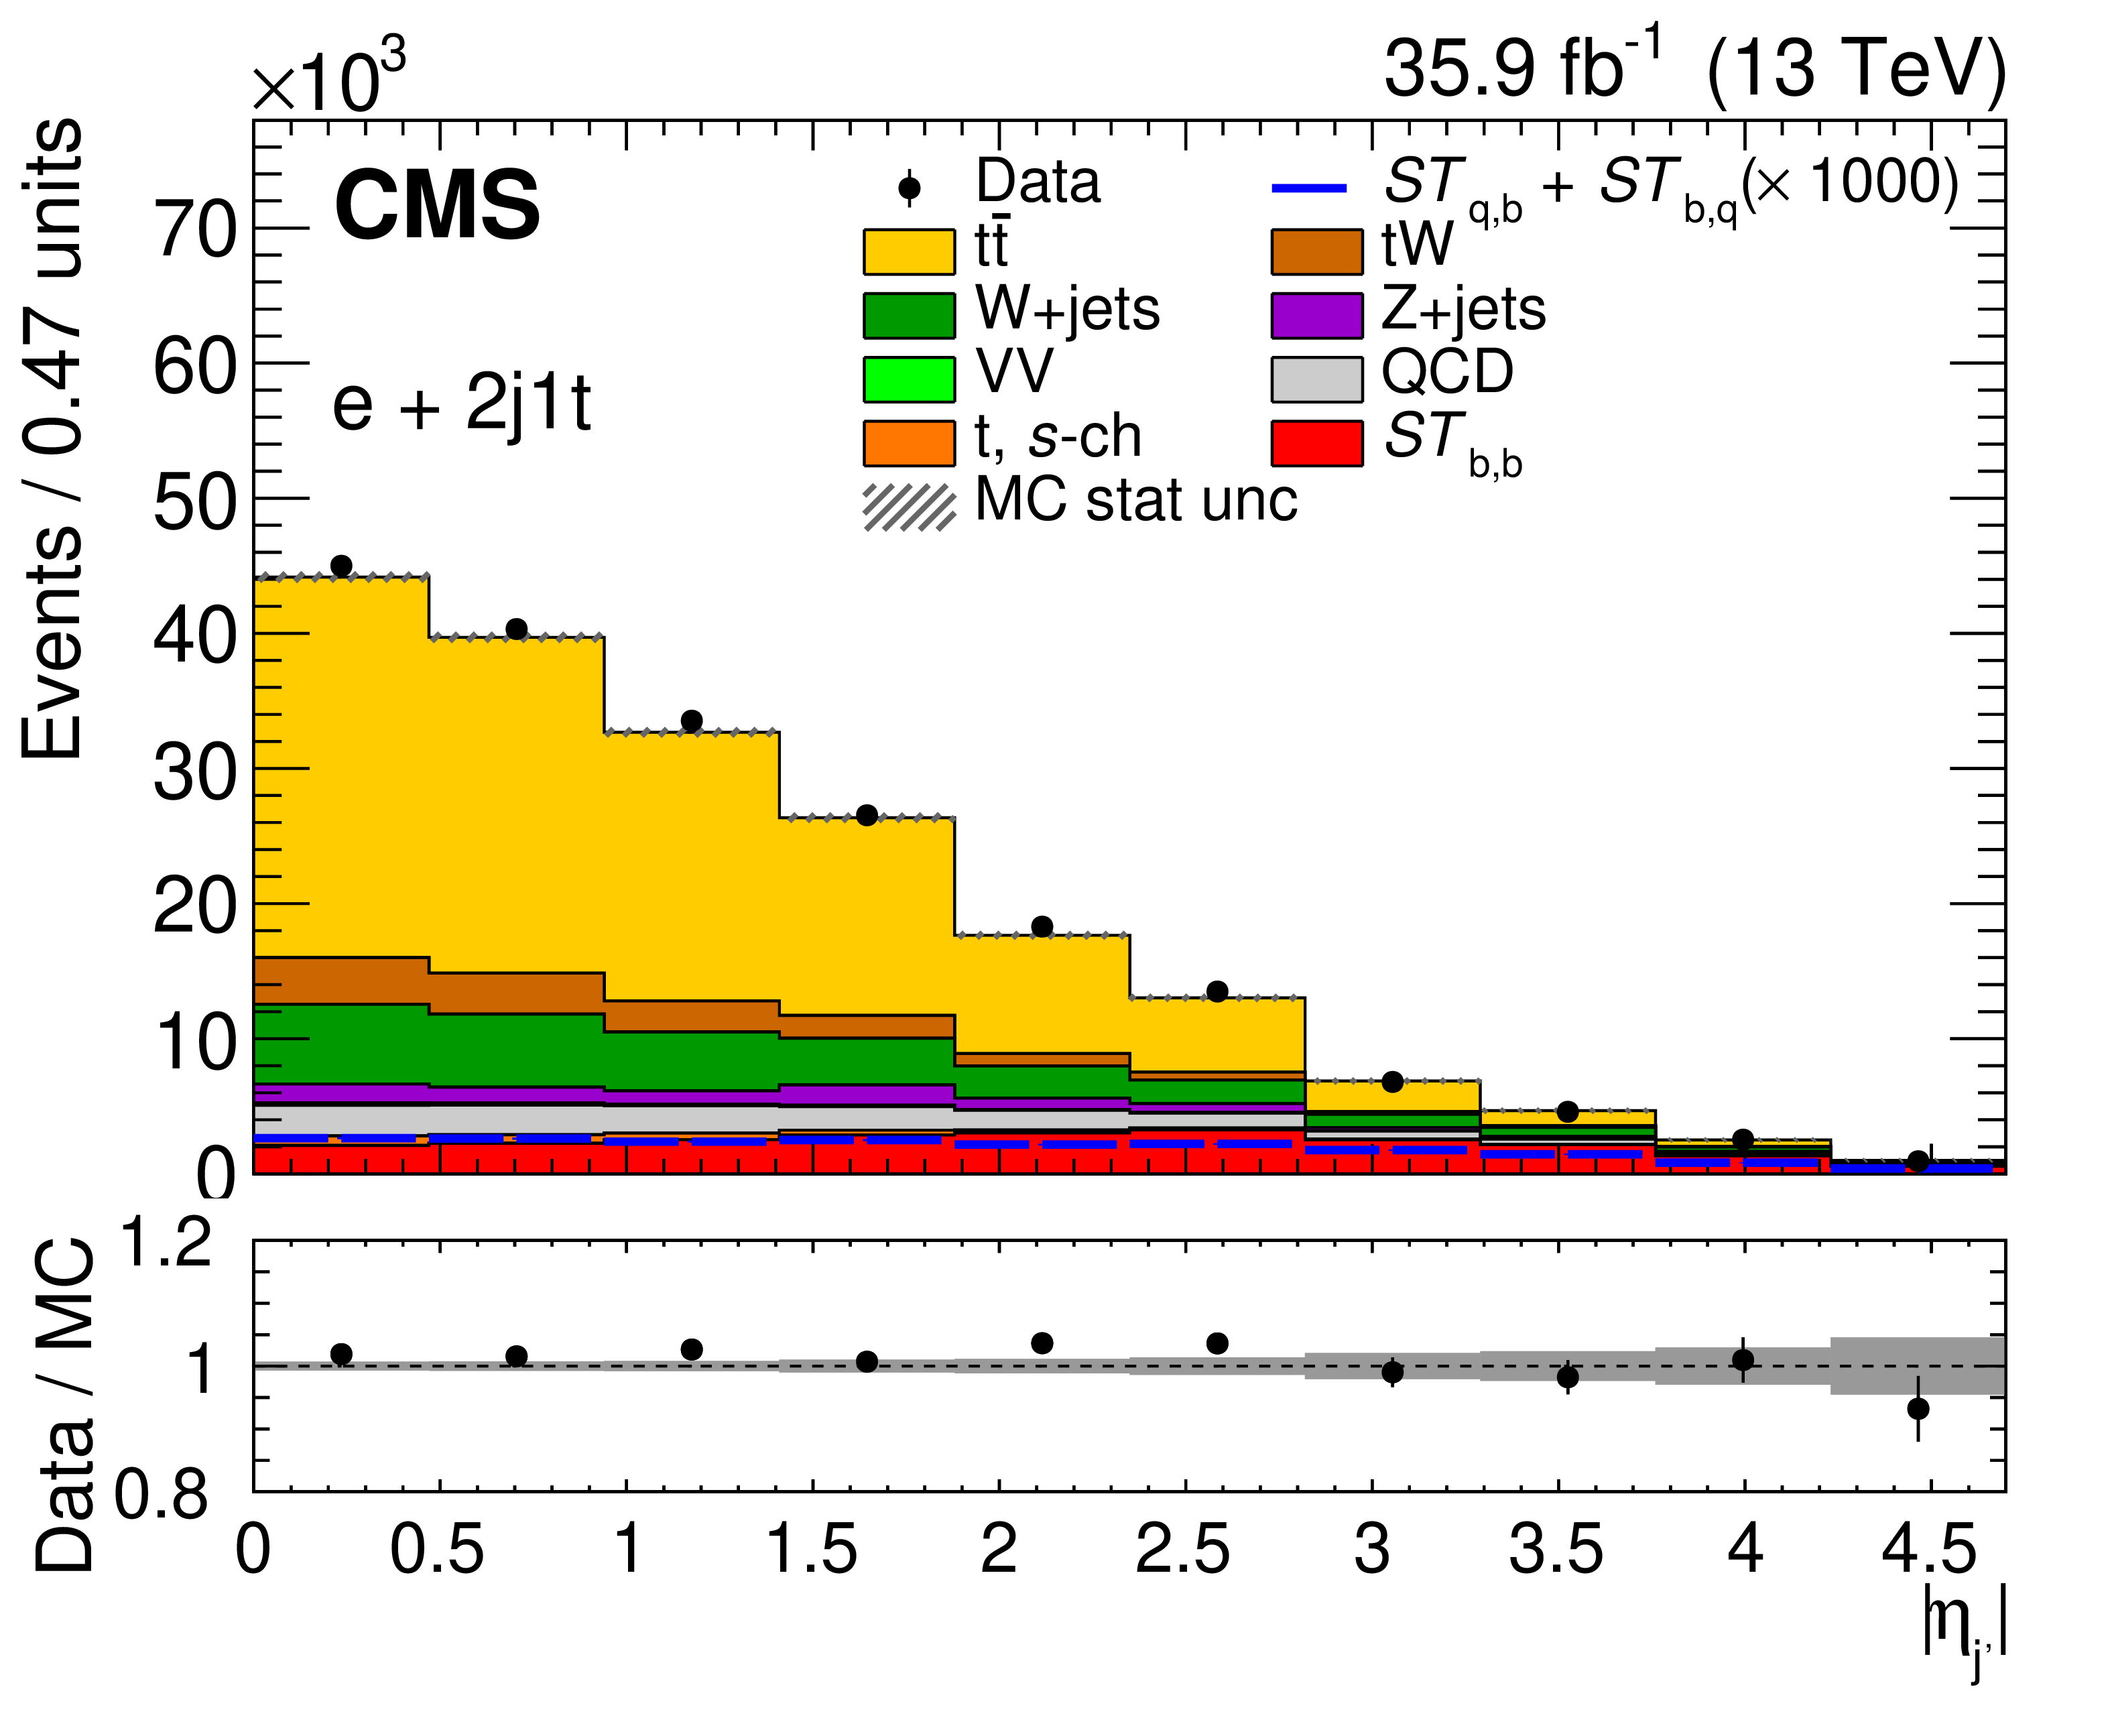
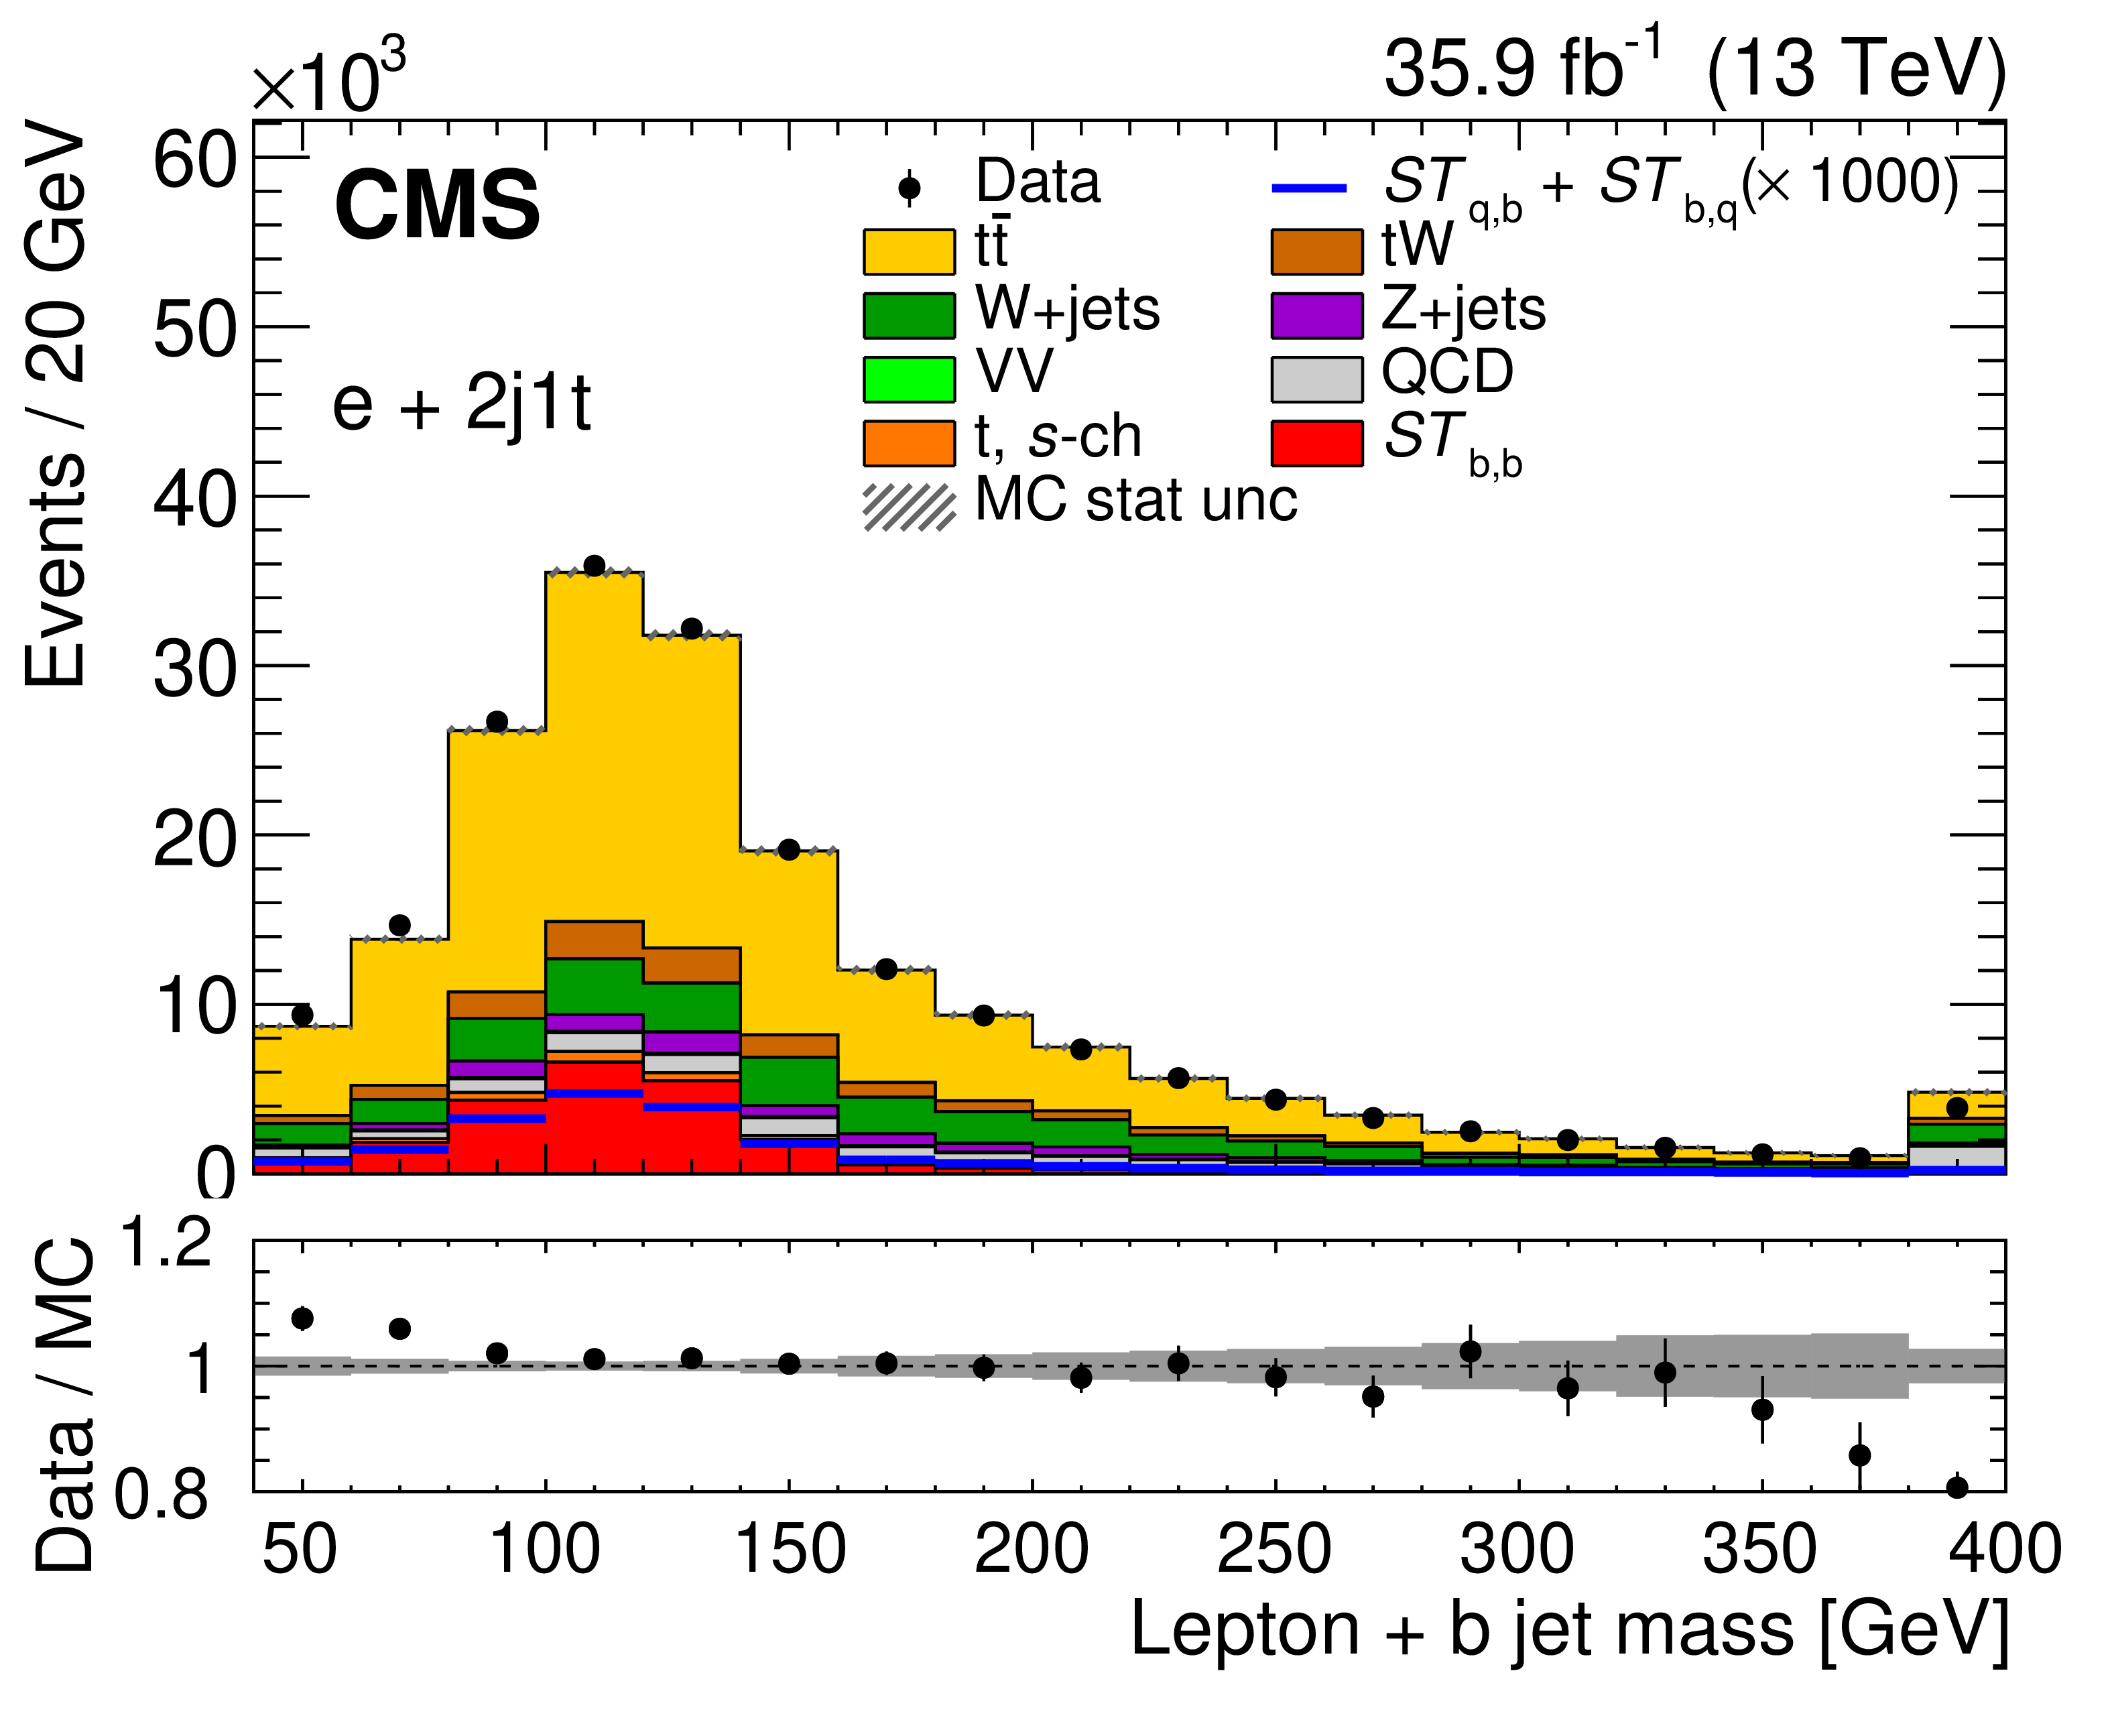
Distributions of the two most discriminating variables from data (points) and simulation (shaded histograms) in the 2j1t category: the ${{| \eta |}}$ of the non-b-tagged jet ${\eta _{\text {j}'}}$ (left) and the invariant mass of lepton and b jet momenta system (right), shown for the muon (upper) and electron (lower) channels, respectively. The vertical lines on the points and the hatched bands show the experimental and MC statistical uncertainties, respectively. The expected distribution from the $ {ST_{\mathrm{q},\mathrm{b}}}+ {ST_{\mathrm{b},\mathrm{q}}}$ processes (multiplied by a factor of 1000) is shown by the solid blue line. The lower panels show the ratio of the data to the MC prediction. |
png pdf |
Figure 3-a:
Distribution of the ${{| \eta |}}$ of the non-b-tagged jet ${\eta _{\text {j}'}}$, from data (points) and simulation (shaded histograms) in the 2j1t category, shown for the muon channel. The vertical lines on the points and the hatched bands show the experimental and MC statistical uncertainties, respectively. The expected distribution from the $ {ST_{\mathrm{q},\mathrm{b}}}+ {ST_{\mathrm{b},\mathrm{q}}}$ processes (multiplied by a factor of 1000) is shown by the solid blue line. The lower panel shows the ratio of the data to the MC prediction. |
png pdf |
Figure 3-b:
Distribution of the invariant mass of lepton and b jet momenta system, from data (points) and simulation (shaded histograms) in the 2j1t category, shown for the muon channel. The vertical lines on the points and the hatched bands show the experimental and MC statistical uncertainties, respectively. The expected distribution from the $ {ST_{\mathrm{q},\mathrm{b}}}+ {ST_{\mathrm{b},\mathrm{q}}}$ processes (multiplied by a factor of 1000) is shown by the solid blue line. The lower panel shows the ratio of the data to the MC prediction. |
png pdf |
Figure 3-c:
Distribution of the ${{| \eta |}}$ of the non-b-tagged jet ${\eta _{\text {j}'}}$, from data (points) and simulation (shaded histograms) in the 2j1t category, shown for the electron channel. The vertical lines on the points and the hatched bands show the experimental and MC statistical uncertainties, respectively. The expected distribution from the $ {ST_{\mathrm{q},\mathrm{b}}}+ {ST_{\mathrm{b},\mathrm{q}}}$ processes (multiplied by a factor of 1000) is shown by the solid blue line. The lower panel shows the ratio of the data to the MC prediction. |
png pdf |
Figure 3-d:
Distribution of the invariant mass of lepton and b jet momenta system, from data (points) and simulation (shaded histograms) in the 2j1t category, shown for the electron channel. The vertical lines on the points and the hatched bands show the experimental and MC statistical uncertainties, respectively. The expected distribution from the $ {ST_{\mathrm{q},\mathrm{b}}}+ {ST_{\mathrm{b},\mathrm{q}}}$ processes (multiplied by a factor of 1000) is shown by the solid blue line. The lower panel shows the ratio of the data to the MC prediction. |
png pdf |
Figure 4:
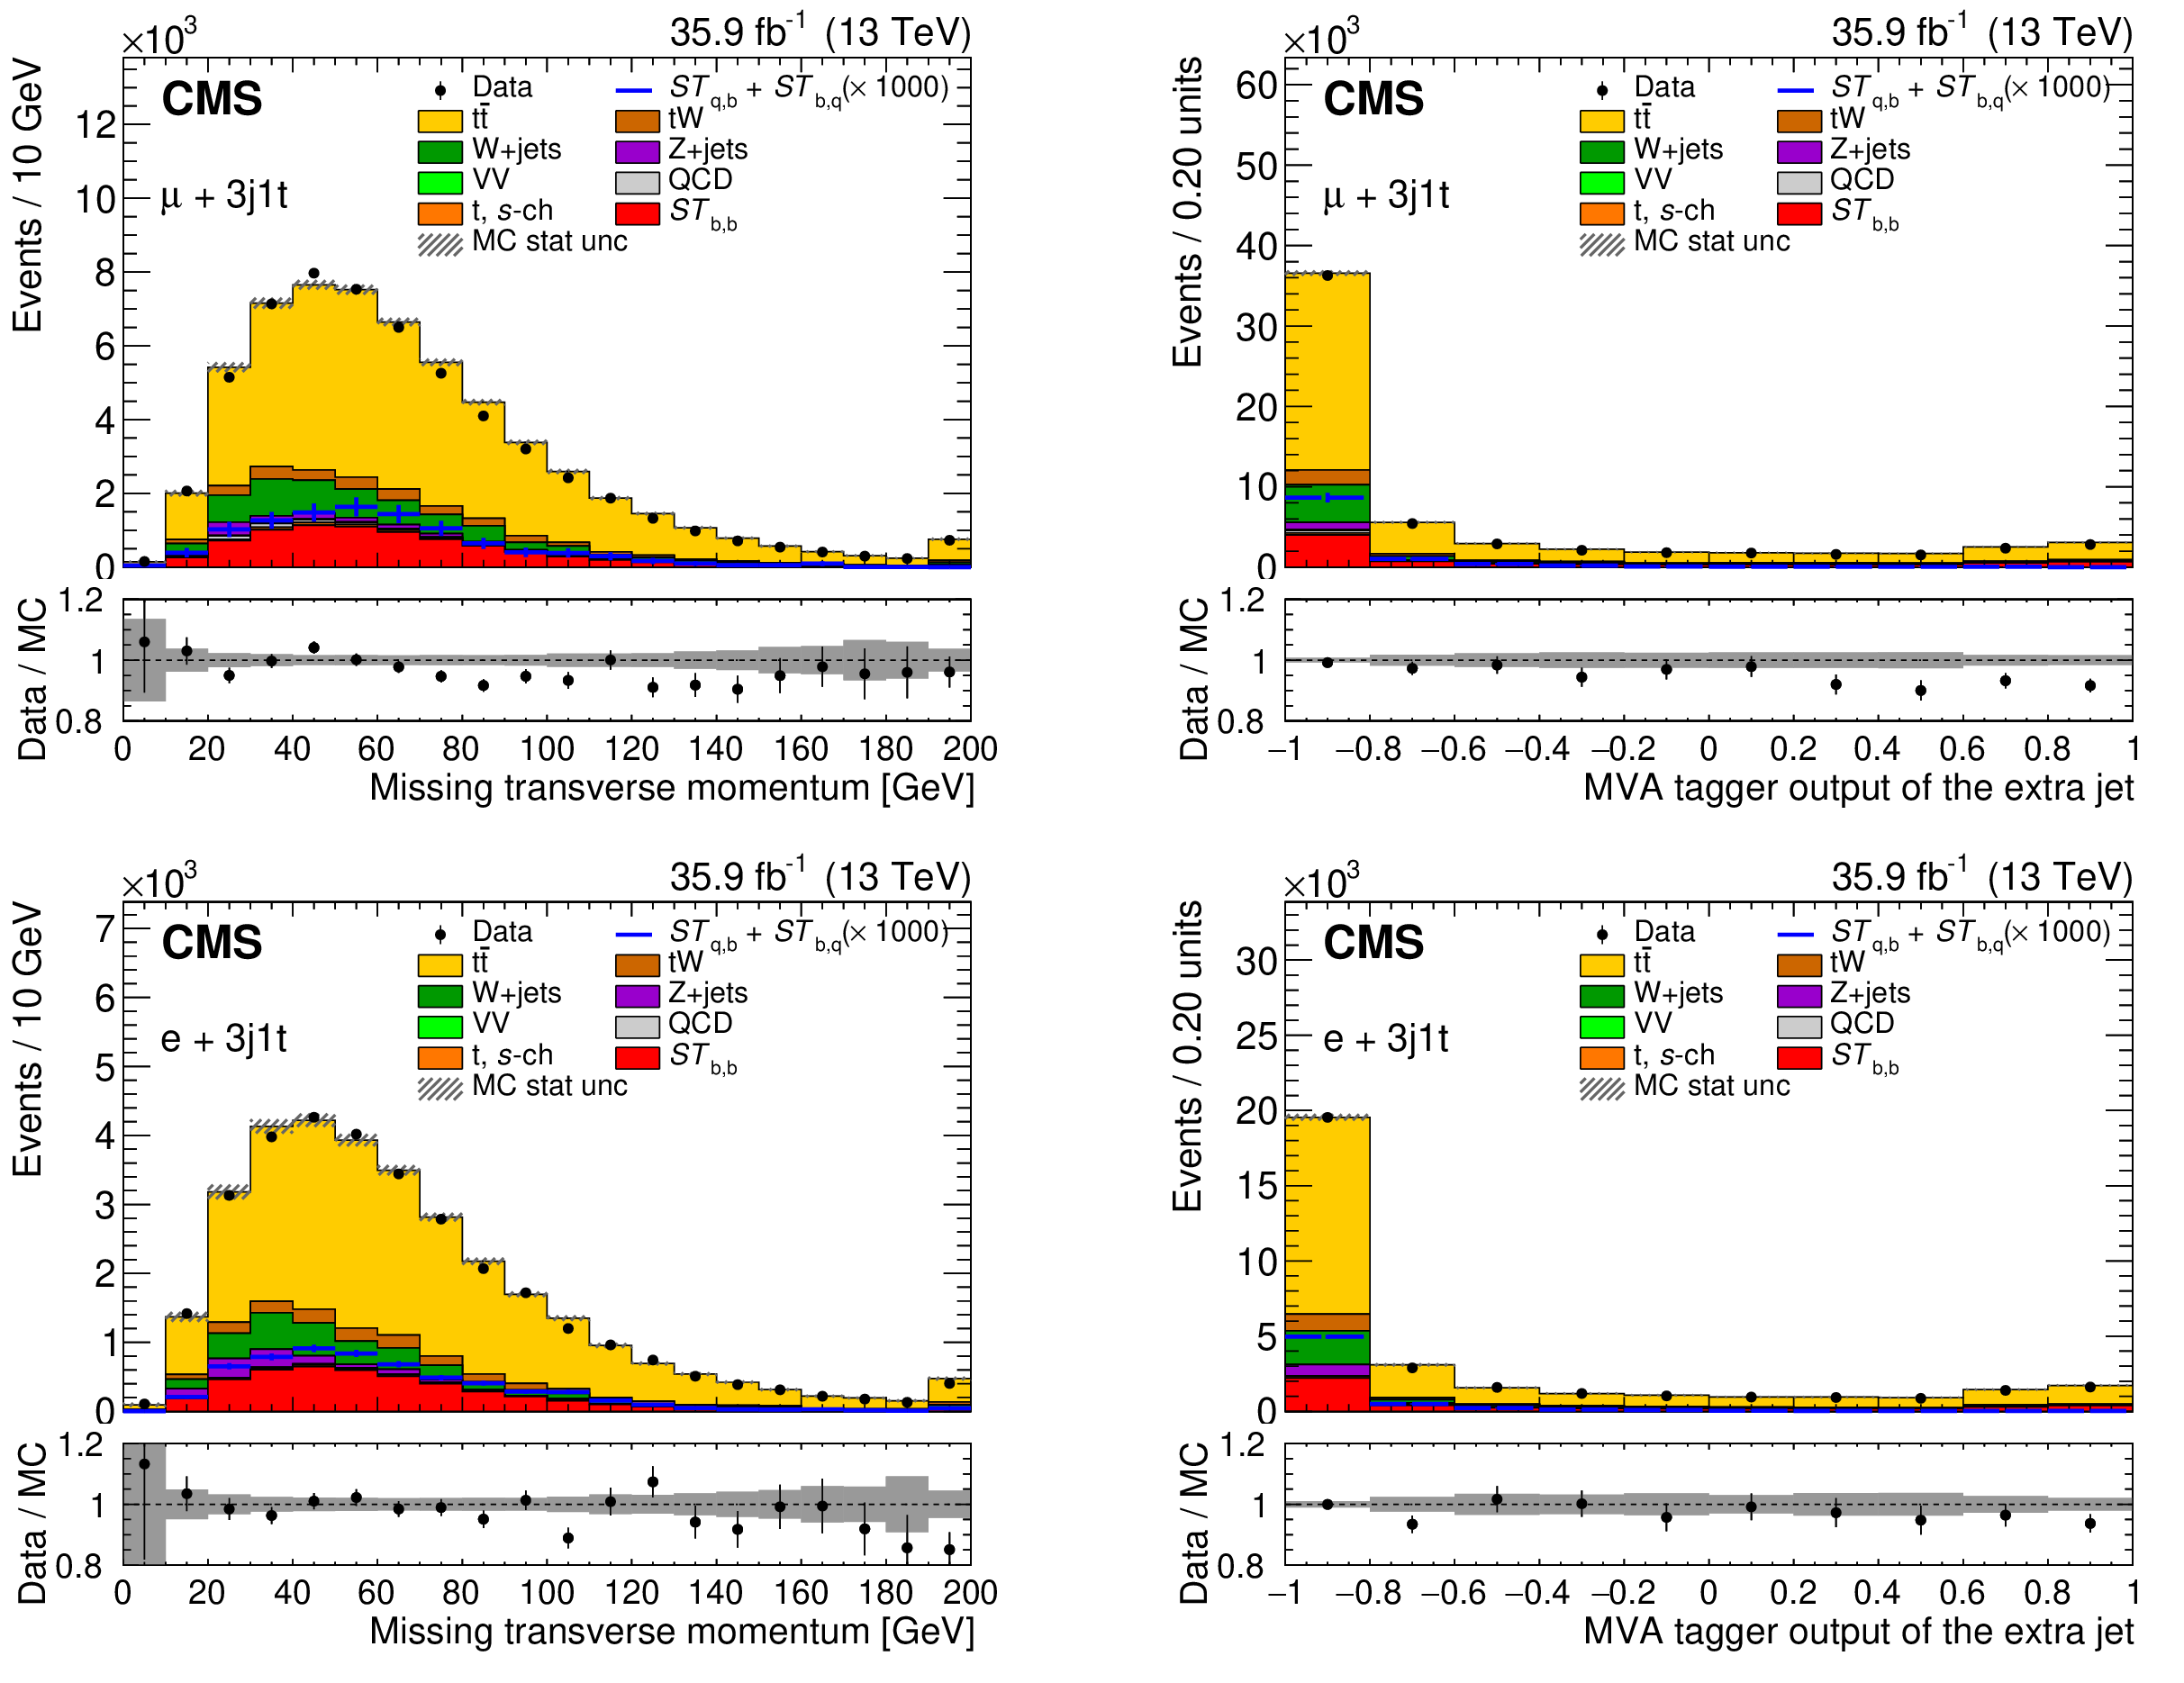
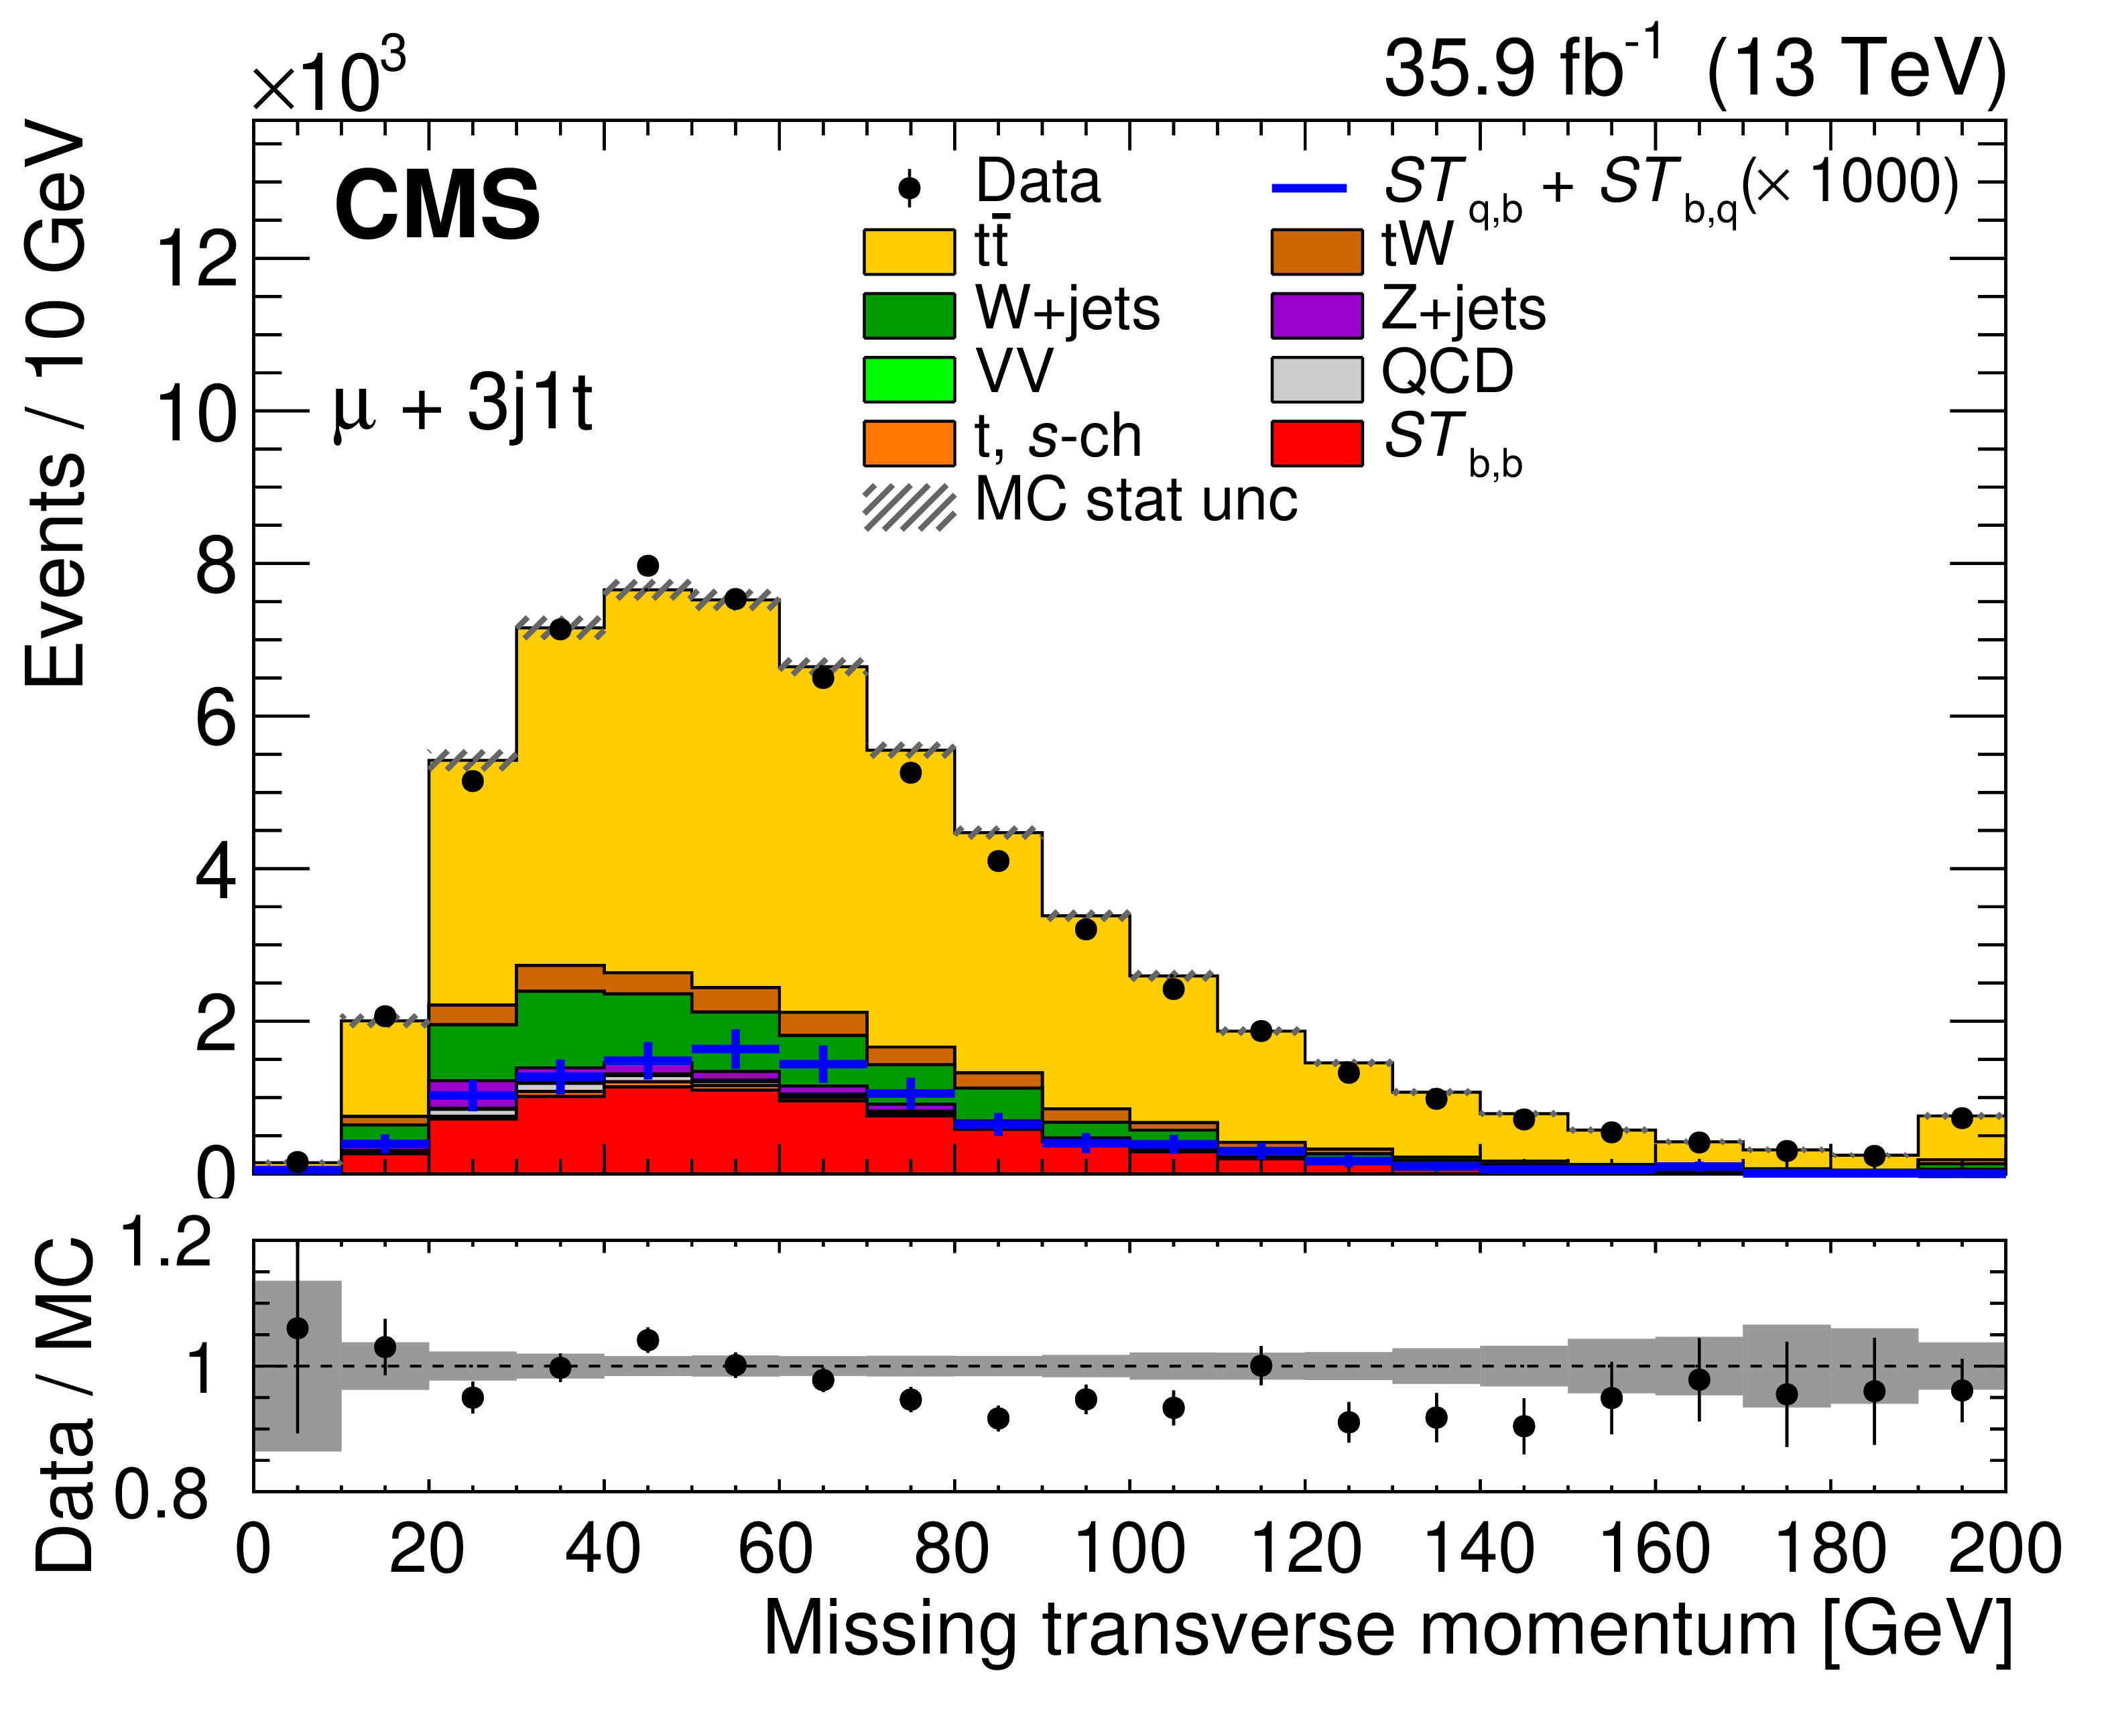
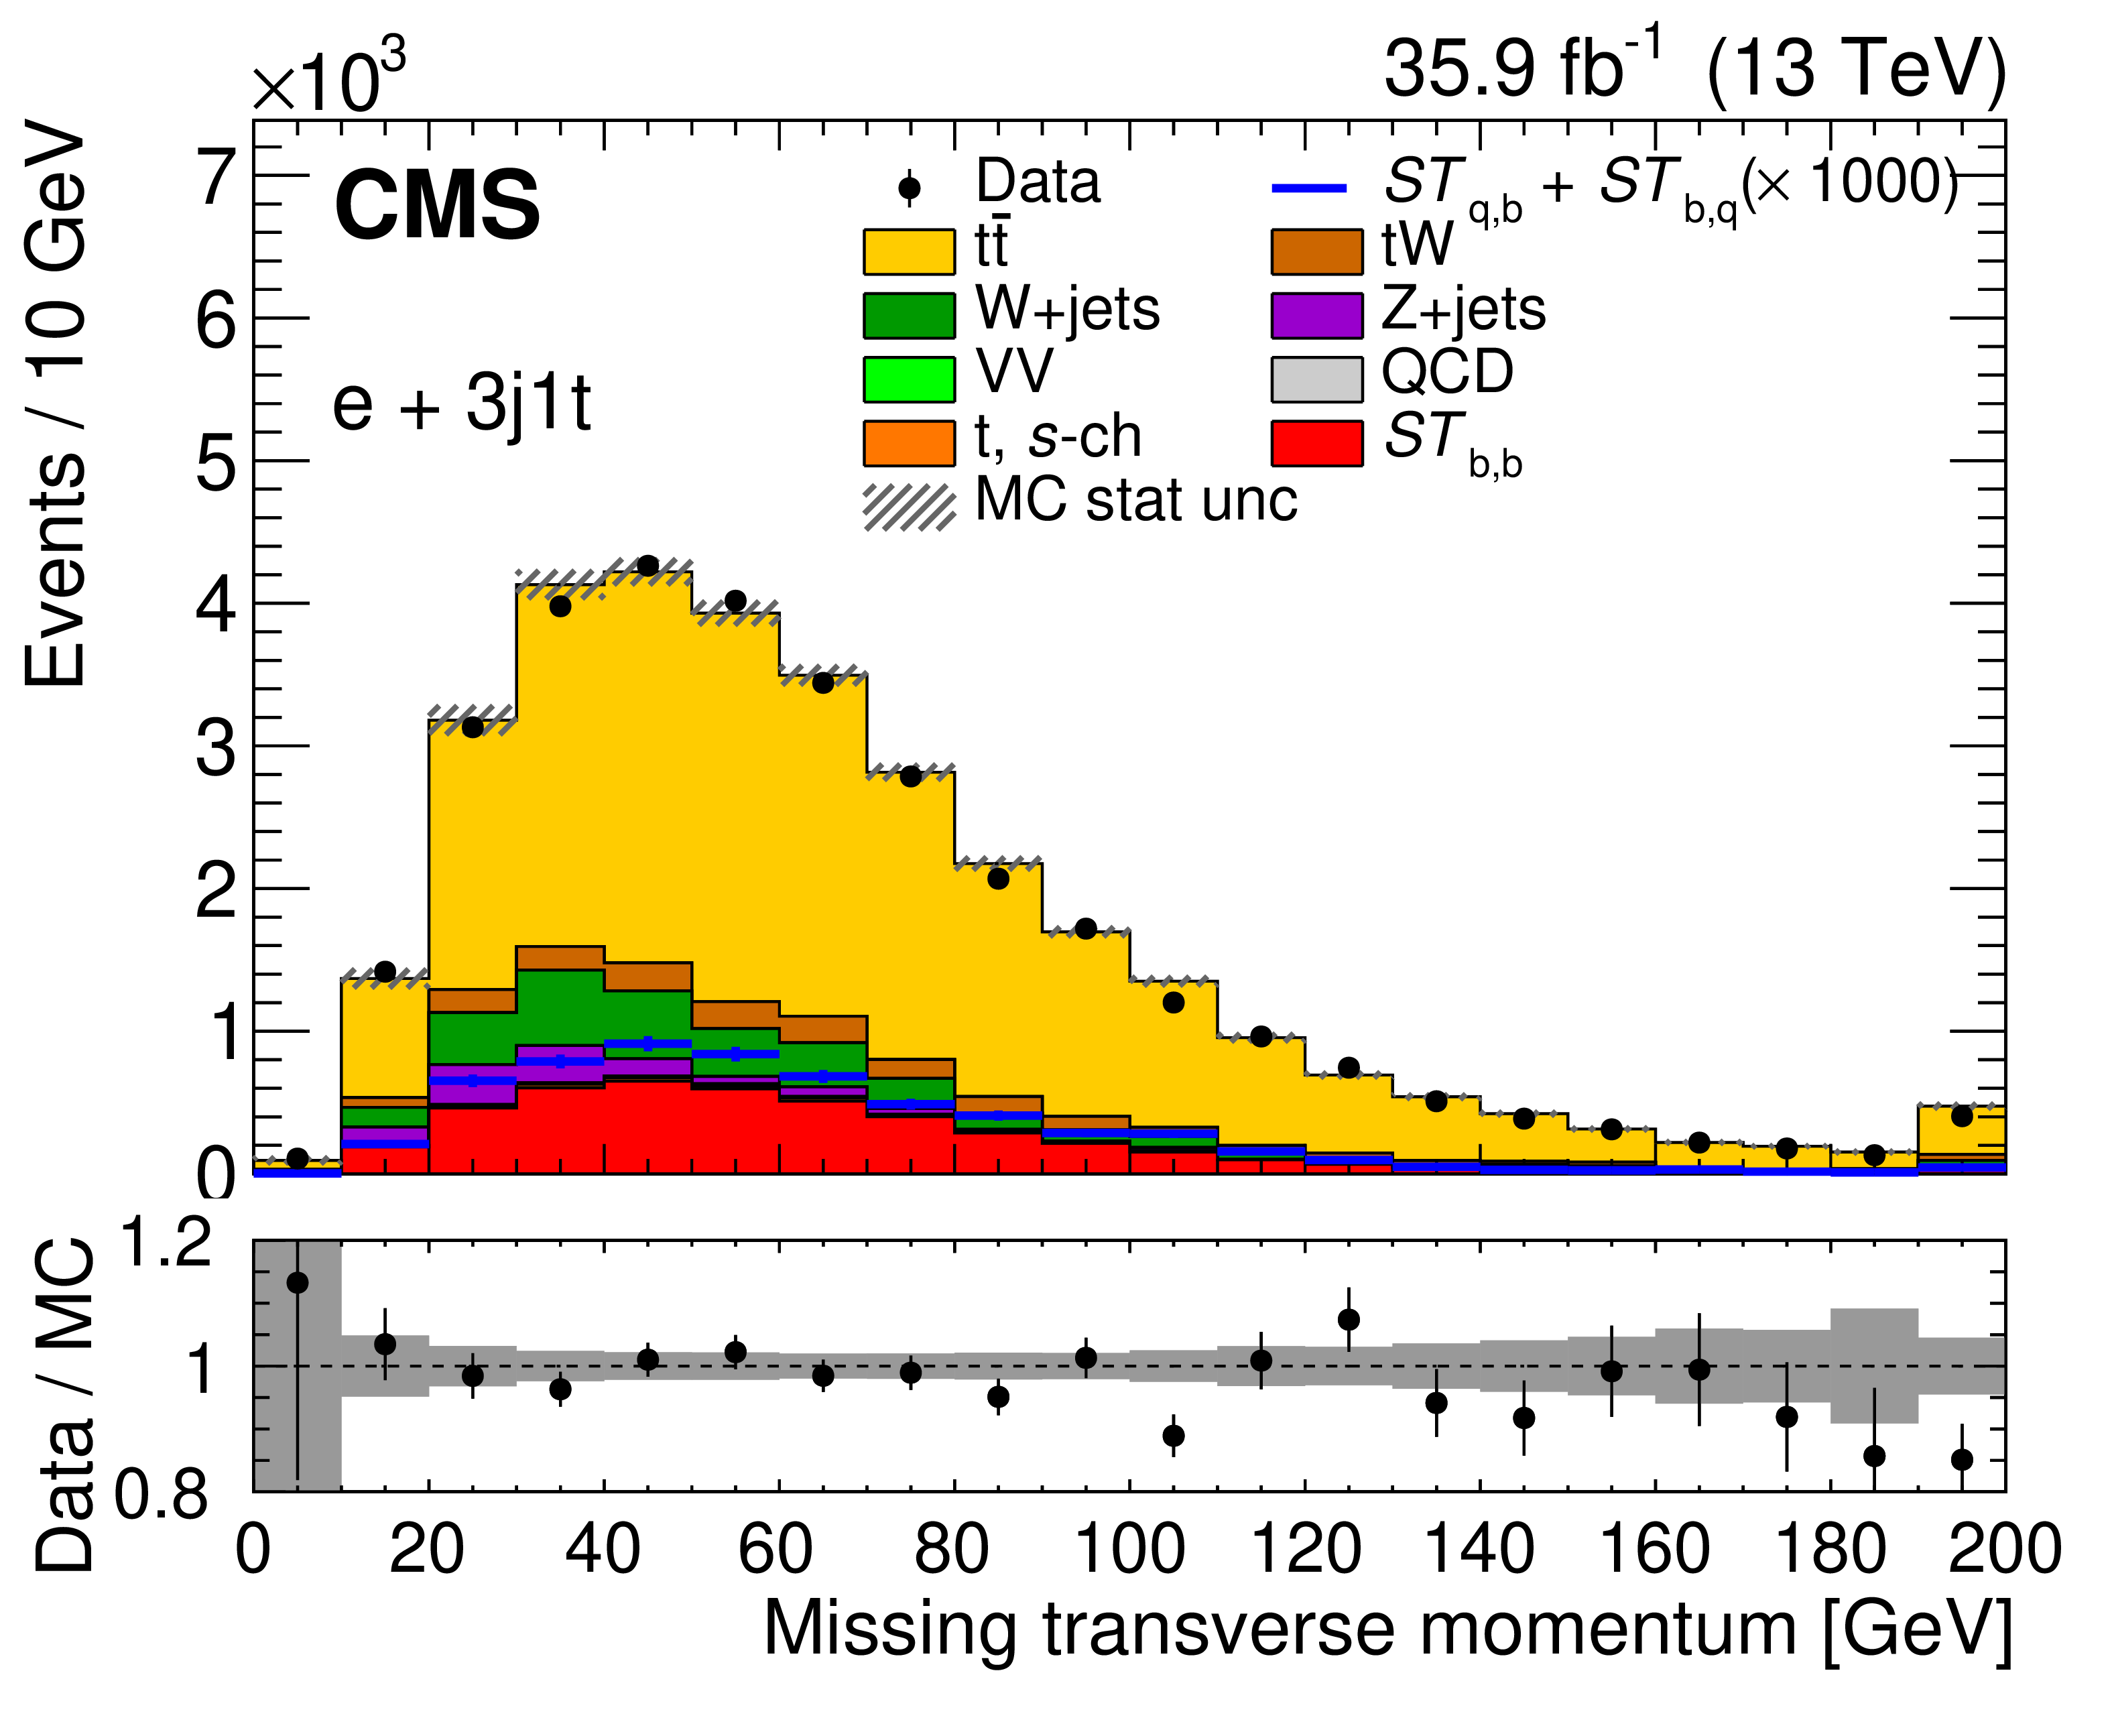
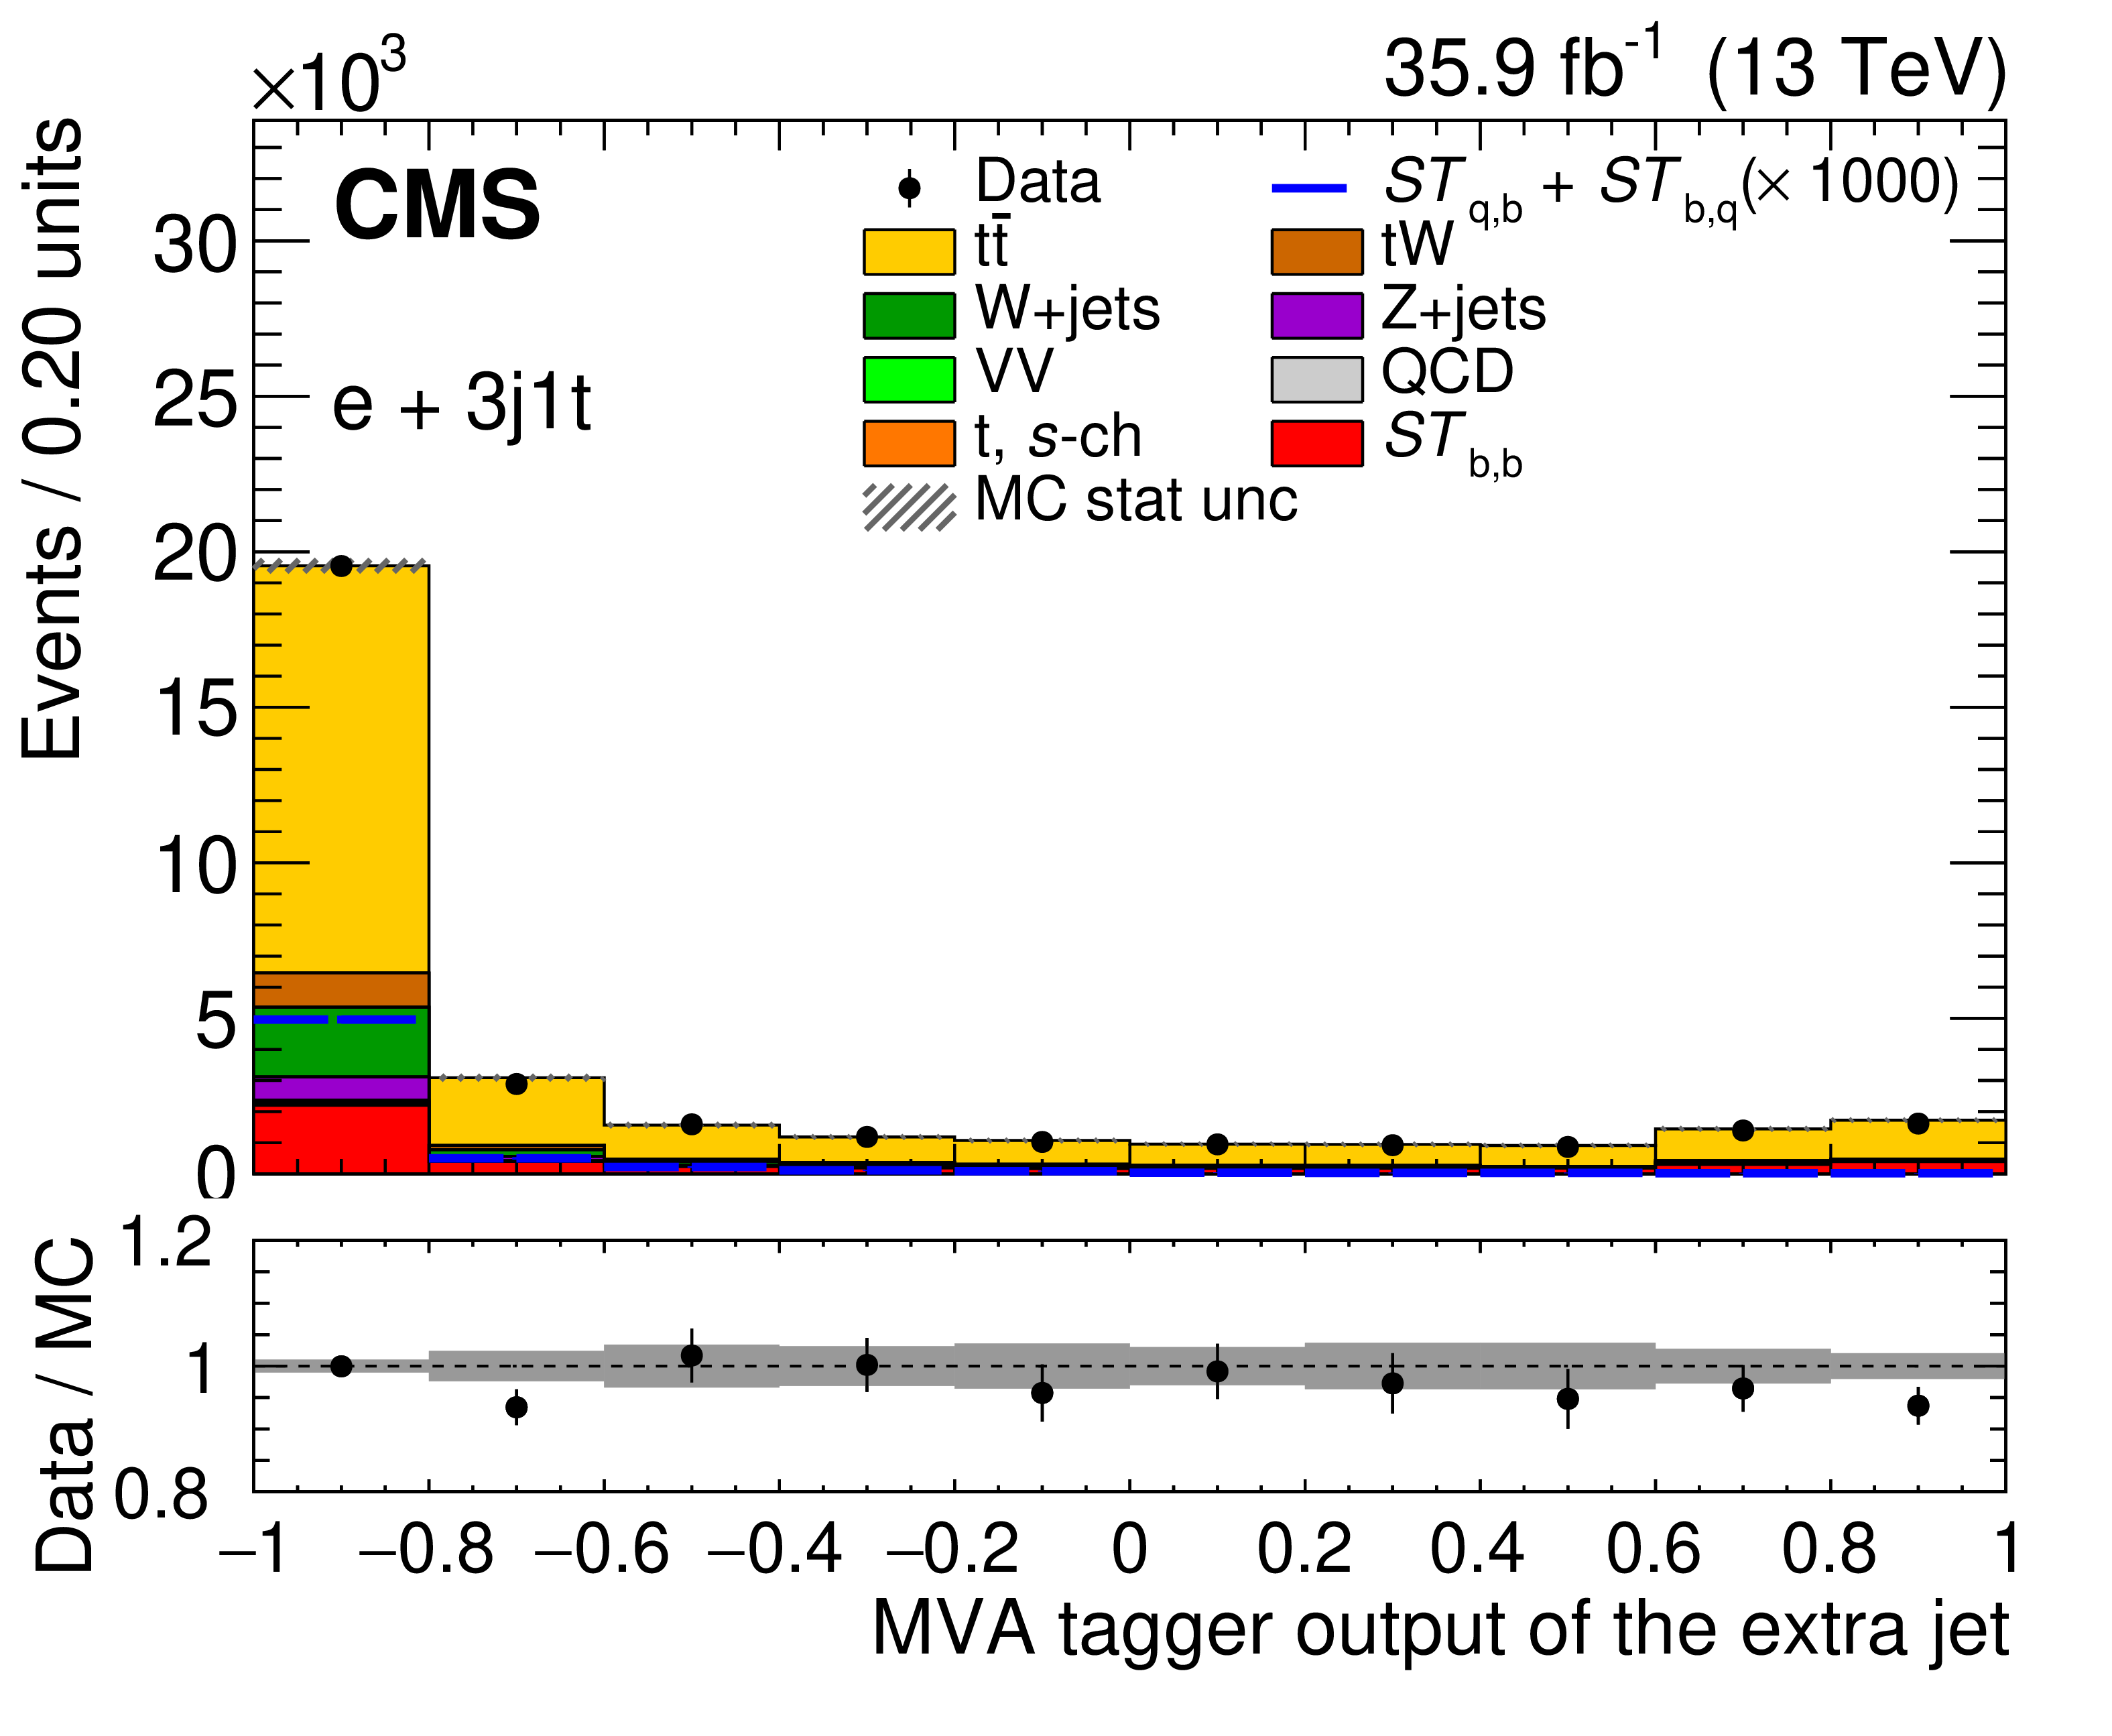
Distributions of the two most discriminating variables from data (points) and simulation (shaded histograms) in the 3j1t category: the ${{p_{\mathrm {T}}} ^\text {miss}}$ in the transverse plane (left) and the value of the MVA b tagger discriminator when applied to the extra jet (right) are shown for the muon (upper) and electron (lower) channels, respectively. The vertical lines on the points and the hatched bands show the experimental and MC statistical uncertainties, respectively. The expected distribution from the $ {ST_{\mathrm{q},\mathrm{b}}}+ {ST_{\mathrm{b},\mathrm{q}}}$ processes (multiplied by a factor of 1000) is shown by the solid blue line. The lower panels show the ratio of the data to the MC prediction. |
png pdf |
Figure 4-a:
Distribution of |

png pdf |
Figure 4-b:
Distribution of the value of the MVA b tagger discriminator when applied to the extra jet, from data (points) and simulation (shaded histograms) in the 3j1t category, shown for the muon channel. The vertical lines on the points and the hatched bands show the experimental and MC statistical uncertainties, respectively. The expected distribution from the $ {ST_{\mathrm{q},\mathrm{b}}}+ {ST_{\mathrm{b},\mathrm{q}}}$ processes (multiplied by a factor of 1000) is shown by the solid blue line. The lower panel shows the ratio of the data to the MC prediction. |
png pdf |
Figure 4-c:
Distribution of the ${{p_{\mathrm {T}}} ^\text {miss}}$ in the transverse plane, from data (points) and simulation (shaded histograms) in the 3j1t category, shown for the electron channel. The vertical lines on the points and the hatched bands show the experimental and MC statistical uncertainties, respectively. The expected distribution from the $ {ST_{\mathrm{q},\mathrm{b}}}+ {ST_{\mathrm{b},\mathrm{q}}}$ processes (multiplied by a factor of 1000) is shown by the solid blue line. The lower panel shows the ratio of the data to the MC prediction. |
png pdf |
Figure 4-d:
Distribution of the value of the MVA b tagger discriminator when applied to the extra jet, from data (points) and simulation (shaded histograms) in the 3j1t category, shown for the electron channel. The vertical lines on the points and the hatched bands show the experimental and MC statistical uncertainties, respectively. The expected distribution from the $ {ST_{\mathrm{q},\mathrm{b}}}+ {ST_{\mathrm{b},\mathrm{q}}}$ processes (multiplied by a factor of 1000) is shown by the solid blue line. The lower panel shows the ratio of the data to the MC prediction. |
png pdf |
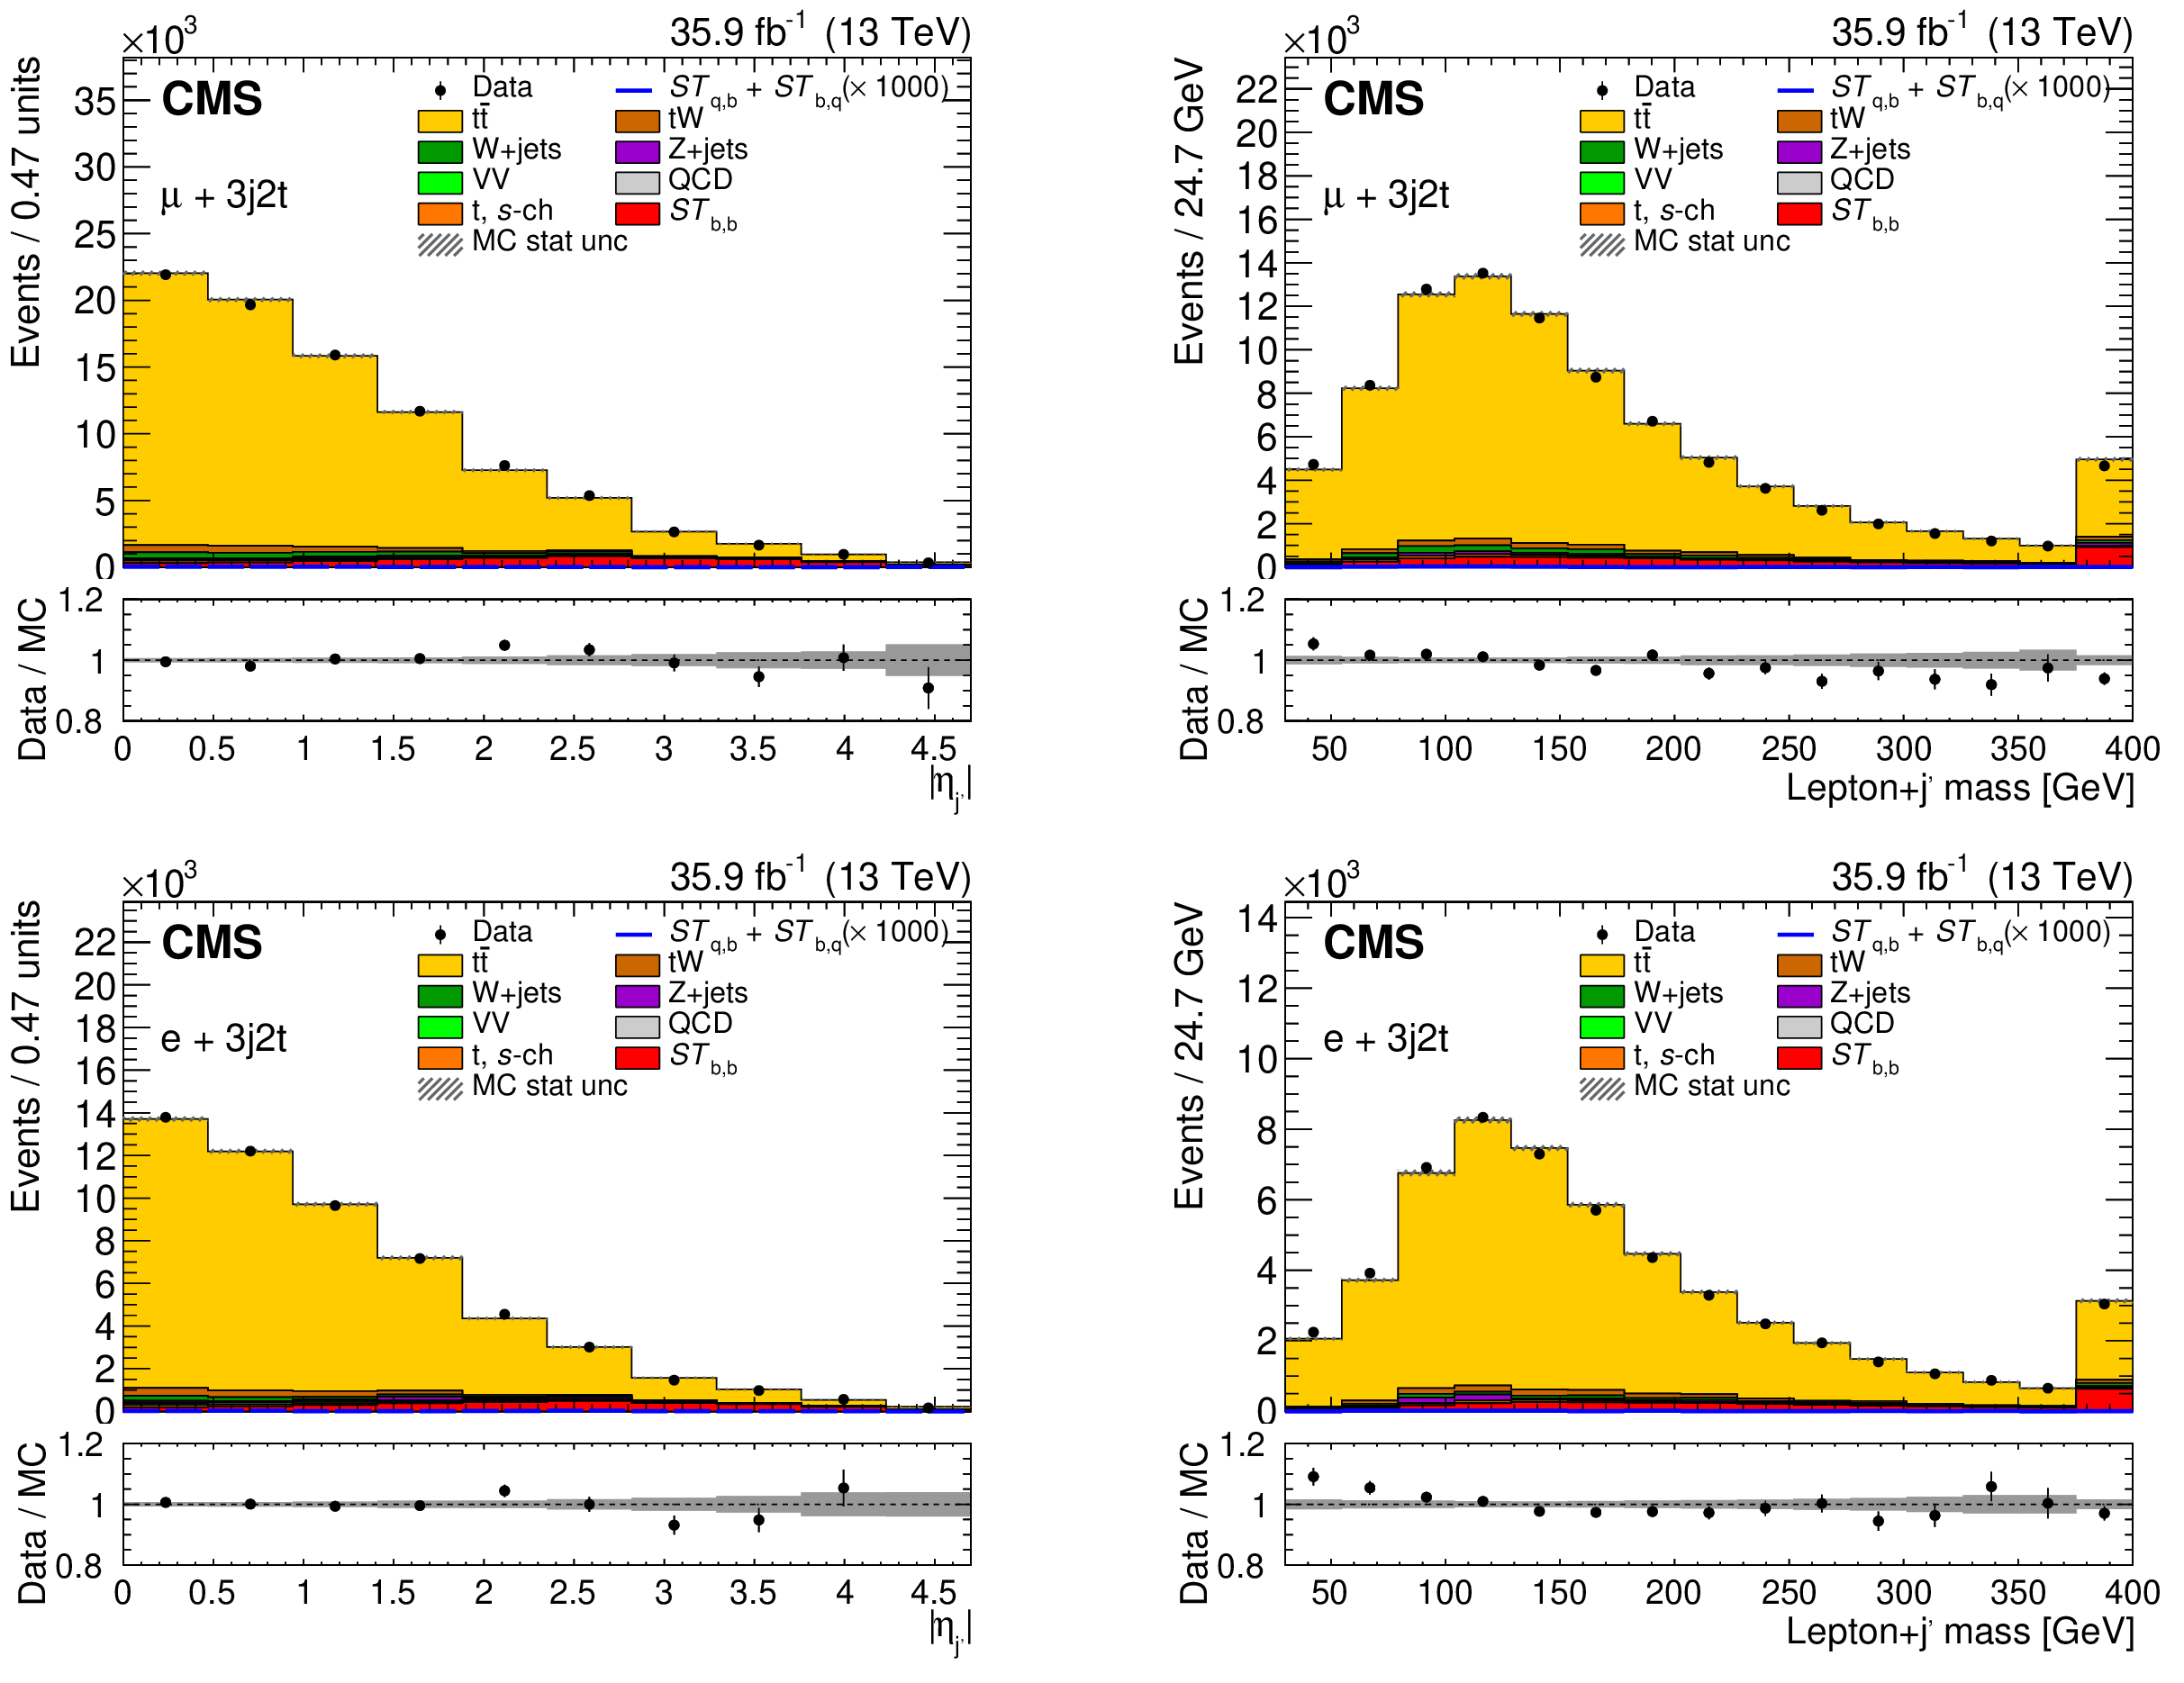
Figure 5:
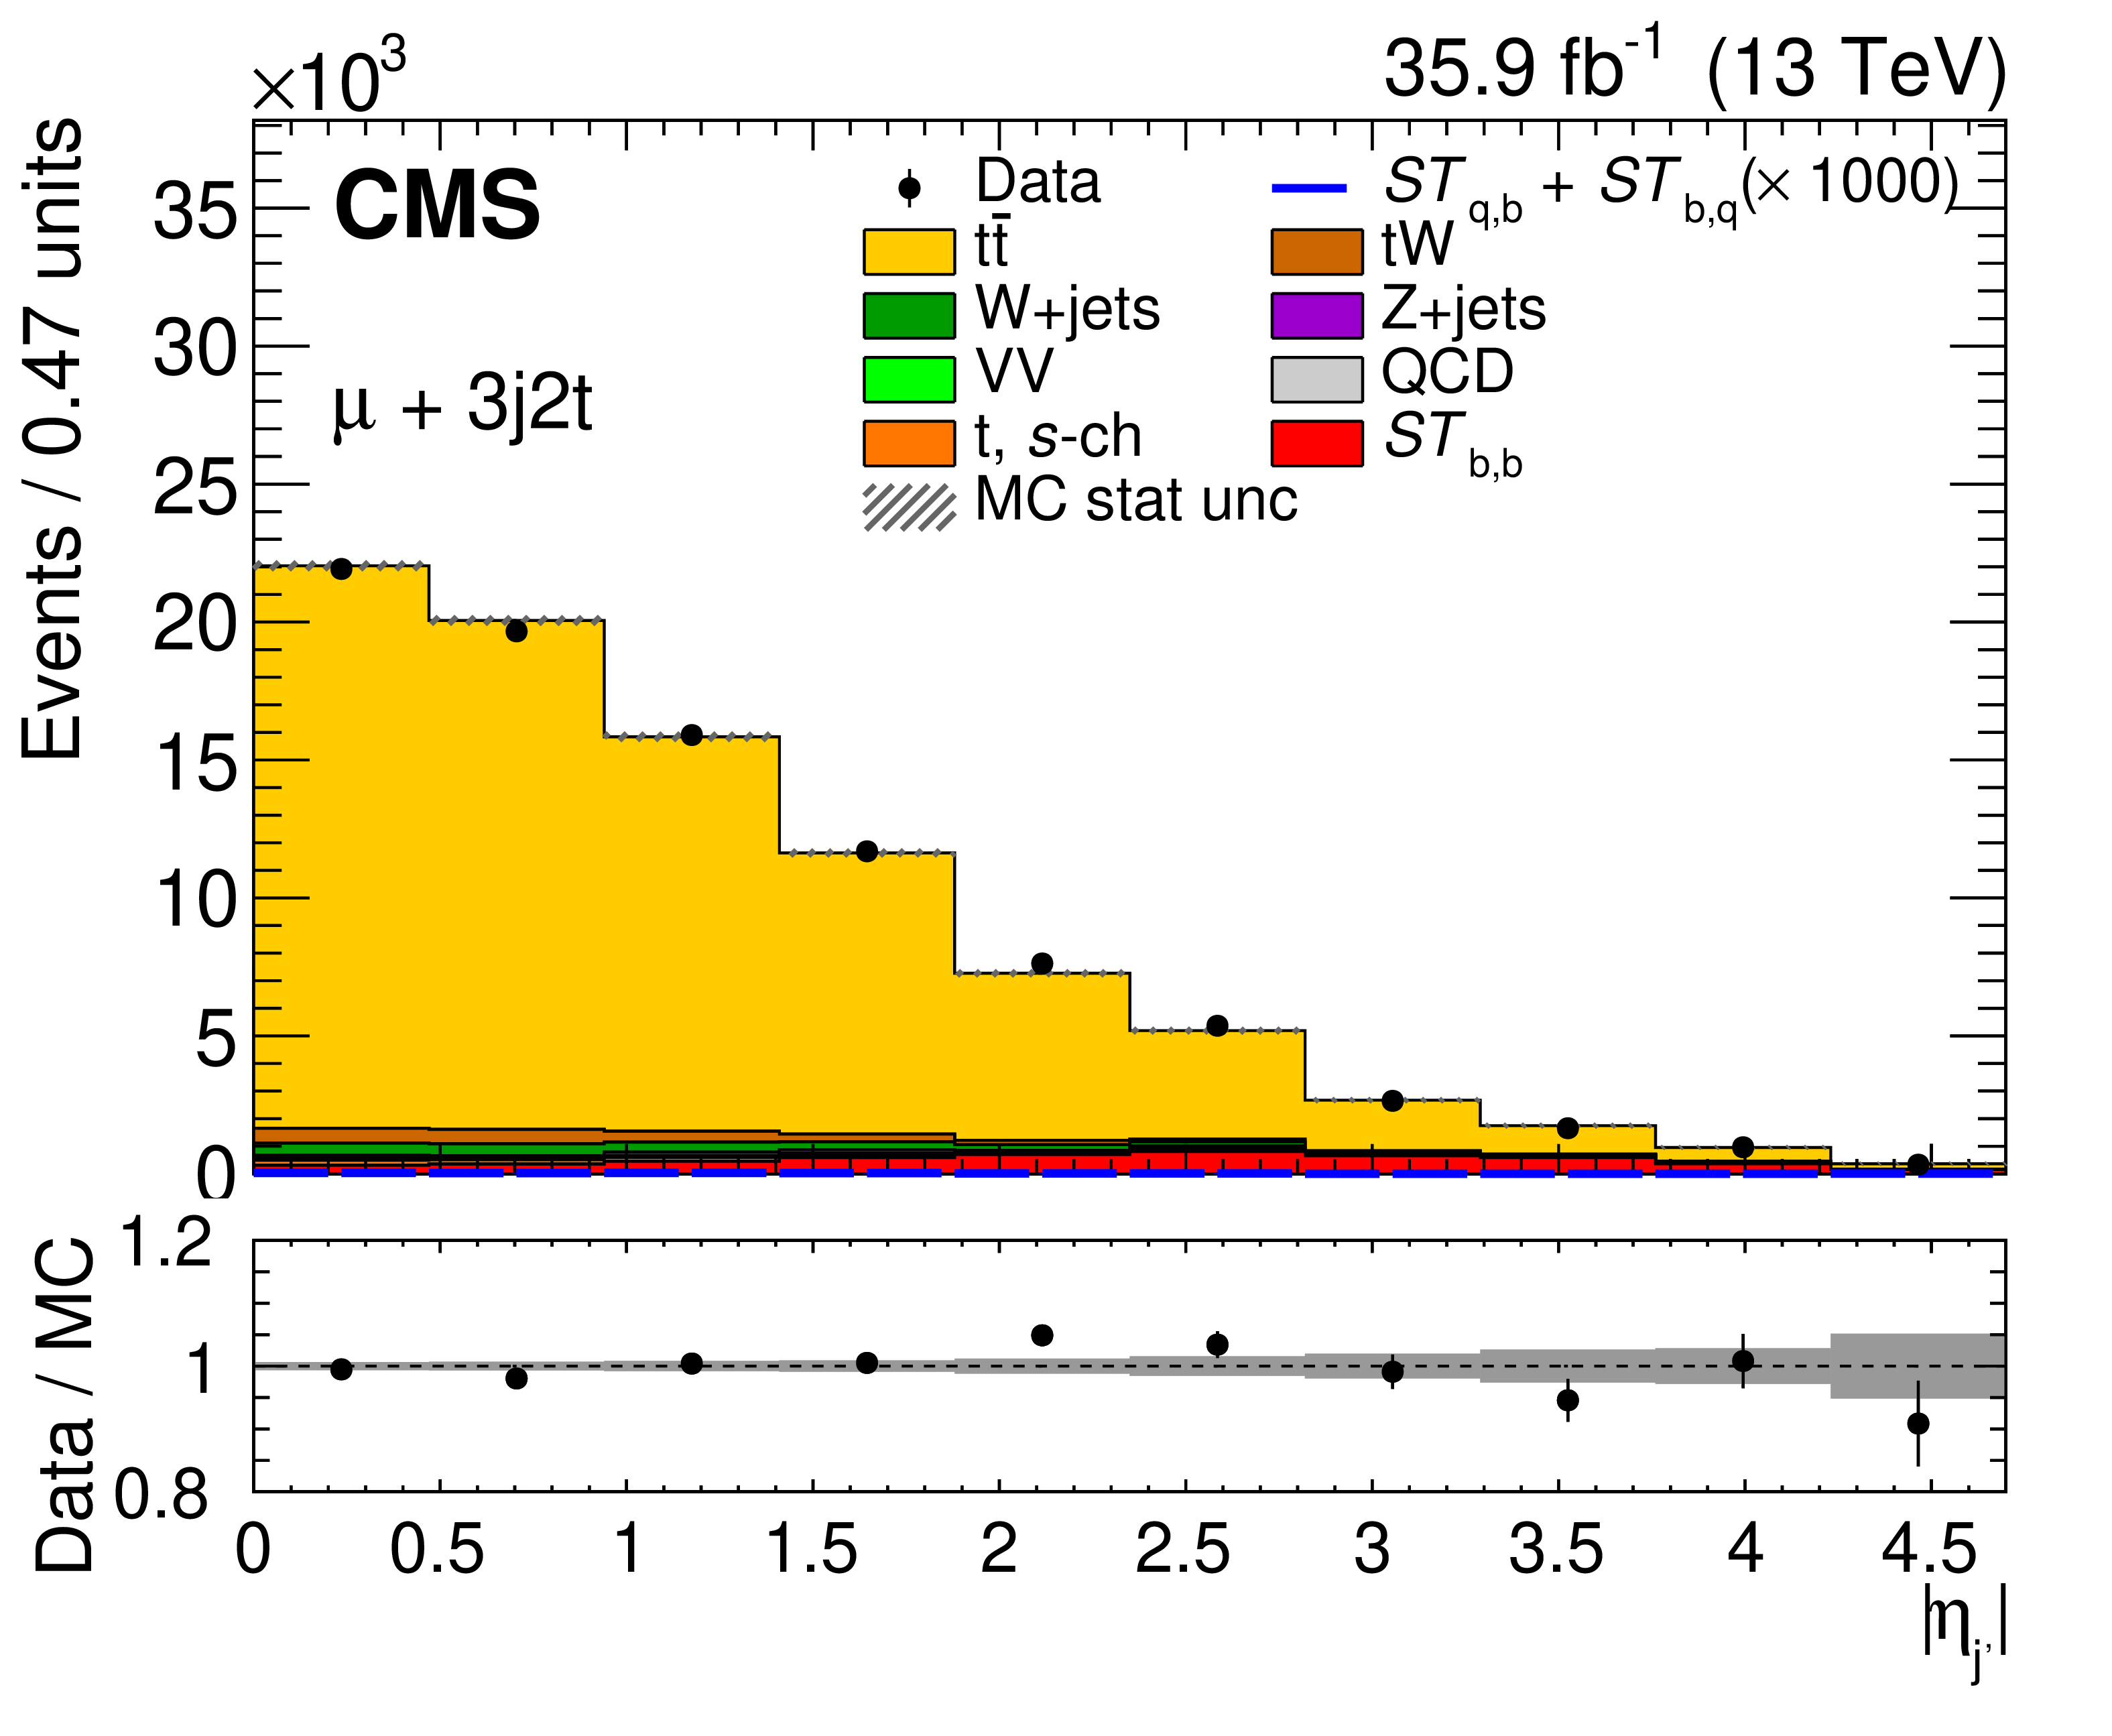
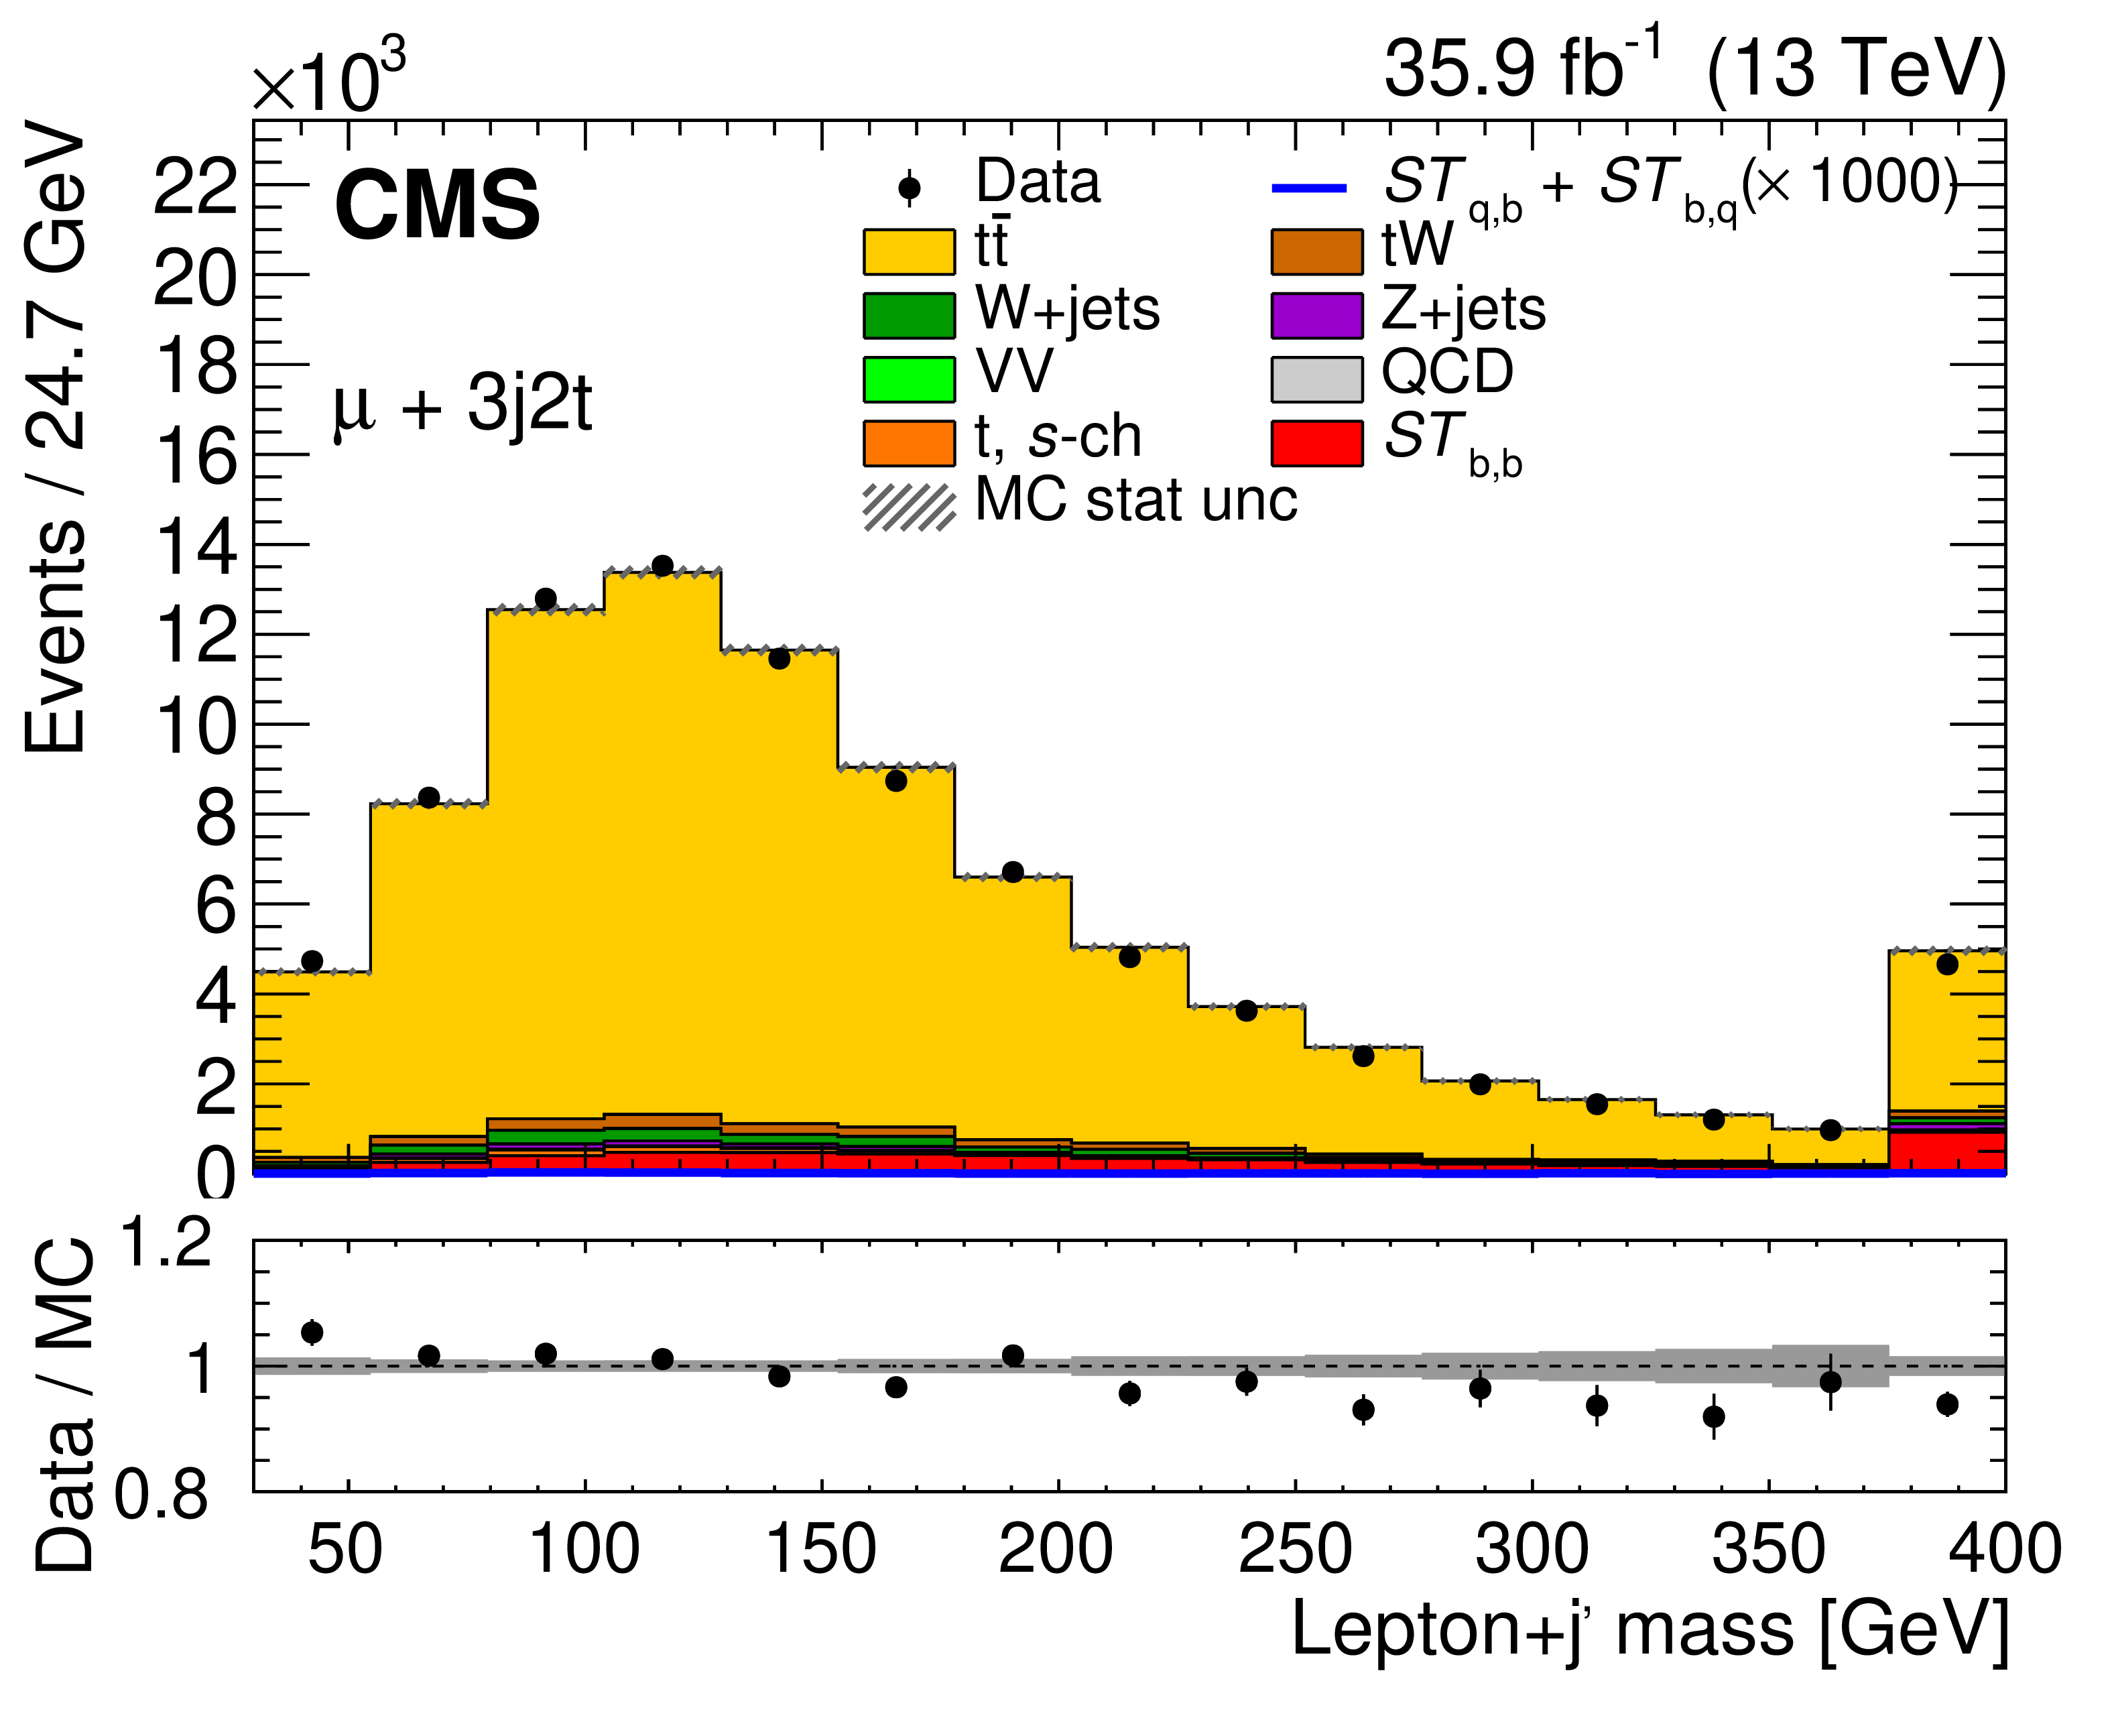
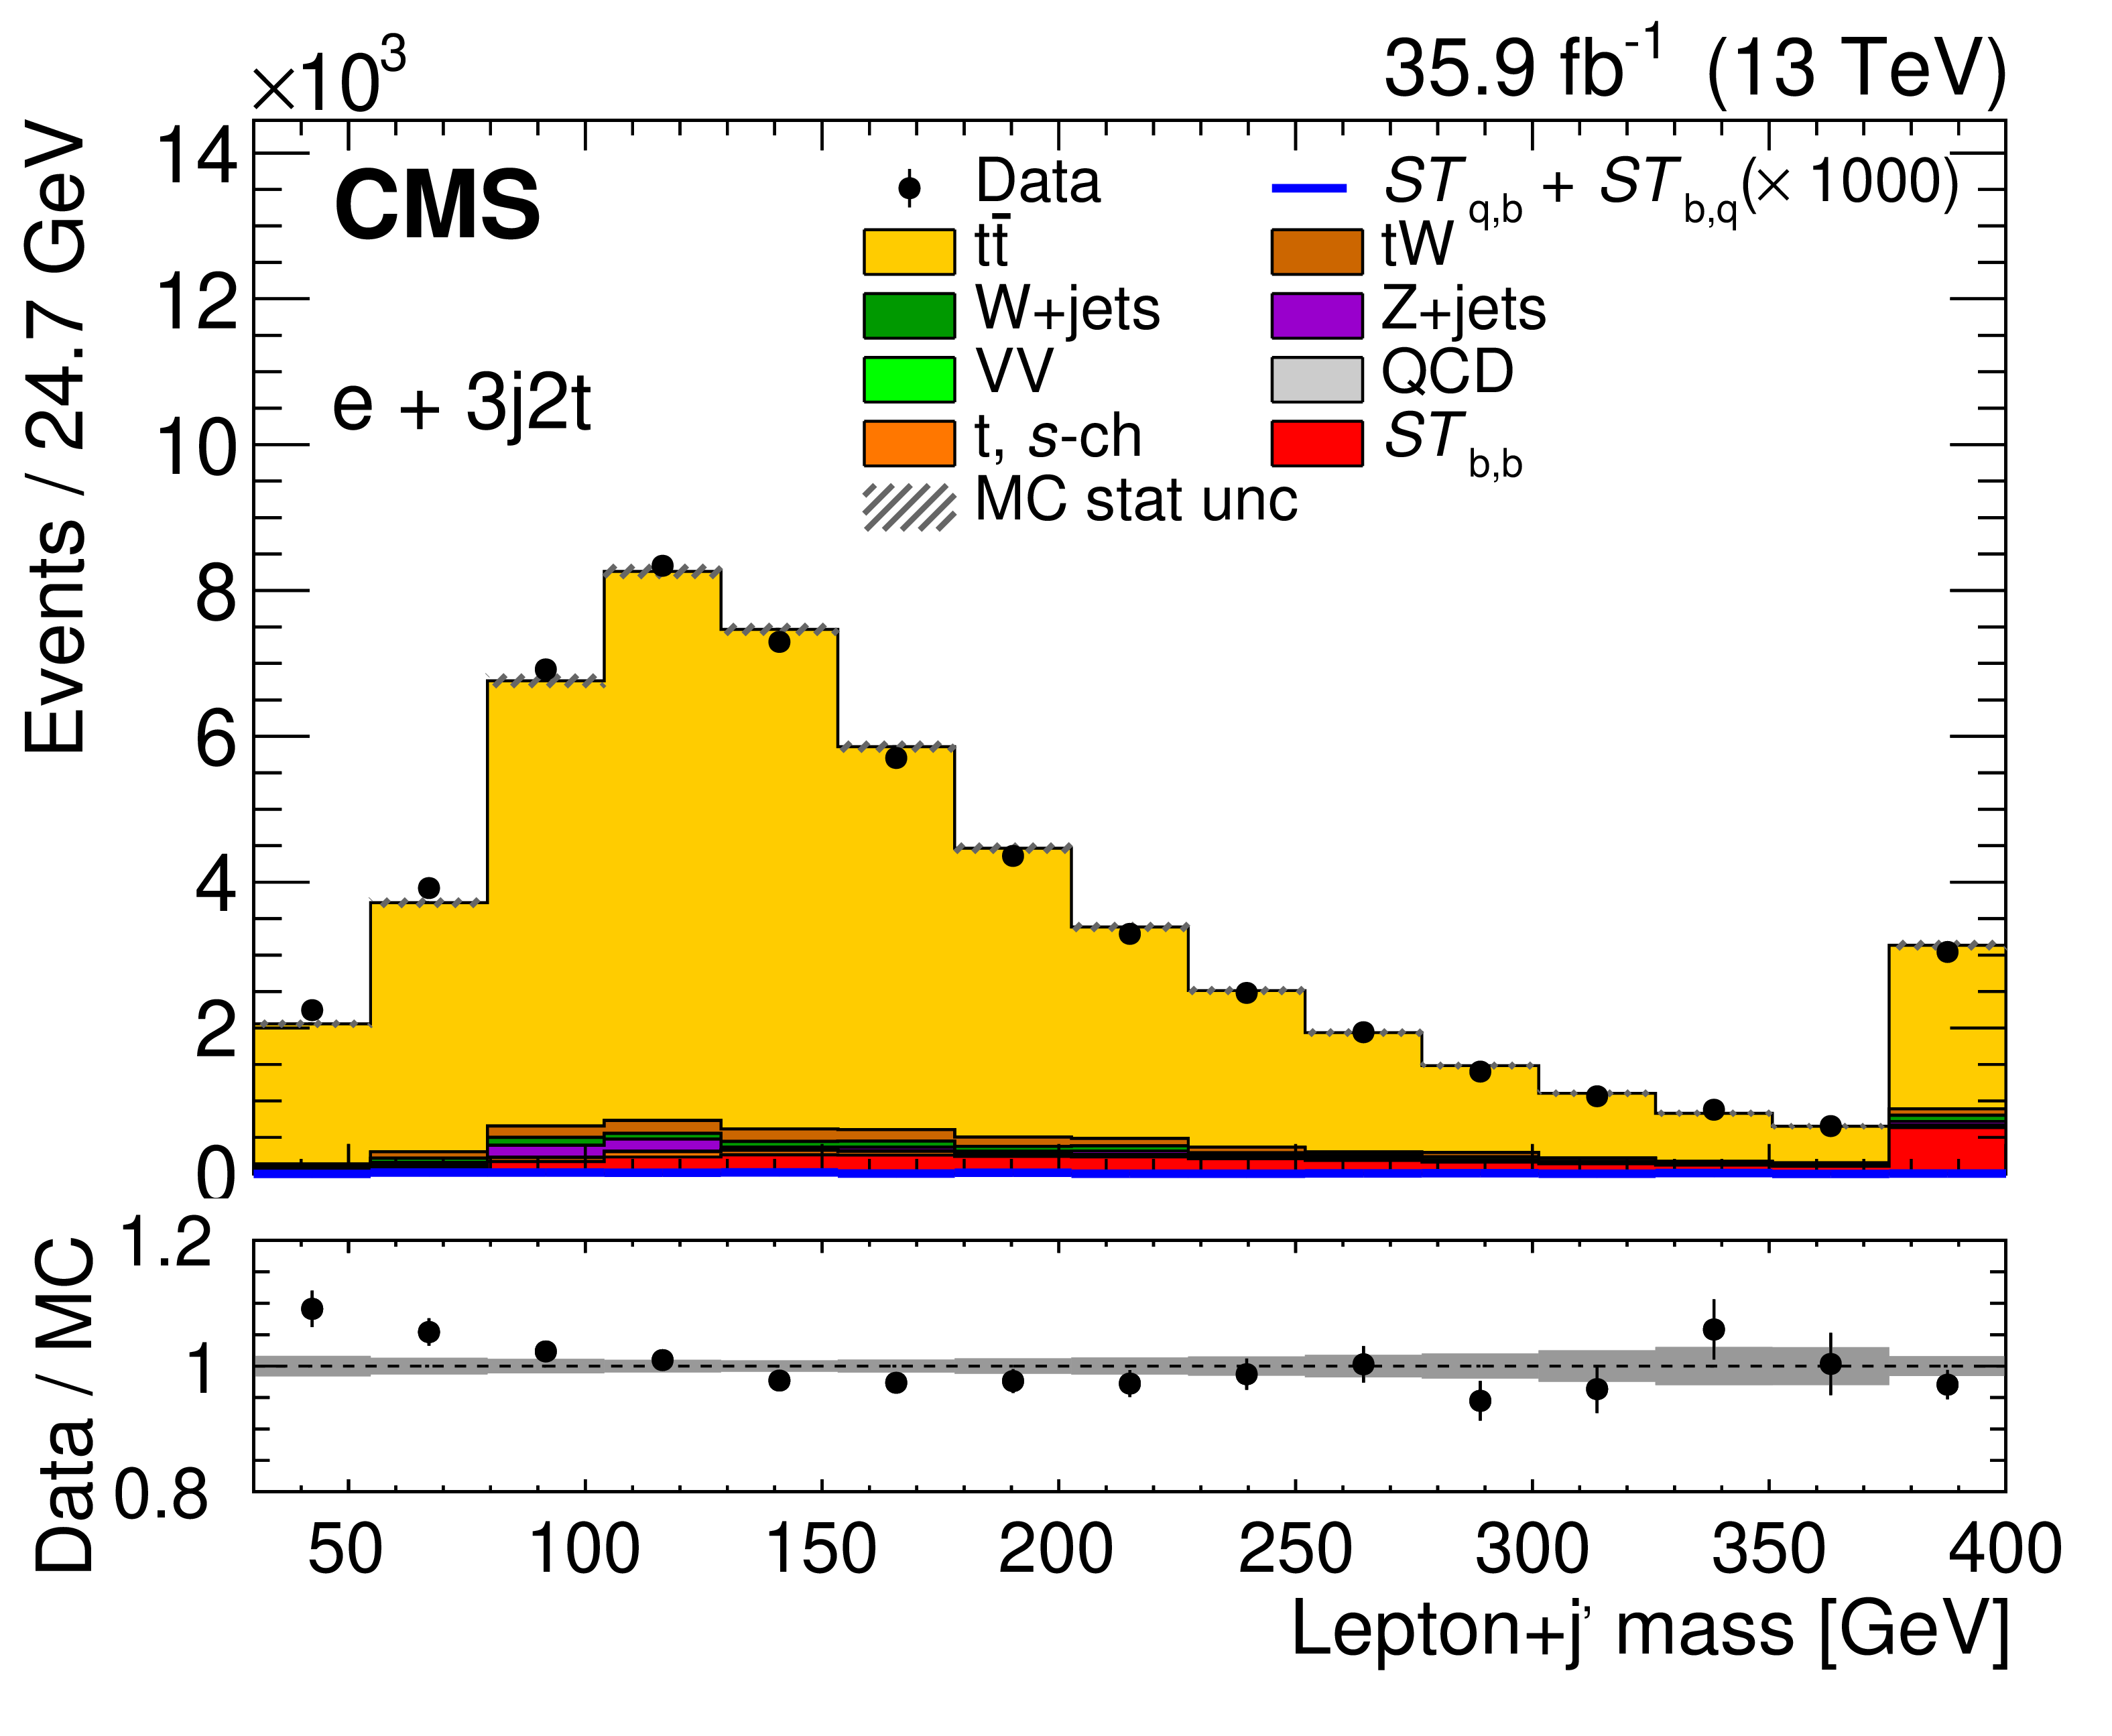
Distributions of the two most discriminating variables from data (points) and simulation (shaded histograms) in the 3j2t category: the ${{| \eta |}}$ of the non-b-tagged jet ${\eta _{\text {j}'}}$ (left) and the invariant mass of lepton and non-b-tagged jet system (right) are shown for the muon (upper) and electron (lower) channels, respectively. The vertical lines on the points and the hatched bands show the experimental and MC statistical uncertainties, respectively. The expected distribution from the $ {ST_{\mathrm{q},\mathrm{b}}}+ {ST_{\mathrm{b},\mathrm{q}}}$ processes (multiplied by a factor of 1000) is shown by the solid blue line. The lower panels show the ratio of the data to the MC prediction. |
png pdf |
Figure 5-a:
Distribution of the ${{| \eta |}}$ of the non-b-tagged jet ${\eta _{\text {j}'}}$, from data (points) and simulation (shaded histograms) in the 3j2t category, shown for the muon channel. The vertical lines on the points and the hatched bands show the experimental and MC statistical uncertainties, respectively. The expected distribution from the $ {ST_{\mathrm{q},\mathrm{b}}}+ {ST_{\mathrm{b},\mathrm{q}}}$ processes (multiplied by a factor of 1000) is shown by the solid blue line. The lower panel shows the ratio of the data to the MC prediction. |
png pdf |
Figure 5-b:
Distribution of the invariant mass of lepton and non-b-tagged jet system, from data (points) and simulation (shaded histograms) in the 3j2t category, shown for the muon channel. The vertical lines on the points and the hatched bands show the experimental and MC statistical uncertainties, respectively. The expected distribution from the $ {ST_{\mathrm{q},\mathrm{b}}}+ {ST_{\mathrm{b},\mathrm{q}}}$ processes (multiplied by a factor of 1000) is shown by the solid blue line. The lower panel shows the ratio of the data to the MC prediction. |

png pdf |
Figure 5-c:
Distribution of the ${{| \eta |}}$ of the non-b-tagged jet ${\eta _{\text {j}'}}$, from data (points) and simulation (shaded histograms) in the 3j2t category, shown for the electron channel. The vertical lines on the points and the hatched bands show the experimental and MC statistical uncertainties, respectively. The expected distribution from the $ {ST_{\mathrm{q},\mathrm{b}}}+ {ST_{\mathrm{b},\mathrm{q}}}$ processes (multiplied by a factor of 1000) is shown by the solid blue line. The lower panel shows the ratio of the data to the MC prediction. |
png pdf |
Figure 5-d:
Distribution of the invariant mass of lepton and non-b-tagged jet system, from data (points) and simulation (shaded histograms) in the 3j2t category, shown for the electron channel. The vertical lines on the points and the hatched bands show the experimental and MC statistical uncertainties, respectively. The expected distribution from the $ {ST_{\mathrm{q},\mathrm{b}}}+ {ST_{\mathrm{b},\mathrm{q}}}$ processes (multiplied by a factor of 1000) is shown by the solid blue line. The lower panel shows the ratio of the data to the MC prediction. |
png pdf |
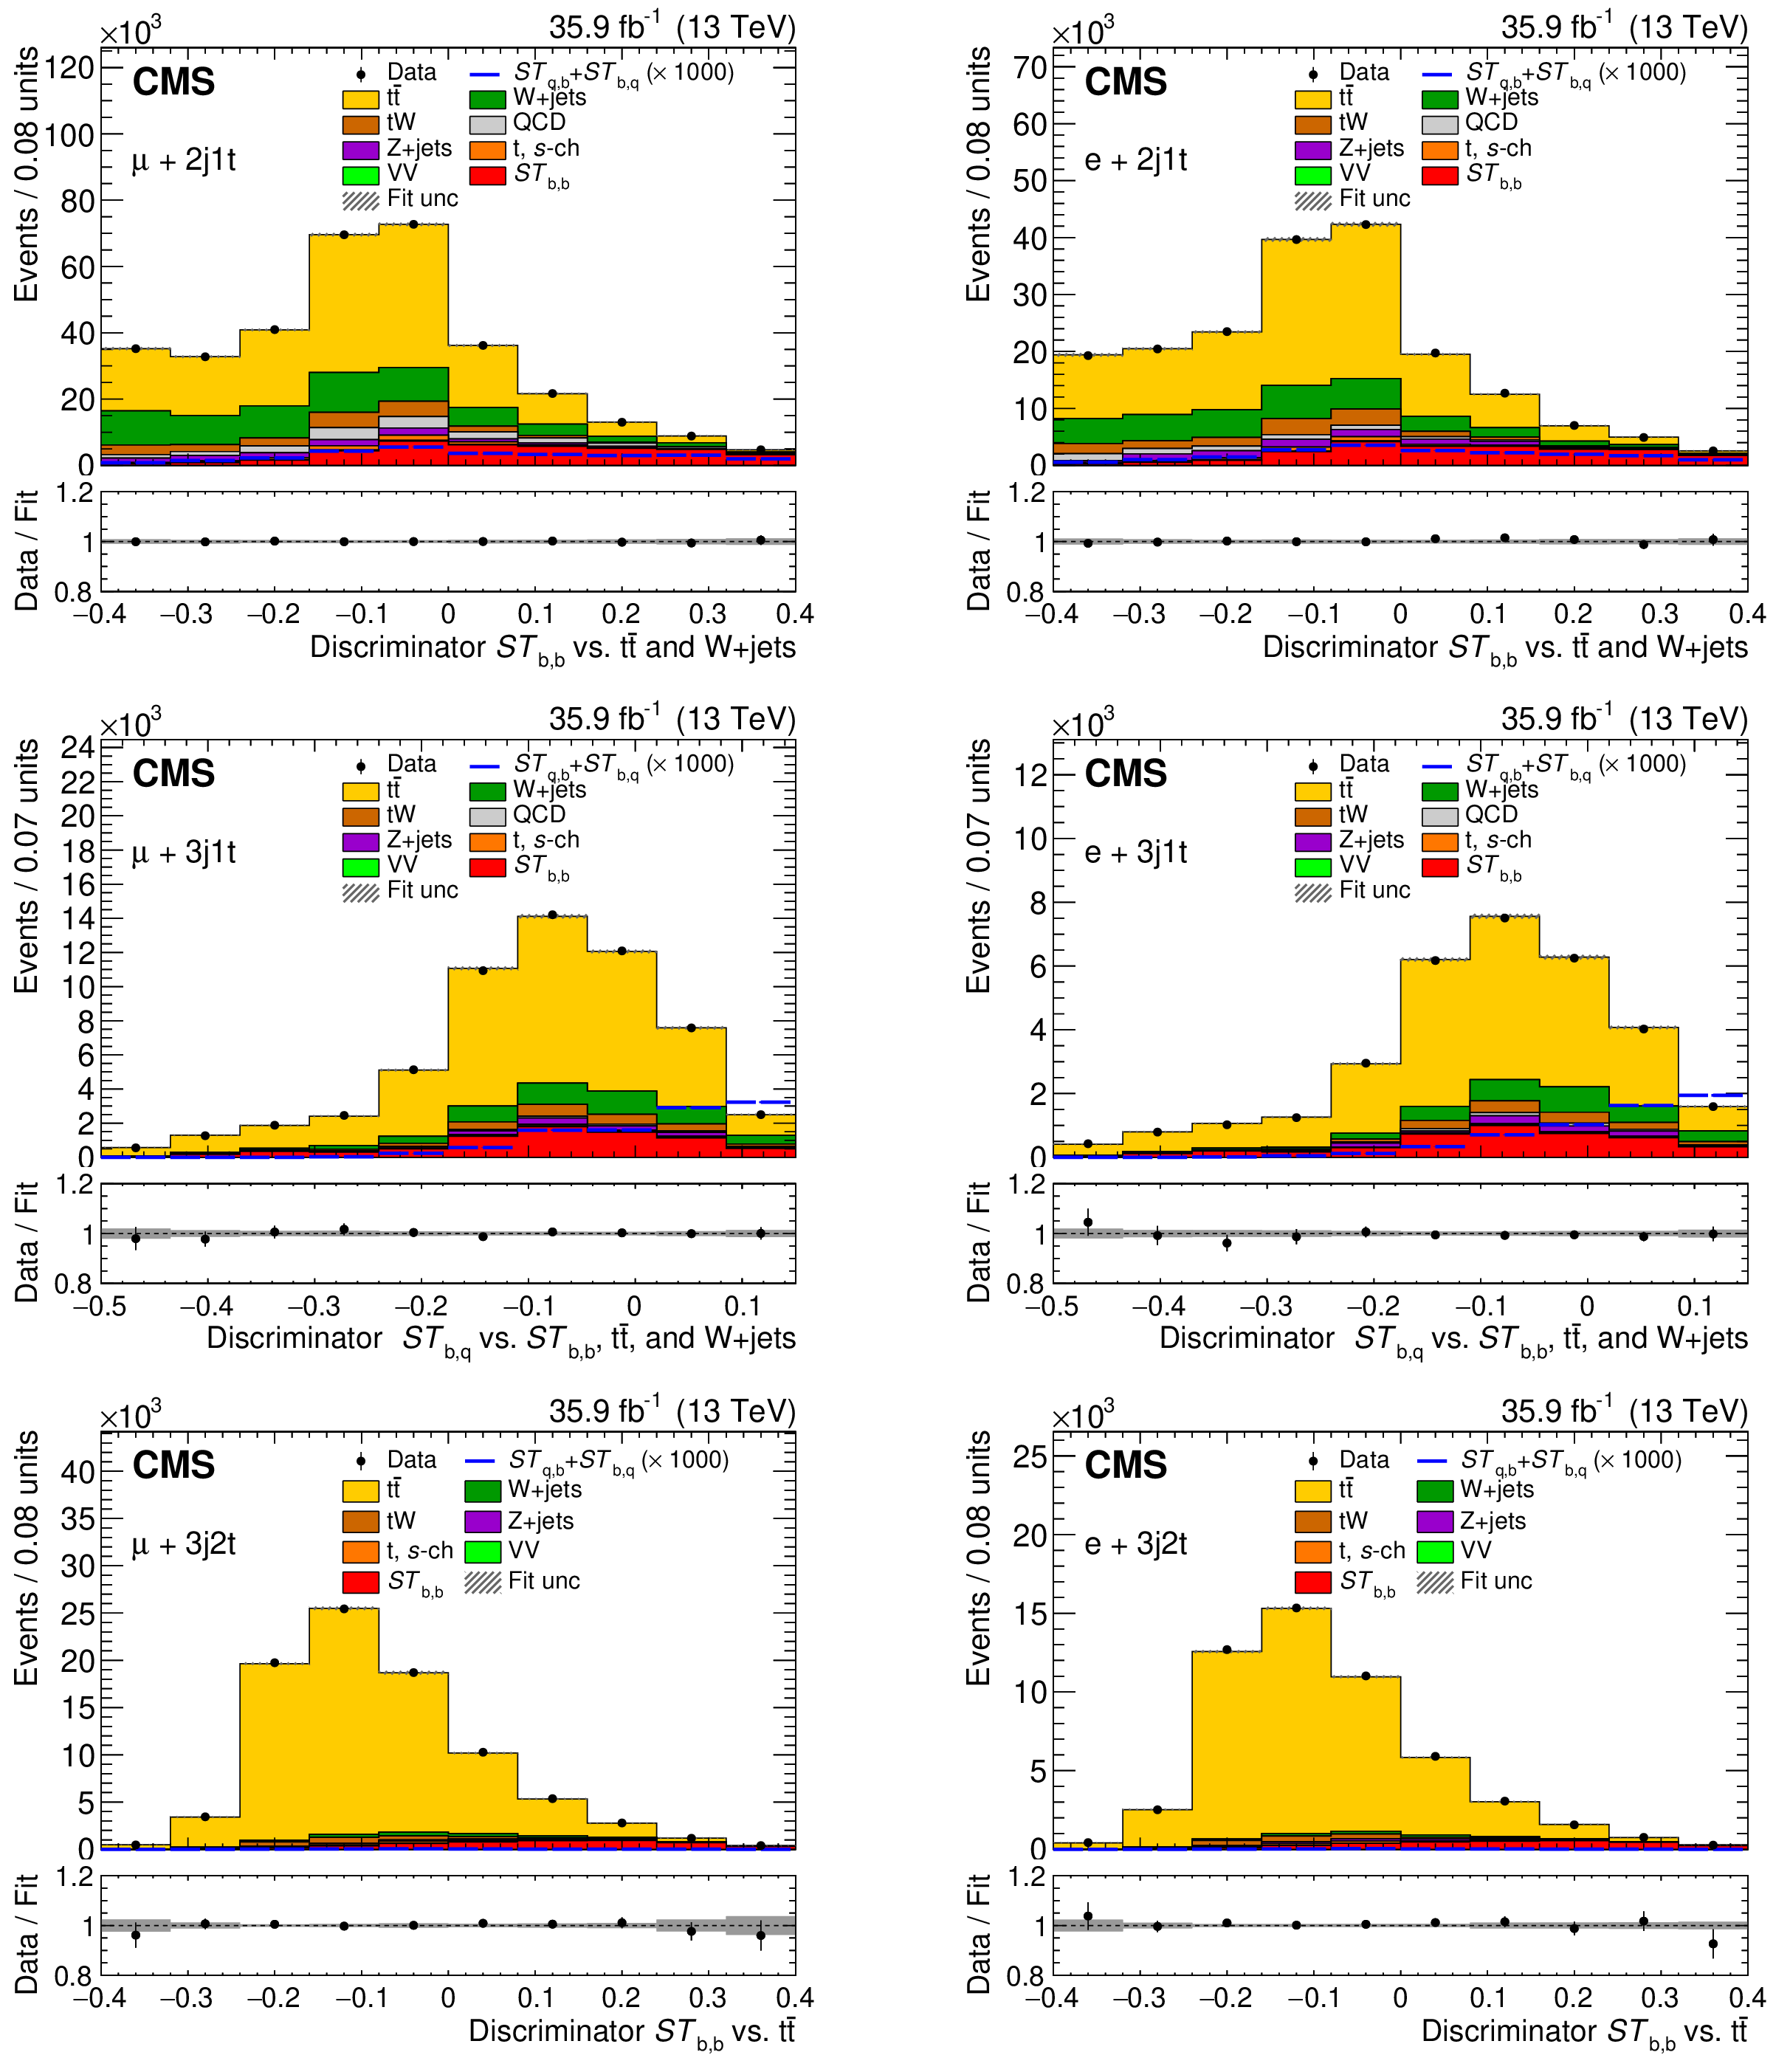
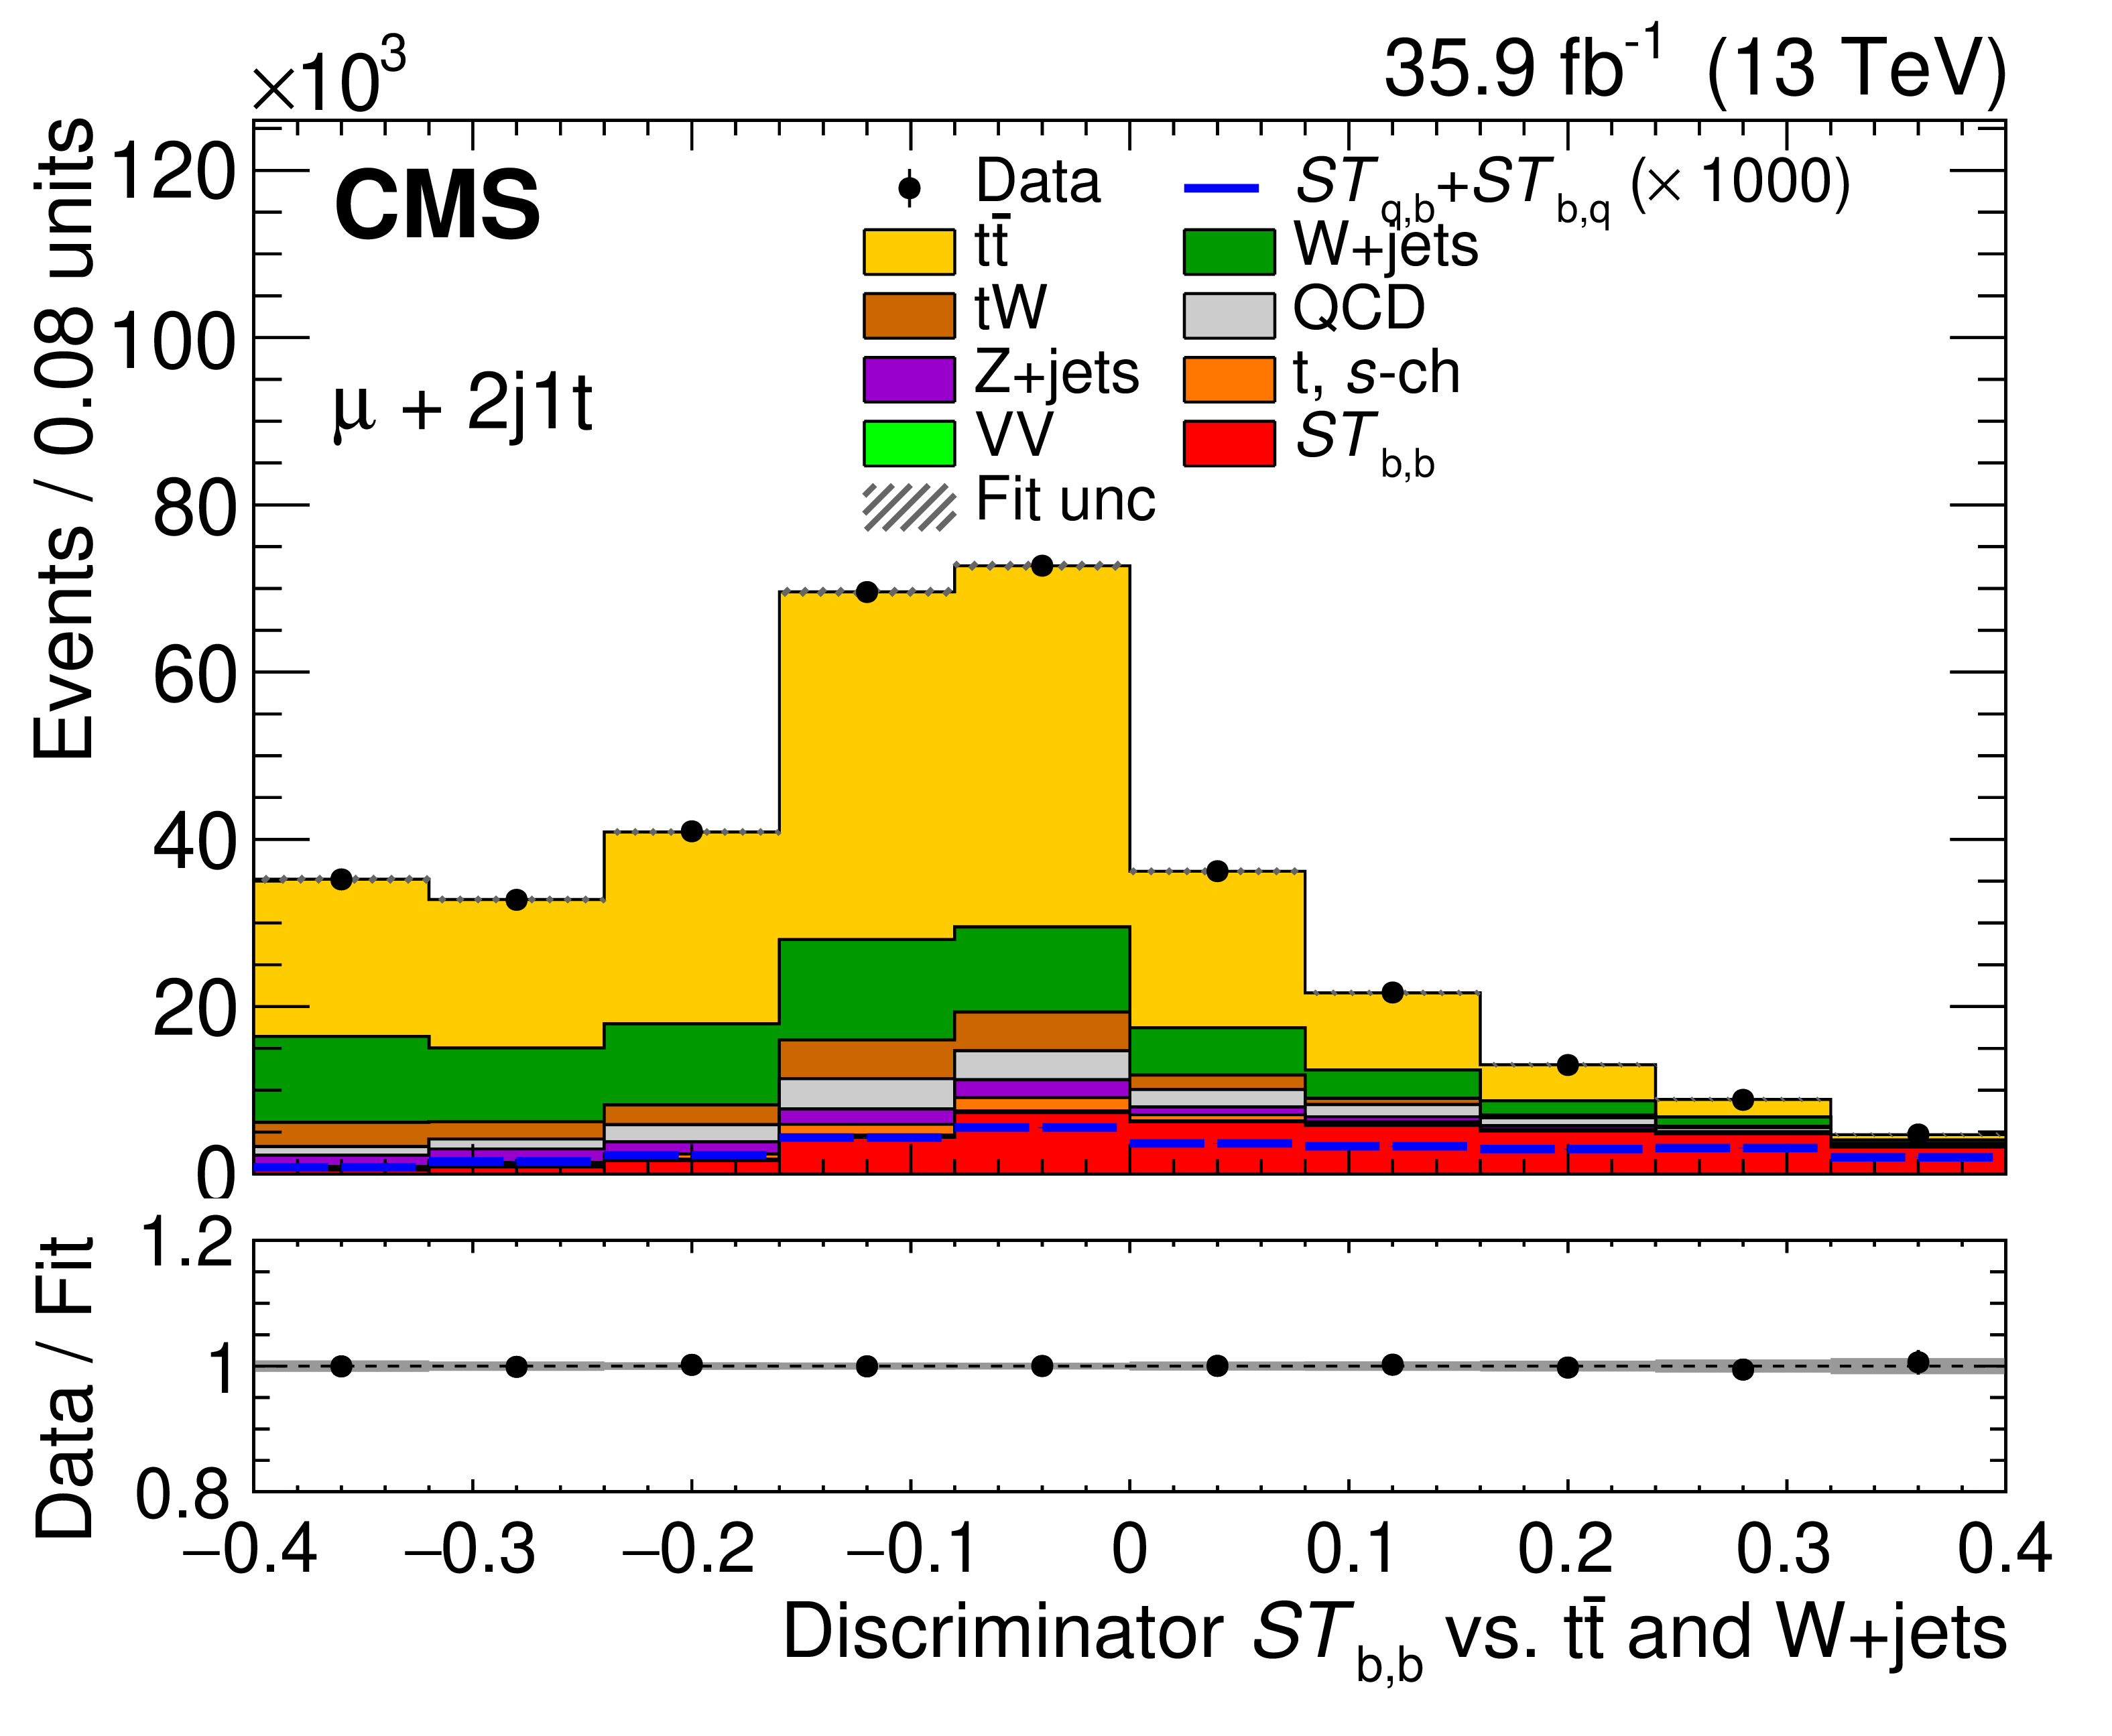
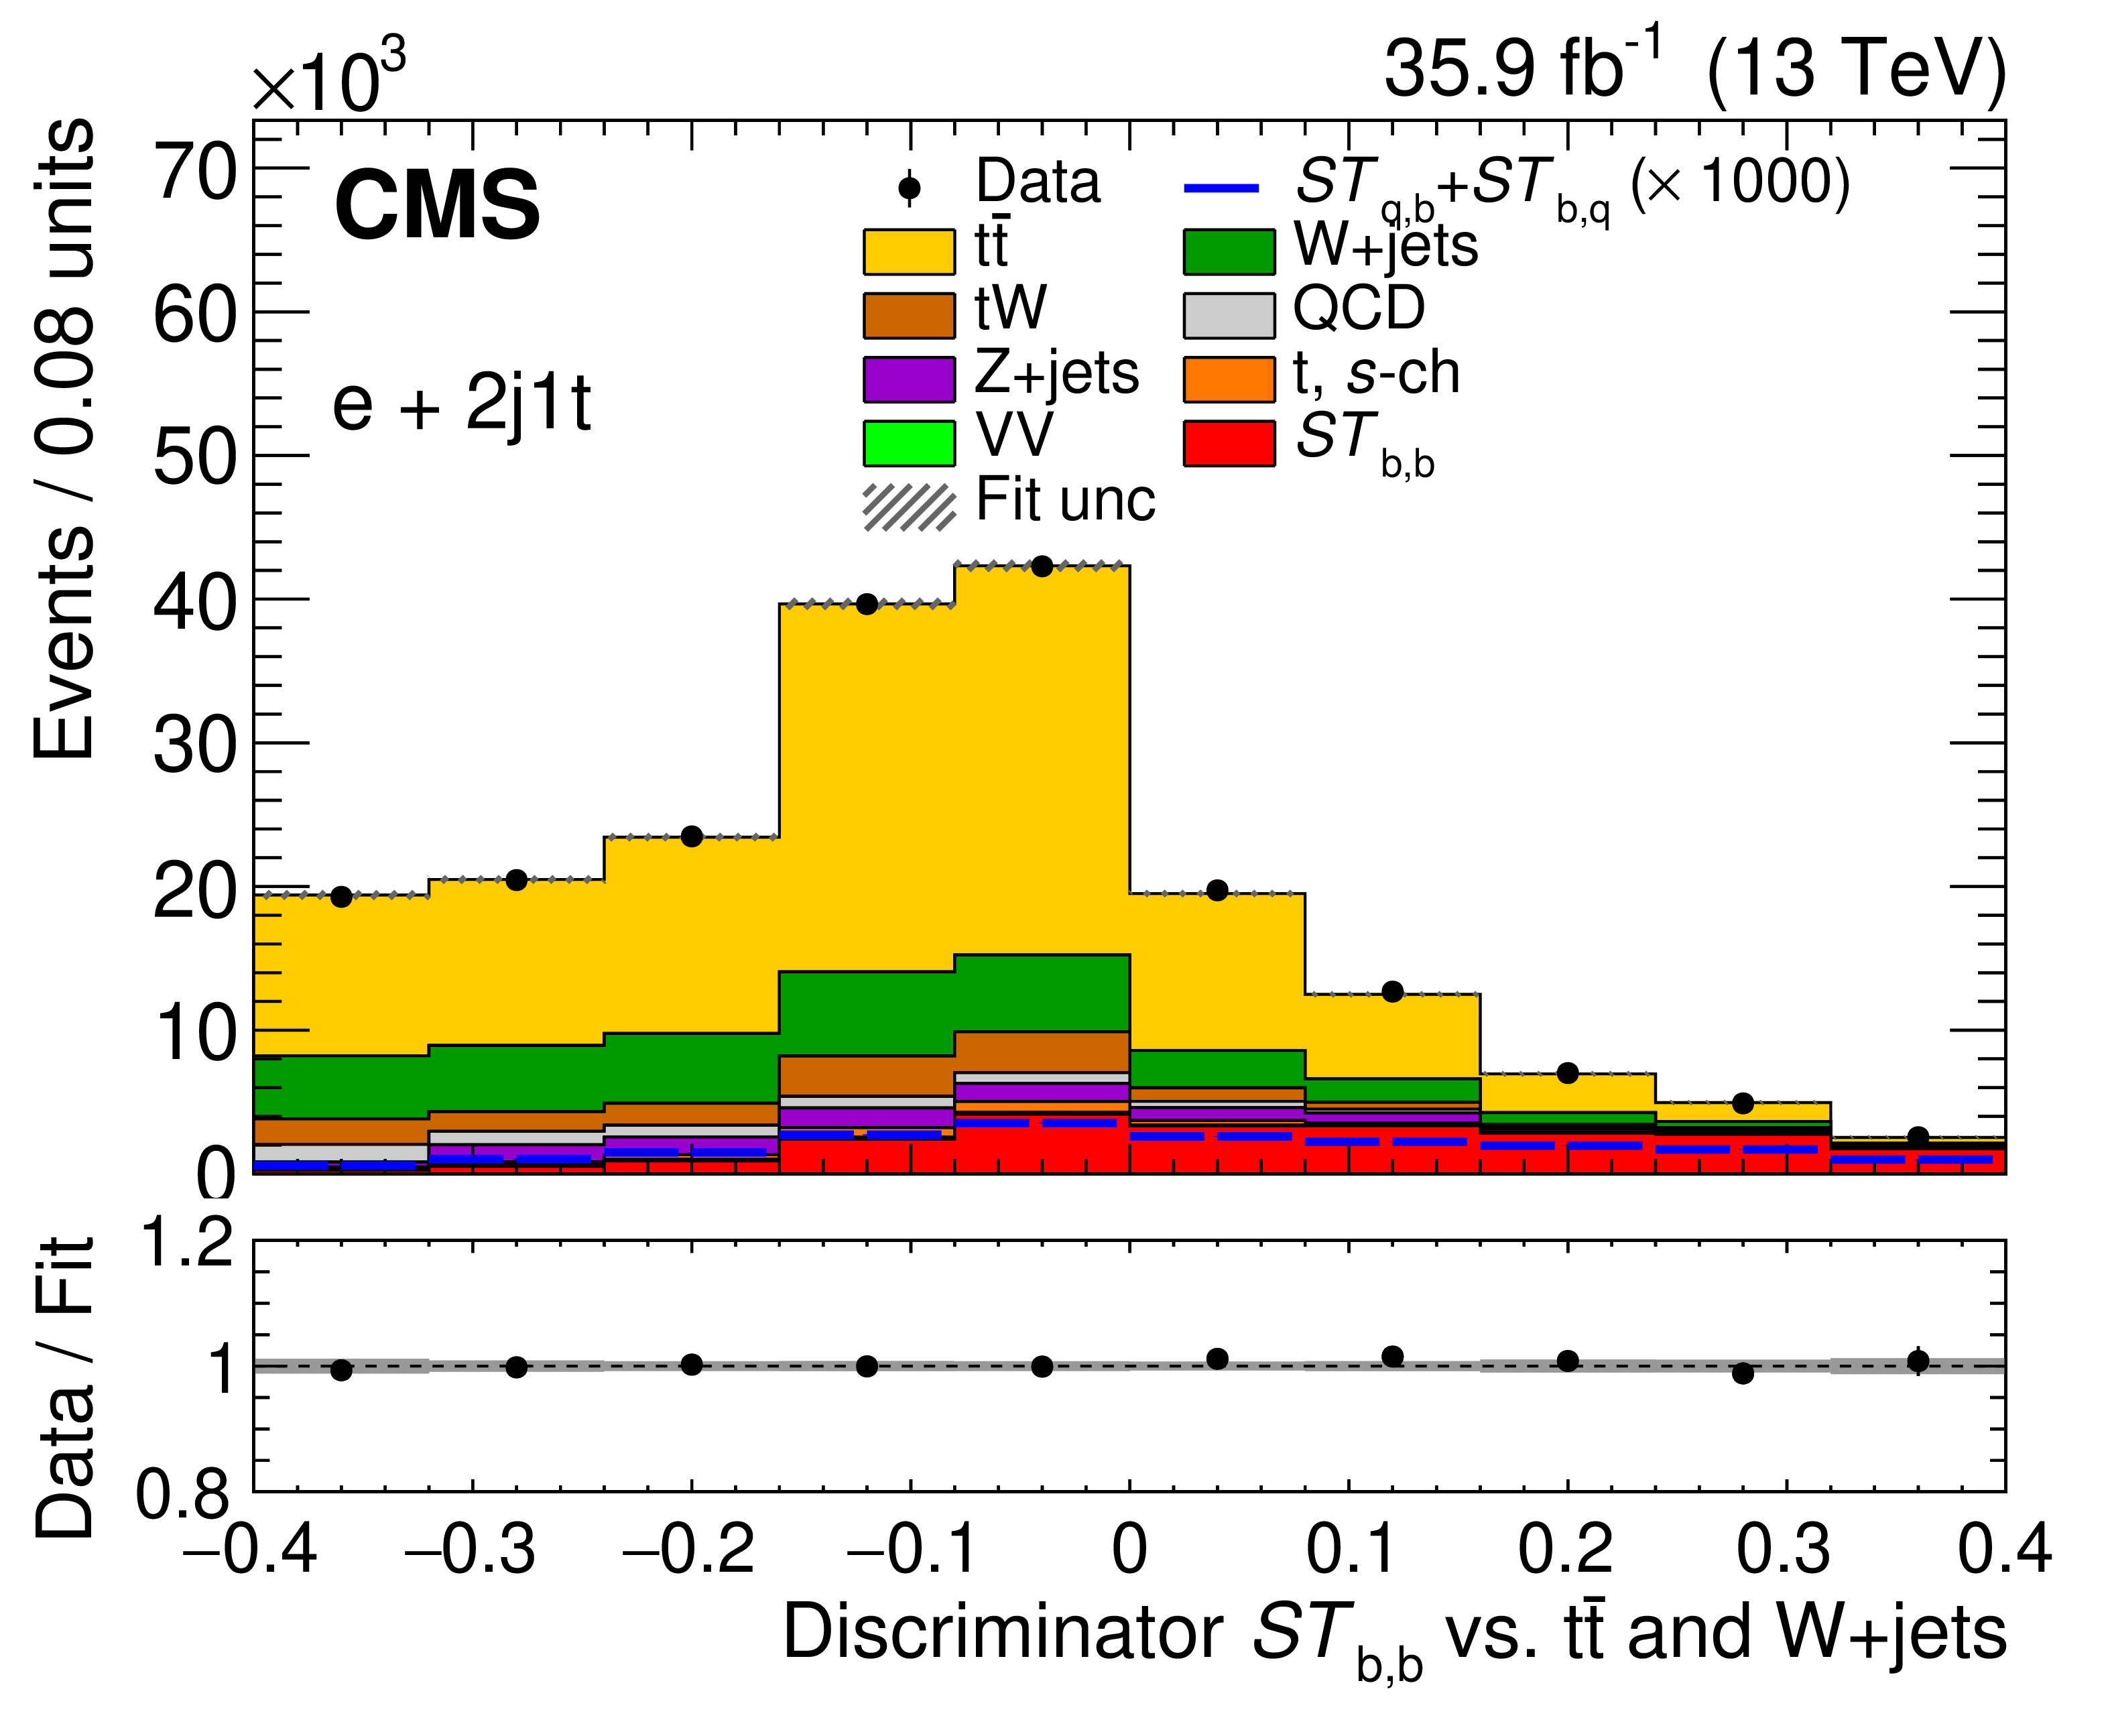
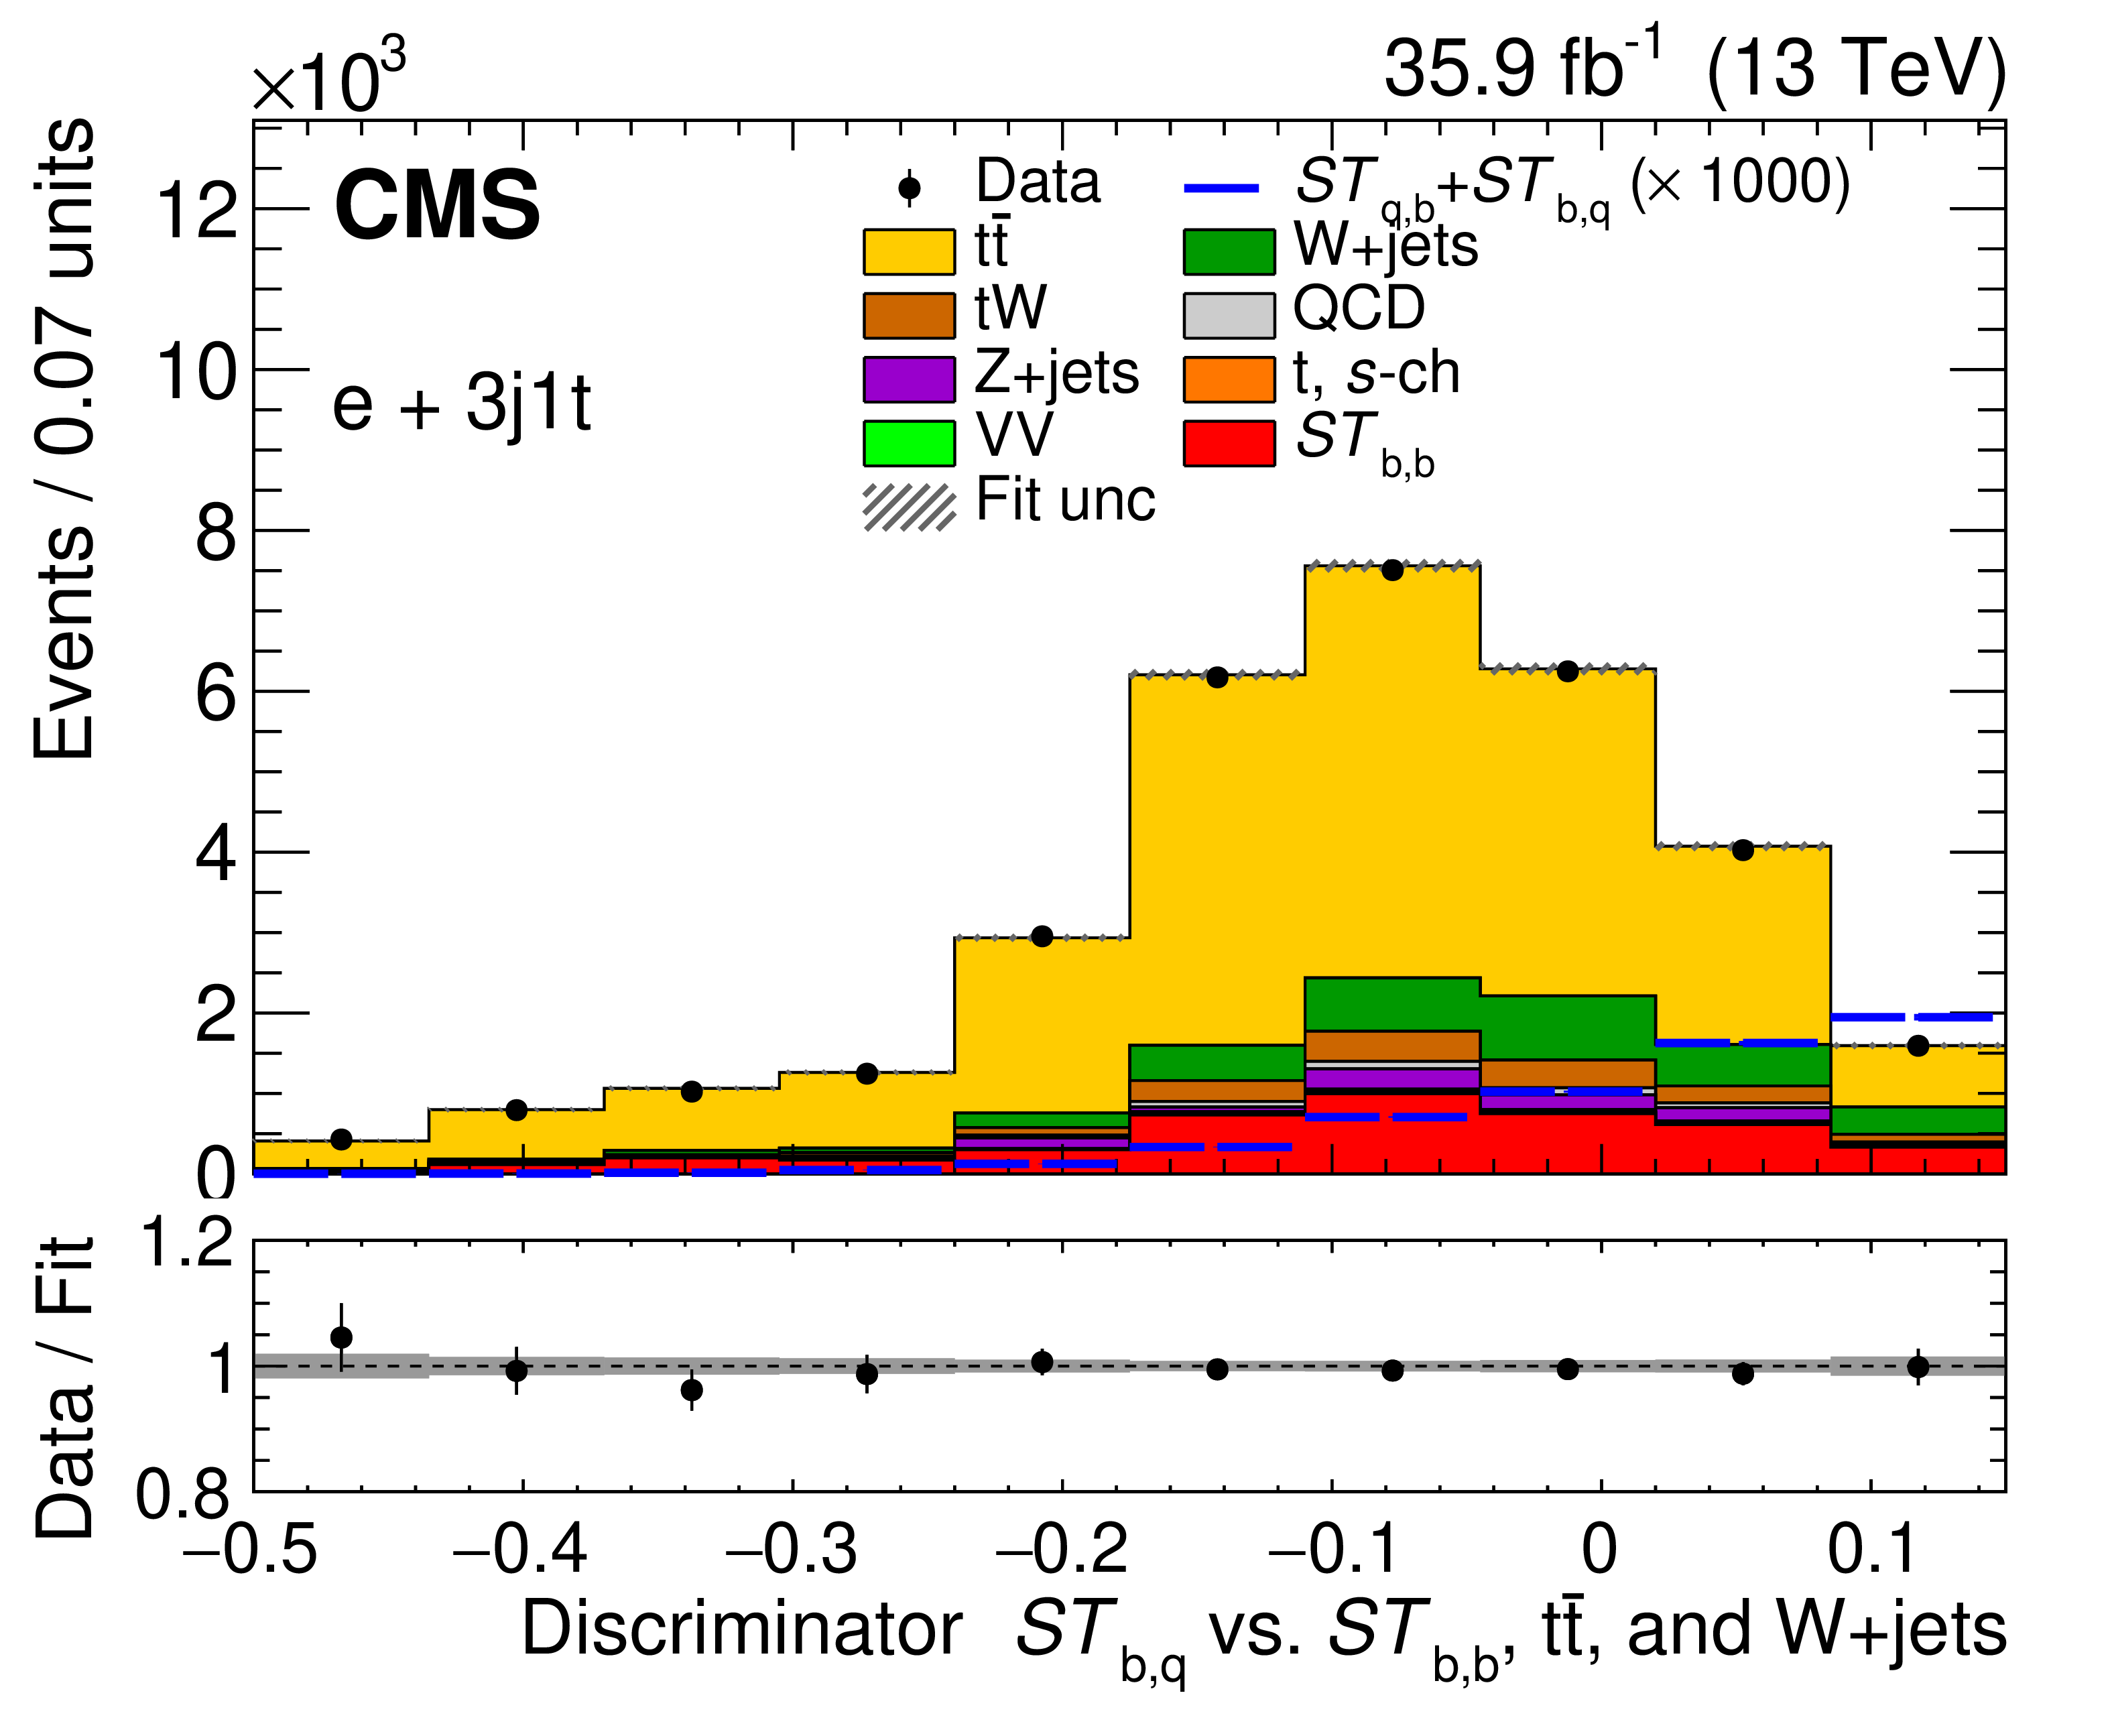
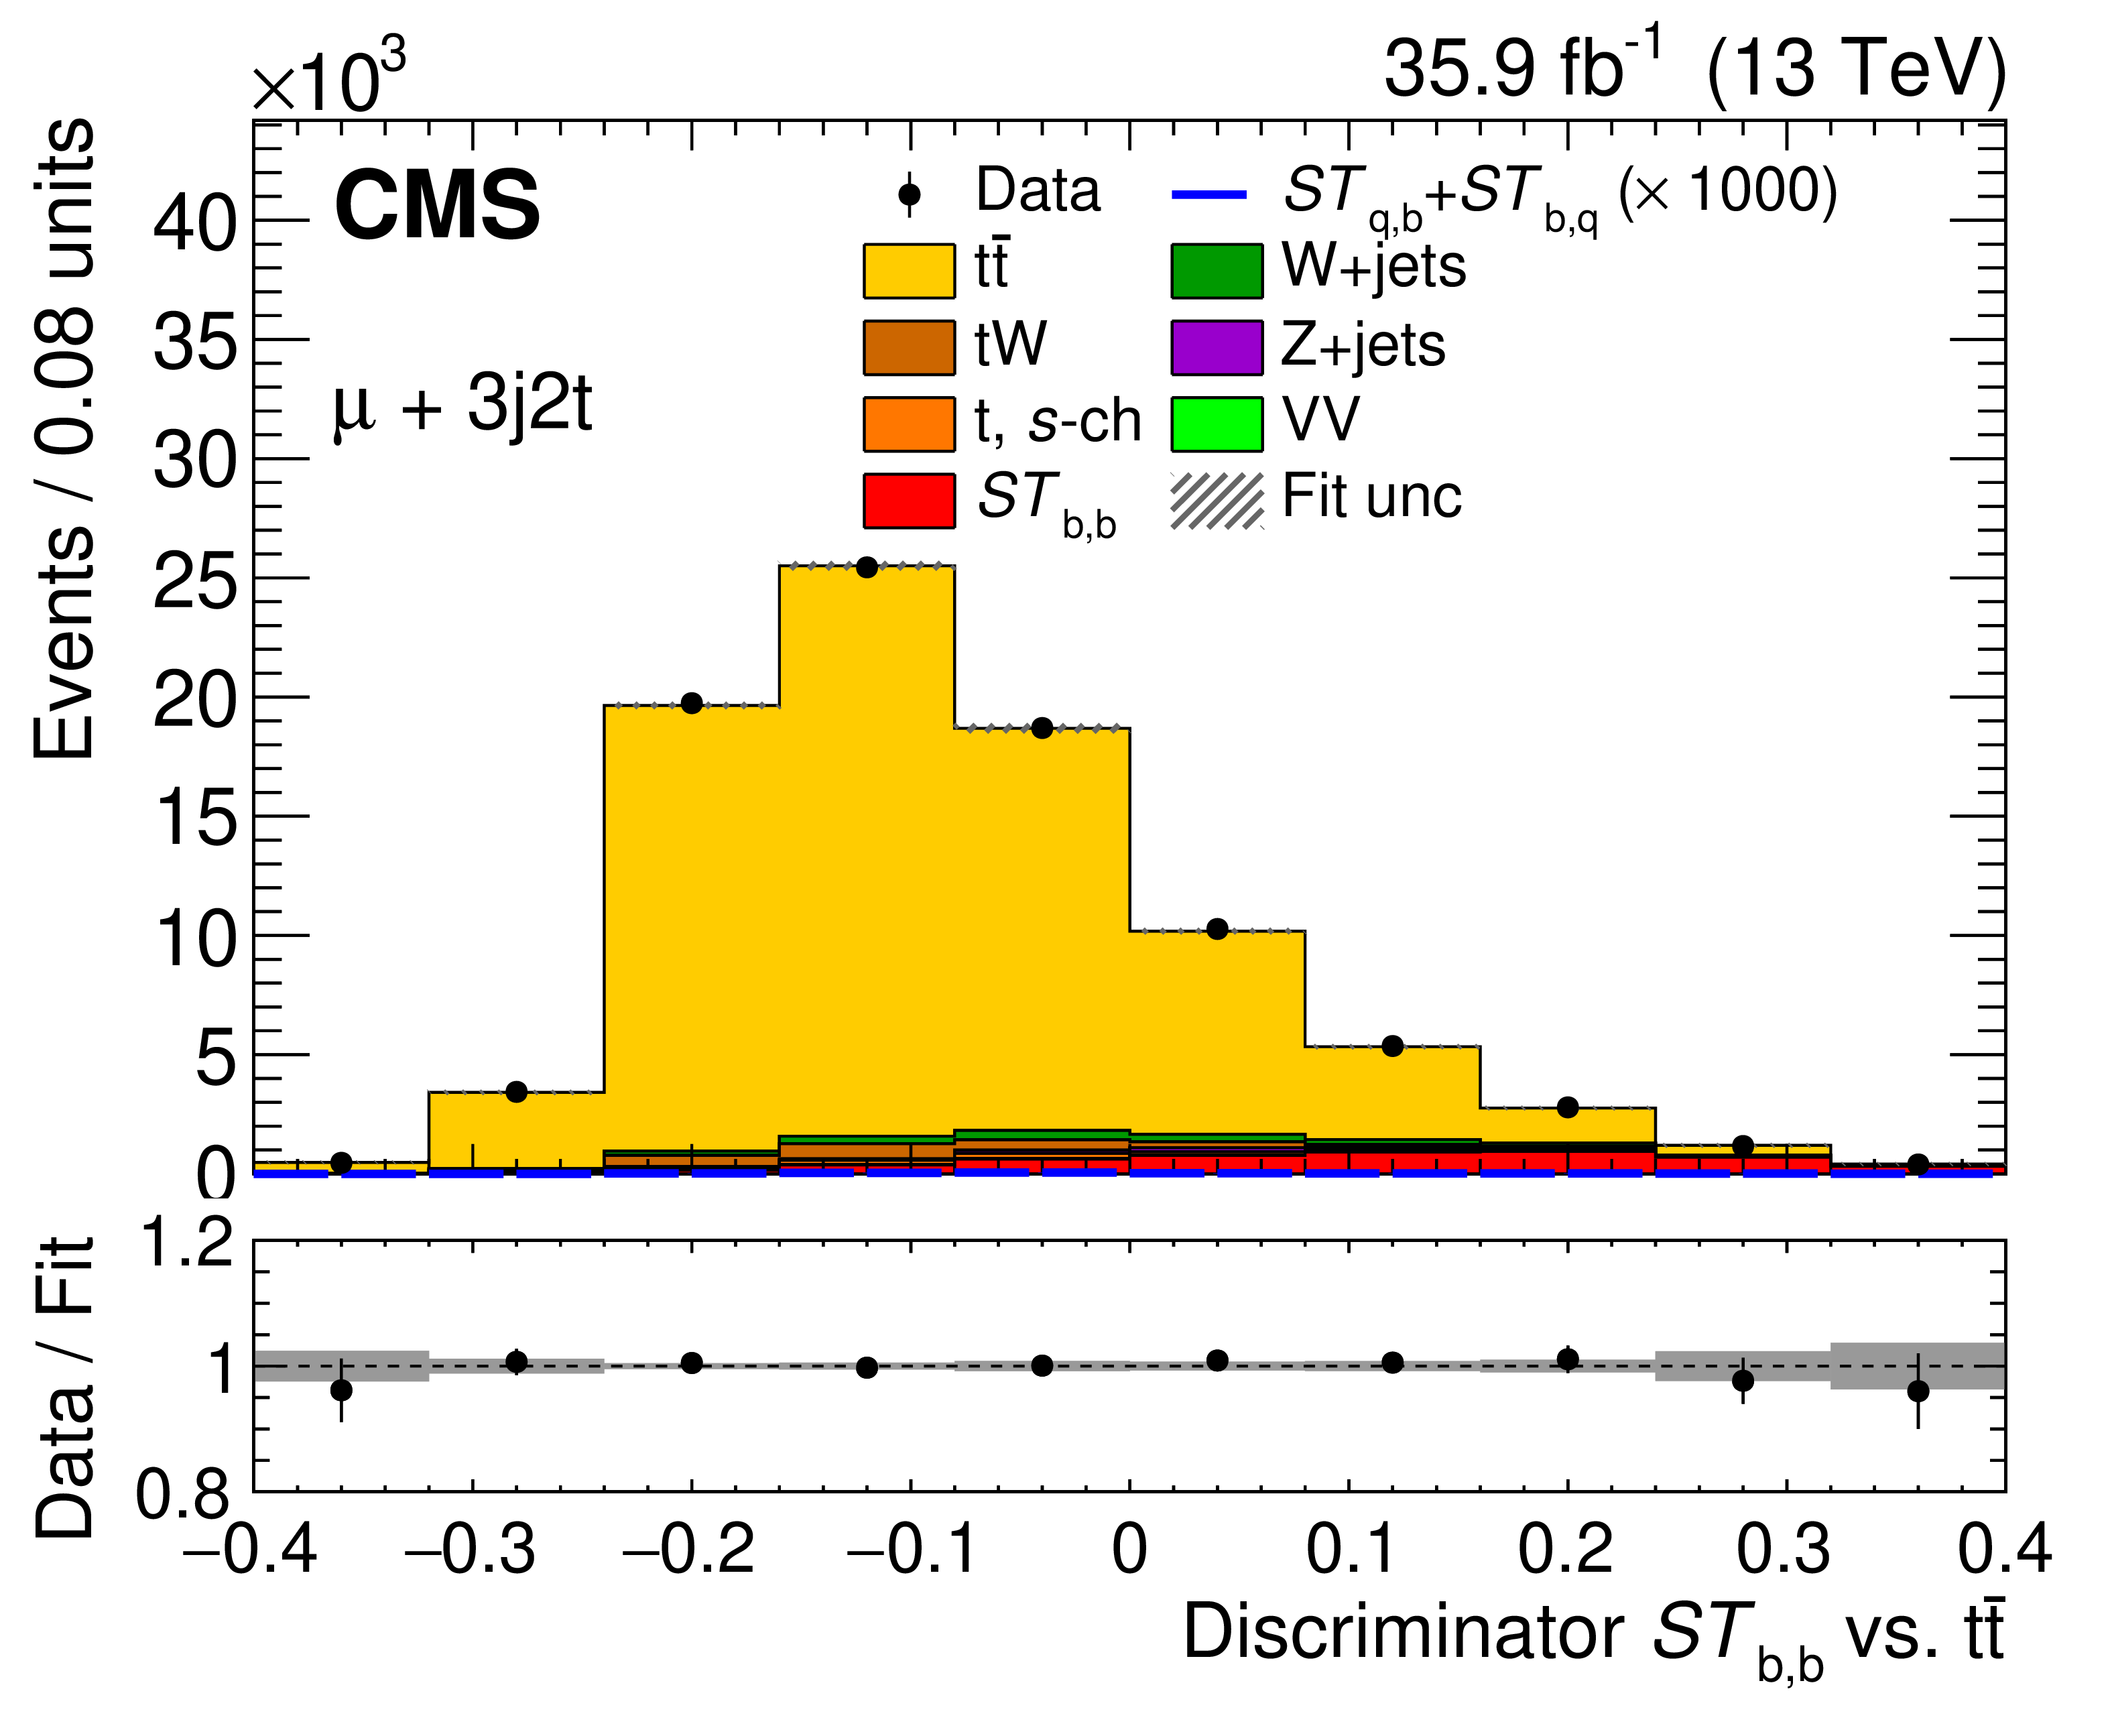
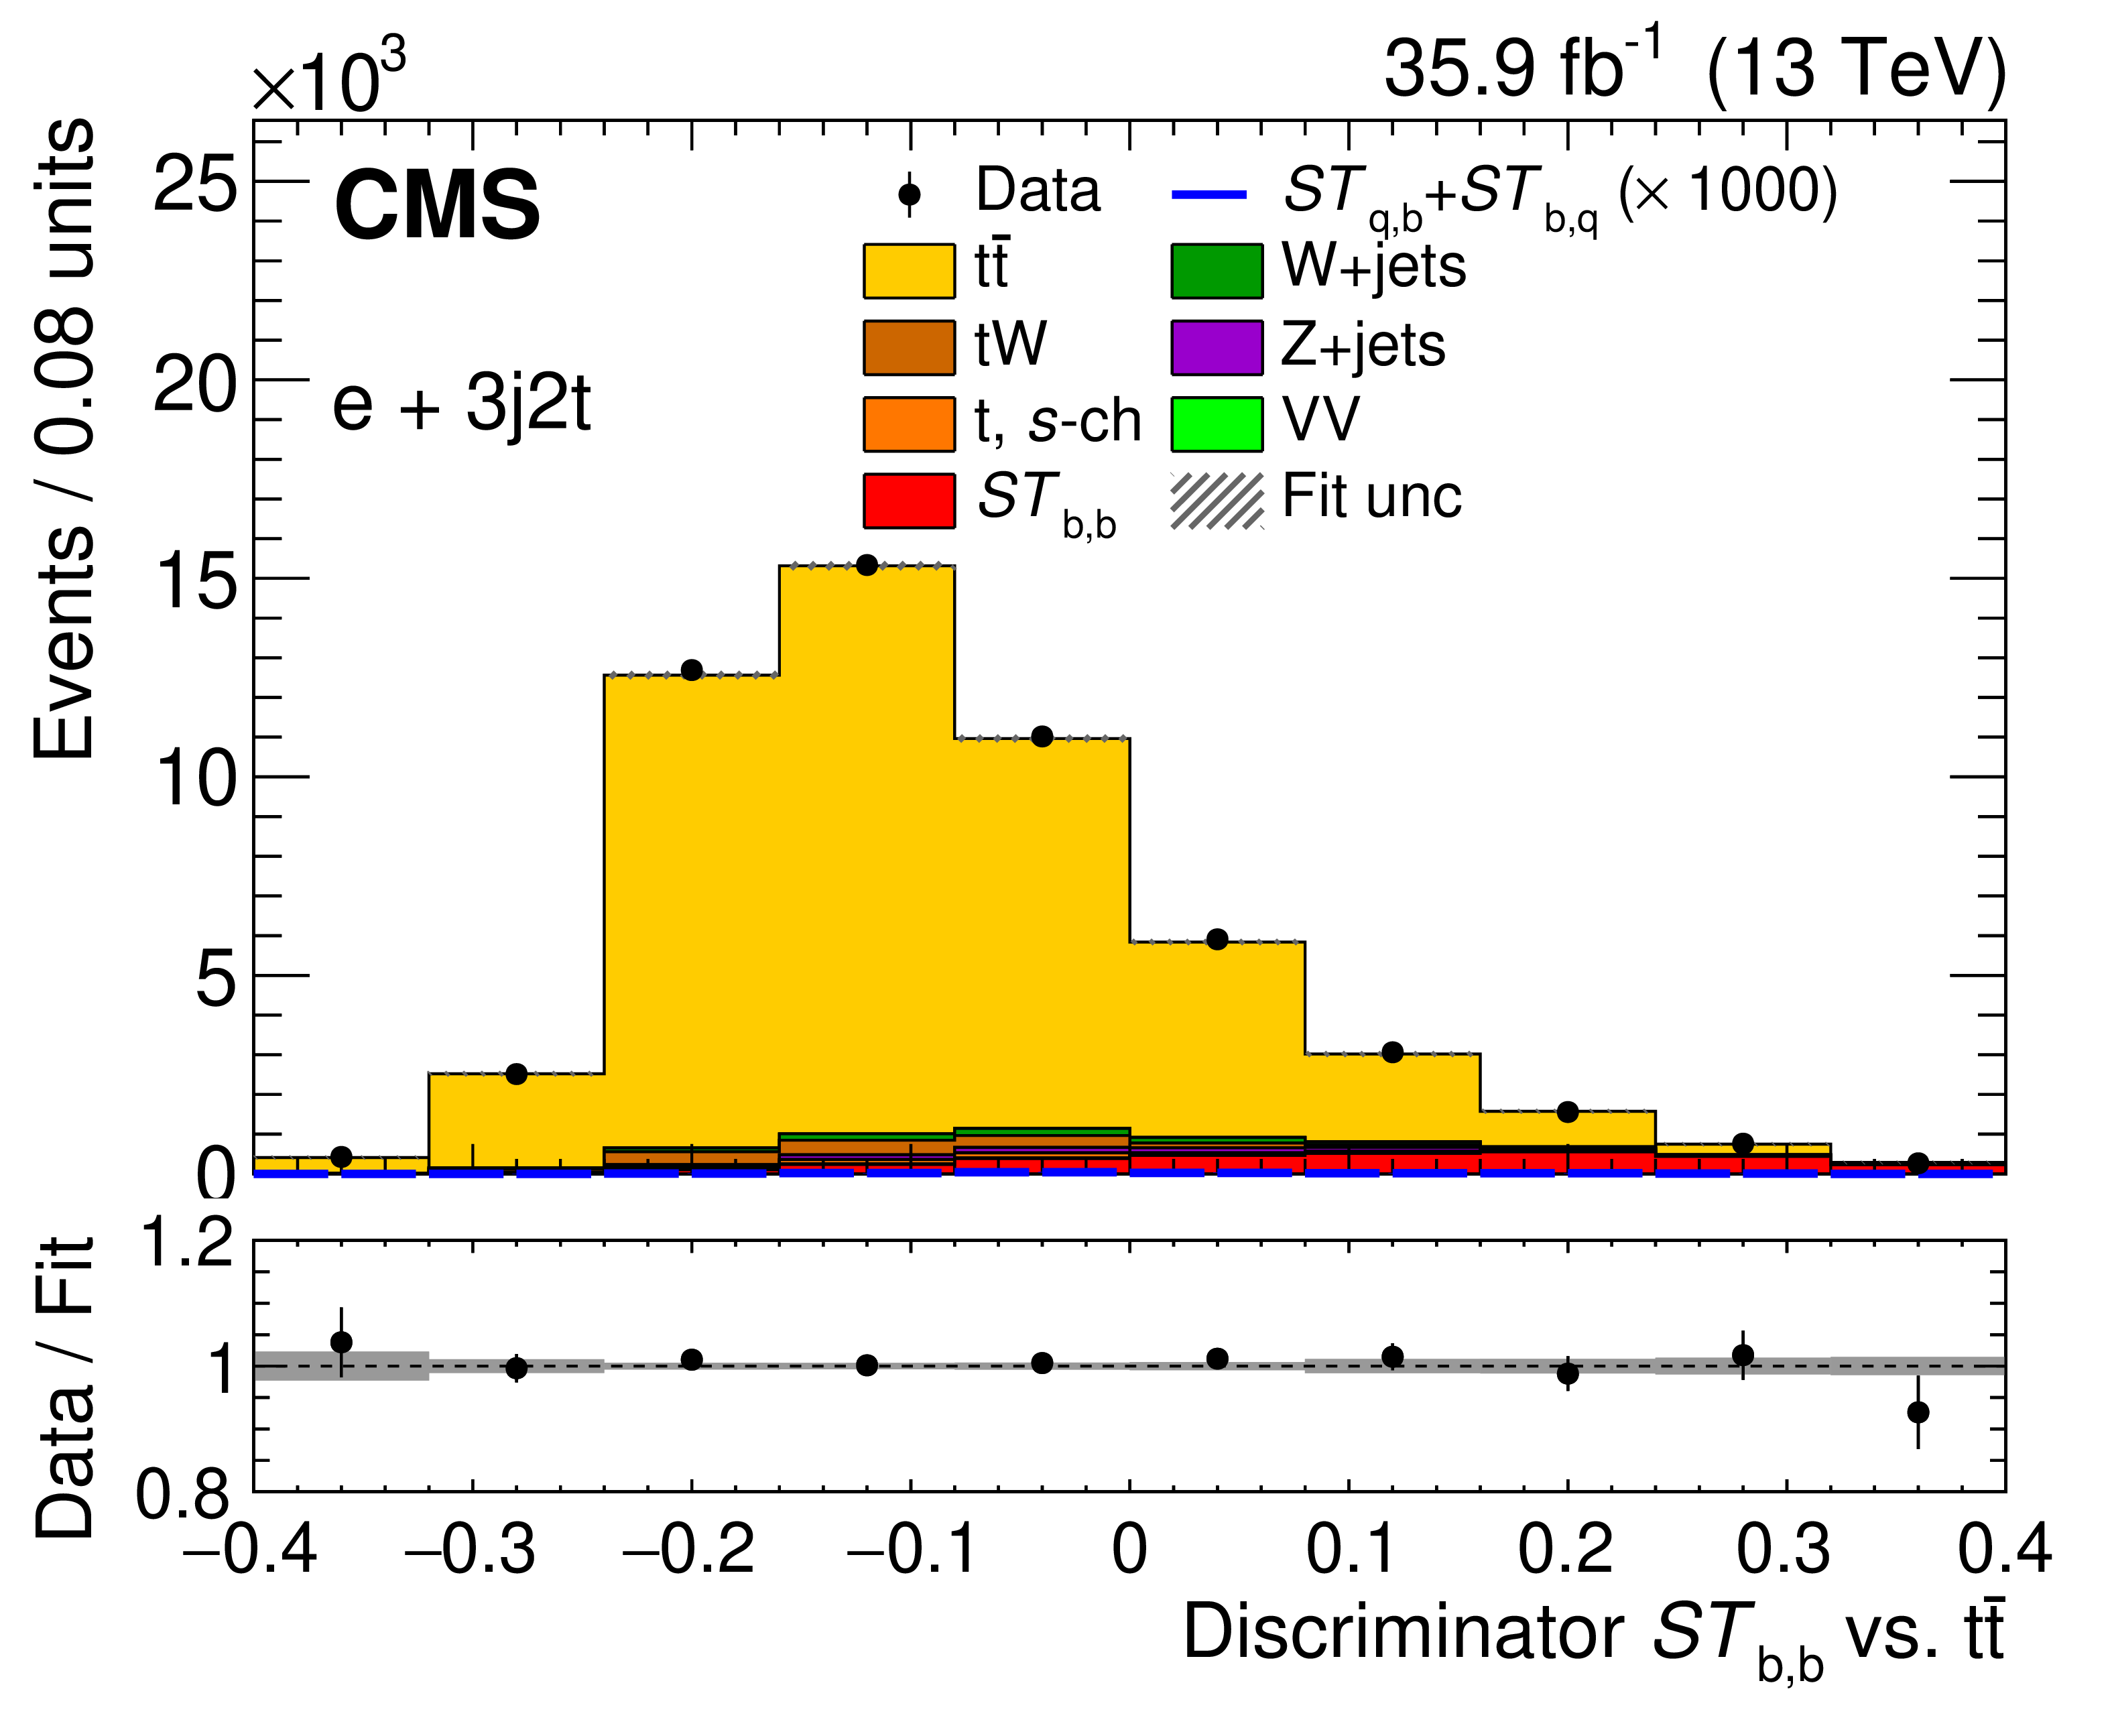
Figure 6:
Distribution of the multivariate discriminators, comparing data to simulation normalised after the fit procedure, for the muon channel on the left and for the electron channel on the right, for 2j1t (upper), 3j1t (middle), and 3j2t (lower). The vertical lines on the points and the hatched bands show the experimental and fit uncertainties, respectively. The expected distribution from the $ {ST_{\mathrm{q},\mathrm{b}}}+ {ST_{\mathrm{b},\mathrm{q}}}$ processes (multiplied by a factor of 1000) is shown by the solid blue line. The lower panels show the ratio of the data to the fit. |
png pdf |
Figure 6-a:
Distribution of the multivariate discriminator, comparing data to simulation normalised after the fit procedure, for the muon channel, for 2j1t. The vertical lines on the points and the hatched bands show the experimental and fit uncertainties, respectively. The expected distribution from the $ {ST_{\mathrm{q},\mathrm{b}}}+ {ST_{\mathrm{b},\mathrm{q}}}$ processes (multiplied by a factor of 1000) is shown by the solid blue line. The lower panel shows the ratio of the data to the fit. |
png pdf |
Figure 6-b:
Distribution of the multivariate discriminator, comparing data to simulation normalised after the fit procedure, for the electron channel, for 2j1t.The vertical lines on the points and the hatched bands show the experimental and fit uncertainties, respectively. The expected distribution from the $ {ST_{\mathrm{q},\mathrm{b}}}+ {ST_{\mathrm{b},\mathrm{q}}}$ processes (multiplied by a factor of 1000) is shown by the solid blue line. The lower panel shows the ratio of the data to the fit. |

png pdf |
Figure 6-c:
Distribution of the multivariate discriminator, comparing data to simulation normalised after the fit procedure, for the muon channel, for 3j1t. The vertical lines on the points and the hatched bands show the experimental and fit uncertainties, respectively. The expected distribution from the $ {ST_{\mathrm{q},\mathrm{b}}}+ {ST_{\mathrm{b},\mathrm{q}}}$ processes (multiplied by a factor of 1000) is shown by the solid blue line. The lower panel shows the ratio of the data to the fit. |
png pdf |
Figure 6-d:
Distribution of the multivariate discriminator, comparing data to simulation normalised after the fit procedure, for the electron channel, for 3j1t. The vertical lines on the points and the hatched bands show the experimental and fit uncertainties, respectively. The expected distribution from the $ {ST_{\mathrm{q},\mathrm{b}}}+ {ST_{\mathrm{b},\mathrm{q}}}$ processes (multiplied by a factor of 1000) is shown by the solid blue line. The lower panel shows the ratio of the data to the fit. |
png pdf |
Figure 6-e:
Distribution of the multivariate discriminator, comparing data to simulation normalised after the fit procedure, for the muon channel, for 3j2t. The vertical lines on the points and the hatched bands show the experimental and fit uncertainties, respectively. The expected distribution from the $ {ST_{\mathrm{q},\mathrm{b}}}+ {ST_{\mathrm{b},\mathrm{q}}}$ processes (multiplied by a factor of 1000) is shown by the solid blue line. The lower panel shows the ratio of the data to the fit. |
png pdf |
Figure 6-f:
Distribution of the multivariate discriminator, comparing data to simulation normalised after the fit procedure, for the electron channel, for 3j2t. The vertical lines on the points and the hatched bands show the experimental and fit uncertainties, respectively. The expected distribution from the $ {ST_{\mathrm{q},\mathrm{b}}}+ {ST_{\mathrm{b},\mathrm{q}}}$ processes (multiplied by a factor of 1000) is shown by the solid blue line. The lower panel shows the ratio of the data to the fit. |
| Tables | |
png pdf |
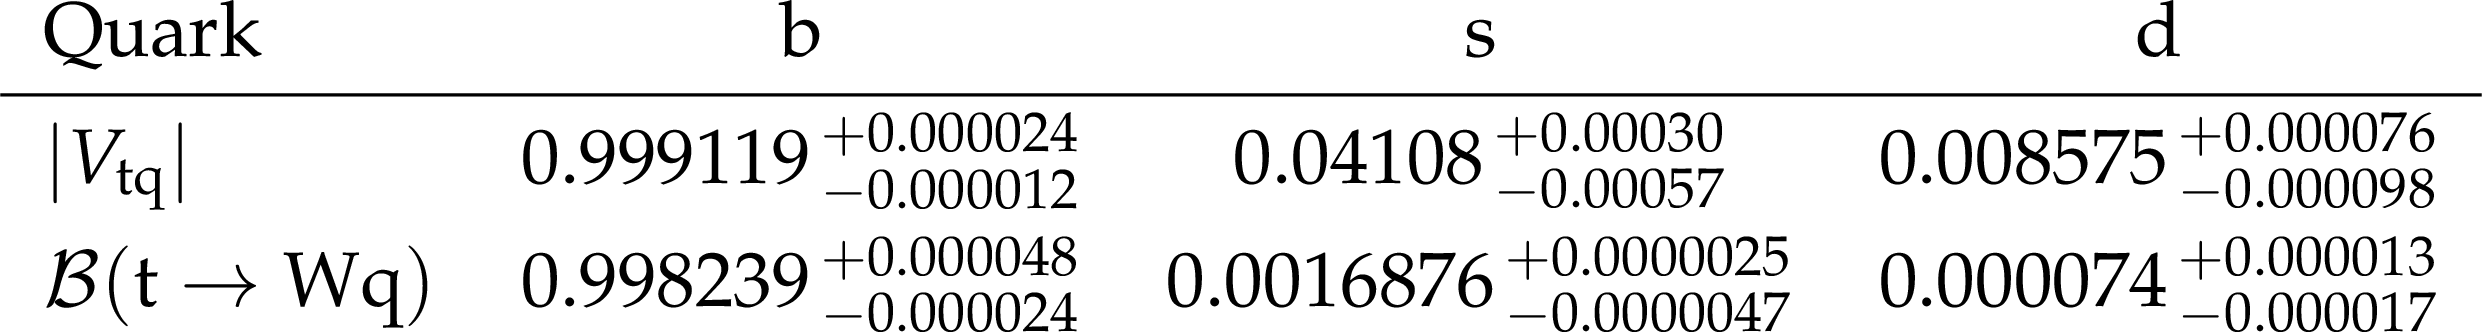
Table 1:
Values of the third-row elements of the CKM matrix inferred from low-energy measurements, taken from Ref. [12], with the respective values of the top quark decay branching fractions. The q in ${{| V_{\mathrm{t} \mathrm{q}} |}}$ and $ {\mathcal {B}(\mathrm{t} \to \mathrm{W} \mathrm{q})}$ in the first column refers to b, s, and d quarks, according to the quark label shown in the header row. |
png pdf |
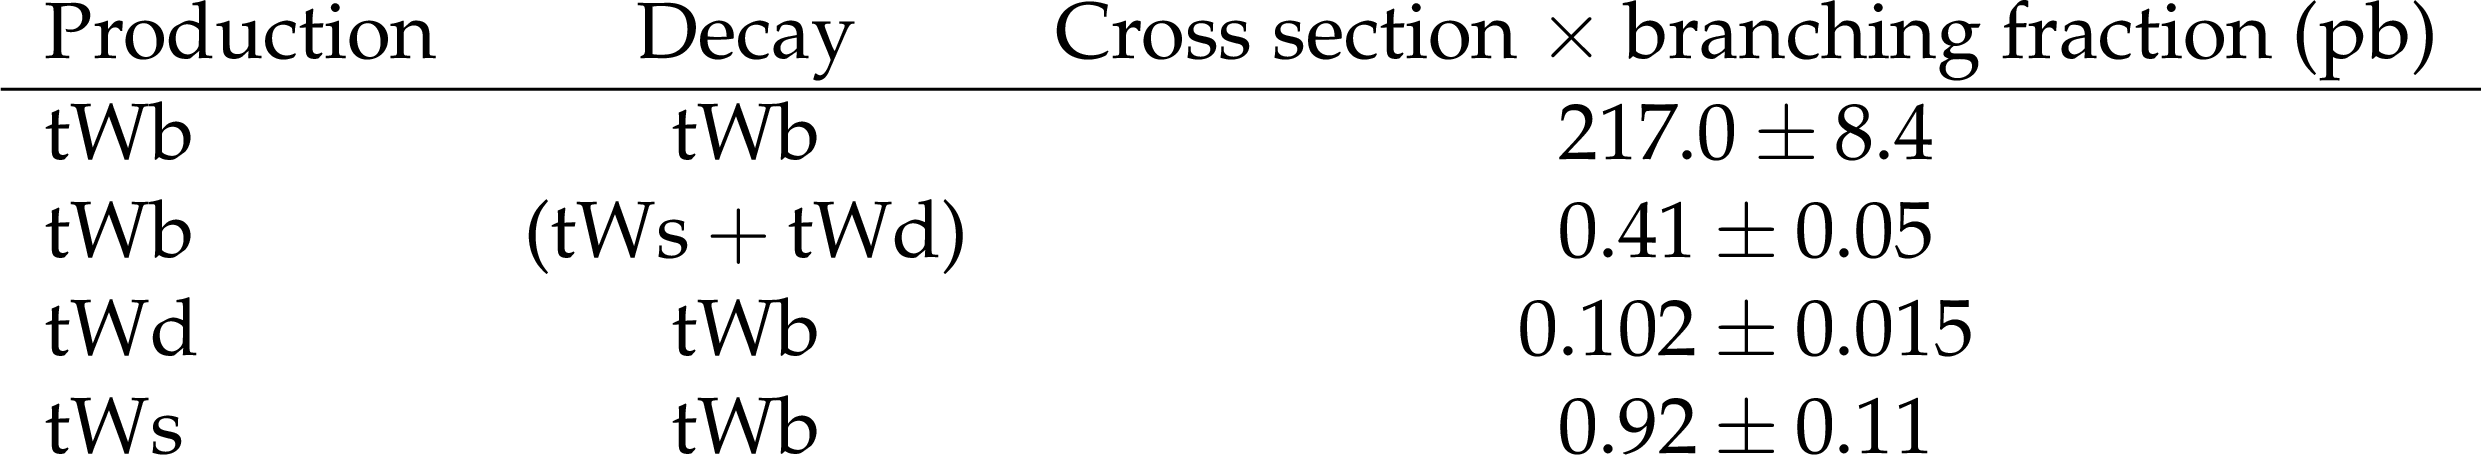
Table 2:
For each of the production and decay vertices, the cross section times branching fraction for the corresponding signal process from simulation. The uncertainties shown include those from the factorisation and renormalisation scales, the PDFs, and any experimental uncertainties, where appropriate. |
png pdf |
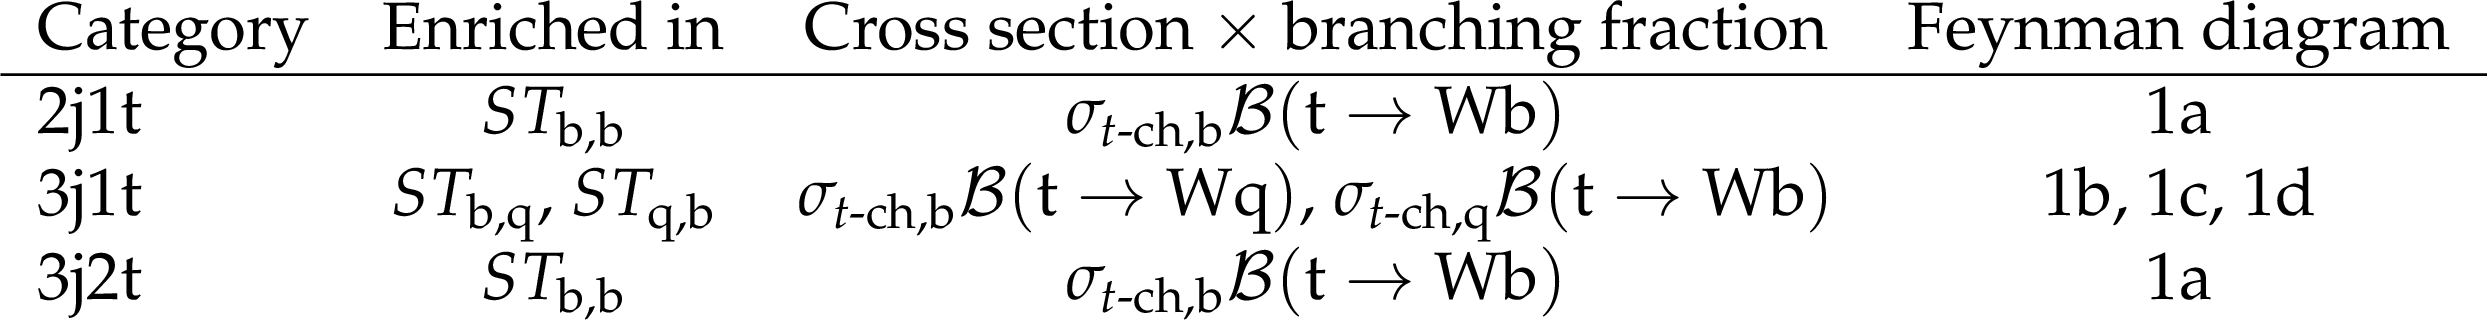
Table 3:
For each category, the corresponding signal process, the cross section times branching fraction expression, and the specific Feynman diagram from Fig. 1 are shown. |
png pdf |
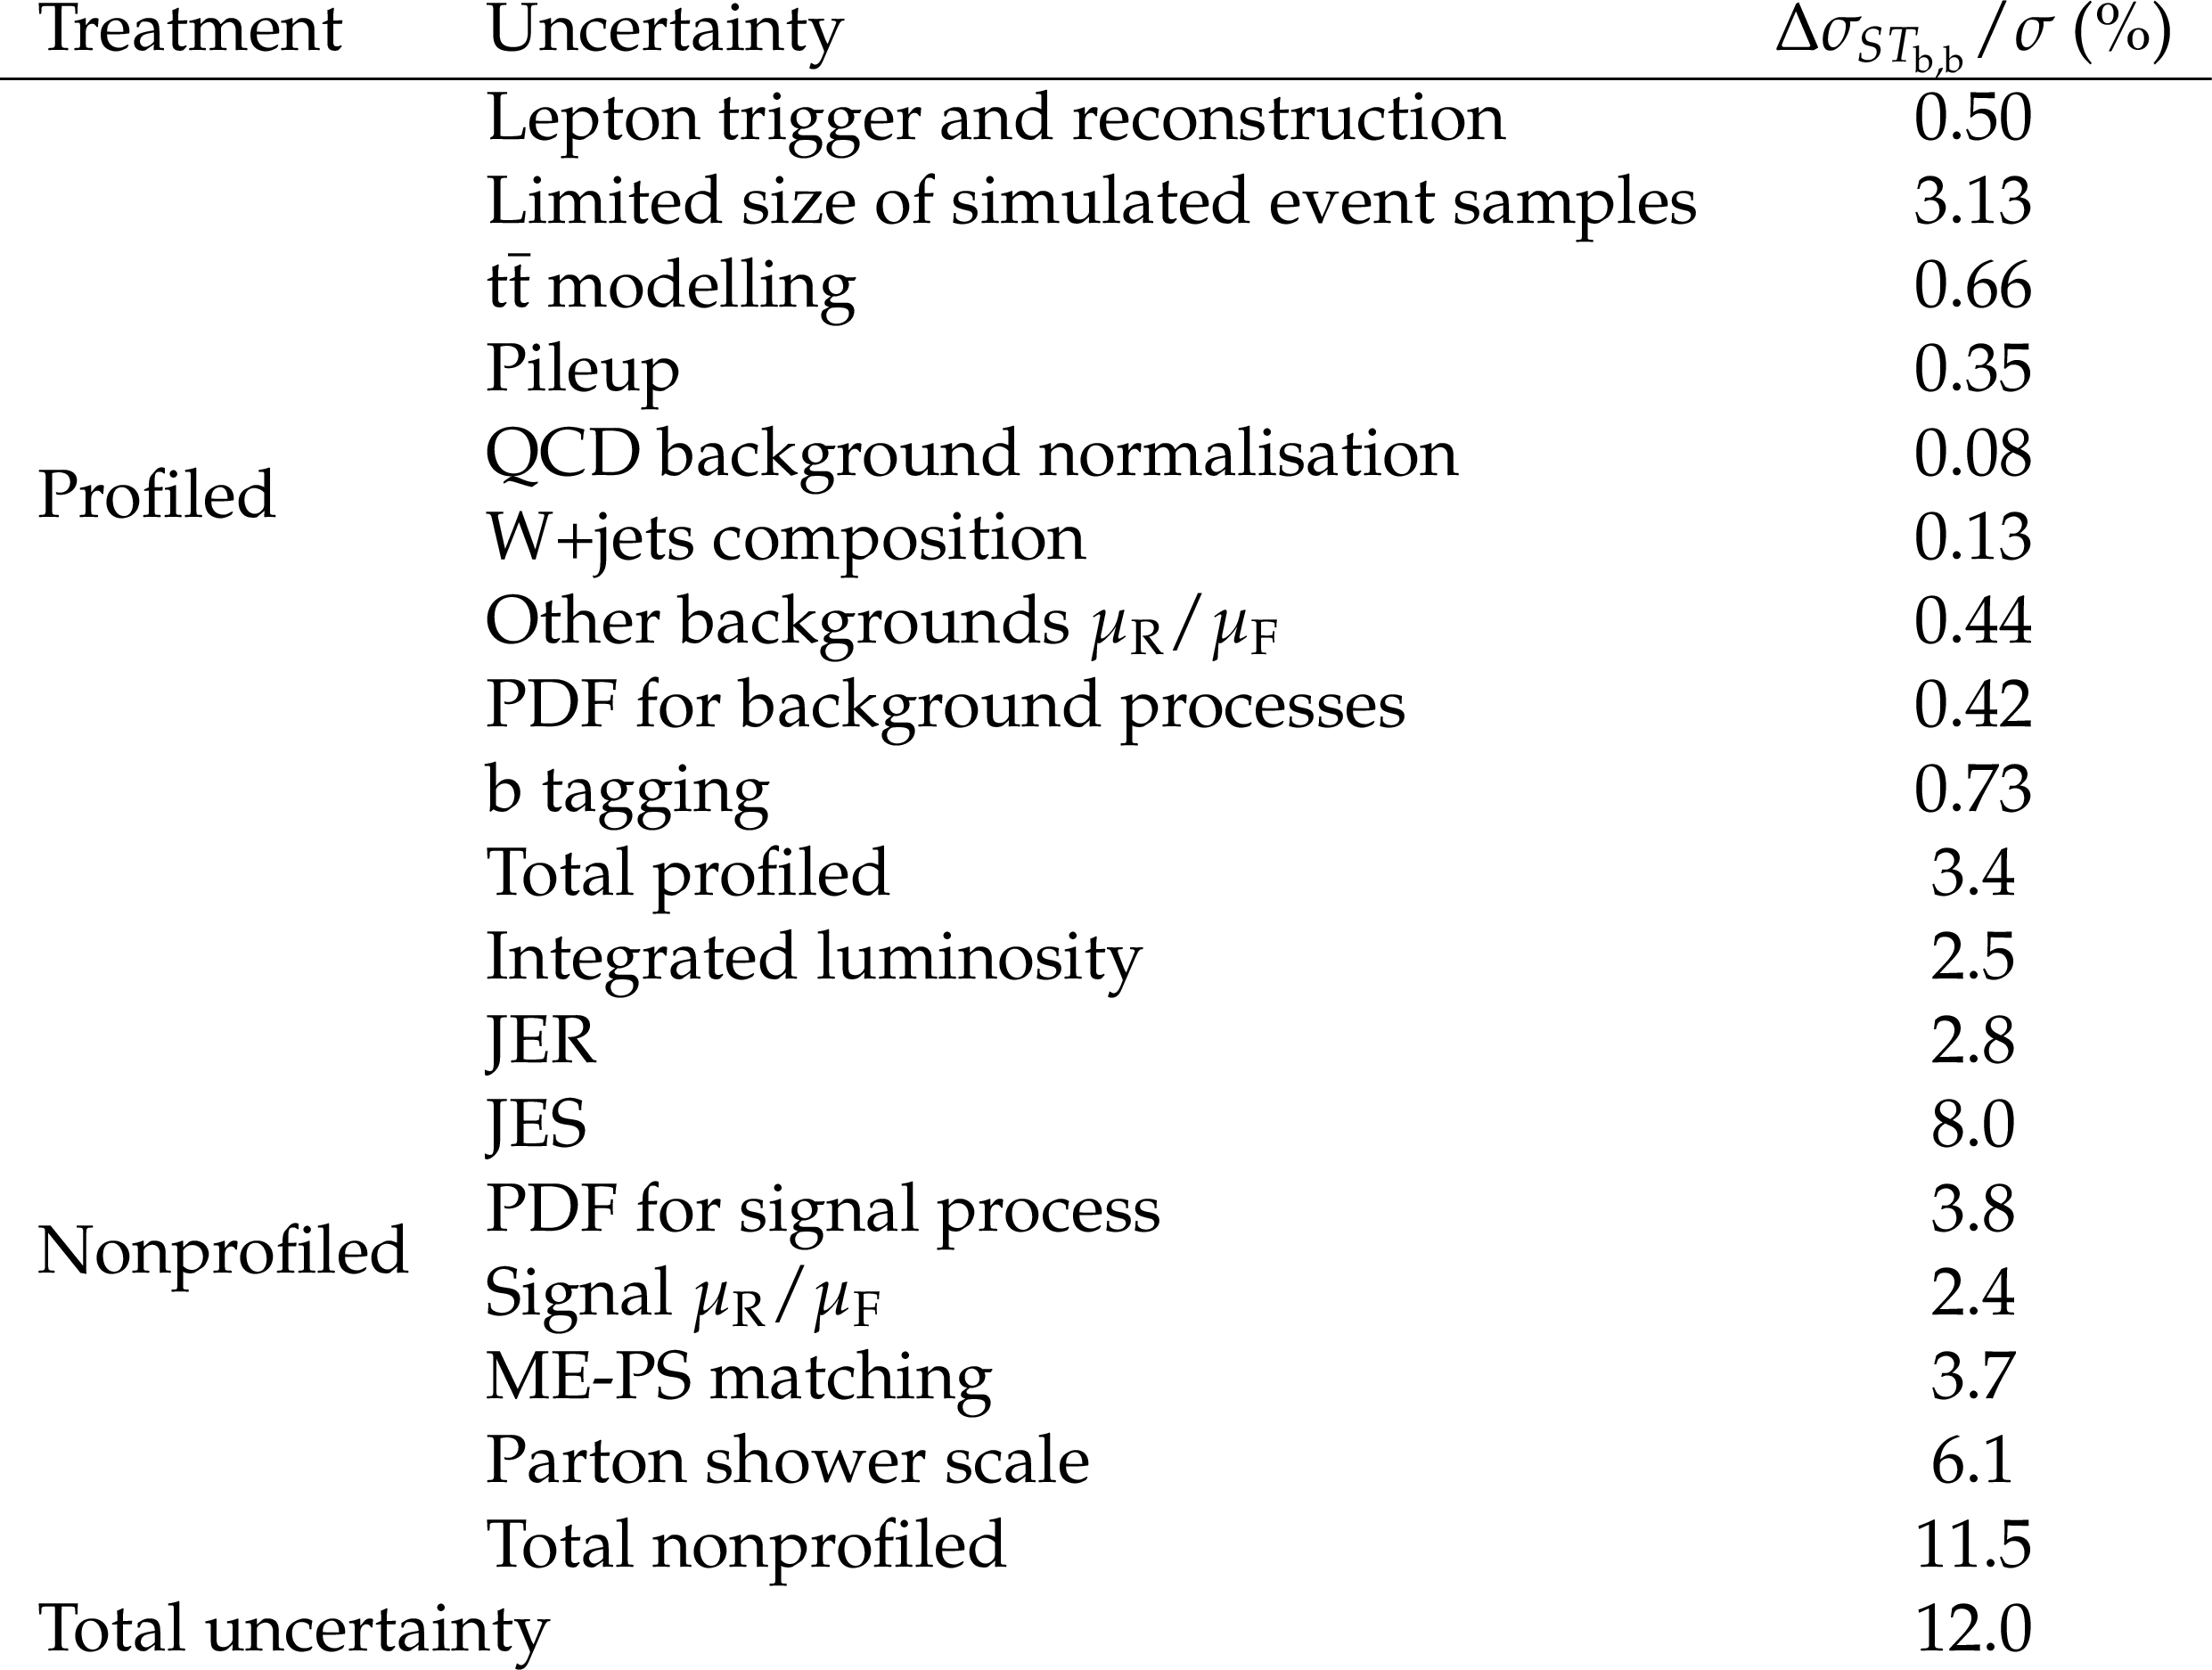
Table 4:
The sources and relative values in percent of the systematic uncertainty in the measurement of the ${ST_{\mathrm{b},\mathrm{b}}}$ cross section. The uncertainties are broken up into profiled and nonprofiled sources. |
| Summary |
|
A measurement of the Cabibbo-Kobayashi-Maskawa (CKM) matrix elements $|{V_{\mathrm{t}\mathrm{b}}}| $, $|{V_{\mathrm{t}\mathrm{d}}}| $, and $|{V_{\mathrm{t}\mathrm{s}}}|$ has been performed in an event sample enriched in $t$-channel single top quark events, featuring one muon or electron and jets in the final state. The data are from proton-proton collisions at $\sqrt{s} = $ 13 TeV, acquired at the LHC by the CMS experiment and correspond to an integrated luminosity of 35.9 fb$^{-1}$. The contributions from single top quark processes featuring all three matrix elements in the production vertex have been considered as separate signal processes, as well as contributions from decays of single top quarks involving all three quark families. The yields of the signal processes have been extracted through a simultaneous fit to data in different selected event categories, and the values of the CKM matrix elements have been inferred from the signal strengths, which are the ratios of the measured top quark $t$-channel cross sections times branching ratios to the expected values. The signal strengths obtained from the fit are $\mu_{\mathrm{b}} = $ 0.99 $\pm$ 0.12, where the uncertainty includes both the statistical and systematic components, and $\mu_{\mathrm{s}\mathrm{d}} < $ 87 at 95% confidence level (CL ). Under the standard model assumption of CKM unitarity, the values are found to be $ |{{V_{\mathrm{t}\mathrm{b}}}}| > $ 0.970 and $ |{V_{\mathrm{t}\mathrm{d}}}|^2 +|{V_{\mathrm{t}\mathrm{s}}}|^2 < $ 0.057 both at 95% CL. Fits were also performed under two different beyond-the-standard-model scenarios. In the first, we assume the presence of additional quark families that are heavier than the top quark. The unitarity constraint for the three CKM matrix elements no longer holds, but the top quark decays through the same channels as in the standard model. We assume the partial width of each top quark decay only varies because of a modified CKM matrix element. The fit gives: $|{V_{\mathrm{t}\mathrm{d}}}|^2 +|{V_{\mathrm{t}\mathrm{s}}}|^2 = $ 0.06 $\pm$ 0.06 where the uncertainties include both the statistical and systematic components. In the second scenario, the top quark width is left unconstrained under the assumption that the contributions to the total width from the mixing of the three families are negligible. The corresponding measured values are: $|{V_{\mathrm{t}\mathrm{d}}}|^2 +|{V_{\mathrm{t}\mathrm{s}}}|^2 = $ 0.06 $\pm$ 0.06 $\Gamma_{\mathrm{t}}^{\text{obs}}/\Gamma_{\mathrm{t}} = $ 0.99 $\pm$ 0.42 where again, both the statistical and systematic uncertainties are included. All results are consistent with each other, and show no deviation with respect to extrapolations of low-energy measurements. These results are the first direct, model-independent measurements of the CKM matrix elements for the third-generation quarks, and provide the best determination of these fundamental SM parameters via single top quark measurements. |
| References | ||||
| 1 | M. Kobayashi and T. Maskawa | CP-violation in the renormalizable theory of weak interaction | Prog. Theor. Phys. 49 (1973) 652 | |
| 2 | CMS Collaboration | Measurement of the $ t $-channel single top quark production cross section in $ pp $ collisions at $ \sqrt{s}= $ 7 TeV | PRL 107 (2011) 091802 | CMS-TOP-10-008 1106.3052 |
| 3 | CMS Collaboration | Measurement of the single-top-quark $ t $-channel cross section in pp collisions at $ \sqrt{s}= $ 7 TeV | JHEP 12 (2012) 035 | CMS-TOP-11-021 1209.4533 |
| 4 | ATLAS Collaboration | Measurement of the $ t $-channel single top-quark production cross section in pp collisions at $ \sqrt{s}= $ 7 TeV with the ATLAS detector | PLB 717 (2012) 330 | 1205.3130 |
| 5 | ATLAS Collaboration | Comprehensive measurements of $ t $-channel single top-quark production cross sections at $ \sqrt{s} = $ 7 TeV with the ATLAS detector | PRD 90 (2014) 112006 | 1406.7844 |
| 6 | CMS Collaboration | Measurement of the $ t $-channel single-top-quark production cross section and of the $ | V_{\rm tb} | $ CKM matrix element in pp collisions at $ \sqrt{s}= $ 8 TeV | JHEP 06 (2014) 090 | CMS-TOP-12-038 1403.7366 |
| 7 | ATLAS Collaboration | Measurement of the inclusive cross-sections of single top-quark and top-antiquark $ t $-channel production in pp collisions at $ \sqrt{s} = $ 13 TeV with the ATLAS detector | JHEP 04 (2017) 086 | 1609.03920 |
| 8 | CMS Collaboration | Cross section measurement of $ t $-channel single top quark production in pp collisions at $ \sqrt{s} = $ 13 TeV | PLB 772 (2017) 752 | CMS-TOP-16-003 1610.00678 |
| 9 | ATLAS Collaboration | Fiducial, total and differential cross-section measurements of $ t $-channel single top-quark production in pp collisions at 8 TeV using data collected by the ATLAS detector | EPJC 77 (2017) 531 | 1702.02859 |
| 10 | CMS Collaboration | Measurement of the single top quark and antiquark production cross sections in the $ t $ channel and their ratio in proton-proton collisions at $ \sqrt{s}= $ 13 TeV | PLB 800 (2019) 135042 | CMS-TOP-17-011 1812.10514 |
| 11 | CMS Collaboration | Measurement of differential cross sections and charge ratios for $ t $-channel single top quark production in proton-proton collisions at $ \sqrt{s}= $ 13 TeV | Accepted by $Eur.\ Phys.\ J.\ C$ | CMS-TOP-17-023 1907.08330 |
| 12 | Particle Data Group, M. Tanabashi et al. | Review of particle physics | PRD 98 (2018) 030001 | |
| 13 | J. Alwall et al. | Is $ V_{\mathrm{tb}}\simeq 1 $? | EPJC 49 (2007) 791 | hep-ph/0607115 |
| 14 | D0 Collaboration | Precision measurement of the ratio $ \rm \mathcal{B}(t \to Wb)/\mathcal{B}(t \to Wq) $ and extraction of $ V_{\rm tb} $ | PRL 107 (2011) 121802 | 1106.5436 |
| 15 | CDF Collaboration | Measurement of $ R = \mathcal{B}({\rm t \rightarrow Wb})/\mathcal{B}({\rm t \rightarrow Wq}) $ in top--quark--pair decays using lepton+jets events and the full CDF Run II data set | PRD 87 (2013) 111101 | 1303.6142 |
| 16 | CDF Collaboration | Measurement of $ \mathcal{B}({\rm t \to Wb})/\mathcal{B}({\rm t \to Wq}) $ in top-quark-pair decays using dilepton events and the full CDF Run II data set | PRL 112 (2014) 221801 | 1404.3392 |
| 17 | CMS Collaboration | Measurement of the ratio $ \mathcal B({\rm t \to Wb})/\mathcal B({\rm t \to Wq}) $ in pp collisions at $ \sqrt{s} = $ 8 TeV | PLB 736 (2014) 33 | CMS-TOP-12-035 1404.2292 |
| 18 | D0 Collaboration | Evidence for production of single top quarks and first direct measurement of $ |V_{\rm tb}| $ | PRL 98 (2007) 181802 | hep-ex/0612052 |
| 19 | D0 Collaboration | Evidence for production of single top quarks | PRD 78 (2008) 012005 | 0803.0739 |
| 20 | CDF Collaboration | Measurement of the single-top-quark production cross section at CDF | PRL 101 (2008) 252001 | 0809.2581 |
| 21 | CDF Collaboration | Observation of electroweak single top quark production | PRL 103 (2009) 092002 | 0903.0885 |
| 22 | CDF Collaboration | Observation of single top quark production and measurement of $ |V_{\rm tb}| $ with CDF | PRD 82 (2010) 112005 | 1004.1181 |
| 23 | D0 Collaboration | Observation of single top-quark production | PRL 103 (2009) 092001 | 0903.0850 |
| 24 | The CDF Collaboration, The D0 Collaboration, The Tevatron electroweak working group | Combination of CDF and D0 measurements of the single top production cross section | 0908.2171 | |
| 25 | CDF Collaboration | Measurement of the single top quark production cross section and $ |V_{\rm tb}| $ in events with one charged lepton, large missing transverse energy, and jets at CDF | PRL 113 (2014) 261804 | 1407.4031 |
| 26 | D0 Collaboration | Evidence for $ s $-channel single top quark production in p$ \bar{\rm p} $ collisions at $ \sqrt{s} = $ 1.96 TeV | PLB 726 (2013) 656 | 1307.0731 |
| 27 | CDF, D0 Collaboration | Observation of $ s $-channel production of single top quarks at the Tevatron | PRL 112 (2014) 231803 | 1402.5126 |
| 28 | CMS Collaboration | Search for anomalous Wtb couplings and flavour-changing neutral currents in t-channel single top quark production in pp collisions at $ \sqrt{s} = $ 7 and 8 TeV | JHEP 02 (2017) 028 | CMS-TOP-14-007 1610.03545 |
| 29 | ATLAS, CMS Collaboration | Combinations of single-top-quark production cross-section measurements and $ |f_{\rm LV}V_{\rm tb}| $ determinations at $ \sqrt{s}= $ 7 and 8 TeV with the ATLAS and CMS experiments | JHEP 05 (2019) 088 | 1902.07158 |
| 30 | H. Lacker et al. | Model-independent extraction of $ |V_{tq}| $ matrix elements from top-quark measurements at hadron colliders | EPJC 72 (2012) 2048 | 1202.4694 |
| 31 | J. A. Aguilar-Saavedra and A. Onofre | Using single top rapidity to measure $ V_{\rm td} $, $ V_{\rm ts} $, $ V_{\rm tb} $ at hadron colliders | PRD 83 (2011) 073003 | 1002.4718 |
| 32 | B. Clerbaux, W. Fang, A. Giammanco, and R. Goldouzian | Model-independent constraints on the CKM matrix elements $ |V_{\rm tb}| $, $ |V_{\rm ts}| $ and $ |V_{\rm td}| $ | JHEP 03 (2019) 022 | 1807.07319 |
| 33 | E. Alvarez, L. Da Rold, M. Estevez, and J. F. Kamenik | Measuring $ |V_{\rm td}| $ at the LHC | PRD 97 (2018) 033002 | 1709.07887 |
| 34 | A. Giammanco and R. Schwienhorst | Single top-quark production at the Tevatron and the LHC | Rev. Mod. Phys. 90 (2018) 035001 | 1710.10699 |
| 35 | CMS Collaboration | The CMS experiment at the CERN LHC | JINST 3 (2008) S08004 | CMS-00-001 |
| 36 | CMS Collaboration | The CMS trigger system | JINST 12 (2017) P01020 | CMS-TRG-12-001 1609.02366 |
| 37 | P. Nason | A new method for combining NLO QCD with shower Monte Carlo algorithms | JHEP 11 (2004) 040 | hep-ph/0409146 |
| 38 | S. Frixione, P. Nason, and C. Oleari | Matching NLO QCD computations with parton shower simulations: the POWHEG method | JHEP 11 (2007) 070 | 0709.2092 |
| 39 | S. Alioli, P. Nason, C. Oleari, and E. Re | A general framework for implementing NLO calculations in shower Monte Carlo programs: the POWHEG BOX | JHEP 06 (2010) 043 | 1002.2581 |
| 40 | R. Frederix, E. Re, and P. Torrielli | Single-top $ t $-channel hadroproduction in the four-flavour scheme with POWHEG and aMC@NLO | JHEP 09 (2012) 130 | 1207.5391 |
| 41 | S. Alioli, P. Nason, C. Oleari, and E. Re | NLO single-top production matched with shower in POWHEG: $ s $- and $ t $-channel contributions | JHEP 09 (2009) 111 | 0907.4076 |
| 42 | P. Artoisenet, R. Frederix, O. Mattelaer, and R. Rietkerk | Automatic spin-entangled decays of heavy resonances in Monte Carlo simulations | JHEP 03 (2013) 015 | 1212.3460 |
| 43 | S. Frixione, P. Nason, and G. Ridolfi | A positive-weight next-to-leading-order Monte Carlo for heavy flavour hadroproduction | JHEP 09 (2007) 126 | 0707.3088 |
| 44 | T. Melia, P. Nason, R. Rontsch, and G. Zanderighi | $ \rm W^+W^- $, $ \rm WZ $ and $ \rm ZZ $ production in the POWHEG BOX | JHEP 11 (2011) 078 | 1107.5051 |
| 45 | P. Nason and G. Zanderighi | $ \rm W^+ W^- $, $ \rm W Z $ and $ \rm Z Z $ production in the POWHEG-BOX-V2 | EPJC 74 (2014) 2702 | 1311.1365 |
| 46 | E. Re | Single-top $ \rm Wt $-channel production matched with parton showers using the POWHEG method | EPJC 71 (2011) 1547 | 1009.2450 |
| 47 | J. Alwall et al. | The automated computation of tree-level and next-to-leading order differential cross sections, and their matching to parton shower simulations | JHEP 07 (2014) 079 | 1405.0301 |
| 48 | T. Sjostrand, S. Mrenna, and P. Z. Skands | A brief introduction to PYTHIA 8.1 | CPC 178 (2008) 852 | 0710.3820 |
| 49 | CMS Collaboration | Event generator tunes obtained from underlying event and multiparton scattering measurements | EPJC 76 (2016) 155 | CMS-GEN-14-001 1512.00815 |
| 50 | CMS Collaboration | Investigations of the impact of the parton shower tuning in PYTHIA 8 in the modelling of $ \mathrm{t\overline{t}} $ at $ \sqrt{s}= $ 8 and 13 TeV | CMS-PAS-TOP-16-021 | CMS-PAS-TOP-16-021 |
| 51 | R. Frederix and S. Frixione | Merging meets matching in MC@NLO | JHEP 12 (2012) 061 | 1209.6215 |
| 52 | NNPDF Collaboration | Parton distributions for the LHC Run II | JHEP 04 (2015) 040 | 1410.8849 |
| 53 | GEANT4 Collaboration | GEANT4--a simulation toolkit | NIMA 506 (2003) 250 | |
| 54 | M. Cacciari, G. P. Salam, and G. Soyez | Fastjet user manual | EPJC 72 (2012) 1896 | 1111.6097 |
| 55 | M. Cacciari, G. P. Salam, and G. Soyez | The anti-$ {k_{\mathrm{T}}} $ jet clustering algorithm | JHEP 04 (2008) 063 | 0802.1189 |
| 56 | CMS Collaboration | Particle-flow reconstruction and global event description with the CMS detector | JINST 12 (2017) P10003 | CMS-PRF-14-001 1706.04965 |
| 57 | CMS Collaboration | Performance of the CMS muon detector and muon reconstruction with proton-proton collisions at $ \sqrt{s}= $ 13 TeV | JINST 13 (2018) P06015 | CMS-MUO-16-001 1804.04528 |
| 58 | M. Cacciari and G. P. Salam | Pileup subtraction using jet areas | PLB 659 (2008) 119 | 0707.1378 |
| 59 | CMS Collaboration | Jet energy scale and resolution in the CMS experiment in pp collisions at 8 TeV | JINST 12 (2017) P02014 | CMS-JME-13-004 1607.03663 |
| 60 | CMS Collaboration | Identification of b-quark jets with the CMS experiment | JINST 8 (2013) P04013 | CMS-BTV-12-001 1211.4462 |
| 61 | CMS Collaboration | Identification of heavy-flavour jets with the CMS detector in pp collisions at 13 TeV | JINST 13 (2018) P05011 | CMS-BTV-16-002 1712.07158 |
| 62 | M. Aliev et al. | HATHOR -- HAdronic Top and Heavy quarks crOss section calculatoR | CPC 182 (2011) 1034 | 1007.1327 |
| 63 | R. Barlow and C. Beeston | Fitting using finite Monte Carlo samples | CPC 77 (1993) 219 | |
| 64 | J. S. Conway | Nuisance parameters in likelihoods for multisource spectra | in Proceedings of PHYSTAT 2011 Workshop on Statistical Issues Related to Discovery Claims in Search Experiments and Unfolding, H. Prosper and L. Lyons, eds., CERN-2011-006 | |
| 65 | CMS Collaboration | Measurements of inclusive W and Z cross sections in pp collisions at $ \sqrt{s}= $ 7 TeV | JHEP 01 (2011) 080 | CMS-EWK-10-002 1012.2466 |
| 66 | CMS Collaboration | Measurement of the inelastic proton-proton cross section at $ \sqrt{s}= $ 13 TeV | JHEP 07 (2018) 161 | CMS-FSQ-15-005 1802.02613 |
| 67 | J. Butterworth et al. | PDF4LHC recommendations for LHC run II | JPG 43 (2016) 023001 | 1510.03865 |
| 68 | CMS Collaboration | CMS luminosity measurements for the 2016 data taking period | CMS-PAS-LUM-17-001 | CMS-PAS-LUM-17-001 |
| 69 | D0 Collaboration | Improved determination of the width of the top quark | PRD 85 (2012) 091104 | 1201.4156 |
| 70 | ATLAS Collaboration | Direct top-quark decay width measurement in the $ \rm t\bar{t} $ lepton+jets channel at $ \sqrt{s}= $ 8 TeV with the ATLAS experiment | EPJC 78 (2018) 129 | 1709.04207 |
|
|
Compact Muon Solenoid LHC, CERN |
|

|

|

|

|

|