

Compact Muon Solenoid
LHC, CERN
| CMS-TOP-18-008 ; CERN-EP-2018-328 | ||
| Observation of single top quark production in association with a Z boson in proton-proton collisions at $\sqrt{s} = $ 13 TeV | ||
| CMS Collaboration | ||
| 14 December 2018 | ||
| Phys. Rev. Lett. 122 (2019) 132003 | ||
| Abstract: The observation of single top quark production in association with a Z boson and a quark ($\mathrm{t Z q} $ ) is reported. Events from proton-proton collisions at a center-of-mass energy of 13 TeV containing three charged leptons (either electrons or muons) and at least two jets are analyzed. The data were collected with the CMS detector in 2016 and 2017, and correspond to an integrated luminosity of 77.4 fb$^{-1}$. The increased integrated luminosity, a multivariate lepton identification, and a redesigned analysis strategy improve significantly the sensitivity of the analysis compared to previous searches for $\mathrm{t Z q} $ production. The $\mathrm{t Z q} $ signal is observed with a significance well over five standard deviations. The measured $\mathrm{t Z q} $ production cross section is $\sigma ({\mathrm{p}}{\mathrm{p}} \to \mathrm{t Z q} \to \mathrm{t} \ell^{+} \ell^{-} \mathrm{q} )= $ 111 $\pm$ 13 (stat) $ _{-9}^{+11}$ (syst) fb, for dilepton invariant masses above 30 GeV, in agreement with the standard model expectation. | ||
| Links: e-print arXiv:1812.05900 [hep-ex] (PDF) ; CDS record ; inSPIRE record ; CADI line (restricted) ; | ||
| Figures & Tables | Summary | Additional Figures & Tables | References | CMS Publications |
|---|
| Figures | |

png pdf |
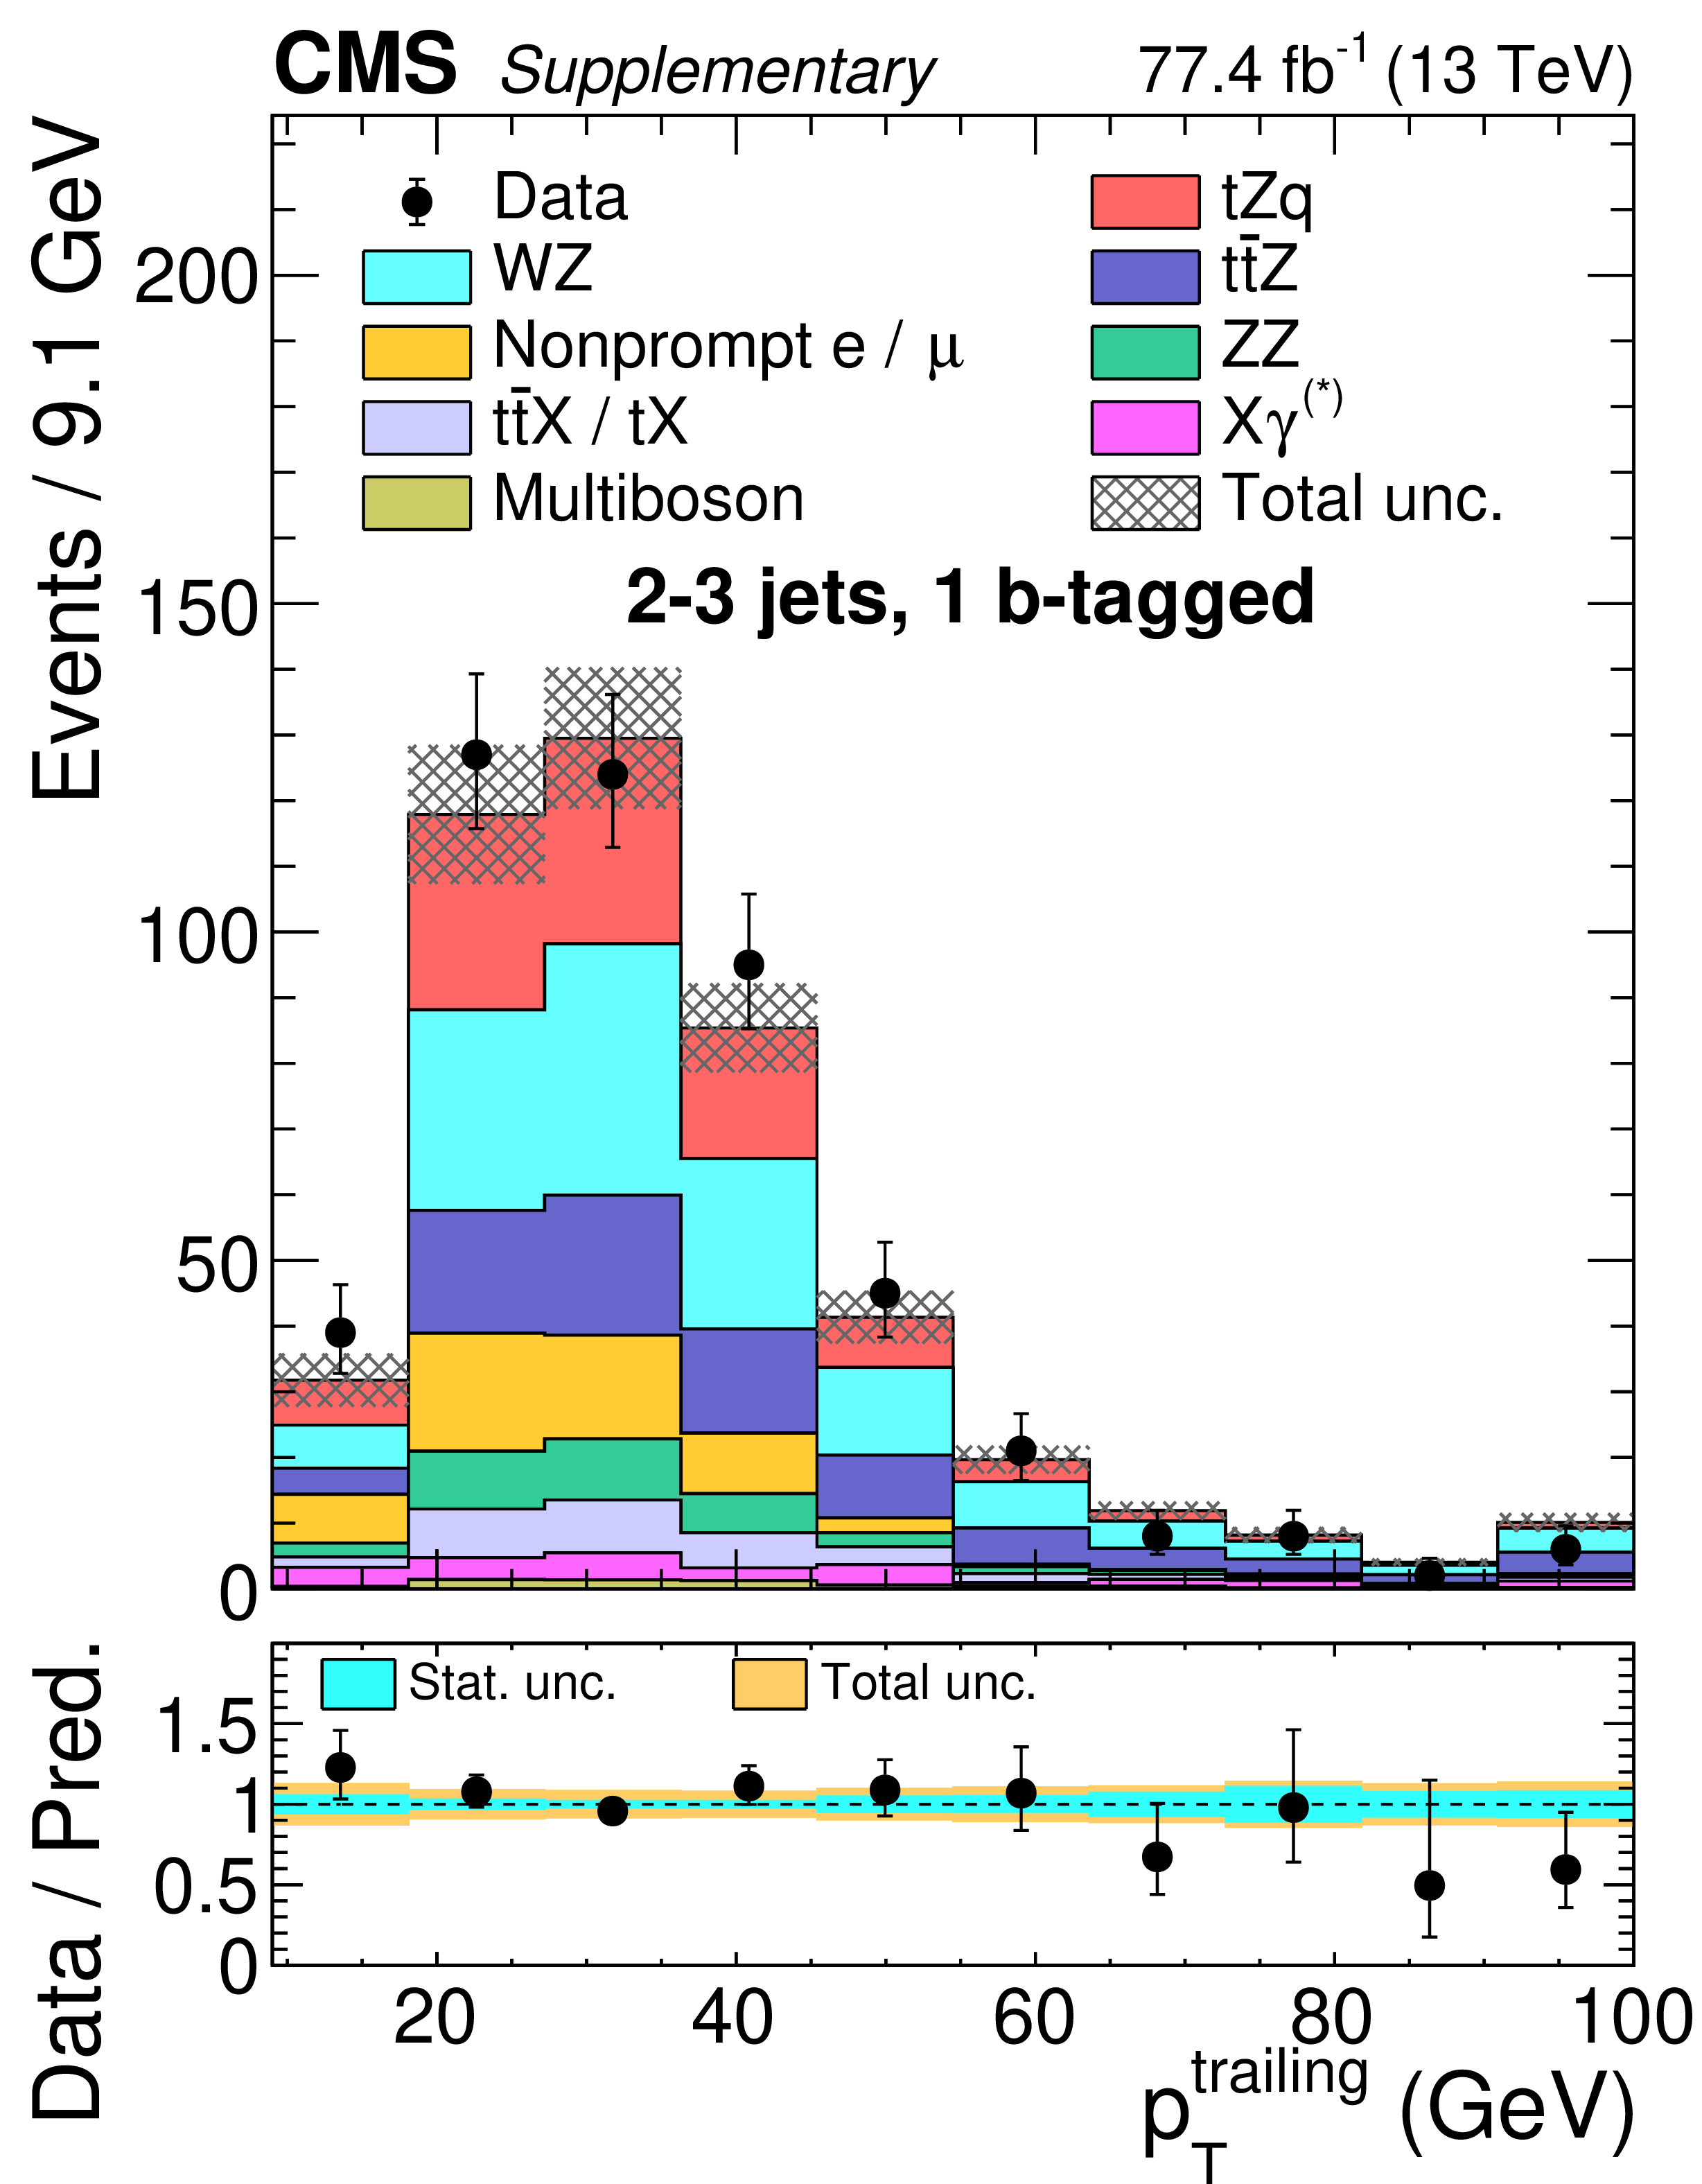
Figure 1:
Observed (points) and post-fit expected (shaded histograms) BDT distributions for events in SR-2/3j-1b (left), SR-4j-1b (middle), and SR-2b (right). The vertical bars on the points represent the statistical uncertainties in data. The hatched regions show the total uncertainties in the background. The lower panels display the ratio of the observed data to the predictions, including the ${\mathrm {t}} {\mathrm {Z}} {\mathrm {q}}$ signal, with inner and outer shaded bands, respectively, representing the statistical and total uncertainties in the predictions. |
png pdf |
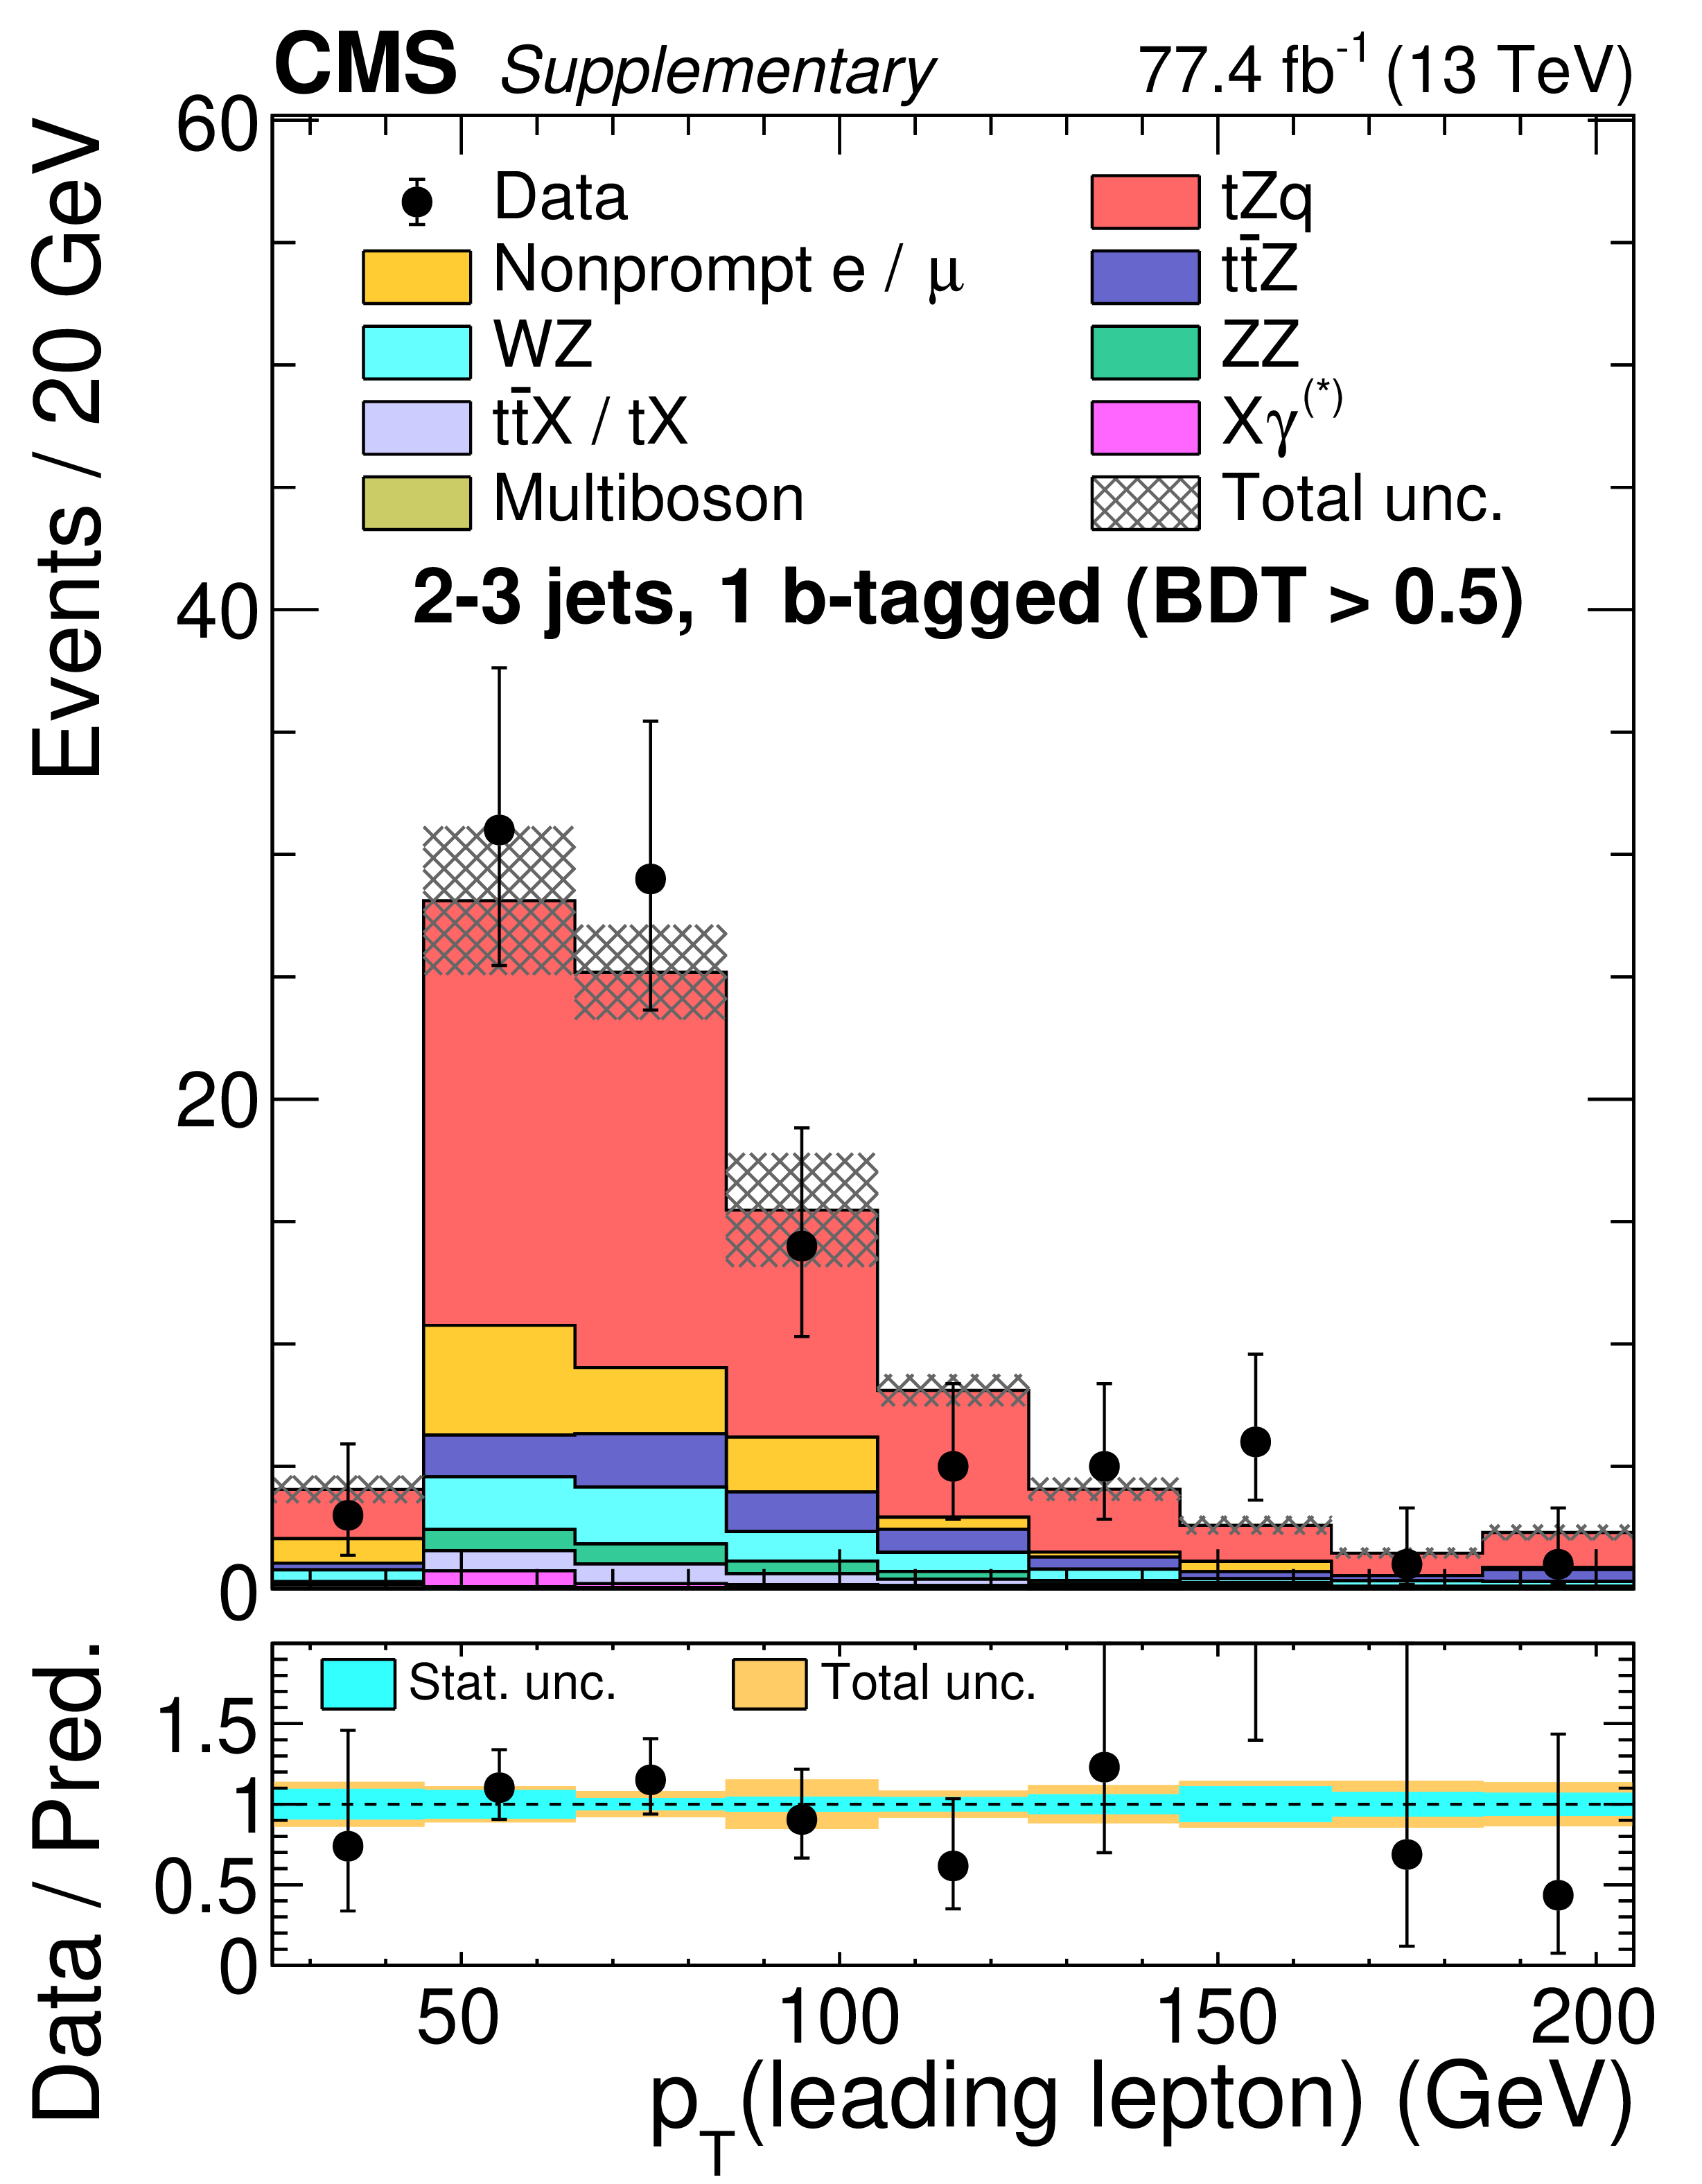
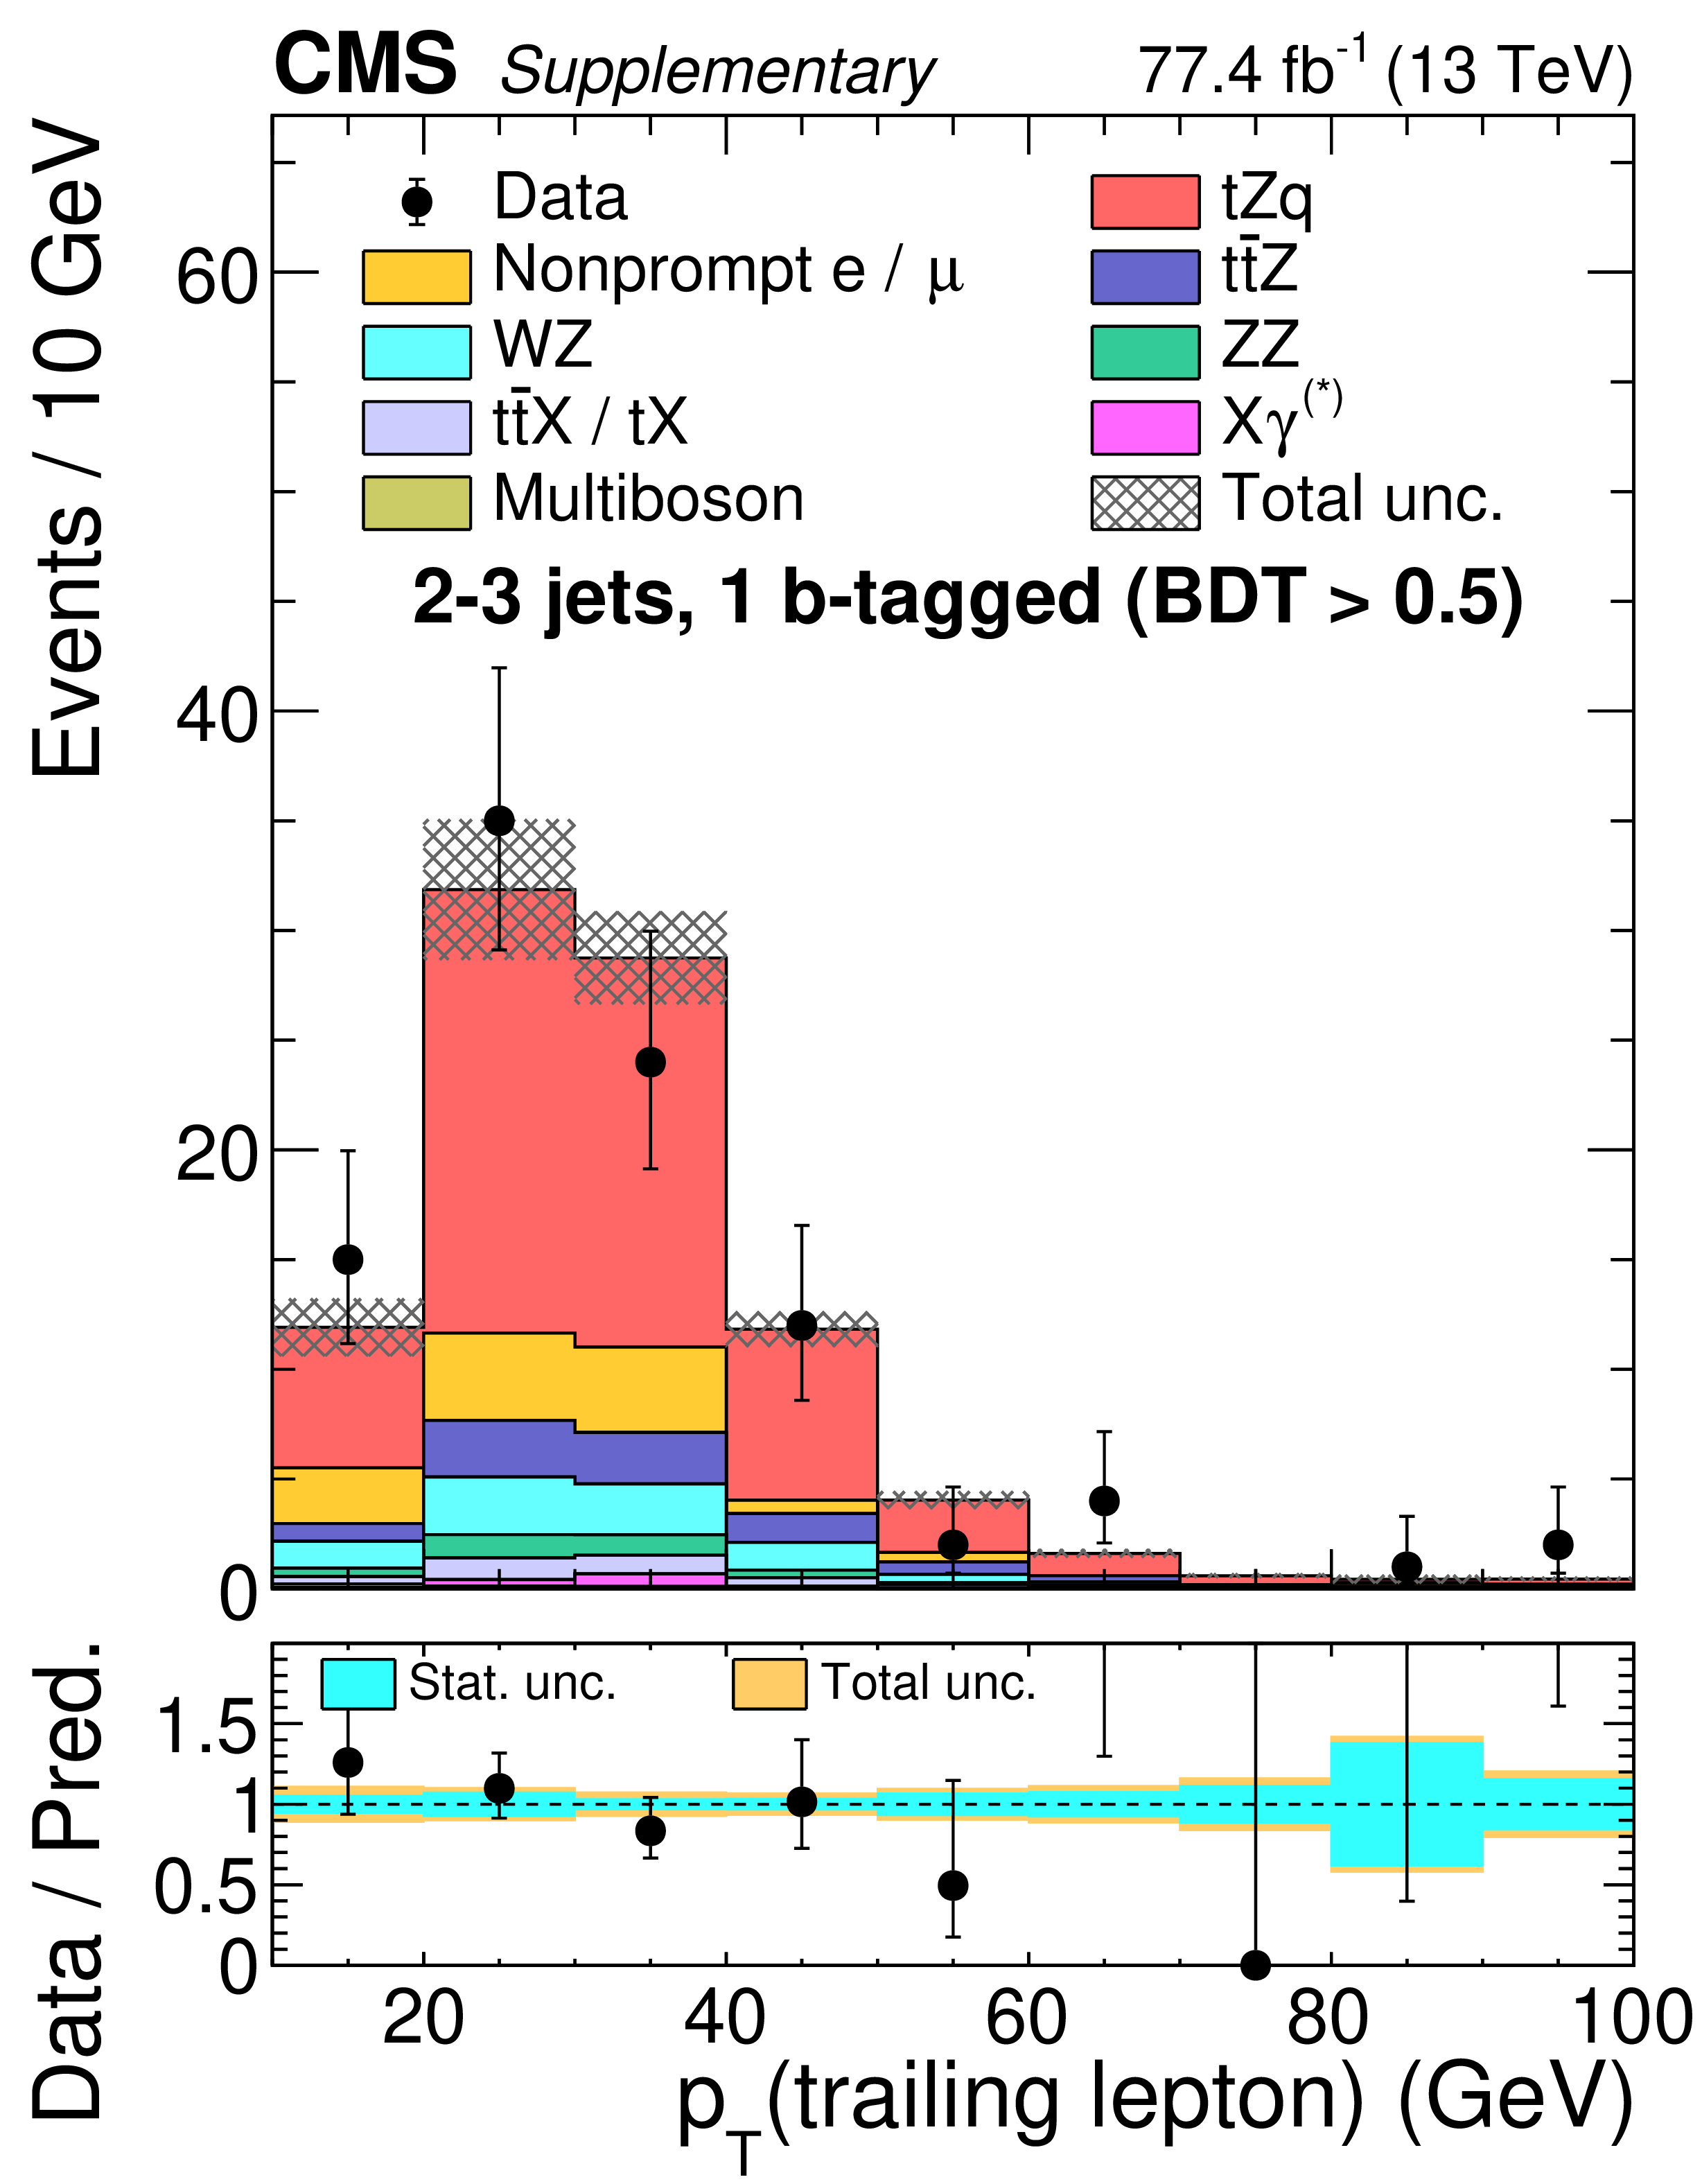
Figure 1-a:
Observed (points) and post-fit expected (shaded histograms) BDT distributions for events in SR-2/3j-1b. The vertical bars on the points represent the statistical uncertainties in data. The hatched regions show the total uncertainties in the background. The lower panel displays the ratio of the observed data to the predictions, including the ${\mathrm {t}} {\mathrm {Z}} {\mathrm {q}}$ signal, with inner and outer shaded bands, respectively, representing the statistical and total uncertainties in the predictions. |
png pdf |
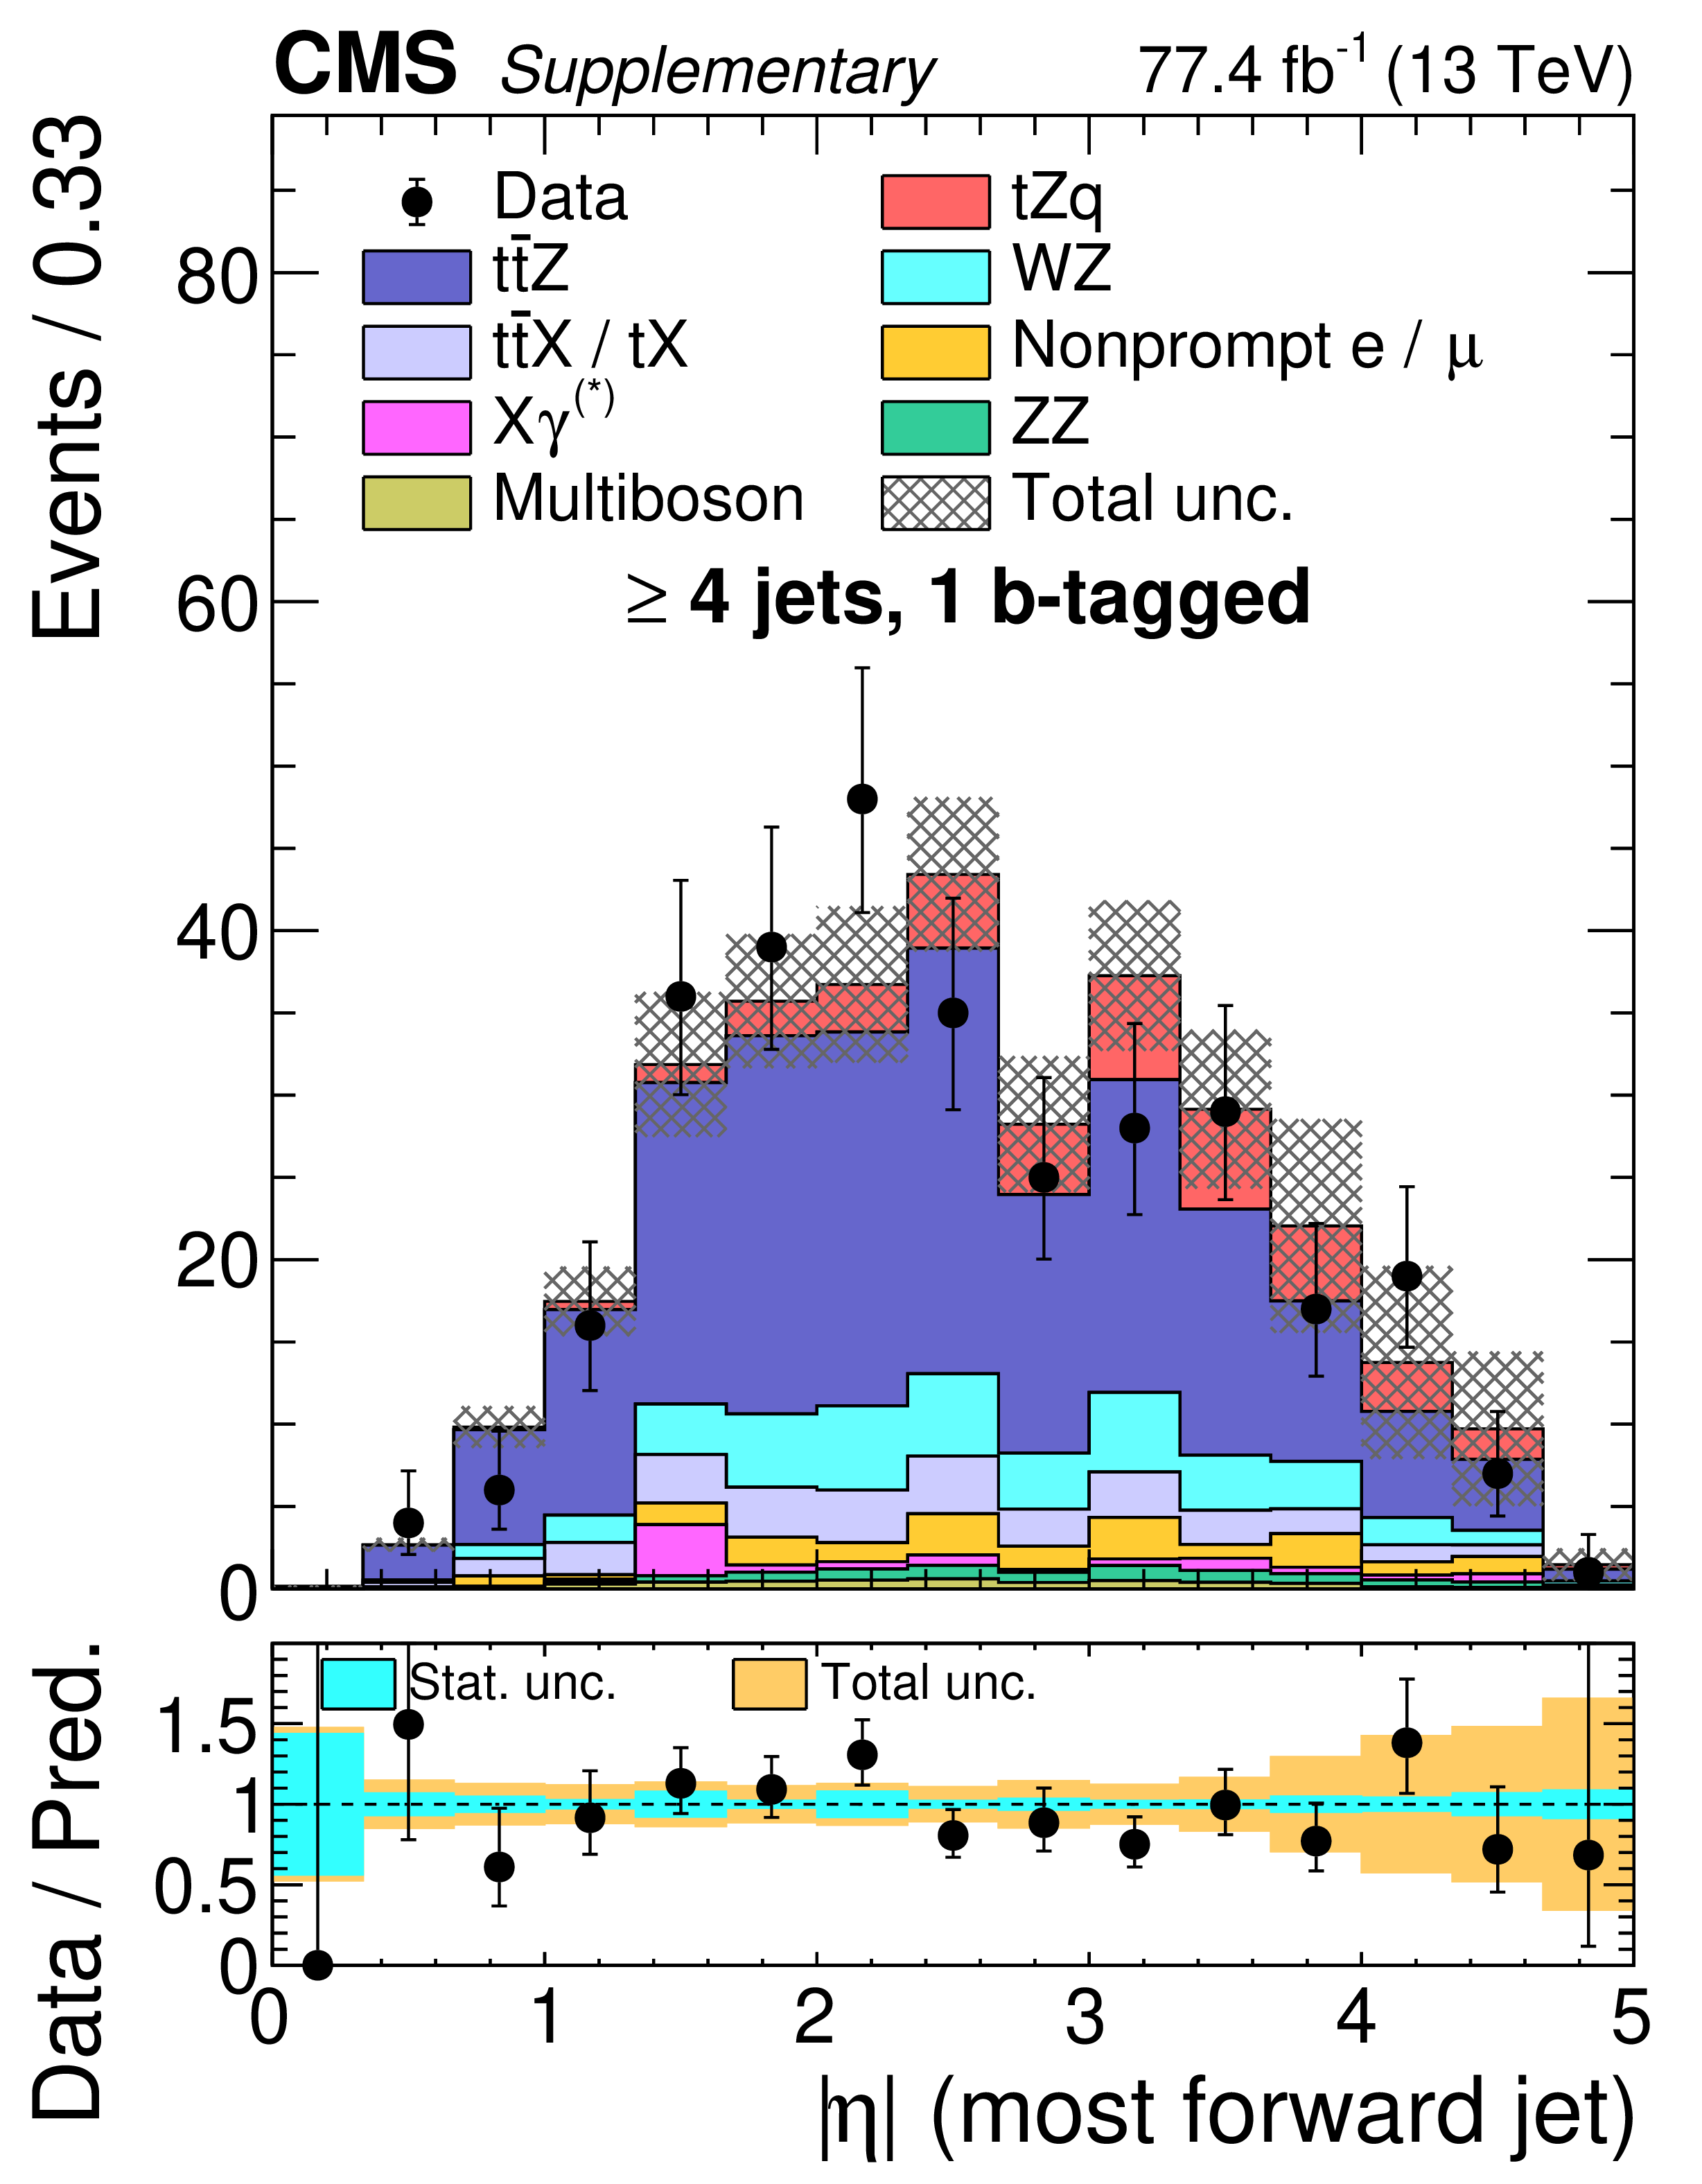
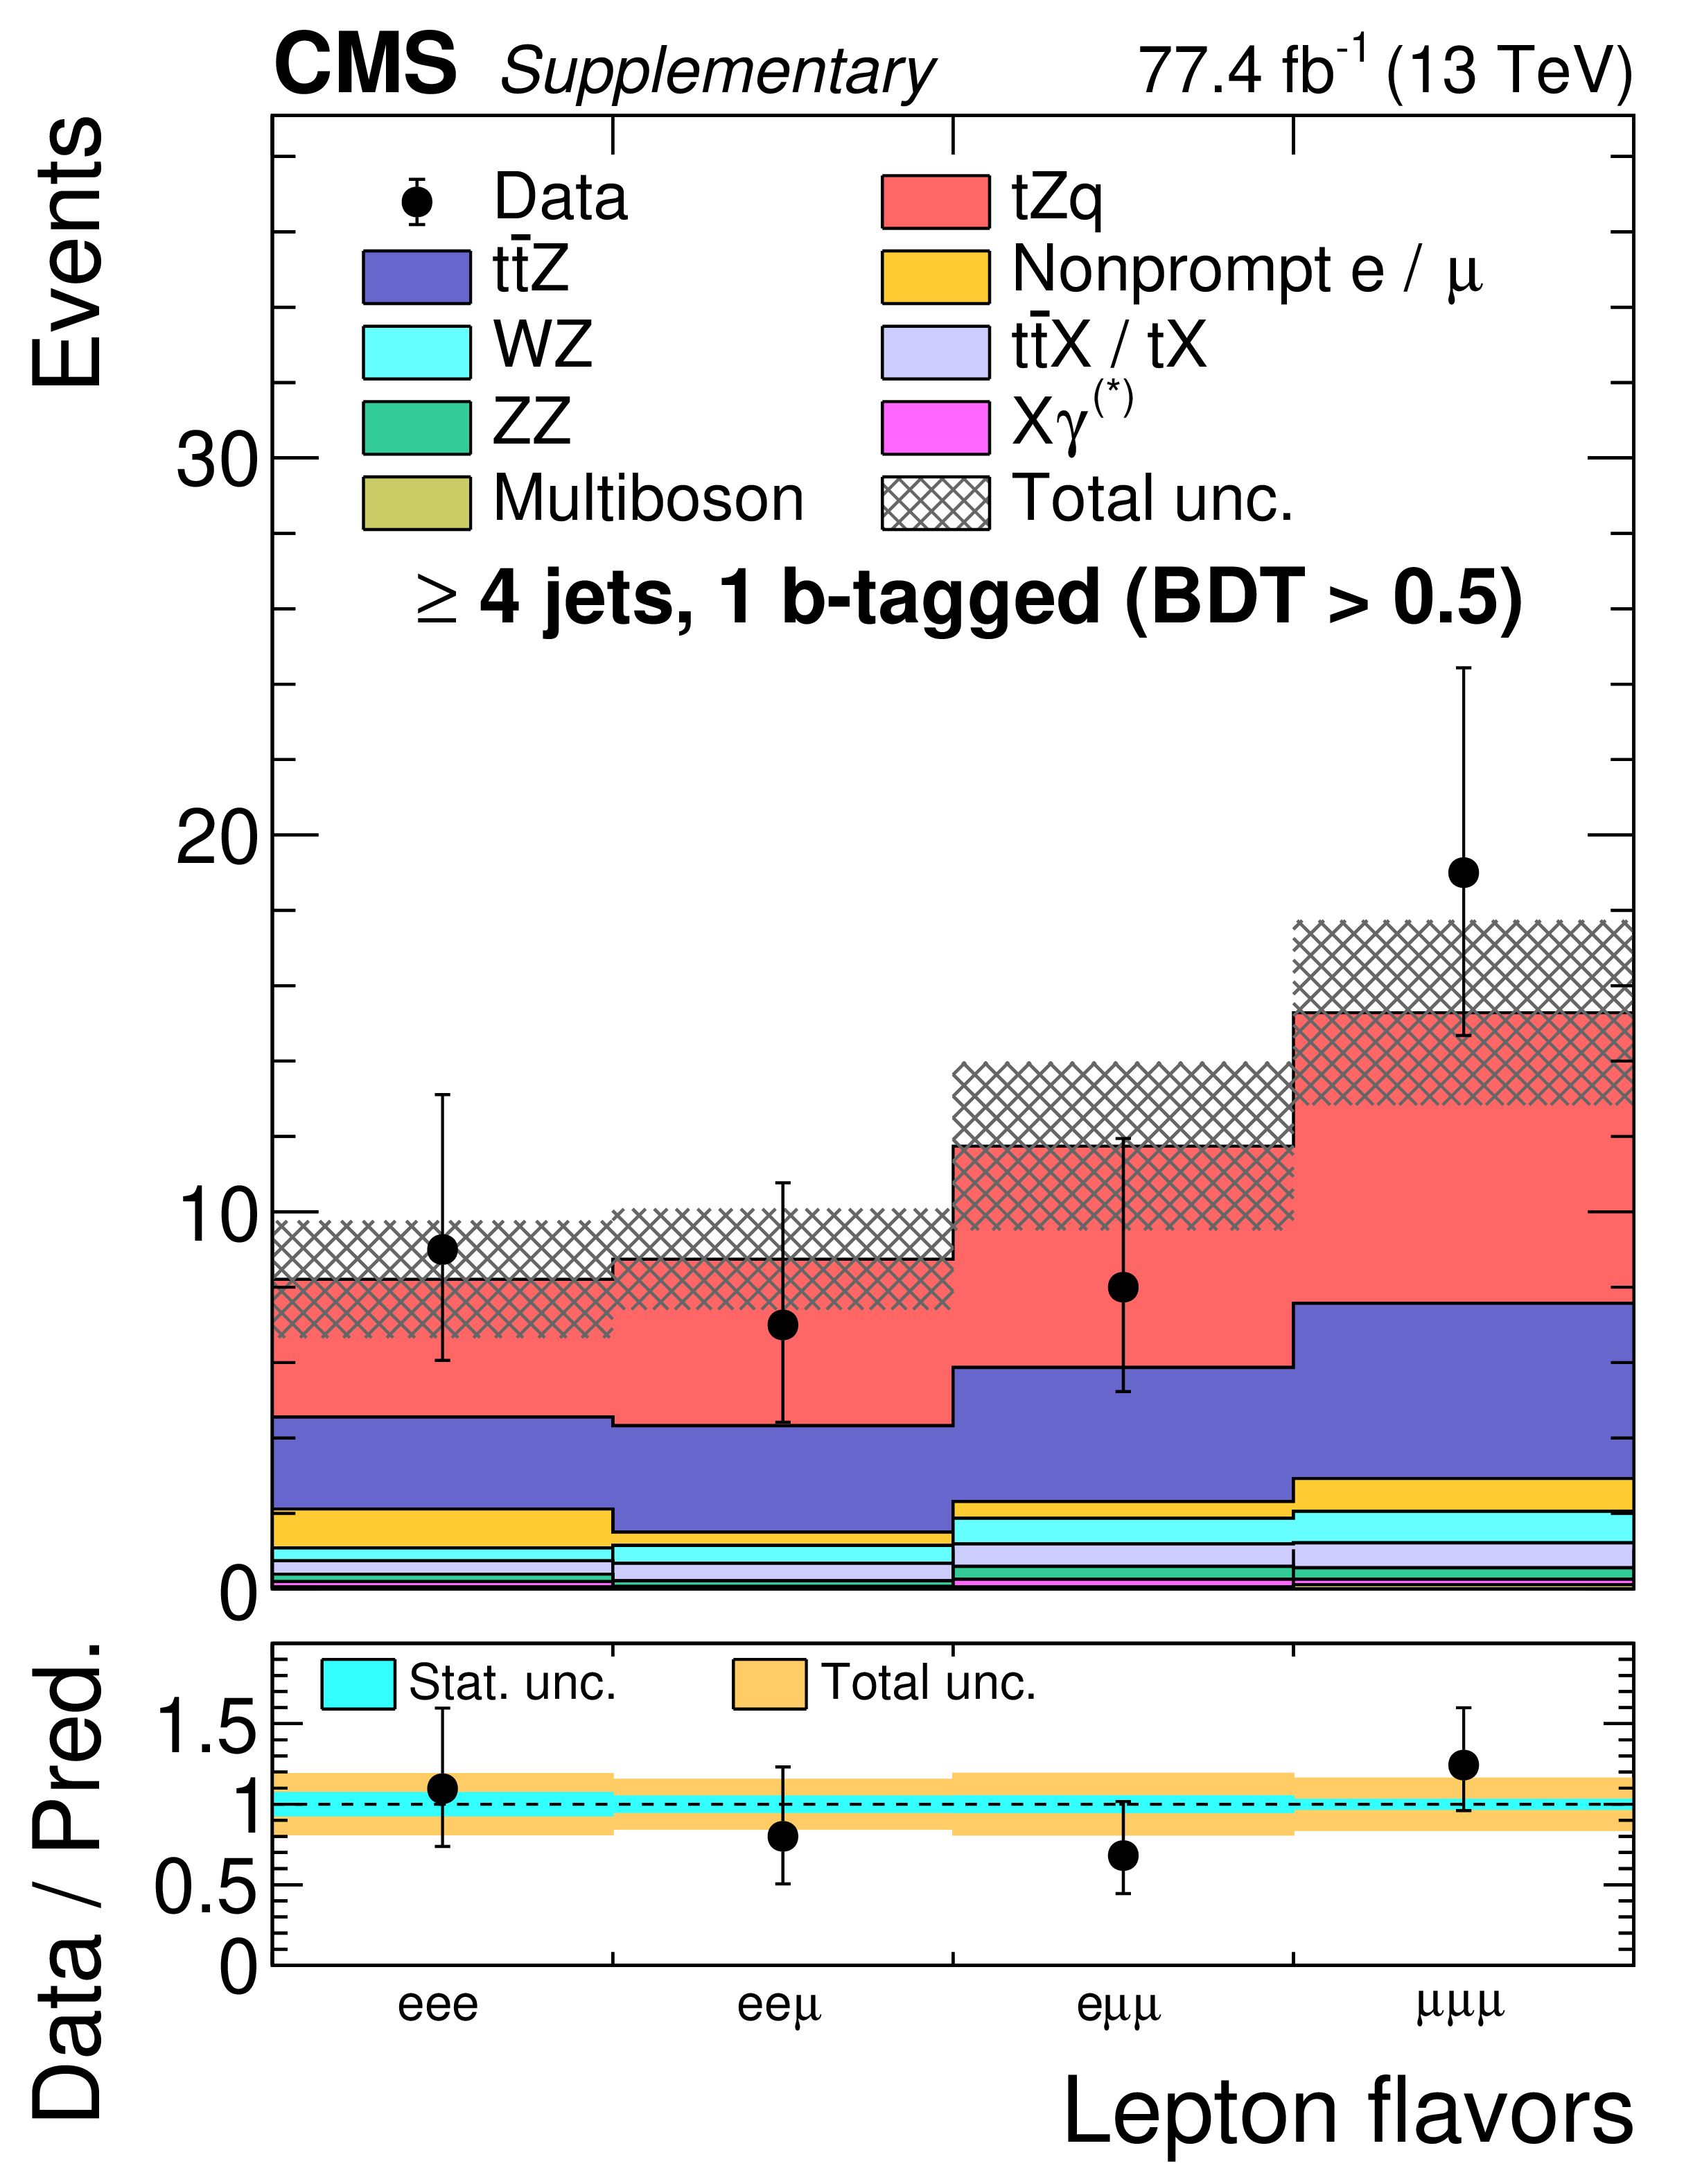
Figure 1-b:
Observed (points) and post-fit expected (shaded histograms) BDT distributions for events in SR-4j-1b. The vertical bars on the points represent the statistical uncertainties in data. The hatched regions show the total uncertainties in the background. The lower panel displays the ratio of the observed data to the predictions, including the ${\mathrm {t}} {\mathrm {Z}} {\mathrm {q}}$ signal, with inner and outer shaded bands, respectively, representing the statistical and total uncertainties in the predictions. |
png pdf |
Figure 1-c:
Observed (points) and post-fit expected (shaded histograms) BDT distributions for events in SR-2b. The vertical bars on the points represent the statistical uncertainties in data. The hatched regions show the total uncertainties in the background. The lower panel displays the ratio of the observed data to the predictions, including the ${\mathrm {t}} {\mathrm {Z}} {\mathrm {q}}$ signal, with inner and outer shaded bands, respectively, representing the statistical and total uncertainties in the predictions. |
png pdf |
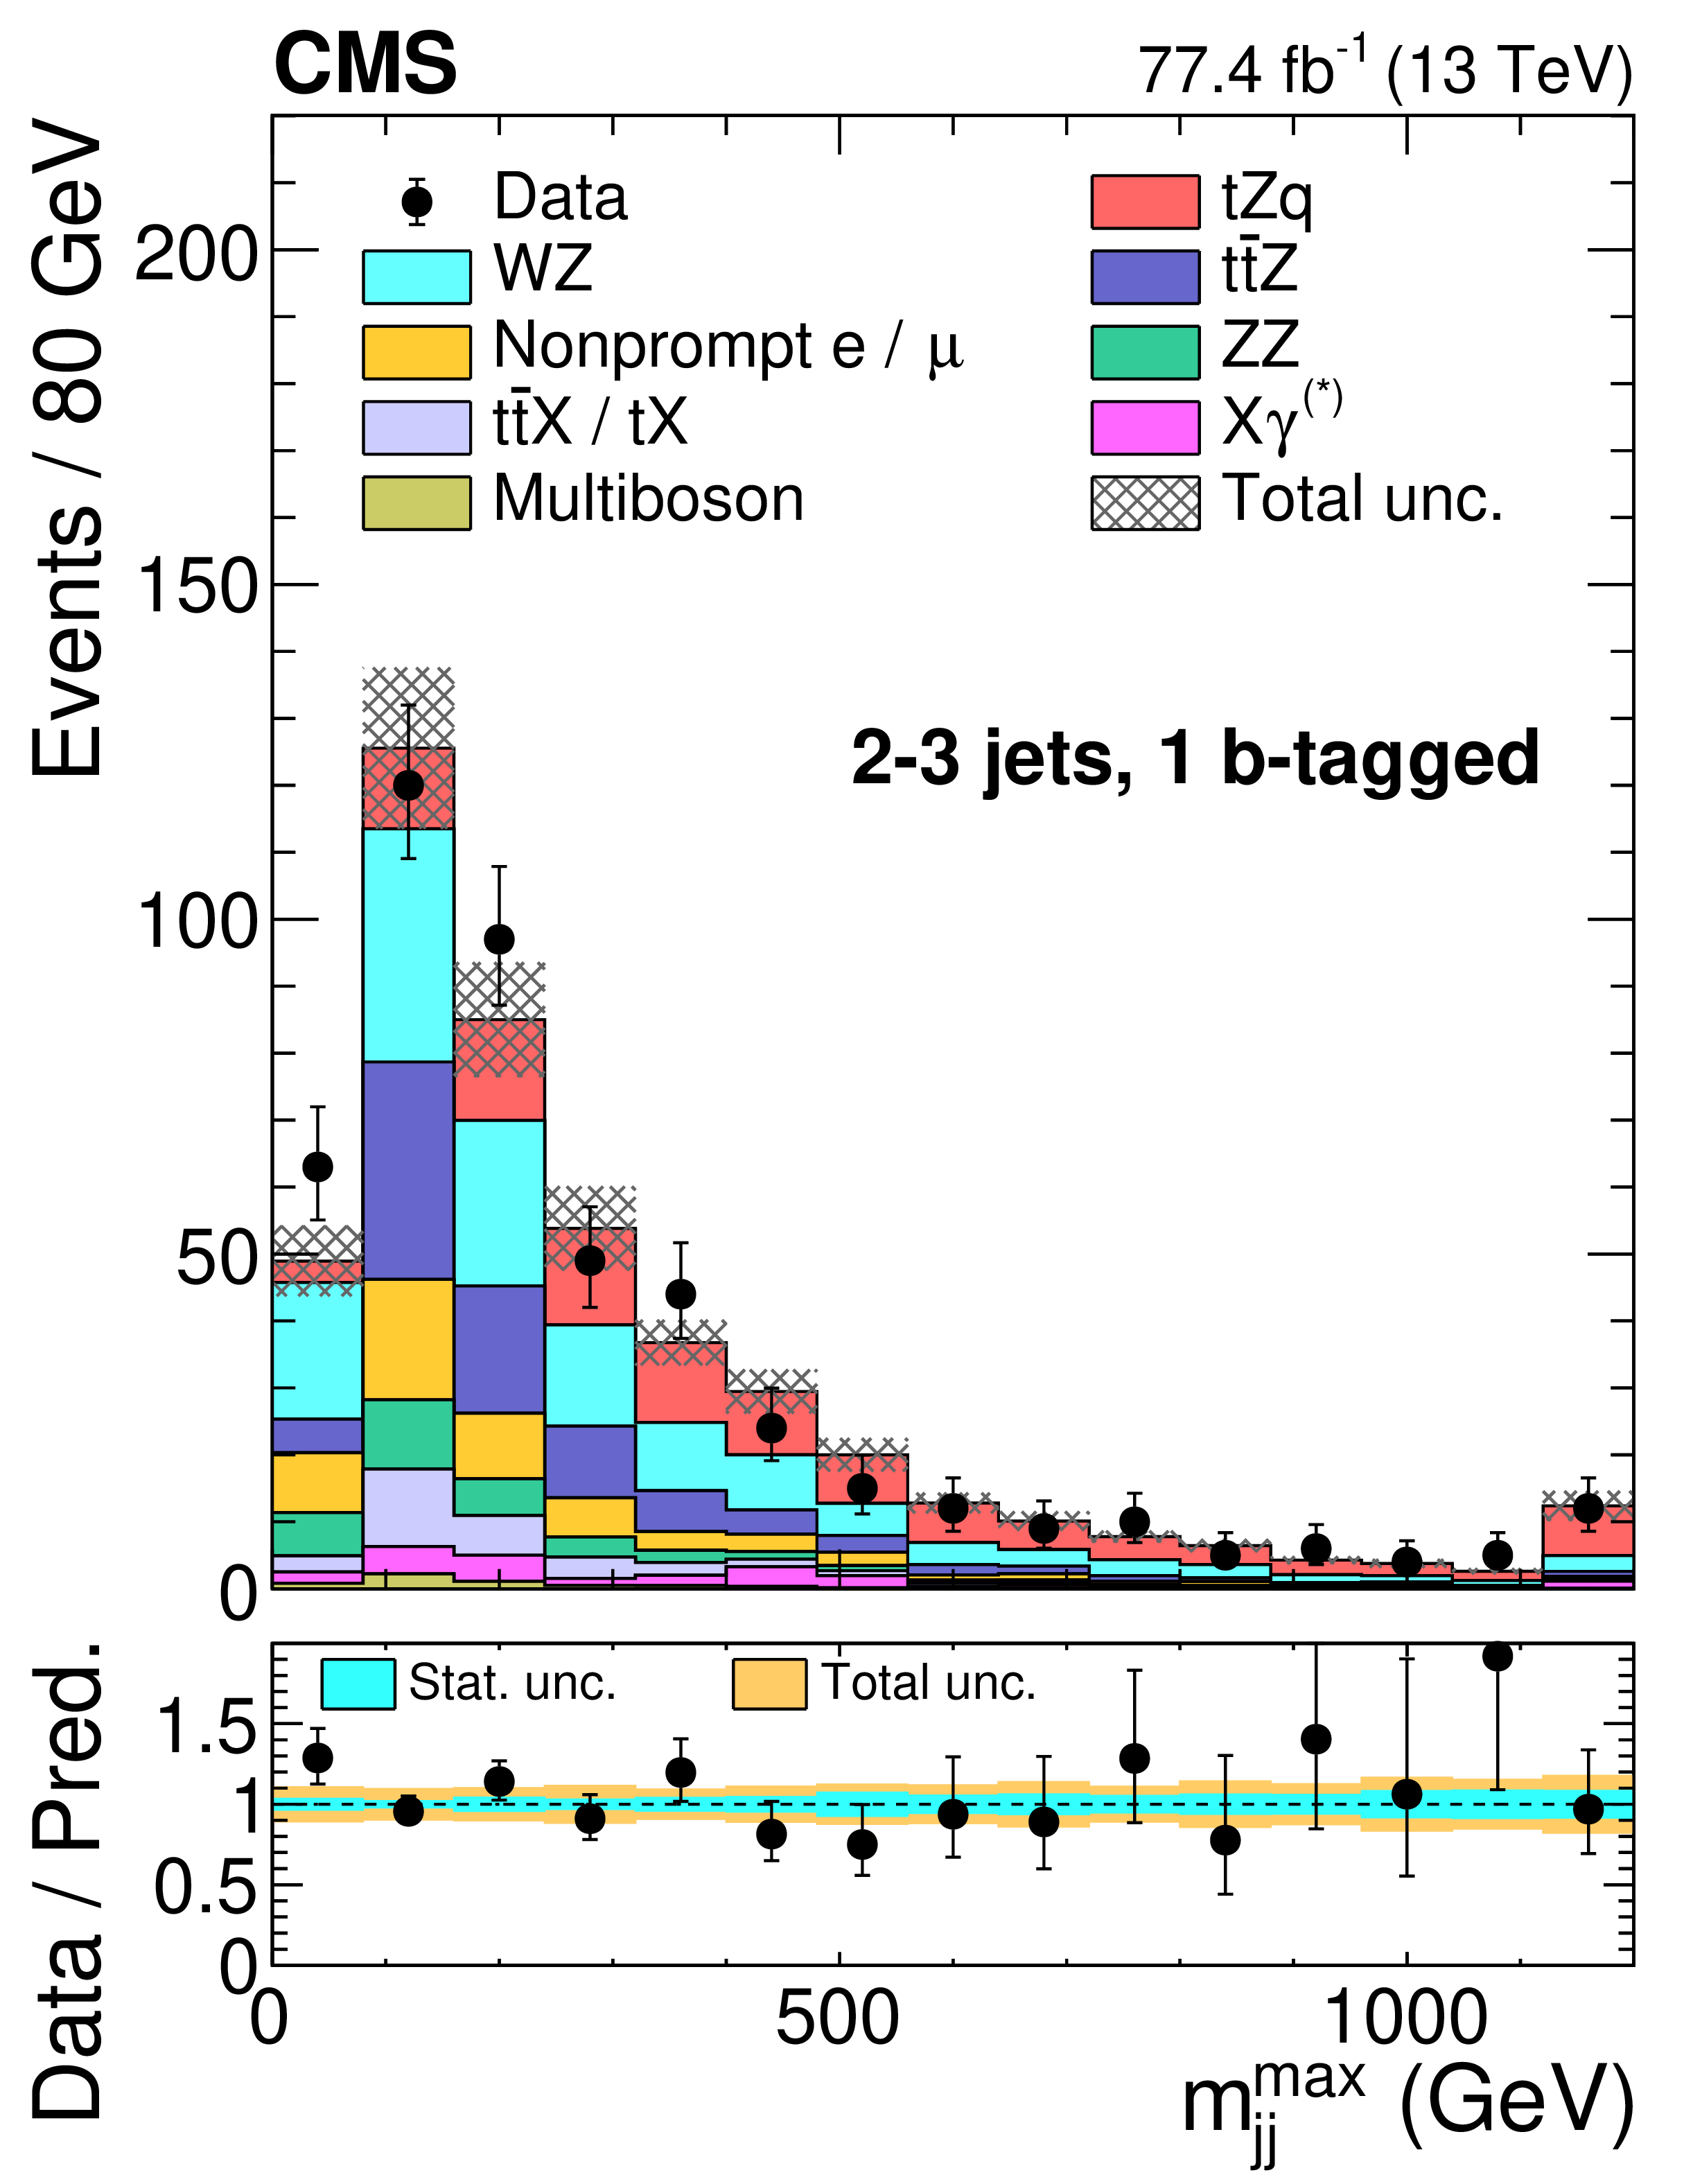
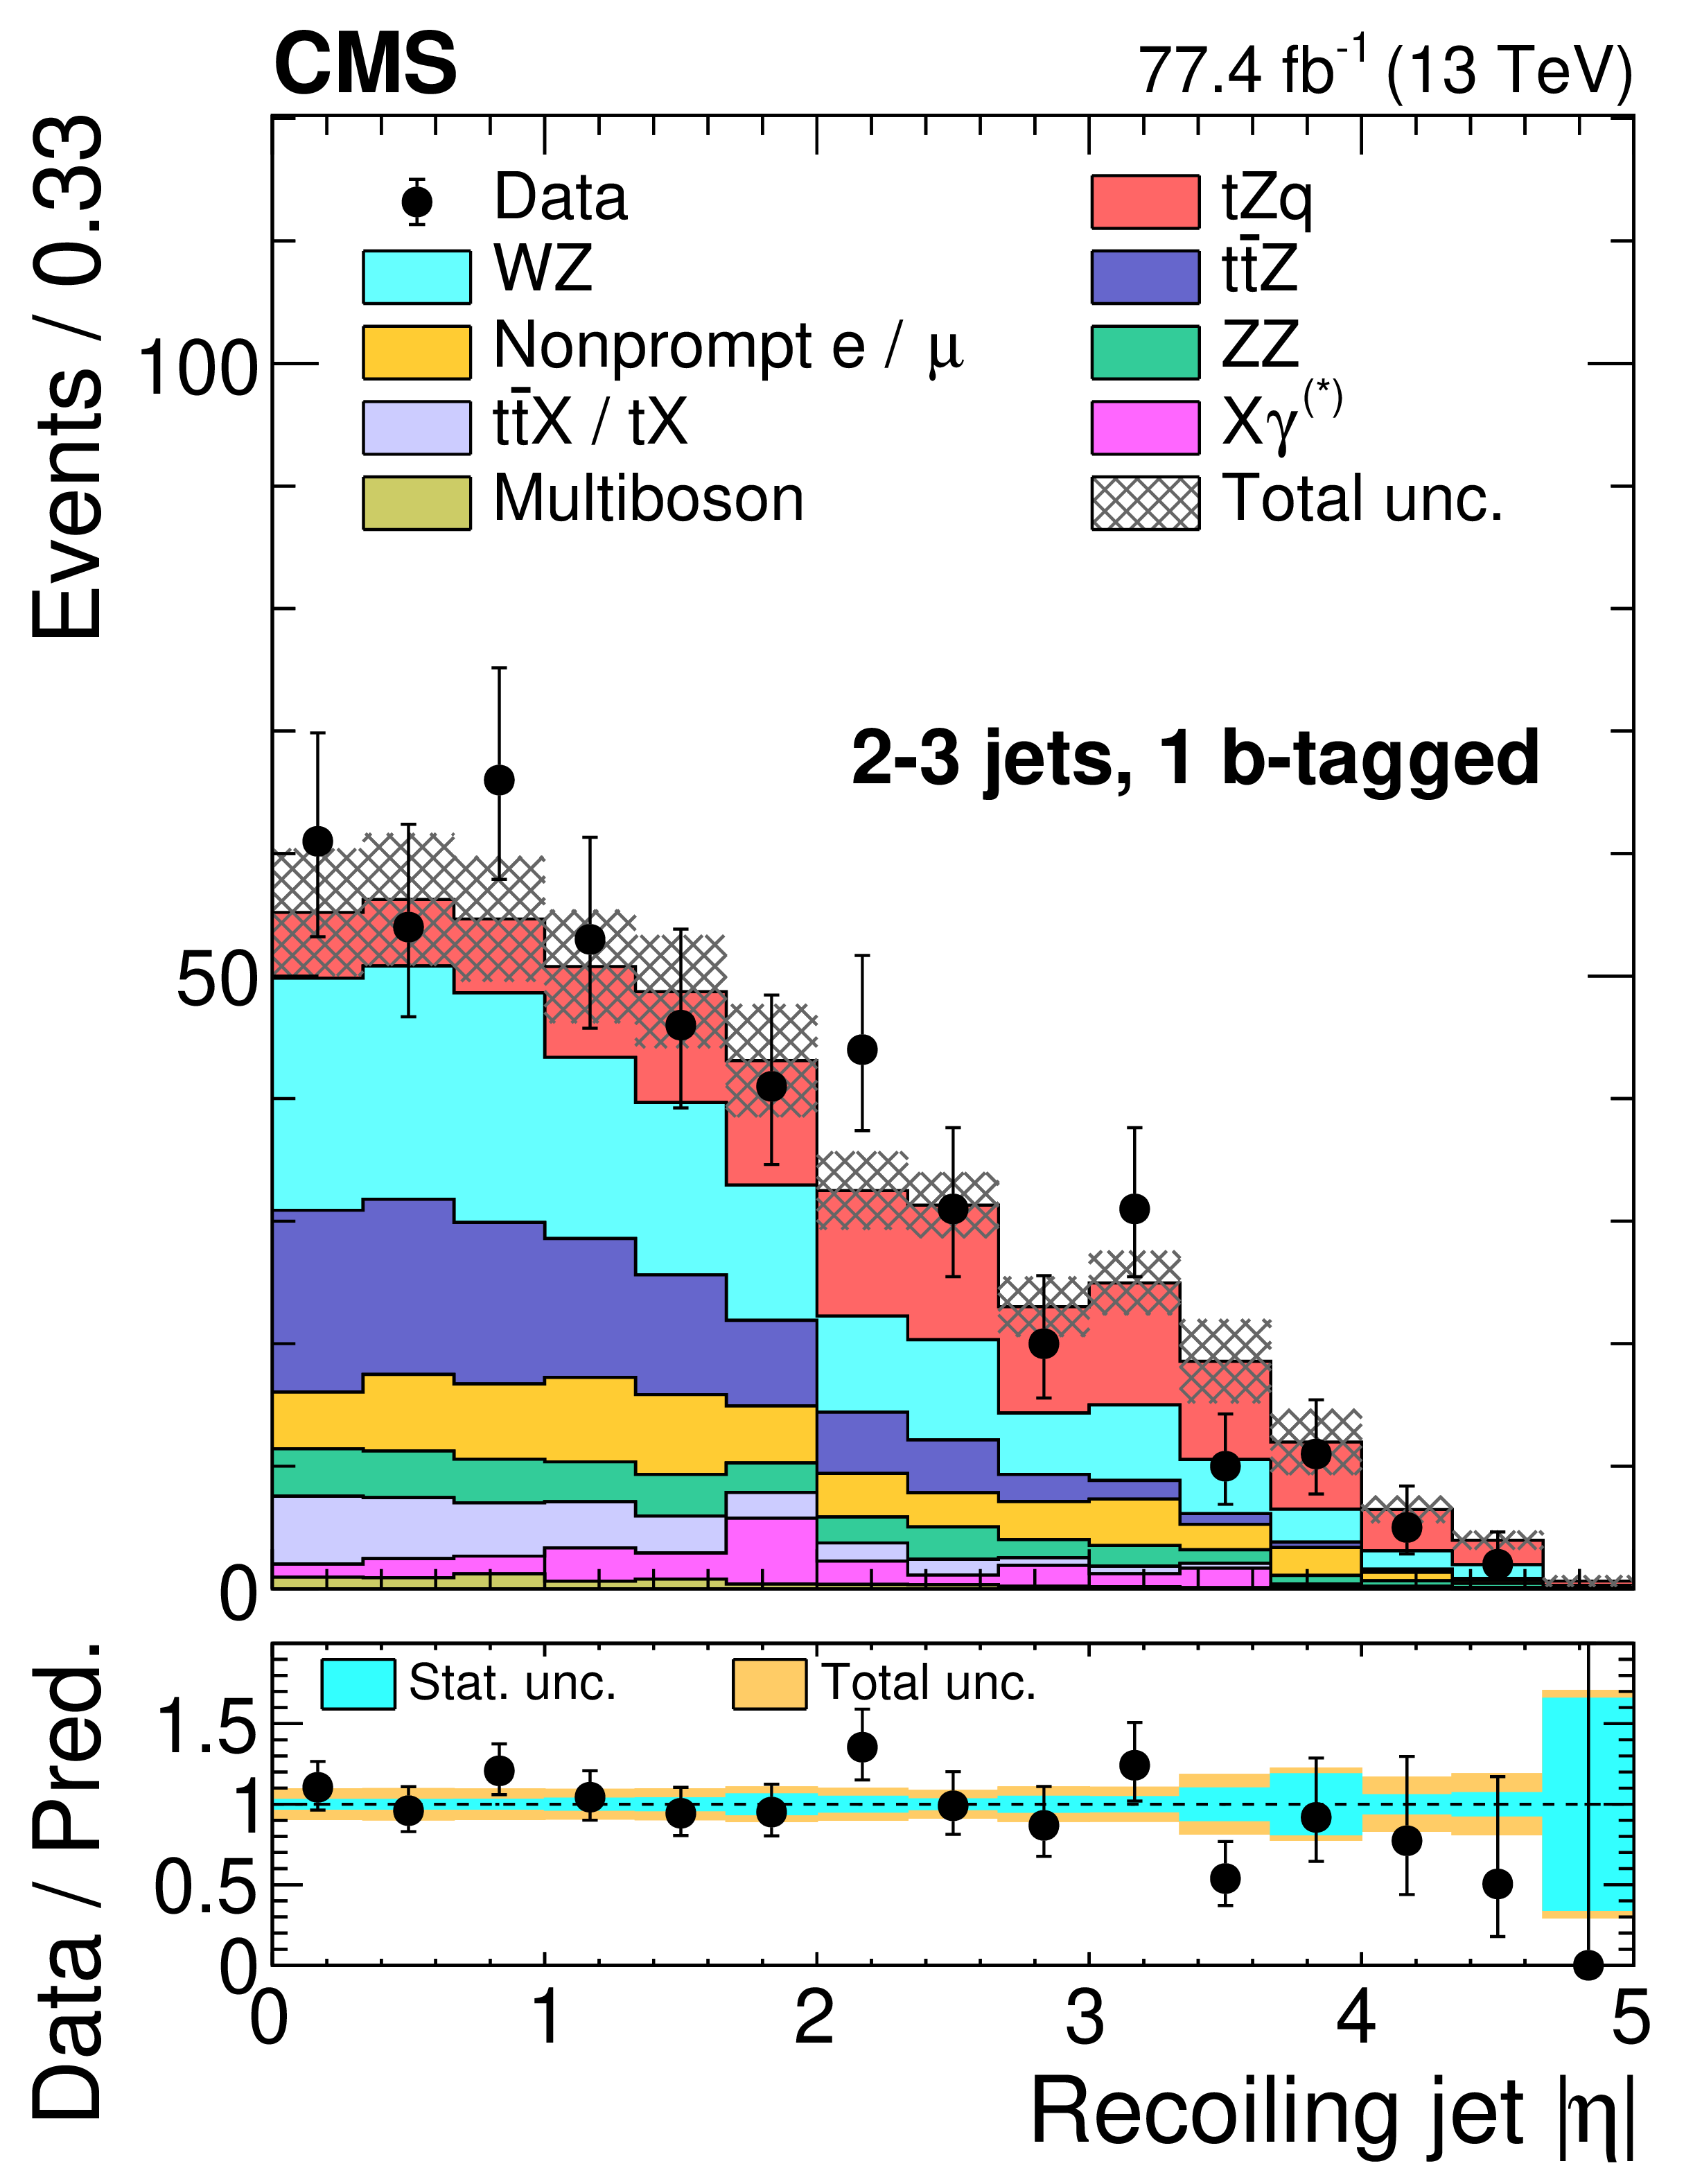
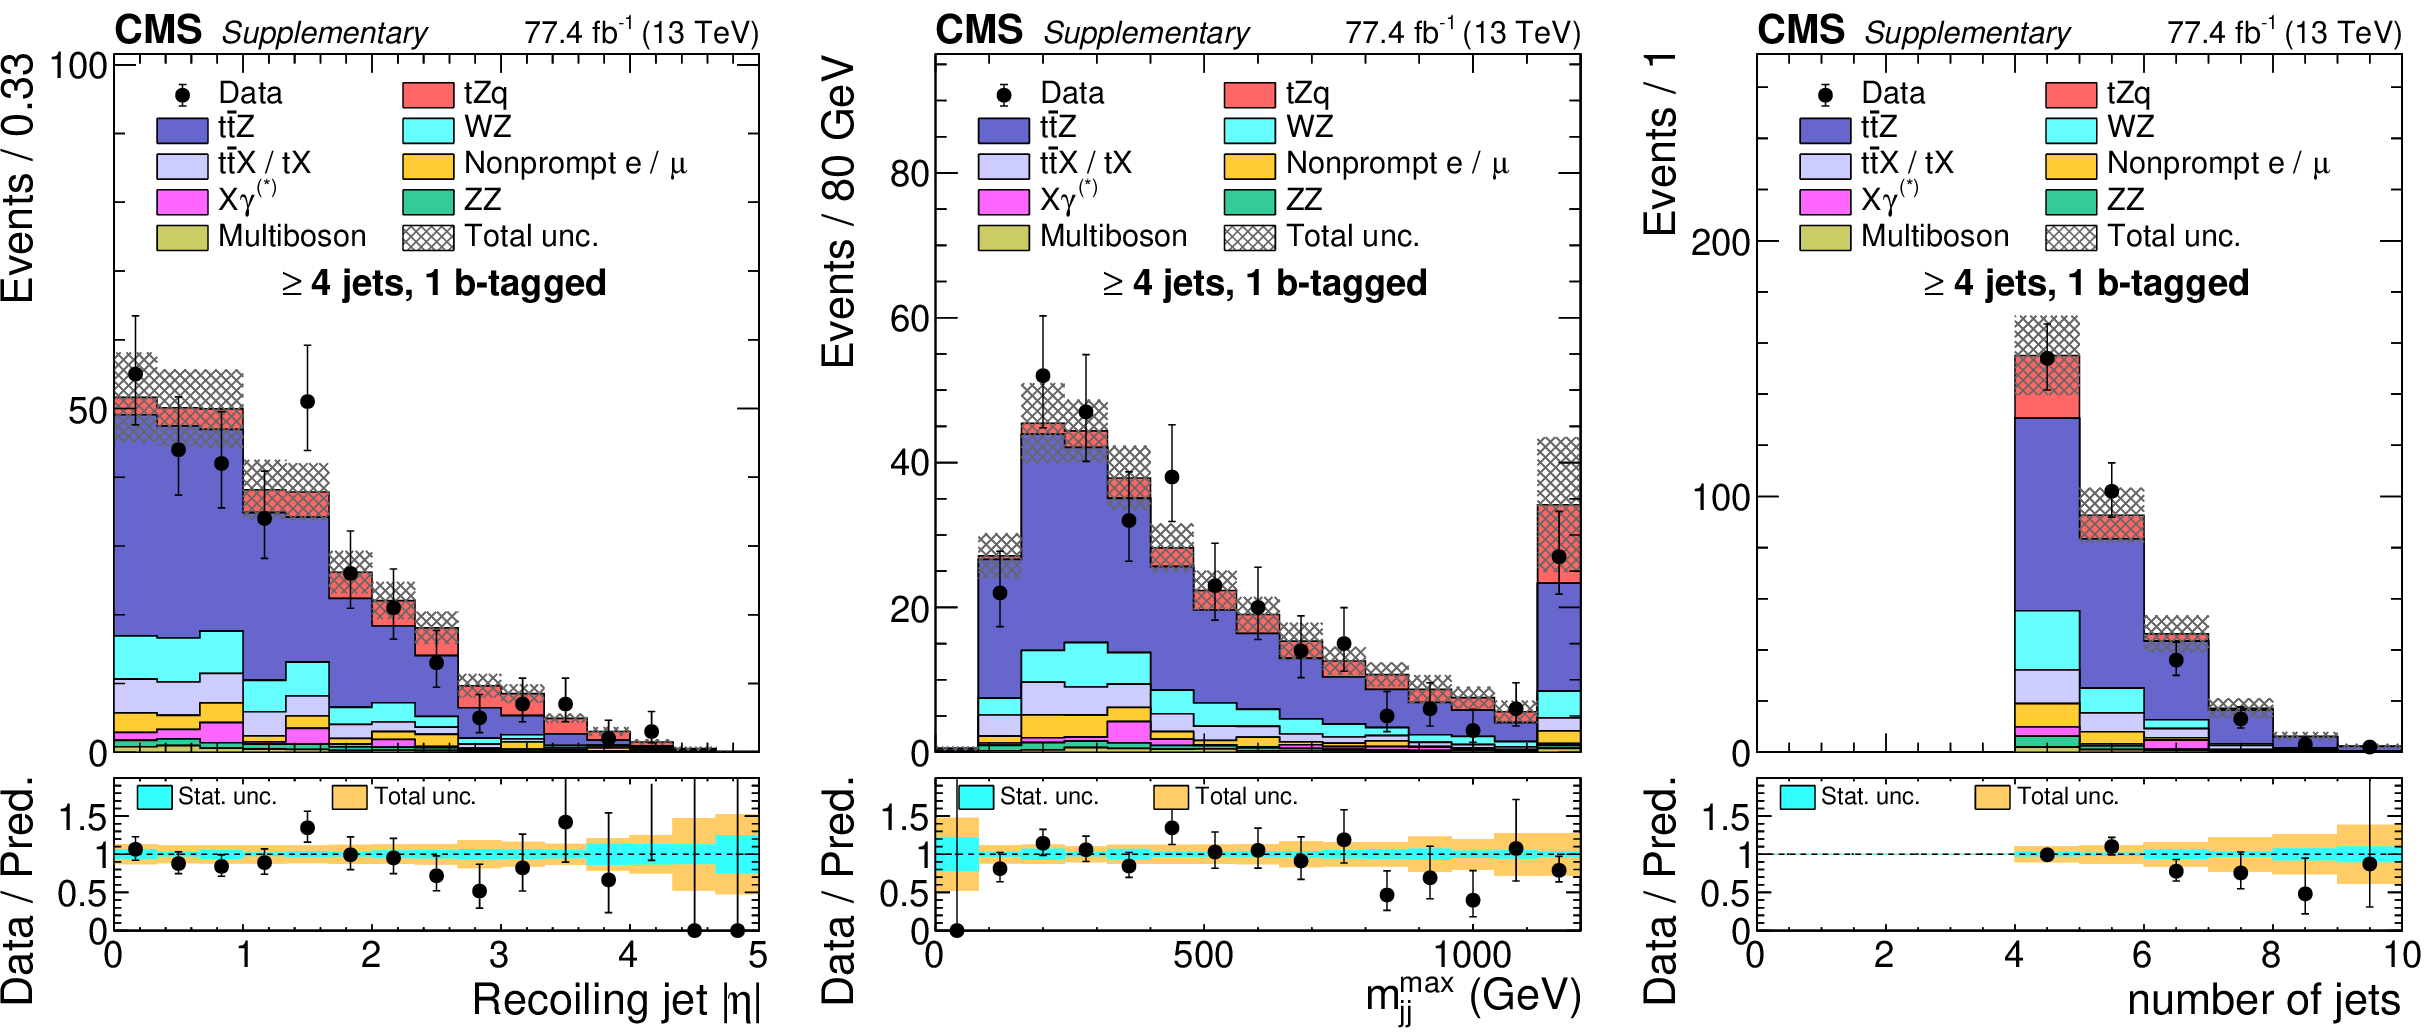
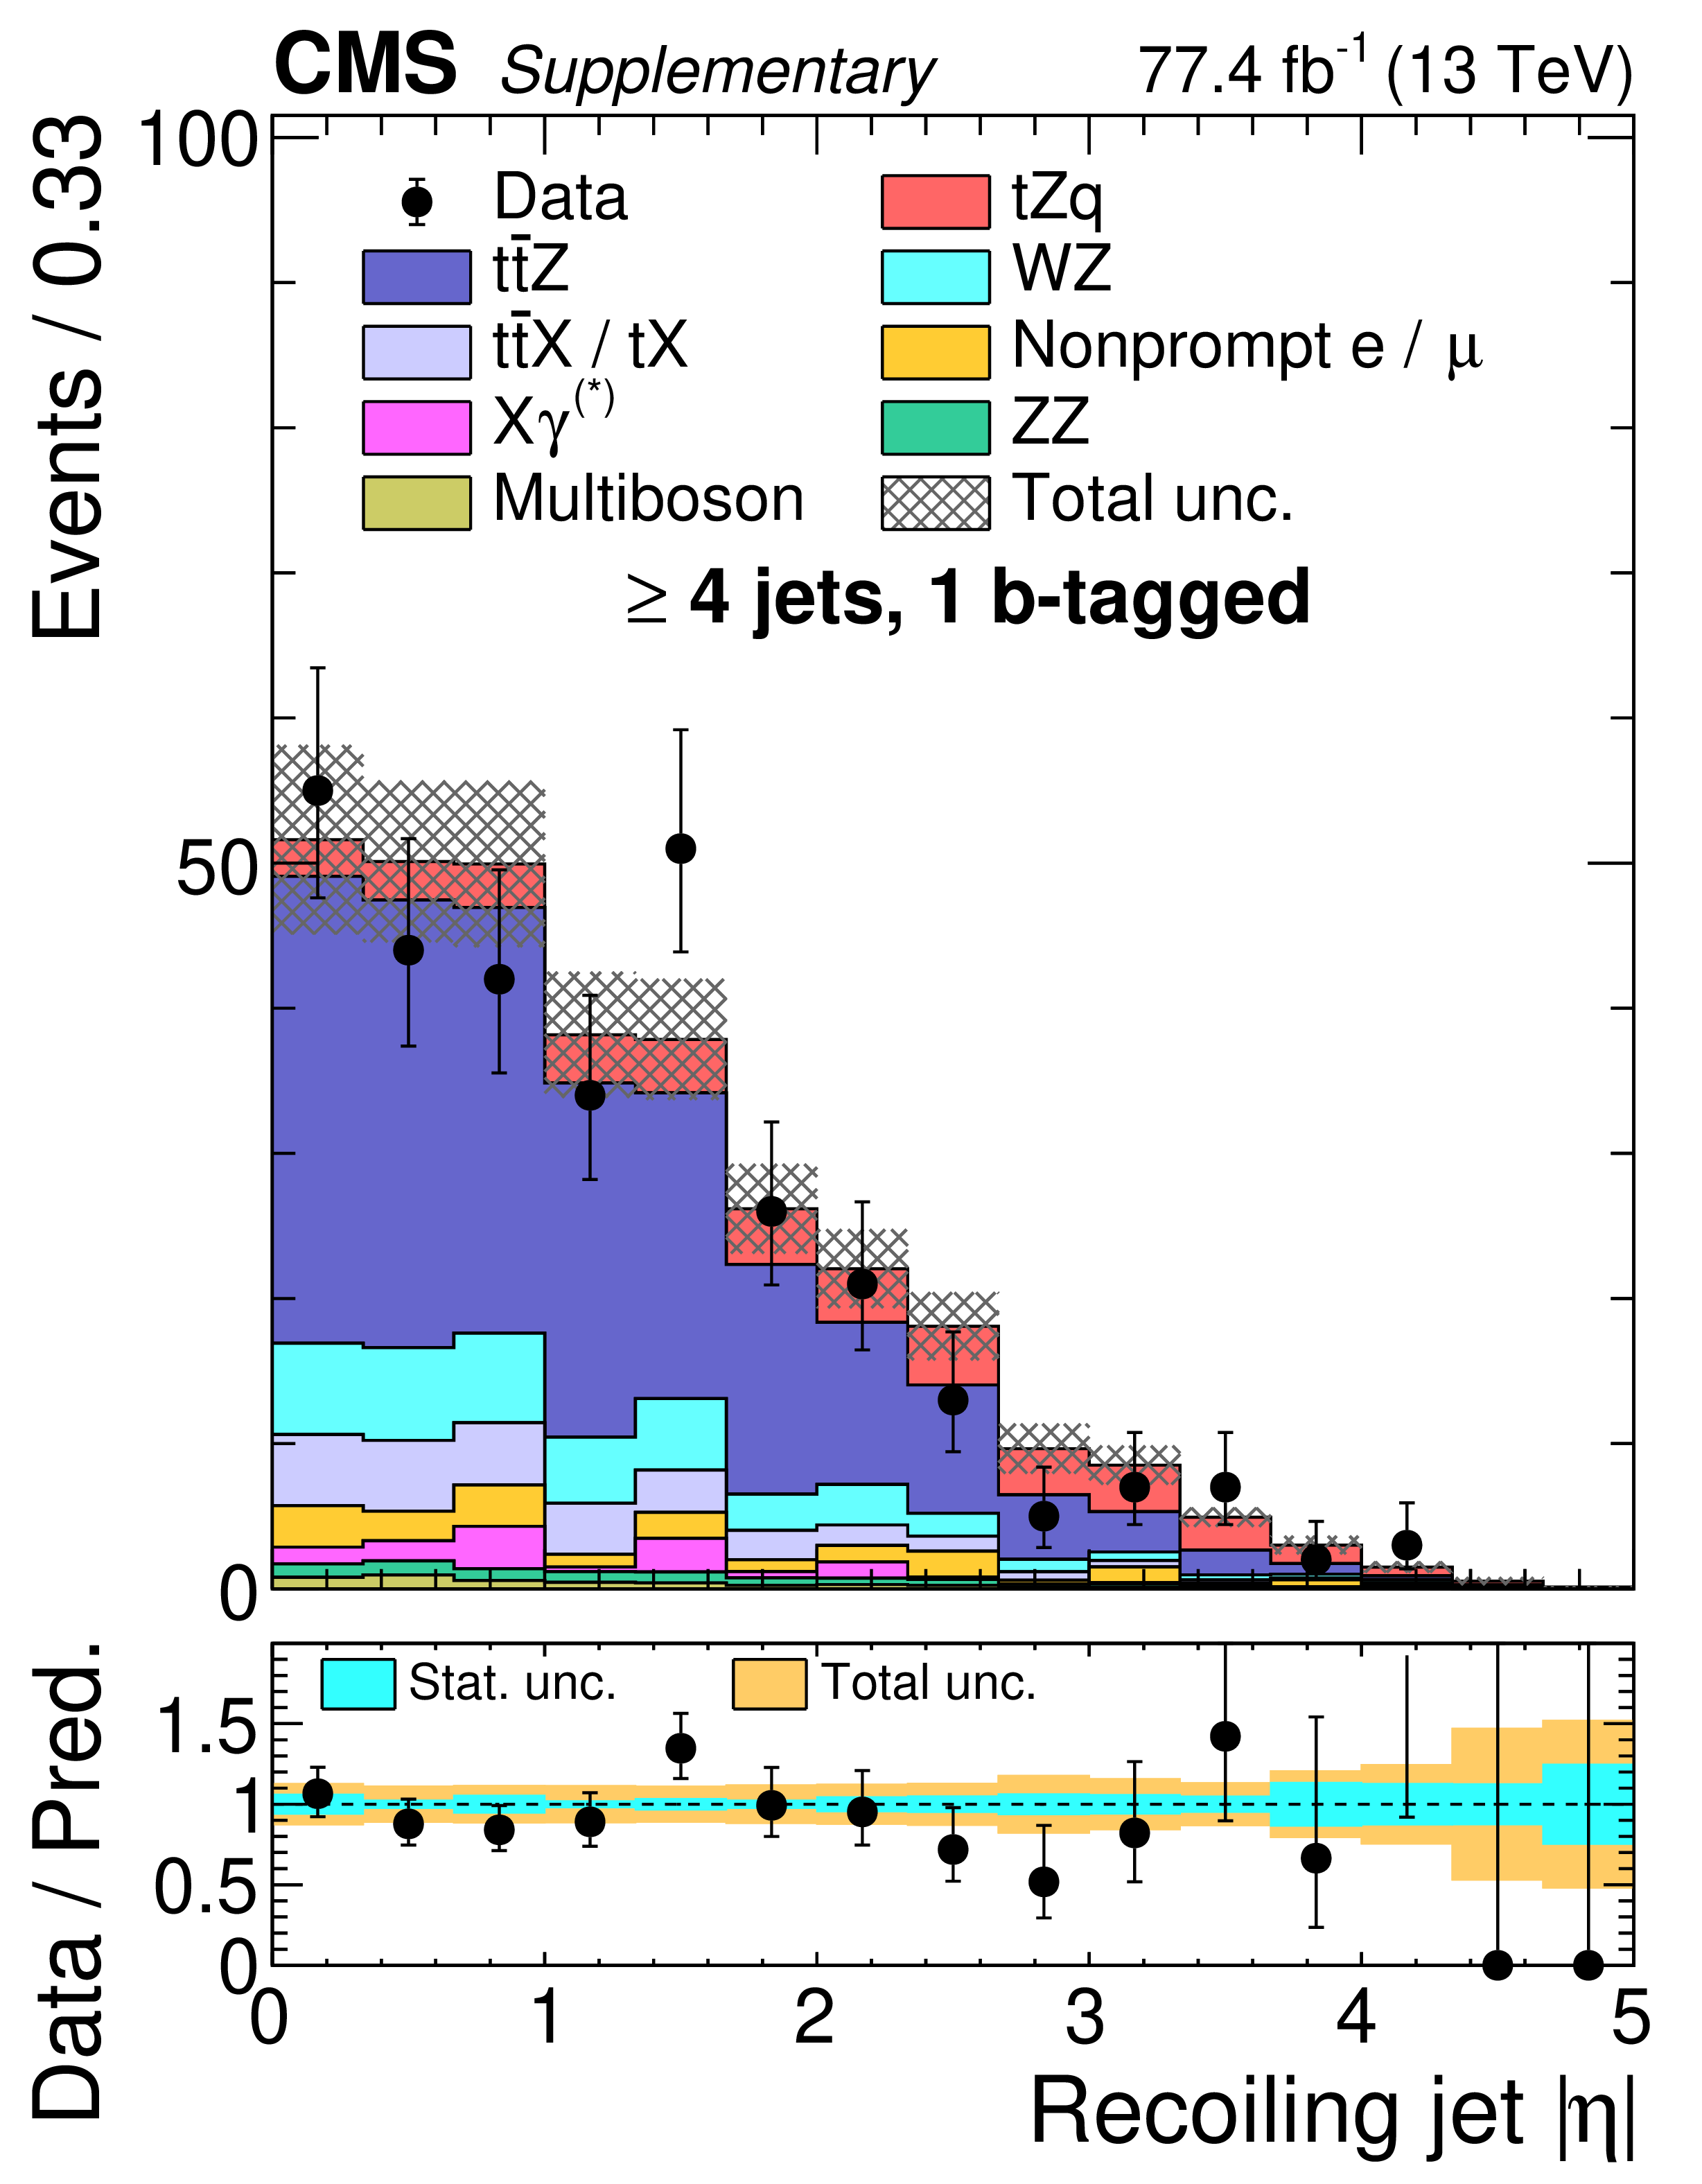
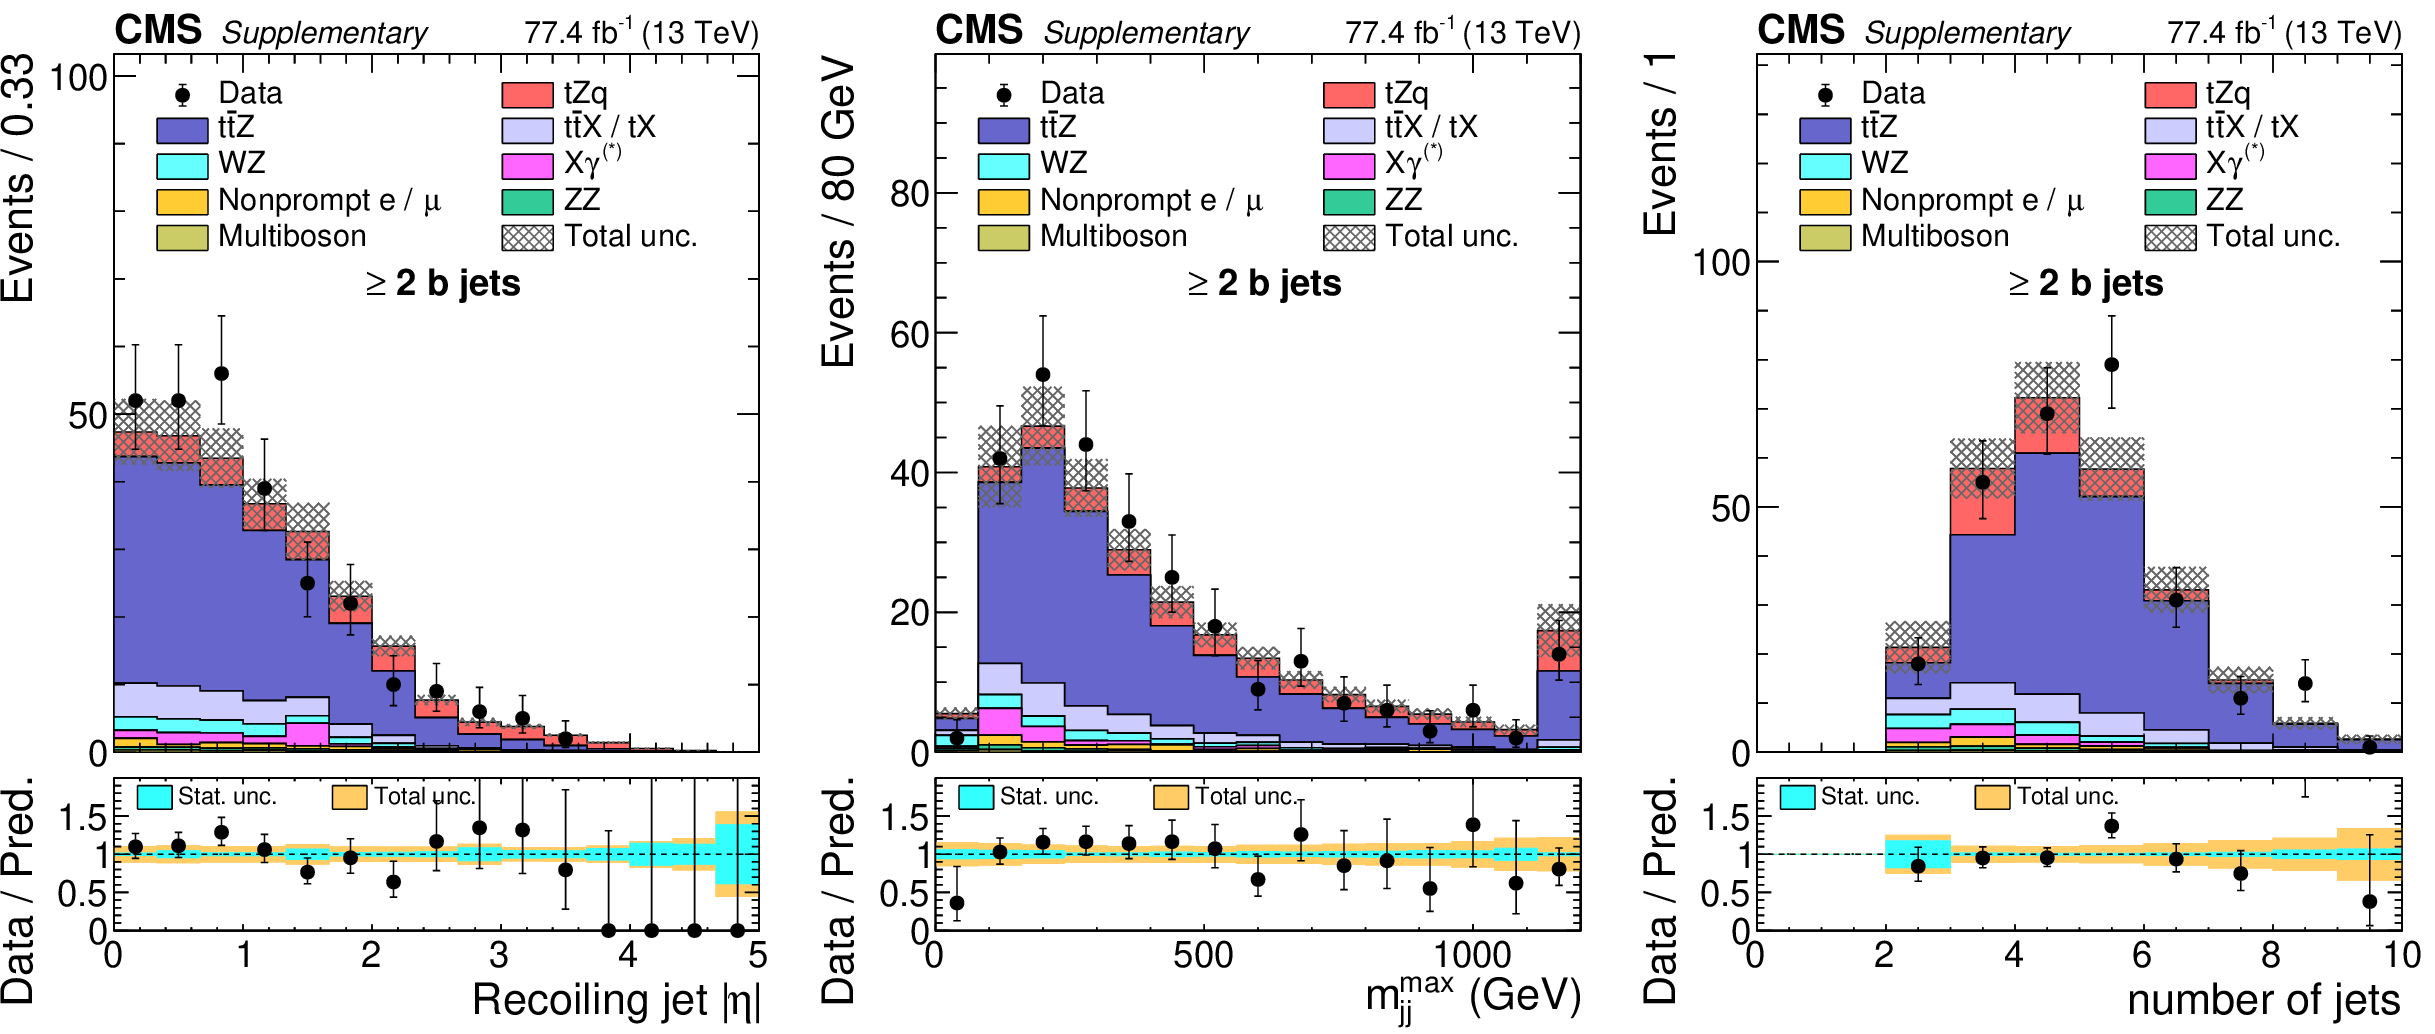
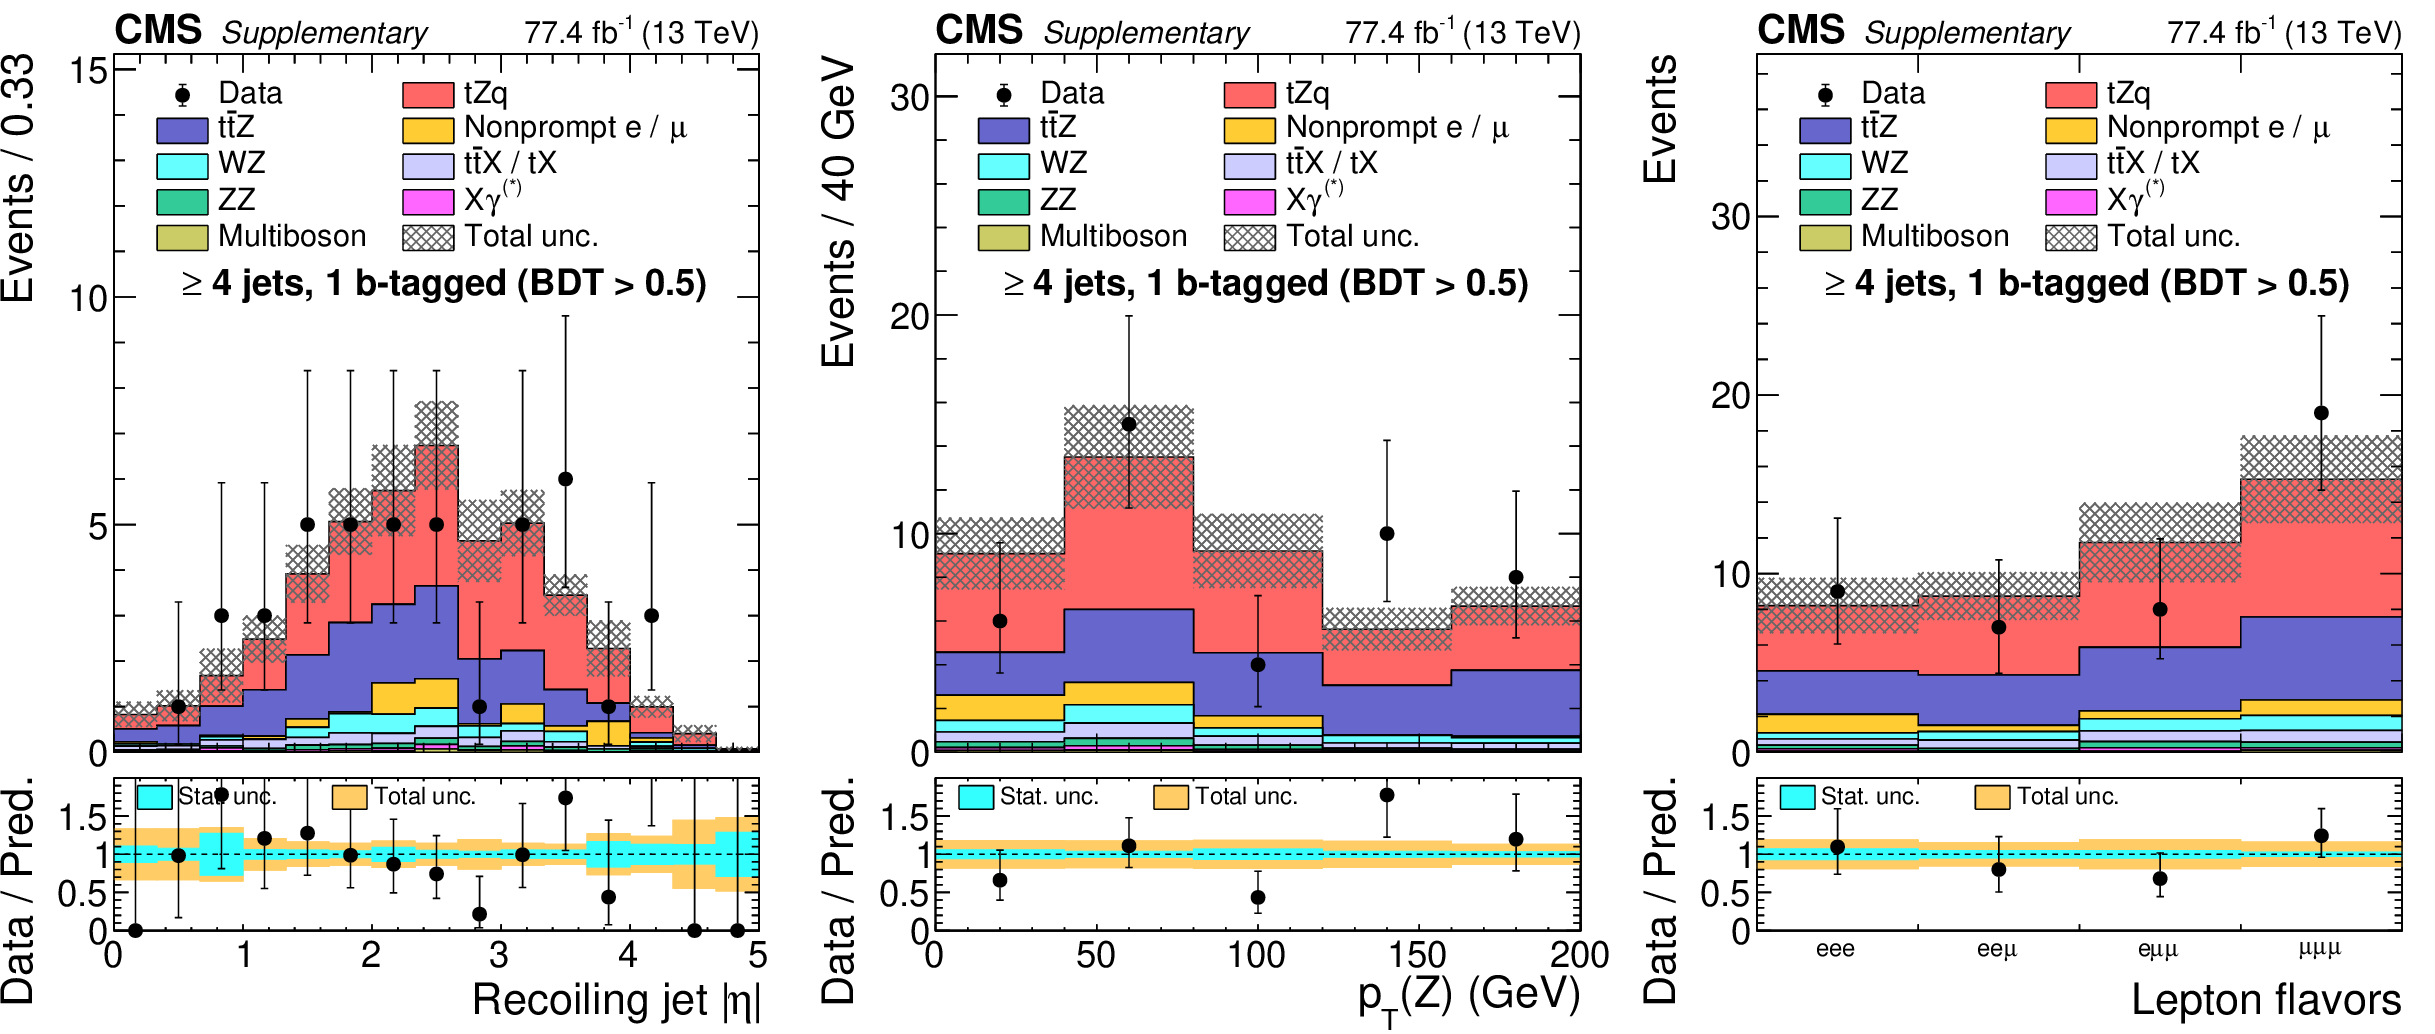
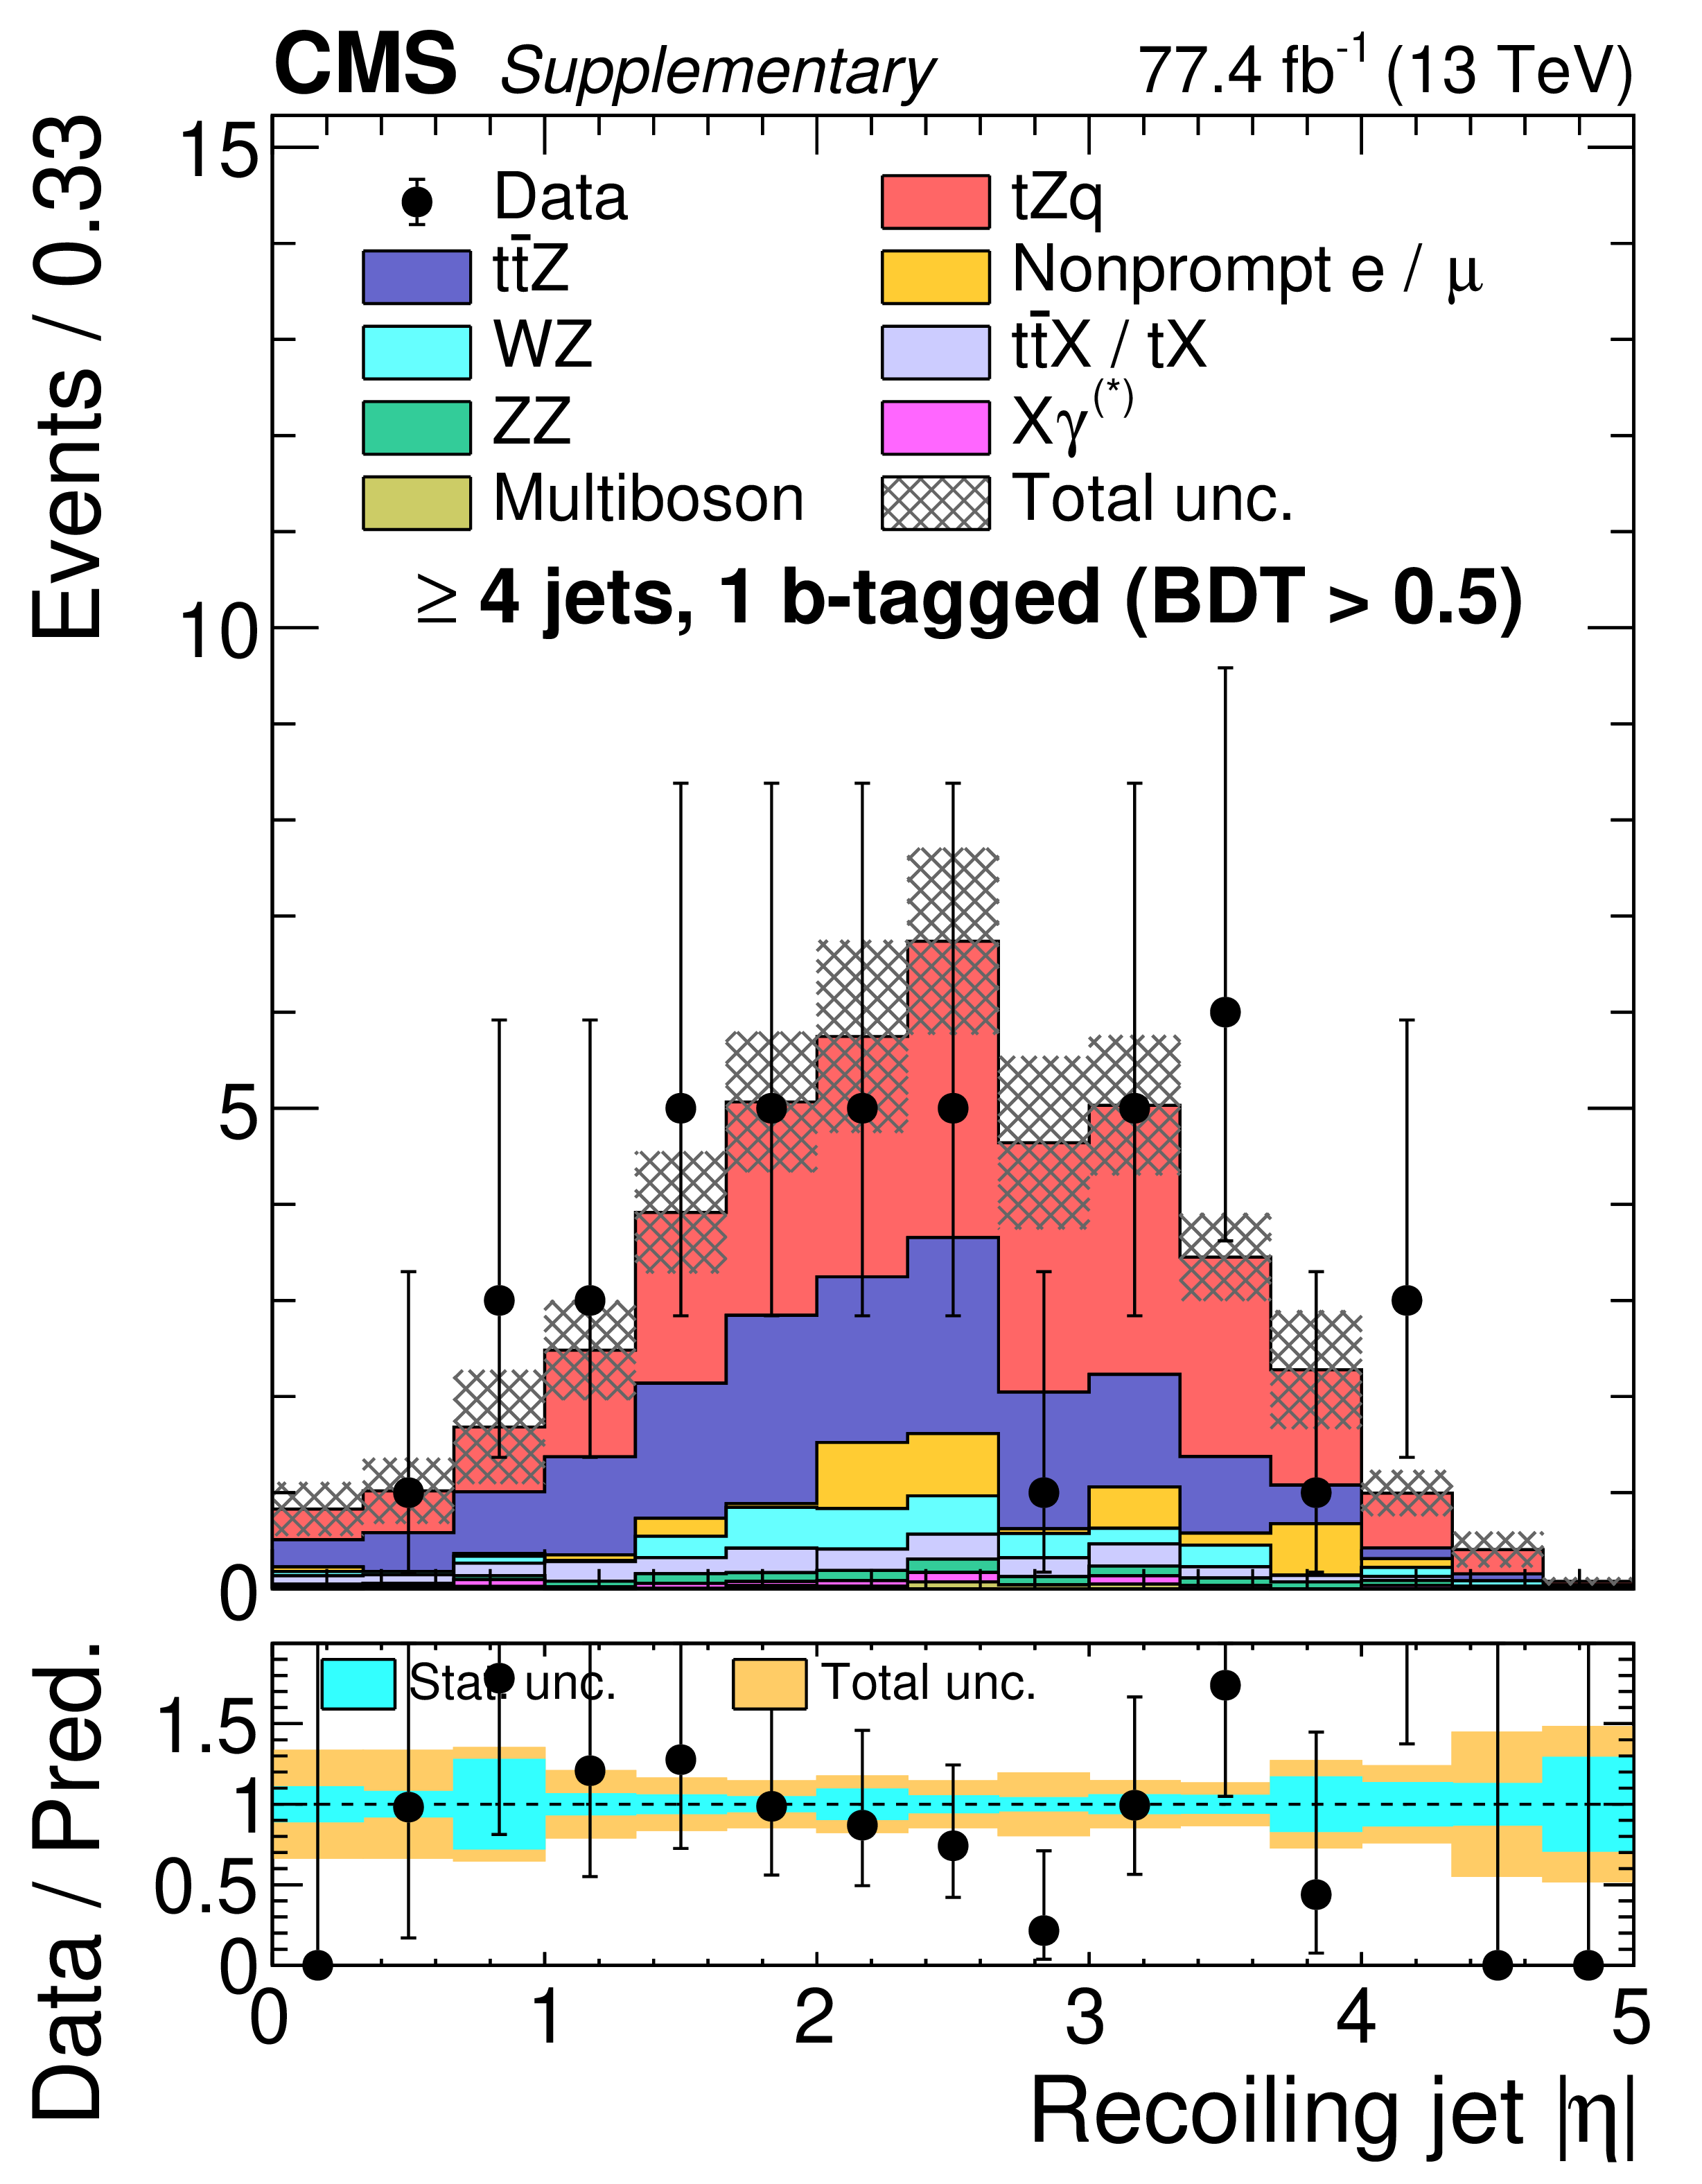
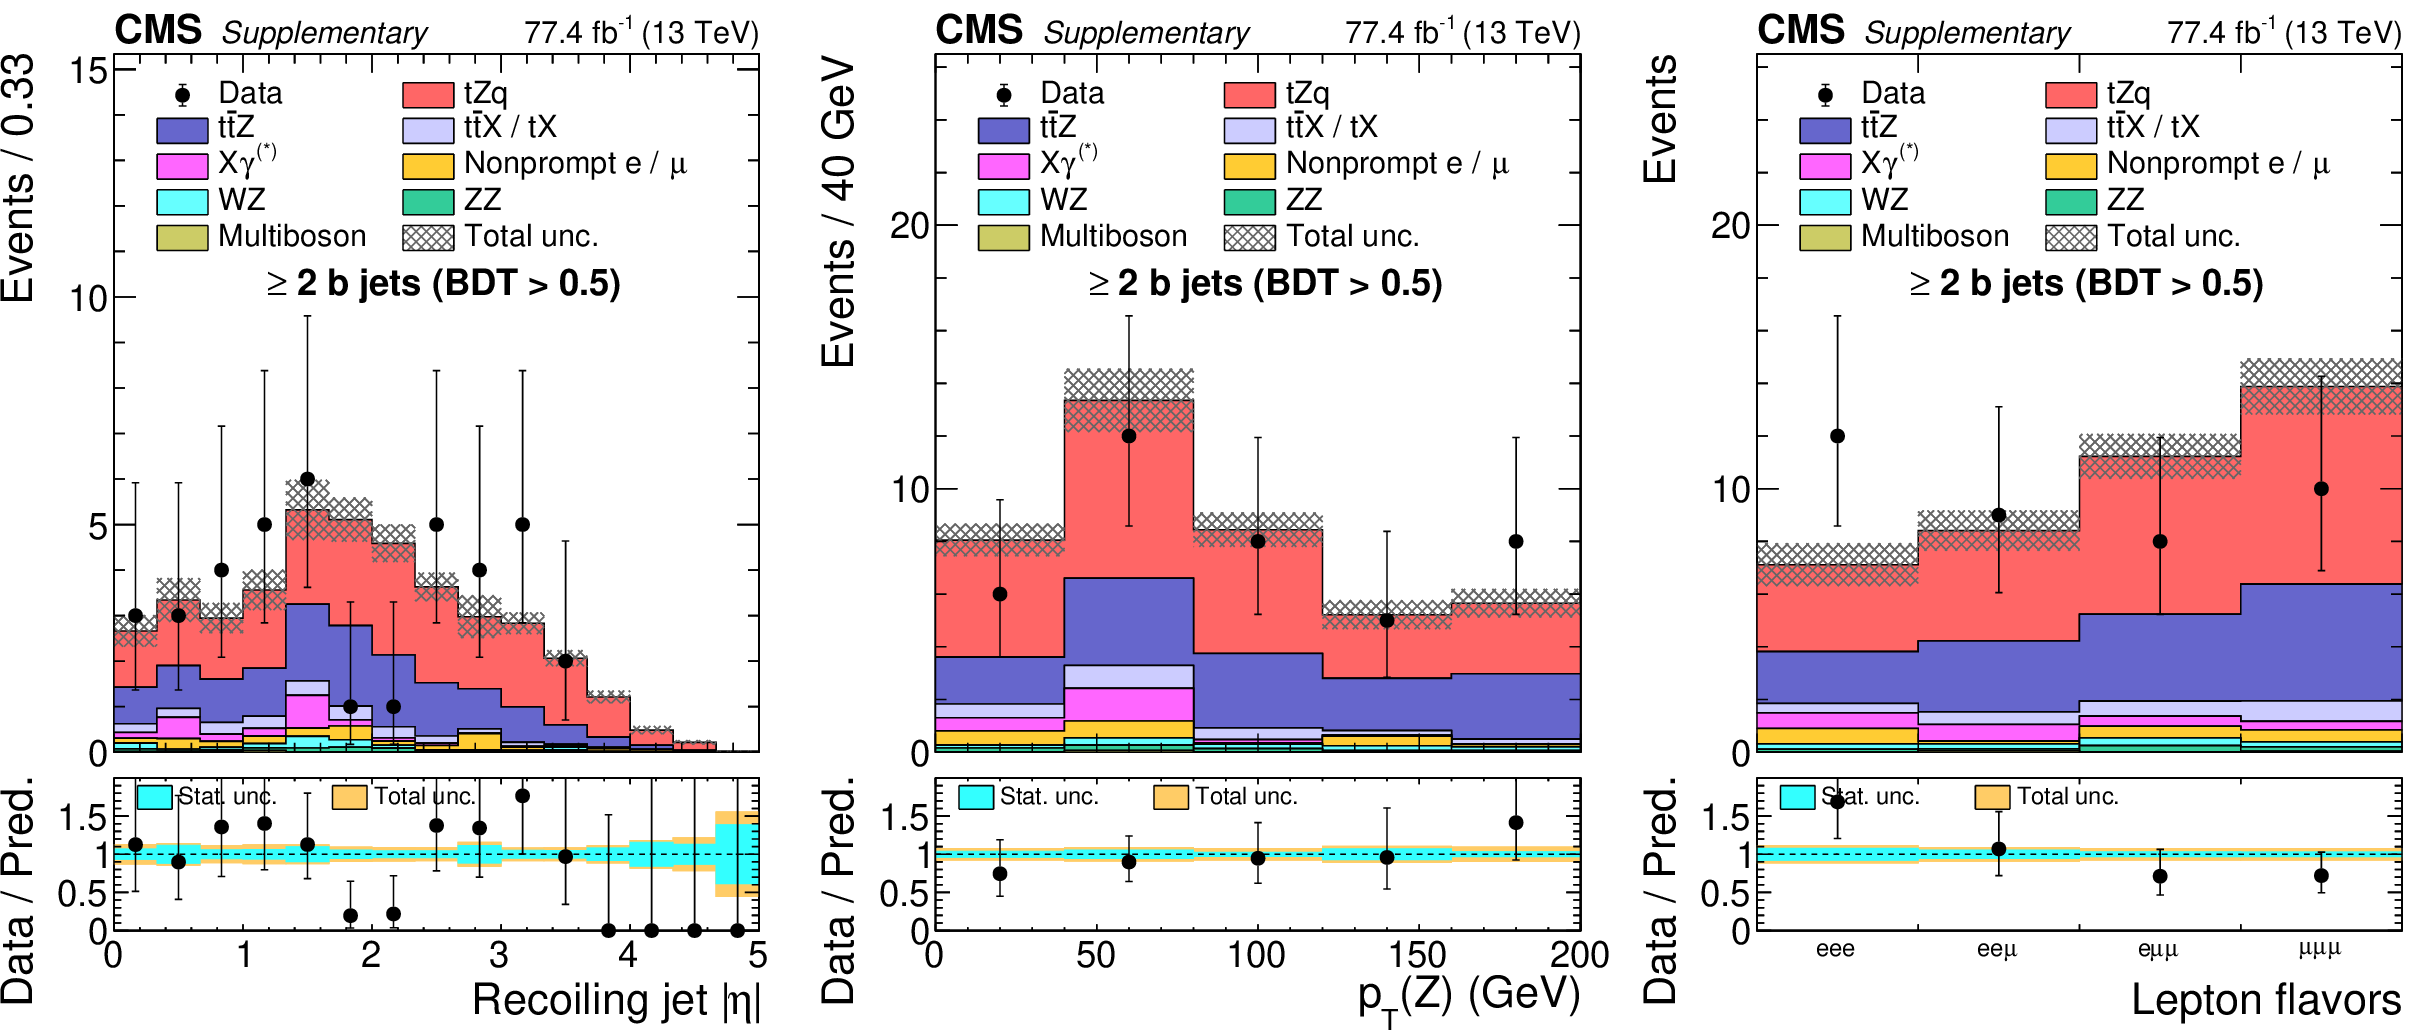
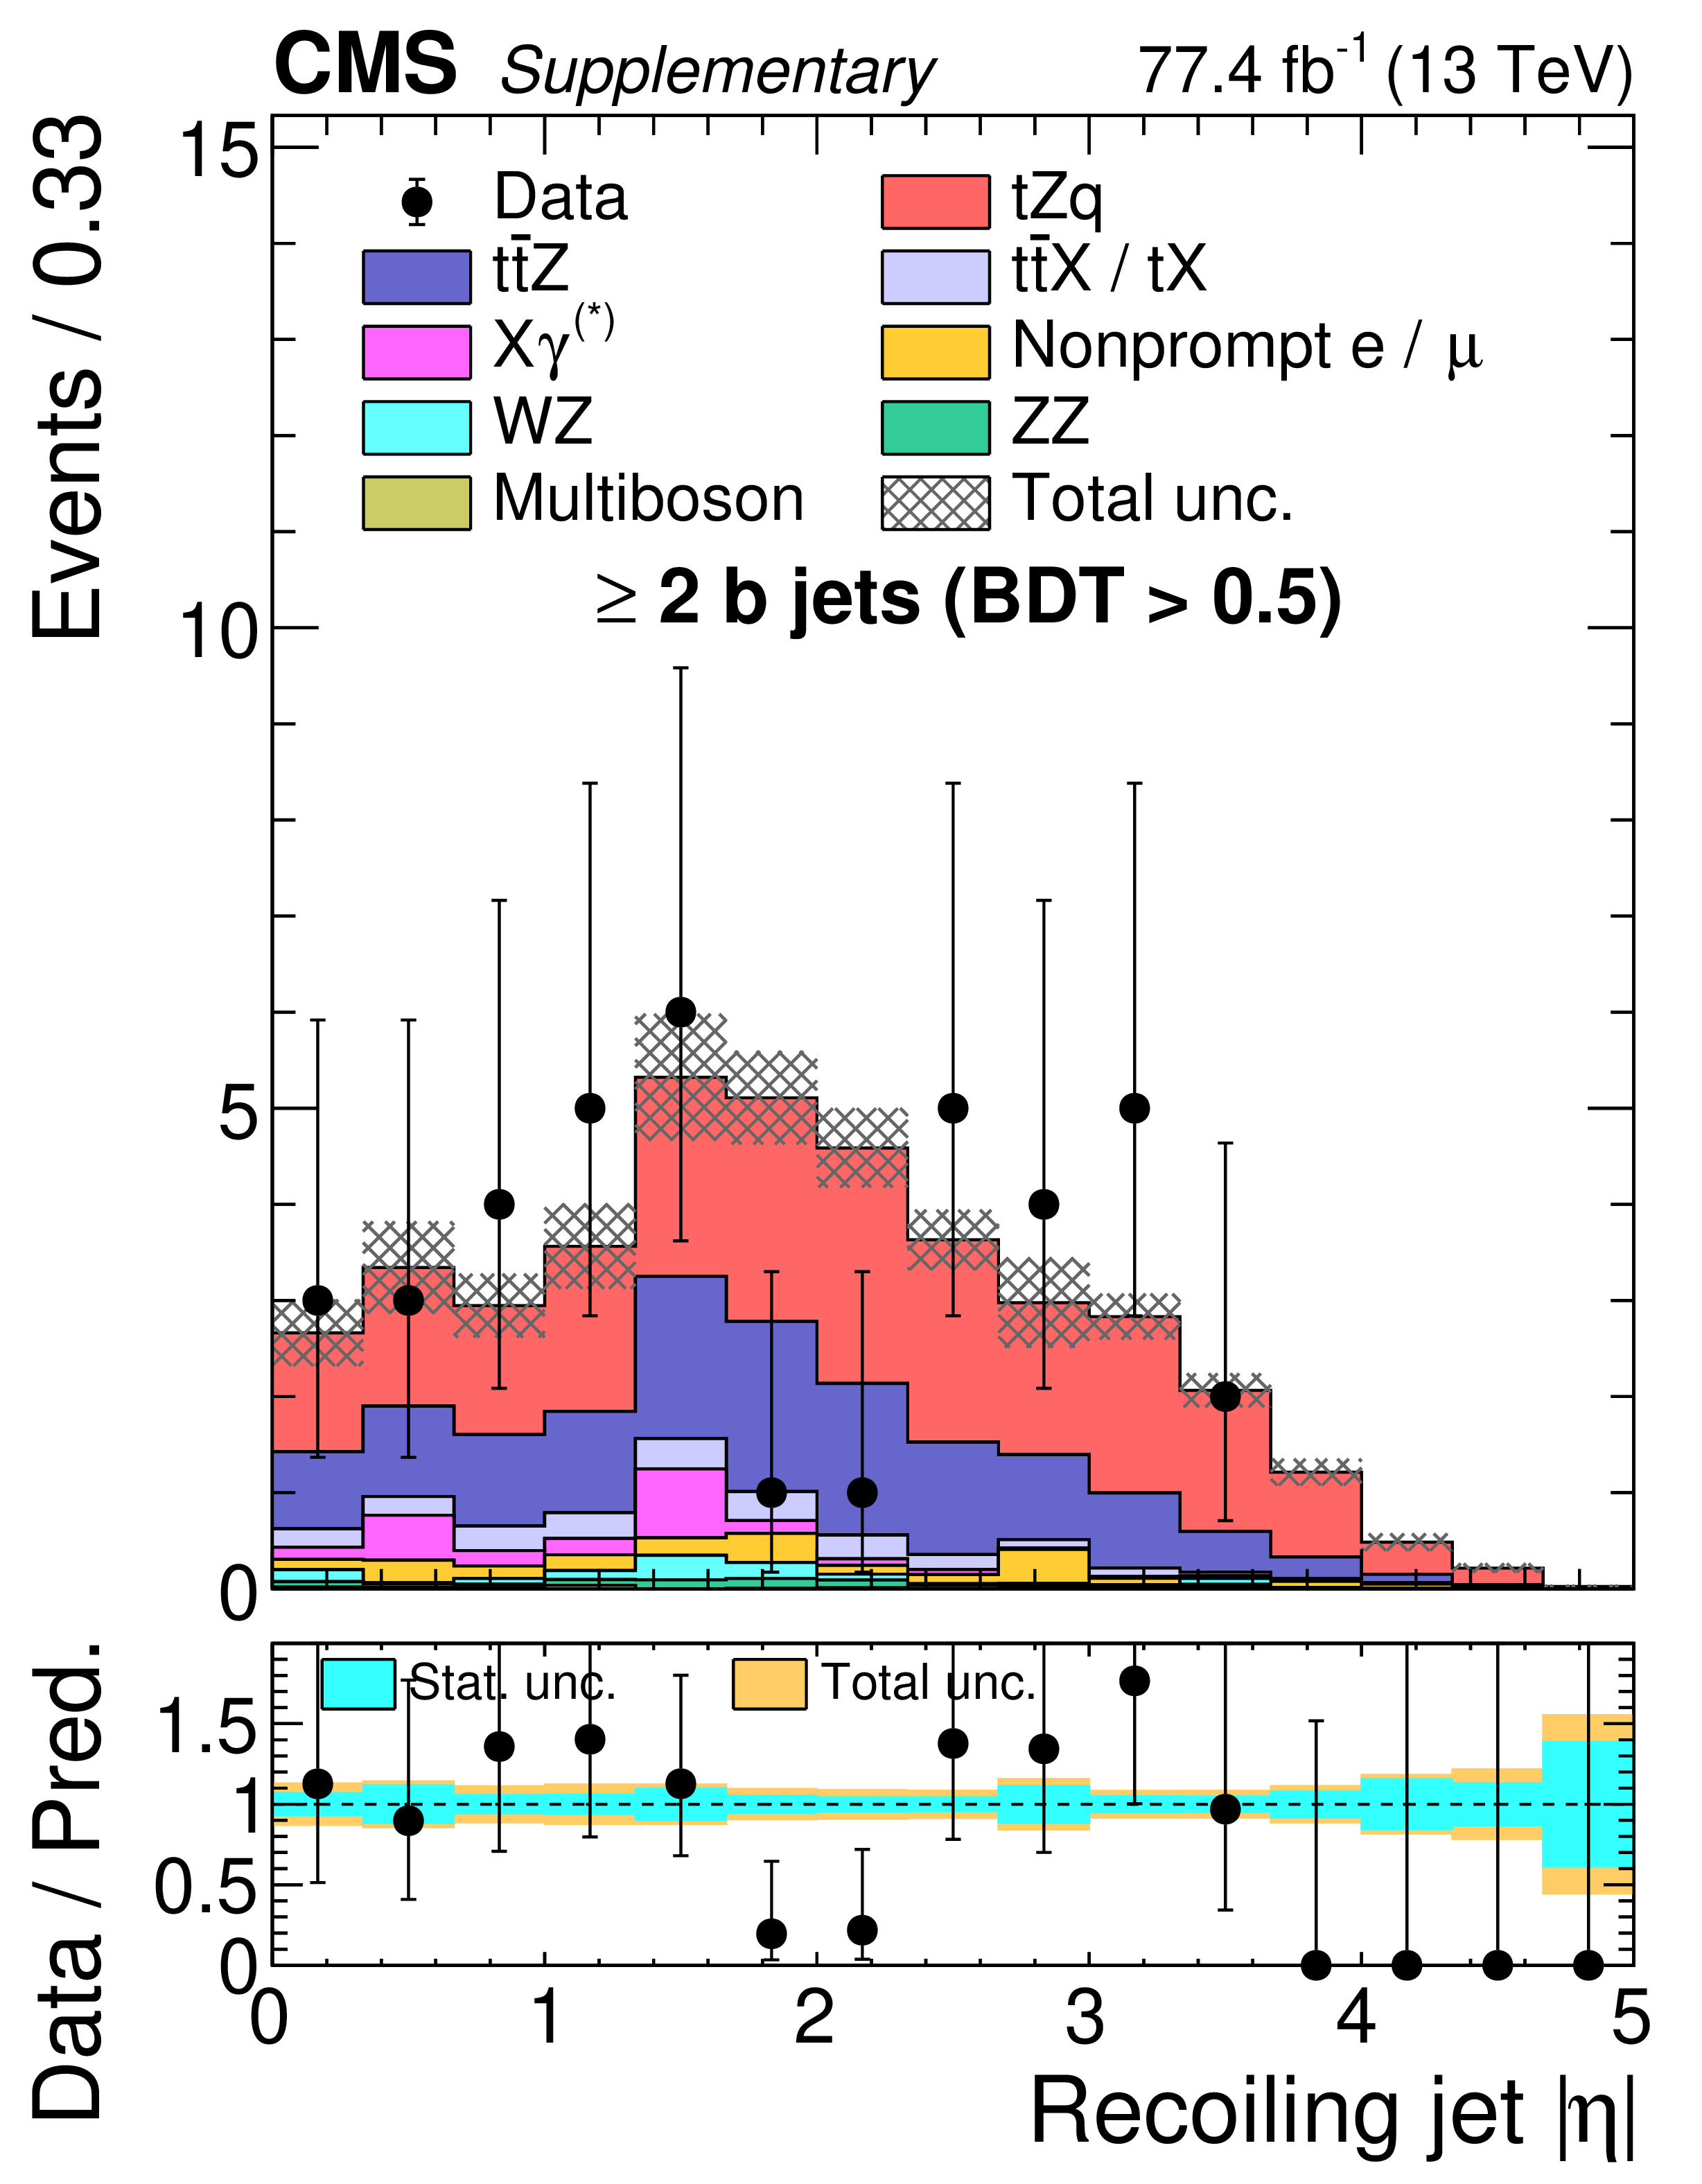
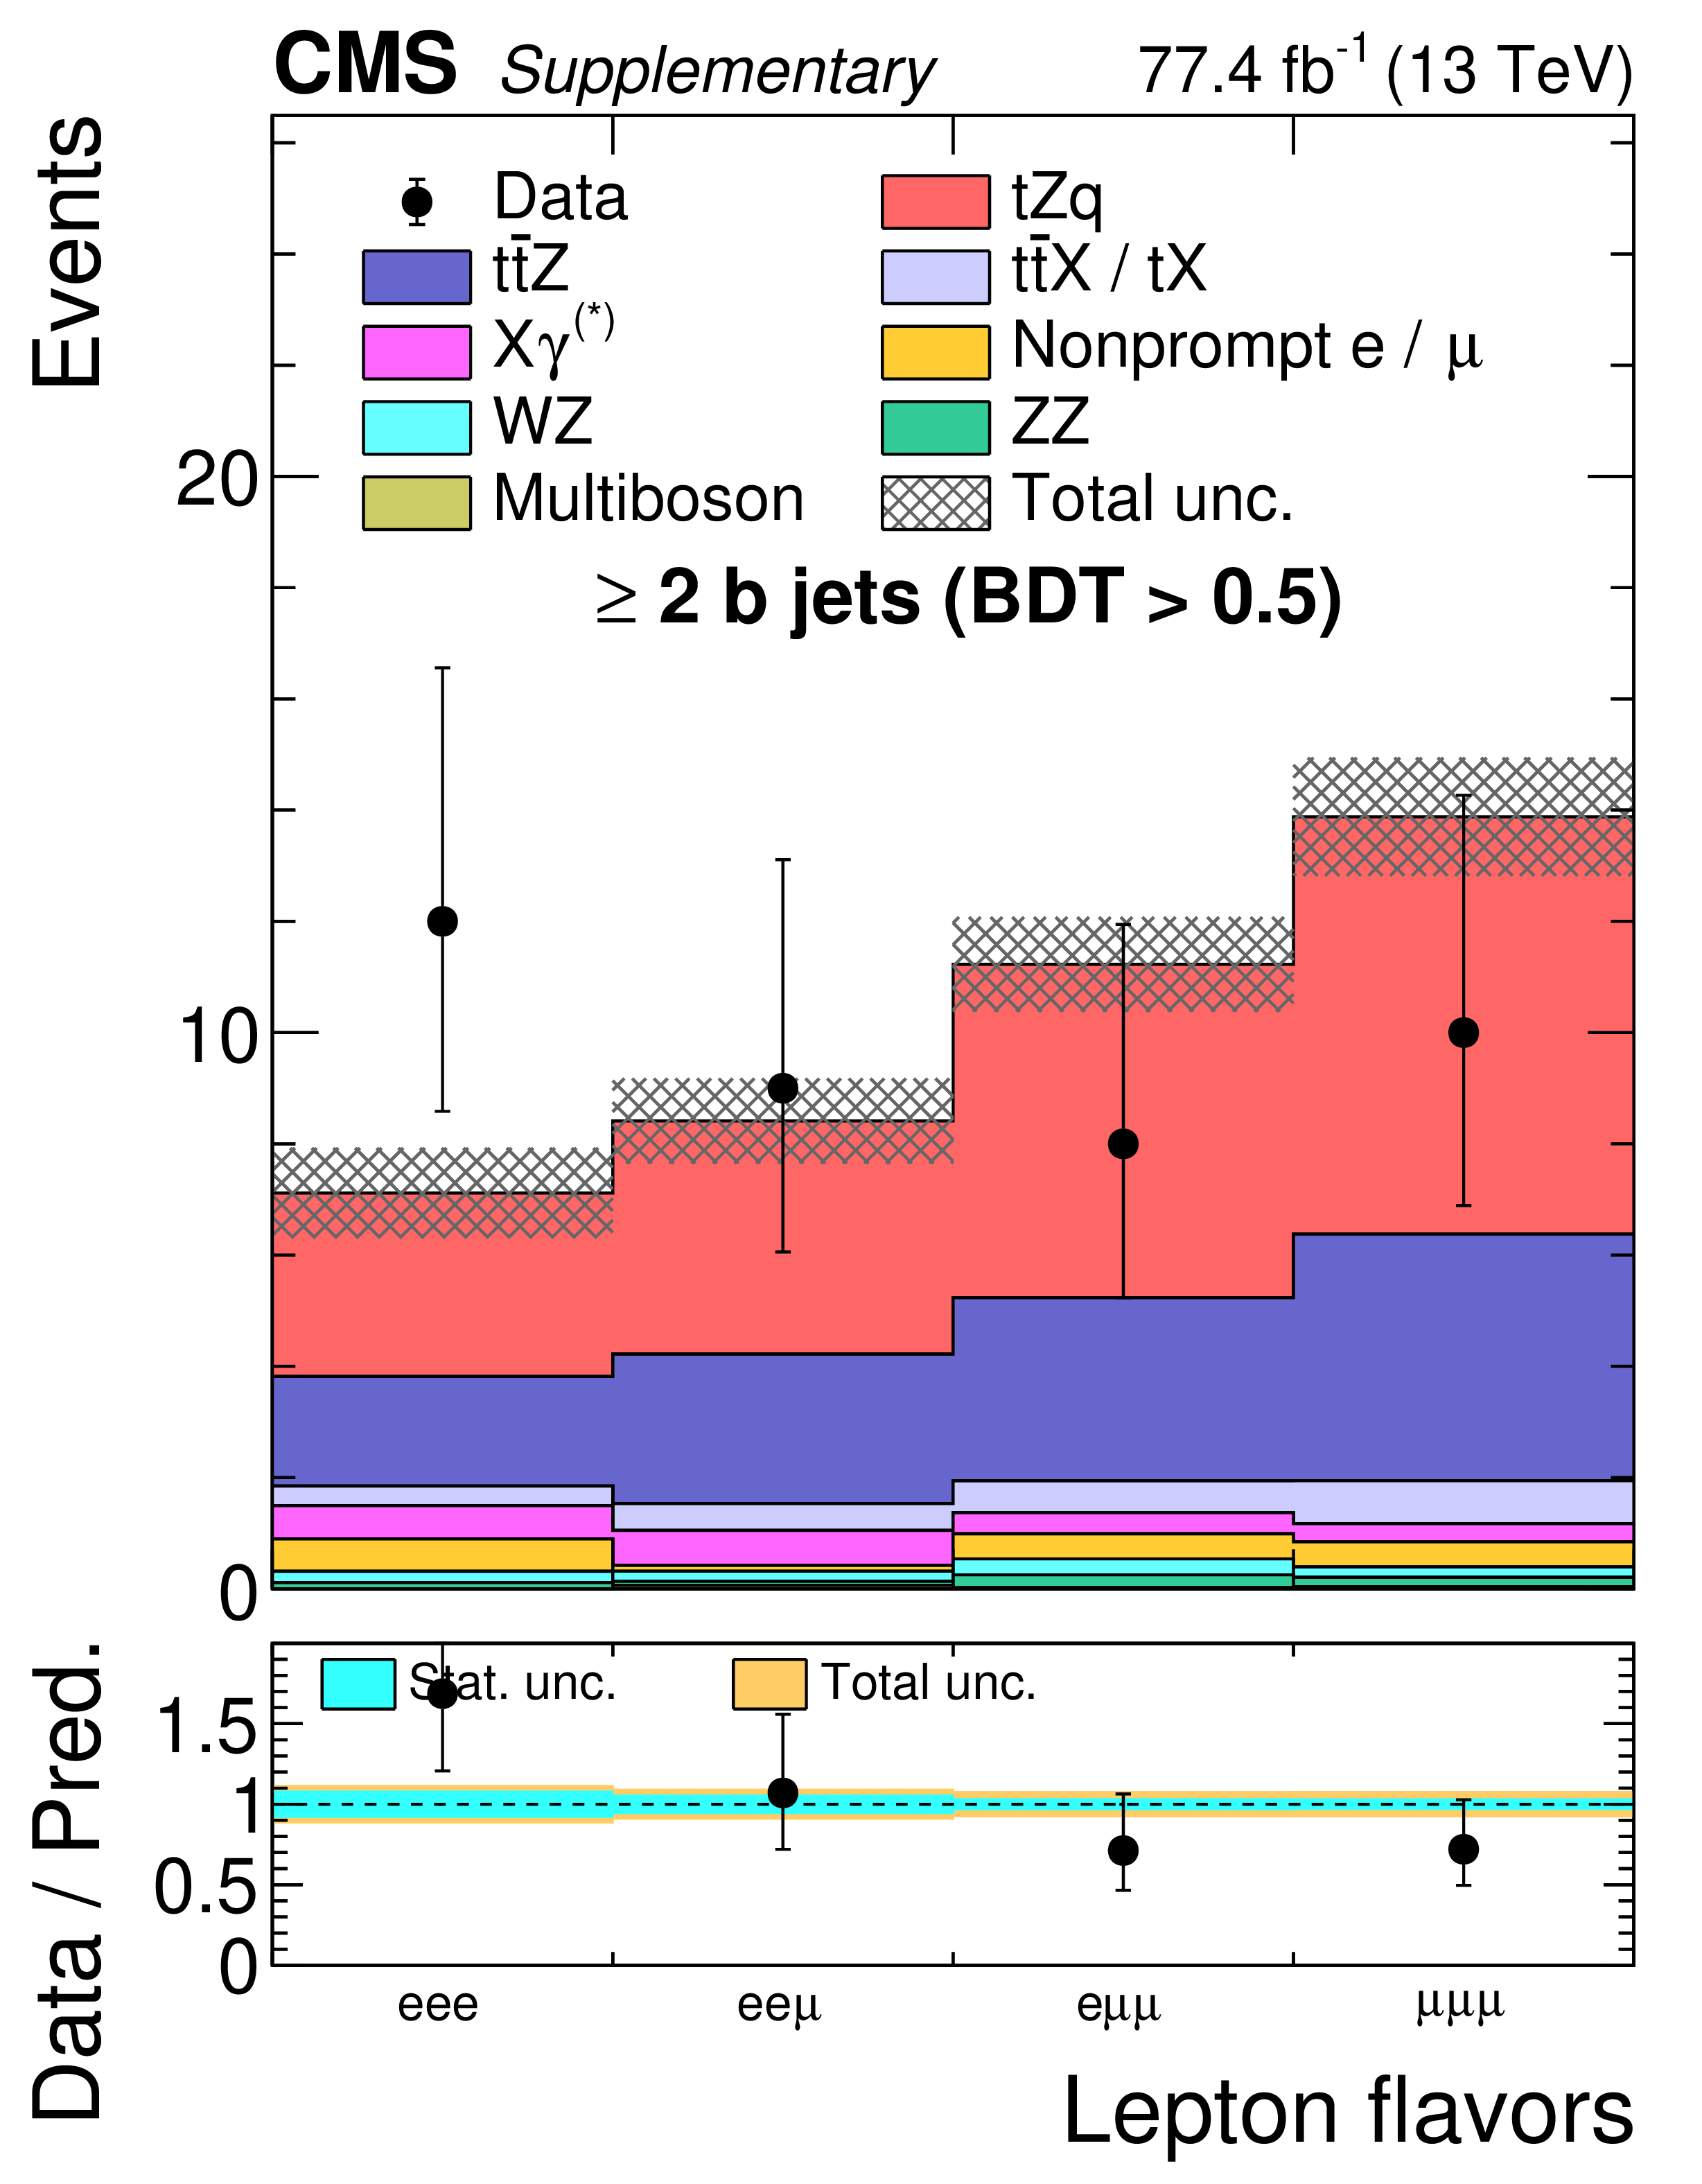
Figure A1:
Observed (points) and post-fit expected distributions (shaded histograms) in SR-2/3j-1b events for the two most discriminating variables used in the BDT discriminant, the maximum dijet invariant mass among all pairs of jets in the event (left), and the ${{| \eta |}}$ of the recoiling jet (middle). The right plot shows the ${p_{\mathrm {T}}}$ of the Z boson, reconstructed from its leptonic decay products, for events with BDT discriminant values in excess of 0.5 in SR-2/3j-1b. This observable is highly sensitive to the presence of new physics phenomena. The vertical bars on the points give the statistical uncertainty in data, and the hatched regions display the total uncertainty in the prediction. The lower panels display the ratio of the observed data to the predictions, including the ${\mathrm {t}} {\mathrm {Z}} {\mathrm {q}}$ signal, with inner and outer shaded bands, respectively, representing the statistical and total uncertainties in the predictions. |
png pdf |
Figure A1-a:
Observed (points) and post-fit expected distributions (shaded histograms) in SR-2/3j-1b events for the maximum dijet invariant mass among all pairs of jets in the event.The vertical bars on the points give the statistical uncertainty in data, and the hatched regions display the total uncertainty in the prediction. The lower panel displays the ratio of the observed data to the predictions, including the ${\mathrm {t}} {\mathrm {Z}} {\mathrm {q}}$ signal, with inner and outer shaded bands, respectively, representing the statistical and total uncertainties in the predictions. |
png pdf |
Figure A1-b:
Observed (points) and post-fit expected distributions (shaded histograms) in SR-2/3j-1b events for the ${{| \eta |}}$ of the recoiling jet. The vertical bars on the points give the statistical uncertainty in data, and the hatched regions display the total uncertainty in the prediction. The lower panel displays the ratio of the observed data to the predictions, including the ${\mathrm {t}} {\mathrm {Z}} {\mathrm {q}}$ signal, with inner and outer shaded bands, respectively, representing the statistical and total uncertainties in the predictions. |

png pdf |
Figure A1-c:
The plot shows the ${p_{\mathrm {T}}}$ of the Z boson, reconstructed from its leptonic decay products, for events with BDT discriminant values in excess of 0.5 in SR-2/3j-1b. This observable is highly sensitive to the presence of new physics phenomena. The vertical bars on the points give the statistical uncertainty in data, and the hatched regions display the total uncertainty in the prediction. The lower panel displays the ratio of the observed data to the predictions, including the ${\mathrm {t}} {\mathrm {Z}} {\mathrm {q}}$ signal, with inner and outer shaded bands, respectively, representing the statistical and total uncertainties in the predictions. |
png pdf |
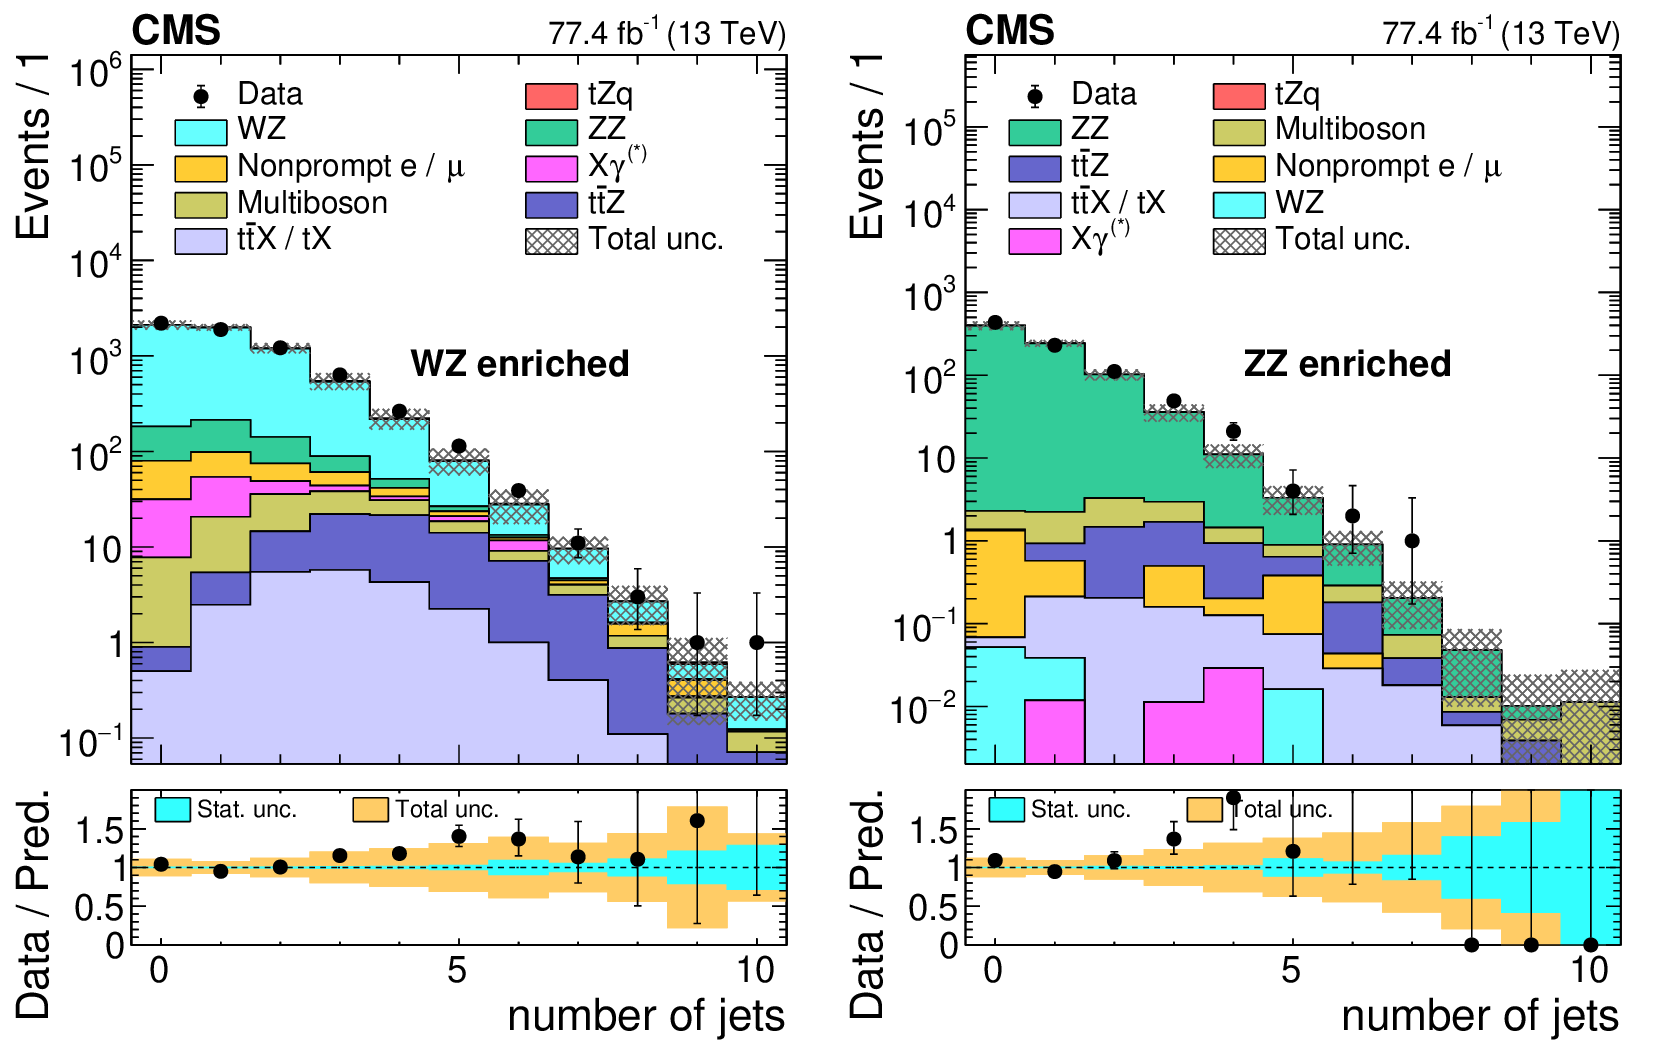
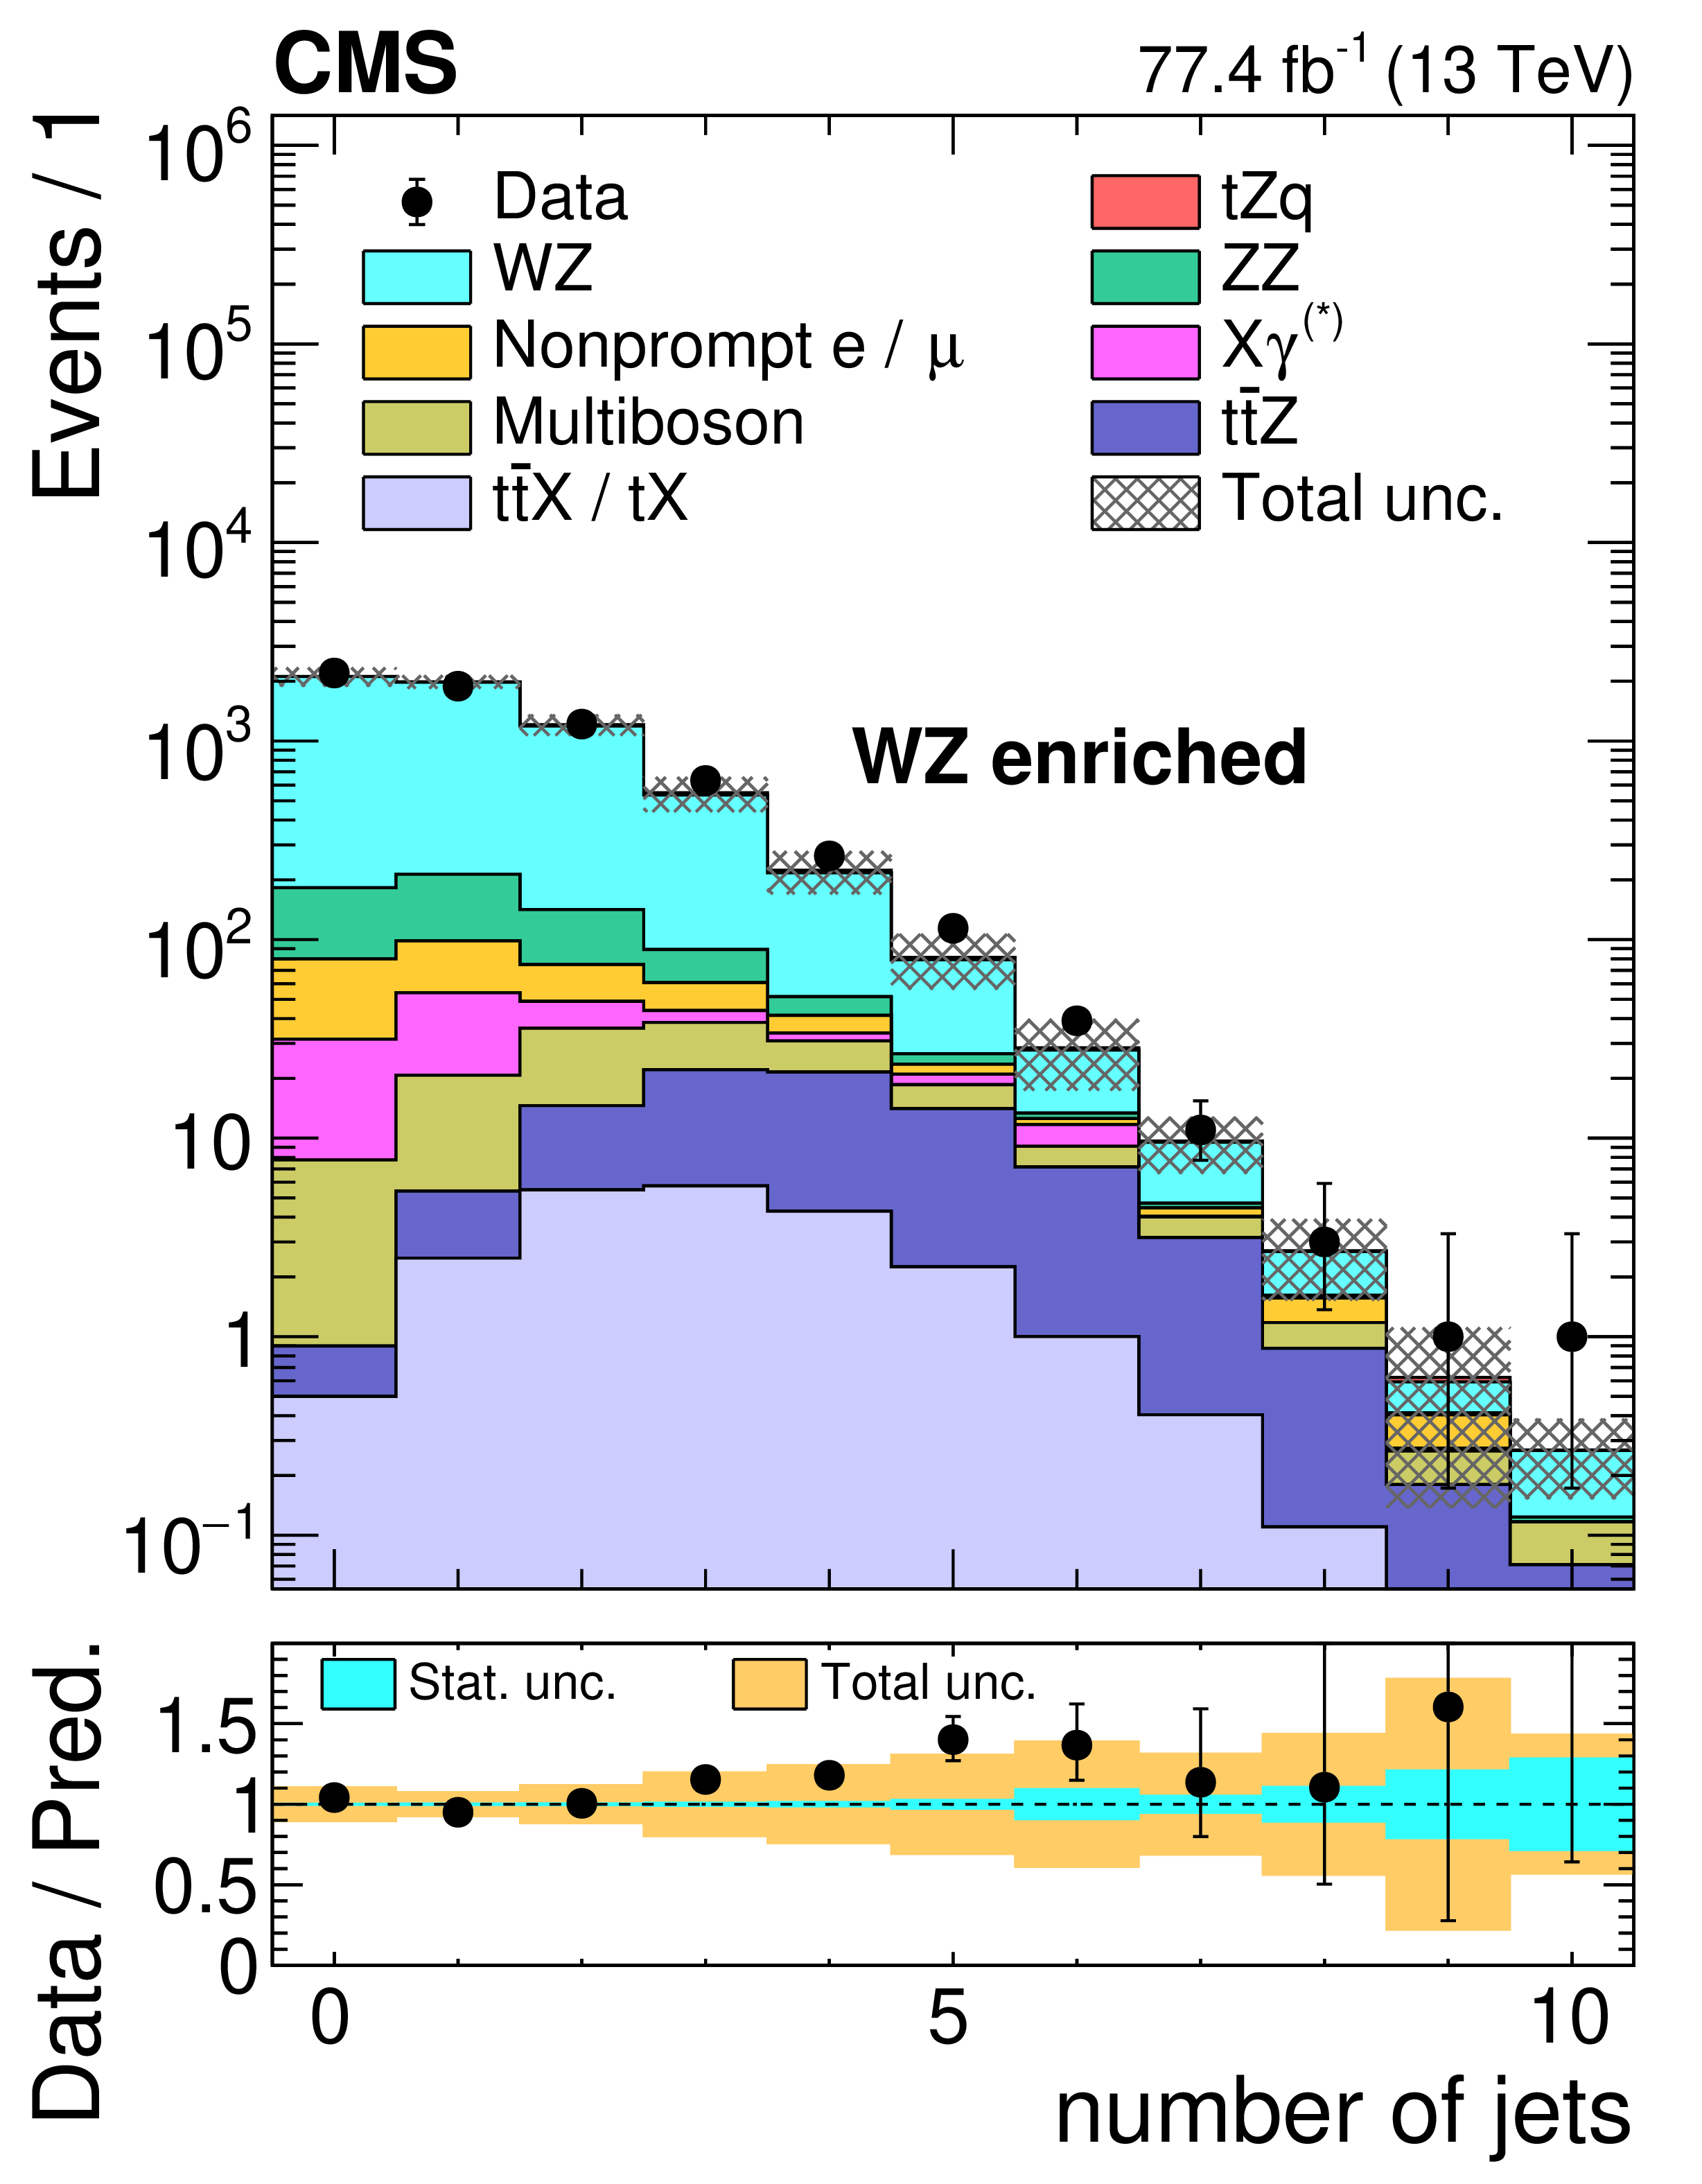
Figure A2:
Observed (points) and pre-fit expected distributions (shaded histograms) of the number of jets in the event for the WZ (left), and ZZ (right) control regions. The vertical bars on the points give the statistical uncertainty in data, and the hatched regions display the total uncertainty in the prediction. The lower panels display the ratio of the observed data to the predictions, including the tZq signal, with inner and outer shaded bands, respectively, representing the statistical and total uncertainties in the predictions. |
png pdf |
Figure A2-a:
Observed (points) and pre-fit expected distributions (shaded histograms) of the number of jets in the event for the WZ control region. The vertical bars on the points give the statistical uncertainty in data, and the hatched regions display the total uncertainty in the prediction. The lower panel displays the ratio of the observed data to the predictions, including the tZq signal, with inner and outer shaded bands, respectively, representing the statistical and total uncertainties in the predictions. |

png pdf |
Figure A2-b:
Observed (points) and pre-fit expected distributions (shaded histograms) of the number of jets in the event for the ZZ control region. The vertical bars on the points give the statistical uncertainty in data, and the hatched regions display the total uncertainty in the prediction. The lower panel displays the ratio of the observed data to the predictions, including the tZq signal, with inner and outer shaded bands, respectively, representing the statistical and total uncertainties in the predictions. |
| Tables | |
png pdf |
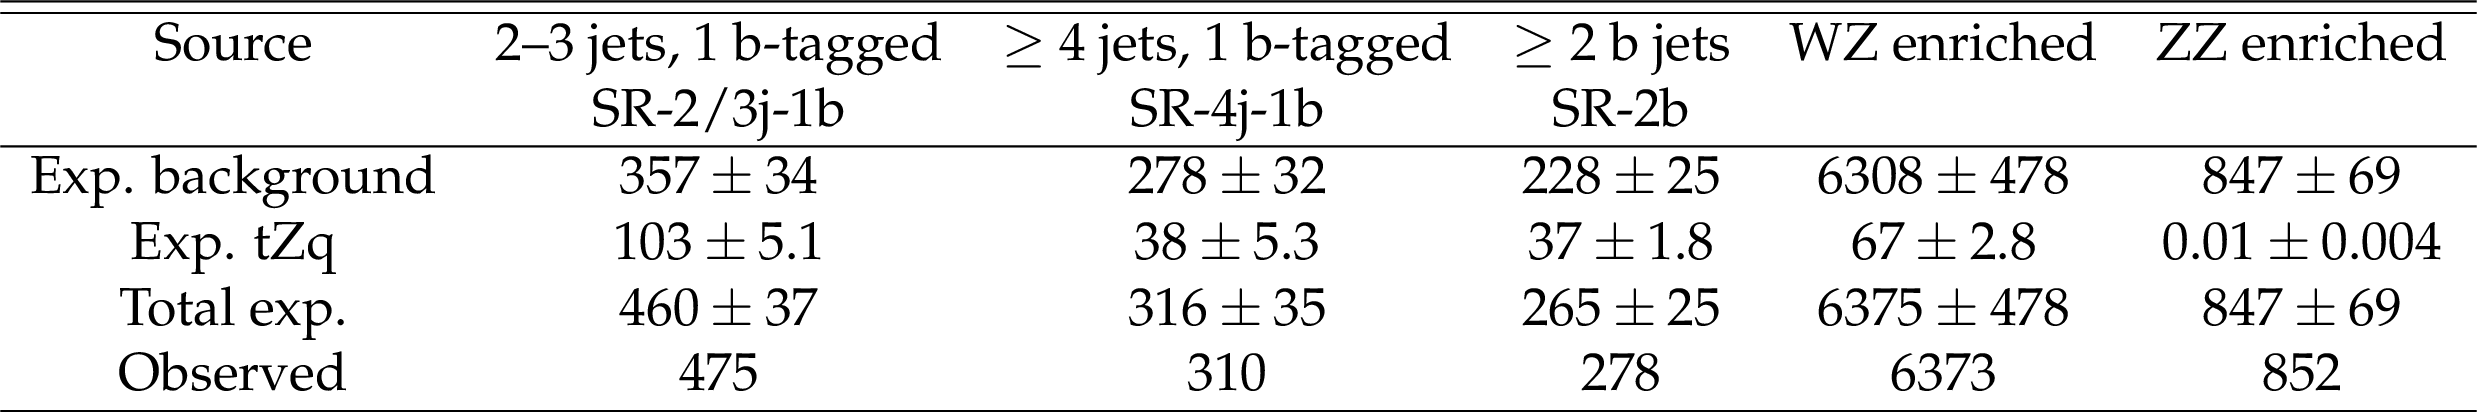
Table A1:
Post-fit expected background and ${\mathrm {t}} {\mathrm {Z}} {\mathrm {q}}$ signal event yields with their total uncertainties, and observed number of events in data in each of the signal regions. |
png pdf |
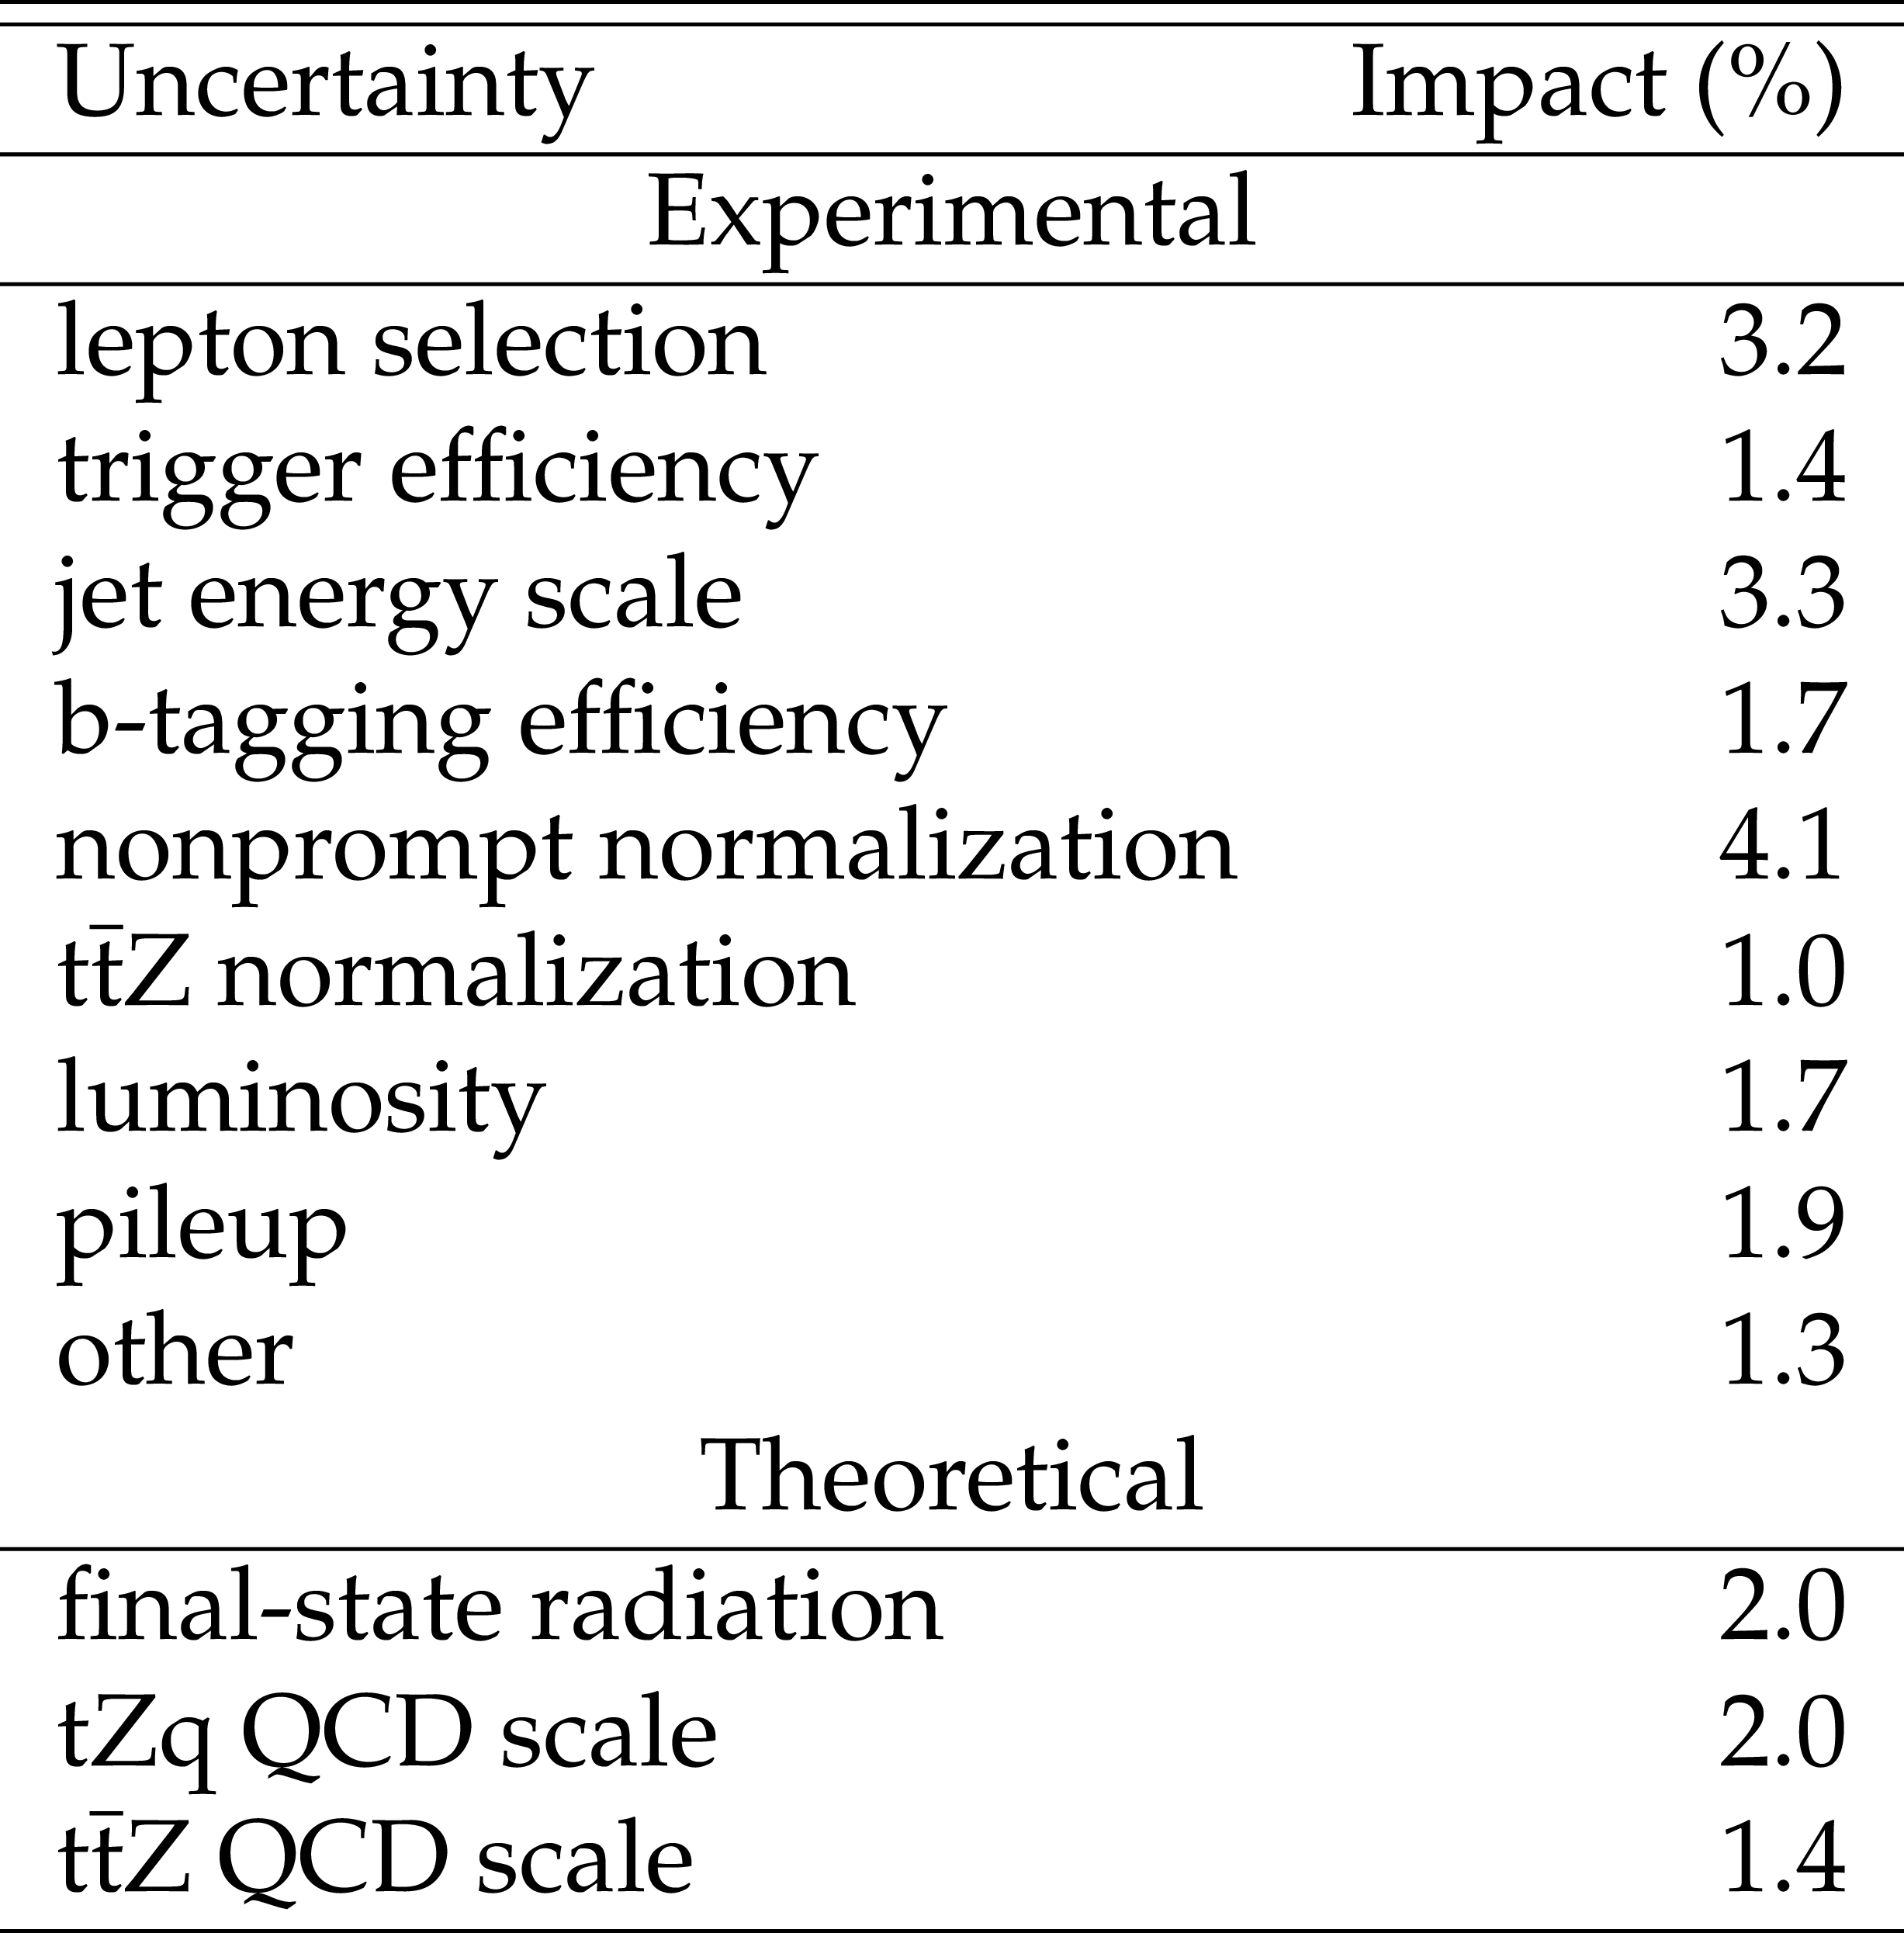
Table A2:
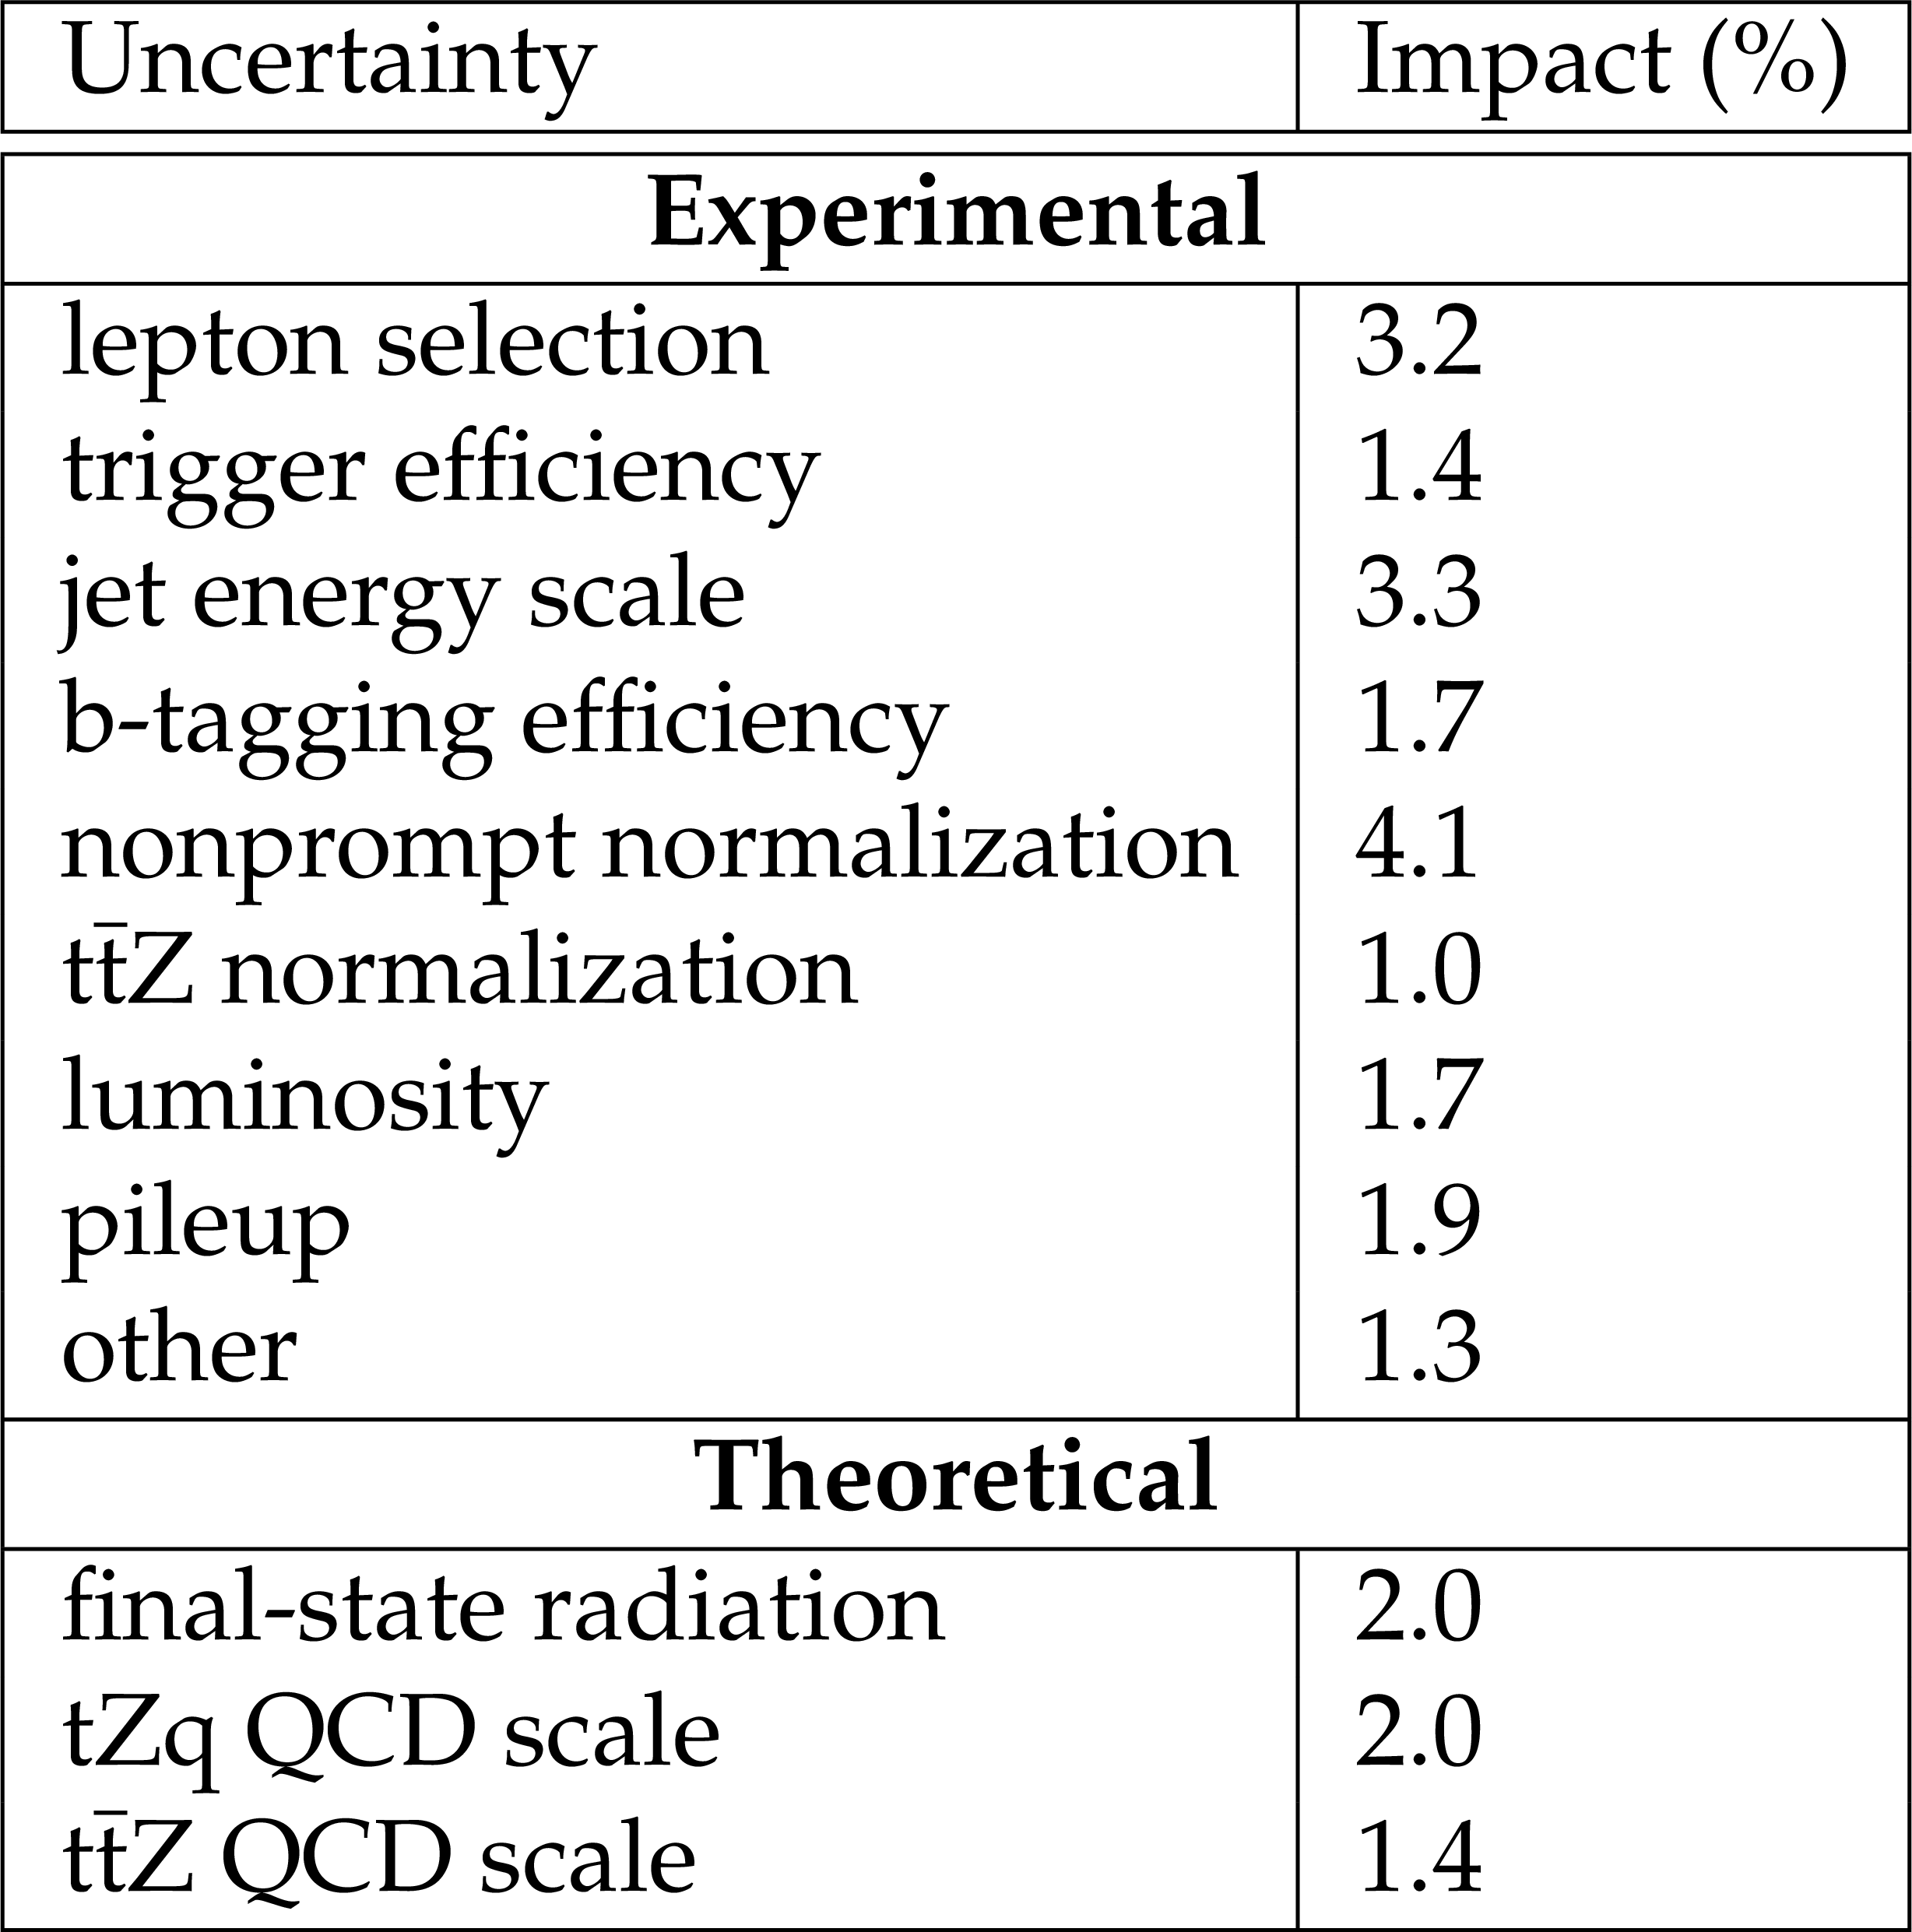
Average impact on the measured tZq signal strength for major sources of systematic uncertainty. The impact of a particular nuisance parameter on the signal strength is computed by shifting the nuisance parameter by one standard deviation up and down from its post-fit value and recomputing the signal strength. All other nuisances are profiled as in the nominal fit when doing this computation. |
| Summary |
| In summary, we have reported the observation of single top quark production in association with a Z boson and a quark, $\mathrm{t Z q} $, using the leptonic $\mathrm{t Z q} $ decay mode. The $\mathrm{t Z q} $ signal is observed with a significance of well over five standard deviations. The $\mathrm{t Z q} $ production cross section is measured to be $\sigma(\mathrm{pp} \to \mathrm{t Z q} \to \mathrm{t} \ell^{+} \ell^{-} \mathrm{q}) =$ 111 $\pm$ 13 (stat) $ _{-9}^{+11}$ (syst) fb, where $\ell$ refers to an electron, muon, or $\tau$ lepton, for dilepton invariant masses in excess of 30 GeV, in agreement with the standard model prediction. |
| Additional Figures | |
png pdf |
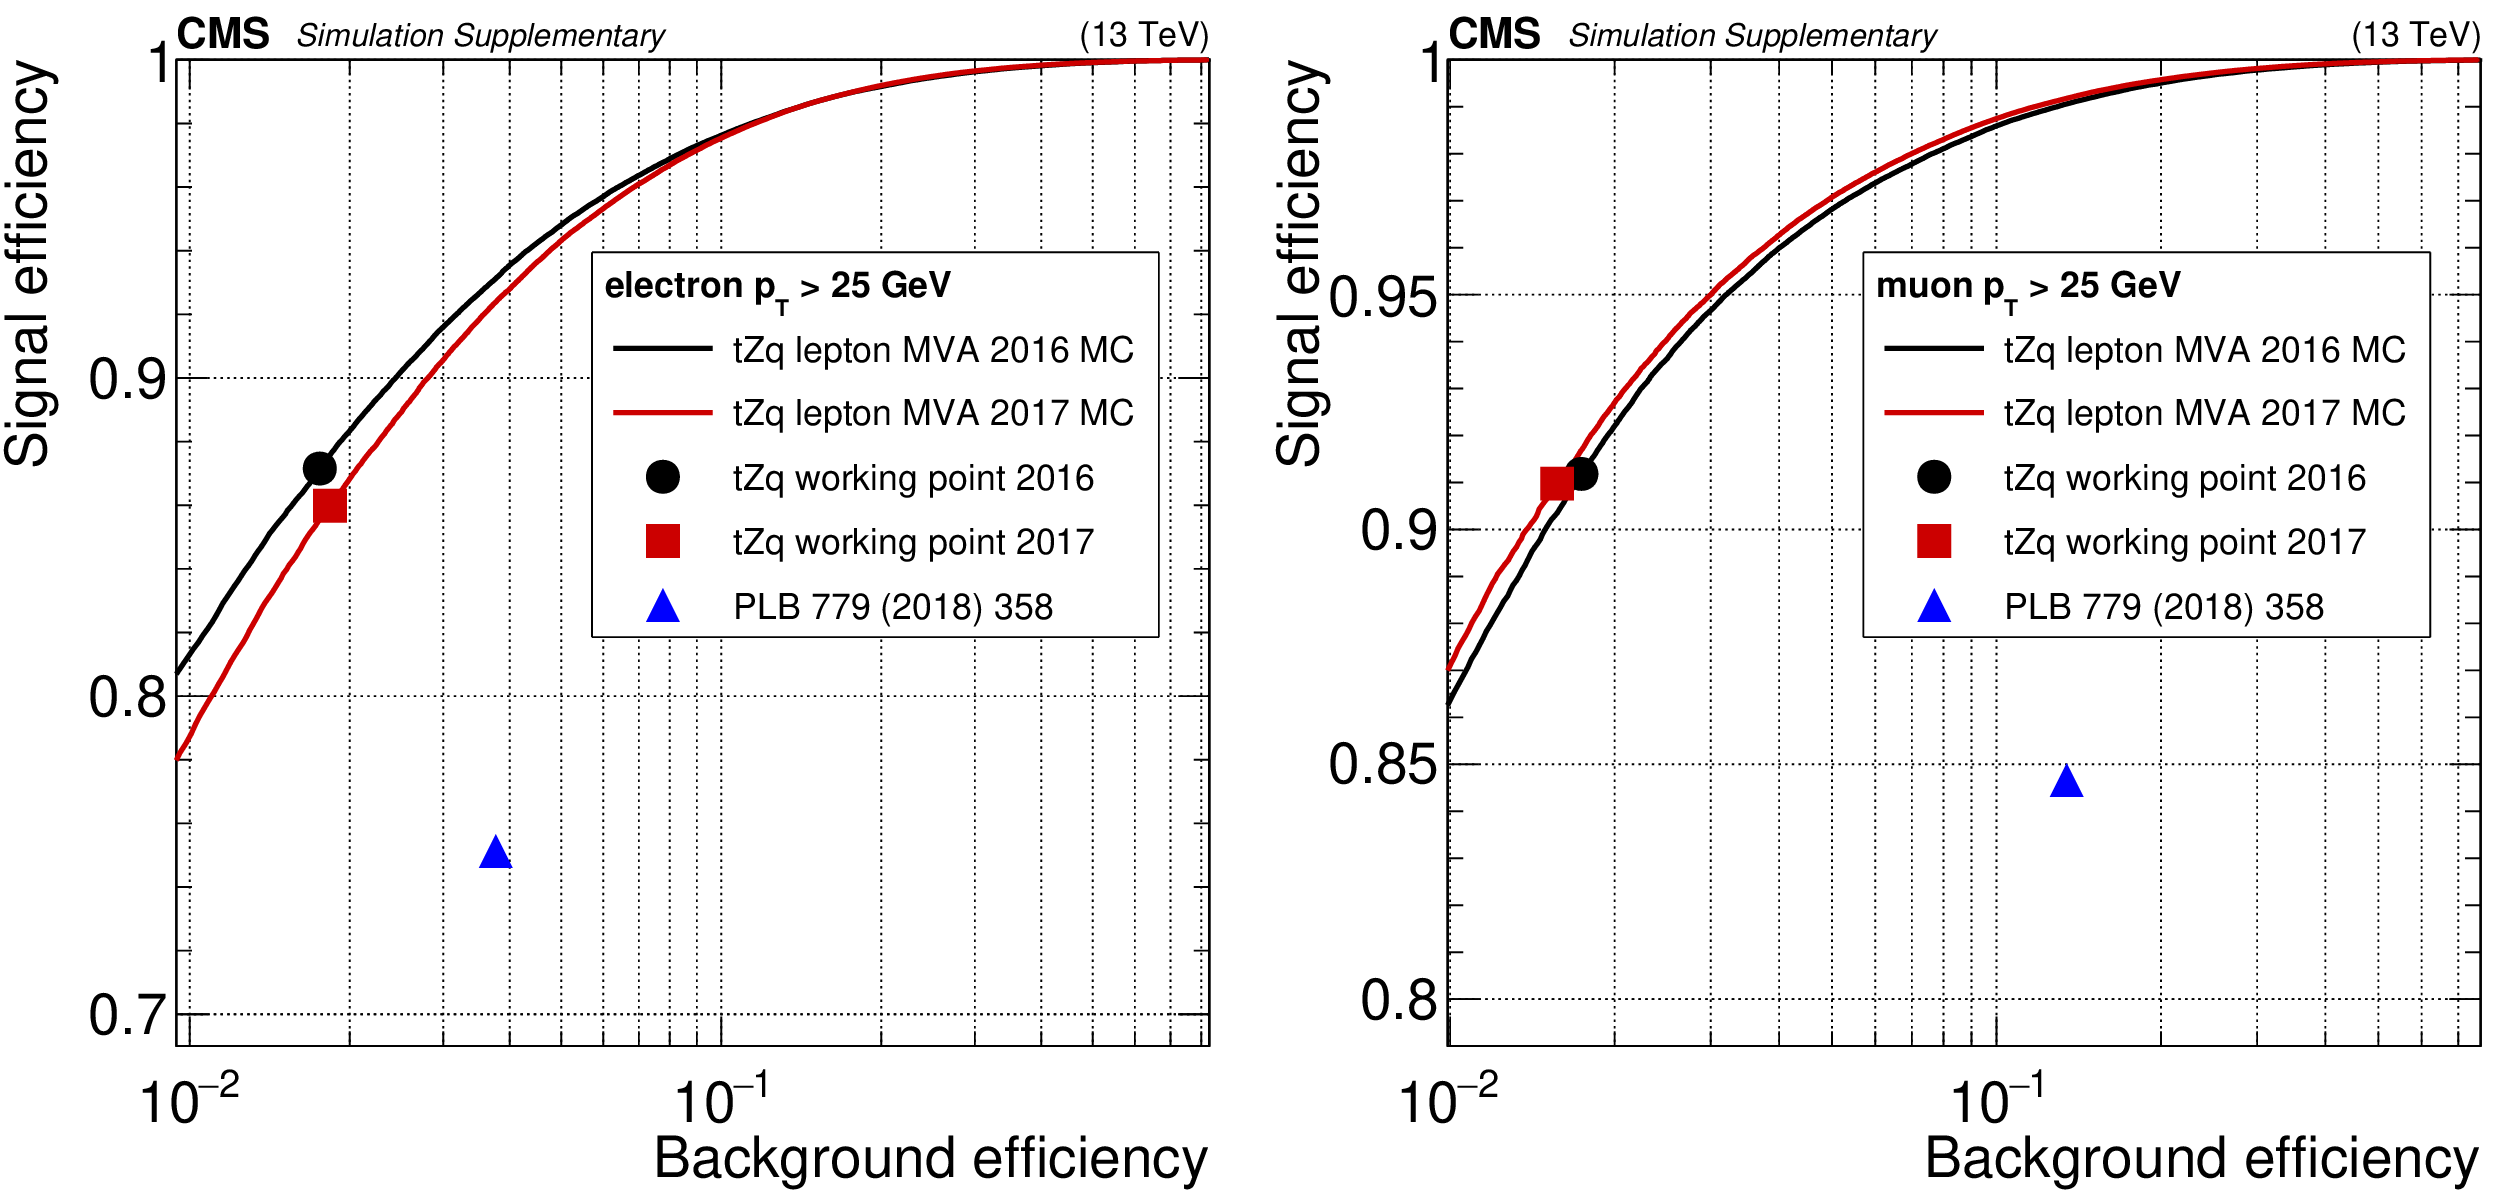
Additional Figure 1:
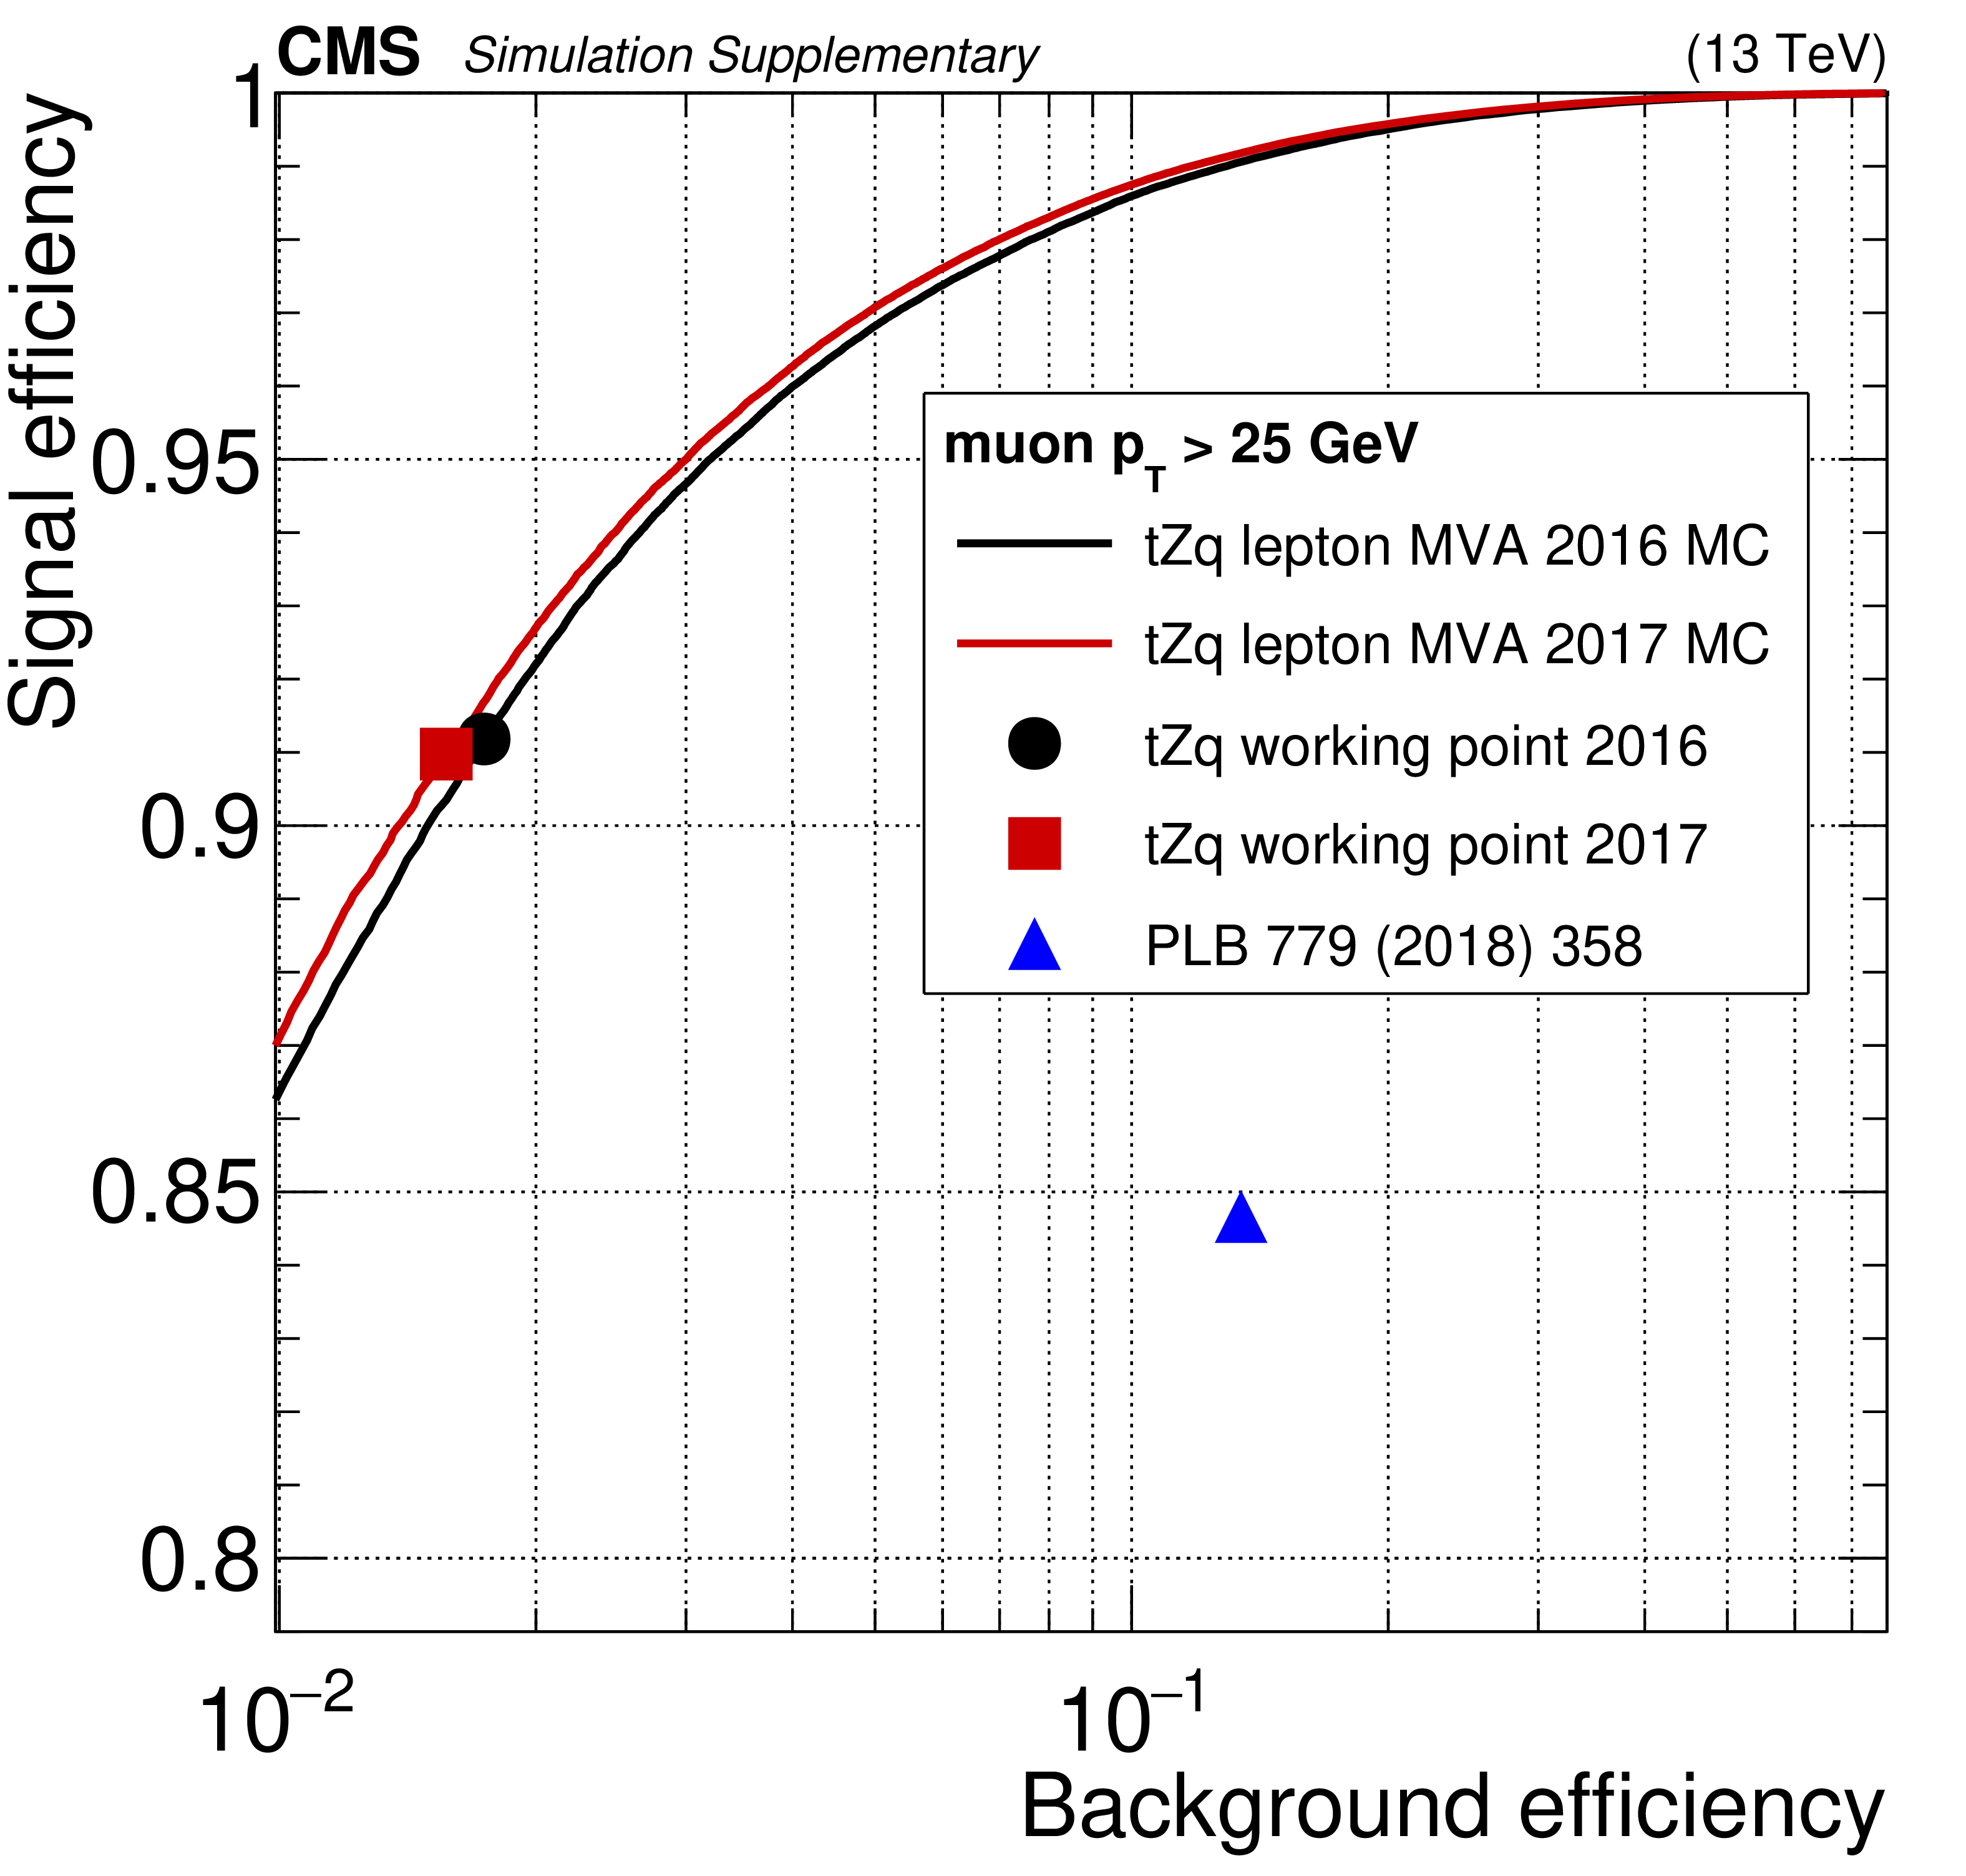
Efficiency of selecting prompt electrons (left), and muons (right) from simulated ${\mathrm {t}} {\mathrm {Z}} {\mathrm {q}}$ and ${{\mathrm {t}} {\overline {\mathrm {t}}} {\mathrm {Z}}}$ events as a function of the misidentification probability for nonprompt leptons from simulated ${{\mathrm {t}\overline {\mathrm {t}}}}$ events for the lepton MVA (black and red lines for respectively 2016 and 2017 simulations), and for the cutoff-based lepton identification used in the previous CMS search for ${\mathrm {t}} {\mathrm {Z}} {\mathrm {q}}$ (blue point). The black and red points correspond to the cut on the lepton MVA discriminator chosen for this analysis. |
png pdf |
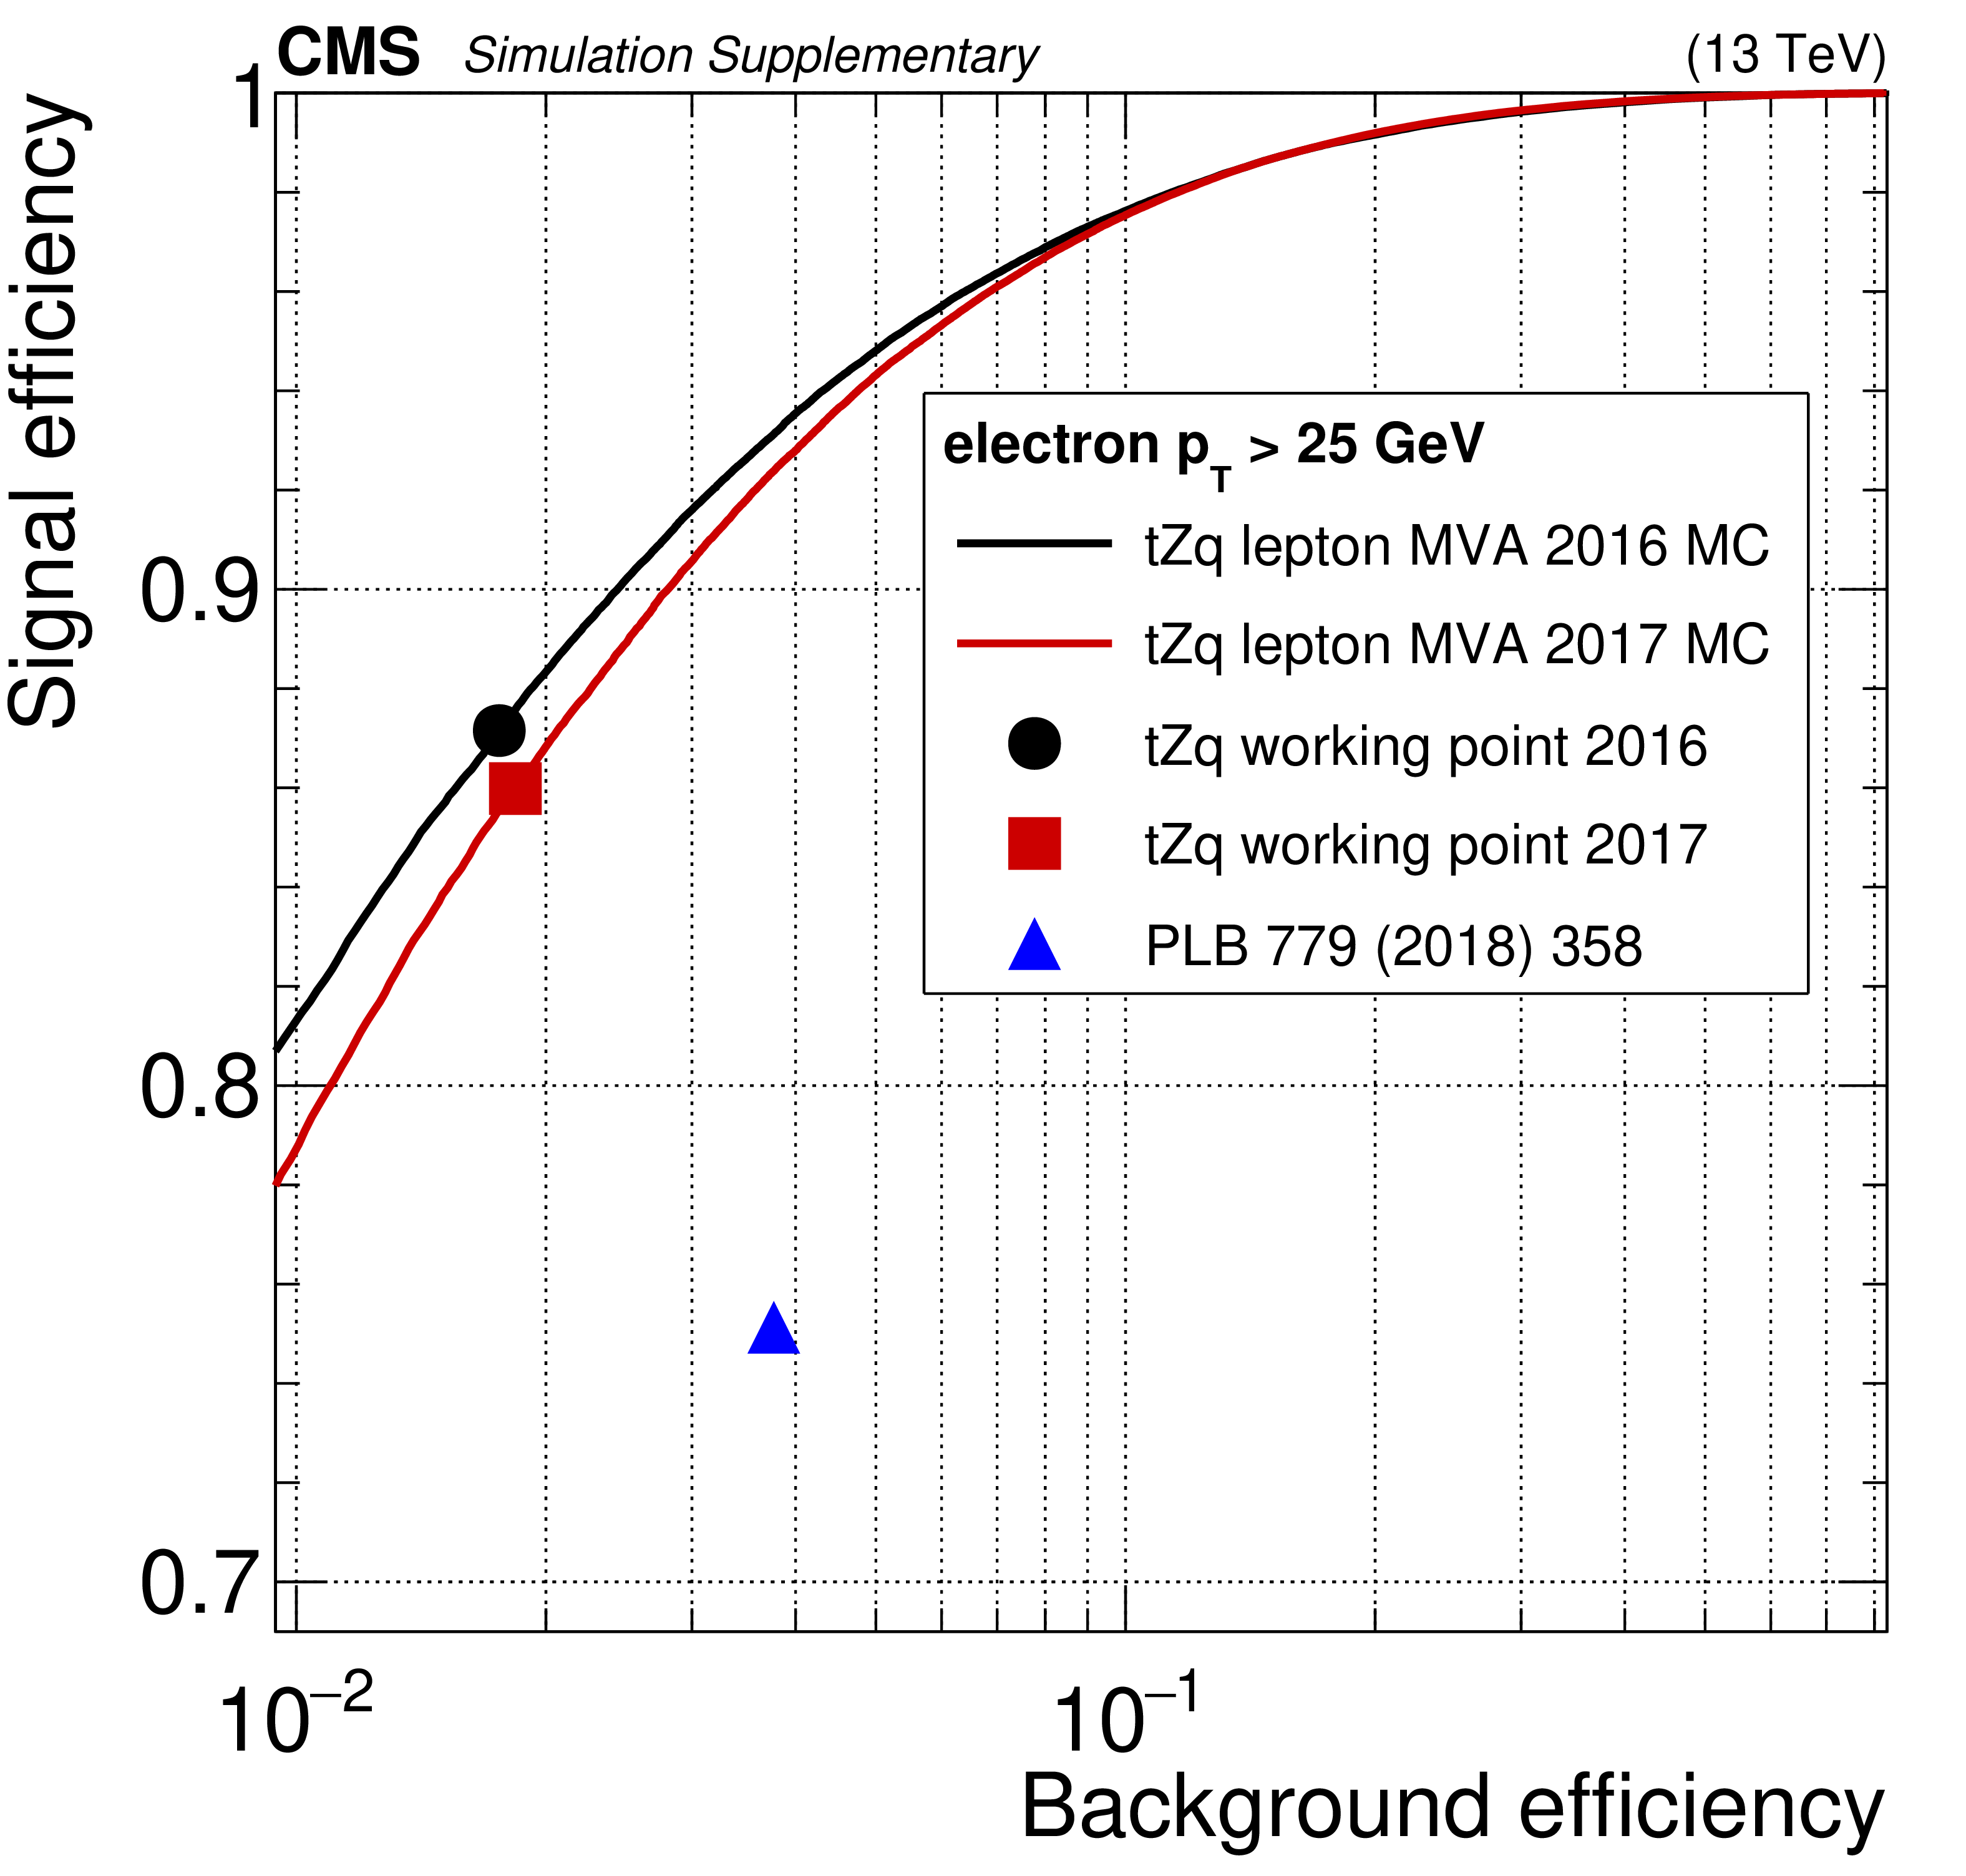
Additional Figure 1-a:
Efficiency of selecting prompt electrons from simulated ${\mathrm {t}} {\mathrm {Z}} {\mathrm {q}}$ and ${{\mathrm {t}} {\overline {\mathrm {t}}} {\mathrm {Z}}}$ events as a function of the misidentification probability for nonprompt leptons from simulated ${{\mathrm {t}\overline {\mathrm {t}}}}$ events for the lepton MVA (black and red lines for respectively 2016 and 2017 simulations), and for the cutoff-based lepton identification used in the previous CMS search for ${\mathrm {t}} {\mathrm {Z}} {\mathrm {q}}$ (blue point). The black and red points correspond to the cut on the lepton MVA discriminator chosen for this analysis. |
png pdf |
Additional Figure 1-b:
Efficiency of selecting prompt muons from simulated ${\mathrm {t}} {\mathrm {Z}} {\mathrm {q}}$ and ${{\mathrm {t}} {\overline {\mathrm {t}}} {\mathrm {Z}}}$ events as a function of the misidentification probability for nonprompt leptons from simulated ${{\mathrm {t}\overline {\mathrm {t}}}}$ events for the lepton MVA (black and red lines for respectively 2016 and 2017 simulations), and for the cutoff-based lepton identification used in the previous CMS search for ${\mathrm {t}} {\mathrm {Z}} {\mathrm {q}}$ (blue point). The black and red points correspond to the cut on the lepton MVA discriminator chosen for this analysis. |
png pdf |
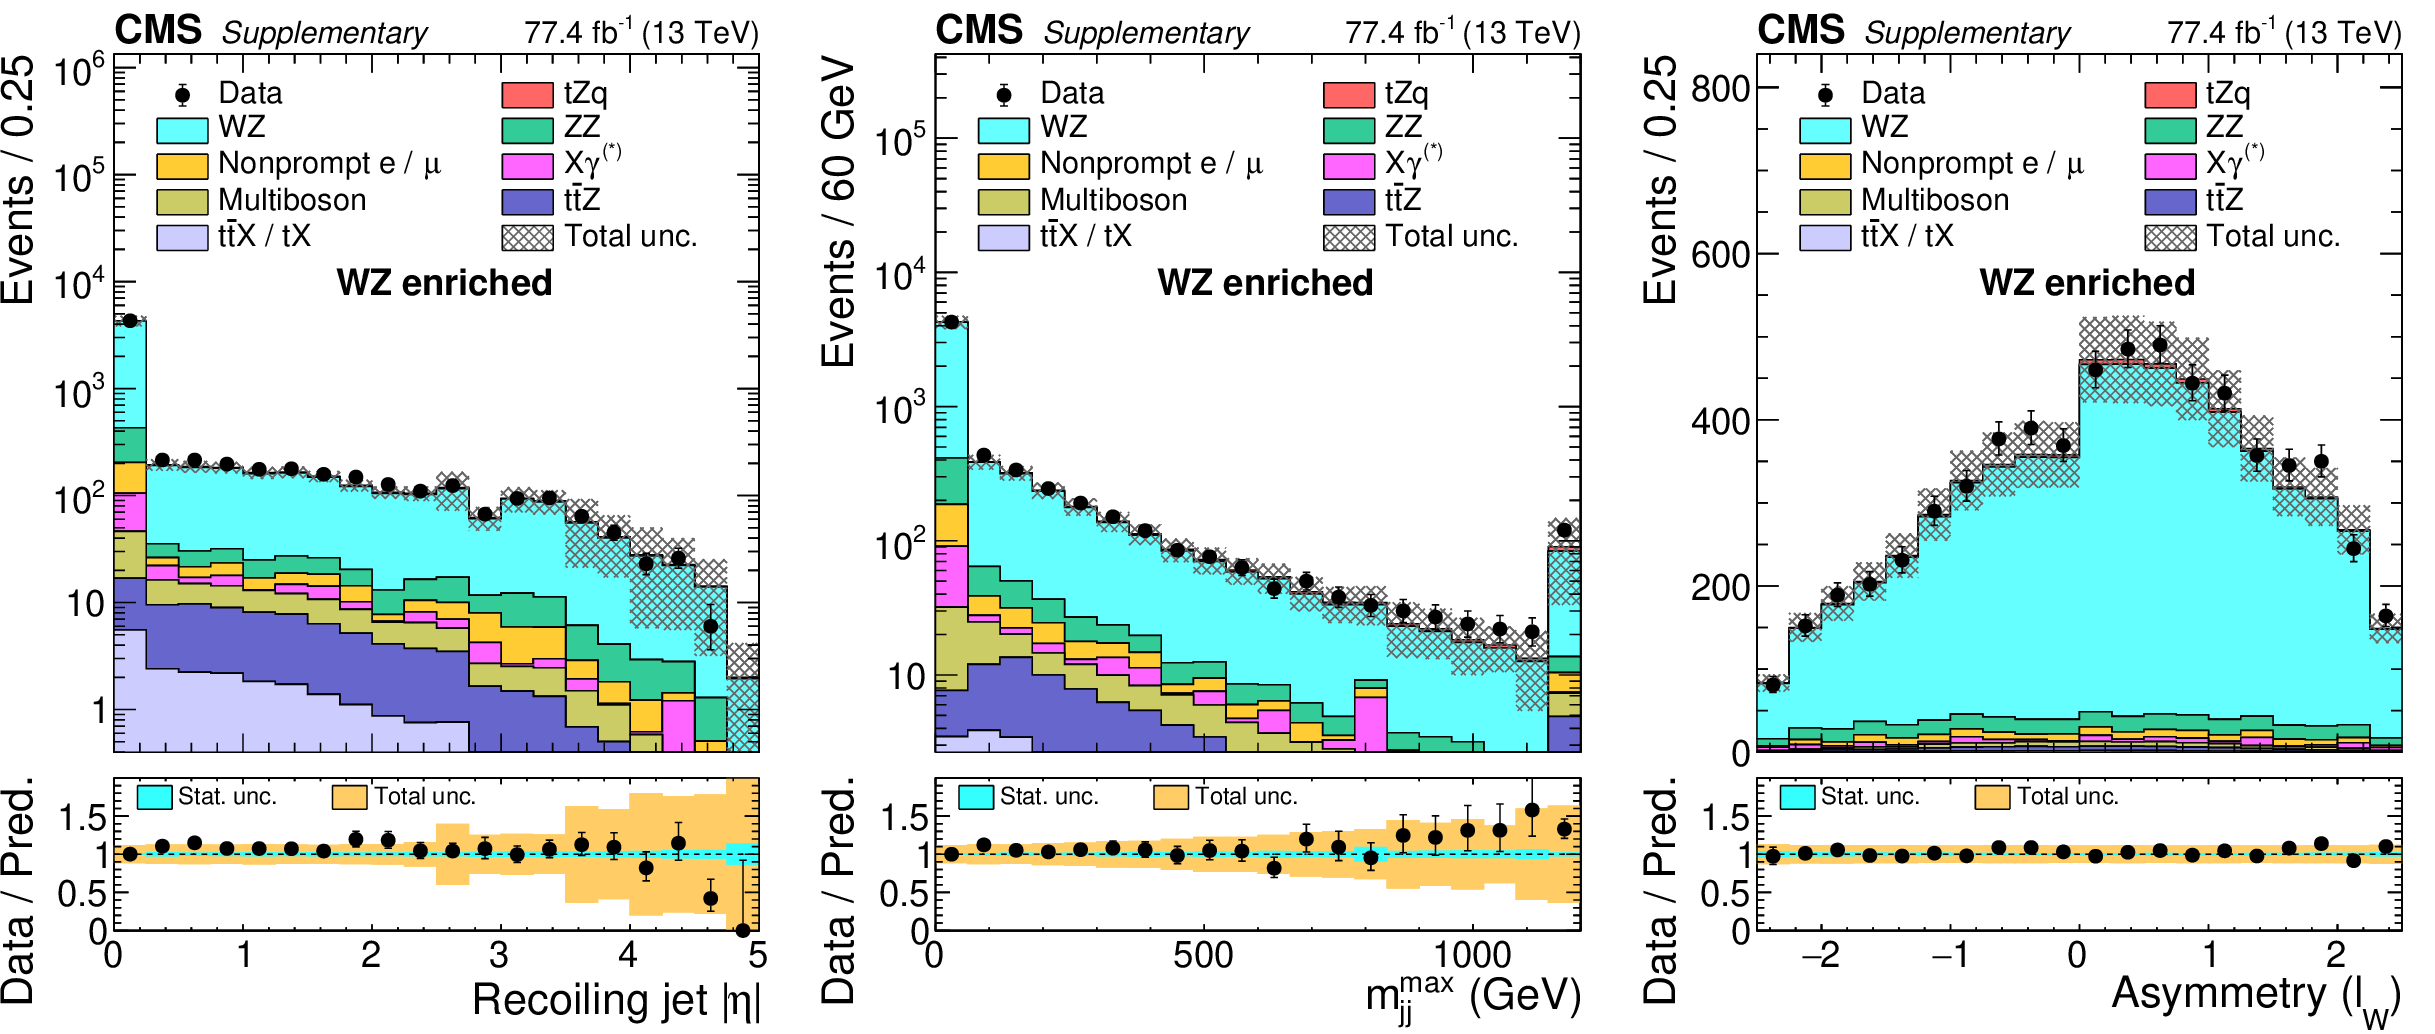
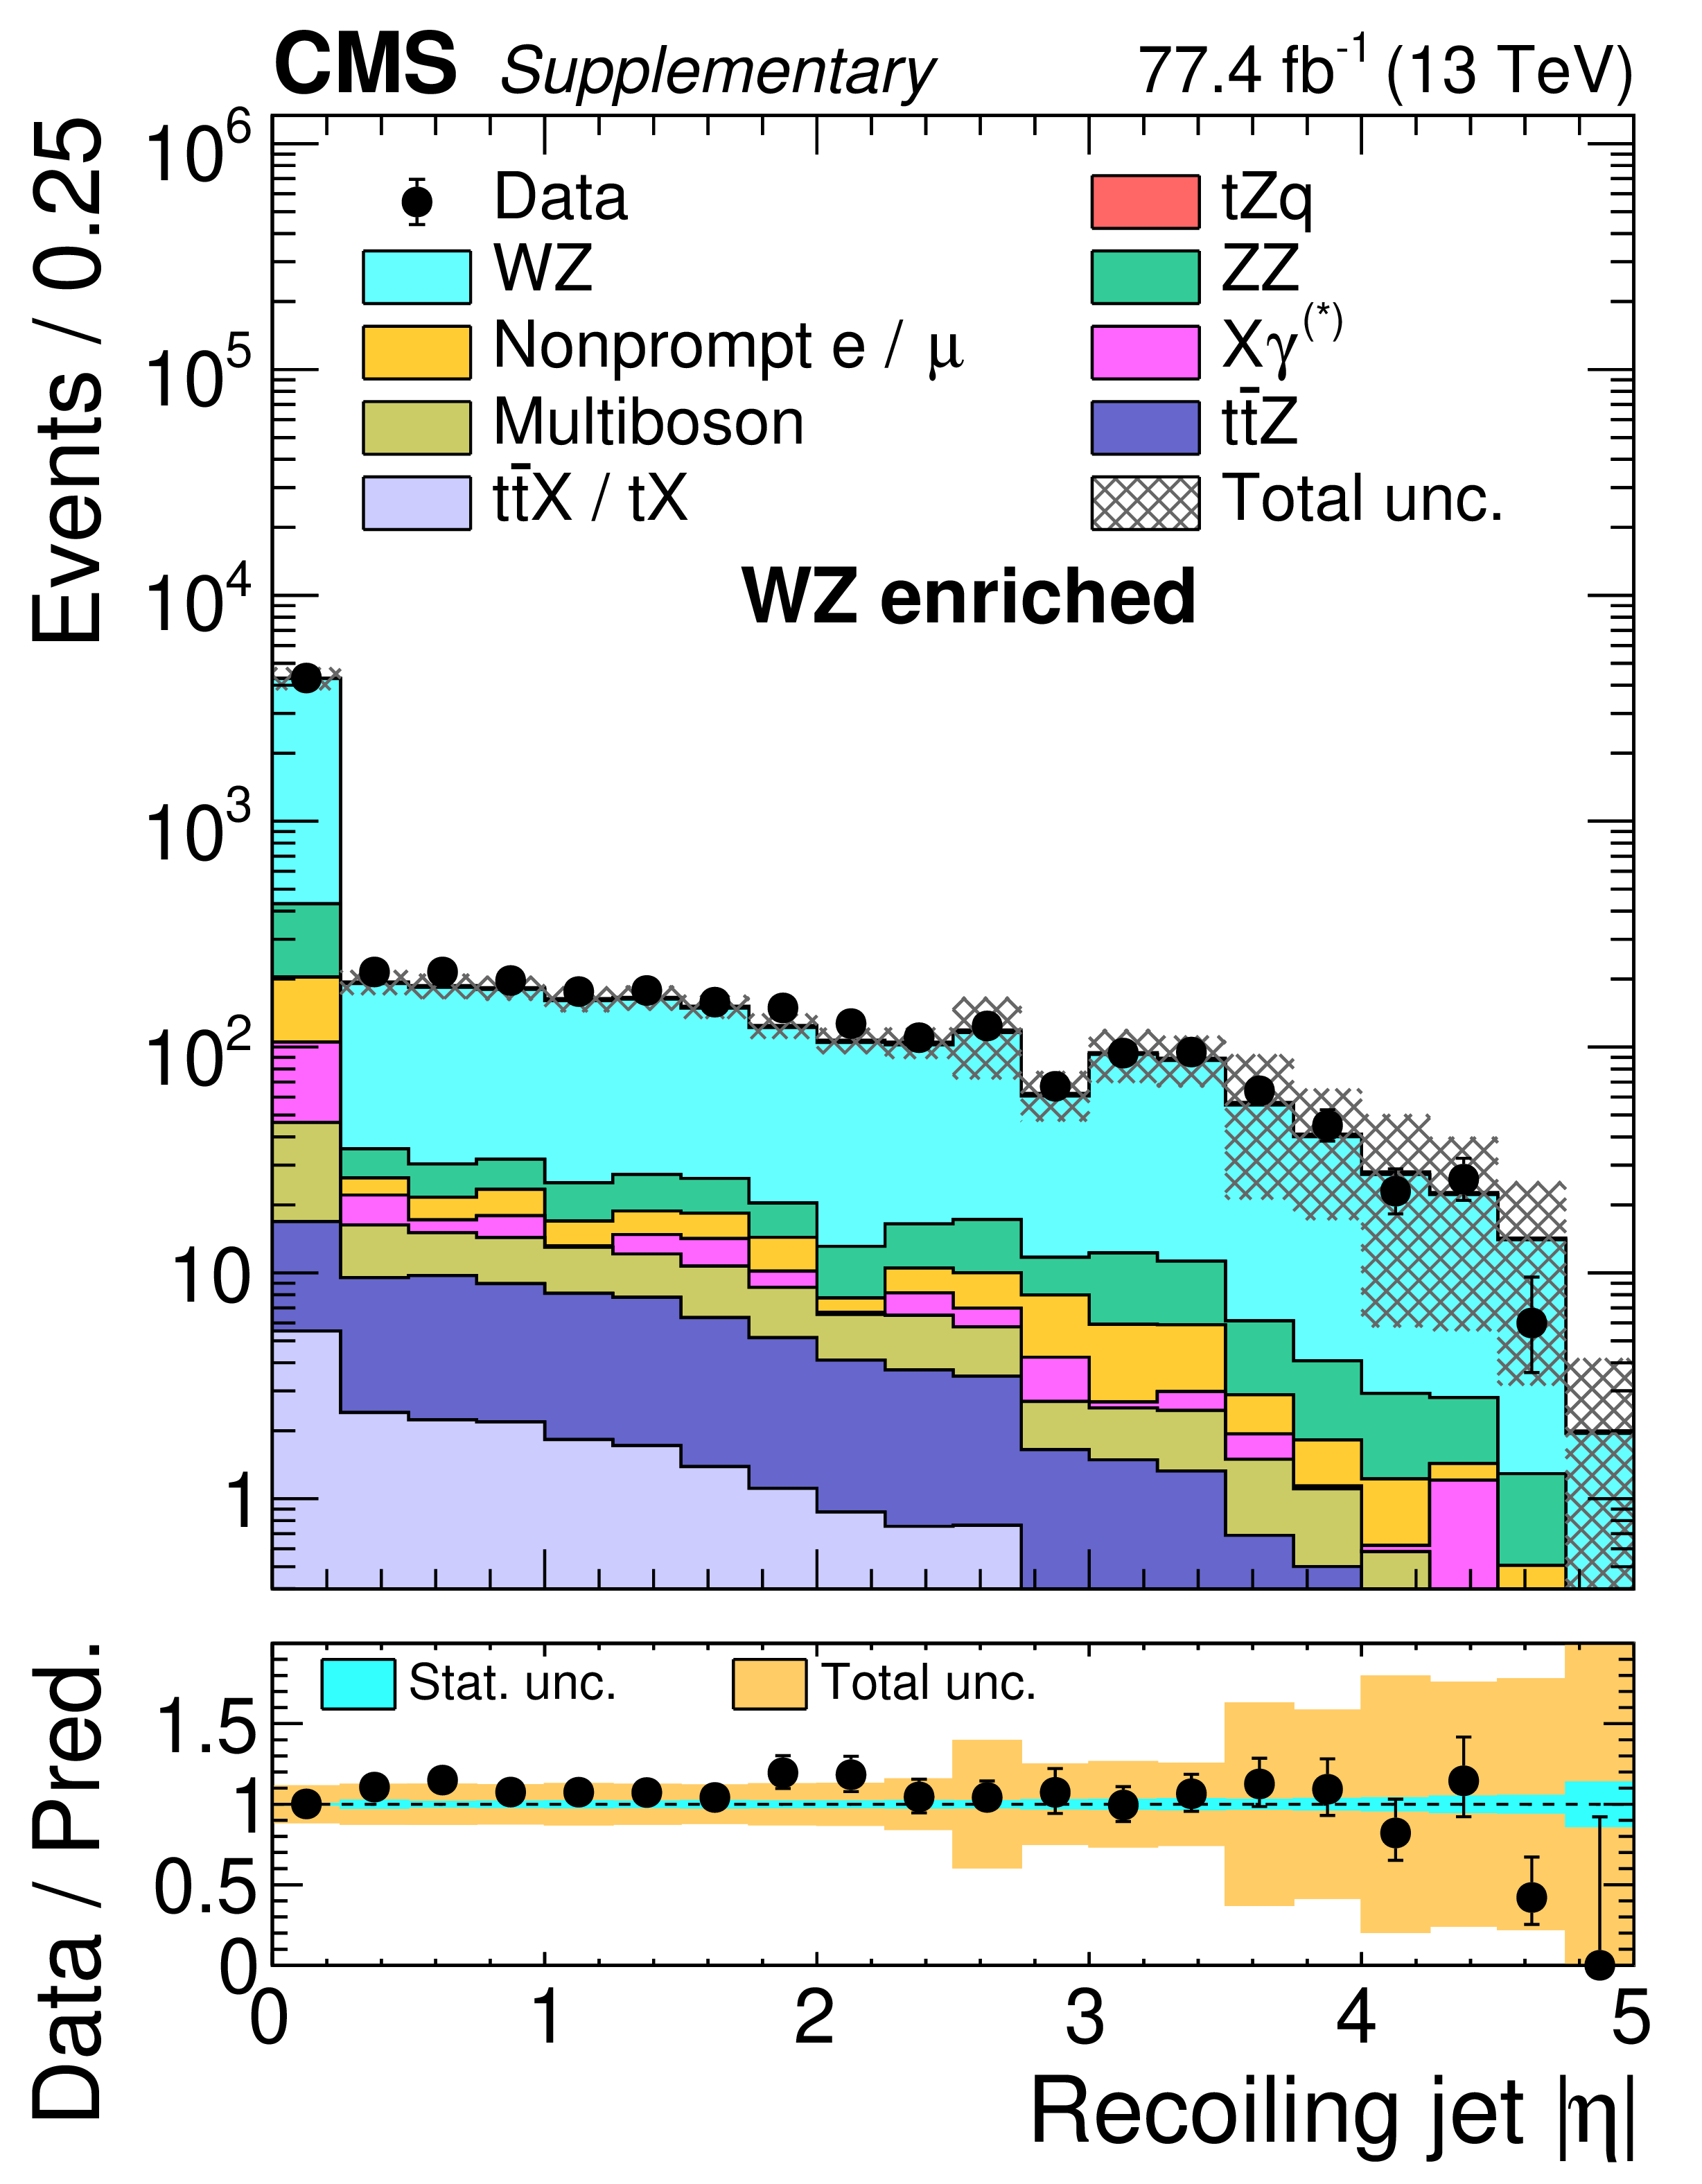
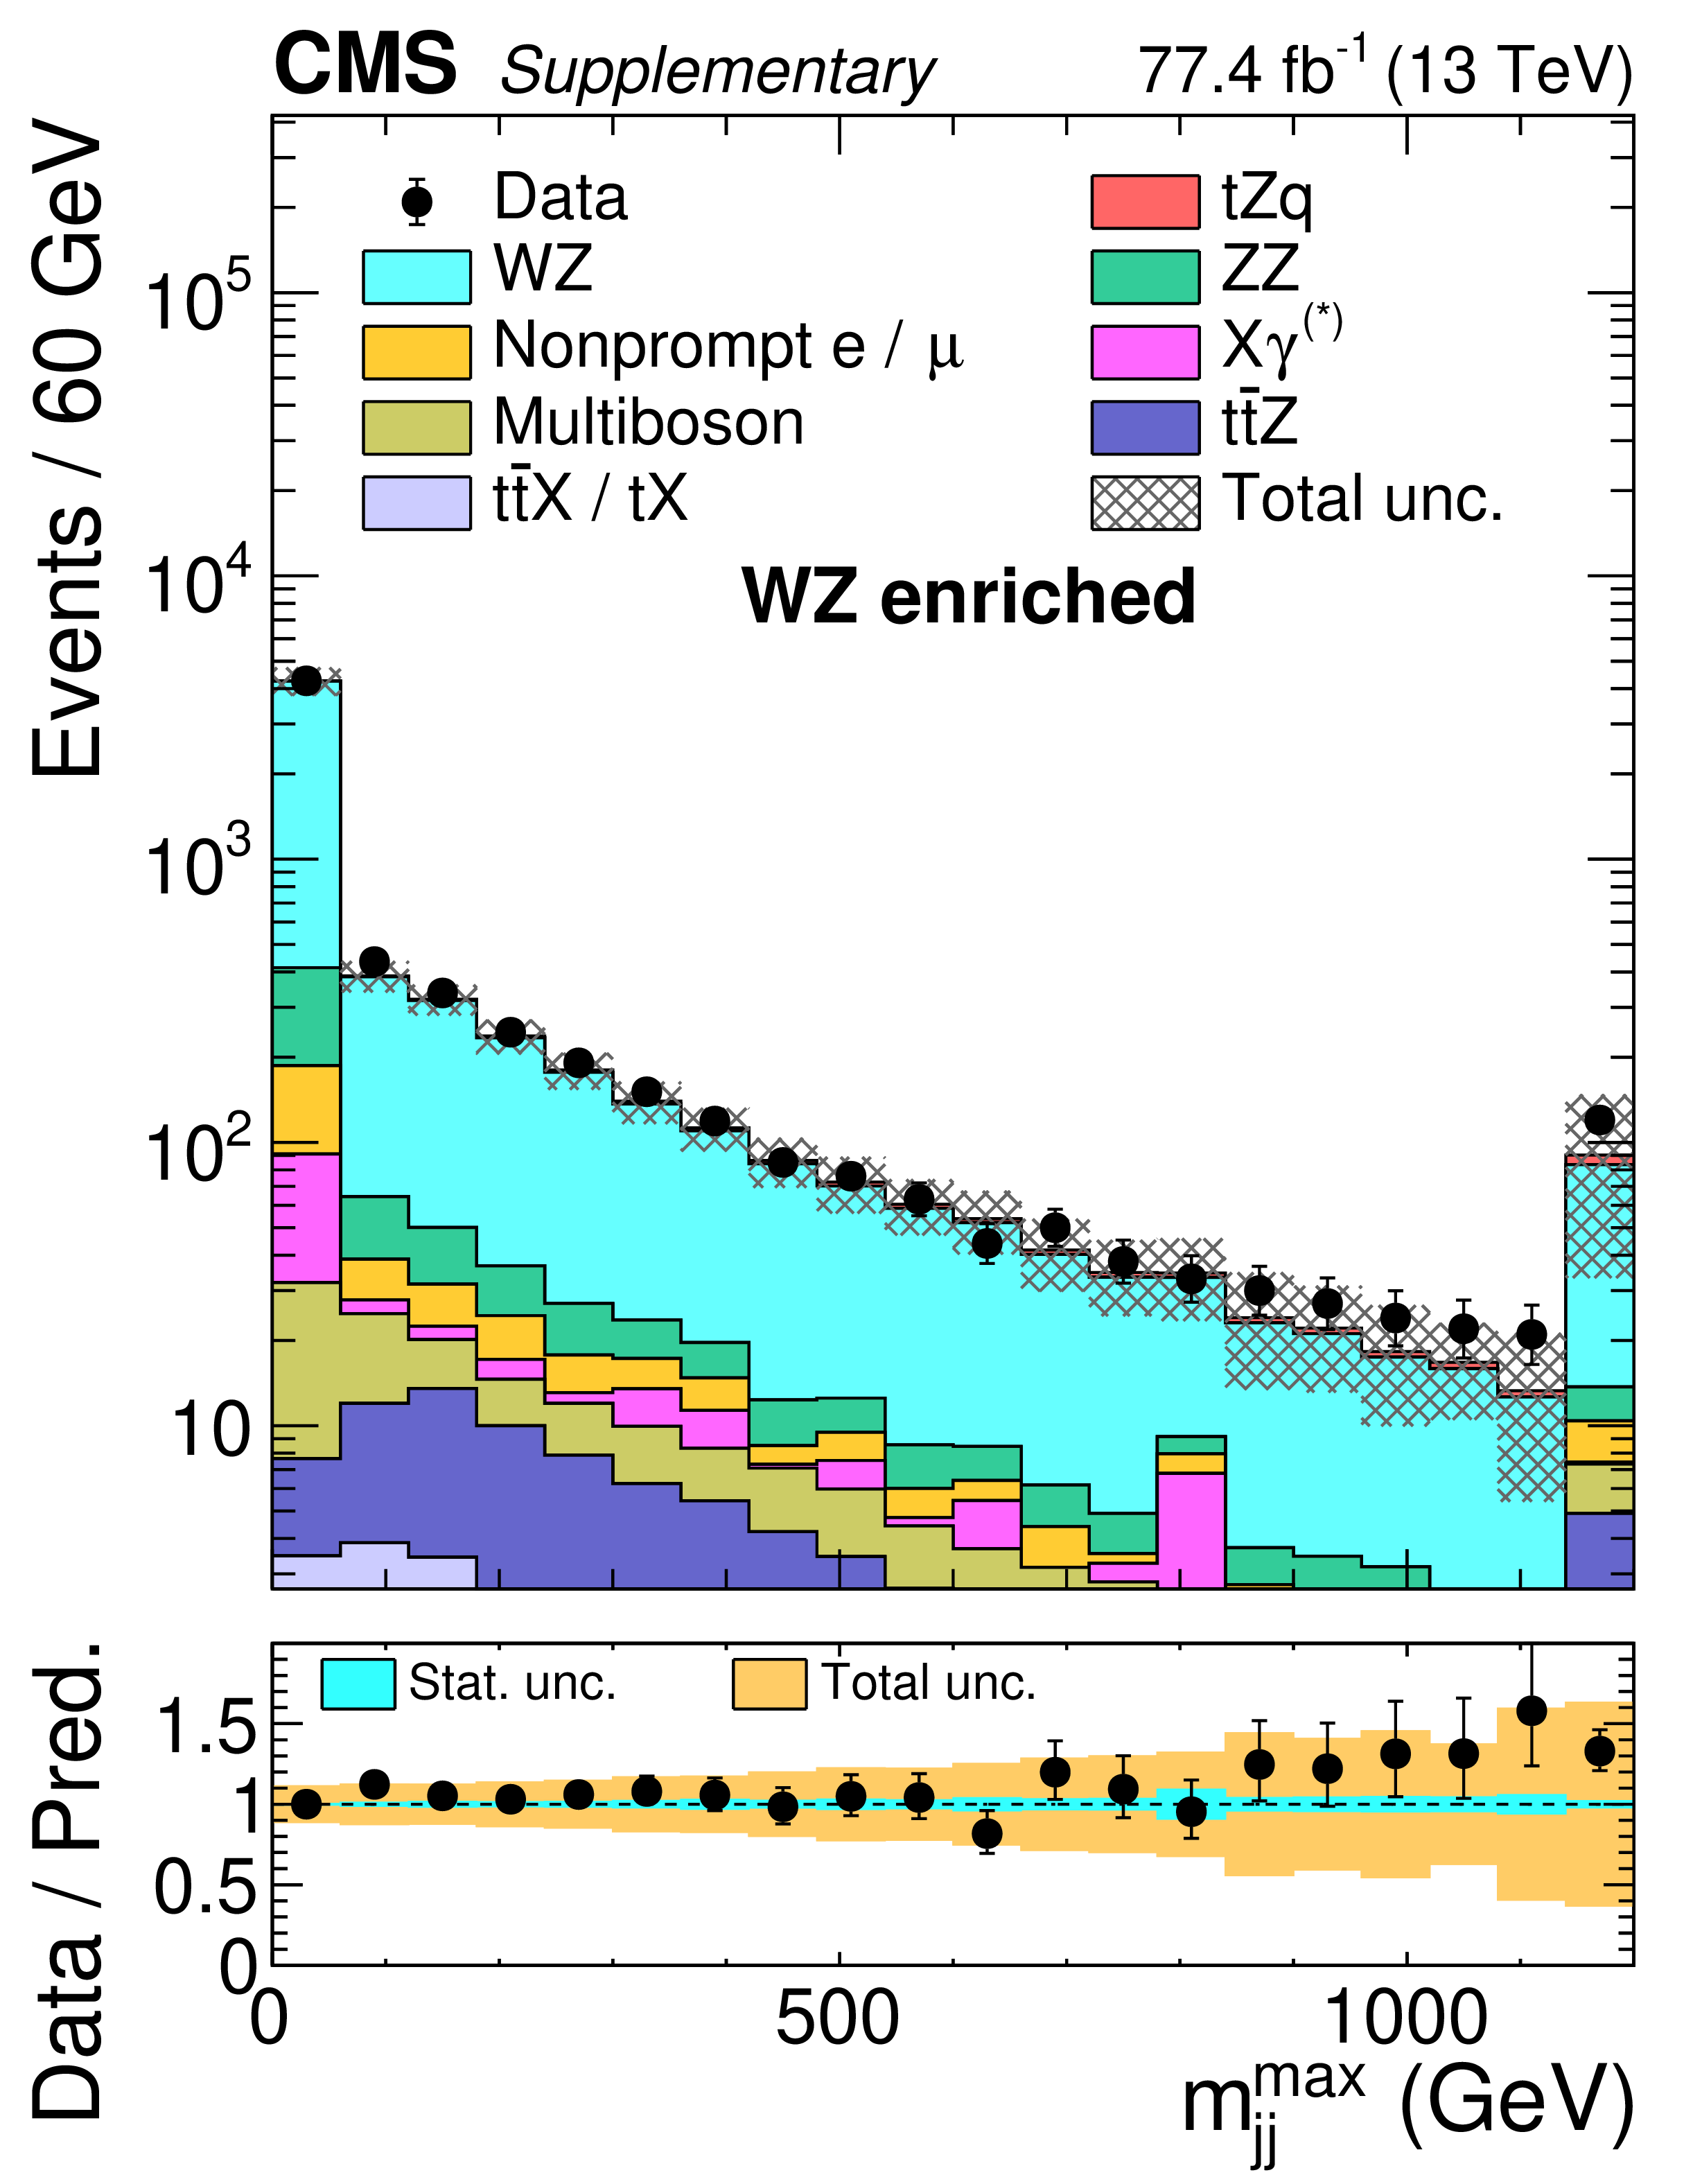
Additional Figure 2:
Expected and observed distributions in the ${{\mathrm {W}} {\mathrm {Z}}}$ control region of the $| \eta |$ of the recoiling jet (left), the maximum dijet invariant mass out of any combination of jets in the event (middle), and the asymmetry of the lepton not forming the Z boson candidate ($\ell _{W}$), defined as its $| \eta |$ multiplied by its charge (right). |
png pdf |
Additional Figure 2-a:
Expected and observed distributions in the ${{\mathrm {W}} {\mathrm {Z}}}$ control region of the $| \eta |$ of the recoiling jet. the maximum dijet invariant mass out of any combination of jets in the event. |
png pdf |
Additional Figure 2-b:
Expected and observed distributions in the ${{\mathrm {W}} {\mathrm {Z}}}$ control region of the maximum dijet invariant mass out of any combination of jets in the event. |
png pdf |
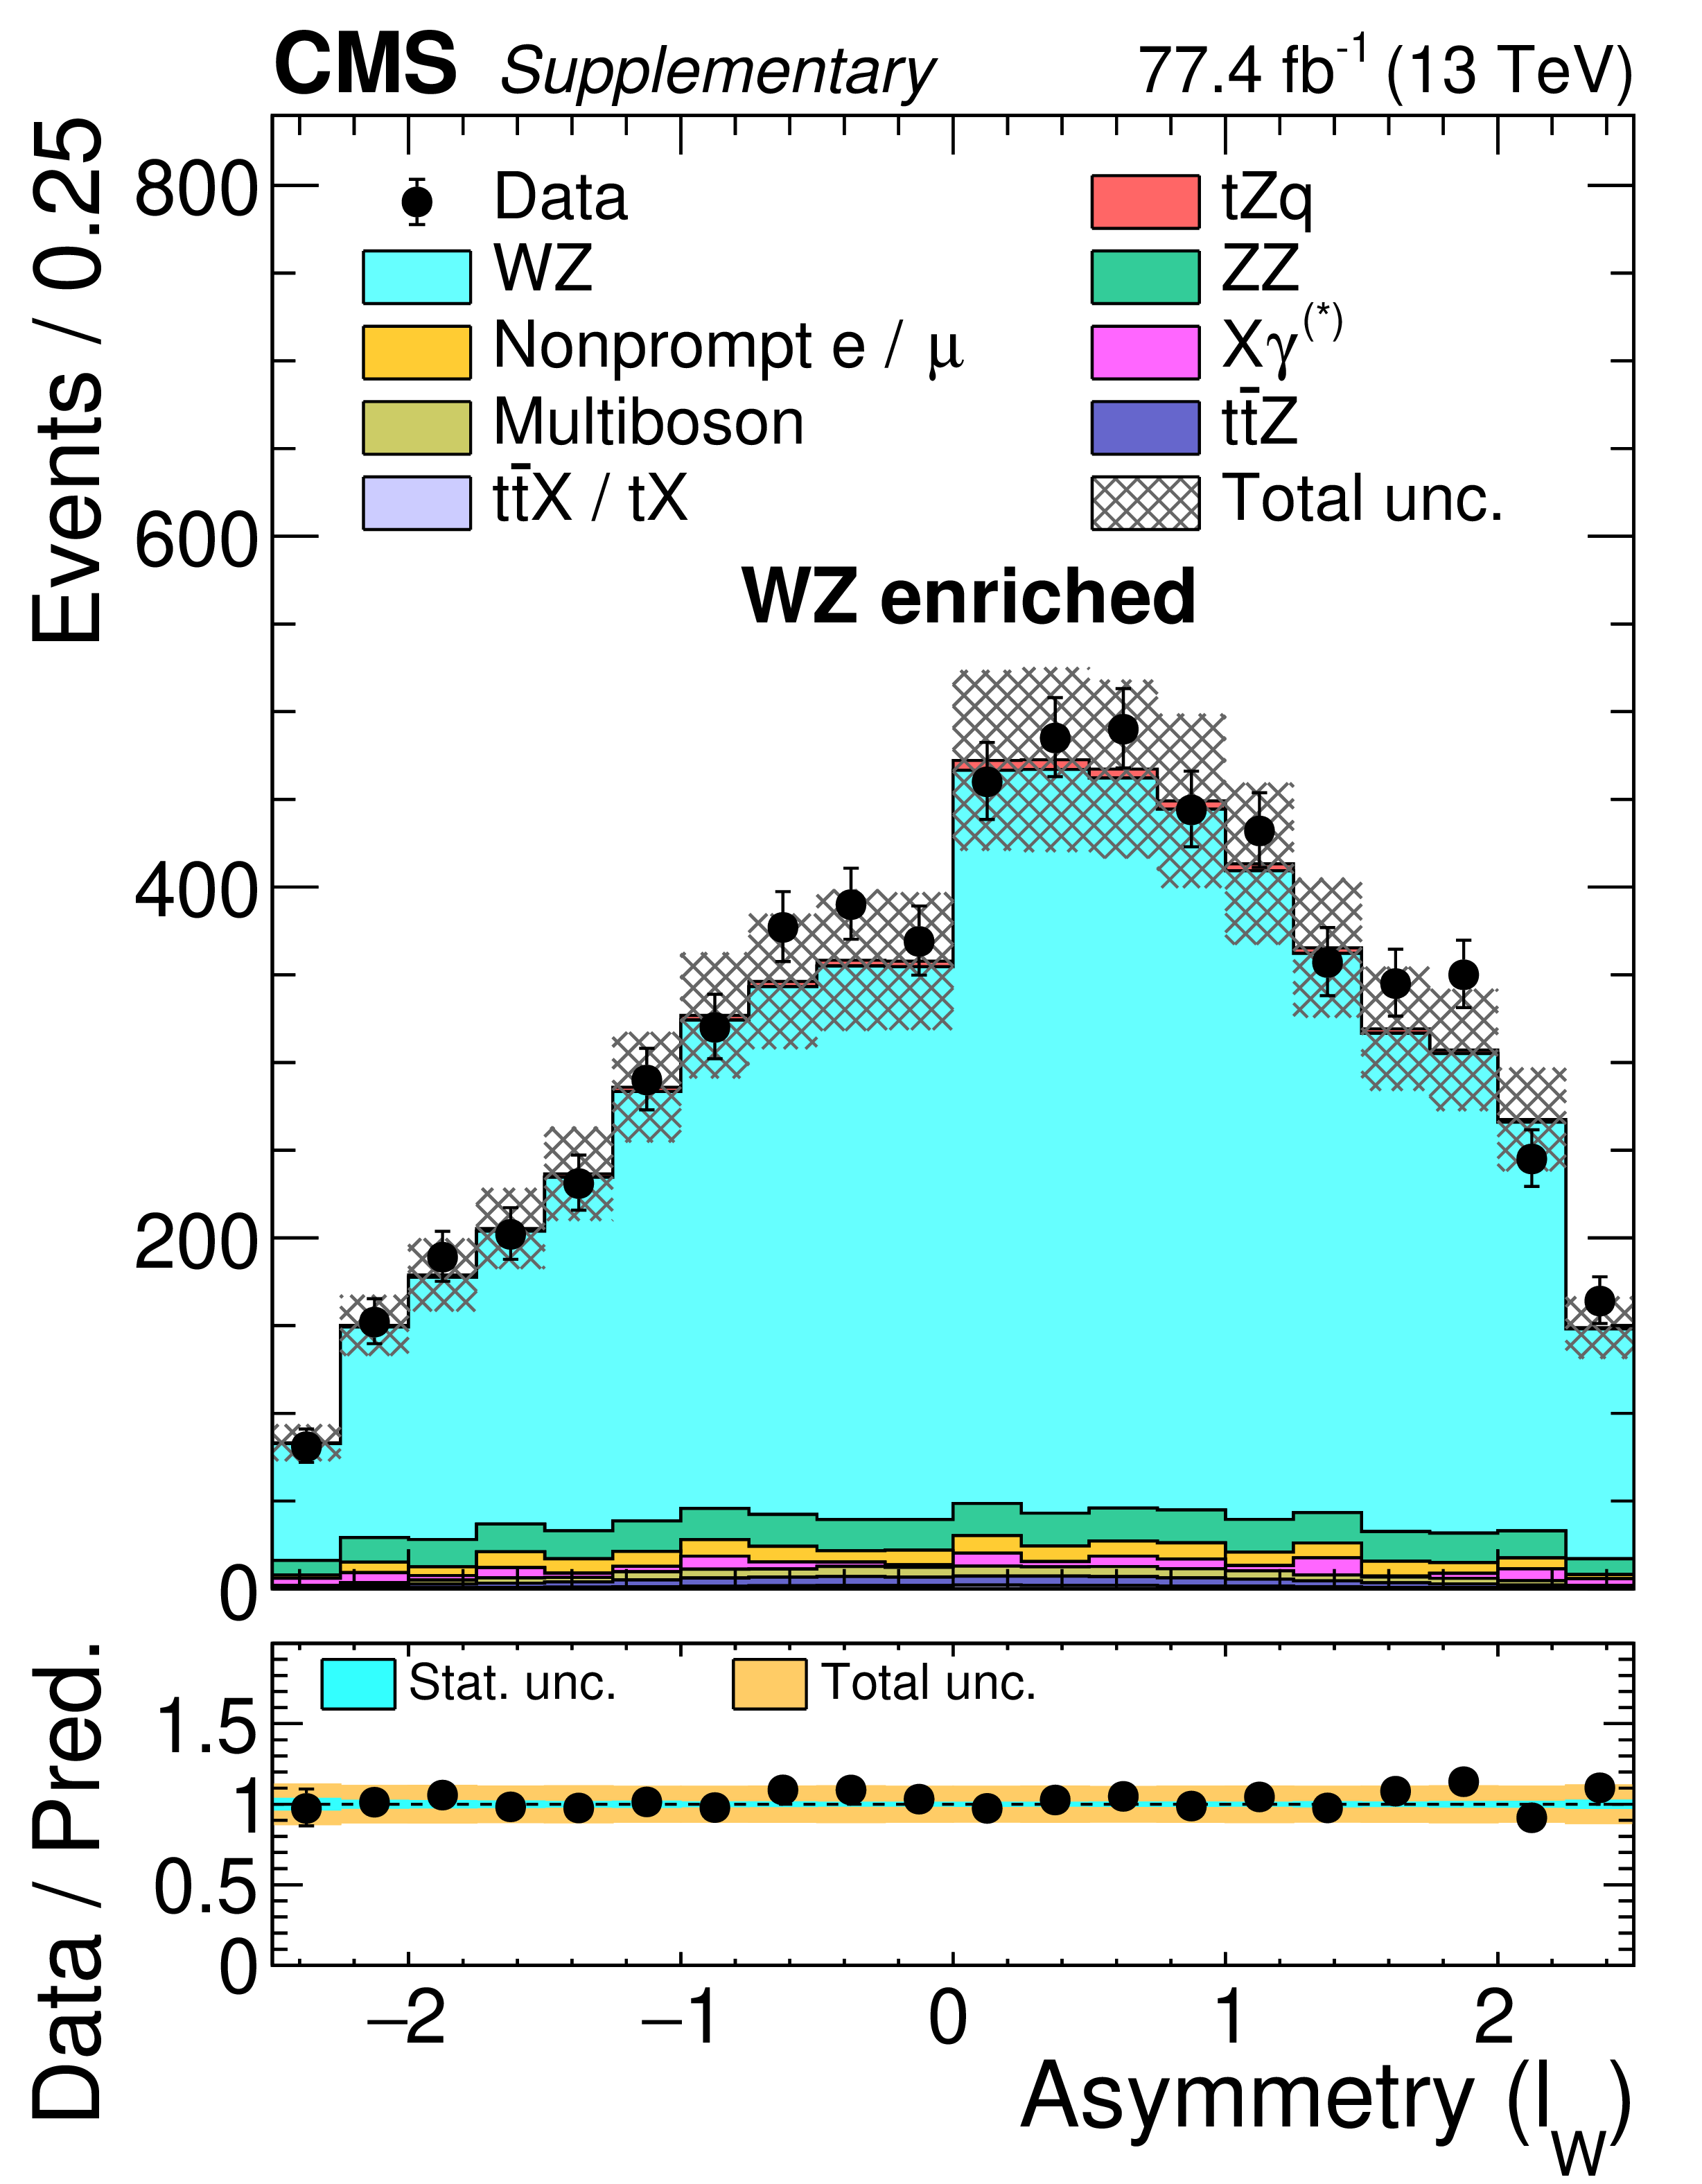
Additional Figure 2-c:
Expected and observed distributions in the ${{\mathrm {W}} {\mathrm {Z}}}$ control region of the asymmetry of the lepton not forming the Z boson candidate ($\ell _{W}$), defined as its $| \eta |$ multiplied by its charge. |
png pdf |
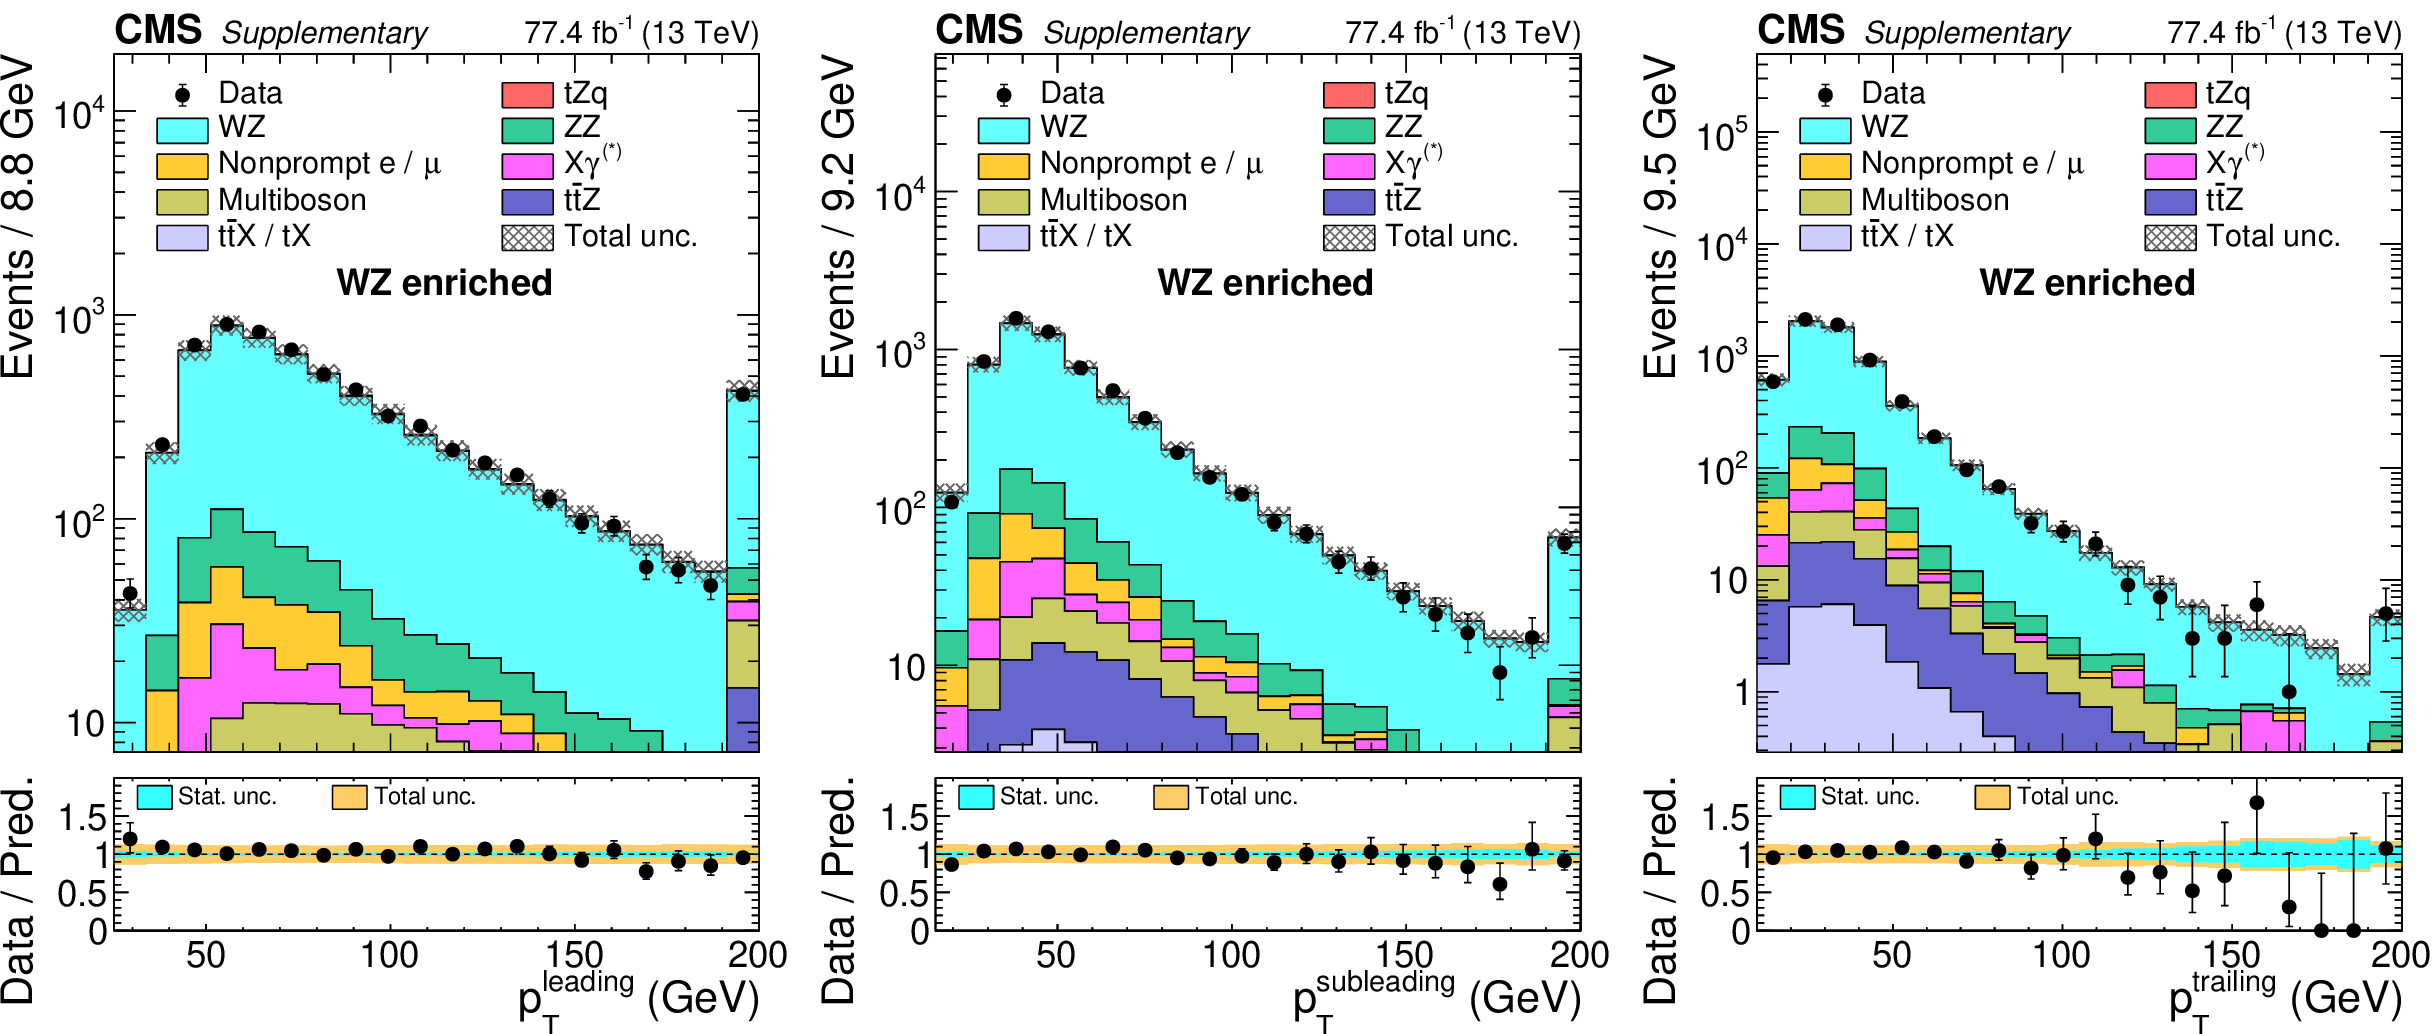
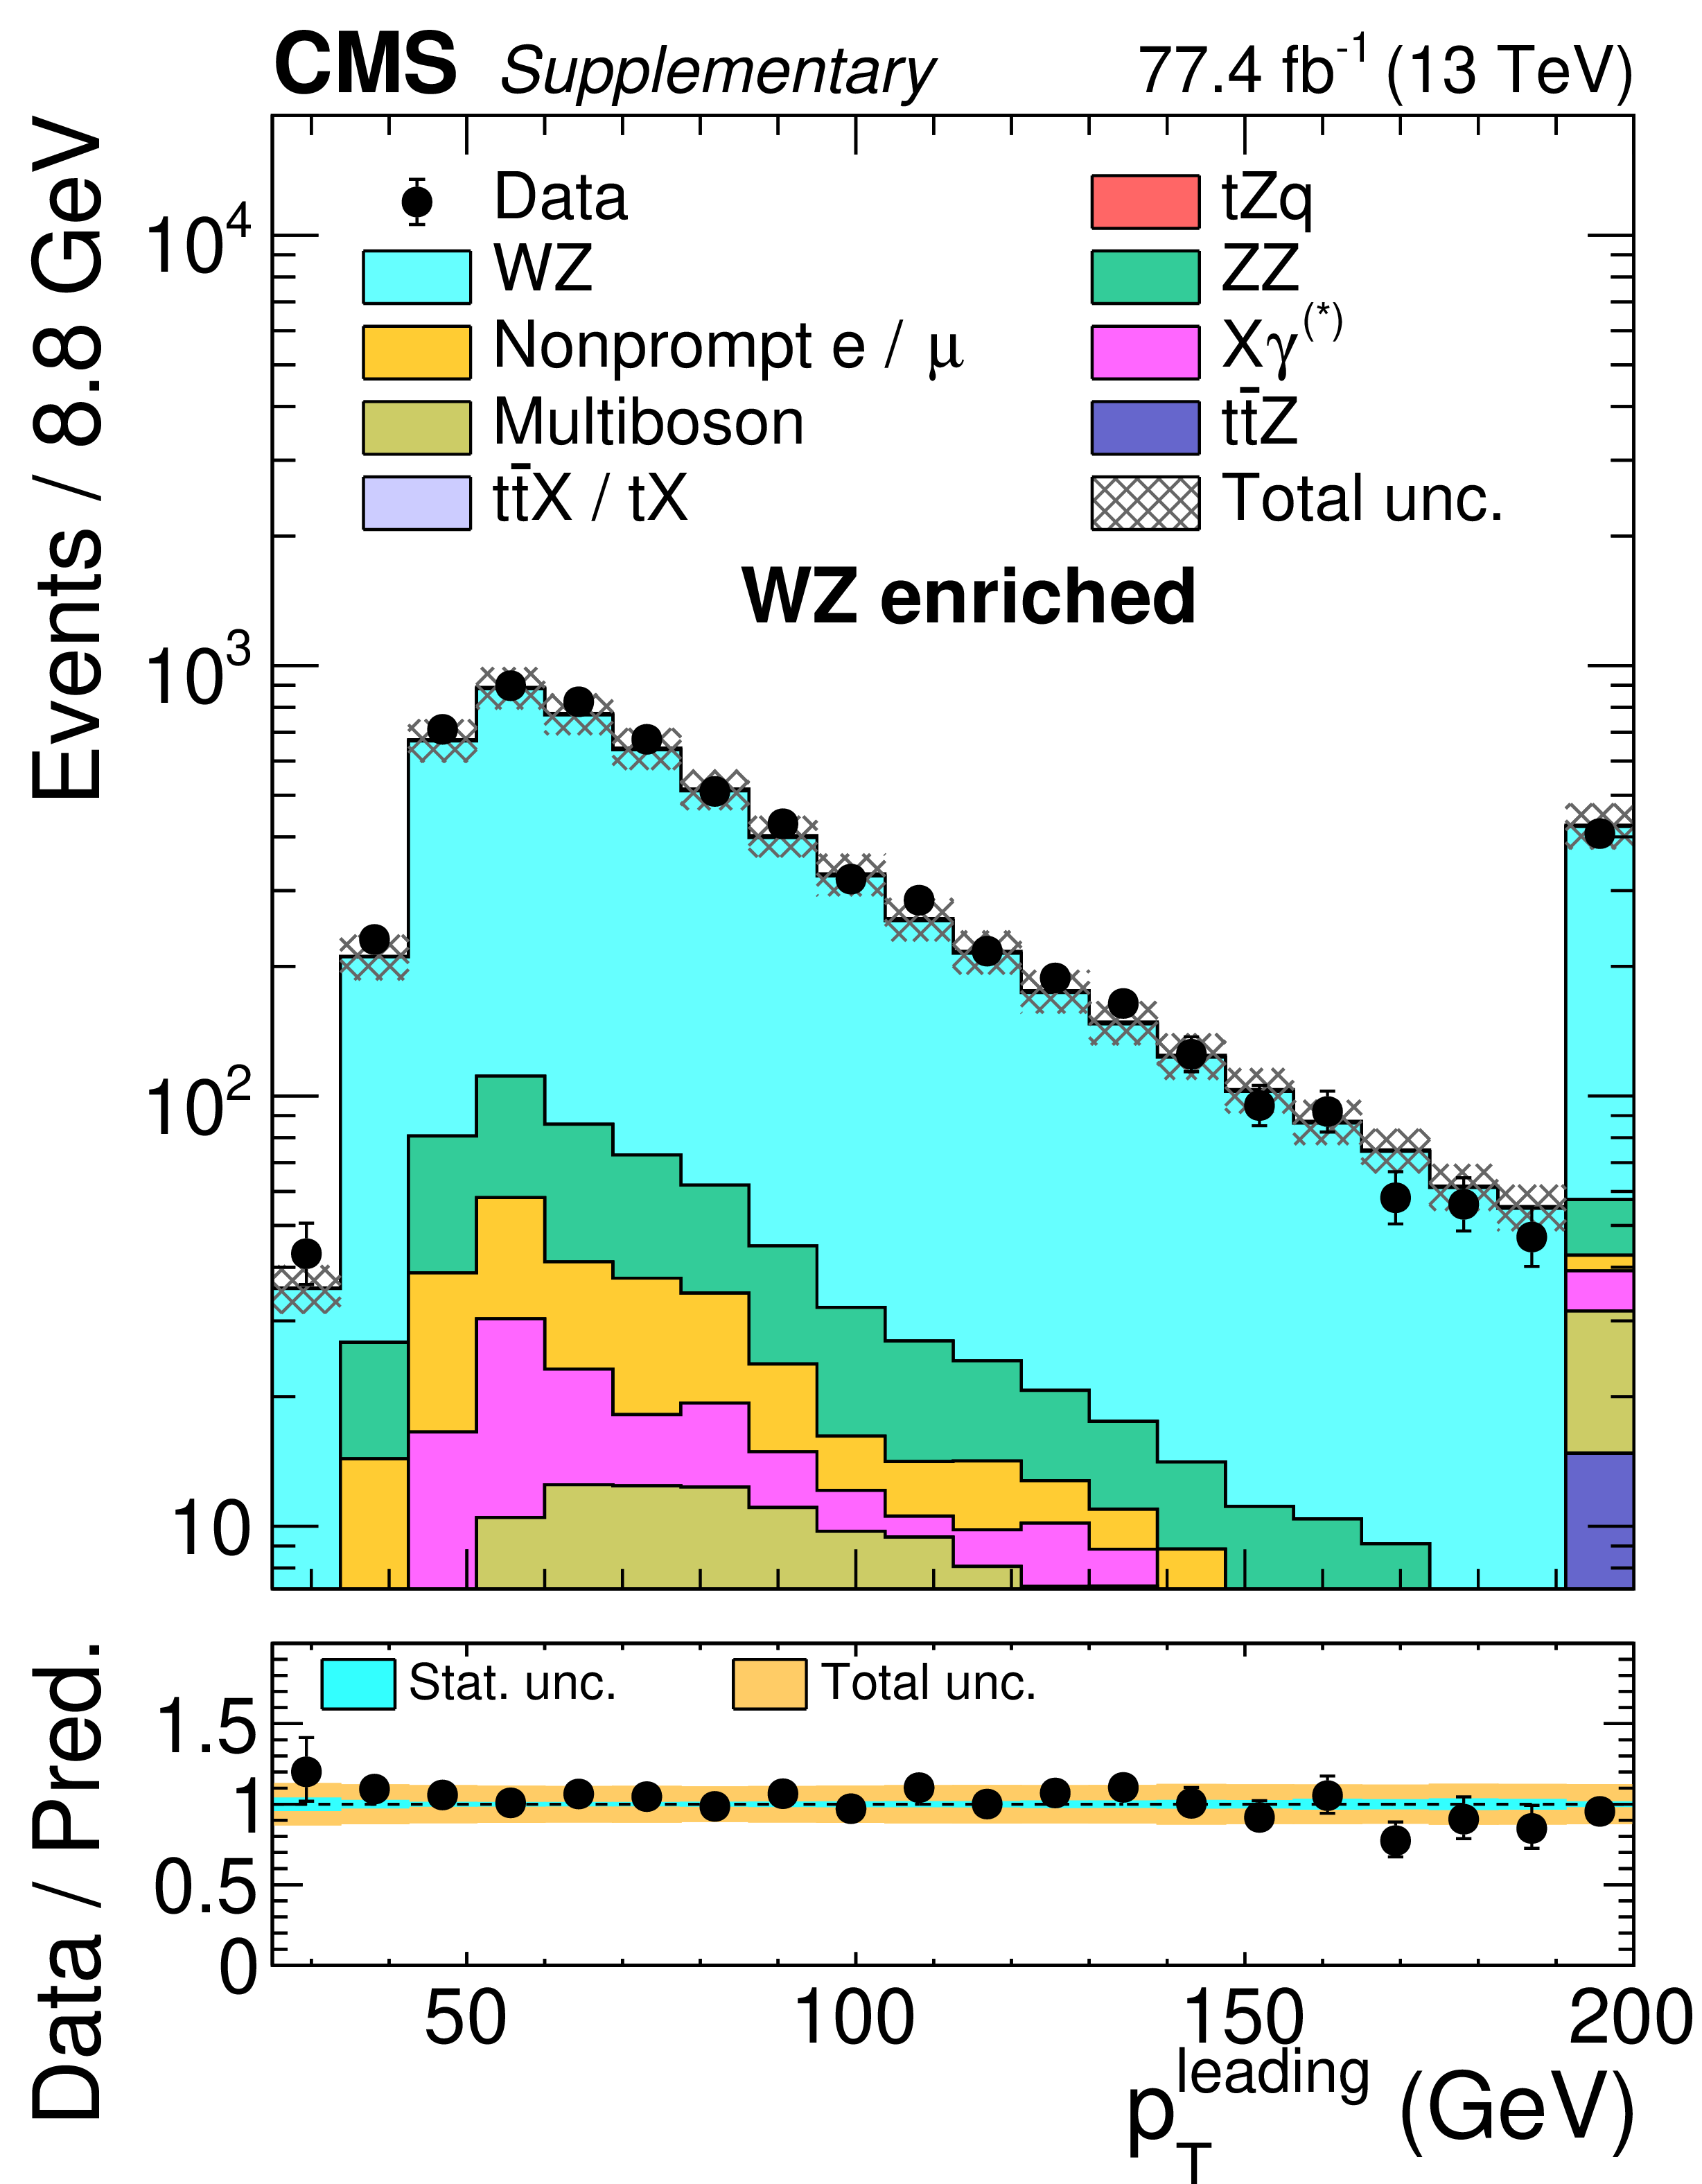
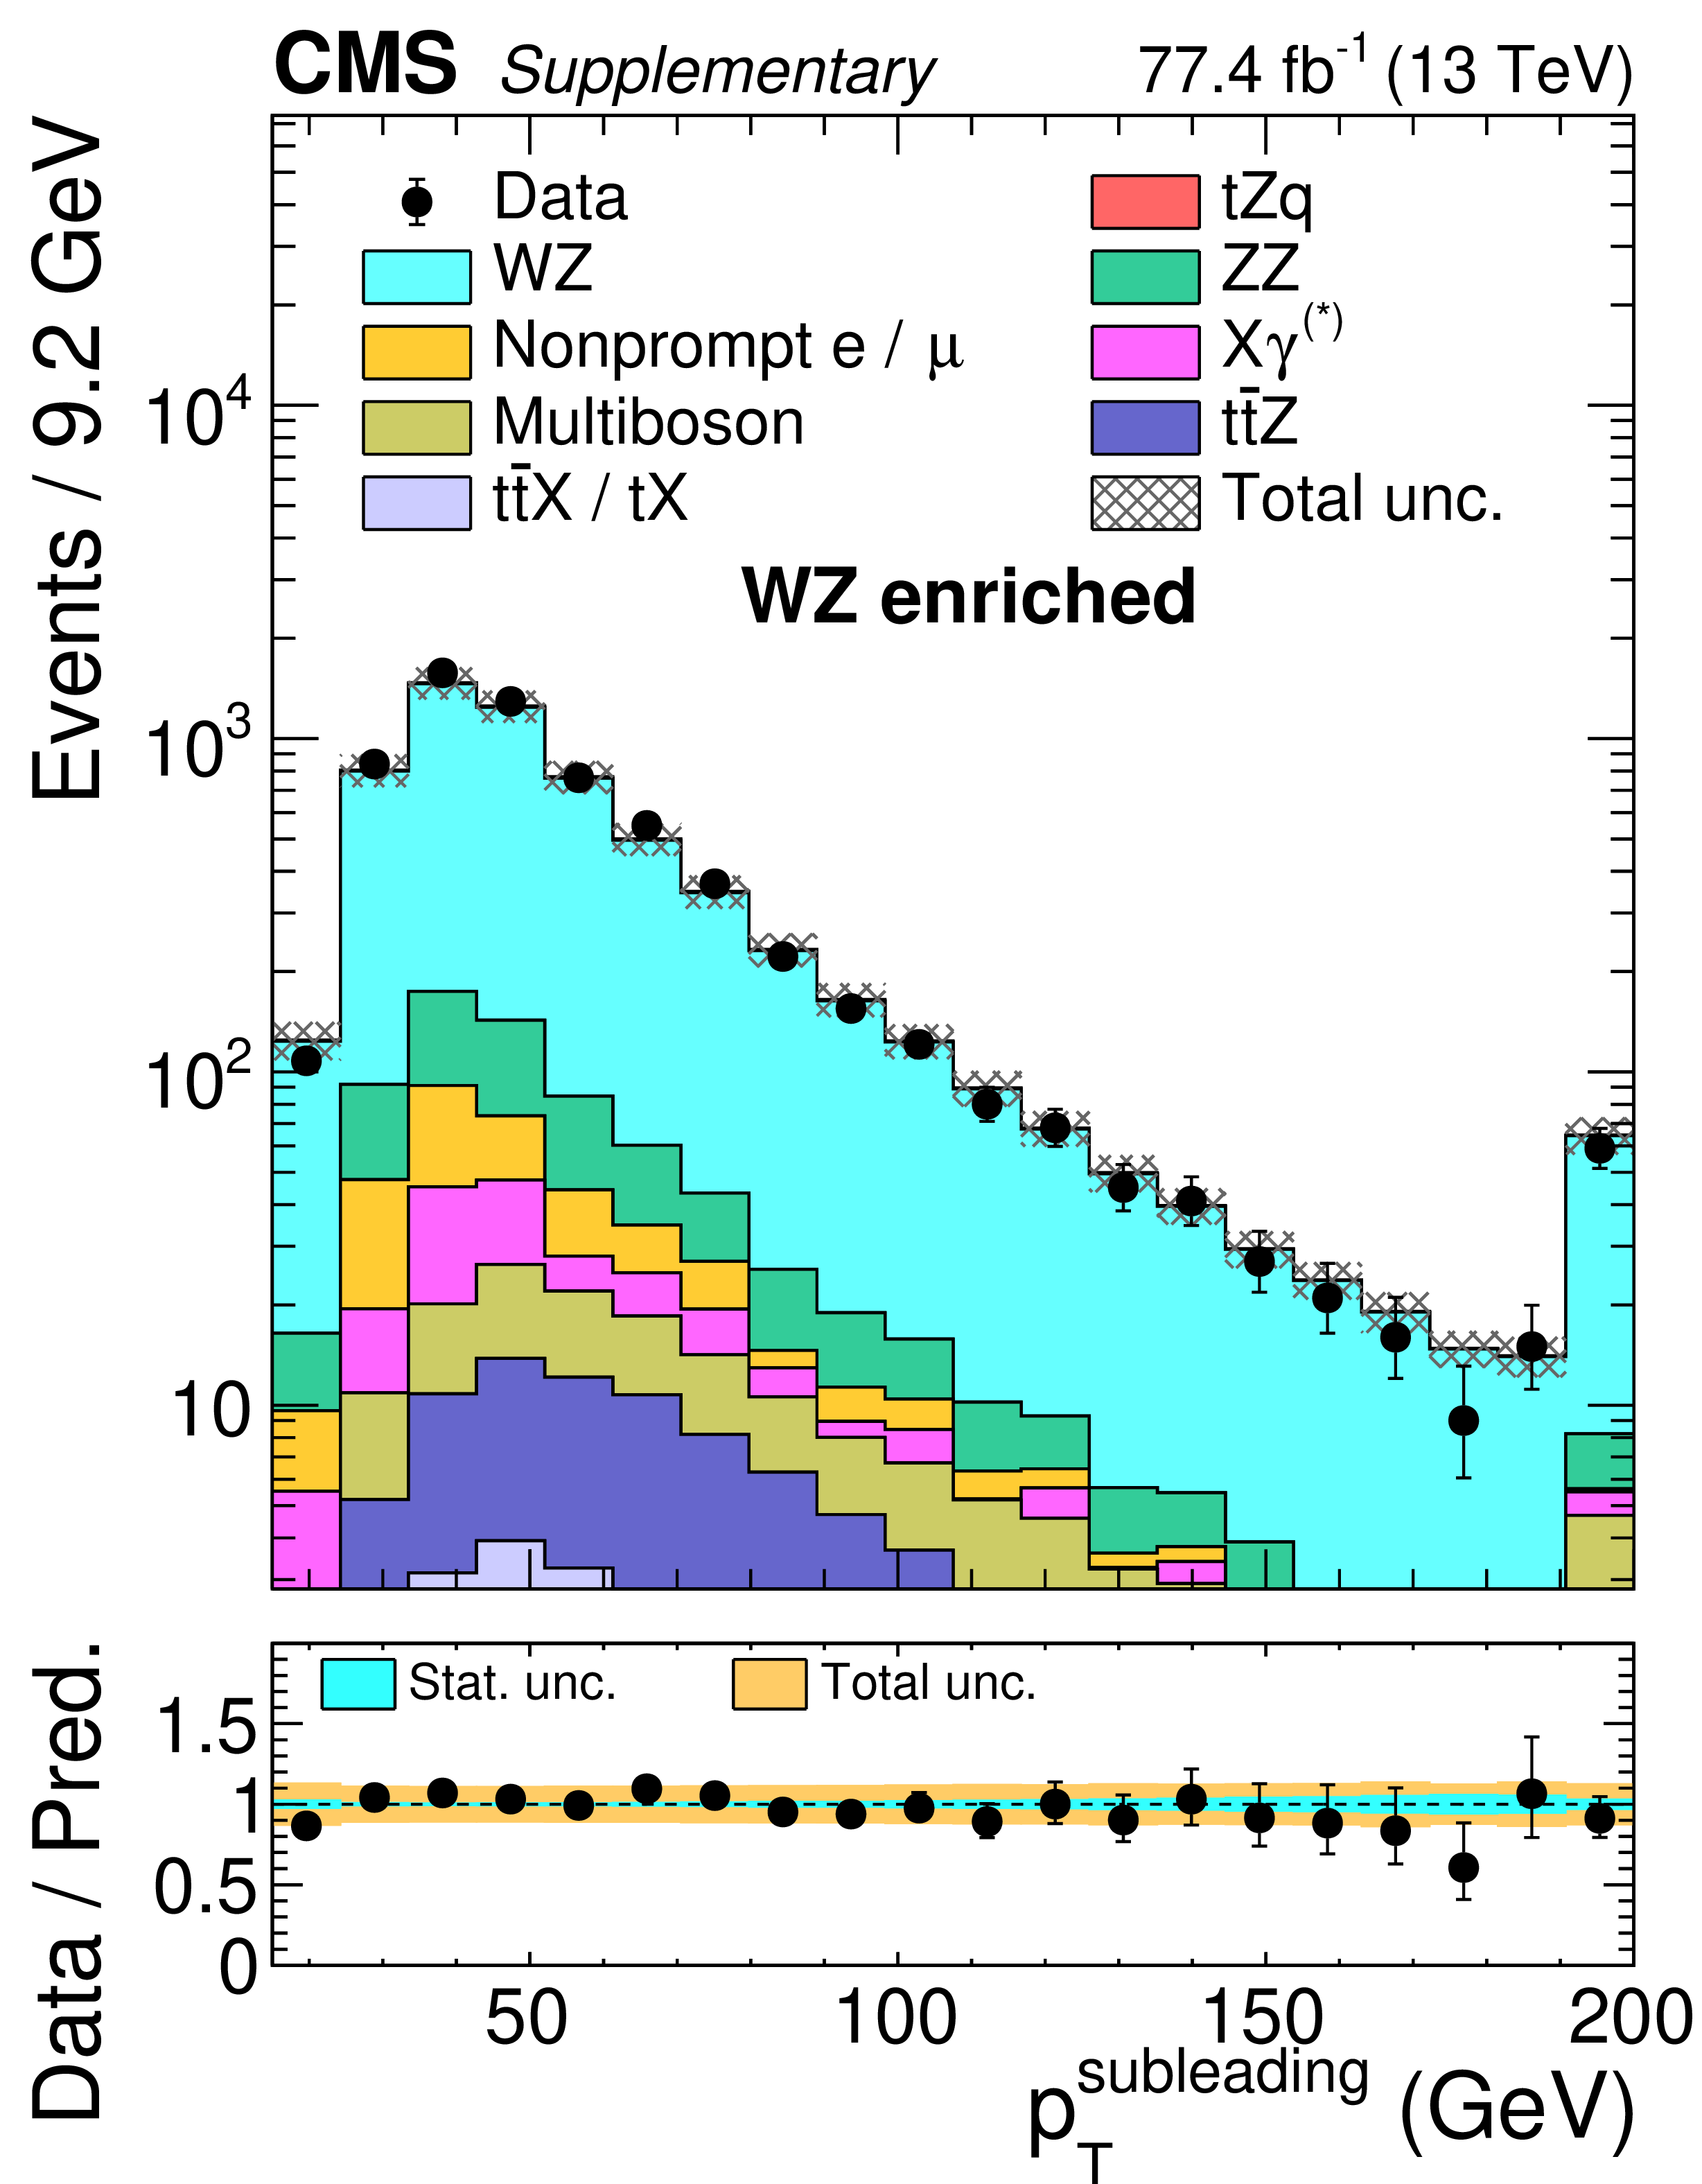
Additional Figure 3:
Expected and observed distributions in the ${{\mathrm {W}} {\mathrm {Z}}}$ control region of the highest lepton ${p_{\mathrm {T}}}$ (left), second highest lepton ${p_{\mathrm {T}}}$ (middle) and lowest lepton ${p_{\mathrm {T}}}$ (right). |
png pdf |
Additional Figure 3-a:
Expected and observed distributions in the ${{\mathrm {W}} {\mathrm {Z}}}$ control region of the highest lepton ${p_{\mathrm {T}}}$. |
png pdf |
Additional Figure 3-b:
Expected and observed distributions in the ${{\mathrm {W}} {\mathrm {Z}}}$ control region of the second highest lepton ${p_{\mathrm {T}}}$. |

png pdf |
Additional Figure 3-c:
Expected and observed distributions in the ${{\mathrm {W}} {\mathrm {Z}}}$ control region of the lowest lepton ${p_{\mathrm {T}}}$. |
png pdf |
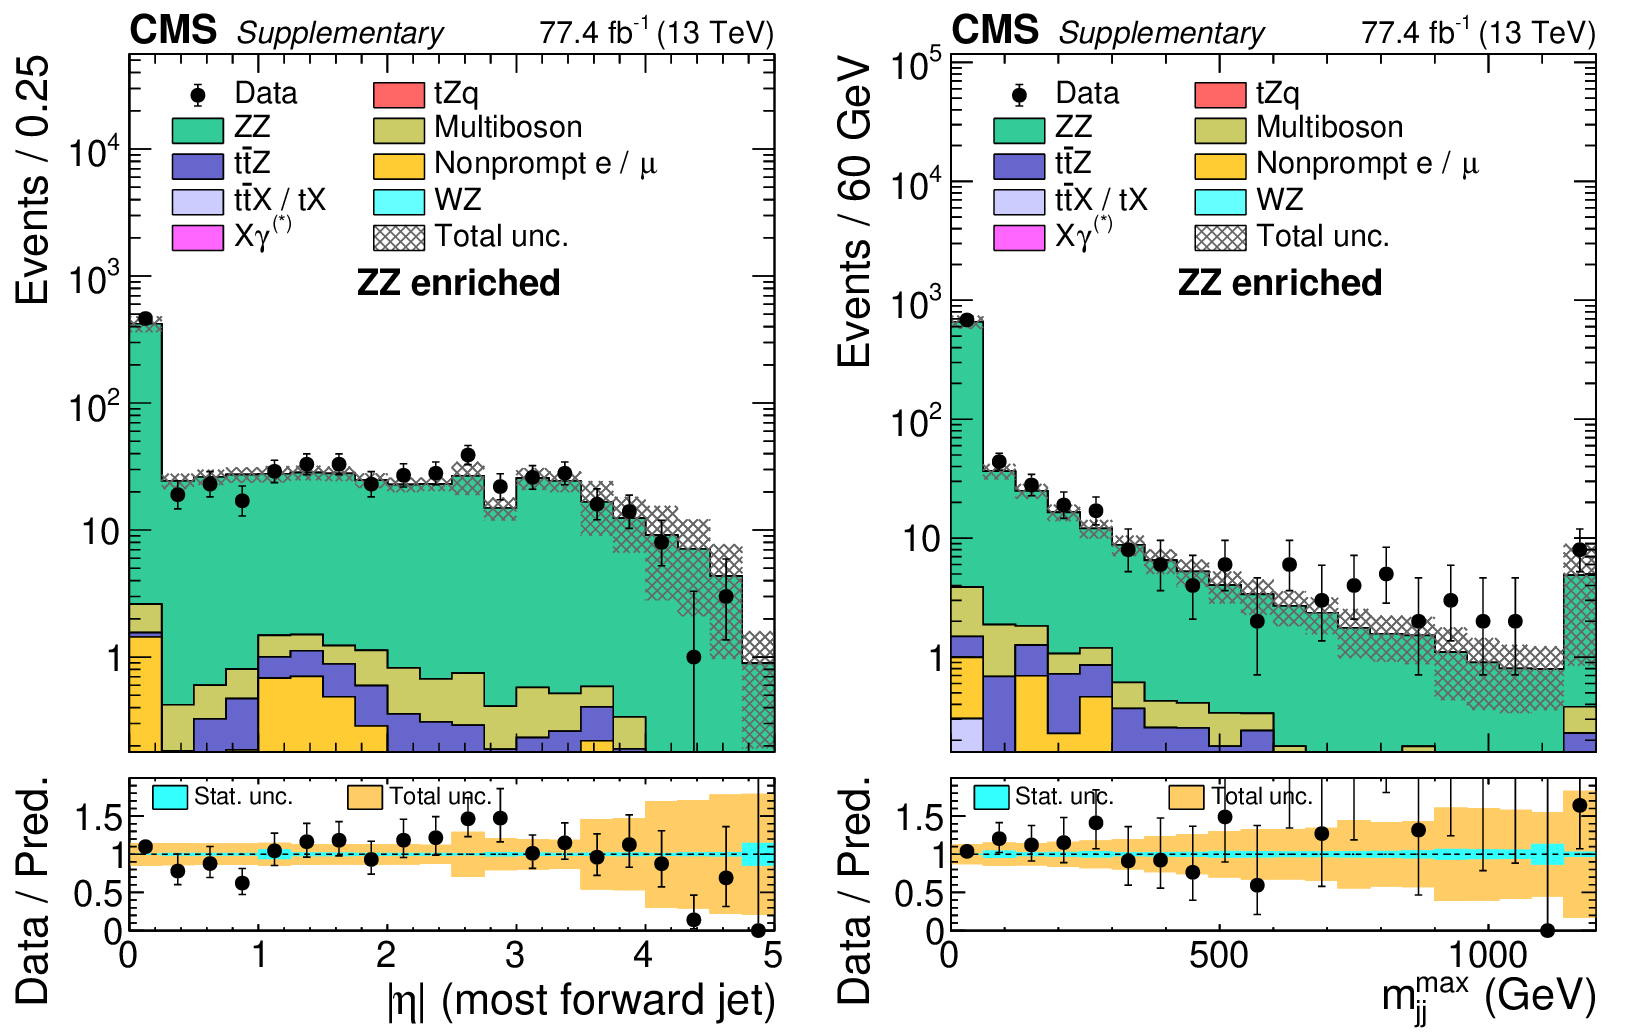
Additional Figure 4:
Expected and observed distributions in the ${{\mathrm {Z}} {\mathrm {Z}}}$ control region of the highest $| \eta |$ value out of any jet in the event (left) and the maximum dijet invariant mass out of any combination of jets in the event (right). |
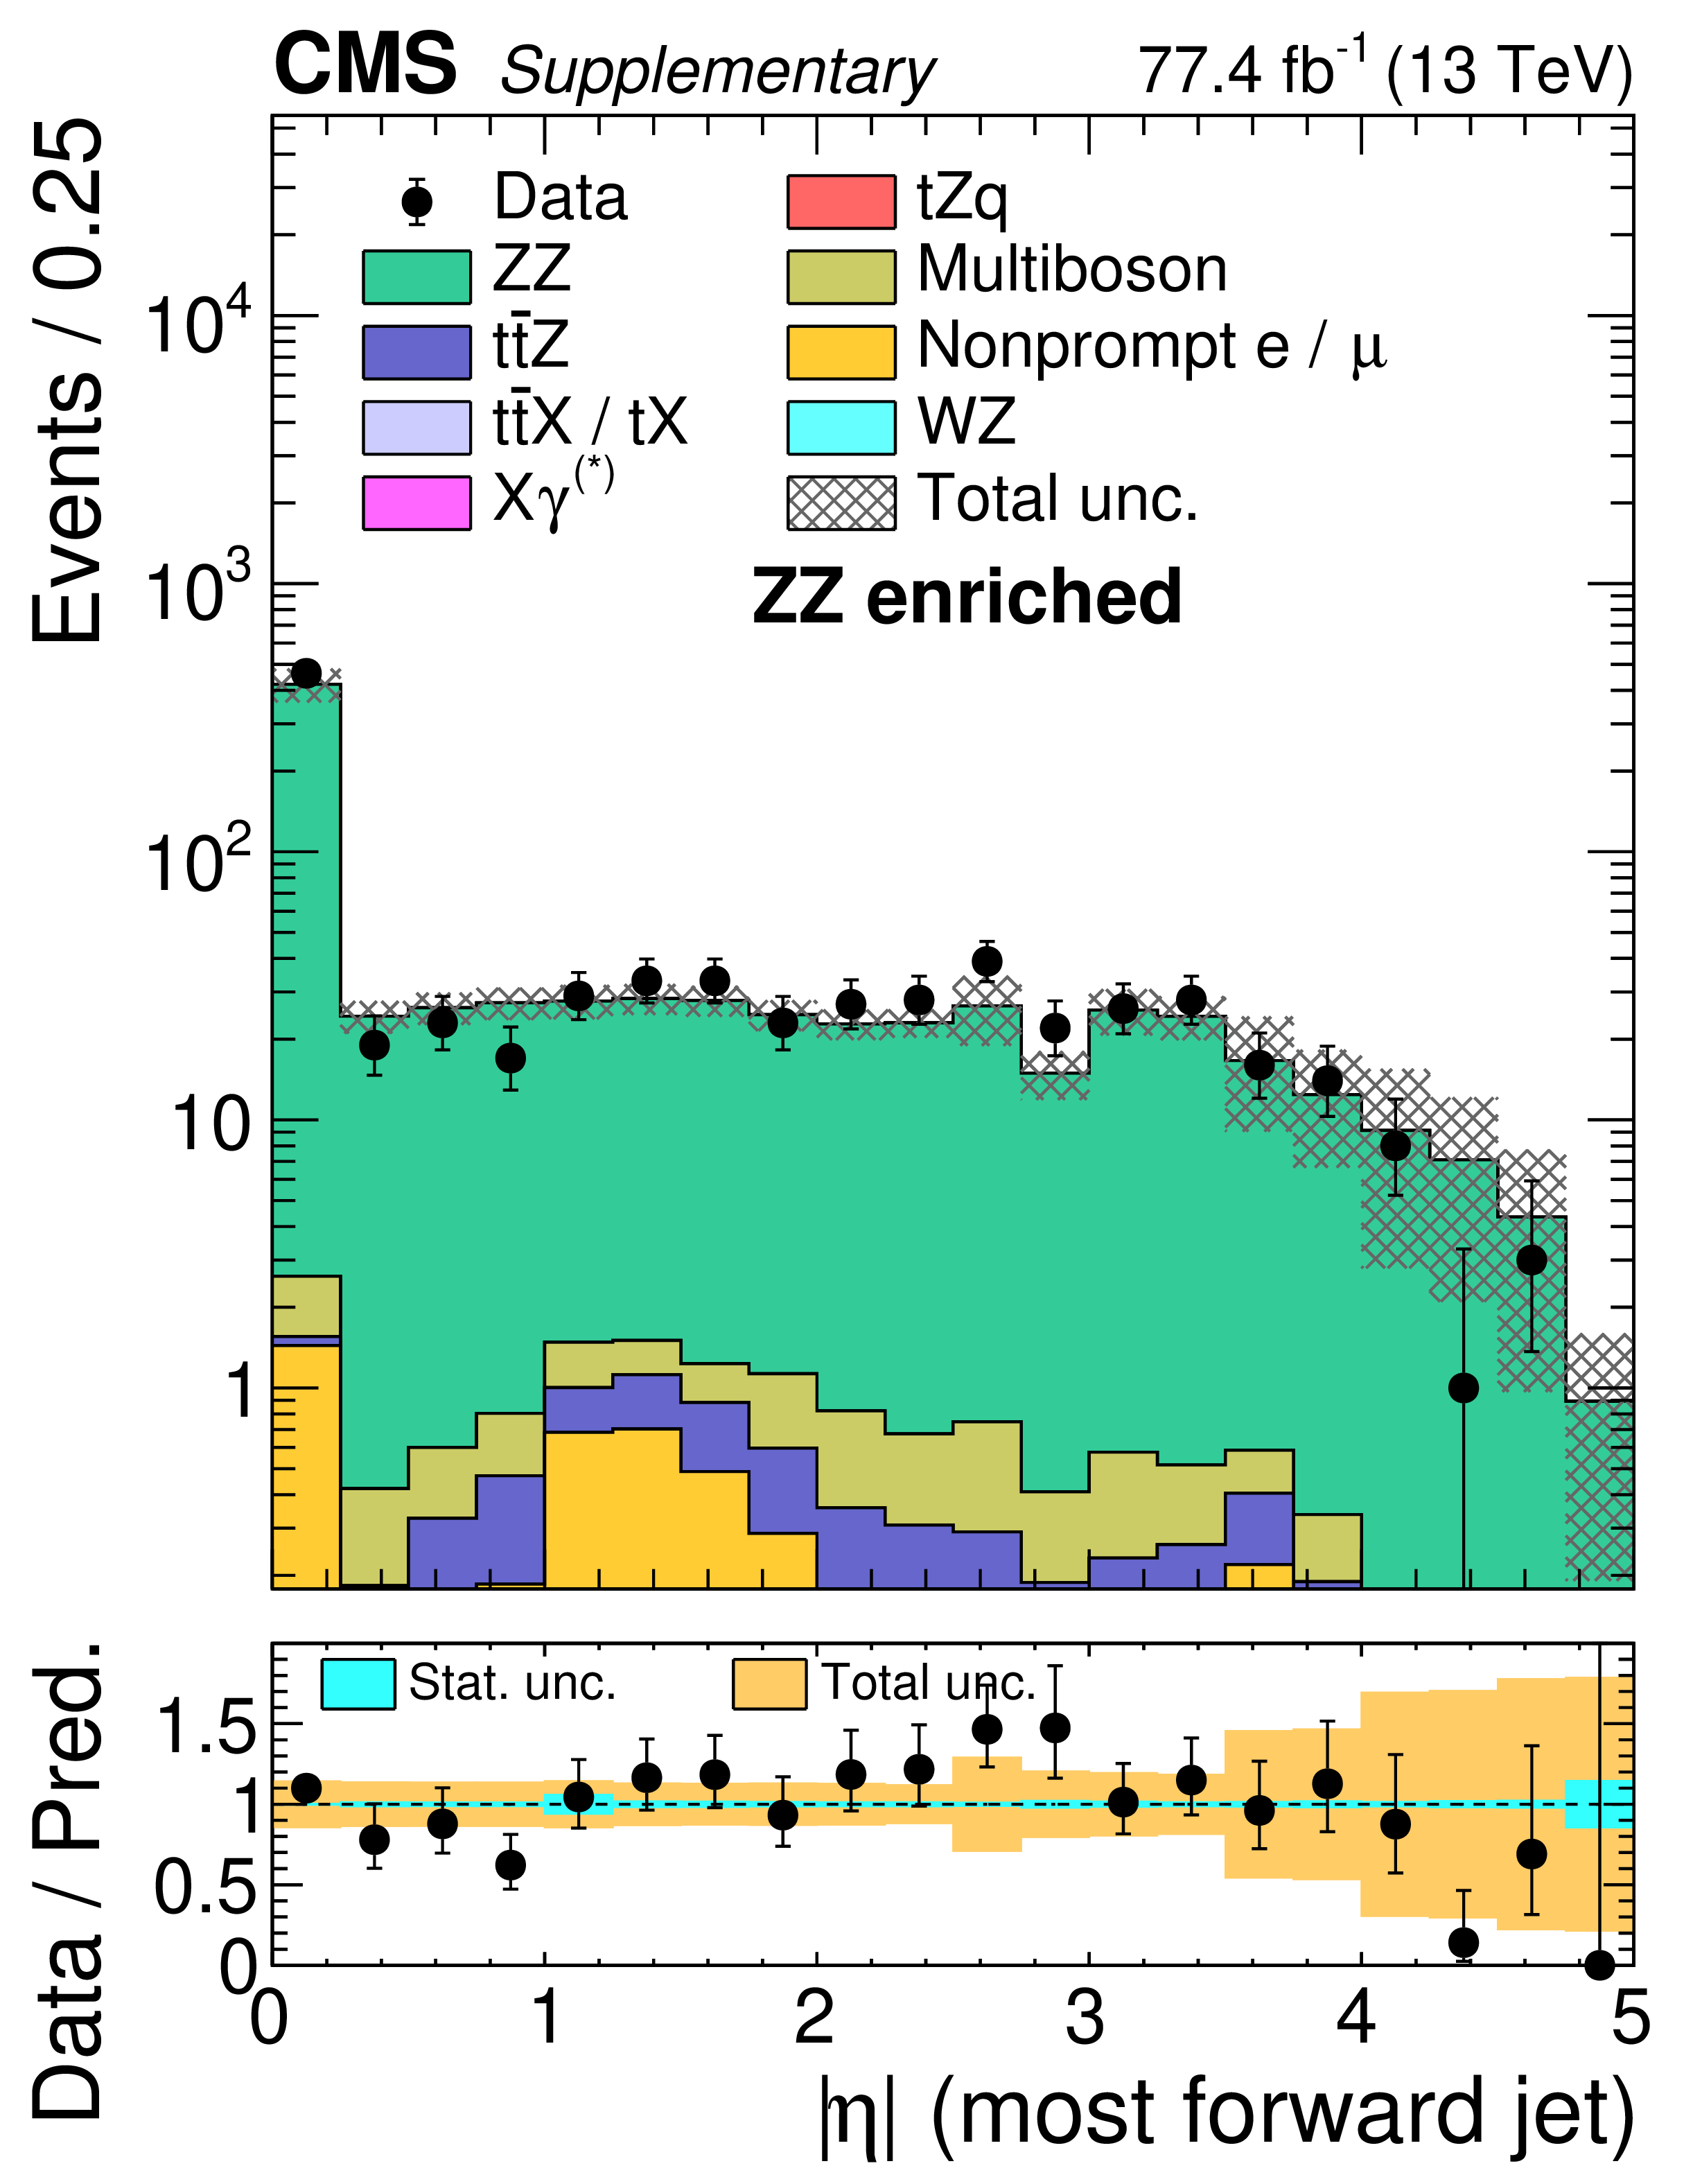
png pdf |
Additional Figure 4-a:
Expected and observed distributions in the ${{\mathrm {Z}} {\mathrm {Z}}}$ control region of the highest $| \eta |$ value out of any jet in the event. Additional Figure 4-b |
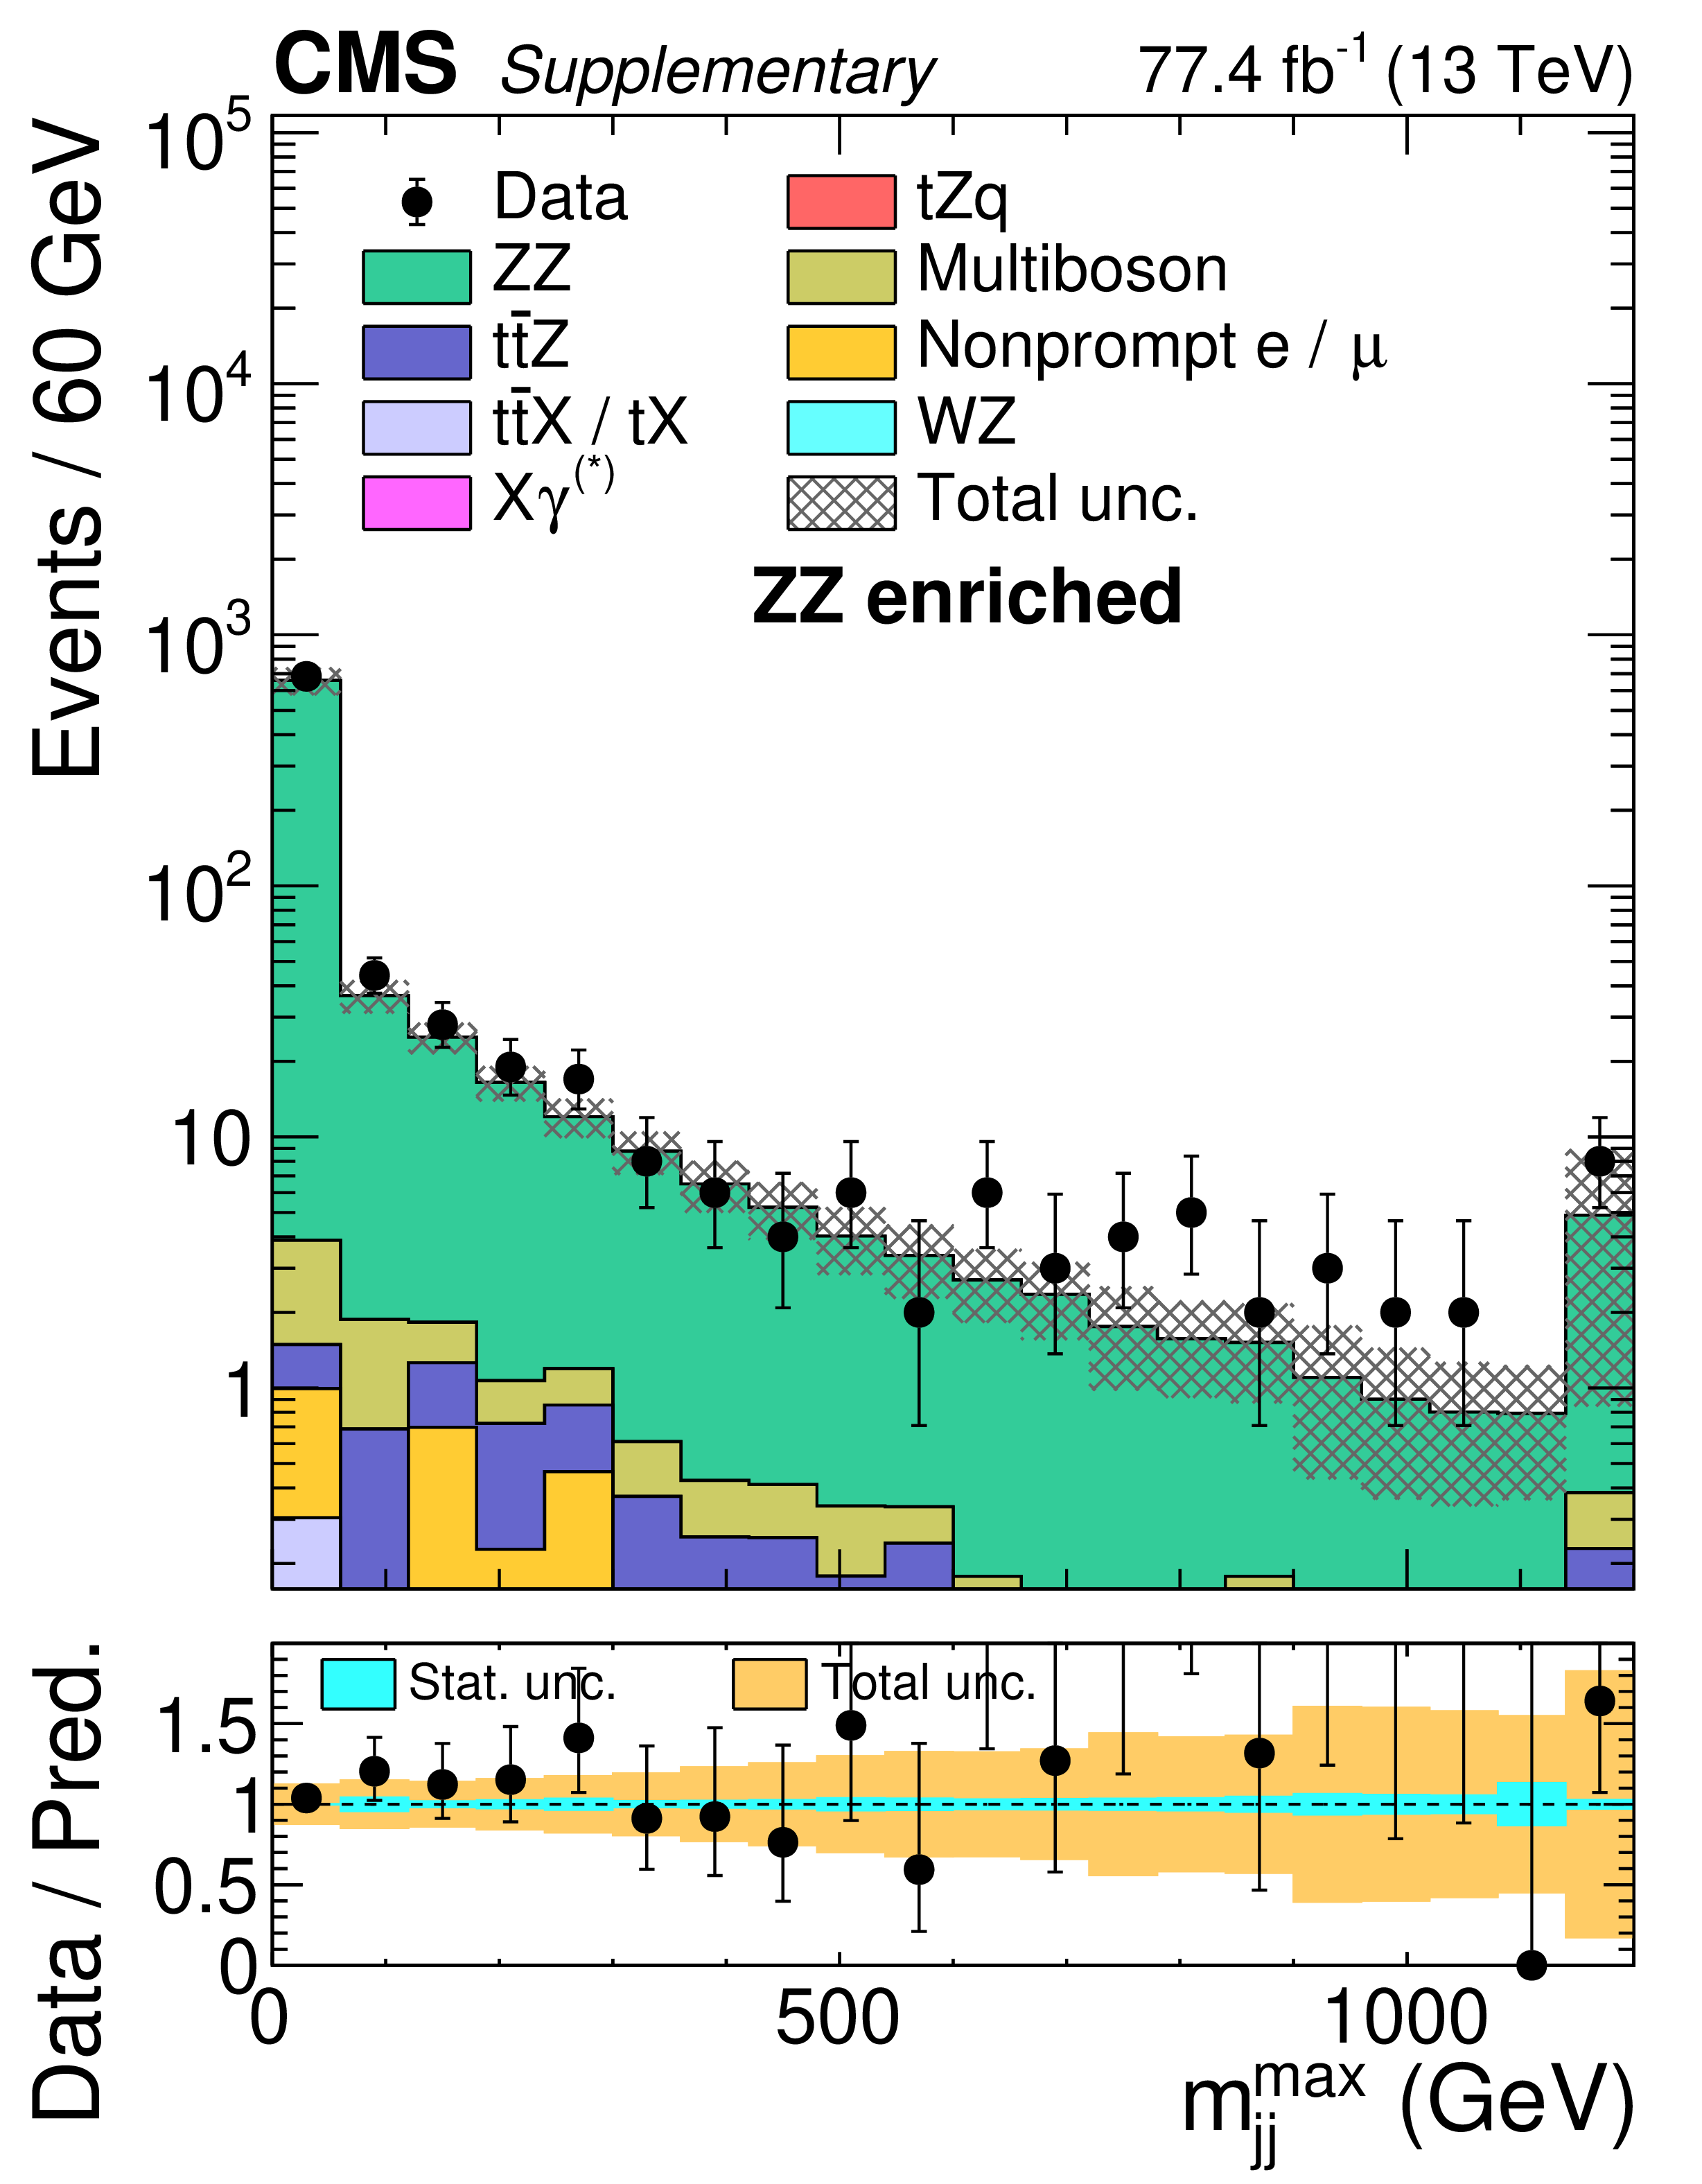
png pdf |
Additional Figure 4-b:
Expected and observed distributions in the ${{\mathrm {Z}} {\mathrm {Z}}}$ control region of the highest $| \eta |$ value out of any jet in the event (left) and the maximum dijet invariant mass out of any combination of jets in the event (right). |
png pdf |
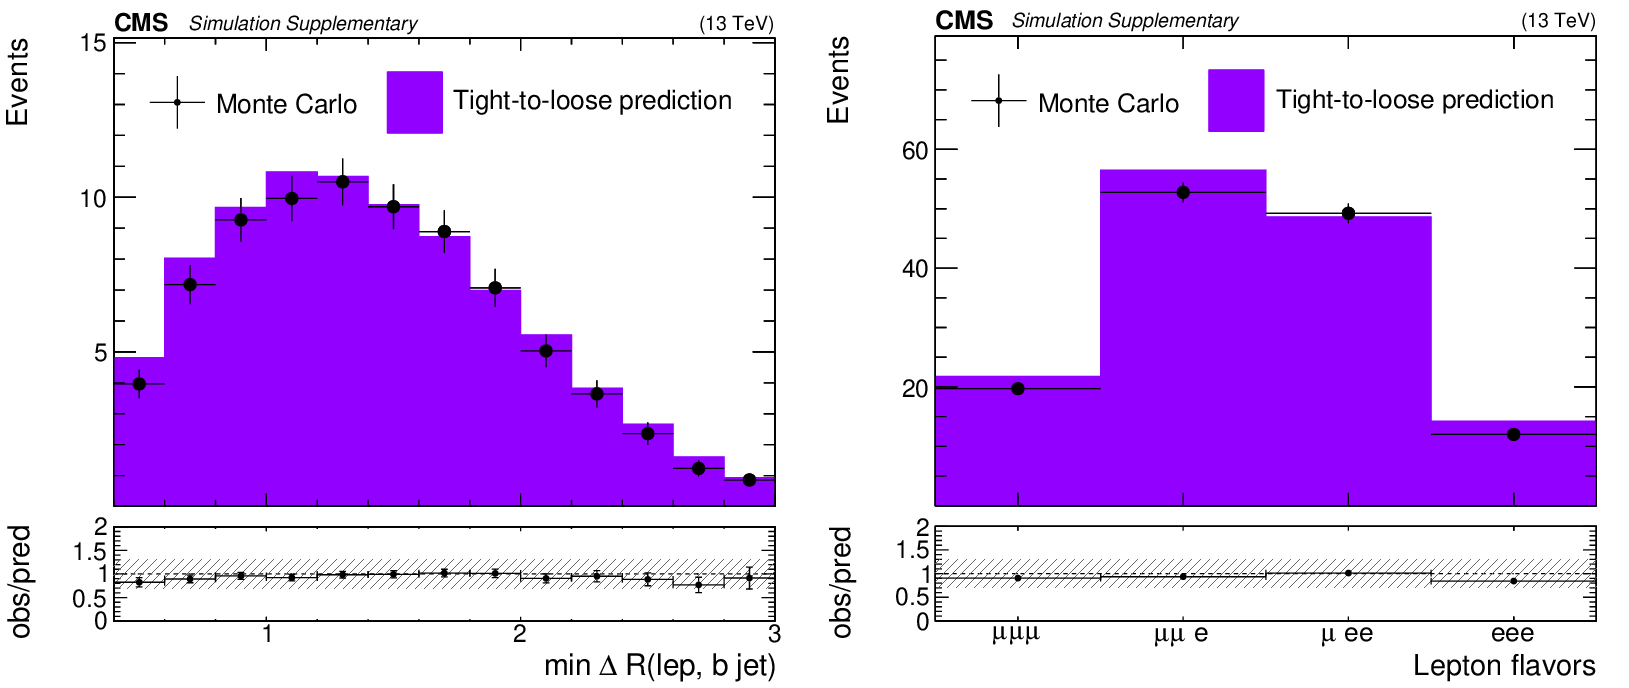
Additional Figure 5:
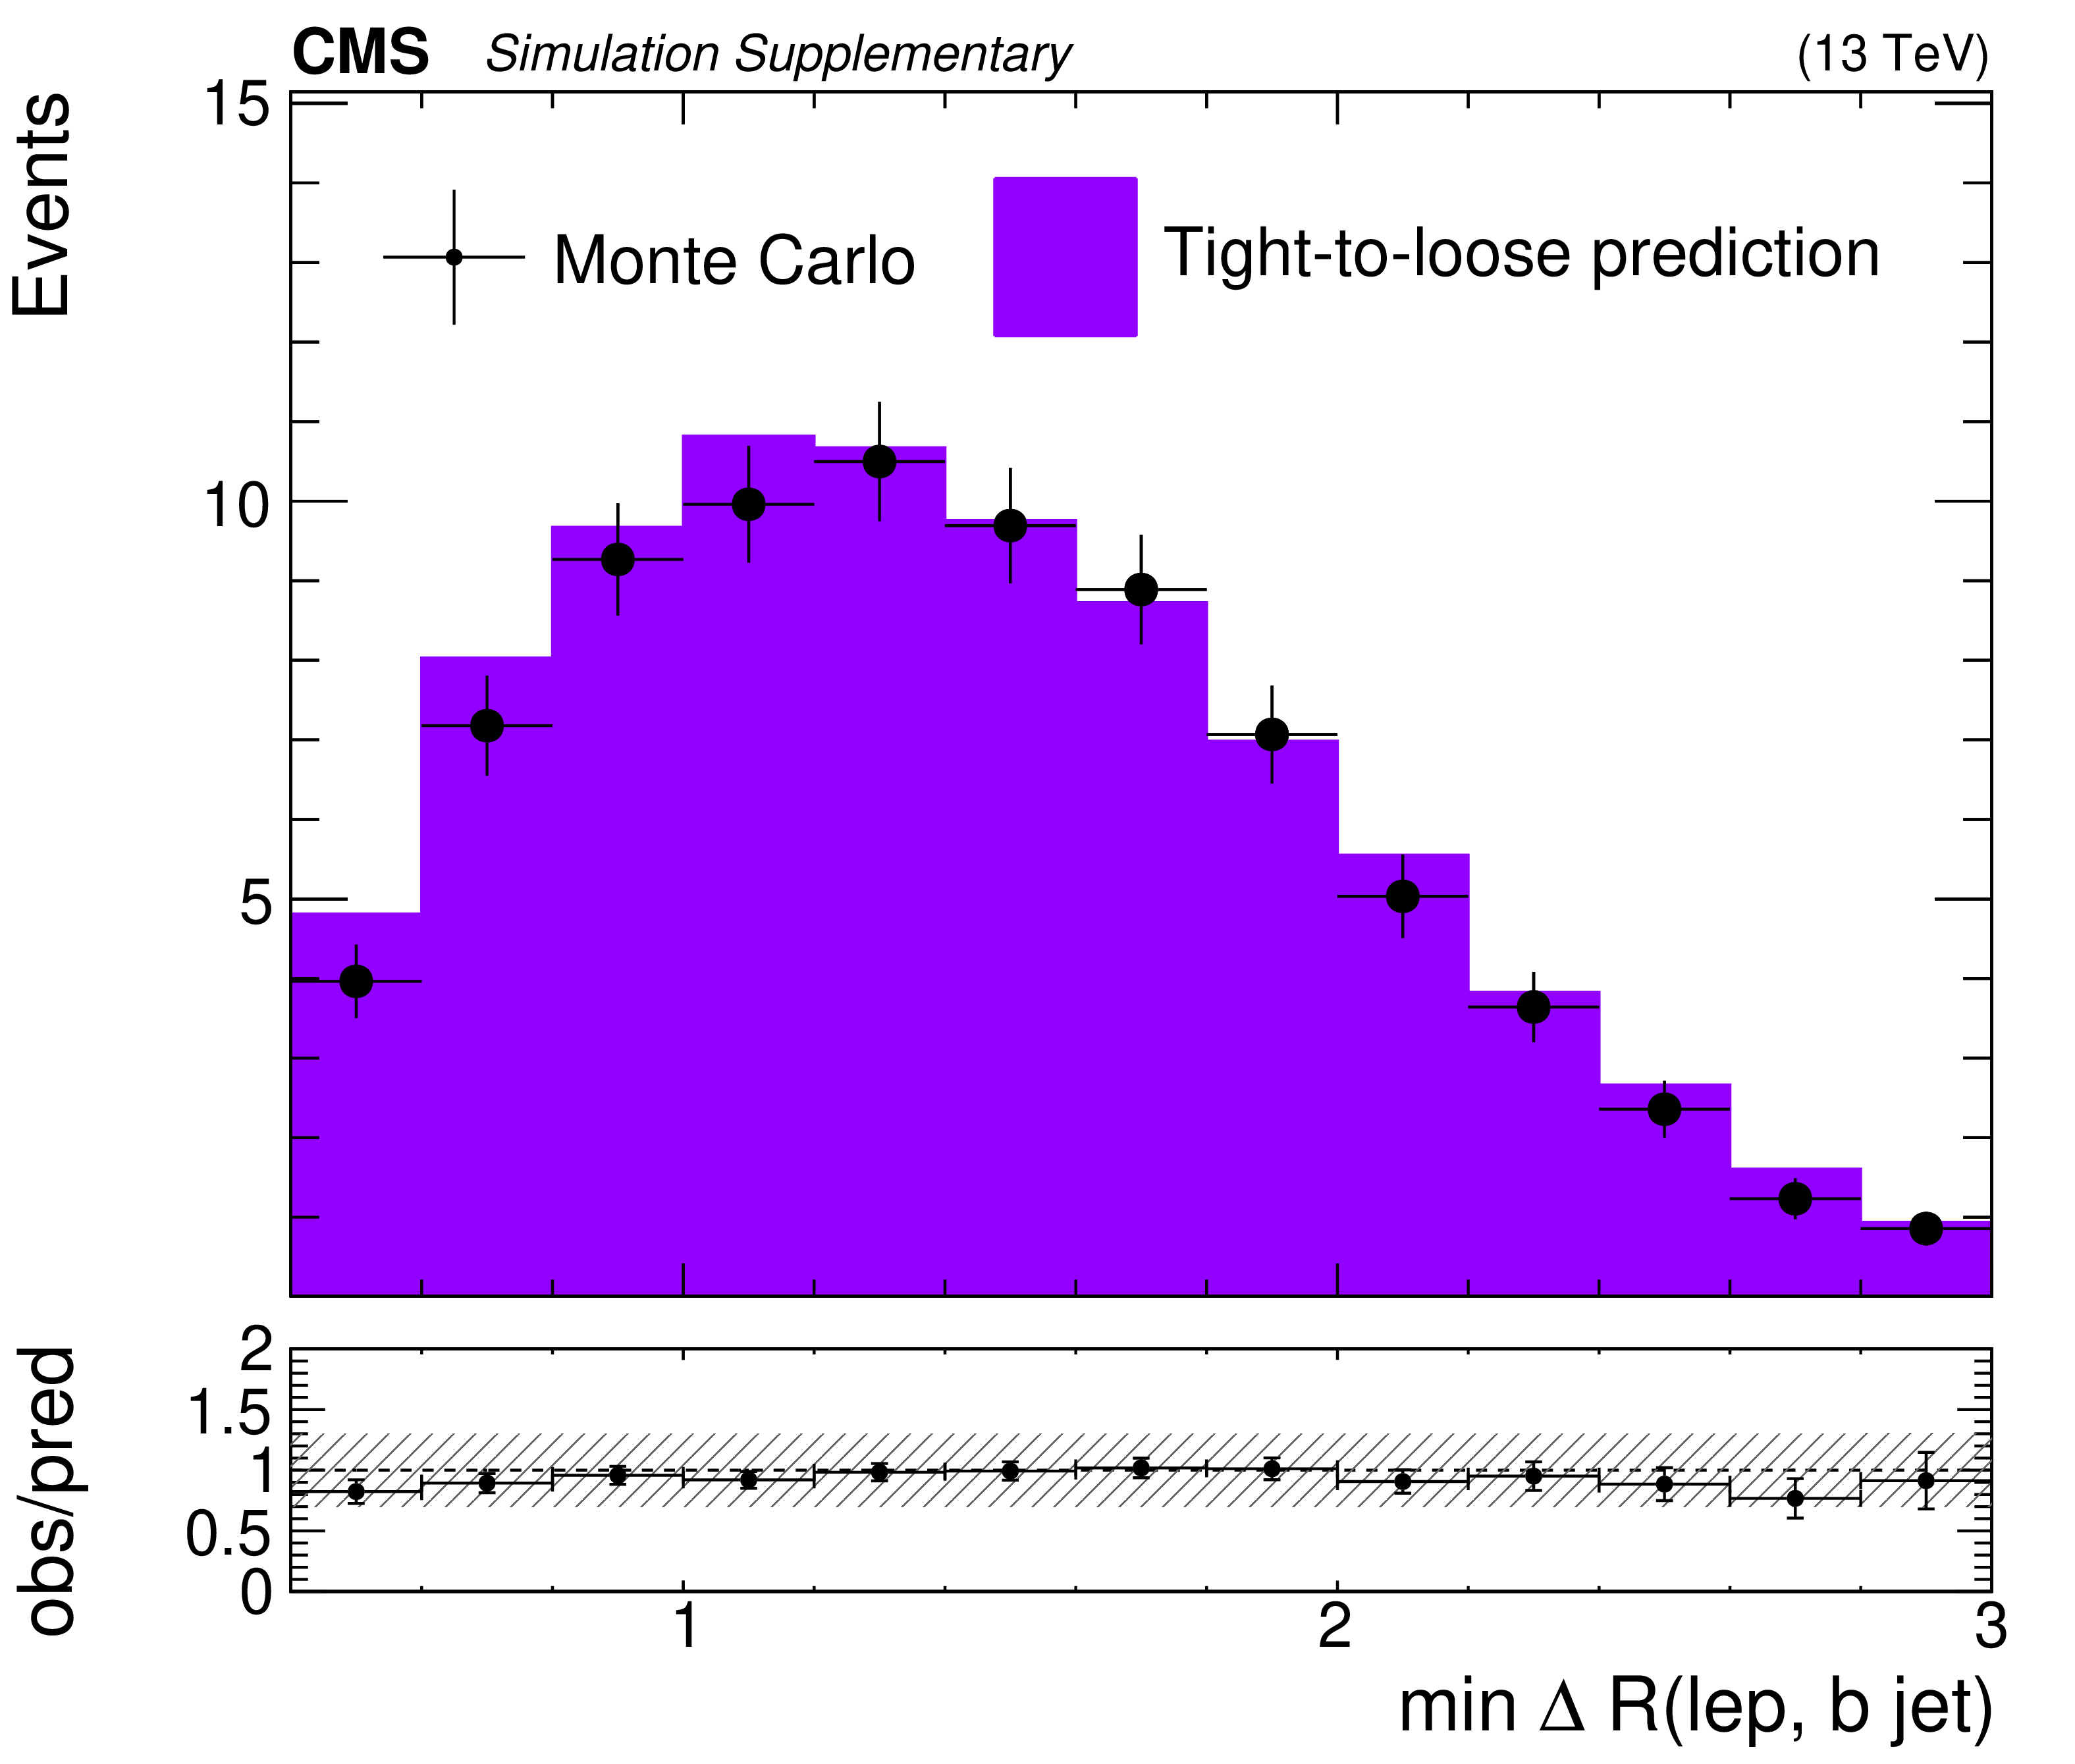
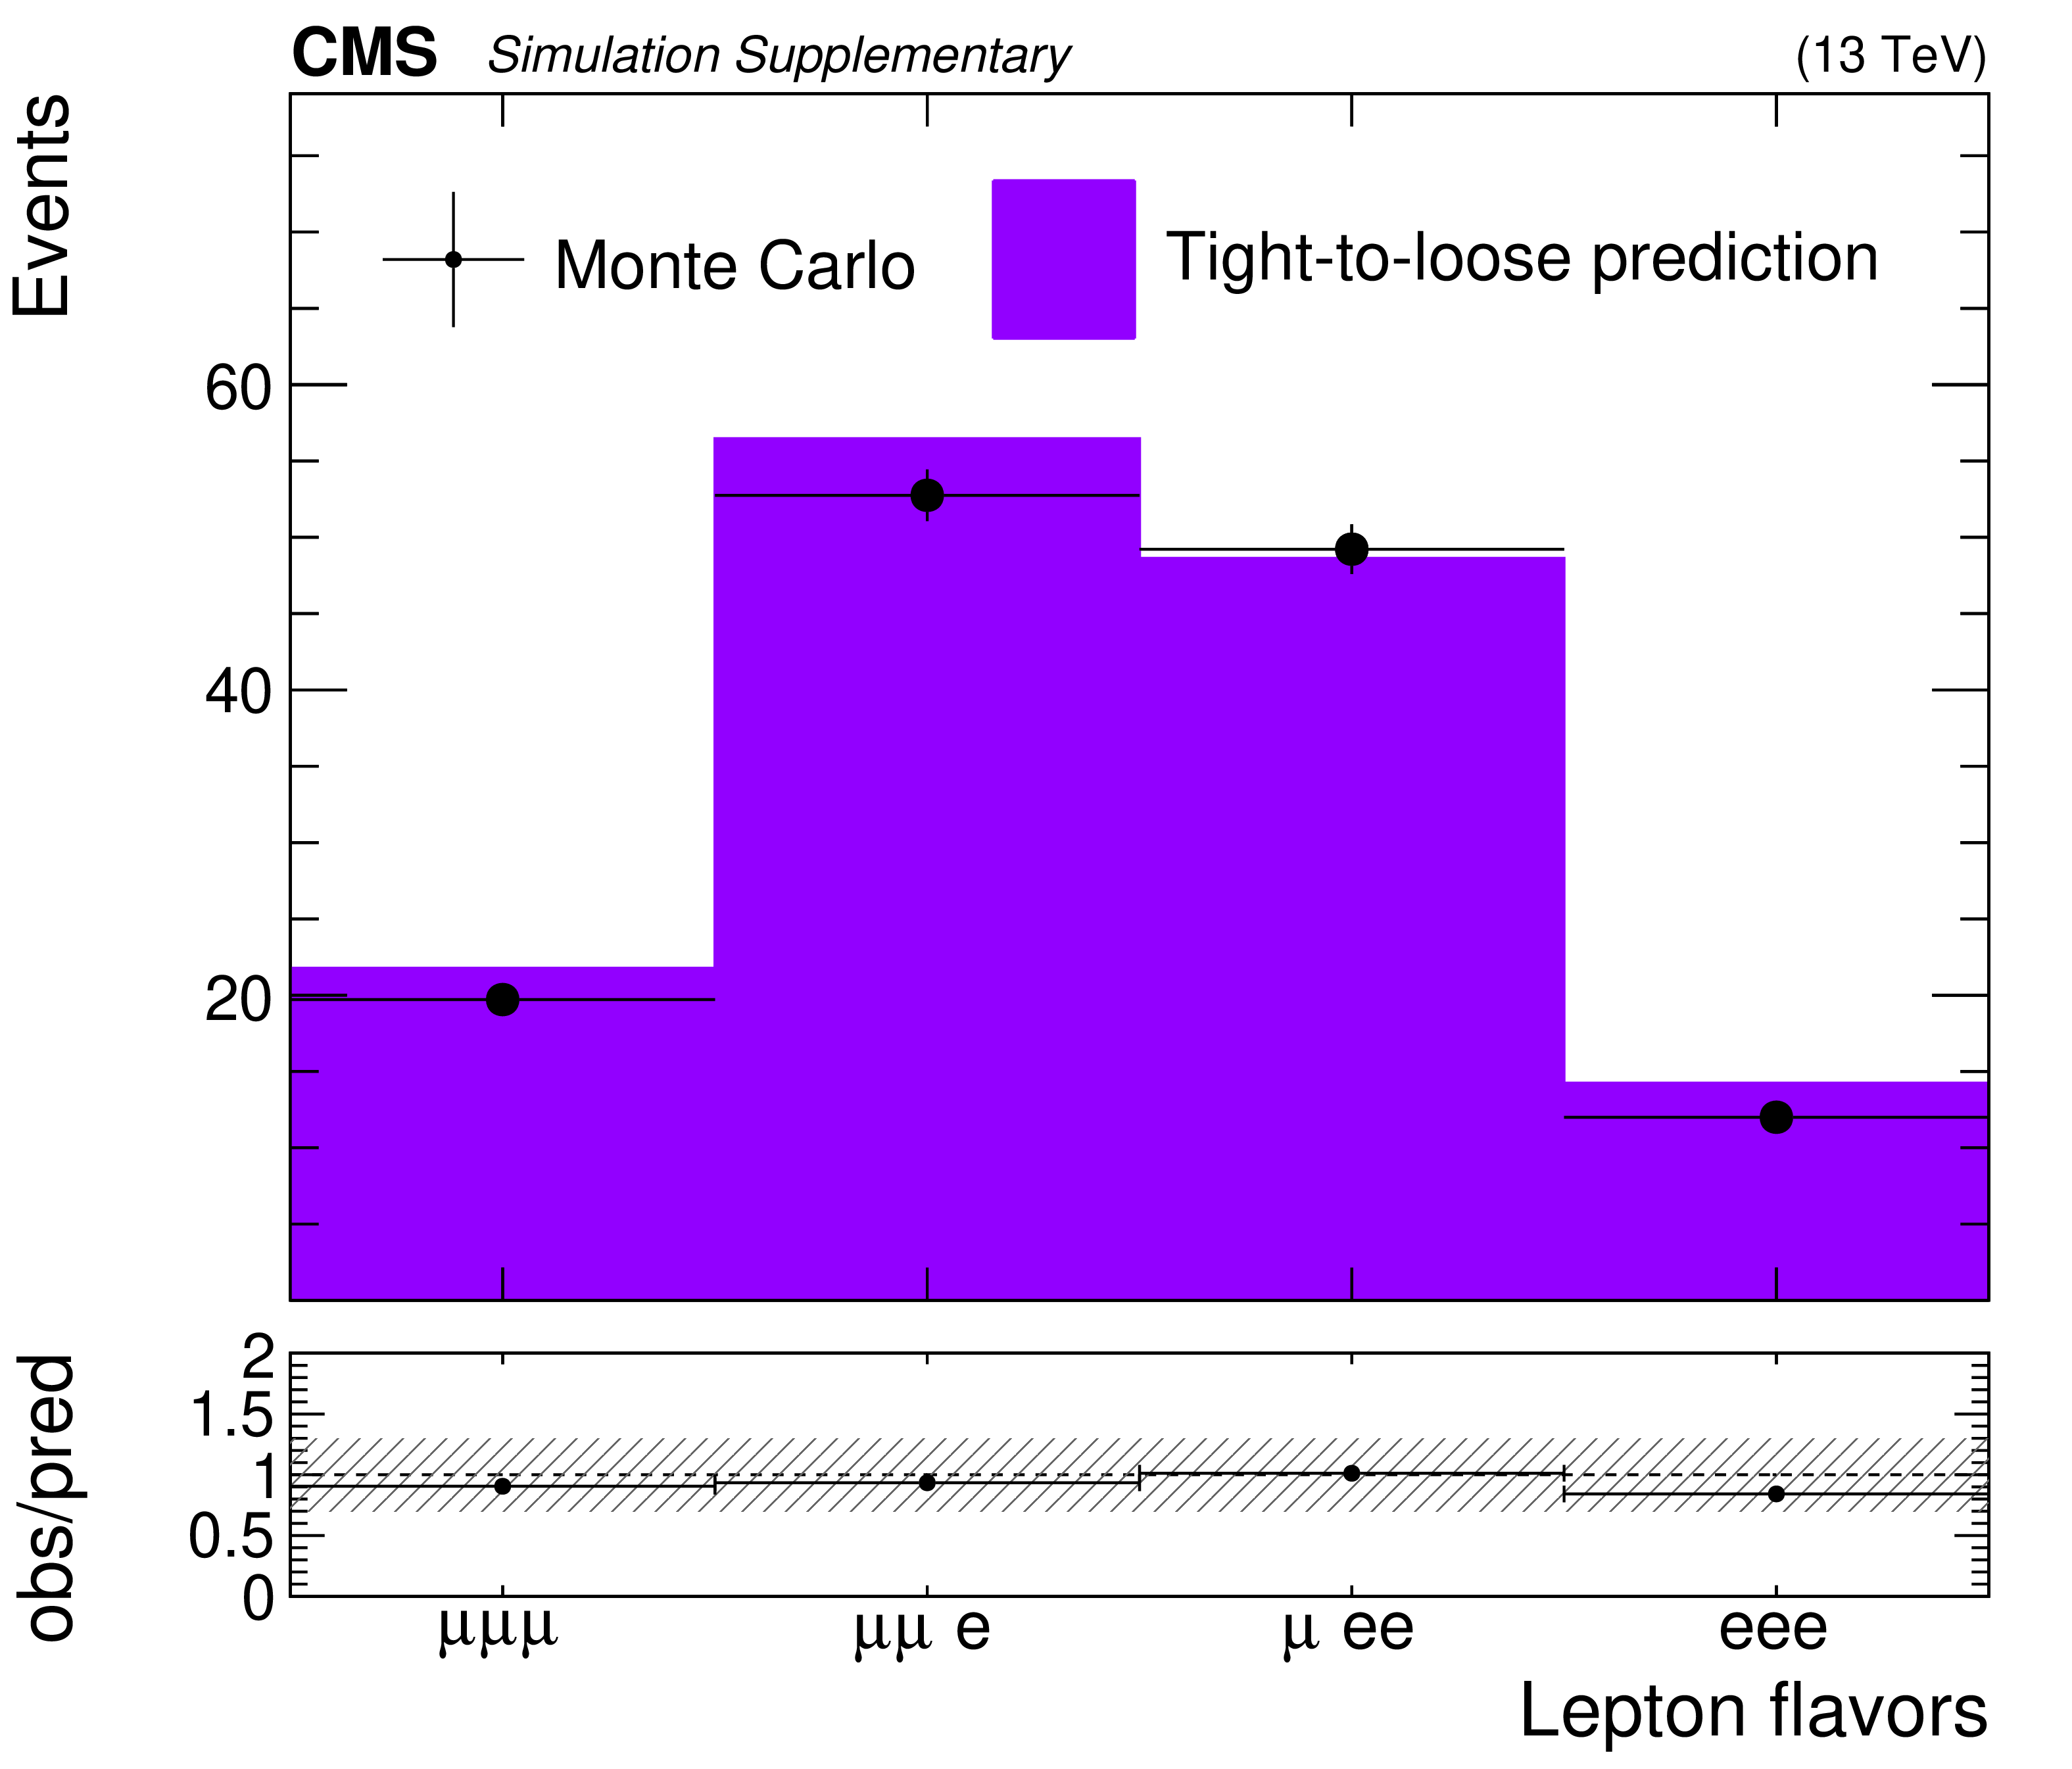
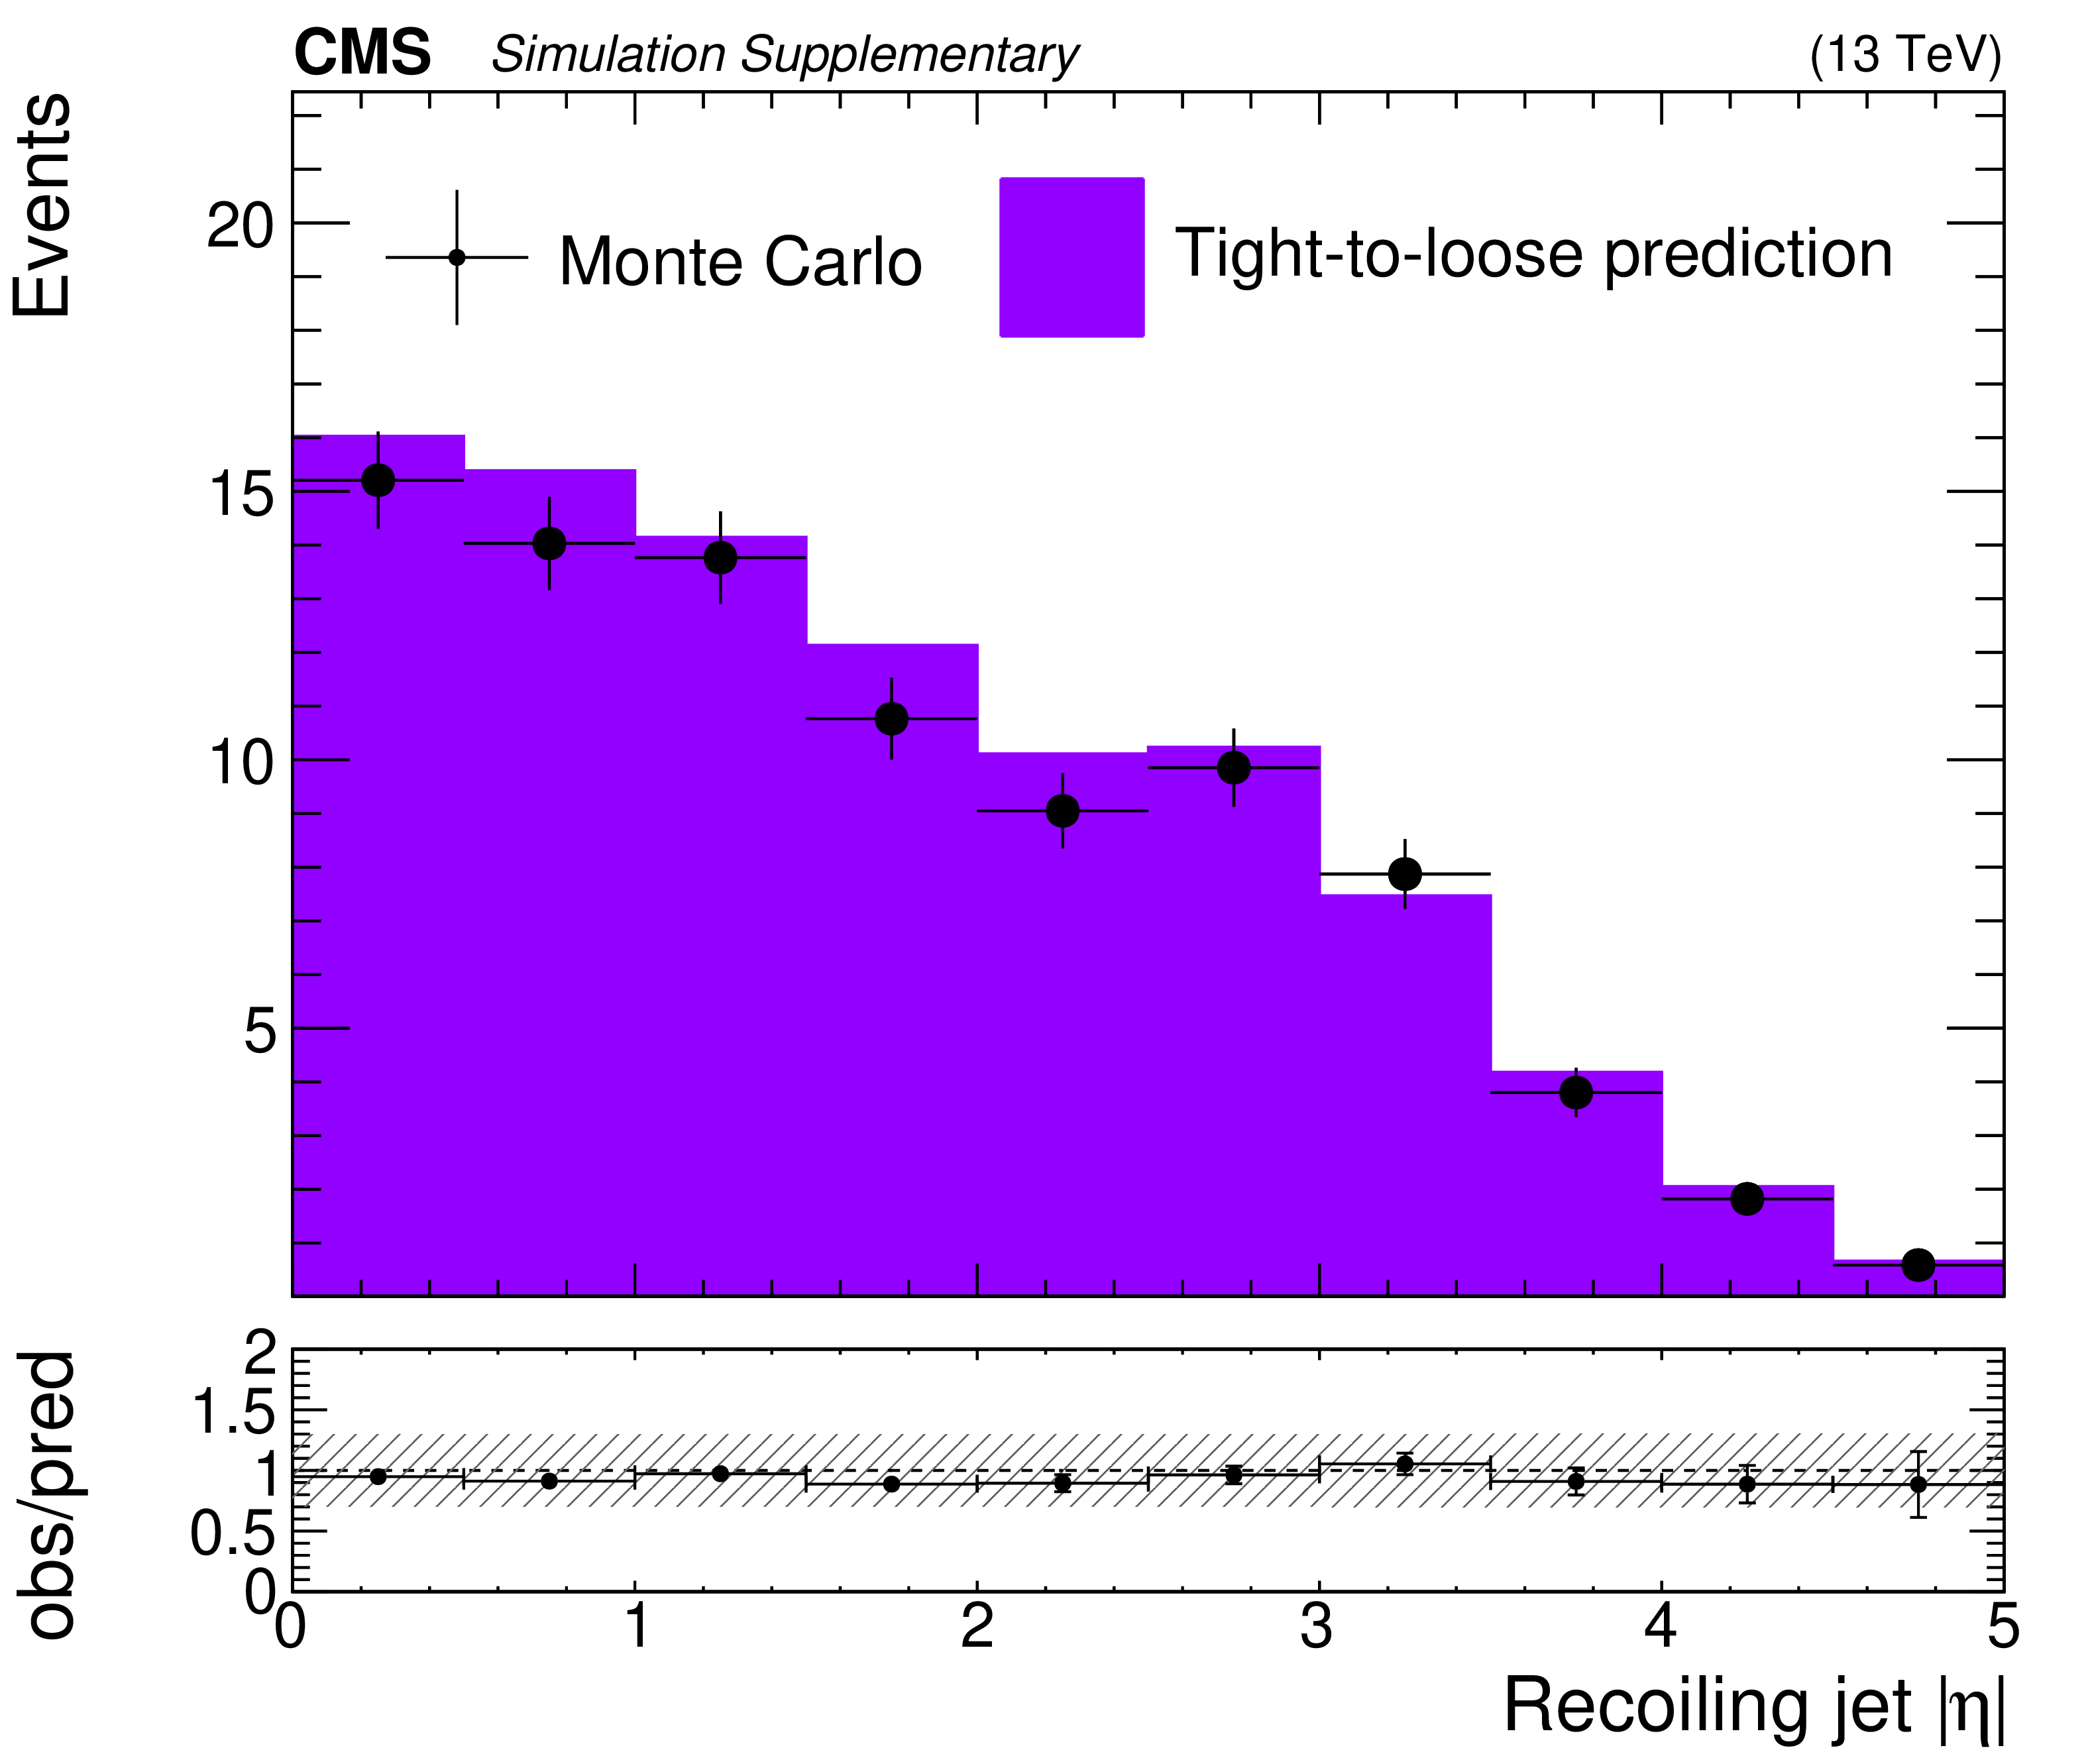
Comparison between the yields from simulated ${{\mathrm {t}\overline {\mathrm {t}}}}$ events where each lepton passes the full signal region lepton selection to the prediction of these yields obtained by taking events in which at least one lepton fails to pass the full selection to which the fake-rate, determined using QCD simulations, is applied, as a function of the minimum $\Delta R$ between any lepton and b jet in the event (left), and the lepton flavor composition of the event (right). |
png pdf |
Additional Figure 5-a:
Comparison between the yields from simulated ${{\mathrm {t}\overline {\mathrm {t}}}}$ events where each lepton passes the full signal region lepton selection to the prediction of these yields obtained by taking events in which at least one lepton fails to pass the full selection to which the fake-rate, determined using QCD simulations, is applied, as a function of the minimum $\Delta R$ between any lepton and b jet in the event. |
png pdf |
Additional Figure 5-b:
Comparison between the yields from simulated ${{\mathrm {t}\overline {\mathrm {t}}}}$ events where each lepton passes the full signal region lepton selection to the prediction of these yields obtained by taking events in which at least one lepton fails to pass the full selection to which the fake-rate, determined using QCD simulations, is applied, as a function of the lepton flavor composition of the event. |
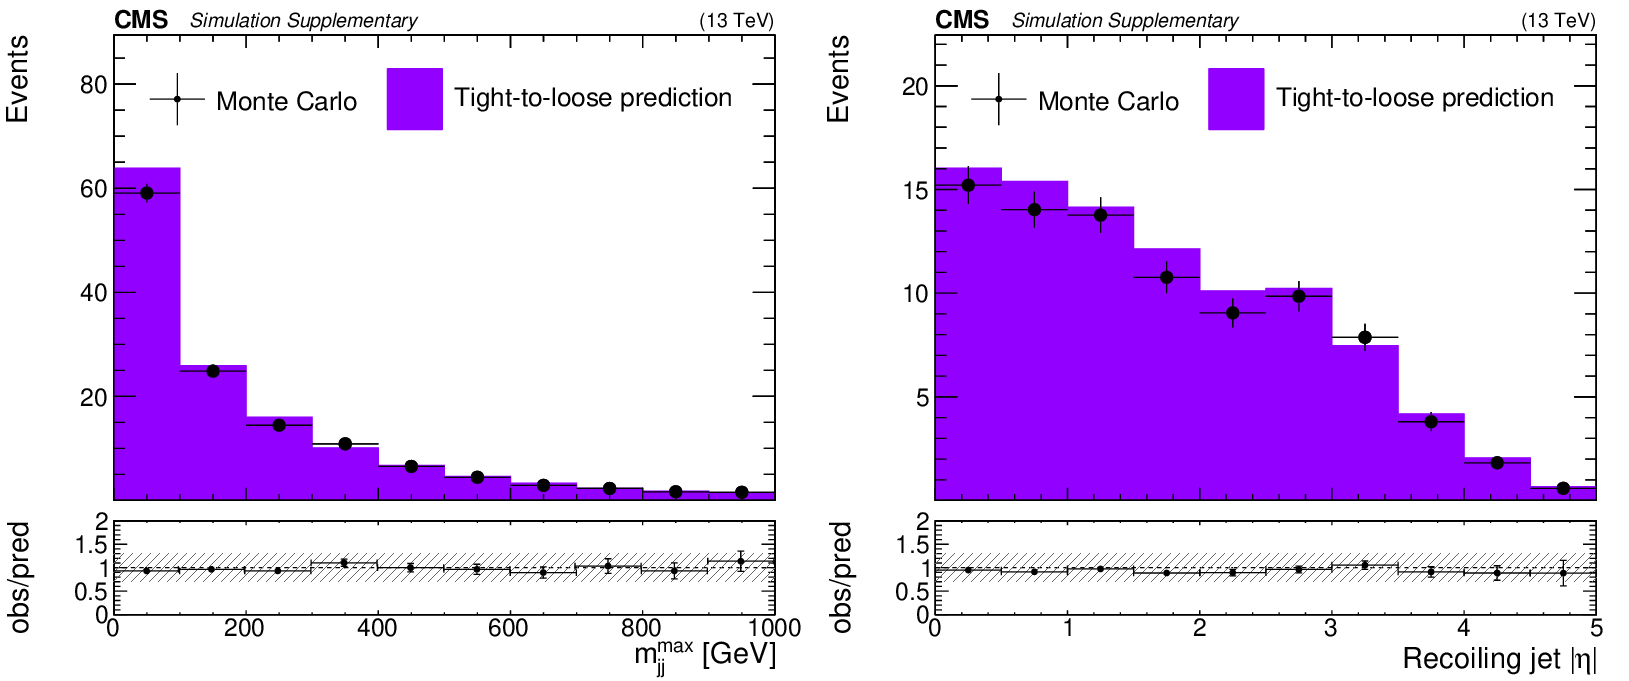
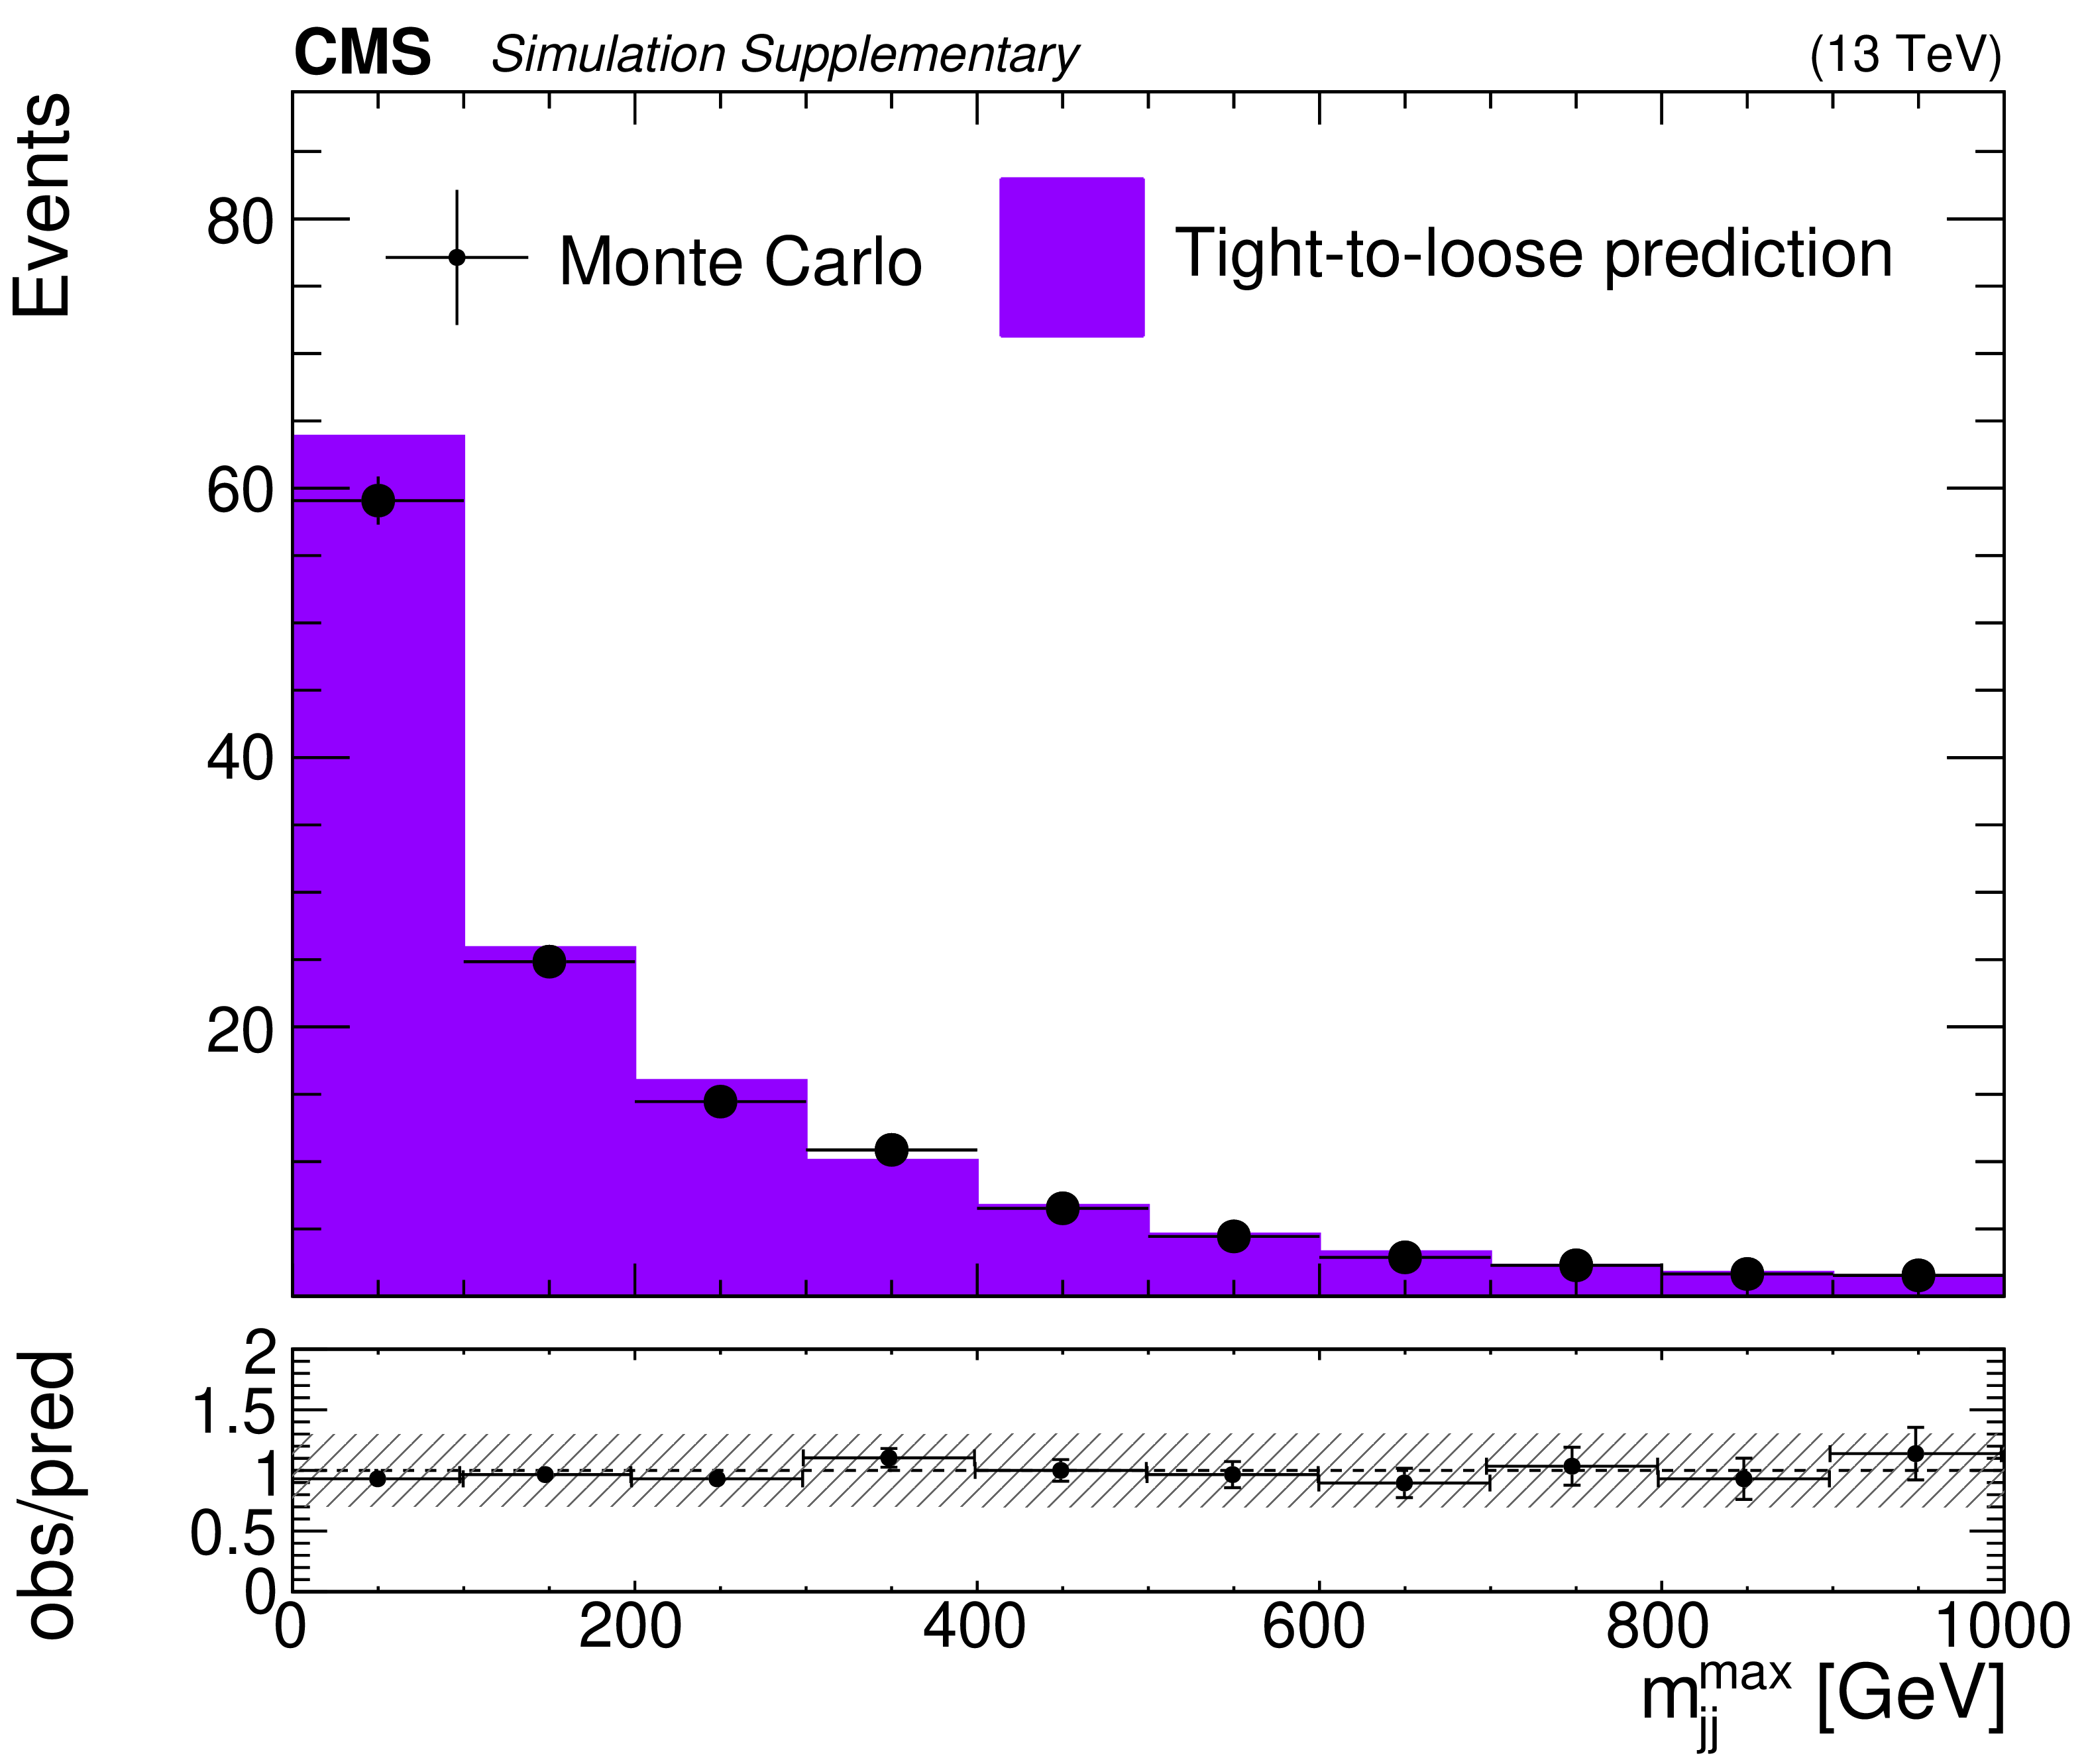
png pdf |
Additional Figure 6:
Comparison between the yields from simulated ${{\mathrm {t}\overline {\mathrm {t}}}}$ events where each lepton passes the full signal region lepton selection to the prediction of these yields obtained by taking events in which at least one lepton fails to pass the full selection to which the fake-rate, determined using QCD simulations, is applied, as a function of the minimum angular separation in terms of the maximum dijet invariant mass out of any combination of jets in the event (left), and the $| \eta |$ of the recoiling jet (right). |
png pdf |
Additional Figure 6-a:
Comparison between the yields from simulated ${{\mathrm {t}\overline {\mathrm {t}}}}$ events where each lepton passes the full signal region lepton selection to the prediction of these yields obtained by taking events in which at least one lepton fails to pass the full selection to which the fake-rate, determined using QCD simulations, is applied, as a function of the minimum angular separation in terms of the maximum dijet invariant mass out of any combination of jets in the event. |
png pdf |
Additional Figure 6-b:
Comparison between the yields from simulated ${{\mathrm {t}\overline {\mathrm {t}}}}$ events where each lepton passes the full signal region lepton selection to the prediction of these yields obtained by taking events in which at least one lepton fails to pass the full selection to which the fake-rate, determined using QCD simulations, is applied, as a function of the $| \eta |$ of the recoiling jet. |
png pdf |
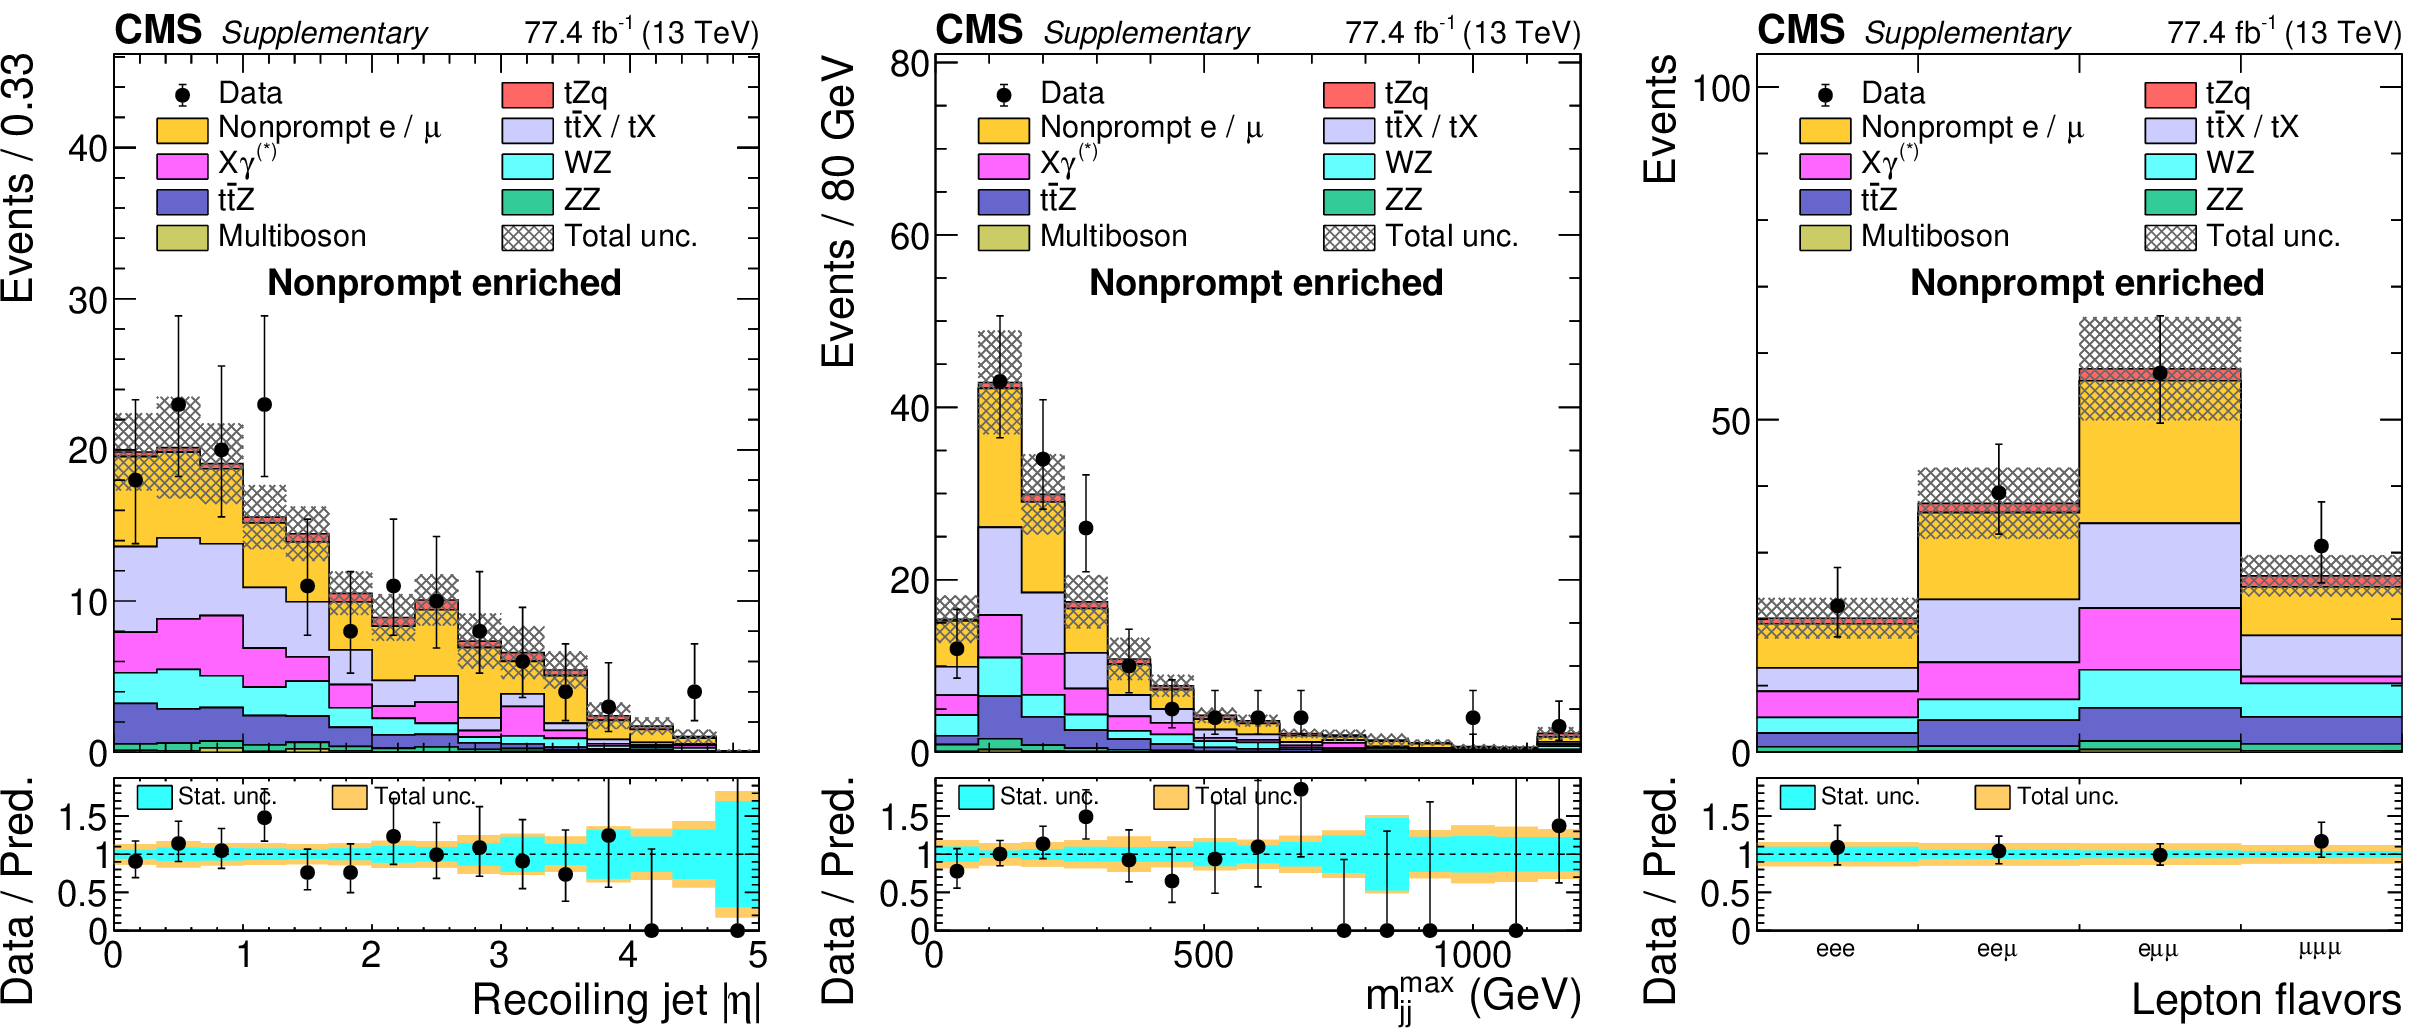
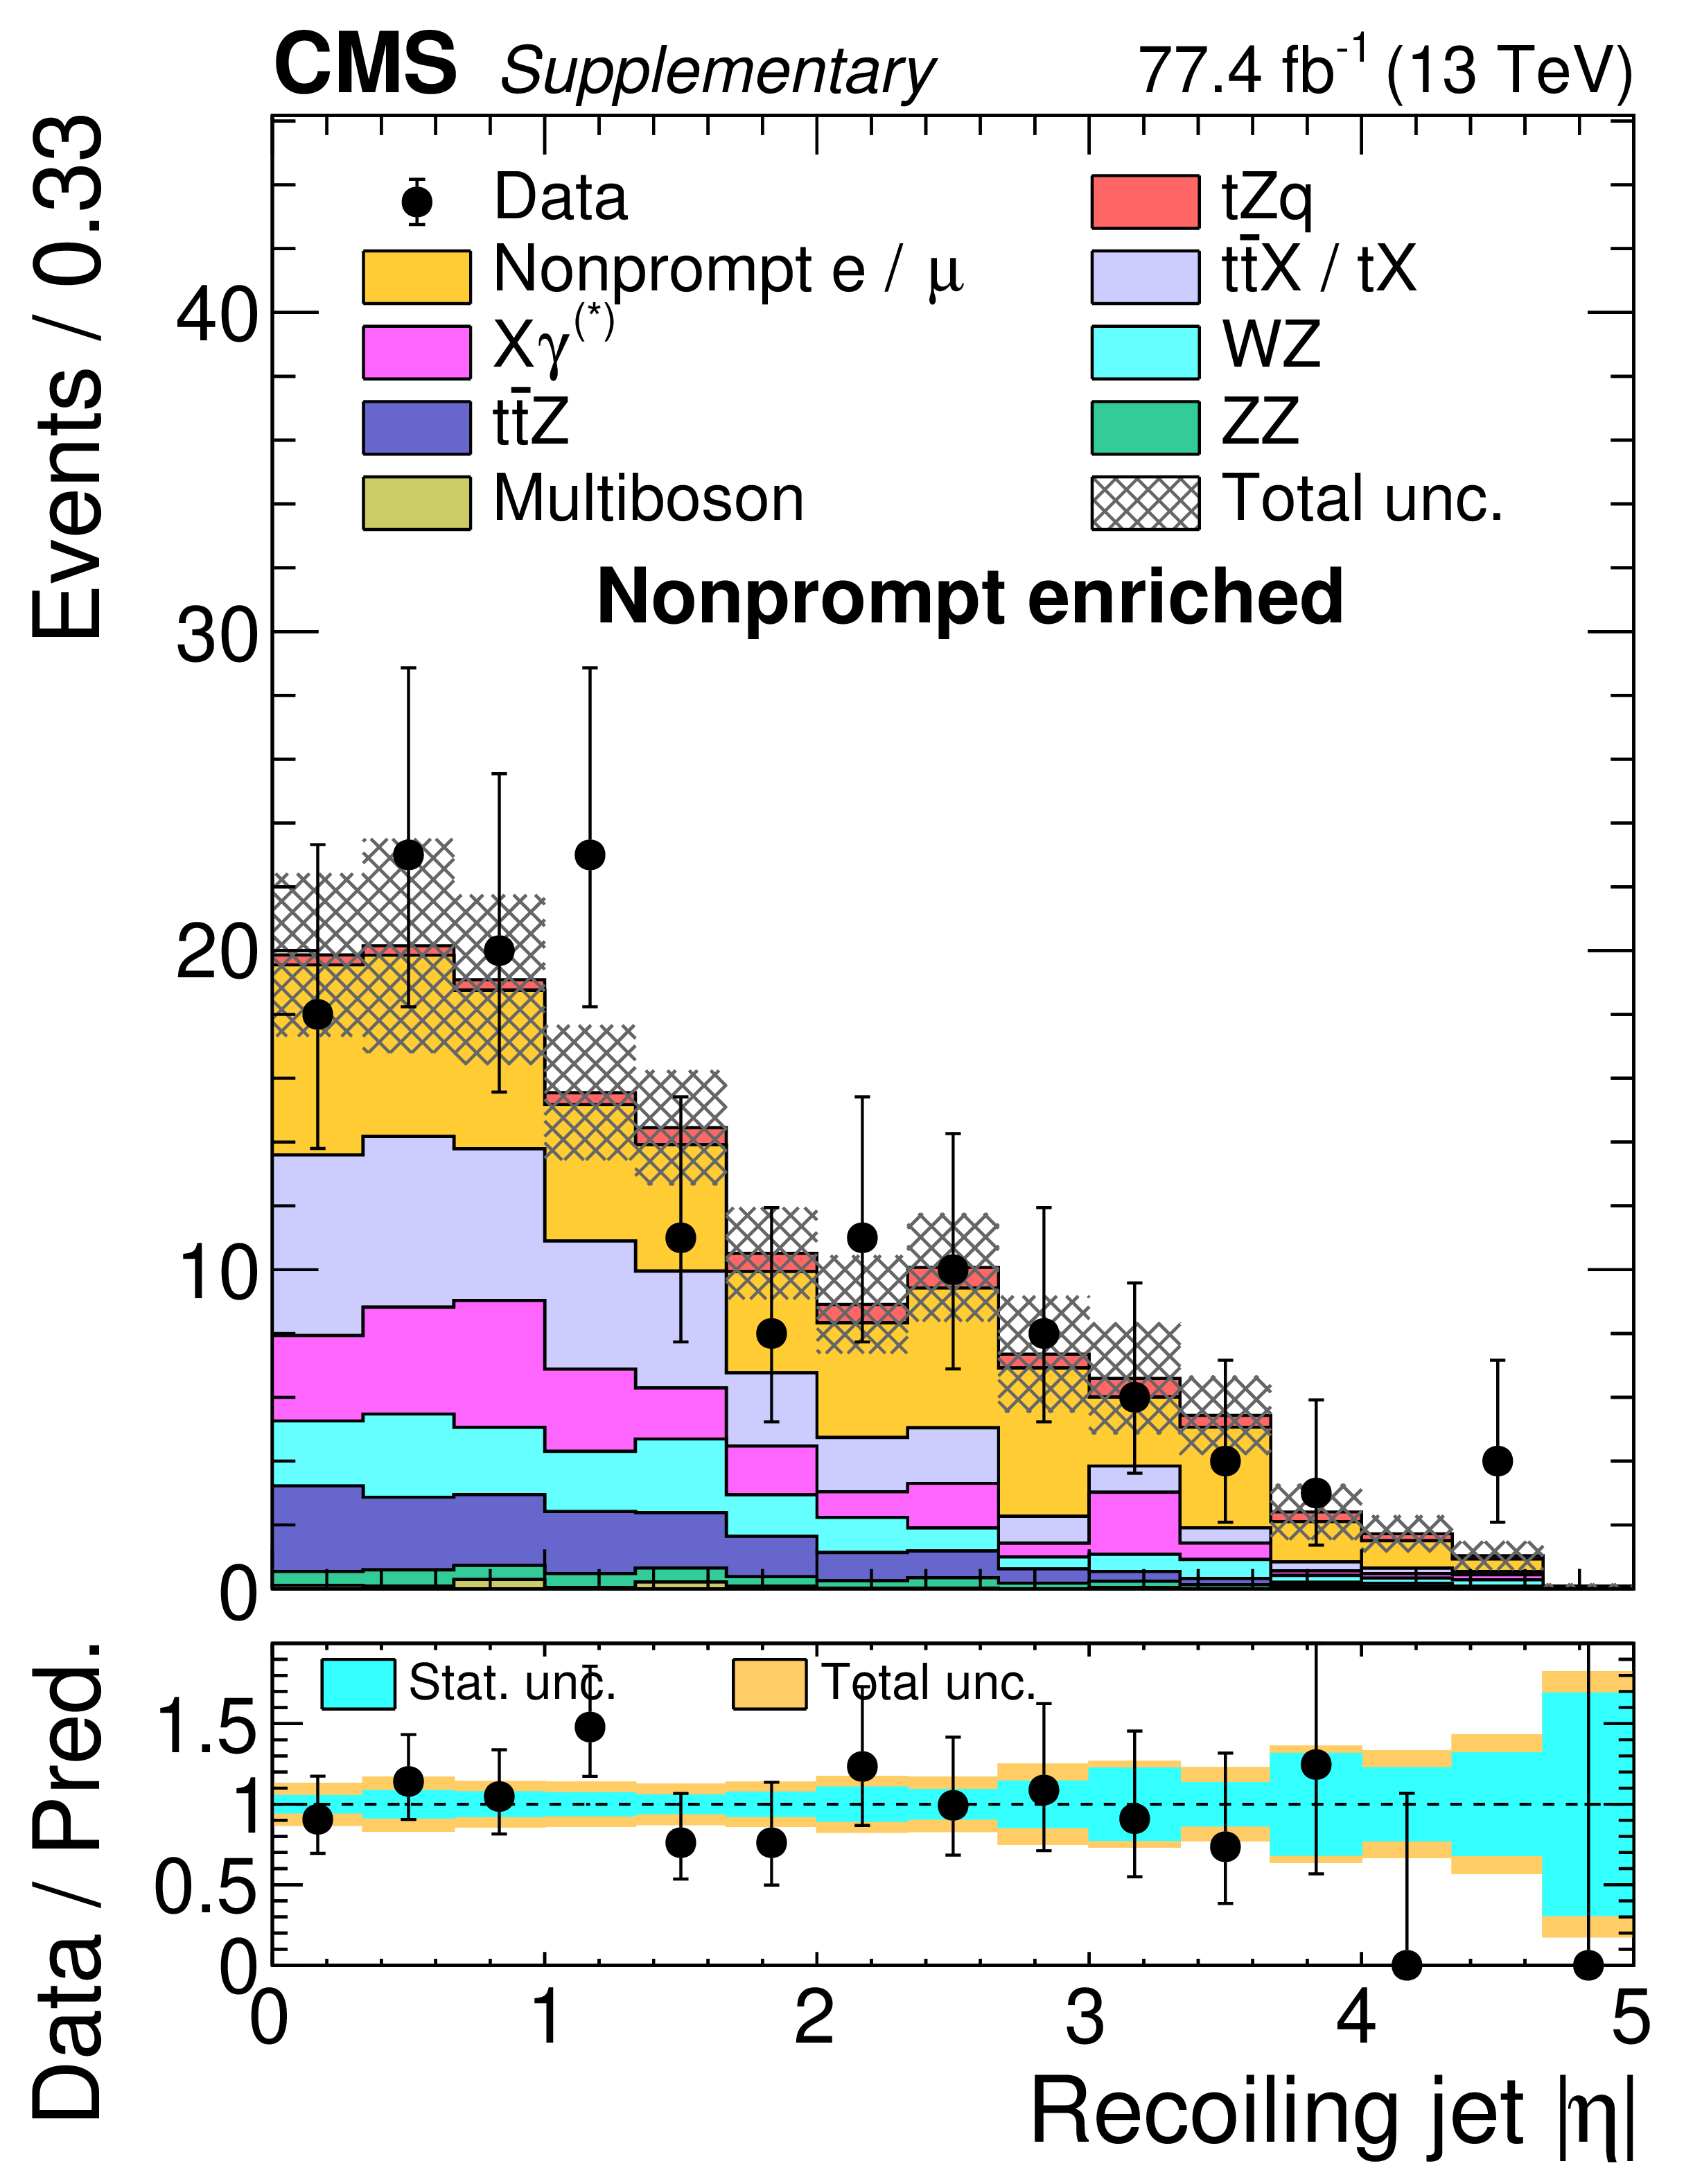
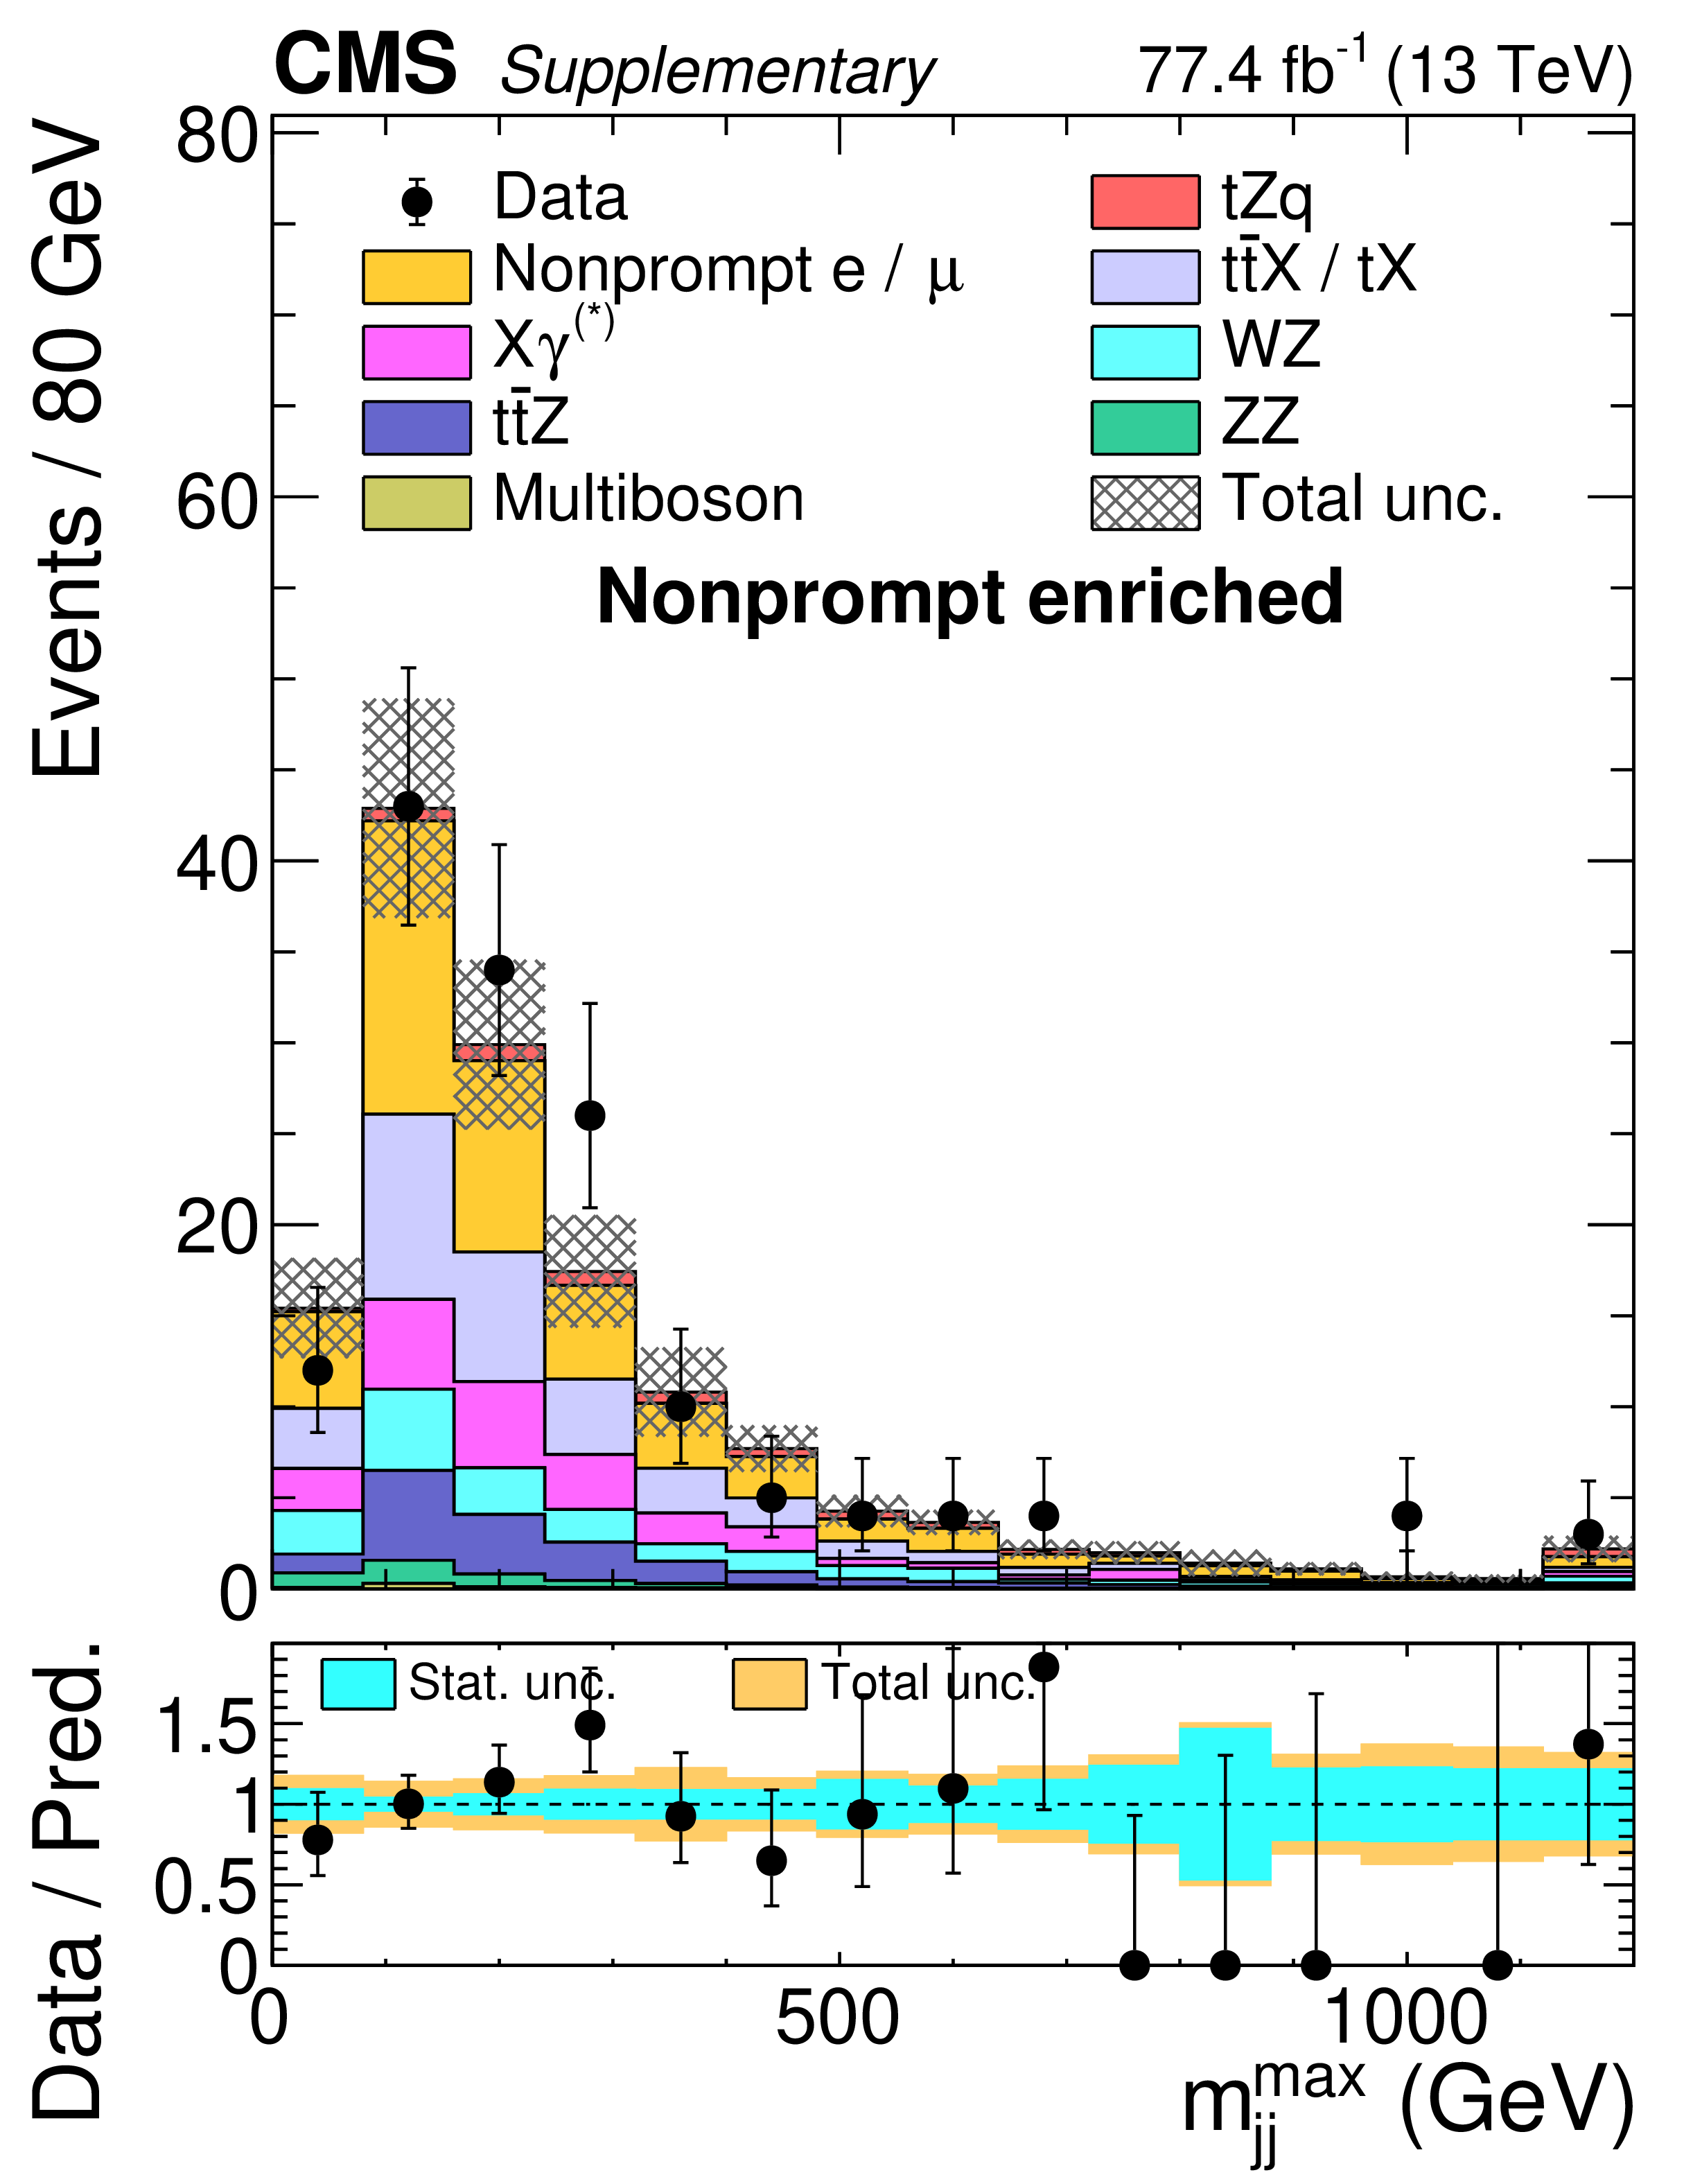
Additional Figure 7:
Observed and expected distributions of the $| \eta |$ of the recoiling jet (left), the maximum dijet invariant mass out of any combination of jets in the event (middle), and the lepton flavor composition of the event (right). The selected events are trilepton events that either have no pair of opposite sign and same flavor leptons, or events in which there is no dilepton pair with a mass close to that of the Z boson and where the trilepton invariant mass is not compatible with that of the Z boson. The events are required to have 2 or 3 jets, exactly one of which is b-tagged to further enrich the sample in nonprompt leptons. |
png pdf |
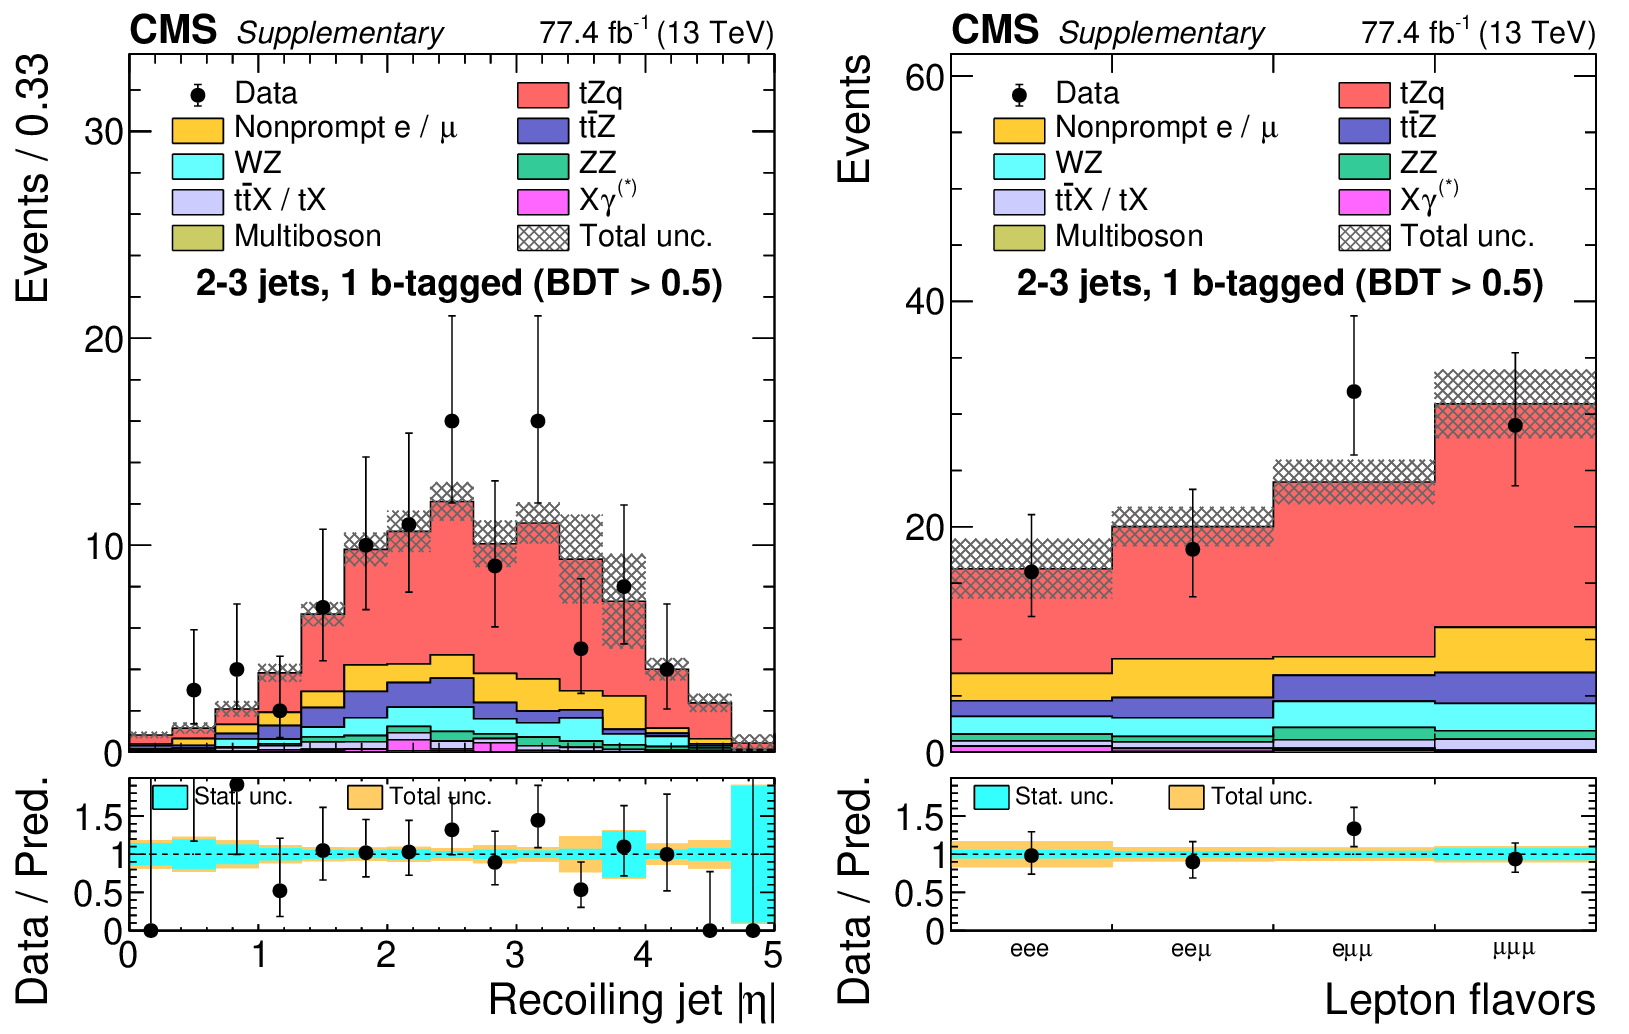
Additional Figure 7-a:
Observed and expected distributions of the $| \eta |$ of the recoiling jet. The selected events are trilepton events that either have no pair of opposite sign and same flavor leptons, or events in which there is no dilepton pair with a mass close to that of the Z boson and where the trilepton invariant mass is not compatible with that of the Z boson. The events are required to have 2 or 3 jets, exactly one of which is b-tagged to further enrich the sample in nonprompt leptons. |
png pdf |
Additional Figure 7-b:
Observed and expected distributions of the maximum dijet invariant mass out of any combination of jets in the event. The selected events are trilepton events that either have no pair of opposite sign and same flavor leptons, or events in which there is no dilepton pair with a mass close to that of the Z boson and where the trilepton invariant mass is not compatible with that of the Z boson. The events are required to have 2 or 3 jets, exactly one of which is b-tagged to further enrich the sample in nonprompt leptons. |
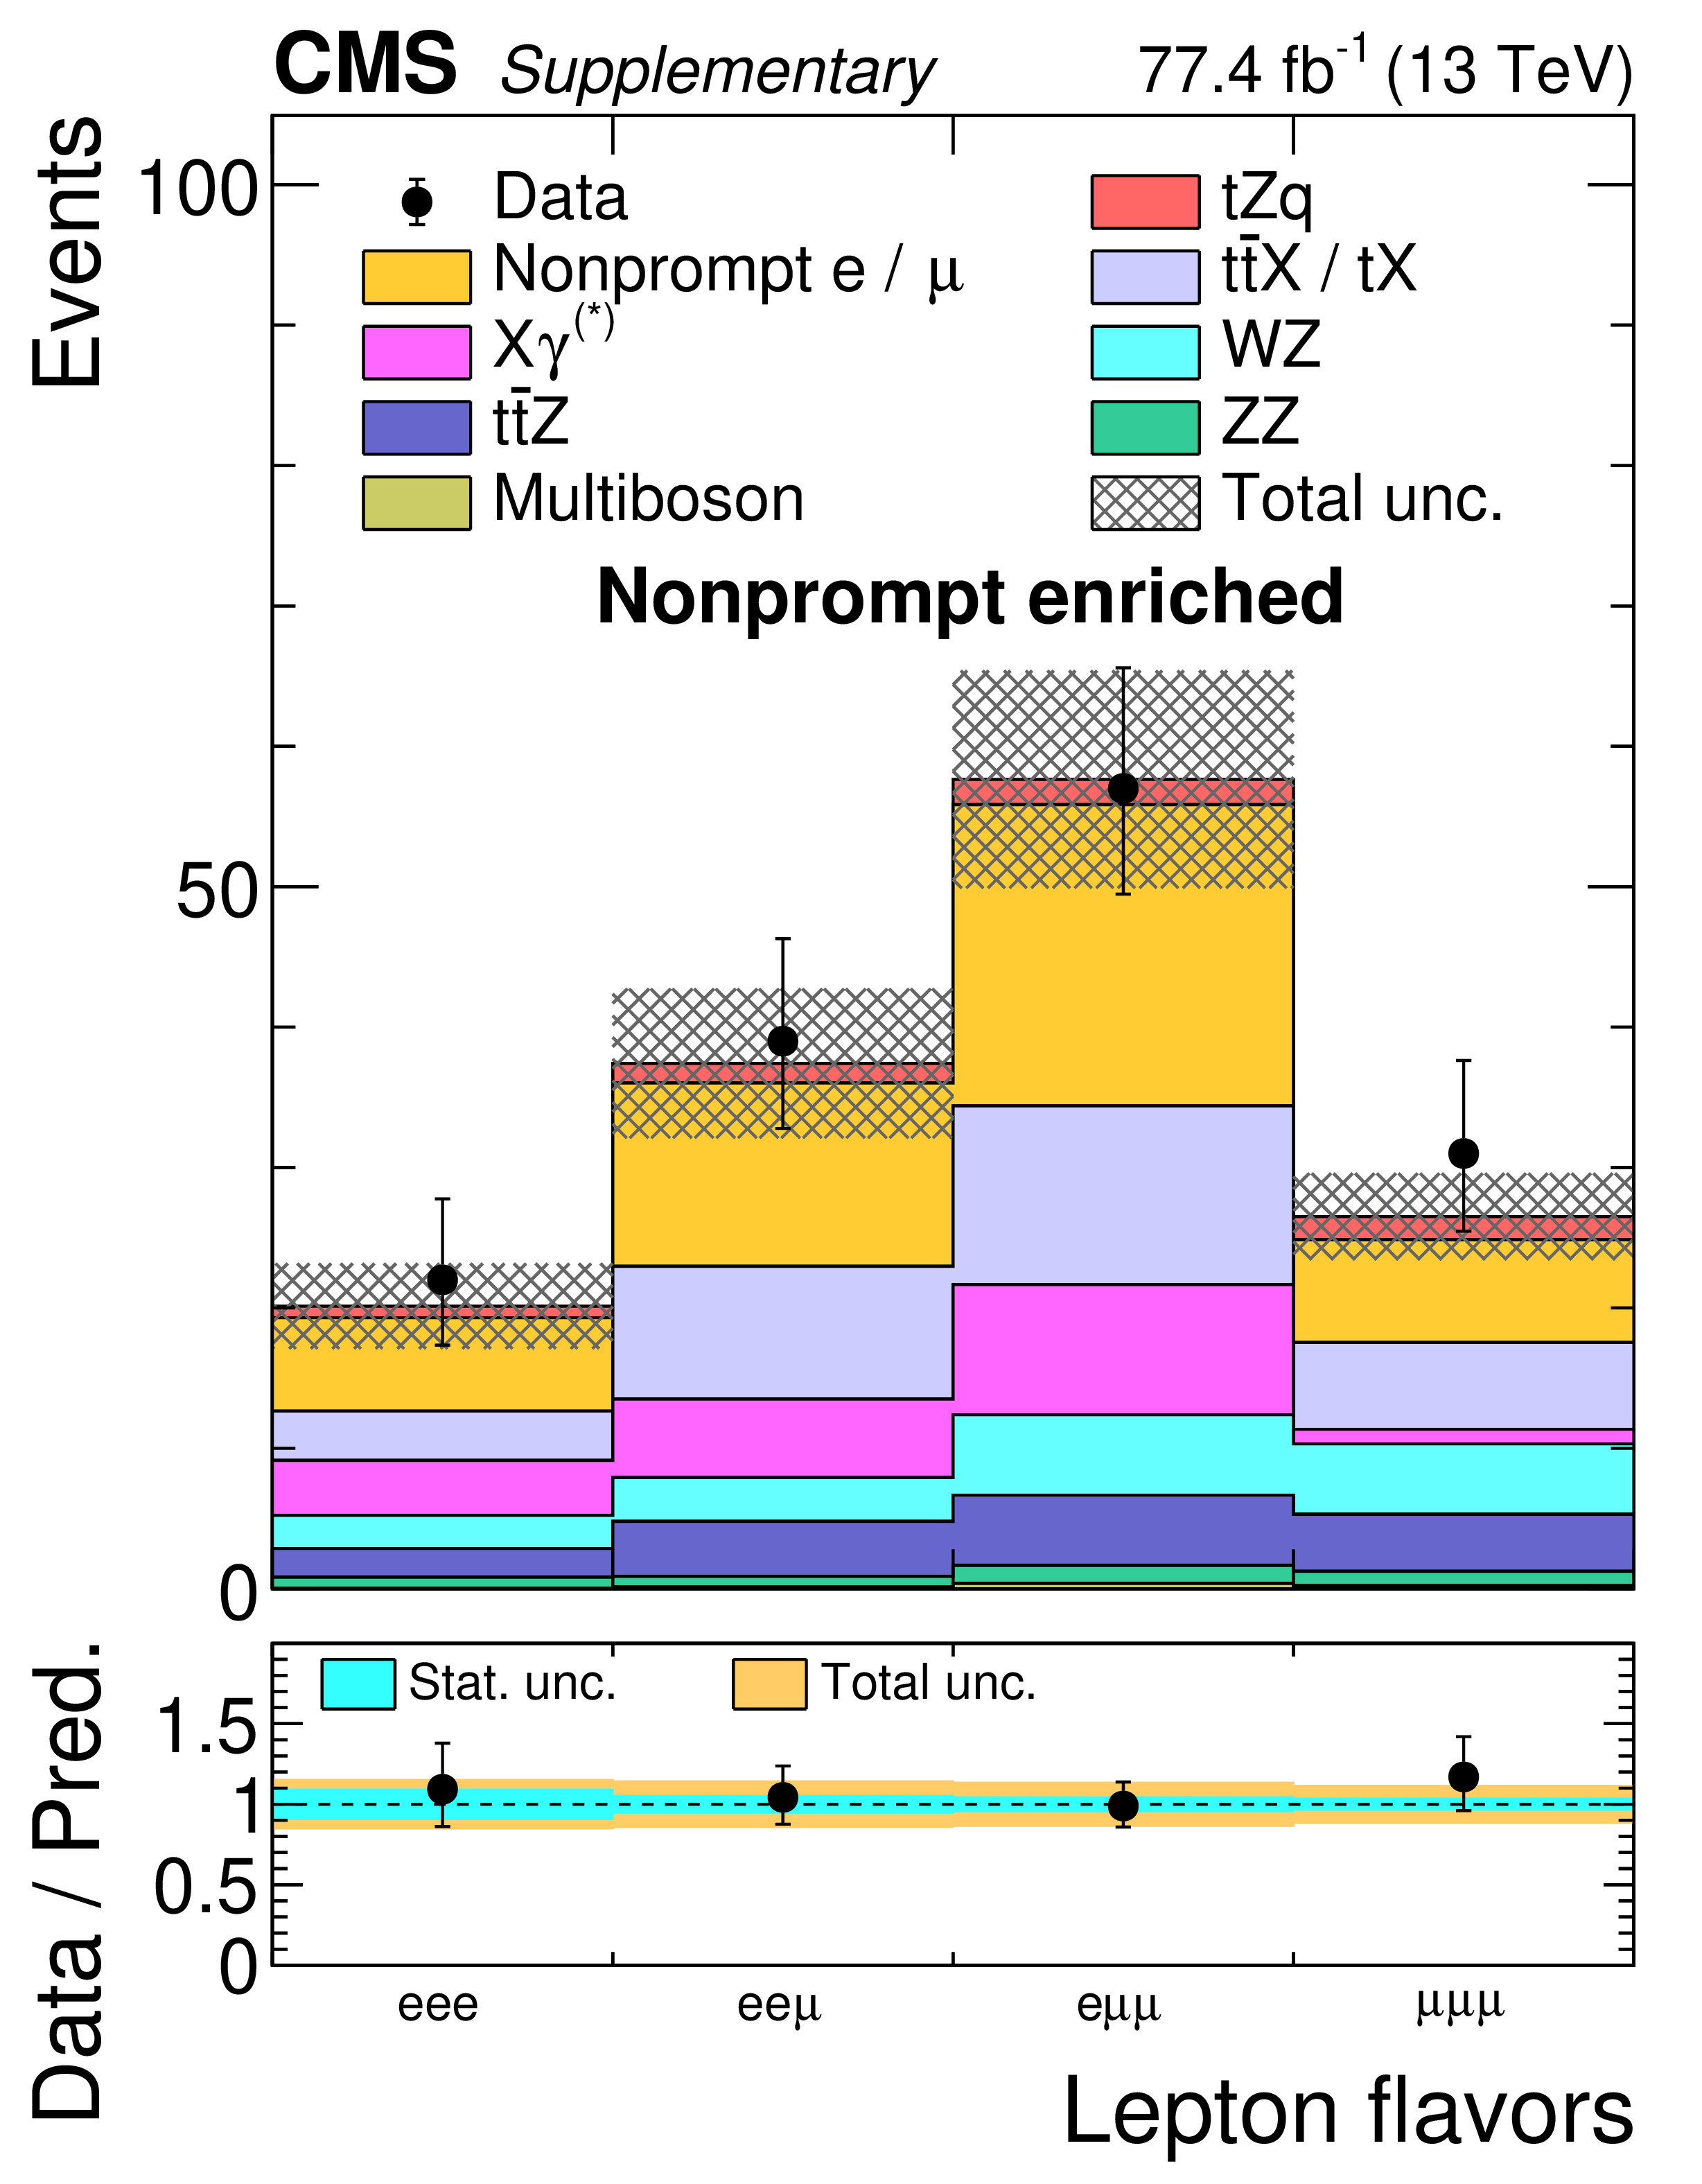
png pdf |
Additional Figure 7-c:
Observed and expected distributions of the lepton flavor composition of the event. The selected events are trilepton events that either have no pair of opposite sign and same flavor leptons, or events in which there is no dilepton pair with a mass close to that of the Z boson and where the trilepton invariant mass is not compatible with that of the Z boson. The events are required to have 2 or 3 jets, exactly one of which is b-tagged to further enrich the sample in nonprompt leptons. |
png pdf |
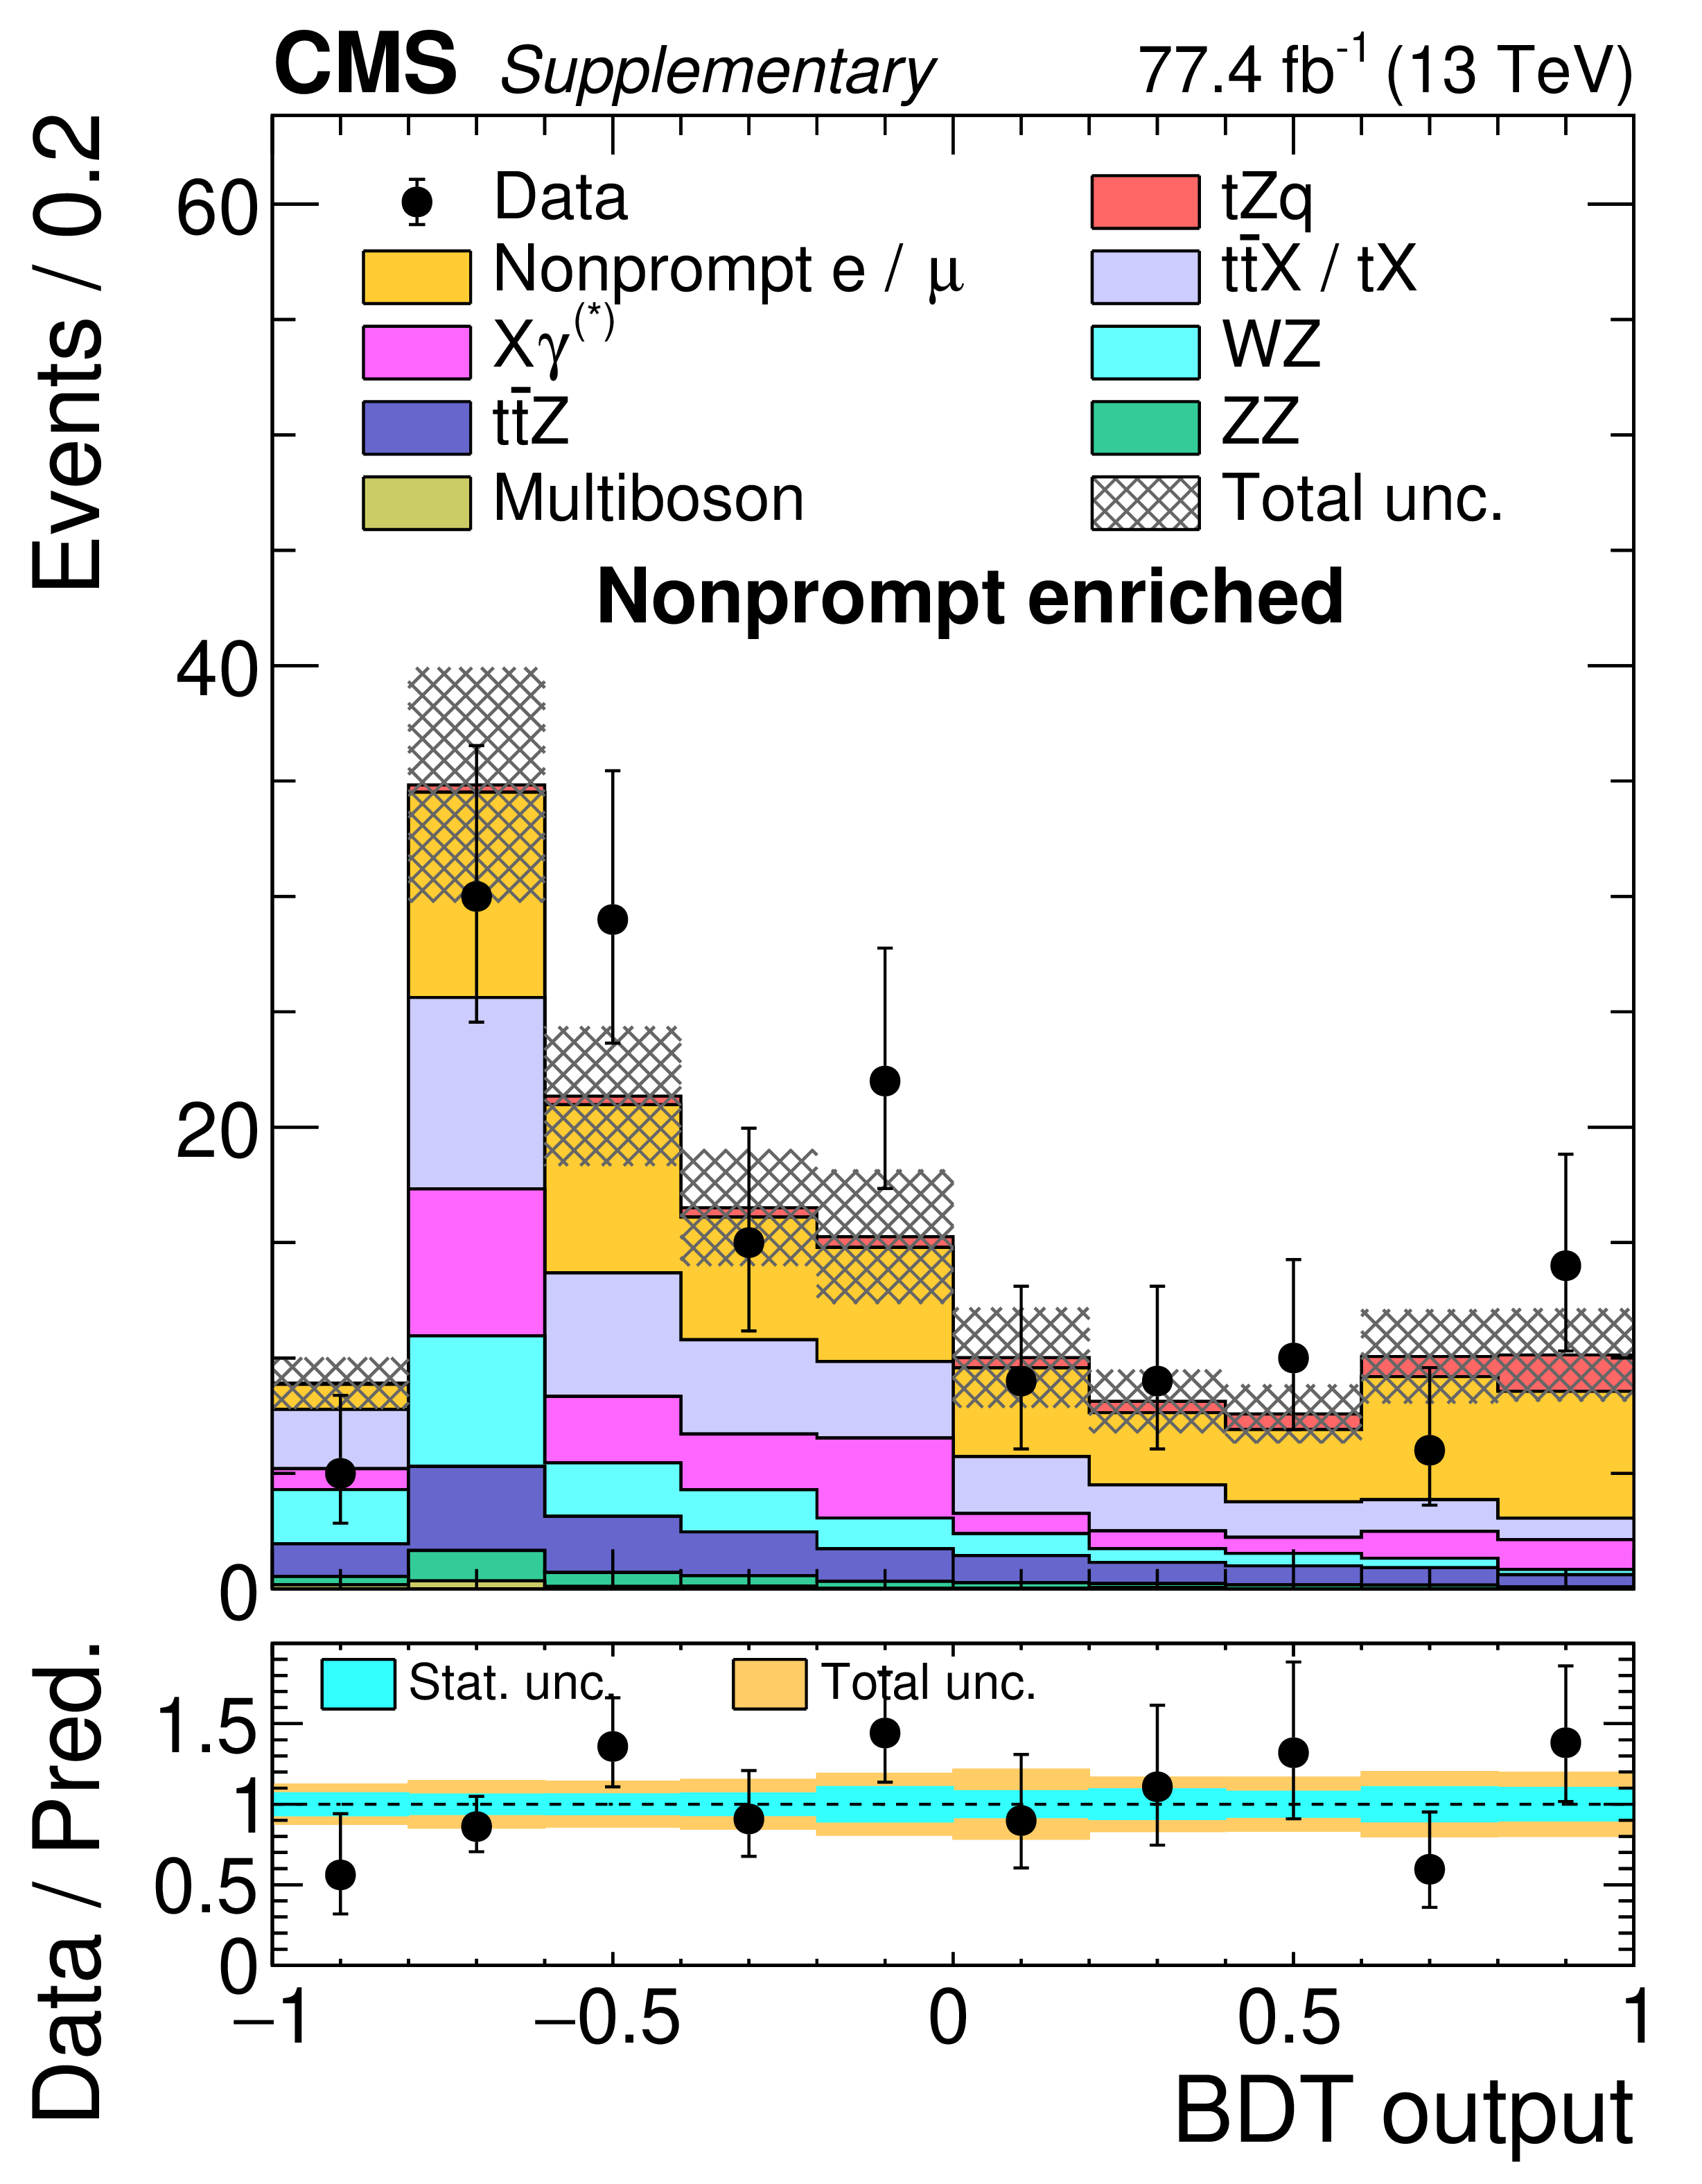
Additional Figure 8:
Observed and expected distributions of the BDT used for signal extraction in SR-2/3j-1b. The selected events are trilepton events that either have no pair of opposite sign and same flavor leptons, or events in which there is no dilepton pair with a mass close to that of the Z boson and where the trilepton invariant mass is not compatible with that of the Z boson. The events are required to have 2 or 3 jets, exactly one of which is b-tagged to further enrich the sample in nonprompt leptons. |
png pdf |
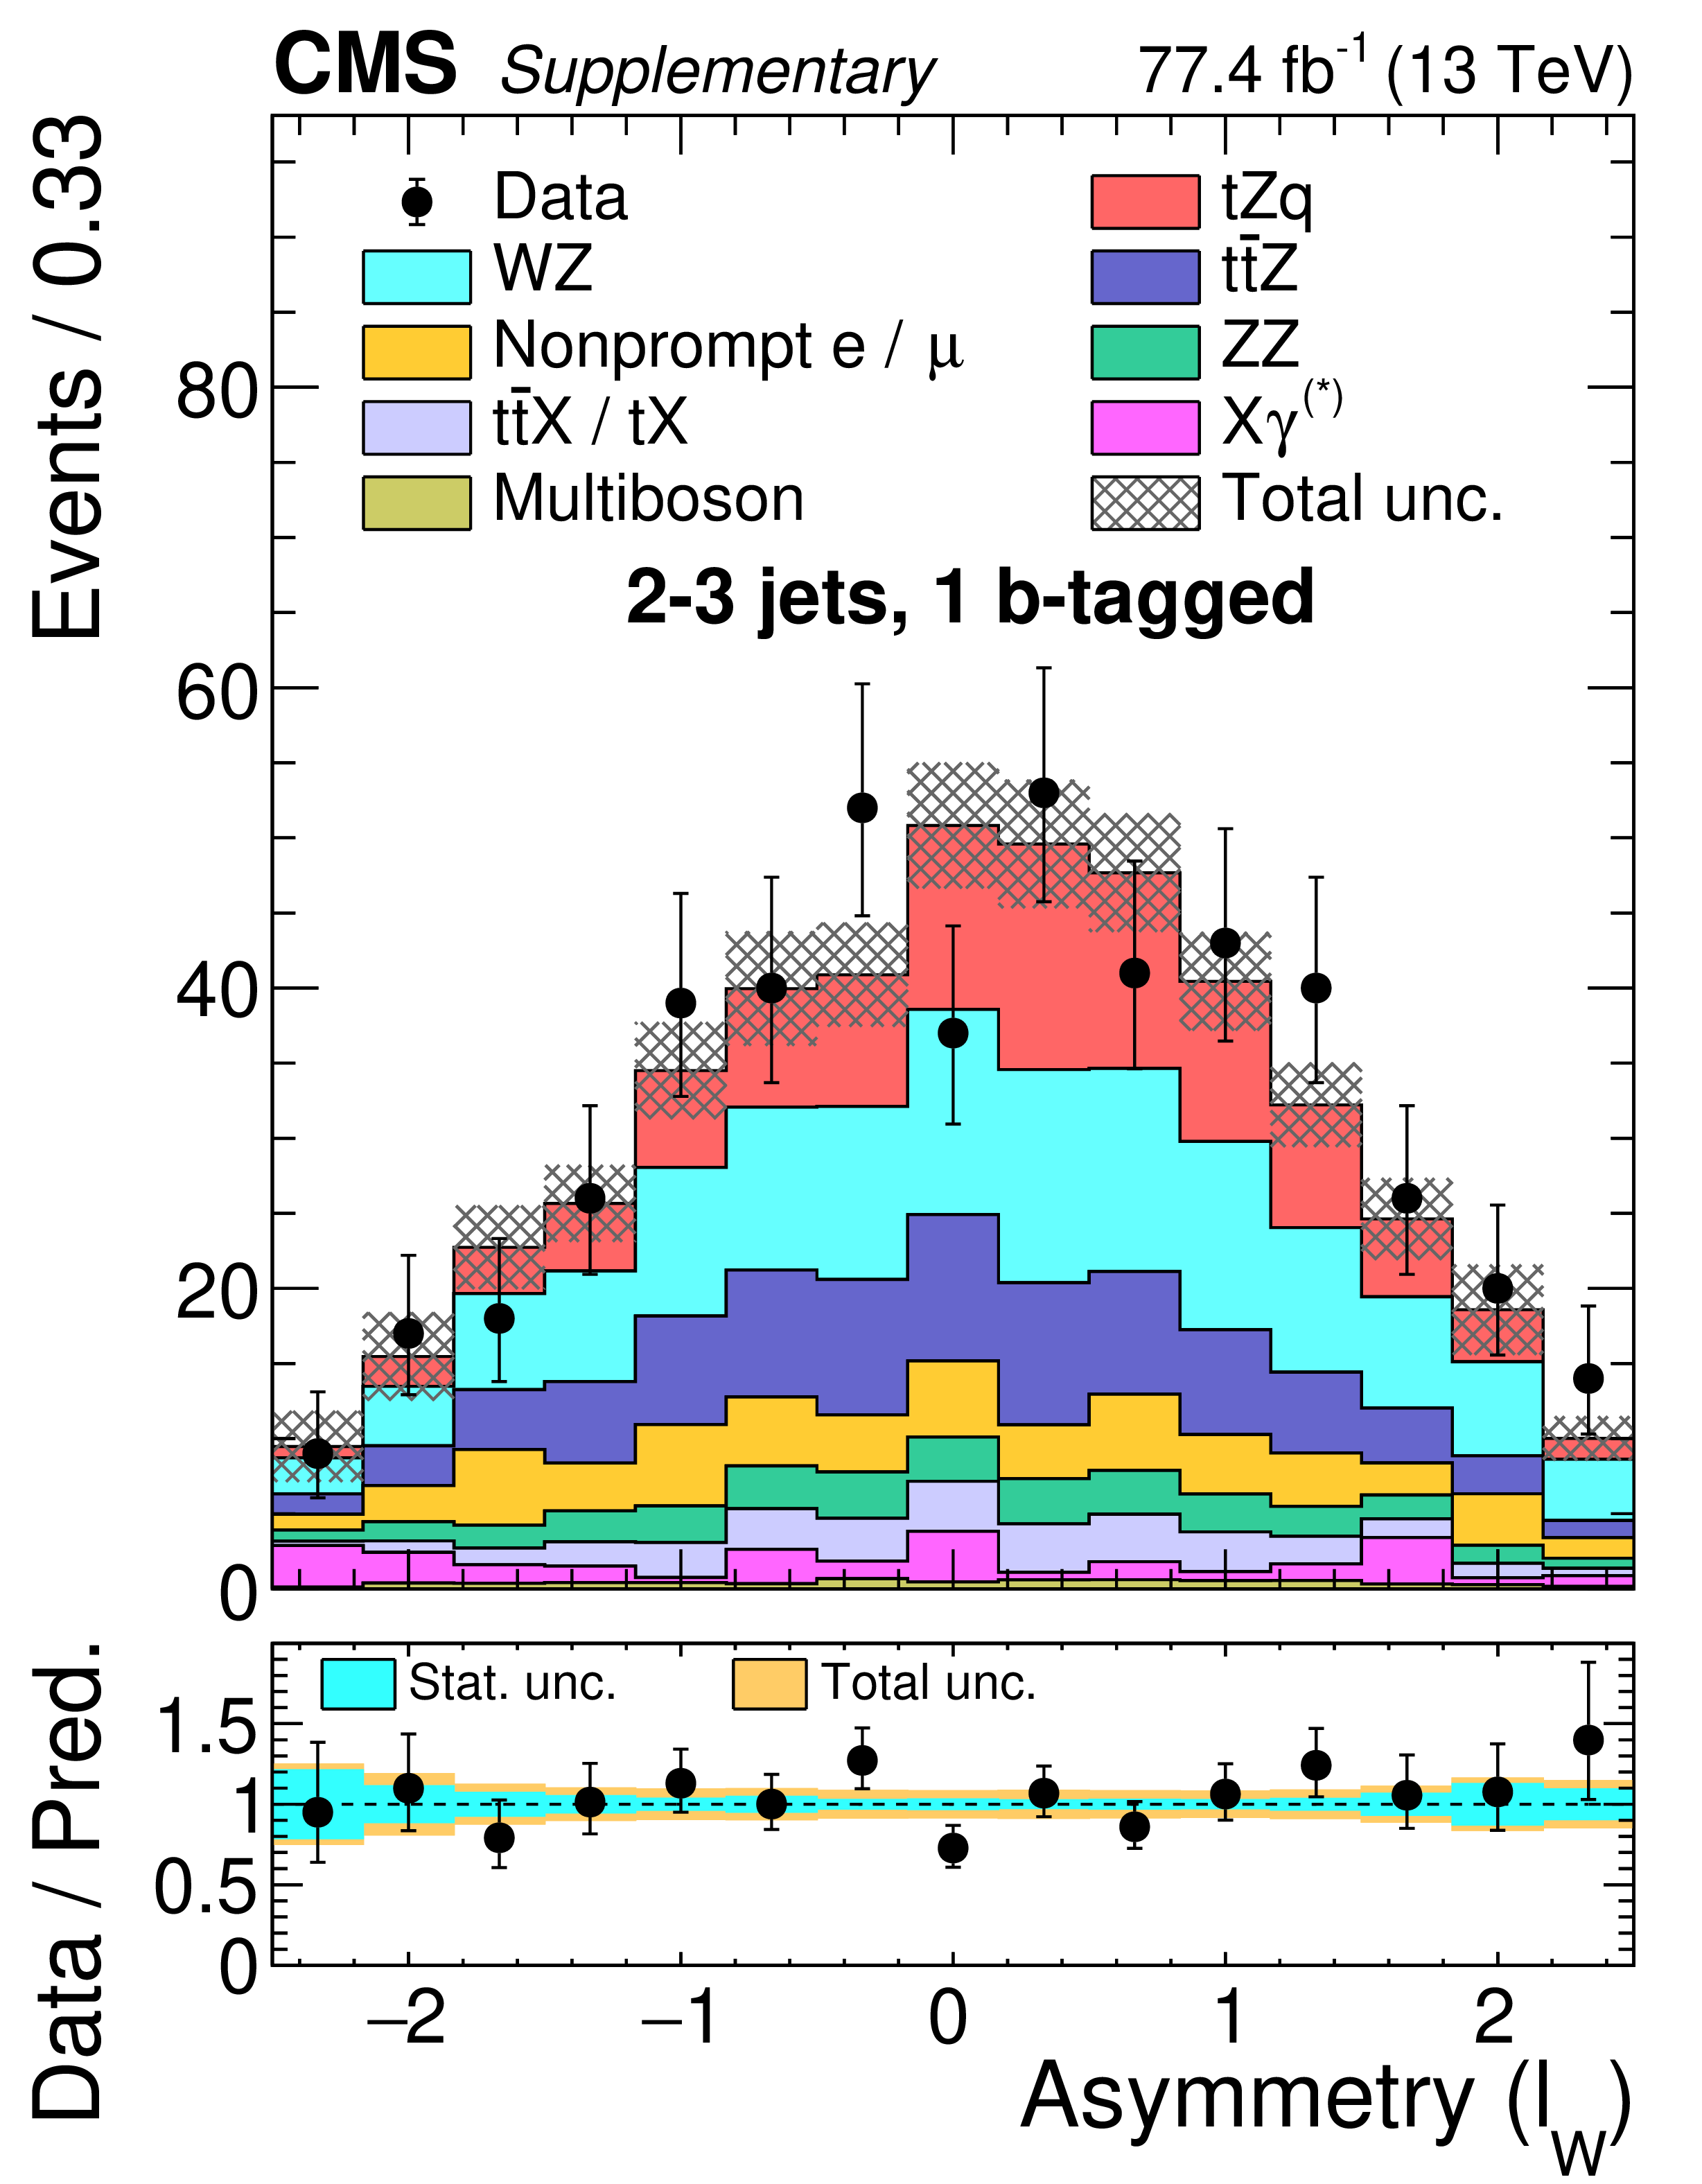
Additional Figure 9:
Post-fit expected and observed distribution in SR-2/3j-1b of the asymmetry of the lepton not forming the Z boson candidate ($\ell _{W}$), defined as its $| \eta |$ multiplied by its charge. |

png pdf |
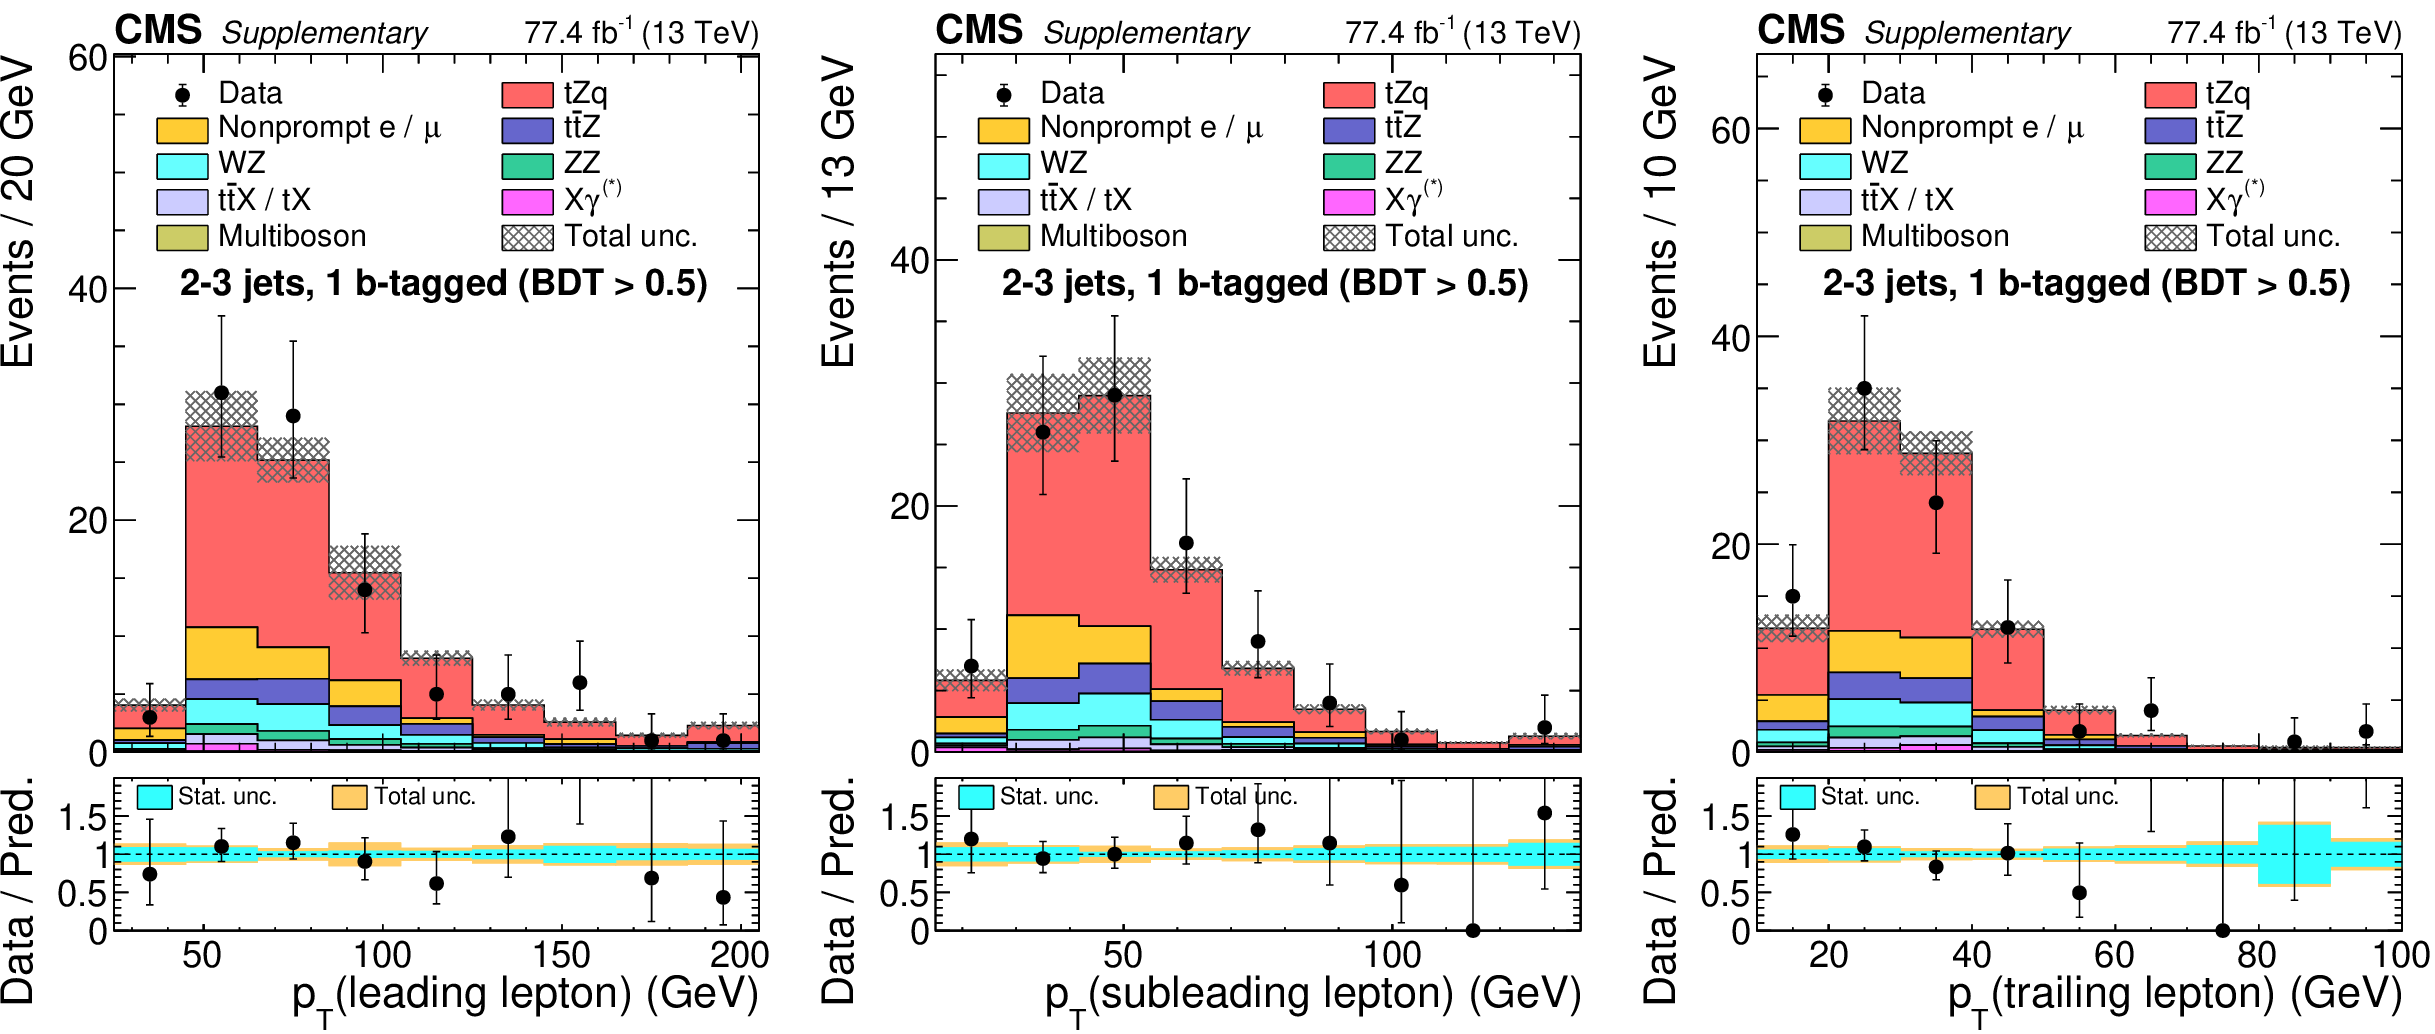
Additional Figure 10:
Post-fit expected and observed distributions in the SR-2/3j-1b of the highest lepton ${p_{\mathrm {T}}}$ (left), second highest lepton ${p_{\mathrm {T}}}$ (middle) and lowest lepton ${p_{\mathrm {T}}}$ (right). |

png pdf |
Additional Figure 10-a:
Post-fit expected and observed distributions in the SR-2/3j-1b of the highest lepton ${p_{\mathrm {T}}}$. |
png pdf |
Additional Figure 10-b:
Post-fit expected and observed distributions in the SR-2/3j-1b of the second highest lepton ${p_{\mathrm {T}}}$. |
png pdf |
Additional Figure 10-c:
Post-fit expected and observed distributions in the SR-2/3j-1b of the lowest lepton ${p_{\mathrm {T}}}$. |
png pdf |
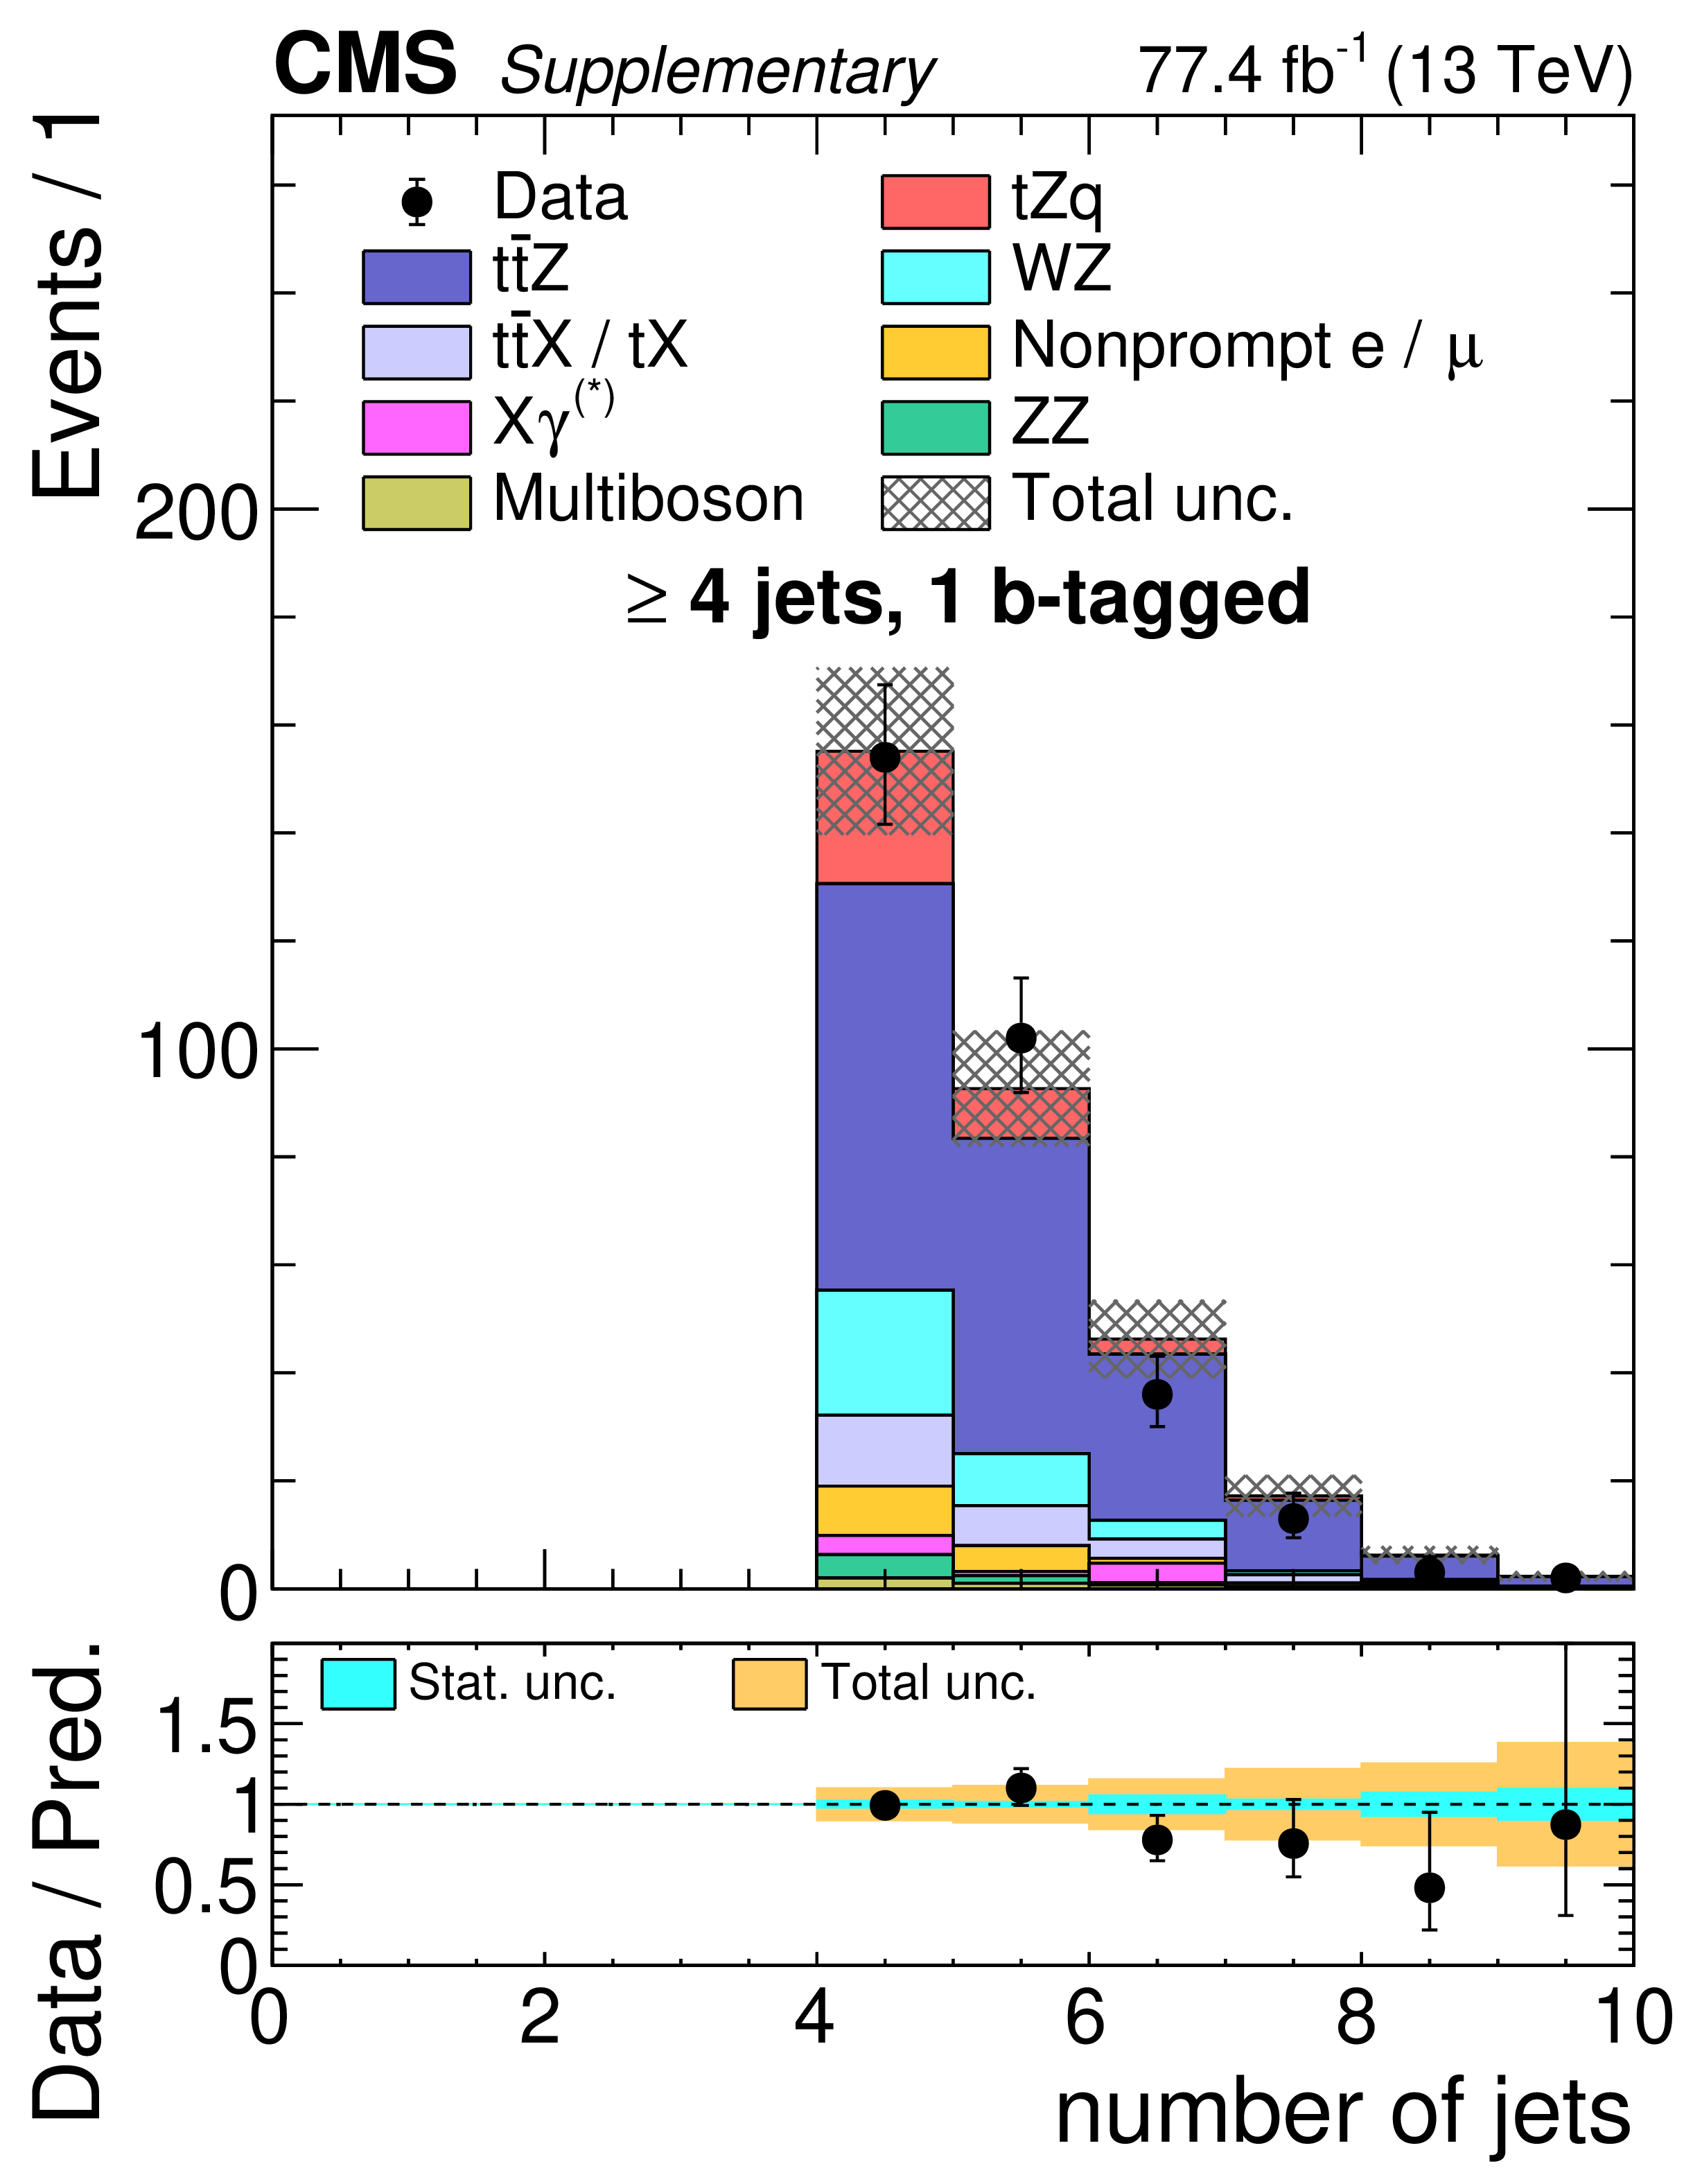
Additional Figure 11:
Post-fit expected and observed distributions in SR-4j-1b of the $| \eta |$ of the recoiling jet (left), the maximum dijet mass out of any combination of jets in the event (middle), and the number of jets in the event (right). |
png pdf |
Additional Figure 11-a:
Post-fit expected and observed distributions in SR-4j-1b of the $| \eta |$ of the recoiling jet. |

png pdf |
Additional Figure 11-b:
Post-fit expected and observed distributions in SR-4j-1b of the maximum dijet mass out of any combination of jets in the event. |
png pdf |
Additional Figure 11-c:
Post-fit expected and observed distributions in SR-4j-1b of the number of jets in the event. |
png pdf |
Additional Figure 12:
Post-fit expected and observed distributions in SR-4j-1b of the highest $| \eta |$ value out of any jet in the event. |
png pdf |
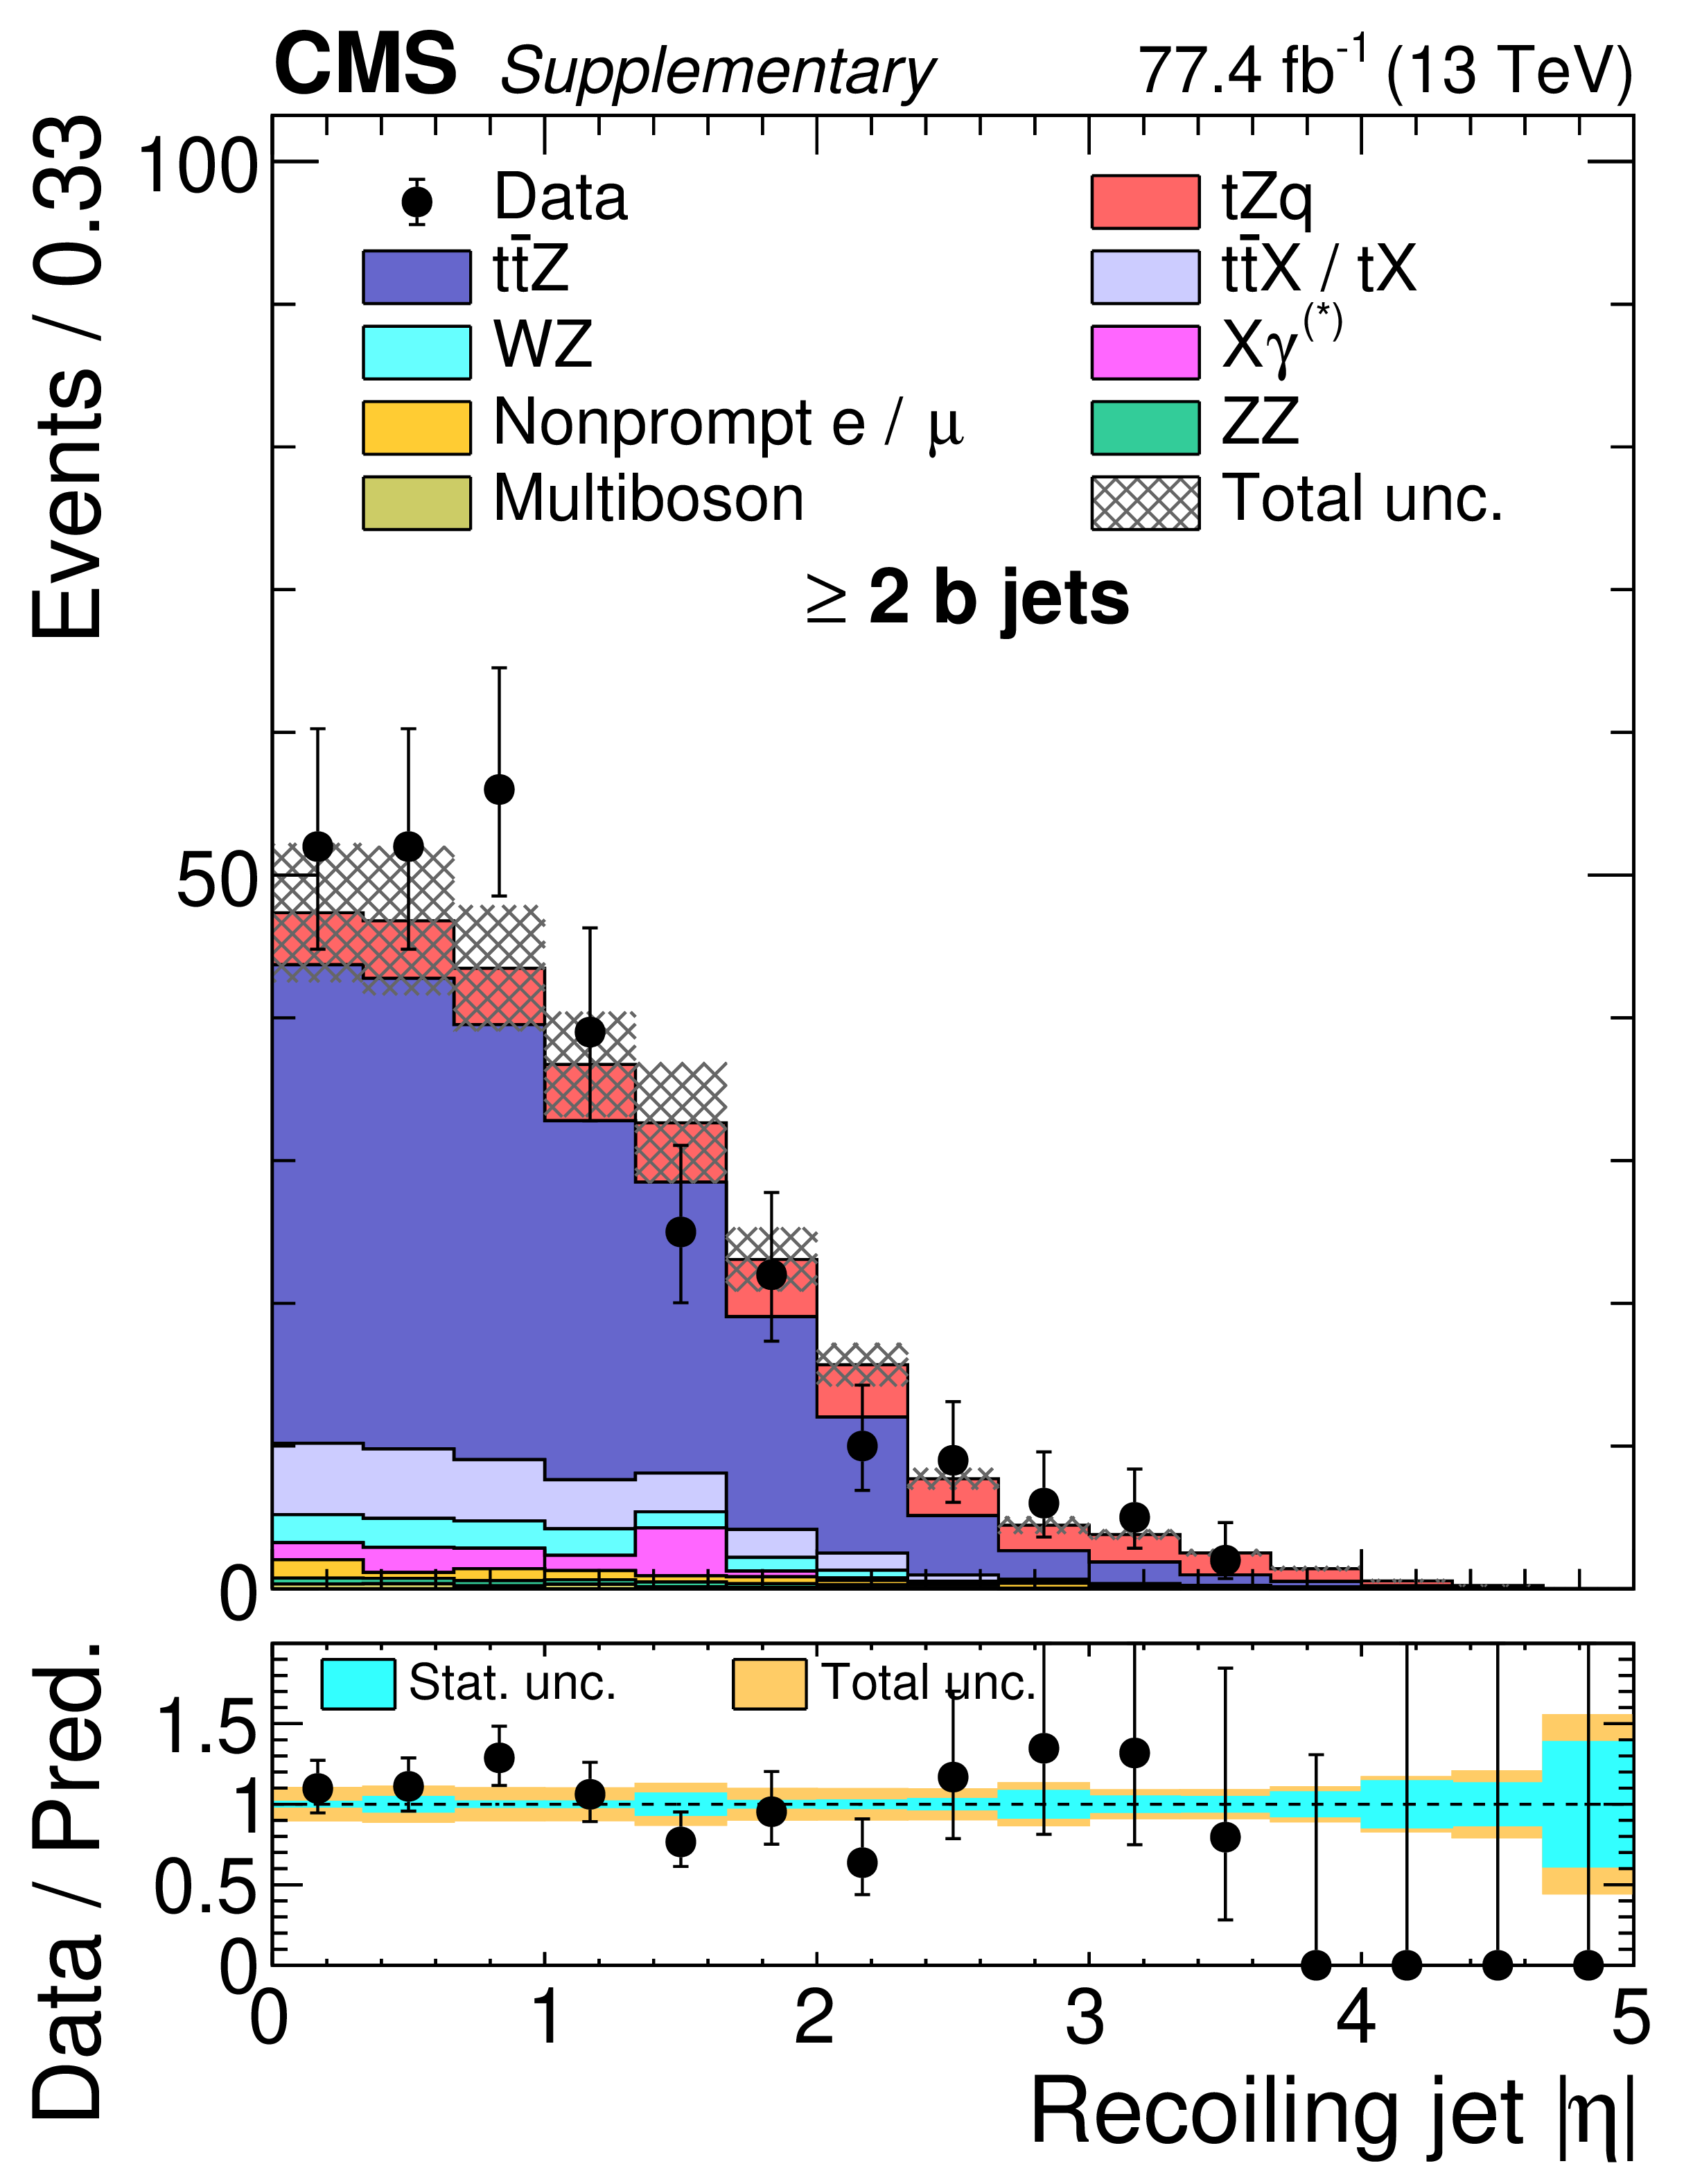
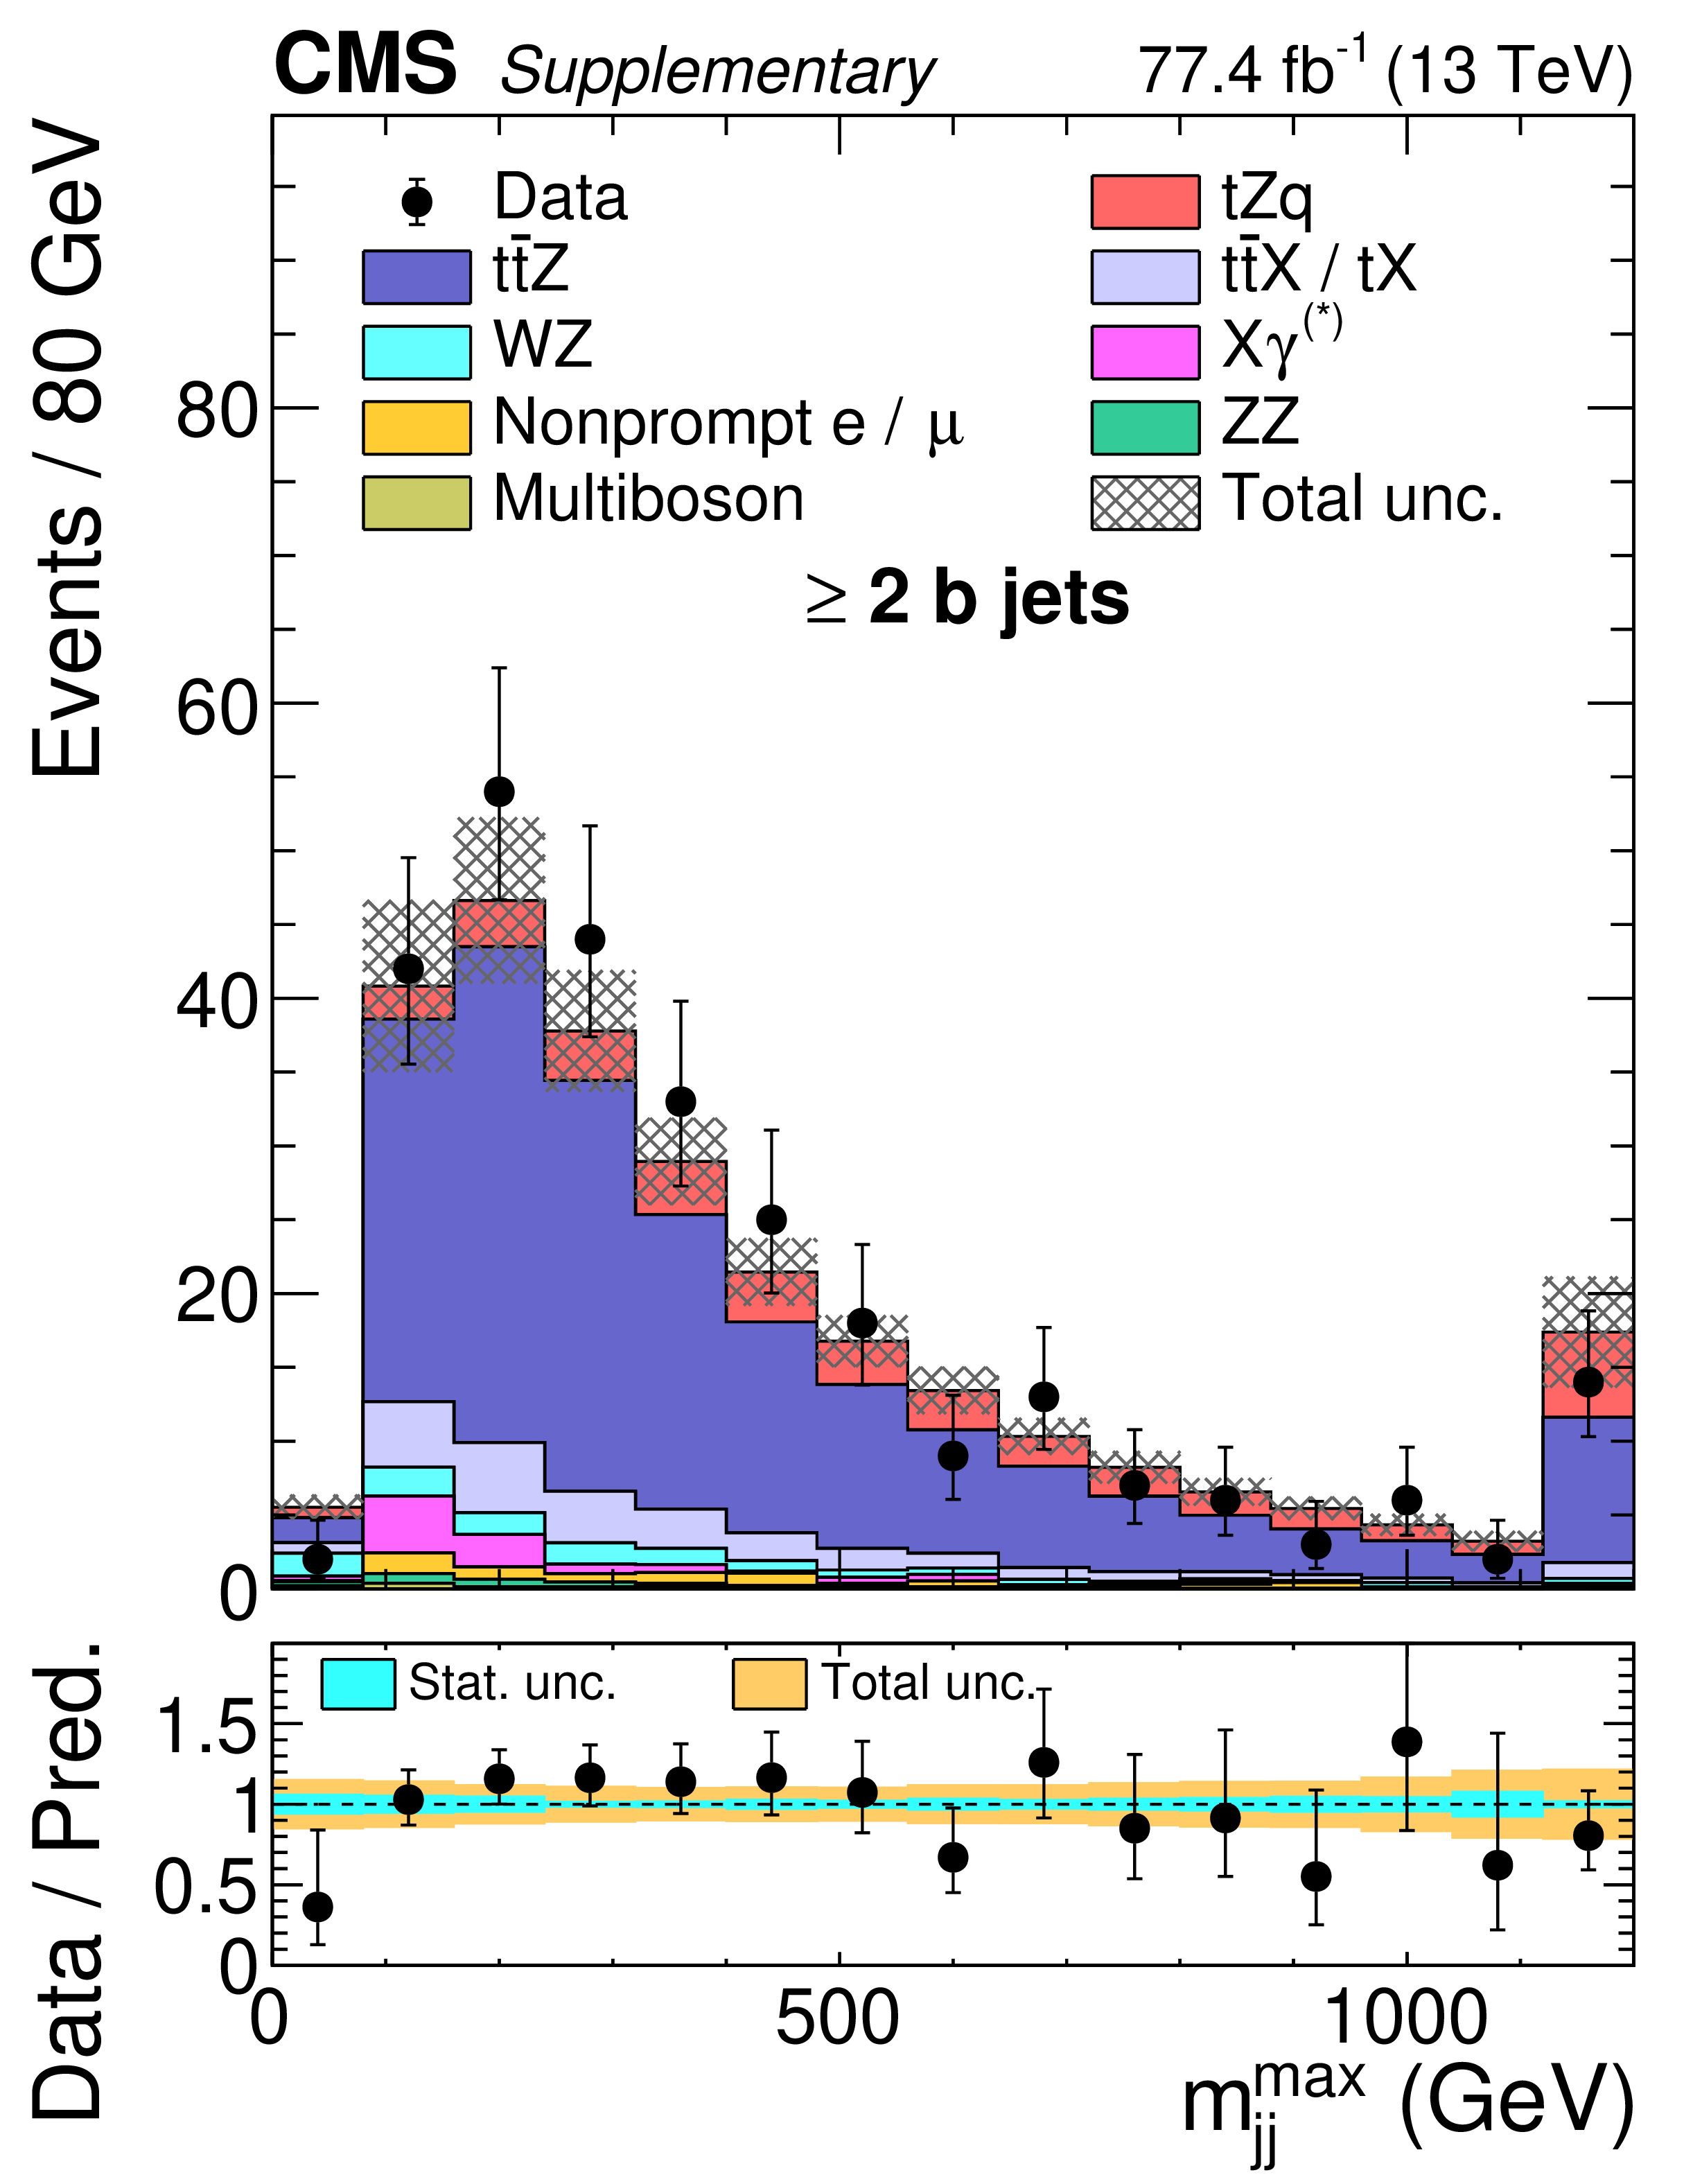
Additional Figure 13:
Post-fit expected and observed distributions in SR-2b of the $| \eta |$ of the recoiling jet (left), the maximum dijet mass out of any combination of jets in the event (middle), and the number of jets in the event (right). |
png pdf |
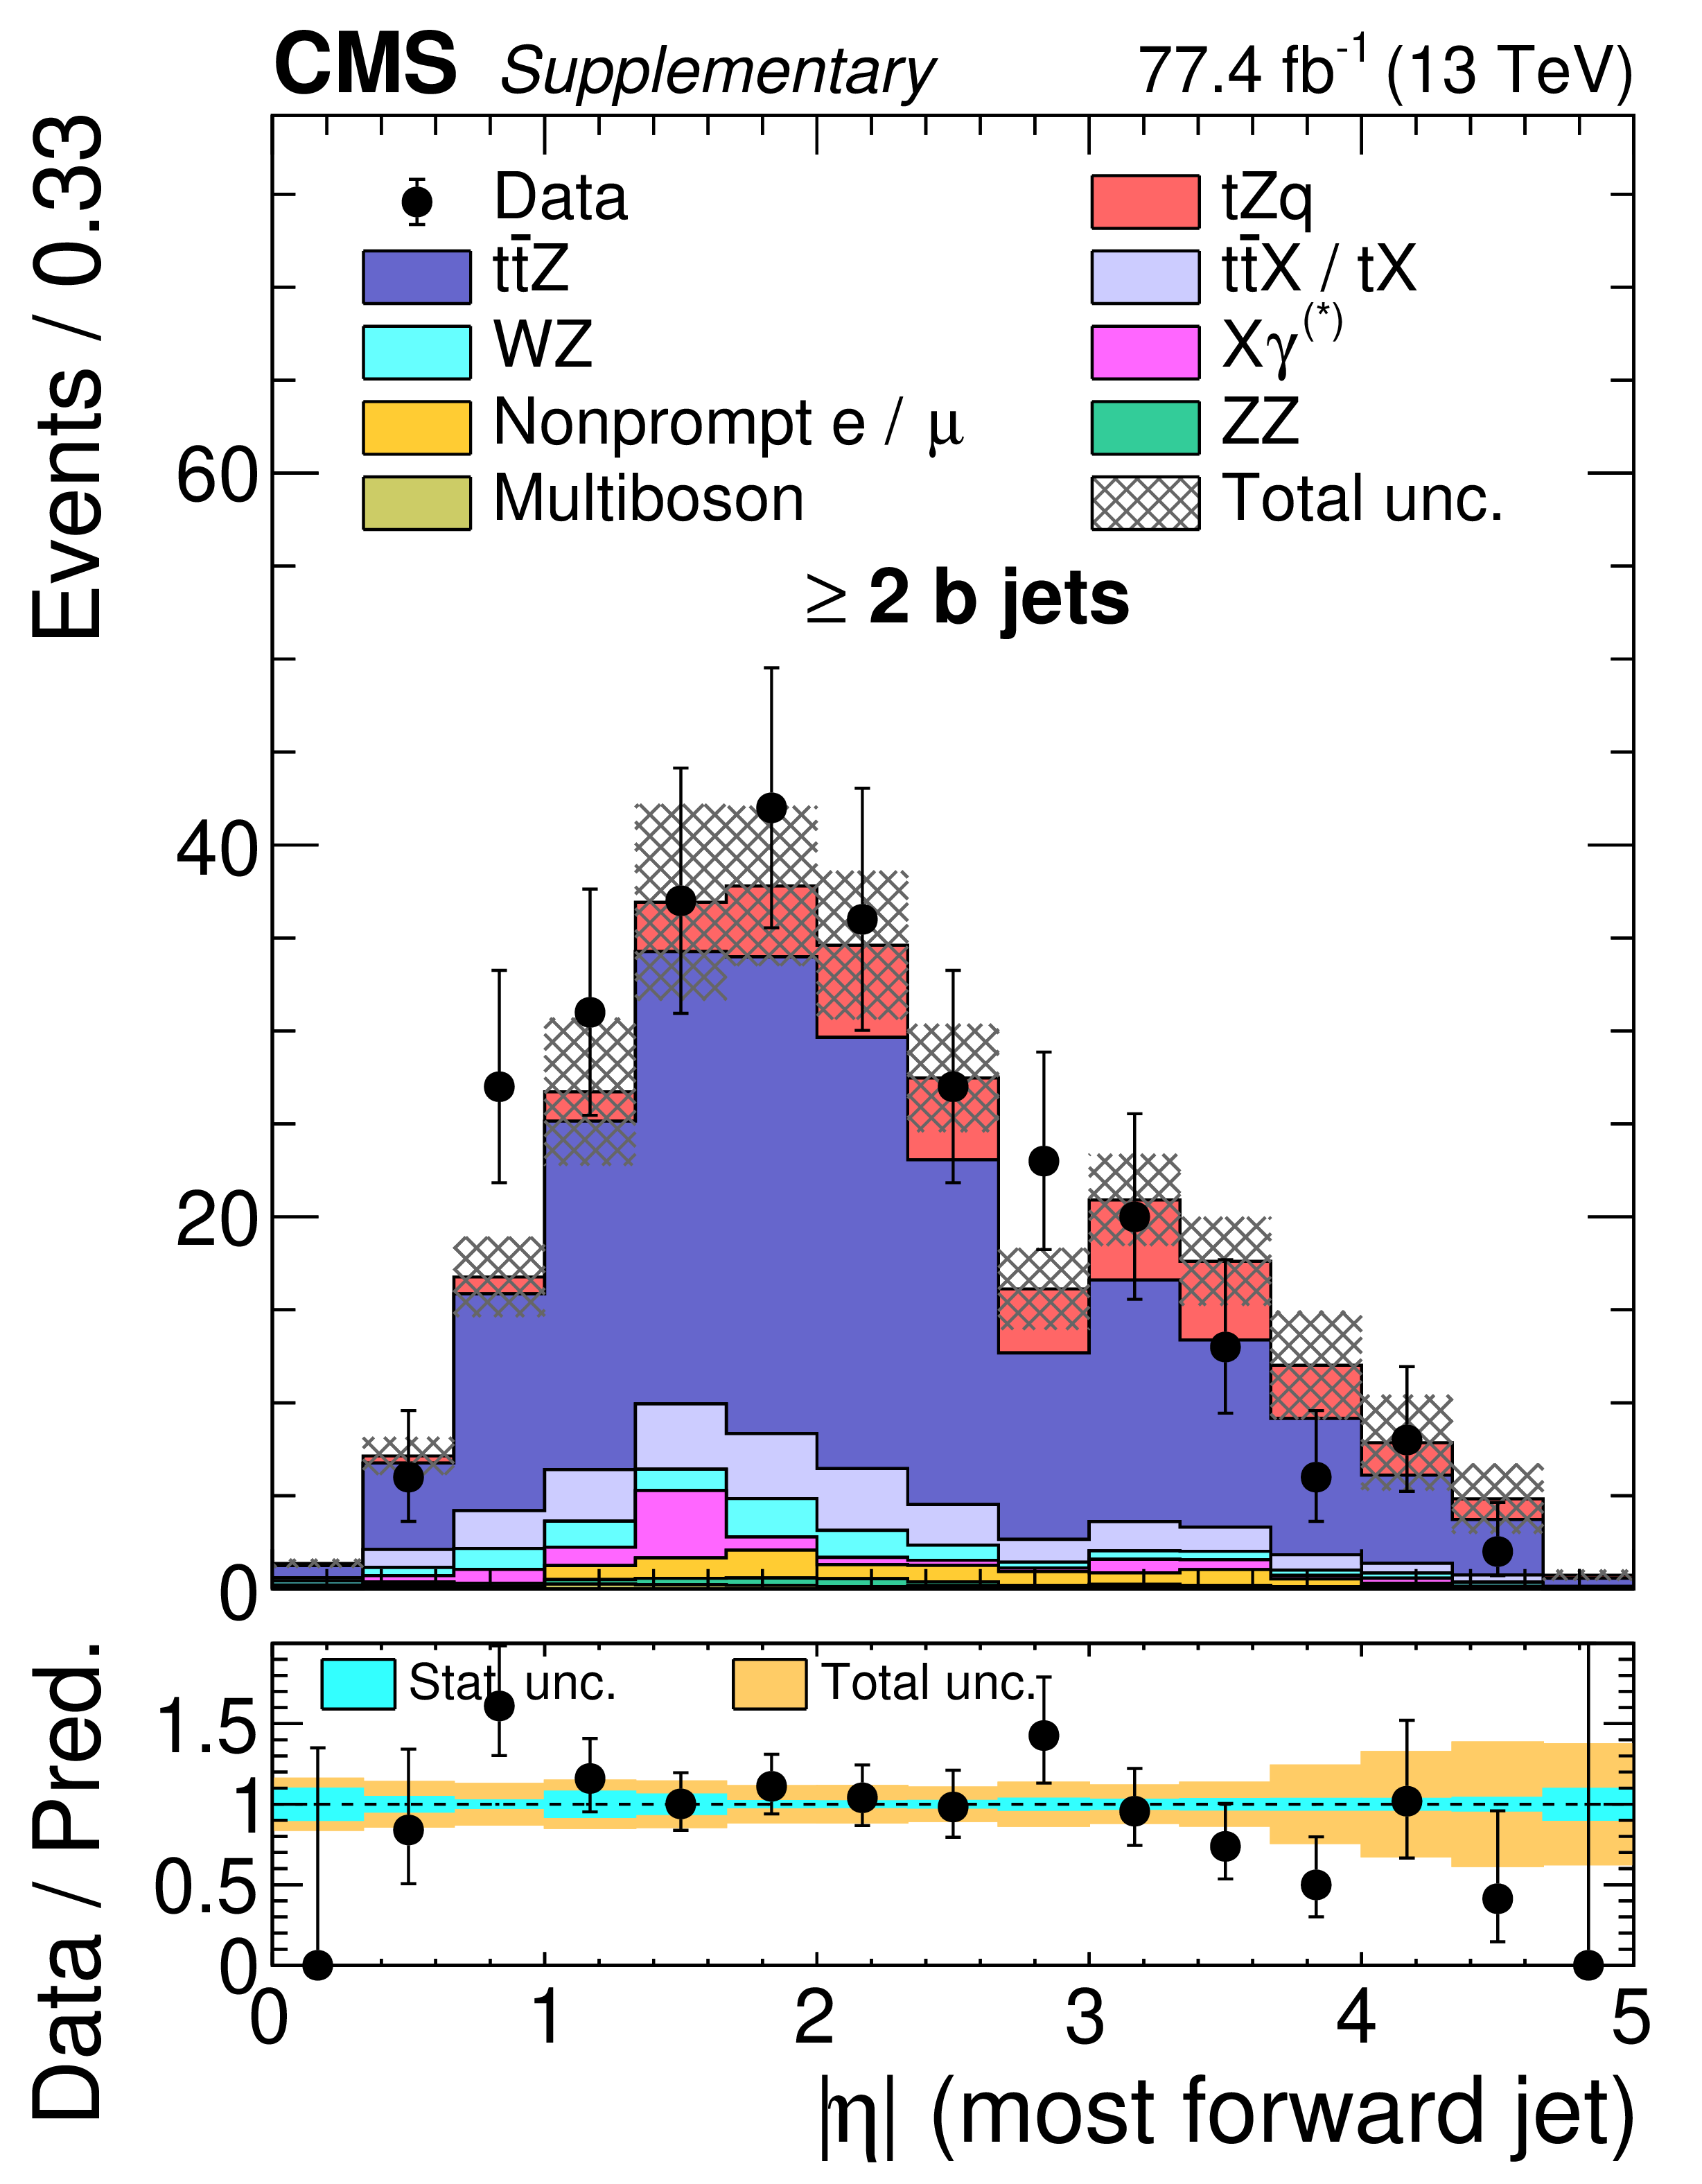
Additional Figure 13-a:
Post-fit expected and observed distributions in SR-2b of the $| \eta |$ of the recoiling jet. |
png pdf |
Additional Figure 13-b:
Post-fit expected and observed distributions in SR-2b of the $| \eta |$ of the maximum dijet mass out of any combination of jets in the event. |
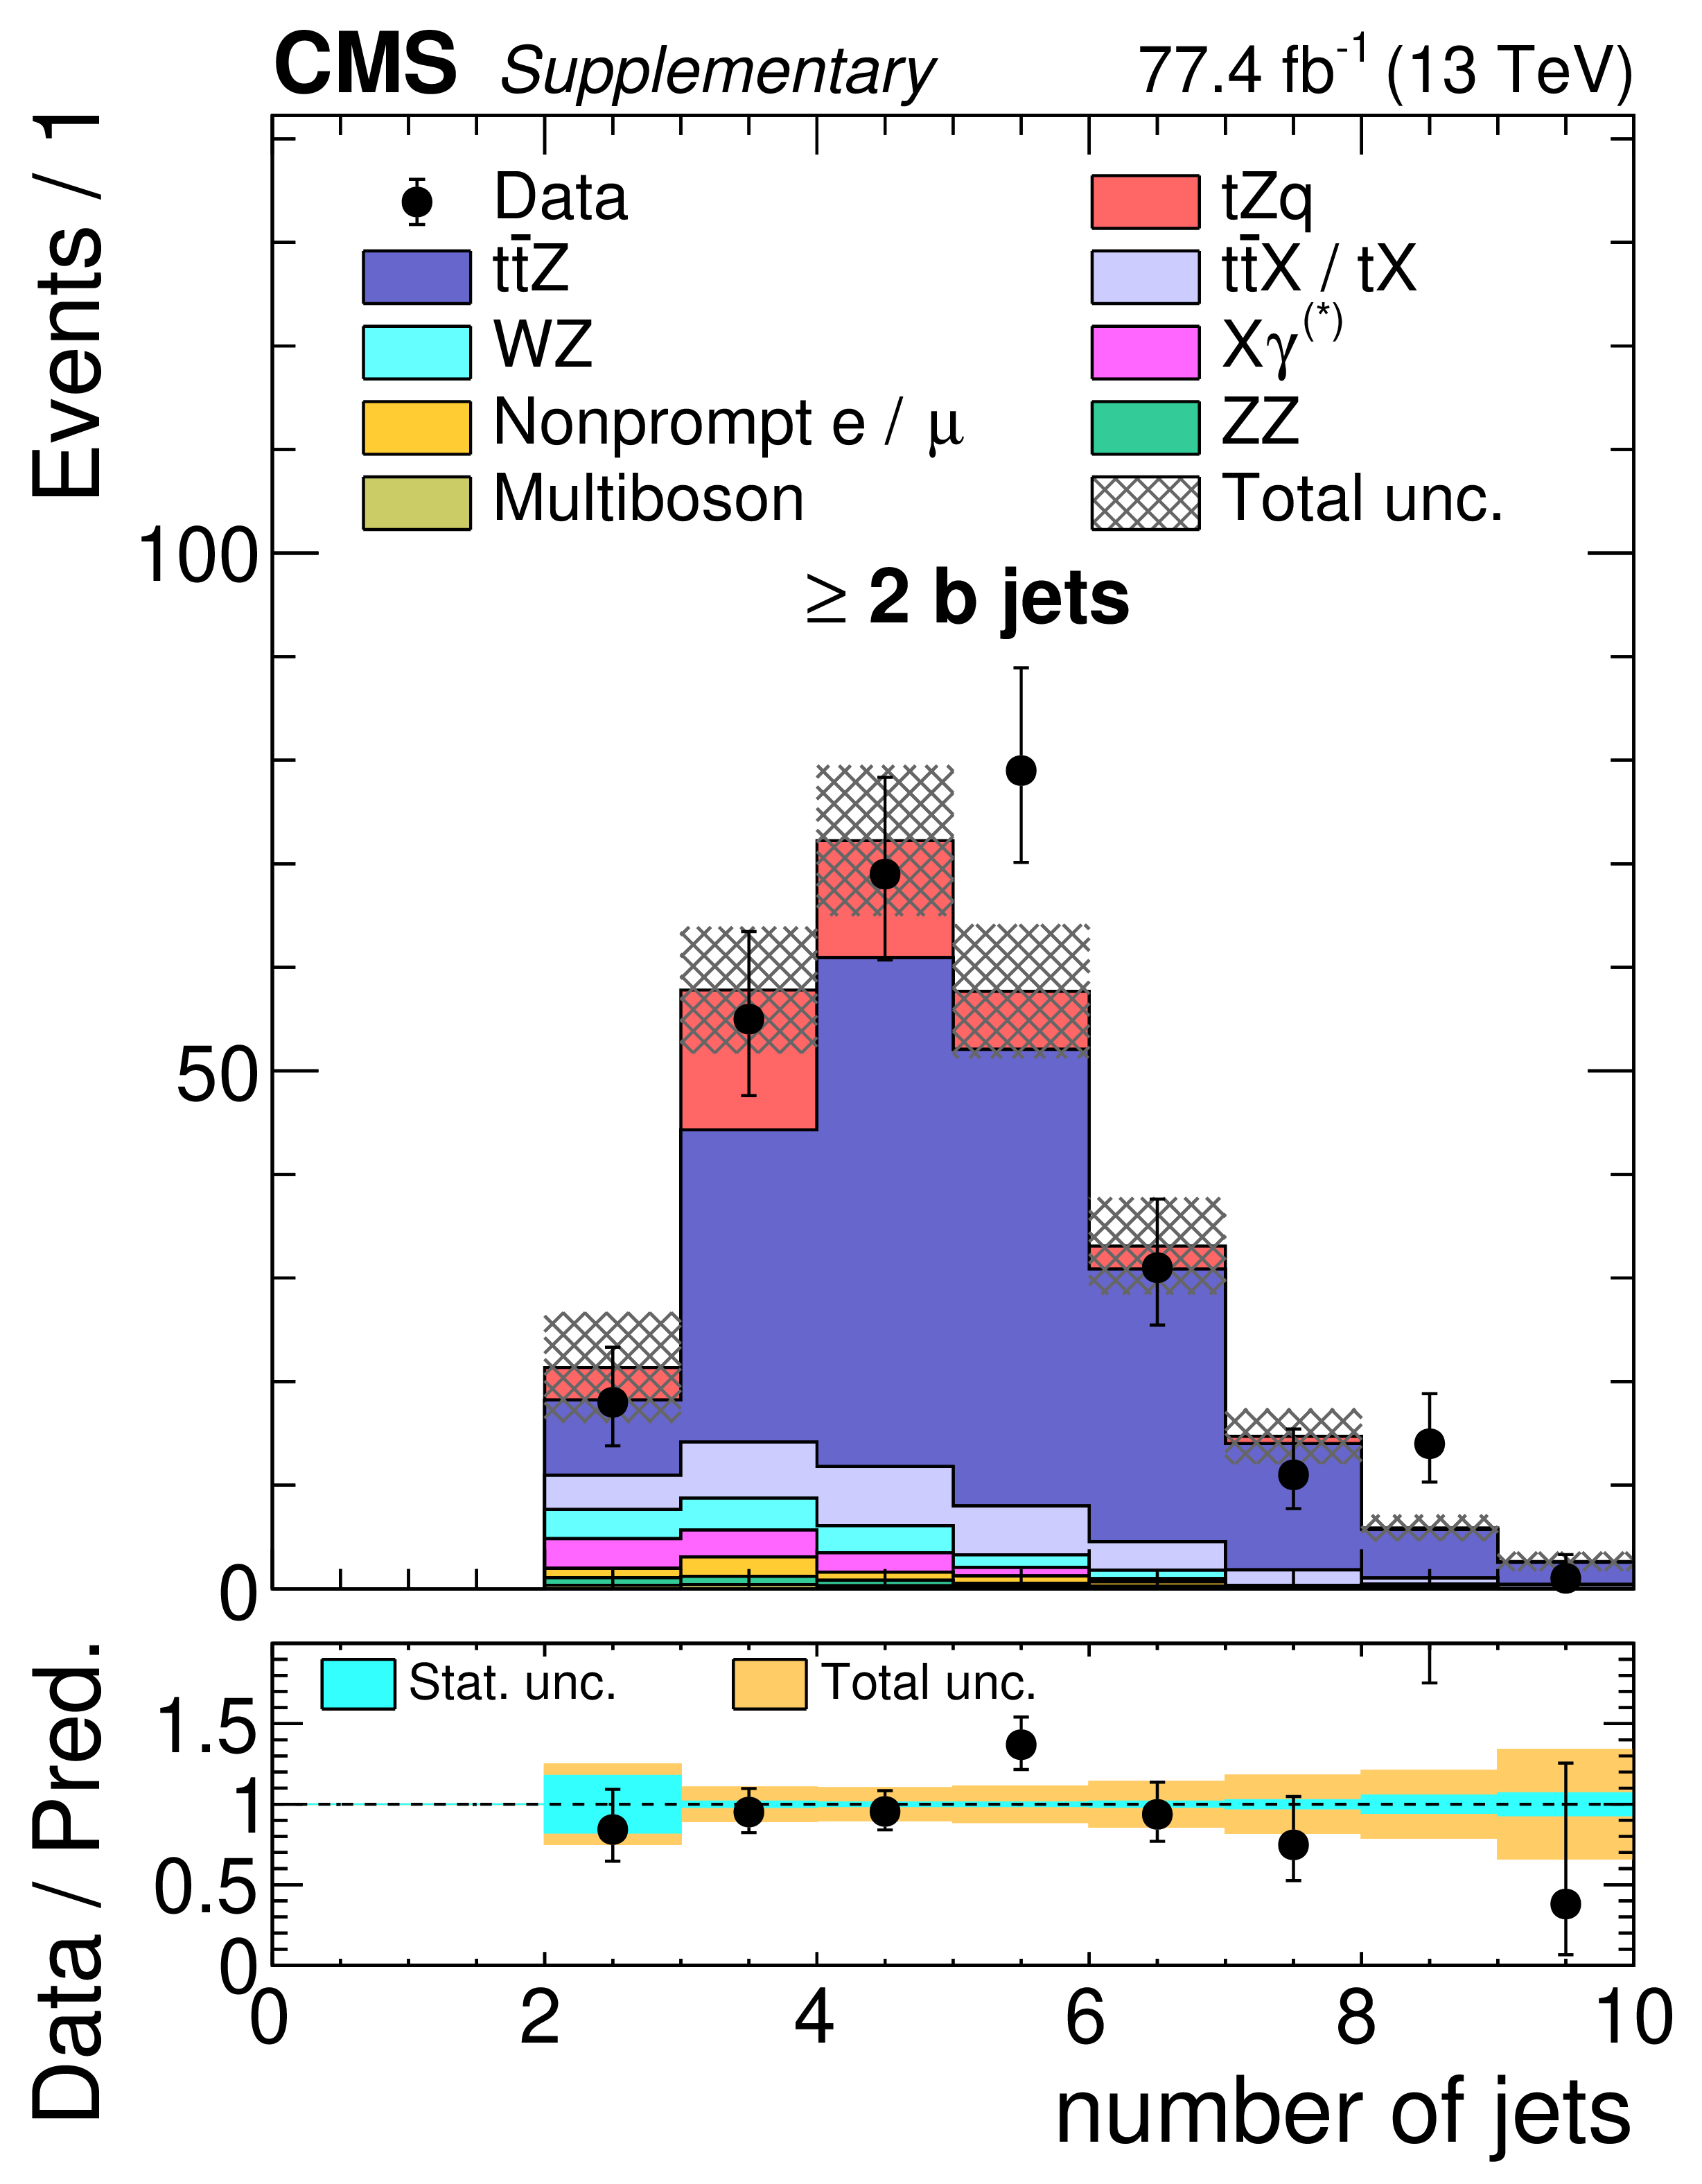
png pdf |
Additional Figure 13-c:
Post-fit expected and observed distributions in SR-2b of the $| \eta |$ of the number of jets in the event. |
png pdf |
Additional Figure 14:
Post-fit expected and observed distributions in SR-2b of the highest $| \eta |$ value out of any jet in the event. |
png pdf |
Additional Figure 15:
Post-fit expected and observed distributions in SR-2/3j-1b events with BDT values greater than 0.5 of the $| \eta |$ of the recoiling jet (left), and the lepton flavor composition of the event (right). |

png pdf |
Additional Figure 15-a:
Post-fit expected and observed distributions in SR-2/3j-1b events with BDT values greater than 0.5 of the $| \eta |$ of the recoiling jet. |

png pdf |
Additional Figure 15-b:
Post-fit expected and observed distributions in SR-2/3j-1b events with BDT values greater than 0.5 of the lepton flavor composition of the event. |
png pdf |
Additional Figure 16:
Post-fit expected and observed distributions in SR-2/3j-1b events with BDT values greater than 0.5 of the highest lepton ${p_{\mathrm {T}}}$ (left), second highest lepton ${p_{\mathrm {T}}}$ (middle) and lowest lepton ${p_{\mathrm {T}}}$ (right). |
png pdf |
Additional Figure 16-a:
Post-fit expected and observed distributions in SR-2/3j-1b events with BDT values greater than 0.5 of the highest lepton ${p_{\mathrm {T}}}$. |

png pdf |
Additional Figure 16-b:
Post-fit expected and observed distributions in SR-2/3j-1b events with BDT values greater than 0.5 of the second highest lepton ${p_{\mathrm {T}}}$. |
png pdf |
Additional Figure 16-c:
Post-fit expected and observed distributions in SR-2/3j-1b events with BDT values greater than 0.5 of the lowest lepton ${p_{\mathrm {T}}}$. |
png pdf |
Additional Figure 17:
Post-fit expected and observed distributions in SR-4j-1b events with BDT values greater than 0.5 of the $| \eta |$ of the recoiling jet (left), the ${p_{\mathrm {T}}}$ of the Z boson reconstructed from the dilepton pair of invariant mass closest to the mass of the Z boson (middle), and the lepton flavor composition of the event (right). |
png pdf |
Additional Figure 17-a:
Post-fit expected and observed distributions in SR-4j-1b events with BDT values greater than 0.5 of the $| \eta |$ of the recoiling jet. |

png pdf |
Additional Figure 17-b:
Post-fit expected and observed distributions in SR-4j-1b events with BDT values greater than 0.5 of the ${p_{\mathrm {T}}}$ of the Z boson reconstructed from the dilepton pair of invariant mass closest to the mass of the Z boson. |
png pdf |
Additional Figure 17-c:
Post-fit expected and observed distributions in SR-4j-1b events with BDT values greater than 0.5 of the lepton flavor composition of the event. |
png pdf |
Additional Figure 18:
Post-fit expected and observed distributions in SR-2b events with BDT values greater than 0.5 of the $| \eta |$ of the recoiling jet (left), the ${p_{\mathrm {T}}}$ of the Z boson reconstructed from the dilepton pair of invariant mass closest to the mass of the Z boson (middle), and the lepton flavor composition of the event (right). |
png pdf |
Additional Figure 18-a:
Post-fit expected and observed distributions in SR-2b events with BDT values greater than 0.5 of the $| \eta |$ of the recoiling jet. |

png pdf |
Additional Figure 18-b:
Post-fit expected and observed distributions in SR-2b events with BDT values greater than 0.5 of the ${p_{\mathrm {T}}}$ of the Z boson reconstructed from the dilepton pair of invariant mass closest to the mass of the Z boson. |
png pdf |
Additional Figure 18-c:
Post-fit expected and observed distributions in SR-2b events with BDT values greater than 0.5 of the lepton flavor composition of the event. |
png pdf |
Additional Figure 19:
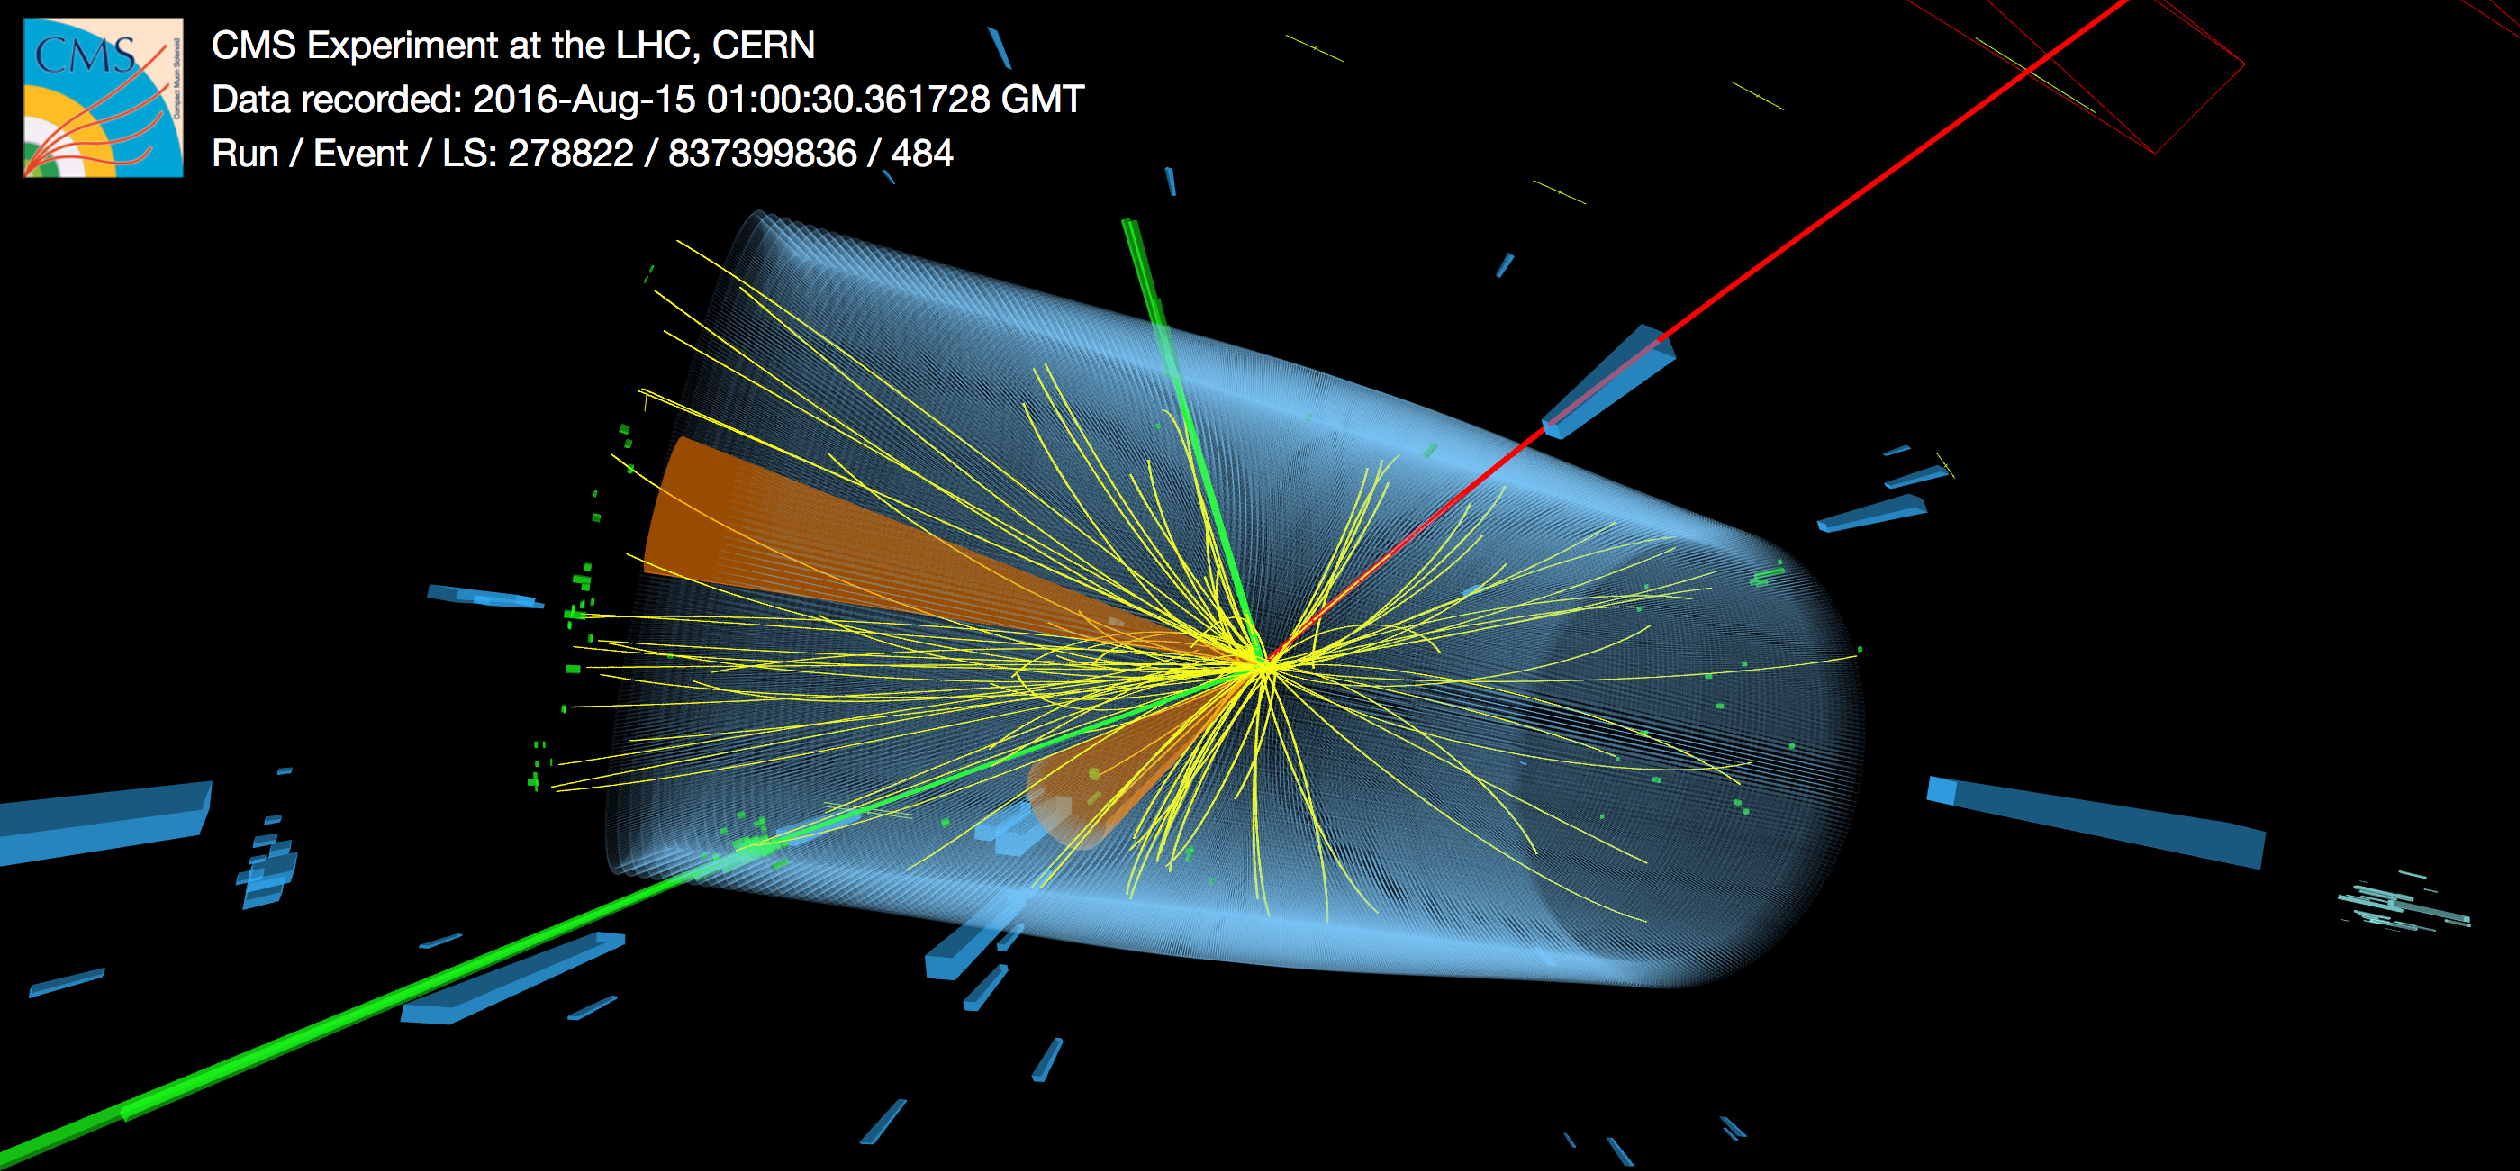
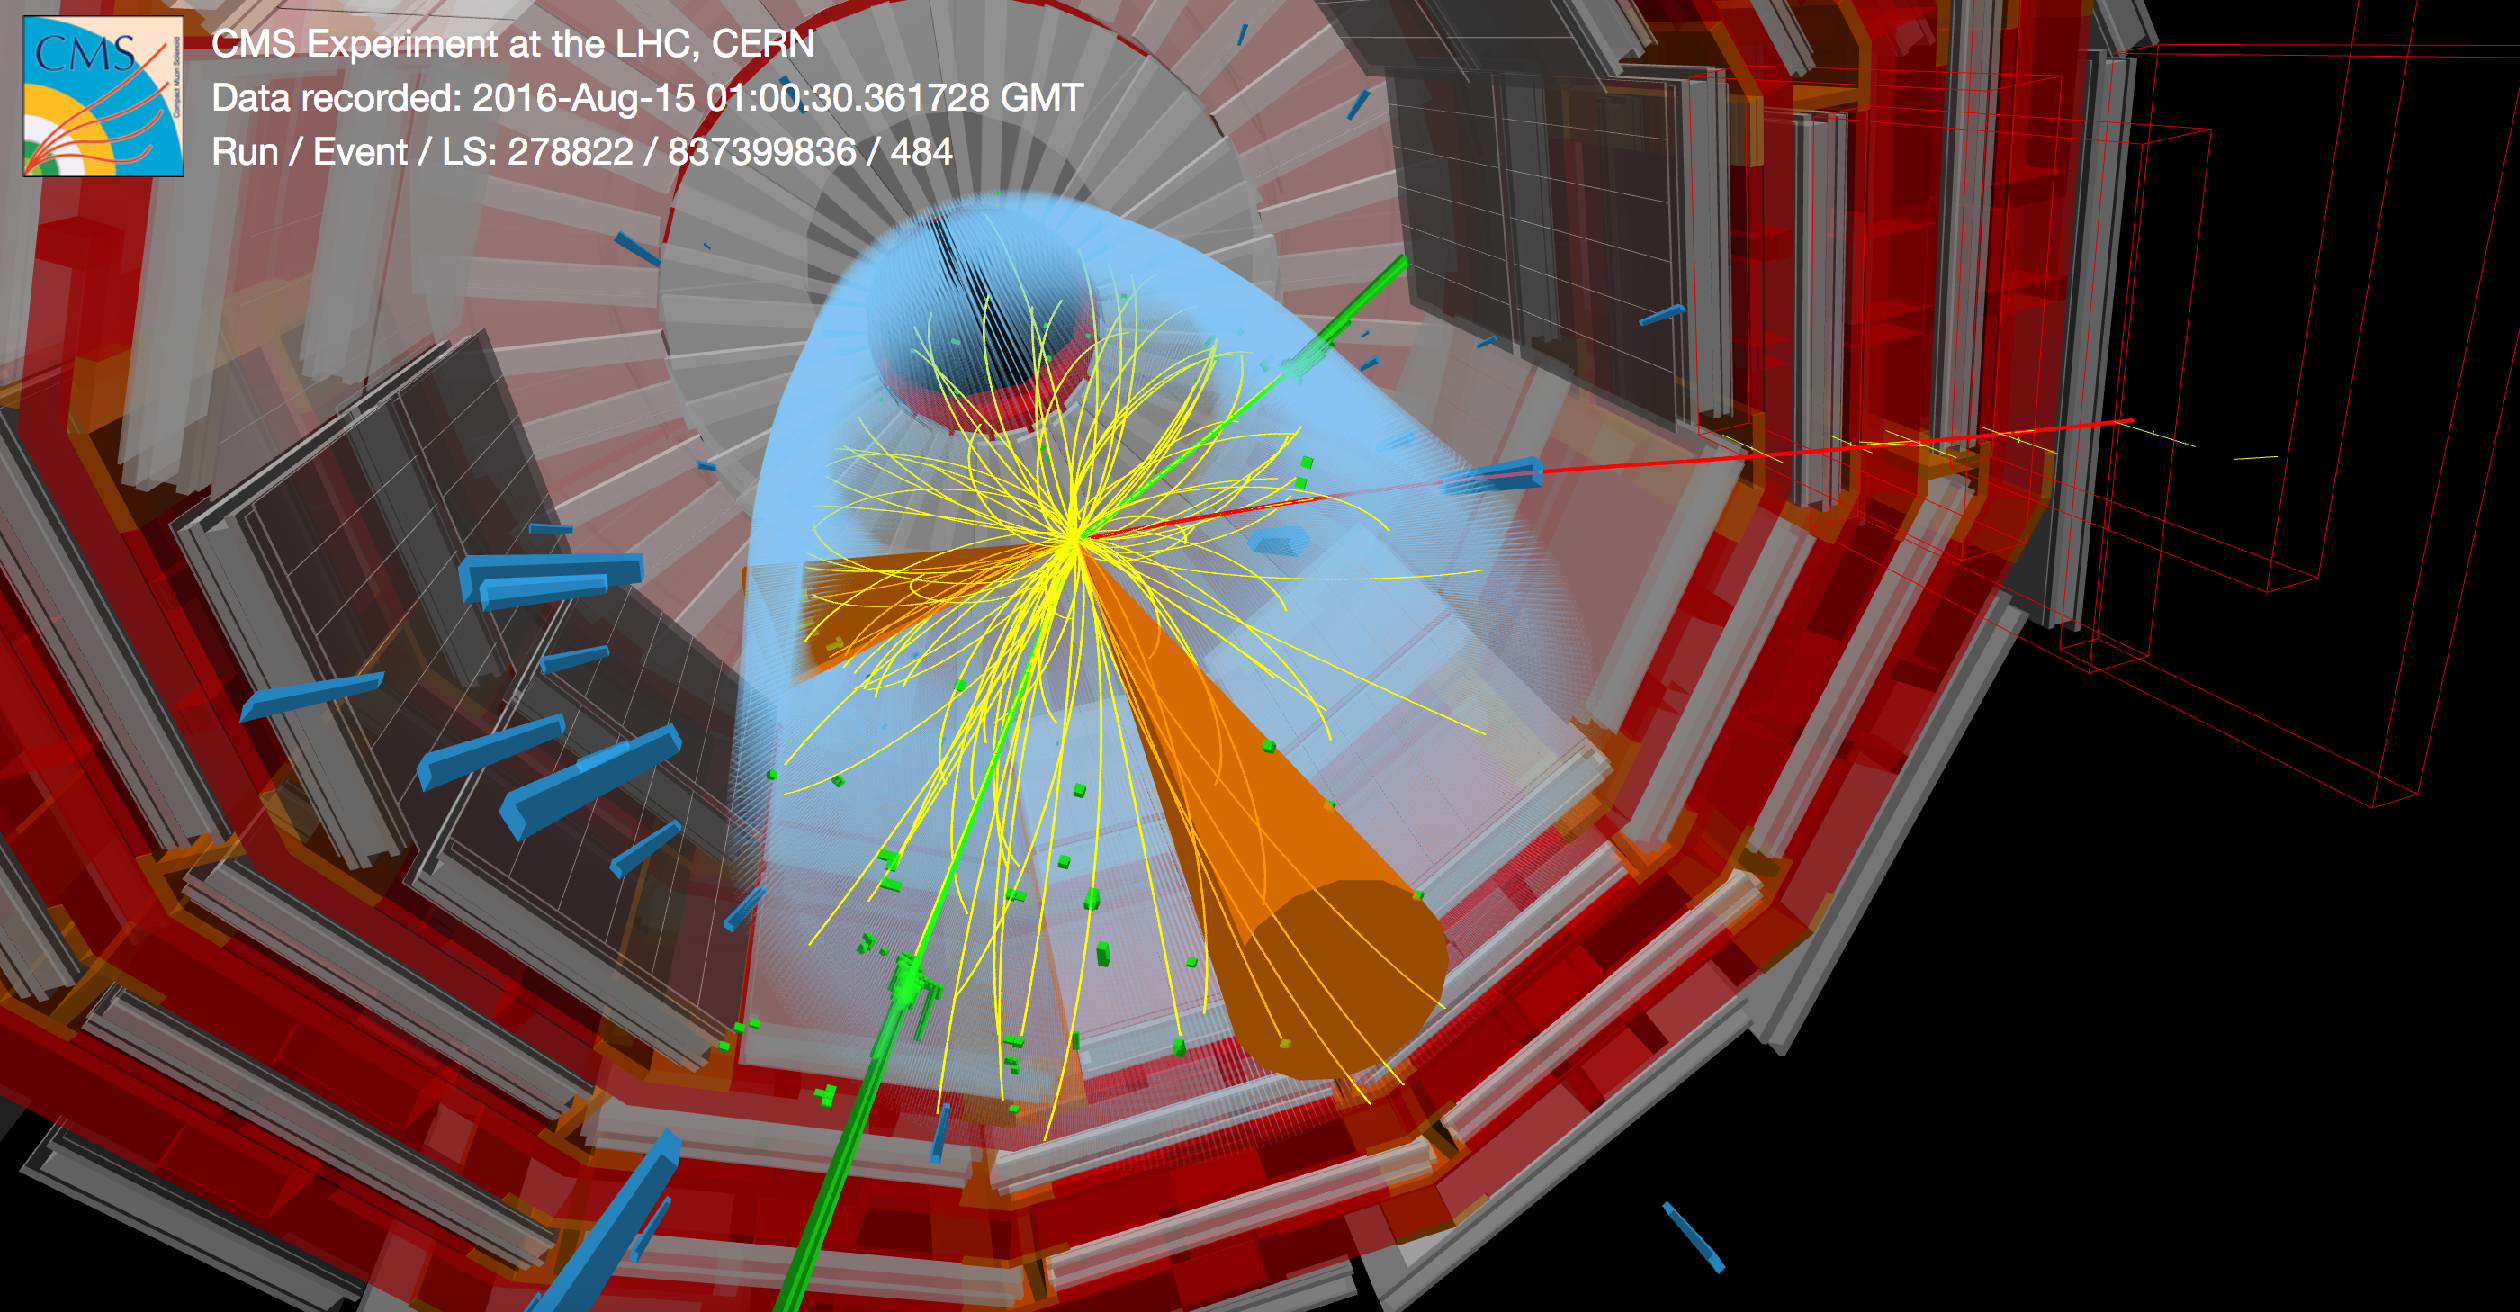
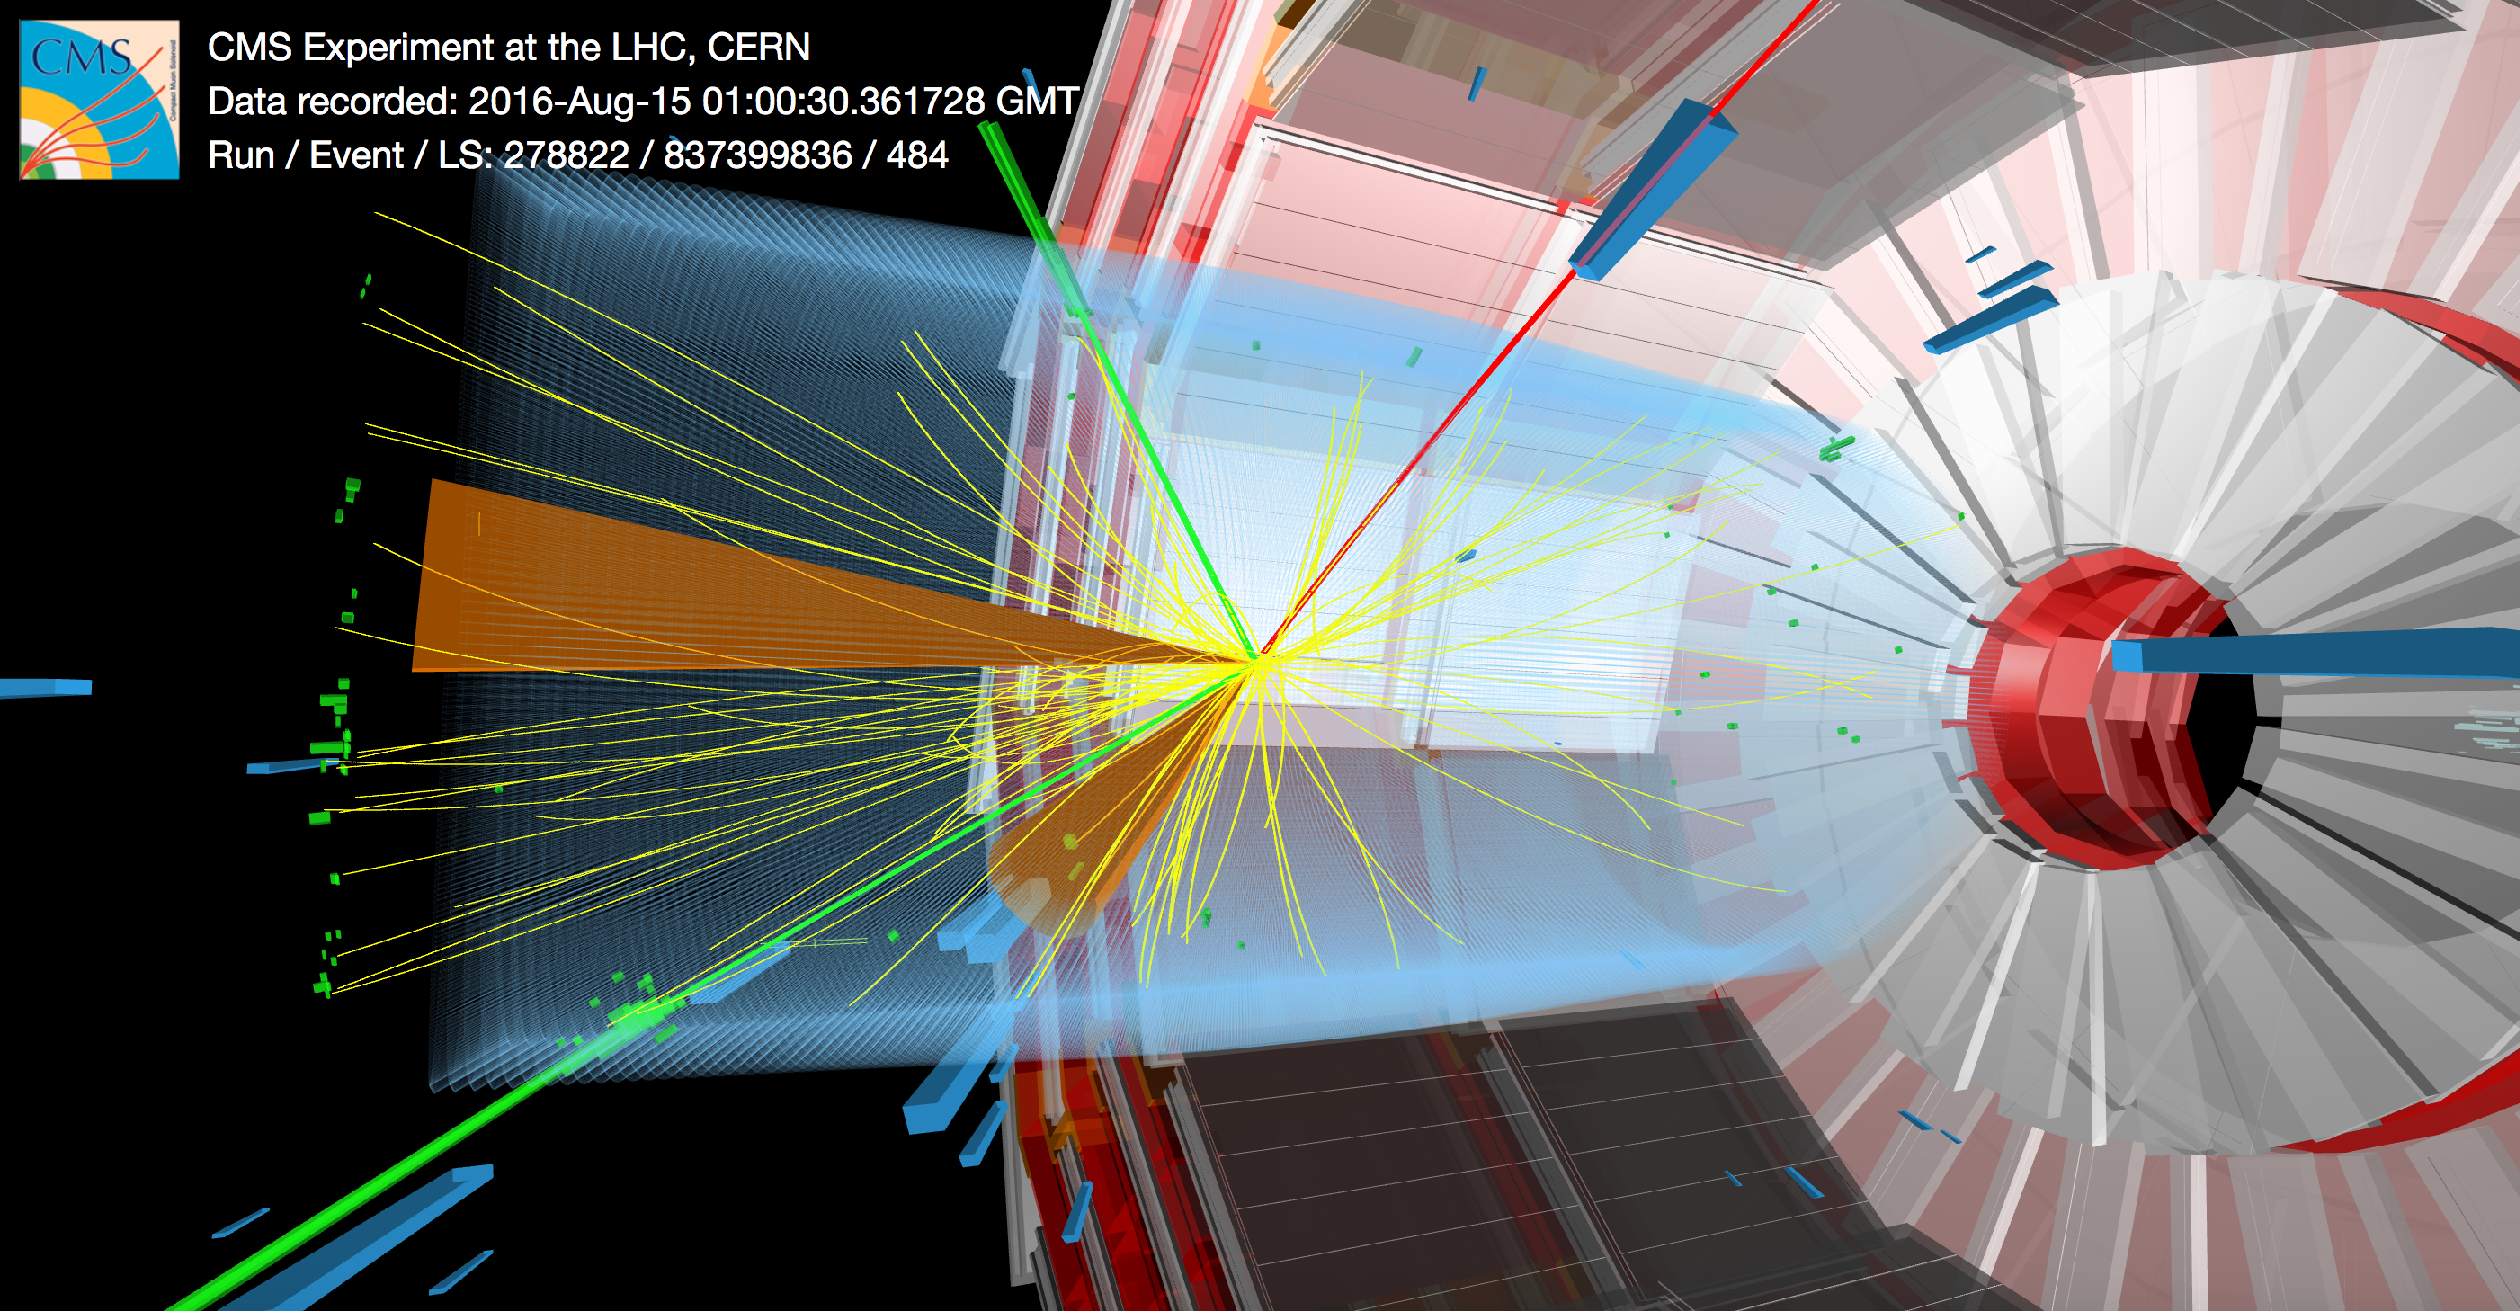
Event display of a 2016 data event in SR-2/3j-1b with a very high BDT score, which is thus highly likely to come from ${\mathrm {t}} {\mathrm {Z}} {\mathrm {q}}$ production. In the event, two electrons forming a Z mass, a muon, a b jet and a forward jet can be seen, as would be expected in a ${\mathrm {t}} {\mathrm {Z}} {\mathrm {q}}$ event. Electrons (muons) are highlighted in green (red), while jets are represented as orange cones. |
png pdf |
Additional Figure 20:
Event display of a 2016 data event in SR-2/3j-1b with a very high BDT score, which is thus highly likely to come from ${\mathrm {t}} {\mathrm {Z}} {\mathrm {q}}$ production. In the event, two electrons forming a Z mass, a muon, a b jet and a forward jet can be seen, as would be expected in a ${\mathrm {t}} {\mathrm {Z}} {\mathrm {q}}$ event. Electrons (muons) are highlighted in green (red), while jets are represented as orange cones. |
png pdf |
Additional Figure 21:
Event display of a 2016 data event in SR-2/3j-1b with a very high BDT score, which is thus highly likely to come from ${\mathrm {t}} {\mathrm {Z}} {\mathrm {q}}$ production. In the event, two electrons forming a Z mass, a muon, a b jet and a forward jet can be seen, as would be expected in a ${\mathrm {t}} {\mathrm {Z}} {\mathrm {q}}$ event. Electrons (muons) are highlighted in green (red), while jets are represented as orange cones. |

png pdf |
Additional Figure 22:
Event display of a 2016 data event in SR-2/3j-1b with a very high BDT score, which is thus highly likely to come from ${\mathrm {t}} {\mathrm {Z}} {\mathrm {q}}$ production. In the event, two electrons forming a Z mass, a muon, a b jet and a forward jet can be seen, as would be expected in a ${\mathrm {t}} {\mathrm {Z}} {\mathrm {q}}$ event. Electrons (muons) are highlighted in green (red), while jets are represented as orange cones. |

png pdf |
Additional Figure 23:
Event display of a 2017 data event in SR-2/3j-1b with a very high BDT score, which is thus highly likely to come from ${\mathrm {t}} {\mathrm {Z}} {\mathrm {q}}$ production. In the event, two muons forming a Z mass, an electron, a b jet and a forward jet can be seen, as would be expected in a ${\mathrm {t}} {\mathrm {Z}} {\mathrm {q}}$ event. Electrons (muons) are highlighted in green (red), while jets are represented as orange cones.21 |
| Additional Tables | |
png pdf |
Additional Table 1:
Average impact on the measured ${\mathrm {t}} {\mathrm {Z}} {\mathrm {q}}$ signal strength for major sources of systematic uncertainty. The impact of a particular nuisance parameter on the signal strength is computed by shifting the nuisance parameter by one standard deviation up and down from its post-fit value and recomputing the signal strength. All other nuisances are profiled as in the nominal fit when doing this computation. |
| References | ||||
| 1 | J. Campbell, R. K. Ellis, and R. Rontsch | Single top production in association with a Z boson at the LHC | PRD 87 (2013) 114006 | 1302.3856 |
| 2 | C. Degrande et al. | Single-top associated production with a Z or H boson at the LHC: the SMEFT interpretation | JHEP 10 (2018) 005 | 1804.07773 |
| 3 | J. A. Aguilar-Saavedra | Top flavor-changing neutral interactions: theoretical expectations and experimental detection | Acta Phys. Polon. B 35 (2004) 2695 | hep-ph/0409342 |
| 4 | J.-L. Agram et al. | Probing top anomalous couplings at the LHC with trilepton signatures in the single top mode | PLB 725 (2013) 123 | 1304.5551 |
| 5 | S. L. Glashow, J. Iliopoulos, and L. Maiani | Weak interactions with lepton-hadron symmetry | PRD 2 (1970) 1285 | |
| 6 | ATLAS Collaboration | Measurement of the production cross-section of a single top quark in association with a Z boson in proton-proton collisions at 13 TeV with the ATLAS detector | PLB 780 (2018) 557 | 1710.03659 |
| 7 | CMS Collaboration | Measurement of the associated production of a single top quark and a Z boson in pp collisions at $ \sqrt{s} = $ 13 TeV | PLB 779 (2018) 358 | CMS-TOP-16-020 1712.02825 |
| 8 | CMS Collaboration | The CMS experiment at the CERN LHC | JINST 3 (2008) S08004 | CMS-00-001 |
| 9 | CMS Collaboration | The CMS trigger system | JINST 12 (2017) P01020 | CMS-TRG-12-001 1609.02366 |
| 10 | J. Alwall et al. | The automated computation of tree-level and next-to-leading order differential cross sections, and their matching to parton shower simulations | JHEP 07 (2014) 079 | 1405.0301 |
| 11 | S. Frixione and B. R. Webber | Matching NLO QCD computations and parton shower simulations | JHEP 06 (2002) 029 | hep-ph/0204244 |
| 12 | T. Melia, P. Nason, R. Rontsch, and G. Zanderighi | $ \mathrm{W}^+ \mathrm{W}^- $, $ \mathrm{W} \mathrm{Z} $ and $ \mathrm{Z} \mathrm{Z} $ production in the POWHEG BOX | JHEP 11 (2011) 078 | 1107.5051 |
| 13 | P. Nason and G. Zanderighi | $ \mathrm{W}^+ \mathrm{W}^- $, $ \mathrm{W} \mathrm{Z} $ and $ \mathrm{Z} \mathrm{Z} $ production in the POWHEG-BOX-V2 | EPJC 74 (2014) 2702 | 1311.1365 |
| 14 | P. Nason | A new method for combining NLO QCD with shower Monte Carlo algorithms | JHEP 11 (2004) 040 | hep-ph/0409146 |
| 15 | S. Frixione, P. Nason, and C. Oleari | Matching NLO QCD computations with parton shower simulations: the POWHEG method | JHEP 11 (2007) 070 | 0709.2092 |
| 16 | S. Alioli, P. Nason, C. Oleari, and E. Re | A general framework for implementing NLO calculations in shower Monte Carlo programs: the POWHEG BOX | JHEP 06 (2010) 043 | 1002.2581 |
| 17 | NNPDF Collaboration | Parton distributions for the LHC Run II | JHEP 04 (2015) 040 | 1410.8849 |
| 18 | NNPDF Collaboration | Parton distributions from high-precision collider data | EPJC 77 (2017) 663 | 1706.00428 |
| 19 | A. Buckley et al. | LHAPDF6: parton density access in the LHC precision era | EPJC 75 (2015) 132 | 1412.7420 |
| 20 | T. Sjostrand et al. | An introduction to PYTHIA 8.2 | CPC 191 (2015) 159 | 1410.3012 |
| 21 | P. Skands, S. Carrazza, and J. Rojo | Tuning PYTHIA 8.1: the Monash 2013 tune | EPJC 74 (2014) 3024 | 1404.5630 |
| 22 | CMS Collaboration | Event generator tunes obtained from underlying event and multiparton scattering measurements | EPJC 76 (2016) 155 | CMS-GEN-14-001 1512.00815 |
| 23 | CMS Collaboration | Extraction and validation of a new set of CMS PYTHIA 8 tunes from underlying event measurements | CDS | |
| 24 | R. Frederix and S. Frixione | Merging meets matching in MC@NLO | JHEP 12 (2012) 061 | 1209.6215 |
| 25 | J. Alwall et al. | Comparative study of various algorithms for the merging of parton showers and matrix elements in hadronic collisions | EPJC 53 (2008) 473 | 0706.2569 |
| 26 | GEANT4 Collaboration | GEANT4---a simulation toolkit | NIMA 506 (2003) 250 | |
| 27 | CMS Collaboration | Particle-flow reconstruction and global event description with the CMS detector | JINST 12 (2017) P10003 | CMS-PRF-14-001 1706.04965 |
| 28 | M. Cacciari, G. P. Salam, and G. Soyez | The anti-$ {k_{\mathrm{T}}} $ jet clustering algorithm | JHEP 04 (2008) 063 | 0802.1189 |
| 29 | M. Cacciari, G. P. Salam, and G. Soyez | FastJet user manual | EPJC 72 (2012) 1896 | 1111.6097 |
| 30 | M. Cacciari and G. P. Salam | Dispelling the $ N^{3} $ myth for the $ k_{t} $ jet-finder | PLB 641 (2006) 57 | hep-ph/0512210 |
| 31 | CMS Collaboration | Jet performance in pp collisions at $ \sqrt{s} = $ 7 TeV | CMS-PAS-JME-10-003 | |
| 32 | CMS Collaboration | Determination of jet energy calibration and transverse momentum resolution in CMS | JINST 6 (2011) P11002 | CMS-JME-10-011 1107.4277 |
| 33 | CMS Collaboration | Jet energy scale and resolution in the CMS experiment in pp collisions at 8 TeV | JINST 12 (2017) P02014 | CMS-JME-13-004 1607.03663 |
| 34 | CMS Collaboration | Identification of heavy-flavour jets with the CMS detector in pp collisions at 13 TeV | JINST 13 (2018) P05011 | CMS-BTV-16-002 1712.07158 |
| 35 | CMS Collaboration | Jet algorithms performance in 13 TeV data | CMS-PAS-JME-16-003 | CMS-PAS-JME-16-003 |
| 36 | CMS Collaboration | Performance of electron reconstruction and selection with the CMS detector in proton-proton collisions at $ \sqrt{s} = $ 8 TeV | JINST 10 (2015) P06005 | CMS-EGM-13-001 1502.02701 |
| 37 | CMS Collaboration | Performance of the CMS muon detector and muon reconstruction with proton-proton collisions at $ \sqrt{s}= $ 13 TeV | JINST 13 (2018) P06015 | CMS-MUO-16-001 1804.04528 |
| 38 | CMS Collaboration | Search for new physics in same-sign dilepton events in proton-proton collisions at $ \sqrt{s} = $ 13 TeV | EPJC 76 (2016) 439 | CMS-SUS-15-008 1605.03171 |
| 39 | H. Voss, A. Hocker, J. Stelzer, and F. Tegenfeldt | TMVA, the toolkit for multivariate data analysis with ROOT | in XIth International Workshop on Advanced Computing and Analysis Techniques in Physics Research (ACAT), p. 40 2007 [PoS(ACAT)040] | physics/0703039 |
| 40 | F. Chollet et al. | Keras | 2015 Software available from | |
| 41 | M. Abadi et al. | TensorFlow: Large-scale machine learning on heterogeneous systems | Software available from | 1603.04467 |
| 42 | Particle Data Group, M. Tanabashi et al. | Review of particle physics | PRD 98 (2018) 030001 | |
| 43 | CMS Collaboration | Measurement of the inelastic proton-proton cross section at $ \sqrt{s}= $ 13 TeV | JHEP 07 (2018) 161 | CMS-FSQ-15-005 1802.02613 |
| 44 | CMS Collaboration | CMS luminosity measurements for the 2016 data-taking period | CMS-PAS-LUM-17-001 | CMS-PAS-LUM-17-001 |
| 45 | CMS Collaboration | CMS luminosity measurement for the 2017 data-taking period at 13 TeV | CMS-PAS-LUM-17-004 | CMS-PAS-LUM-17-004 |
| 46 | J. Butterworth et al. | PDF4LHC recommendations for LHC Run II | JPG 43 (2016) 023001 | 1510.03865 |
| 47 | CMS Collaboration | Precise determination of the mass of the Higgs boson and tests of compatibility of its couplings with the standard model predictions using proton collisions at 7 and 8 TeV | EPJC 75 (2015) 212 | CMS-HIG-14-009 1412.8662 |
| 48 | G. Cowan, K. Cranmer, E. Gross, and O. Vitells | Asymptotic formulae for likelihood-based tests of new physics | EPJC 71 (2011) 1554 | 1007.1727 |
| 49 | The ATLAS Collaboration, The CMS Collaboration, The LHC Higgs Combination Group | Procedure for the LHC Higgs boson search combination in Summer 2011 | CMS-NOTE-2011-005 | |
|
|
Compact Muon Solenoid LHC, CERN |
|

|

|

|

|

|