

Compact Muon Solenoid
LHC, CERN
| CMS-B2G-20-002 ; CERN-EP-2022-001 | ||
| Search for a W' boson decaying to a vector-like quark and a top or bottom quark in the all-jets final state at $\sqrt{s} = $ 13 TeV | ||
| CMS Collaboration | ||
| 25 February 2022 | ||
| JHEP 09 (2022) 088 | ||
| Abstract: A search is presented for a heavy W' boson resonance decaying to a B or T vector-like quark and a t or a b quark, respectively. The analysis is performed using proton-proton collisions collected with the CMS detector at the LHC. The data correspond to an integrated luminosity of 138 fb$^{-1}$ at a center-of-mass energy of 13 TeV. Both decay channels result in a signature with a t quark, a Higgs or Z boson, and a b quark, each produced with a significant Lorentz boost. The all-hadronic decays of the Higgs or Z boson and of the t quark are selected using jet substructure techniques to reduce standard model backgrounds, resulting in a distinct three-jet W' boson decay signature. No significant deviation in data with respect to the standard model background prediction is observed. Upper limits are set at 95% confidence level on the product of the W' boson cross section and the final state branching fraction. A W' boson with a mass below 3.1 TeV is excluded, given the benchmark model assumption of democratic branching fractions. In addition, limits are set based on generalizations of these assumptions. These are the most sensitive limits to date for this final state. | ||
| Links: e-print arXiv:2202.12988 [hep-ex] (PDF) ; CDS record ; inSPIRE record ; HepData record ; CADI line (restricted) ; | ||
| Figures & Tables | Summary | Additional Figures | References | CMS Publications |
|---|
| Figures | |

png pdf |
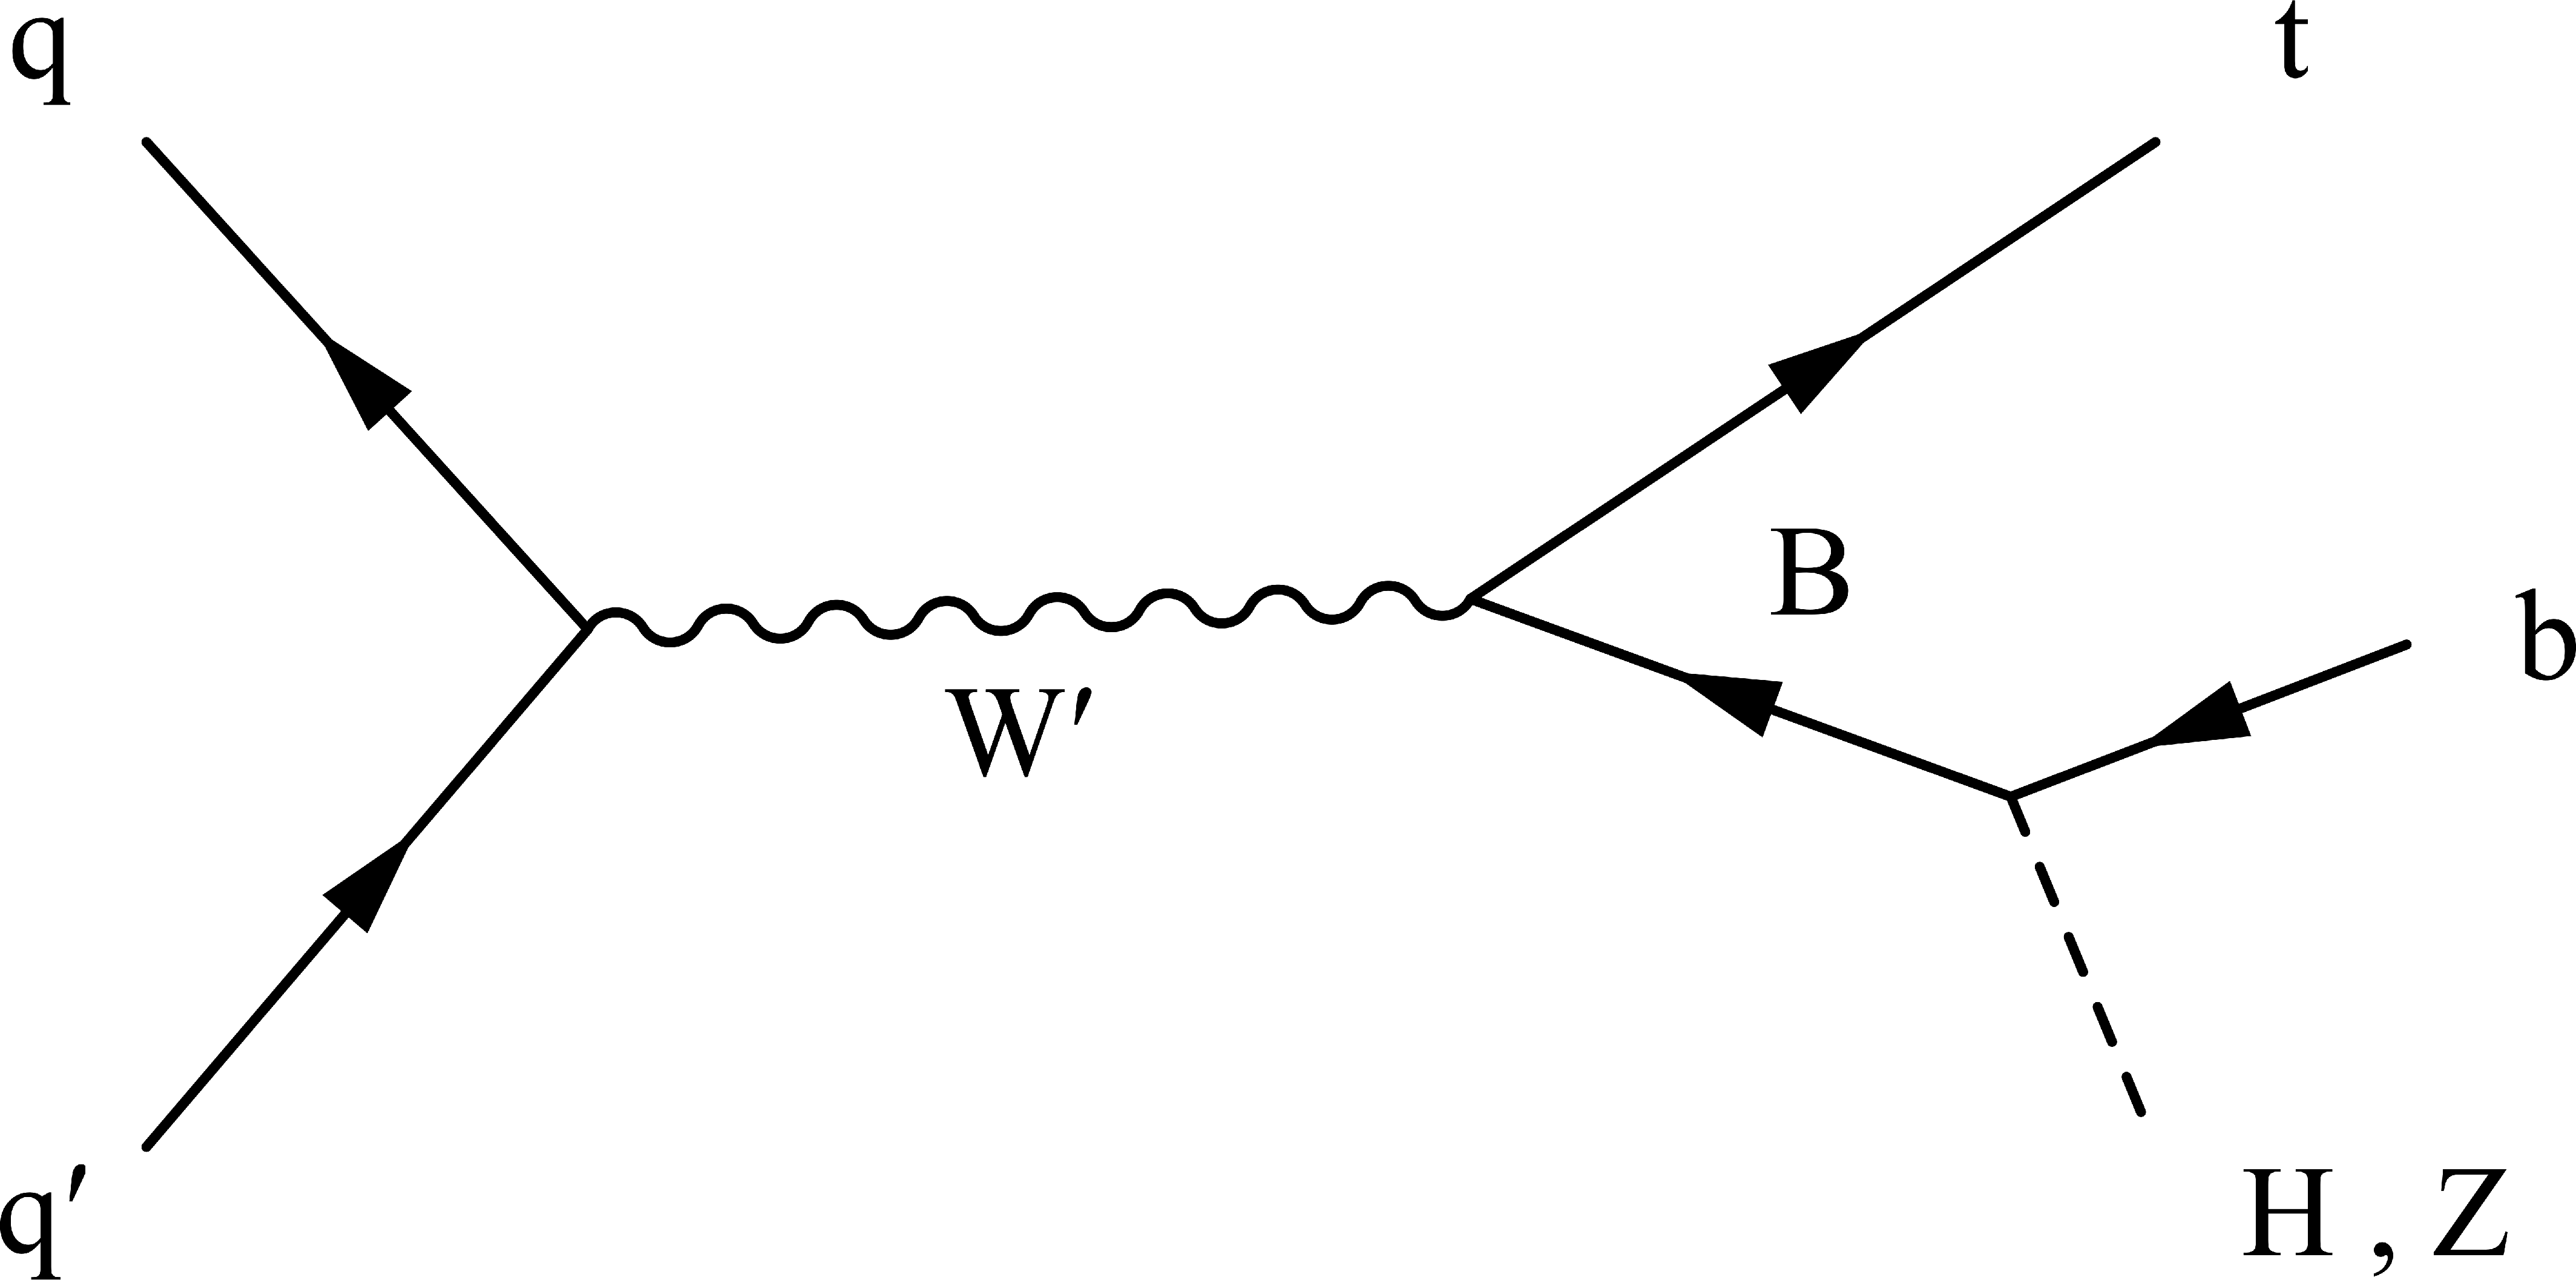
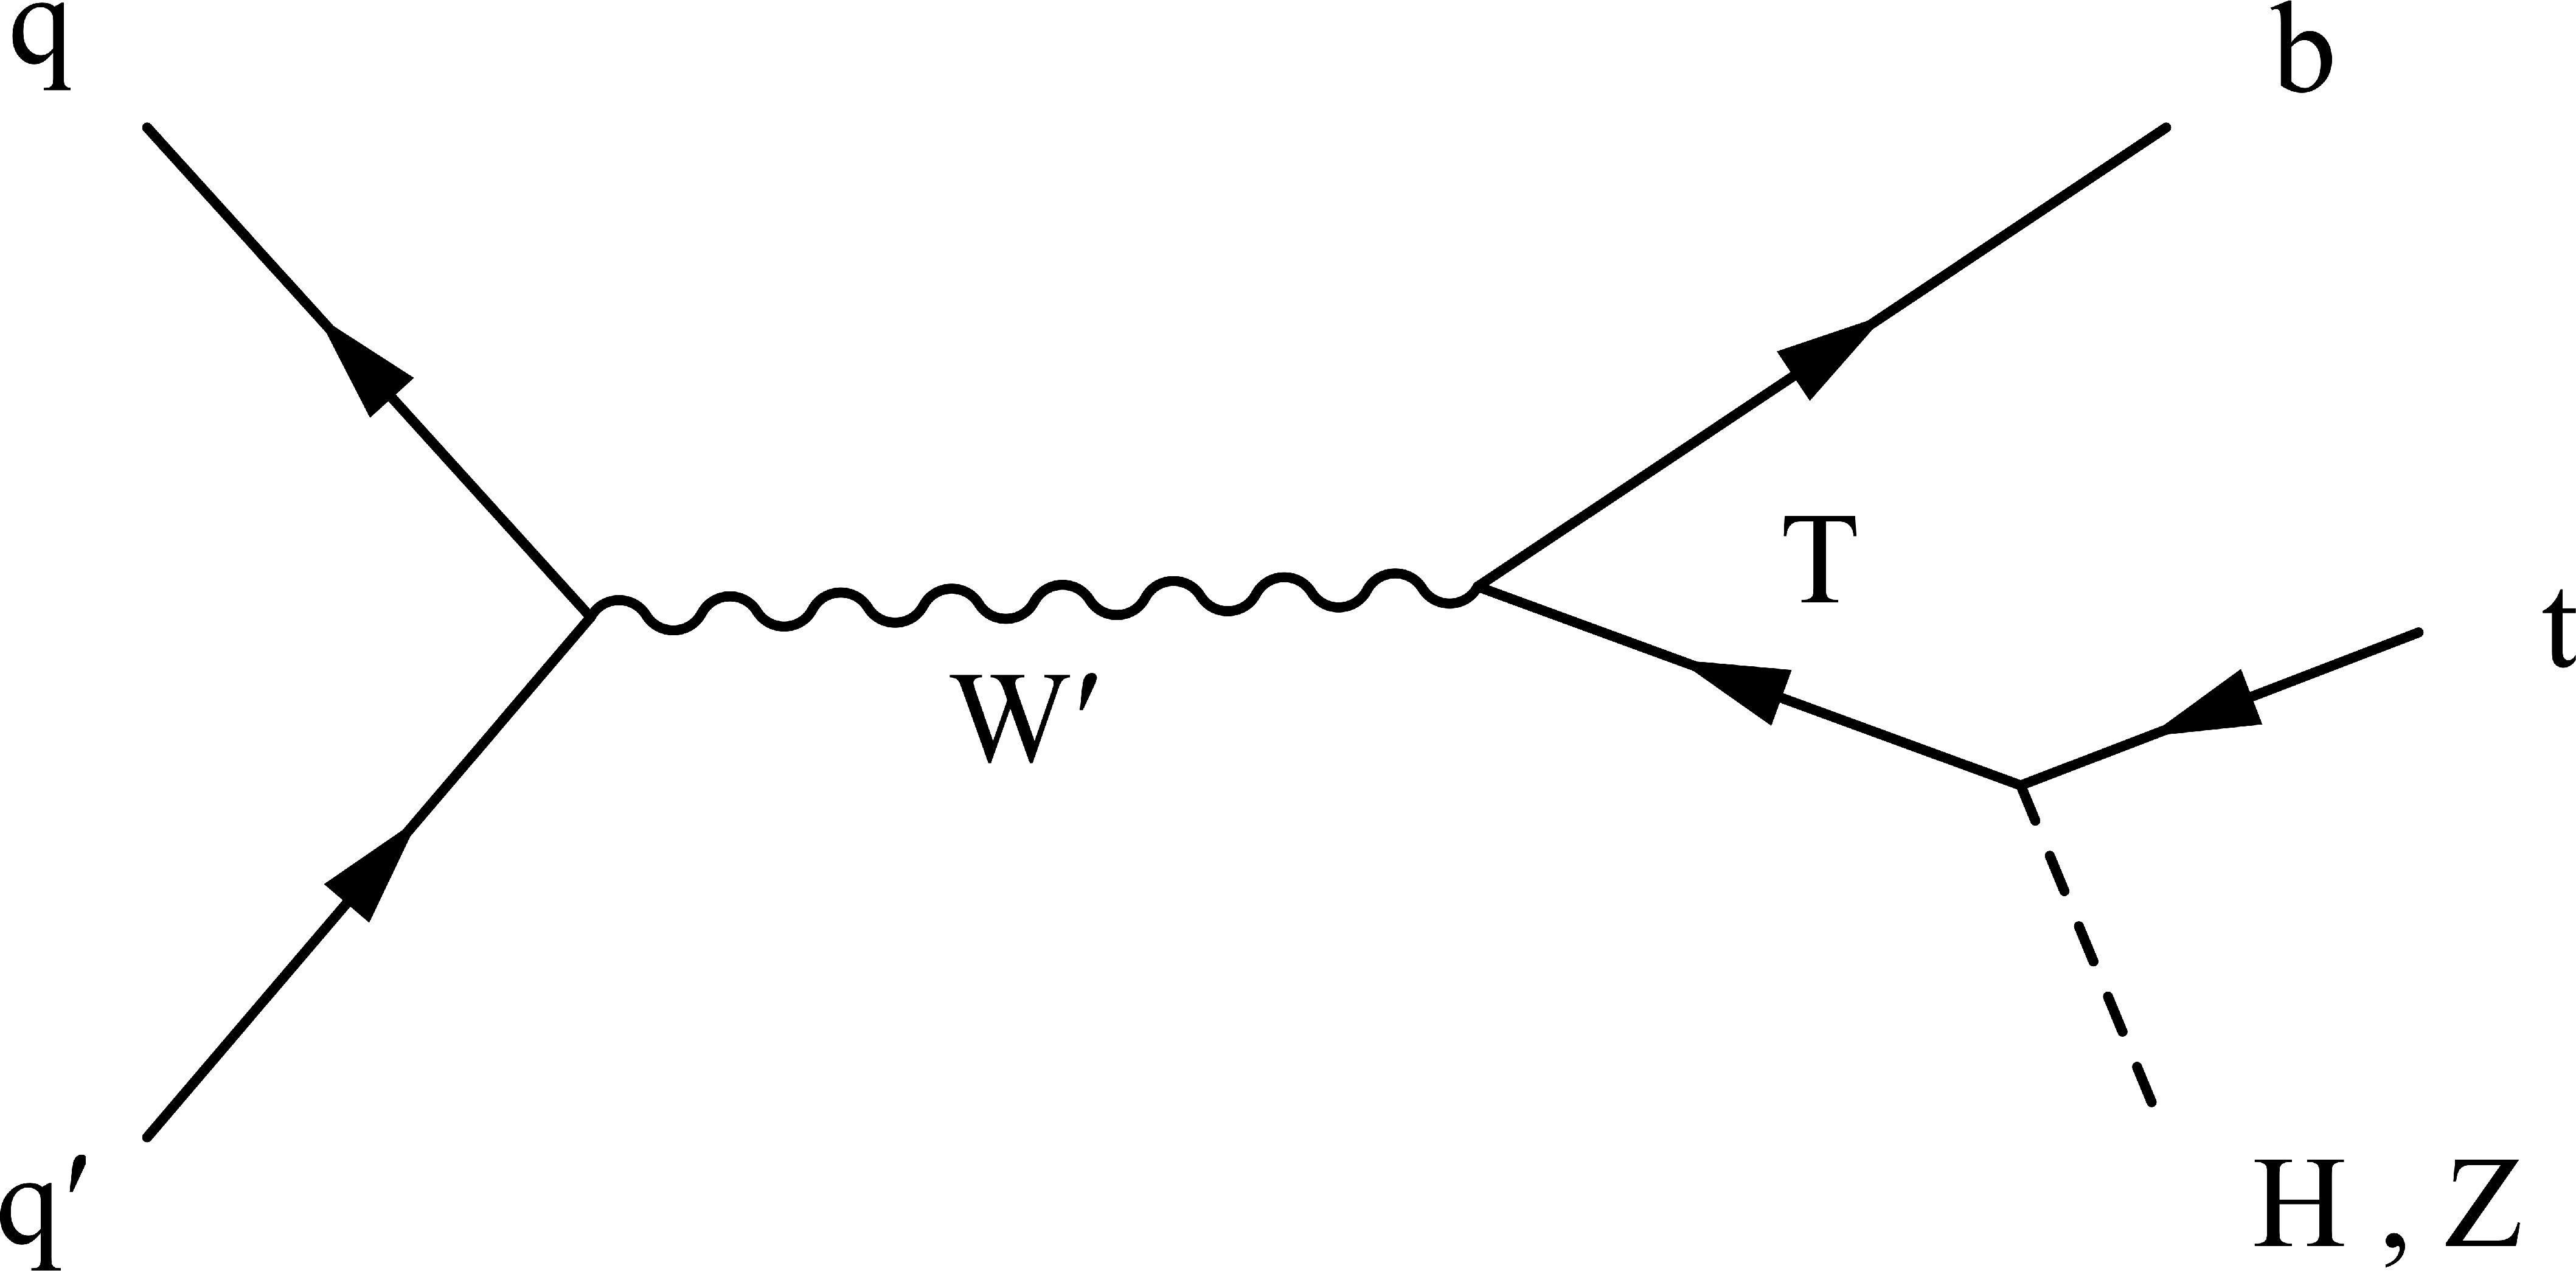
Figure 1:
Dominant Feynman diagrams for the signal model considered. |
png pdf |
Figure 1-a:
Dominant Feynman diagram for the signal model considered. |
png pdf |
Figure 1-b:
Dominant Feynman diagram for the signal model considered. |
png pdf |
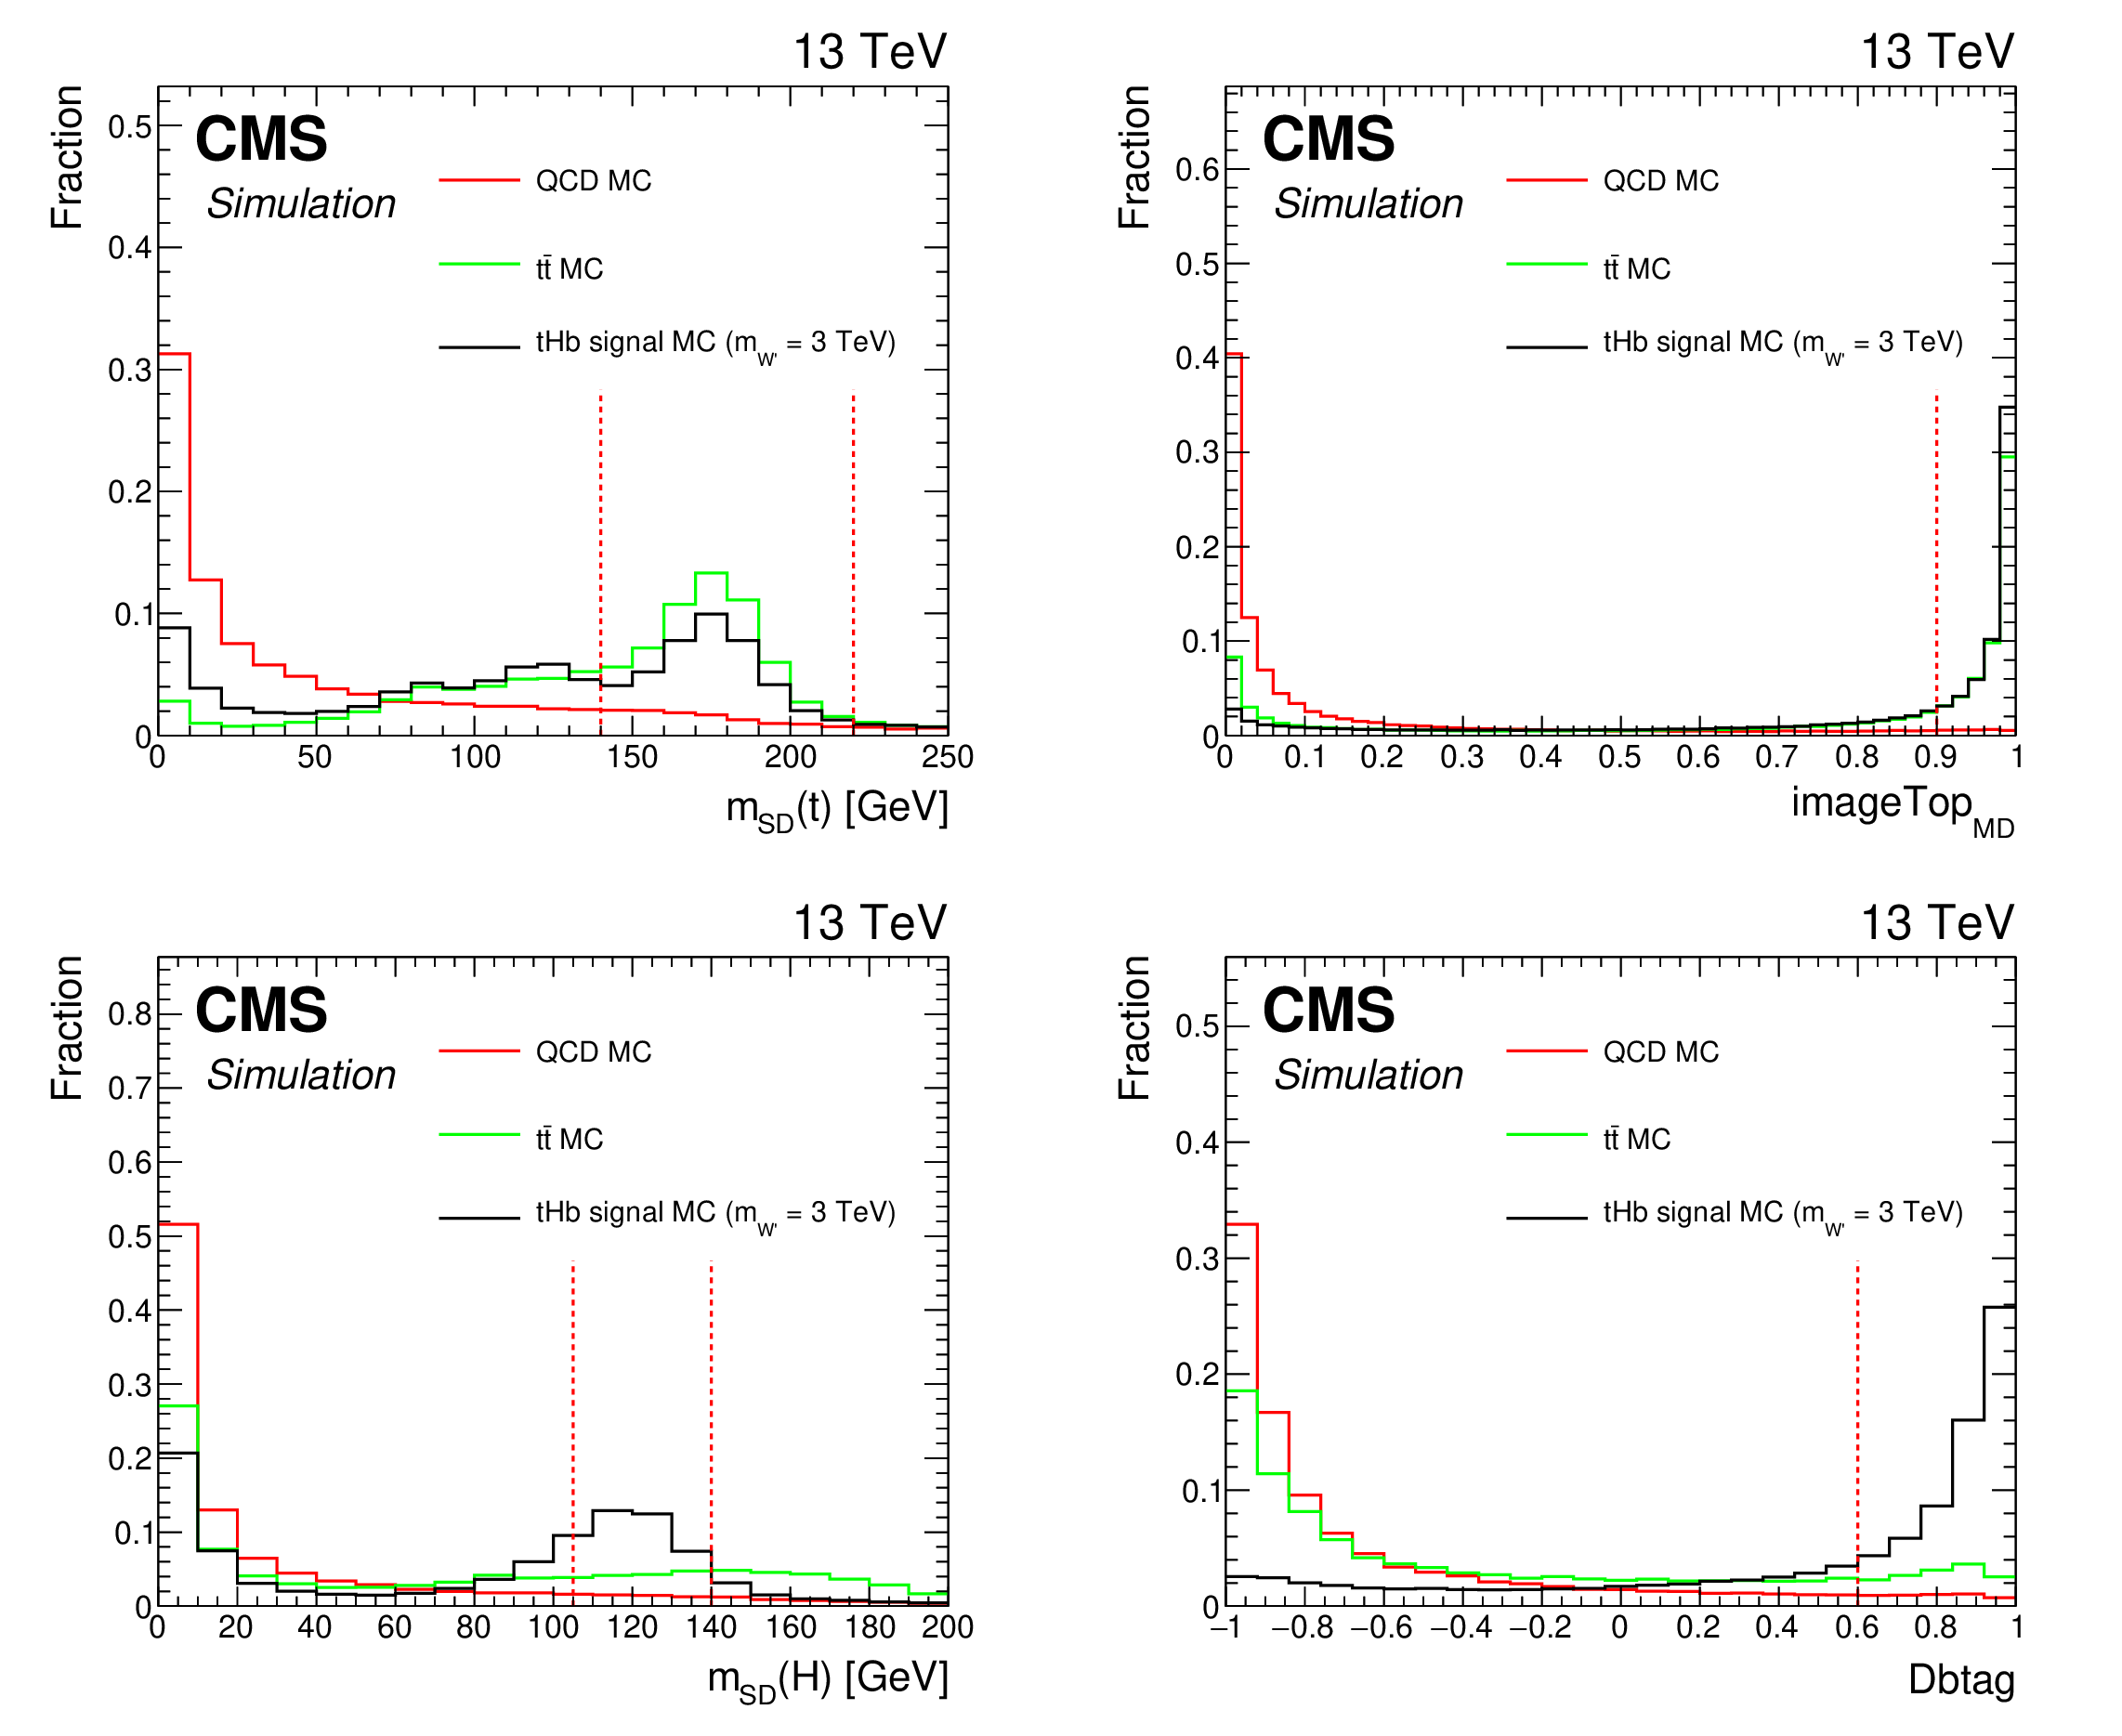
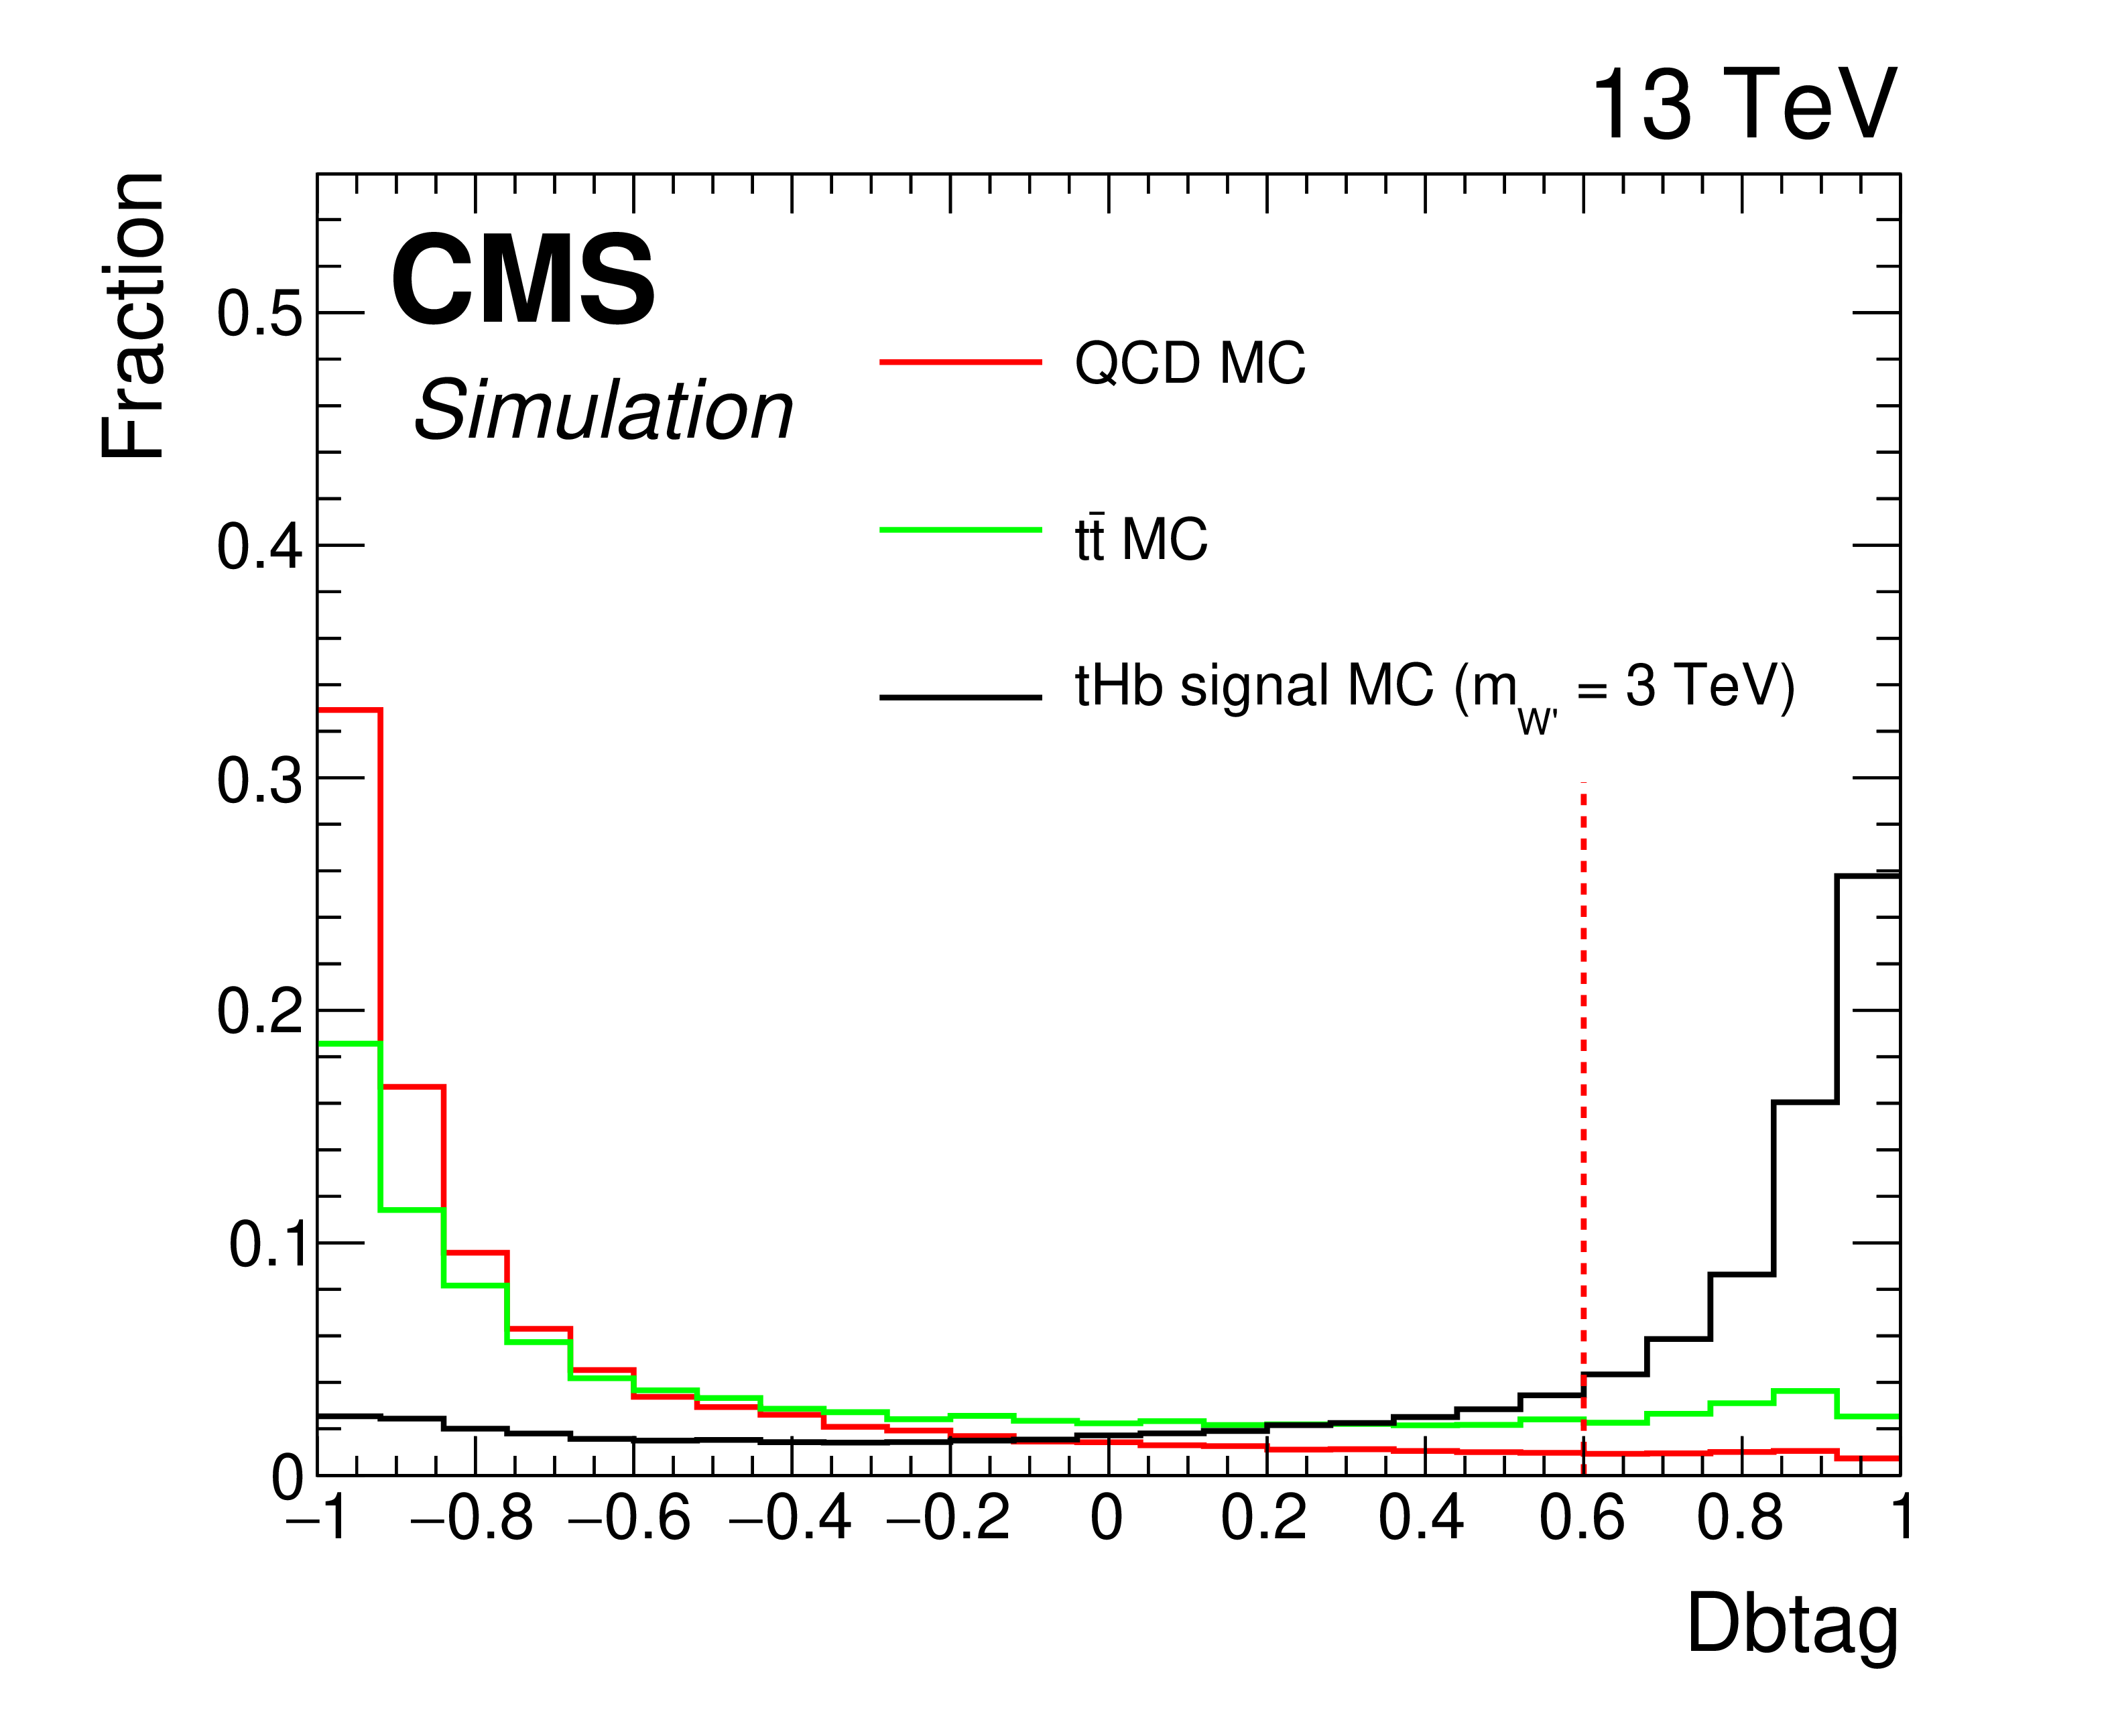
Figure 2:
Simulated distributions of the discriminating variables for ${{\mathrm {t}\overline {\mathrm {t}}}}$, QCD, and ${{\mathrm {t}} {\mathrm {H}} {\mathrm {b}}}$ signal simulated events normalized to unity for the ${{\mathrm {t}} {\mathrm {H}} {\mathrm {b}}}$ analysis. Discriminant thresholds are shown as vertical dashed lines. |
png pdf |
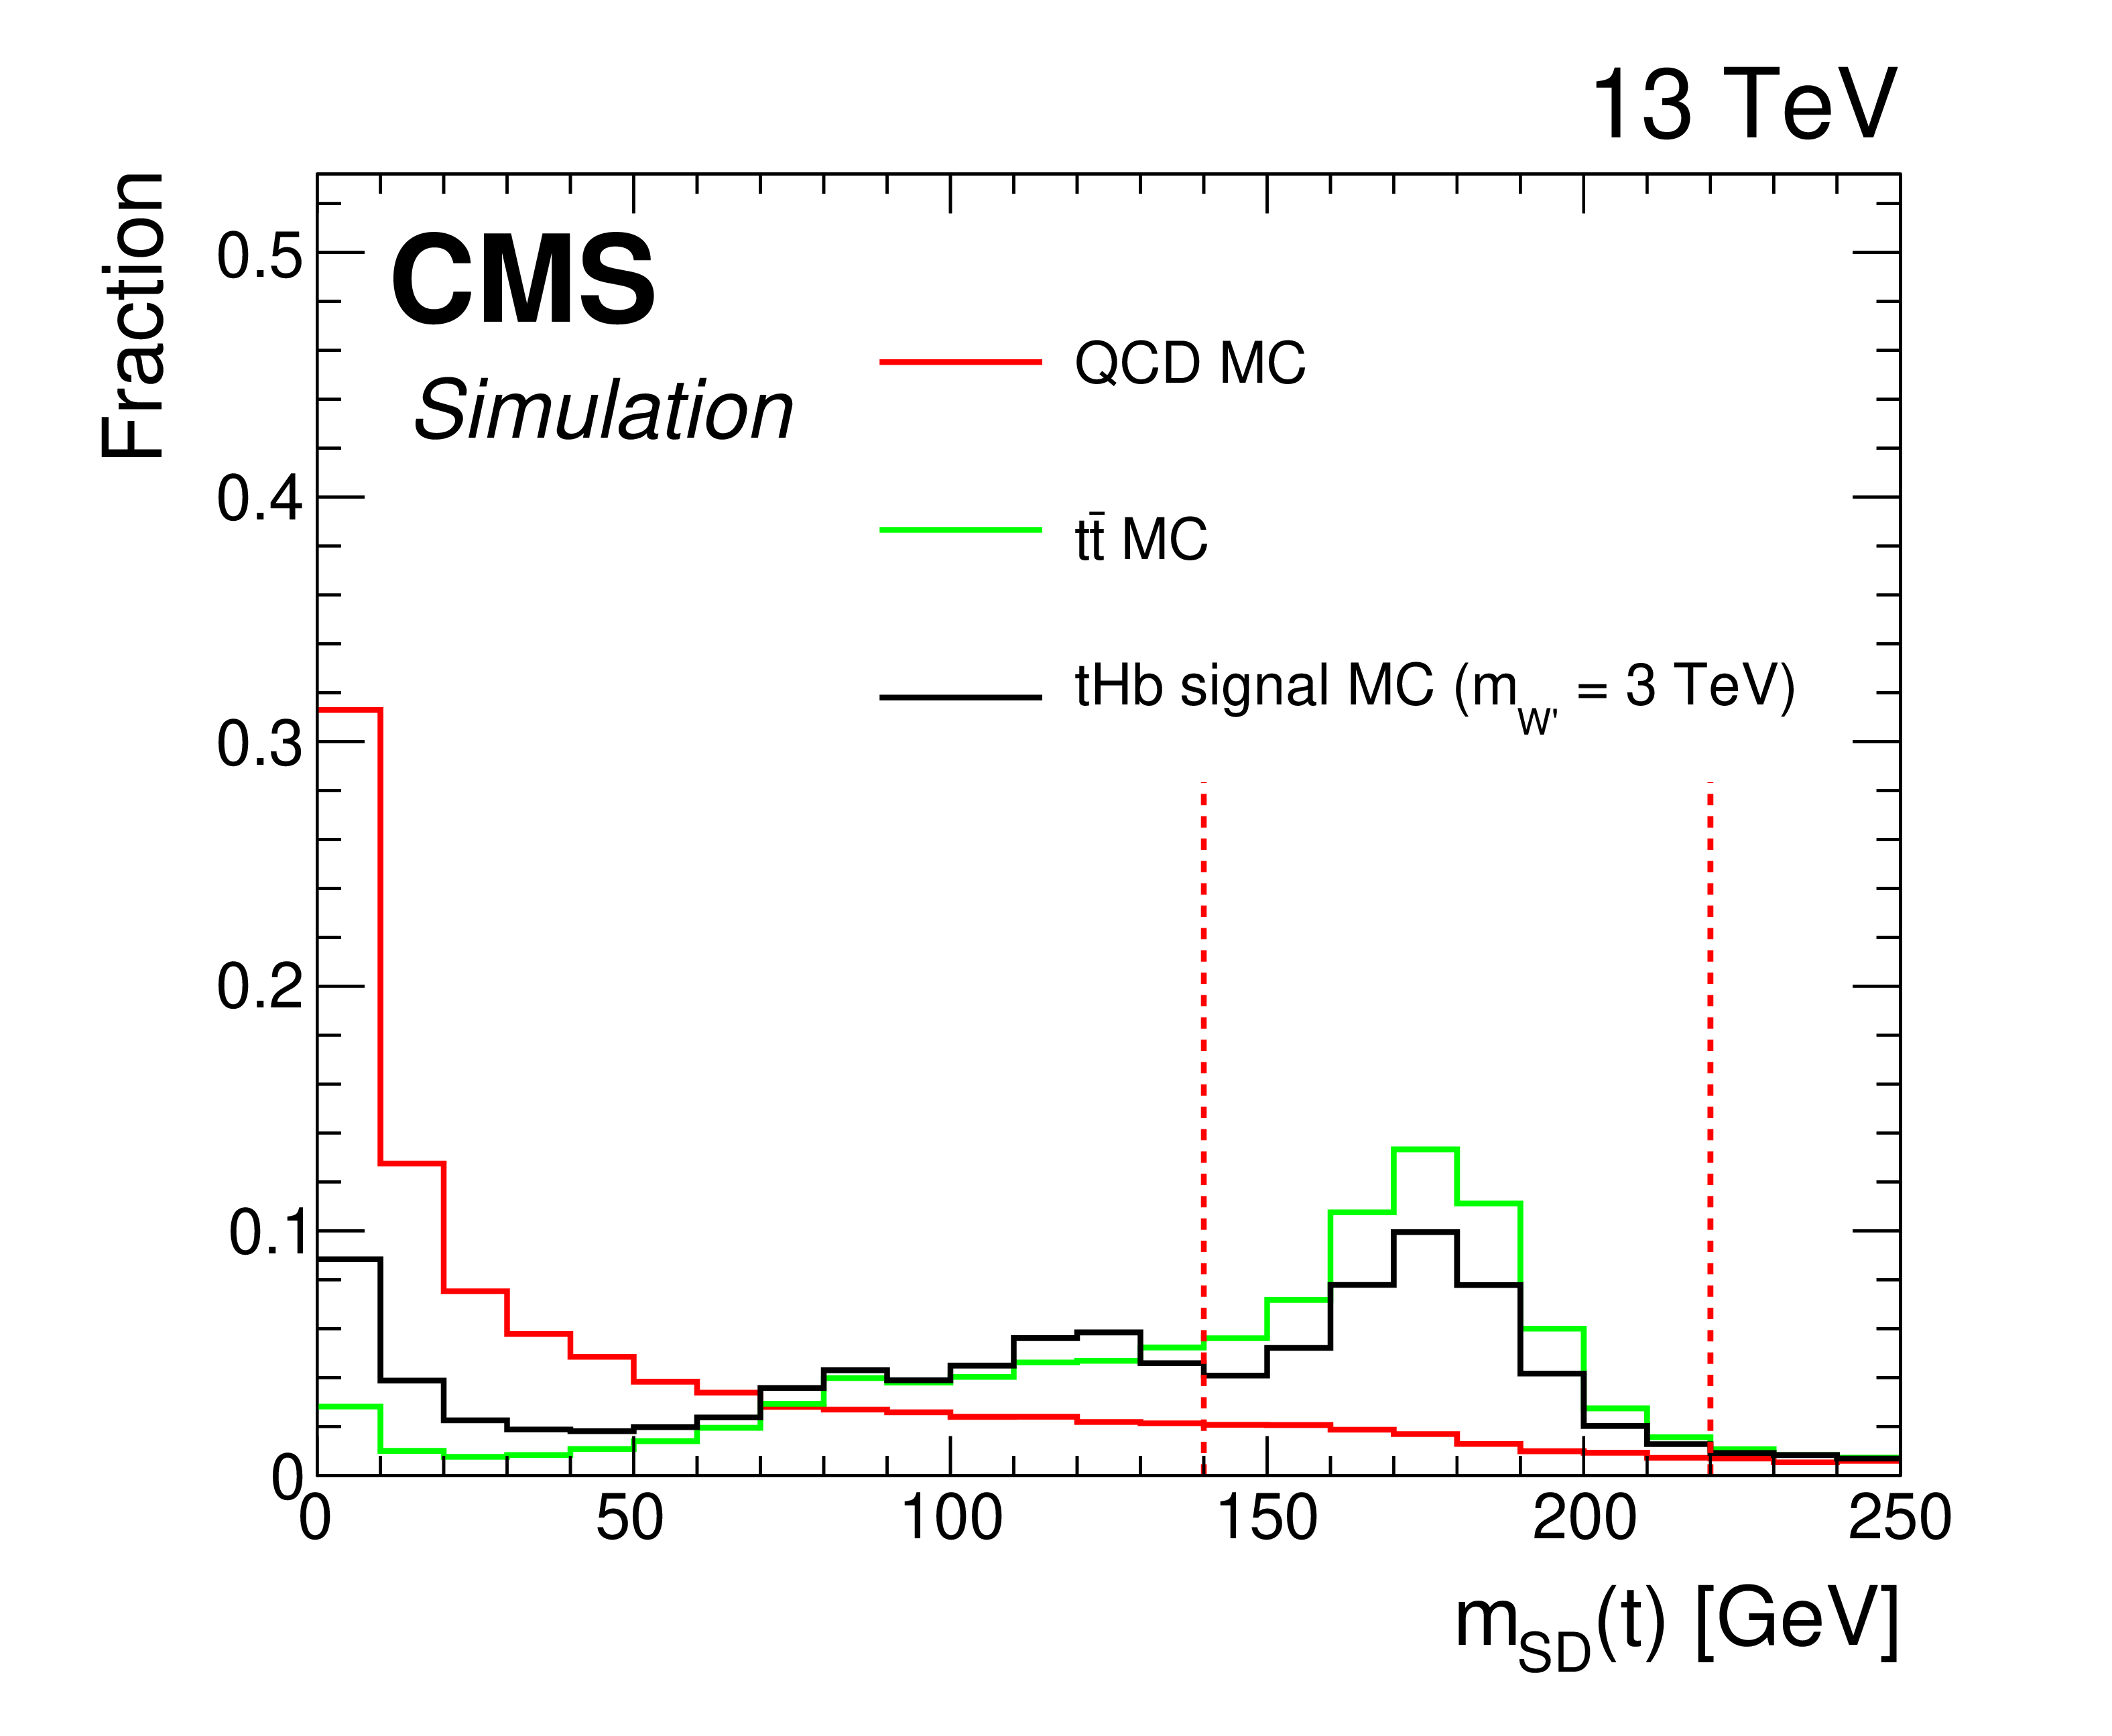
Figure 2-a:
Simulated distribution of a discriminating variable for ${{\mathrm {t}\overline {\mathrm {t}}}}$, QCD, and ${{\mathrm {t}} {\mathrm {H}} {\mathrm {b}}}$ signal simulated events normalized to unity for the ${{\mathrm {t}} {\mathrm {H}} {\mathrm {b}}}$ analysis. |

png pdf |
Figure 2-b:
Simulated distribution of a discriminating variable for ${{\mathrm {t}\overline {\mathrm {t}}}}$, QCD, and ${{\mathrm {t}} {\mathrm {H}} {\mathrm {b}}}$ signal simulated events normalized to unity for the ${{\mathrm {t}} {\mathrm {H}} {\mathrm {b}}}$ analysis. |

png pdf |
Figure 2-c:
Simulated distribution of a discriminating variable for ${{\mathrm {t}\overline {\mathrm {t}}}}$, QCD, and ${{\mathrm {t}} {\mathrm {H}} {\mathrm {b}}}$ signal simulated events normalized to unity for the ${{\mathrm {t}} {\mathrm {H}} {\mathrm {b}}}$ analysis. |
png pdf |
Figure 2-d:
Simulated distribution of a discriminating variable for ${{\mathrm {t}\overline {\mathrm {t}}}}$, QCD, and ${{\mathrm {t}} {\mathrm {H}} {\mathrm {b}}}$ signal simulated events normalized to unity for the ${{\mathrm {t}} {\mathrm {H}} {\mathrm {b}}}$ analysis. |
png pdf |
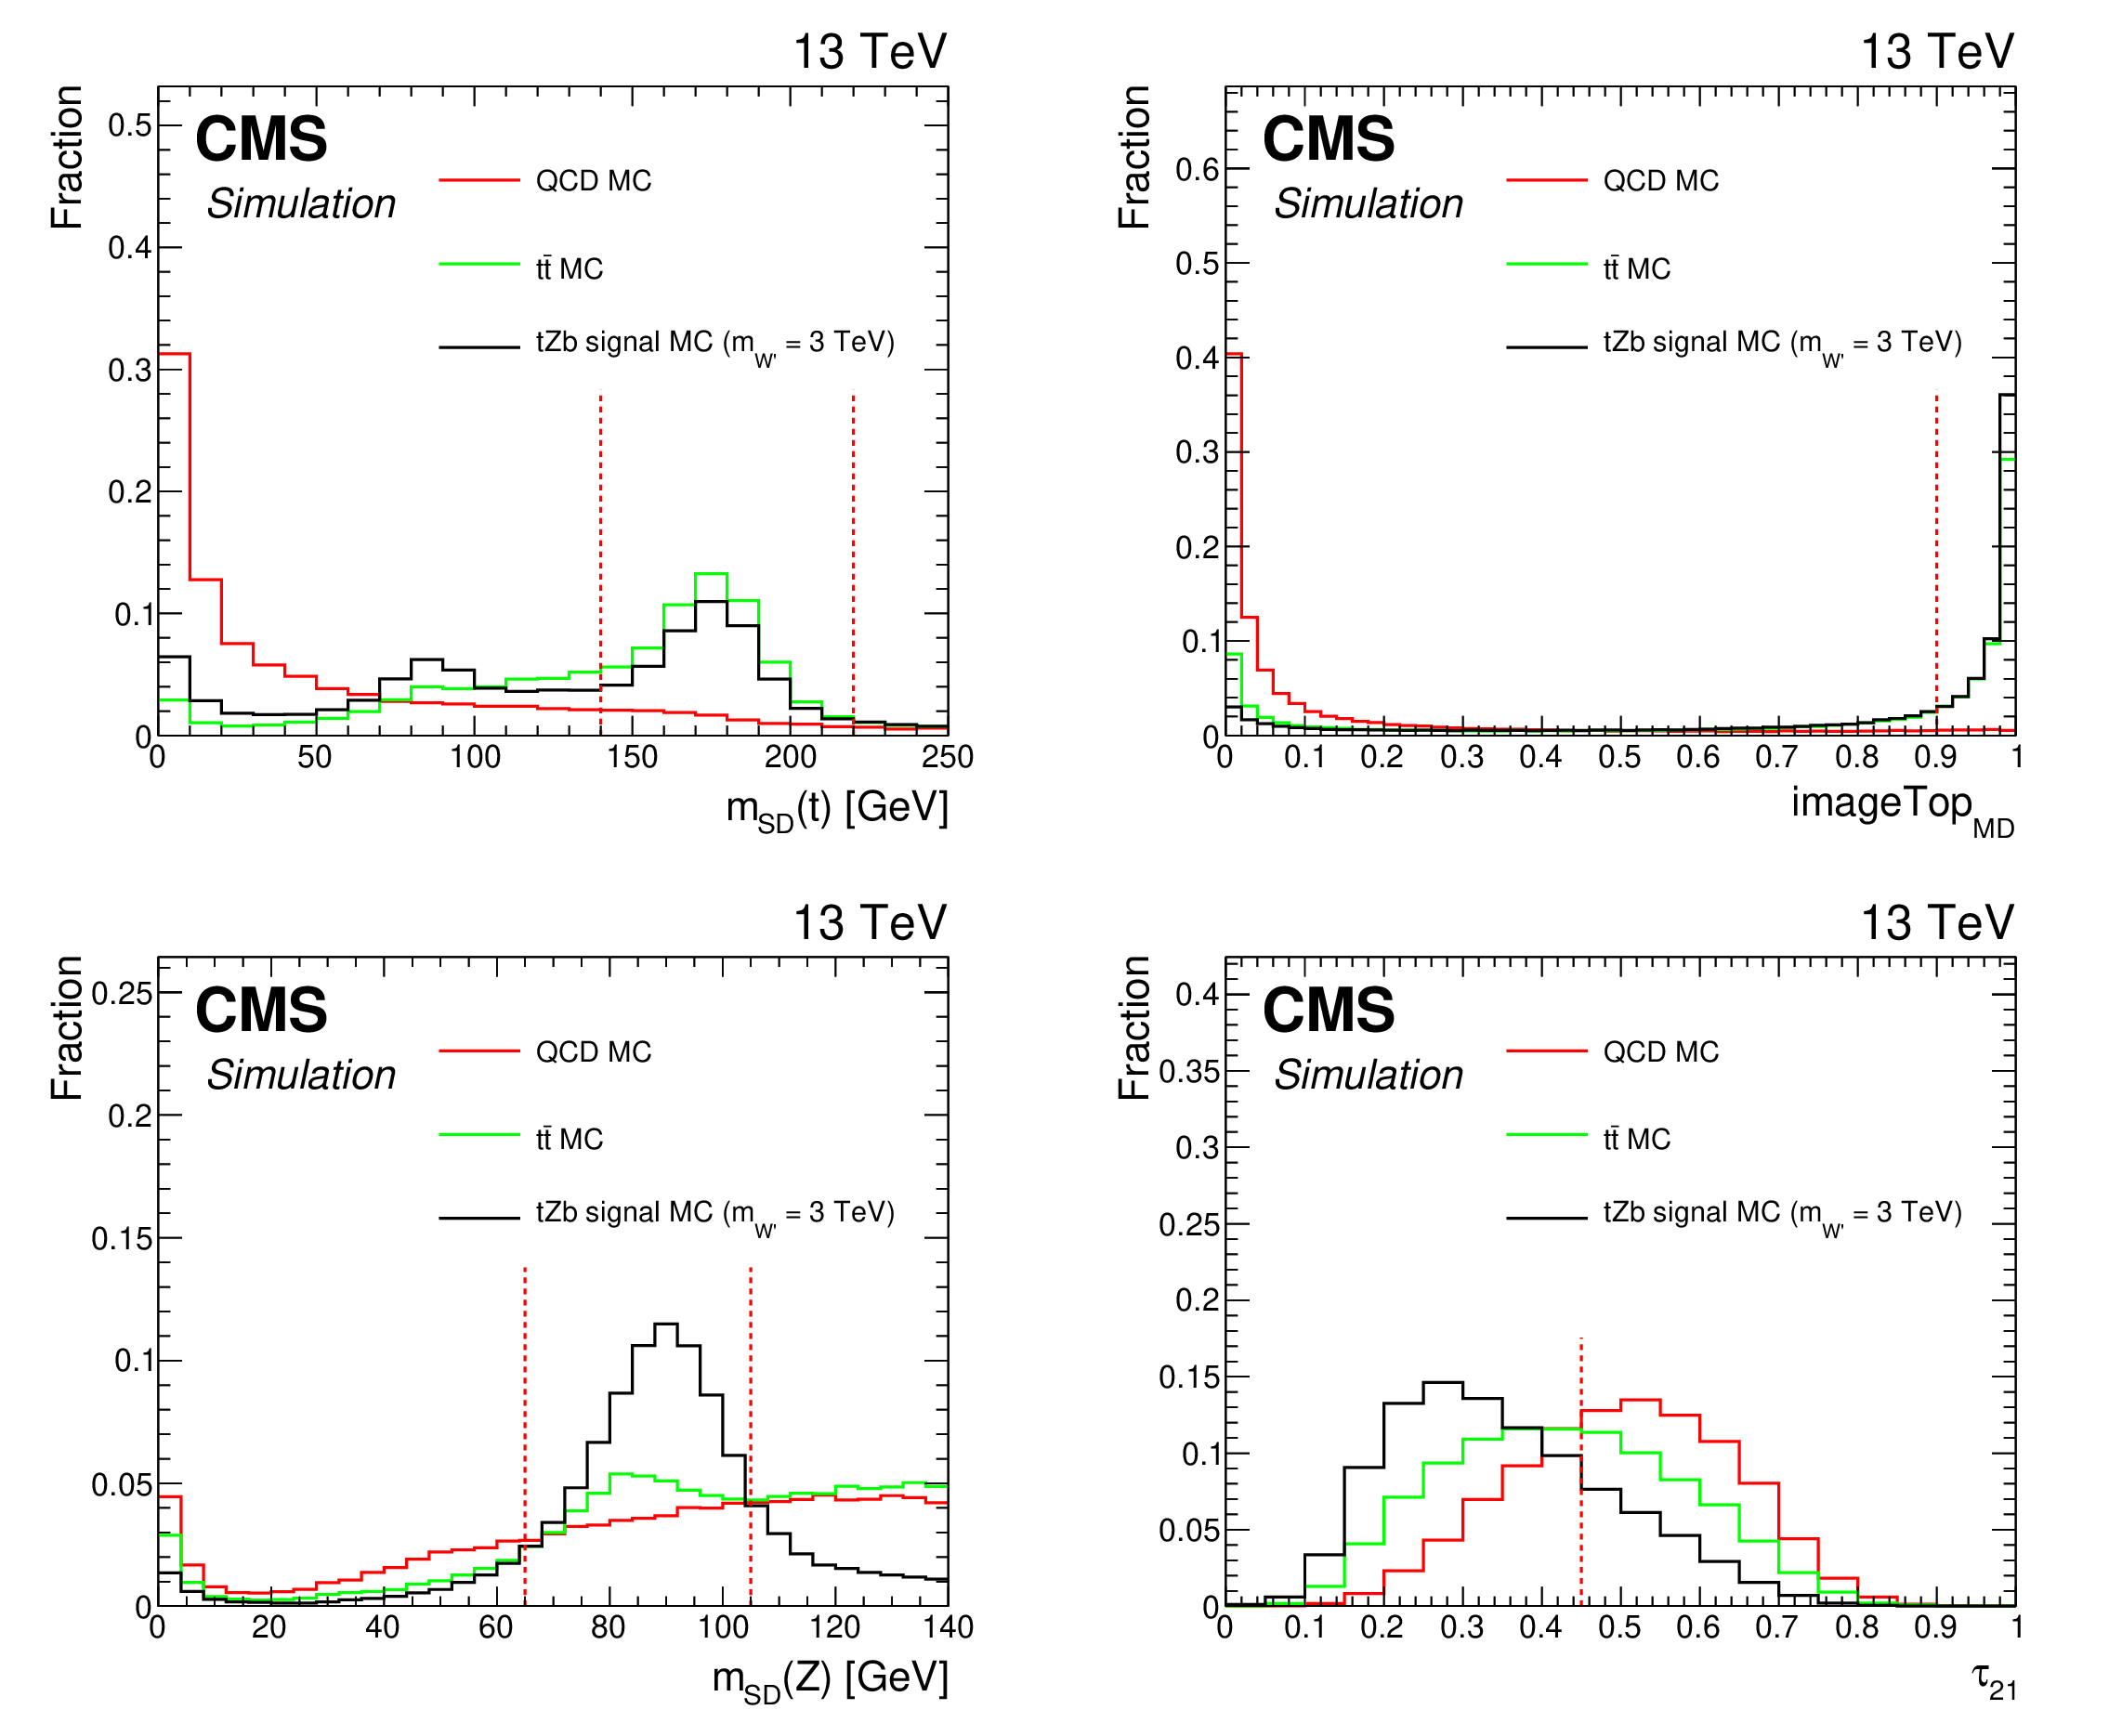
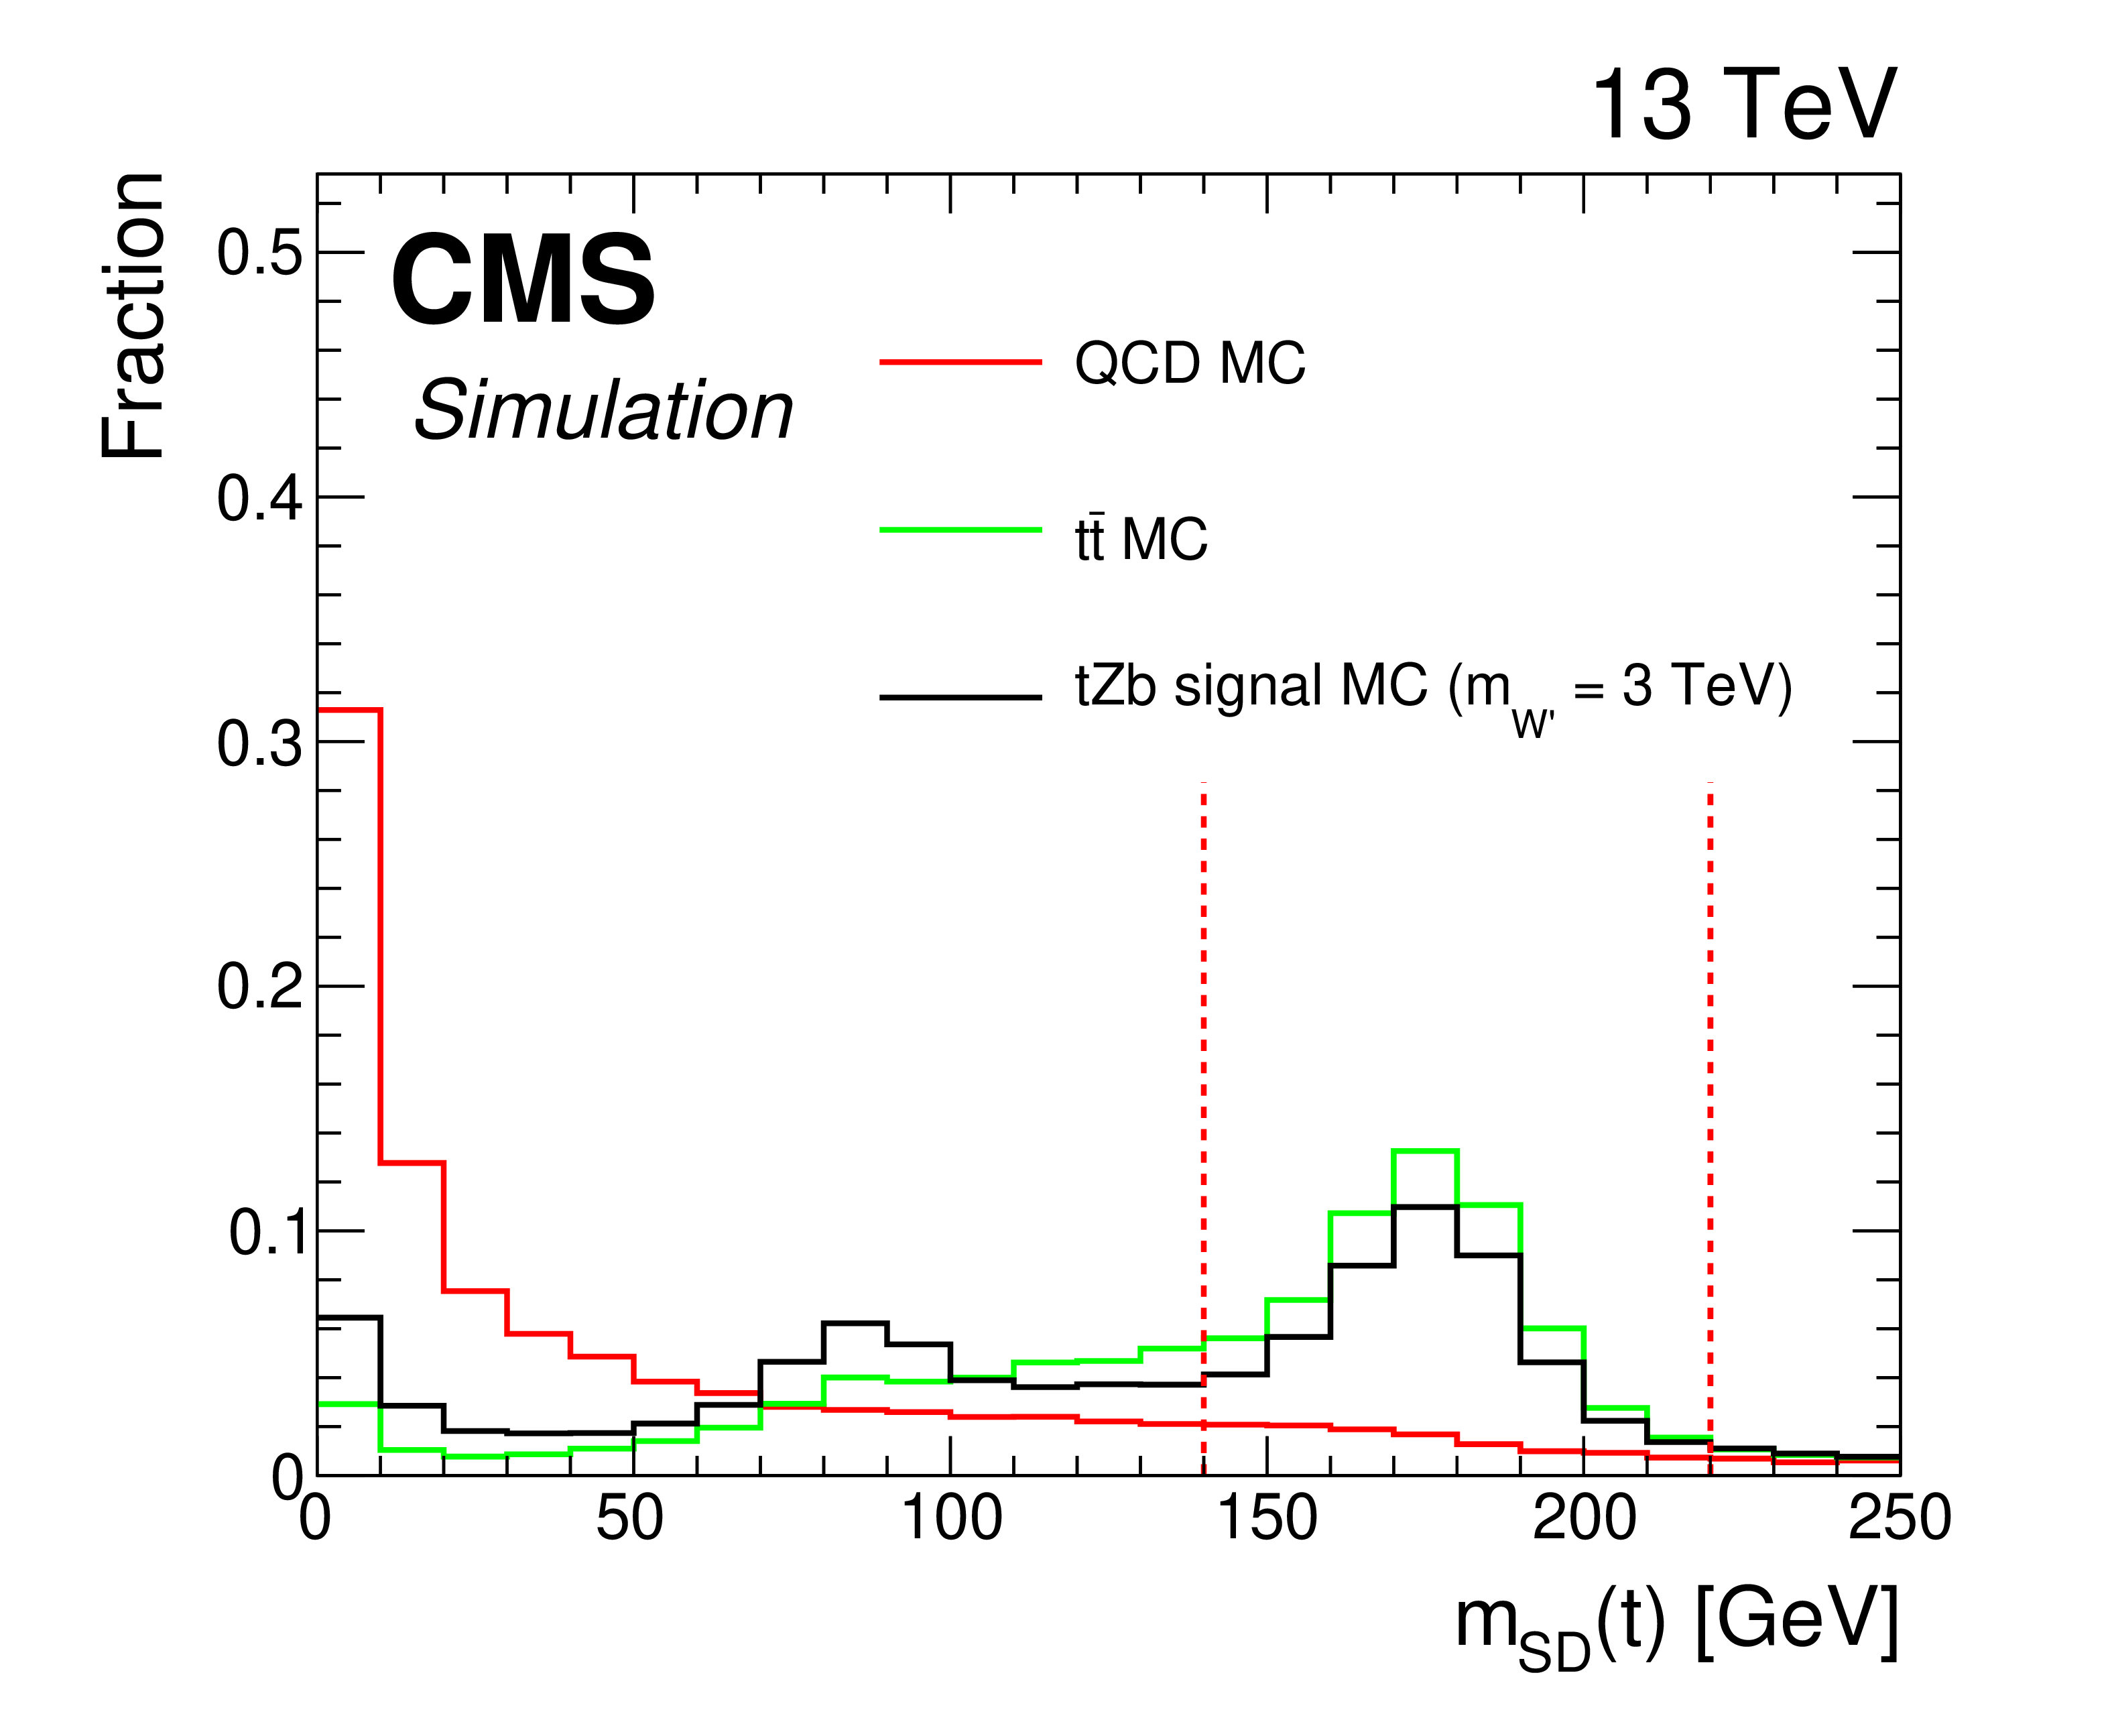
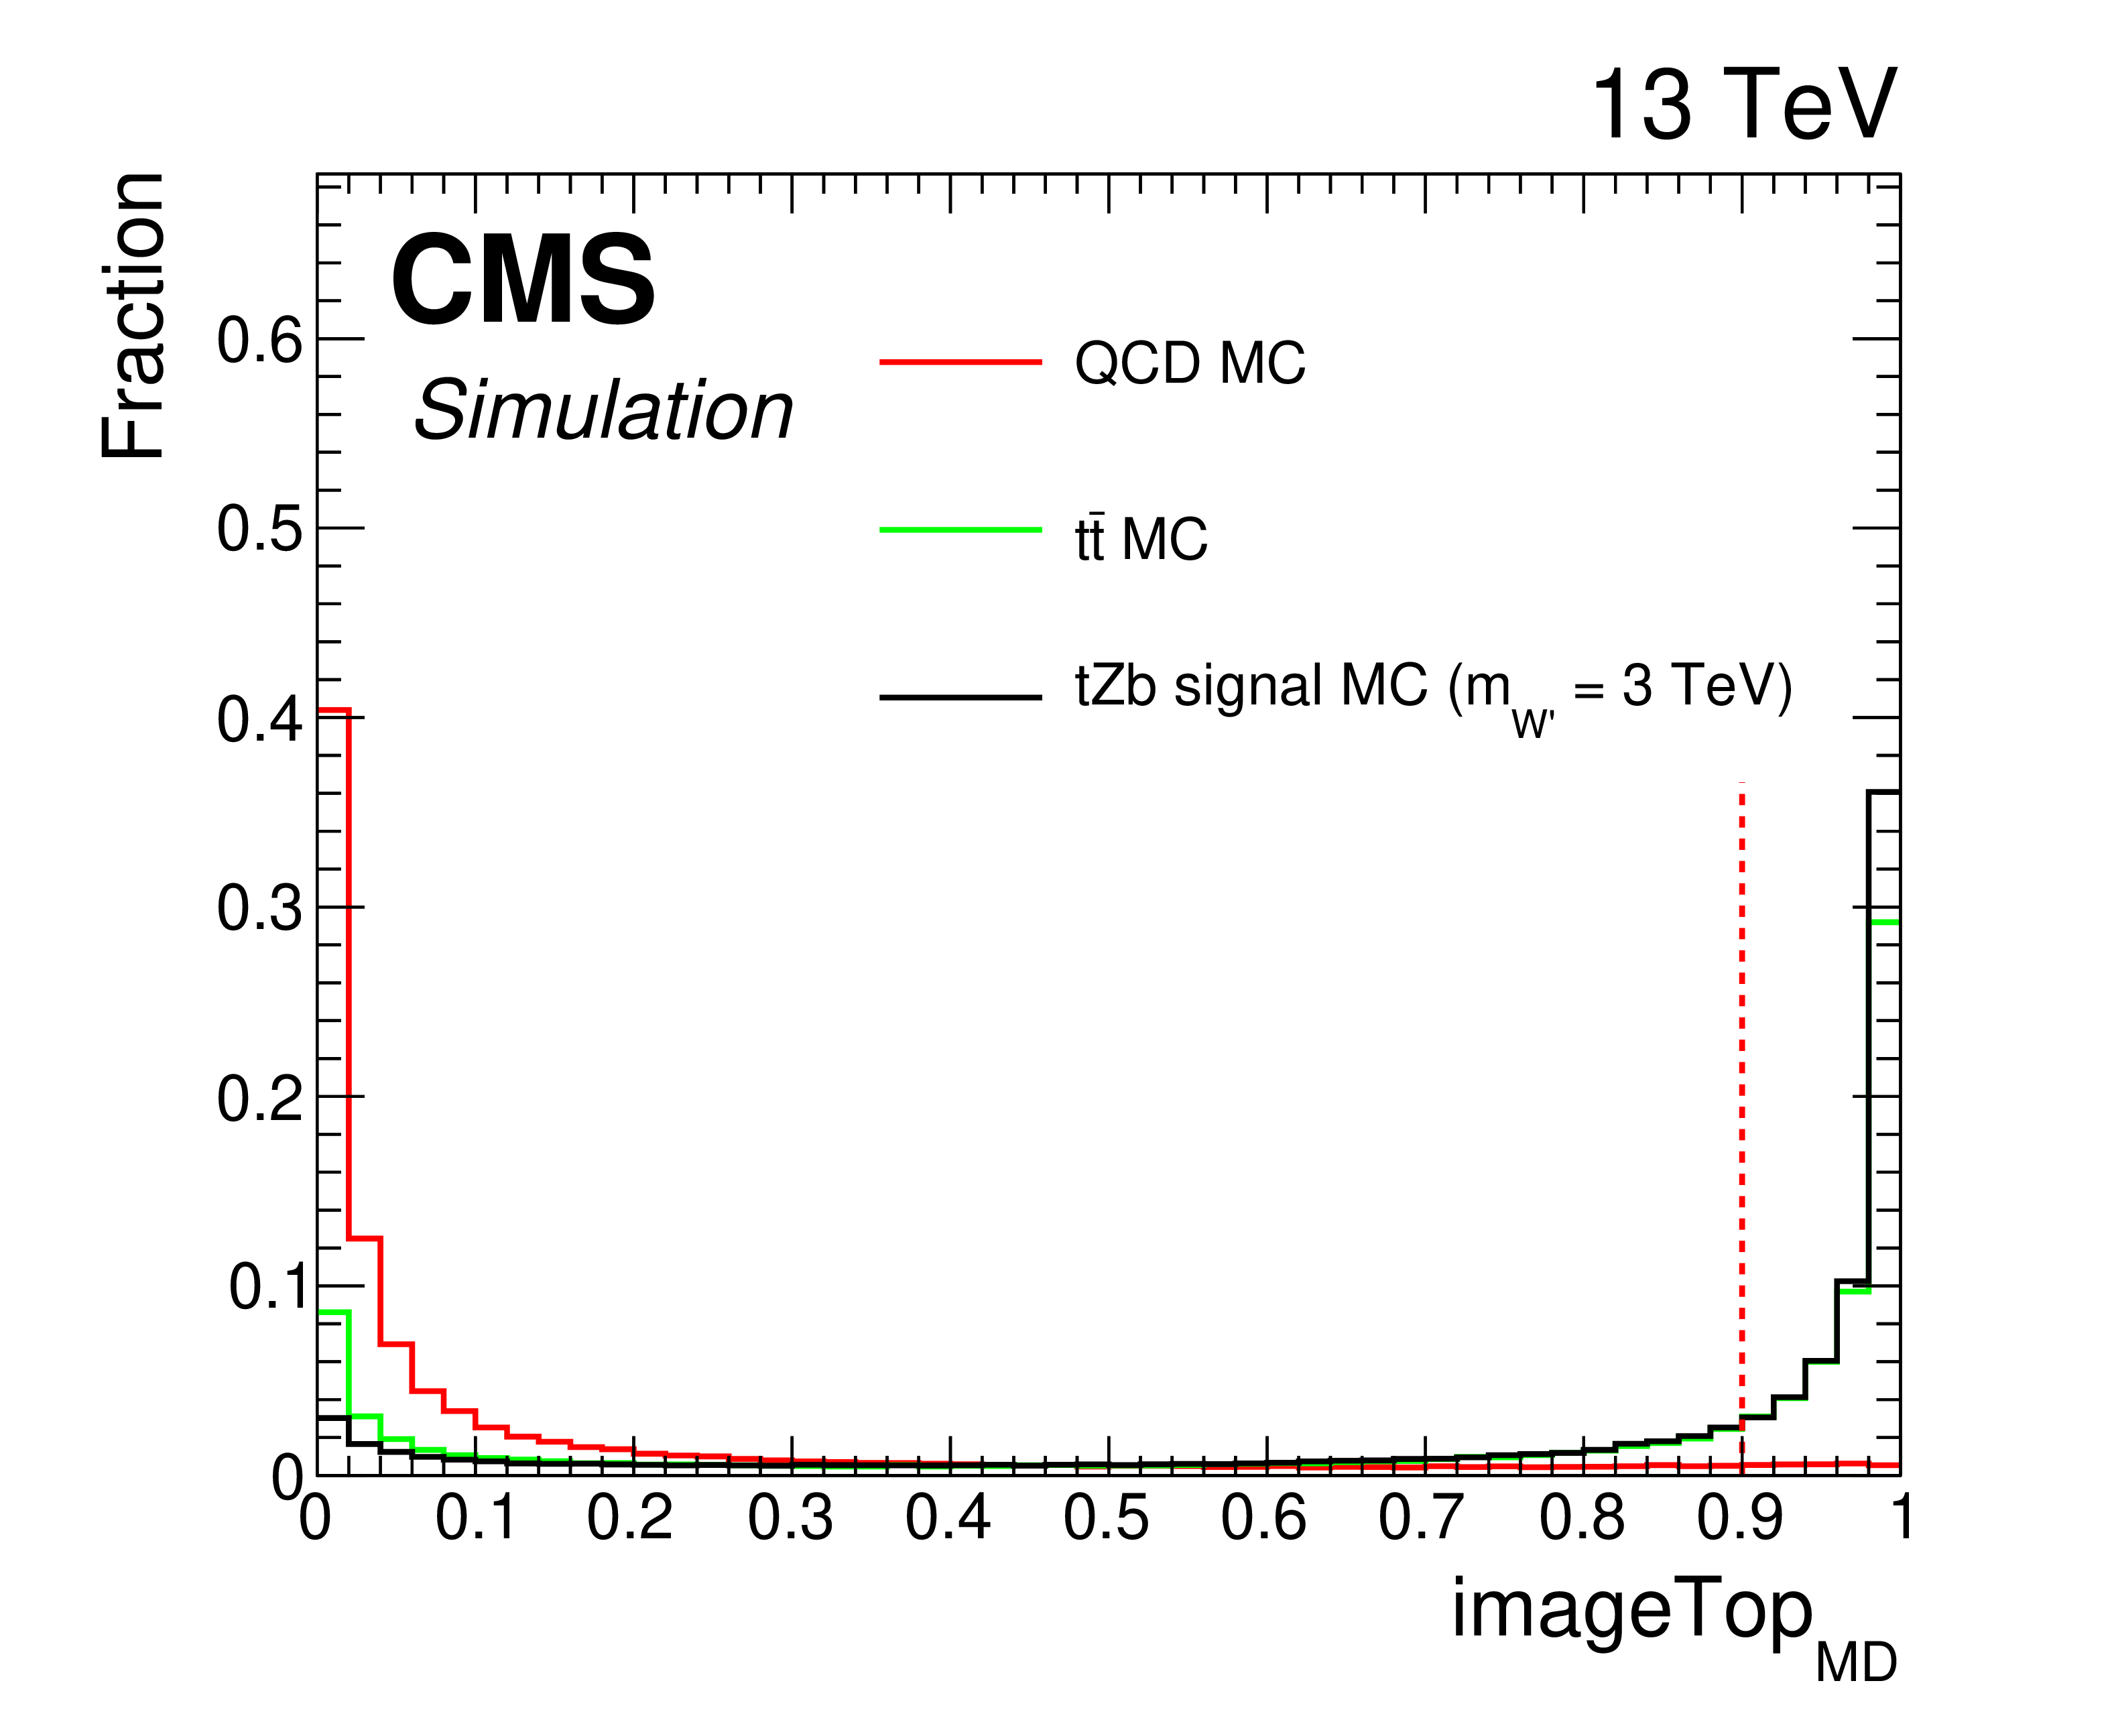
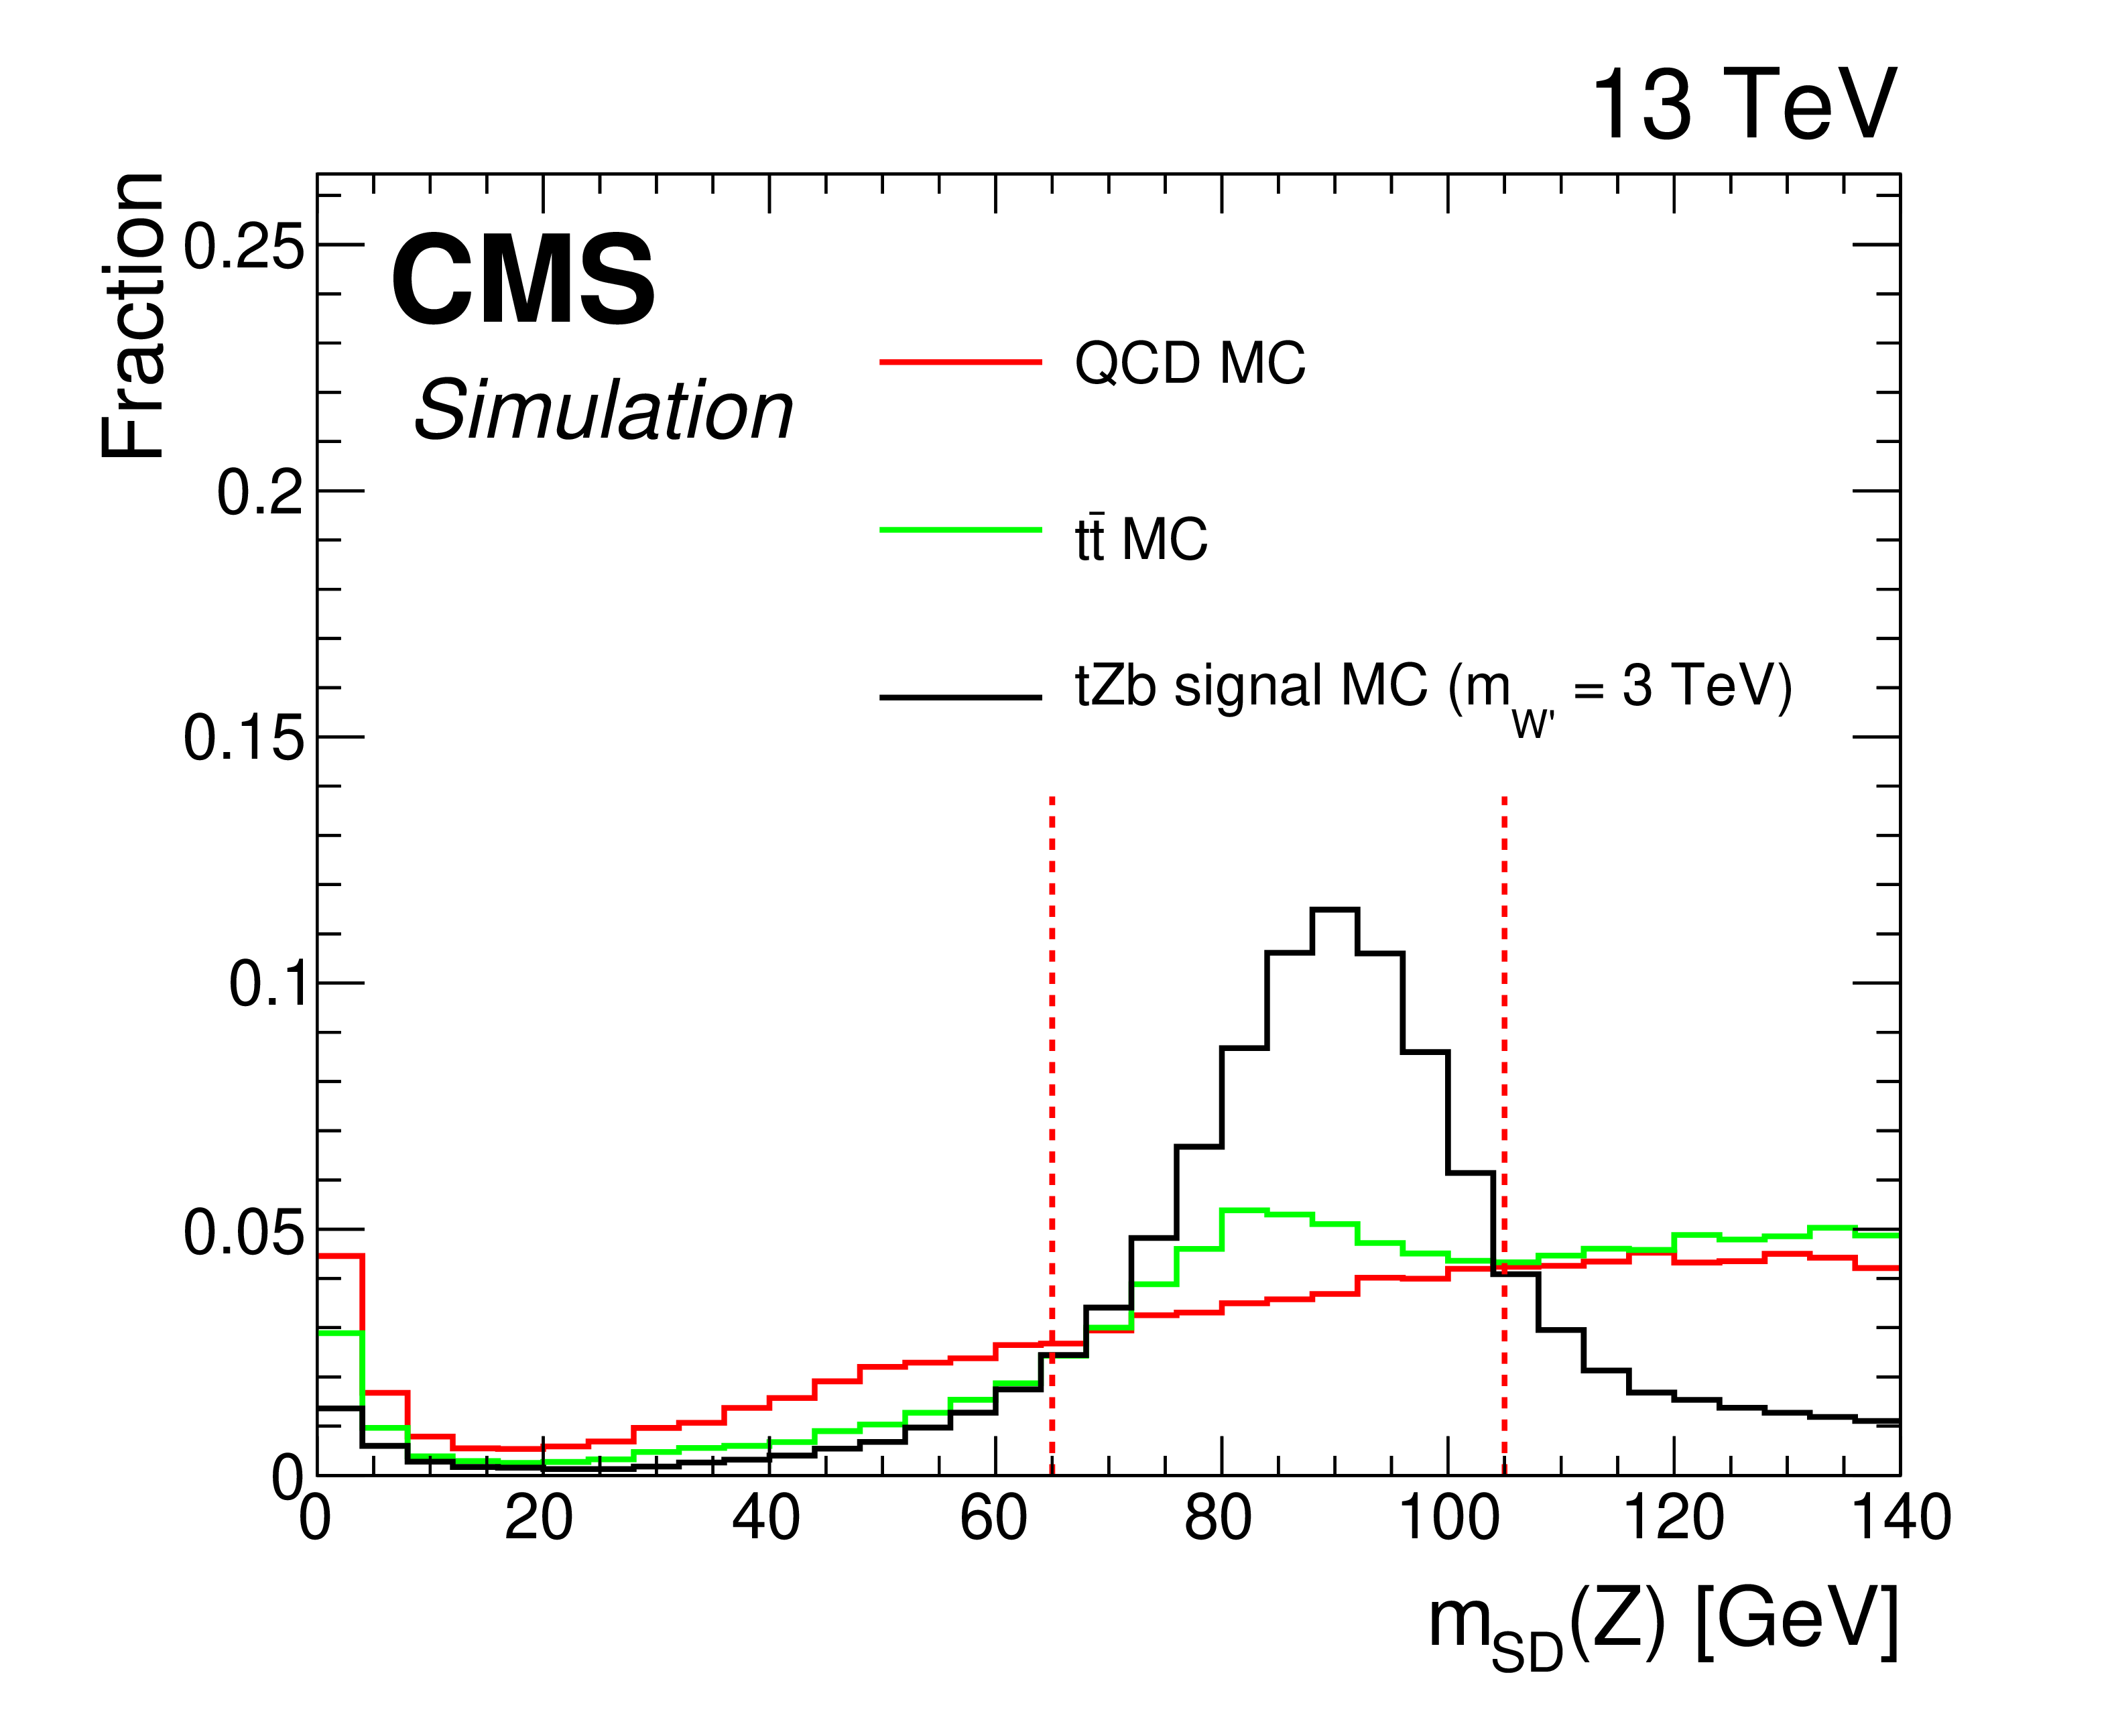
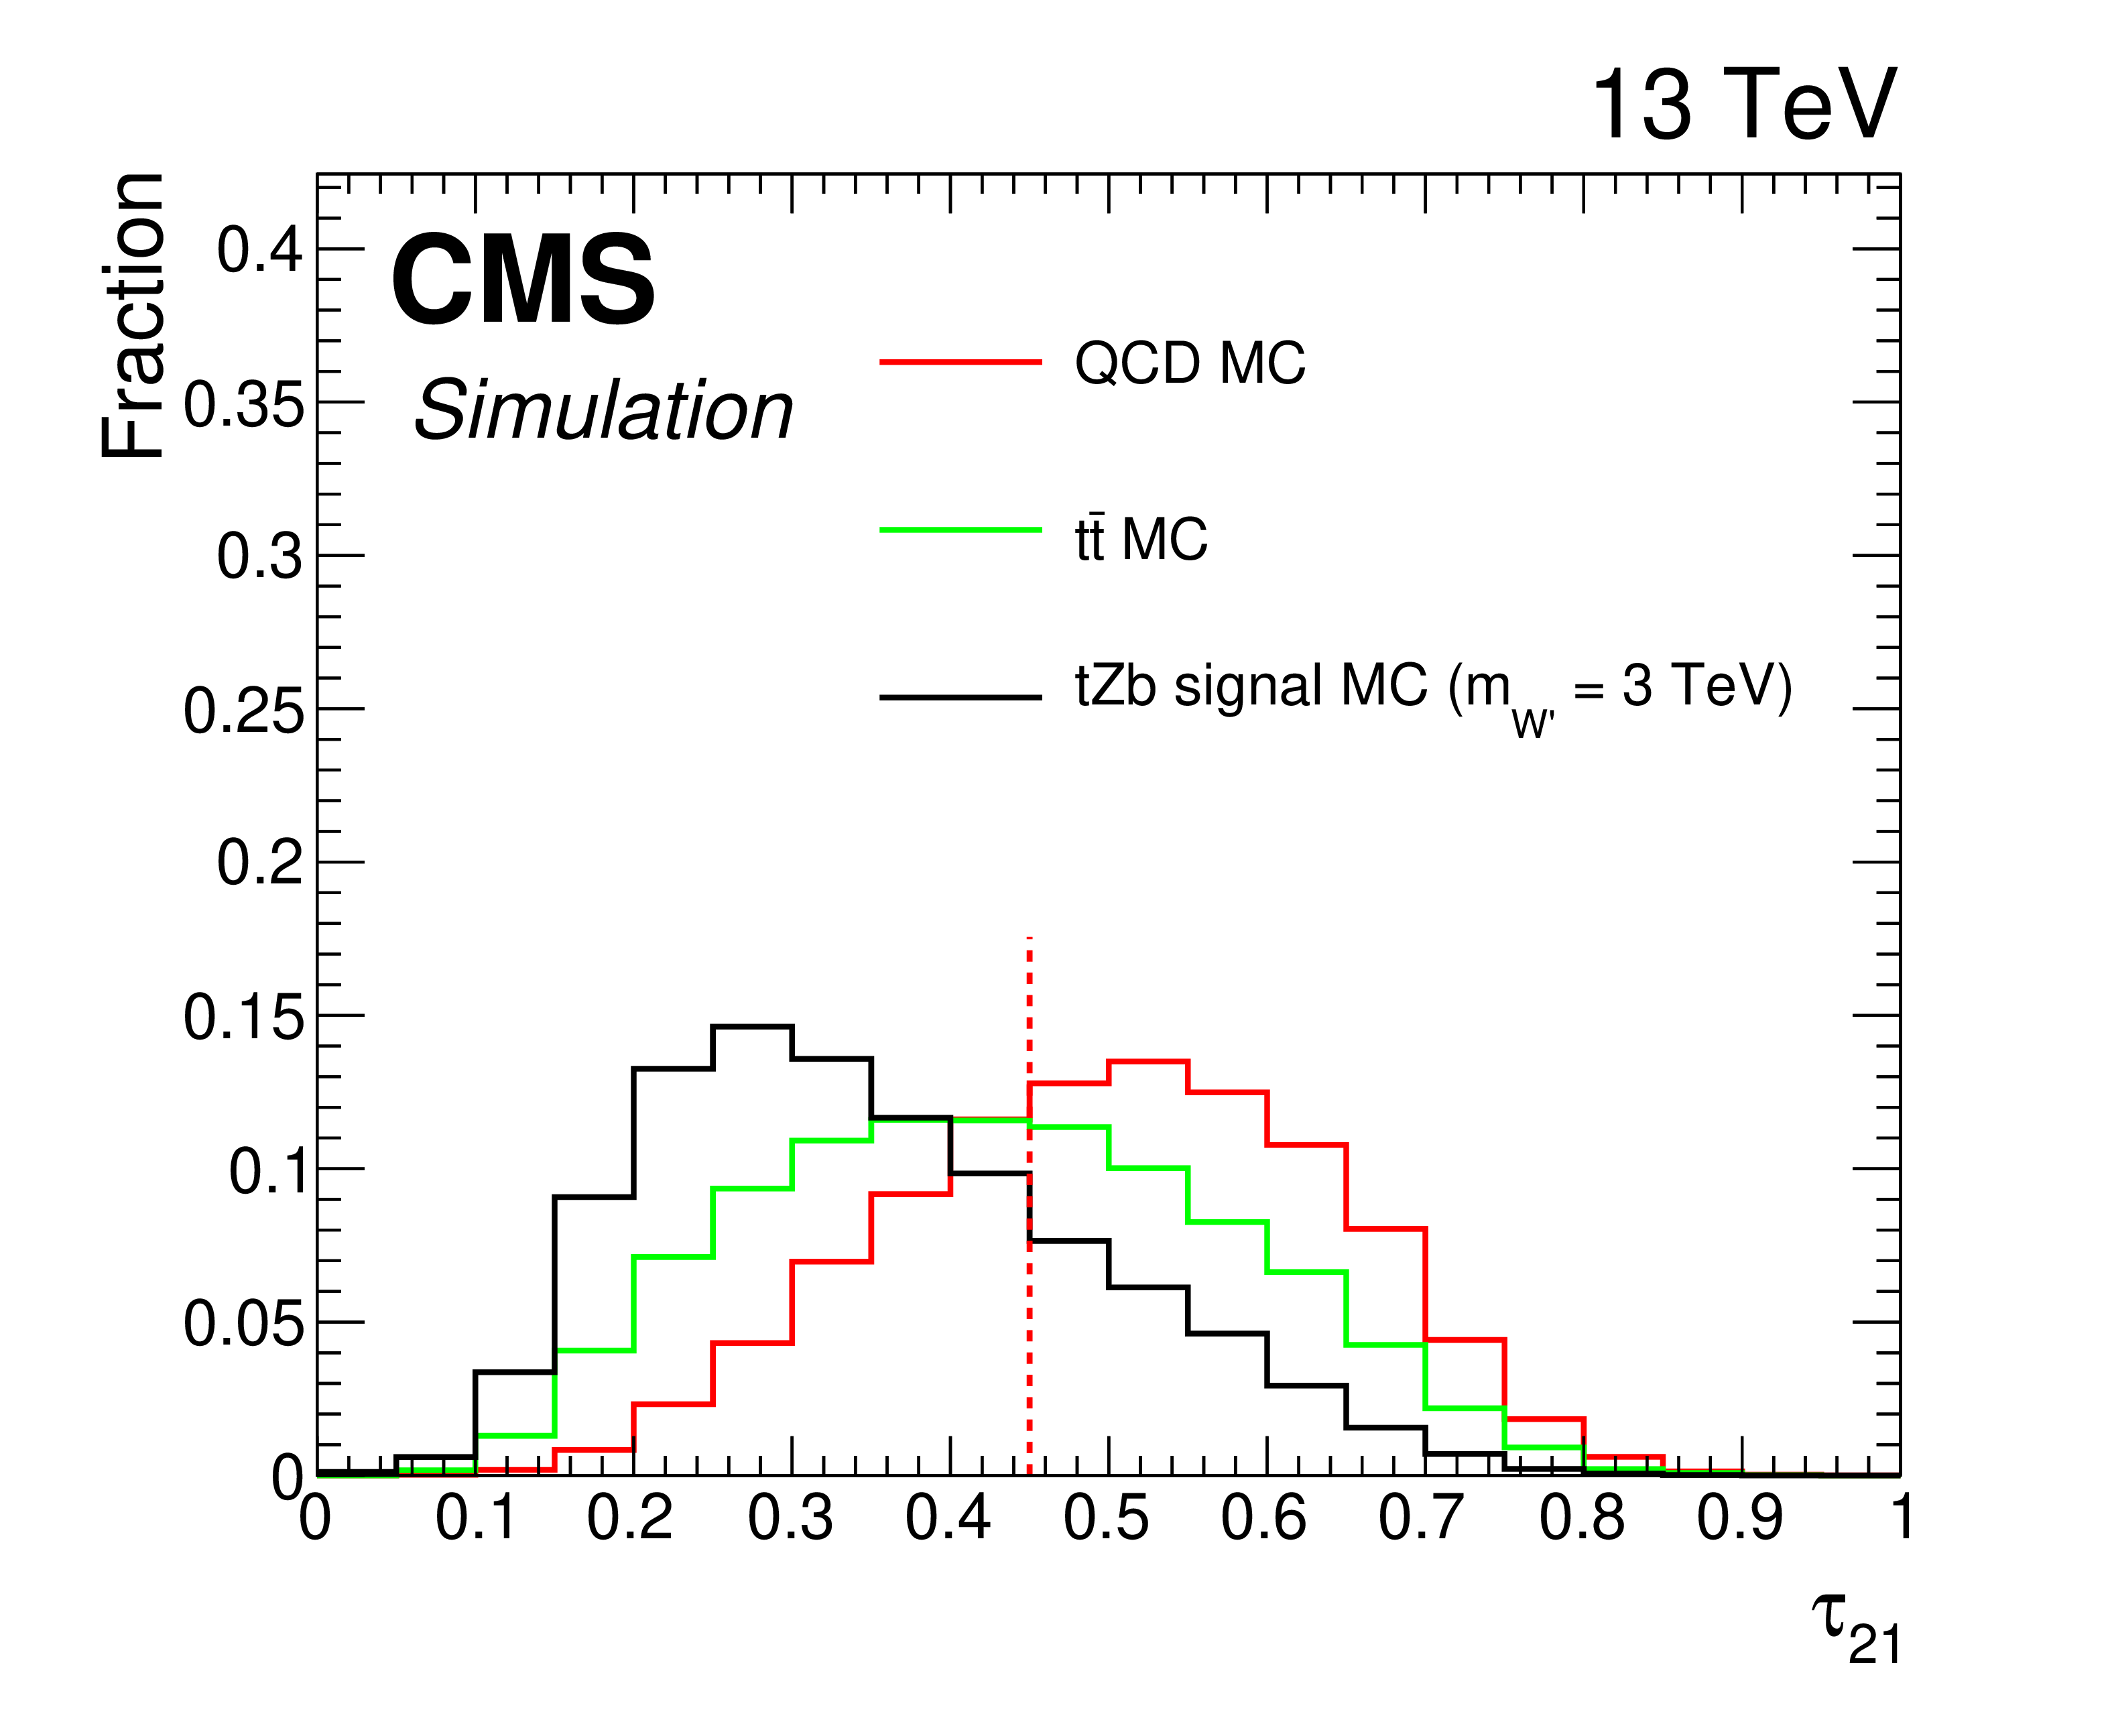
Figure 3:
Simulated distributions of the discriminating variables for ${{\mathrm {t}\overline {\mathrm {t}}}}$, QCD, and ${{\mathrm {t}} {\mathrm {Z}} {\mathrm {b}}}$ signal simulated events normalized to unity for the ${{\mathrm {t}} {\mathrm {Z}} {\mathrm {b}}}$ analysis. Discriminant thresholds are shown as vertical dashed lines. |
png pdf |
Figure 3-a:
Simulated distribution of a discriminating variables for ${{\mathrm {t}\overline {\mathrm {t}}}}$, QCD, and ${{\mathrm {t}} {\mathrm {Z}} {\mathrm {b}}}$ signal simulated events normalized to unity for the ${{\mathrm {t}} {\mathrm {Z}} {\mathrm {b}}}$ analysis. |
png pdf |
Figure 3-b:
Simulated distribution of a discriminating variables for ${{\mathrm {t}\overline {\mathrm {t}}}}$, QCD, and ${{\mathrm {t}} {\mathrm {Z}} {\mathrm {b}}}$ signal simulated events normalized to unity for the ${{\mathrm {t}} {\mathrm {Z}} {\mathrm {b}}}$ analysis. |
png pdf |
Figure 3-c:
Simulated distribution of a discriminating variables for ${{\mathrm {t}\overline {\mathrm {t}}}}$, QCD, and ${{\mathrm {t}} {\mathrm {Z}} {\mathrm {b}}}$ signal simulated events normalized to unity for the ${{\mathrm {t}} {\mathrm {Z}} {\mathrm {b}}}$ analysis. |
png pdf |
Figure 3-d:
Simulated distribution of a discriminating variables for ${{\mathrm {t}\overline {\mathrm {t}}}}$, QCD, and ${{\mathrm {t}} {\mathrm {Z}} {\mathrm {b}}}$ signal simulated events normalized to unity for the ${{\mathrm {t}} {\mathrm {Z}} {\mathrm {b}}}$ analysis. |
png pdf |
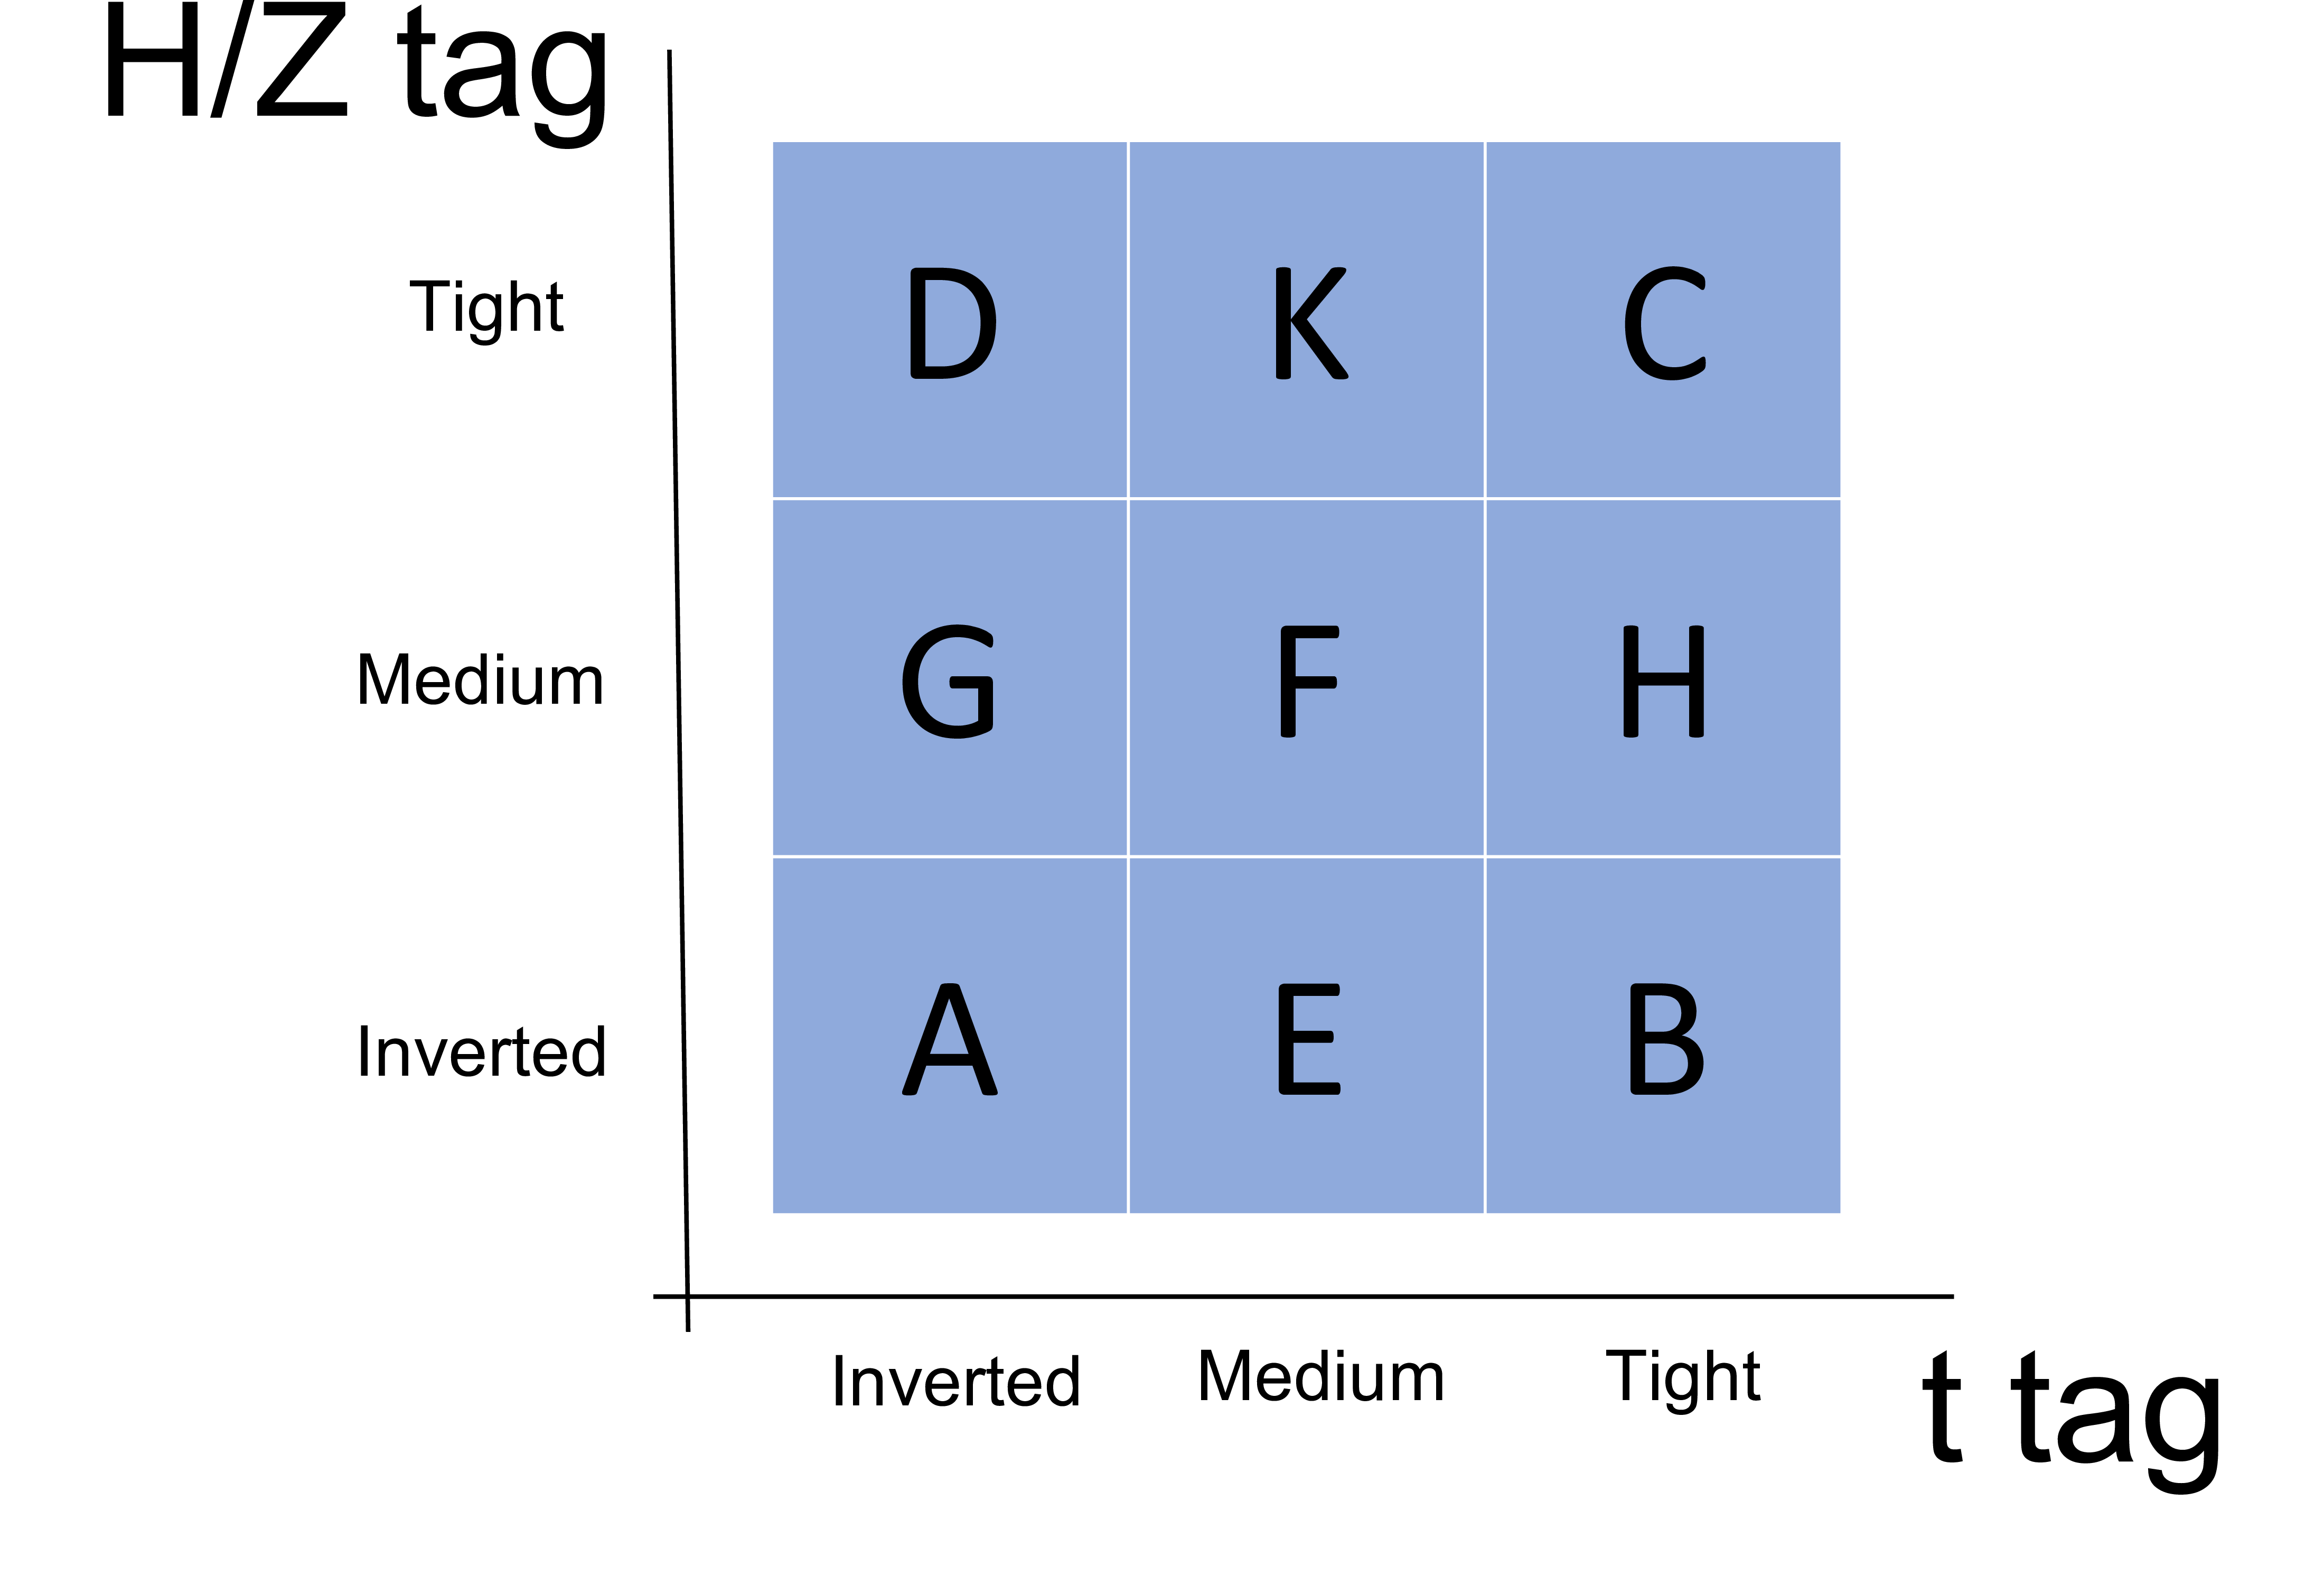
Figure 4:
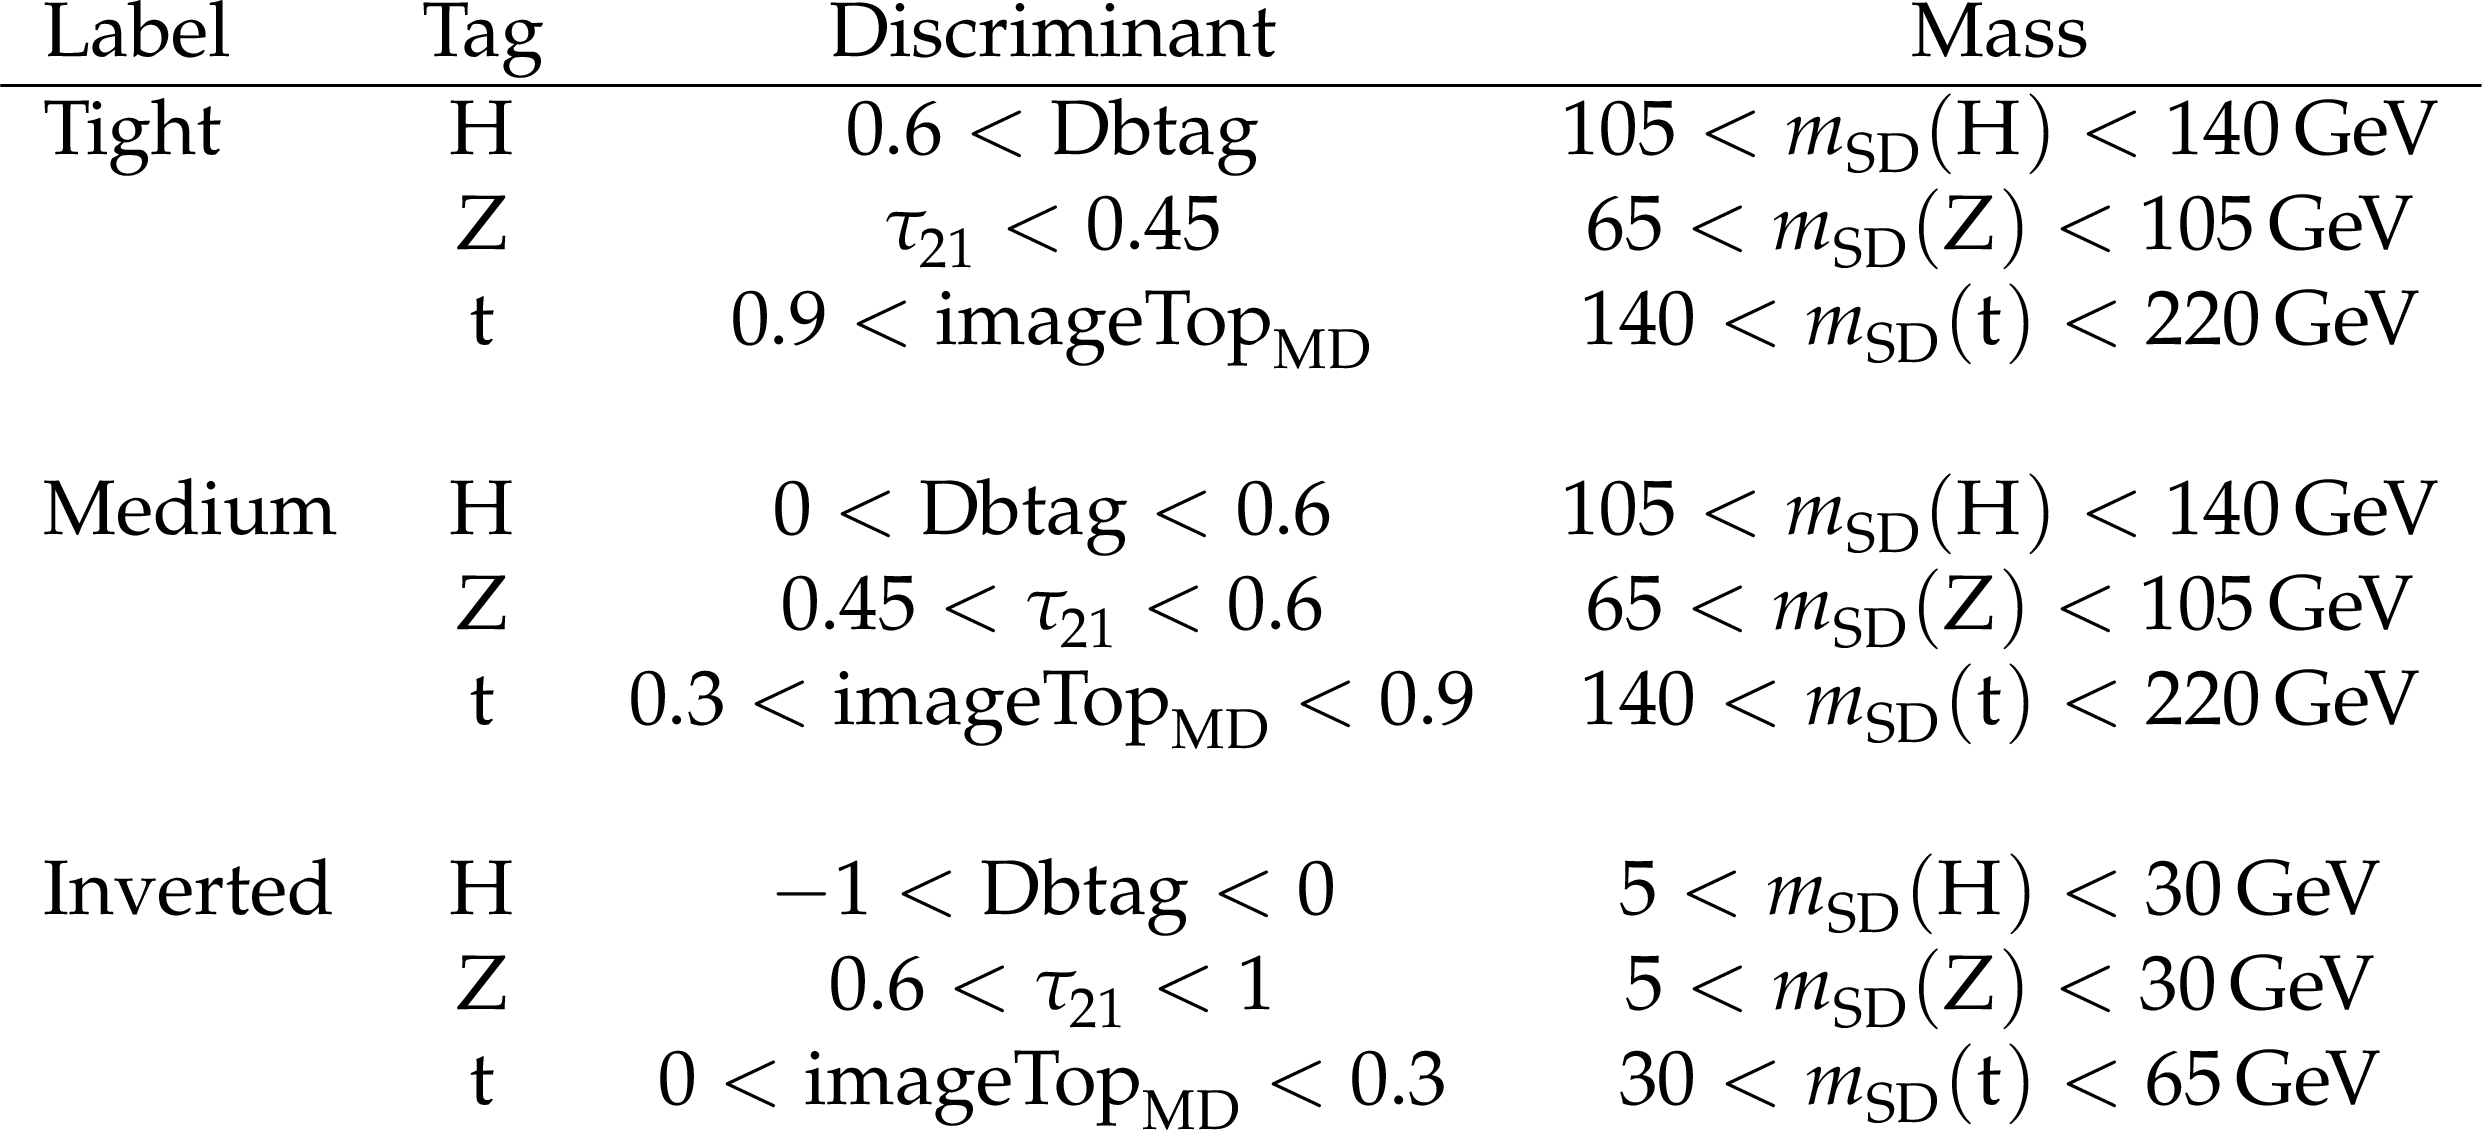
Diagram showing the regions used for background estimation. The signal region is C, the regions A and B are used to determine ${TF({p_{\mathrm {T}}}, \eta)}$, and F, K, and H are validation regions. The $x$ axis indicates the t tag category, and the $y$ axis represents the Higgs or Z boson tag category. The inverted, medium, and tight tag category definitions are given in Table 1. |

png pdf |
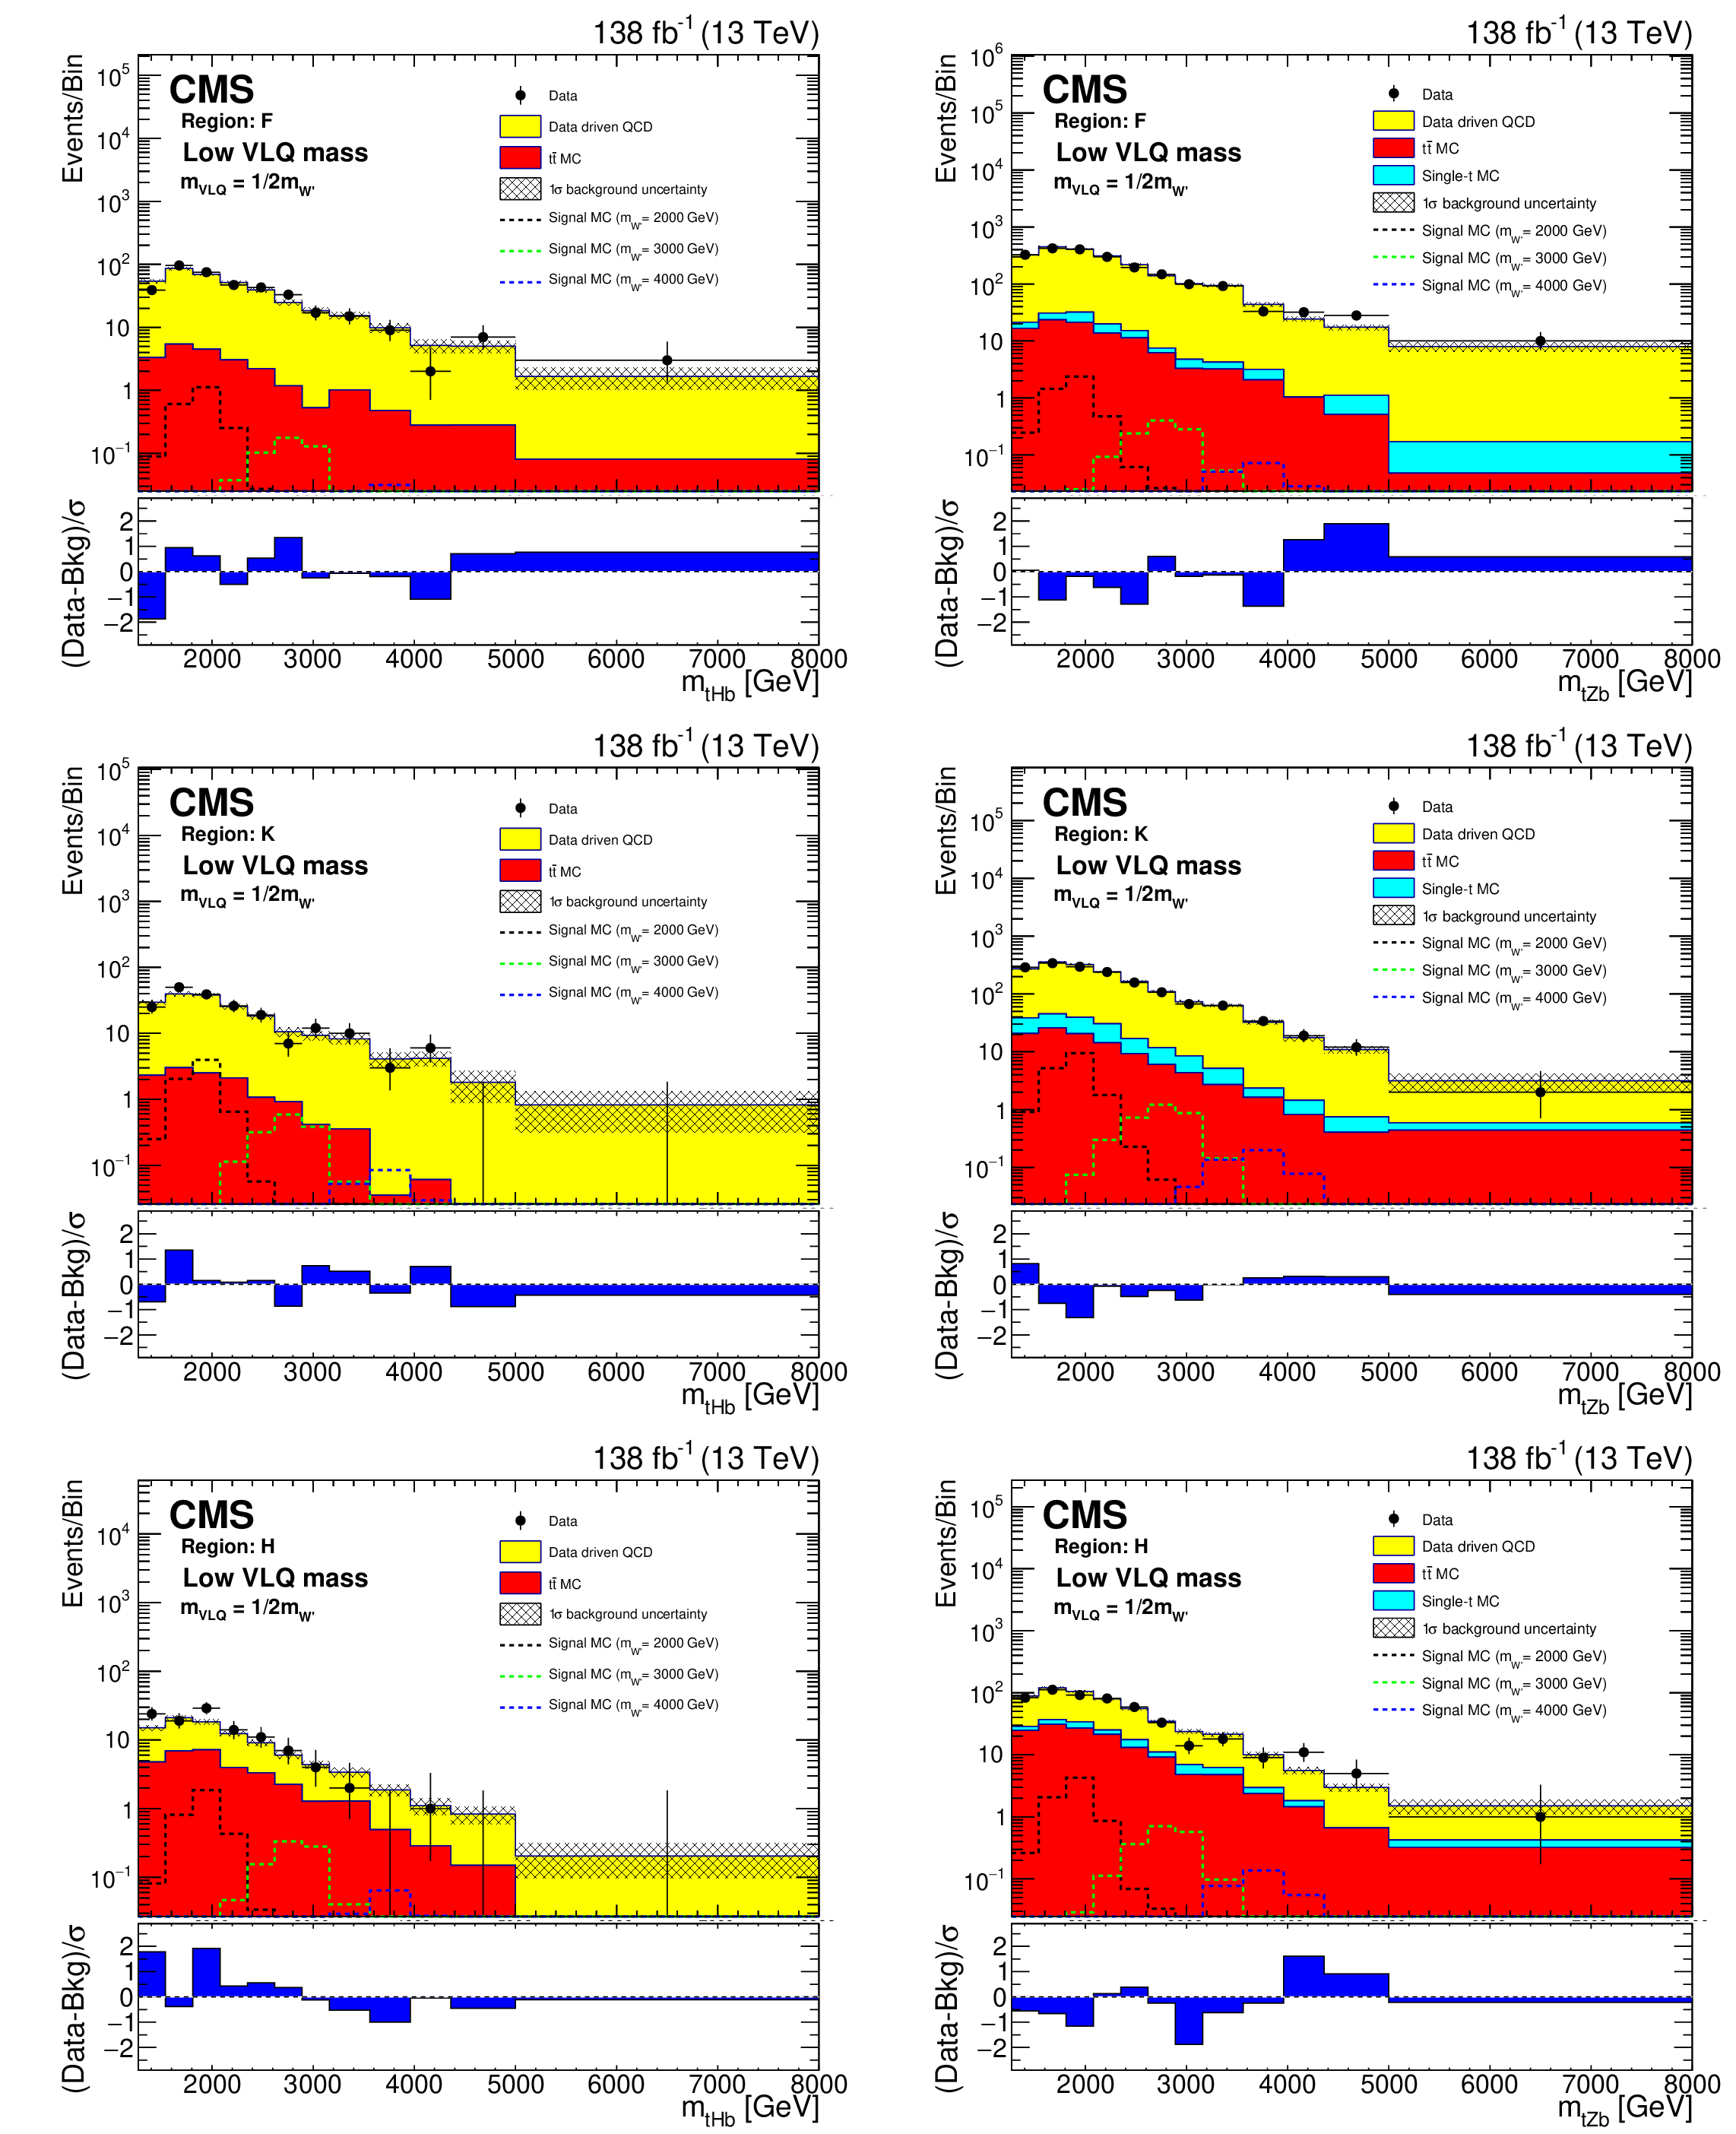
Figure 5:
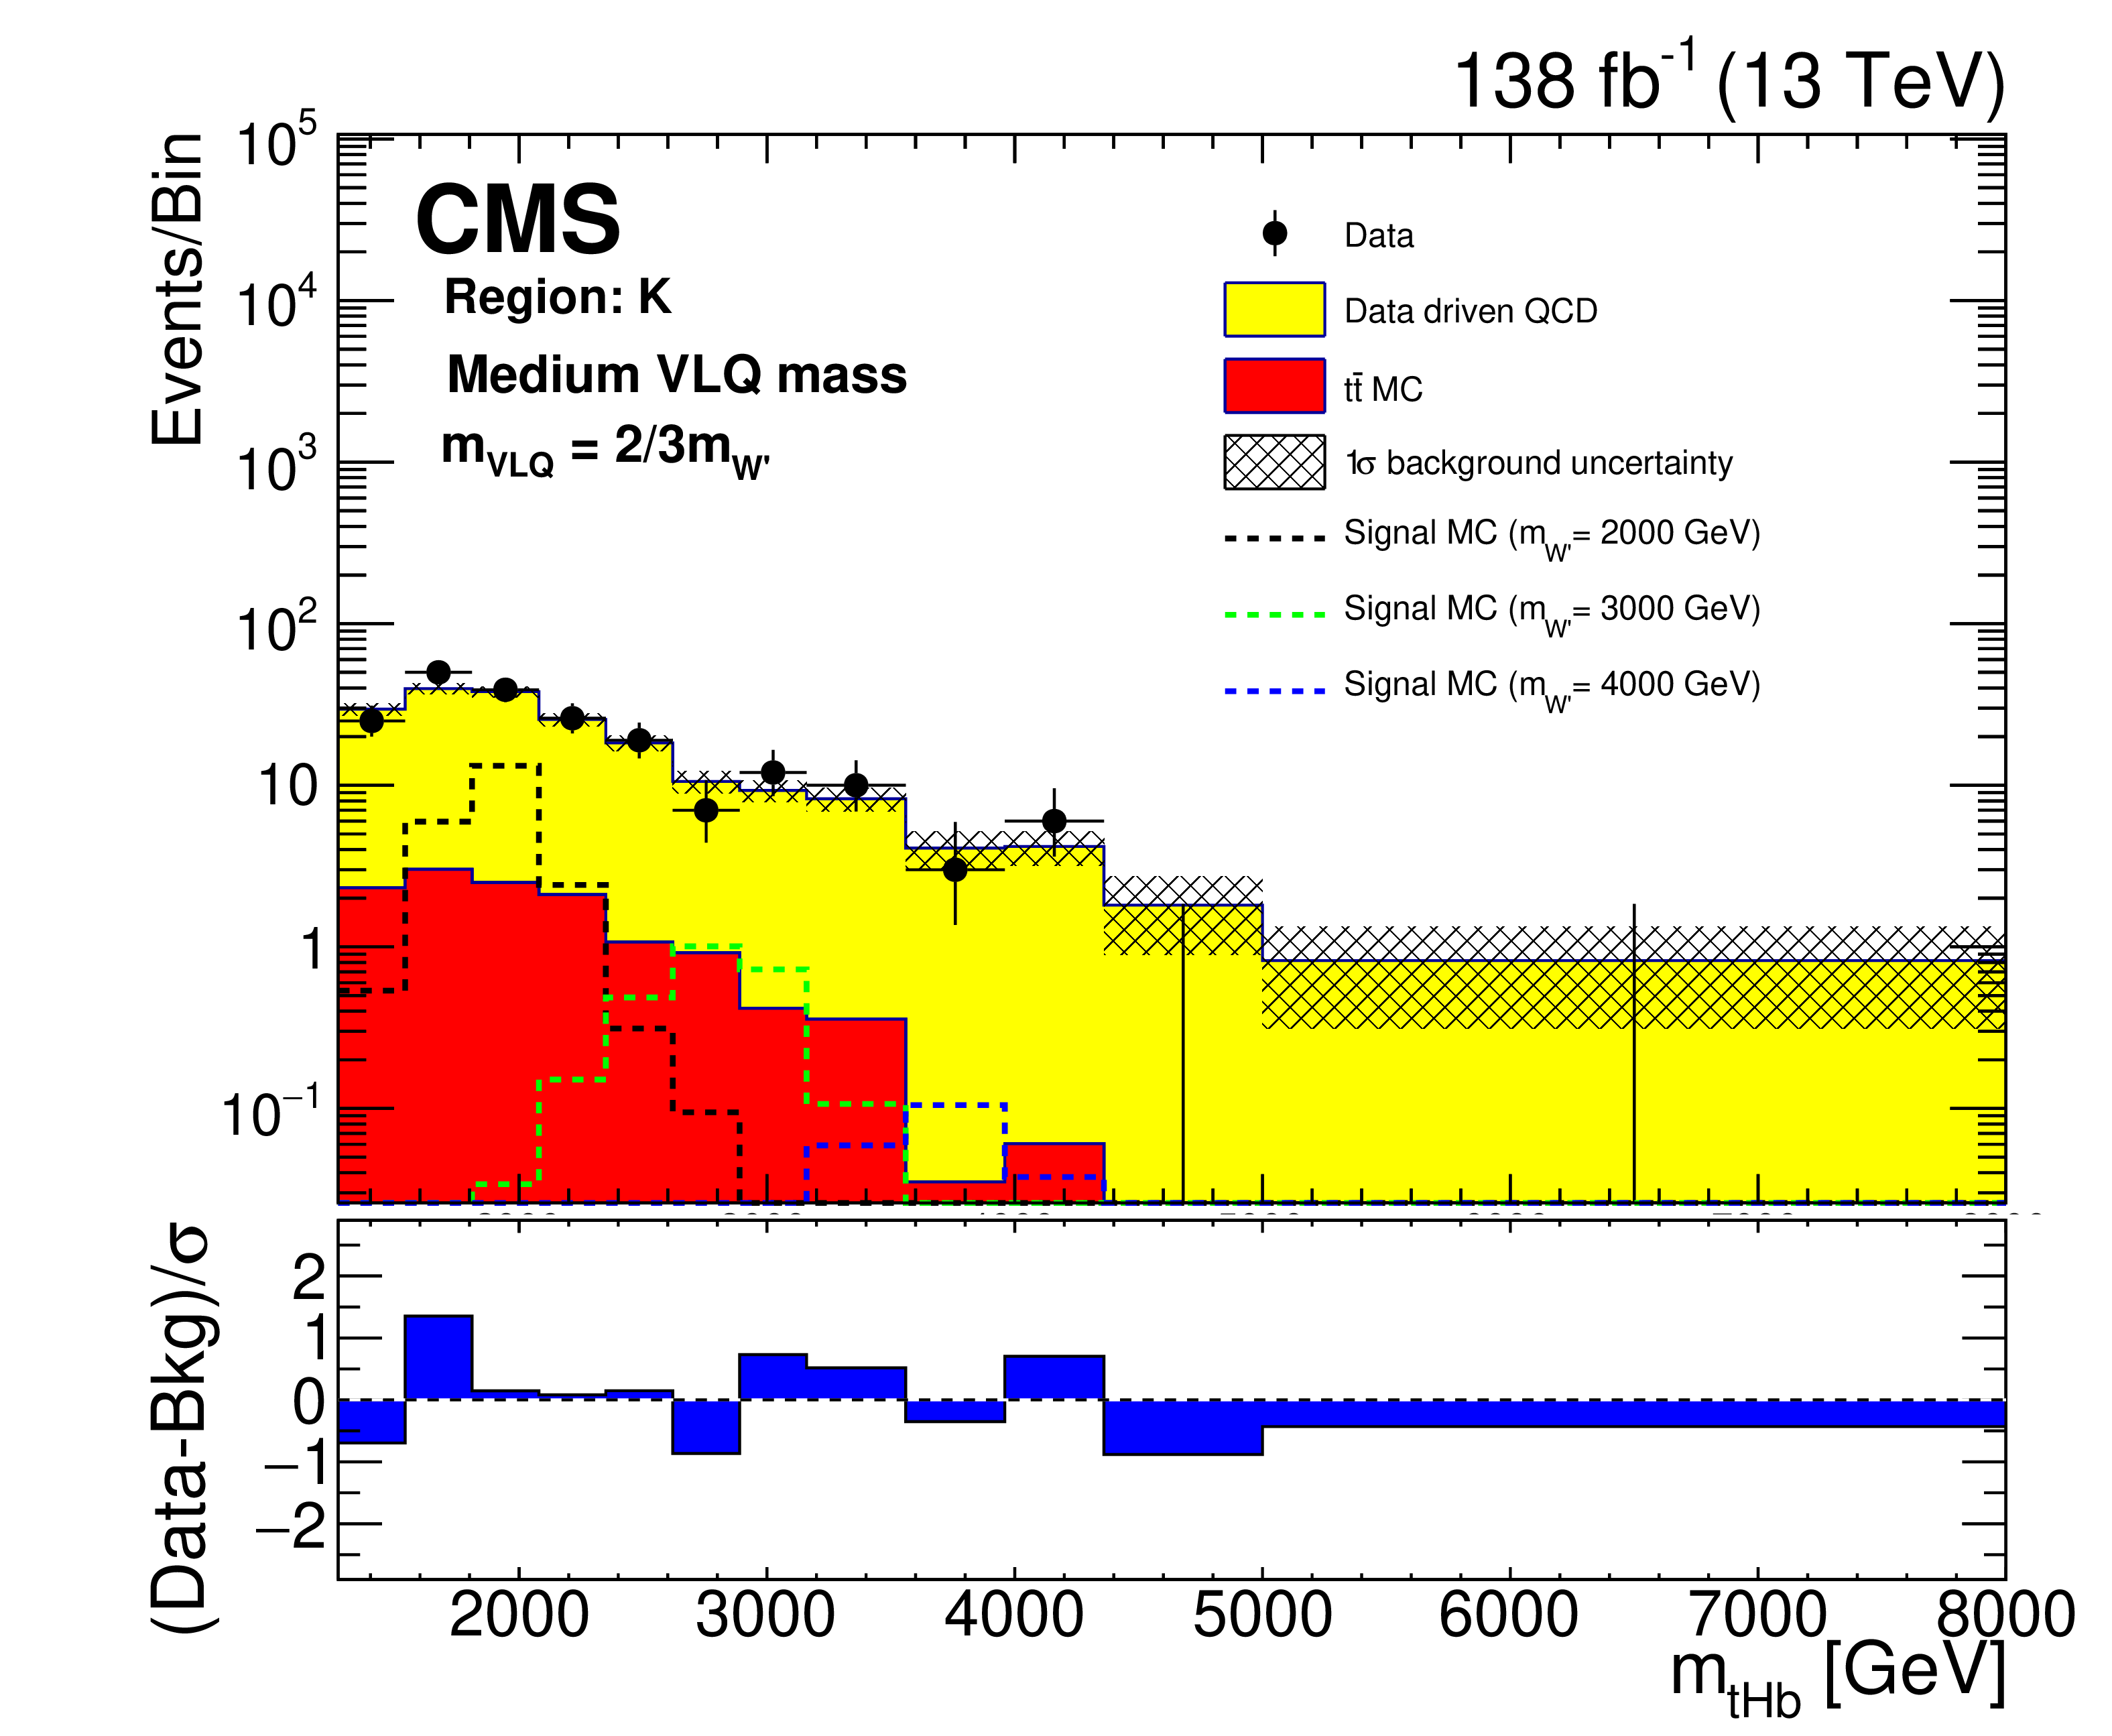
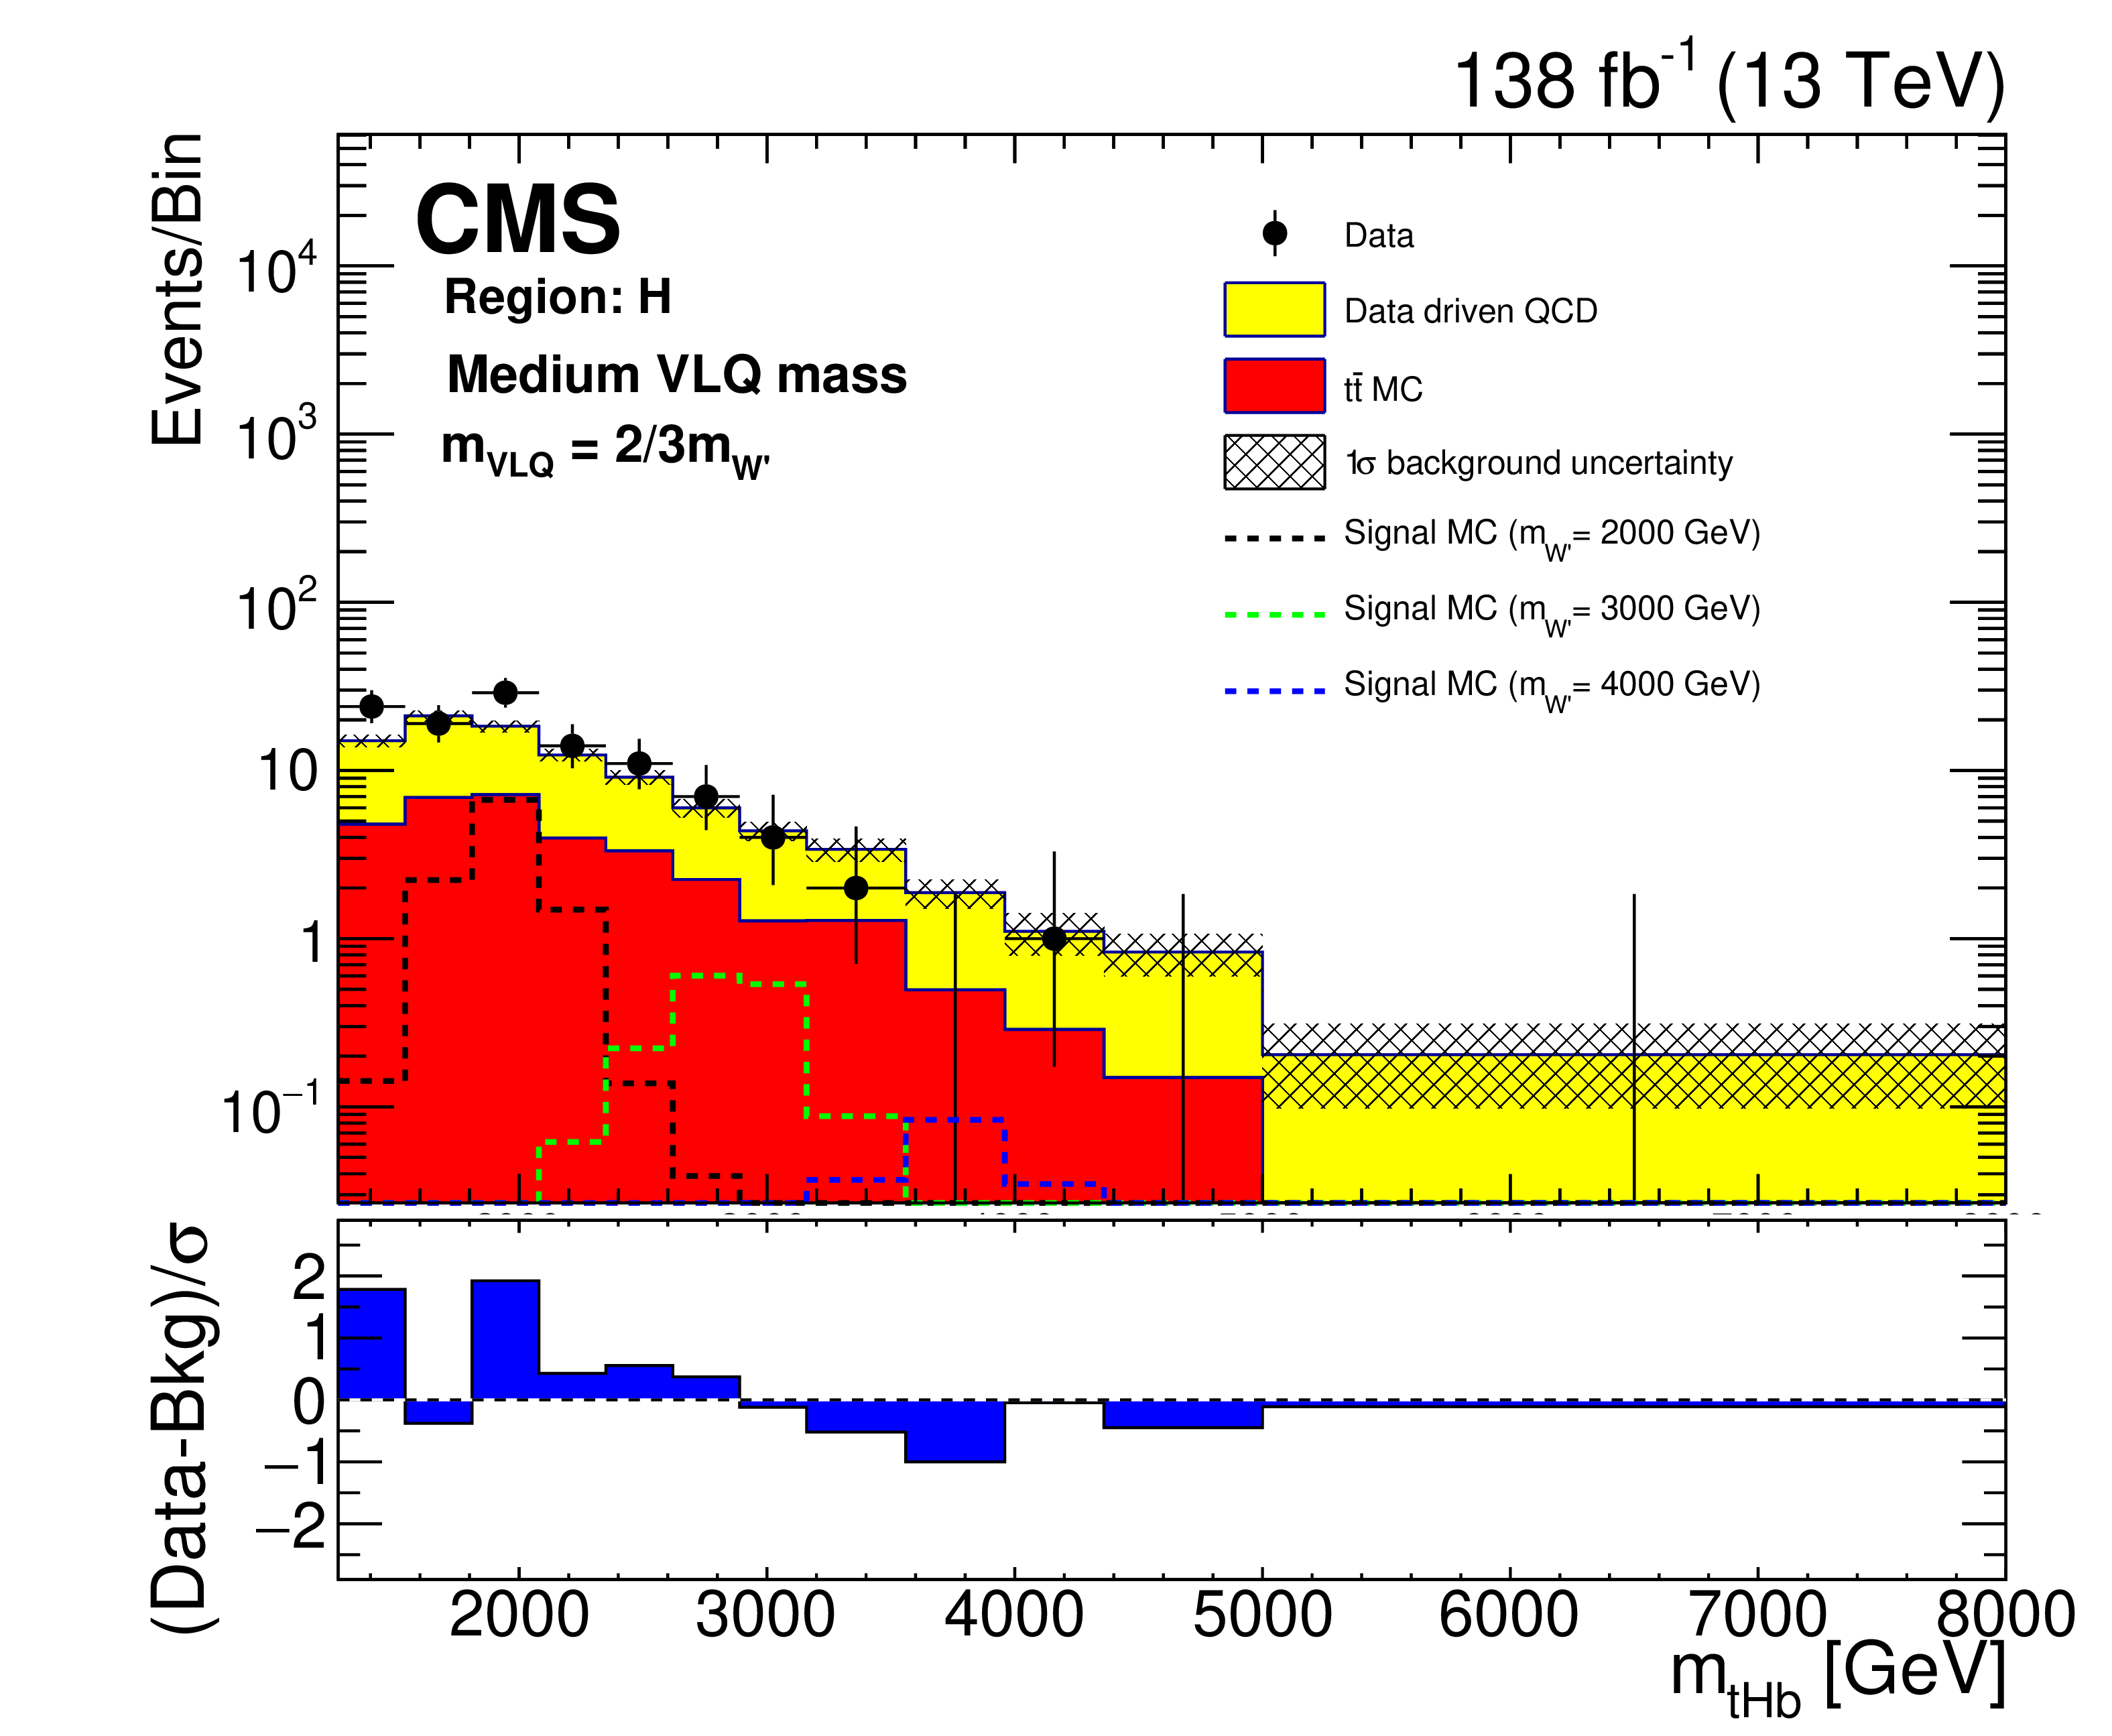
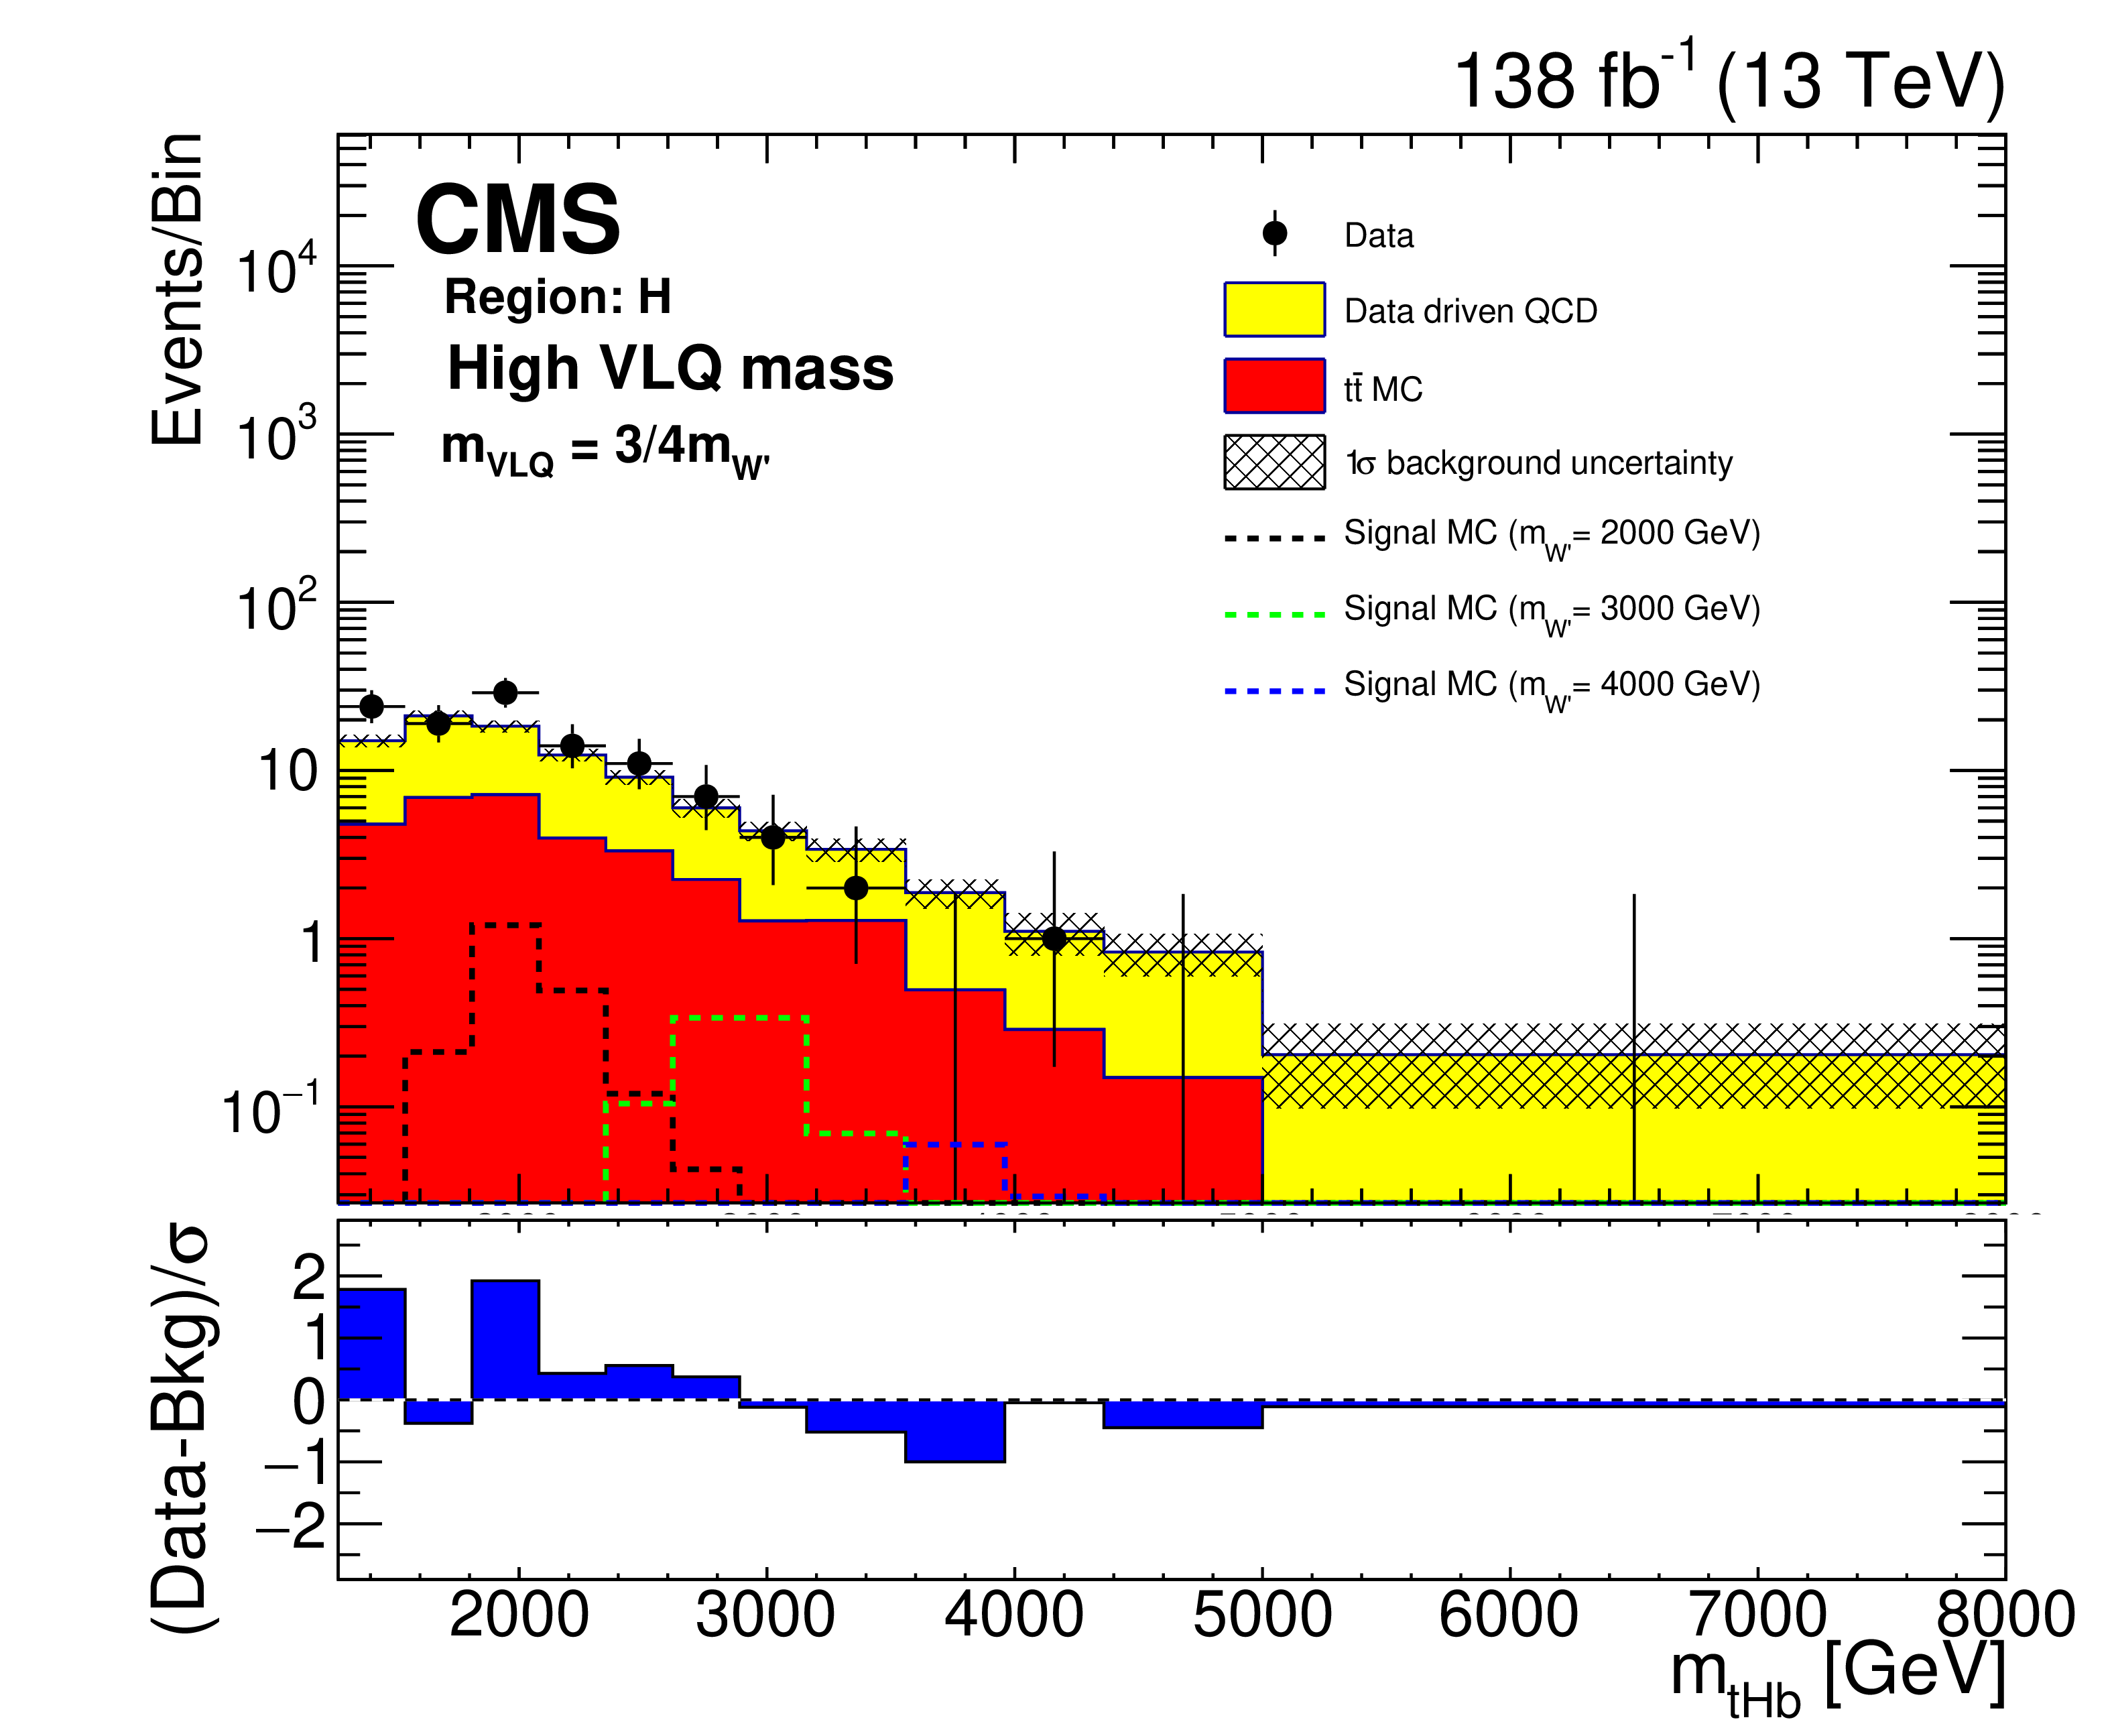
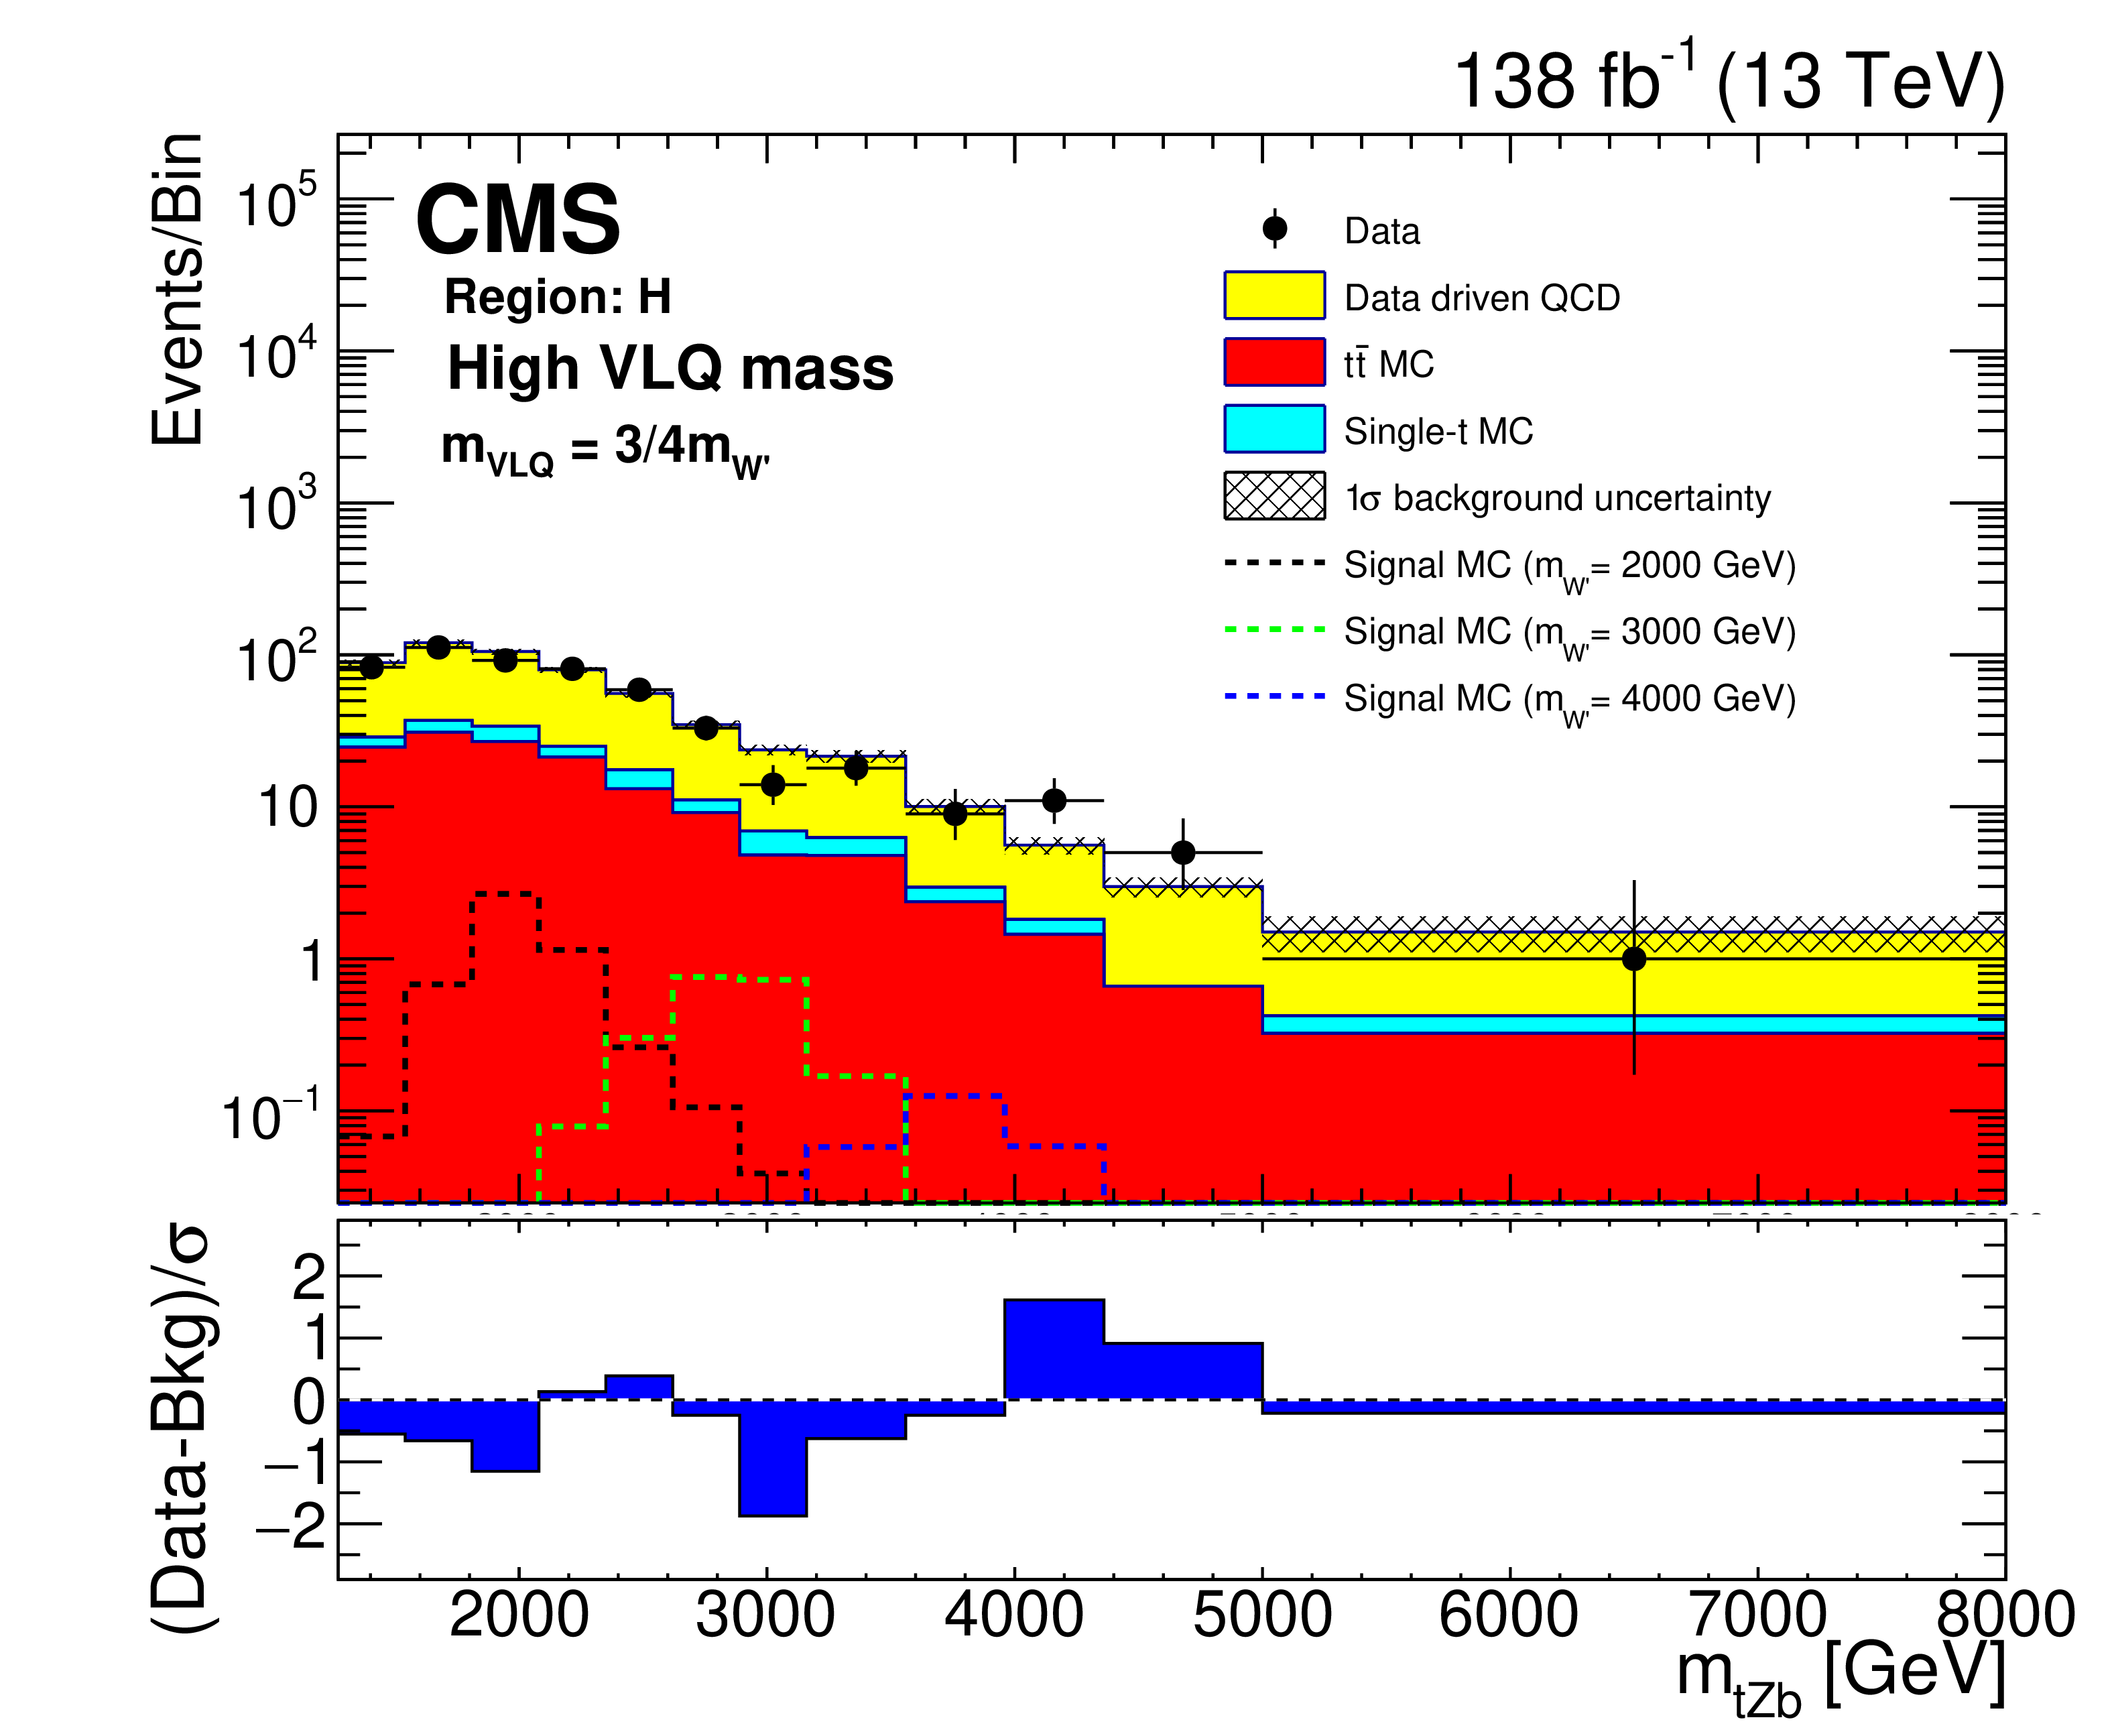
Background closure test for the reconstructed W' boson invariant mass in region F (upper), K (middle), and H (lower) for the purpose of validation in the ${{\mathrm {t}} {\mathrm {H}} {\mathrm {b}}}$ (left) and ${{\mathrm {t}} {\mathrm {Z}} {\mathrm {b}}}$ (right) analyses. The data are shown as points with error bars and the estimated backgrounds as solid histograms after a background-only fit, with a hatched band indicating the uncertainty. Expected signals for three different W' mass hypotheses, assuming the medium VLQ mass, are shown as dotted histograms. The lower panel of each plot shows the difference between the number of events observed in the data and the predicted background, divided by the total uncertainty in the background and the statistical uncertainty in the data added in quadrature. |

png pdf |
Figure 5-a:
Background closure test for the reconstructed W' boson invariant mass in region H, for the purpose of validation in the ${{\mathrm {t}} {\mathrm {Z}} {\mathrm {b}}}$ analysis. The data are shown as points with error bars and the estimated backgrounds as solid histograms after a background-only fit, with a hatched band indicating the uncertainty. Expected signals for three different W' mass hypotheses, assuming the medium VLQ mass, are shown as dotted histograms. The lower panel shows the difference between the number of events observed in the data and the predicted background, divided by the total uncertainty in the background and the statistical uncertainty in the data added in quadrature. |
png pdf |
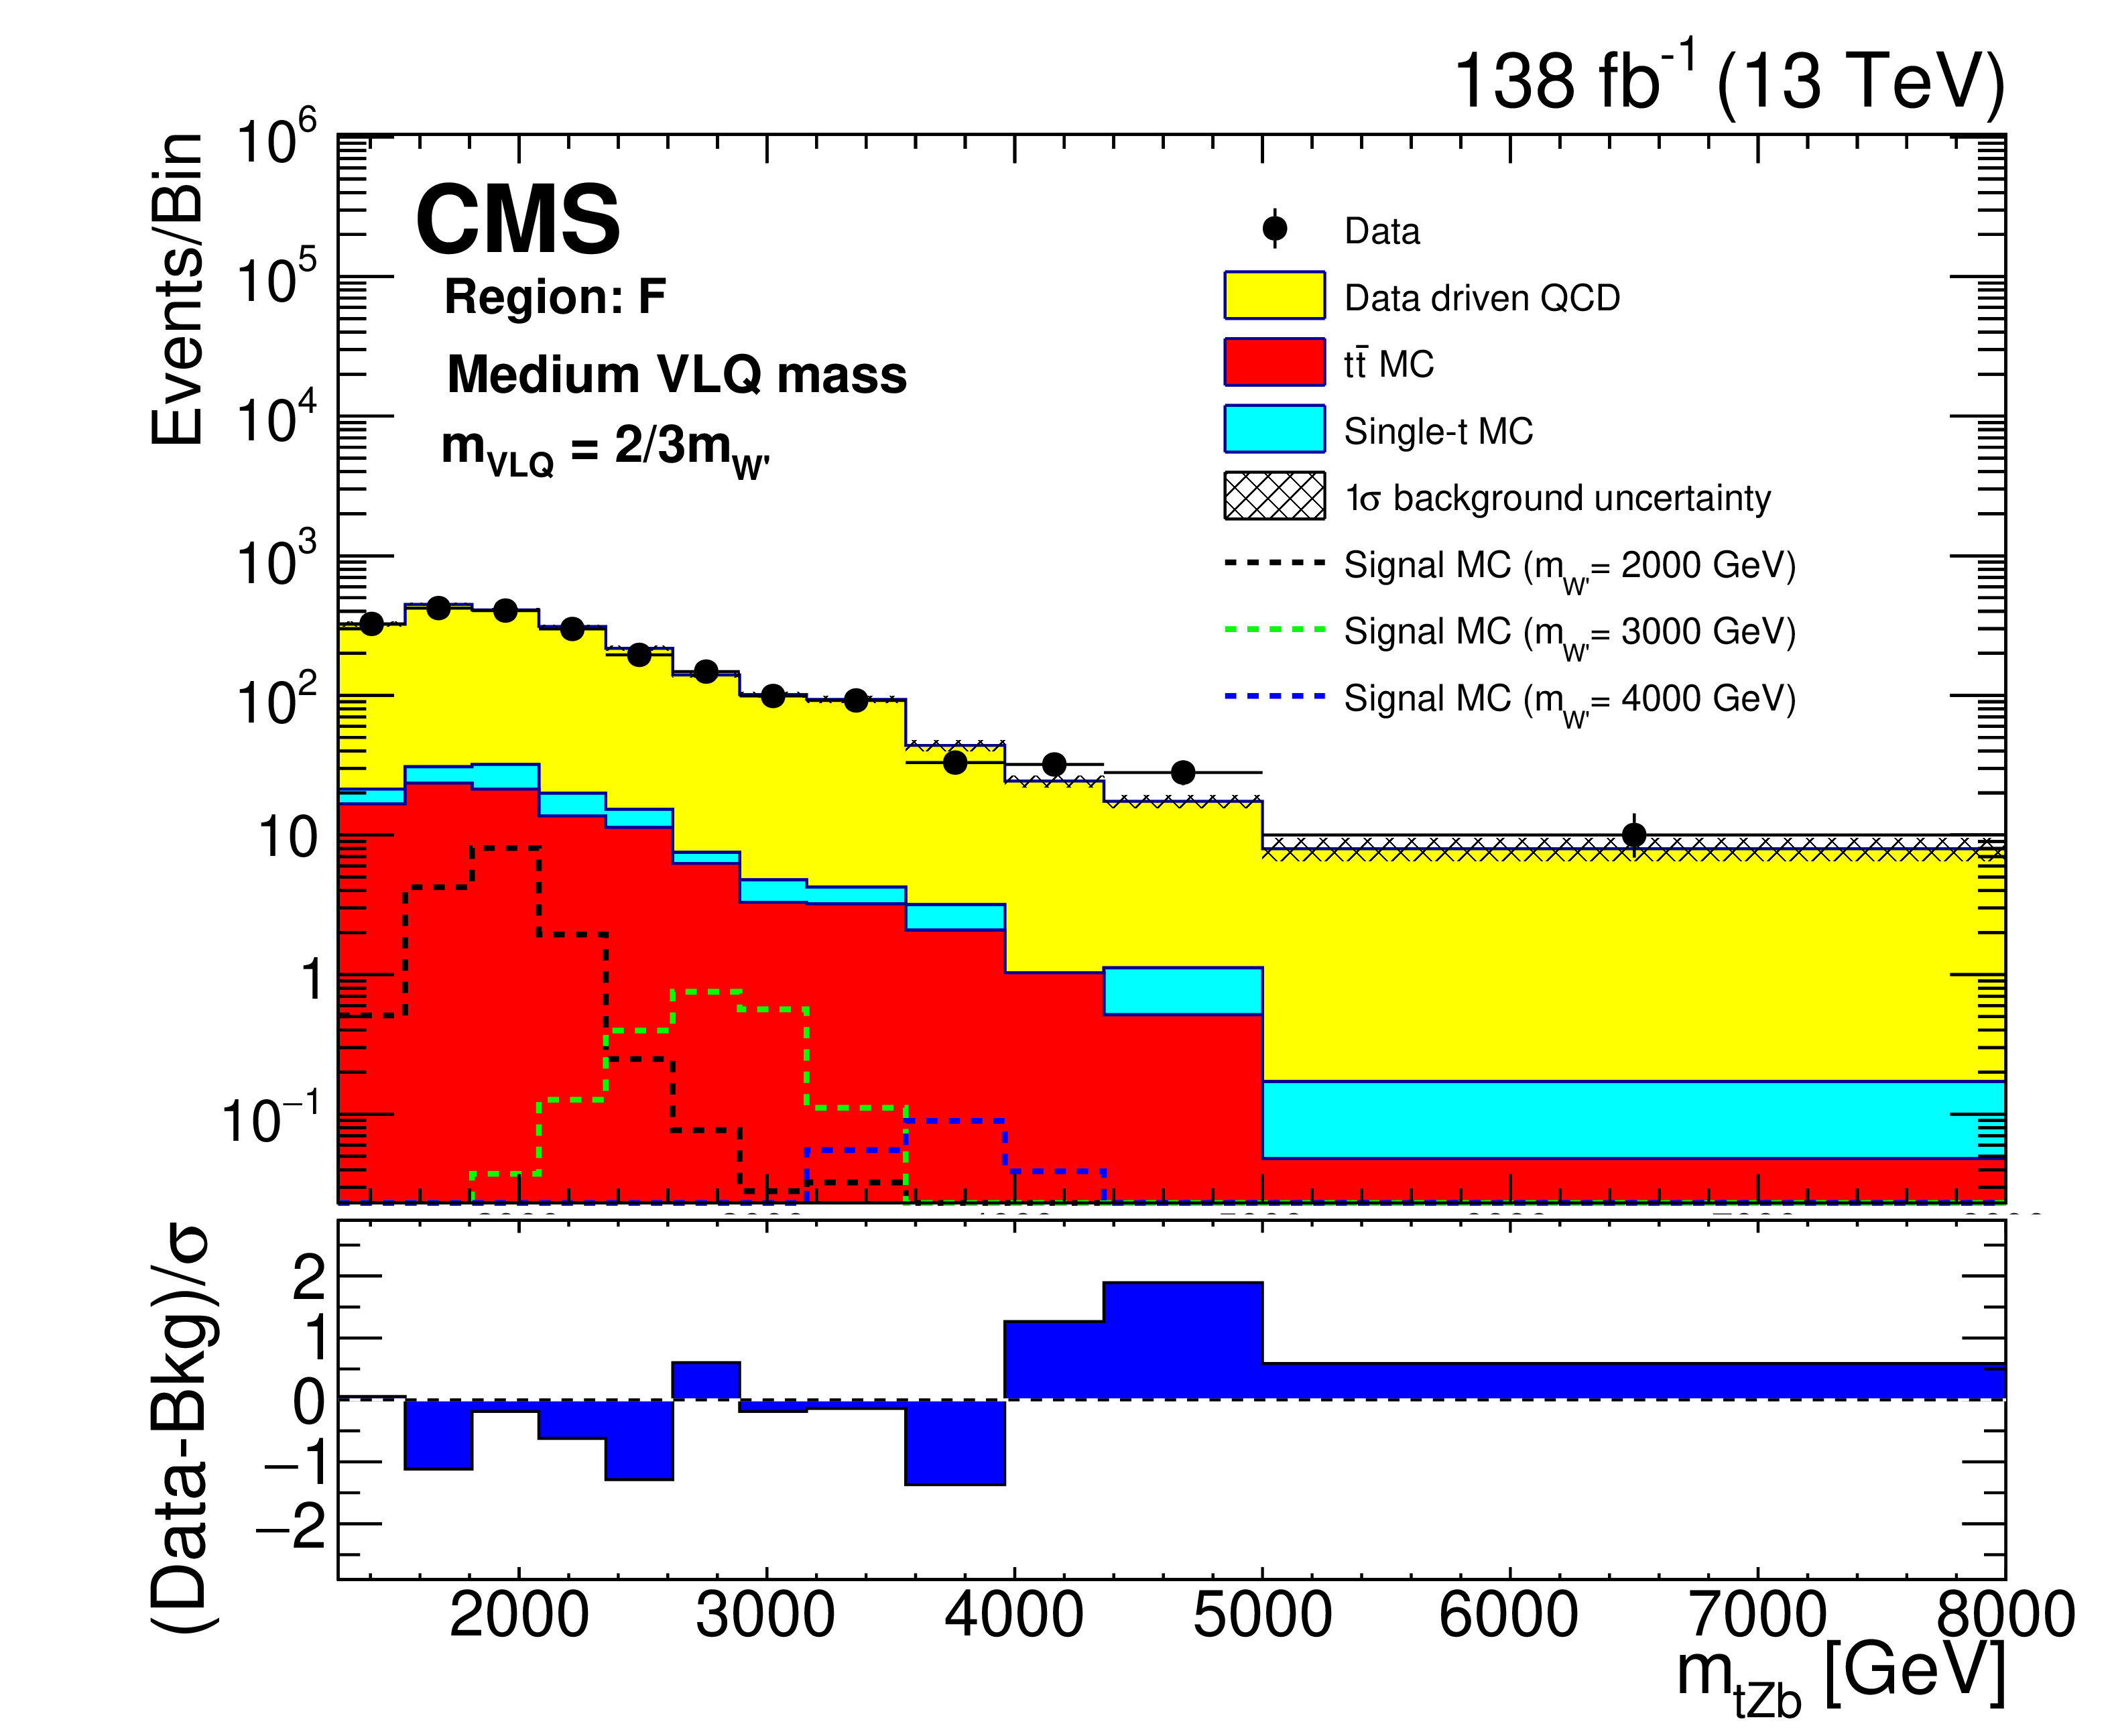
Figure 5-b:
Background closure test for the reconstructed W' boson invariant mass in region F, for the purpose of validation in the ${{\mathrm {t}} {\mathrm {Z}} {\mathrm {b}}}$ analysis. The data are shown as points with error bars and the estimated backgrounds as solid histograms after a background-only fit, with a hatched band indicating the uncertainty. Expected signals for three different W' mass hypotheses, assuming the medium VLQ mass, are shown as dotted histograms. The lower panel shows the difference between the number of events observed in the data and the predicted background, divided by the total uncertainty in the background and the statistical uncertainty in the data added in quadrature. |
png pdf |
Figure 5-c:
Background closure test for the reconstructed W' boson invariant mass in region K, for the purpose of validation in the ${{\mathrm {t}} {\mathrm {H}} {\mathrm {b}}}$ analysis. The data are shown as points with error bars and the estimated backgrounds as solid histograms after a background-only fit, with a hatched band indicating the uncertainty. Expected signals for three different W' mass hypotheses, assuming the medium VLQ mass, are shown as dotted histograms. The lower panel shows the difference between the number of events observed in the data and the predicted background, divided by the total uncertainty in the background and the statistical uncertainty in the data added in quadrature. |

png pdf |
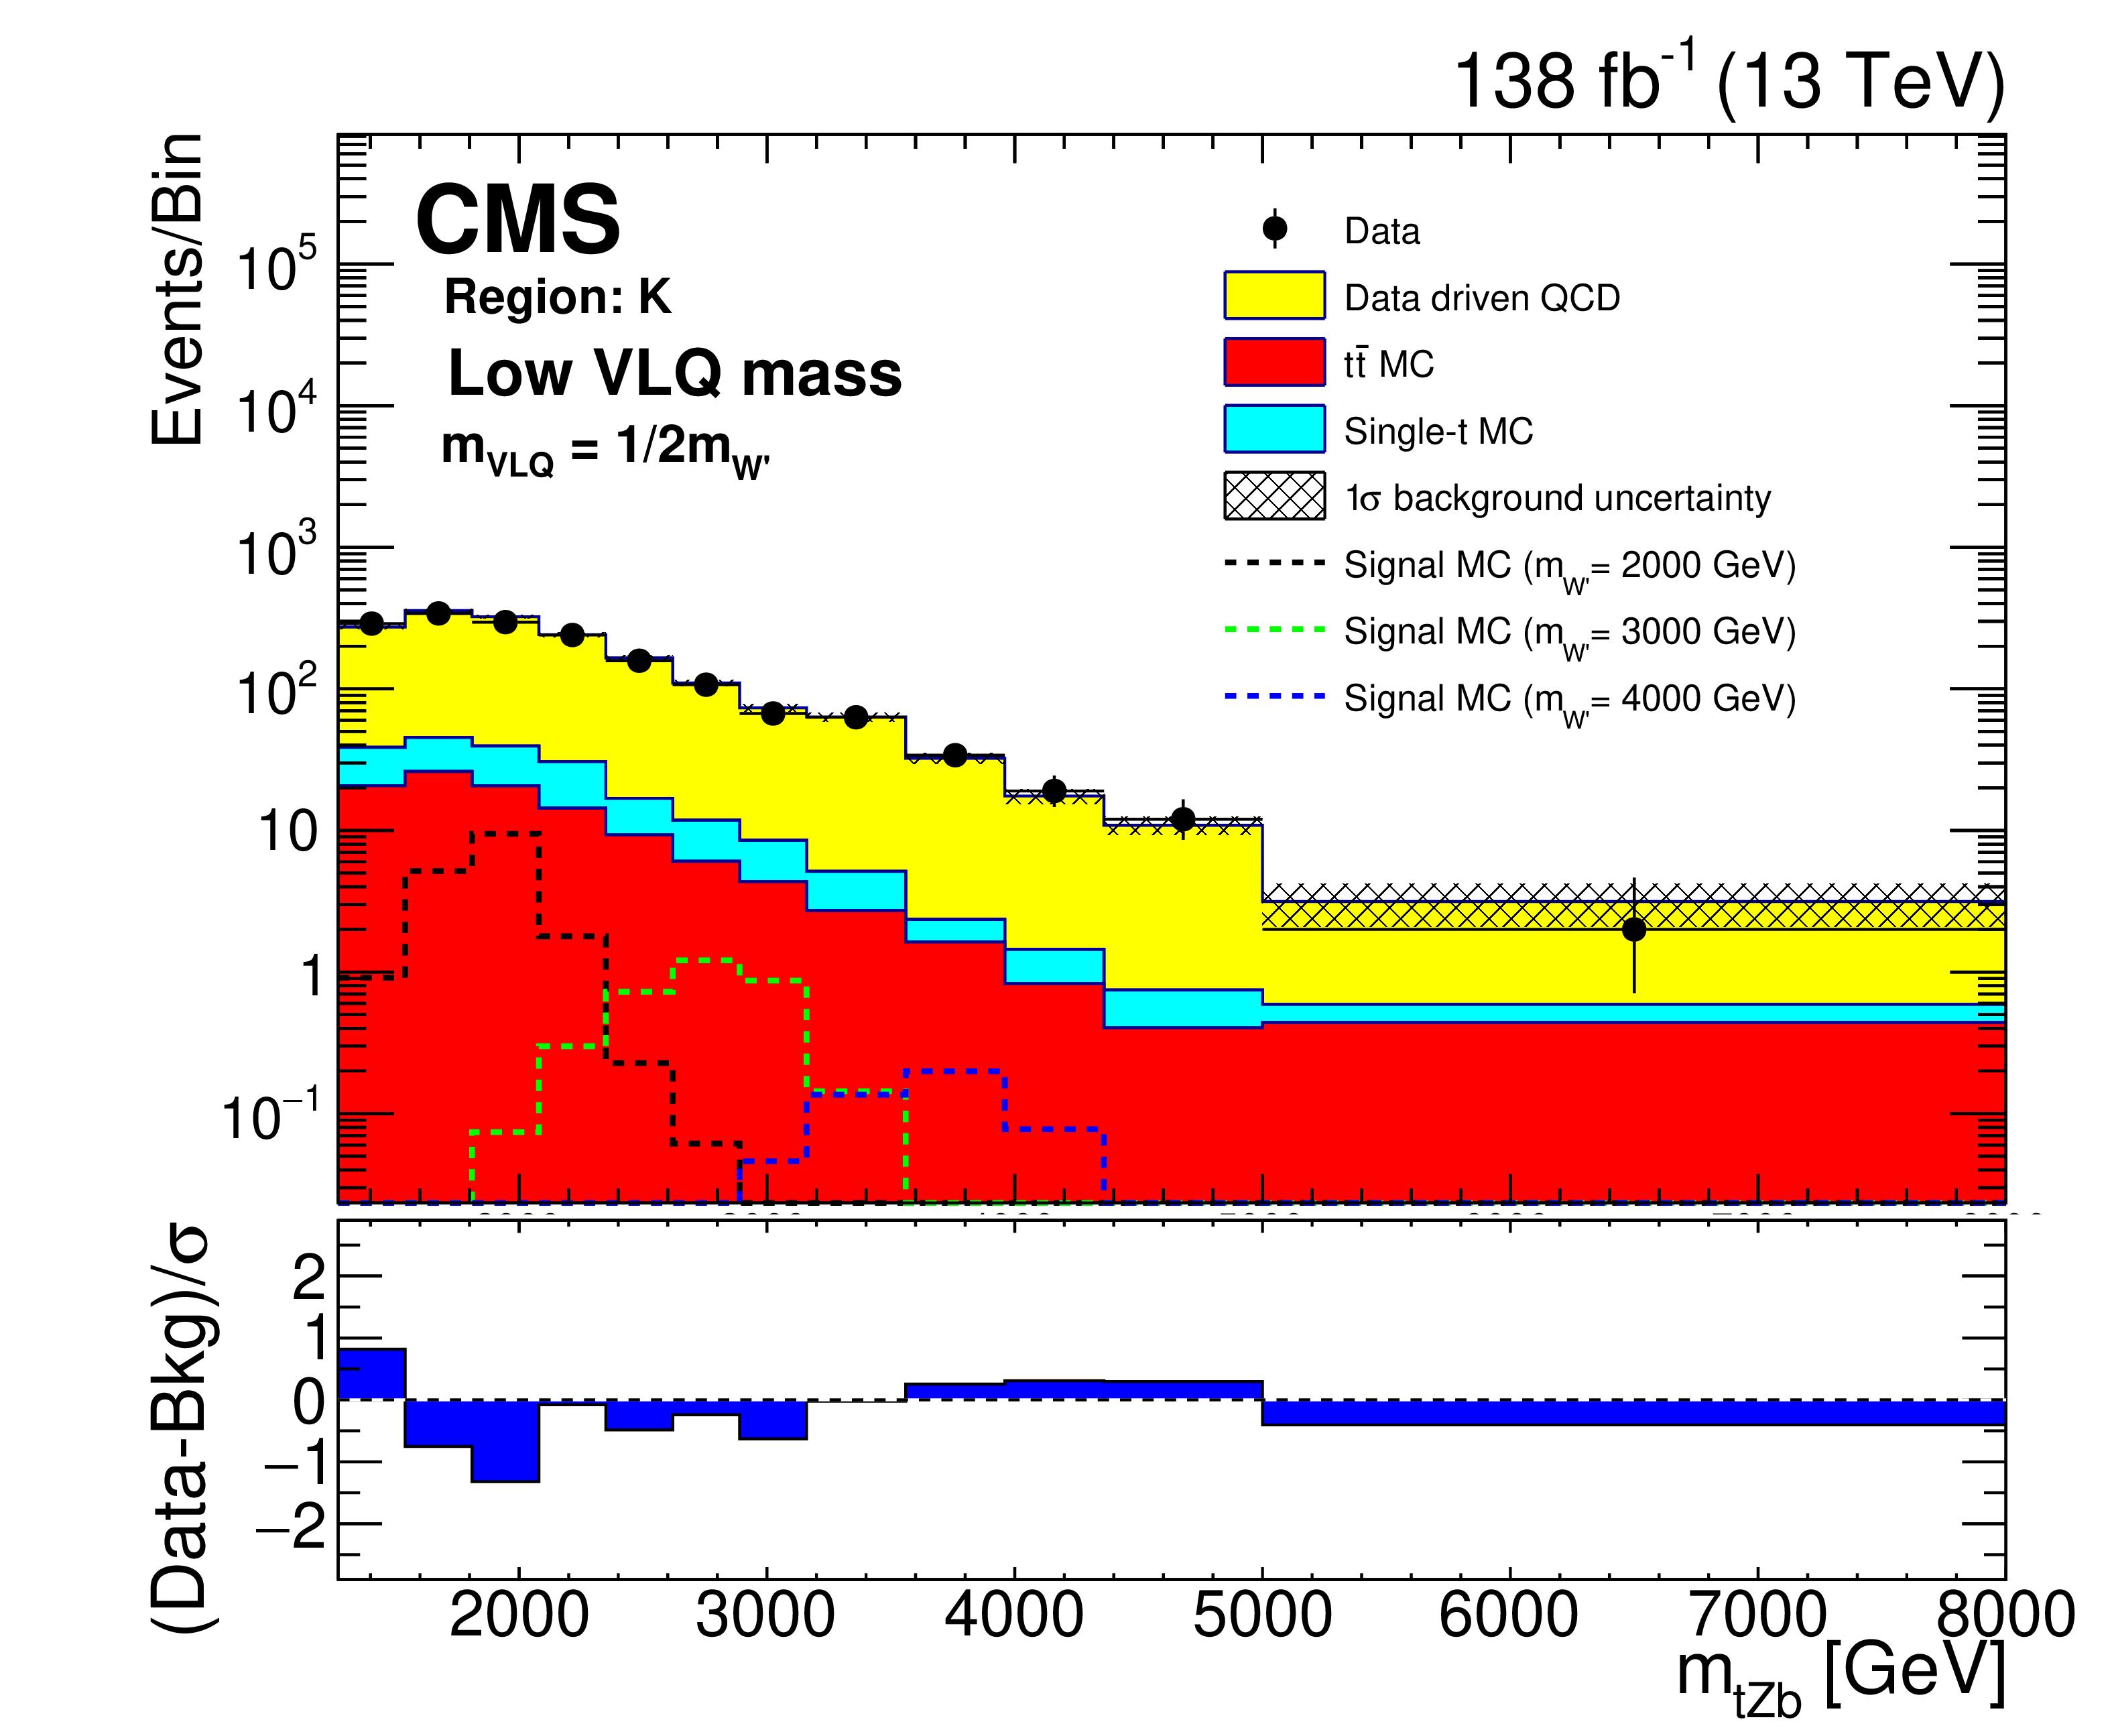
Figure 5-d:
Background closure test for the reconstructed W' boson invariant mass in region K, for the purpose of validation in the ${{\mathrm {t}} {\mathrm {Z}} {\mathrm {b}}}$ analysis. The data are shown as points with error bars and the estimated backgrounds as solid histograms after a background-only fit, with a hatched band indicating the uncertainty. Expected signals for three different W' mass hypotheses, assuming the medium VLQ mass, are shown as dotted histograms. The lower panel shows the difference between the number of events observed in the data and the predicted background, divided by the total uncertainty in the background and the statistical uncertainty in the data added in quadrature. |
png pdf |
Figure 5-e:
Background closure test for the reconstructed W' boson invariant mass in region H, for the purpose of validation in the ${{\mathrm {t}} {\mathrm {H}} {\mathrm {b}}}$ analysis. The data are shown as points with error bars and the estimated backgrounds as solid histograms after a background-only fit, with a hatched band indicating the uncertainty. Expected signals for three different W' mass hypotheses, assuming the medium VLQ mass, are shown as dotted histograms. The lower panel shows the difference between the number of events observed in the data and the predicted background, divided by the total uncertainty in the background and the statistical uncertainty in the data added in quadrature. |

png pdf |
Figure 5-f:
Background closure test for the reconstructed W' boson invariant mass in region F (upper), K (middle), and H (lower) for the purpose of validation in the ${{\mathrm {t}} {\mathrm {H}} {\mathrm {b}}}$ (left) and ${{\mathrm {t}} {\mathrm {Z}} {\mathrm {b}}}$ (right) analyses. The data are shown as points with error bars and the estimated backgrounds as solid histograms after a background-only fit, with a hatched band indicating the uncertainty. Expected signals for three different W' mass hypotheses, assuming the medium VLQ mass, are shown as dotted histograms. The lower panel of each plot shows the difference between the number of events observed in the data and the predicted background, divided by the total uncertainty in the background and the statistical uncertainty in the data added in quadrature. |

png pdf |
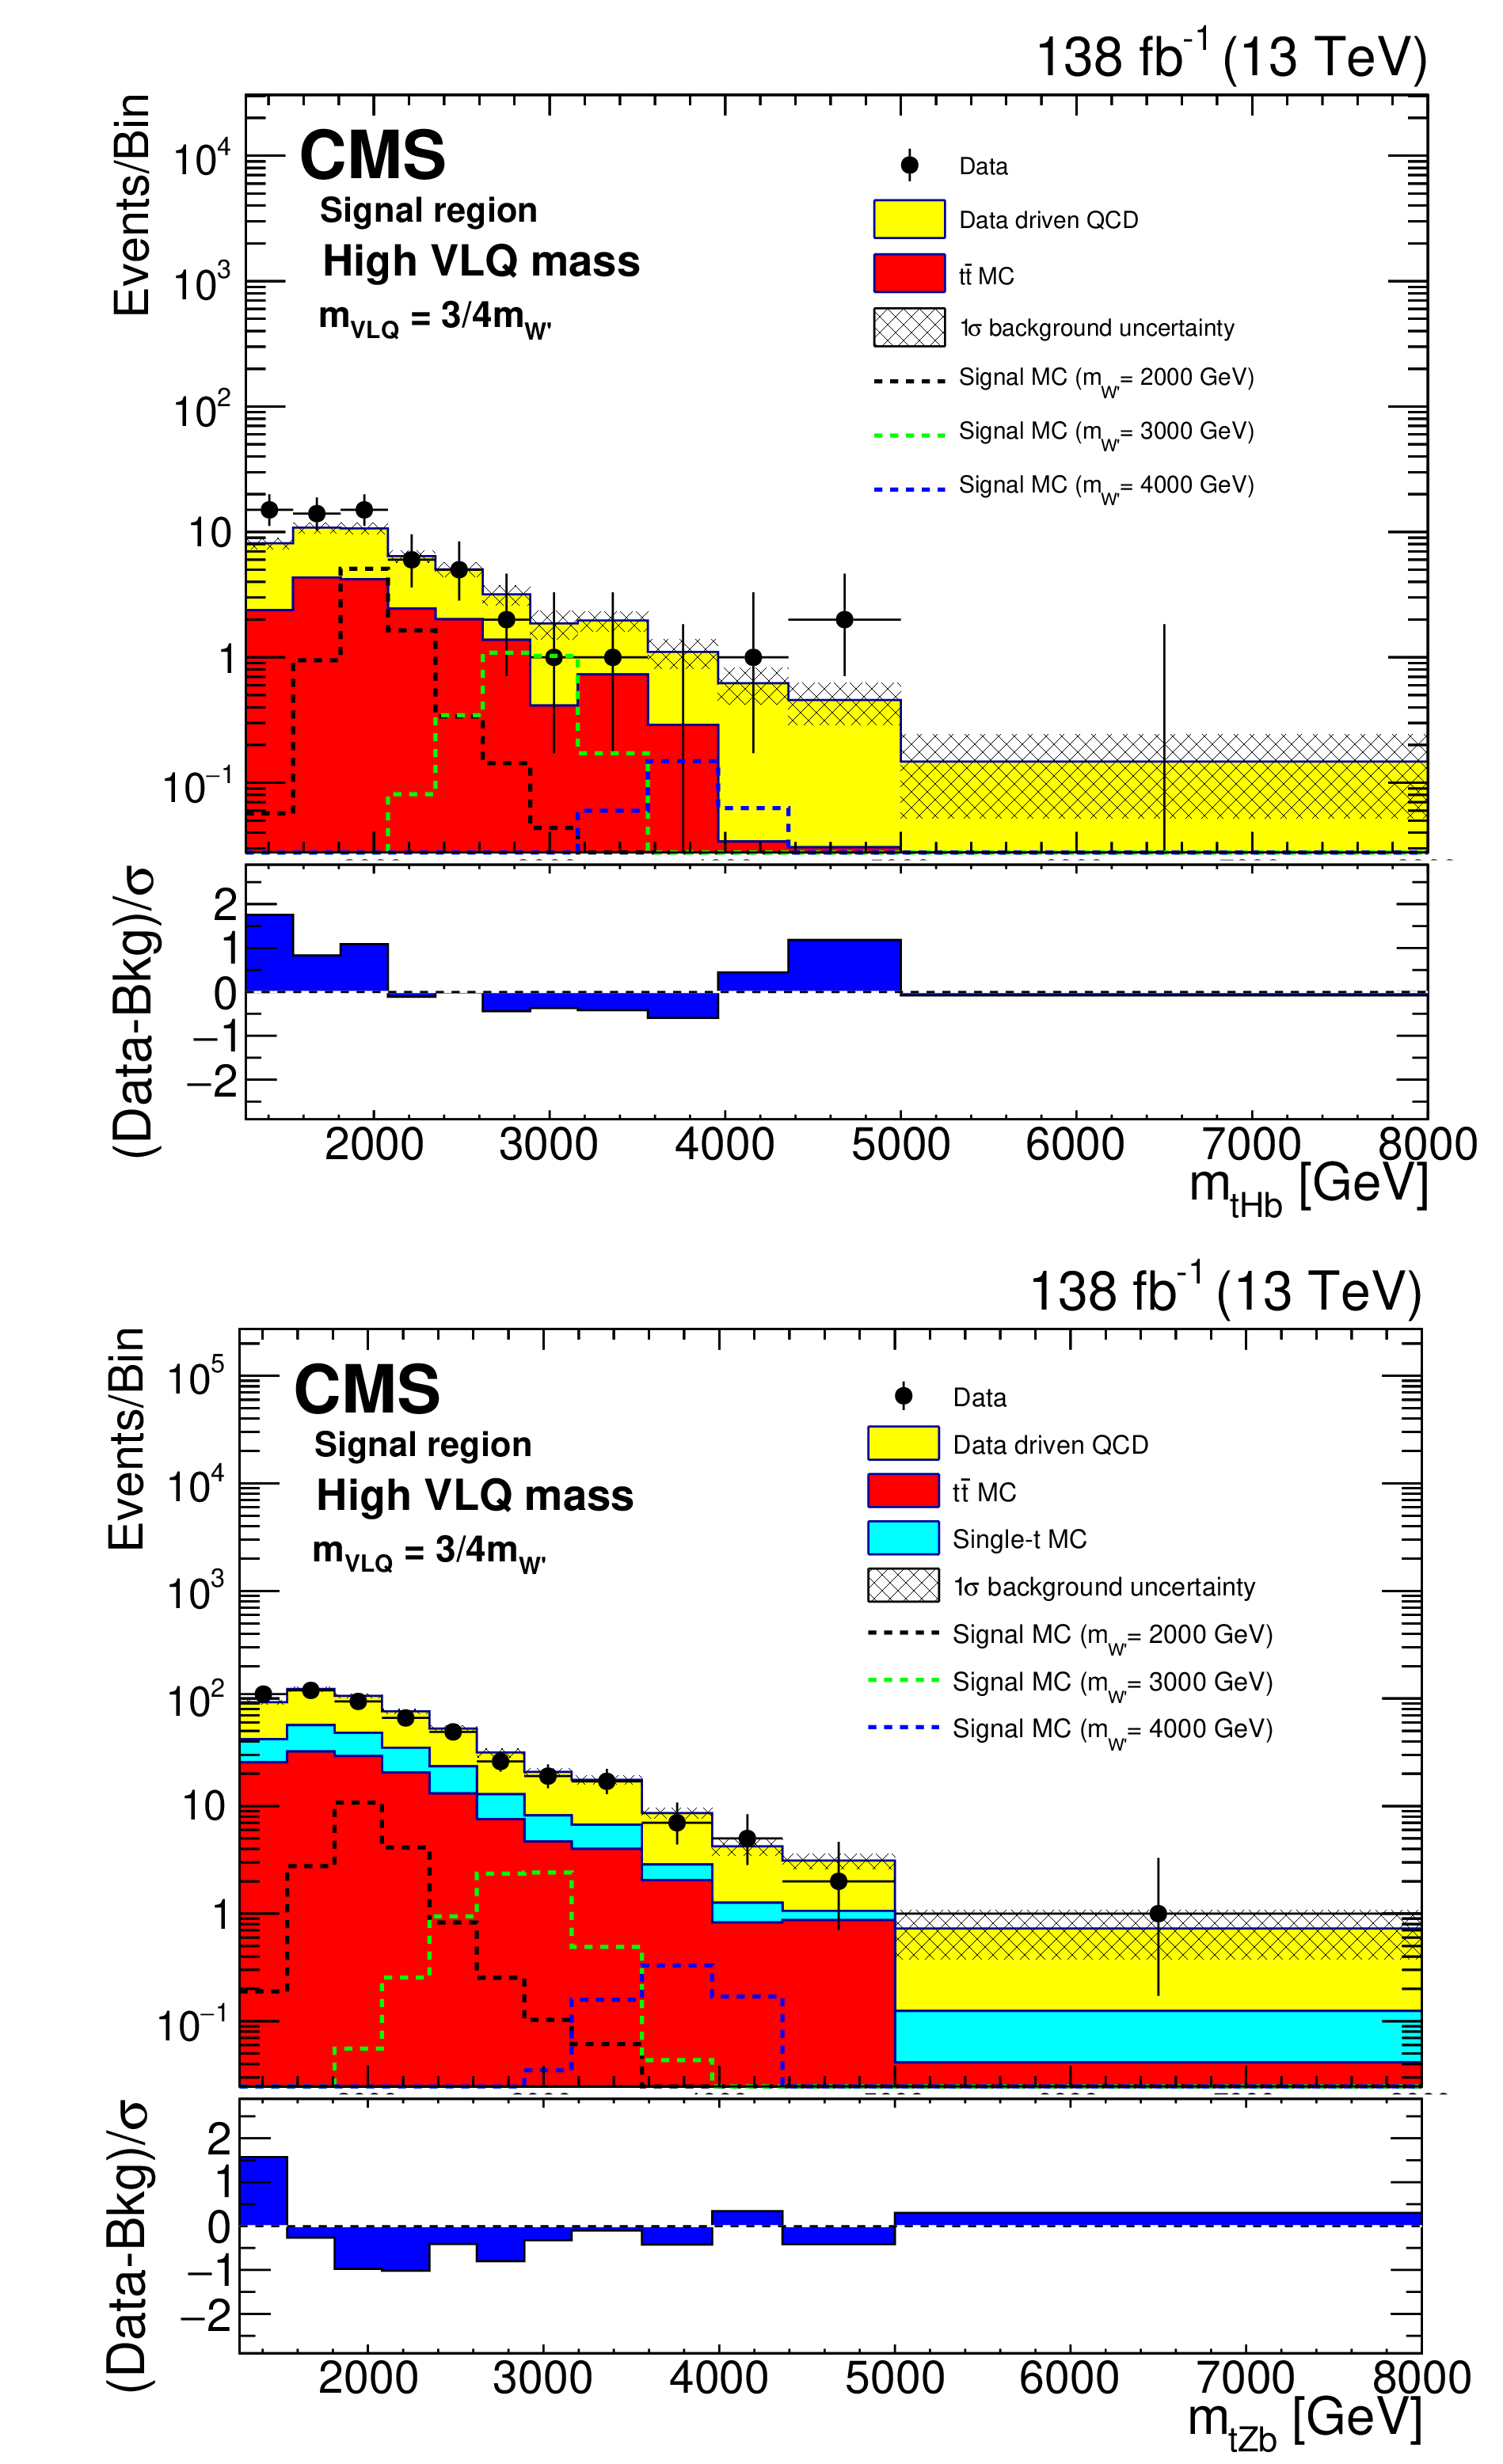
Figure 6:
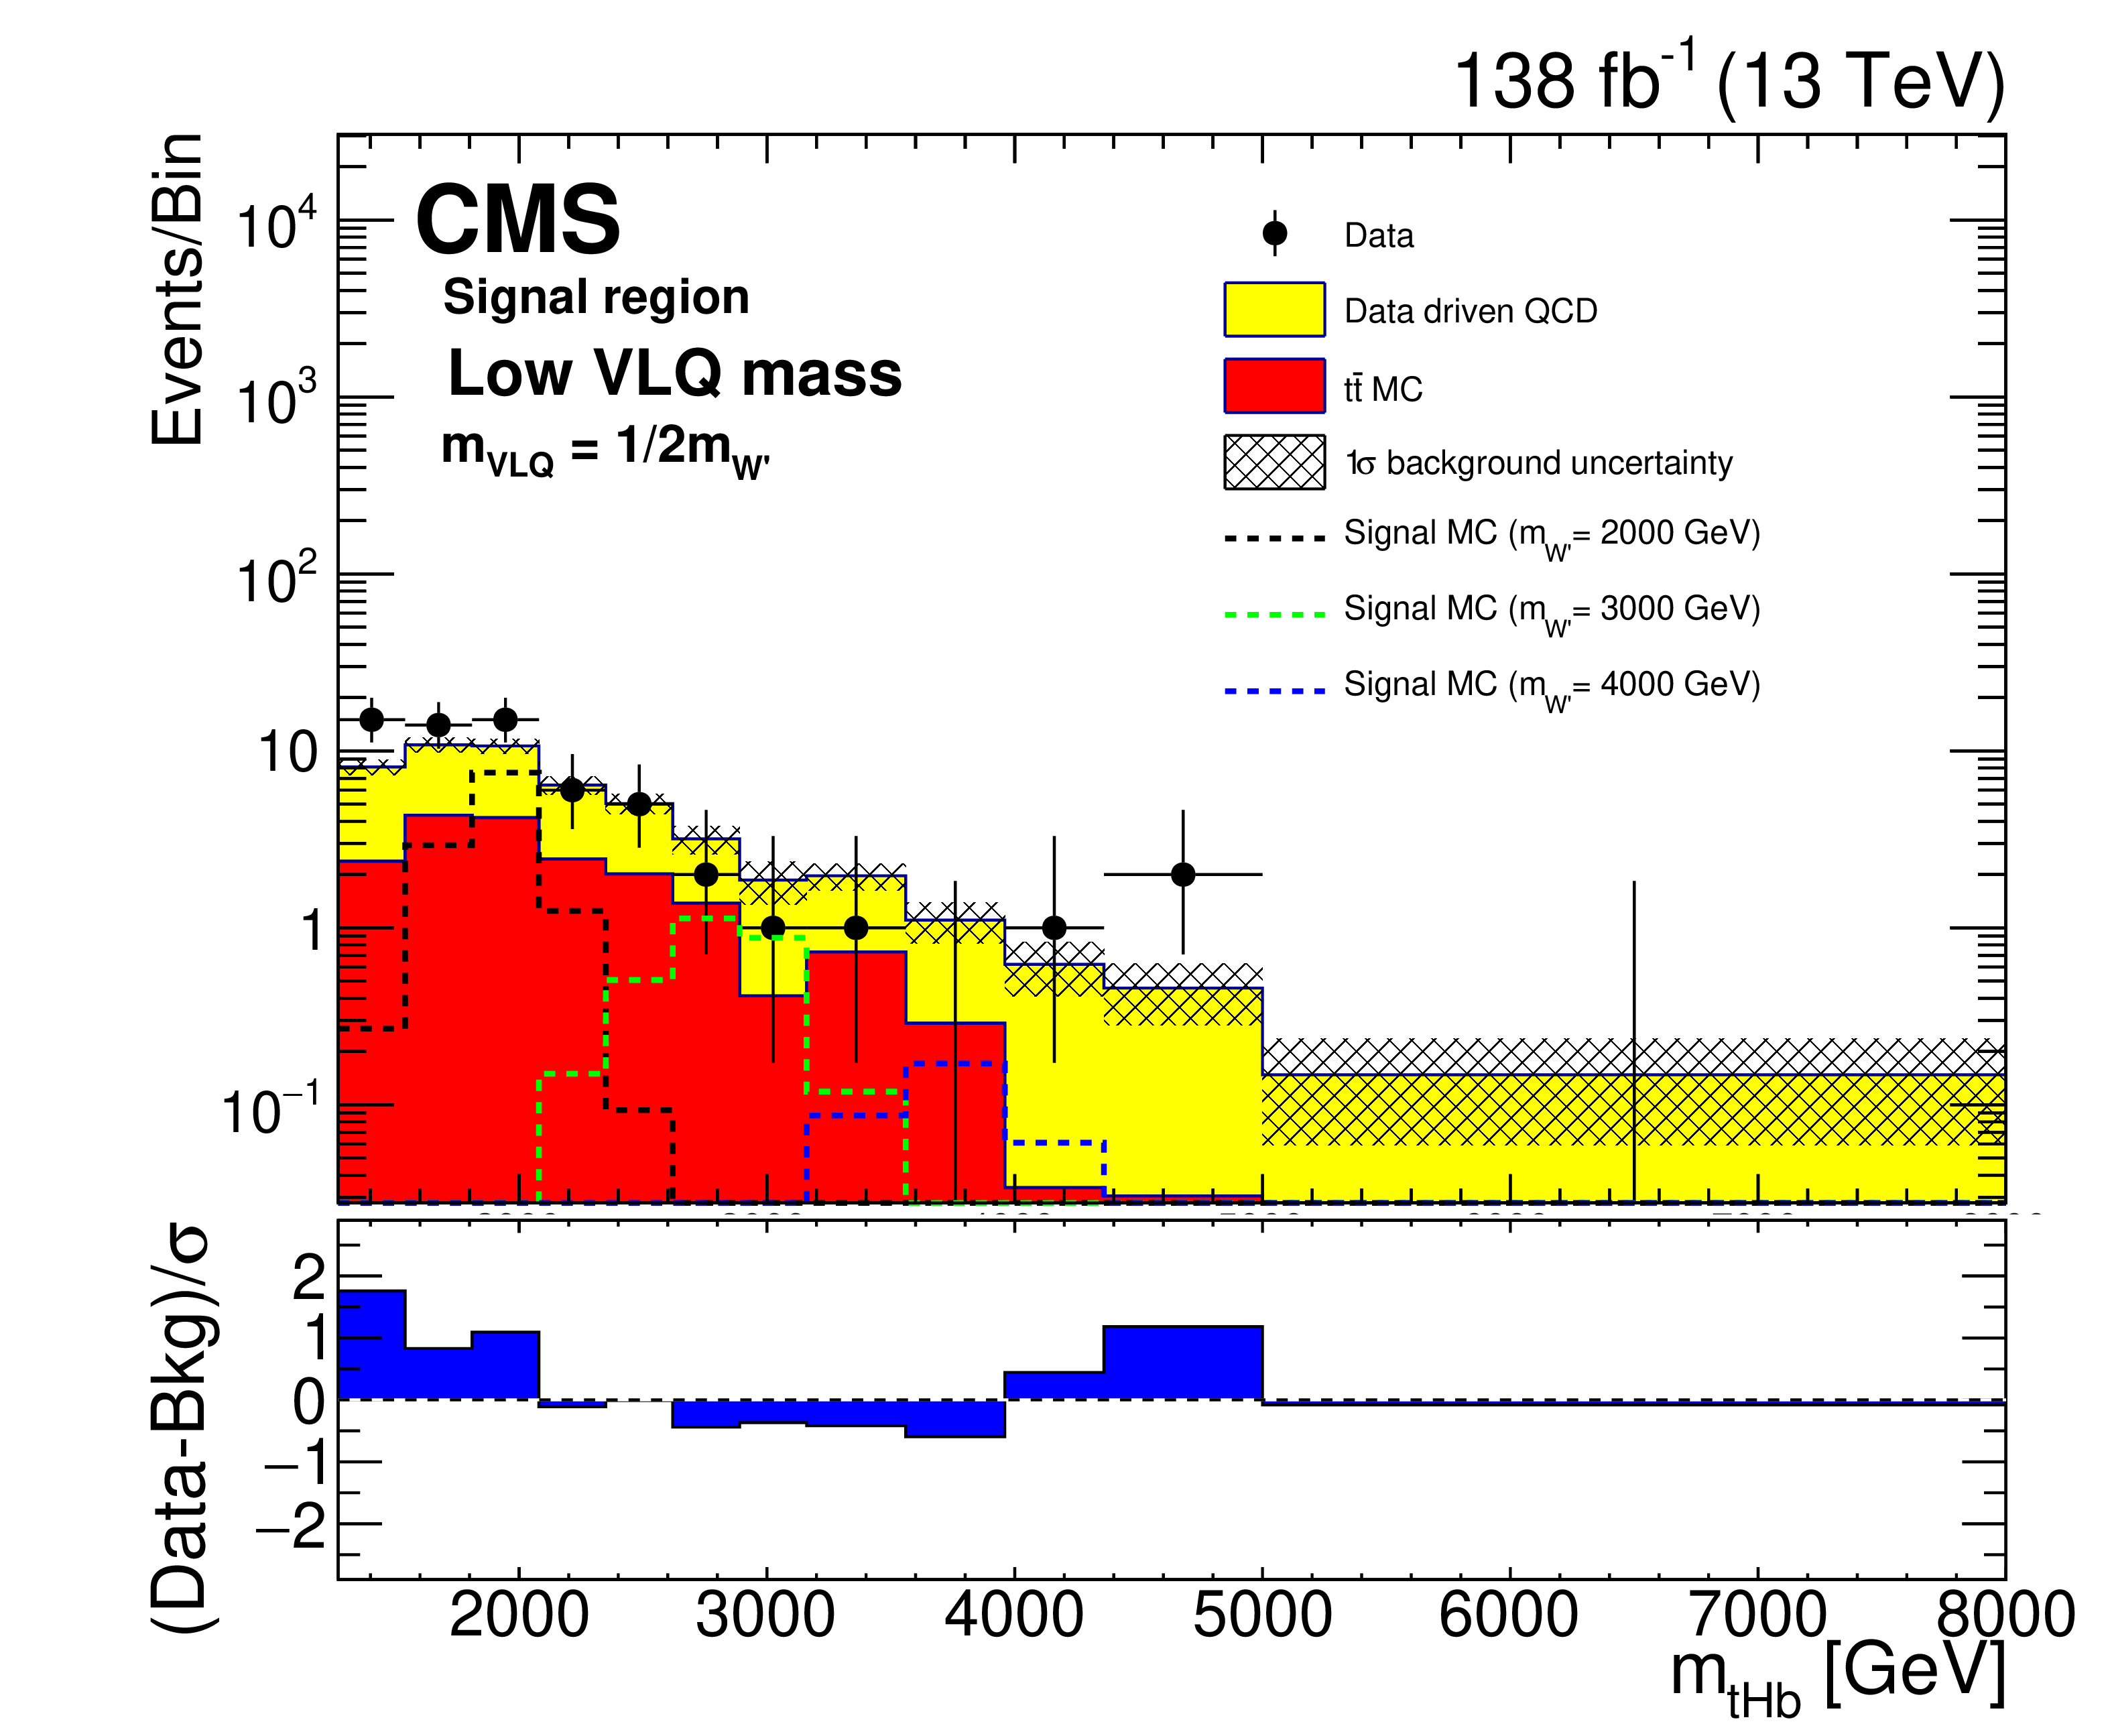
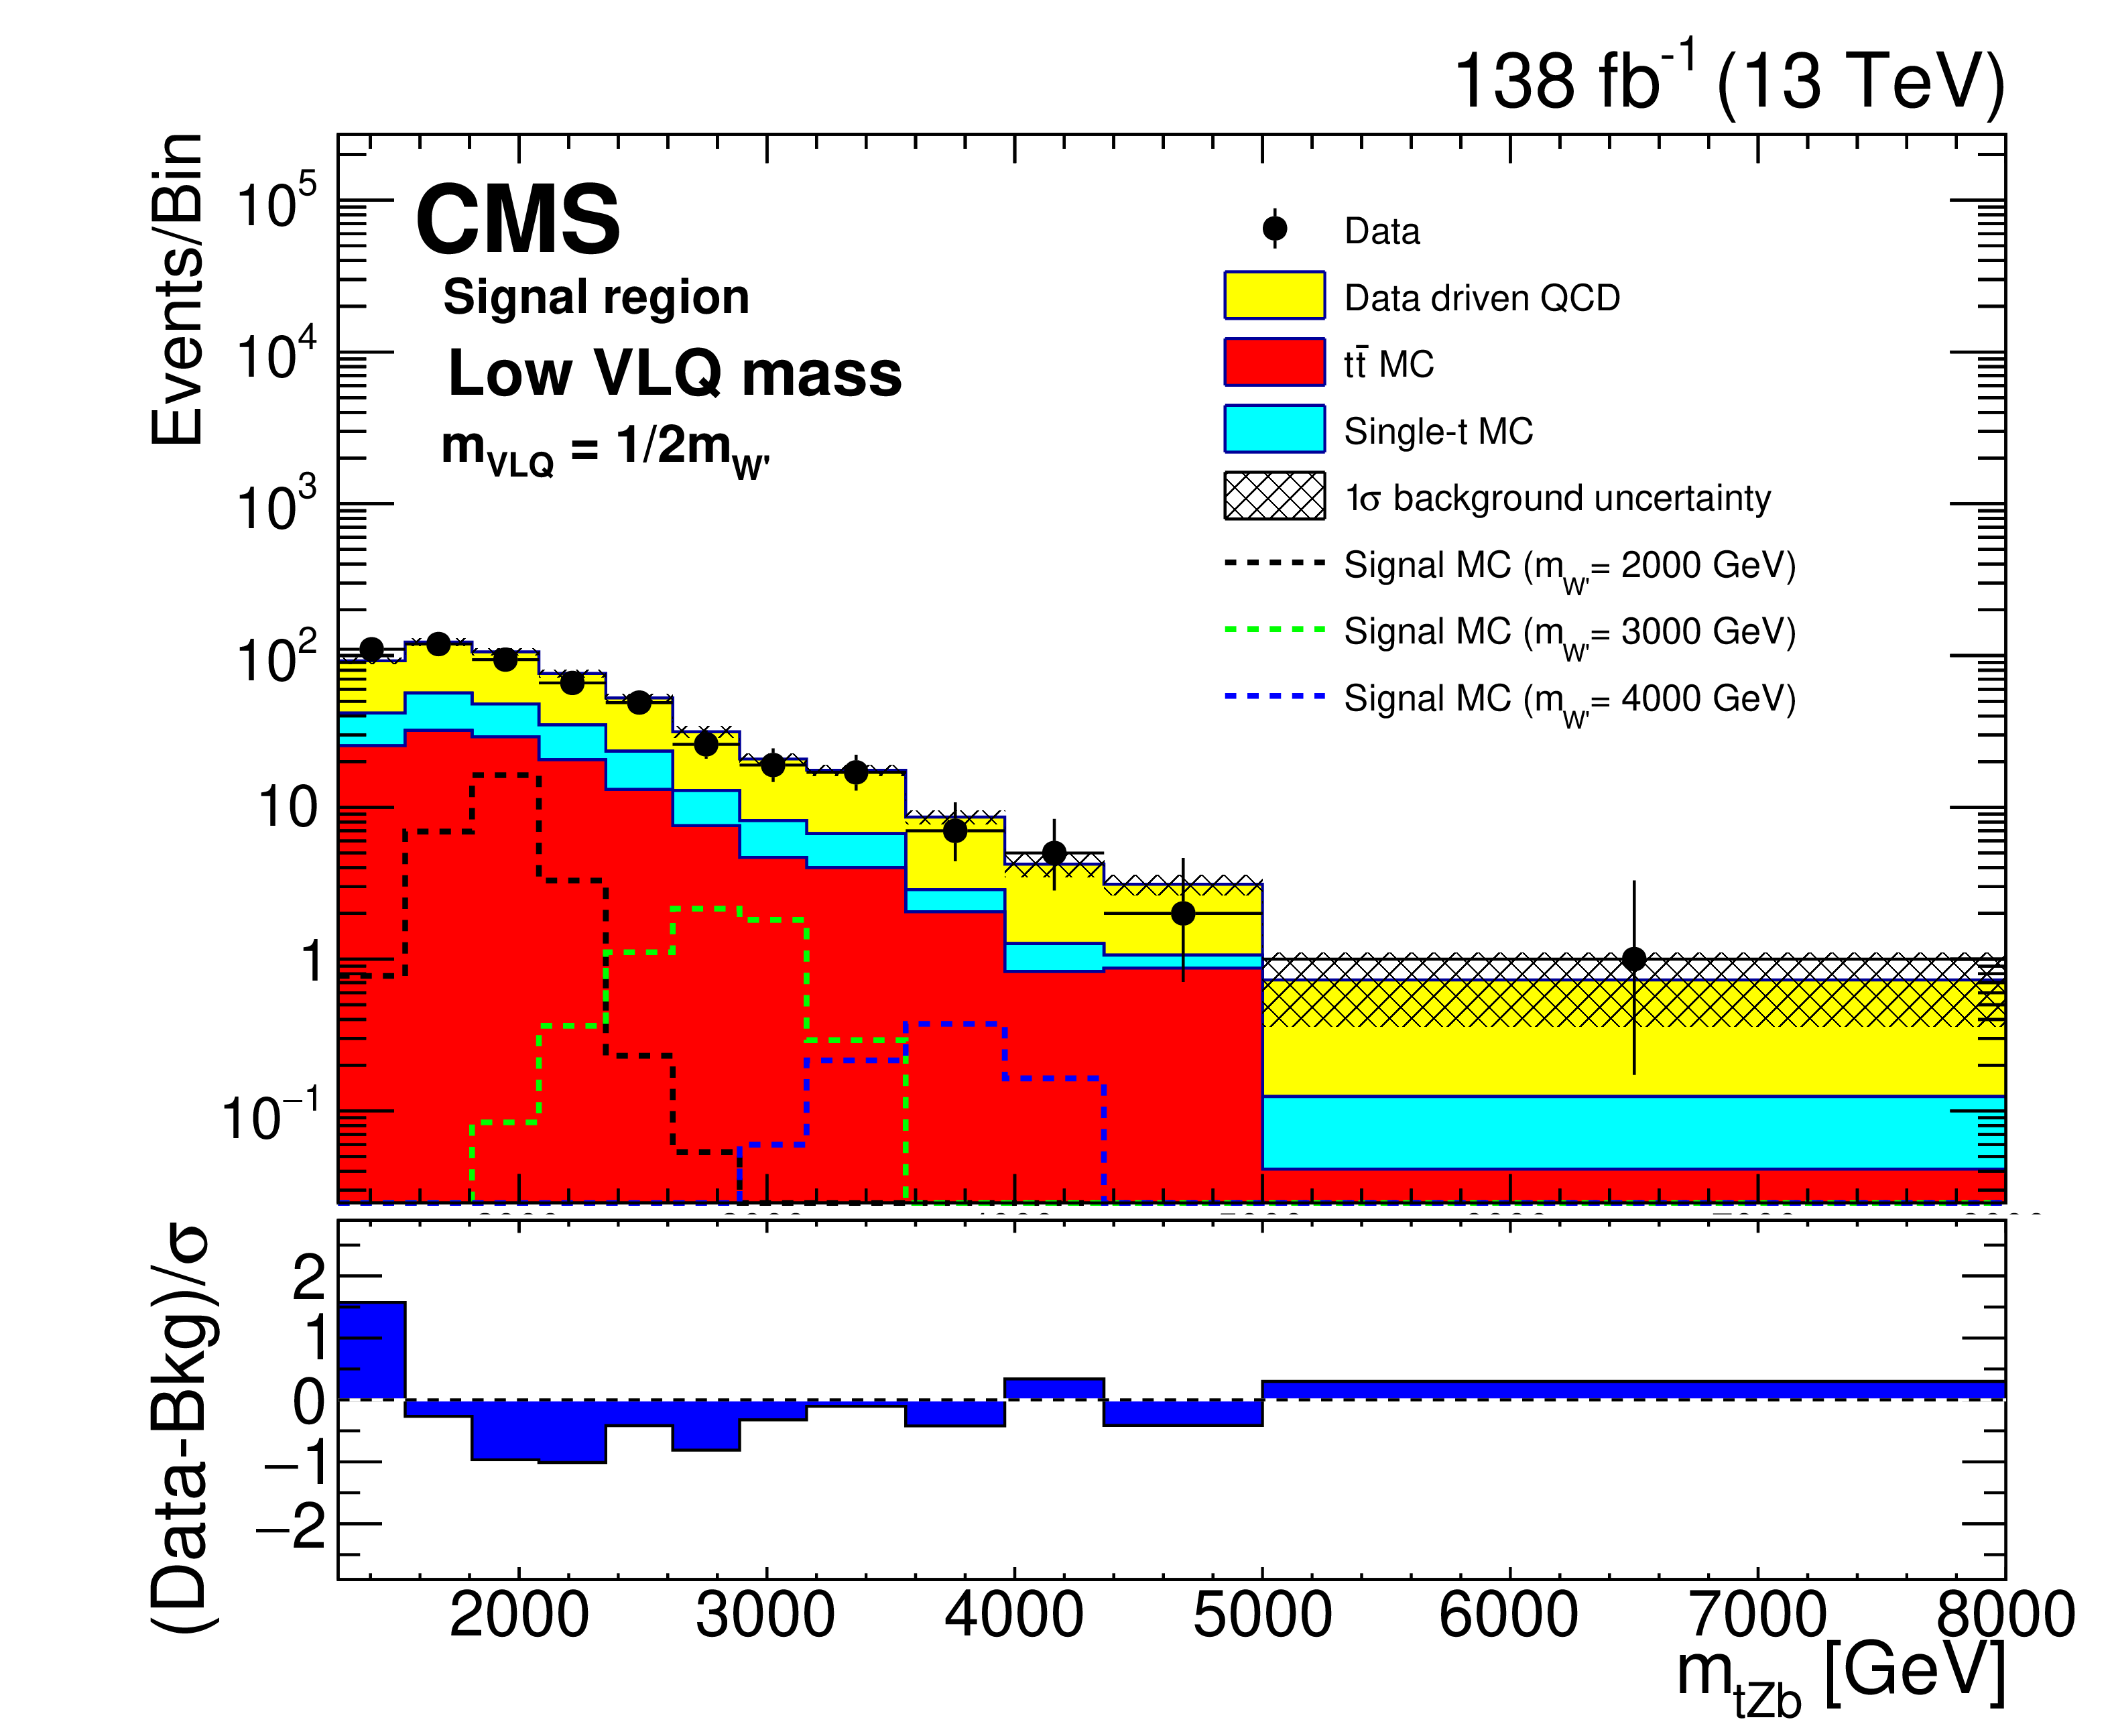
Reconstructed $m_{{\mathrm {W}'}}$ distributions (${m_{{\mathrm {t}} {\mathrm {H}} {\mathrm {b}}}}$ (upper), and ${m_{{\mathrm {t}} {\mathrm {Z}} {\mathrm {b}}}}$ (lower)) in the signal region with estimated backgrounds and signal for several W' boson mass hypotheses at the medium VLQ mass, after a background-only fit. The combined statistical and systematic uncertainty in the total estimated background is indicated by the hatched region. The lower panels show the difference between the number of events observed in the data and the predicted background, divided by the total uncertainty in the background and the statistical uncertainty in the data added in quadrature. |

png pdf |
Figure 6-a:
Reconstructed $m_{{\mathrm {W}'}}$ distributions (${m_{{\mathrm {t}} {\mathrm {H}} {\mathrm {b}}}}$) in the signal region with estimated backgrounds and signal for several W' boson mass hypotheses at the medium VLQ mass, after a background-only fit. The combined statistical and systematic uncertainty in the total estimated background is indicated by the hatched region. The lower panel shows the difference between the number of events observed in the data and the predicted background, divided by the total uncertainty in the background and the statistical uncertainty in the data added in quadrature. |

png pdf |
Figure 6-b:
Reconstructed $m_{{\mathrm {W}'}}$ distributions (${m_{{\mathrm {t}} {\mathrm {Z}} {\mathrm {b}}}}$) in the signal region with estimated backgrounds and signal for several W' boson mass hypotheses at the medium VLQ mass, after a background-only fit. The combined statistical and systematic uncertainty in the total estimated background is indicated by the hatched region. The lower panel shows the difference between the number of events observed in the data and the predicted background, divided by the total uncertainty in the background and the statistical uncertainty in the data added in quadrature. |
png pdf |
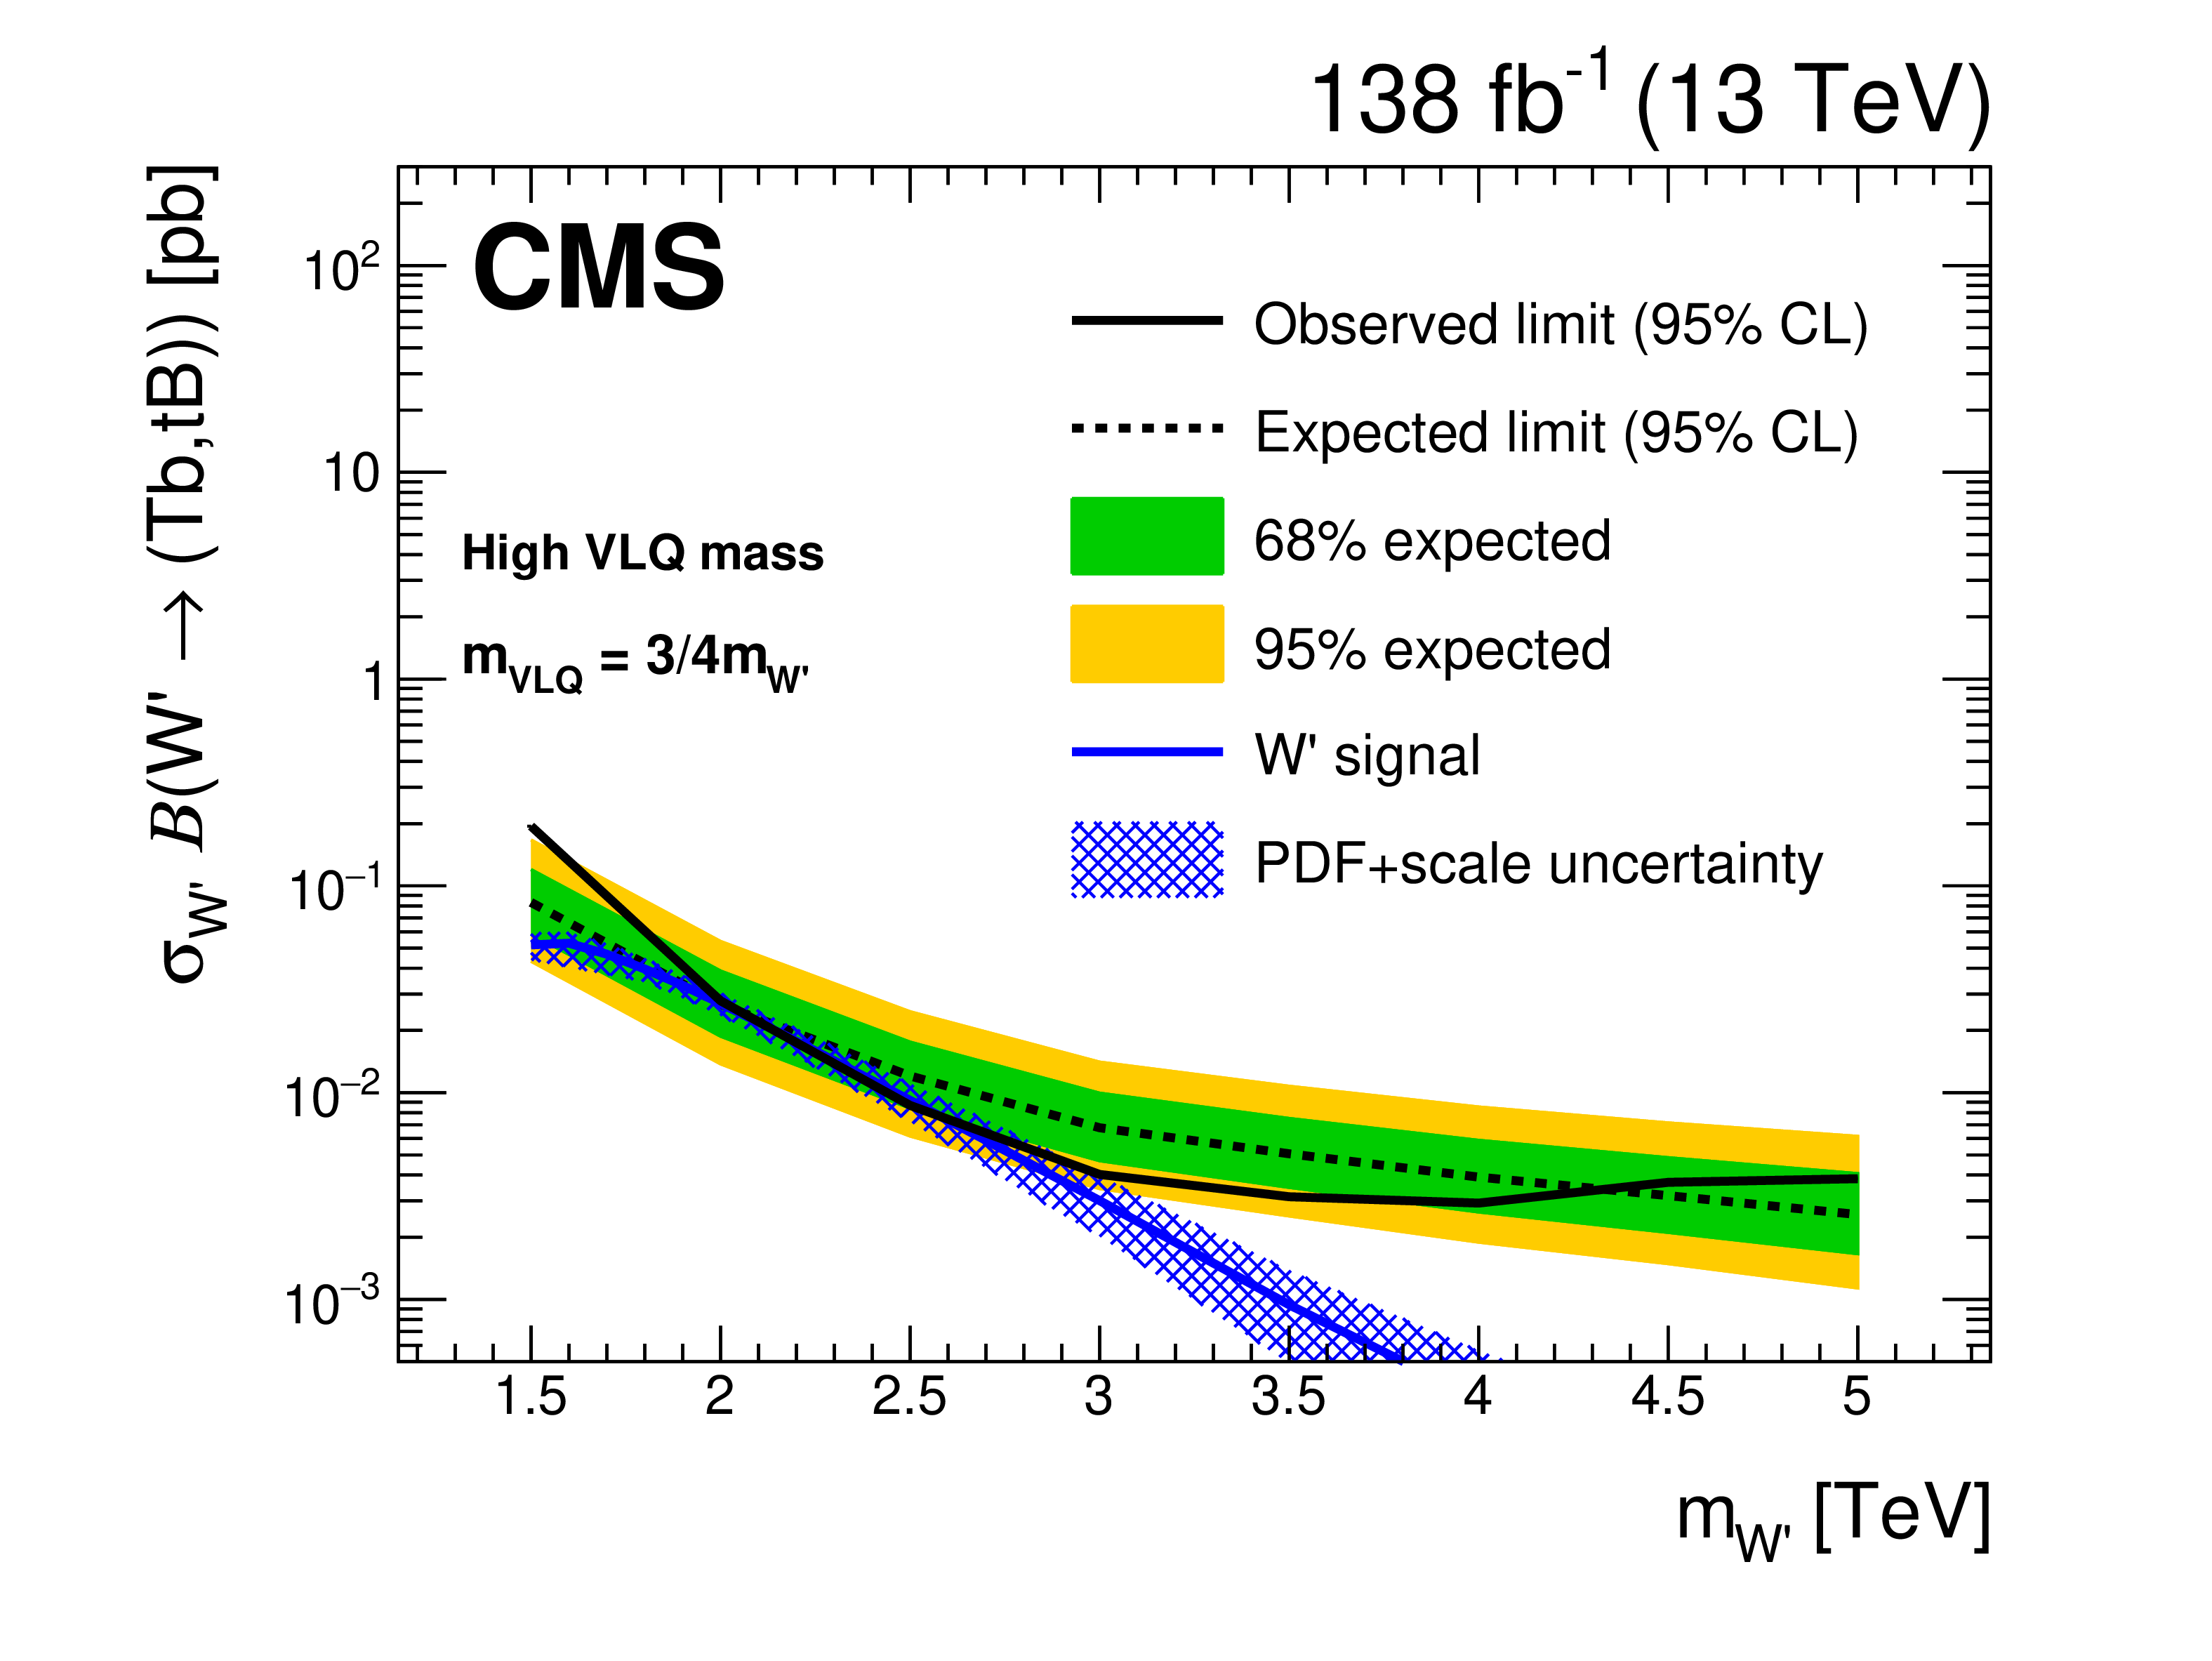
Figure 7:
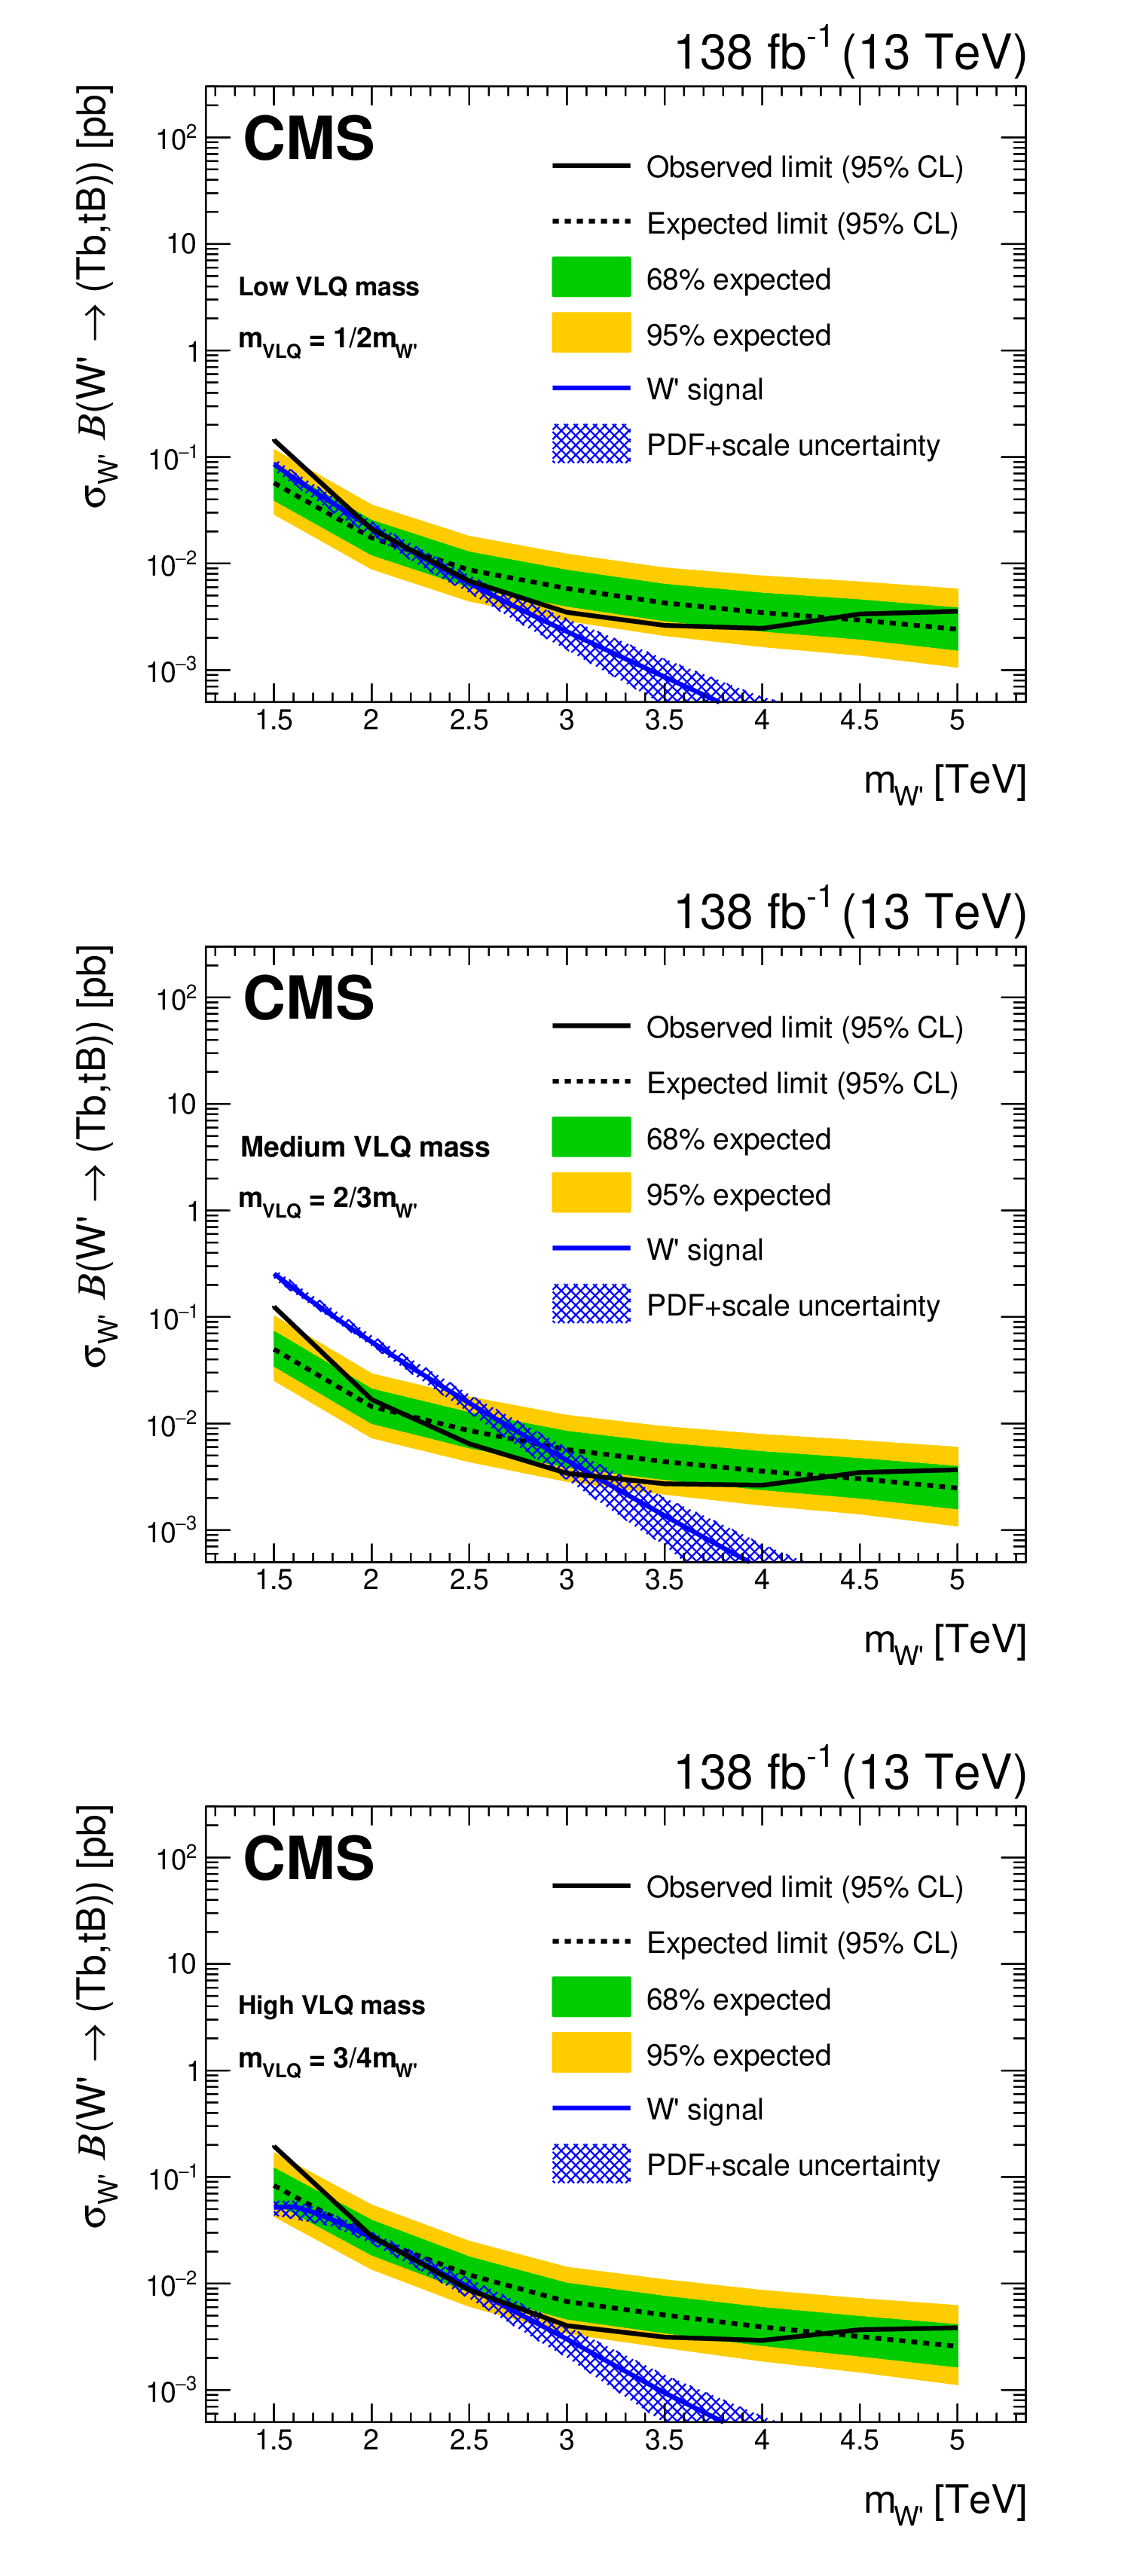
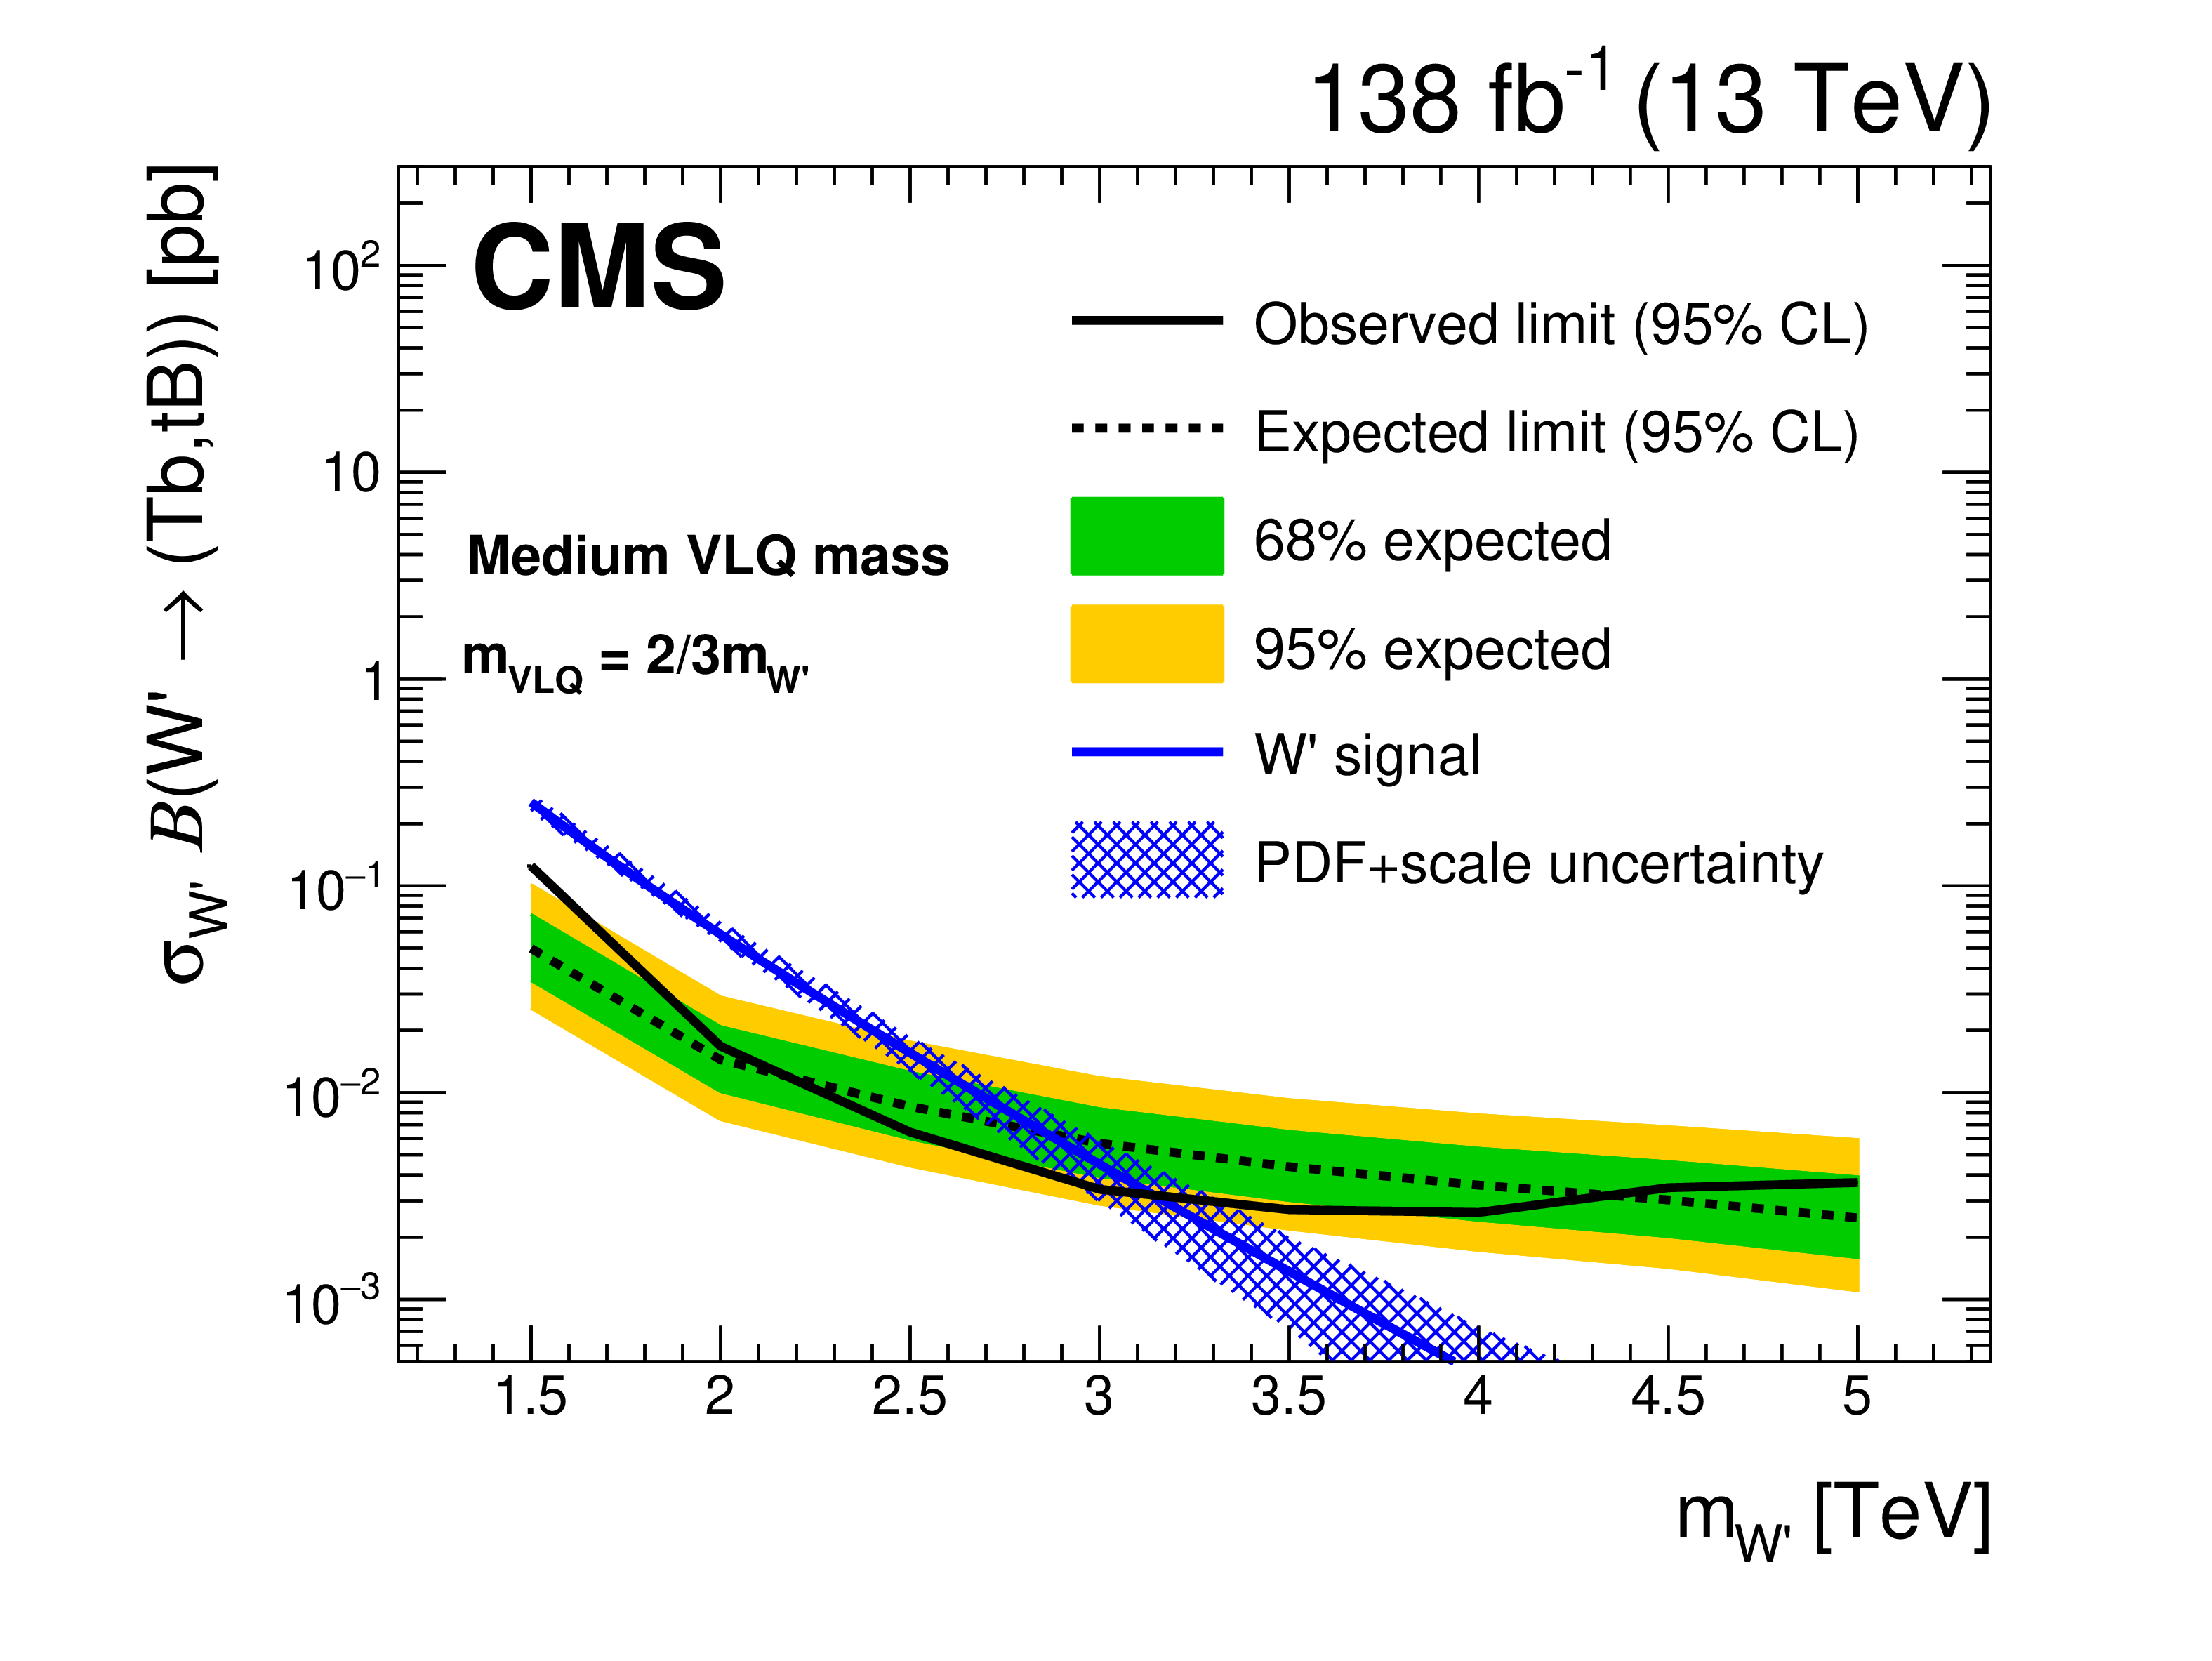
The W' boson 95% CL limits on the product of cross section and branching fraction. The expected (dashed) and observed (solid) limits, as well as the W' boson theoretical cross section, with its PDF and scale normalization uncertainties, are shown. The green (inner) and yellow (outer) bands indicate the 68% and 95% confidence intervals of the expected limit. The limits are given for the low (upper), medium (center), and high (lower) VLQ mass ranges. |

png pdf |
Figure 7-a:
The W' boson 95% CL limits on the product of cross section and branching fraction. The expected (dashed) and observed (solid) limits, as well as the W' boson theoretical cross section, with its PDF and scale normalization uncertainties, are shown. The green (inner) and yellow (outer) bands indicate the 68% and 95% confidence intervals of the expected limit. The limits are given for the low VLQ mass range. |
png pdf |
Figure 7-b:
The W' boson 95% CL limits on the product of cross section and branching fraction. The expected (dashed) and observed (solid) limits, as well as the W' boson theoretical cross section, with its PDF and scale normalization uncertainties, are shown. The green (inner) and yellow (outer) bands indicate the 68% and 95% confidence intervals of the expected limit. The limits are given for the medium VLQ mass range. |
png pdf |
Figure 7-c:
The W' boson 95% CL limits on the product of cross section and branching fraction. The expected (dashed) and observed (solid) limits, as well as the W' boson theoretical cross section, with its PDF and scale normalization uncertainties, are shown. The green (inner) and yellow (outer) bands indicate the 68% and 95% confidence intervals of the expected limit. The limits are given for the high VLQ mass range. |
png pdf |
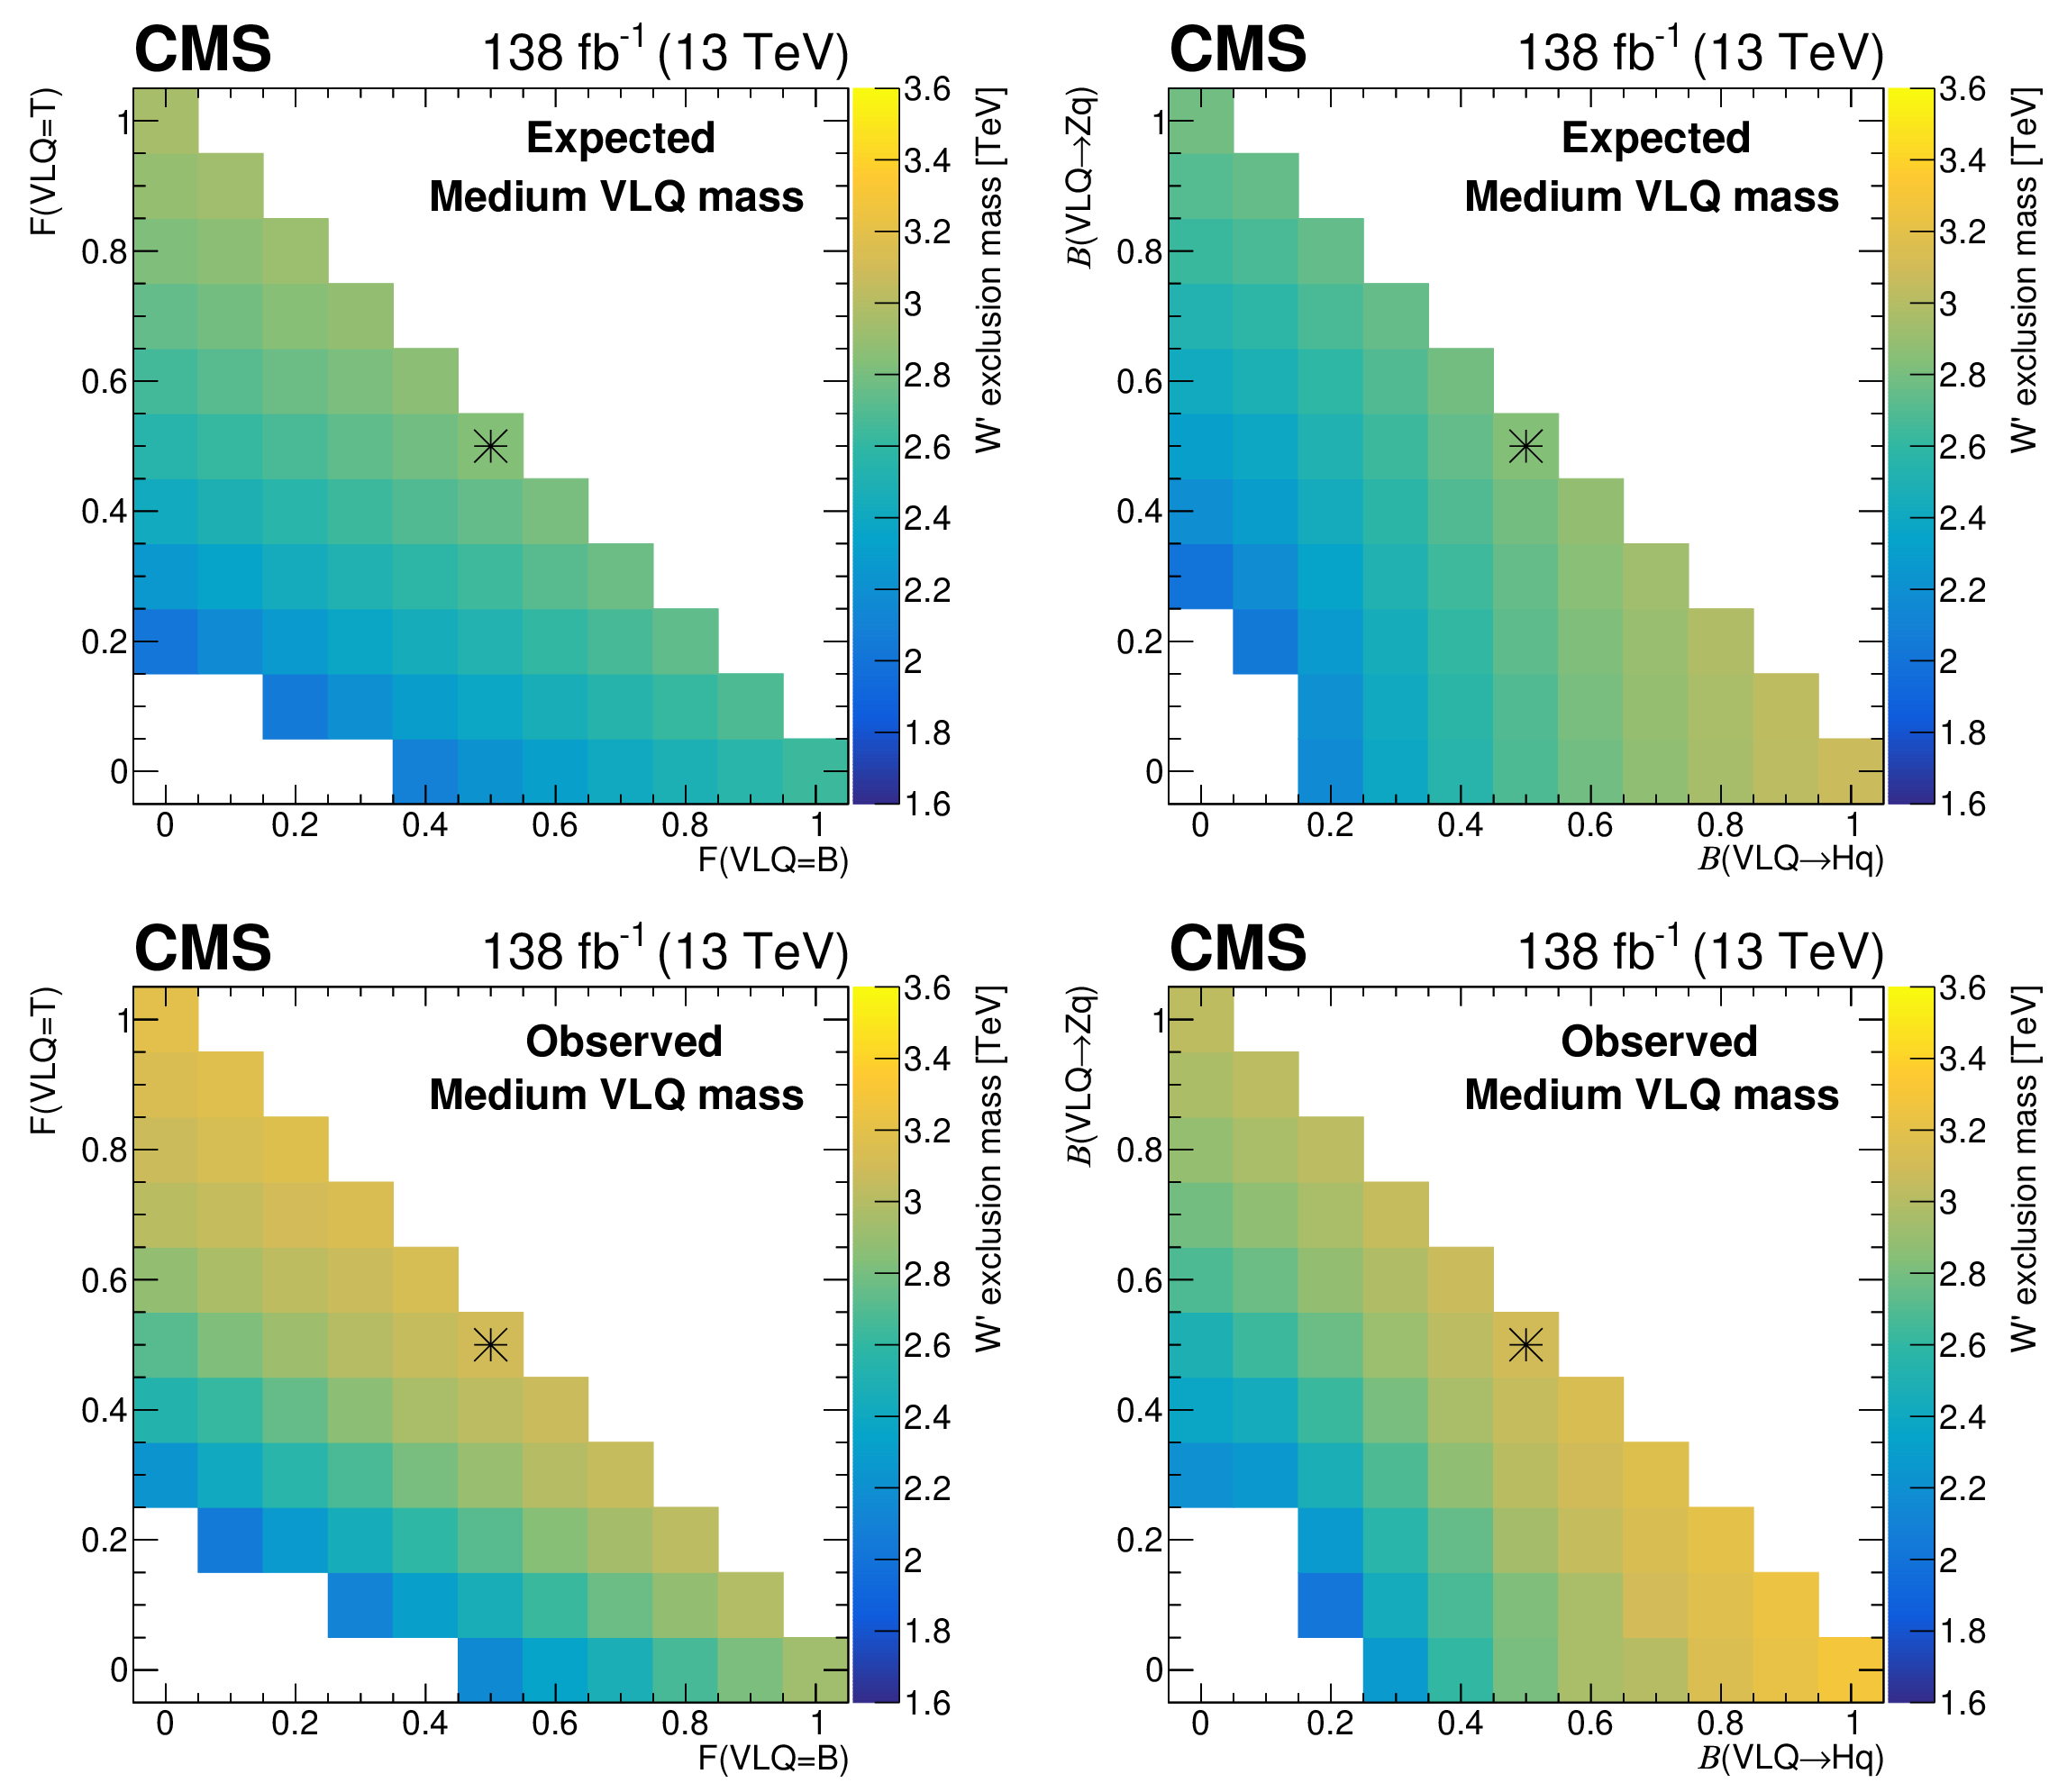
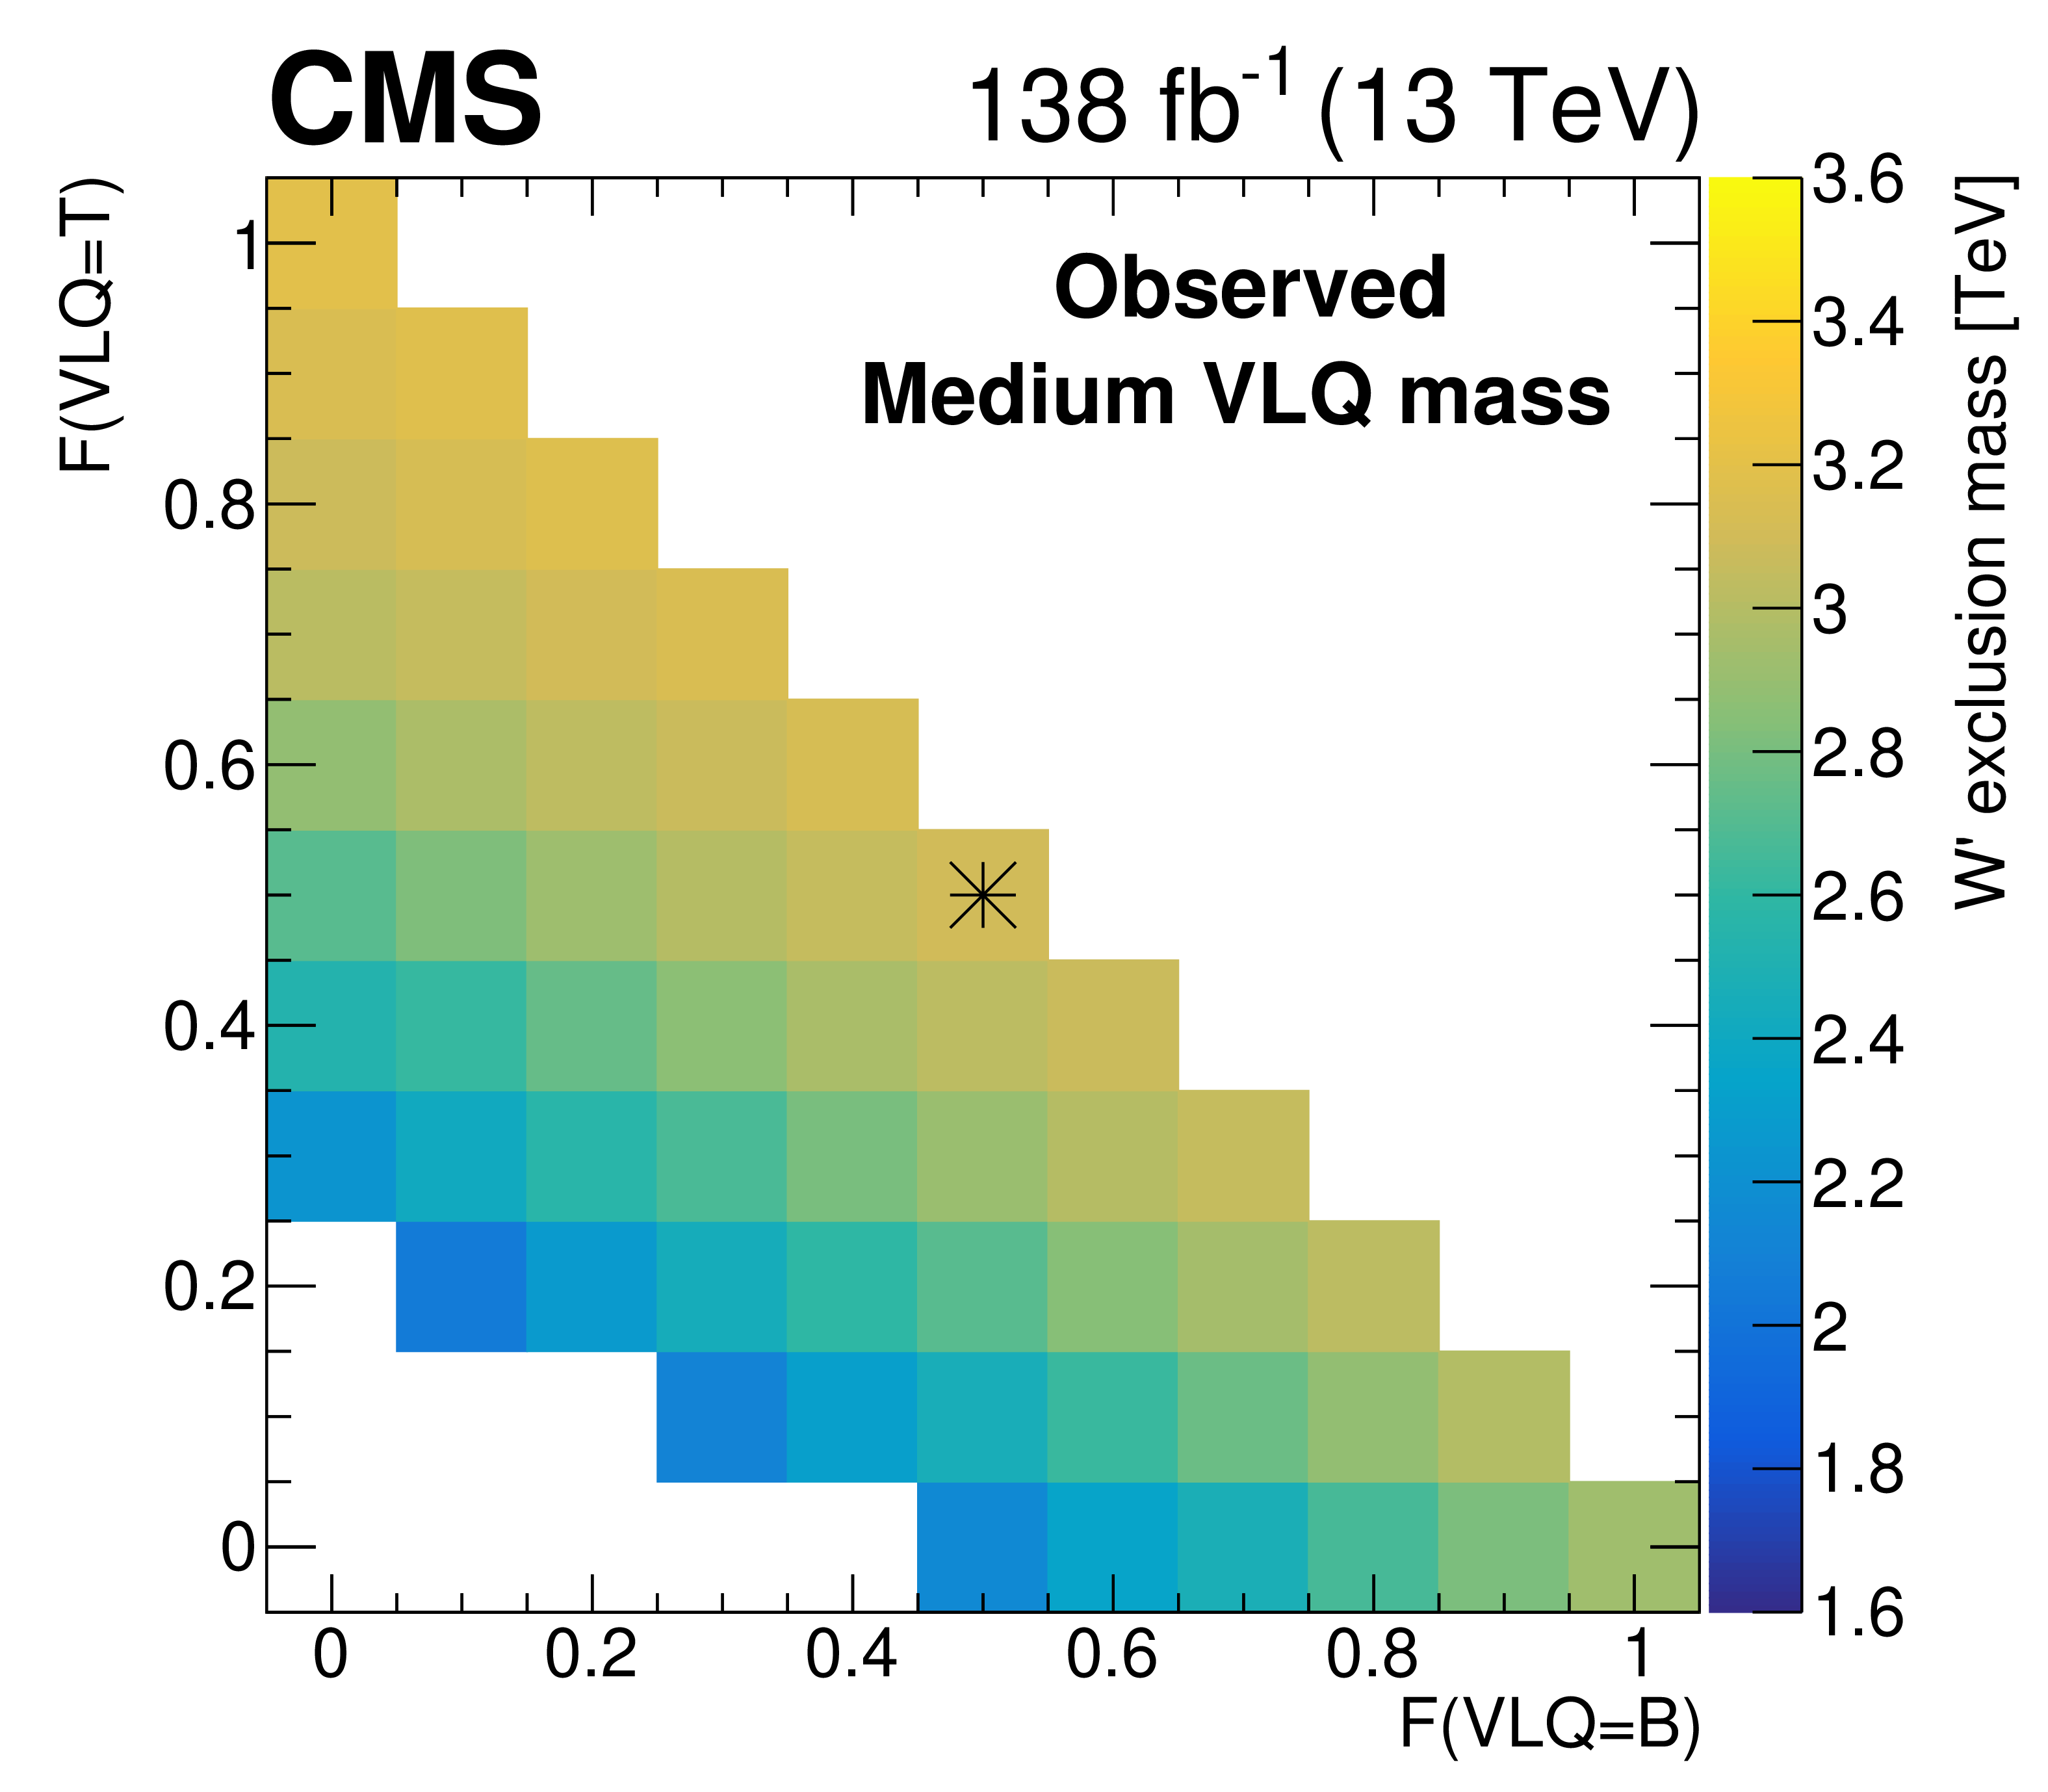
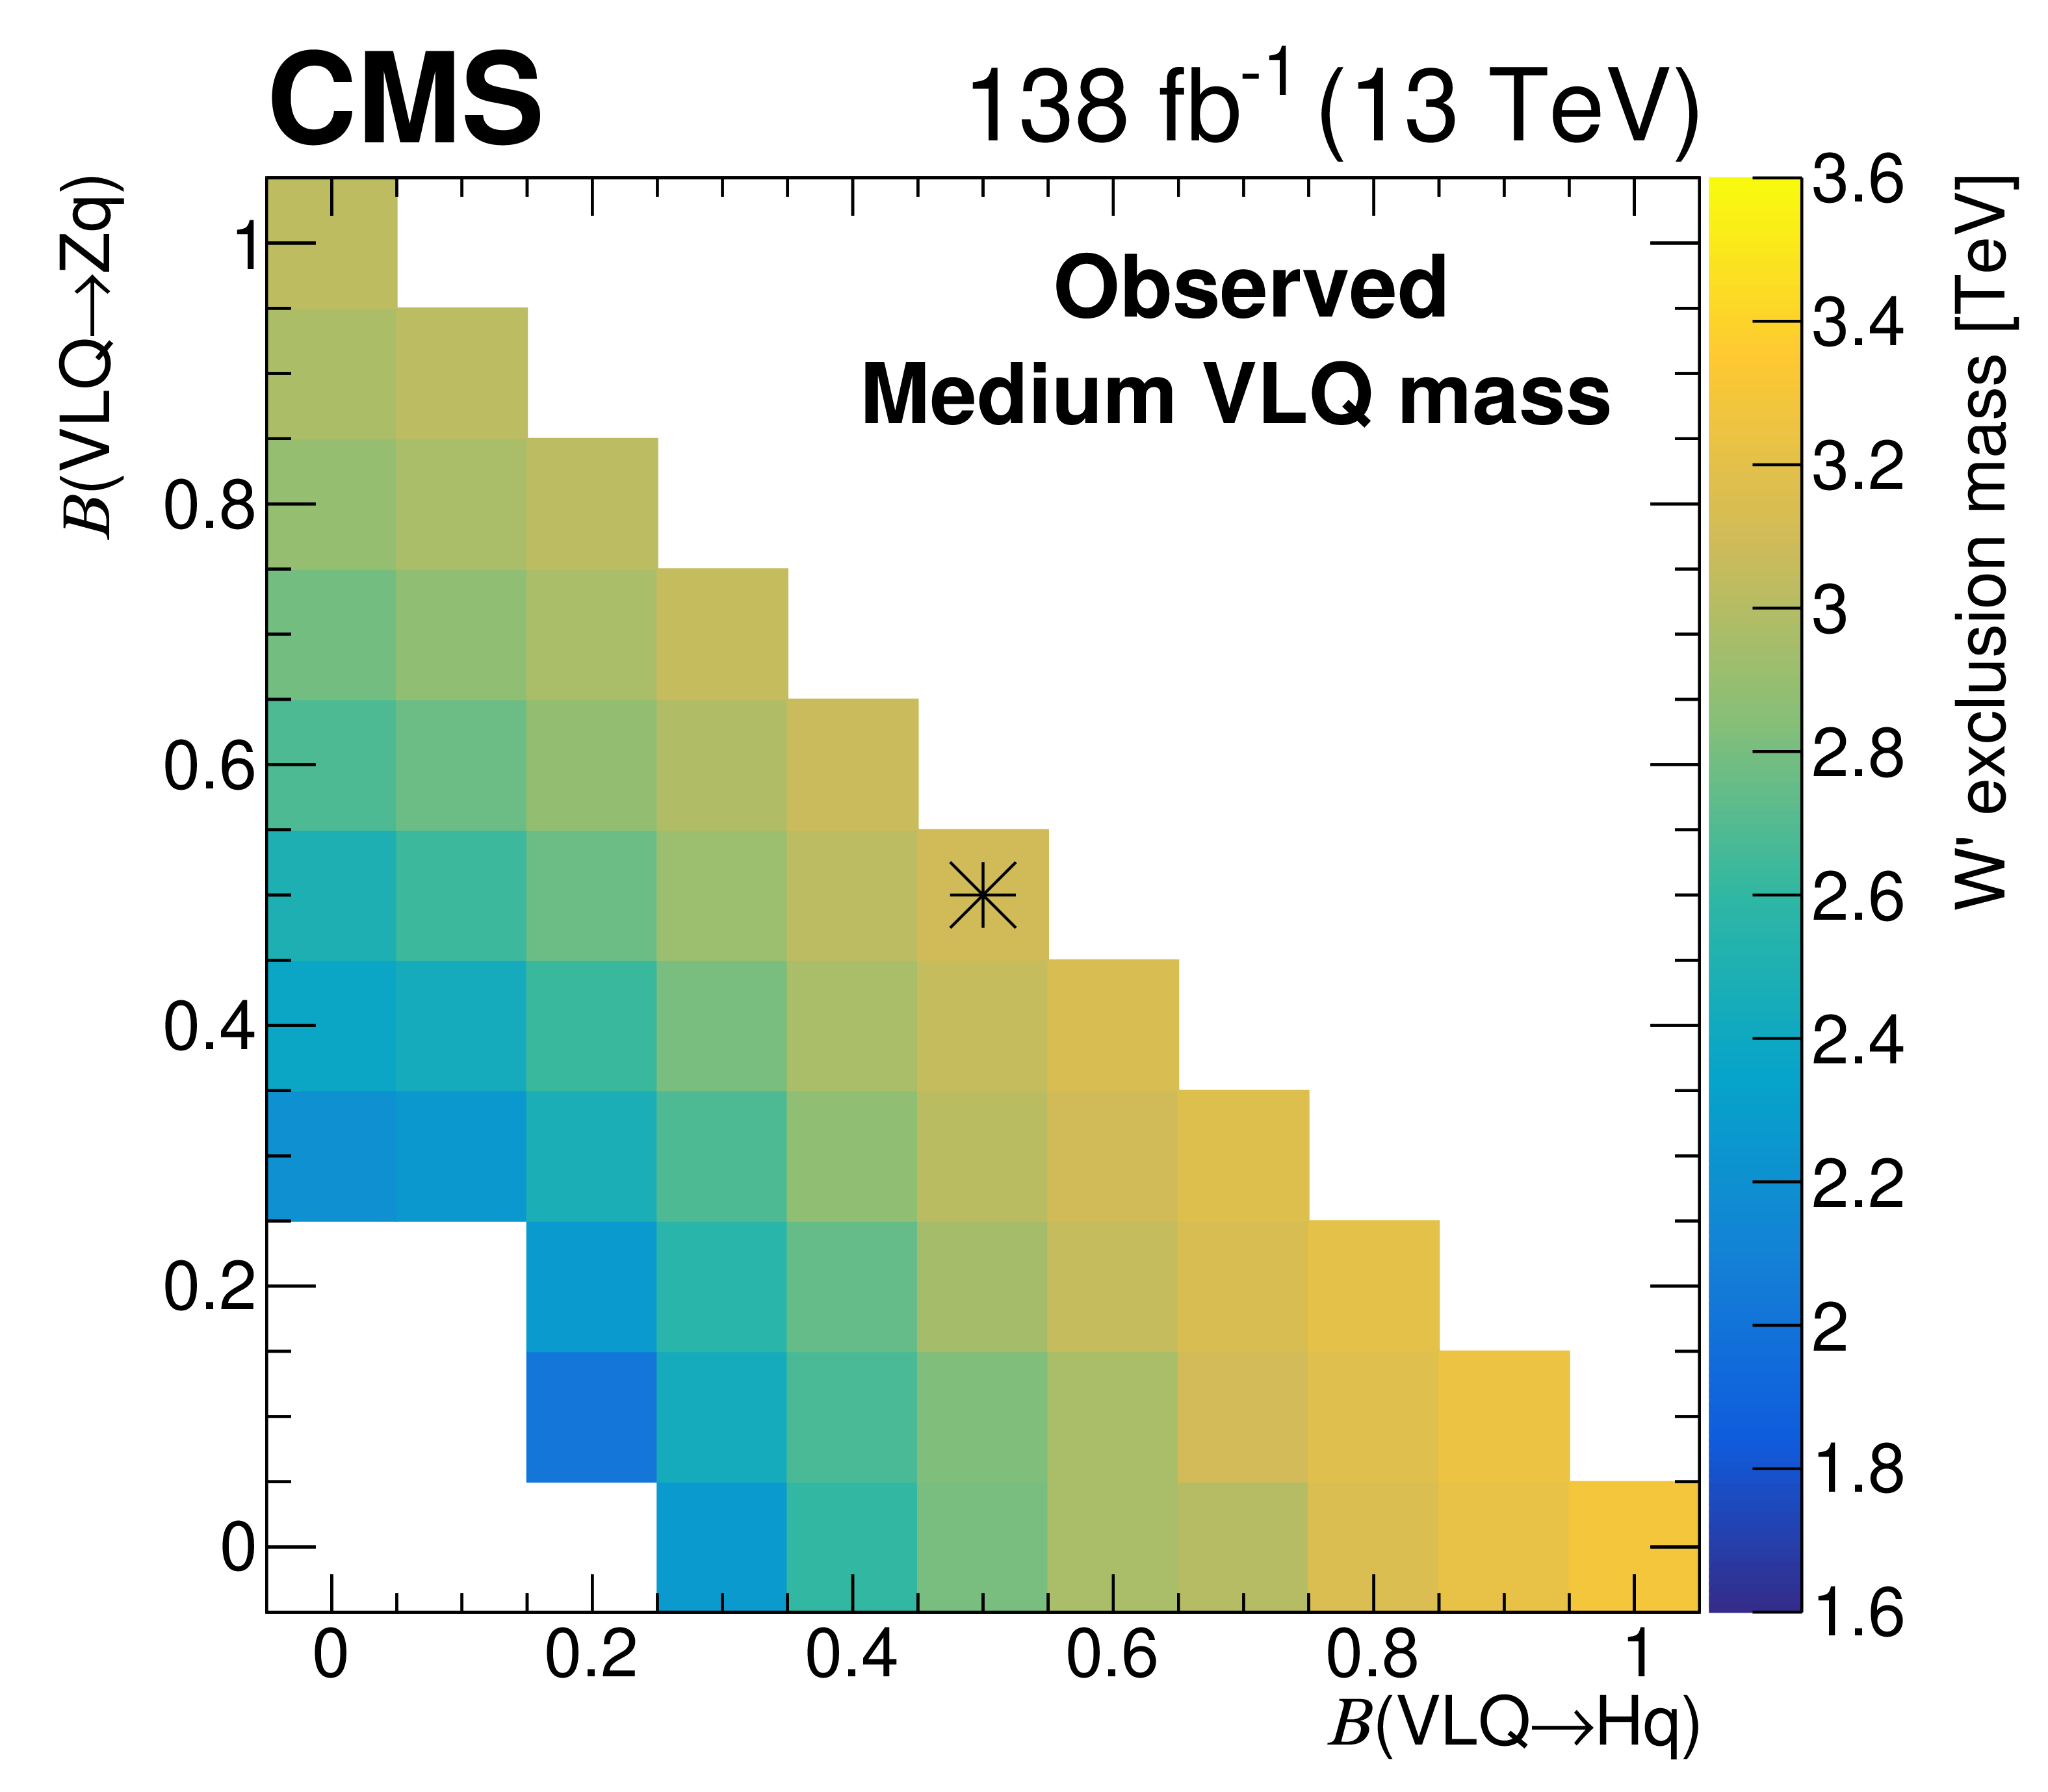
Figure 8:
Expected (upper) and observed (lower) 95% CL limits for generalized hypotheses varying the fraction of tB (F(VLQ= B) and bT (F(VLQ= T)) from the W' decay (left), and the VLQ branching fraction to qH and qZ (right). The asterisk marker signifies the branching fractions for the benchmark model |
png pdf |
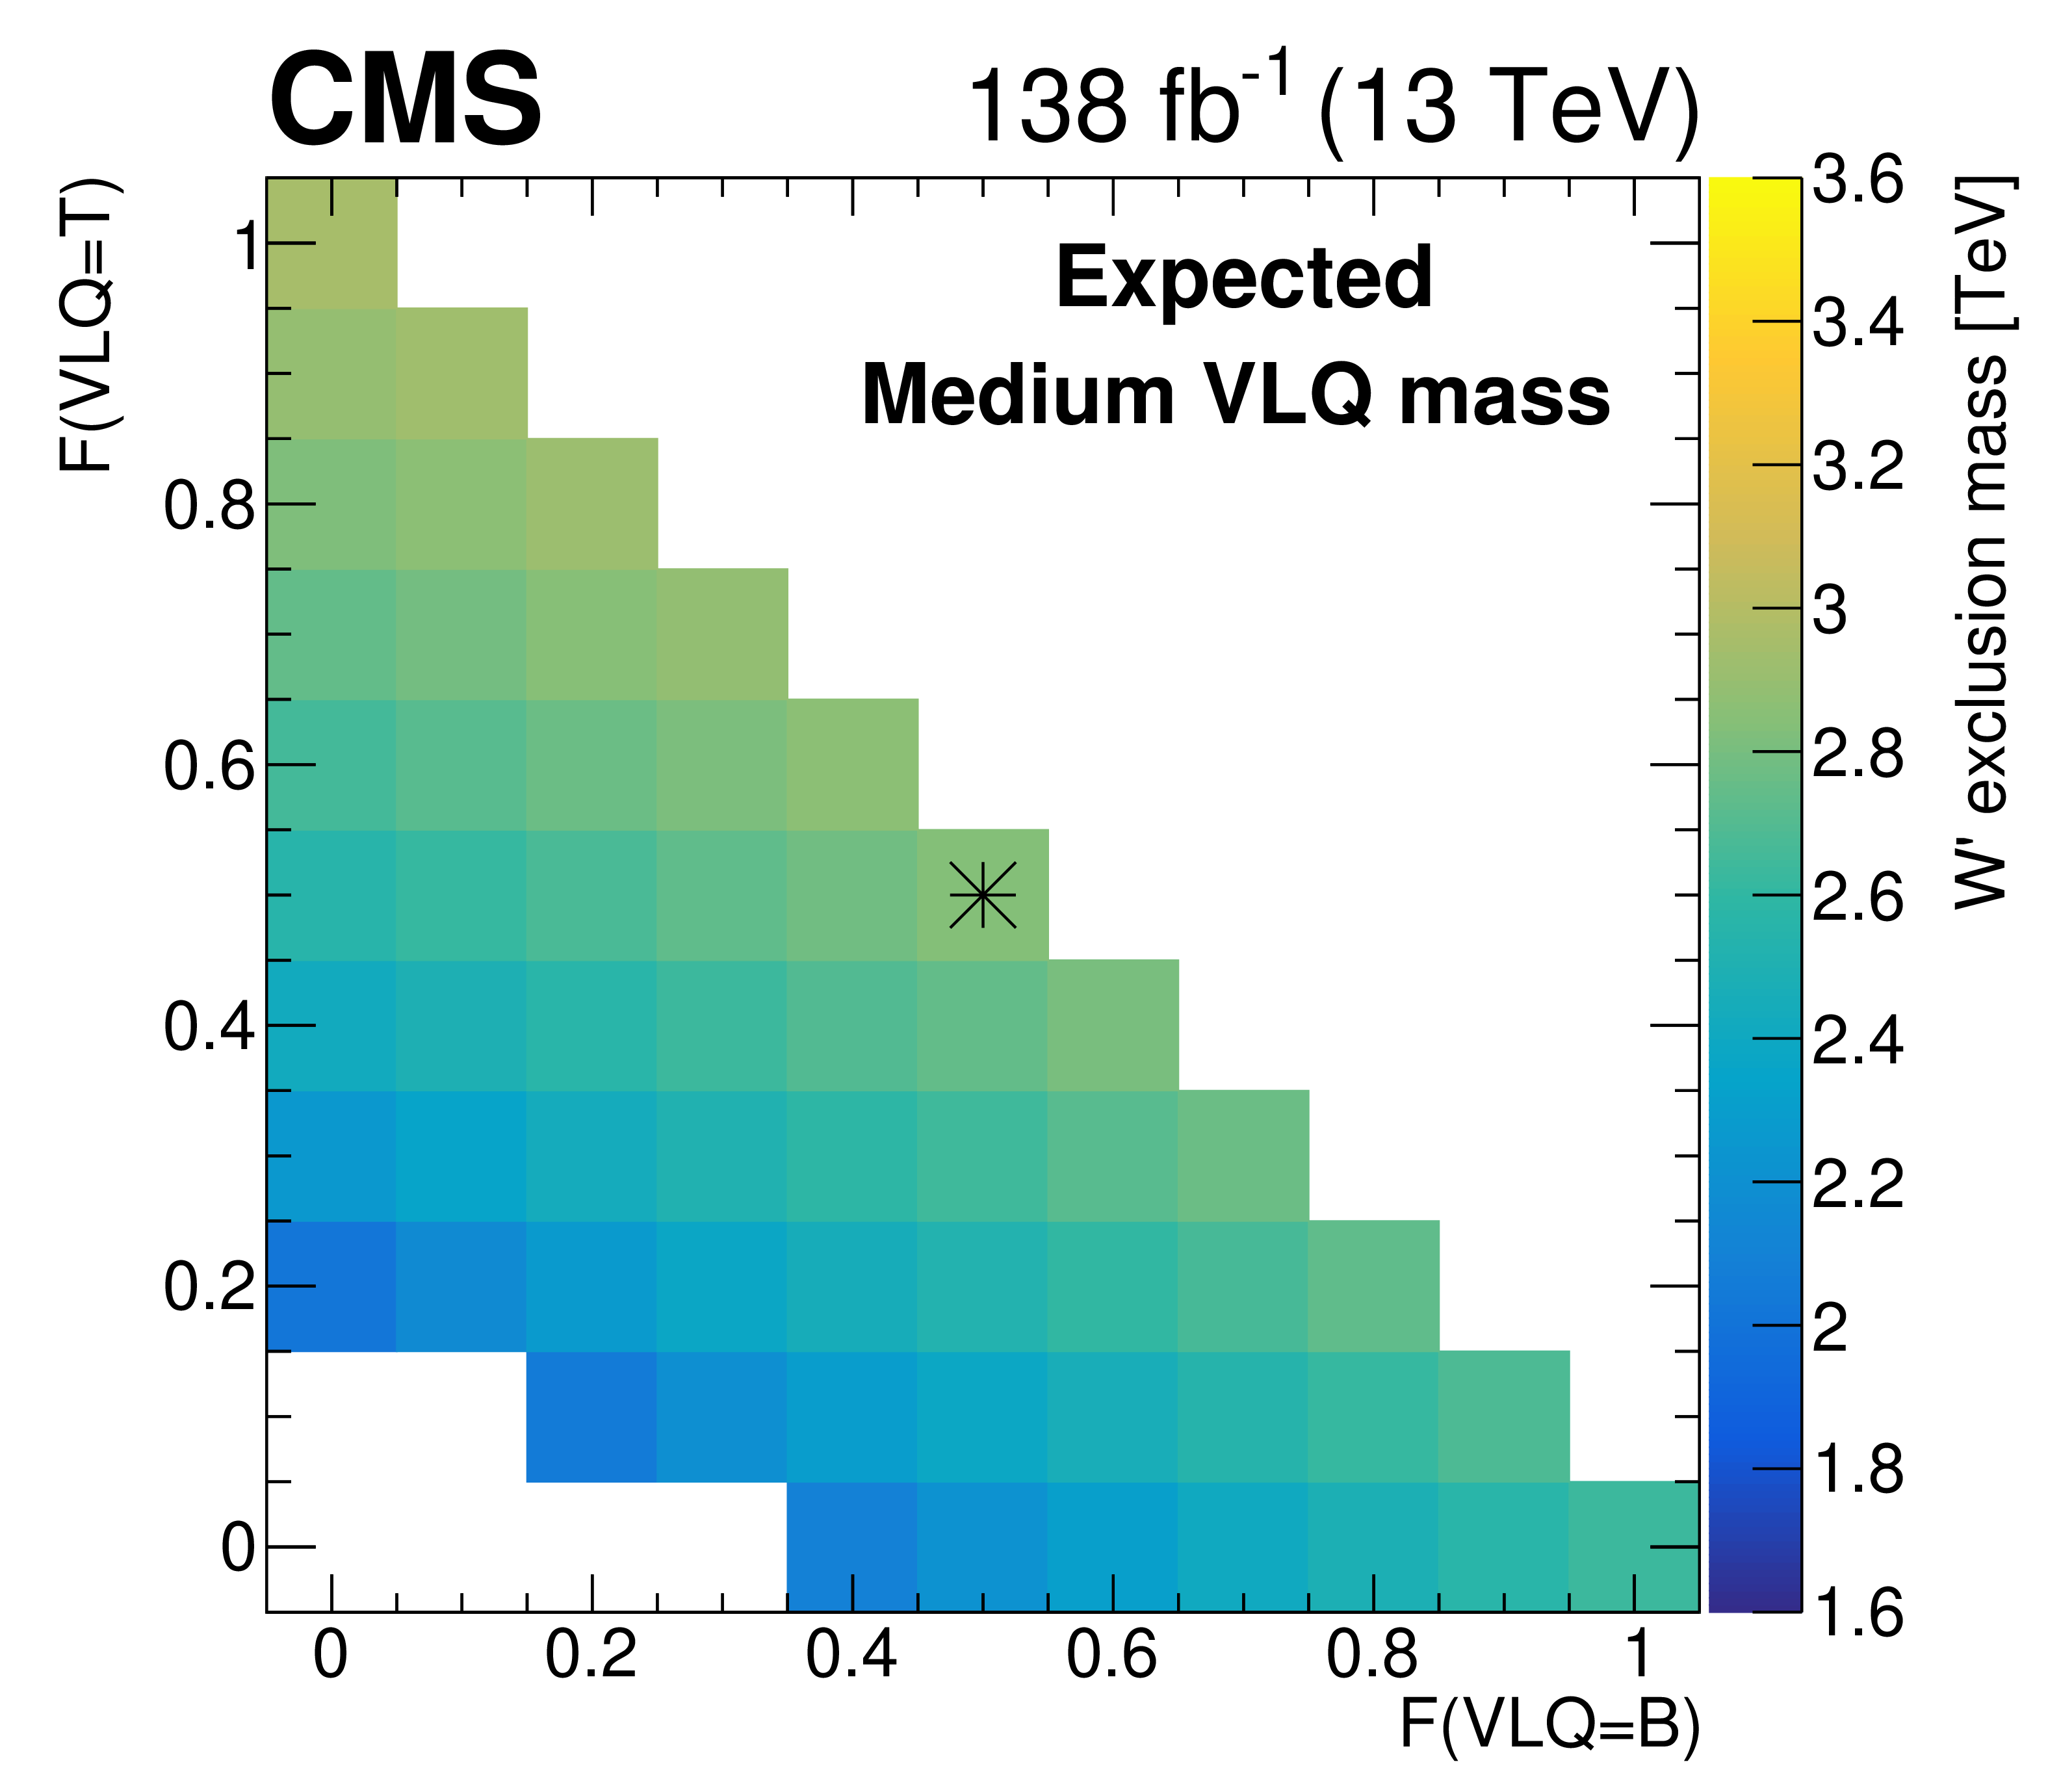
Figure 8-a:
Expected 95% CL limits for generalized hypotheses varying the fraction of tB (F(VLQ= B) and bT (F(VLQ= T)) from the W' decay. The asterisk marker signifies the branching fractions for the benchmark model |
png pdf |
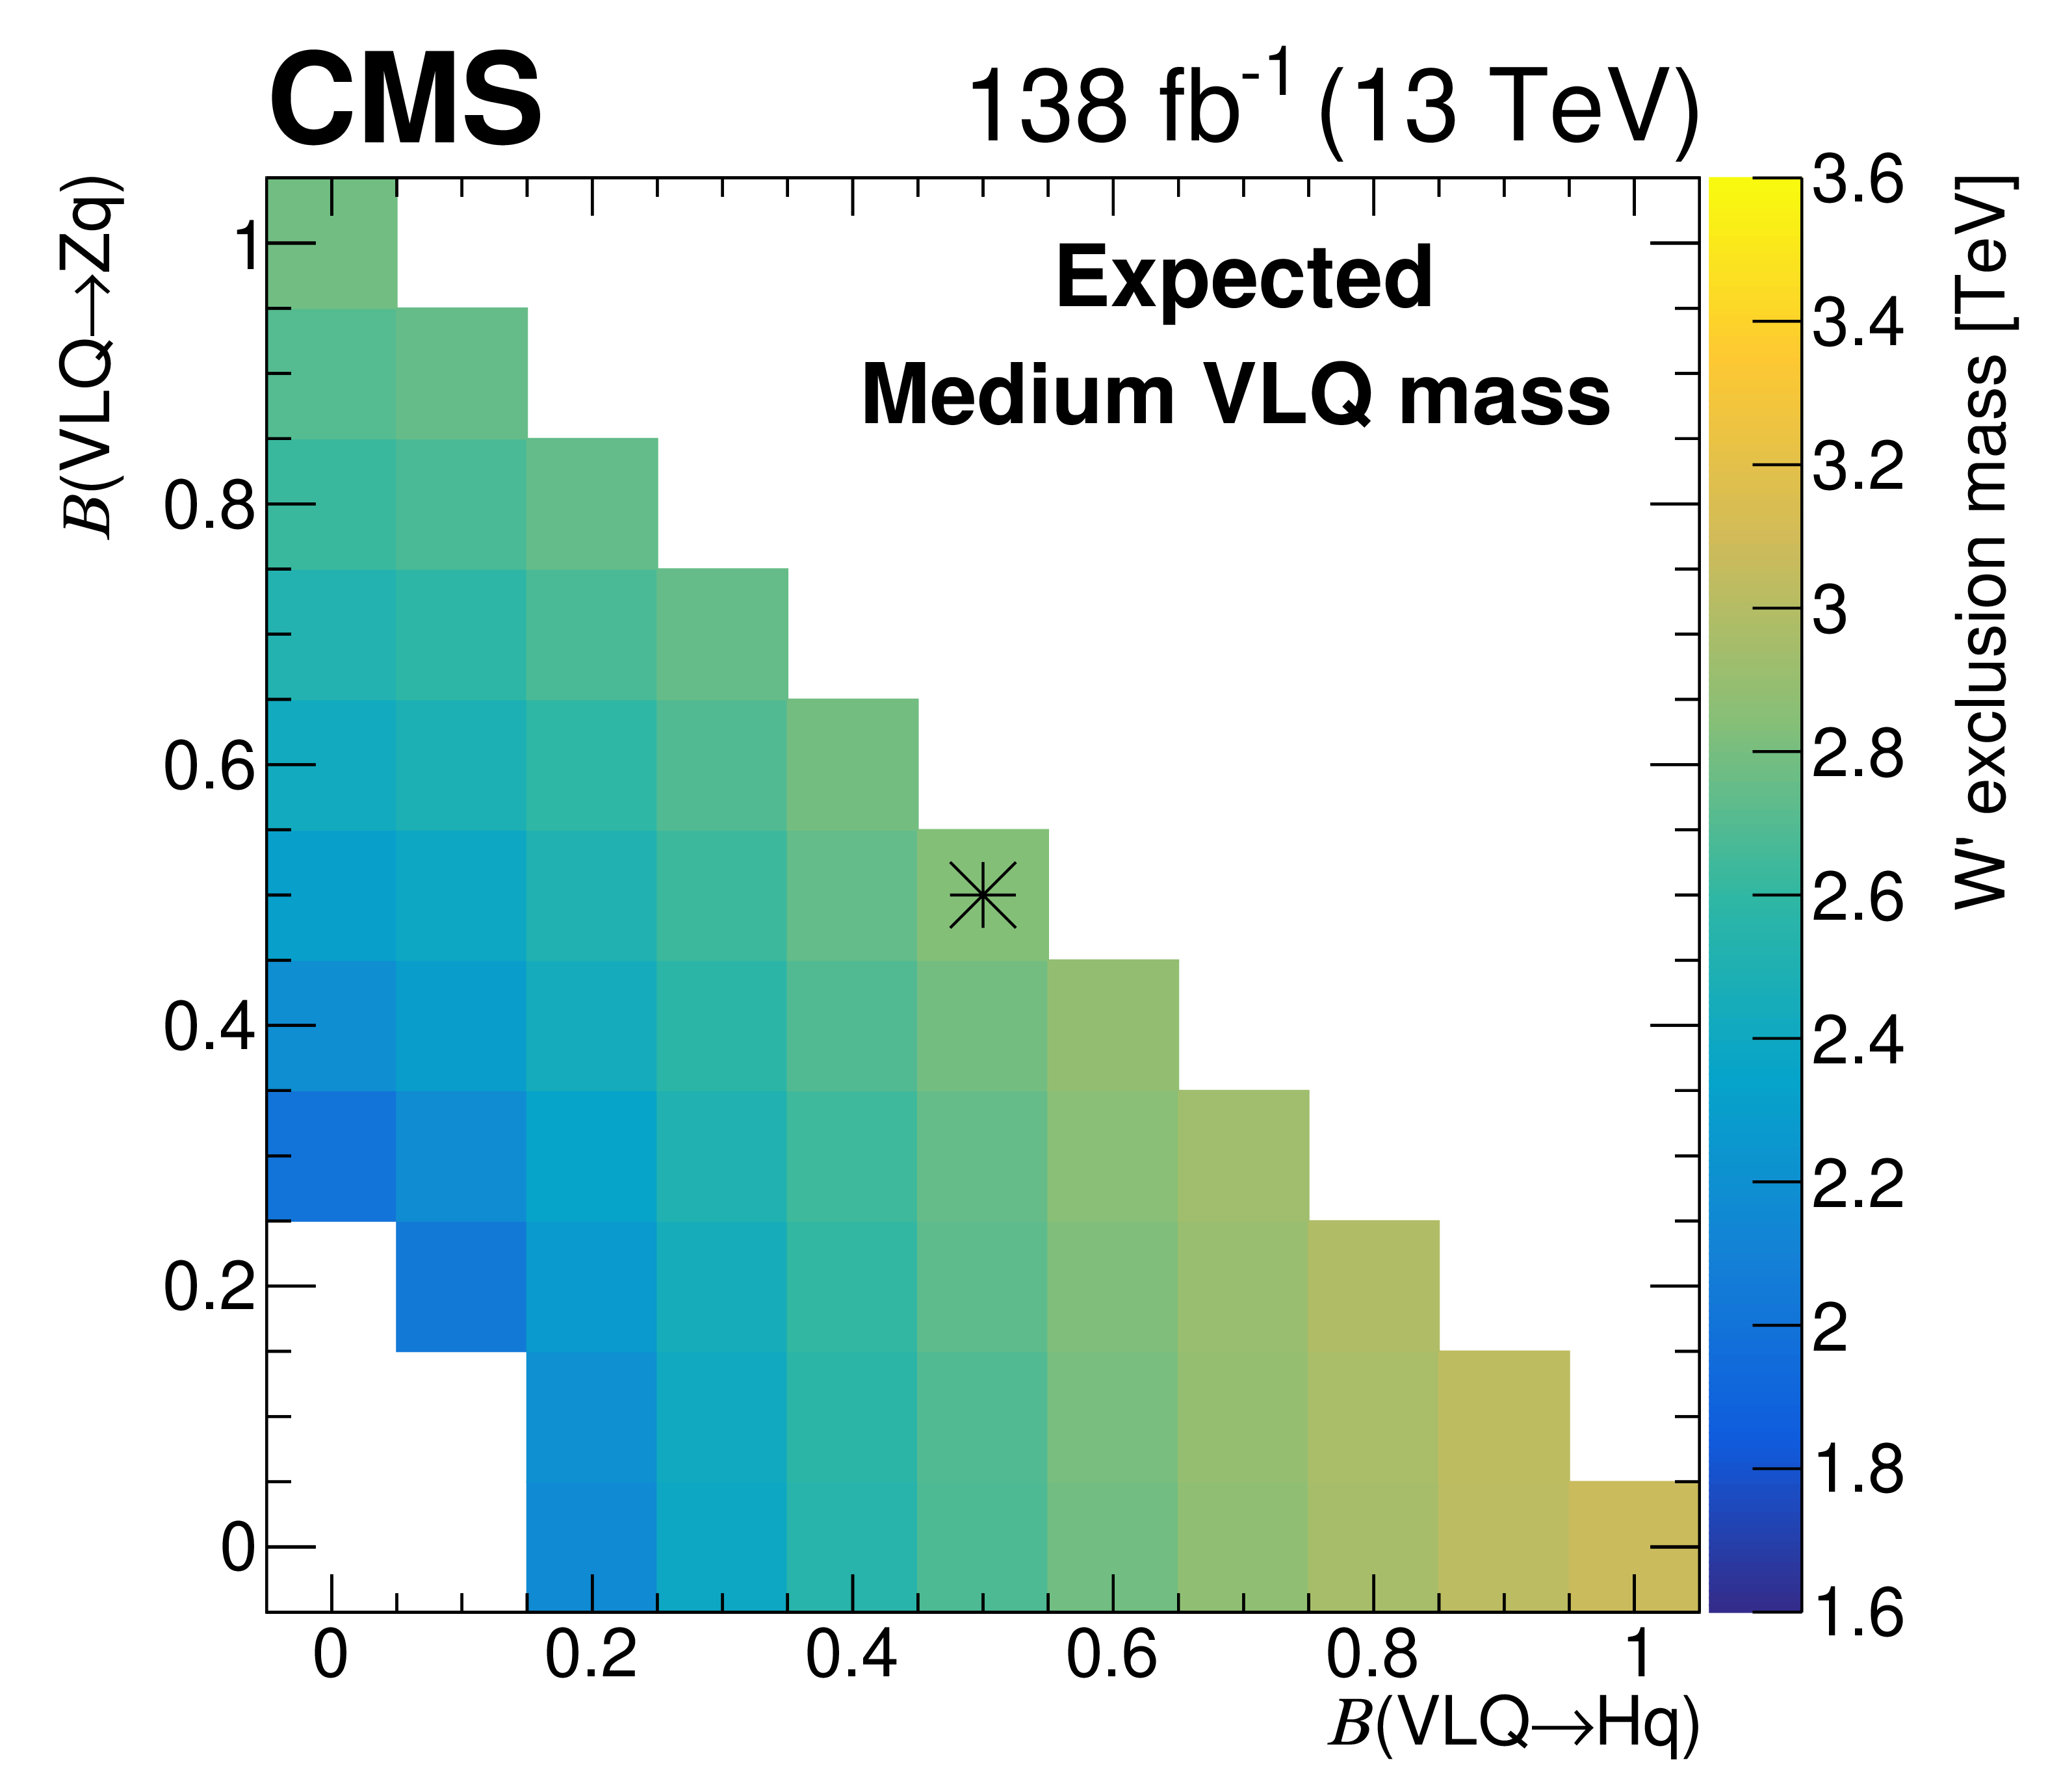
Figure 8-b:
Expected 95% CL limits for generalized hypotheses varying the fraction of tB (F(VLQ= B) and bT (F(VLQ= T)) from the VLQ branching fraction to qH and qZ. The asterisk marker signifies the branching fractions for the benchmark model |
png pdf |
Figure 8-c:
Observed 95% CL limits for generalized hypotheses varying the fraction of tB (F(VLQ= B) and bT (F(VLQ= T)) from the W' decay. The asterisk marker signifies the branching fractions for the benchmark model |
png pdf |
Figure 8-d:
Observed 95% CL limits for generalized hypotheses varying the fraction of tB (F(VLQ= B) and bT (F(VLQ= T)) from the VLQ branching fraction to qH and qZ. The asterisk marker signifies the branching fractions for the benchmark model |
| Tables | |
png pdf |
Table 1:
Selection regions used for signal identification and background estimation. The AK8 jet discriminant and mass selections are explicitly defined here for the t, Higgs, and Z jet tags. |
png pdf |
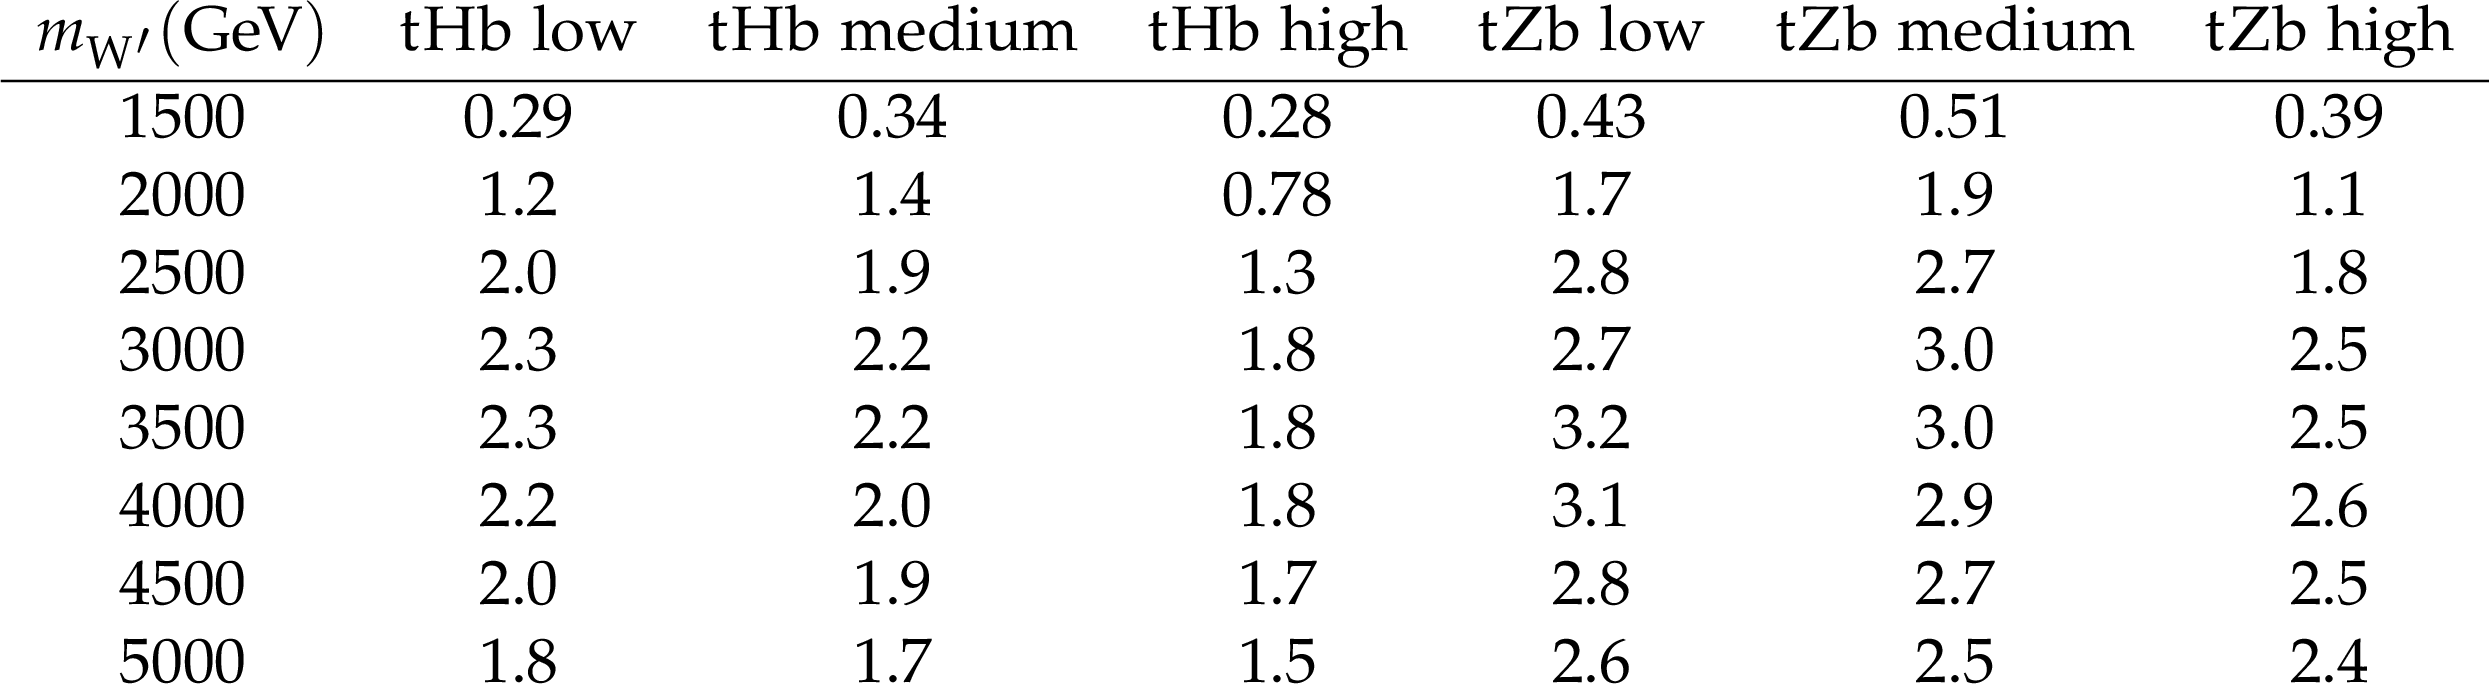
Table 2:
The signal efficiency (in percent) for the three VLQ mass ranges considered. The efficiency is given for the ${{\mathrm {t}} {\mathrm {H}} {\mathrm {b}}}$ and ${{\mathrm {t}} {\mathrm {Z}} {\mathrm {b}}}$ final states, separated into the low, medium, and high VLQ mass categories. |
png pdf |
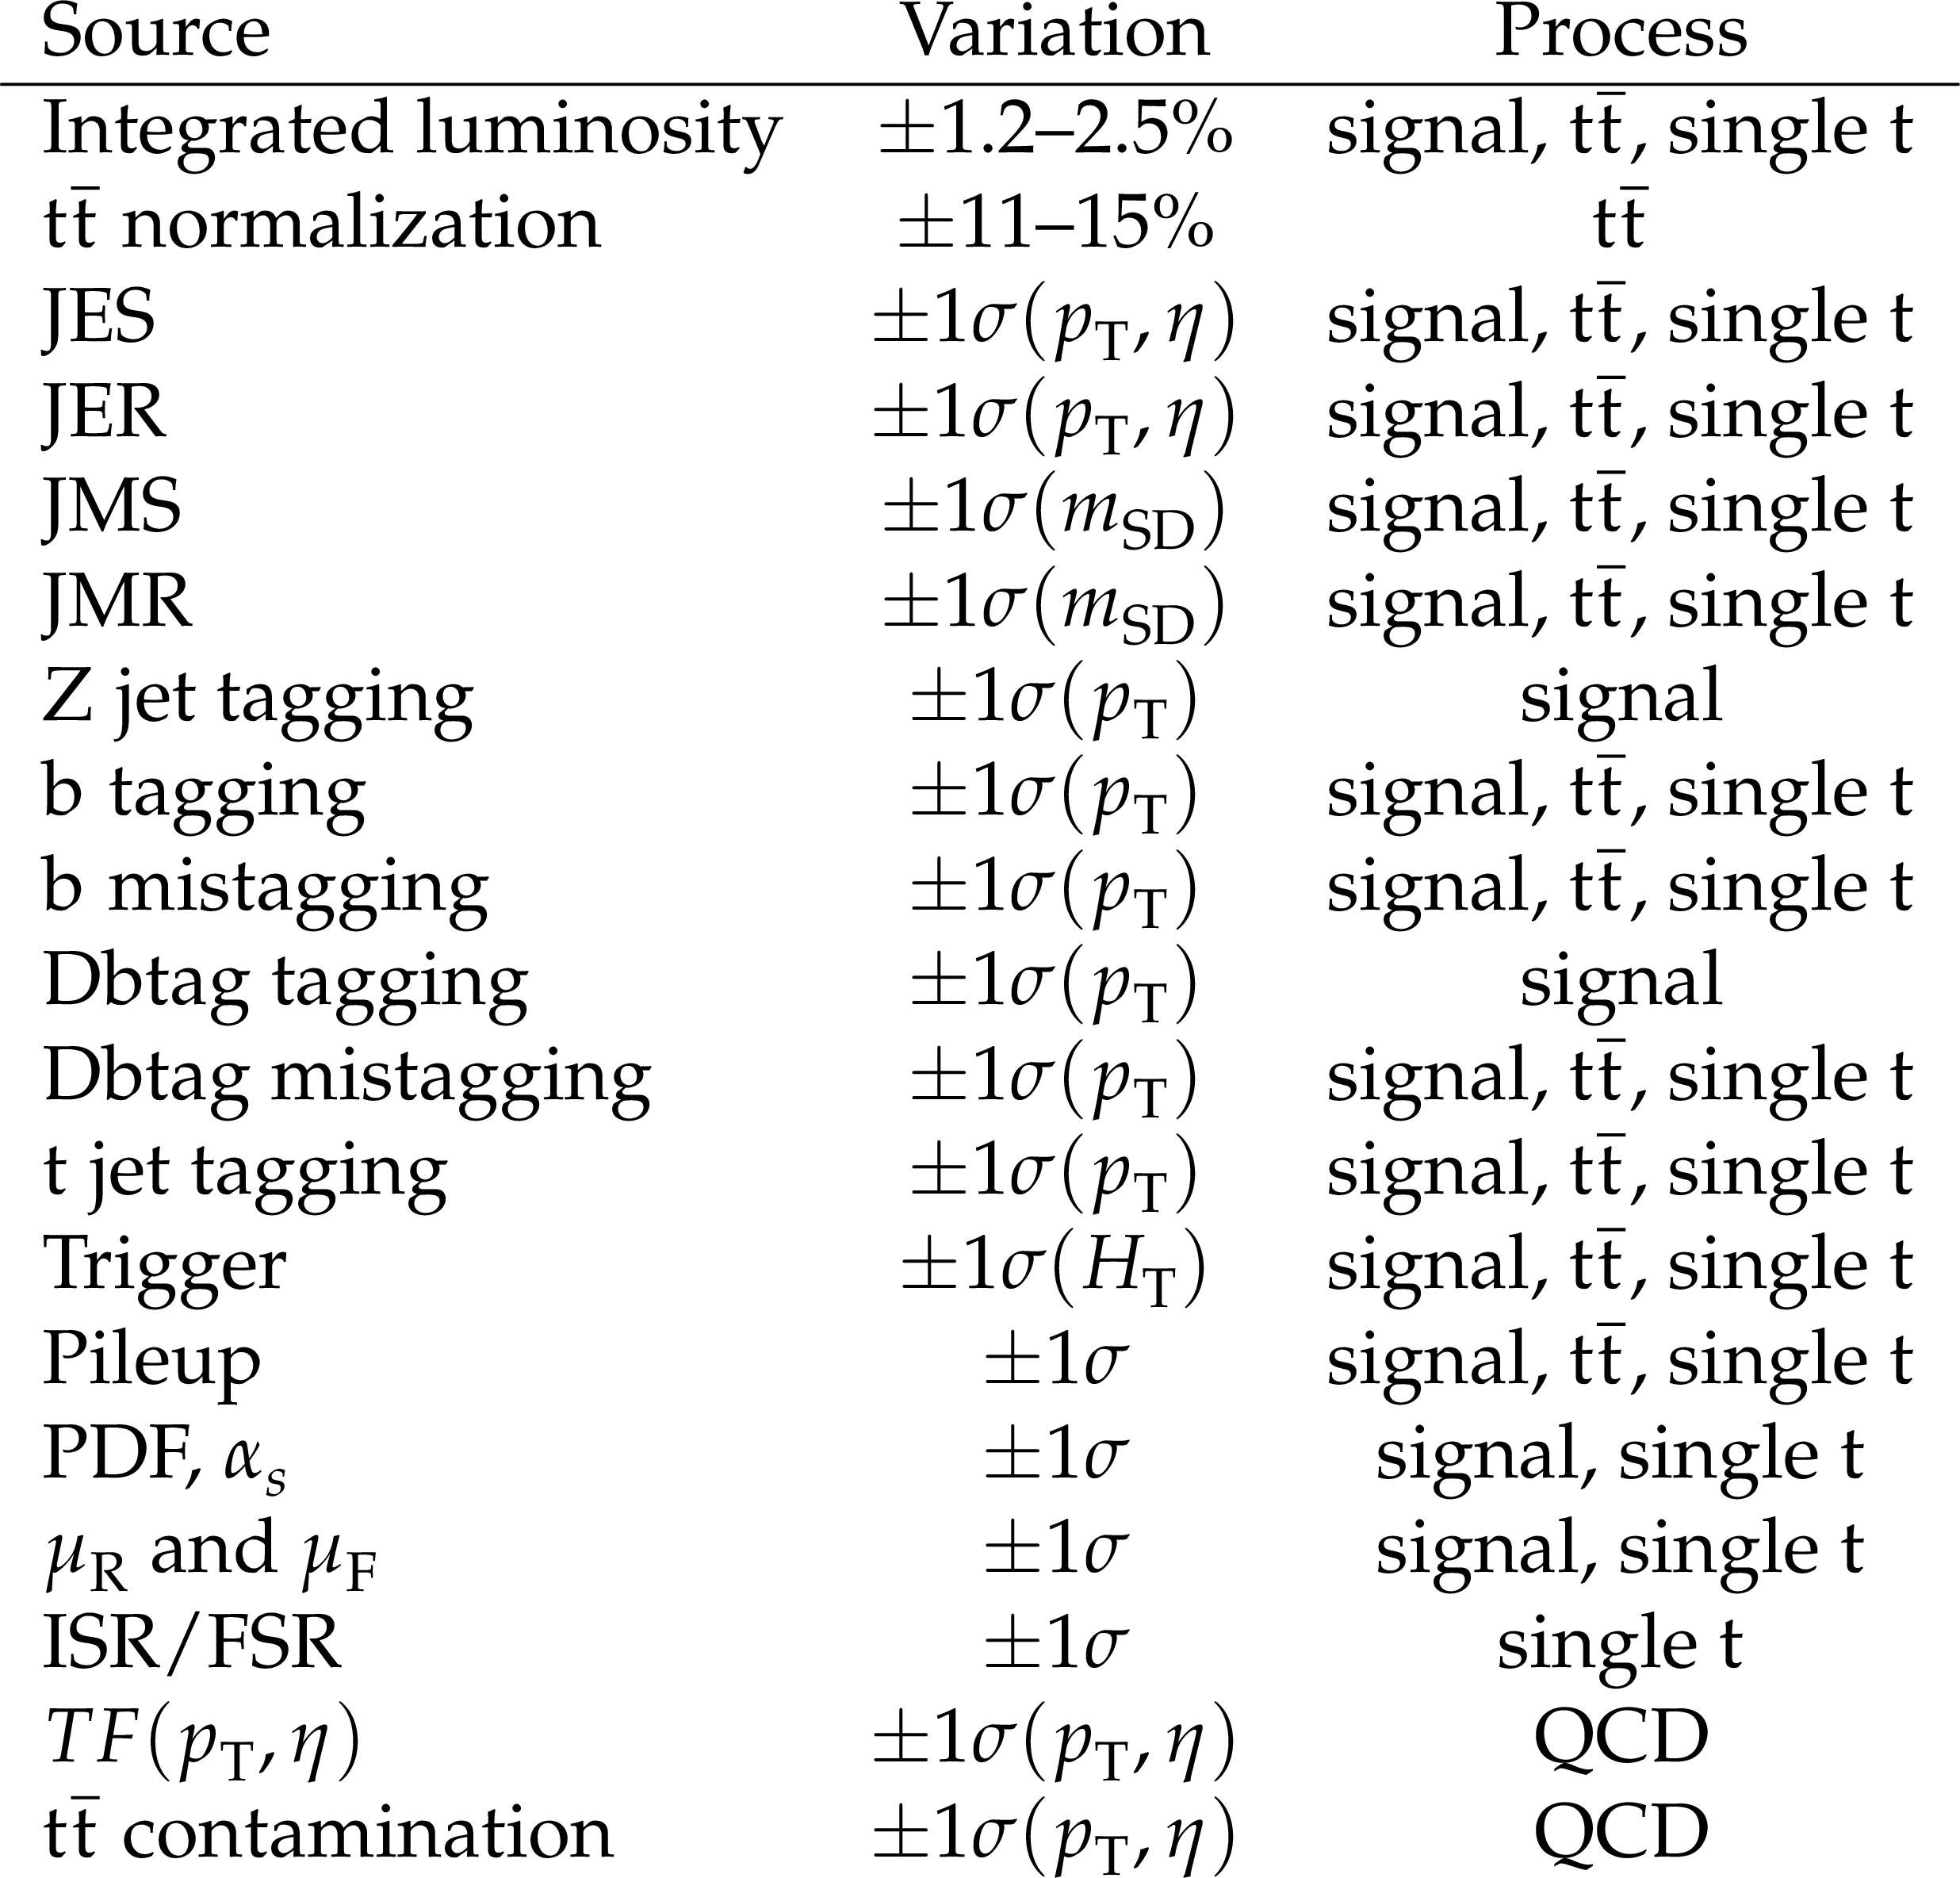
Table 3:
Sources of systematic uncertainty that affect the final distributions. Sources that affect the normalization only are represented by a range of values for the systematic variation. Sources listing the systematic variation as ${\pm}1\sigma (x)$ affect the shape of the three-jet invariant mass distribution as well, which is dependent on $x$. |
| Summary |
| A search has been presented for a heavy W' boson decaying to a B or T vector-like quark and a t or b quark, respectively. The data correspond to an integrated luminosity of 138 fb$^{-1}$ collected between 2016 and 2018 with the CMS detector at the LHC in proton-proton collisions at $\sqrt{s} = $ 13 TeV. The signature considered for both decay modes is a t quark and a Higgs or Z boson, each decaying hadronically, and a b quark jet. Boosted heavy-resonance identification techniques are used to select the events containing three energetic jets and to suppress standard model backgrounds. No significant deviation from the standard model background prediction is observed. Upper limits are placed on the product of the W' boson cross section and the final state branching fraction as a function of the $m_{\mathrm{W'}}$. A W' boson with a mass below 3.1 TeV is excluded at 95% confidence level, given the benchmark model assumption of democratic branching fractions. In addition, limits are set based on generalizations of these assumptions. These are the most sensitive limits to date for this final state. |
| Additional Figures | |
png pdf |
Additional Figure 1:
Background closure test for the reconstructed W' boson invariant mass in region F (upper), K (middle), and H (lower) for the purpose of validation in the tHb (left) and tZb (right) analyses given the low VLQ mass hypothesis.. The data are shown as points with error bars and the estimated backgrounds as solid histograms after a background-only fit, with a hatched band indicating the uncertainty. Expected signals for for several W' boson mass hypotheses are shown. The lower panel of each plot shows the difference between the number of events observed in the data and the predicted background, divided by the total uncertainty in the background and the statistical uncertainty in the data added in quadrature. |

png pdf |
Additional Figure 1-a:
Background closure test for the reconstructed W' boson invariant mass in region F for the purpose of validation in the tHb analysis given the low VLQ mass hypothesis.. The data are shown as points with error bars and the estimated backgrounds as solid histograms after a background-only fit, with a hatched band indicating the uncertainty. Expected signals for for several W' boson mass hypotheses are shown. The lower panel shows the difference between the number of events observed in the data and the predicted background, divided by the total uncertainty in the background and the statistical uncertainty in the data added in quadrature. |

png pdf |
Additional Figure 1-b:
Background closure test for the reconstructed W' boson invariant mass in region F for the purpose of validation in the tZb analysis given the low VLQ mass hypothesis.. The data are shown as points with error bars and the estimated backgrounds as solid histograms after a background-only fit, with a hatched band indicating the uncertainty. Expected signals for for several W' boson mass hypotheses are shown. The lower panel shows the difference between the number of events observed in the data and the predicted background, divided by the total uncertainty in the background and the statistical uncertainty in the data added in quadrature. |

png pdf |
Additional Figure 1-c:
Background closure test for the reconstructed W' boson invariant mass in region K for the purpose of validation in the tHb analysis given the low VLQ mass hypothesis.. The data are shown as points with error bars and the estimated backgrounds as solid histograms after a background-only fit, with a hatched band indicating the uncertainty. Expected signals for for several W' boson mass hypotheses are shown. The lower panel shows the difference between the number of events observed in the data and the predicted background, divided by the total uncertainty in the background and the statistical uncertainty in the data added in quadrature. |
png pdf |
Additional Figure 1-d:
Background closure test for the reconstructed W' boson invariant mass in region K for the purpose of validation in the tZb analysis given the low VLQ mass hypothesis.. The data are shown as points with error bars and the estimated backgrounds as solid histograms after a background-only fit, with a hatched band indicating the uncertainty. Expected signals for for several W' boson mass hypotheses are shown. The lower panel shows the difference between the number of events observed in the data and the predicted background, divided by the total uncertainty in the background and the statistical uncertainty in the data added in quadrature. |

png pdf |
Additional Figure 1-e:
Background closure test for the reconstructed W' boson invariant mass in region H for the purpose of validation in the tHb analysis given the low VLQ mass hypothesis.. The data are shown as points with error bars and the estimated backgrounds as solid histograms after a background-only fit, with a hatched band indicating the uncertainty. Expected signals for for several W' boson mass hypotheses are shown. The lower panel shows the difference between the number of events observed in the data and the predicted background, divided by the total uncertainty in the background and the statistical uncertainty in the data added in quadrature. |

png pdf |
Additional Figure 1-f:
Background closure test for the reconstructed W' boson invariant mass in region H for the purpose of validation in the tZb analysis given the low VLQ mass hypothesis.. The data are shown as points with error bars and the estimated backgrounds as solid histograms after a background-only fit, with a hatched band indicating the uncertainty. Expected signals for for several W' boson mass hypotheses are shown. The lower panel shows the difference between the number of events observed in the data and the predicted background, divided by the total uncertainty in the background and the statistical uncertainty in the data added in quadrature. |

png pdf |
Additional Figure 2:
Background closure test for the reconstructed W' boson invariant mass in region F (upper), K (middle), and H (lower) for the purpose of validation in the tHb (left) and tZb (right) analyses given the high VLQ mass hypothesis. The data are shown as points with error bars and the estimated backgrounds as solid histograms after a background-only fit, with a hatched band indicating the uncertainty. Expected signals for for several W' boson mass hypotheses are shown. The lower panel of each plot shows the difference between the number of events observed in the data and the predicted background, divided by the total uncertainty in the background and the statistical uncertainty in the data added in quadrature. |
png pdf |
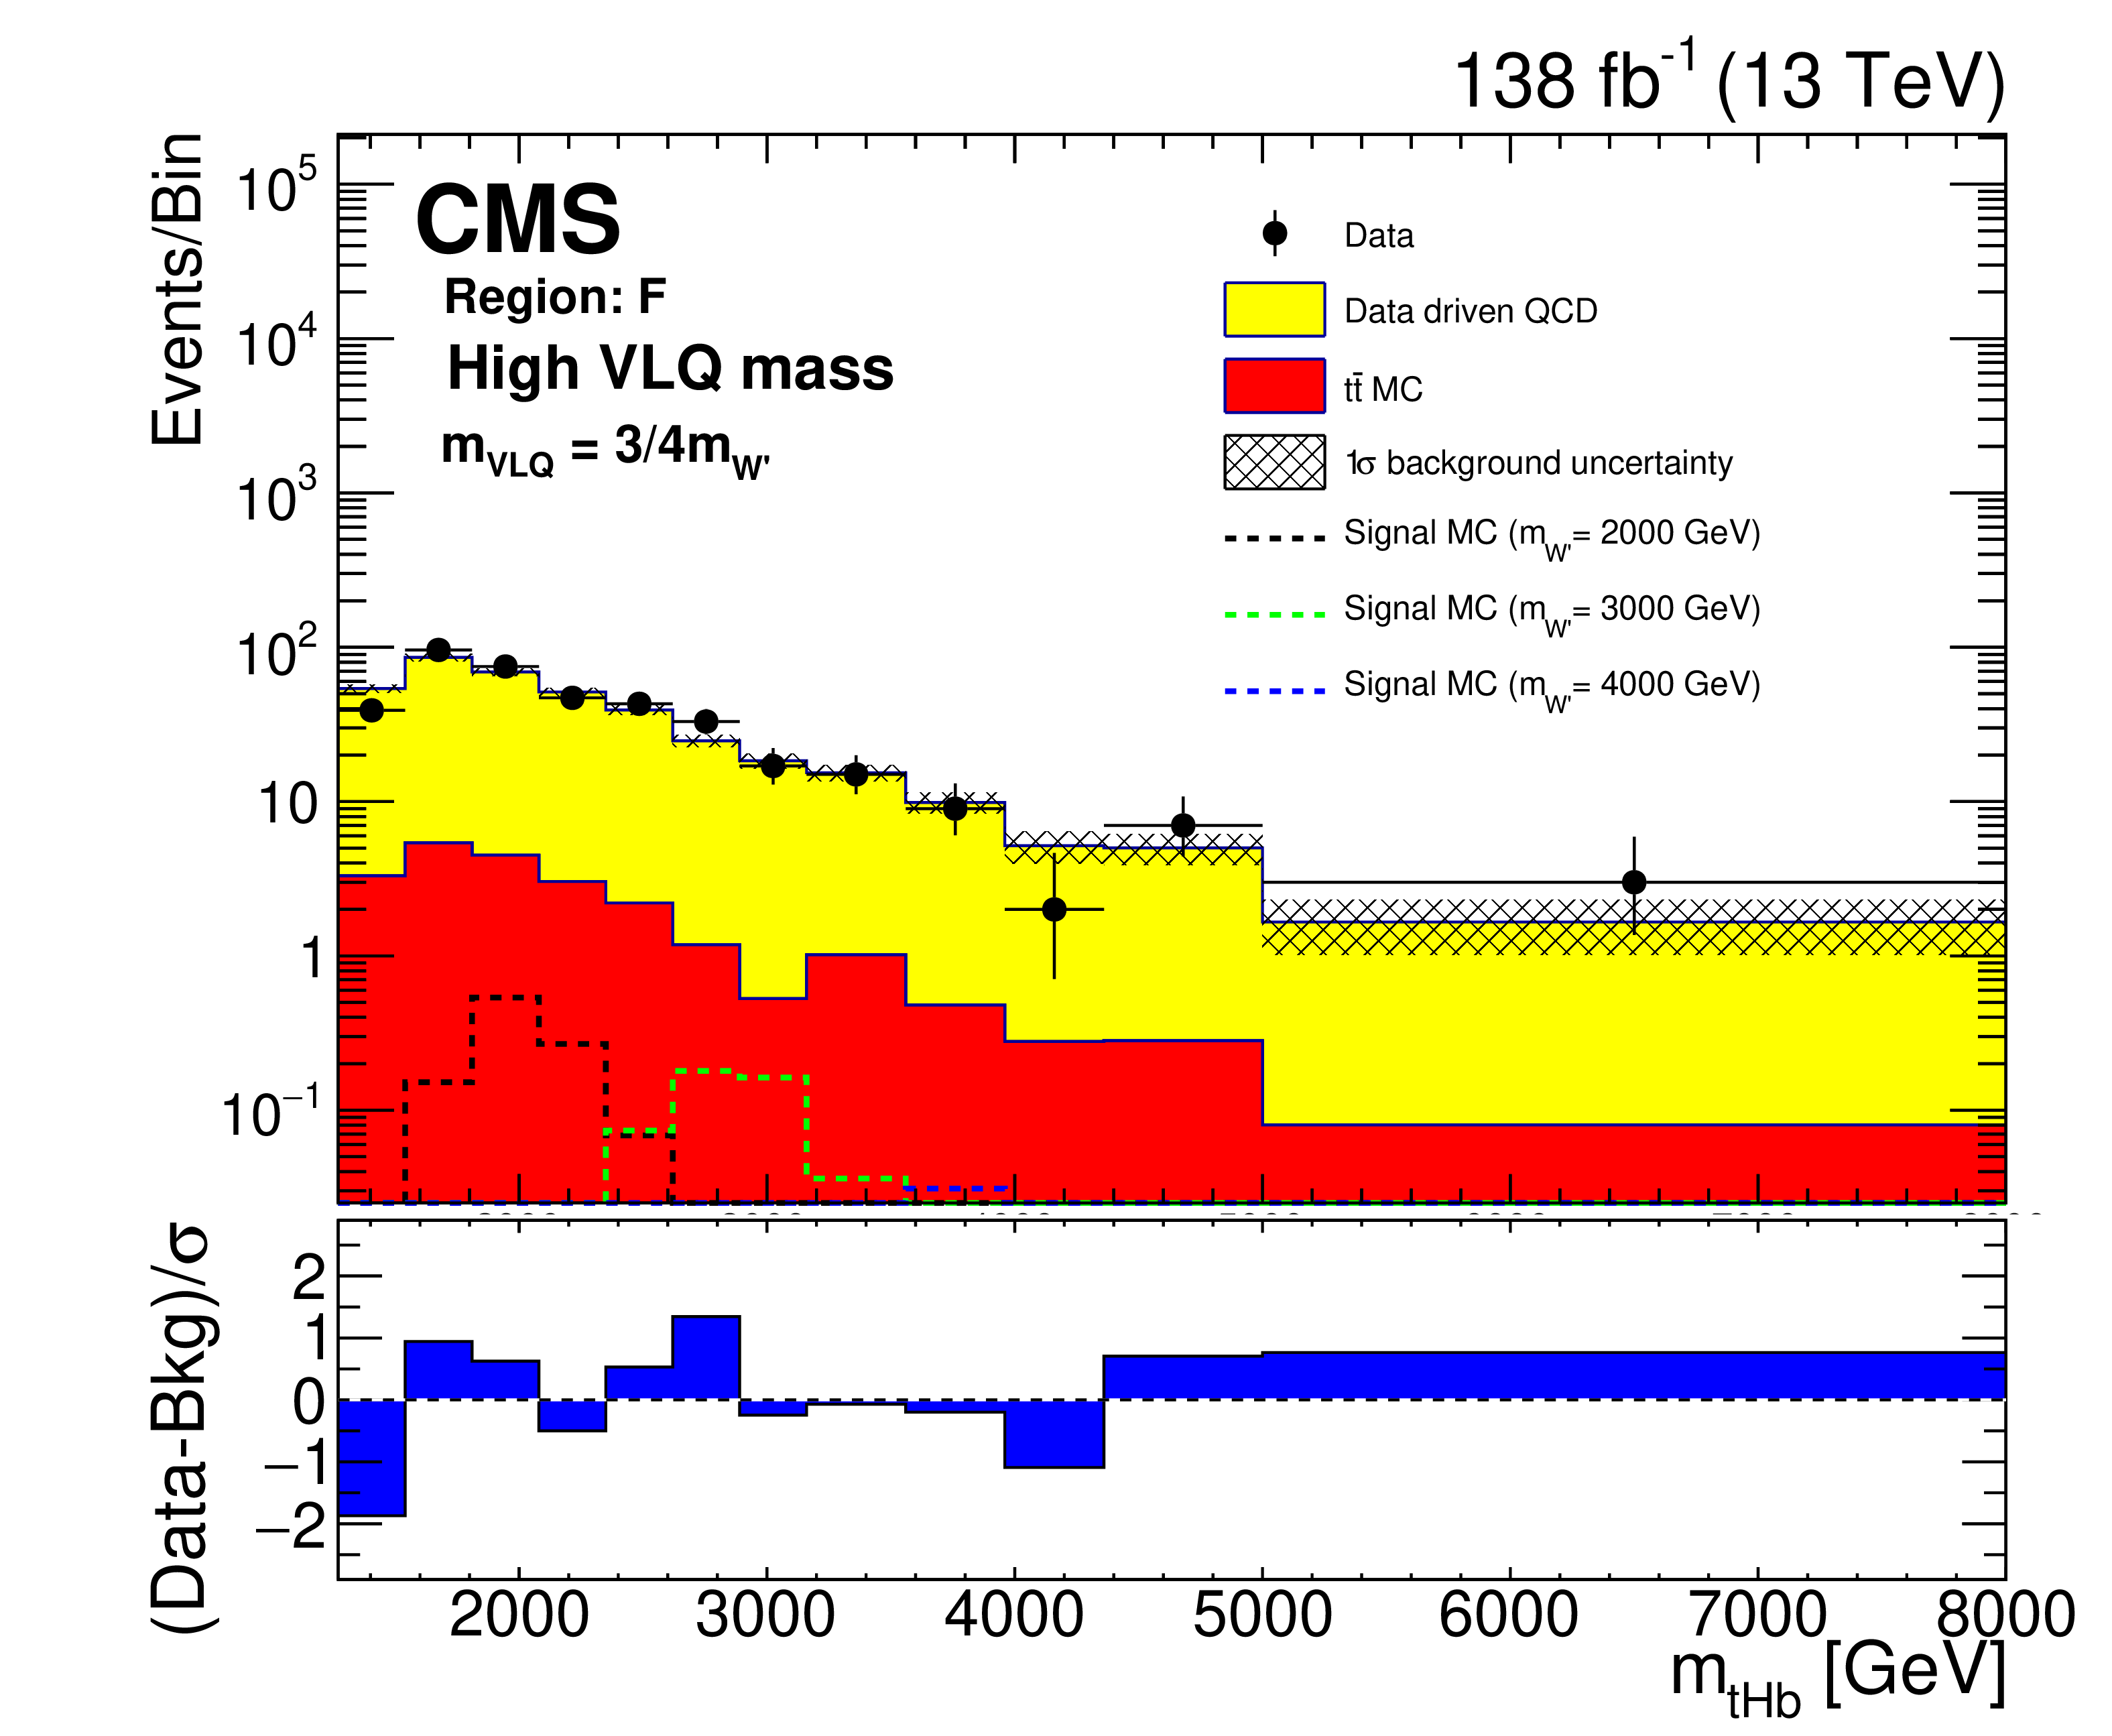
Additional Figure 2-a:
Background closure test for the reconstructed W' boson invariant mass in region F for the purpose of validation in the tHb analysis given the high VLQ mass hypothesis. The data are shown as points with error bars and the estimated backgrounds as solid histograms after a background-only fit, with a hatched band indicating the uncertainty. Expected signals for for several W' boson mass hypotheses are shown. The lower panel shows the difference between the number of events observed in the data and the predicted background, divided by the total uncertainty in the background and the statistical uncertainty in the data added in quadrature. |

png pdf |
Additional Figure 2-b:
Background closure test for the reconstructed W' boson invariant mass in region F for the purpose of validation in the tZb analysis given the high VLQ mass hypothesis. The data are shown as points with error bars and the estimated backgrounds as solid histograms after a background-only fit, with a hatched band indicating the uncertainty. Expected signals for for several W' boson mass hypotheses are shown. The lower panel shows the difference between the number of events observed in the data and the predicted background, divided by the total uncertainty in the background and the statistical uncertainty in the data added in quadrature. |

png pdf |
Additional Figure 2-c:
Background closure test for the reconstructed W' boson invariant mass in region K for the purpose of validation in the tHb analysis given the high VLQ mass hypothesis. The data are shown as points with error bars and the estimated backgrounds as solid histograms after a background-only fit, with a hatched band indicating the uncertainty. Expected signals for for several W' boson mass hypotheses are shown. The lower panel shows the difference between the number of events observed in the data and the predicted background, divided by the total uncertainty in the background and the statistical uncertainty in the data added in quadrature. |

png pdf |
Additional Figure 2-d:
Background closure test for the reconstructed W' boson invariant mass in region K for the purpose of validation in the tZb analysis given the high VLQ mass hypothesis. The data are shown as points with error bars and the estimated backgrounds as solid histograms after a background-only fit, with a hatched band indicating the uncertainty. Expected signals for for several W' boson mass hypotheses are shown. The lower panel shows the difference between the number of events observed in the data and the predicted background, divided by the total uncertainty in the background and the statistical uncertainty in the data added in quadrature. |
png pdf |
Additional Figure 2-e:
Background closure test for the reconstructed W' boson invariant mass in region H for the purpose of validation in the tHb analysis given the high VLQ mass hypothesis. The data are shown as points with error bars and the estimated backgrounds as solid histograms after a background-only fit, with a hatched band indicating the uncertainty. Expected signals for for several W' boson mass hypotheses are shown. The lower panel shows the difference between the number of events observed in the data and the predicted background, divided by the total uncertainty in the background and the statistical uncertainty in the data added in quadrature. |
png pdf |
Additional Figure 2-f:
Background closure test for the reconstructed W' boson invariant mass in region H for the purpose of validation in the tZb analysis given the high VLQ mass hypothesis. The data are shown as points with error bars and the estimated backgrounds as solid histograms after a background-only fit, with a hatched band indicating the uncertainty. Expected signals for for several W' boson mass hypotheses are shown. The lower panel shows the difference between the number of events observed in the data and the predicted background, divided by the total uncertainty in the background and the statistical uncertainty in the data added in quadrature. |

png pdf |
Additional Figure 3:
Reconstructed $m_{\mathrm{W'}}$ distributions (${m_{\mathrm{t} \mathrm{H} \mathrm{b}}}$ (upper), and ${m_{\mathrm{t} \mathrm{Z} \mathrm{b}}}$ (lower)) in the signal region with estimated backgrounds and signal for several W' boson mass hypotheses, after a background-only fit given the low VLQ mass hypothesis. The combined statistical and systematic uncertainty in the total estimated background is indicated by the hatched region. The lower panels show the difference between the number of events observed in the data and the predicted background, divided by the total uncertainty in the background and the statistical uncertainty in the data added in quadrature. |
png pdf |
Additional Figure 3-a:
Reconstructed $m_{\mathrm{W'}}$ distribution (${m_{\mathrm{t} \mathrm{H} \mathrm{b}}}$) in the signal region with estimated backgrounds and signal for several W' boson mass hypotheses, after a background-only fit given the low VLQ mass hypothesis. The combined statistical and systematic uncertainty in the total estimated background is indicated by the hatched region. The lower panel shows the difference between the number of events observed in the data and the predicted background, divided by the total uncertainty in the background and the statistical uncertainty in the data added in quadrature. |
png pdf |
Additional Figure 3-b:
Reconstructed $m_{\mathrm{W'}}$ distribution (${m_{\mathrm{t} \mathrm{Z} \mathrm{b}}}$) in the signal region with estimated backgrounds and signal for several W' boson mass hypotheses, after a background-only fit given the low VLQ mass hypothesis. The combined statistical and systematic uncertainty in the total estimated background is indicated by the hatched region. The lower panel shows the difference between the number of events observed in the data and the predicted background, divided by the total uncertainty in the background and the statistical uncertainty in the data added in quadrature. |
png pdf |
Additional Figure 4:
Reconstructed $m_{\mathrm{W'}}$ distributions (${m_{\mathrm{t} \mathrm{H} \mathrm{b}}}$ (upper), and ${m_{\mathrm{t} \mathrm{Z} \mathrm{b}}}$ (lower)) in the signal region with estimated backgrounds and signal for several W' boson mass hypotheses, after a background-only fit given the high VLQ mass hypothesis. The combined statistical and systematic uncertainty in the total estimated background is indicated by the hatched region. The lower panels show the difference between the number of events observed in the data and the predicted background, divided by the total uncertainty in the background and the statistical uncertainty in the data added in quadrature. |

png pdf |
Additional Figure 4-a:
Reconstructed $m_{\mathrm{W'}}$ distribution (${m_{\mathrm{t} \mathrm{H} \mathrm{b}}}$) in the signal region with estimated backgrounds and signal for several W' boson mass hypotheses, after a background-only fit given the high VLQ mass hypothesis. The combined statistical and systematic uncertainty in the total estimated background is indicated by the hatched region. The lower panel shows the difference between the number of events observed in the data and the predicted background, divided by the total uncertainty in the background and the statistical uncertainty in the data added in quadrature. |

png pdf |
Additional Figure 4-b:
Reconstructed $m_{\mathrm{W'}}$ distribution (${m_{\mathrm{t} \mathrm{Z} \mathrm{b}}}$) in the signal region with estimated backgrounds and signal for several W' boson mass hypotheses, after a background-only fit given the high VLQ mass hypothesis. The combined statistical and systematic uncertainty in the total estimated background is indicated by the hatched region. The lower panel shows the difference between the number of events observed in the data and the predicted background, divided by the total uncertainty in the background and the statistical uncertainty in the data added in quadrature. |
| References | ||||
| 1 | M. Schmaltz and D. Tucker-Smith | Little Higgs theories | Ann. Rev. Nucl. Part. Sci. 55 (2005) 229 | hep-ph/0502182 |
| 2 | T. Appelquist, H.-C. Cheng, and B. A. Dobrescu | Bounds on universal extra dimensions | PRD 64 (2001) 035002 | hep-ph/0012100 |
| 3 | R. N. Mohapatra and J. C. Pati | Left-right gauge symmetry and an `isoconjugate' model of CP violation | PRD 11 (1975) 566 | |
| 4 | CMS Collaboration | Search for high-mass resonances in final states with a lepton and missing transverse momentum at $ \sqrt{s}= $ 13 TeV | JHEP 06 (2018) 128 | CMS-EXO-16-033 1803.11133 |
| 5 | ATLAS Collaboration | Search for a heavy charged boson in events with a charged lepton and missing transverse momentum from pp collisions at $ \sqrt{s} = $ 13 TeV with the ATLAS detector | PRD 100 (2019) 052013 | 1906.05609 |
| 6 | CMS Collaboration | Search for a heavy resonance decaying to a pair of vector bosons in the lepton plus merged jet final state at $ \sqrt{s}= $ 13 TeV | JHEP 05 (2018) 088 | 1802.09407 |
| 7 | ATLAS Collaboration | Search for WW/WZ resonance production in $ \nu $qq final states in pp collisions at $ \sqrt{s}= $ 13 TeV with the ATLAS detector | JHEP 03 (2018) 042 | 1710.07235 |
| 8 | CMS Collaboration | Searches for $ \mathrm{W^{'}} $ bosons decaying to a top quark and a bottom quark in proton-proton collisions at 13 TeV | JHEP 08 (2017) 029 | 1706.04260 |
| 9 | ATLAS Collaboration | Search for W' $ \rightarrow $ tb decays in the hadronic final state using pp collisions at $ \sqrt{s}= $ 13 TeV with the ATLAS detector | PLB 781 (2018) 327 | 1801.07893 |
| 10 | K. Agashe, R. Contino, and A. Pomarol | The minimal composite Higgs model | NPB 719 (2005) 165 | hep-ph/0412089 |
| 11 | D. Barducci et al. | Exploring Drell-Yan signals from the 4D composite Higgs model at the LHC | JHEP 04 (2013) 152 | 1210.2927 |
| 12 | D. Barducci and C. Delaunay | Bounding wide composite vector resonances at the LHC | JHEP 02 (2016) 55 | 1511.01101 |
| 13 | N. Vignaroli | New W$ ' $ signals at the LHC | PRD 89 (2014) 095027 | 1404.5558 |
| 14 | CMS Collaboration | Search for single production of vector-like quarks decaying into a b quark and a W boson in proton-proton collisions at $ \sqrt s = $ 13 TeV | PLB 772 (2017) 634 | 1701.08328 |
| 15 | CMS Collaboration | Search for single production of vector-like quarks decaying to a b quark and a Higgs boson | JHEP 06 (2018) 031 | 1802.01486 |
| 16 | CMS Collaboration | Search for single production of a vector-like T quark decaying to a Z boson and a top quark in proton-proton collisions at $ \sqrt{s} = $13 TeV | PLB 781 (2018) 574 | 1708.01062 |
| 17 | ATLAS Collaboration | Search for pair- and single-production of vector-like quarks in final states with at least one $ Z $ boson decaying into a pair of electrons or muons in $ pp $ collision data collected with the ATLAS detector at $ \sqrt{s} = $ 13 TeV | PRD 98 (2018) 112010 | 1806.10555 |
| 18 | ATLAS Collaboration | Search for single production of a vector-like $ T $ quark decaying into a Higgs boson and top quark with fully hadronic final states using the ATLAS detector | Phys. Rev. D 105 (1,) 0, 2022 link |
2201.07045 |
| 19 | CMS Collaboration | Search for pair production of vector-like quarks in the bWbW channel from proton-proton collisions at $ \sqrt{s} = $13 TeV | PLB 779 (2018) 82 | 1710.01539 |
| 20 | CMS Collaboration | Search for vector-like T and B quark pairs in final states with leptons at $ \sqrt{s} = $ 13 TeV | JHEP 08 (2018) 177 | 1805.04758 |
| 21 | ATLAS Collaboration | Combination of the searches for pair-produced vector-like partners of the third-generation quarks at $ \sqrt{s} = $ 13 TeV with the ATLAS detector | PRL 121 (2018) 211801 | 1808.02343 |
| 22 | CMS Collaboration | A search for bottom-type, vector-like quark pair production in a fully hadronic final state in proton-proton collisions at $ \sqrt{s} = $ 13 TeV | PRD 102 (2020) 112004 | 2008.09835 |
| 23 | CMS Collaboration | Precision luminosity measurement in proton-proton collisions at $ \sqrt{s} = $ 13 TeV in 2015 and 2016 at CMS | EPJC 81 (2021) 800 | CMS-LUM-17-003 2104.01927 |
| 24 | CMS Collaboration | CMS luminosity measurement for the 2017 data-taking period at $ \sqrt{s} $ = 13 TeV | CMS Physics Analysis Summary, 2018 link |
CMS-PAS-LUM-17-004 |
| 25 | CMS Collaboration | CMS luminosity measurement for the 2018 data-taking period at $ \sqrt{s} $ = 13 TeV | CMS Physics Analysis Summary, 2019 link |
CMS-PAS-LUM-18-002 |
| 26 | CMS Collaboration | HEPData record for this analysis | link | |
| 27 | CMS Collaboration | Performance of the CMS Level-1 trigger in proton-proton collisions at $ \sqrt{s} = $ 13 TeV | JINST 15 (2020) P10017 | CMS-TRG-17-001 2006.10165 |
| 28 | CMS Collaboration | The CMS trigger system | JINST 12 (2017) P01020 | CMS-TRG-12-001 1609.02366 |
| 29 | CMS Collaboration | The CMS experiment at the CERN LHC | JINST 3 (2008) S08004 | |
| 30 | CMS Collaboration | Particle-flow reconstruction and global event description with the CMS detector | JINST 12 (2017) P10003 | CMS-PRF-14-001 1706.04965 |
| 31 | M. Cacciari, G. P. Salam, and G. Soyez | The anti-$ k_{\mathrm{T}} $ jet clustering algorithm | JHEP 04 (2008) 063 | 0802.1189 |
| 32 | M. Cacciari, G. P. Salam, and G. Soyez | FastJet user manual | EPJC 72 (2012) 1896 | 1111.6097 |
| 33 | D. Bertolini, P. Harris, M. Low, and N. Tran | Pileup per particle identification | JHEP 10 (2014) 059 | 1407.6013 |
| 34 | CMS Collaboration | Jet energy scale and resolution in the CMS experiment in pp collisions at 8 TeV | JINST 12 (2017) P02014 | CMS-JME-13-004 1607.03663 |
| 35 | P. Nason | A new method for combining NLO QCD with shower Monte Carlo algorithms | JHEP 11 (2004) 040 | hep-ph/0409146 |
| 36 | S. Frixione, P. Nason, and C. Oleari | Matching NLO QCD computations with parton shower simulations: the POWHEG method | JHEP 11 (2007) 070 | 0709.2092 |
| 37 | S. Alioli, P. Nason, C. Oleari, and E. Re | A general framework for implementing NLO calculations in shower Monte Carlo programs: the POWHEG BOX | JHEP 06 (2010) 043 | 1002.2581 |
| 38 | S. Alioli, P. Nason, C. Oleari, and E. Re | NLO single-top production matched with shower in POWHEG: $ s $- and $ t $-channel contributions | JHEP 09 (2009) 111 | 0907.4076 |
| 39 | R. Frederix, E. Re, and P. Torrielli | Single-top $ t $-channel hadroproduction in the four-flavour scheme with POWHEG and aMC@NLO | JHEP 09 (2012) 130 | 1207.5391 |
| 40 | S. Alioli, S.-O. Moch, and P. Uwer | Hadronic top-quark pair-production with one jet and parton showering | JHEP 01 (2012) 137 | 1110.5251 |
| 41 | J. Alwall et al. | The automated computation of tree-level and next-to-leading order differential cross sections, and their matching to parton shower simulations | JHEP 07 (2014) 079 | 1405.0301 |
| 42 | J. Alwall et al. | Comparative study of various algorithms for the merging of parton showers and matrix elements in hadronic collisions | EPJC 53 (2008) 473 | 0706.2569 |
| 43 | NNPDF Collaboration | Parton distributions for the LHC Run II | JHEP 04 (2015) 040 | 1410.8849 |
| 44 | NNPDF Collaboration | Parton distributions from high-precision collider data | EPJC 77 (2017) 663 | 1706.00428 |
| 45 | T. Sjöstrand et al. | An introduction to PYTHIA 8.2 | Comput. Phys. Commun. 191 (2015) 159 | 1410.3012 |
| 46 | CMS Collaboration | Investigations of the impact of the parton shower tuning in Pythia 8 in the modelling of $ \mathrm{t\overline{t}} $ at $ \sqrt{s}= $ 8 and 13 TeV | CMS Physics Analysis Summary, 2016 CMS-PAS-TOP-16-021 |
CMS-PAS-TOP-16-021 |
| 47 | CMS Collaboration | Event generator tunes obtained from underlying event and multiparton scattering measurements | EPJC 76 (2016) 155 | CMS-GEN-14-001 1512.00815 |
| 48 | CMS Collaboration | Extraction and validation of a new set of CMS PYTHIA8 tunes from underlying-event measurements | EPJC 80 (2020) 4 | CMS-GEN-17-001 1903.12179 |
| 49 | GEANT4 Collaboration | GEANT 4---a simulation toolkit | NIM 506 (2003) 250 | |
| 50 | CMS Collaboration | Identification of heavy, energetic, hadronically decaying particles using machine-learning techniques | JINST 15 (2020) P06005 | CMS-JME-18-002 2004.08262 |
| 51 | M. Dasgupta, A. Fregoso, S. Marzani, and G. P. Salam | Towards an understanding of jet substructure | JHEP 09 (2013) 029 | 1307.0007 |
| 52 | A. J. Larkoski, S. Marzani, G. Soyez, and J. Thaler | Soft drop | JHEP 05 (2014) 146 | 1402.2657 |
| 53 | CMS Collaboration | Search for massive resonances decaying into WW, WZ, ZZ, qW, and qZ with dijet final states at $ \sqrt{s}=$ 13 TeV | PRD 97 (2018) 072006 | 1708.05379 |
| 54 | CMS Collaboration | Jet algorithms performance in 13 TeV data | CMS Physics Analysis Summary, 2017 CMS-PAS-JME-16-003 |
CMS-PAS-JME-16-003 |
| 55 | CMS Collaboration | Identification of heavy-flavour jets with the CMS detector in pp collisions at 13 TeV | JINST 13 (2018) P05011 | CMS-BTV-16-002 1712.07158 |
| 56 | J. Thaler and K. Van Tilburg | Maximizing boosted top identification by minimizing $ N $-subjettiness | JHEP 02 (2012) 093 | 1108.2701 |
| 57 | E. Bols et al. | Jet flavour classification using DeepJet | JINST 15 (2020) P12012 | 2008.10519 |
| 58 | CMS Collaboration | Performance of the DeepJet b tagging algorithm using 41.9/fb of data from proton-proton collisions at 13 TeV with Phase 1 CMS detector | CMS Detector Performance Note CMS-DP-2018-058, 2018 CDS |
|
| 59 | CMS Collaboration | Measurement of differential cross sections for top quark pair production using the lepton+jets final state in proton-proton collisions at 13 TeV | PRD 95 (2017) 092001 | CMS-TOP-16-008 1610.04191 |
| 60 | J. S. Conway | Incorporating nuisance parameters in likelihoods for multisource spectra | in Proceedings, PHYSTAT workshop on statistical issues related to discovery claims in search experiments and unfolding, CERN, 2011 link |
1103.0354 |
| 61 | CMS Collaboration | Measurement of the inelastic proton-proton cross section at $ \sqrt{s}= $ 13 TeV | JHEP 07 (2018) 161 | CMS-FSQ-15-005 1802.02613 |
| 62 | M. Botje et al. | The PDF4LHC working group interim recommendations | 1101.0538 | |
| 63 | S. Alekhin et al. | The PDF4LHC working group interim report | 1101.0536 | |
| 64 | R. J. Barlow and C. Beeston | Fitting using finite Monte Carlo samples | Comput. Phys. Commun. 77 (1993) 219 | |
| 65 | T. Junk | Confidence level computation for combining searches with small statistics | NIM A 434 (1999) 435 | hep-ex/9902006 |
| 66 | A. L. Read | Presentation of search results: The $\text{CL}_\text{s}$ technique | JPG 28 (2002) 2693 | |
| 67 | G. Cowan, K. Cranmer, E. Gross, and O. Vitells | Asymptotic formulae for likelihood-based tests of new physics | EPJC 71 (2011) 1554 | 1007.1727 |
|
|
Compact Muon Solenoid LHC, CERN |
|

|

|

|

|

|