

Compact Muon Solenoid
LHC, CERN
| CMS-EXO-18-005 ; CERN-EP-2019-088 | ||
| Search for vector-like leptons in multilepton final states in proton-proton collisions at $\sqrt{s} = $ 13 TeV | ||
| CMS Collaboration | ||
| 27 May 2019 | ||
| Phys. Rev. D. 100 (2019) 052003 | ||
| Abstract: A search for vector-like leptons in multilepton final states is presented. The data sample corresponds to an integrated luminosity of 77.4 fb$^{-1}$ of proton-proton collisions at a center-of-mass energy of 13 TeV collected by the CMS experiment at the LHC in 2016 and 2017. Events are categorized by the multiplicity of electrons, muons, and hadronically decaying $\tau$ leptons. The missing transverse momentum and the scalar sum of the lepton transverse momenta are used to distinguish the signal from background. The observed results are consistent with the expectations from the standard model hypothesis. The existence of a vector-like lepton doublet, coupling to the third generation standard model leptons in the mass range of 120-790 GeV, is excluded at 95% confidence level. These are the most stringent limits yet on the production of a vector-like lepton doublet, coupling to the third generation standard model leptons. | ||
| Links: e-print arXiv:1905.10853 [hep-ex] (PDF) ; CDS record ; inSPIRE record ; CADI line (restricted) ; | ||
| Figures | |

png pdf |
Figure 1:
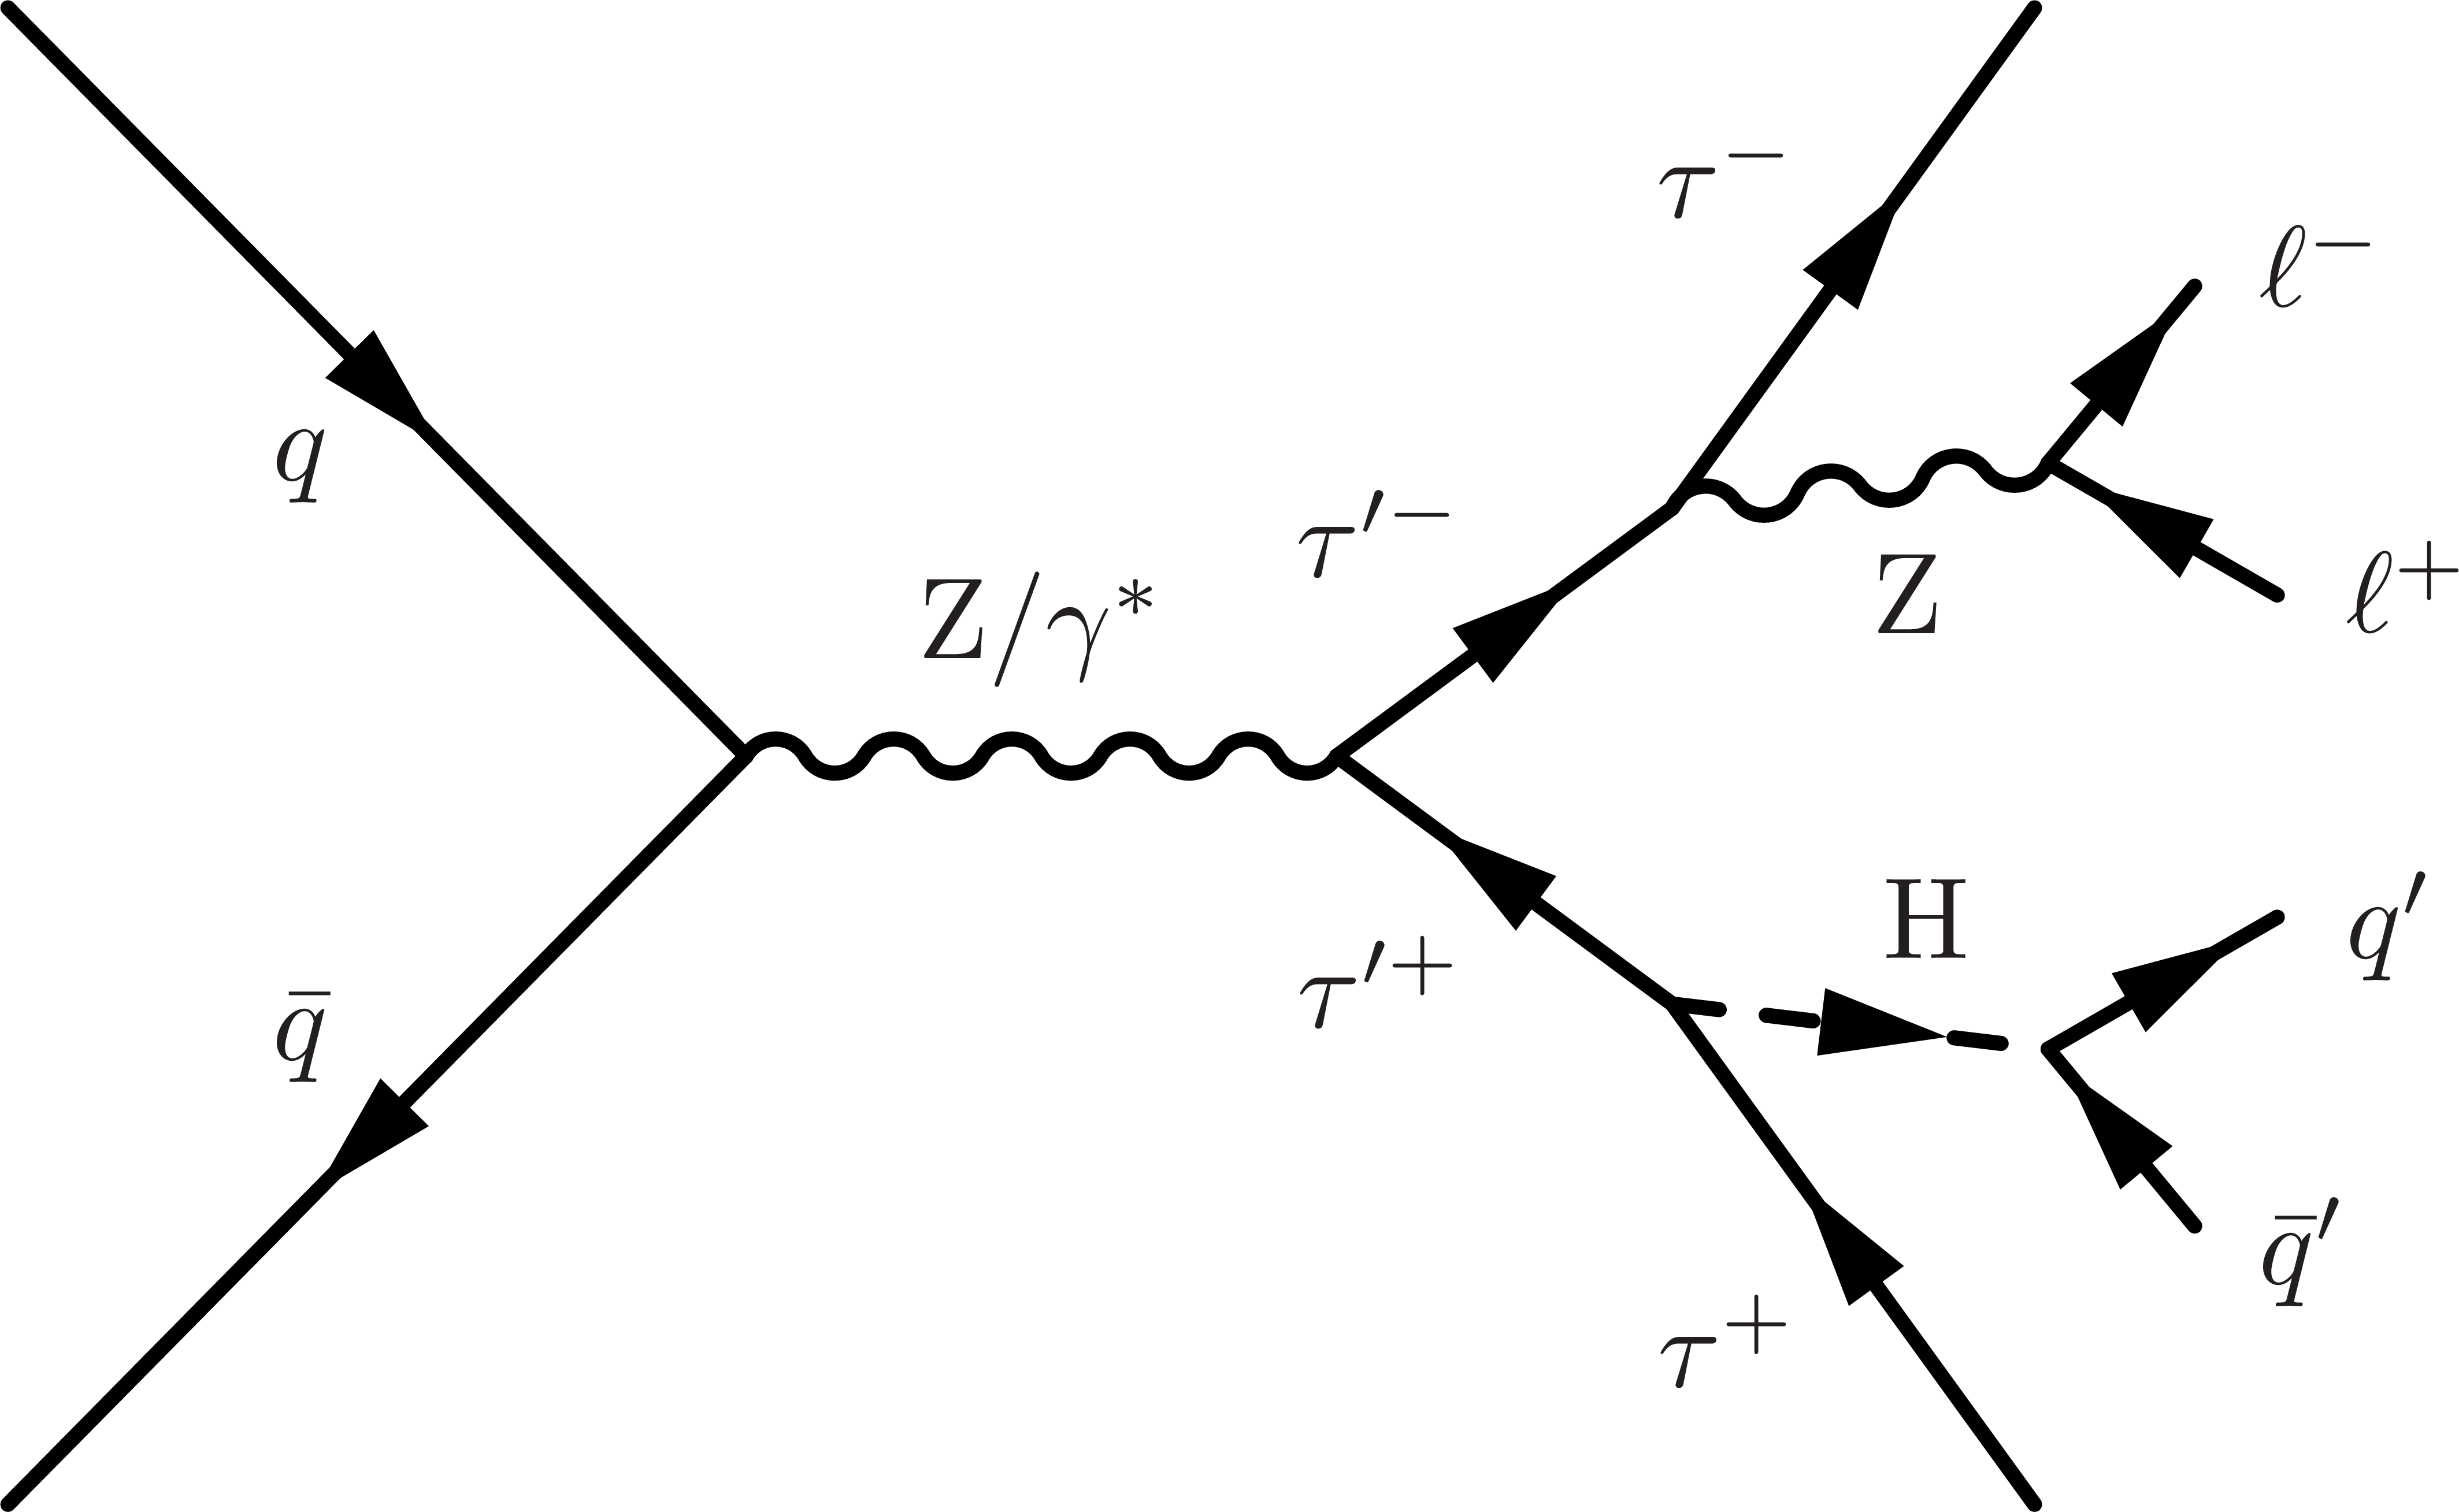
Two illustrative leading order Feynman diagrams for associated production of $\tau^{\prime}$ with a $\nu^{\prime} _{\tau}$ (left) and for pair production of $\tau^{\prime}$ (right), and possible subsequent decay chains that result in a multilepton final state. |

png pdf |
Figure 1-a:
Illustrative leading order Feynman diagram for the associated production of $\tau^{\prime}$ with a $\nu^{\prime} _{\tau}$, and possible subsequent decay chains that result in a multilepton final state. |
png pdf |
Figure 1-b:
Illustrative leading order Feynman diagram for the pair production of $\tau^{\prime}$, and possible subsequent decay chains that result in a multilepton final state. |

png pdf |
Figure 2:
The upper row shows the ${m_{\mathrm {T}}}$ (left) and the ${L_\mathrm {T}}$ (right) distributions in the WZ control region in data and simulation. The WZ control region contains events with three leptons and an OSSF pair with mass on-Z, and 50 $ < {{p_{\mathrm {T}}} ^\text {miss}} < $ 100 GeV. The lower row shows the $m_{4\ell}$ (left) and the ${L_\mathrm {T}}$ (right) distributions in the ZZ control region. The ZZ control region contains events with two OSSF lepton pairs, both of which are on-Z, and $ {{p_{\mathrm {T}}} ^\text {miss}} < $ 50 GeV. The total SM background is shown as a stack of all contributing processes. The hatched gray bands in the upper panels represent the total uncertainty in the expected background. The lower panels show the ratios of observed data to the total expected background. In the lower panels, the light gray band represents the combined statistical and systematic uncertainty in the expected background, while the dark gray band represents the statistical uncertainty only. The rightmost bins include the overflow events. |

png pdf |
Figure 2-a:
${L_\mathrm {T}}$ distribution in the WZ control region in data and simulation. The WZ control region contains events with three leptons and an OSSF pair with mass on-Z, and 50 $ < {{p_{\mathrm {T}}} ^\text {miss}} < $ 100 GeV. The total SM background is shown as a stack of all contributing processes. The hatched gray bands in the upper panel represent the total uncertainty in the expected background. The lower panel shows the ratios of observed data to the total expected background. In the lower panel, the light gray band represents the combined statistical and systematic uncertainty in the expected background, while the dark gray band represents the statistical uncertainty only. The rightmost bin includes the overflow events. |

png pdf |
Figure 2-b:
The upper row shows the ${m_{\mathrm {T}}}$ (left) and the ${L_\mathrm {T}}$ (right) distributions in the WZ control region in data and simulation. The WZ control region contains events with three leptons and an OSSF pair with mass on-Z, and 50 $ < {{p_{\mathrm {T}}} ^\text {miss}} < $ 100 GeV. The lower row shows the $m_{4\ell}$ (left) and the ${L_\mathrm {T}}$ (right) distributions in the ZZ control region. The ZZ control region contains events with two OSSF lepton pairs, both of which are on-Z, and $ {{p_{\mathrm {T}}} ^\text {miss}} < $ 50 GeV. The total SM background is shown as a stack of all contributing processes. The hatched gray bands in the upper panels represent the total uncertainty in the expected background. The lower panels show the ratios of observed data to the total expected background. In the lower panels, the light gray band represents the combined statistical and systematic uncertainty in the expected background, while the dark gray band represents the statistical uncertainty only. The rightmost bins include the overflow events. |

png pdf |
Figure 2-c:
$m_{4\ell}$ distribution in the ZZ control region. The ZZ control region contains events with two OSSF lepton pairs, both of which are on-Z, and $ {{p_{\mathrm {T}}} ^\text {miss}} < $ 50 GeV. The total SM background is shown as a stack of all contributing processes. The hatched gray bands in the upper panel represent the total uncertainty in the expected background. The lower panel shows the ratios of observed data to the total expected background. In the lower panel, the light gray band represents the combined statistical and systematic uncertainty in the expected background, while the dark gray band represents the statistical uncertainty only. The rightmost bin includes the overflow events. |

png pdf |
Figure 2-d:
${L_\mathrm {T}}$ distribution in the ZZ control region. The ZZ control region contains events with two OSSF lepton pairs, both of which are on-Z, and $ {{p_{\mathrm {T}}} ^\text {miss}} < $ 50 GeV. The total SM background is shown as a stack of all contributing processes. The hatched gray bands in the upper panel represent the total uncertainty in the expected background. The lower panel shows the ratios of observed data to the total expected background. In the lower panel, the light gray band represents the combined statistical and systematic uncertainty in the expected background, while the dark gray band represents the statistical uncertainty only. The rightmost bin includes the overflow events. |

png pdf |
Figure 3:
The dilepton mass (left) and the ${L_\mathrm {T}}$ (right) distributions in data and simulation in a misidentified ${\tau _\mathrm {h}}$ control region. This control region contains 2L1T (OS) events with $ {{p_{\mathrm {T}}} ^\text {miss}} < $ 50 GeV. The total SM background is shown as a stack of all contributing processes. The hatched gray bands in the upper panels represent the total uncertainty in the expected background. The lower panels show the ratios of observed data to the total expected background. In the lower panels, the light gray band represents the combined statistical and systematic uncertainty in the expected background, while the dark gray band represents the statistical uncertainty only. The rightmost bins include the overflow events. |

png pdf |
Figure 3-a:
The dilepton mass distribution in data and simulation in a misidentified ${\tau _\mathrm {h}}$ control region. This control region contains 2L1T (OS) events with $ {{p_{\mathrm {T}}} ^\text {miss}} < $ 50 GeV. The total SM background is shown as a stack of all contributing processes. The hatched gray bands in the upper panel represent the total uncertainty in the expected background. The lower panel shows the ratios of observed data to the total expected background. In the lower panel, the light gray band represents the combined statistical and systematic uncertainty in the expected background, while the dark gray band represents the statistical uncertainty only. The rightmost bin includes the overflow events. |
png pdf |
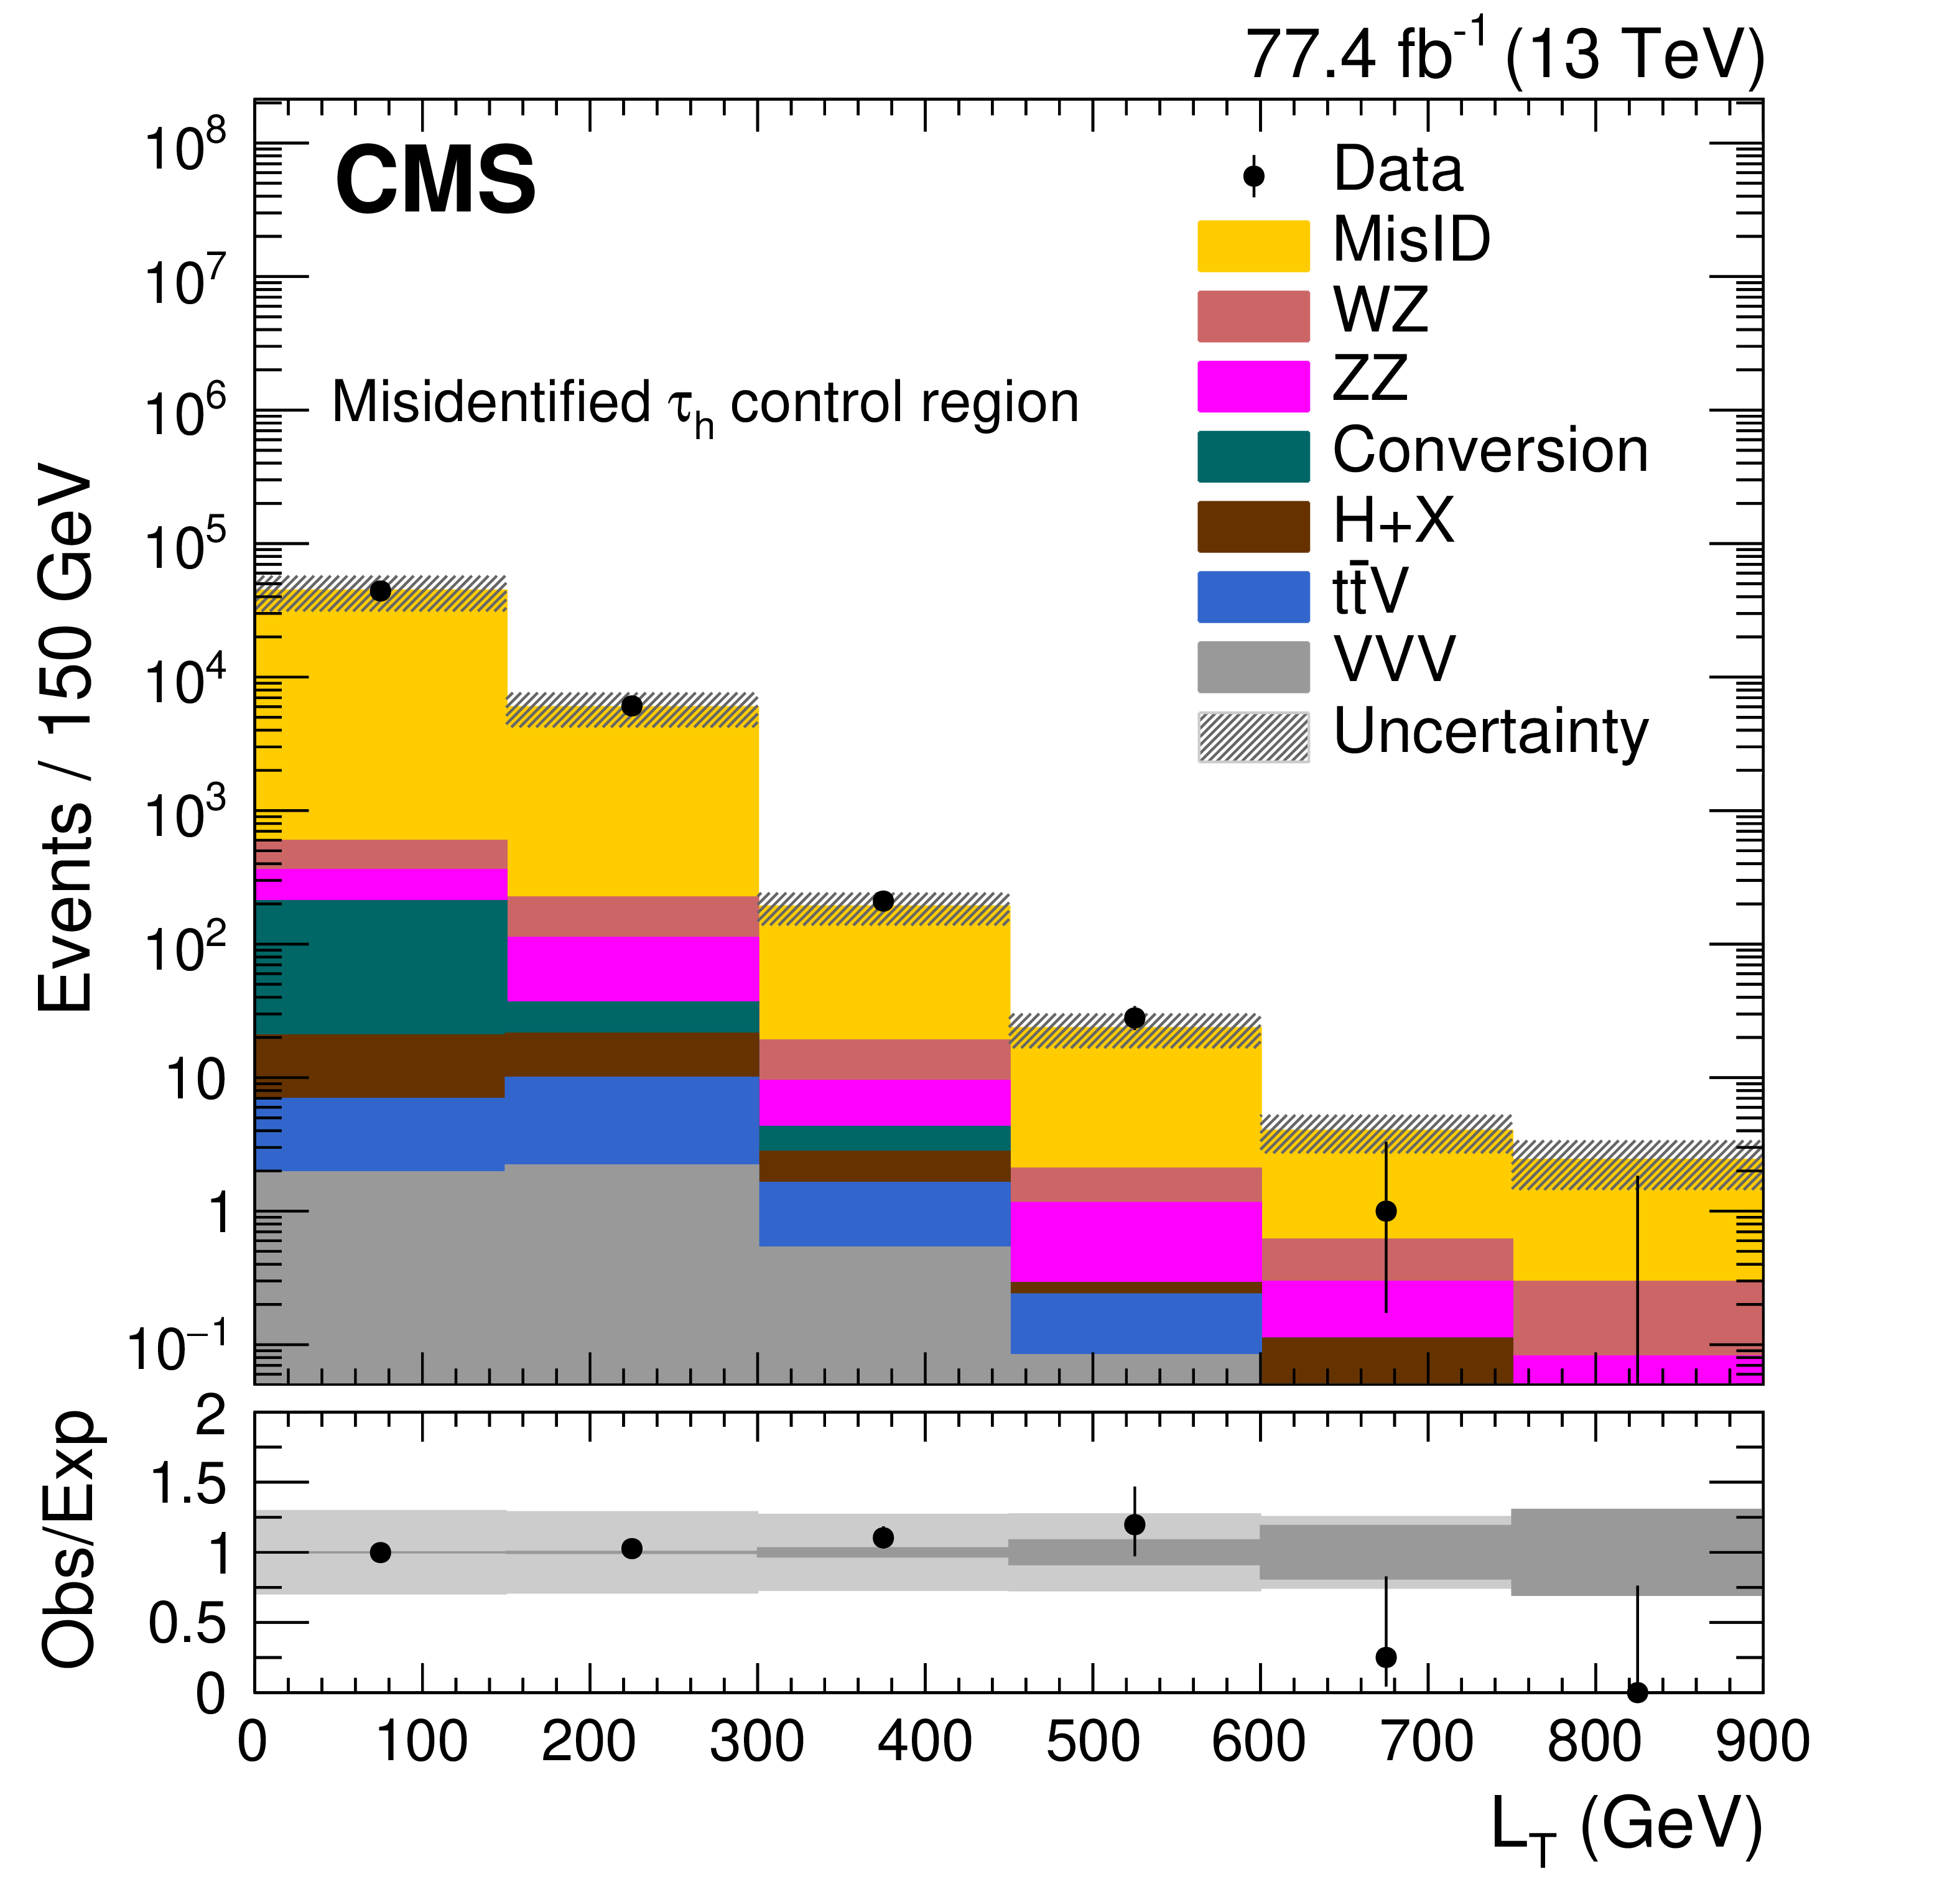
Figure 3-b:
${L_\mathrm {T}}$ distribution in data and simulation in a misidentified ${\tau _\mathrm {h}}$ control region. This control region contains 2L1T (OS) events with $ {{p_{\mathrm {T}}} ^\text {miss}} < $ 50 GeV. The total SM background is shown as a stack of all contributing processes. The hatched gray bands in the upper panel represent the total uncertainty in the expected background. The lower panel shows the ratios of observed data to the total expected background. In the lower panel, the light gray band represents the combined statistical and systematic uncertainty in the expected background, while the dark gray band represents the statistical uncertainty only. The rightmost bin includes the overflow events. |
png pdf |
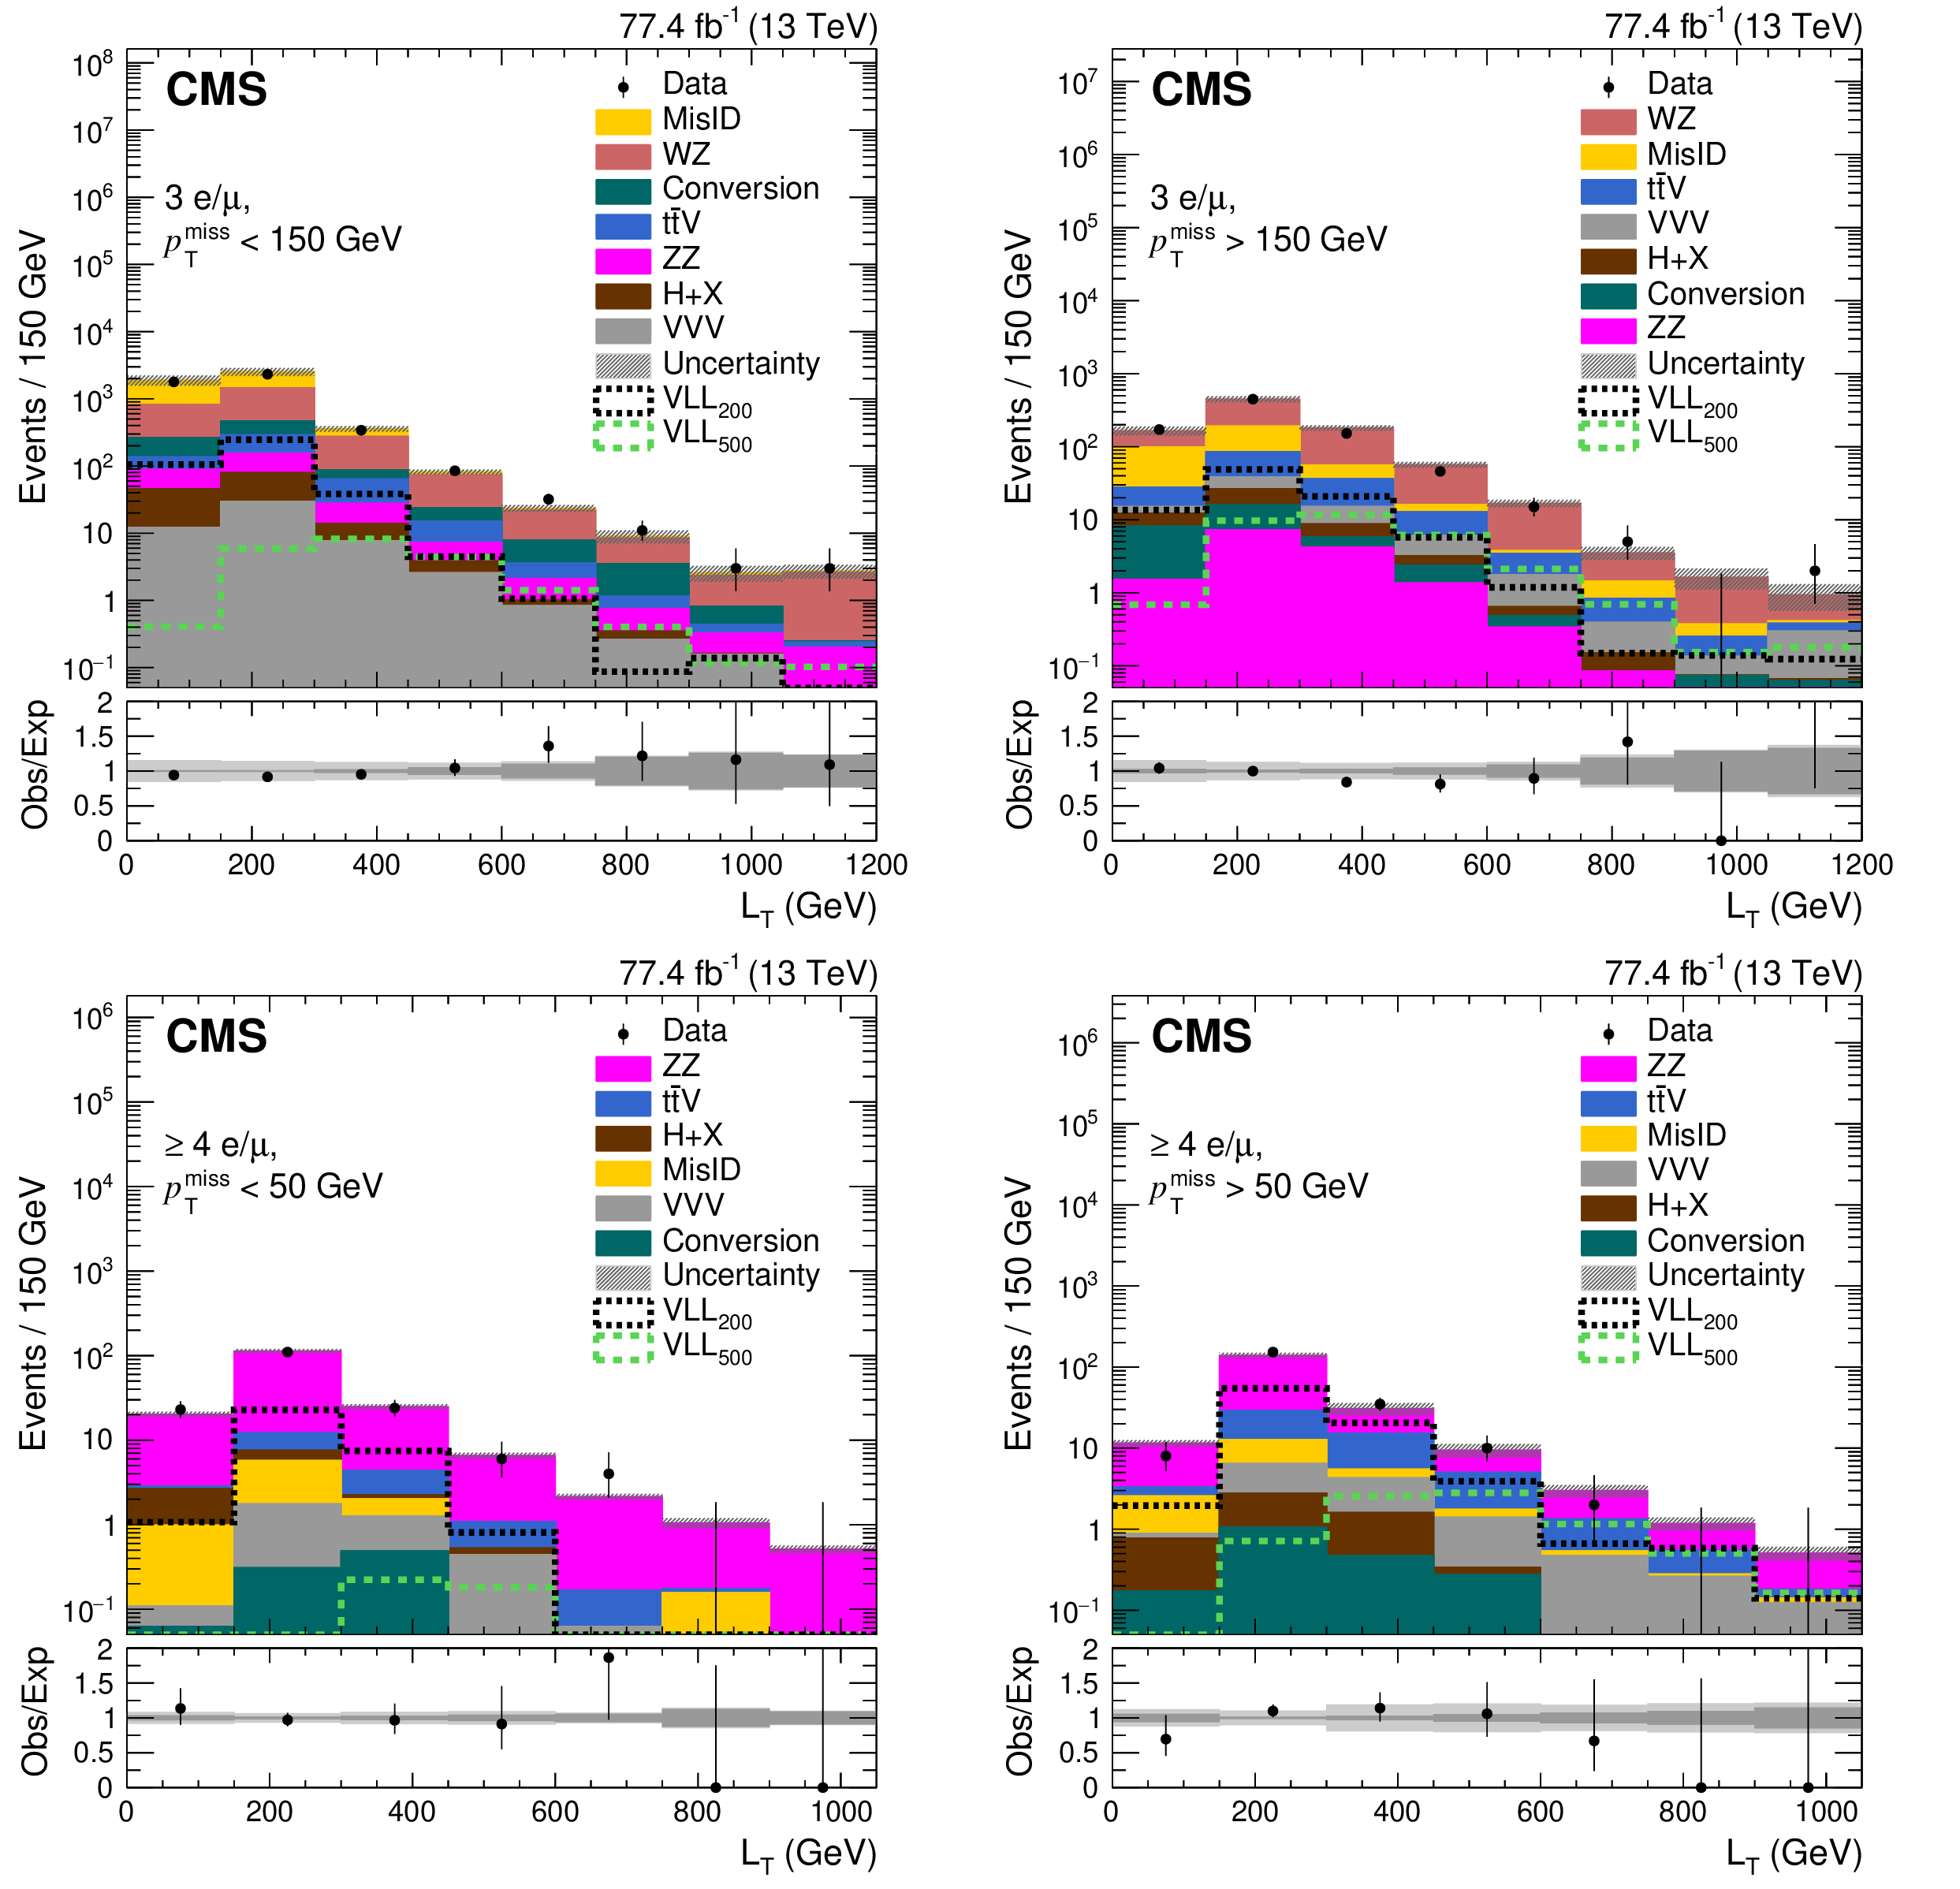
Figure 4:
The ${L_\mathrm {T}}$ distributions for the 3L signal regions with $ {{p_{\mathrm {T}}} ^\text {miss}} < $ 150 GeV (upper left) and $ {{p_{\mathrm {T}}} ^\text {miss}} > $ 150 GeV (upper right), and for the 4L signal regions with $ {{p_{\mathrm {T}}} ^\text {miss}} < $ 50 GeV (lower left) and $ {{p_{\mathrm {T}}} ^\text {miss}} > $ 50 GeV (lower right). The total SM background is shown as a stack of all contributing processes. The predictions for VLL signal models (the sum of all production and decay modes) with $m_{\tau^{\prime}/\nu^{\prime}} = $ 200 and 500 GeV are shown as dashed lines. The hatched gray bands in the upper panels represent the total uncertainty in the expected background. The lower panels show the ratios of observed data to the total expected background. In the lower panels, the light gray band represents the combined statistical and systematic uncertainty in the expected background, while the dark gray band represents the statistical uncertainty only. The rightmost bins include the overflow events. |

png pdf |
Figure 4-a:
The ${L_\mathrm {T}}$ distribution for the 3L signal regions with $ {{p_{\mathrm {T}}} ^\text {miss}} < $ 150 GeV. The total SM background is shown as a stack of all contributing processes. The predictions for VLL signal models (the sum of all production and decay modes) with $m_{\tau^{\prime}/\nu^{\prime}} = $ 200 and 500 GeV are shown as dashed lines. The hatched gray bands in the upper panel represent the total uncertainty in the expected background. The lower panel shows the ratios of observed data to the total expected background. In the lower panel, the light gray band represents the combined statistical and systematic uncertainty in the expected background, while the dark gray band represents the statistical uncertainty only. The rightmost bin includes the overflow events. |
png pdf |
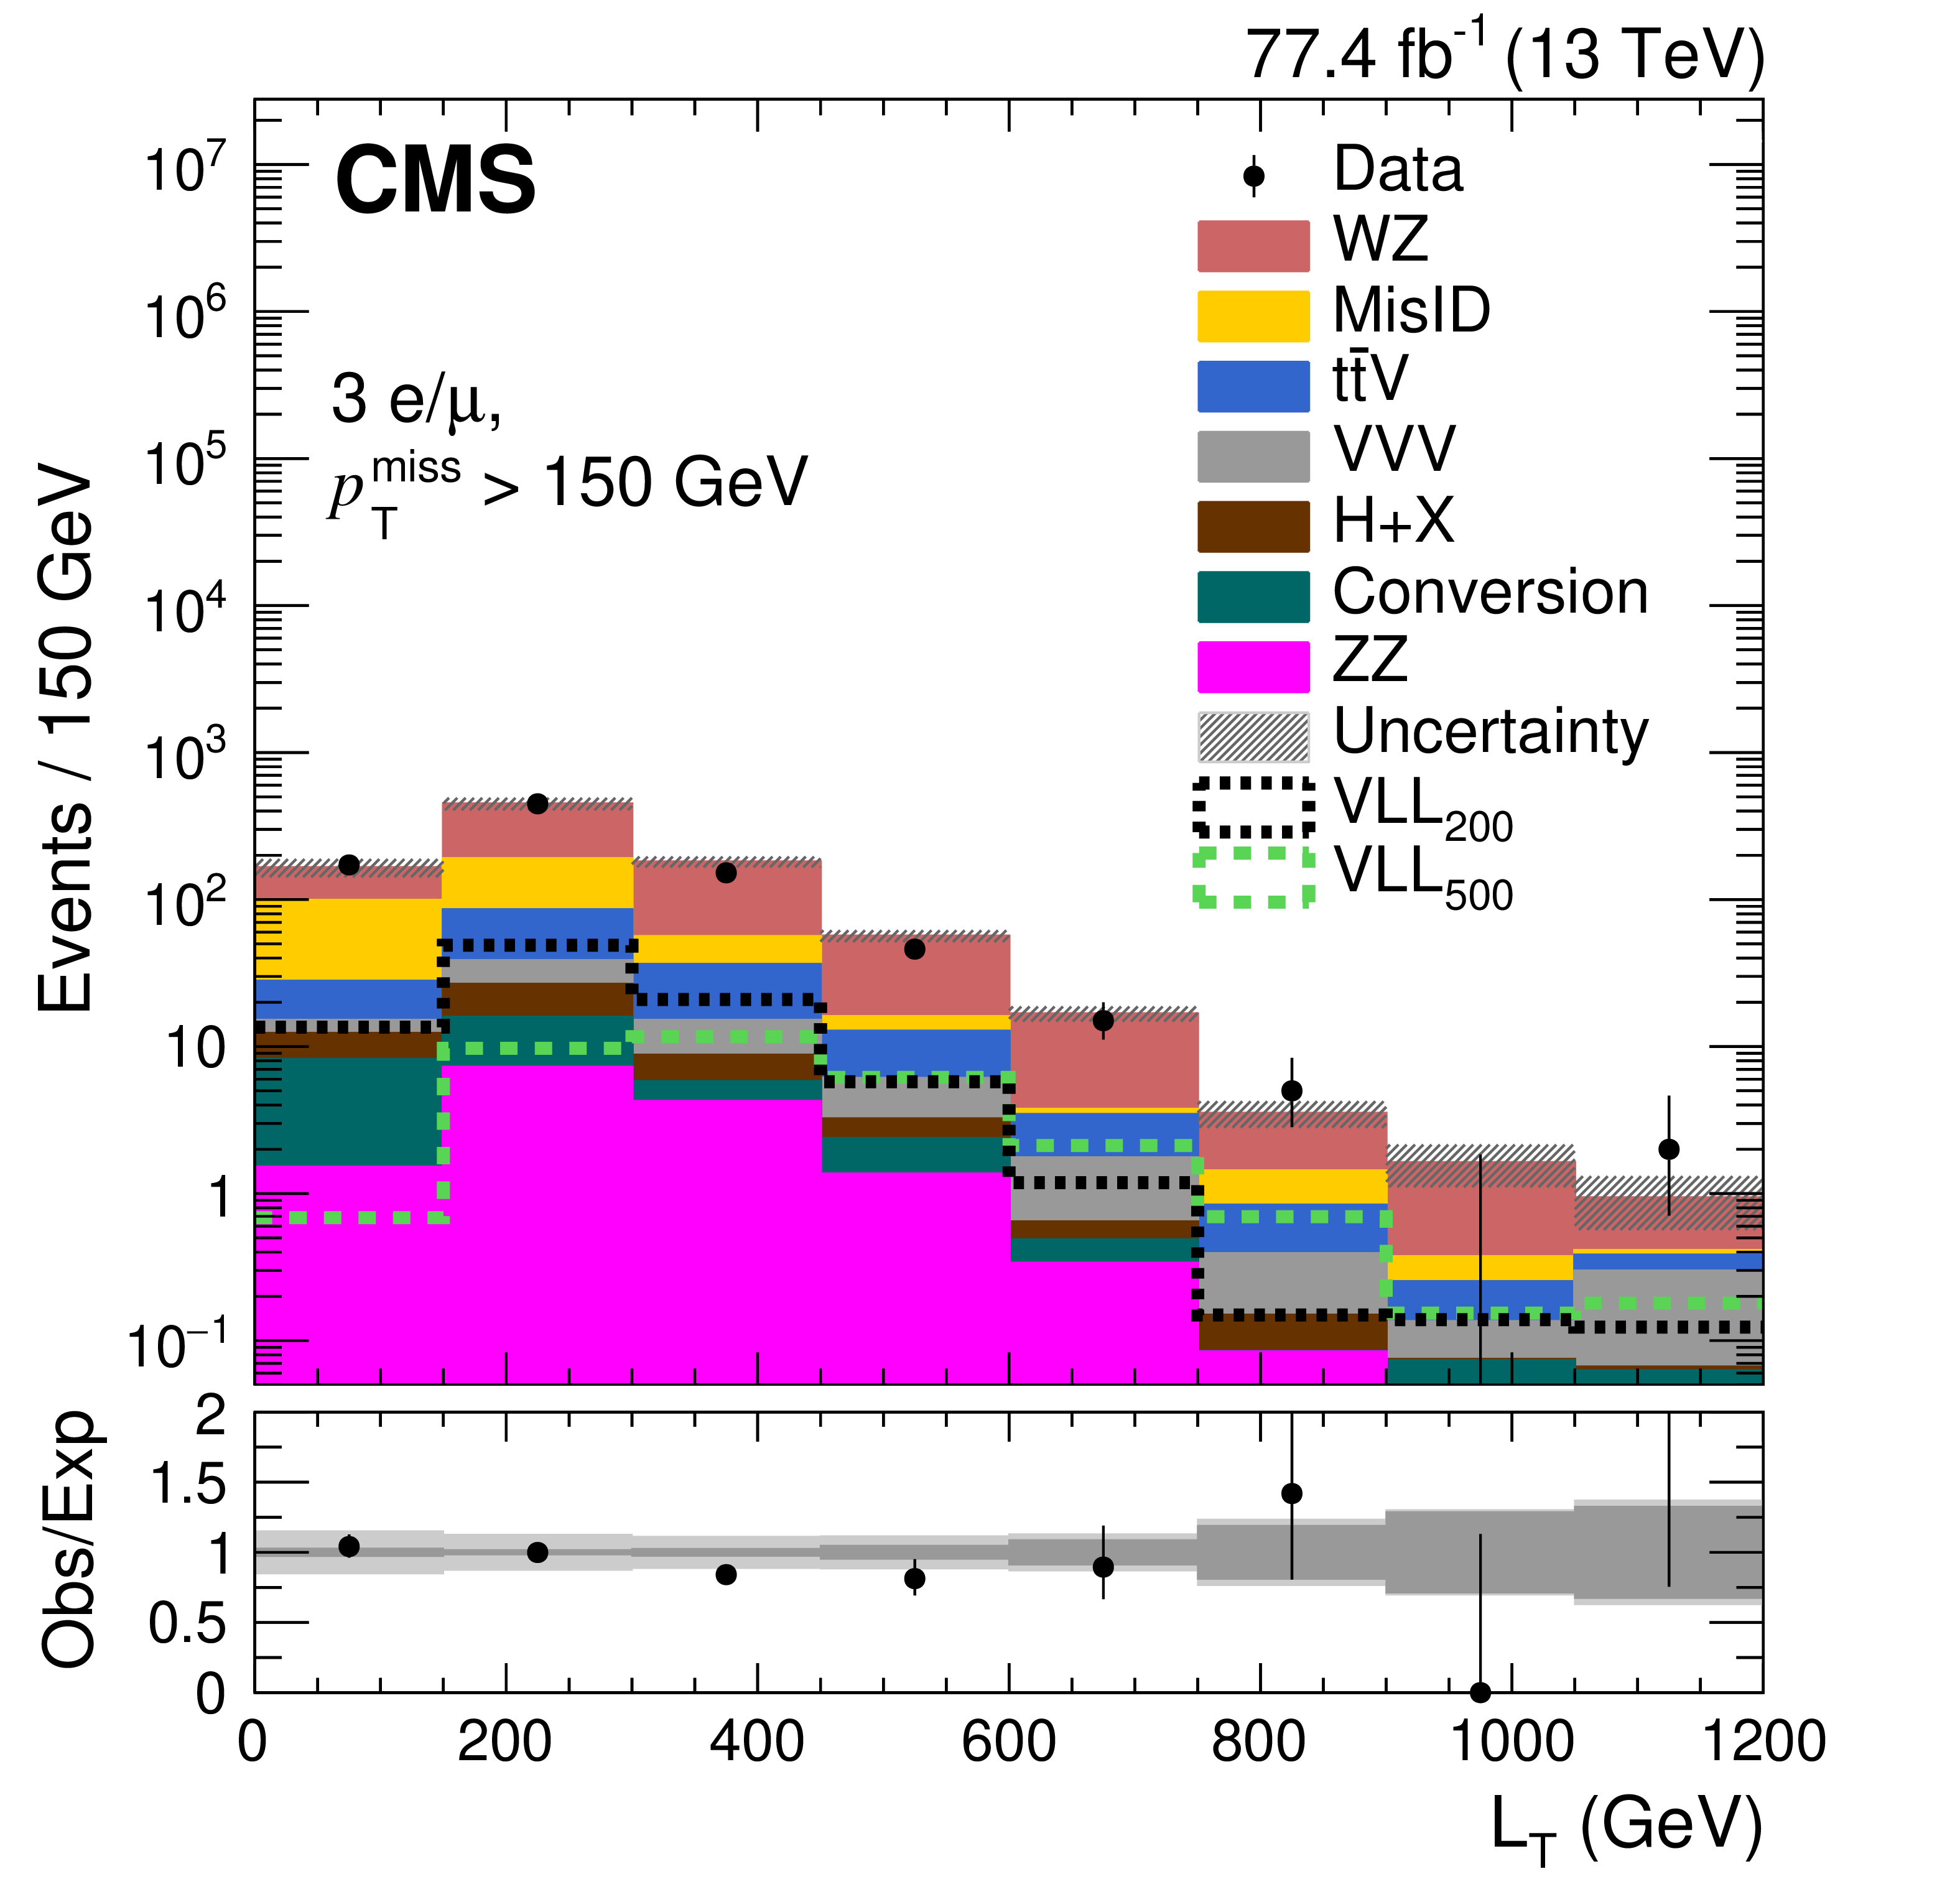
Figure 4-b:
The ${L_\mathrm {T}}$ distribution for the 3L signal regions with ${{p_{\mathrm {T}}} ^\text {miss}} > $ 150 GeV. The total SM background is shown as a stack of all contributing processes. The predictions for VLL signal models (the sum of all production and decay modes) with $m_{\tau^{\prime}/\nu^{\prime}} = $ 200 and 500 GeV are shown as dashed lines. The hatched gray bands in the upper panel represent the total uncertainty in the expected background. The lower panel shows the ratios of observed data to the total expected background. In the lower panel, the light gray band represents the combined statistical and systematic uncertainty in the expected background, while the dark gray band represents the statistical uncertainty only. The rightmost bin includes the overflow events. |

png pdf |
Figure 4-c:
The ${L_\mathrm {T}}$ distribution for the 4L signal regions with $ {{p_{\mathrm {T}}} ^\text {miss}} < $ 50 GeV. The total SM background is shown as a stack of all contributing processes. The predictions for VLL signal models (the sum of all production and decay modes) with $m_{\tau^{\prime}/\nu^{\prime}} = $ 200 and 500 GeV are shown as dashed lines. The hatched gray bands in the upper panel represent the total uncertainty in the expected background. The lower panel shows the ratios of observed data to the total expected background. In the lower panel, the light gray band represents the combined statistical and systematic uncertainty in the expected background, while the dark gray band represents the statistical uncertainty only. The rightmost bin includes the overflow events. |

png pdf |
Figure 4-d:
The ${L_\mathrm {T}}$ distribution for the 4L signal regions with $ {{p_{\mathrm {T}}} ^\text {miss}} < $ 50 GeV. The total SM background is shown as a stack of all contributing processes. The predictions for VLL signal models (the sum of all production and decay modes) with $m_{\tau^{\prime}/\nu^{\prime}} = $ 200 and 500 GeV are shown as dashed lines. The hatched gray bands in the upper panel represent the total uncertainty in the expected background. The lower panel shows the ratios of observed data to the total expected background. In the lower panel, the light gray band represents the combined statistical and systematic uncertainty in the expected background, while the dark gray band represents the statistical uncertainty only. The rightmost bin includes the overflow events. |

png pdf |
Figure 5:
The ${L_\mathrm {T}}$ distributions for the 2L1T OS signal regions with $ {{p_{\mathrm {T}}} ^\text {miss}} < $ 150 GeV (upper left) and $ {{p_{\mathrm {T}}} ^\text {miss}} > $ 150 GeV (upper right), and for the 2L1T SS signal regions with $ {{p_{\mathrm {T}}} ^\text {miss}} < $ 150 GeV (lower left) and $ {{p_{\mathrm {T}}} ^\text {miss}} > $ 150 GeV (lower right). The total SM background is shown as a stack of all contributing processes. The predictions for VLL signal models (sum of all production and decay modes) with $m_{\tau^{\prime}/\nu^{\prime}} = $ 200 and 500 GeV are also shown as dashed lines. The hatched gray bands in the upper panels represent the total uncertainty in the expected background. The lower panels show the ratios of observed data to the total expected background. In the lower panels, the light gray band represents the combined statistical and systematic uncertainty in the expected background, while the dark gray band represents the statistical uncertainty only. The rightmost bins include the overflow events. |

png pdf |
Figure 5-a:
The ${L_\mathrm {T}}$ distribution for the 2L1T OS signal regions with $ {{p_{\mathrm {T}}} ^\text {miss}} < $ 150 GeV. The total SM background is shown as a stack of all contributing processes. The predictions for VLL signal models (sum of all production and decay modes) with $m_{\tau^{\prime}/\nu^{\prime}} = $ 200 and 500 GeV are also shown as dashed lines. The hatched gray bands in the upper panel represent the total uncertainty in the expected background. The lower panel shows the ratios of observed data to the total expected background. In the lower panel, the light gray band represents the combined statistical and systematic uncertainty in the expected background, while the dark gray band represents the statistical uncertainty only. The rightmost bin includes the overflow events. |

png pdf |
Figure 5-b:
The ${L_\mathrm {T}}$ distribution for the 2L1T OS signal regions with $ {{p_{\mathrm {T}}} ^\text {miss}} > $ 150 GeV. The total SM background is shown as a stack of all contributing processes. The predictions for VLL signal models (sum of all production and decay modes) with $m_{\tau^{\prime}/\nu^{\prime}} = $ 200 and 500 GeV are also shown as dashed lines. The hatched gray bands in the upper panel represent the total uncertainty in the expected background. The lower panel shows the ratios of observed data to the total expected background. In the lower panel, the light gray band represents the combined statistical and systematic uncertainty in the expected background, while the dark gray band represents the statistical uncertainty only. The rightmost bin includes the overflow events. |

png pdf |
Figure 5-c:
The ${L_\mathrm {T}}$ distribution for the 2L1T SS signal regions with $ {{p_{\mathrm {T}}} ^\text {miss}} < $ 150 GeV. The total SM background is shown as a stack of all contributing processes. The predictions for VLL signal models (sum of all production and decay modes) with $m_{\tau^{\prime}/\nu^{\prime}} = $ 200 and 500 GeV are also shown as dashed lines. The hatched gray bands in the upper panel represent the total uncertainty in the expected background. The lower panel shows the ratios of observed data to the total expected background. In the lower panel, the light gray band represents the combined statistical and systematic uncertainty in the expected background, while the dark gray band represents the statistical uncertainty only. The rightmost bin includes the overflow events. |

png pdf |
Figure 5-d:
The ${L_\mathrm {T}}$ distribution for the 2L1T SS signal regions with $ {{p_{\mathrm {T}}} ^\text {miss}} > $ 150 GeV. The total SM background is shown as a stack of all contributing processes. The predictions for VLL signal models (sum of all production and decay modes) with $m_{\tau^{\prime}/\nu^{\prime}} = $ 200 and 500 GeV are also shown as dashed lines. The hatched gray bands in the upper panel represent the total uncertainty in the expected background. The lower panel shows the ratios of observed data to the total expected background. In the lower panel, the light gray band represents the combined statistical and systematic uncertainty in the expected background, while the dark gray band represents the statistical uncertainty only. The rightmost bin includes the overflow events. |

png pdf |
Figure 6:
The 95$%$ confidence level upper limits on the total cross section for associated ($\tau^{\prime \pm} \nu^{\prime} _{\tau}$) and pair ($\tau^{\prime +} \tau^{\prime -}$/$\nu^{\prime} _{\tau}\nu^{\prime} _{\tau}$) production of VLLs. Also shown is the theoretical prediction for the production cross section of a vector-like lepton doublet coupling to the third generation SM leptons. The observed (expected) exclusion limit on the masses of VLLs is in the range of 120-790 (120-680) GeV. |
| Tables | |

png pdf |
Table 1:
The signal regions defined in this analysis. The on-Z mass window is defined as 76 $ < m_{\ell \ell} < $ 106 GeV, while the below-Z condition is defined as $m_{\ell \ell} < $ 76 GeV. |

png pdf |
Table 2:
The sources of systematic uncertainty and the typical variations (%) observed in the affected background and signal yields in the analysis. All sources of uncertainty are considered as correlated between the 2016 and 2017 data analyses except for the lepton identification and isolation, the single lepton trigger, and the integrated luminosity. The label ALL is defined as WZ, ZZ, Rare (${\mathrm{t} {}\mathrm{\bar{t}}} $V, VVV, Higgs boson), and Signal processes. |
| Summary |
| A search for vector-like leptons coupled to the third generation standard model leptons has been performed in several multilepton final states using 77.4 fb$^{-1}$ of proton-proton collision data at a center-of-mass energy of 13 TeV, collected by the CMS experiment in 2016 and 2017. No significant deviations of the data from the standard model predictions are observed. These results exclude a vector-like lepton doublet with a common mass in the range 120-790 GeV at 95% confidence level. These are the most stringent limits yet on the production of a vector-like lepton doublet, coupling to the third generation standard model leptons. |
| References | ||||
| 1 | Particle Data Group Collaboration | Review of particle physics | PRD 98 (2018) 030001 | |
| 2 | S. P. Martin | Extra vector-like matter and the lightest Higgs scalar boson mass in low-energy supersymmetry | PRD 81 (2010) 035004 | 0910.2732 |
| 3 | M. Endo, K. Hamaguchi, S. Iwamoto, and N. Yokozaki | Higgs mass and muon anomalous magnetic moment in supersymmetric models with vector-like matters | PRD 84 (2011) 075017 | 1108.3071 |
| 4 | R. Dermisek and A. Raval | Explanation of the muon g-2 anomaly with vectorlike leptons and its implications for Higgs decays | PRD 88 (2013) 013017 | 1305.3522 |
| 5 | J. Halverson, N. Orlofsky, and A. Pierce | Vectorlike leptons as the tip of the dark matter iceberg | PRD 90 (2014) 015002 | 1403.1592 |
| 6 | N. Kumar and S. P. Martin | Vectorlike leptons at the Large Hadron Collider | PRD 92 (2015) 115018 | 1510.03456 |
| 7 | ATLAS Collaboration | Search for heavy lepton resonances decaying to a $ Z $ boson and a lepton in pp collisions at $ \sqrt{s}= $ 8 TeV with the ATLAS detector | JHEP 09 (2015) 108 | 1506.01291 |
| 8 | L3 Collaboration | Search for heavy neutral and charged leptons in $ e^{+} e^{-} $ annihilation at LEP | PLB 517 (2001) 75 | hep-ex/0107015 |
| 9 | CMS Collaboration | The CMS trigger system | JINST 12 (2017) P01020 | CMS-TRG-12-001 1609.02366 |
| 10 | CMS Collaboration | The CMS experiment at the CERN LHC | JINST 3 (2008) S08004 | CMS-00-001 |
| 11 | CMS Collaboration | Particle-flow reconstruction and global event description with the CMS detector | JINST 12 (2017) P10003 | CMS-PRF-14-001 1706.04965 |
| 12 | M. Cacciari, G. P. Salam, and G. Soyez | The anti-$ {k_{\mathrm{T}}} $ jet clustering algorithm | JHEP 04 (2008) 063 | 0802.1189 |
| 13 | M. Cacciari, G. P. Salam, and G. Soyez | FastJet user manual | EPJC 72 (2012) 1896 | 1111.6097 |
| 14 | M. Cacciari and G. P. Salam | Pileup subtraction using jet areas | PLB 659 (2008) 119 | 0707.1378 |
| 15 | CMS Collaboration | Jet energy scale and resolution performance with 13 TeV data collected by CMS in 2016 | CDS | |
| 16 | W. Adam, R. Fruhwirth, A. Strandlie, and T. Todorov | Reconstruction of electrons with the Gaussian-sum filter in the CMS tracker at the LHC | JPG 31 (2005) N9 | physics.data-an/0306087 |
| 17 | CMS Collaboration | Performance of electron reconstruction and selection with the CMS detector in proton-proton collisions at $ \sqrt{s} = $ 8 TeV | JINST 10 (2015) P06005 | CMS-EGM-13-001 1502.02701 |
| 18 | CMS Collaboration | Performance of the CMS muon detector and muon reconstruction with proton-proton collisions at $ \sqrt{s}= $ 13 TeV | JINST 13 (2018) P06015 | CMS-MUO-16-001 1804.04528 |
| 19 | CMS Collaboration | Reconstruction and identification of $ \tau $ lepton decays to hadrons and $ \nu_\tau $ at CMS | JINST 11 (2016) P01019 | CMS-TAU-14-001 1510.07488 |
| 20 | CMS Collaboration | Performance of reconstruction and identification of $ \tau $ leptons decaying to hadrons and $ \nu_\tau $ in pp collisions at $ \sqrt{s}= $ 13 TeV | JINST 13 (2018) P10005 | CMS-TAU-16-003 1809.02816 |
| 21 | P. Nason | A new method for combining NLO QCD with shower Monte Carlo algorithms | JHEP 11 (2004) 040 | hep-ph/0409146 |
| 22 | S. Frixione, P. Nason, and C. Oleari | Matching NLO QCD computations with Parton Shower simulations: the POWHEG method | JHEP 11 (2007) 070 | 0709.2092 |
| 23 | S. Alioli, P. Nason, C. Oleari, and E. Re | A general framework for implementing NLO calculations in shower Monte Carlo programs: the POWHEG BOX | JHEP 06 (2010) 043 | 1002.2581 |
| 24 | T. Melia, P. Nason, R. Rontsch, and G. Zanderighi | $ {W}^+{W}^{-} $, WZ and ZZ production in the POWHEG BOX | JHEP 11 (2011) 078 | 1107.5051 |
| 25 | P. Nason and G. Zanderighi | $ {W}^+{W}^- $, $ {WZ} $, and $ {ZZ} $ production in the POWHEG-BOX-V2 | EPJC 74 (2014) 2702 | 1311.1365 |
| 26 | J. Alwall et al. | The automated computation of tree-level and next-to-leading order differential cross sections, and their matching to parton shower simulations | JHEP 07 (2014) 079 | 1405.0301 |
| 27 | E. Bagnaschi, G. Degrassi, P. Slavich, and A. Vicini | Higgs production via gluon fusion in the POWHEG approach in the SM and in the MSSM | JHEP 02 (2012) 088 | 1111.2854 |
| 28 | M. Klasen, K. Kovarik, P. Nason, and C. Weydert | Associated production of charged Higgs bosons and top quarks with POWHEG | EPJC 72 (2012) 2088 | 1203.1341 |
| 29 | Y. Gao et al. | Spin determination of single-produced resonances at hadron colliders | PRD 81 (2010) 075022 | 1001.3396 |
| 30 | S. Bolognesi et al. | On the spin and parity of a single-produced resonance at the LHC | PRD 86 (2012) 095031 | 1208.4018 |
| 31 | I. Anderson et al. | Constraining anomalous HVV interactions at proton and lepton colliders | PRD 89 (2014) 035007 | 1309.4819 |
| 32 | A. V. Gritsan, R. Rontsch, M. Schulze, and M. Xiao | Constraining anomalous Higgs boson couplings to the heavy flavor fermions using matrix element techniques | PRD 94 (2016) 055023 | 1606.03107 |
| 33 | T. Sjostrand et al. | An introduction to PYTHIA 8.2 | CPC 191 (2015) 159 | 1410.3012 |
| 34 | CMS Collaboration | Event generator tunes obtained from underlying event and multiparton scattering measurements | EPJC 76 (2016) 155 | CMS-GEN-14-001 1512.00815 |
| 35 | CMS Collaboration | Extraction and validation of a new set of CMS PYTHIA8 tunes from underlying-event measurements | Submitted to EPJC | CMS-GEN-17-001 1903.12179 |
| 36 | NNPDF Collaboration | Parton distributions for the LHC Run II | JHEP 04 (2015) 040 | 1410.8849 |
| 37 | NNPDF Collaboration | Parton distributions from high-precision collider data | EPJC 77 (2017) 663 | 1706.00428 |
| 38 | GEANT4 Collaboration | GEANT4-a simulation toolkit | NIMA 506 (2003) 250 | |
| 39 | CMS Collaboration | Measurement of the $ \mathrm{t\bar{t}} $ production cross section in the dilepton channel in pp collisions at $ \sqrt{s}= $ 7 TeV | JHEP 11 (2012) 067 | CMS-TOP-11-005 1208.2671 |
| 40 | CMS Collaboration | CMS luminosity measurements for the 2016 data taking period | CMS-PAS-LUM-17-001 | CMS-PAS-LUM-17-001 |
| 41 | CMS Collaboration | CMS luminosity measurement for the 2017 data-taking period at $ \sqrt{s} = $ 13 TeV | CMS-PAS-LUM-17-004 | CMS-PAS-LUM-17-004 |
| 42 | T. Junk | Confidence level computation for combining searches with small statistics | NIMA 434 (1999) 435 | hep-ex/9902006 |
| 43 | A. L. Read | Presentation of search results: The $ CL_s $ technique | JPG 28 (2002) 2693 | |
| 44 | G. Cowan, K. Cranmer, E. Gross, and O. Vitells | Asymptotic formulae for likelihood-based tests of new physics | EPJC 71 (2011) 1554 | 1007.1727 |
|
|
Compact Muon Solenoid LHC, CERN |
|

|

|

|

|

|