

Compact Muon Solenoid
LHC, CERN
| CMS-HIG-19-007 ; CERN-EP-2021-093 | ||
| Search for low-mass dilepton resonances in Higgs boson decays to four-lepton final states in proton-proton collisions at $\sqrt{s} = $ 13 TeV | ||
| CMS Collaboration | ||
| 1 November 2021 | ||
| Eur. Phys. J. C 82 (2022) 290 | ||
| Abstract: A search for low-mass dilepton resonances in Higgs boson decays is conducted in the four-lepton final state. The decay is assumed to proceed via a pair of beyond the standard model particles, or one such particle and a Z boson. The search uses proton-proton collision data collected with the CMS detector at the CERN LHC, corresponding to an integrated luminosity of 137 fb$^{-1}$, at a center-of-mass energy $\sqrt{s} = $ 13 TeV. No significant deviation from the standard model expectation is observed. Upper limits at 95% confidence level are set on model-independent Higgs boson decay branching fractions. Additionally, limits on dark photon and axion-like particle production, based on two specific models, are reported. | ||
| Links: e-print arXiv:2111.01299 [hep-ex] (PDF) ; CDS record ; inSPIRE record ; HepData record ; CADI line (restricted) ; | ||
| Figures | |

png pdf |
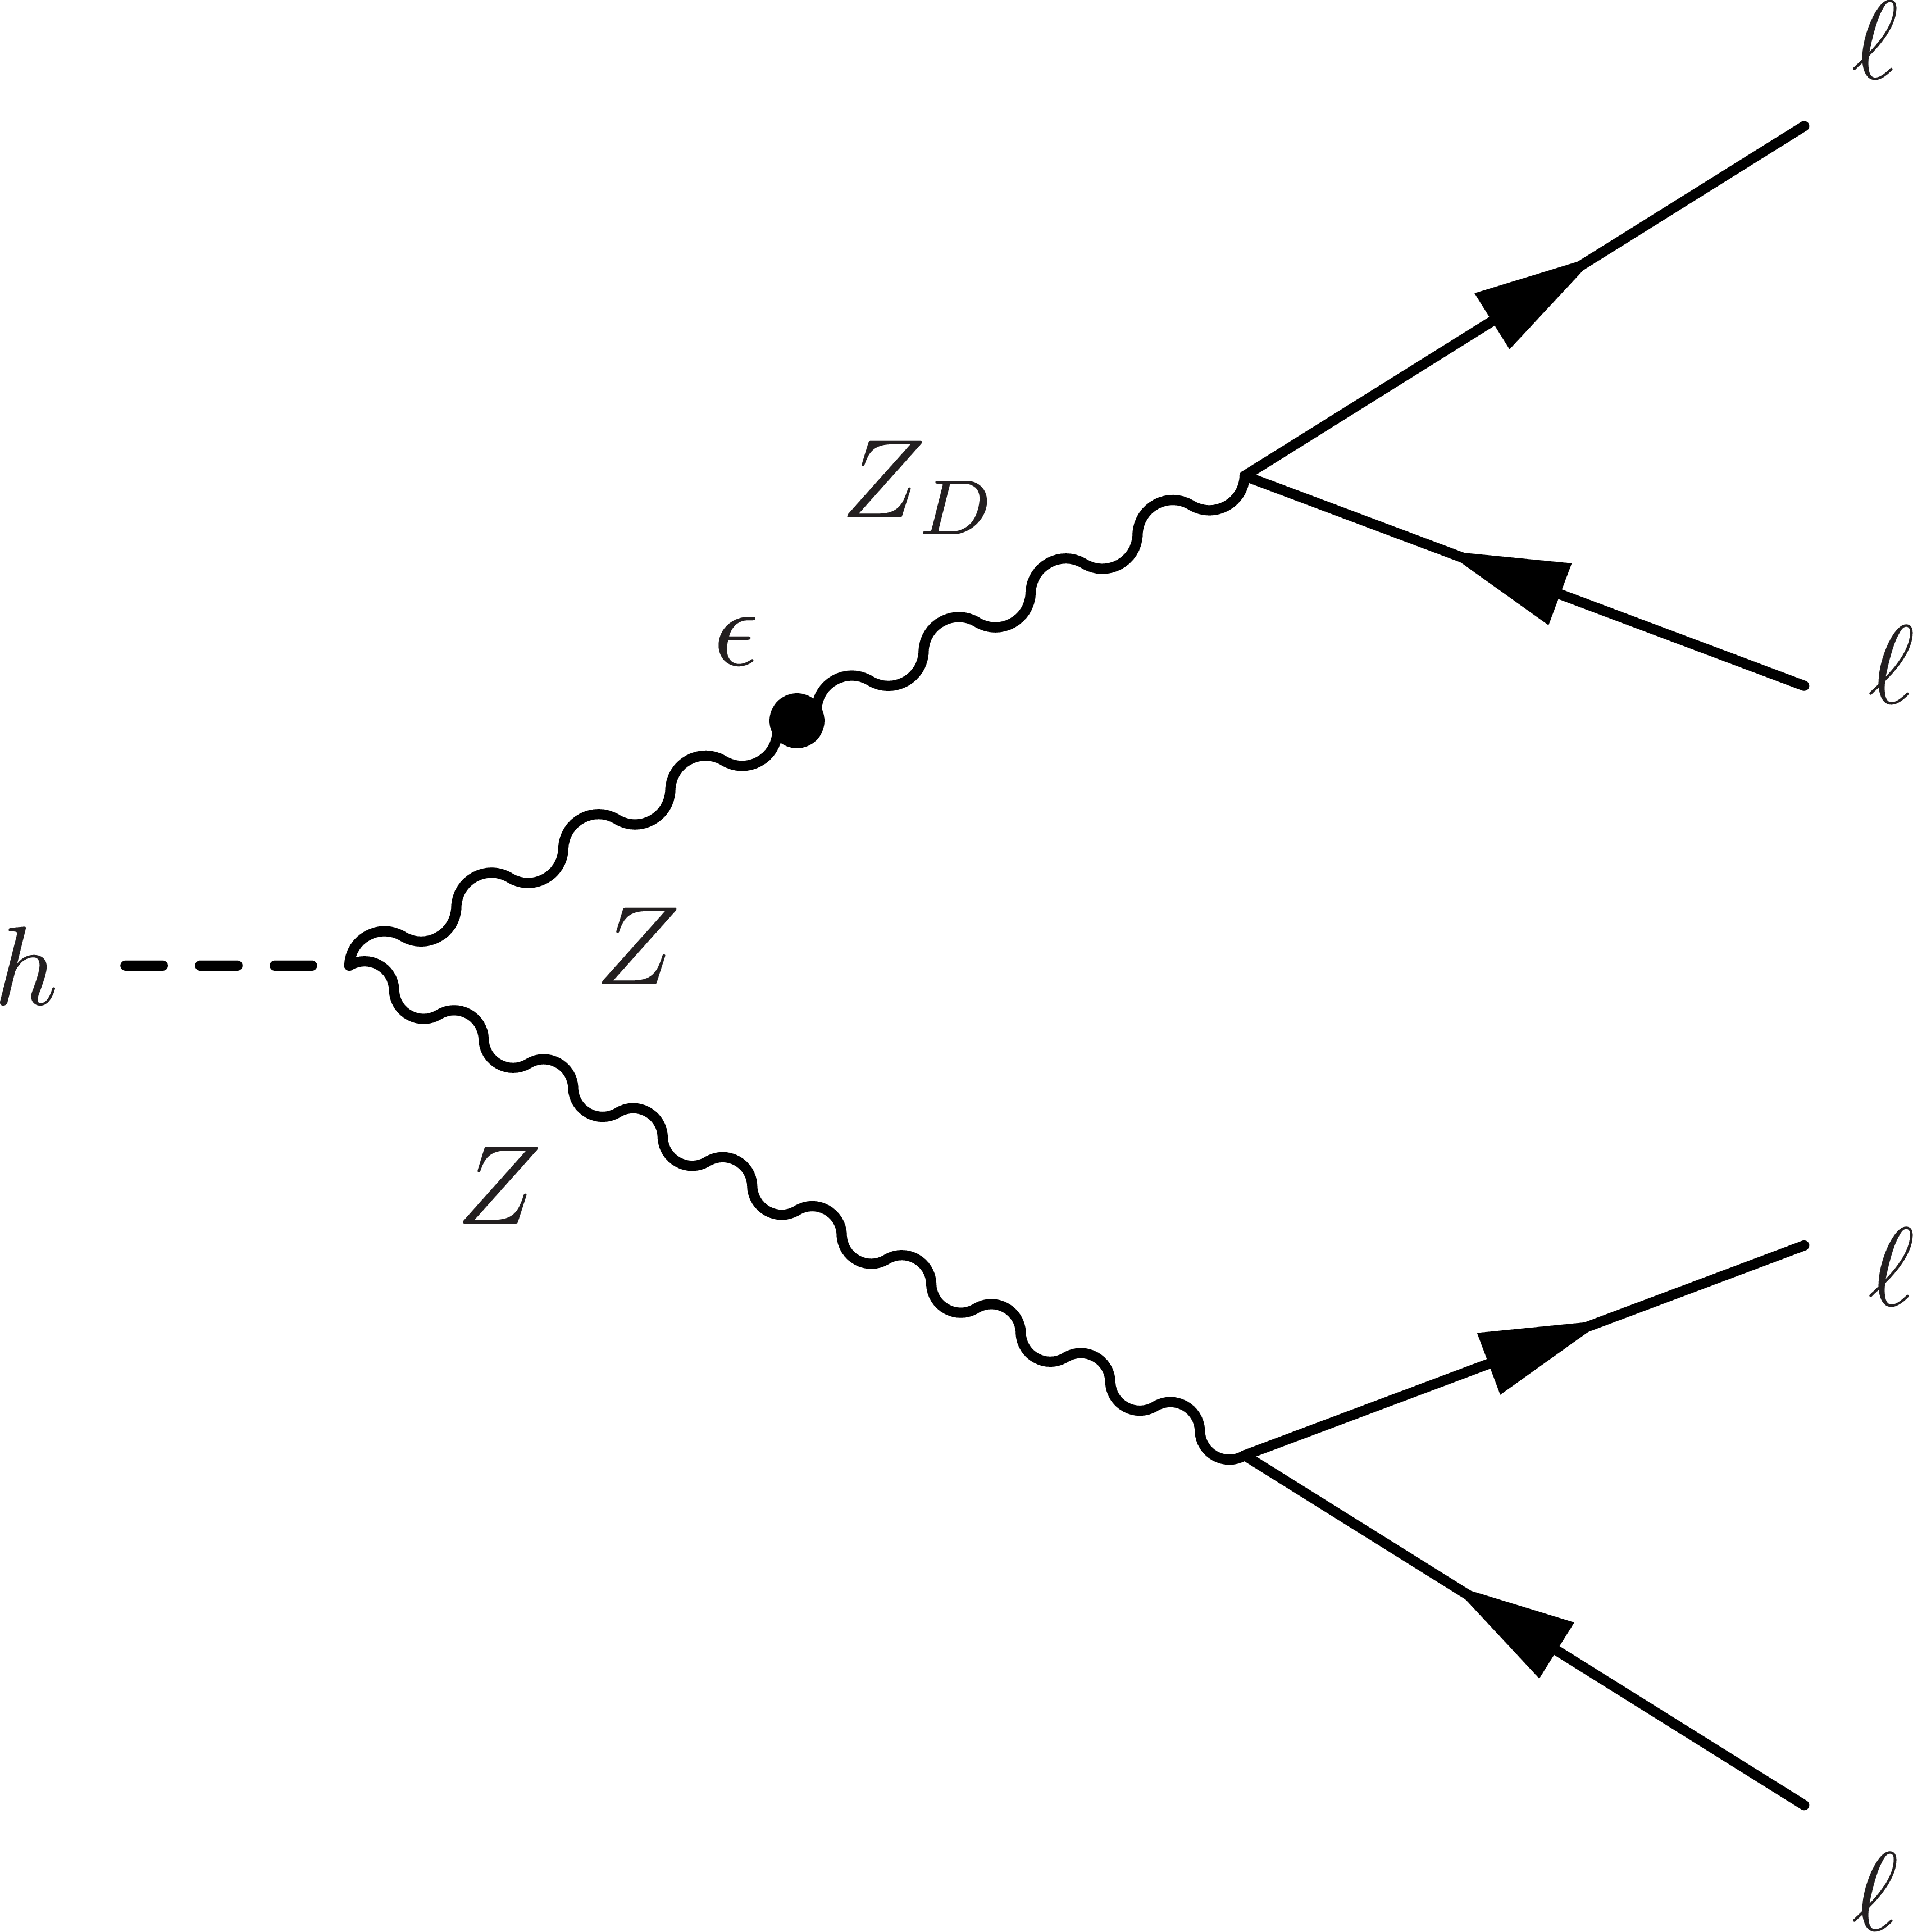
Figure 1:
Feynman diagrams for Higgs boson decay via the kinetic-mixing (left) or Higgs-mixing mechanism (right) [7]. The symbol $h$ represents the Higgs boson, and $s$ represents the dark Higgs boson. The symbol ${\varepsilon}$ represents the kinetic-mixing parameter while $\kappa $ represents the Higgs-mixing parameter. |
png pdf |
Figure 1-a:
Feynman diagram for Higgs boson decay via the kinetic-mixing mechanism [7]. The symbol $h$ represents the Higgs boson. The symbol ${\varepsilon}$ represents the kinetic-mixing parameter. |

png pdf |
Figure 1-b:
Feynman diagram for Higgs boson decay via the Higgs-mixing mechanism [7]. The symbol $h$ represents the Higgs boson, and $s$ represents the dark Higgs boson. The symbol $\kappa $ represents the Higgs-mixing parameter. |
png pdf |
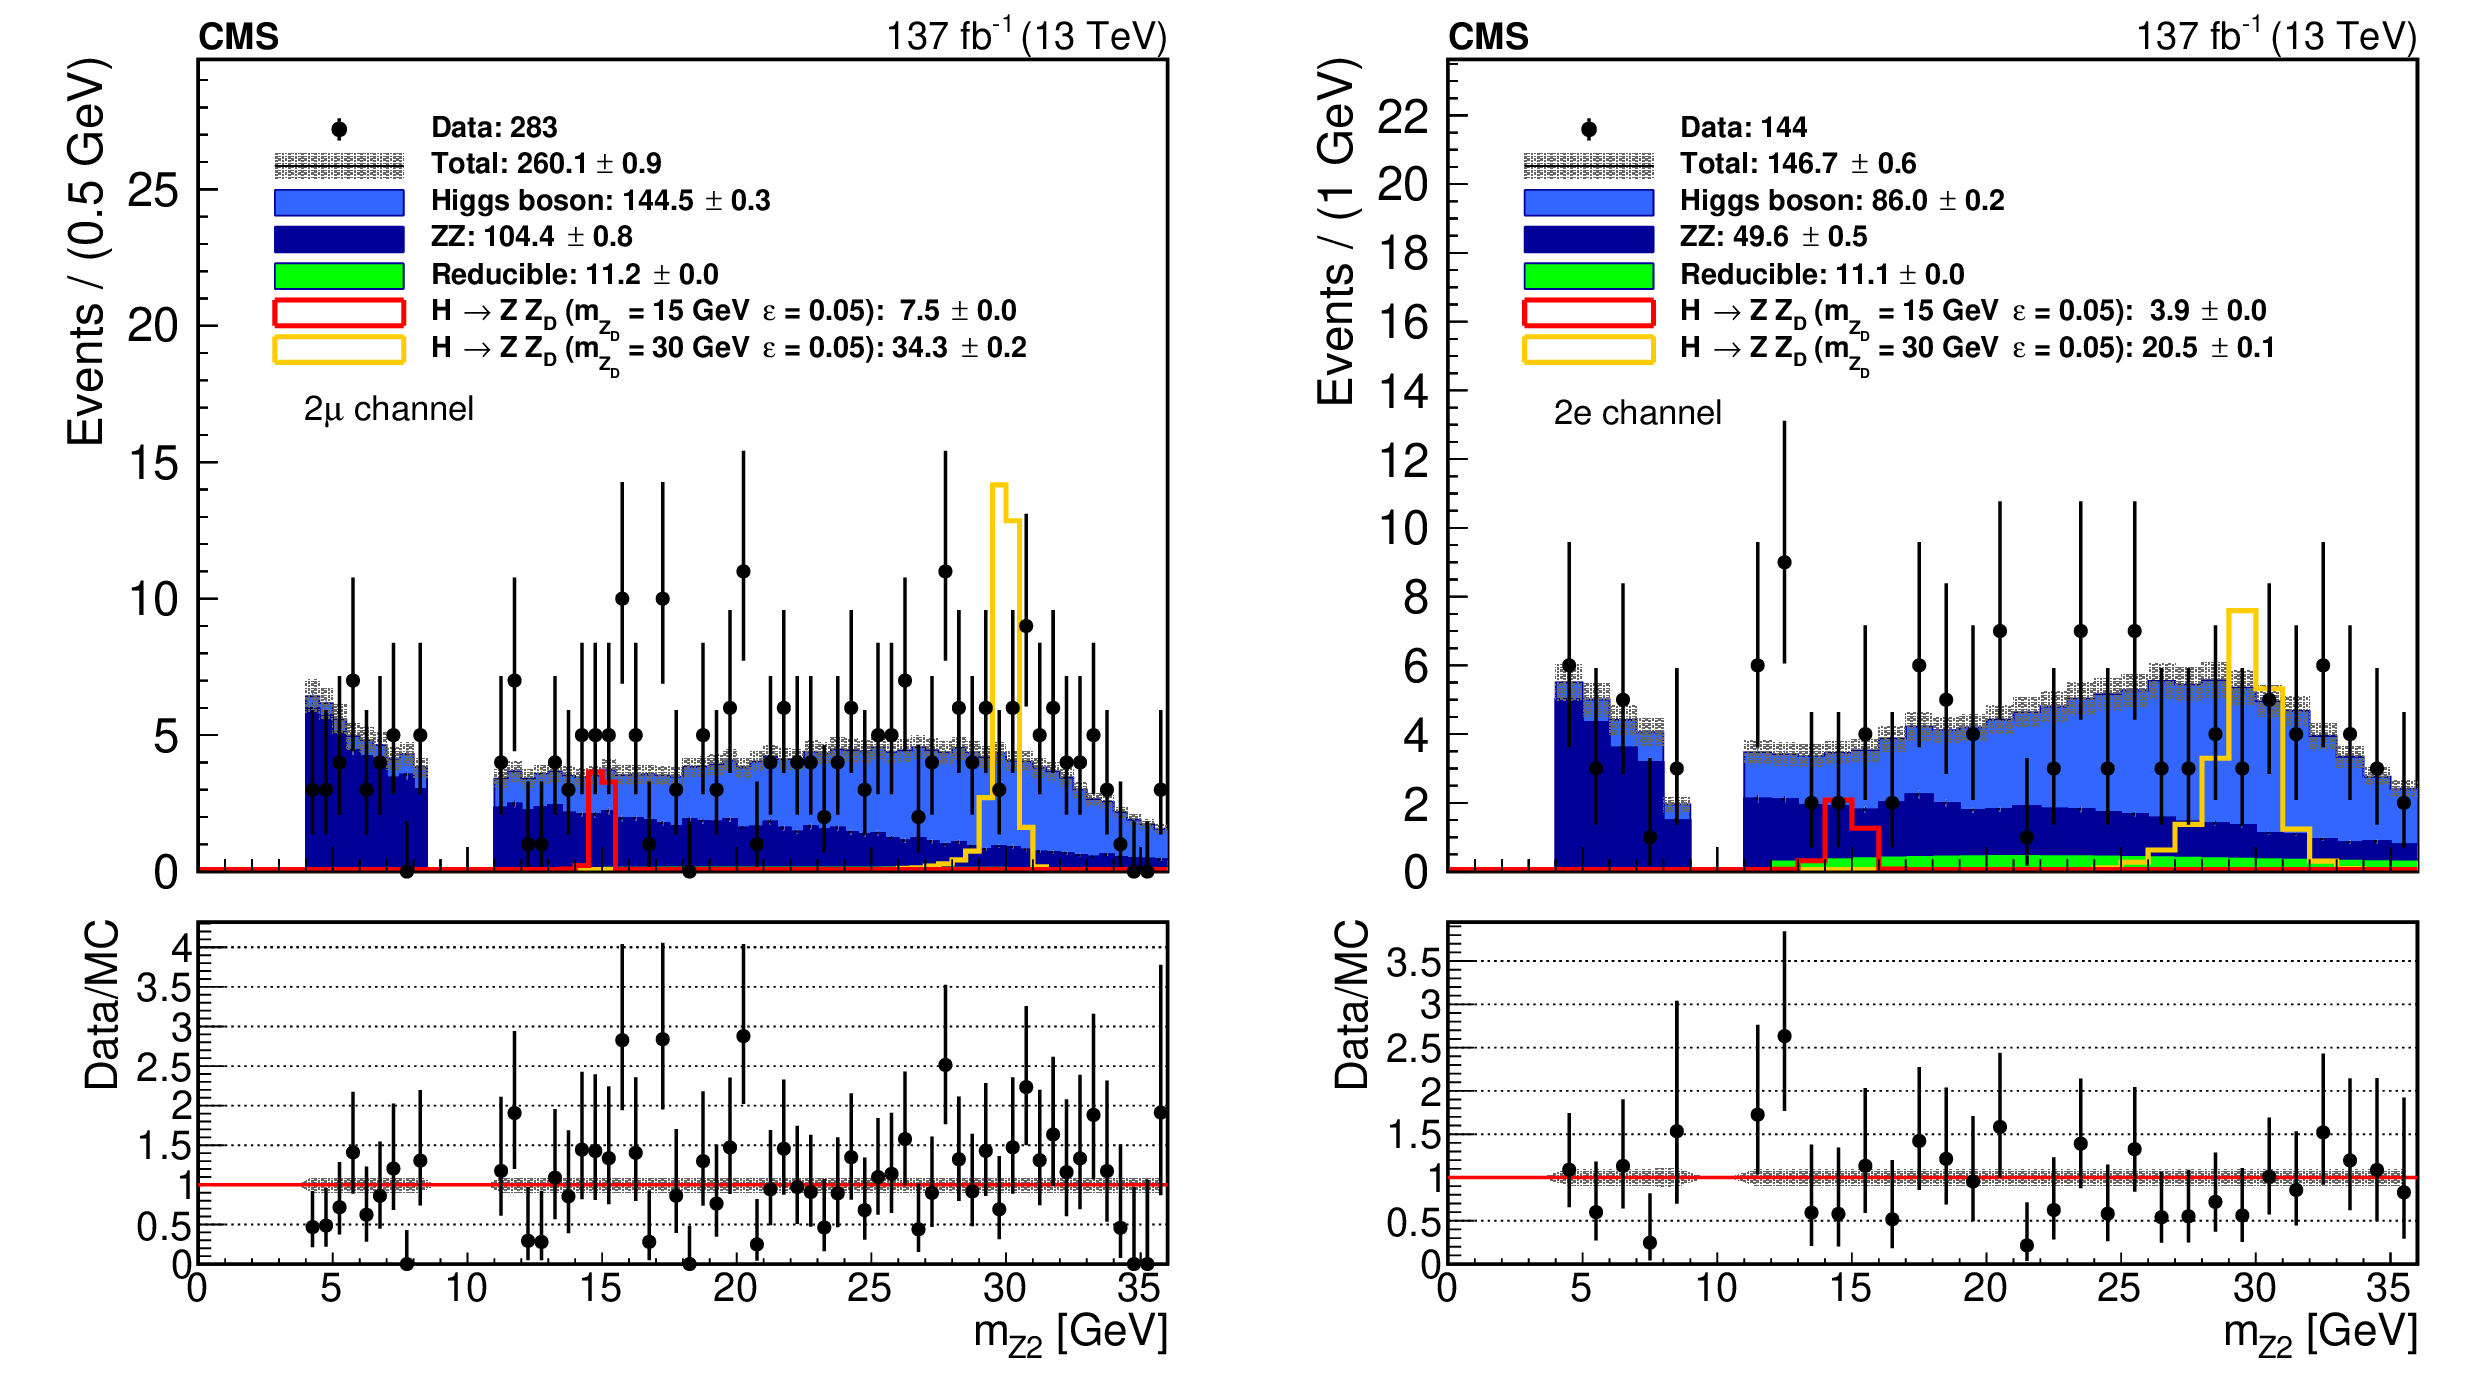
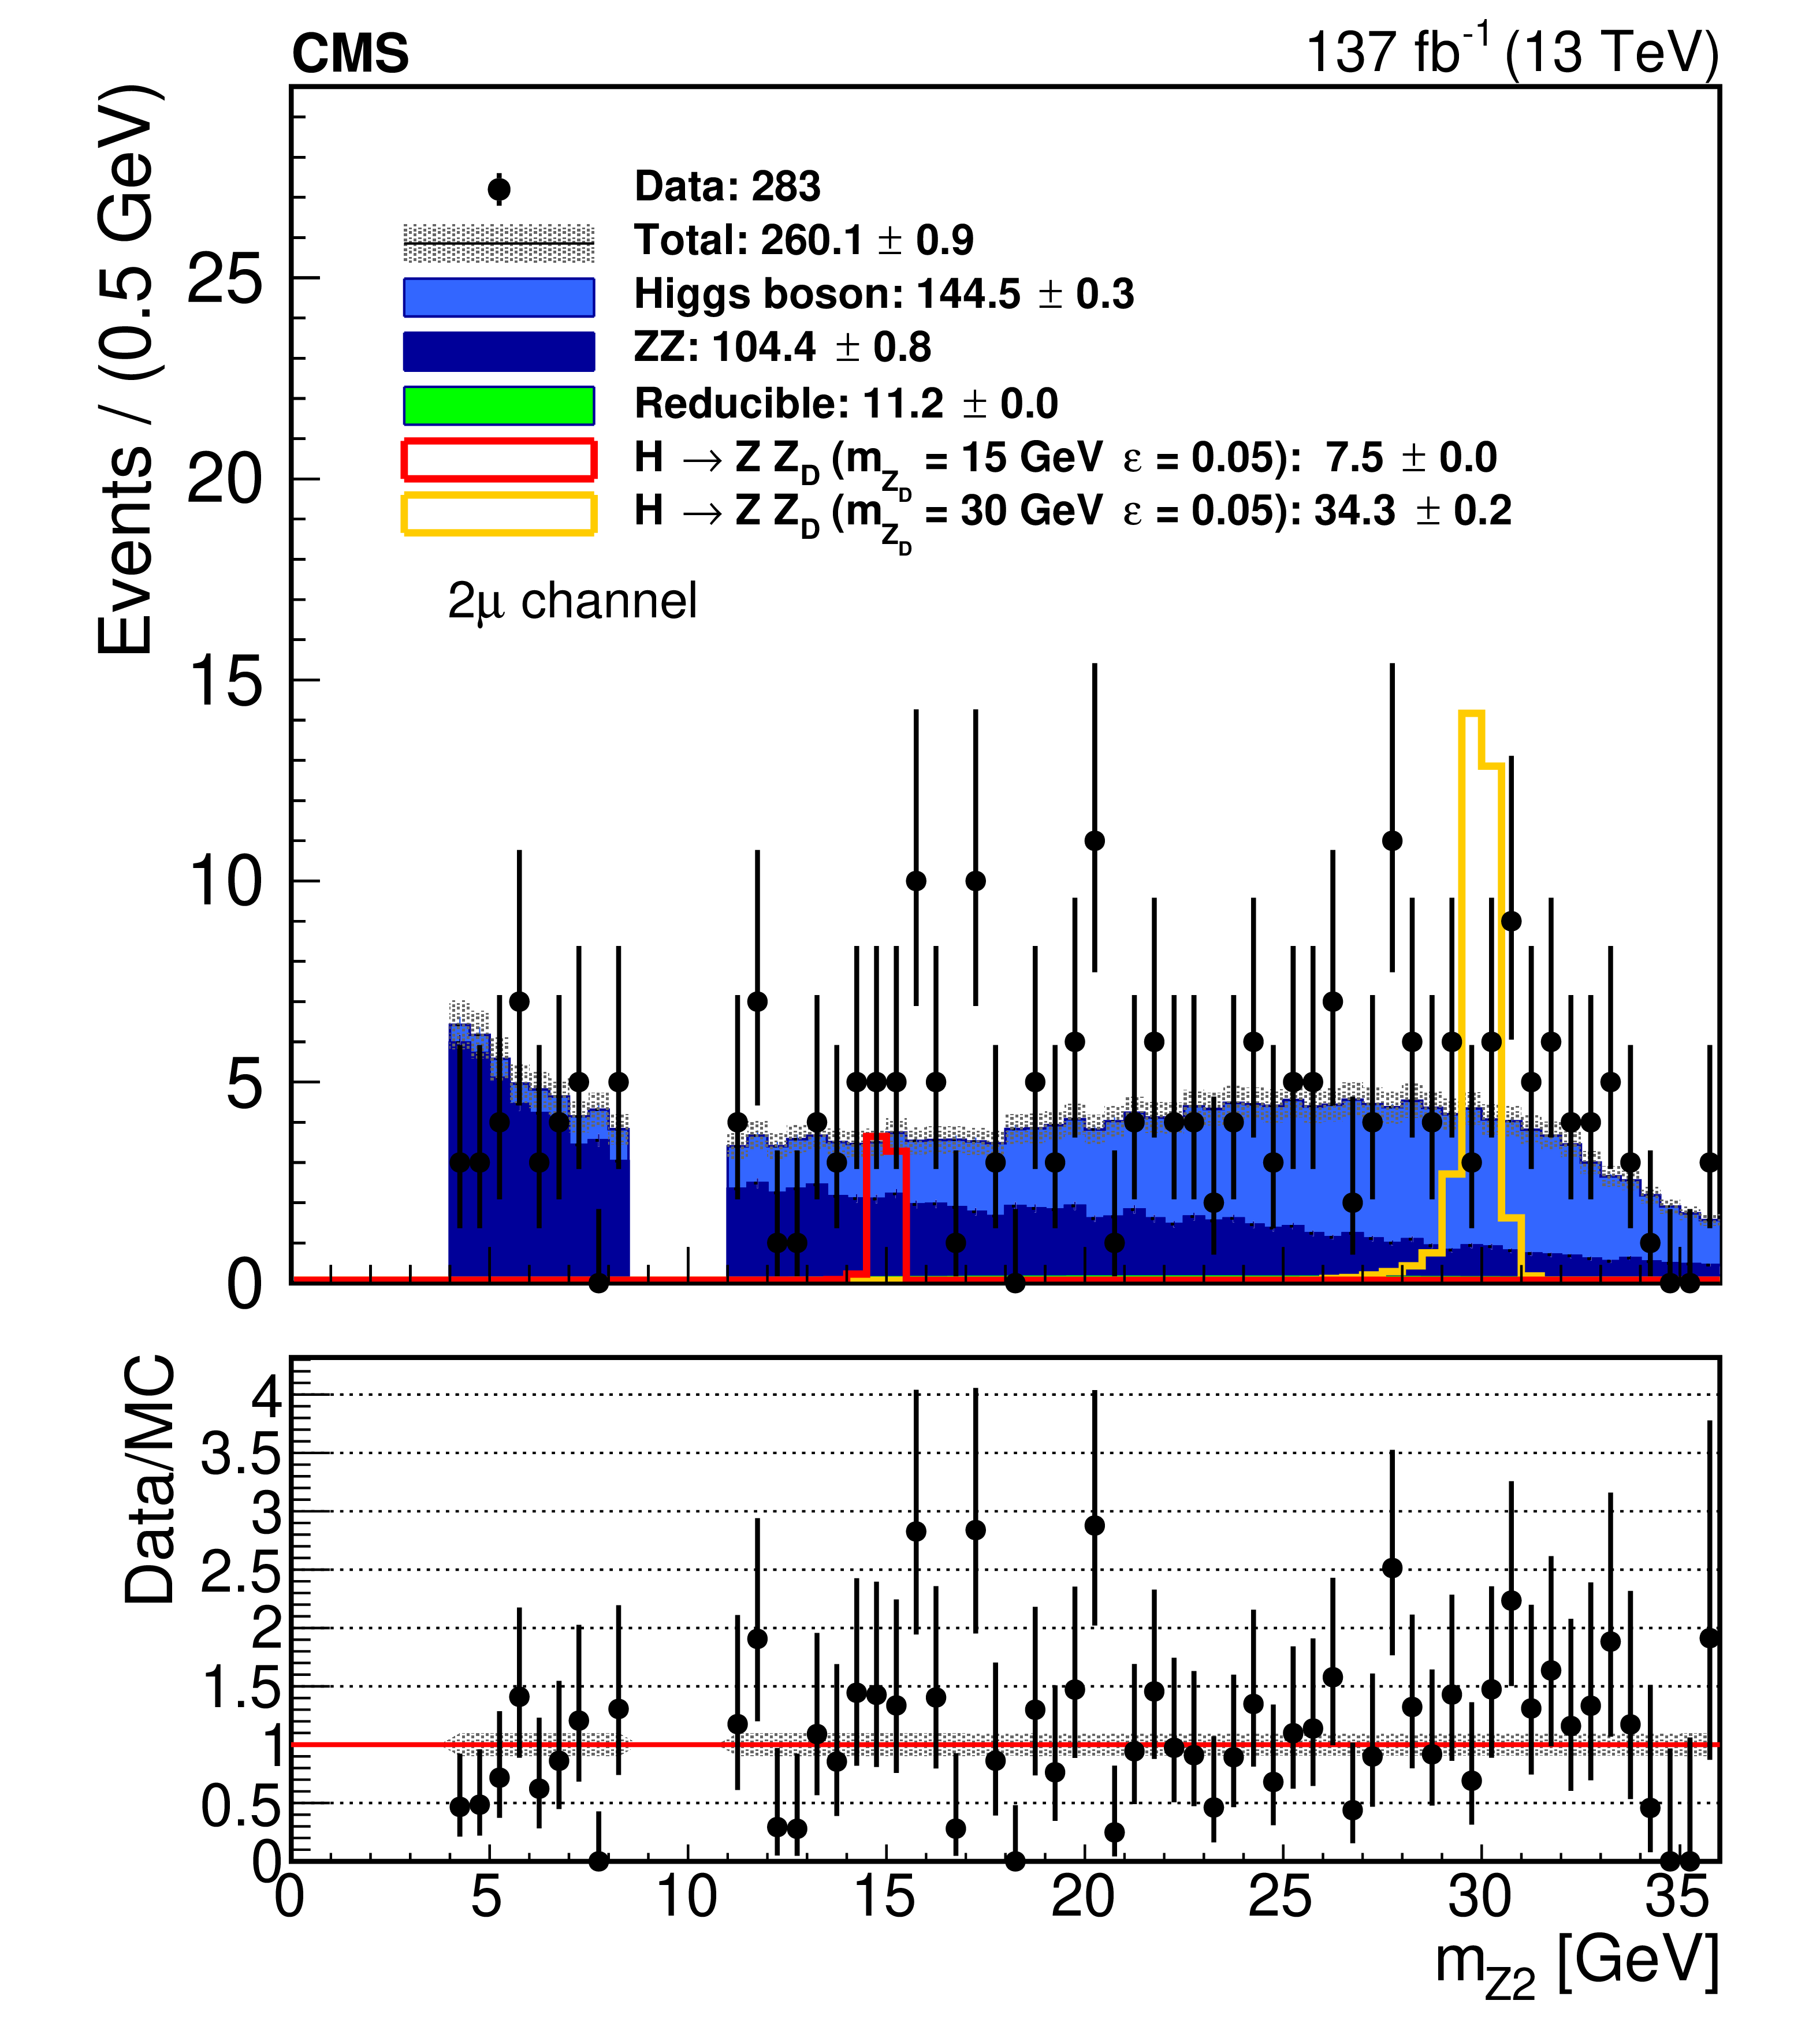
Figure 2:
Event yields against $m_{\mathrm{Z} _2}$ with the ZX selection for the muon and electron channels. Numbers in the legend show the total event yields with the ZX selection corresponding to data, and the expected yields for each background and signal processes, along with the corresponding statistical uncertainty coming from the amount of simulated data. |
png pdf |
Figure 2-a:
Event yields against $m_{\mathrm{Z} _2}$ with the ZX selection for the muon channel. Numbers in the legend show the total event yields with the ZX selection corresponding to data, and the expected yields for each background and signal processes, along with the corresponding statistical uncertainty coming from the amount of simulated data. |

png pdf |
Figure 2-b:
Event yields against $m_{\mathrm{Z} _2}$ with the ZX selection for the electron channel. Numbers in the legend show the total event yields with the ZX selection corresponding to data, and the expected yields for each background and signal processes, along with the corresponding statistical uncertainty coming from the amount of simulated data. |

png pdf |
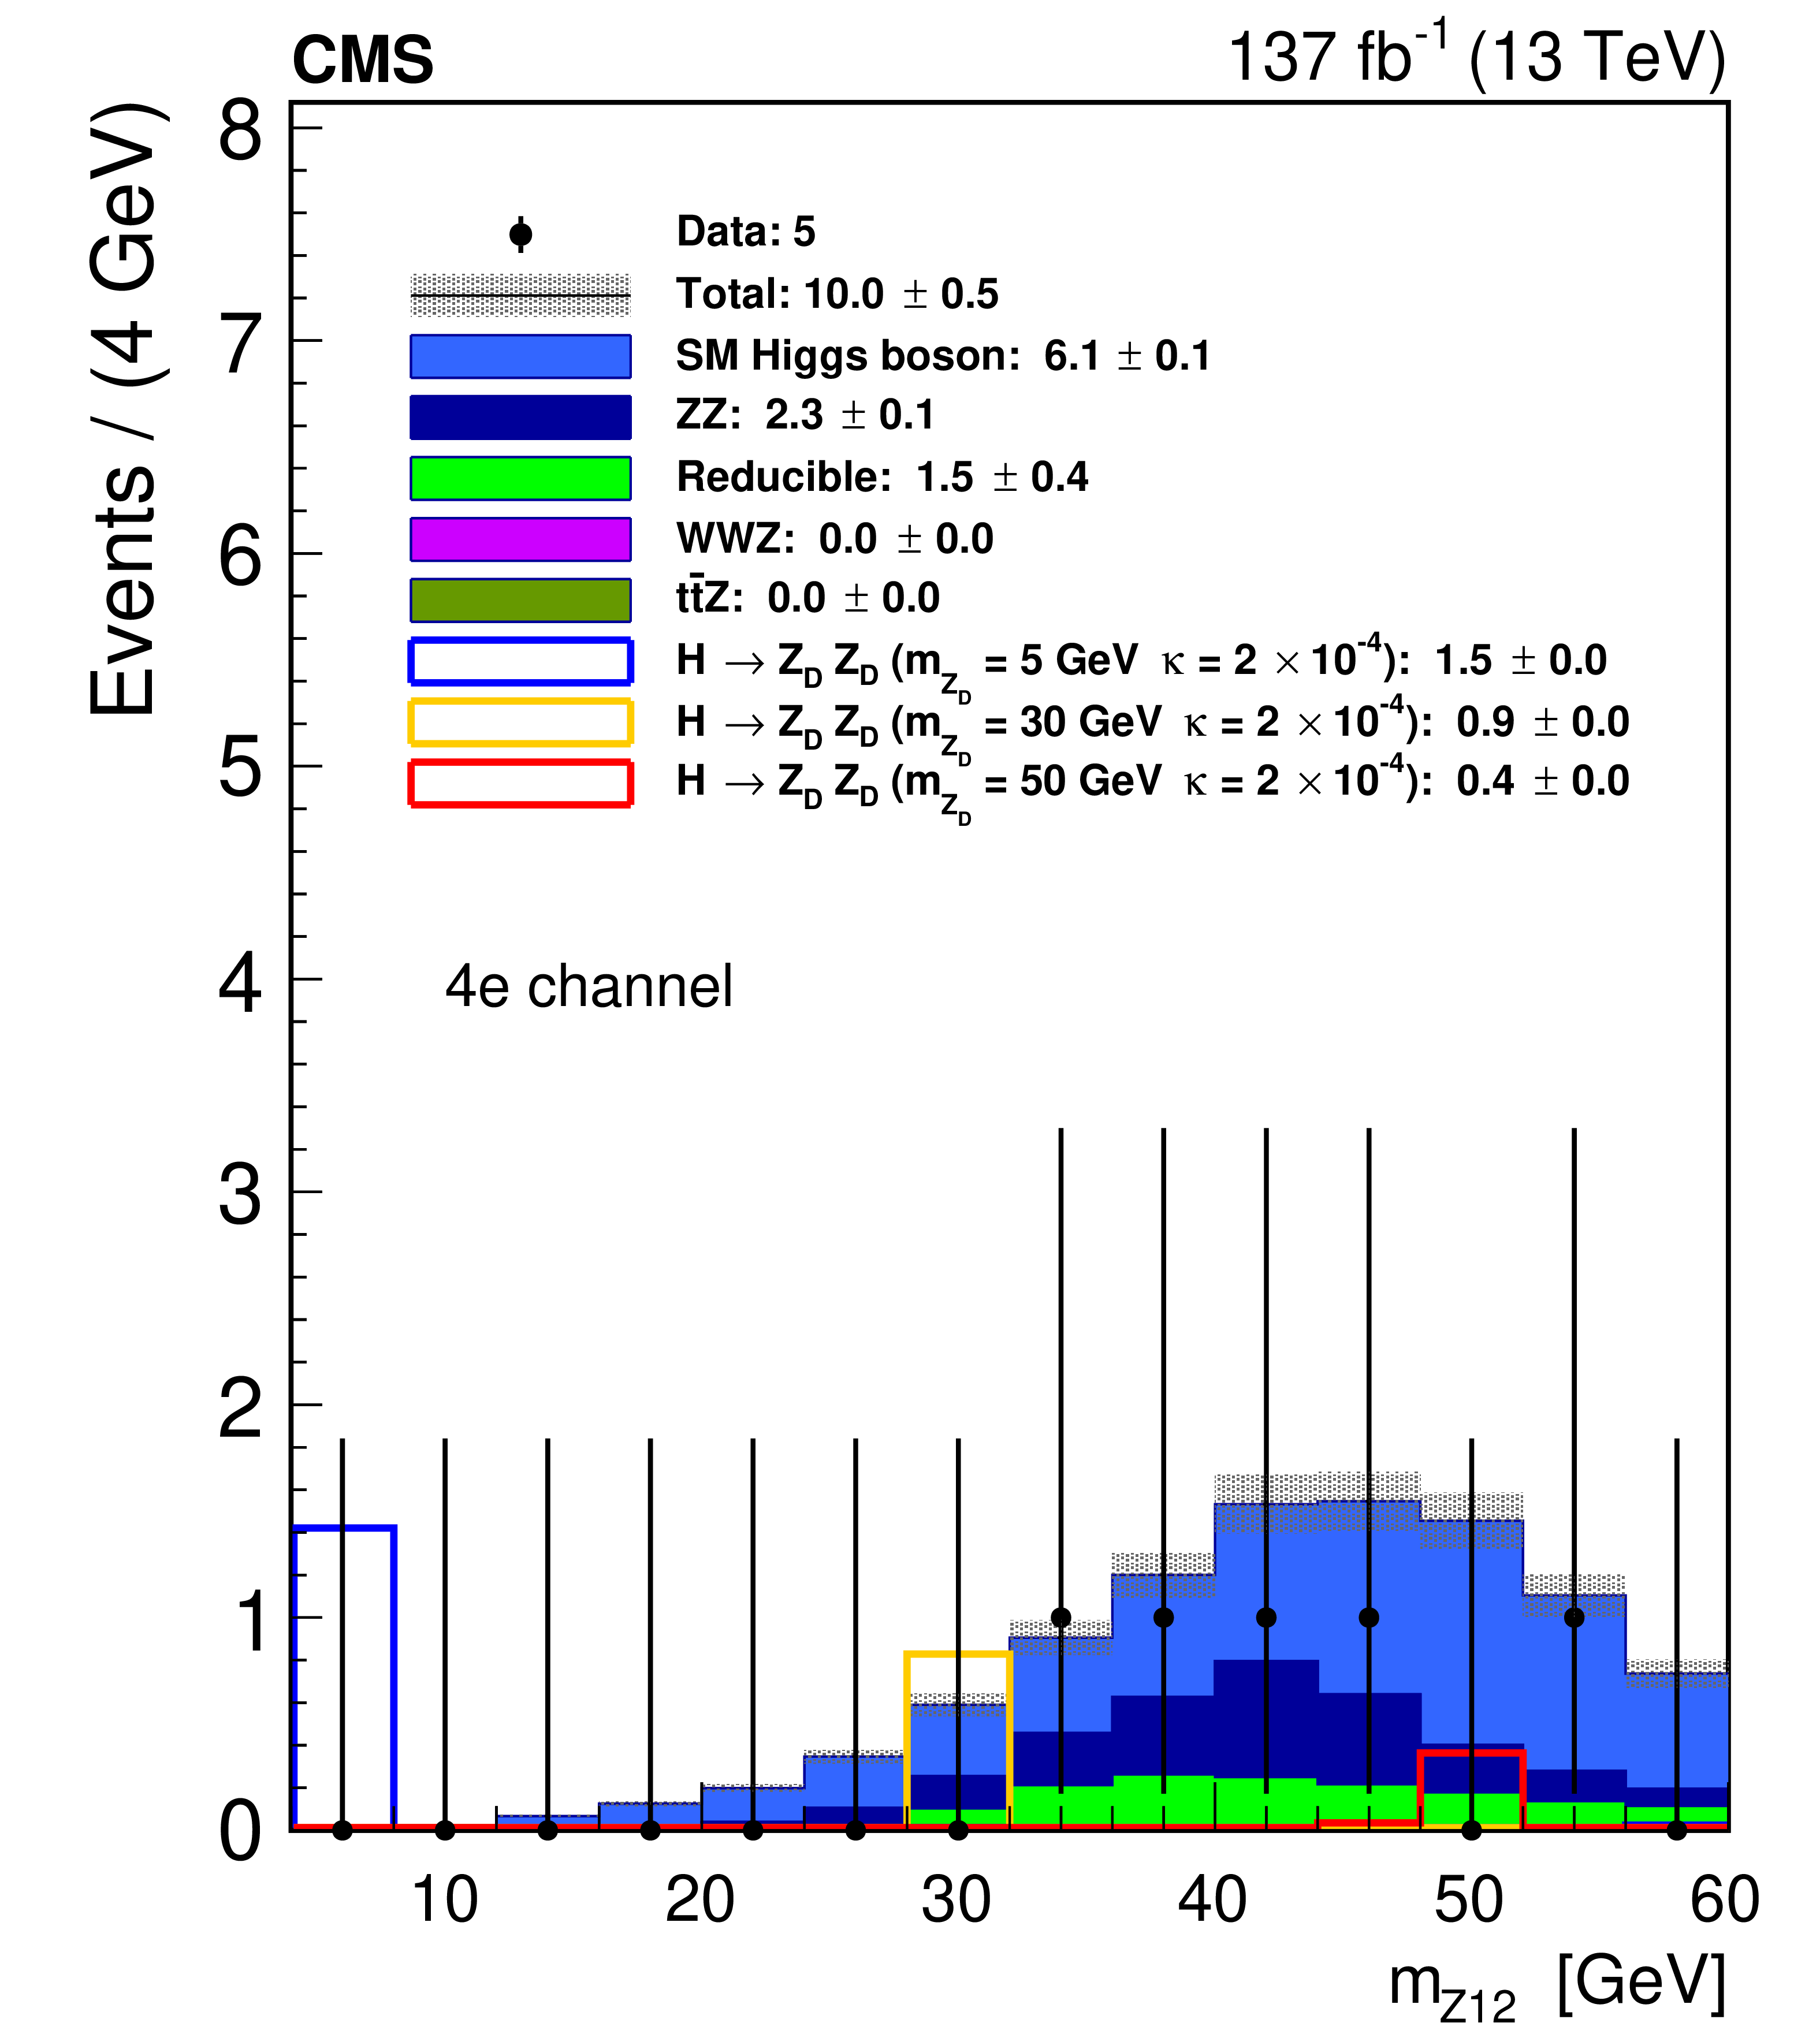
Figure 3:
Event yields against $ {m_{Z12}} = ({m_{{\mathrm{Z} _1}}} + {m_{{\mathrm{Z} _2}}})/2$ with the XX selection for the 4$\mu$, 2e2$\mu$ and 4e final states. Numbers in the legend show the total event yields with the XX selection corresponding to data, and the expected yields for each background and signal processes, along with the corresponding statistical uncertainty coming from the amount of simulated data. |

png pdf |
Figure 3-a:
Event yields against $ {m_{Z12}} = ({m_{{\mathrm{Z} _1}}} + {m_{{\mathrm{Z} _2}}})/2$ with the XX selection for the 4$\mu$ final state. Numbers in the legend show the total event yields with the XX selection corresponding to data, and the expected yields for each background and signal processes, along with the corresponding statistical uncertainty coming from the amount of simulated data. |

png pdf |
Figure 3-b:
Event yields against $ {m_{Z12}} = ({m_{{\mathrm{Z} _1}}} + {m_{{\mathrm{Z} _2}}})/2$ with the XX selection for the 2e2$\mu$ final state. Numbers in the legend show the total event yields with the XX selection corresponding to data, and the expected yields for each background and signal processes, along with the corresponding statistical uncertainty coming from the amount of simulated data. |
png pdf |
Figure 3-c:
Event yields against $ {m_{Z12}} = ({m_{{\mathrm{Z} _1}}} + {m_{{\mathrm{Z} _2}}})/2$ with the XX selection for the 4e final state. Numbers in the legend show the total event yields with the XX selection corresponding to data, and the expected yields for each background and signal processes, along with the corresponding statistical uncertainty coming from the amount of simulated data. |
png pdf |
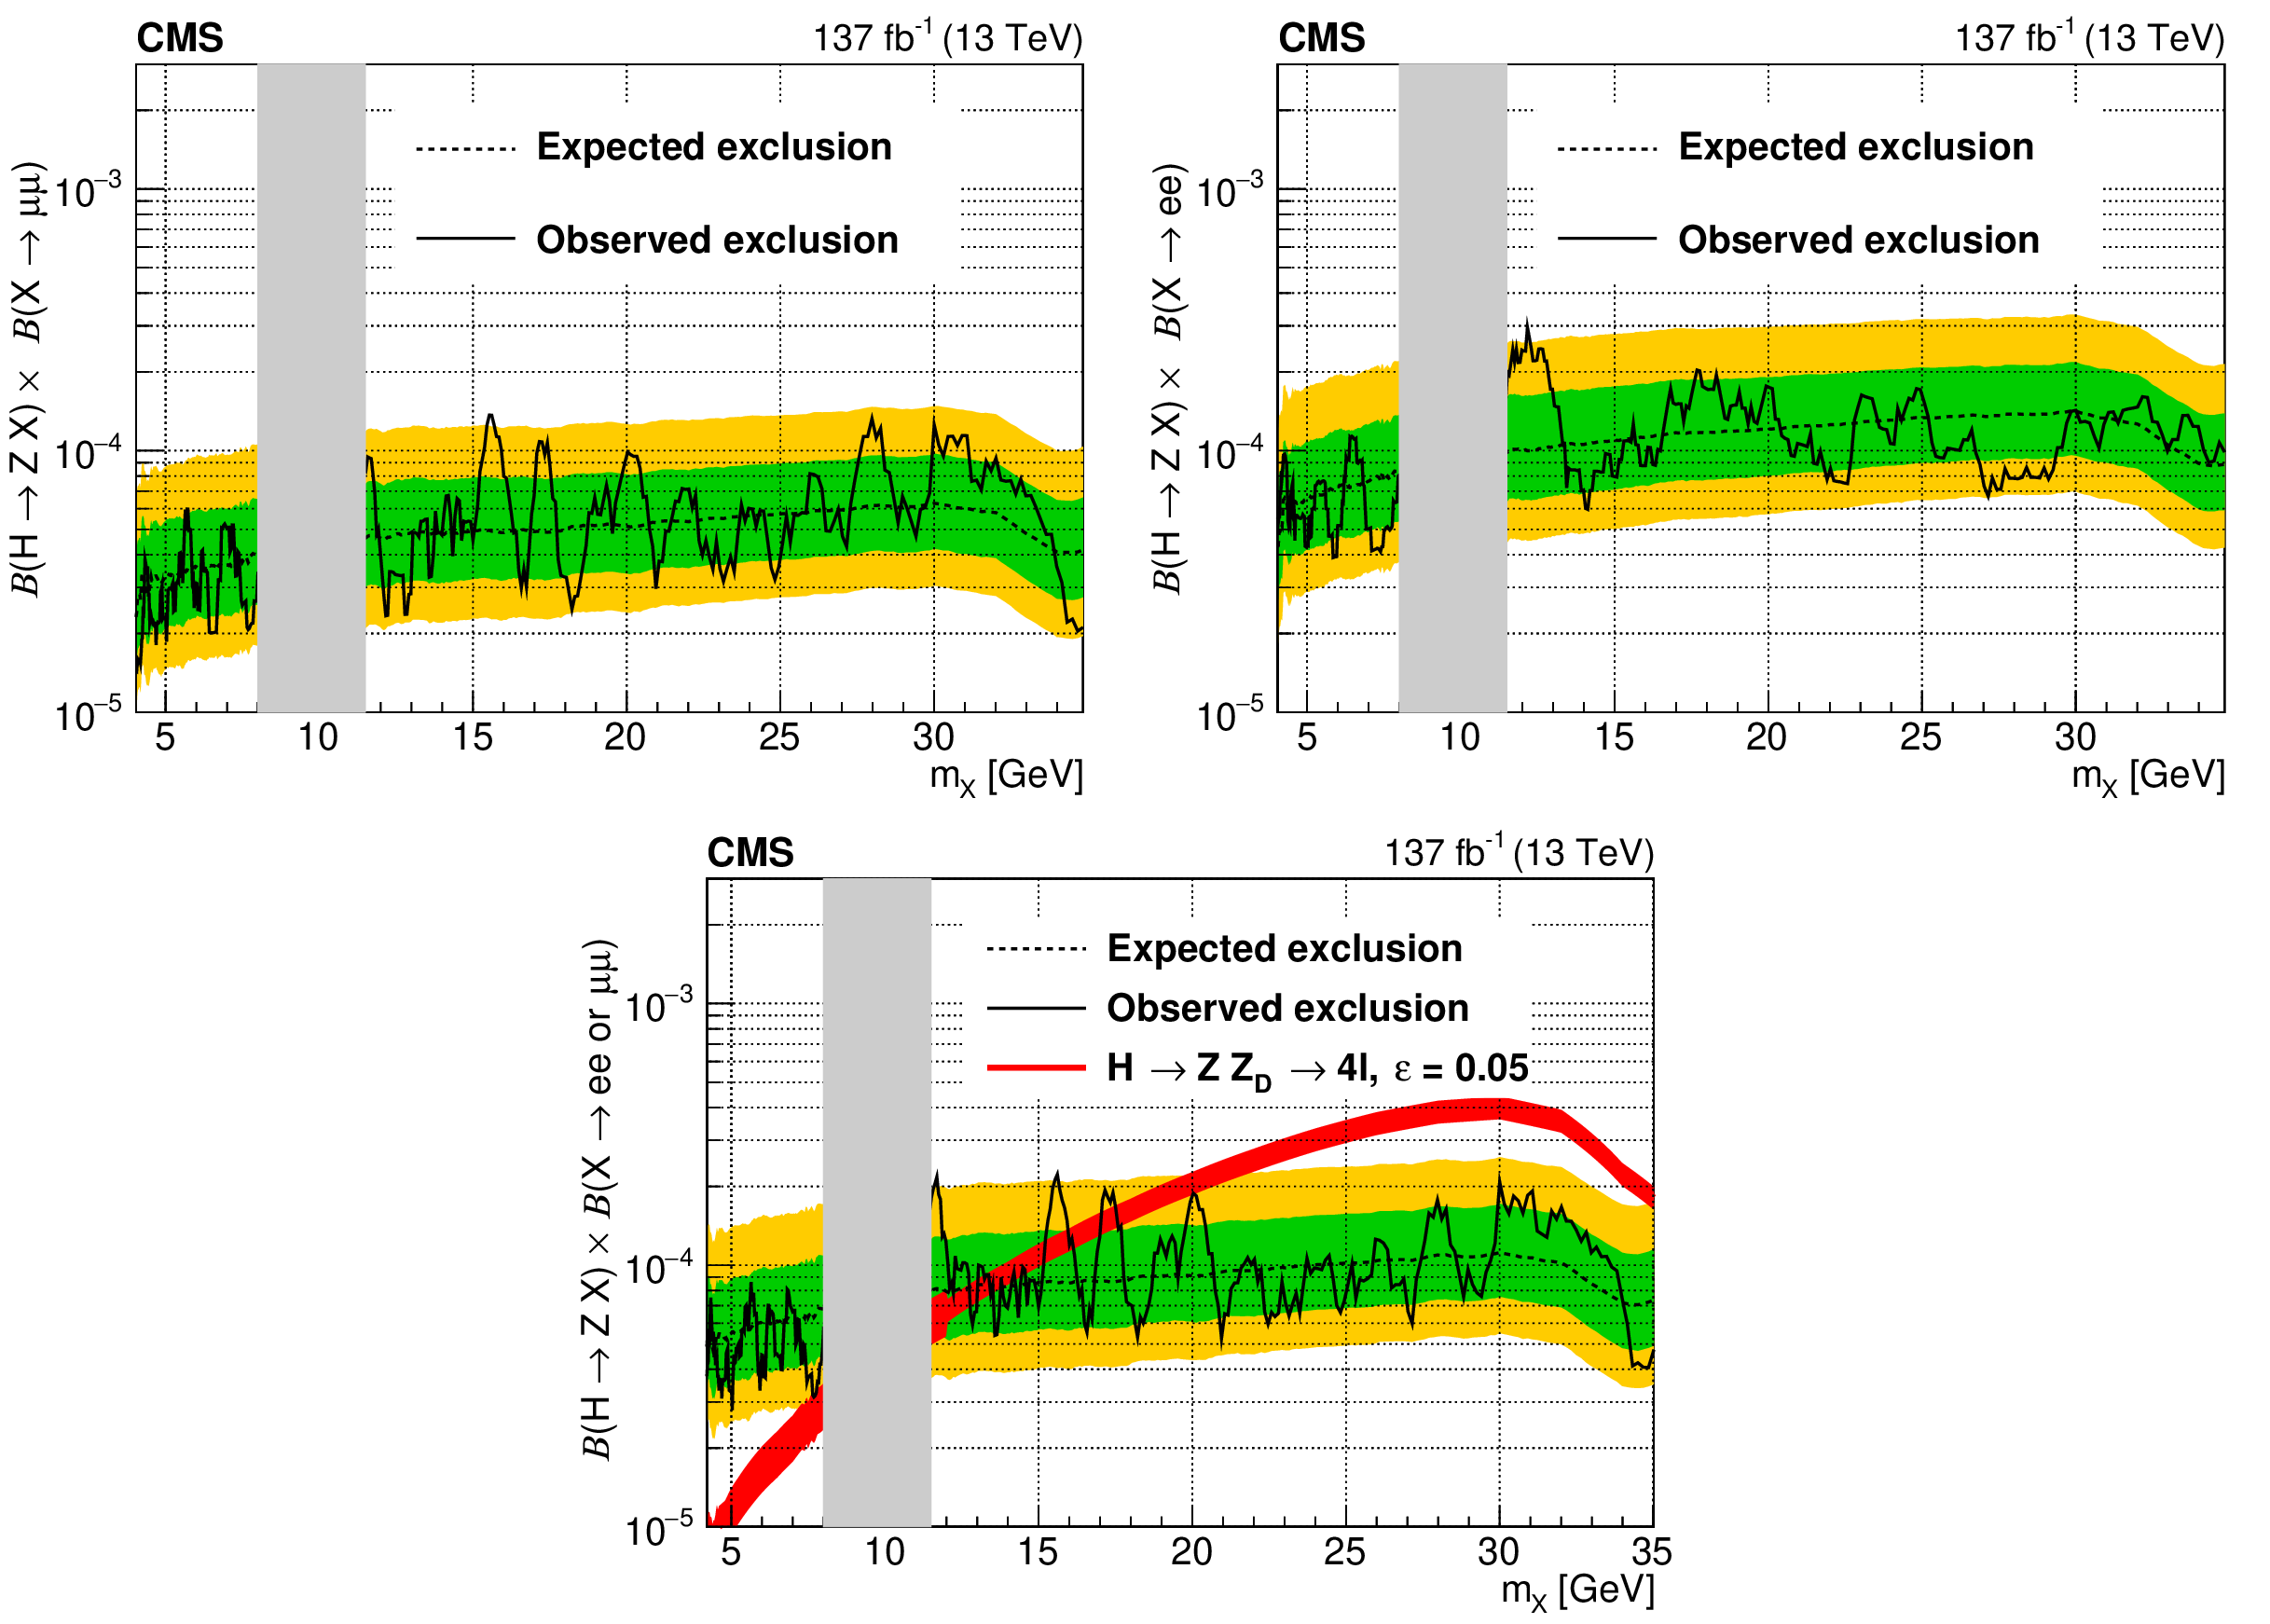
Figure 4:
Expected and observed 95% CL limits on $\mathcal {B}(\mathrm{H} \to \mathrm{Z} \mathrm{X}) \mathcal {B}(\mathrm{X} \to \mu \mu)$ assuming X decays to dimuons only, $\mathcal {B}(\mathrm{H} \to \mathrm{Z} \mathrm{X}) \mathcal {B}(\mathrm{X} \to \mathrm{e} \mathrm{e})$ assuming X decays to dielectrons only, and $\mathcal {B}(\mathrm{H} \to \mathrm{Z} \mathrm{X}) \mathcal {B}(\mathrm{X} \to $ ee or $\mu \mu)$ assuming a flavor symmetric decay of X to dimuons and dielectrons. The dashed black curve is the expected upper limit, with one and two standard-deviation bands shown in green and yellow, respectively. The solid black curve is the observed upper limit. The red curve represents the theoretical cross section for the signal process $\mathrm{H} \to \mathrm{Z} \mathrm{X} \to $ 4$\ell $. The discontinuity at 12 GeV in the uncertainty is due to the switch from experimental to theoretical uncertainty estimates of $\mathcal {B}({\mathrm{Z} _{\mathrm {D}}} \to $ ee or $\mu \mu)$, as described in Ref. [7]. The symbol $ {\varepsilon} $ is the kinetic-mixing parameter. The grey band corresponds to the excluded region around the $\mathrm{b} \mathrm{\bar{b}} $ bound states of $\Upsilon $. |
png pdf |
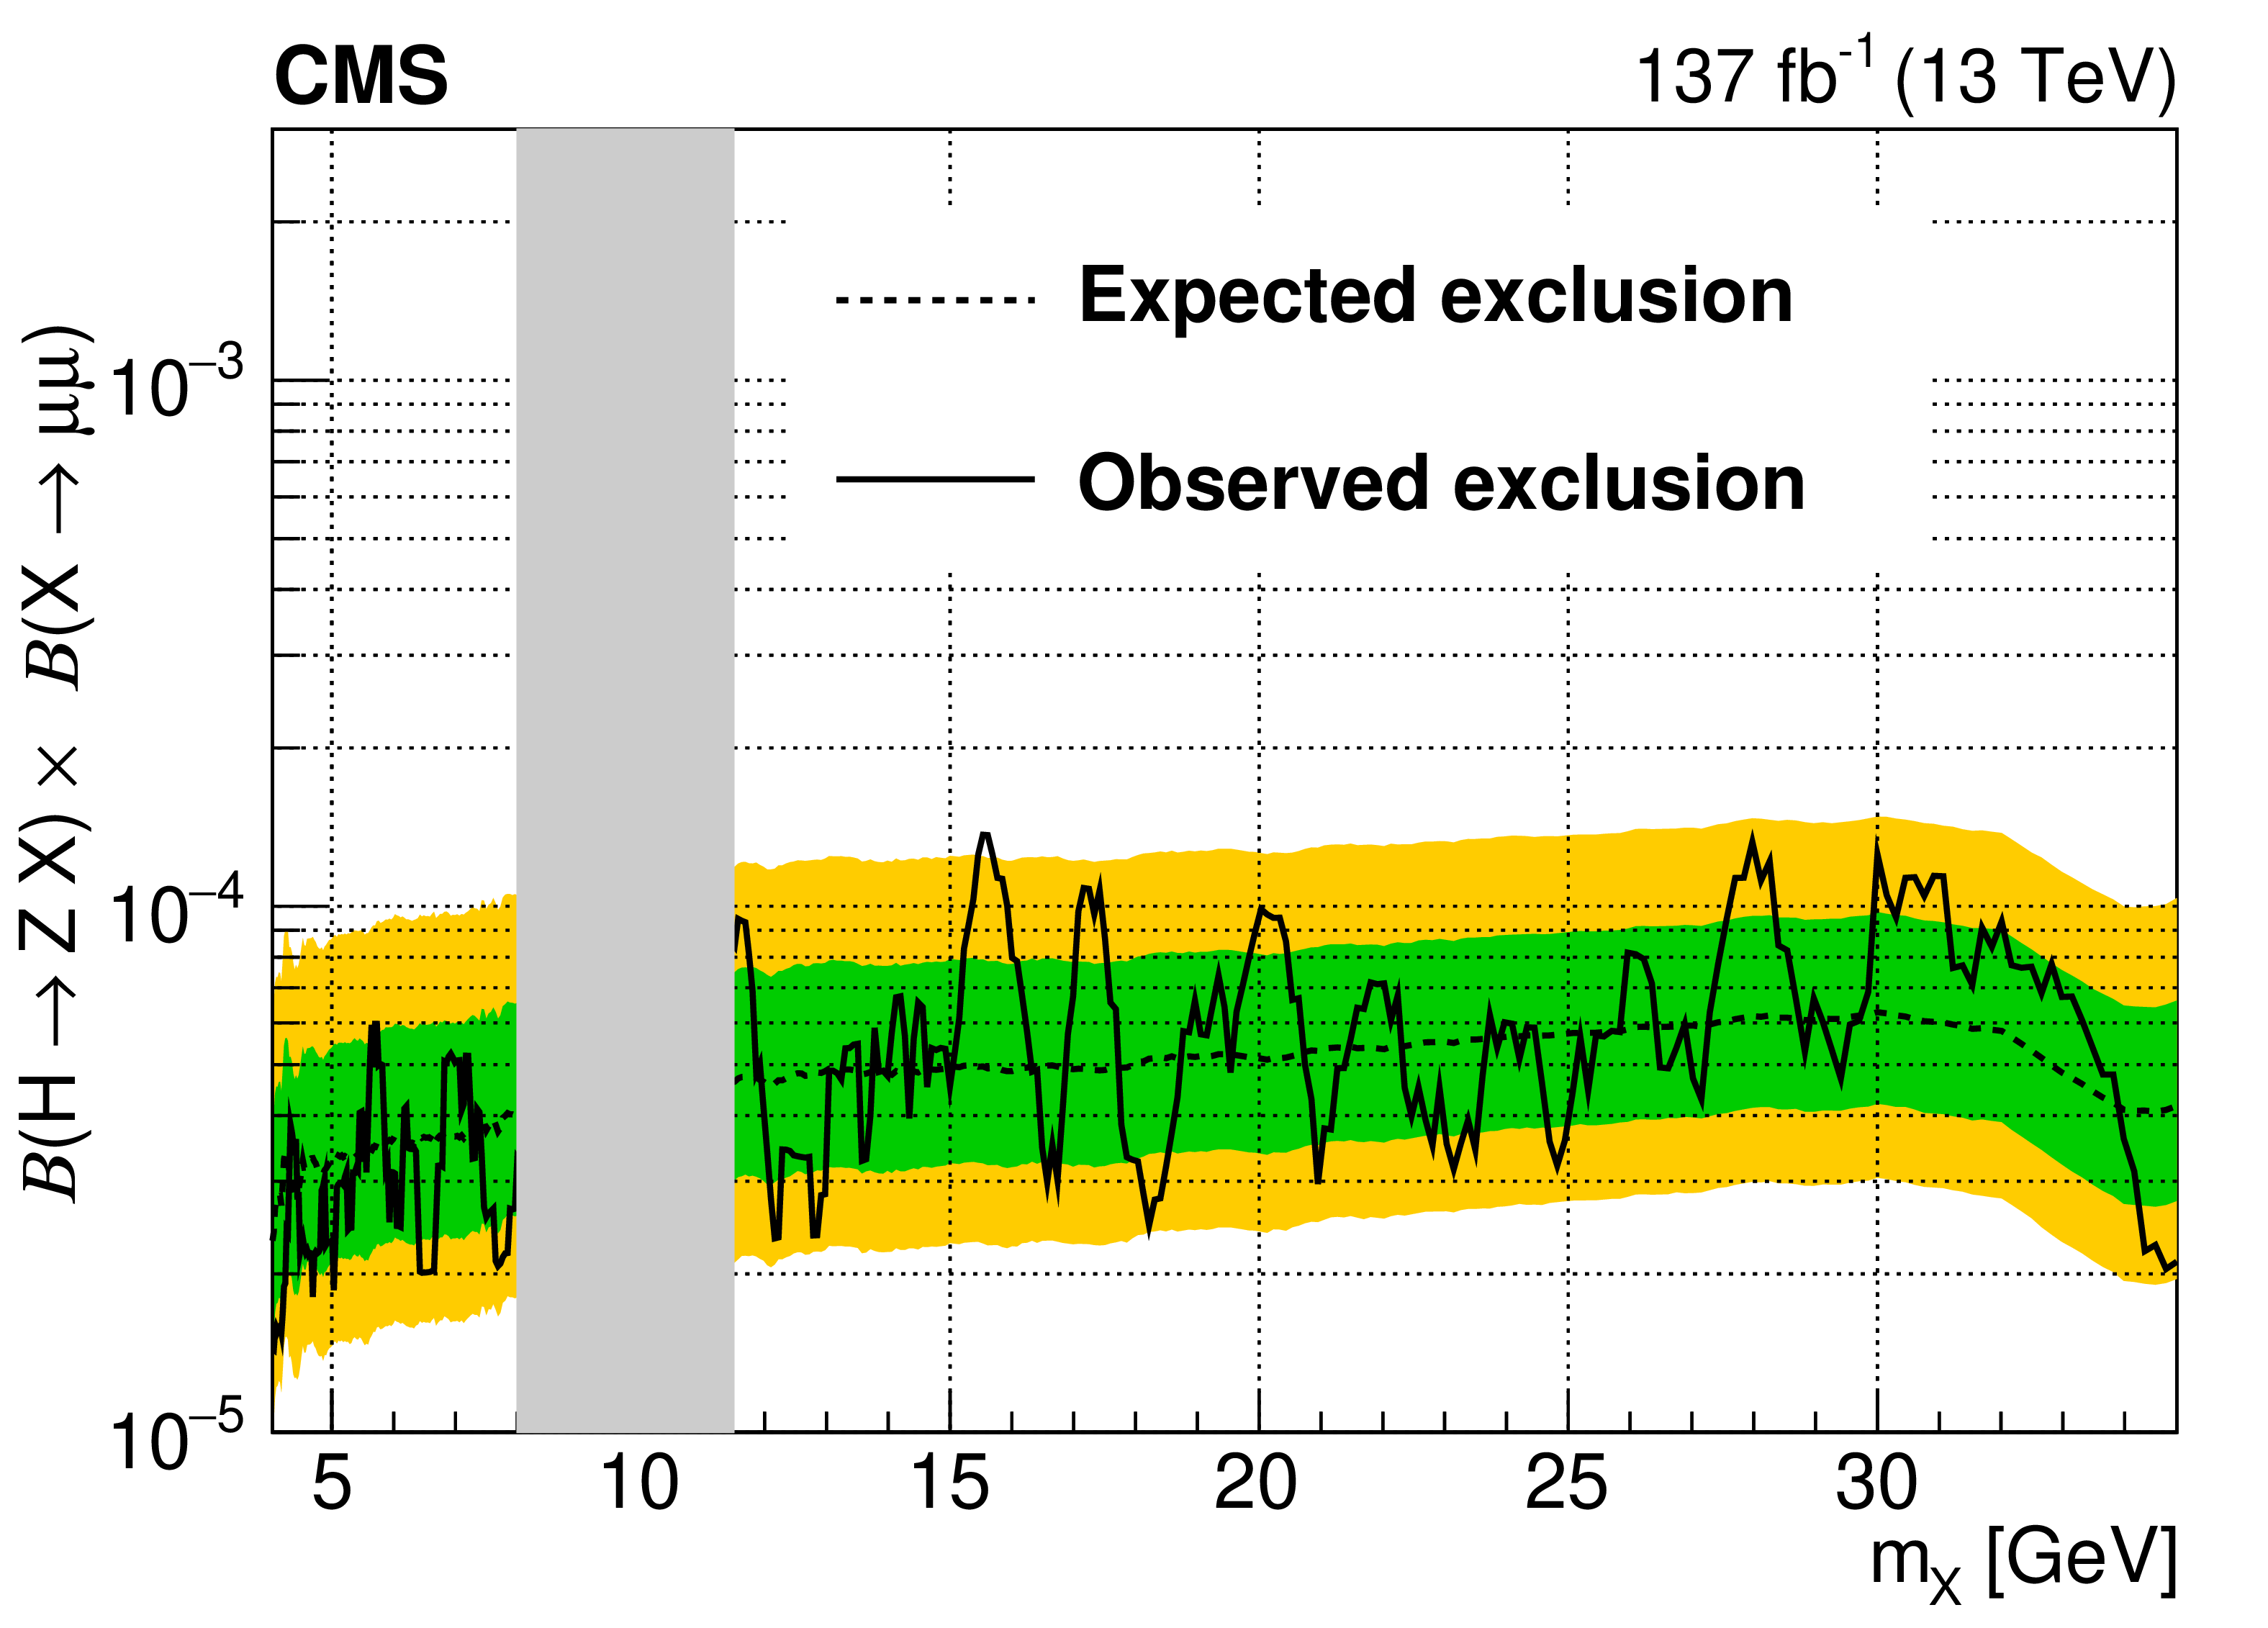
Figure 4-a:
Expected and observed 95% CL limits on $\mathcal {B}(\mathrm{H} \to \mathrm{Z} \mathrm{X}) \mathcal {B}(\mathrm{X} \to \mu \mu)$ assuming X decays to dimuons only. The dashed black curve is the expected upper limit, with one and two standard-deviation bands shown in green and yellow, respectively. The solid black curve is the observed upper limit. The discontinuity at 12 GeV in the uncertainty is due to the switch from experimental to theoretical uncertainty estimates of $\mathcal {B}({\mathrm{Z} _{\mathrm {D}}} \to $ ee or $\mu \mu)$, as described in Ref. [7]. The symbol $ {\varepsilon} $ is the kinetic-mixing parameter. The grey band corresponds to the excluded region around the $\mathrm{b} \mathrm{\bar{b}} $ bound states of $\Upsilon $. |
png pdf |
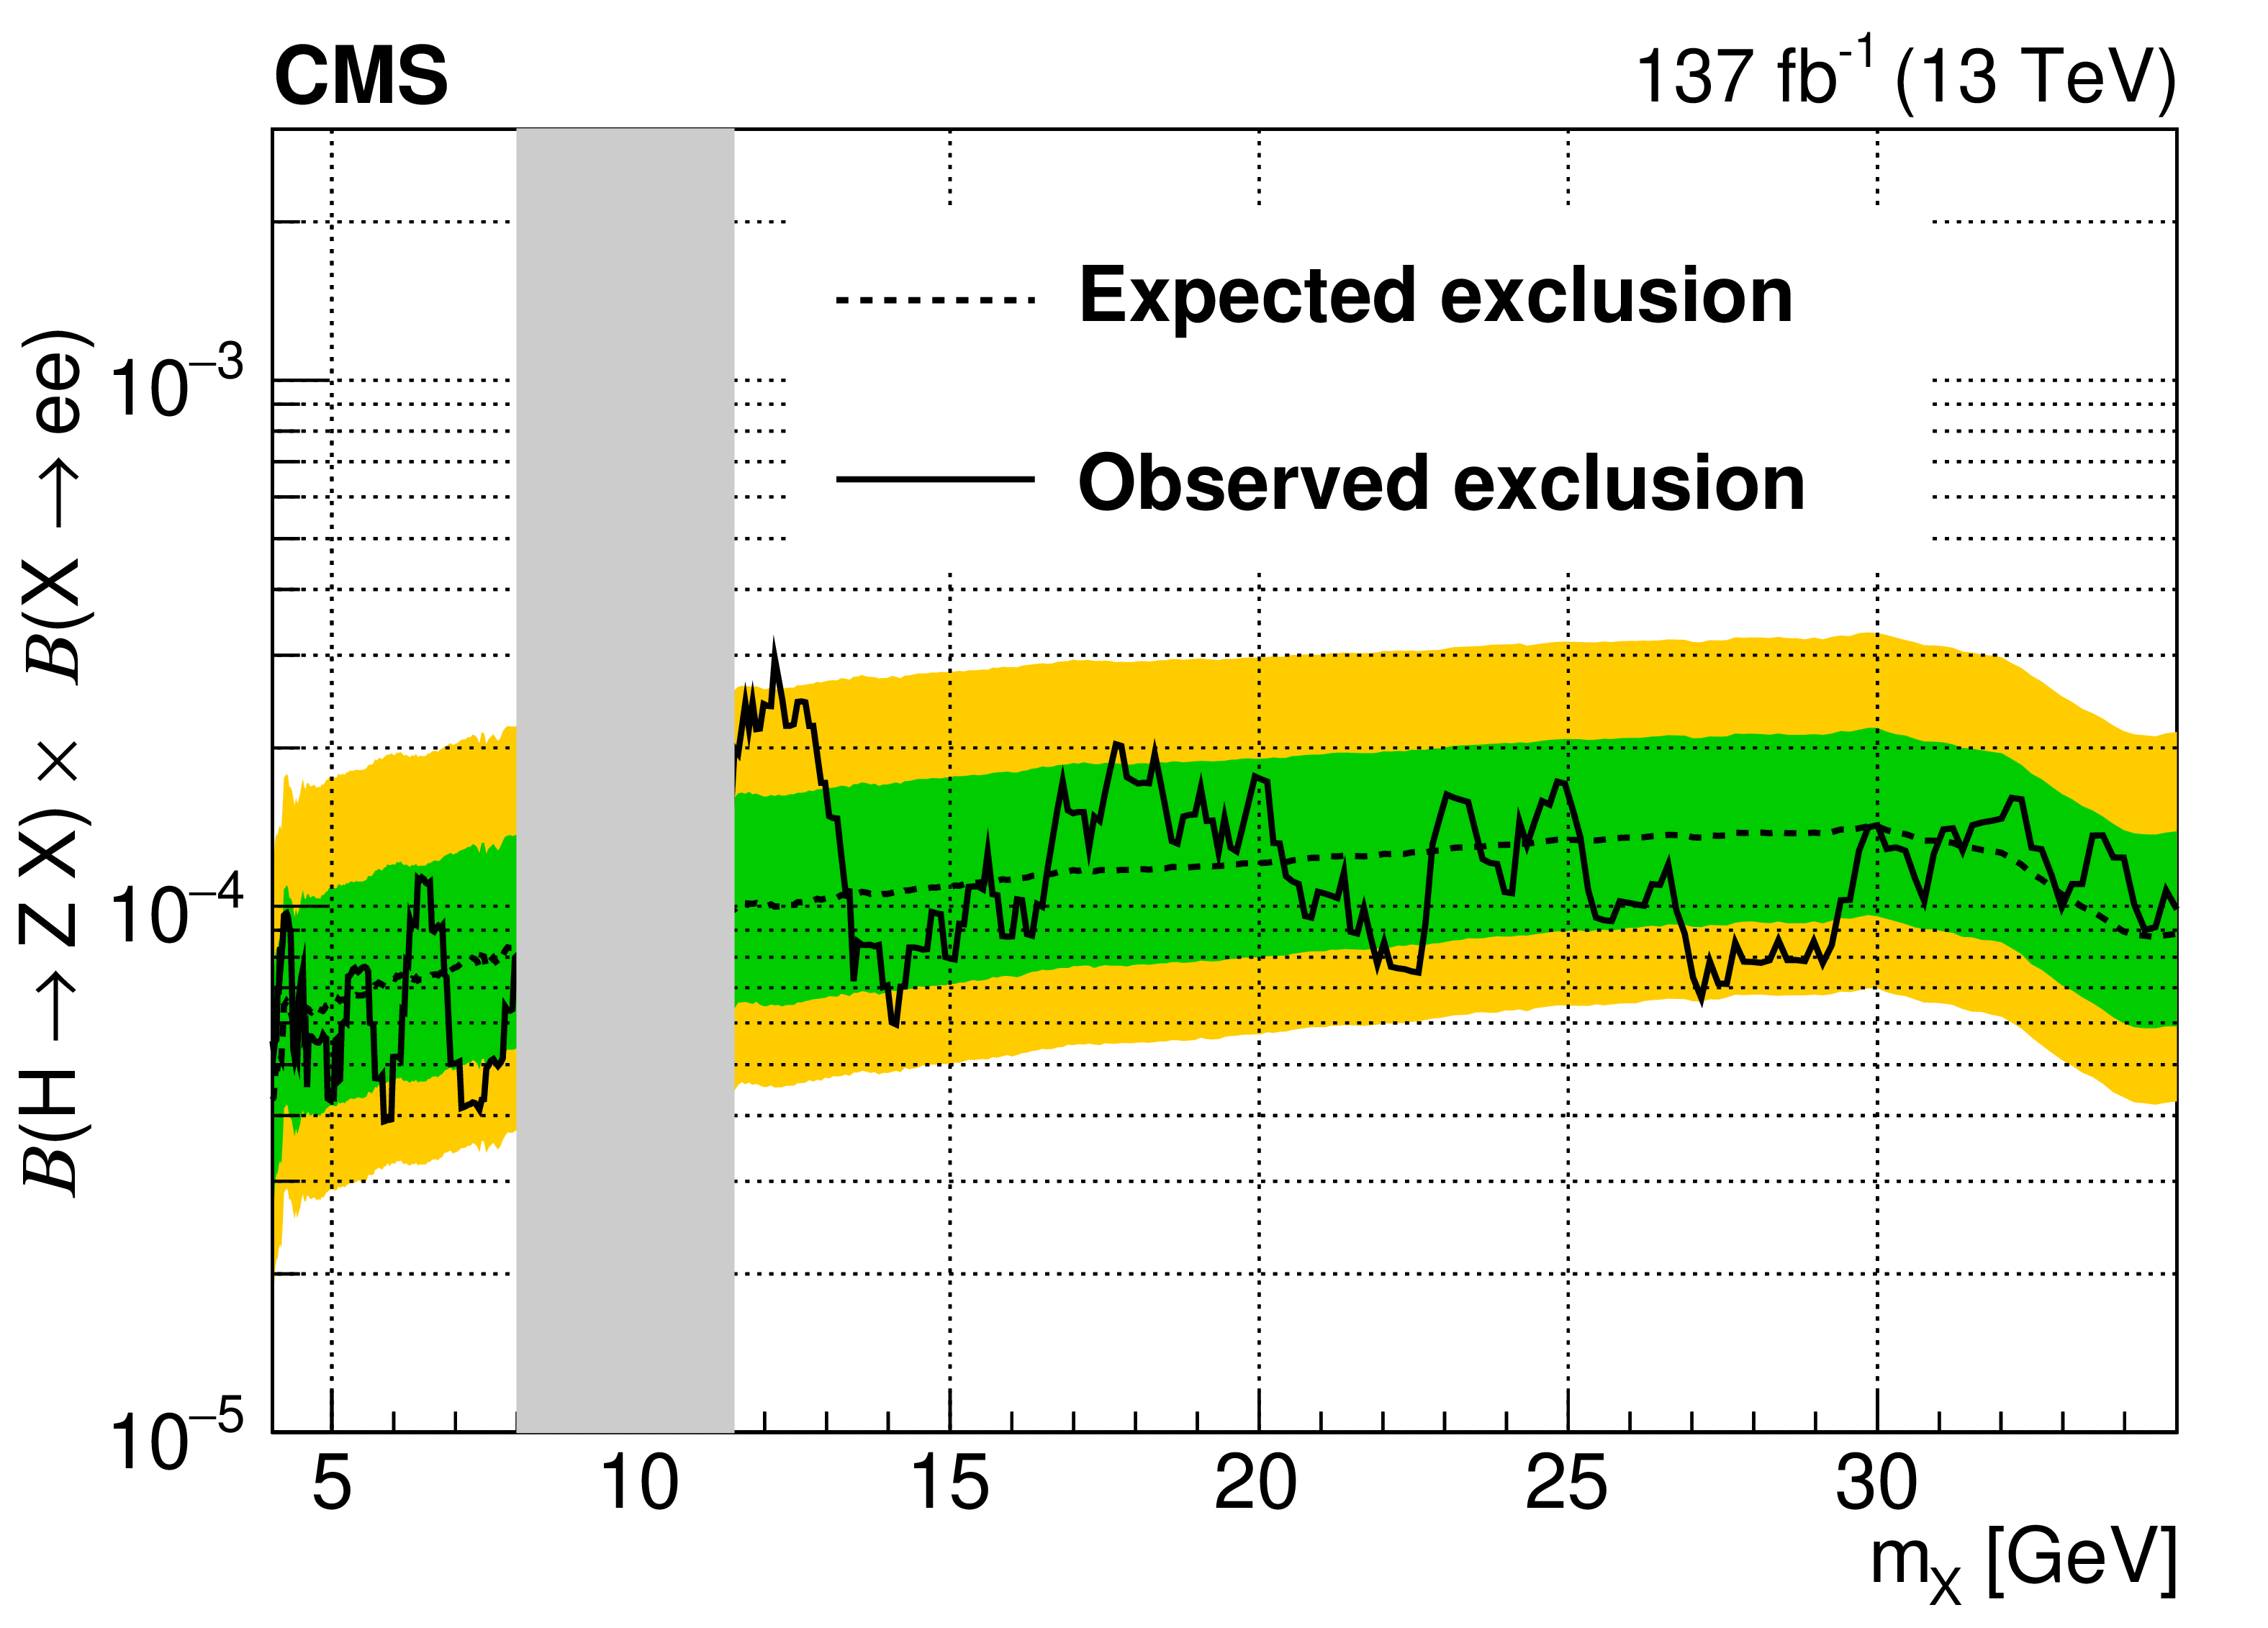
Figure 4-b:
Expected and observed 95% CL limits on $\mathcal {B}(\mathrm{H} \to \mathrm{Z} \mathrm{X}) \mathcal {B}(\mathrm{X} \to \mathrm{e} \mathrm{e})$ assuming X decays to dielectrons only. The dashed black curve is the expected upper limit, with one and two standard-deviation bands shown in green and yellow, respectively. The solid black curve is the observed upper limit. The discontinuity at 12 GeV in the uncertainty is due to the switch from experimental to theoretical uncertainty estimates of $\mathcal {B}({\mathrm{Z} _{\mathrm {D}}} \to $ ee or $\mu \mu)$, as described in Ref. [7]. The symbol $ {\varepsilon} $ is the kinetic-mixing parameter. The grey band corresponds to the excluded region around the $\mathrm{b} \mathrm{\bar{b}} $ bound states of $\Upsilon $. |

png pdf |
Figure 4-c:
Expected and observed 95% CL limits on $\mathcal {B}(\mathrm{H} \to \mathrm{Z} \mathrm{X}) \mathcal {B}(\mathrm{X} \to $ ee or $\mu \mu)$ assuming a flavor symmetric decay of X to dimuons and dielectrons. The dashed black curve is the expected upper limit, with one and two standard-deviation bands shown in green and yellow, respectively. The solid black curve is the observed upper limit. The red curve represents the theoretical cross section for the signal process $\mathrm{H} \to \mathrm{Z} \mathrm{X} \to $ 4$\ell $. The discontinuity at 12 GeV in the uncertainty is due to the switch from experimental to theoretical uncertainty estimates of $\mathcal {B}({\mathrm{Z} _{\mathrm {D}}} \to $ ee or $\mu \mu)$, as described in Ref. [7]. The symbol $ {\varepsilon} $ is the kinetic-mixing parameter. The grey band corresponds to the excluded region around the $\mathrm{b} \mathrm{\bar{b}} $ bound states of $\Upsilon $. |

png pdf |
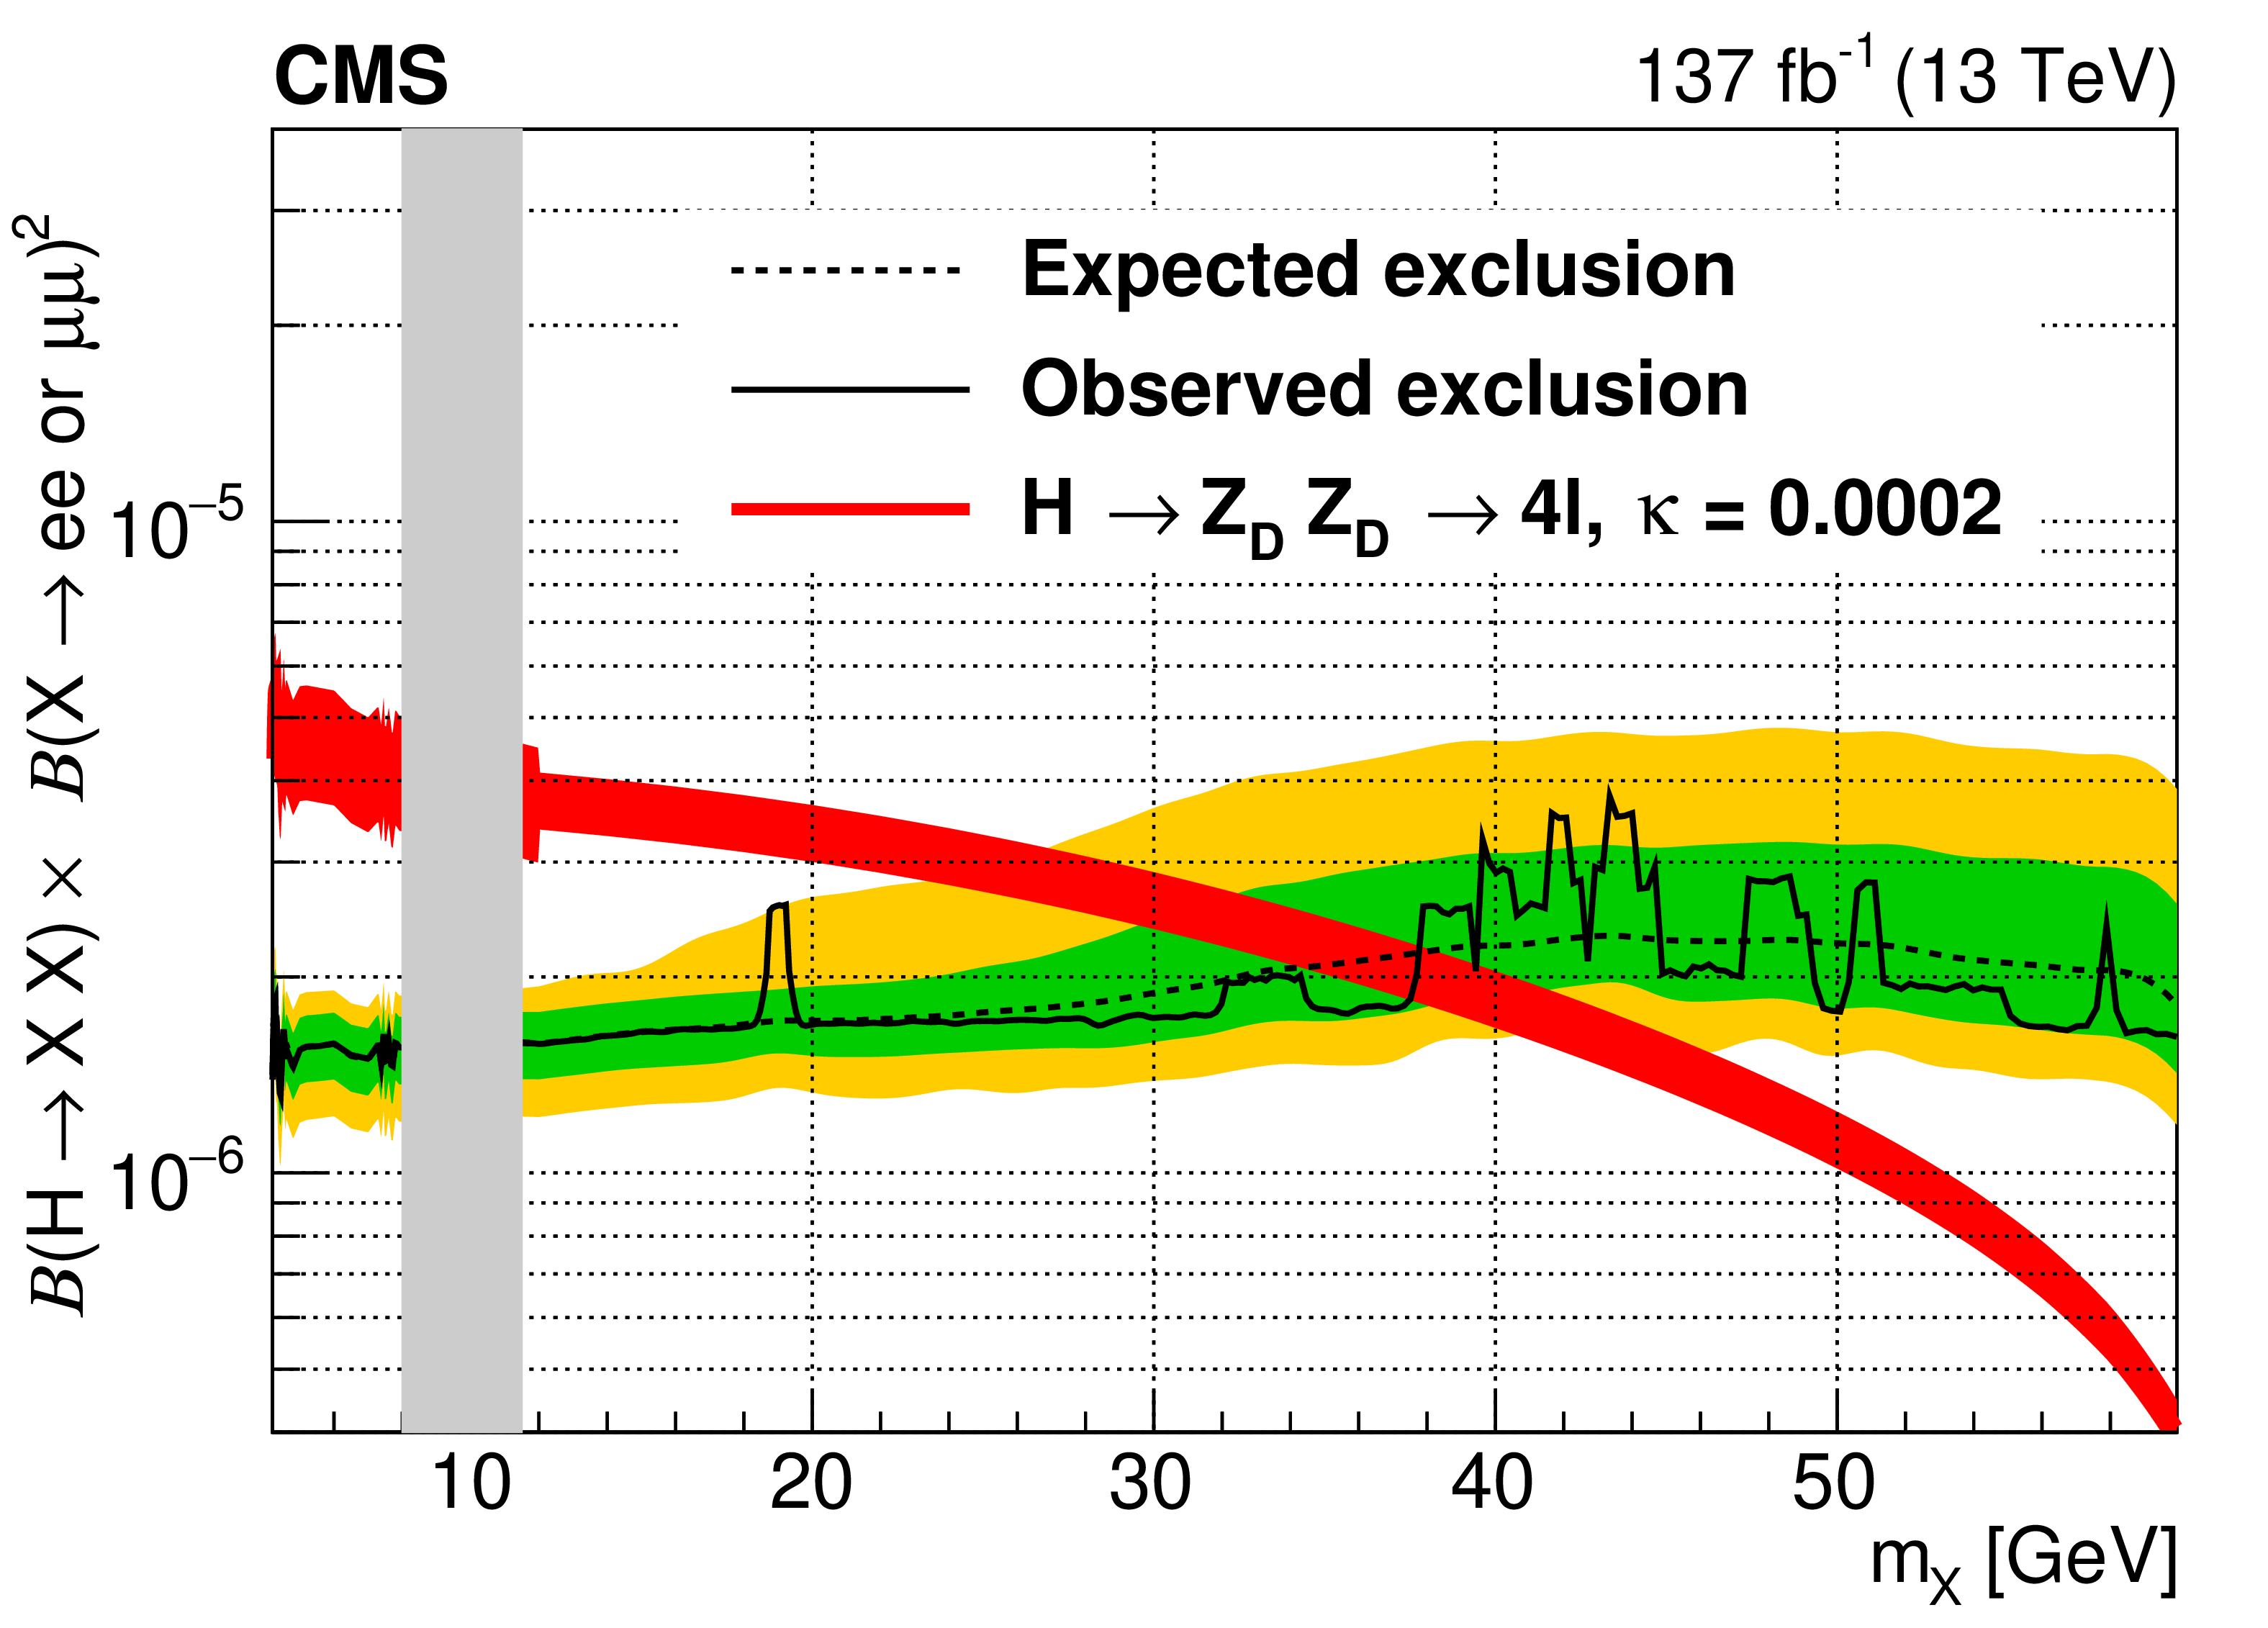
Figure 5:
Expected and observed 95% CL limits on $\mathcal {B}(\mathrm{H} \to \mathrm{X} \mathrm{X}) \mathcal {B}(\mathrm{X} \to \mathrm{e} \mathrm{e})^2$ assuming X decays to dielectrons only, $\mathcal {B}(\mathrm{H} \to \mathrm{X} \mathrm{X}) \mathcal {B}(\mathrm{X} \to \mu \mu)^2$ assuming X decays to dimuons only, and $\mathcal {B}(\mathrm{H} \to \mathrm{X} \mathrm{X}) \mathcal {B}(\mathrm{X} \to \mathrm{e} \mathrm{e} \ \text {or}\ mu\mu)^2$ assuming a flavor symmetric decay of X to dimuons and dielectrons. The dashed black curve is the expected upper limit, with one and two standard-deviation bands shown in green and yellow, respectively. The solid black curve is the observed upper limit. The red curve represents the theoretical cross section for the signal process $\mathrm{H} \to \mathrm{X} \mathrm{X} \to $ 4$\ell $. The discontinuity at 12 GeV in uncertainty is due to the switch from experimental to theoretical uncertainty estimates of $\mathcal {B}({\mathrm{Z} _{\mathrm {D}}} \to $ ee or $\mu \mu)$, as described in Ref. [7]. The symbol $\kappa $ is the Higgs-mixing parameter. The grey band corresponds to the excluded region around the $\mathrm{b} \mathrm{\bar{b}} $ bound states of $\Upsilon $. |

png pdf |
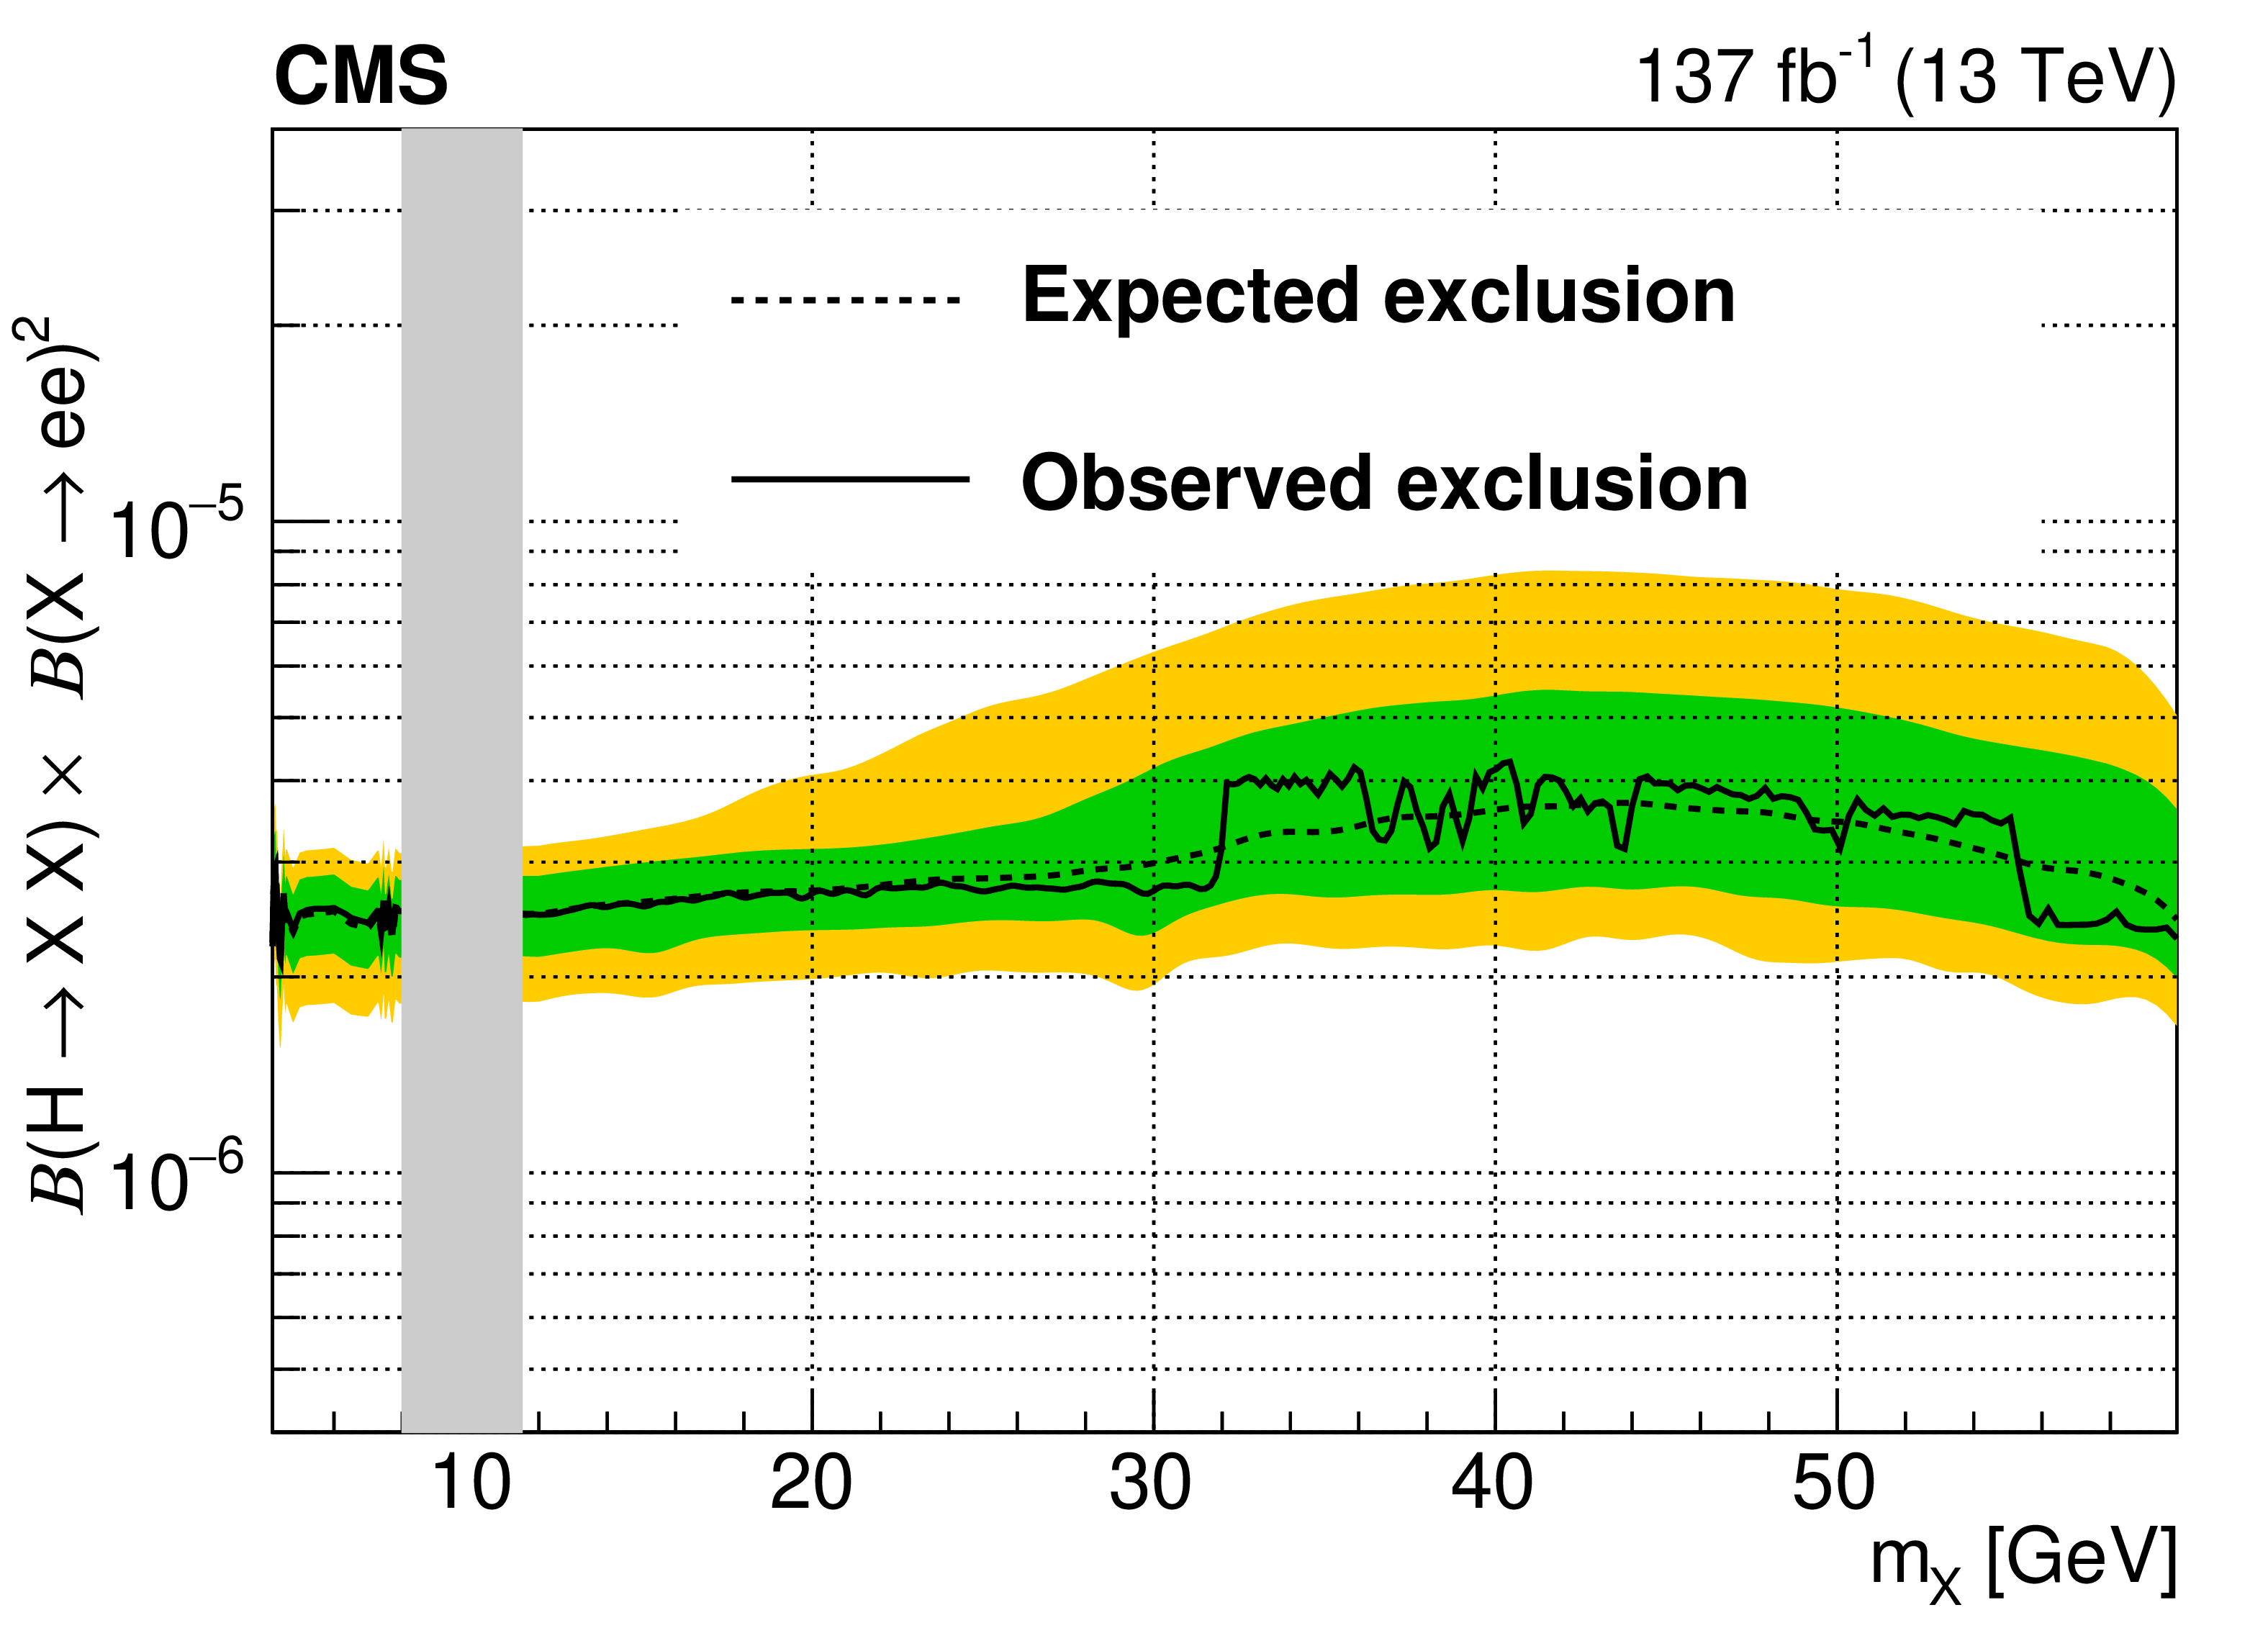
Figure 5-a:
Expected and observed 95% CL limits on $\mathcal {B}(\mathrm{H} \to \mathrm{X} \mathrm{X}) \mathcal {B}(\mathrm{X} \to \mathrm{e} \mathrm{e})^2$ assuming X decays to dielectrons only. The dashed black curve is the expected upper limit, with one and two standard-deviation bands shown in green and yellow, respectively. The solid black curve is the observed upper limit. The discontinuity at 12 GeV in uncertainty is due to the switch from experimental to theoretical uncertainty estimates of $\mathcal {B}({\mathrm{Z} _{\mathrm {D}}} \to $ ee or $\mu \mu)$, as described in Ref. [7]. The symbol $\kappa $ is the Higgs-mixing parameter. The grey band corresponds to the excluded region around the $\mathrm{b} \mathrm{\bar{b}} $ bound states of $\Upsilon $. |
png pdf |
Figure 5-b:
Expected and observed 95% CL limits on $\mathcal {B}(\mathrm{H} \to \mathrm{X} \mathrm{X}) \mathcal {B}(\mathrm{X} \to \mu \mu)^2$ assuming X decays to dimuons only. The dashed black curve is the expected upper limit, with one and two standard-deviation bands shown in green and yellow, respectively. The solid black curve is the observed upper limit. The discontinuity at 12 GeV in uncertainty is due to the switch from experimental to theoretical uncertainty estimates of $\mathcal {B}({\mathrm{Z} _{\mathrm {D}}} \to $ ee or $\mu \mu)$, as described in Ref. [7]. The symbol $\kappa $ is the Higgs-mixing parameter. The grey band corresponds to the excluded region around the $\mathrm{b} \mathrm{\bar{b}} $ bound states of $\Upsilon $. |
png pdf |
Figure 5-c:
Expected and observed 95% CL limits on $\mathcal {B}(\mathrm{H} \to \mathrm{X} \mathrm{X}) \mathcal {B}(\mathrm{X} \to \mathrm{e} \mathrm{e} \ \text {or}\ mu\mu)^2$ assuming a flavor symmetric decay of X to dimuons and dielectrons. The dashed black curve is the expected upper limit, with one and two standard-deviation bands shown in green and yellow, respectively. The solid black curve is the observed upper limit. The red curve represents the theoretical cross section for the signal process $\mathrm{H} \to \mathrm{X} \mathrm{X} \to $ 4$\ell $. The discontinuity at 12 GeV in uncertainty is due to the switch from experimental to theoretical uncertainty estimates of $\mathcal {B}({\mathrm{Z} _{\mathrm {D}}} \to $ ee or $\mu \mu)$, as described in Ref. [7]. The symbol $\kappa $ is the Higgs-mixing parameter. The grey band corresponds to the excluded region around the $\mathrm{b} \mathrm{\bar{b}} $ bound states of $\Upsilon $. |
png pdf |
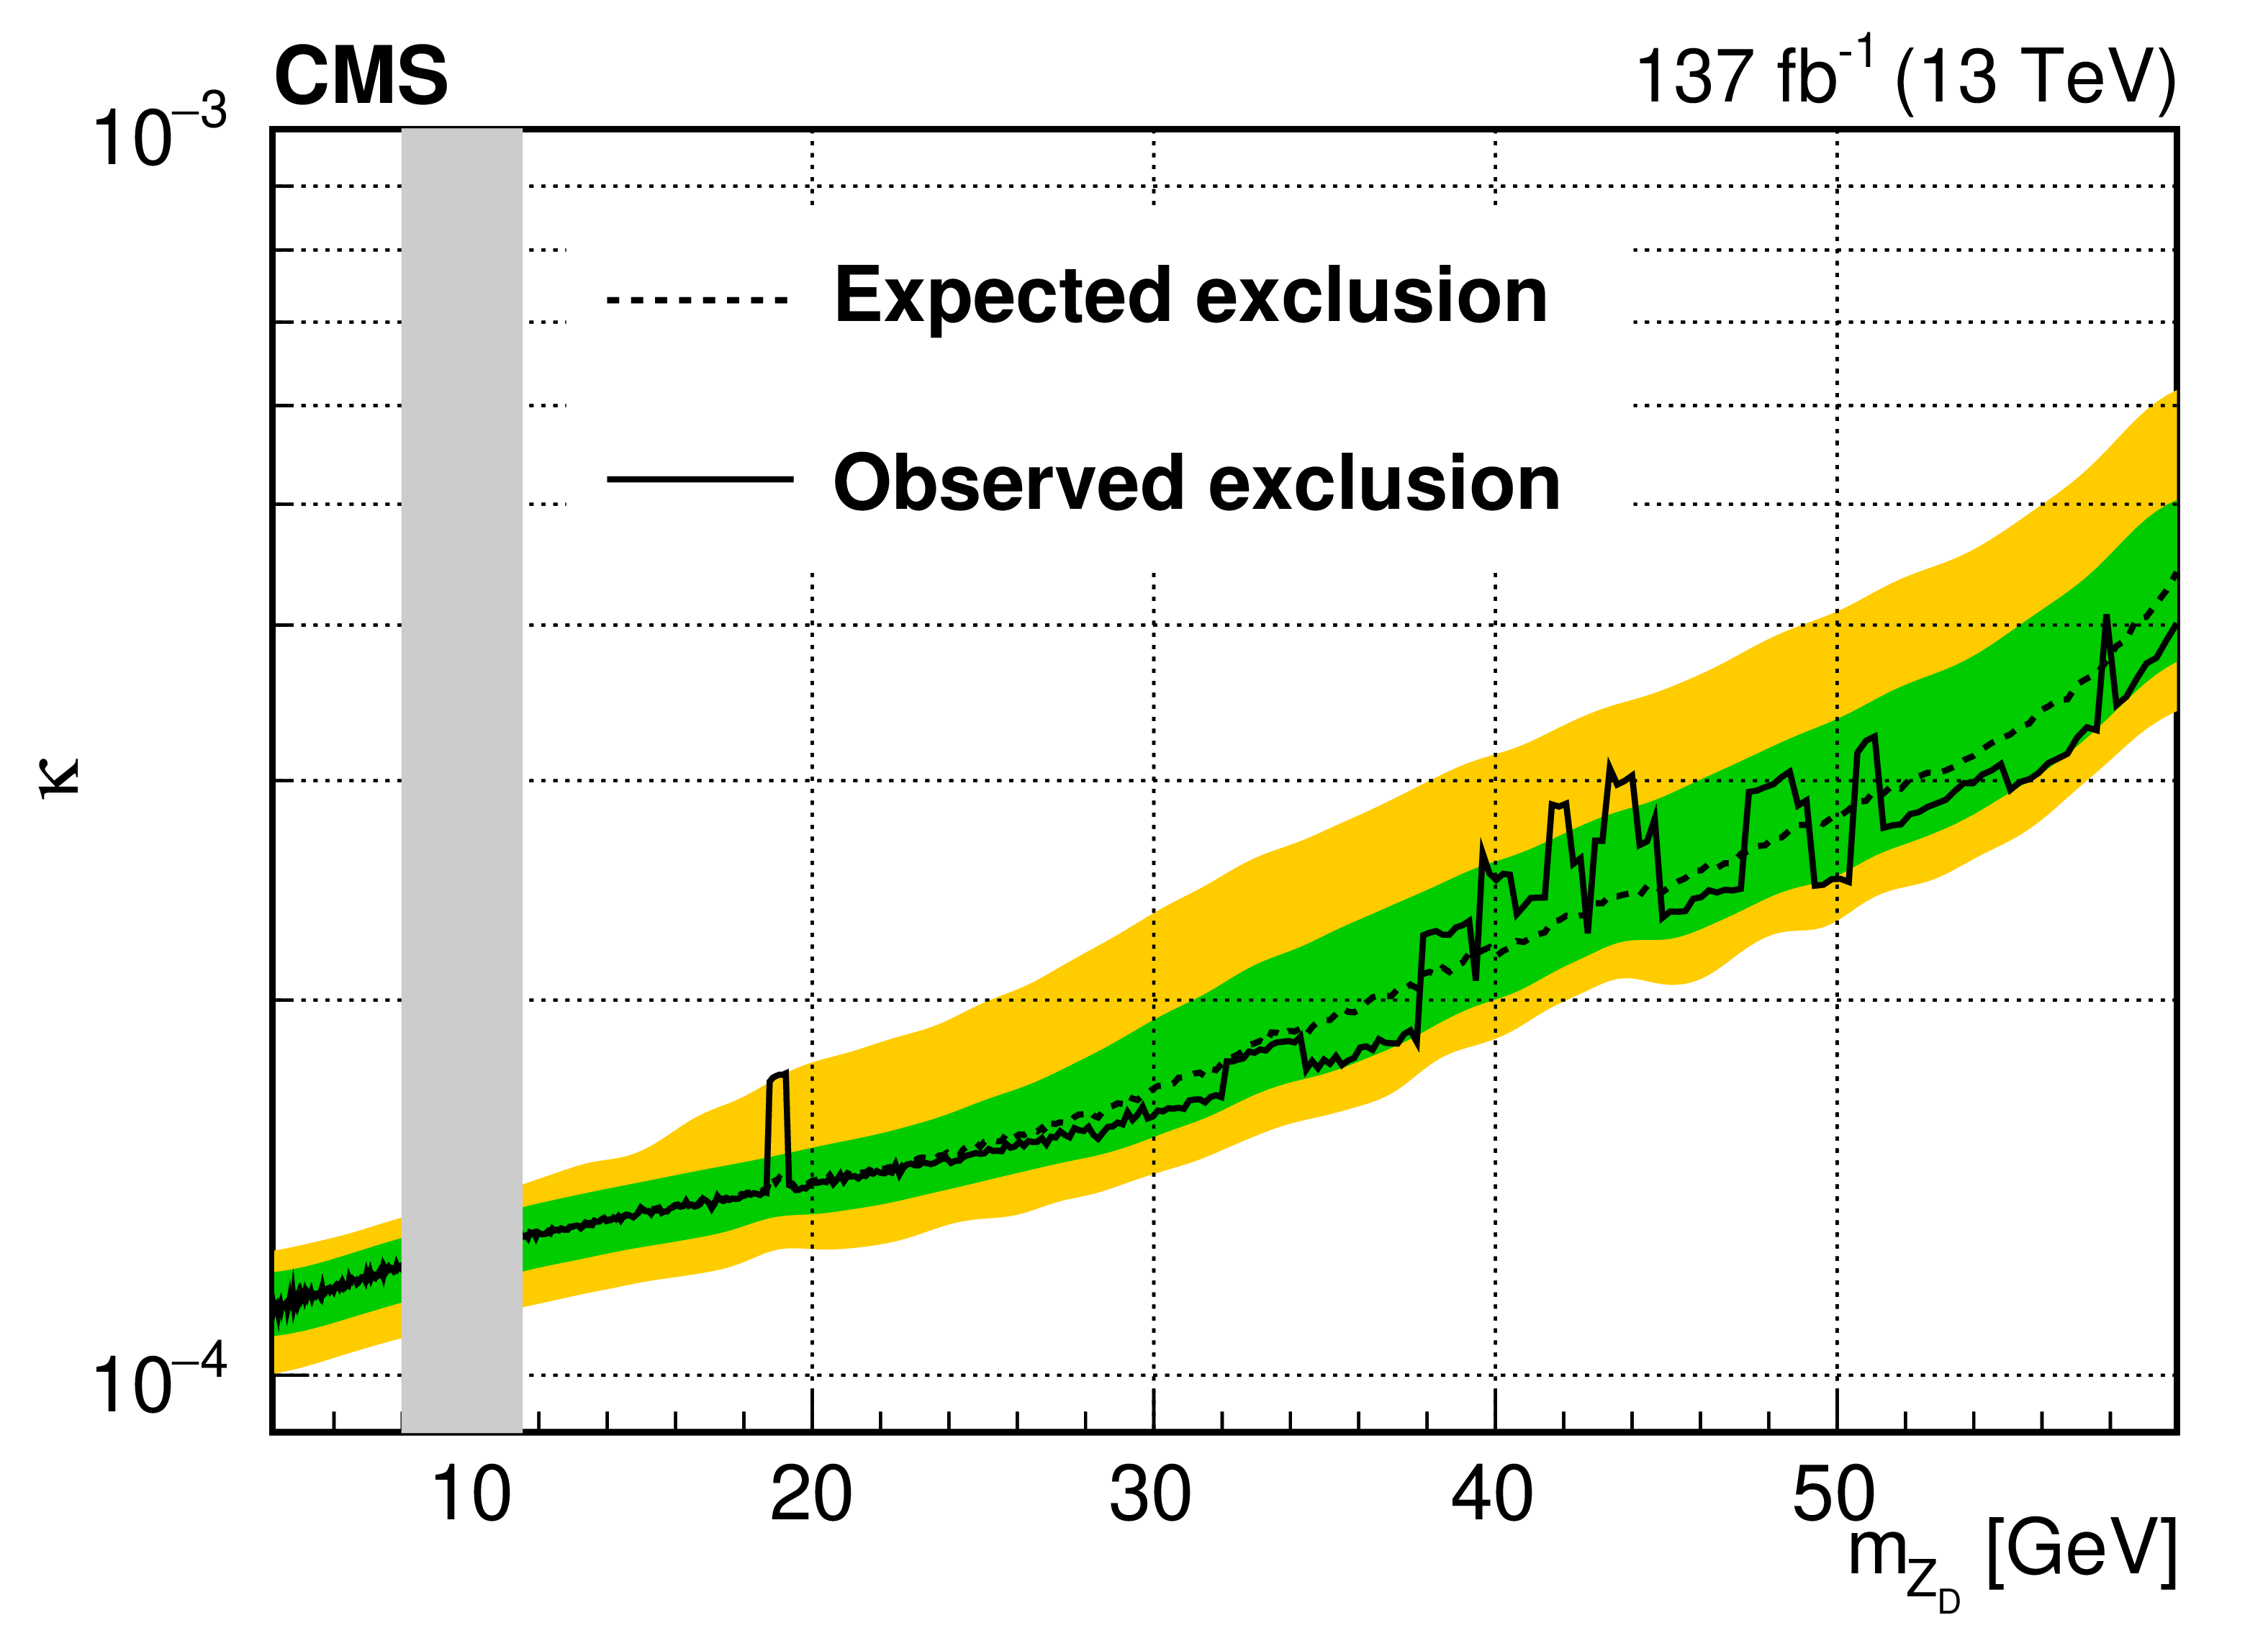
Figure 6:
95% CL limits on the Higgs-mixing parameter $\kappa $, based on the XX selection, as function of ${m_{{\mathrm{Z} _{\mathrm {D}}}}}$. The dashed black curve is the expected upper limit, with one and two standard-deviation bands shown in green and yellow, respectively. The solid black curve is the observed upper limit. The grey band corresponds to the excluded region around the $\mathrm{b} \mathrm{\bar{b}} $ bound states of $\Upsilon $. |
png pdf |
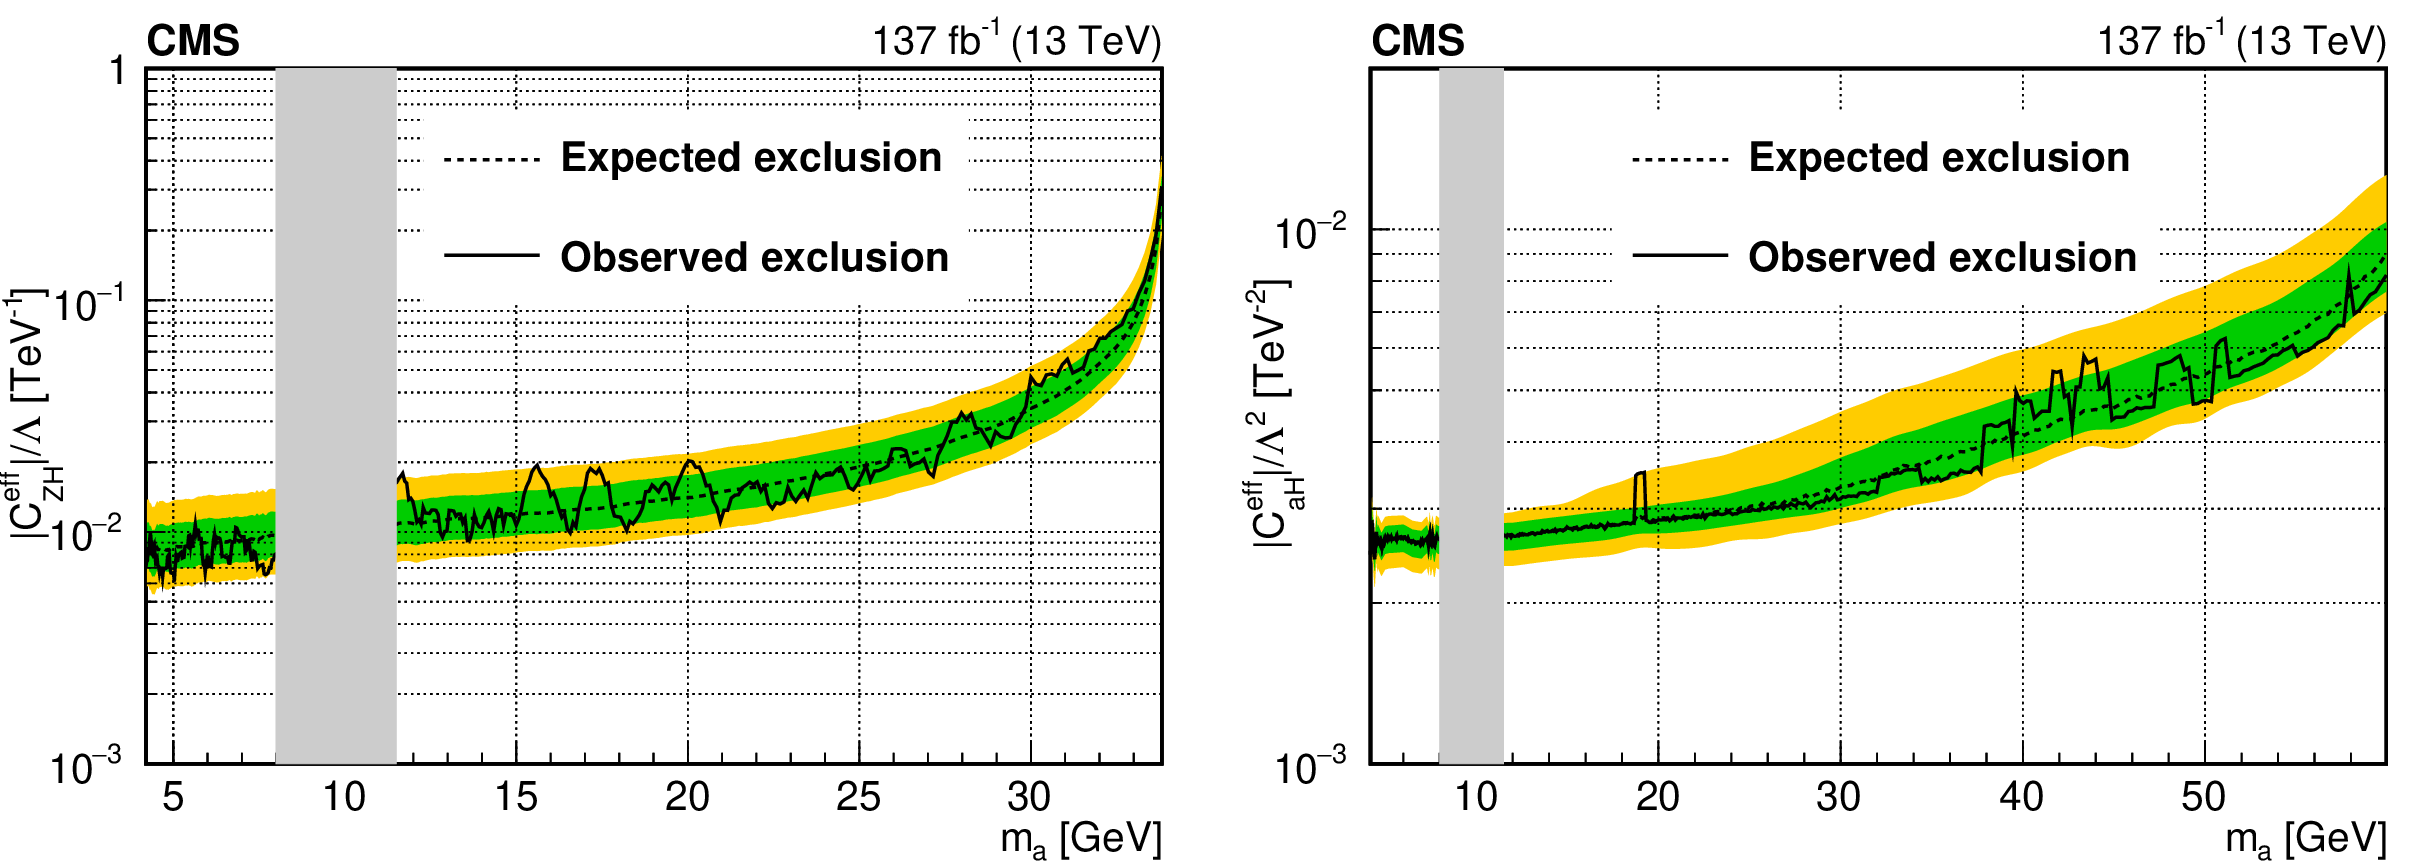
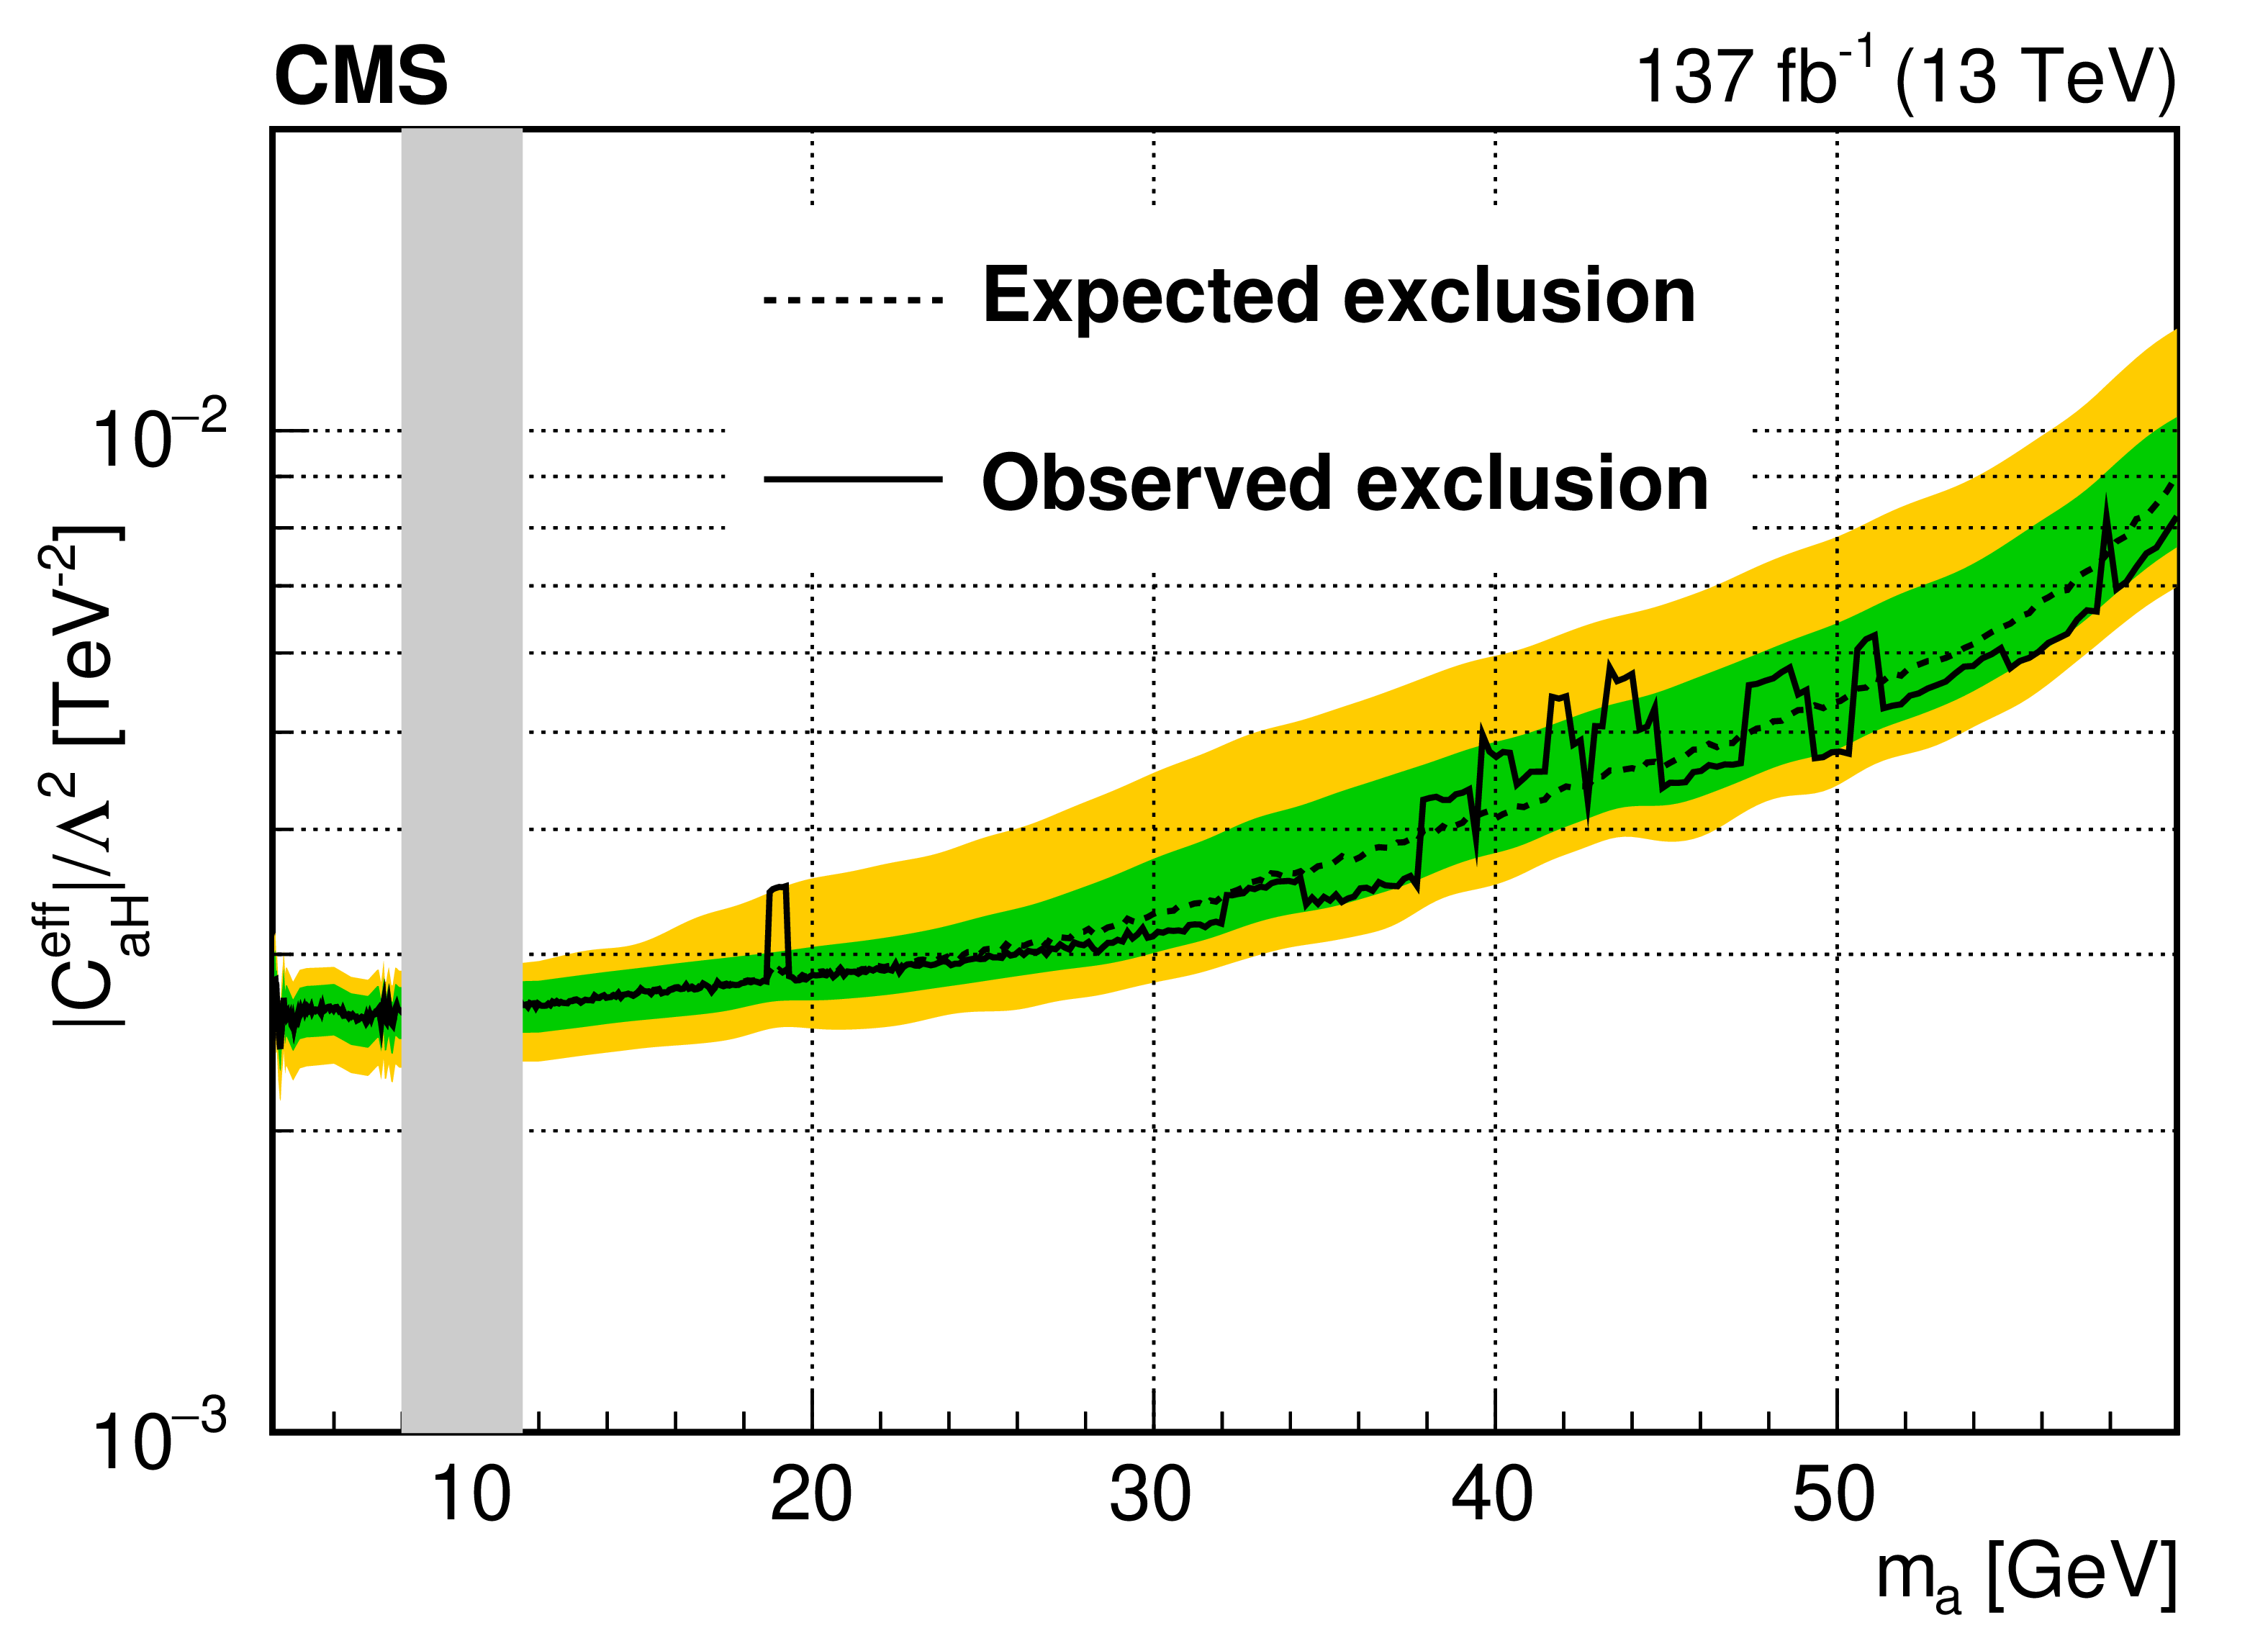
Figure 7:
95% CL limit on ${C_{\mathrm{Z} \mathrm{H}}/\Lambda}$ and ${C_{\mathrm{a} \mathrm{H}}/\Lambda ^2}$ as function of $m_{\mathrm{a}}$. Black curves are the expected upper limits, with one and two standard-deviation bands shown in green and yellow, respectively. The solid black curves represent the observed upper limits. The grey band corresponds to the excluded region around the $\mathrm{b} \mathrm{\bar{b}} $ bound states of $\Upsilon $. |
png pdf |
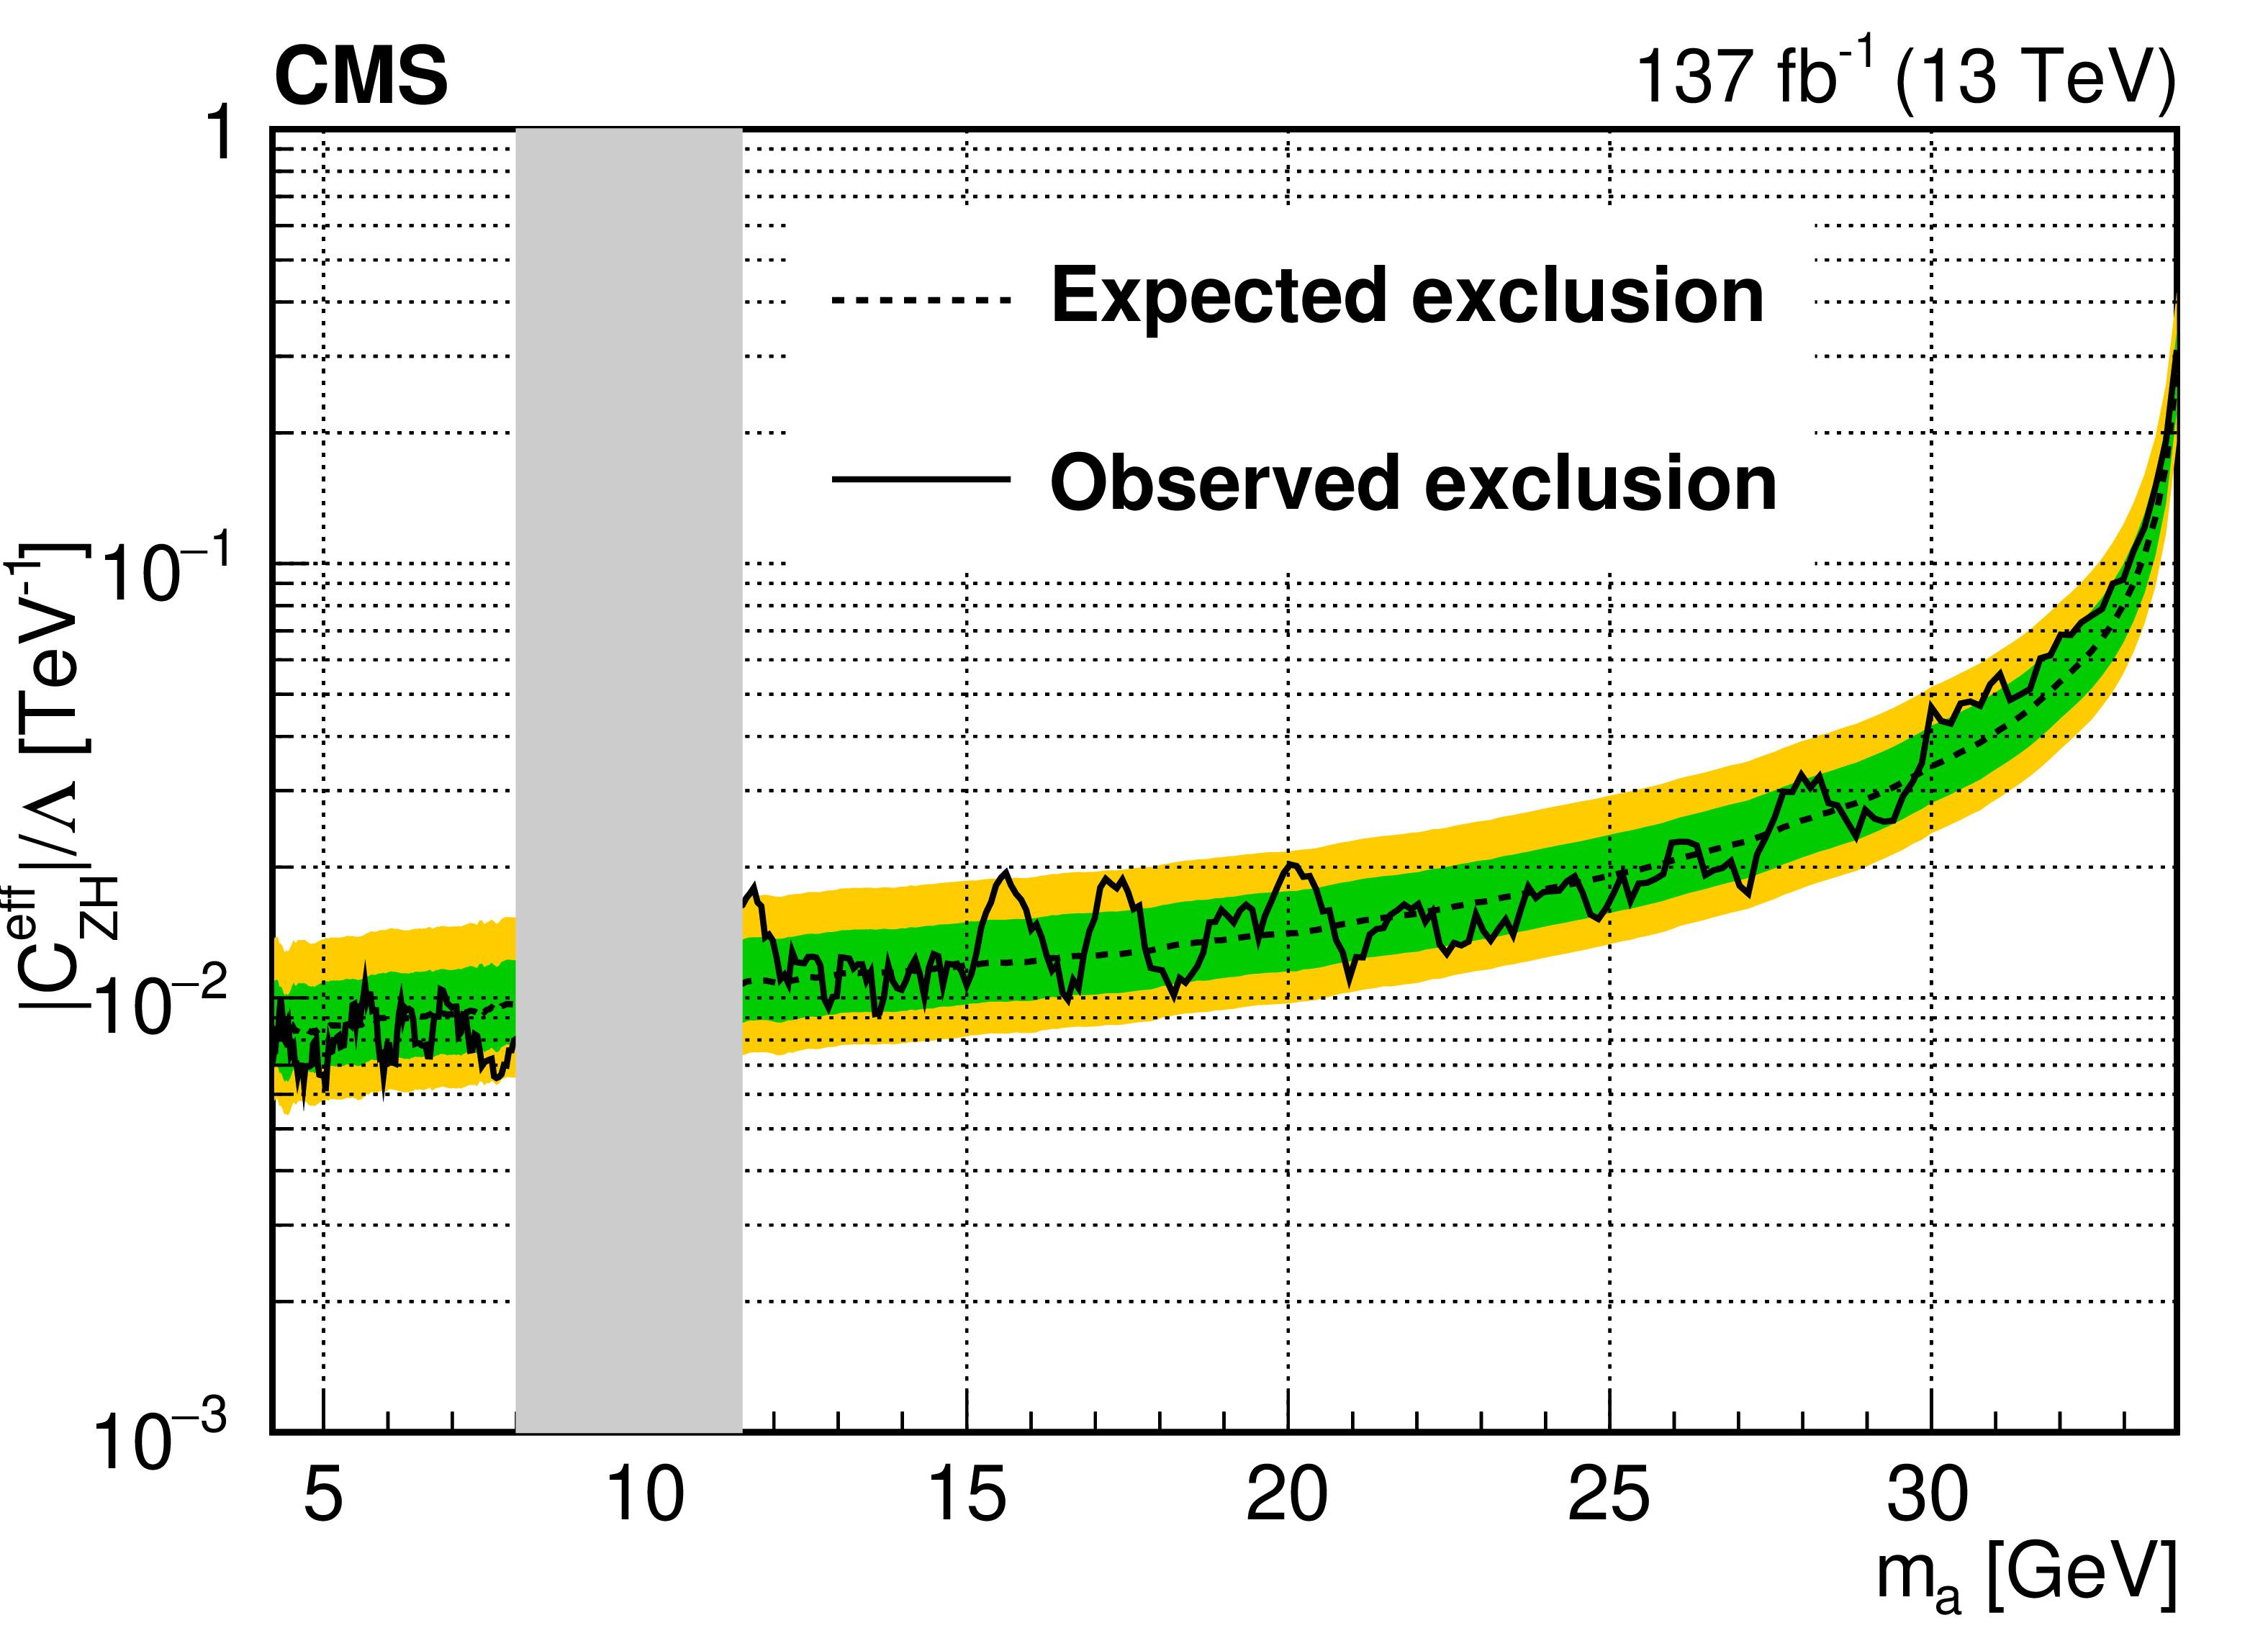
Figure 7-a:
95% CL limit on ${C_{\mathrm{Z} \mathrm{H}}/\Lambda}$ as function of $m_{\mathrm{a}}$. The dashed black curve is the expected upper limit, with one and two standard-deviation bands shown in green and yellow, respectively. The solid black curve represents the observed upper limit. The grey band corresponds to the excluded region around the $\mathrm{b} \mathrm{\bar{b}} $ bound states of $\Upsilon $. |
png pdf |
Figure 7-b:
95% CL limit on ${C_{\mathrm{a} \mathrm{H}}/\Lambda ^2}$ as function of $m_{\mathrm{a}}$. The dashed black curve is the expected upper limit, with one and two standard-deviation bands shown in green and yellow, respectively. The solid black curve represents the observed upper limit. The grey band corresponds to the excluded region around the $\mathrm{b} \mathrm{\bar{b}} $ bound states of $\Upsilon $. |
| Summary |
| A search for dilepton resonances in Higgs boson decays to four-lepton final states has been presented. The search considers the two intermediate decay topologies $\mathrm{H} \to \mathrm{Z} \mathrm{X}$ and $\mathrm{H} \to \mathrm{X} \mathrm{X}$. No significant deviations from the standard model expectations are observed. The search imposes experimental constraints on products of model-independent branching fractions of $\mathcal{B}(\mathrm{H} \to \mathrm{Z} \mathrm{X})$, $\mathcal{B}(\mathrm{H} \to \mathrm{X} \mathrm{X})$ and $\mathcal{B}(\mathrm{X} \to \mathrm{e}\mathrm{e}\ \text{or}\ \mu\mu)$, assuming flavor-symmetric decays of X to dimuons and dielectrons, exclusive decays of X to dimuons, and exclusive decays of X to dielectrons, for $m{\mathrm{X}} > $ 4 GeV. In addition, two well-motivated theoretical frameworks beyond the standard model are considered. Due to the presence of the Higgs boson production in LHC proton-proton collisions, the search provides unique constraints on the Higgs-mixing parameter $\kappa < $ 4 $\times$ 10$^{-4}$ at 95% confidence level (CL) in a dark photon model with the XX selection, in Higgs-mixing-dominated scenarios, while searches for ${\mathrm{Z}_{\mathrm{D}}}$ in Drell-Yan processes [67,14] provide better exclusion limits on $\varepsilon$ in kinetic-mixing-dominated scenarios. For the axion-like particle model, upper limits at 95% CL are placed on two relevant Wilson coefficients ${C_{\mathrm{Z}\mathrm{H}}/\Lambda}$ and ${C_{\mathrm{a}\mathrm{H}}/\Lambda^2}$. This is the first direct limit on decays of the observed Higgs boson to axion-like particles decaying to leptons. |
| References | ||||
| 1 | ATLAS Collaboration | Observation of a new particle in the search for the Standard Model Higgs boson with the ATLAS detector at the LHC | PLB 716 (2012) 1 | 1207.7214 |
| 2 | CMS Collaboration | Observation of a new boson at a mass of 125 GeV with the CMS Experiment at the LHC | PLB 716 (2012) 30 | CMS-HIG-12-028 1207.7235 |
| 3 | CMS Collaboration | Observation of a new boson with mass near 125 GeV in $ pp $ collisions at $ \sqrt{s} = $ 7 and 8 TeV | JHEP 06 (2013) 081 | CMS-HIG-12-036 1303.4571 |
| 4 | CMS Collaboration | Measurements of production cross sections of the Higgs boson in the four-lepton final state in proton-proton collisions at $ \sqrt{s} = $ 13 TeV | EPJC 81 (2021) 488 | CMS-HIG-19-001 2103.04956 |
| 5 | CMS Collaboration | Constraints on anomalous Higgs boson couplings to vector bosons and fermions in its production and decay using the four-lepton final state | PRD 104 (2021) 052004 | CMS-HIG-19-009 2104.12152 |
| 6 | CMS Collaboration | Measurements of Higgs boson production cross sections and couplings in the diphoton decay channel at $ \sqrt{\mathrm{s}} = $ 13 TeV | JHEP 07 (2021) 027 | CMS-HIG-19-015 2103.06956 |
| 7 | D. Curtin, R. Essig, S. Gori, and J. Shelton | Illuminating dark photons with high-energy colliders | JHEP 02 (2015) 157 | 1412.0018 |
| 8 | D. Curtin et al. | Exotic decays of the 125 GeV Higgs boson | PRD 90 (2014) 075004 | 1312.4992 |
| 9 | H. Davoudiasl, H.-S. Lee, I. Lewis, and W. J. Marciano | Higgs decays as a window into the dark sector | PRD 88 (2013) 015022 | 1304.4935 |
| 10 | H. Davoudiasl, H.-S. Lee, and W. J. Marciano | 'Dark' Z implications for parity violation, rare meson decays, and Higgs physics | PRD 85 (2012) 115019 | 1203.2947 |
| 11 | S. Gopalakrishna, S. Jung, and J. D. Wells | Higgs boson decays to four fermions through an Abelian hidden sector | PRD 78 (2008) 055002 | 0801.3456 |
| 12 | ATLAS Collaboration | Search for new light gauge bosons in Higgs boson decays to four-lepton final states in $ pp $ collisions at $ \sqrt{s}= $ 8 TeV with the ATLAS detector at the LHC | PRD 92 (2015) 092001 | 1505.07645 |
| 13 | ATLAS Collaboration | Search for Higgs boson decays to beyond-the-Standard-Model light bosons in four-lepton events with the ATLAS detector at $ \sqrt{s}= $ 13 TeV | JHEP 06 (2018) 166 | 1802.03388 |
| 14 | LHCb Collaboration | Search for dark photons produced in 13 TeV pp collisions | PRL 120 (2018) 061801 | 1710.02867 |
| 15 | R. Essig et al. | Working group report: new light weakly coupled particles | in Proceedings, 2013 Community Summer Study on the Future of U.S. Particle Physics: Snowmass on the Mississippi (CSS2013) 2013 | 1311.0029 |
| 16 | J. Beacham et al. | Physics Beyond Colliders at CERN: Beyond the Standard Model Working Group Report | JPG 47 (2020) 010501 | 1901.09966 |
| 17 | R. D. Peccei and H. R. Quinn | $ \mathrm{CP} $ conservation in the presence of pseudoparticles | PRL 38 (1977) 1440 | |
| 18 | M. Bauer, M. Neubert, and A. Thamm | LHC as an axion factory: probing an axion explanation for $ (g-2)_\mu $ with exotic Higgs decays | PRL 119 (2017) 031802 | 1704.08207 |
| 19 | H. Georgi, D. B. Kaplan, and L. Randall | Manifesting the invisible axion at low-energies | PLB 169B (1986) 73 | |
| 20 | M. Bauer, M. Neubert, and A. Thamm | Collider probes of axion-like particles | JHEP 12 (2017) 044 | 1708.00443 |
| 21 | CMS Collaboration | Search for a non-Standard-Model Higgs boson decaying to a pair of new light bosons in four-muon final states | PLB 726 (2013) 564 | CMS-EXO-12-012 1210.7619 |
| 22 | ATLAS Collaboration | Search for new phenomena in events with at least three photons collected in $ pp $ collisions at $ \sqrt{s} = $ 8 TeV with the ATLAS detector | EPJC 76 (2016) 210 | 1509.05051 |
| 23 | CMS Collaboration | Search for a very light NMSSM Higgs boson produced in decays of the 125 GeV scalar boson and decaying into $ \tau $ leptons in pp collisions at $ \sqrt{s}= $ 8 TeV | JHEP 01 (2016) 079 | CMS-HIG-14-019 1510.06534 |
| 24 | CMS Collaboration | Search for light bosons in decays of the 125 GeV Higgs boson in proton-proton collisions at $ \sqrt{s}= $ 8 TeV | JHEP 10 (2017) 076 | CMS-HIG-16-015 1701.02032 |
| 25 | ATLAS Collaboration | Search for Higgs boson decays into a $ Z $ boson and a light hadronically decaying resonance using 13 TeV pp collision data from the ATLAS detector | PRL 125 (2020) 221802 | 2004.01678 |
| 26 | CMS Collaboration | HEPData record for this analysis | link | |
| 27 | CMS Collaboration | The CMS experiment at the CERN LHC | JINST 3 (2008) S08004 | CMS-00-001 |
| 28 | CMS Collaboration | The CMS trigger system | JINST 12 (2017) P01020 | CMS-TRG-12-001 1609.02366 |
| 29 | M. Cacciari, G. P. Salam, and G. Soyez | The anti-$ {k_{\mathrm{T}}} $ jet clustering algorithm | JHEP 04 (2008) 063 | 0802.1189 |
| 30 | M. Cacciari, G. P. Salam, and G. Soyez | FastJet user manual | EPJC 72 (2012) 1896 | 1111.6097 |
| 31 | CMS Collaboration | Particle-flow reconstruction and global event description with the CMS detector | JINST 12 (2017) P10003 | CMS-PRF-14-001 1706.04965 |
| 32 | CMS Collaboration | Performance of missing transverse momentum reconstruction in proton-proton collisions at $ \sqrt{s} = $ 13 TeV using the CMS detector | JINST 14 (2019) P07004 | CMS-JME-17-001 1903.06078 |
| 33 | CMS Collaboration | Performance of the CMS muon detector and muon reconstruction with proton-proton collisions at $ \sqrt{s}= $ 13 TeV | JINST 13 (2018) P06015 | CMS-MUO-16-001 1804.04528 |
| 34 | CMS Collaboration | Electron and photon reconstruction and identification with the CMS experiment at the CERN LHC | JINST 16 (2021) P05014 | CMS-EGM-17-001 2012.06888 |
| 35 | CMS Collaboration | Measurements of properties of the Higgs boson decaying into the four-lepton final state in pp collisions at $ \sqrt{s}= $ 13 TeV | JHEP 11 (2017) 047 | CMS-HIG-16-041 1706.09936 |
| 36 | CMS Collaboration | Measurements of inclusive $ W $ and $ Z $ cross sections in $ pp $ collisions at $ \sqrt{s}= $ 7 TeV | JHEP 01 (2011) 080 | CMS-EWK-10-002 1012.2466 |
| 37 | J. Alwall et al. | The automated computation of tree-level and next-to-leading order differential cross sections, and their matching to parton shower simulations | JHEP 07 (2014) 079 | 1405.0301 |
| 38 | J. Alwall et al. | Comparative study of various algorithms for the merging of parton showers and matrix elements in hadronic collisions | EPJC 53 (2008) 473 | 0706.2569 |
| 39 | R. Frederix and S. Frixione | Merging meets matching in MC@NLO | JHEP 12 (2012) 061 | 1209.6215 |
| 40 | C. Anastasiou et al. | High precision determination of the gluon fusion Higgs boson cross-section at the LHC | JHEP 05 (2016) 058 | 1602.00695 |
| 41 | E. Bagnaschi, G. Degrassi, P. Slavich, and A. Vicini | Higgs production via gluon fusion in the POWHEG approach in the SM and in the MSSM | JHEP 02 (2012) 088 | 1111.2854 |
| 42 | P. Nason | A new method for combining NLO QCD with shower Monte Carlo algorithms | JHEP 11 (2004) 040 | hep-ph/0409146 |
| 43 | S. Frixione, P. Nason, and C. Oleari | Matching NLO QCD computations with parton shower simulations: the POWHEG method | JHEP 11 (2007) 070 | 0709.2092 |
| 44 | S. Alioli, P. Nason, C. Oleari, and E. Re | A general framework for implementing NLO calculations in shower Monte Carlo programs: the POWHEG BOX | JHEP 06 (2010) 043 | 1002.2581 |
| 45 | Y. Gao et al. | Spin determination of single-produced resonances at hadron colliders | PRD 81 (2010) 075022 | 1001.3396 |
| 46 | S. Bolognesi et al. | Spin and parity of a single-produced resonance at the LHC | PRD 86 (2012) 095031 | |
| 47 | J. Campbell and T. Neumann | Precision phenomenology with MCFM | JHEP 12 (2019) 034 | 1909.09117 |
| 48 | M. Grazzini, S. Kallweit, and M. Wiesemann | Fully differential NNLO computations with MATRIX | EPJC 78 (2018) 537 | 1711.06631 |
| 49 | NNPDF Collaboration | Parton distributions for the LHC Run II | JHEP 04 (2015) 040 | 1410.8849 |
| 50 | NNPDF Collaboration | Parton distributions from high-precision collider data | EPJC 77 (2017) 663 | 1706.00428 |
| 51 | T. Sjostrand et al. | An introduction to PYTHIA 8.2 | CPC 191 (2015) 159 | 1410.3012 |
| 52 | CMS Collaboration | Event generator tunes obtained from underlying event and multiparton scattering measurements | EPJC 76 (2016) 155 | CMS-GEN-14-001 1512.00815 |
| 53 | CMS Collaboration | Extraction and validation of a new set of CMS PYTHIA8 tunes from underlying-event measurements | EPJC 80 (2020) 4 | CMS-GEN-17-001 1903.12179 |
| 54 | GEANT4 Collaboration | GEANT4: a simulation toolkit | NIMA 506 (2003) 250 | |
| 55 | J. Allison et al. | Geant4 developments and applications | IEEE Trans. Nucl. Sci. 53 (2006) 270 | |
| 56 | Particle Data Group, P. A. Zyla et al. | Review of particle physics | Prog. Theor. Exp. Phys. 2020 (2020) 083C01 | |
| 57 | CMS Collaboration | CMS luminosity measurements for the 2016 data taking period | CMS-PAS-LUM-17-001 | CMS-PAS-LUM-17-001 |
| 58 | CMS Collaboration | CMS luminosity measurement for the 2017 data-taking period at $ \sqrt{s} = $ 13 TeV | CMS-PAS-LUM-17-004 | CMS-PAS-LUM-17-004 |
| 59 | CMS Collaboration | CMS luminosity measurement for the 2018 data-taking period at $ \sqrt{s} = $ 13 TeV | CMS-PAS-LUM-18-002 | CMS-PAS-LUM-18-002 |
| 60 | CMS Collaboration | Precision luminosity measurement in proton-proton collisions at $ \sqrt{s} = $ 13 TeV in 2015 and 2016 at CMS | EPJC 81 (2021) 800 | CMS-LUM-17-003 2104.01927 |
| 61 | M. J. Oreglia | A study of the reactions $\psi' \to \gamma\gamma \psi$ | PhD thesis, Stanford University, 1980 SLAC Report SLAC-R-236, see Appendix D | |
| 62 | J. Butterworth et al. | PDF4LHC recommendations for LHC Run II | JPG 43 (2016) 023001 | 1510.03865 |
| 63 | ATLAS and CMS Collaborations | Procedure for the LHC Higgs boson search combination in summer 2011 | ATL-PHYS-PUB-2011-011, CMS NOTE-2011/005 | |
| 64 | T. Junk | Confidence level computation for combining searches with small statistics | NIMA 434 (1999) 435 | hep-ex/9902006 |
| 65 | A. L. Read | Presentation of search results: the $ \mathrm{CL}_\mathrm{s} $ technique | JPG 28 (2002) 2693 | |
| 66 | G. Cowan, K. Cranmer, E. Gross, and O. Vitells | Asymptotic formulae for likelihood-based tests of new physics | EPJC 71 (2011) 1554 | 1007.1727 |
| 67 | CMS Collaboration | Search for a narrow resonance lighter than 200 GeV decaying to a pair of muons in proton-proton collisions at $ \sqrt{s}= $ 13 TeV | PRL 124 (2020) 131802 | CMS-EXO-19-018 1912.04776 |
|
|
Compact Muon Solenoid LHC, CERN |
|

|

|

|

|

|