

Compact Muon Solenoid
LHC, CERN
| CMS-HIG-20-018 ; CERN-EP-2022-010 | ||
| Search for light Higgs bosons from supersymmetric cascade decays in pp collisions at $\sqrt s = $ 13 TeV | ||
| CMS Collaboration | ||
| 28 April 2022 | ||
| Eur. Phys. J. C 83 (2023) 571 | ||
| Abstract: A search is reported for pairs of light Higgs bosons (H$_{1}$) produced in supersymmetric cascade decays in final states with small missing transverse momentum. A data set of LHC pp collisions collected with the CMS detector at $\sqrt s = $ 13 TeV and corresponding to an integrated luminosity of 138 fb$^{-1}$ is used. The search targets events where both H$_{1}$ bosons decay into $\mathrm{b\bar{b}}$ pairs that are reconstructed as large-radius jets using substructure techniques. No evidence is found for an excess of events beyond the background expectations of the standard model (SM). Results from the search are interpreted in the next-to-minimal supersymmetric extension of the SM, where a "singlino'' of small mass leads to squark and gluino cascade decays that can predominantly end in a highly Lorentz-boosted singlet-like H$_{1}$ and a singlino-like neutralino of small transverse momentum. Upper limits are set on the product of the squark or gluino pair production cross section and the square of the $\mathrm{b\bar{b}}$ branching fraction of the H$_{1}$ in a benchmark model containing almost mass-degenerate gluinos and light-flavour squarks. Under the assumption of an SM-like H$_{1}$ $\to\mathrm{b\bar{b}}$ branching fraction, H$_{1}$ bosons with masses in the range 40-120 GeV arising from the decays of squarks or gluinos with a mass of 1200 to 2500 GeV are excluded at 95% confidence level. | ||
| Links: e-print arXiv:2204.13532 [hep-ex] (PDF) ; CDS record ; inSPIRE record ; HepData record ; CADI line (restricted) ; | ||
| Figures & Tables | Summary | Additional Figures | References | CMS Publications |
|---|
| Figures | |
png pdf |
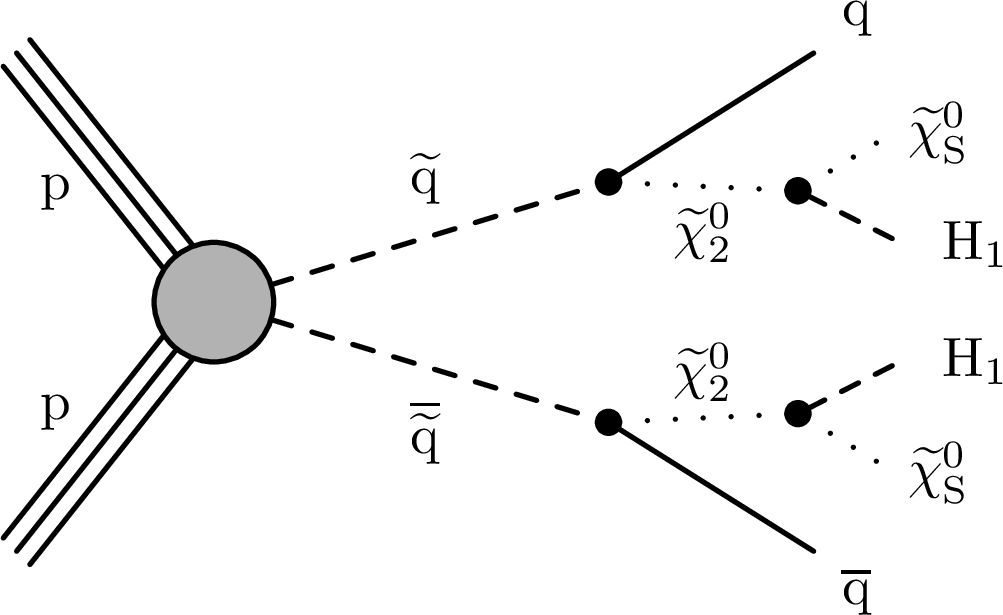
Figure 1:
Diagram of squark pair production and subsequent cascade decay in the benchmark signal model. The particle $\tilde{\chi}^{0}_{2}$ is the next-to-LSP, ${\tilde{\chi} _{\text {S}}^0}$ is the singlino-like LSP, and H$_{1}$ is the CP-even singlet-like Higgs boson. |
png pdf |
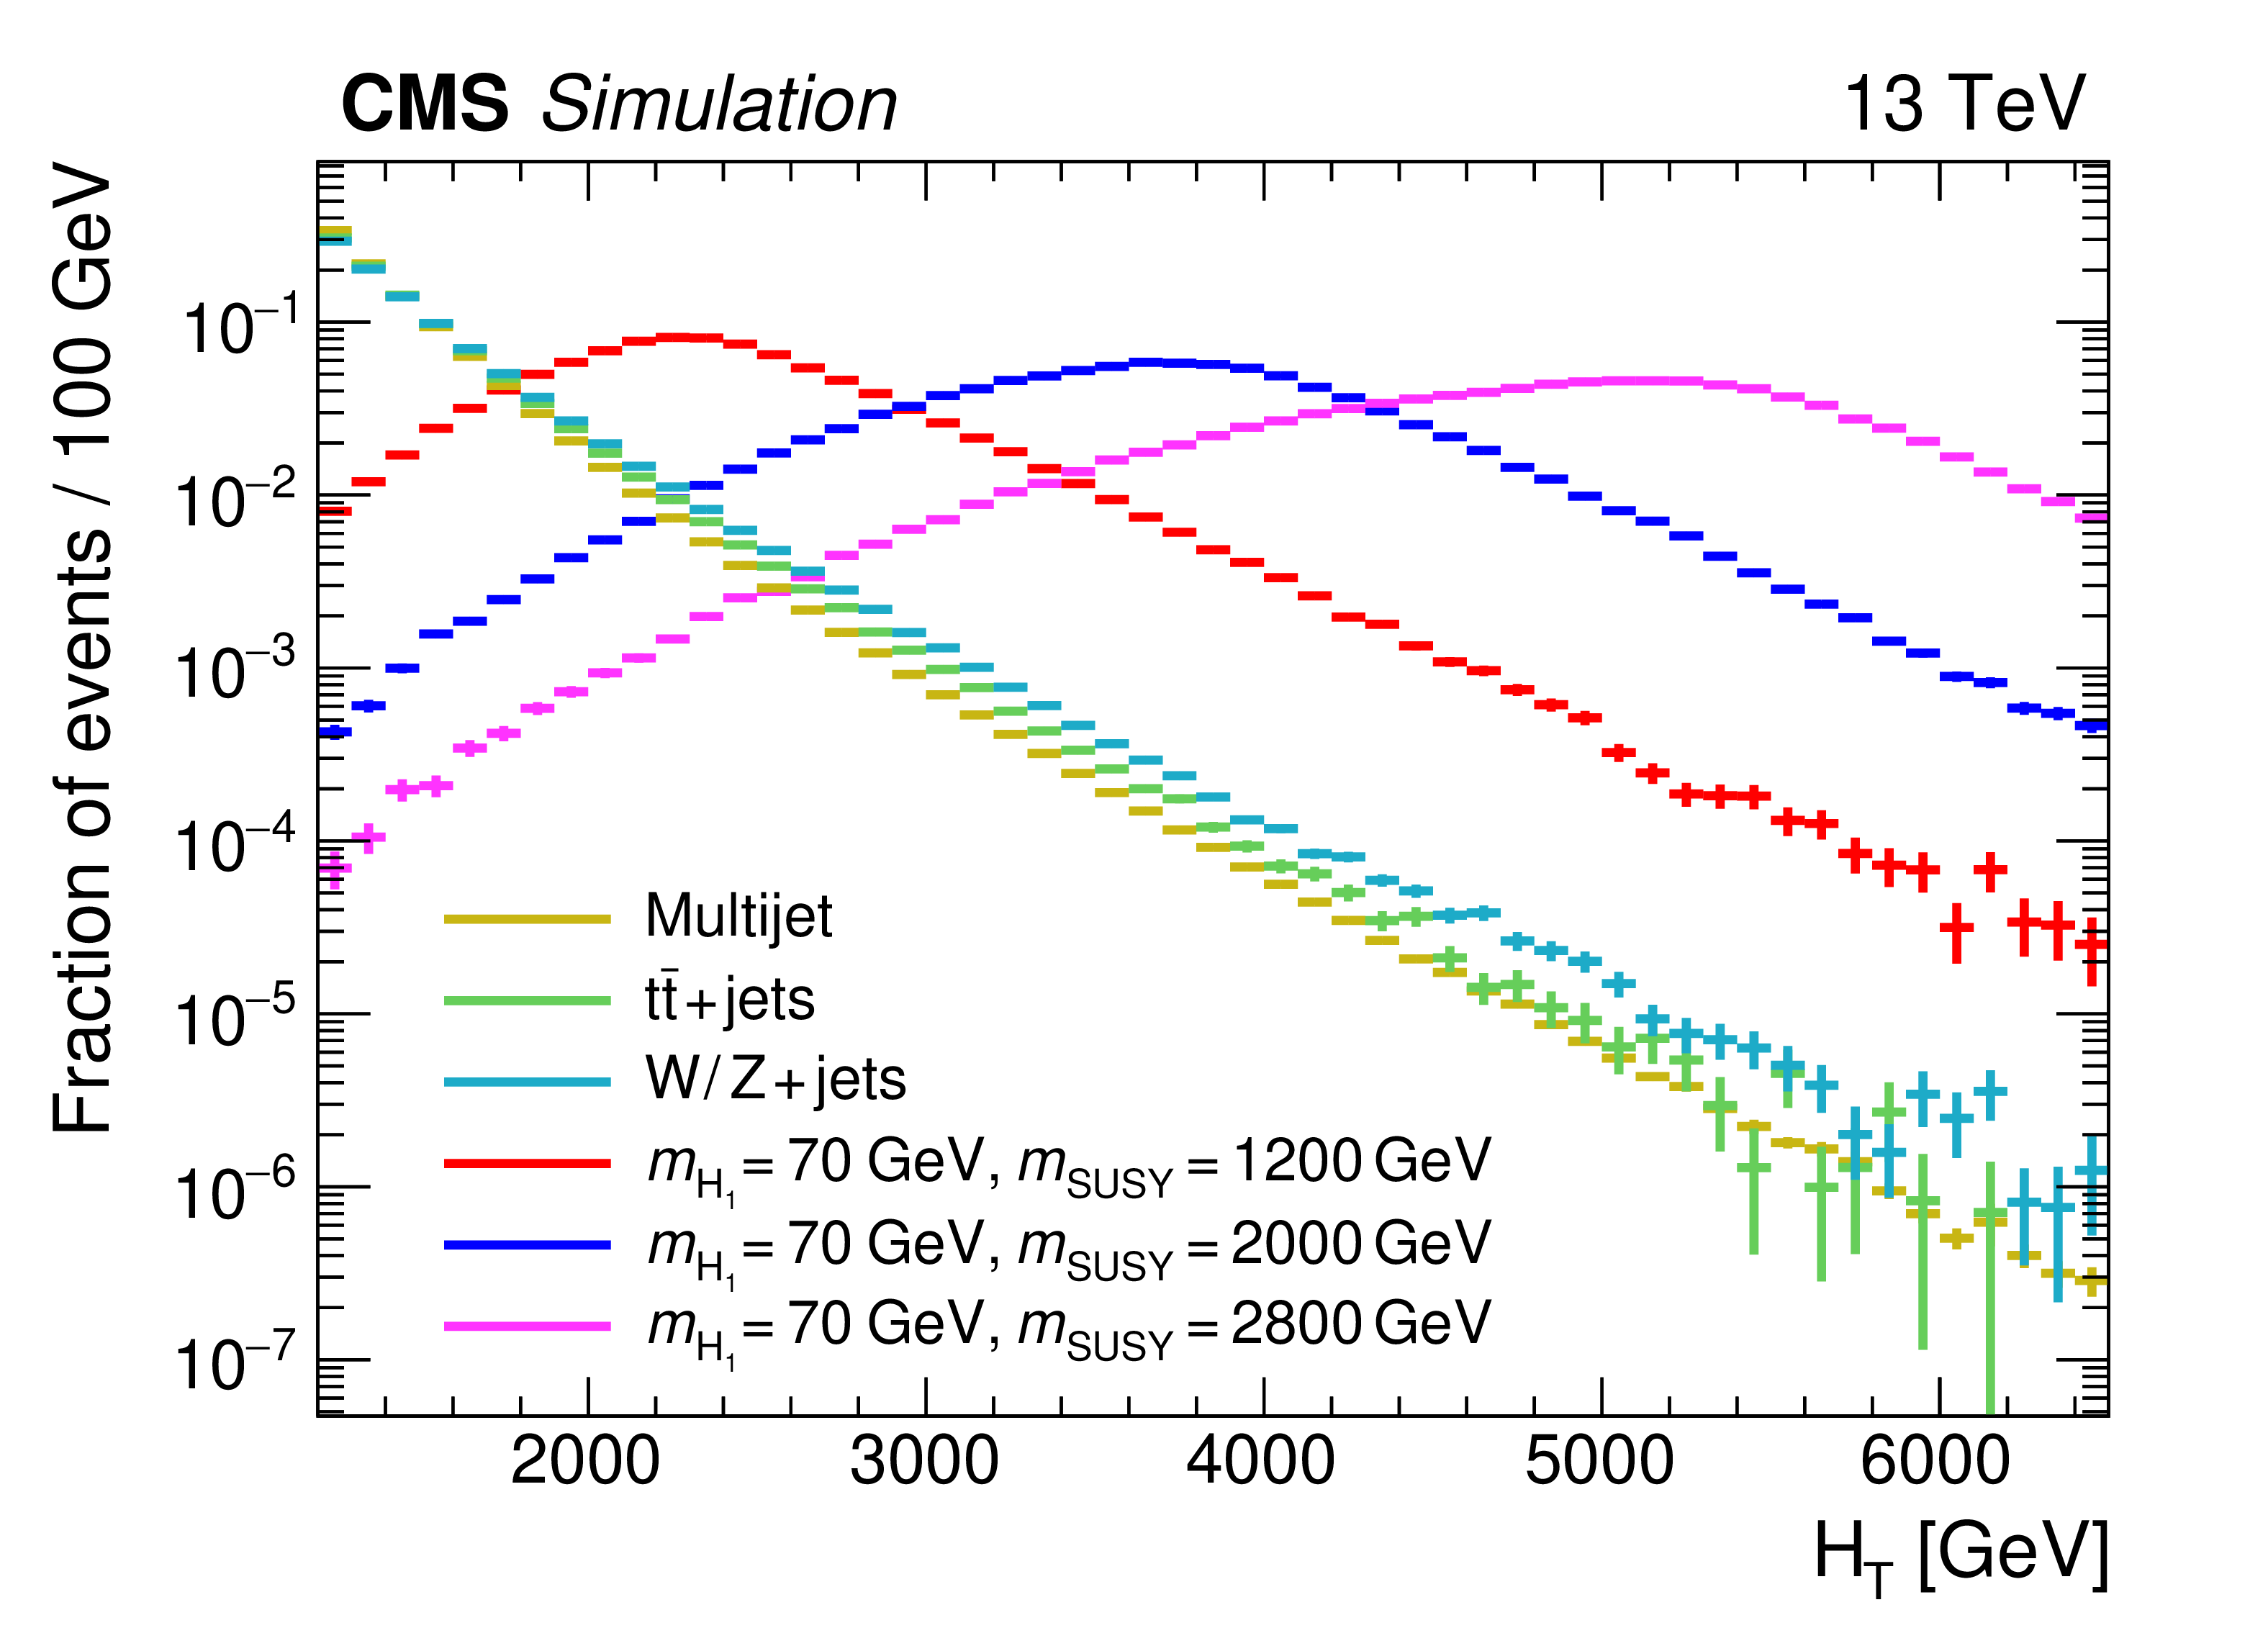
Figure 2:
The ${H_{\mathrm {T}}}$ distribution in signal events with different values of ${m_{\text {SUSY}}}$, and in the simulated SM backgrounds, normalised to unit area. The uncertainties are statistical. All events satisfy the preselection. |
png pdf |
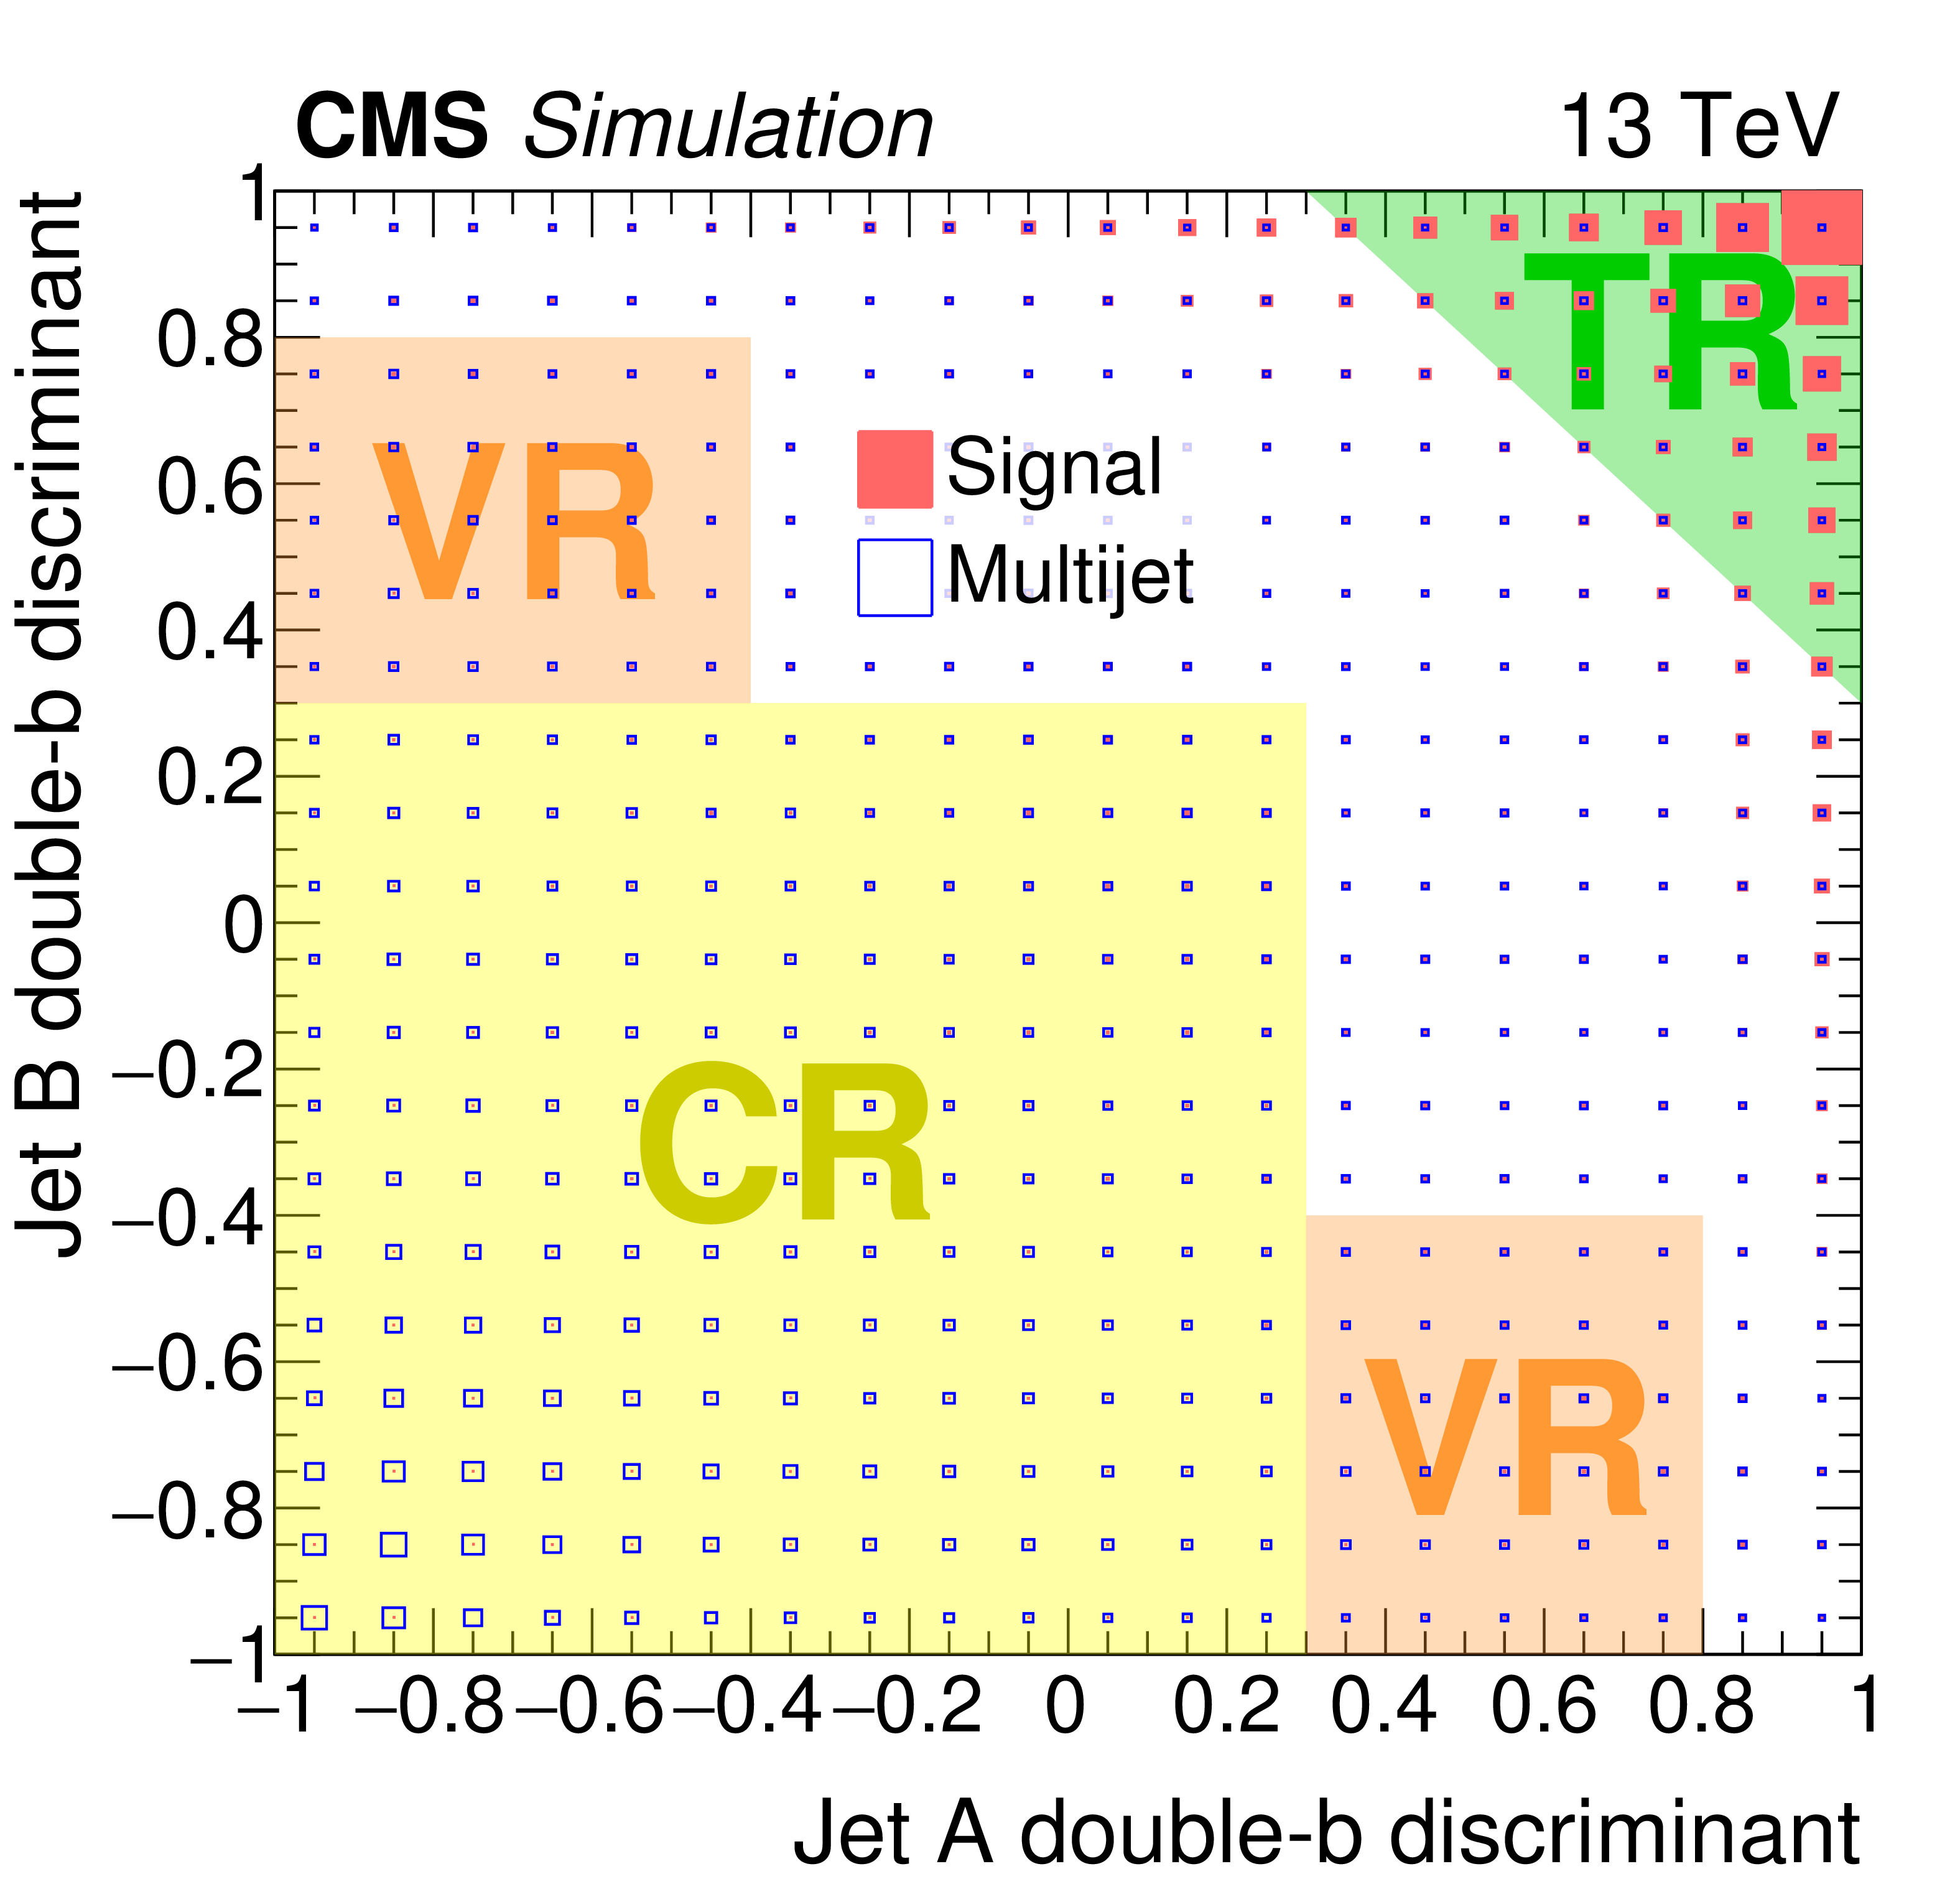
Figure 3:
Distributions of simulated signal and multijet events in the 2D double-b tag discriminant plane, where the fractions of events in each bin are represented by the areas of the filled red and open blue squares, respectively. The signal parameters are $ {m_{\mathrm{H} _1}} = $ 70 GeV and $ {m_{\text {SUSY}}} = $ 2000 GeV. The kinematic selection is implemented with the masses of the two AK8 jets required to be within the set of signal and sideband mass regions defined in Section 5.2. The green, yellow, and orange shaded areas represent the tag region (TR), control region (CR), and validation region (VR), respectively. Of the plotted signal events, 65% fall within the TR. |
png pdf |
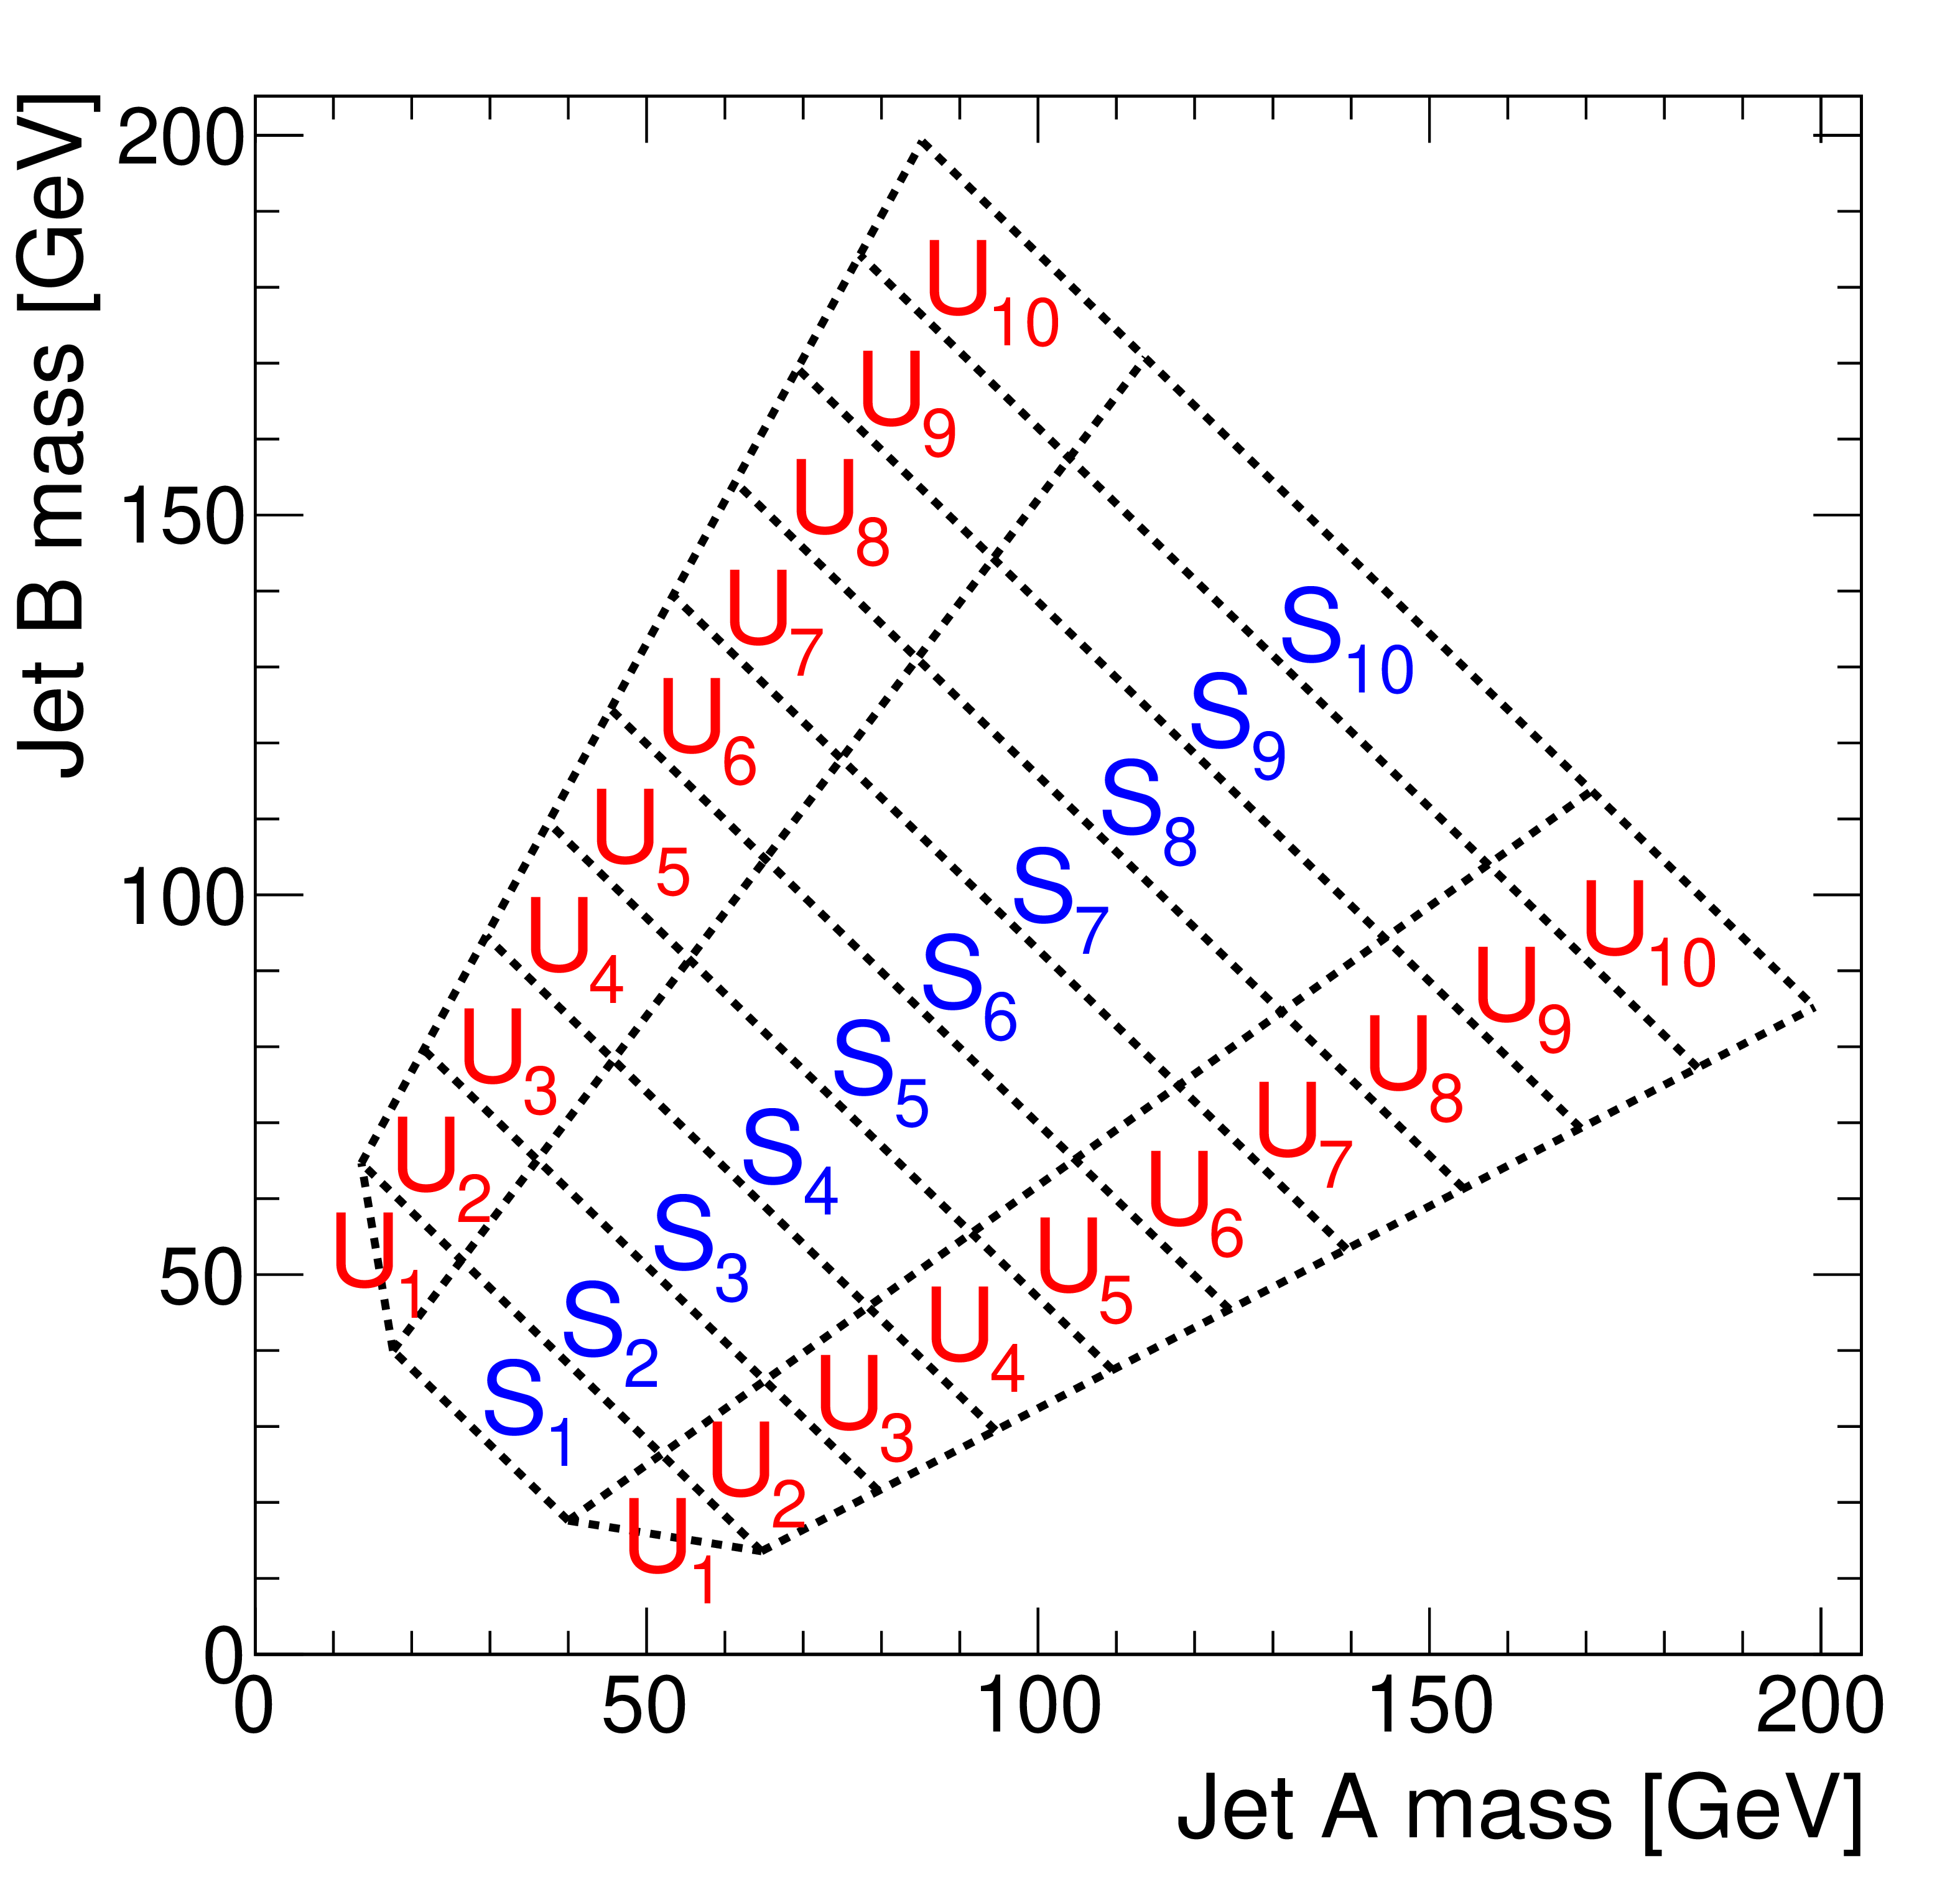
Figure 4:
Map of mass regions used in the 2D soft-drop mass plane. The regions labelled $S_i$ are the signal mass regions, and the disjoint regions ${U_{i}}$ form the corresponding sidebands. |
png pdf |
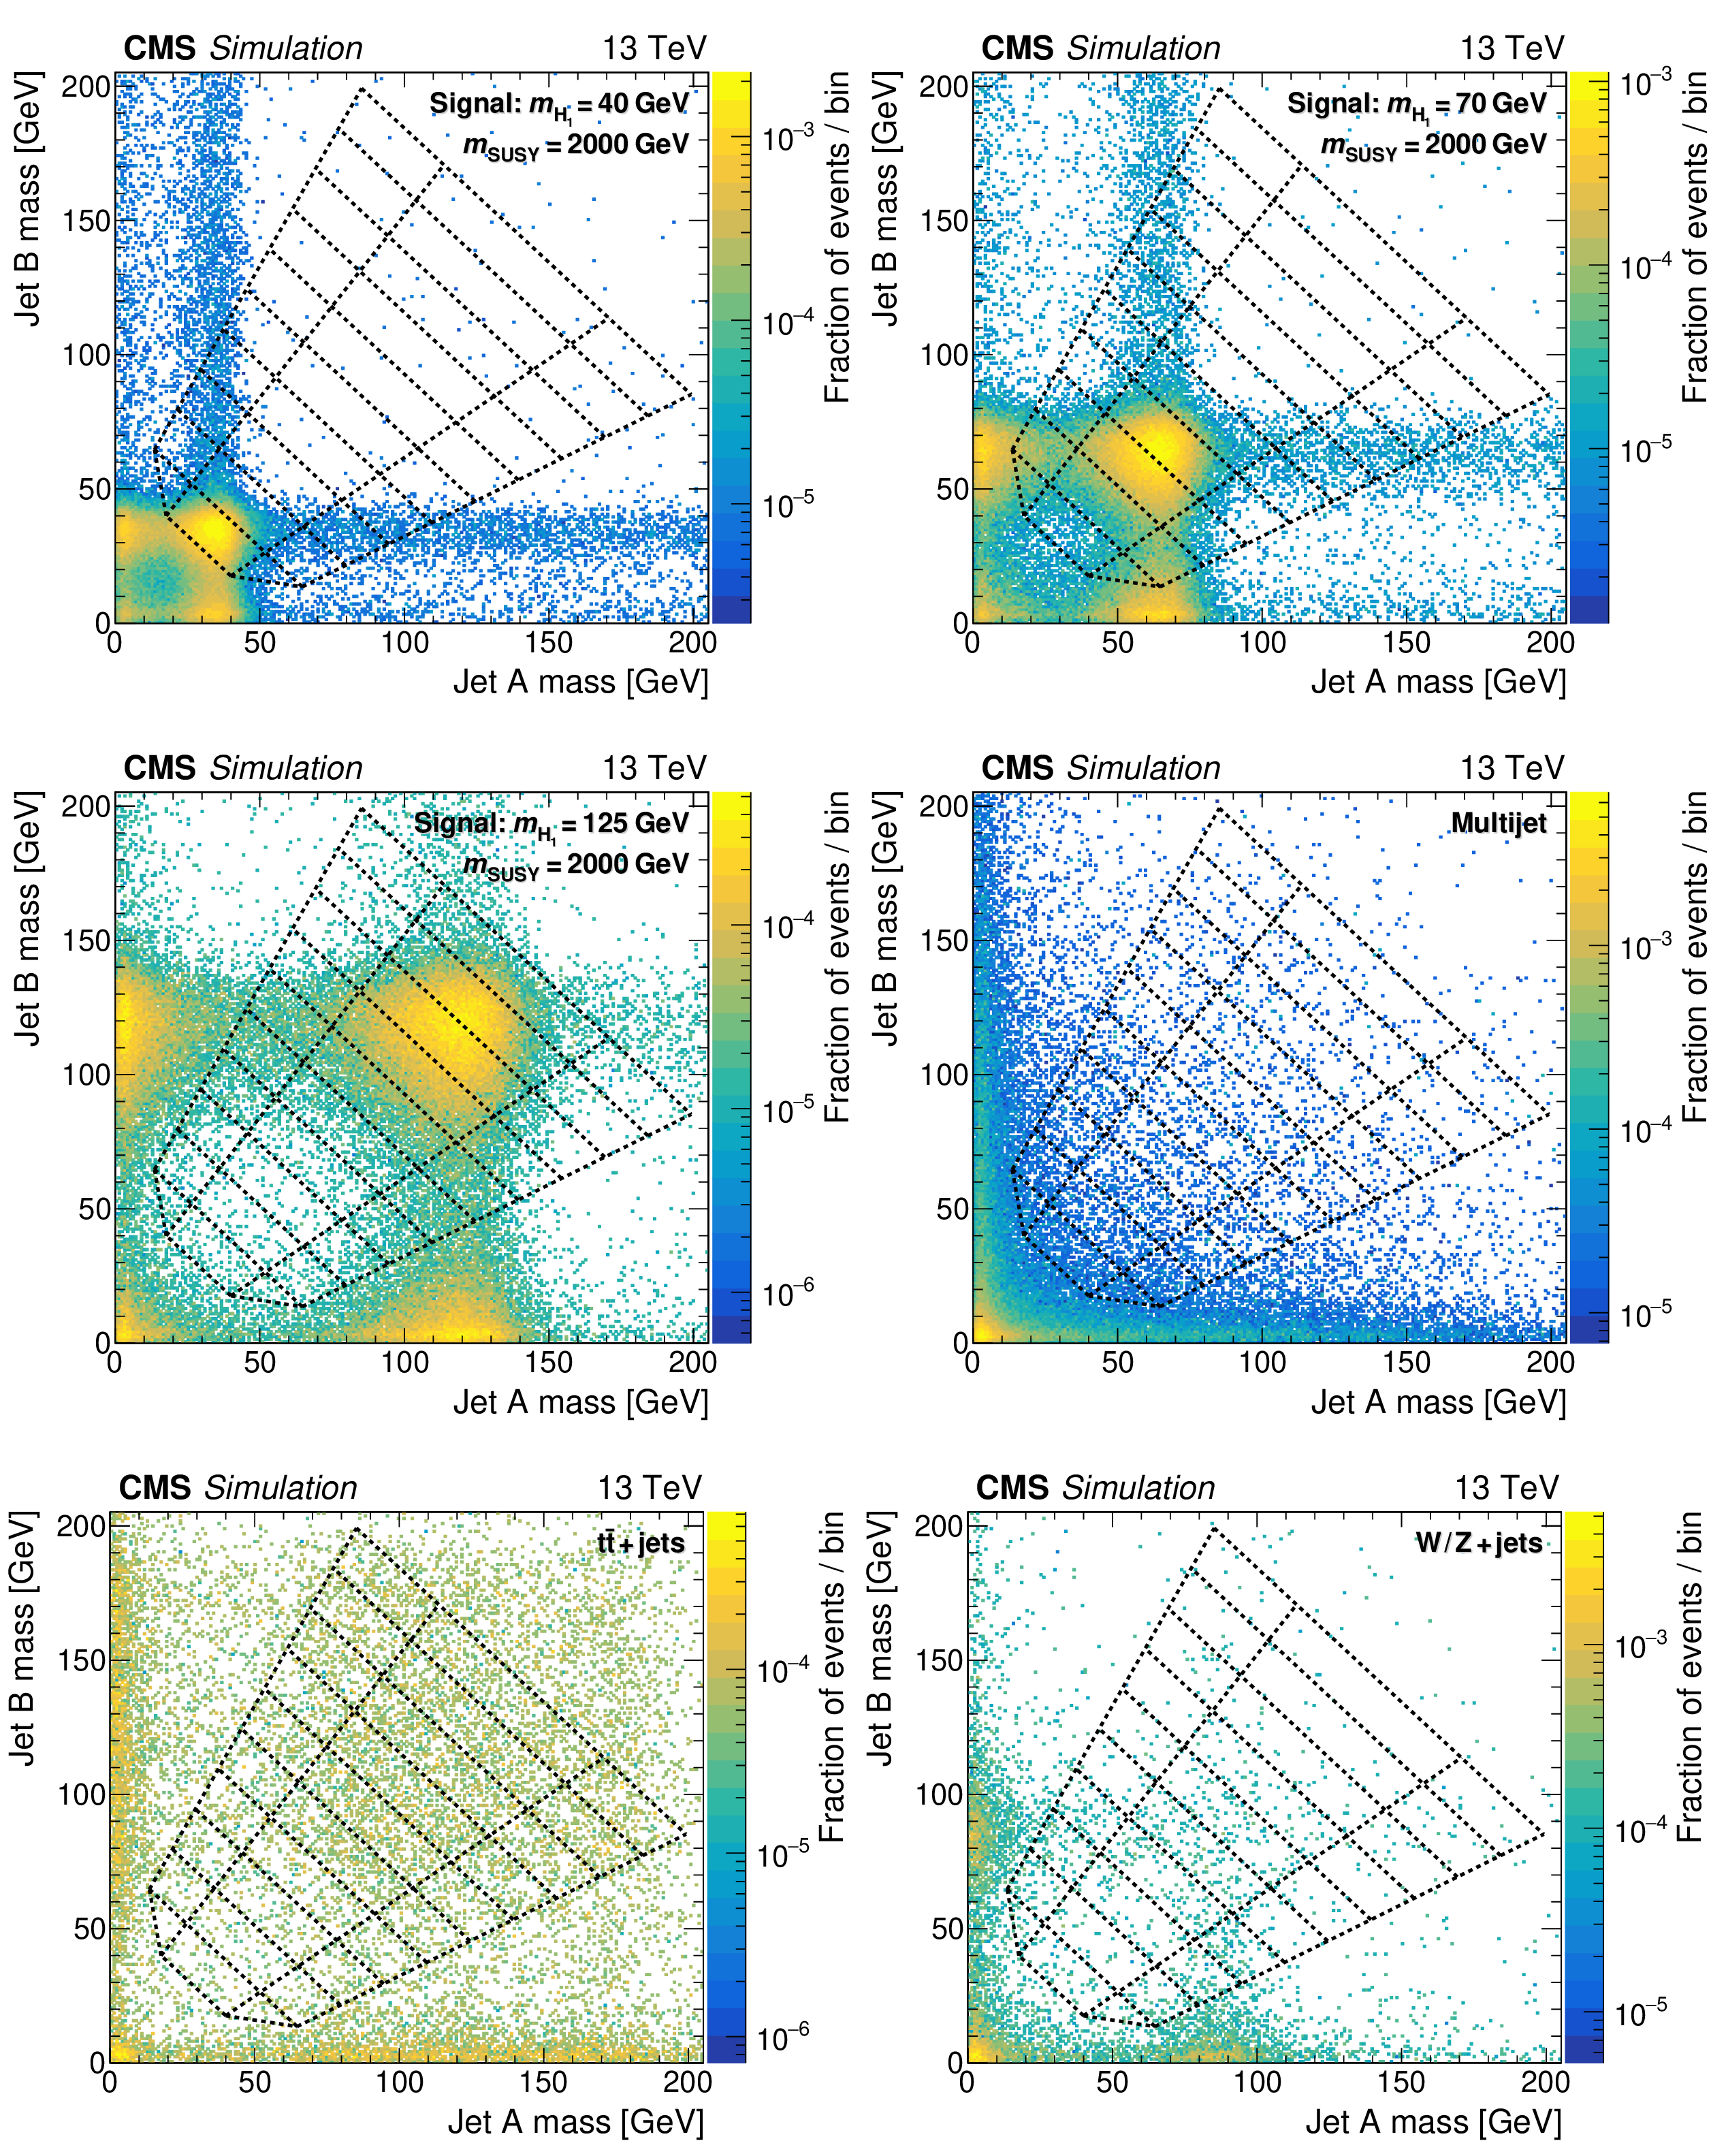
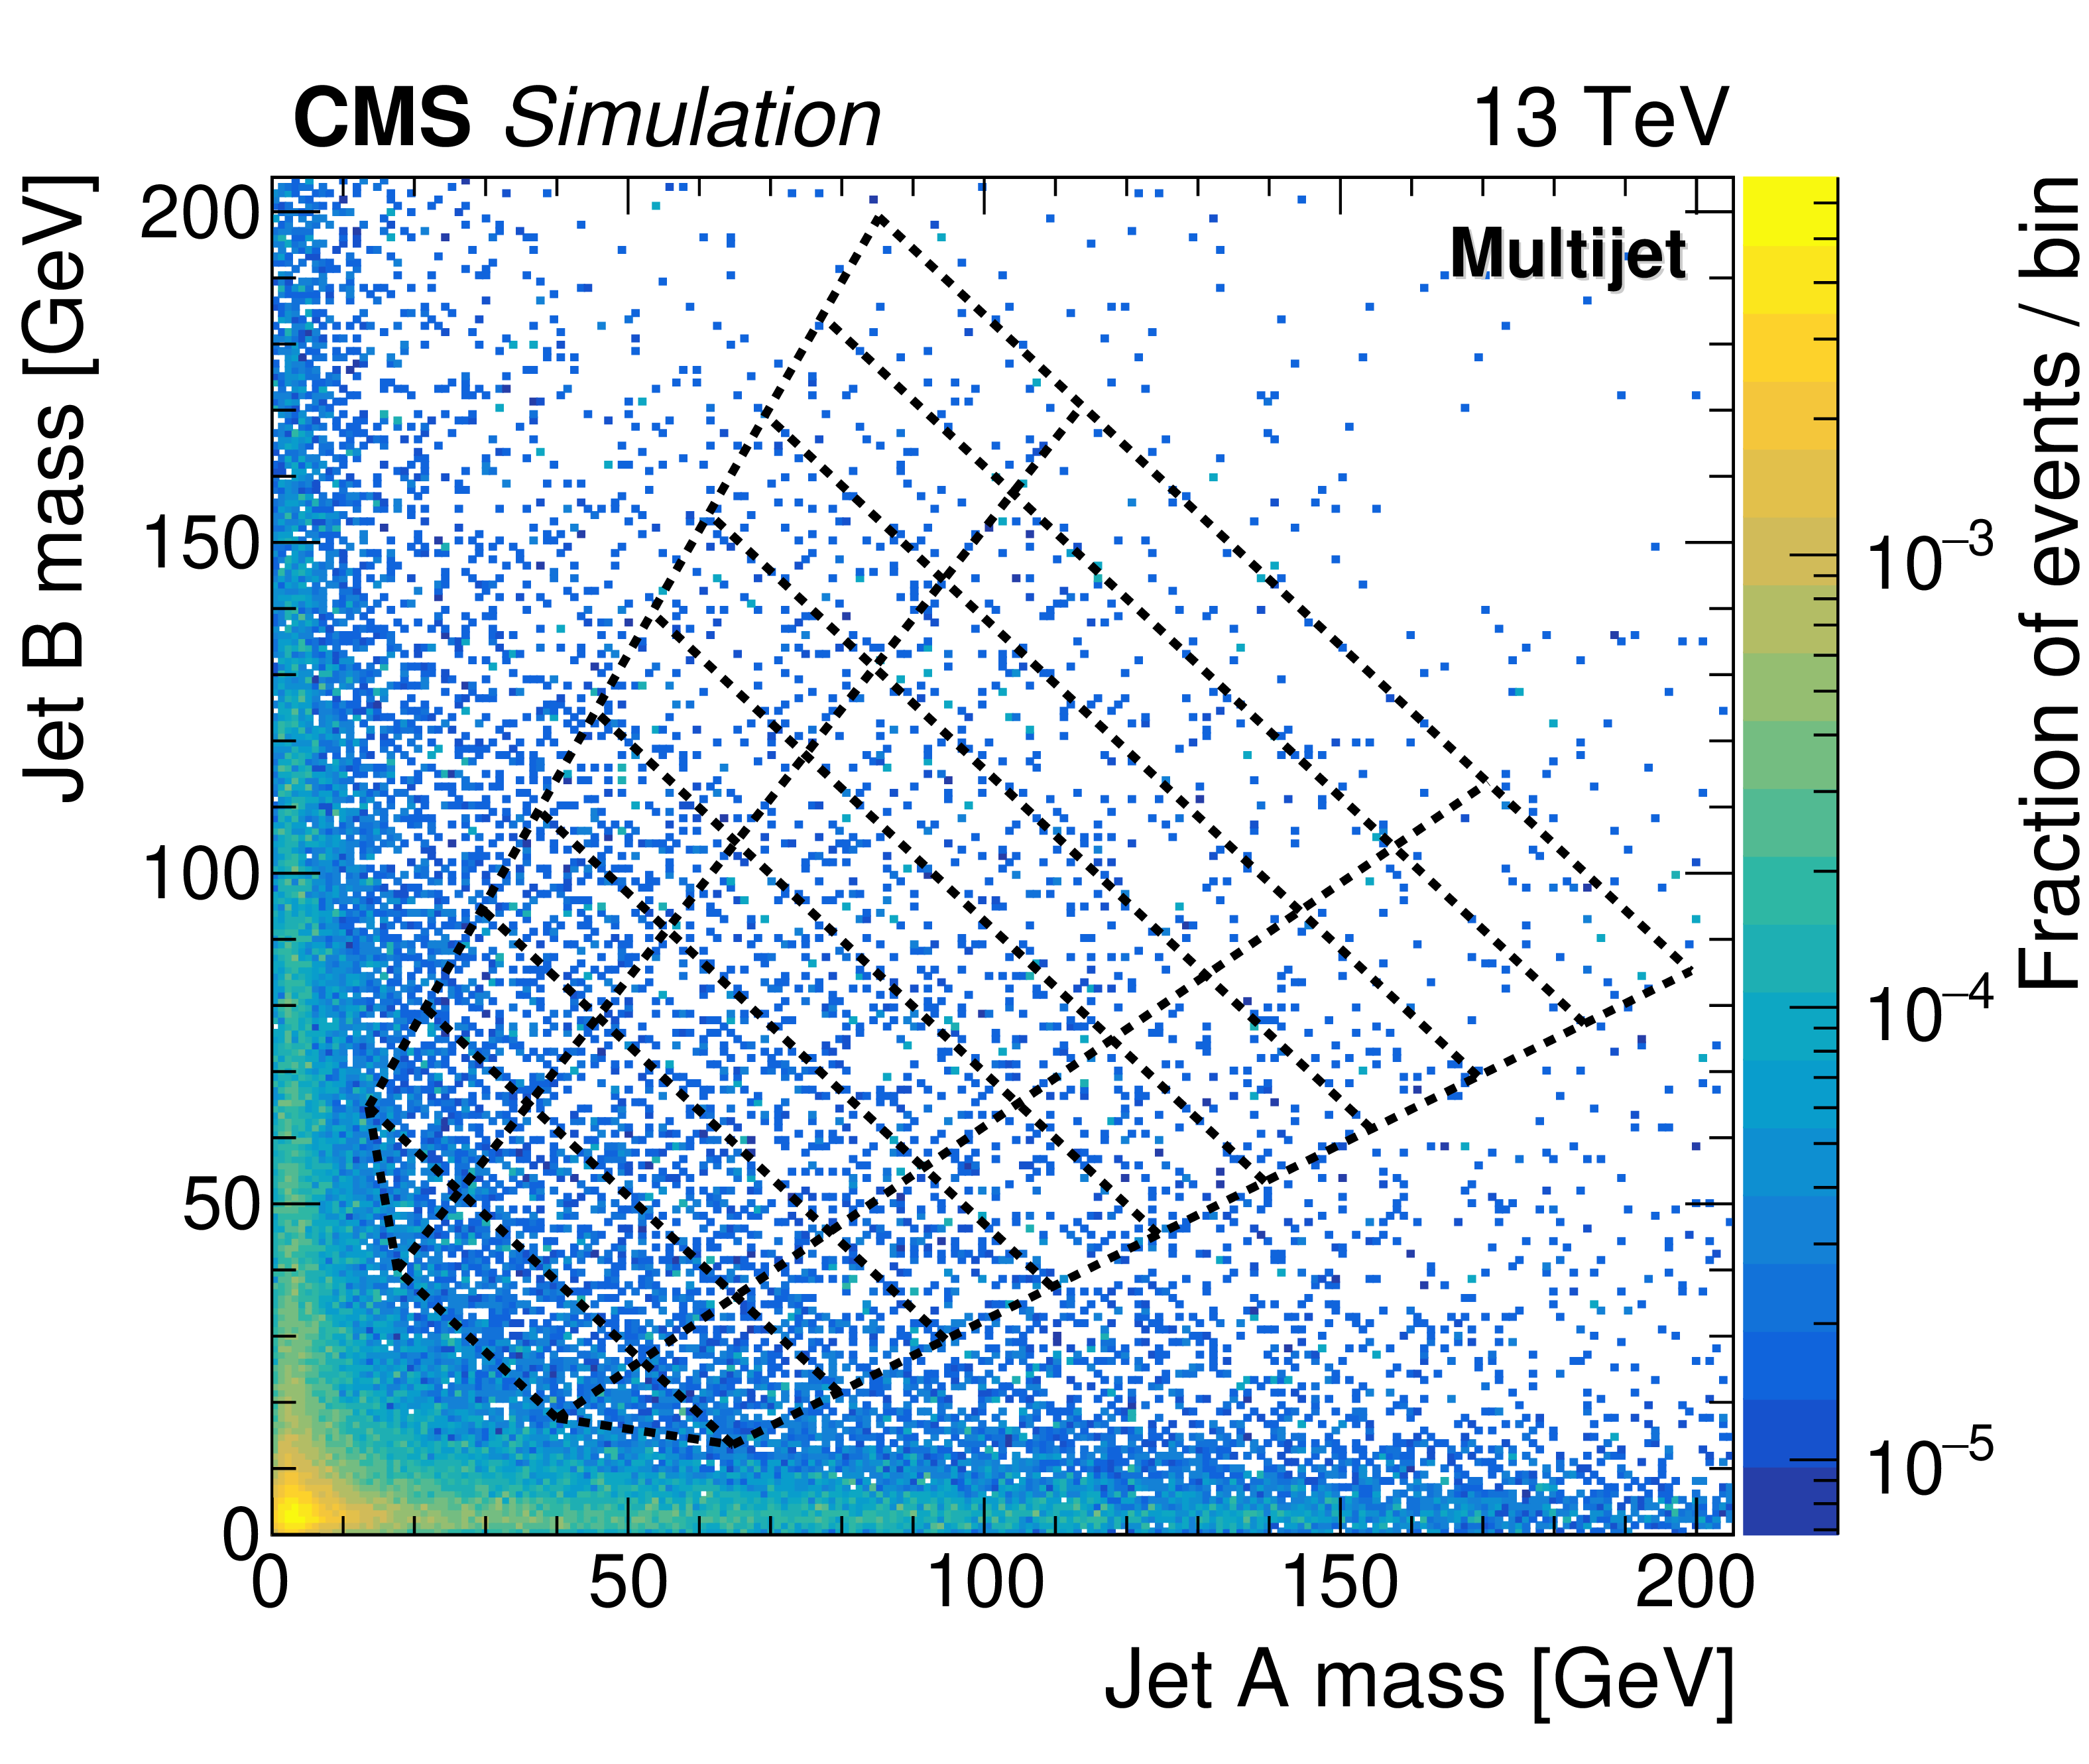
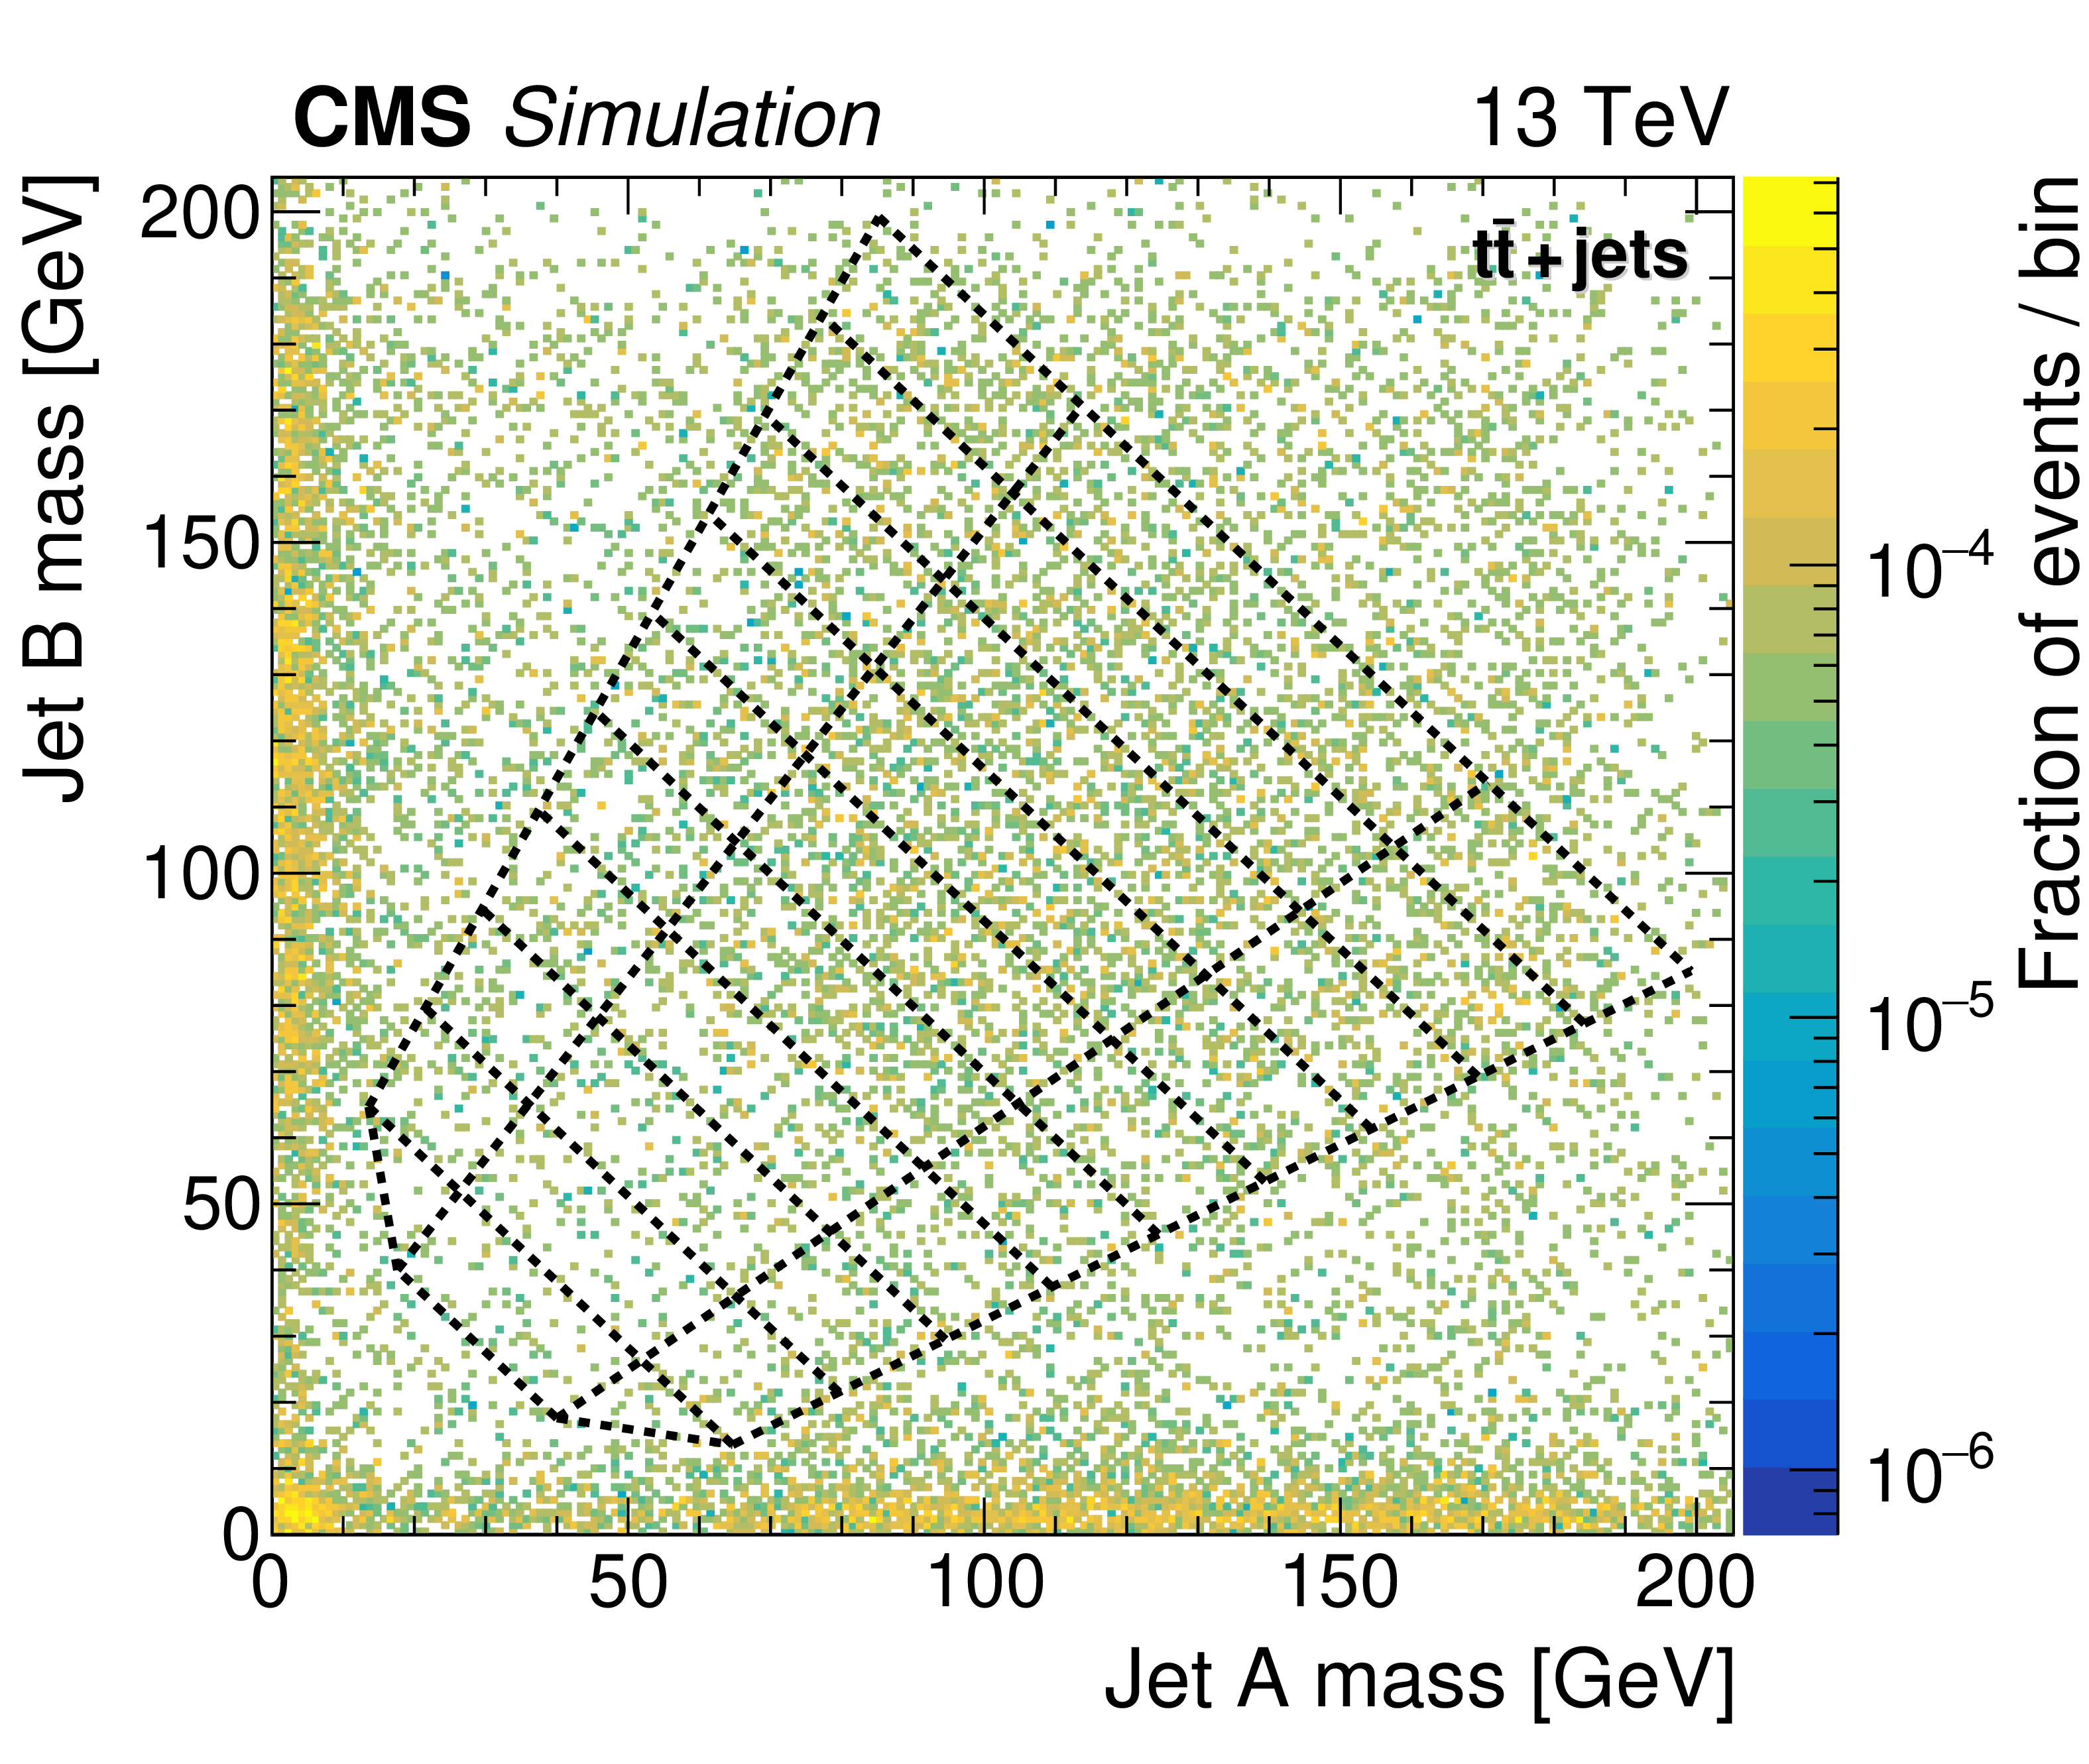
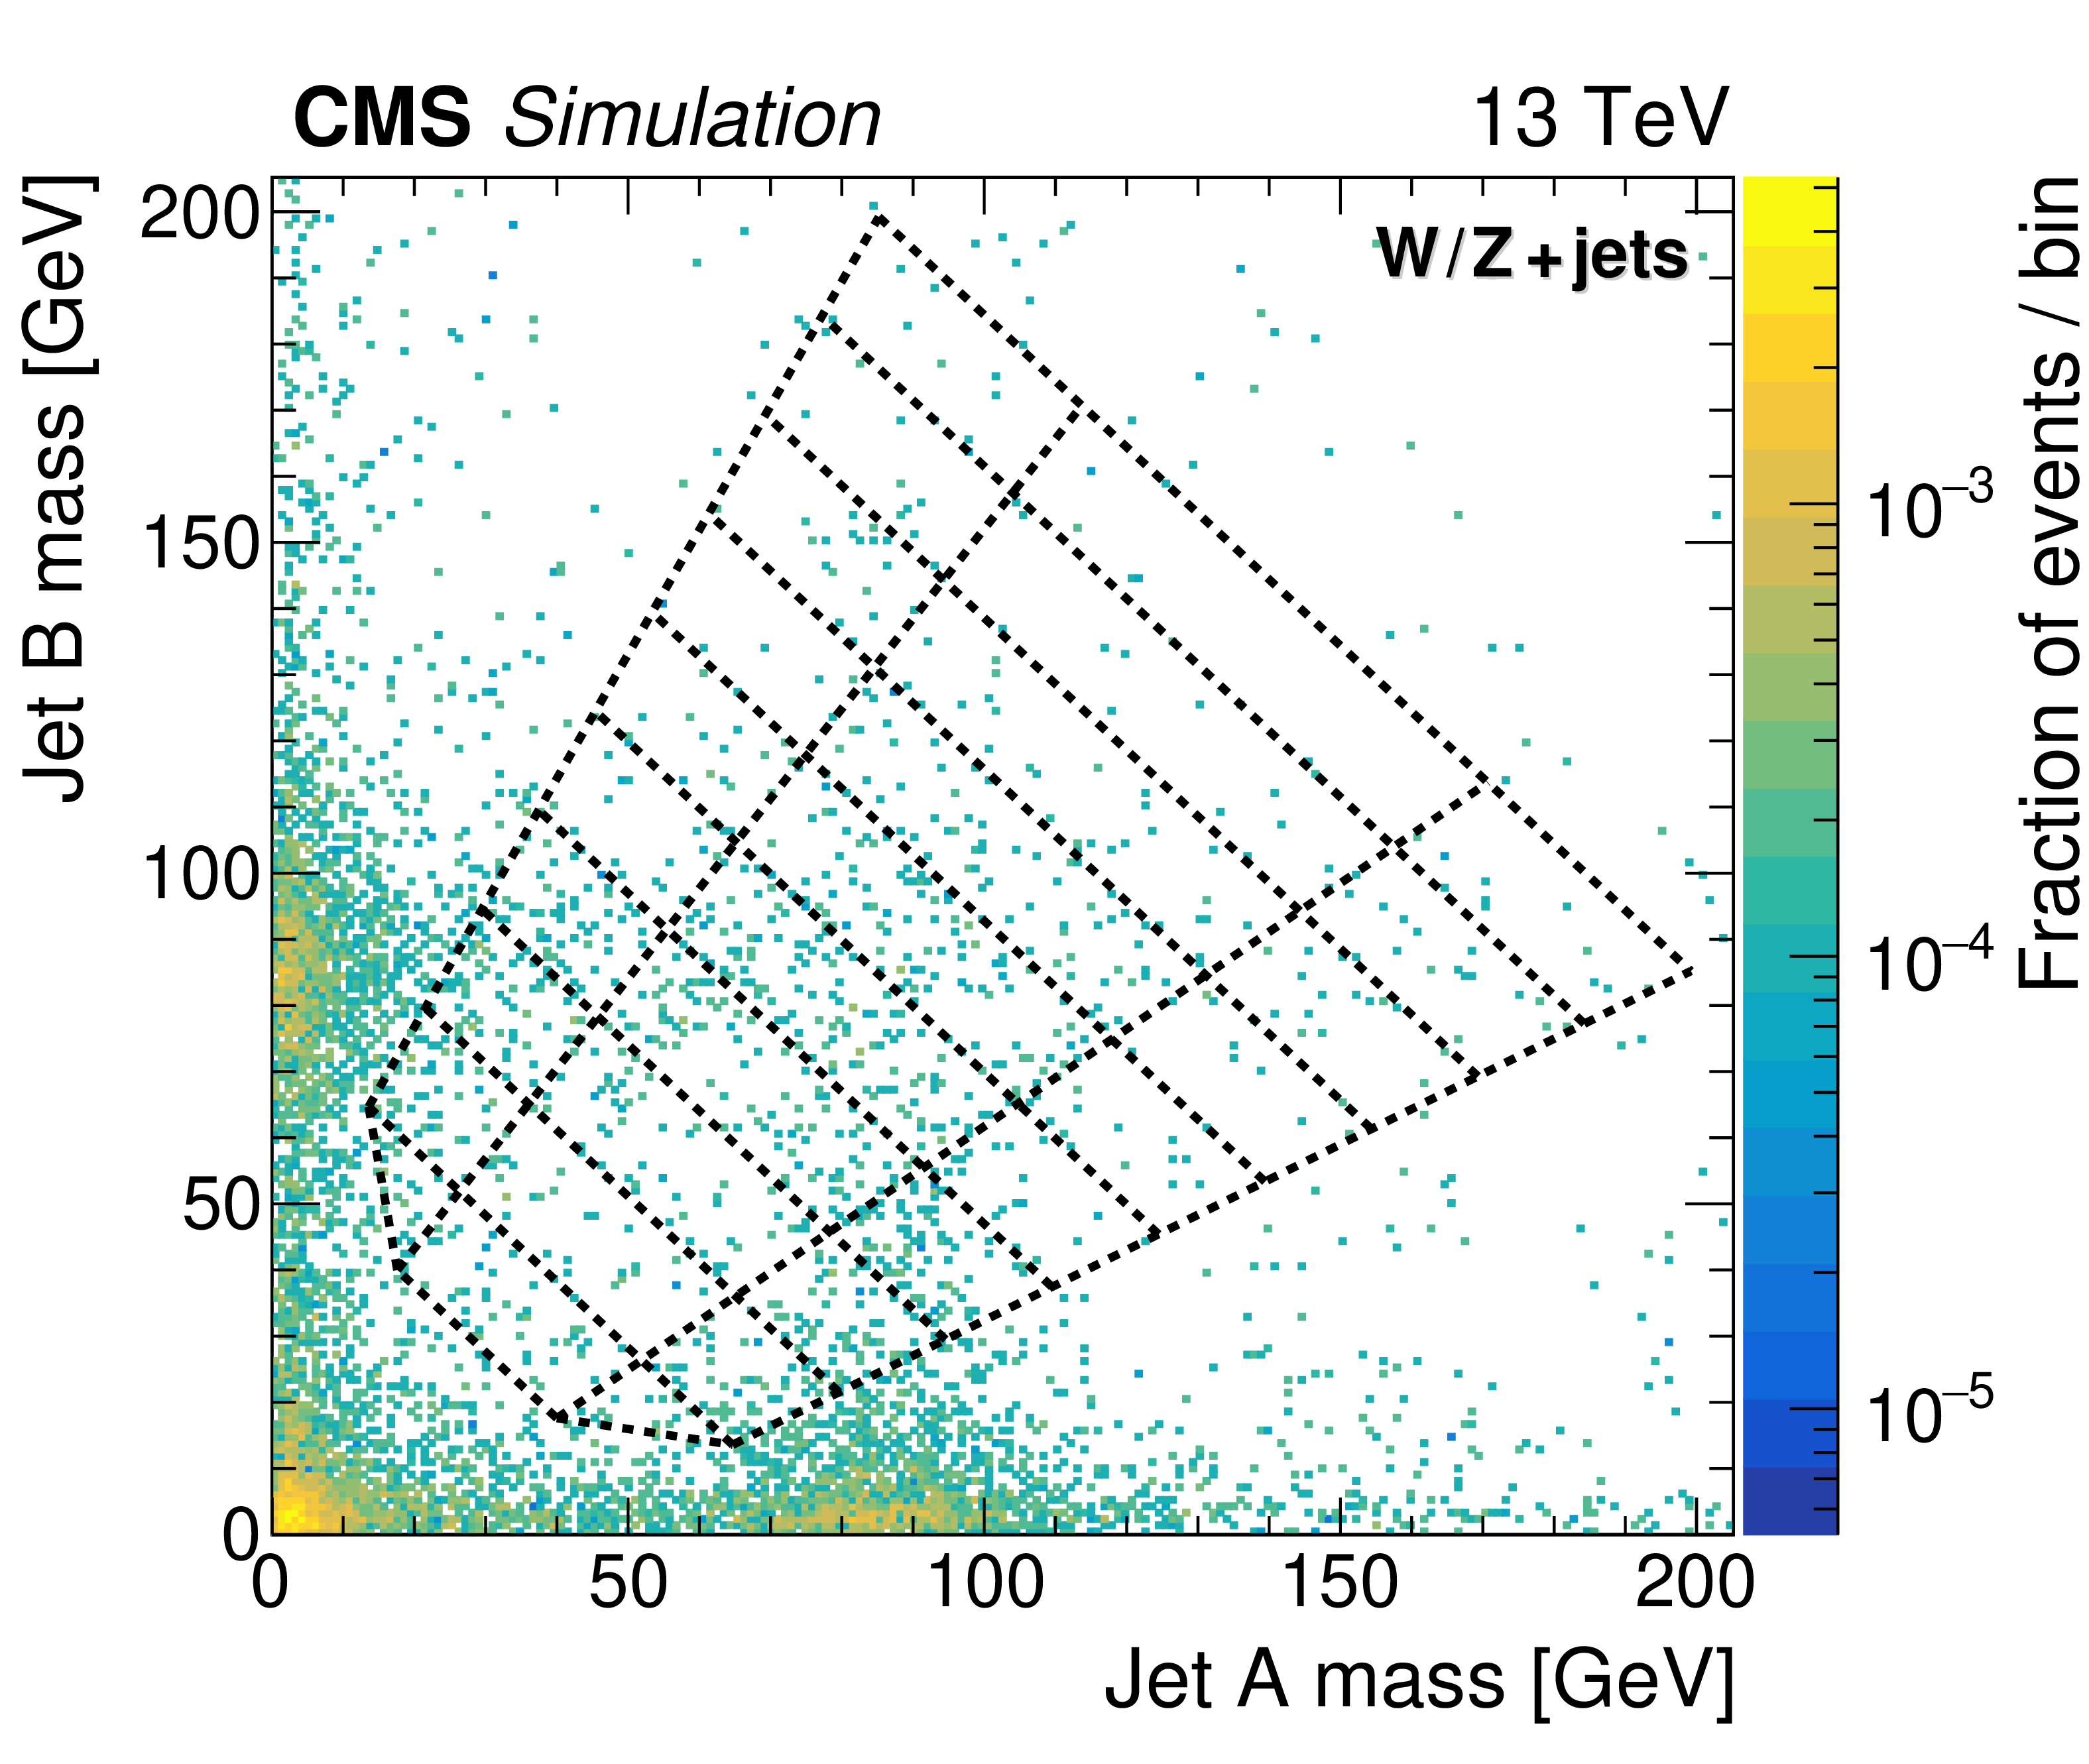
Figure 5:
The normalised distribution of events in the 2D soft-drop mass plane overlaid by the map of mass regions. The upper left, upper right, and middle left panels correspond to signal events for $ {m_{\text {SUSY}}} = $ 2000 GeV and ${m_{\mathrm{H} _1}}$ values of 40, 70, and 125 GeV, respectively. The panels at middle right, lower left, and lower right correspond to simulated multijet, ${\mathrm{t} {}\mathrm{\bar{t}}}$, and vector boson backgrounds, respectively. All events satisfy the TR requirement and the kinematic selection. |
png pdf |
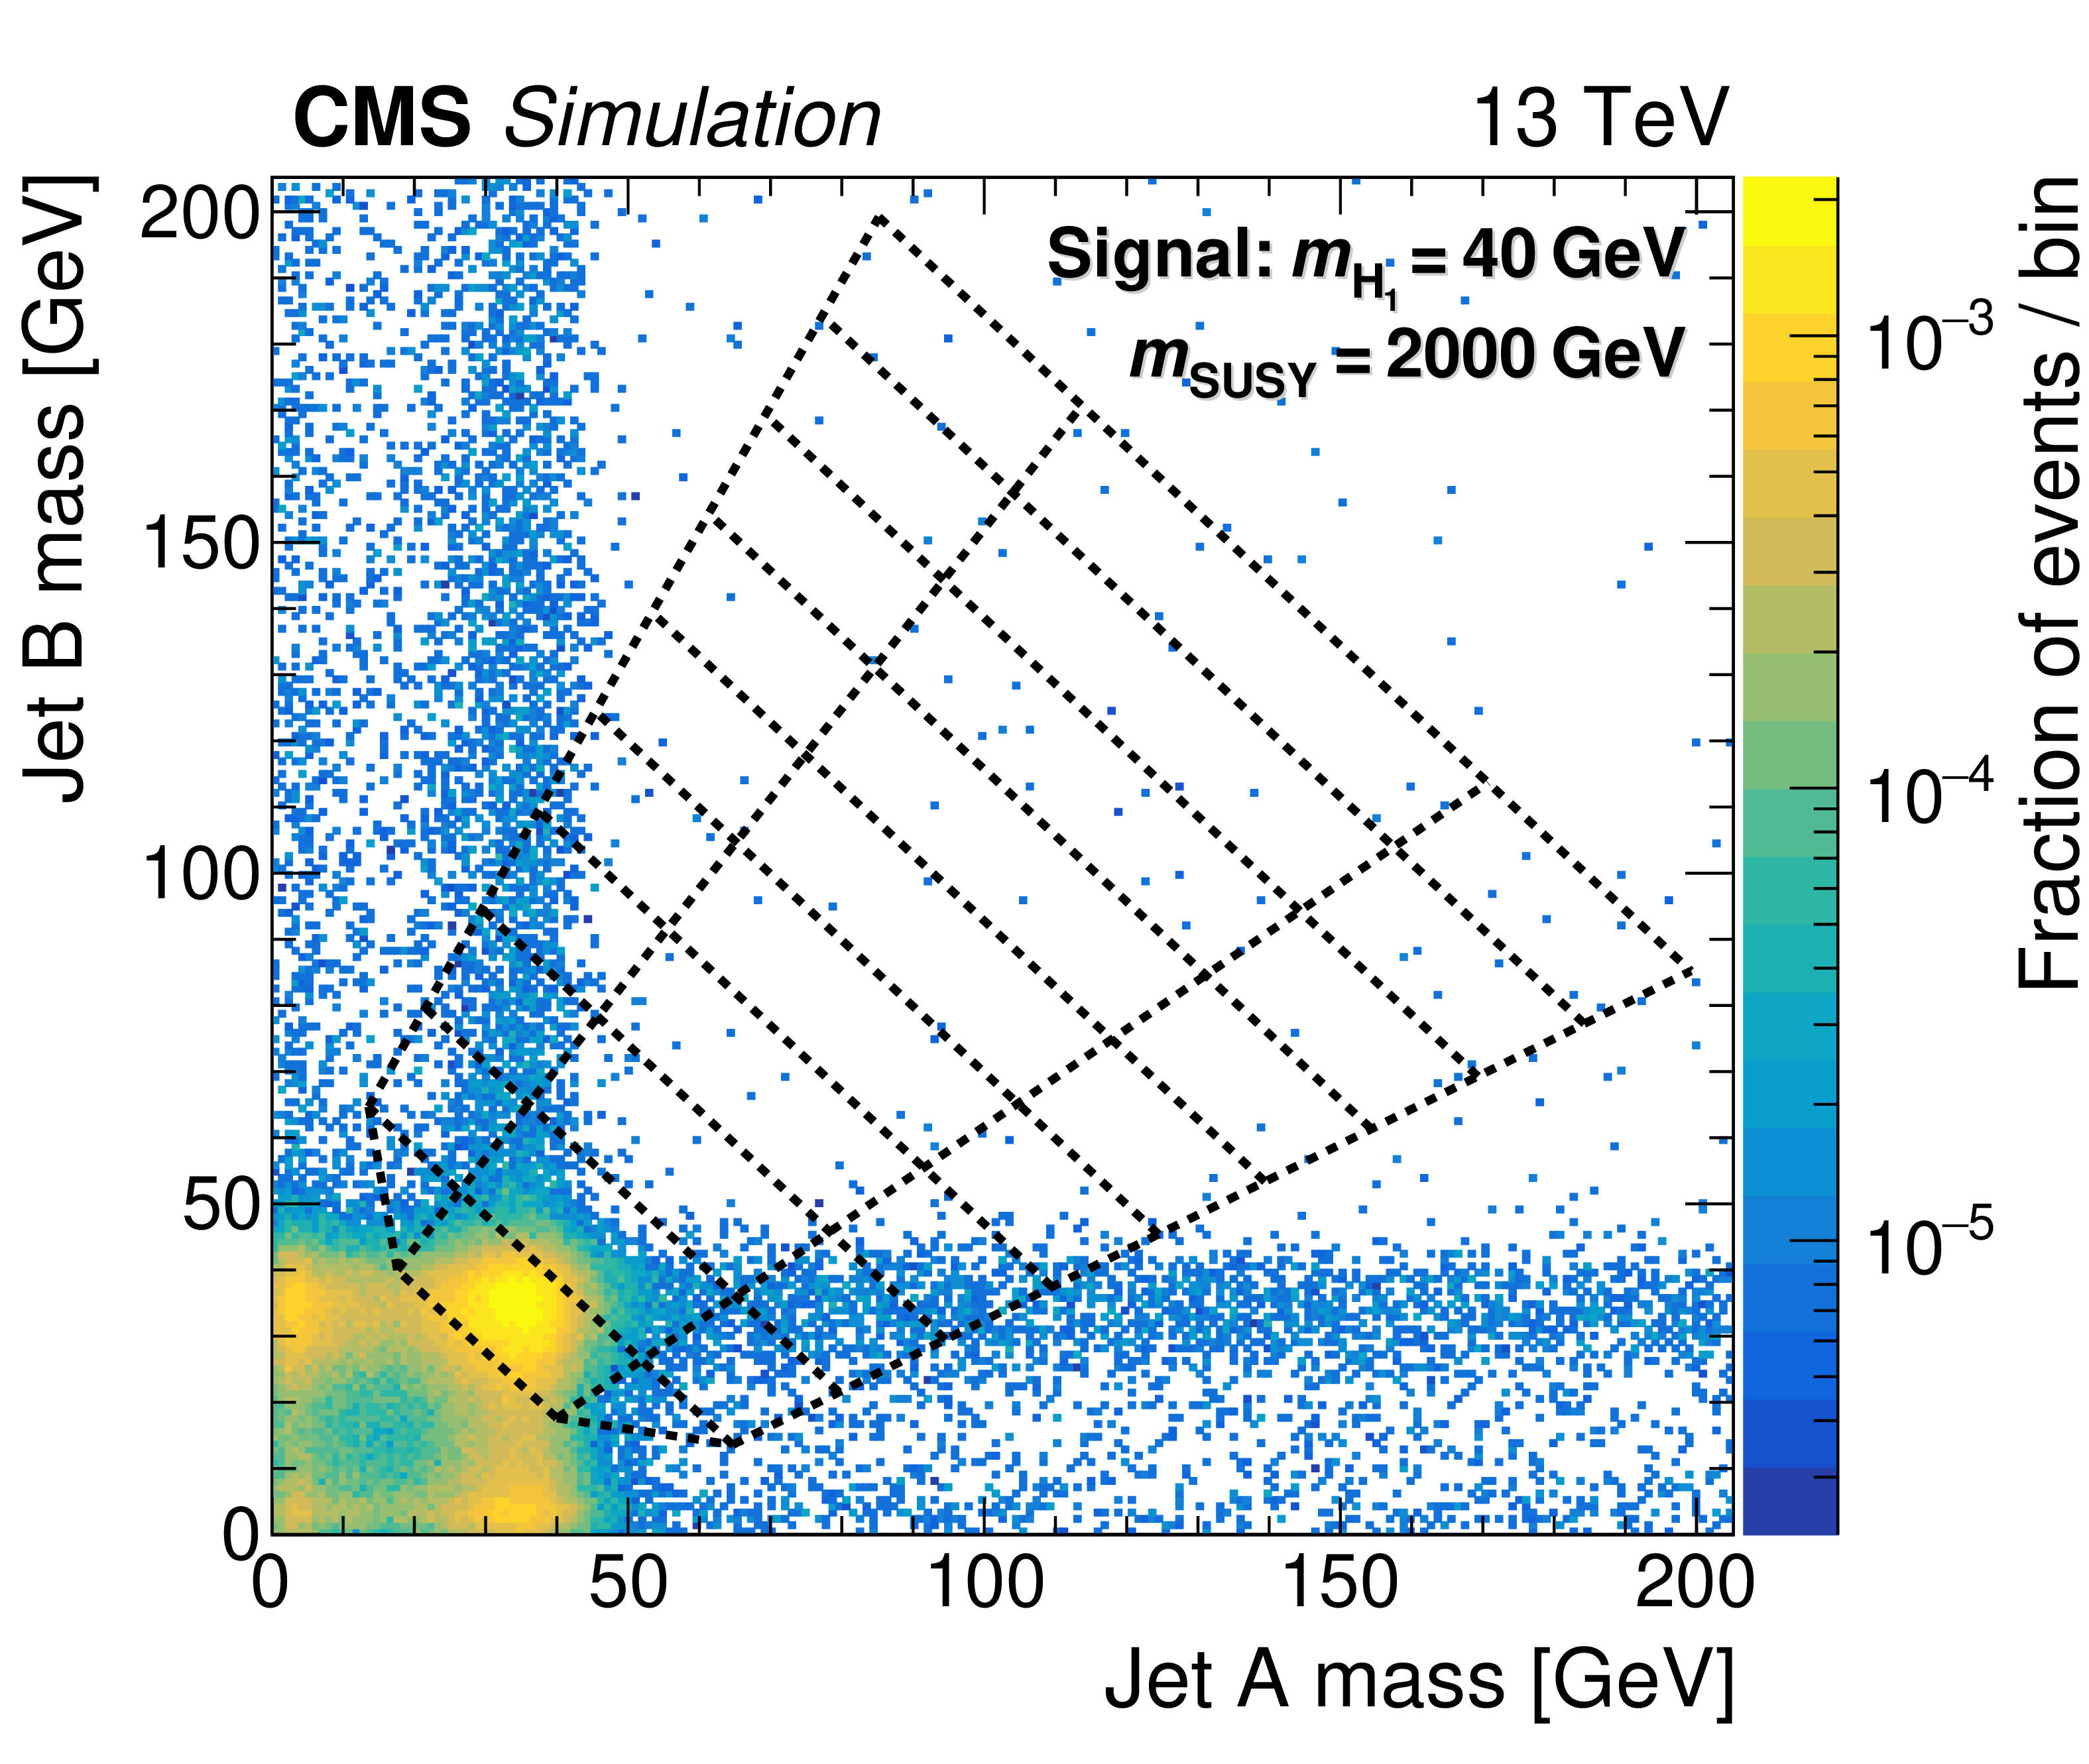
Figure 5-a:
The normalised distribution of events in the 2D soft-drop mass plane overlaid by the map of mass regions. The panel corresponds to signal events for $ {m_{\text {SUSY}}} = $ 2000 GeV and ${m_{\mathrm{H} _1}}$ values of 40 GeV. All events satisfy the TR requirement and the kinematic selection. |
png pdf |
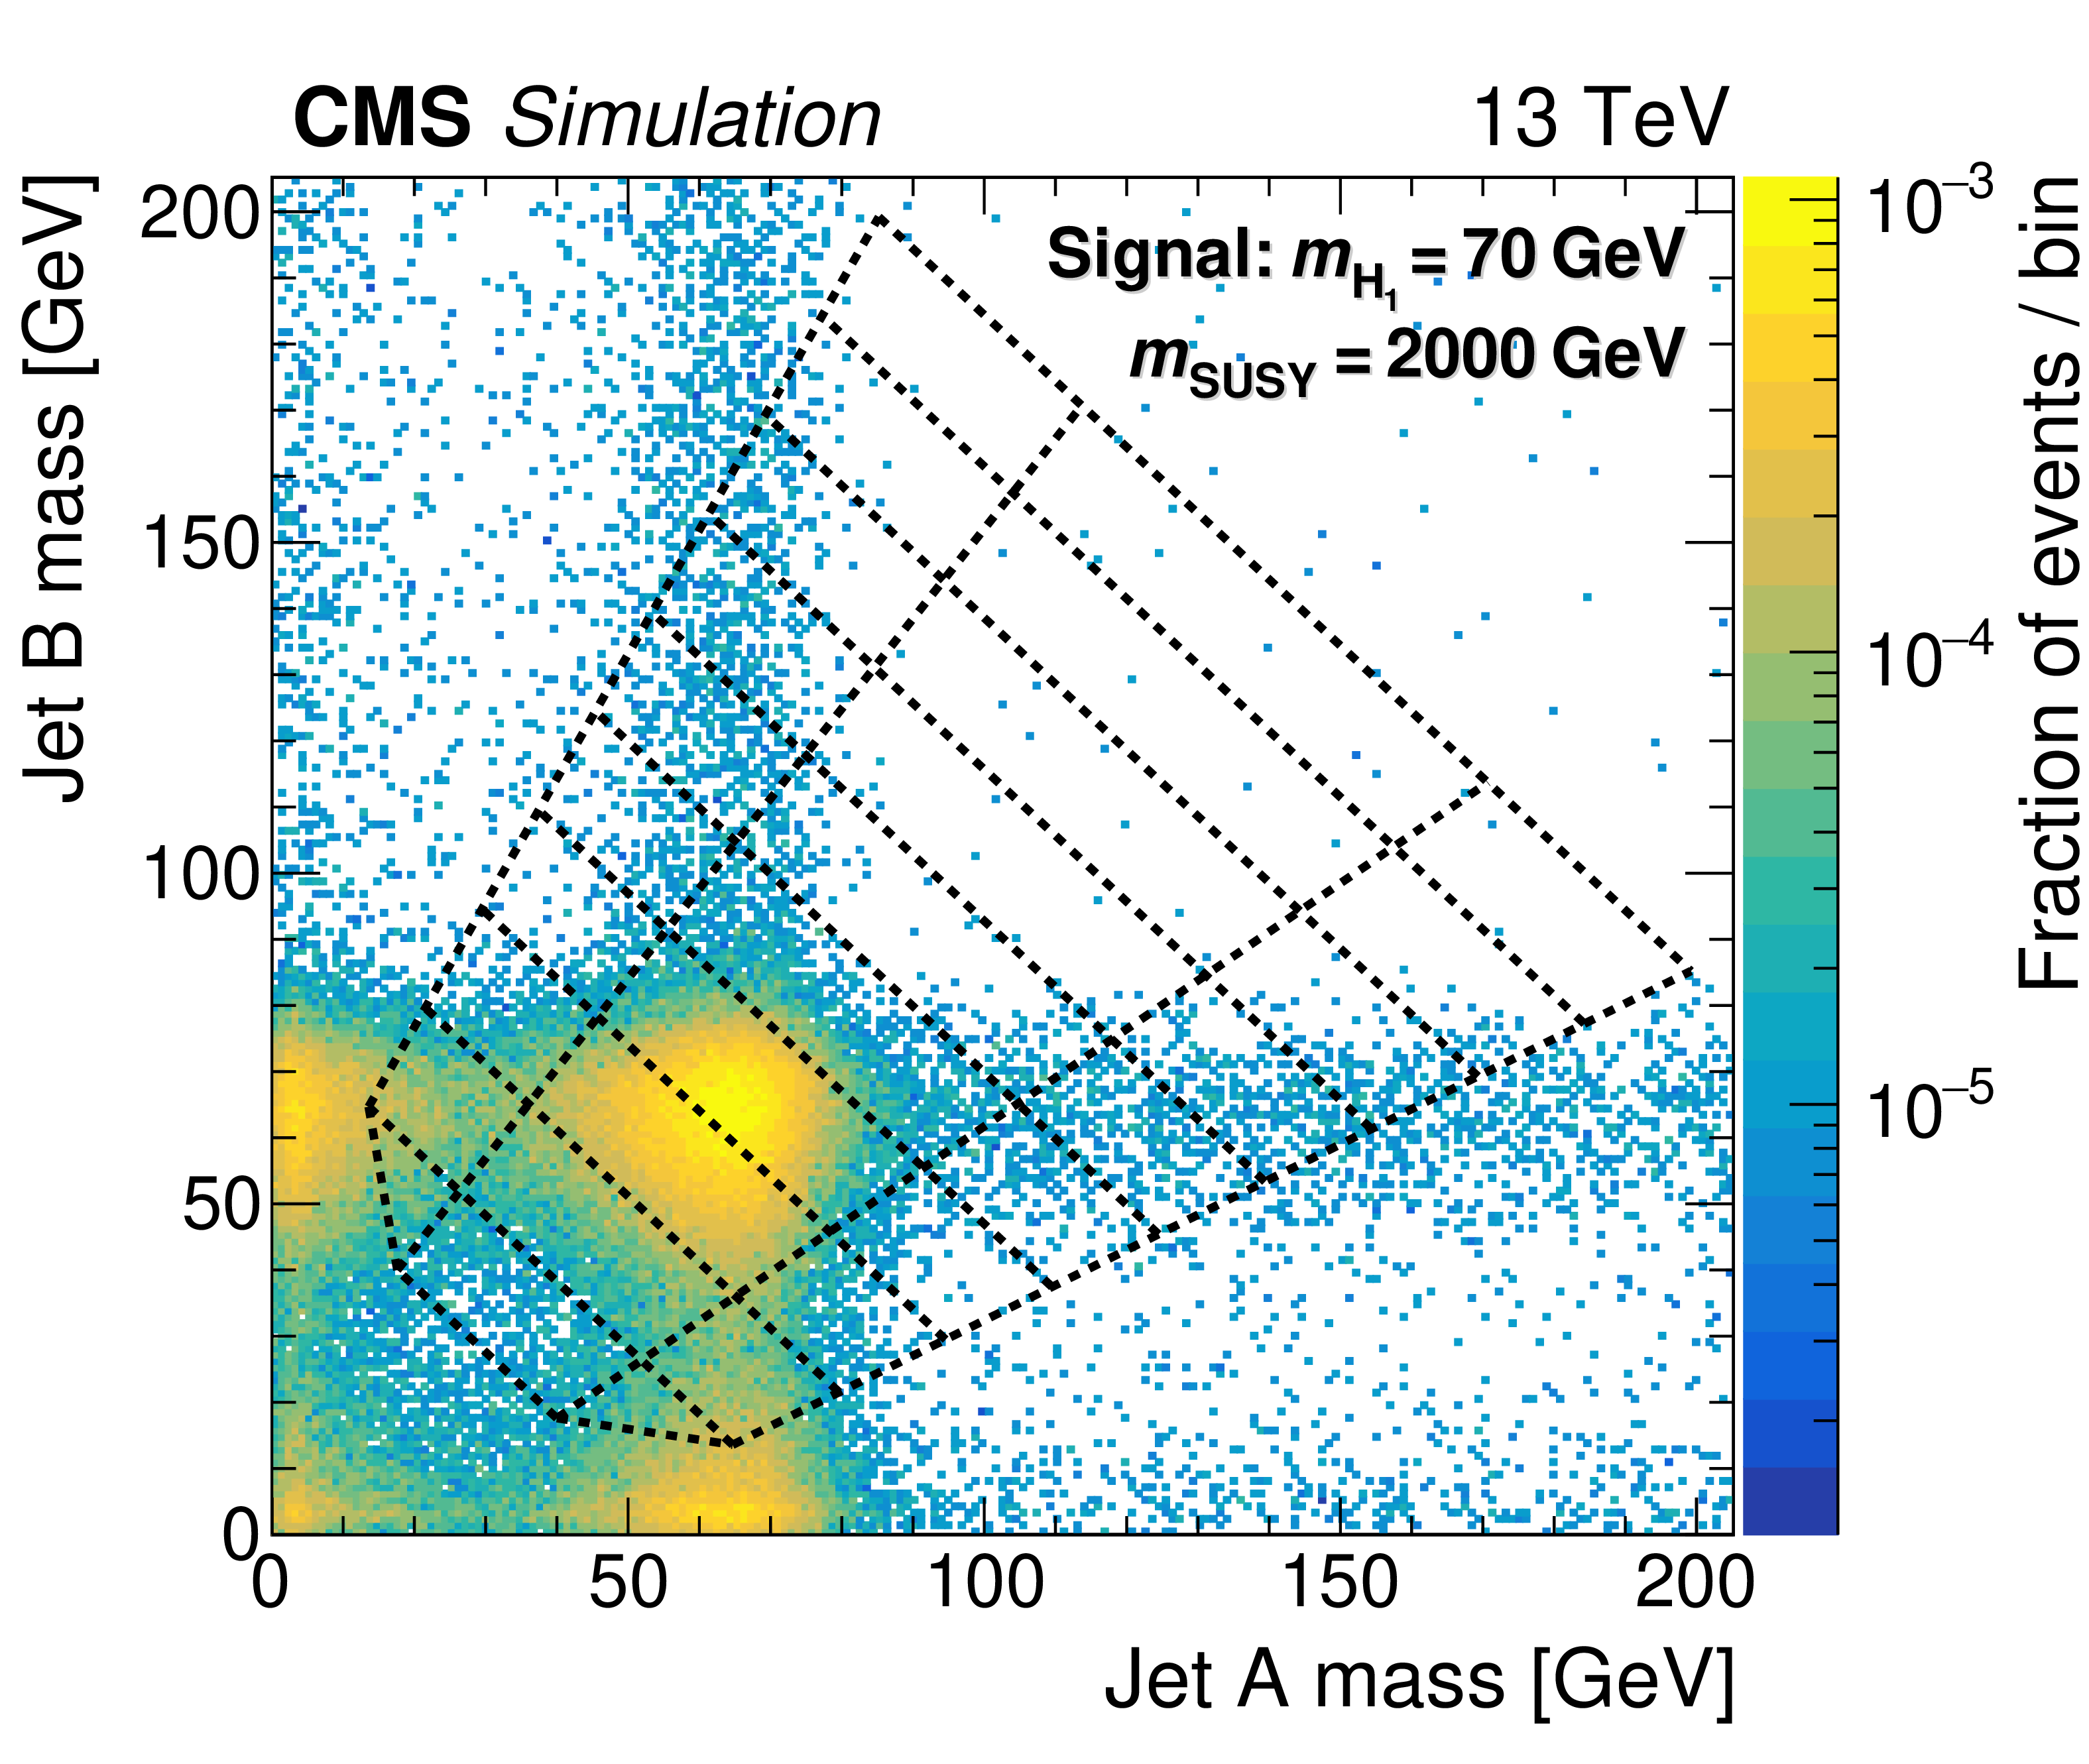
Figure 5-b:
The normalised distribution of events in the 2D soft-drop mass plane overlaid by the map of mass regions. The panel corresponds to signal events for $ {m_{\text {SUSY}}} = $ 2000 GeV and ${m_{\mathrm{H} _1}}$ values of 70 GeV. All events satisfy the TR requirement and the kinematic selection. |
png pdf |
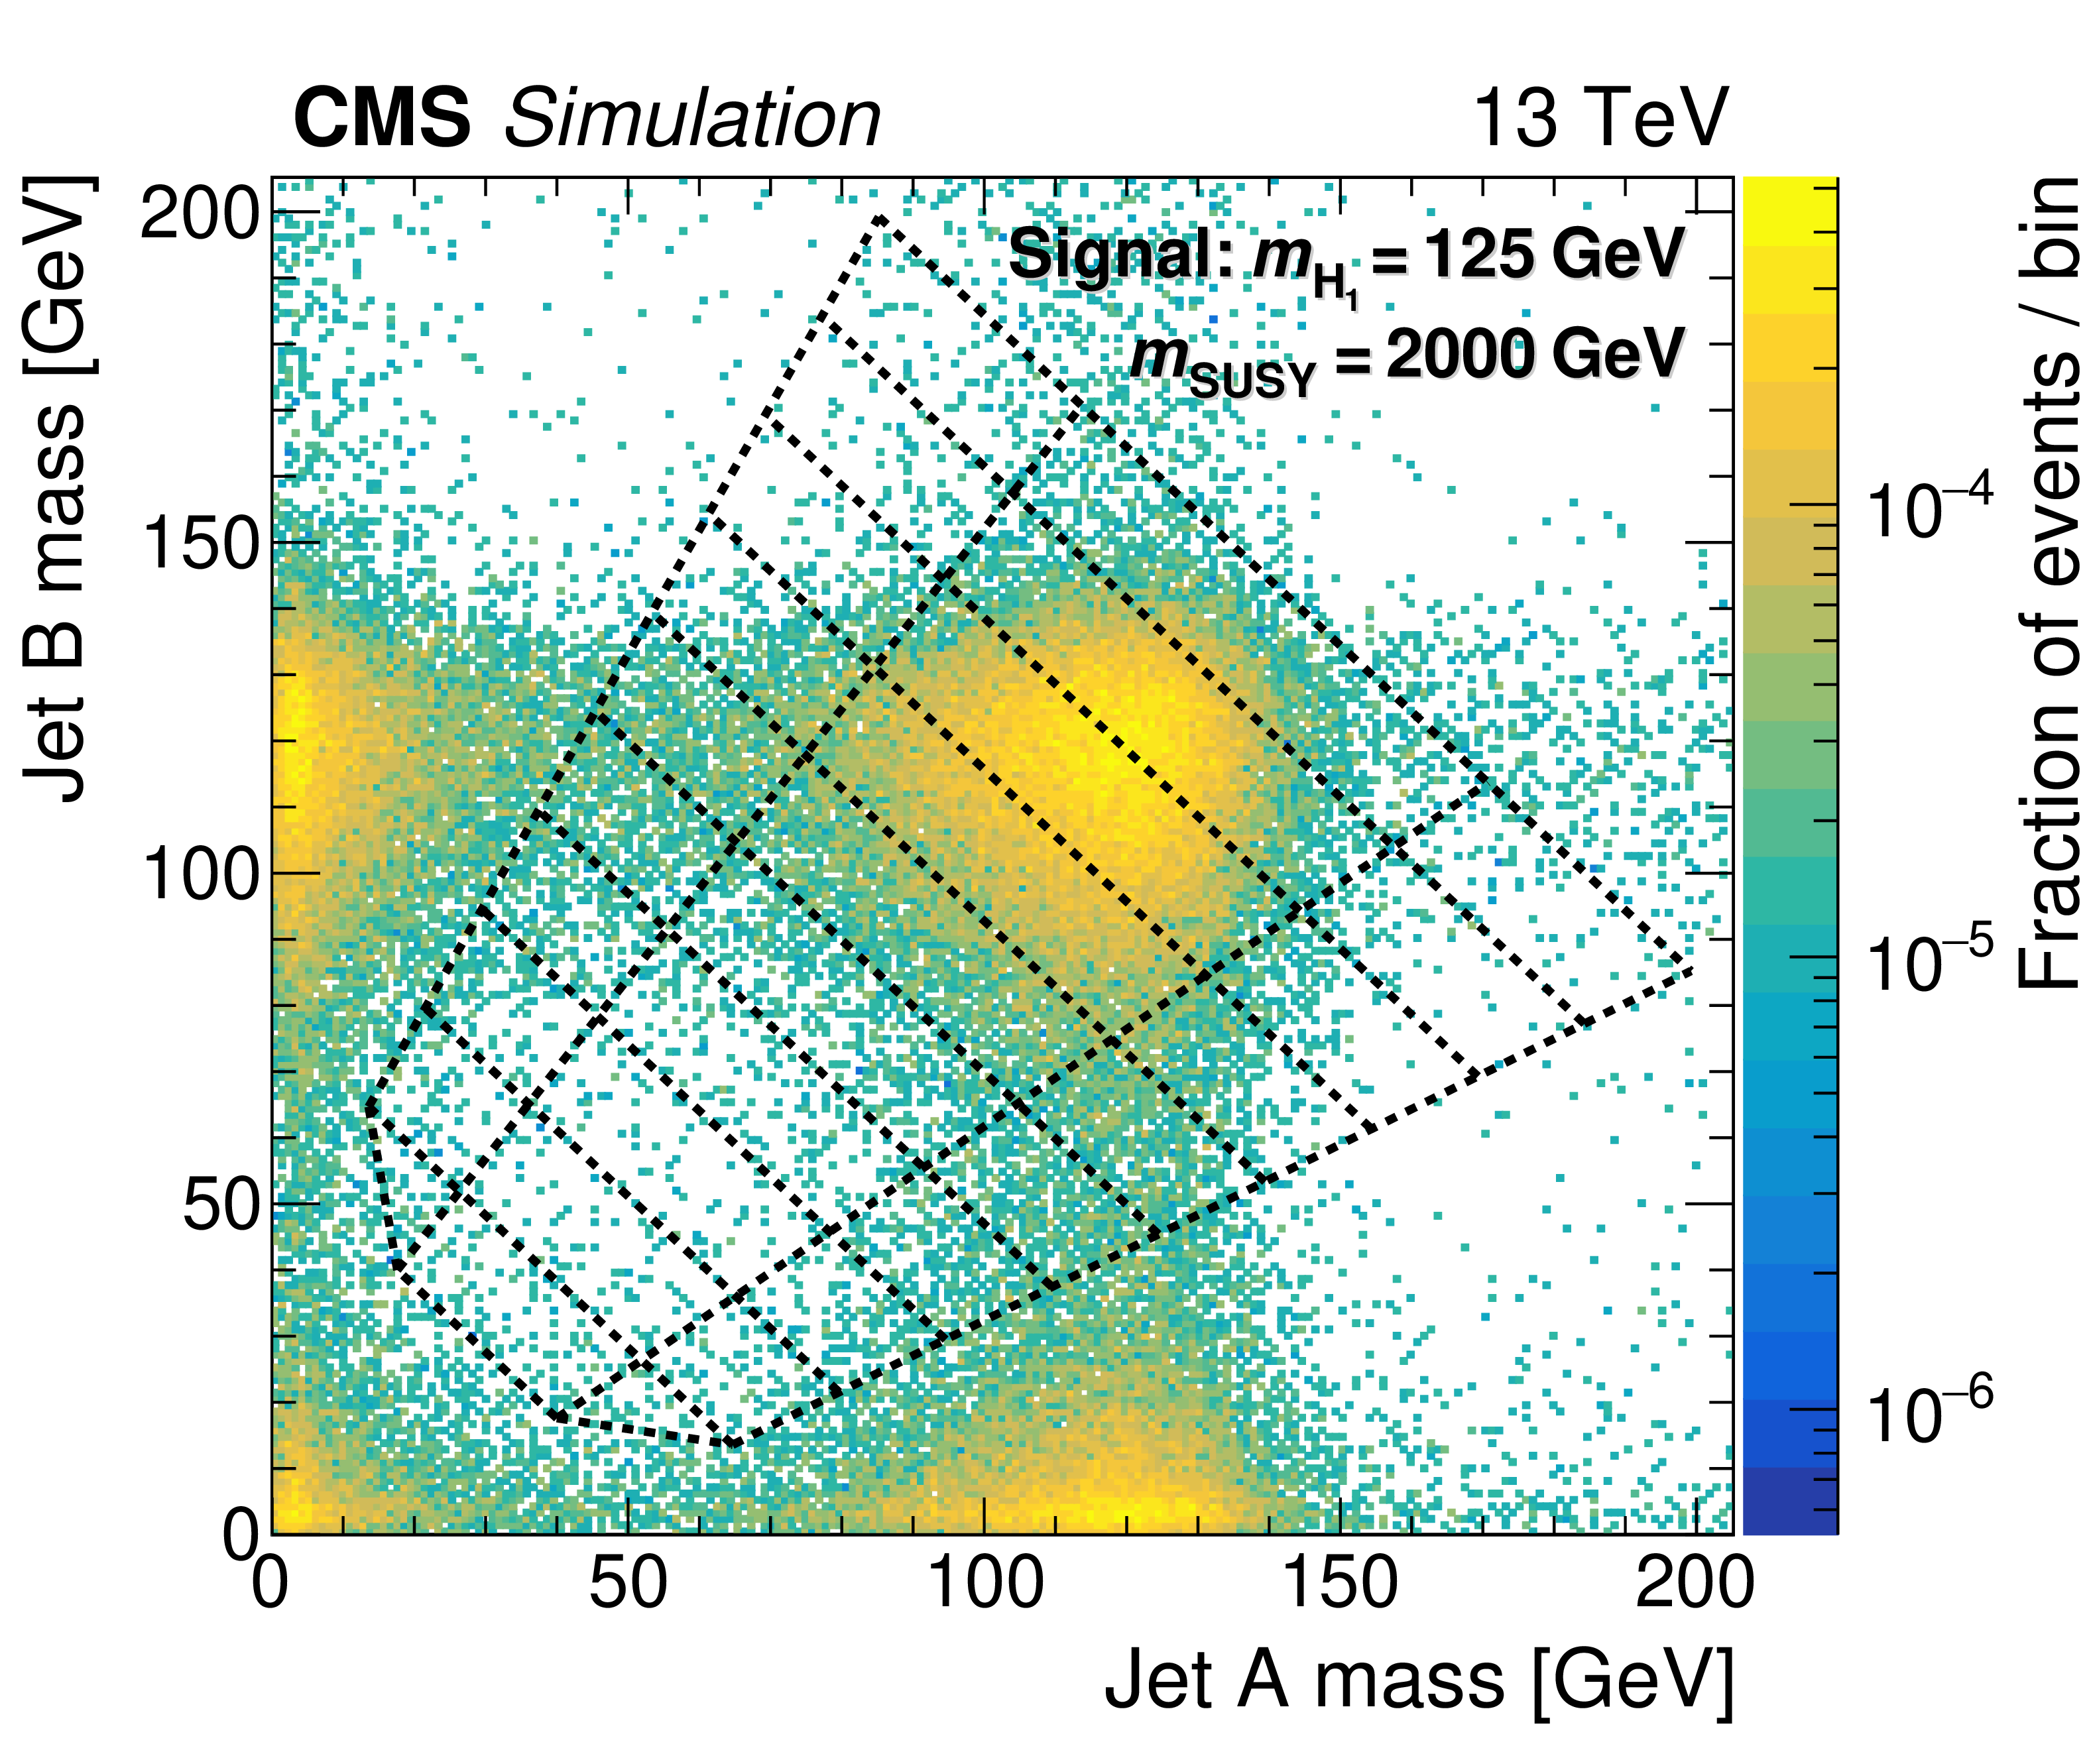
Figure 5-c:
The normalised distribution of events in the 2D soft-drop mass plane overlaid by the map of mass regions. The panel corresponds to signal events for $ {m_{\text {SUSY}}} = $ 2000 GeV and ${m_{\mathrm{H} _1}}$ values of 125 GeV. All events satisfy the TR requirement and the kinematic selection. |
png pdf |
Figure 5-d:
The normalised distribution of events in the 2D soft-drop mass plane overlaid by the map of mass regions. The panel corresponds to the simulated multijet background. All events satisfy the TR requirement and the kinematic selection. |
png pdf |
Figure 5-e:
The normalised distribution of events in the 2D soft-drop mass plane overlaid by the map of mass regions. The panel corresponds to the ${\mathrm{t} {}\mathrm{\bar{t}}}$ background. All events satisfy the TR requirement and the kinematic selection. |
png pdf |
Figure 5-f:
The normalised distribution of events in the 2D soft-drop mass plane overlaid by the map of mass regions. The panel corresponds to the vector boson background. All events satisfy the TR requirement and the kinematic selection. |
png pdf |
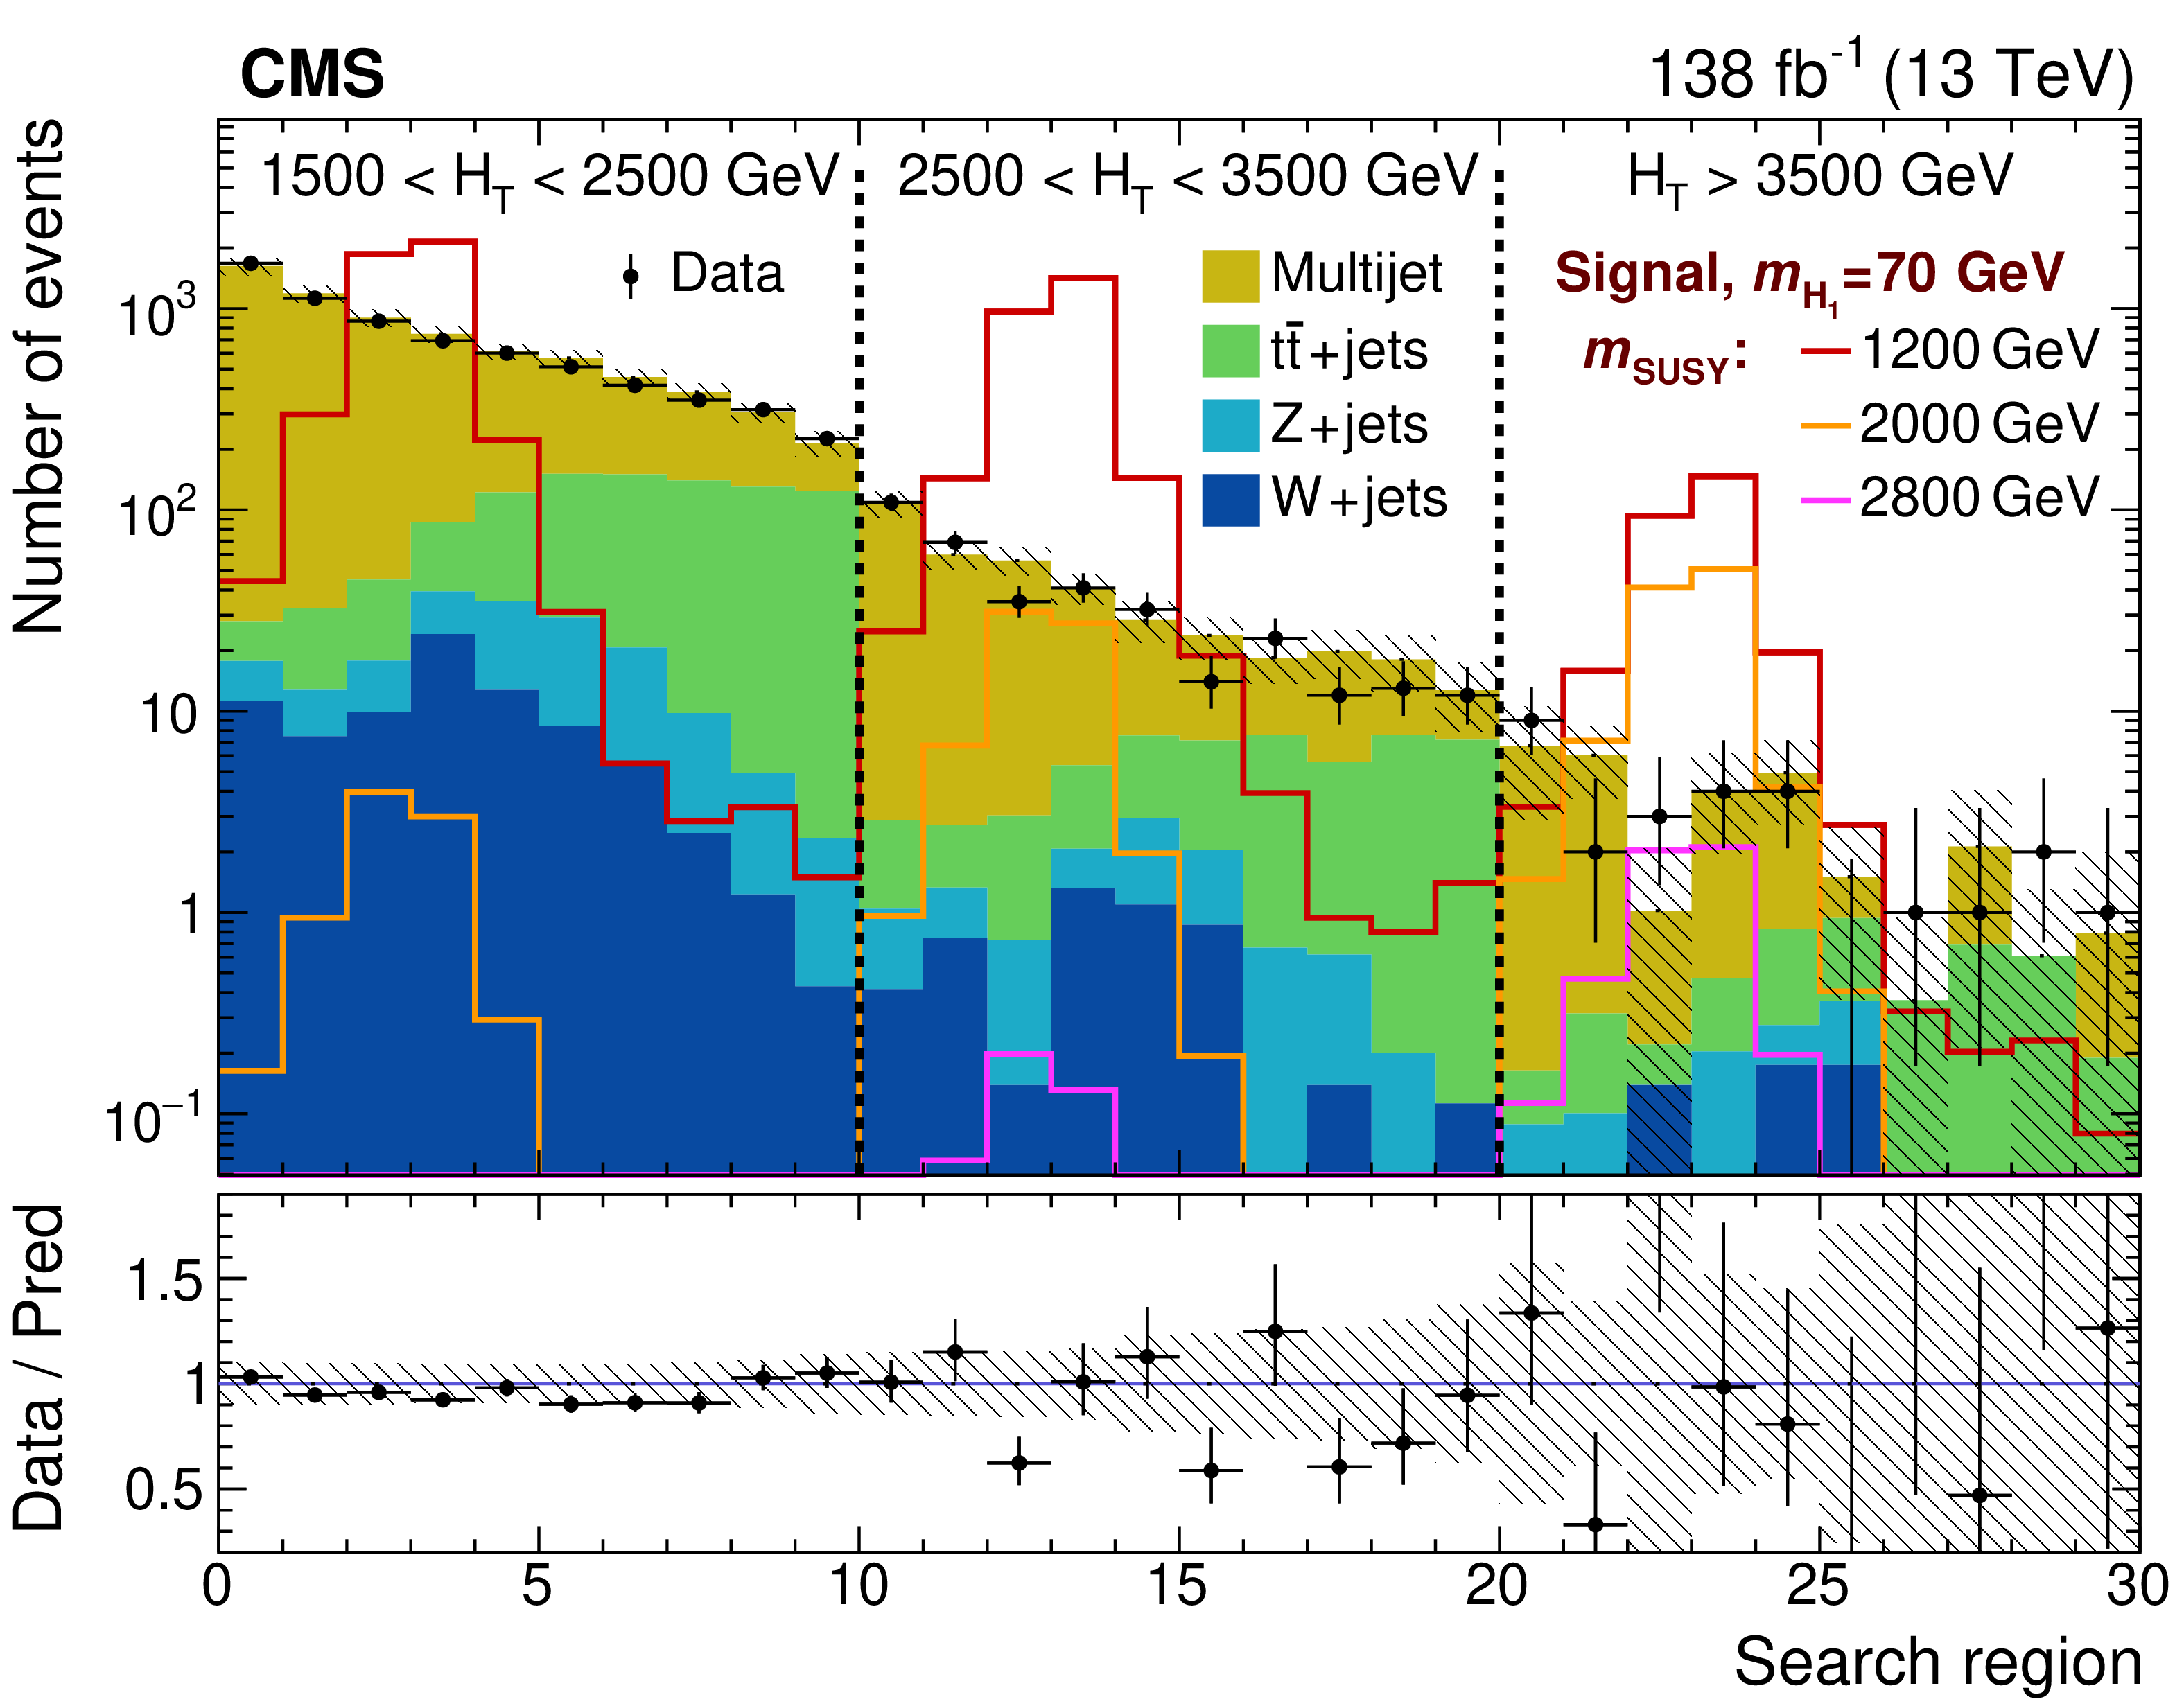
Figure 6:
Observed and expected yields in the TR for each of the 30 search regions, summed over the three data-taking years. The multijet background is estimated from data using the method described in Section 6, while the other backgrounds are simulated. Example signal distributions are shown for $ {m_{\mathrm{H} _1}} = $ 70 GeV and $ {m_{\text {SUSY}}} =$ 1200, 2000, and 2800 GeV. The error bars represent the statistical uncertainties and the hatched bands the systematic uncertainties. |
png pdf |
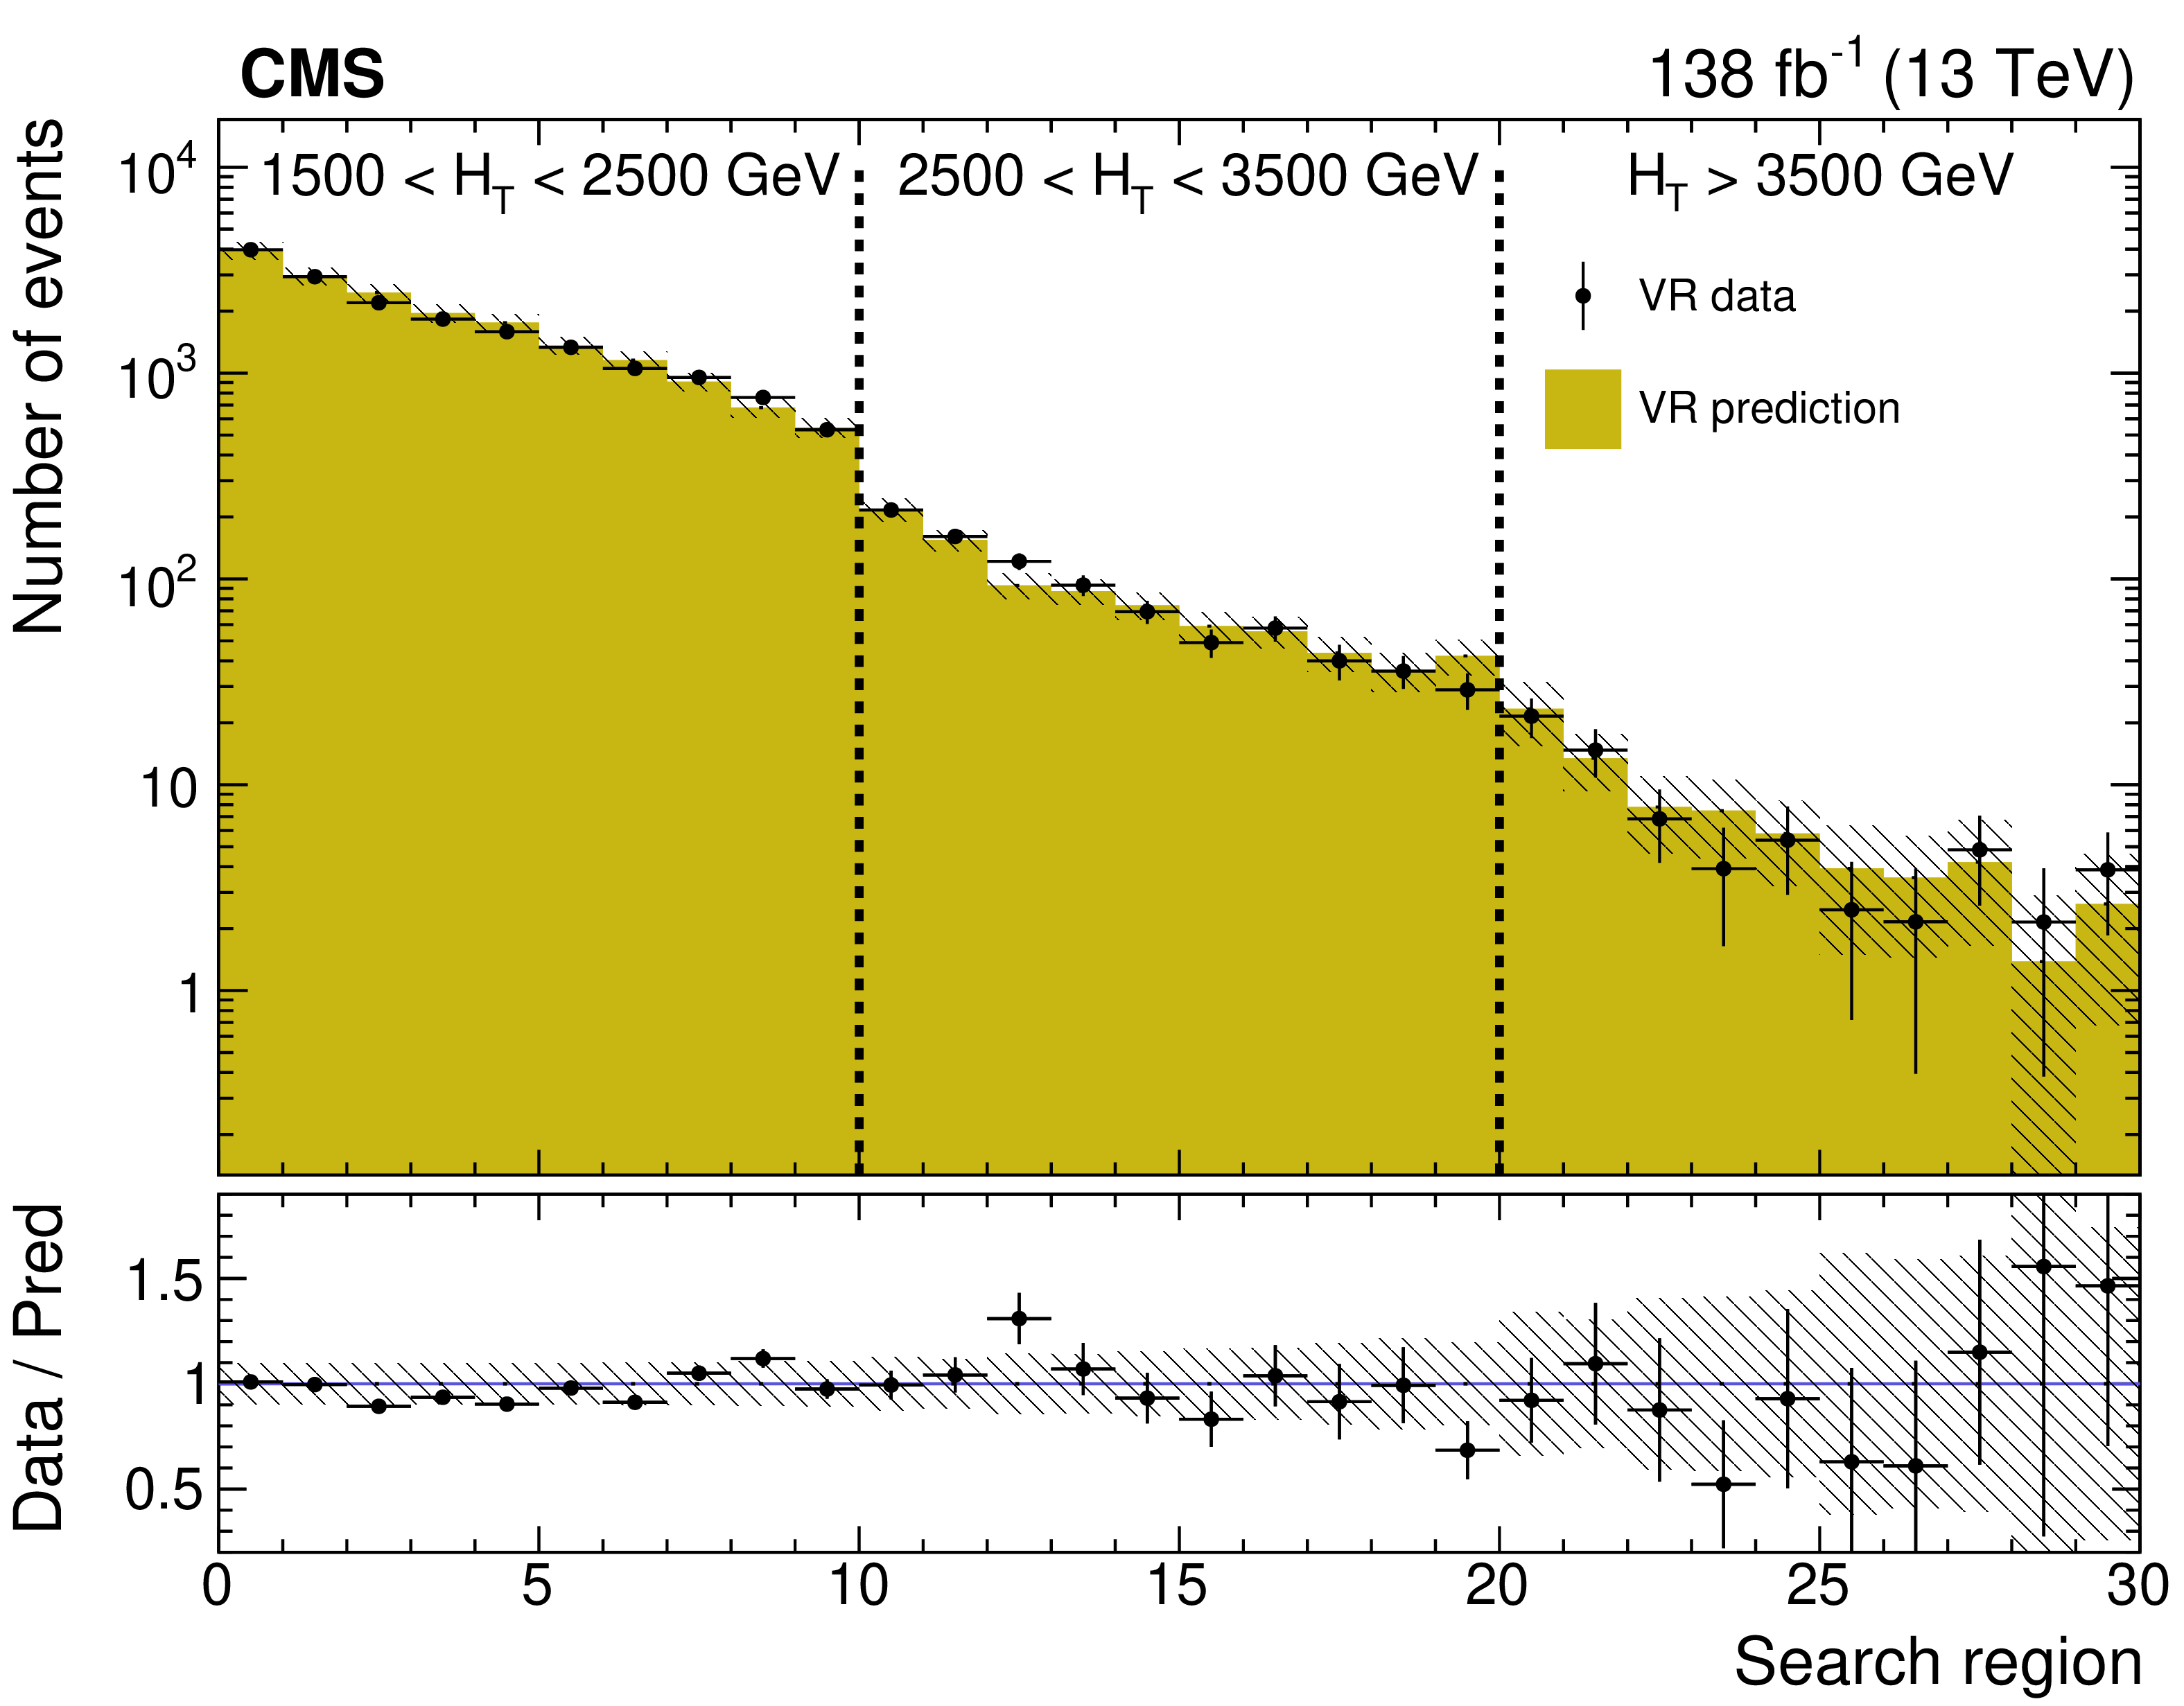
Figure 7:
A comparison of the predicted and observed multijet yields in the validation region (VR), after subtraction of the other simulated backgrounds. The prediction is made separately for the three data-taking years, and the results are summed. The error bars on the data points represent their statistical uncertainties. The uncertainties in the predicted yields (statistical and systematic) are indicated by the hatched bands. |
png pdf |
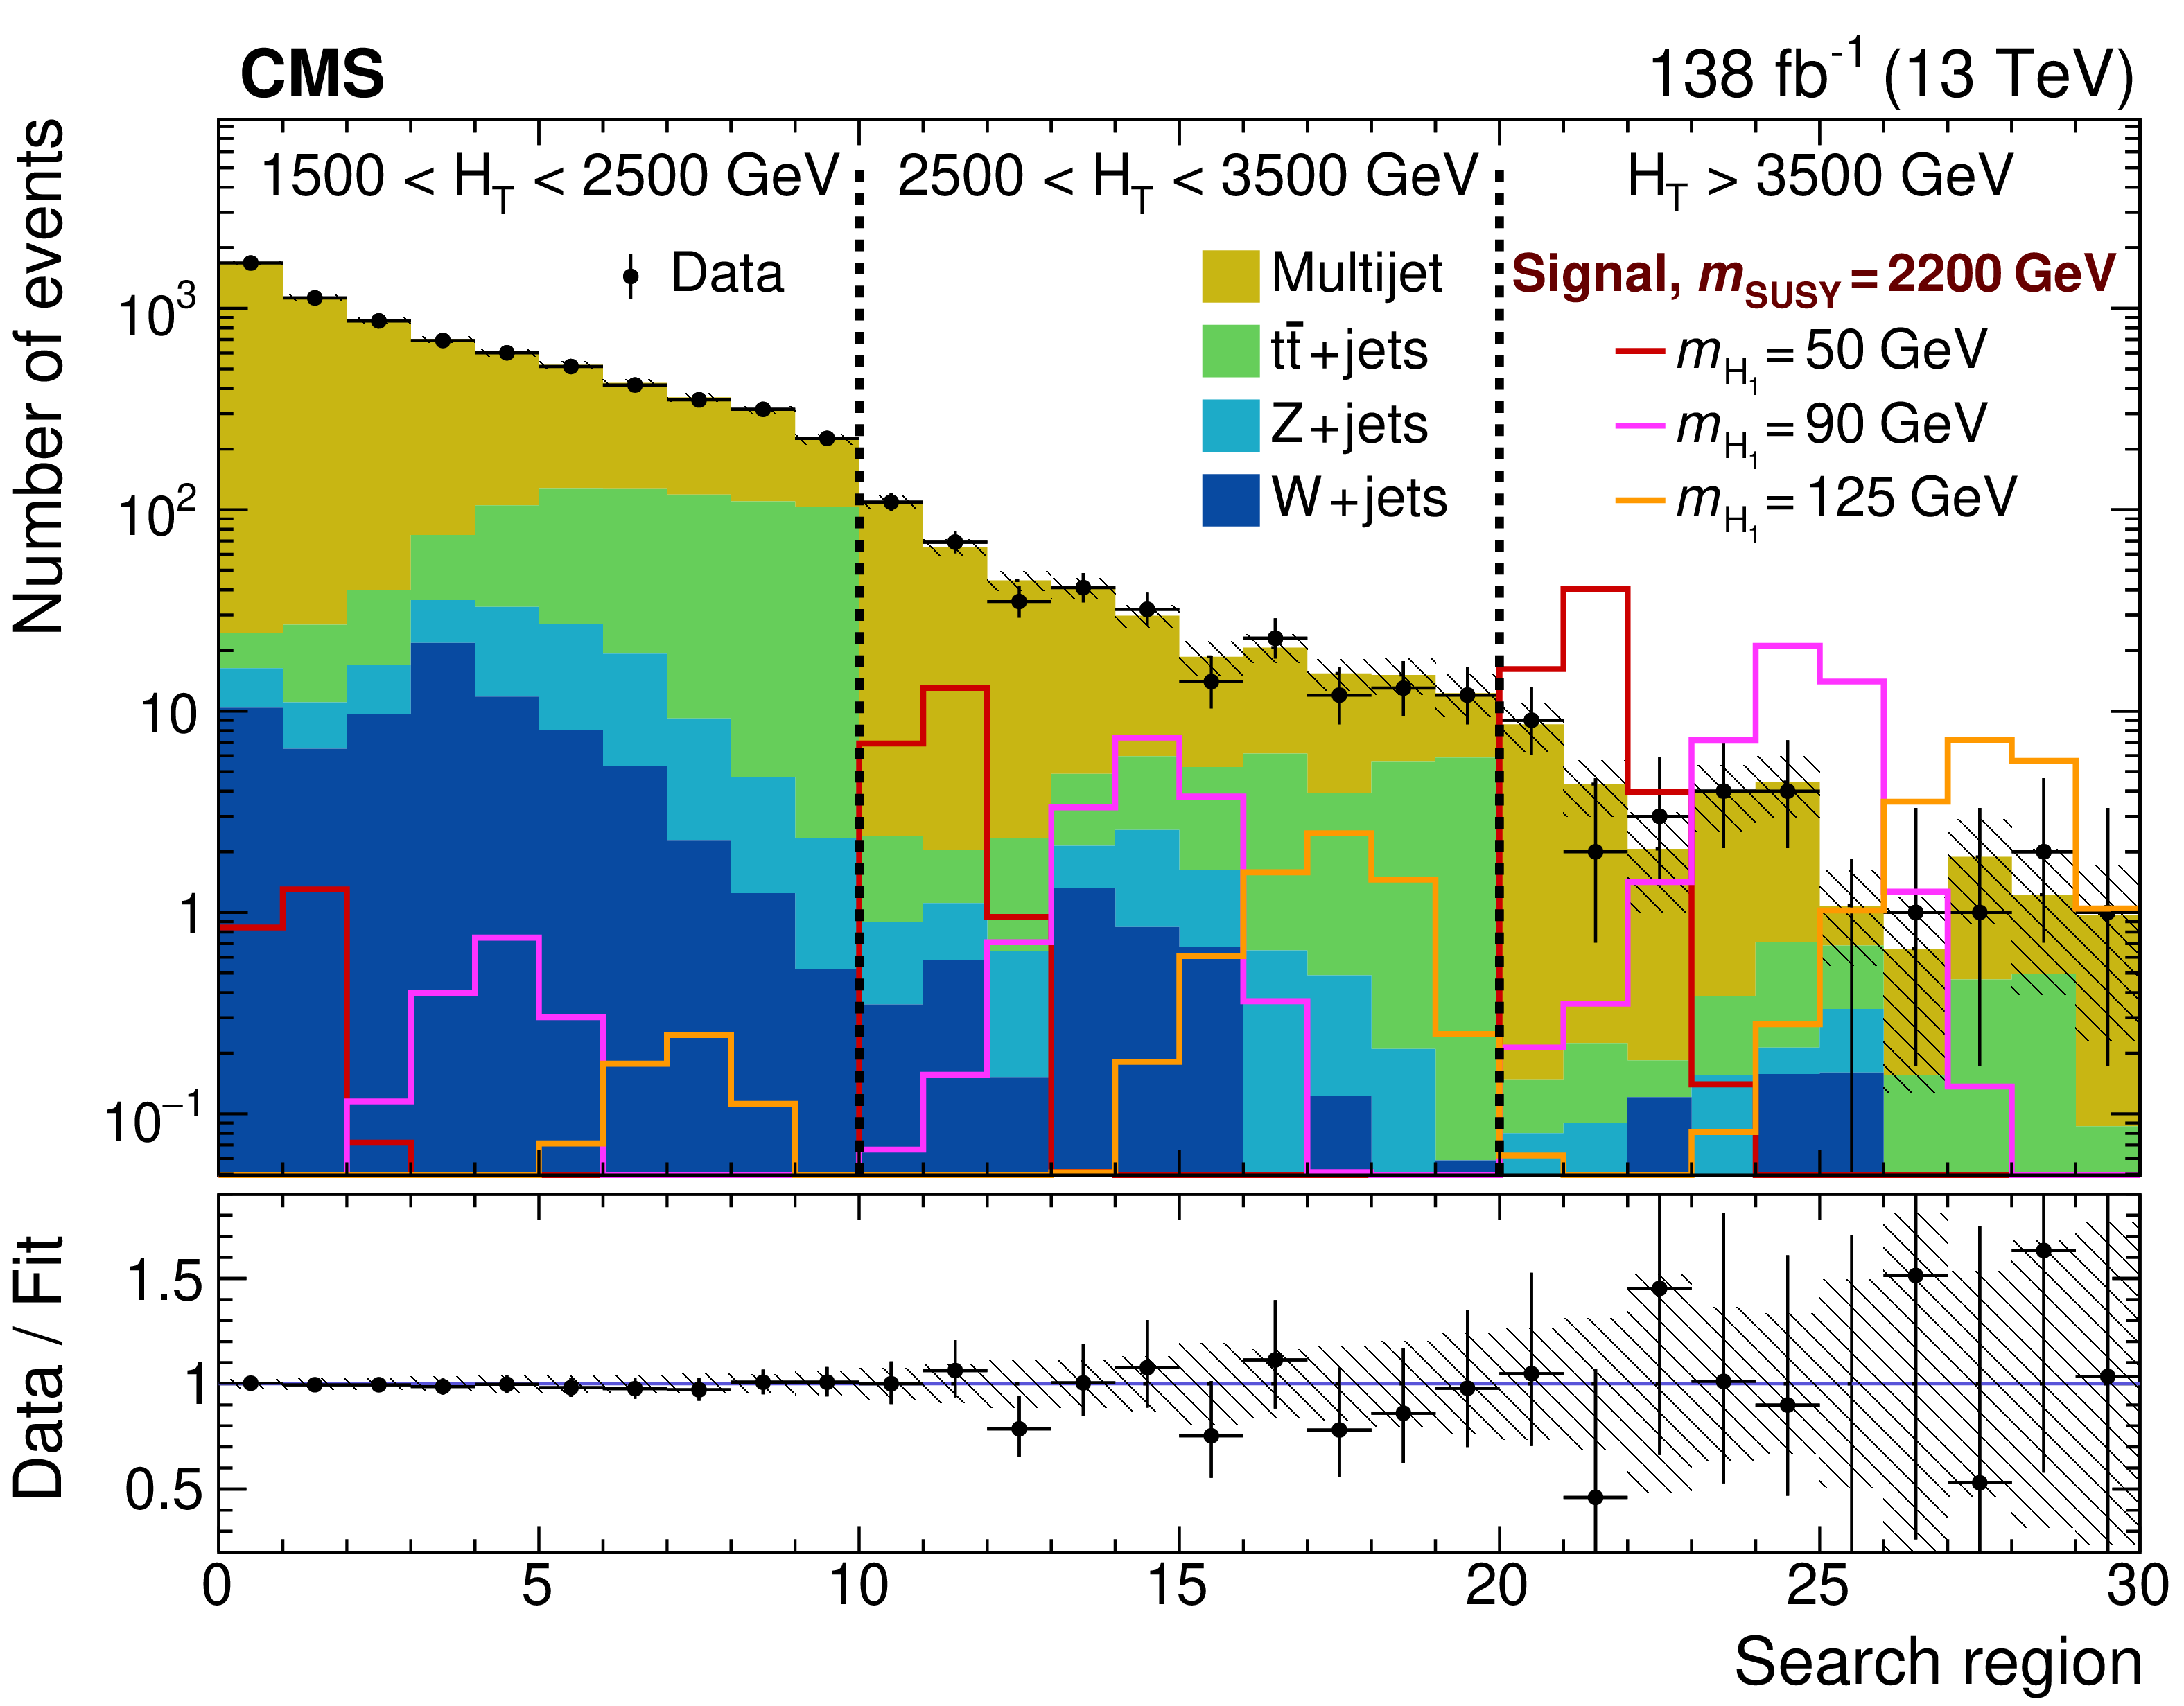
Figure 8:
Yields in all search regions after the background-only fit, summed over the three data-taking years. Example signal contributions used in the signal+background fits are shown for $ {m_{\text {SUSY}}} = $ 2200 GeV, and $ {m_{\mathrm{H} _1}} =$ 50, 90, and 125 GeV. The error bars represent the statistical uncertainties and the hatched bands the systematic uncertainties. |

png pdf |
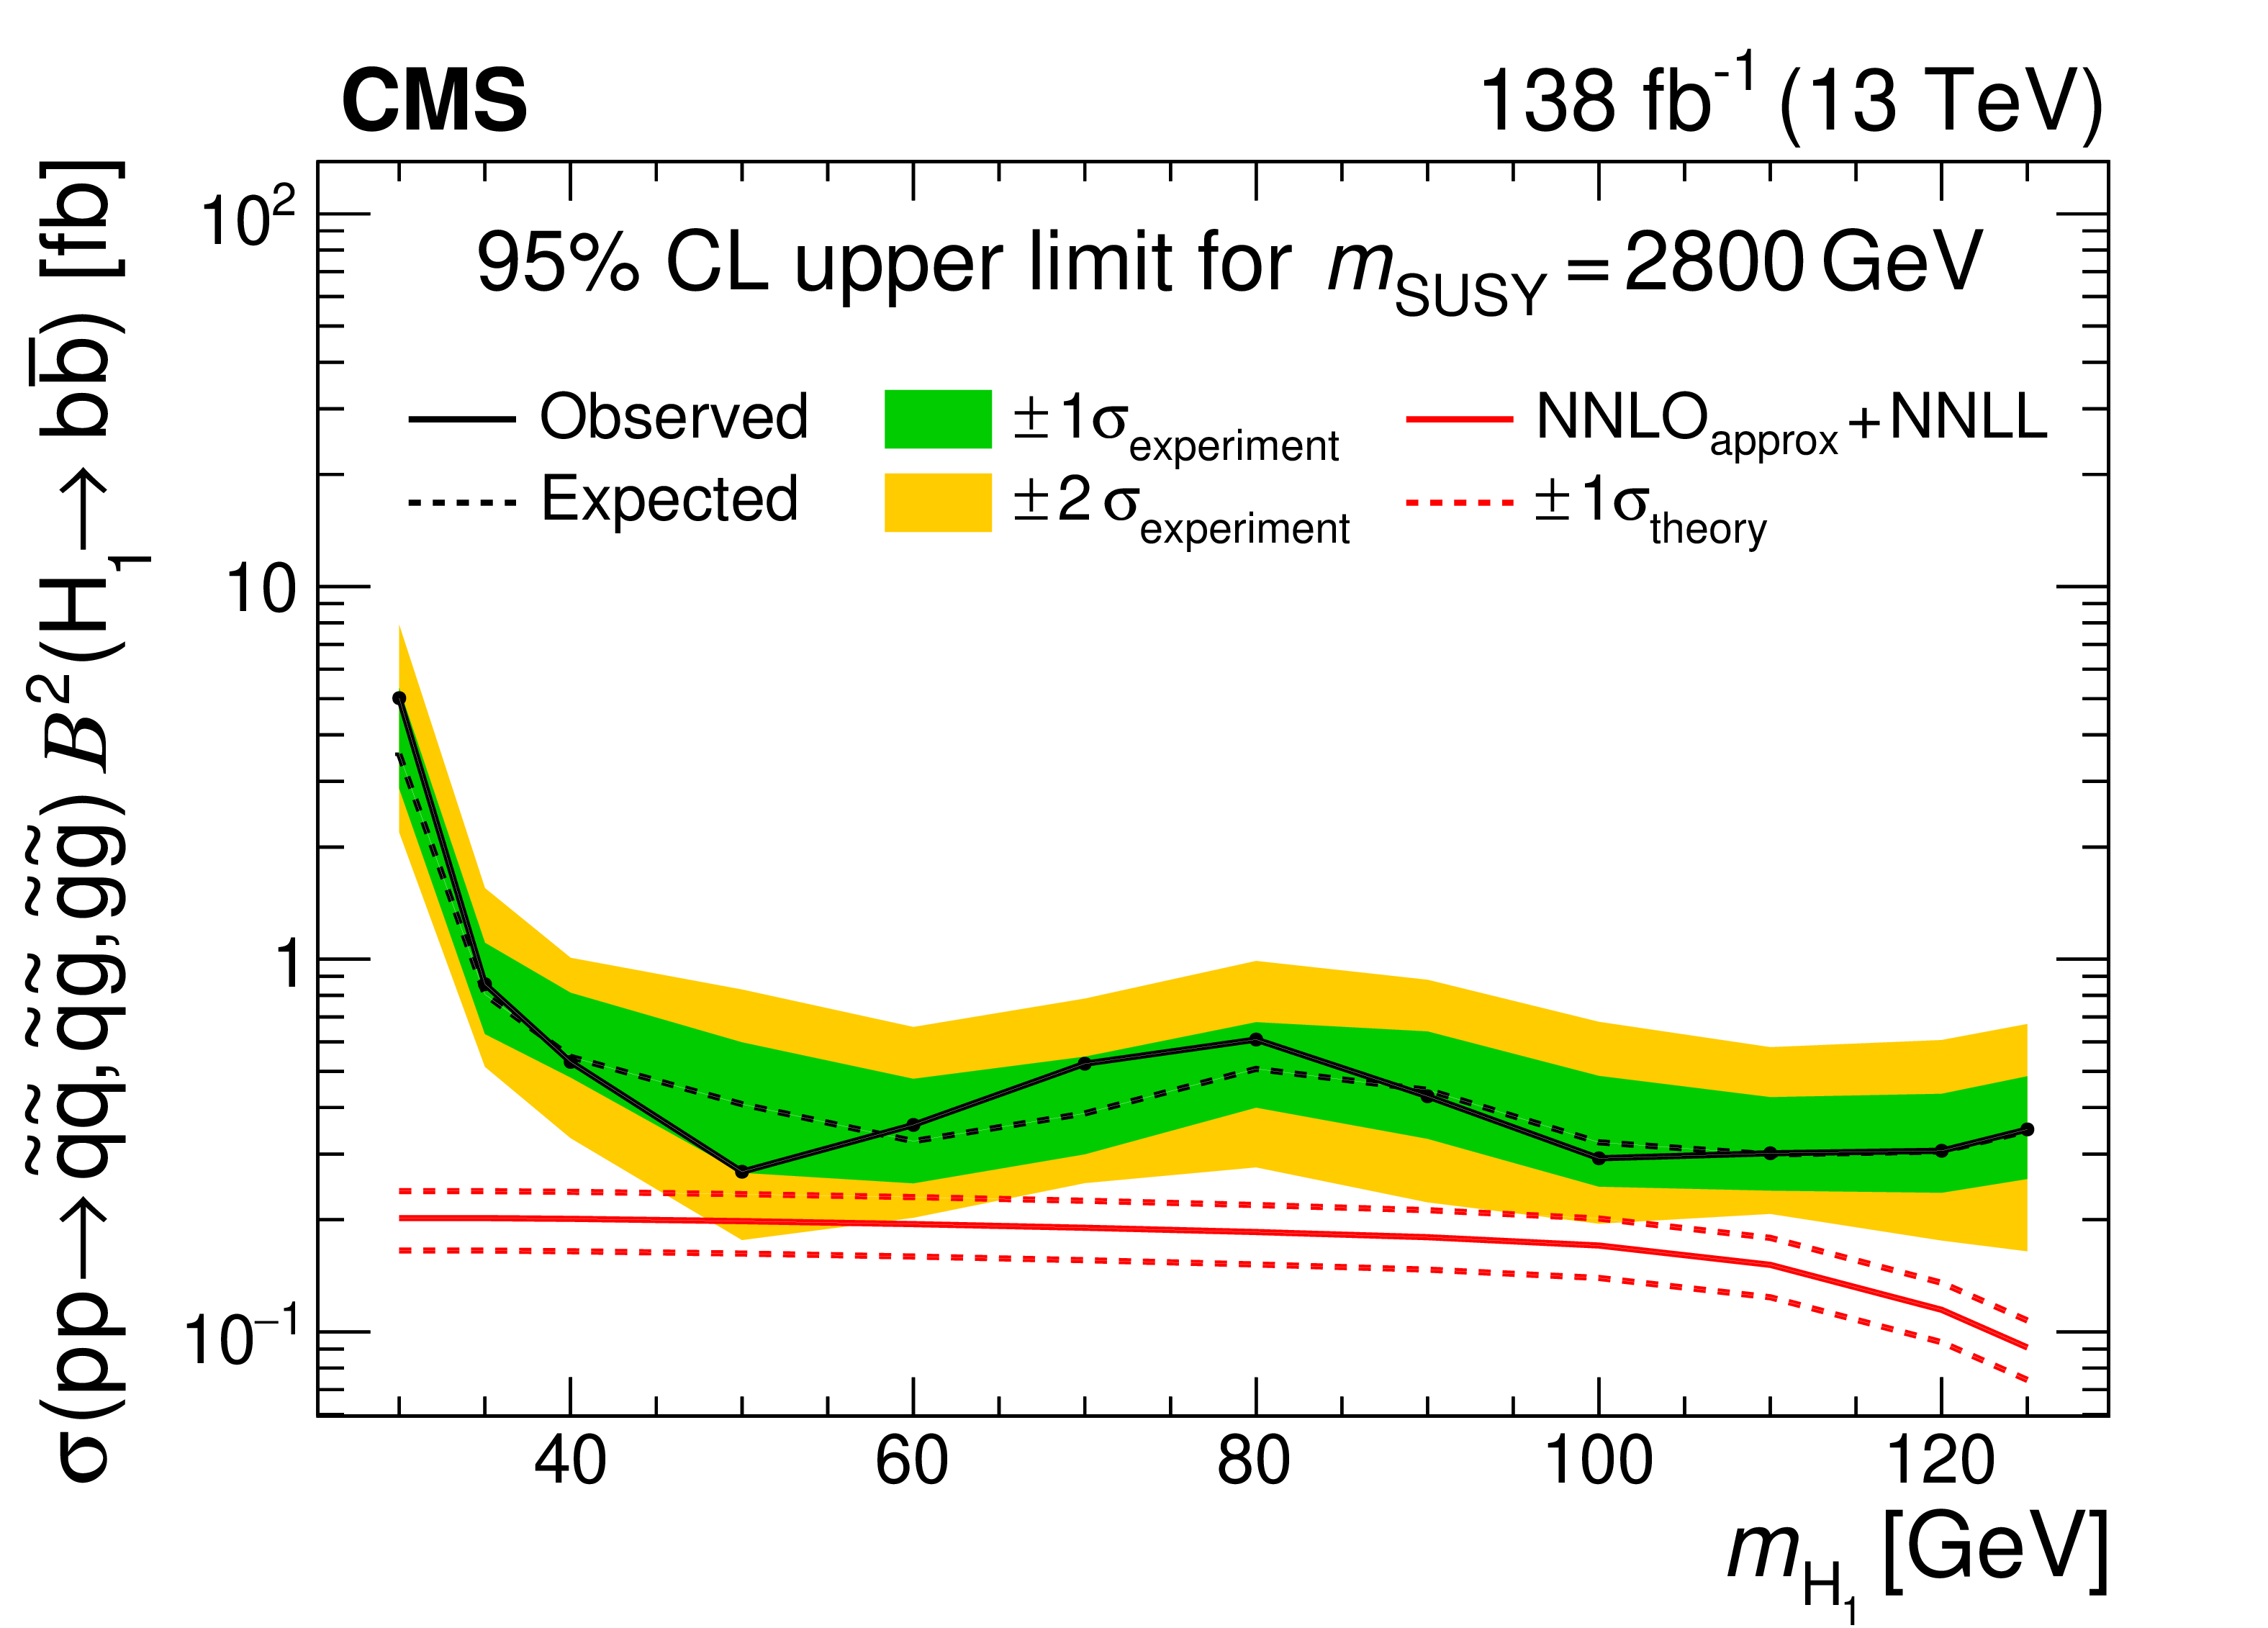
Figure 9:
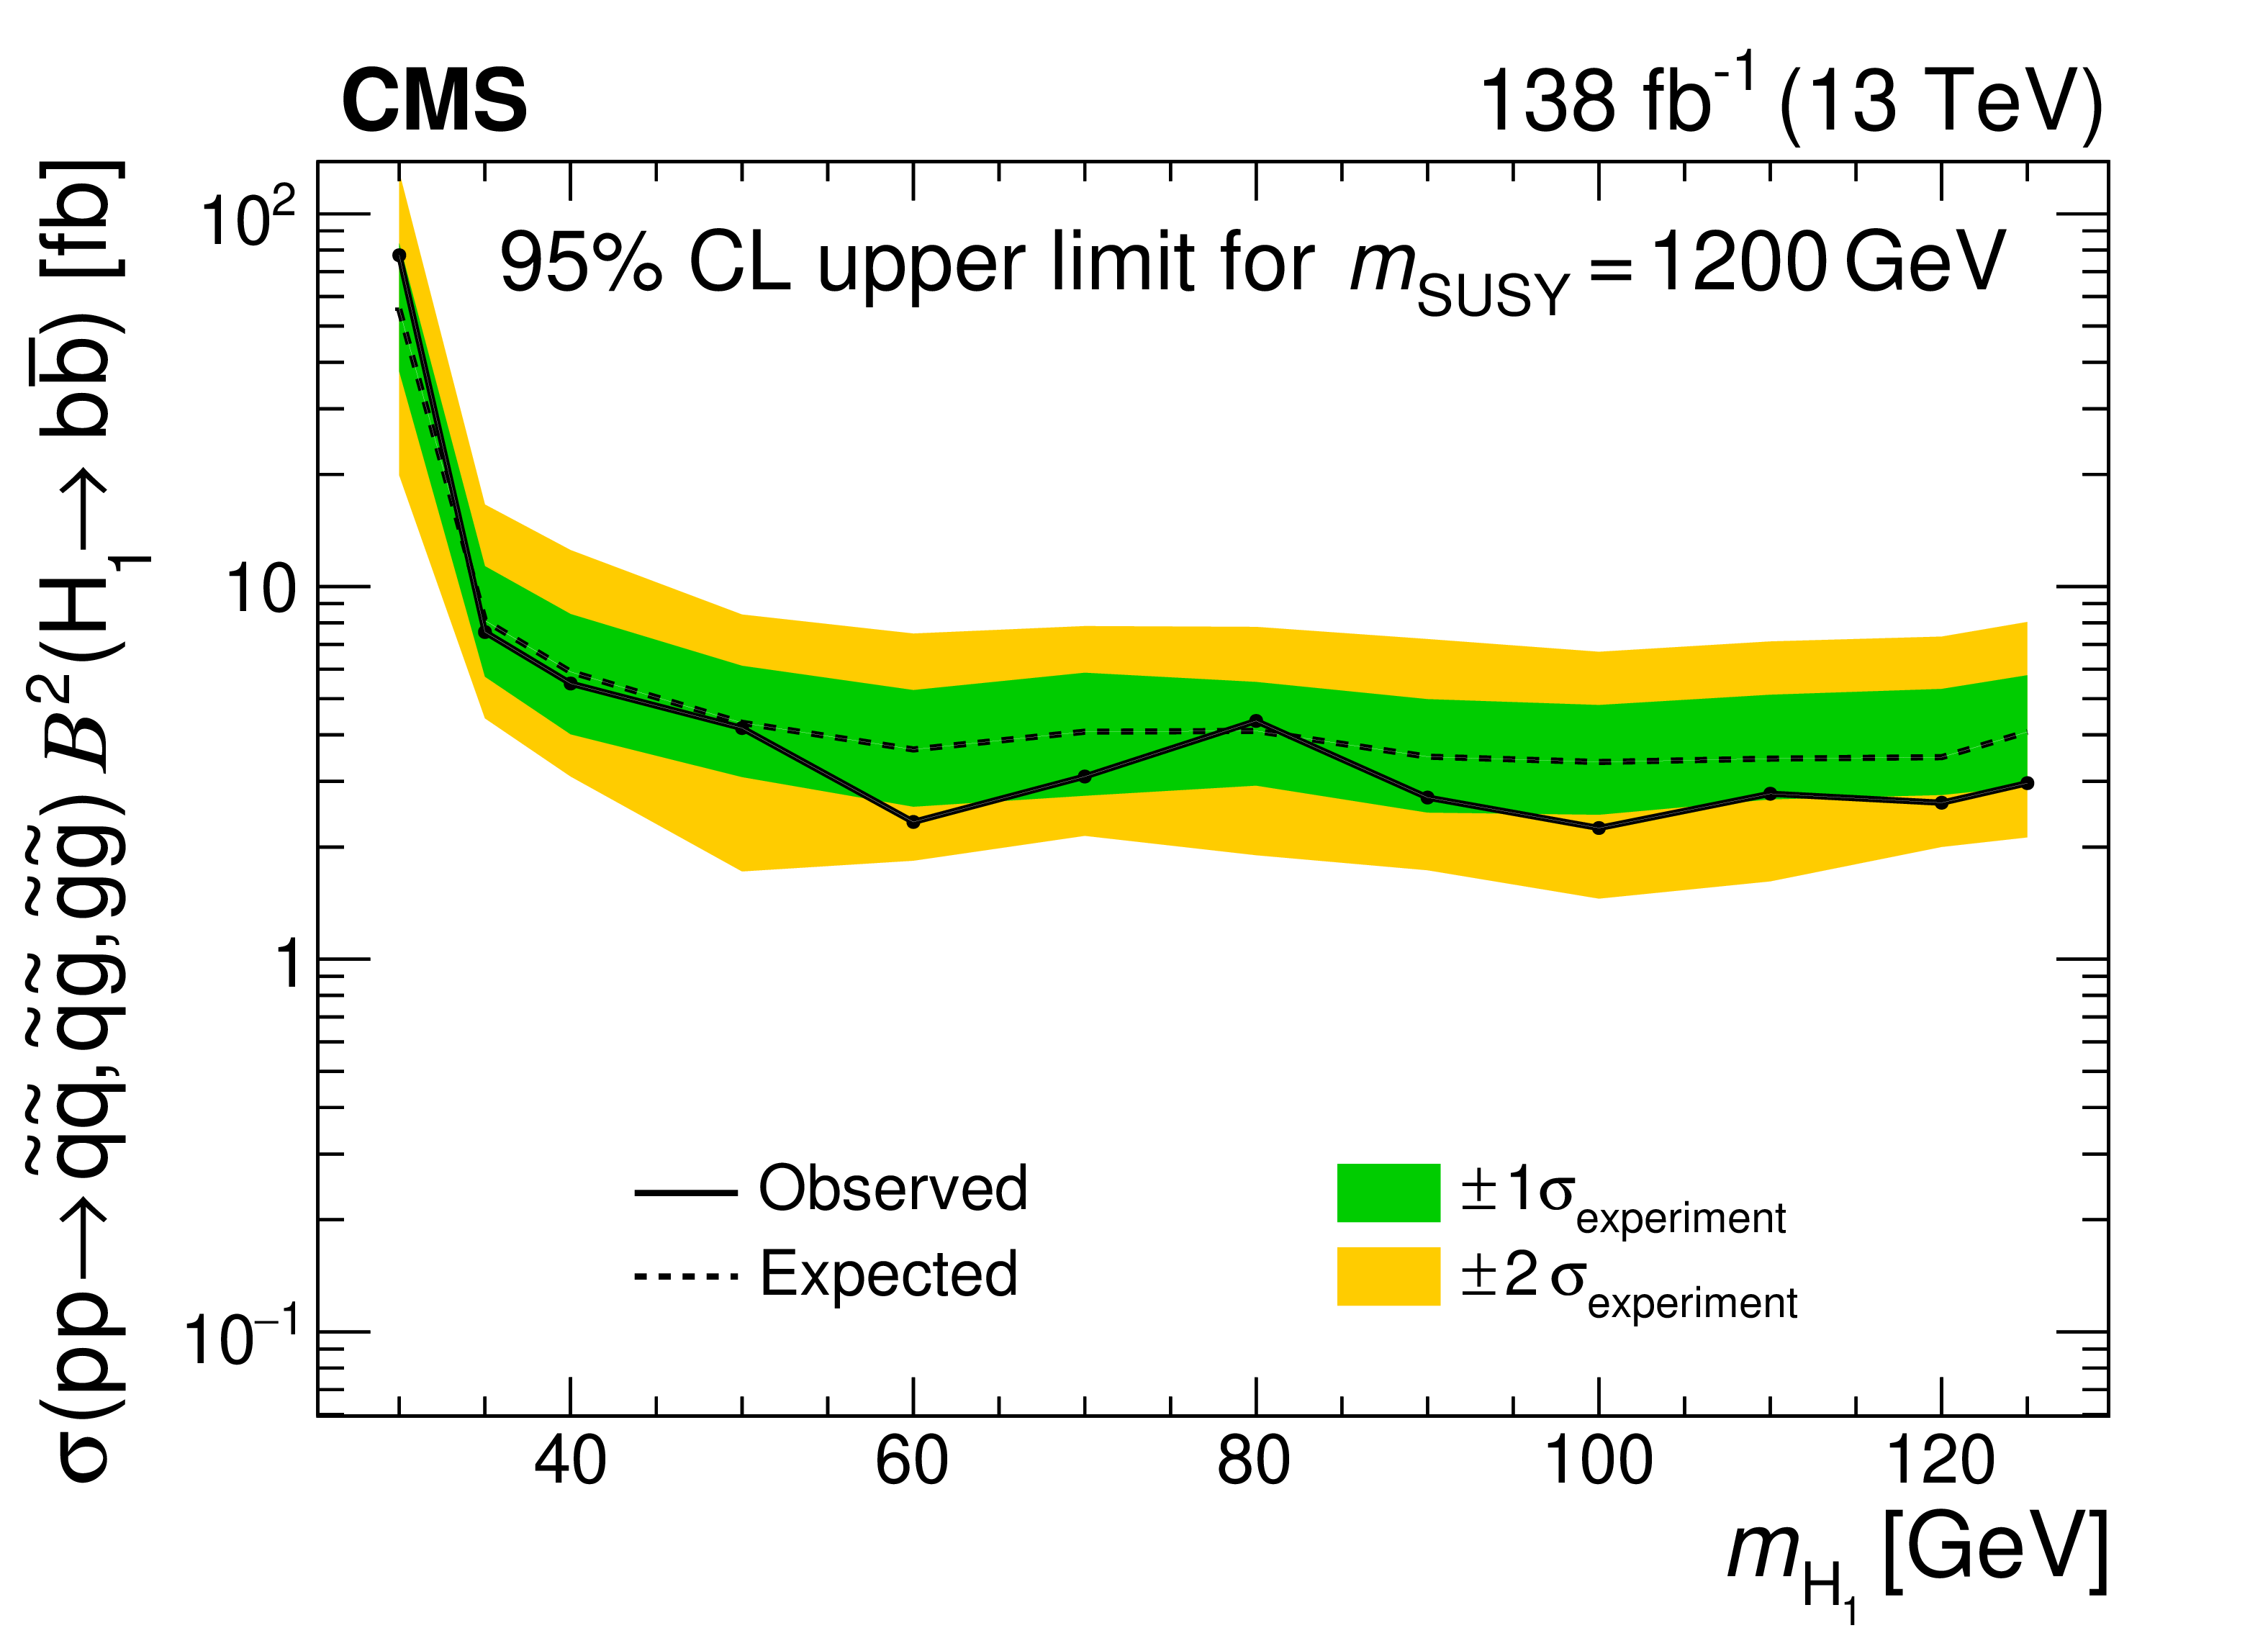
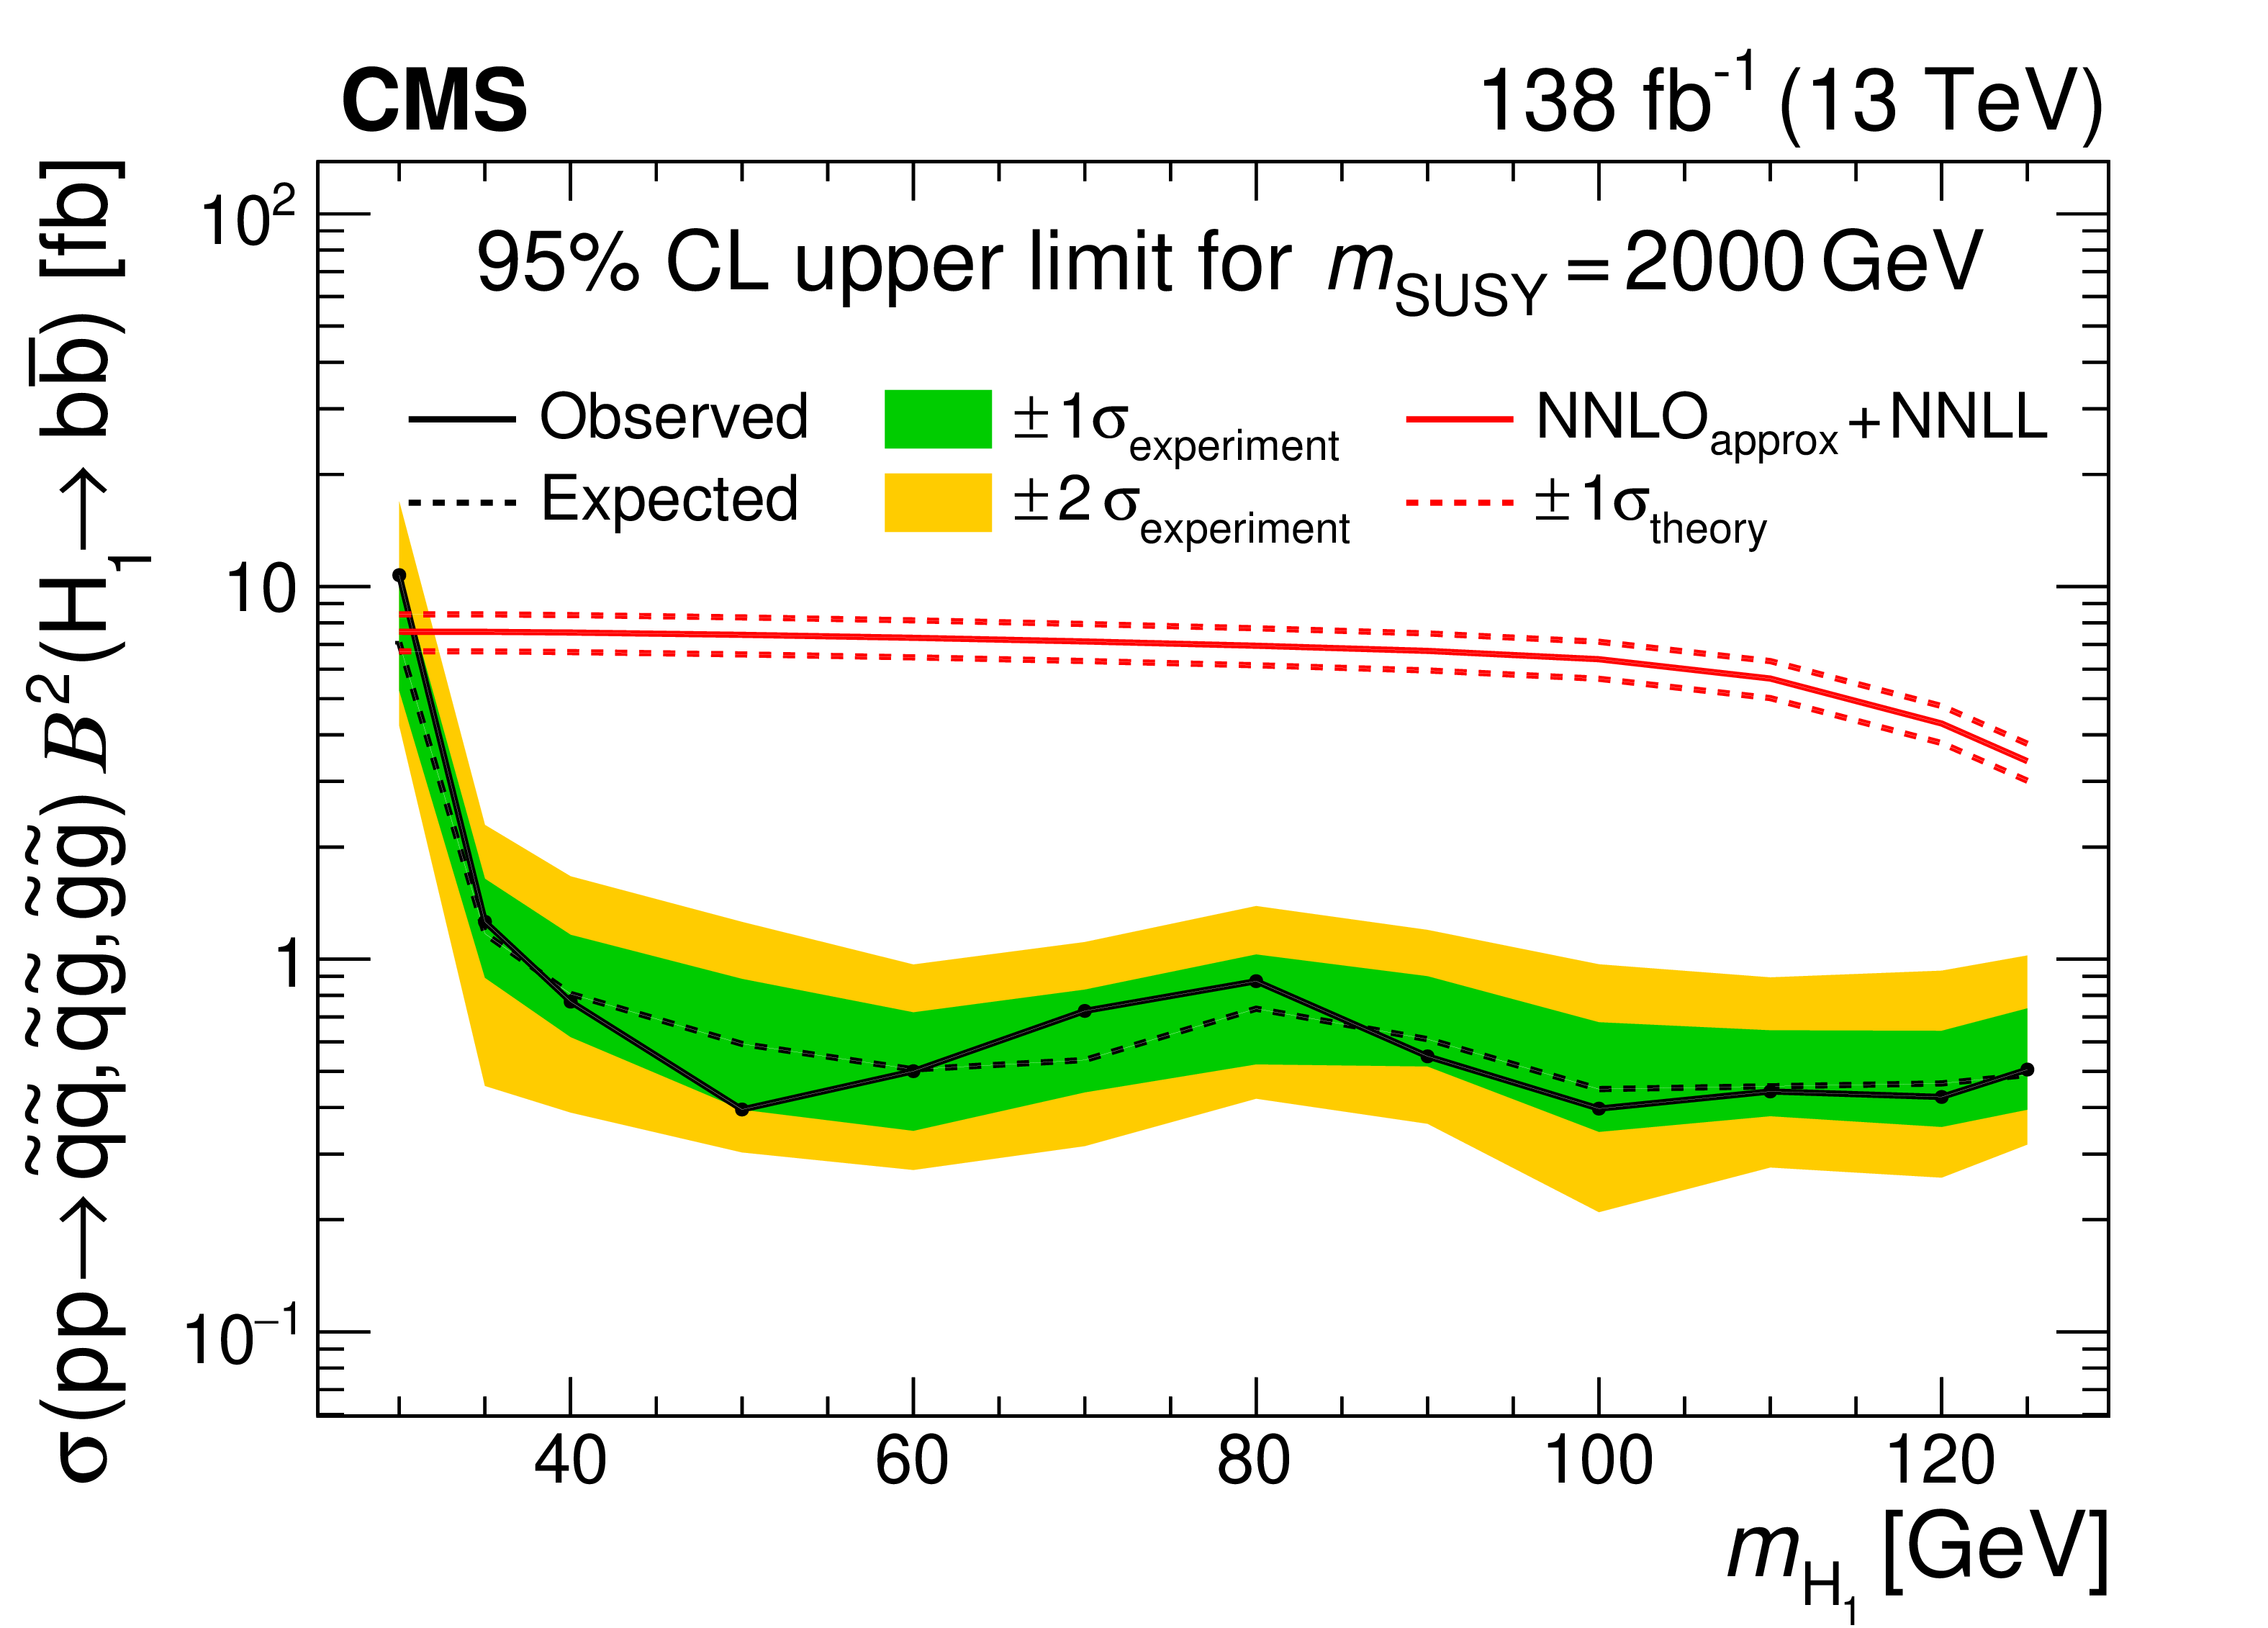
Upper limits at 95% CL on $\sigma {\mathcal {B}} ^2$ as a function of ${m_{\mathrm{H} _1}}$, for ${m_{\text {SUSY}}}$ values of 1200 (upper), 2000 (middle), and 2800 GeV (lower). The solid and dashed black lines indicate the observed and median expected limits, respectively. The inner (green) band and the outer (yellow) band indicate the regions containing 68 and 95%, respectively, of the distribution of limits expected under the background-only hypothesis. The solid and dashed red lines show the theoretical value of $\sigma {\mathcal {B}} ^2$ and its uncertainty [21-30]. In the upper plot, these $\sigma {\mathcal {B}} ^2$ values are beyond the maximum of the vertical axis. |
png pdf |
Figure 9-a:
Upper limits at 95% CL on $\sigma {\mathcal {B}} ^2$ as a function of ${m_{\mathrm{H} _1}}$, for ${m_{\text {SUSY}}}$ values of 1200 GeV. The solid and dashed black lines indicate the observed and median expected limits, respectively. The inner (green) band and the outer (yellow) band indicate the regions containing 68 and 95%, respectively, of the distribution of limits expected under the background-only hypothesis. The solid and dashed red lines show the theoretical value of $\sigma {\mathcal {B}} ^2$ and its uncertainty [21-30]. These $\sigma {\mathcal {B}} ^2$ values are beyond the maximum of the vertical axis. |
png pdf |
Figure 9-b:
Upper limits at 95% CL on $\sigma {\mathcal {B}} ^2$ as a function of ${m_{\mathrm{H} _1}}$, for ${m_{\text {SUSY}}}$ values of 2000 GeV. The solid and dashed black lines indicate the observed and median expected limits, respectively. The inner (green) band and the outer (yellow) band indicate the regions containing 68 and 95%, respectively, of the distribution of limits expected under the background-only hypothesis. The solid and dashed red lines show the theoretical value of $\sigma {\mathcal {B}} ^2$ and its uncertainty [21-30]. |
png pdf |
Figure 9-c:
Upper limits at 95% CL on $\sigma {\mathcal {B}} ^2$ as a function of ${m_{\mathrm{H} _1}}$, for ${m_{\text {SUSY}}}$ values of 2800 GeV. The solid and dashed black lines indicate the observed and median expected limits, respectively. The inner (green) band and the outer (yellow) band indicate the regions containing 68 and 95%, respectively, of the distribution of limits expected under the background-only hypothesis. The solid and dashed red lines show the theoretical value of $\sigma {\mathcal {B}} ^2$ and its uncertainty [21-30]. |
png pdf |
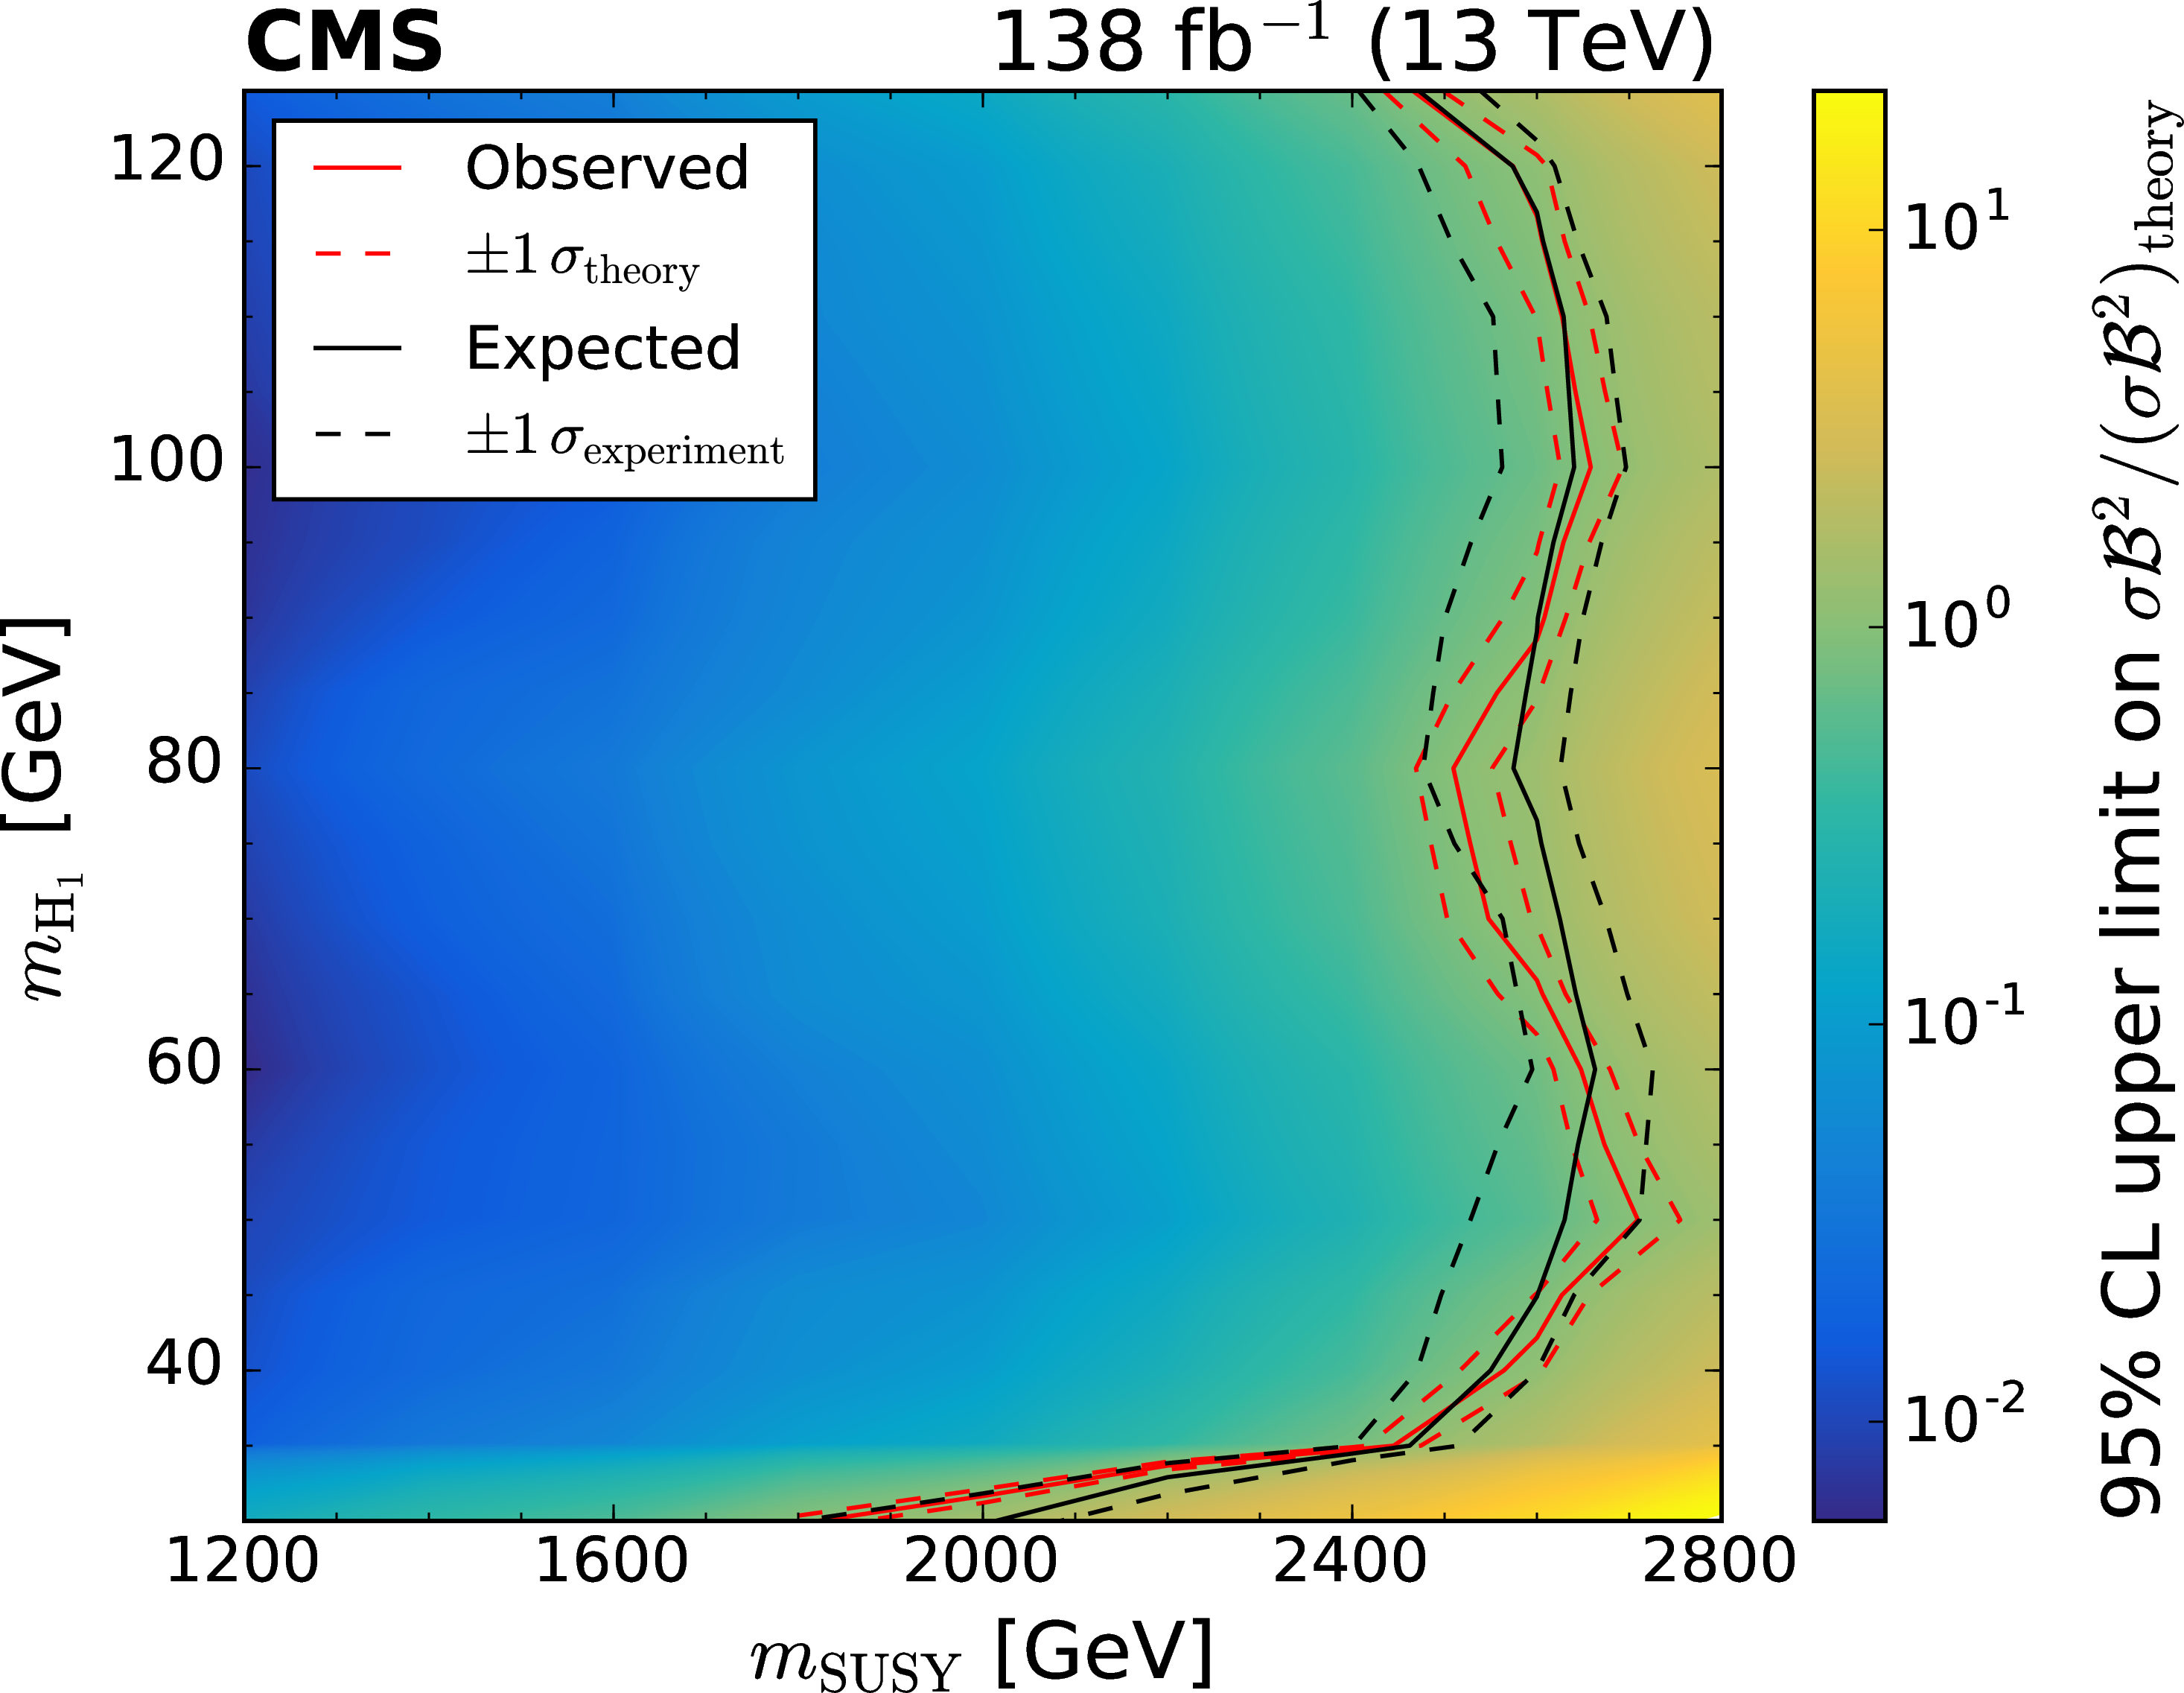
Figure 10:
The observed 95% CL upper limit on $\sigma {\mathcal {B}} ^2 / (\sigma {\mathcal {B}} ^2)_{\textrm {theory}}$, quantified by the colour scale as a function of ${m_{\mathrm{H} _1}}$ and ${m_{\text {SUSY}}}$. The solid and dashed red lines indicate the observed excluded region and its theoretical uncertainty, respectively. The solid and dashed black lines respectively represent the expected excluded region and its 68% CL interval, under the background-only hypothesis. |
png pdf |
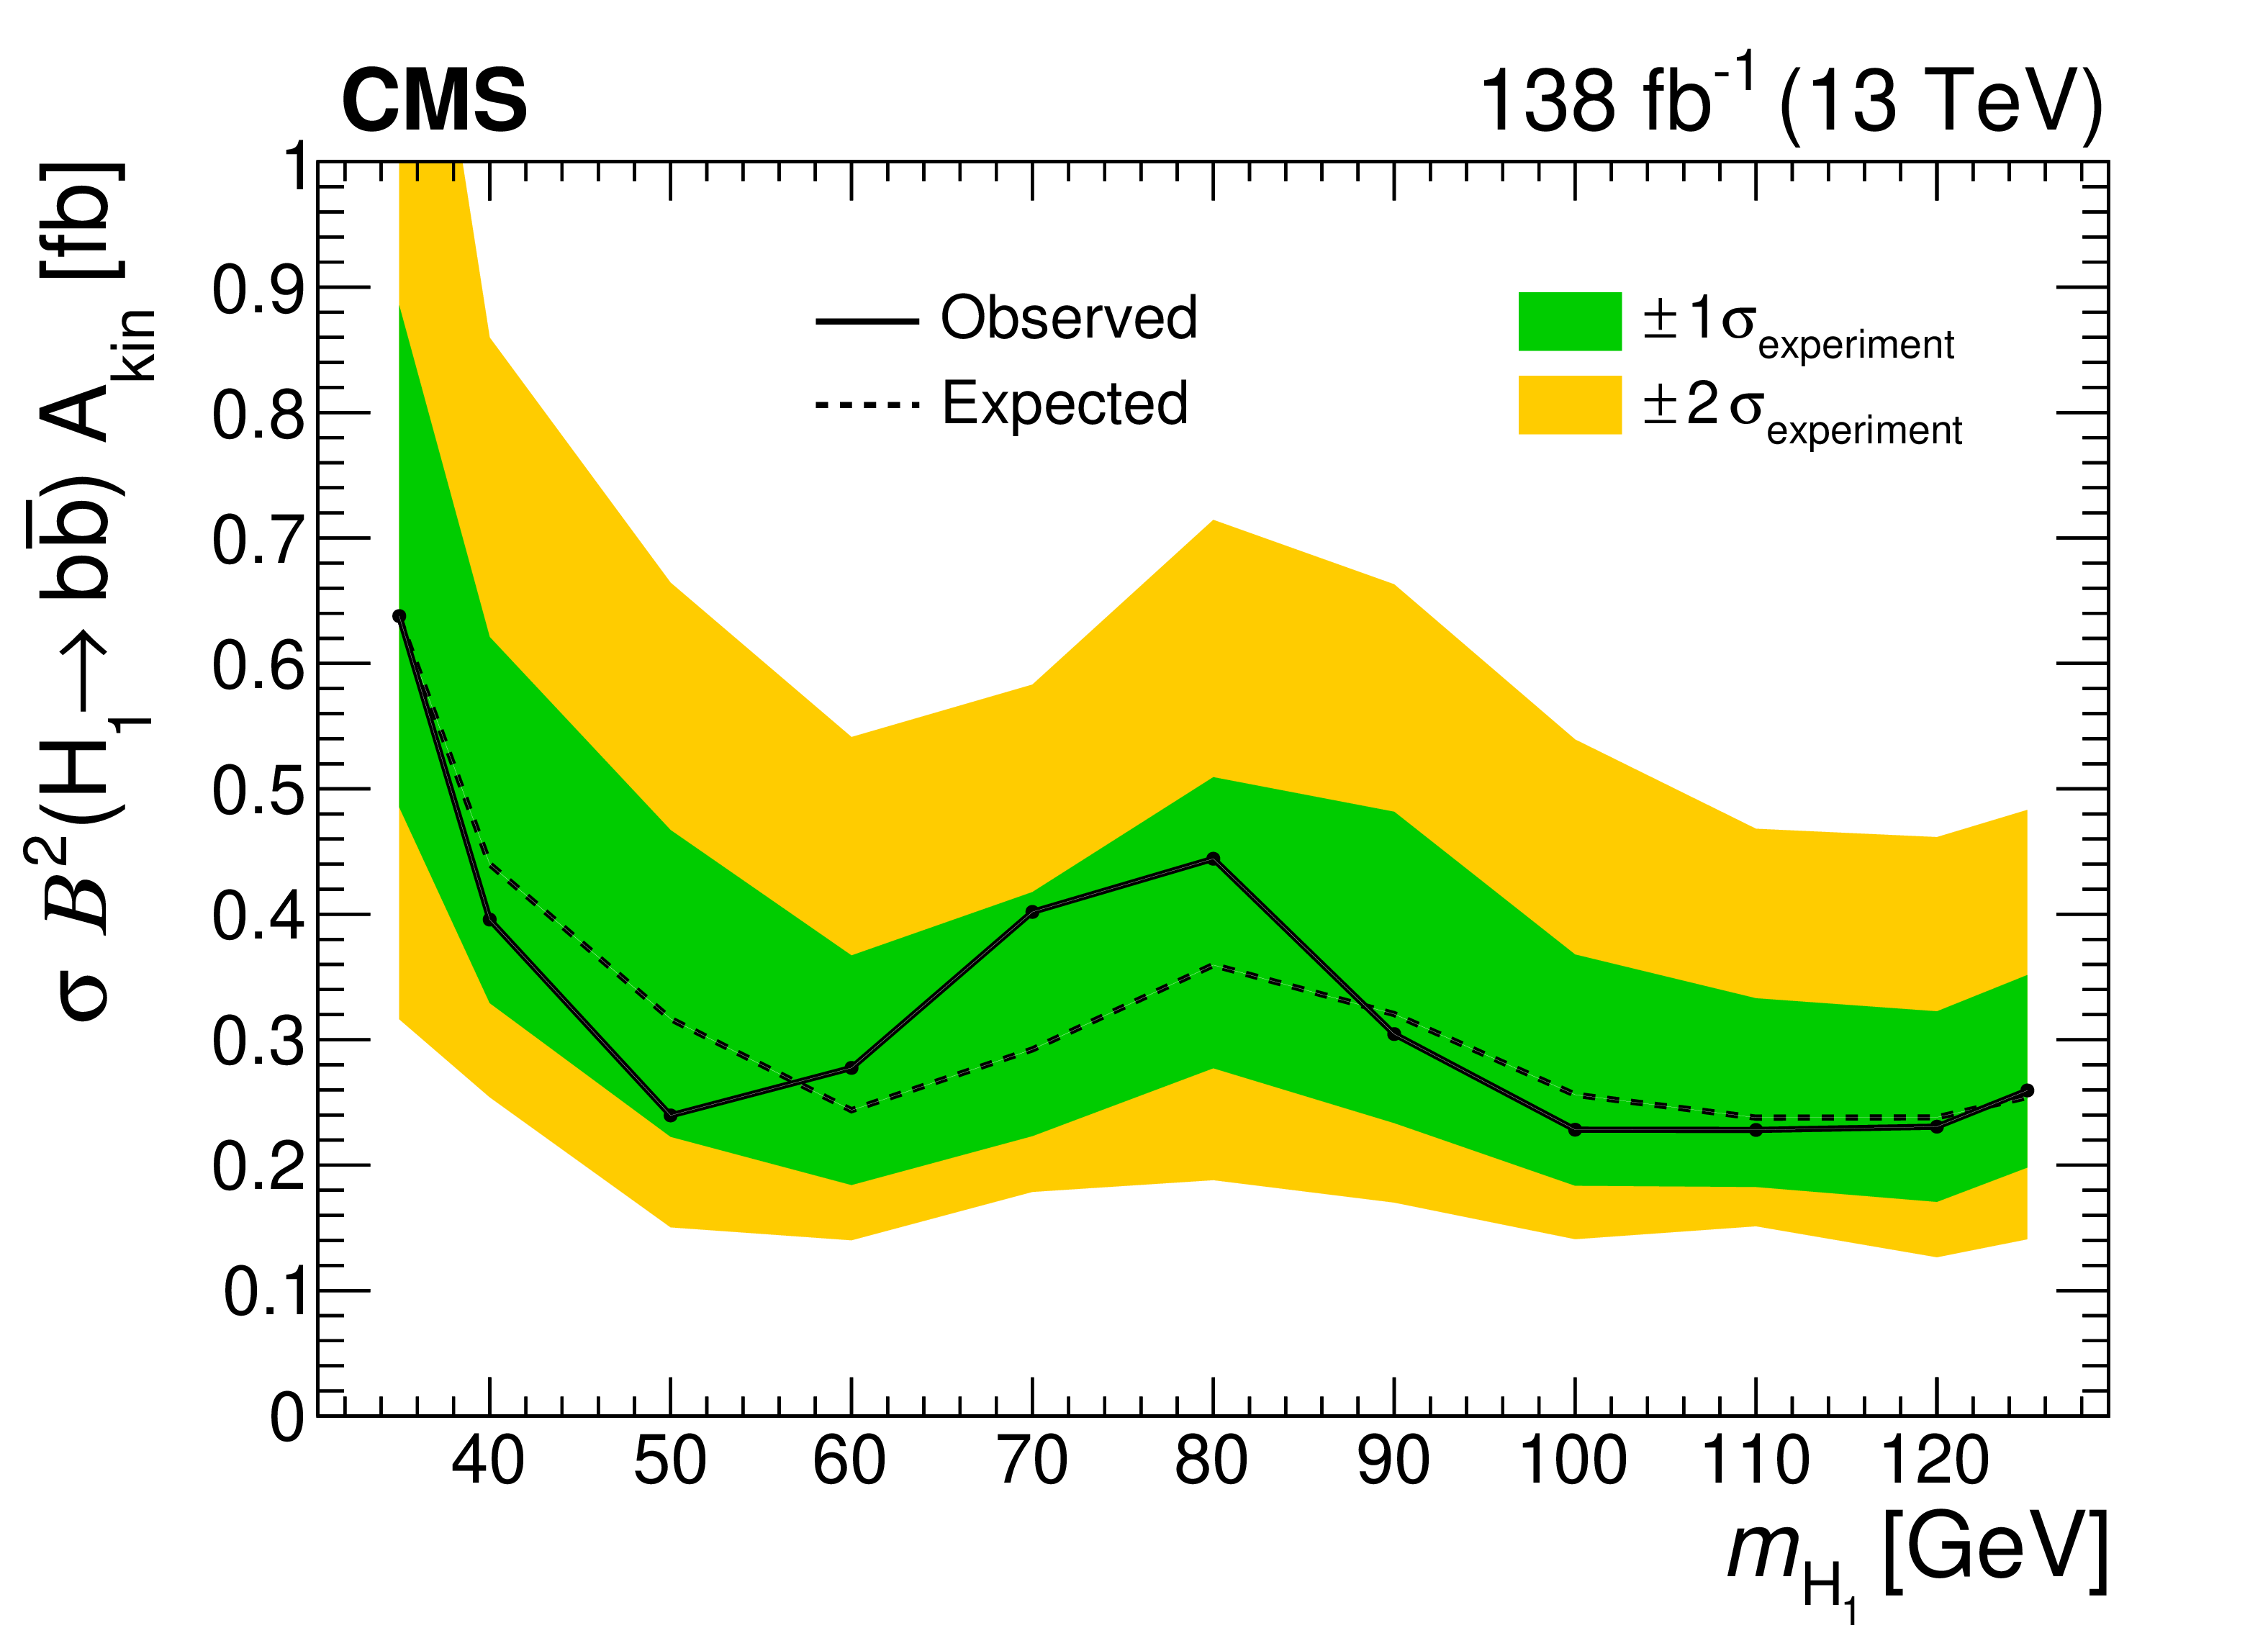
Figure A1:
The observed and expected 95% CL upper limit on the product of $\sigma {\mathcal {B}} ^2$ and ${A_{\text {kin}}}$, the kinematic acceptance and efficiency for the $ {H_{\mathrm {T}}} > $ 3500 GeV region, as a function of ${m_{\mathrm{H} _1}}$. The results are independent of ${m_{\text {SUSY}}}$ within 10% in the range 1600 $ < {m_{\text {SUSY}}} < $ 2800 GeV. The solid and dashed black lines indicate the observed and median expected limits, respectively. The inner (green) band and the outer (yellow) band indicate the regions containing 68 and 95%, respectively, of the distribution of limits expected under the background-only hypothesis. |
| Tables | |
png pdf |
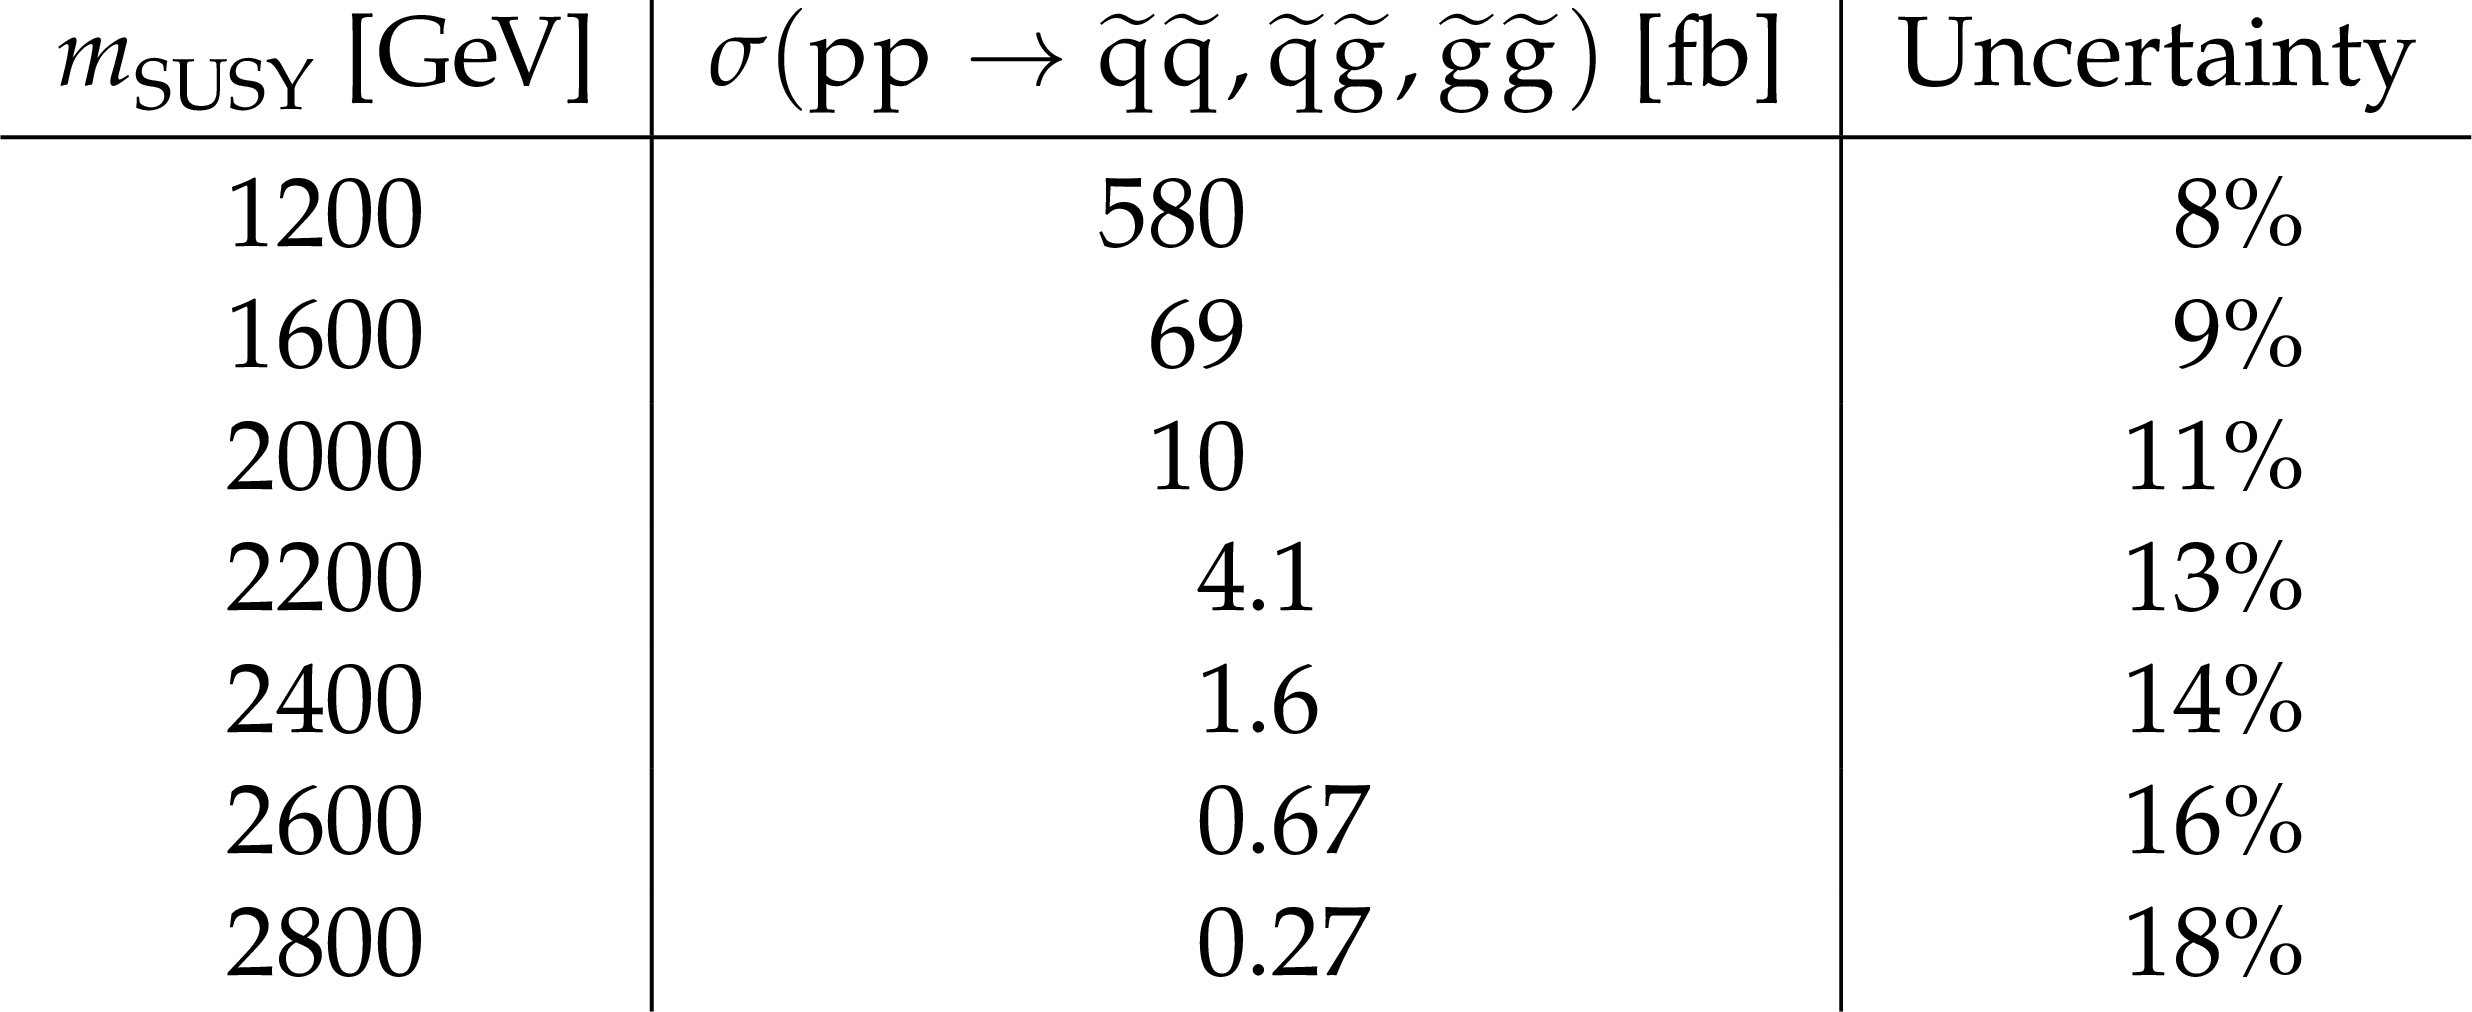
Table 1:
Inclusive pair-production cross sections calculated at approximately NNLO and NNLL in ${\alpha _\mathrm {S}}$ [21-29] for squark mass ${m_{\text {SUSY}}}$ and gluino mass 1% larger. The quoted uncertainty is obtained from variations in the choice of scales, parton distribution functions, and ${\alpha _\mathrm {S}}$. |

png pdf |
Table 2:
The ${m_{\mathrm{H} _1}}$ values in this search and corresponding H$_{1}$ $\to\mathrm{b\bar{b}}$ branching fractions. |
png pdf |
Table A1:
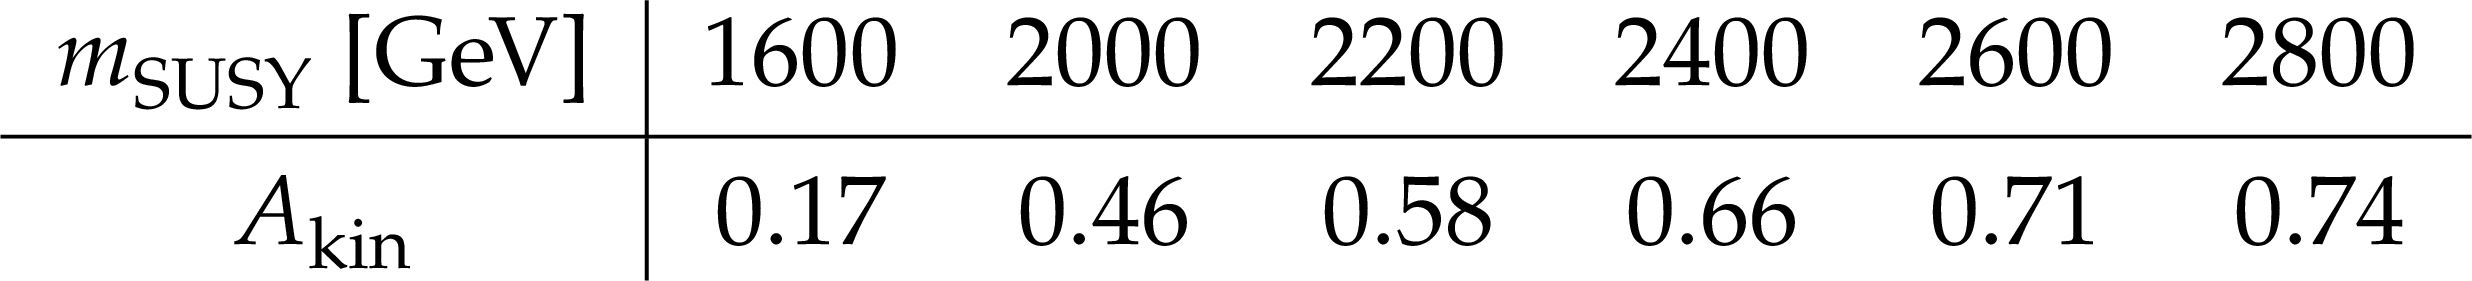
Reference values of the product of kinematic acceptance and efficiency (${A_{\text {kin}}}$) for the $ {H_{\mathrm {T}}} > $ 3500 GeV region for the benchmark signal model with different values of ${m_{\text {SUSY}}}$. These values are independent of ${m_{\mathrm{H} _1}}$ within 2% in the range 30 $ < {m_{\mathrm{H} _1}} < $ 125 GeV. |
| Summary |
|
This paper presents a search for pairs of light Higgs bosons (H$_{1}$) produced in supersymmetric cascade decays. The targeted final states have small amounts of missing transverse momentum and two H$_{1}$ $\to\mathrm{b\bar{b}}$ decays that are reconstructed as large-radius jets using substructure techniques. The search is based on data from pp collisions collected by the CMS experiment at $\sqrt s = $ 13 TeV during 2016-2018, corresponding to an integrated luminosity of 138 fb$^{-1}$. With no evidence found for an excess of events beyond the background expectations of the standard model (SM), the results are interpreted in the next-to-minimal supersymmetric extension of the SM (NMSSM), where a "singlino'' of small mass leads to squark and gluino cascade decays that can predominantly end in a highly Lorentz-boosted singlet-like H$_{1}$ and a singlino-like neutralino of small transverse momentum. Upper limits are set on the product of the production cross section and the square of the $\mathrm{b\bar{b}}$ branching fraction of the H$_{1}$ for an NMSSM benchmark model with almost mass-degenerate gluinos and light-flavour squarks and branching fractions of unity for the cascade decays ending with the H$_{1}$. Under the assumption of an SM-like H$_{1}$ $\to\mathrm{b\bar{b}}$ branching fraction, H$_{1}$ bosons with masses in the range 40-120 GeV, arising from the decays of squarks or gluinos with a mass from 1200 to 2500 GeV, are excluded at 95% confidence level. |
| Additional Figures | |
png pdf |
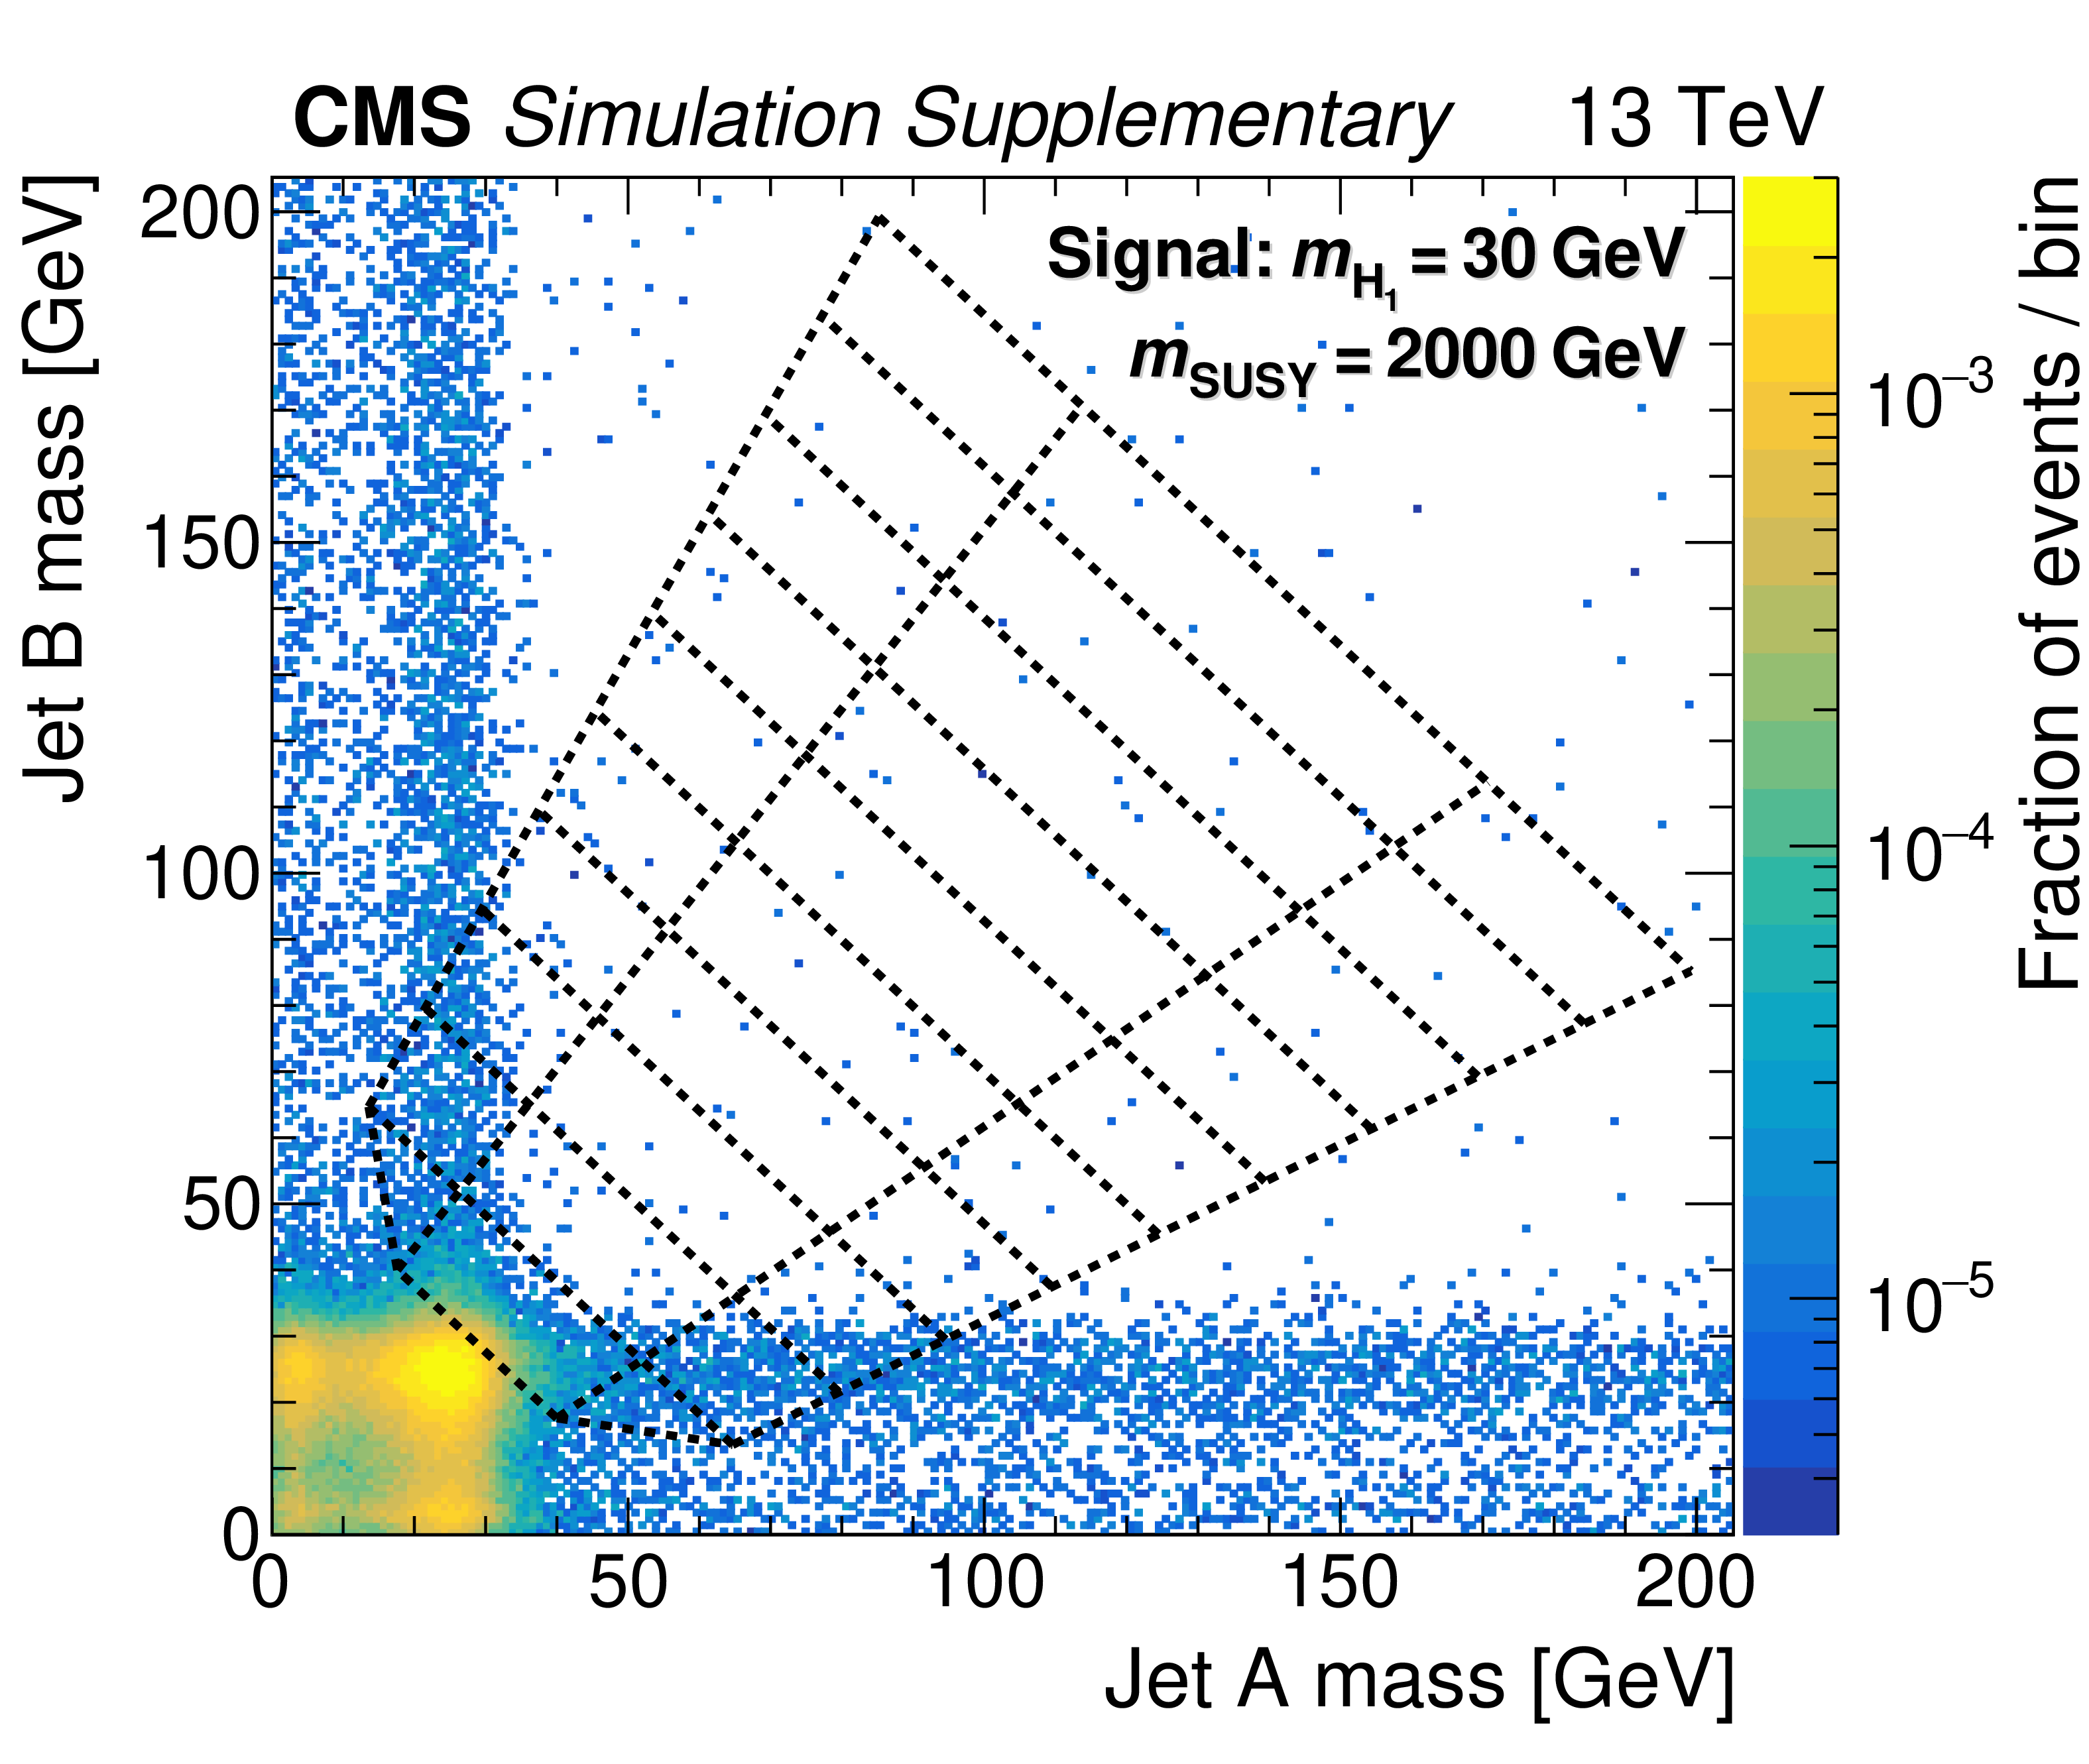
Additional Figure 1:
The normalised distribution of signal events in the 2D soft-drop mass plane, overlaid by the map of mass regions. The signal parameters are $ {m_{\text {SUSY}}} = $ 2000 GeV and $ {m_{\mathrm{H} _1}} = $ 30 GeV. All events satisfy the TR requirement and the kinematic selection. |
png pdf |
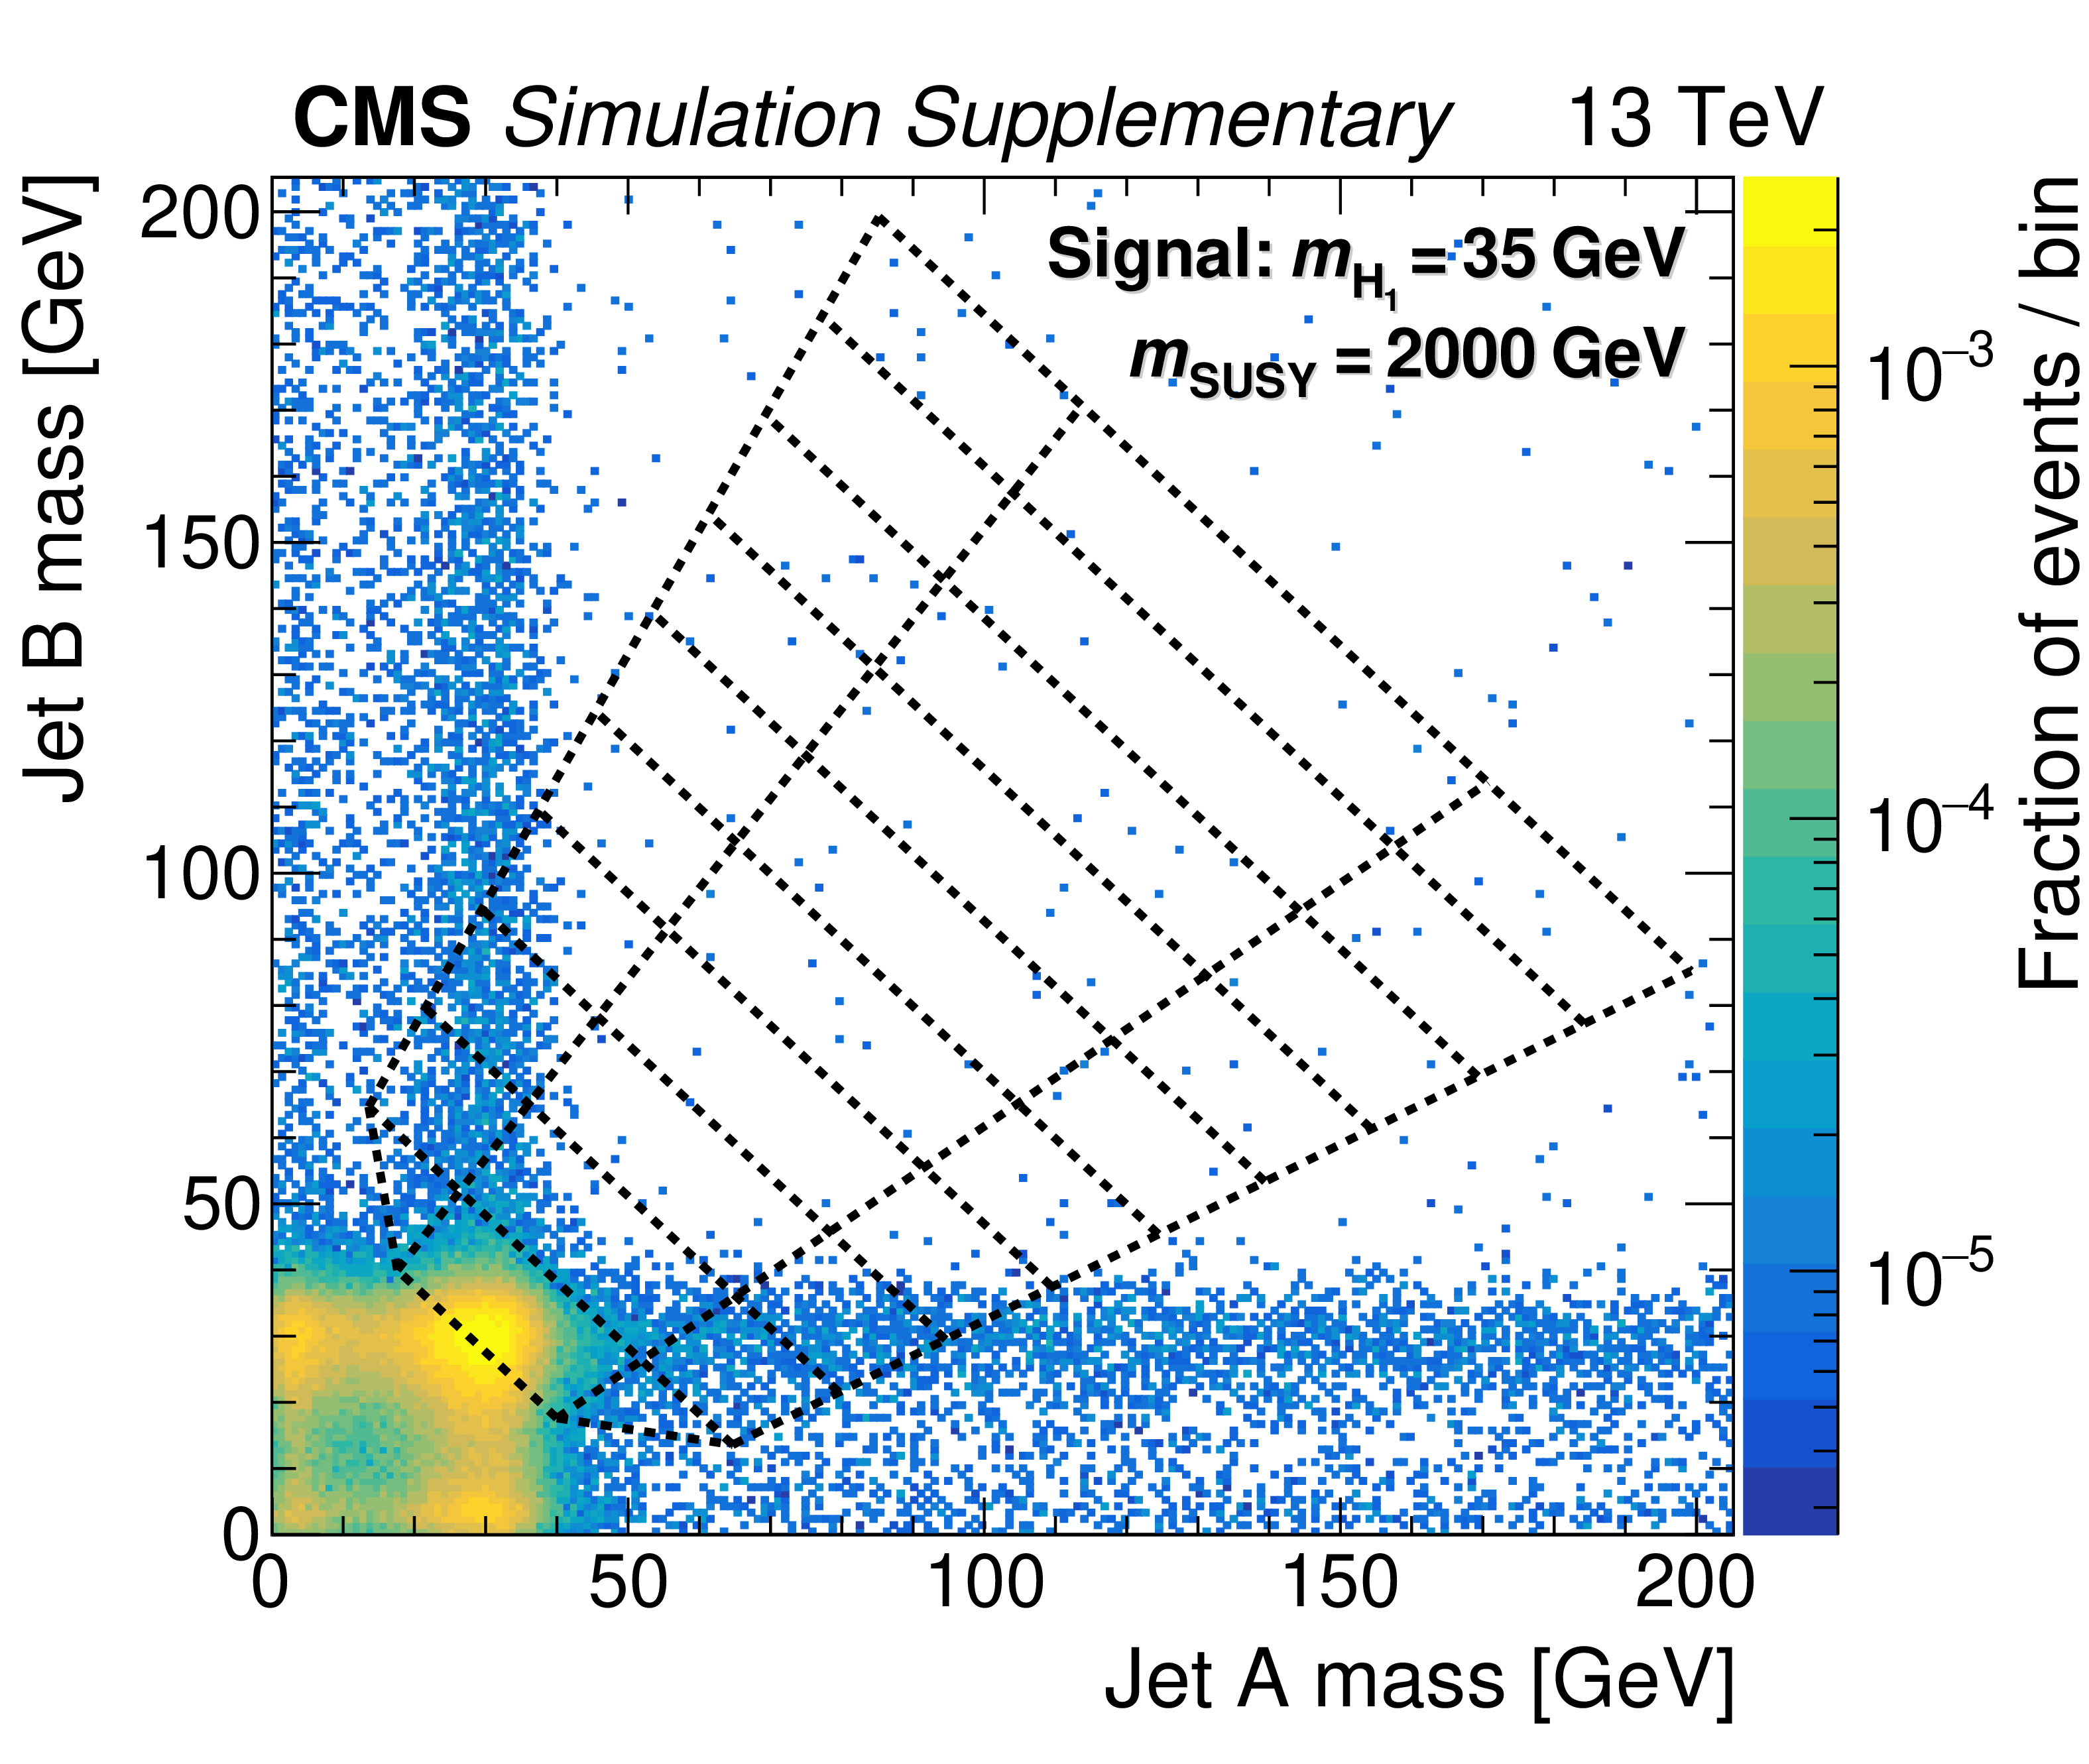
Additional Figure 2:
The normalised distribution of signal events in the 2D soft-drop mass plane, overlaid by the map of mass regions. The signal parameters are $ {m_{\text {SUSY}}} = $ 2000 GeV and $ {m_{\mathrm{H} _1}} = $ 35 GeV. All events satisfy the TR requirement and the kinematic selection. |
png pdf |
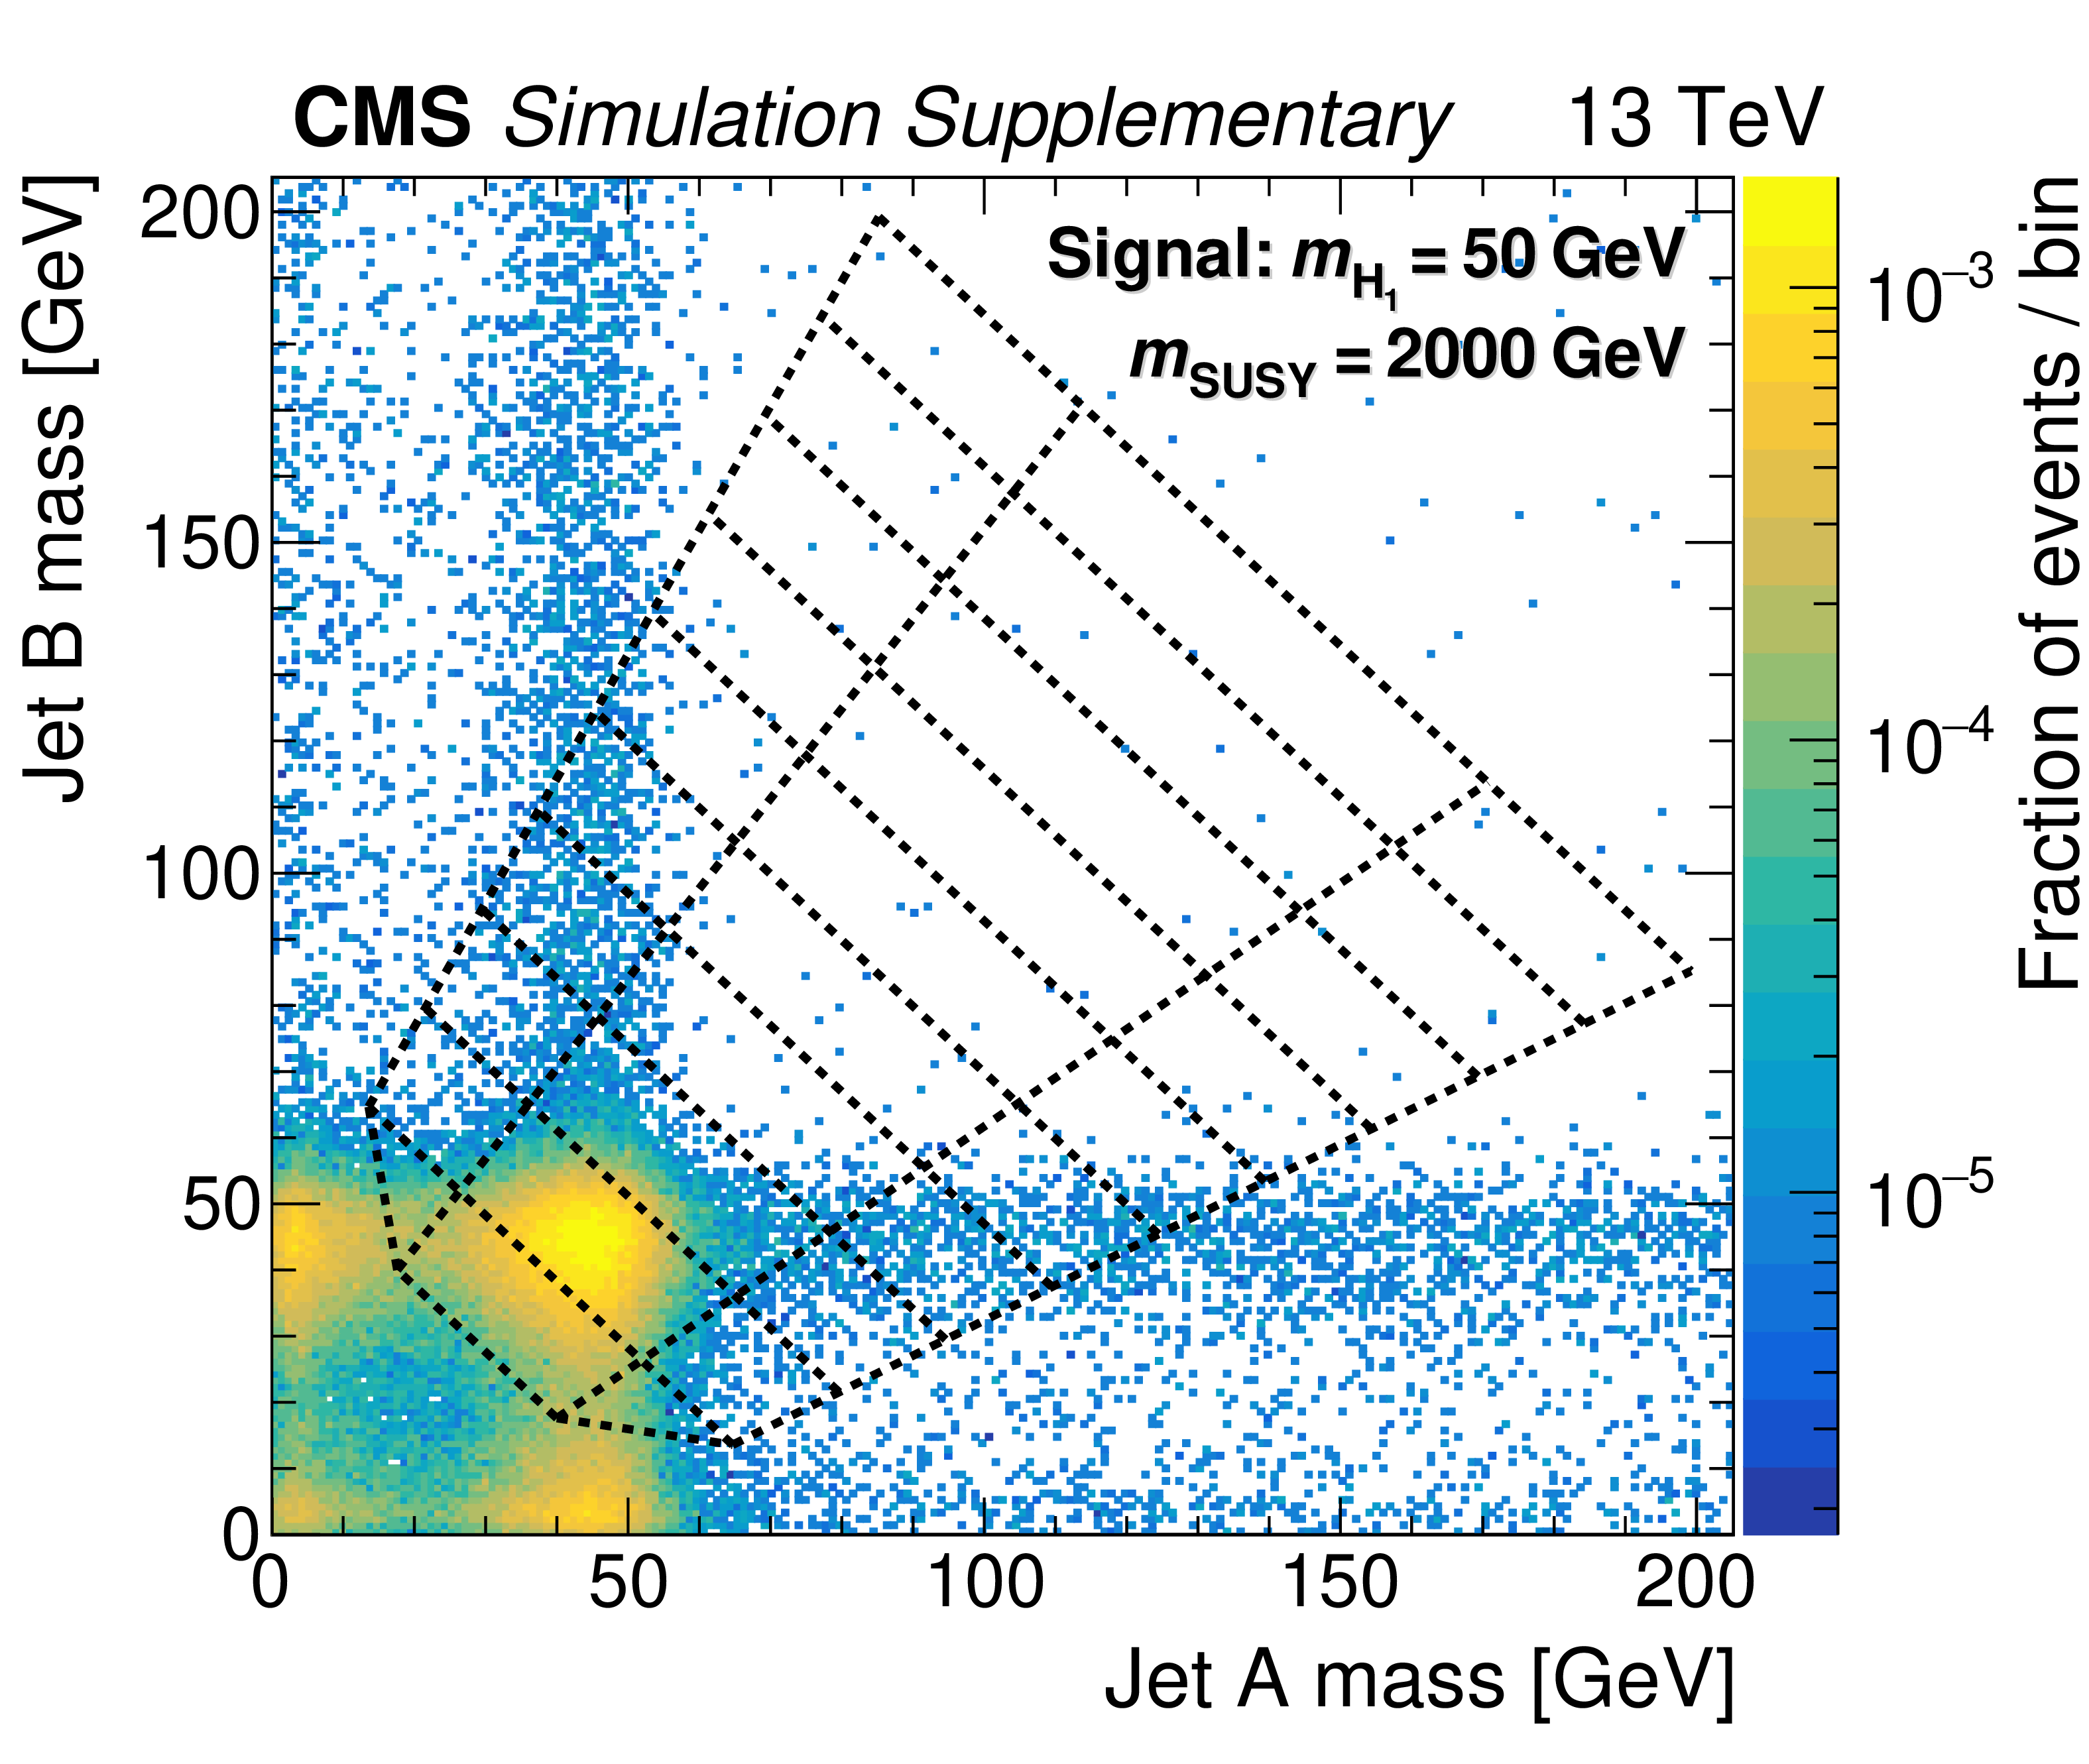
Additional Figure 3:
The normalised distribution of signal events in the 2D soft-drop mass plane, overlaid by the map of mass regions. The signal parameters are $ {m_{\text {SUSY}}} = $ 2000 GeV and $ {m_{\mathrm{H} _1}} = $ 50 GeV. All events satisfy the TR requirement and the kinematic selection. |
png pdf |
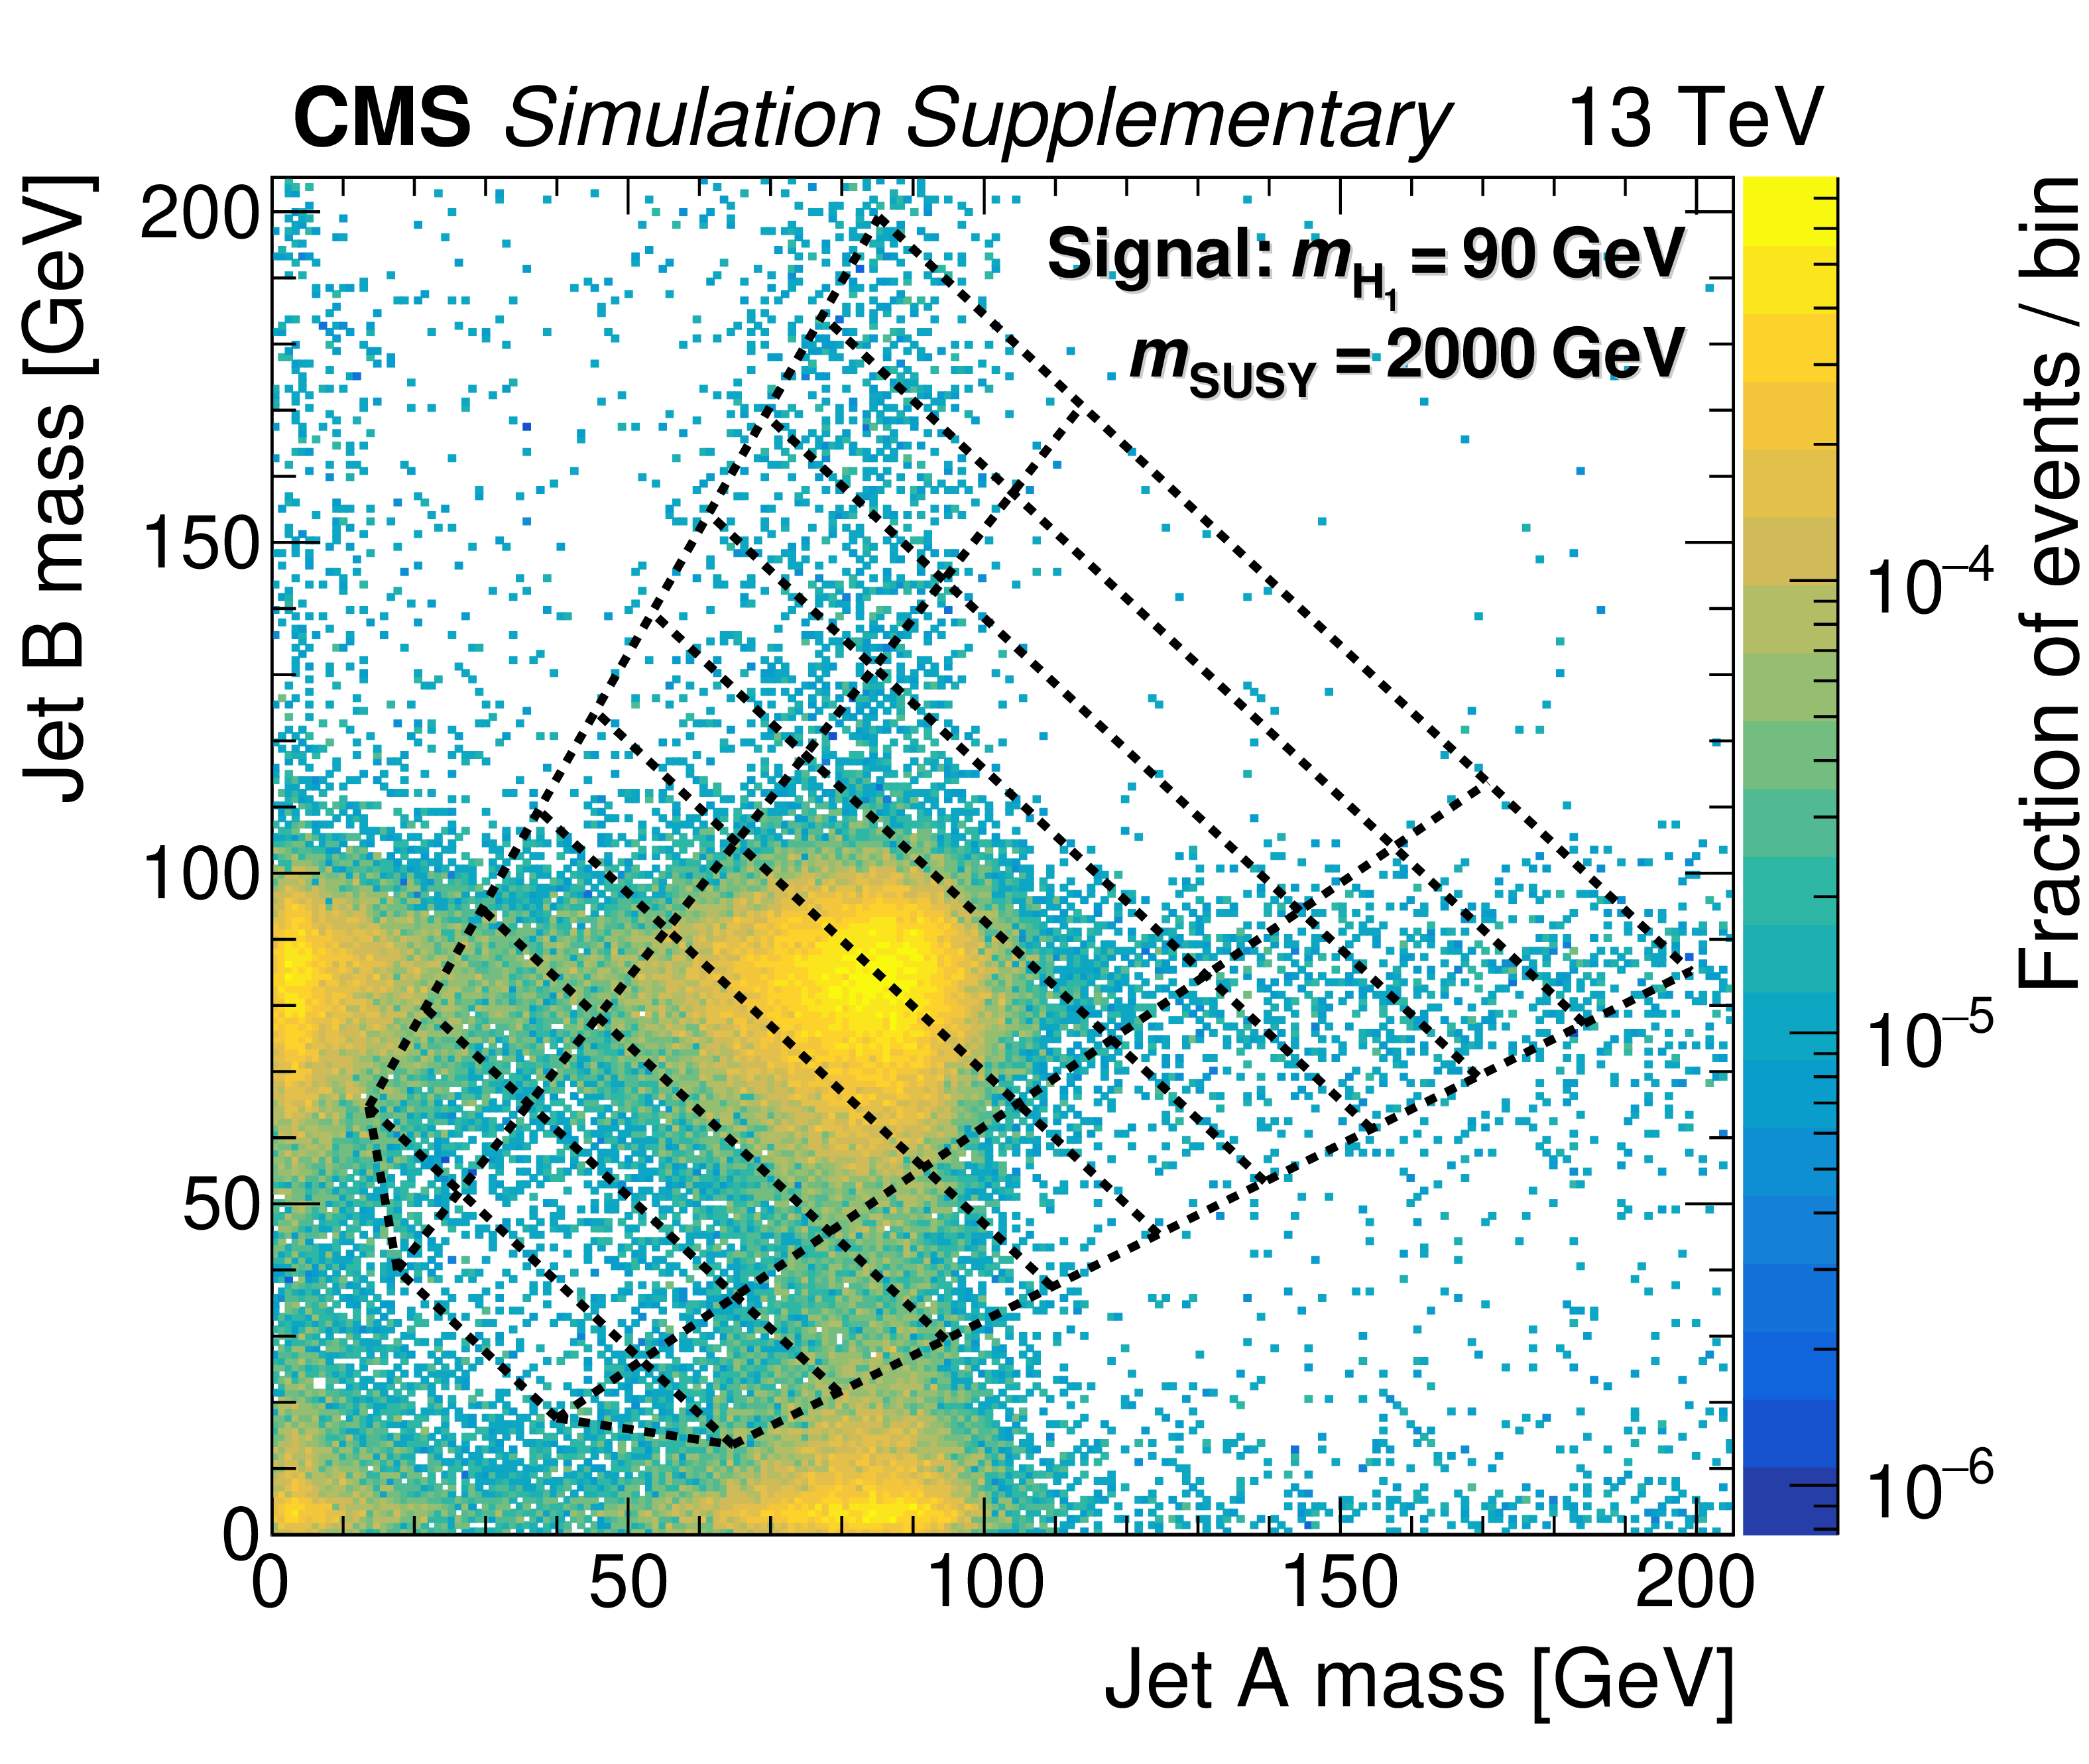
Additional Figure 4:
The normalised distribution of signal events in the 2D soft-drop mass plane, overlaid by the map of mass regions. The signal parameters are $ {m_{\text {SUSY}}} = $ 2000 GeV and $ {m_{\mathrm{H} _1}} = $ 90 GeV. All events satisfy the TR requirement and the kinematic selection. |

png pdf |
Additional Figure 5:
The normalised distribution of signal events in the 2D soft-drop mass plane, overlaid by the map of mass regions. The signal parameters are $ {m_{\text {SUSY}}} = $ 2000 GeV and $ {m_{\mathrm{H} _1}} = $ 110 GeV. All events satisfy the TR requirement and the kinematic selection. |
png pdf |
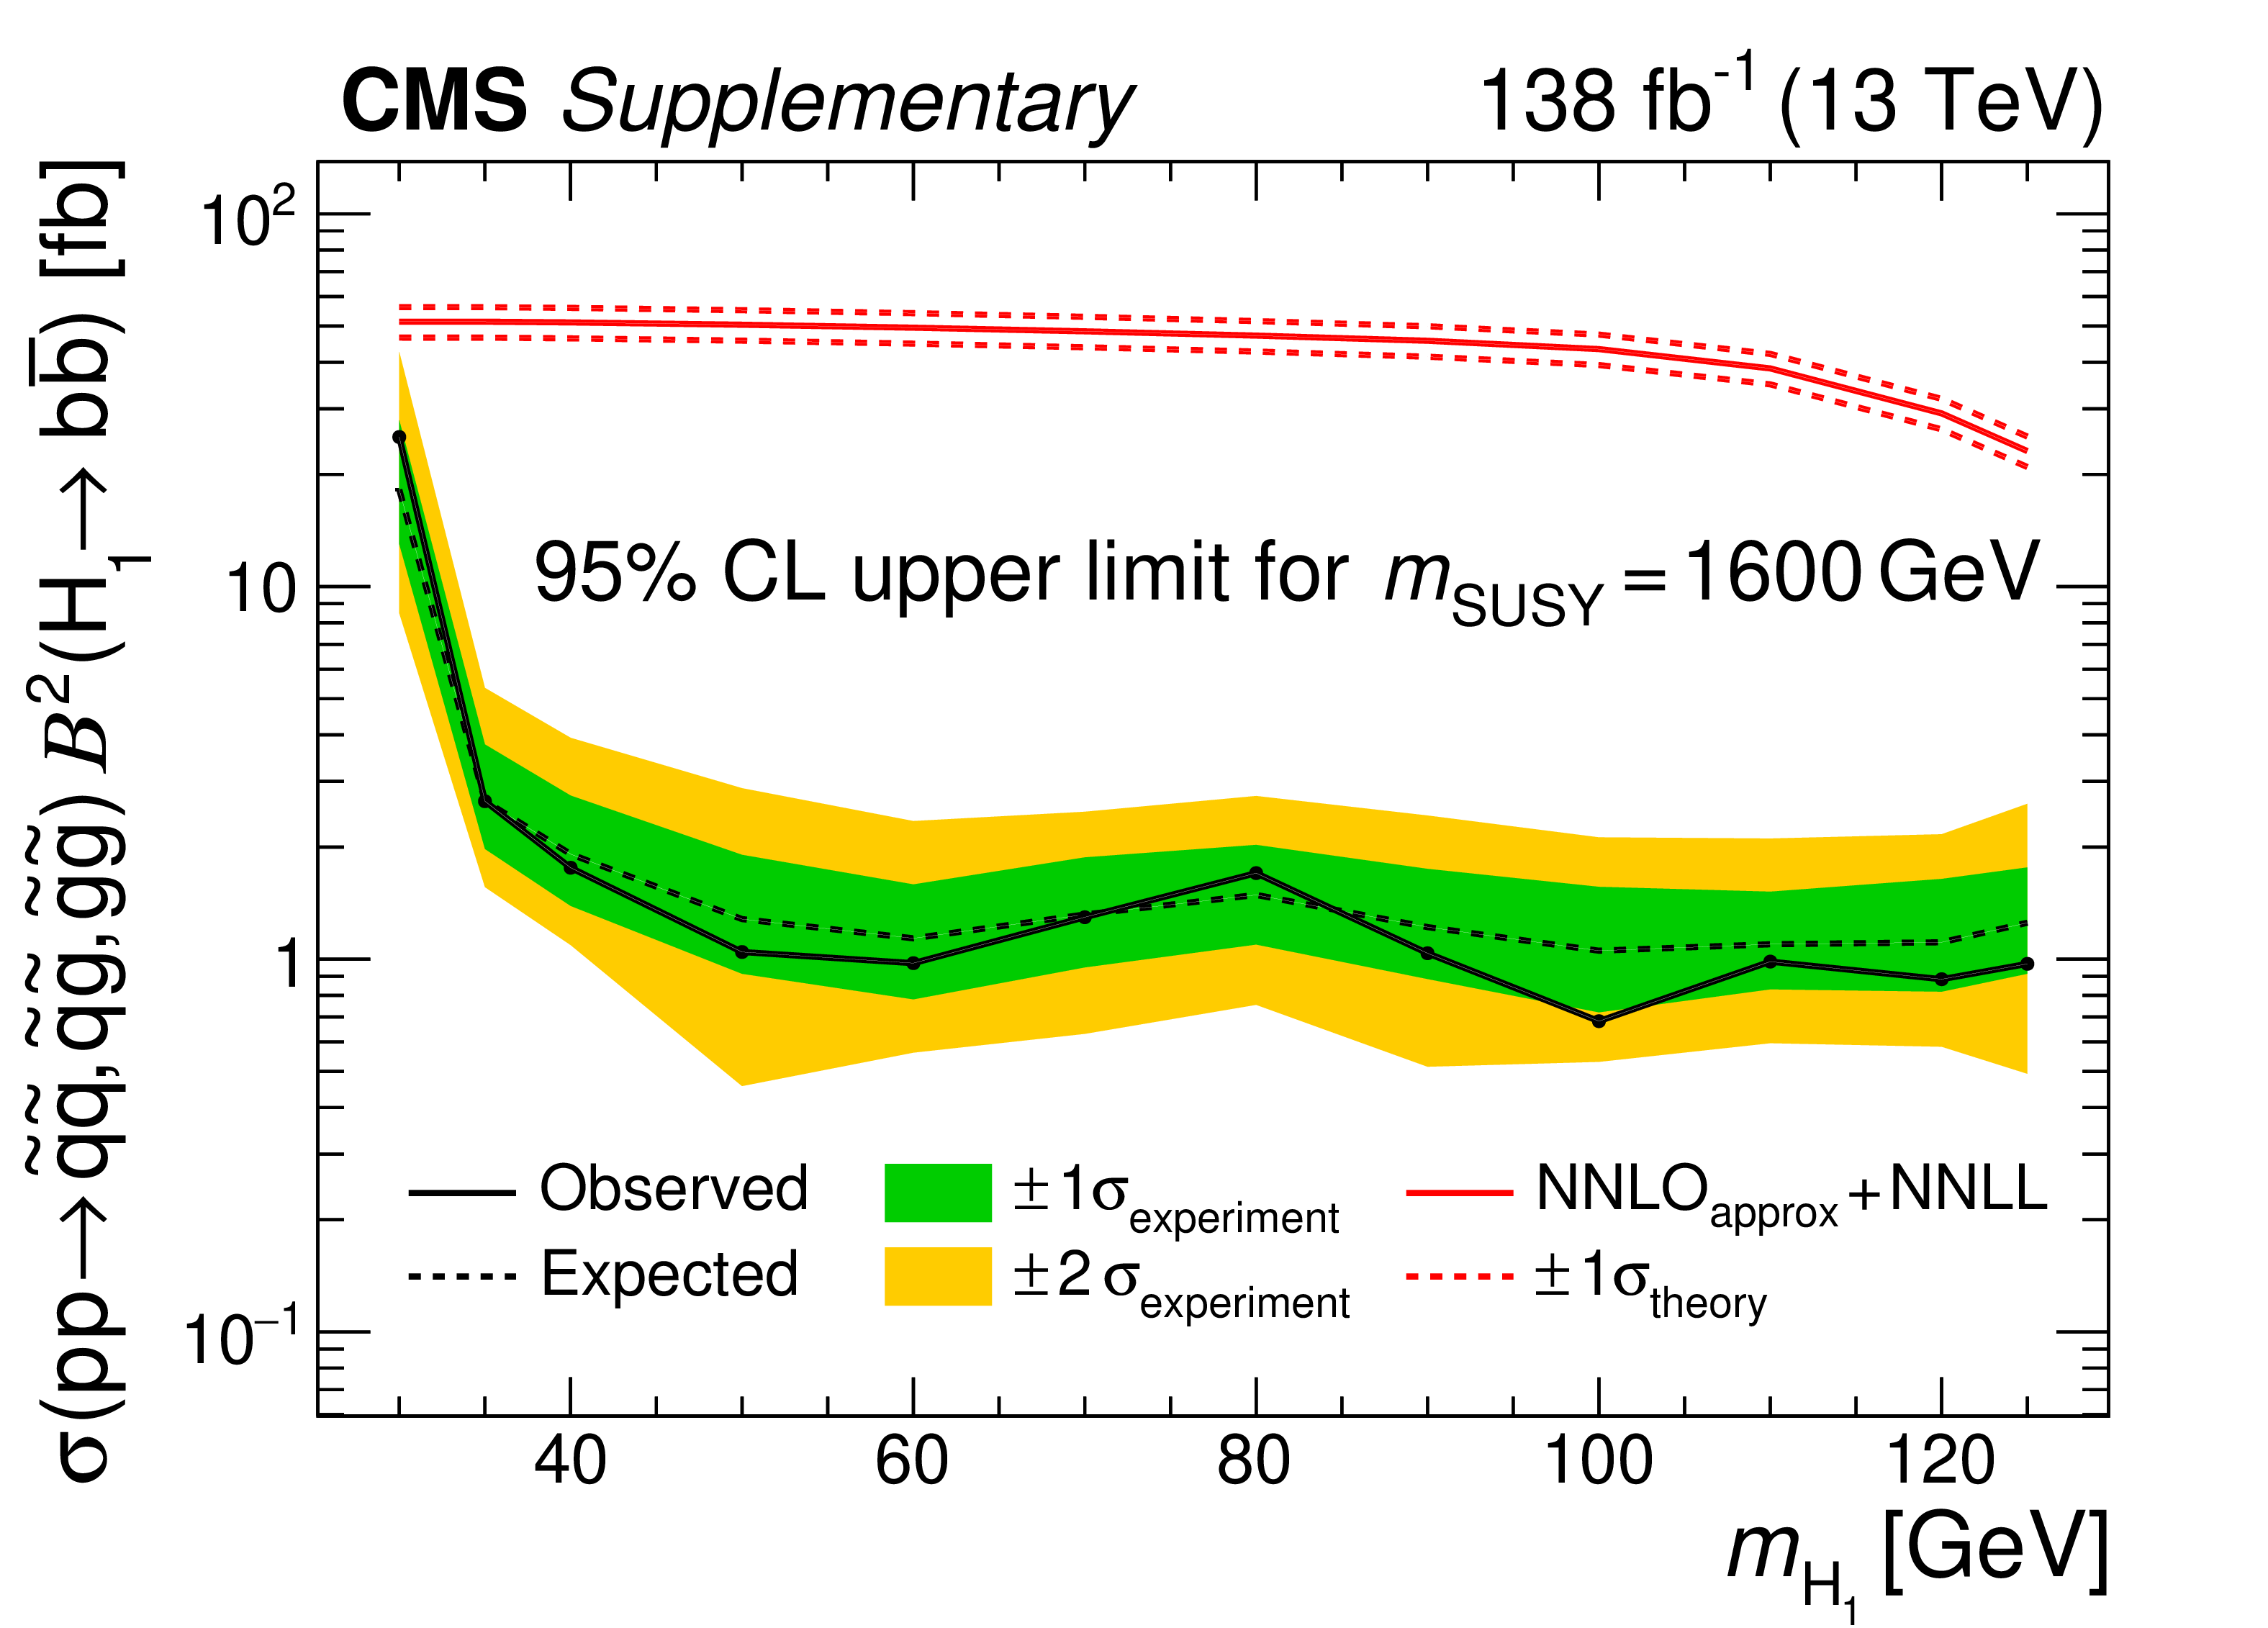
Additional Figure 6:
Upper limits at 95% CL on $\sigma \mathcal {B}^2$ as a function of ${m_{\mathrm{H} _1}}$, for $ {m_{\text {SUSY}}} = $ 1600 GeV. The solid and dashed black lines indicate the observed and median expected limits, respectively. The inner (green) band and the outer (yellow) band indicate the regions containing 68 and 95%, respectively, of the distribution of limits expected under the background-only hypothesis. The solid and dashed red lines show the theoretical value of $\sigma \mathcal {B}^2$ and its uncertainty. |
png pdf |
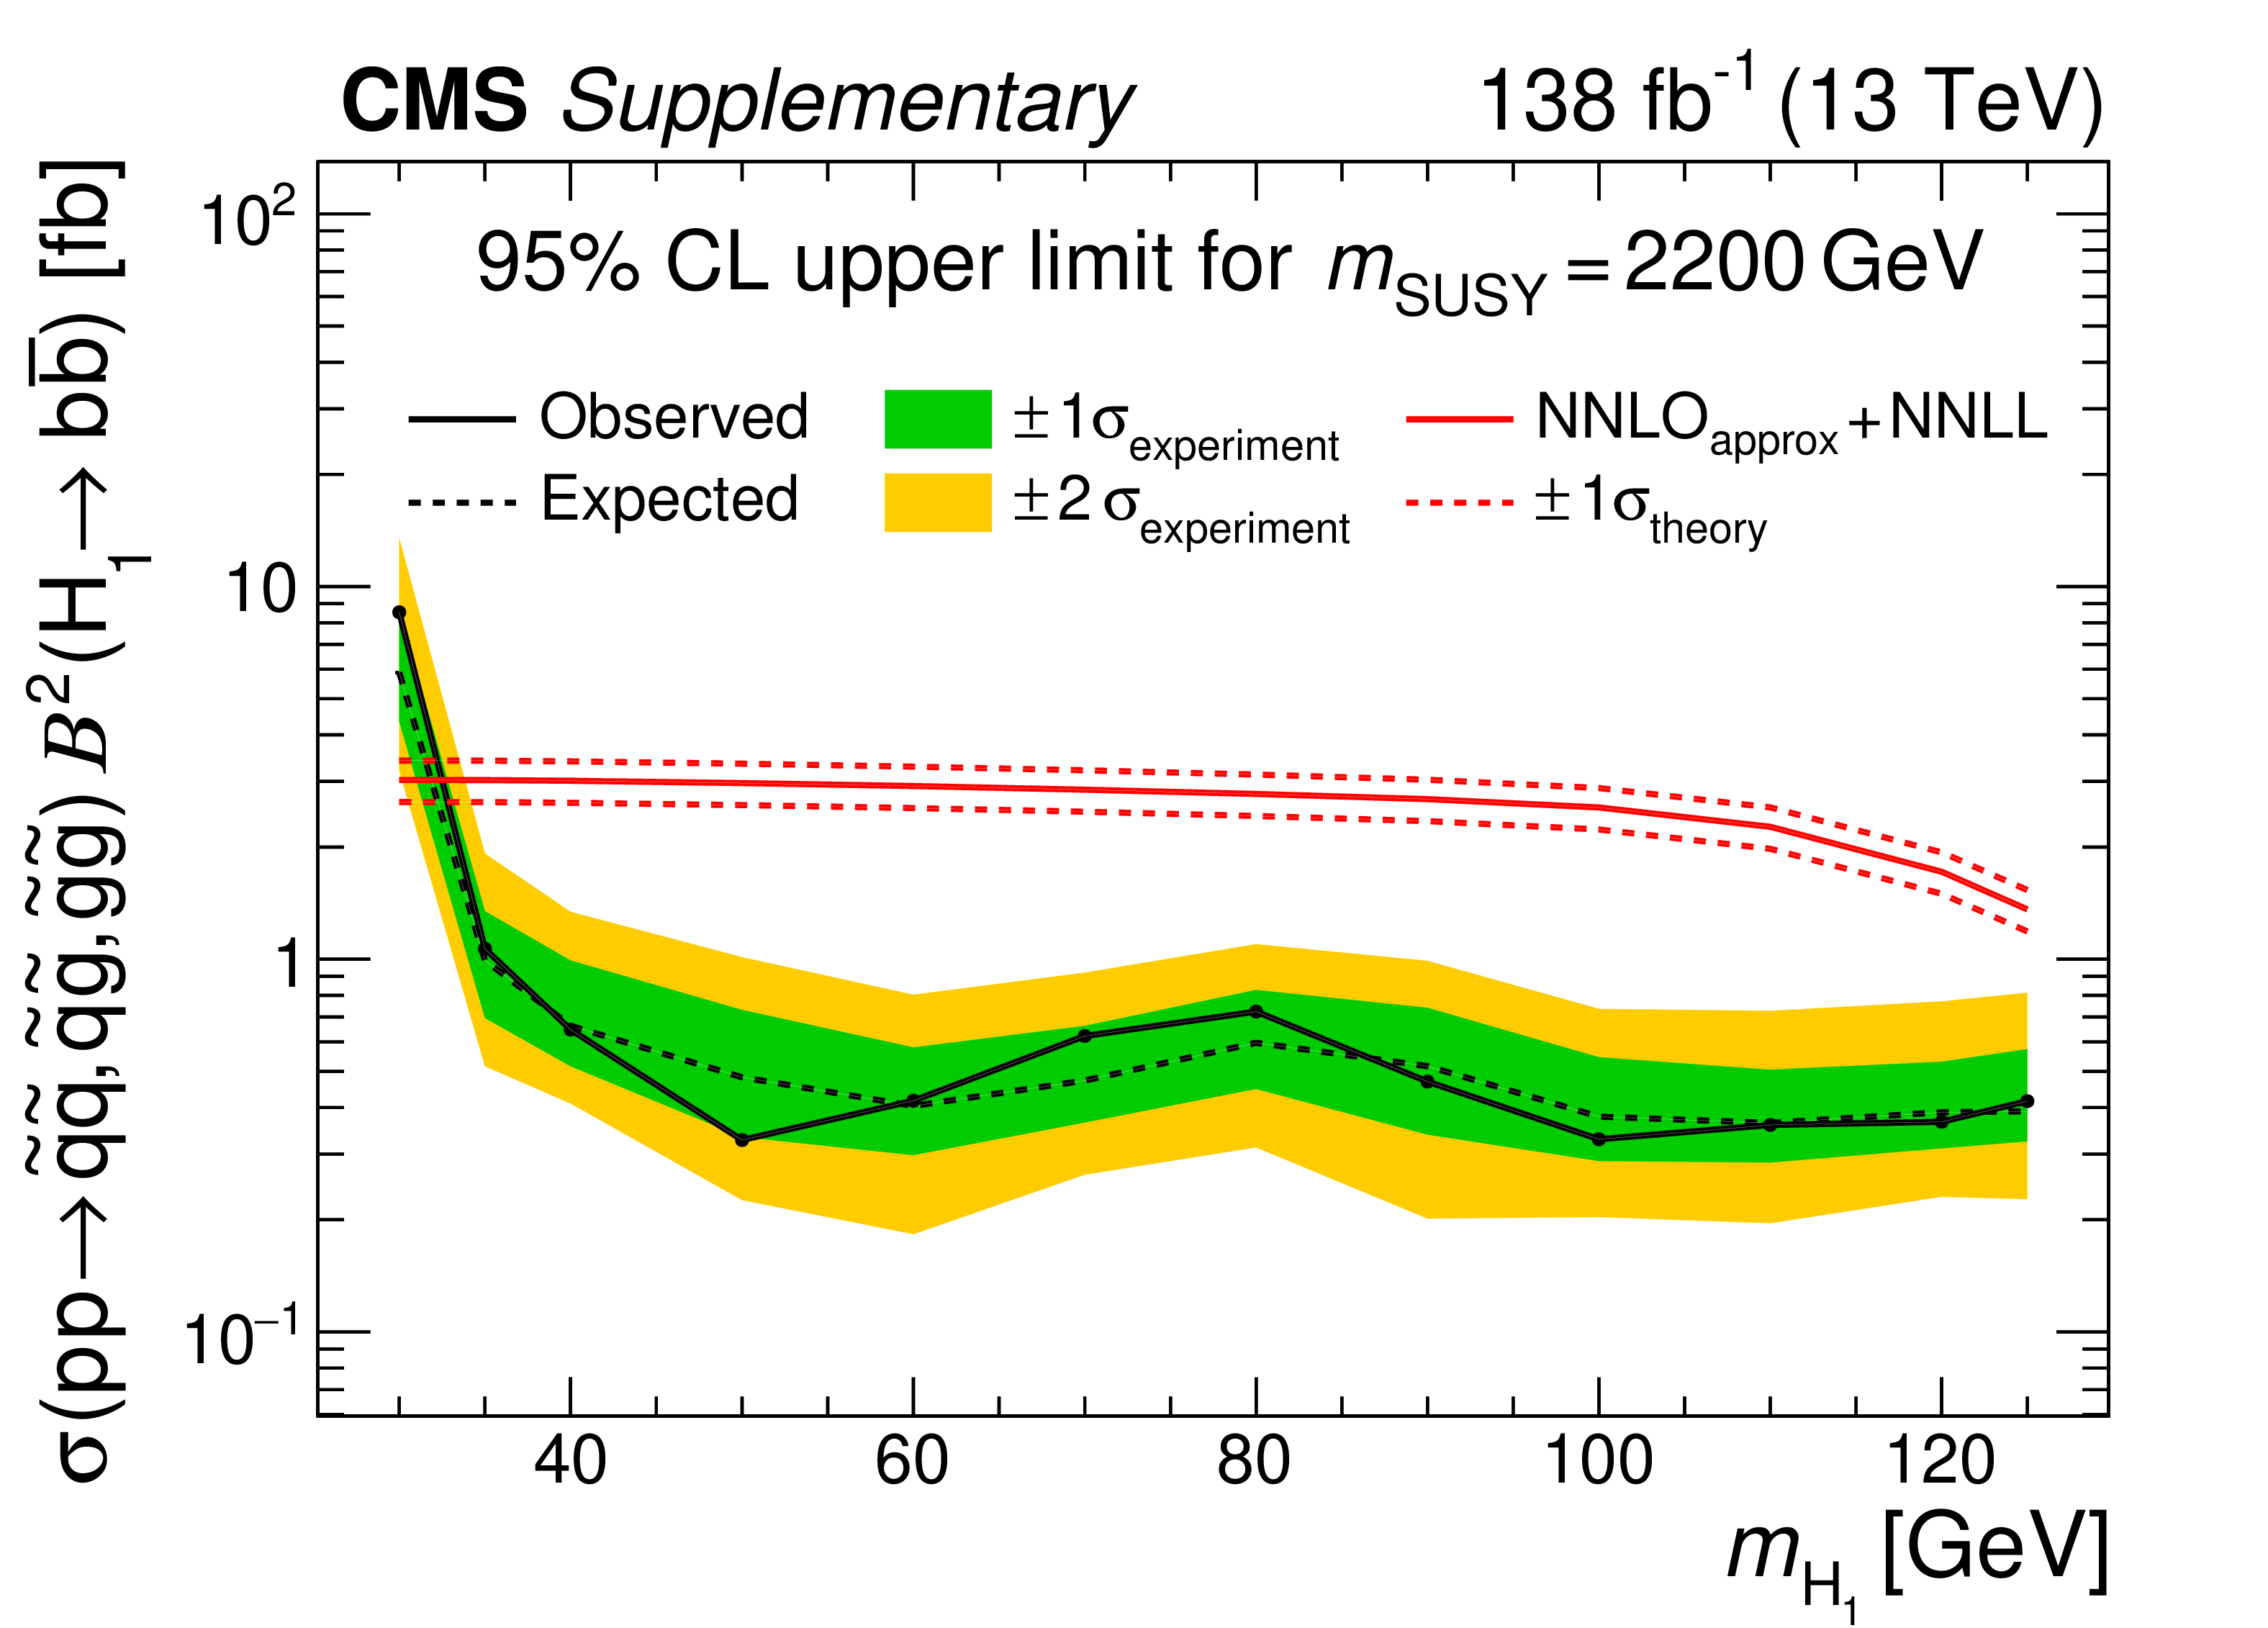
Additional Figure 7:
Upper limits at 95% CL on $\sigma \mathcal {B}^2$ as a function of ${m_{\mathrm{H} _1}}$, for $ {m_{\text {SUSY}}} = $ 2200 GeV. The solid and dashed black lines indicate the observed and median expected limits, respectively. The inner (green) band and the outer (yellow) band indicate the regions containing 68 and 95%, respectively, of the distribution of limits expected under the background-only hypothesis. The solid and dashed red lines show the theoretical value of $\sigma \mathcal {B}^2$ and its uncertainty. |
png pdf |
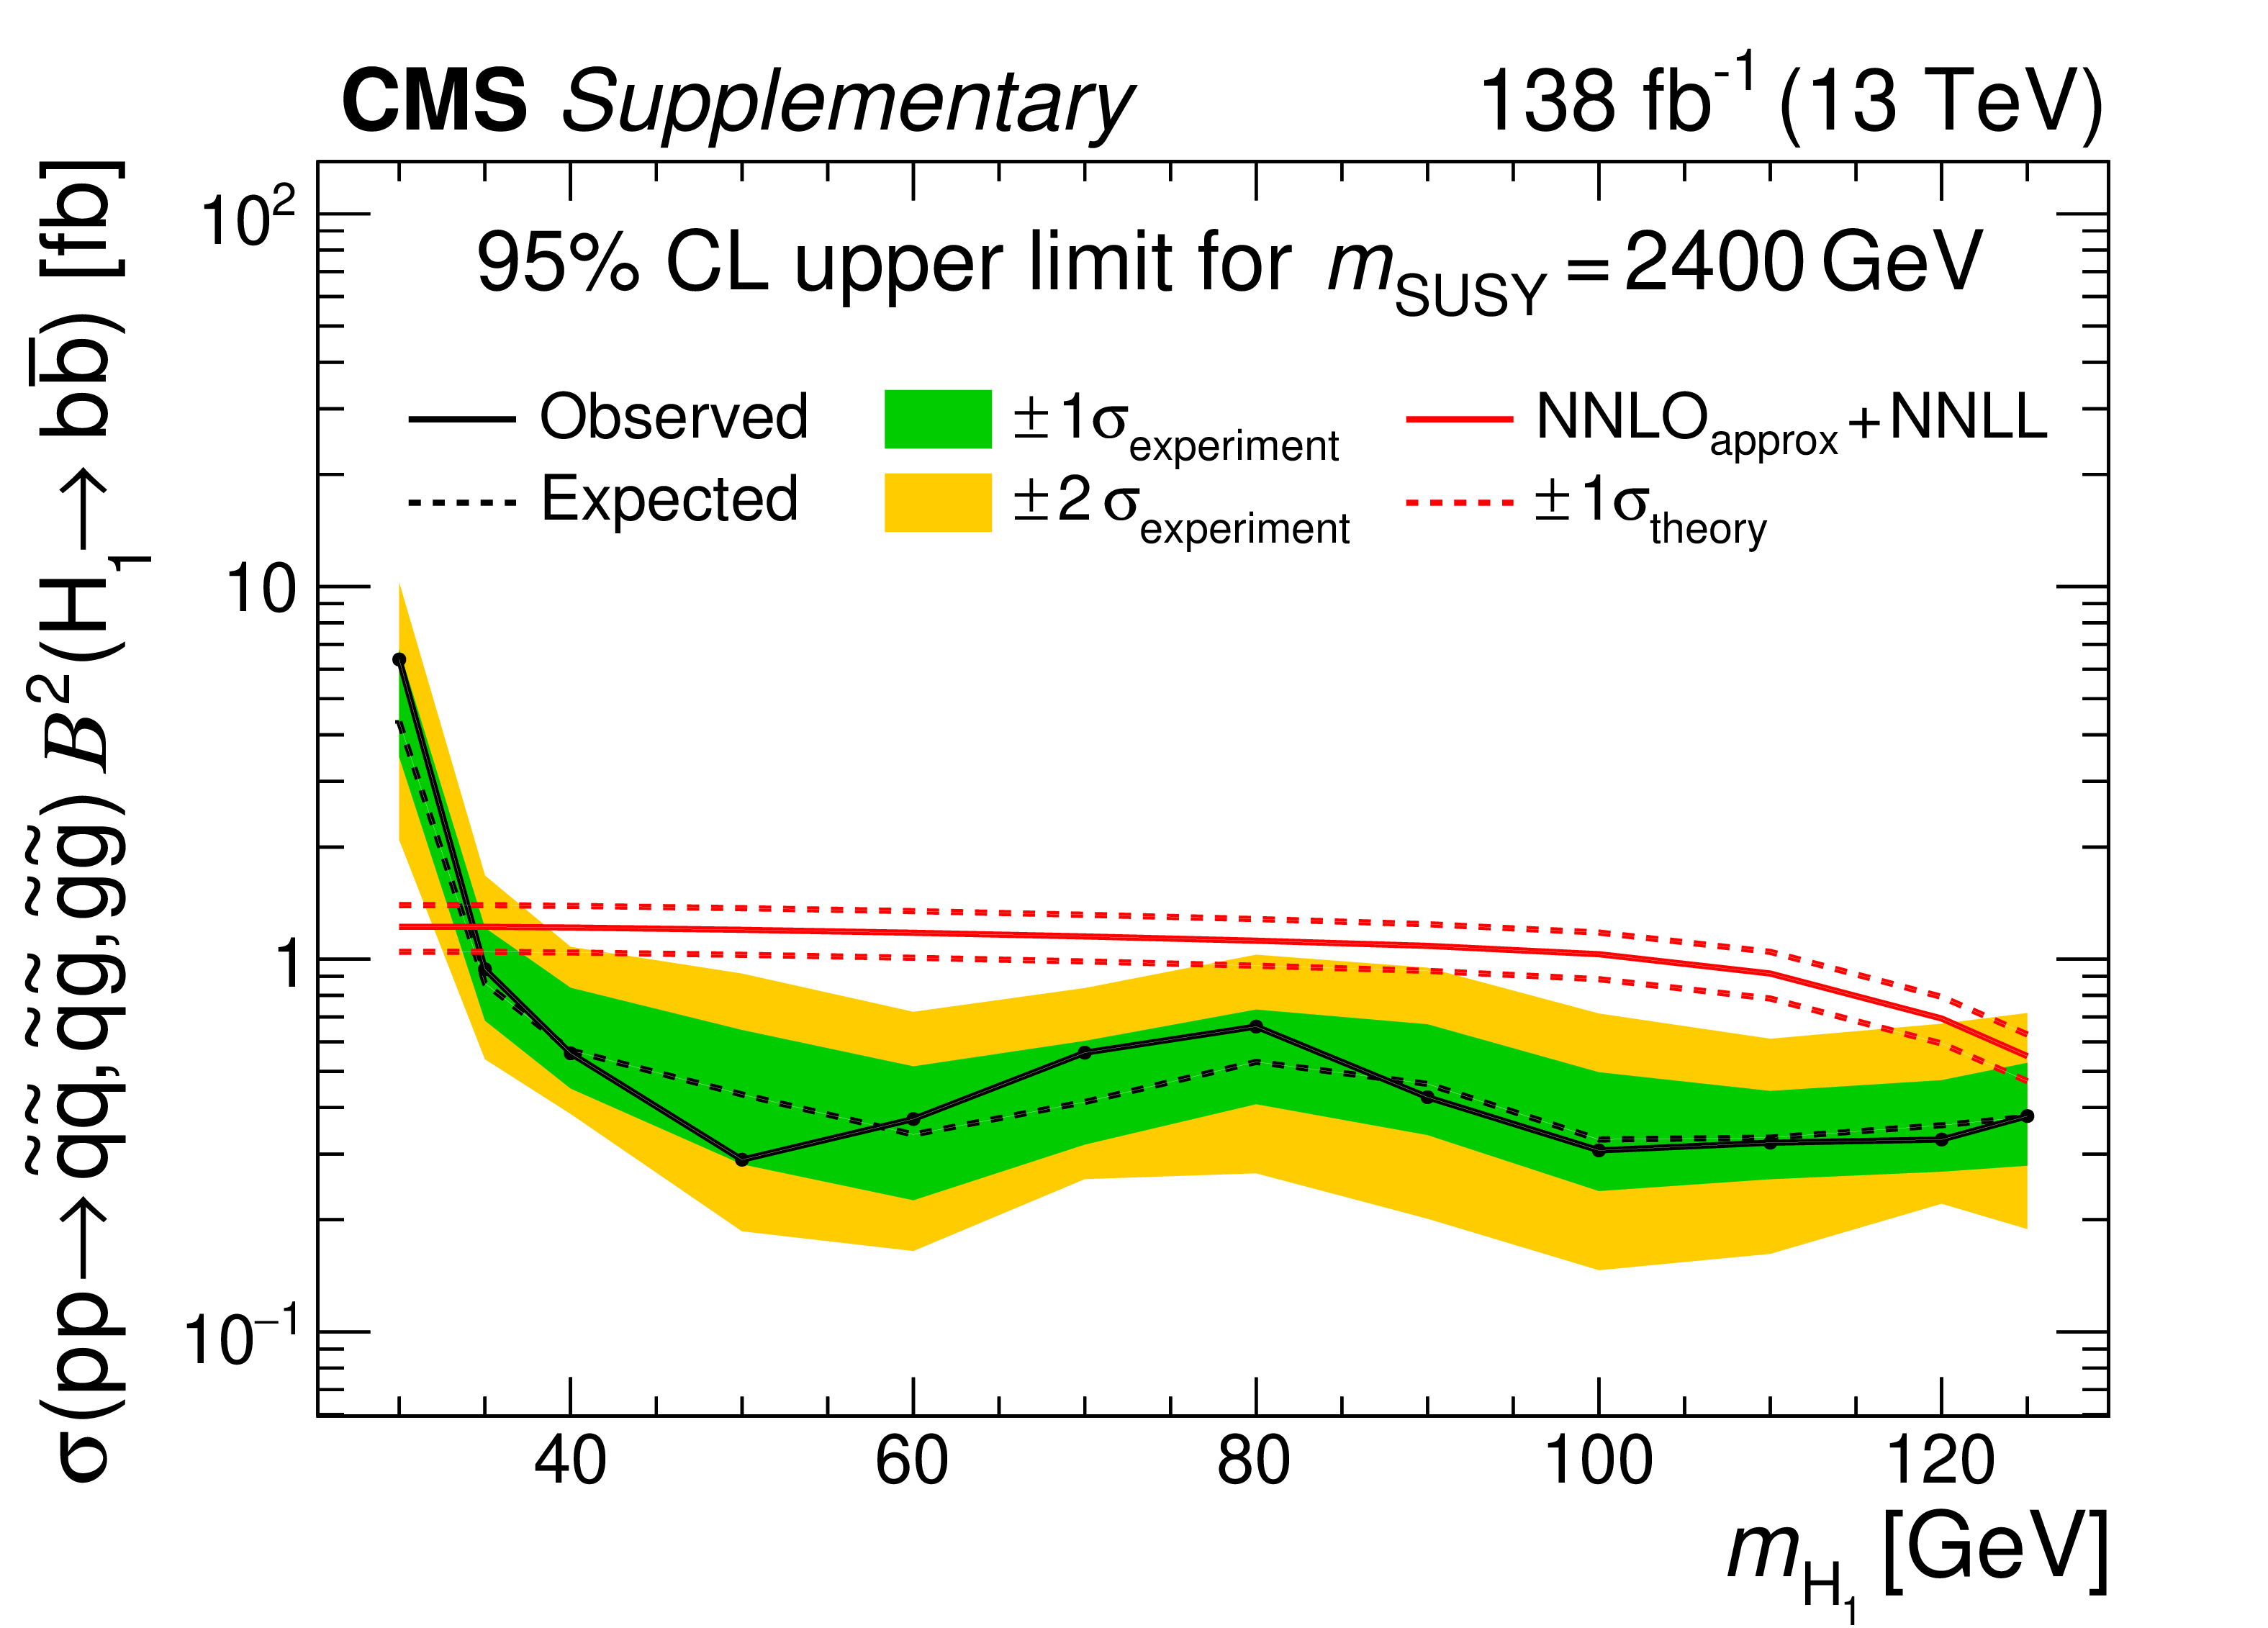
Additional Figure 8:
Upper limits at 95% CL on $\sigma \mathcal {B}^2$ as a function of ${m_{\mathrm{H} _1}}$, for $ {m_{\text {SUSY}}} = $ 2400 GeV. The solid and dashed black lines indicate the observed and median expected limits, respectively. The inner (green) band and the outer (yellow) band indicate the regions containing 68 and 95%, respectively, of the distribution of limits expected under the background-only hypothesis. The solid and dashed red lines show the theoretical value of $\sigma \mathcal {B}^2$ and its uncertainty. |
png pdf |
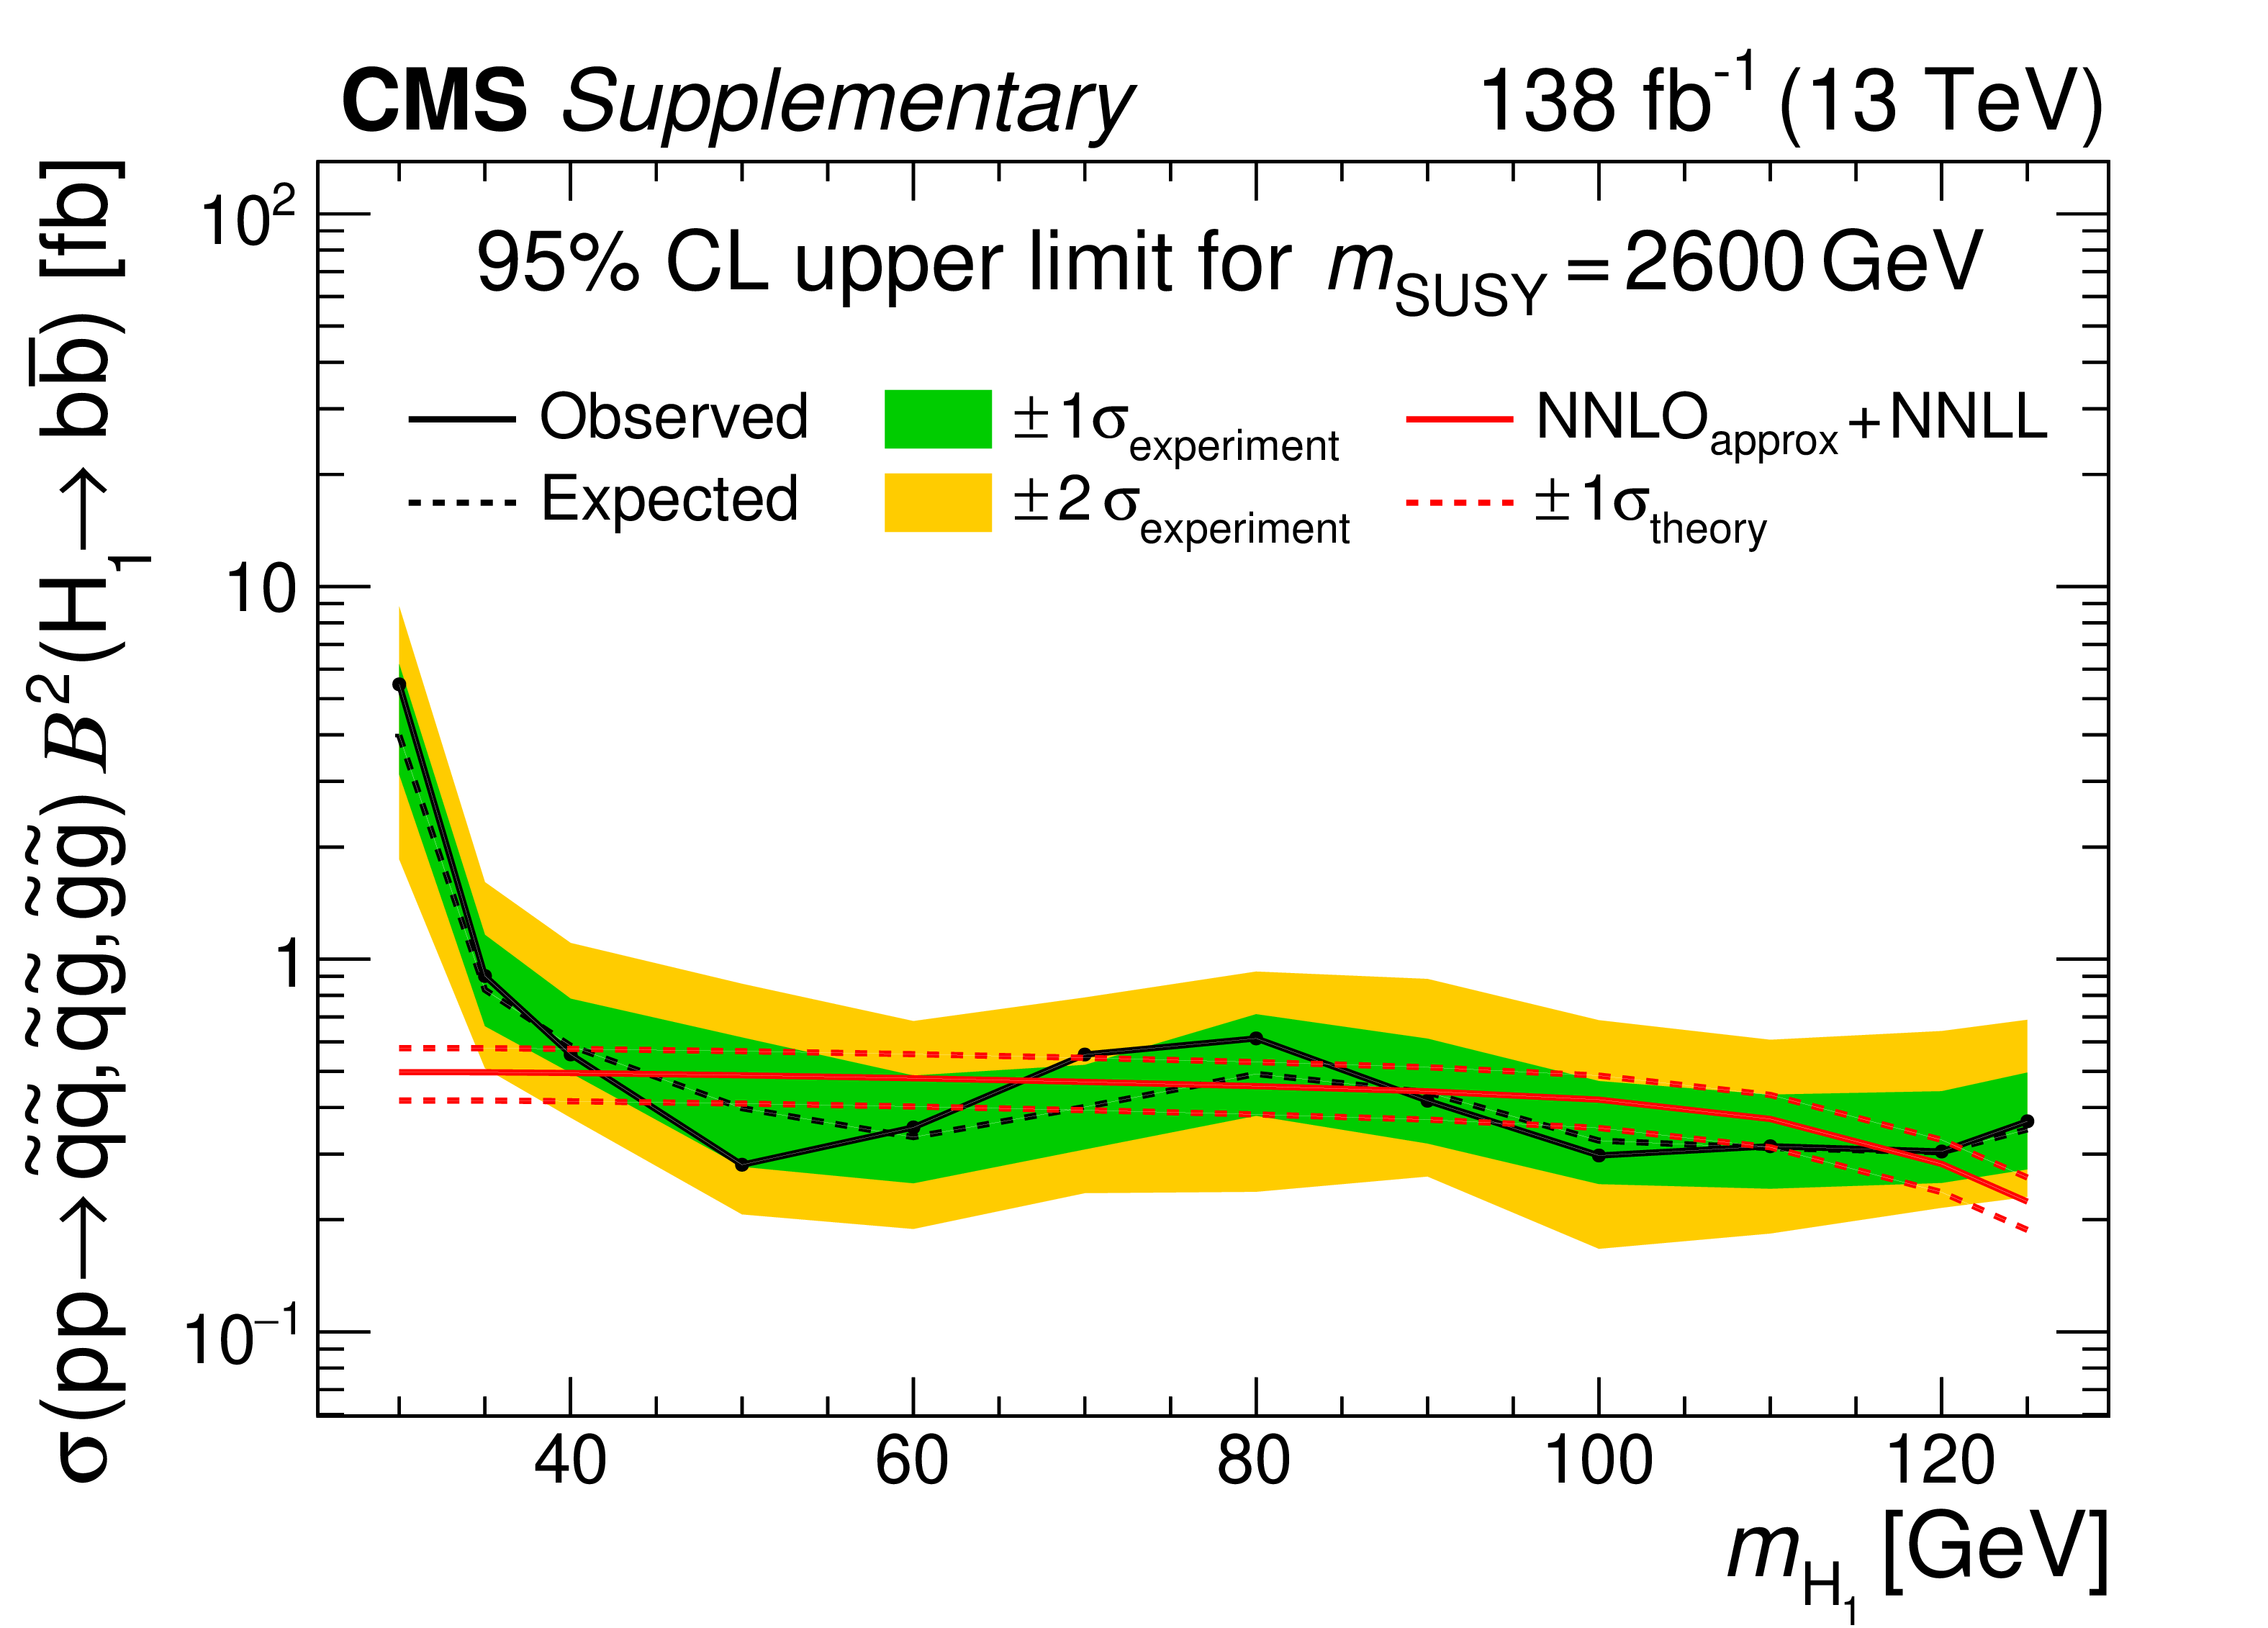
Additional Figure 9:
Upper limits at 95% CL on $\sigma \mathcal {B}^2$ as a function of ${m_{\mathrm{H} _1}}$, for $ {m_{\text {SUSY}}} = $ 2600 GeV. The solid and dashed black lines indicate the observed and median expected limits, respectively. The inner (green) band and the outer (yellow) band indicate the regions containing 68 and 95%, respectively, of the distribution of limits expected under the background-only hypothesis. The solid and dashed red lines show the theoretical value of $\sigma \mathcal {B}^2$ and its uncertainty. |
| References | ||||
| 1 | P. Ramond | Dual theory for free fermions | PRD 3 (1971) 2415 | |
| 2 | Y. A. Golfand and E. P. Likhtman | Extension of the algebra of Poincaré group generators and violation of P invariance | JEPTL 13 (1971)323 | |
| 3 | A. Neveu and J. H. Schwarz | Factorizable dual model of pions | NPB 31 (1971) 86 | |
| 4 | D. V. Volkov and V. P. Akulov | Possible universal neutrino interaction | JEPTL 16 (1972)438 | |
| 5 | J. Wess and B. Zumino | A Lagrangian model invariant under supergauge transformations | PLB 49 (1974) 52 | |
| 6 | J. Wess and B. Zumino | Supergauge transformations in four dimensions | NPB 70 (1974) 39 | |
| 7 | P. Fayet | Supergauge invariant extension of the Higgs mechanism and a model for the electron and its neutrino | NPB 90 (1975) 104 | |
| 8 | H. P. Nilles | Supersymmetry, supergravity and particle physics | Phys. Rep. 110 (1984) 1 | |
| 9 | U. Ellwanger, C. Hugonie, and A. M. Teixeira | The Next-to-Minimal Supersymmetric Standard Model | Phys. Repts. 496 (2010) 1 | 0910.1785 |
| 10 | U. Ellwanger and A. Teixeira | NMSSM with a singlino LSP: possible challenges for searches for supersymmetry at the LHC | JHEP 10 (2014) 113 | 1406.7221 |
| 11 | U. Ellwanger and A. Teixeira | Excessive Higgs pair production with little MET from squarks and gluinos in the NMSSM | JHEP 04 (2015) 172 | 1412.6394 |
| 12 | A. Titterton et al. | Exploring sensitivity to NMSSM signatures with low missing transverse energy at the LHC | JHEP 10 (2018) 064 | 1807.10672 |
| 13 | CMS Collaboration | Search for physics beyond the standard model in events with high-momentum Higgs bosons and missing transverse momentum in proton-proton collisions at 13 TeV | PRL 120 (2018) 241801 | CMS-SUS-17-006 1712.08501 |
| 14 | CMS Collaboration | Search for higgsinos in channels with two Higgs bosons and missing transverse momentum in proton-proton collisions at $ \sqrt{s} = $ 13 TeV | 2021. Submitted to JHEP | CMS-SUS-20-004 2201.04206 |
| 15 | ATLAS Collaboration | Search for pair production of higgsinos in final states with at least three $ b $-tagged jets in $ \sqrt{s} = $ 13 TeV pp collisions using the ATLAS detector | PRD 98 (2018) 092002 | 1806.04030 |
| 16 | CMS Collaboration | Searches for electroweak neutralino and chargino production in channels with Higgs, Z, and W bosons in pp collisions at 8 TeV | PRD 90 (2014) 092007 | CMS-SUS-14-002 1409.3168 |
| 17 | CMS Collaboration | Search for higgsino pair production in $ {\mathrm{p}}{\mathrm{p}} $ collisions at $ \sqrt{s} = $ 13 TeV in final states with large missing transverse momentum and two Higgs bosons decaying via $ \mathrm{H} \to \mathrm{b\bar{b}} $ | PRD 97 (2018) 032007 | CMS-SUS-16-044 1709.04896 |
| 18 | CMS Collaboration | Precision luminosity measurement in proton-proton collisions at $ \sqrt{s} = $ 13 TeV in 2015 and 2016 at CMS | EPJC 81 (2021) 800 | CMS-LUM-17-003 2104.01927 |
| 19 | CMS Collaboration | CMS luminosity measurement for the 2017 data-taking period at $ \sqrt{s} = $ 13 TeV | CMS-PAS-LUM-17-004 | CMS-PAS-LUM-17-004 |
| 20 | CMS Collaboration | CMS luminosity measurement for the 2018 data-taking period at $ \sqrt{s} = $ 13 TeV | CMS-PAS-LUM-18-002 | CMS-PAS-LUM-18-002 |
| 21 | W. Beenakker, R. Hopker, M. Spira, and P. M. Zerwas | Squark and gluino production at hadron colliders | NPB 492 (1997) 51 | hep-ph/9610490 |
| 22 | A. Kulesza and L. Motyka | Threshold resummation for squark-antisquark and gluino-pair production at the LHC | PRL 102 (2009) 111802 | 0807.2405 |
| 23 | A. Kulesza and L. Motyka | Soft gluon resummation for the production of gluino-gluino and squark-antisquark pairs at the LHC | PRD 80 (2009) 095004 | 0905.4749 |
| 24 | W. Beenakker et al. | Soft-gluon resummation for squark and gluino hadroproduction | JHEP 12 (2009) 041 | 0909.4418 |
| 25 | W. Beenakker et al. | Squark and gluino hadroproduction | Int. J. Mod. Phys. A 26 (2011) 2637 | 1105.1110 |
| 26 | W. Beenakker et al. | NNLL resummation for squark-antisquark pair production at the LHC | JHEP 01 (2012) 076 | 1110.2446 |
| 27 | W. Beenakker et al. | Towards NNLL resummation: hard matching coefficients for squark and gluino hadroproduction | JHEP 10 (2013) 120 | 1304.6354 |
| 28 | W. Beenakker et al. | NNLL resummation for squark and gluino production at the LHC | JHEP 12 (2014) 023 | 1404.3134 |
| 29 | W. Beenakker et al. | NNLL-fast: predictions for coloured supersymmetric particle production at the LHC with threshold and Coulomb resummation | JHEP 12 (2016) 133 | 1607.07741 |
| 30 | A. Djouadi, J. Kalinowski, and M. Spira | HDECAY: a program for Higgs boson decays in the standard model and its supersymmetric extension | CPC 108 (1998) 56 | hep-ph/9704448 |
| 31 | A. Djouadi, J. Kalinowski, M. Muhlleitner, and M. Spira | HDECAY: Twenty++ years after | CPC 238 (2019) 214 | 1801.09506 |
| 32 | CMS Collaboration | Performance of the CMS Level-1 trigger in proton-proton collisions at $ \sqrt{s} = $ 13 TeV | JINST 15 (2020) P10017 | CMS-TRG-17-001 2006.10165 |
| 33 | CMS Collaboration | The CMS trigger system | JINST 12 (2017) P01020 | CMS-TRG-12-001 1609.02366 |
| 34 | CMS Collaboration | The CMS experiment at the CERN LHC | JINST 3 (2008) S08004 | CMS-00-001 |
| 35 | J. Alwall et al. | The automated computation of tree-level and next-to-leading order differential cross sections, and their matching to parton shower simulations | JHEP 07 (2014) 079 | 1405.0301 |
| 36 | J. Alwall et al. | Comparative study of various algorithms for the merging of parton showers and matrix elements in hadronic collisions | EPJC 53 (2008) 473 | 0706.2569 |
| 37 | S. Frixione, P. Nason, and G. Ridolfi | A positive-weight next-to-leading-order Monte Carlo for heavy flavour hadroproduction | JHEP 09 (2007) 126 | 0707.3088 |
| 38 | P. Nason | A new method for combining NLO QCD with shower Monte Carlo algorithms | JHEP 11 (2004) 040 | hep-ph/0409146 |
| 39 | S. Frixione, P. Nason, and C. Oleari | Matching NLO QCD computations with parton shower simulations: the POWHEG method | JHEP 11 (2007) 070 | 0709.2092 |
| 40 | S. Alioli, P. Nason, C. Oleari, and E. Re | A general framework for implementing NLO calculations in shower Monte Carlo programs: the POWHEG BOX | JHEP 06 (2010) 043 | 1002.2581 |
| 41 | NNPDF Collaboration | Unbiased global determination of parton distributions and their uncertainties at NNLO and LO | NPB 855 (2012) 153 | 1107.2652 |
| 42 | NNPDF Collaboration | Parton distributions for the LHC Run II | JHEP 04 (2015) 040 | 1410.8849 |
| 43 | NNPDF Collaboration | Parton distributions with QED corrections | NPB 877 (2013) 290 | 1308.0598 |
| 44 | NNPDF Collaboration | Parton distributions from high-precision collider data | EPJC 77 (2017) 663 | 1706.00428 |
| 45 | T. Sjostrand et al. | An introduction to PYTHIA 8.2 | CPC 191 (2015) 159 | 1410.3012 |
| 46 | CMS Collaboration | Event generator tunes obtained from underlying event and multiparton scattering measurements | EPJC 76 (2016) 155 | CMS-GEN-14-001 1512.00815 |
| 47 | P. Skands, S. Carrazza, and J. Rojo | Tuning PYTHIA 8.1: the Monash 2013 tune | EPJC 74 (2014) 3024 | 1404.5630 |
| 48 | CMS Collaboration | Extraction and validation of a new set of CMS PYTHIA 8 tunes from underlying-event measurements | EPJC 80 (2020) 4 | CMS-GEN-17-001 1903.12179 |
| 49 | M. Czakon and A. Mitov | TOP++: a program for the calculation of the top-pair cross-section at hadron colliders | CPC 185 (2014) 2930 | 1112.5675 |
| 50 | R. Gavin, Y. Li, F. Petriello, and S. Quackenbush | FEWZ 2.0: A code for hadronic Z production at next-to-next-to-leading order | CPC 182 (2011) 2388 | 1011.3540 |
| 51 | R. Gavin, Y. Li, F. Petriello, and S. Quackenbush | W physics at the LHC with FEWZ 2.1 | CPC 184 (2013) 208 | 1201.5896 |
| 52 | Y. Li and F. Petriello | Combining QCD and electroweak corrections to dilepton production in FEWZ | PRD 86 (2012) 094034 | 1208.5967 |
| 53 | CMS Collaboration | Measurement of the inelastic proton-proton cross section at $ \sqrt{s}= $ 13 TeV | JHEP 07 (2018) 161 | CMS-FSQ-15-005 1802.02613 |
| 54 | GEANT4 Collaboration | GEANT4--a simulation toolkit | NIMA 506 (2003) 250 | |
| 55 | CMS Collaboration | Particle-flow reconstruction and global event description with the CMS detector | JINST 12 (2017) P10003 | CMS-PRF-14-001 1706.04965 |
| 56 | M. Cacciari, G. P. Salam, and G. Soyez | The anti-$ {k_{\mathrm{T}}} $ jet clustering algorithm | JHEP 04 (2008) 063 | 0802.1189 |
| 57 | M. Cacciari, G. P. Salam, and G. Soyez | FastJet user manual | EPJC 72 (2012) 1896 | 1111.6097 |
| 58 | CMS Collaboration | Technical proposal for the Phase-II upgrade of the Compact Muon Solenoid | CMS-PAS-TDR-15-002 | CMS-PAS-TDR-15-002 |
| 59 | CMS Collaboration | Pileup mitigation at CMS in 13 TeV data | JINST 15 (2020) P09018 | CMS-JME-18-001 2003.00503 |
| 60 | D. Bertolini, P. Harris, M. Low, and N. Tran | Pileup Per Particle Identification | JHEP 10 (2014) 059 | 1407.6013 |
| 61 | CMS Collaboration | Jet energy scale and resolution in the CMS experiment in pp collisions at 8 TeV | JINST 12 (2017) P02014 | CMS-JME-13-004 1607.03663 |
| 62 | CMS Collaboration | Jet energy scale and resolution performance with 13 TeV data collected by CMS in 2016 | CDS | |
| 63 | CMS Collaboration | Jet performance in pp collisions at $ \sqrt{s}= $ 7 TeV | CMS-PAS-JME-10-003 | |
| 64 | CMS Collaboration | Jet algorithms performance in 13 TeV data | CMS-PAS-JME-16-003 | CMS-PAS-JME-16-003 |
| 65 | CMS Collaboration | Identification of heavy-flavour jets with the CMS detector in pp collisions at 13 TeV | JINST 13 (2018) P05011 | CMS-BTV-16-002 1712.07158 |
| 66 | T. Adams et al. | Beam test evaluation of electromagnetic calorimeter modules made from proton-damaged PbWO$ _4 $ crystals | JINST 11 (2016) P04012 | |
| 67 | A. J. Larkoski, S. Marzani, G. Soyez, and J. Thaler | Soft Drop | JHEP 05 (2014) 146 | 1402.2657 |
| 68 | ATLAS and CMS Collaborations | Procedure for the LHC Higgs boson search combination in summer 2011 | CMS-NOTE-2011-005 | |
| 69 | T. Junk | Confidence level computation for combining searches with small statistics | NIMA 434 (1999) 435 | hep-ex/9902006 |
| 70 | A. L. Read | Presentation of search results: The CLs technique | JPG 28 (2002) 2693 | |
| 71 | CMS Collaboration | HEPData record for this analysis | link | |
|
|
Compact Muon Solenoid LHC, CERN |
|

|

|

|

|

|