

Compact Muon Solenoid
LHC, CERN
| CMS-HIG-21-015 ; CERN-EP-2022-131 | ||
| Search for the Higgs boson decay to a pair of electrons in proton-proton collisions at $\sqrt{s}=$ 13 TeV | ||
| CMS Collaboration | ||
| 30 July 2022 | ||
| Phys. Lett. B 846 (2023) 137783 | ||
| Abstract: A search is presented for the Higgs boson decay to a pair of electrons (e$^{+}$e$^{-}$) in proton-proton collisions at $\sqrt{s}=$ 13 TeV. The data set was collected with the CMS experiment at the LHC between 2016 and 2018, corresponding to an integrated luminosity of 138 fb$^{-1}$. The analysis uses event categories targeting Higgs boson production via gluon fusion and vector boson fusion. The observed upper limit on the Higgs boson branching fraction to an electron pair is 3.0 $\times$ 10$^{-4}$ (3.0 $\times$ 10$^{-4}$ expected) at the 95% confidence level, which is the most stringent limit on this branching fraction to date. | ||
| Links: e-print arXiv:2208.00265 [hep-ex] (PDF) ; CDS record ; inSPIRE record ; HepData record ; CADI line (restricted) ; | ||
| Figures | |
png pdf |
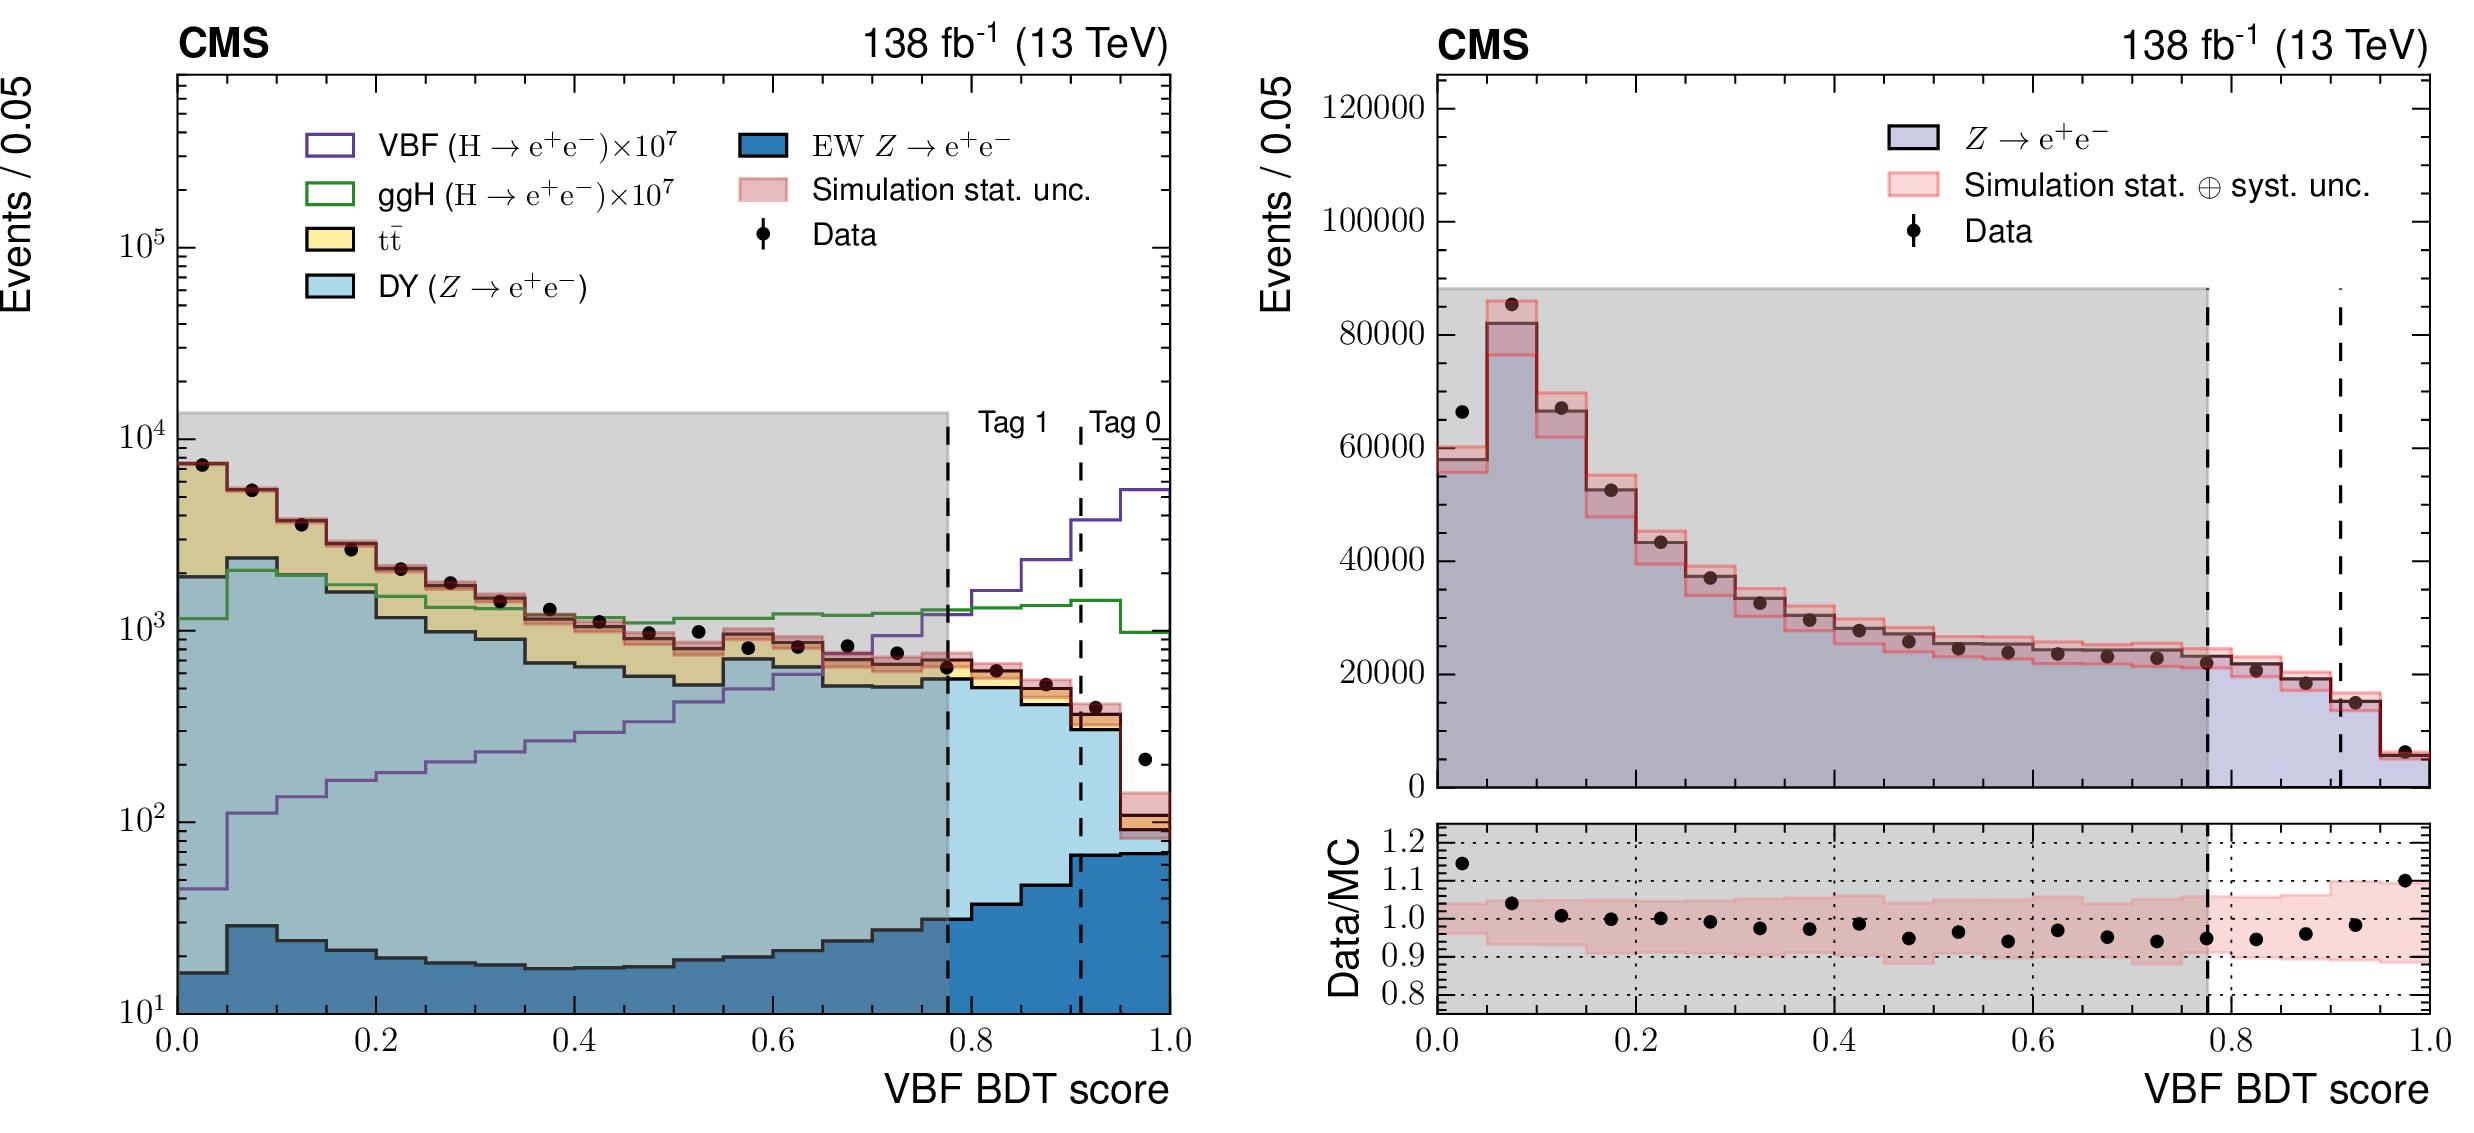
Figure 1:
Distribution of the output score of the VBF BDT in all simulated background and signal events, and data (left), passing VBF preselection. The ggH and VBF signals are scaled for better visibility. Category boundaries targeting VBF production are denoted with dashed lines. The shaded region defines events which are not selected to enter VBF analysis categories, but may populate those targeting ggH. The right plot shows the distribution of the output score of the VBF BDT in a control region around the Z boson mass. The combined impact of the statistical and systematic uncertainties in simulation is shown by the red shaded band, where the systematic component includes uncertainties on the jet energy scale and resolution corrections, alongside the electron energy scale corrections. Uncertainties in the efficiency of electron identification, reconstruction, and trigger selection are also included, as well as the uncertainty on the integrated luminosity, presented in Section 7. Good agreement is observed between the DY simulation (filled histogram) and data (black markers), within the phase space in which the analysis categories are constructed. |
png pdf |
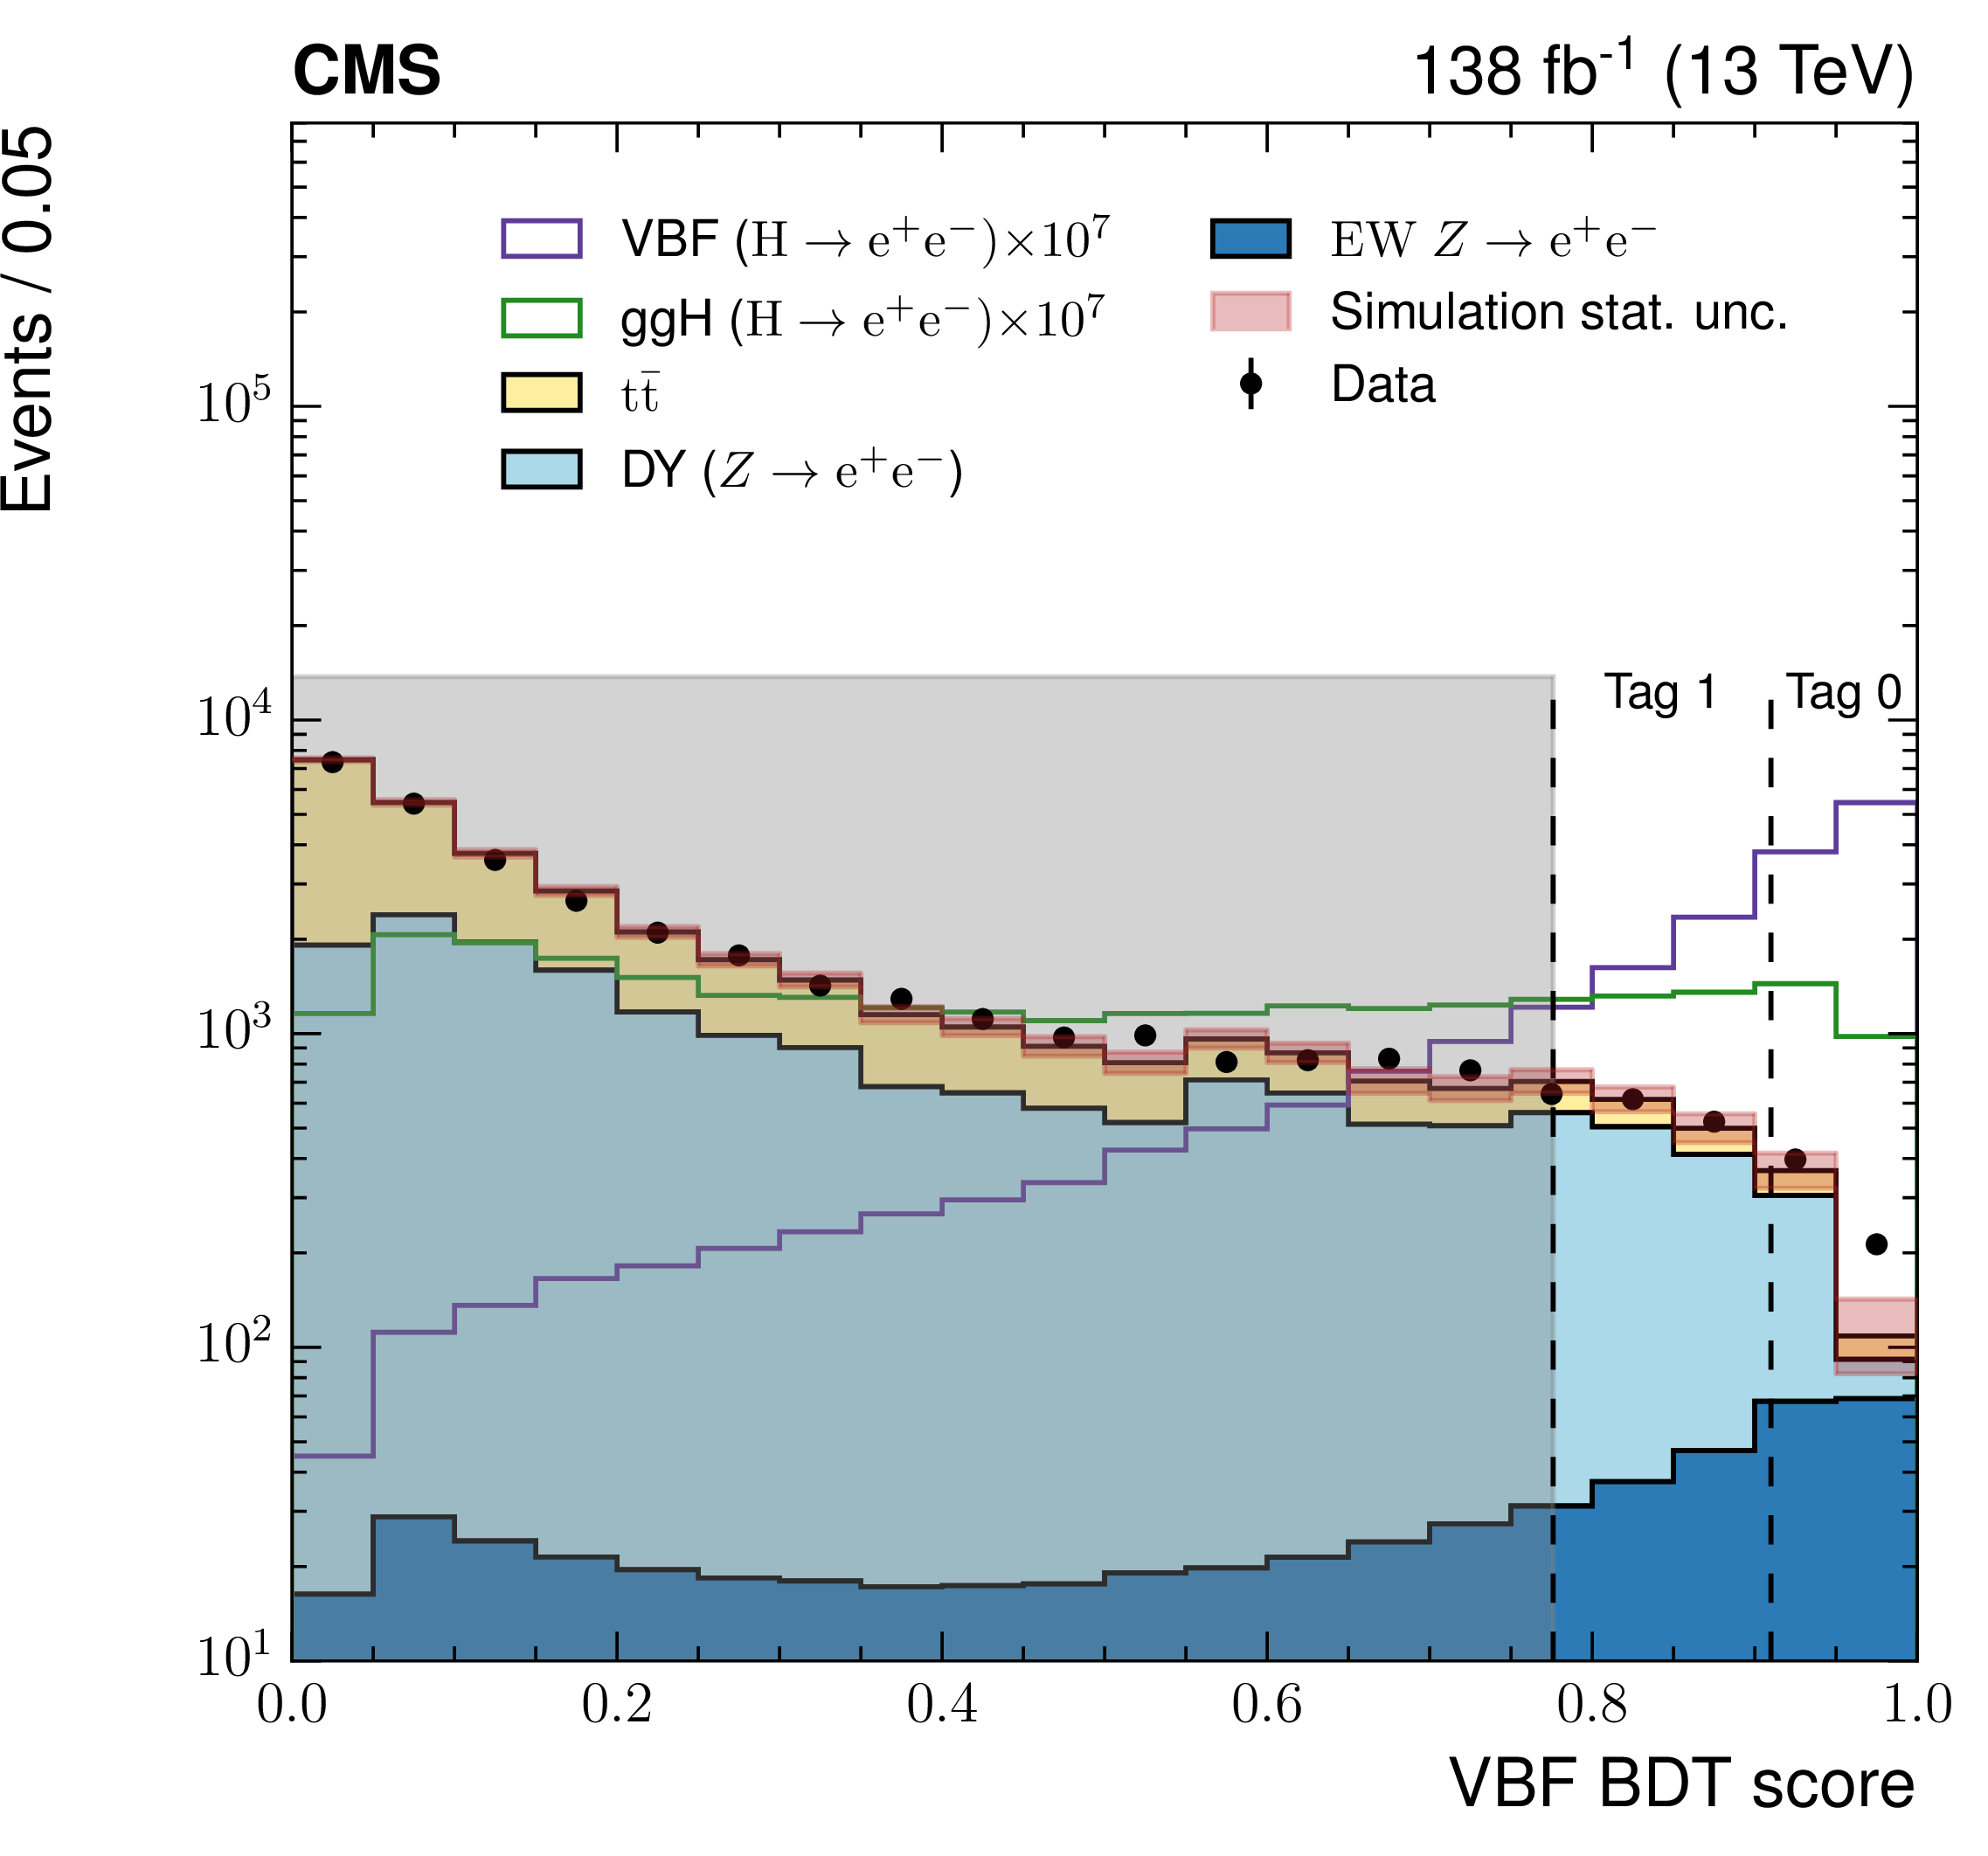
Figure 1-a:
Distribution of the output score of the VBF BDT in all simulated background and signal events, and data, passing VBF preselection. The ggH and VBF signals are scaled for better visibility. Category boundaries targeting VBF production are denoted with dashed lines. The shaded region defines events which are not selected to enter VBF analysis categories, but may populate those targeting ggH. The combined impact of the statistical and systematic uncertainties in simulation is shown by the red shaded band, where the systematic component includes uncertainties on the jet energy scale and resolution corrections, alongside the electron energy scale corrections. Uncertainties in the efficiency of electron identification, reconstruction, and trigger selection are also included, as well as the uncertainty on the integrated luminosity, presented in Section 7. |

png pdf |
Figure 1-b:
Distribution of the output score of the VBF BDT in a control region around the Z boson mass. The combined impact of the statistical and systematic uncertainties in simulation is shown by the red shaded band, where the systematic component includes uncertainties on the jet energy scale and resolution corrections, alongside the electron energy scale corrections. Uncertainties in the efficiency of electron identification, reconstruction, and trigger selection are also included, as well as the uncertainty on the integrated luminosity, presented in Section 7. Good agreement is observed between the DY simulation (filled histogram) and data (black markers), within the phase space in which the analysis categories are constructed. |
png pdf |
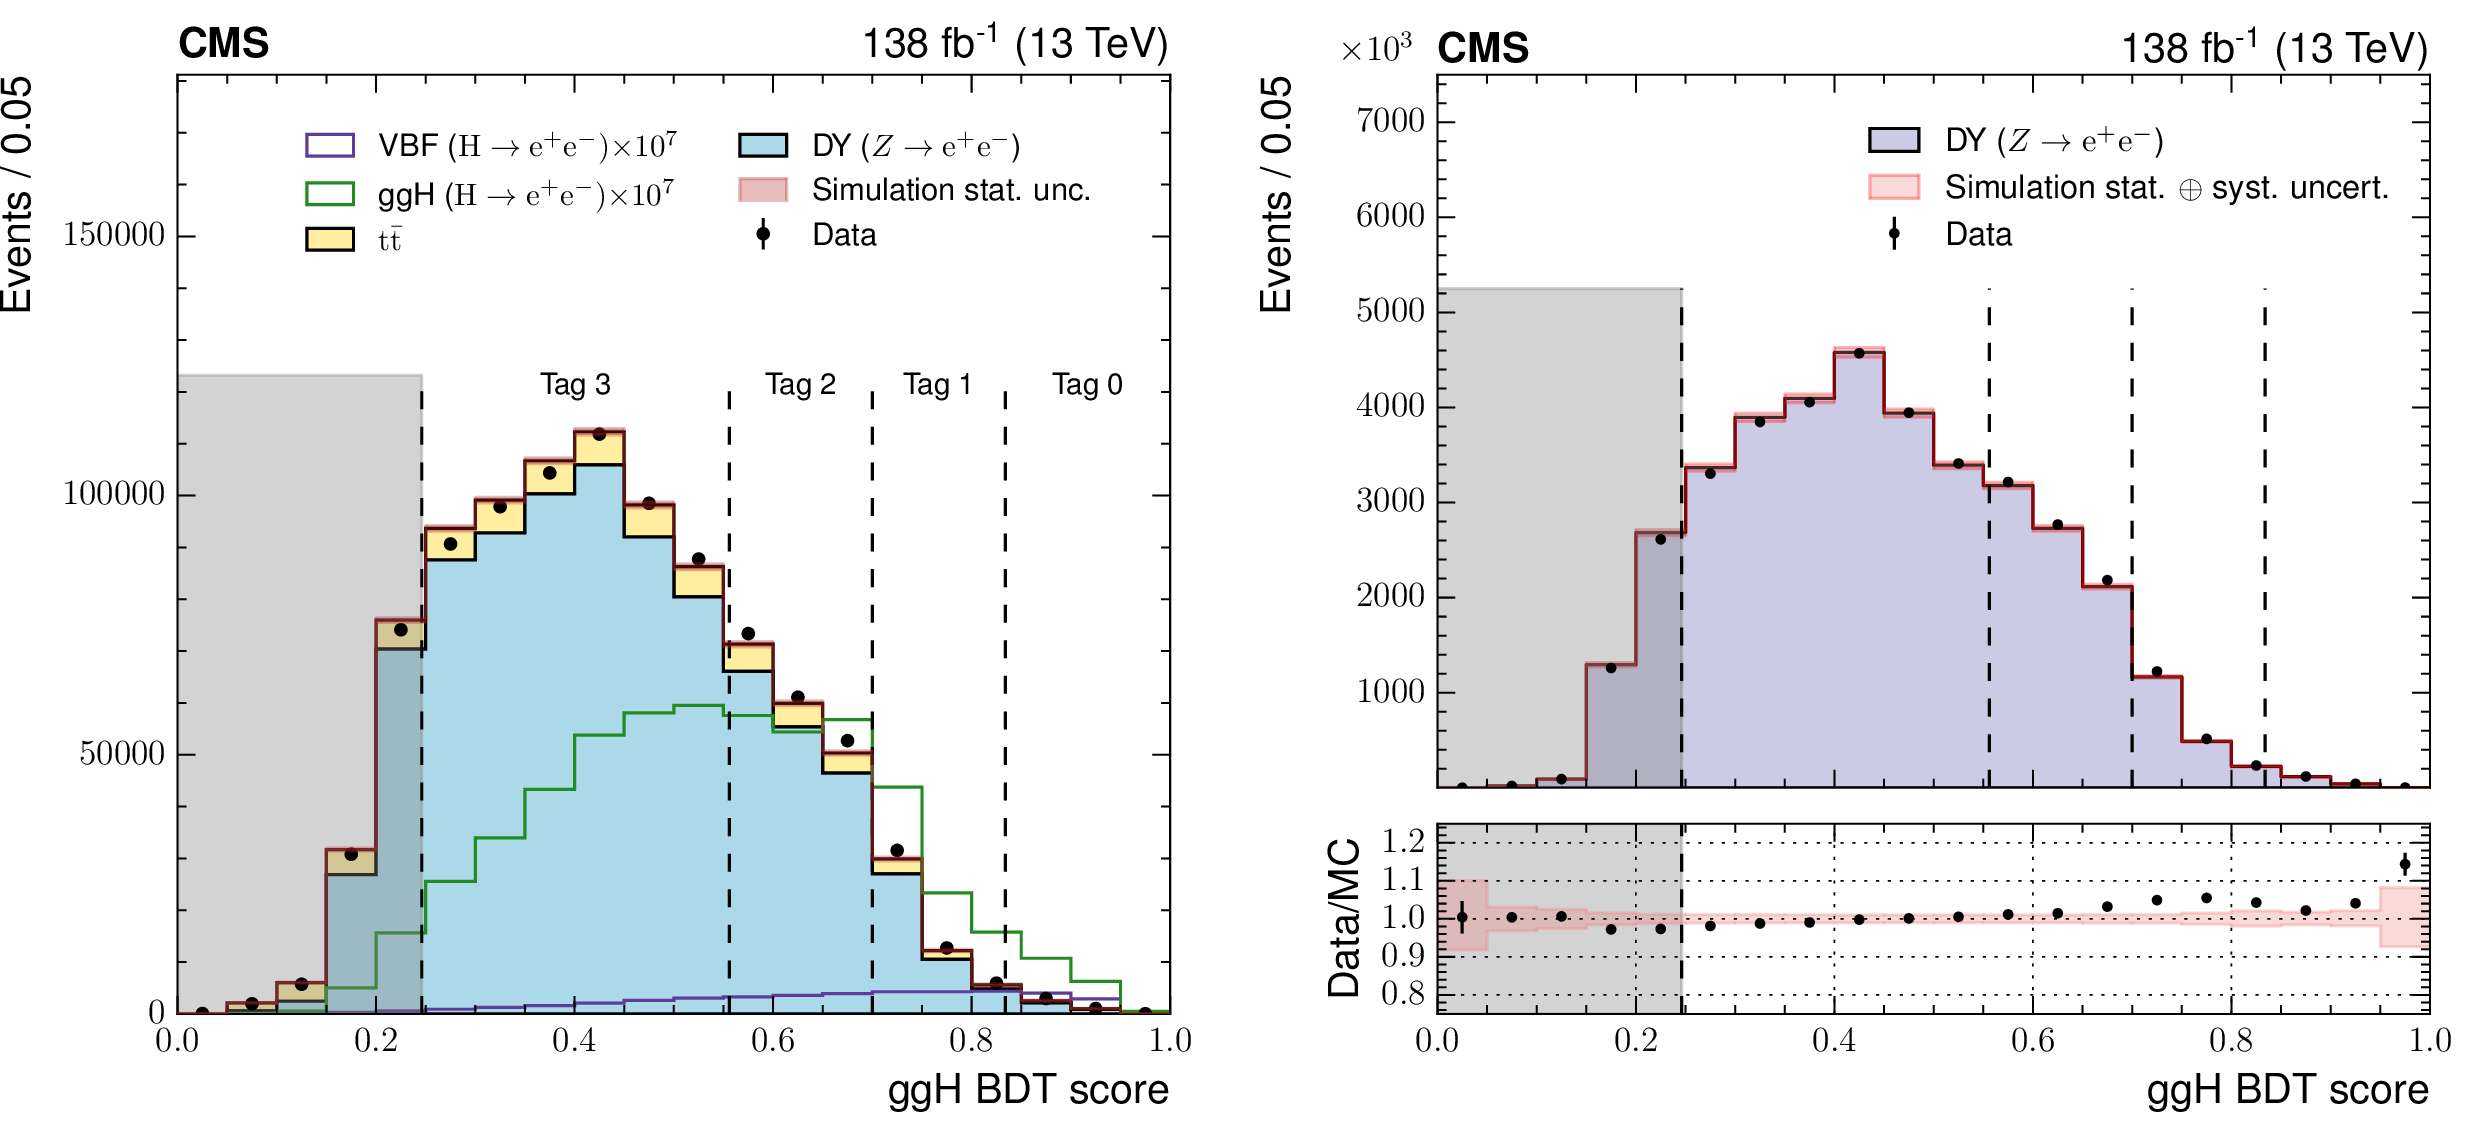
Figure 2:
Distribution of the output score of the ggH BDT in simulated background and signal events, and data (left). The ggH and VBF signals are scaled such that they are visible. Category boundaries targeting ggH Higgs boson production are denoted with dashed lines. Events with scores in the grey shaded region are discarded from the analysis. The right plot shows the distribution of the output score of the ggH BDT in a control region around the Z boson mass. Agreement is compared between the DY simulation (filled histogram) and data (black points). The combined impact of the statistical and systematic uncertainties in simulation is shown by the red shaded band, where the sources contributing to the systematic component are identical to those included in Fig. 1. Residual differences between data and simulation are smaller than the ggH cross section uncertainty which is included in the final maximum likelihood fit. |

png pdf |
Figure 2-a:
Distribution of the output score of the ggH BDT in simulated background and signal events, and data. The ggH and VBF signals are scaled such that they are visible. Category boundaries targeting ggH Higgs boson production are denoted with dashed lines. Events with scores in the grey shaded region are discarded from the analysis. |
png pdf |
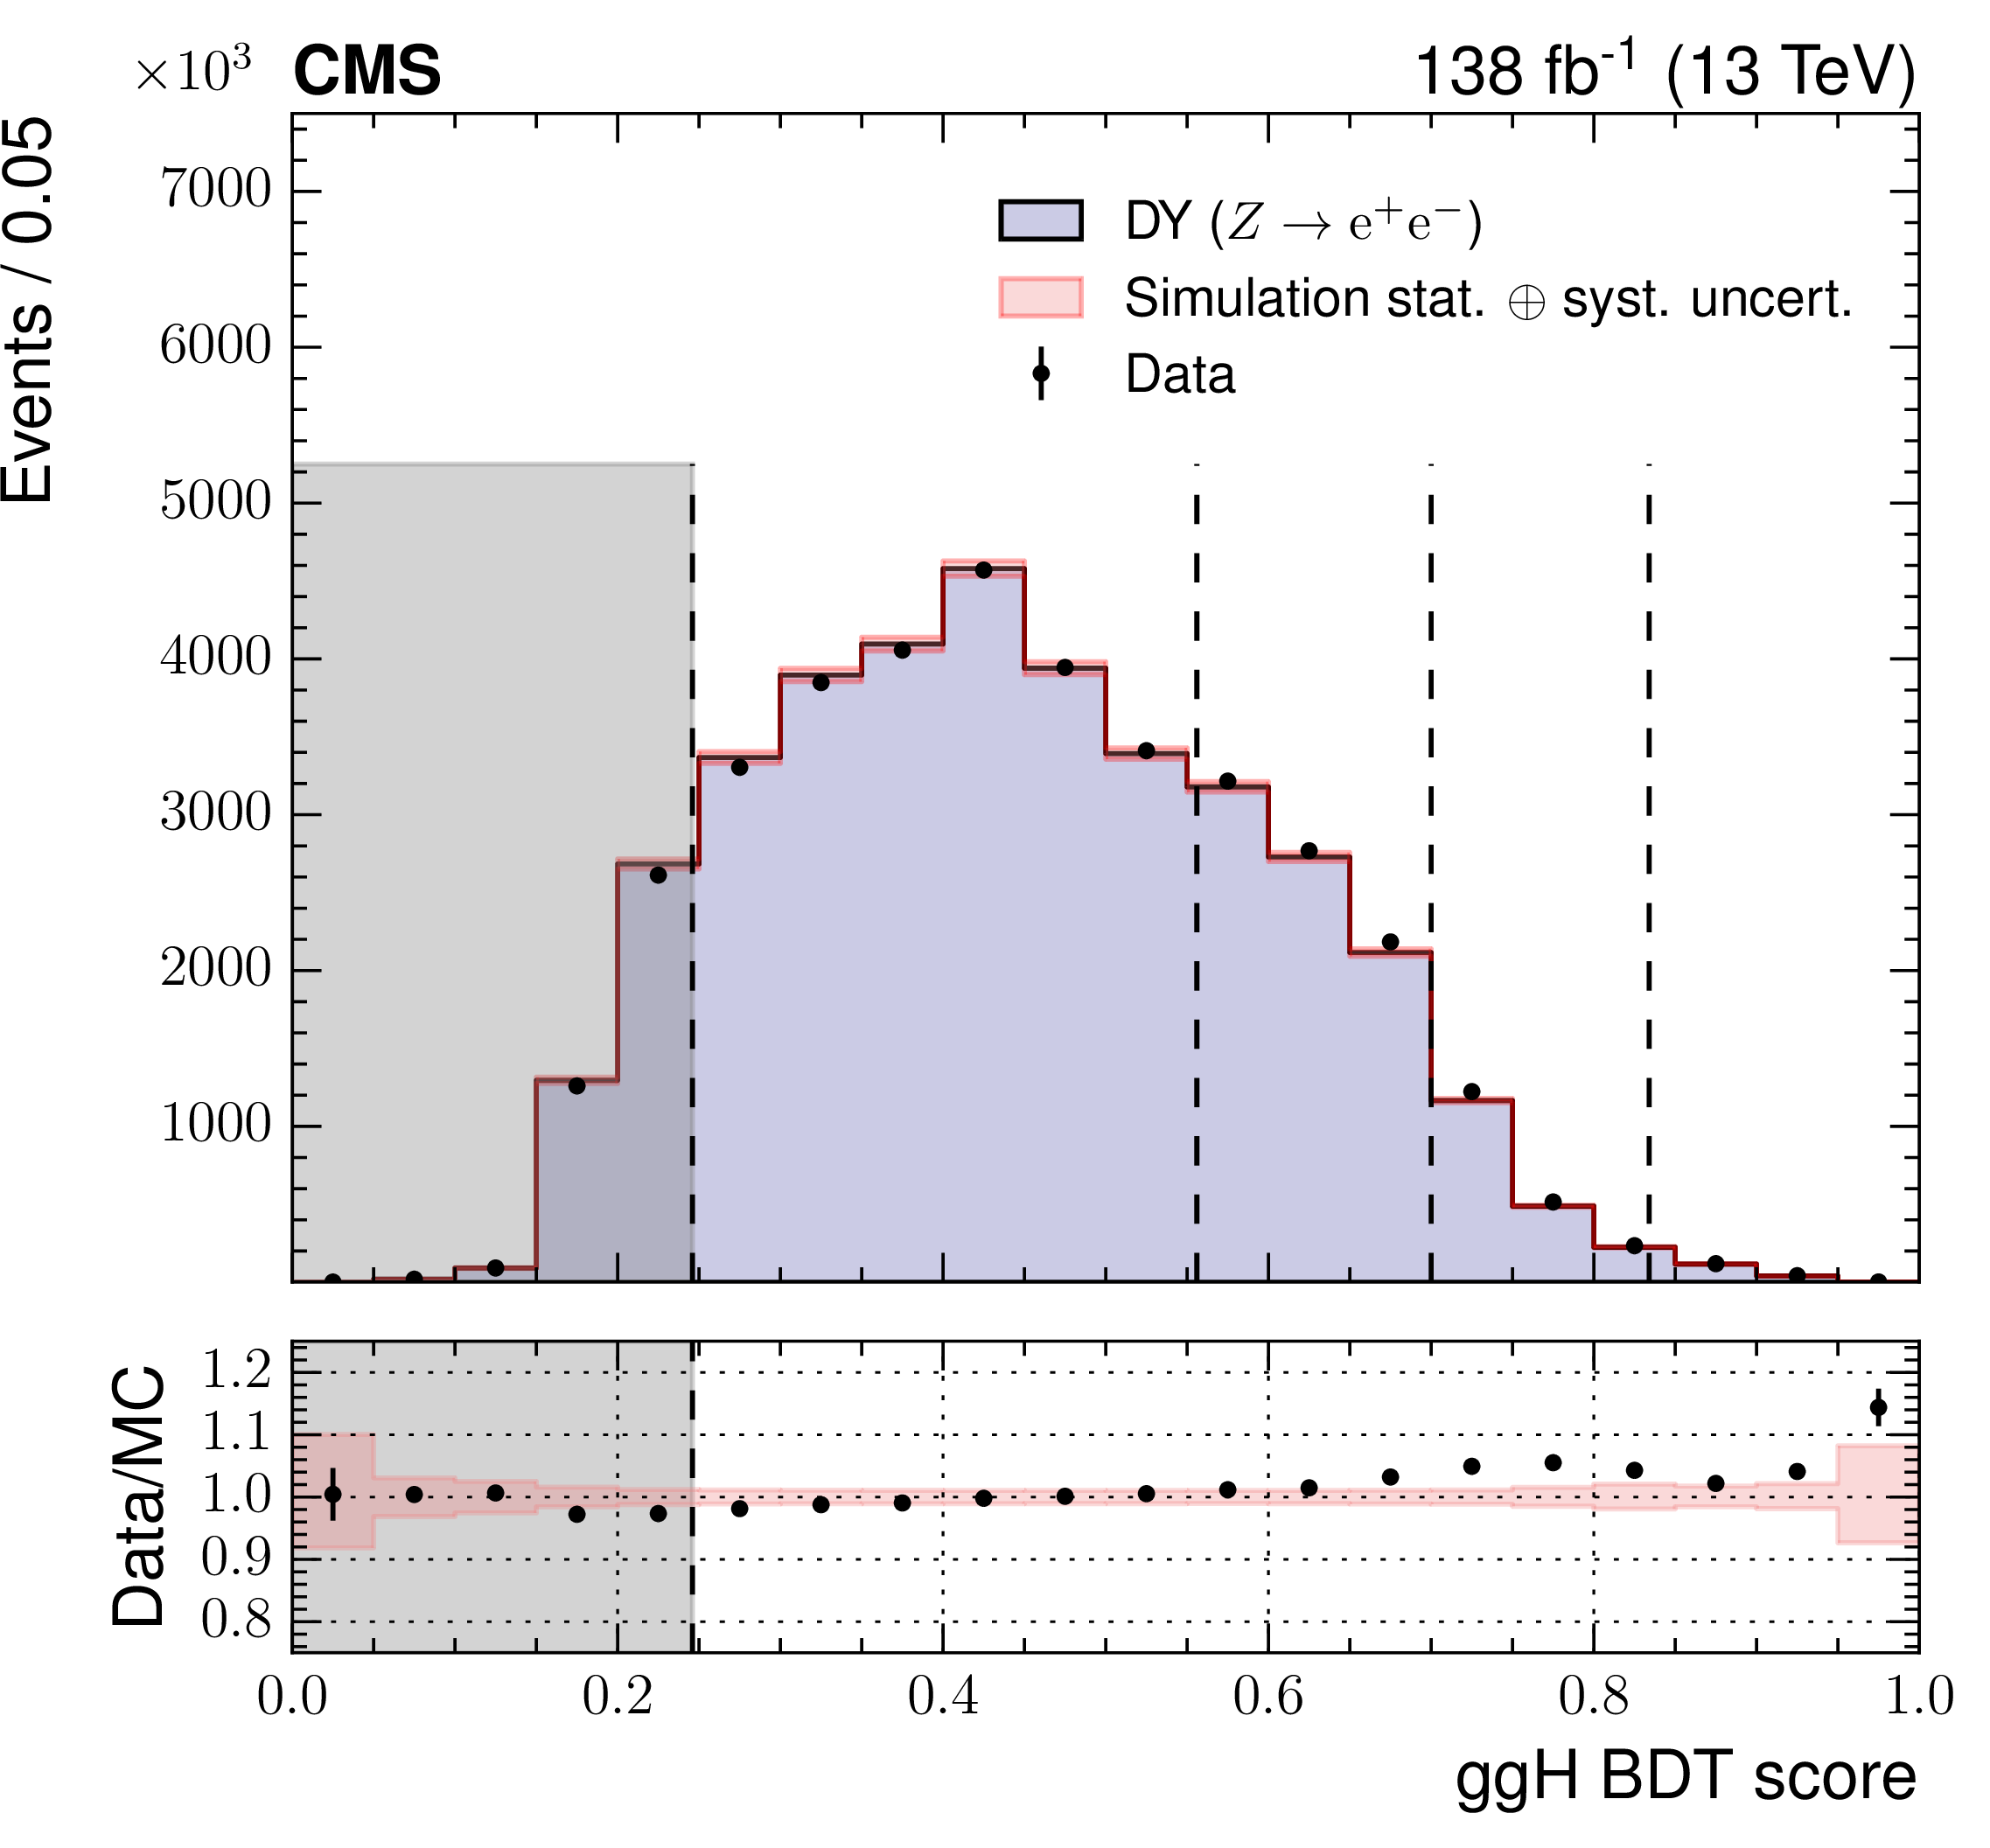
Figure 2-b:
Distribution of the output score of the ggH BDT in a control region around the Z boson mass. Agreement is compared between the DY simulation (filled histogram) and data (black points). The combined impact of the statistical and systematic uncertainties in simulation is shown by the red shaded band, where the sources contributing to the systematic component are identical to those included in Fig. 1. Residual differences between data and simulation are smaller than the ggH cross section uncertainty which is included in the final maximum likelihood fit. |

png pdf |
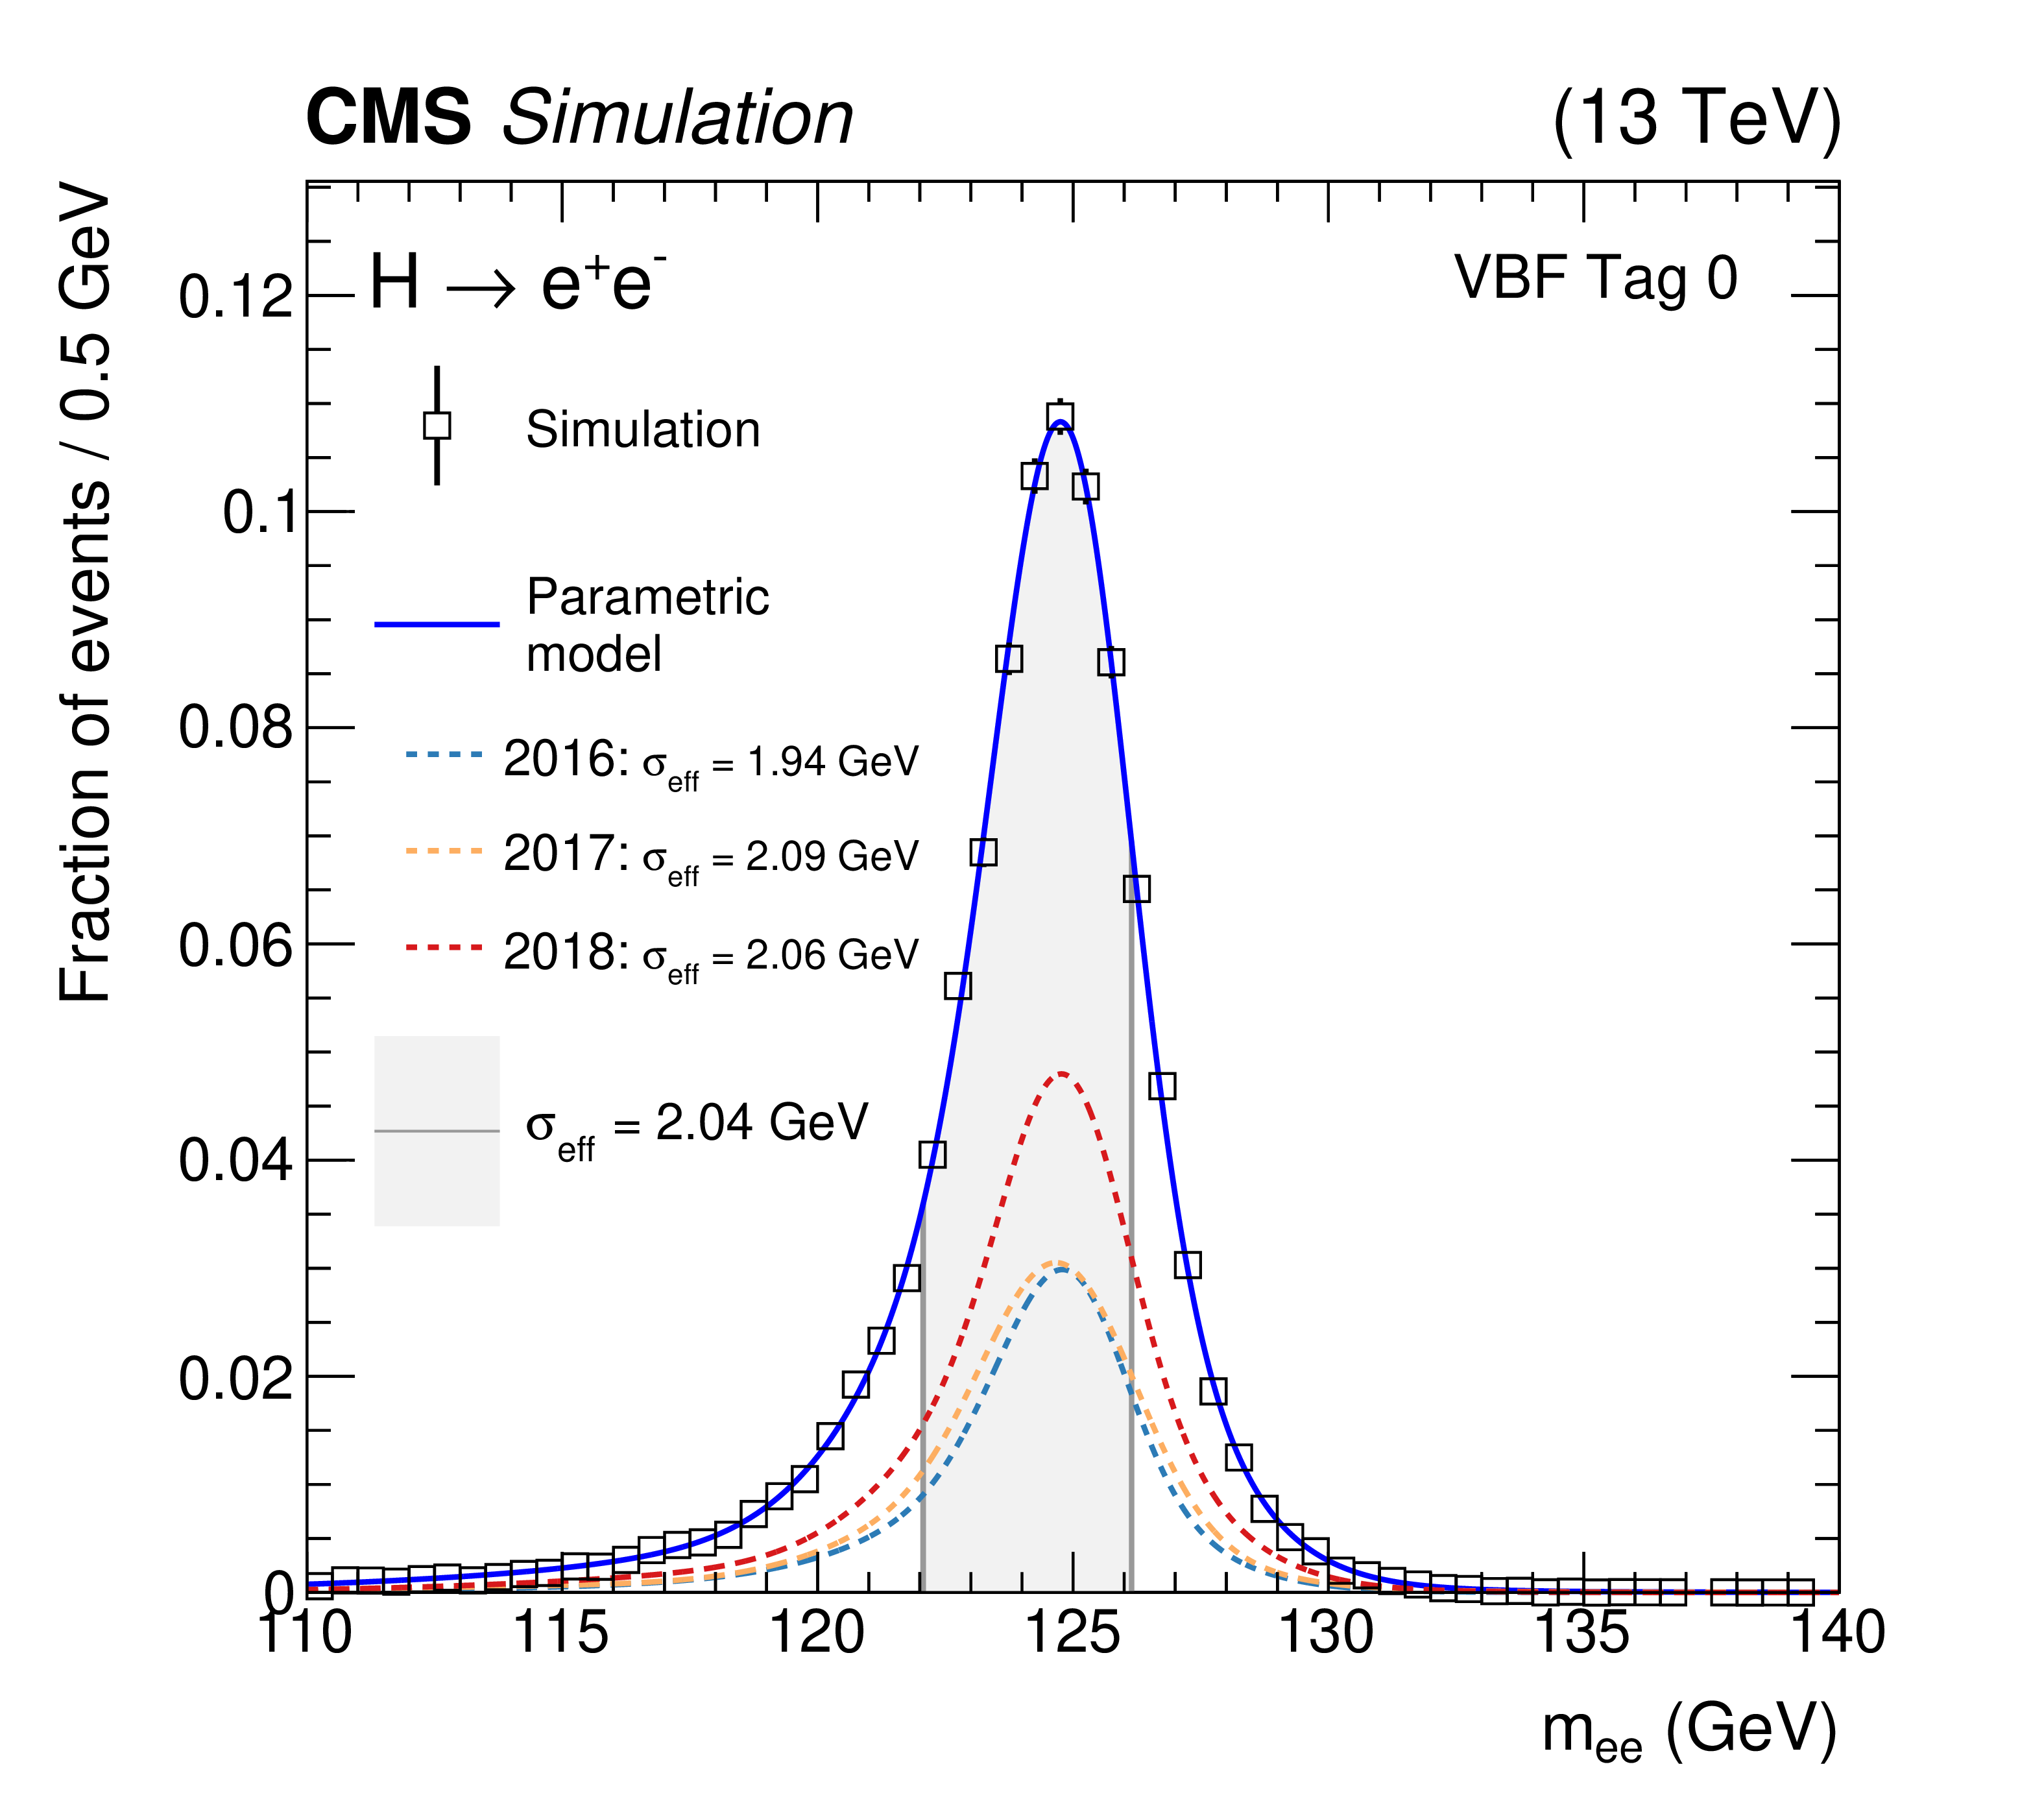
Figure 3:
Signal models for the highest S/B categories targeting ggH and VBF processes, integrated over production processes, for Higgs boson events simulated at $ {m_\mathrm{H}} = $ 125 GeV. Contributions from each of the three years are shown by the dashed lines. The models are normalized to unit area. The ${\sigma _{\text {eff}}}$ is the smallest interval containing 68.3% of the ${m_{\mathrm{e} \mathrm{e}}}$ signal distribution. |

png pdf |
Figure 3-a:
Signal models for the highest S/B category targeting the VBF process, integrated over production processes, for Higgs boson events simulated at $ {m_\mathrm{H}} = $ 125 GeV. Contributions from each of the three years are shown by the dashed lines. The models are normalized to unit area. The ${\sigma _{\text {eff}}}$ is the smallest interval containing 68.3% of the ${m_{\mathrm{e} \mathrm{e}}}$ signal distribution. |
png pdf |
Figure 3-b:
Signal models for the highest S/B categories targeting ggH and VBF processes, integrated over production processes, for Higgs boson events simulated at $ {m_\mathrm{H}} = $ 125 GeV. Contributions from each of the three years are shown by the dashed lines. The models are normalized to unit area. The ${\sigma _{\text {eff}}}$ is the smallest interval containing 68.3% of the ${m_{\mathrm{e} \mathrm{e}}}$ signal distribution. |

png pdf |
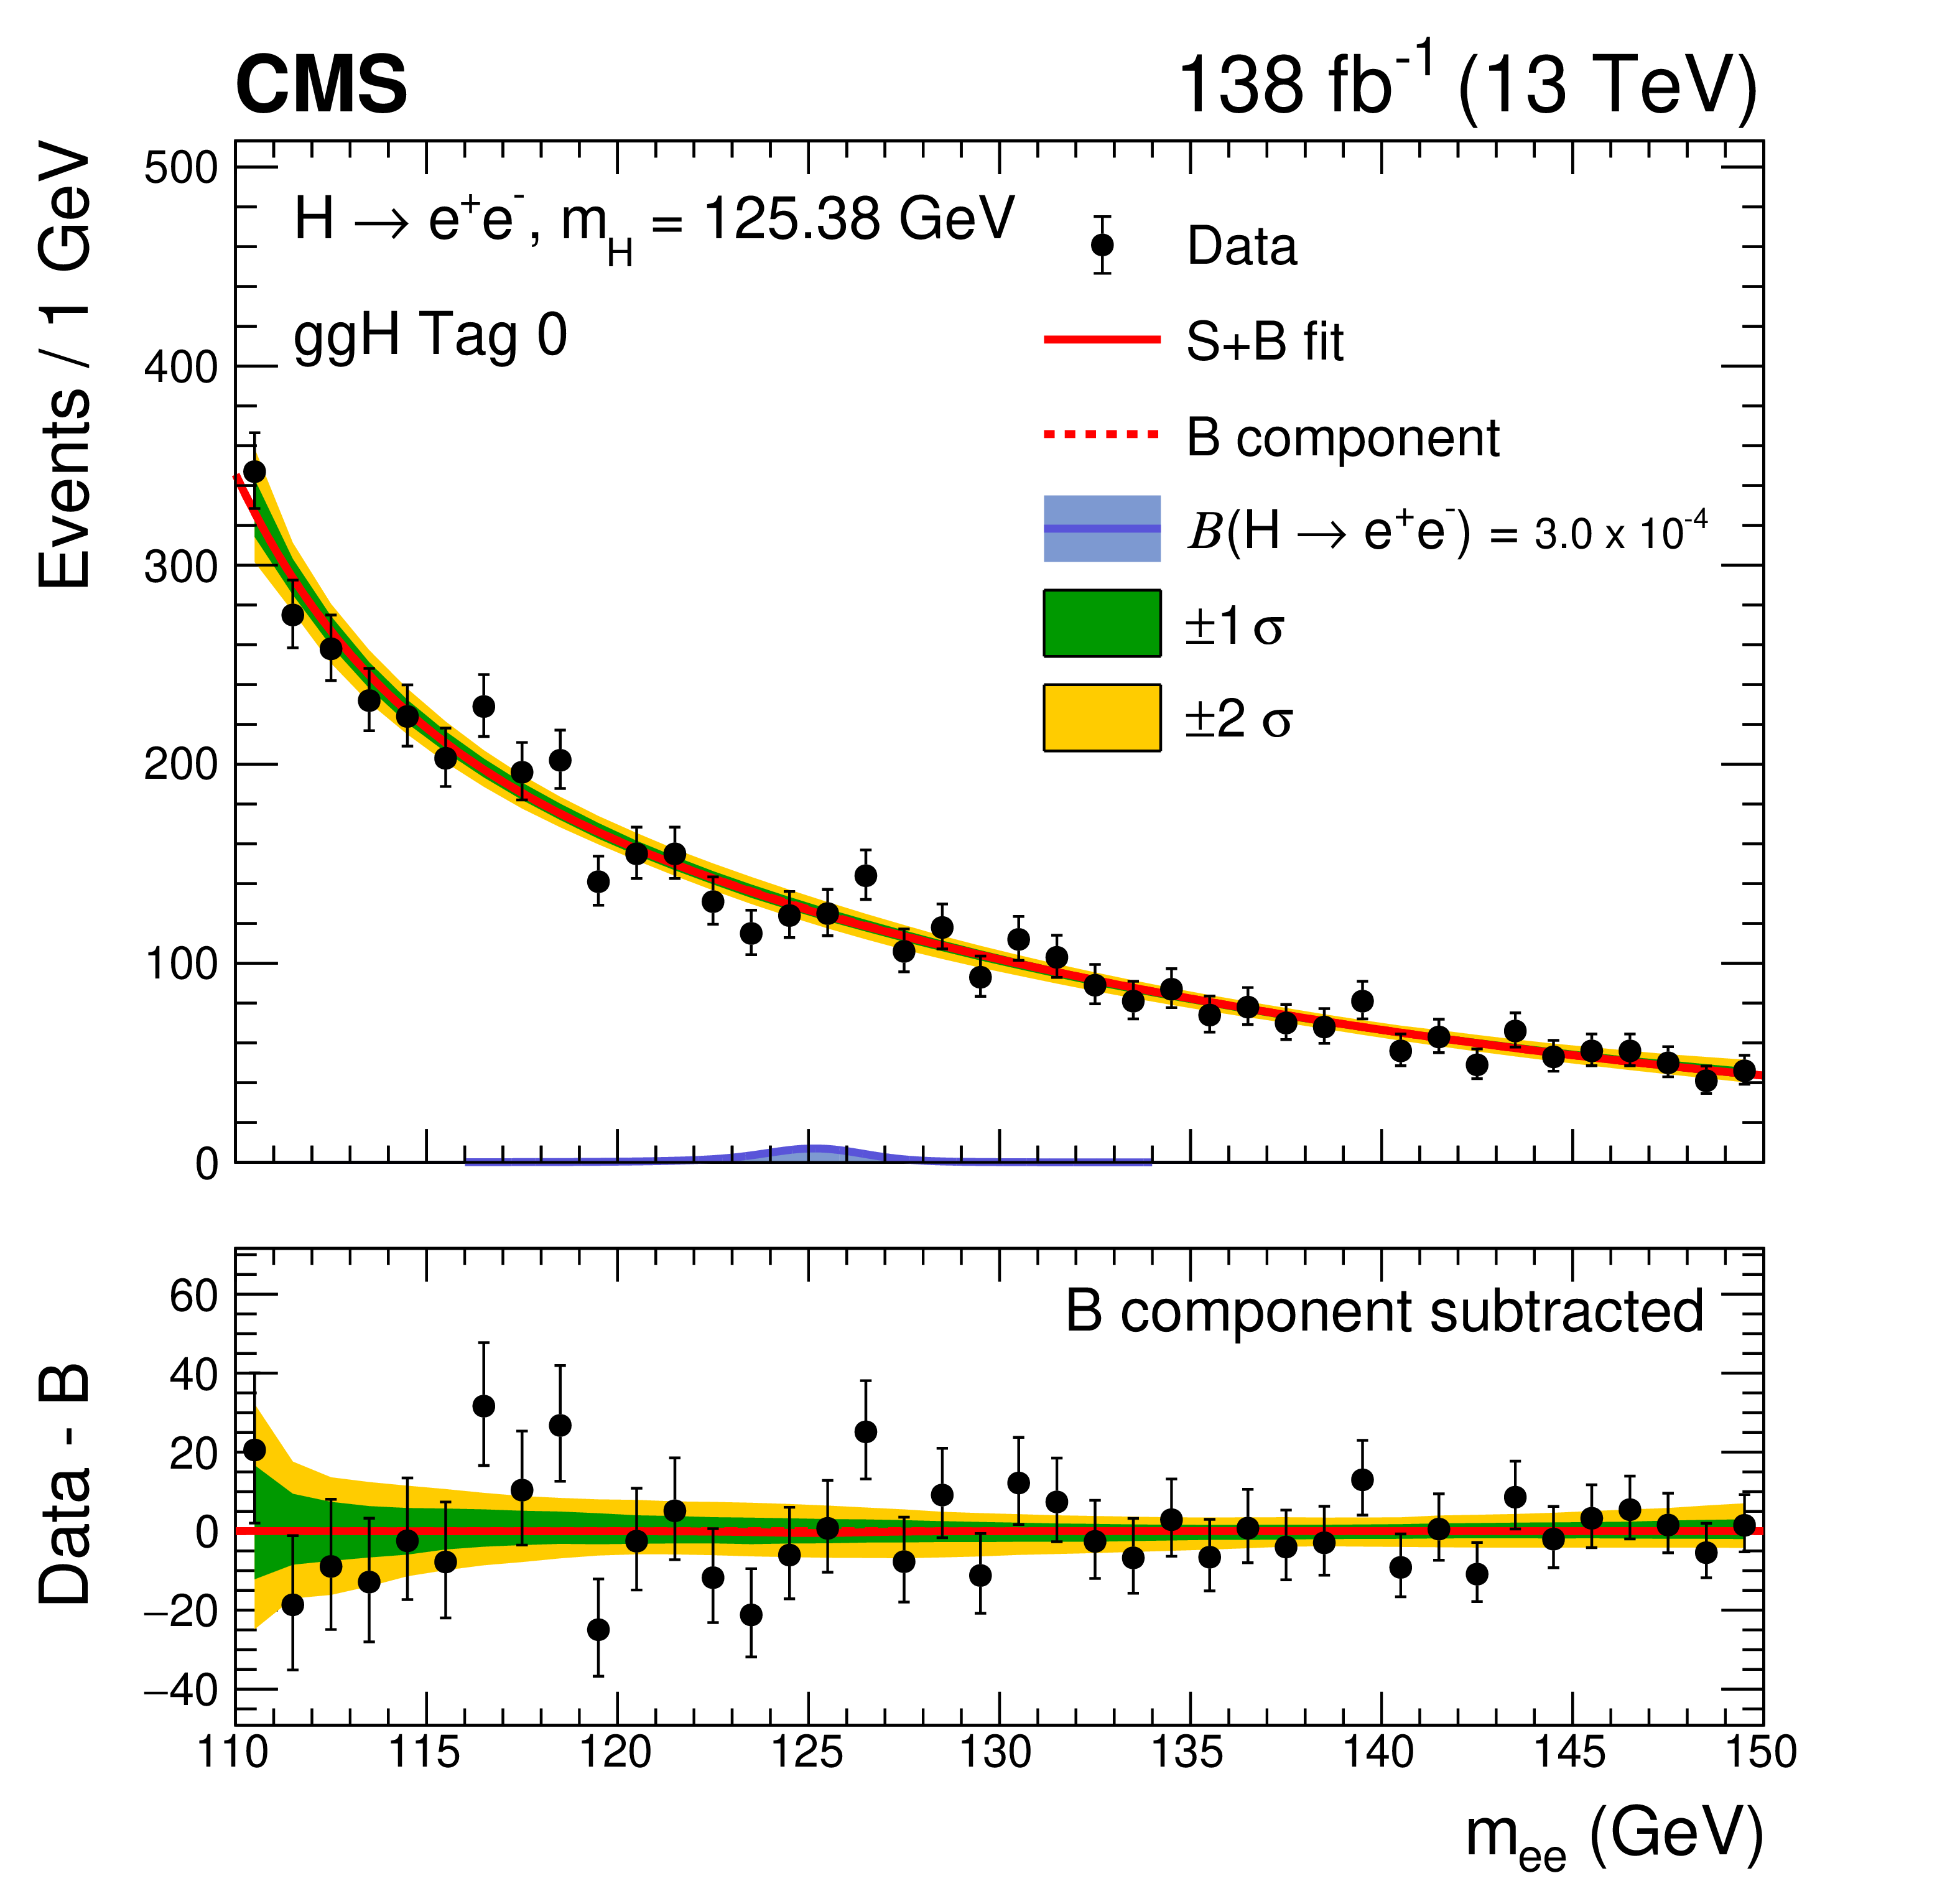
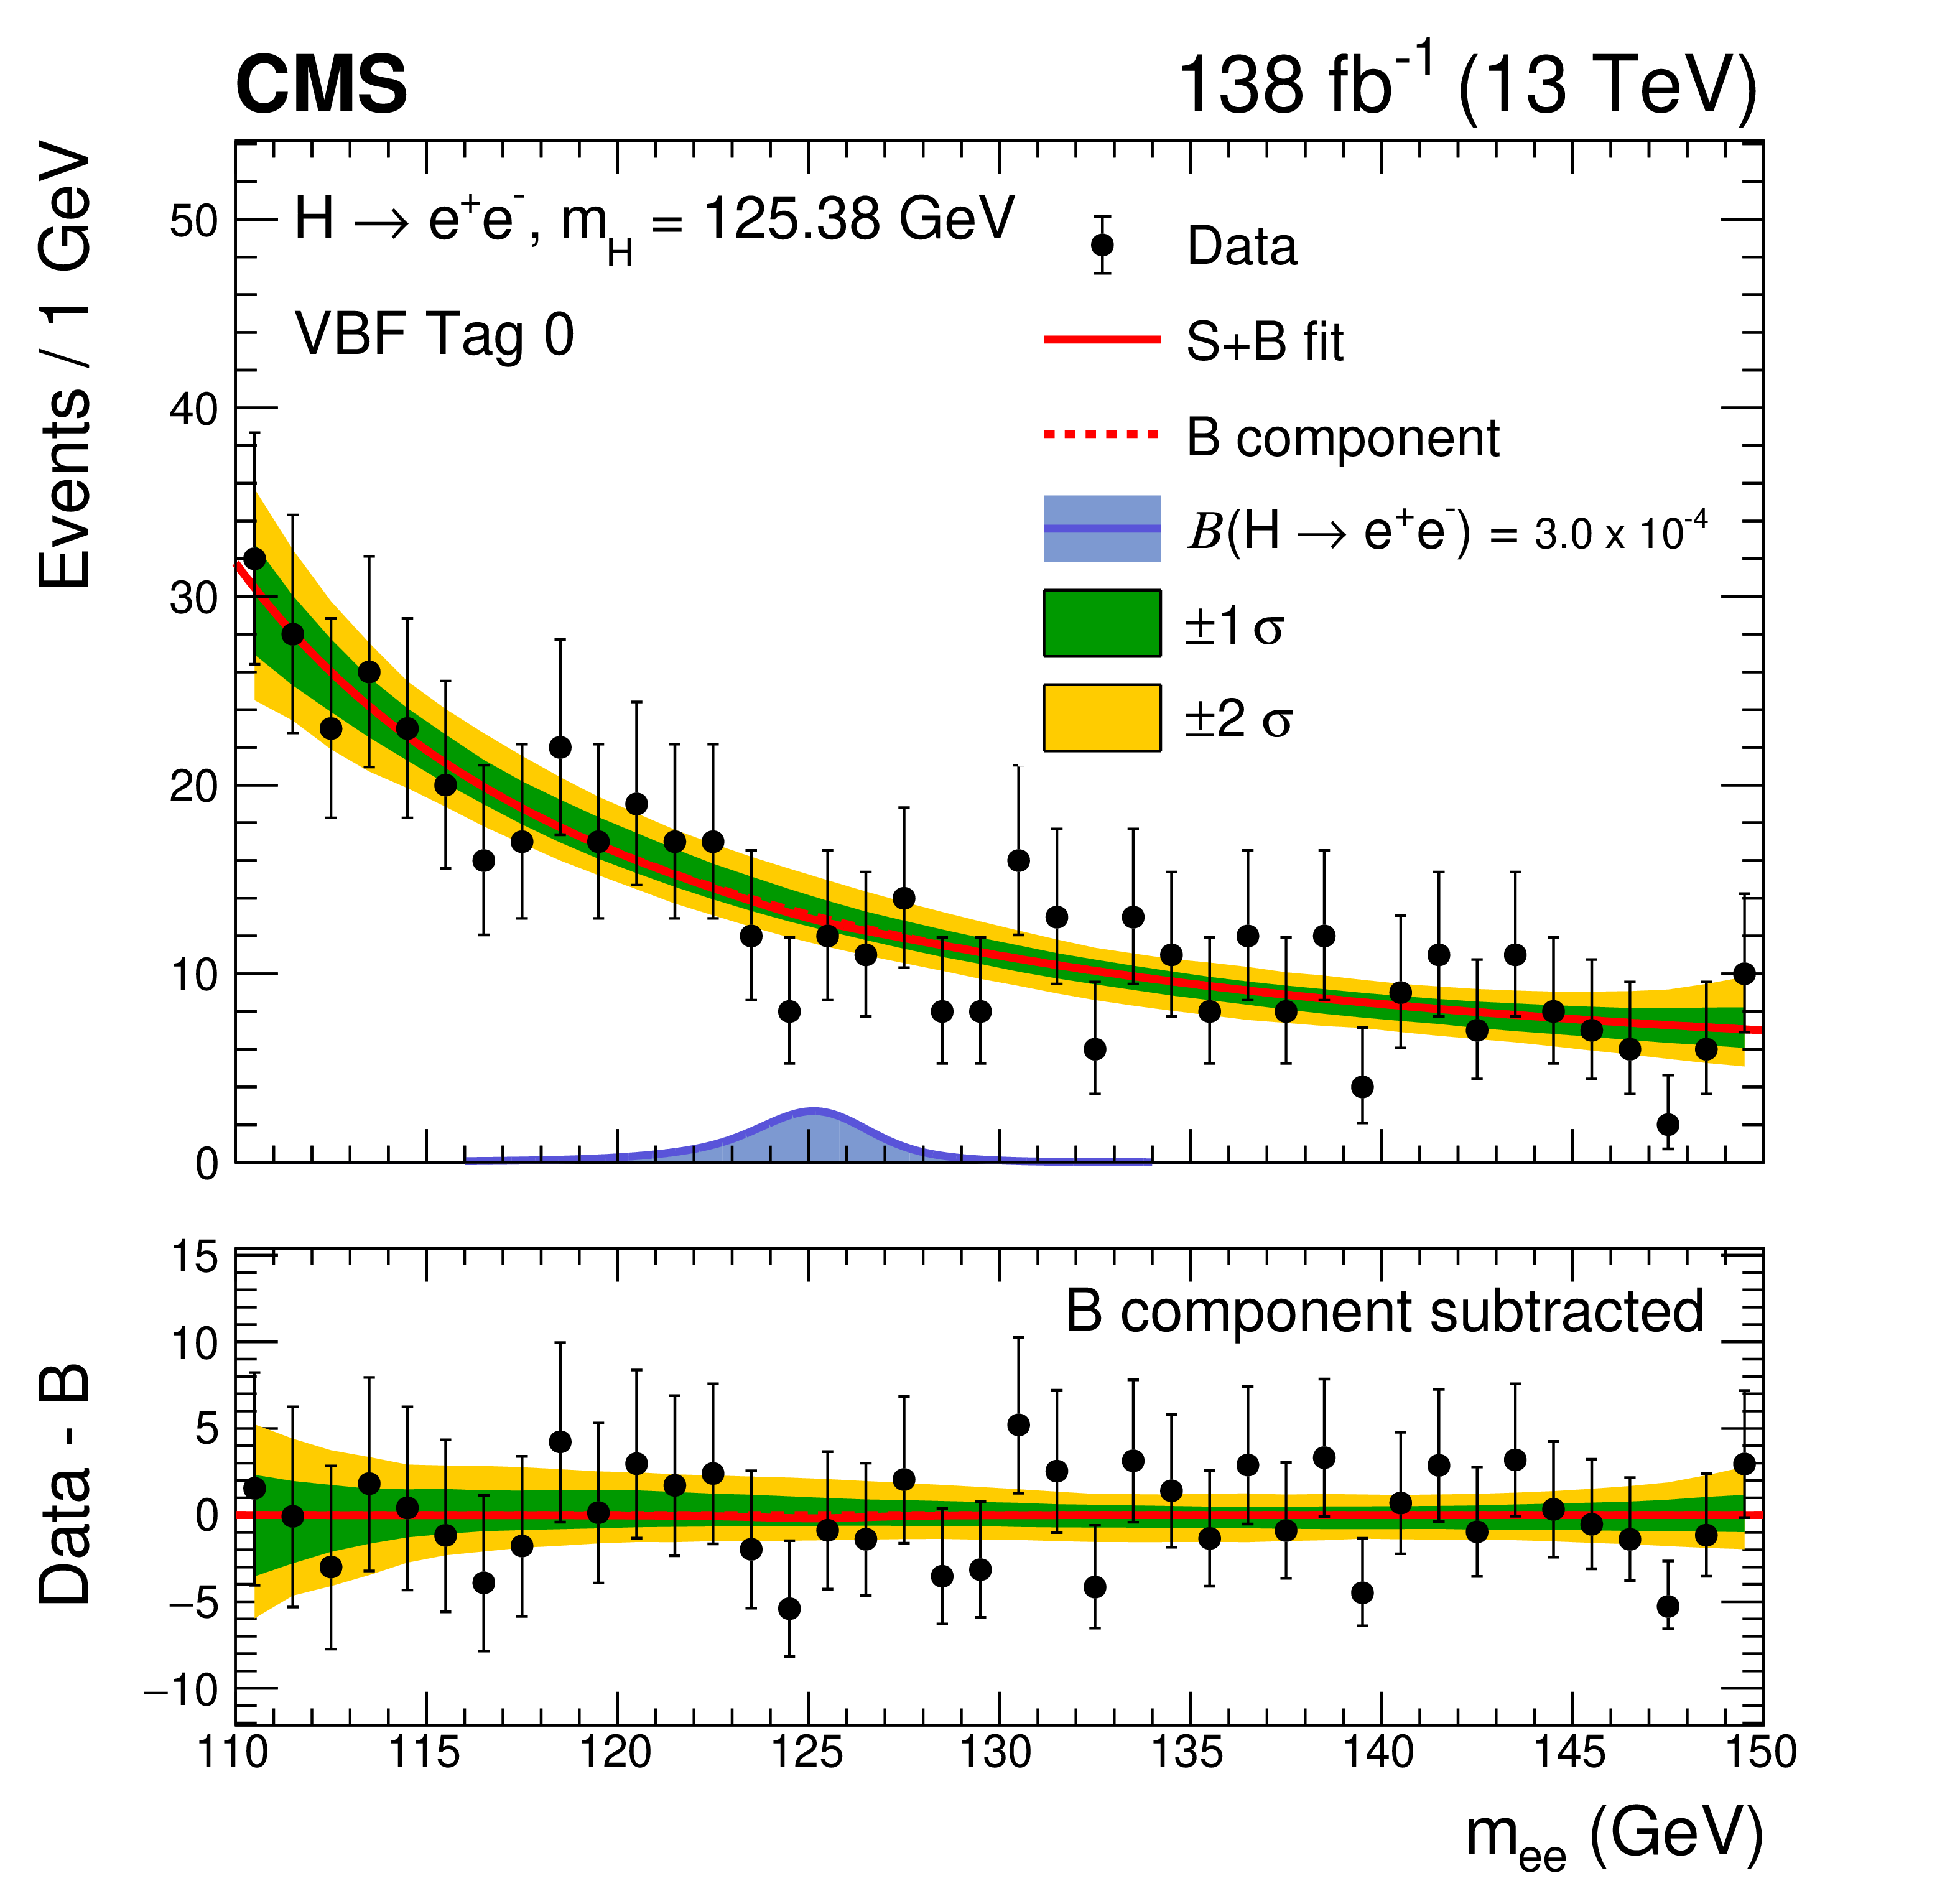
Figure 4:
The signal-plus-background model fit to the ${m_{\mathrm{e} \mathrm{e}}}$ distribution for the highest S/B analysis categories targeting the ggH (left) and VBF (right) processes. The signal model for each category is also shown, scaled to the observed limit at $ {m_\mathrm{H}} = $ 125.38 GeV. The one (green) and two (yellow) standard deviation bands show the uncertainties in the background component of the fit. The lower panel shows the residuals after subtraction of this background component. The background functions describe the data well, with no excess observed. |
png pdf |
Figure 4-a:
The signal-plus-background model fit to the ${m_{\mathrm{e} \mathrm{e}}}$ distribution for the highest S/B analysis categories targeting the ggH process. The signal model is also shown, scaled to the observed limit at $ {m_\mathrm{H}} = $ 125.38 GeV. The one (green) and two (yellow) standard deviation bands show the uncertainties in the background component of the fit. The lower panel shows the residuals after subtraction of this background component. The background functions describe the data well, with no excess observed. |
png pdf |
Figure 4-b:
The signal-plus-background model fit to the ${m_{\mathrm{e} \mathrm{e}}}$ distribution for the highest S/B analysis categories targeting the VBF process. The signal model is also shown, scaled to the observed limit at $ {m_\mathrm{H}} = $ 125.38 GeV. The one (green) and two (yellow) standard deviation bands show the uncertainties in the background component of the fit. The lower panel shows the residuals after subtraction of this background component. The background functions describe the data well, with no excess observed. |

png pdf |
Figure 5:
Expected and observed limits on ${\mathcal {B}({\mathrm{H} \to \mathrm{e^{+}} \mathrm{e^{-}}})}$ for a Higgs boson mass between 120-130 GeV. |

png pdf |
Figure 6:
Expected and observed limits on ${\mathcal {B}({\mathrm{H} \to \mathrm{e^{+}} \mathrm{e^{-}}})}$ for each analysis category, and all categories combined The results here are computed for $ {m_\mathrm{H}} = $ 125.38 GeV. |
| Tables | |
png pdf |
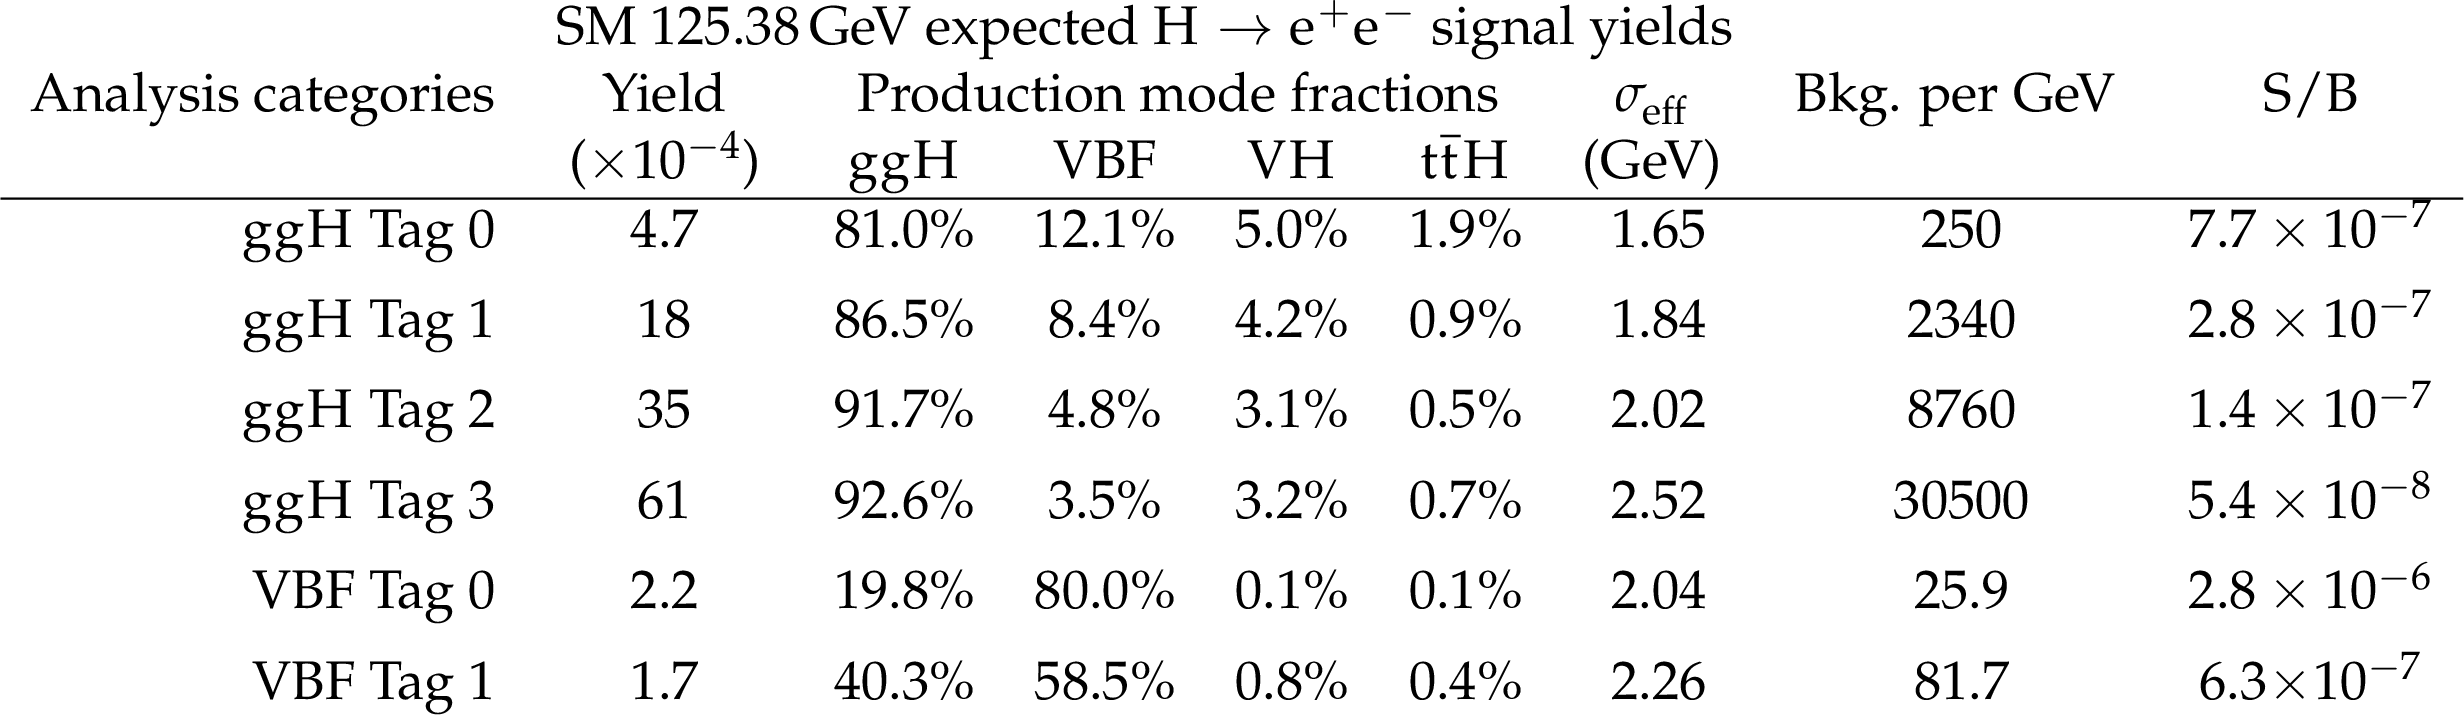
Table 1:
The total expected number of signal events for $ {m_\mathrm{H}} = $ 125.38 GeV in analysis categories targeting ggH and VBF events, for an integrated luminosity of 138 fb$^{-1}$. The fractional contribution from each production mode to each category is also shown. The ${\sigma _{\text {eff}}}$, defined as the smallest interval containing 68.3% of the ${m_{\mathrm{e} \mathrm{e}}}$ distribution, is listed for each analysis category. The final column shows the expected ratio of signal to background, where S and B are the numbers of expected signal and background events in a $ \pm $1$ {\sigma _{\text {eff}}} $ window centred on $m_\mathrm{H}$. |
| Summary |
| A search for the Higgs boson decaying to an e$^{+}$e$^{-}$ pair is performed using proton-proton collision data collected at $\sqrt{s}=$ 13 TeV with the CMS experiment at the LHC between 2016-2018, corresponding to an integrated luminosity of 138 fb$^{-1}$. The analysis uses categories targeting Higgs boson production via gluon fusion and vector boson fusion, with dedicated boosted decision tree classifiers trained for each production mode to enhance the sensitivity of the resulting categories. A maximum likelihood fit to the dielectron mass distribution is performed simultaneously in each analysis category to extract an upper limit on the Higgs boson to electron pair branching fraction; the resulting observed (expected) limit at the 95% confidence level on the branching fraction for H $\to$ e$^{+}$e$^{-}$ decays is 3.0 $ \times$ 10$^{-4} $ (3.0 $ \times$ 10$^{-4} $). This is the most stringent limit on the Higgs boson branching fraction to an e$^{+}$e$^{-}$ pair to date. When compared with the previous best limit from the CMS Collaboration [18], where analysis categories were constructed using a selection on electron and jet kinematics, the improvement in sensitivity presented in this Letter is attributed primarily to the use of BDT classifiers, which significantly improve the S/B ratio of analysis categories. Accounting both for the increase in integrated luminosity and centre-of-mass energy, the use of BDT classifiers further improves the limit on $ \mathcal{B}(\mathrm{H}\to\mathrm{e}^+\mathrm{e}^-) $ by a factor of approximately 1.5. |
| References | ||||
| 1 | ATLAS Collaboration | Observation of a new particle in the search for the standard model Higgs boson with the ATLAS detector at the LHC | PLB 716 (2012) 1 | 1207.7214 |
| 2 | CMS Collaboration | Observation of a new boson at a mass of 125 GeV with the CMS experiment at the LHC | PLB 716 (2012) 30 | CMS-HIG-12-028 1207.7235 |
| 3 | CMS Collaboration | Observation of a new boson with mass near 125 GeV in pp collisions at $ \sqrt{s} = $ 7 and 8 TeV | JHEP 06 (2013) 081 | CMS-HIG-12-036 1303.4571 |
| 4 | CMS Collaboration | Observation of ttH production | PRL 120 (2018) 231801 | CMS-HIG-17-035 1804.02610 |
| 5 | ATLAS Collaboration | Observation of Higgs boson production in association with a top quark pair at the LHC with the ATLAS detector | PLB 784 (2018) 173 | 1806.00425 |
| 6 | CMS Collaboration | Observation of Higgs boson decay to bottom quarks | PRL 121 (2018) 121801 | CMS-HIG-18-016 1808.08242 |
| 7 | ATLAS Collaboration | Observation of $ \mathrm{H} \to \mathrm{b}\mathrm{\bar{b}} $ decays and VH production with the ATLAS detector | PLB 786 (2018) 59 | 1808.08238 |
| 8 | CMS Collaboration | Observation of the Higgs boson decay to a pair of $ \tau $ leptons with the CMS detector | PLB 779 (2018) 283 | CMS-HIG-16-043 1708.00373 |
| 9 | ATLAS Collaboration | Cross-section measurements of the Higgs boson decaying into a pair of $ \tau $-leptons in proton-proton collisions at $ \sqrt{s} = $ 13 TeV with the ATLAS detector | PRD 99 (2019) 072001 | 1811.08856 |
| 10 | CMS Collaboration | Evidence for Higgs boson decay to a pair of muons | JHEP 01 (2021) 148 | CMS-HIG-19-006 2009.04363 |
| 11 | F. Englert and R. Brout | Broken symmetry and the mass of gauge vector mesons | PRL 13 (1964) 321 | |
| 12 | P. W. Higgs | Broken symmetries and the masses of gauge bosons | PRL 13 (1964) 508 | |
| 13 | P. W. Higgs | Spontaneous symmetry breakdown without massless bosons | PR145 (1966) 1156 | |
| 14 | LHC Higgs Cross Section Working Group | Handbook of LHC Higgs Cross Sections: 3. Higgs Properties | technical report | 1307.1347 |
| 15 | A. Dery, C. Frugiuele, and Y. Nir | Large Higgs-electron Yukawa coupling in 2HDM | JHEP 04 (2018) 044 | 1712.04514 |
| 16 | W. Altmannshofer, J. Brod, and M. Schmaltz | Experimental constraints on the coupling of the Higgs boson to electrons | JHEP 05 (2015) 125 | 1503.04830 |
| 17 | G. F. Giudice and O. Lebedev | Higgs-dependent Yukawa couplings | PLB 665 (2008) 79 | 0804.1753 |
| 18 | CMS Collaboration | Search for a standard model-like Higgs boson in the $ \mu^{+}\mu^{-} $ and e$^{+}$e$^{-}$ decay channels at the LHC | PLB 744 (2015) 184 | CMS-HIG-13-007 1410.6679 |
| 19 | ATLAS Collaboration | Search for the Higgs boson decays $ \mathrm{H} \to \mathrm{e}\mathrm{e} $ and $ \mathrm{H} \to \mathrm{e}\mu $ in pp collisions at $ \sqrt{s} = $ 13 TeV with the ATLAS detector | PLB 801 (2020) 135148 | 1909.10235 |
| 20 | CMS Collaboration | Performance of the CMS Level-1 trigger in proton-proton collisions at $ \sqrt{s} = $ 13 TeV | JINST 15 (2020) P10017 | CMS-TRG-17-001 2006.10165 |
| 21 | CMS Collaboration | The CMS trigger system | JINST 12 (2017) P01020 | CMS-TRG-12-001 1609.02366 |
| 22 | CMS Collaboration | Particle-flow reconstruction and global event description with the CMS detector | JINST 12 (2017) P10003 | CMS-PRF-14-001 1706.04965 |
| 23 | CMS Collaboration | ECAL 2016 refined calibration and Run2 summary plots | CDS | |
| 24 | CMS Collaboration | Electron and photon reconstruction and identification with the CMS experiment at the CERN LHC | JINST 16 (2021) P05014 | CMS-EGM-17-001 2012.06888 |
| 25 | M. Cacciari, G. P. Salam, and G. Soyez | The anti-$ {k_{\mathrm{T}}} $ jet clustering algorithm | JHEP 04 (2008) 063 | 0802.1189 |
| 26 | M. Cacciari, G. P. Salam, and G. Soyez | FastJet user manual | EPJC 72 (2012) 1896 | 1111.6097 |
| 27 | CMS Collaboration | The CMS experiment at the CERN LHC | JINST 3 (2008) S08004 | CMS-00-001 |
| 28 | CMS Collaboration | Measurements of Higgs boson production cross sections and couplings in the diphoton decay channel at $ \sqrt{s} = $ 13 TeV | JHEP 07 (2021) 027 | CMS-HIG-19-015 2103.06956 |
| 29 | P. D. Dauncey, M. Kenzie, N. Wardle, and G. J. Davies | Handling uncertainties in background shapes: the discrete profiling method | JINST 10 (2015) P04015 | 1408.6865 |
| 30 | J. Alwall et al. | The automated computation of tree-level and next-to-leading order differential cross sections, and their matching to parton shower simulations | JHEP 07 (2014) 079 | 1405.0301 |
| 31 | K. Hamilton, P. Nason, E. Re, and G. Zanderighi | NNLOPS simulation of Higgs boson production | JHEP 10 (2013) 222 | 1309.0017 |
| 32 | P. Nason | A new method for combining NLO QCD with shower Monte Carlo algorithms | JHEP 11 (2004) 040 | hep-ph/0409146 |
| 33 | S. Frixione, P. Nason, and C. Oleari | Matching NLO QCD computations with parton shower simulations: the POWHEG method | JHEP 11 (2007) 070 | 0709.2092 |
| 34 | S. Alioli, P. Nason, C. Oleari, and E. Re | A general framework for implementing NLO calculations in shower Monte Carlo programs: the POWHEG BOX | JHEP 06 (2010) 043 | 1002.2581 |
| 35 | S. Frixione, P. Nason, and G. Ridolfi | A positive-weight next-to-leading-order Monte Carlo for heavy flavour hadroproduction | JHEP 09 (2007) 126 | 0707.3088 |
| 36 | T. Sjostrand et al. | An introduction to PYTHIA 8.2 | CPC 191 (2015) 159 | 1410.3012 |
| 37 | CMS Collaboration | Extraction and validation of a new set of CMS PYTHIA-8 tunes from underlying-event measurements | EPJC 80 (2020) 4 | CMS-GEN-17-001 1903.12179 |
| 38 | NNPDF Collaboration | Parton distributions from high-precision collider data | EPJC 77 (2017) 663 | 1706.00428 |
| 39 | LHC Higgs Cross Section Working Group | Handbook of LHC Higgs Cross Sections: 4. Deciphering the nature of the Higgs sector | technical report | 1610.07922 |
| 40 | GEANT4 Collaboration | GEANT4--a simulation toolkit | NIMA 506 (2003) 250 | |
| 41 | CMS Collaboration | Pileup mitigation at CMS in 13 TeV data | JINST 15 (2020) P09018 | CMS-JME-18-001 2003.00503 |
| 42 | D. L. Rainwater, R. Szalapski, and D. Zeppenfeld | Probing color-singlet exchange in Z+2-jet events at the CERN LHC | PRD 54 (1996) 6680 | hep-ph/9605444 |
| 43 | CMS Collaboration | Jet algorithms performance in 13 TeV data | CMS-PAS-JME-16-003 | CMS-PAS-JME-16-003 |
| 44 | J. Butterworth et al. | PDF4LHC recommendations for LHC Run II | JPG 43 (2016) 023001 | 1510.03865 |
| 45 | CMS Collaboration | Measurement of the inclusive W and Z production cross sections in pp collisions at $ \sqrt{s} = $ 7 TeV | JHEP 10 (2011) 132 | CMS-EWK-10-005 1107.4789 |
| 46 | CMS Collaboration | Precision luminosity measurement in proton-proton collisions at $ \sqrt{s} = $ 13 TeV in 2015 and 2016 at CMS | EPJC 81 (2021) 800 | CMS-LUM-17-003 2104.01927 |
| 47 | CMS Collaboration | CMS luminosity measurement for the 2017 data-taking period at $ \sqrt{s} = $ 13 TeV | CMS-PAS-LUM-17-004 | CMS-PAS-LUM-17-004 |
| 48 | CMS Collaboration | CMS luminosity measurement for the 2018 data-taking period at $ \sqrt{s} = $ 13 TeV | CMS-PAS-LUM-18-002 | CMS-PAS-LUM-18-002 |
| 49 | R. A. Fisher | On the interpretation of $ \chi^2 $ from contingency tables, and the calculation of p | J. R. Stat. Soc. 85 (1922) 87 | |
| 50 | G. Passarino | Higgs boson production and decay: Dalitz sector | PLB 727 (2013) 424 | 1308.0422 |
| 51 | A. L. Read | Presentation of search results: The CLs technique | JPG 28 (2002) 2693 | |
| 52 | T. Junk | Confidence level computation for combining searches with small statistics | NIMA 434 (1999) 435 | hep-ex/9902006 |
| 53 | ATLAS and CMS Collaborations, and LHC Higgs Combination Group | Procedure for the LHC Higgs boson search combination in Summer 2011 | CMS-NOTE-2011-005 | |
| 54 | G. Cowan, K. Cranmer, E. Gross, and O. Vitells | Asymptotic formulae for likelihood-based tests of new physics | EPJC 71 (2011) 1554 | 1007.1727 |
| 55 | CMS Collaboration | A measurement of the Higgs boson mass in the diphoton decay channel | PLB 805 (2020) 135425 | CMS-HIG-19-004 2002.06398 |
| 56 | CMS Collaboration | HEPData record for this analysis | link | |
|
|
Compact Muon Solenoid LHC, CERN |
|

|

|

|

|

|