

Compact Muon Solenoid
LHC, CERN
| CMS-SMP-19-011 ; CERN-EP-2020-206 | ||
| Measurement of differential cross sections for Z bosons produced in association with charm jets in pp collisions at $\sqrt{s} = $ 13 TeV | ||
| CMS Collaboration | ||
| 7 December 2020 | ||
| JHEP 04 (2021) 109 | ||
| Abstract: Measurements are presented of differential cross sections for the production of Z bosons in association with at least one jet initiated by a charm quark in pp collisions at $\sqrt{s} = $ 13 TeV. The data recorded by the CMS experiment at the LHC correspond to an integrated luminosity of 35.9 fb$^{-1}$. The final states that contain a pair of electrons or muons that are the decay products of a Z boson, and a jet consistent with being initiated by a charm quark produced in the hard interaction. Differential cross sections as a function of the ${p_{\mathrm{T}}}$ of the Z boson and ${p_{\mathrm{T}}}$ of the charm jet are compared with predictions from Monte Carlo event generators. The inclusive production cross section 405.4 $\pm$ 5.6 (stat) $\pm$ 24.3 (exp) $\pm$ 3.7 (theo) pb, is measured in a fiducial region requiring both leptons to have $| \eta | < $ 2.4 and ${p_{\mathrm{T}}} > $ 10 GeV, at least one lepton with ${p_{\mathrm{T}}} > $ 26 GeV, and a mass of the pair in the range 71-111 GeV, while the charm jet is required to have ${p_{\mathrm{T}}} > $ 30 GeV and $| \eta | < $ 2.4. These are the first measurements of these cross sections in proton-proton collisions at 13 TeV. | ||
| Links: e-print arXiv:2012.04119 [hep-ex] (PDF) ; CDS record ; inSPIRE record ; CADI line (restricted) ; | ||
| Figures | |
png pdf |
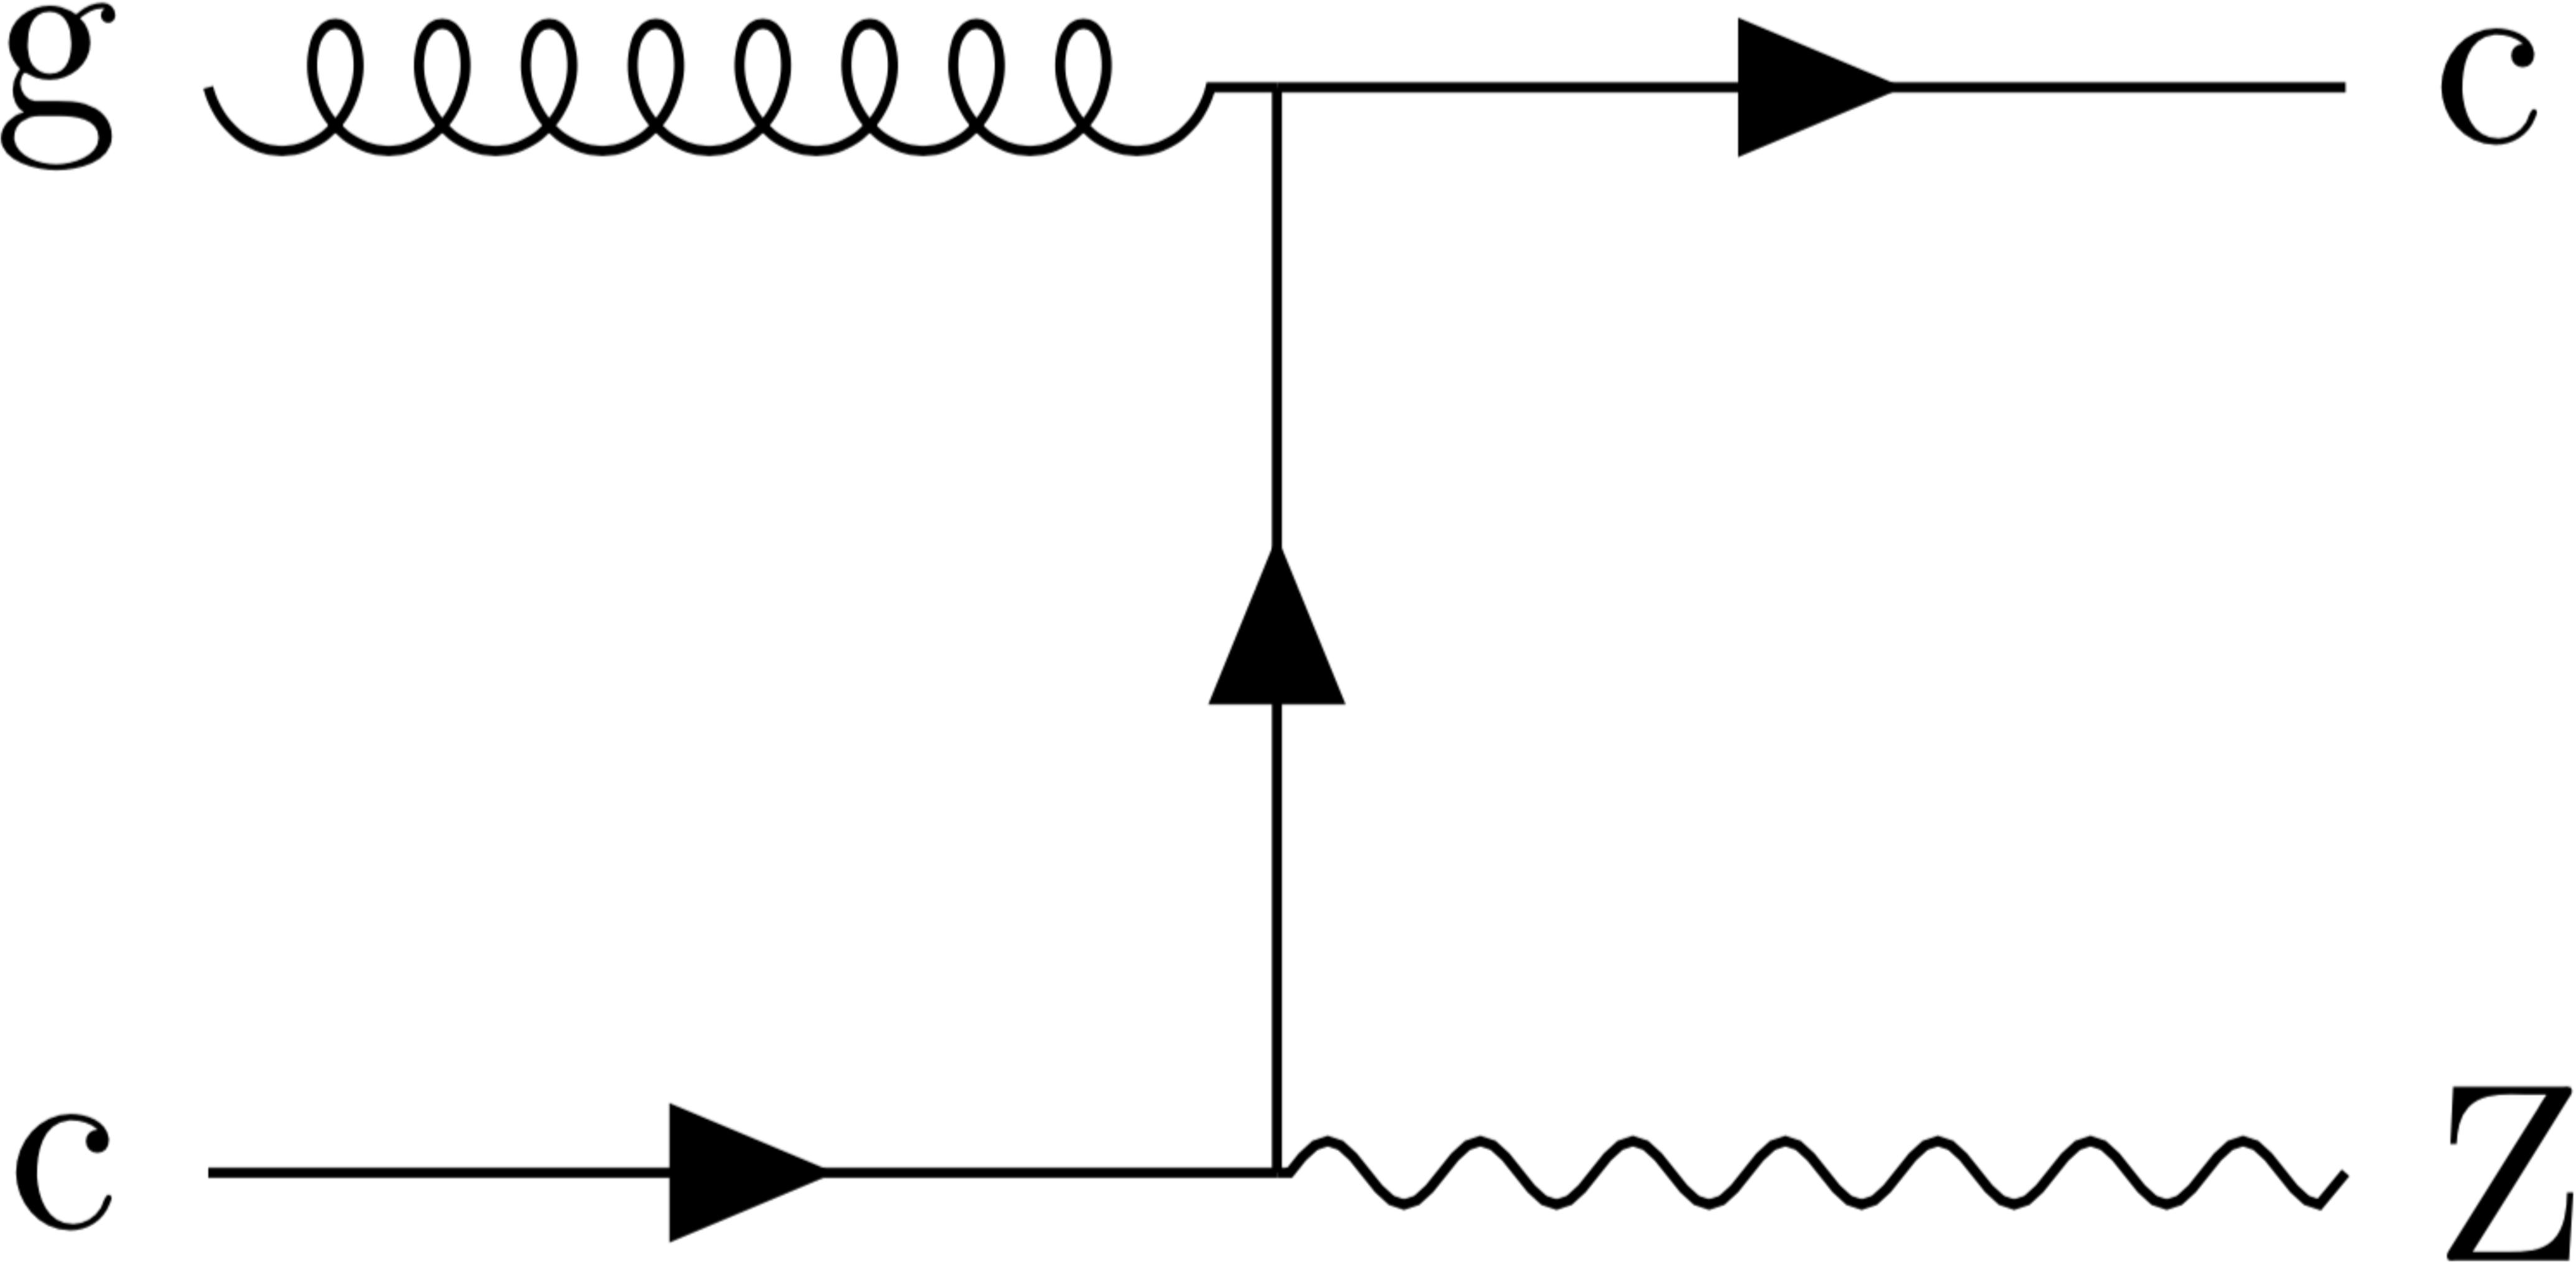
Figure 1:
Example Feynman diagram for the Z$+$c-jet process. |
png pdf |
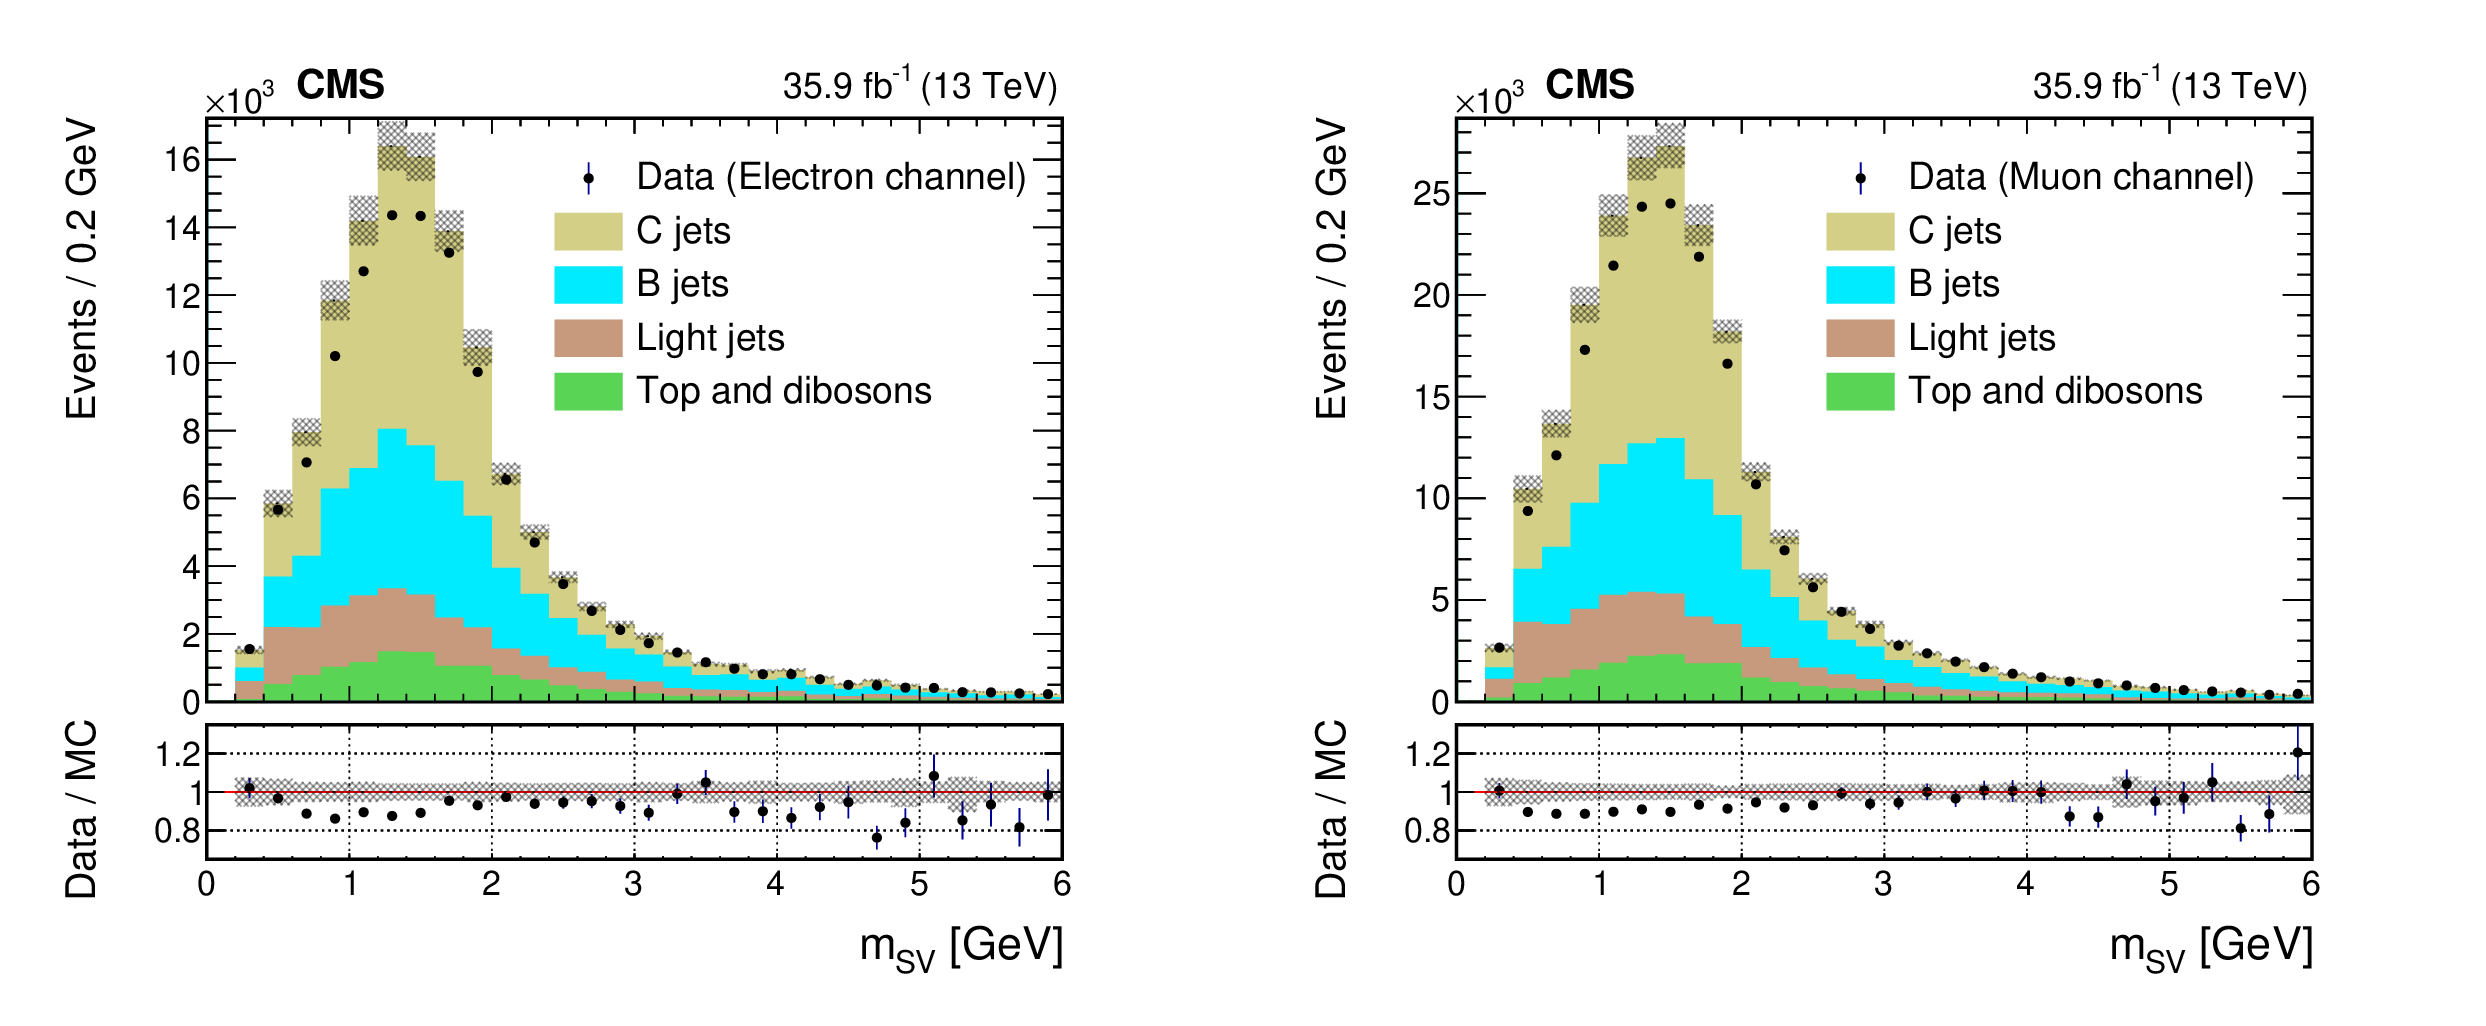
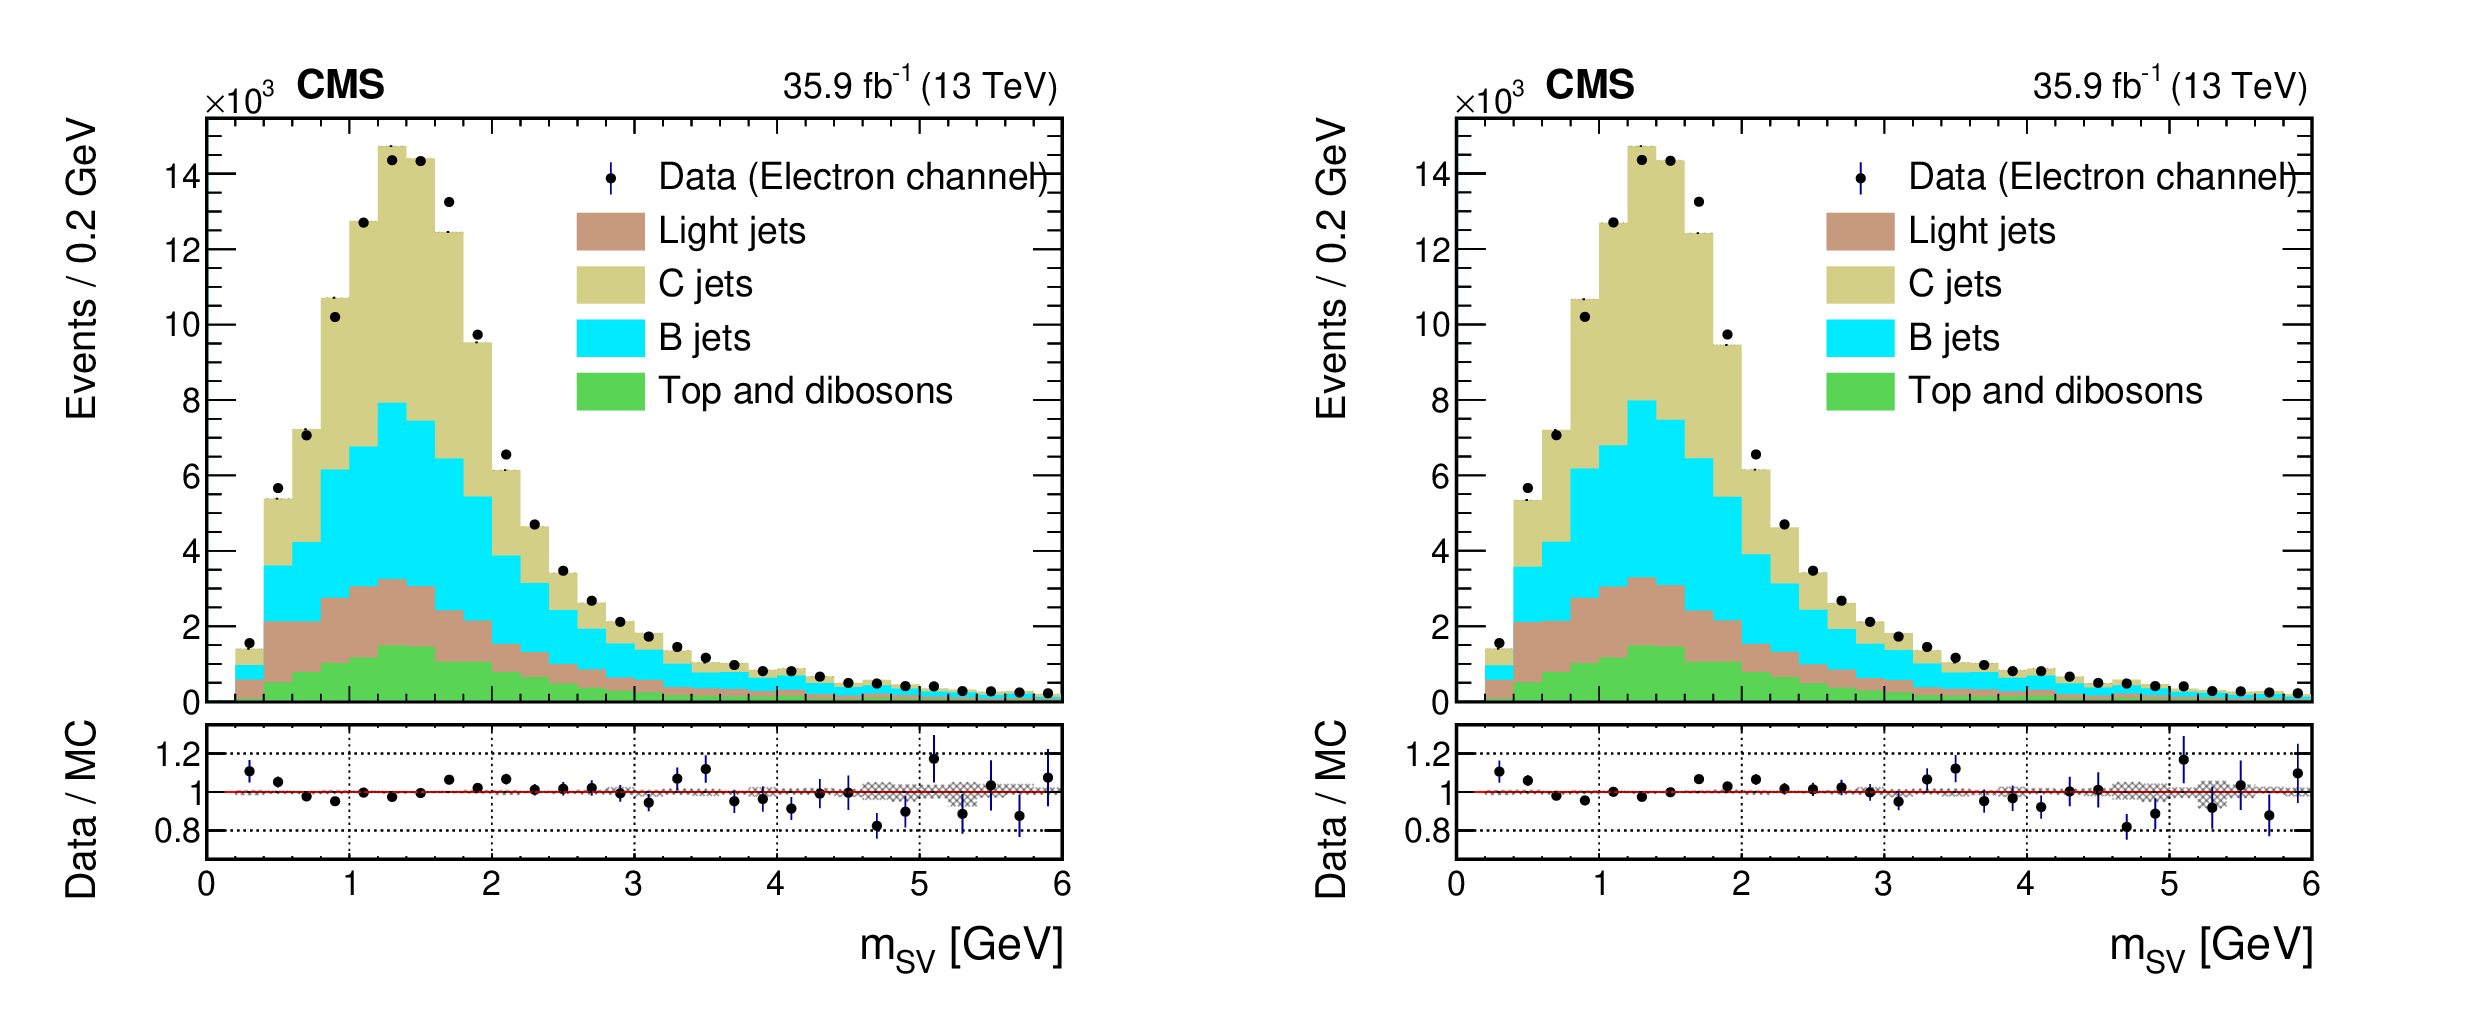
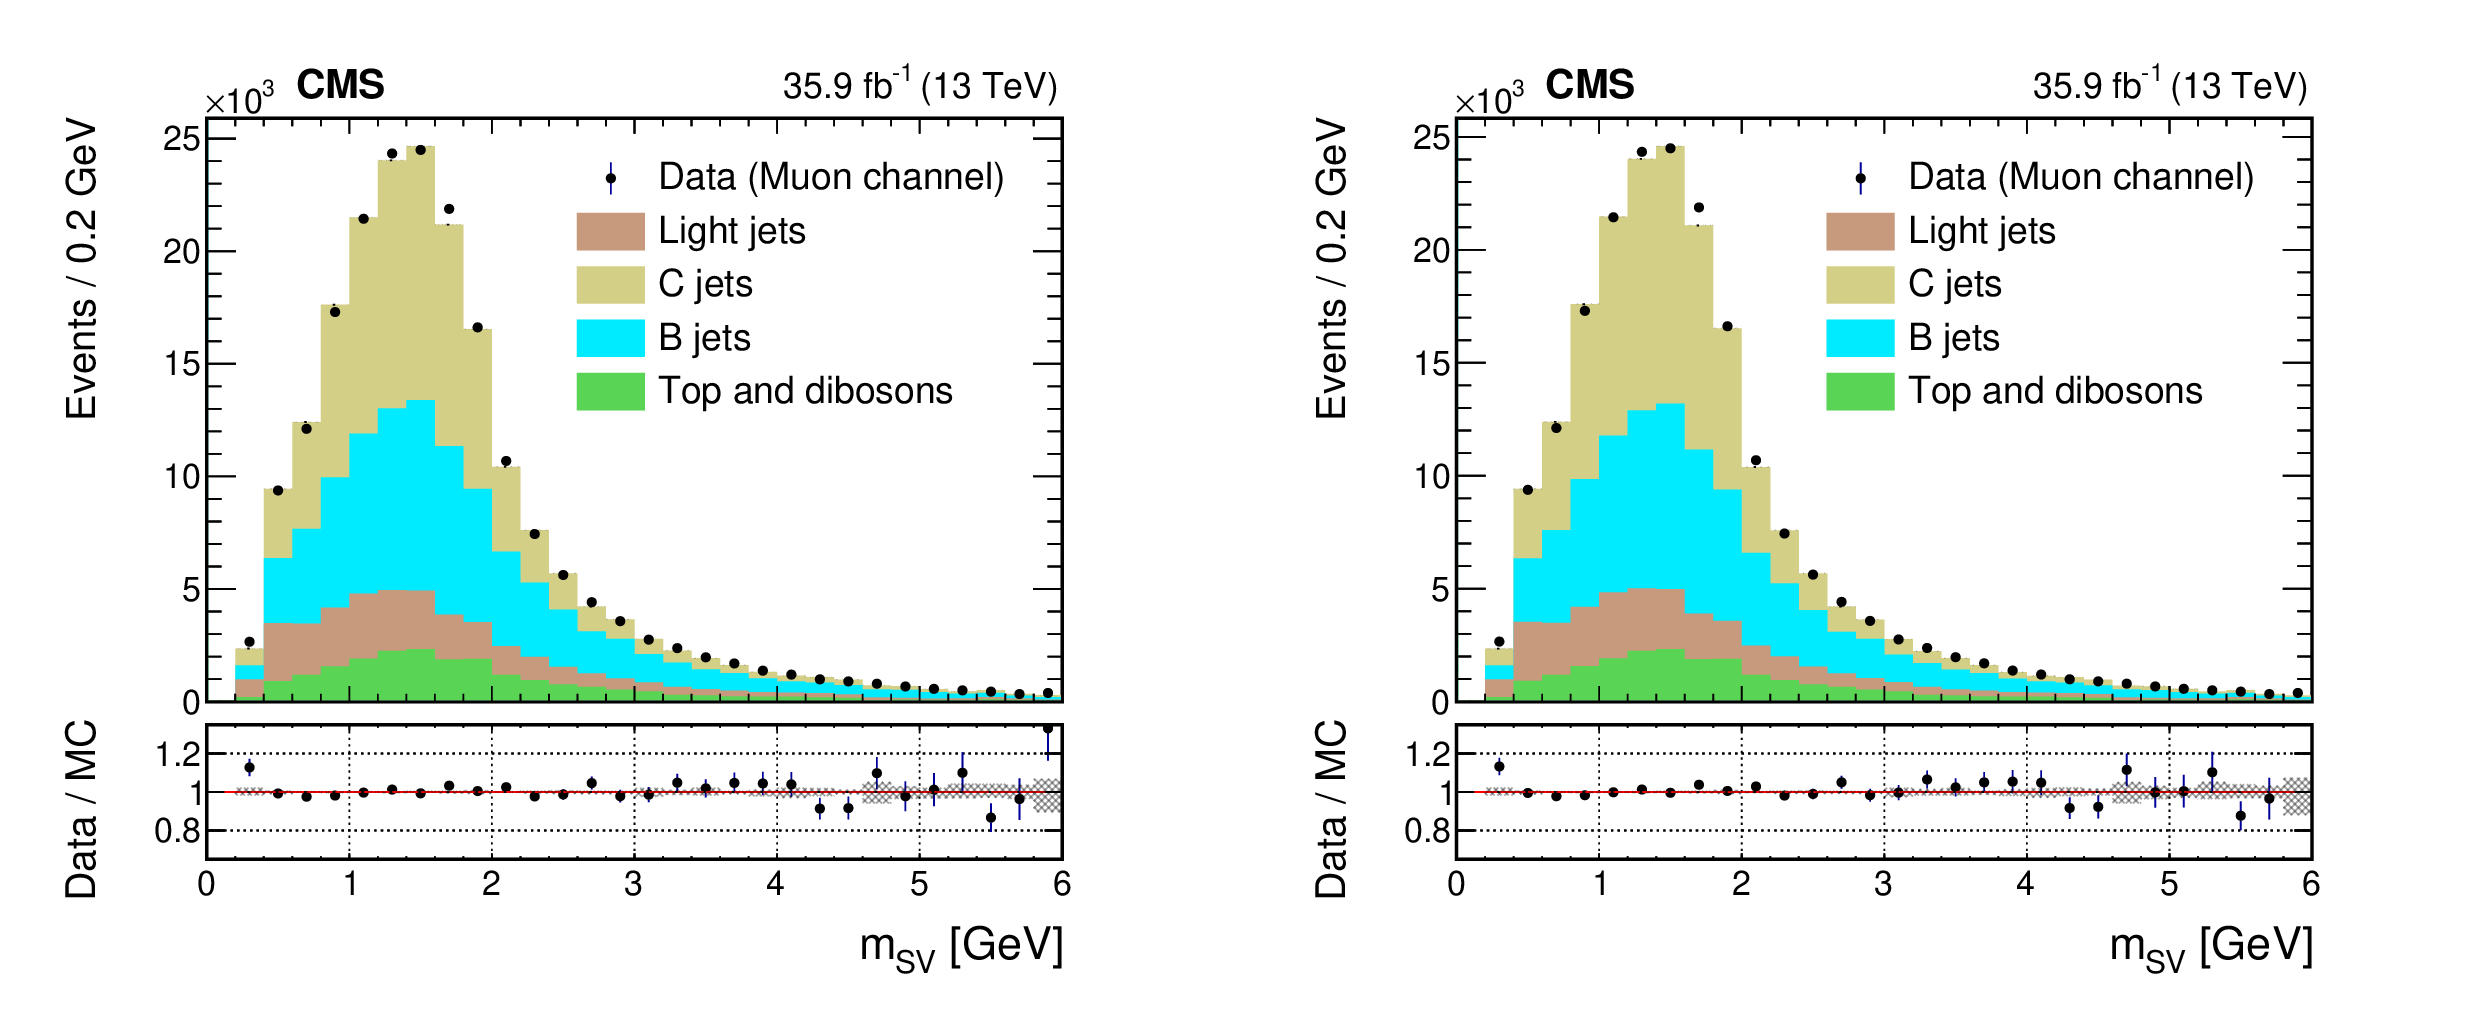
Figure 2:
Distribution of the secondary vertex mass ${M_{\mathrm {SV}}}$ of the highest-${{p_{\mathrm {T}}}}$ c-tagged central jet, for electron (left) and muon (right) channels.The observed data is compared with the different signal and background components in simulation, before normalization scale factors are applied. Dashed area represents MC systematic uncertainties. The vertical bars on the data points represent statistical uncertainties. |
png pdf |
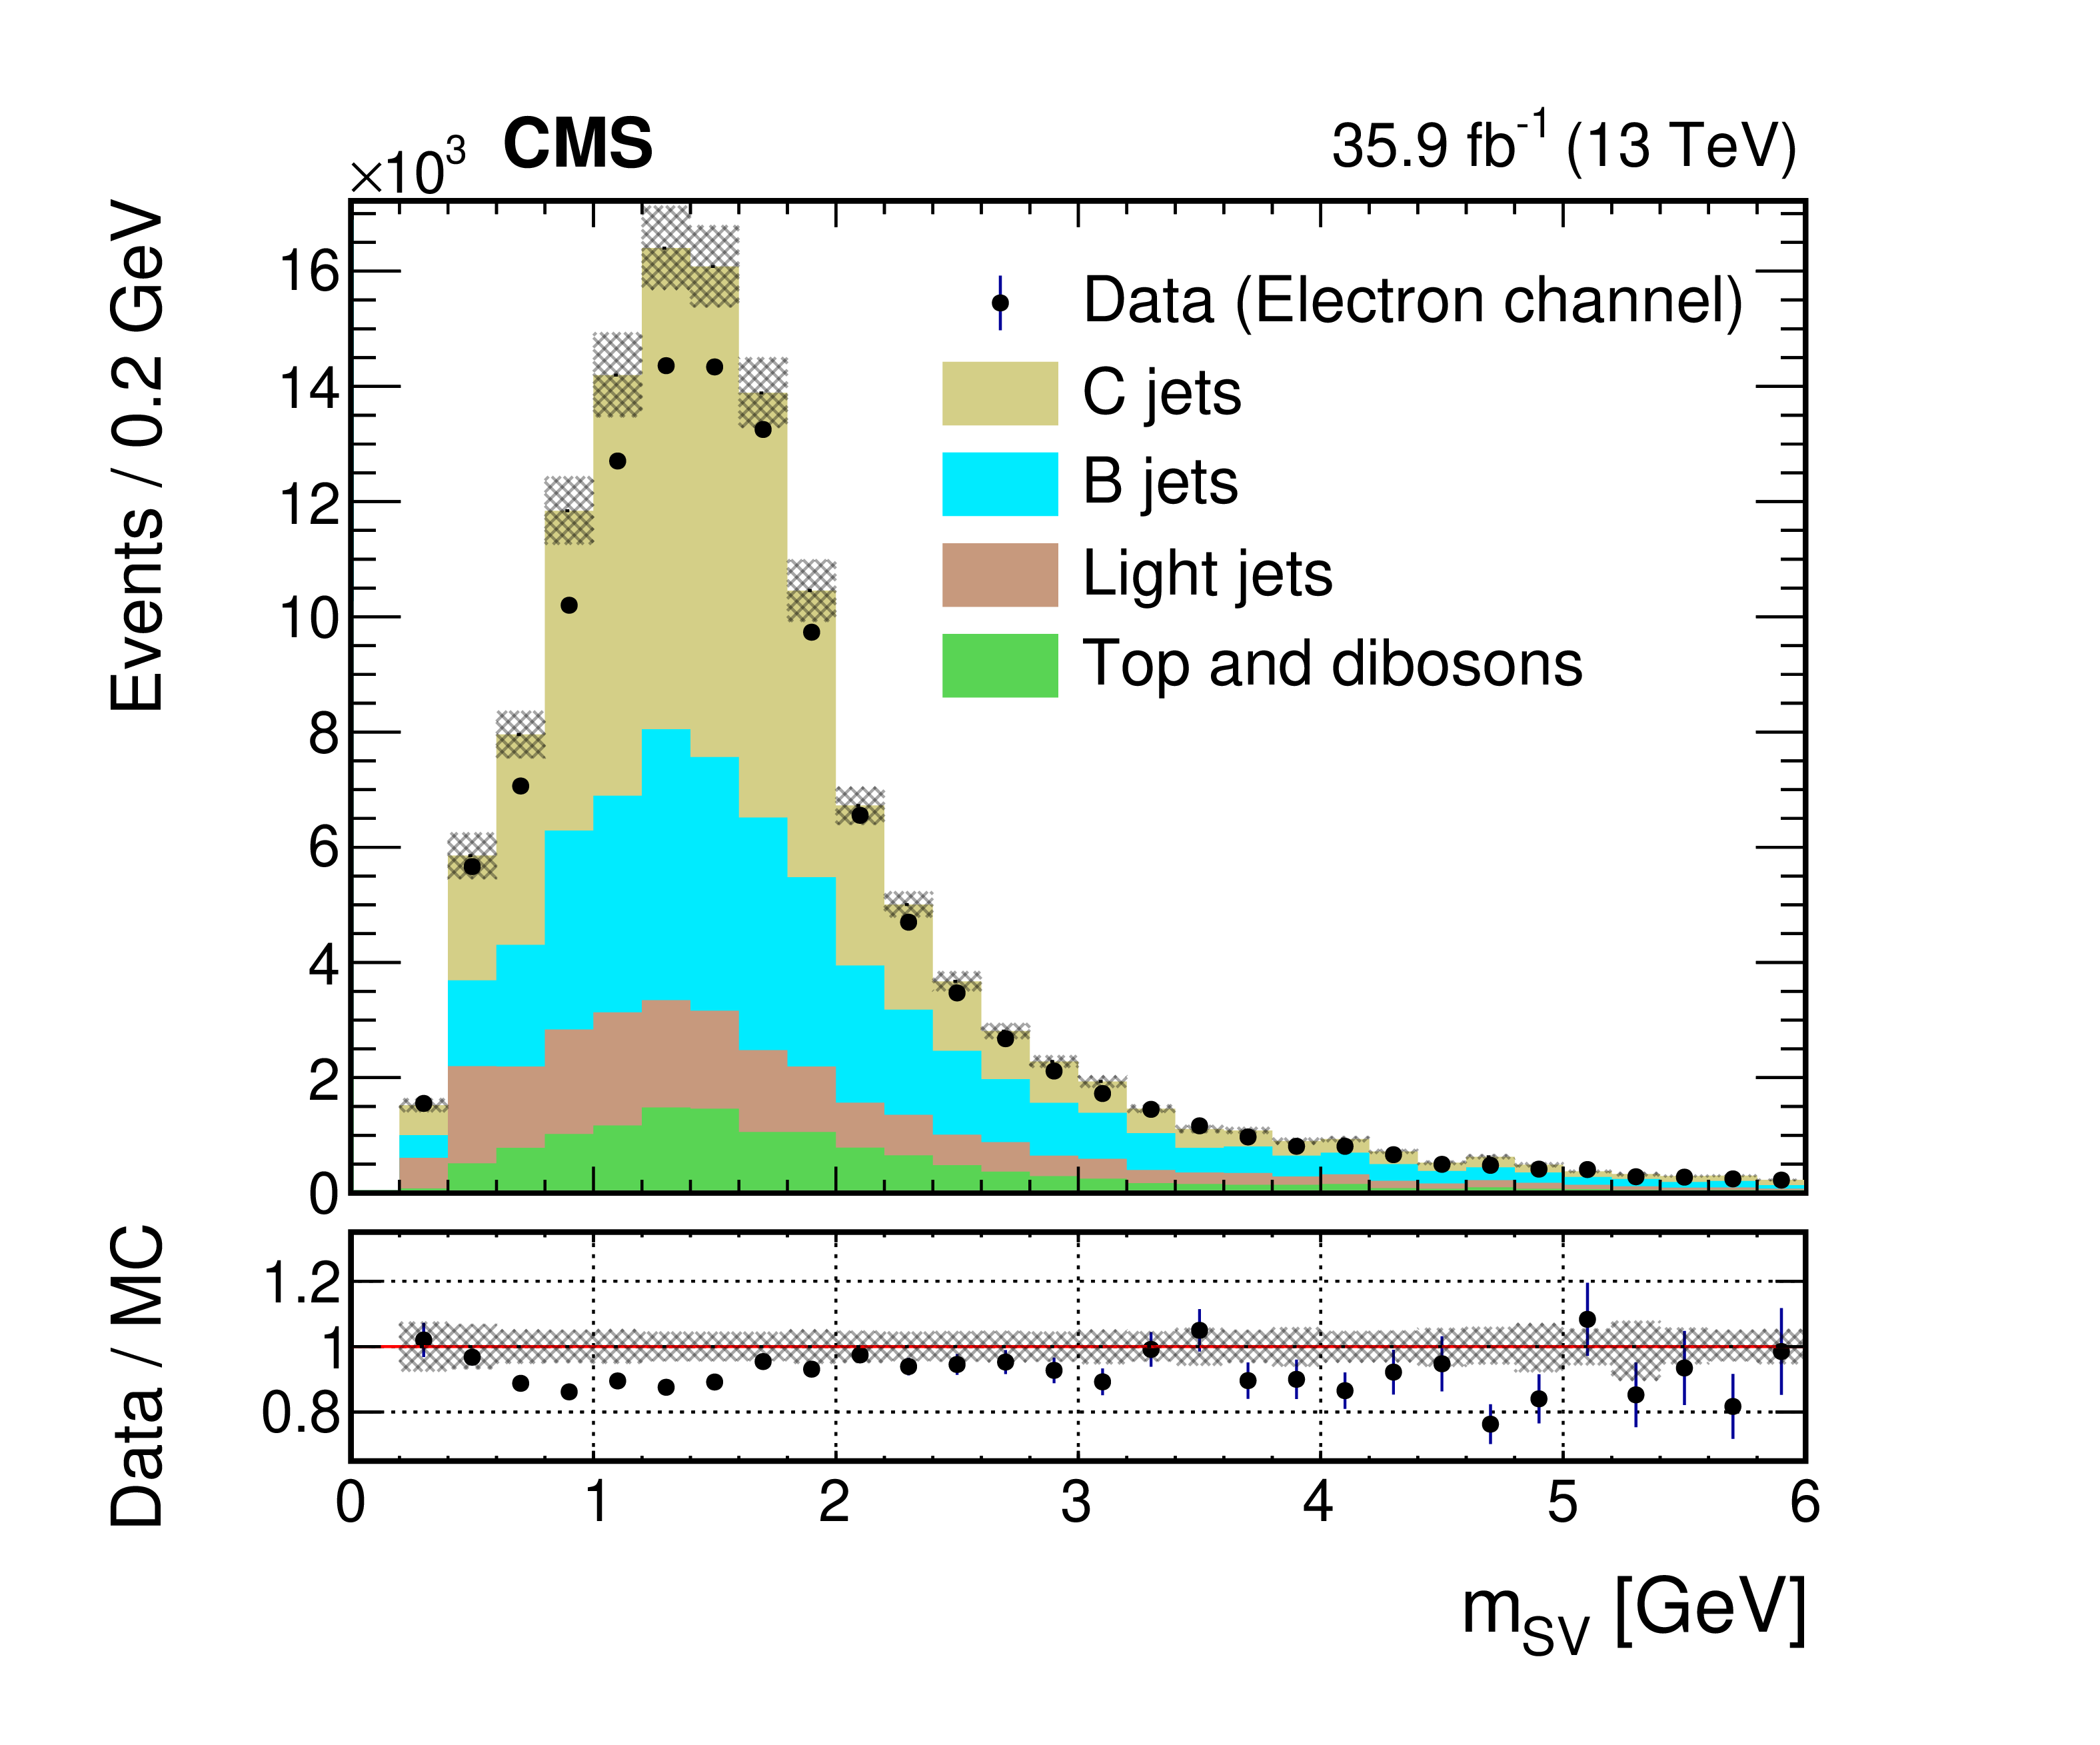
Figure 2-a:
Distribution of the secondary vertex mass ${M_{\mathrm {SV}}}$ of the highest-${{p_{\mathrm {T}}}}$ c-tagged central jet, for the electron channel.The observed data is compared with the different signal and background components in simulation, before normalization scale factors are applied. Dashed area represents MC systematic uncertainties. The vertical bars on the data points represent statistical uncertainties. |
png pdf |
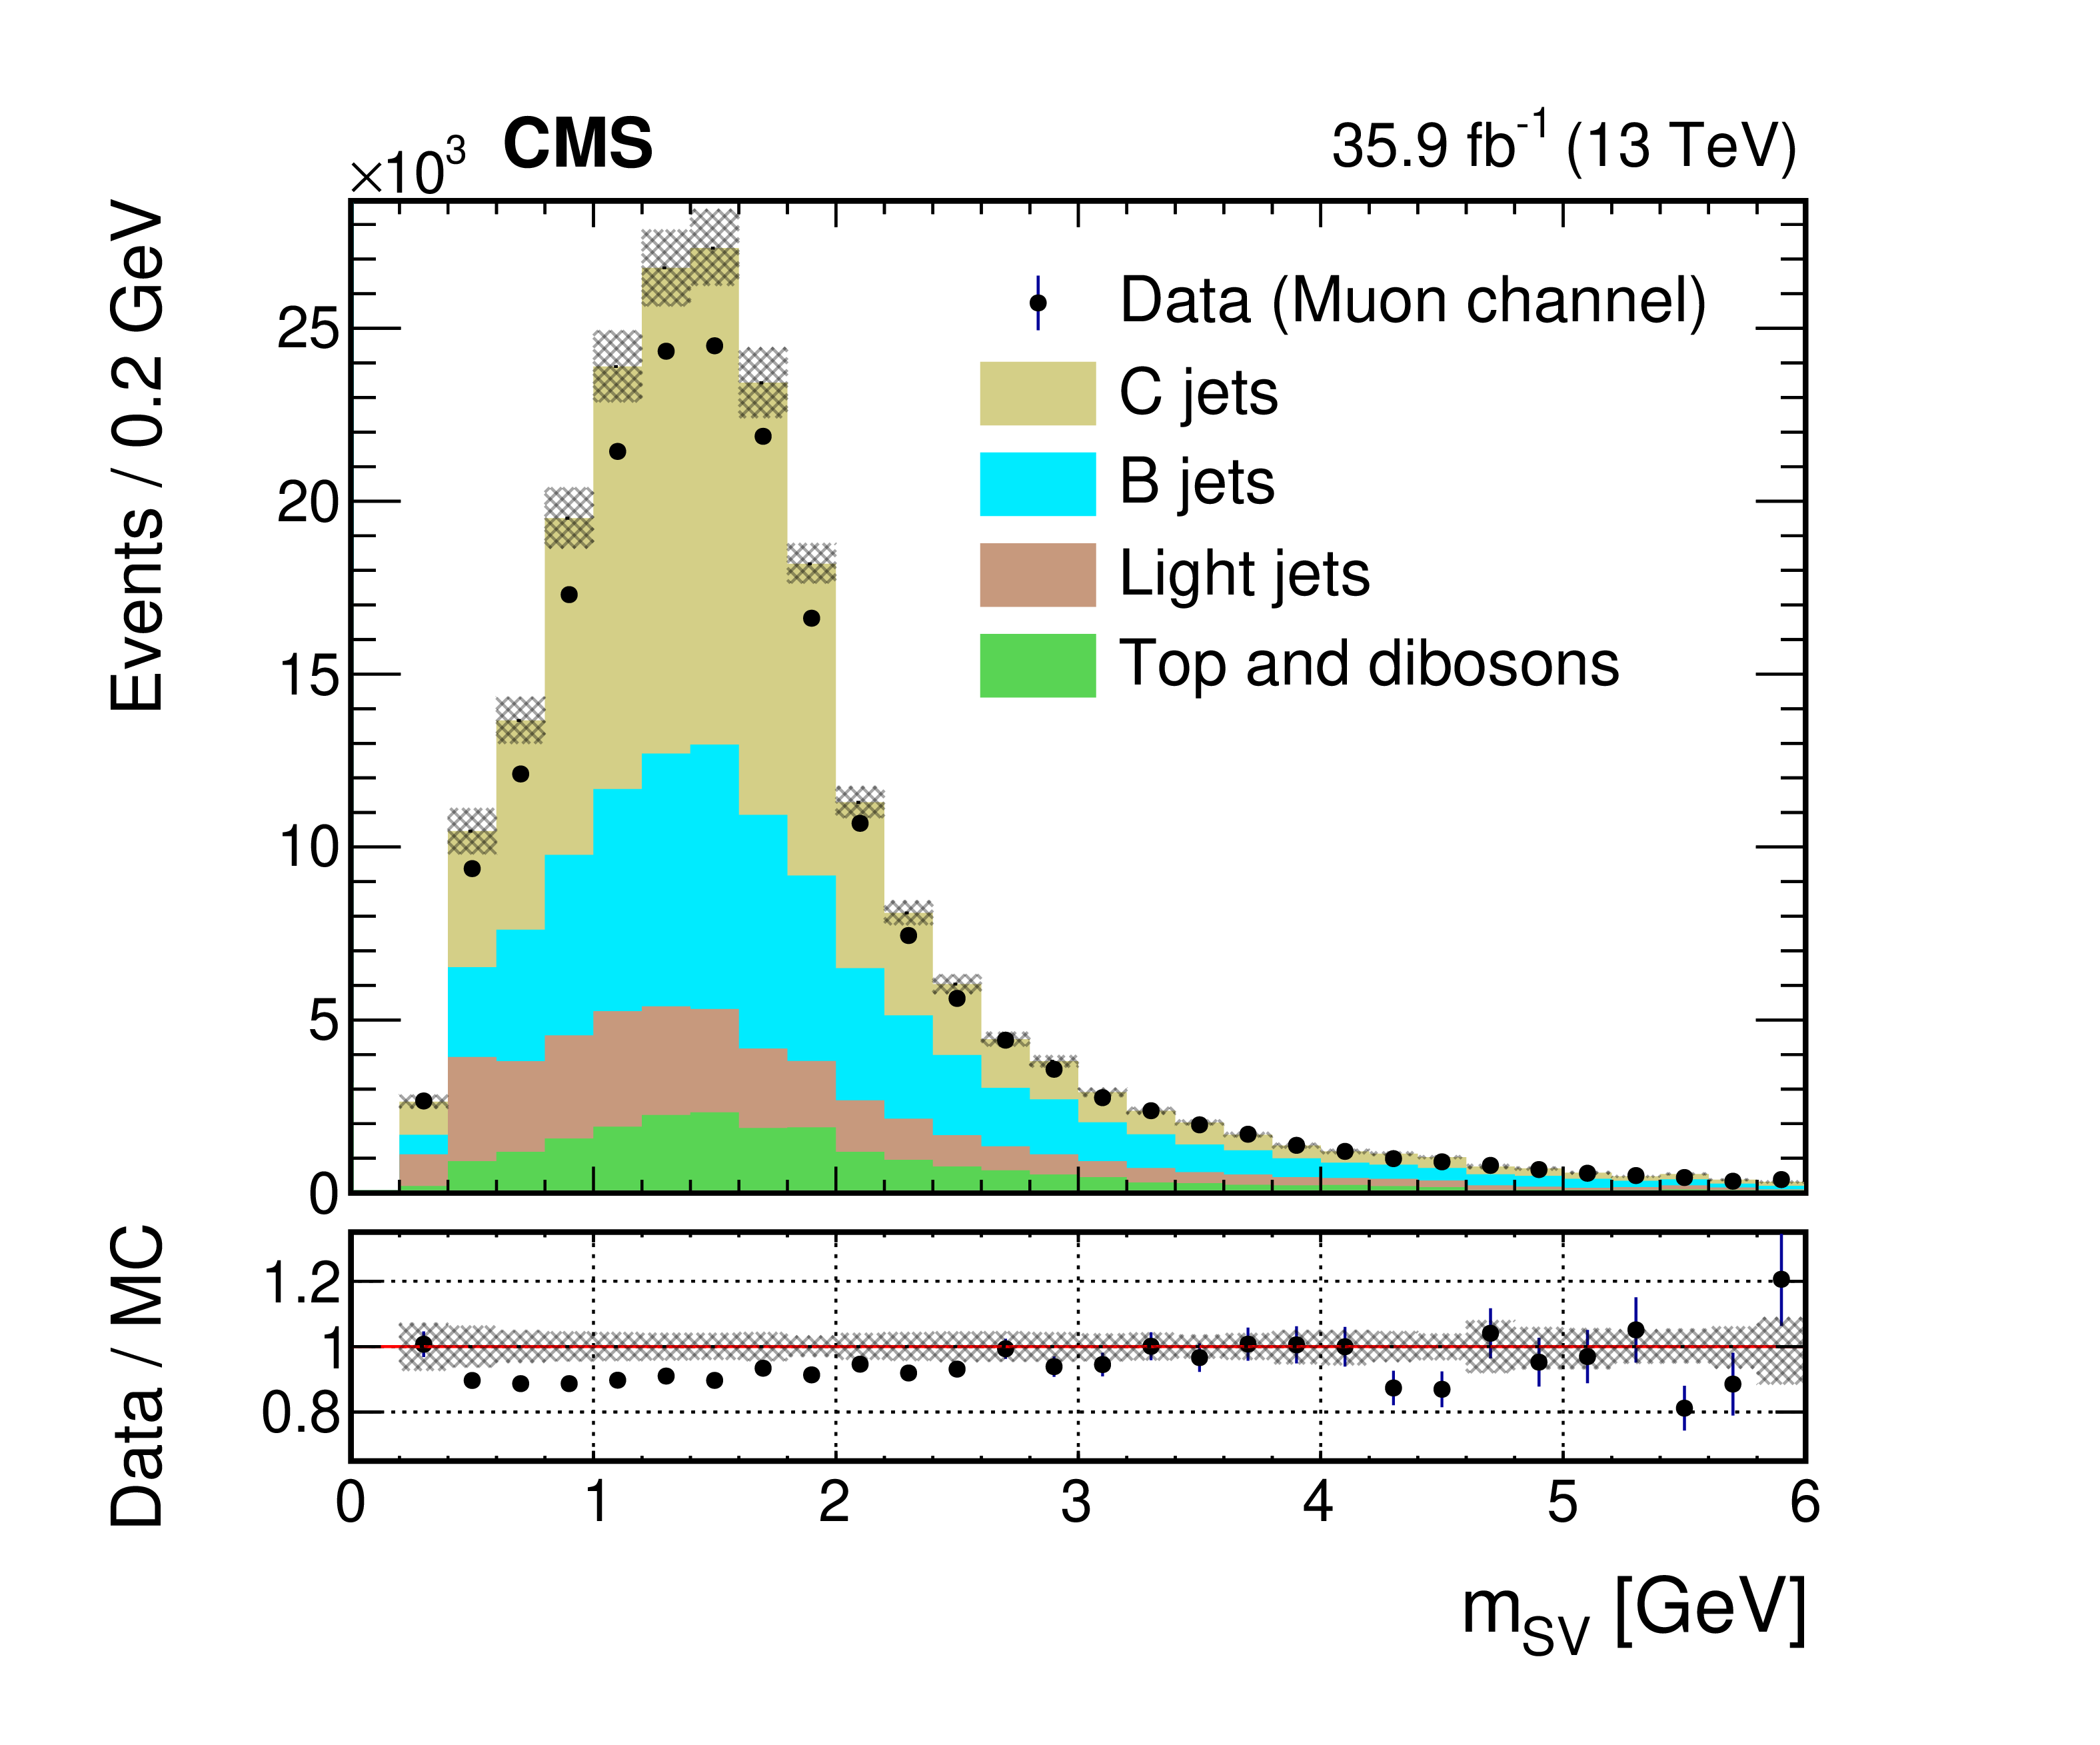
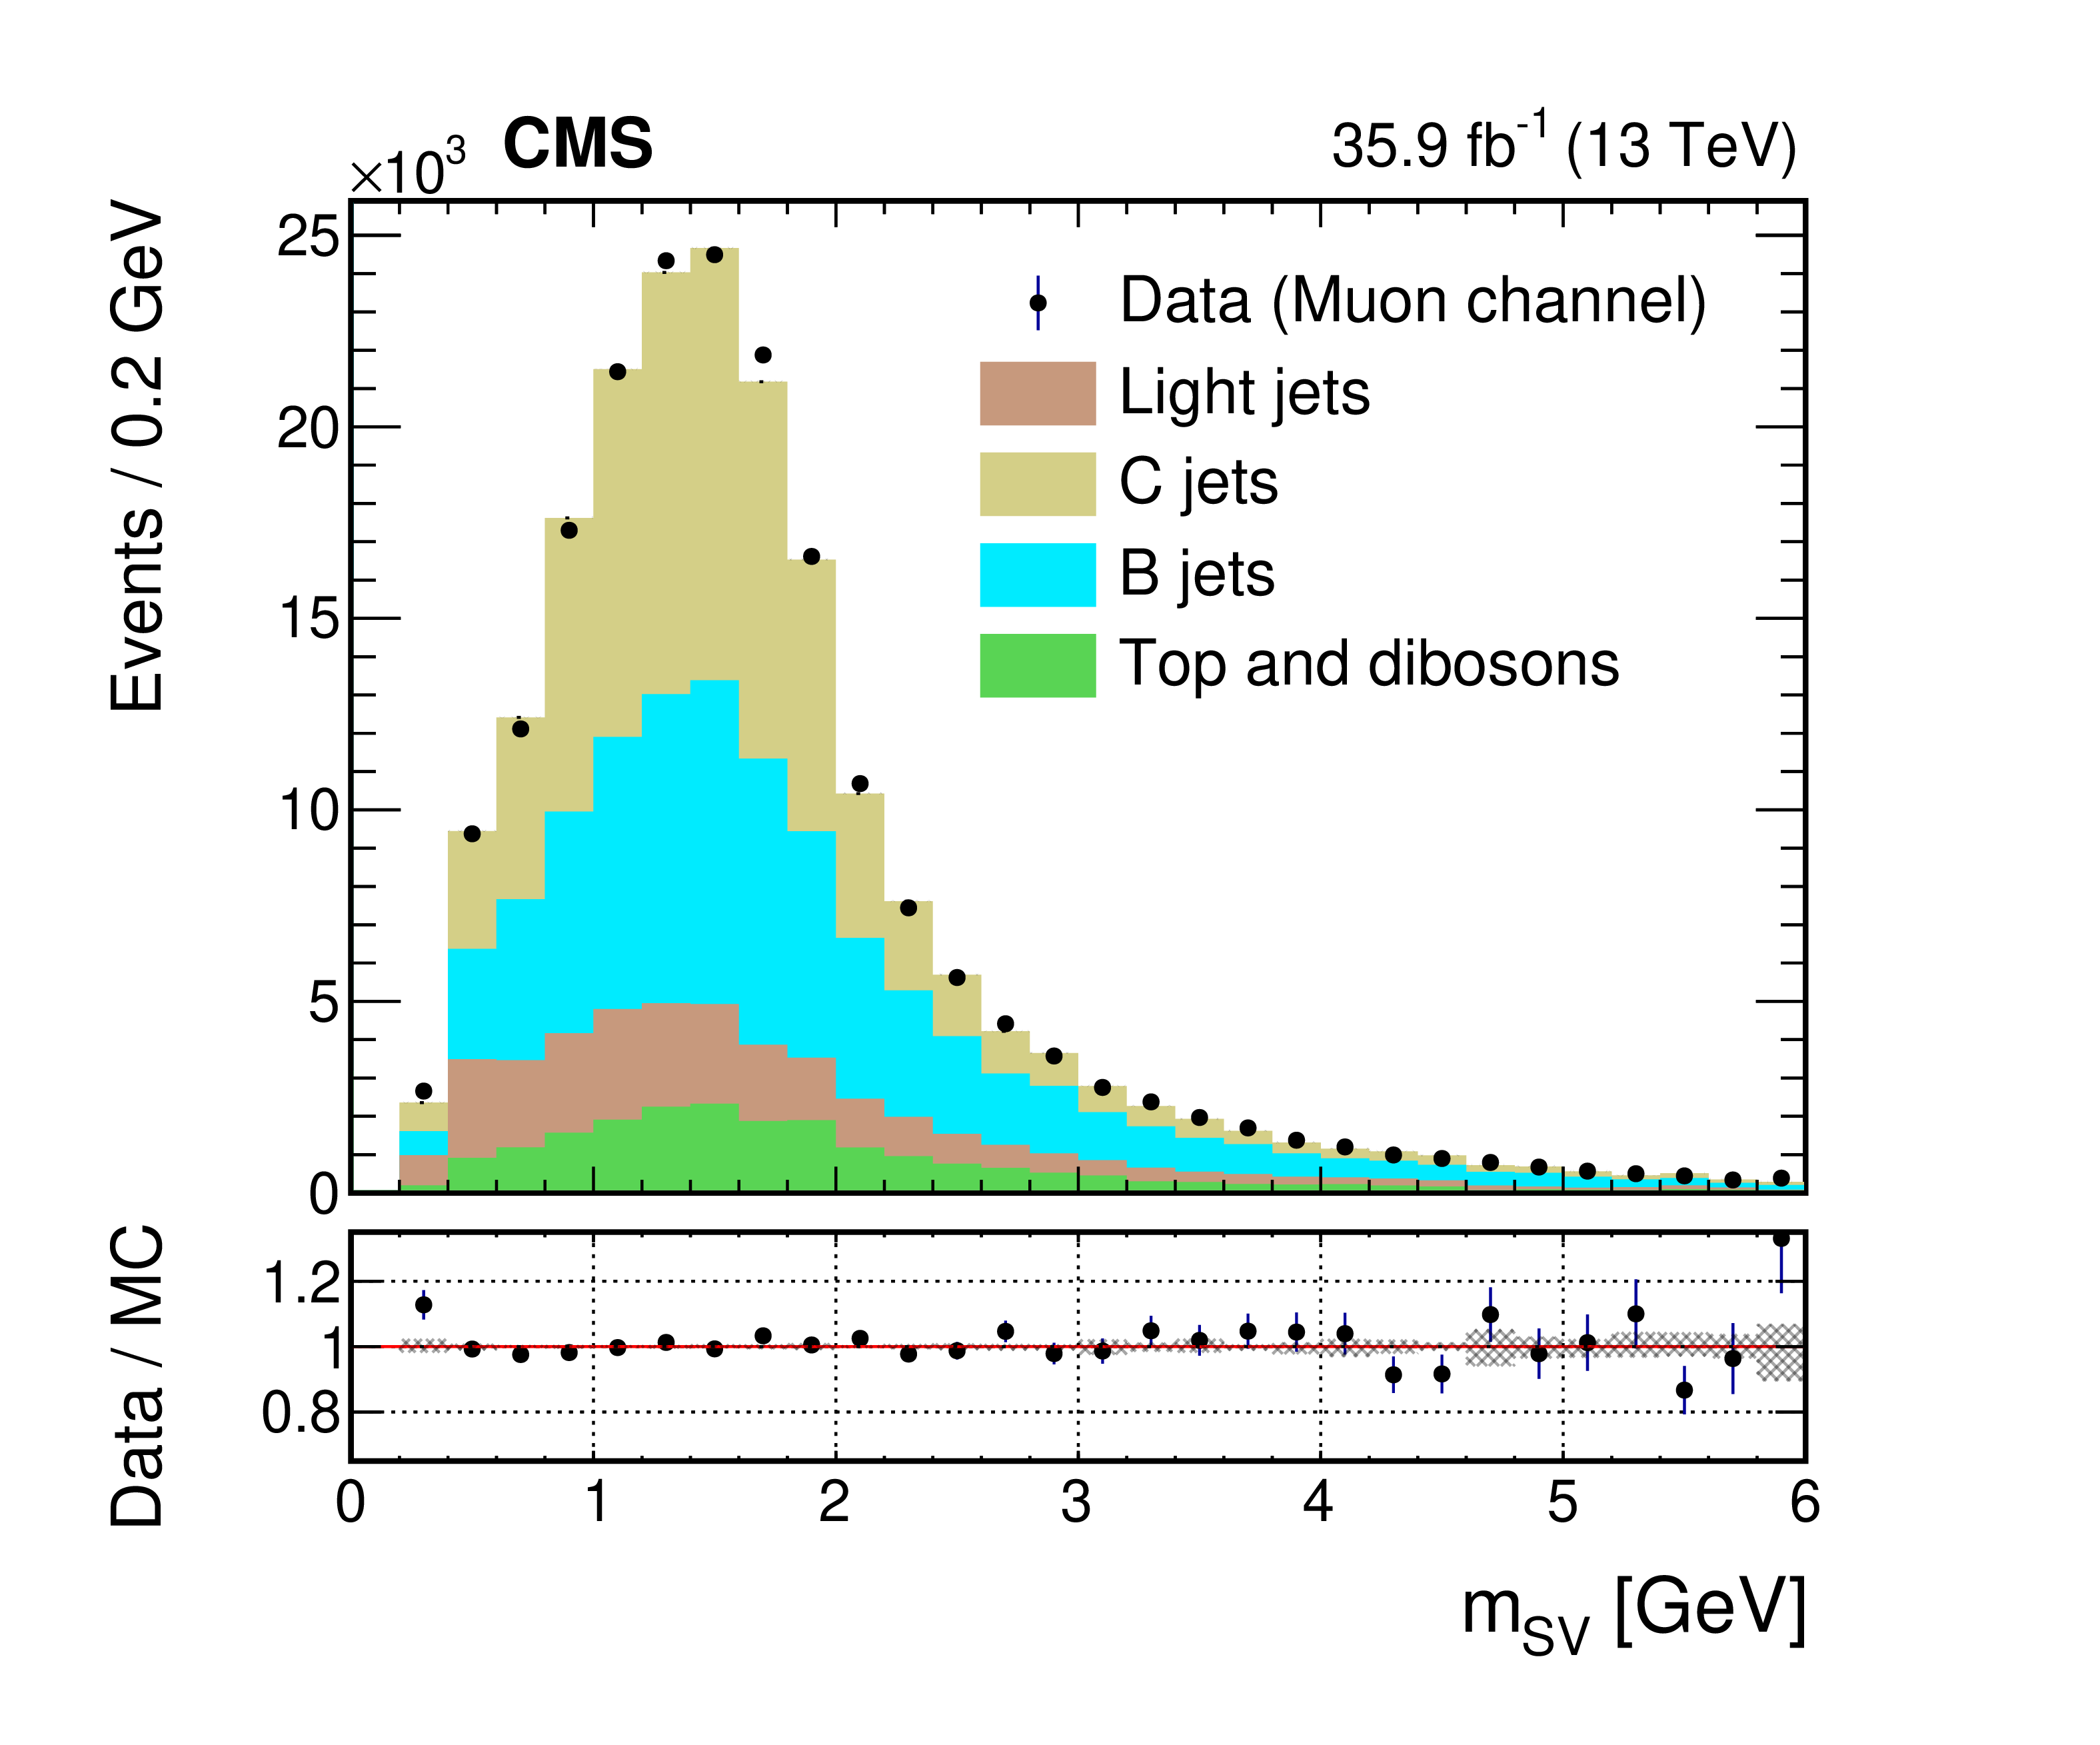
Figure 2-b:
Distribution of the secondary vertex mass ${M_{\mathrm {SV}}}$ of the highest-${{p_{\mathrm {T}}}}$ c-tagged central jet, for the electron channel.The observed data is compared with the different signal and background components in simulation, before normalization scale factors are applied. Dashed area represents MC systematic uncertainties. The vertical bars on the data points represent statistical uncertainties. |
png pdf |
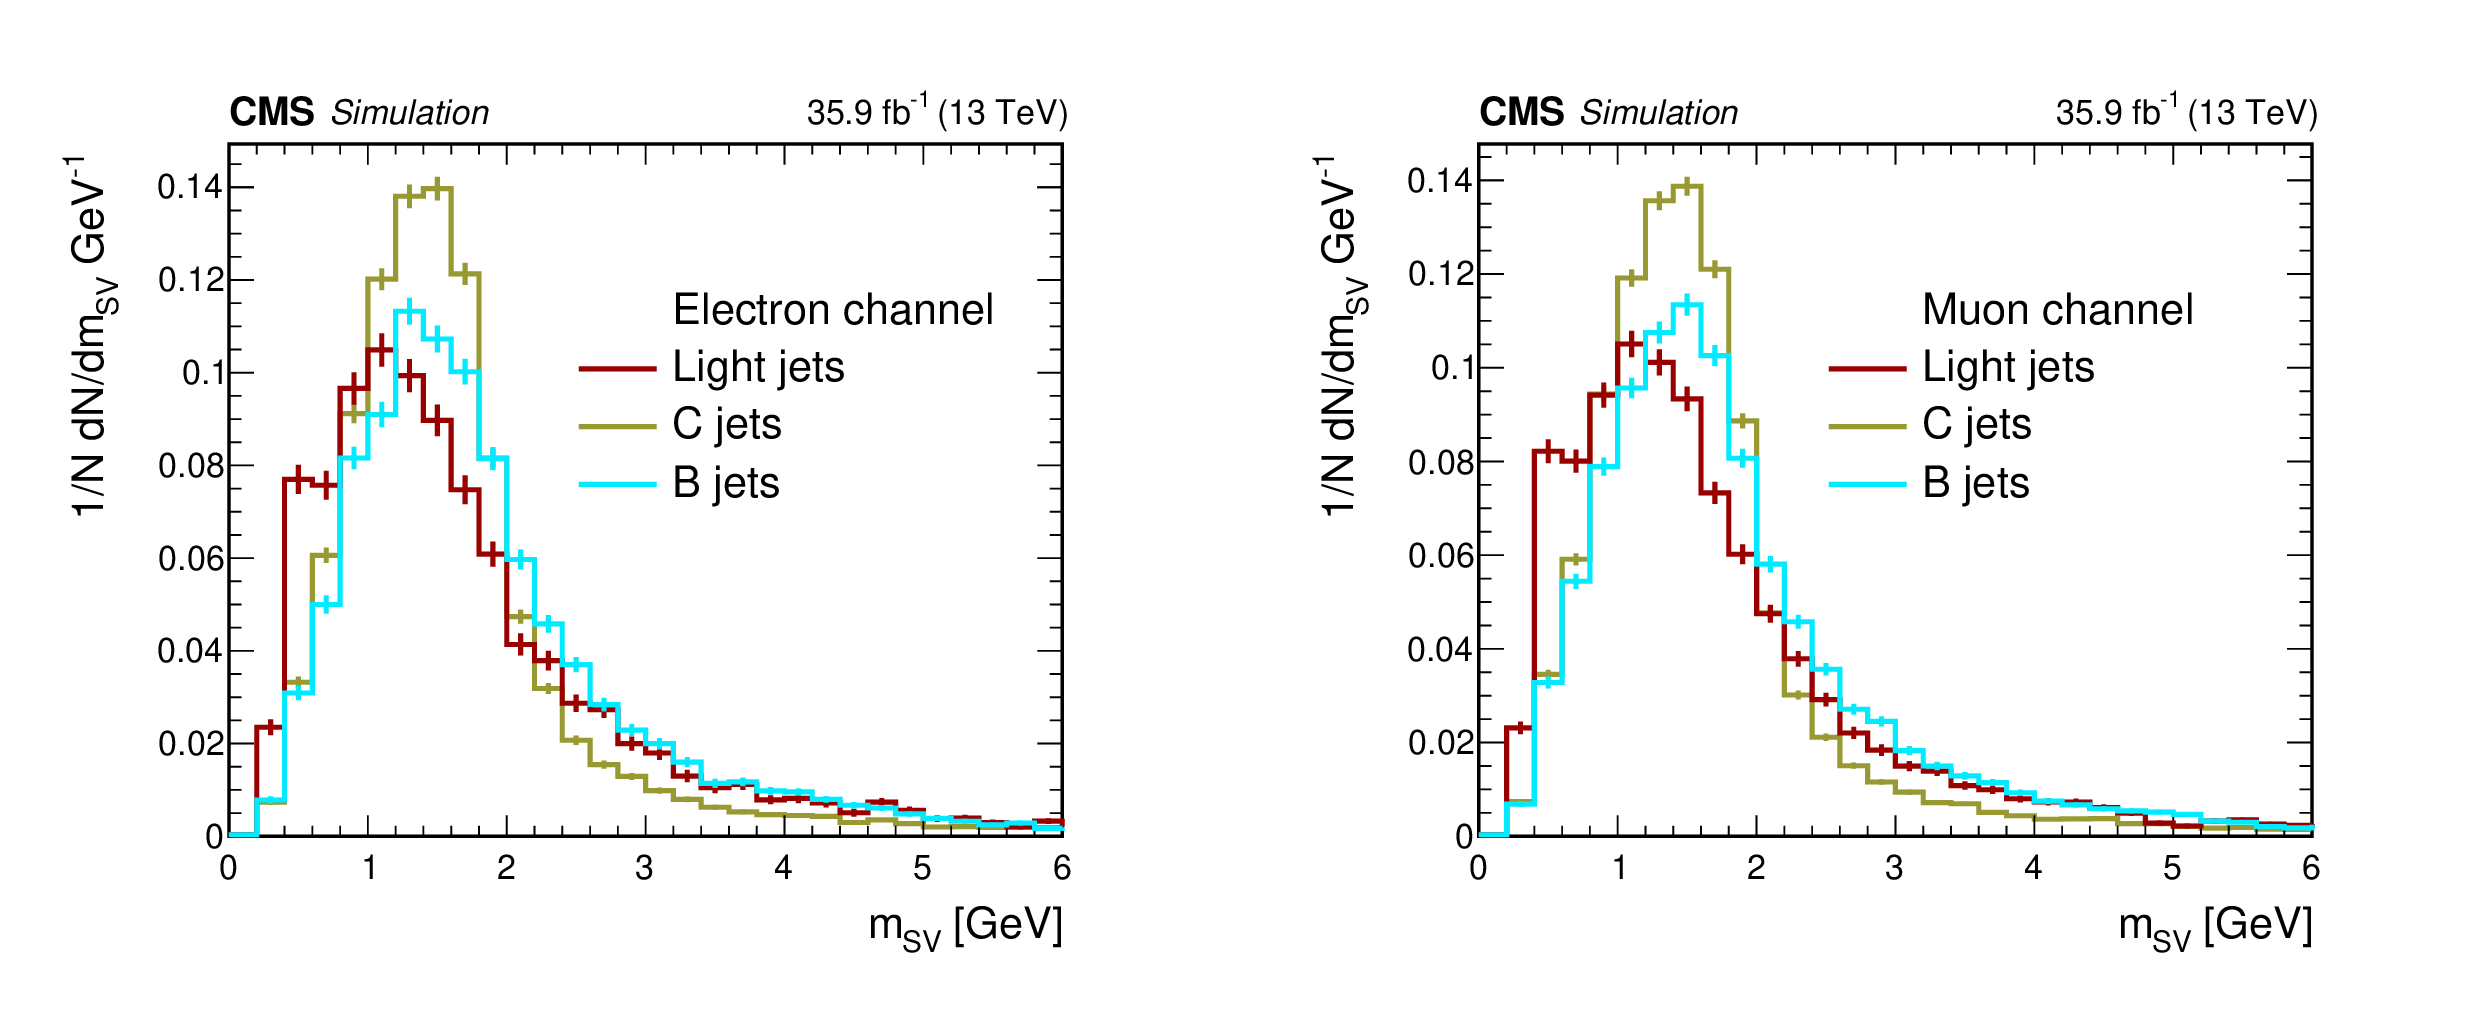
Figure 3:
Distribution of the secondary vertex mass of the highest-${{p_{\mathrm {T}}}}$ c-tagged central jet, for electron (left) and muon (right) channels for Z$+$light-jet, Z$+$c-jet and Z$+$b-jet components, normalized to 1. Vertical bars represent statistical uncertainties. |

png pdf |
Figure 3-a:
Distribution of the secondary vertex mass of the highest-${{p_{\mathrm {T}}}}$ c-tagged central jet, for the electron channel for Z$+$light-jet, Z$+$c-jet and Z$+$b-jet components, normalized to 1. Vertical bars represent statistical uncertainties. |
png pdf |
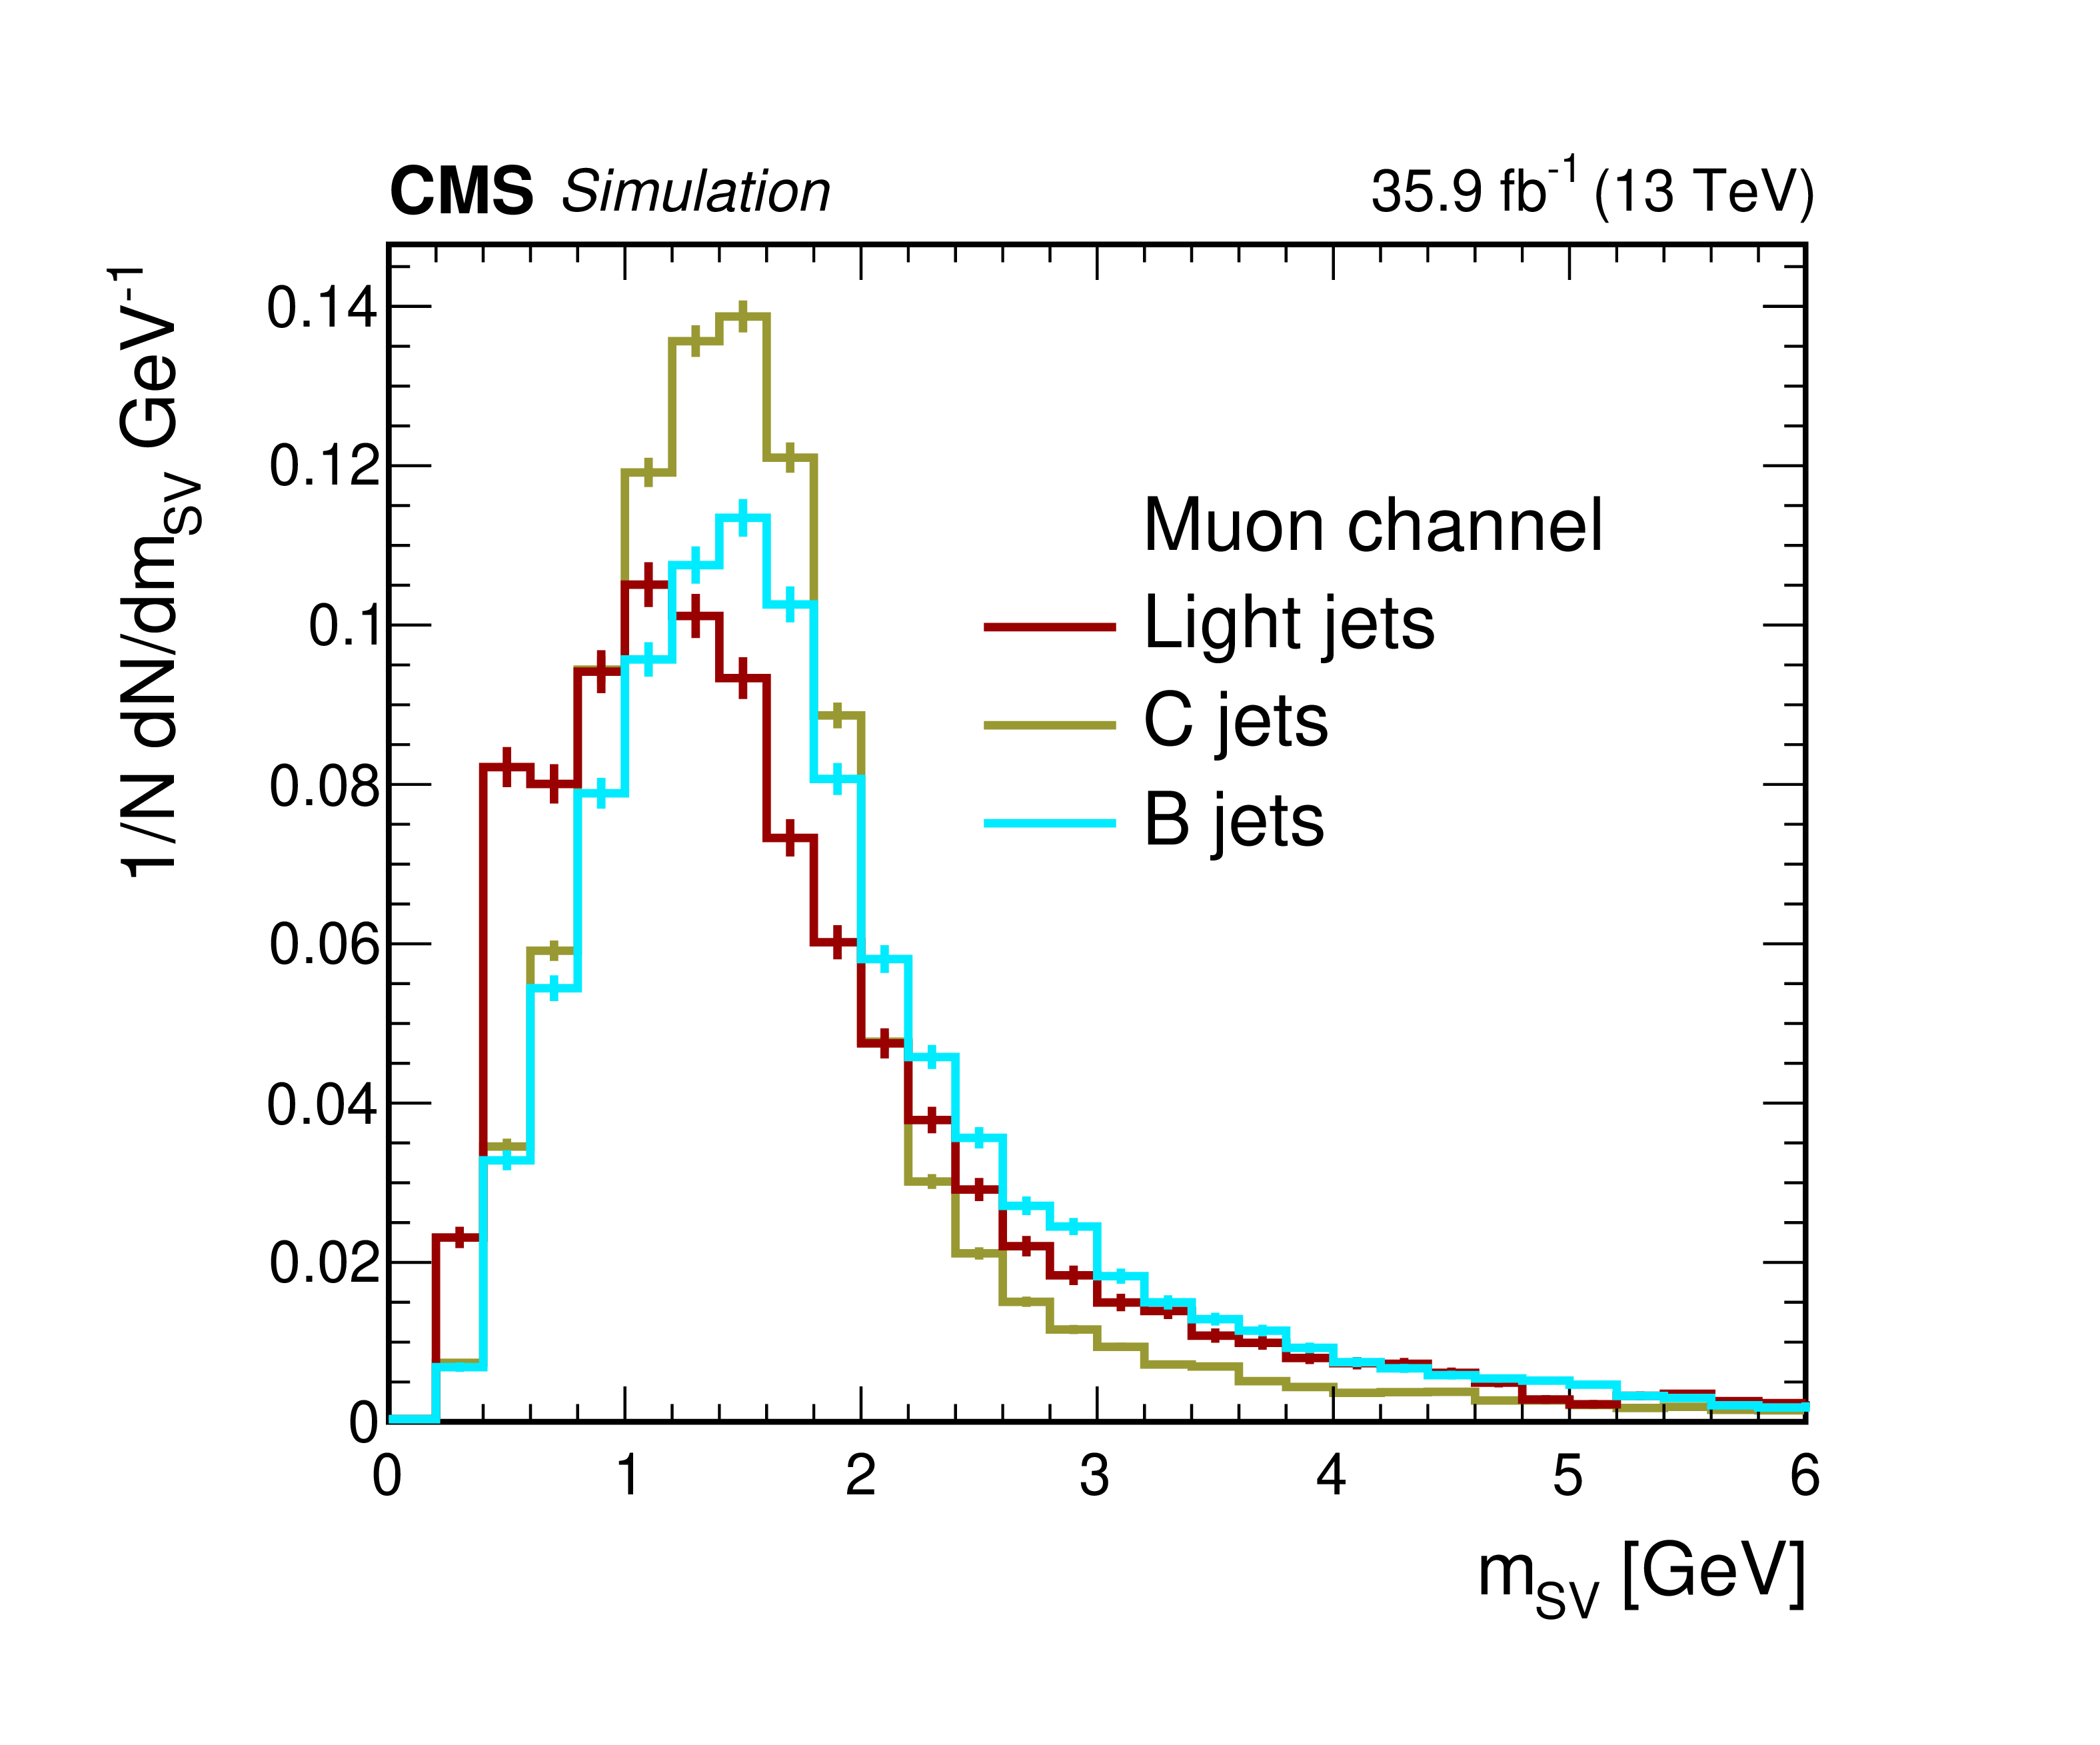
Figure 3-b:
Distribution of the secondary vertex mass of the highest-${{p_{\mathrm {T}}}}$ c-tagged central jet, for the muon channel for Z$+$light-jet, Z$+$c-jet and Z$+$b-jet components, normalized to 1. Vertical bars represent statistical uncertainties. |
png pdf |
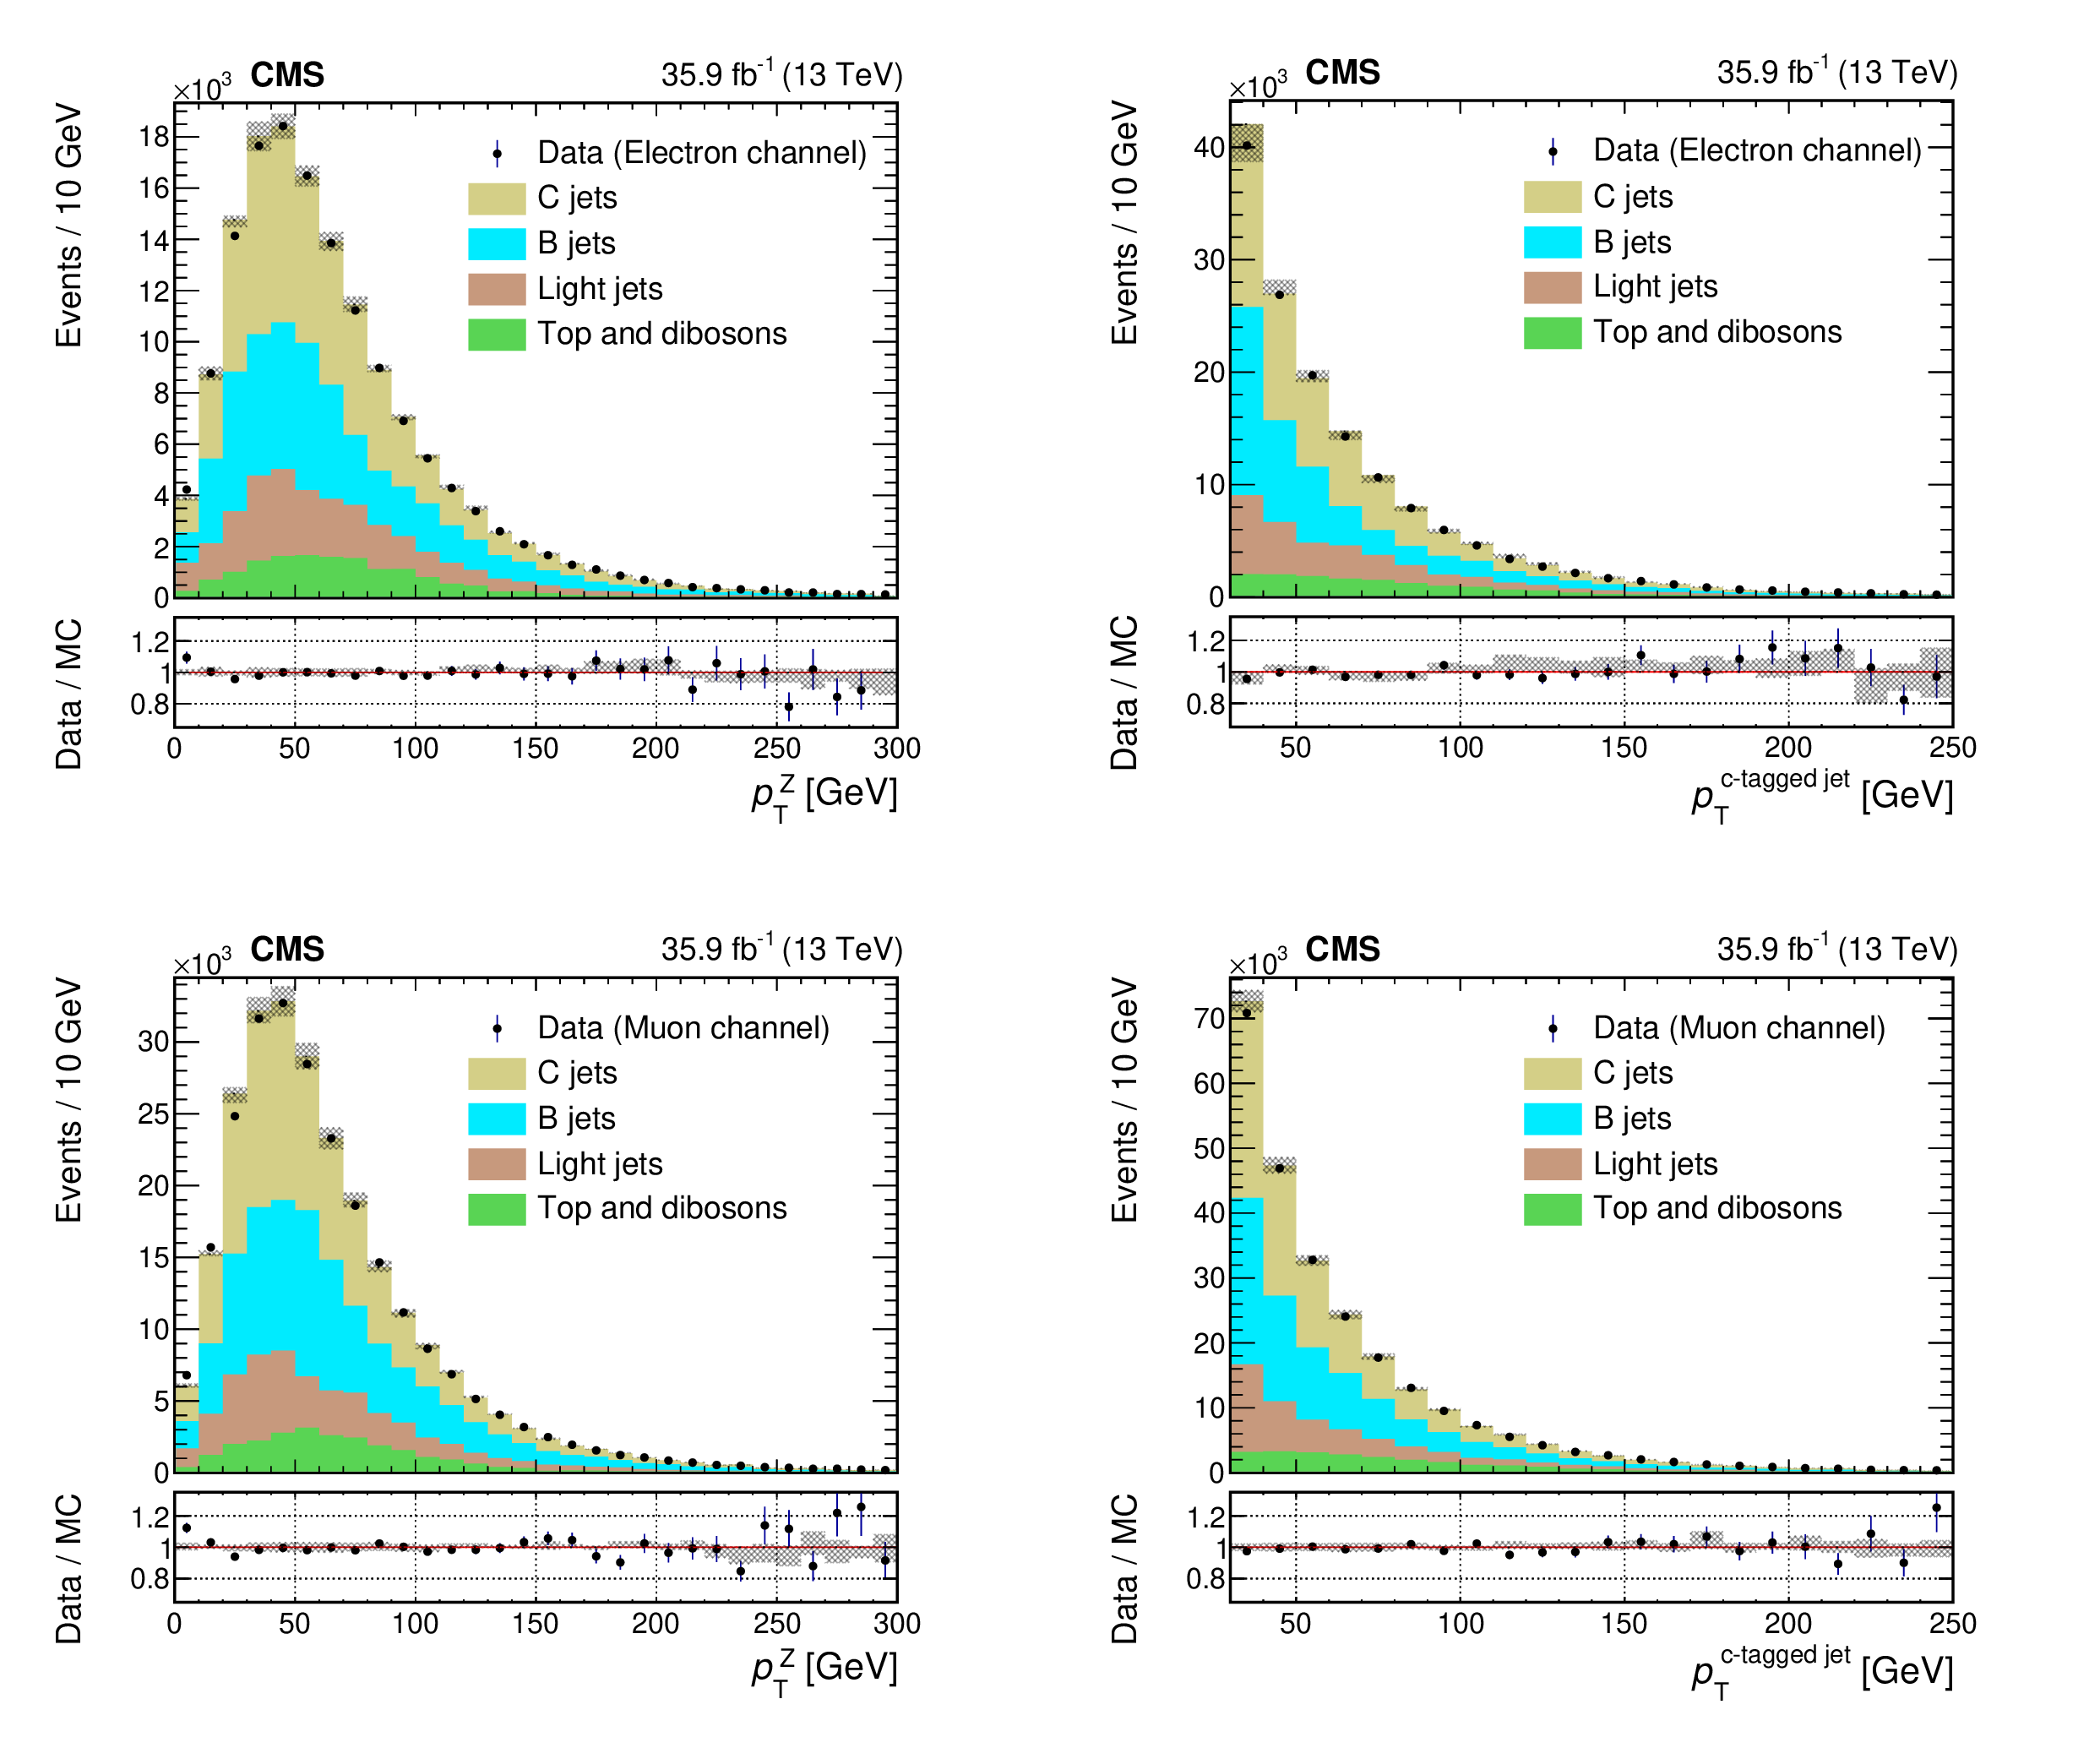
Figure 4:
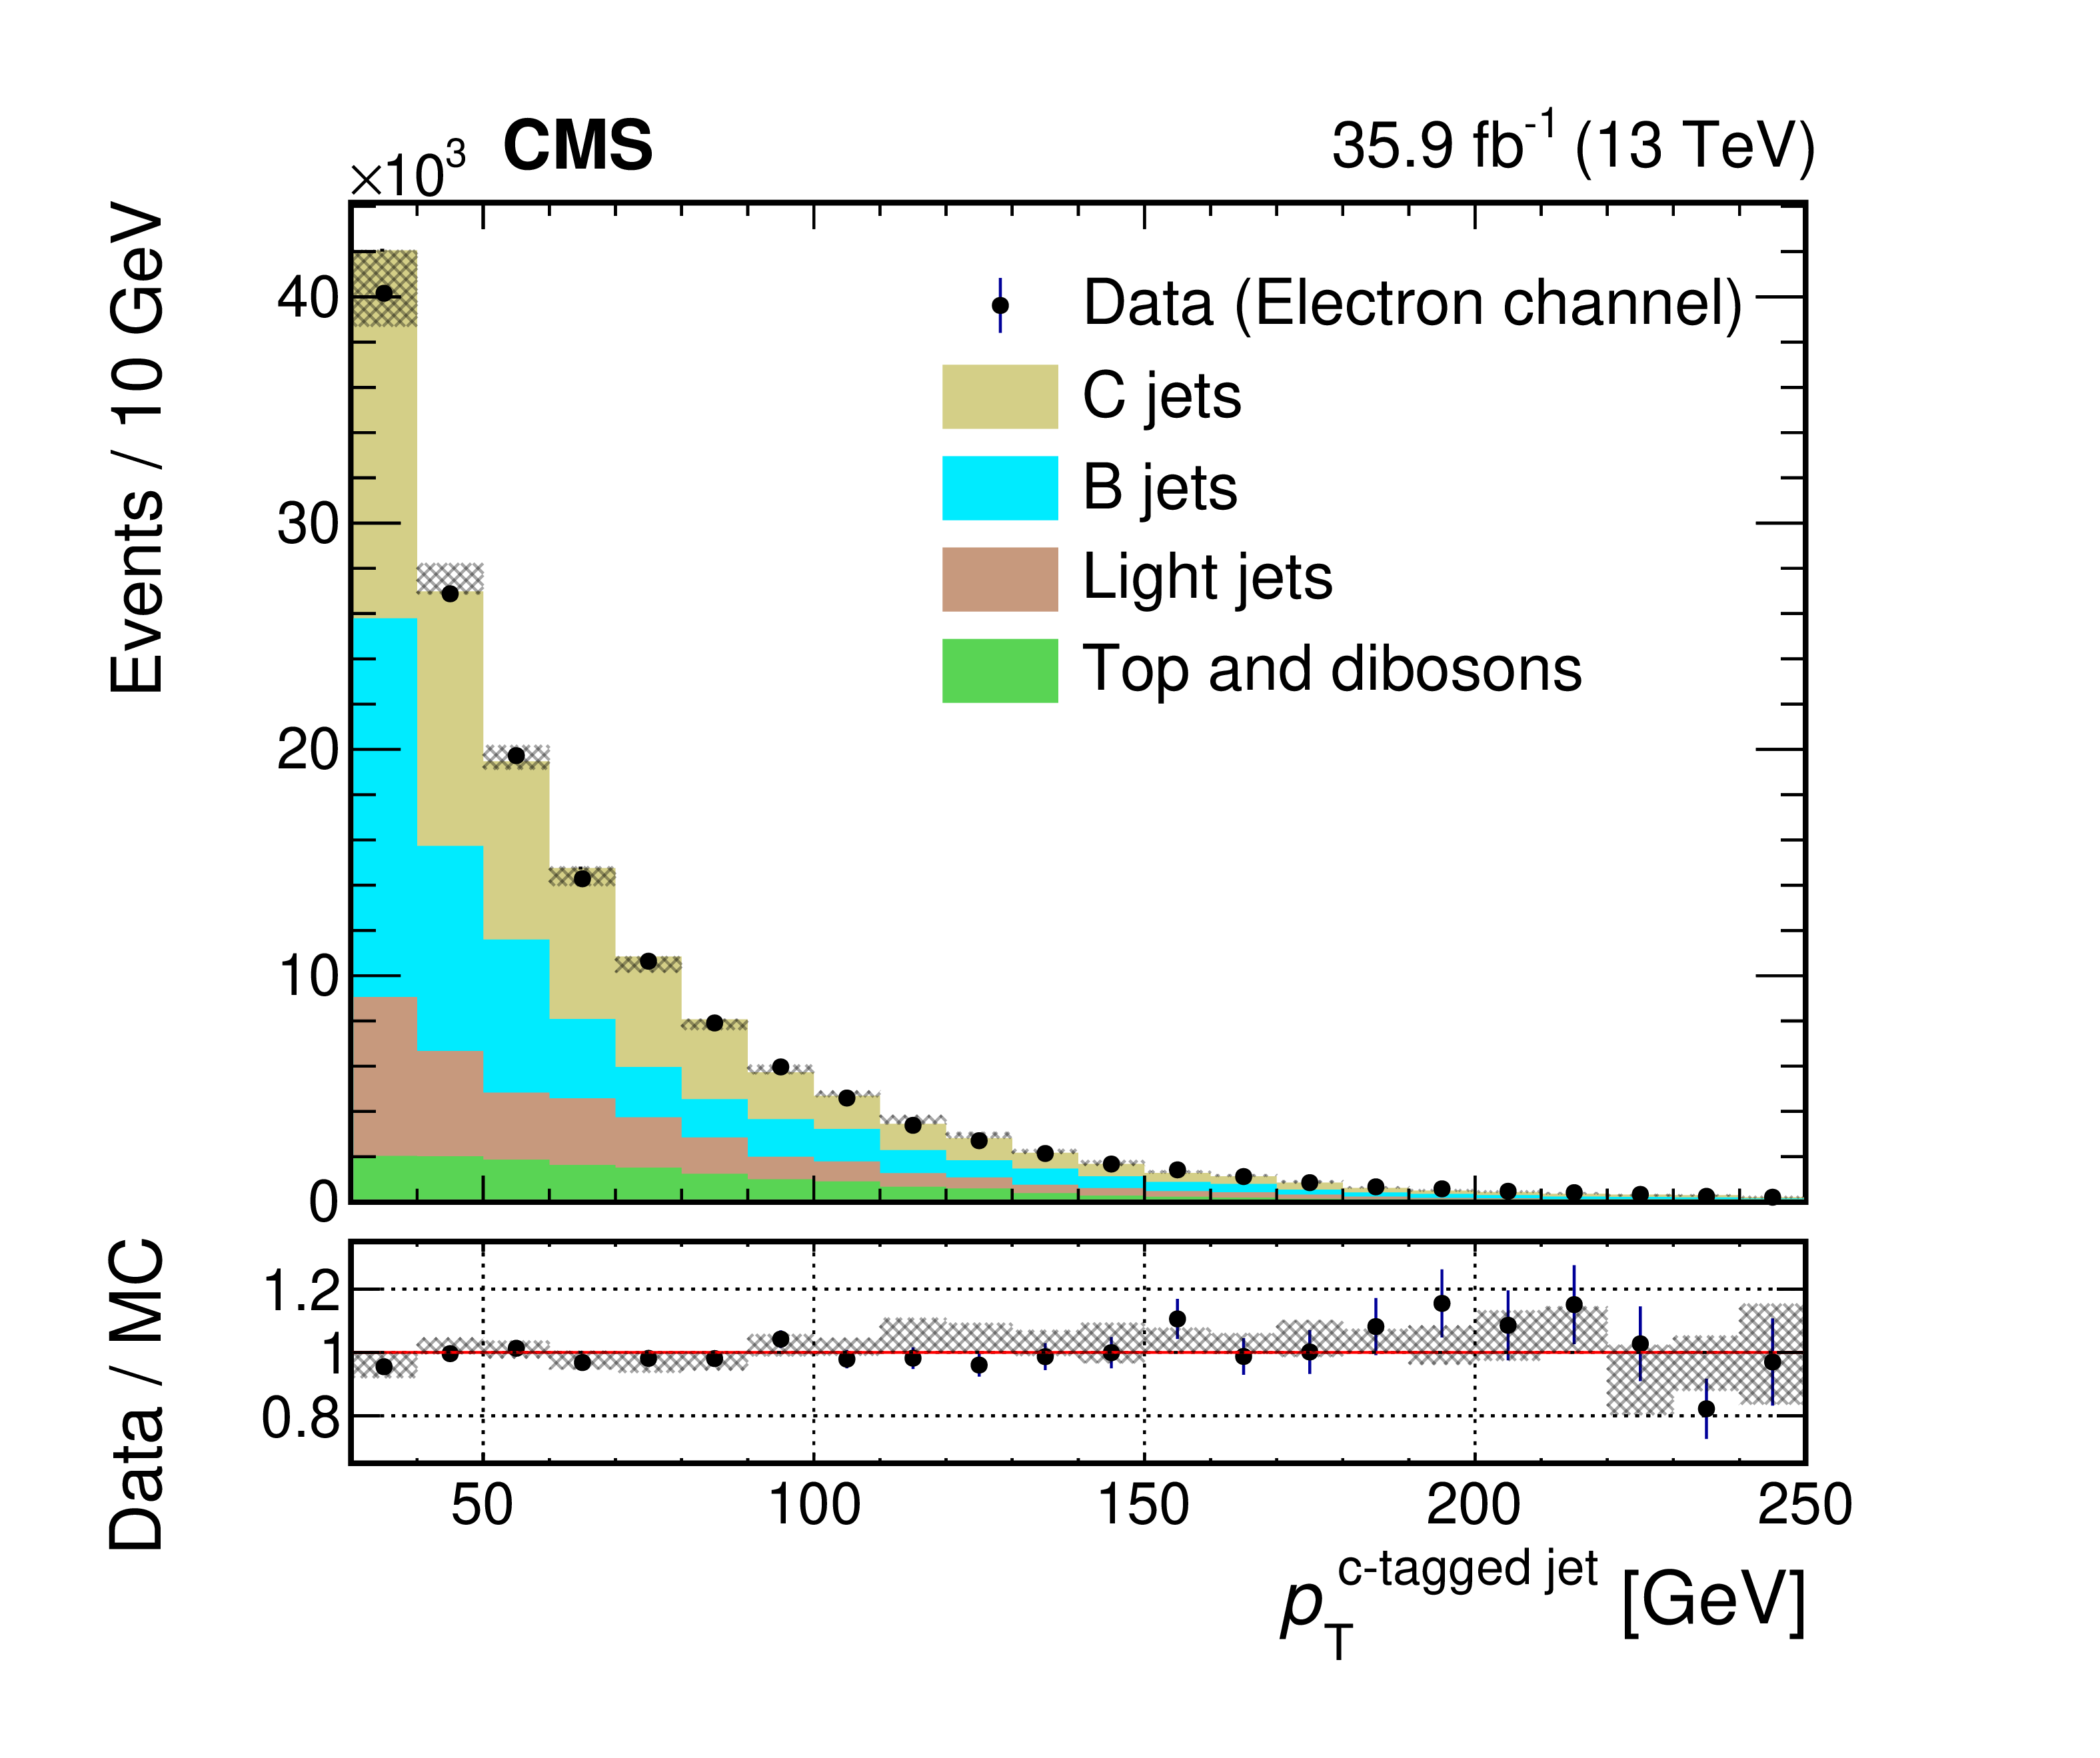
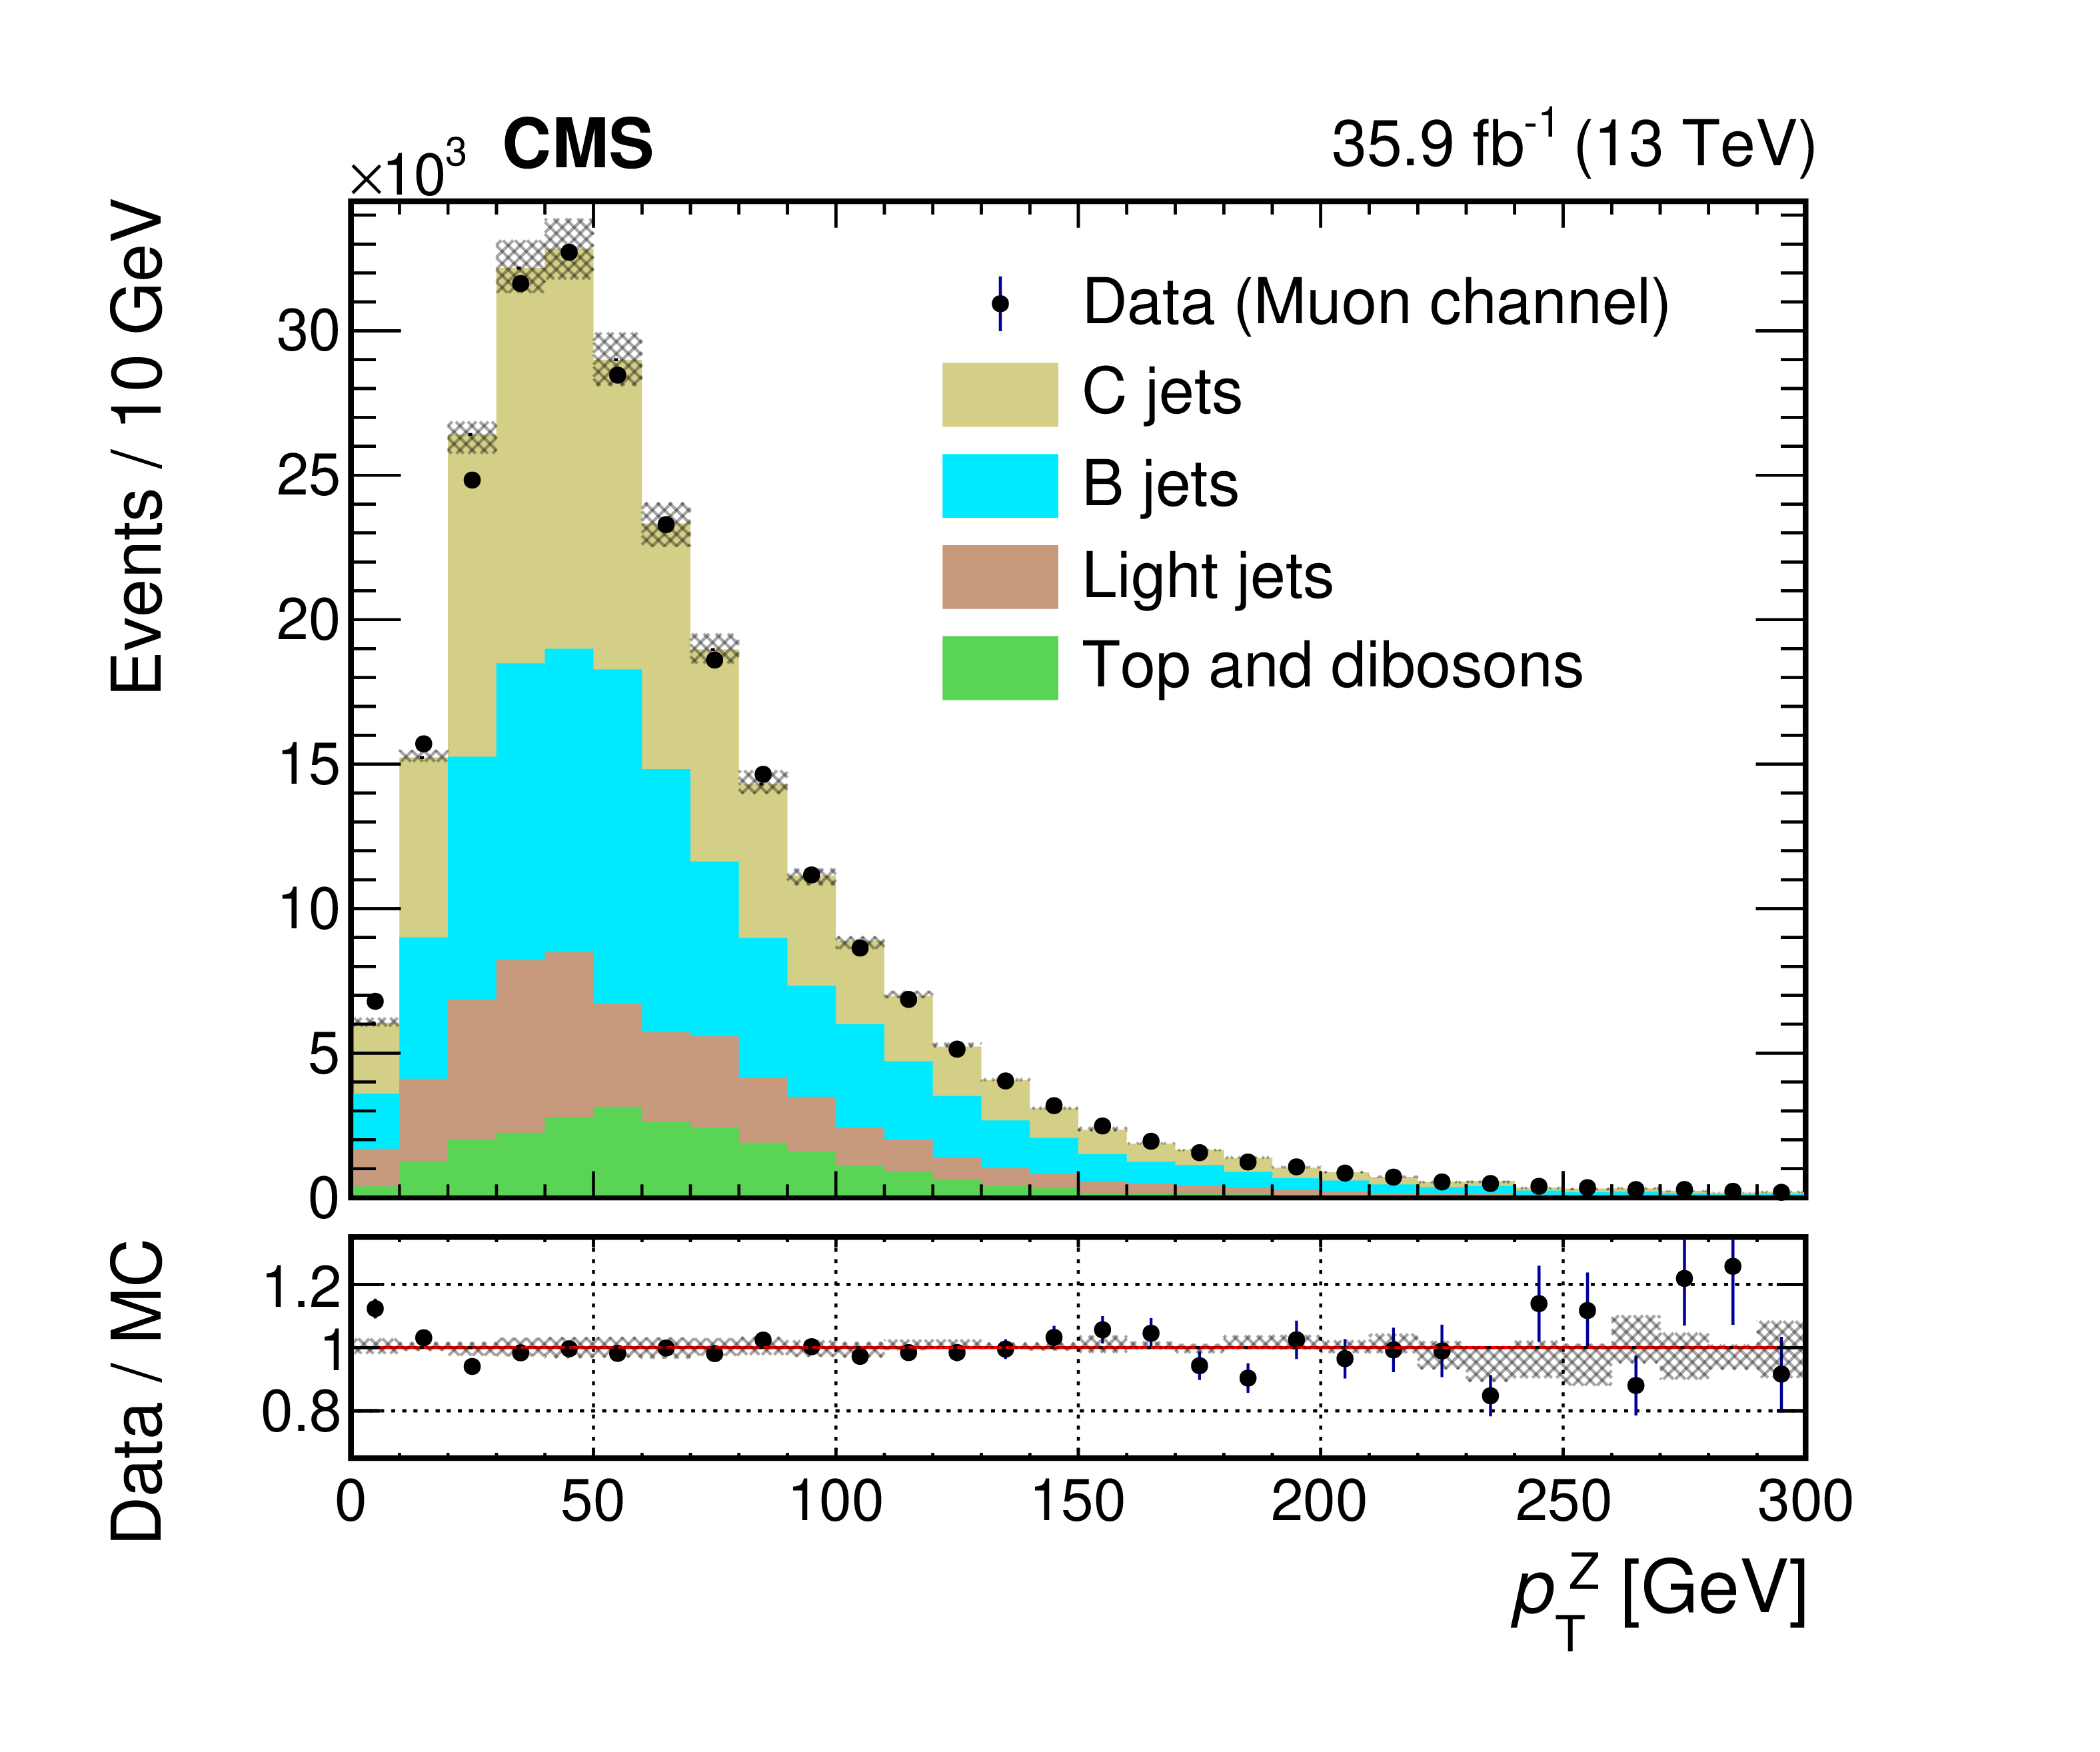
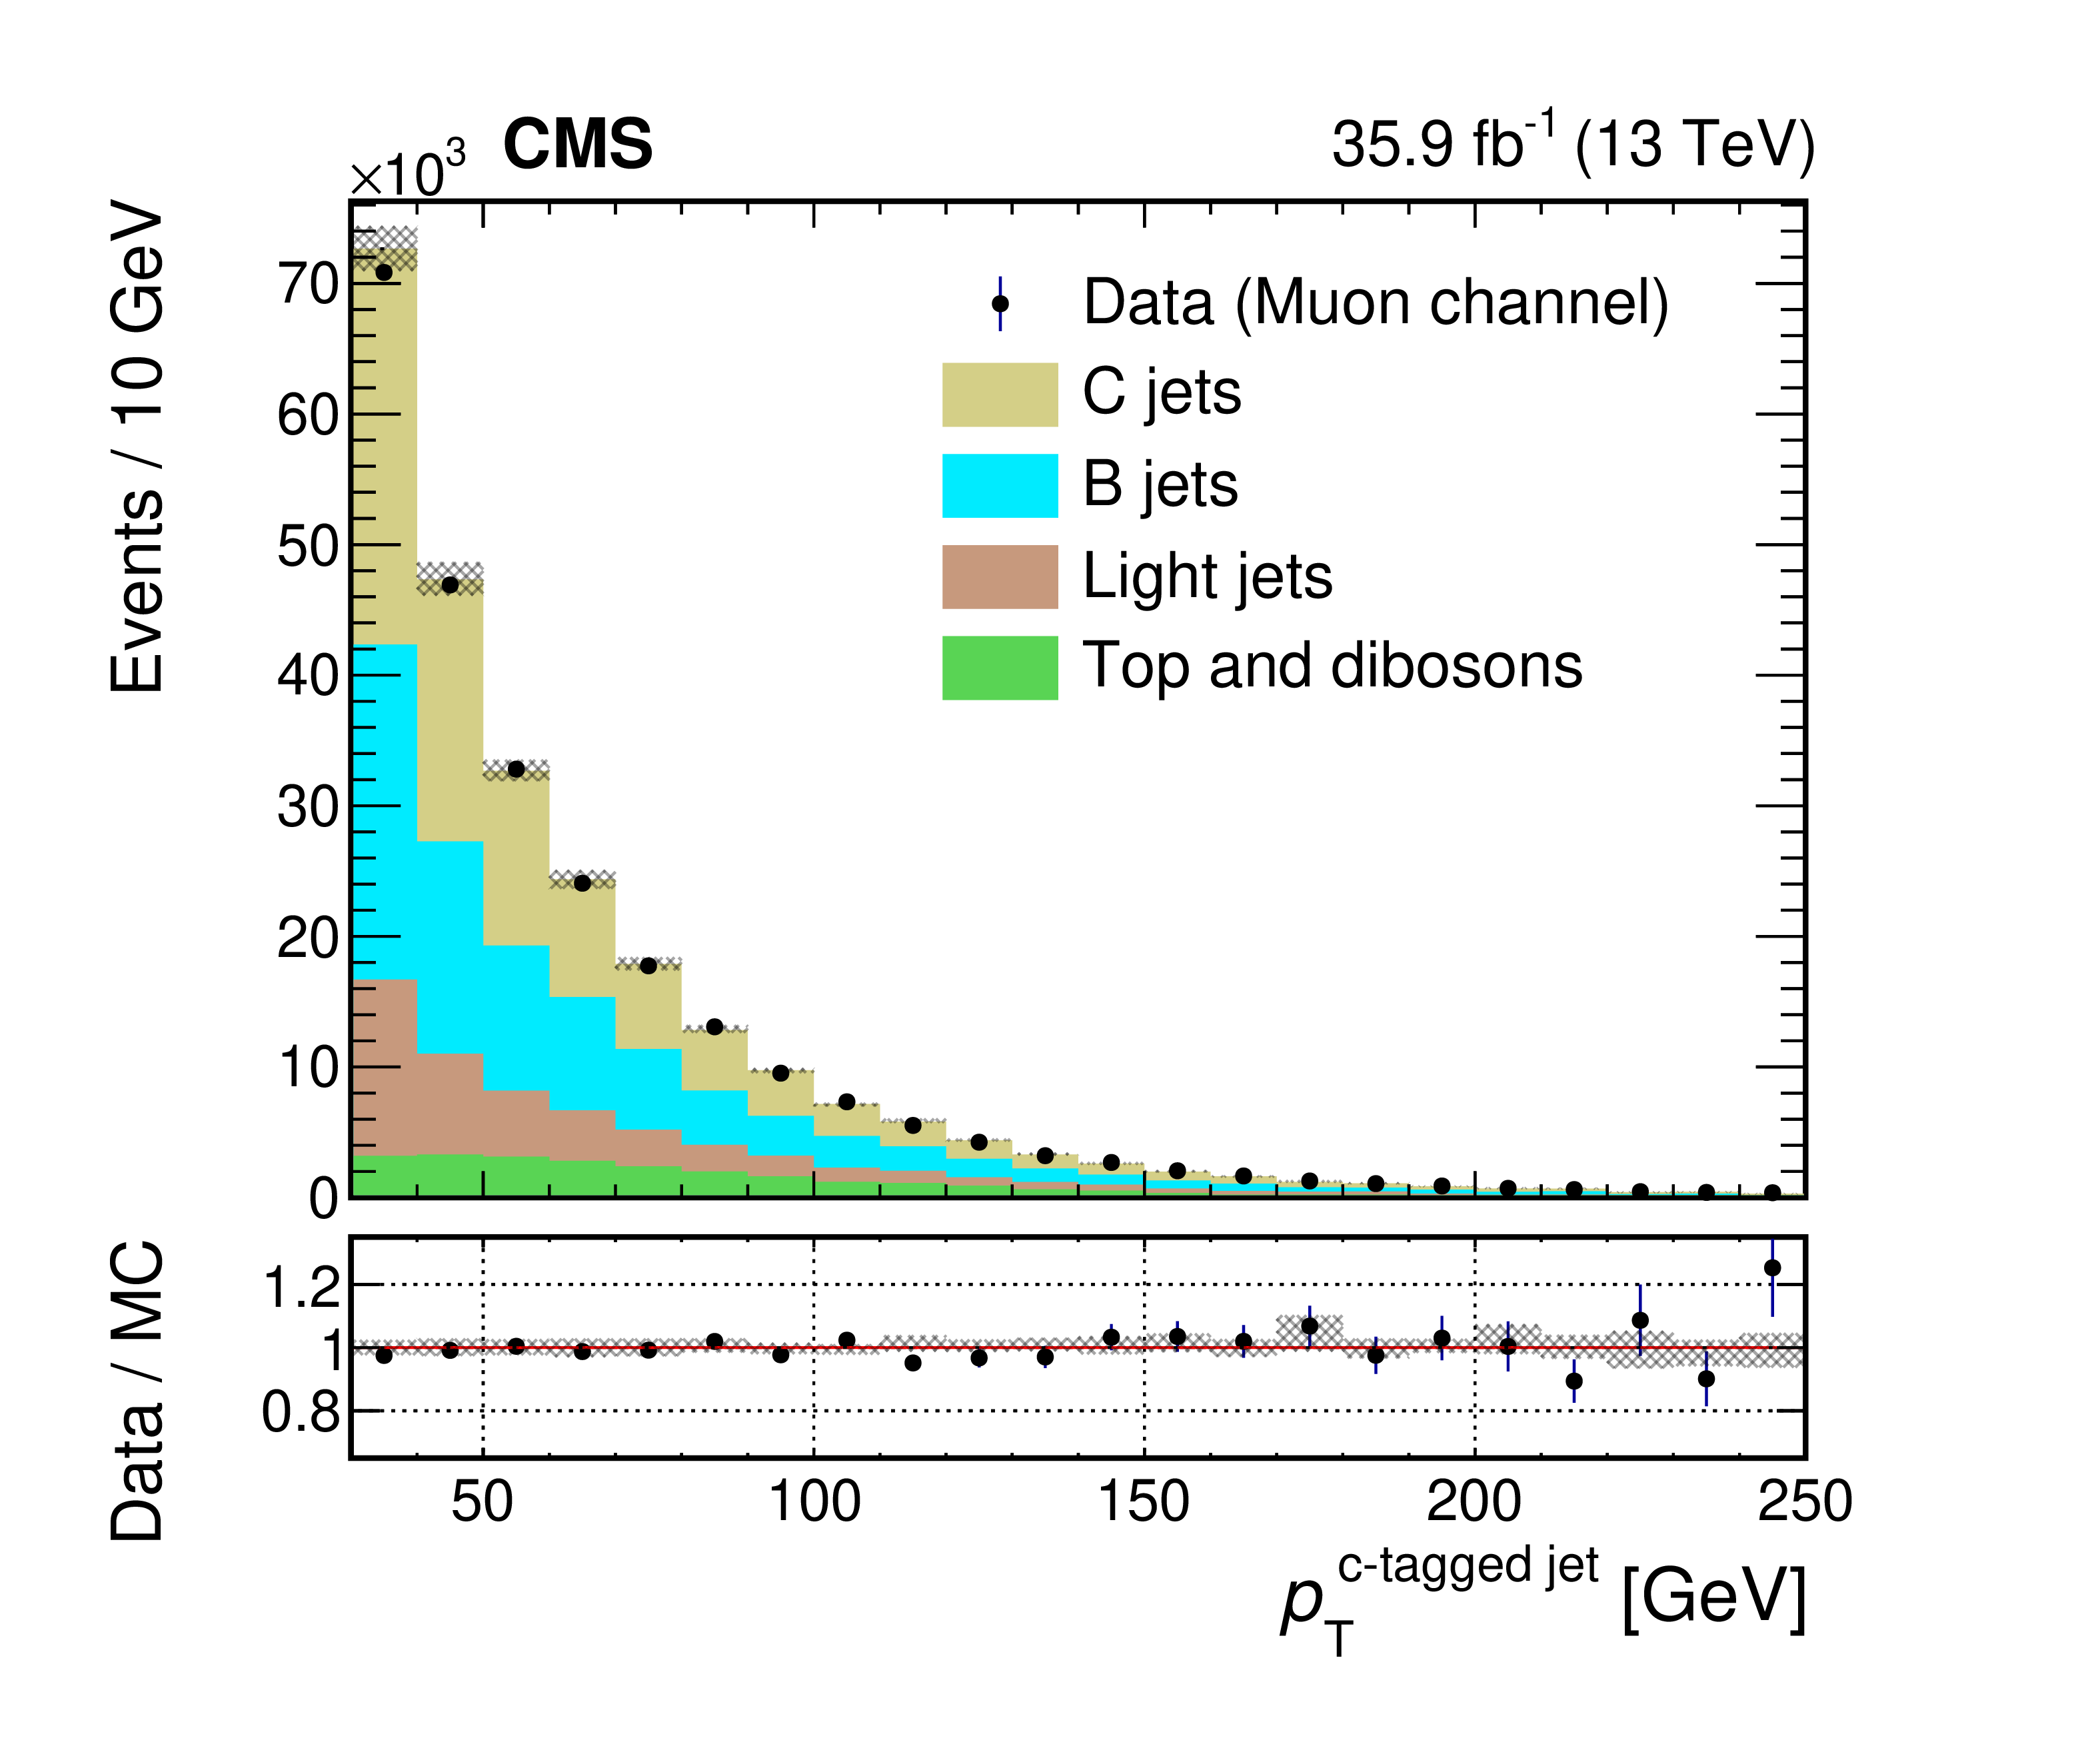
The distributions of ${p_{\mathrm {T}}}$ in data and corrected simulation, after applying the fitted scale factors to the Drell-Yan components. The upper plots show distributions for the electron channel, with the ${p_{\mathrm {T}}}$ of the electron pair (left) and c-tagged jet (right). The lower plots show distributions for the muon channel with the ${p_{\mathrm {T}}}$ of the muon pair (left) and c-tagged jet (right). Dashed area represents MC systematic uncertainties. The vertical bars on the data points represent statistical uncertainties. |
png pdf |
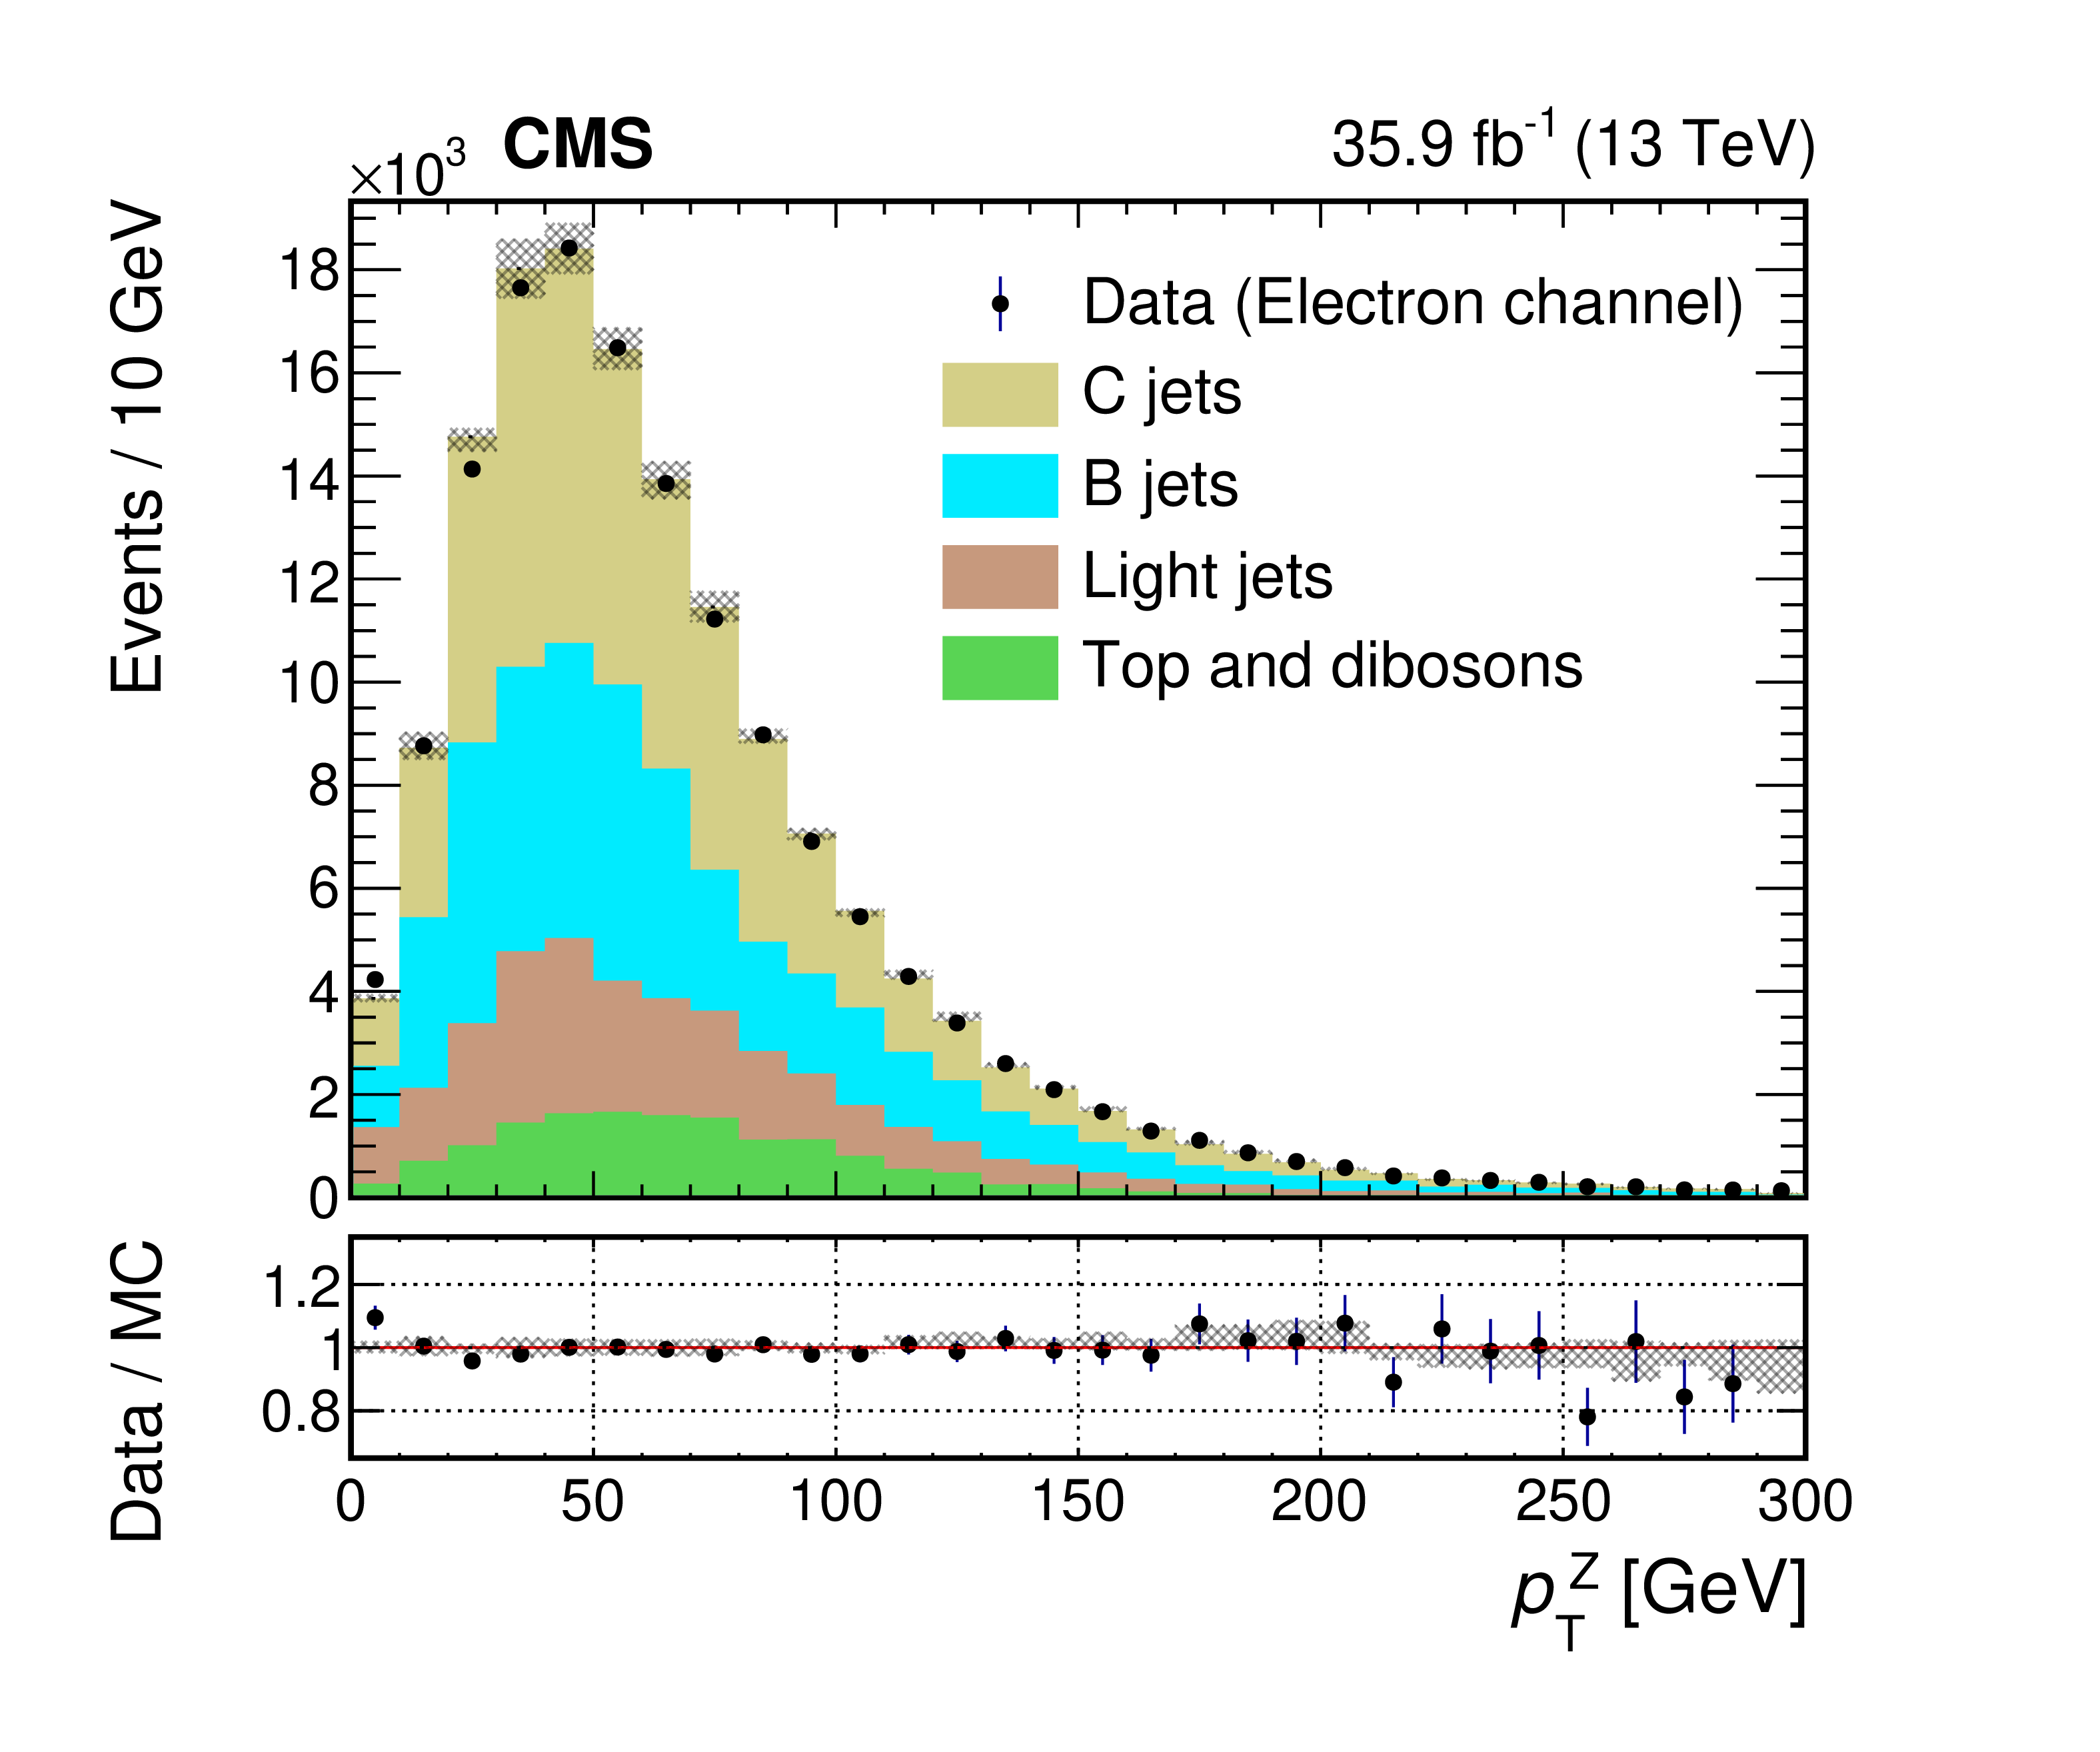
Figure 4-a:
The distribution of the ${p_{\mathrm {T}}}$ of the electron pair in data and corrected simulation, after applying the fitted scale factors to the Drell-Yan components, for the electron channel. Dashed area represents MC systematic uncertainties. The vertical bars on the data points represent statistical uncertainties. |
png pdf |
Figure 4-b:
The distribution of the ${p_{\mathrm {T}}}$ of the c-tagged jet in data and corrected simulation, after applying the fitted scale factors to the Drell-Yan components, for the electron channel. Dashed area represents MC systematic uncertainties. The vertical bars on the data points represent statistical uncertainties. |
png pdf |
Figure 4-c:
The distribution of the ${p_{\mathrm {T}}}$ of the muon pair in data and corrected simulation, after applying the fitted scale factors to the Drell-Yan components, for the muon channel. Dashed area represents MC systematic uncertainties. The vertical bars on the data points represent statistical uncertainties. |
png pdf |
Figure 4-d:
The distribution of the ${p_{\mathrm {T}}}$ of the c-tagged jet in data and corrected simulation, after applying the fitted scale factors to the Drell-Yan components, for the muon channel. Dashed area represents MC systematic uncertainties. The vertical bars on the data points represent statistical uncertainties. |
png pdf |
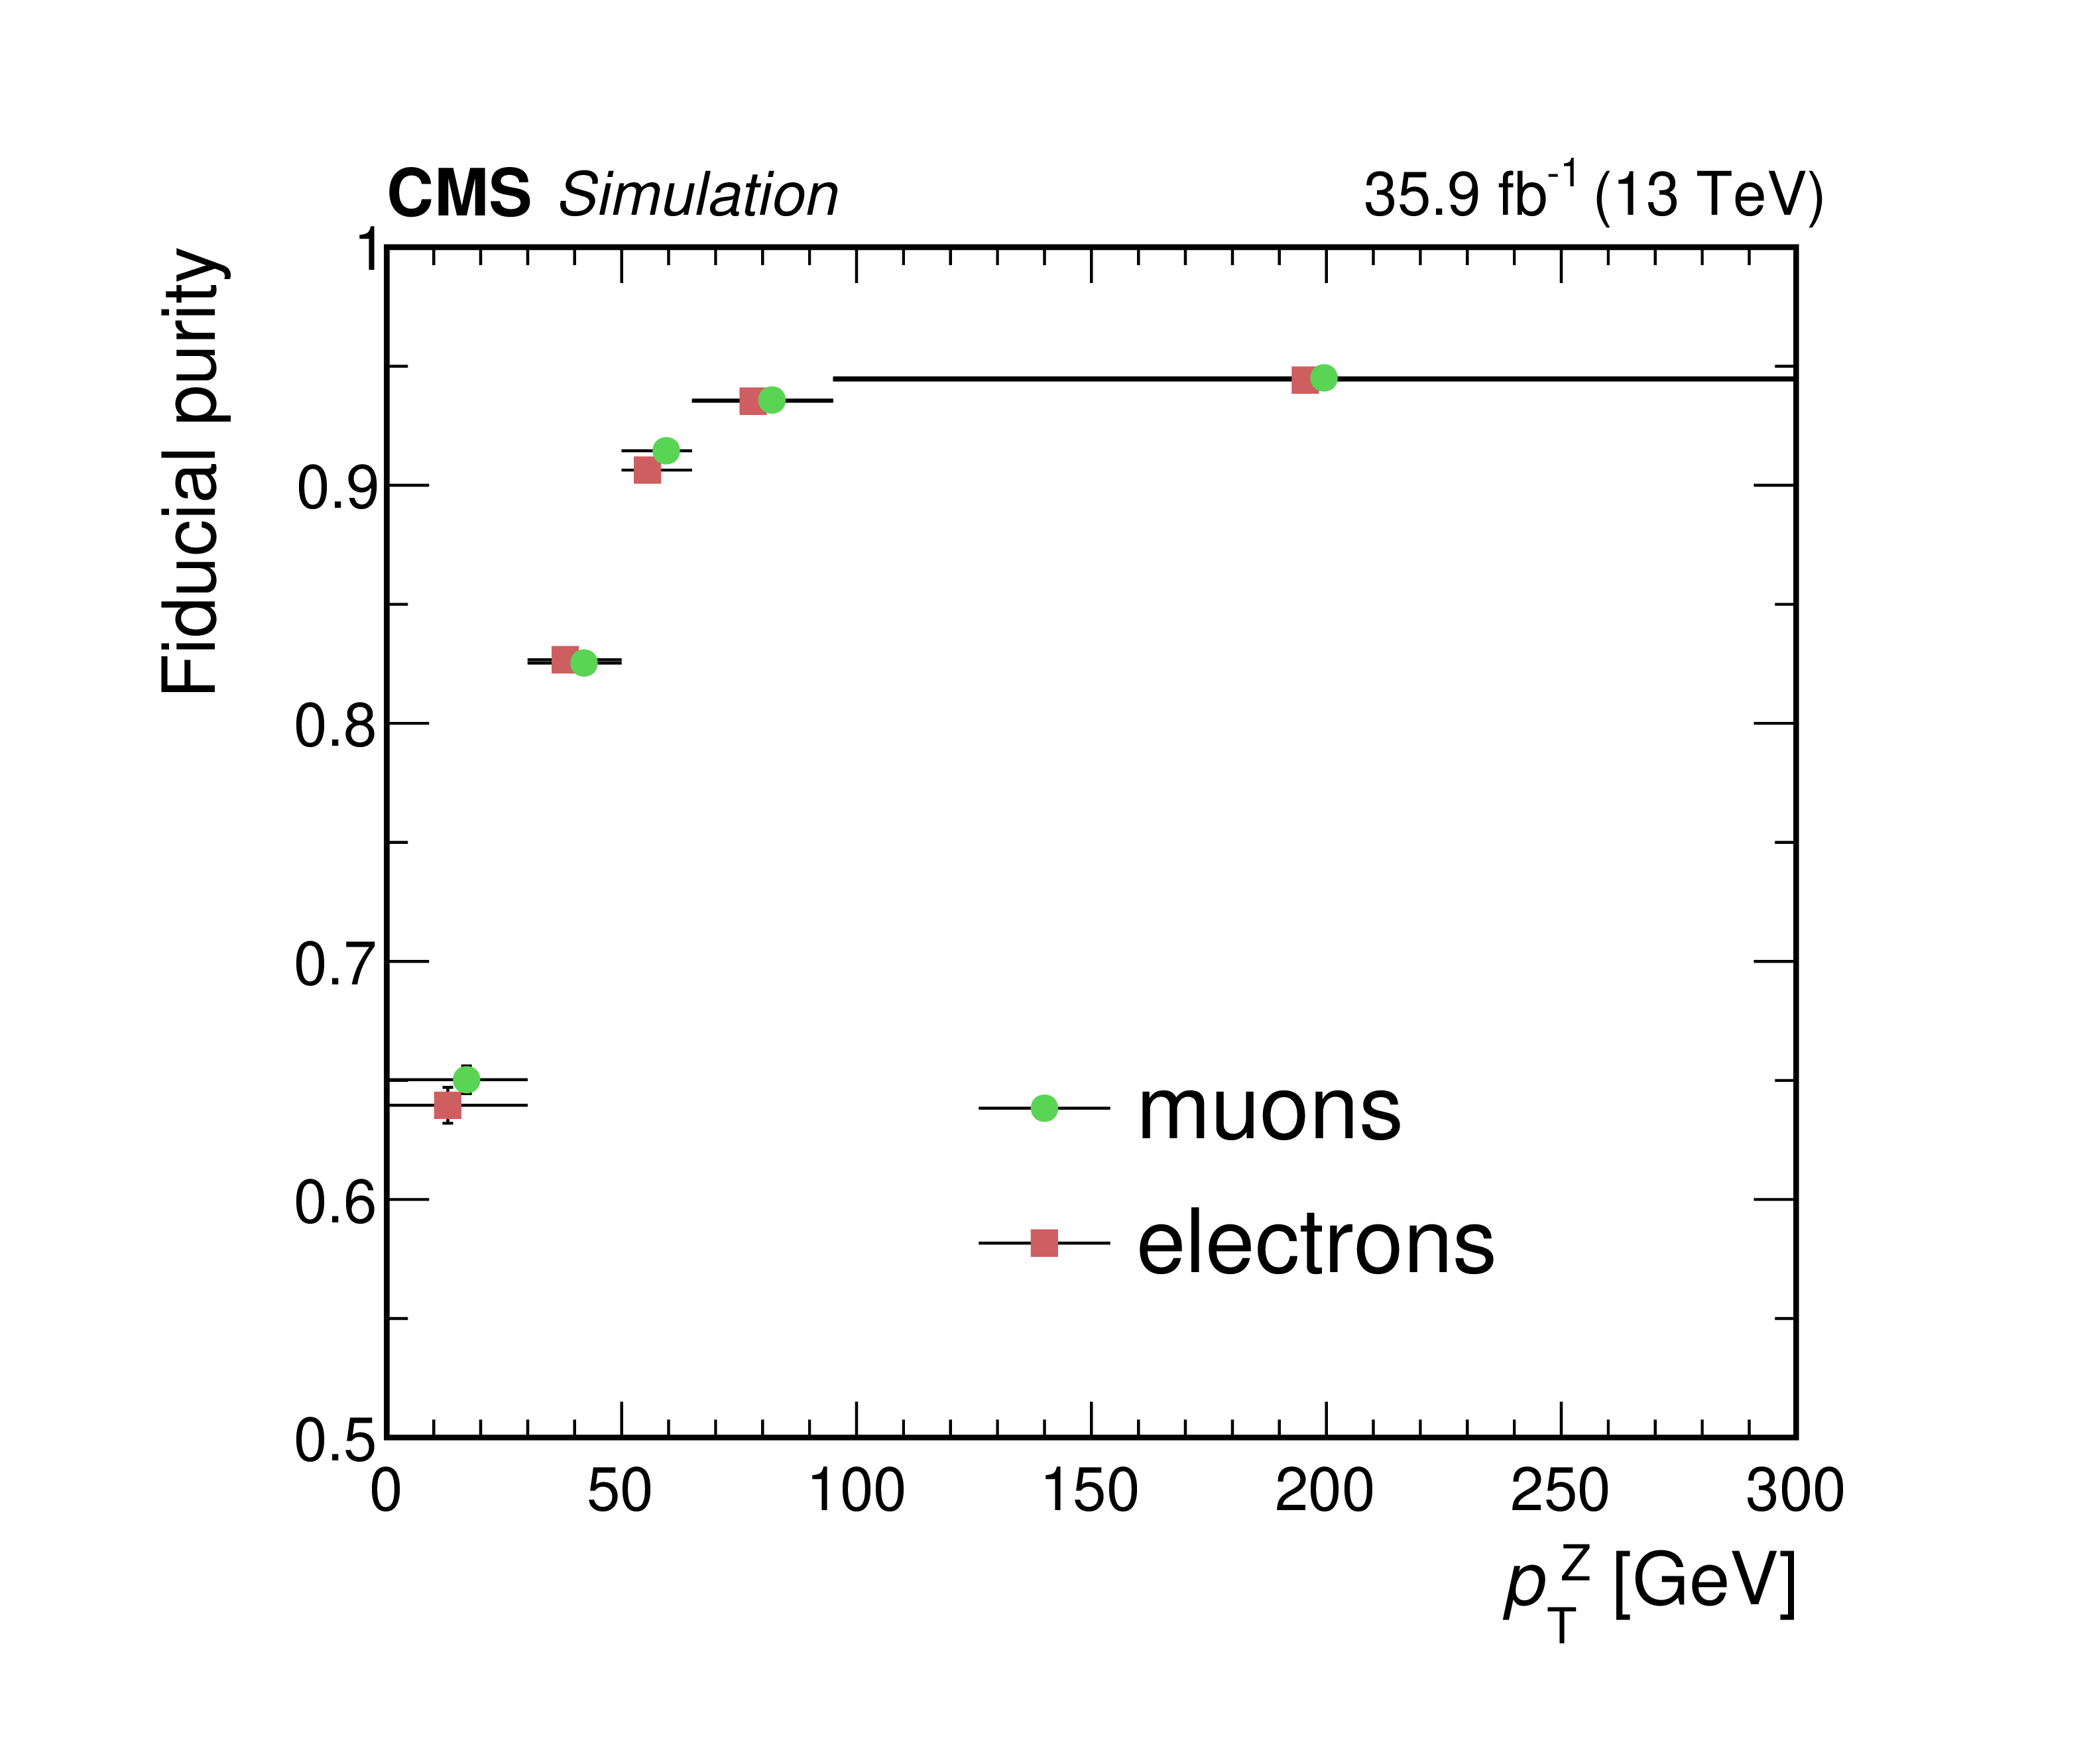
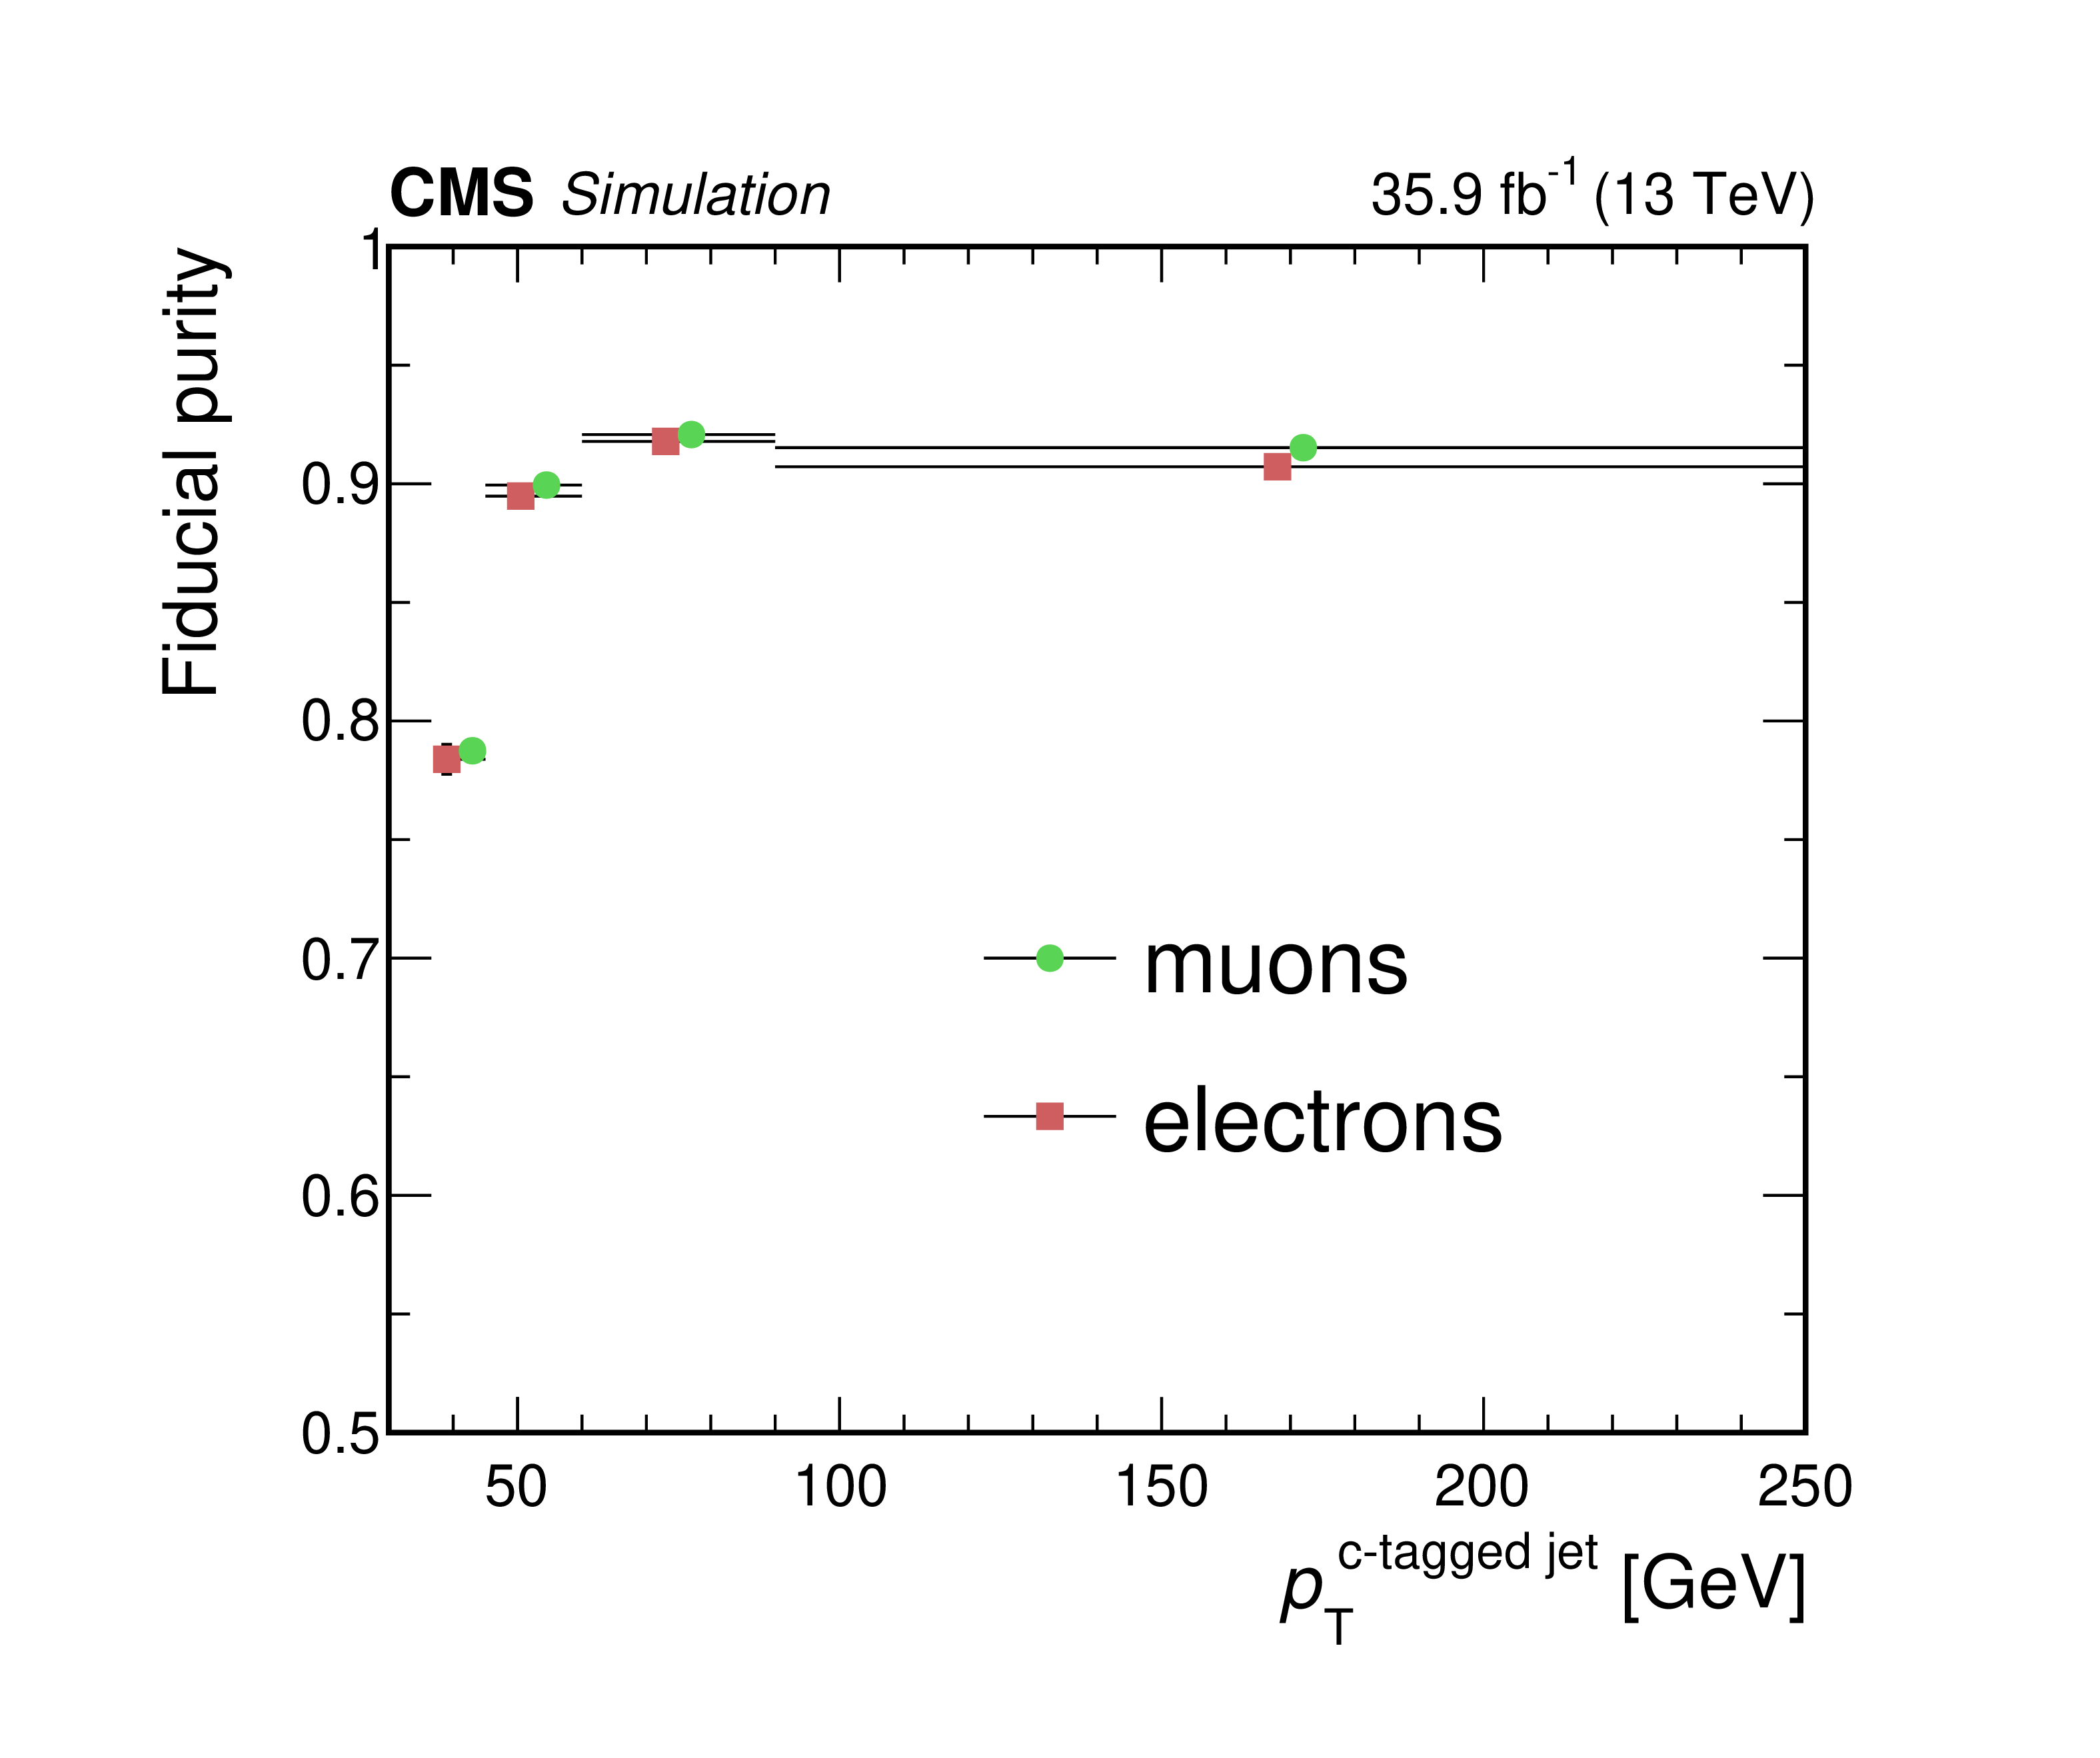
Figure 5:
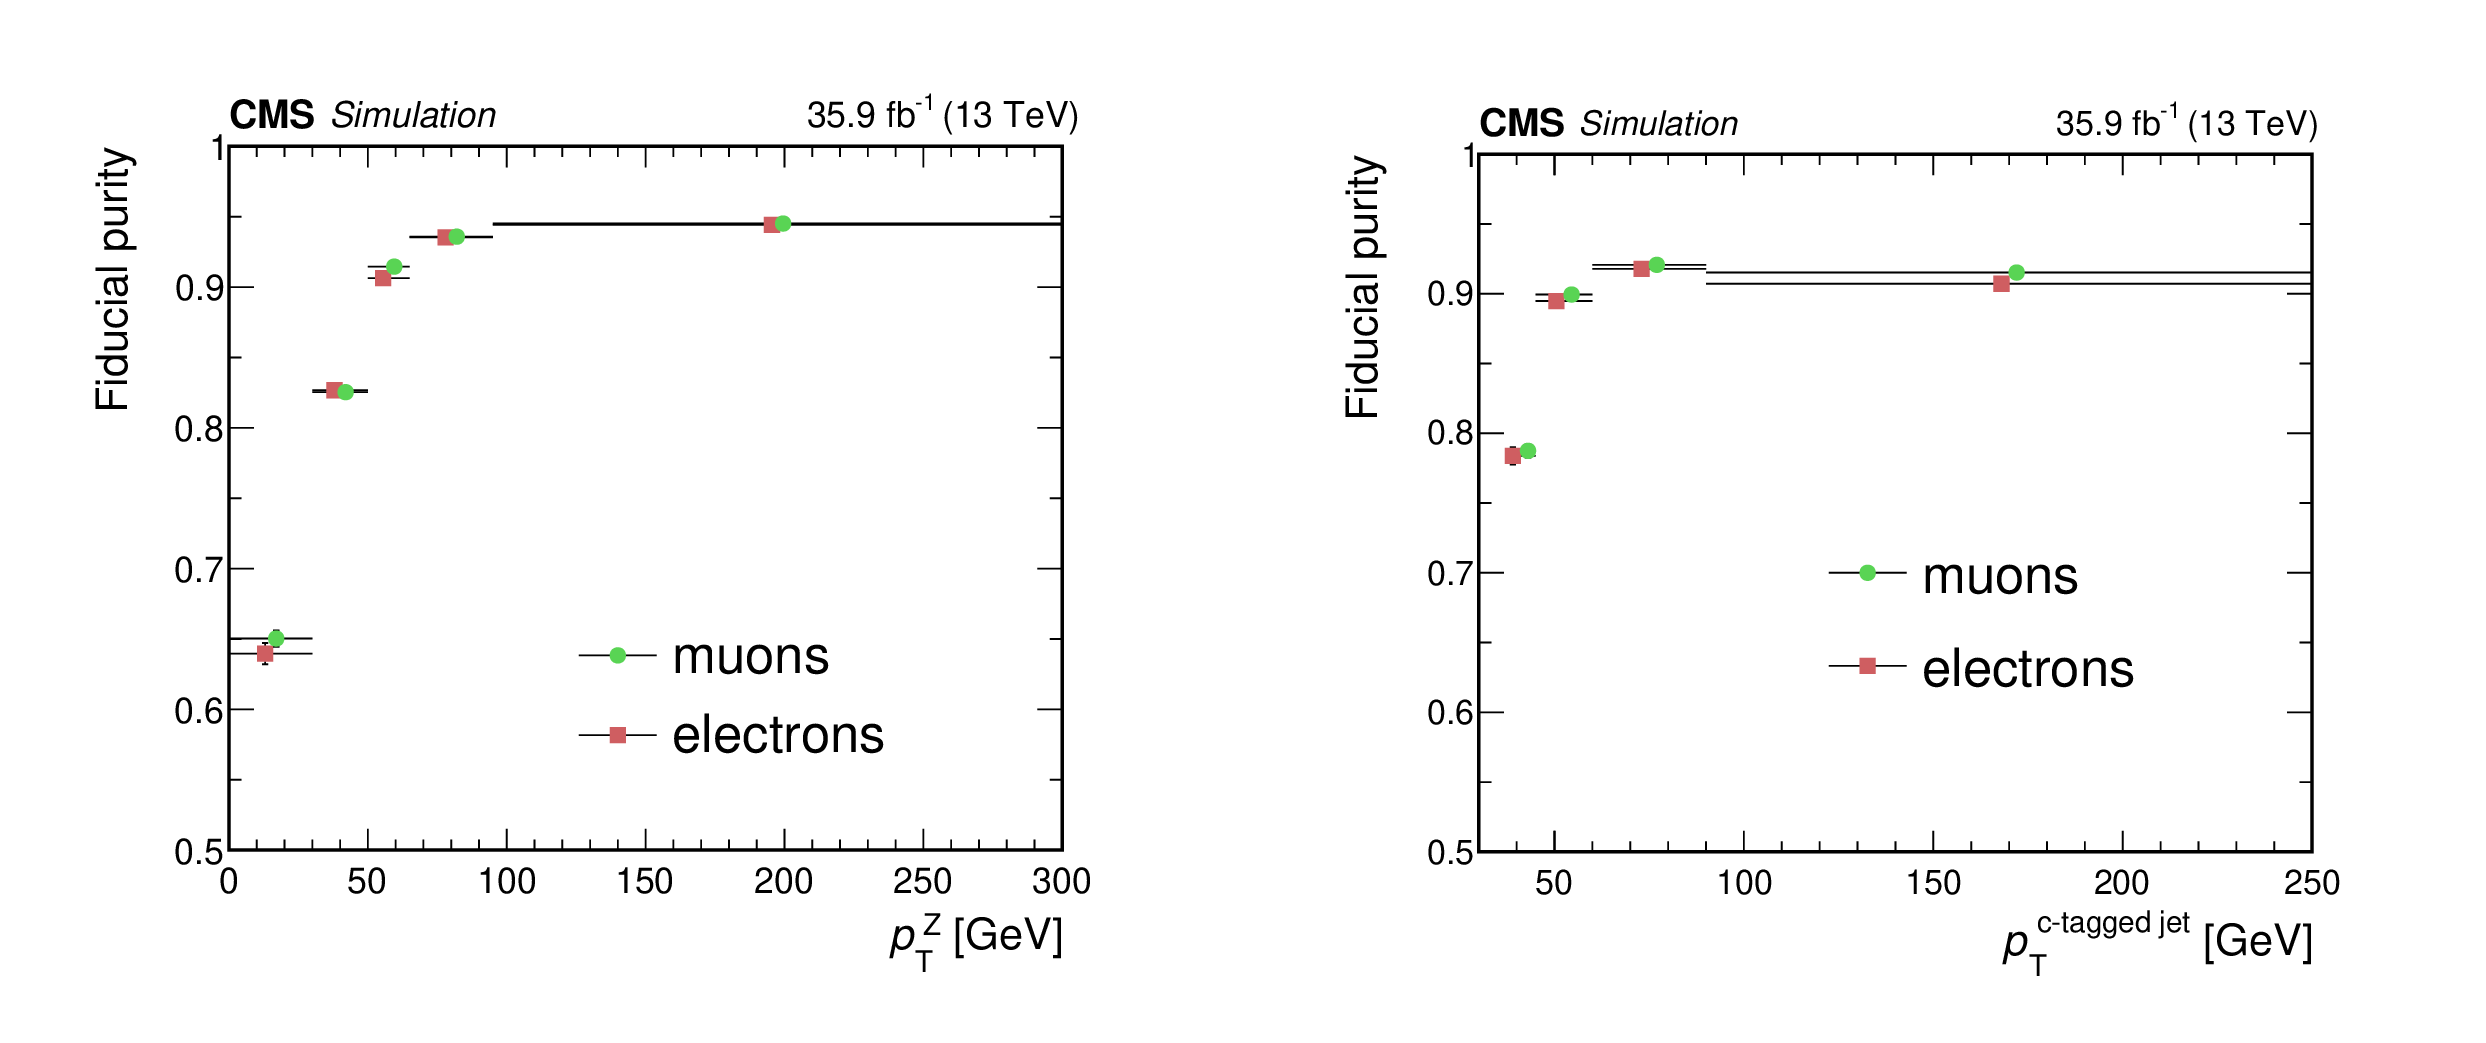
Fraction of selected Z$+$c-jet events originating within the fiducial phase space as a function of ${p_{\mathrm {T}}}$. The plots show distributions for electron and muons channels as a function of ${{p_{\mathrm {T}}} ^{\mathrm{Z}}}$ (left) and ${{p_{\mathrm {T}}} ^{{\mathrm{c}}\text {-tagged jet}}}$ (right). |
png pdf |
Figure 5-a:
Fraction of selected Z$+$c-jet events originating within the fiducial phase space as a function of ${p_{\mathrm {T}}}$. The plot shows the distribution for electron and muons channels as a function of ${{p_{\mathrm {T}}} ^{\mathrm{Z}}}$. |
png pdf |
Figure 5-b:
Fraction of selected Z$+$c-jet events originating within the fiducial phase space as a function of ${p_{\mathrm {T}}}$. The plot shows the distribution for electron and muons channels as a function of ${{p_{\mathrm {T}}} ^{{\mathrm{c}}\text {-tagged jet}}}$ . |
png pdf |
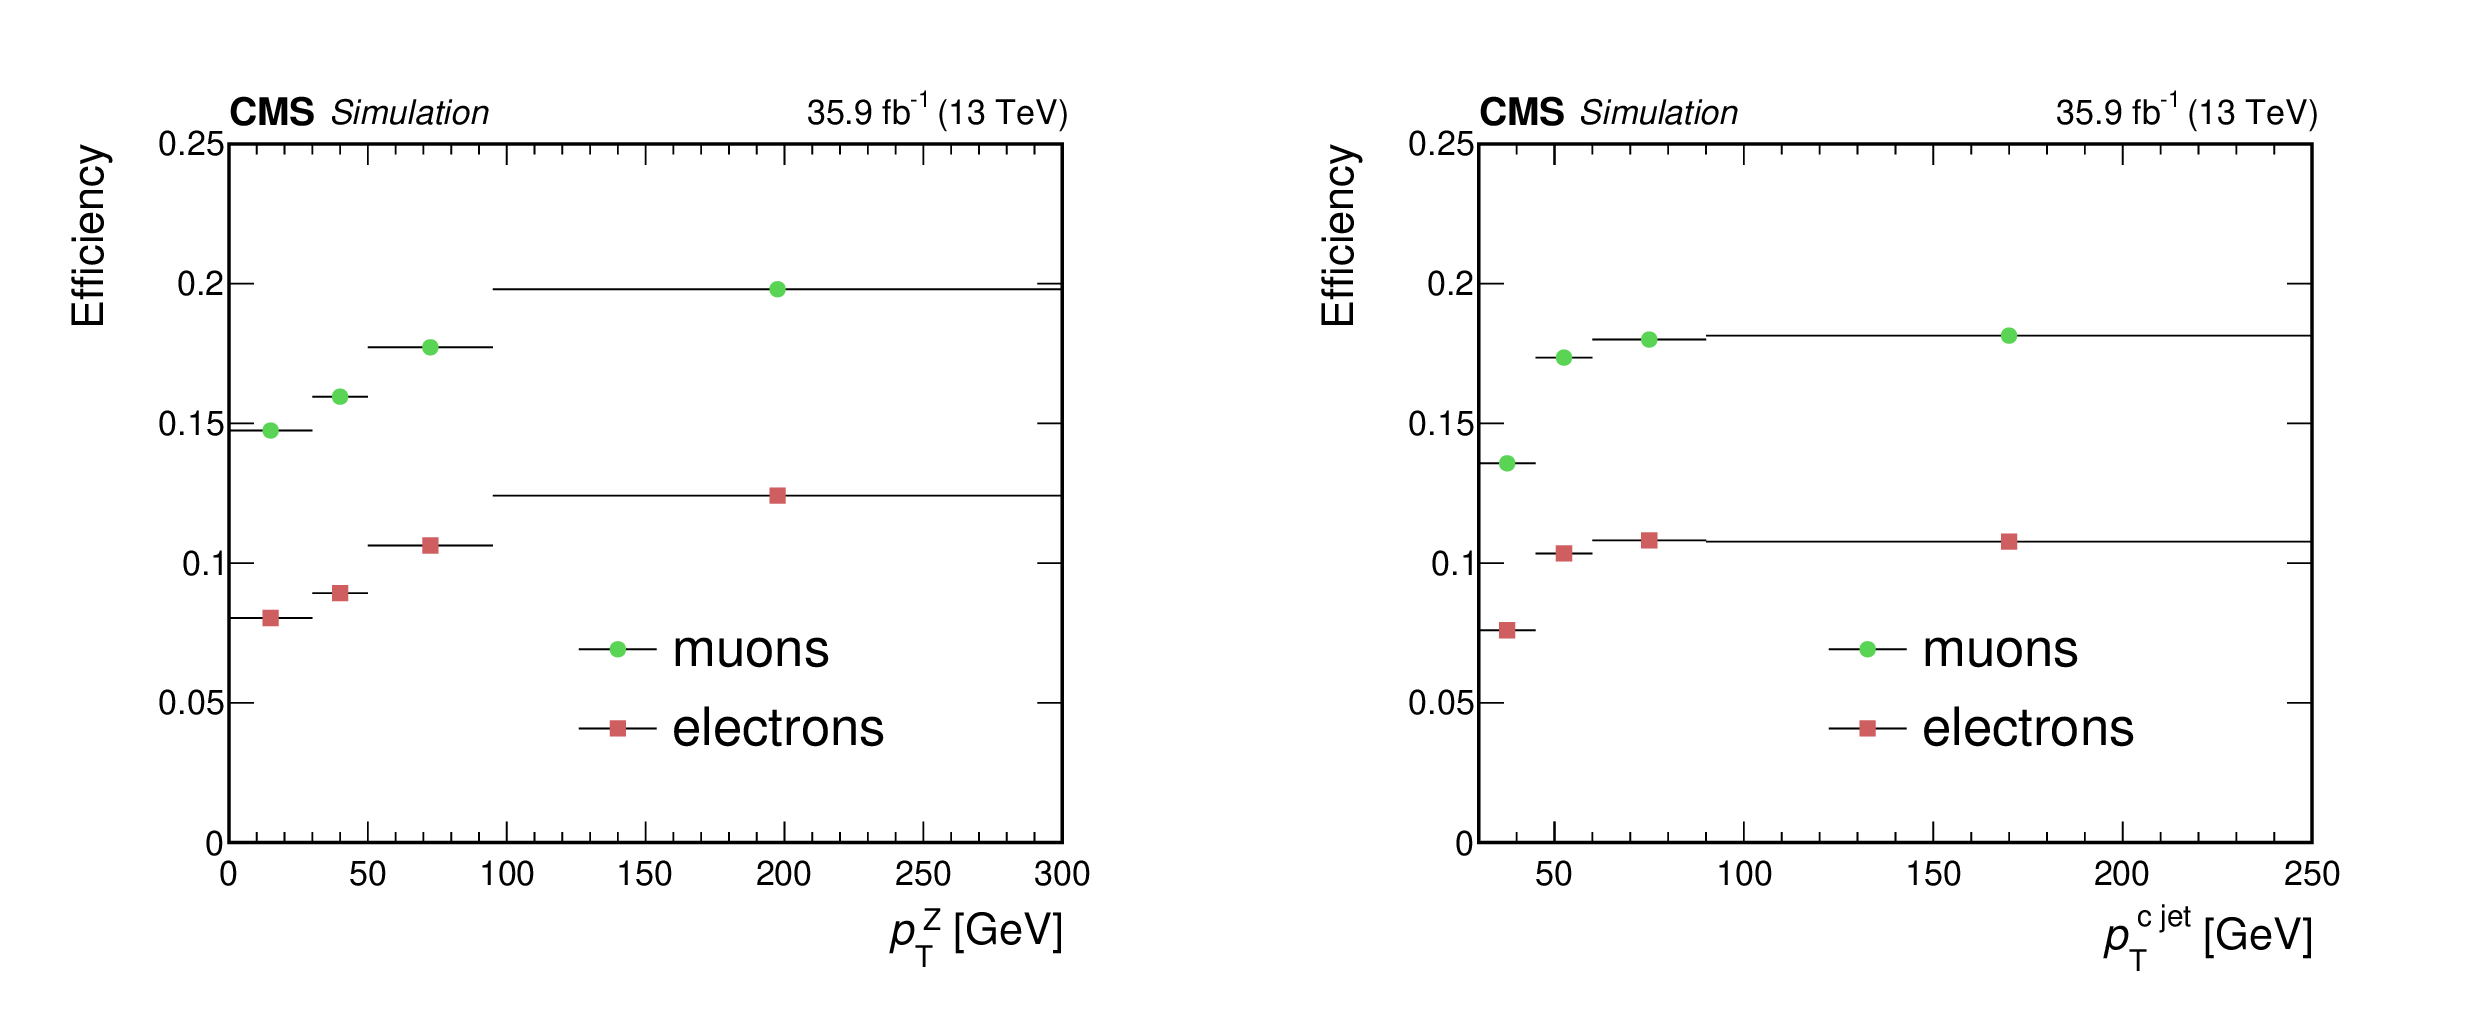
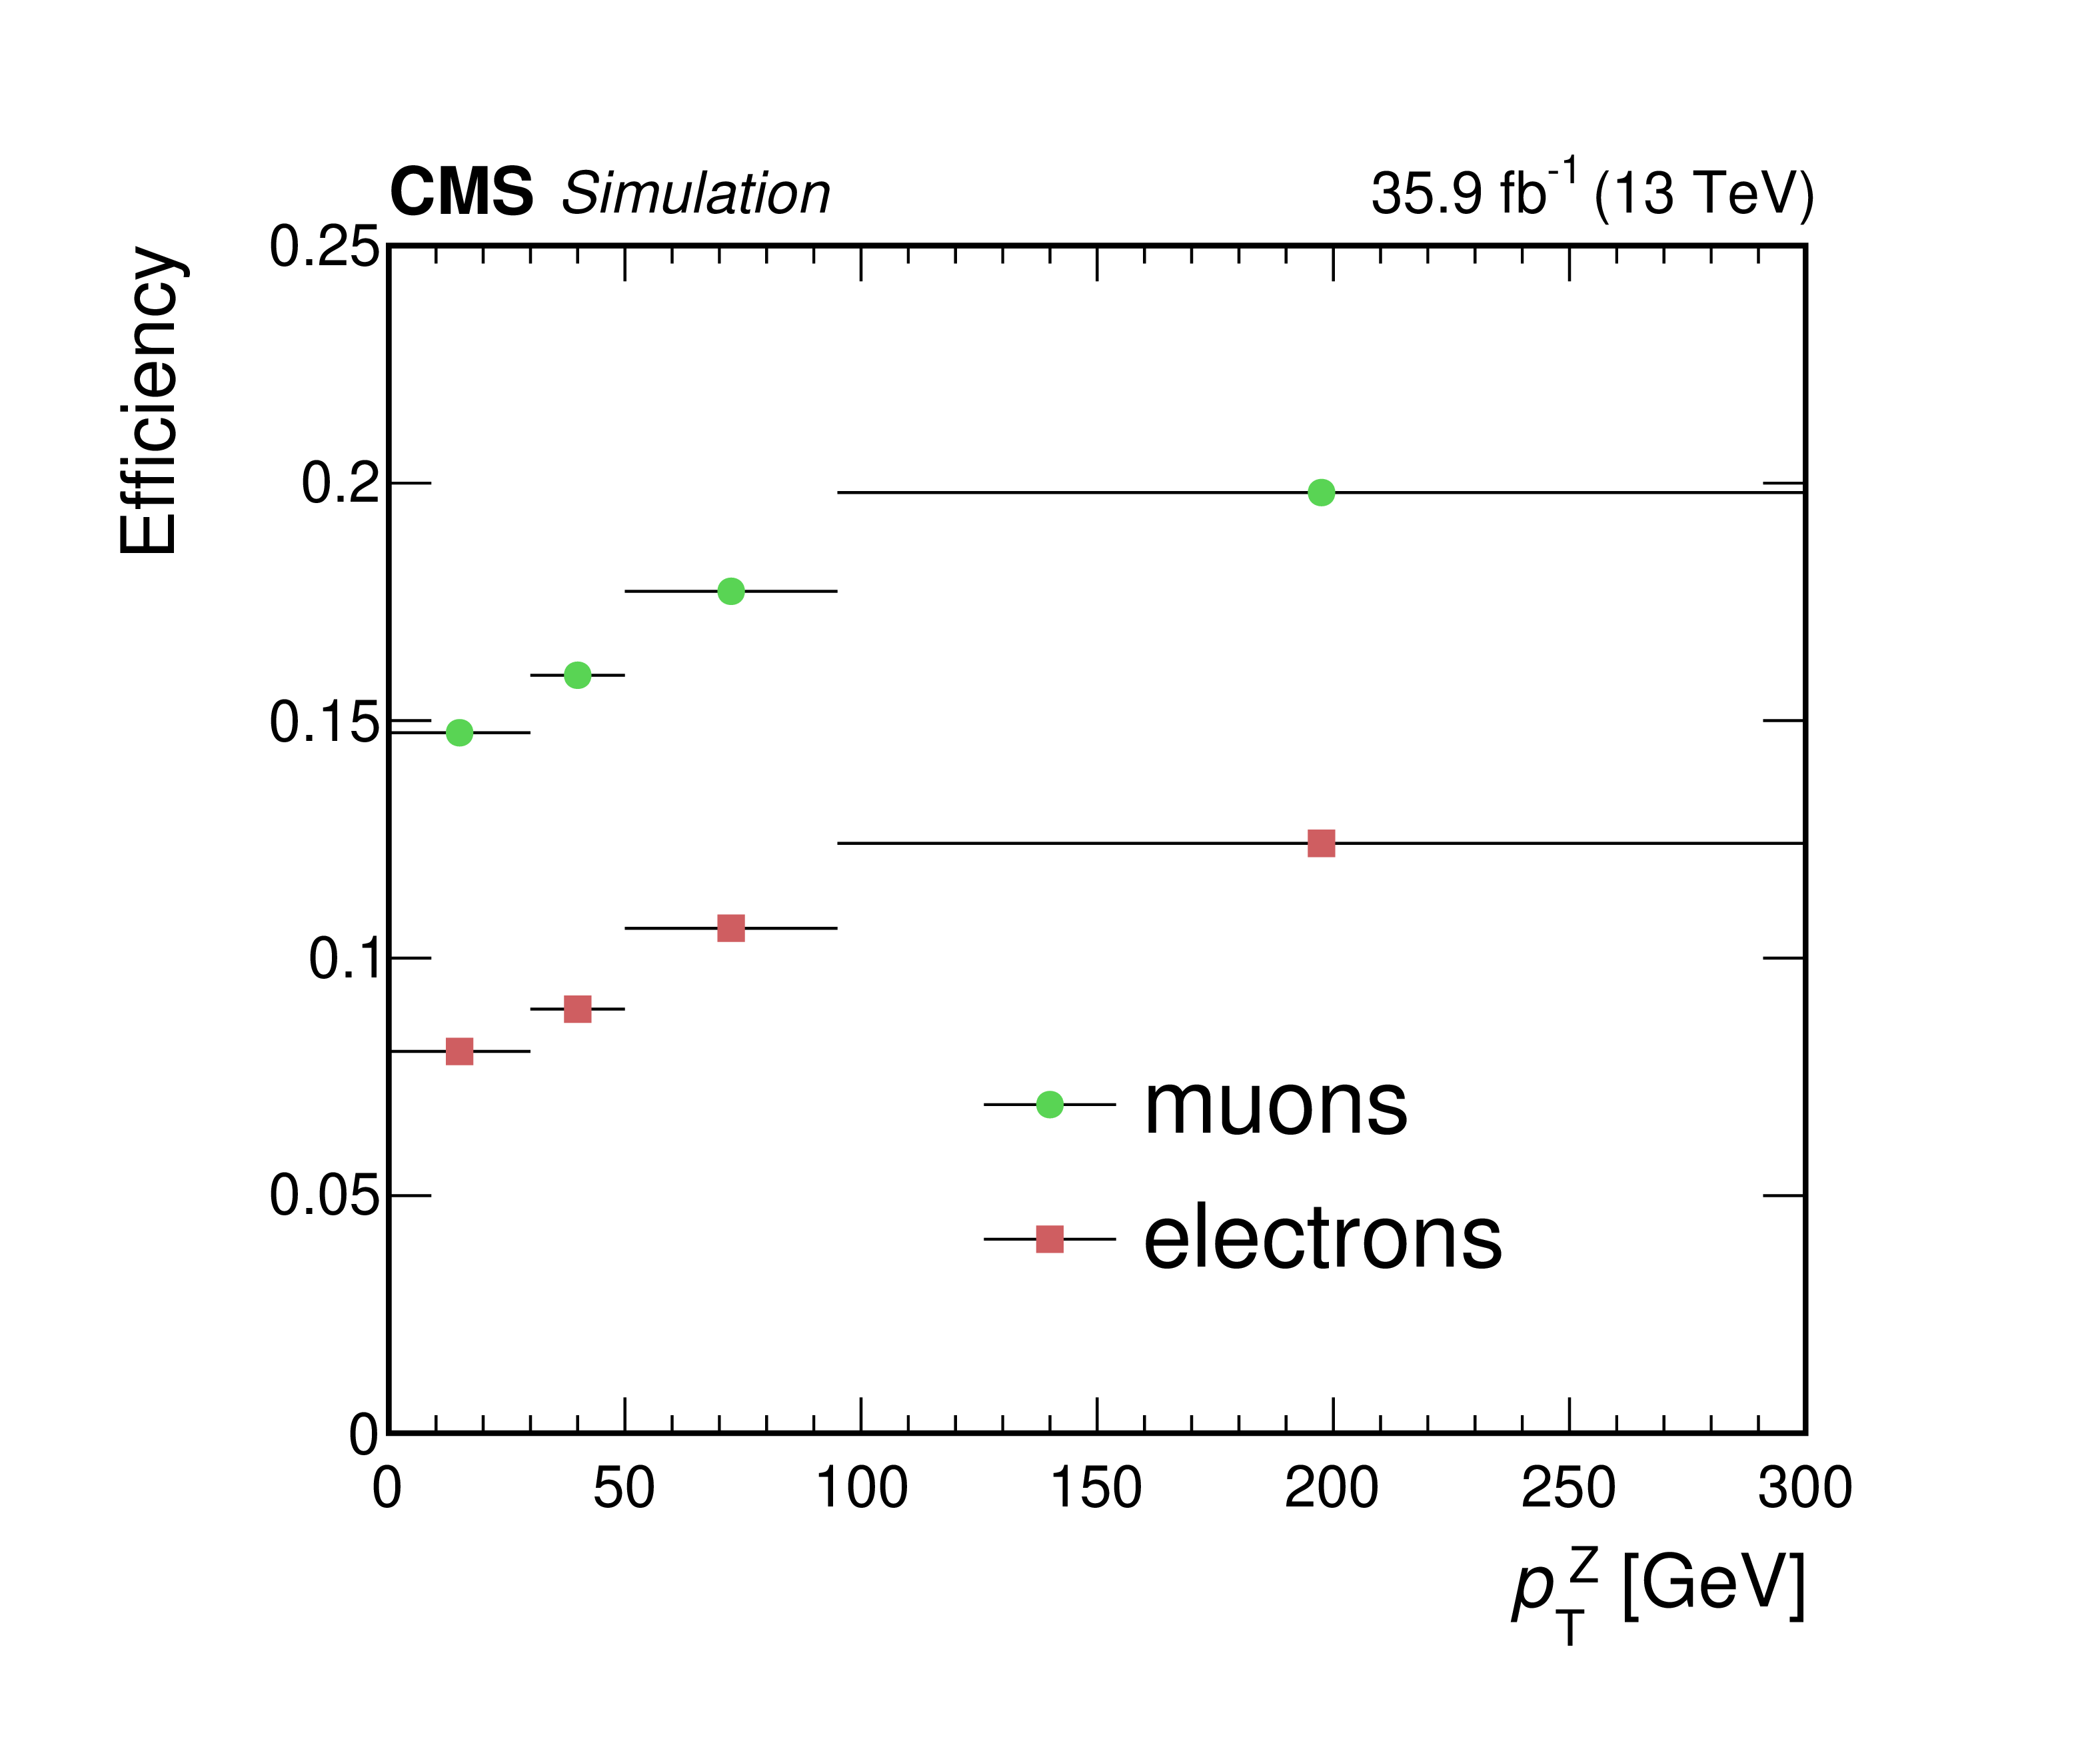
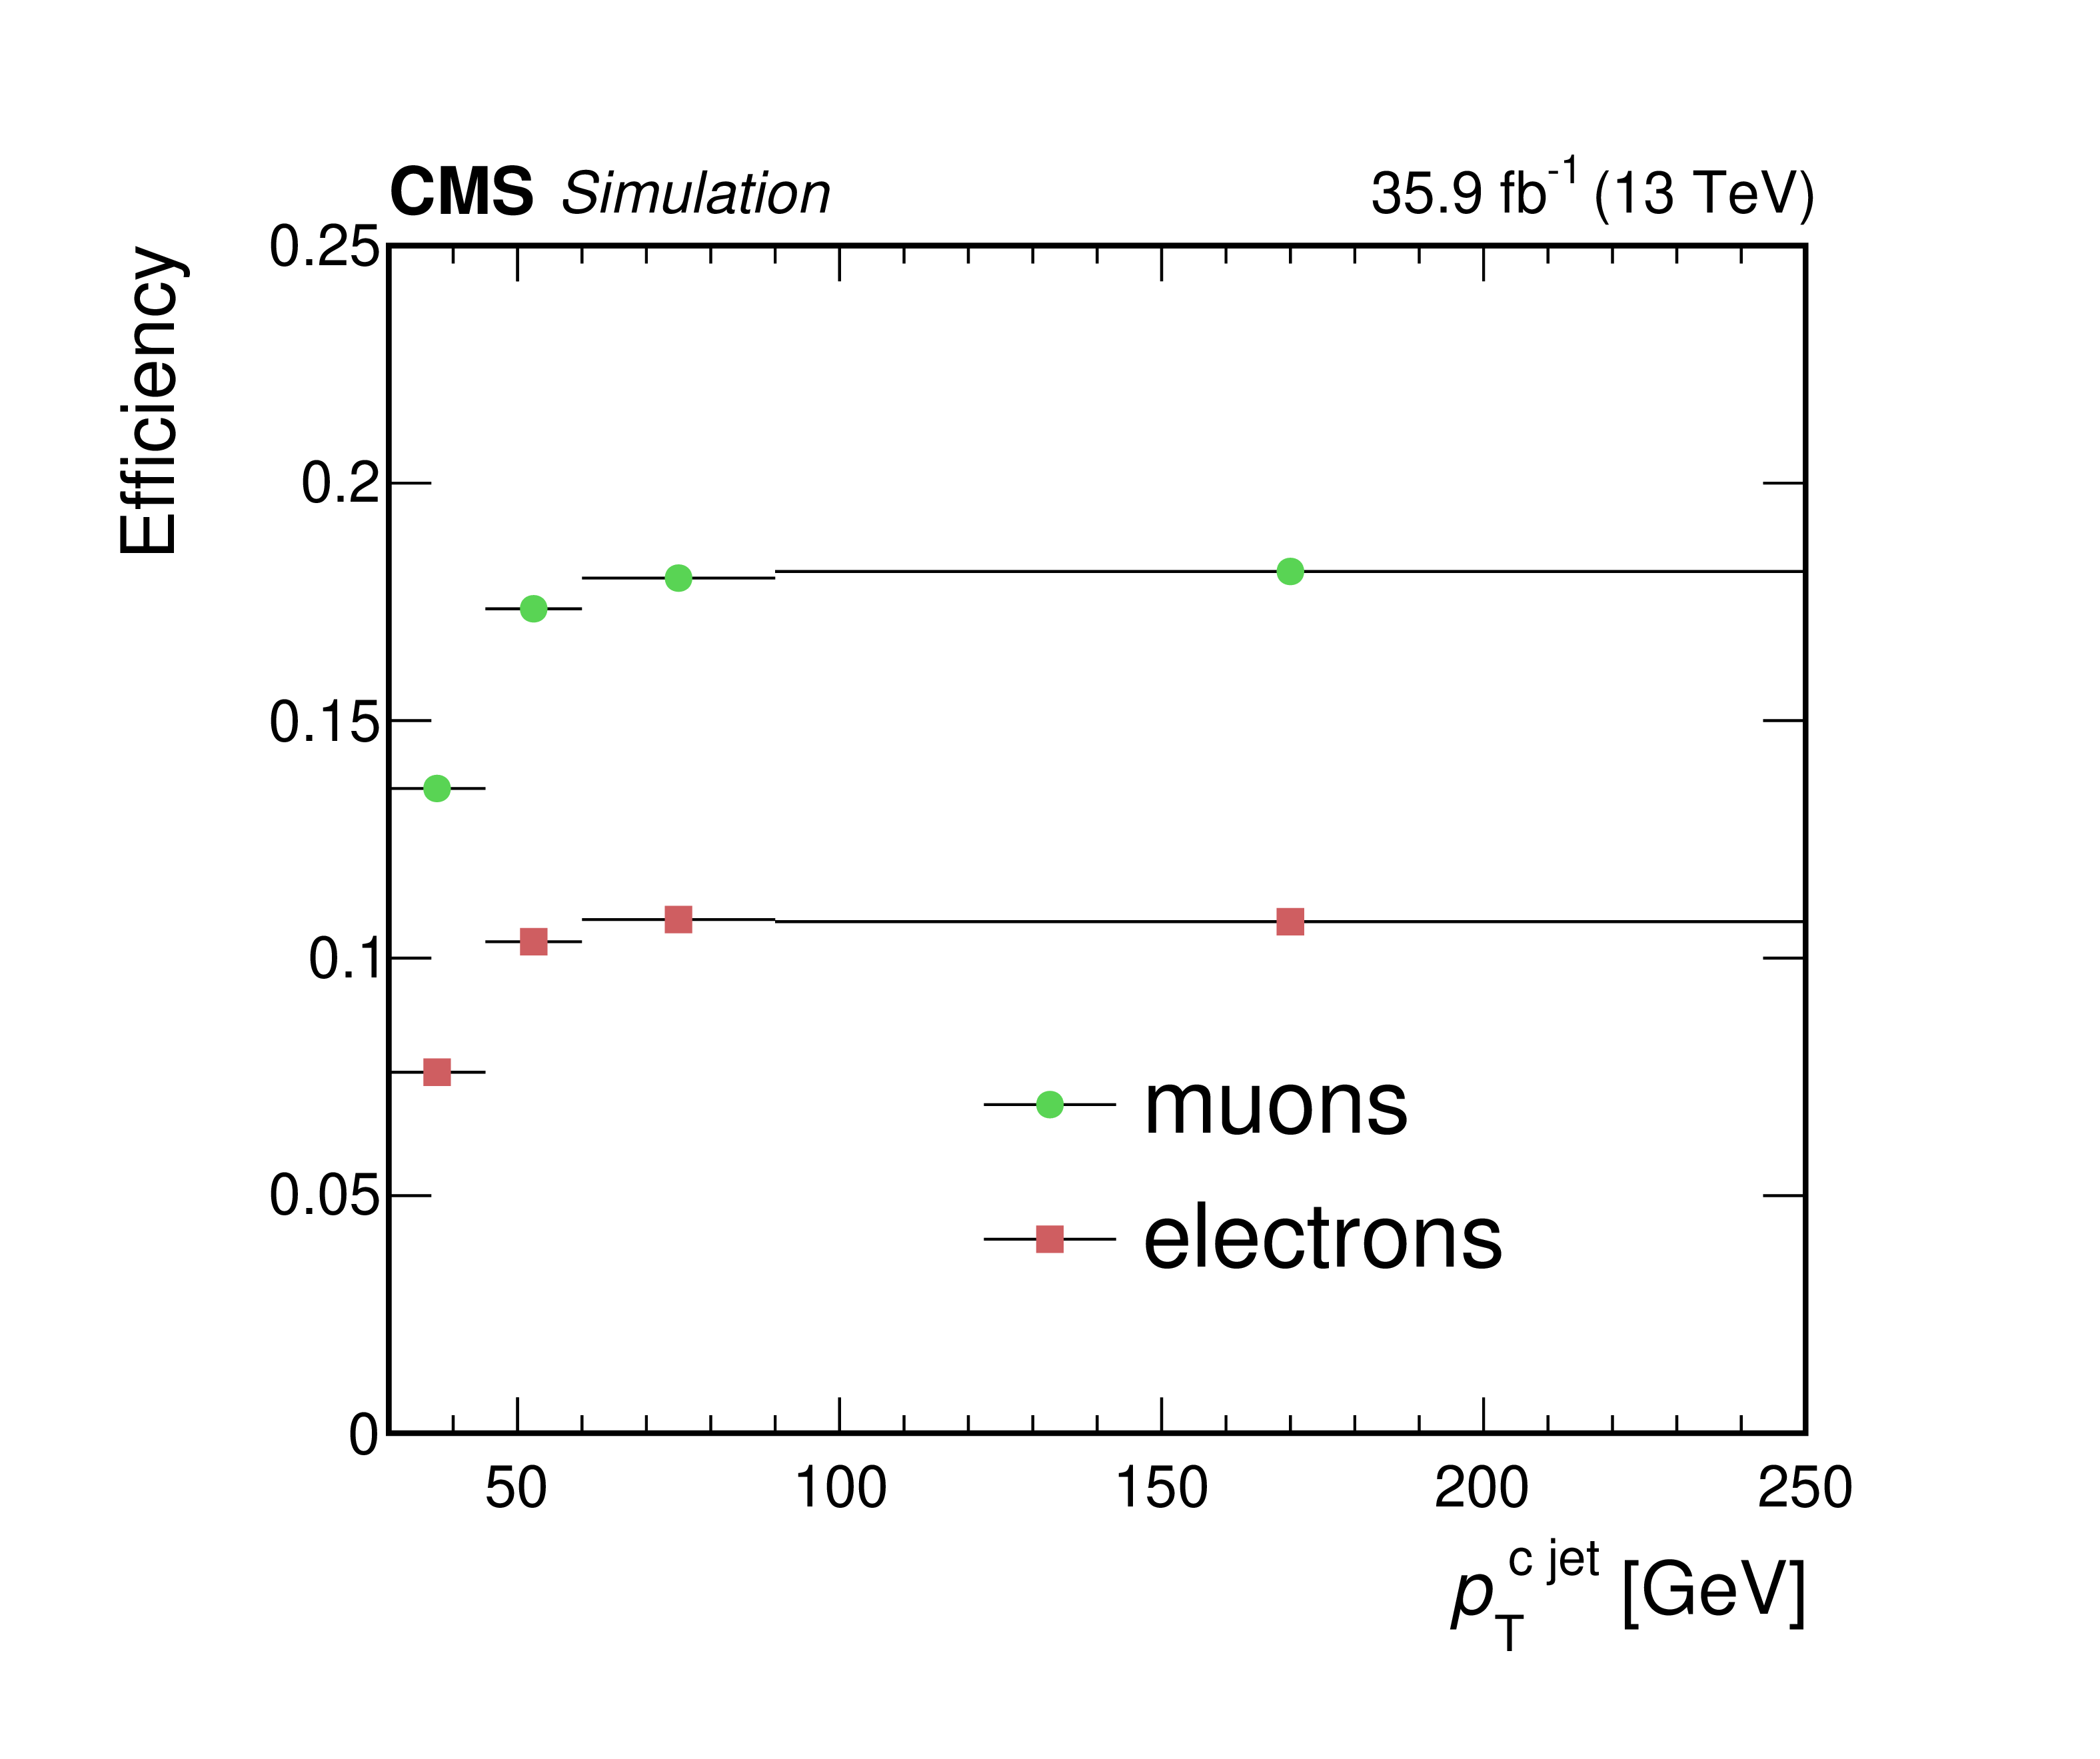
Figure 6:
Efficiency as a function of ${p_{\mathrm {T}}}$. The plots show distributions for the electron and muon channels, as a function of ${{p_{\mathrm {T}}} ^{\mathrm{Z}}}$ (left) and ${{p_{\mathrm {T}}} ^{\mathrm{c} \text {jet}}}$ (right). |
png pdf |
Figure 6-a:
Efficiency as a function of ${p_{\mathrm {T}}}$. The plot shows the distribution for the electron and muon channels, as a function of ${{p_{\mathrm {T}}} ^{\mathrm{Z}}}$. |
png pdf |
Figure 6-b:
Efficiency as a function of ${p_{\mathrm {T}}}$. The plot shows the distribution for the electron and muon channels, as a function of ${{p_{\mathrm {T}}} ^{\mathrm{c} \text {jet}}}$. |
png pdf |
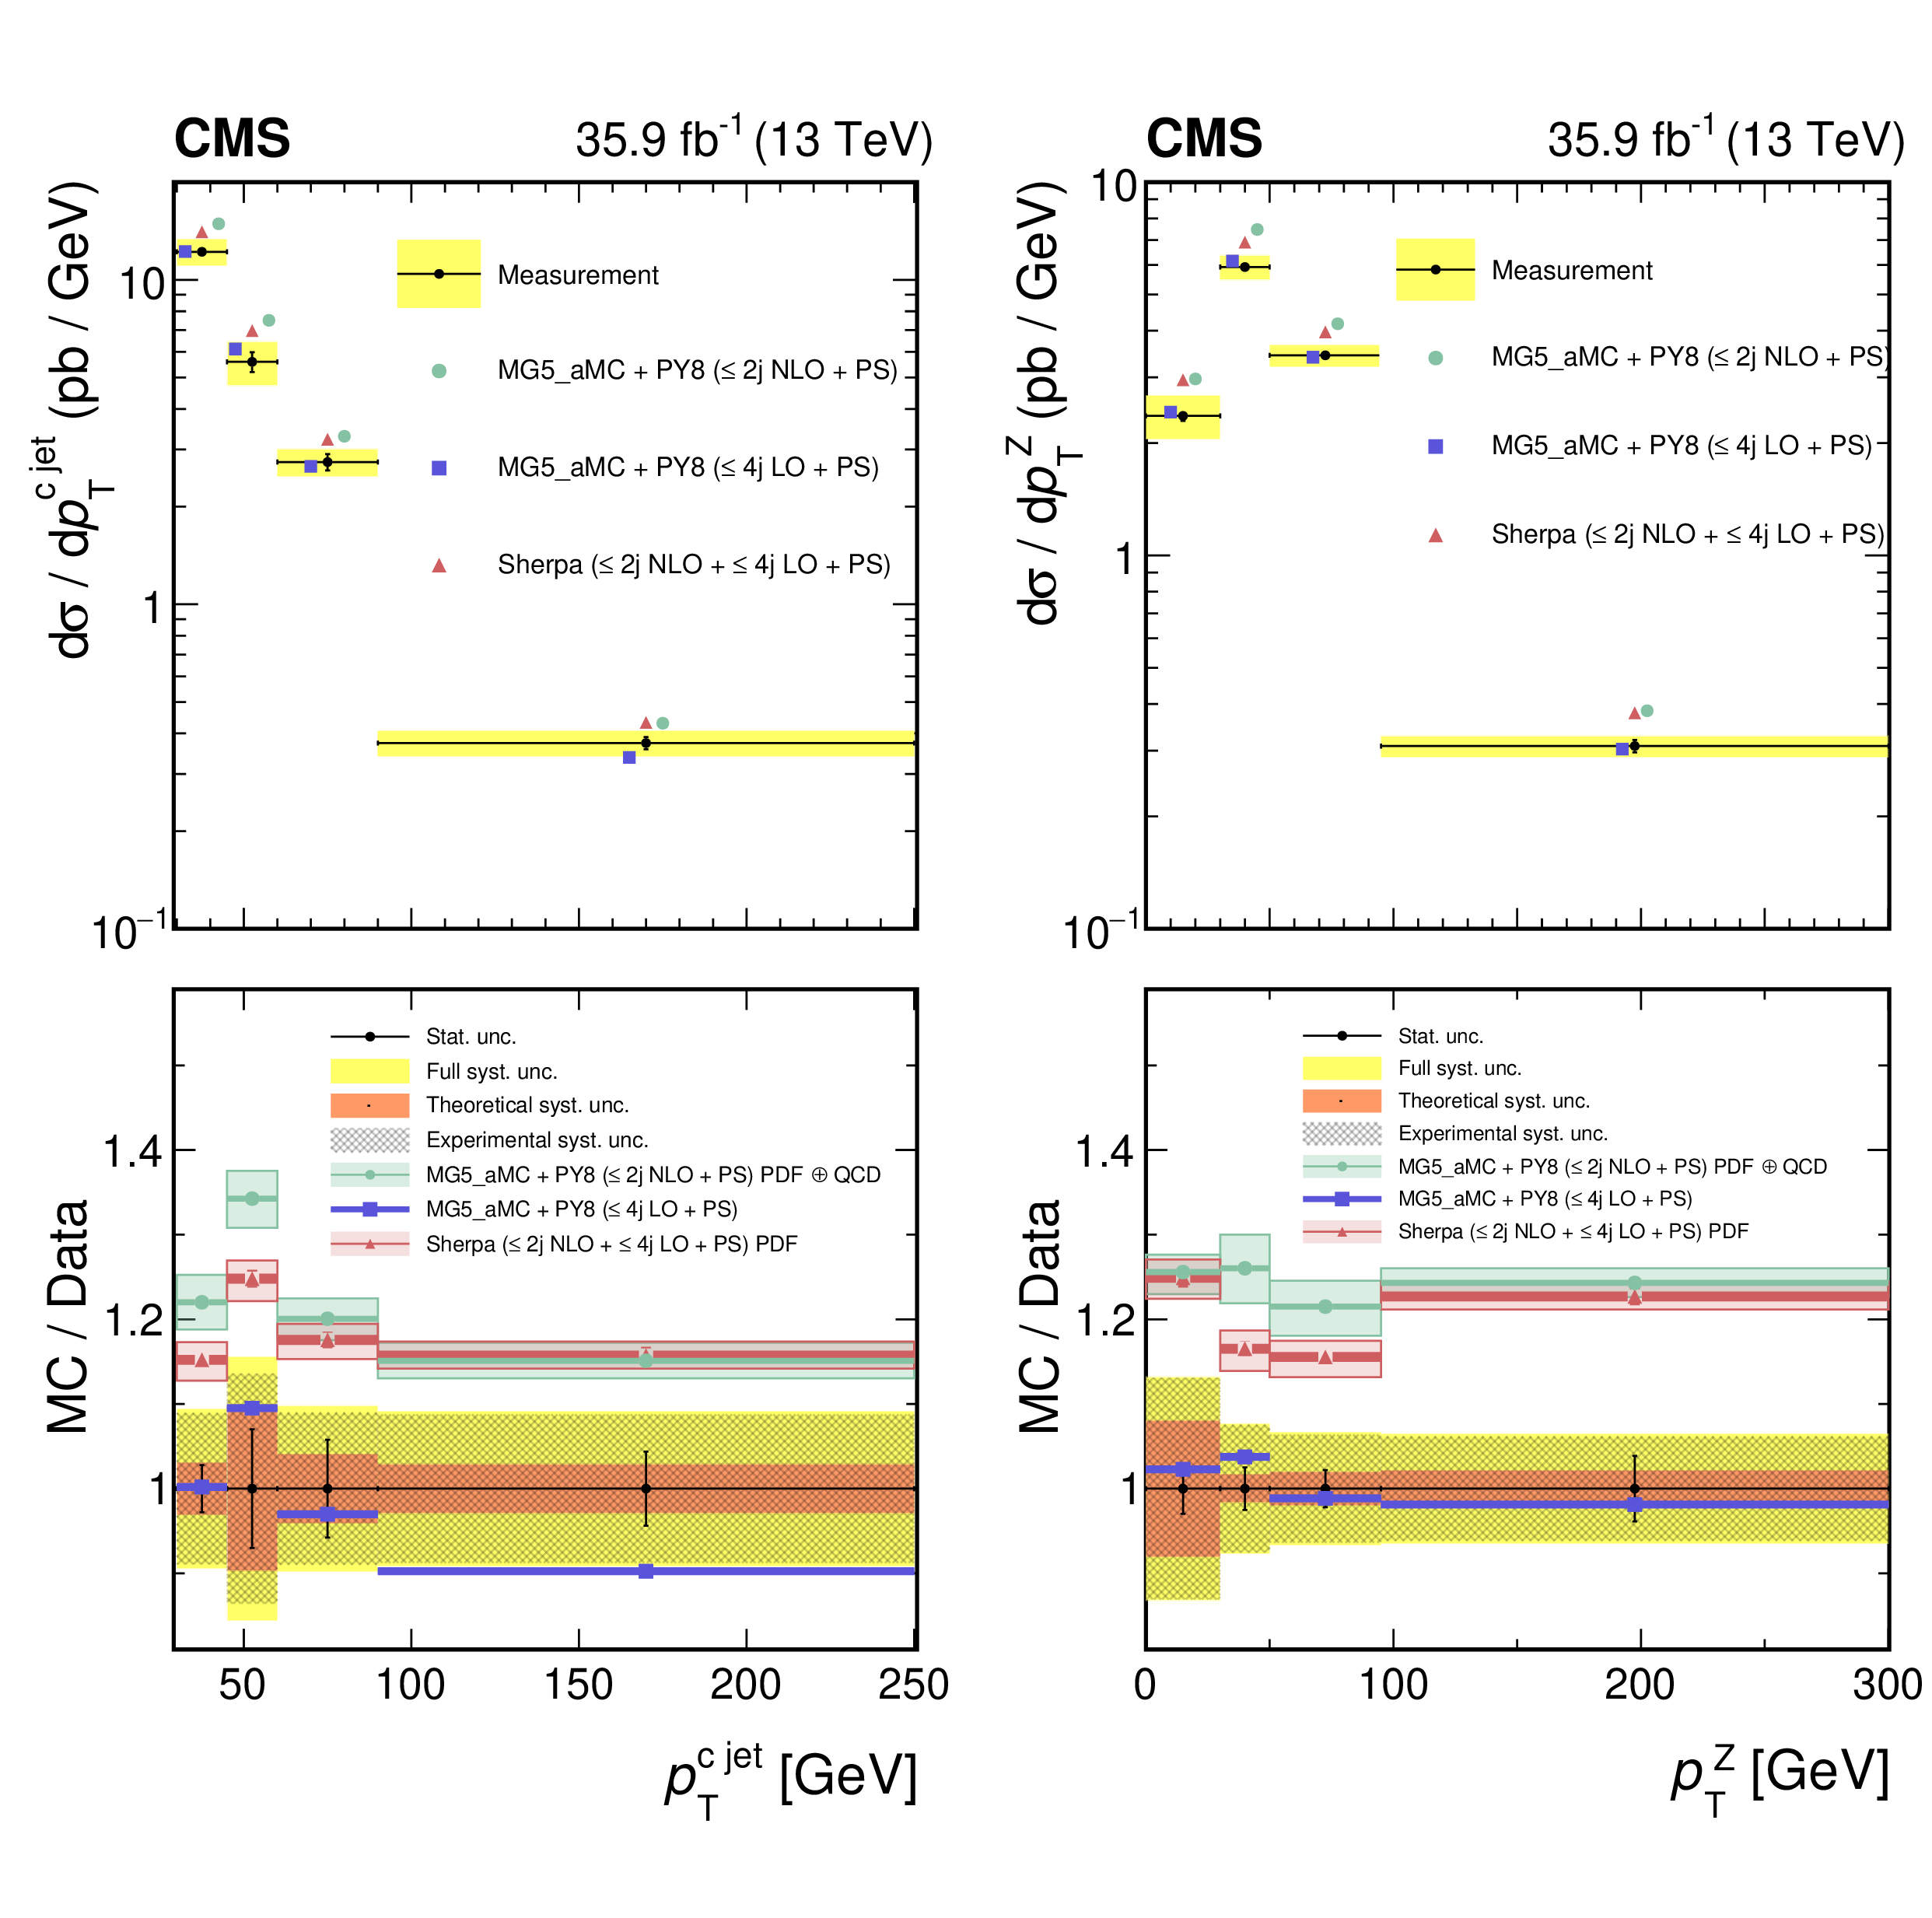
Figure 7:
Measured fiducial differential cross sections for inclusive Z$+$c-jet production, ${{\mathrm {d}}\sigma /{{\mathrm {d}} {{p_{\mathrm {T}}} ^{\mathrm{c} \text {jet}}}}}$ (left) and ${{\mathrm {d}}\sigma /{{\mathrm {d}} {{p_{\mathrm {T}}} ^{\mathrm{Z}}}}}$ (right). Yellow band shows total systematic uncertainties. Predictions from MG5_aMC (LO) are shown with statistical uncertainties only. The vertical bars on the data points represent statistical uncertainties. |
png pdf |
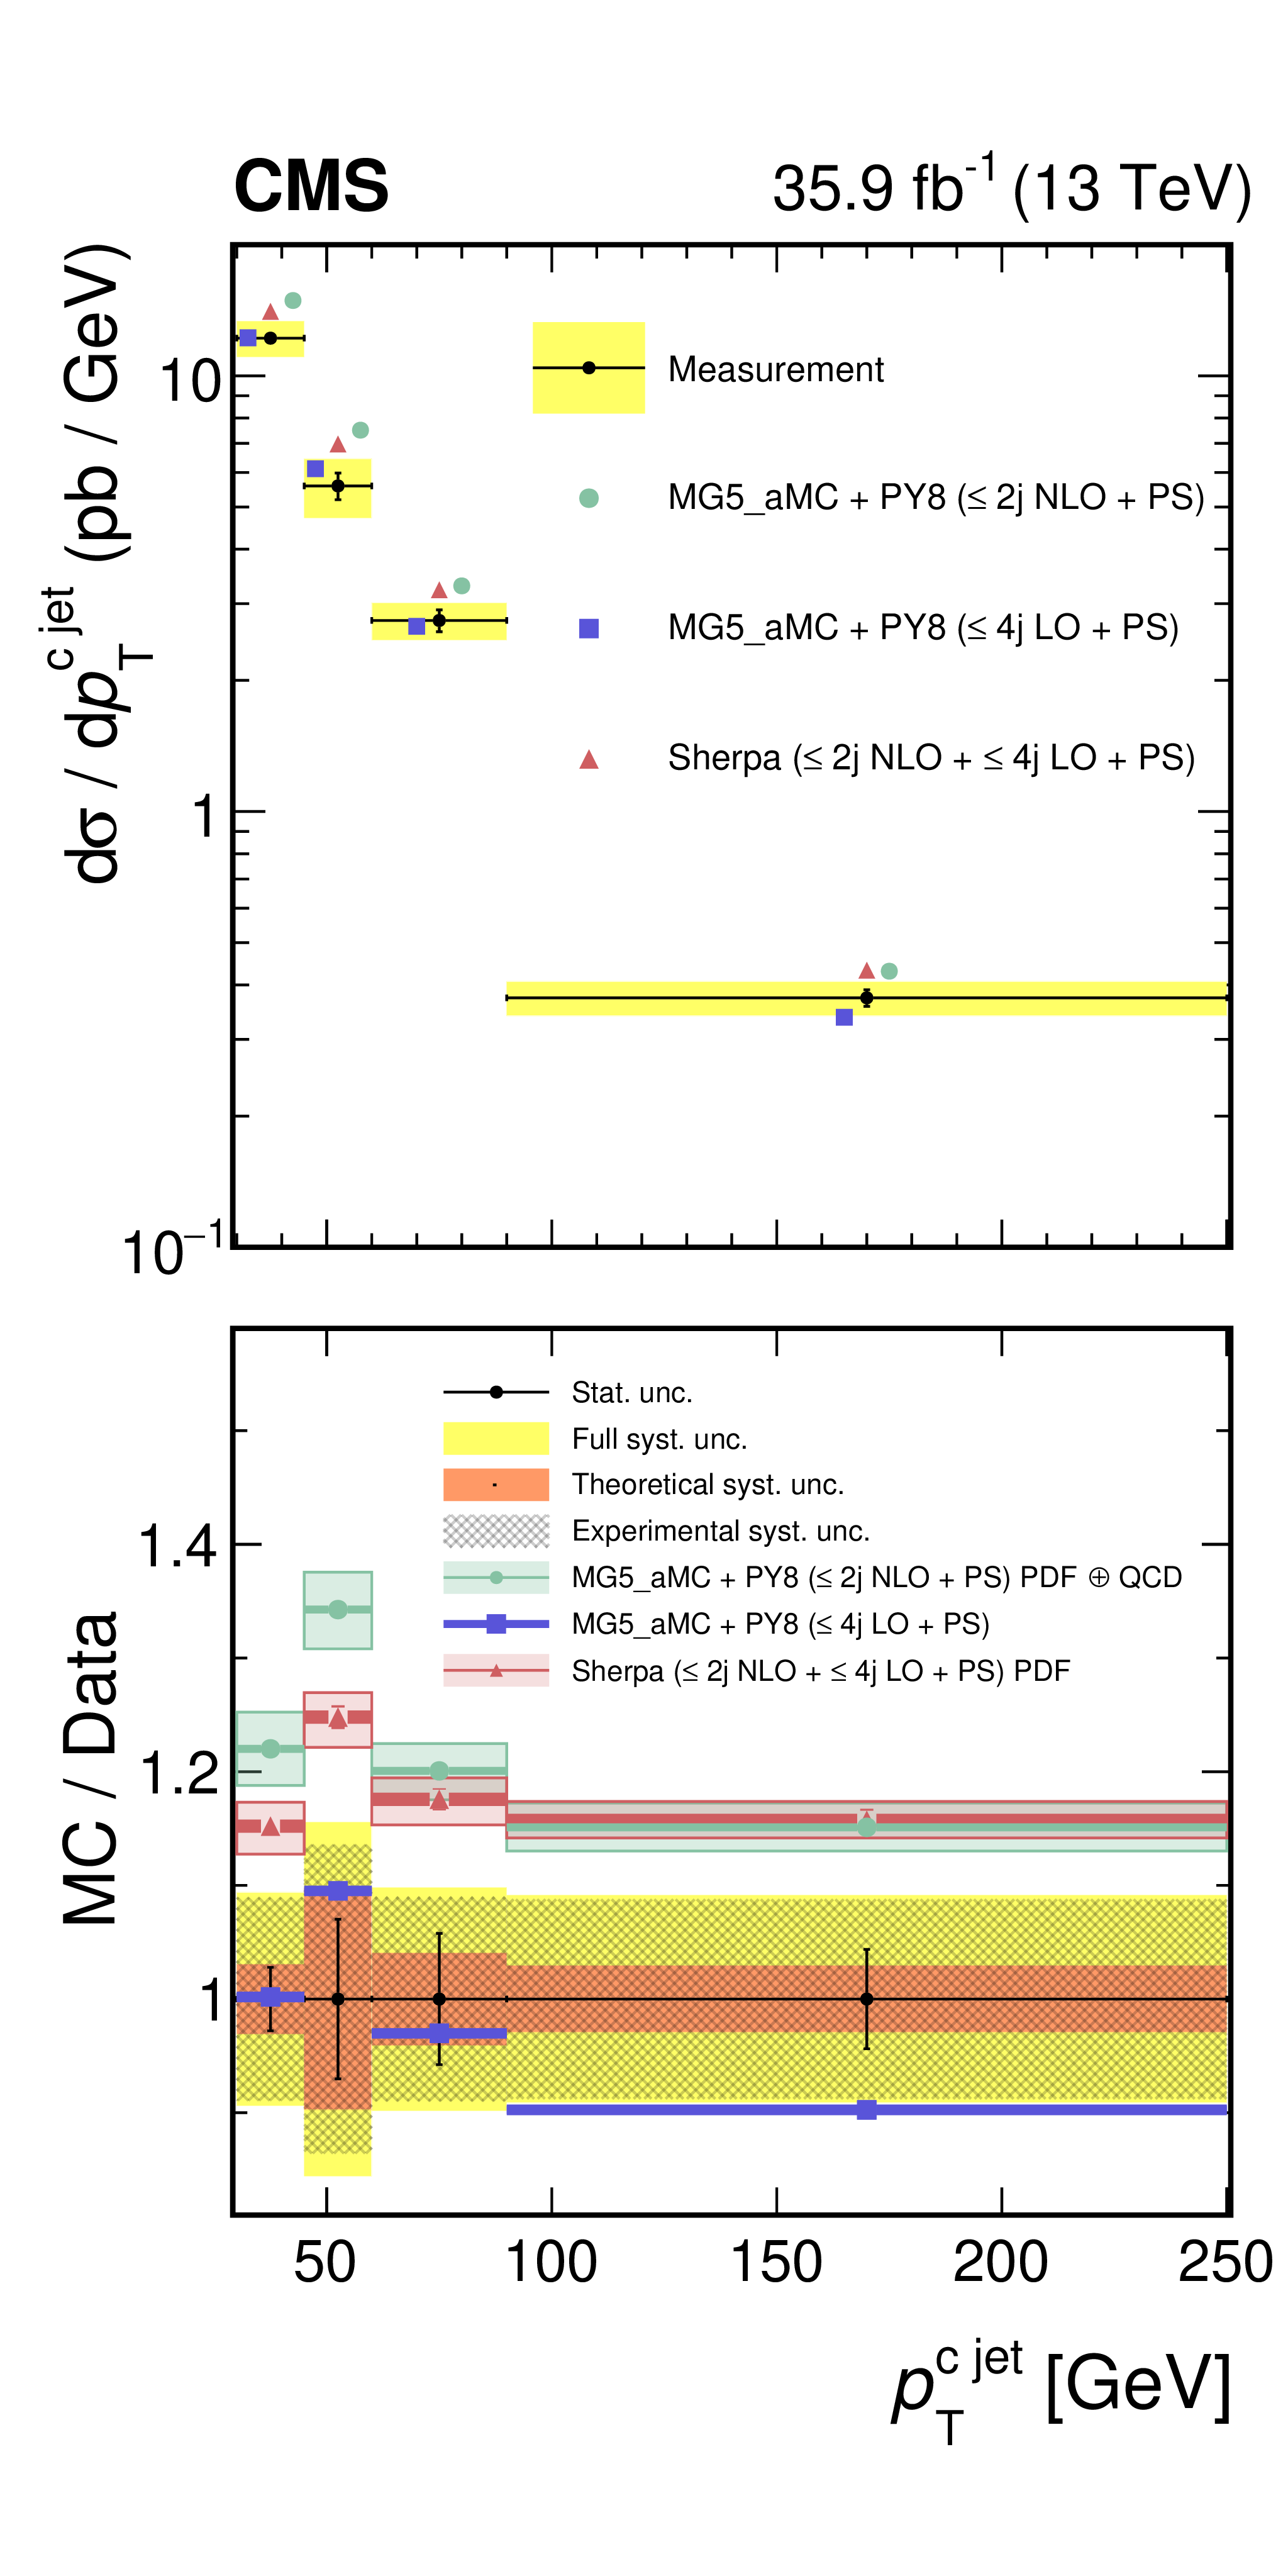
Figure 7-a:
Measured fiducial differential cross sections for inclusive Z$+$c-jet production, ${{\mathrm {d}}\sigma /{{\mathrm {d}} {{p_{\mathrm {T}}} ^{\mathrm{c} \text {jet}}}}}$. ${{\mathrm {d}}\sigma /{{\mathrm {d}} {{p_{\mathrm {T}}} ^{\mathrm{Z}}}}}$. Yellow band shows total systematic uncertainties. Predictions from MG5_aMC (LO) are shown with statistical uncertainties only. The vertical bars on the data points represent statistical uncertainties. |
png pdf |
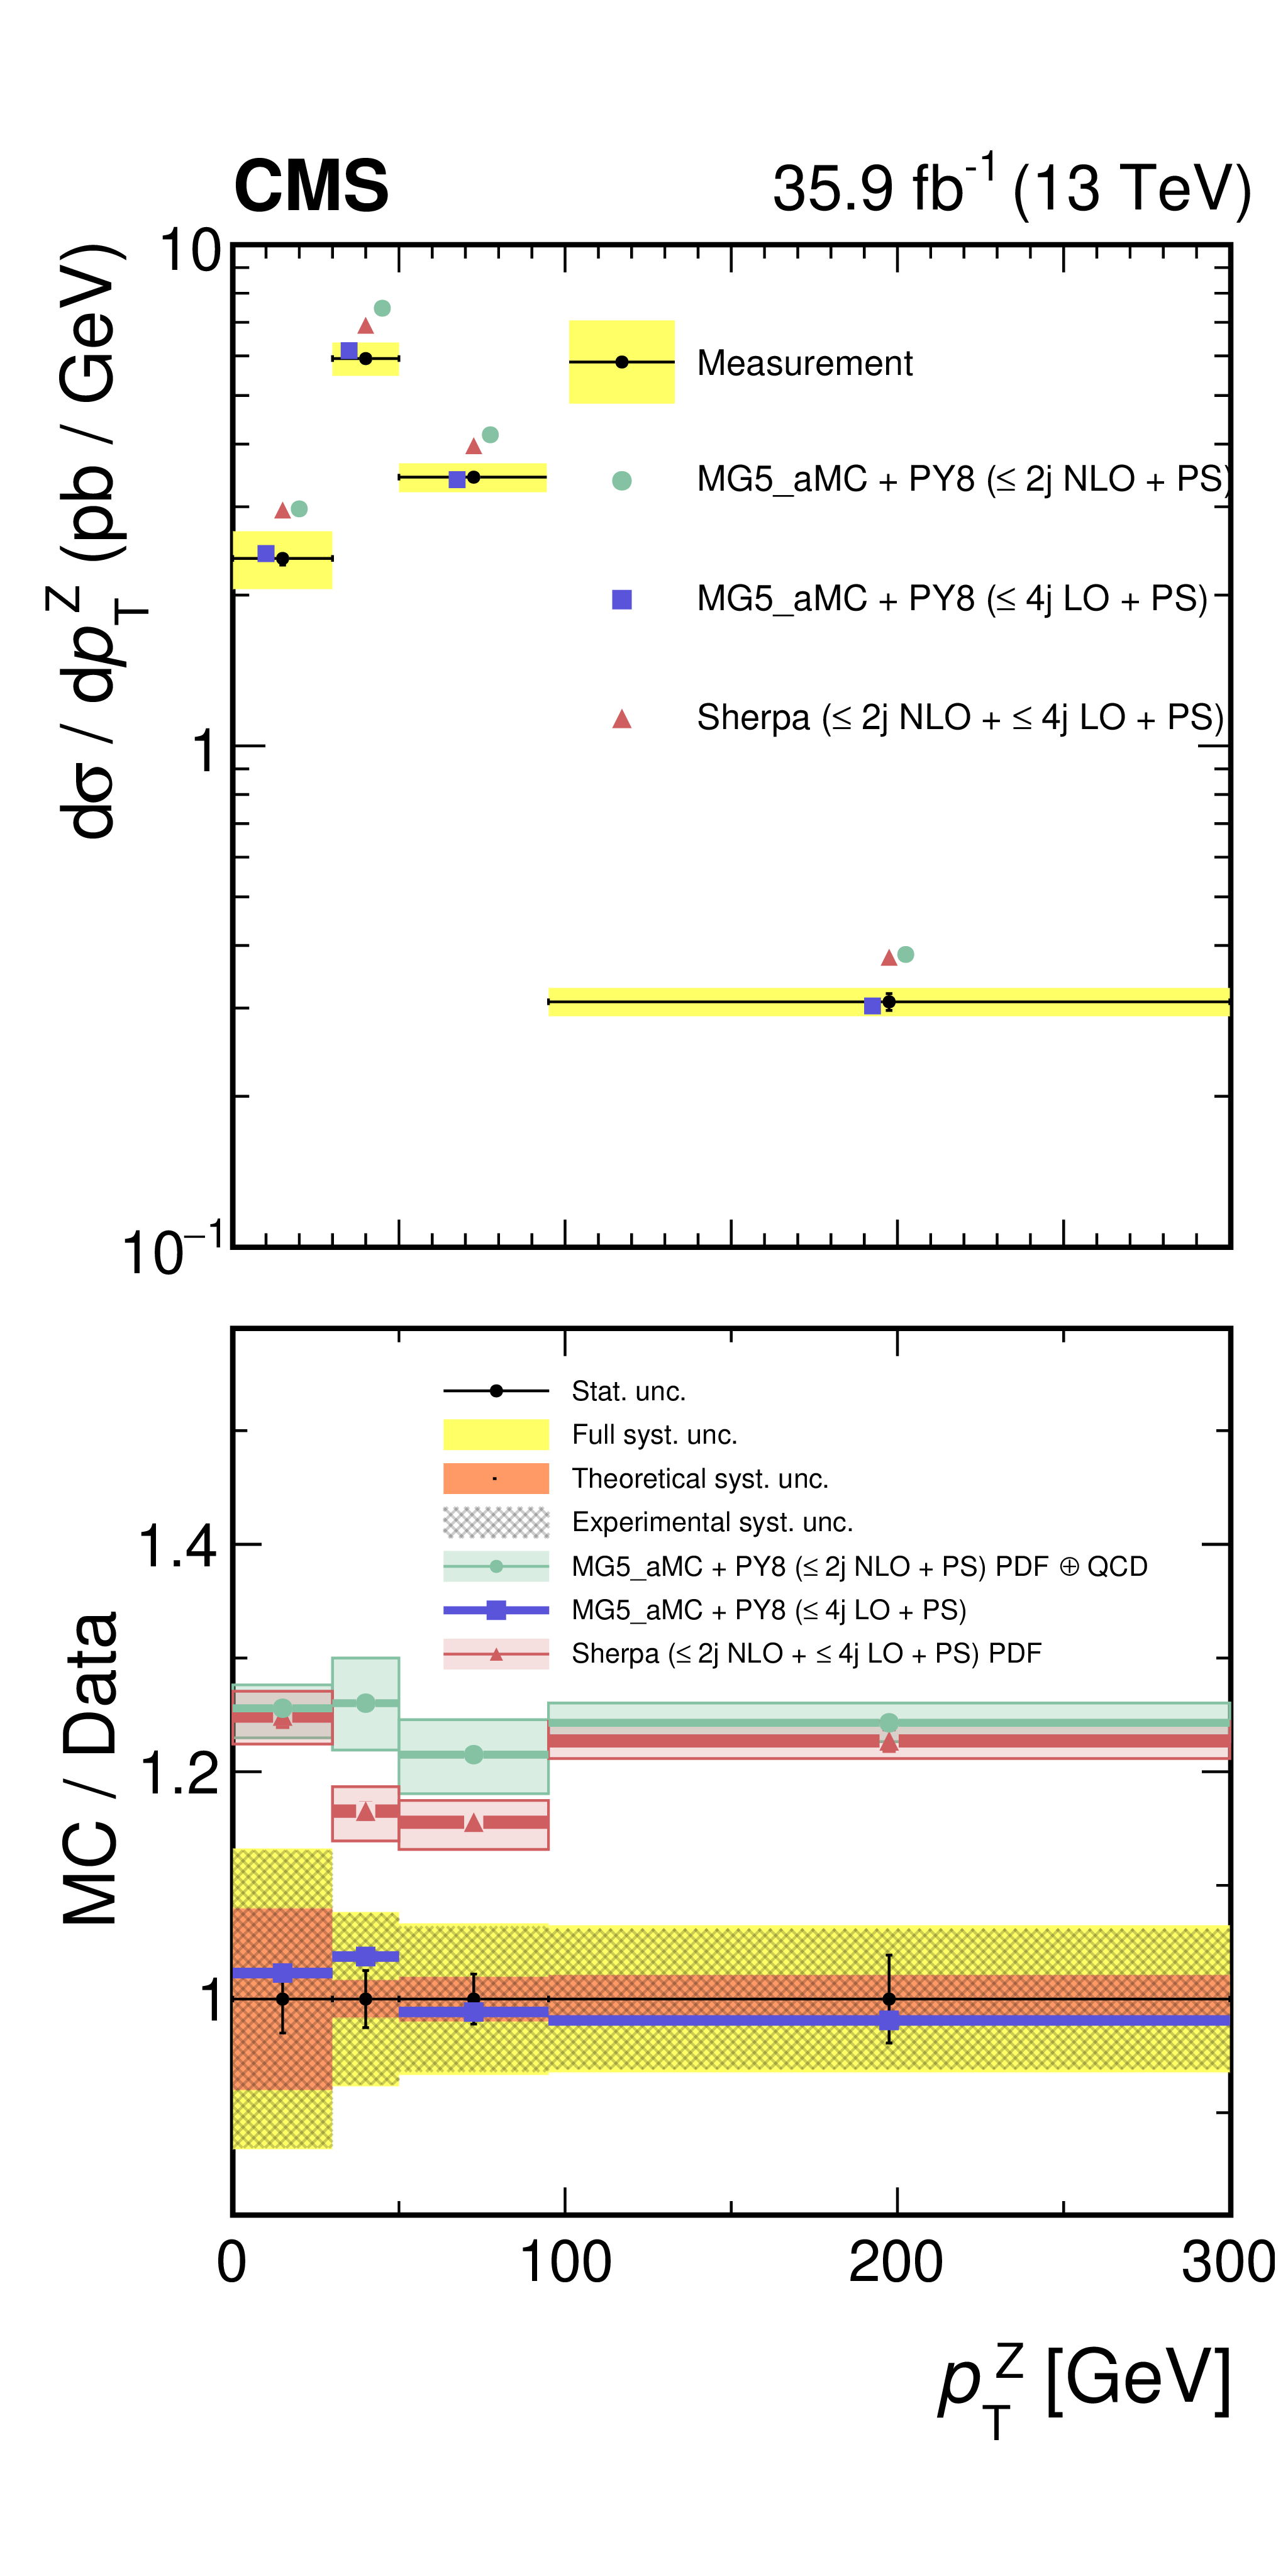
Figure 7-b:
Measured fiducial differential cross sections for inclusive Z$+$c-jet production, ${{\mathrm {d}}\sigma /{{\mathrm {d}} {{p_{\mathrm {T}}} ^{\mathrm{c} \text {jet}}}}}$ (left) and ${{\mathrm {d}}\sigma /{{\mathrm {d}} {{p_{\mathrm {T}}} ^{\mathrm{Z}}}}}$ (right). Yellow band shows total systematic uncertainties. Predictions from MG5_aMC (LO) are shown with statistical uncertainties only. The vertical bars on the data points represent statistical uncertainties. |
png pdf |
Figure A1:
Distribution of the secondary vertex mass of the highest-${{p_{\mathrm {T}}}}$ c-tagged central jet, for electron channel.The observed data is compared to the different signal and background components in simulation, after normalization scale factors as function of Z ${p_{\mathrm {T}}}$ (left) and c-tagged central jet ${p_{\mathrm {T}}}$ (right) are applied. |

png pdf |
Figure A1-a:
Distribution of the secondary vertex mass of the highest-${{p_{\mathrm {T}}}}$ c-tagged central jet, for electron channel.The observed data is compared to the different signal and background components in simulation, after normalization scale factors as function of Z ${p_{\mathrm {T}}}$ are applied. |

png pdf |
Figure A1-b:
Distribution of the secondary vertex mass of the highest-${{p_{\mathrm {T}}}}$ c-tagged central jet, for electron channel.The observed data is compared to the different signal and background components in simulation, after normalization scale factors as function of c-tagged central jet ${p_{\mathrm {T}}}$ are applied. |
png pdf |
Figure A2:
Distribution of the secondary vertex mass of the highest-${{p_{\mathrm {T}}}}$ c-tagged central jet, for muon channel.The observed data is compared to the different signal and background components in simulation, after normalization scale factors as function of Z ${p_{\mathrm {T}}}$ (left) and c-tagged central jet ${p_{\mathrm {T}}}$ (right) are applied. |
png pdf |
Figure A2-a:
Distribution of the secondary vertex mass of the highest-${{p_{\mathrm {T}}}}$ c-tagged central jet, for muon channel.The observed data is compared to the different signal and background components in simulation, after normalization scale factors as function of Z ${p_{\mathrm {T}}}$ are applied. |

png pdf |
Figure A2-b:
Distribution of the secondary vertex mass of the highest-${{p_{\mathrm {T}}}}$ c-tagged central jet, for muon channel.The observed data is compared to the different signal and background components in simulation, after normalization scale factors as function of c-tagged central jet ${p_{\mathrm {T}}}$ are applied. |
| Tables | |
png pdf |
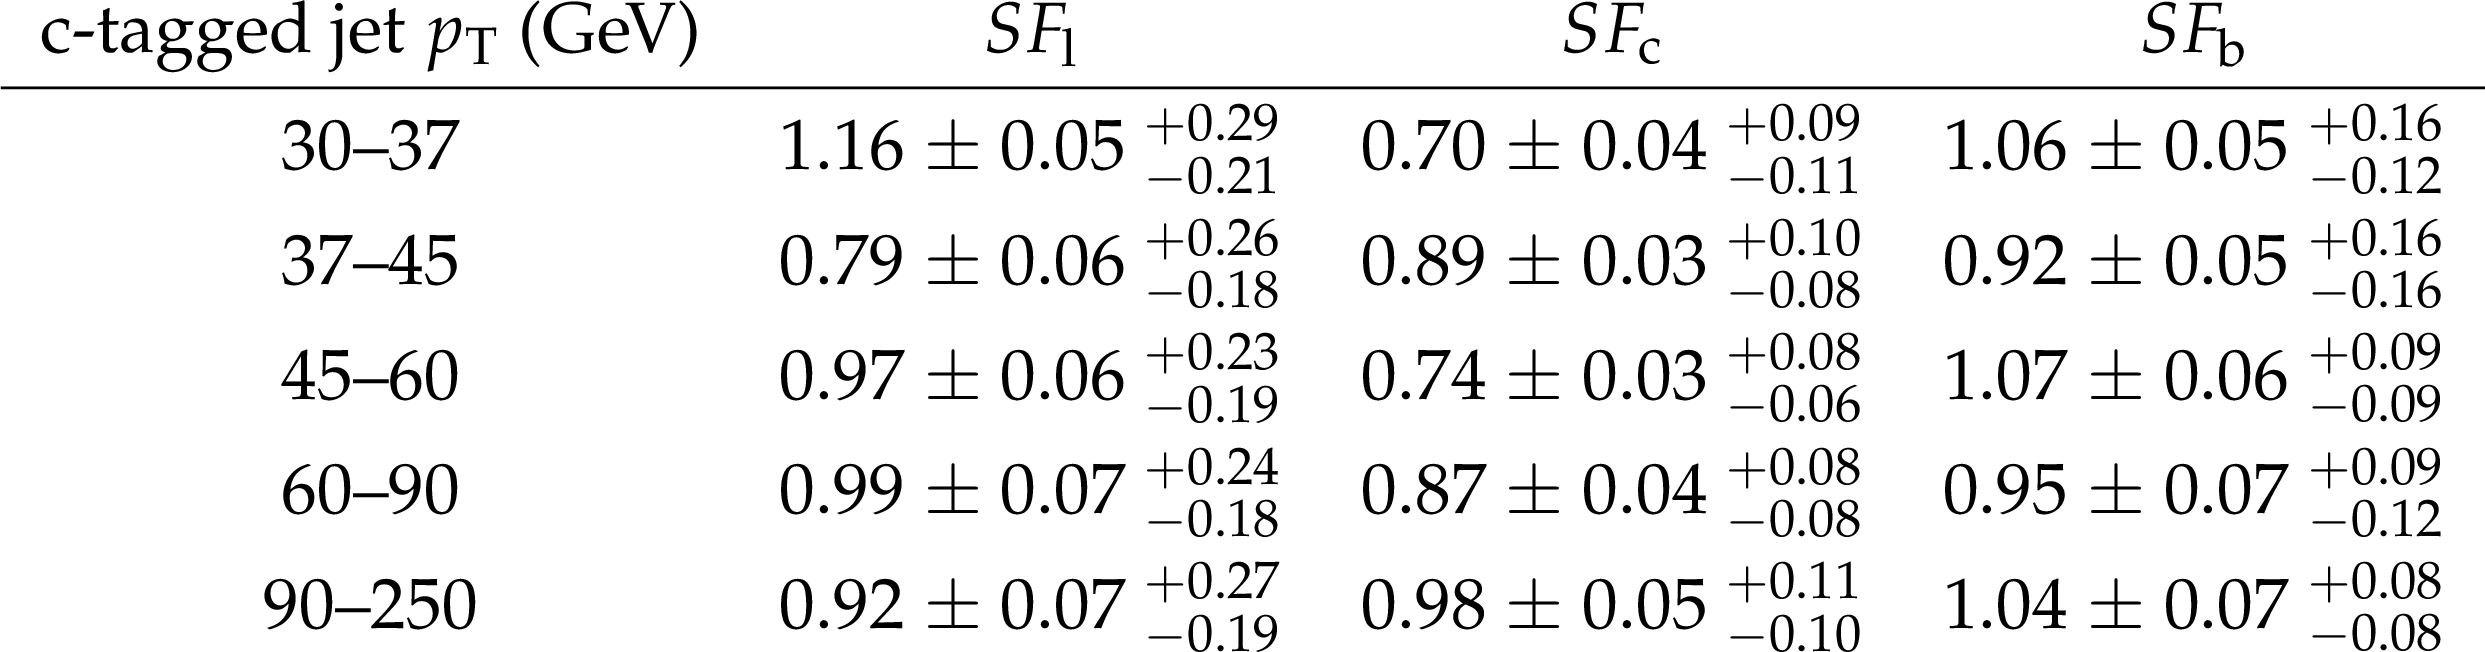
Table 1:
Values of Z$+$light-jet ${SF_\mathrm {l}}$, Z$+$c-jet ${SF_\mathrm{c}}$, and Z$+$b-jet ${SF_\mathrm{b}}$ scale factors measured in the electron channel, as a function of c-tagged jet ${p_{\mathrm {T}}}$. The first uncertainty in each case is the statistical uncertainty from the fit, the second is the systematic uncertainty. |
png pdf |
Table 2:
Values of Z$+$light-jet ${SF_\mathrm {l}}$, Z$+$c-jet ${SF_\mathrm{c}}$, and Z$+$b-jet ${SF_\mathrm{b}}$ scale factors measured in the electron channel, as a function of Z candidate ${p_{\mathrm {T}}}$. The first uncertainty in each case is the statistical uncertainty from the fit, the second is the systematic uncertainty. |
png pdf |
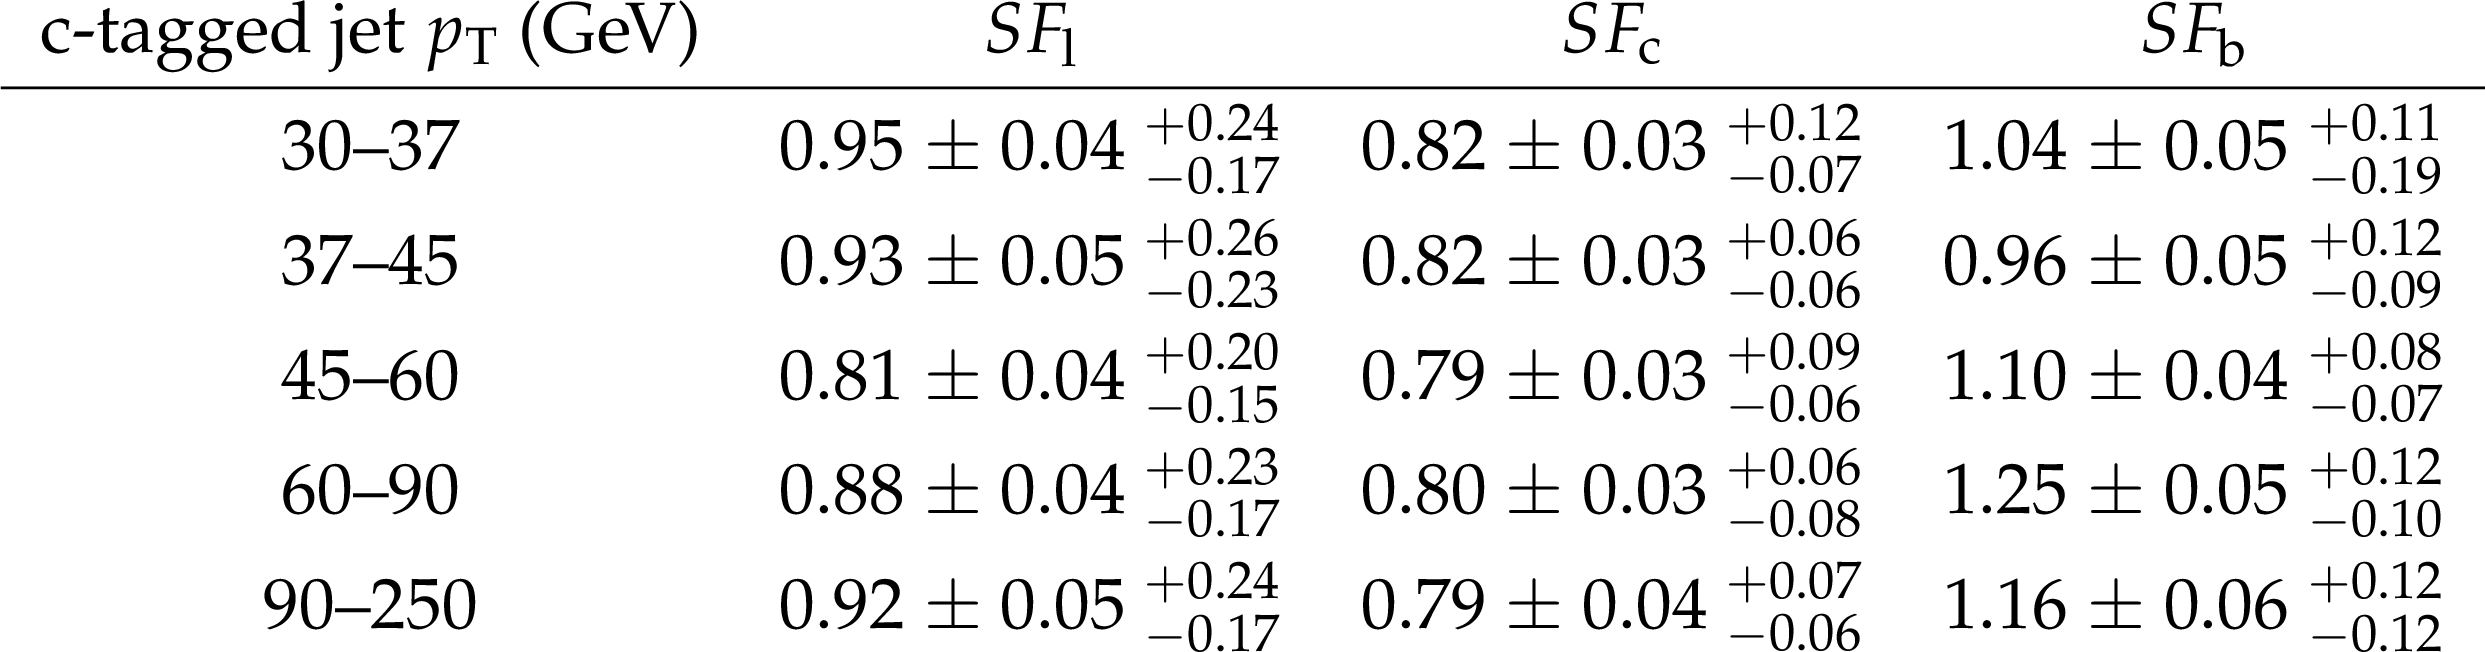
Table 3:
Values of Z$+$light-jet ${SF_\mathrm {l}}$, Z$+$c-jet ${SF_\mathrm{c}}$, and Z$+$b-jet ${SF_\mathrm{b}}$ scale factors measured in the muon channel, as a function of c-tagged jet ${p_{\mathrm {T}}}$. The first uncertainty in each case is the statistical uncertainty from the fit, the second is the systematic uncertainty. |

png pdf |
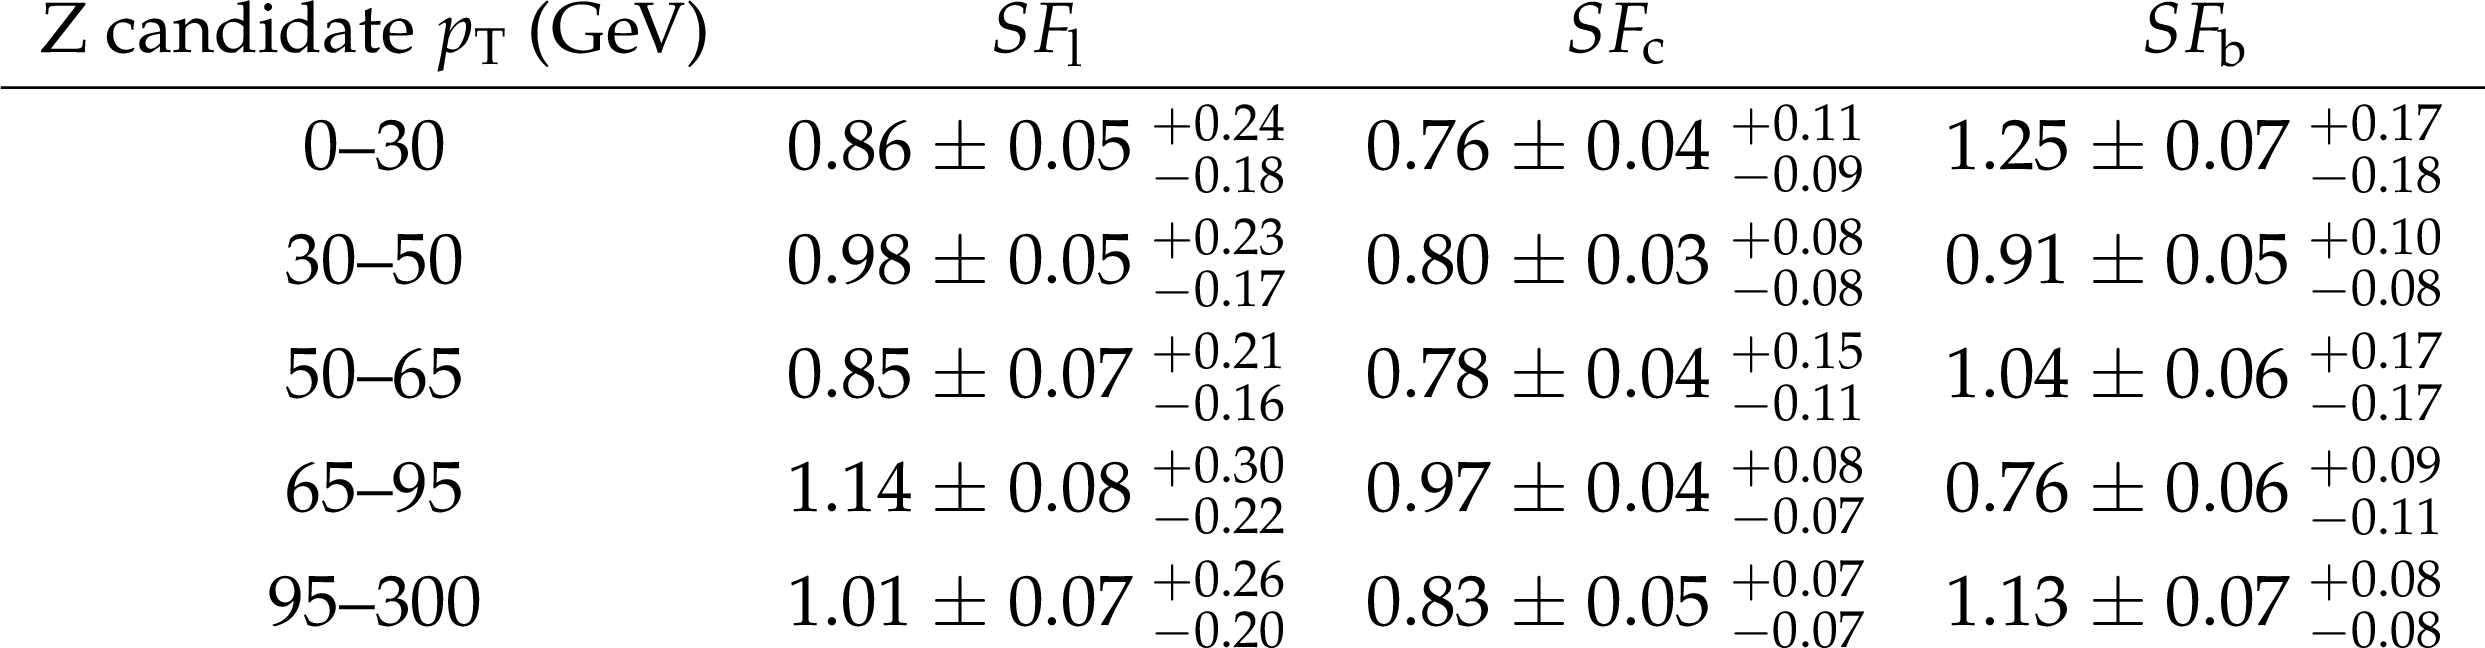
Table 4:
Values of Z$+$light-jet ${SF_\mathrm {l}}$, Z$+$c-jet ${SF_\mathrm{c}}$, and Z$+$b-jet ${SF_\mathrm{b}}$ scale factors measured in the muon channel, as a function of Z candidate ${p_{\mathrm {T}}}$. The first uncertainty in each case is the statistical uncertainty from the fit, the second is the systematic uncertainty. |
png pdf |
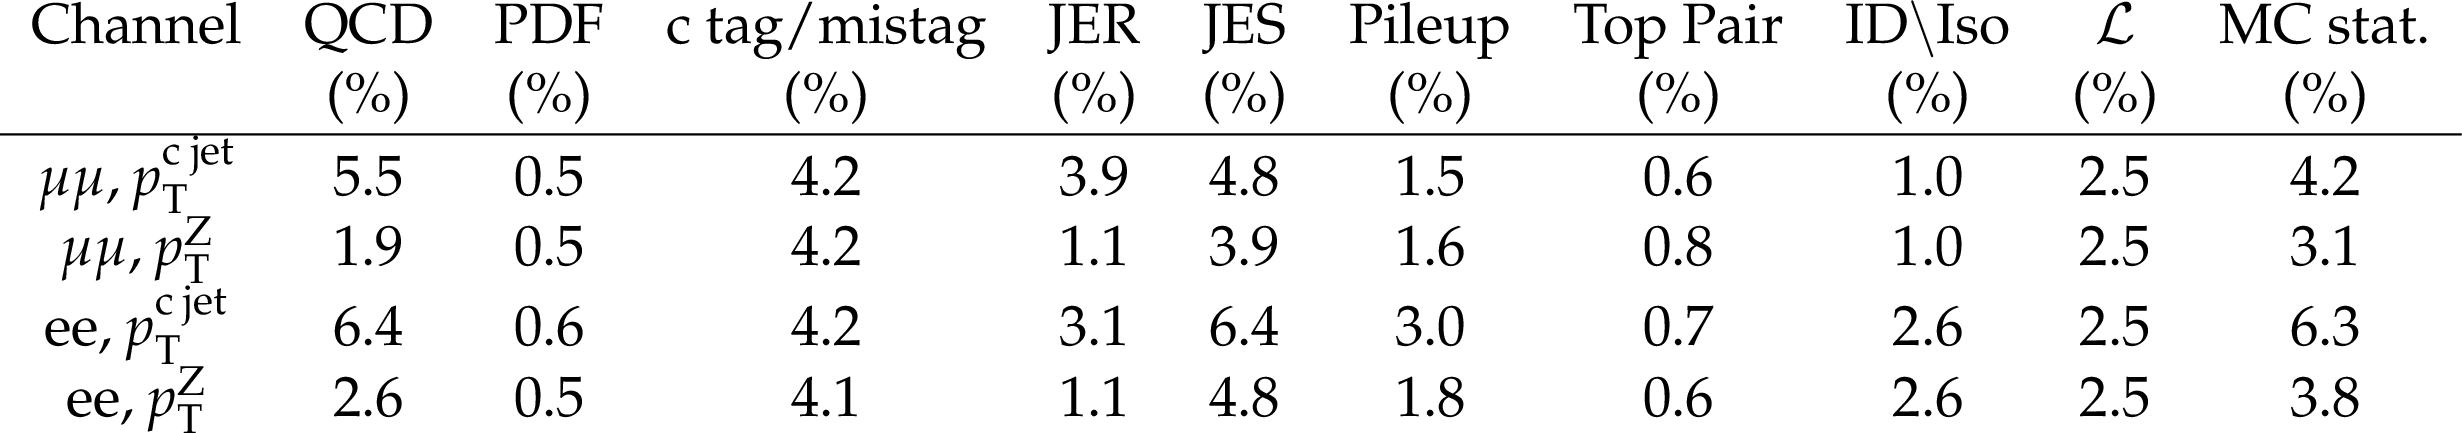
Table 5:
Summary of the systematic uncertainties in the integral fiducial cross section arising from the various sources. |
png pdf |
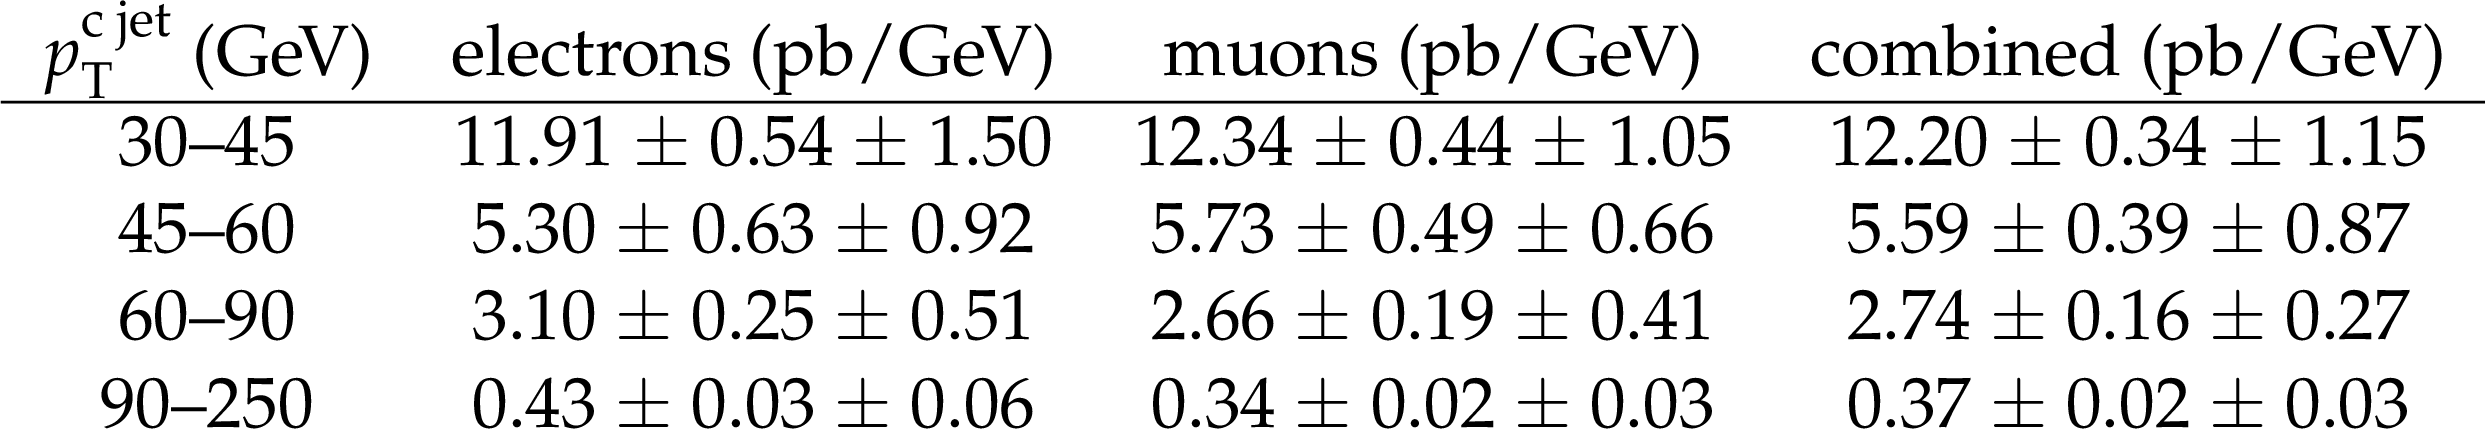
Table 6:
Measured differential cross section as a function of ${{p_{\mathrm {T}}} ^{\mathrm{c} \text {jet}}}$ for electron, muon and combine channels. The first and second uncertainty values correspond to the statistical and systematic contributions, respectively. |

png pdf |
Table 7:
Measured differential cross section as a function of ${{p_{\mathrm {T}}} ^{\mathrm{Z}}}$ for electron, muon and combine channels. The first and second uncertainty values correspond to the statistical and systematic contributions, respectively. |
| Summary |
|
The first differential cross sections for inclusive Z$+$c-jet production as functions of transverse momenta ${p_{\mathrm{T}}}$ of the Z boson and of the associated c-jet are presented for collisions at $\sqrt{s} = $ 13 TeV using 35.9 fb$^{-1}$ of data collected by the CMS experiment at the CERN LHC. The measurements pertain to a fiducial space defined as containing a c-jet with $ {p_{\mathrm{T}}} > $ 30 GeV and pseudorapidity $| \eta | < $ 2.4, and a pair of leptons with each lepton having ${p_{\mathrm{T}}} > $ 10 GeV, $| \eta | < $ 2.4, and at least one with ${p_{\mathrm{T}}} > $ 26 GeV, and a dilepton mass between 71 and 111 GeV. The main backgrounds correspond to Z$+$light-jet, Z$+$b-jet, top quark pair, and diboson (ZZ, ZW, or WW) production. To provide a direct comparison with predictions from Monte Carlo (MC) event generators, we unfold detector effects from our measurements. The total fiducial cross section for the Z boson with ${p_{\mathrm{T}}} < $ 300 GeV is measured to be 405.4 $\pm$ 5.6 (stat) $\pm$ 24.3 (exp) $\pm$ 3.7 (theo) pb, while the MadGraph5+MCatNLO generator at next-to-leading order predicts 524.9 $\pm$ 11.7 (theo) pb for the same fiducial region. The theoretical uncertainties include QCD scale variation and parton distribution function uncertainties. The predictions from MC event generators were compared with measurements, which are in good agreement with MadGraph5+MCatNLO at leading order, while both MadGraph5+MCatNLO and SHERPA at next-to-leading order tend to overestimate the cross section. Predictions from all three generators were normalized to the cross section calculated with FEWZ at next-to-next-to-leading order. Since the prediction of inclusive Z$+$jets production at next-to-leading order is in better agreement with data than that at leading order [45]. This could be an indication that the parton distribution functions overestimate the charm content. These results can be used to improve existing constraints on the charm quark content in the proton. |
| References | ||||
| 1 | S. J. Brodsky et al. | A review of the intrinsic heavy quark content of the nucleon | Adv. High Energy Phys. 2015 (2015) 231547 | 1504.06287 |
| 2 | T.-J. Hou et al. | CT14 intrinsic charm parton distribution functions from CTEQ-TEA global analysis | JHEP 02 (2018) 059 | 1707.00657 |
| 3 | NNPDF Collaboration | A determination of the charm content of the proton | EPJC 76 (2016) 647 | 1605.06515 |
| 4 | CMS Collaboration | Search for the pair production of third-generation squarks with two-body decays to a bottom or charm quark and a neutralino in proton-proton collisions at $ \sqrt{s} = $ 13 TeV | PLB 778 (2018) 263 | CMS-SUS-16-032 1707.07274 |
| 5 | CMS Collaboration | Measurement of associated Z + charm production in proton-proton collisions at $ \sqrt{s} = $ 8 TeV | EPJC 78 (2018) 287 | CMS-SMP-15-009 1711.02143 |
| 6 | CMS Collaboration | Identification of heavy-flavour jets with the CMS detector in pp collisions at 13 TeV | JINST 13 (2018) P05011 | CMS-BTV-16-002 1712.07158 |
| 7 | CMS Collaboration | The CMS trigger system | JINST 12 (2017) P01020 | CMS-TRG-12-001 1609.02366 |
| 8 | CMS Collaboration | The CMS experiment at the CERN LHC | JINST 3 (2008) S08004 | CMS-00-001 |
| 9 | J. Alwall et al. | The automated computation of tree-level and next-to-leading order differential cross sections, and their matching to parton shower simulations | JHEP 07 (2014) 079 | 1405.0301 |
| 10 | T. Gleisberg, S. Hoeche, F. Krauss, M. Schoenherr, S. Schumann, F. Siegert, and J. Winter | Event generation with SHERPA 1.1 | JHEP 07 (2008) 0902 | 0811.4622 |
| 11 | F. Buccioni, J. Lang, J. M. Lindert, P. Maierhofer, S. Pozzorini, H. Zhang, and M. F. Zoller | OpenLoops 2 | EPJC 79 (2019) 866 | 1907.13071 |
| 12 | Y. Li and F. Petriello | Combining QCD and electroweak corrections to dilepton production in the framework of the FEWZ simulation code | PRD 86 (2012) 094034 | 1208.5967 |
| 13 | NNPDF Collaboration | Parton distributions for the LHC run II | JHEP 04 (2015) 040 | 1410.8849 |
| 14 | CMS Collaboration | Measurement of the $ t \bar t $ production cross section using events with one lepton and at least one jet in pp collisions at $ \sqrt{s} = $ 13 TeV | JHEP 09 (2017) 051 | CMS-TOP-16-006 1701.06228 |
| 15 | CMS Collaboration | Measurement of the $ t\bar{t} $ production cross section using events in the e$ \mu $ final state in pp collisions at $ \sqrt{s} = $ 13 TeV | EPJC 77 (2017) 172 | CMS-TOP-16-005 1611.04040 |
| 16 | N. Kidonakis | Differential and total cross sections for top pair and single top production | in Proceedings of the XX International Workshop on Deep-Inelastic Scattering and Related Subjects Bonn, Germany | 1205.3453 |
| 17 | S. Alioli, P. Nason, C. Oleari, and E. Re | NLO single-top production matched with shower in POWHEG: s- and t-channel contributions | JHEP 09 (2009) 111 | 0907.4076 |
| 18 | P. Nason | A new method for combining NLO QCD with shower Monte Carlo algorithms | JHEP 11 (2004) 040 | hep-ph/0409146 |
| 19 | S. Frixione, P. Nason, and C. Oleari | Matching NLO QCD computations with Parton Shower simulations: the POWHEG method | JHEP 11 (2007) 070 | 0709.2092 |
| 20 | S. Alioli, P. Nason, C. Oleari, and E. Re | A general framework for implementing NLO calculations in shower Monte Carlo programs: the POWHEG BOX | JHEP 06 (2010) 043 | 1002.2581 |
| 21 | T. Sjostrand et al. | An introduction to PYTHIA 8.2 | CPC 191 (2015) 159 | 1410.3012 |
| 22 | CMS Collaboration | Event generator tunes obtained from underlying event and multiparton scattering measurements | EPJC 76 (2016) 155 | CMS-GEN-14-001 1512.00815 |
| 23 | CMS Collaboration | Investigations of the impact of the parton shower tuning in PYTHIA 8 in the modelling of $ \mathrm{t\overline{t}} $ at $ \sqrt{s}= $ 8 and 13 TeV | CMS-PAS-TOP-16-021 | CMS-PAS-TOP-16-021 |
| 24 | R. D. Ball et al. | Parton distributions with LHC data | NPB 867 (2013) 244 | 1207.1303 |
| 25 | J. Alwall et al. | Comparative study of various algorithms for the merging of parton showers and matrix elements in hadronic collisions | EPJC 53 (2008) 473 | 0706.2569 |
| 26 | J. Alwall, S. de Visscher, and F. Maltoni | QCD radiation in the production of heavy colored particles at the LHC | JHEP 02 (2009) 017 | 0810.5350 |
| 27 | R. Frederix and S. Frixione | Merging meets matching in MC@NLO | JHEP 12 (2012) 061 | 1209.6215 |
| 28 | GEANT4 Collaboration | GEANT4--a simulation toolkit | NIMA 506 (2003) 250 | |
| 29 | CMS Collaboration | Particle-flow reconstruction and global event description with the CMS detector | JINST 12 (2017) P10003 | CMS-PRF-14-001 1706.04965 |
| 30 | CMS Collaboration | Performance of electron reconstruction and selection with the CMS detector in proton-proton collisions at $ \sqrt{s}= $ 8 TeV | JINST 10 (2015) P06005 | CMS-EGM-13-001 1502.02701 |
| 31 | CMS Collaboration | Performance of the CMS muon detector and muon reconstruction with proton-proton collisions at $ \sqrt{s} = $ 13 TeV | JINST 13 (2018) P06015 | CMS-MUO-16-001 1804.04528 |
| 32 | M. Cacciari and G. P. Salam | Pileup subtraction using jet areas | PLB 659 (2008) 119 | 0707.1378 |
| 33 | M. Cacciari, G. P. Salam, and G. Soyez | The anti-$ {k_{\mathrm{T}}} $ jet clustering algorithm | JHEP 04 (2008) 063 | 0802.1189 |
| 34 | M. Cacciari, G. P. Salam, and G. Soyez | FastJet user manual | EPJC 72 (2012) 1896 | 1111.6097 |
| 35 | CMS Collaboration | Jet energy scale and resolution in the CMS experiment in pp collisions at 8 TeV | JINST 12 (2017) P02014 | CMS-JME-13-004 1607.03663 |
| 36 | CMS Collaboration | Performance of missing transverse momentum in proton-proton collisions at $ \sqrt{s} = $ 13 TeV using the CMS detector | JINST 14 (2019) P07004 | CMS-JME-17-001 1903.06078 |
| 37 | CMS Collaboration | Pileup mitigation at CMS in 13 TeV data | JINST 15 (2020) P09018 | CMS-JME-18-001 2003.00503 |
| 38 | CMS Collaboration | Measurement of the inclusive W and Z production cross sections in pp collisions at $ \sqrt{s}= $ 7 TeV with the CMS experiment | JHEP 10 (2011) 132 | CMS-EWK-10-005 1107.4789 |
| 39 | CMS Collaboration | Measurement of $ B\bar{B} $ angular correlations based on secondary vertex reconstruction at $ \sqrt{s}= $ 7 TeV | JHEP 03 (2011) 136 | CMS-BPH-10-010 1102.3194 |
| 40 | S. Schmitt | TUnfold: an algorithm for correcting migration effects in high energy physics | JINST 7 (2012) T10003 | 1205.6201 |
| 41 | CMS Collaboration | Measurement of the inelastic proton-proton cross section at $ \sqrt{s}= $ 13 TeV | JHEP 07 (2018) 161 | CMS-FSQ-15-005 1802.02613 |
| 42 | M. Czakon, P. Fiedler, and A. Mitov | Total top quark pair production cross section at hadron colliders through O($ \alpha_S^4 $) | PRL 110 (2013) 252004 | 1303.6254 |
| 43 | CMS Collaboration | CMS Luminosity Measurements for the 2016 data taking period | CMS-PAS-LUM-17-001 | CMS-PAS-LUM-17-001 |
| 44 | J. Kieseler | A method and tool for combining differential or inclusive measurements obtained with simultaneously constrained uncertainties | EPJC 77 (2017) 792 | 1706.01681 |
| 45 | CMS Collaboration | Measurement of differential cross sections for Z boson production in association with jets in proton-proton collisions at $ \sqrt{s} = $ 13 TeV | EPJC 78 (2018) 965 | CMS-SMP-16-015 1804.05252 |
|
|
Compact Muon Solenoid LHC, CERN |
|

|

|

|

|

|