

Compact Muon Solenoid
LHC, CERN
| CMS-SUS-17-012 ; CERN-EP-2018-277 | ||
| Search for supersymmetry in events with a photon, a lepton, and missing transverse momentum in proton-proton collisions at $\sqrt{s} = $ 13 TeV | ||
| CMS Collaboration | ||
| 10 December 2018 | ||
| JHEP 01 (2019) 154 | ||
| Abstract: Results of a search for supersymmetry are presented using events with a photon, an electron or muon, and large missing transverse momentum. The analysis is based on a data sample corresponding to an integrated luminosity of 35.9 fb$^{-1}$ of proton-proton collisions at $\sqrt{s} = $ 13 TeV, produced by the LHC and collected with the CMS detector in 2016. Theoretical models with gauge-mediated supersymmetry breaking predict events with photons in the final state, as well as electroweak gauge bosons decaying to leptons. Searches for events with a photon, a lepton, and missing transverse momentum are sensitive probes of these models. No excess of events is observed beyond expectations from standard model processes. The results of the search are interpreted in the context of simplified models inspired by gauge-mediated supersymmetry breaking. These models are used to derive upper limits on the production cross sections and set lower bounds on masses of supersymmetric particles. Gaugino masses below 930 GeV are excluded at the 95% confidence level in a simplified model with electroweak production of a neutralino and chargino. For simplified models of gluino and squark pair production, gluino masses up to 1.75 TeV and squark masses up to 1.43 TeV are excluded at the 95% confidence level. | ||
| Links: e-print arXiv:1812.04066 [hep-ex] (PDF) ; CDS record ; inSPIRE record ; CADI line (restricted) ; | ||
| Figures | |
png pdf |
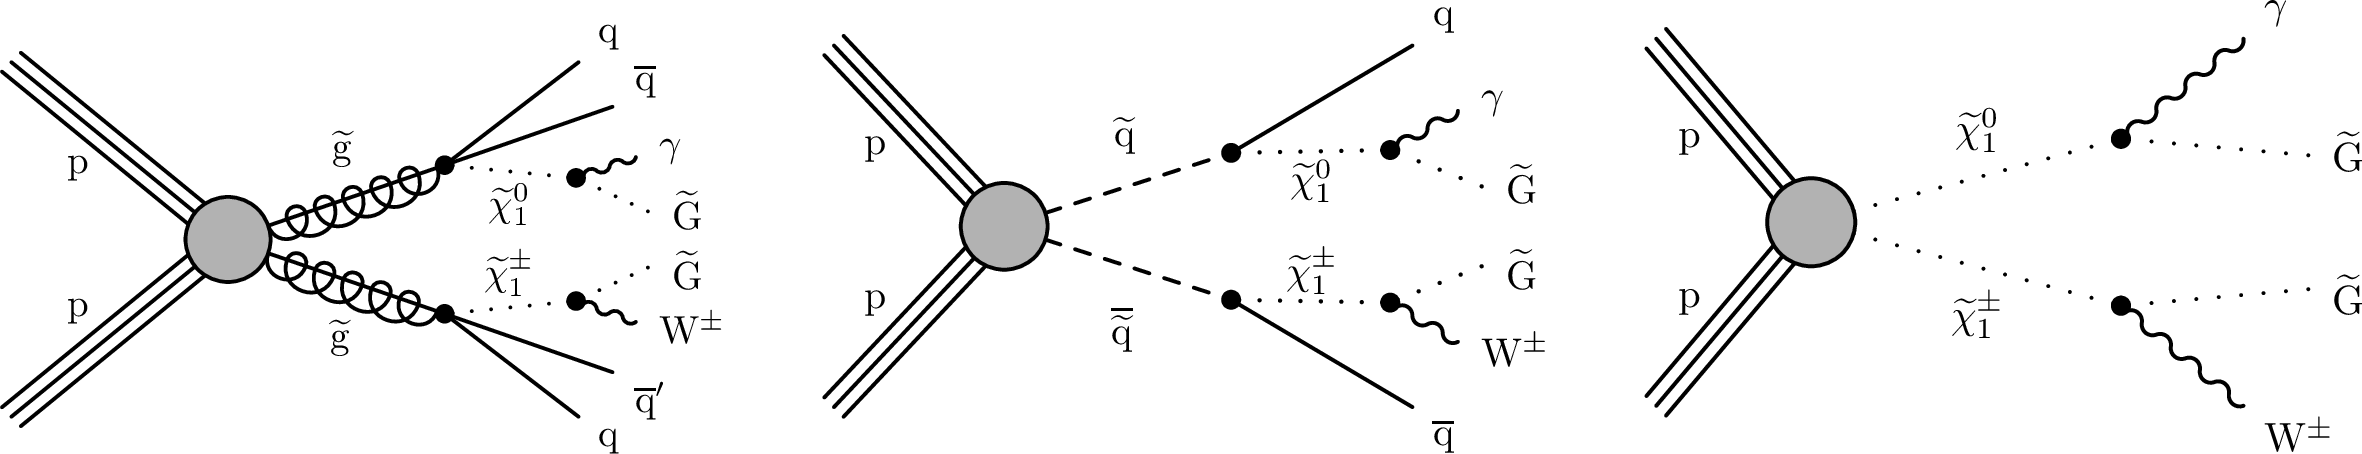
Figure 1:
Diagrams showing the production and decay modes of the signal models T5Wg (left), T6Wg (center), and TChiWg (right) considered in this analysis. |

png pdf |
Figure 1-a:
Diagram showing the production and decay modes of the signal model T5Wg considered in this analysis. |
png pdf |
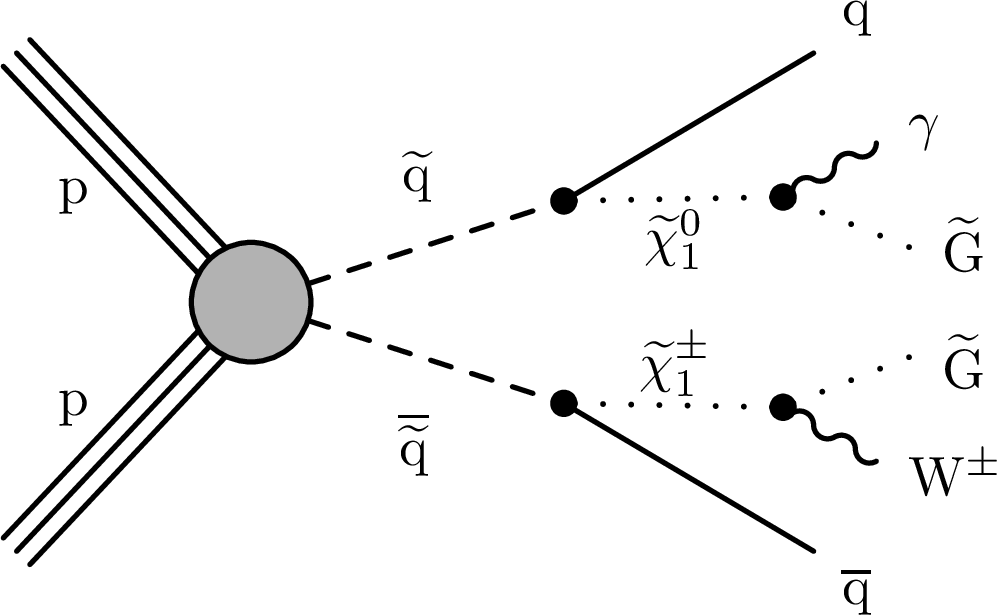
Figure 1-b:
Diagram showing the production and decay modes of the signal model T6Wg considered in this analysis. |
png pdf |
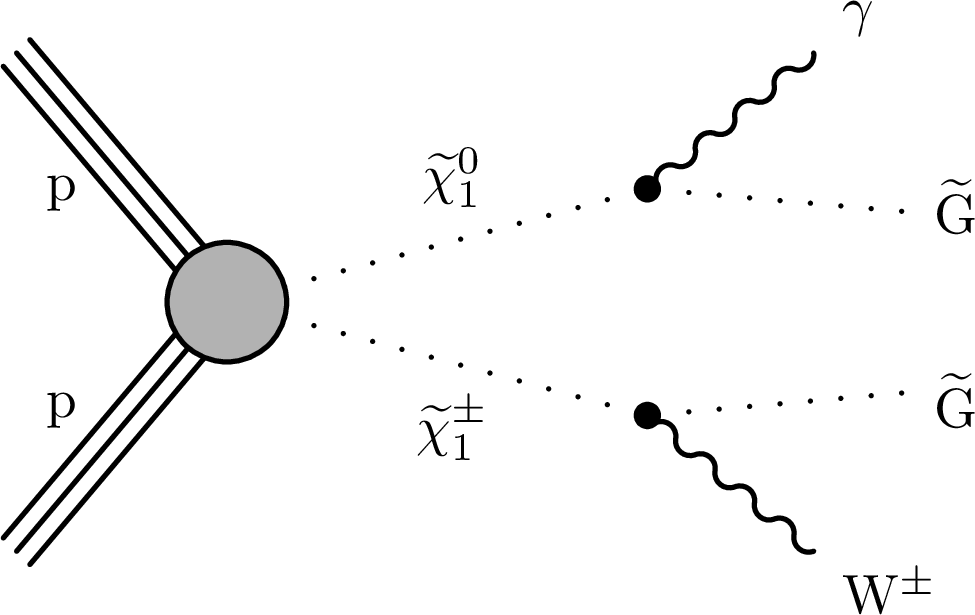
Figure 1-c:
Diagram showing the production and decay modes of the signal model TChiWg considered in this analysis. |
png pdf |
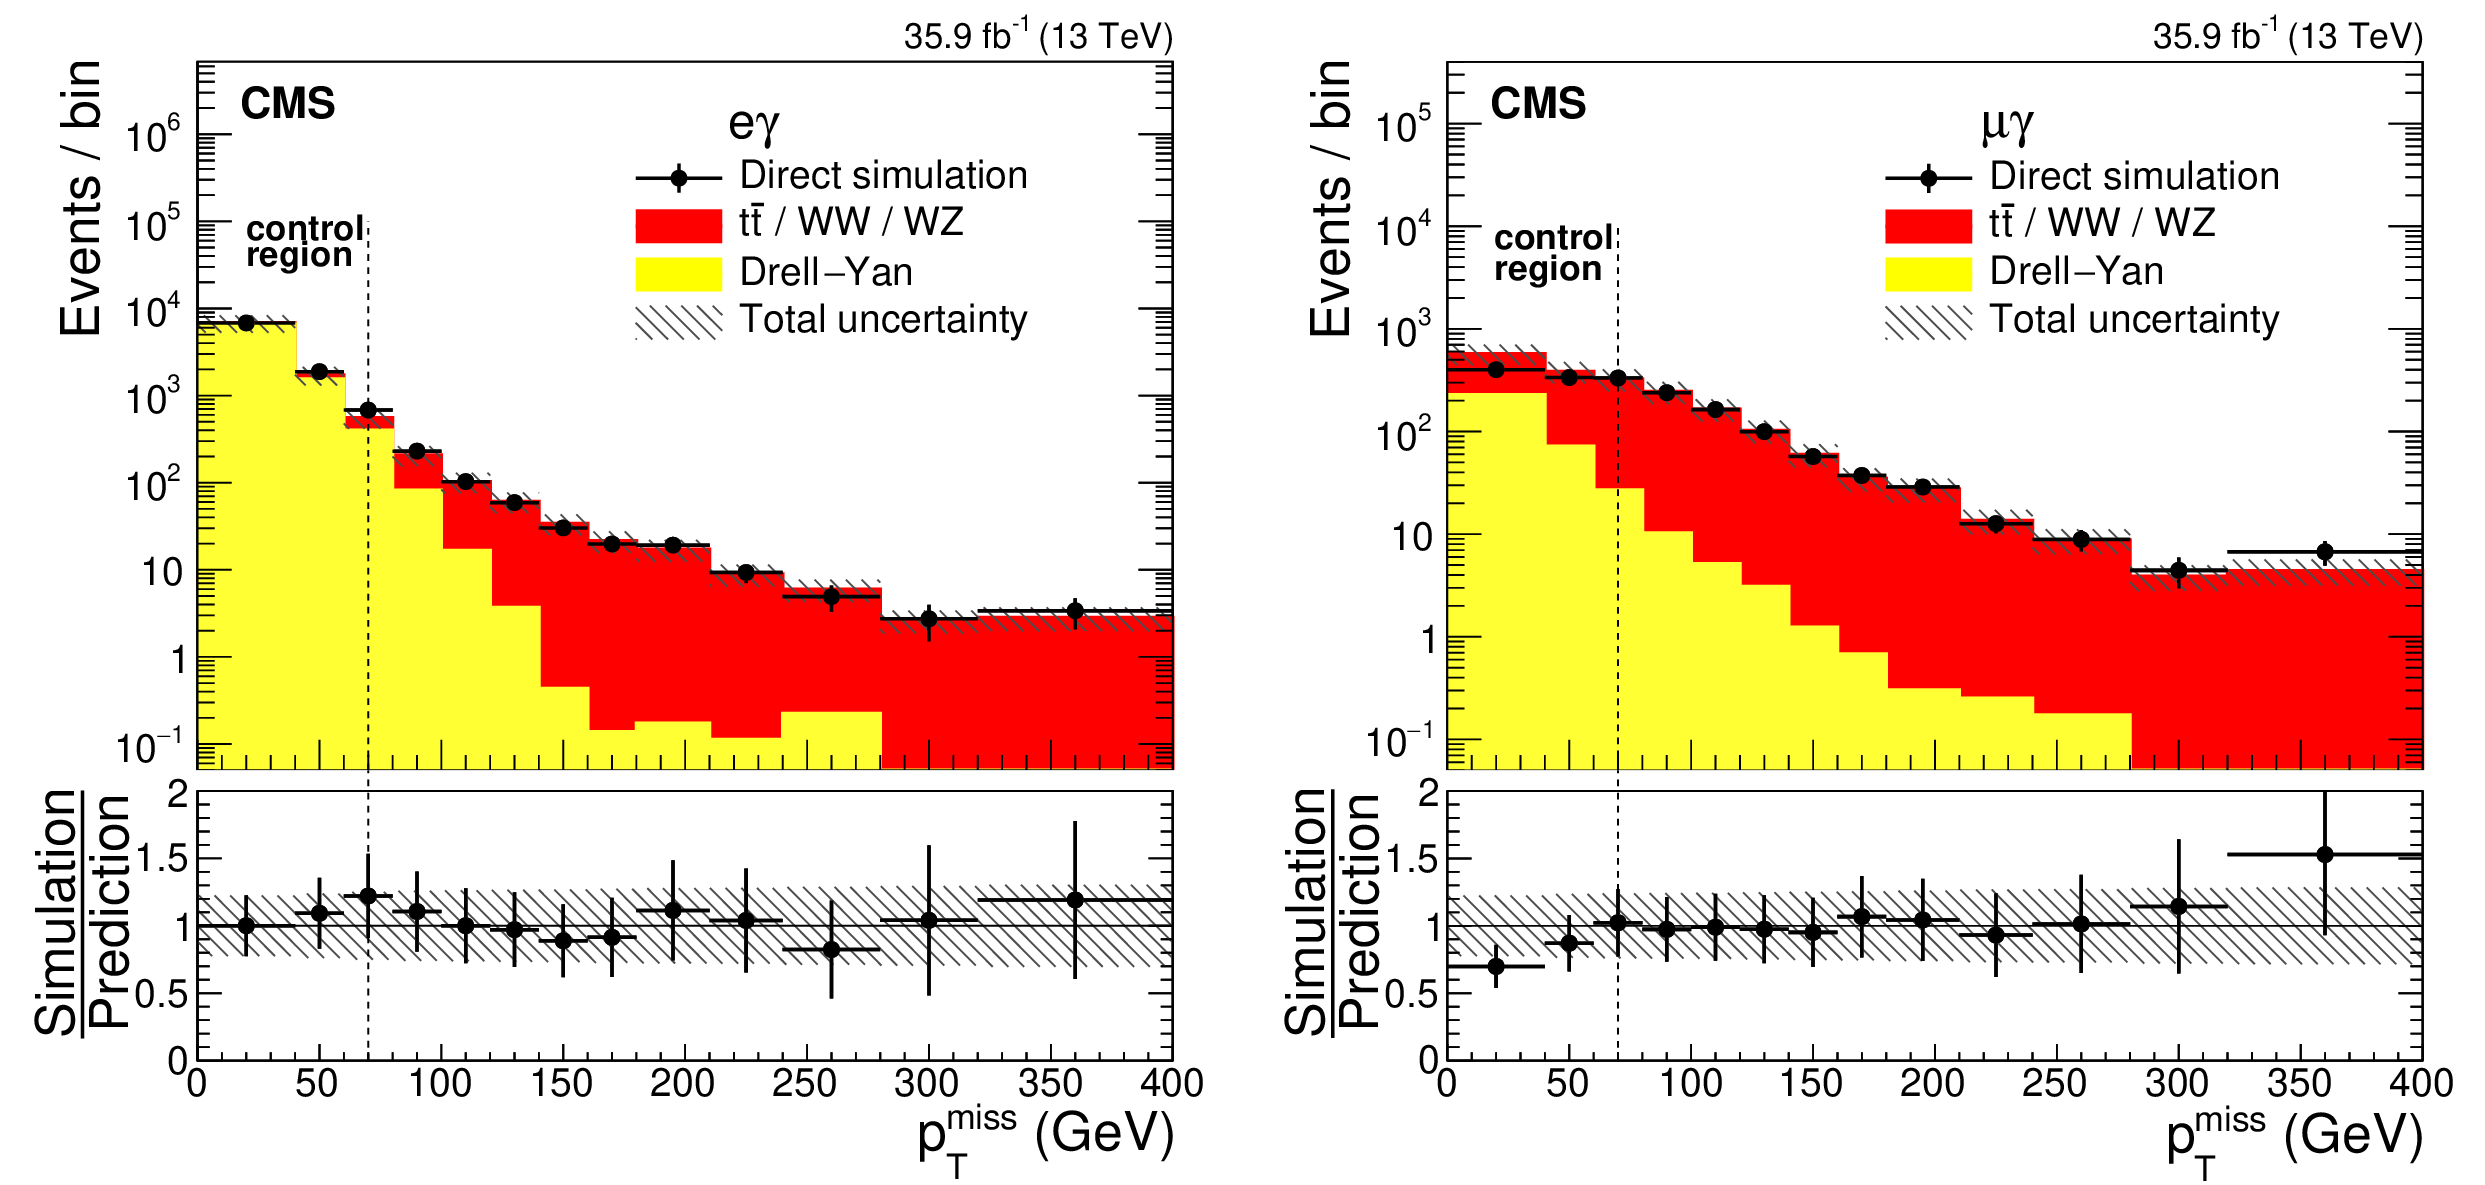
Figure 2:
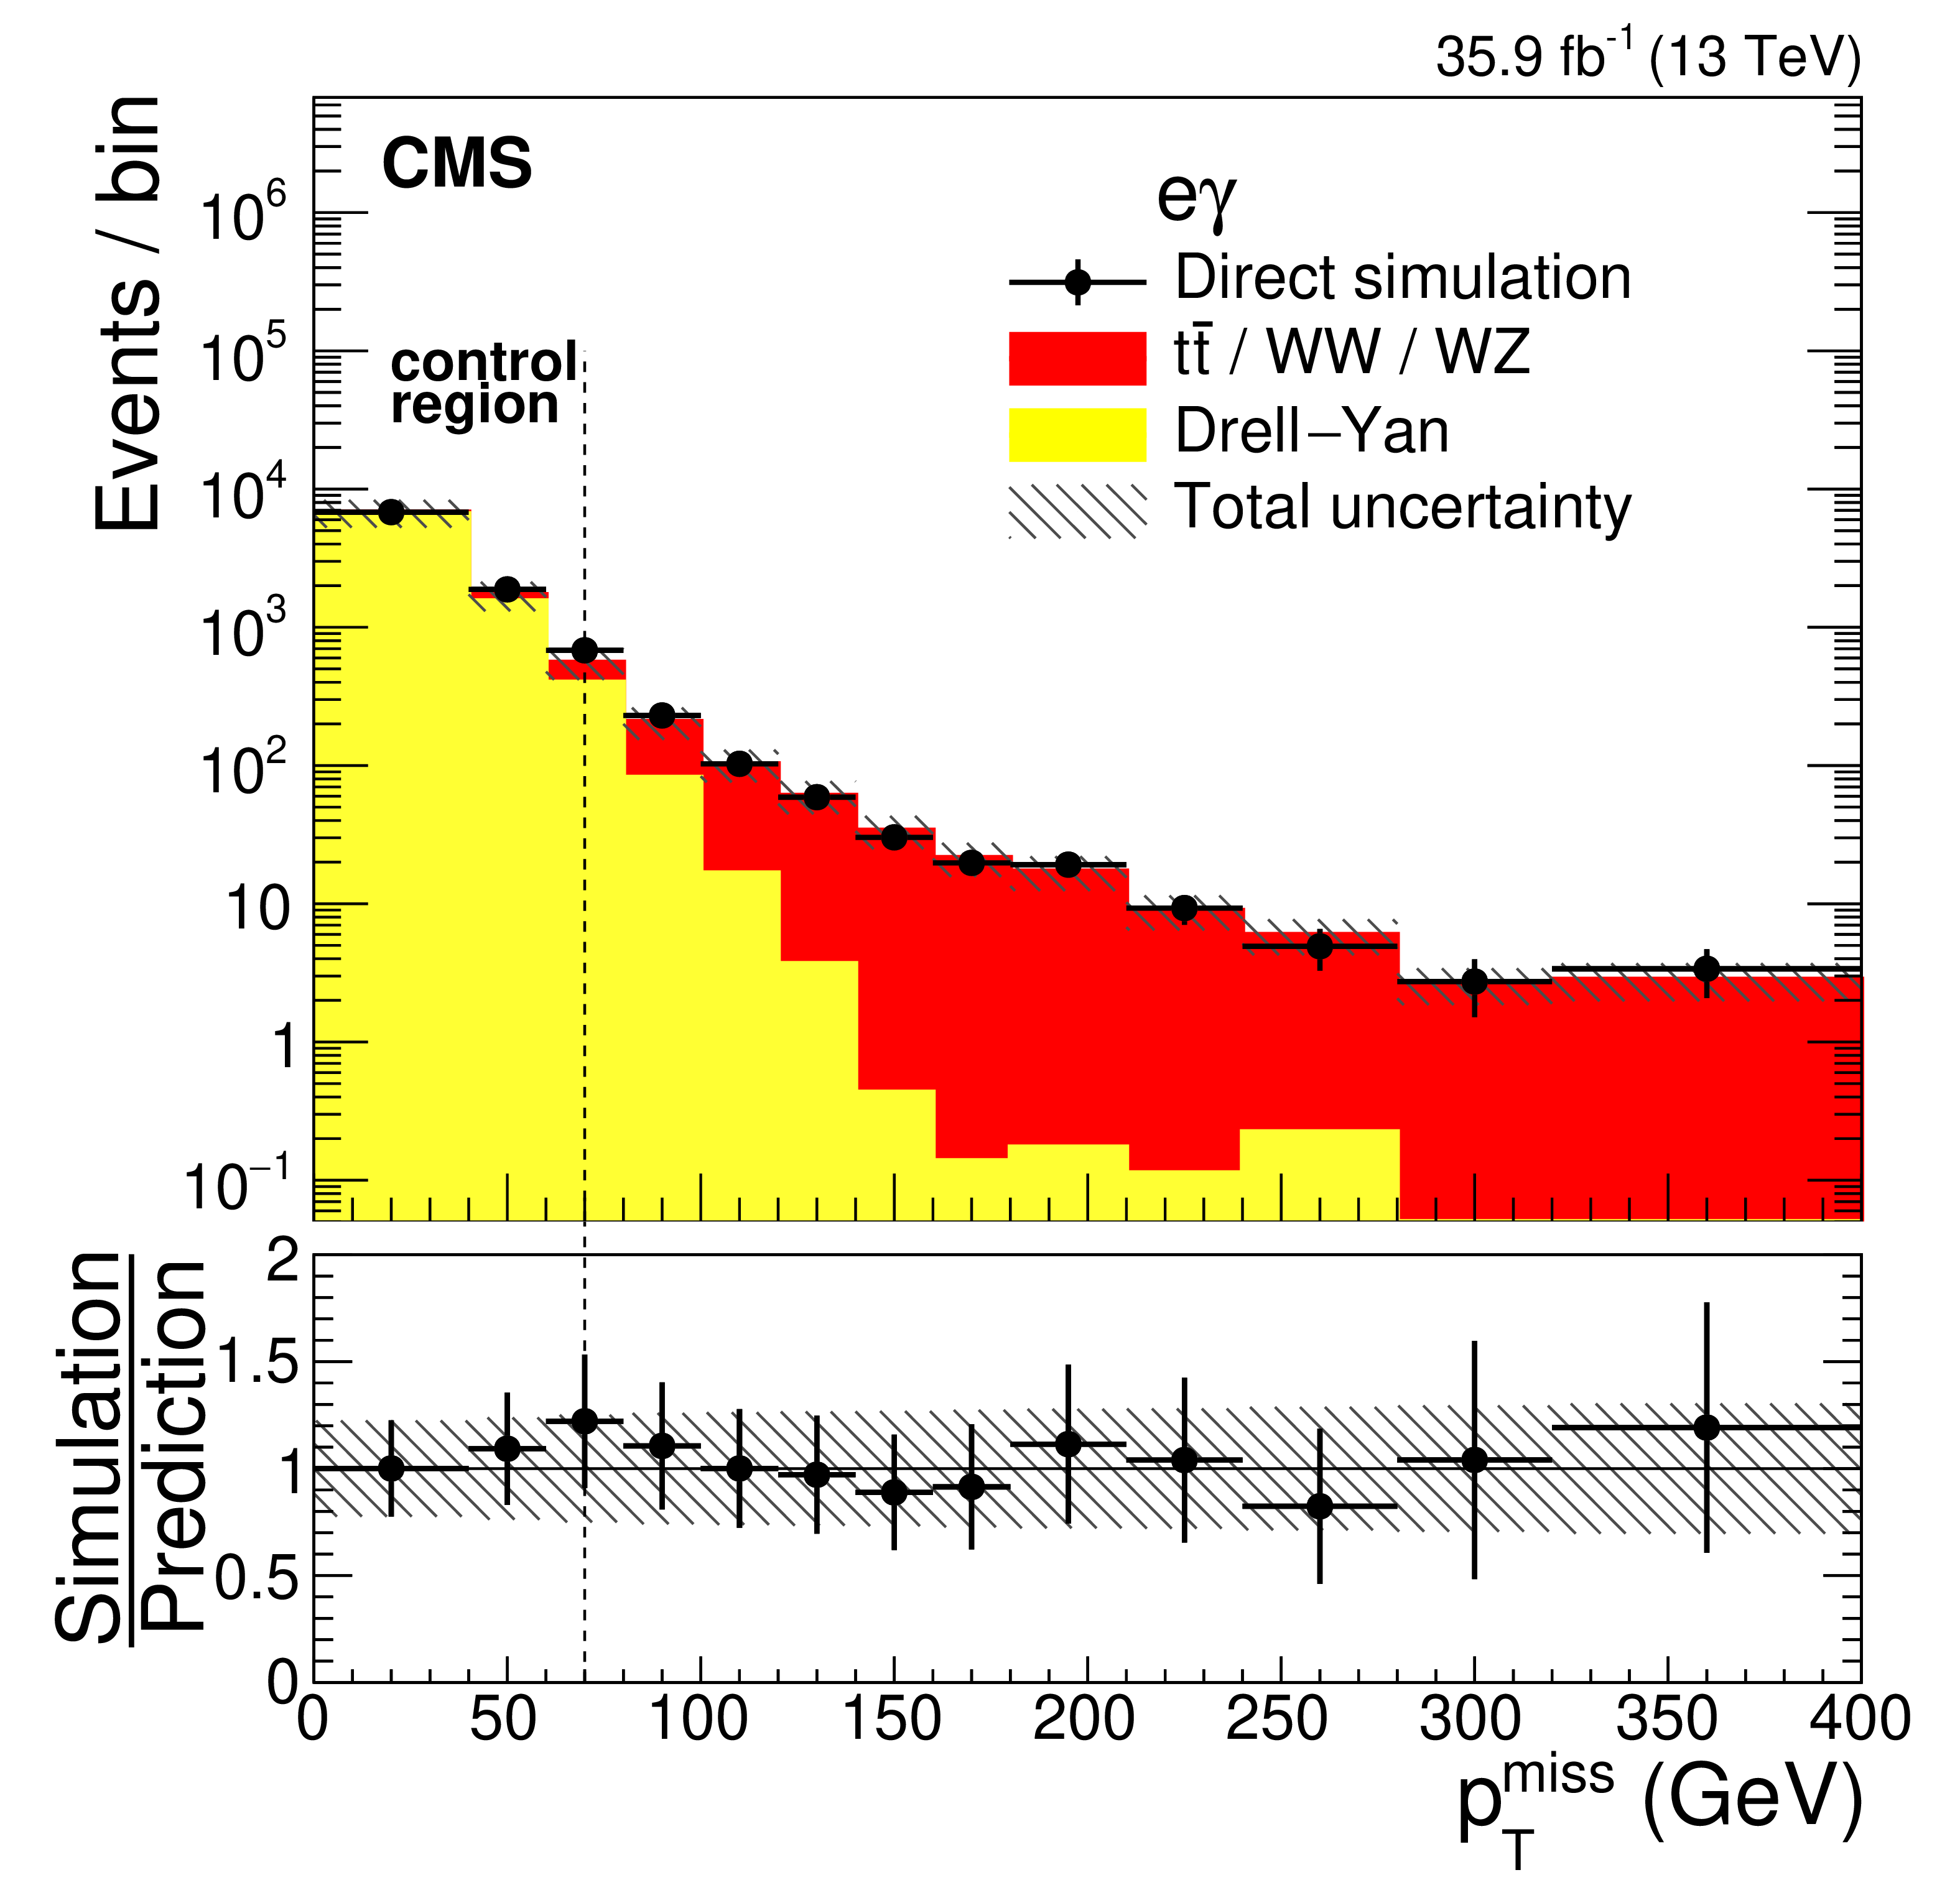
Verification of the e-to-${{\gamma}}$ misidentification estimation method using simulated data. The $ {{p_{\mathrm {T}}} ^\text {miss}} $ distribution for events with misidentified photons in the e$\gamma$ (left) and $\mu {\gamma}$ (right) channels from prediction using the control sample estimation method (histograms) and direct simulation (points), as obtained from the generator-level information of the simulated data. The vertical bars on the points show the statistical uncertainty in the simulation, while the horizontal bars give the bin widths. The dashed vertical line shows the boundary between the control and signal regions. The lower panels show the ratio of the predictions from direct simulation to those estimated with control samples. The vertical bars on the points show again the statistical uncertainty, and the hatched areas give the quadrature sum of the statistical and systematic uncertainties in the simulated background. |
png pdf |
Figure 2-a:
Verification of the e-to-${{\gamma}}$ misidentification estimation method using simulated data. The $ {{p_{\mathrm {T}}} ^\text {miss}} $ distribution for events with misidentified photons in the e$\gamma$ channel from prediction using the control sample estimation method (histograms) and direct simulation (points), as obtained from the generator-level information of the simulated data. The vertical bars on the points show the statistical uncertainty in the simulation, while the horizontal bars give the bin widths. The dashed vertical line shows the boundary between the control and signal regions. The lower panel shows the ratio of the predictions from direct simulation to those estimated with control samples. The vertical bars on the points show again the statistical uncertainty, and the hatched areas give the quadrature sum of the statistical and systematic uncertainties in the simulated background. |
png pdf |
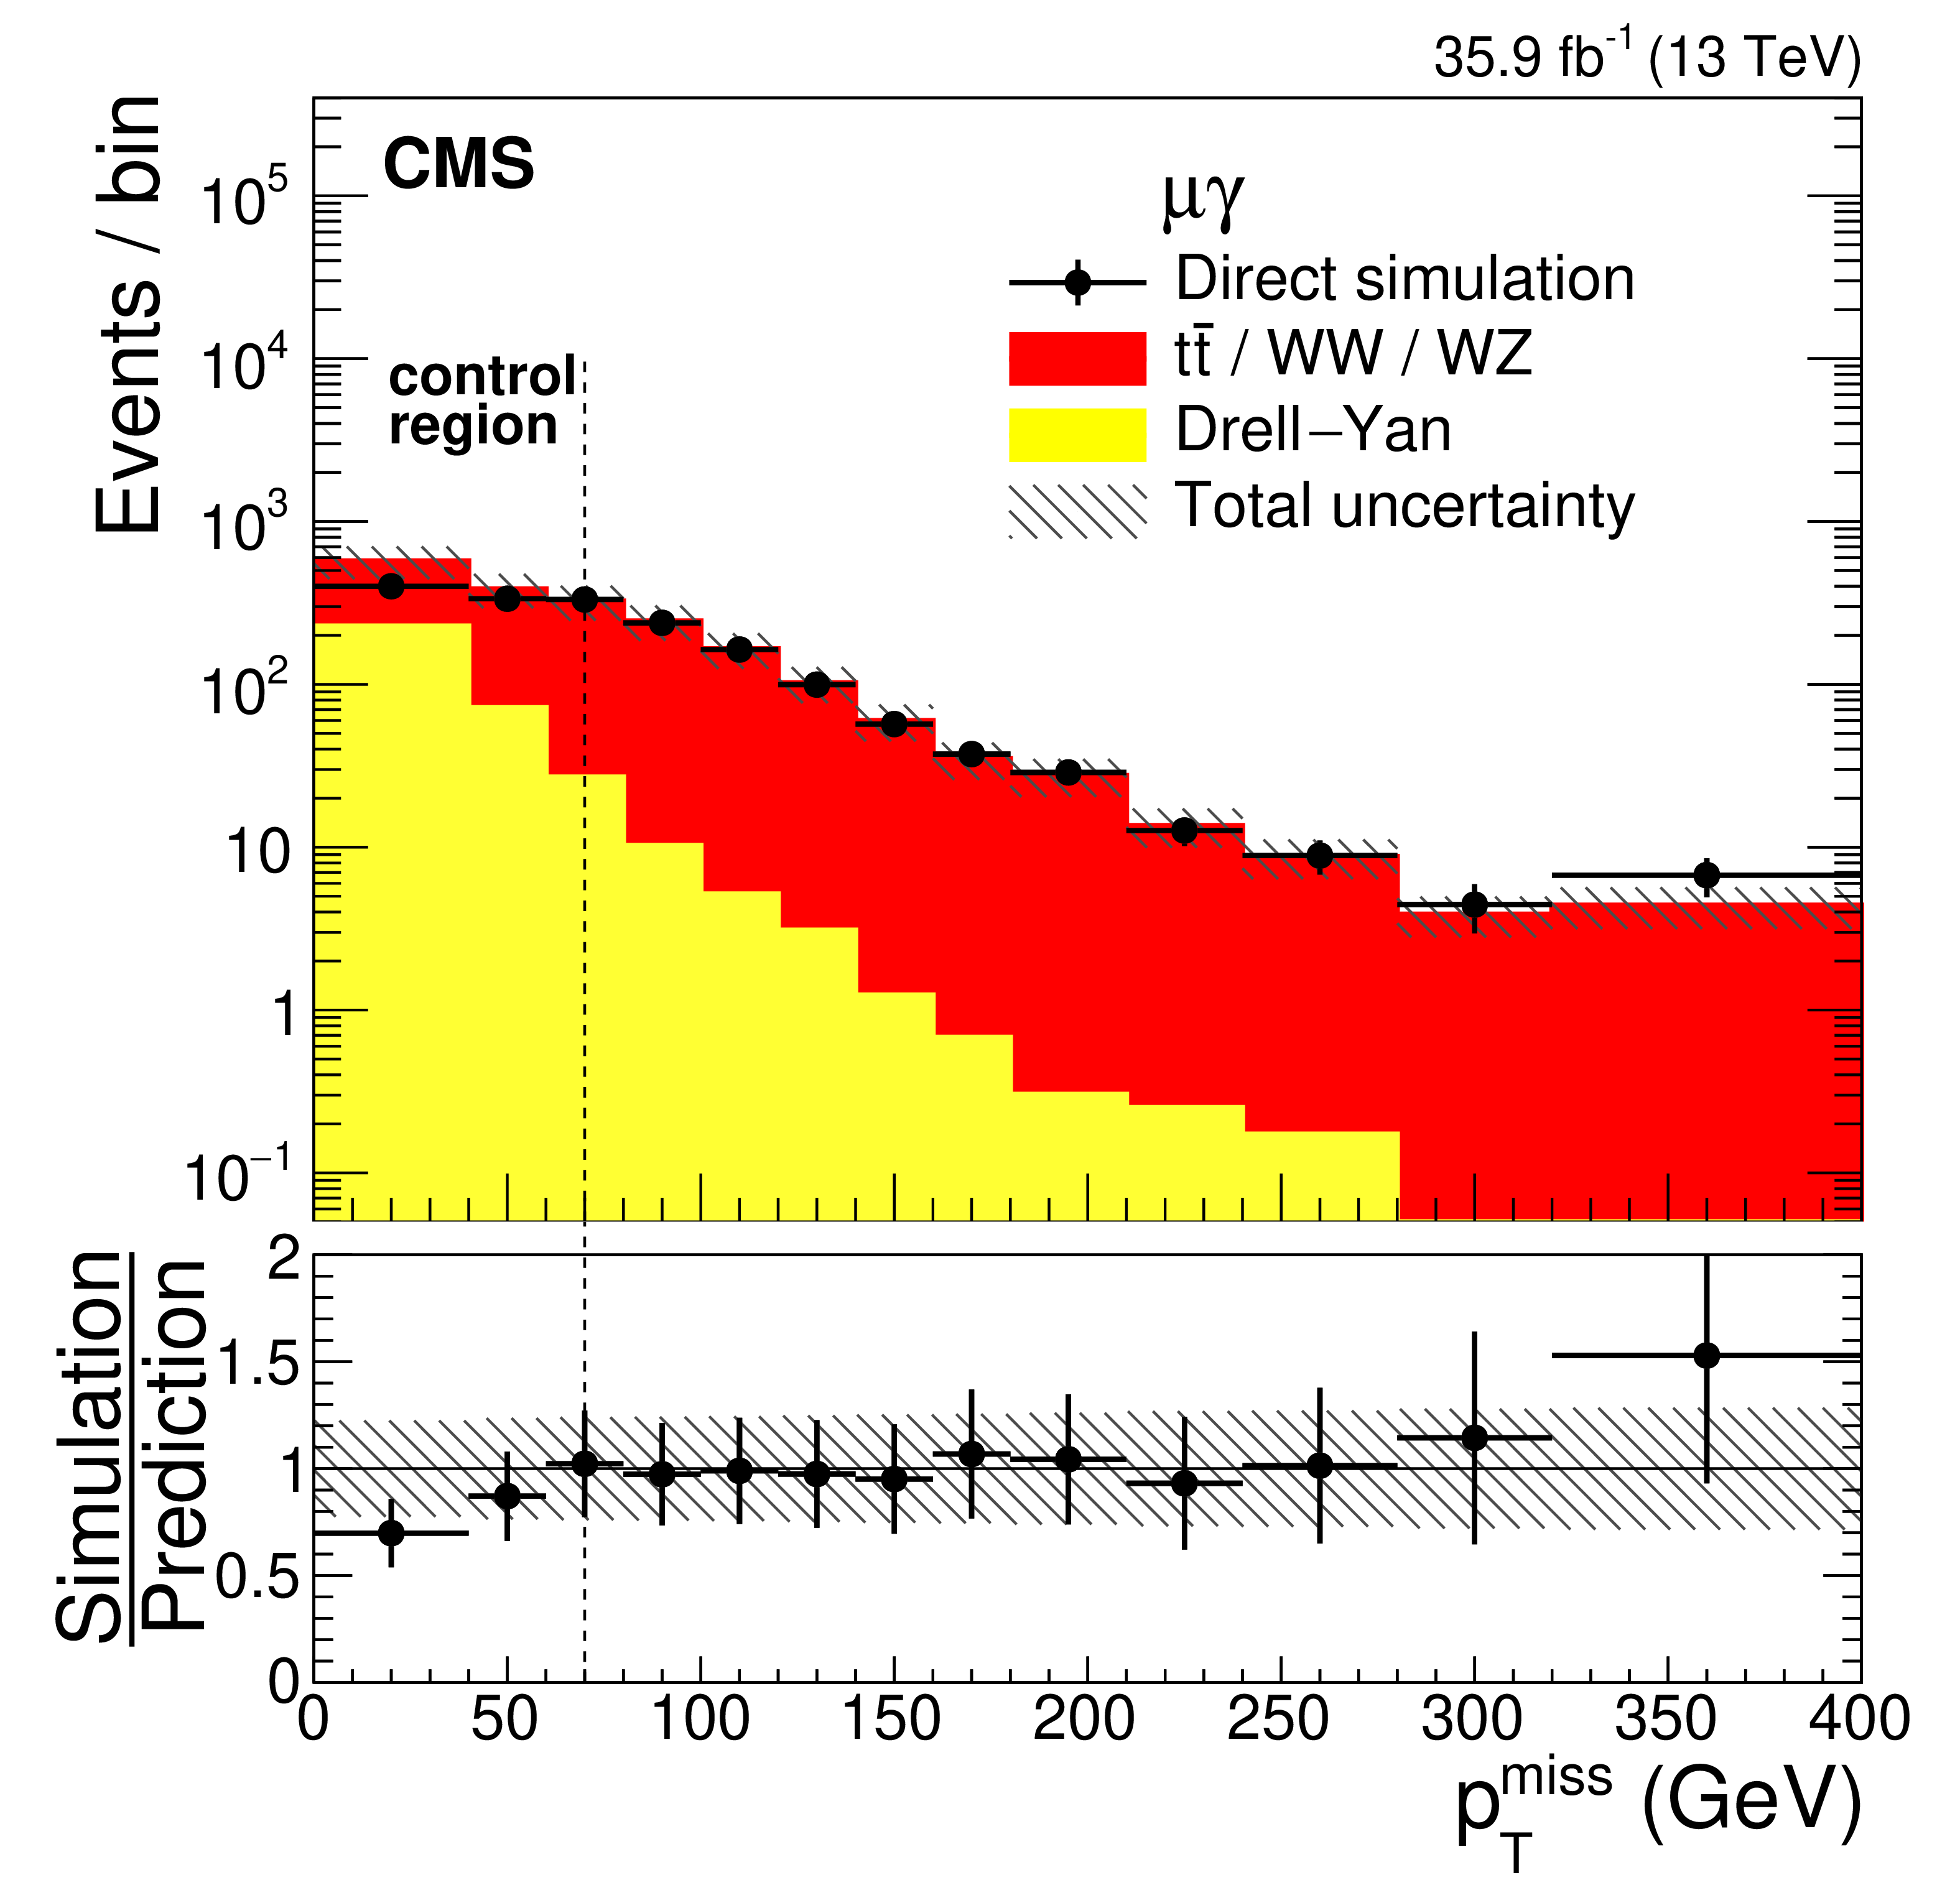
Figure 2-b:
Verification of the e-to-${{\gamma}}$ misidentification estimation method using simulated data. The $ {{p_{\mathrm {T}}} ^\text {miss}} $ distribution for events with misidentified photons in the $\mu {\gamma}$ channel from prediction using the control sample estimation method (histograms) and direct simulation (points), as obtained from the generator-level information of the simulated data. The vertical bars on the points show the statistical uncertainty in the simulation, while the horizontal bars give the bin widths. The dashed vertical line shows the boundary between the control and signal regions. The lower panel shows the ratio of the predictions from direct simulation to those estimated with control samples. The vertical bars on the points show again the statistical uncertainty, and the hatched areas give the quadrature sum of the statistical and systematic uncertainties in the simulated background. |
png pdf |
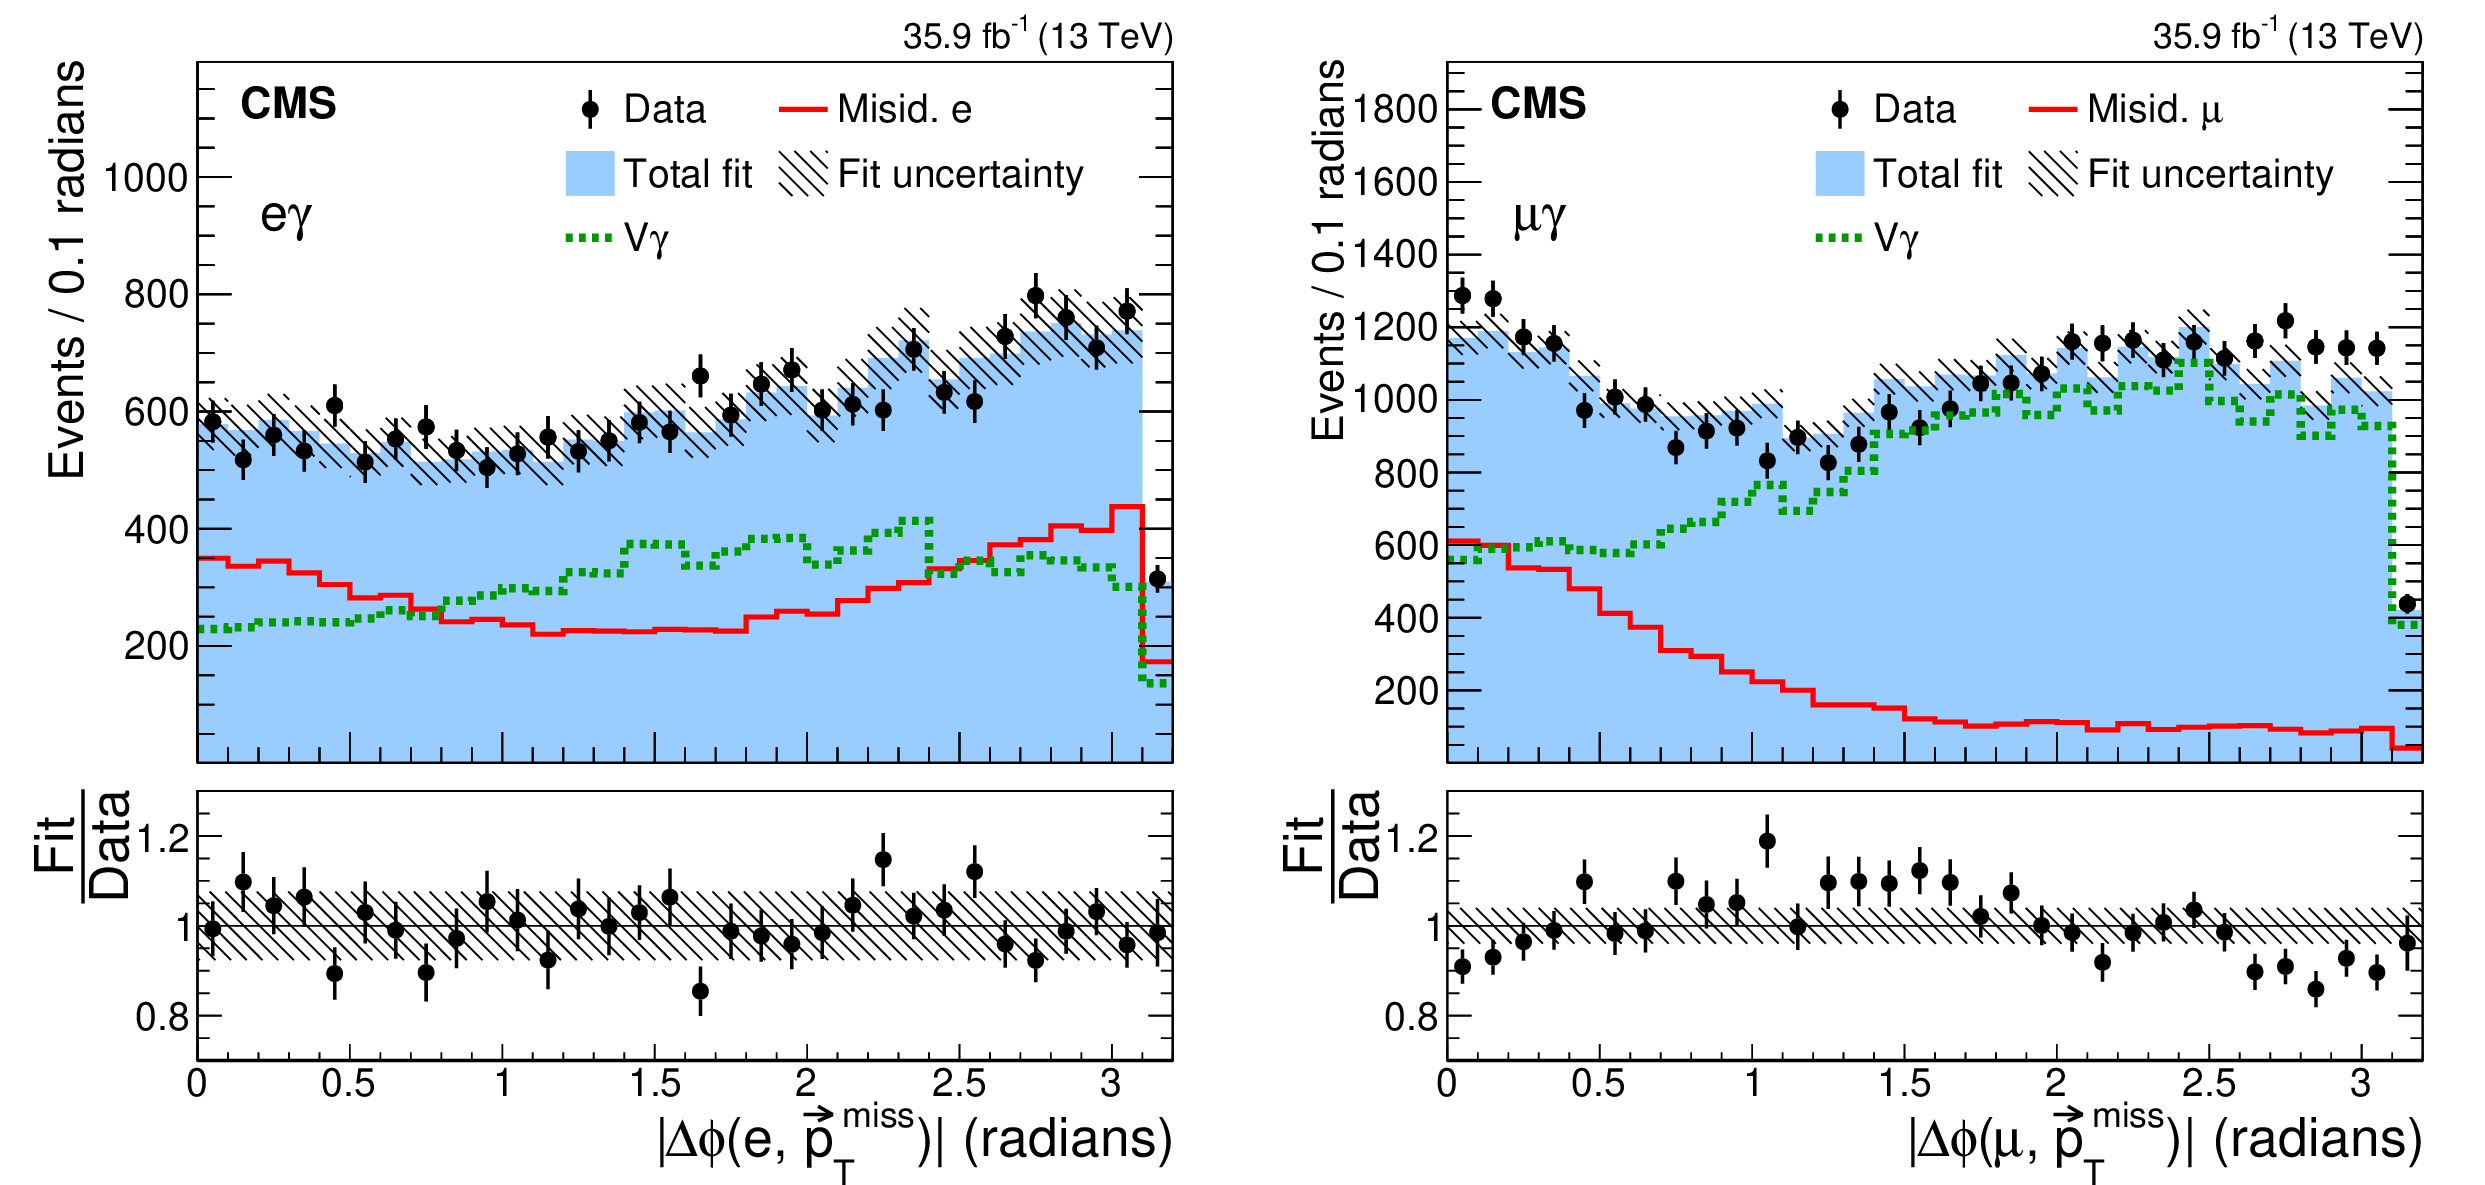
Figure 3:
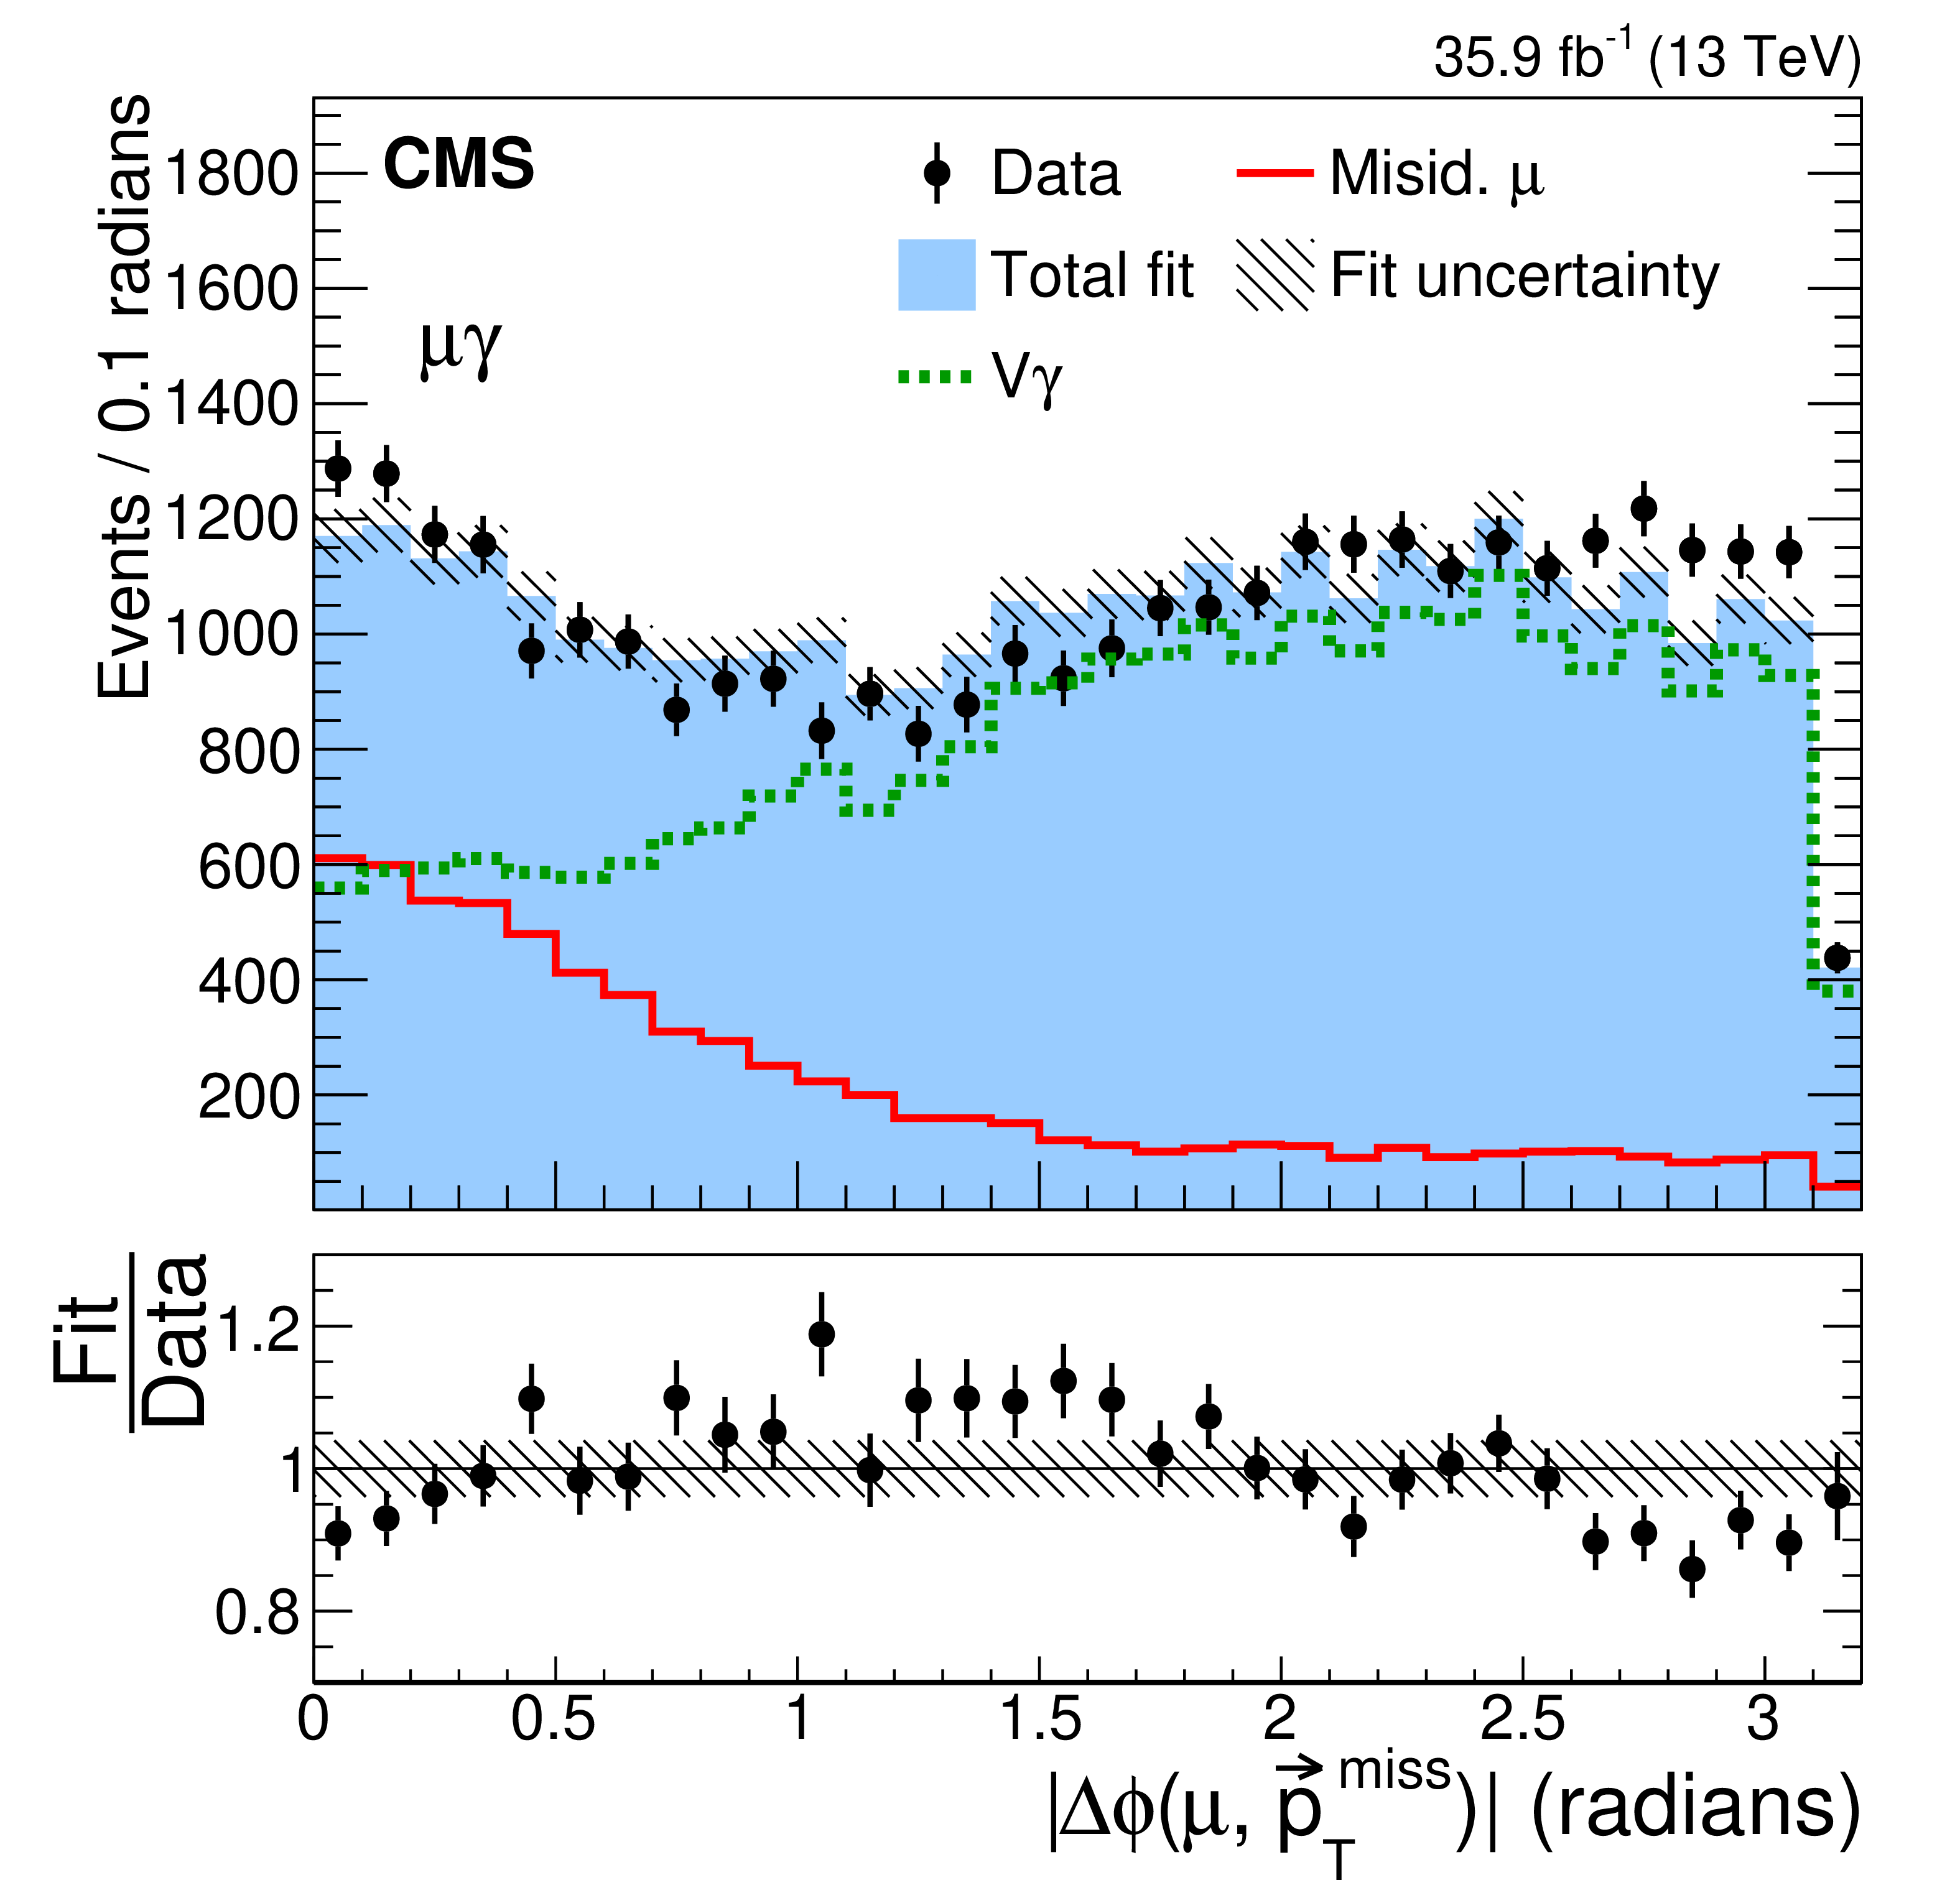
The $ < \Delta \phi (\ell, \vec{p}_{\mathrm {T}}^{\,\text {miss}}) >$ distributions for the data in the 40 $ < {{p_{\mathrm {T}}} ^\text {miss}} < $ 70 GeV control region (points) and the estimated V${{\gamma}}$ (dashed line) and misidentified-lepton (solid line) backgrounds for the e$\gamma$ (left) and $\mu {{\gamma}}$ (right) channels. The filled histogram shows the result of the overall fit and the hatched area indicates the fit uncertainty. The vertical bars on the points represent the statistical uncertainty in the data. The lower panels show the ratio of the fit result to the data. |
png pdf |
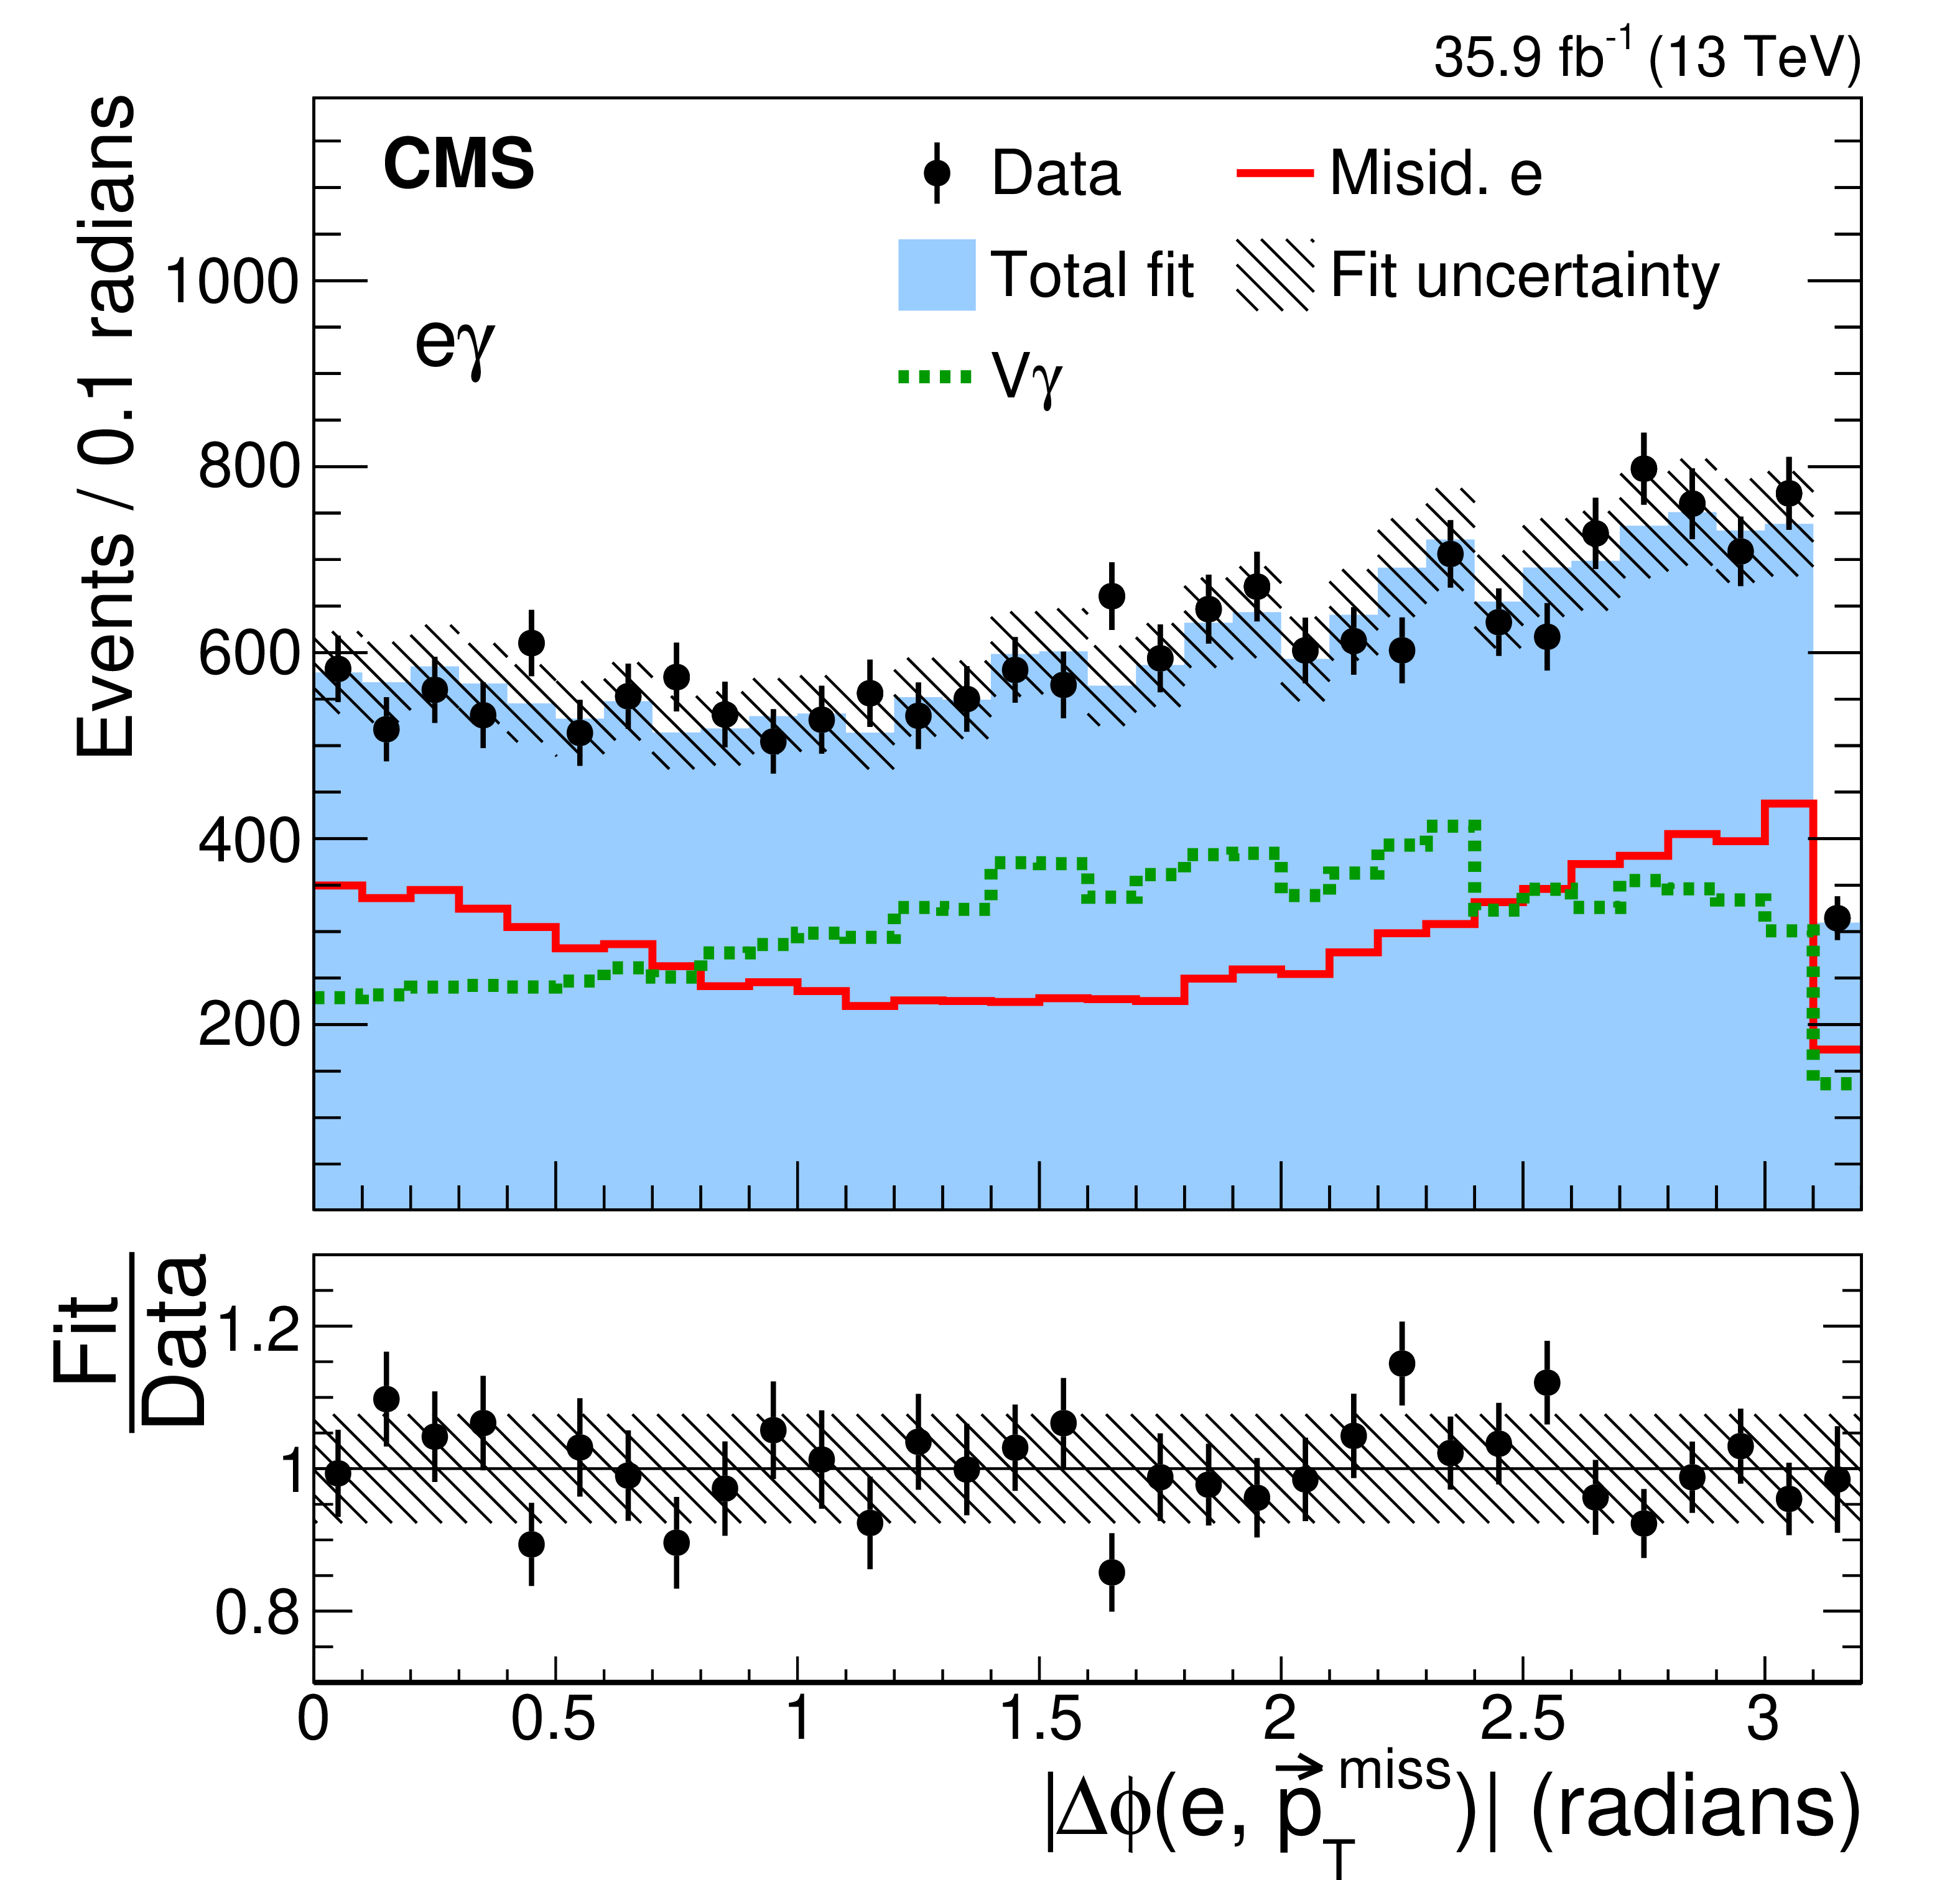
Figure 3-a:
The $ < \Delta \phi (\ell, \vec{p}_{\mathrm {T}}^{\,\text {miss}}) >$ distributions for the data in the 40 $ < {{p_{\mathrm {T}}} ^\text {miss}} < $ 70 GeV control region (points) and the estimated V${{\gamma}}$ (dashed line) and misidentified-lepton (solid line) backgrounds for the e$\gamma$ channel. The filled histogram shows the result of the overall fit and the hatched area indicates the fit uncertainty. The vertical bars on the points represent the statistical uncertainty in the data. The lower panel shows the ratio of the fit result to the data. |
png pdf |
Figure 3-b:
The $ < \Delta \phi (\ell, \vec{p}_{\mathrm {T}}^{\,\text {miss}}) >$ distributions for the data in the 40 $ < {{p_{\mathrm {T}}} ^\text {miss}} < $ 70 GeV control region (points) and the estimated V${{\gamma}}$ (dashed line) and misidentified-lepton (solid line) backgrounds for the $\mu {{\gamma}}$ channel. The filled histogram shows the result of the overall fit and the hatched area indicates the fit uncertainty. The vertical bars on the points represent the statistical uncertainty in the data. The lower panel shows the ratio of the fit result to the data. |
png pdf |
Figure 4:
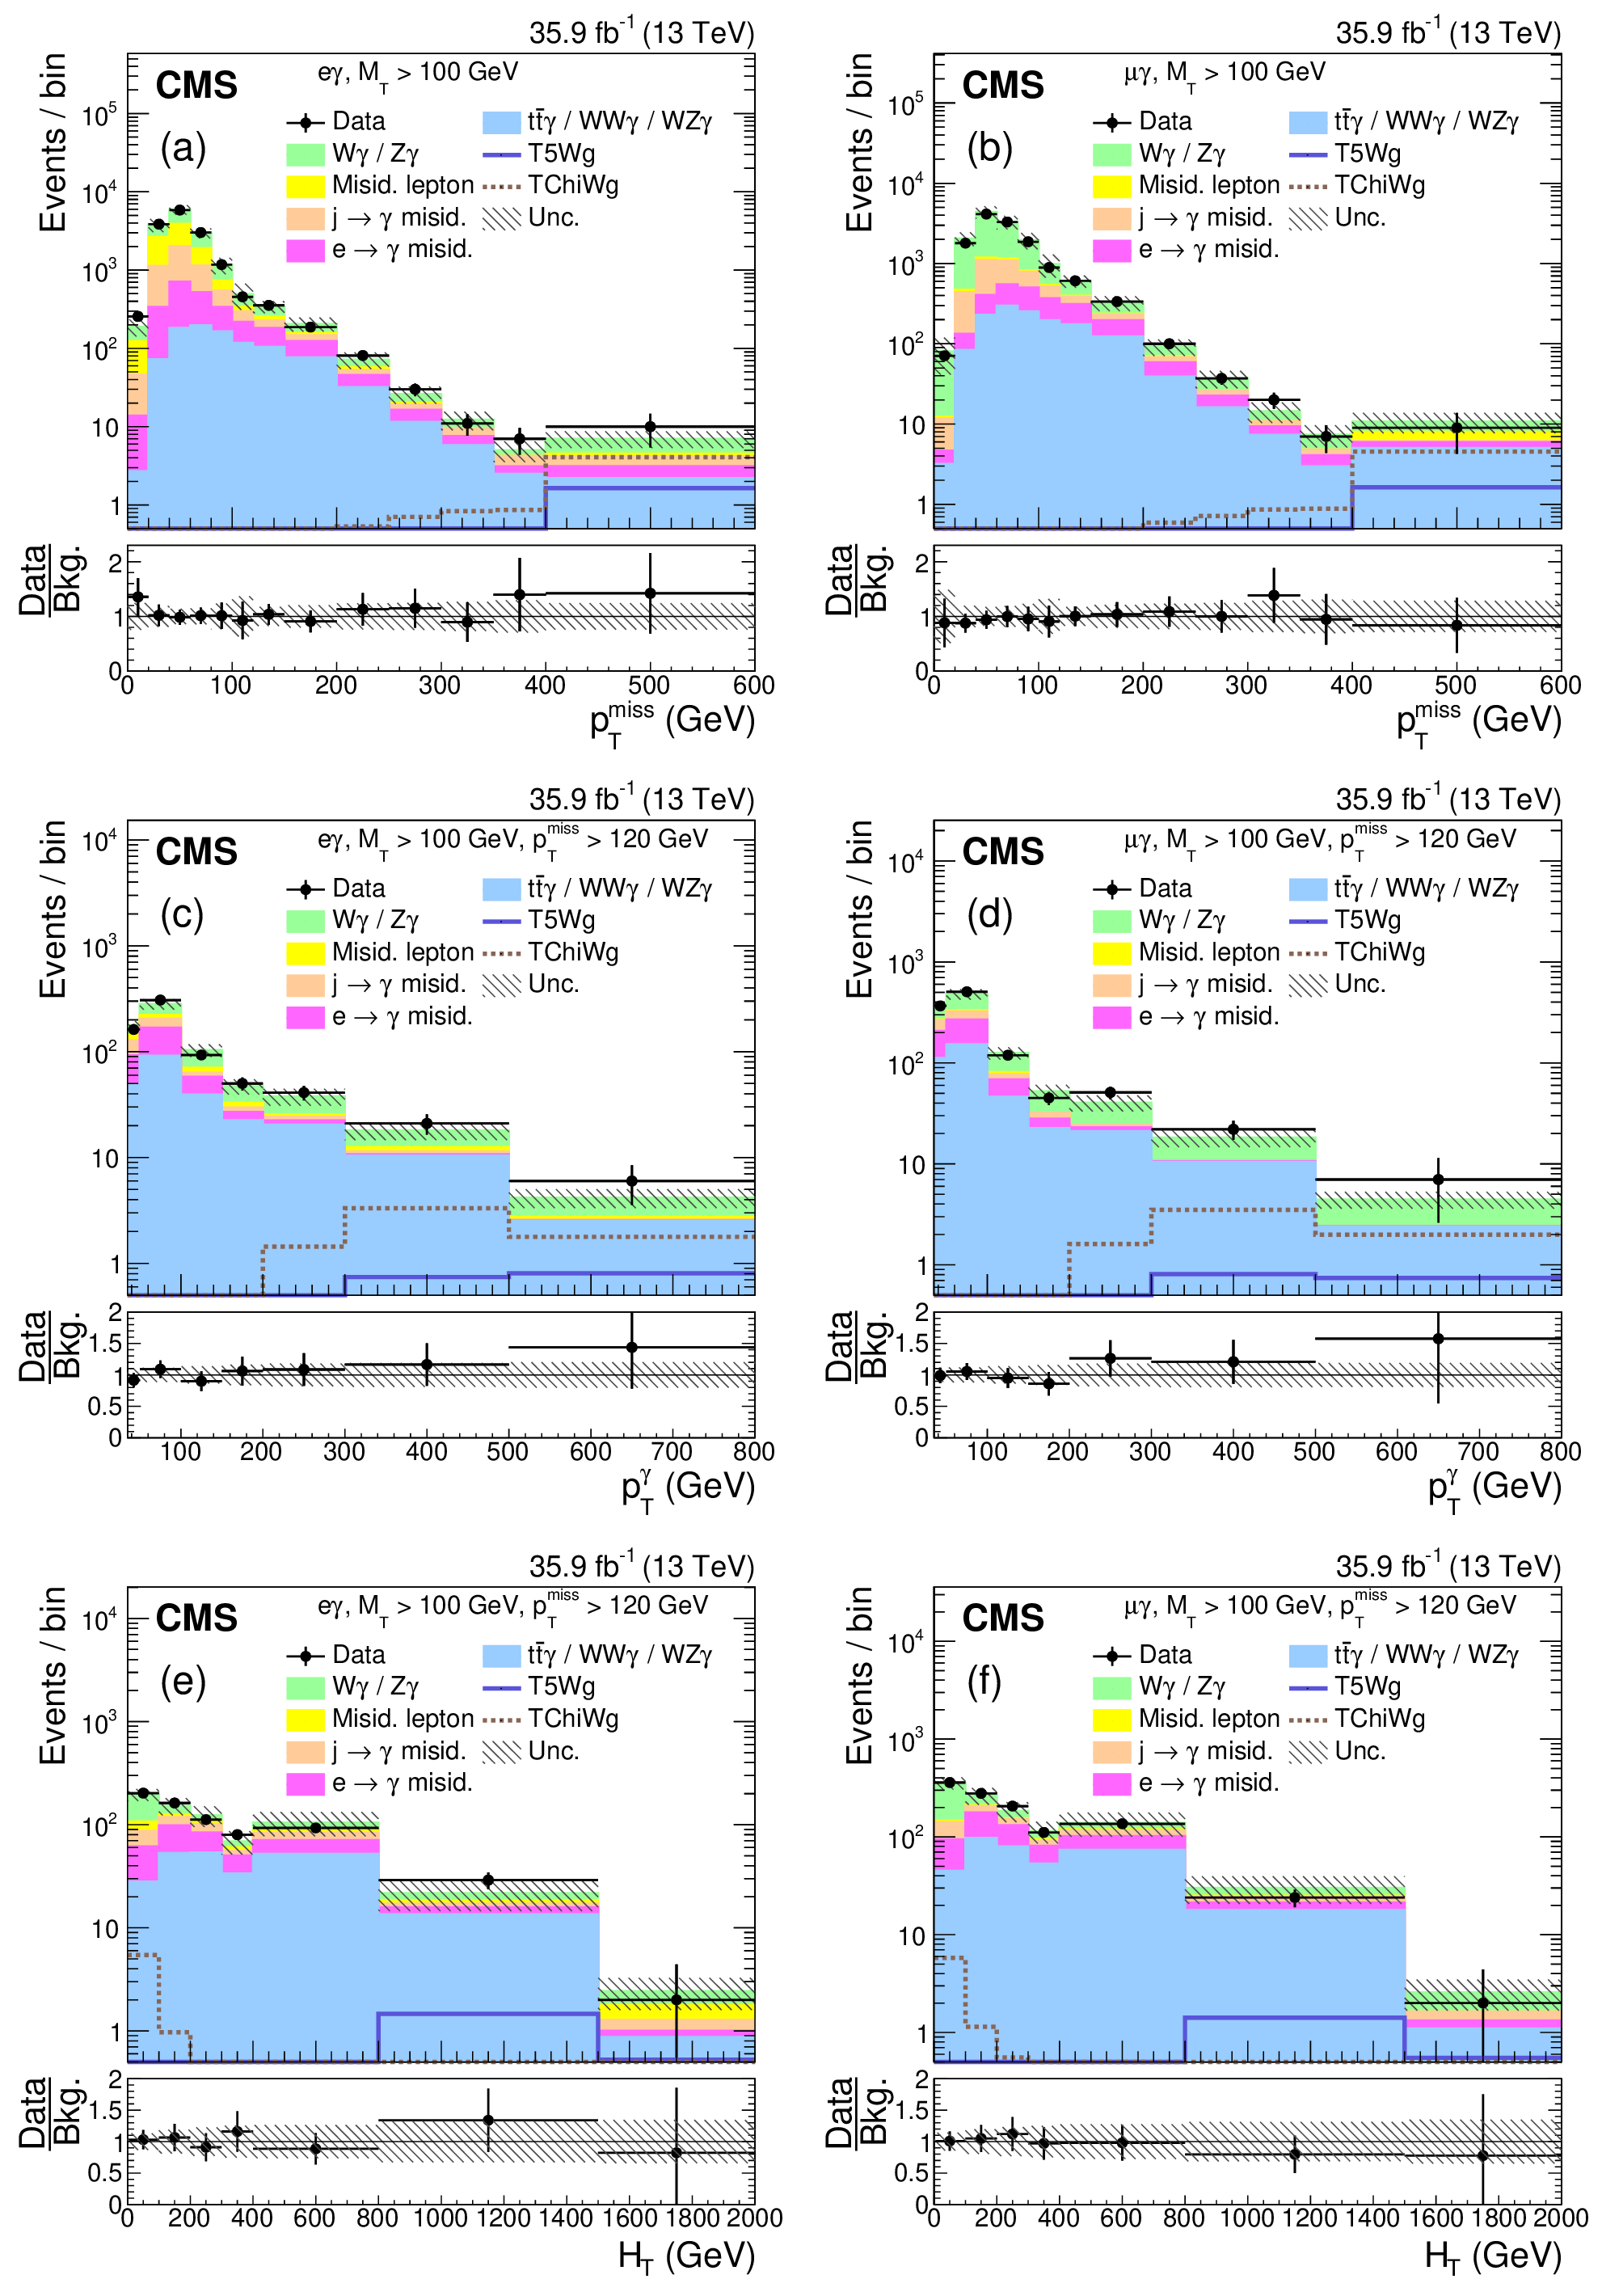
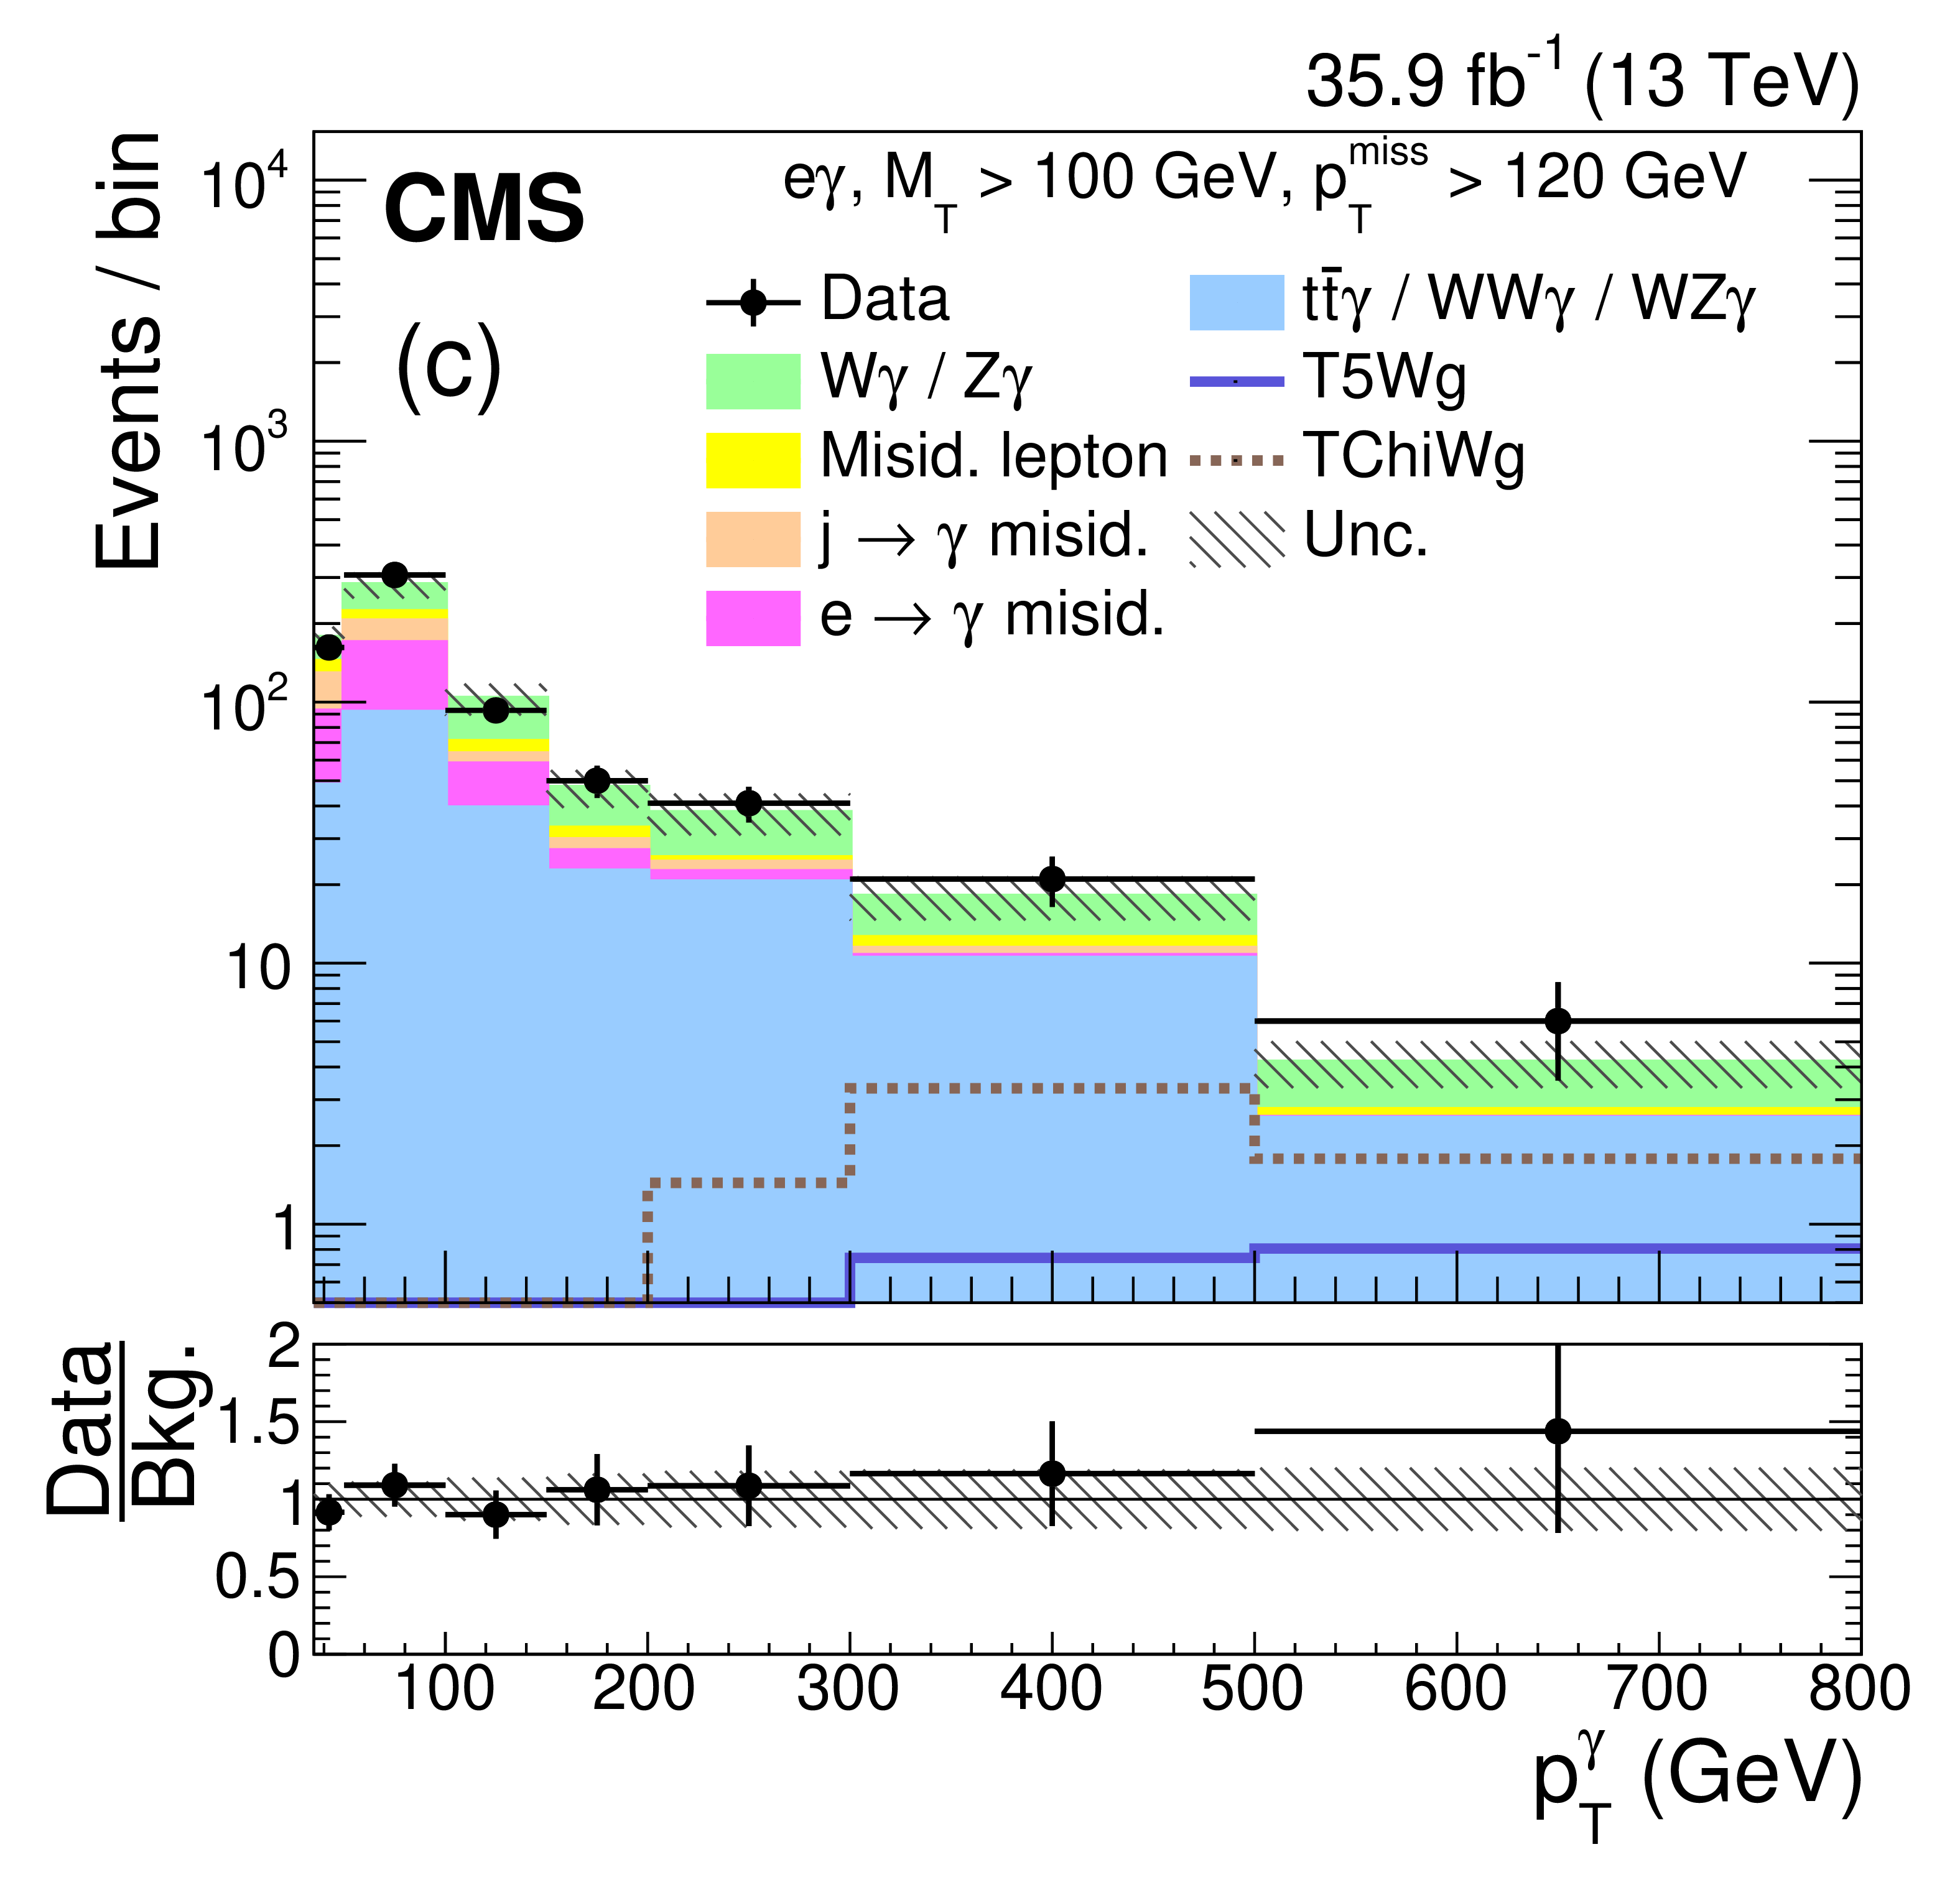
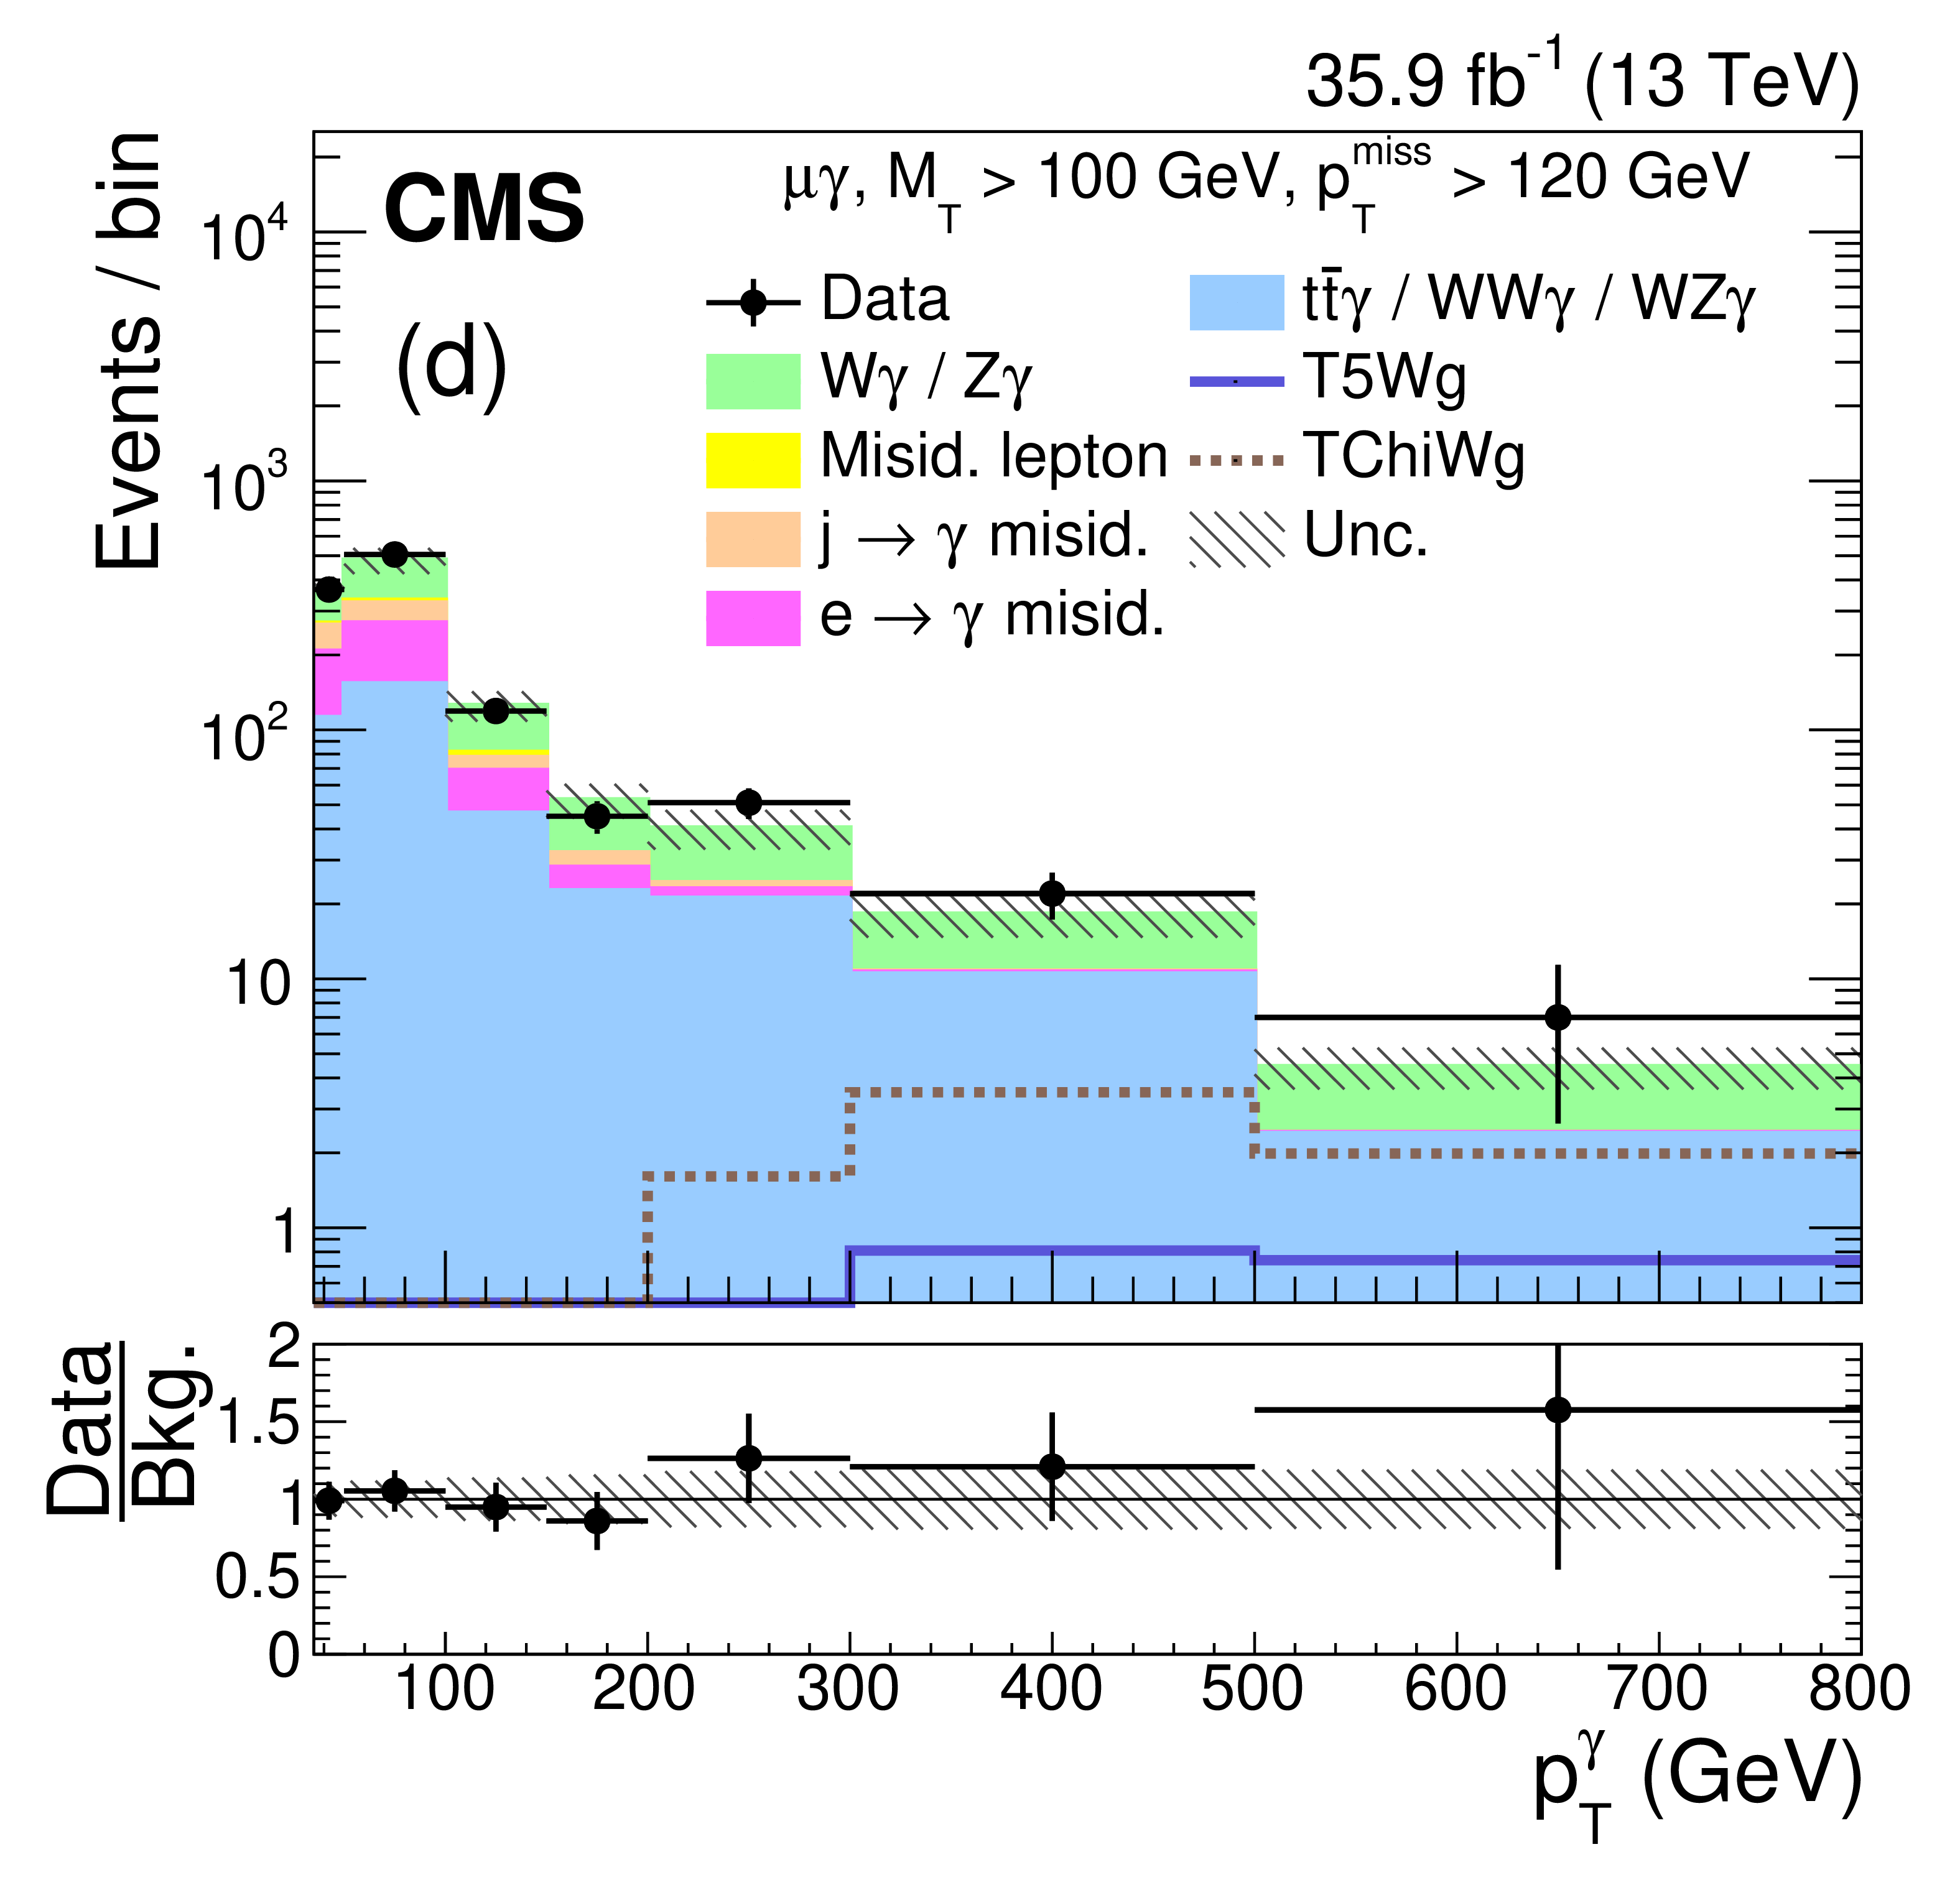
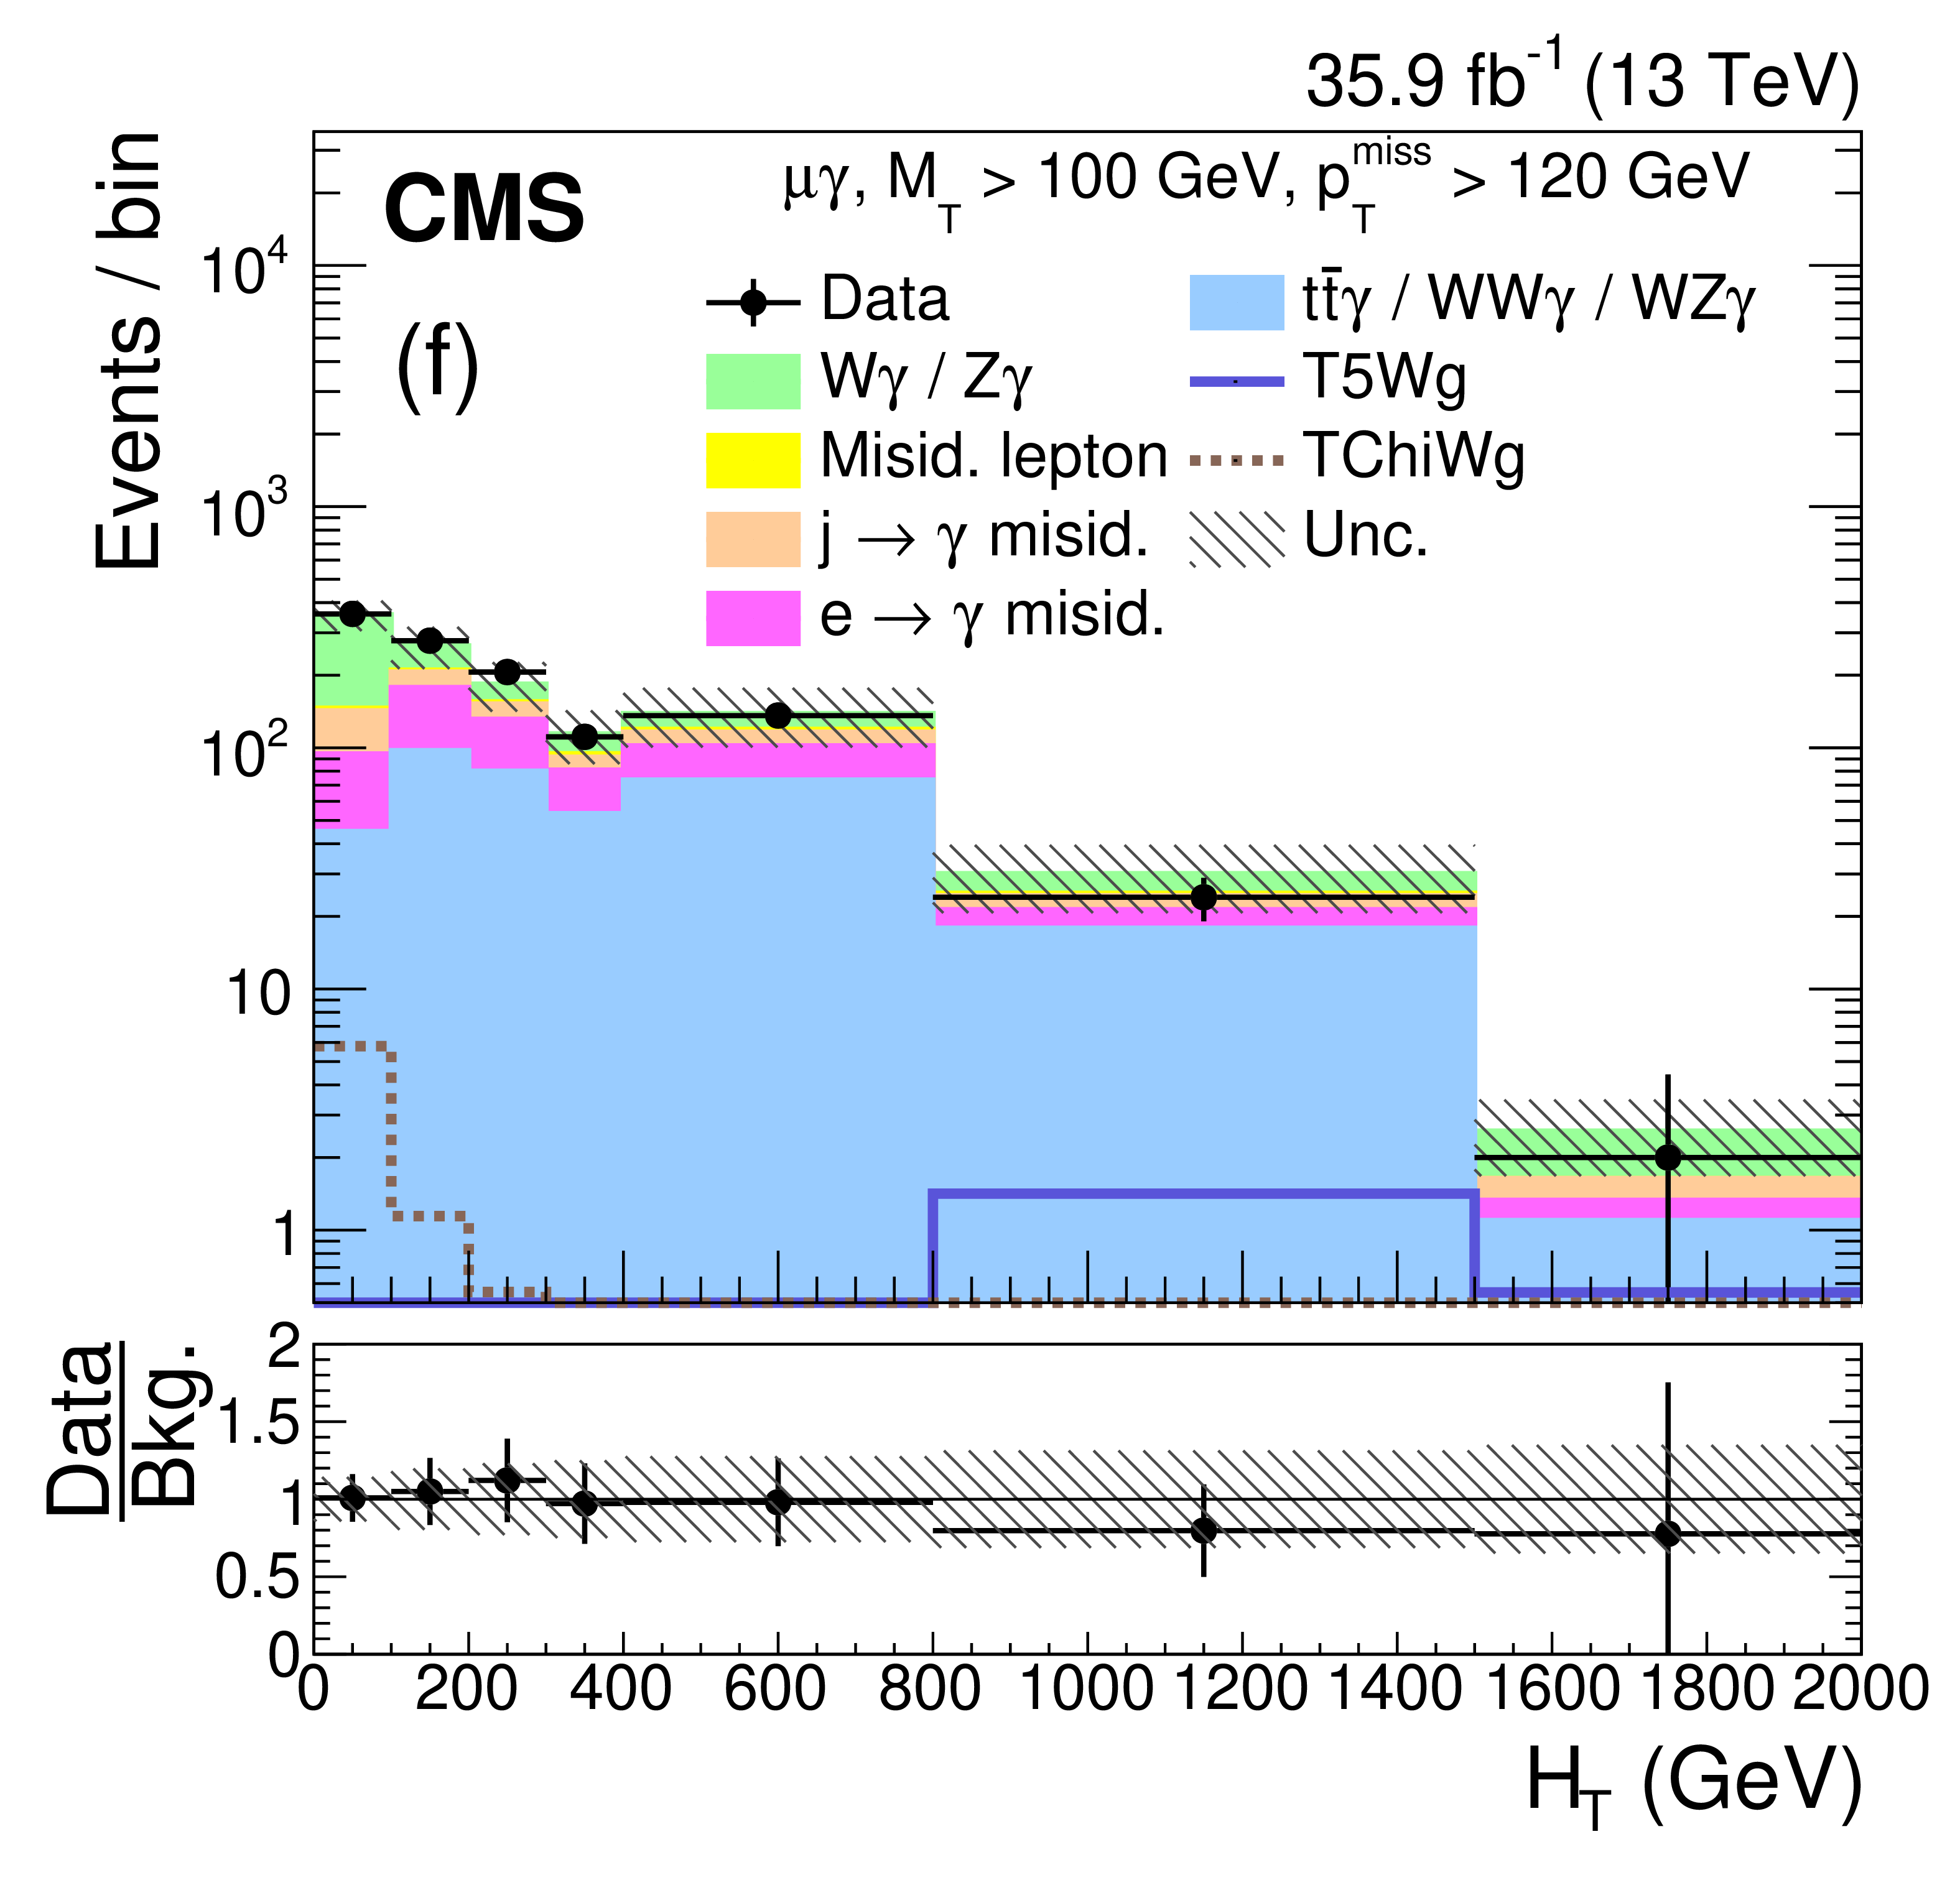
Distributions of $ {{p_{\mathrm {T}}} ^\text {miss}} $ (a, b), $ {p_{\mathrm {T}}} ^{{\gamma}}$ (c, d), and ${H_{\mathrm {T}}}$ (e, f) from data (points) and estimated SM predictions (stacked histograms) for the e$\gamma$ (left) and $\mu {{\gamma}}$ (right) channels. Simulated signal distributions from the TChiWg model (dotted) with $m_{{\tilde{\chi}^0} / {\tilde{\chi}^\pm}} = $ 800 GeV and the T5Wg model (solid) with $m_{{\mathrm {\tilde{g}}}} = $ 1700 GeV are overlaid. The $ {{p_{\mathrm {T}}} ^\text {miss}} $ distribution includes all events with $ {m_{\mathrm {T}}} > $ 100 GeV, while the $ {p_{\mathrm {T}}} ^{{\gamma}}$ and ${H_{\mathrm {T}}}$ distributions only include events with $ {m_{\mathrm {T}}} > $ 100 GeV and $ {{p_{\mathrm {T}}} ^\text {miss}} > $ 120 GeV. The vertical bars on the points give the statistical uncertainty in the data and the horizontal bars show the bin widths. The hatched area represents the quadratic sum of the statistical and systematic uncertainties in the simulated background. The lower panels display the ratio of the data to the total background prediction. |
png pdf |
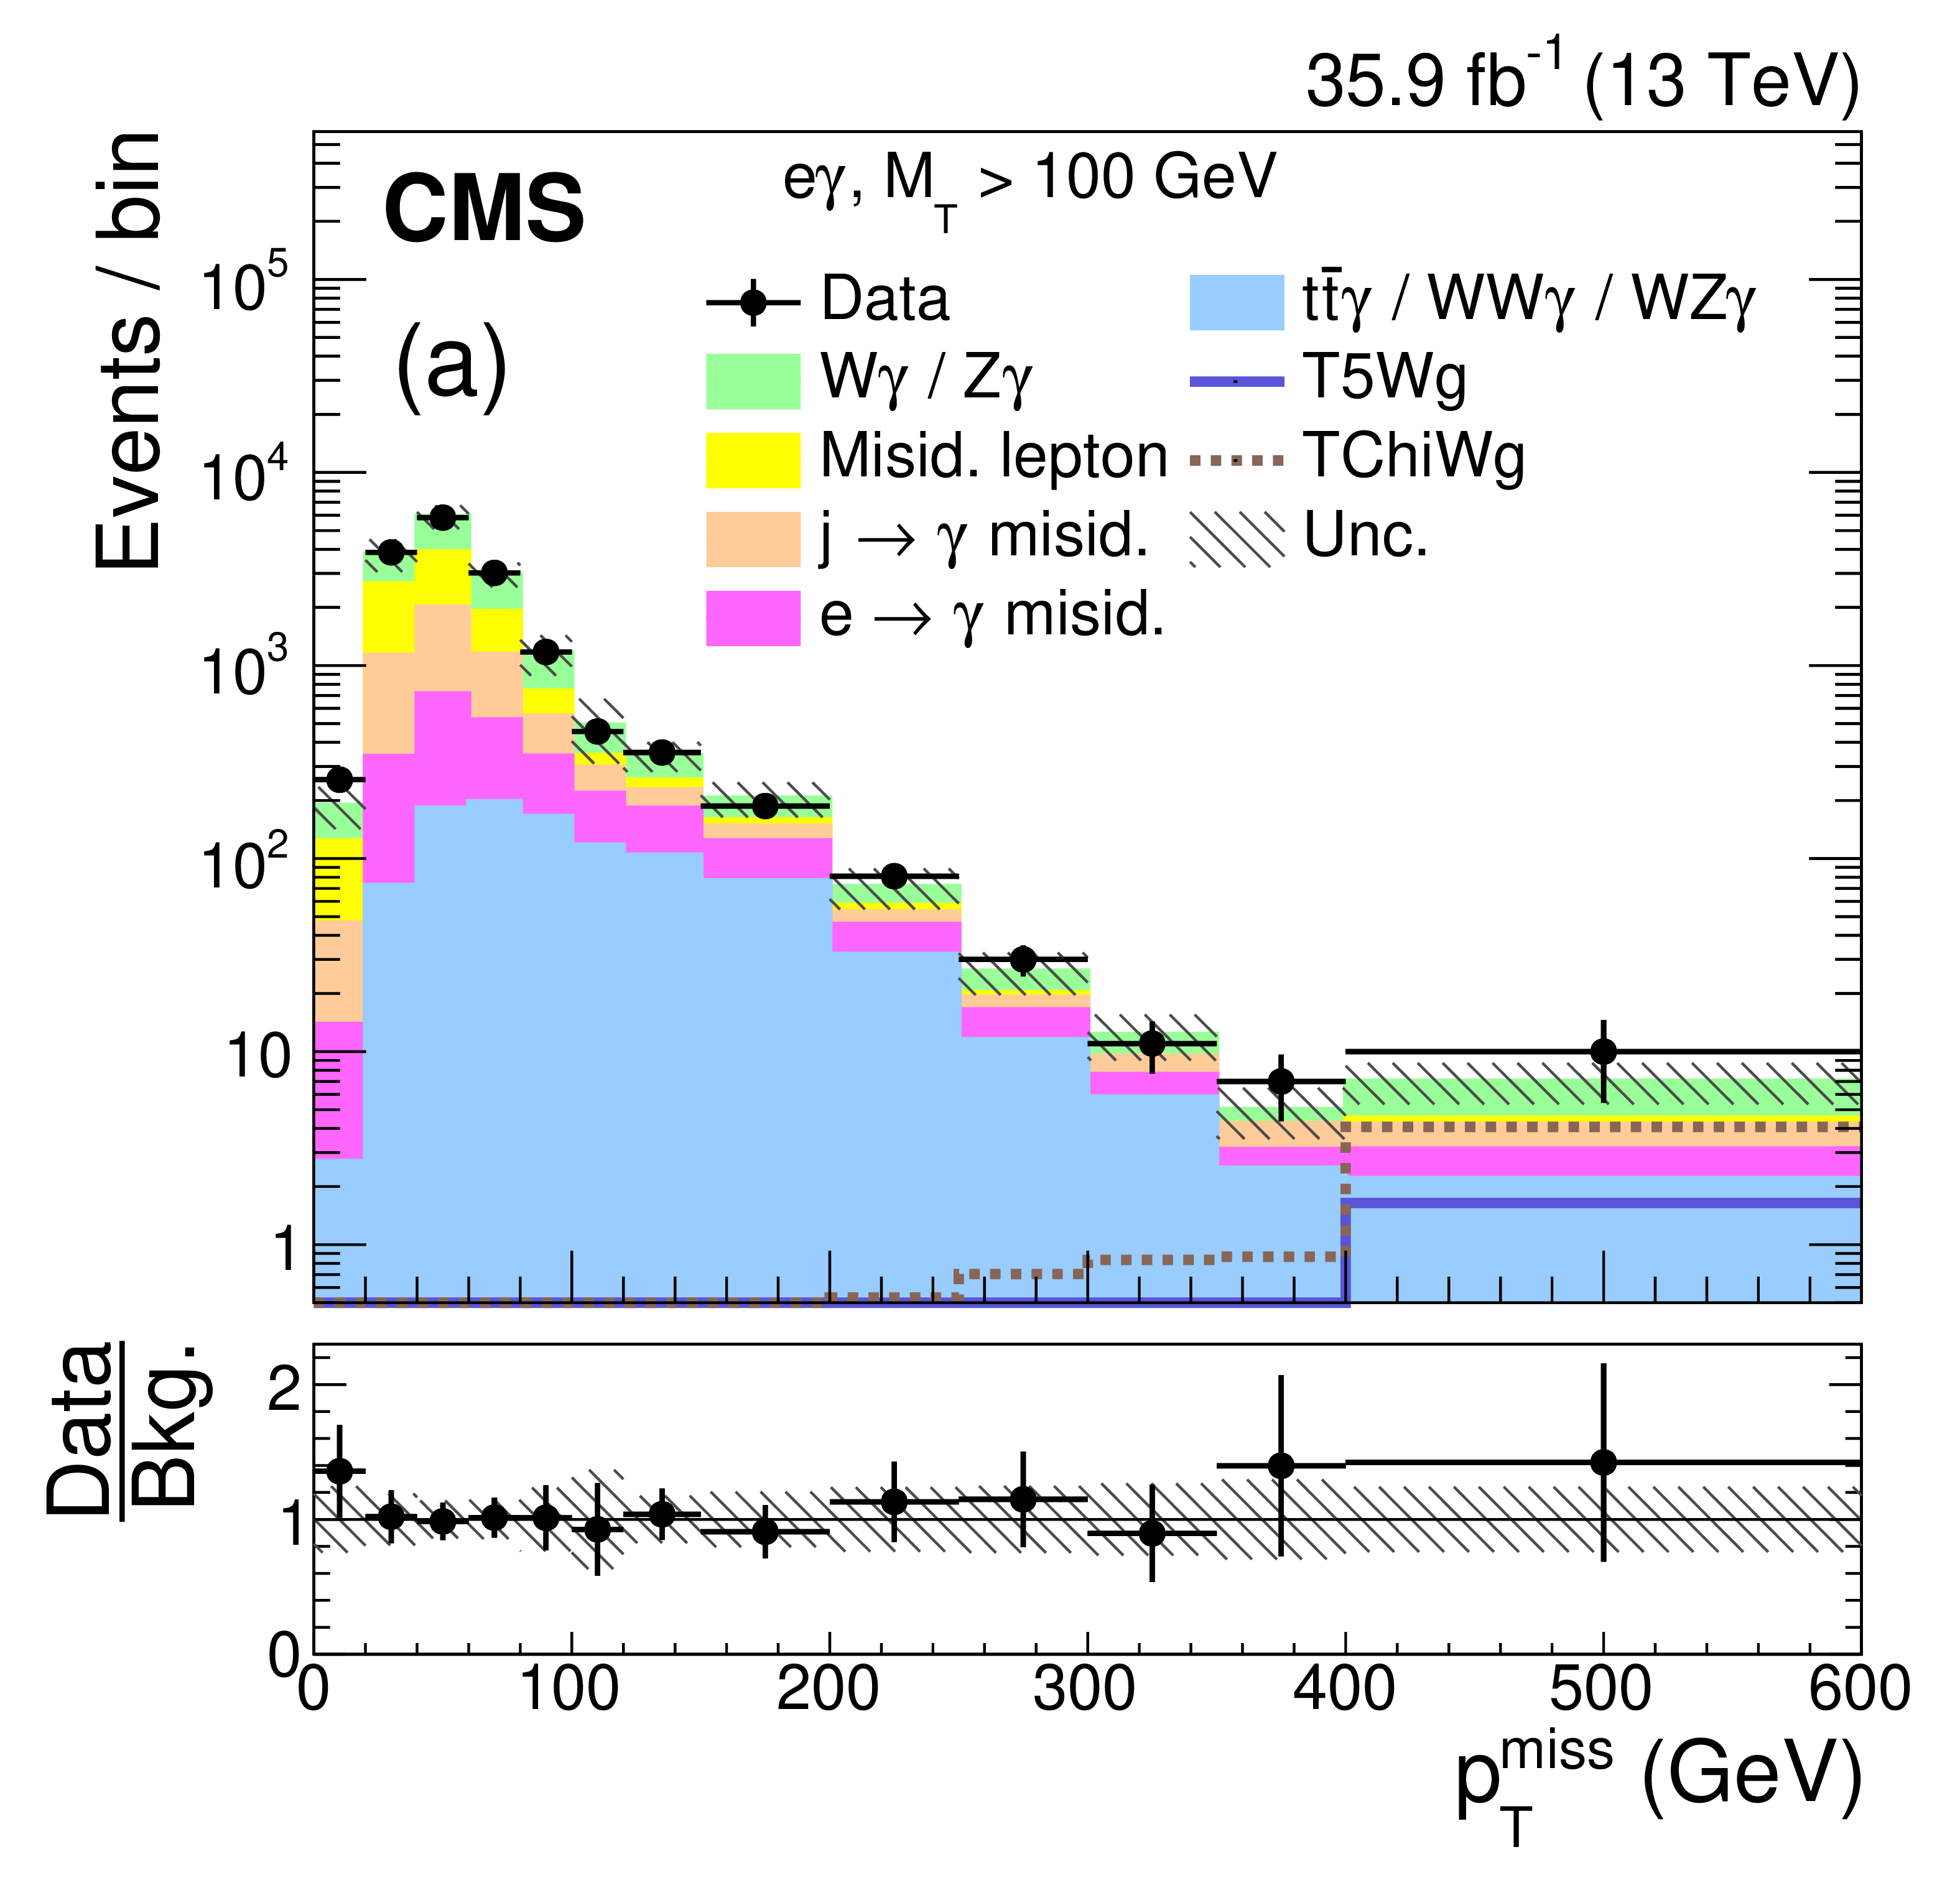
Figure 4-a:
Distribution of $ {{p_{\mathrm {T}}} ^\text {miss}} $ from data (points) and estimated SM predictions (stacked histograms) for the e$\gamma$ channel. Simulated signal distributions from the TChiWg model (dotted) with $m_{{\tilde{\chi}^0} / {\tilde{\chi}^\pm}} = $ 800 GeV and the T5Wg model (solid) with $m_{{\mathrm {\tilde{g}}}} = $ 1700 GeV are overlaid. The $ {{p_{\mathrm {T}}} ^\text {miss}} $ distribution includes all events with $ {m_{\mathrm {T}}} > $ 100 GeV, while the $ {p_{\mathrm {T}}} ^{{\gamma}}$ and ${H_{\mathrm {T}}}$ distributions only include events with $ {m_{\mathrm {T}}} > $ 100 GeV and $ {{p_{\mathrm {T}}} ^\text {miss}} > $ 120 GeV. The vertical bars on the points give the statistical uncertainty in the data and the horizontal bars show the bin widths. The hatched area represents the quadratic sum of the statistical and systematic uncertainties in the simulated background. The lower panel displays the ratio of the data to the total background prediction. |
png pdf |
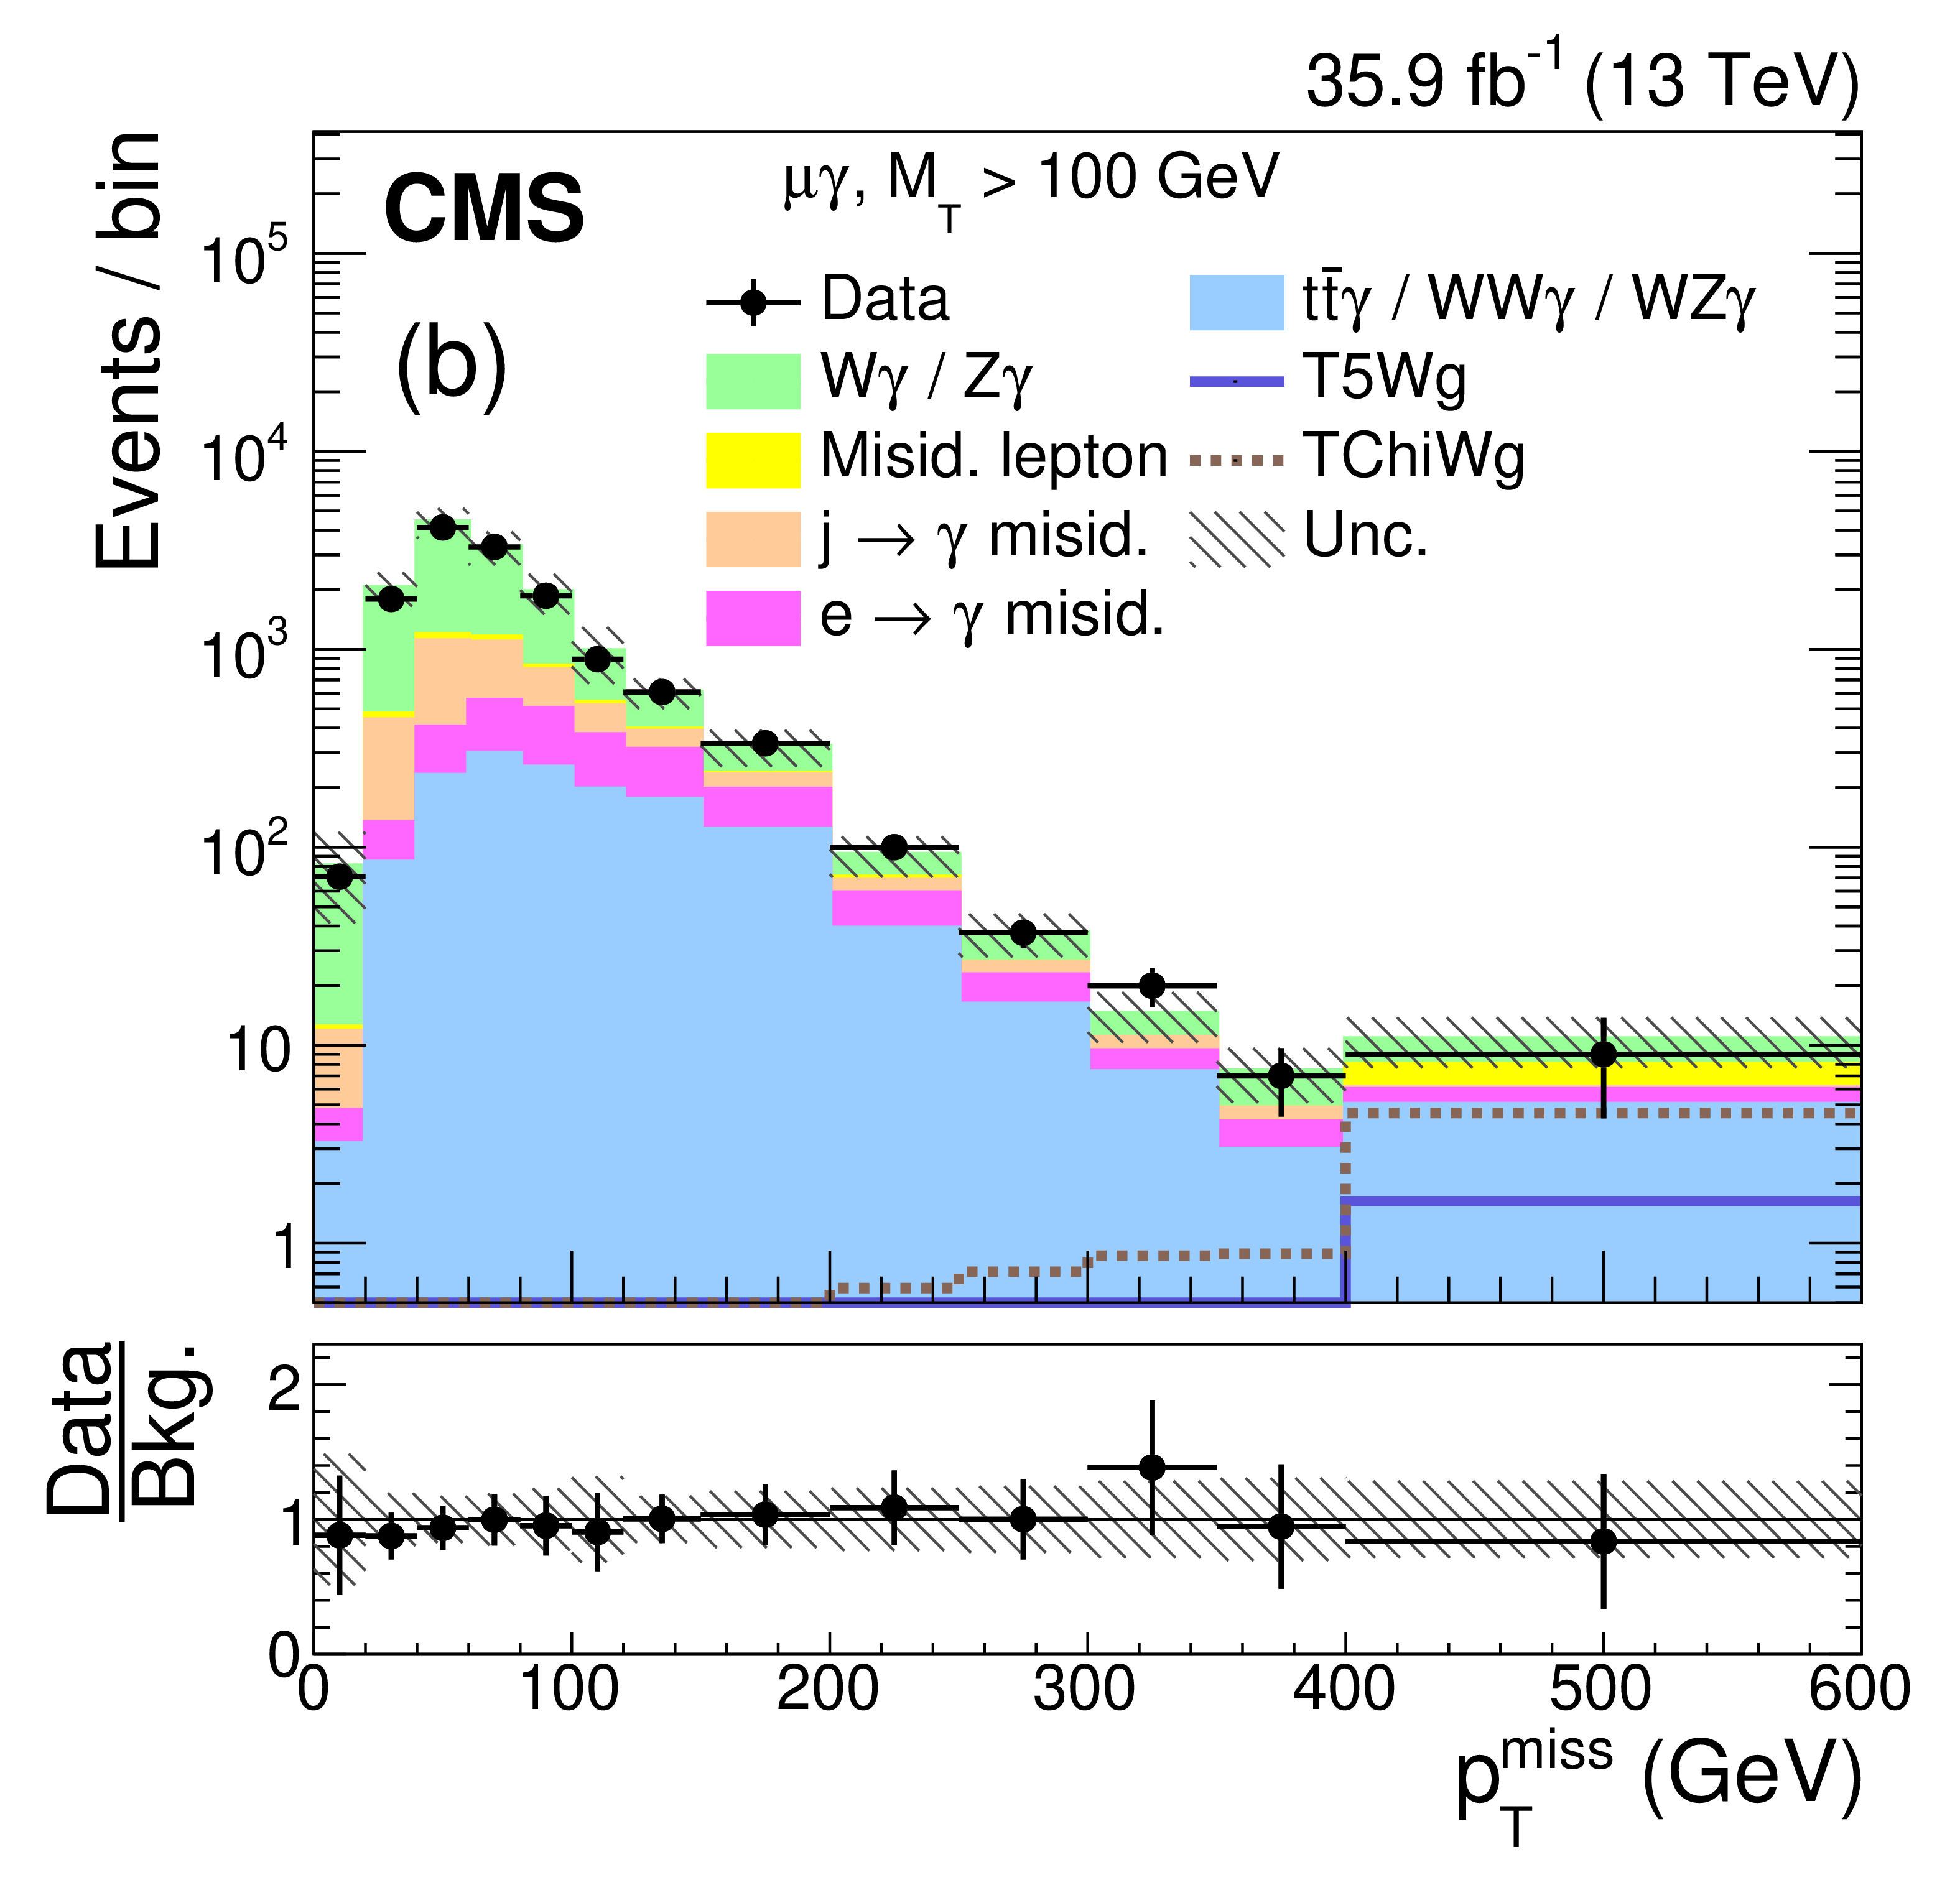
Figure 4-b:
Distribution of $ {{p_{\mathrm {T}}} ^\text {miss}} $ from data (points) and estimated SM predictions (stacked histograms) for the $\mu {{\gamma}}$ channel. Simulated signal distributions from the TChiWg model (dotted) with $m_{{\tilde{\chi}^0} / {\tilde{\chi}^\pm}} = $ 800 GeV and the T5Wg model (solid) with $m_{{\mathrm {\tilde{g}}}} = $ 1700 GeV are overlaid. The $ {{p_{\mathrm {T}}} ^\text {miss}} $ distribution includes all events with $ {m_{\mathrm {T}}} > $ 100 GeV, while the $ {p_{\mathrm {T}}} ^{{\gamma}}$ and ${H_{\mathrm {T}}}$ distributions only include events with $ {m_{\mathrm {T}}} > $ 100 GeV and $ {{p_{\mathrm {T}}} ^\text {miss}} > $ 120 GeV. The vertical bars on the points give the statistical uncertainty in the data and the horizontal bars show the bin widths. The hatched area represents the quadratic sum of the statistical and systematic uncertainties in the simulated background. The lower panel displays the ratio of the data to the total background prediction. |
png pdf |
Figure 4-c:
Distribution of $ {p_{\mathrm {T}}} ^{{\gamma}}$ from data (points) and estimated SM predictions (stacked histograms) for the e$\gamma$ channel. Simulated signal distributions from the TChiWg model (dotted) with $m_{{\tilde{\chi}^0} / {\tilde{\chi}^\pm}} = $ 800 GeV and the T5Wg model (solid) with $m_{{\mathrm {\tilde{g}}}} = $ 1700 GeV are overlaid. The $ {{p_{\mathrm {T}}} ^\text {miss}} $ distribution includes all events with $ {m_{\mathrm {T}}} > $ 100 GeV, while the $ {p_{\mathrm {T}}} ^{{\gamma}}$ and ${H_{\mathrm {T}}}$ distributions only include events with $ {m_{\mathrm {T}}} > $ 100 GeV and $ {{p_{\mathrm {T}}} ^\text {miss}} > $ 120 GeV. The vertical bars on the points give the statistical uncertainty in the data and the horizontal bars show the bin widths. The hatched area represents the quadratic sum of the statistical and systematic uncertainties in the simulated background. The lower panel displays the ratio of the data to the total background prediction. |
png pdf |
Figure 4-d:
Distribution of $ {p_{\mathrm {T}}} ^{{\gamma}}$ from data (points) and estimated SM predictions (stacked histograms) for the $\mu {{\gamma}}$ channel. Simulated signal distributions from the TChiWg model (dotted) with $m_{{\tilde{\chi}^0} / {\tilde{\chi}^\pm}} = $ 800 GeV and the T5Wg model (solid) with $m_{{\mathrm {\tilde{g}}}} = $ 1700 GeV are overlaid. The $ {{p_{\mathrm {T}}} ^\text {miss}} $ distribution includes all events with $ {m_{\mathrm {T}}} > $ 100 GeV, while the $ {p_{\mathrm {T}}} ^{{\gamma}}$ and ${H_{\mathrm {T}}}$ distributions only include events with $ {m_{\mathrm {T}}} > $ 100 GeV and $ {{p_{\mathrm {T}}} ^\text {miss}} > $ 120 GeV. The vertical bars on the points give the statistical uncertainty in the data and the horizontal bars show the bin widths. The hatched area represents the quadratic sum of the statistical and systematic uncertainties in the simulated background. The lower panel displays the ratio of the data to the total background prediction. |

png pdf |
Figure 4-e:
Distribution of ${H_{\mathrm {T}}}$ from data (points) and estimated SM predictions (stacked histograms) for the e$\gamma$ channel. Simulated signal distributions from the TChiWg model (dotted) with $m_{{\tilde{\chi}^0} / {\tilde{\chi}^\pm}} = $ 800 GeV and the T5Wg model (solid) with $m_{{\mathrm {\tilde{g}}}} = $ 1700 GeV are overlaid. The $ {{p_{\mathrm {T}}} ^\text {miss}} $ distribution includes all events with $ {m_{\mathrm {T}}} > $ 100 GeV, while the $ {p_{\mathrm {T}}} ^{{\gamma}}$ and ${H_{\mathrm {T}}}$ distributions only include events with $ {m_{\mathrm {T}}} > $ 100 GeV and $ {{p_{\mathrm {T}}} ^\text {miss}} > $ 120 GeV. The vertical bars on the points give the statistical uncertainty in the data and the horizontal bars show the bin widths. The hatched area represents the quadratic sum of the statistical and systematic uncertainties in the simulated background. The lower panel displays the ratio of the data to the total background prediction. |
png pdf |
Figure 4-f:
Distribution of ${H_{\mathrm {T}}}$ from data (points) and estimated SM predictions (stacked histograms) for the $\mu {{\gamma}}$ channel. Simulated signal distributions from the TChiWg model (dotted) with $m_{{\tilde{\chi}^0} / {\tilde{\chi}^\pm}} = $ 800 GeV and the T5Wg model (solid) with $m_{{\mathrm {\tilde{g}}}} = $ 1700 GeV are overlaid. The $ {{p_{\mathrm {T}}} ^\text {miss}} $ distribution includes all events with $ {m_{\mathrm {T}}} > $ 100 GeV, while the $ {p_{\mathrm {T}}} ^{{\gamma}}$ and ${H_{\mathrm {T}}}$ distributions only include events with $ {m_{\mathrm {T}}} > $ 100 GeV and $ {{p_{\mathrm {T}}} ^\text {miss}} > $ 120 GeV. The vertical bars on the points give the statistical uncertainty in the data and the horizontal bars show the bin widths. The hatched area represents the quadratic sum of the statistical and systematic uncertainties in the simulated background. The lower panel displays the ratio of the data to the total background prediction. |
png pdf |
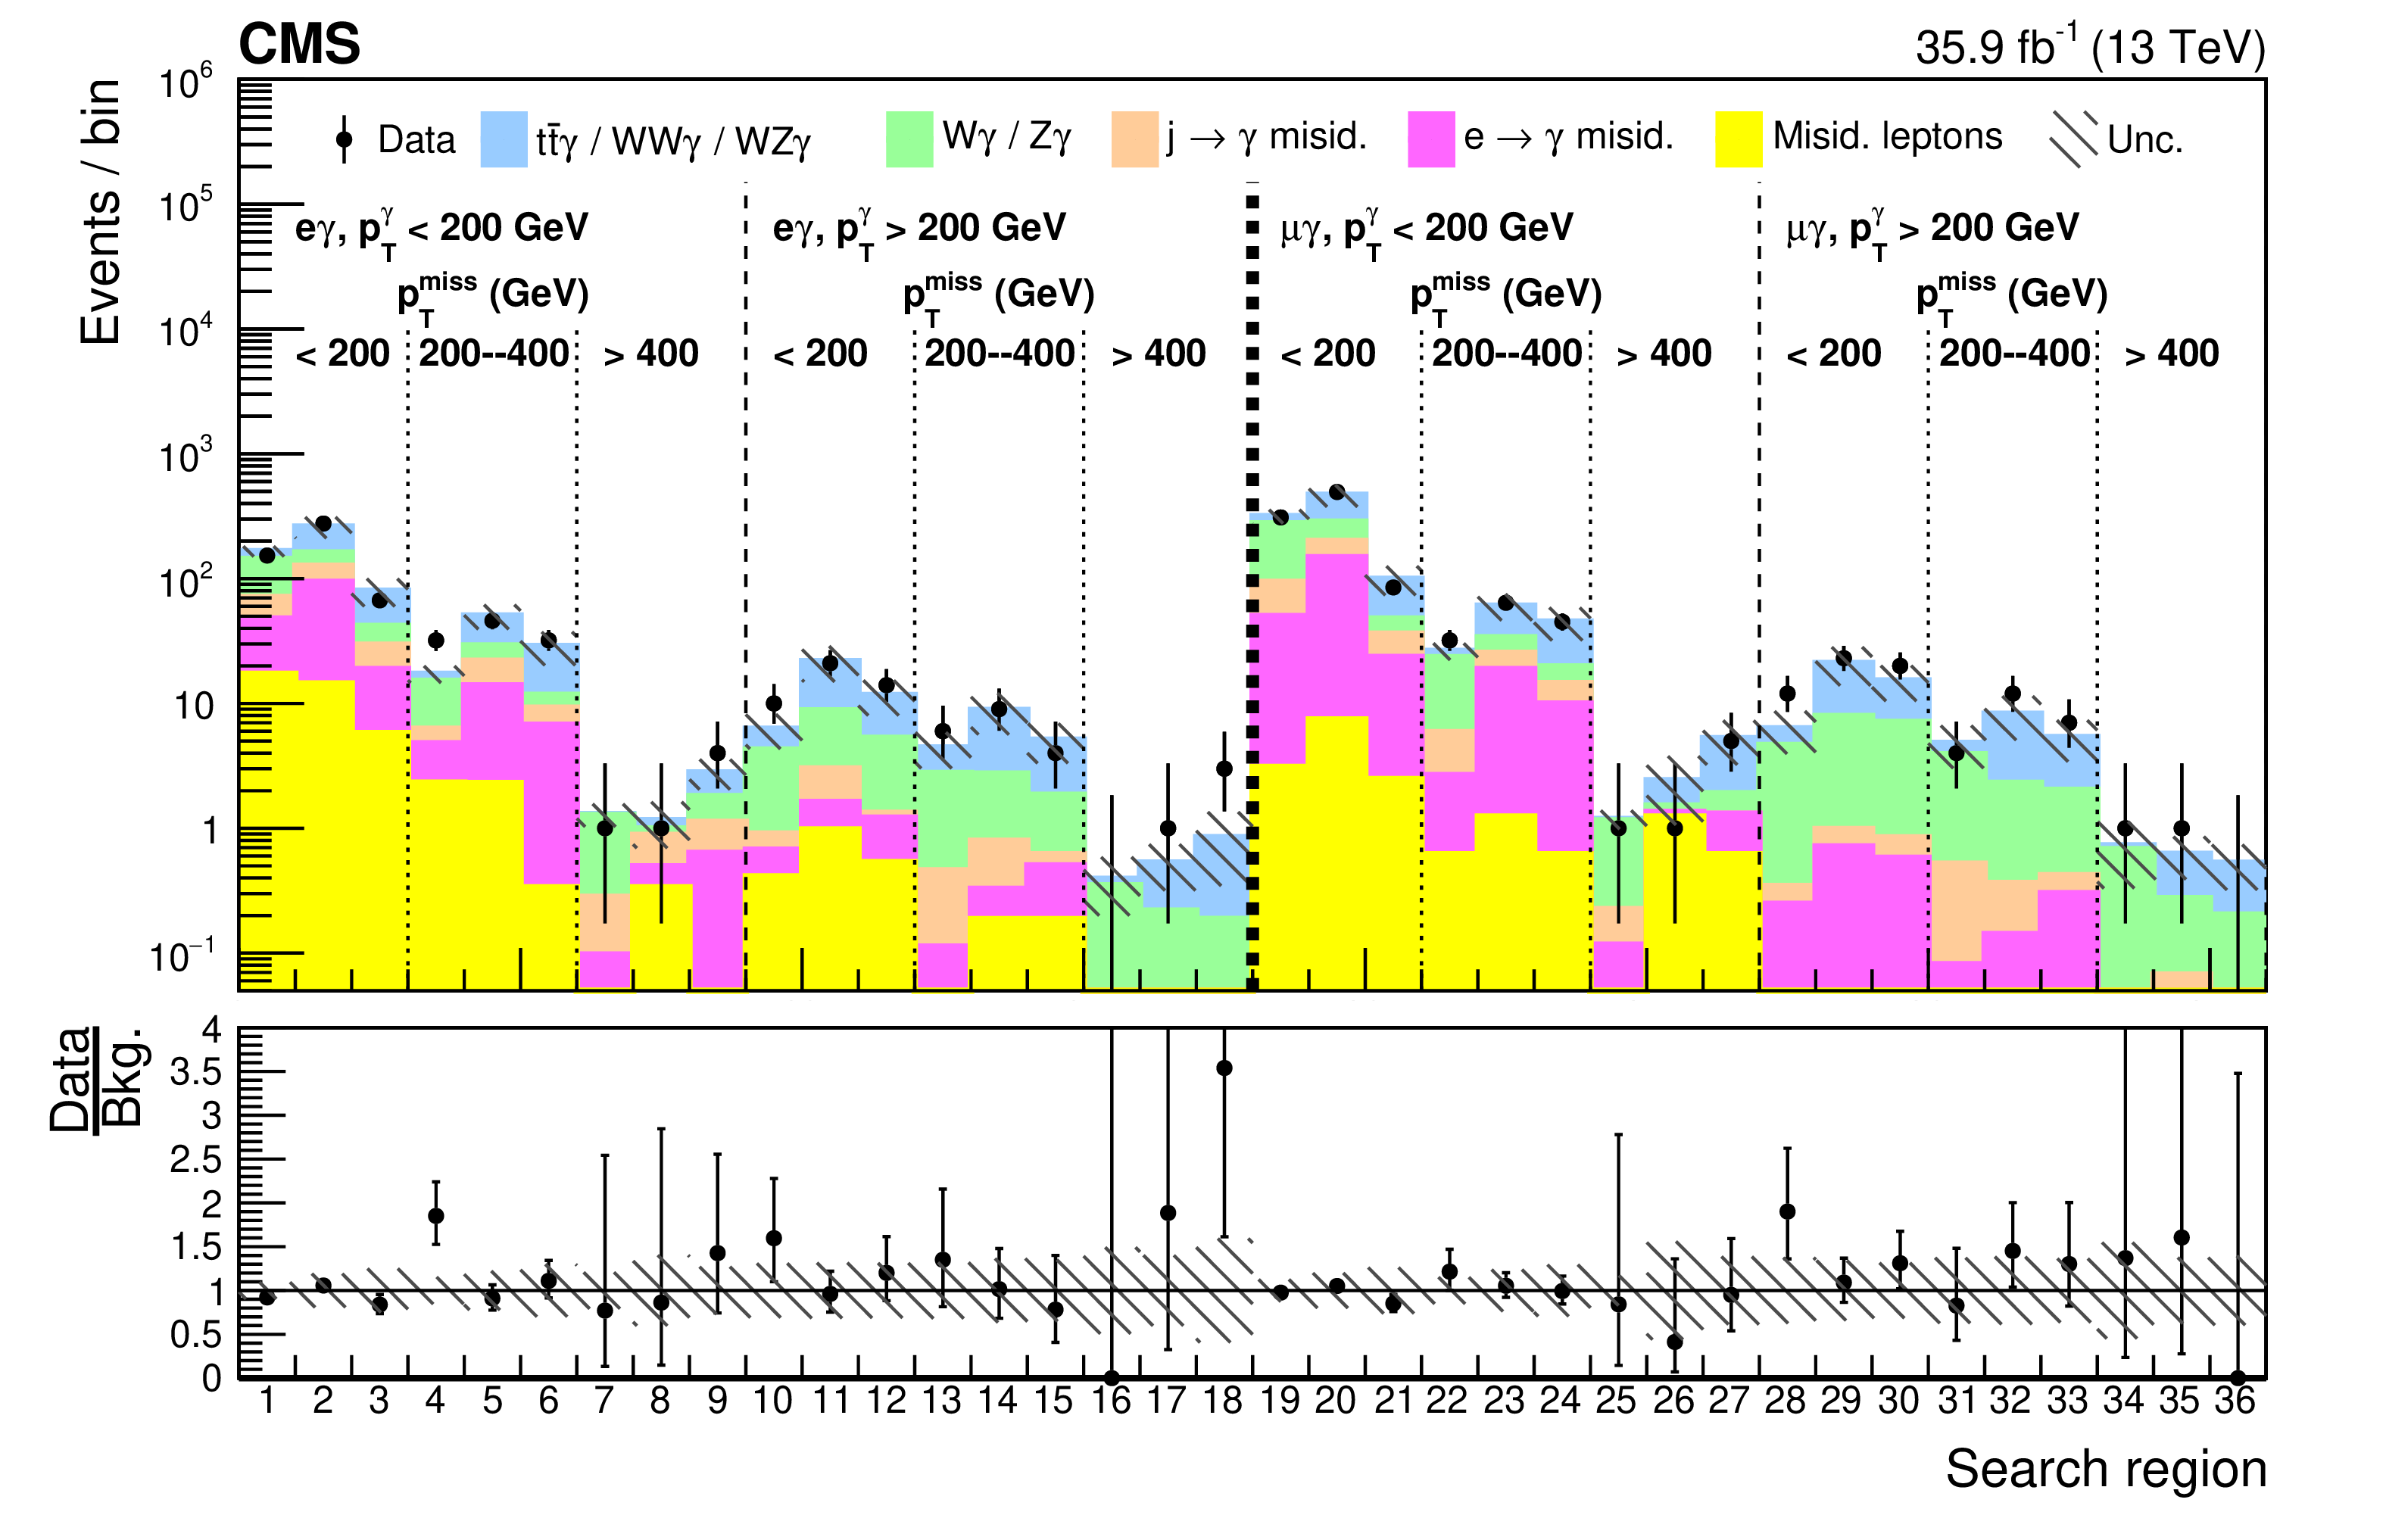
Figure 5:
The number of data events (points) and predicted background events (shaded histograms) for the 18 search regions in $ {{p_{\mathrm {T}}} ^\text {miss}} $, ${H_{\mathrm {T}}}$, and $ {p_{\mathrm {T}}} ^{{\gamma}}$ (separated by dashed vertical lines) in the e$\gamma$ (regions 1-18) and the $\mu {{\gamma}}$ (regions 19-36) channels. For each $ {{p_{\mathrm {T}}} ^\text {miss}} $ range, the first, second, and last bins correspond to the ${H_{\mathrm {T}}}$ regions 0-100, 100-400, and $ > $ 400 GeV, respectively. The lower panel displays the ratio of the data to the background predictions. The vertical bars on the points show the statistical uncertainty in the data, and the hatched areas give the quadrature sum of the statistical and systematic uncertainties in the simulated background. |

png pdf |
Figure 6:
The observed (solid line) and expected (dashed line) 95% CL upper limits on the production cross sections for the TChiWg simplified model, together with the NLO theoretical cross sections as a function of the NLSP mass. The inner (darker) band and outer (lighter) band around the expected upper limits indicate the regions containing 68 and 95%, respectively, of the distribution of limits expected under the background-only hypothesis. The dotted lines around the theoretical cross section gives the $ \pm $1 standard deviation uncertainty in the cross section. |
png pdf |
Figure 7:
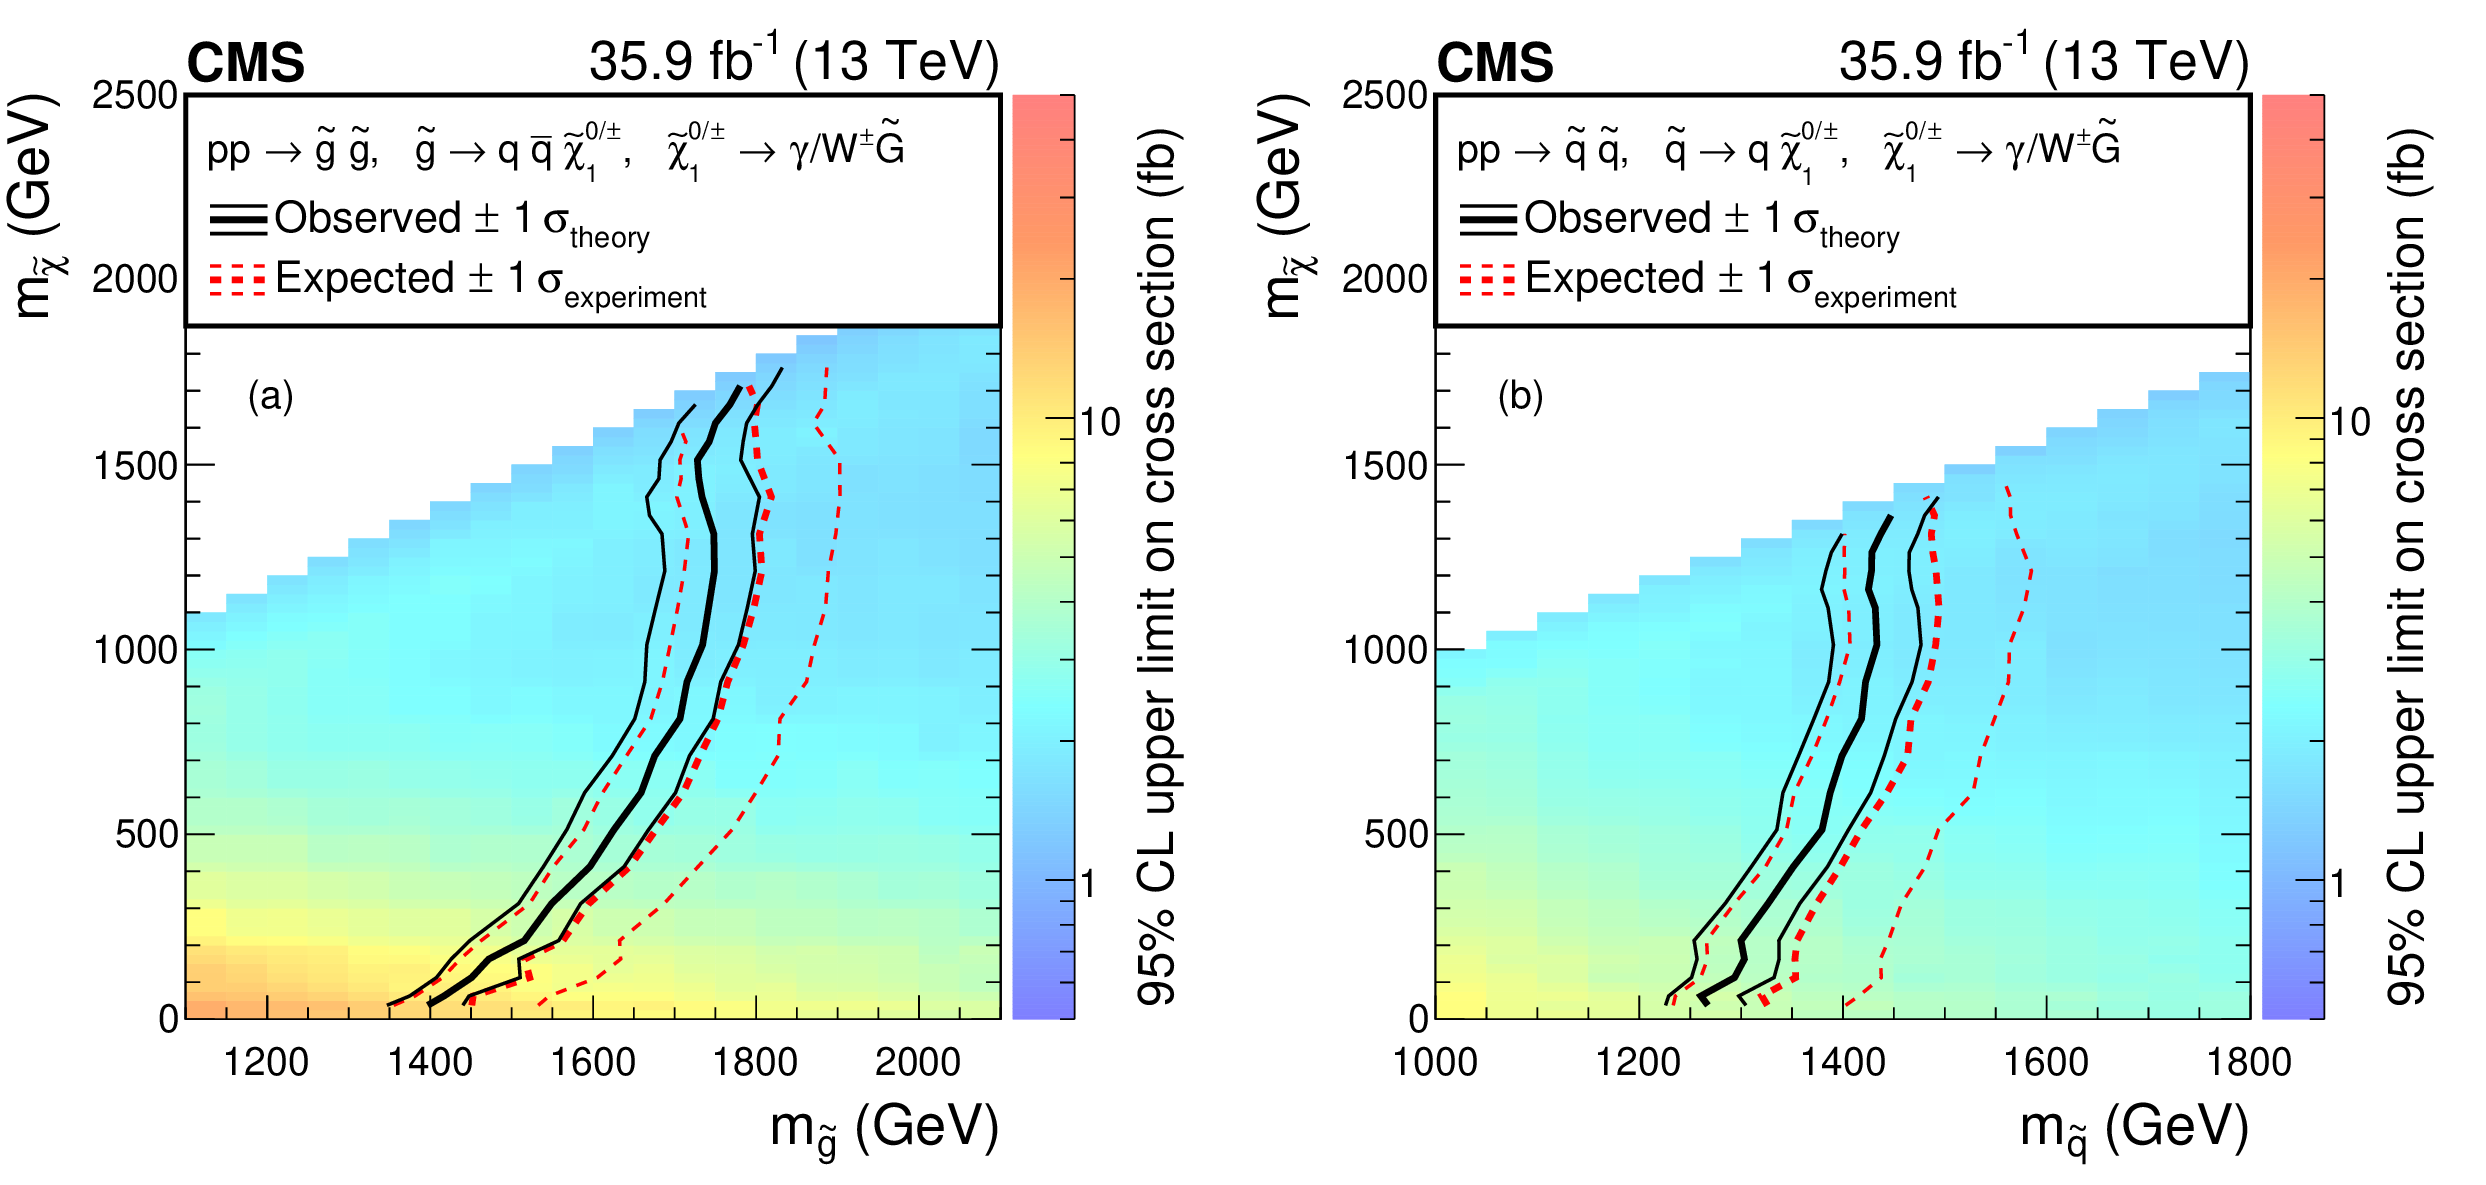
The observed (solid line) and expected (dashed line) 95% CL exclusion contours for (a) $m_{{\mathrm {\tilde{g}}}}$ versus $m_{{\tilde{\chi}}}$ and (b) $m_{{\mathrm {\tilde{q}}}}$ versus $m_{{\tilde{\chi}}}$ (regions to the left of the curves are excluded), and the 95% CL upper limits on the pair production cross sections for (a) ${{\mathrm {\tilde{g}}} {\mathrm {\tilde{g}}}}$ in the T5Wg and (b) ${{\mathrm {\tilde{q}}} {\mathrm {\tilde{q}}}}$ in the T6Wg simplified models (use the scales to the right of the plots). The upper limits on the cross sections assume a 50% branching fraction for $ {\mathrm {\tilde{g}}}\to {\mathrm {q}} {\mathrm {\overline {q}}} {\tilde{\chi}^0} / {\tilde{\chi}^\pm} $ and $ {\mathrm {\tilde{q}}}\to {\mathrm {q}} {\tilde{\chi}^0} / {\tilde{\chi}^\pm} $. The bands around the observed and expected exclusion contours indicate the $ \pm $1 standard deviation range when including the experimental and theoretical uncertainties, respectively. |
png pdf |
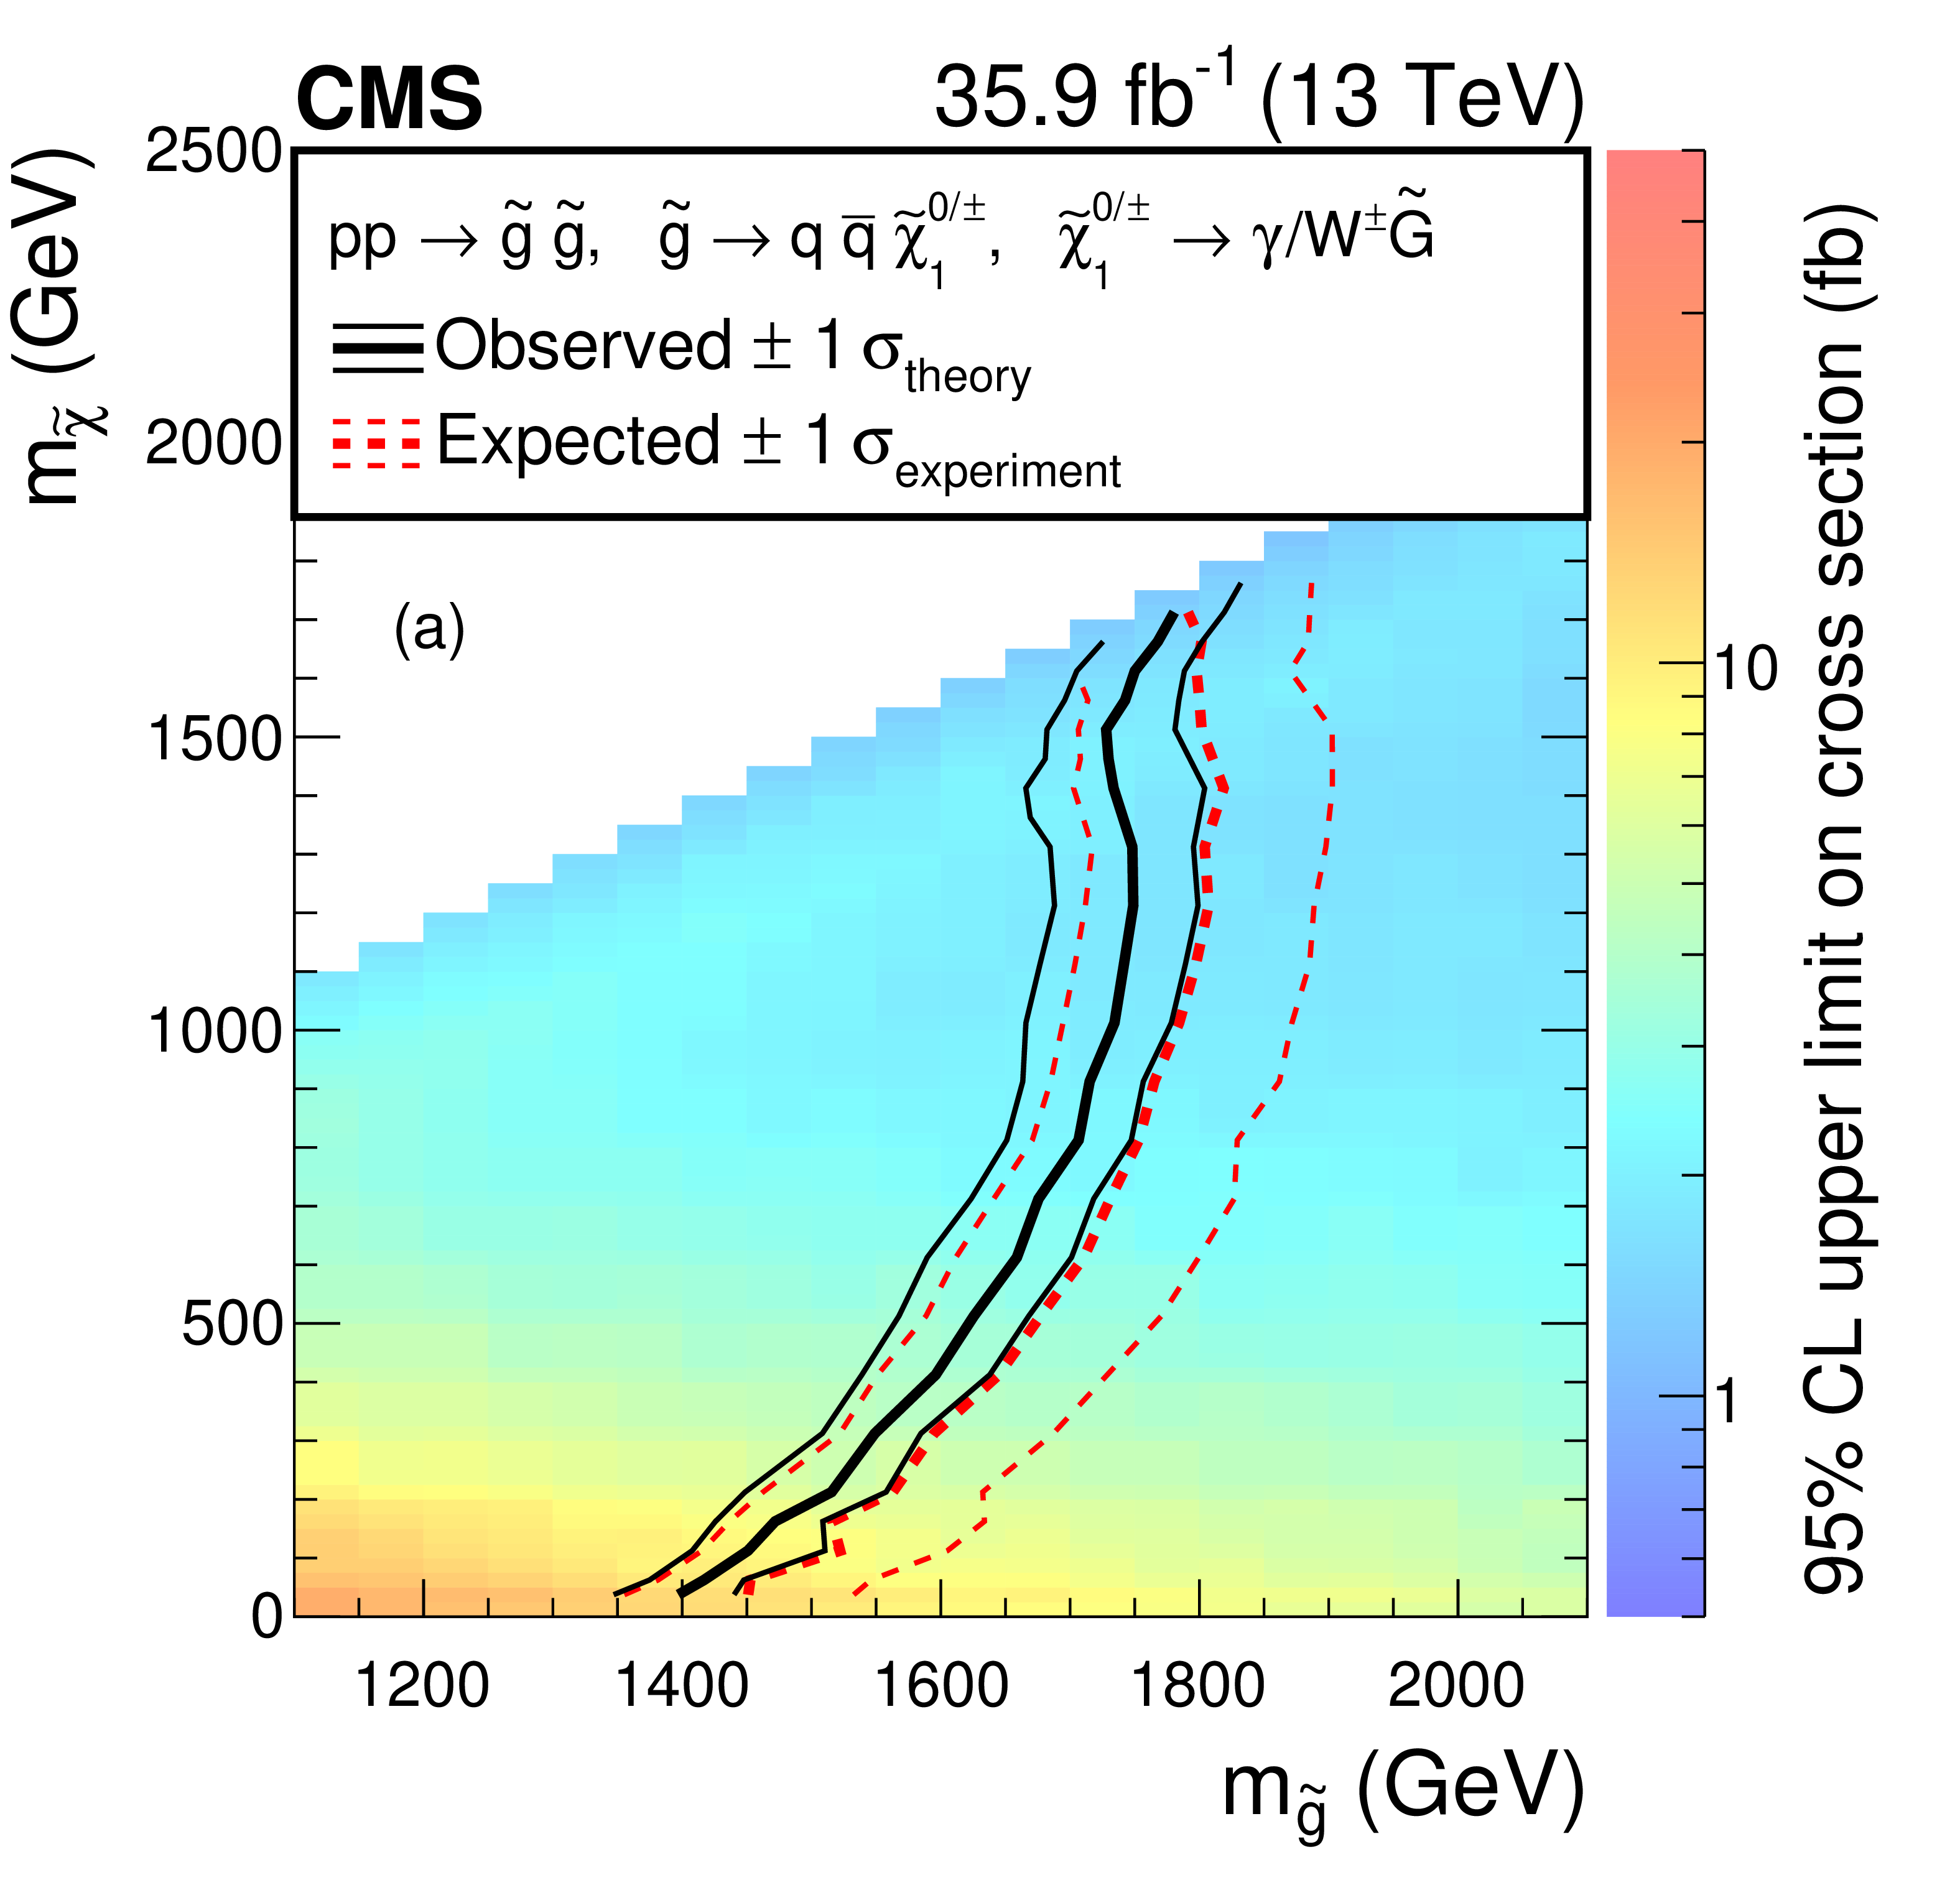
Figure 7-a:
The observed (solid line) and expected (dashed line) 95% CL exclusion contours for $m_{{\mathrm {\tilde{g}}}}$ versus $m_{{\tilde{\chi}}}$ (regions to the left of the curves are excluded), and the 95% CL upper limits on the pair production cross sections for ${{\mathrm {\tilde{g}}} {\mathrm {\tilde{g}}}}$ in the T5Wg simplified model (use the scales to the right of the plots). The upper limits on the cross sections assume a 50% branching fraction for $ {\mathrm {\tilde{g}}}\to {\mathrm {q}} {\mathrm {\overline {q}}} {\tilde{\chi}^0} / {\tilde{\chi}^\pm} $ and $ {\mathrm {\tilde{q}}}\to {\mathrm {q}} {\tilde{\chi}^0} / {\tilde{\chi}^\pm} $. The bands around the observed and expected exclusion contours indicate the $ \pm $1 standard deviation range when including the experimental and theoretical uncertainties, respectively. |
png pdf |
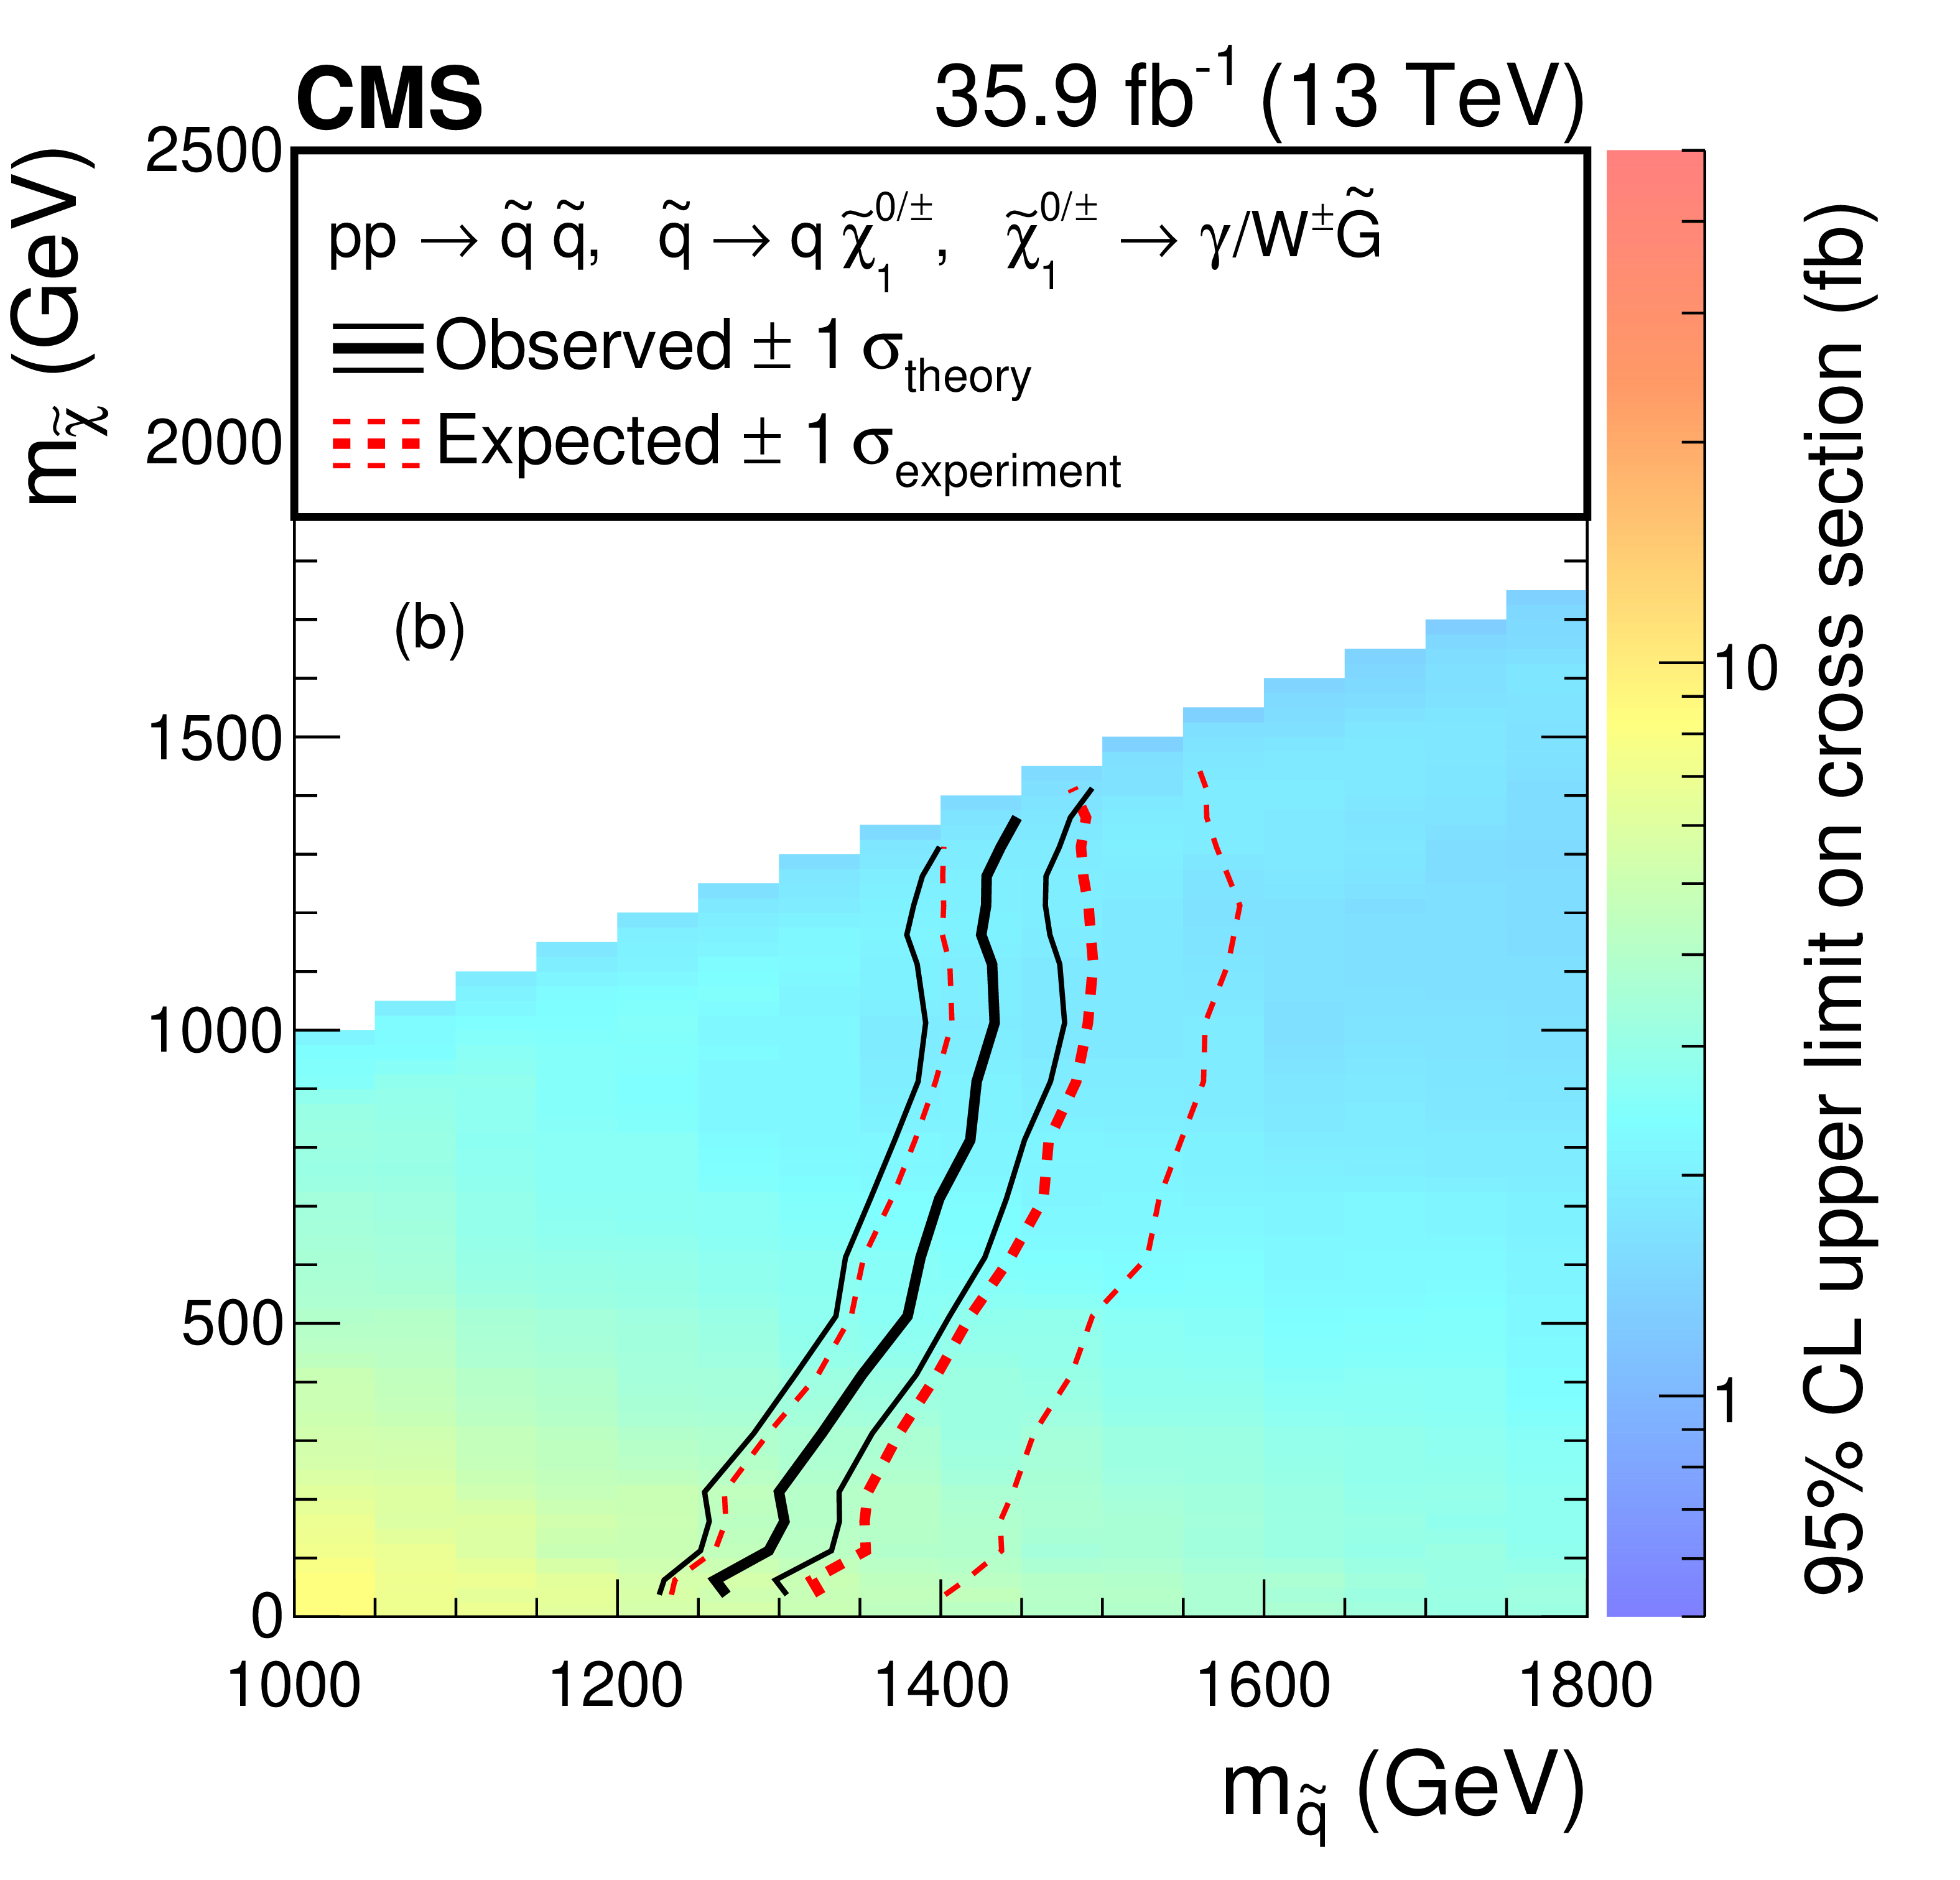
Figure 7-b:
The observed (solid line) and expected (dashed line) 95% CL exclusion contours for $m_{{\mathrm {\tilde{q}}}}$ versus $m_{{\tilde{\chi}}}$ (regions to the left of the curves are excluded), and the 95% CL upper limits on the pair production cross sections for ${{\mathrm {\tilde{q}}} {\mathrm {\tilde{q}}}}$ in the T6Wg simplified model (use the scales to the right of the plots). The upper limits on the cross sections assume a 50% branching fraction for $ {\mathrm {\tilde{g}}}\to {\mathrm {q}} {\mathrm {\overline {q}}} {\tilde{\chi}^0} / {\tilde{\chi}^\pm} $ and $ {\mathrm {\tilde{q}}}\to {\mathrm {q}} {\tilde{\chi}^0} / {\tilde{\chi}^\pm} $. The bands around the observed and expected exclusion contours indicate the $ \pm $1 standard deviation range when including the experimental and theoretical uncertainties, respectively. |
| Tables | |

png pdf |
Table 1:
The relative systematic uncertainties in the SM background processes (third column) and the expected SUSY signal (fourth column). The ranges refer to the uncertainties over the different kinematic regions. |
| Summary |
| A search for supersymmetry with general gauge mediation in events with a photon, an electron or muon, and large missing transverse momentum has been presented. This analysis is based on a sample of proton-proton collisions at $\sqrt{s} = $ 13 TeV, corresponding to an integrated luminosity of 35.9 fb$^{-1}$ recorded by the CMS experiment in 2016. The data are examined in bins of the photon transverse energy, the magnitude of the missing transverse momentum, and the scalar sum of jet energies. The standard model background is evaluated primarily using control samples in the data, with simulation used to evaluate backgrounds from electroweak processes. The data are found to agree with the standard model expectation, without significant excess in the search region. The results of the search are interpreted as 95% confidence level upper limits on the production cross sections of supersymmetric particles in the context of simplified models [23] motivated by gauge-mediated supersymmetry breaking. For strong production models, such as the T5Wg simplified model of gluino pair production and the T6Wg model of squark pair production, this search excludes gluinos (squarks) with masses up to 1.75 (1.43) TeV in the T5Wg (T6Wg) scenarios. The TChiWg simplified model, based on direct electroweak production of a neutralino and chargino, is excluded for next-to-lightest supersymmetric particle masses below 930 GeV, extending the current best limit by about 150 GeV [19]. |
| References | ||||
| 1 | M. Dine and W. Fischler | A phenomenological model of particle physics based on supersymmetry | PLB 110 (1982) 227 | |
| 2 | L. Alvarez-Gaume, M. Claudson, and M. B. Wise | Low-energy supersymmetry | NPB 207 (1982) 96 | |
| 3 | C. R. Nappi and B. A. Ovrut | Supersymmetric extension of the SU(3)xSU(2)xU(1) model | PLB 113 (1982) 175 | |
| 4 | M. Dine and A. E. Nelson | Dynamical supersymmetry breaking at low energies | PRD 48 (1993) 1277 | hep-ph/9303230 |
| 5 | M. Dine, A. E. Nelson, and Y. Shirman | Low energy dynamical supersymmetry breaking simplified | PRD 51 (1995) 1362 | hep-ph/9408384 |
| 6 | M. Dine, A. E. Nelson, Y. Nir, and Y. Shirman | New tools for low-energy dynamical supersymmetry breaking | PRD 53 (1996) 2658 | hep-ph/9507378 |
| 7 | G. R. Farrar and P. Fayet | Phenomenology of the production, decay, and detection of new hadronic states associated with supersymmetry | PLB 76 (1978) 575 | |
| 8 | S. Dimopoulos, G. F. Giudice, and A. Pomarol | Dark matter in theories of gauge mediated supersymmetry breaking | PLB 389 (1996) 37 | hep-ph/9607225 |
| 9 | S. P. Martin | Generalized messengers of supersymmetry breaking and the sparticle mass spectrum | PRD 55 (1997) 3177 | hep-ph/9608224 |
| 10 | E. Poppitz and S. P. Trivedi | Some remarks on gauge mediated supersymmetry breaking | PLB 401 (1997) 38 | hep-ph/9703246 |
| 11 | P. Meade, N. Seiberg, and D. Shih | General gauge mediation | Prog. Theor. Phys. Suppl. 177 (2009) 143 | 0801.3278 |
| 12 | M. Buican, P. Meade, N. Seiberg, and D. Shih | Exploring general gauge mediation | JHEP 03 (2009) 016 | 0812.3668 |
| 13 | S. Abel, M. J. Dolan, J. Jaeckel, and V. V. Khoze | Phenomenology of pure general gauge mediation | JHEP 12 (2009) 001 | 0910.2674 |
| 14 | L. M. Carpenter, M. Dine, G. Festuccia, and J. D. Mason | Implementing general gauge mediation | PRD 79 (2009) 035002 | 0805.2944 |
| 15 | T. T. Dumitrescu, Z. Komargodski, N. Seiberg, and D. Shih | General messenger gauge mediation | JHEP 05 (2010) 096 | 1003.2661 |
| 16 | ATLAS Collaboration | Search for photonic signatures of gauge-mediated supersymmetry in 8 TeV pp collisions with the ATLAS detector | PRD 92 (2015) 072001 | 1507.05493 |
| 17 | CMS Collaboration | Search for supersymmetry in events with a lepton, a photon, and large missing transverse energy in pp collisions at $ \sqrt{s}= $ 7 TeV | JHEP 06 (2011) 093 | CMS-SUS-11-002 1105.3152 |
| 18 | CMS Collaboration | Search for supersymmetry with photons in pp collisions at $ \sqrt{s}= $ 8 TeV | PRD 92 (2015) 072006 | CMS-SUS-14-004 1507.02898 |
| 19 | CMS Collaboration | Search for gauge-mediated supersymmetry in events with at least one photon and missing transverse momentum in pp collisions at $ \sqrt{s} = $ 13 TeV | PLB 780 (2018) 118 | CMS-SUS-16-046 1711.08008 |
| 20 | CMS Collaboration | Search for supersymmetry in events with at least one photon, missing transverse momentum, and large transverse event activity in proton-proton collisions at $ \sqrt{s} = $ 13 TeV | JHEP 12 (2017) 142 | CMS-SUS-16-047 1707.06193 |
| 21 | ATLAS Collaboration | Search for photonic signatures of gauge-mediated supersymmetry in 13 TeV pp collisions with the ATLAS detector | PRD 97 (2018) 092006 | 1802.03158 |
| 22 | CMS Collaboration | Search for supersymmetry in events with a photon, a lepton, and missing transverse momentum in pp collisions at $ \sqrt{s}= $ 8 TeV | PLB 757 (2016) 6 | CMS-SUS-14-013 1508.01218 |
| 23 | CMS Collaboration | Interpretation of searches for supersymmetry with simplified models | PRD 88 (2013) 052017 | CMS-SUS-11-016 1301.2175 |
| 24 | CMS Collaboration | Performance of photon reconstruction and identification with the CMS detector in proton-proton collisions at $ \sqrt{s}= $ 8 TeV | JINST 10 (2015) P08010 | CMS-EGM-14-001 1502.02702 |
| 25 | CMS Collaboration | Performance of electron reconstruction and selection with the CMS detector in proton-proton collisions at $ \sqrt{s}= $ 8 TeV | JINST 10 (2015) P06005 | CMS-EGM-13-001 1502.02701 |
| 26 | CMS Collaboration | Performance of the CMS muon detector and muon reconstruction with proton-proton collisions at $ \sqrt{s}= $ 13 TeV | JINST 13 (2018) P06015 | CMS-MUO-16-001 1804.04528 |
| 27 | CMS Collaboration | The CMS experiment at the CERN LHC | JINST 3 (2008) S08004 | CMS-00-001 |
| 28 | CMS Collaboration | Particle-flow reconstruction and global event description with the CMS detector | JINST 12 (2017) P10003 | CMS-PRF-14-001 1706.04965 |
| 29 | M. Cacciari, G. P. Salam, and G. Soyez | The anti-$ {k_{\mathrm{T}}} $ jet clustering algorithm | JHEP 04 (2008) 063 | 0802.1189 |
| 30 | M. Cacciari, G. P. Salam, and G. Soyez | FastJet user manual | EPJC 72 (2012) 1896 | 1111.6097 |
| 31 | K. Rehermann and B. Tweedie | Efficient identification of boosted semileptonic top quarks at the LHC | JHEP 03 (2011) 059 | |
| 32 | M. Cacciari and G. P. Salam | Pileup subtraction using jet areas | PLB 659 (2008) 119 | 0707.1378 |
| 33 | CMS Collaboration | Determination of jet energy calibration and transverse momentum resolution in CMS | JINST 6 (2011) P11002 | CMS-JME-10-011 1107.4277 |
| 34 | CMS Collaboration | Performance of the CMS missing transverse momentum reconstruction in pp data at $ \sqrt{s} = $ 8 TeV | JINST 10 (2015) P02006 | CMS-JME-13-003 1411.0511 |
| 35 | J. Alwall et al. | The automated computation of tree-level and next-to-leading order differential cross sections, and their matching to parton shower simulations | JHEP 07 (2014) 079 | 1405.0301 |
| 36 | R. D. Ball et al. | Parton distributions for the LHC run II | JHEP 04 (2015) 040 | 1410.8849 |
| 37 | T. Sjostrand et al. | An introduction to PYTHIA 8.2 | CPC 191 (2015) 159 | 1410.3012 |
| 38 | CMS Collaboration | Event generator tunes obtained from underlying event and multiparton scattering measurements | EPJC 76 (2016) 155 | CMS-GEN-14-001 1512.00815 |
| 39 | A. Kalogeropoulos and J. Alwall | The SysCalc code: A tool to derive theoretical systematic uncertainties | 1801.08401 | |
| 40 | G. Bozzi et al. | Production of Drell--Yan lepton pairs in hadron collisions: Transverse-momentum resummation at next-to-next-to-leading logarithmic accuracy | PLB 696 (2011) 207 | 1007.2351 |
| 41 | GEANT4 Collaboration | GEANT4--a simulation toolkit | NIMA 506 (2003) 250 | |
| 42 | B. Fuks, M. Klasen, D. R. Lamprea, and M. Rothering | Gaugino production in proton-proton collisions at a center-of-mass energy of 8 TeV | JHEP 10 (2012) 081 | 1207.2159 |
| 43 | B. Fuks, M. Klasen, D. R. Lamprea, and M. Rothering | Precision predictions for electroweak superpartner production at hadron colliders with resummino | EPJC 73 (2013) 2480 | 1304.0790 |
| 44 | C. Borschensky et al. | Squark and gluino production cross sections in $ \textrm{pp} $ collisions at $ \sqrt{s} = $ 13, 14, 33 and 100 TeV | Eur. Phys. J C 74 (2014) 3174 | 1407.5066 |
| 45 | S. Abdullin et al. | The fast simulation of the CMS detector at LHC | J. Phys.: Conf. Ser. 331 (2011) 032049 | |
| 46 | CMS Collaboration | Search for top-squark pair production in the single-lepton final state in pp collisions at $ \sqrt{s} = $ 8 TeV | EPJC 73 (2013) 2677 | CMS-SUS-13-011 1308.1586 |
| 47 | CMS Collaboration | The CMS trigger system | JINST 12 (2017) P01020 | CMS-TRG-12-001 1609.02366 |
| 48 | Particle Data Group, C. Patrignani et al. | Review of particle physics | CPC 40 (2016) 100001 | |
| 49 | CMS Collaboration | Measurement of the inclusive W and Z production cross sections in pp collisions at $ \sqrt{s}= $ 7 TeV | JHEP 10 (2011) 132 | CMS-EWK-10-005 1107.4789 |
| 50 | CMS Collaboration | Measurement of the semileptonic $ \mathrm{t\bar{t}} $+$ \gamma $ production cross section in pp collisions at $ \sqrt{s}= $ 8 TeV | JHEP 10 (2017) 006 | CMS-TOP-14-008 1706.08128 |
| 51 | CMS Collaboration | Measurement of the $ \mathrm{t\bar{t}}$ production cross section using events in the e$ \mu $ final state in pp collisions at $ \sqrt{s}= $ 13 TeV | EPJC 77 (2017) 172 | CMS-TOP-16-005 1611.04040 |
| 52 | CMS Collaboration | Jet energy scale and resolution in the CMS experiment in pp collisions at 8 TeV | JINST 12 (2017) P02014 | CMS-JME-13-004 1607.03663 |
| 53 | CMS Collaboration | CMS luminosity measurements for the 2016 data taking period | CMS-PAS-LUM-17-001 | CMS-PAS-LUM-17-001 |
| 54 | T. Junk | Confidence level computation for combining searches with small statistics | NIMA 434 (1999) 435 | hep-ex/9902006 |
| 55 | A. L. Read | Presentation of search results: The CLs technique | JPG 28 (2002) 2693 | |
| 56 | The ATLAS Collaboration, The CMS Collaboration, The LHC Higgs Combination Group | Procedure for the LHC Higgs boson search combination in Summer 2011 | CMS-NOTE-2011-005 | |
| 57 | G. Cowan, K. Cranmer, E. Gross, and O. Vitells | Asymptotic formulae for likelihood-based tests of new physics | EPJC 71 (2011) 1554 | 1007.1727 |
|
|
Compact Muon Solenoid LHC, CERN |
|

|

|

|

|

|