

Compact Muon Solenoid
LHC, CERN
| CMS-SUS-21-001 ; CERN-EP-2022-032 | ||
| Search for direct pair production of supersymmetric partners of $\tau$ leptons in the final state with two hadronically decaying $\tau$ leptons and missing transverse momentum in proton-proton collisions at $\sqrt{s} = $ 13 TeV | ||
| CMS Collaboration | ||
| 5 July 2022 | ||
| Phys. Rev. D 108 (2023) 012011 | ||
| Abstract: A search for the direct production of a pair of $\tau$ sleptons, the supersymmetric partners of $\tau$ leptons, is presented. Each $\tau$ slepton is assumed to decay to a $\tau$ lepton and the lightest supersymmetric particle (LSP), which is assumed to be stable and to not interact in the detector, leading to an imbalance in the total reconstructed transverse momentum. The search is carried out in events identified as containing two $\tau$ leptons, each decaying to one or more hadrons and a neutrino, and significant transverse momentum imbalance. In addition to scenarios in which the $\tau$ sleptons decay promptly, the search also addresses scenarios in which the $\tau$ sleptons have sufficiently long lifetimes to give rise to nonprompt $\tau$ leptons. The data were collected in proton-proton collisions at a center-of-mass energy of 13 TeV at the CERN LHC with the CMS detector in 2016-2018, and correspond to an integrated luminosity of 138 fb$^{-1}$. No significant excess is seen with respect to standard model expectations. Upper limits on cross sections for the pair production of $\tau$ sleptons are obtained in the framework of simplified models. In a scenario in which the $\tau$ sleptons are superpartners of left-handed $\tau$ leptons, and each undergoes a prompt decay to a $\tau$ lepton and a nearly massless LSP, $\tau$ slepton masses between 115 and 340 GeV are excluded. In a scenario in which the lifetime of the $\tau$ sleptons corresponds to ${c\tau_{0}} =$ 0.1 mm, where $\tau_{0}$ represents the mean proper lifetime of the $\tau$ slepton, masses between 150 and 220 GeV are excluded. | ||
| Links: e-print arXiv:2207.02254 [hep-ex] (PDF) ; CDS record ; inSPIRE record ; HepData record ; CADI line (restricted) ; | ||
| Figures | |
png pdf |
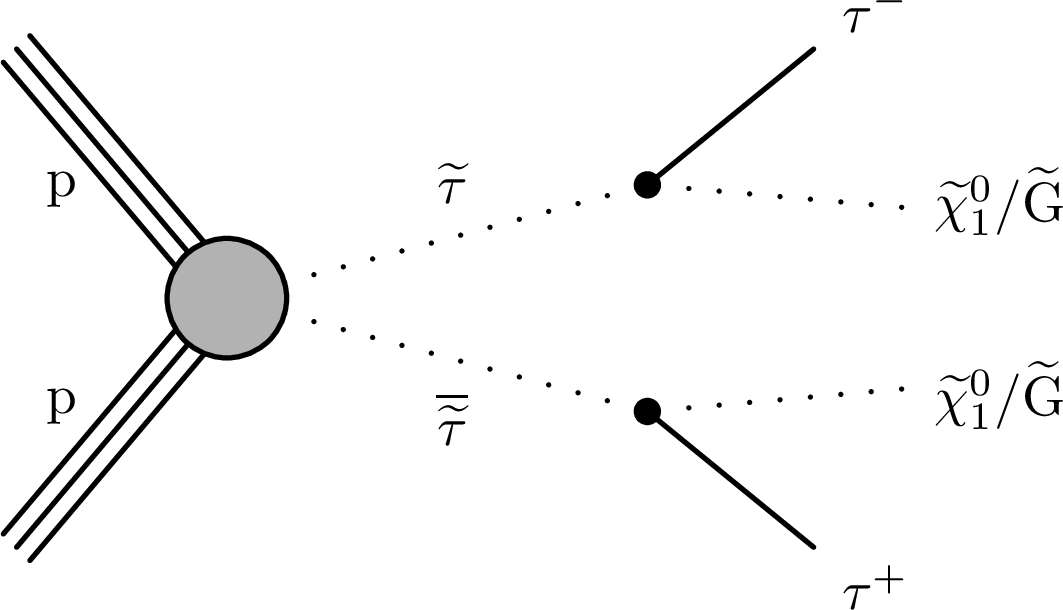
Figure 1:
Diagram for direct $\tilde{\tau}$ pair production, followed by decay of each $\tilde{\tau}$ to a $\tau$ lepton and an LSP. For models with promptly decaying $\tau$ sleptons, the LSP is assumed to be $\tilde{\chi}^0_1$, the lightest neutralino. For models with long-lived $\tau$ sleptons, it is assumed to be the gravitino, $\tilde{\mathrm{G}}$. |
png pdf |
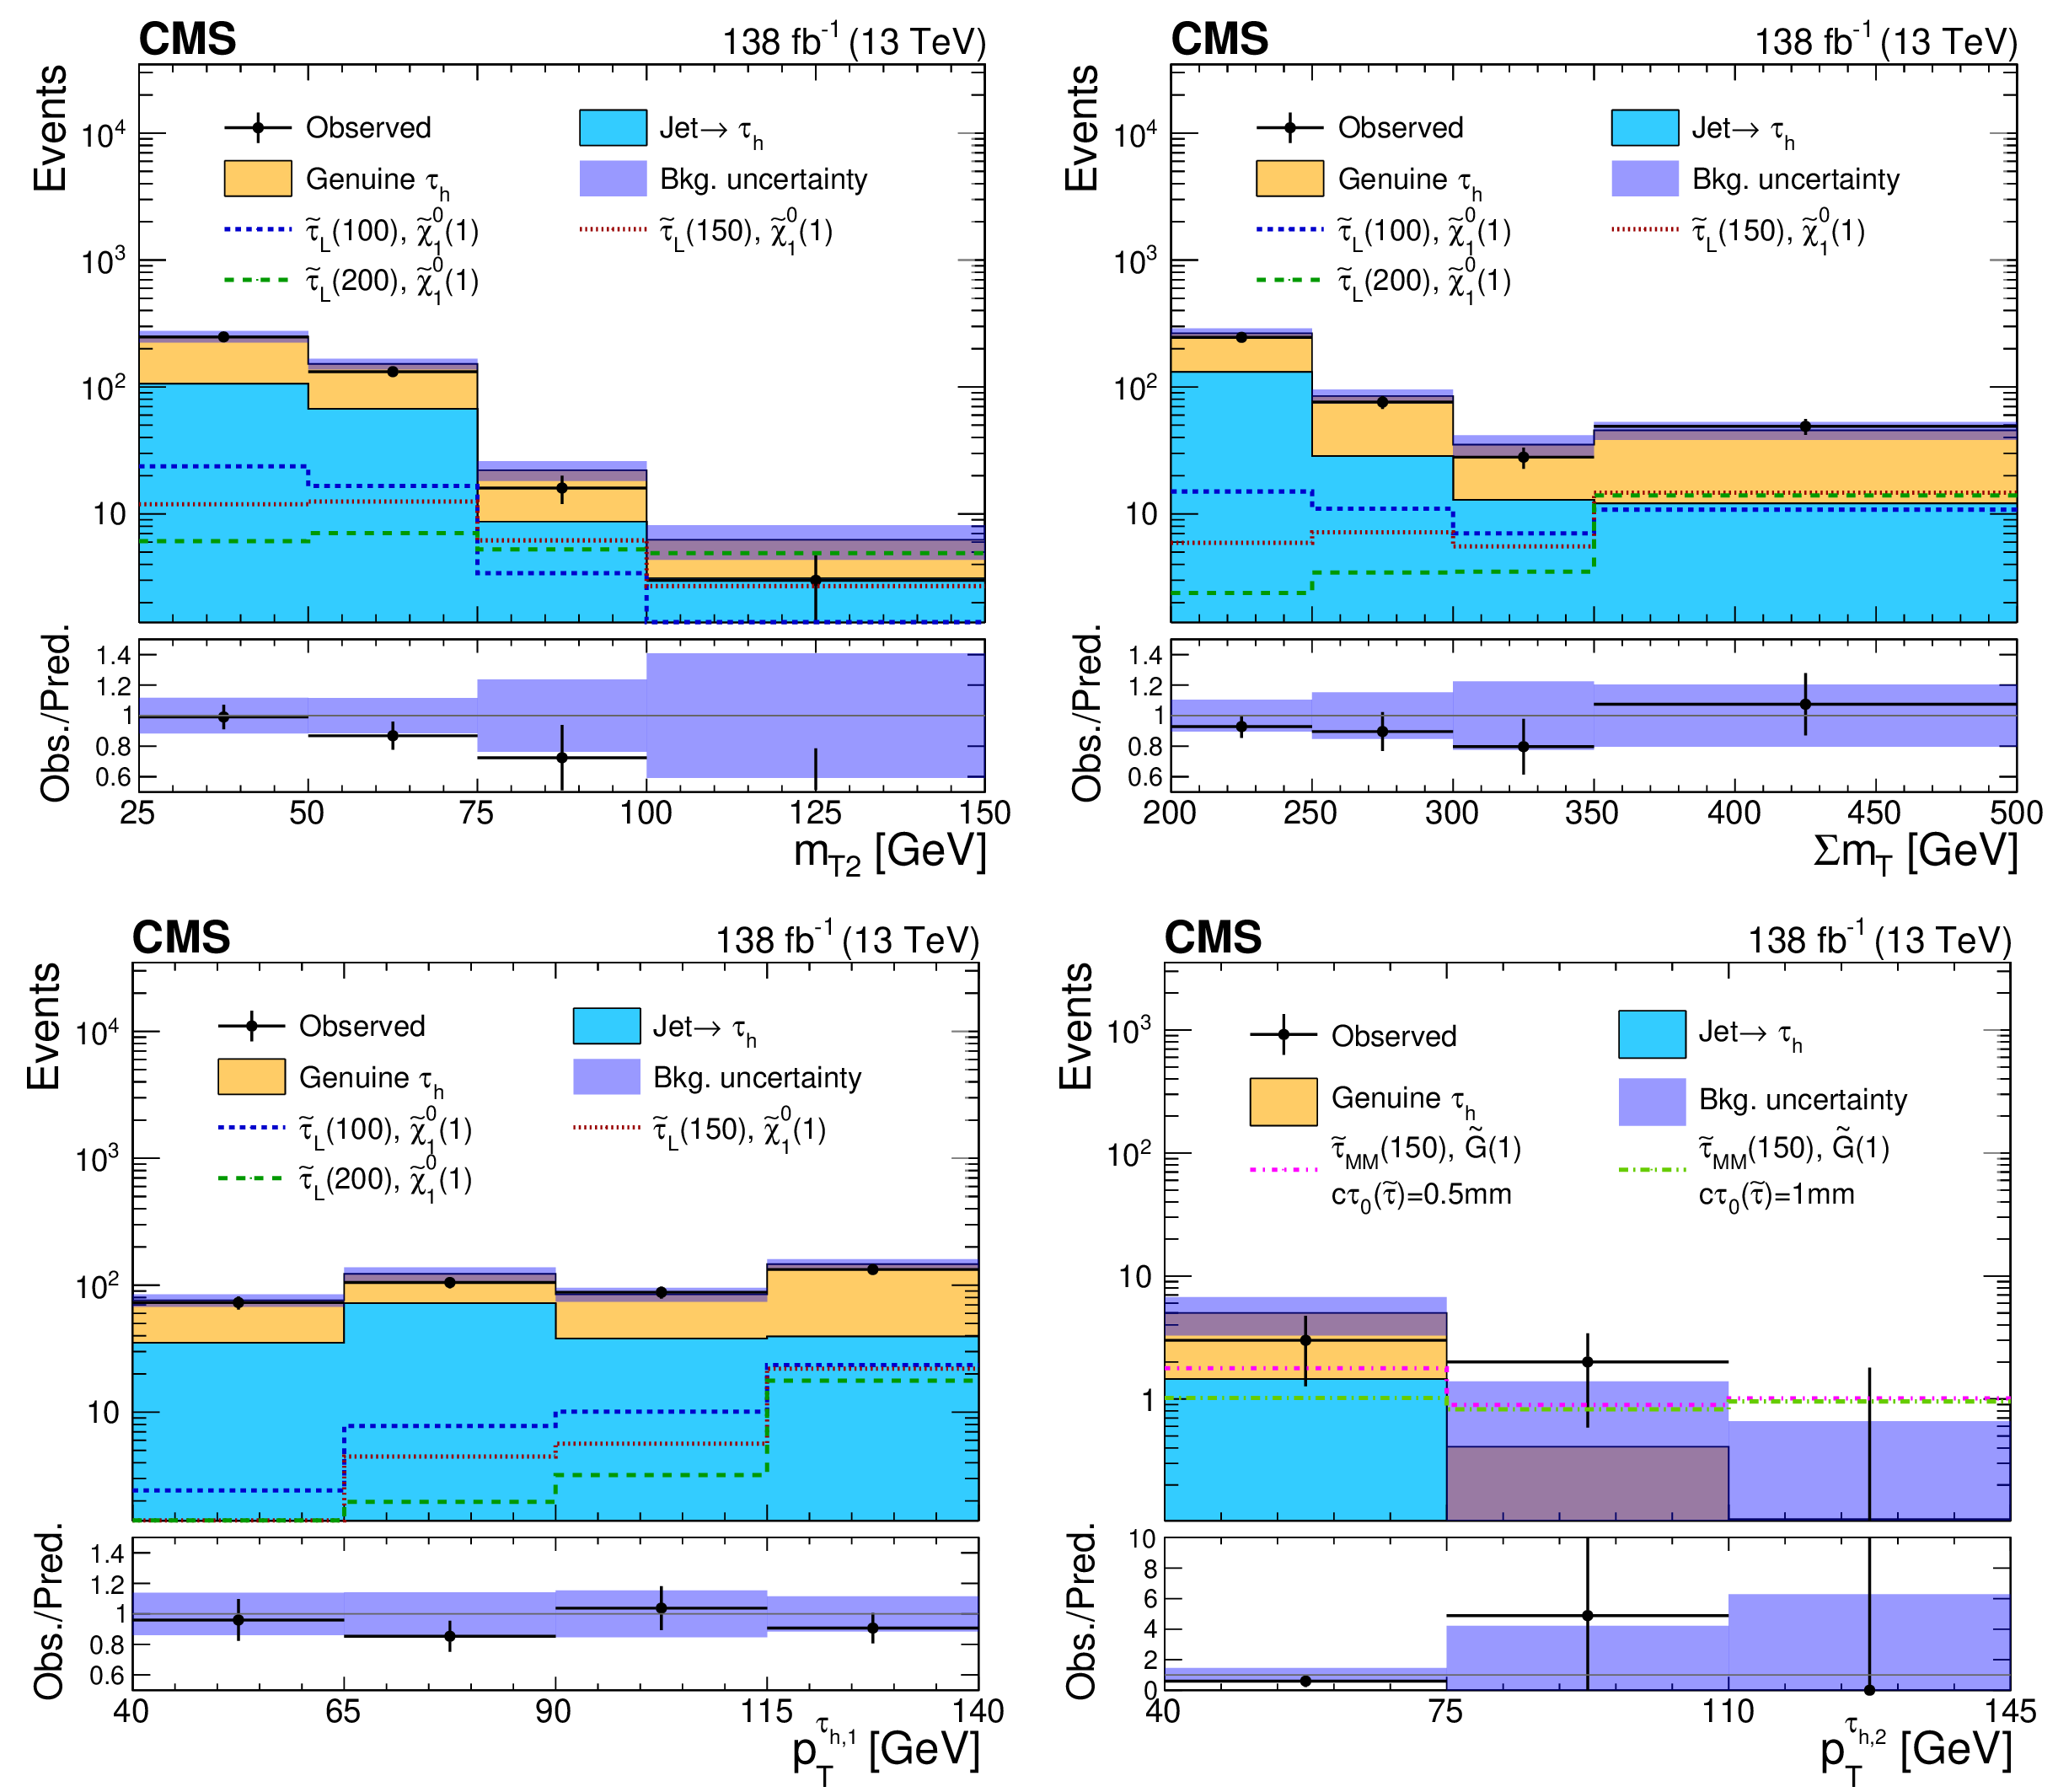
Figure 2:
Distributions of ${m_{\mathrm {T2}}}$ (upper left), ${\Sigma {m_{\mathrm {T}}}}$ (upper right), and ${{p_{\mathrm {T}}} ^{\tau _{\mathrm {h},1}}}$ (lower left) for events passing the selection criteria common to all prompt SRs, and of ${{p_{\mathrm {T}}} ^{\tau _{\mathrm {h},2}}}$ (lower right) for those passing the criteria common to all displaced SRs. The shaded band indicates the combined statistical and systematic uncertainty in the total SM background prediction. The lower panels show the ratio of the observed event counts to the total background prediction. Signal distributions are shown for benchmark models of $\tilde{\tau}$ pair production that are described in the text. The numbers in parentheses correspond to the masses of the $\tilde{\tau}$ and LSP in units of GeV for the different signal models. |
png pdf |
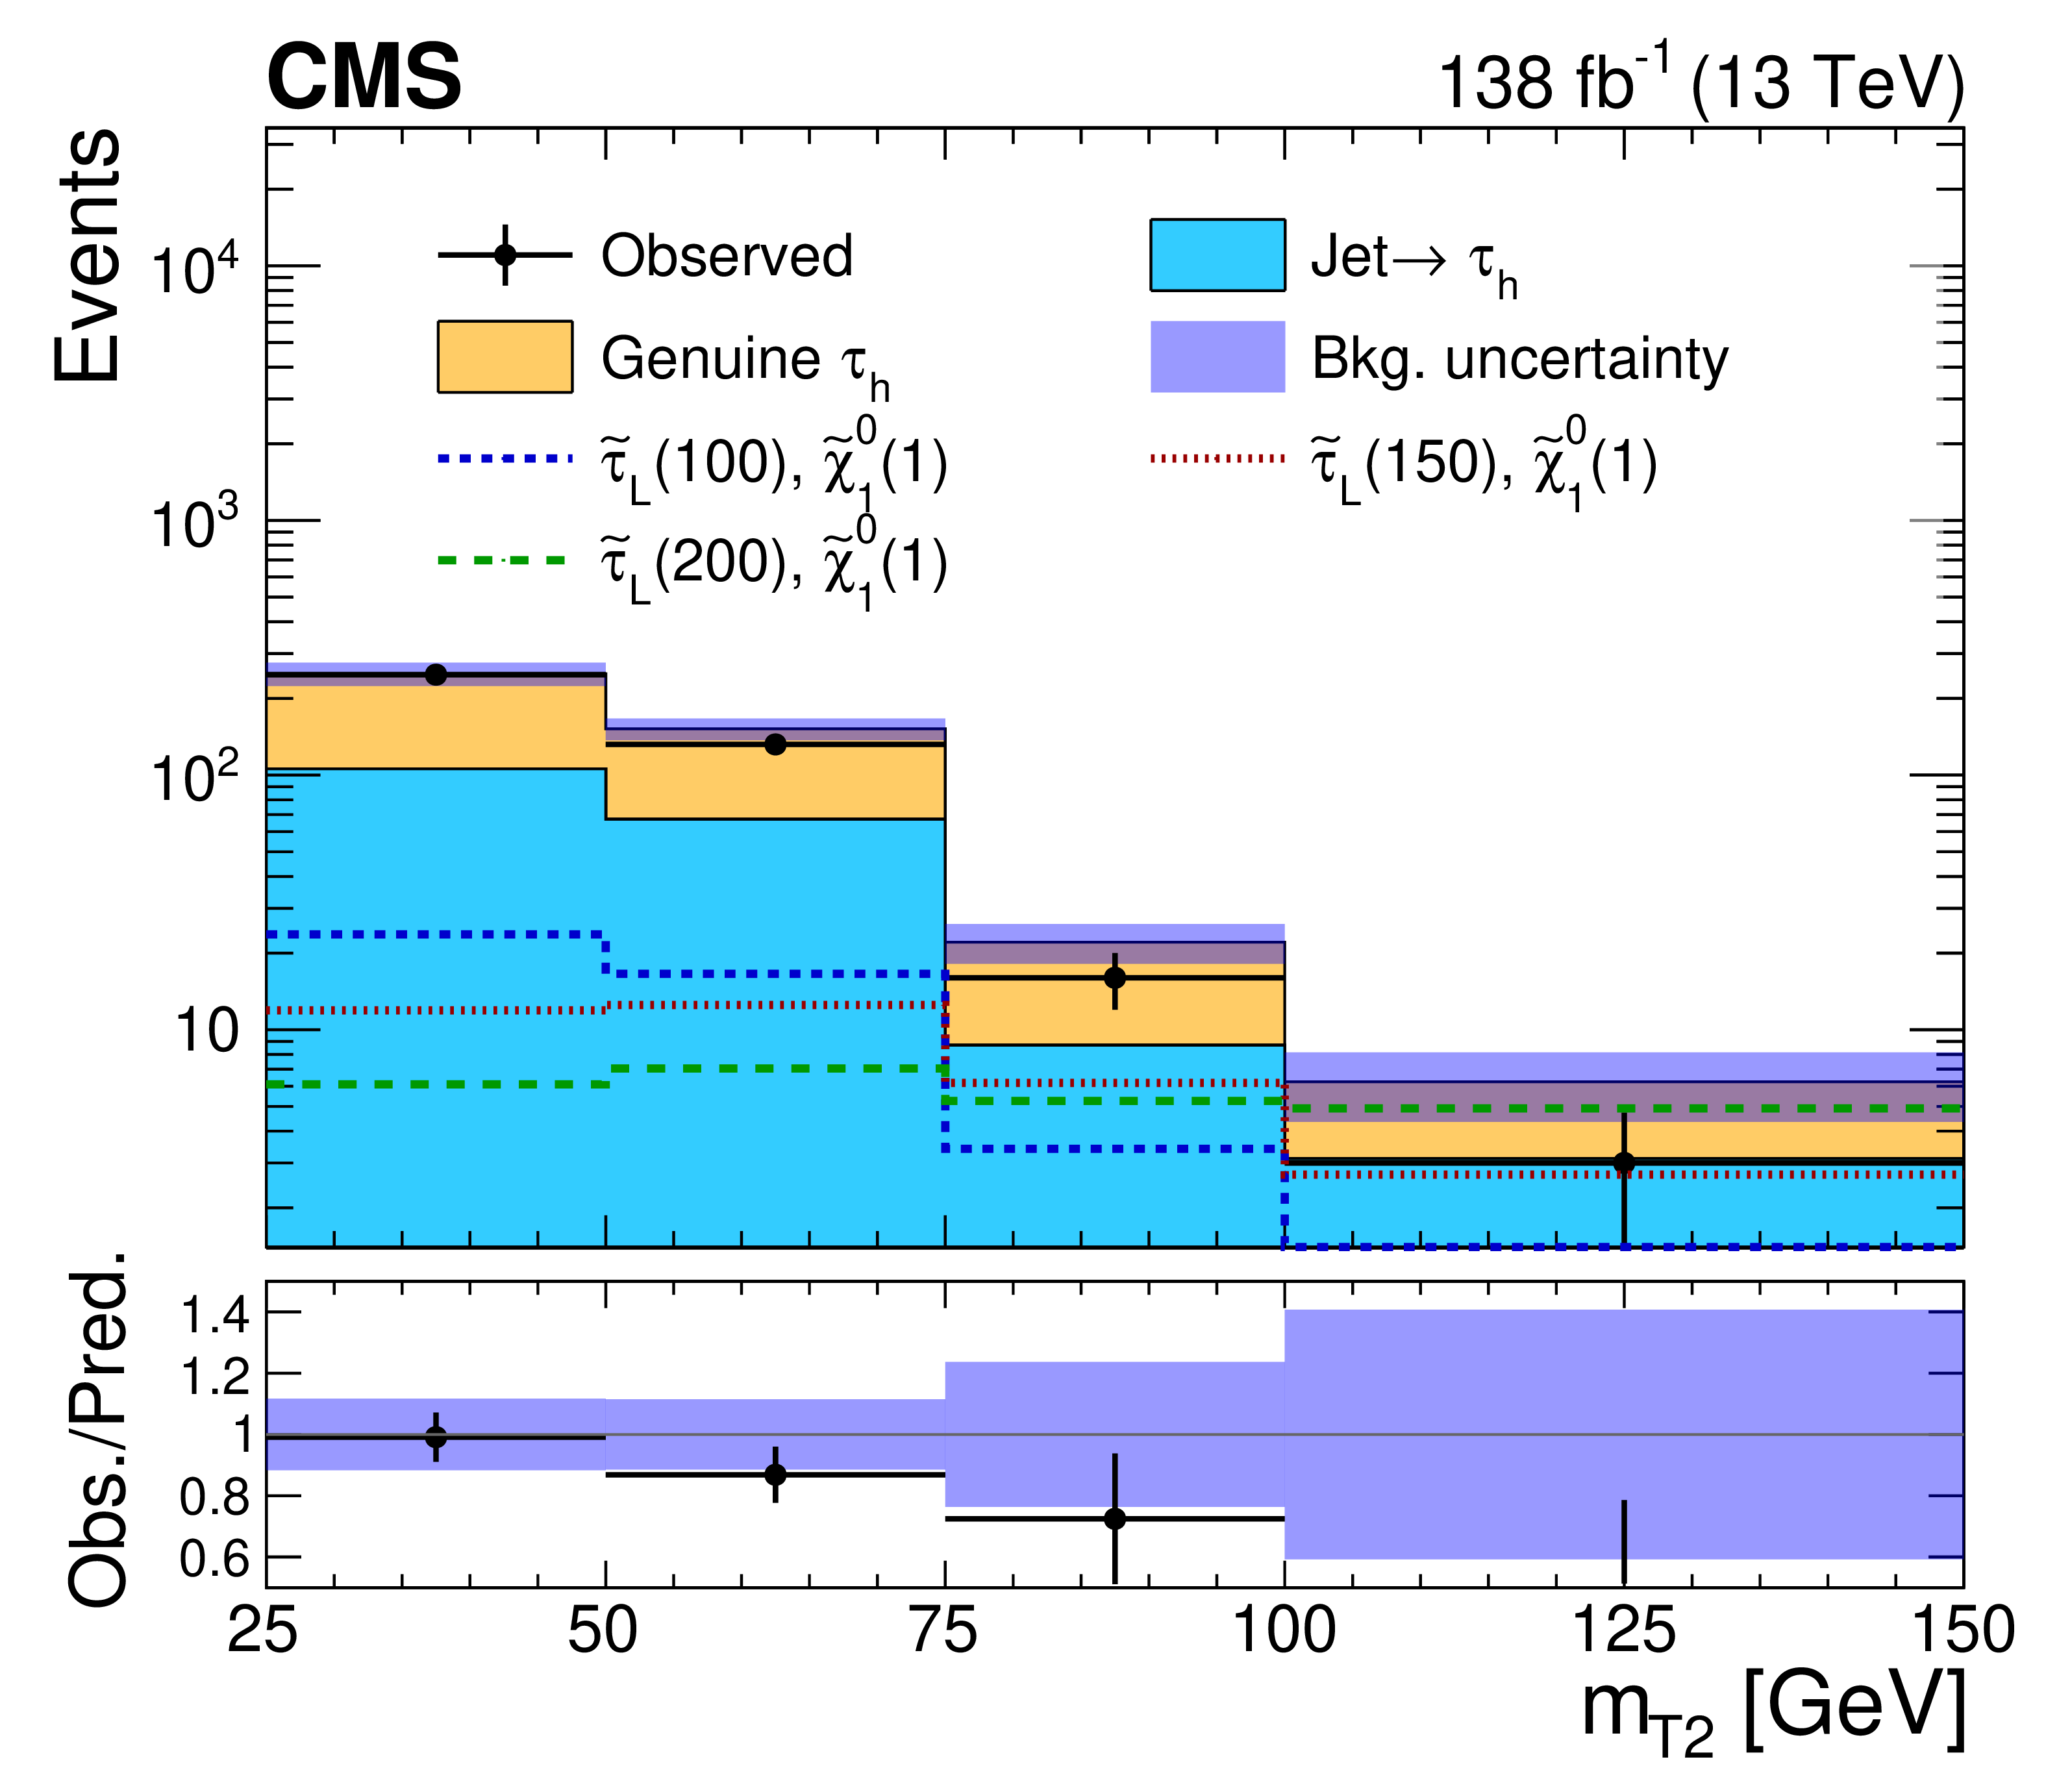
Figure 2-a:
Distribution of ${m_{\mathrm {T2}}}$ for events passing the selection criteria common to all prompt SRs. The shaded band indicates the combined statistical and systematic uncertainty in the total SM background prediction. The lower panel shows the ratio of the observed event counts to the total background prediction. Signal distributions are shown for benchmark models of $\tilde{\tau}$ pair production that are described in the text. The numbers in parentheses correspond to the masses of the $\tilde{\tau}$ and LSP in units of GeV for the different signal models. |
png pdf |
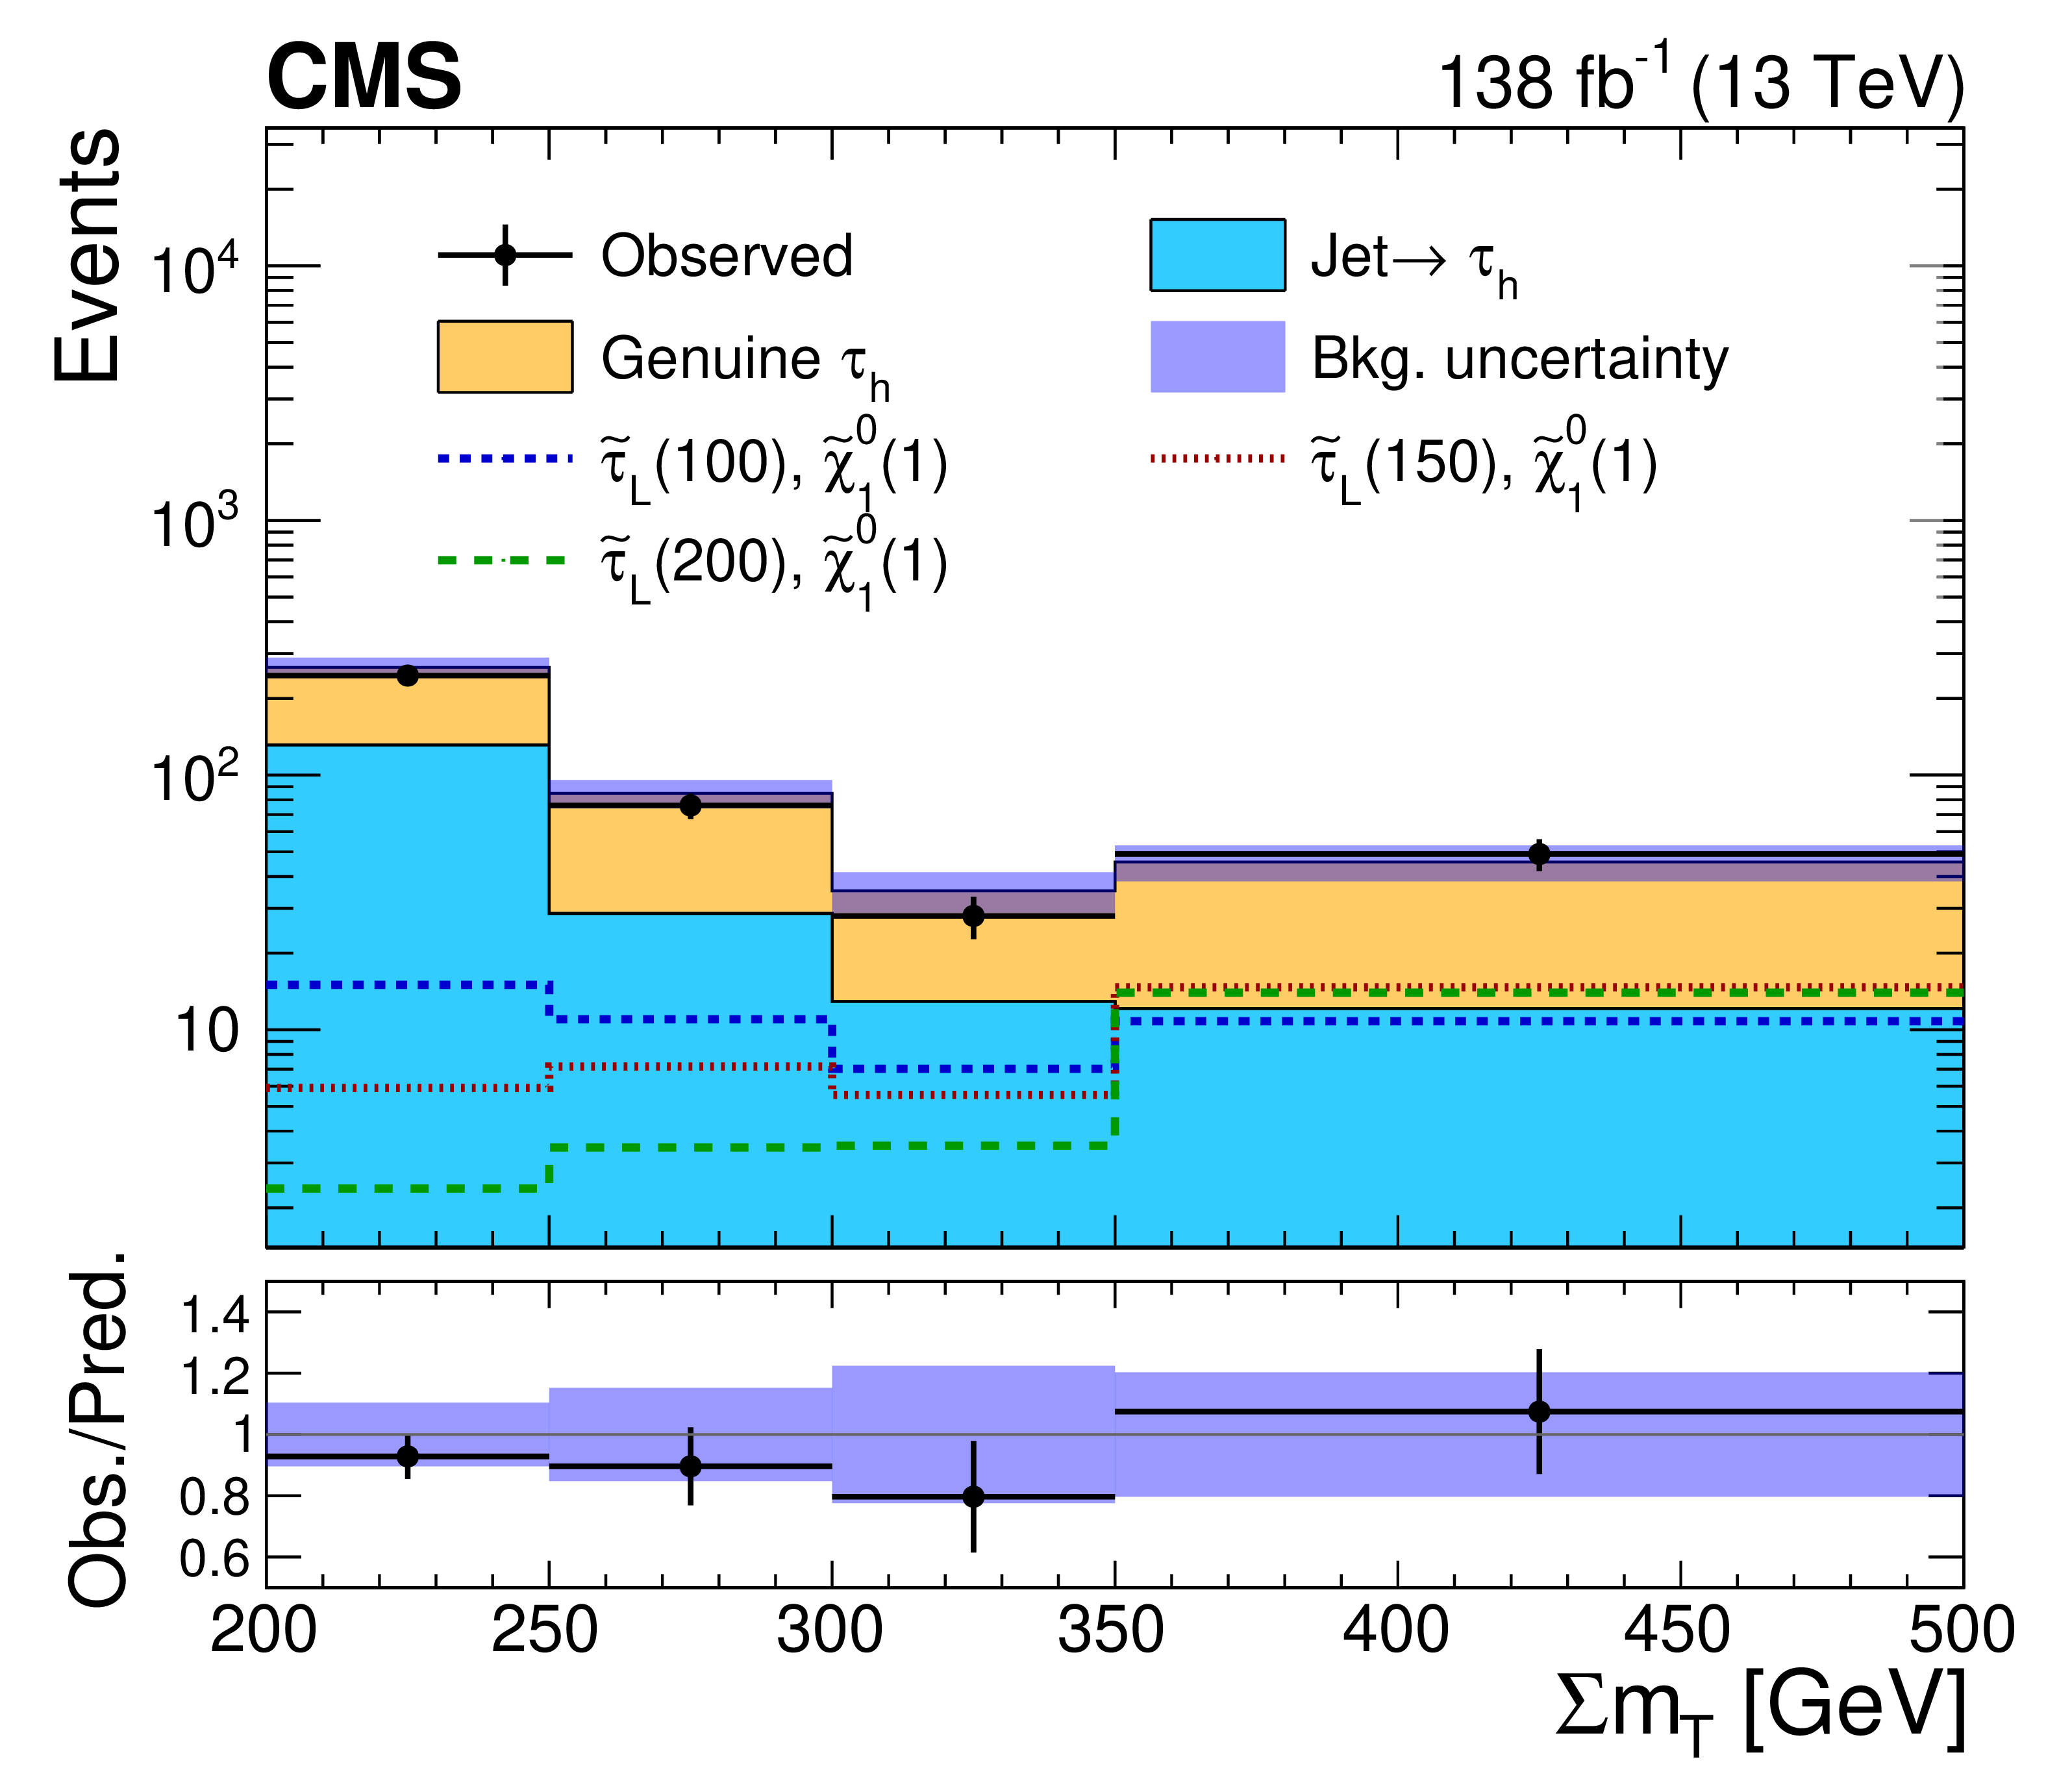
Figure 2-b:
Distribution of ${\Sigma {m_{\mathrm {T}}}}$ for events passing the selection criteria common to all prompt SRs. The shaded band indicates the combined statistical and systematic uncertainty in the total SM background prediction. The lower panel shows the ratio of the observed event counts to the total background prediction. Signal distributions are shown for benchmark models of $\tilde{\tau}$ pair production that are described in the text. The numbers in parentheses correspond to the masses of the $\tilde{\tau}$ and LSP in units of GeV for the different signal models. |
png pdf |
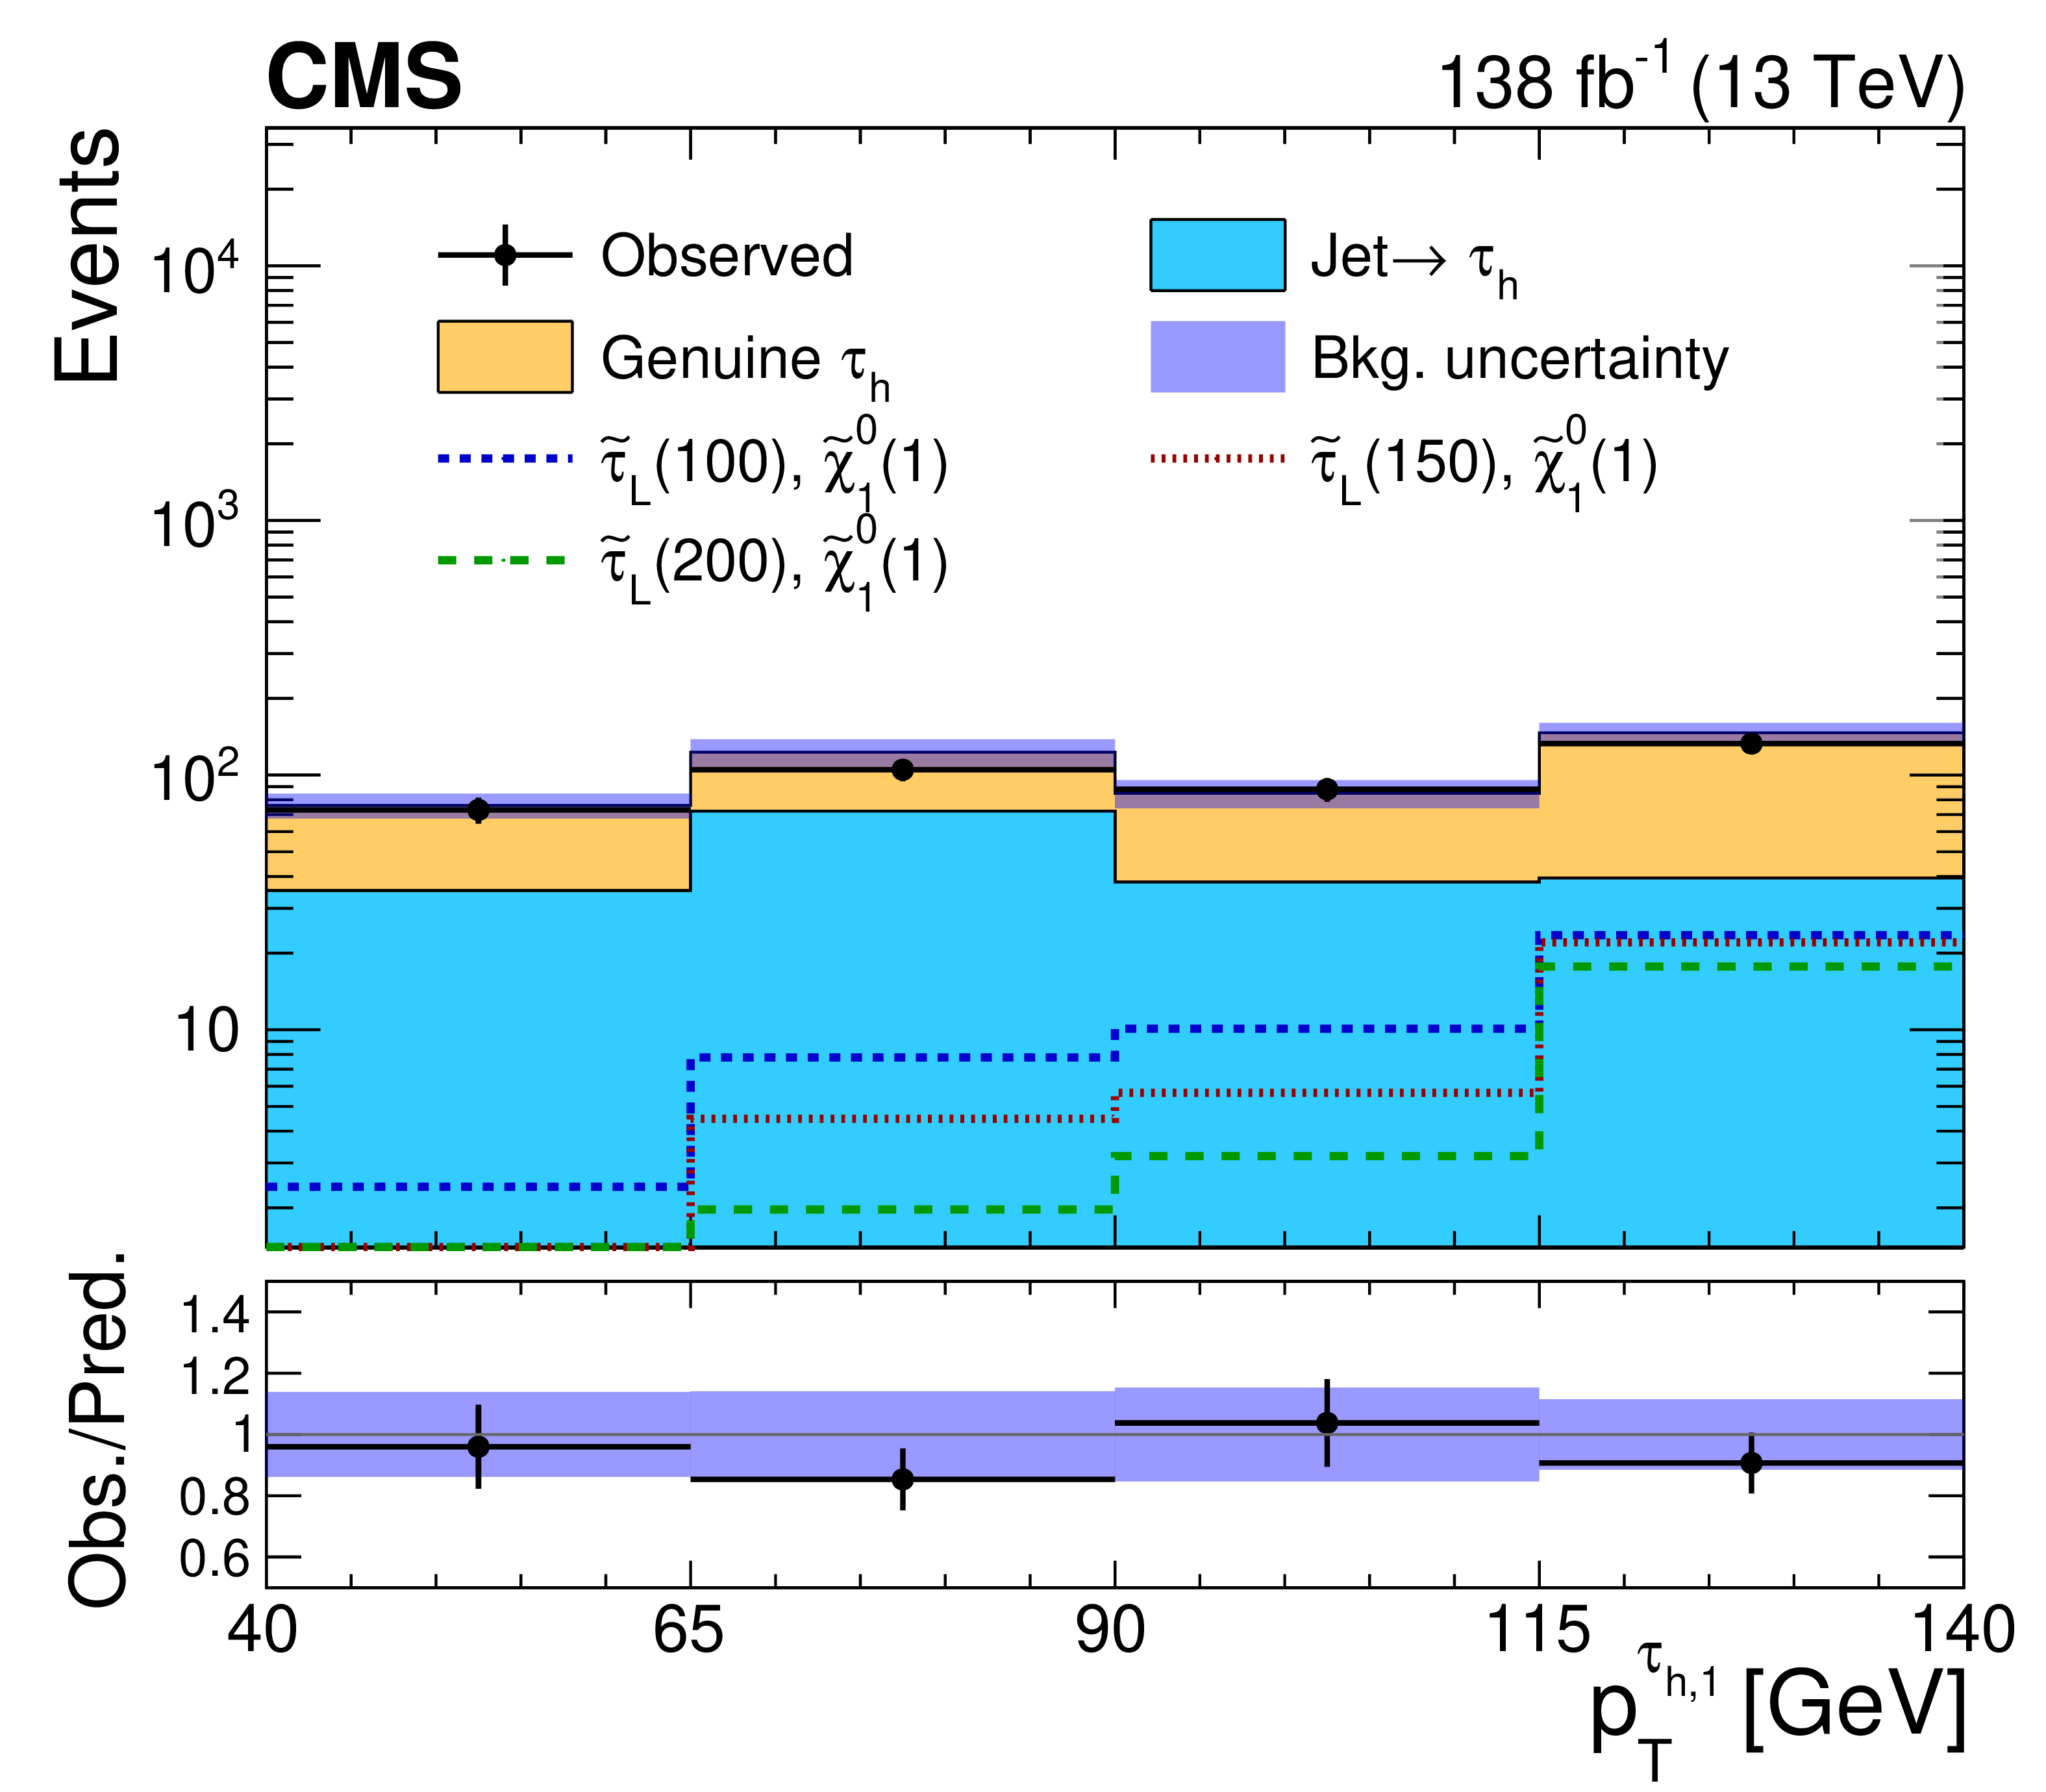
Figure 2-c:
Distribution of ${{p_{\mathrm {T}}} ^{\tau _{\mathrm {h},1}}}$ for events passing the selection criteria common to all prompt SRs. The shaded band indicates the combined statistical and systematic uncertainty in the total SM background prediction. The lower panel shows the ratio of the observed event counts to the total background prediction. Signal distributions are shown for benchmark models of $\tilde{\tau}$ pair production that are described in the text. The numbers in parentheses correspond to the masses of the $\tilde{\tau}$ and LSP in units of GeV for the different signal models. |
png pdf |
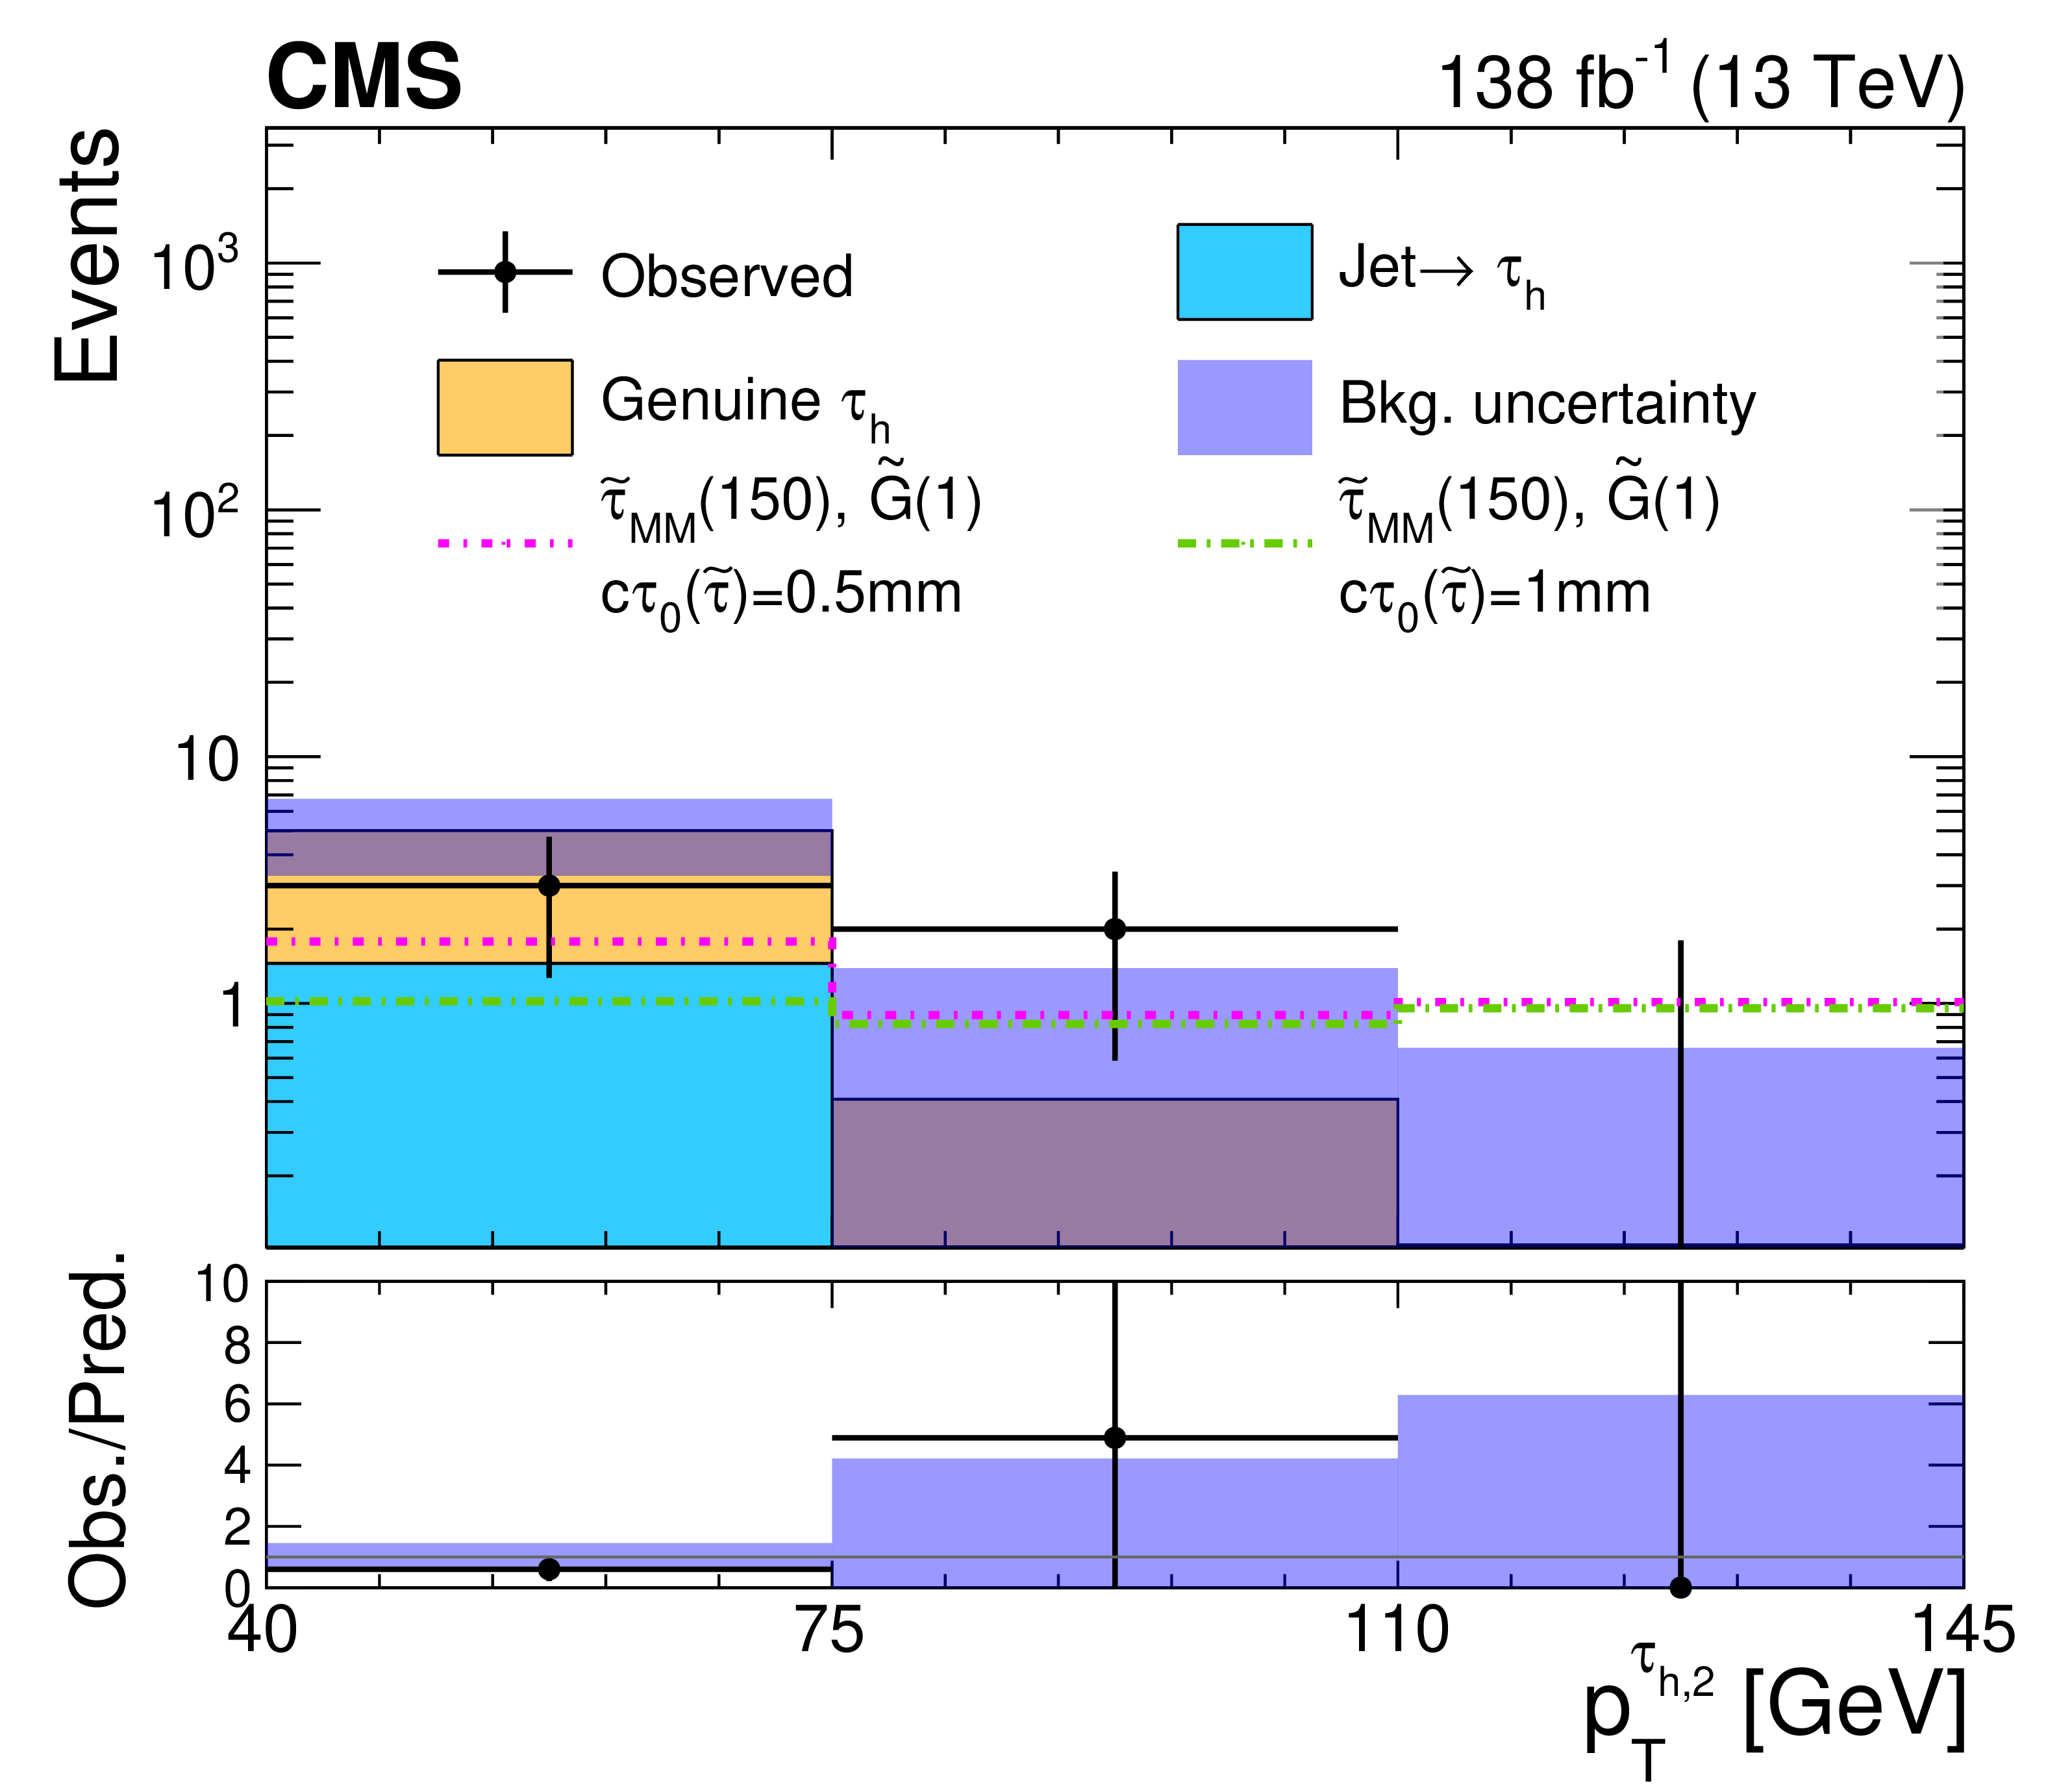
Figure 2-d:
Distribution of ${{p_{\mathrm {T}}} ^{\tau _{\mathrm {h},2}}}$ for events passing the selection criteria common to all displaced SRs. The shaded band indicates the combined statistical and systematic uncertainty in the total SM background prediction. The lower panel shows the ratio of the observed event counts to the total background prediction. Signal distributions are shown for benchmark models of $\tilde{\tau}$ pair production that are described in the text. The numbers in parentheses correspond to the masses of the $\tilde{\tau}$ and LSP in units of GeV for the different signal models. |

png pdf |
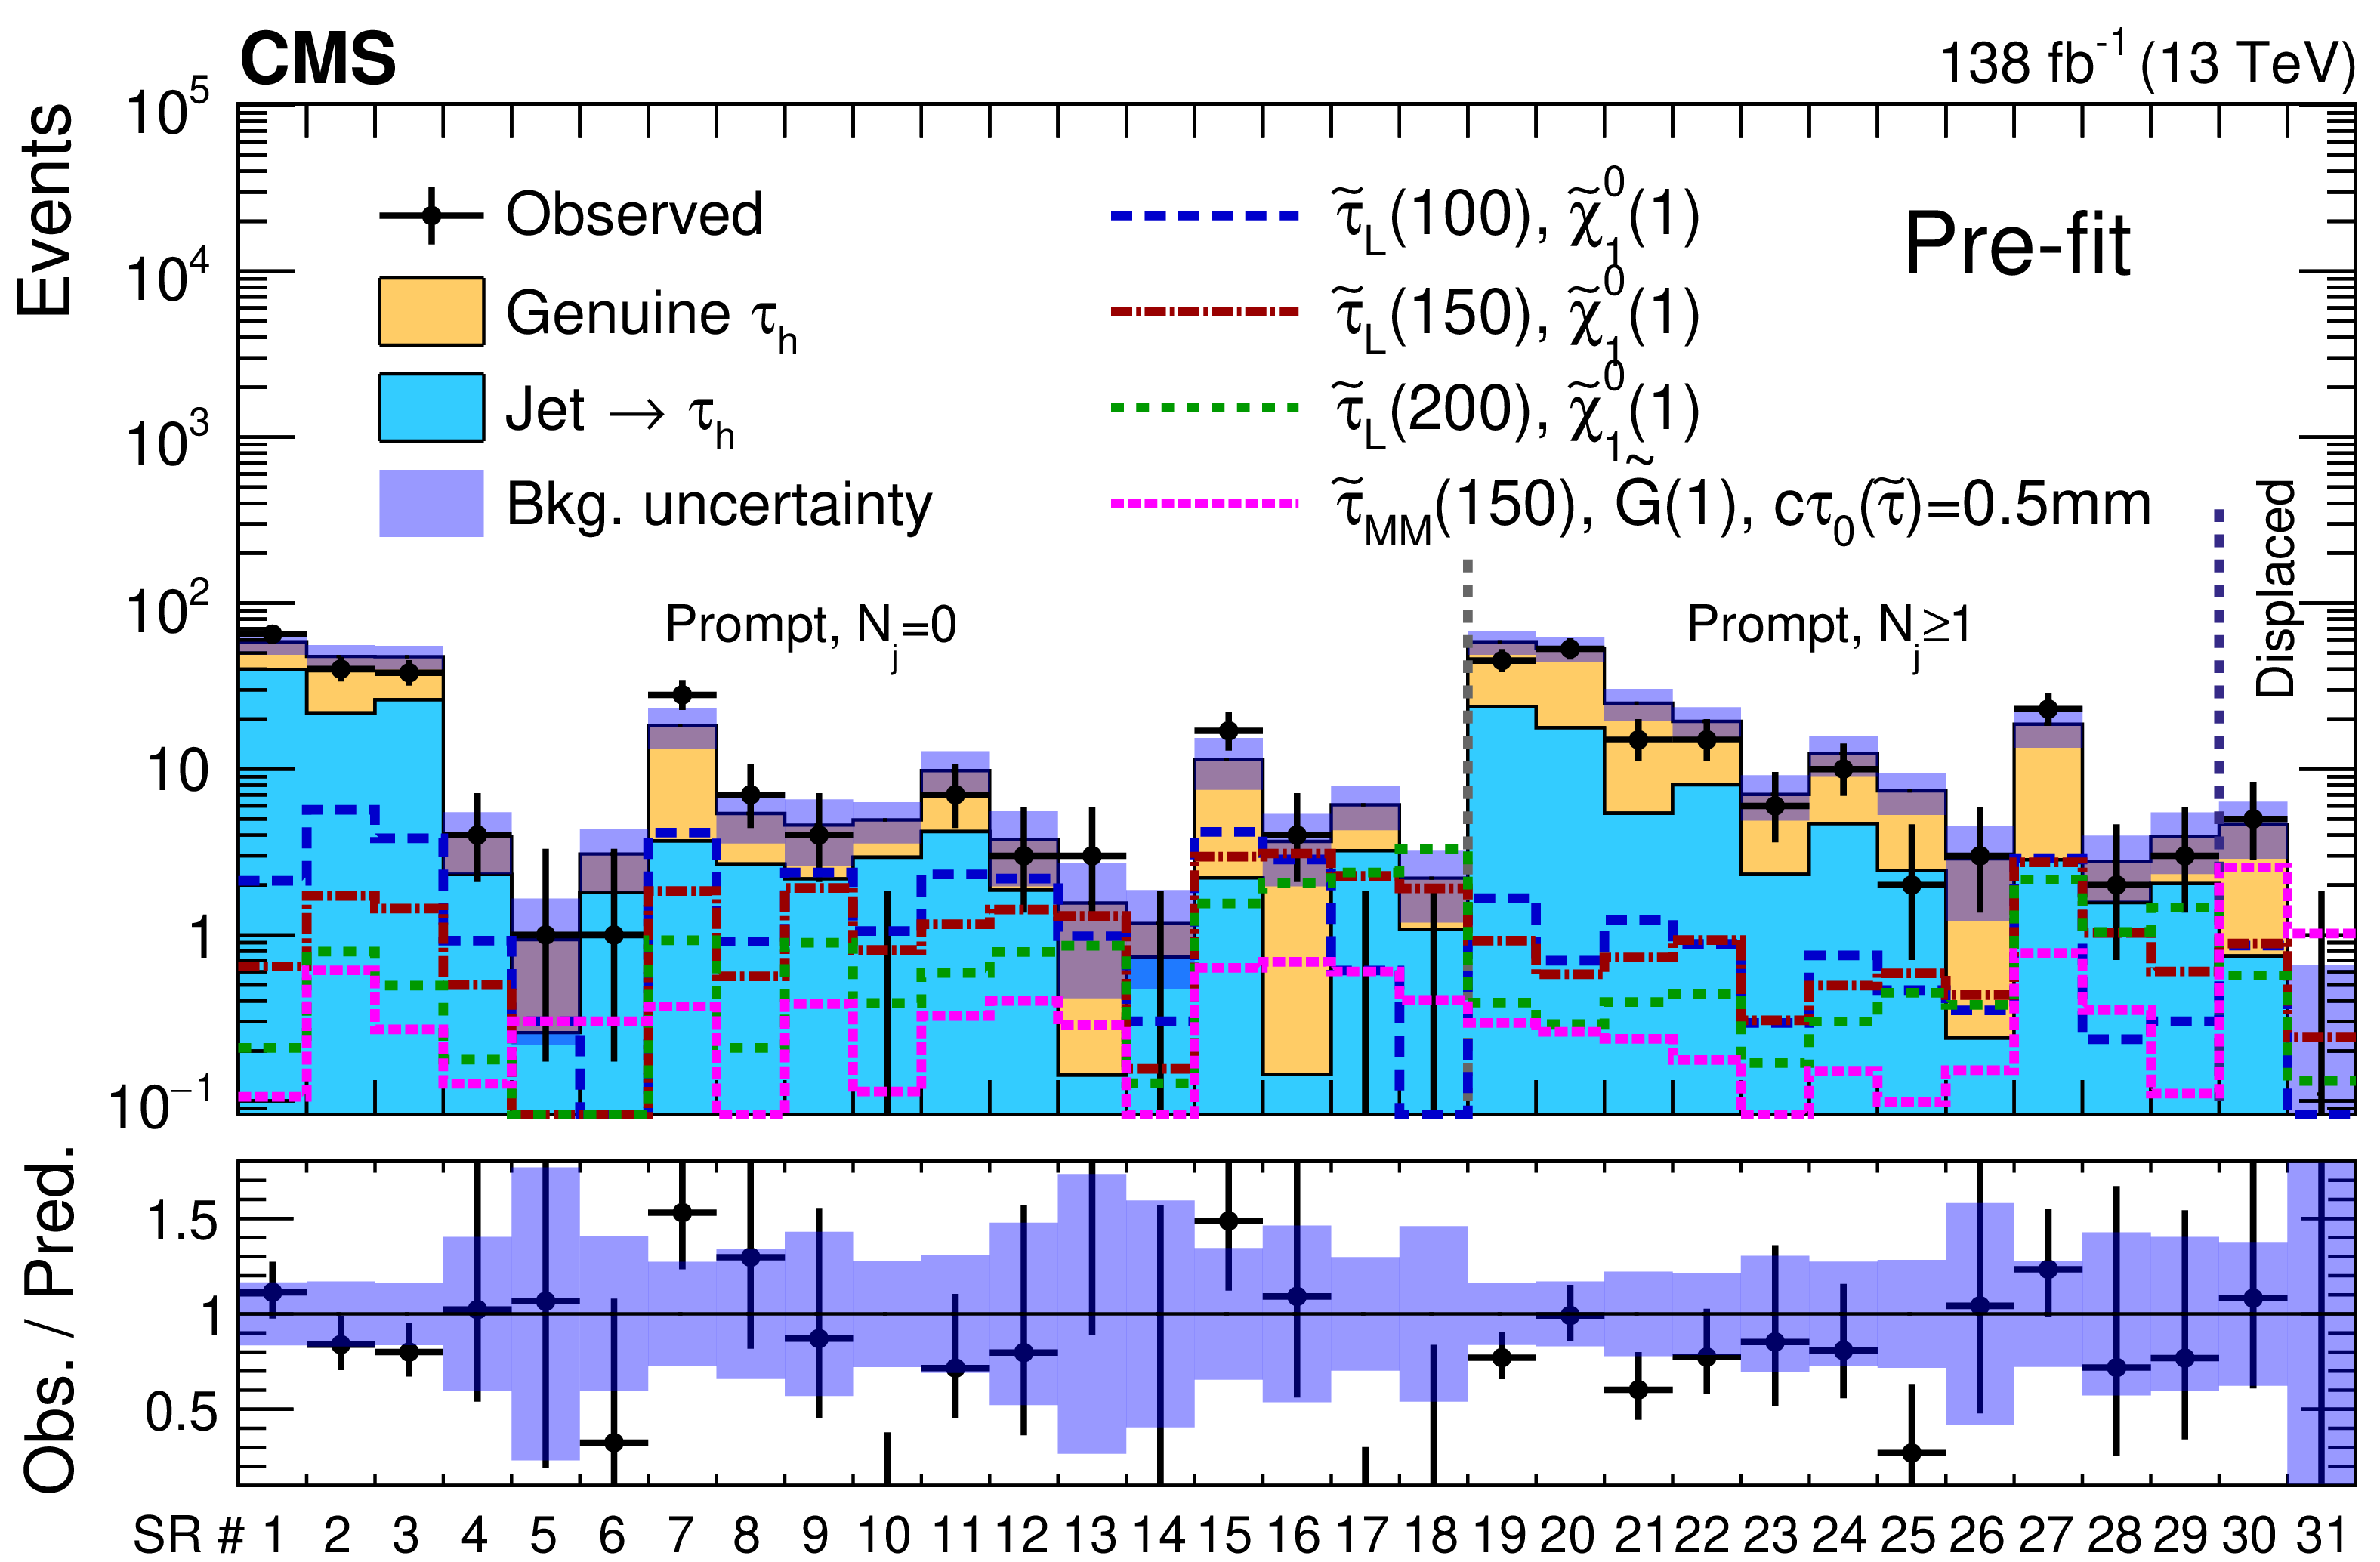
Figure 3:
Event counts and predicted yields in each SR for the SM background before (upper) and after (lower) a maximum likelihood fit to the data under the background-only hypothesis. The yields expected for 3 benchmark models of left-handed $\tilde{\tau}$ pair production assuming prompt $\tilde{\tau}$ decays, and one model of long-lived $\tilde{\tau}$ pair production in the maximally mixed scenario ($\tilde{\tau} _{\text {MM}}$) are overlaid in the pre-fit case. The numbers in parentheses correspond to the masses of the $\tilde{\tau}$ and LSP in units of GeV for the different signal models. The lower panels show the ratio of the observed event counts to the total SM background prediction. The first 29 bins correspond to the prompt SRs, while bins 30 and 31 correspond to the displaced SRs, as labeled in Table 1. |
png pdf |
Figure 3-a:
Event counts and predicted yields in each SR for the SM background before a maximum likelihood fit to the data under the background-only hypothesis. The yields expected for 3 benchmark models of left-handed $\tilde{\tau}$ pair production assuming prompt $\tilde{\tau}$ decays, and one model of long-lived $\tilde{\tau}$ pair production in the maximally mixed scenario ($\tilde{\tau} _{\text {MM}}$) are overlaid in the pre-fit case. The numbers in parentheses correspond to the masses of the $\tilde{\tau}$ and LSP in units of GeV for the different signal models. The lower panel shows the ratio of the observed event counts to the total SM background prediction. The first 29 bins correspond to the prompt SRs, while bins 30 and 31 correspond to the displaced SRs, as labeled in Table 1. |

png pdf |
Figure 3-b:
Event counts and predicted yields in each SR for the SM background after a maximum likelihood fit to the data under the background-only hypothesis. The yields expected for 3 benchmark models of left-handed $\tilde{\tau}$ pair production assuming prompt $\tilde{\tau}$ decays, and one model of long-lived $\tilde{\tau}$ pair production in the maximally mixed scenario ($\tilde{\tau} _{\text {MM}}$) are overlaid in the pre-fit case. The numbers in parentheses correspond to the masses of the $\tilde{\tau}$ and LSP in units of GeV for the different signal models. The lower panel shows the ratio of the observed event counts to the total SM background prediction. The first 29 bins correspond to the prompt SRs, while bins 30 and 31 correspond to the displaced SRs, as labeled in Table 1. |
png pdf |
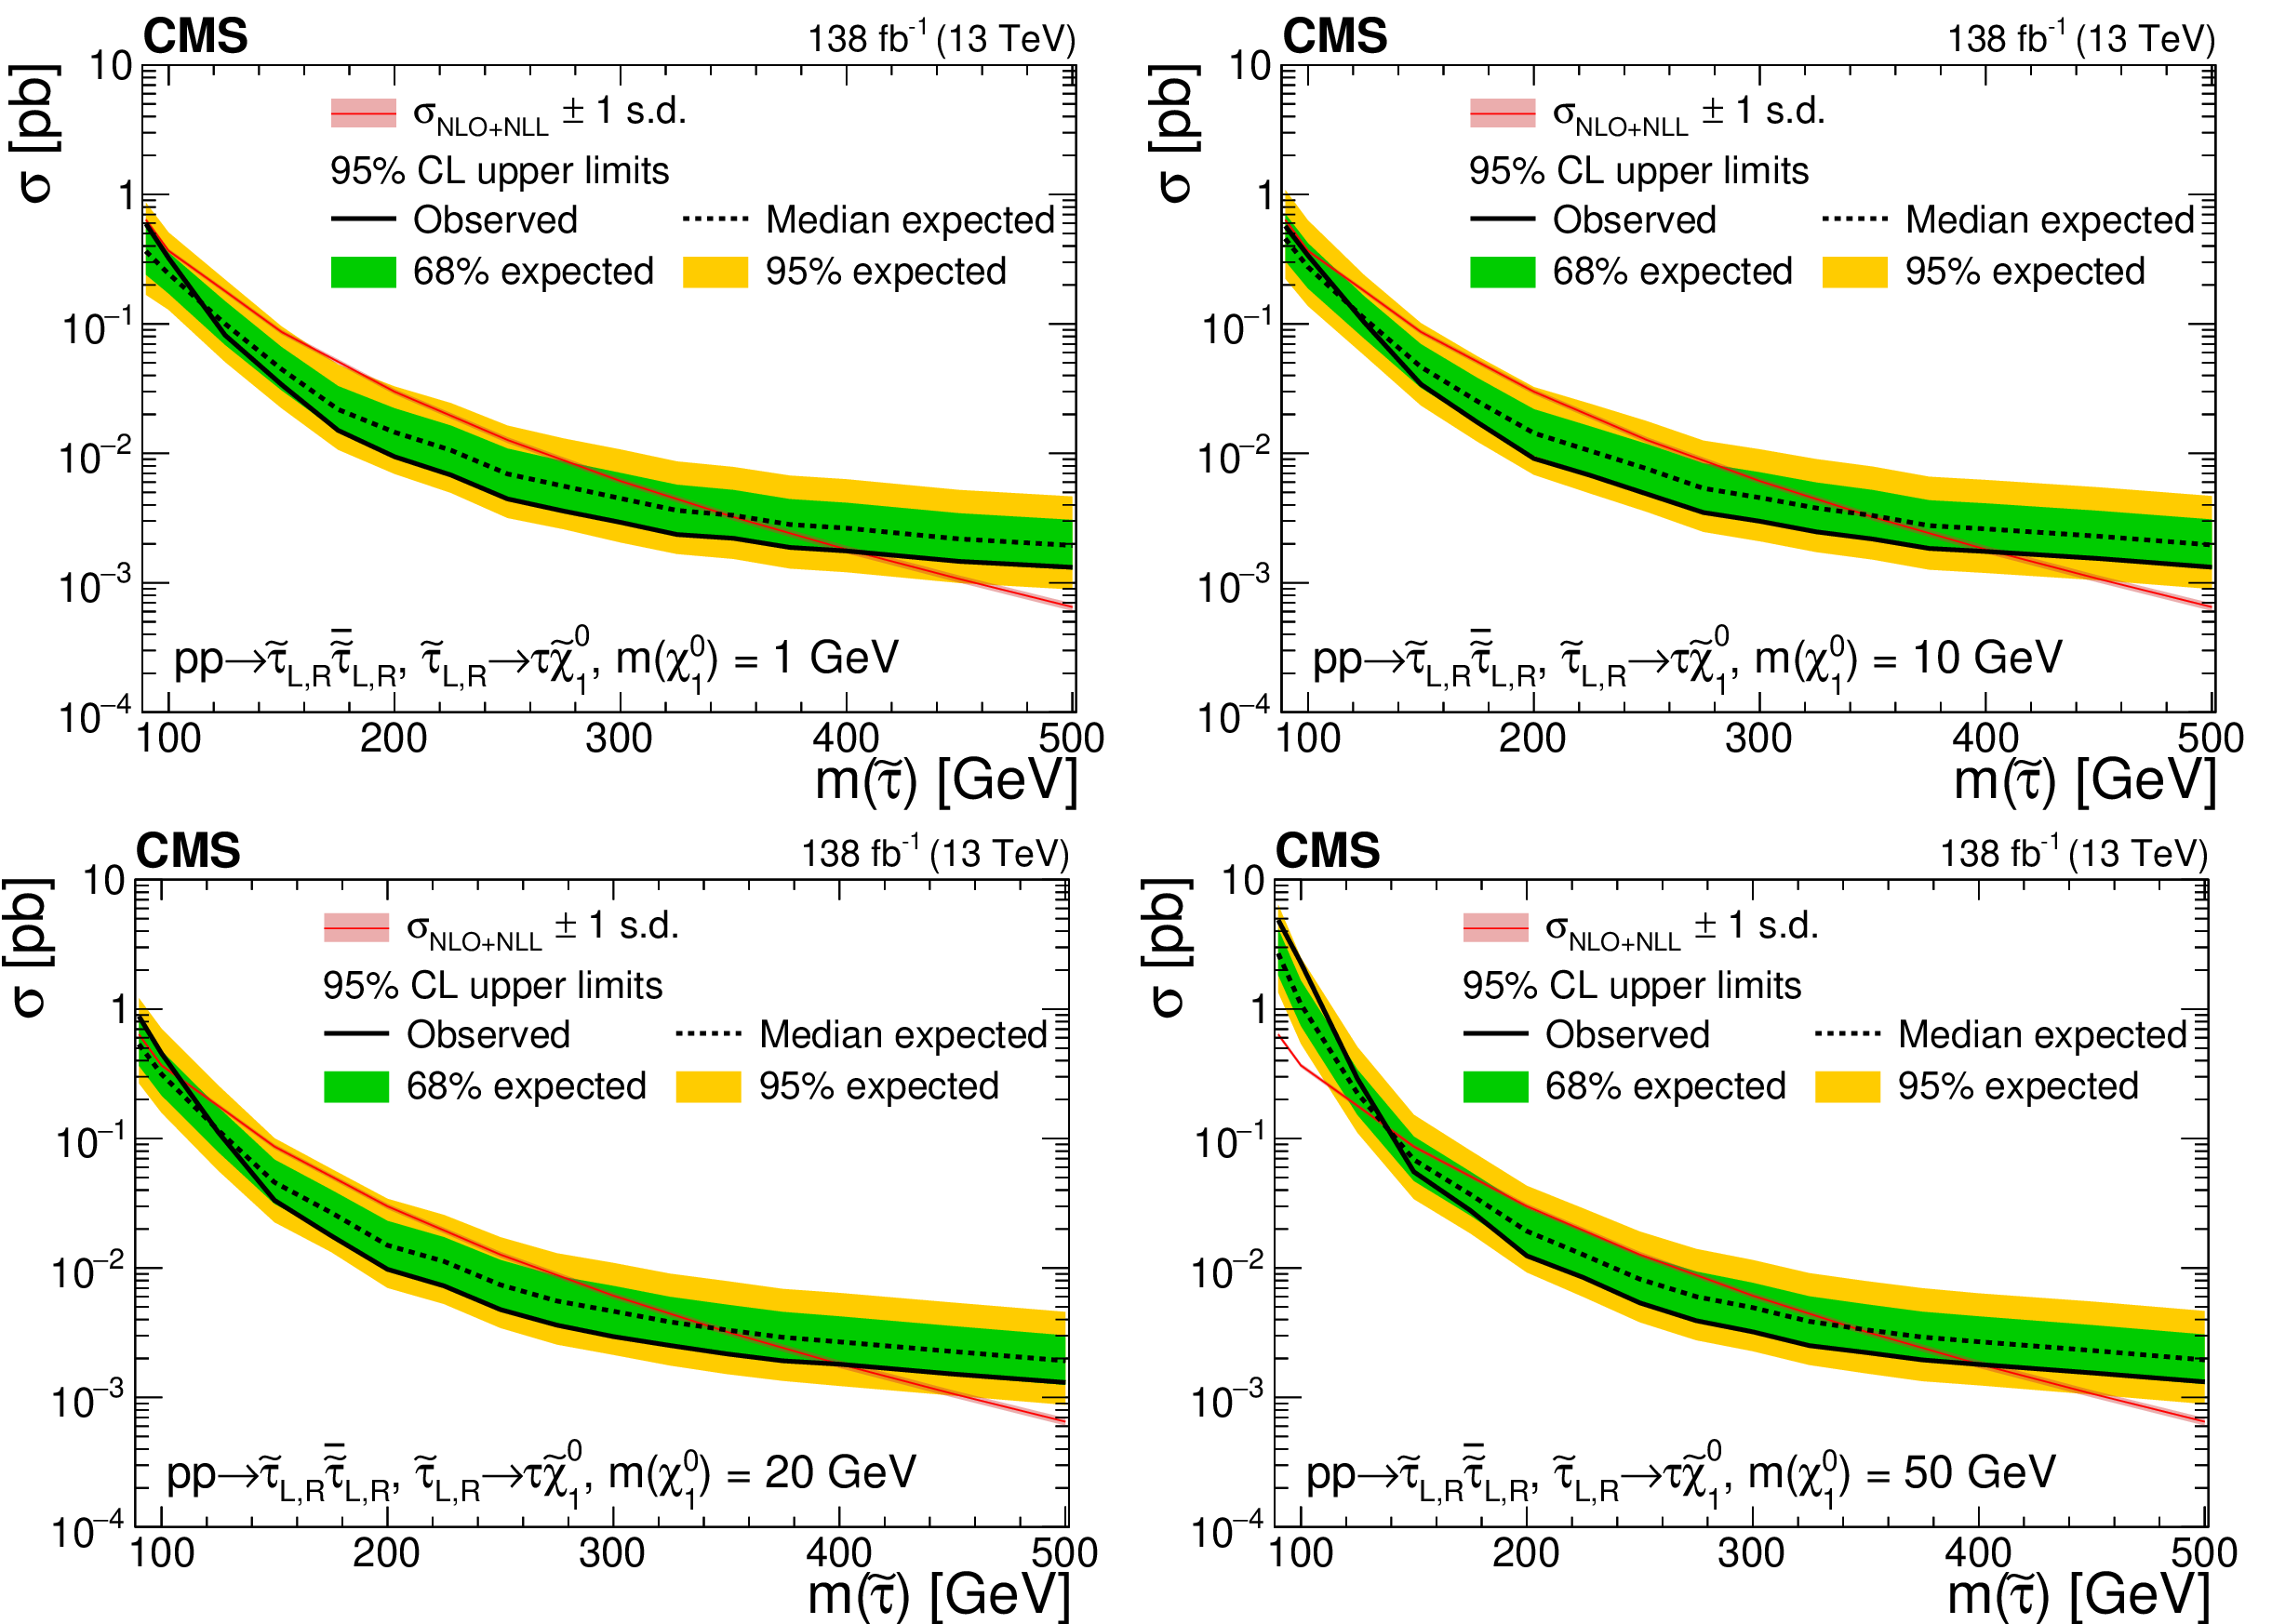
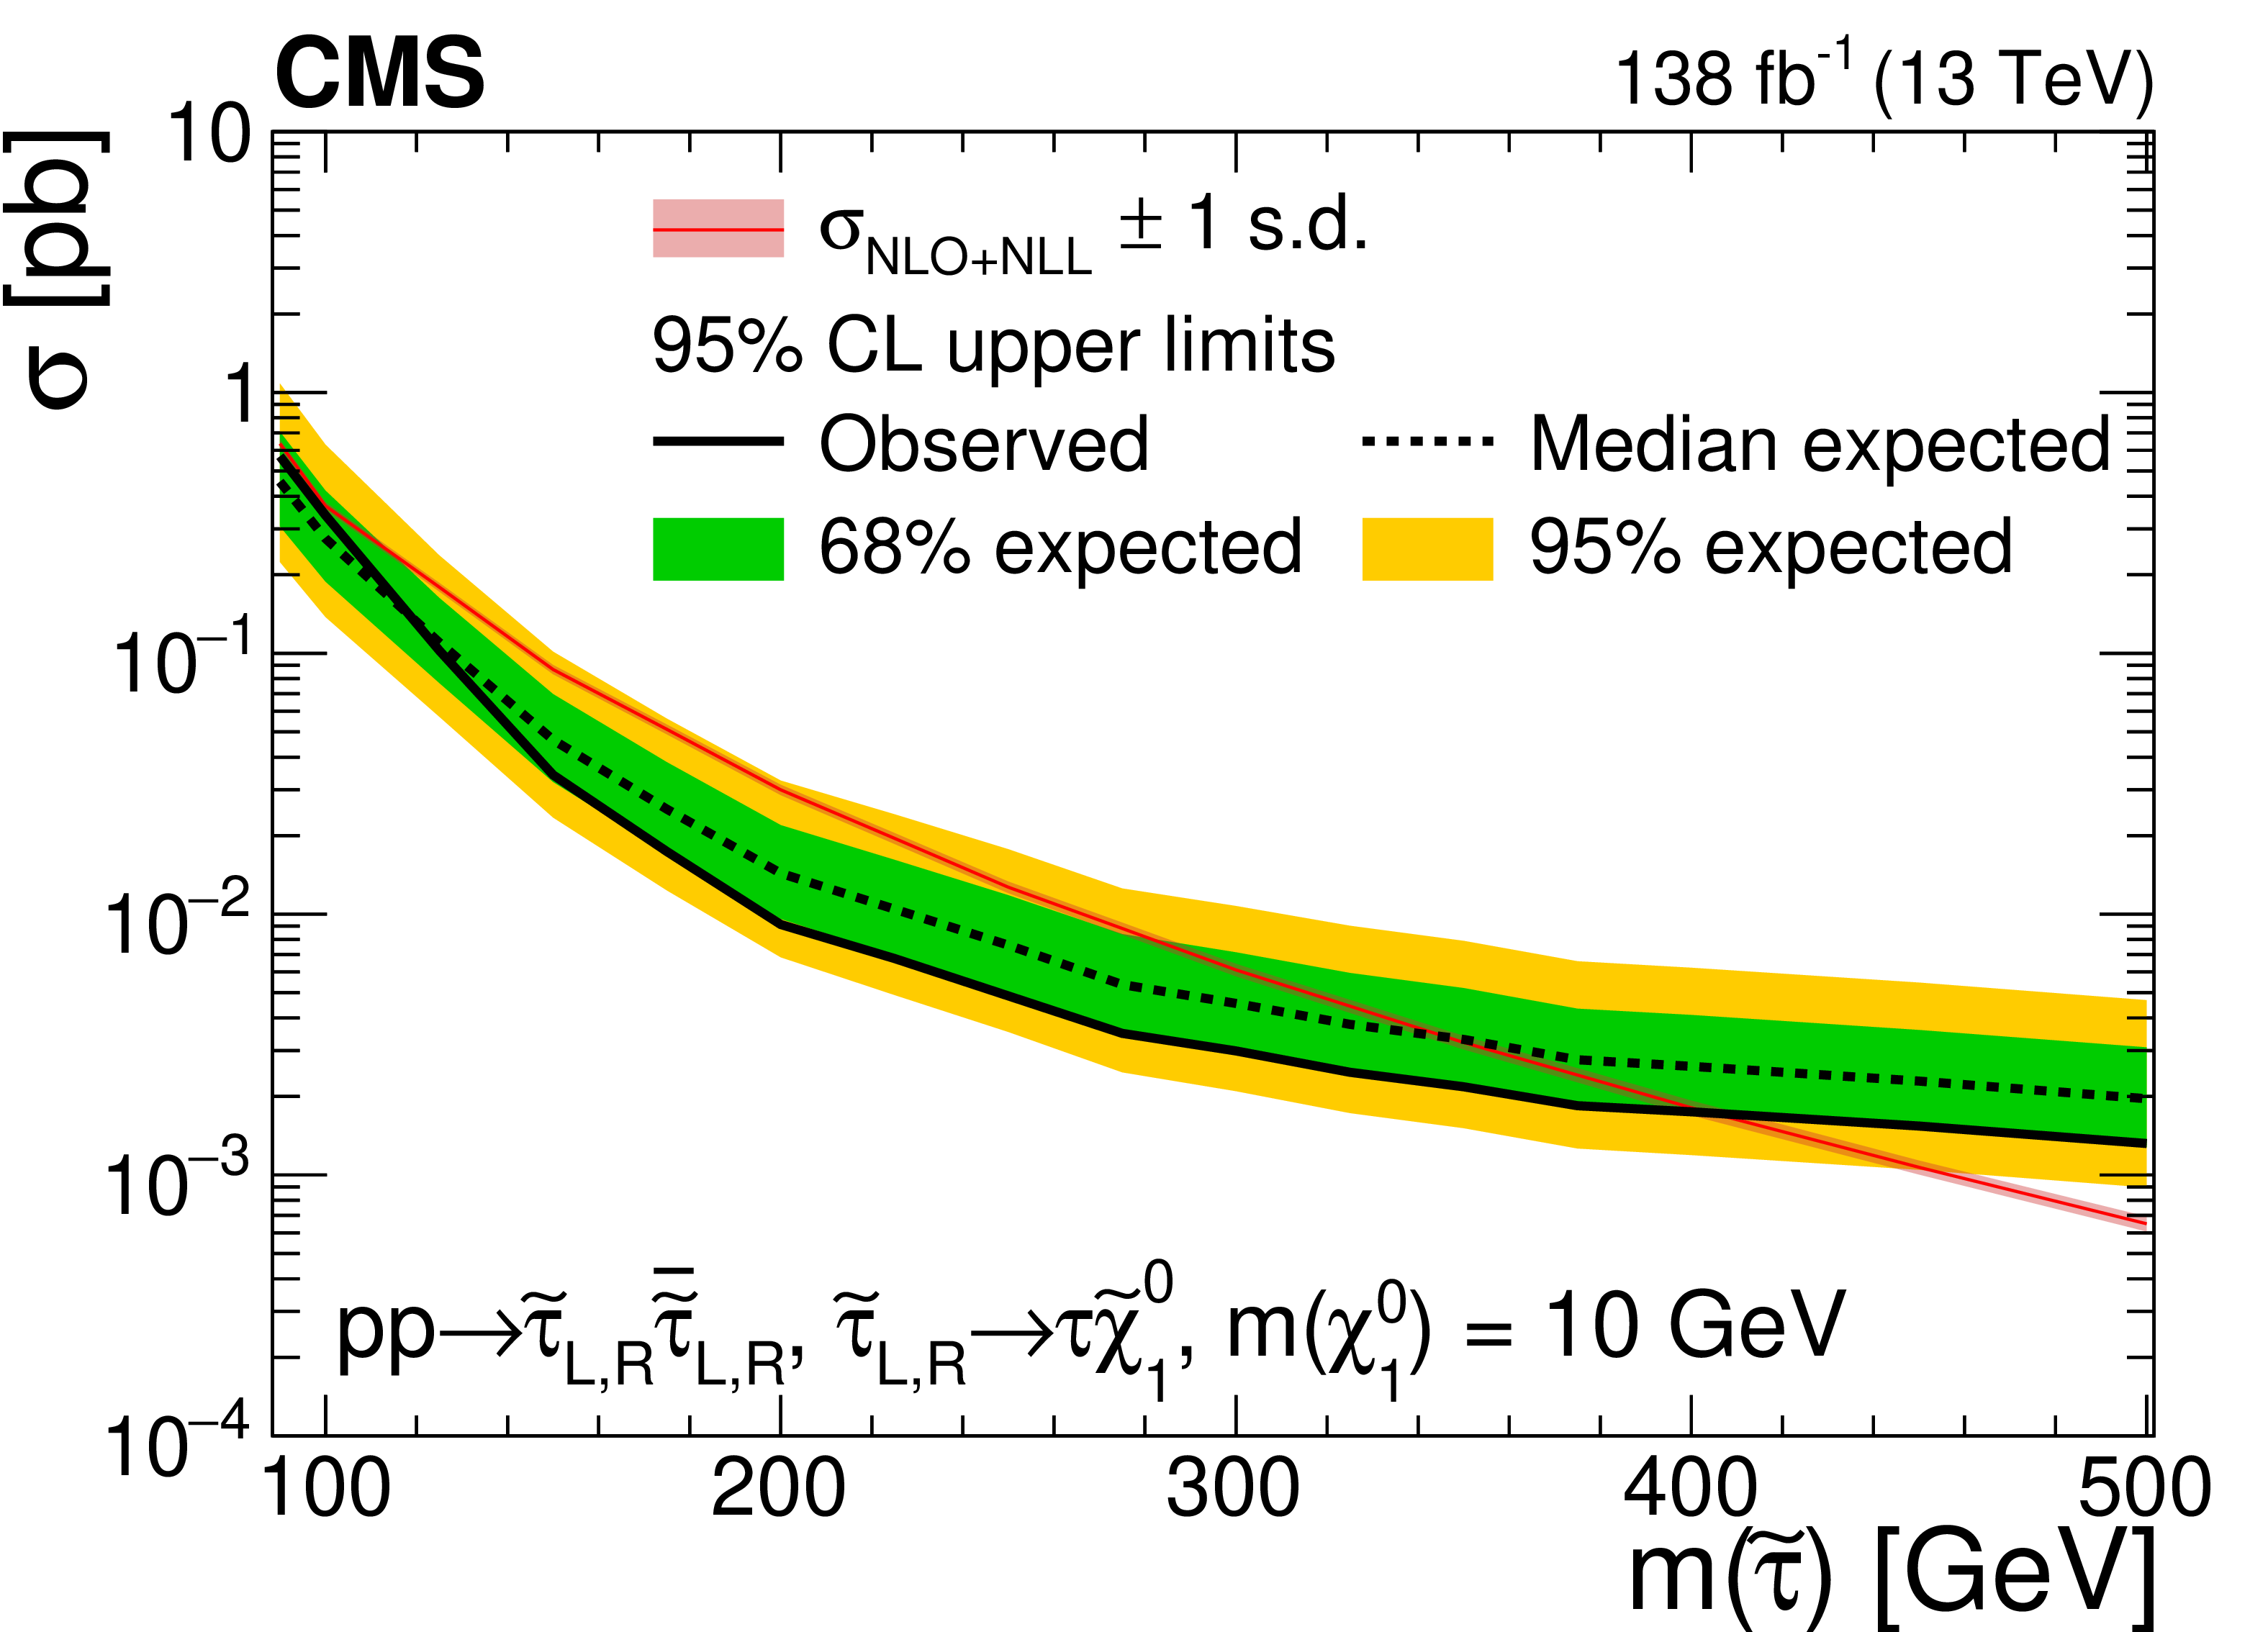
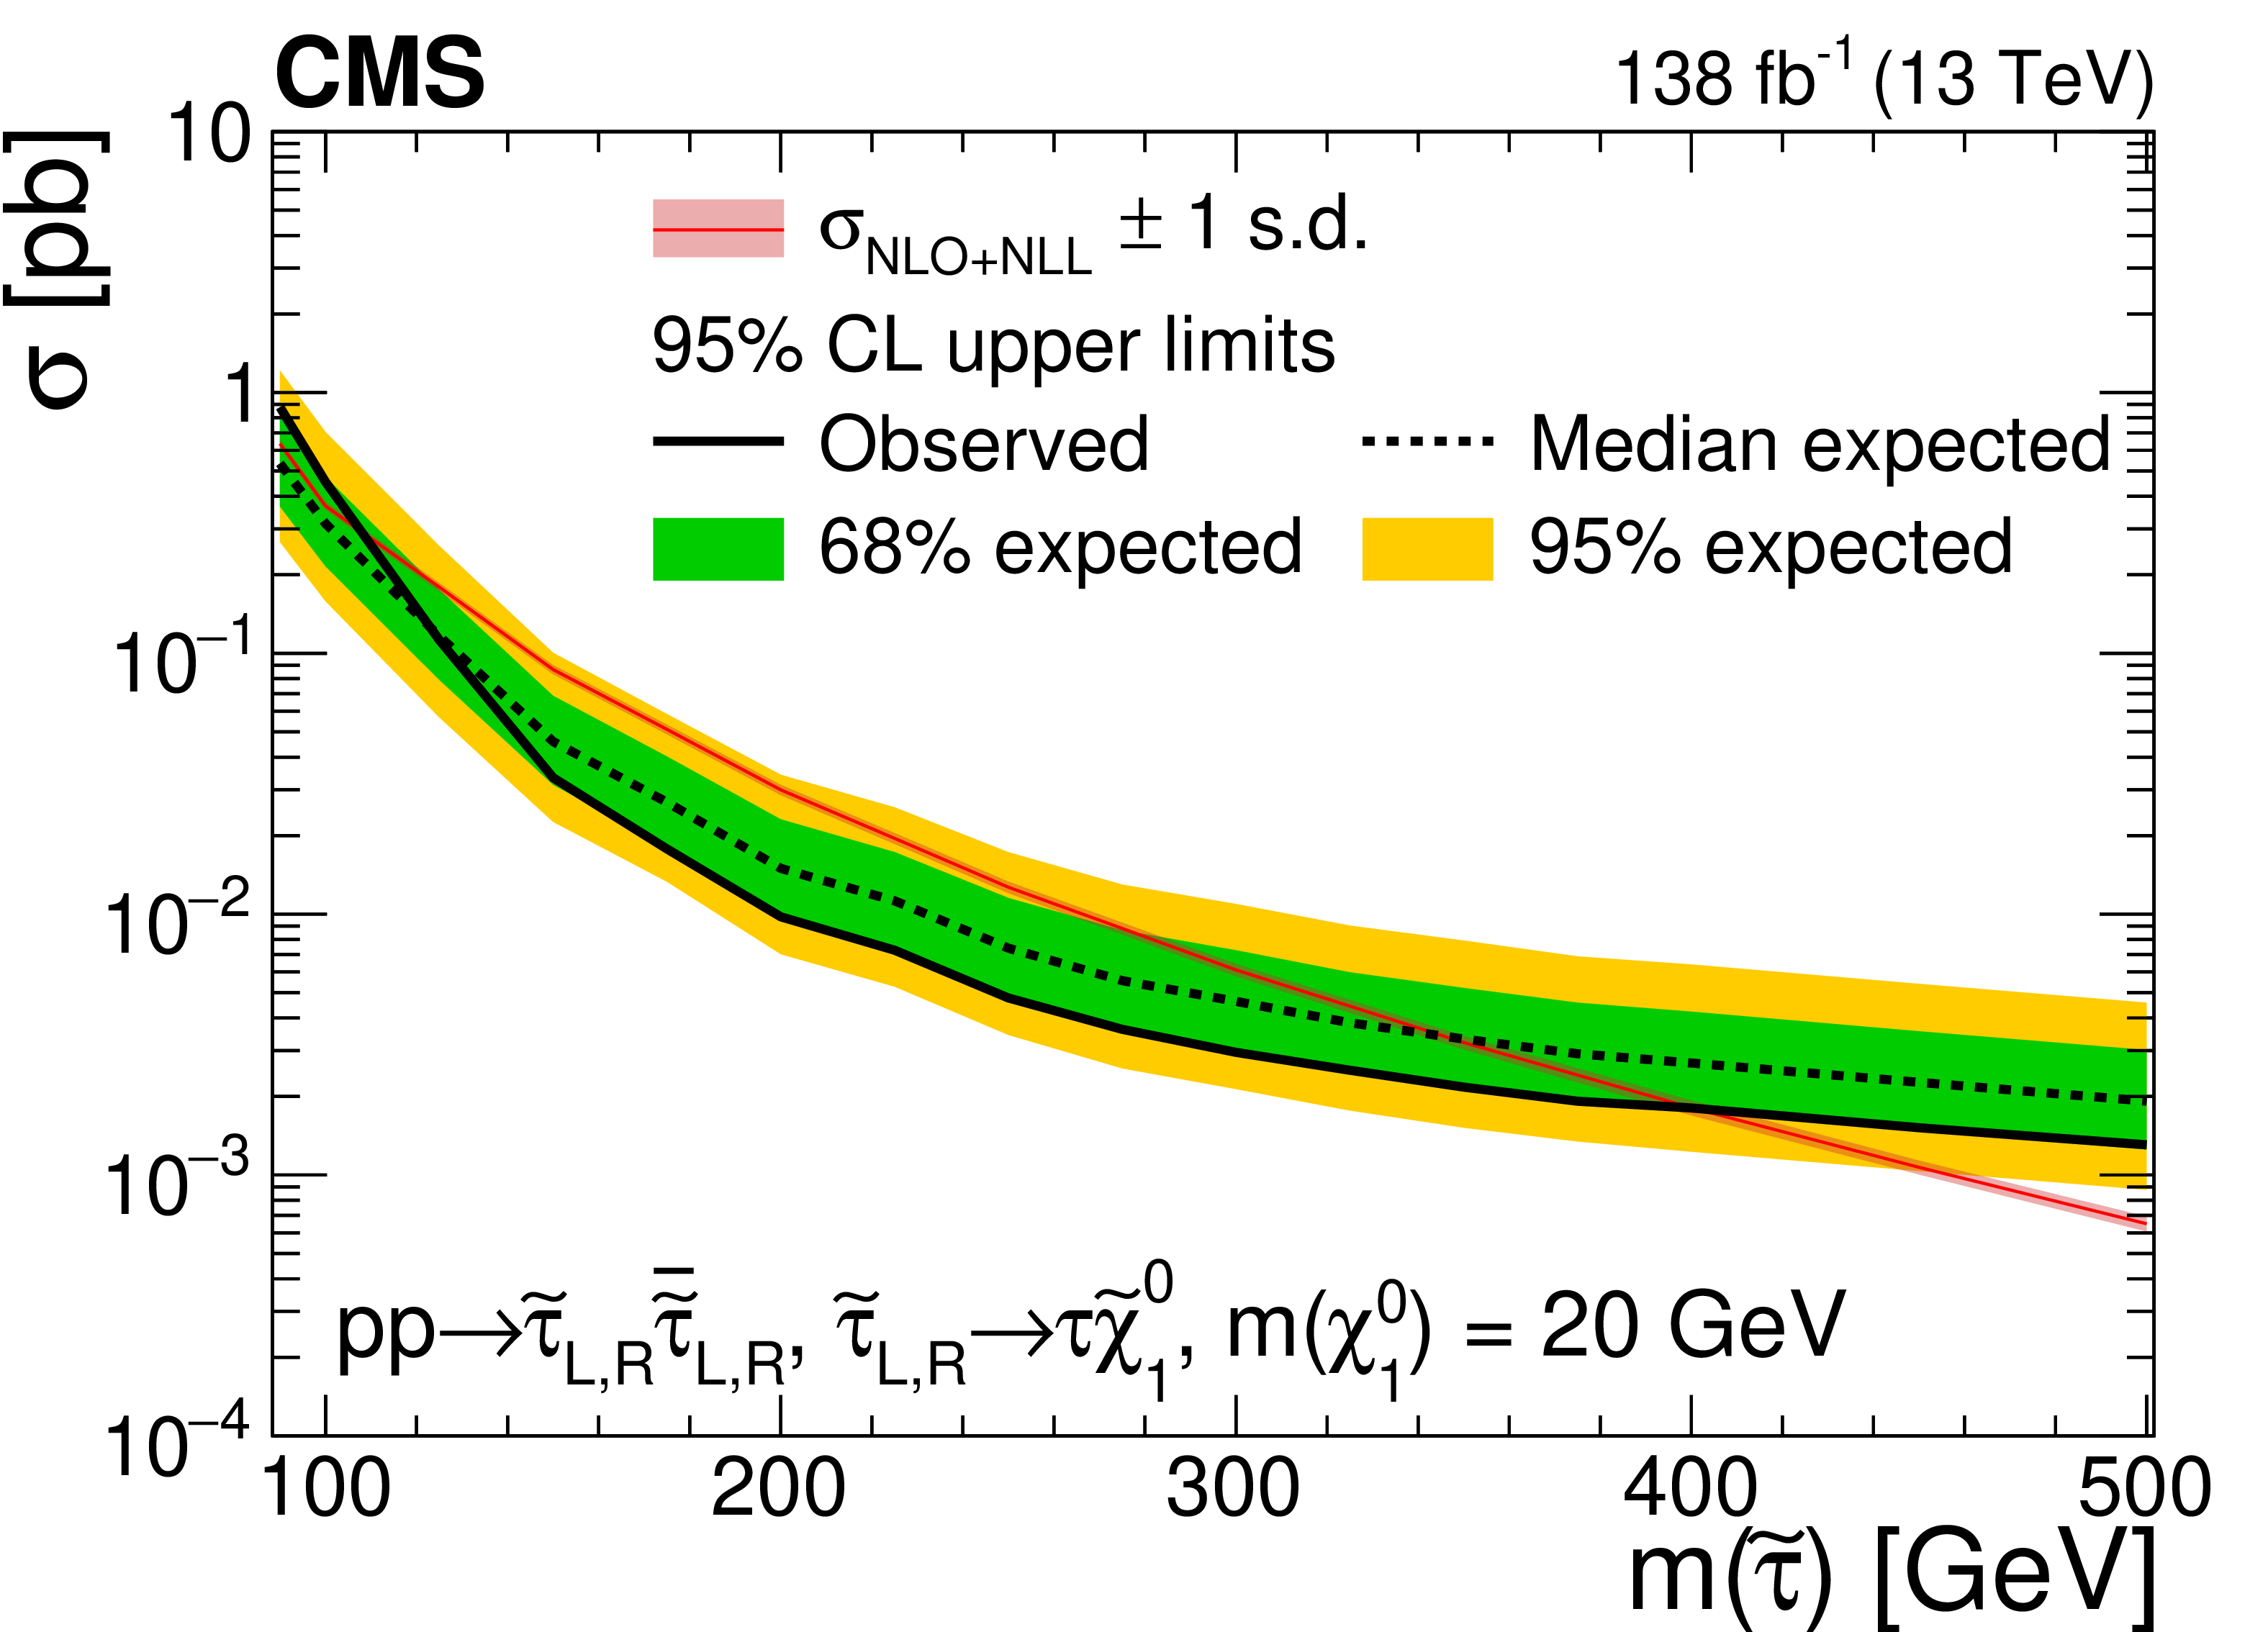
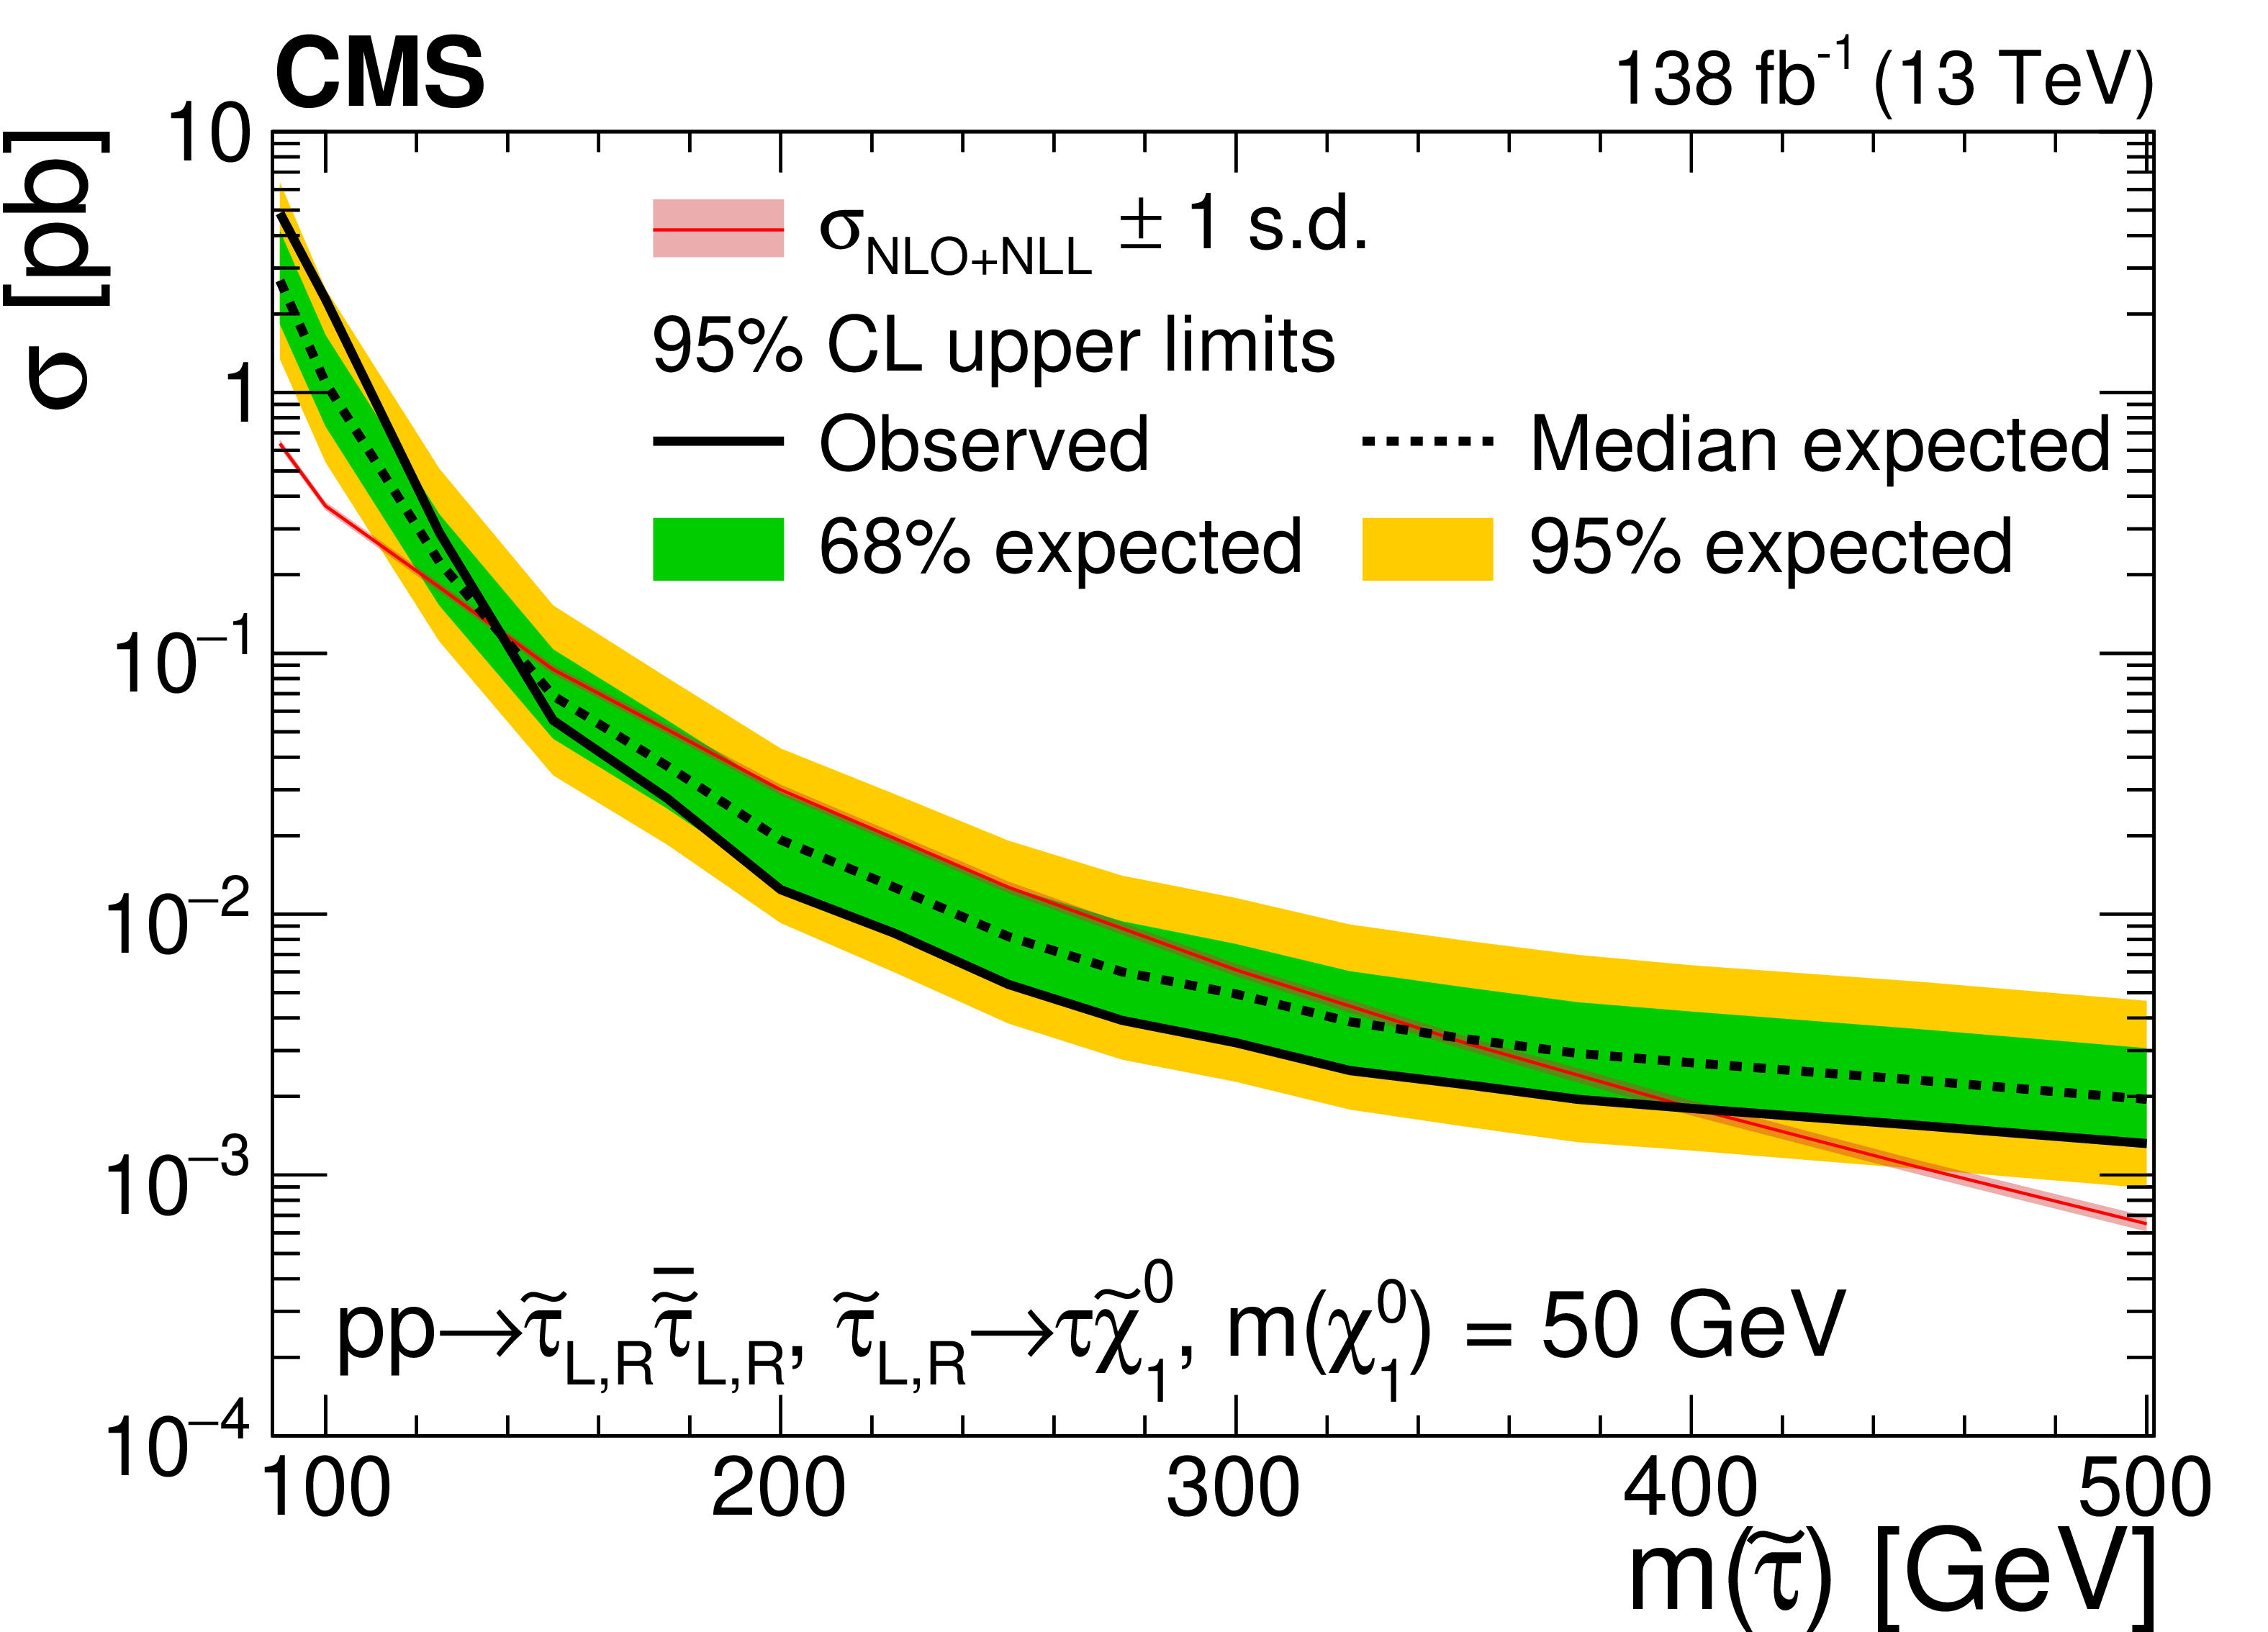
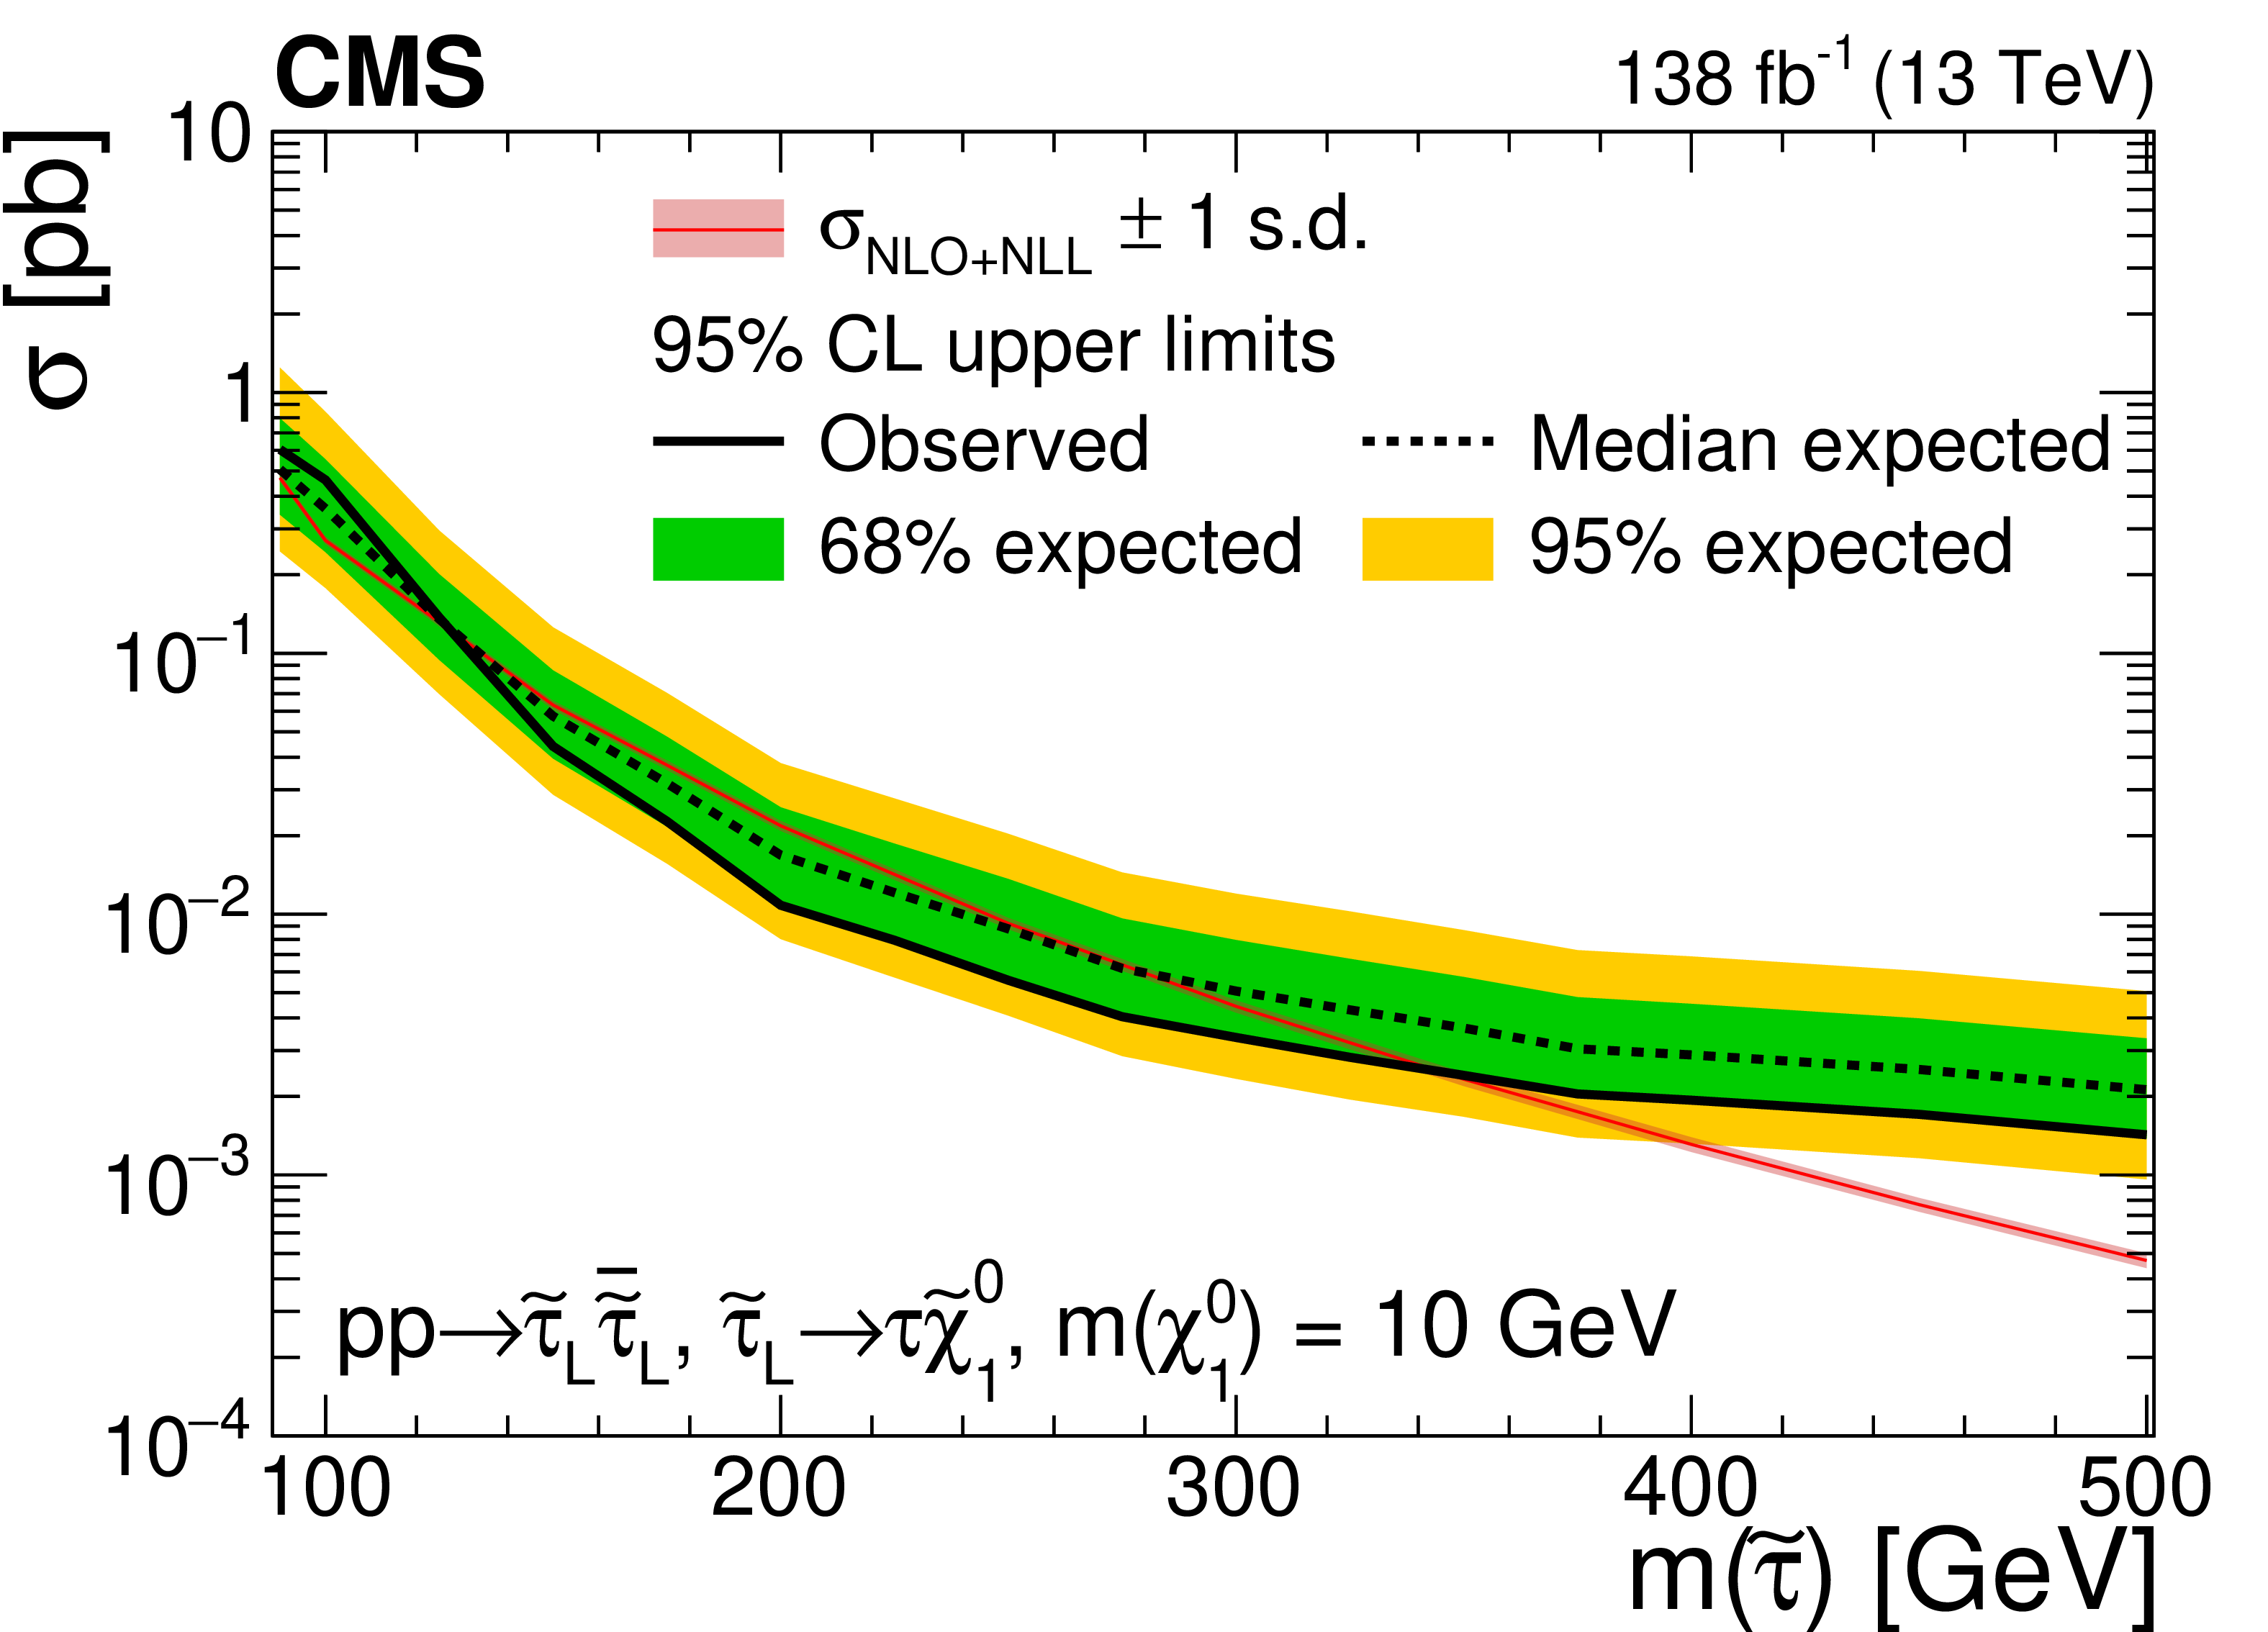
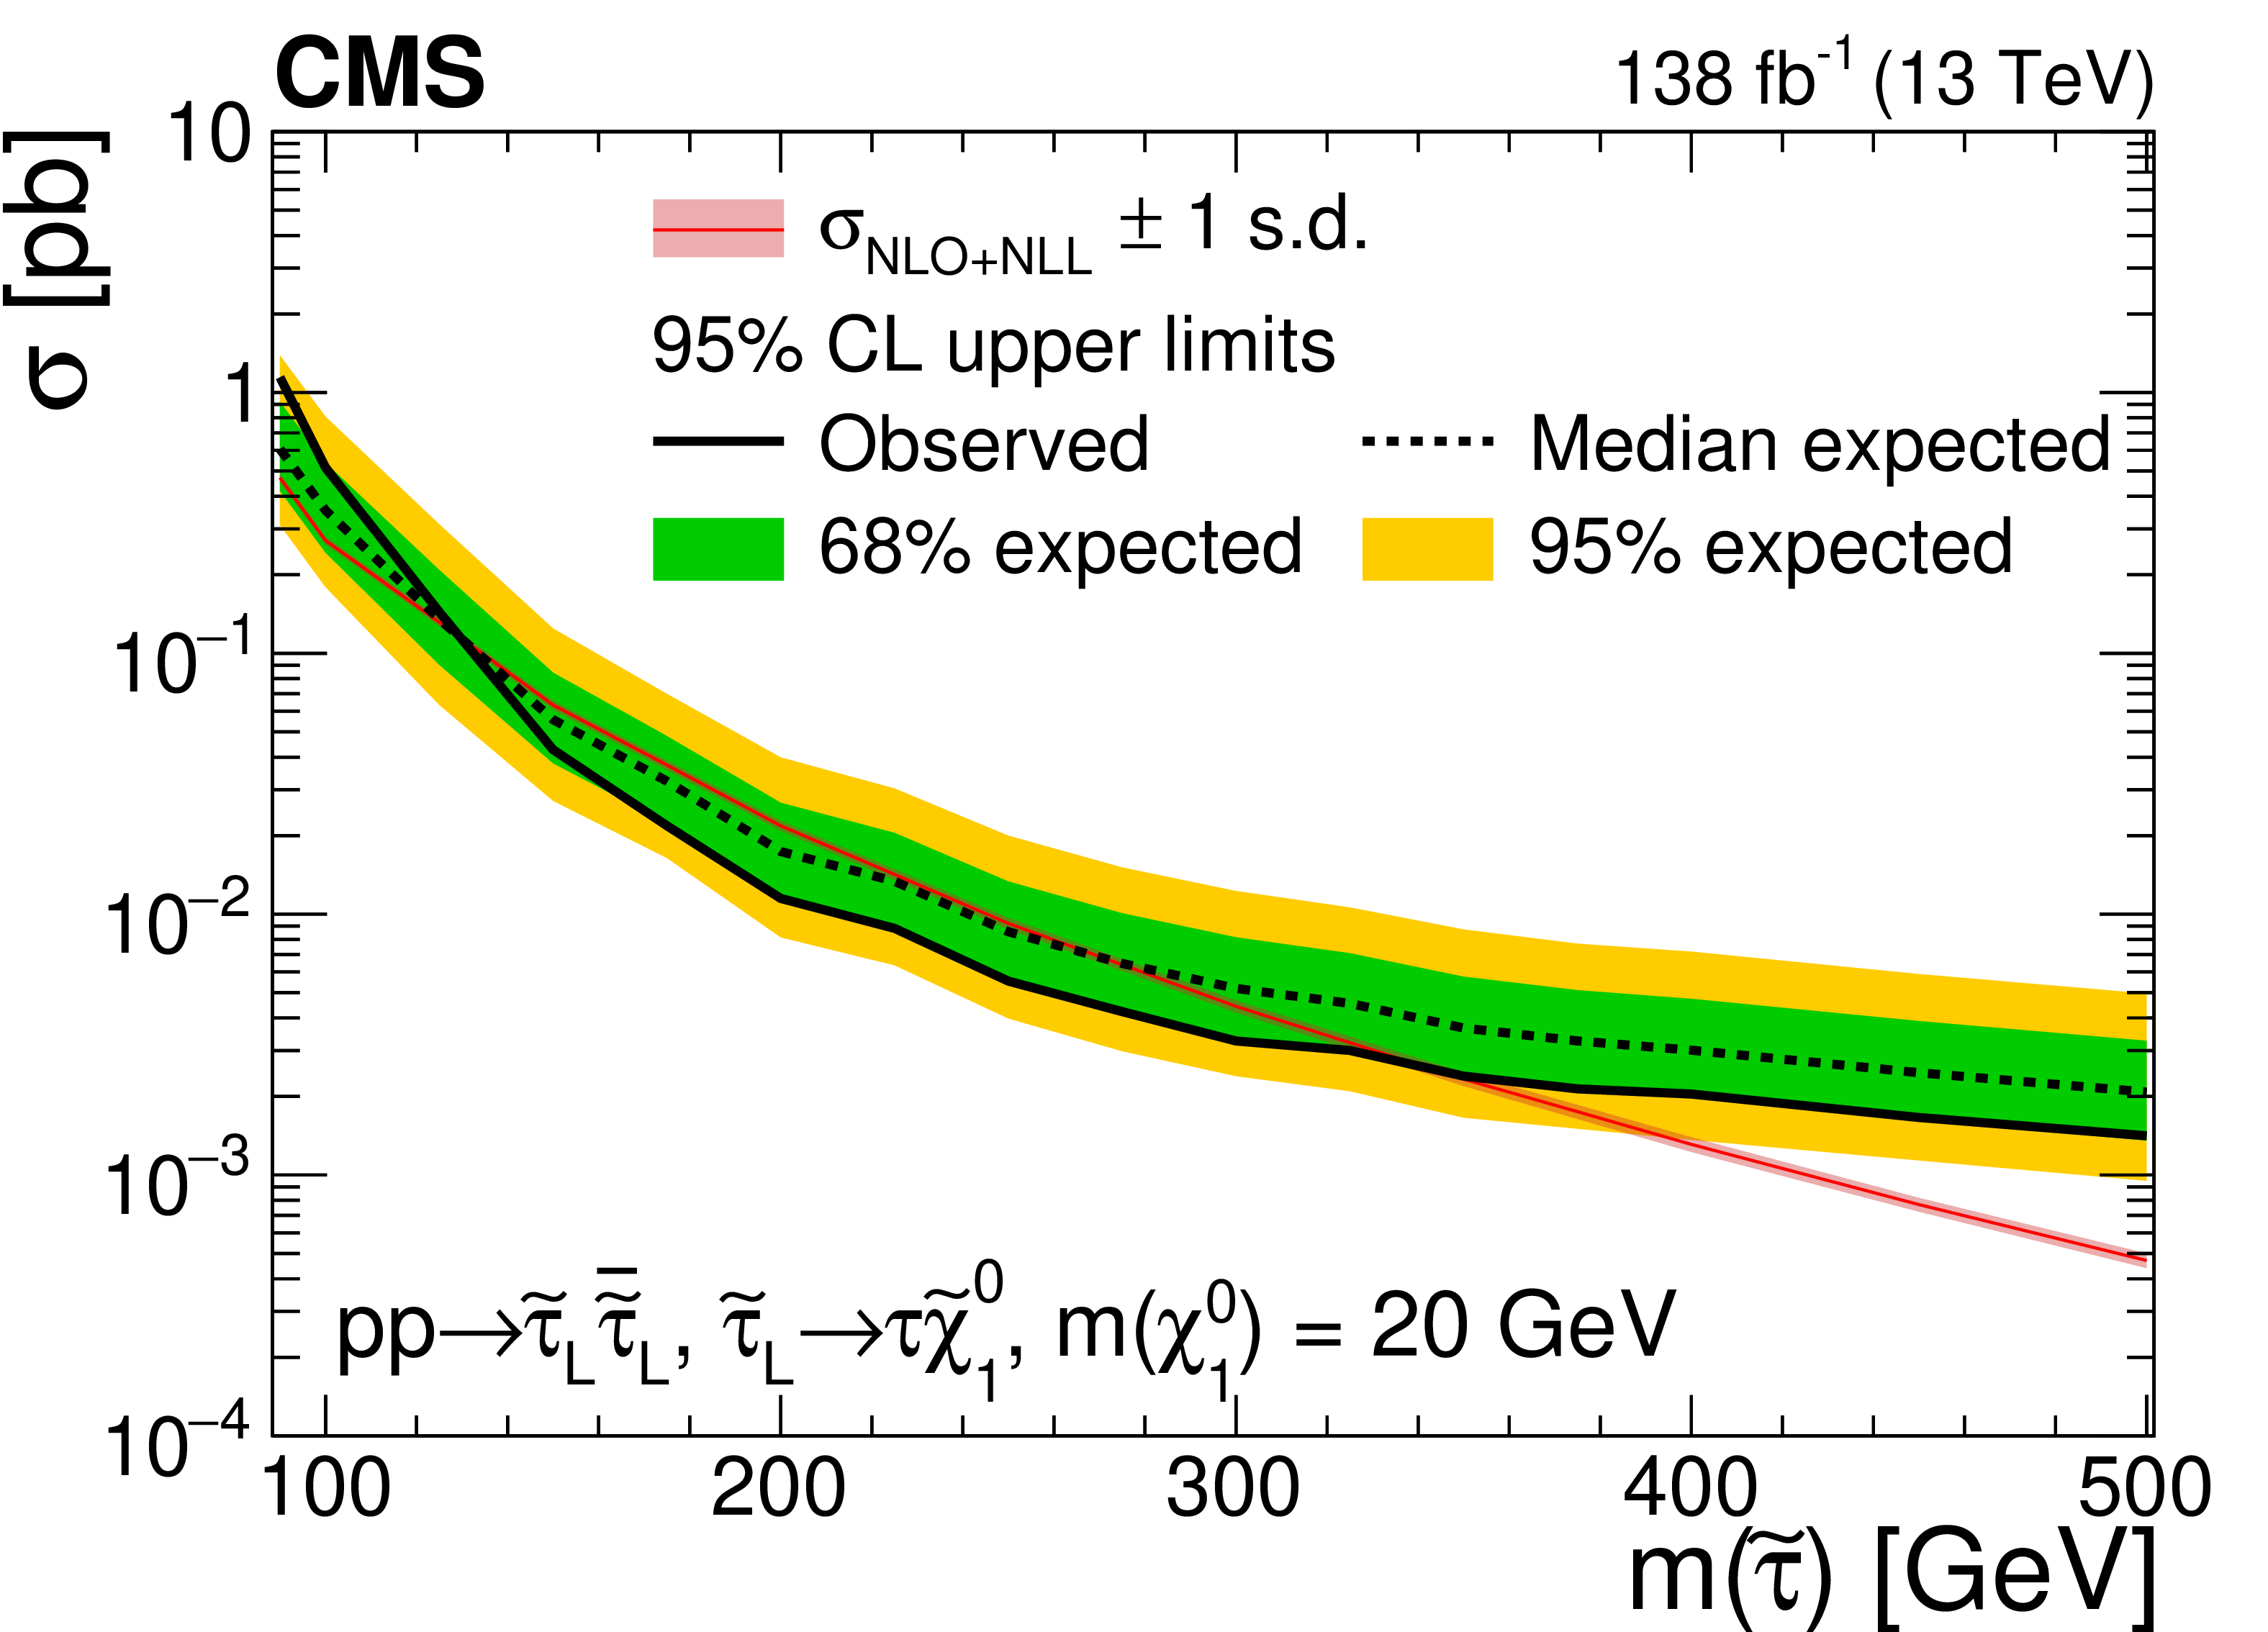
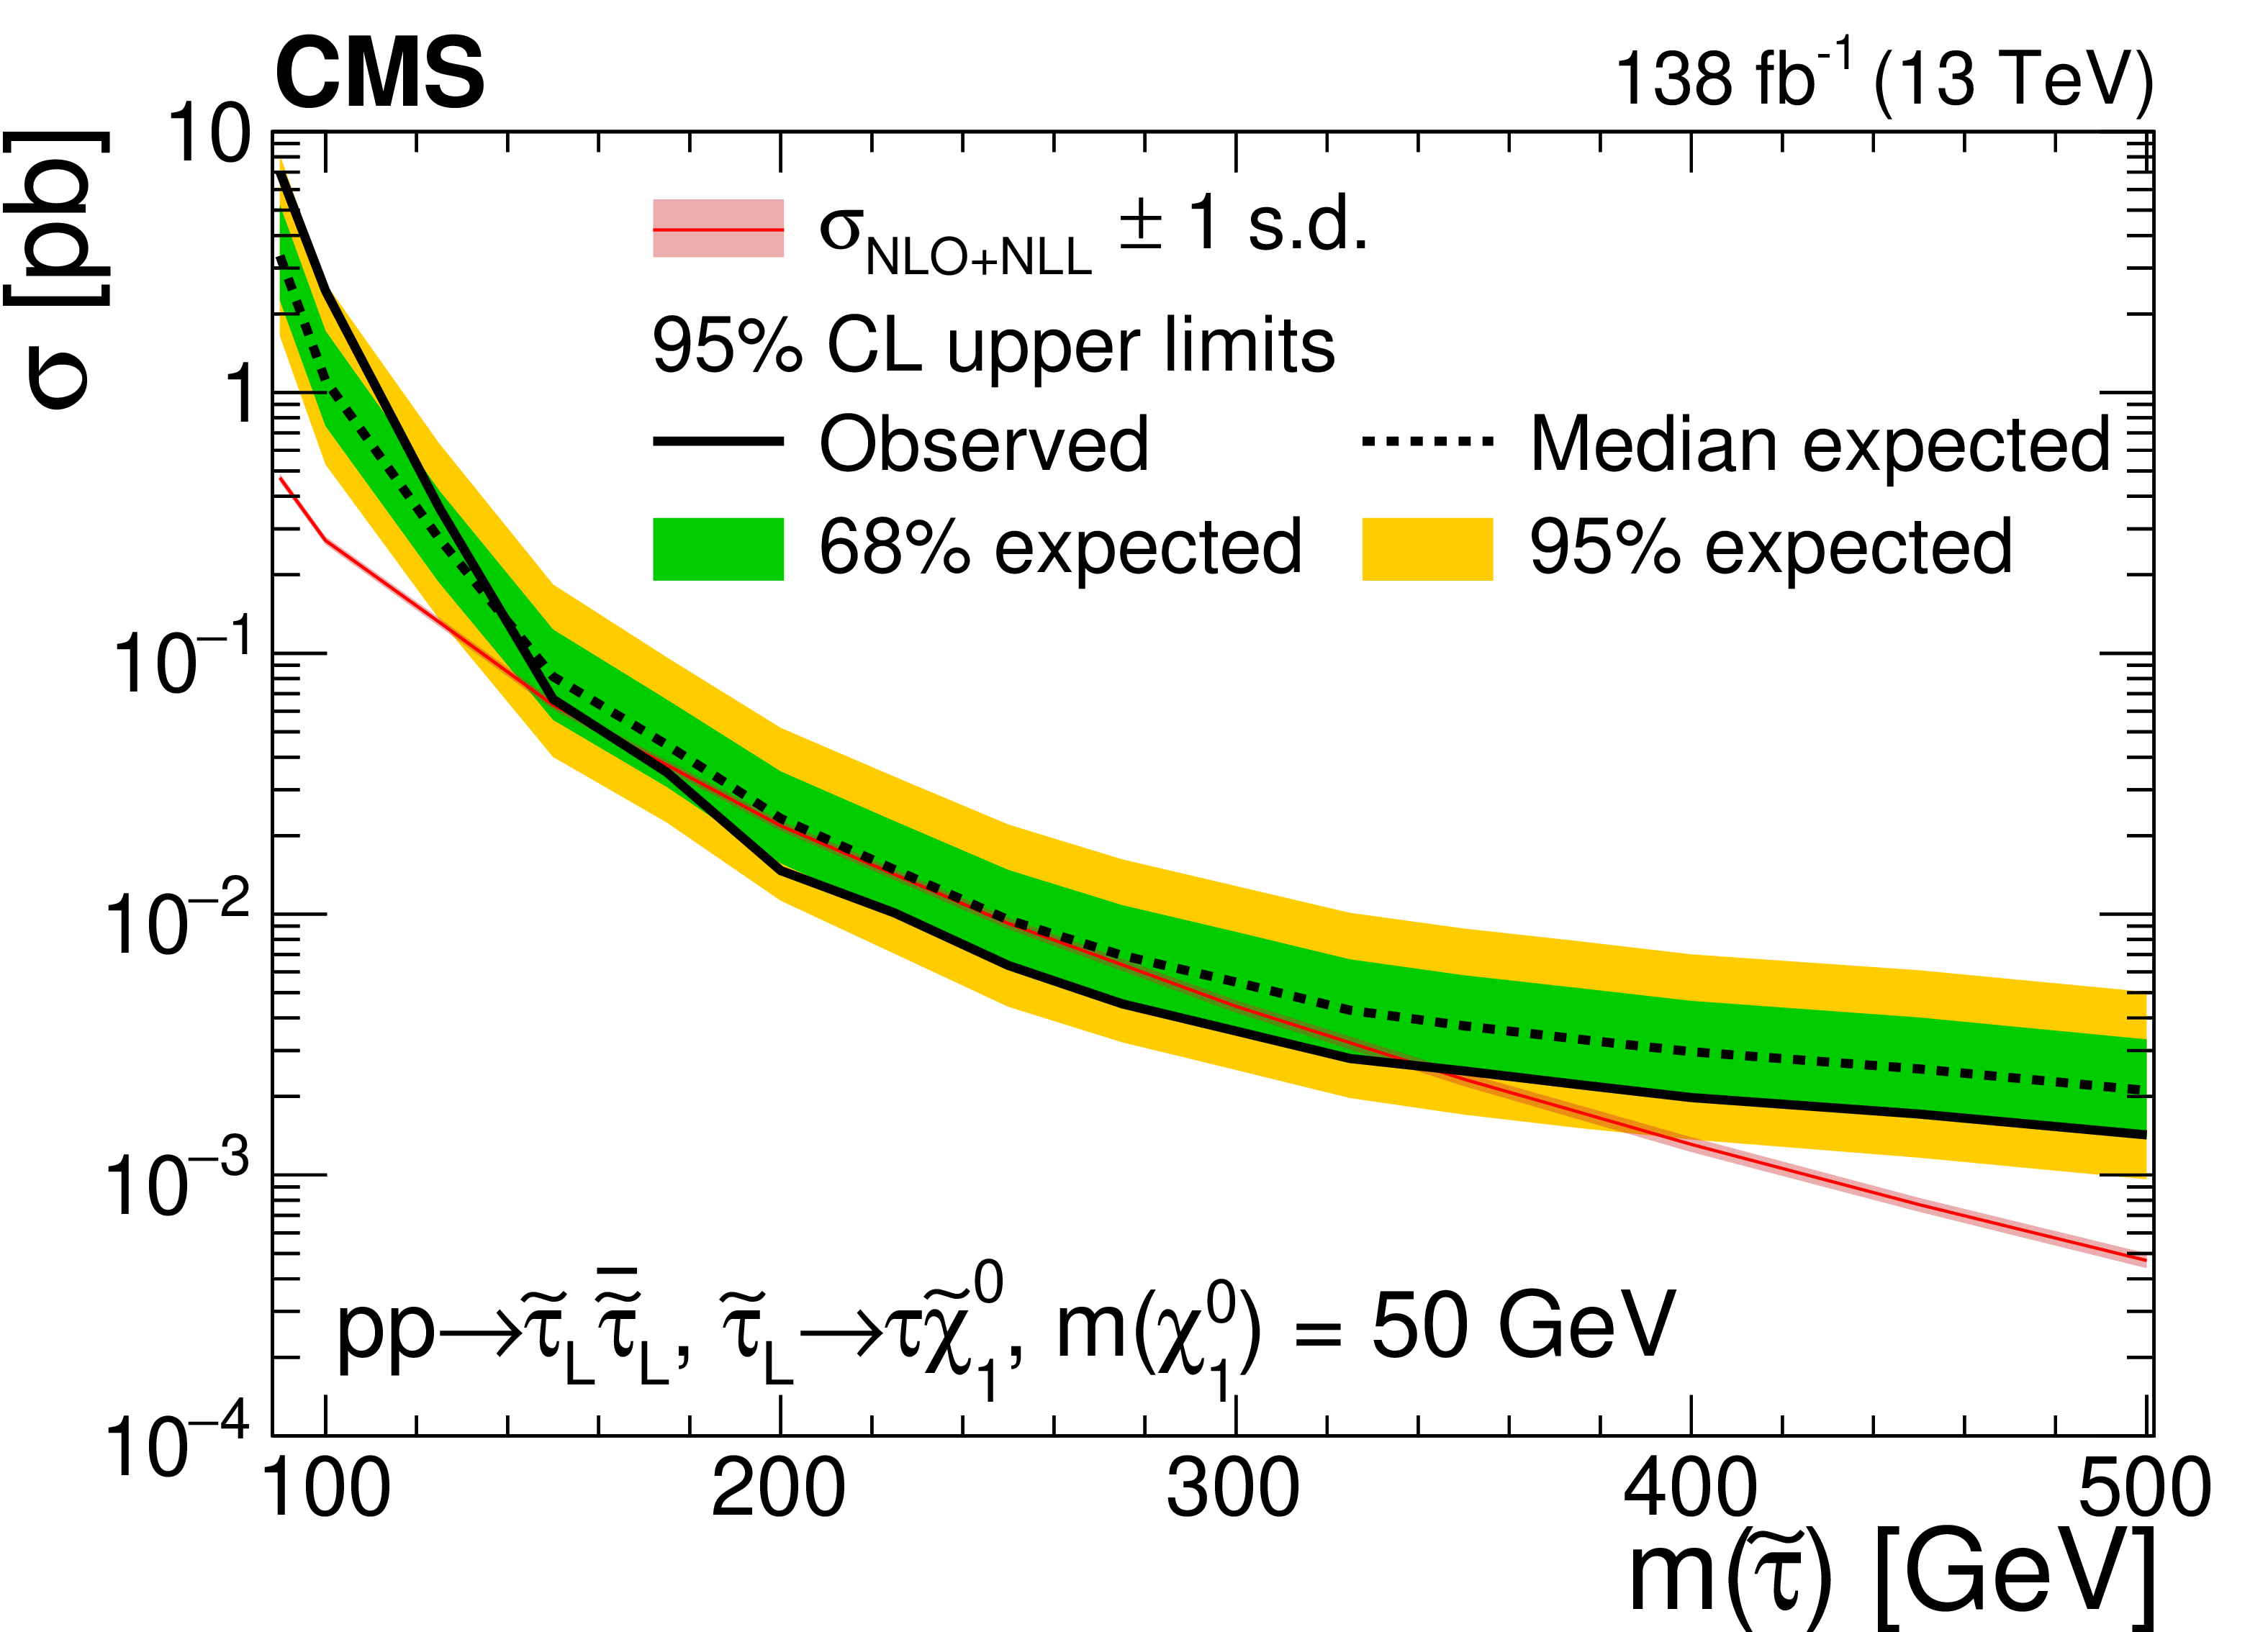
Figure 4:
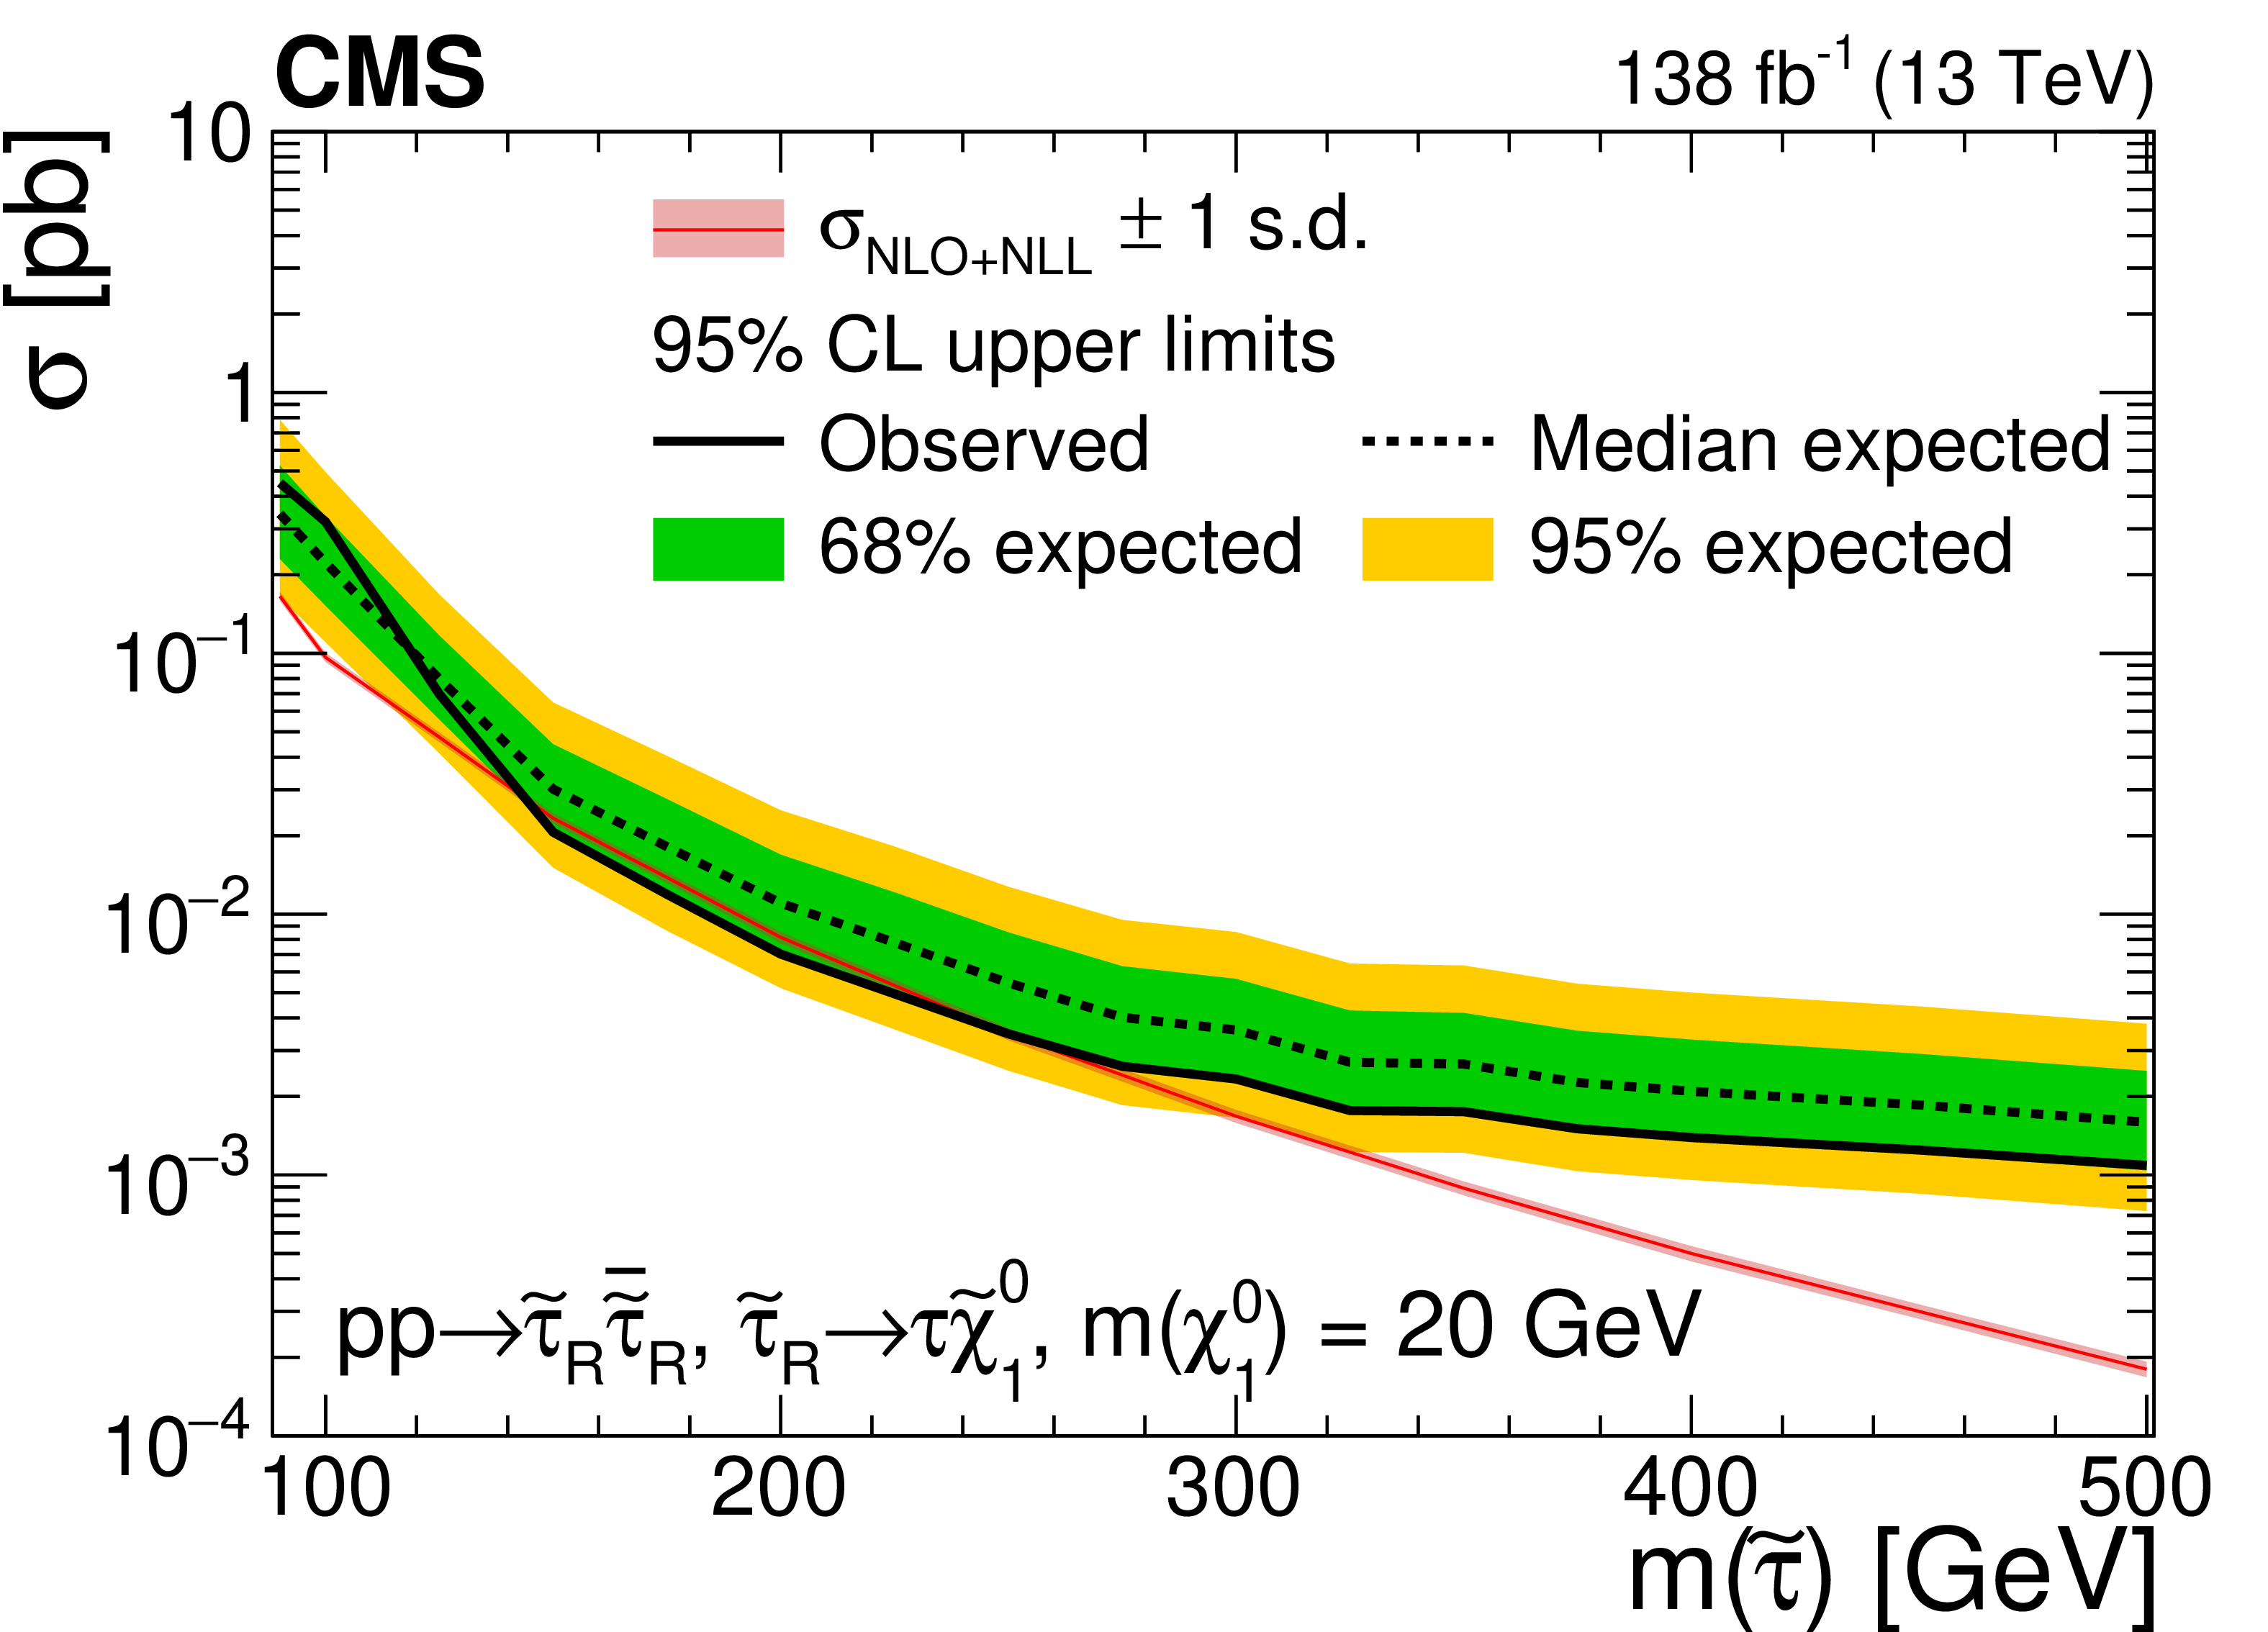
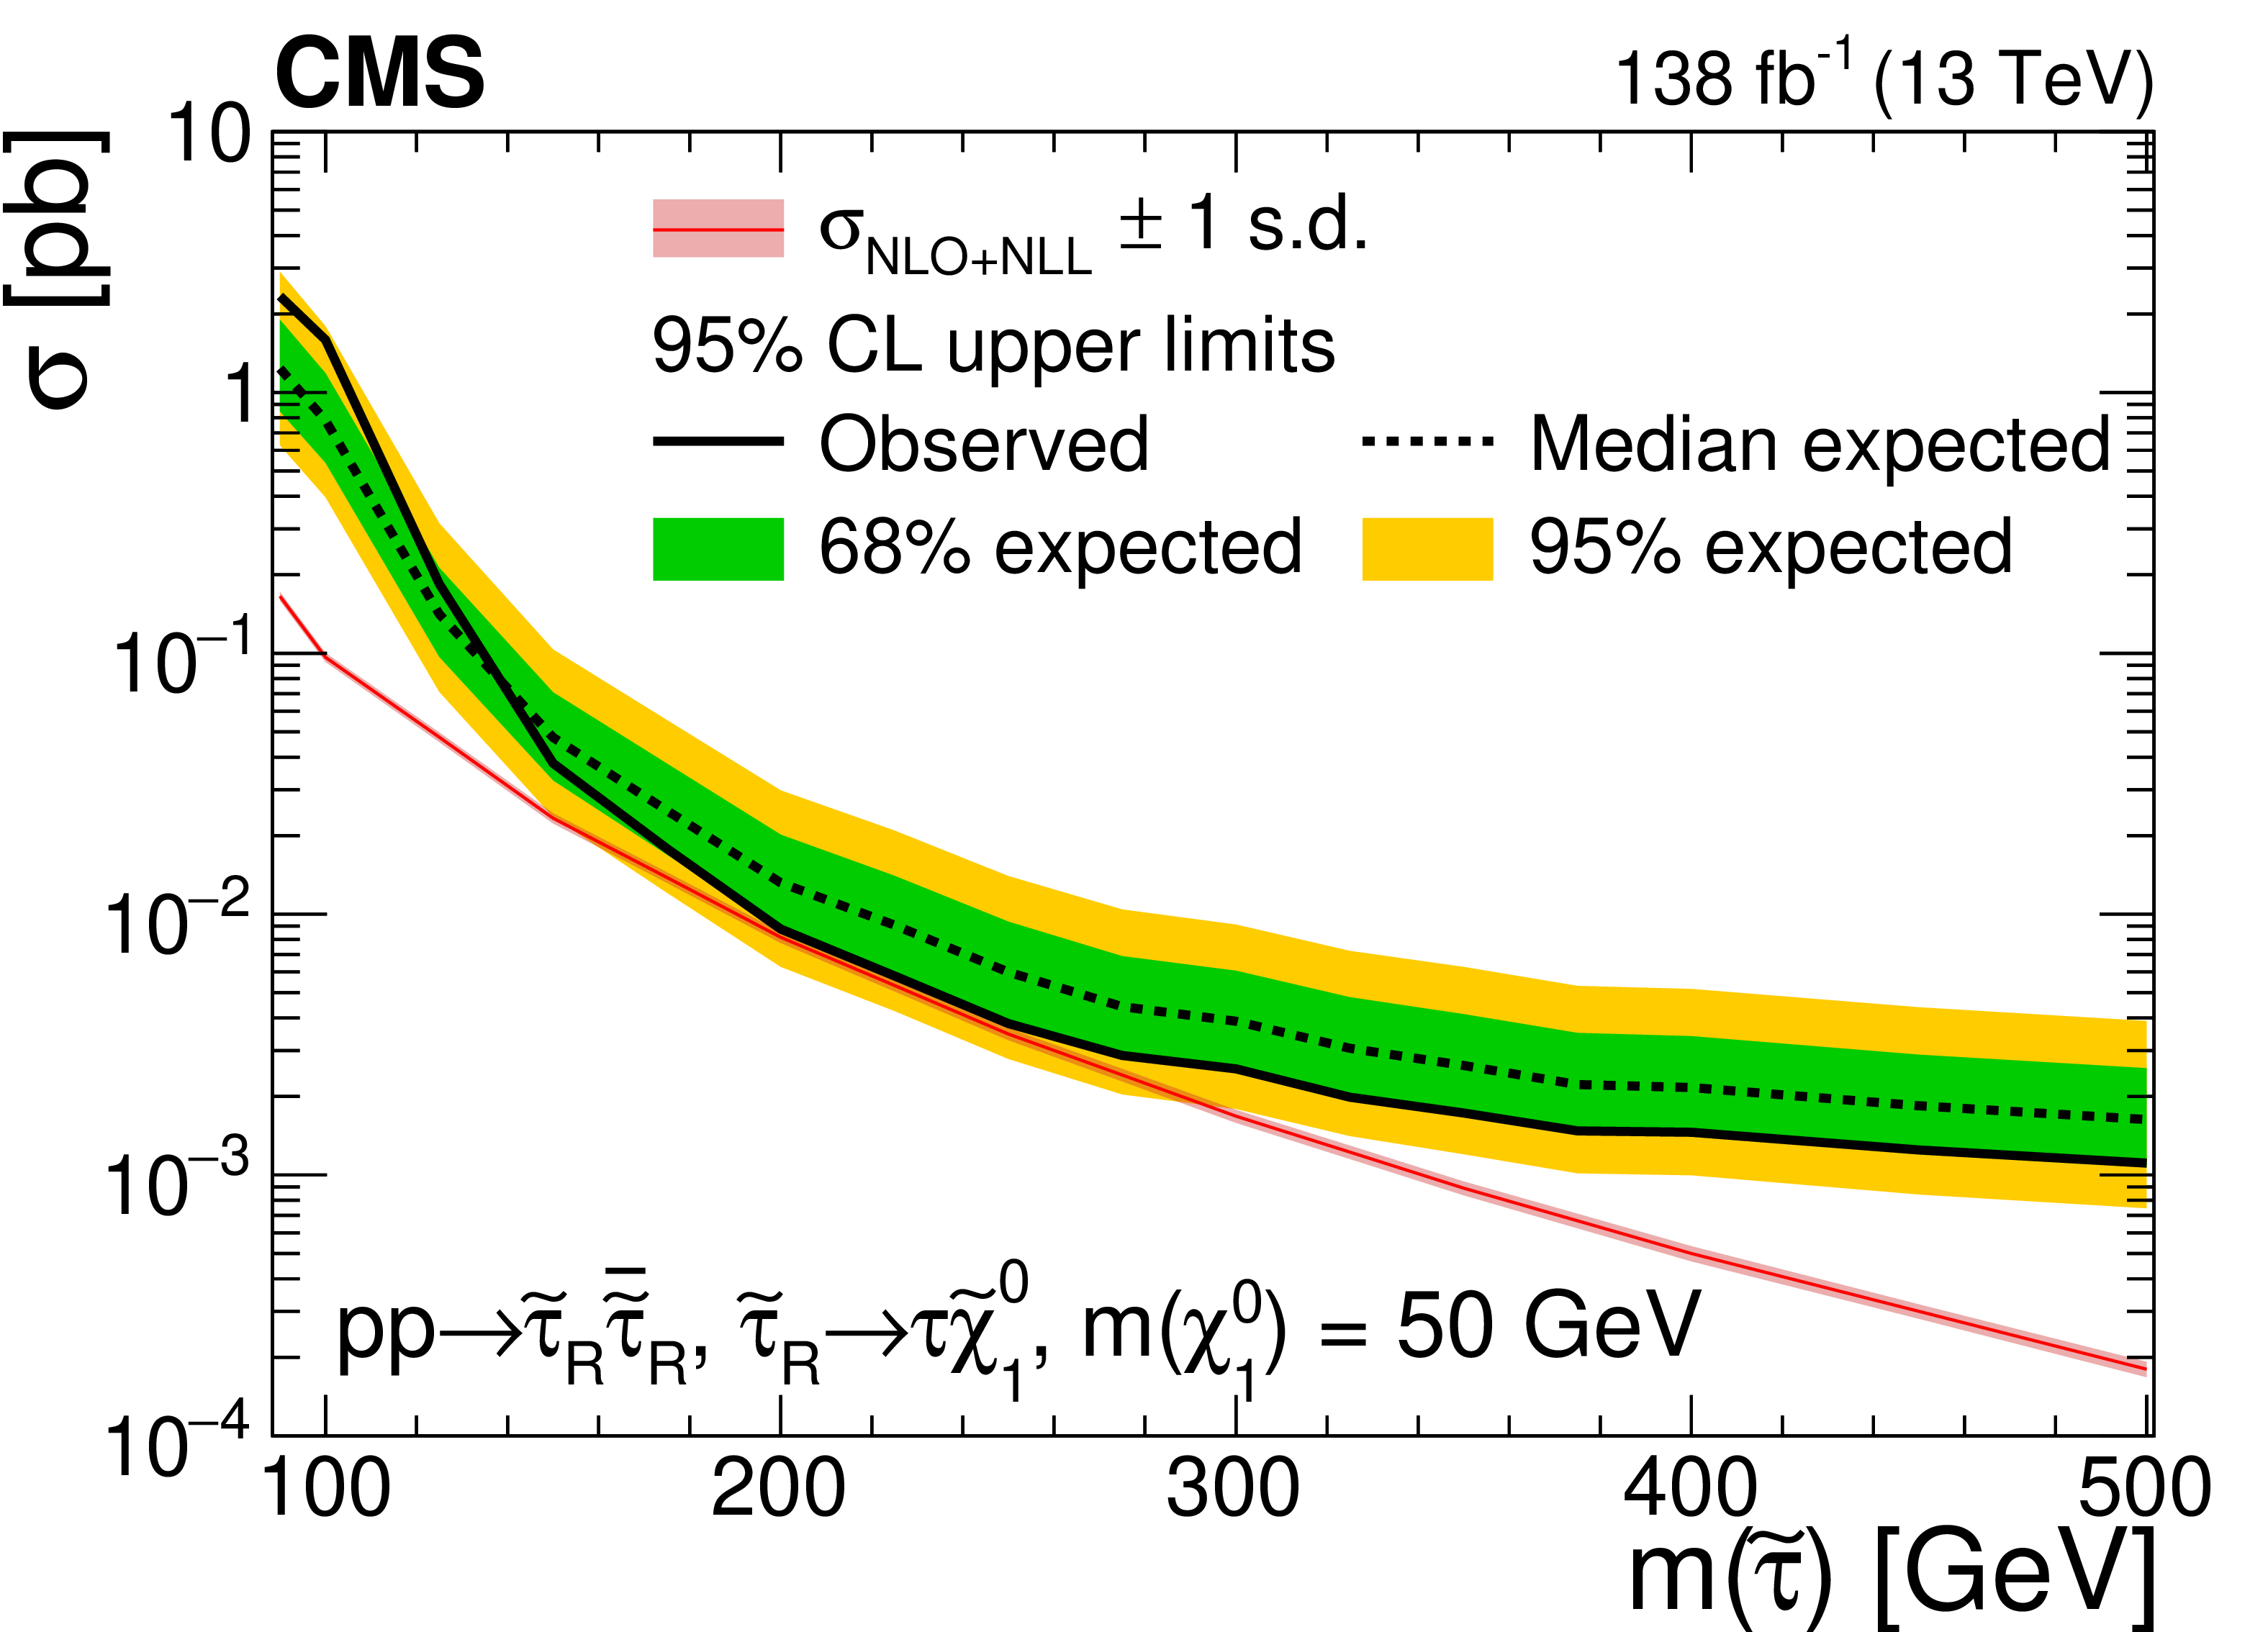
Expected and observed 95% CL cross section upper limits as functions of the $\tilde{\tau}$ mass in the degenerate $\tilde{\tau}$ scenario for $\tilde{\chi}^0_1$ masses of 1, 10, 20, and 50 GeV (upper left to lower right). The inner (green) band and the outer (yellow) band indicate the regions containing 68 and 95%, respectively, of the distribution of limits expected under the background-only hypothesis. The red line and thin shaded band indicate the NLO+NLL prediction for the signal production cross section calculated with Resummino [29], and its uncertainty. |

png pdf |
Figure 4-a:
Expected and observed 95% CL cross section upper limits as functions of the $\tilde{\tau}$ mass in the degenerate $\tilde{\tau}$ scenario for $\tilde{\chi}^0_1$ masses of 1 GeV. The inner (green) band and the outer (yellow) band indicate the regions containing 68 and 95%, respectively, of the distribution of limits expected under the background-only hypothesis. The red line and thin shaded band indicate the NLO+NLL prediction for the signal production cross section calculated with Resummino [29], and its uncertainty. |
png pdf |
Figure 4-b:
Expected and observed 95% CL cross section upper limits as functions of the $\tilde{\tau}$ mass in the degenerate $\tilde{\tau}$ scenario for $\tilde{\chi}^0_1$ masses of 10 GeV. The inner (green) band and the outer (yellow) band indicate the regions containing 68 and 95%, respectively, of the distribution of limits expected under the background-only hypothesis. The red line and thin shaded band indicate the NLO+NLL prediction for the signal production cross section calculated with Resummino [29], and its uncertainty. |
png pdf |
Figure 4-c:
Expected and observed 95% CL cross section upper limits as functions of the $\tilde{\tau}$ mass in the degenerate $\tilde{\tau}$ scenario for $\tilde{\chi}^0_1$ masses of 20 GeV. The inner (green) band and the outer (yellow) band indicate the regions containing 68 and 95%, respectively, of the distribution of limits expected under the background-only hypothesis. The red line and thin shaded band indicate the NLO+NLL prediction for the signal production cross section calculated with Resummino [29], and its uncertainty. |
png pdf |
Figure 4-d:
Expected and observed 95% CL cross section upper limits as functions of the $\tilde{\tau}$ mass in the degenerate $\tilde{\tau}$ scenario for $\tilde{\chi}^0_1$ masses of 50 GeV. The inner (green) band and the outer (yellow) band indicate the regions containing 68 and 95%, respectively, of the distribution of limits expected under the background-only hypothesis. The red line and thin shaded band indicate the NLO+NLL prediction for the signal production cross section calculated with Resummino [29], and its uncertainty. |

png pdf |
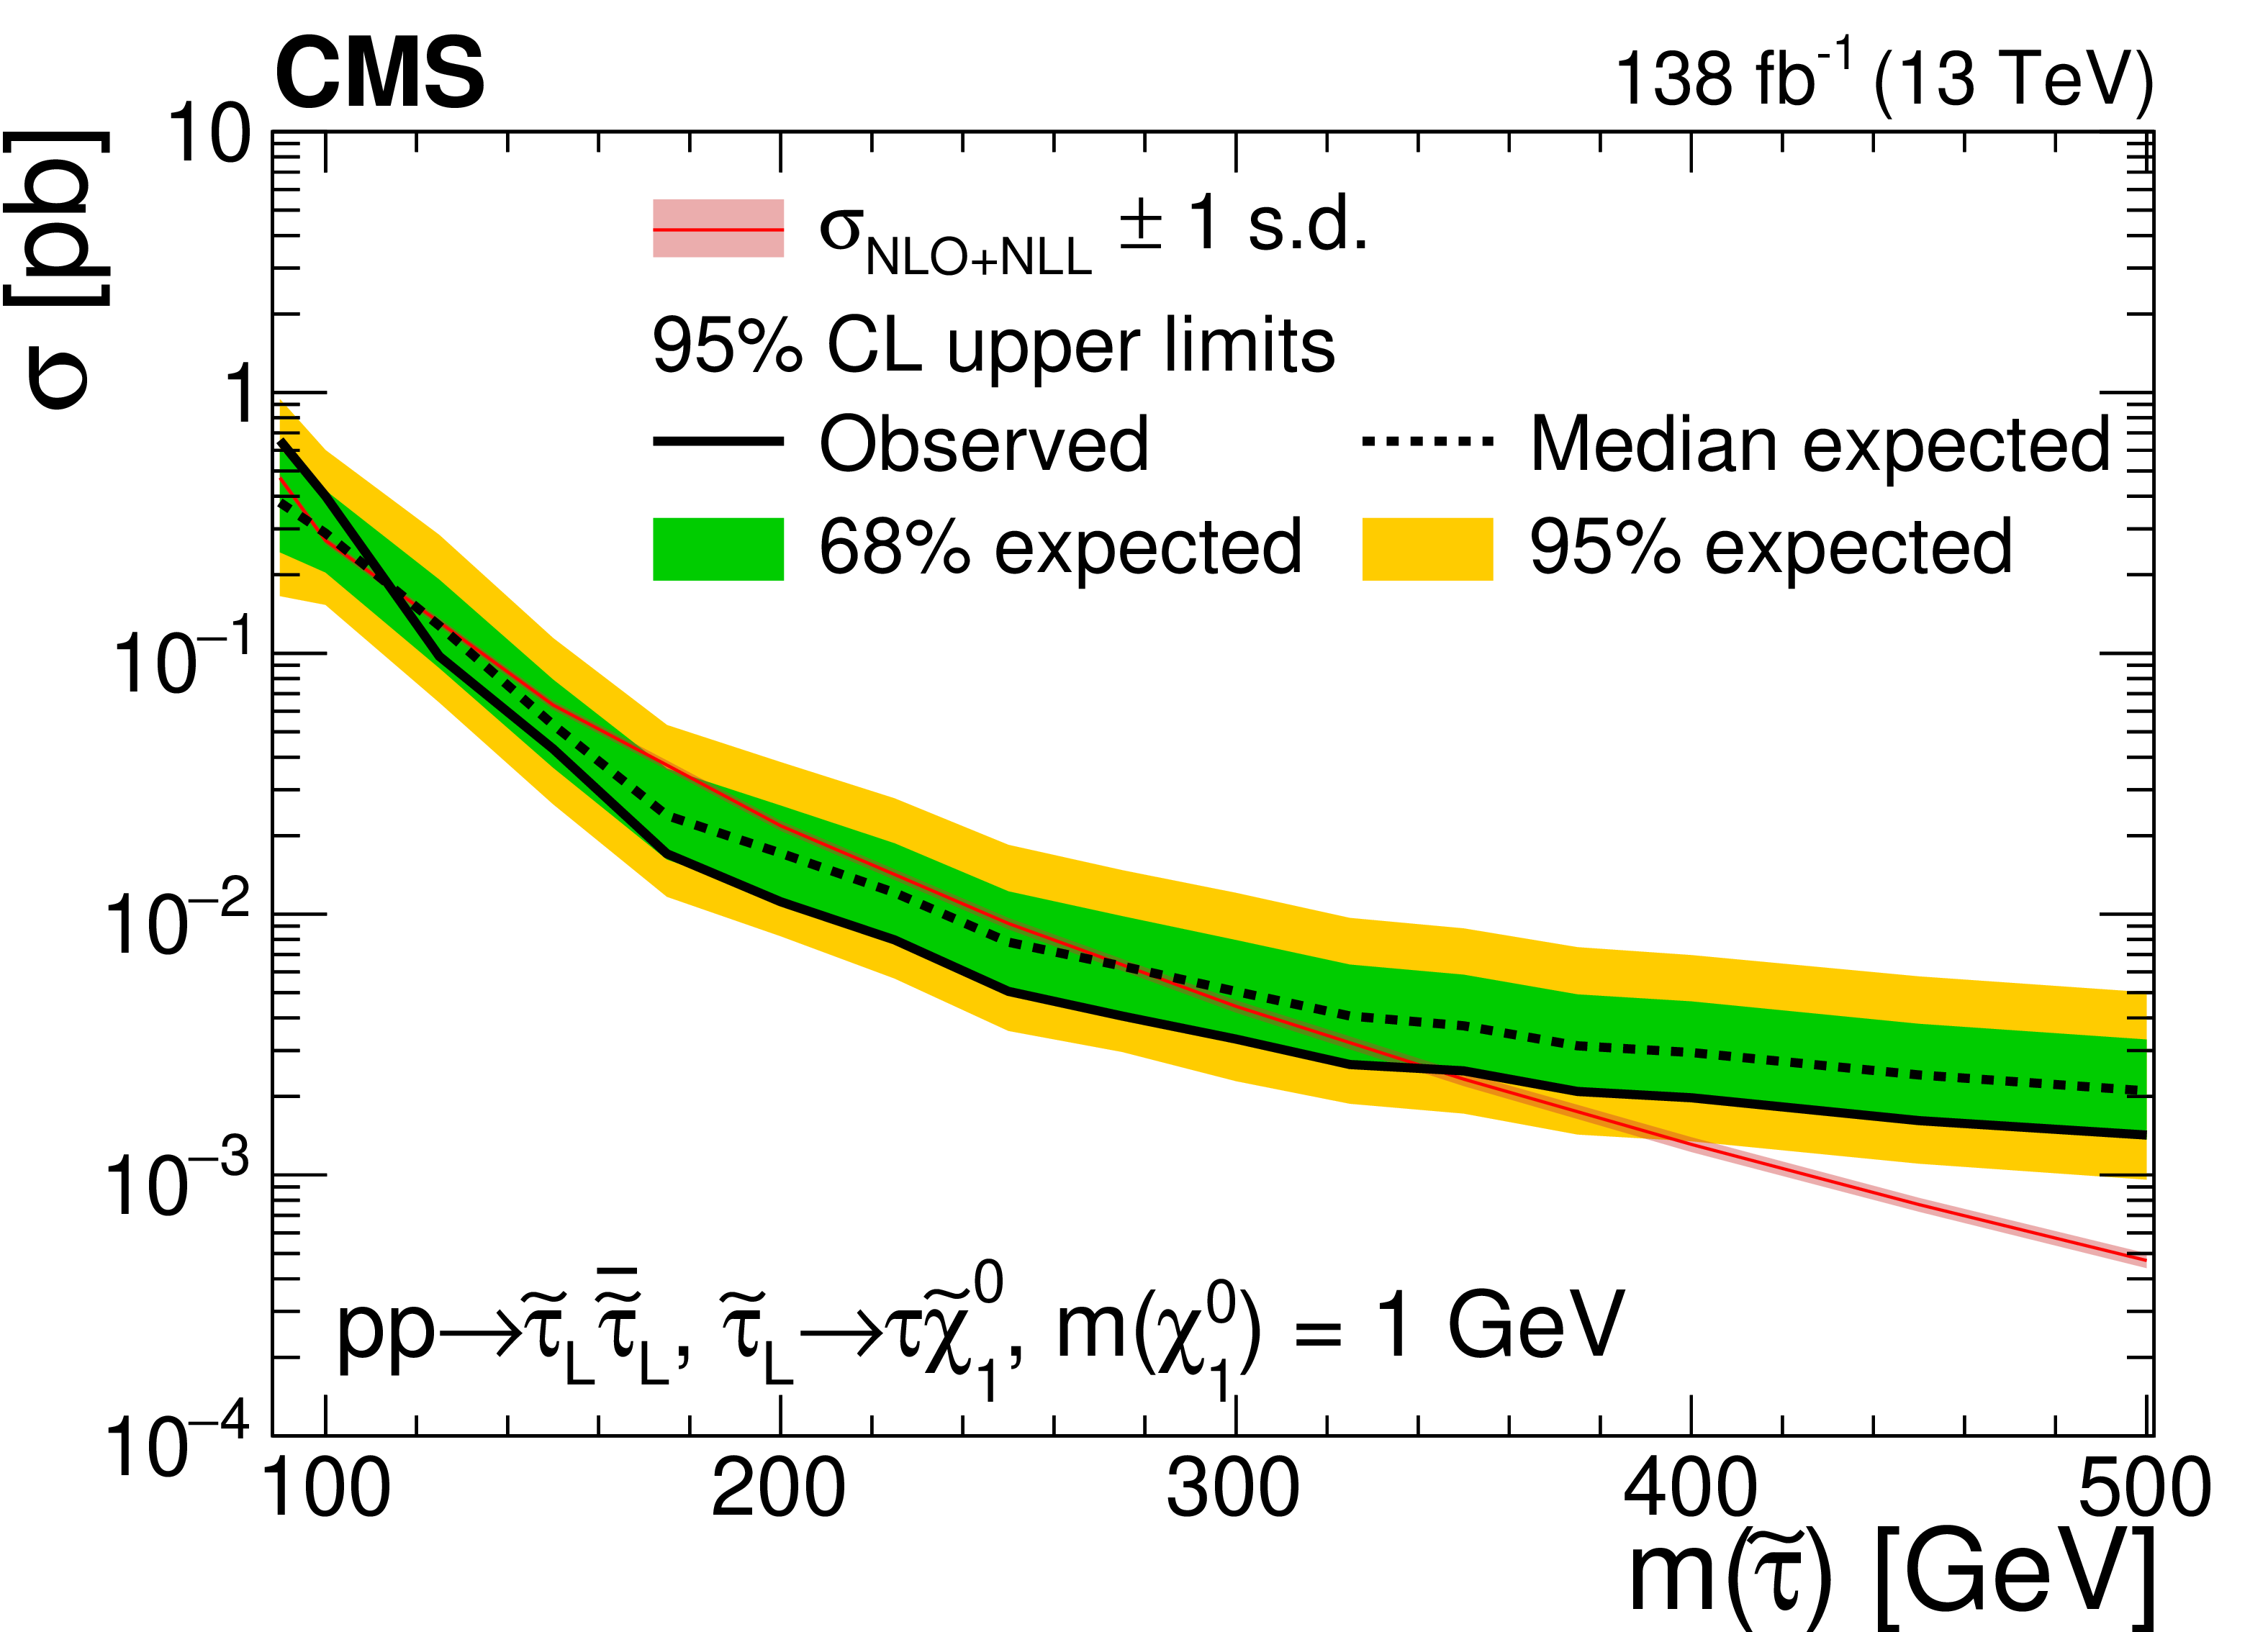
Figure 5:
Expected and observed 95% CL cross section upper limits as functions of the $\tilde{\tau}$ mass in the purely left-handed $\tilde{\tau}$ scenario for $\tilde{\chi}^0_1$ masses of 1, 10, 20, and 50 GeV (upper left to lower right). The inner (green) band and the outer (yellow) band indicate the regions containing 68 and 95%, respectively, of the distribution of limits expected under the background-only hypothesis. The red line and thin shaded band indicate the NLO+NLL prediction for the signal production cross section calculated with Resummino [29], and its uncertainty. |
png pdf |
Figure 5-a:
Expected and observed 95% CL cross section upper limits as functions of the $\tilde{\tau}$ mass in the purely left-handed $\tilde{\tau}$ scenario for $\tilde{\chi}^0_1$ masses of 1 GeV. The inner (green) band and the outer (yellow) band indicate the regions containing 68 and 95%, respectively, of the distribution of limits expected under the background-only hypothesis. The red line and thin shaded band indicate the NLO+NLL prediction for the signal production cross section calculated with Resummino [29], and its uncertainty. |
png pdf |
Figure 5-b:
Expected and observed 95% CL cross section upper limits as functions of the $\tilde{\tau}$ mass in the purely left-handed $\tilde{\tau}$ scenario for $\tilde{\chi}^0_1$ masses of 10 GeV. The inner (green) band and the outer (yellow) band indicate the regions containing 68 and 95%, respectively, of the distribution of limits expected under the background-only hypothesis. The red line and thin shaded band indicate the NLO+NLL prediction for the signal production cross section calculated with Resummino [29], and its uncertainty. |
png pdf |
Figure 5-c:
Expected and observed 95% CL cross section upper limits as functions of the $\tilde{\tau}$ mass in the purely left-handed $\tilde{\tau}$ scenario for $\tilde{\chi}^0_1$ masses of 20 GeV. The inner (green) band and the outer (yellow) band indicate the regions containing 68 and 95%, respectively, of the distribution of limits expected under the background-only hypothesis. The red line and thin shaded band indicate the NLO+NLL prediction for the signal production cross section calculated with Resummino [29], and its uncertainty. |
png pdf |
Figure 5-d:
Expected and observed 95% CL cross section upper limits as functions of the $\tilde{\tau}$ mass in the purely left-handed $\tilde{\tau}$ scenario for $\tilde{\chi}^0_1$ masses of 50 GeV. The inner (green) band and the outer (yellow) band indicate the regions containing 68 and 95%, respectively, of the distribution of limits expected under the background-only hypothesis. The red line and thin shaded band indicate the NLO+NLL prediction for the signal production cross section calculated with Resummino [29], and its uncertainty. |
png pdf |
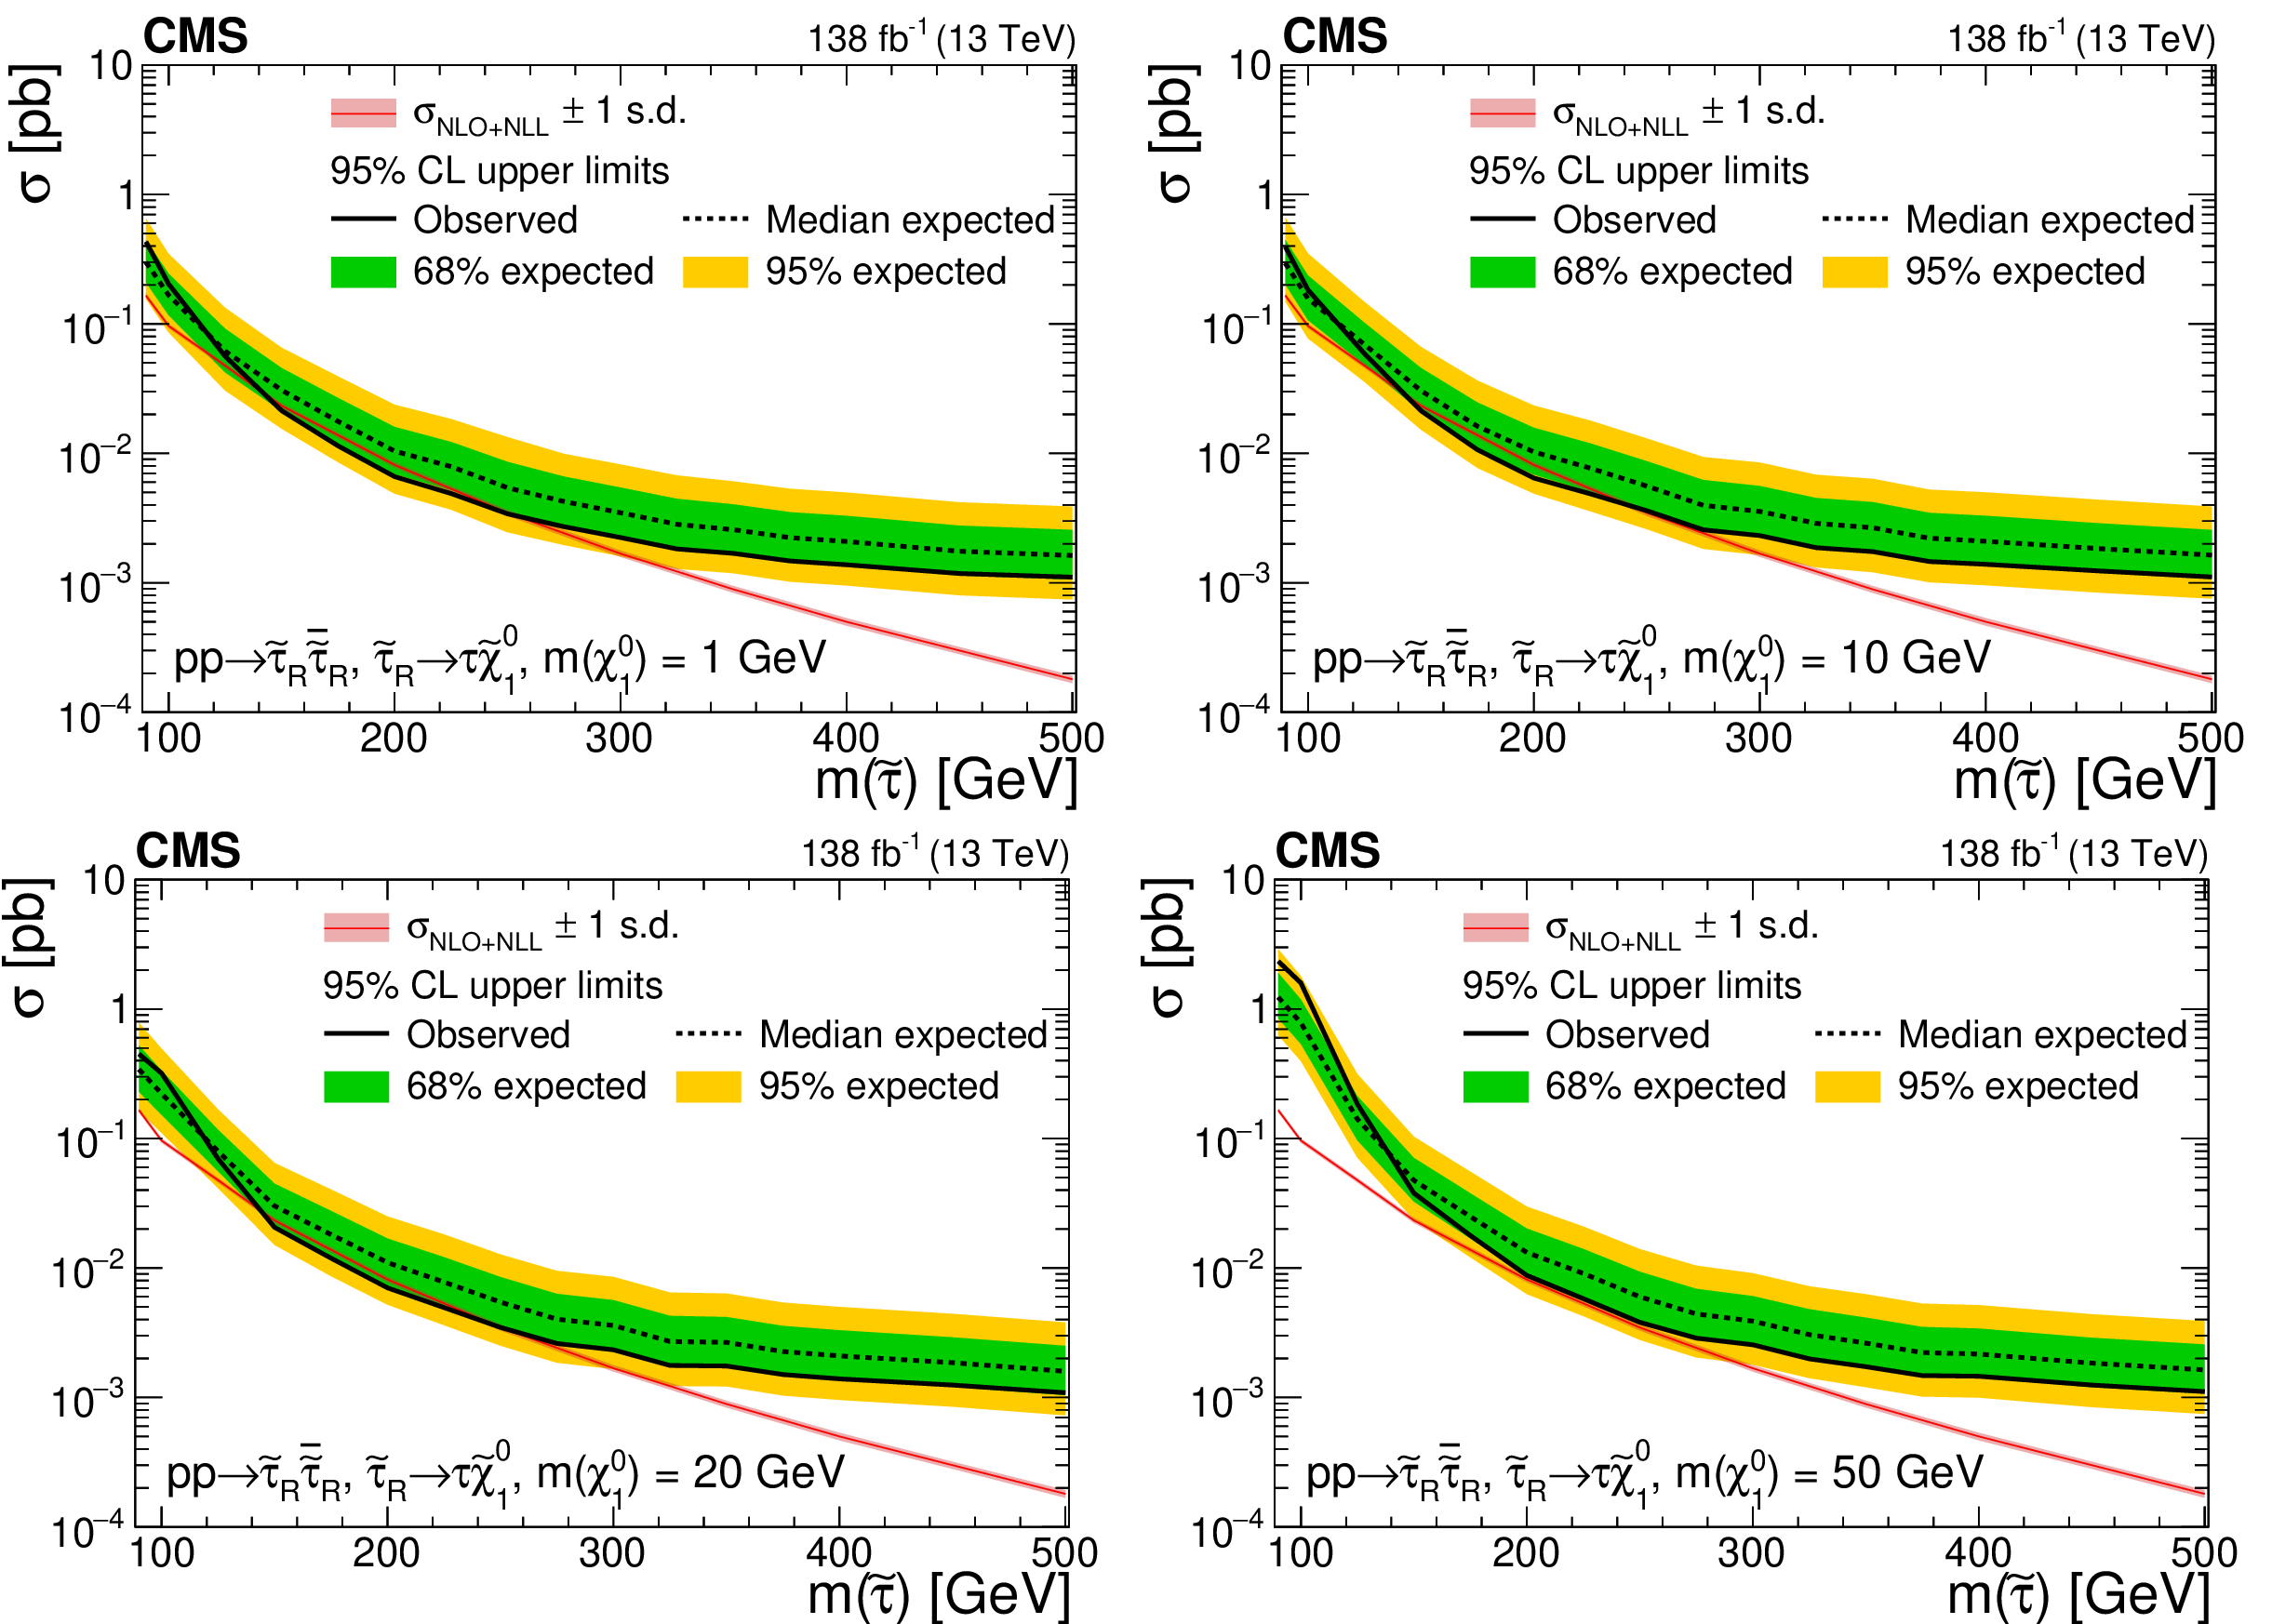
Figure 6:
Expected and observed 95% CL cross section upper limits as functions of the $\tilde{\tau}$ mass in the purely right-handed $\tilde{\tau}$ scenario for $\tilde{\chi}^0_1$ masses of 1, 10, 20, and 50 GeV (upper left to lower right). The inner (green) band and the outer (yellow) band indicate the regions containing 68 and 95%, respectively, of the distribution of limits expected under the background-only hypothesis. The red line and thin shaded band indicate the NLO+NLL prediction for the signal production cross section calculated with Resummino [29], and its uncertainty. |

png pdf |
Figure 6-a:
Expected and observed 95% CL cross section upper limits as functions of the $\tilde{\tau}$ mass in the purely right-handed $\tilde{\tau}$ scenario for $\tilde{\chi}^0_1$ masses of 1 GeV. The inner (green) band and the outer (yellow) band indicate the regions containing 68 and 95%, respectively, of the distribution of limits expected under the background-only hypothesis. The red line and thin shaded band indicate the NLO+NLL prediction for the signal production cross section calculated with Resummino [29], and its uncertainty. |

png pdf |
Figure 6-b:
Expected and observed 95% CL cross section upper limits as functions of the $\tilde{\tau}$ mass in the purely right-handed $\tilde{\tau}$ scenario for $\tilde{\chi}^0_1$ masses of 10 GeV. The inner (green) band and the outer (yellow) band indicate the regions containing 68 and 95%, respectively, of the distribution of limits expected under the background-only hypothesis. The red line and thin shaded band indicate the NLO+NLL prediction for the signal production cross section calculated with Resummino [29], and its uncertainty. |
png pdf |
Figure 6-c:
Expected and observed 95% CL cross section upper limits as functions of the $\tilde{\tau}$ mass in the purely right-handed $\tilde{\tau}$ scenario for $\tilde{\chi}^0_1$ masses of 20 GeV. The inner (green) band and the outer (yellow) band indicate the regions containing 68 and 95%, respectively, of the distribution of limits expected under the background-only hypothesis. The red line and thin shaded band indicate the NLO+NLL prediction for the signal production cross section calculated with Resummino [29], and its uncertainty. |
png pdf |
Figure 6-d:
Expected and observed 95% CL cross section upper limits as functions of the $\tilde{\tau}$ mass in the purely right-handed $\tilde{\tau}$ scenario for $\tilde{\chi}^0_1$ masses of 50 GeV. The inner (green) band and the outer (yellow) band indicate the regions containing 68 and 95%, respectively, of the distribution of limits expected under the background-only hypothesis. The red line and thin shaded band indicate the NLO+NLL prediction for the signal production cross section calculated with Resummino [29], and its uncertainty. |

png pdf |
Figure 7:
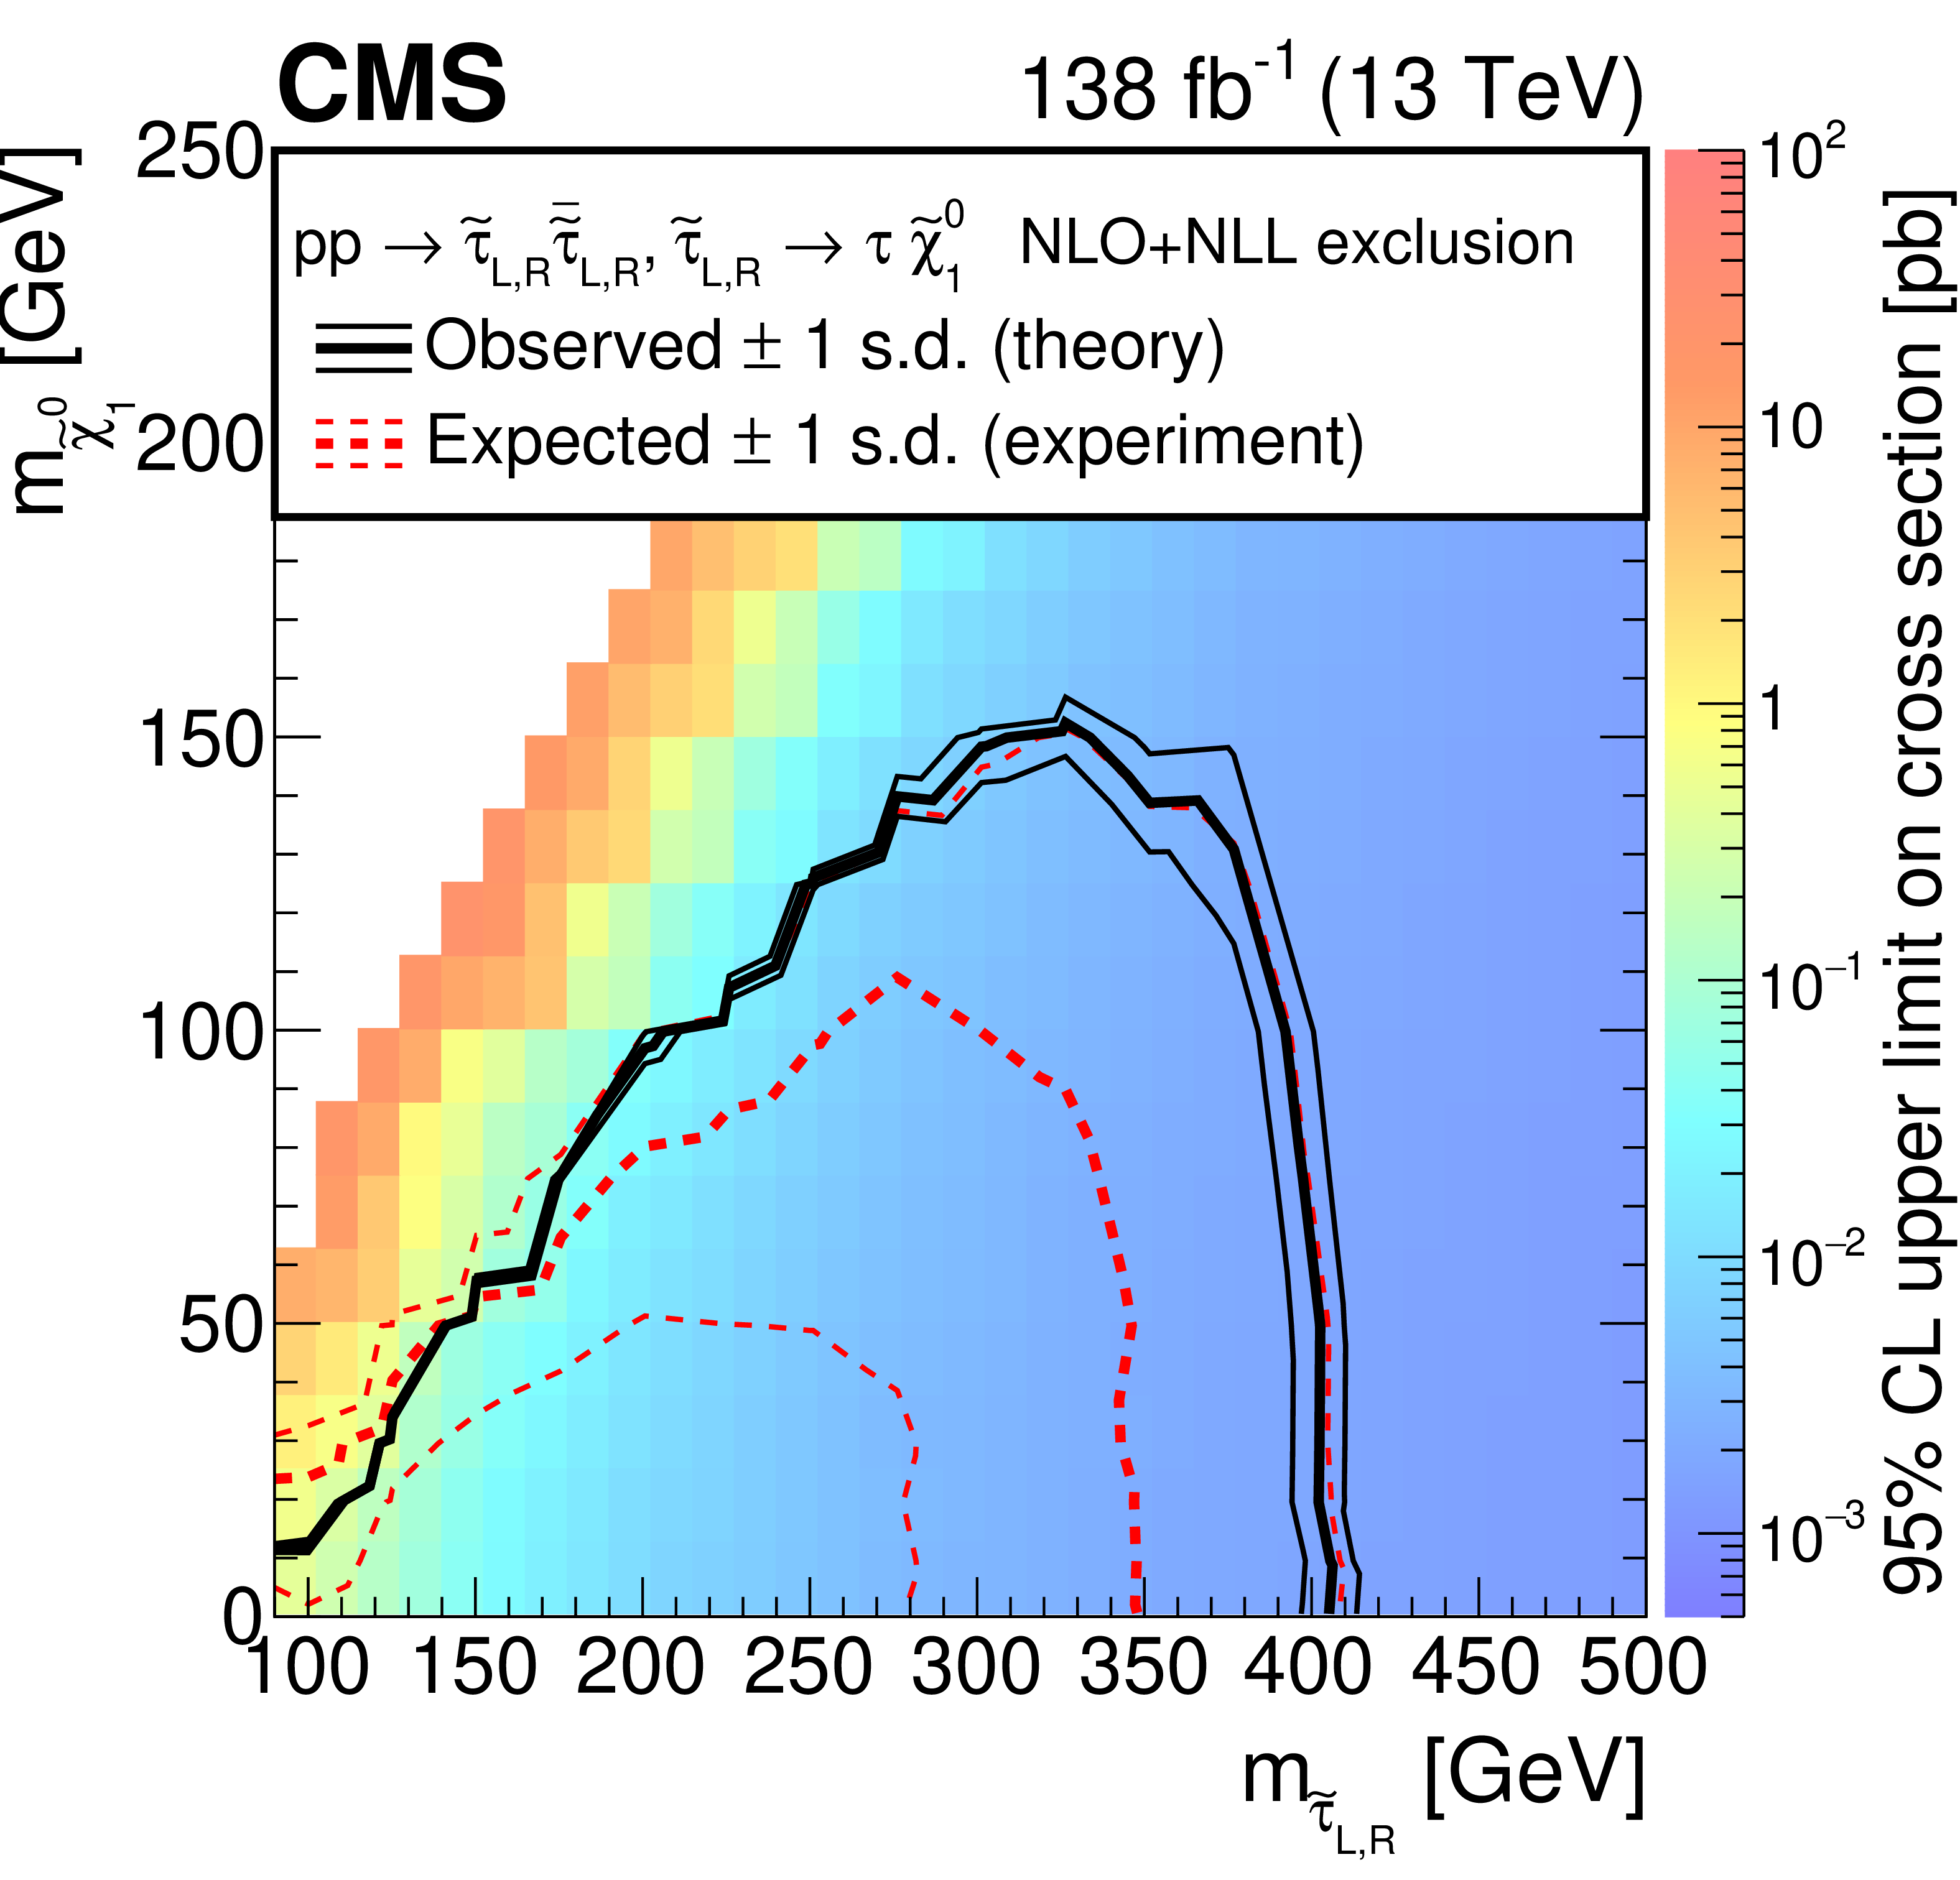
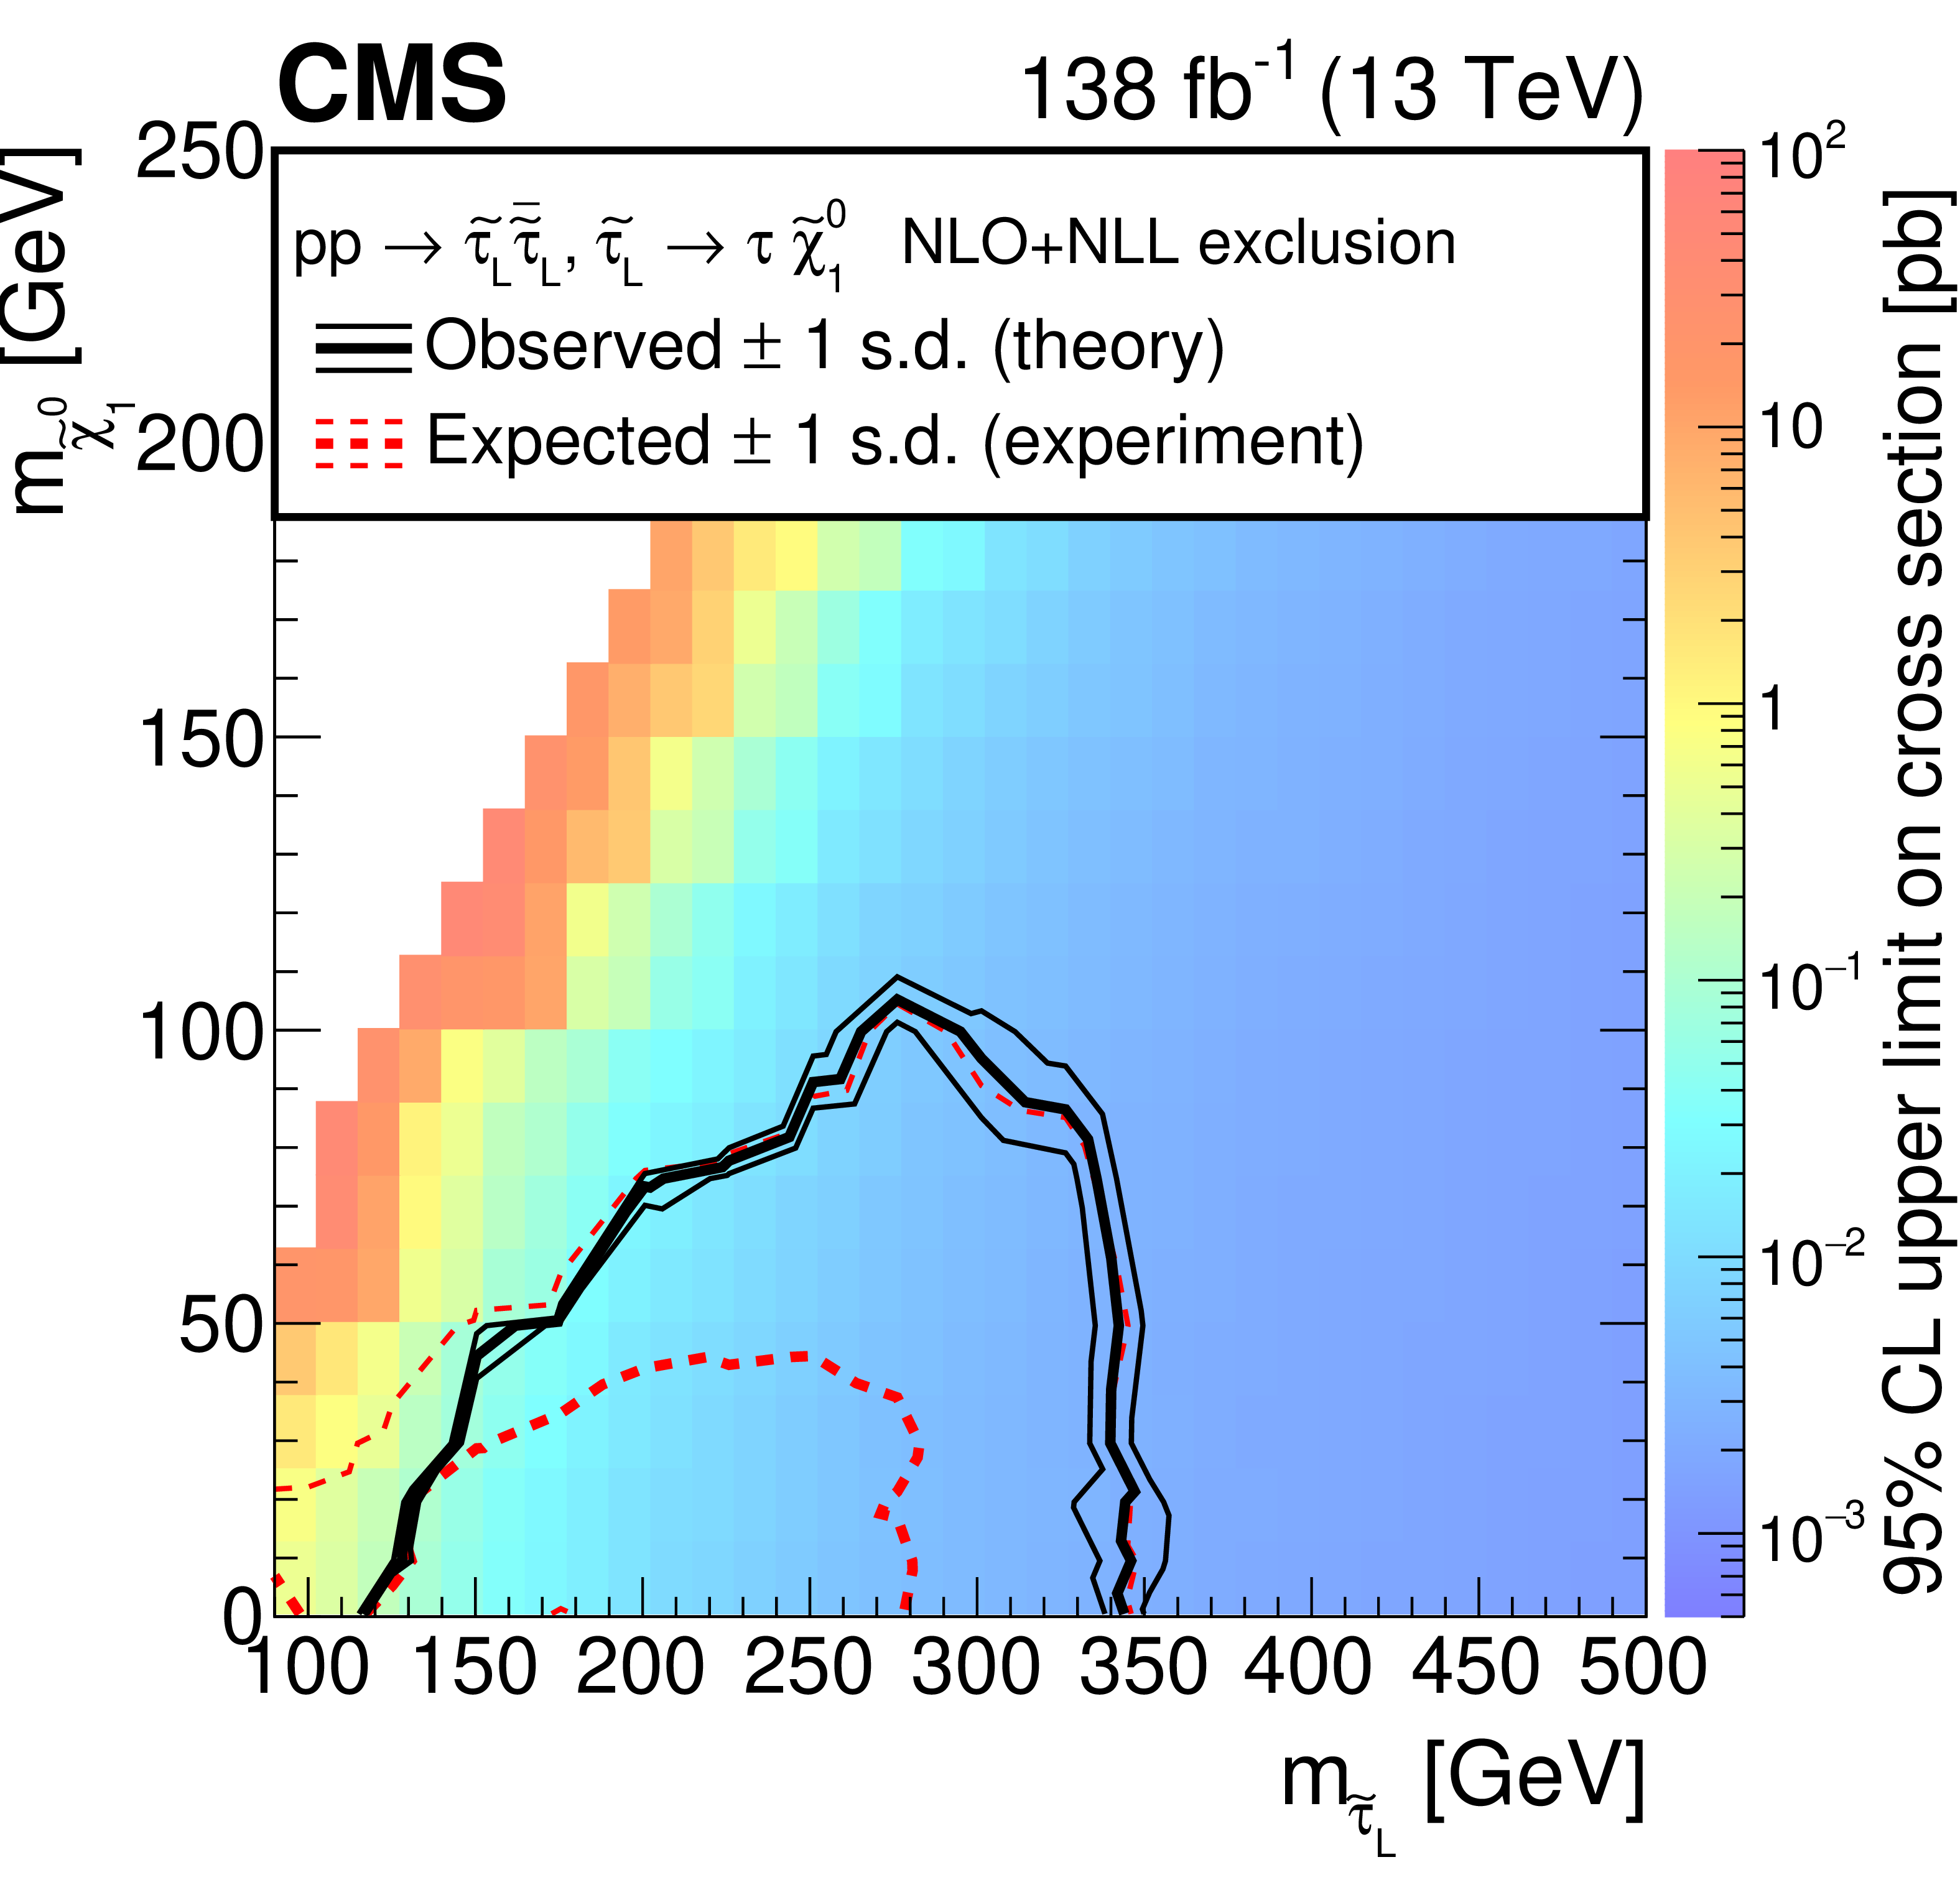
Upper limits at 95% CL on the cross section for degenerate (left) and purely left-handed (right) $\tilde{\tau}$ pair production in the $m(\tilde{\tau})$-$m(\tilde{\chi}^0_1)$ plane. The thick black (red) curves show the observed (expected) exclusion limits assuming NLO+NLL predictions for the signal cross sections. The thin black curves represent the variations in the observed limits obtained when these cross sections are varied by their $ \pm 1 $ standard deviation uncertainties. The thin dashed red curves indicate the region containing 68% of the distribution of limits expected under the background-only hypothesis. |
png pdf |
Figure 7-a:
Upper limits at 95% CL on the cross section for degenerate $\tilde{\tau}$ pair production in the $m(\tilde{\tau})$-$m(\tilde{\chi}^0_1)$ plane. The thick black (red) curves show the observed (expected) exclusion limits assuming NLO+NLL predictions for the signal cross sections. The thin black curves represent the variations in the observed limits obtained when these cross sections are varied by their $ \pm 1 $ standard deviation uncertainties. The thin dashed red curves indicate the region containing 68% of the distribution of limits expected under the background-only hypothesis. |
png pdf |
Figure 7-b:
Upper limits at 95% CL on the cross section for purely left-handed $\tilde{\tau}$ pair production in the $m(\tilde{\tau})$-$m(\tilde{\chi}^0_1)$ plane. The thick black (red) curves show the observed (expected) exclusion limits assuming NLO+NLL predictions for the signal cross sections. The thin black curves represent the variations in the observed limits obtained when these cross sections are varied by their $ \pm 1 $ standard deviation uncertainties. The thin dashed red curves indicate the region containing 68% of the distribution of limits expected under the background-only hypothesis. |
png pdf |
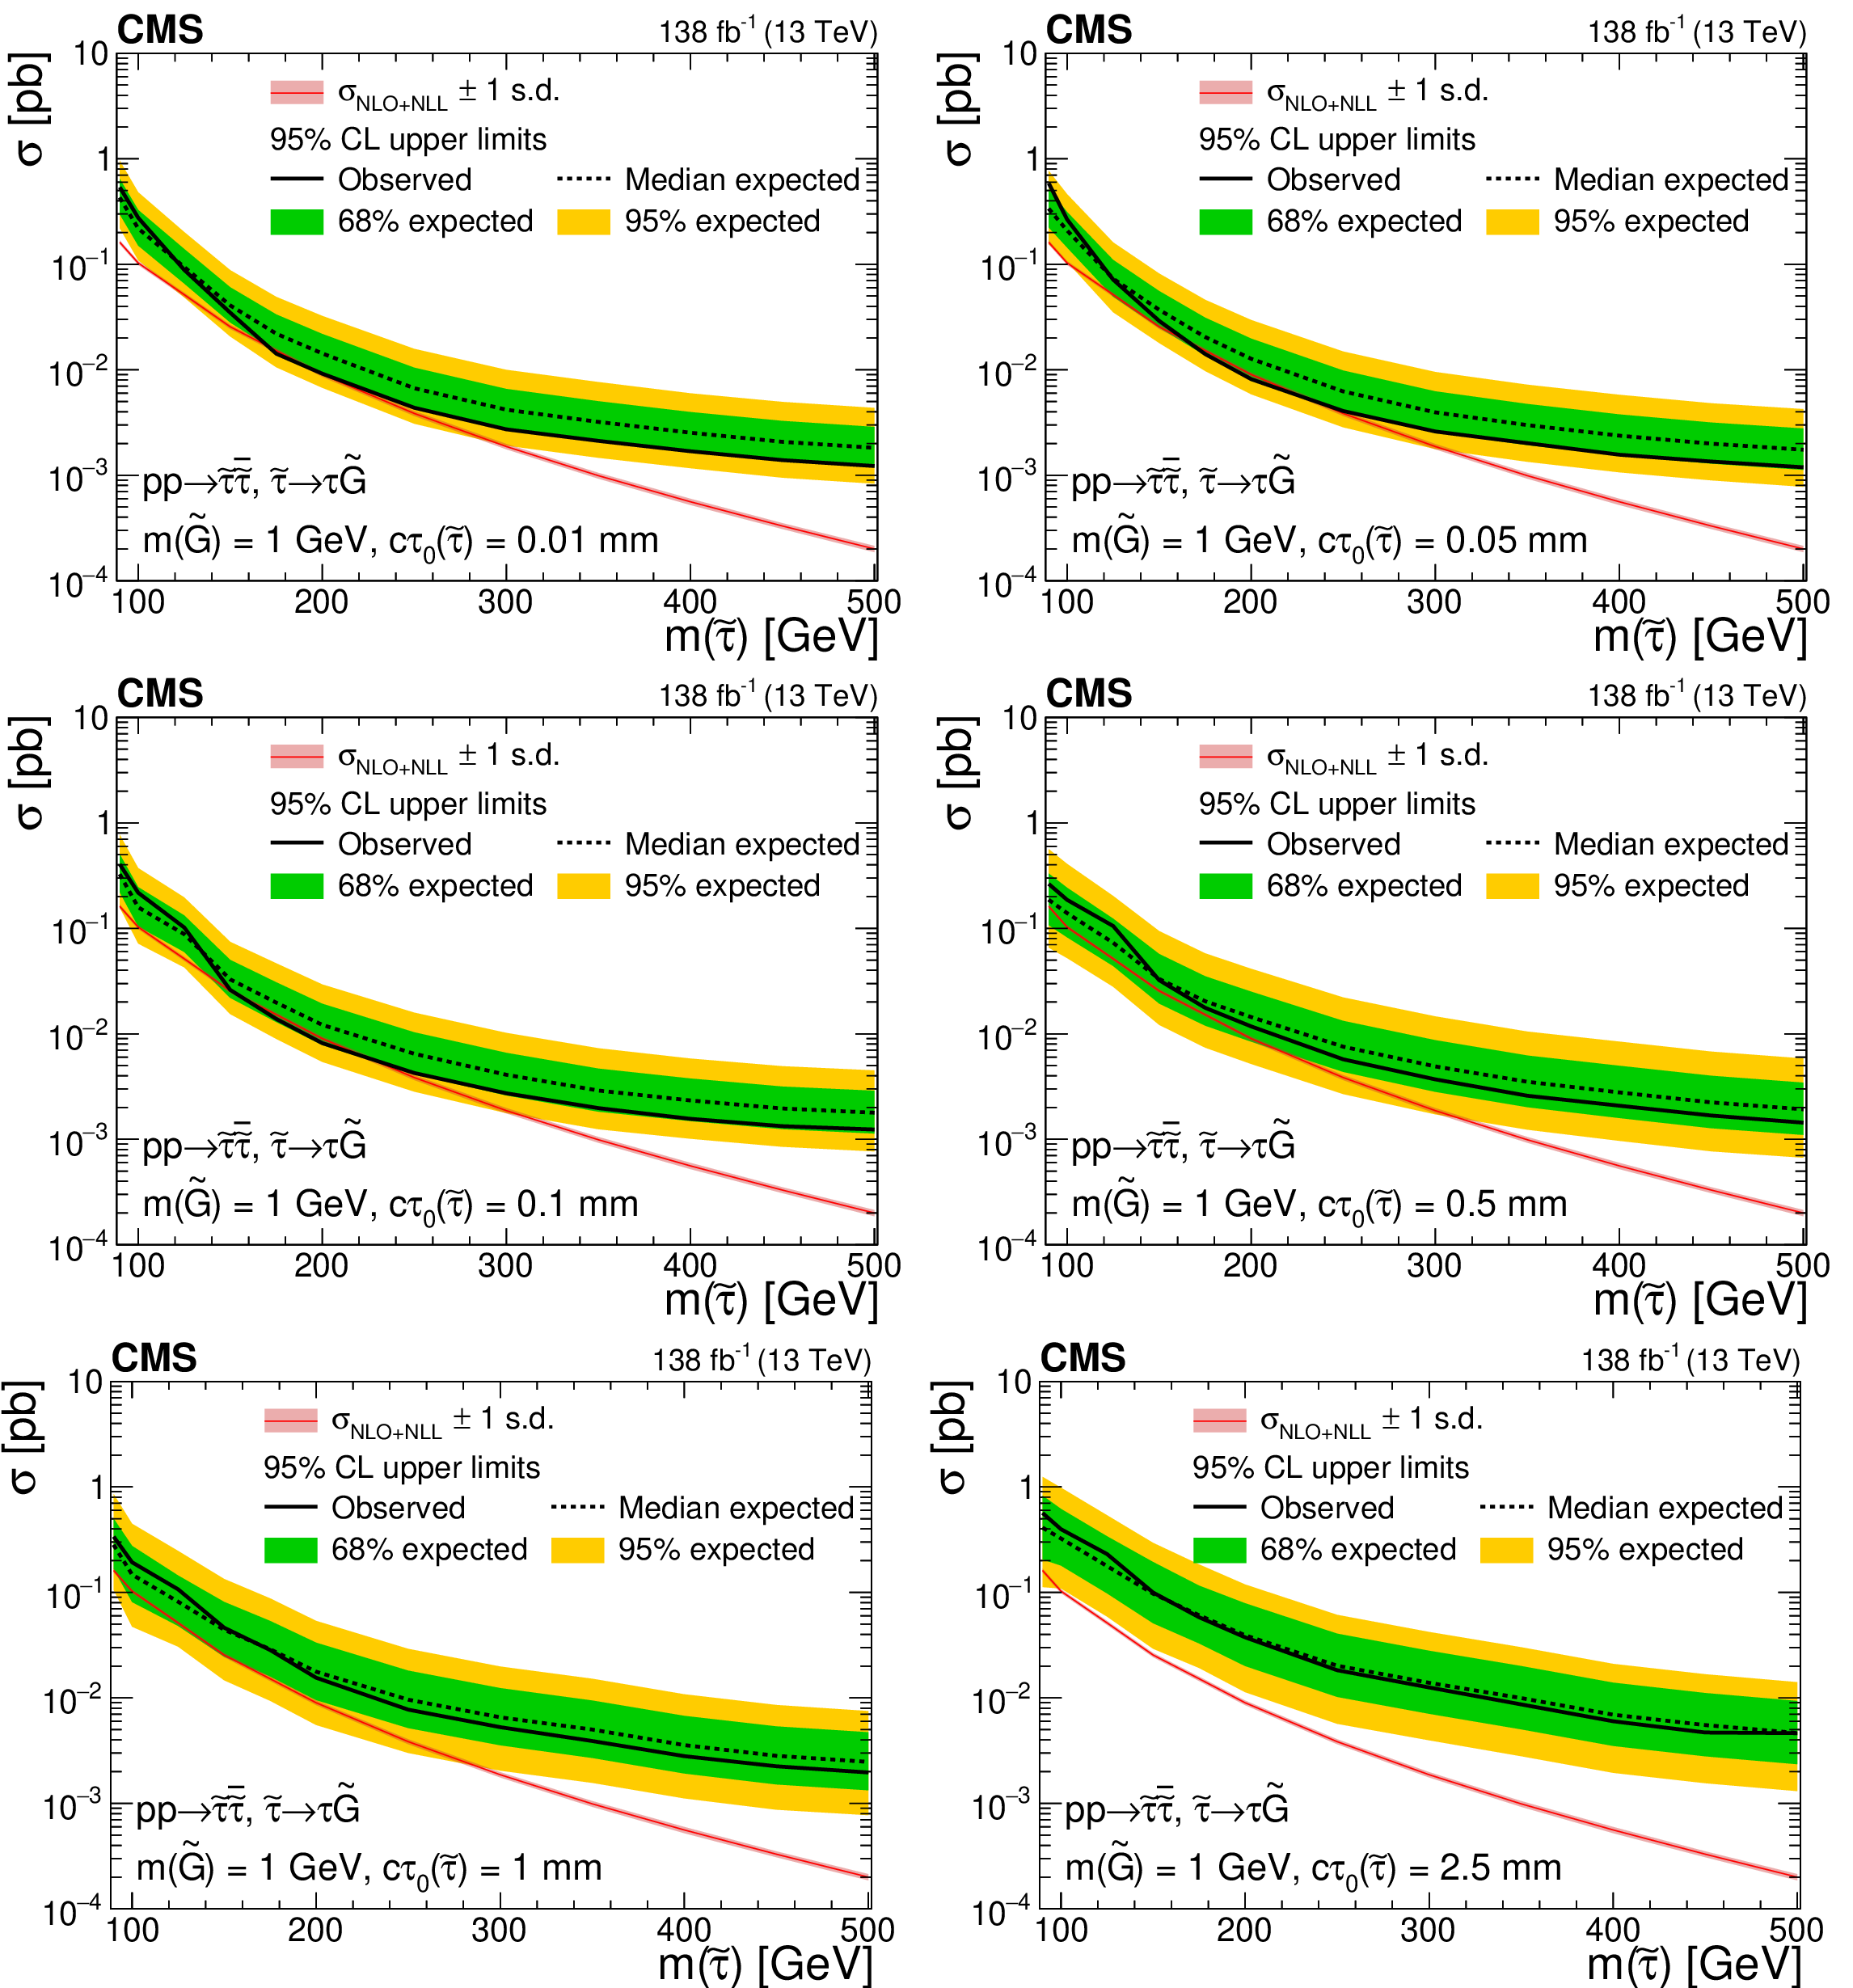
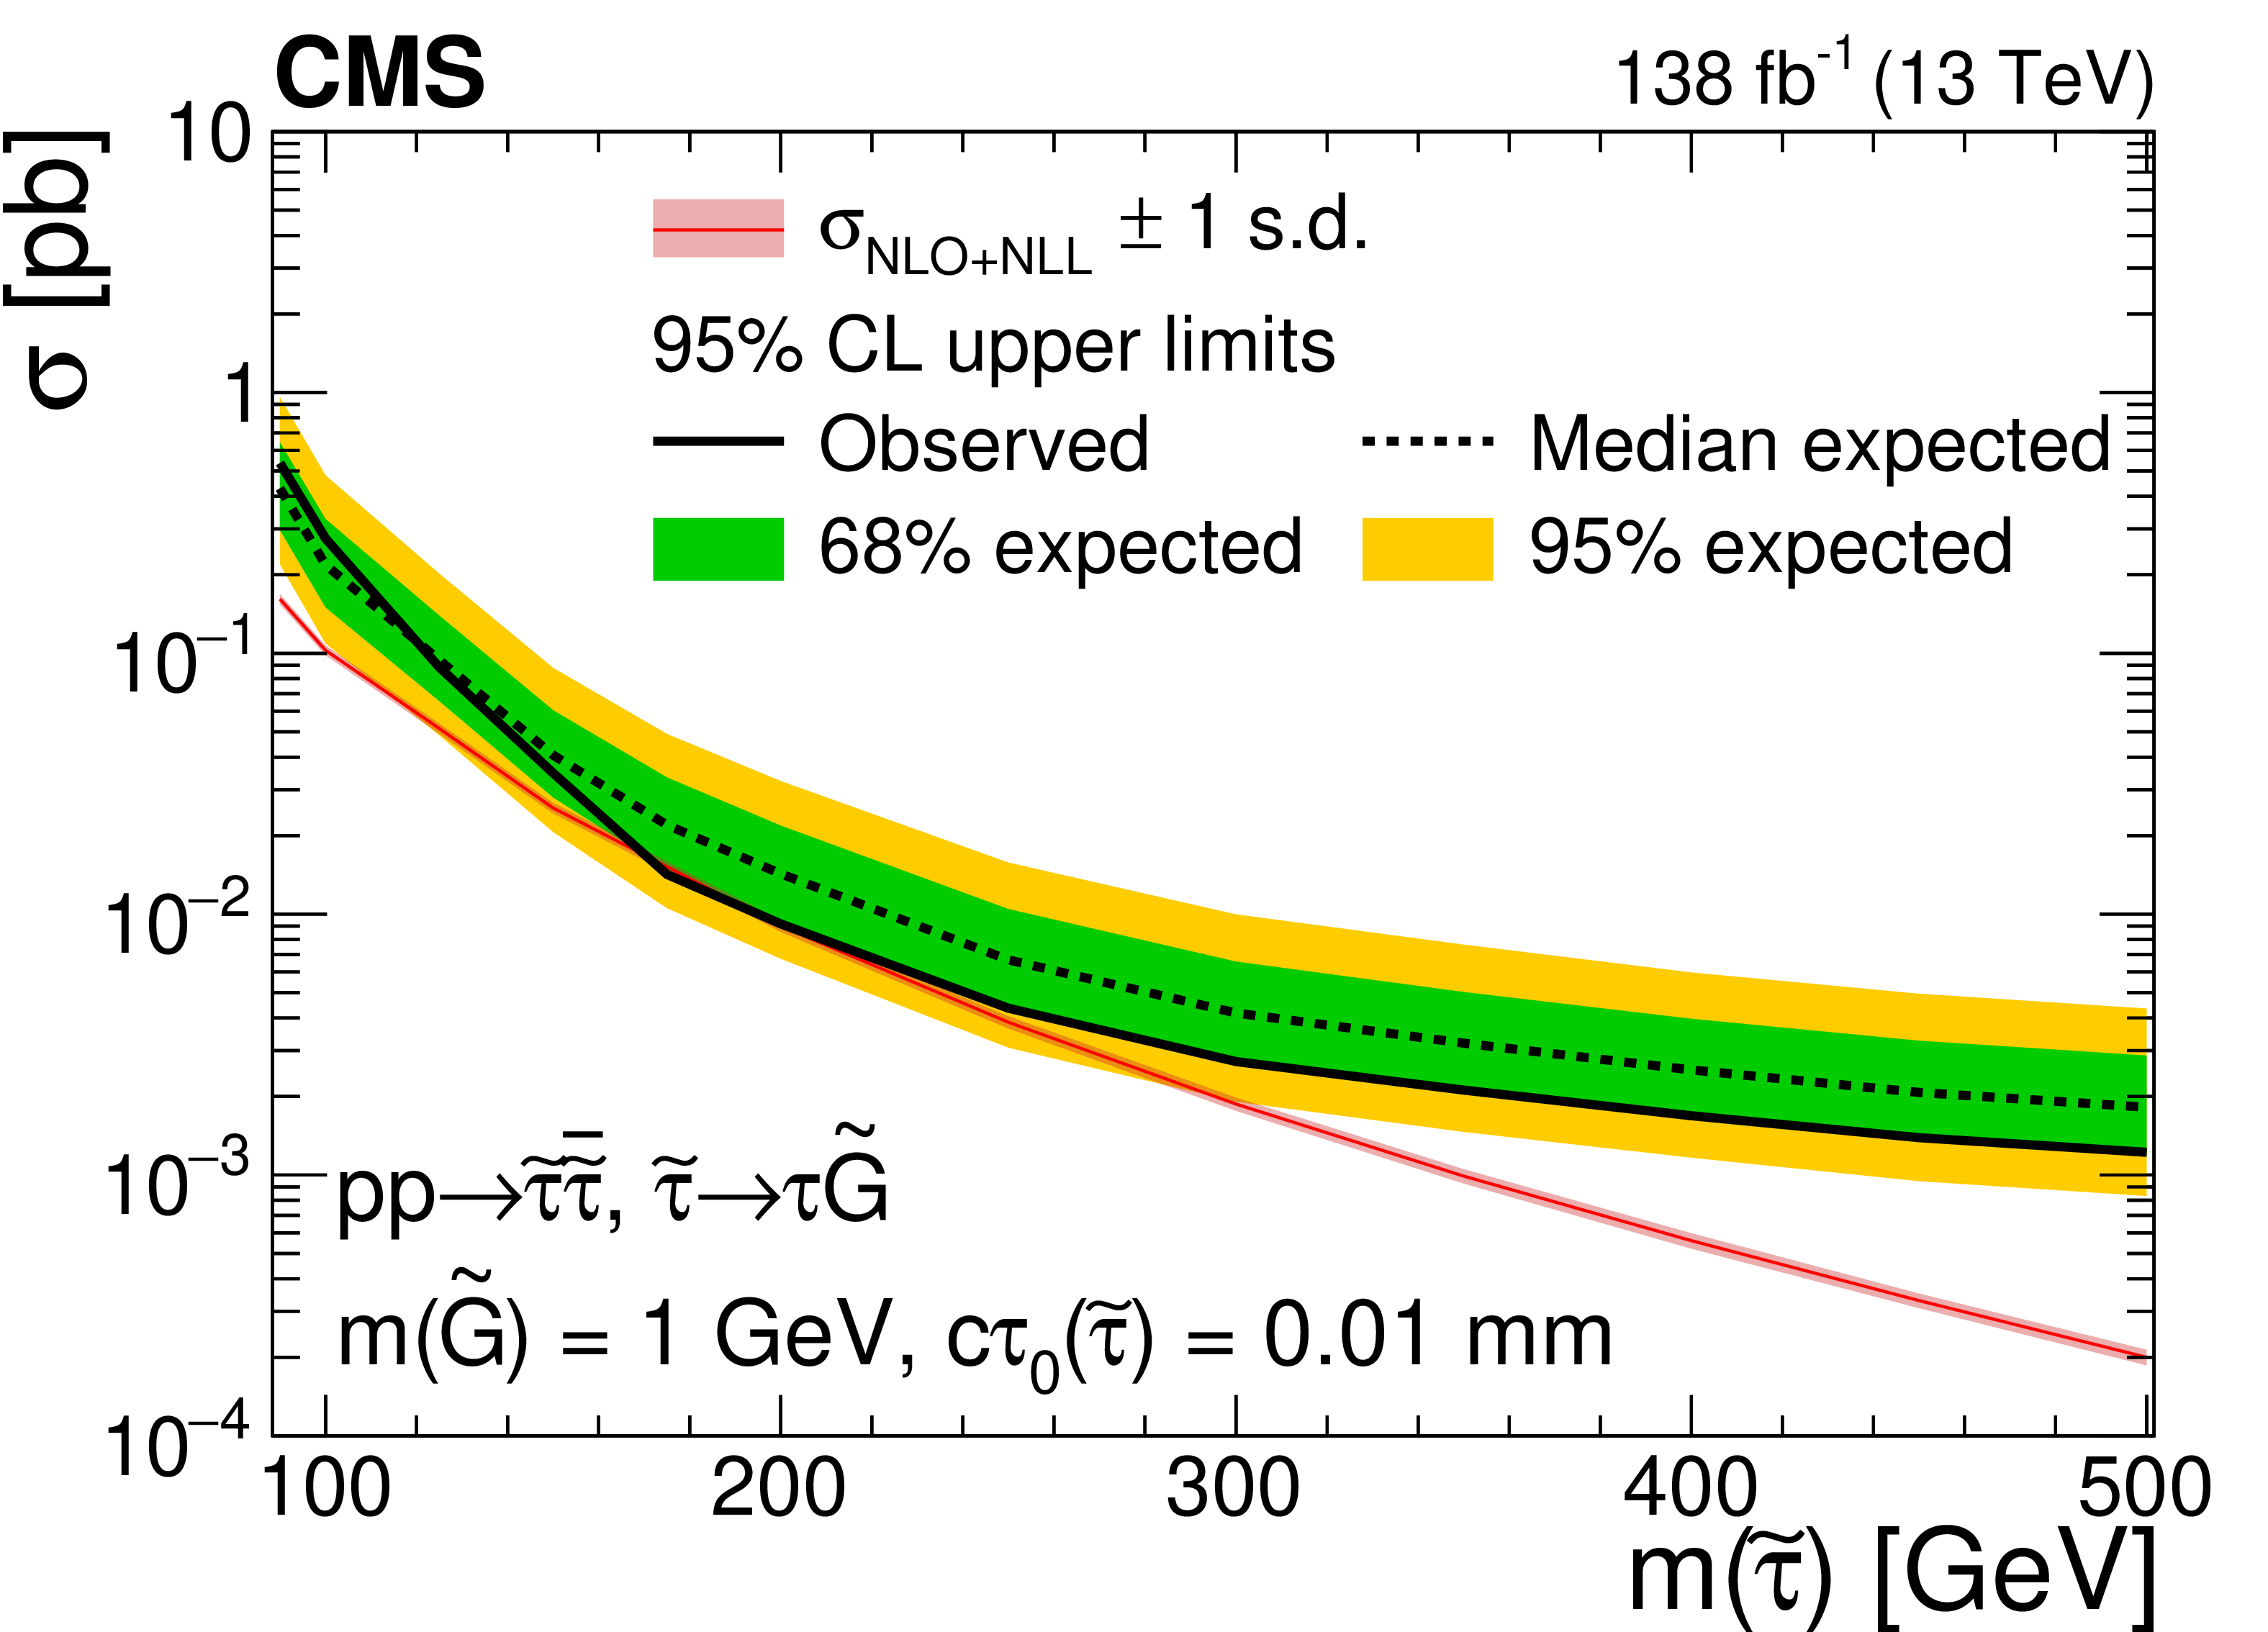
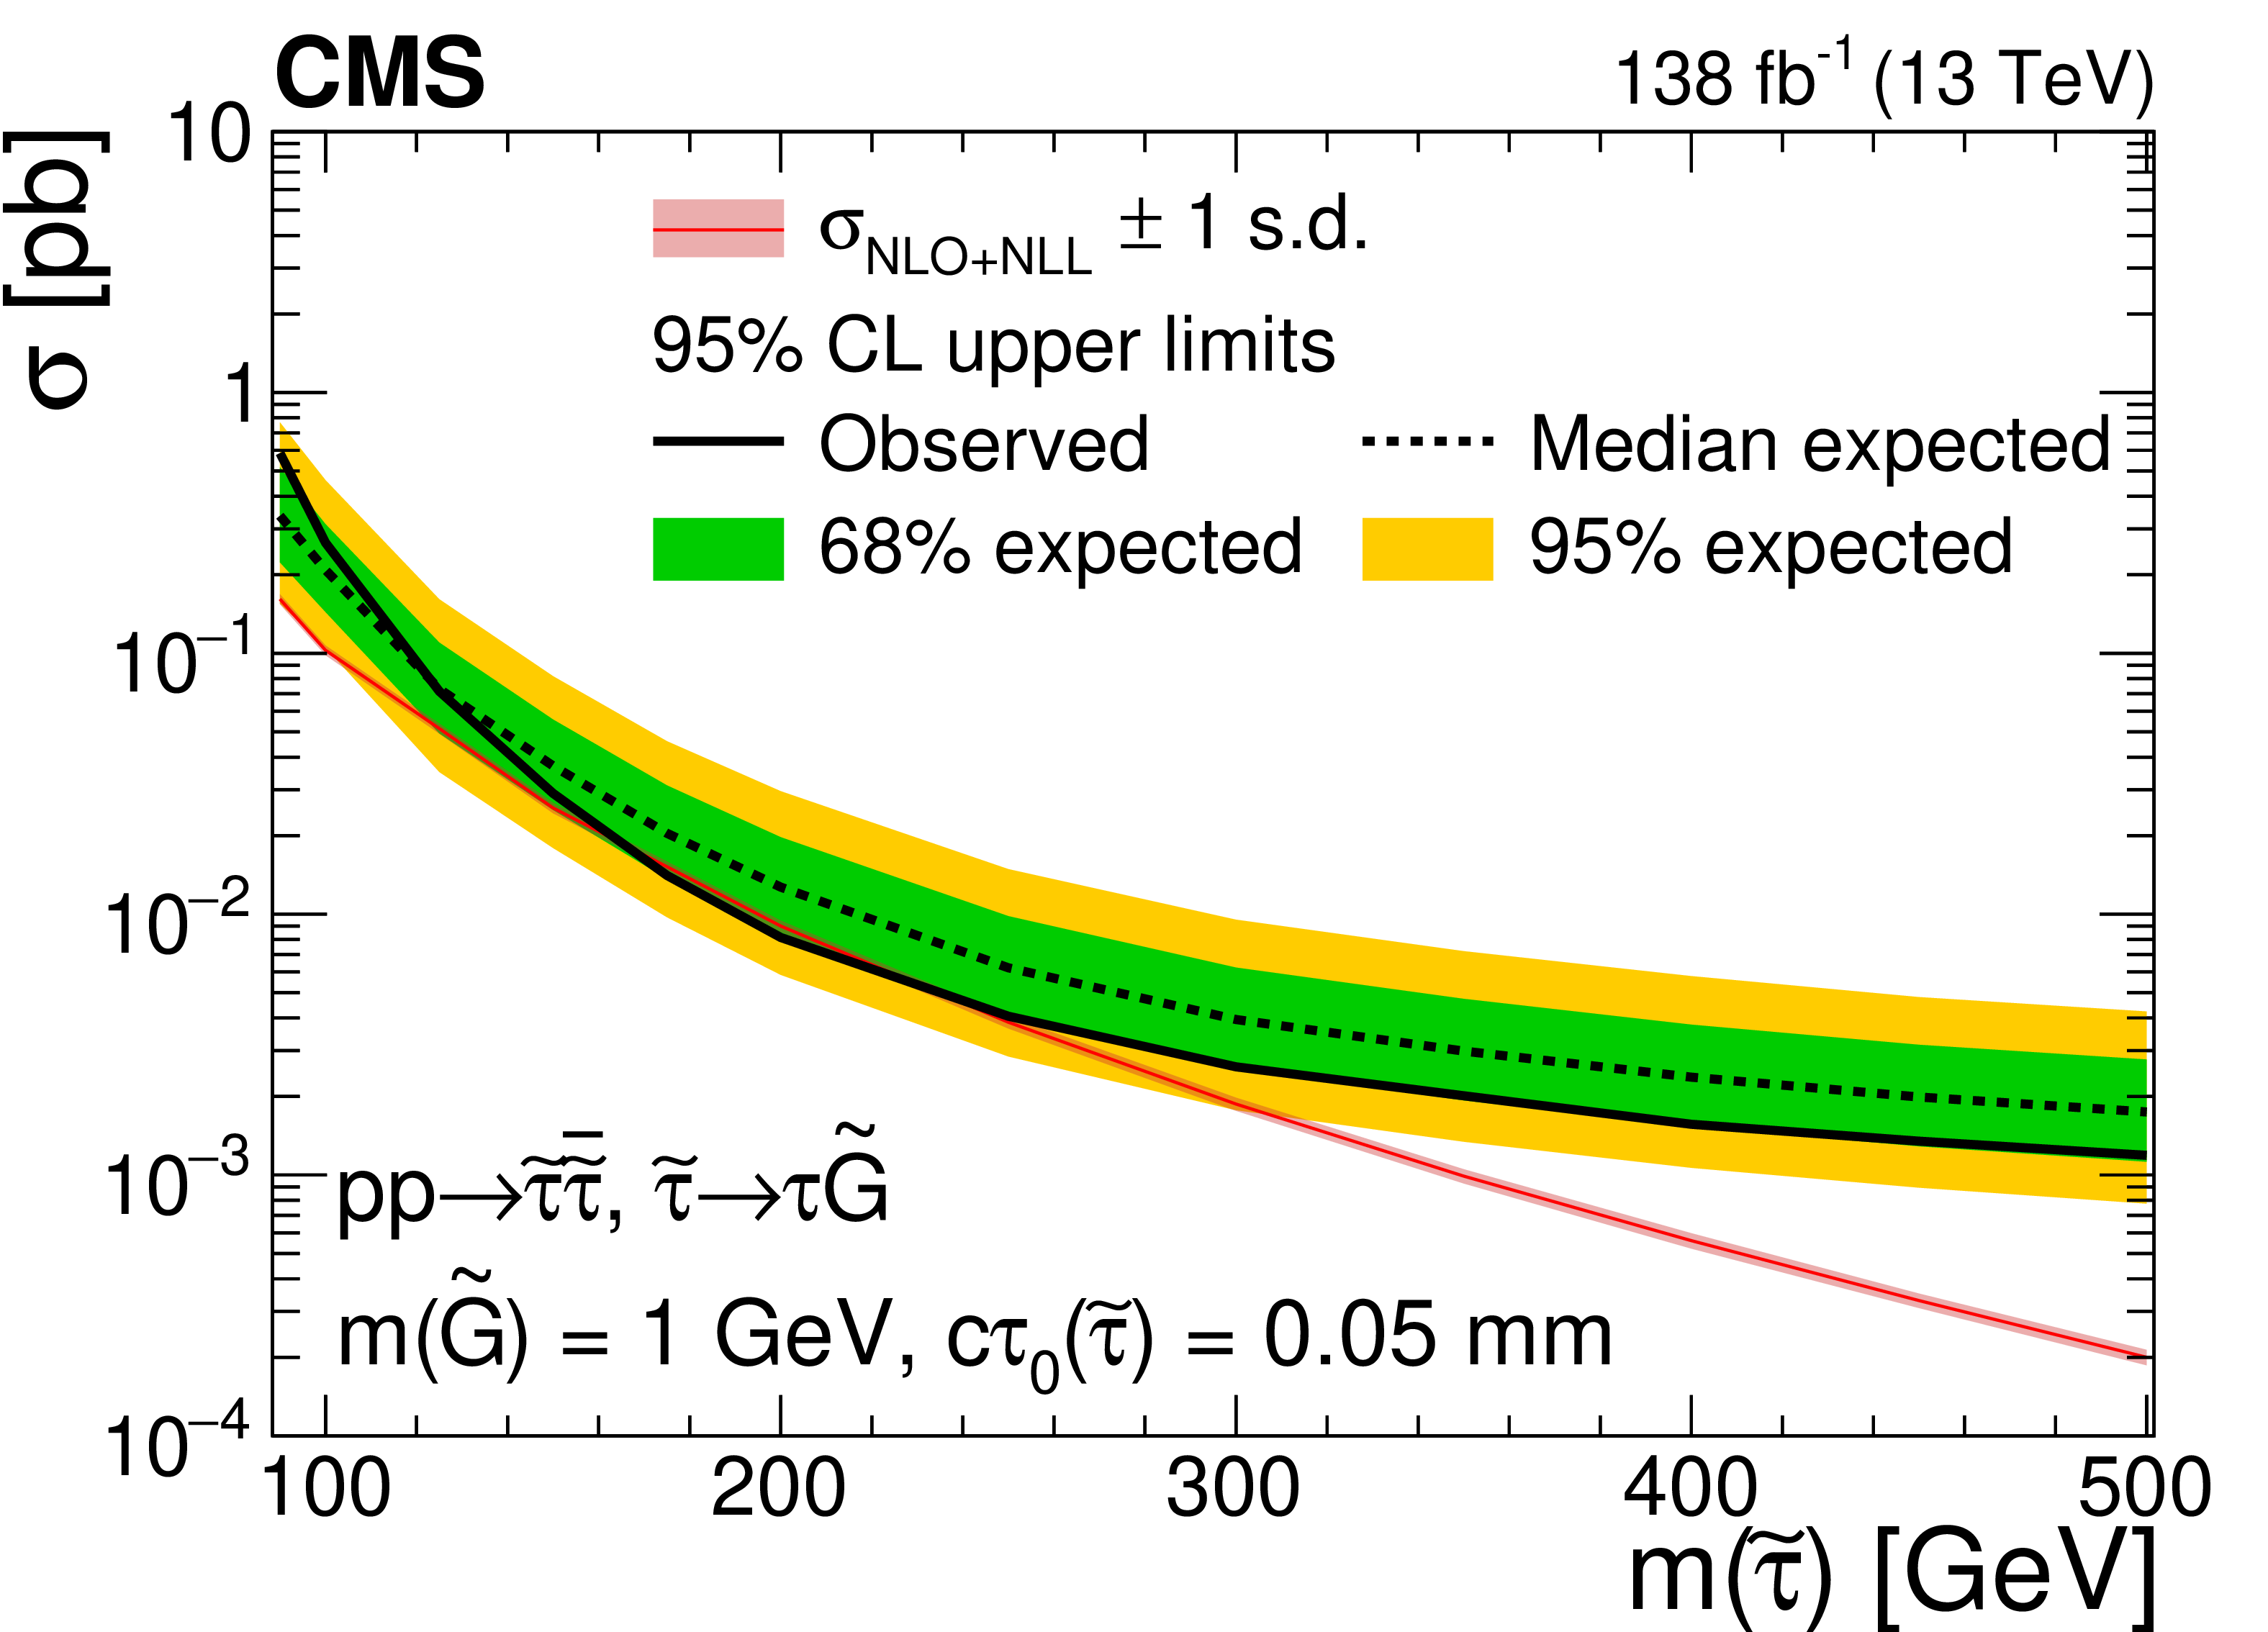
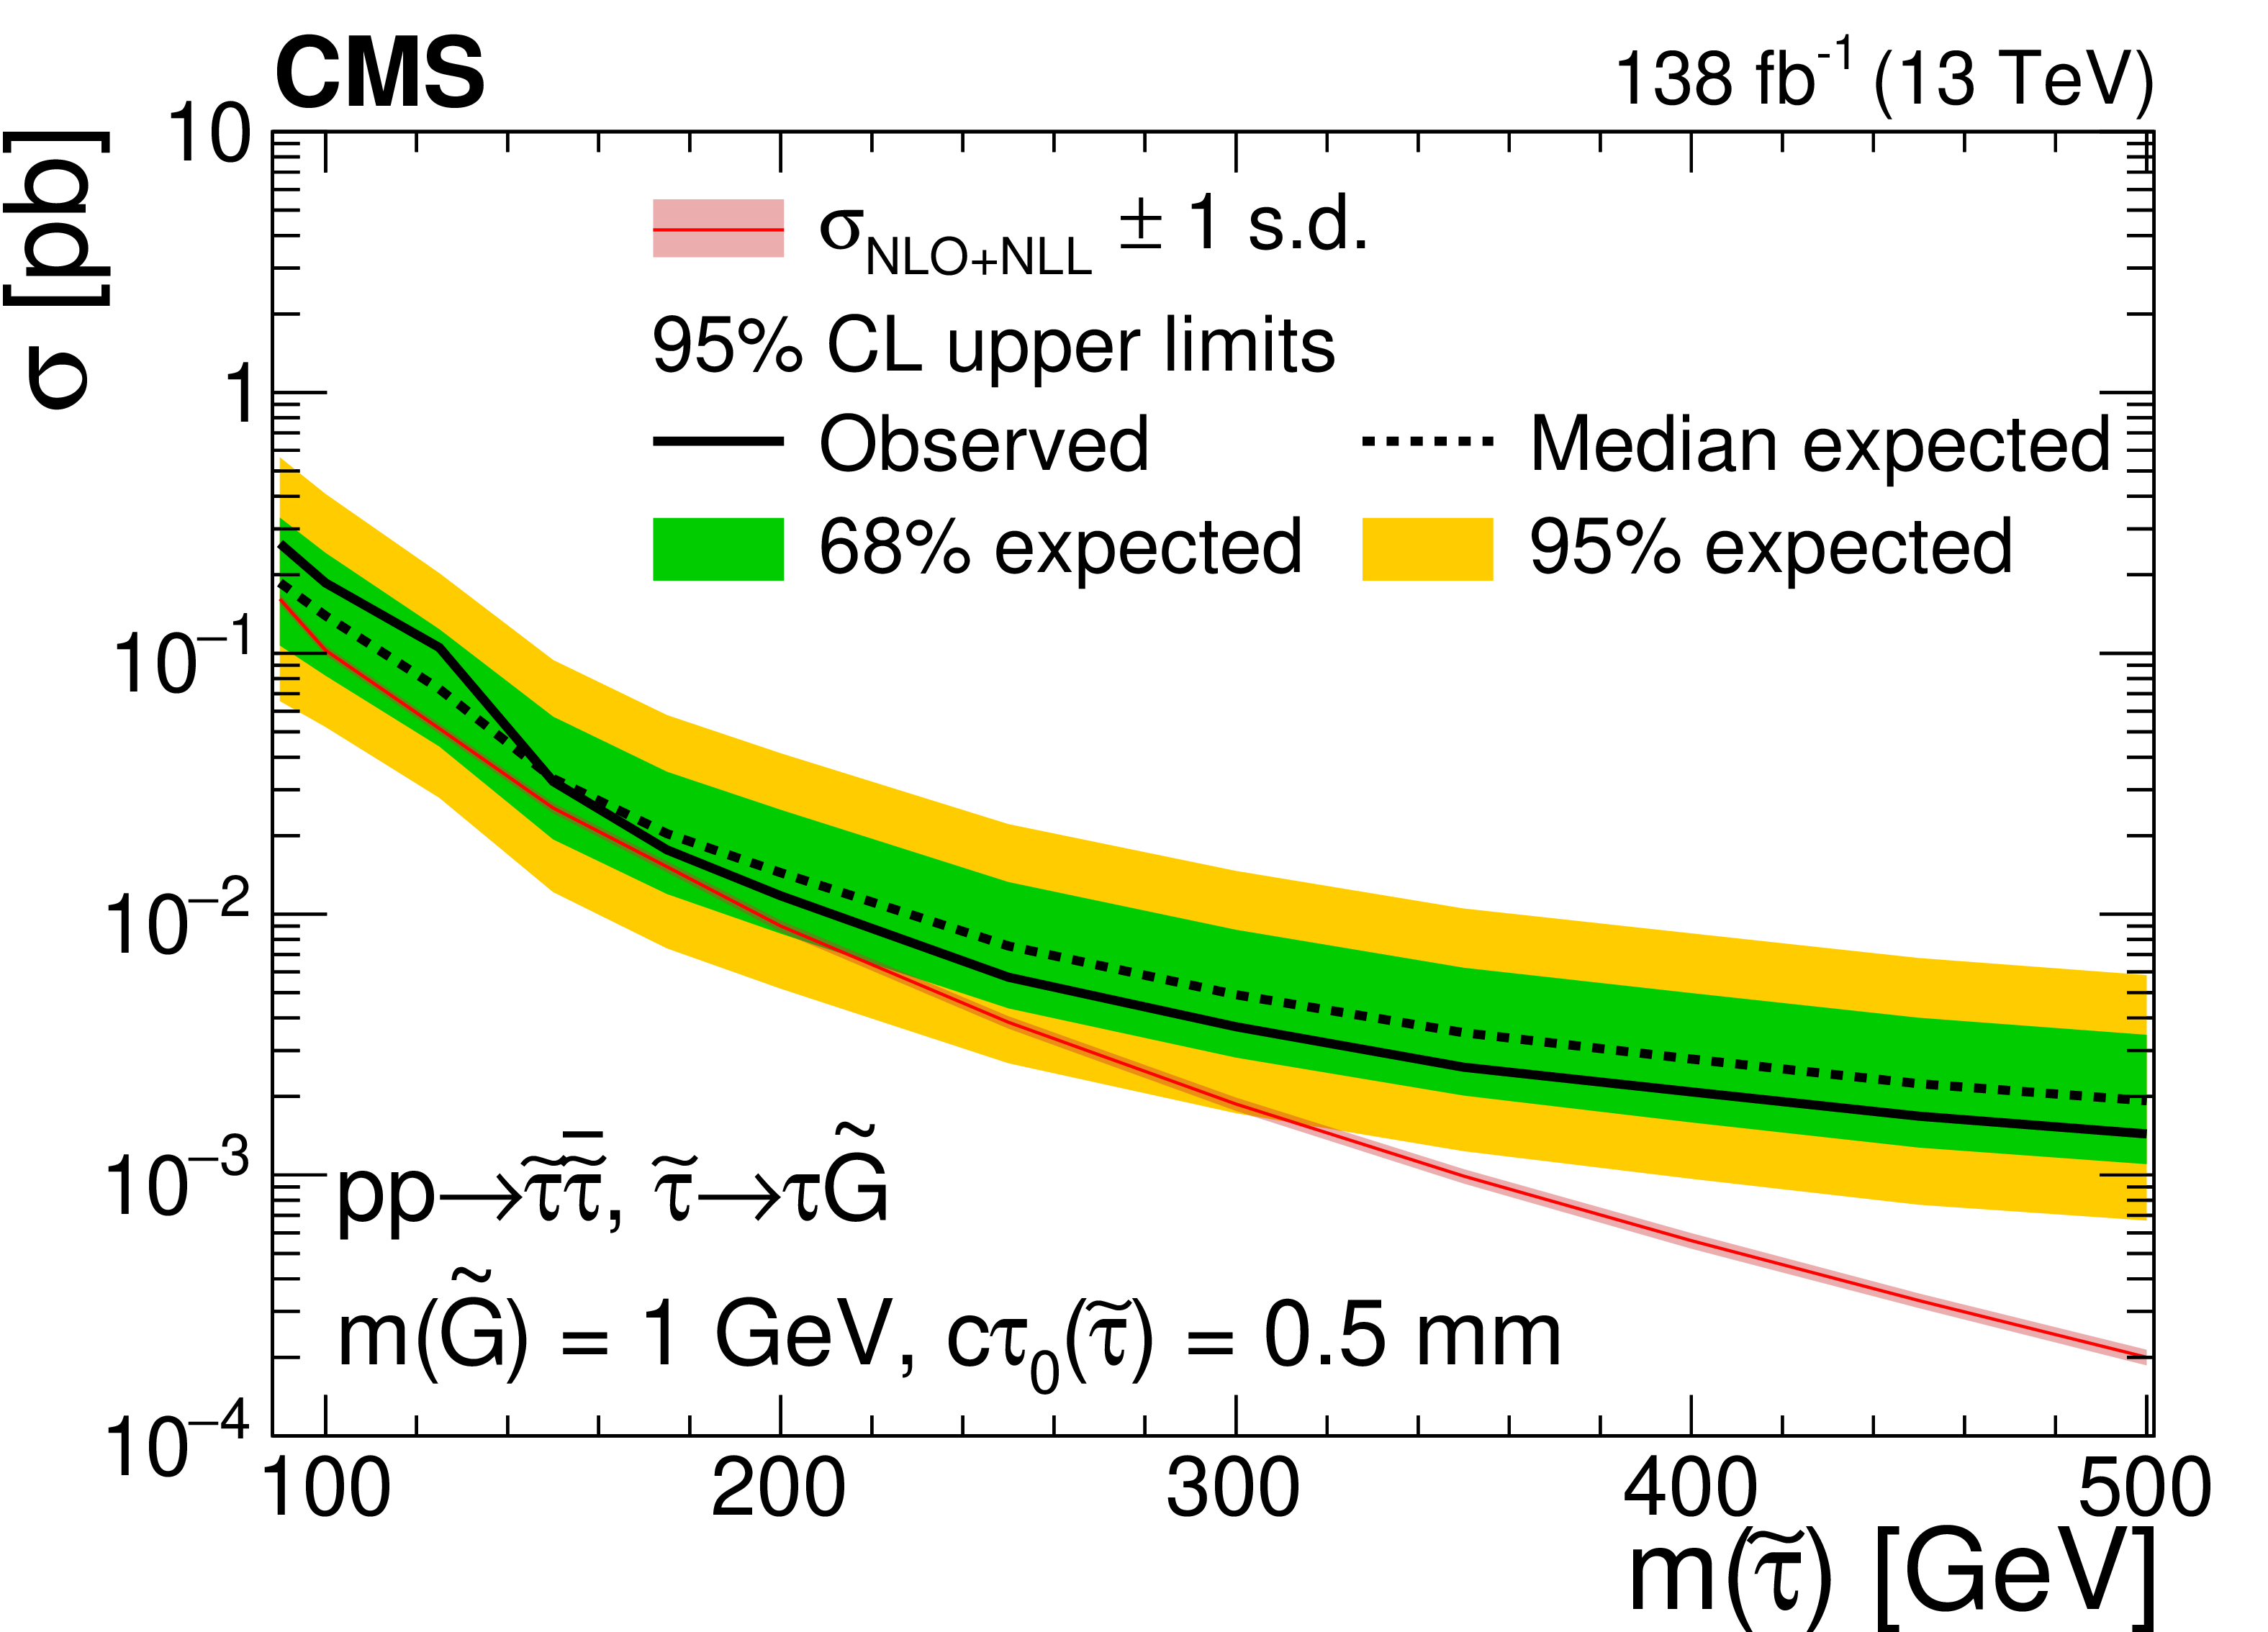
Figure 8:
Expected and observed 95% CL cross section upper limits as functions of the $\tilde{\tau}$ mass for long-lived $\tilde{\tau}$ in the maximally mixed scenario for an LSP mass of 1 GeV, and for ${c\tau _{0}}$ values of 0.01, 0.05, 0.1, 0.5, 1, and 2.5 mm (upper left to lower right). The inner (green) band and the outer (yellow) band indicate the regions containing 68 and 95%, respectively, of the distribution of limits expected under the background-only hypothesis. The red line and thin shaded band indicate the NLO+NLL prediction for the signal production cross section calculated with Resummino [29], and its uncertainty. |
png pdf |
Figure 8-a:
Expected and observed 95% CL cross section upper limits as functions of the $\tilde{\tau}$ mass for long-lived $\tilde{\tau}$ in the maximally mixed scenario for an LSP mass of 1 GeV, and for ${c\tau _{0}}$ values of 0.01 mm. The inner (green) band and the outer (yellow) band indicate the regions containing 68 and 95%, respectively, of the distribution of limits expected under the background-only hypothesis. The red line and thin shaded band indicate the NLO+NLL prediction for the signal production cross section calculated with Resummino [29], and its uncertainty. |
png pdf |
Figure 8-b:
Expected and observed 95% CL cross section upper limits as functions of the $\tilde{\tau}$ mass for long-lived $\tilde{\tau}$ in the maximally mixed scenario for an LSP mass of 1 GeV, and for ${c\tau _{0}}$ values of 0.05 mm. The inner (green) band and the outer (yellow) band indicate the regions containing 68 and 95%, respectively, of the distribution of limits expected under the background-only hypothesis. The red line and thin shaded band indicate the NLO+NLL prediction for the signal production cross section calculated with Resummino [29], and its uncertainty. |

png pdf |
Figure 8-c:
Expected and observed 95% CL cross section upper limits as functions of the $\tilde{\tau}$ mass for long-lived $\tilde{\tau}$ in the maximally mixed scenario for an LSP mass of 1 GeV, and for ${c\tau _{0}}$ values of 0.1 mm. The inner (green) band and the outer (yellow) band indicate the regions containing 68 and 95%, respectively, of the distribution of limits expected under the background-only hypothesis. The red line and thin shaded band indicate the NLO+NLL prediction for the signal production cross section calculated with Resummino [29], and its uncertainty. |
png pdf |
Figure 8-d:
Expected and observed 95% CL cross section upper limits as functions of the $\tilde{\tau}$ mass for long-lived $\tilde{\tau}$ in the maximally mixed scenario for an LSP mass of 1 GeV, and for ${c\tau _{0}}$ values of 0.5 mm. The inner (green) band and the outer (yellow) band indicate the regions containing 68 and 95%, respectively, of the distribution of limits expected under the background-only hypothesis. The red line and thin shaded band indicate the NLO+NLL prediction for the signal production cross section calculated with Resummino [29], and its uncertainty. |
png pdf |
Figure 8-e:
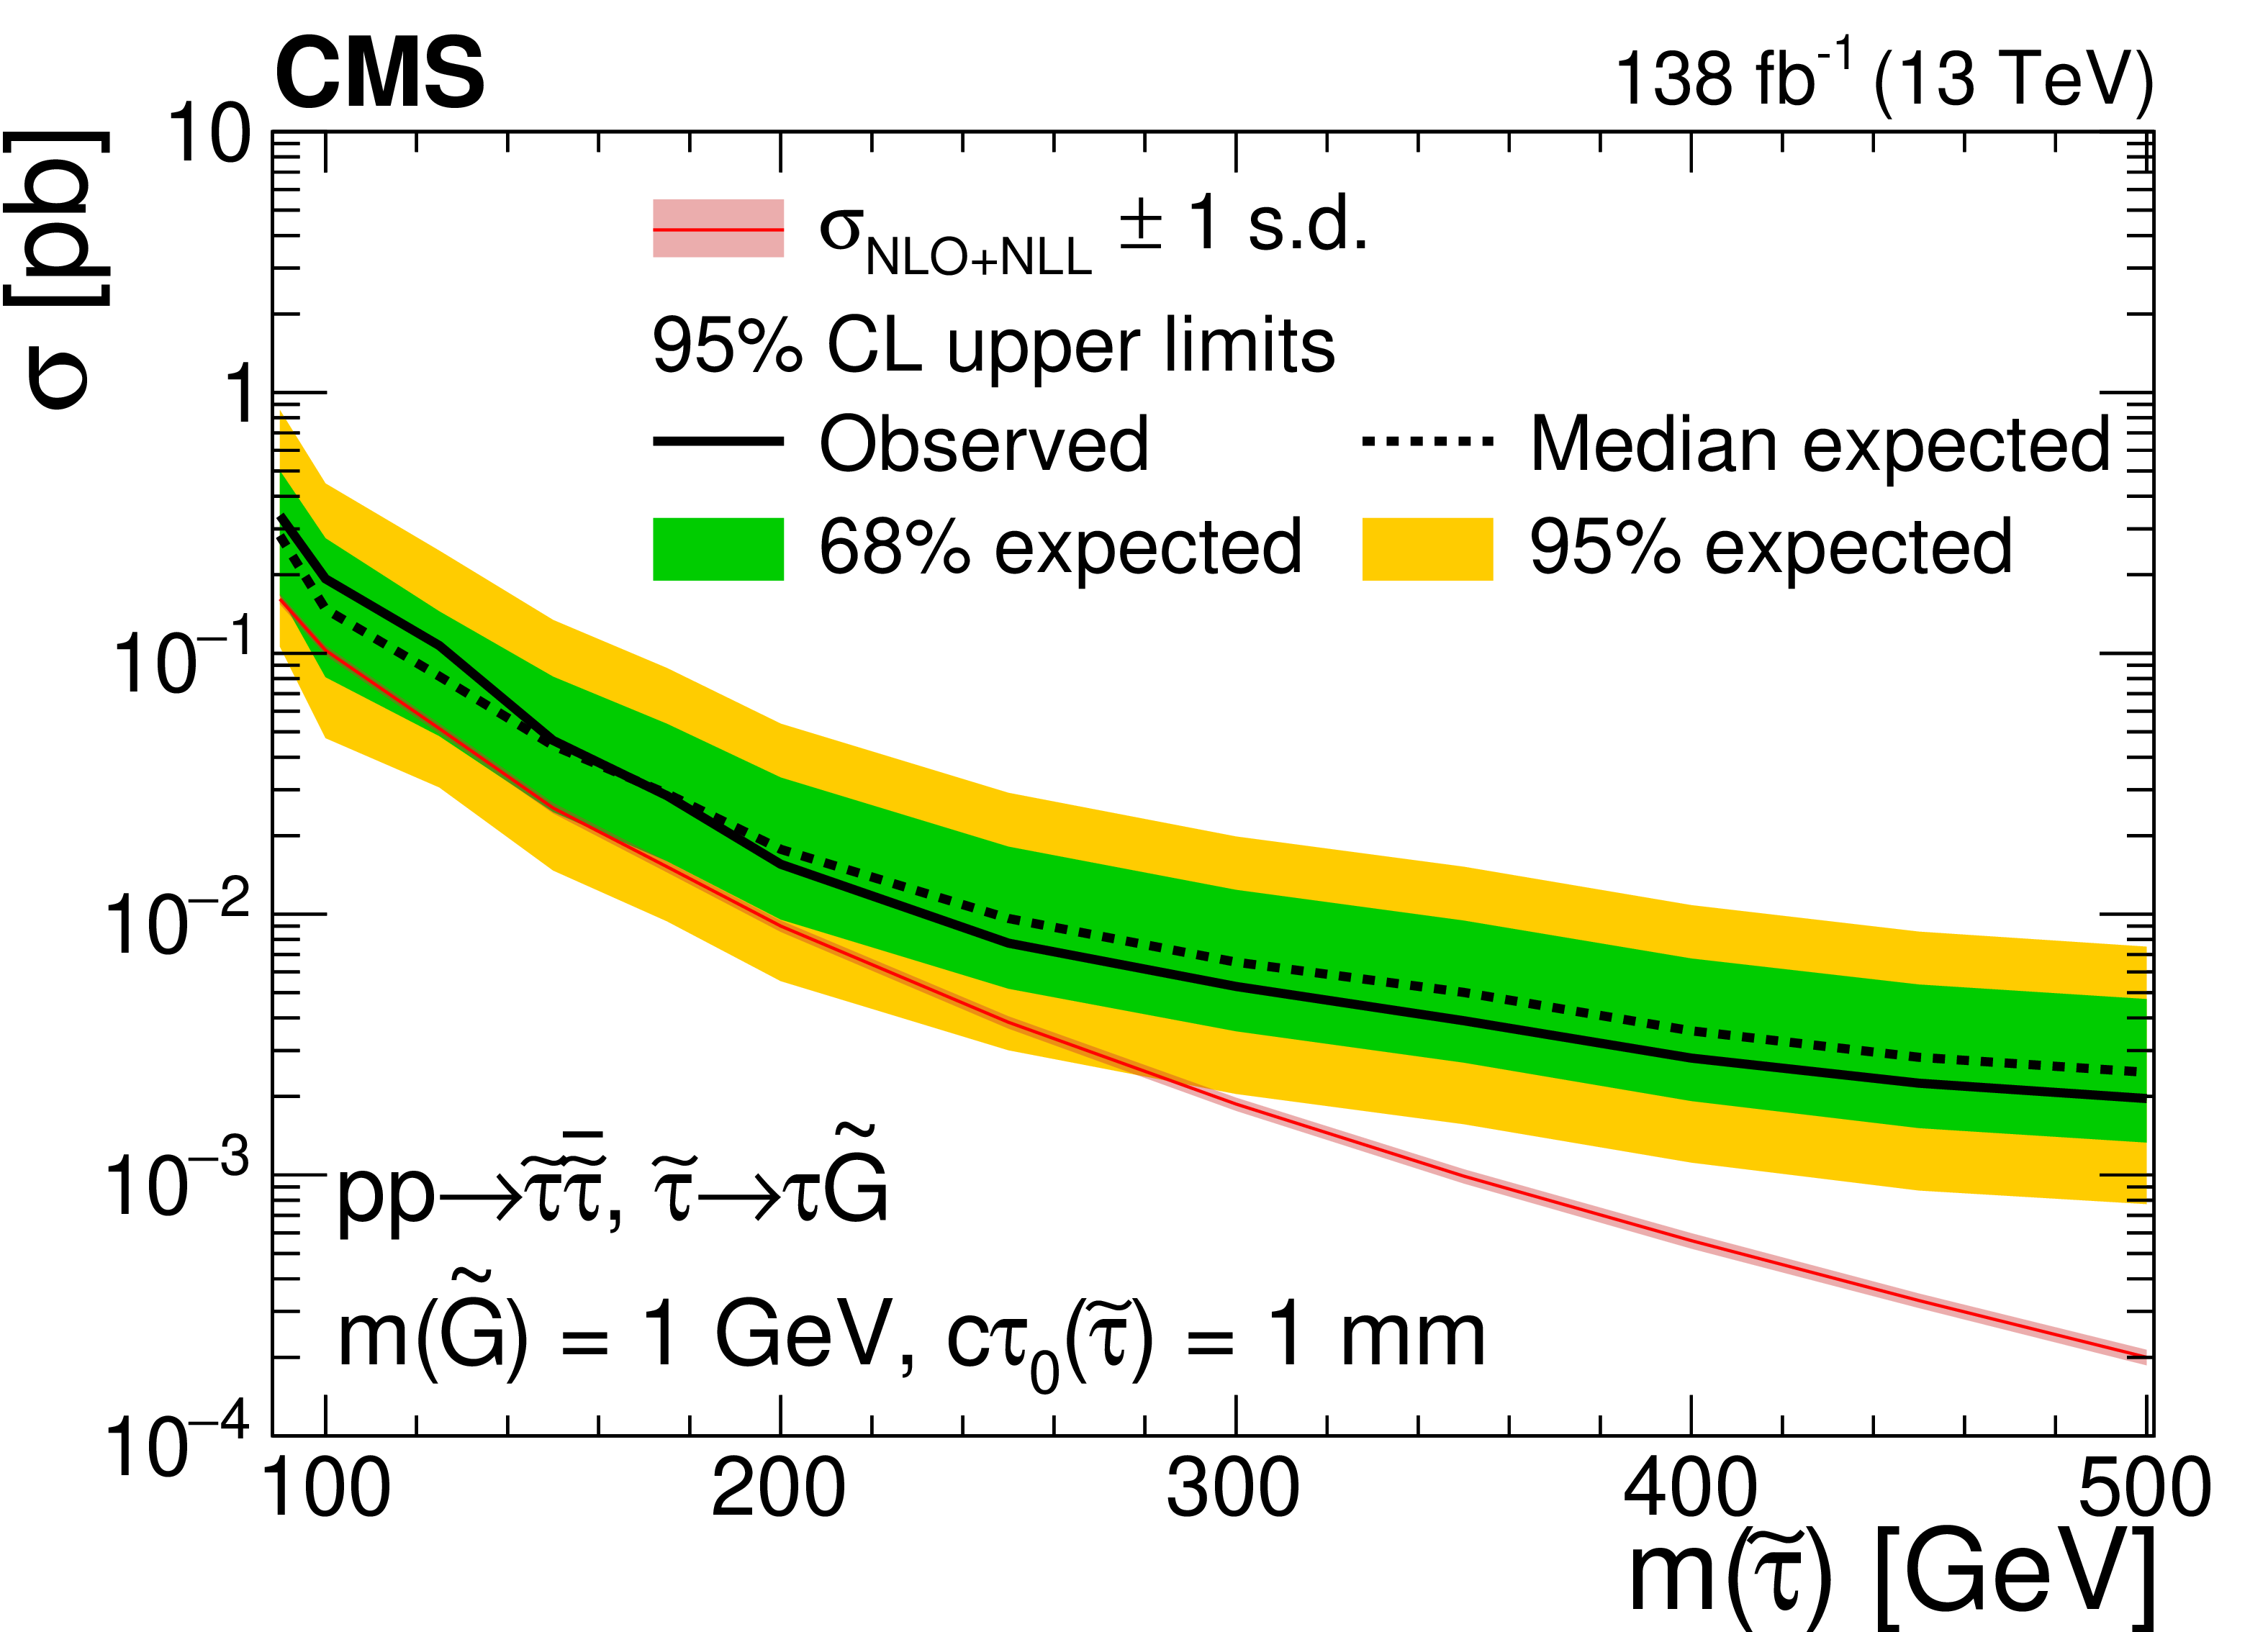
Expected and observed 95% CL cross section upper limits as functions of the $\tilde{\tau}$ mass for long-lived $\tilde{\tau}$ in the maximally mixed scenario for an LSP mass of 1 GeV, and for ${c\tau _{0}}$ values of 1 mm. The inner (green) band and the outer (yellow) band indicate the regions containing 68 and 95%, respectively, of the distribution of limits expected under the background-only hypothesis. The red line and thin shaded band indicate the NLO+NLL prediction for the signal production cross section calculated with Resummino [29], and its uncertainty. |
png pdf |
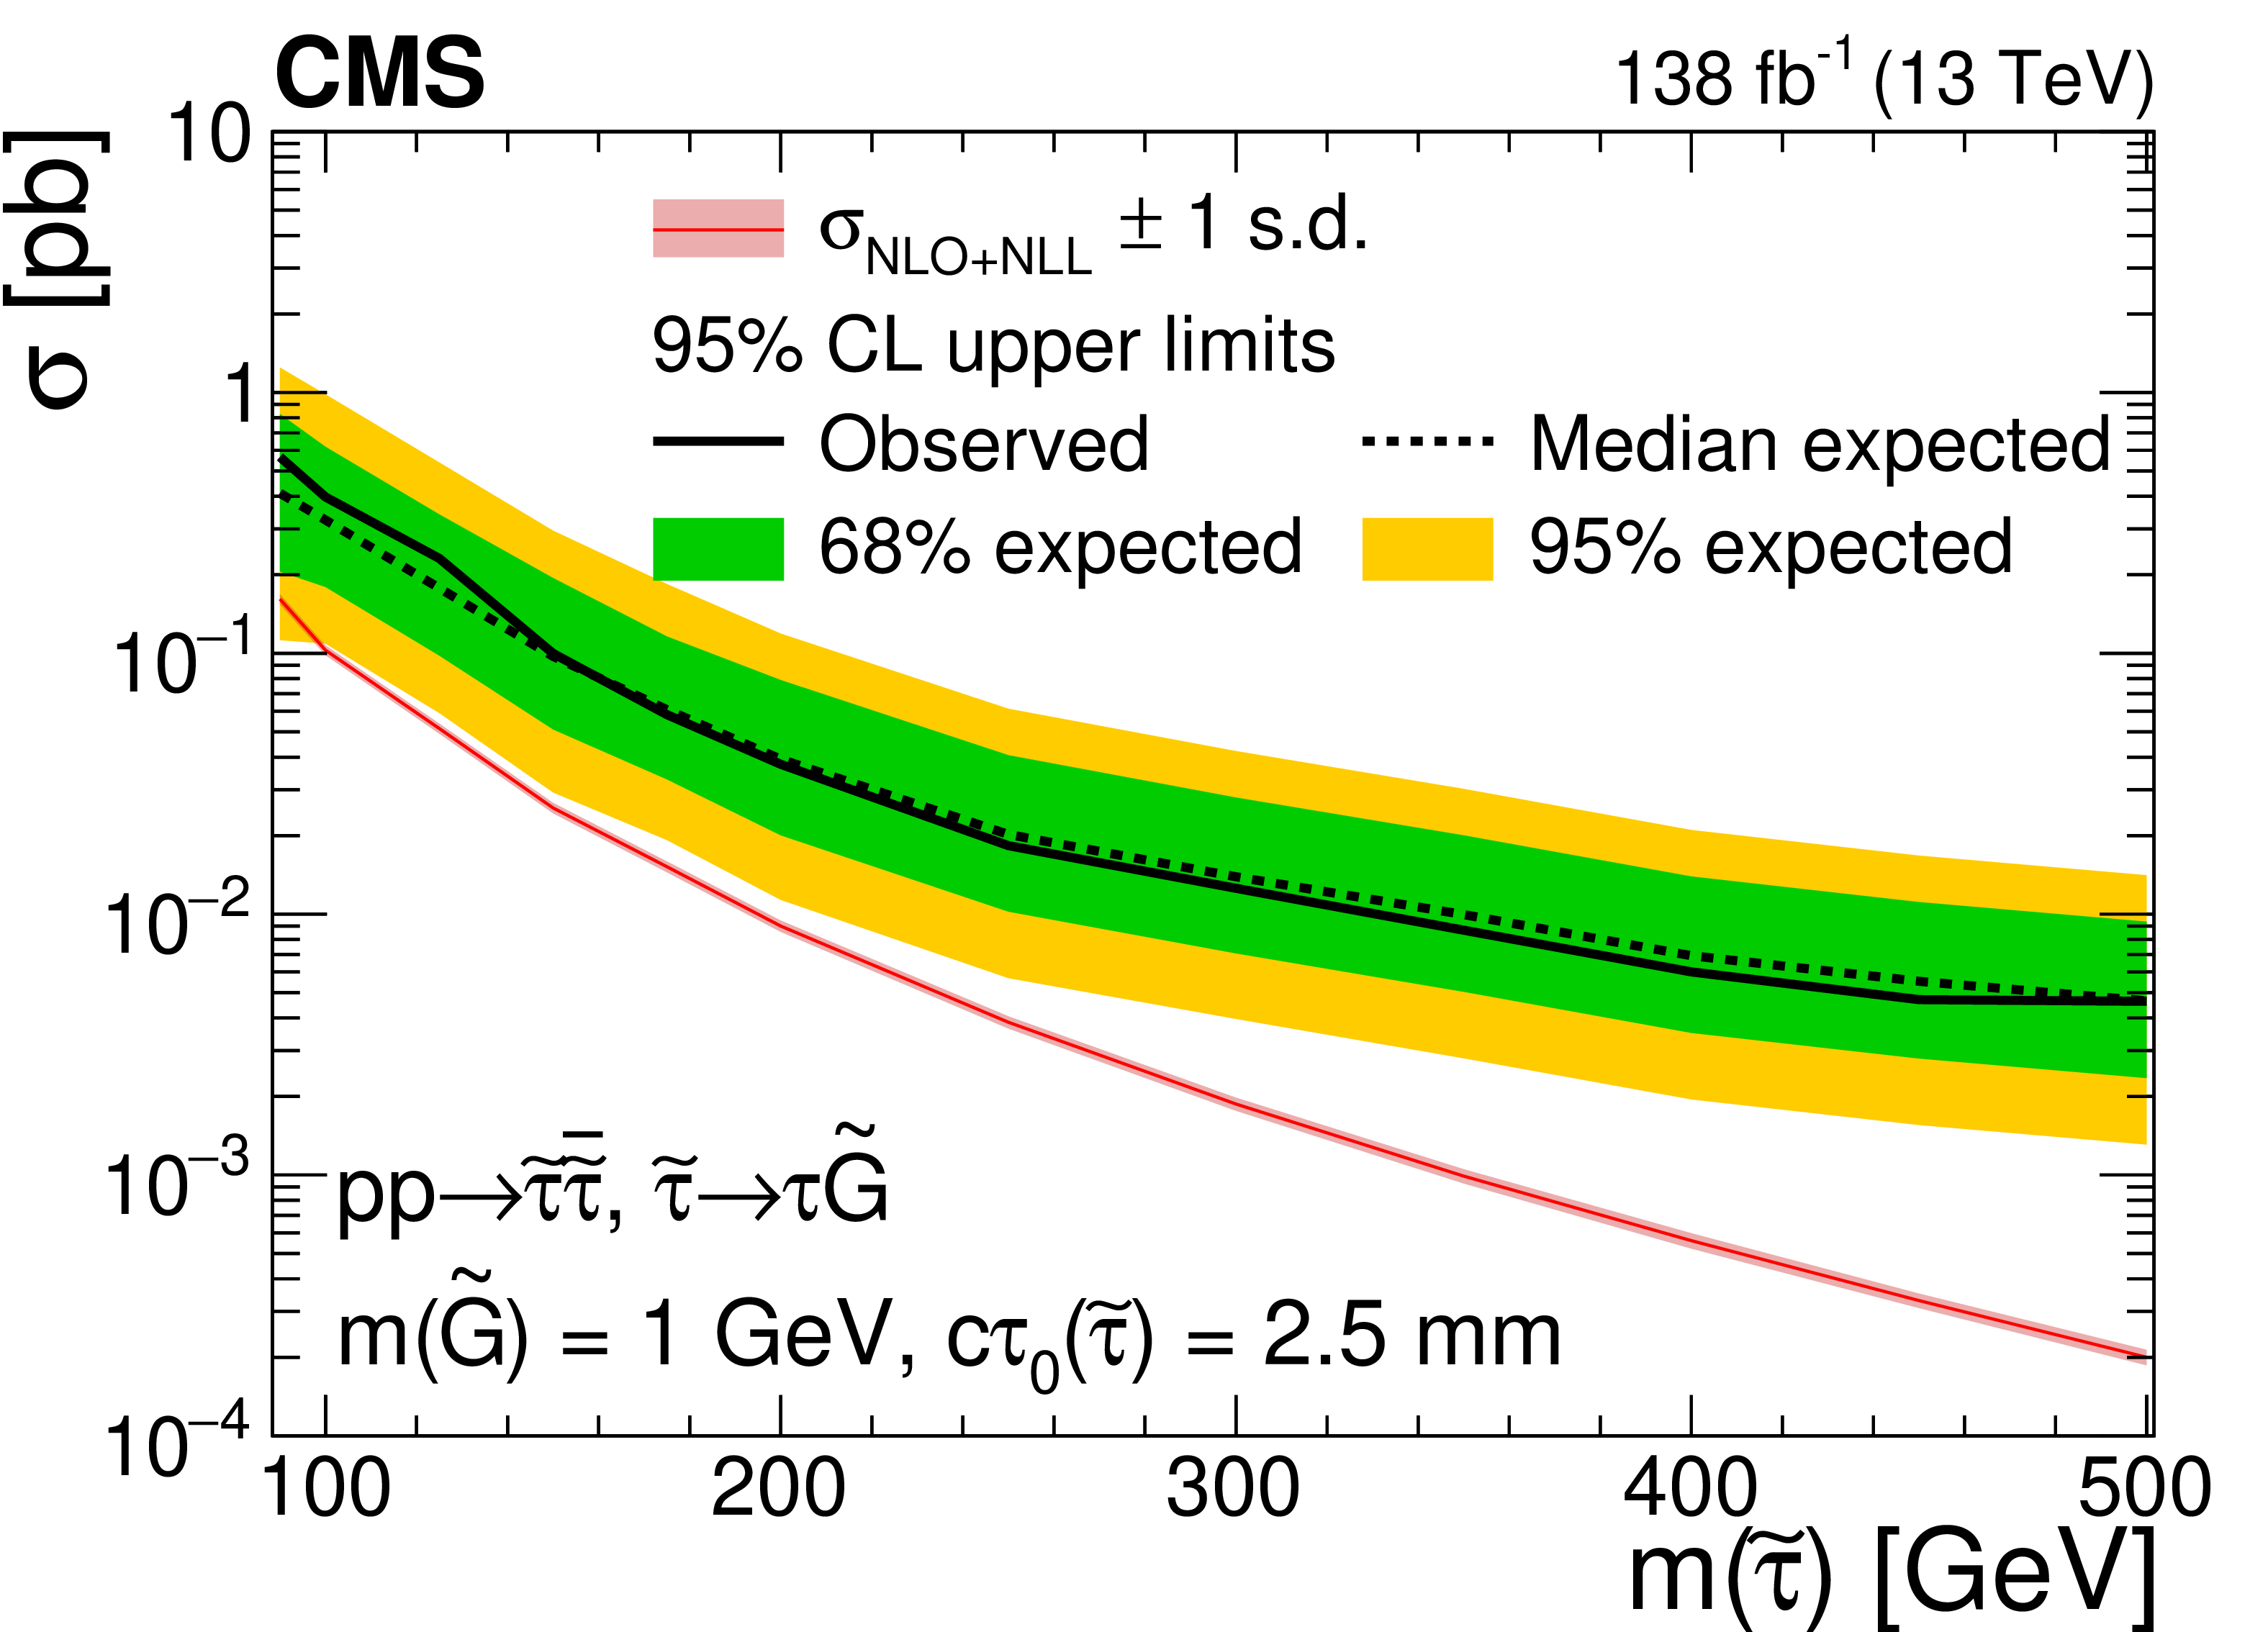
Figure 8-f:
Expected and observed 95% CL cross section upper limits as functions of the $\tilde{\tau}$ mass for long-lived $\tilde{\tau}$ in the maximally mixed scenario for an LSP mass of 1 GeV, and for ${c\tau _{0}}$ values of 2.5 mm. The inner (green) band and the outer (yellow) band indicate the regions containing 68 and 95%, respectively, of the distribution of limits expected under the background-only hypothesis. The red line and thin shaded band indicate the NLO+NLL prediction for the signal production cross section calculated with Resummino [29], and its uncertainty. |
| Tables | |
png pdf |
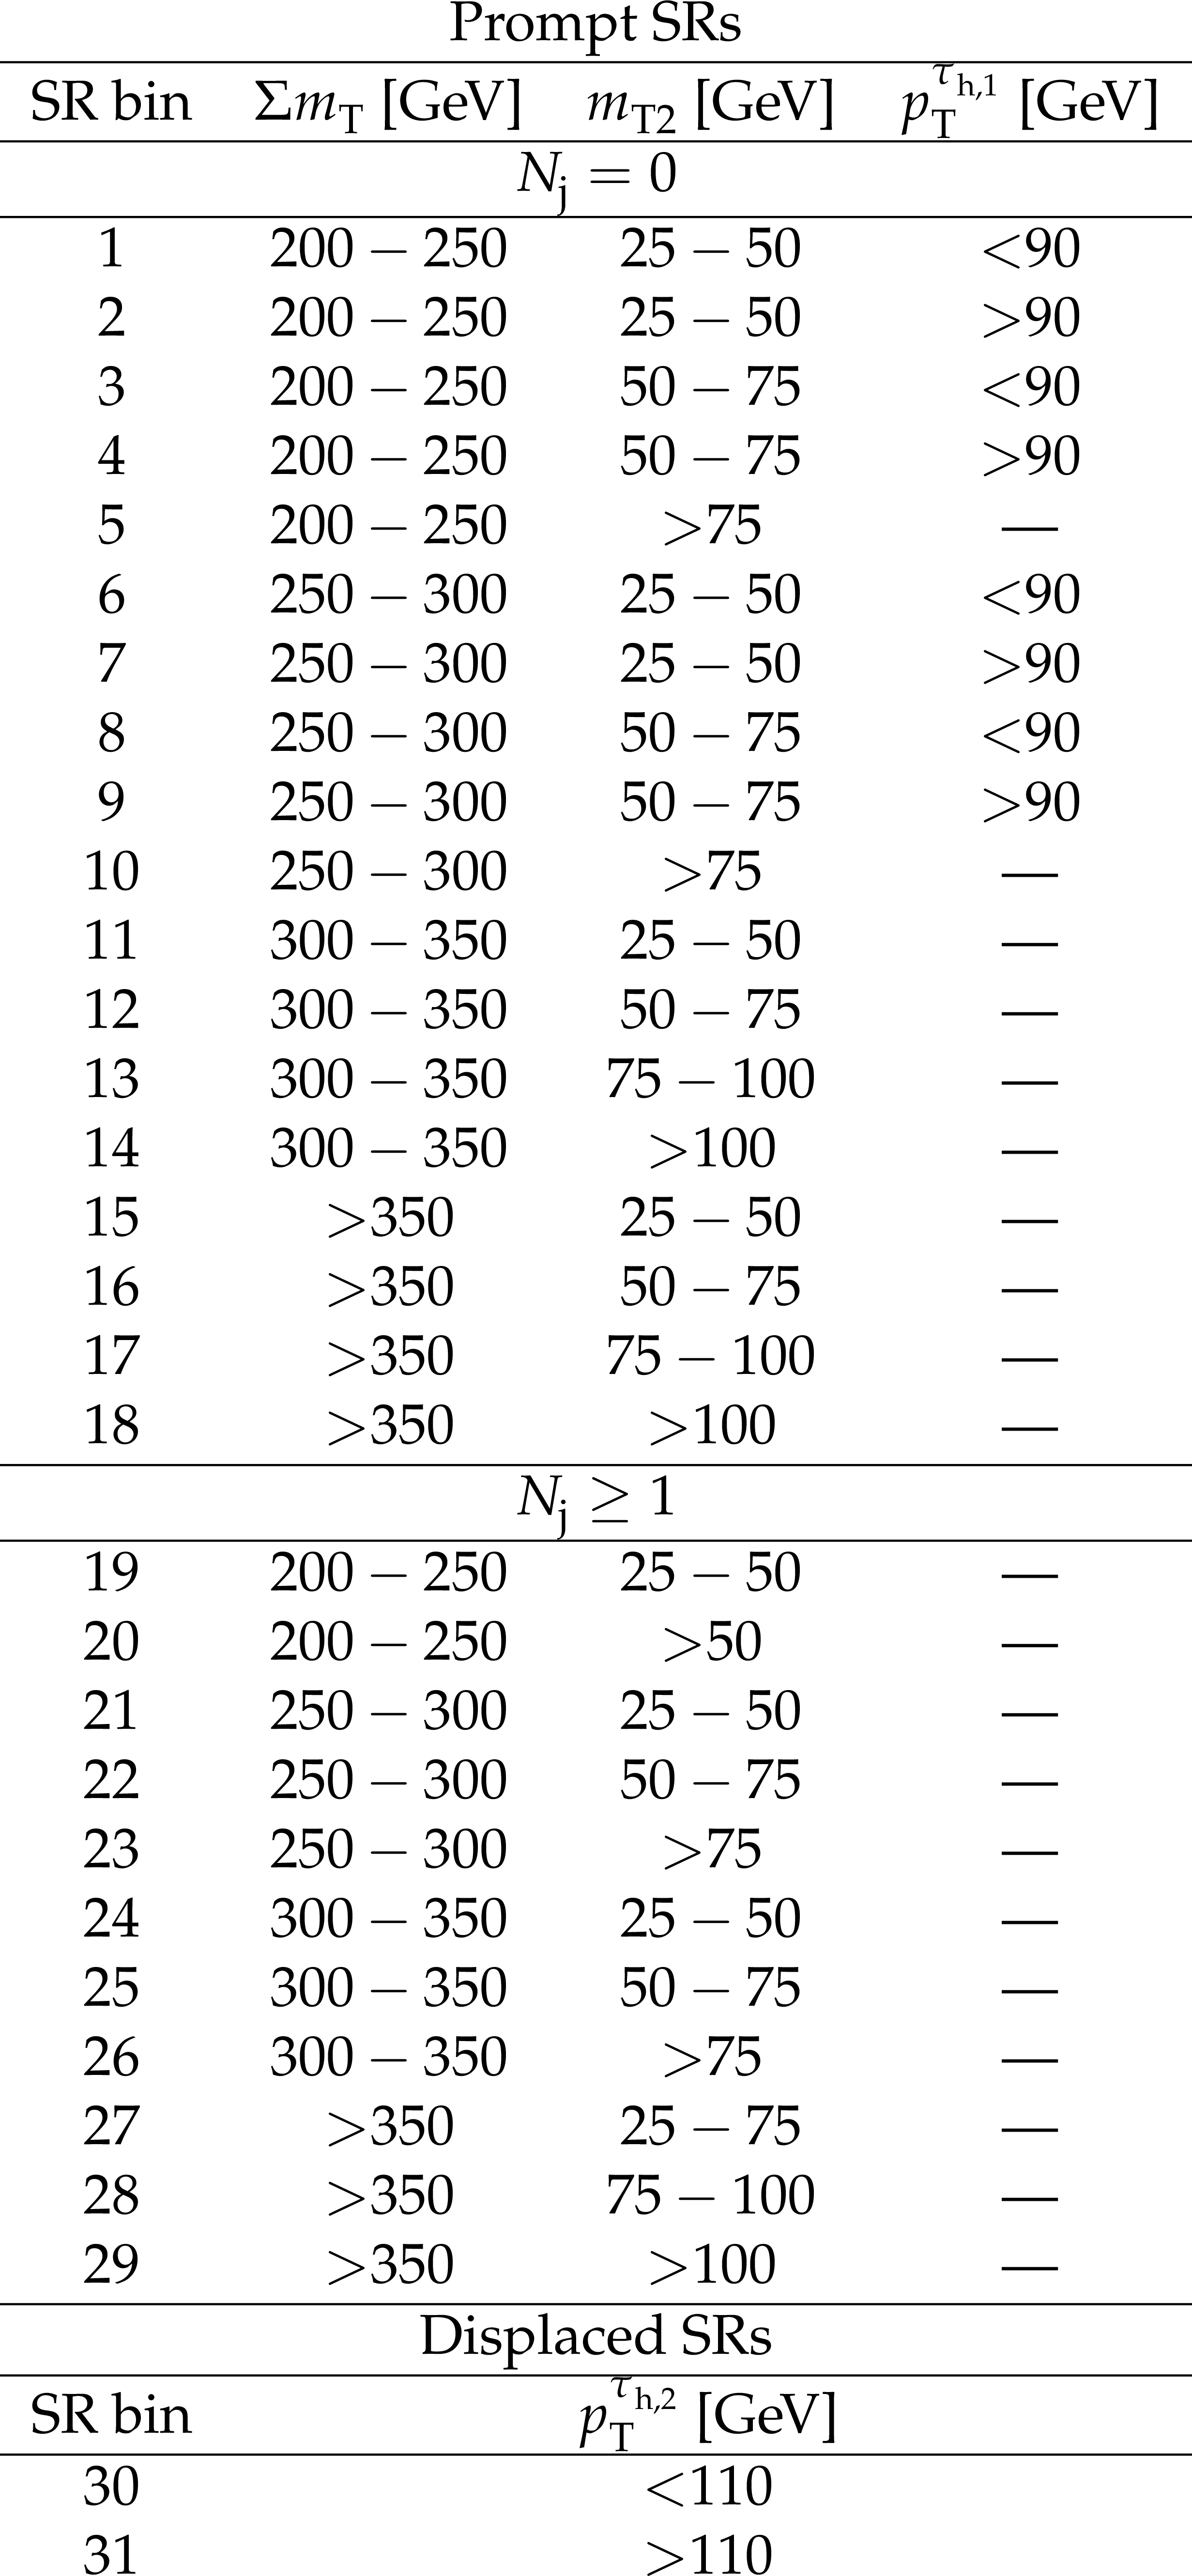
Table 1:
Ranges of ${\Sigma {m_{\mathrm {T}}}}, {m_{\mathrm {T2}}}$, and ${{p_{\mathrm {T}}} ^{\tau _{\mathrm {h},1}}}$ used to define the prompt SRs for the $ {N_{\text {j}}} =$ 0 and $ {N_{\text {j}}} \geq $ 1 event categories, and ranges of ${{p_{\mathrm {T}}} ^{\tau _{\mathrm {h},2}}}$ used to define the displaced SRs. |

png pdf |
Table 2:
Uncertainties in the analysis affecting signal and the SM backgrounds. The numbers indicate the percentage effect of propagating $ \pm $ 1-standard deviation variations of the respective sources of uncertainty on the predicted signal and background yields, prior to a fit to the data. The ranges shown for signal refer to a representative benchmark model of ${\tilde{\tau} _{\mathrm {L}}}$ pair production with $m({\tilde{\tau} _{\mathrm {L}}}) = $ 150 GeV, $m(\tilde{\chi}^0_1) = $ 1 GeV. |

png pdf |
Table 3:
Predicted SM background yields, observed event counts, and predicted signal yields for two benchmark models with a $\tilde{\tau}$ mass of 150 GeV and an LSP mass of 1 GeV, in all prompt and displaced SRs as labeled in Table 1. For the prompt signal model shown, we assume left-handed $\tilde{\tau}$ pair production, while for the displaced signal model we assume a maximally mixed scenario and $c\tau _{0}(\tilde{\tau})=$ 0.5 mm. The uncertainties listed are the sum in quadrature of the statistical and systematic components. For any estimate with no events in the data sideband, embedded, or simulation sample corresponding to a given SR selection, we provide the one standard deviation upper bound evaluated for that estimate. |
| Summary |
| A search for direct $\tau$ slepton ($\tilde{\tau}$) pair production has been performed in proton-proton collisions at a center-of-mass energy of 13 TeV in events with two hadronically decaying $\tau$ leptons and significant missing transverse momentum. The data used for this search correspond to an integrated luminosity of 138 fb$^{-1}$ collected in 2016--2018 with the CMS detector. Both prompt and displaced decays of the $\tau$ slepton are studied. Thirty-one different search regions are used in the analysis, based on kinematic observables that exploit expected differences between signal and background. No significant excess of events above the expected standard model background has been observed. Upper limits have been set on the cross section for direct $\tilde{\tau}$ pair production for simplified models in which each $\tilde{\tau}$ decays to a $\tau$ lepton and the lightest supersymmetric particle (LSP). For purely left-handed $\tilde{\tau}$ pair production with prompt decays, $\tilde{\tau}$ masses between 115 and 340 GeV are excluded at 95% confidence level for the case of a nearly massless LSP, while for the degenerate production of left- and right-handed $\tilde{\tau}$ pairs, $\tilde{\tau}$ masses up to 400 GeV are excluded under the same hypothesis. The limits observed are the most stringent obtained thus far in the case of direct $\tilde{\tau}$ pair production with prompt $\tilde{\tau}$ decays, for both the purely left-handed and degenerate production scenarios. They represent a considerable improvement in sensitivity with respect to the previous CMS search reported in Ref. [38]. In the context of long-lived $\tau$ sleptons, final states with displaced $\tau_{\mathrm{h}}$candidates are investigated for the first time. In a scenario with $c\tau(\tilde{\tau})=$ 0.1 mm, where $\tau_{0}$ denotes the mean proper lifetime of the $\tilde{\tau}$, masses between 150 and 220 GeV are excluded for the case that the LSP is nearly massless. |
| References | ||||
| 1 | P. Ramond | Dual theory for free fermions | PRD 3 (1971) 2415 | |
| 2 | Y. A. Gol'fand and E. P. Likhtman | Extension of the algebra of Poincaré group generators and violation of P invariance | JEPTL 13 (1971)323 | |
| 3 | A. Neveu and J. H. Schwarz | Factorizable dual model of pions | NPB 31 (1971) 86 | |
| 4 | D. V. Volkov and V. P. Akulov | Possible universal neutrino interaction | JEPTL 16 (1972)438 | |
| 5 | J. Wess and B. Zumino | A Lagrangian model invariant under supergauge transformations | PLB 49 (1974) 52 | |
| 6 | J. Wess and B. Zumino | Supergauge transformations in four dimensions | NPB 70 (1974) 39 | |
| 7 | P. Fayet | Supergauge invariant extension of the Higgs mechanism and a model for the electron and its neutrino | NPB 90 (1975) 104 | |
| 8 | H. P. Nilles | Supersymmetry, supergravity and particle physics | Phys. Rep. 110 (1984) 1 | |
| 9 | E. Gildener | Gauge symmetry hierarchies | PRD 14 (1976) 1667 | |
| 10 | M. J. G. Veltman | Second threshold in weak interactions | Acta Phys. Polon. B 8 (1977)475 | |
| 11 | G. 't Hooft | Naturalness, chiral symmetry, and spontaneous chiral symmetry breaking | NATO Sci. Ser. B 59 (1980)135 | |
| 12 | E. Witten | Dynamical breaking of supersymmetry | NPB 188 (1981) 513 | |
| 13 | G. R. Farrar and P. Fayet | Phenomenology of the production, decay, and detection of new hadronic states associated with supersymmetry | PLB 76 (1978) 575 | |
| 14 | H. Goldberg | Constraint on the photino mass from cosmology | PRL 50 (1983) 1419 | |
| 15 | J. R. Ellis et al. | Supersymmetric relics from the Big Bang | NPB 238 (1984) 453 | |
| 16 | G. Jungman, M. Kamionkowski, and K. Griest | Supersymmetric dark matter | PR 267 (1996) 195 | hep-ph/9506380 |
| 17 | G. Hinshaw et al. | Nine-year Wilkinson Microwave Anisotropy Probe (WMAP) observations: cosmological parameter results | Astrophys. J. Suppl. 208 (2013) 19 | 1212.5226 |
| 18 | K. Griest and D. Seckel | Three exceptions in the calculation of relic abundances | PRD 43 (1991) 3191 | |
| 19 | D. Albornoz Vasquez, G. Bélanger, and C. Boehm | Revisiting light neutralino scenarios in the MSSM | PRD 84 (2011) 095015 | 1108.1338 |
| 20 | S. F. King, J. P. Roberts, and D. P. Roy | Natural dark matter in SUSY GUTs with non-universal gaugino masses | JHEP 10 (2007) 106 | 0705.4219 |
| 21 | M. Battaglia et al. | Proposed post-LEP benchmarks for supersymmetry | EPJC 22 (2001) 535 | hep-ph/0106204 |
| 22 | R. L. Arnowitt et al. | Determining the dark matter relic density in the minimal supergravity stau-neutralino coannihilation region at the Large Hadron Collider | PRL 100 (2008) 231802 | 0802.2968 |
| 23 | G. Bélanger, S. Biswas, C. Boehm, and B. Mukhopadhyaya | Light neutralino dark matter in the MSSM and its implication for LHC searches for staus | JHEP 12 (2012) 076 | 1206.5404 |
| 24 | E. Arganda, V. Martin-Lozano, A. D. Medina, and N. Mileo | Potential discovery of staus through heavy Higgs boson decays at the LHC | JHEP 09 (2018) 056 | 1804.10698 |
| 25 | E. Arganda, V. Martín-Lozano, A. D. Medina, and N. I. Mileo | Discovery and exclusion prospects for staus produced by heavy Higgs boson decays at the LHC | Adv. High Energy Phys. 2022 (2022) 2569290 | 2102.02290 |
| 26 | J. A. Evans and J. Shelton | Long-lived staus and displaced leptons at the LHC | JHEP 04 (2016) 056 | 1601.01326 |
| 27 | J. Alwall, P. C. Schuster, and N. Toro | Simplified models for a first characterization of new physics at the LHC | PRD 79 (2009) 075020 | 0810.3921 |
| 28 | J. Alwall, M.-P. Le, M. Lisanti, and J. G. Wacker | Model-independent jets plus missing energy searches | PRD 79 (2009) 015005 | 0809.3264 |
| 29 | LHC New Physics Working Group | Simplified models for LHC new physics searches | JPG 39 (2012) 105005 | 1105.2838 |
| 30 | B. Fuks, M. Klasen, D. R. Lamprea, and M. Rothering | Revisiting slepton pair production at the Large Hadron Collider | JHEP 01 (2014) 168 | 1310.2621 |
| 31 | ALEPH Collaboration | Search for scalar leptons in e$ ^{+} $e$ ^{-} $ collisions at center-of-mass energies up to 209 GeV | PLB 526 (2002) 206 | hep-ex/0112011 |
| 32 | DELPHI Collaboration | Searches for supersymmetric particles in e$ ^{+} $e$ ^{-} $ collisions up to 208 GeV and interpretation of the results within the MSSM | EPJC 31 (2003) 421 | hep-ex/0311019 |
| 33 | L3 Collaboration | Search for scalar leptons and scalar quarks at LEP | PLB 580 (2004) 37 | hep-ex/0310007 |
| 34 | OPAL Collaboration | Search for anomalous production of dilepton events with missing transverse momentum in e$ ^{+} $e$ ^{-} $ collisions at $ \sqrt{s} = $ 183 GeV to 209 GeV | EPJC 32 (2004) 453 | hep-ex/0309014 |
| 35 | ATLAS Collaboration | Search for the direct production of charginos, neutralinos and staus in final states with at least two hadronically decaying taus and missing transverse momentum in pp collisions at $ \sqrt{s} = $ 8 TeV with the ATLAS detector | JHEP 10 (2014) 96 | 1407.0350 |
| 36 | ATLAS Collaboration | Search for the electroweak production of supersymmetric particles in $ \sqrt{s} = $ 8 TeV pp collisions with the ATLAS detector | PRD 93 (2016) 052002 | 1509.07152 |
| 37 | CMS Collaboration | Search for electroweak production of charginos in final states with two tau leptons in pp collisions at $ \sqrt{s}= $ 8 TeV | JHEP 04 (2017) 018 | CMS-SUS-14-022 1610.04870 |
| 38 | ATLAS Collaboration | Search for direct stau production in events with two hadronic $ \tau $-leptons in $ \sqrt{s} = $13 TeV pp collisions with the ATLAS detector | PRD 101 (2020) 032009 | 1911.06660 |
| 39 | CMS Collaboration | Search for direct pair production of supersymmetric partners to the $ \tau $ lepton in proton-proton collisions at $ \sqrt{s}= $ 13 TeV | EPJC 80 (2020) 189 | CMS-SUS-18-006 1907.13179 |
| 40 | OPAL Collaboration | Searches for gauge-mediated supersymmetry breaking topologies in e$ ^{+} $e$ ^{-} $ collisions at LEP2 | EPJC 46 (2006) 307 | hep-ex/0507048 |
| 41 | ATLAS Collaboration | Search for displaced leptons in $ \sqrt{s} = $ 13 TeV pp collisions with the ATLAS detector | PRL 127 (2021) 051802 | 2011.07812 |
| 42 | CMS Collaboration | An embedding technique to determine $ \tau\tau $ backgrounds in proton-proton collision data | JINST 14 (2019) P06032 | CMS-TAU-18-001 1903.01216 |
| 43 | CMS Collaboration | Identification of hadronic tau lepton decays using a deep neural network | Submitted to JINST | CMS-TAU-20-001 2201.08458 |
| 44 | CMS Collaboration | HEPData record for this analysis | link | |
| 45 | CMS Collaboration | Performance of the CMS Level-1 trigger in proton-proton collisions at $ \sqrt{s} = $ 13 TeV | JINST 15 (2020) P10017 | CMS-TRG-17-001 2006.10165 |
| 46 | CMS Collaboration | The CMS trigger system | JINST 12 (2017) P01020 | CMS-TRG-12-001 1609.02366 |
| 47 | CMS Collaboration | Particle-flow reconstruction and global event description with the CMS detector | JINST 12 (2017) P10003 | CMS-PRF-14-001 1706.04965 |
| 48 | CMS Collaboration | Performance of missing transverse momentum reconstruction in proton-proton collisions at $ \sqrt{s} = $ 13 TeV using the CMS detector | JINST 14 (2019) P07004 | CMS-JME-17-001 1903.06078 |
| 49 | CMS Collaboration | Technical proposal for the Phase-II upgrade of the Compact Muon Solenoid | CMS-PAS-TDR-15-002 | CMS-PAS-TDR-15-002 |
| 50 | M. Cacciari, G. P. Salam, and G. Soyez | The anti-$ {k_{\mathrm{T}}} $ jet clustering algorithm | JHEP 04 (2008) 063 | 0802.1189 |
| 51 | M. Cacciari, G. P. Salam, and G. Soyez | FastJet user manual | EPJC 72 (2012) 1896 | 1111.6097 |
| 52 | CMS Collaboration | Jet energy scale and resolution in the CMS experiment in pp collisions at 8 TeV | JINST 12 (2017) P02014 | CMS-JME-13-004 1607.03663 |
| 53 | CMS Collaboration | Identification of heavy-flavour jets with the CMS detector in pp collisions at 13 TeV | JINST 13 (2018) P05011 | CMS-BTV-16-002 1712.07158 |
| 54 | CMS Collaboration | Performance of reconstruction and identification of $ \tau $ leptons decaying to hadrons and $ \nu_\tau $ in pp collisions at $ \sqrt{s}= $ 13 TeV | JINST 13 (2018) P10005 | CMS-TAU-16-003 1809.02816 |
| 55 | J. Alwall et al. | The automated computation of tree-level and next-to-leading order differential cross sections, and their matching to parton shower simulations | JHEP 07 (2014) 079 | 1405.0301 |
| 56 | T. Sjostrand et al. | An introduction to PYTHIA 8.2 | CPC 191 (2015) 159 | 1410.3012 |
| 57 | CMS Collaboration | Event generator tunes obtained from underlying event and multiparton scattering measurements | EPJC 76 (2016) 155 | CMS-GEN-14-001 1512.00815 |
| 58 | CMS Collaboration | Extraction and validation of a new set of CMS PYTHIA 8 tunes from underlying-event measurements | EPJC 80 (2020) 4 | CMS-GEN-17-001 1903.12179 |
| 59 | NNPDF Collaboration | Parton distributions for the LHC Run II | JHEP 04 (2015) 040 | 1410.8849 |
| 60 | GEANT4 Collaboration | GEANT4 --- a simulation toolkit | NIMA 506 (2003) 250 | |
| 61 | A. Kalogeropoulos and J. Alwall | The SysCalc code: A tool to derive theoretical systematic uncertainties | 2018 | 1801.08401 |
| 62 | W. Beenakker et al. | Production of charginos, neutralinos, and sleptons at hadron colliders | PRL 83 (1999) 3780 | hep-ph/9906298 |
| 63 | P. Nason | A new method for combining NLO QCD with shower Monte Carlo algorithms | JHEP 11 (2004) 040 | hep-ph/0409146 |
| 64 | S. Frixione, P. Nason, and C. Oleari | Matching NLO QCD computations with parton shower simulations: the POWHEG method | JHEP 11 (2007) 070 | 0709.2092 |
| 65 | S. Alioli, P. Nason, C. Oleari, and E. Re | A general framework for implementing NLO calculations in shower Monte Carlo programs: the POWHEG BOX | JHEP 06 (2010) 043 | 1002.2581 |
| 66 | E. Re | Single-top Wt-channel production matched with parton showers using the POWHEG method | EPJC 71 (2011) 1547 | 1009.2450 |
| 67 | CMS Collaboration | Search for top-squark pair production in the single-lepton final state in pp collisions at $ \sqrt{s} = $ 8 TeV | EPJC 73 (2013) 2677 | CMS-SUS-13-011 1308.1586 |
| 68 | C. G. Lester and D. J. Summers | Measuring masses of semi-invisibly decaying particle pairs produced at hadron colliders | PLB 463 (1999) 99 | hep-ph/9906349 |
| 69 | A. Barr, C. Lester, and P. Stephens | $ m_{\mathrm{T2}} $: the truth behind the glamour | JPG 29 (2003) 2343 | hep-ph/0304226 |
| 70 | C. G. Lester and B. Nachman | Bisection-based asymmetric $ m_{\mathrm{T2}} $ computation: a higher precision calculator than existing symmetric methods | JHEP 03 (2015) 100 | 1411.4312 |
| 71 | CMS Collaboration | Precision luminosity measurement in proton-proton collisions at $ \sqrt{s} = $ 13 TeV in 2015 and 2016 at CMS | EPJC 81 (2021) 800 | CMS-LUM-17-003 2104.01927 |
| 72 | CMS Collaboration | CMS luminosity measurement for the 2017 data-taking period at $ \sqrt{s} = $ 13 TeV | CMS-PAS-LUM-17-004 | CMS-PAS-LUM-17-004 |
| 73 | CMS Collaboration | CMS luminosity measurement for the 2018 data-taking period at $ \sqrt{s} = $ 13 TeV | CMS-PAS-LUM-18-002 | CMS-PAS-LUM-18-002 |
| 74 | CMS Collaboration | Interpretation of searches for supersymmetry with simplified models | PRD 88 (2013) 052017 | CMS-SUS-11-016 1301.2175 |
| 75 | T. Junk | Confidence level computation for combining searches with small statistics | NIMA 434 (1999) 435 | hep-ex/9902006 |
| 76 | A. L. Read | Presentation of search results: the CL$_\text{s} $ technique | JPG 28 (2002) 2693 | |
| 77 | ATLAS and CMS Collaborations, and the LHC Higgs Combination Group | Procedure for the LHC Higgs boson search combination in Summer 2011 | CMS-NOTE-2011-005 | |
| 78 | G. Cowan, K. Cranmer, E. Gross, and O. Vitells | Asymptotic formulae for likelihood-based tests of new physics | EPJC 71 (2011) 1554 | 1007.1727 |
|
|
Compact Muon Solenoid LHC, CERN |
|

|

|

|

|

|