

Compact Muon Solenoid
LHC, CERN
| CMS-TOP-17-007 ; CERN-EP-2018-063 | ||
| Measurement of the top quark mass with lepton+jets final states using pp collisions at $\sqrt{s}= $ 13 TeV | ||
| CMS Collaboration | ||
| 3 May 2018 | ||
| Eur. Phys. J. C 78 (2018) 891 | ||
| Abstract: The mass of the top quark is measured using a sample of $ \mathrm{t\bar{t}} $ events containing one isolated muon or electron and at least four jets in the final state, collected by the CMS detector using proton-proton collisions at $\sqrt{s}=$ 13 TeV at the CERN LHC. The events are selected from data corresponding to an integrated luminosity of 35.9 fb$^{-1}$. For each event the mass is reconstructed from a kinematic fit of the decay products to a $ \mathrm{t\bar{t}} $ hypothesis. Using the ideogram method, the top quark mass is determined simultaneously with an overall jet energy scale factor (JSF), constrained by the mass of the W boson in $ \mathrm{q\bar{q}'} $ decays. The measurement is calibrated on samples simulated at next-to-leading order matched to a leading-order parton shower. The top quark mass is found to be 172.25 $\pm$ 0.08 (stat+JSF) $\pm$ 0.62 (syst) GeV. The dependence of this result on the kinematic properties of the event is studied and compared to predictions of different models of $ \mathrm{t\bar{t}} $ production, and no indications of a bias in the measurements are observed. | ||
| Links: e-print arXiv:1805.01428 [hep-ex] (PDF) ; CDS record ; inSPIRE record ; HepData record ; CADI line (restricted) ; | ||
| Figures | |

png pdf |
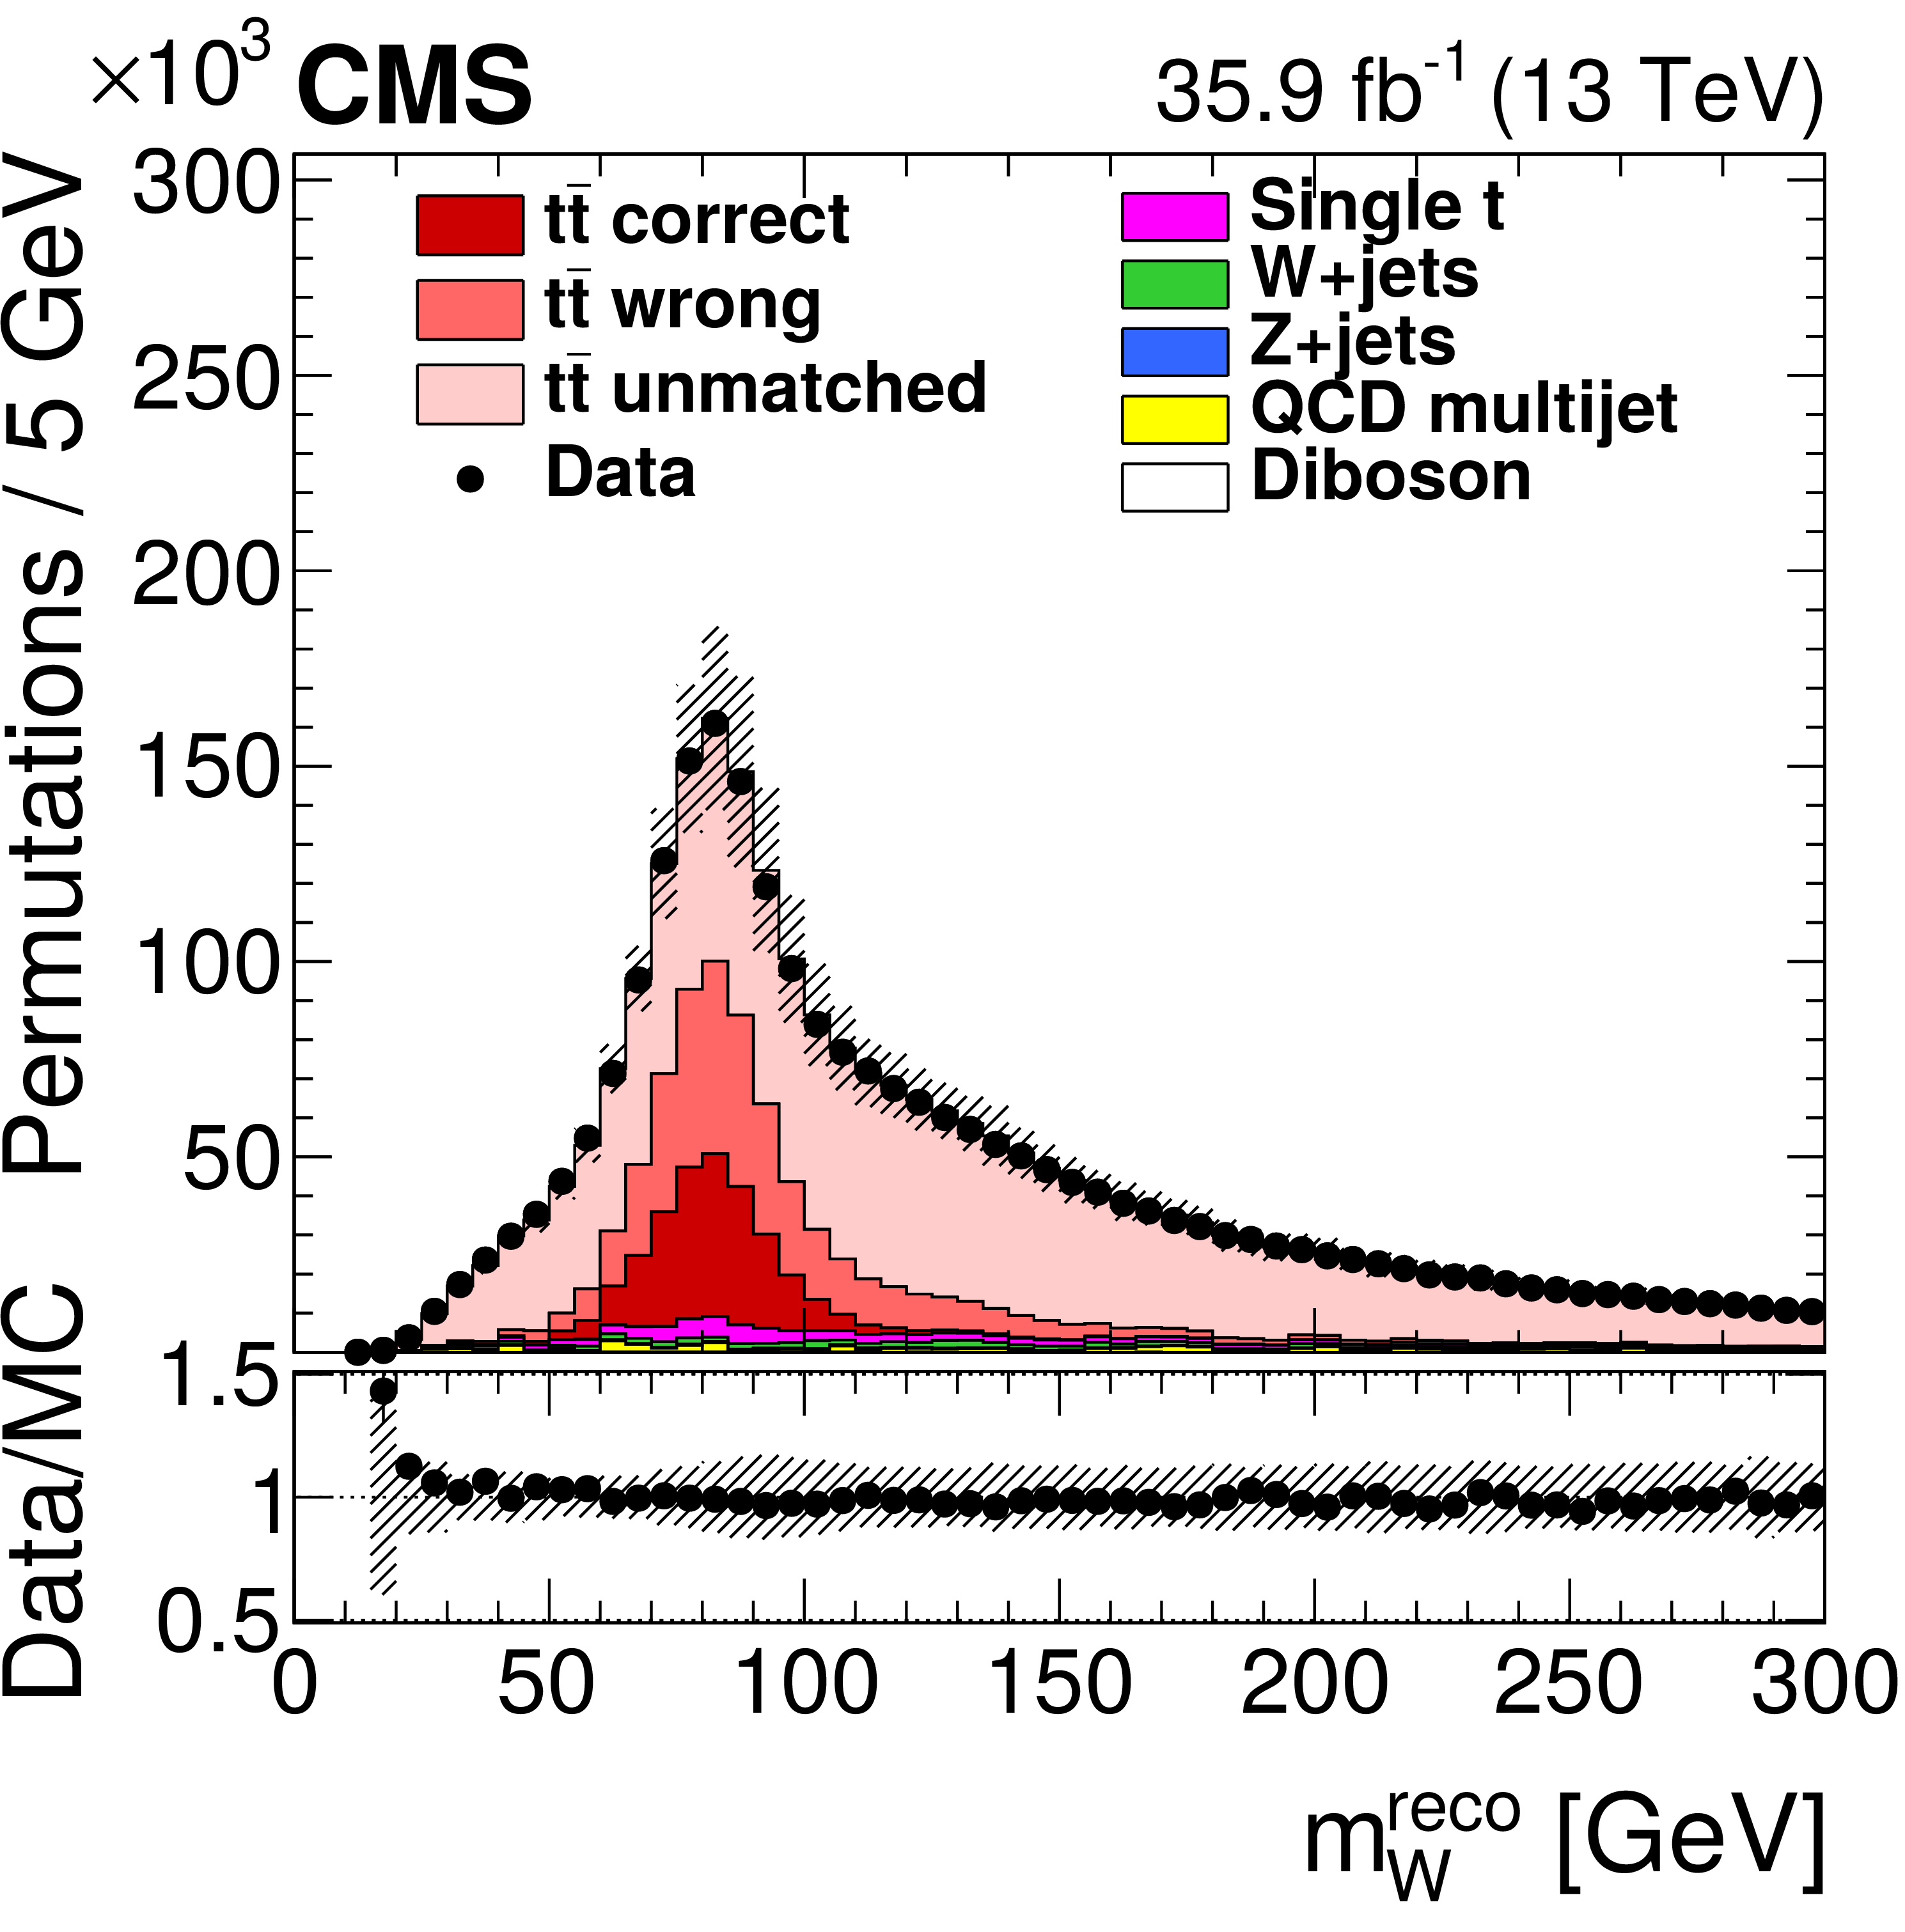
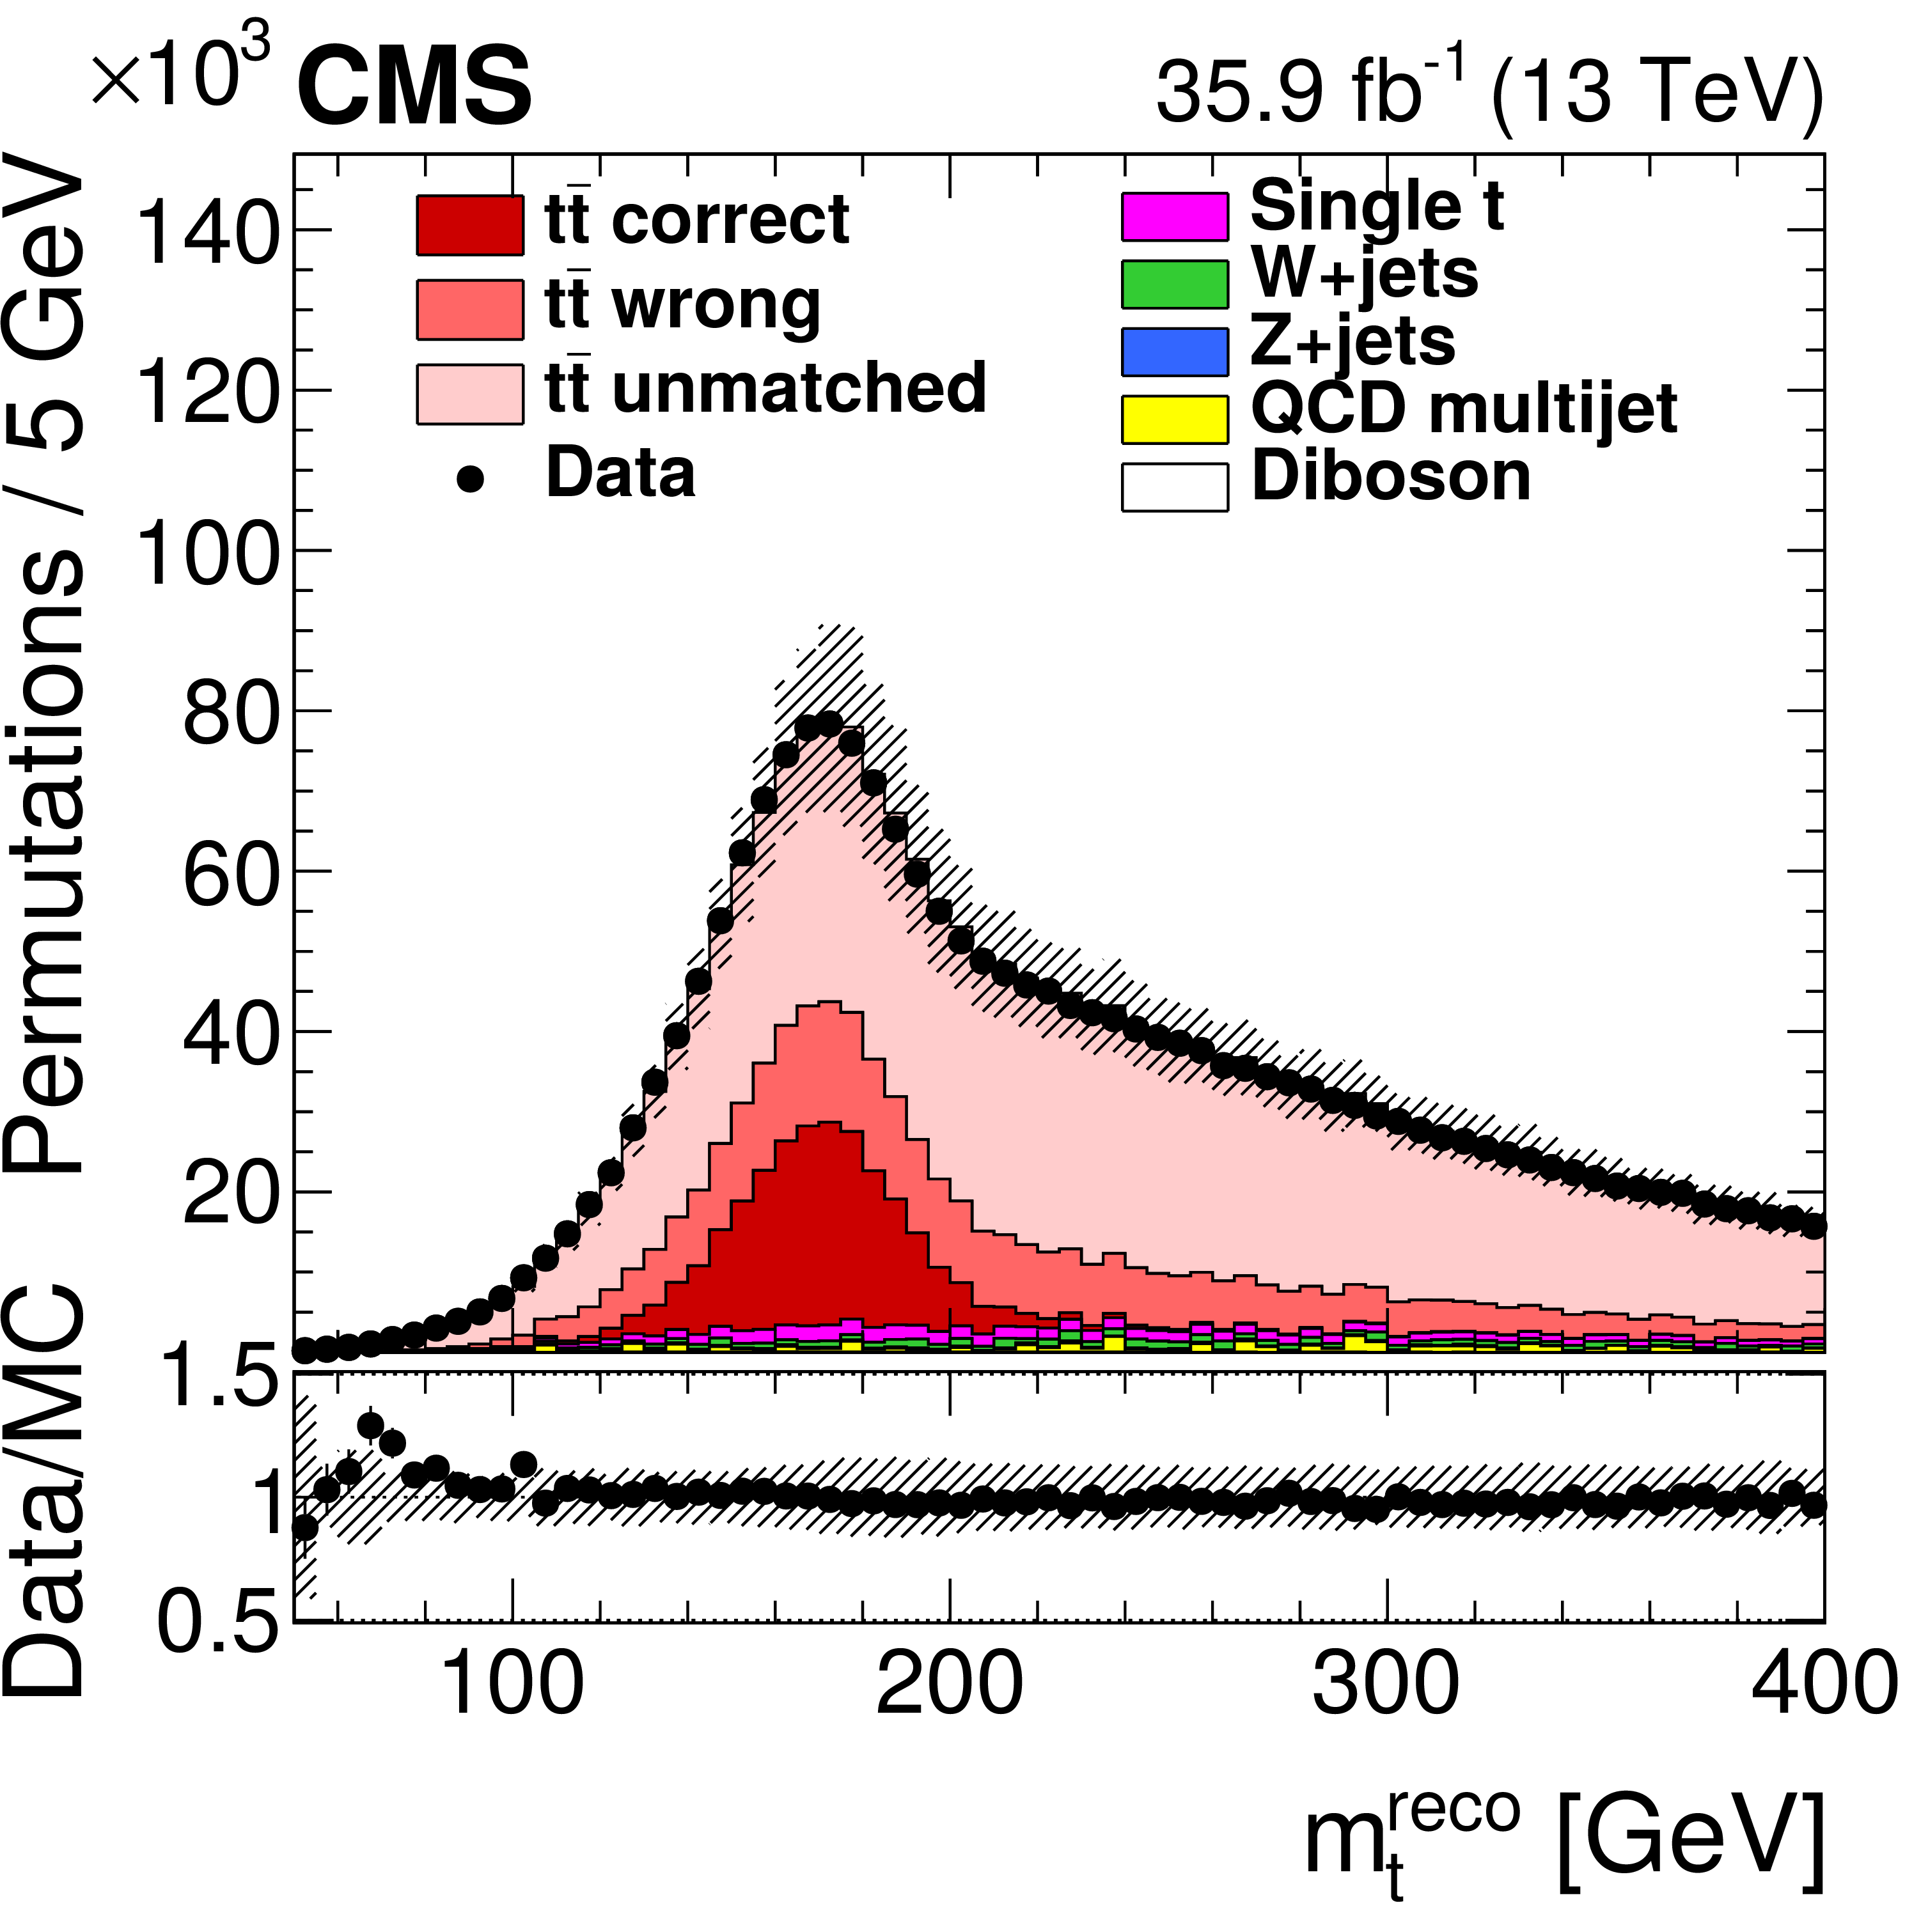
Figure 1:
Invariant mass $m_ {\mathrm {W}}^\text {reco}$ of the two untagged jets (left) and invariant mass $ {m_{{\mathrm {t}}}} ^\text {reco}$ of the two untagged jets and one of the b-tagged jets (right) after the b tagging requirement. For the simulated $ {{\mathrm {t}\overline {\mathrm {t}}}} $ events, the jet-parton assignments are classified as correct, wrong, and unmatched permutations as described in the text. The vertical bars show the statistical uncertainty on the data and the hatched bands show the systematic uncertainties considered in Section 5. The lower portion of each panel shows the ratio of the yields between data and the simulation. The simulations are normalized to the integrated luminosity. |
png pdf |
Figure 1-a:
Invariant mass $m_ {\mathrm {W}}^\text {reco}$ of the two untagged jets after the b tagging requirement. For the simulated $ {{\mathrm {t}\overline {\mathrm {t}}}} $ events, the jet-parton assignments are classified as correct, wrong, and unmatched permutations as described in the text. The vertical bars show the statistical uncertainty on the data and the hatched bands show the systematic uncertainties considered in Section 5. The lower portion of the panel shows the ratio of the yields between data and the simulation. The simulations are normalized to the integrated luminosity. |
png pdf |
Figure 1-b:
Invariant mass $ {m_{{\mathrm {t}}}} ^\text {reco}$ of the two untagged jets and one of the b-tagged jets after the b tagging requirement. For the simulated $ {{\mathrm {t}\overline {\mathrm {t}}}} $ events, the jet-parton assignments are classified as correct, wrong, and unmatched permutations as described in the text. The vertical bars show the statistical uncertainty on the data and the hatched bands show the systematic uncertainties considered in Section 5. The lower portion of the panel shows the ratio of the yields between data and the simulation. The simulations are normalized to the integrated luminosity. |
png pdf |
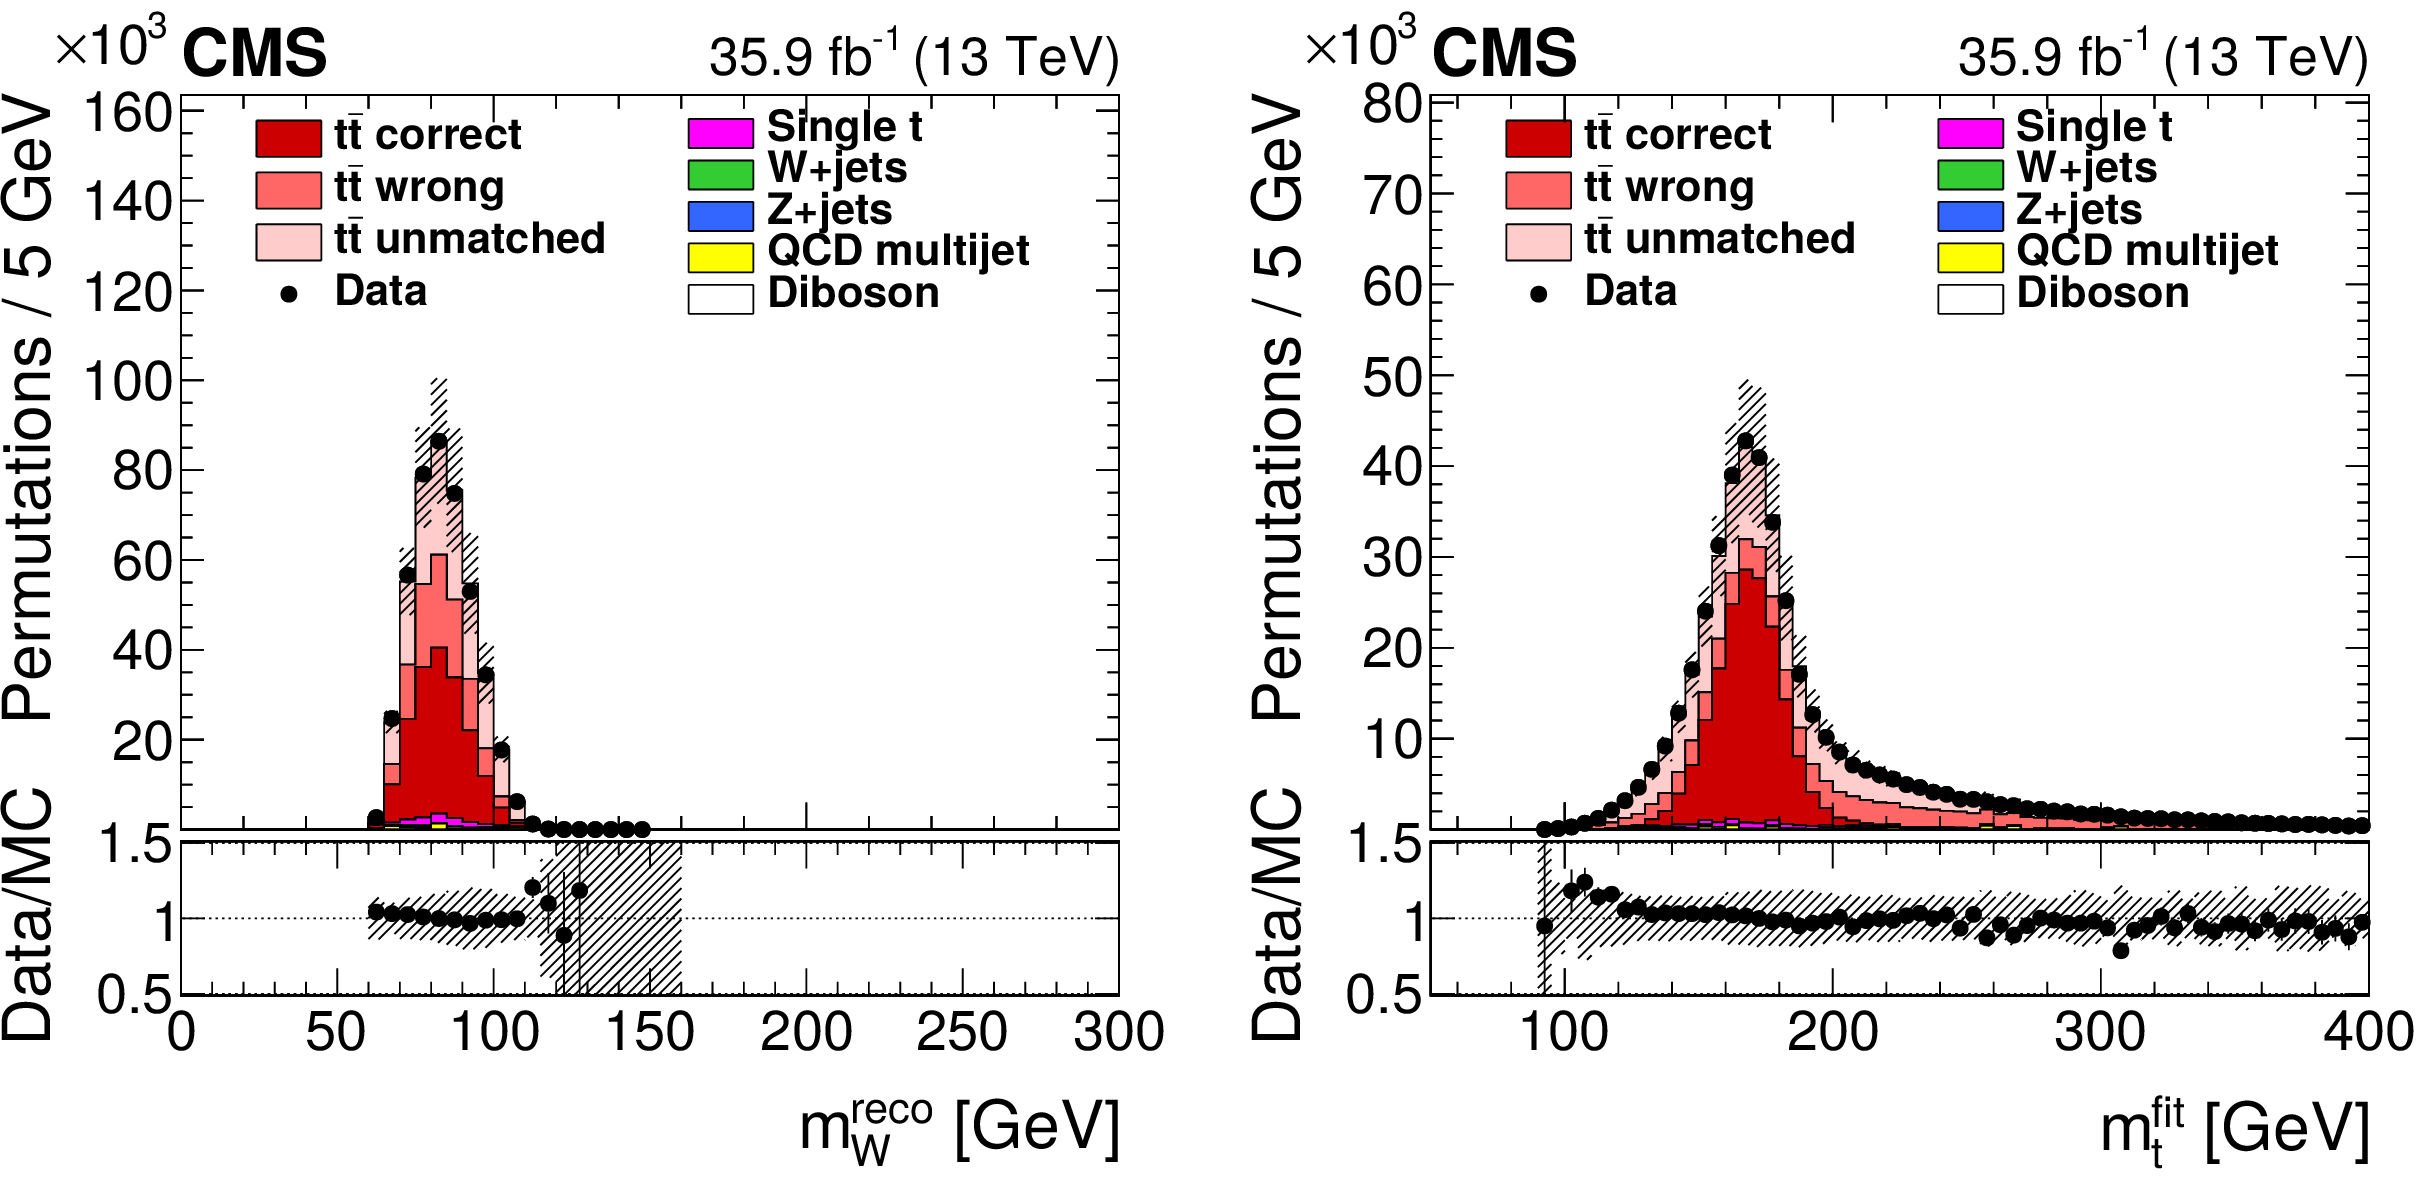
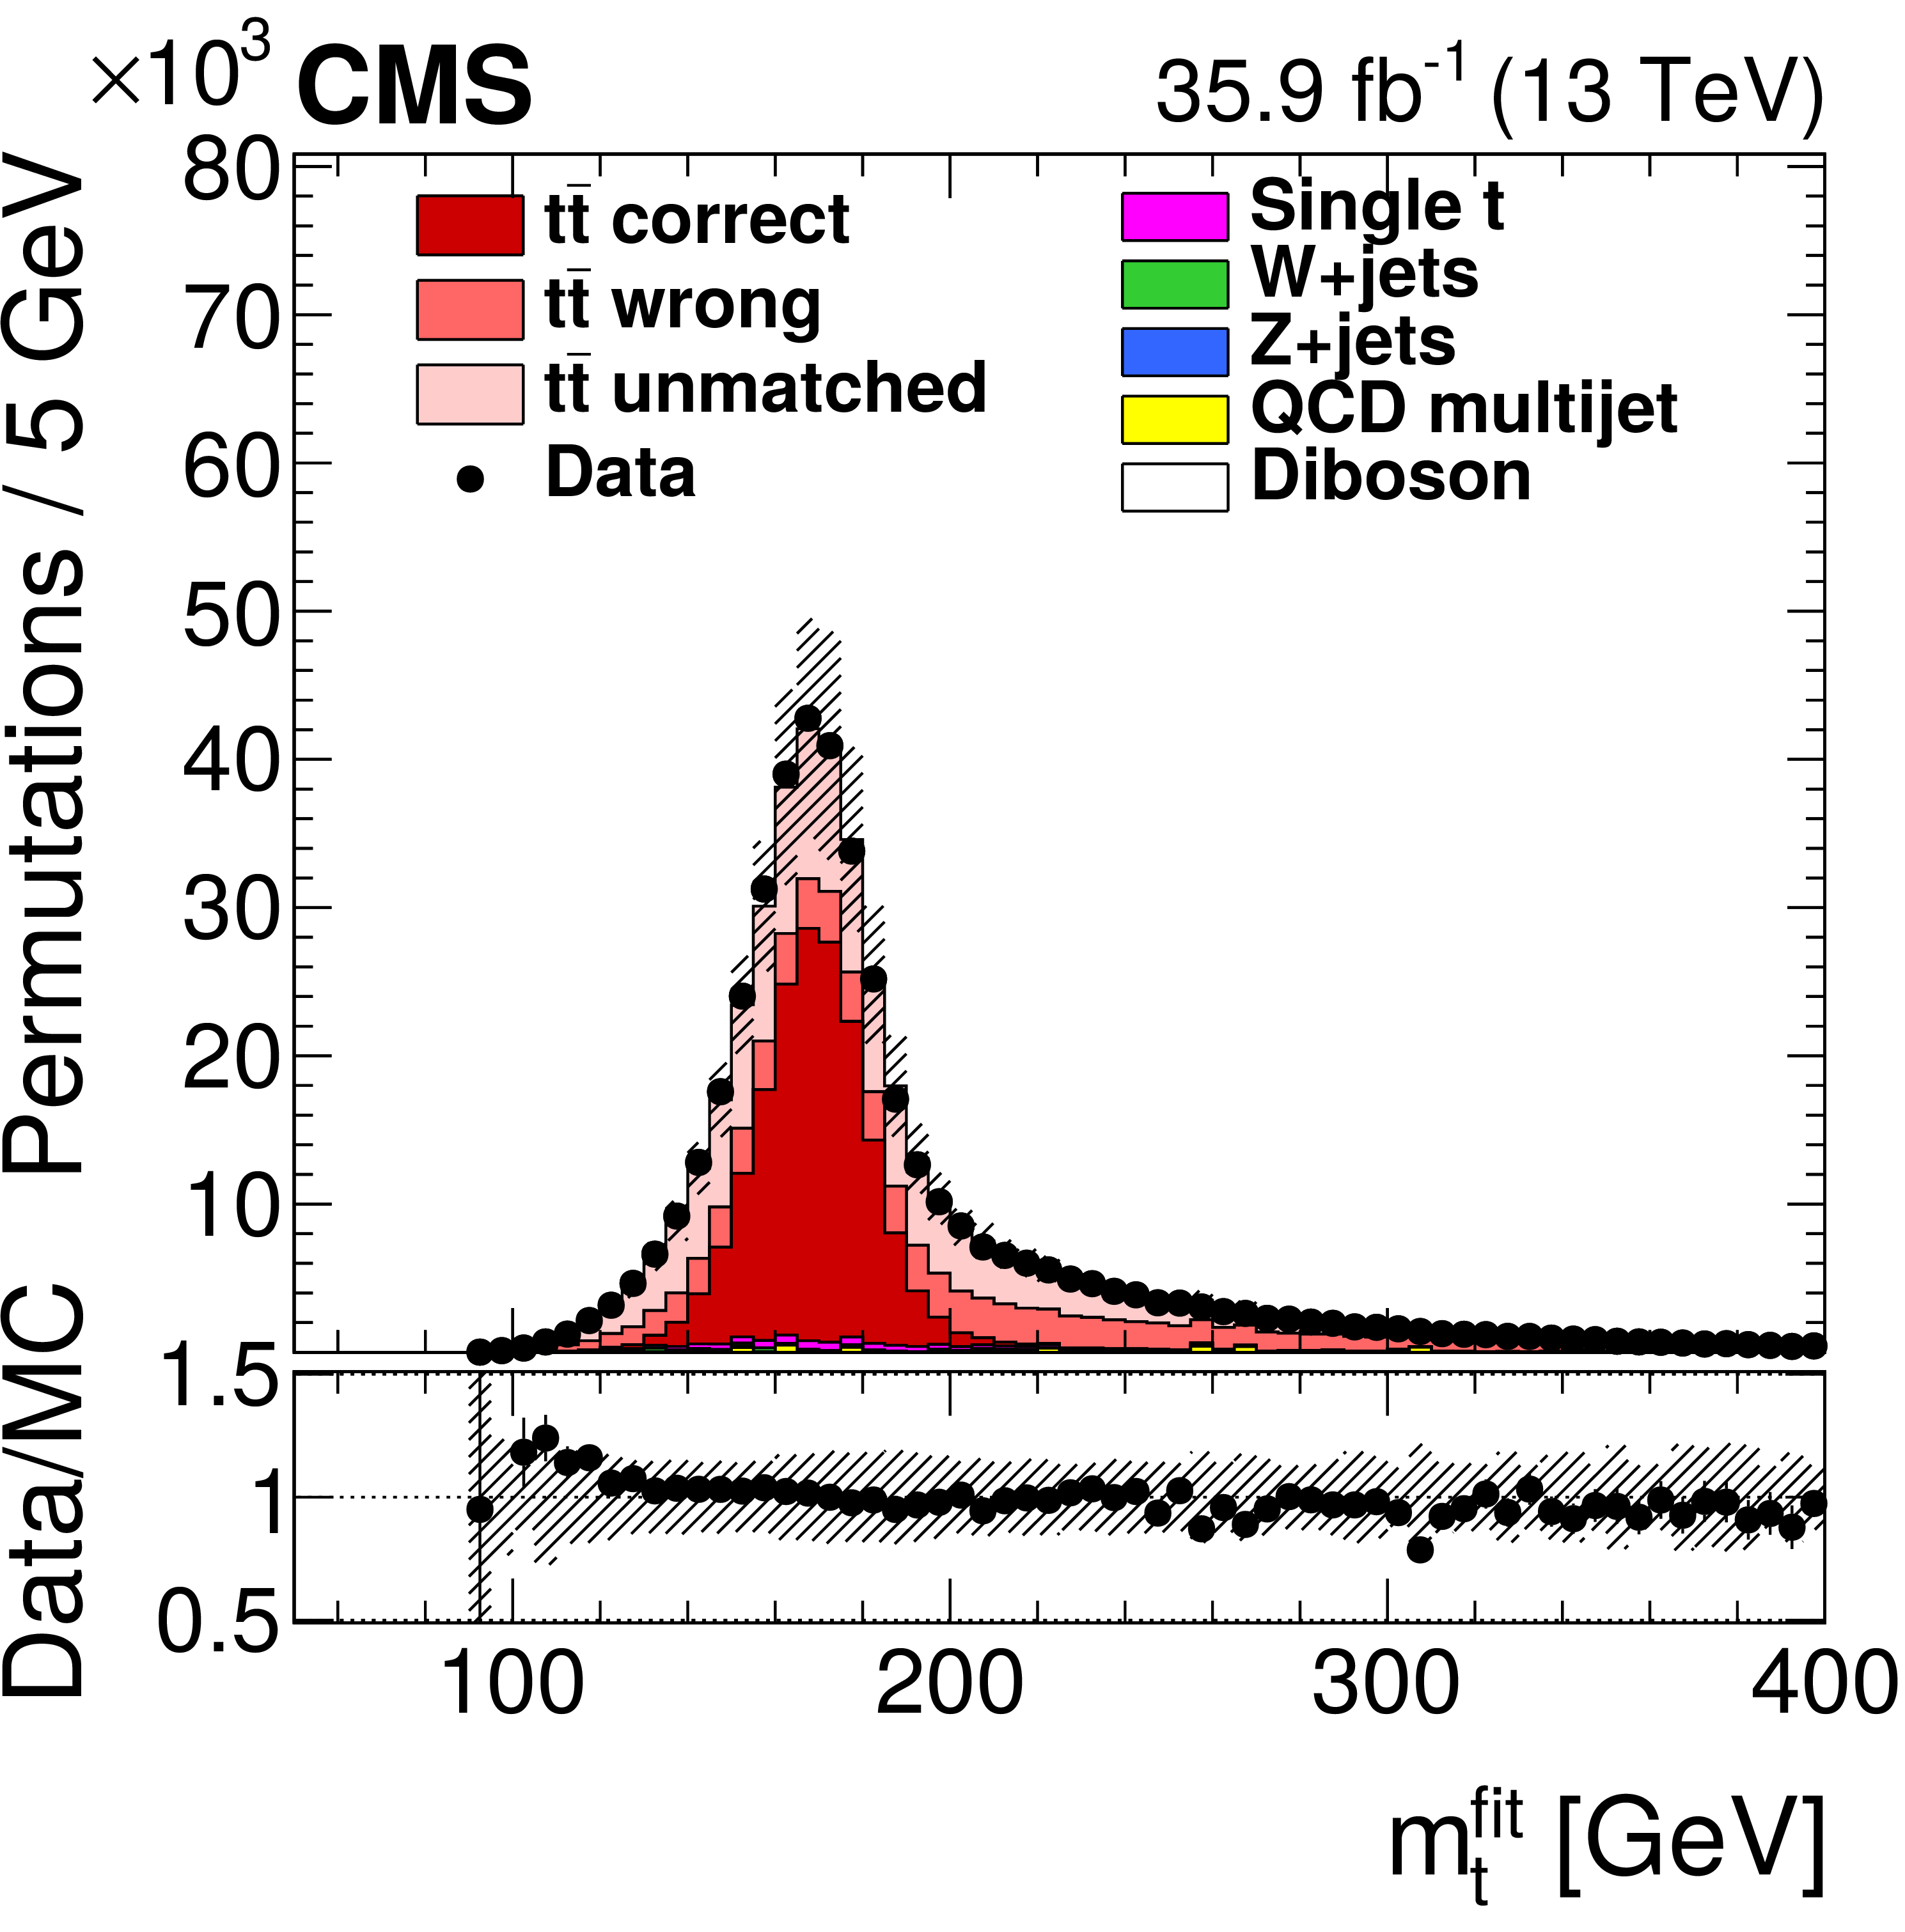
Figure 2:
Reconstructed W boson masses $m_ {\mathrm {W}}^\text {reco}$ (left) and fitted top quark masses $ {m_{{\mathrm {t}}}} ^\text {fit}$ (right) after the goodness-of-fit selection and the weighting by $P_\text {gof}$. Symbols and patterns are the same as in Fig. 1. The simulations are normalized to the integrated luminosity. |

png pdf |
Figure 2-a:
Reconstructed W boson masses $m_ {\mathrm {W}}^\text {reco}$ after the goodness-of-fit selection and the weighting by $P_\text {gof}$. Symbols and patterns are the same as in Fig. 1. The simulations are normalized to the integrated luminosity. |
png pdf |
Figure 2-b:
Fitted top quark masses $ {m_{{\mathrm {t}}}} ^\text {fit}$ after the goodness-of-fit selection and the weighting by $P_\text {gof}$. Symbols and patterns are the same as in Fig. 1. The simulations are normalized to the integrated luminosity. |
png pdf |
Figure 3:
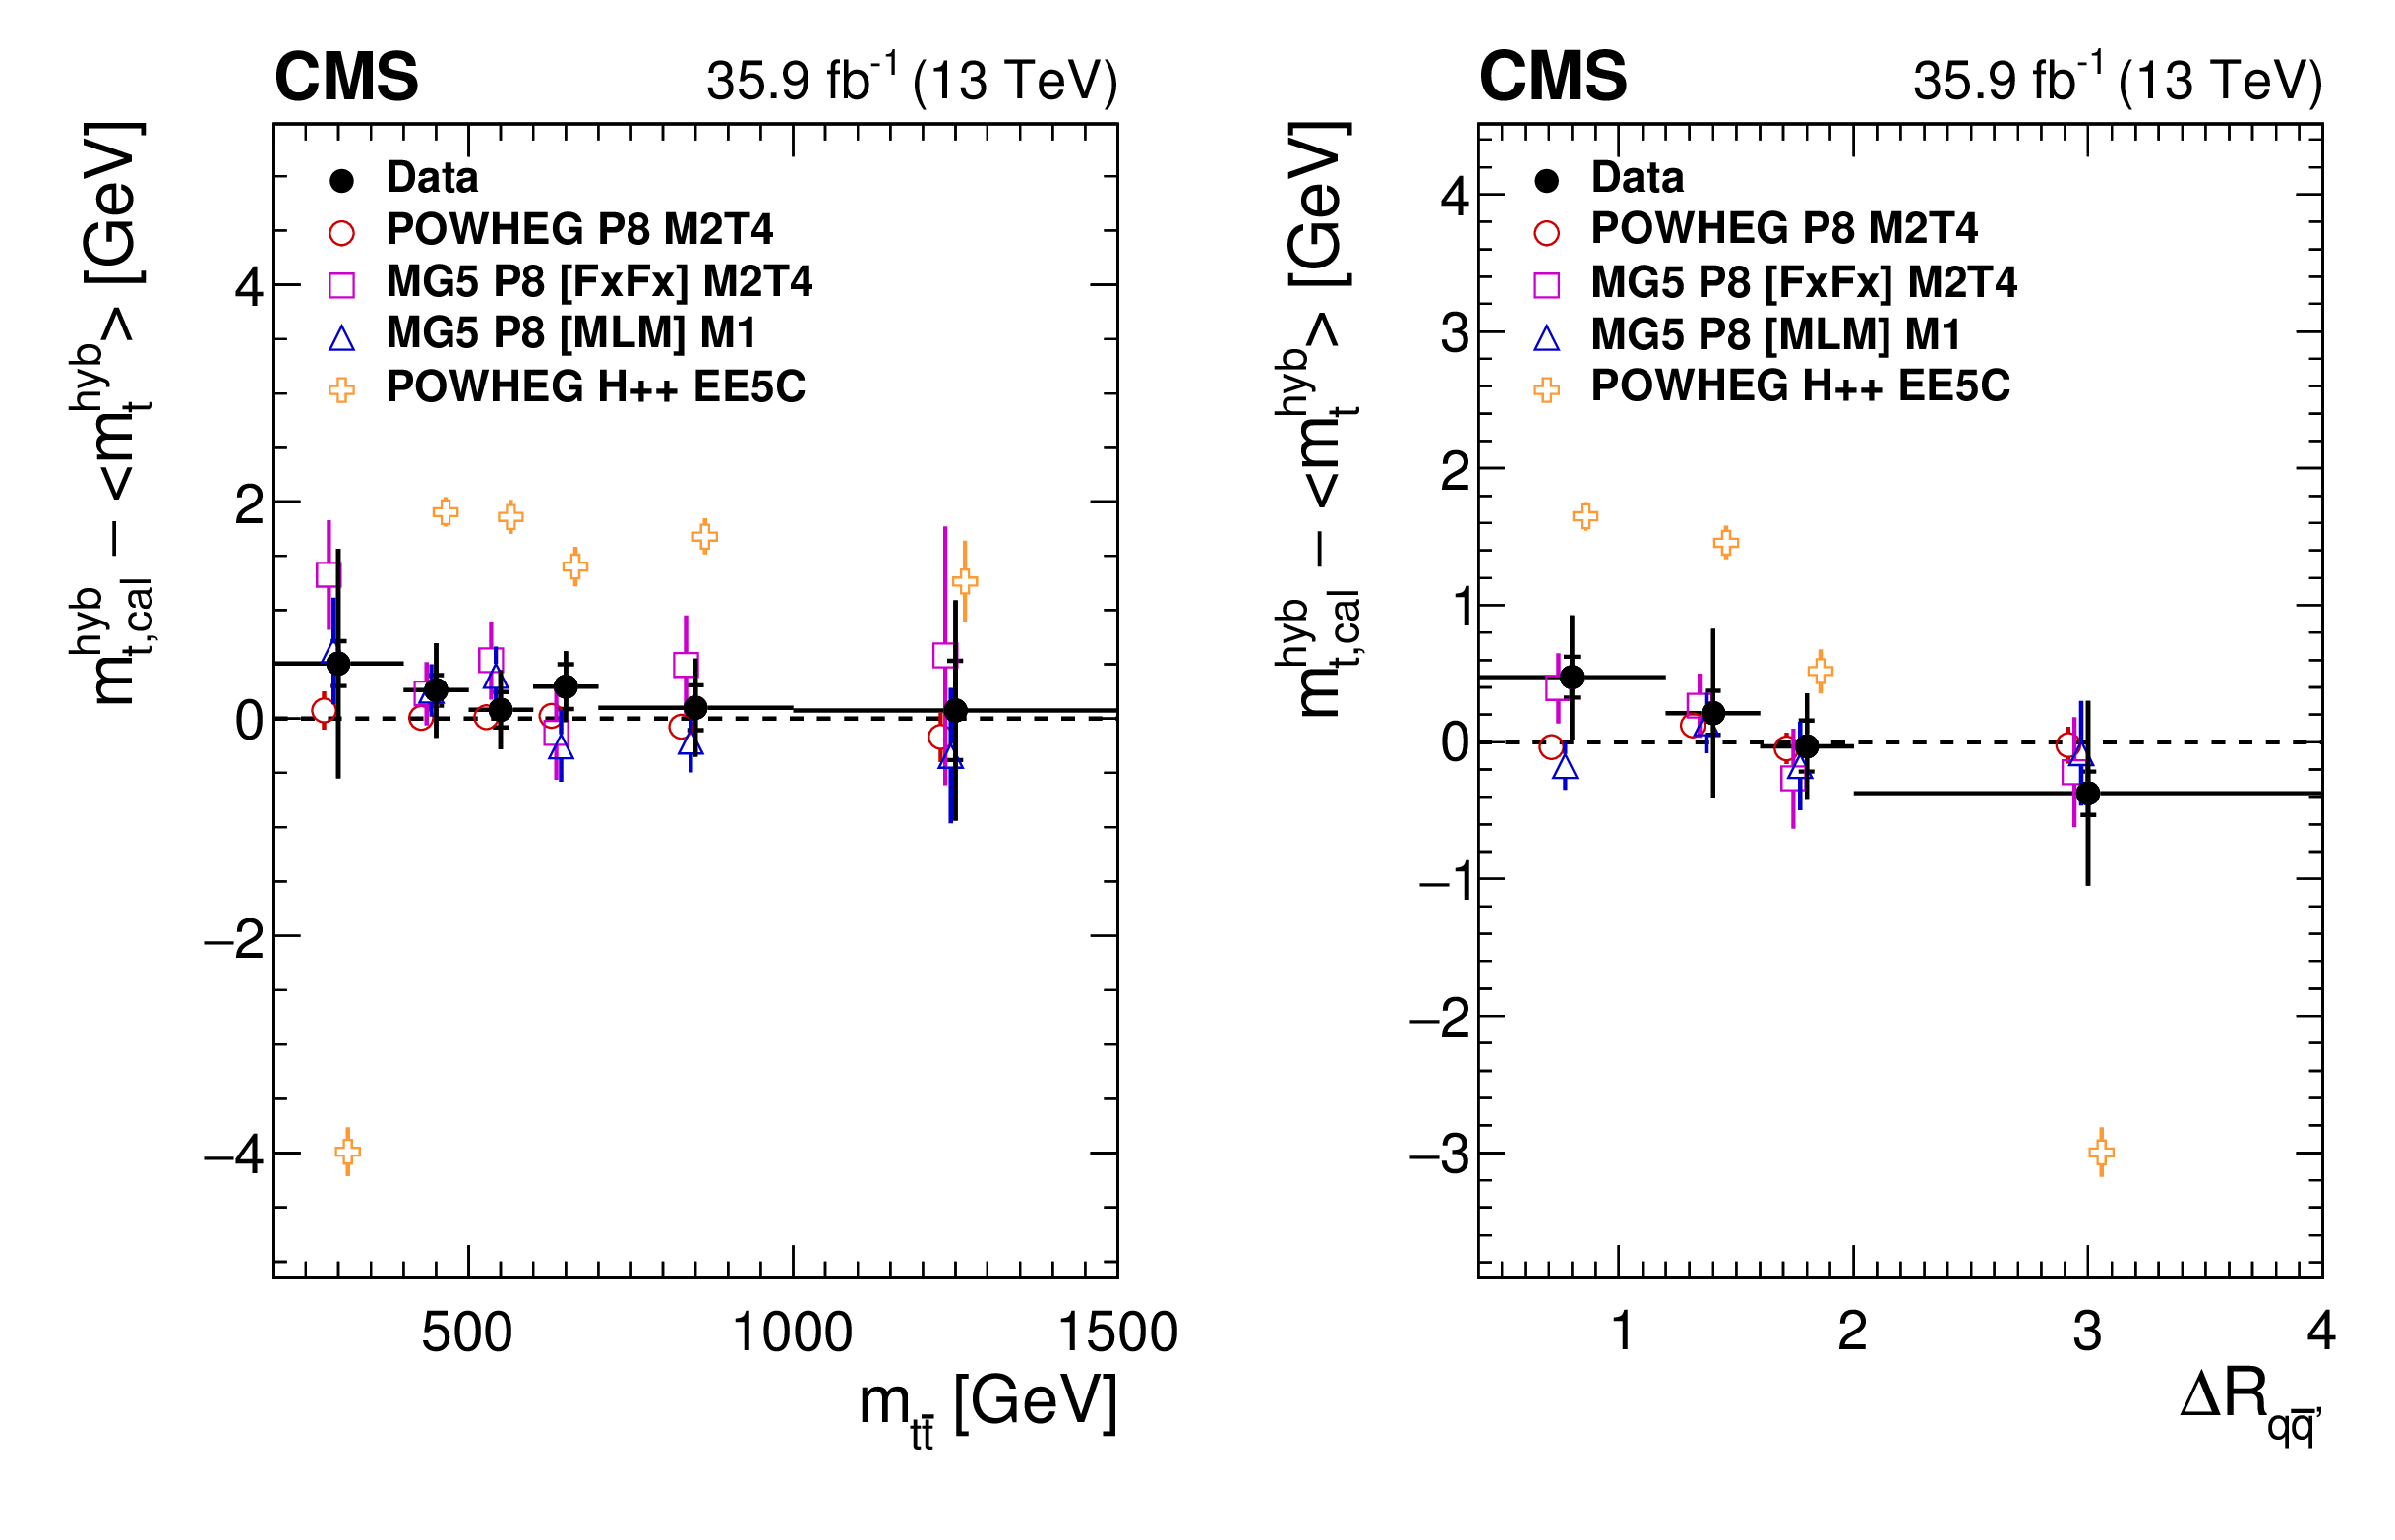
Measurements of $ {m_{{\mathrm {t}}}} $ as a function of the invariant mass of the $ {{\mathrm {t}\overline {\mathrm {t}}}} $ system $m_{{{\mathrm {t}\overline {\mathrm {t}}}}}$ (left) and the $\Delta R$ between the light-quark jets $\Delta R_{{{\mathrm {q}} {\overline {\mathrm {q}}} ^\prime}}$ (right) compared to different generator models. The filled circles represent the data, and the other symbols are for the simulations. For reasons of clarity, the horizontal bars indicating the bin widths are shown only for the data points and each of the simulations is shown as a single offset point with a vertical error bar representing its statistical uncertainty. The statistical uncertainty of the data is displayed by the inner error bars. For the outer error bars, the systematic uncertainties are added in quadrature. |
png pdf |
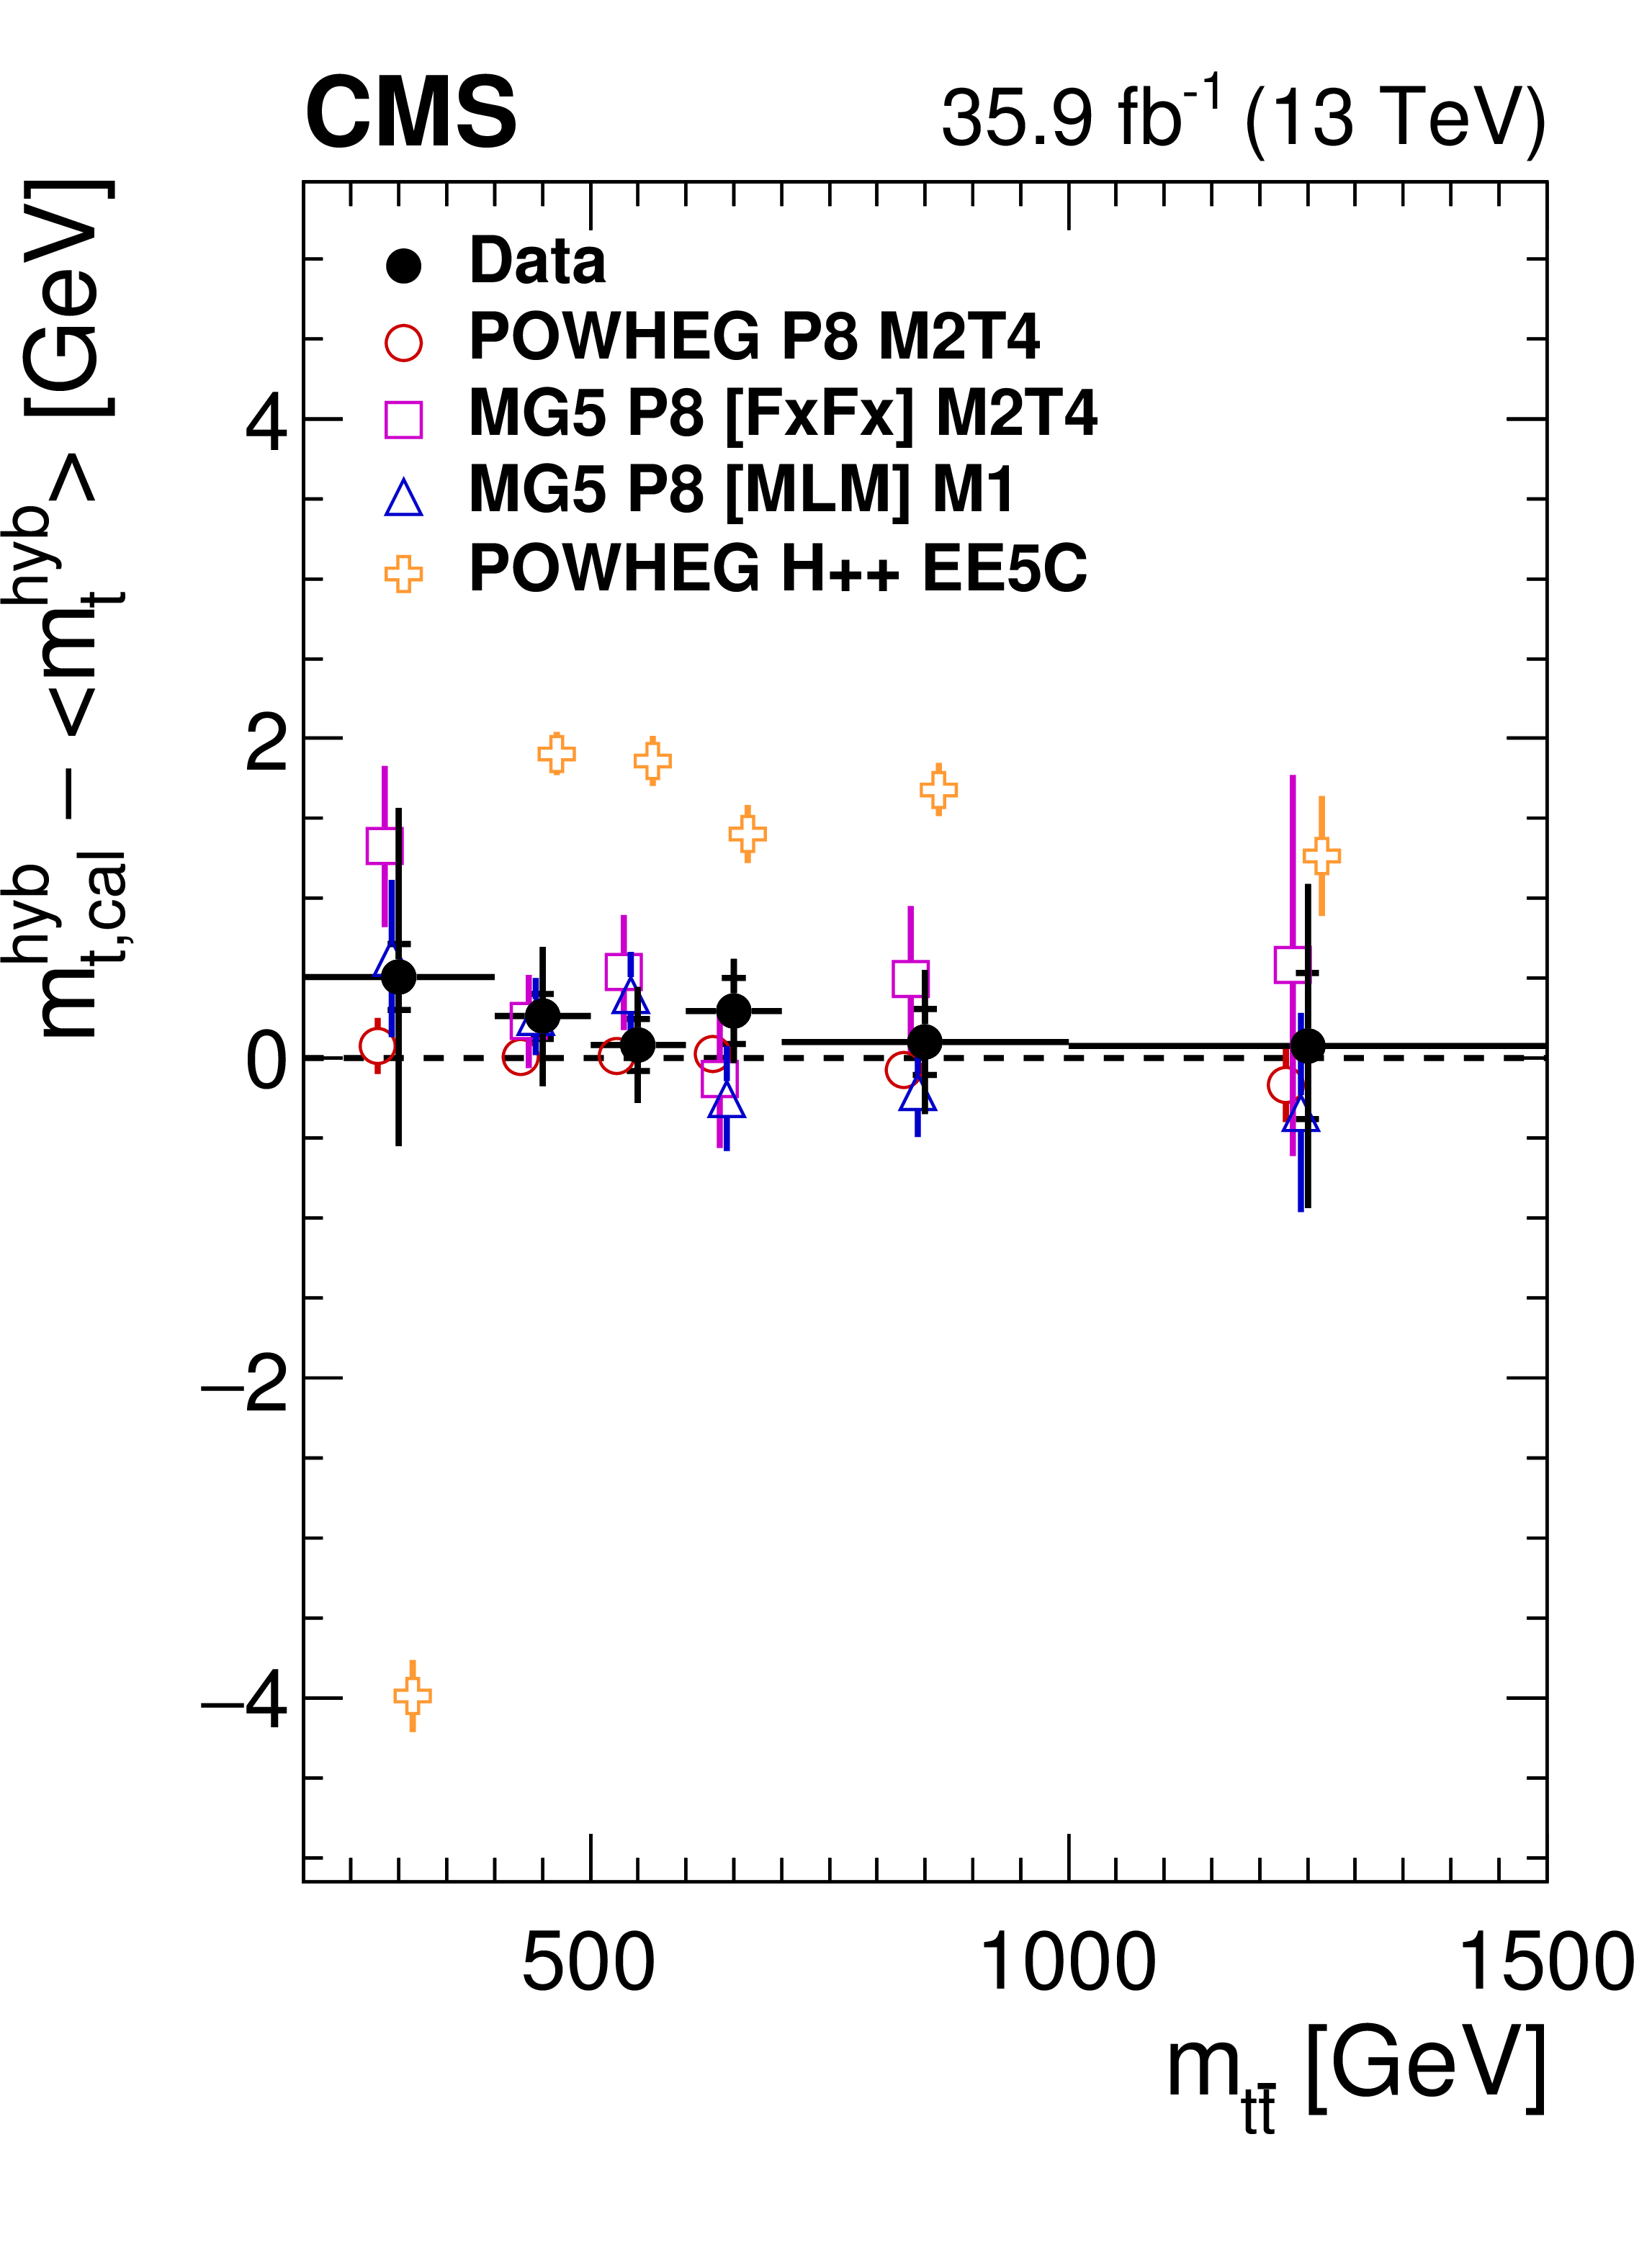
Figure 3-a:
Measurements of $ {m_{{\mathrm {t}}}} $ as a function of the invariant mass of the $ {{\mathrm {t}\overline {\mathrm {t}}}} $ system $m_{{{\mathrm {t}\overline {\mathrm {t}}}}}$ compared to different generator models. The filled circles represent the data, and the other symbols are for the simulations. For reasons of clarity, the horizontal bars indicating the bin widths are shown only for the data points and each of the simulations is shown as a single offset point with a vertical error bar representing its statistical uncertainty. The statistical uncertainty of the data is displayed by the inner error bars. For the outer error bars, the systematic uncertainties are added in quadrature. |
png pdf |
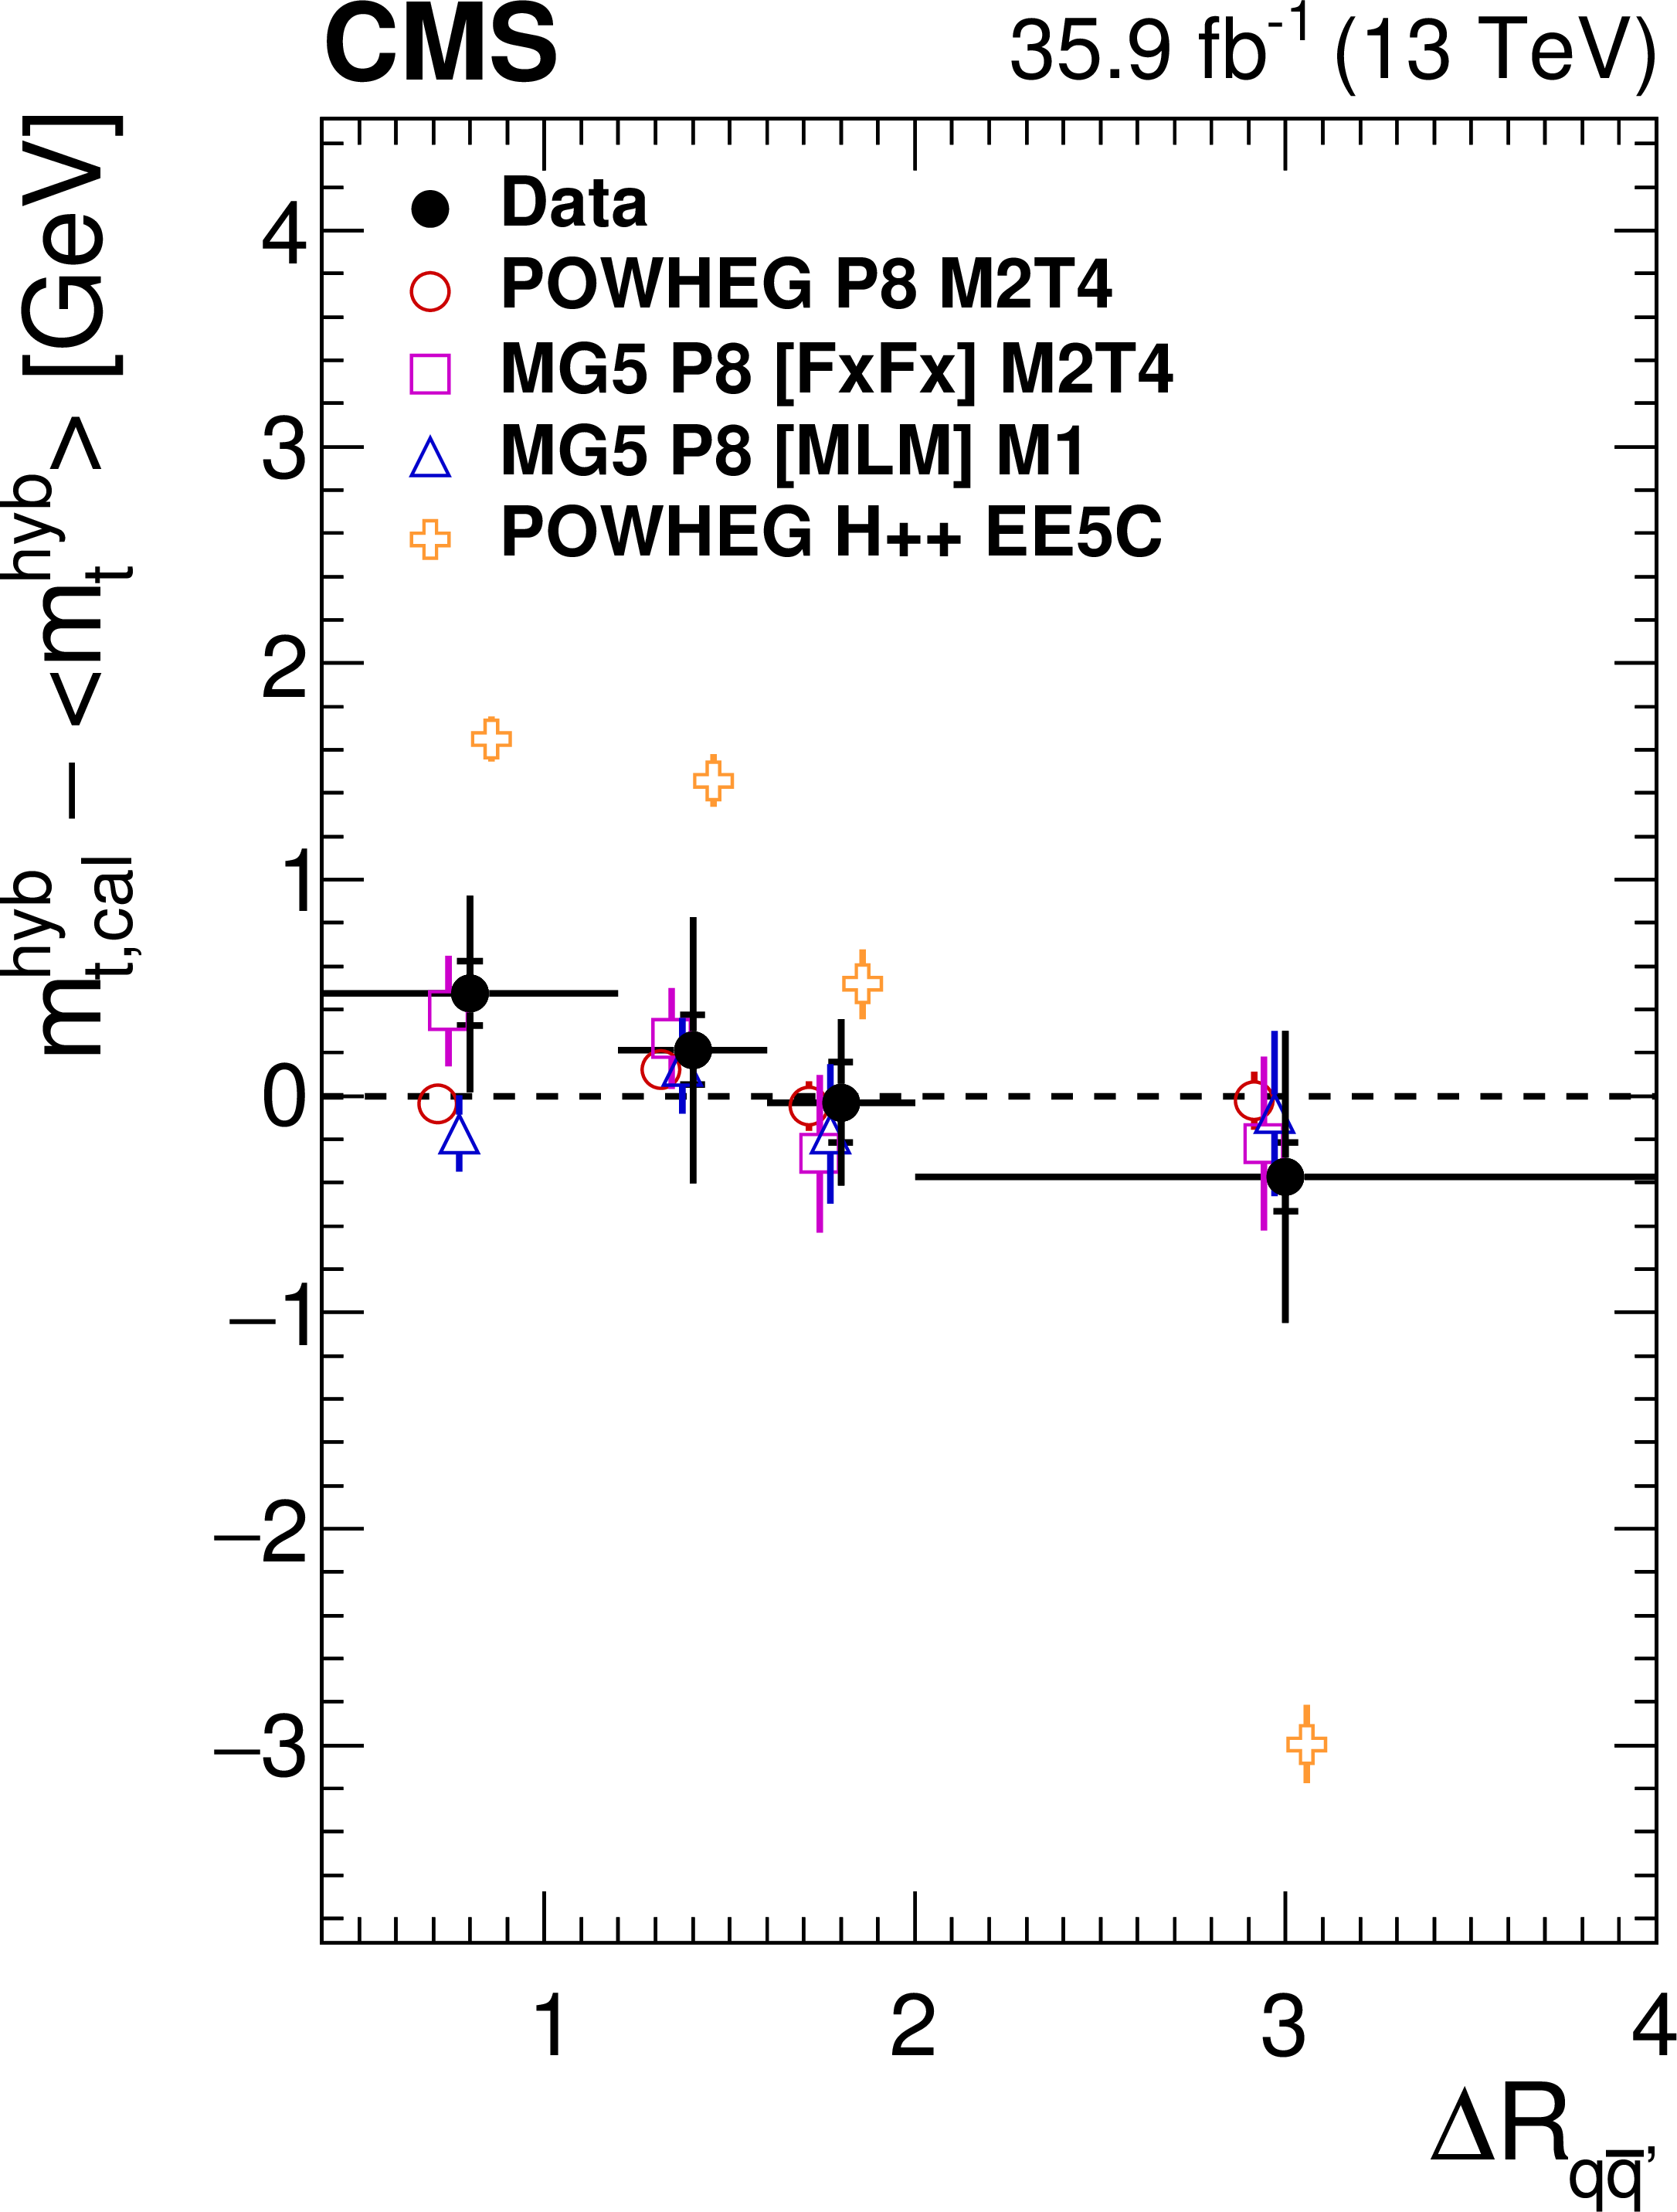
Figure 3-b:
Measurements of $ {m_{{\mathrm {t}}}} $ as a function of the $\Delta R$ between the light-quark jets $\Delta R_{{{\mathrm {q}} {\overline {\mathrm {q}}} ^\prime}}$ compared to different generator models. The filled circles represent the data, and the other symbols are for the simulations. For reasons of clarity, the horizontal bars indicating the bin widths are shown only for the data points and each of the simulations is shown as a single offset point with a vertical error bar representing its statistical uncertainty. The statistical uncertainty of the data is displayed by the inner error bars. For the outer error bars, the systematic uncertainties are added in quadrature. |
png pdf |
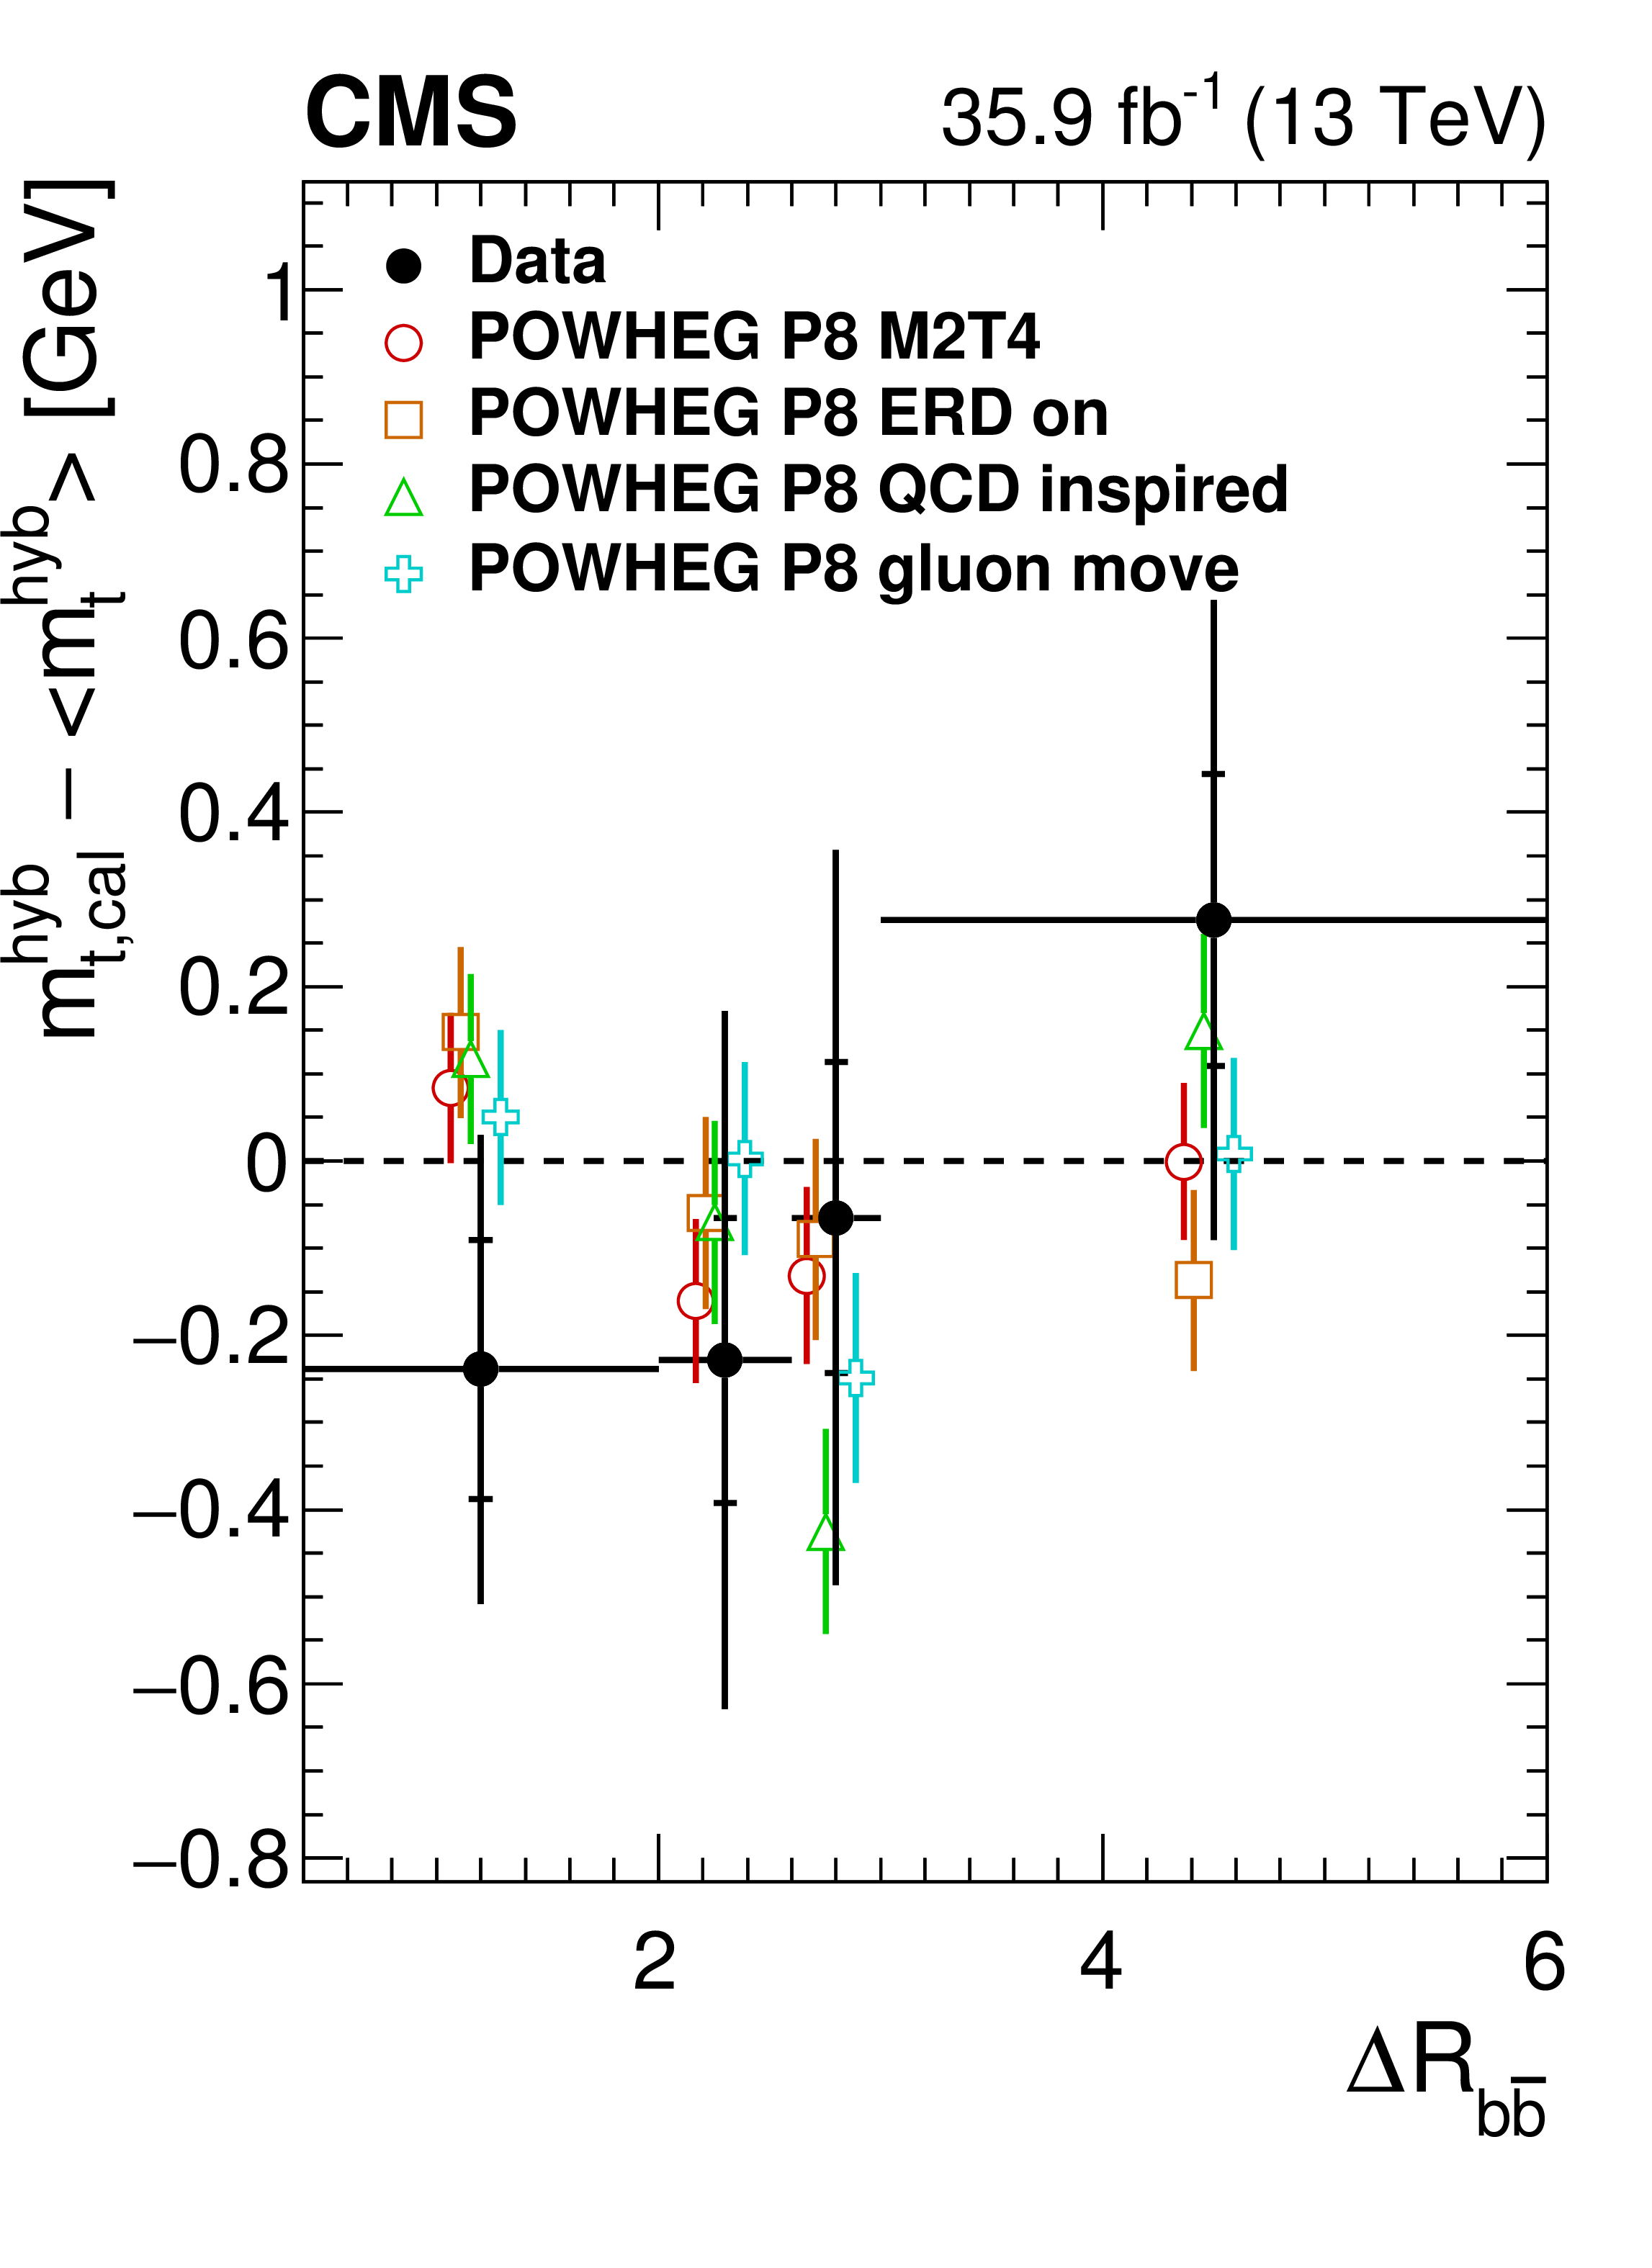
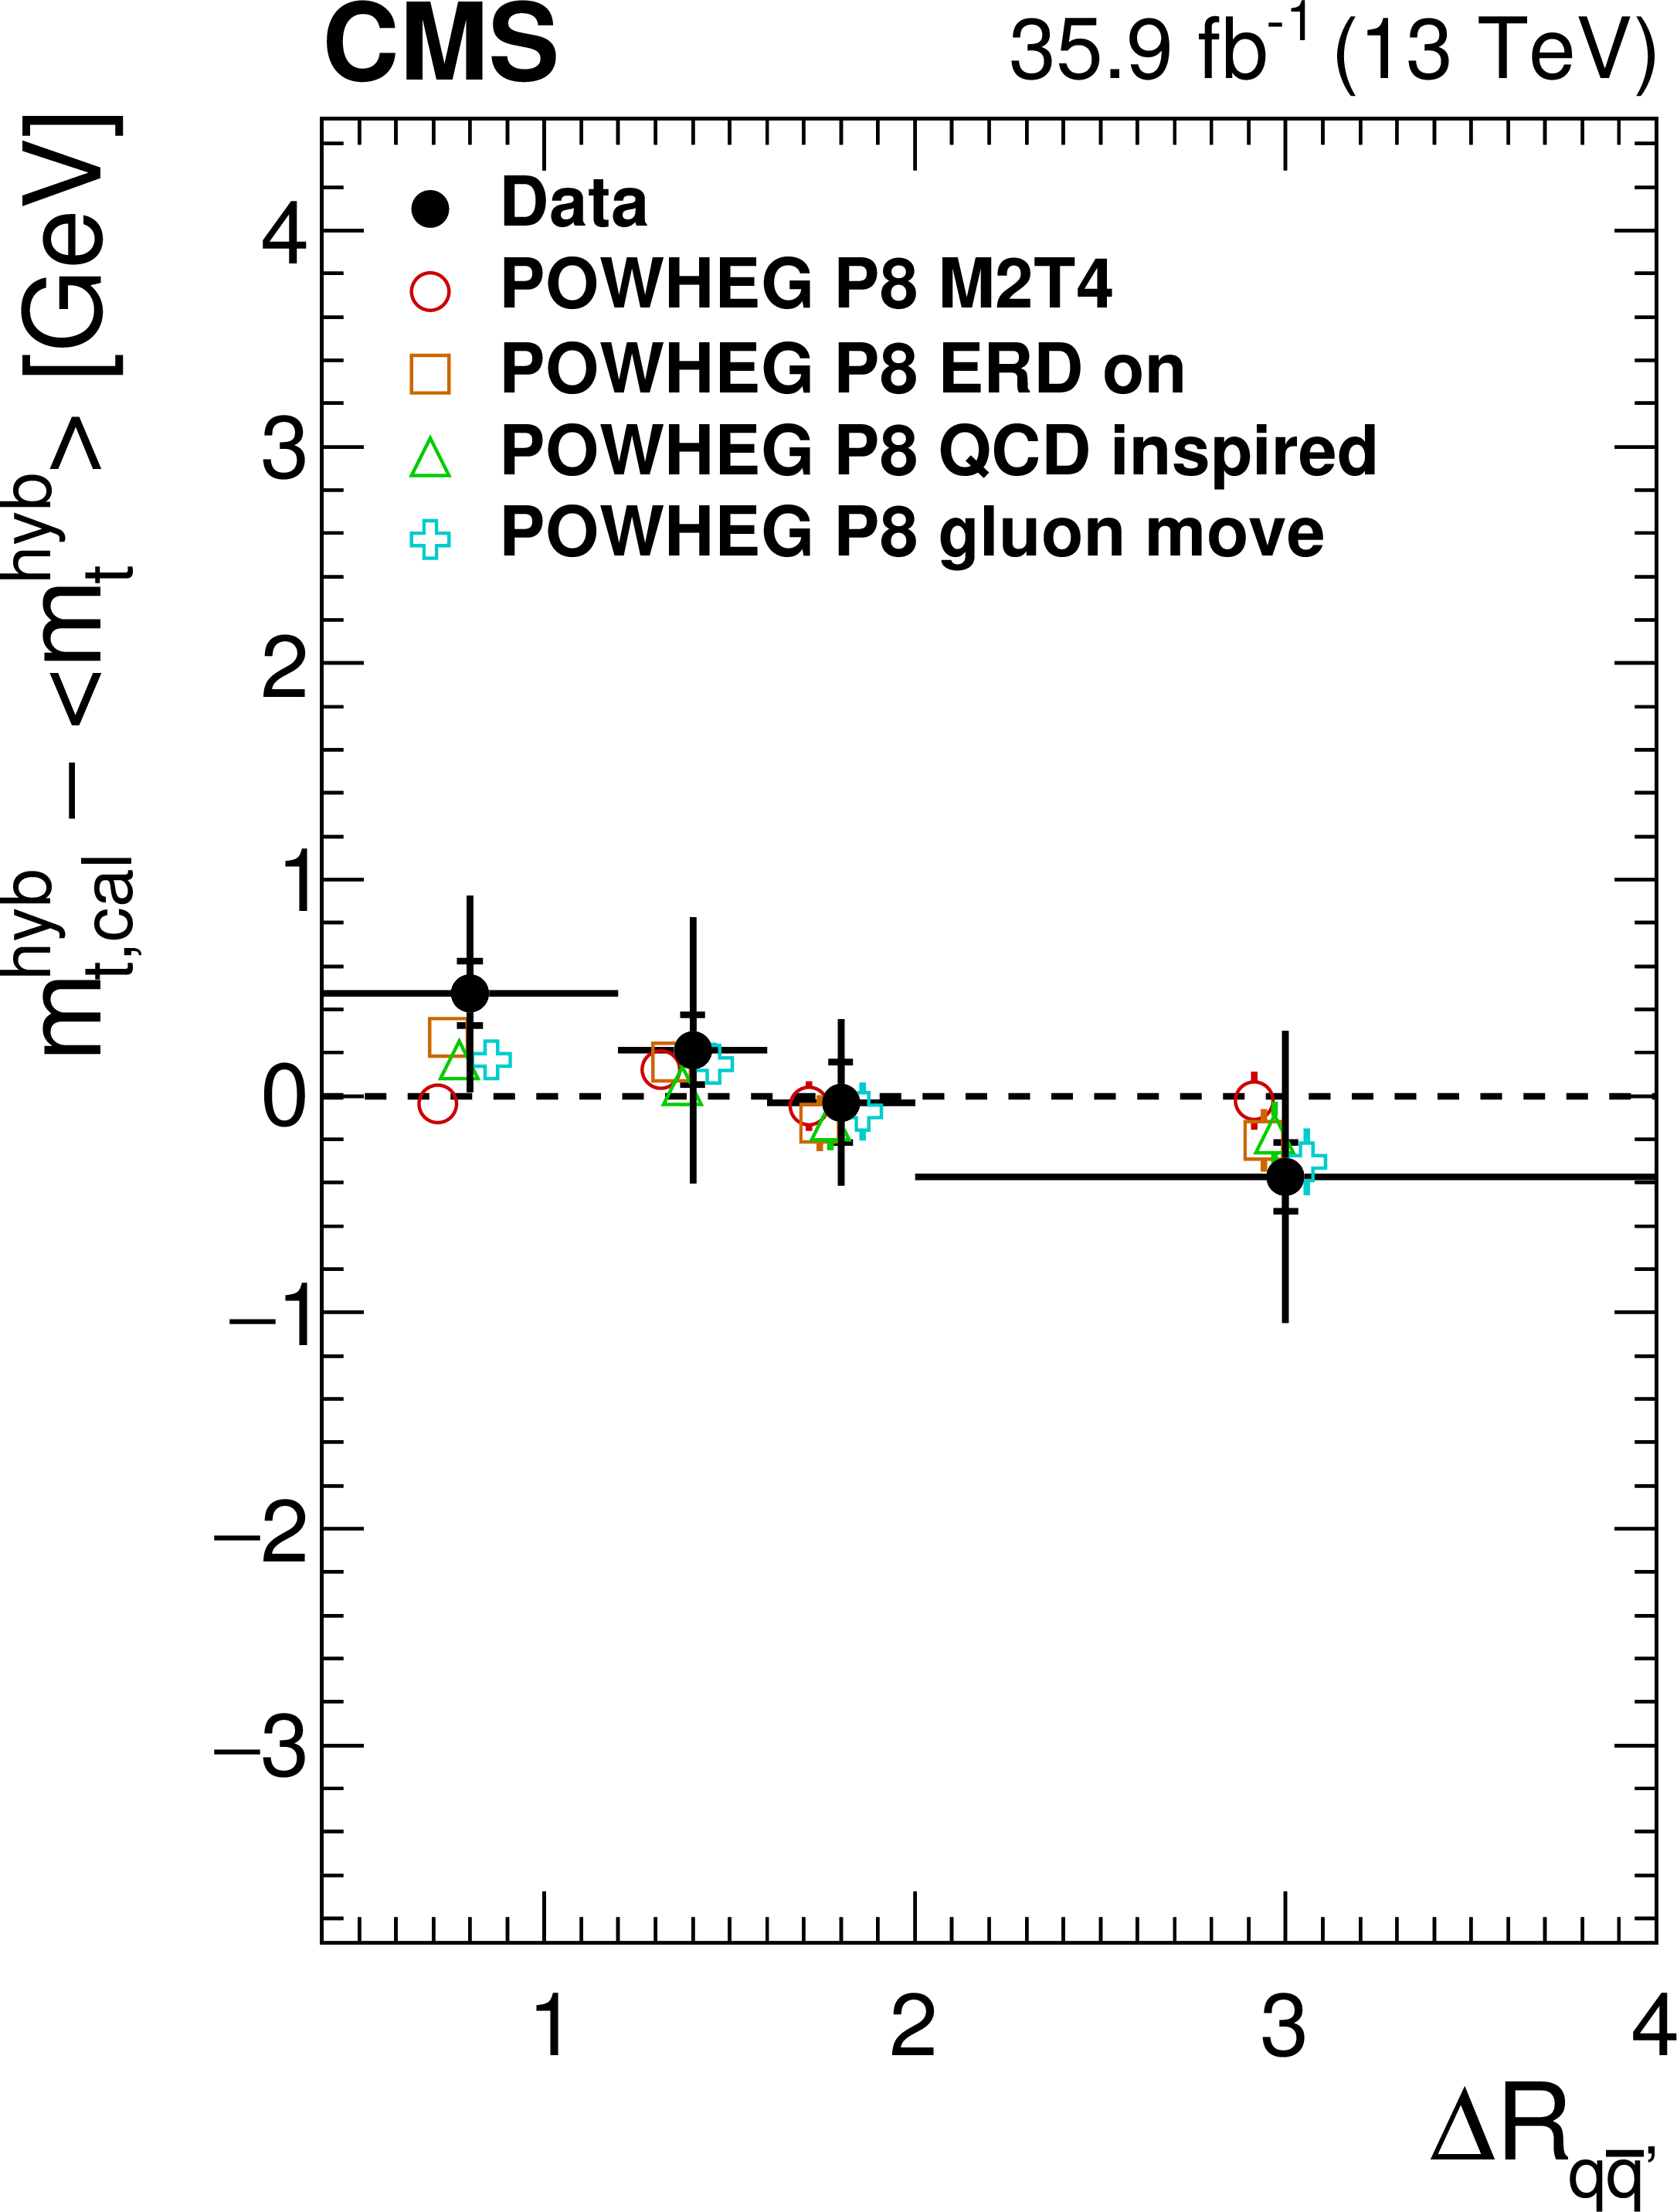
Figure 4:
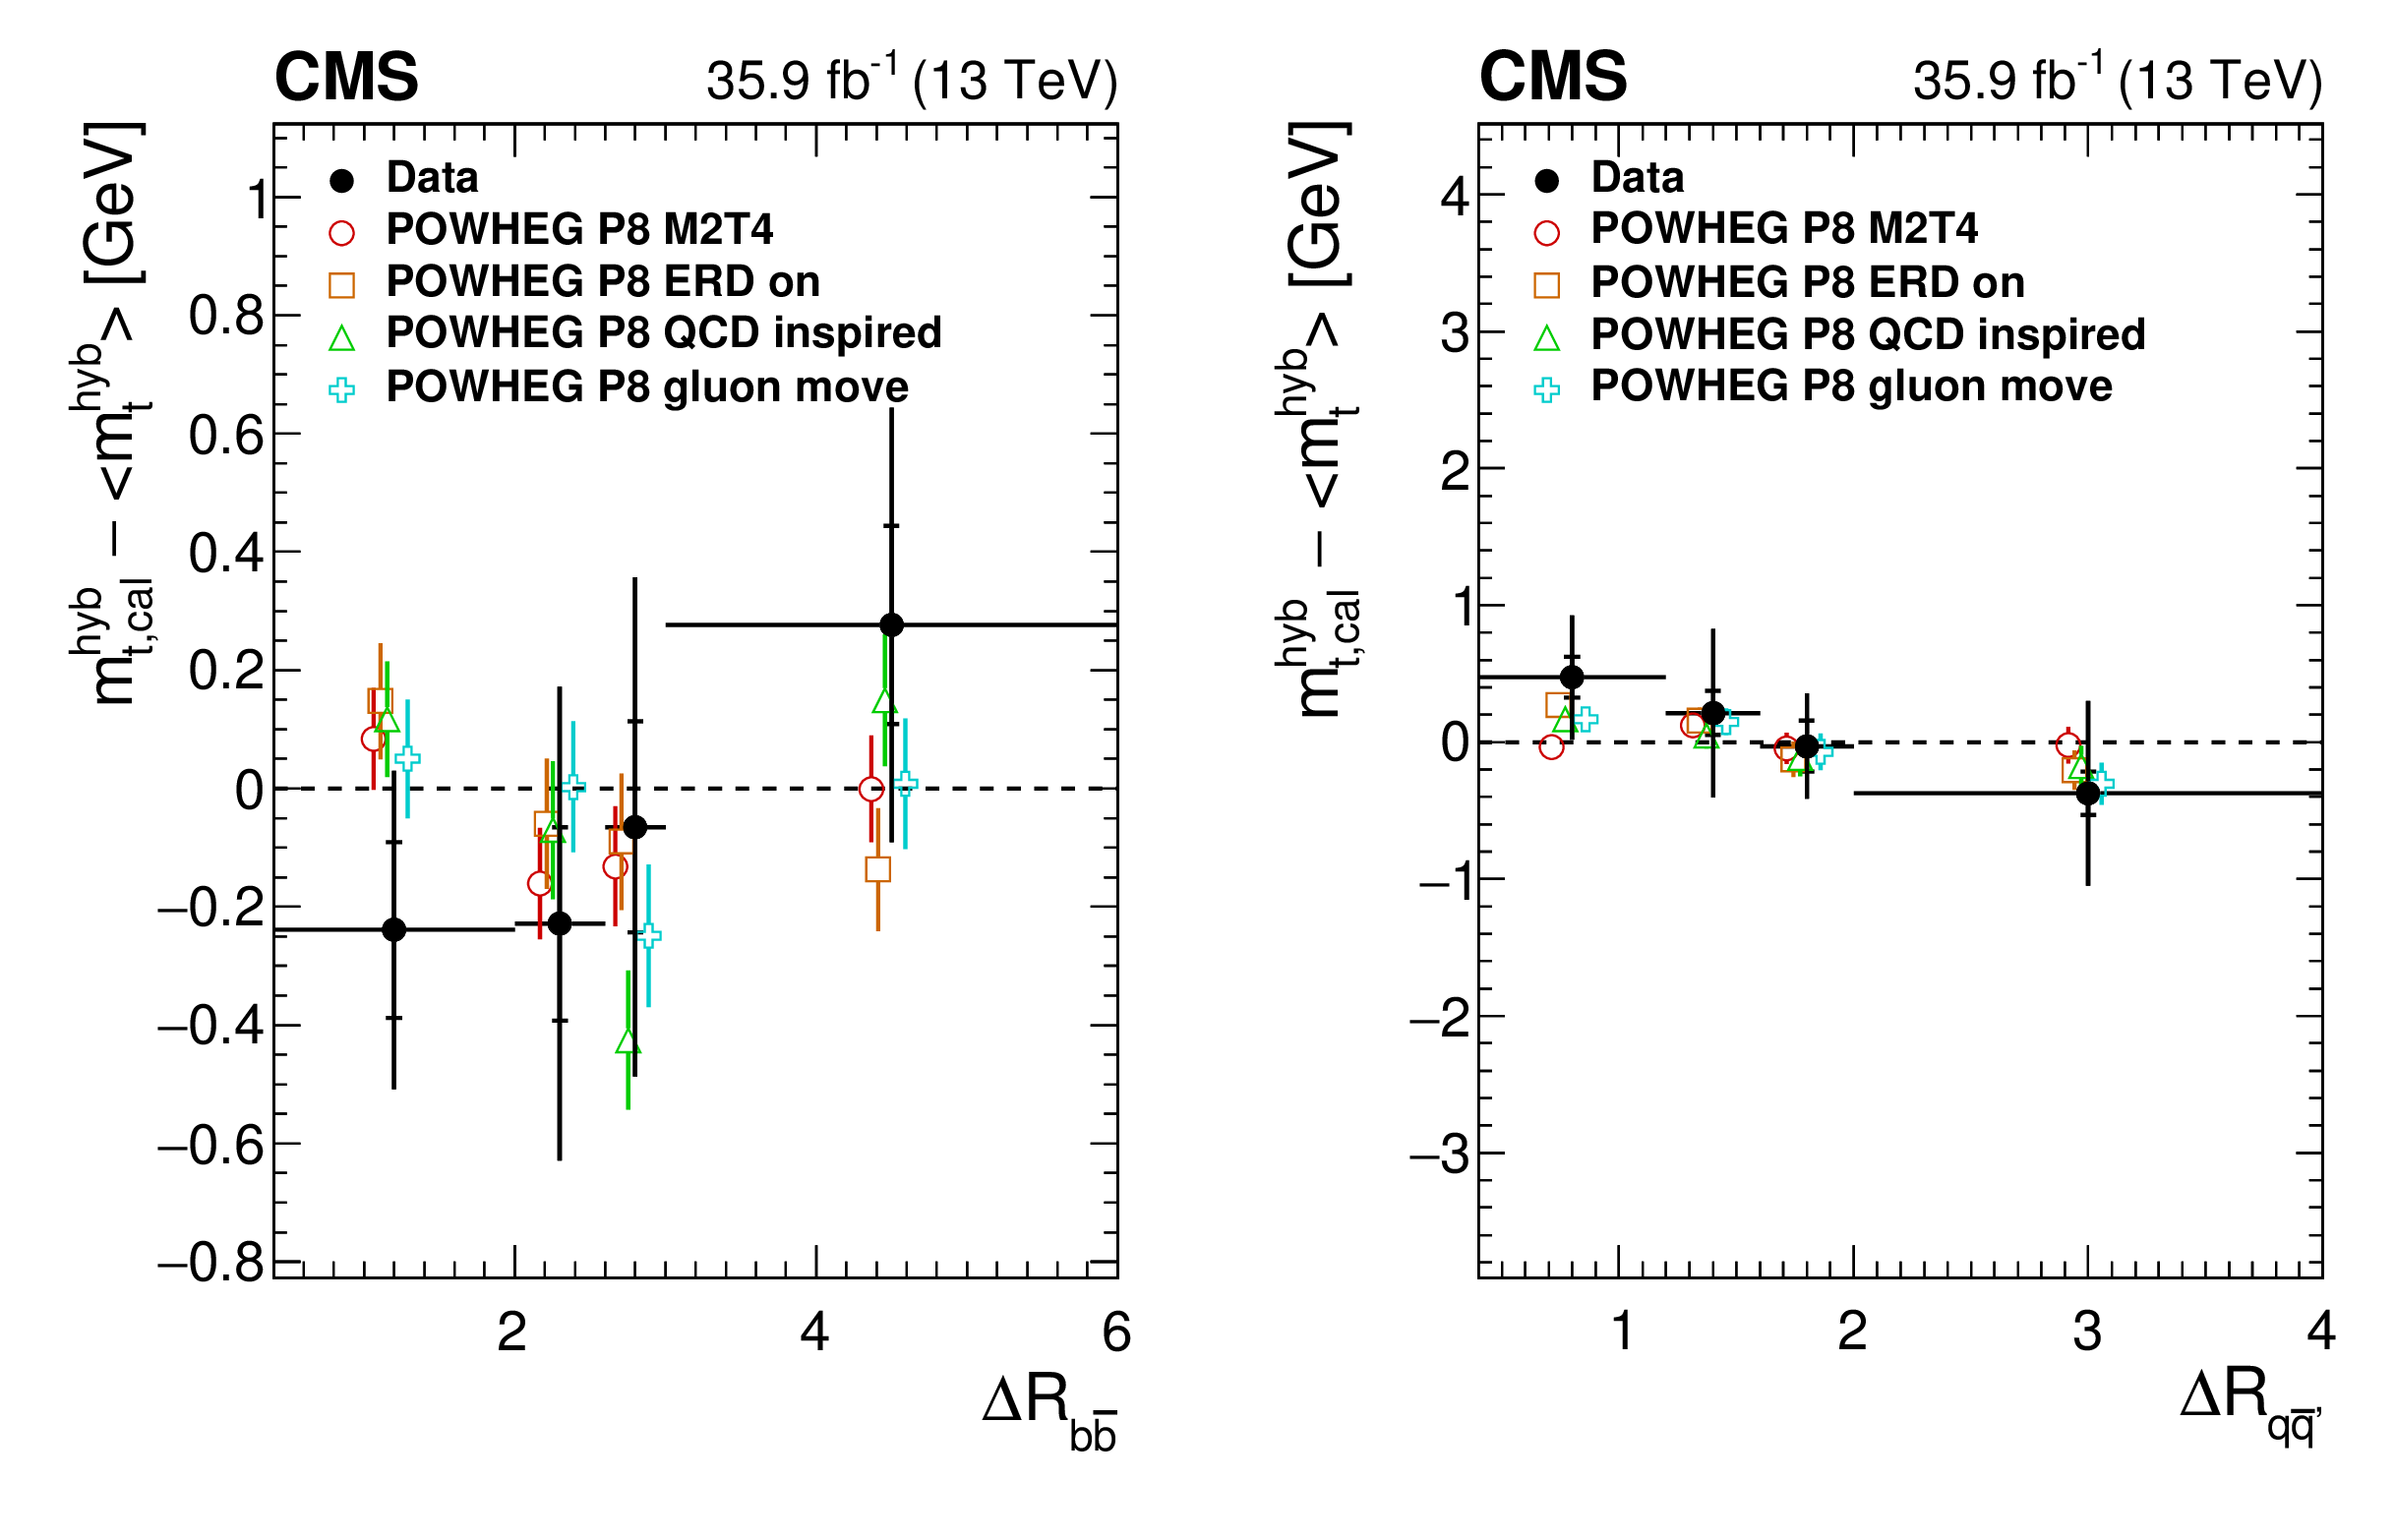
Measurements of $ {m_{{\mathrm {t}}}} $ as a function of the $\Delta R$ between the b jets $\Delta R_{{{\mathrm {b}} {\overline {\mathrm {b}}}}}$ (left) and the light-quark jets $\Delta R_{{{\mathrm {q}} {\overline {\mathrm {q}}} ^\prime}}$ (right) compared to alternative models of color reconnection. The symbols and conventions are the same as in Fig. 3. |
png pdf |
Figure 4-a:
Measurements of $ {m_{{\mathrm {t}}}} $ as a function of the $\Delta R$ between the b jets $\Delta R_{{{\mathrm {b}} {\overline {\mathrm {b}}}}}$ compared to alternative models of color reconnection. The symbols and conventions are the same as in Fig. 3. |
png pdf |
Figure 4-b:
Measurements of $ {m_{{\mathrm {t}}}} $ as a function of the light-quark jets $\Delta R_{{{\mathrm {q}} {\overline {\mathrm {q}}} ^\prime}}$ compared to alternative models of color reconnection. The symbols and conventions are the same as in Fig. 3. |
| Tables | |
png pdf |
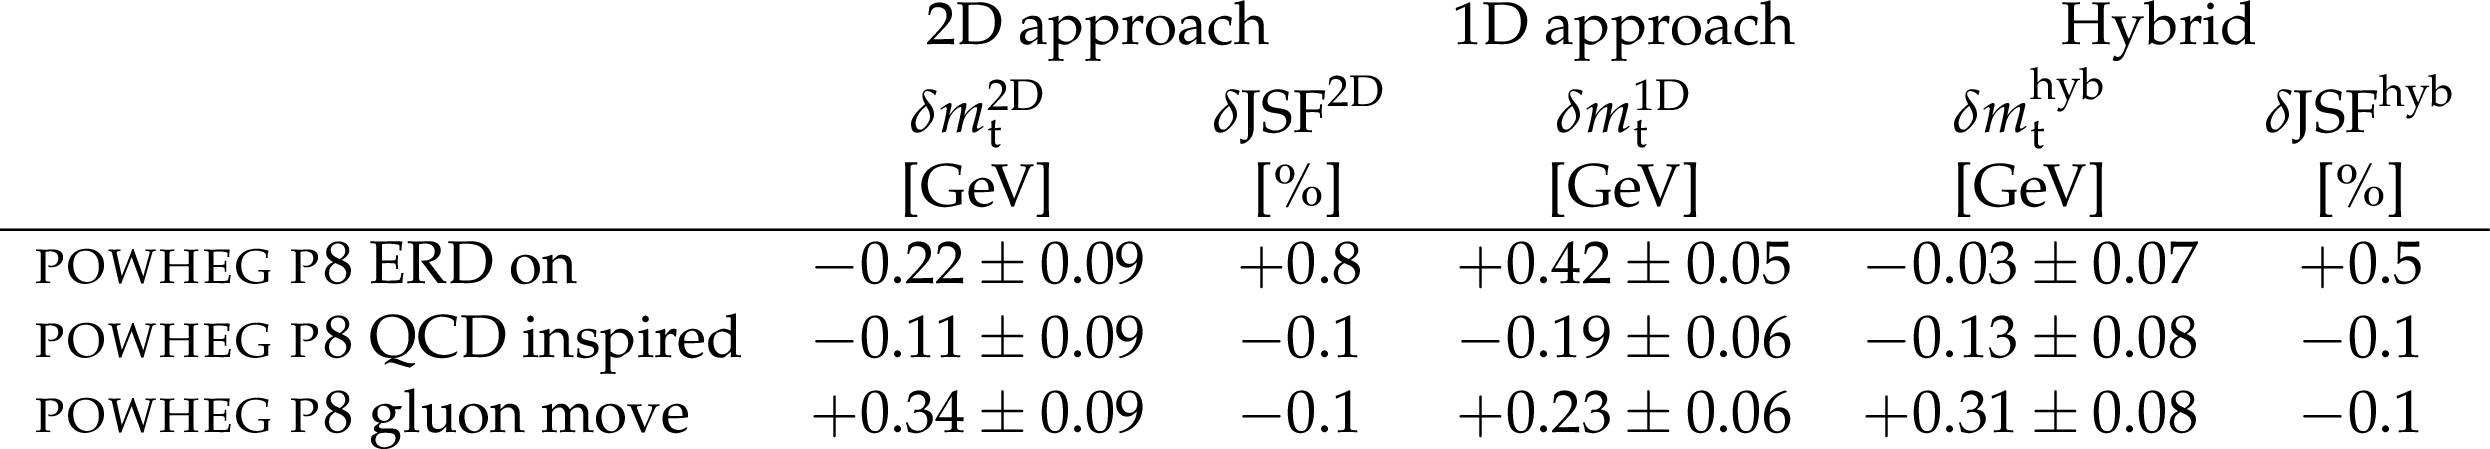
Table 1:
Observed shifts with respect to the default simulation for different models of color reconnection. The "QCD inspired'' and "gluon move'' models are compared to the default model with ERDs. The statistical uncertainty in the JSF shifts is 0.1%. |

png pdf |
Table 2:
Observed shifts with respect to the default simulation for different generator setups. The statistical uncertainty in the JSF shifts is 0.1%. |

png pdf |
Table 3:
List of systematic uncertainties for the fits to the combined data set using the procedures described in Section 5. With the exception of the flavor-dependent JEC terms, the total systematic uncertainty is obtained from the sum in quadrature of the individual systematic uncertainties. The values in parentheses with indented labels are already included in the preceding uncertainty source. A positive sign indicates an increase in the value of $ {m_{{\mathrm {t}}}} $ or the JSF in response to a $+1\sigma $ shift and a negative sign indicates a decrease. The statistical uncertainty in the shift in $ {m_{{\mathrm {t}}}} $ is given when different samples are compared. The statistical uncertainty in the JSF shifts is 0.1% for these sources. |
png pdf |
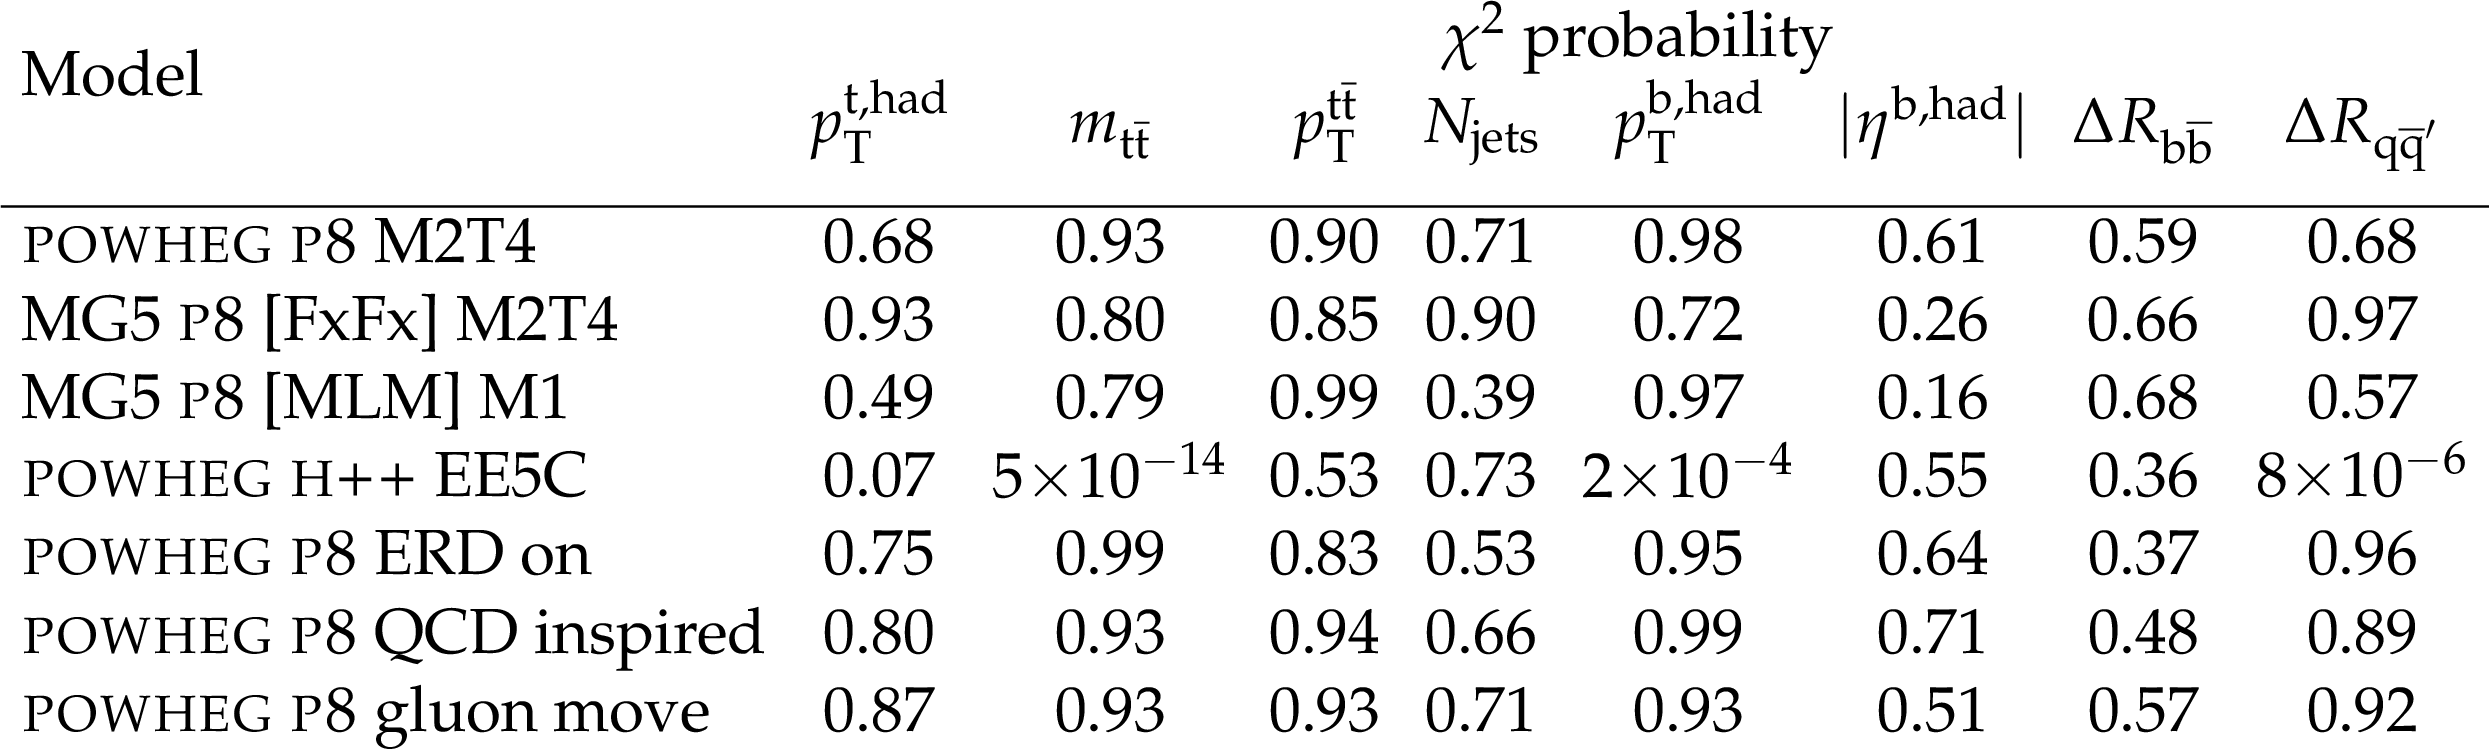
Table 4:
Compatibility of different models with the differential measurement of the top quark mass. For each variable and model, the probability of the cumulative $\chi ^2$ is computed. The setup with {powheg} v2 + {herwig++} does not use ME corrections to the top quark decay and shows large deviations from the data. |
| Summary |
| This study measured the mass of the top quark using the 2016 data at $\sqrt{s}=$ 13 TeV corresponding to an integrated luminosity of 35.9 fb$^{-1}$, and POWHEG v2 interfaced with PYTHIA 8 with the CUETP8M2T4 tune for the simulation. The top quark mass is measured to be 172.25 $\pm$ 0.08 (stat+JSF) $\pm$ 0.62 (syst) GeV from the selected lepton+jets events. The result is consistent with the CMS measurements of Run 1 of the LHC at $\sqrt{s}=$ 7 and 8 TeV, with no shift observed from the new experimental setup and the use of the next-to-leading-order matrix-element generator and the new parton-shower simulation and tune. Along with the new generator setup, a more advanced treatment of the modeling uncertainties with respect to the Run 1 analysis is employed. In particular, a broader set of color-reconnection models is considered. The top quark mass has also been studied as a function of the event-level kinematic properties, and no indications of a bias in the measurements are observed. |
| References | ||||
| 1 | M. Baak et al. | The global electroweak fit at NNLO and prospects for the LHC and ILC | EPJC 74 (2014) 3046 | 1407.3792 |
| 2 | G. Degrassi et al. | Higgs mass and vacuum stability in the Standard Model at NNLO | JHEP 08 (2012) 098 | 1205.6497 |
| 3 | Particle Data Group, C. Patrignani et al. | Review of particle physics | CPC 40 (2016) 100001 | |
| 4 | CDF and D0 Collaborations | Combination of CDF and D0 results on the mass of the top quark using up to $ 9.7\:{\rm fb}^{-1} $ at the Tevatron | 1608.01881 | |
| 5 | ATLAS Collaboration | Measurement of the top quark mass in the $ \mathrm{t\bar{t}}\to $ dilepton channel from $ \sqrt{s}= $ 8 TeV ATLAS data | PLB 761 (2016) 350 | 1606.02179 |
| 6 | CMS Collaboration | Measurement of the top quark mass using proton-proton data at $ {\sqrt{s}} = $ 7 and 8 TeV | PRD 93 (2016) 072004 | CMS-TOP-14-022 1509.04044 |
| 7 | S. Moch et al. | High precision fundamental constants at the TeV scale | 1405.4781 | |
| 8 | P. Marquard, A. V. Smirnov, V. A. Smirnov, and M. Steinhauser | Quark mass relations to four-loop order in perturbative QCD | PRL 114 (2015) 142002 | 1502.01030 |
| 9 | M. Beneke, P. Marquard, P. Nason, and M. Steinhauser | On the ultimate uncertainty of the top quark pole mass | PLB 775 (2017) 63 | 1605.03609 |
| 10 | M. Butenschoen et al. | Top quark mass calibration for Monte Carlo event generators | PRL 117 (2016) 232001 | 1608.01318 |
| 11 | P. Nason | The top quark mass at the LHC | in 10th International Workshop on Top Quark Physics (TOP2017) Braga, Portugal, September 17-22, 2017 2018 | 1801.04826 |
| 12 | CMS Collaboration | The CMS experiment at the CERN LHC | JINST 3 (2008) S08004 | CMS-00-001 |
| 13 | CMS Collaboration | Particle-flow reconstruction and global event description with the CMS detector | JINST 12 (2017) P10003 | CMS-PRF-14-001 1706.04965 |
| 14 | M. Cacciari and G. P. Salam | Dispelling the $ N^{3} $ myth for the $ k_{\rm t} $ jet-finder | PLB 641 (2006) 57 | hep-ph/0512210 |
| 15 | M. Cacciari, G. P. Salam, and G. Soyez | The anti-$ k_{\rm t} $ jet clustering algorithm | JHEP 04 (2008) 063 | 0802.1189 |
| 16 | M. Cacciari, G. P. Salam, and G. Soyez | FastJet user manual | EPJC 72 (2012) 1896 | 1111.6097 |
| 17 | M. Cacciari and G. P. Salam | Pileup subtraction using jet areas | PLB 659 (2008) 119 | 0707.1378 |
| 18 | CMS Collaboration | Jet energy scale and resolution in the CMS experiment in pp collisions at 8 TeV | JINST 12 (2017) P02014 | CMS-JME-13-004 1607.03663 |
| 19 | CMS Collaboration | Jet algorithms performance in 13 TeV data | CMS-PAS-JME-16-003 | CMS-PAS-JME-16-003 |
| 20 | CMS Collaboration | CMS luminosity measurements for the 2016 data taking period | CMS-PAS-LUM-17-001 | CMS-PAS-LUM-17-001 |
| 21 | P. Nason | A new method for combining NLO QCD with shower Monte Carlo algorithms | JHEP 11 (2004) 040 | hep-ph/0409146 |
| 22 | S. Frixione, P. Nason, and C. Oleari | Matching NLO QCD computations with parton shower simulations: the POWHEG method | JHEP 11 (2007) 070 | 0709.2092 |
| 23 | S. Alioli, P. Nason, C. Oleari, and E. Re | A general framework for implementing NLO calculations in shower Monte Carlo programs: the POWHEG BOX | JHEP 06 (2010) 043 | 1002.2581 |
| 24 | J. M. Campbell, R. K. Ellis, P. Nason, and E. Re | Top-pair production and decay at NLO matched with parton showers | JHEP 04 (2015) 114 | 1412.1828 |
| 25 | T. Sjostrand, S. Mrenna, and P. Skands | A brief introduction to PYTHIA 8.1 | CPC 178 (2008) 852 | 0710.3820 |
| 26 | P. Skands, S. Carrazza, and J. Rojo | Tuning PYTHIA 8.1: the Monash 2013 tune | EPJC 74 (2014) 3024 | 1404.5630 |
| 27 | CMS Collaboration | Investigations of the impact of the parton shower tuning in PYTHIA 8 in the modelling of $ \mathrm{t\overline{t}} $ at $ \sqrt{s}= $ 8 and 13 TeV | CMS-PAS-TOP-16-021 | CMS-PAS-TOP-16-021 |
| 28 | S. Alioli, P. Nason, C. Oleari, and E. Re | NLO single-top production matched with shower in $ POWHEG: s $- and $ t $-channel contributions | JHEP 09 (2009) 111 | 0907.4076 |
| 29 | E. Re | Single-top Wt-channel production matched with parton showers using the POWHEG method | EPJC 71 (2011) 1547 | 1009.2450 |
| 30 | J. Alwall et al. | The automated computation of tree-level and next-to-leading order differential cross sections, and their matching to parton shower simulations | JHEP 07 (2014) 079 | 1405.0301 |
| 31 | J. Alwall et al. | Comparative study of various algorithms for the merging of parton showers and matrix elements in hadronic collisions | EPJC 53 (2008) 473 | 0706.2569 |
| 32 | R. Frederix and S. Frixione | Merging meets matching in MC@NLO | JHEP 12 (2012) 061 | 1209.6215 |
| 33 | NNPDF Collaboration | Parton distributions for the LHC Run II | JHEP 04 (2015) 040 | 1410.8849 |
| 34 | M. Czakon and A. Mitov | Top++: A program for the calculation of the top-pair cross-section at hadron colliders | CPC 185 (2014) 2930 | 1112.5675 |
| 35 | Y. Li and F. Petriello | Combining QCD and electroweak corrections to dilepton production in FEWZ | PRD 86 (2012) 094034 | 1208.5967 |
| 36 | P. Kant et al. | HatHor for single top-quark production: Updated predictions and uncertainty estimates for single top-quark production in hadronic collisions | CPC 191 (2015) 74 | 1406.4403 |
| 37 | N. Kidonakis | NNLL threshold resummation for top-pair and single-top production | Phys. Part. Nucl. 45 (2014) 714 | 1210.7813 |
| 38 | GEANT4 Collaboration | GEANT4---a simulation toolkit | NIMA 506 (2003) 250 | |
| 39 | CMS Collaboration | Performance of CMS muon reconstruction in pp collision events at $ \sqrt{s} = $ 7 TeV | JINST 7 (2012) P10002 | CMS-MUO-10-004 1206.4071 |
| 40 | CMS Collaboration | Performance of electron reconstruction and selection with the CMS detector in proton-proton collisions at $ \sqrt{s}= $ 8 TeV | JINST 10 (2015) P06005 | CMS-EGM-13-001 1502.02701 |
| 41 | CMS Collaboration | Identification of heavy-flavour jets with the CMS detector in pp collisions at 13 TeV | Submitted to \it JINST | CMS-BTV-16-002 1712.07158 |
| 42 | D0 Collaboration | Direct measurement of the top quark mass at D0 | PRD 58 (1998) 052001 | hep-ex/9801025 |
| 43 | DELPHI Collaboration | Measurement of the mass and width of the W boson in $ {\rm e}^{+}{\rm e}^{-} $ collisions at $ \sqrt{s} = $ 161 -- 209 GeV | EPJC 55 (2008) 1 | 0803.2534 |
| 44 | CMS Collaboration | Measurement of the top-quark mass in $ \mathrm{t\bar{t}} $ events with lepton+jets final states in pp collisions at $ \sqrt{s}= $ 7 TeV | JHEP 12 (2012) 105 | CMS-TOP-11-015 1209.2319 |
| 45 | S. Argyropoulos and T. Sjostrand | Effects of color reconnection on $ \mathrm{t\bar{t}} $ final states at the LHC | JHEP 11 (2014) 043 | 1407.6653 |
| 46 | J. R. Christiansen and P. Skands | String formation beyond leading colour | JHEP 08 (2015) 003 | 1505.01681 |
| 47 | ATLAS and CMS Collaborations | Jet energy scale uncertainty correlations between ATLAS and CMS at 8 TeV | ATL-PHYS-PUB-2015-049, CMS-PAS-JME-15-001 | |
| 48 | CMS Collaboration | Measurement of the $ t $-channel single-top-quark production cross section and of the $ \mid V_{tb} \mid $ CKM matrix element in pp collisions at $ \sqrt{s} = $ 8 TeV | JHEP 06 (2014) 090 | CMS-TOP-12-038 1403.7366 |
| 49 | CMS Collaboration | Cross section measurement of $ t $-channel single top quark production in pp collisions at $ \sqrt s = $ 13 TeV | PLB 772 (2017) 752 | CMS-TOP-16-003 1610.00678 |
| 50 | CMS Collaboration | Measurement of the production cross section of a W boson in association with two b jets in pp collisions at $ \sqrt{s} = $ 8 TeV | Eur. Phys. J C. 77 (2017) 92 | CMS-SMP-14-020 1608.07561 |
| 51 | CMS Collaboration | Measurements of the associated production of a Z boson and b jets in pp collisions at $ {\sqrt{s}} = $ 8 TeV | EPJC 77 (2017) 751 | CMS-SMP-14-010 1611.06507 |
| 52 | CMS Collaboration | Measurement of the WZ production cross section in pp collisions at $ \sqrt{s} = $ 13 TeV | PLB 766 (2017) 268 | CMS-SMP-16-002 1607.06943 |
| 53 | CMS Collaboration | Measurements of the $ \mathrm {p}\mathrm {p}\rightarrow \mathrm{Z}\mathrm{Z} $ production cross section and the $ \mathrm{Z}\rightarrow 4\ell $ branching fraction, and constraints on anomalous triple gauge couplings at $ \sqrt{s} = $ 13 TeV | EPJC 78 (2018) 165 | CMS-SMP-16-017 1709.08601 |
| 54 | T. Sjostrand, S. Mrenna, and P. Skands | PYTHIA 6.4 physics and manual | JHEP 05 (2006) 026 | hep-ph/0603175 |
| 55 | M. Bahr et al. | Herwig++ physics and manual | EPJC 58 (2008) 639 | 0803.0883 |
| 56 | ALEPH Collaboration | Study of the fragmentation of b quarks into B mesons at the Z peak | PLB 512 (2001) 30 | hep-ex/0106051 |
| 57 | DELPHI Collaboration | A study of the b-quark fragmentation function with the DELPHI detector at LEP I and an averaged distribution obtained at the Z pole | EPJC 71 (2011) 1557 | 1102.4748 |
| 58 | M. G. Bowler | $ {\rm e}^{+}{\rm e}^{-} $ Production of heavy quarks in the string model | Z. Phys. 11 (1981) 169 | |
| 59 | C. Peterson, D. Schlatter, I. Schmitt, and P. M. Zerwas | Scaling violations in inclusive $ {\rm e}^{+}{\rm e}^{-} $ annihilation spectra | PRD 27 (1983) 105 | |
| 60 | J. Rojo et al. | The PDF4LHC report on PDFs and LHC data: Results from Run I and preparation for Run II | JPG 42 (2015) 103103 | 1507.00556 |
| 61 | J. Butterworth et al. | PDF4LHC recommendations for LHC Run II | JPG 43 (2016) 023001 | 1510.03865 |
| 62 | A. Accardi et al. | A critical appraisal and evaluation of modern PDFs | EPJC 76 (2016) 471 | 1603.08906 |
| 63 | M. Czakon, D. Heymes, and A. Mitov | High-precision differential predictions for top-quark pairs at the LHC | PRL 116 (2016) 082003 | 1511.00549 |
| 64 | CMS Collaboration | Measurement of differential cross sections for top quark pair production using the lepton+jets final state in proton-proton collisions at 13 TeV | PRD 95 (2017) 092001 | CMS-TOP-16-008 1610.04191 |
| 65 | CMS Collaboration | Measurement of normalized differential $ \mathrm{t\bar{t}} $ cross sections in the dilepton channel from pp collisions at $ \sqrt{s} = $ 13 TeV | Submitted to JHEP | CMS-TOP-16-007 1708.07638 |
| 66 | M. H. Seymour and A. Siodmok | Constraining MPI models using $ \sigma_{eff} $ and recent Tevatron and LHC underlying event data | JHEP 10 (2013) 113 | 1307.5015 |
| 67 | CMS Collaboration | Measurement of differential cross sections for the production of top quark pairs and of additional jets in lepton+jets events from pp collisions at $ \sqrt{s} = $ 13 TeV | Submitted to \it PRD | CMS-TOP-17-002 1803.08856 |
| 68 | J. Alwall et al. | MadGraph 5: going beyond | JHEP 06 (2011) 128 | 1106.0522 |
| 69 | R. Field | Early LHC underlying event data---findings and surprises | 1010.3558 | |
|
|
Compact Muon Solenoid LHC, CERN |
|

|

|

|

|

|