

Compact Muon Solenoid
LHC, CERN
| CMS-TOP-17-002 ; CERN-EP-2018-039 | ||
| Measurement of differential cross sections for the production of top quark pairs and of additional jets in lepton+jets events from pp collisions at $\sqrt{s} = $ 13 TeV | ||
| CMS Collaboration | ||
| 23 March 2018 | ||
| Phys. Rev. D 97 (2018) 112003 | ||
| Abstract: Differential and double-differential cross sections for the production of top quark pairs in proton-proton collisions at $\sqrt{s} = $ 13 TeV are measured as a function of kinematic variables of the top quarks and the top quark-antiquark ($ \mathrm{t\bar{t}} $) system. In addition, kinematic variables and multiplicities of jets associated with the $ \mathrm{t\bar{t}} $ production are measured. This analysis is based on data collected by the CMS experiment at the LHC in 2016 corresponding to an integrated luminosity of 35.8 fb$^{-1}$. The measurements are performed in the lepton+jets decay channels with a single muon or electron and jets in the final state. The differential cross sections are presented at the particle level, within a phase space close to the experimental acceptance, and at the parton level in the full phase space. The results are compared to several standard model predictions that use different methods and approximations. The kinematic variables of the top quarks and the $ \mathrm{t\bar{t}} $ system are reasonably described in general, though none predict all the measured distributions. In particular, the transverse momentum distribution of the top quarks is more steeply falling than predicted. The kinematic distributions and multiplicities of jets are adequately modeled by certain combinations of next-to-leading-order calculations and parton shower models. | ||
| Links: e-print arXiv:1803.08856 [hep-ex] (PDF) ; CDS record ; inSPIRE record ; HepData record ; CADI line (restricted) ; | ||
| Figures & Tables | Summary | Additional Figures | References | CMS Publications |
|---|
| Figures | |
png pdf |
Figure 1:
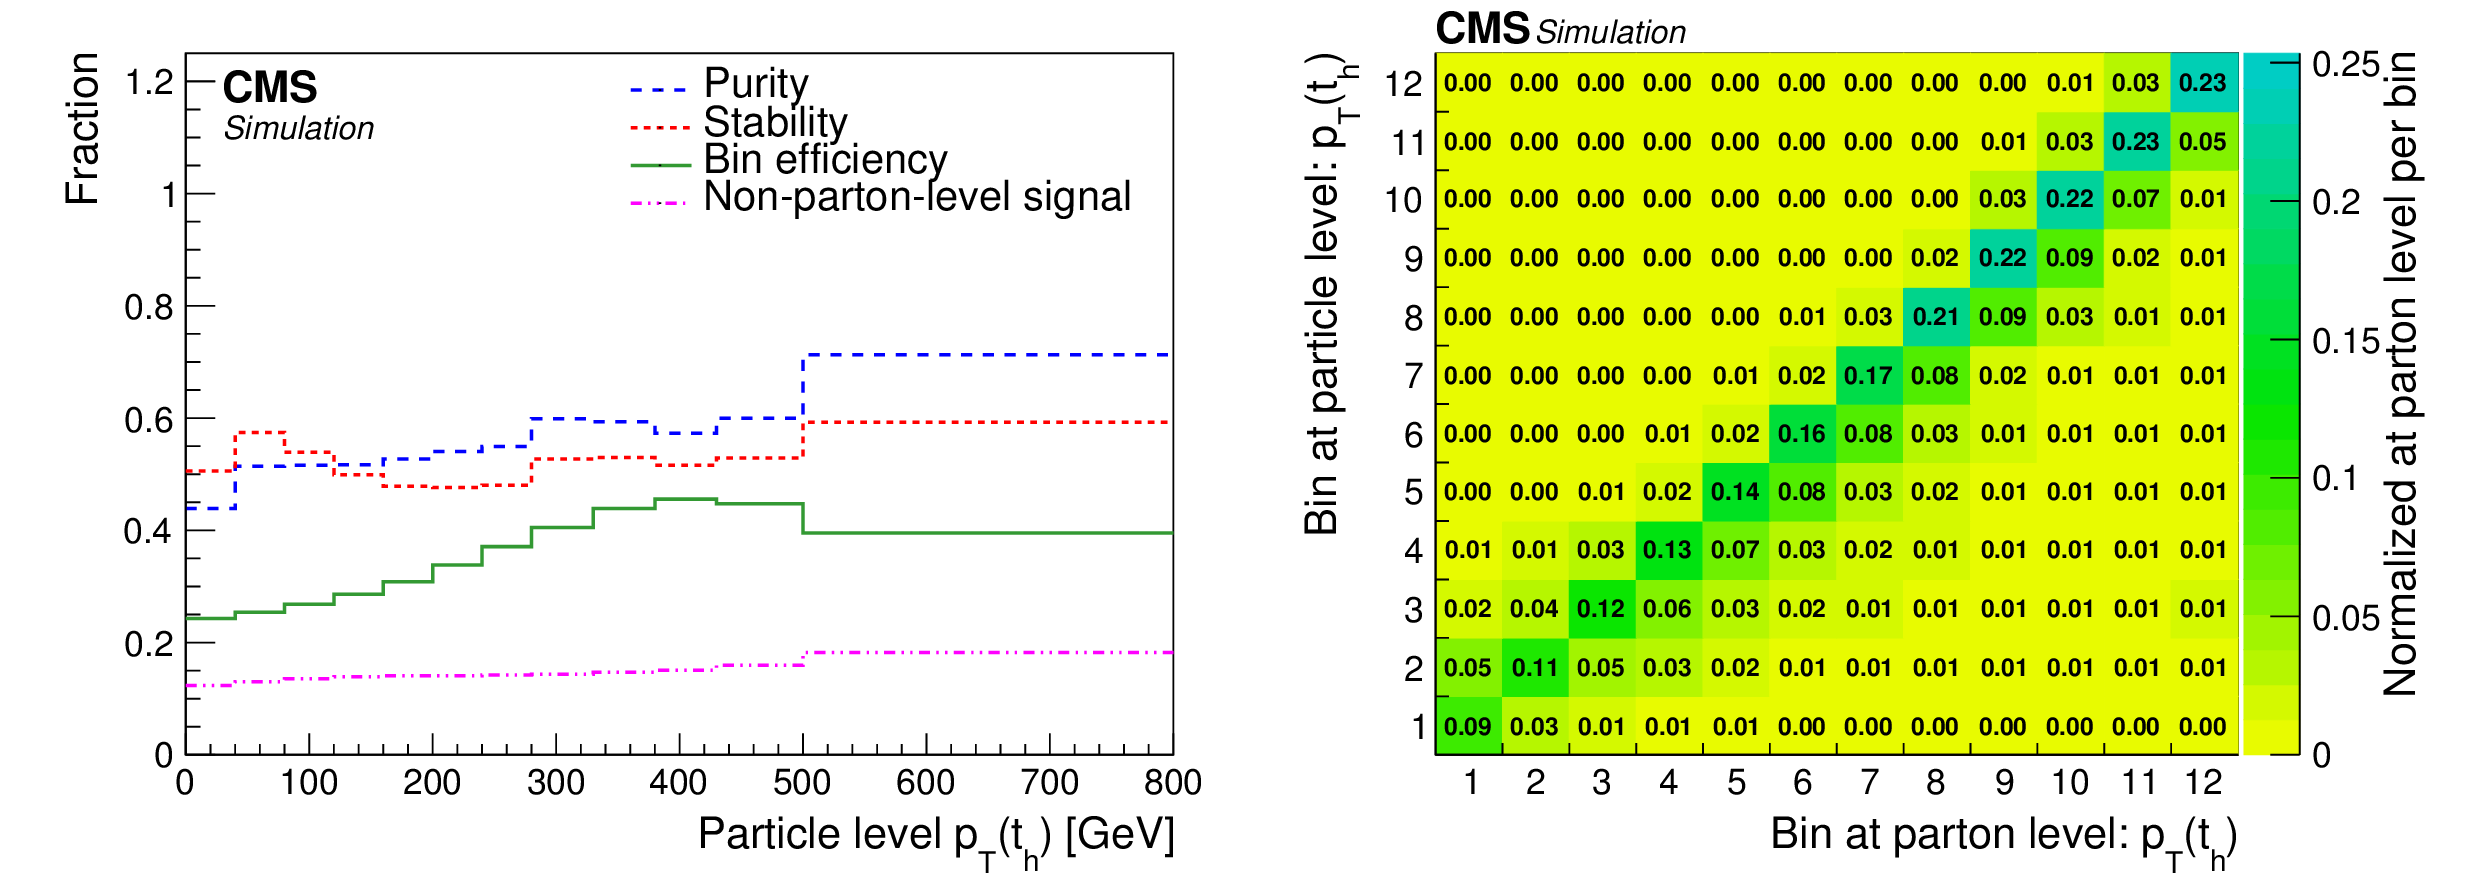
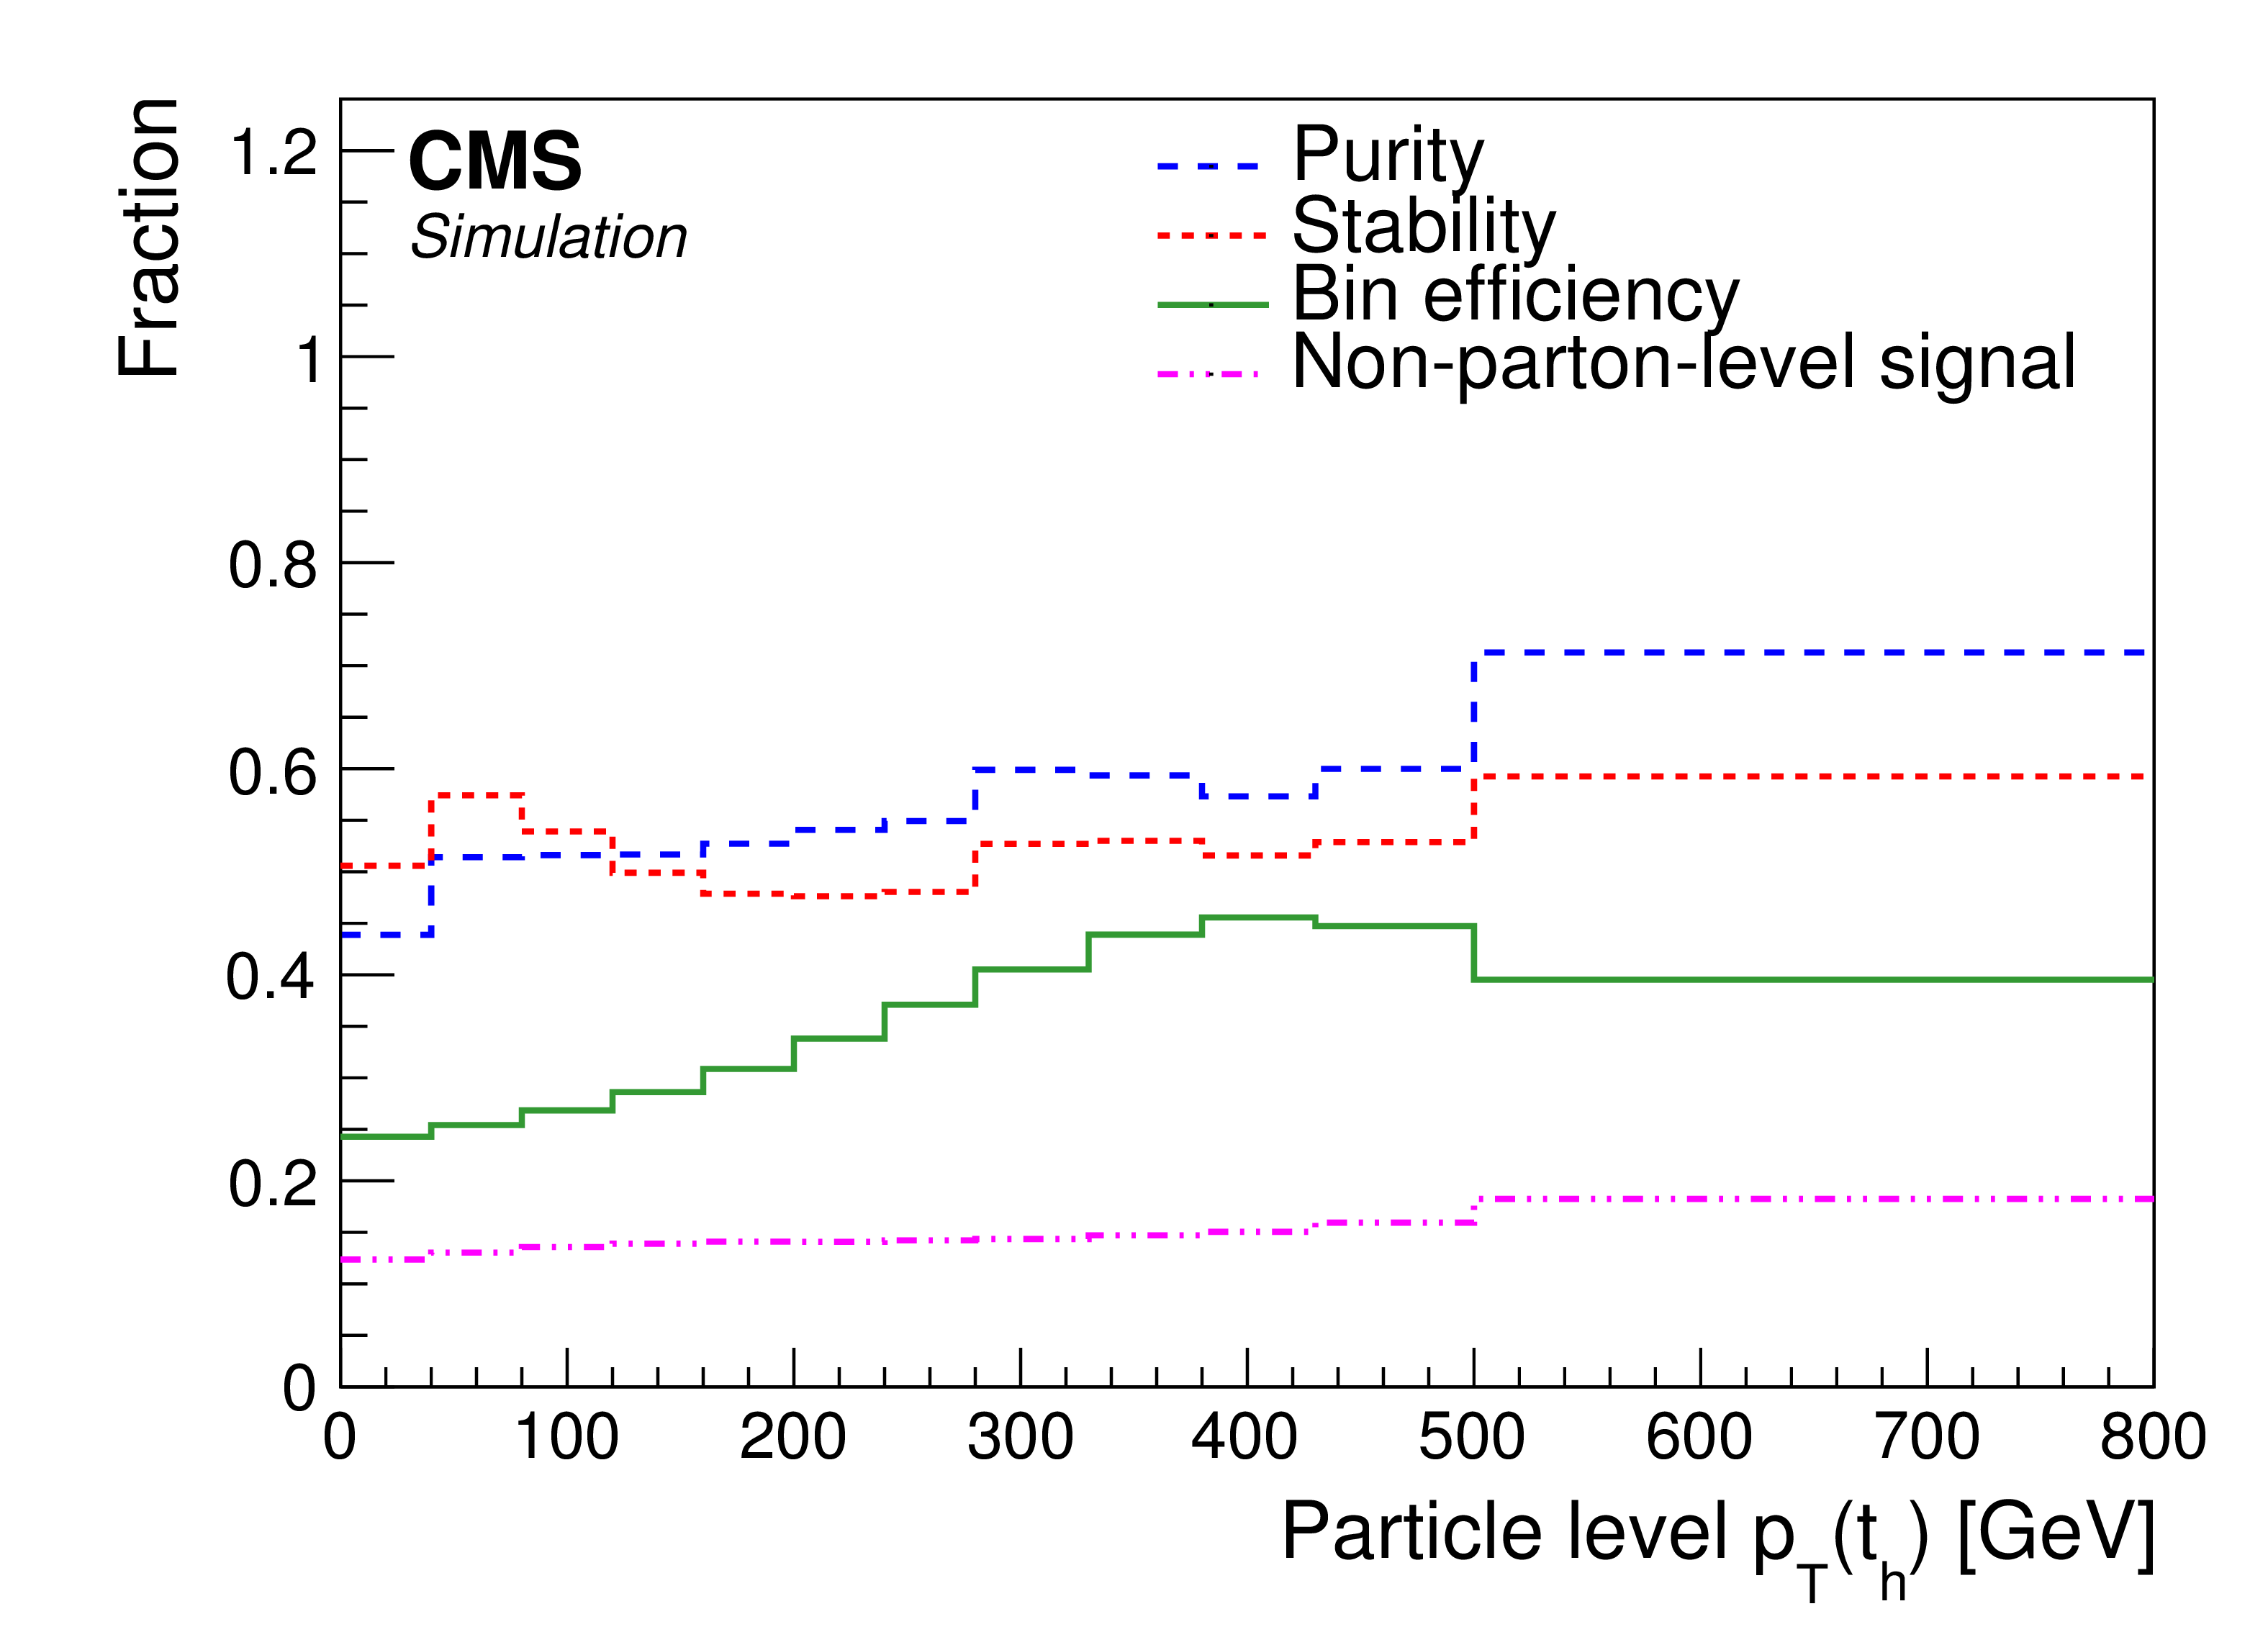
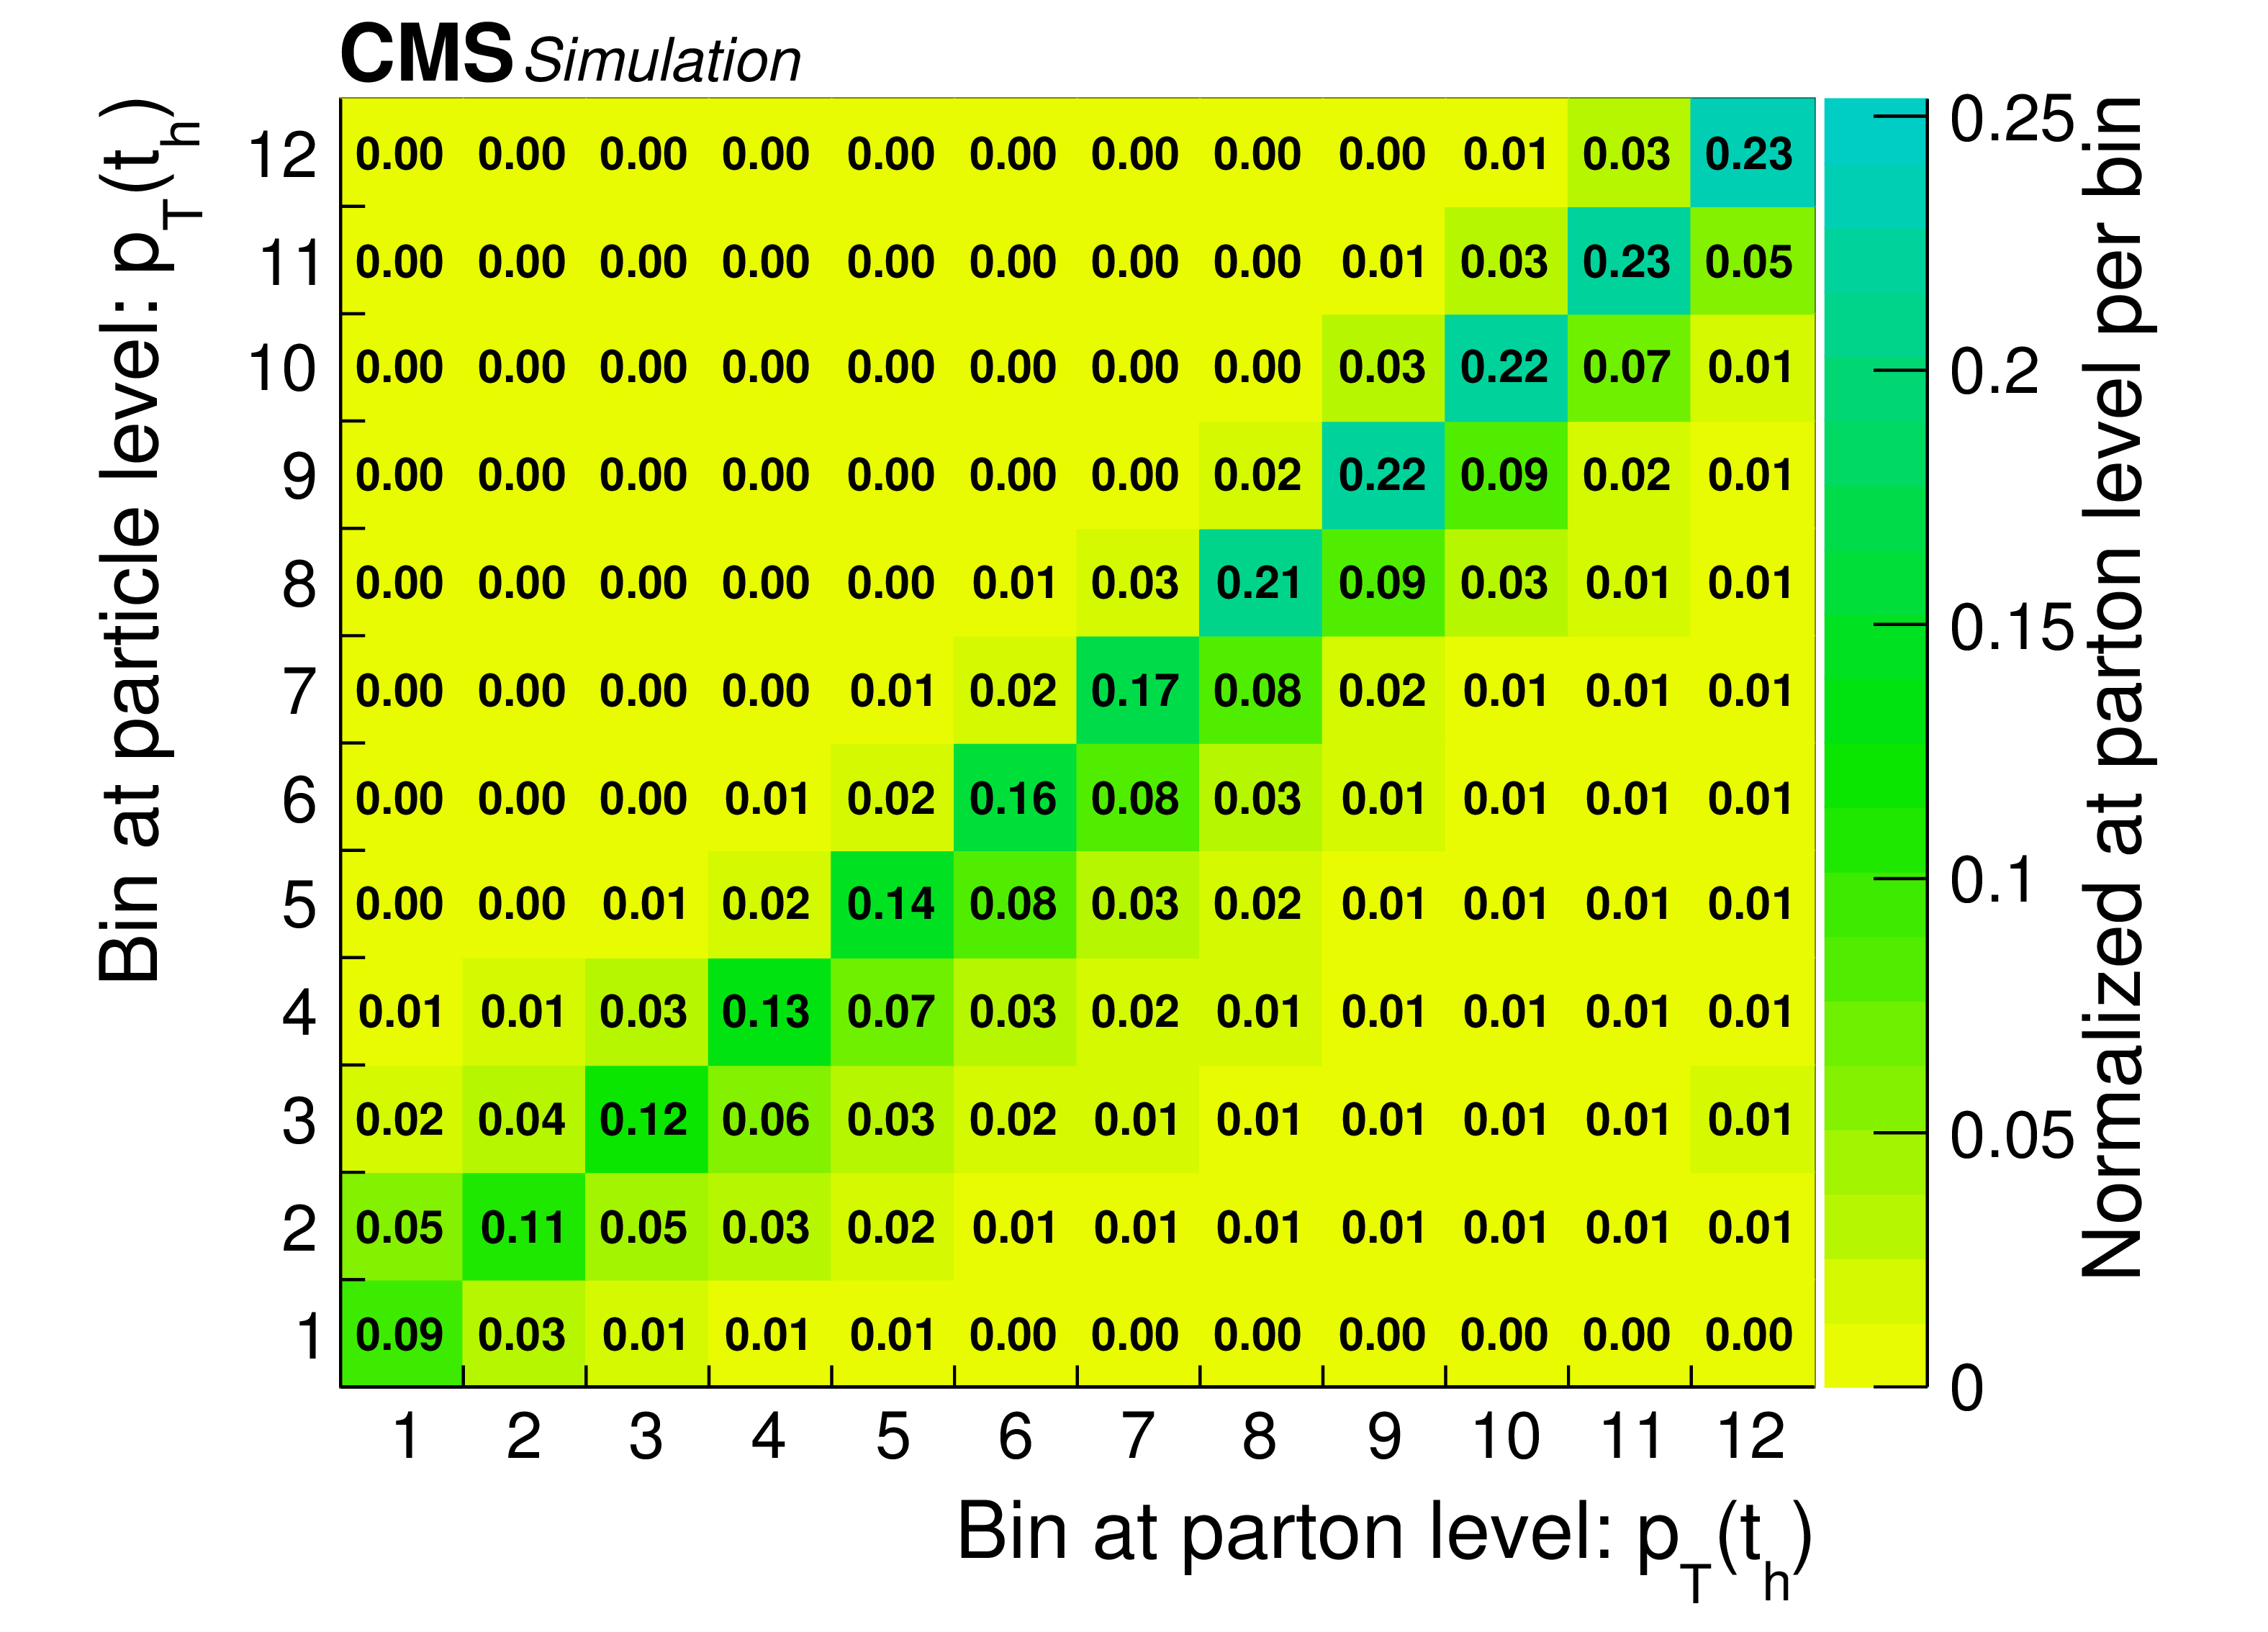
Comparison between the $ {p_{\mathrm {T}}} ({\mathrm{t} _\mathrm {h}})$ distributions at the particle and parton level, extracted from the POWHEG+PYTHIA8 simulation. Left : fraction of parton-level top quarks in the same $ {p_{\mathrm {T}}} $ bin at the particle level (purity), fraction of particle-level top quarks in the same $ {p_{\mathrm {T}}} $ bin at the parton level (stability), ratio of the number of particle- to parton-level top quarks (bin efficiency), and fraction of events with a particle-level top quark pair that are not considered as signal events at the parton level (non-parton-level signal). Right : $ {p_{\mathrm {T}}} $-bin migrations between particle and parton level. The $ {p_{\mathrm {T}}} $ range of the bins can be taken from the left panel. Each column is normalized such that the sum of its entries corresponds to the fraction of particle-level events in this bin at the parton level in the full phase space. |
png pdf |
Figure 1-a:
Comparison between the $ {p_{\mathrm {T}}} ({\mathrm{t} _\mathrm {h}})$ distributions at the particle and parton level, extracted from the POWHEG+PYTHIA8 simulation. Left : fraction of parton-level top quarks in the same $ {p_{\mathrm {T}}} $ bin at the particle level (purity), fraction of particle-level top quarks in the same $ {p_{\mathrm {T}}} $ bin at the parton level (stability), ratio of the number of particle- to parton-level top quarks (bin efficiency), and fraction of events with a particle-level top quark pair that are not considered as signal events at the parton level (non-parton-level signal). Right : $ {p_{\mathrm {T}}} $-bin migrations between particle and parton level. The $ {p_{\mathrm {T}}} $ range of the bins can be taken from the left panel. Each column is normalized such that the sum of its entries corresponds to the fraction of particle-level events in this bin at the parton level in the full phase space. |
png pdf |
Figure 1-b:
Comparison between the $ {p_{\mathrm {T}}} ({\mathrm{t} _\mathrm {h}})$ distributions at the particle and parton level, extracted from the POWHEG+PYTHIA8 simulation. Left : fraction of parton-level top quarks in the same $ {p_{\mathrm {T}}} $ bin at the particle level (purity), fraction of particle-level top quarks in the same $ {p_{\mathrm {T}}} $ bin at the parton level (stability), ratio of the number of particle- to parton-level top quarks (bin efficiency), and fraction of events with a particle-level top quark pair that are not considered as signal events at the parton level (non-parton-level signal). Right : $ {p_{\mathrm {T}}} $-bin migrations between particle and parton level. The $ {p_{\mathrm {T}}} $ range of the bins can be taken from the left panel. Each column is normalized such that the sum of its entries corresponds to the fraction of particle-level events in this bin at the parton level in the full phase space. |
png pdf |
Figure 2:
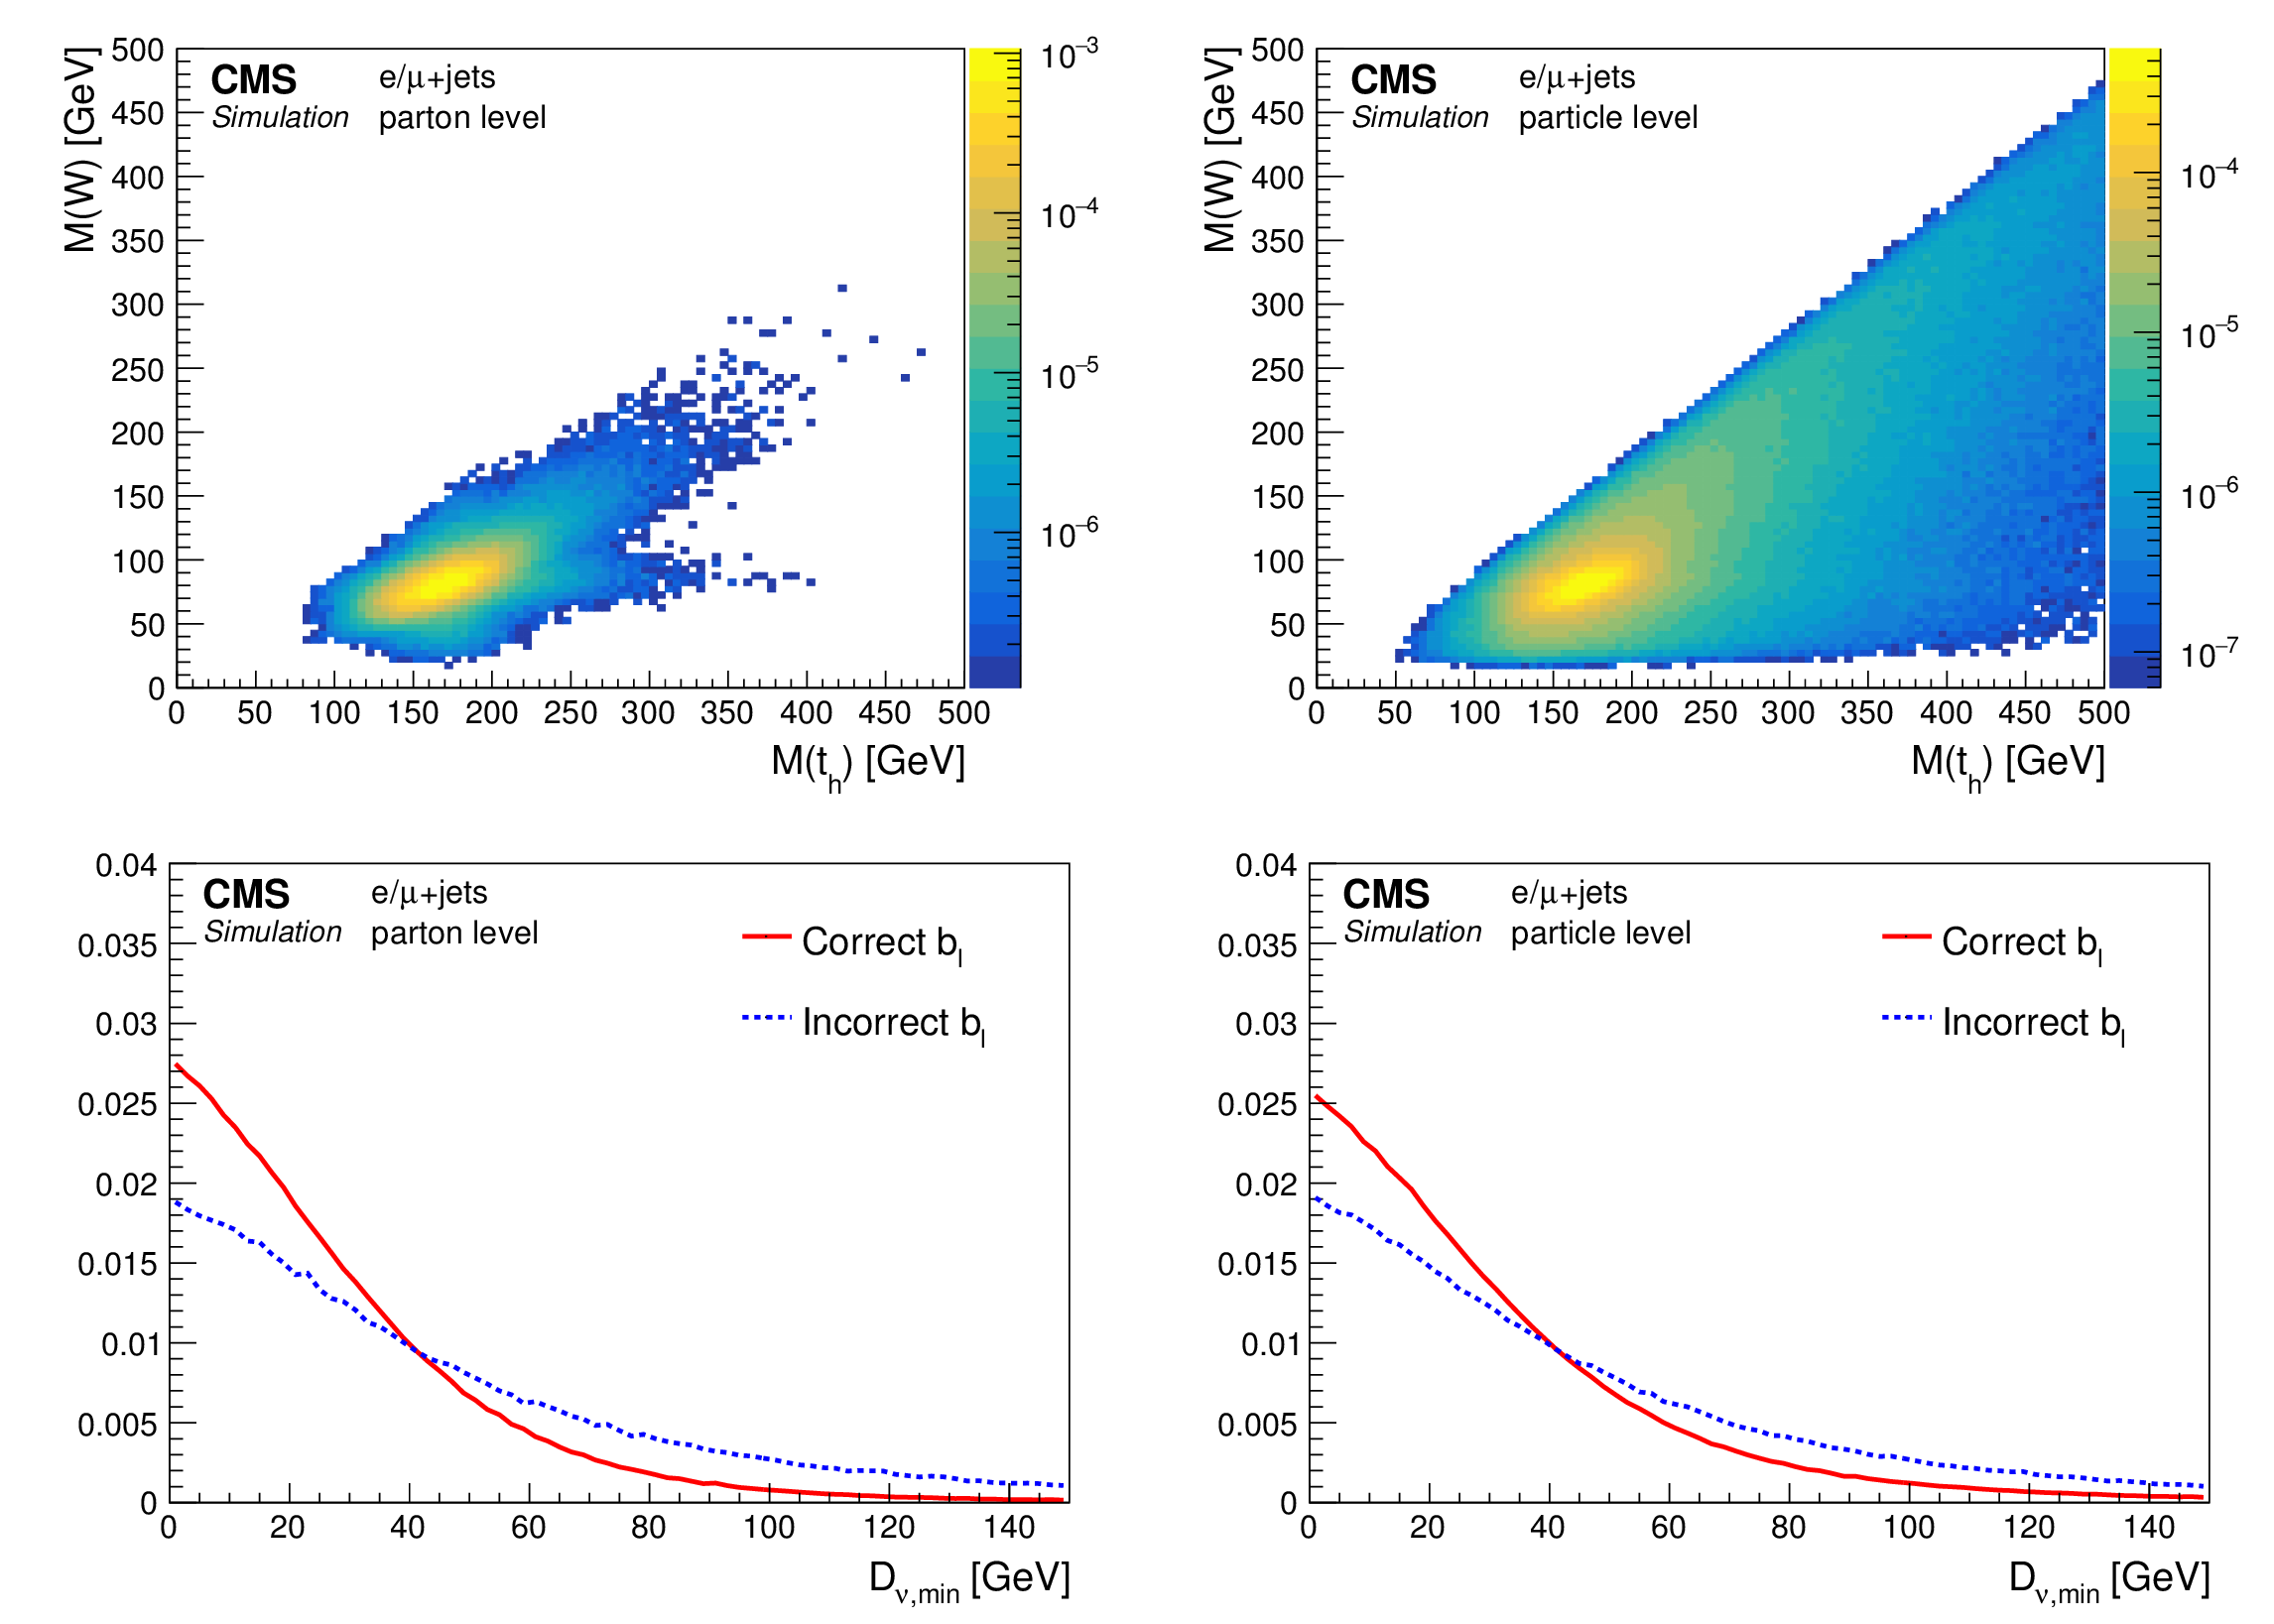
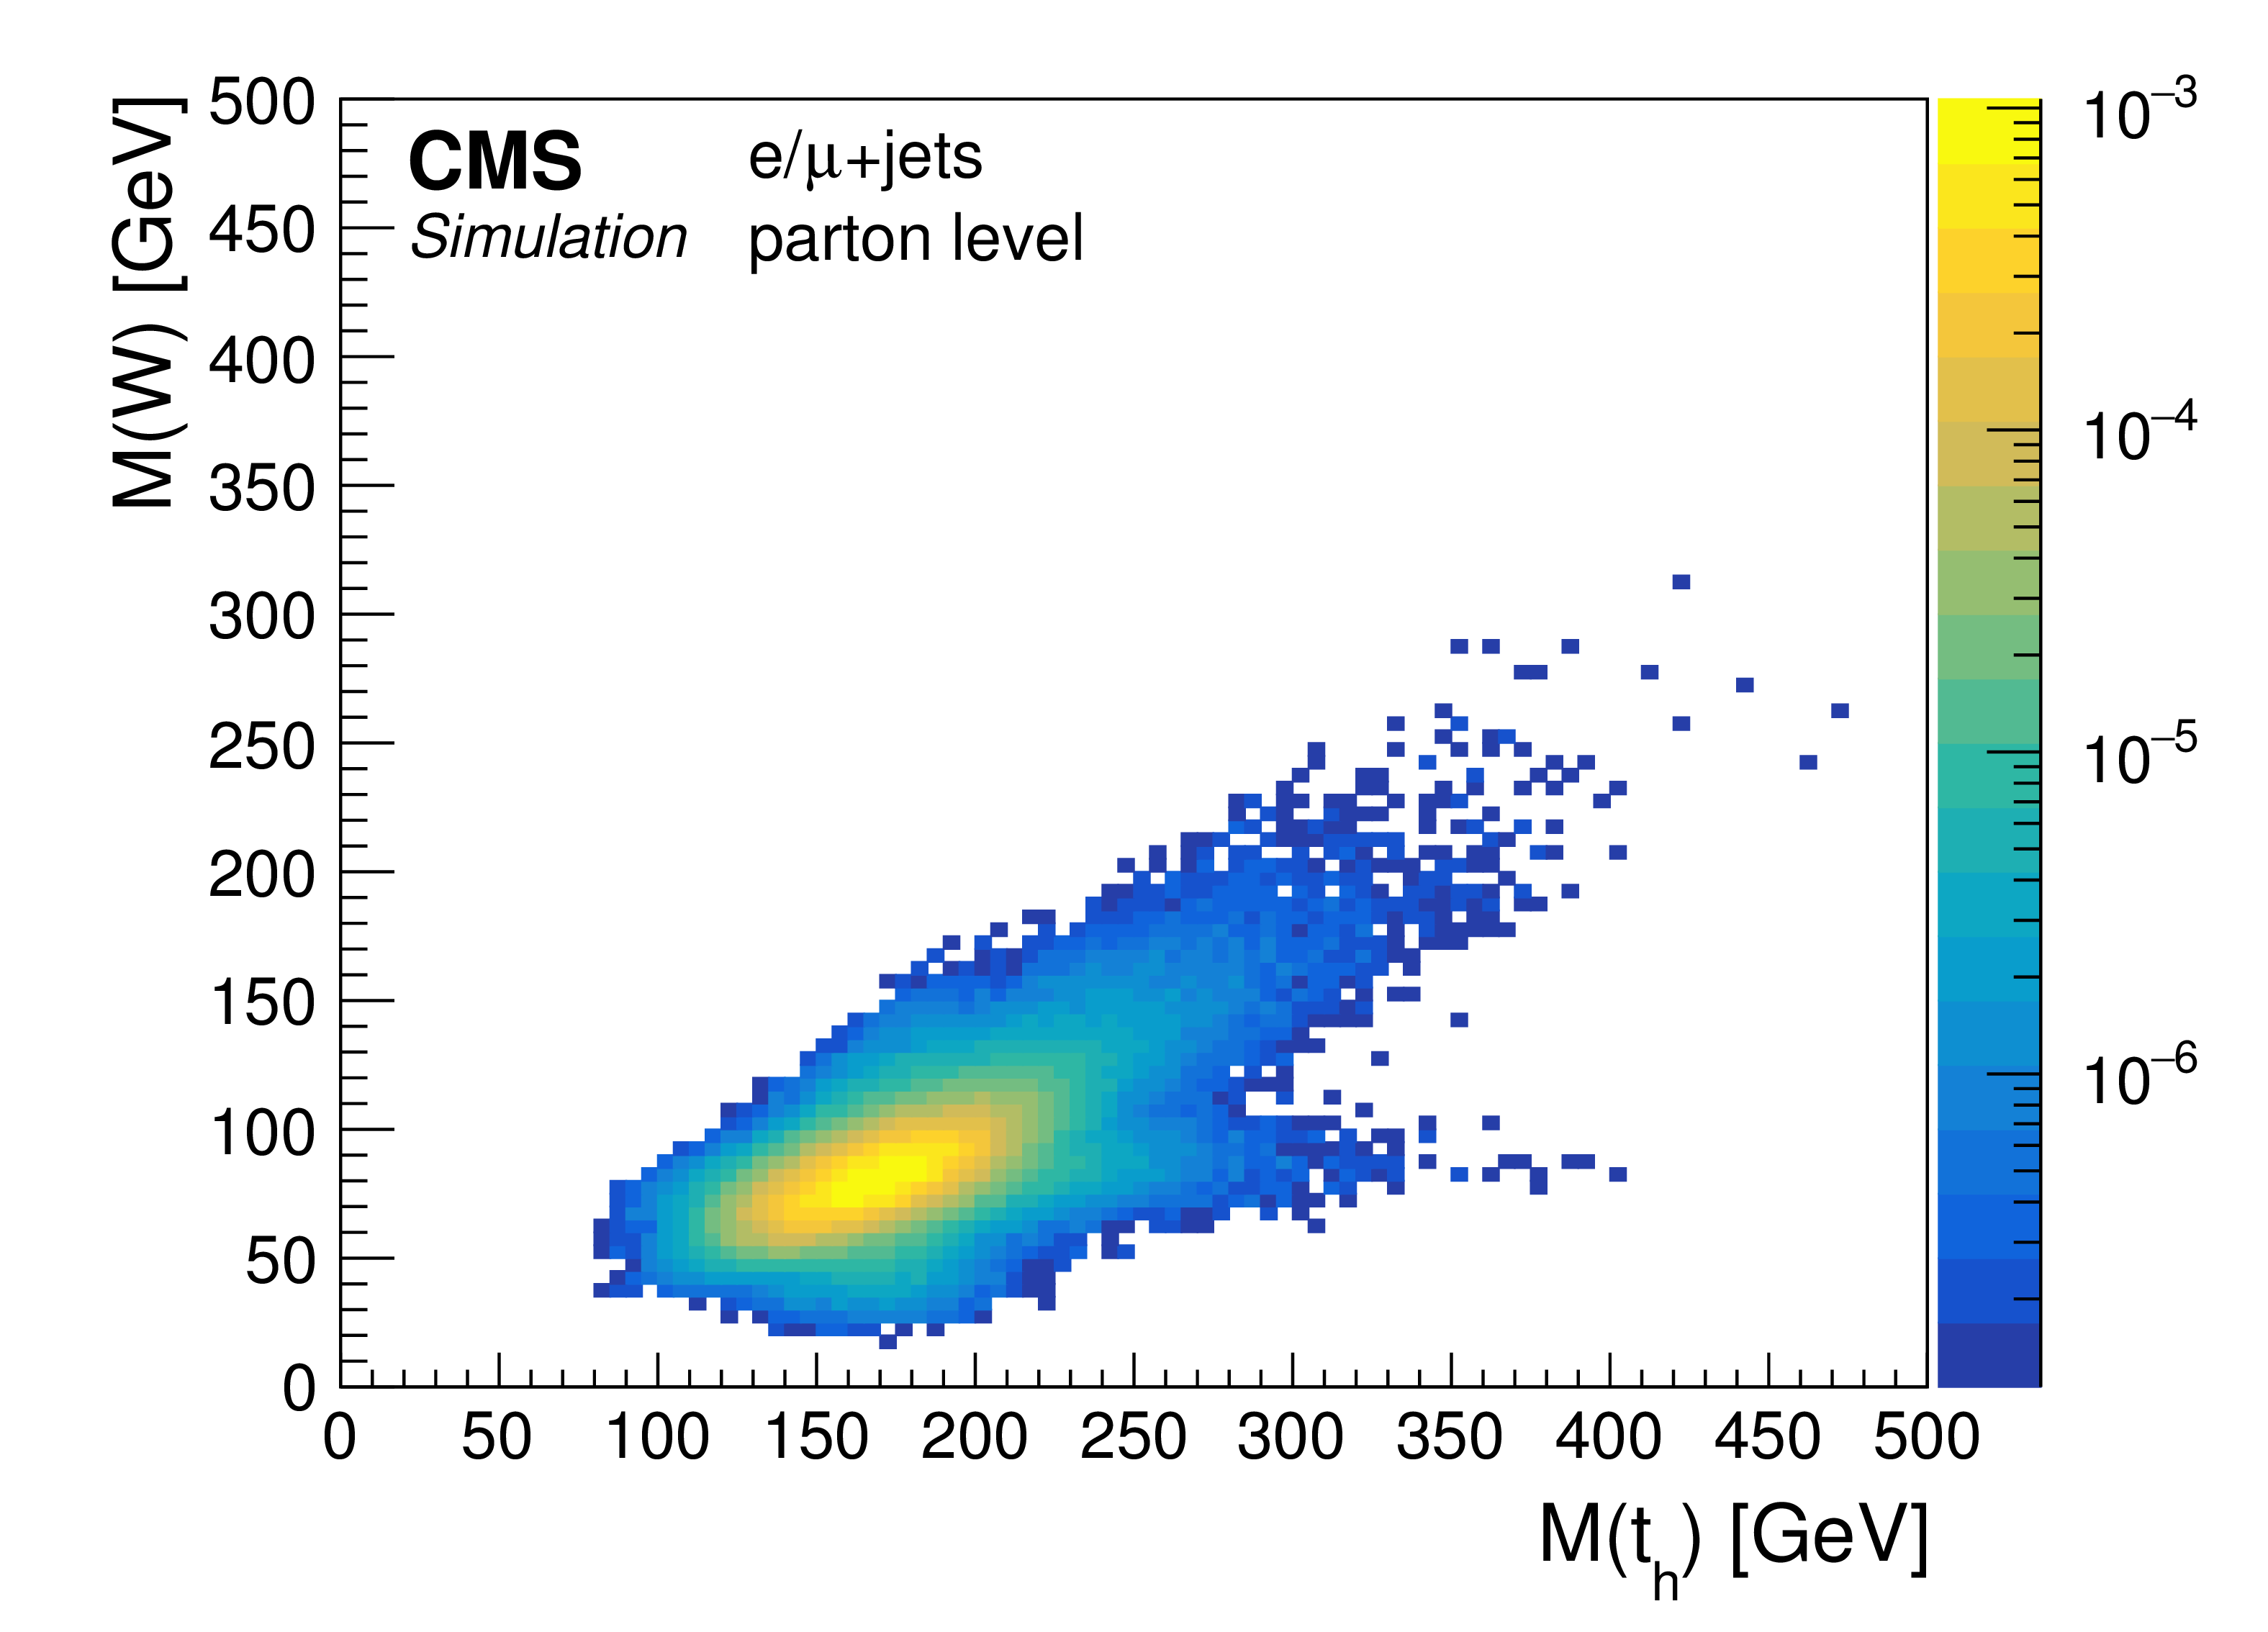
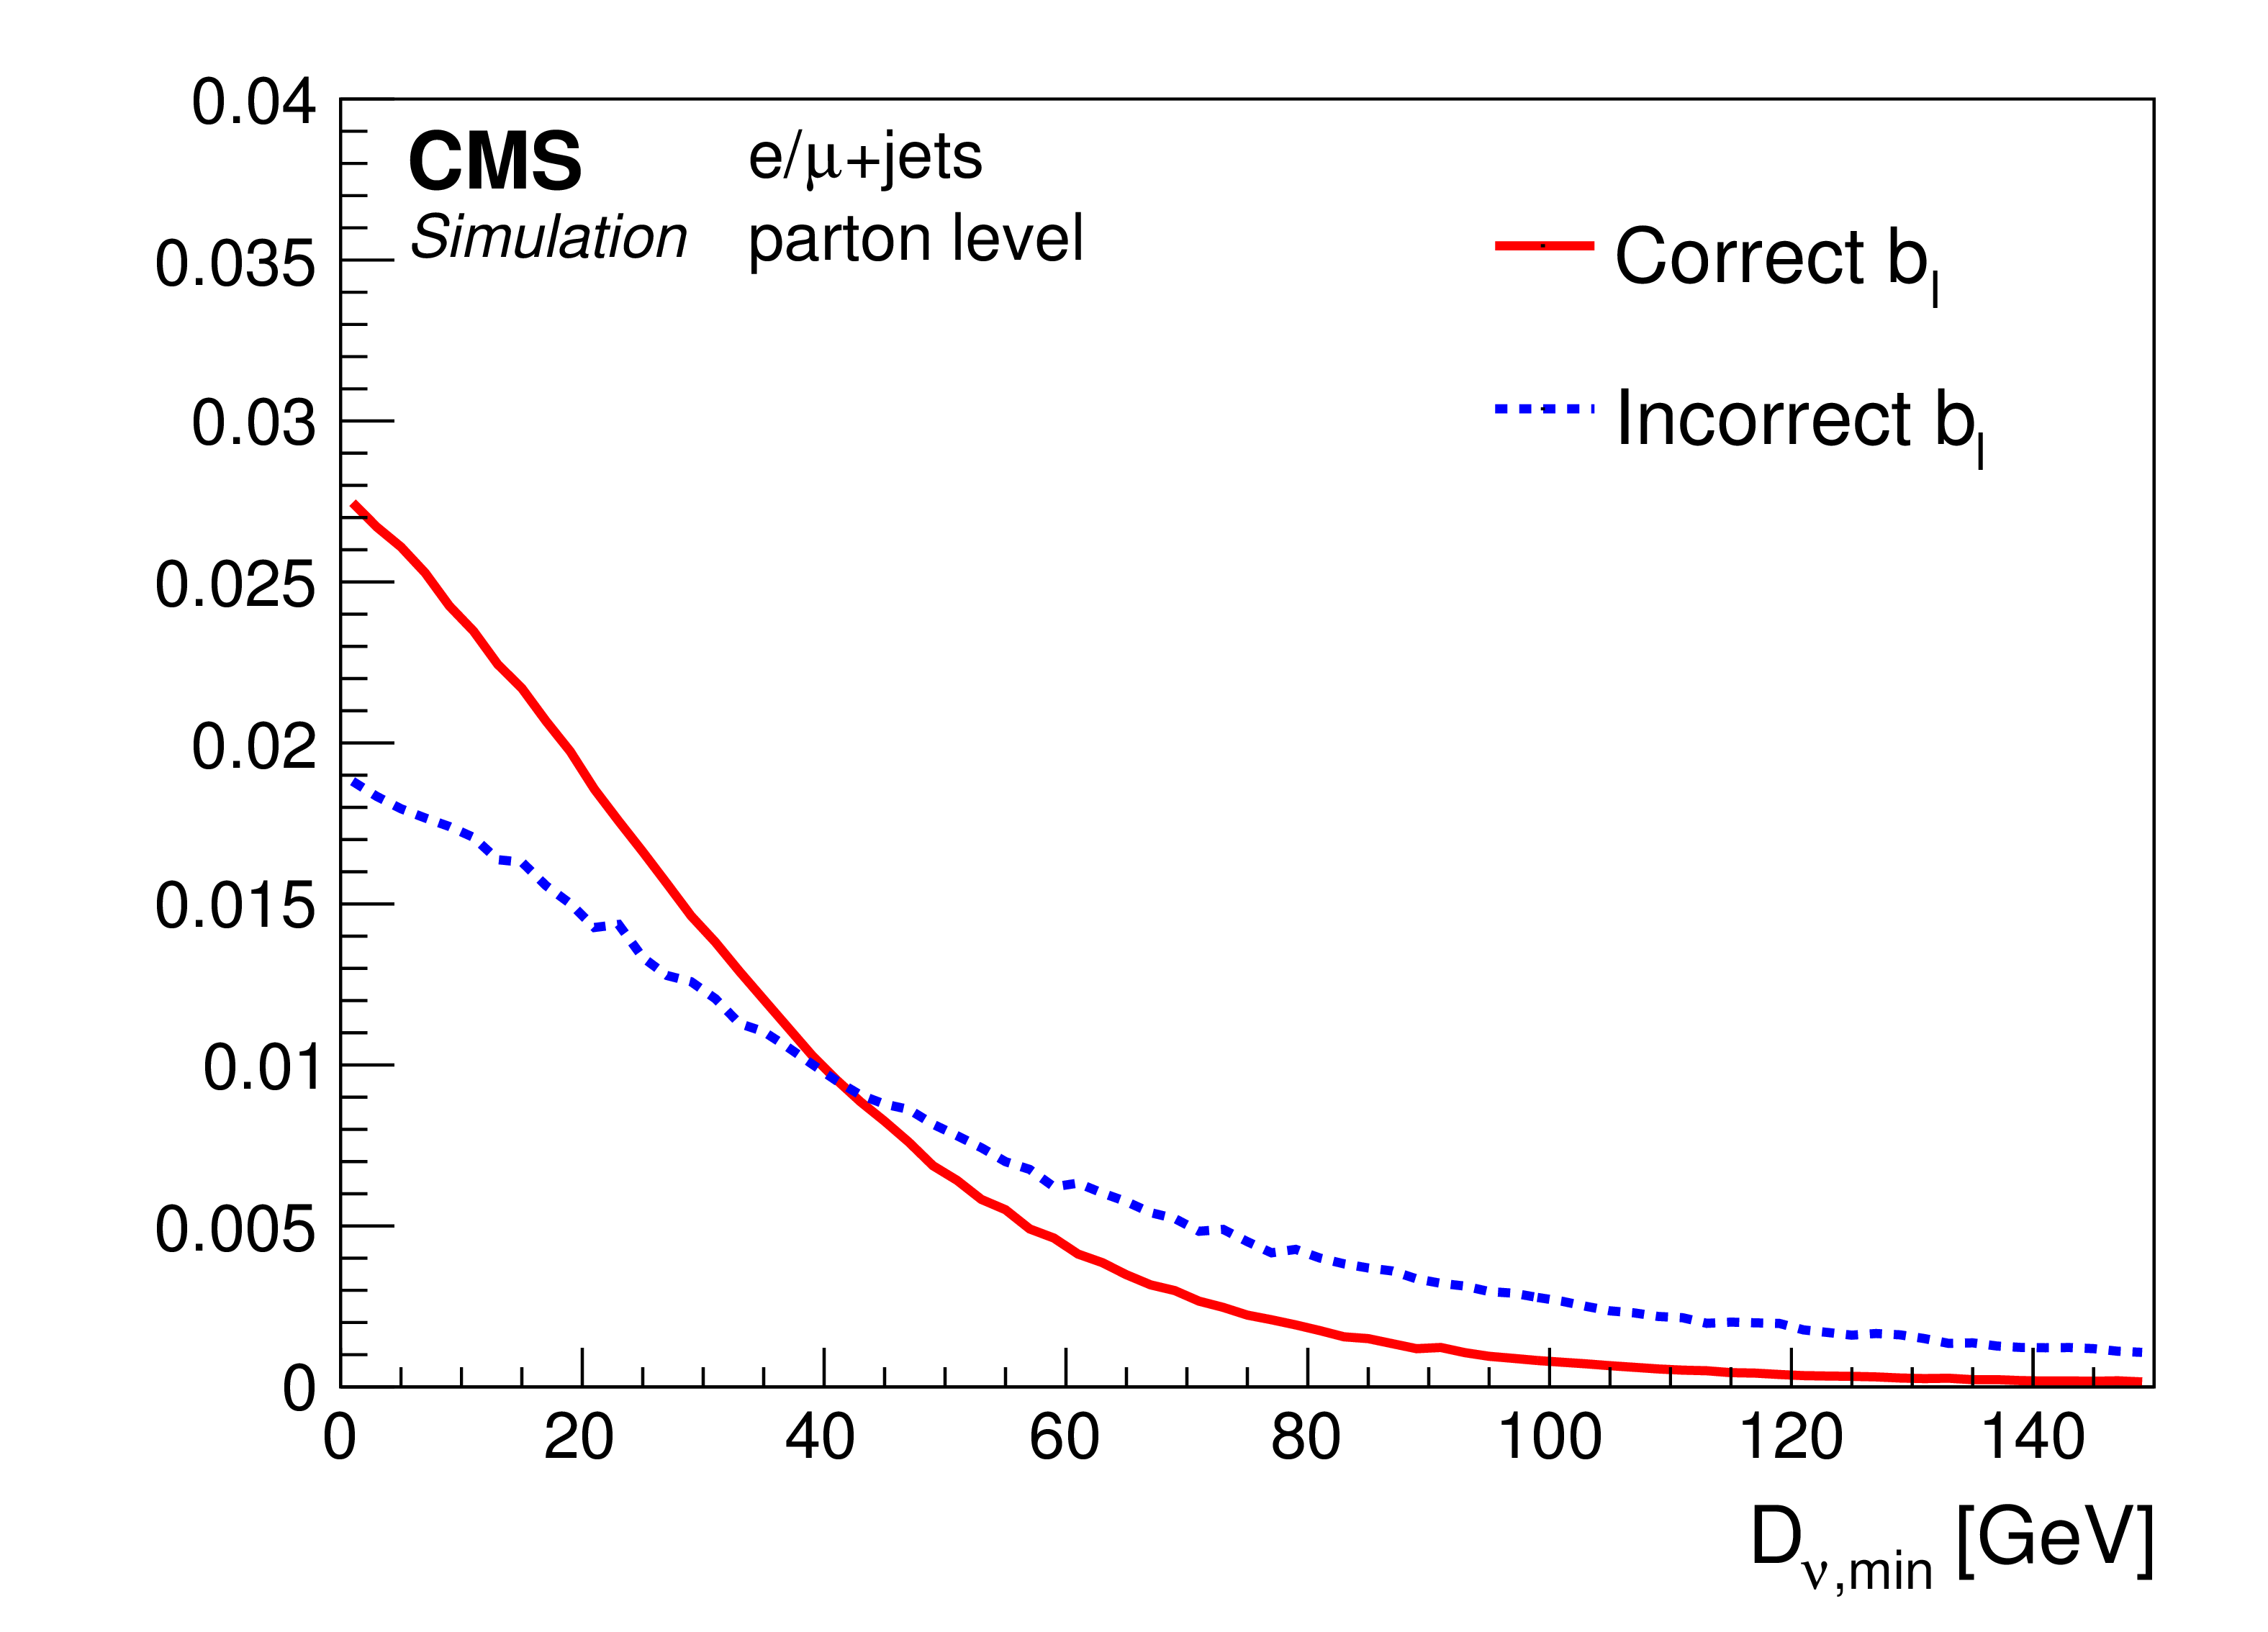
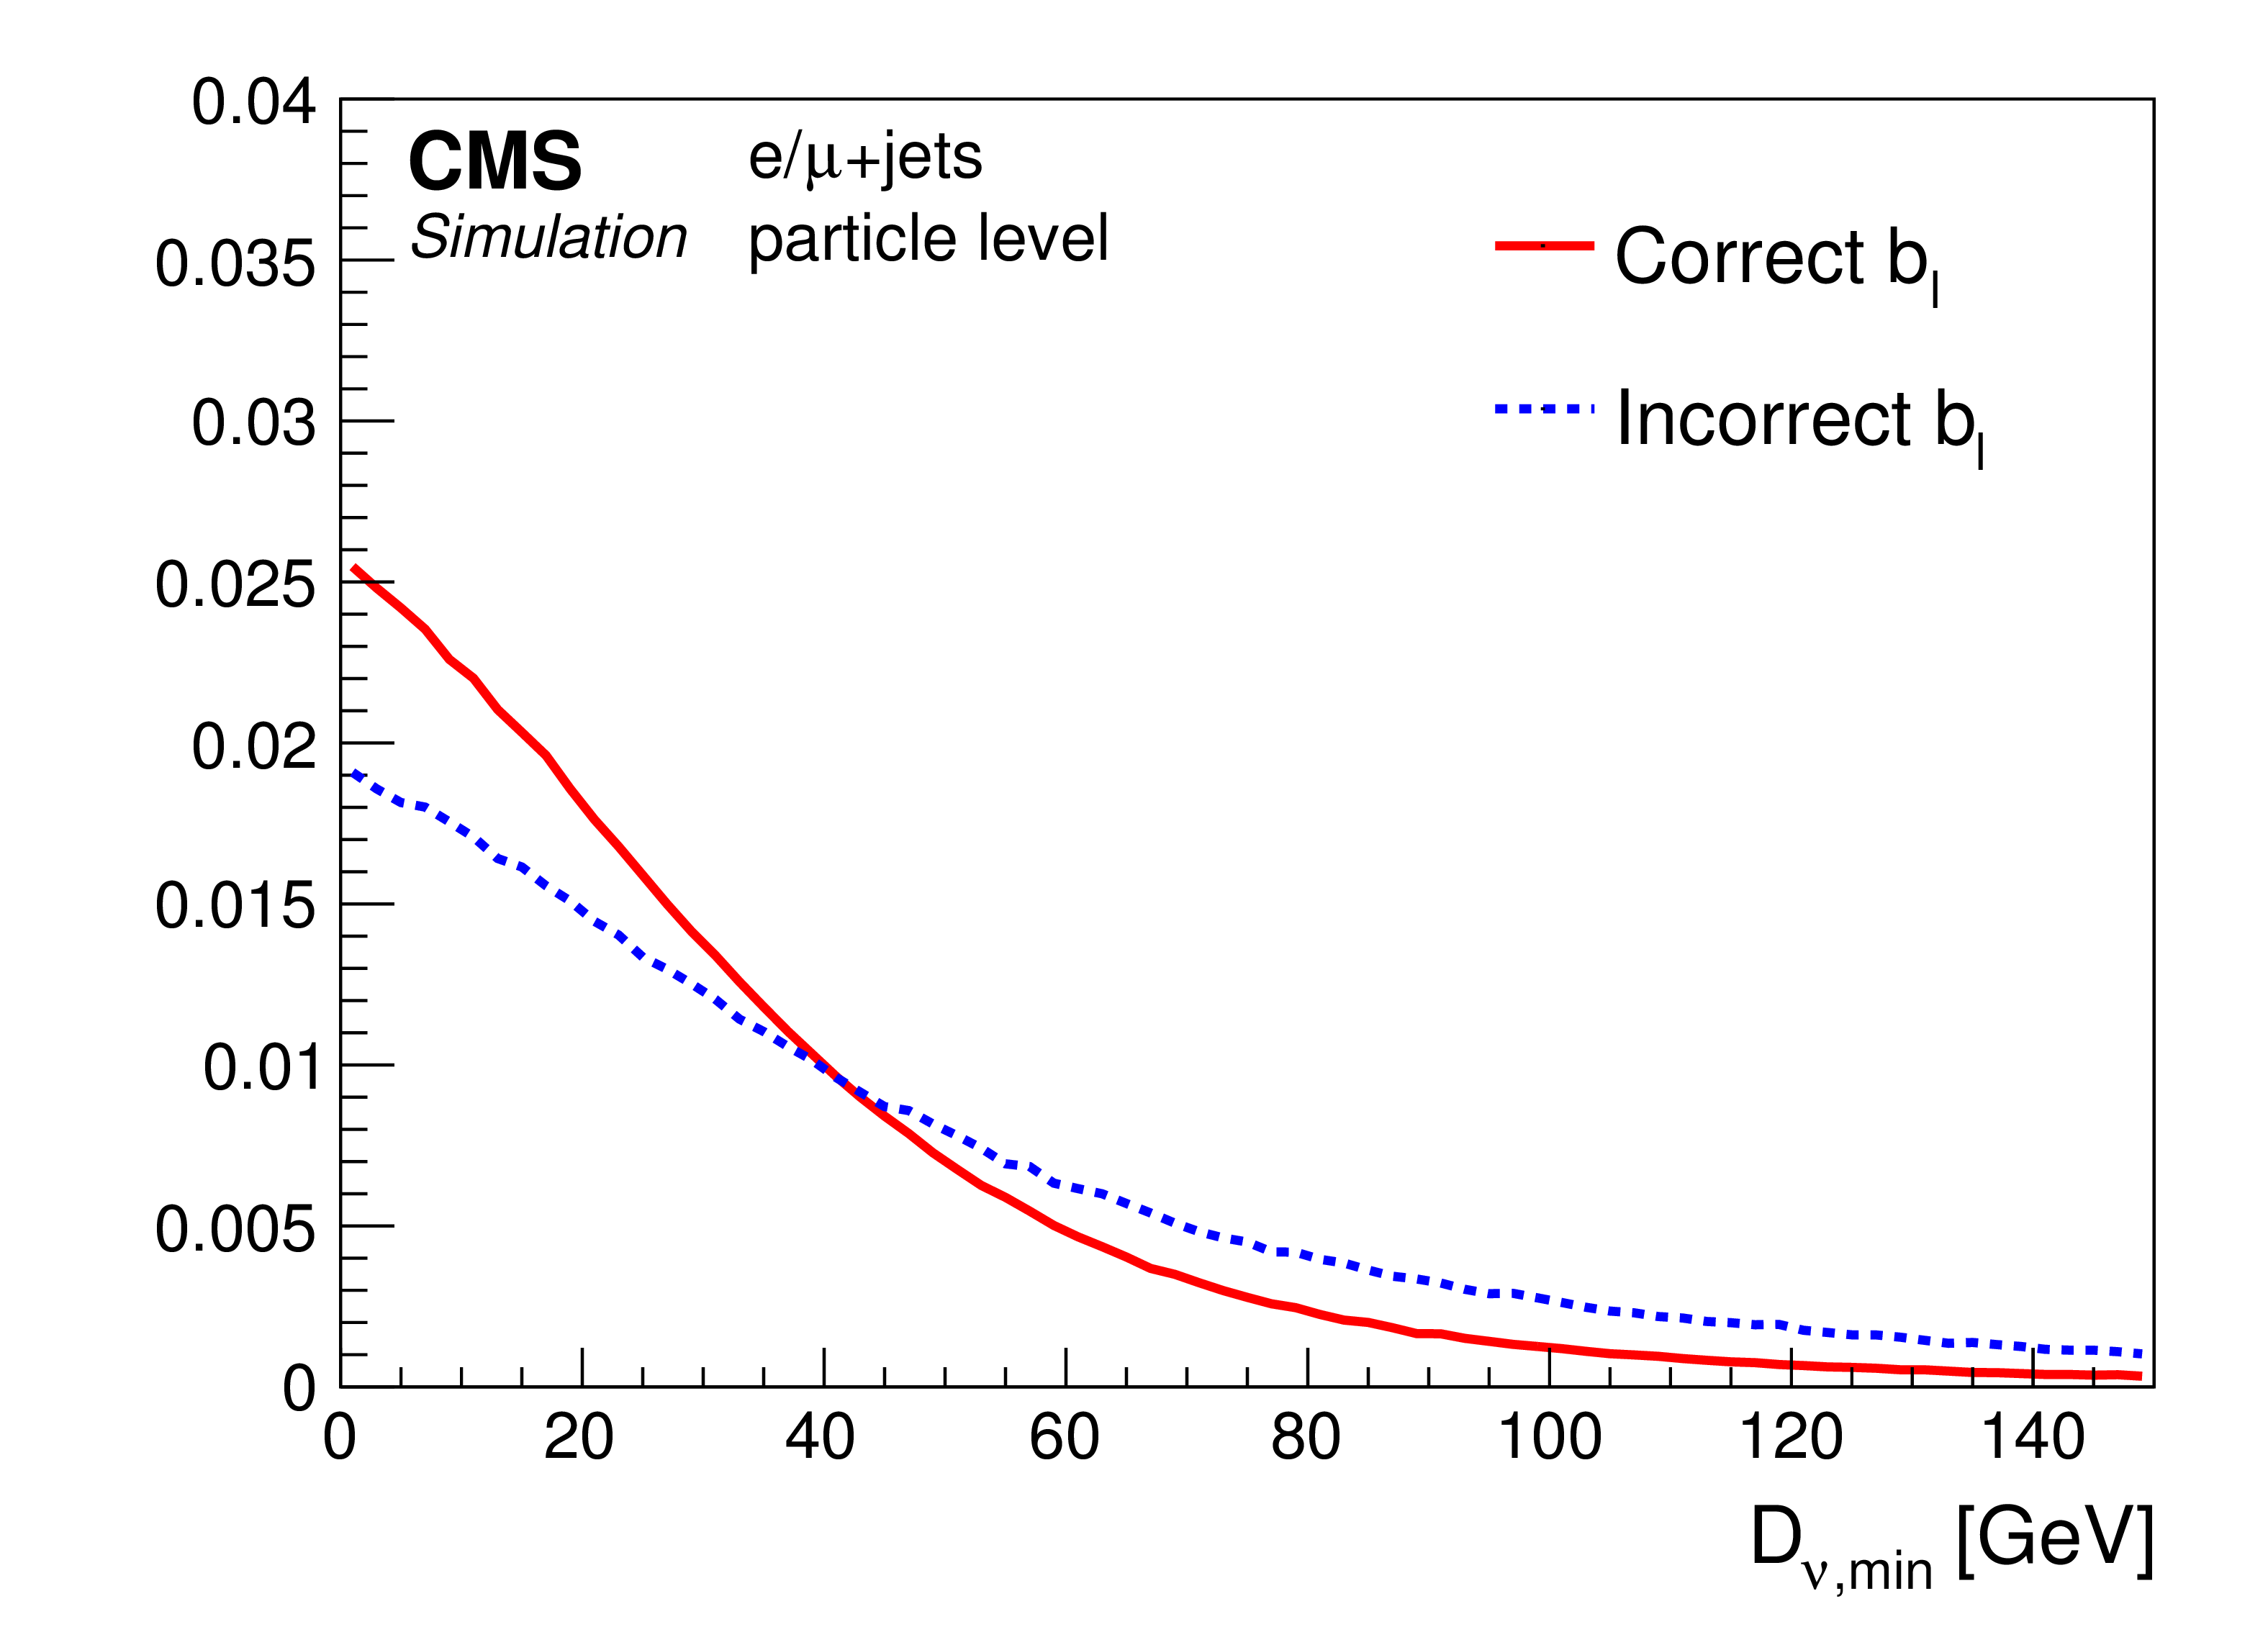
Upper: normalized two-dimensional mass distribution of the correctly reconstructed hadronically decaying W bosons $M({\mathrm{W}})$ and the correctly reconstructed top quarks $M({\mathrm{t} _\mathrm {h}})$ for the (left) parton- and the (right) particle-level measurements. Lower: normalized distributions of the distance $ {D_{\nu,\text {min}}} $ for correctly and incorrectly selected b jets from the leptonically decaying top quarks. The distributions are taken from the POWHEG+PYTHIA8 $ {\mathrm{t} \mathrm{\bar{t}}} $ simulation. |
png pdf |
Figure 2-a:
Upper: normalized two-dimensional mass distribution of the correctly reconstructed hadronically decaying W bosons $M({\mathrm{W}})$ and the correctly reconstructed top quarks $M({\mathrm{t} _\mathrm {h}})$ for the (left) parton- and the (right) particle-level measurements. Lower: normalized distributions of the distance $ {D_{\nu,\text {min}}} $ for correctly and incorrectly selected b jets from the leptonically decaying top quarks. The distributions are taken from the POWHEG+PYTHIA8 $ {\mathrm{t} \mathrm{\bar{t}}} $ simulation. |

png pdf |
Figure 2-b:
Upper: normalized two-dimensional mass distribution of the correctly reconstructed hadronically decaying W bosons $M({\mathrm{W}})$ and the correctly reconstructed top quarks $M({\mathrm{t} _\mathrm {h}})$ for the (left) parton- and the (right) particle-level measurements. Lower: normalized distributions of the distance $ {D_{\nu,\text {min}}} $ for correctly and incorrectly selected b jets from the leptonically decaying top quarks. The distributions are taken from the POWHEG+PYTHIA8 $ {\mathrm{t} \mathrm{\bar{t}}} $ simulation. |
png pdf |
Figure 2-c:
Upper: normalized two-dimensional mass distribution of the correctly reconstructed hadronically decaying W bosons $M({\mathrm{W}})$ and the correctly reconstructed top quarks $M({\mathrm{t} _\mathrm {h}})$ for the (left) parton- and the (right) particle-level measurements. Lower: normalized distributions of the distance $ {D_{\nu,\text {min}}} $ for correctly and incorrectly selected b jets from the leptonically decaying top quarks. The distributions are taken from the POWHEG+PYTHIA8 $ {\mathrm{t} \mathrm{\bar{t}}} $ simulation. |
png pdf |
Figure 2-d:
Upper: normalized two-dimensional mass distribution of the correctly reconstructed hadronically decaying W bosons $M({\mathrm{W}})$ and the correctly reconstructed top quarks $M({\mathrm{t} _\mathrm {h}})$ for the (left) parton- and the (right) particle-level measurements. Lower: normalized distributions of the distance $ {D_{\nu,\text {min}}} $ for correctly and incorrectly selected b jets from the leptonically decaying top quarks. The distributions are taken from the POWHEG+PYTHIA8 $ {\mathrm{t} \mathrm{\bar{t}}} $ simulation. |
png pdf |
Figure 3:
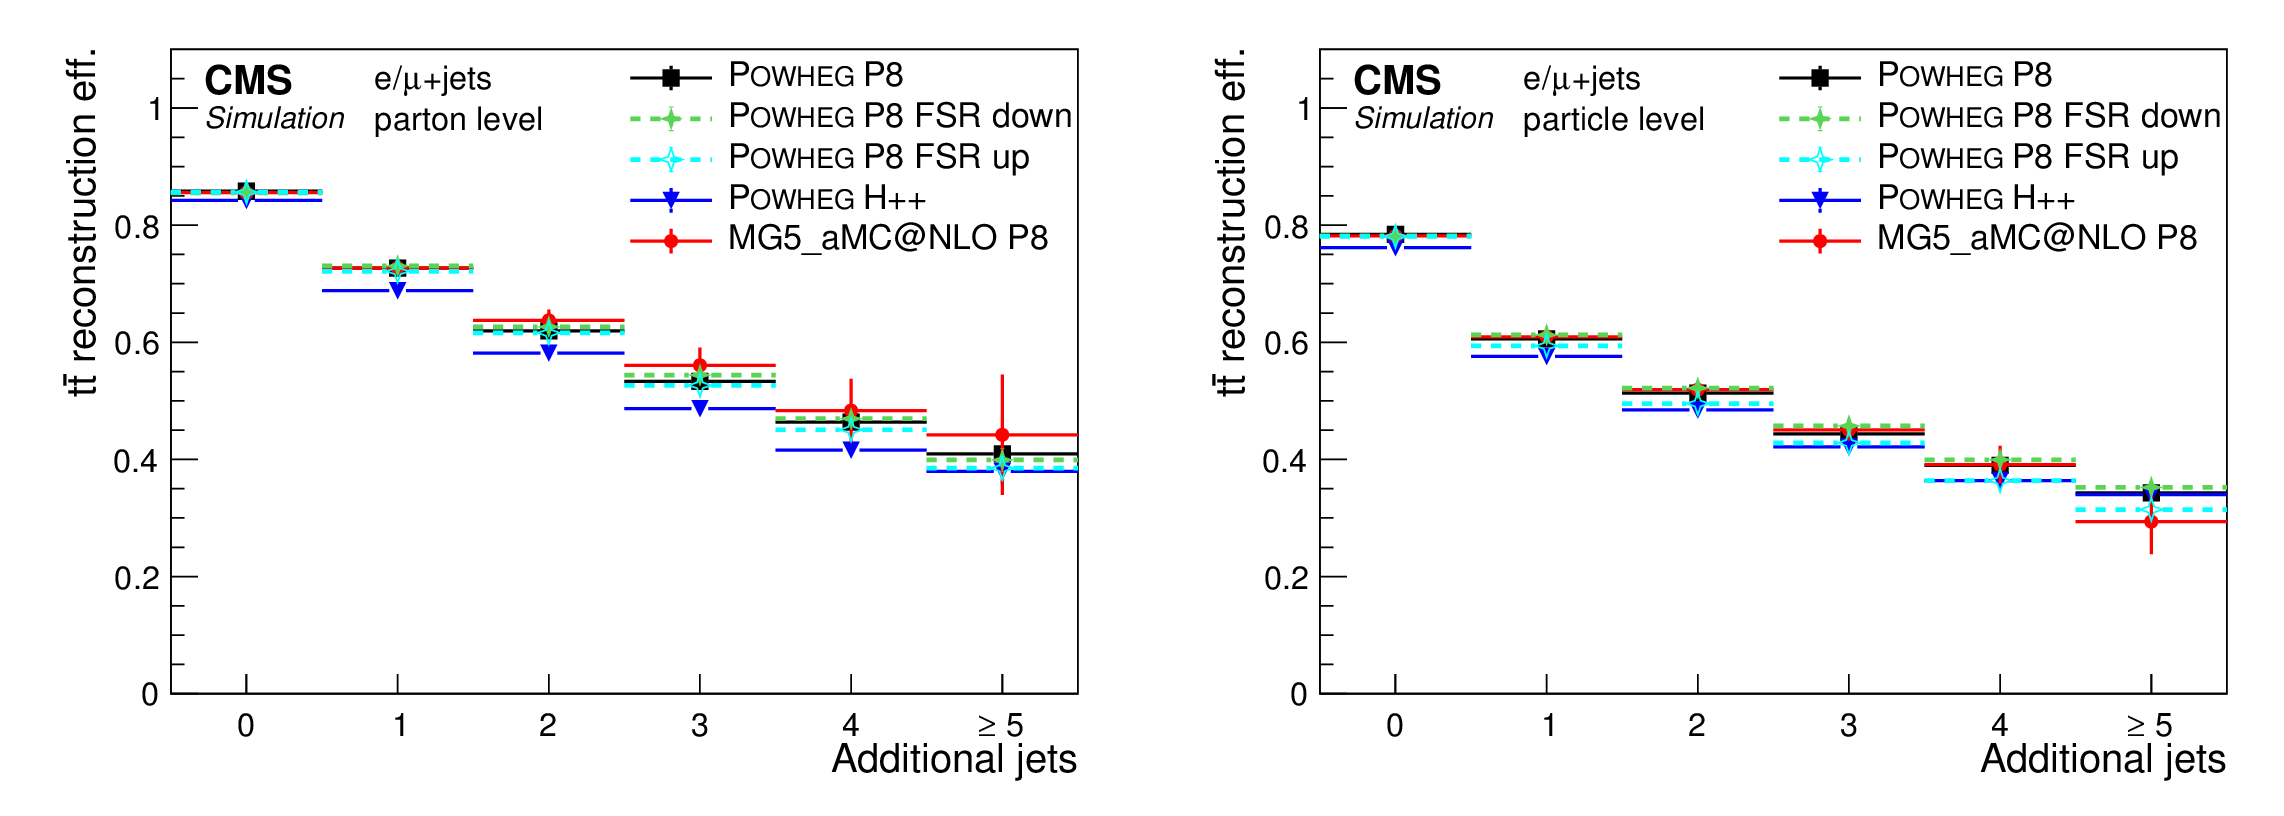
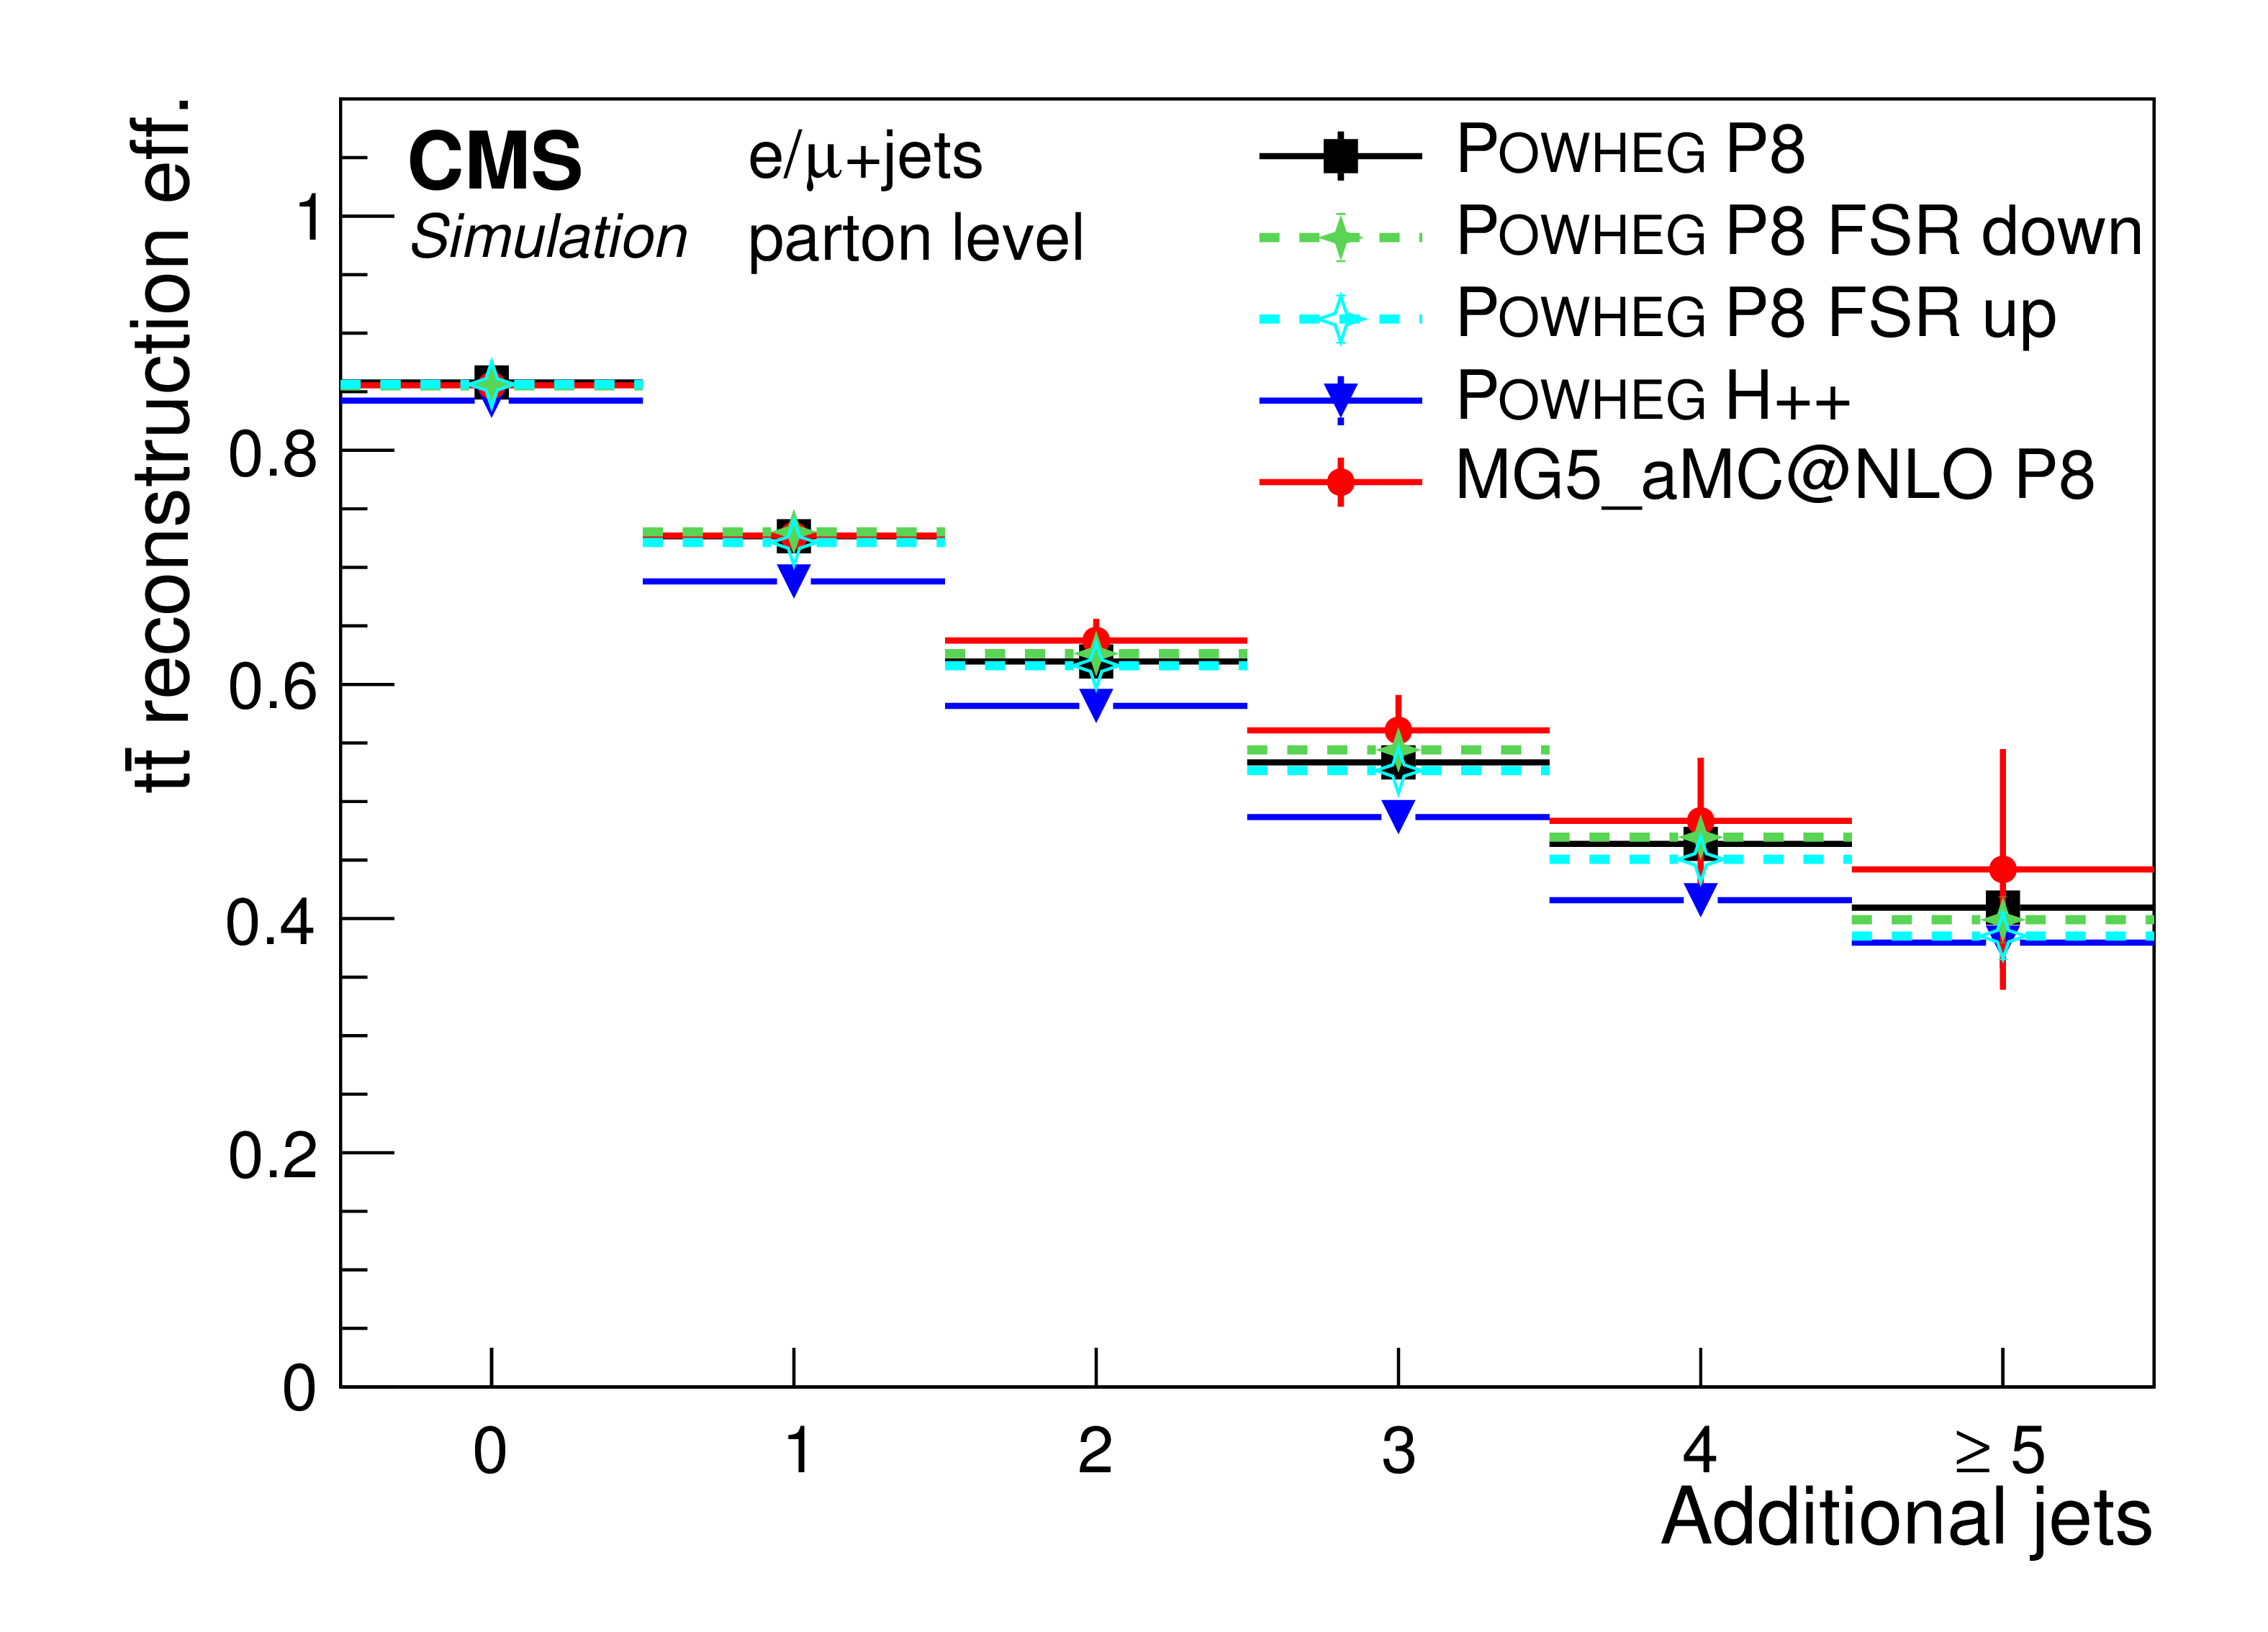
Reconstruction efficiency of the $ {\mathrm{t} \mathrm{\bar{t}}} $ system as a function of the number of additional jets for the (left) parton- and (right) particle-level measurements. The efficiencies are calculated based on the simulations with POWHEG+PYTHIA8 (P8) with scale variations up and down of the final-state PS, POWHEG+HERWIG++ (H++), and MG5_aMC@NLO+PYTHIA8. The vertical bars represent the statistical uncertainties in each simulation. |
png pdf |
Figure 3-a:
Reconstruction efficiency of the $ {\mathrm{t} \mathrm{\bar{t}}} $ system as a function of the number of additional jets for the (left) parton- and (right) particle-level measurements. The efficiencies are calculated based on the simulations with POWHEG+PYTHIA8 (P8) with scale variations up and down of the final-state PS, POWHEG+HERWIG++ (H++), and MG5_aMC@NLO+PYTHIA8. The vertical bars represent the statistical uncertainties in each simulation. |

png pdf |
Figure 3-b:
Reconstruction efficiency of the $ {\mathrm{t} \mathrm{\bar{t}}} $ system as a function of the number of additional jets for the (left) parton- and (right) particle-level measurements. The efficiencies are calculated based on the simulations with POWHEG+PYTHIA8 (P8) with scale variations up and down of the final-state PS, POWHEG+HERWIG++ (H++), and MG5_aMC@NLO+PYTHIA8. The vertical bars represent the statistical uncertainties in each simulation. |

png pdf |
Figure 4:
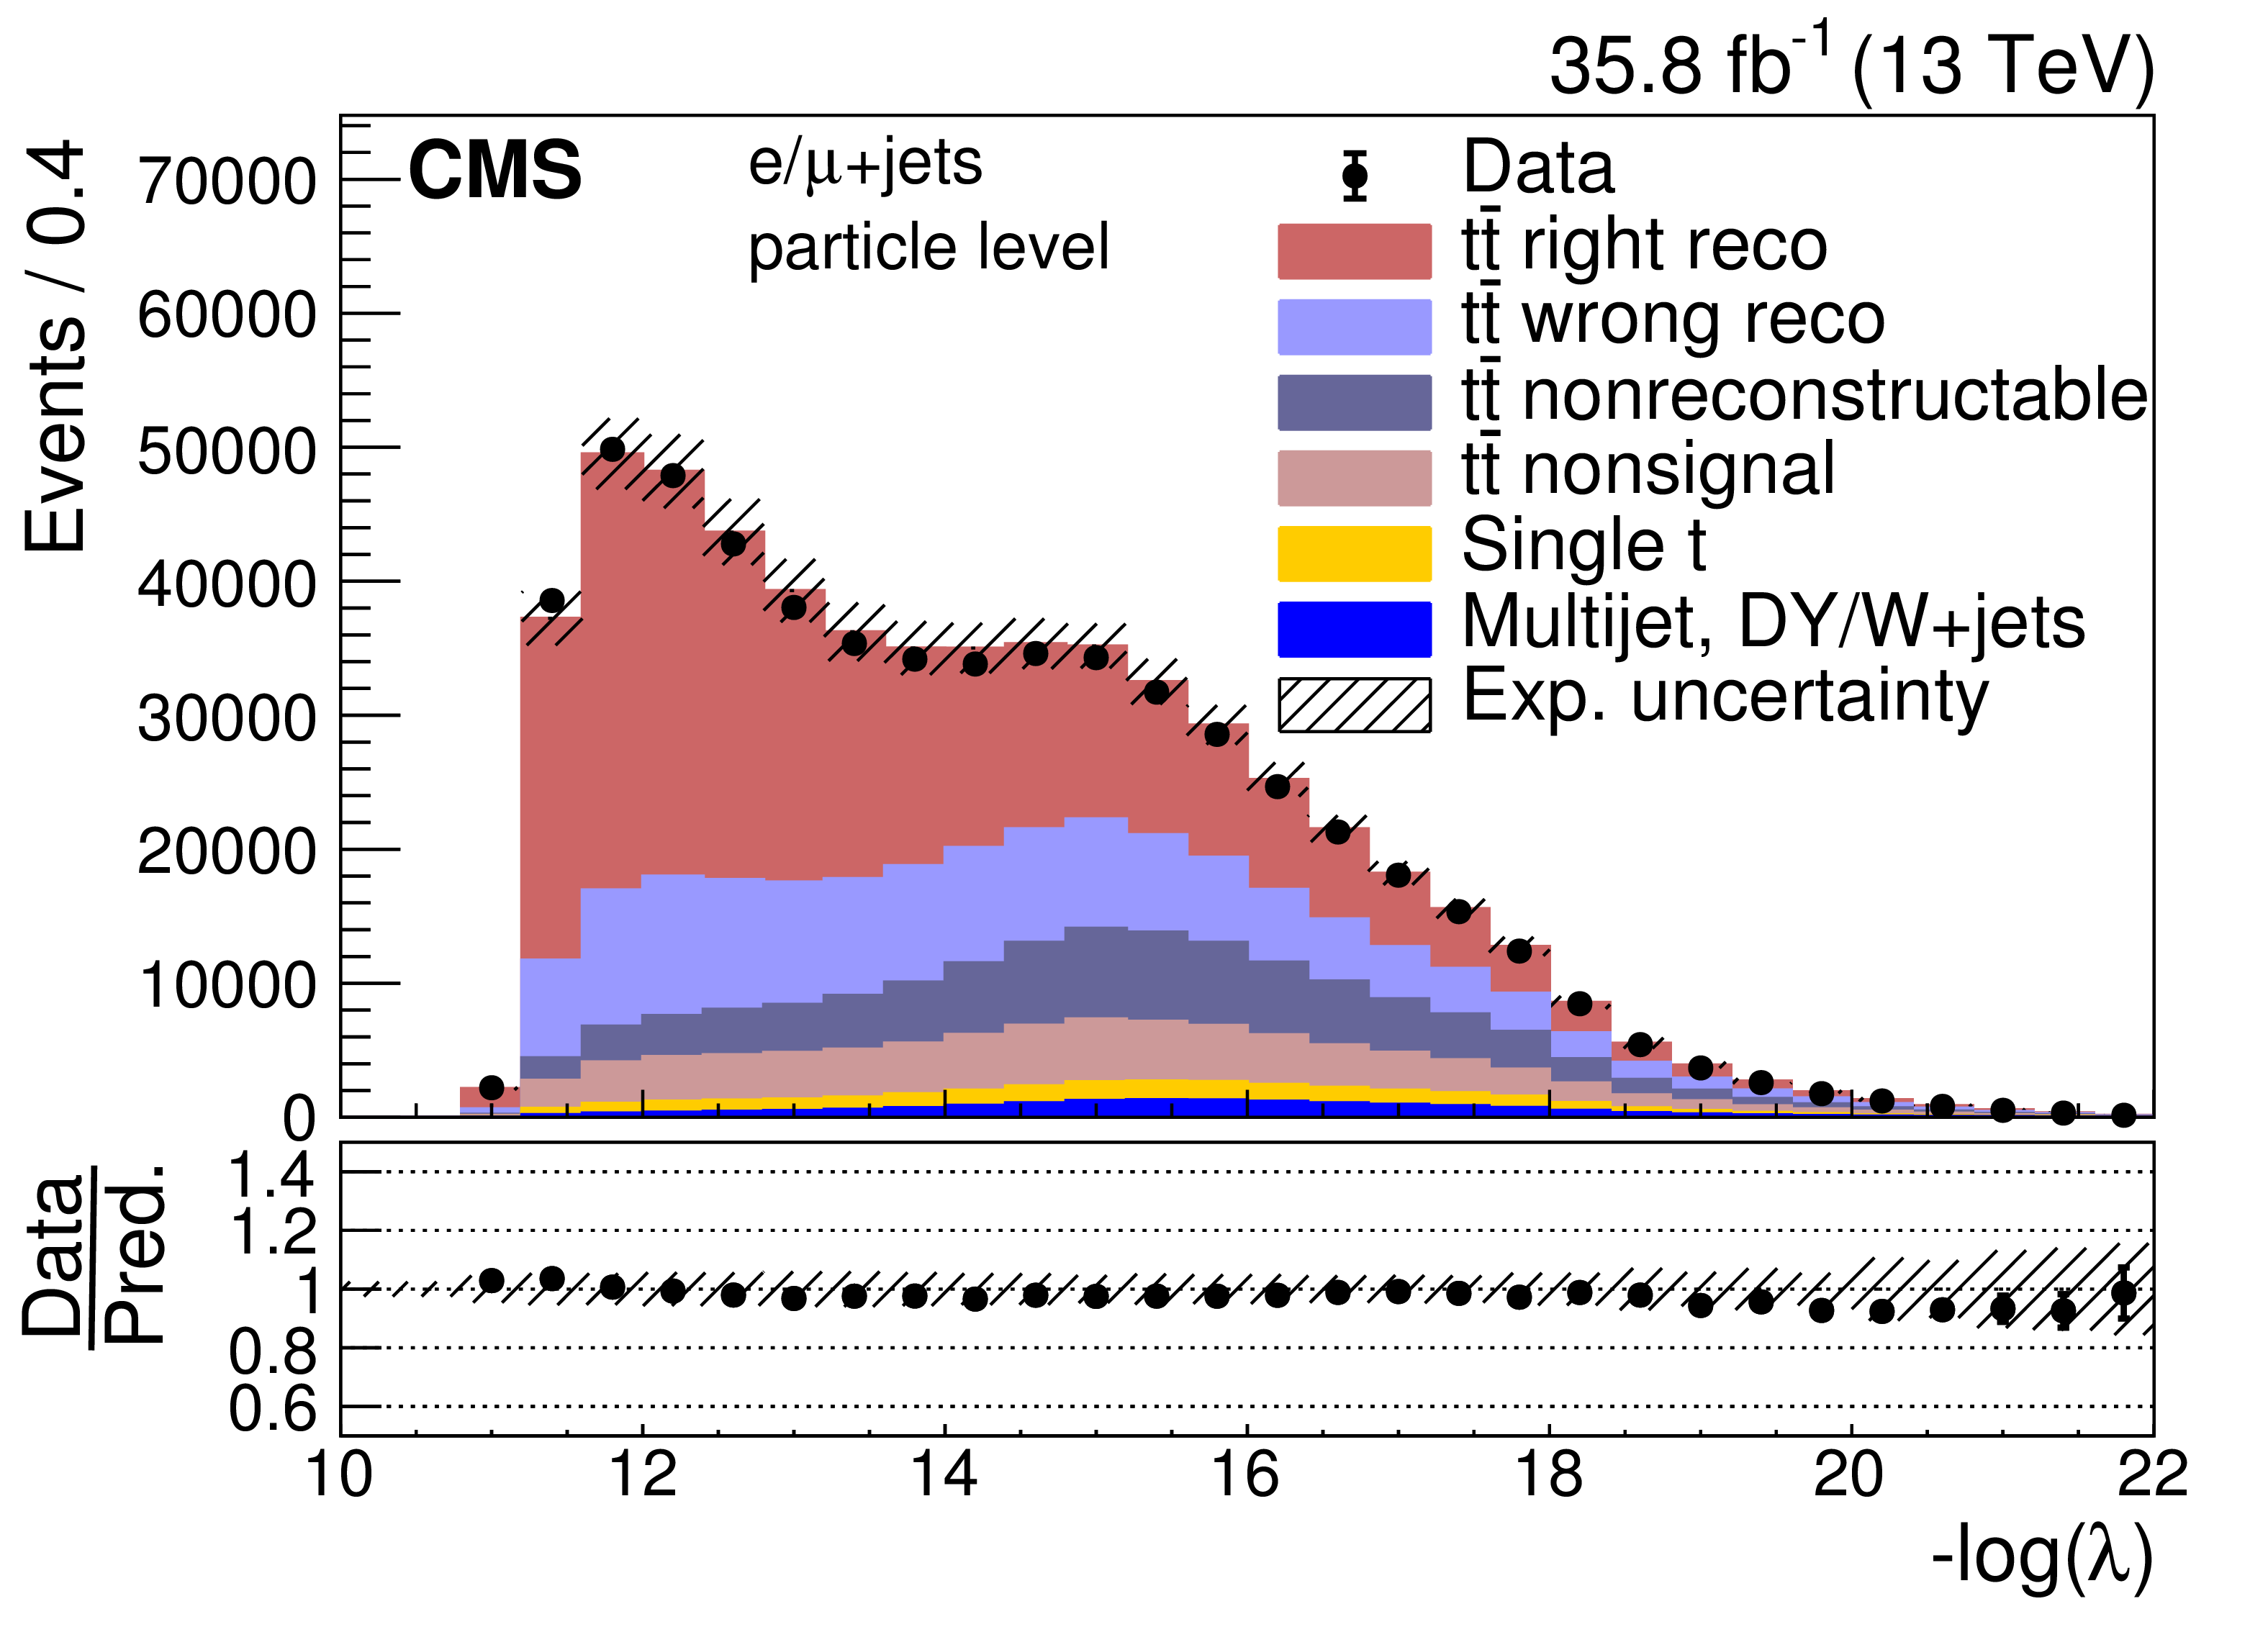
Distribution of the negative log-likelihood for the selected best permutation in the (left) parton- and the (right) particle-level measurements in data and simulations. Events generated with POWHEG+PYTHIA8 are used to describe the $ {\mathrm{t} \mathrm{\bar{t}}} $ production. The contribution of multijet, DY, and W boson plus jets background events is extracted from the data (cf. Section7). Combined experimental (cf. Section 9) and statistical uncertainties (hatched area) are shown for the total predicted yields. The data points are shown with statistical uncertainties. The ratios of data to the sum of the predicted yields are provided at the bottom of each panel. |

png pdf |
Figure 4-a:
Distribution of the negative log-likelihood for the selected best permutation in the (left) parton- and the (right) particle-level measurements in data and simulations. Events generated with POWHEG+PYTHIA8 are used to describe the $ {\mathrm{t} \mathrm{\bar{t}}} $ production. The contribution of multijet, DY, and W boson plus jets background events is extracted from the data (cf. Section7). Combined experimental (cf. Section 9) and statistical uncertainties (hatched area) are shown for the total predicted yields. The data points are shown with statistical uncertainties. The ratios of data to the sum of the predicted yields are provided at the bottom of each panel. |
png pdf |
Figure 4-b:
Distribution of the negative log-likelihood for the selected best permutation in the (left) parton- and the (right) particle-level measurements in data and simulations. Events generated with POWHEG+PYTHIA8 are used to describe the $ {\mathrm{t} \mathrm{\bar{t}}} $ production. The contribution of multijet, DY, and W boson plus jets background events is extracted from the data (cf. Section7). Combined experimental (cf. Section 9) and statistical uncertainties (hatched area) are shown for the total predicted yields. The data points are shown with statistical uncertainties. The ratios of data to the sum of the predicted yields are provided at the bottom of each panel. |
png pdf |
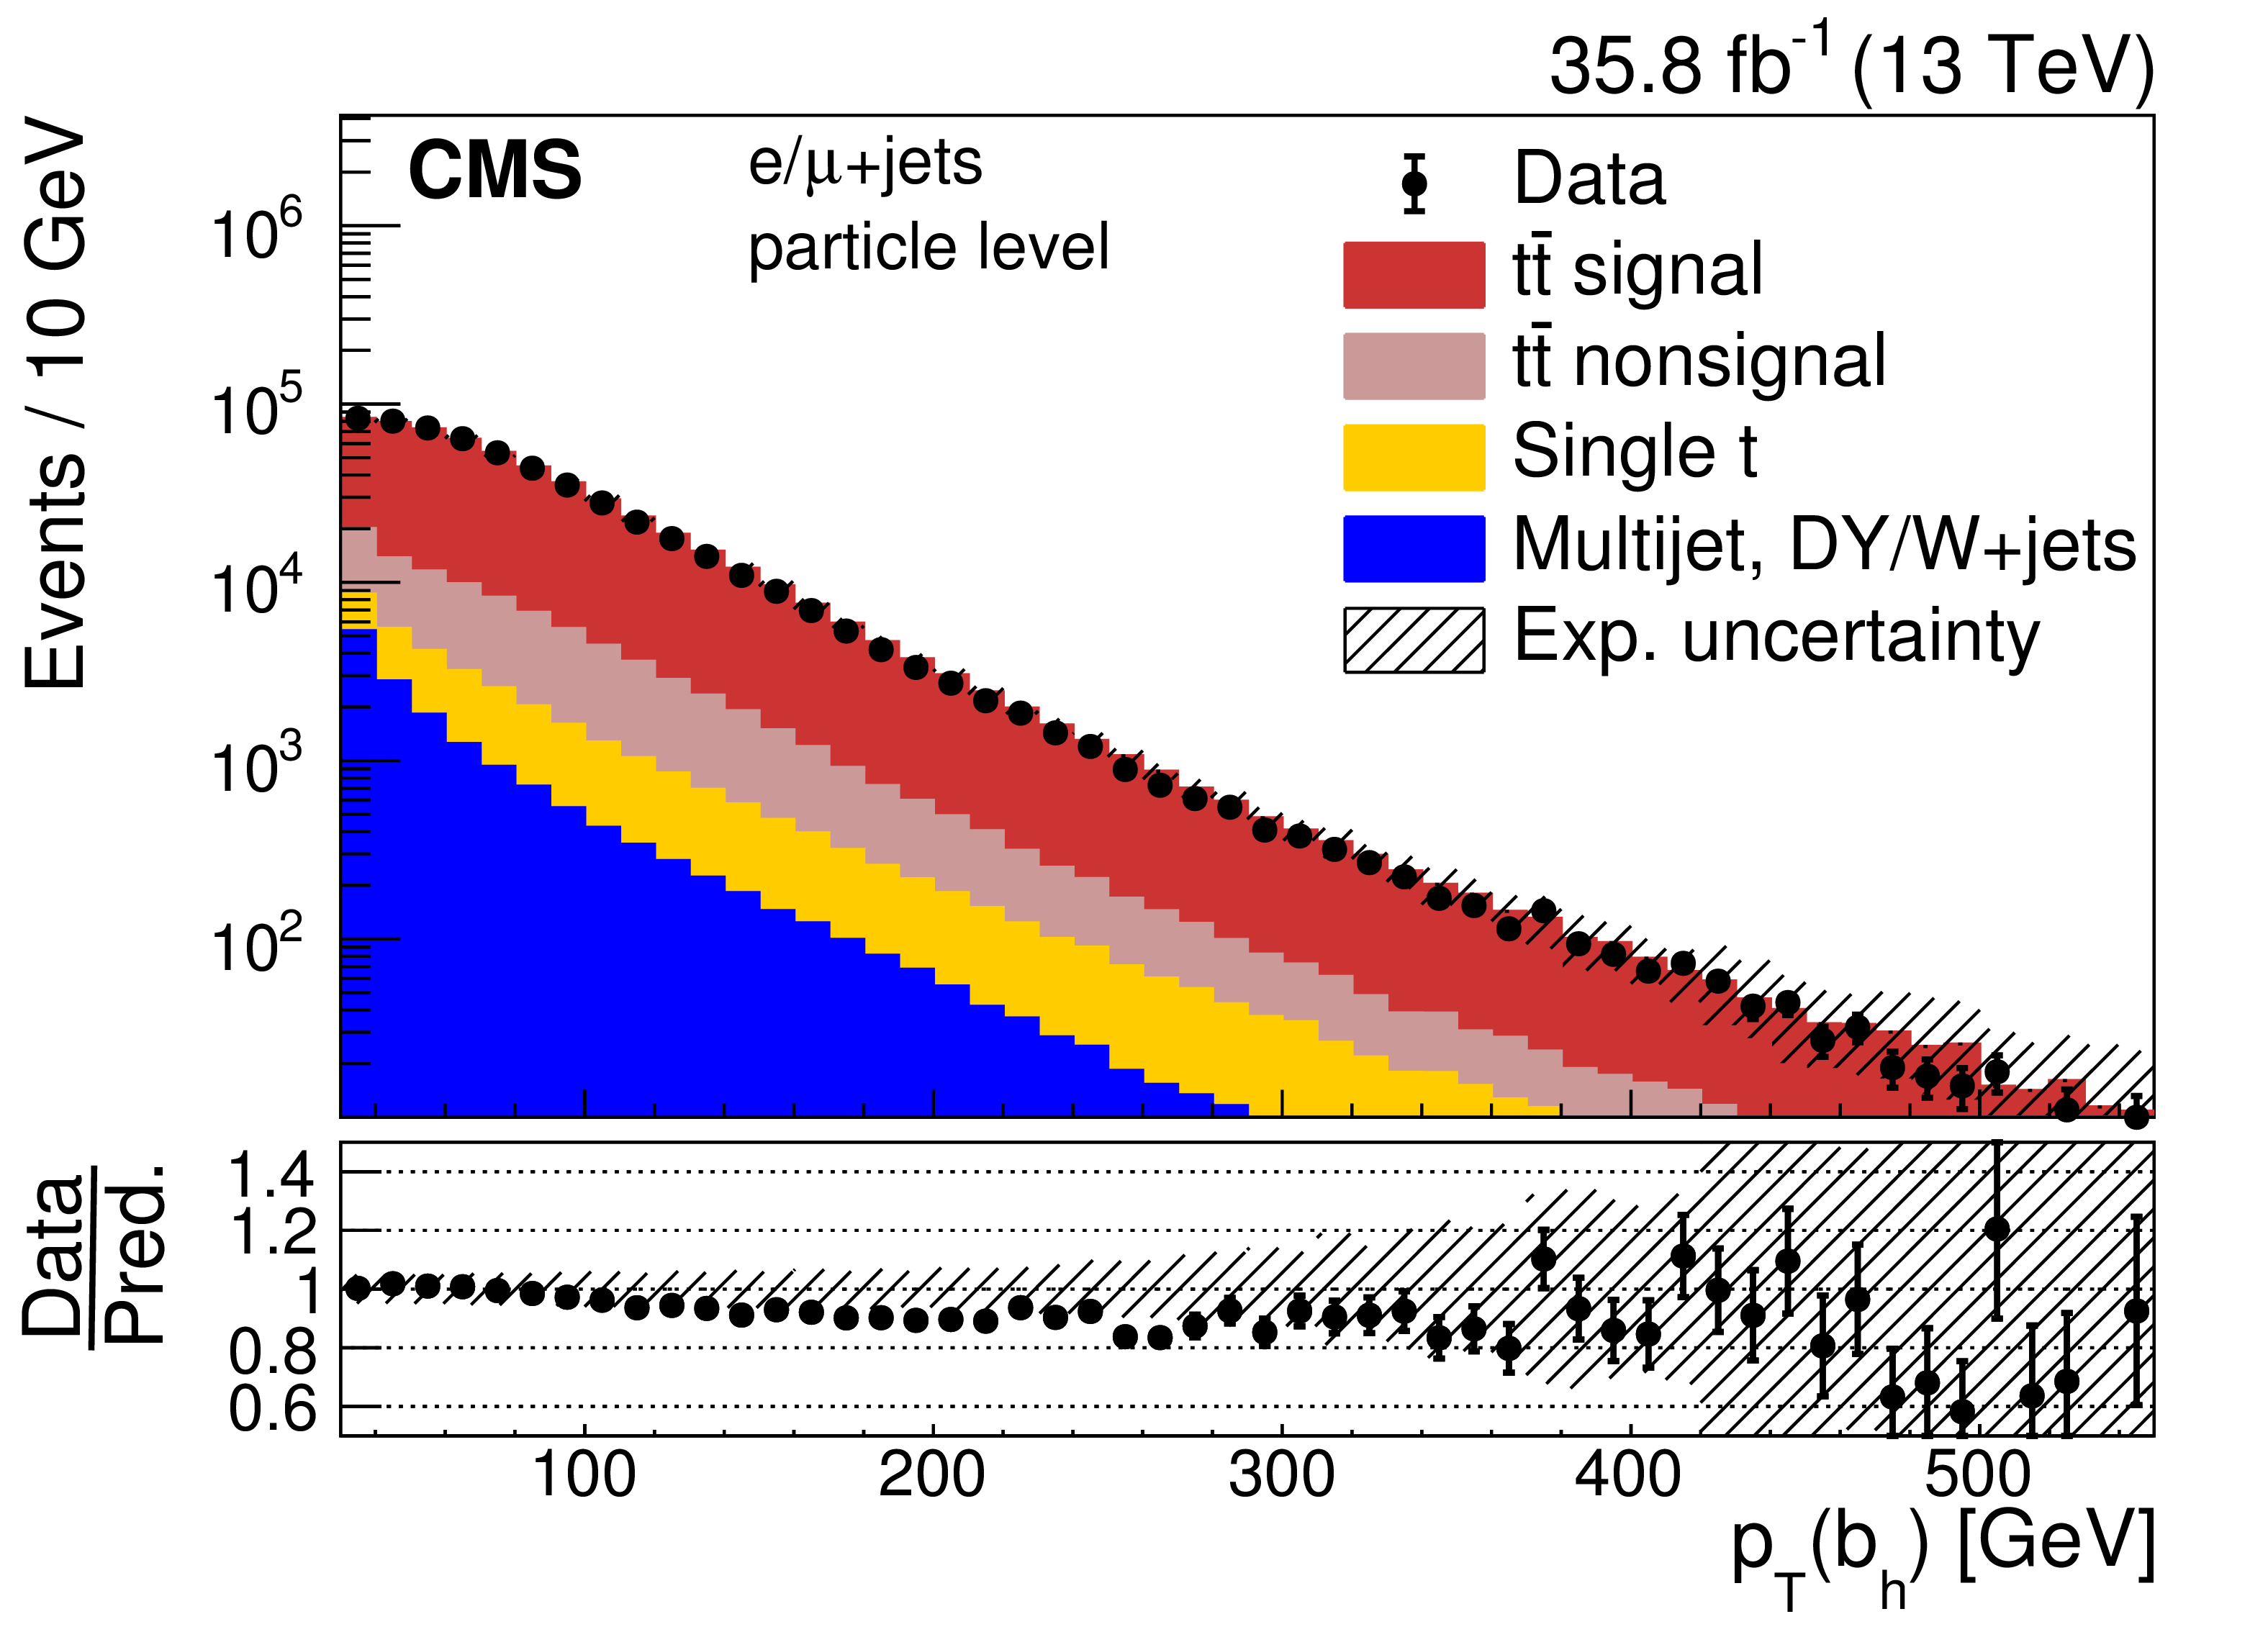
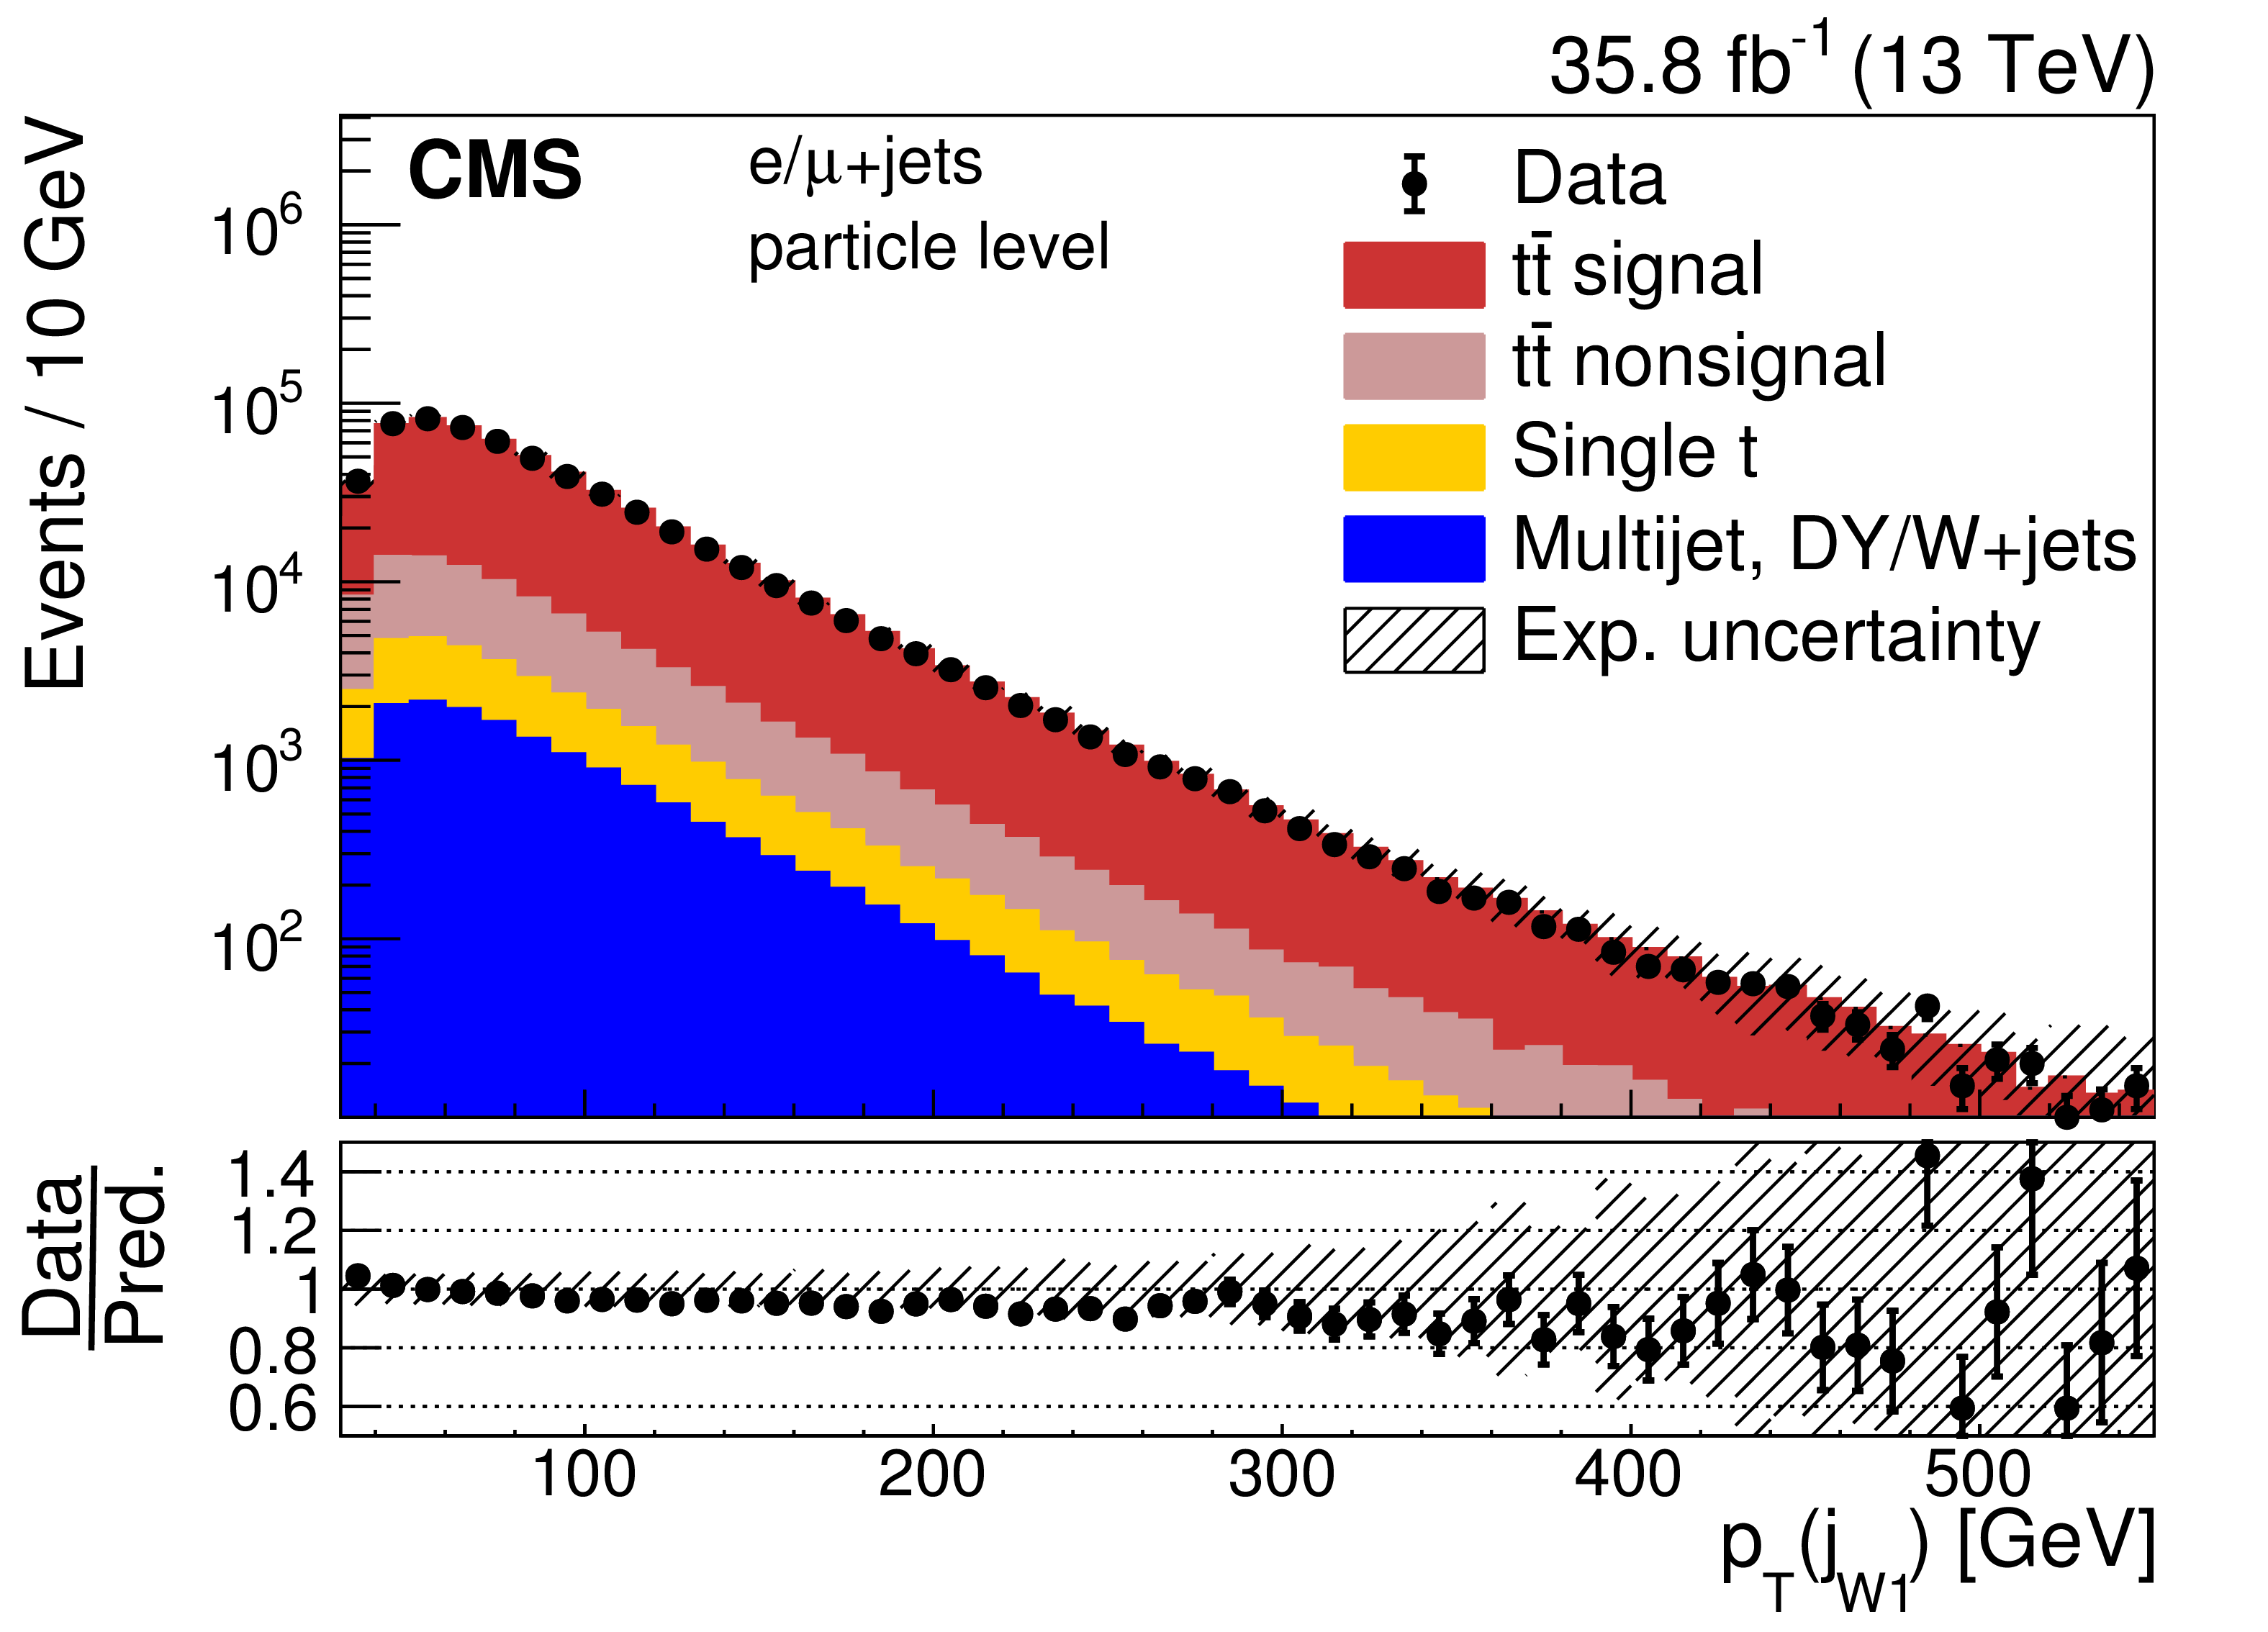
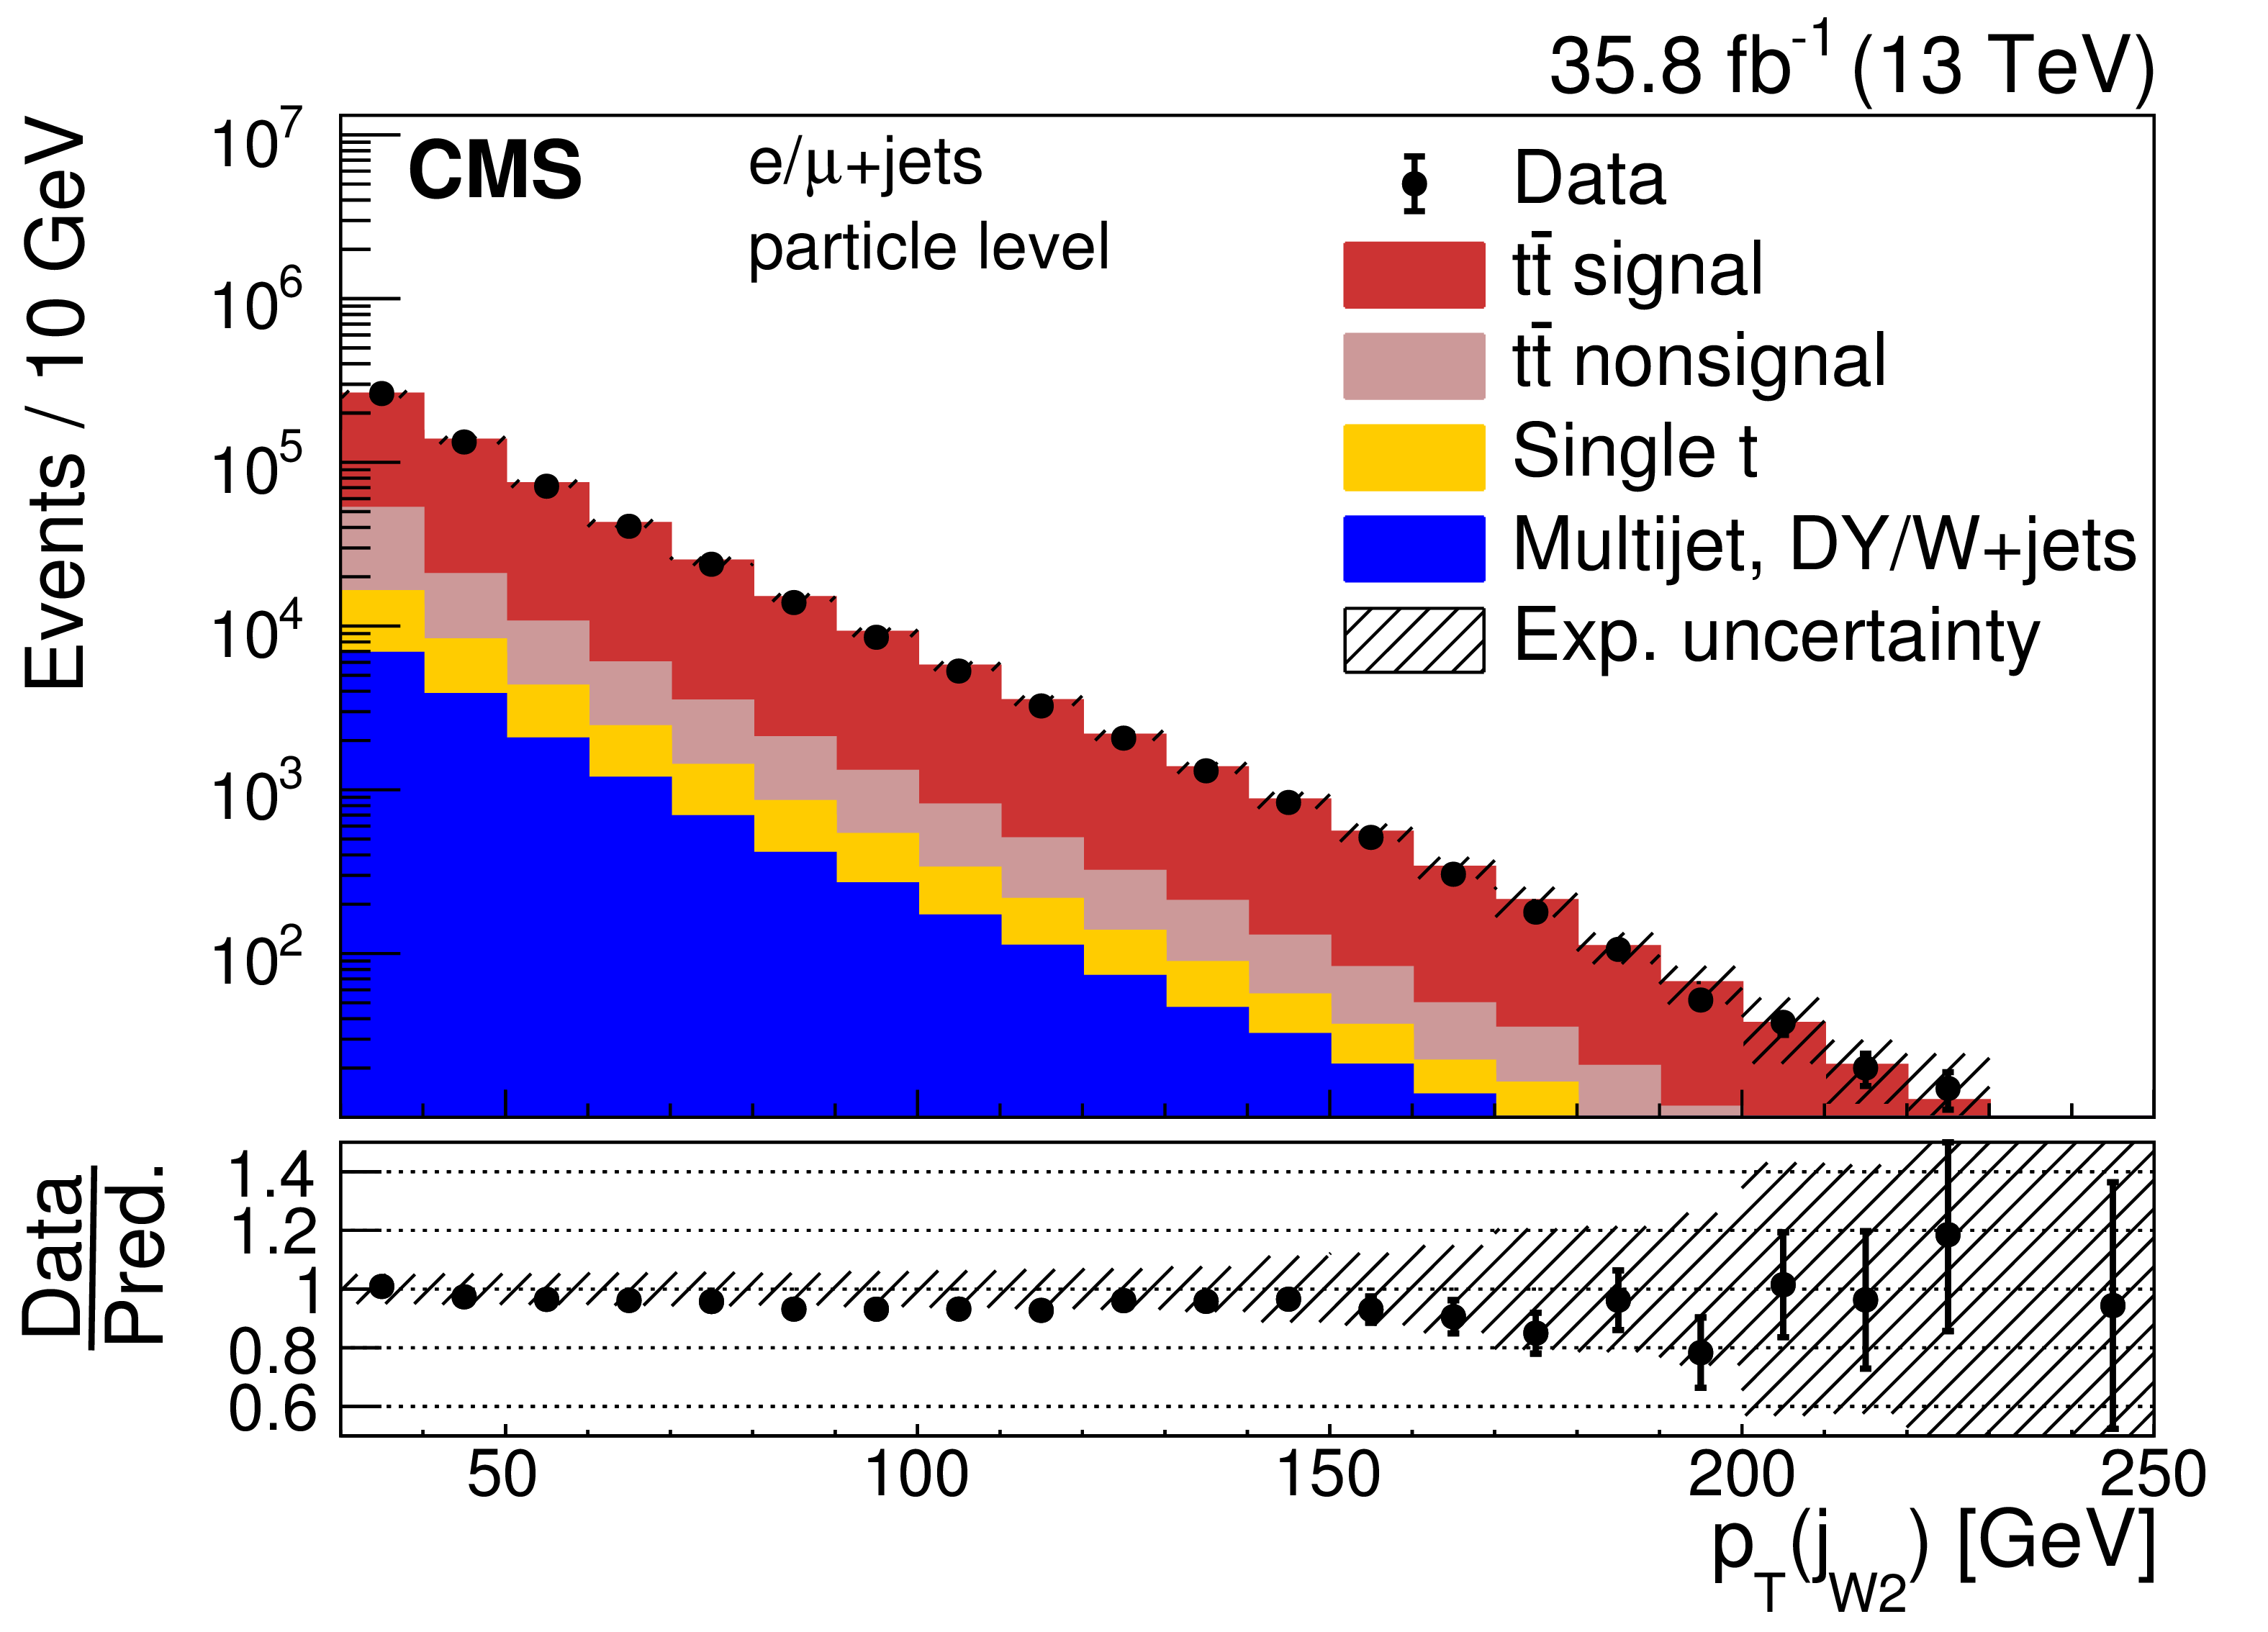
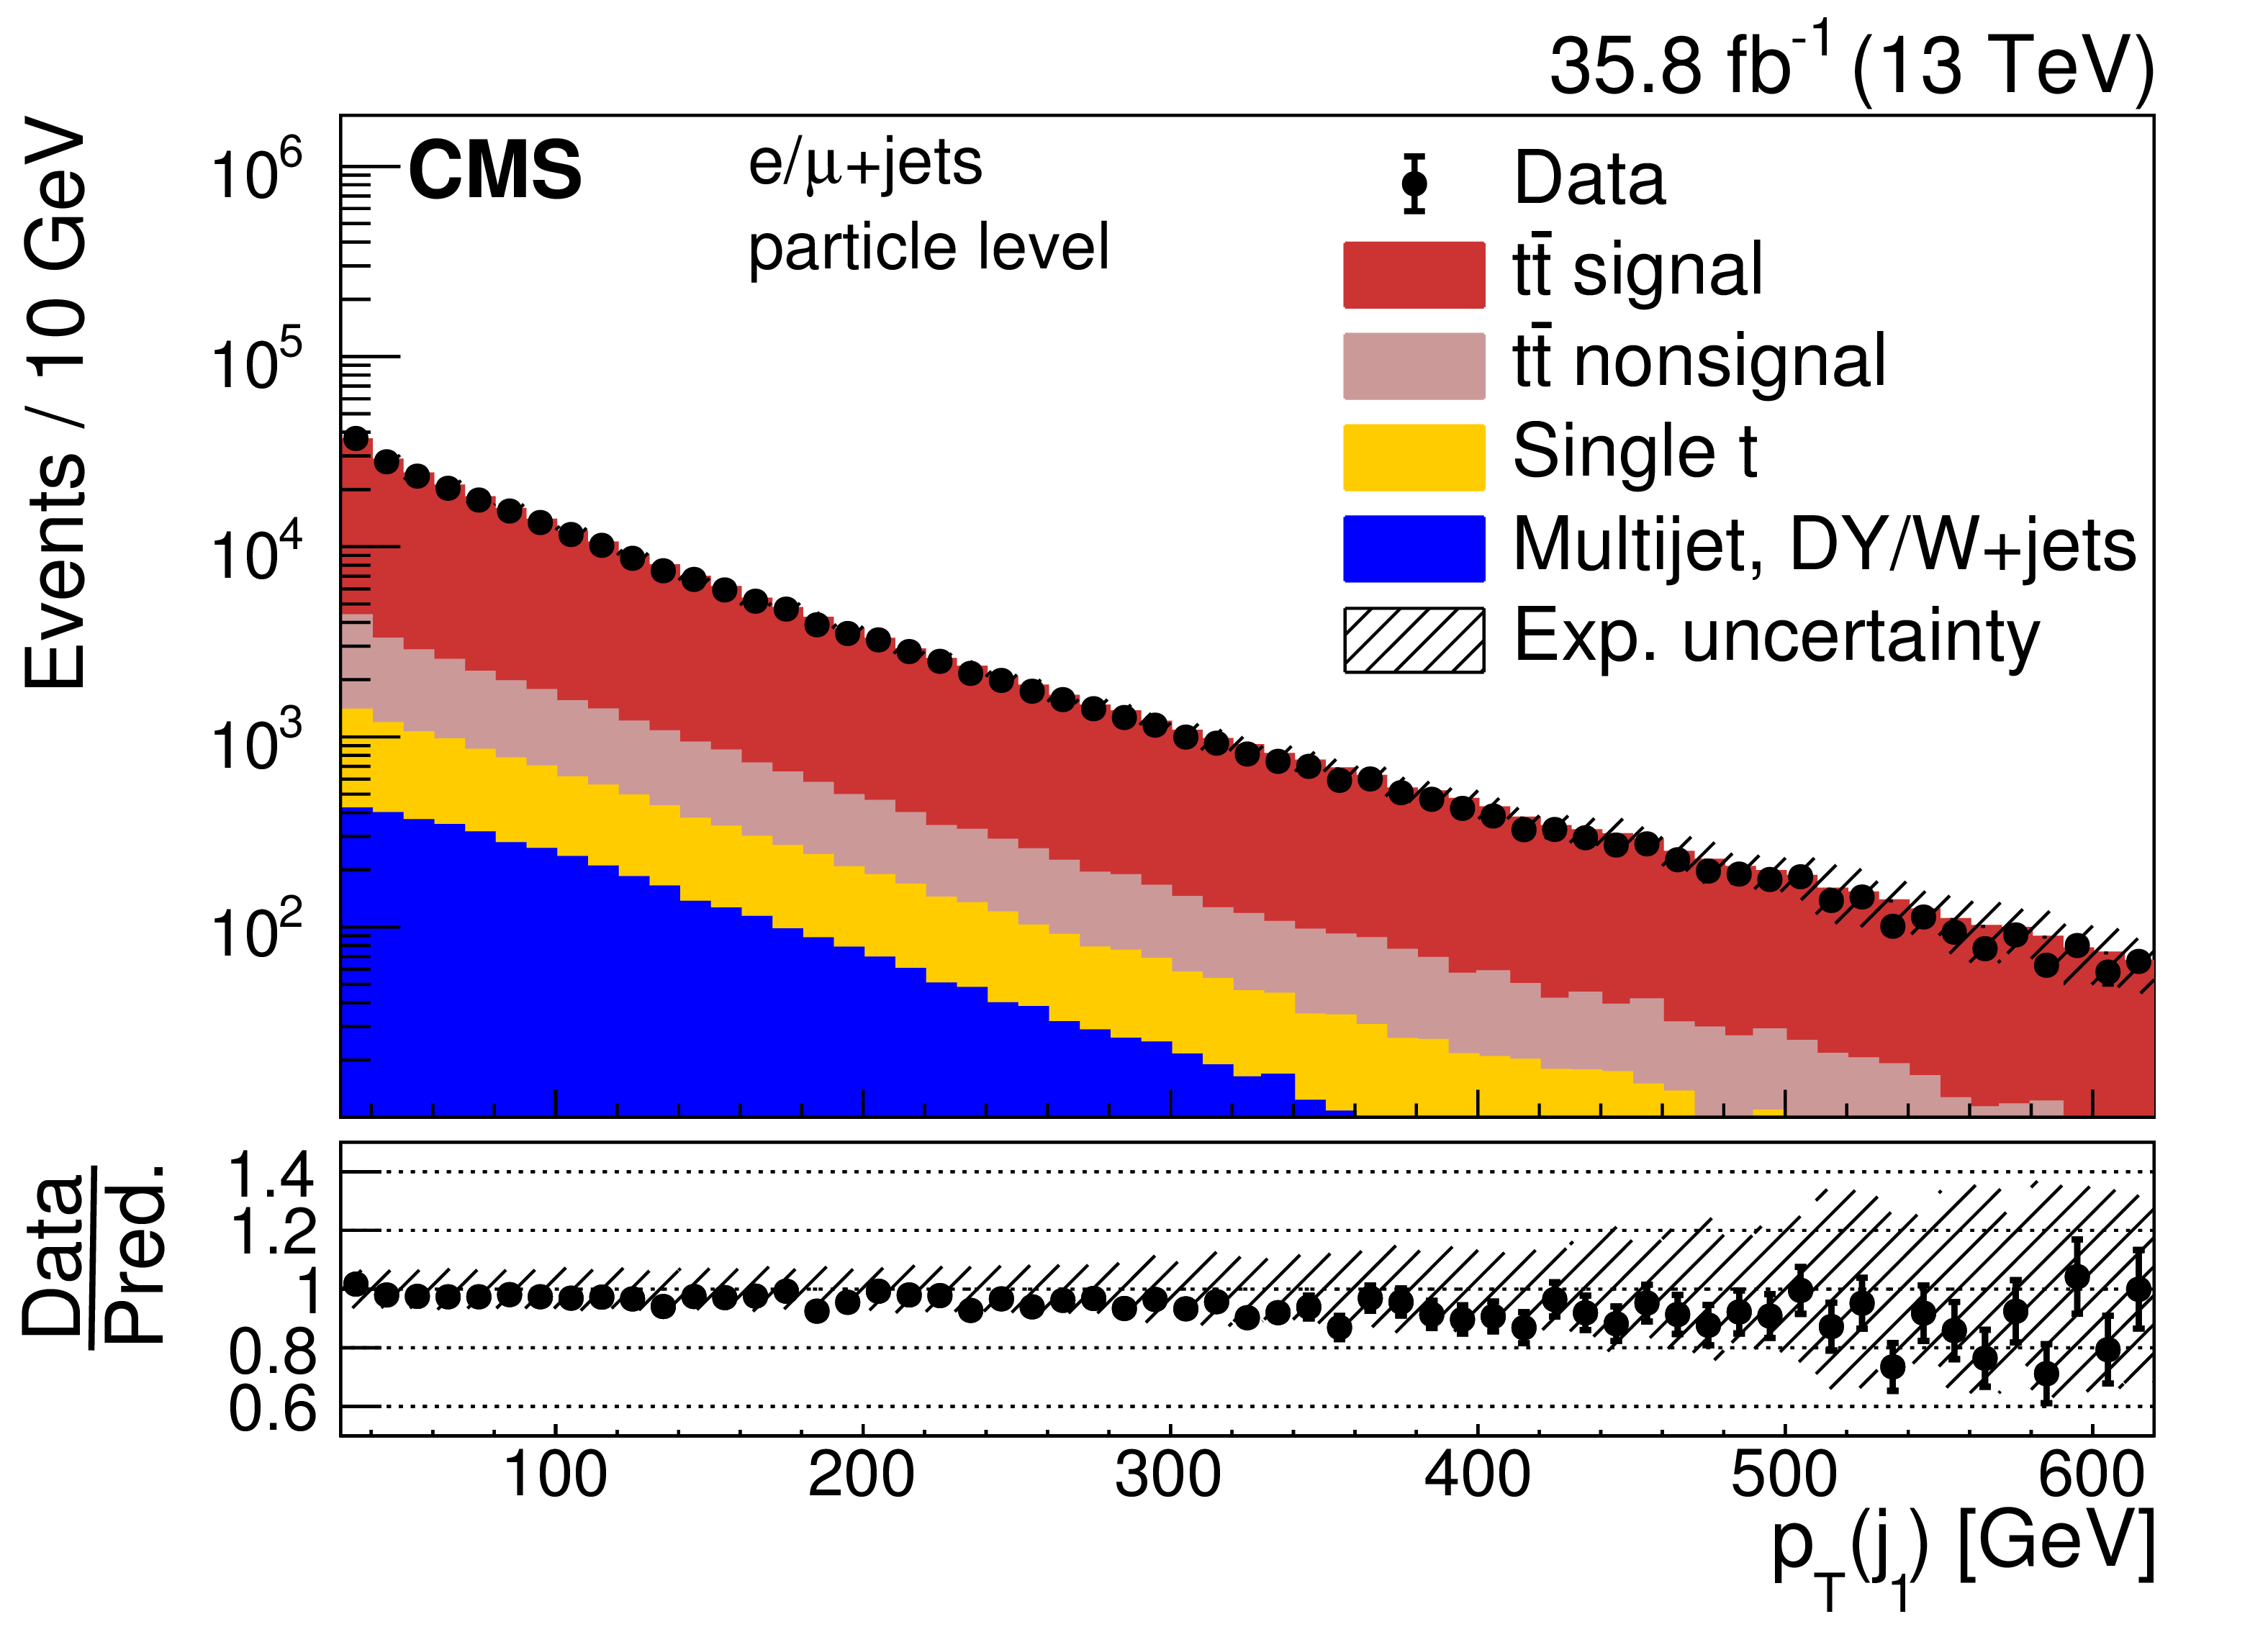
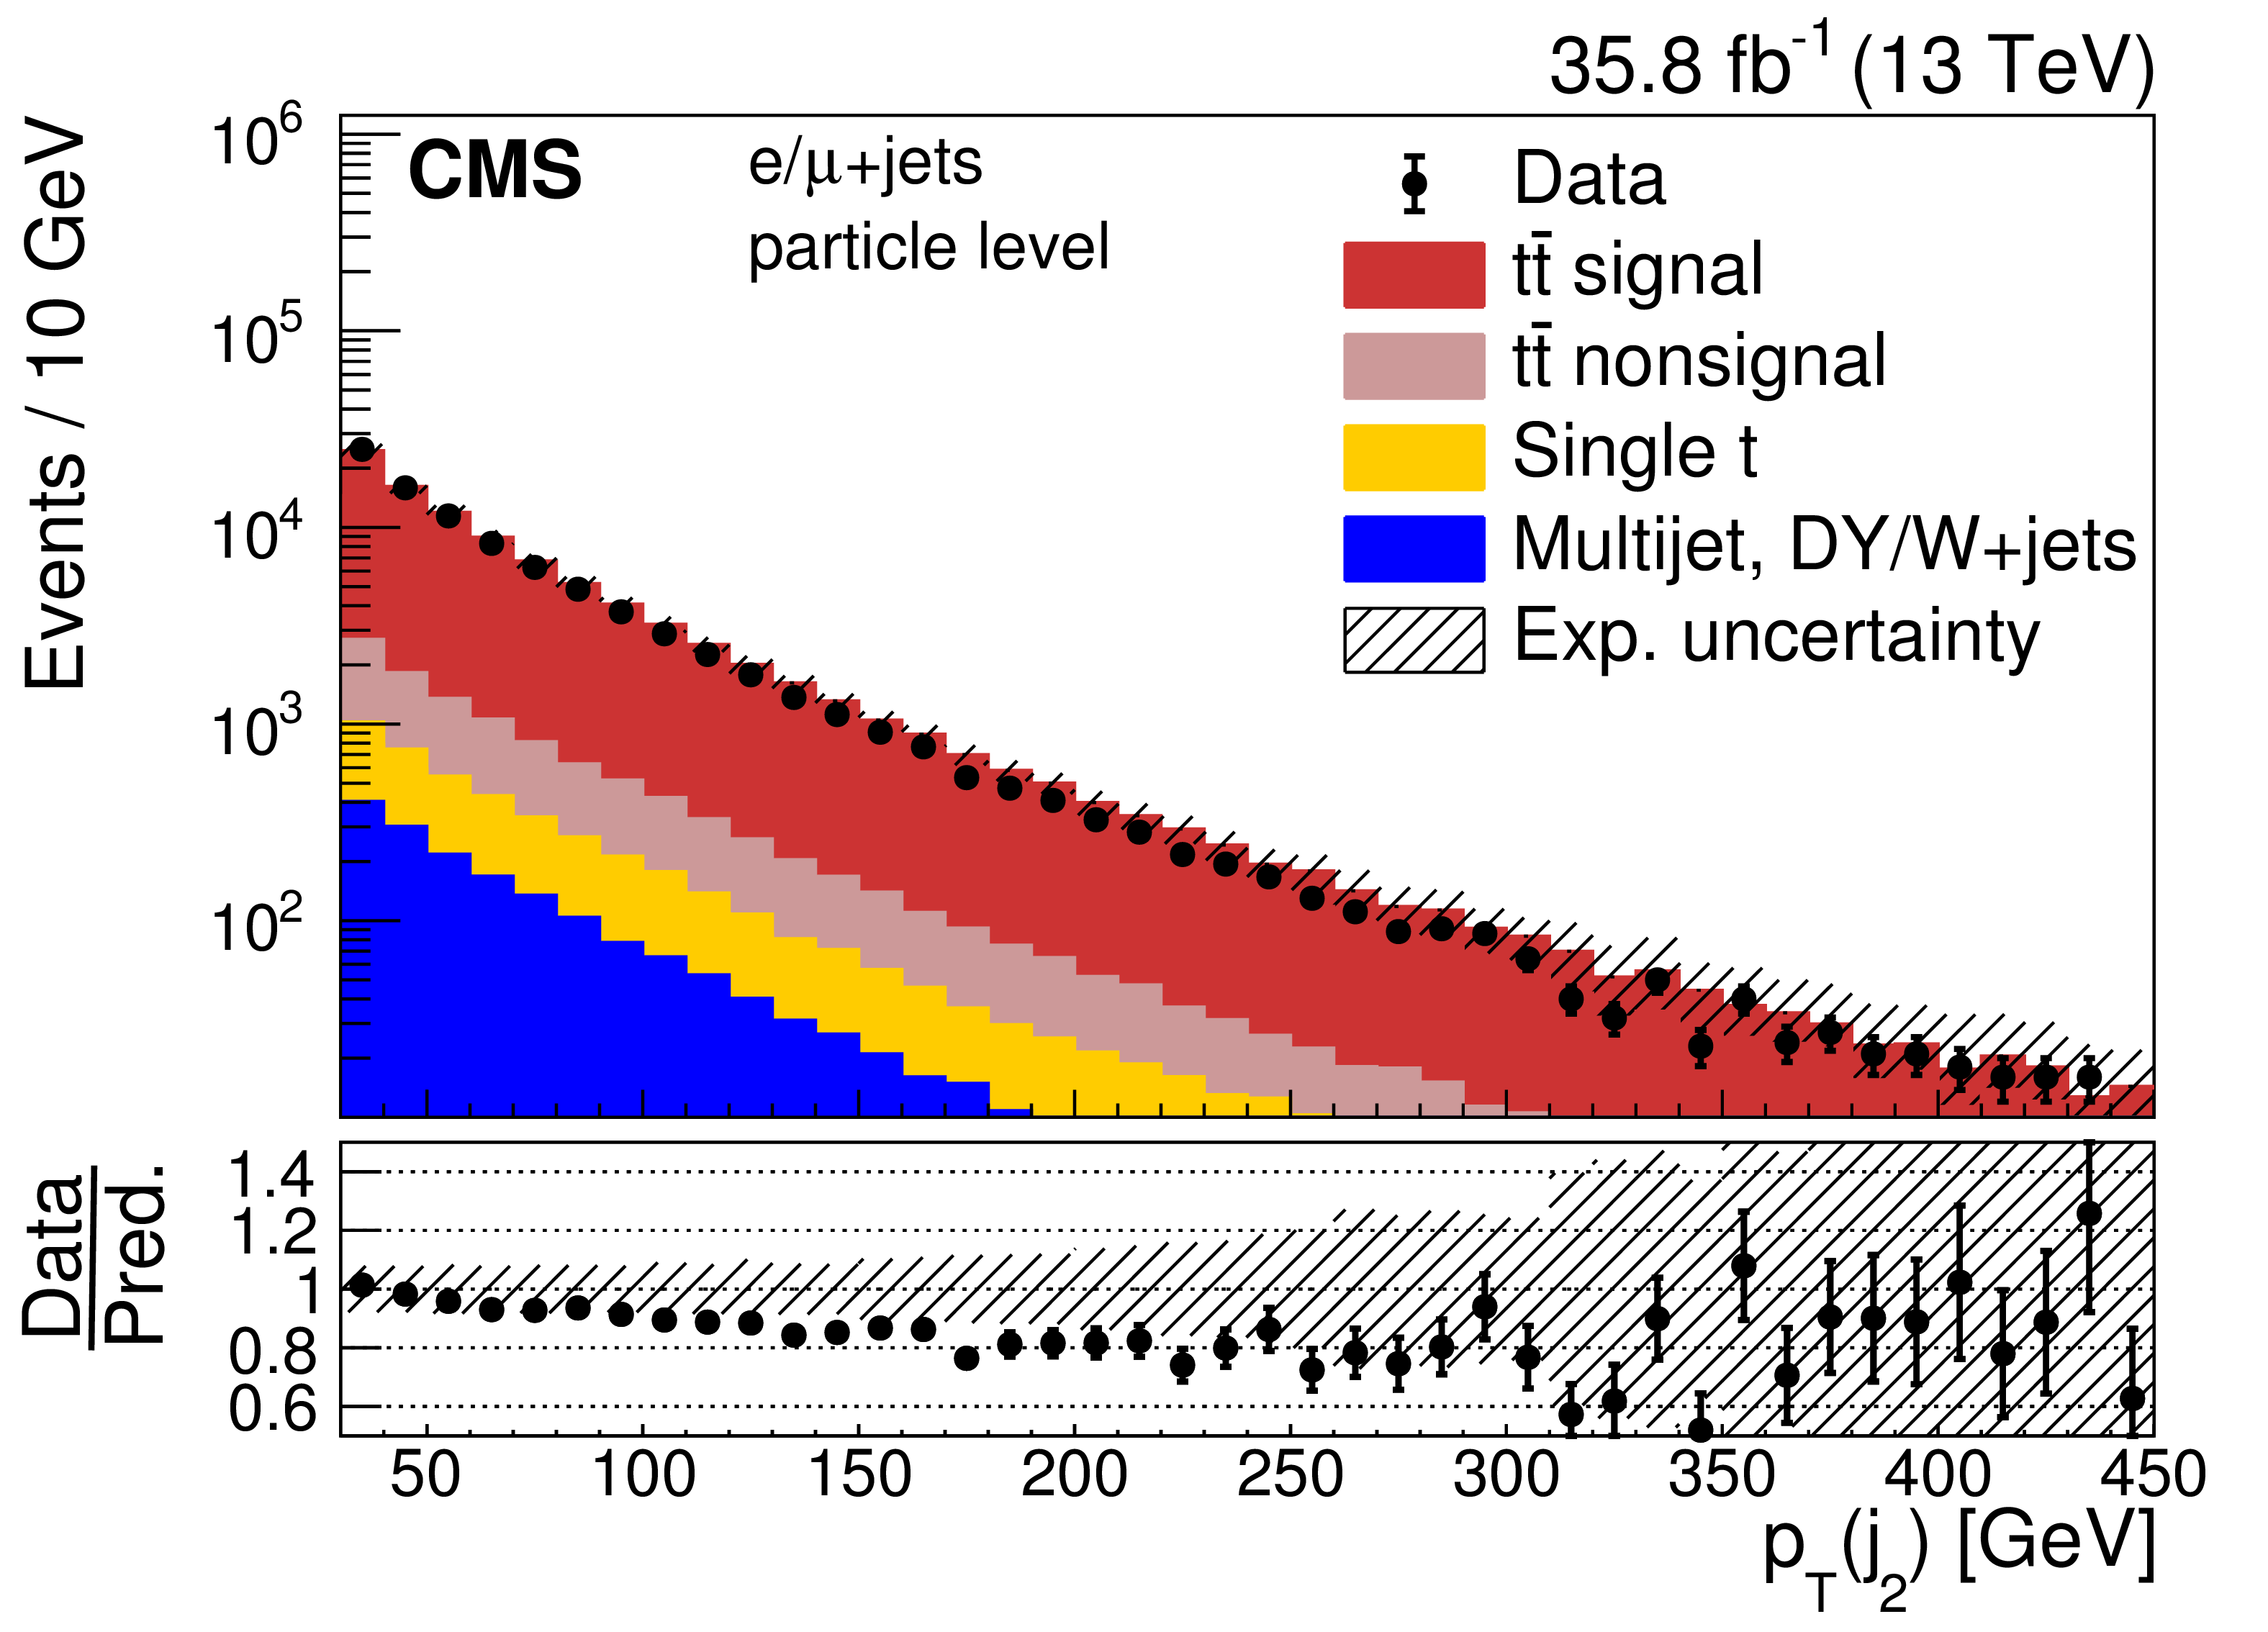
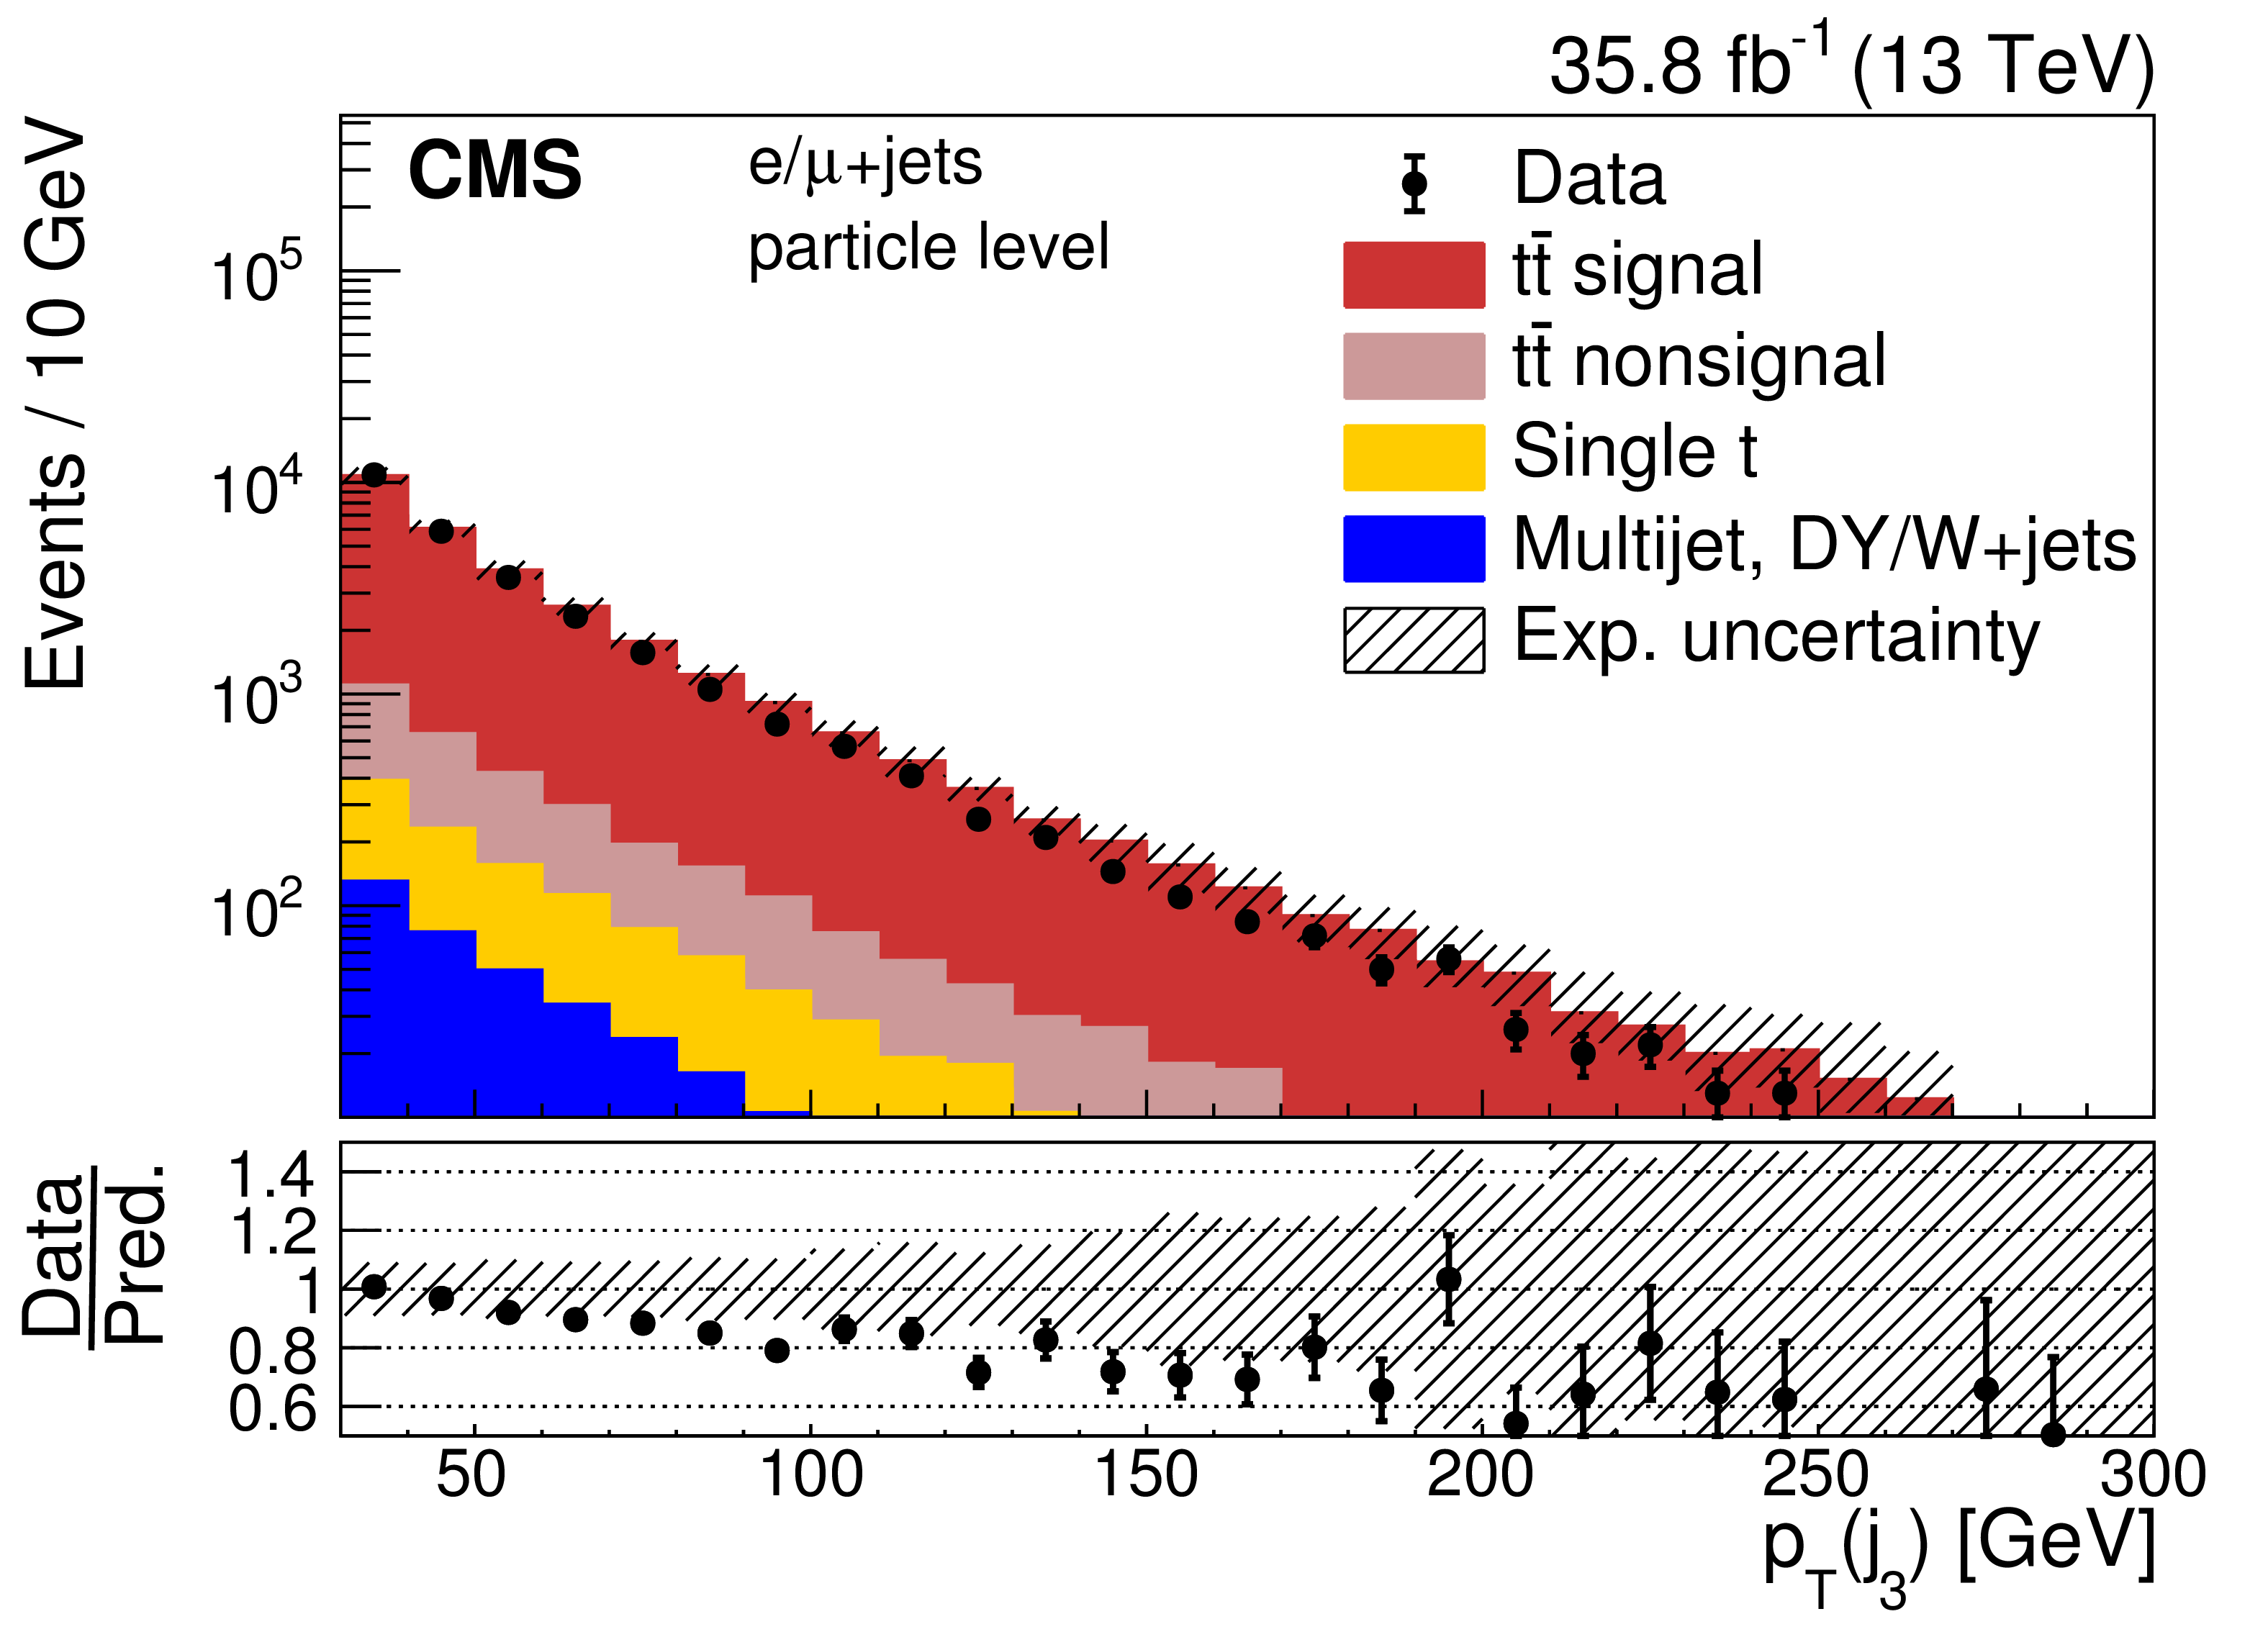
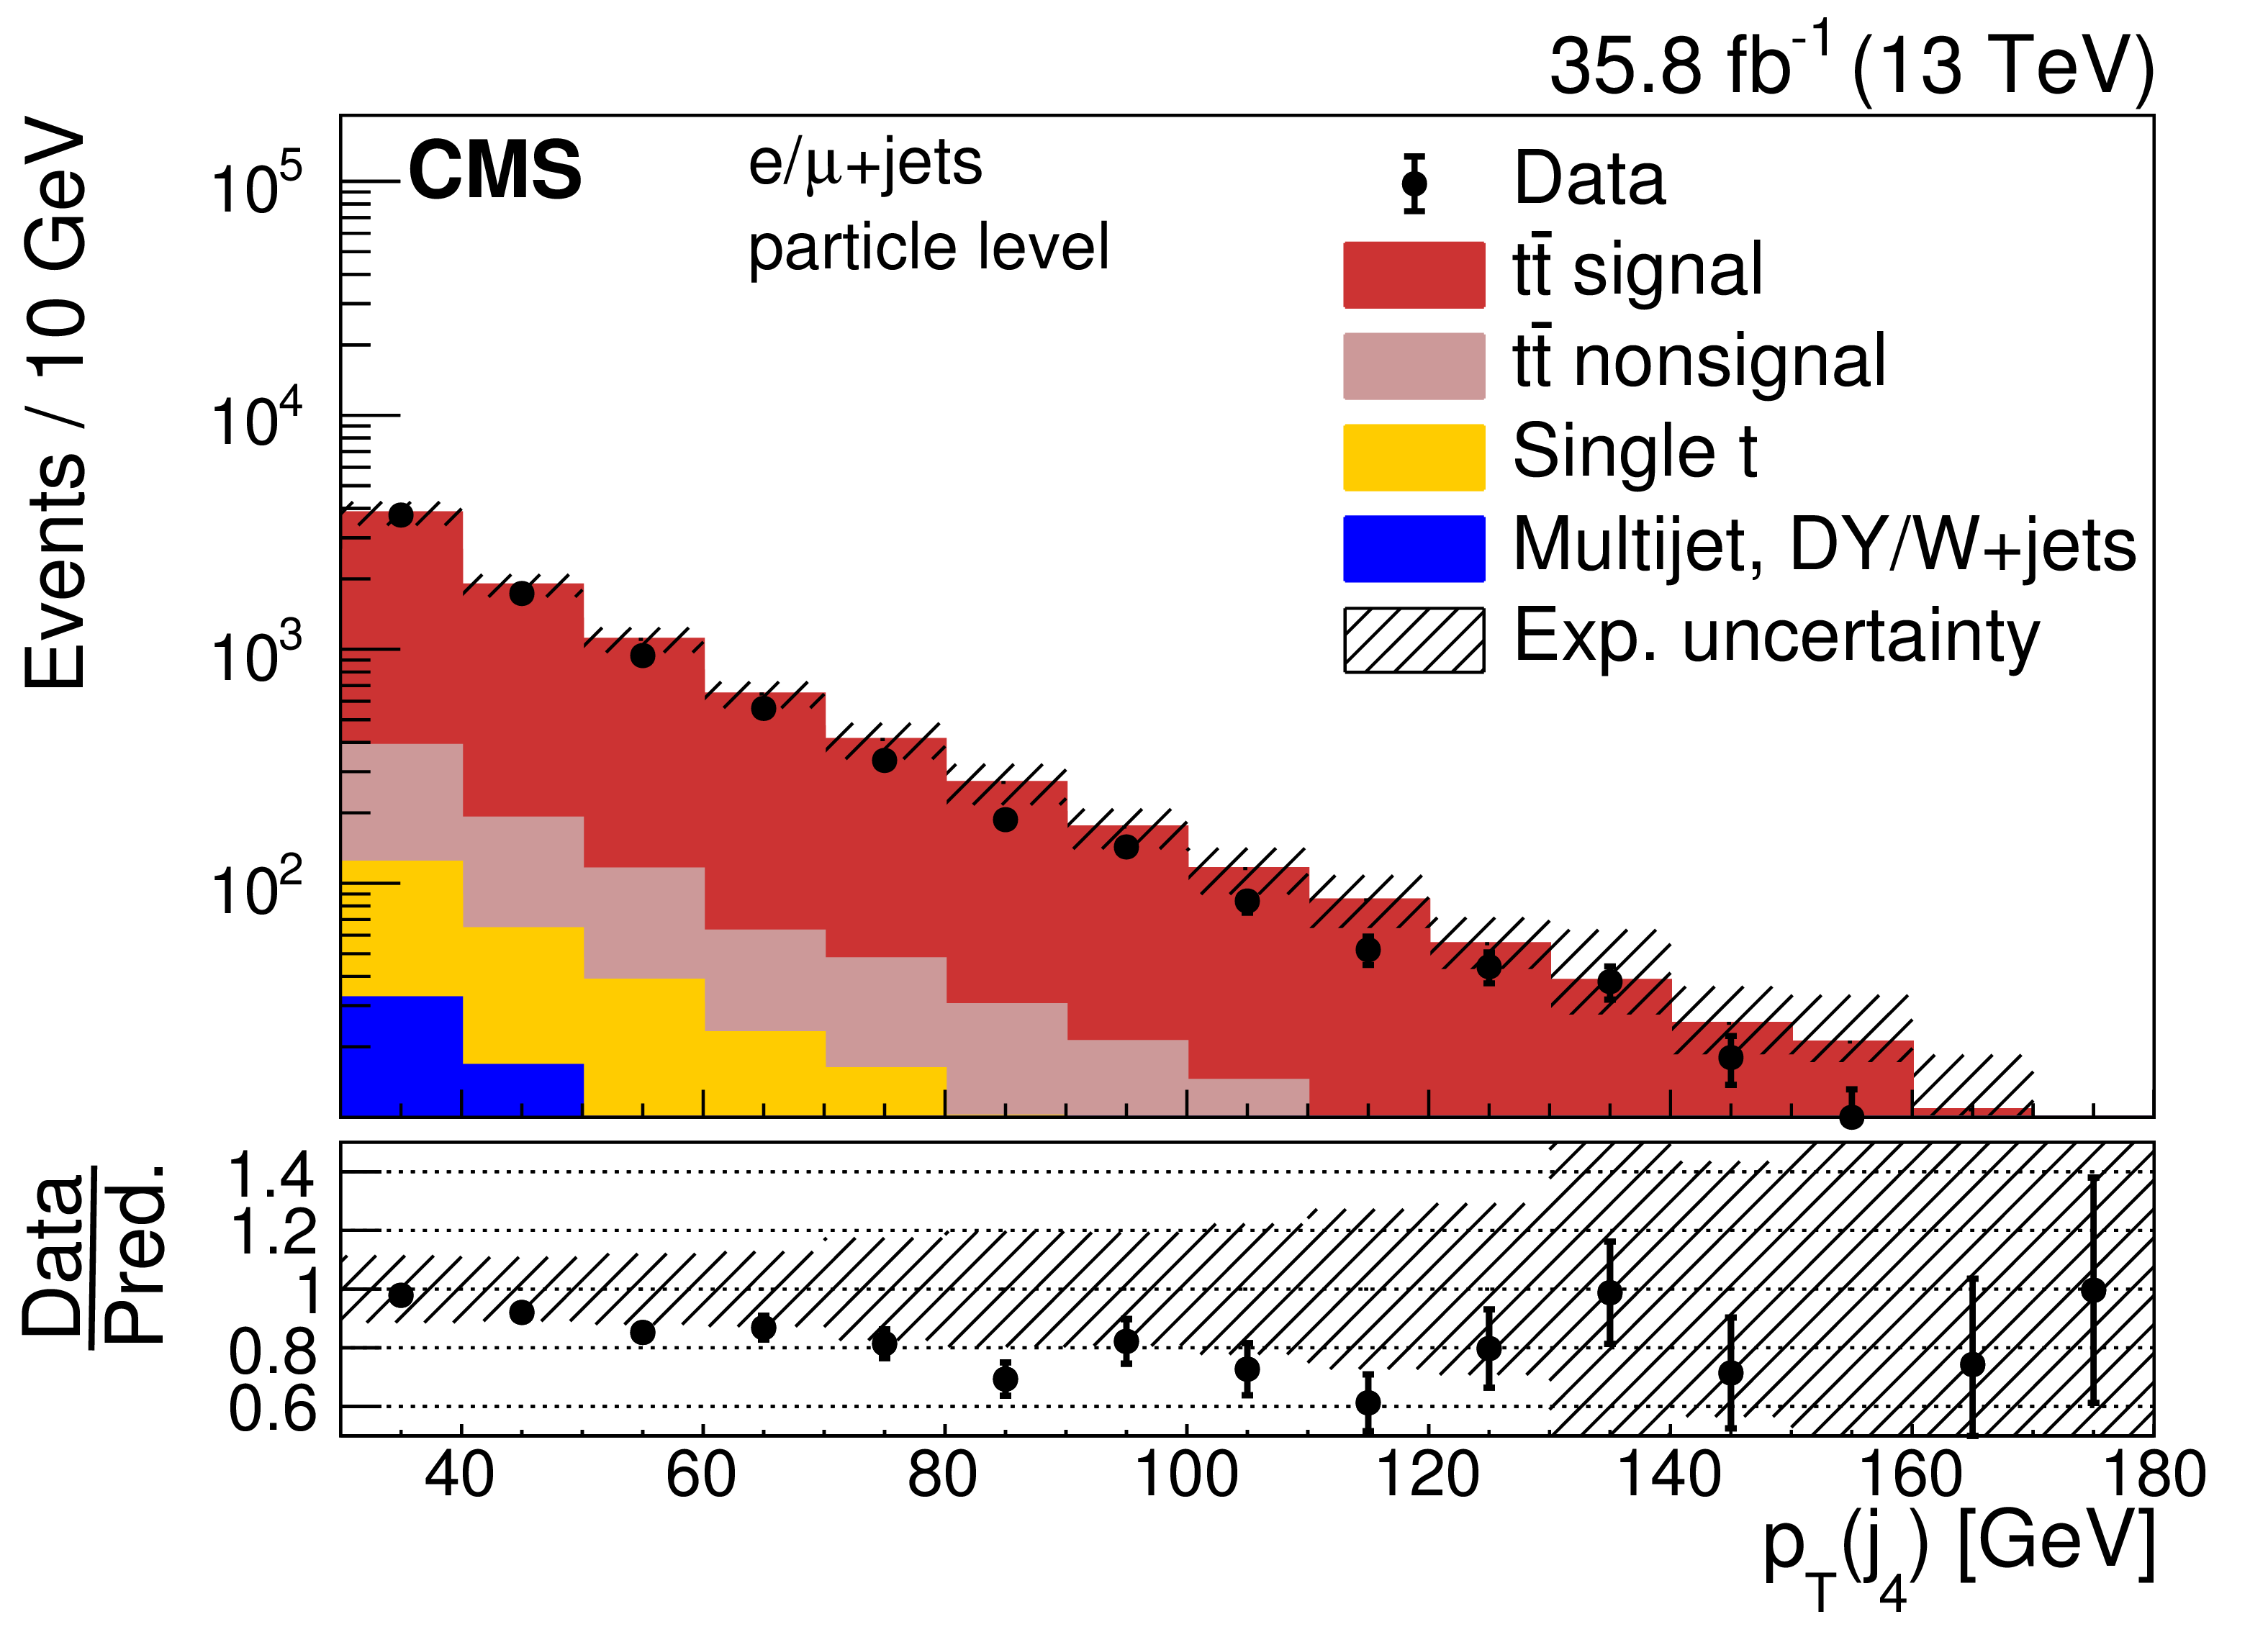
Figure 5:
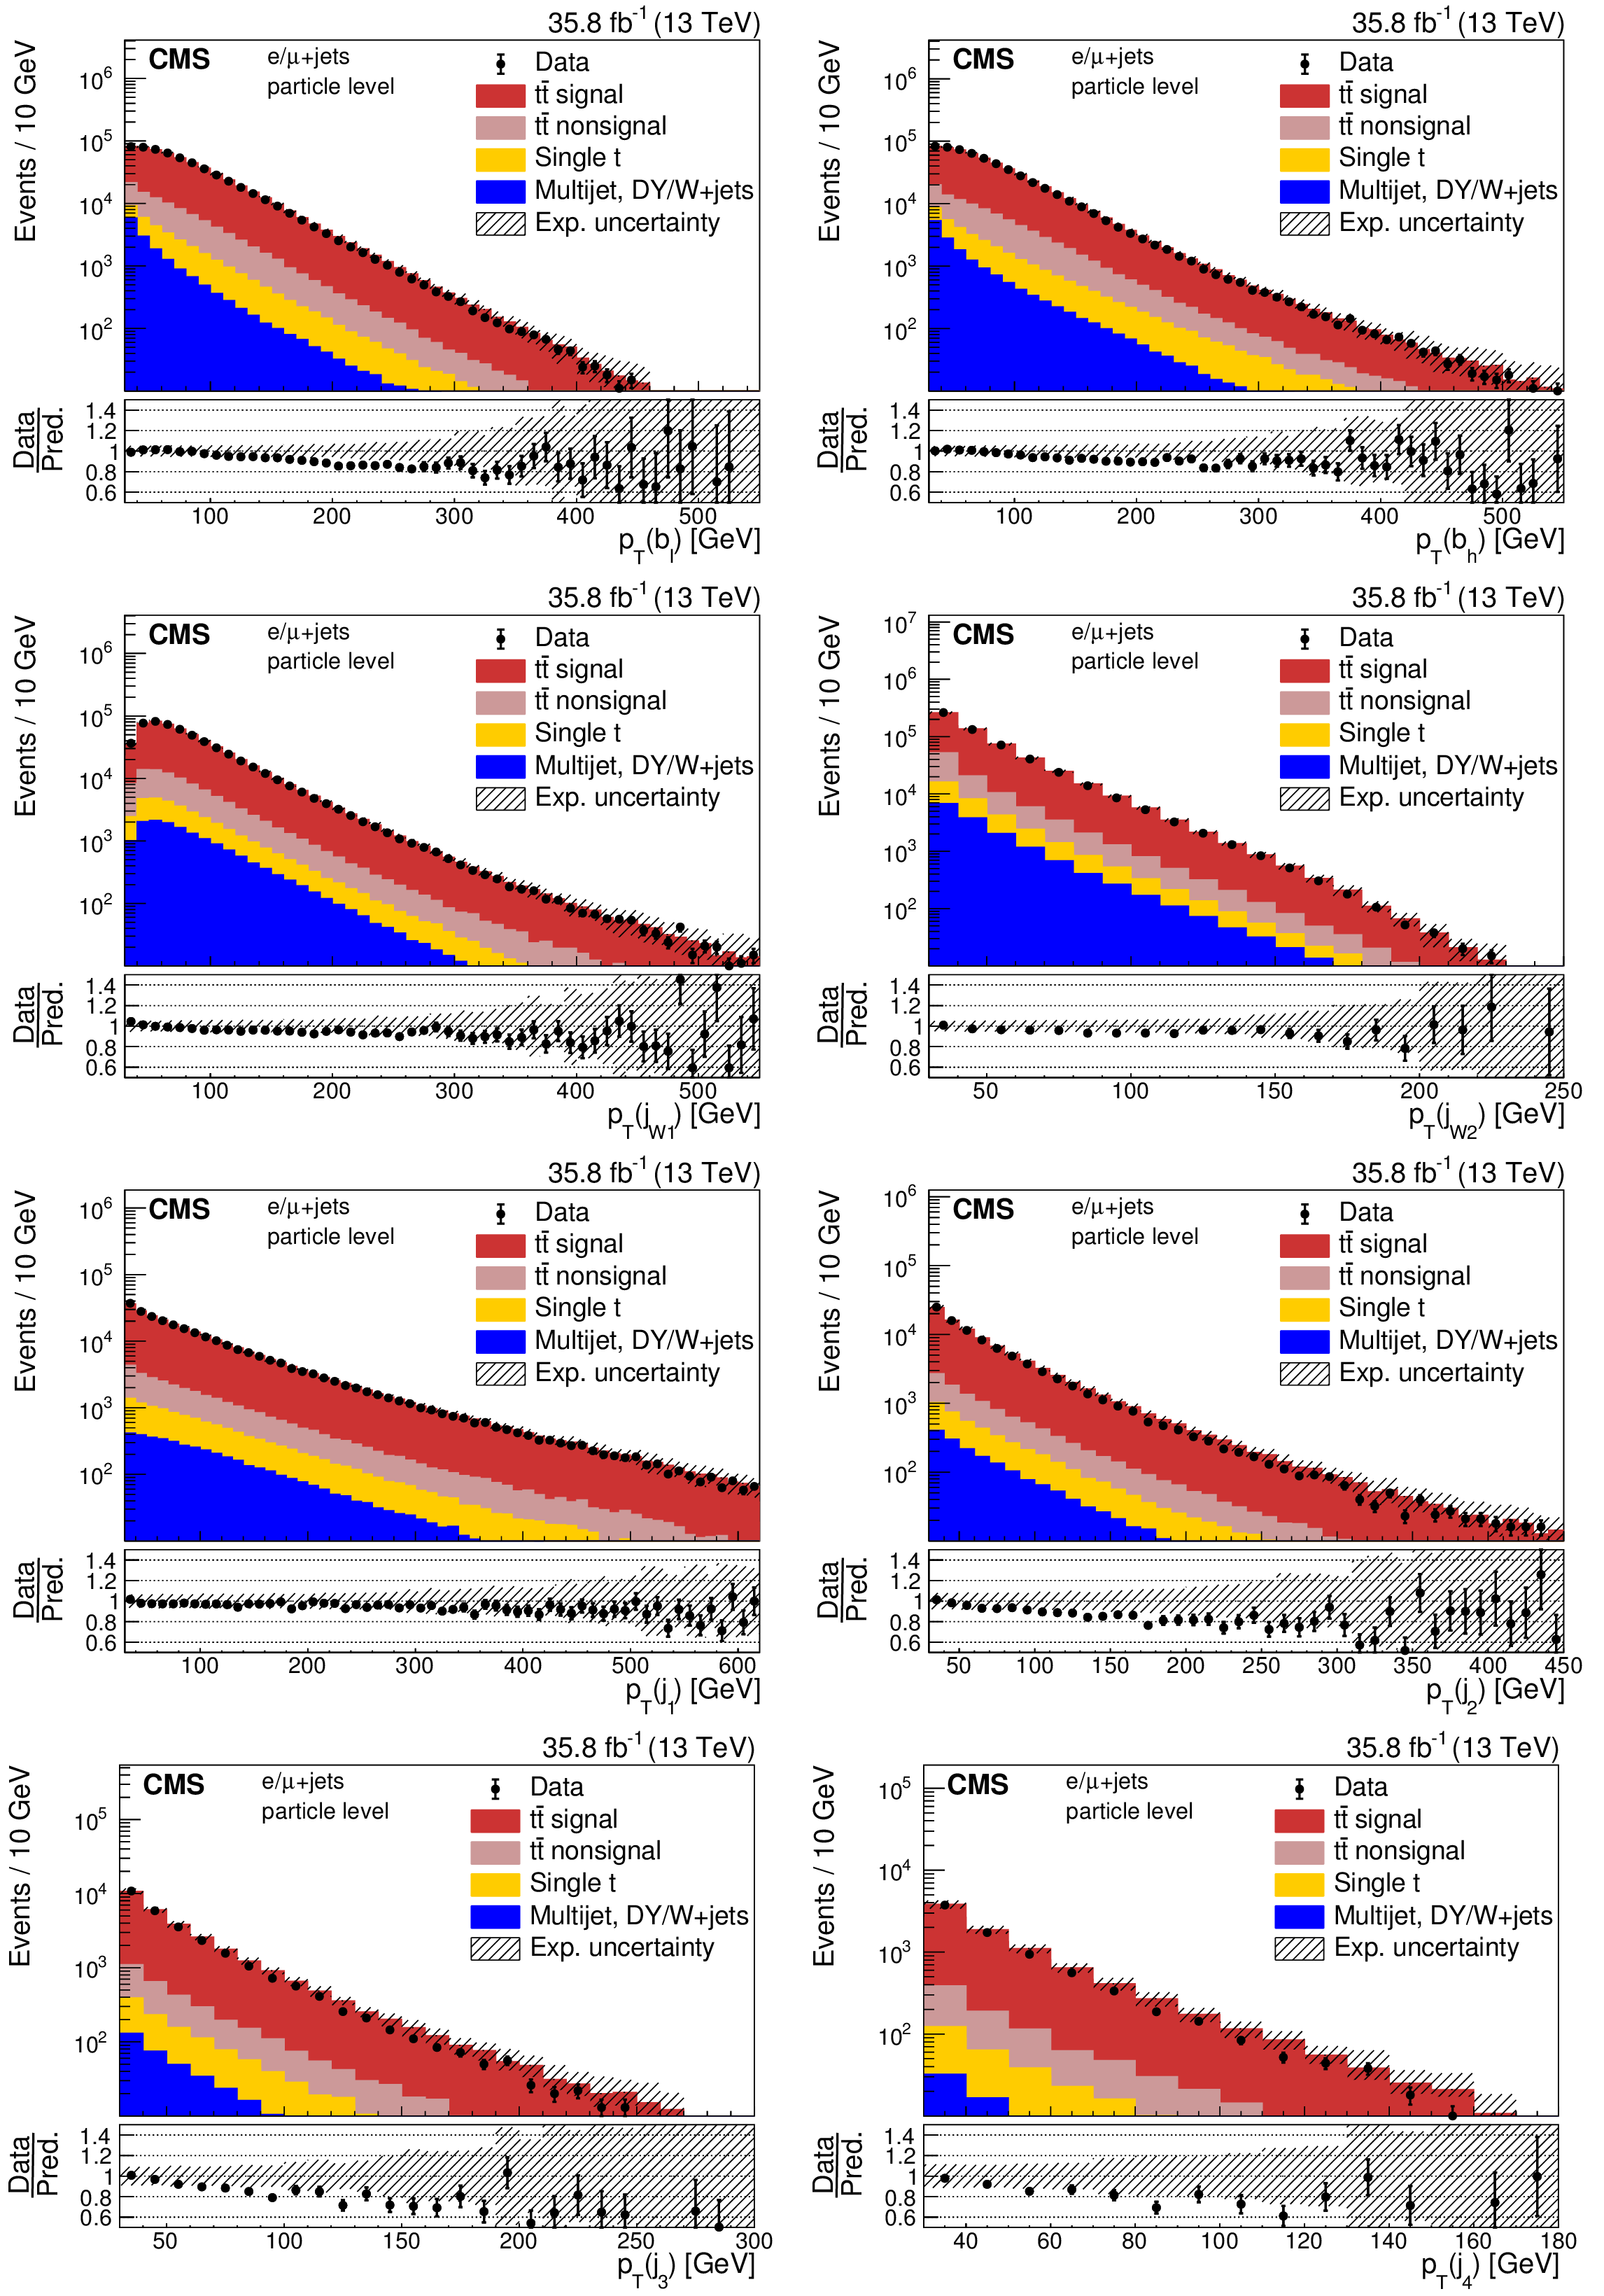
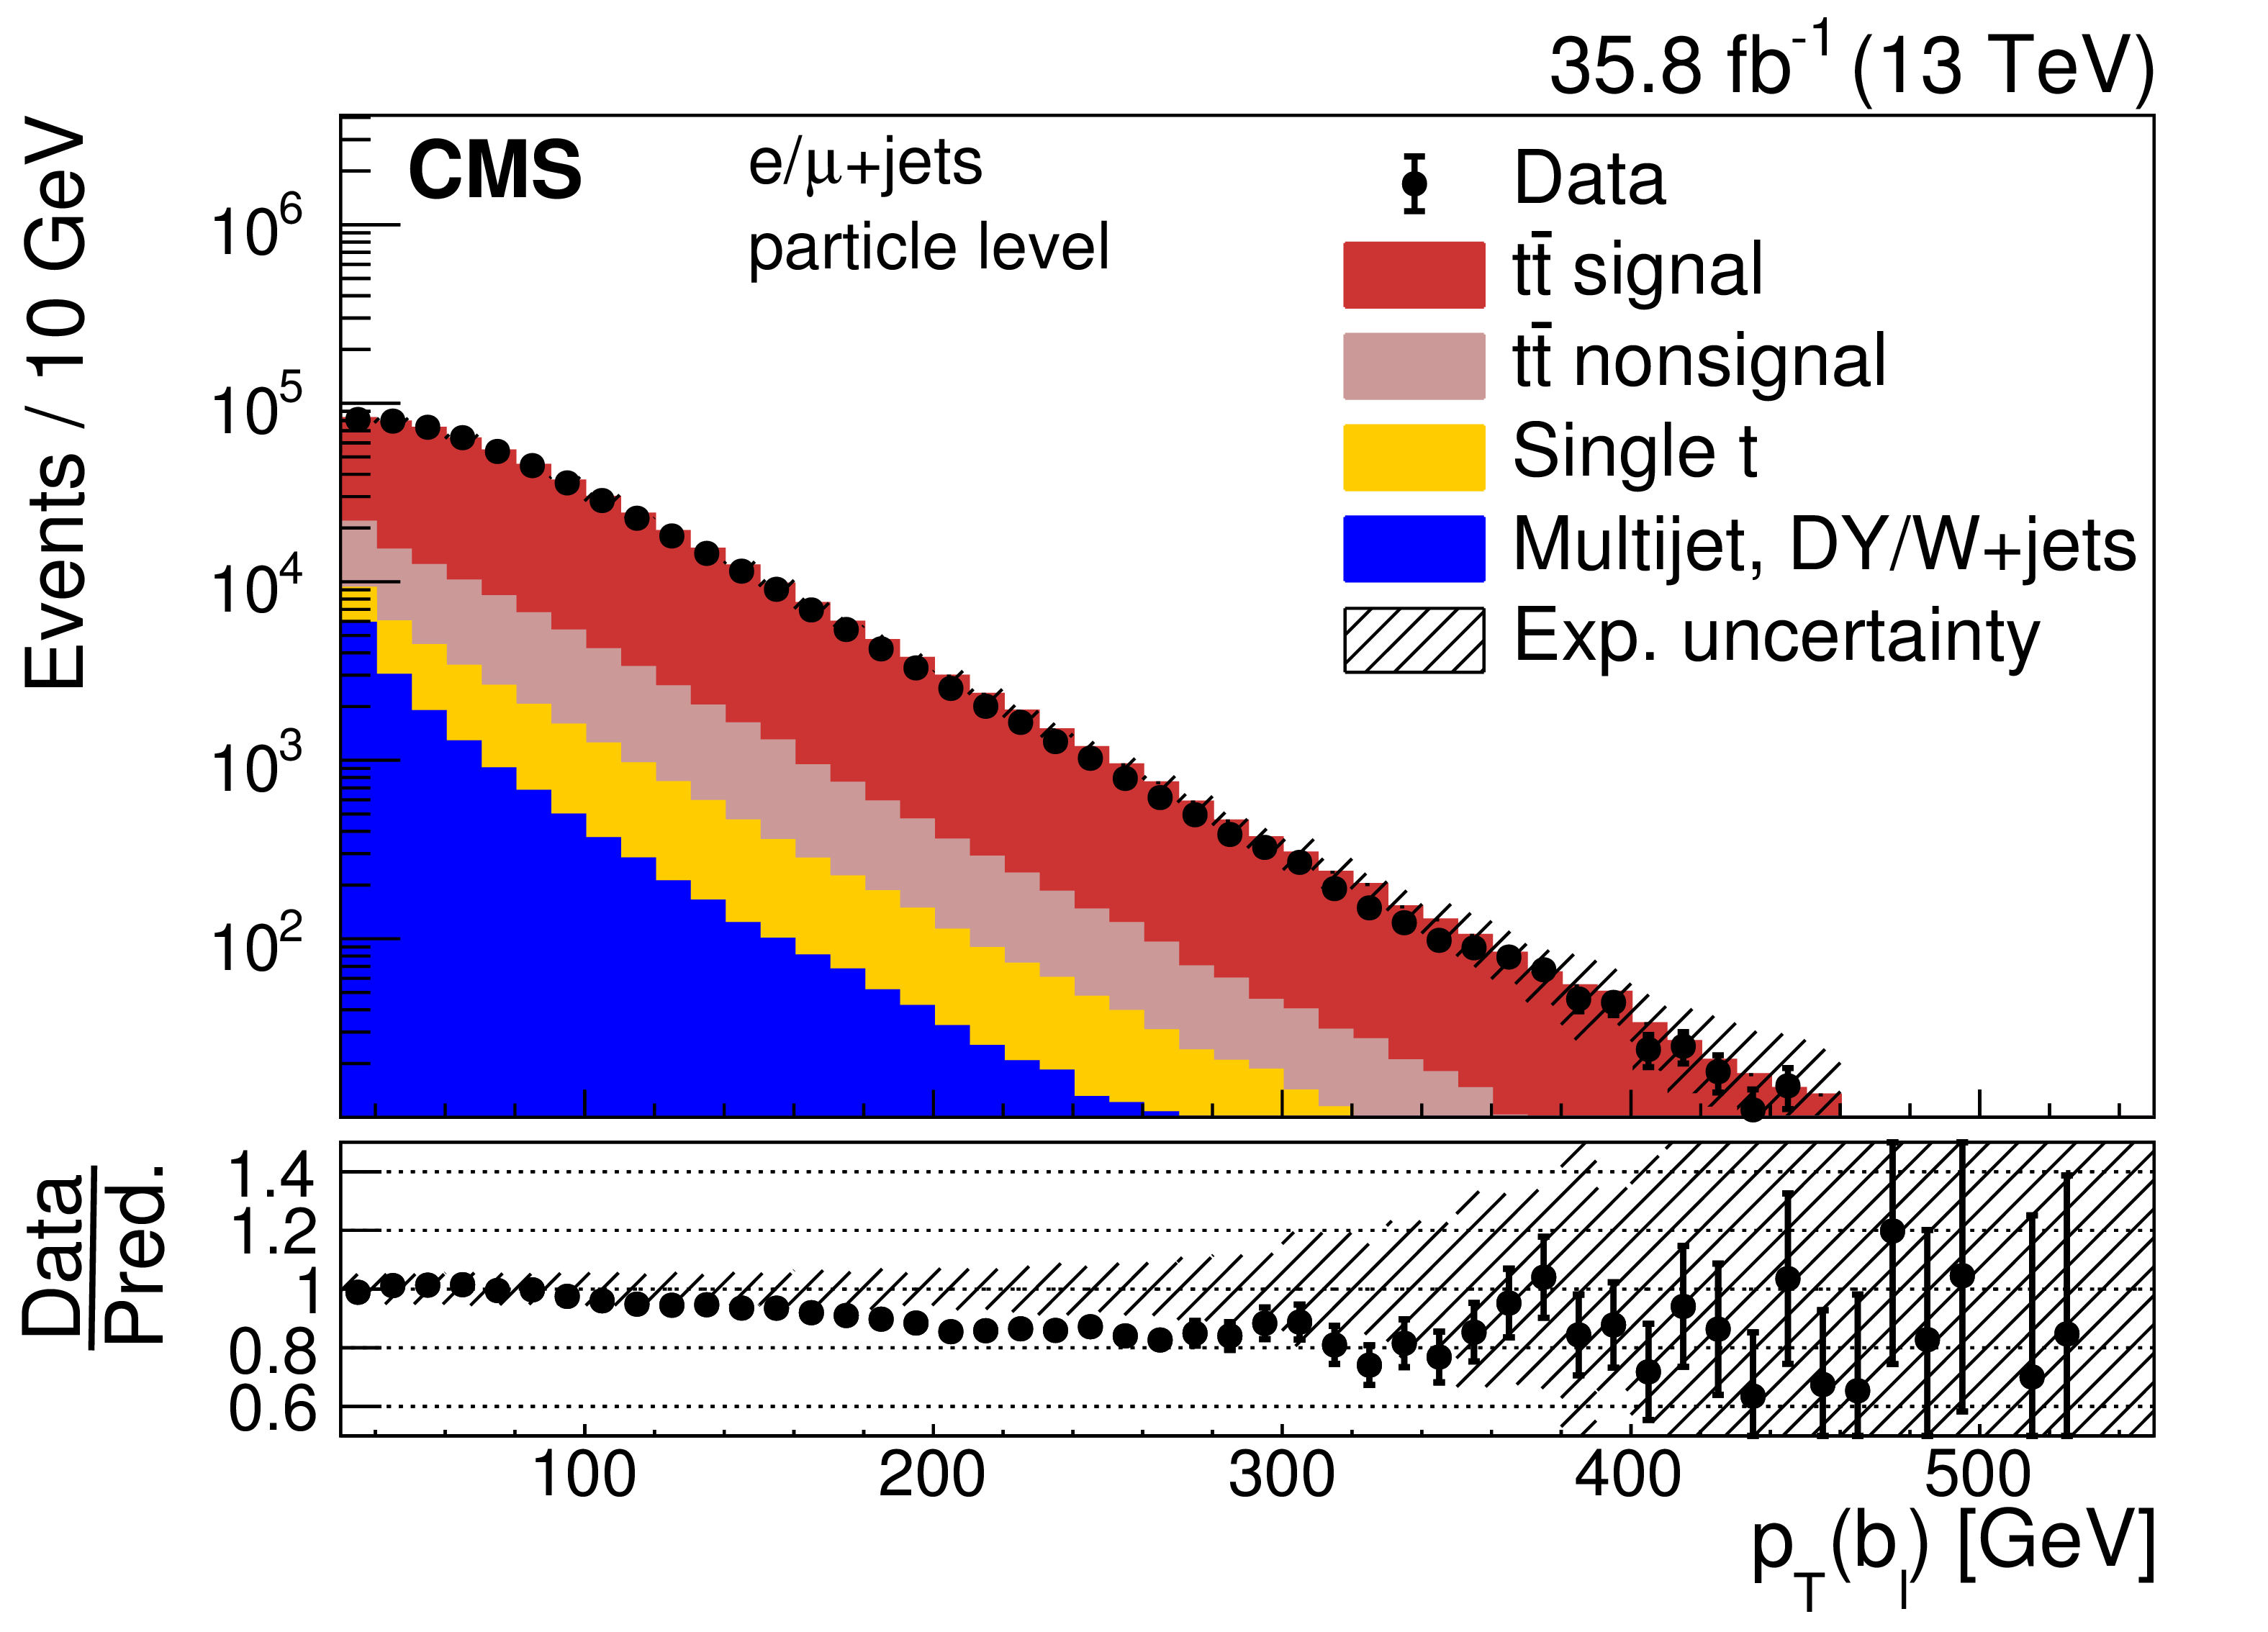
Comparisons between data and simulation at the particle level of the reconstructed distributions of the $ {p_{\mathrm {T}}} $ of jets as identified by the $ {\mathrm{t} \mathrm{\bar{t}}} $ reconstruction algorithm. The simulation of POWHEG+PYTHIA8 is used to describe the $ {\mathrm{t} \mathrm{\bar{t}}} $ production. The contribution of multijet, DY, and W boson plus jets background events is extracted from the data (cf. Section 7). Combined experimental (cf. Section 9) and statistical uncertainties (hatched area) are shown for the total predicted yields. The data points are shown with statistical uncertainties. The ratios of data to the predicted yields are given at the bottom of each panel. |
png pdf |
Figure 5-a:
Comparisons between data and simulation at the particle level of the reconstructed distributions of the $ {p_{\mathrm {T}}} $ of jets as identified by the $ {\mathrm{t} \mathrm{\bar{t}}} $ reconstruction algorithm. The simulation of POWHEG+PYTHIA8 is used to describe the $ {\mathrm{t} \mathrm{\bar{t}}} $ production. The contribution of multijet, DY, and W boson plus jets background events is extracted from the data (cf. Section 7). Combined experimental (cf. Section 9) and statistical uncertainties (hatched area) are shown for the total predicted yields. The data points are shown with statistical uncertainties. The ratios of data to the predicted yields are given at the bottom of each panel. |
png pdf |
Figure 5-b:
Comparisons between data and simulation at the particle level of the reconstructed distributions of the $ {p_{\mathrm {T}}} $ of jets as identified by the $ {\mathrm{t} \mathrm{\bar{t}}} $ reconstruction algorithm. The simulation of POWHEG+PYTHIA8 is used to describe the $ {\mathrm{t} \mathrm{\bar{t}}} $ production. The contribution of multijet, DY, and W boson plus jets background events is extracted from the data (cf. Section 7). Combined experimental (cf. Section 9) and statistical uncertainties (hatched area) are shown for the total predicted yields. The data points are shown with statistical uncertainties. The ratios of data to the predicted yields are given at the bottom of each panel. |
png pdf |
Figure 5-c:
Comparisons between data and simulation at the particle level of the reconstructed distributions of the $ {p_{\mathrm {T}}} $ of jets as identified by the $ {\mathrm{t} \mathrm{\bar{t}}} $ reconstruction algorithm. The simulation of POWHEG+PYTHIA8 is used to describe the $ {\mathrm{t} \mathrm{\bar{t}}} $ production. The contribution of multijet, DY, and W boson plus jets background events is extracted from the data (cf. Section 7). Combined experimental (cf. Section 9) and statistical uncertainties (hatched area) are shown for the total predicted yields. The data points are shown with statistical uncertainties. The ratios of data to the predicted yields are given at the bottom of each panel. |
png pdf |
Figure 5-d:
Comparisons between data and simulation at the particle level of the reconstructed distributions of the $ {p_{\mathrm {T}}} $ of jets as identified by the $ {\mathrm{t} \mathrm{\bar{t}}} $ reconstruction algorithm. The simulation of POWHEG+PYTHIA8 is used to describe the $ {\mathrm{t} \mathrm{\bar{t}}} $ production. The contribution of multijet, DY, and W boson plus jets background events is extracted from the data (cf. Section 7). Combined experimental (cf. Section 9) and statistical uncertainties (hatched area) are shown for the total predicted yields. The data points are shown with statistical uncertainties. The ratios of data to the predicted yields are given at the bottom of each panel. |
png pdf |
Figure 5-e:
Comparisons between data and simulation at the particle level of the reconstructed distributions of the $ {p_{\mathrm {T}}} $ of jets as identified by the $ {\mathrm{t} \mathrm{\bar{t}}} $ reconstruction algorithm. The simulation of POWHEG+PYTHIA8 is used to describe the $ {\mathrm{t} \mathrm{\bar{t}}} $ production. The contribution of multijet, DY, and W boson plus jets background events is extracted from the data (cf. Section 7). Combined experimental (cf. Section 9) and statistical uncertainties (hatched area) are shown for the total predicted yields. The data points are shown with statistical uncertainties. The ratios of data to the predicted yields are given at the bottom of each panel. |
png pdf |
Figure 5-f:
Comparisons between data and simulation at the particle level of the reconstructed distributions of the $ {p_{\mathrm {T}}} $ of jets as identified by the $ {\mathrm{t} \mathrm{\bar{t}}} $ reconstruction algorithm. The simulation of POWHEG+PYTHIA8 is used to describe the $ {\mathrm{t} \mathrm{\bar{t}}} $ production. The contribution of multijet, DY, and W boson plus jets background events is extracted from the data (cf. Section 7). Combined experimental (cf. Section 9) and statistical uncertainties (hatched area) are shown for the total predicted yields. The data points are shown with statistical uncertainties. The ratios of data to the predicted yields are given at the bottom of each panel. |
png pdf |
Figure 5-g:
Comparisons between data and simulation at the particle level of the reconstructed distributions of the $ {p_{\mathrm {T}}} $ of jets as identified by the $ {\mathrm{t} \mathrm{\bar{t}}} $ reconstruction algorithm. The simulation of POWHEG+PYTHIA8 is used to describe the $ {\mathrm{t} \mathrm{\bar{t}}} $ production. The contribution of multijet, DY, and W boson plus jets background events is extracted from the data (cf. Section 7). Combined experimental (cf. Section 9) and statistical uncertainties (hatched area) are shown for the total predicted yields. The data points are shown with statistical uncertainties. The ratios of data to the predicted yields are given at the bottom of each panel. |
png pdf |
Figure 5-h:
Comparisons between data and simulation at the particle level of the reconstructed distributions of the $ {p_{\mathrm {T}}} $ of jets as identified by the $ {\mathrm{t} \mathrm{\bar{t}}} $ reconstruction algorithm. The simulation of POWHEG+PYTHIA8 is used to describe the $ {\mathrm{t} \mathrm{\bar{t}}} $ production. The contribution of multijet, DY, and W boson plus jets background events is extracted from the data (cf. Section 7). Combined experimental (cf. Section 9) and statistical uncertainties (hatched area) are shown for the total predicted yields. The data points are shown with statistical uncertainties. The ratios of data to the predicted yields are given at the bottom of each panel. |
png pdf |
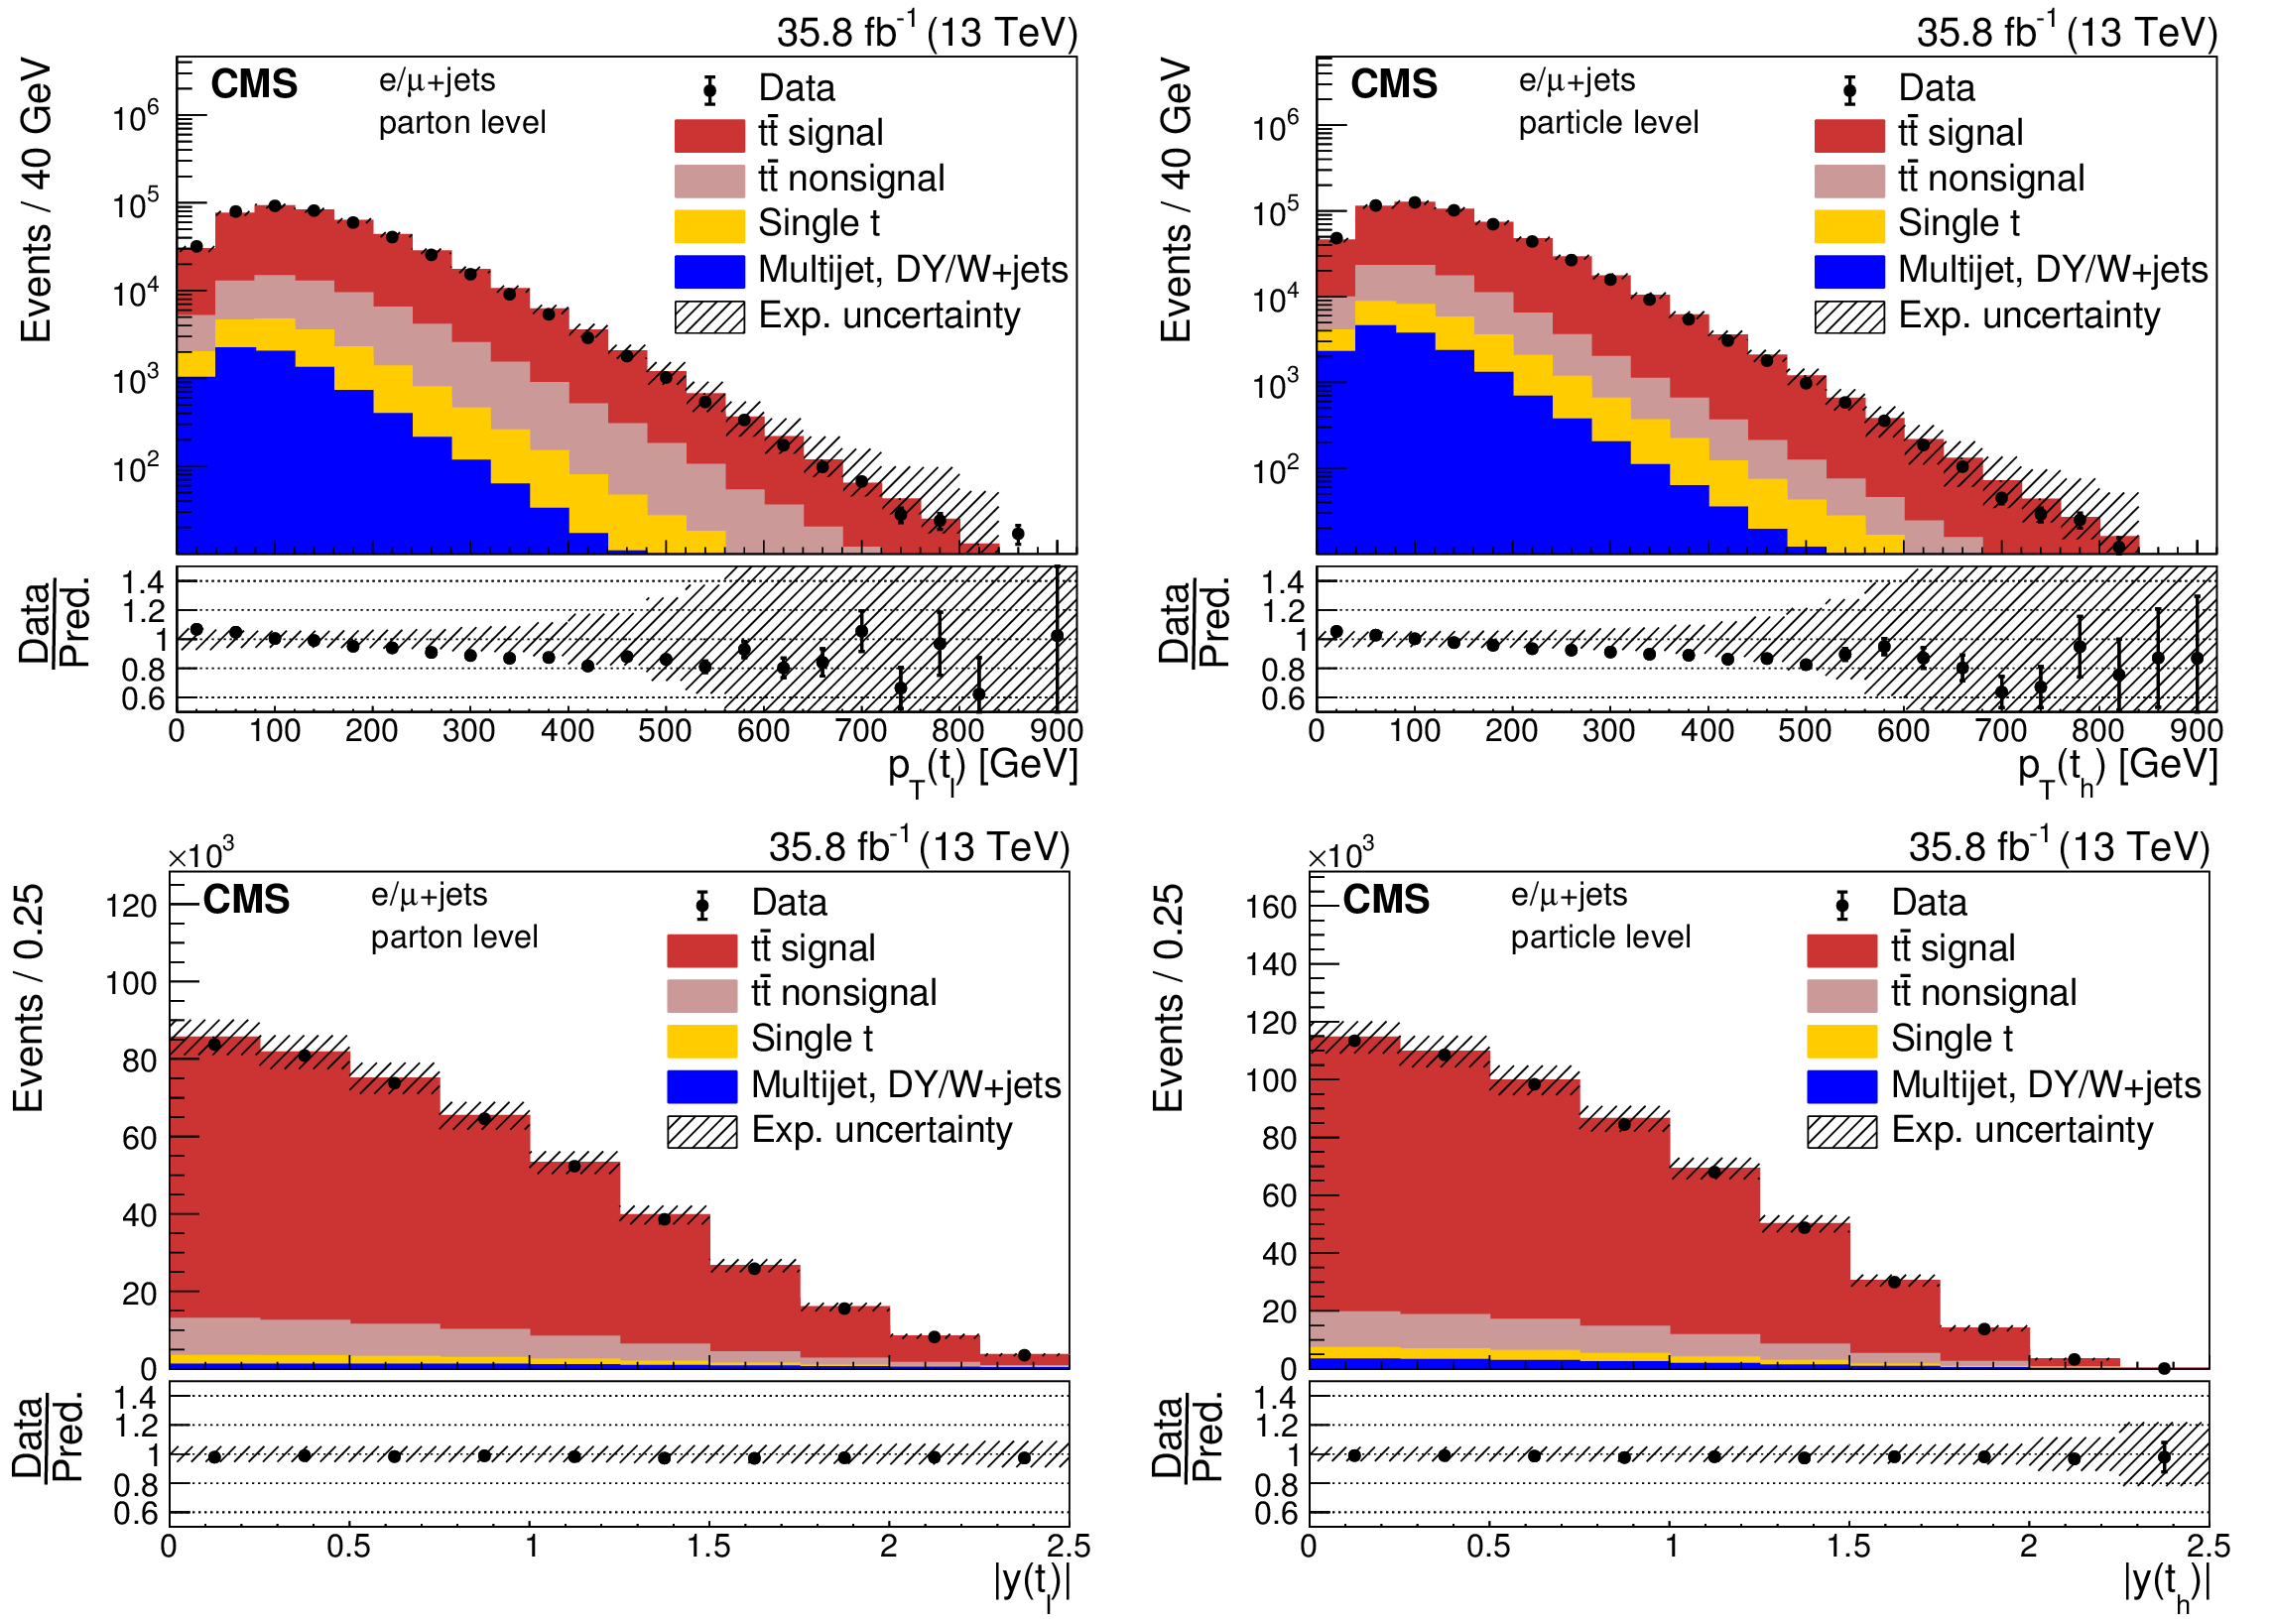
Figure 6:
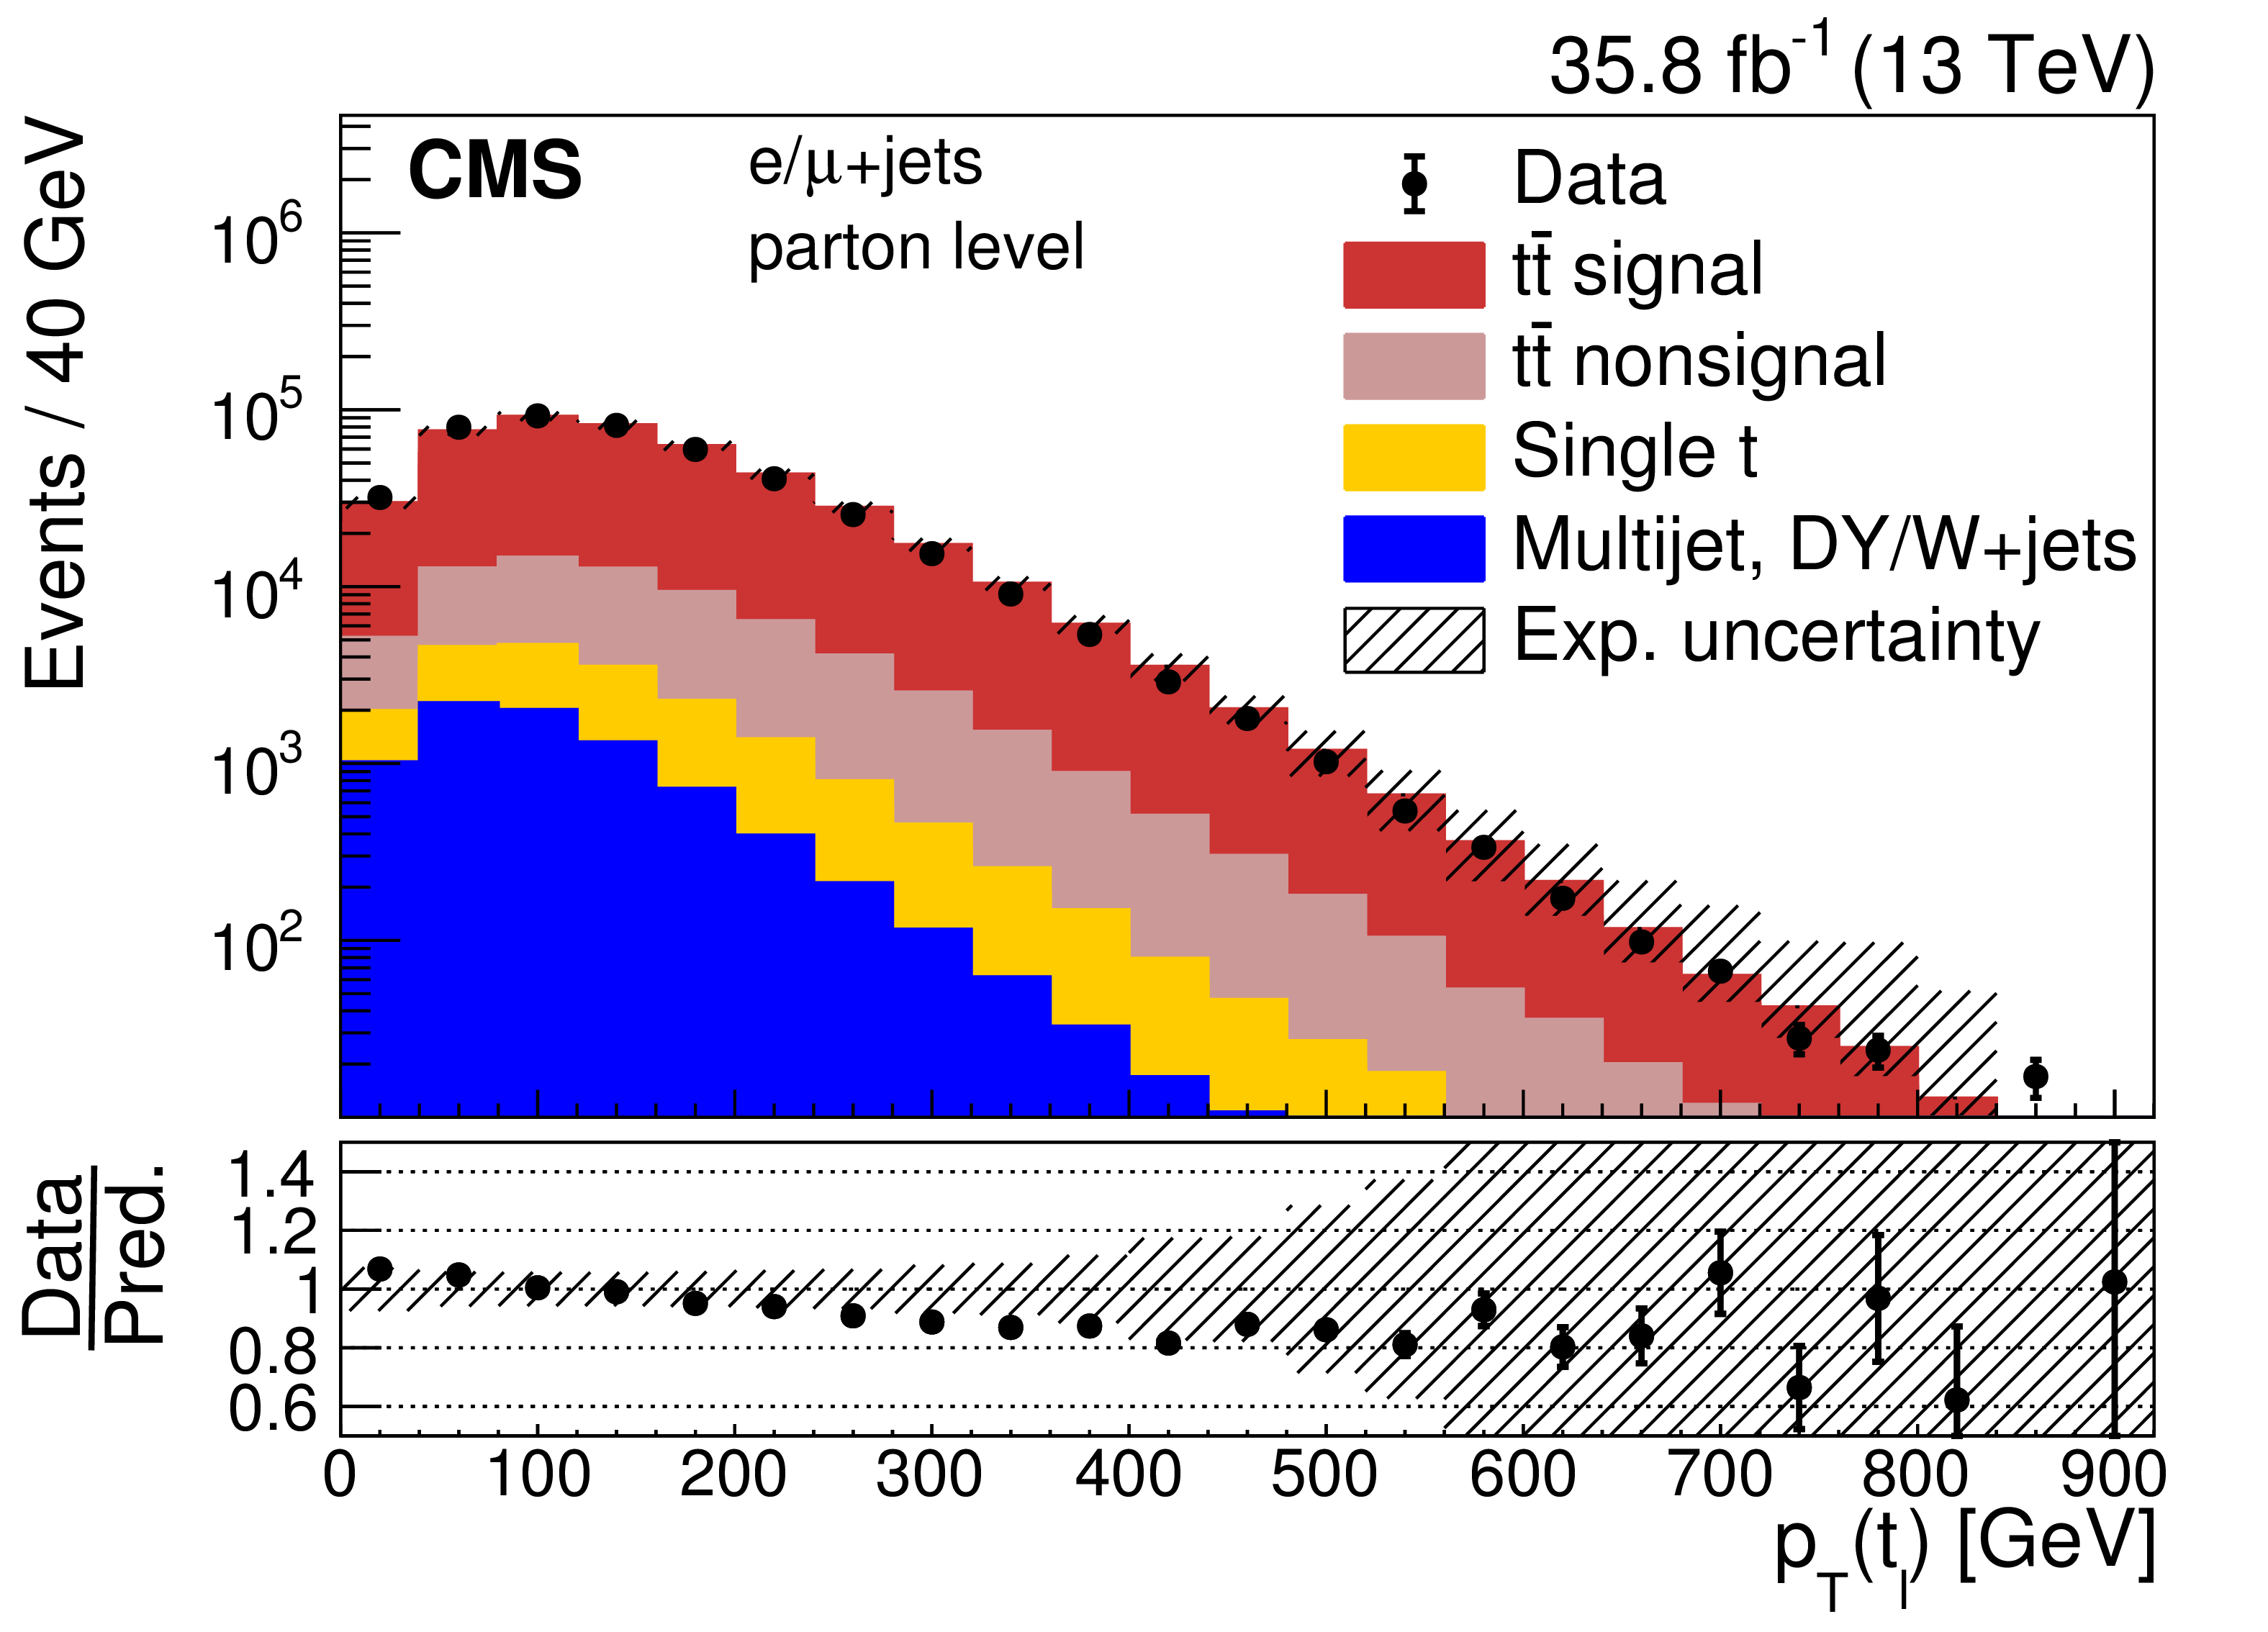
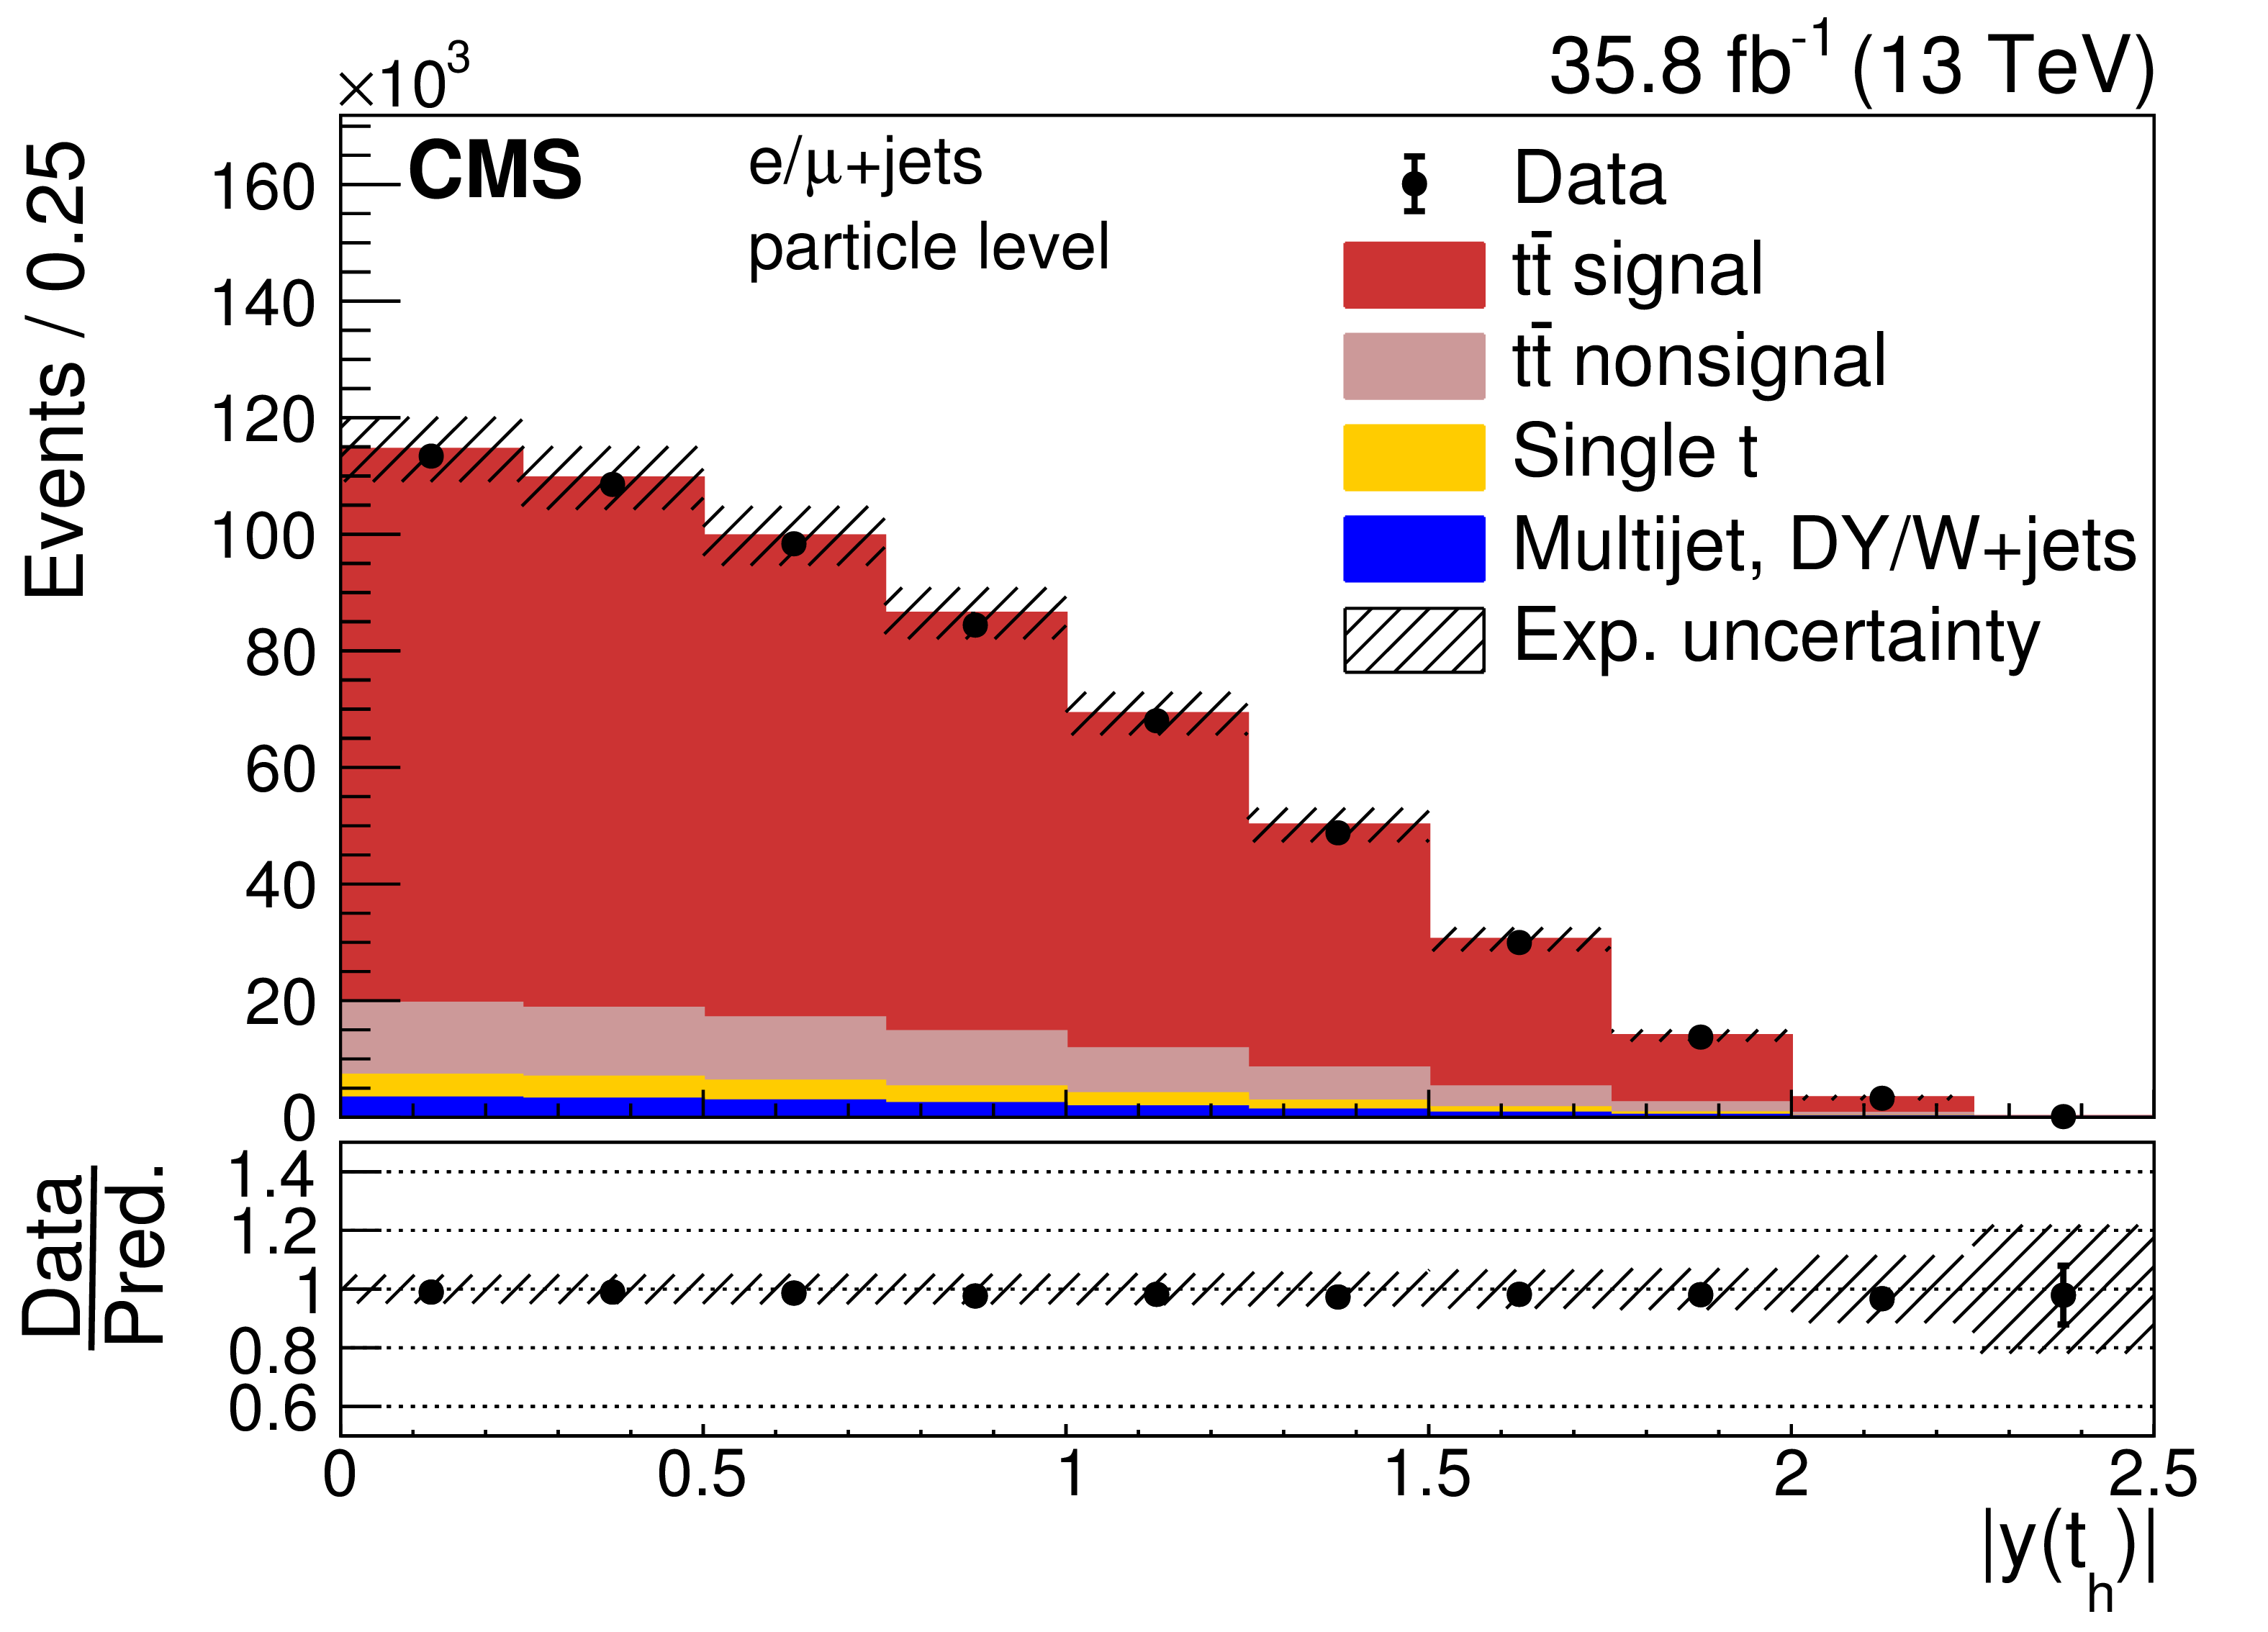
Comparisons of the reconstructed $ {p_{\mathrm {T}}} $ (upper) and $ { | y | }$ (lower) in data and simulations for the $ {\mathrm{t} _{\ell}} $ (left) at the parton level and the $ {\mathrm{t} _\mathrm {h}} $ (right) at the particle level. The simulation of POWHEG+PYTHIA8 is used to describe the $ {\mathrm{t} \mathrm{\bar{t}}} $ production. The contribution of multijet, DY, and W boson plus jets background events is extracted from the data (cf. Section 7). Combined experimental (cf. Section 9) and statistical uncertainties (hatched area) are shown for the total predicted yields. The data points are shown with statistical uncertainties. The ratios of data to the predicted yields are given at the bottom of each panel. |
png pdf |
Figure 6-a:
Comparisons of the reconstructed $ {p_{\mathrm {T}}} $ (upper) and $ { | y | }$ (lower) in data and simulations for the $ {\mathrm{t} _{\ell}} $ (left) at the parton level and the $ {\mathrm{t} _\mathrm {h}} $ (right) at the particle level. The simulation of POWHEG+PYTHIA8 is used to describe the $ {\mathrm{t} \mathrm{\bar{t}}} $ production. The contribution of multijet, DY, and W boson plus jets background events is extracted from the data (cf. Section 7). Combined experimental (cf. Section 9) and statistical uncertainties (hatched area) are shown for the total predicted yields. The data points are shown with statistical uncertainties. The ratios of data to the predicted yields are given at the bottom of each panel. |
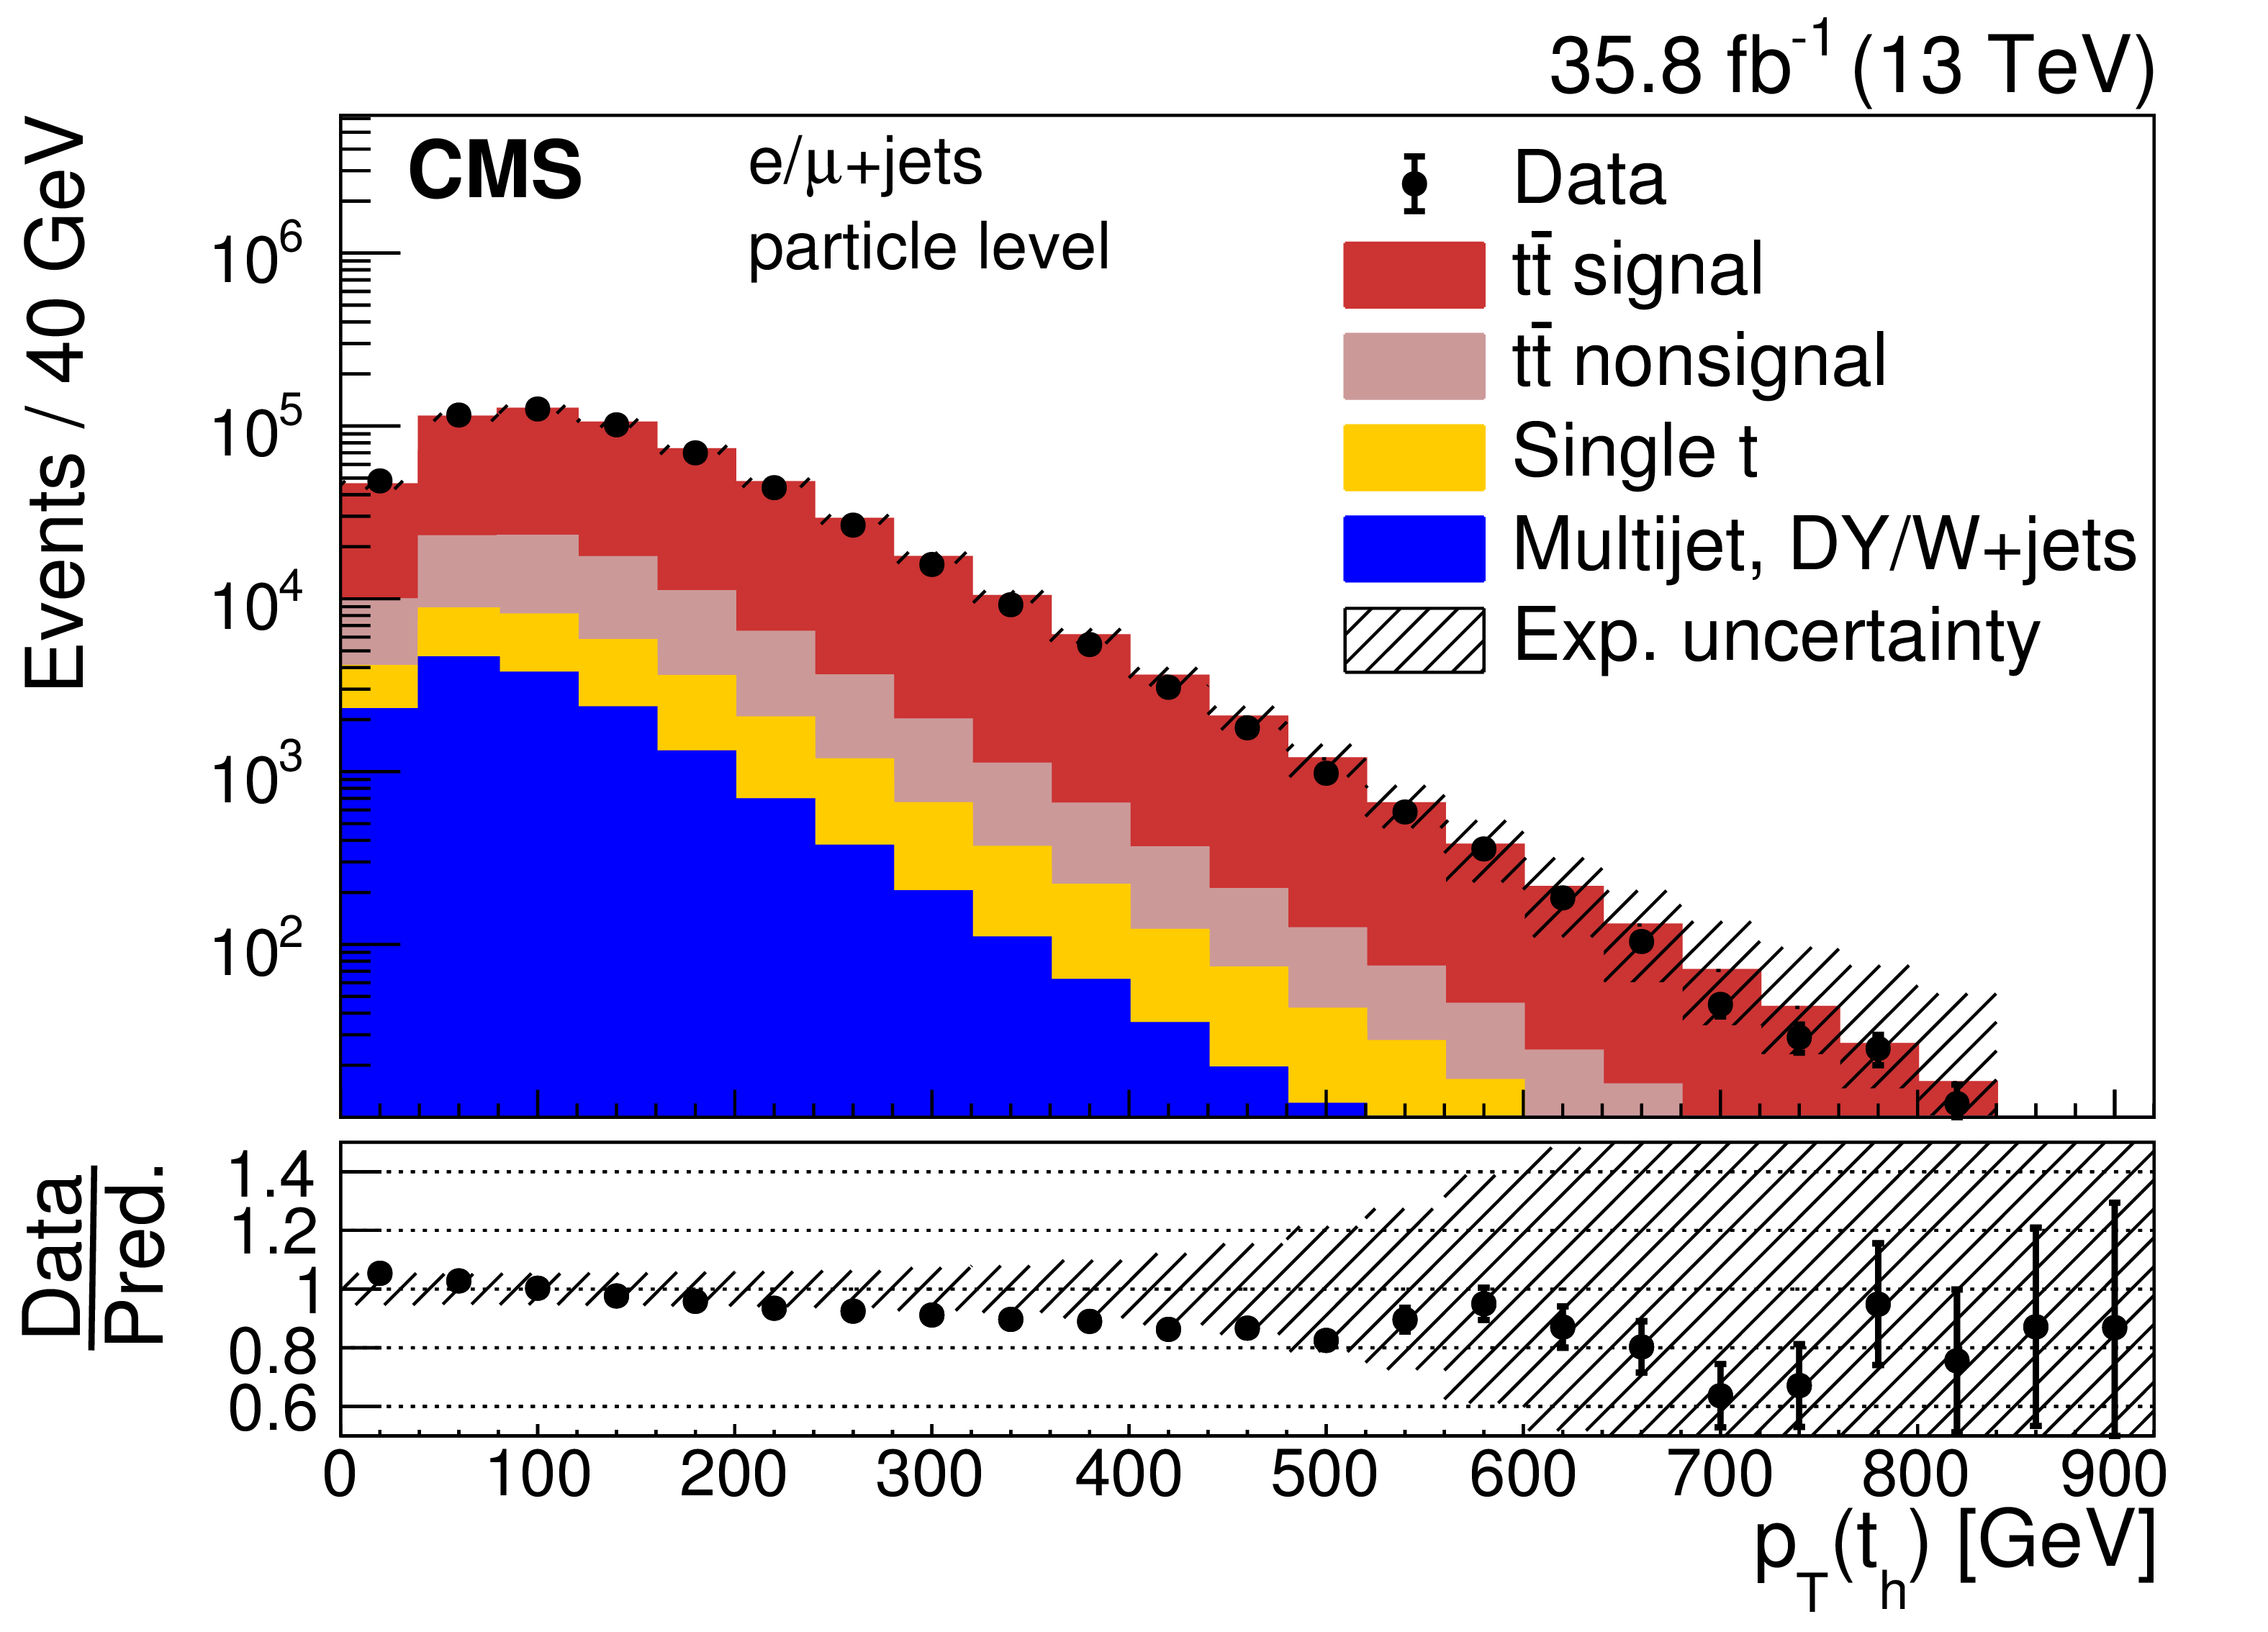
png pdf |
Figure 6-b:
Comparisons of the reconstructed $ {p_{\mathrm {T}}} $ (upper) and $ { | y | }$ (lower) in data and simulations for the $ {\mathrm{t} _{\ell}} $ (left) at the parton level and the $ {\mathrm{t} _\mathrm {h}} $ (right) at the particle level. The simulation of POWHEG+PYTHIA8 is used to describe the $ {\mathrm{t} \mathrm{\bar{t}}} $ production. The contribution of multijet, DY, and W boson plus jets background events is extracted from the data (cf. Section 7). Combined experimental (cf. Section 9) and statistical uncertainties (hatched area) are shown for the total predicted yields. The data points are shown with statistical uncertainties. The ratios of data to the predicted yields are given at the bottom of each panel. |

png pdf |
Figure 6-c:
Comparisons of the reconstructed $ {p_{\mathrm {T}}} $ (upper) and $ { | y | }$ (lower) in data and simulations for the $ {\mathrm{t} _{\ell}} $ (left) at the parton level and the $ {\mathrm{t} _\mathrm {h}} $ (right) at the particle level. The simulation of POWHEG+PYTHIA8 is used to describe the $ {\mathrm{t} \mathrm{\bar{t}}} $ production. The contribution of multijet, DY, and W boson plus jets background events is extracted from the data (cf. Section 7). Combined experimental (cf. Section 9) and statistical uncertainties (hatched area) are shown for the total predicted yields. The data points are shown with statistical uncertainties. The ratios of data to the predicted yields are given at the bottom of each panel. |
png pdf |
Figure 6-d:
Comparisons of the reconstructed $ {p_{\mathrm {T}}} $ (upper) and $ { | y | }$ (lower) in data and simulations for the $ {\mathrm{t} _{\ell}} $ (left) at the parton level and the $ {\mathrm{t} _\mathrm {h}} $ (right) at the particle level. The simulation of POWHEG+PYTHIA8 is used to describe the $ {\mathrm{t} \mathrm{\bar{t}}} $ production. The contribution of multijet, DY, and W boson plus jets background events is extracted from the data (cf. Section 7). Combined experimental (cf. Section 9) and statistical uncertainties (hatched area) are shown for the total predicted yields. The data points are shown with statistical uncertainties. The ratios of data to the predicted yields are given at the bottom of each panel. |
png pdf |
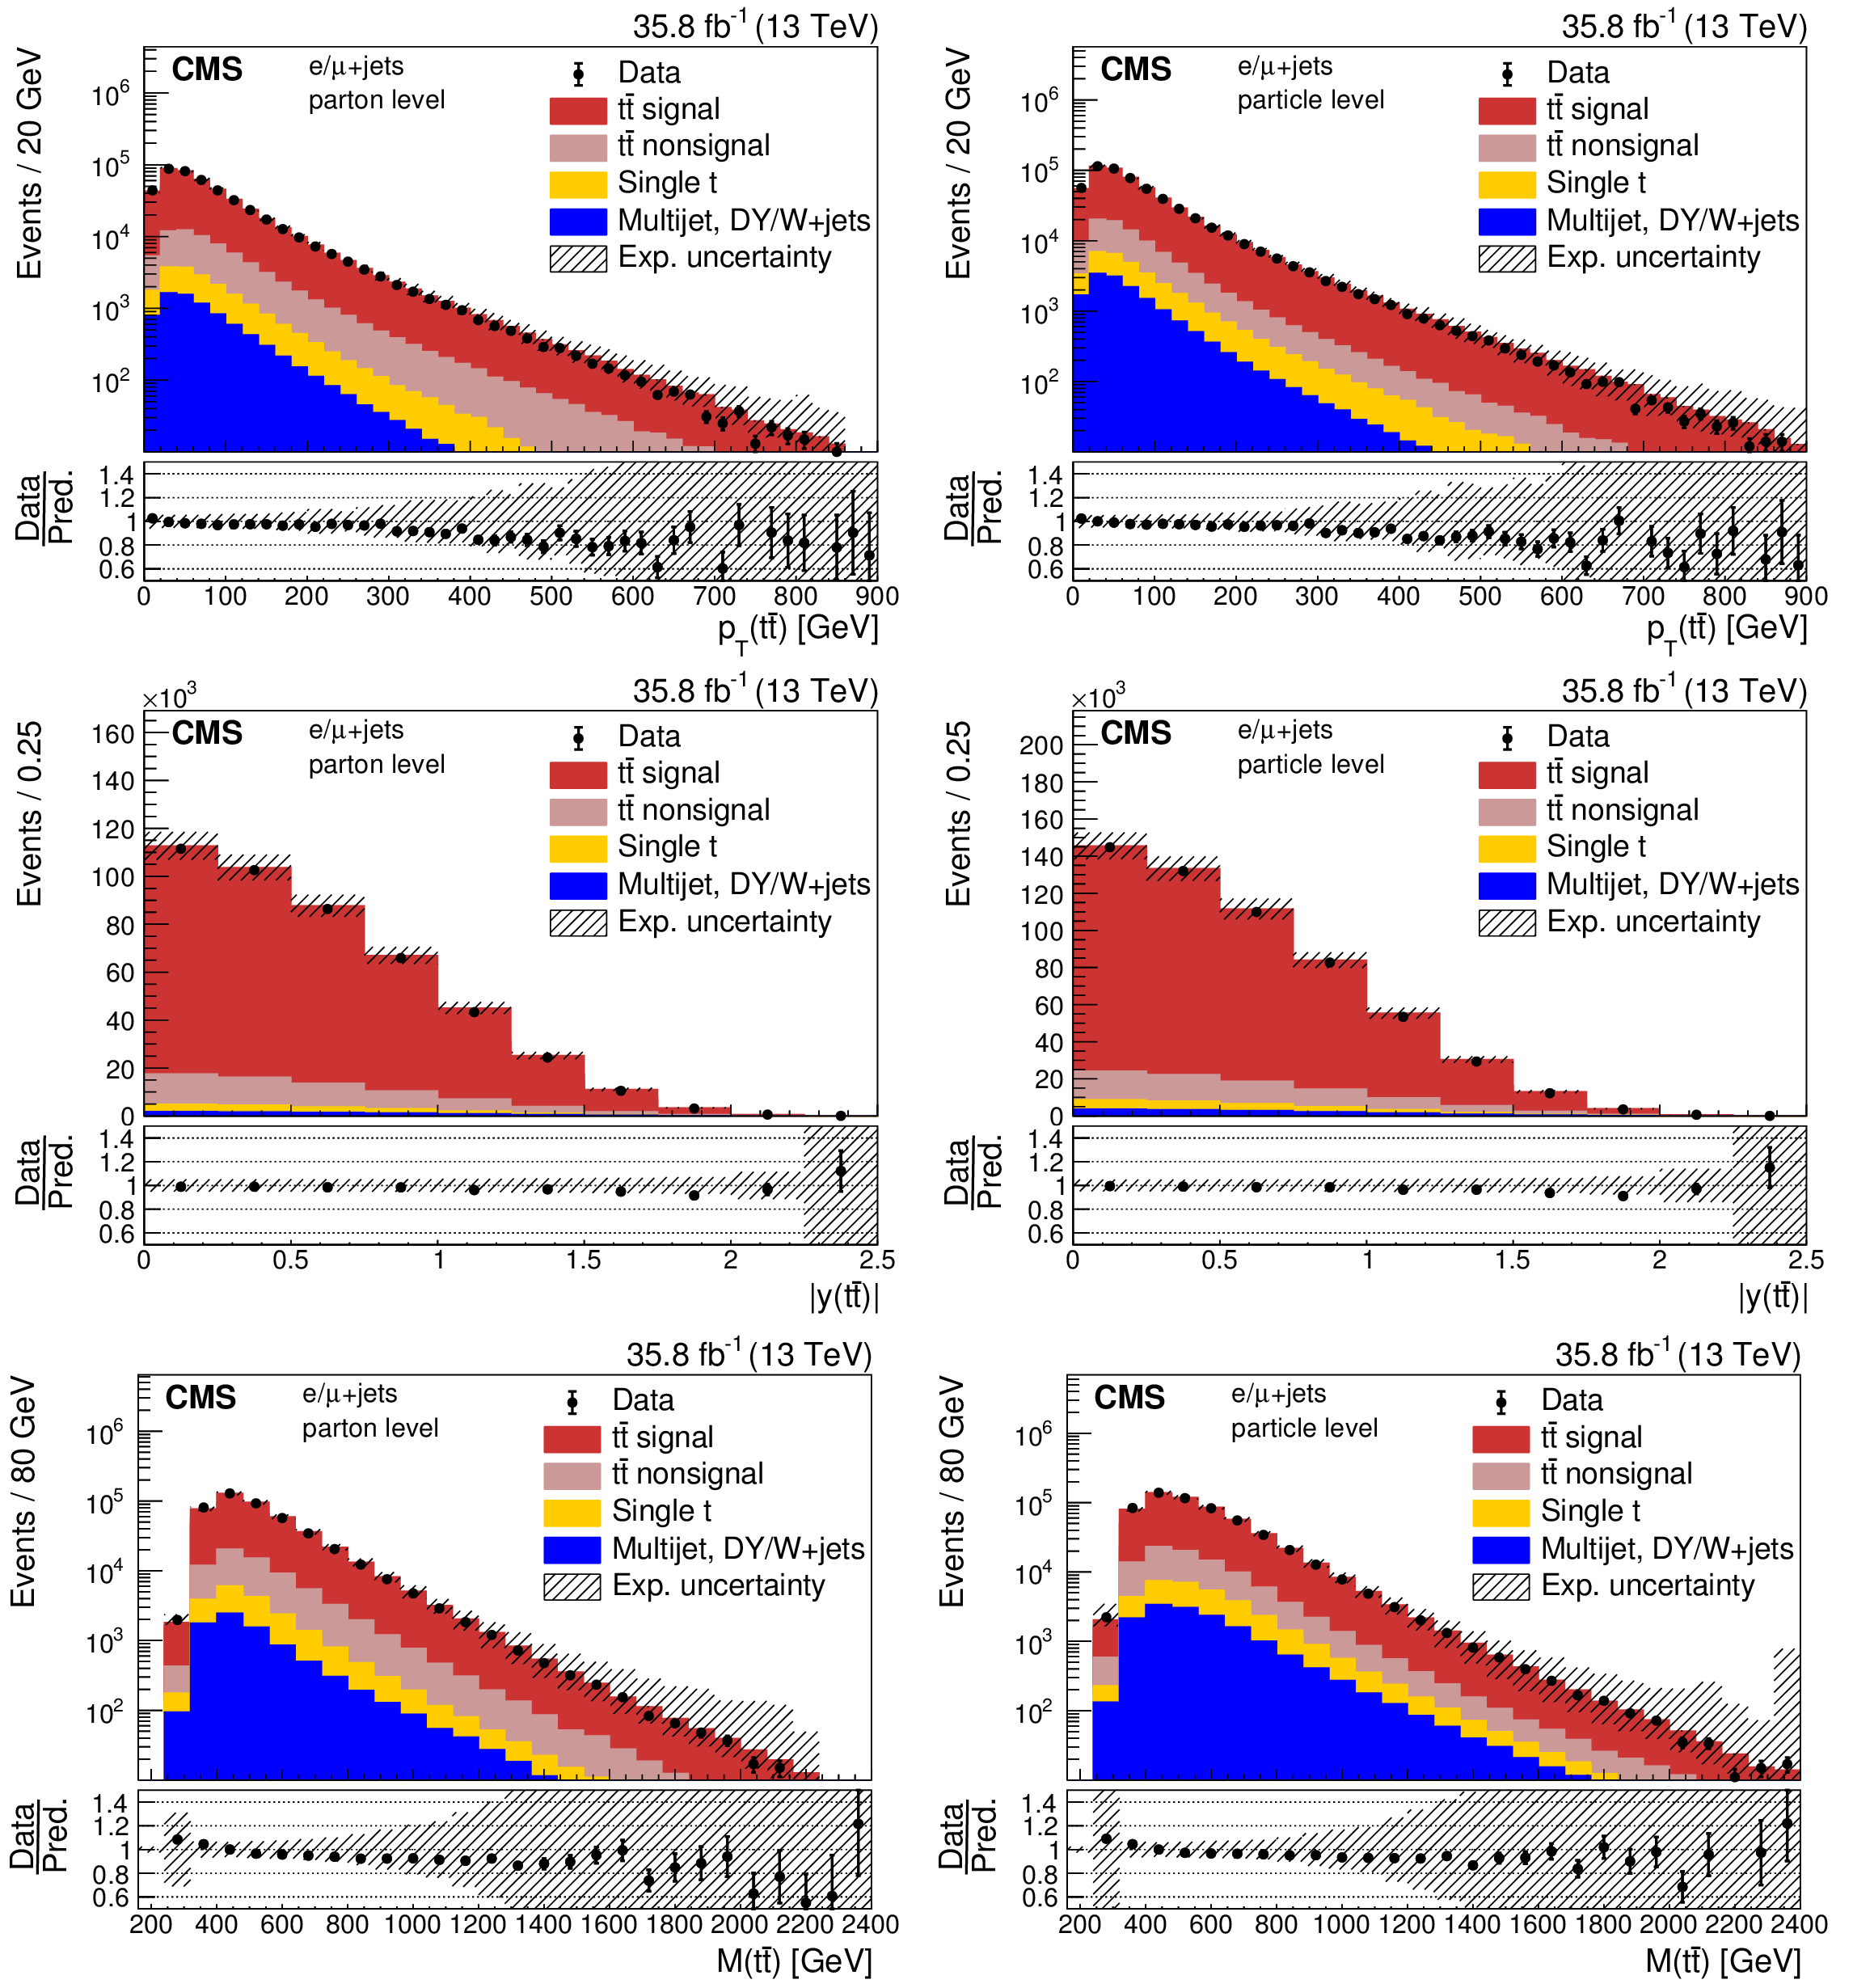
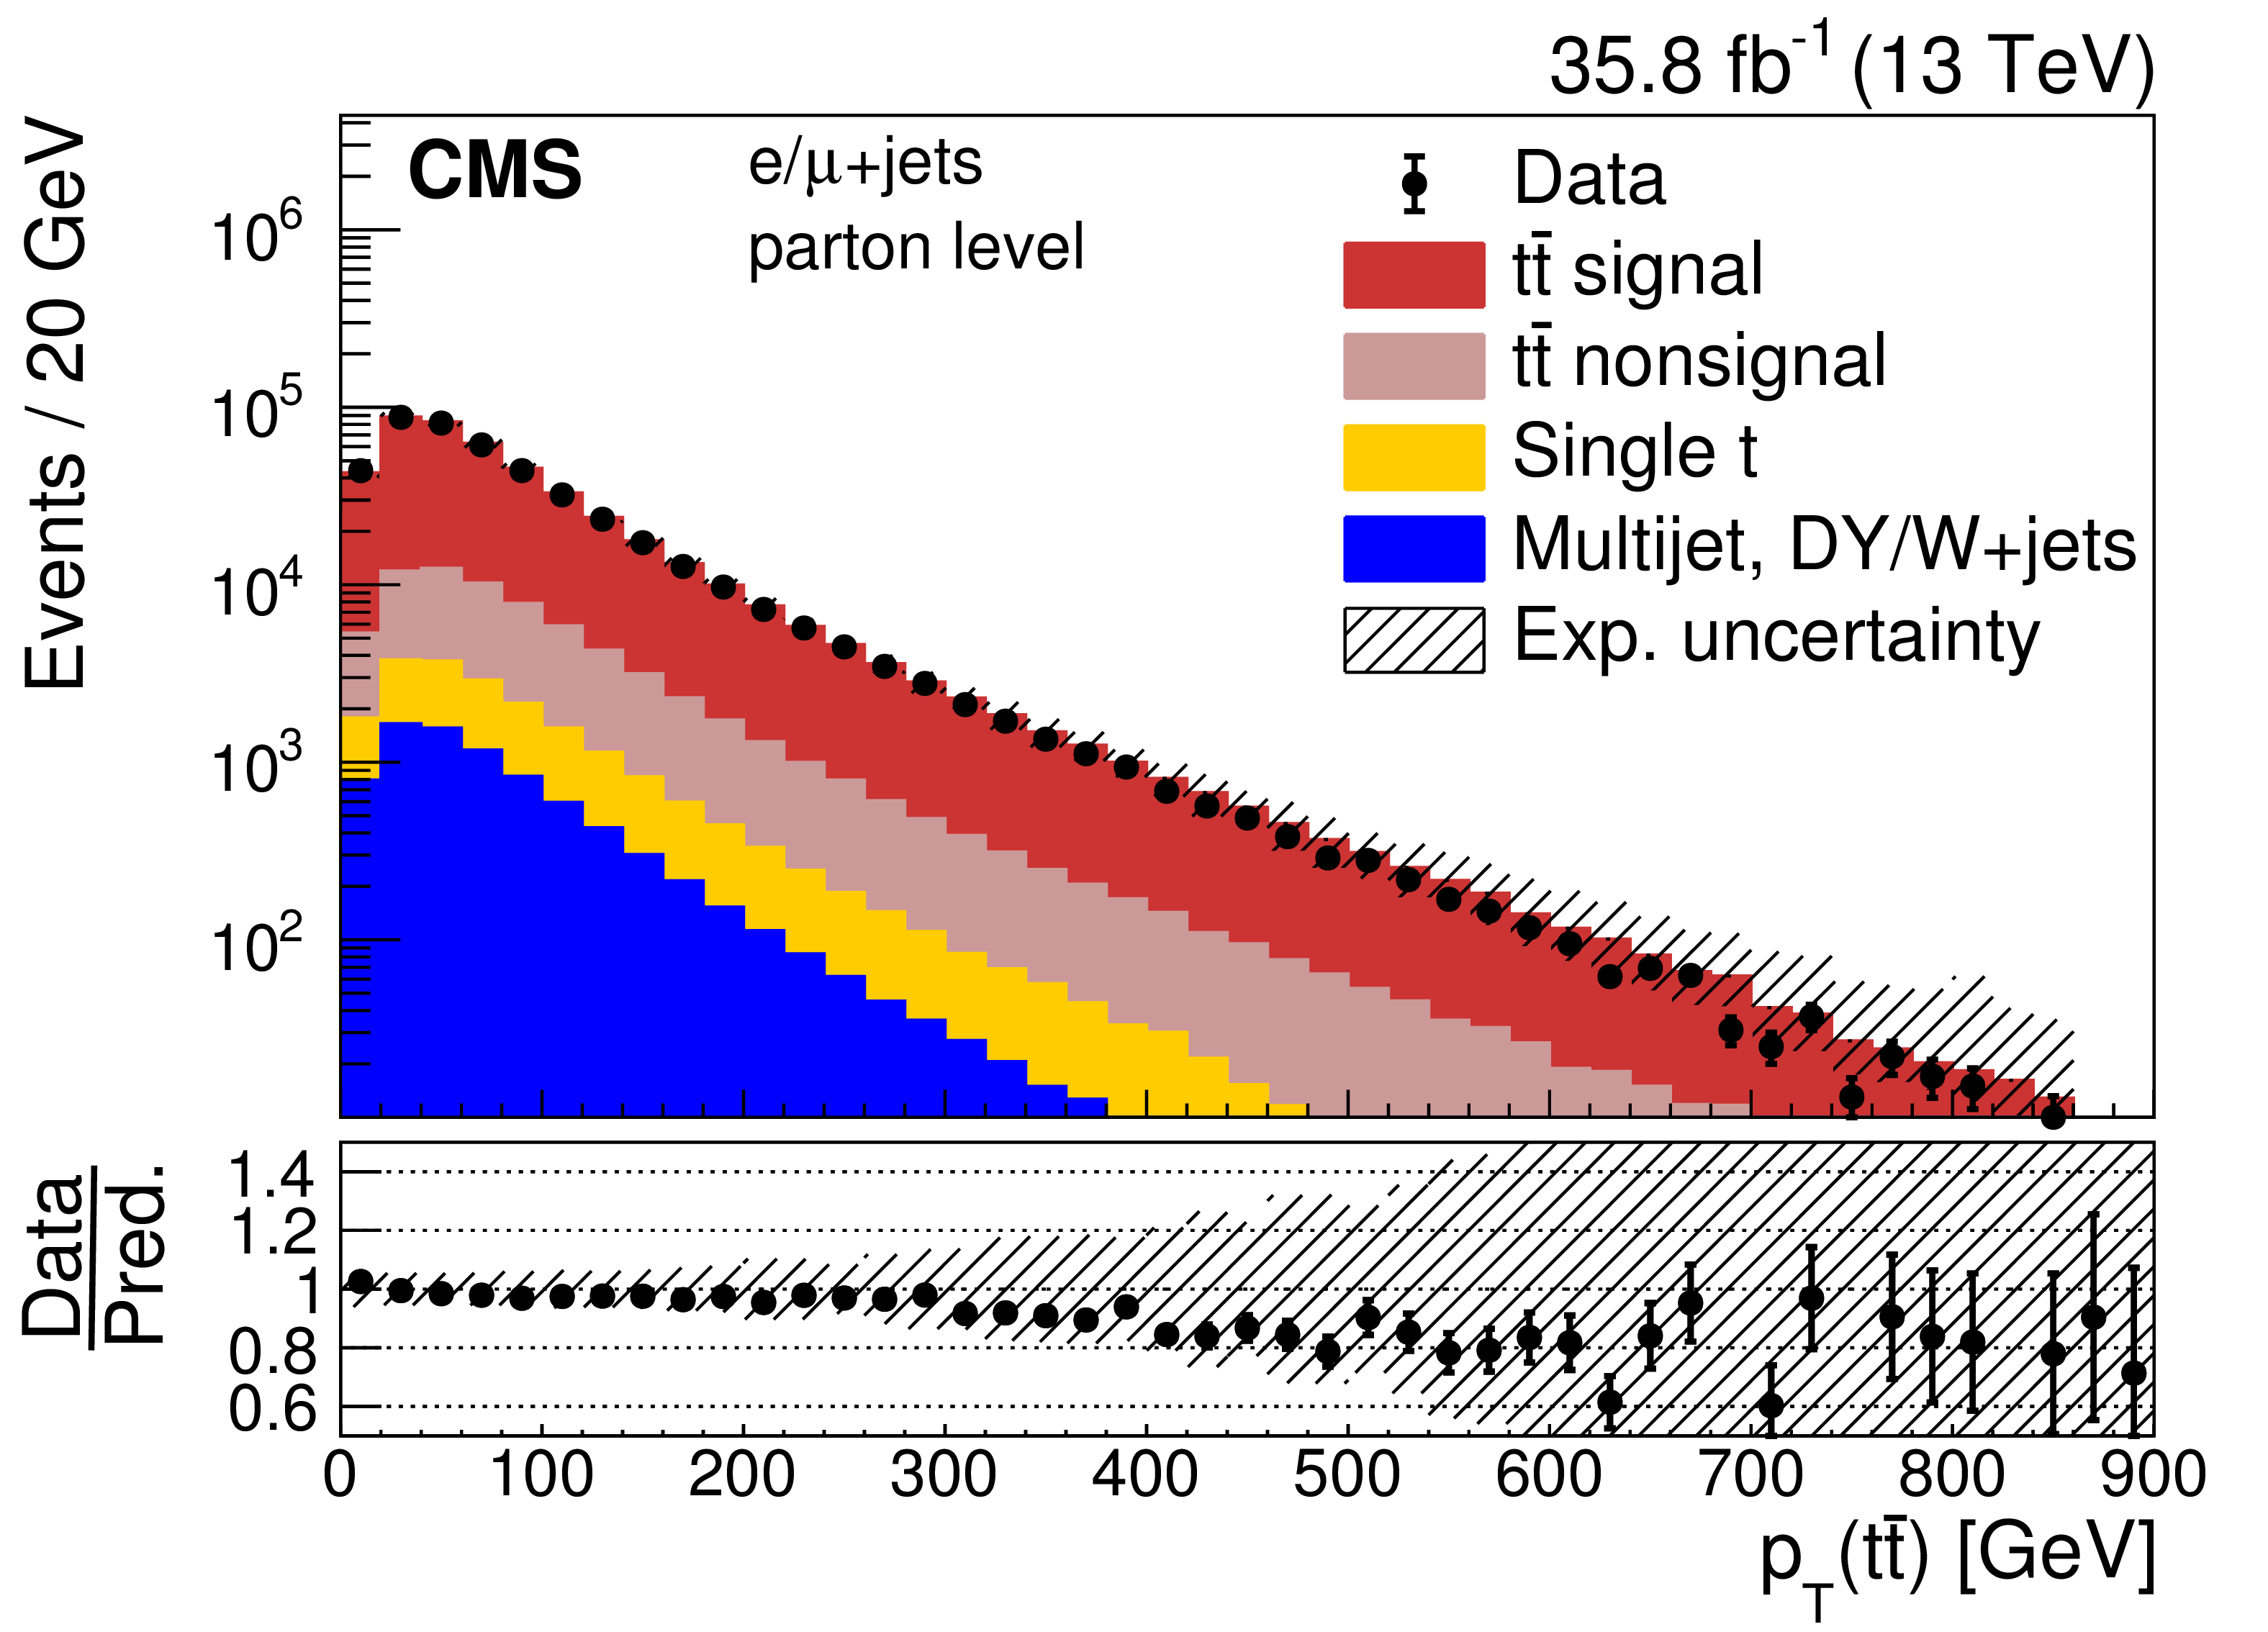
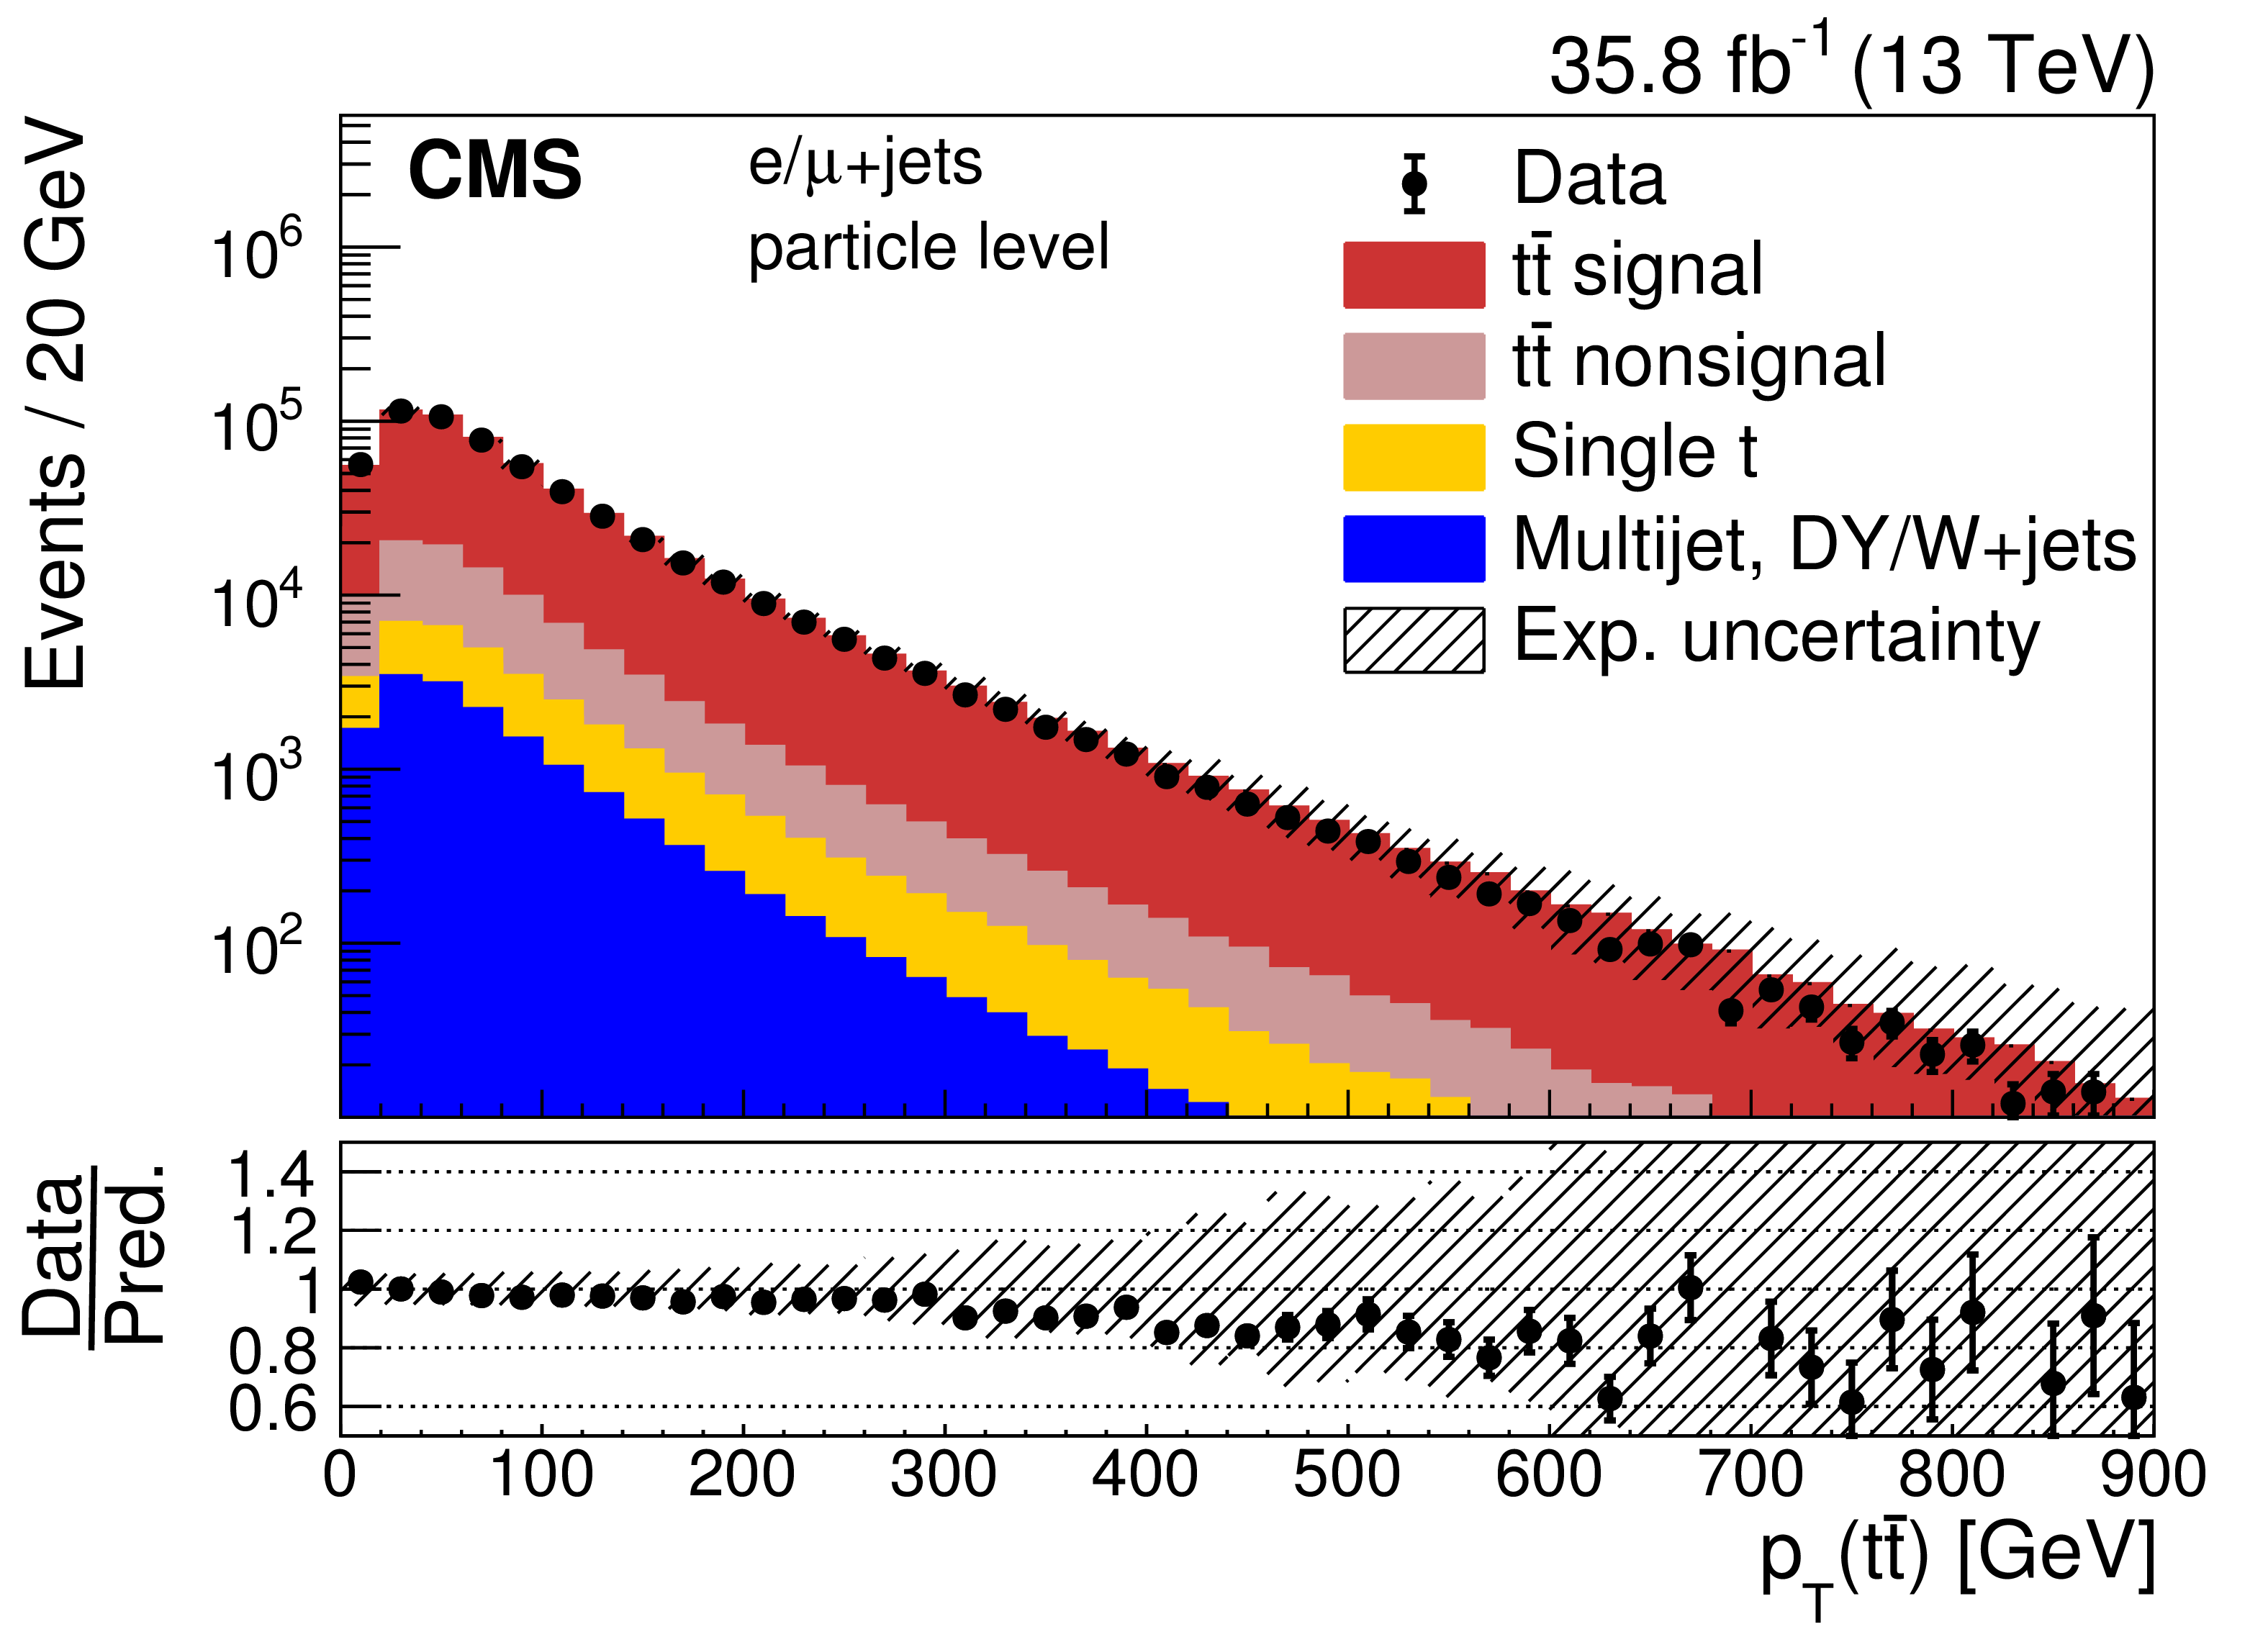
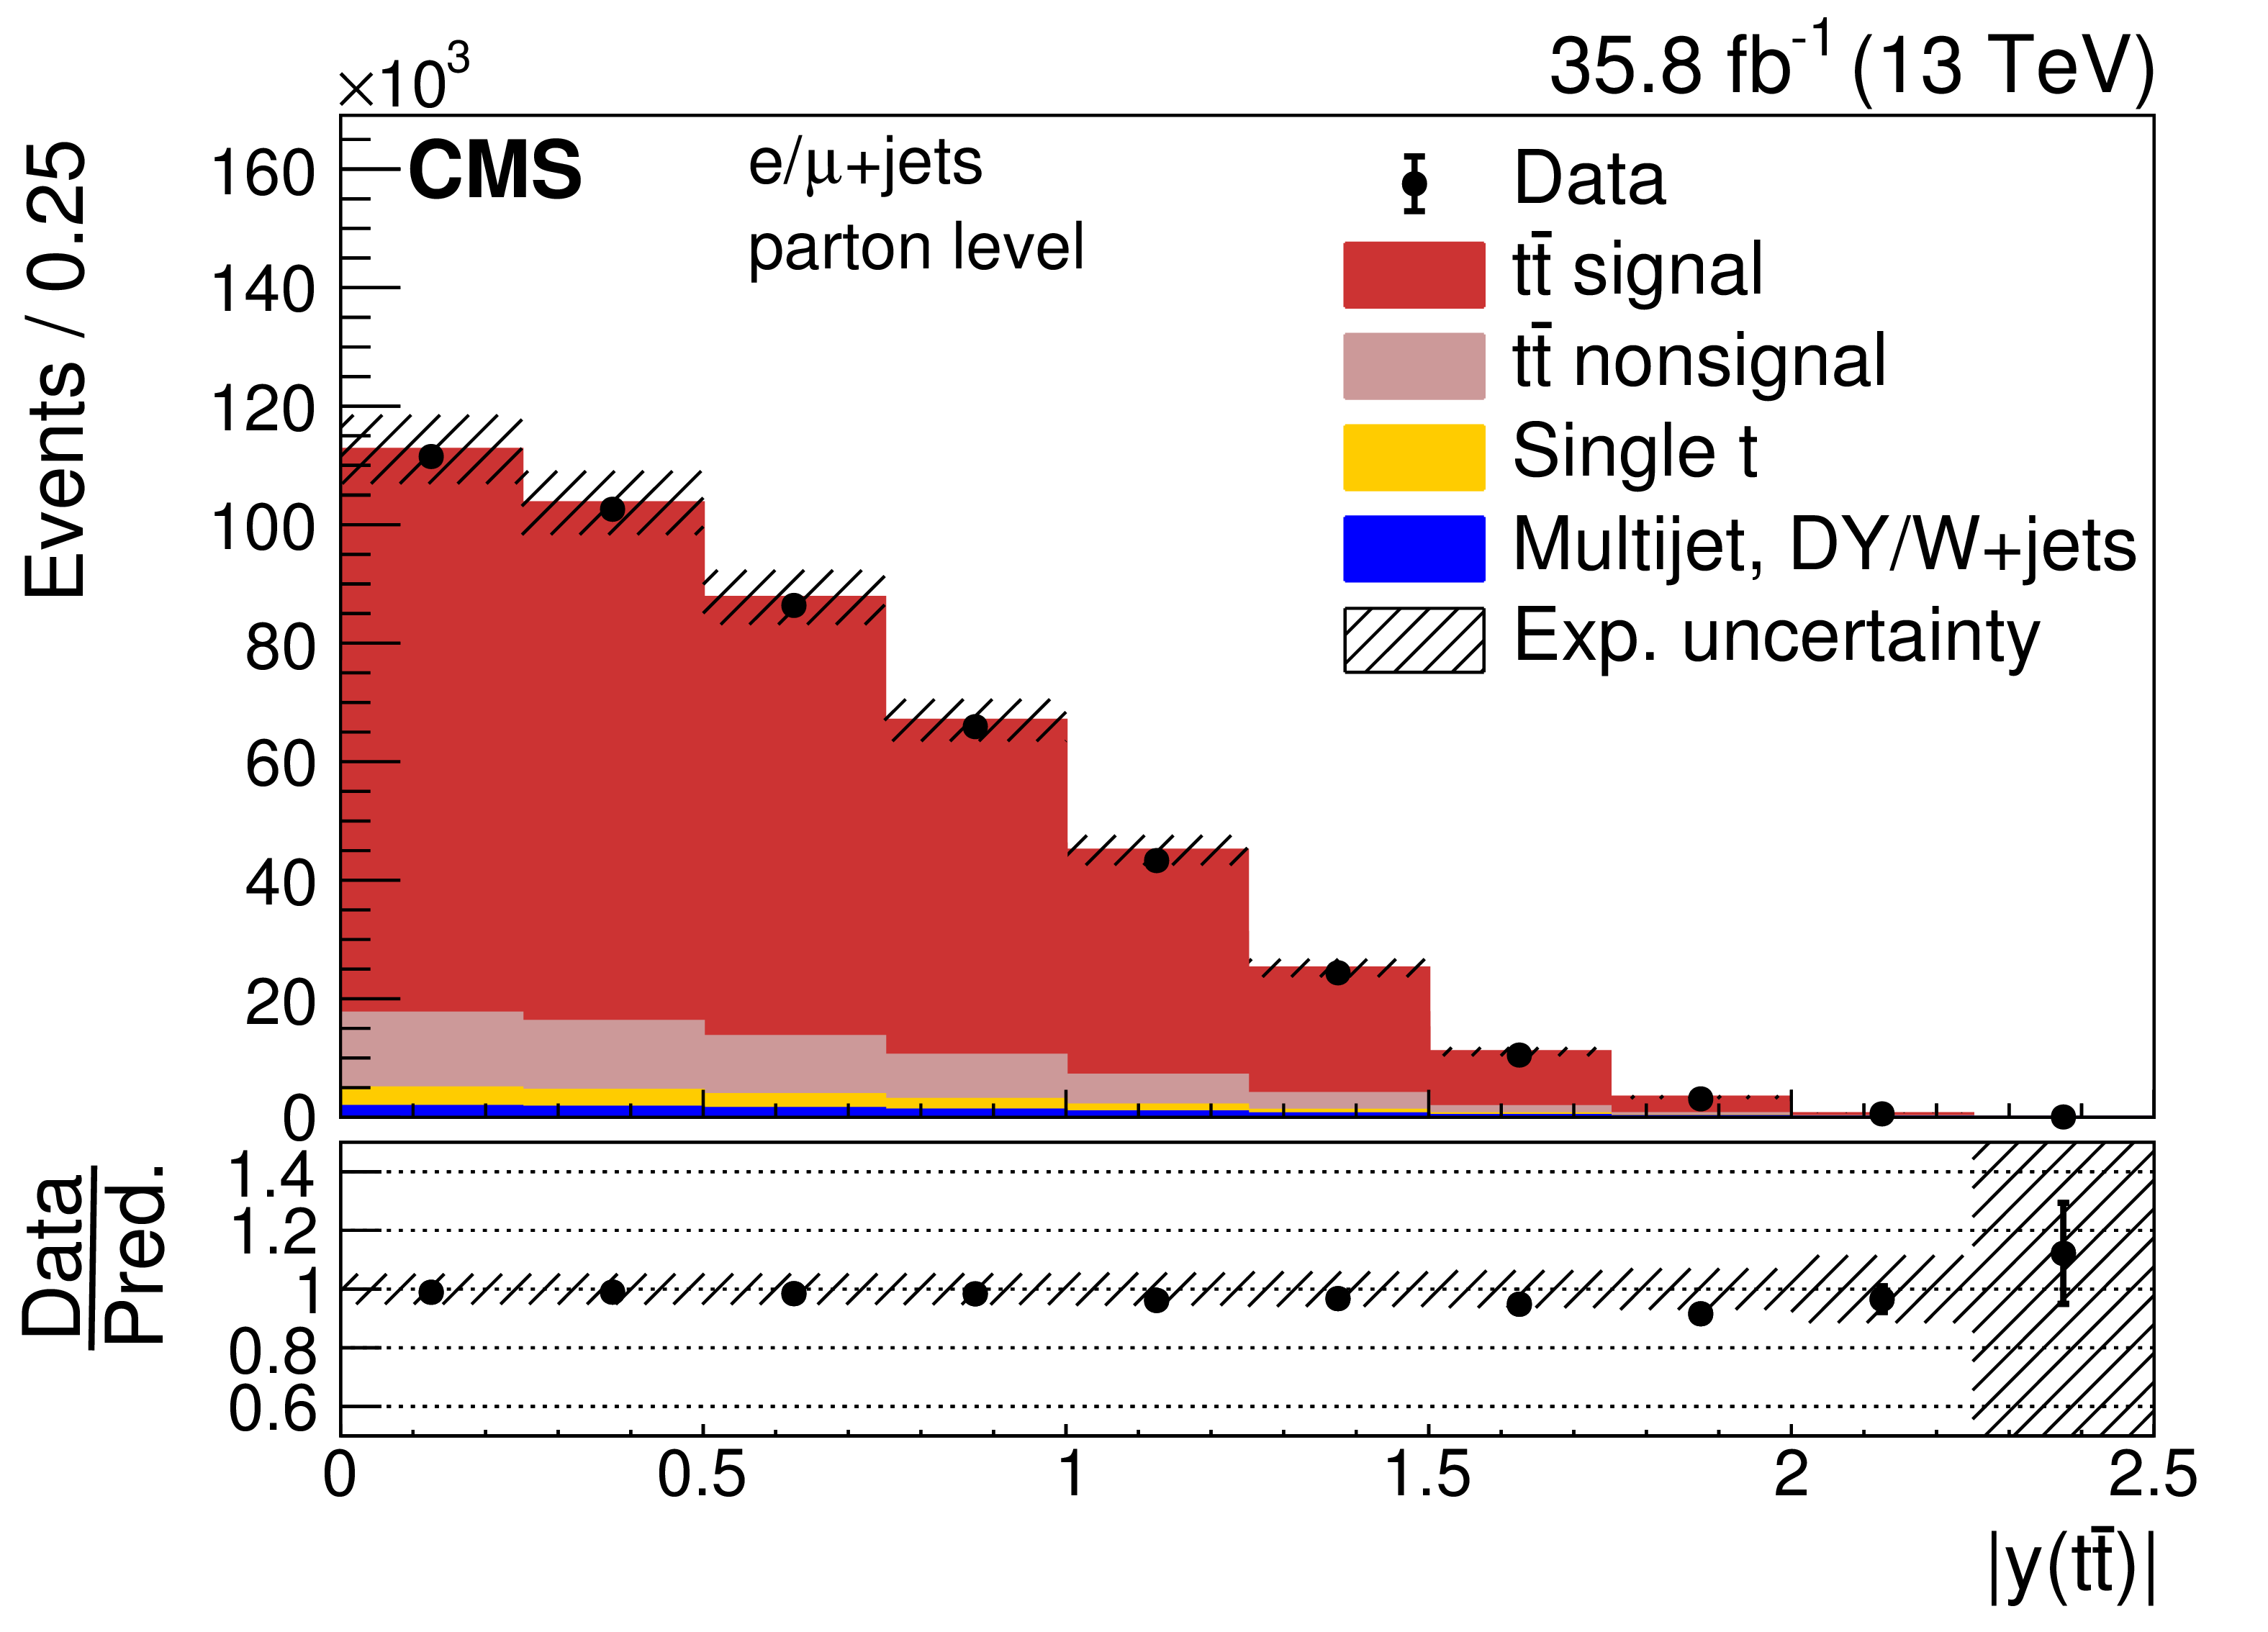
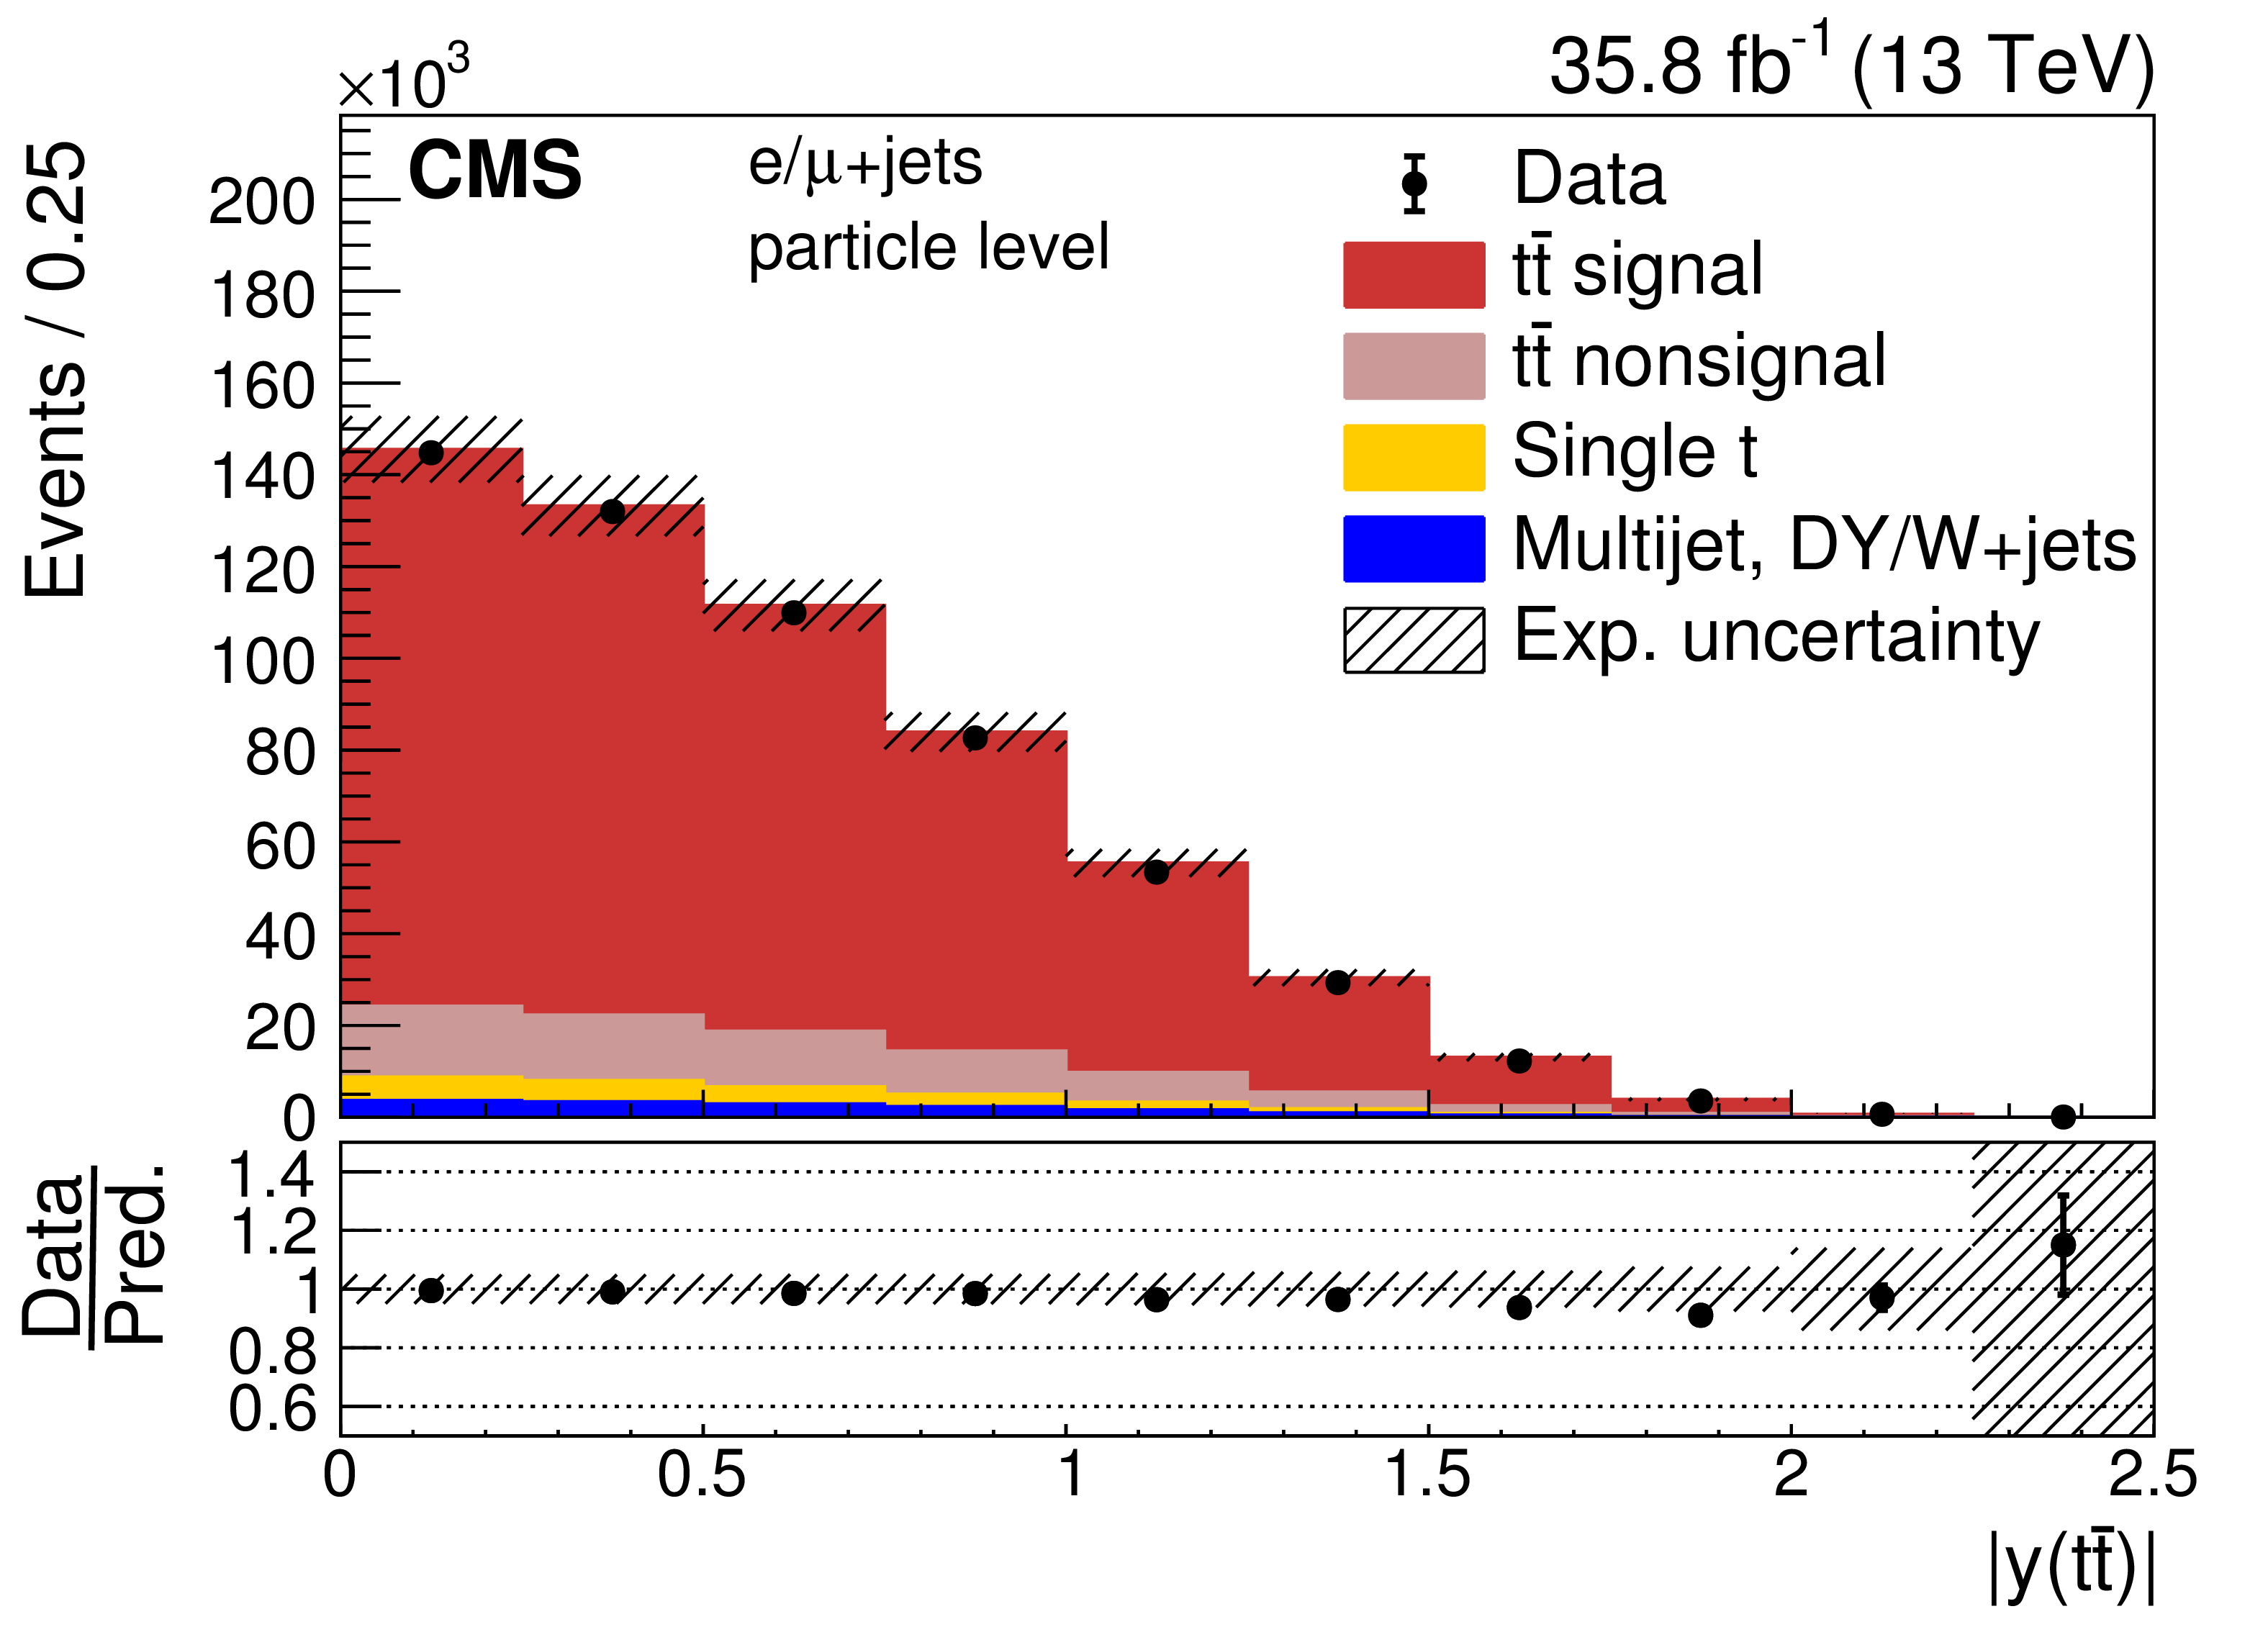
Figure 7:
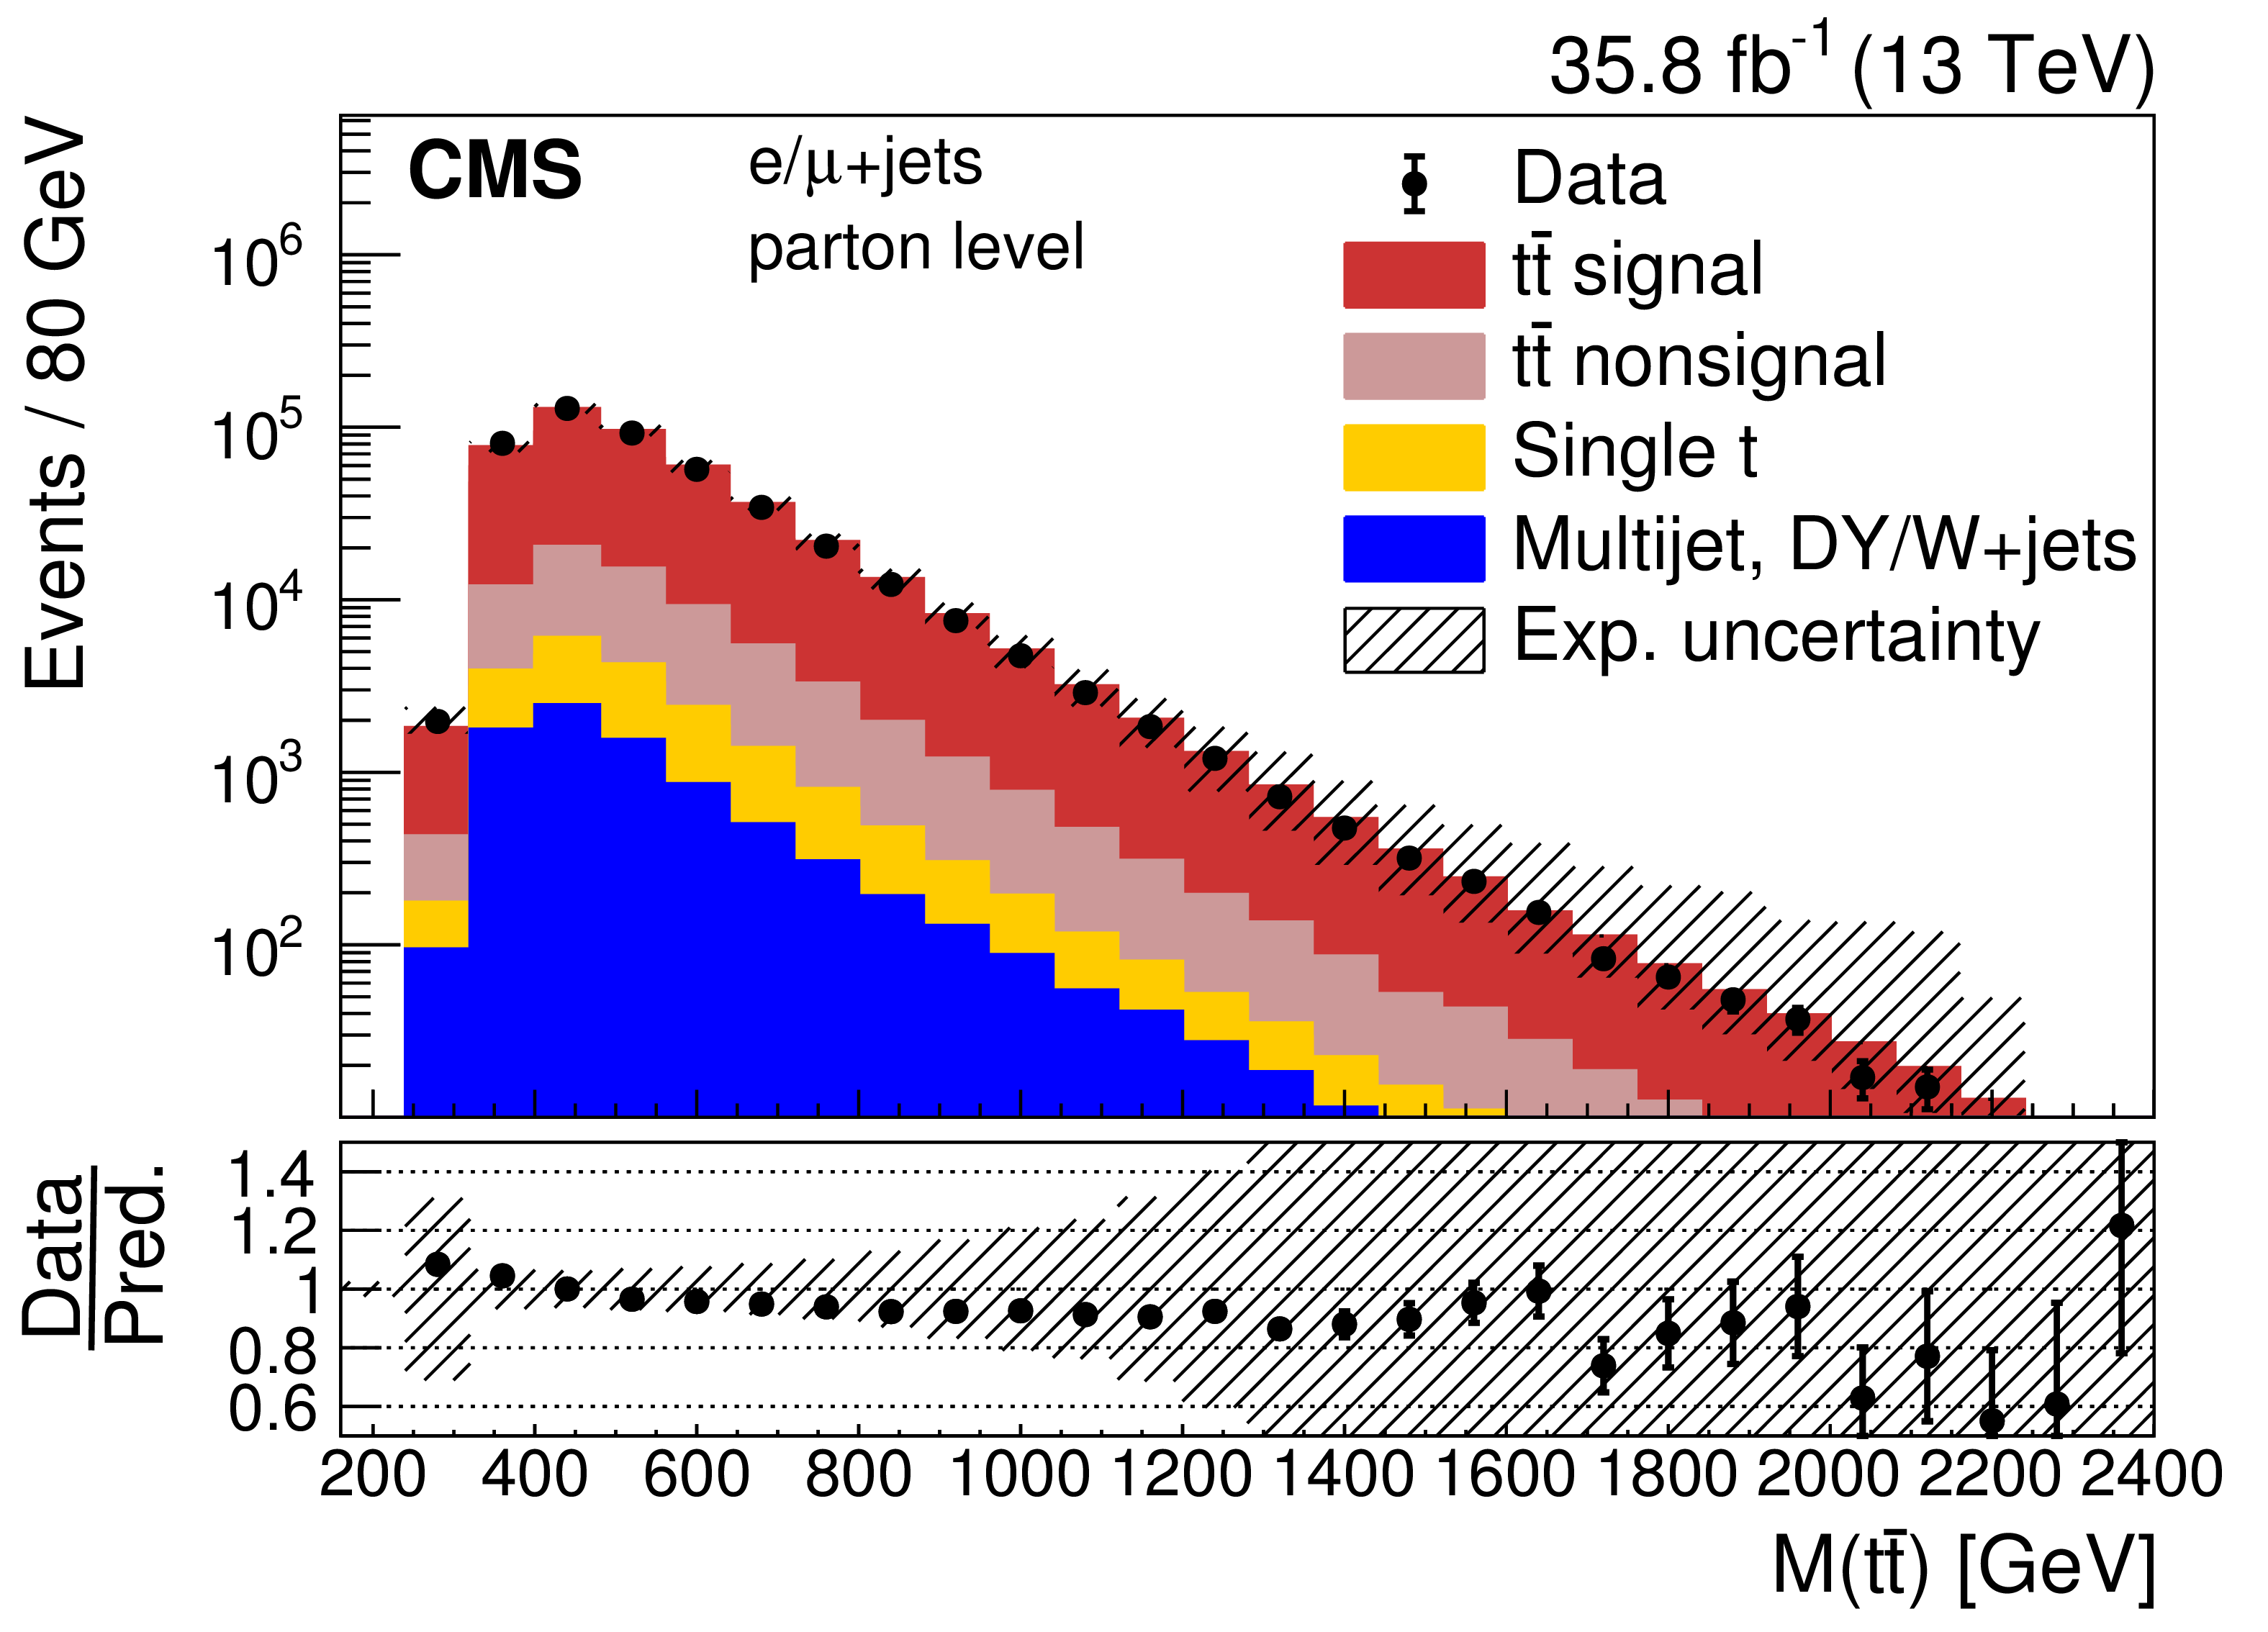
Comparisons of the reconstructed distributions of $ {p_{\mathrm {T}}} ({\mathrm{t} \mathrm{\bar{t}}})$ (upper), $ { | y({\mathrm{t} \mathrm{\bar{t}}}) | }$ (middle), and $M({\mathrm{t} \mathrm{\bar{t}}})$ (lower) for the (left) parton- and the (right) particle-level measurements in data and simulation. The simulation of POWHEG+PYTHIA8 is used to describe the $ {\mathrm{t} \mathrm{\bar{t}}} $ production. The contribution of multijet, DY, and W boson plus jets background events is extracted from the data (cf. Section 7). Combined experimental (cf. Section 9) and statistical uncertainties (hatched area) are shown for the total predicted yields. The data points are shown with statistical uncertainties. The ratios of data to the predicted yields are given at the bottom of each panel. |
png pdf |
Figure 7-a:
Comparisons of the reconstructed distributions of $ {p_{\mathrm {T}}} ({\mathrm{t} \mathrm{\bar{t}}})$ (upper), $ { | y({\mathrm{t} \mathrm{\bar{t}}}) | }$ (middle), and $M({\mathrm{t} \mathrm{\bar{t}}})$ (lower) for the (left) parton- and the (right) particle-level measurements in data and simulation. The simulation of POWHEG+PYTHIA8 is used to describe the $ {\mathrm{t} \mathrm{\bar{t}}} $ production. The contribution of multijet, DY, and W boson plus jets background events is extracted from the data (cf. Section 7). Combined experimental (cf. Section 9) and statistical uncertainties (hatched area) are shown for the total predicted yields. The data points are shown with statistical uncertainties. The ratios of data to the predicted yields are given at the bottom of each panel. |
png pdf |
Figure 7-b:
Comparisons of the reconstructed distributions of $ {p_{\mathrm {T}}} ({\mathrm{t} \mathrm{\bar{t}}})$ (upper), $ { | y({\mathrm{t} \mathrm{\bar{t}}}) | }$ (middle), and $M({\mathrm{t} \mathrm{\bar{t}}})$ (lower) for the (left) parton- and the (right) particle-level measurements in data and simulation. The simulation of POWHEG+PYTHIA8 is used to describe the $ {\mathrm{t} \mathrm{\bar{t}}} $ production. The contribution of multijet, DY, and W boson plus jets background events is extracted from the data (cf. Section 7). Combined experimental (cf. Section 9) and statistical uncertainties (hatched area) are shown for the total predicted yields. The data points are shown with statistical uncertainties. The ratios of data to the predicted yields are given at the bottom of each panel. |
png pdf |
Figure 7-c:
Comparisons of the reconstructed distributions of $ {p_{\mathrm {T}}} ({\mathrm{t} \mathrm{\bar{t}}})$ (upper), $ { | y({\mathrm{t} \mathrm{\bar{t}}}) | }$ (middle), and $M({\mathrm{t} \mathrm{\bar{t}}})$ (lower) for the (left) parton- and the (right) particle-level measurements in data and simulation. The simulation of POWHEG+PYTHIA8 is used to describe the $ {\mathrm{t} \mathrm{\bar{t}}} $ production. The contribution of multijet, DY, and W boson plus jets background events is extracted from the data (cf. Section 7). Combined experimental (cf. Section 9) and statistical uncertainties (hatched area) are shown for the total predicted yields. The data points are shown with statistical uncertainties. The ratios of data to the predicted yields are given at the bottom of each panel. |
png pdf |
Figure 7-d:
Comparisons of the reconstructed distributions of $ {p_{\mathrm {T}}} ({\mathrm{t} \mathrm{\bar{t}}})$ (upper), $ { | y({\mathrm{t} \mathrm{\bar{t}}}) | }$ (middle), and $M({\mathrm{t} \mathrm{\bar{t}}})$ (lower) for the (left) parton- and the (right) particle-level measurements in data and simulation. The simulation of POWHEG+PYTHIA8 is used to describe the $ {\mathrm{t} \mathrm{\bar{t}}} $ production. The contribution of multijet, DY, and W boson plus jets background events is extracted from the data (cf. Section 7). Combined experimental (cf. Section 9) and statistical uncertainties (hatched area) are shown for the total predicted yields. The data points are shown with statistical uncertainties. The ratios of data to the predicted yields are given at the bottom of each panel. |
png pdf |
Figure 7-e:
Comparisons of the reconstructed distributions of $ {p_{\mathrm {T}}} ({\mathrm{t} \mathrm{\bar{t}}})$ (upper), $ { | y({\mathrm{t} \mathrm{\bar{t}}}) | }$ (middle), and $M({\mathrm{t} \mathrm{\bar{t}}})$ (lower) for the (left) parton- and the (right) particle-level measurements in data and simulation. The simulation of POWHEG+PYTHIA8 is used to describe the $ {\mathrm{t} \mathrm{\bar{t}}} $ production. The contribution of multijet, DY, and W boson plus jets background events is extracted from the data (cf. Section 7). Combined experimental (cf. Section 9) and statistical uncertainties (hatched area) are shown for the total predicted yields. The data points are shown with statistical uncertainties. The ratios of data to the predicted yields are given at the bottom of each panel. |

png pdf |
Figure 7-f:
Comparisons of the reconstructed distributions of $ {p_{\mathrm {T}}} ({\mathrm{t} \mathrm{\bar{t}}})$ (upper), $ { | y({\mathrm{t} \mathrm{\bar{t}}}) | }$ (middle), and $M({\mathrm{t} \mathrm{\bar{t}}})$ (lower) for the (left) parton- and the (right) particle-level measurements in data and simulation. The simulation of POWHEG+PYTHIA8 is used to describe the $ {\mathrm{t} \mathrm{\bar{t}}} $ production. The contribution of multijet, DY, and W boson plus jets background events is extracted from the data (cf. Section 7). Combined experimental (cf. Section 9) and statistical uncertainties (hatched area) are shown for the total predicted yields. The data points are shown with statistical uncertainties. The ratios of data to the predicted yields are given at the bottom of each panel. |
png pdf |
Figure 8:
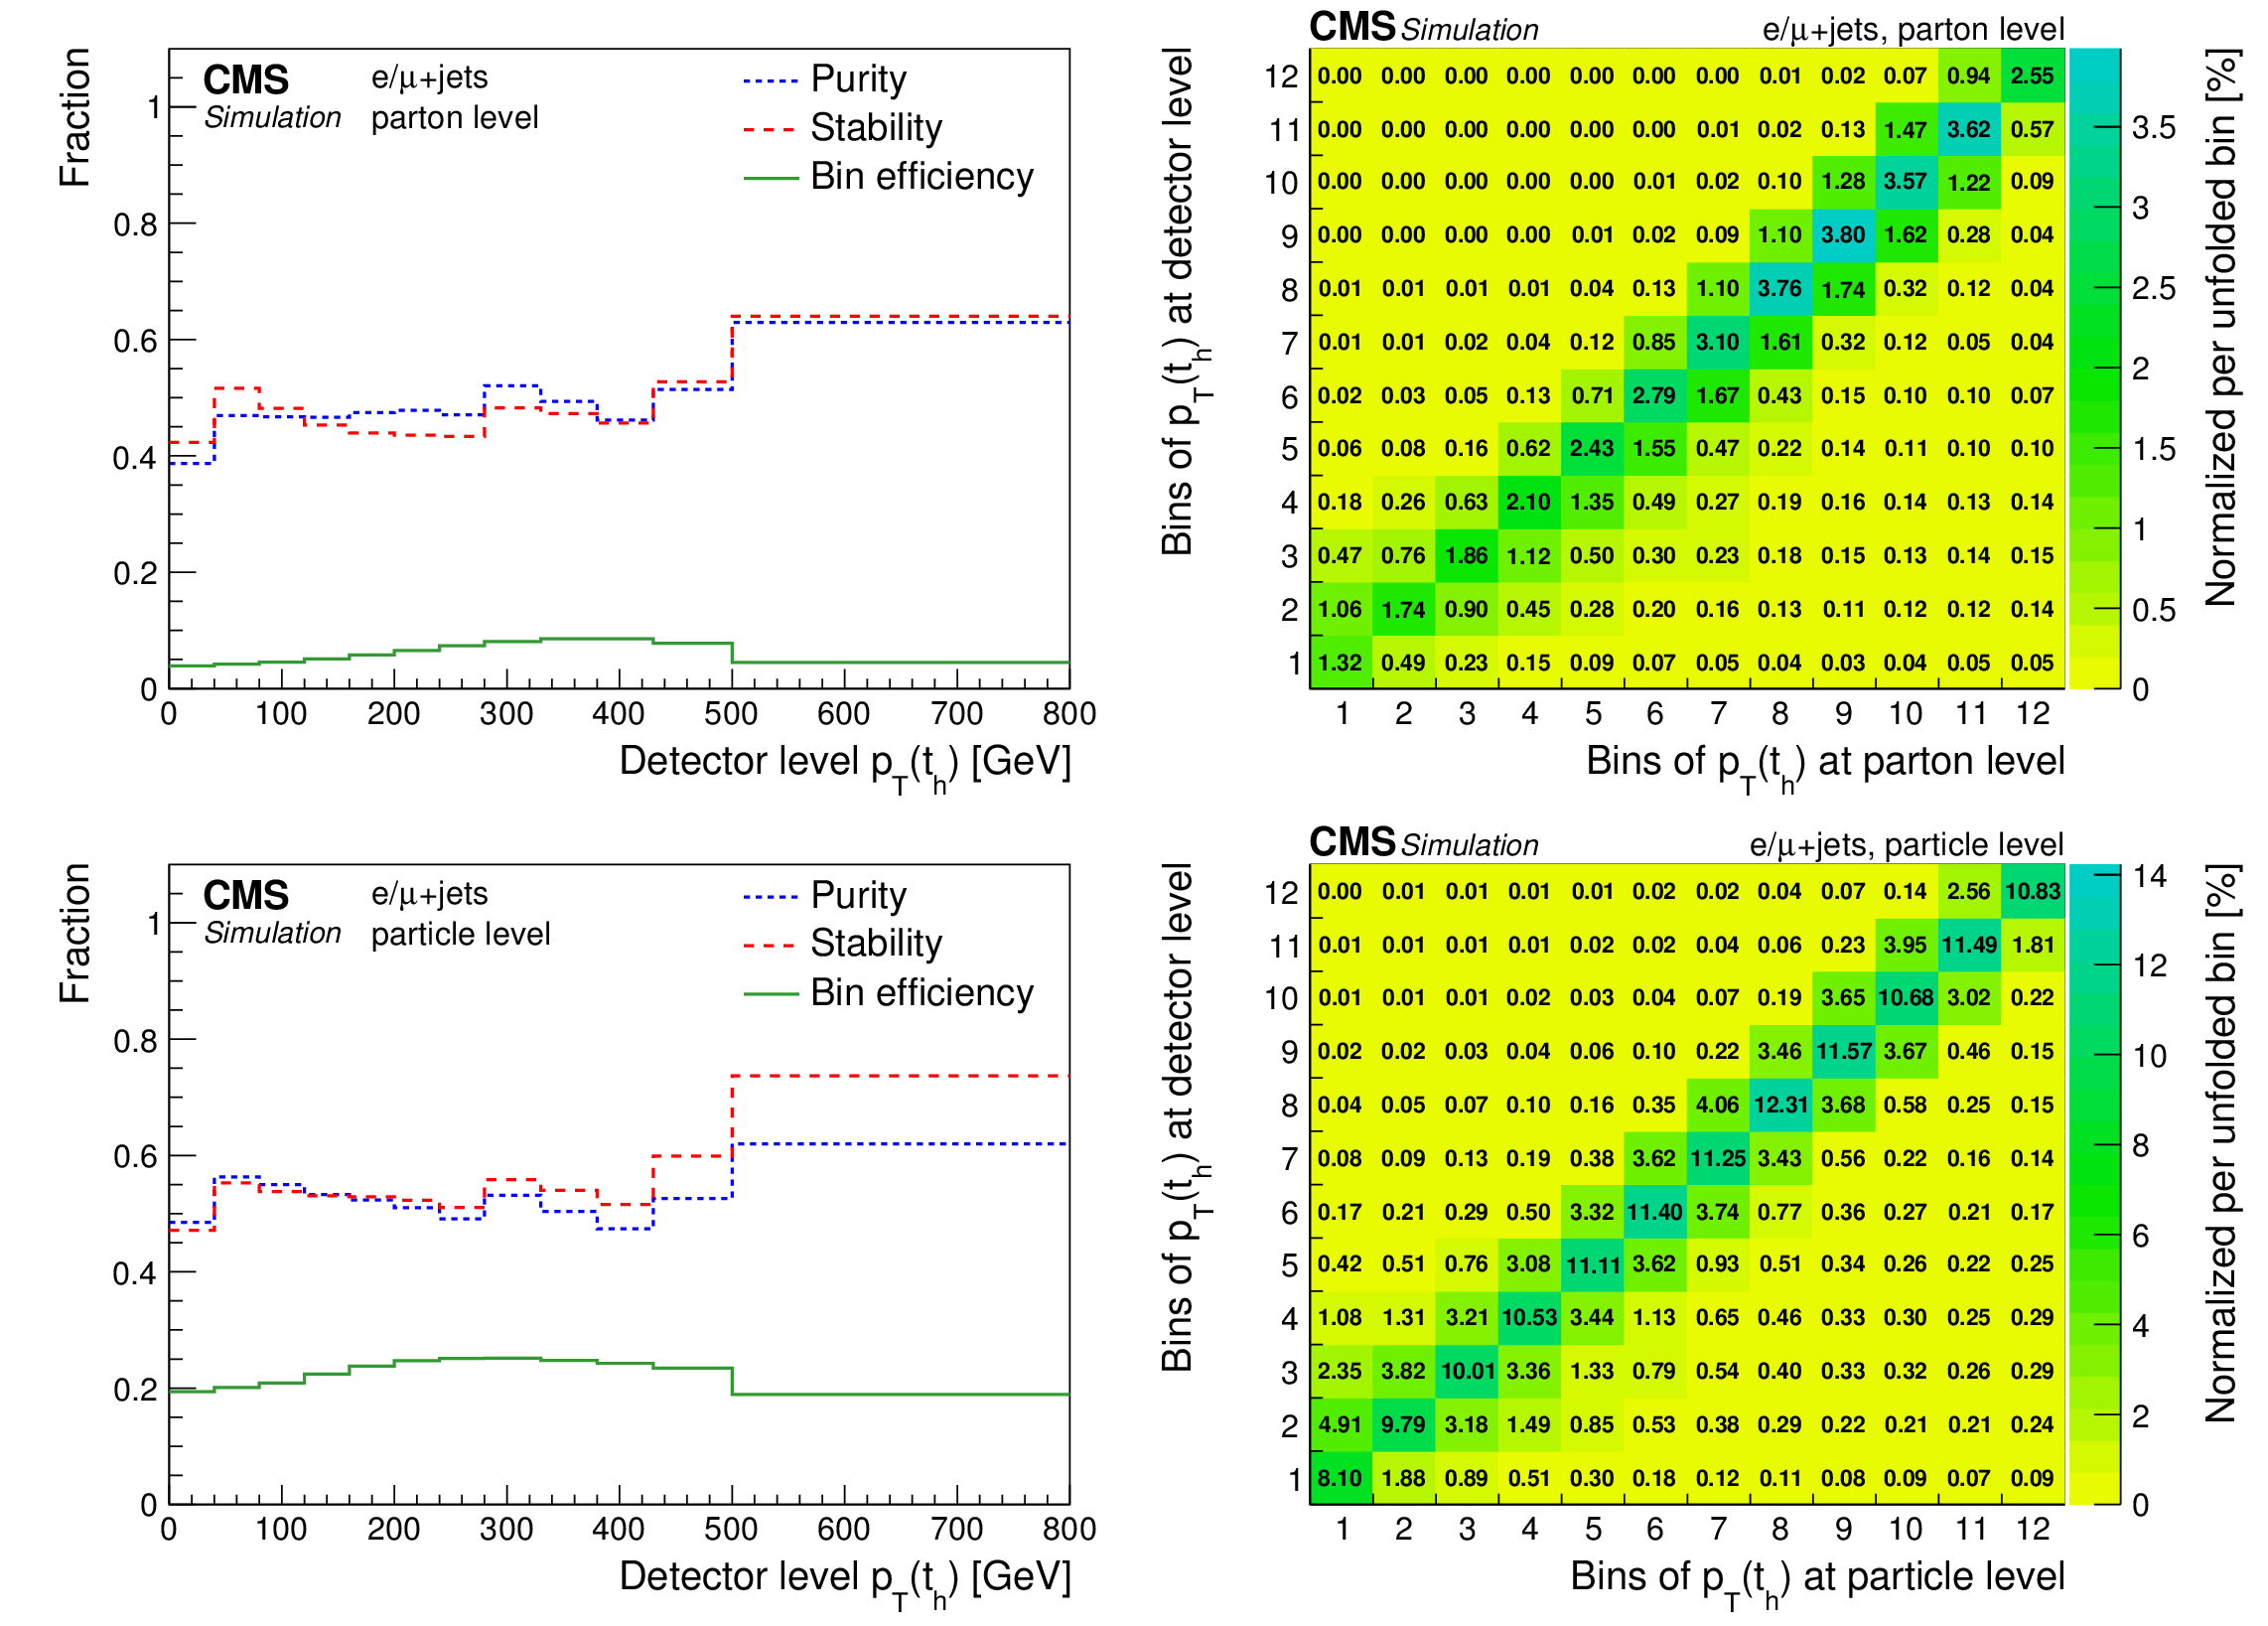
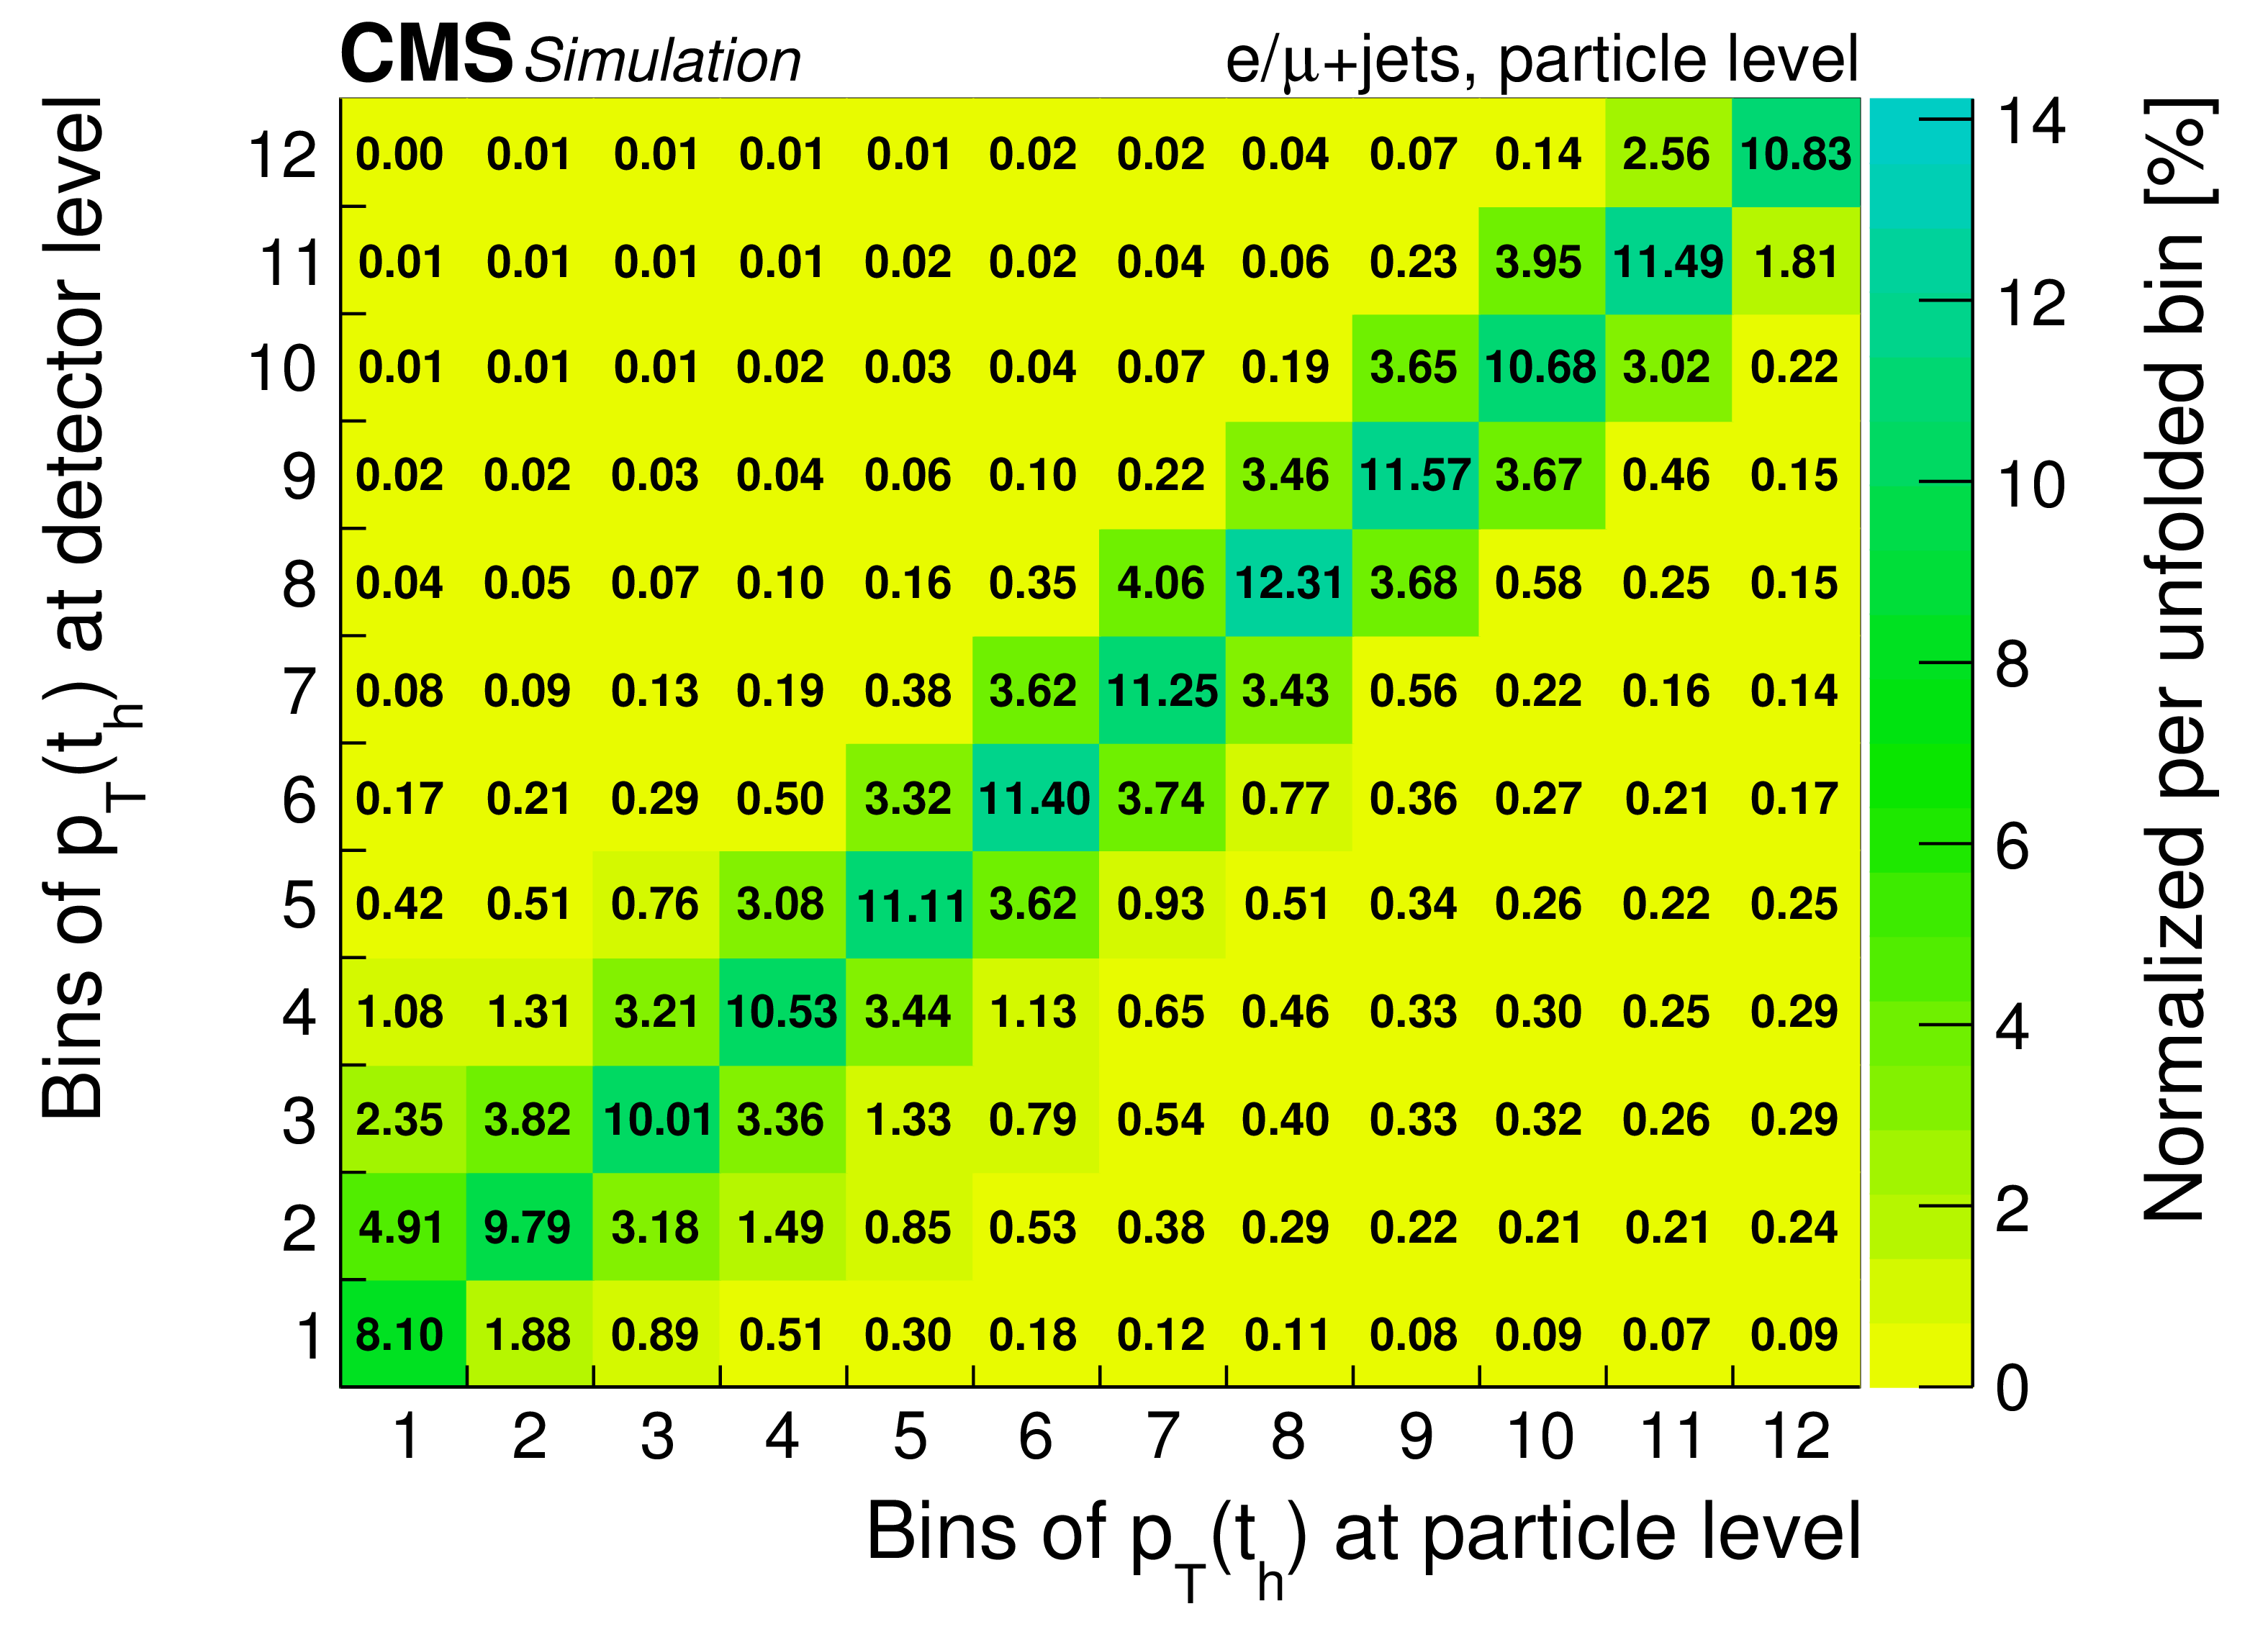
Migration studies of the (upper) parton- and (lower) particle-level measurements of $ {p_{\mathrm {T}}} ({\mathrm{t} _\mathrm {h}})$, extracted from the POWHEG+PYTHIA8 simulation. Left: purity, stability, and bin efficiency. Right: bin migrations between detector and parton (particle) level. The $ {p_{\mathrm {T}}} $ range of the bins can be taken from the left panels. Each column is normalized such that the sum of its entries corresponds to the percentage of reconstructed events in this bin at the parton (particle) level. |

png pdf |
Figure 8-a:
Migration studies of the (upper) parton- and (lower) particle-level measurements of $ {p_{\mathrm {T}}} ({\mathrm{t} _\mathrm {h}})$, extracted from the POWHEG+PYTHIA8 simulation. Left: purity, stability, and bin efficiency. Right: bin migrations between detector and parton (particle) level. The $ {p_{\mathrm {T}}} $ range of the bins can be taken from the left panels. Each column is normalized such that the sum of its entries corresponds to the percentage of reconstructed events in this bin at the parton (particle) level. |

png pdf |
Figure 8-b:
Migration studies of the (upper) parton- and (lower) particle-level measurements of $ {p_{\mathrm {T}}} ({\mathrm{t} _\mathrm {h}})$, extracted from the POWHEG+PYTHIA8 simulation. Left: purity, stability, and bin efficiency. Right: bin migrations between detector and parton (particle) level. The $ {p_{\mathrm {T}}} $ range of the bins can be taken from the left panels. Each column is normalized such that the sum of its entries corresponds to the percentage of reconstructed events in this bin at the parton (particle) level. |

png pdf |
Figure 8-c:
Migration studies of the (upper) parton- and (lower) particle-level measurements of $ {p_{\mathrm {T}}} ({\mathrm{t} _\mathrm {h}})$, extracted from the POWHEG+PYTHIA8 simulation. Left: purity, stability, and bin efficiency. Right: bin migrations between detector and parton (particle) level. The $ {p_{\mathrm {T}}} $ range of the bins can be taken from the left panels. Each column is normalized such that the sum of its entries corresponds to the percentage of reconstructed events in this bin at the parton (particle) level. |
png pdf |
Figure 8-d:
Migration studies of the (upper) parton- and (lower) particle-level measurements of $ {p_{\mathrm {T}}} ({\mathrm{t} _\mathrm {h}})$, extracted from the POWHEG+PYTHIA8 simulation. Left: purity, stability, and bin efficiency. Right: bin migrations between detector and parton (particle) level. The $ {p_{\mathrm {T}}} $ range of the bins can be taken from the left panels. Each column is normalized such that the sum of its entries corresponds to the percentage of reconstructed events in this bin at the parton (particle) level. |
png pdf |
Figure 9:
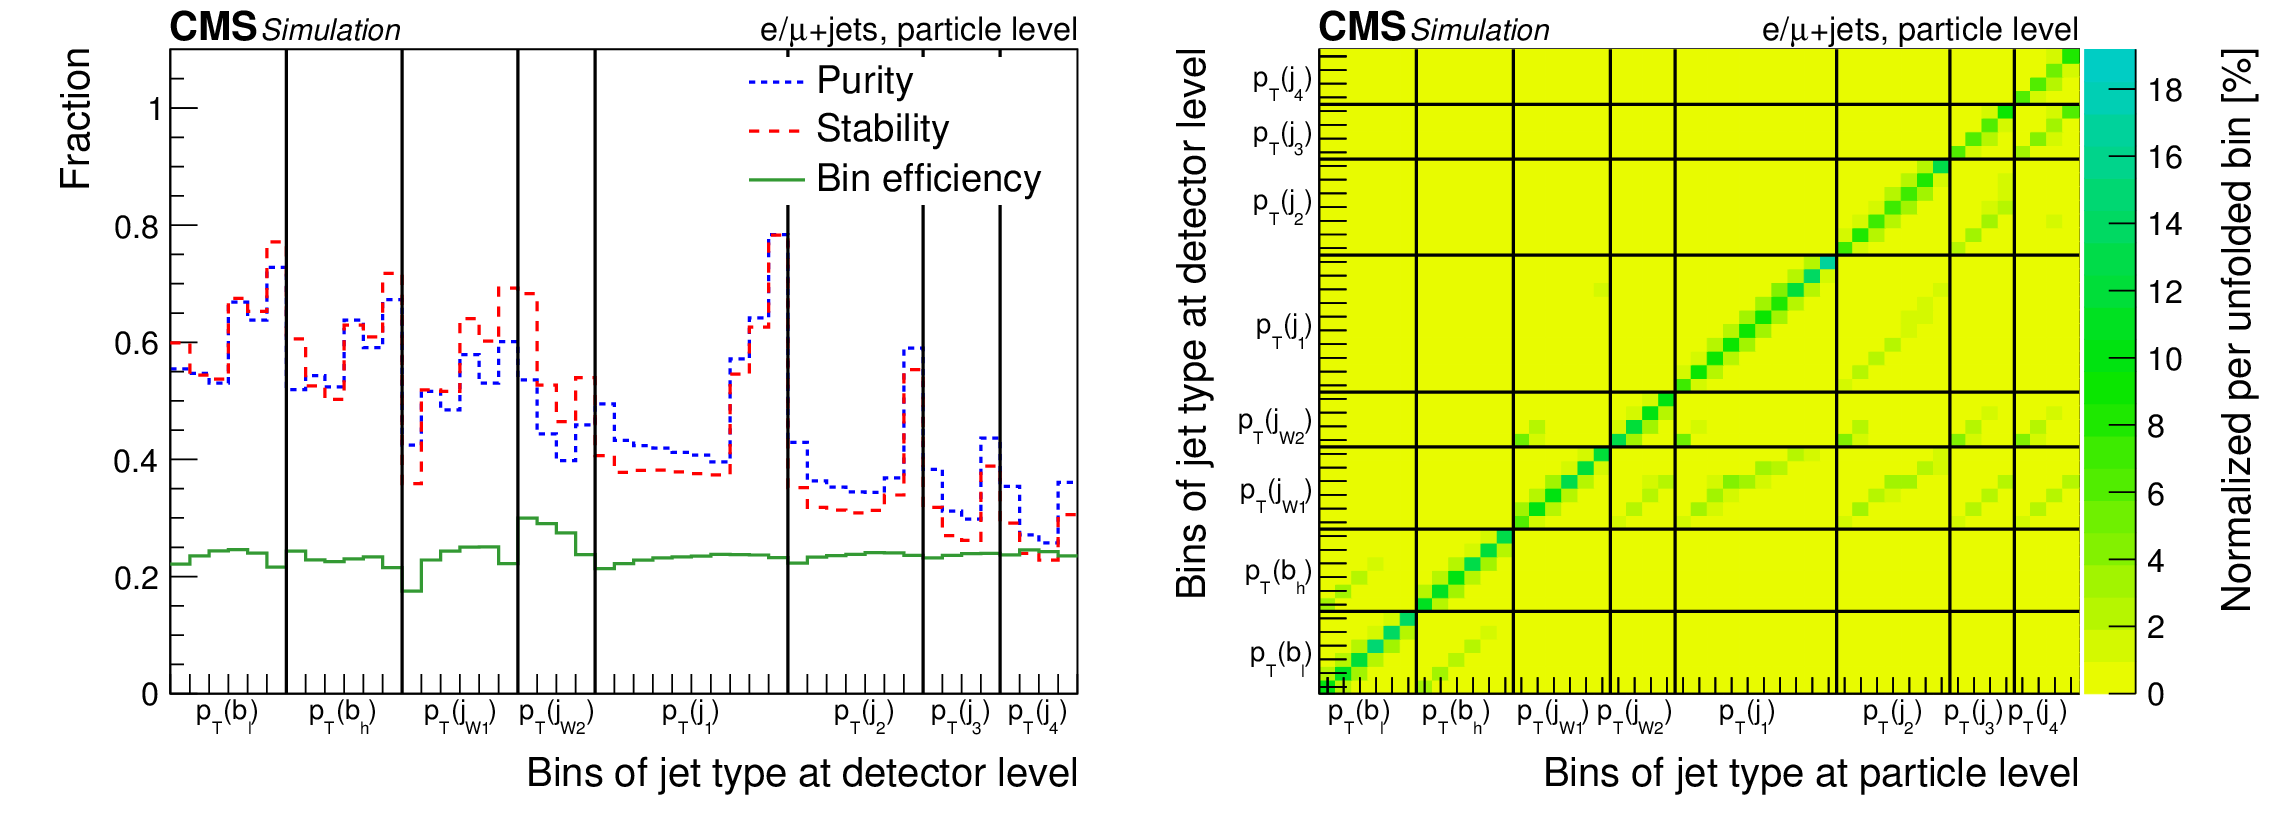
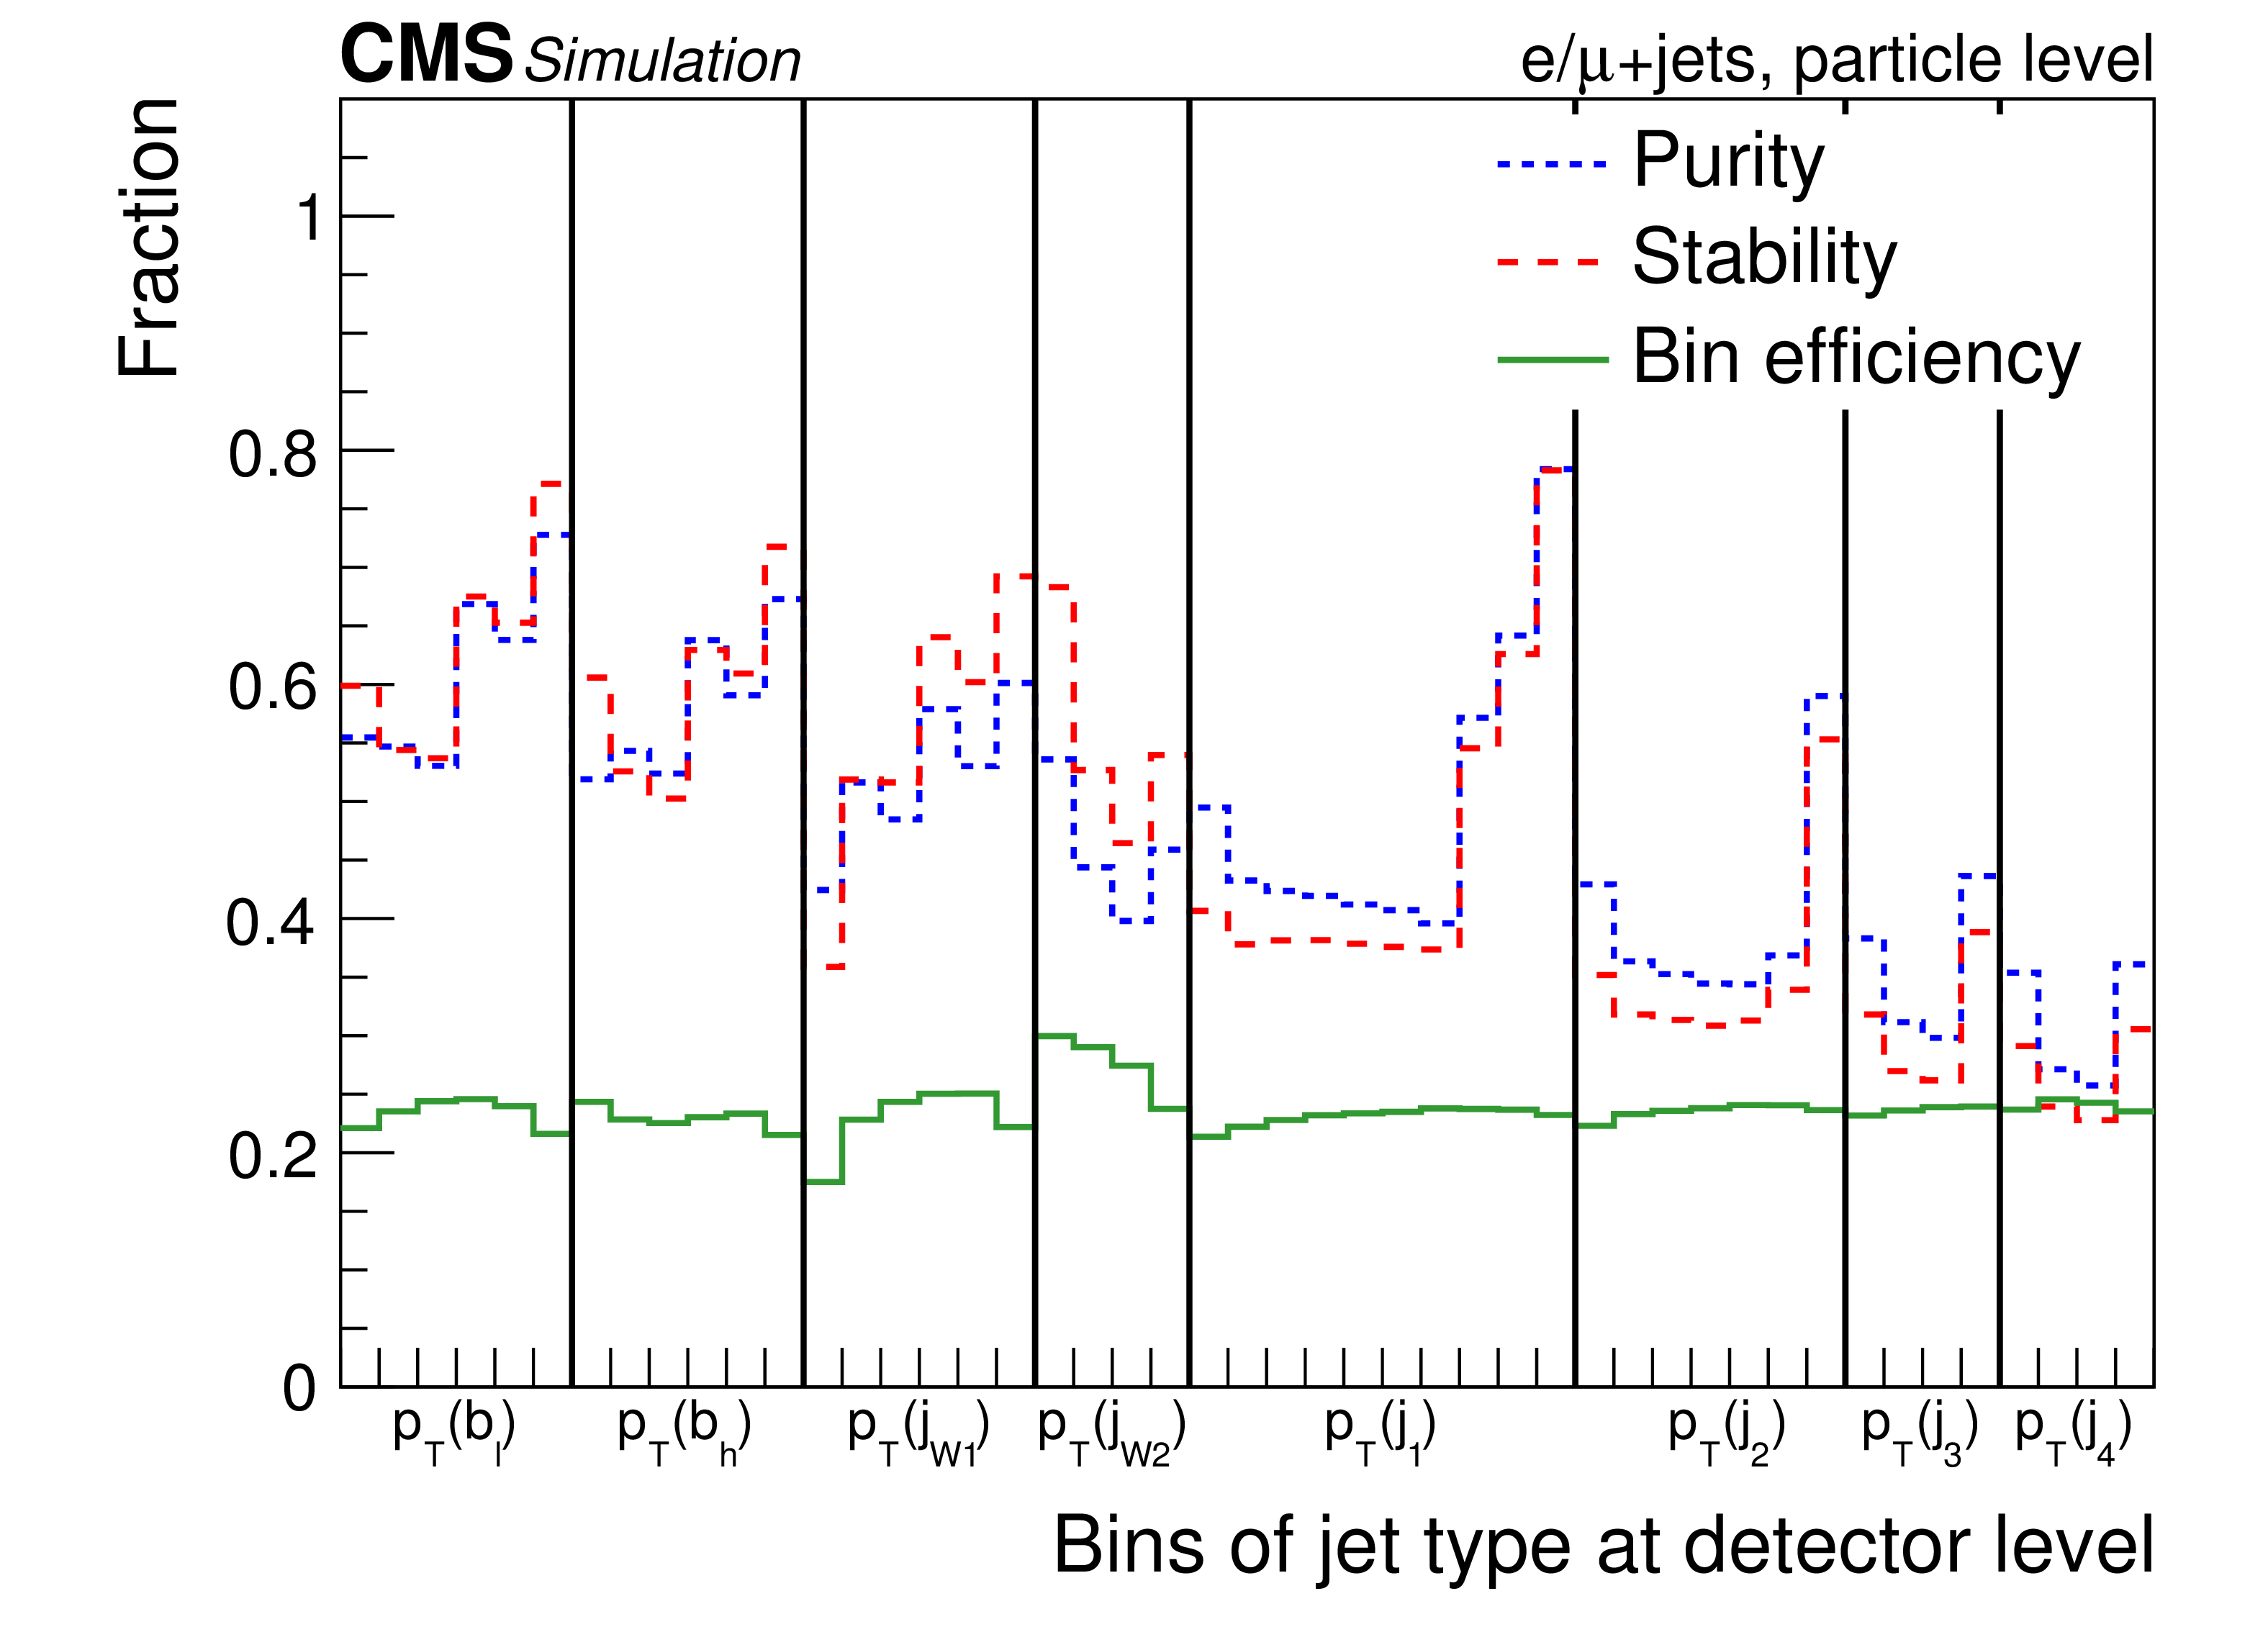
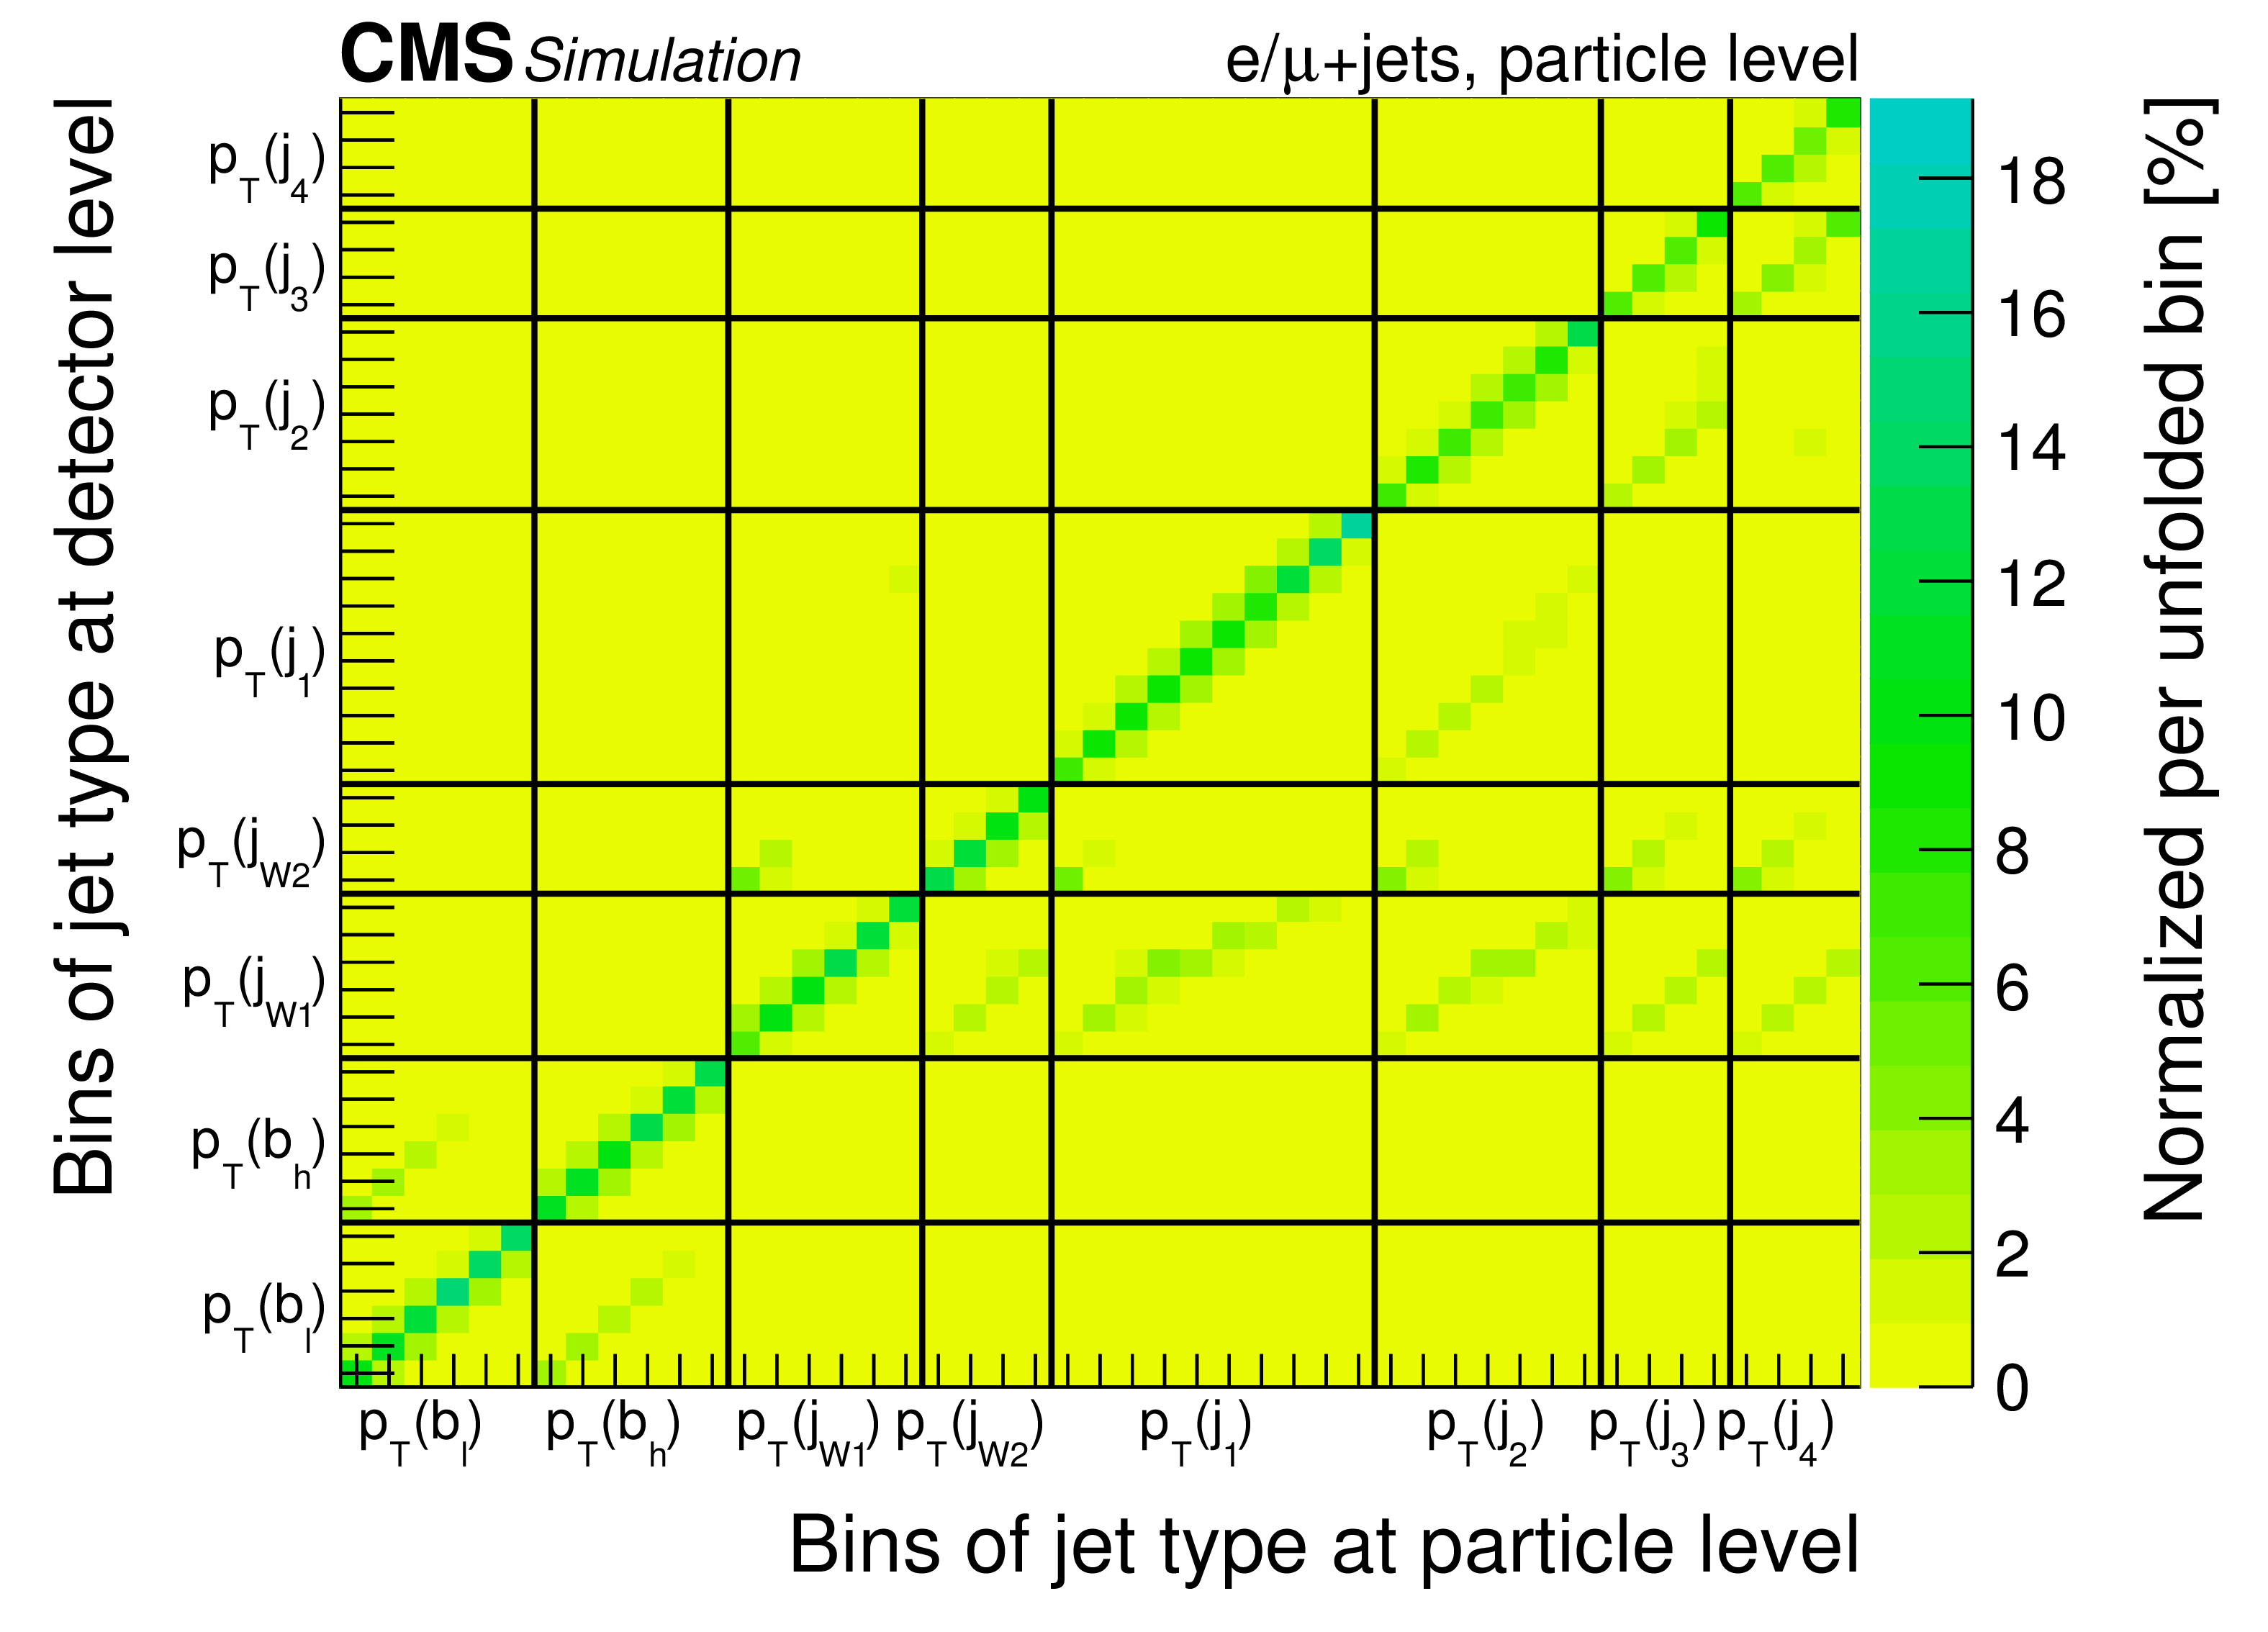
Migration studies of the particle-level measurement of the jet $ {p_{\mathrm {T}}} $ spectra, extracted from the POWHEG+PYTHIA8 simulation. Left: purity, stability, and bin efficiency. Right: bin migrations between detector and particle level. On the axes the $ {p_{\mathrm {T}}} $ bins for each jet are shown. Each column is normalized in the way that the sum of its entries corresponds to the percentage of reconstructed events in this bin at the particle level. |
png pdf |
Figure 9-a:
Migration studies of the particle-level measurement of the jet $ {p_{\mathrm {T}}} $ spectra, extracted from the POWHEG+PYTHIA8 simulation. Left: purity, stability, and bin efficiency. Right: bin migrations between detector and particle level. On the axes the $ {p_{\mathrm {T}}} $ bins for each jet are shown. Each column is normalized in the way that the sum of its entries corresponds to the percentage of reconstructed events in this bin at the particle level. |
png pdf |
Figure 9-b:
Migration studies of the particle-level measurement of the jet $ {p_{\mathrm {T}}} $ spectra, extracted from the POWHEG+PYTHIA8 simulation. Left: purity, stability, and bin efficiency. Right: bin migrations between detector and particle level. On the axes the $ {p_{\mathrm {T}}} $ bins for each jet are shown. Each column is normalized in the way that the sum of its entries corresponds to the percentage of reconstructed events in this bin at the particle level. |
png pdf |
Figure 10:
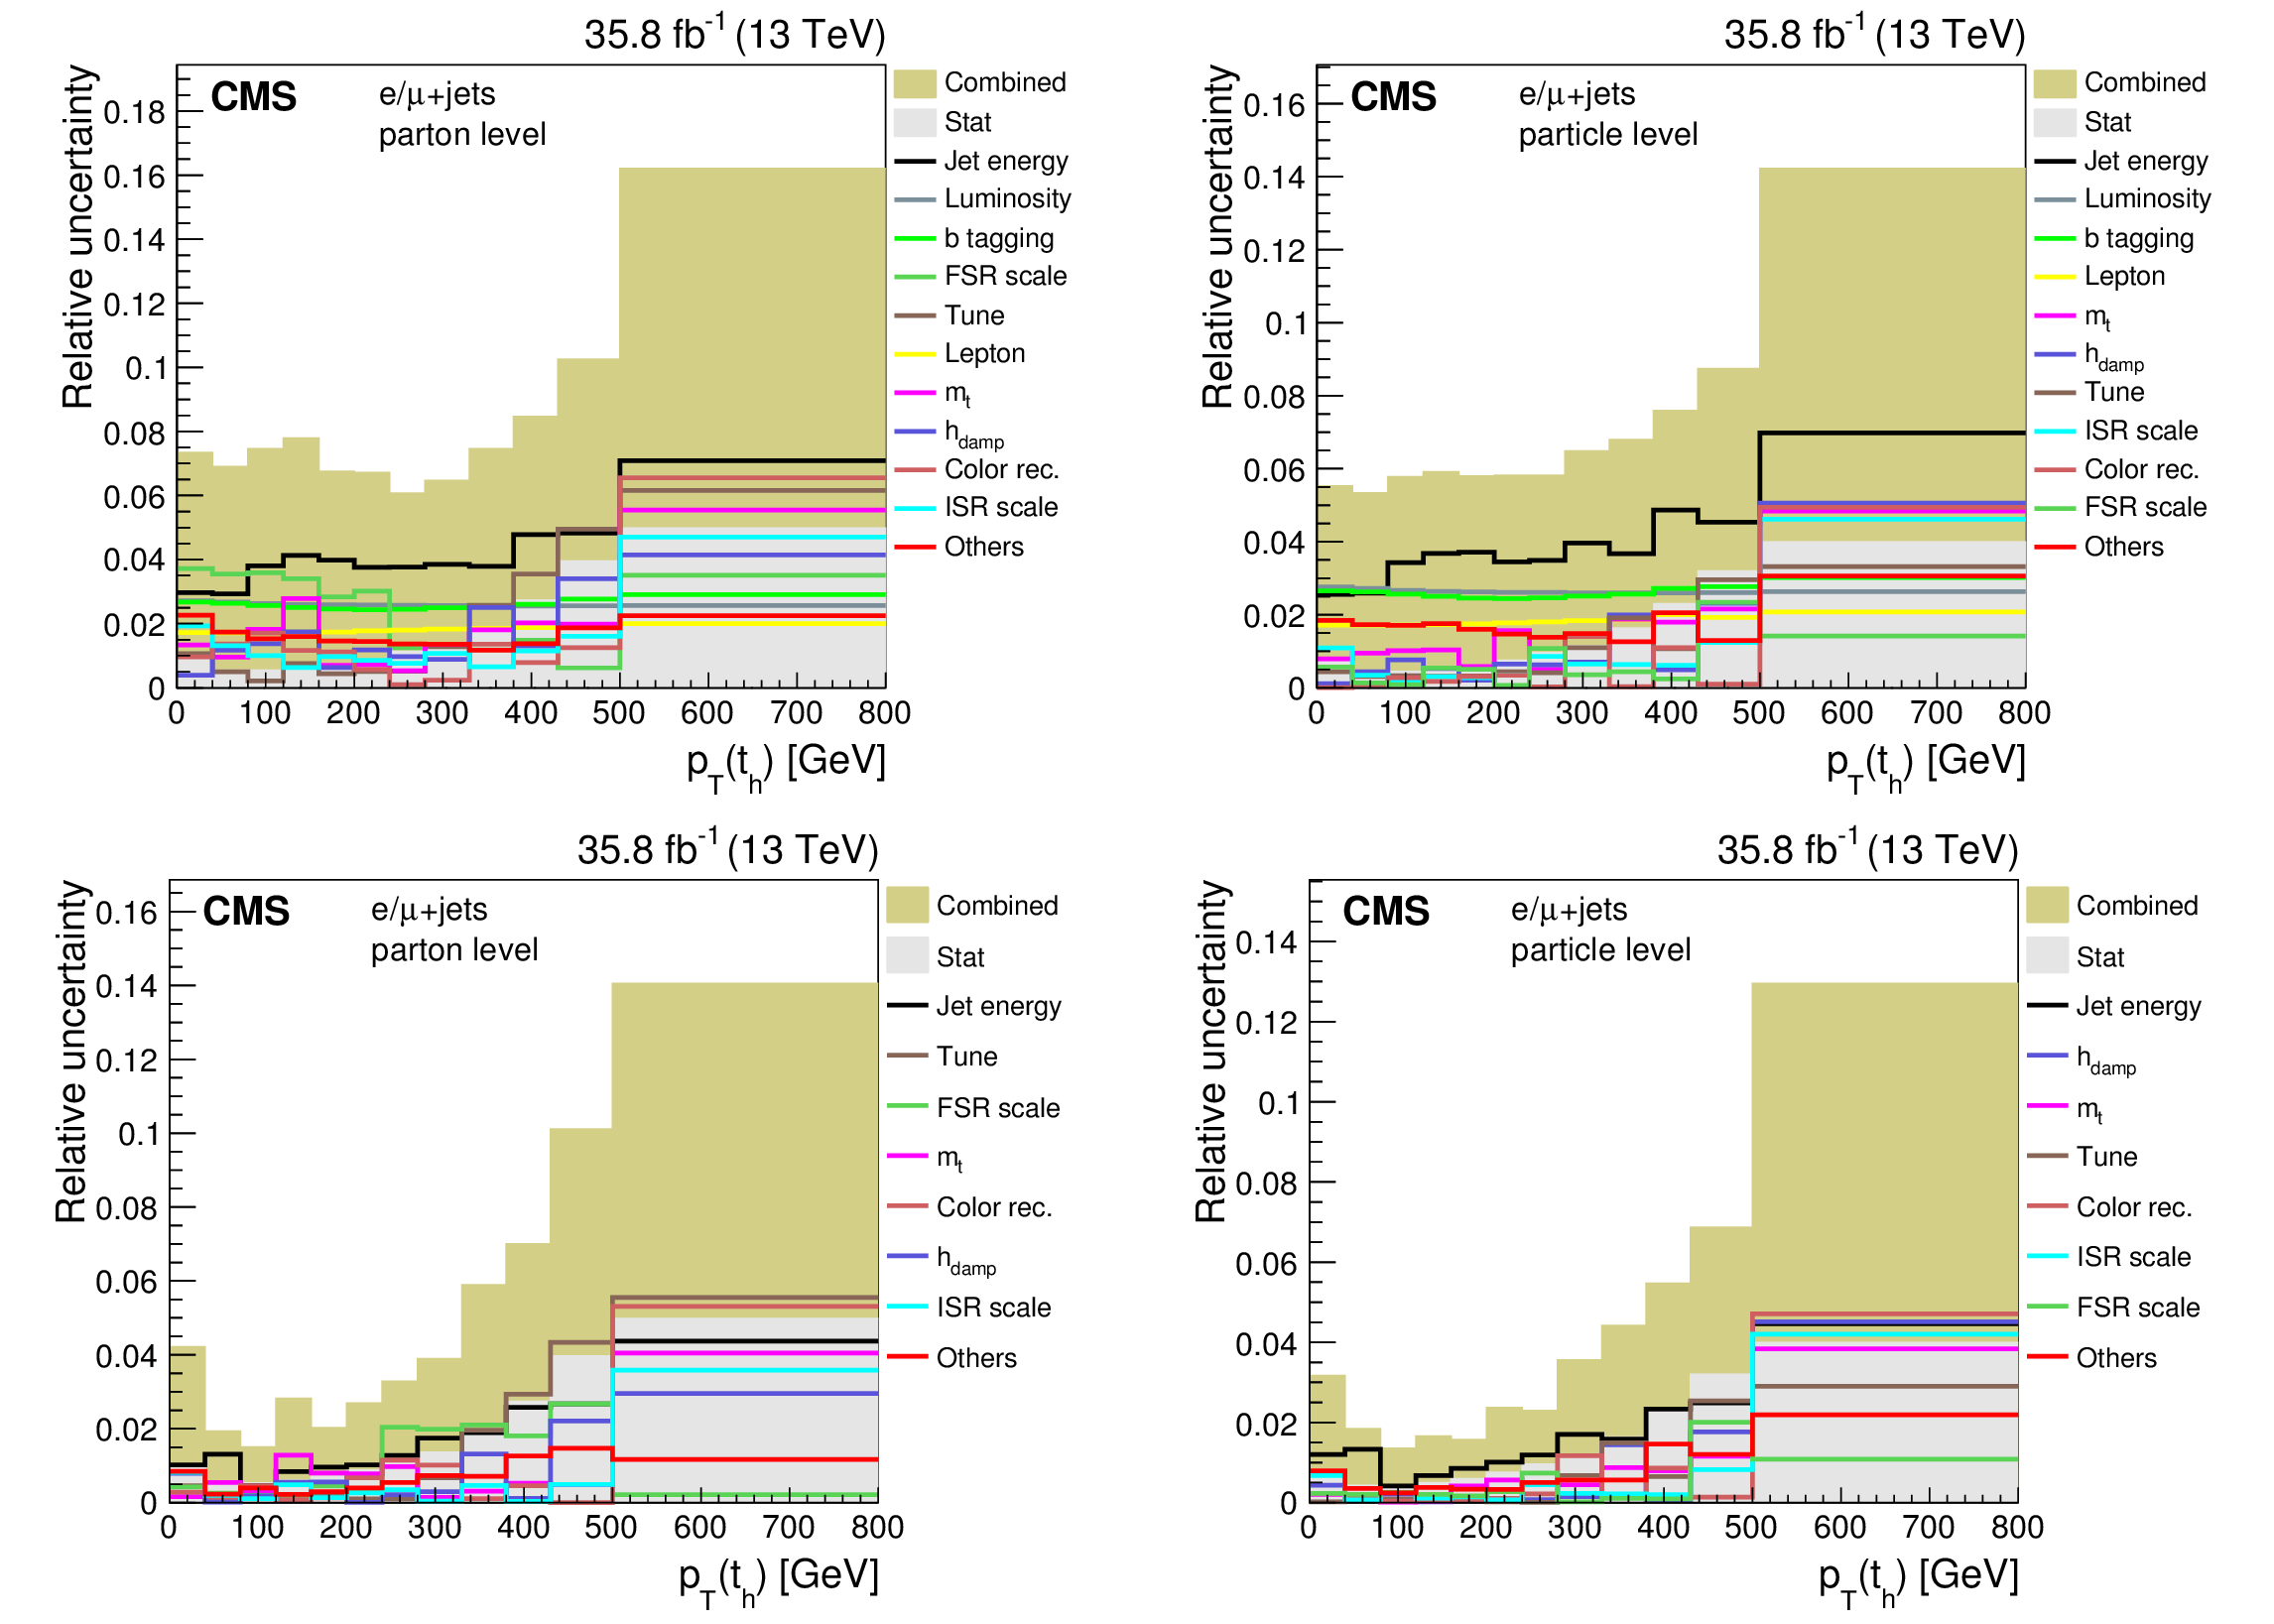
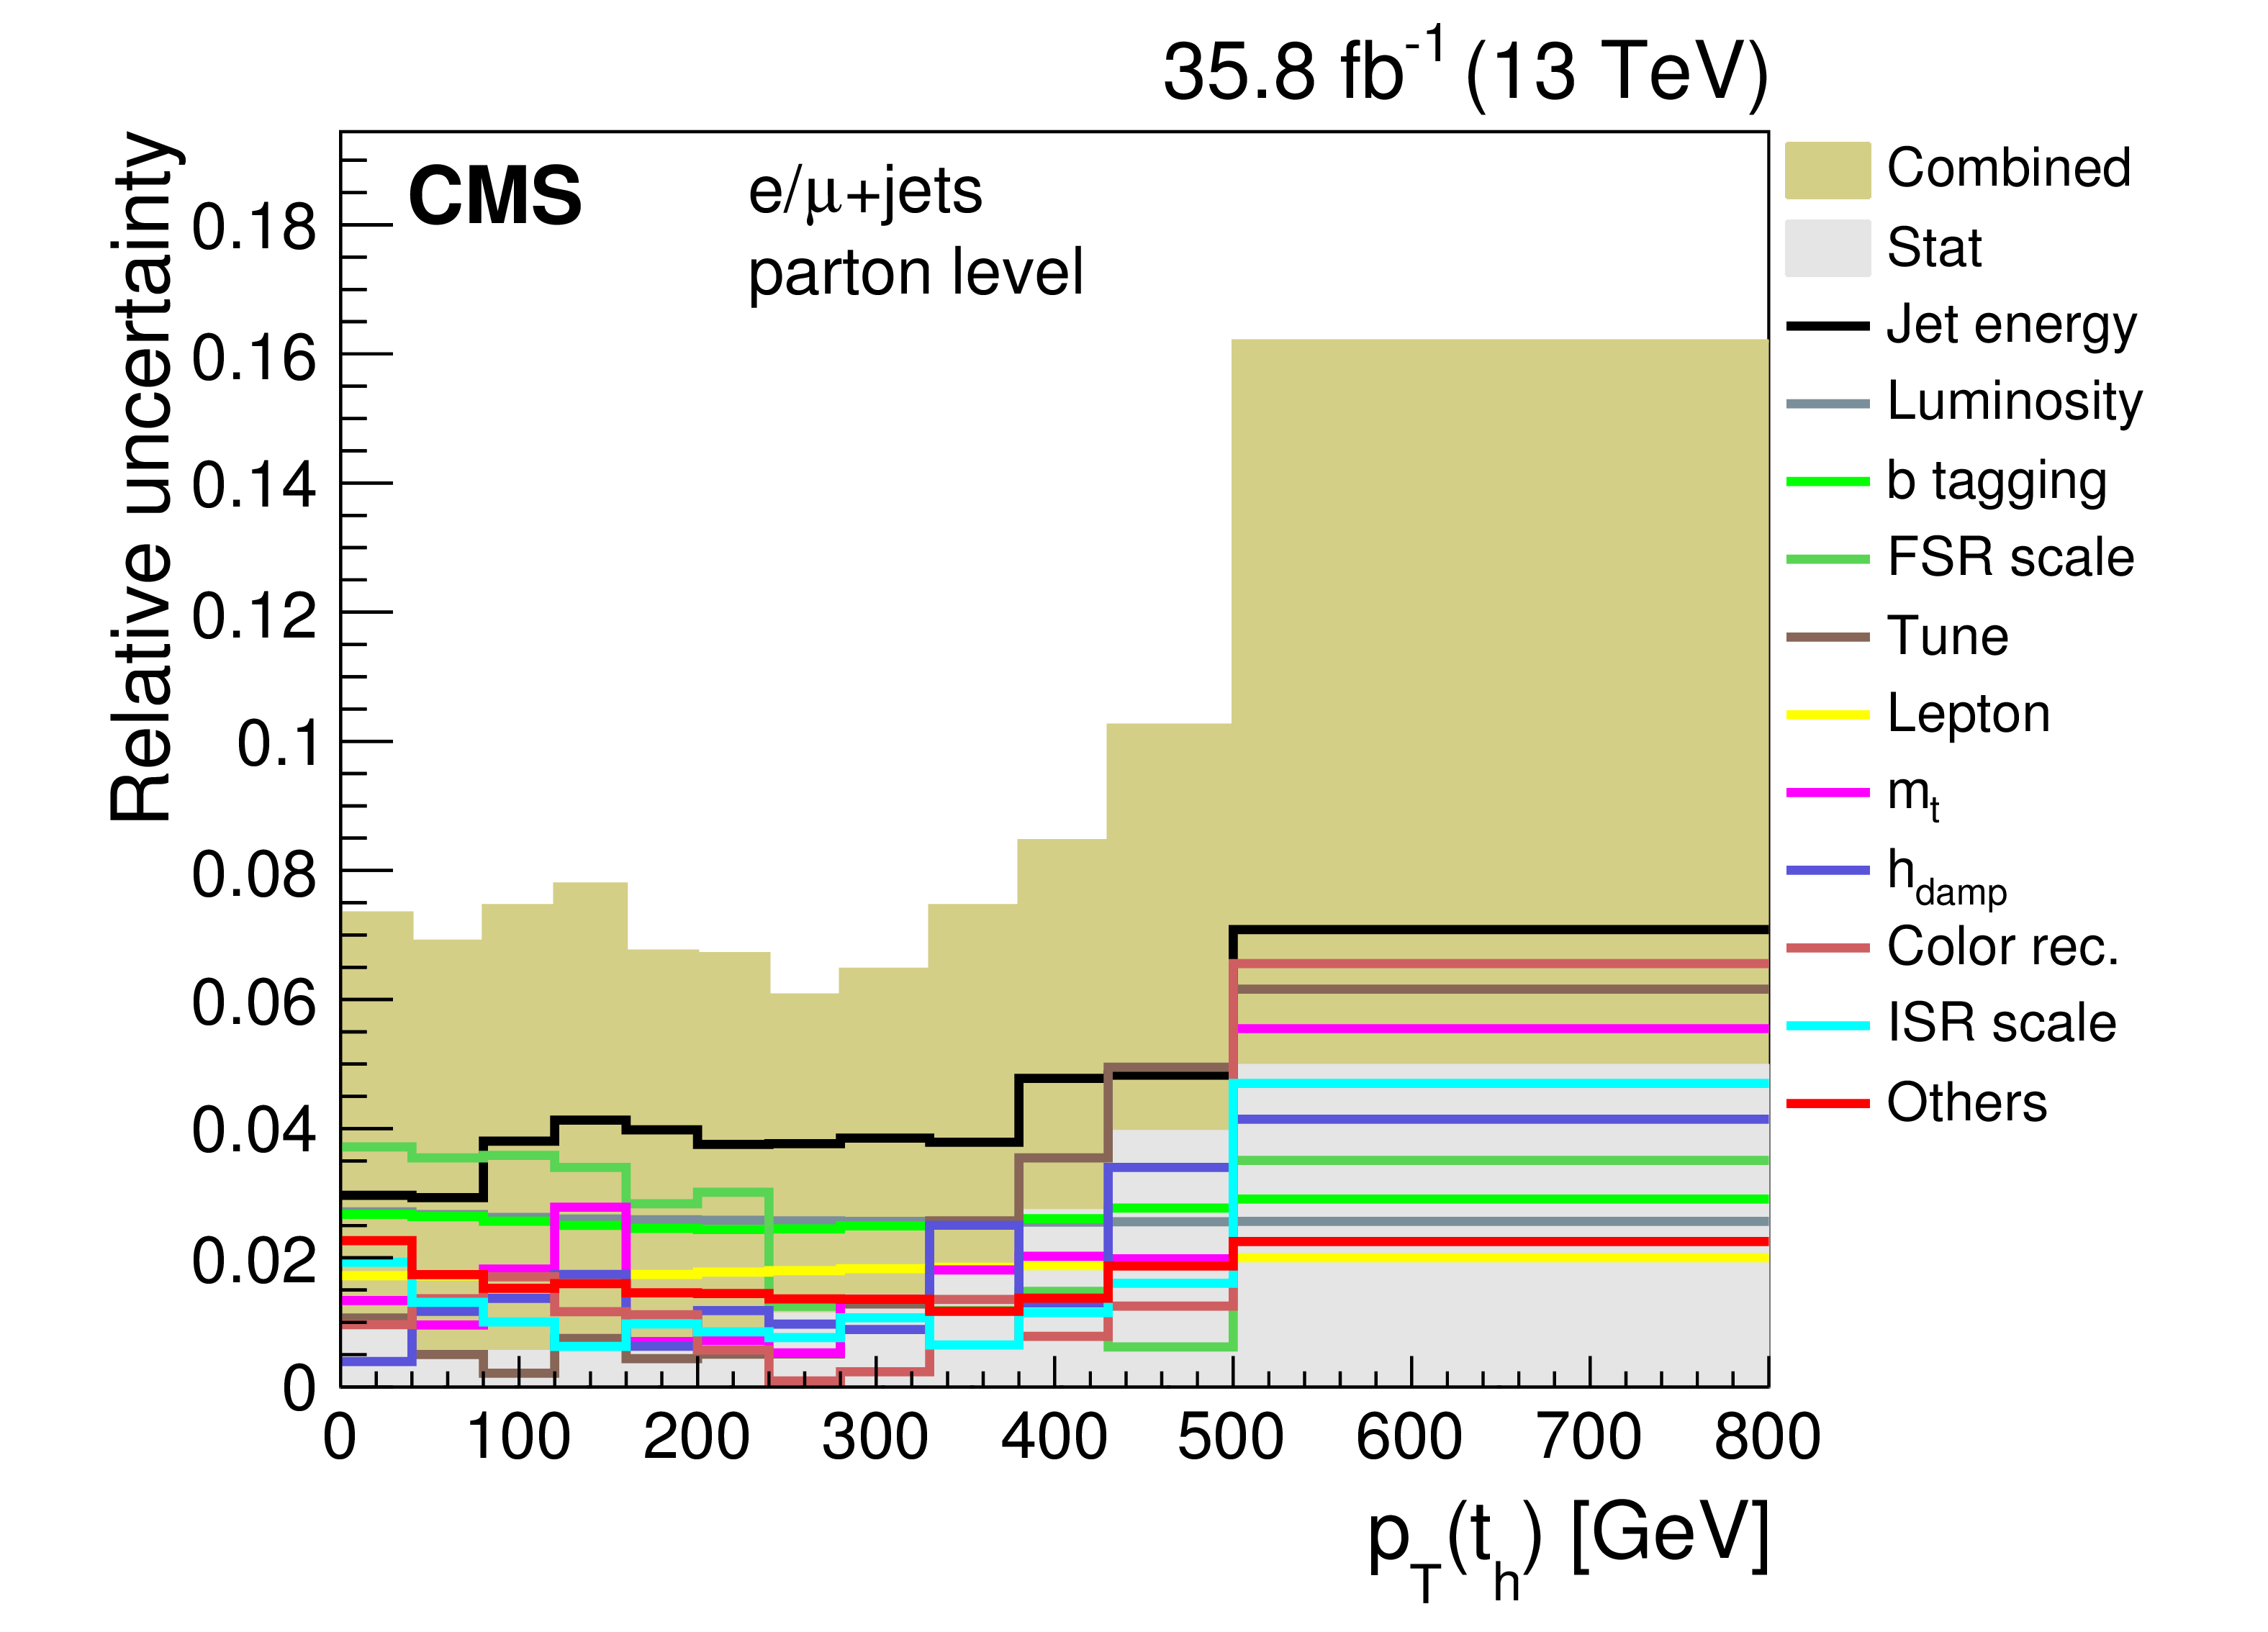
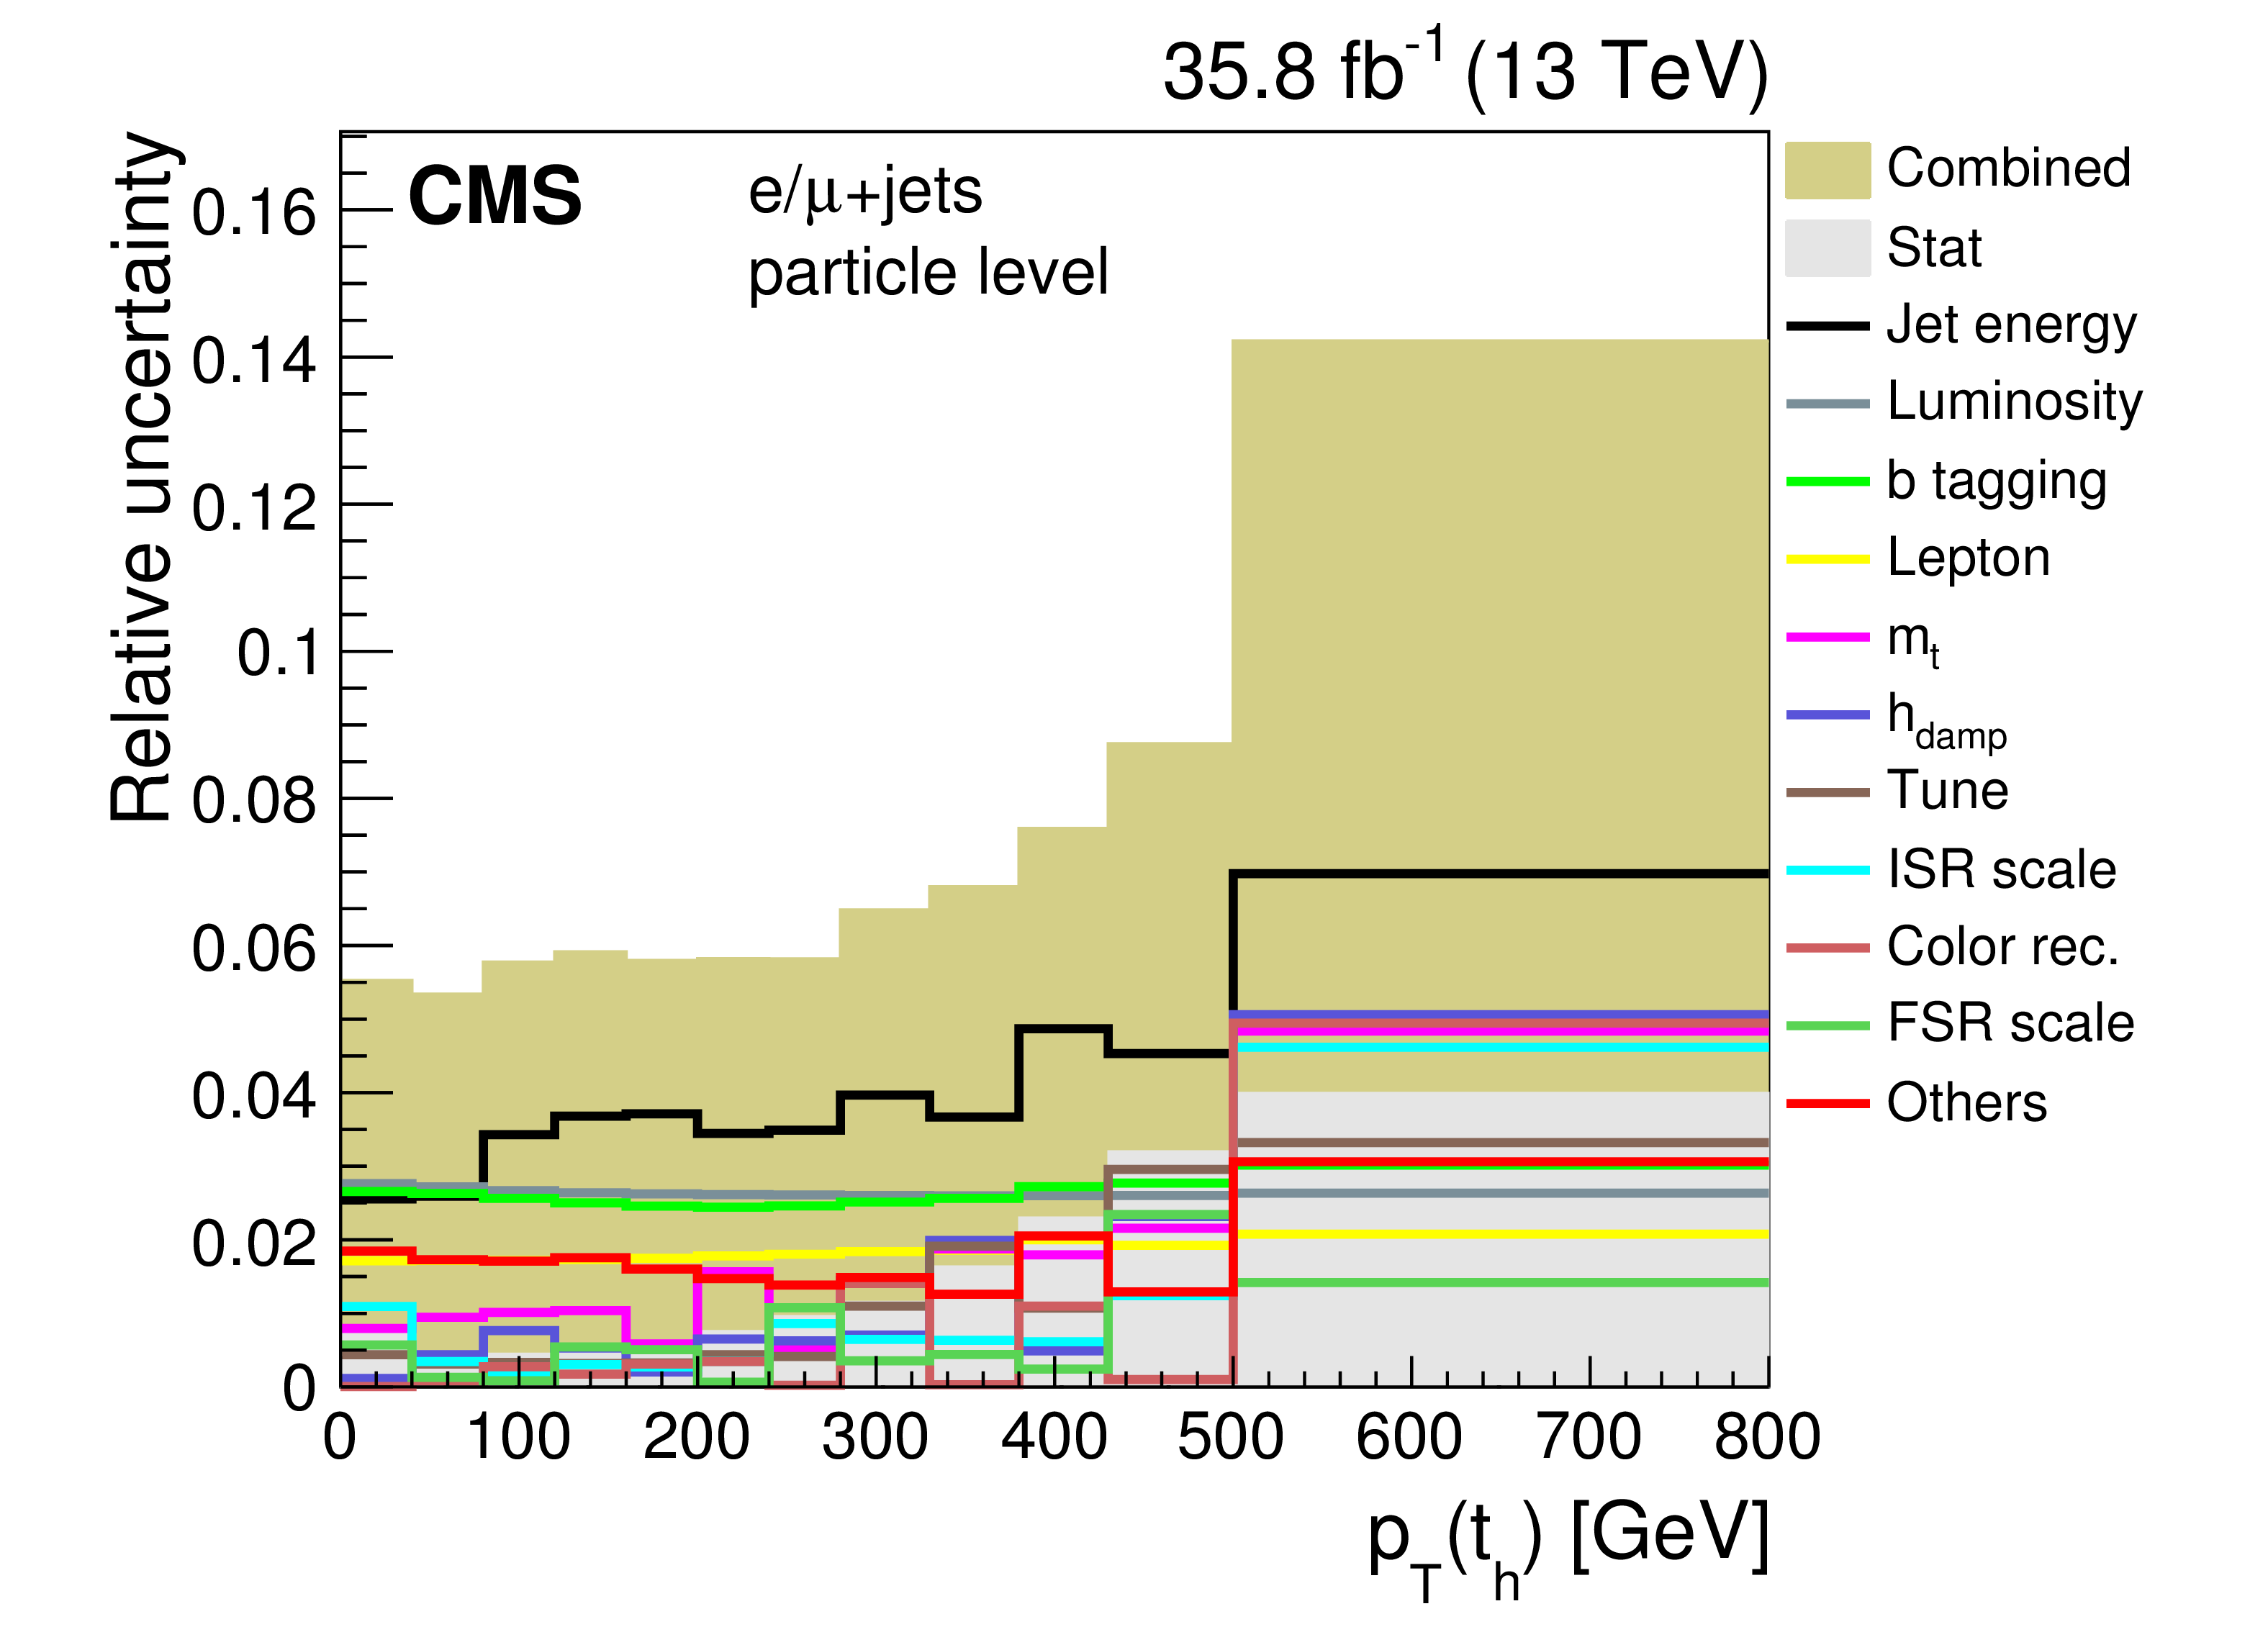
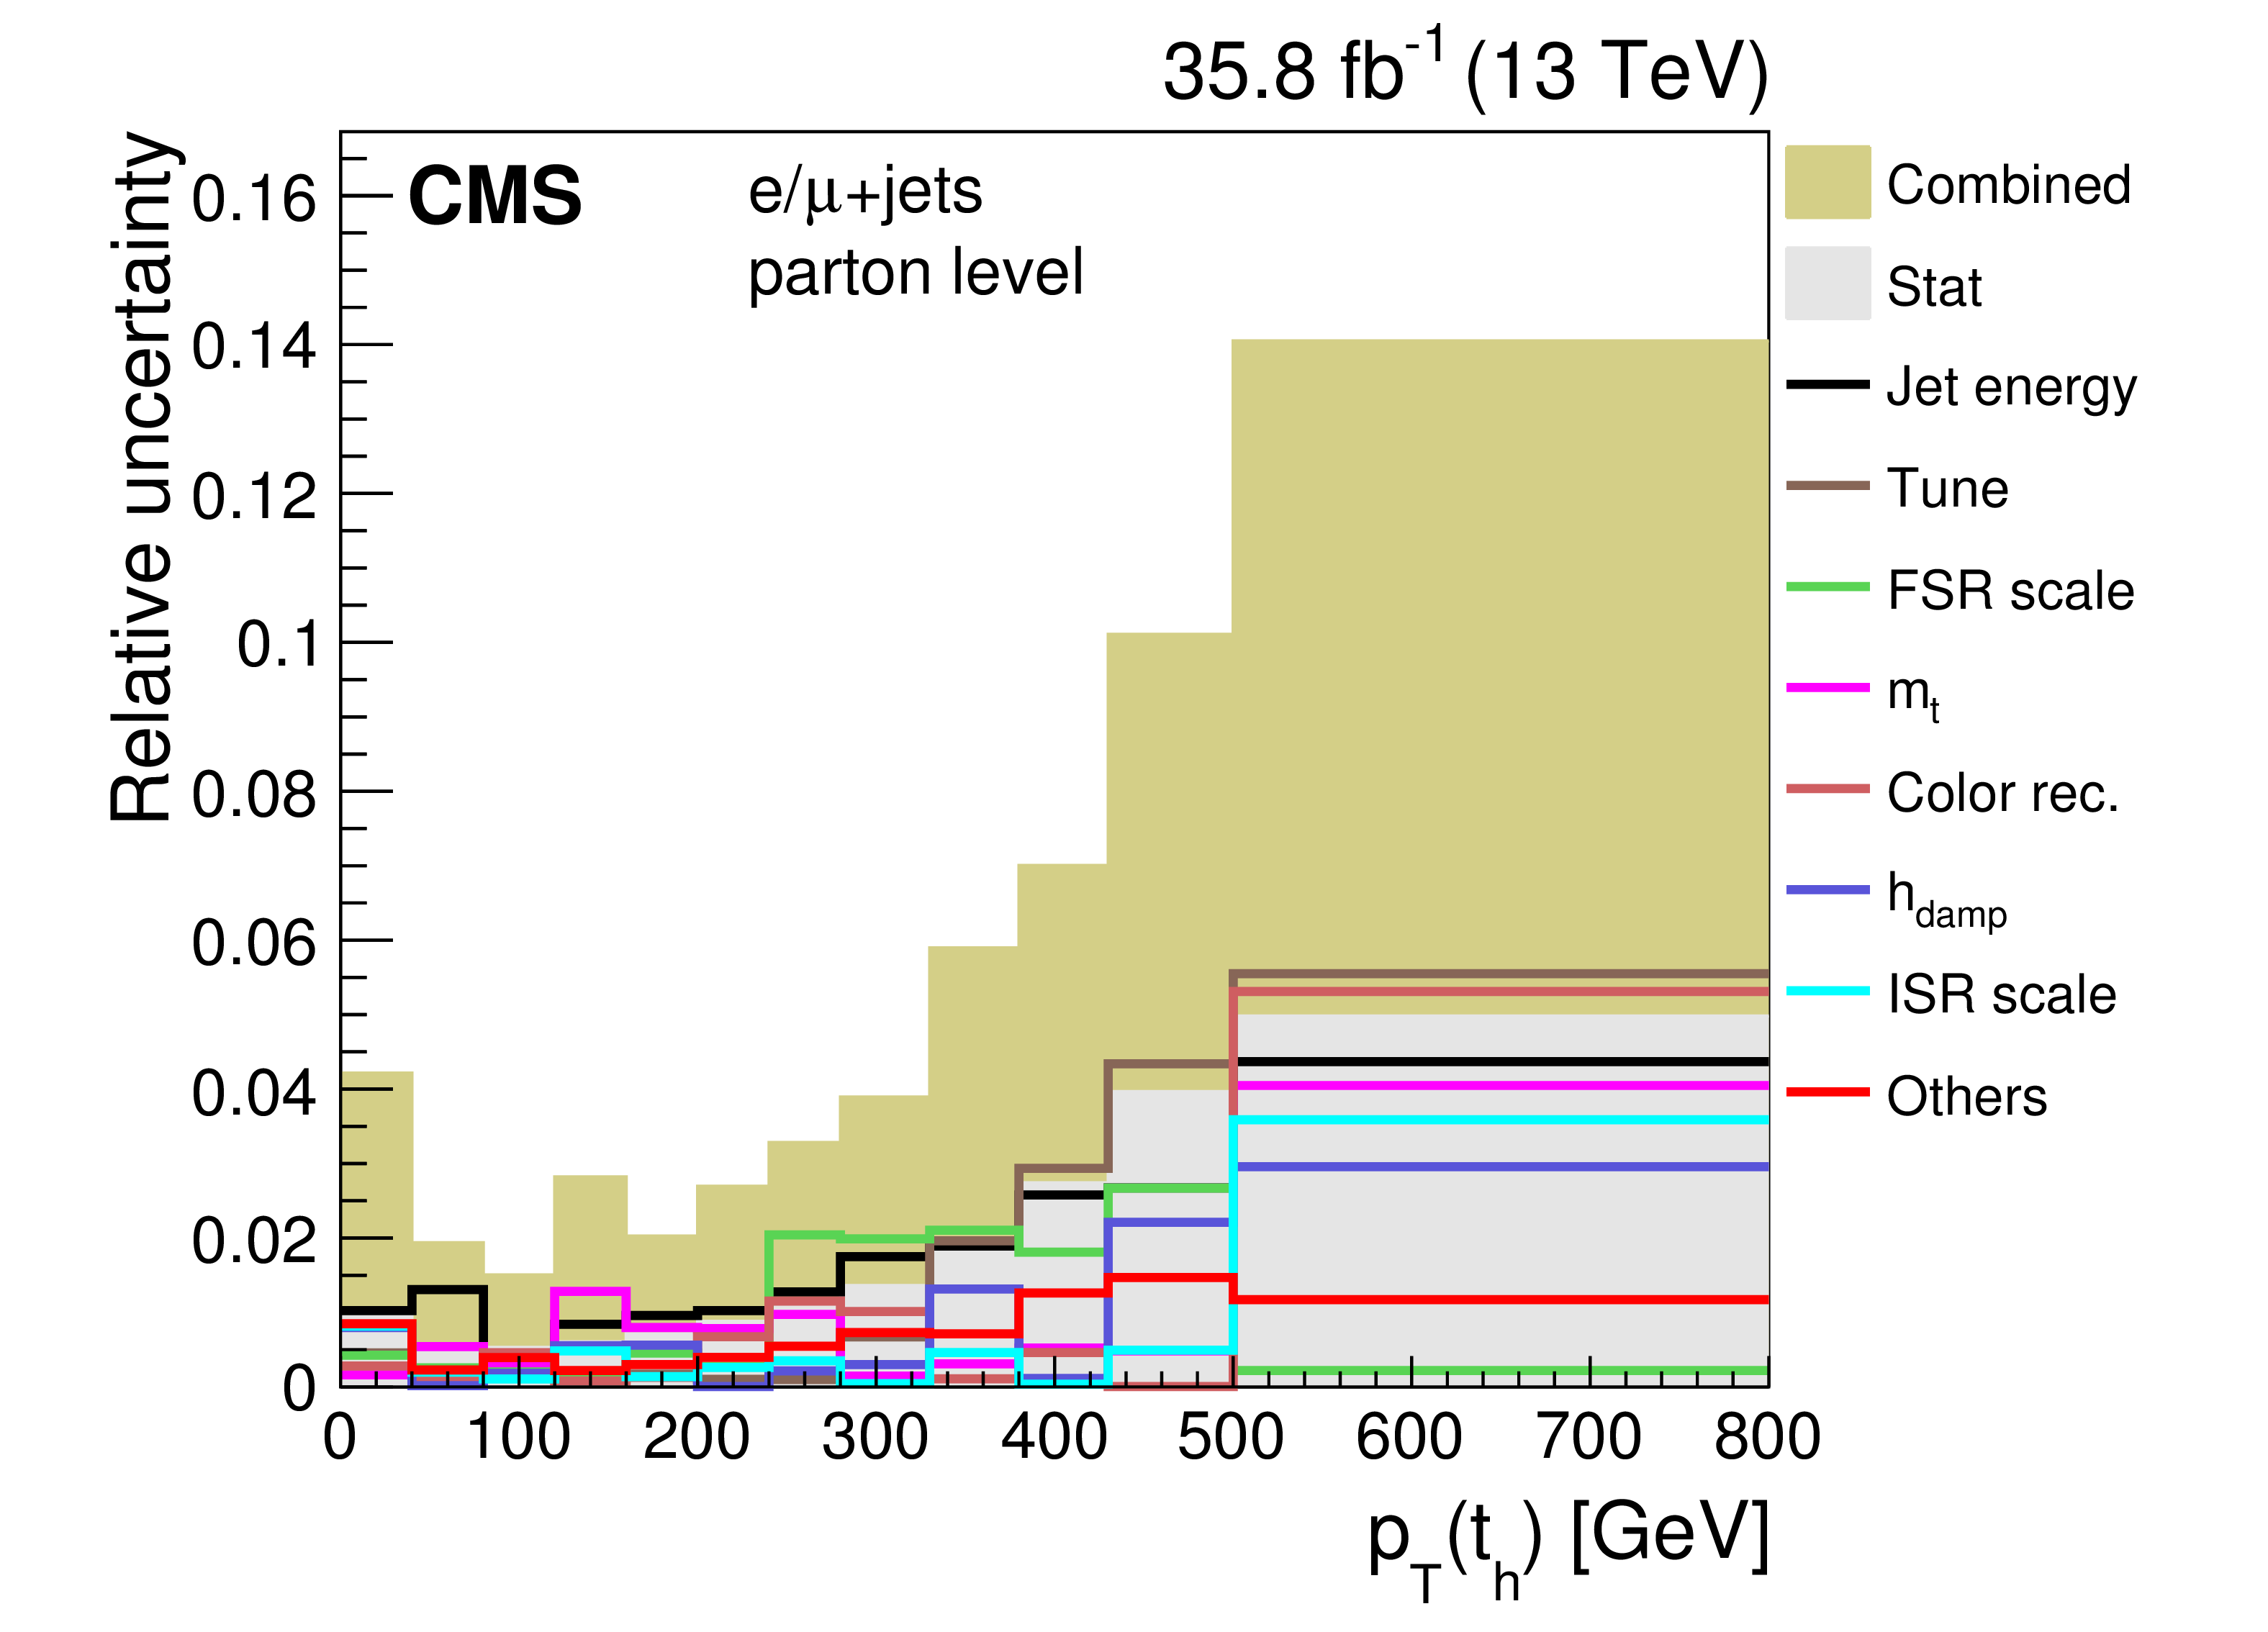
Relative uncertainties due to the individual sources in the absolute (upper) and normalized (lower) measurement of $ {p_{\mathrm {T}}} ({\mathrm{t} _\mathrm {h}})$ at the parton level (left) and particle level (right). Sources whose impact never exceeds 1% are summarized in the category "Others''. The combination of the individual sources of jet energy uncertainty is labeled "Jet energy''. The combined uncertainty is the sum in quadrature of the statistical and all the systematic uncertainties. |
png pdf |
Figure 10-a:
Relative uncertainties due to the individual sources in the absolute (upper) and normalized (lower) measurement of $ {p_{\mathrm {T}}} ({\mathrm{t} _\mathrm {h}})$ at the parton level (left) and particle level (right). Sources whose impact never exceeds 1% are summarized in the category "Others''. The combination of the individual sources of jet energy uncertainty is labeled "Jet energy''. The combined uncertainty is the sum in quadrature of the statistical and all the systematic uncertainties. |
png pdf |
Figure 10-b:
Relative uncertainties due to the individual sources in the absolute (upper) and normalized (lower) measurement of $ {p_{\mathrm {T}}} ({\mathrm{t} _\mathrm {h}})$ at the parton level (left) and particle level (right). Sources whose impact never exceeds 1% are summarized in the category "Others''. The combination of the individual sources of jet energy uncertainty is labeled "Jet energy''. The combined uncertainty is the sum in quadrature of the statistical and all the systematic uncertainties. |
png pdf |
Figure 10-c:
Relative uncertainties due to the individual sources in the absolute (upper) and normalized (lower) measurement of $ {p_{\mathrm {T}}} ({\mathrm{t} _\mathrm {h}})$ at the parton level (left) and particle level (right). Sources whose impact never exceeds 1% are summarized in the category "Others''. The combination of the individual sources of jet energy uncertainty is labeled "Jet energy''. The combined uncertainty is the sum in quadrature of the statistical and all the systematic uncertainties. |

png pdf |
Figure 10-d:
Relative uncertainties due to the individual sources in the absolute (upper) and normalized (lower) measurement of $ {p_{\mathrm {T}}} ({\mathrm{t} _\mathrm {h}})$ at the parton level (left) and particle level (right). Sources whose impact never exceeds 1% are summarized in the category "Others''. The combination of the individual sources of jet energy uncertainty is labeled "Jet energy''. The combined uncertainty is the sum in quadrature of the statistical and all the systematic uncertainties. |

png pdf |
Figure 11:
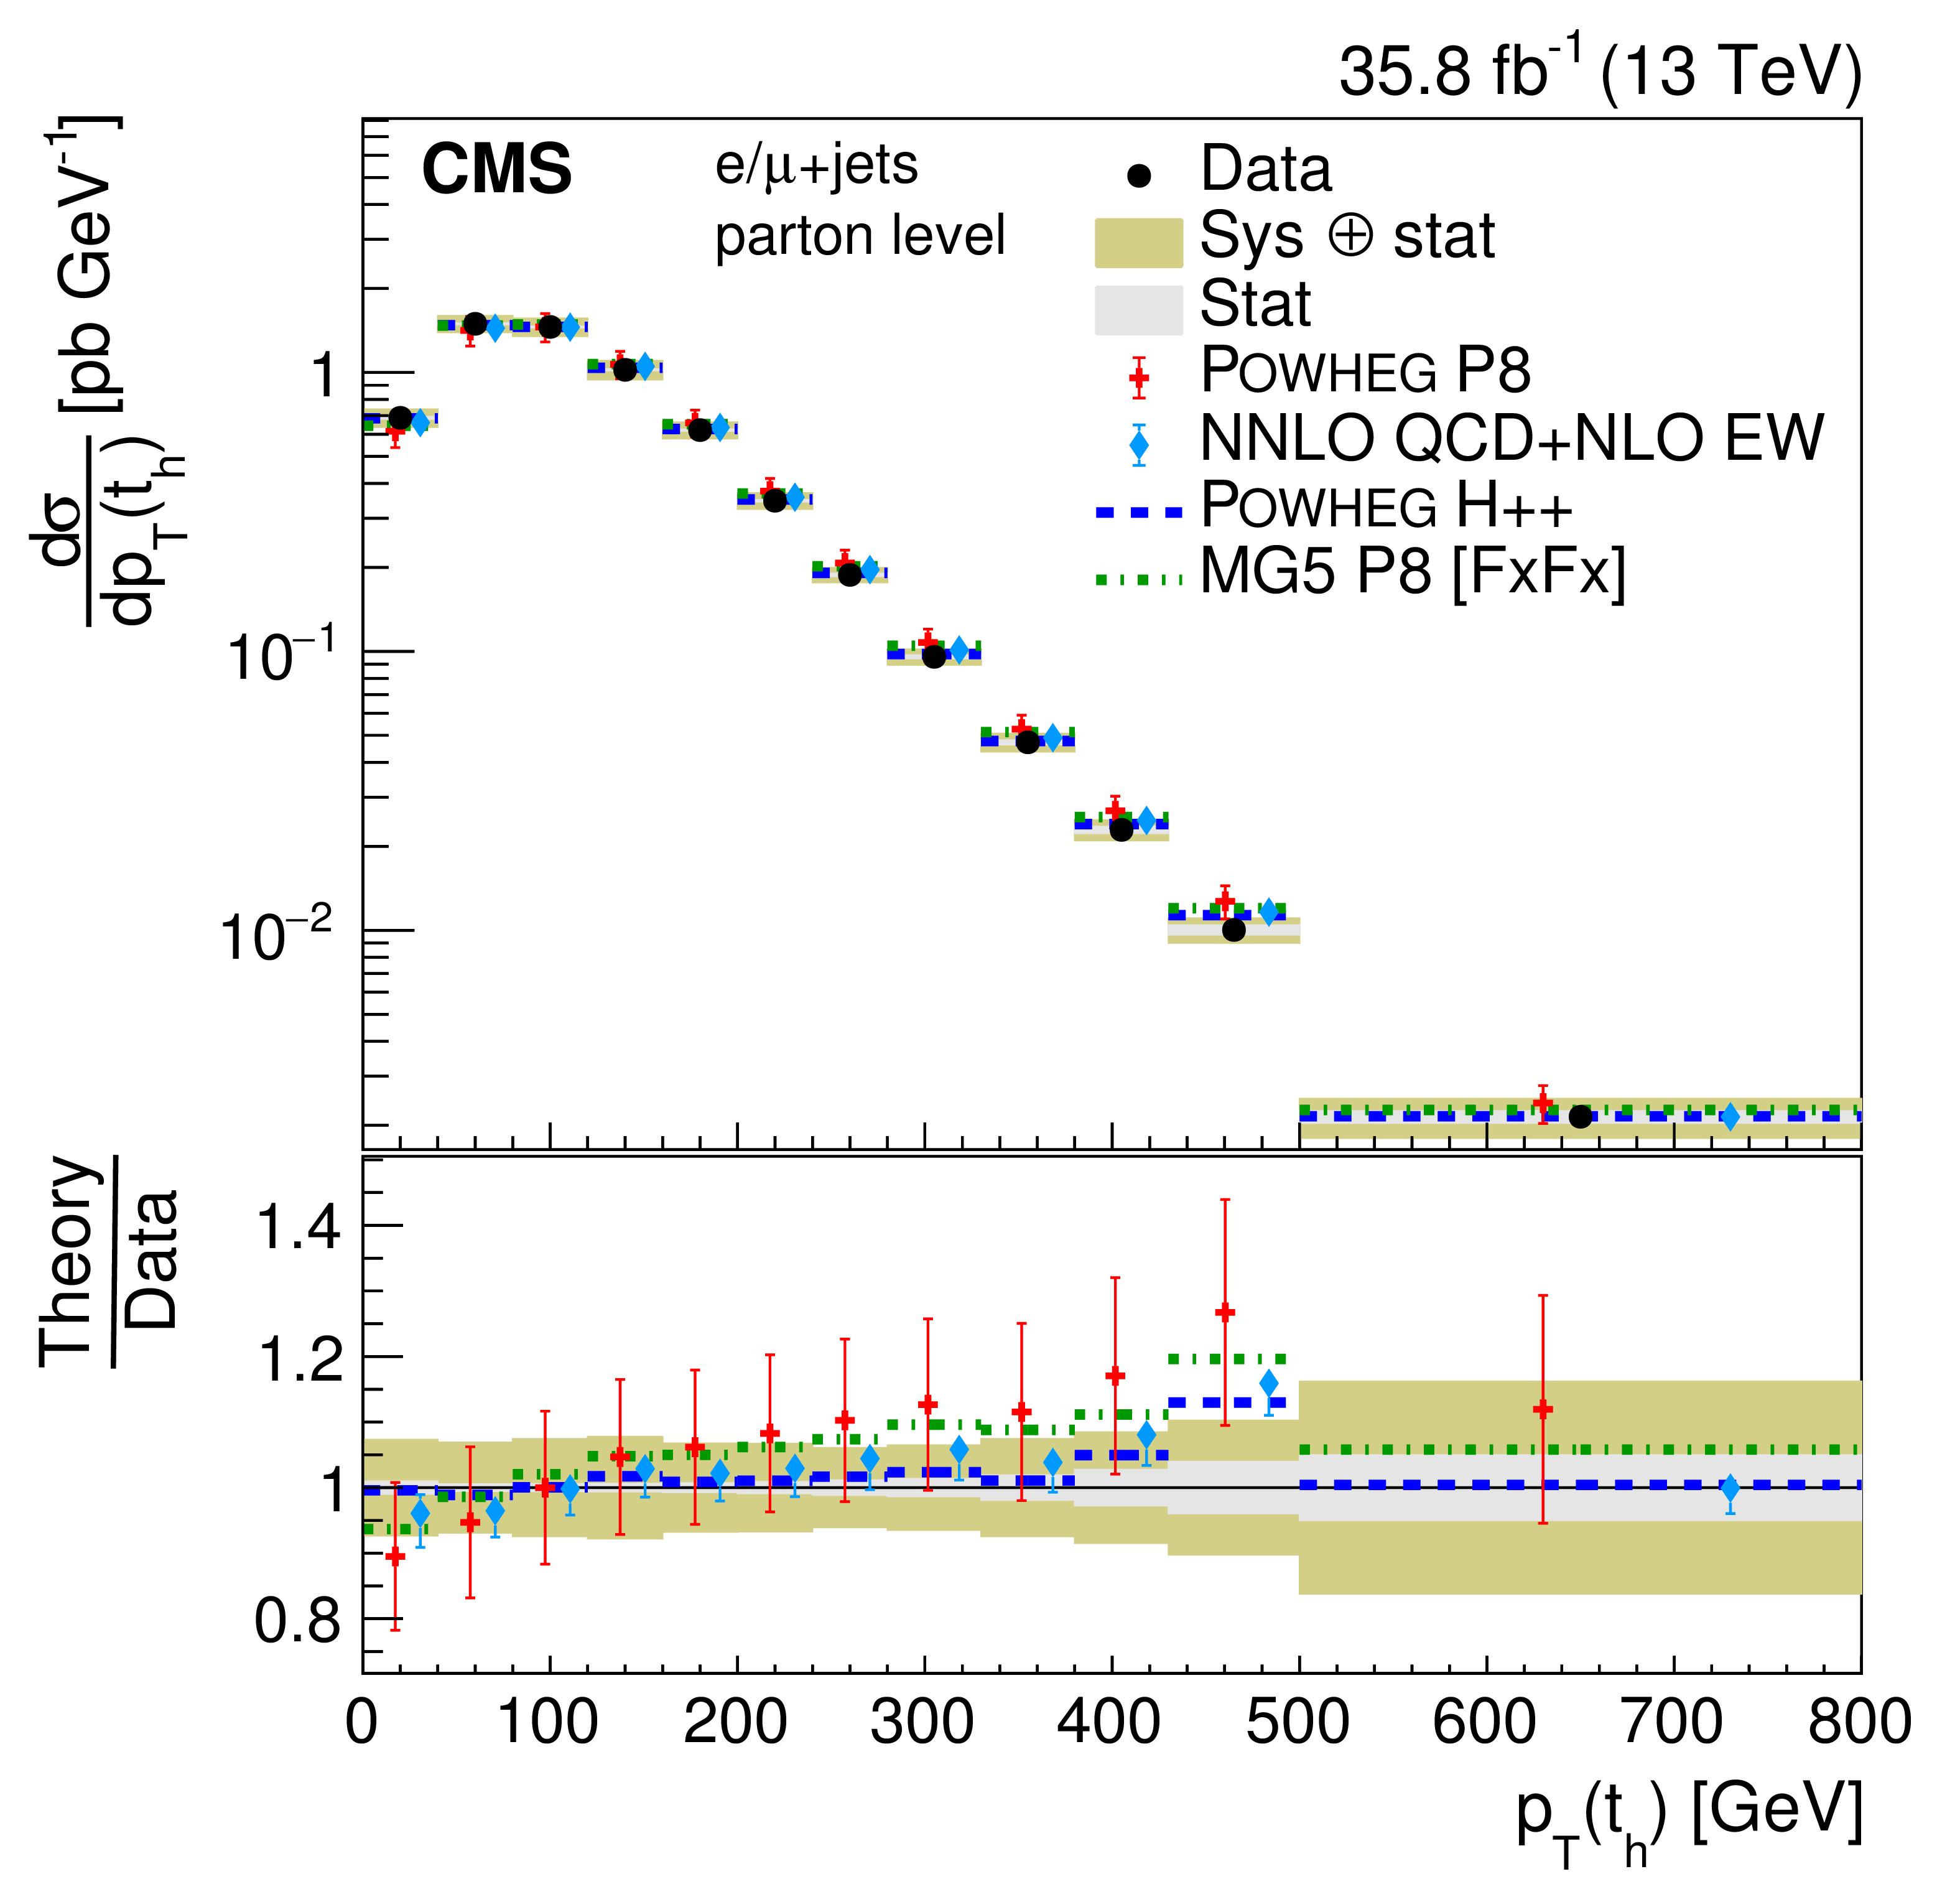
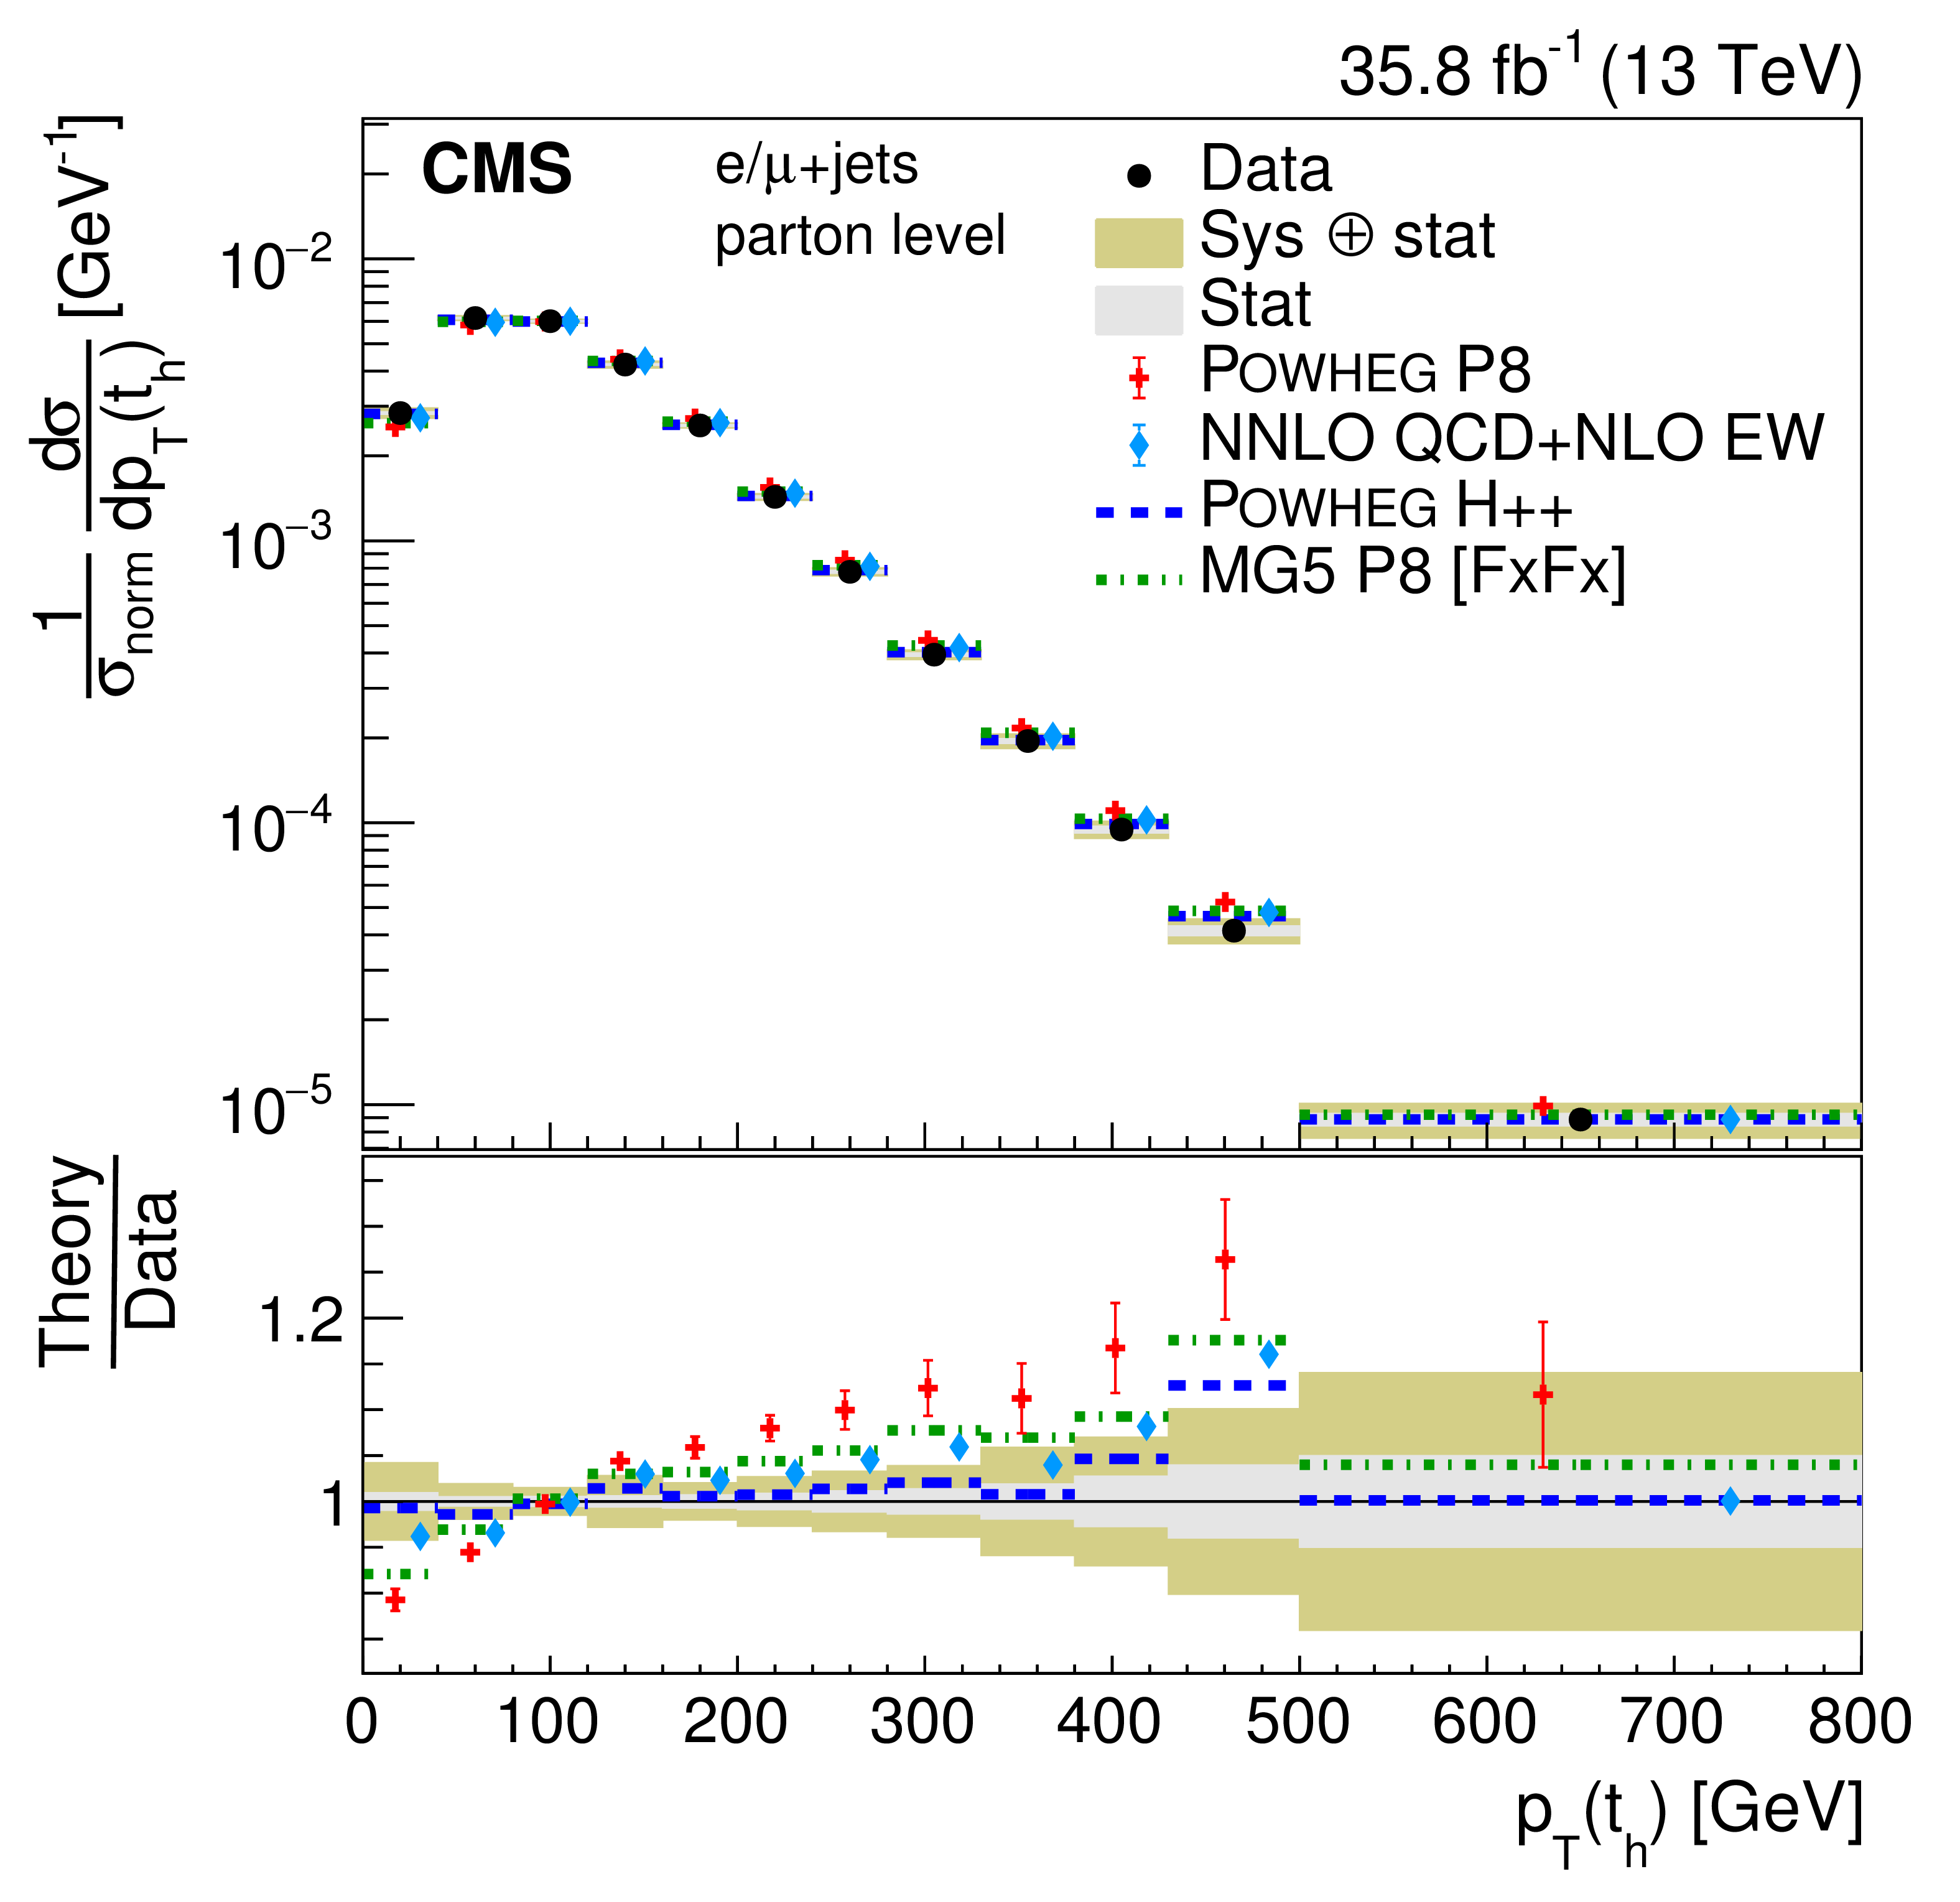
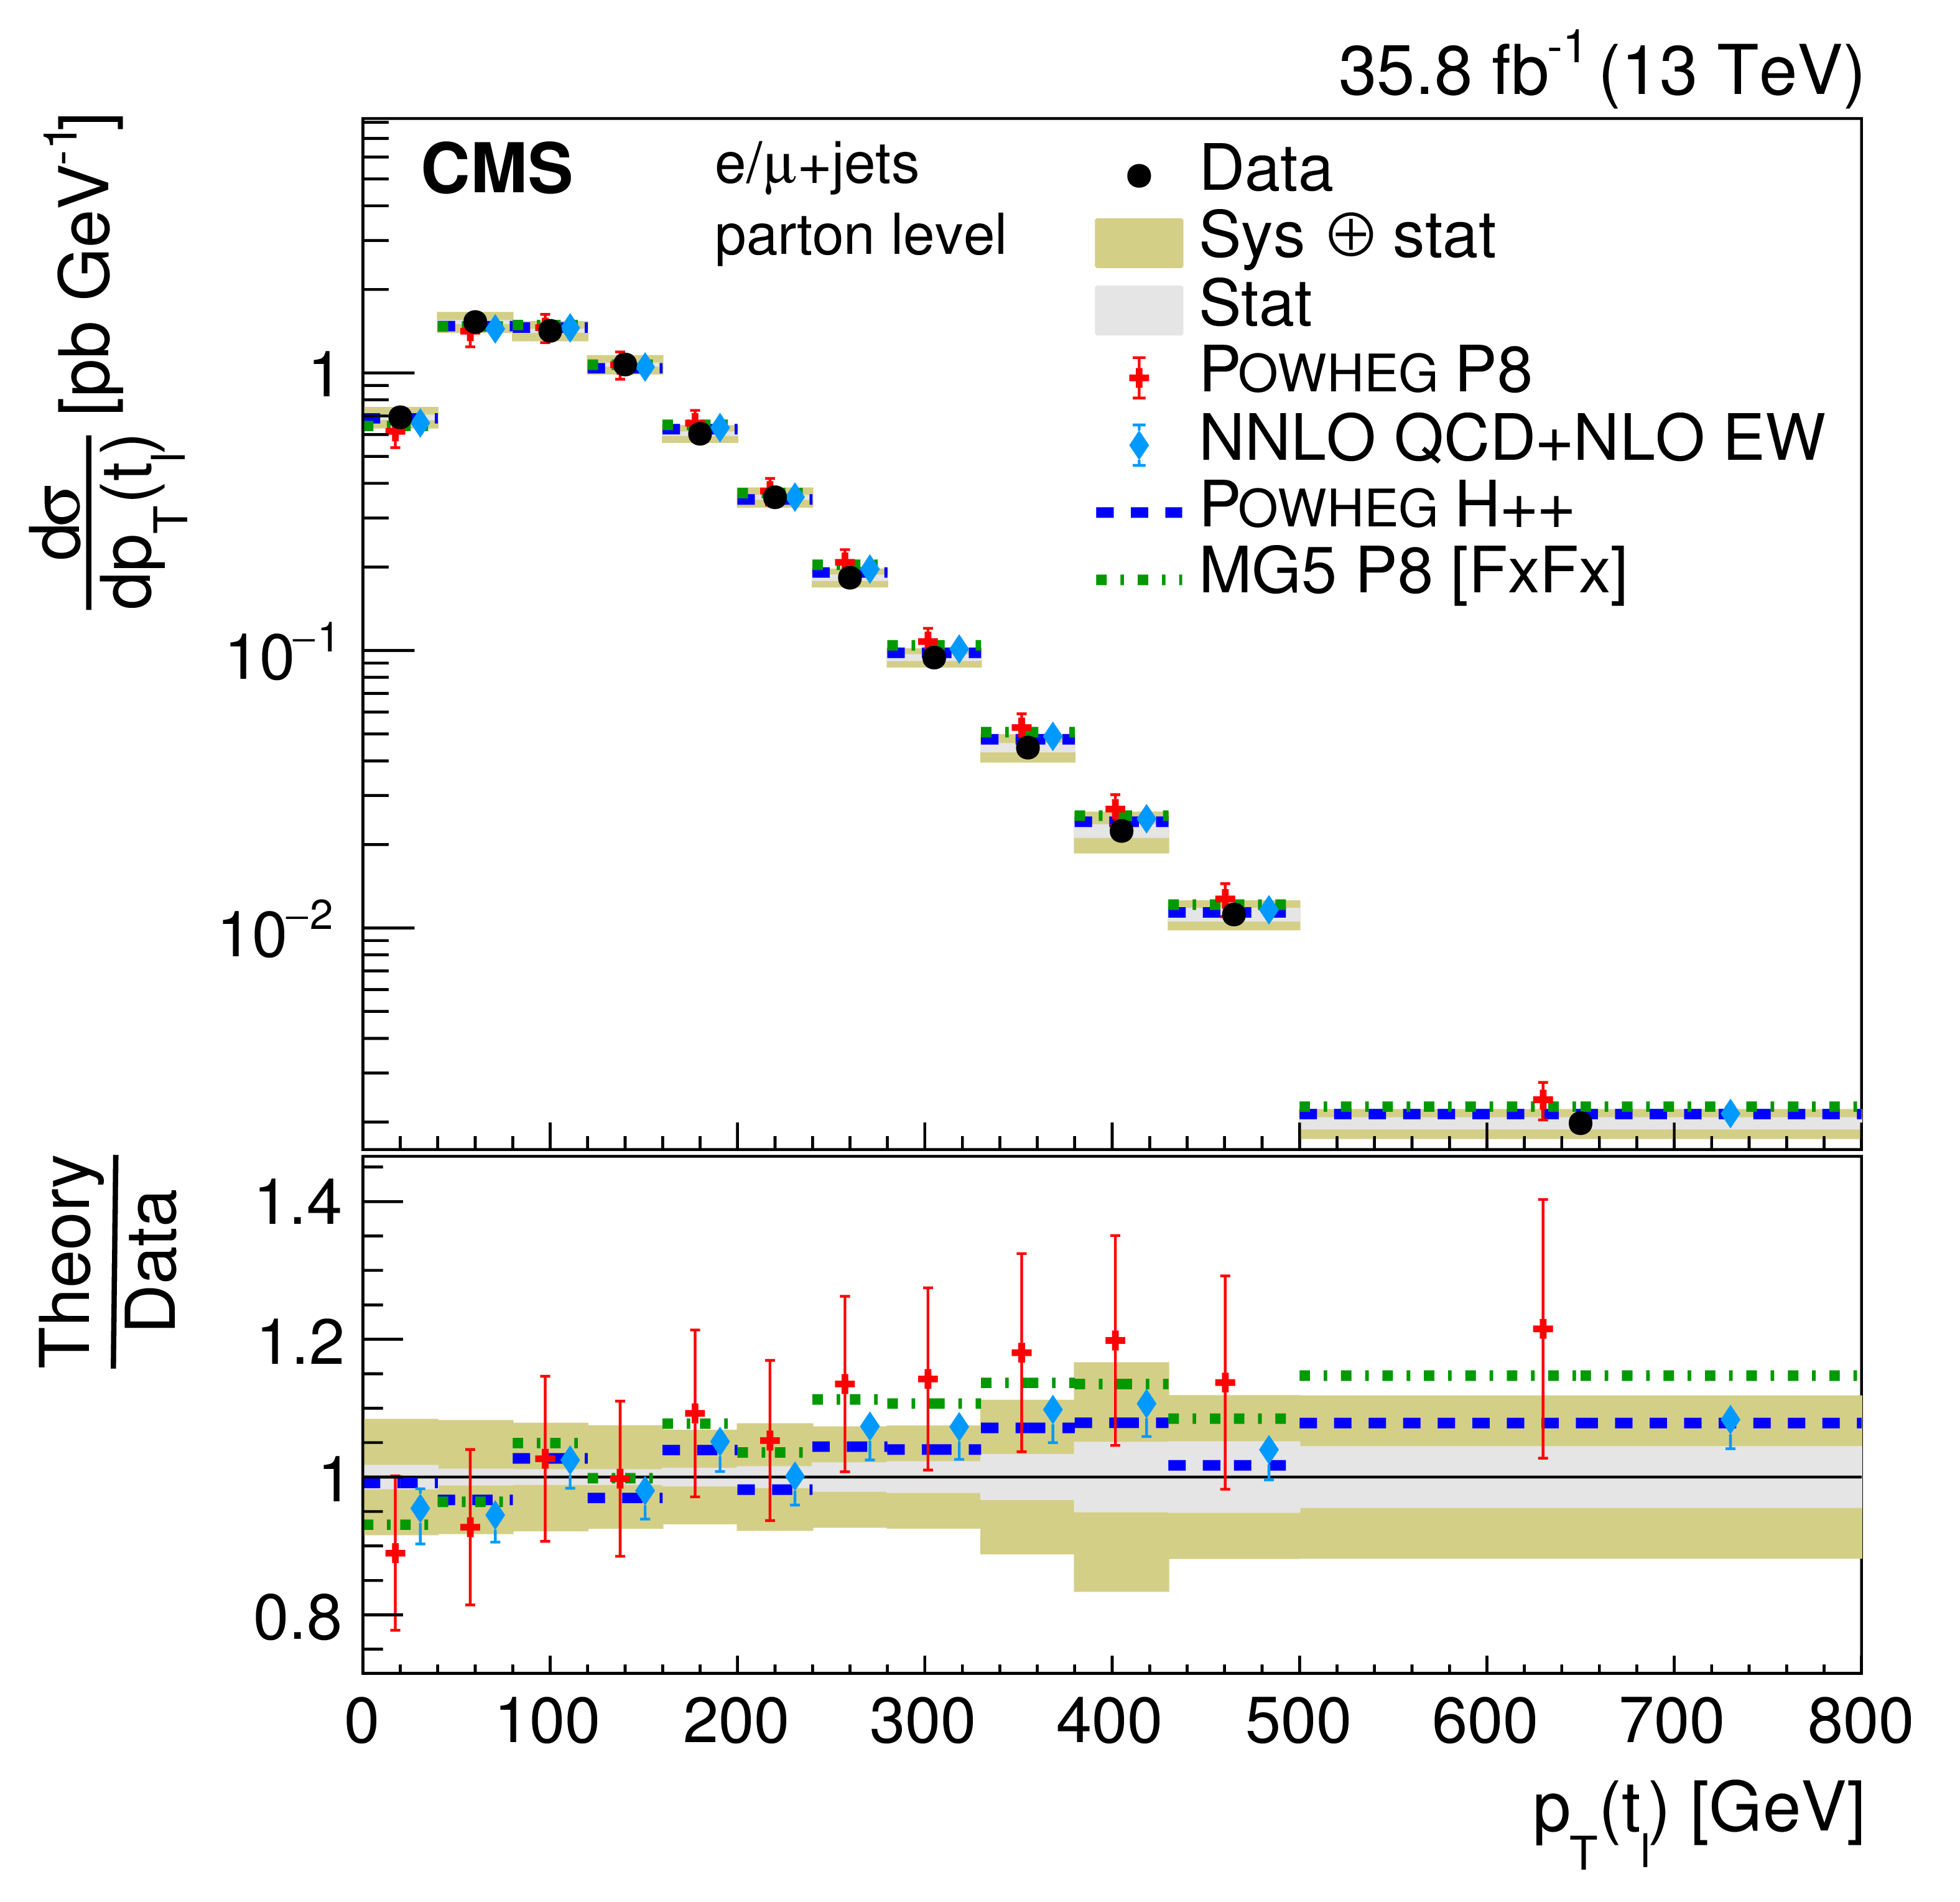
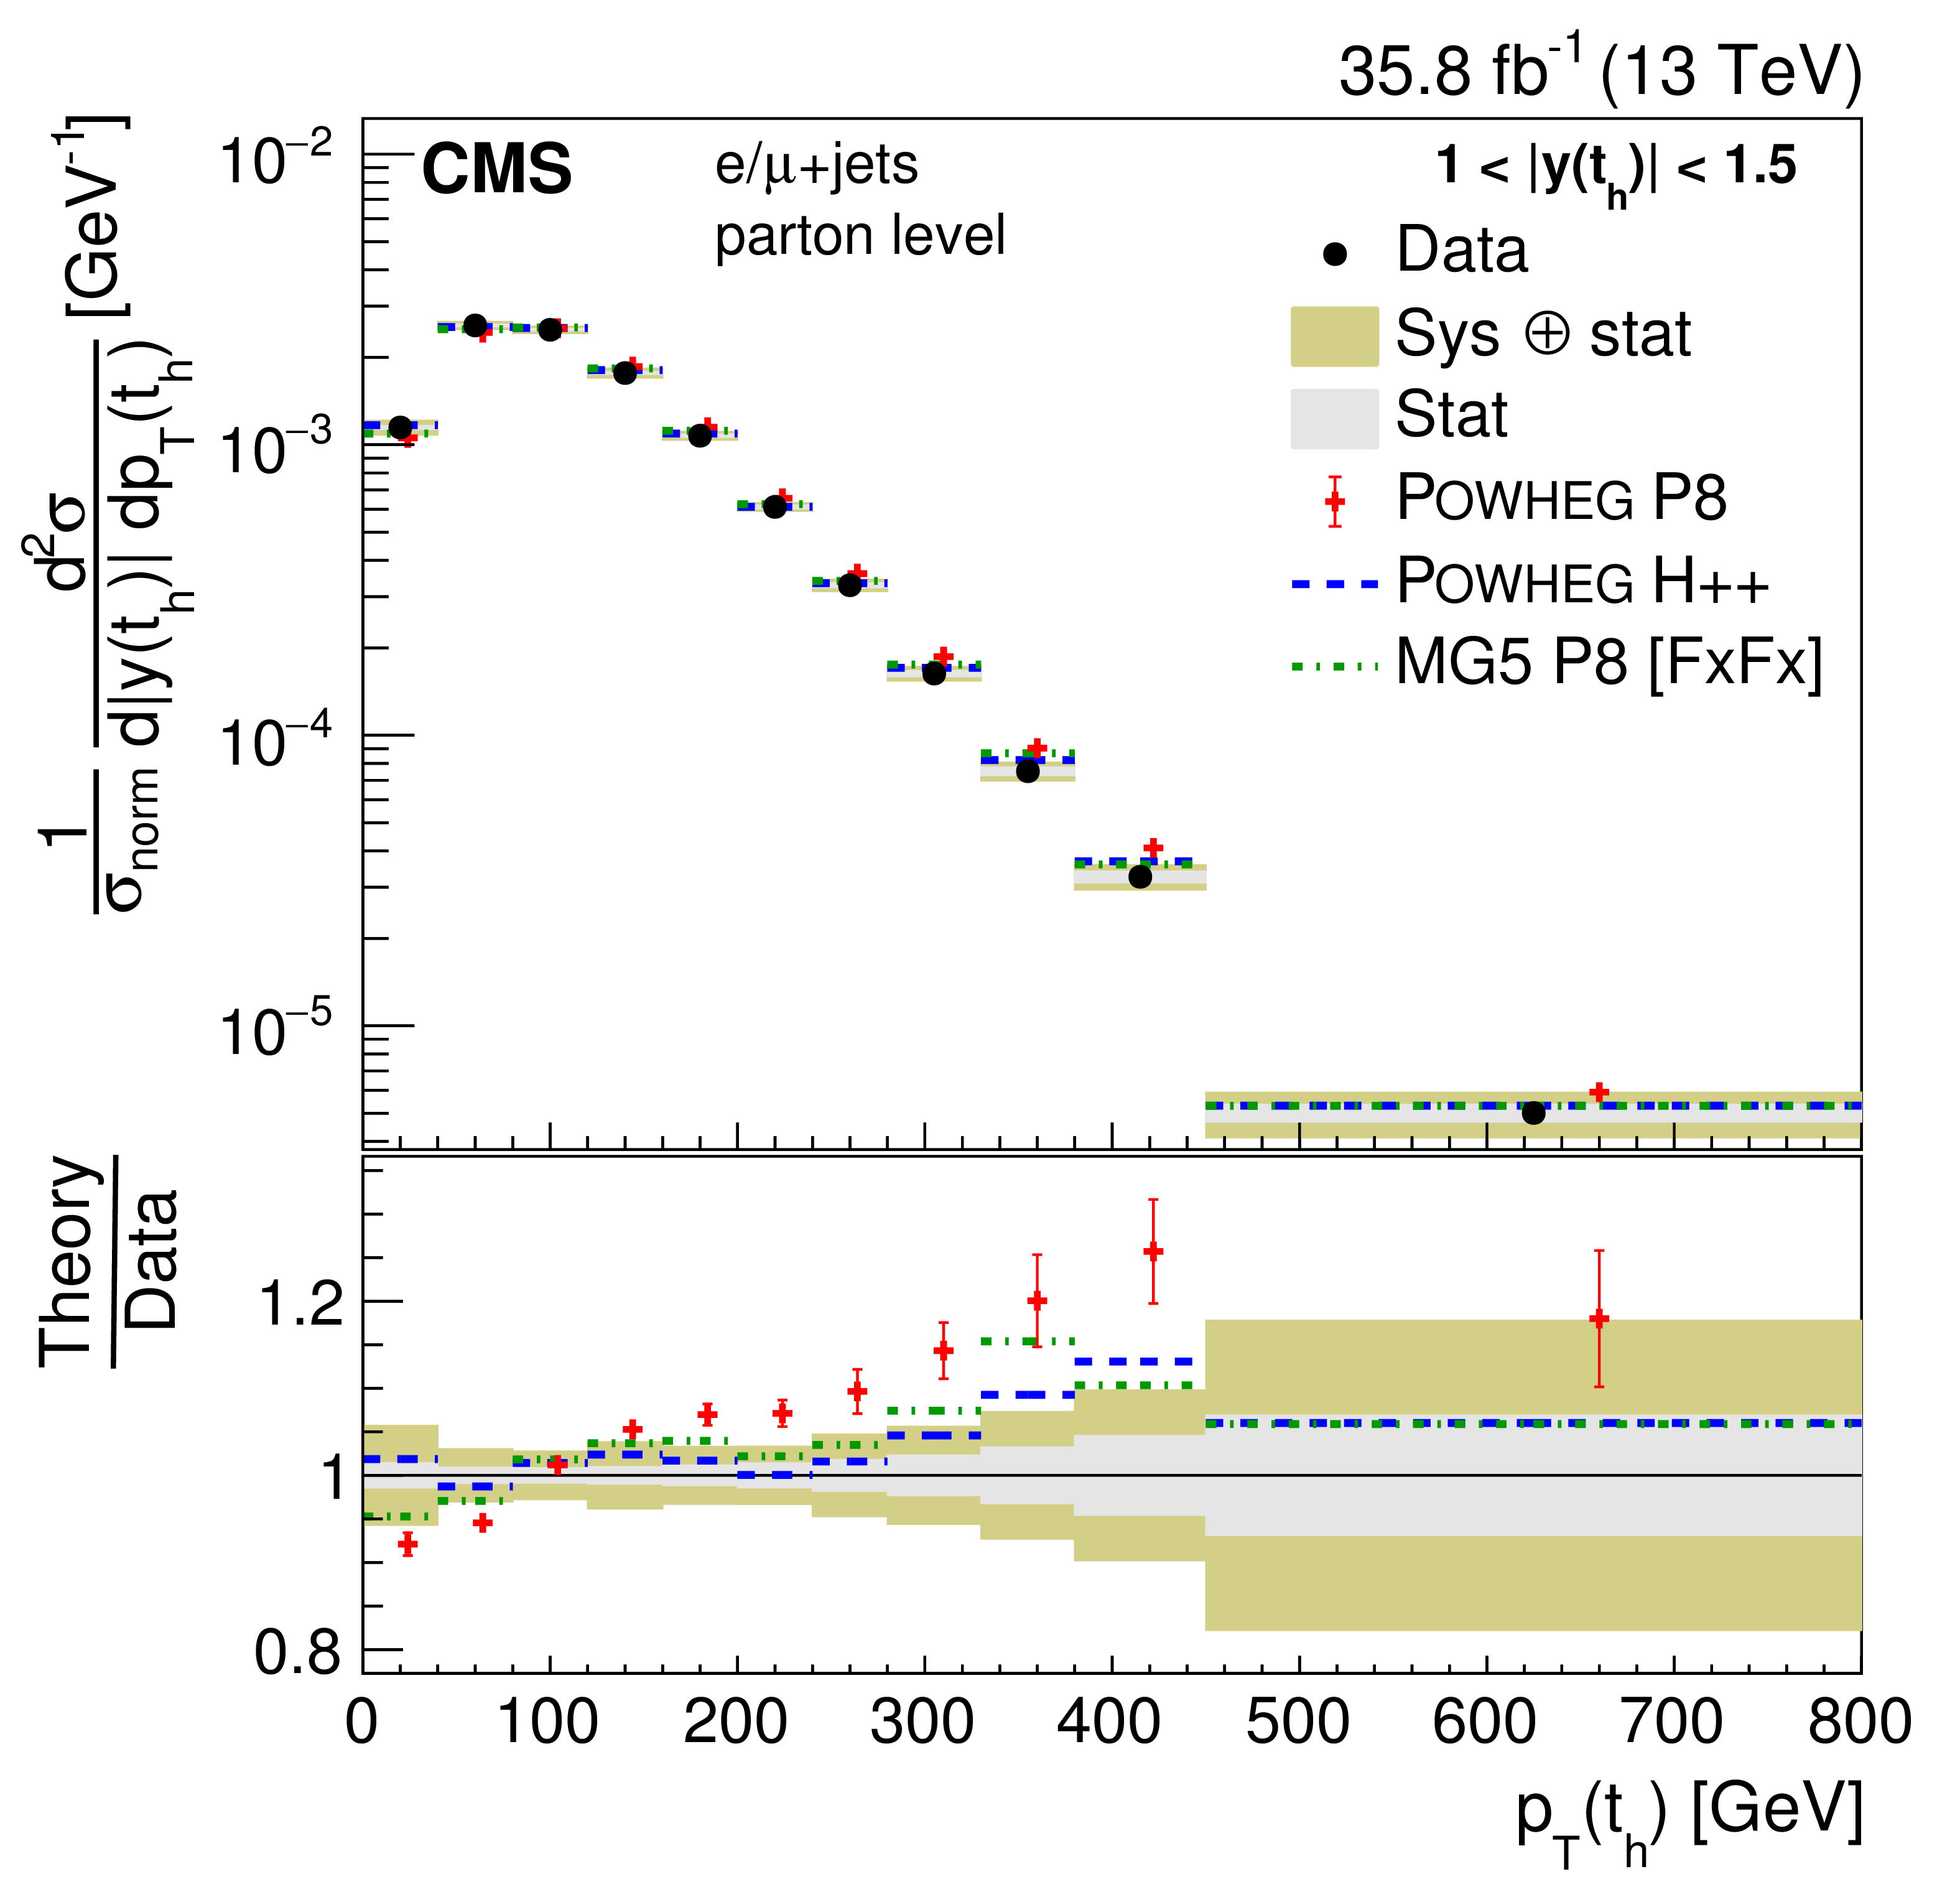
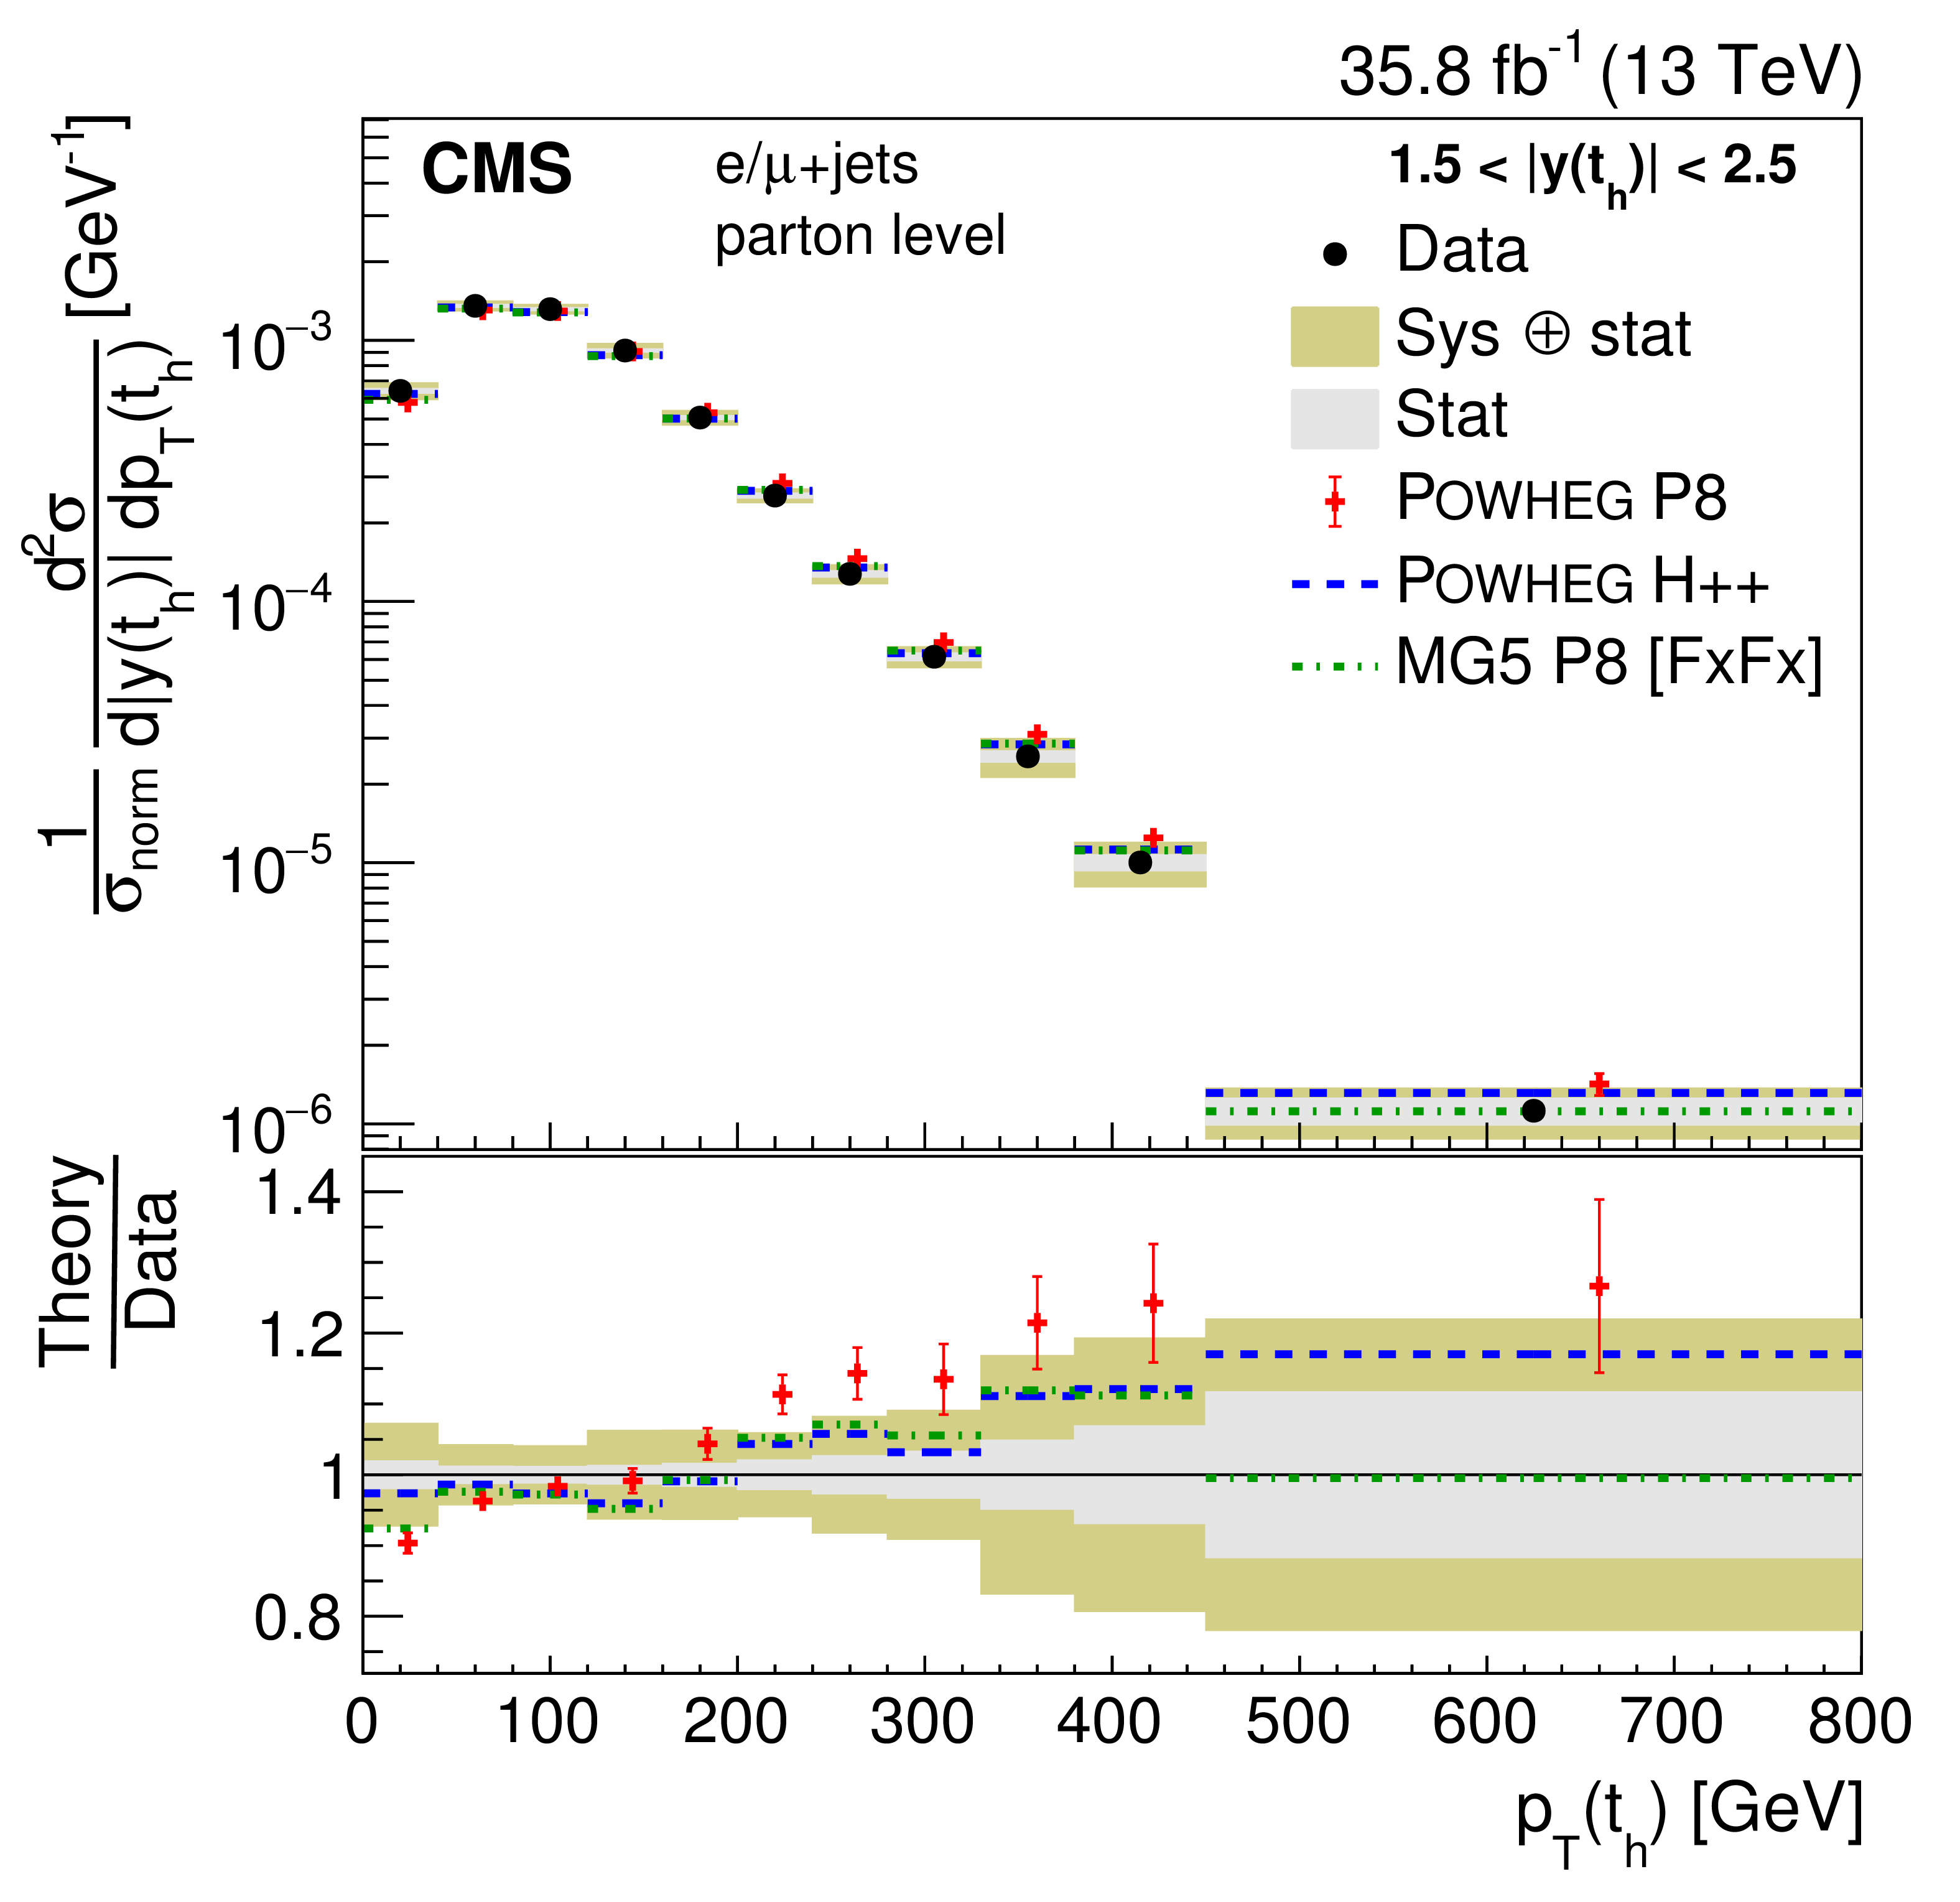
Absolute (left) and normalized (right) differential cross sections at the parton level as a function of $ {p_{\mathrm {T}}} ({\mathrm{t} _\mathrm {h}})$ (upper) and $ {p_{\mathrm {T}}} ({\mathrm{t} _\ell})$ (lower). The data are shown as points with light (dark) bands indicating the statistical (statistical and systematic) uncertainties. The cross sections are compared to the predictions of POWHEG combined with PYTHIA8 (P8) or HERWIG++ (H++), the multiparton simulation MG5_aMC@NLO (MG5)+PYTHIA8 FxFx, and the NNLO QCD+NLO EW calculations. The ratios of the various predictions to the measured cross sections are shown at the bottom of each panel. |
png pdf |
Figure 11-a:
Absolute (left) and normalized (right) differential cross sections at the parton level as a function of $ {p_{\mathrm {T}}} ({\mathrm{t} _\mathrm {h}})$ (upper) and $ {p_{\mathrm {T}}} ({\mathrm{t} _\ell})$ (lower). The data are shown as points with light (dark) bands indicating the statistical (statistical and systematic) uncertainties. The cross sections are compared to the predictions of POWHEG combined with PYTHIA8 (P8) or HERWIG++ (H++), the multiparton simulation MG5_aMC@NLO (MG5)+PYTHIA8 FxFx, and the NNLO QCD+NLO EW calculations. The ratios of the various predictions to the measured cross sections are shown at the bottom of each panel. |
png pdf |
Figure 11-b:
Absolute (left) and normalized (right) differential cross sections at the parton level as a function of $ {p_{\mathrm {T}}} ({\mathrm{t} _\mathrm {h}})$ (upper) and $ {p_{\mathrm {T}}} ({\mathrm{t} _\ell})$ (lower). The data are shown as points with light (dark) bands indicating the statistical (statistical and systematic) uncertainties. The cross sections are compared to the predictions of POWHEG combined with PYTHIA8 (P8) or HERWIG++ (H++), the multiparton simulation MG5_aMC@NLO (MG5)+PYTHIA8 FxFx, and the NNLO QCD+NLO EW calculations. The ratios of the various predictions to the measured cross sections are shown at the bottom of each panel. |
png pdf |
Figure 11-c:
Absolute (left) and normalized (right) differential cross sections at the parton level as a function of $ {p_{\mathrm {T}}} ({\mathrm{t} _\mathrm {h}})$ (upper) and $ {p_{\mathrm {T}}} ({\mathrm{t} _\ell})$ (lower). The data are shown as points with light (dark) bands indicating the statistical (statistical and systematic) uncertainties. The cross sections are compared to the predictions of POWHEG combined with PYTHIA8 (P8) or HERWIG++ (H++), the multiparton simulation MG5_aMC@NLO (MG5)+PYTHIA8 FxFx, and the NNLO QCD+NLO EW calculations. The ratios of the various predictions to the measured cross sections are shown at the bottom of each panel. |

png pdf |
Figure 11-d:
Absolute (left) and normalized (right) differential cross sections at the parton level as a function of $ {p_{\mathrm {T}}} ({\mathrm{t} _\mathrm {h}})$ (upper) and $ {p_{\mathrm {T}}} ({\mathrm{t} _\ell})$ (lower). The data are shown as points with light (dark) bands indicating the statistical (statistical and systematic) uncertainties. The cross sections are compared to the predictions of POWHEG combined with PYTHIA8 (P8) or HERWIG++ (H++), the multiparton simulation MG5_aMC@NLO (MG5)+PYTHIA8 FxFx, and the NNLO QCD+NLO EW calculations. The ratios of the various predictions to the measured cross sections are shown at the bottom of each panel. |

png pdf |
Figure 12:
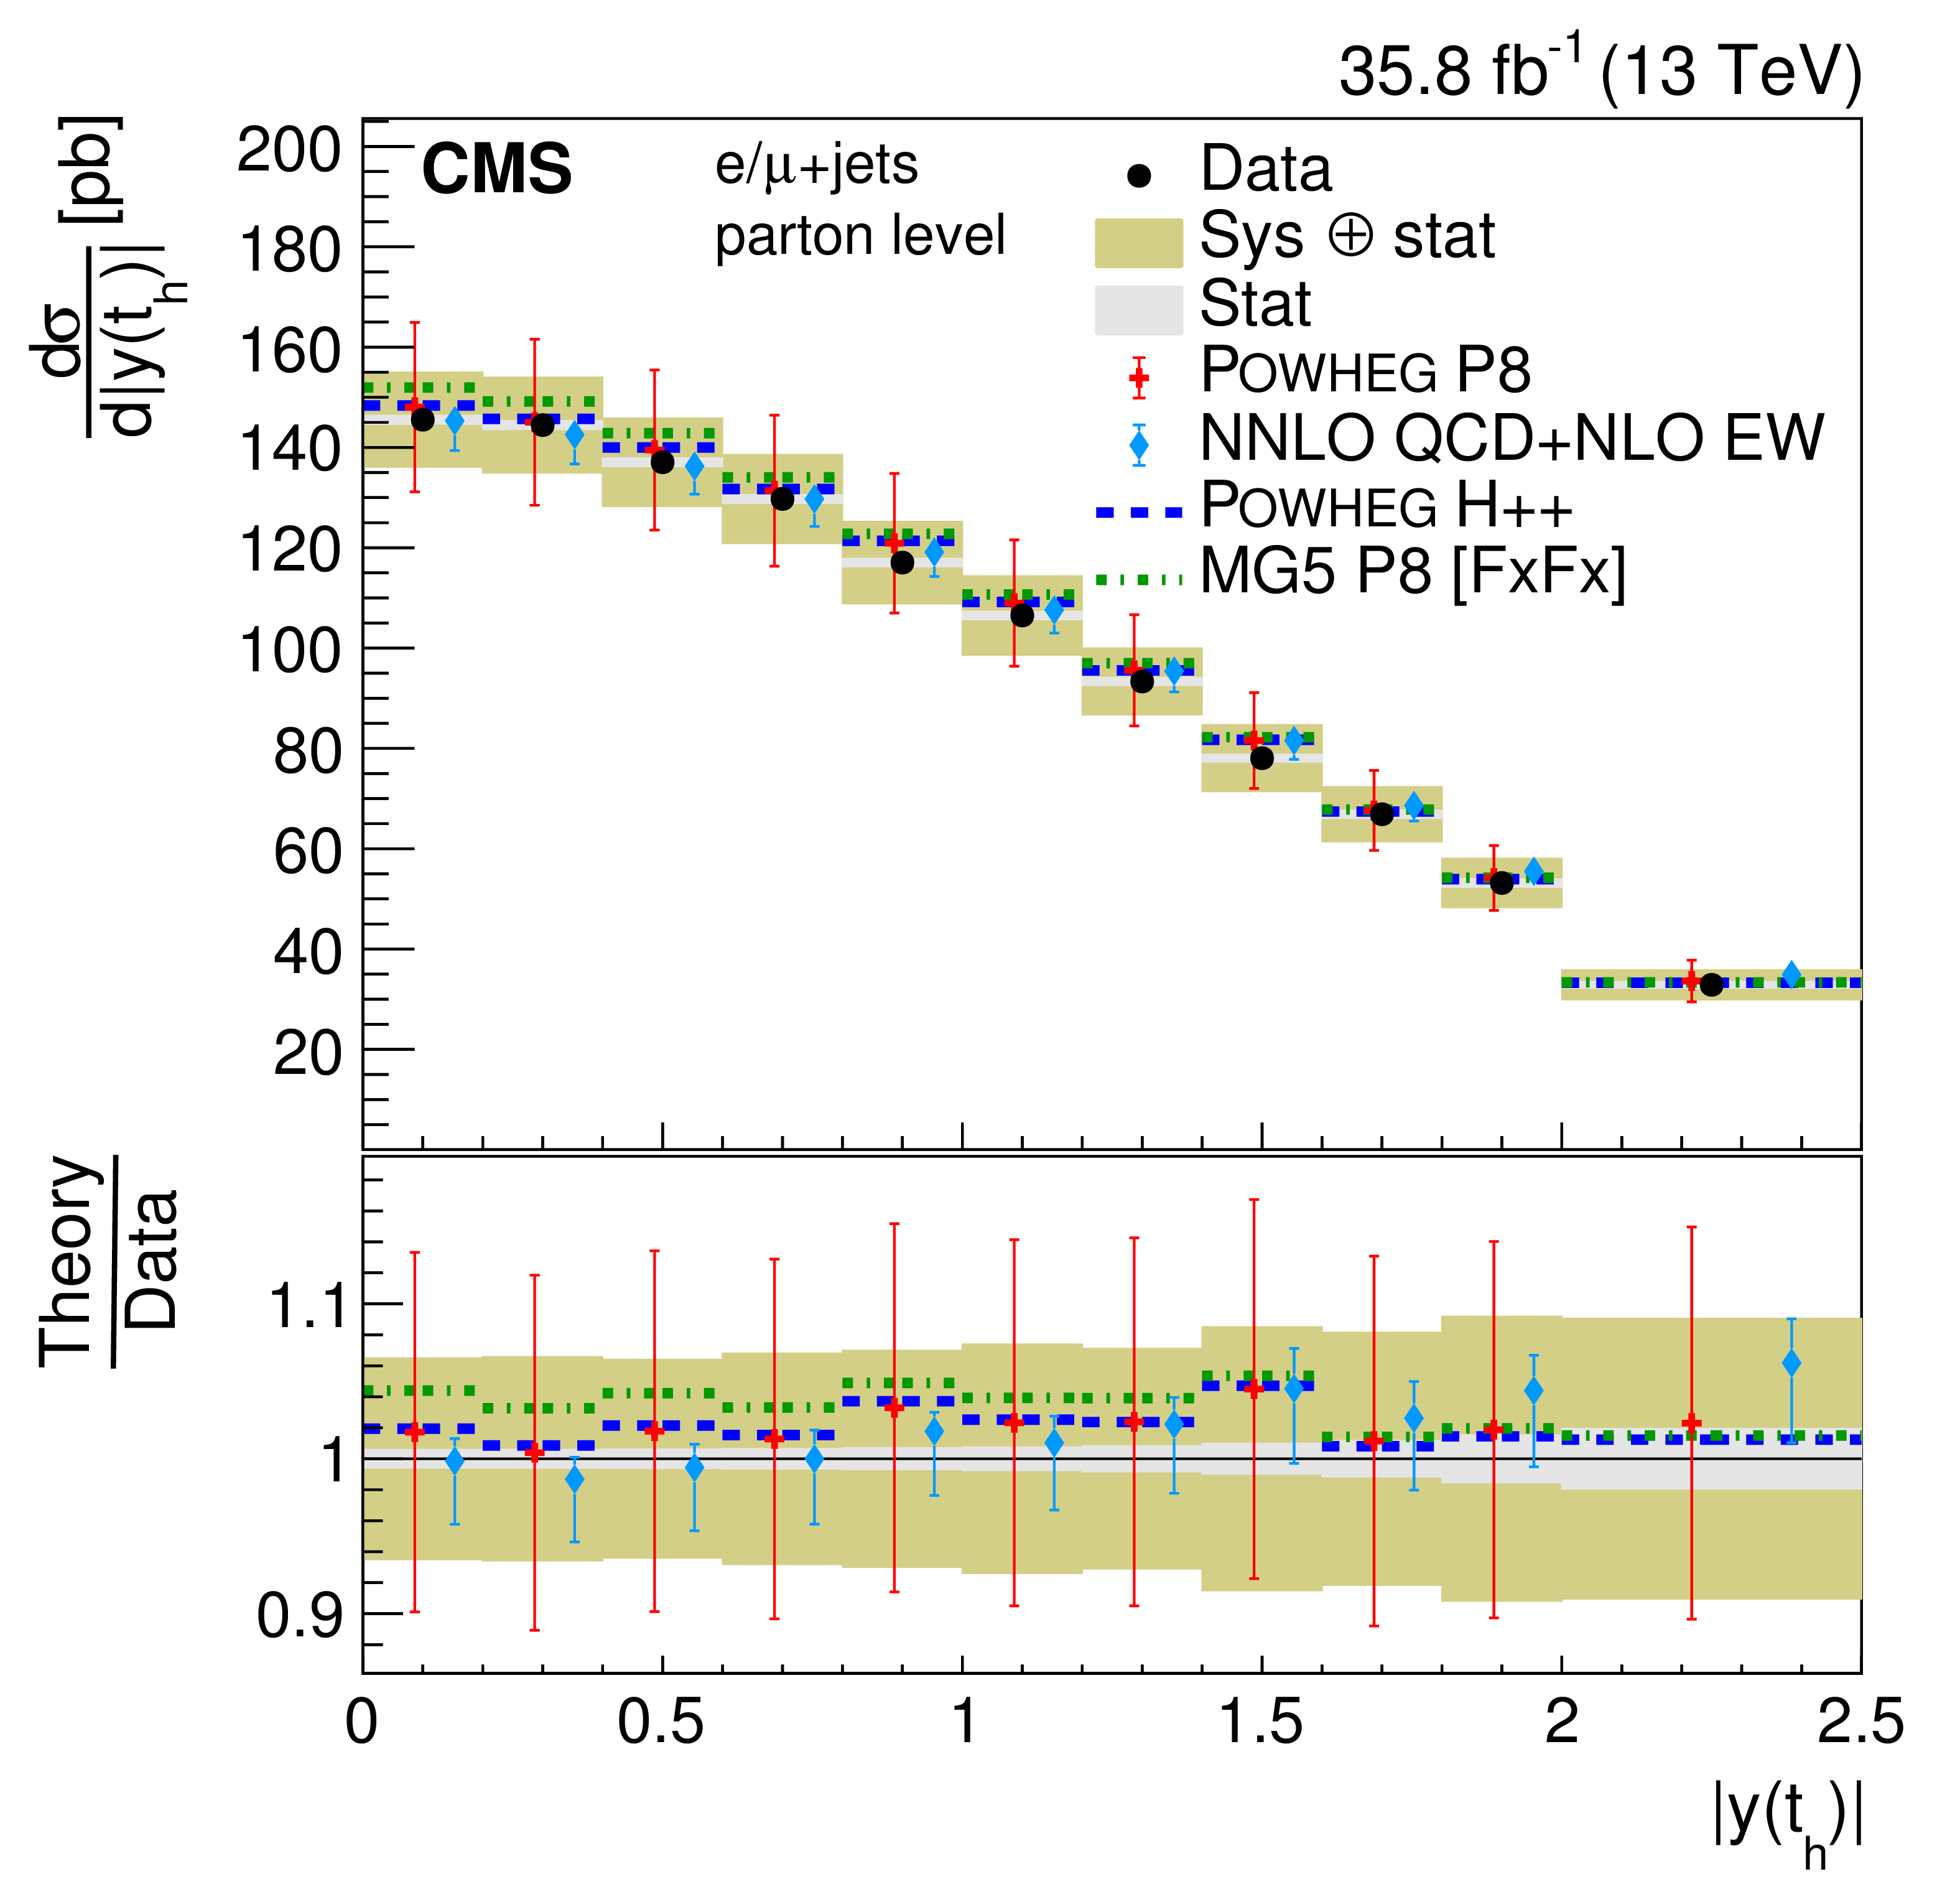
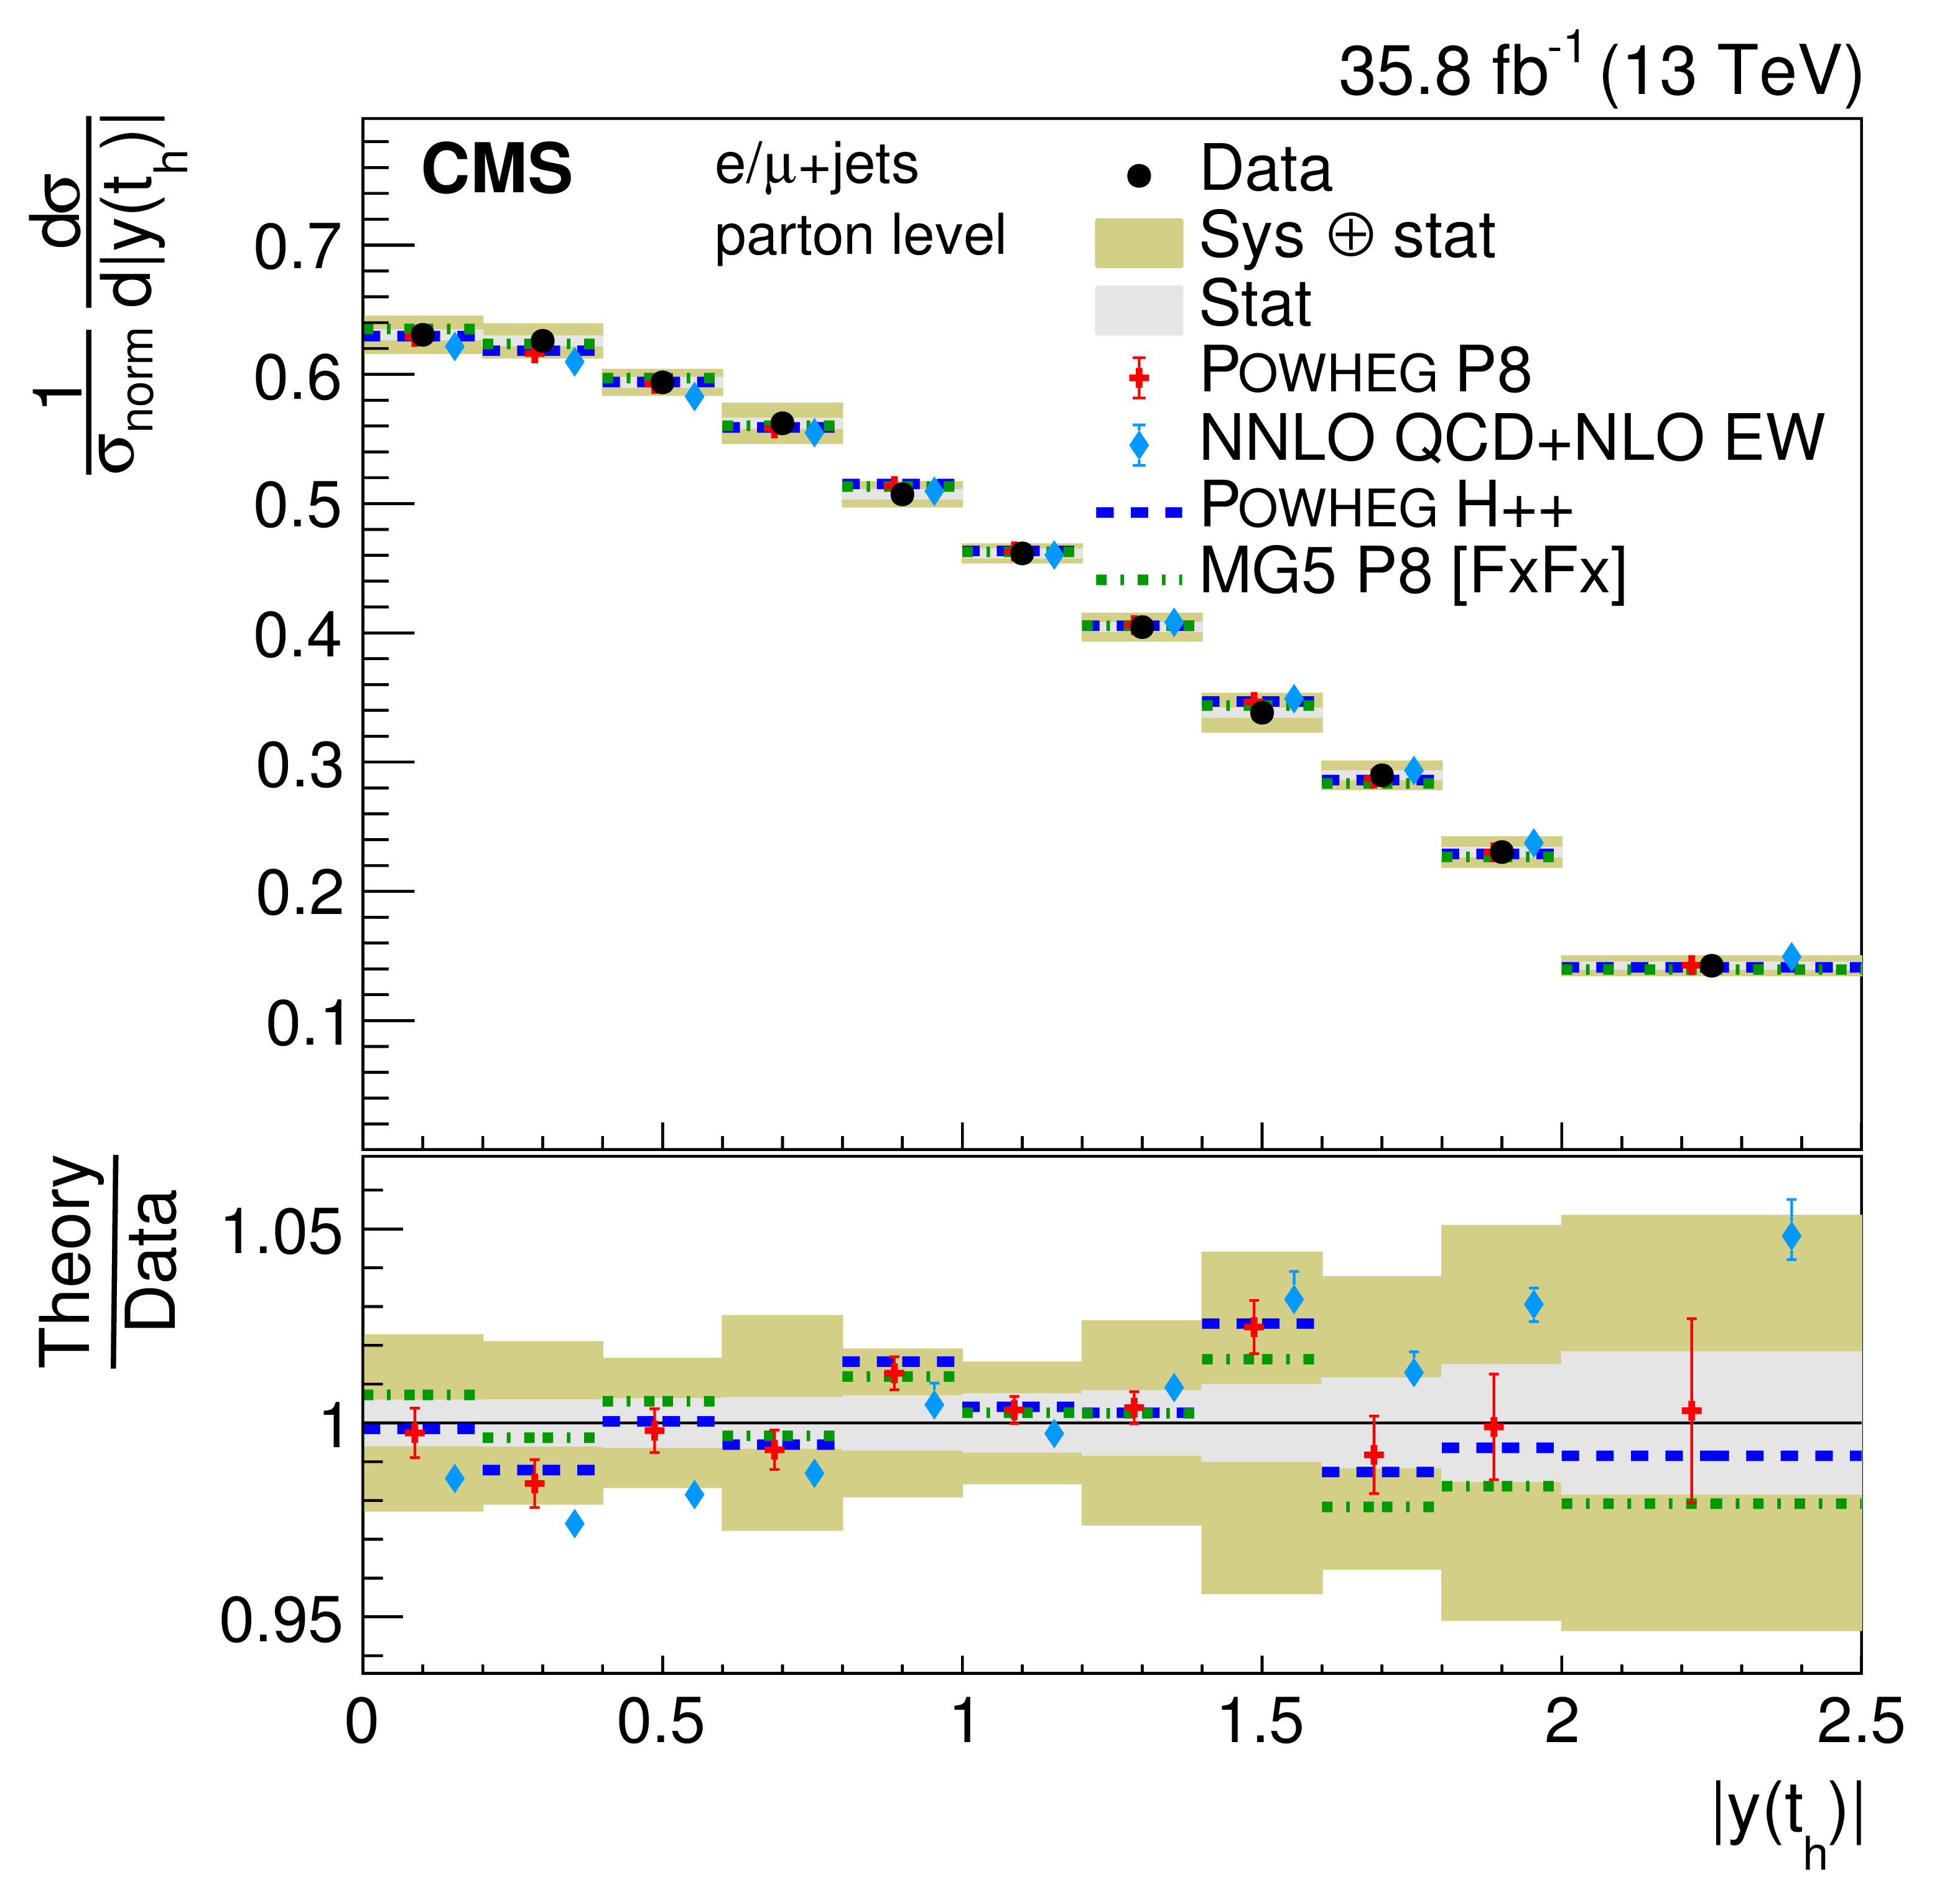
Absolute (left) and normalized (right) differential cross sections at the parton level as a function of $ { | y({\mathrm{t} _\mathrm {h}}) | }$ (upper) and $ { | y({\mathrm{t} _\ell}) | }$ (lower). The data are shown as points with light (dark) bands indicating the statistical (statistical and systematic) uncertainties. The cross sections are compared to the predictions of POWHEG combined with PYTHIA8 (P8) or HERWIG++ (H++), the multiparton simulation MG5_aMC@NLO (MG5)+PYTHIA8 FxFx, and the NNLO QCD+NLO EW calculations. The ratios of the various predictions to the measured cross sections are shown at the bottom of each panel. |
png pdf |
Figure 12-a:
Absolute (left) and normalized (right) differential cross sections at the parton level as a function of $ { | y({\mathrm{t} _\mathrm {h}}) | }$ (upper) and $ { | y({\mathrm{t} _\ell}) | }$ (lower). The data are shown as points with light (dark) bands indicating the statistical (statistical and systematic) uncertainties. The cross sections are compared to the predictions of POWHEG combined with PYTHIA8 (P8) or HERWIG++ (H++), the multiparton simulation MG5_aMC@NLO (MG5)+PYTHIA8 FxFx, and the NNLO QCD+NLO EW calculations. The ratios of the various predictions to the measured cross sections are shown at the bottom of each panel. |
png pdf |
Figure 12-b:
Absolute (left) and normalized (right) differential cross sections at the parton level as a function of $ { | y({\mathrm{t} _\mathrm {h}}) | }$ (upper) and $ { | y({\mathrm{t} _\ell}) | }$ (lower). The data are shown as points with light (dark) bands indicating the statistical (statistical and systematic) uncertainties. The cross sections are compared to the predictions of POWHEG combined with PYTHIA8 (P8) or HERWIG++ (H++), the multiparton simulation MG5_aMC@NLO (MG5)+PYTHIA8 FxFx, and the NNLO QCD+NLO EW calculations. The ratios of the various predictions to the measured cross sections are shown at the bottom of each panel. |

png pdf |
Figure 12-c:
Absolute (left) and normalized (right) differential cross sections at the parton level as a function of $ { | y({\mathrm{t} _\mathrm {h}}) | }$ (upper) and $ { | y({\mathrm{t} _\ell}) | }$ (lower). The data are shown as points with light (dark) bands indicating the statistical (statistical and systematic) uncertainties. The cross sections are compared to the predictions of POWHEG combined with PYTHIA8 (P8) or HERWIG++ (H++), the multiparton simulation MG5_aMC@NLO (MG5)+PYTHIA8 FxFx, and the NNLO QCD+NLO EW calculations. The ratios of the various predictions to the measured cross sections are shown at the bottom of each panel. |

png pdf |
Figure 12-d:
Absolute (left) and normalized (right) differential cross sections at the parton level as a function of $ { | y({\mathrm{t} _\mathrm {h}}) | }$ (upper) and $ { | y({\mathrm{t} _\ell}) | }$ (lower). The data are shown as points with light (dark) bands indicating the statistical (statistical and systematic) uncertainties. The cross sections are compared to the predictions of POWHEG combined with PYTHIA8 (P8) or HERWIG++ (H++), the multiparton simulation MG5_aMC@NLO (MG5)+PYTHIA8 FxFx, and the NNLO QCD+NLO EW calculations. The ratios of the various predictions to the measured cross sections are shown at the bottom of each panel. |
png pdf |
Figure 13:
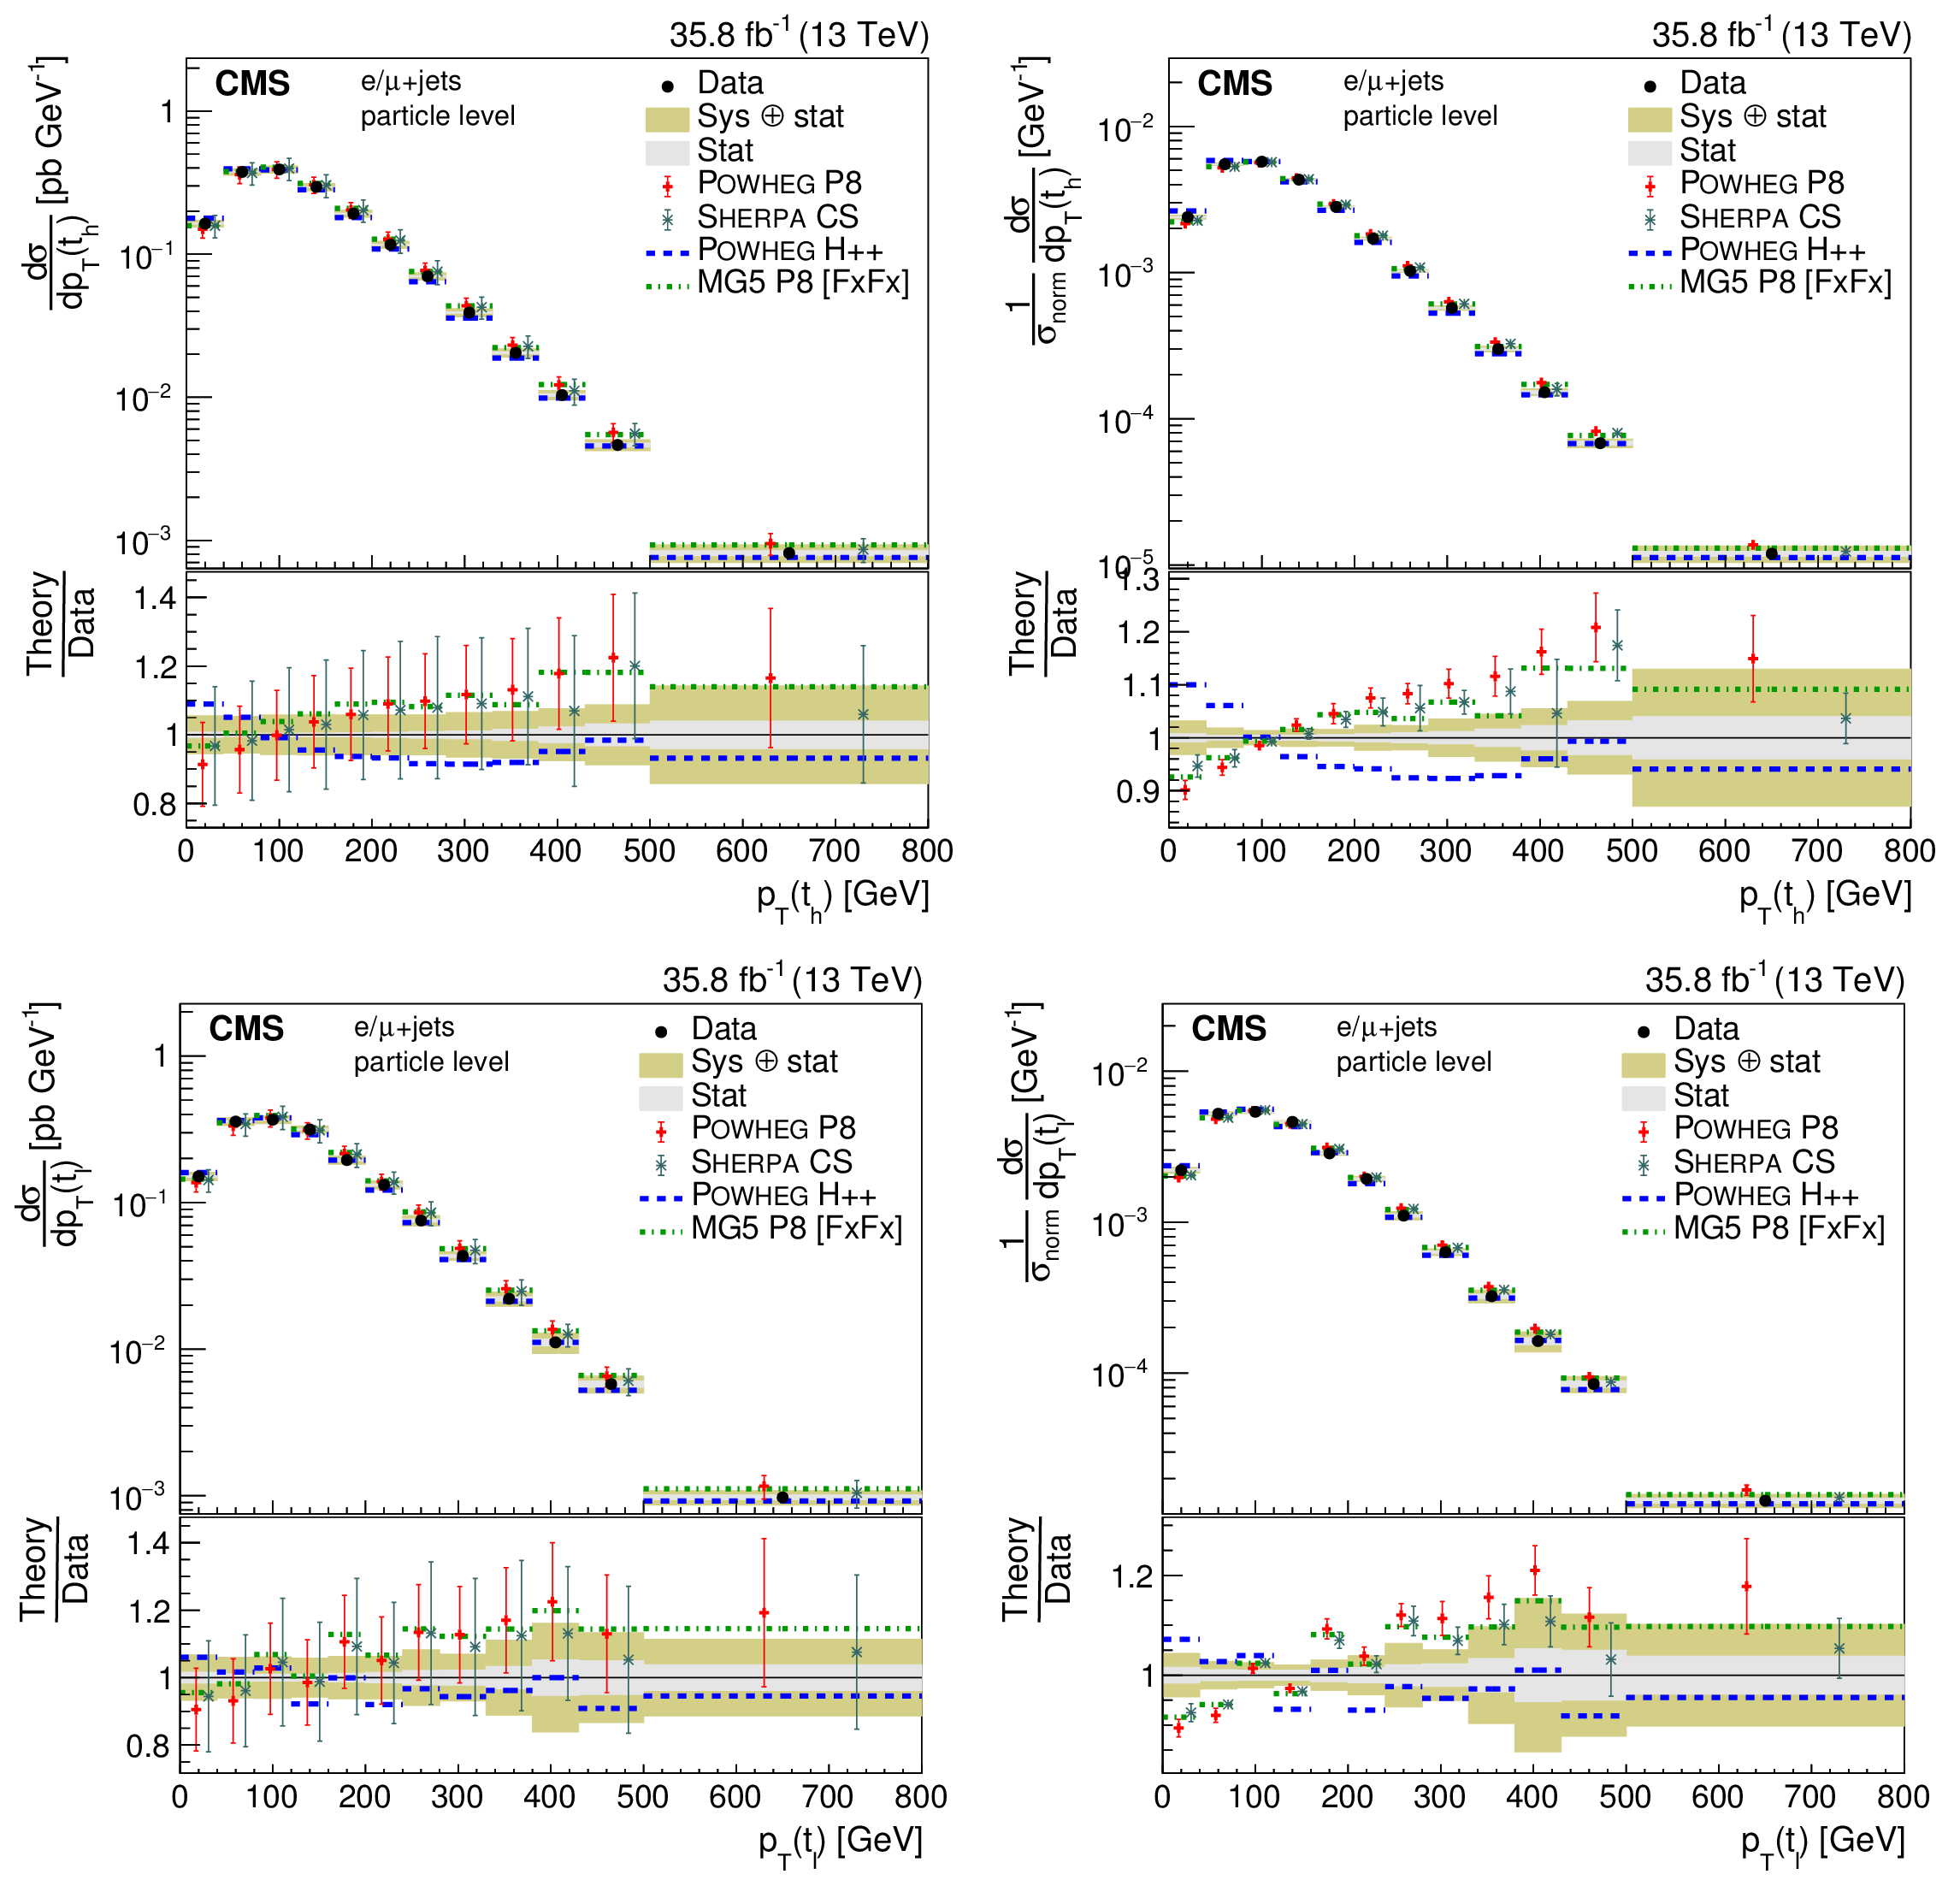
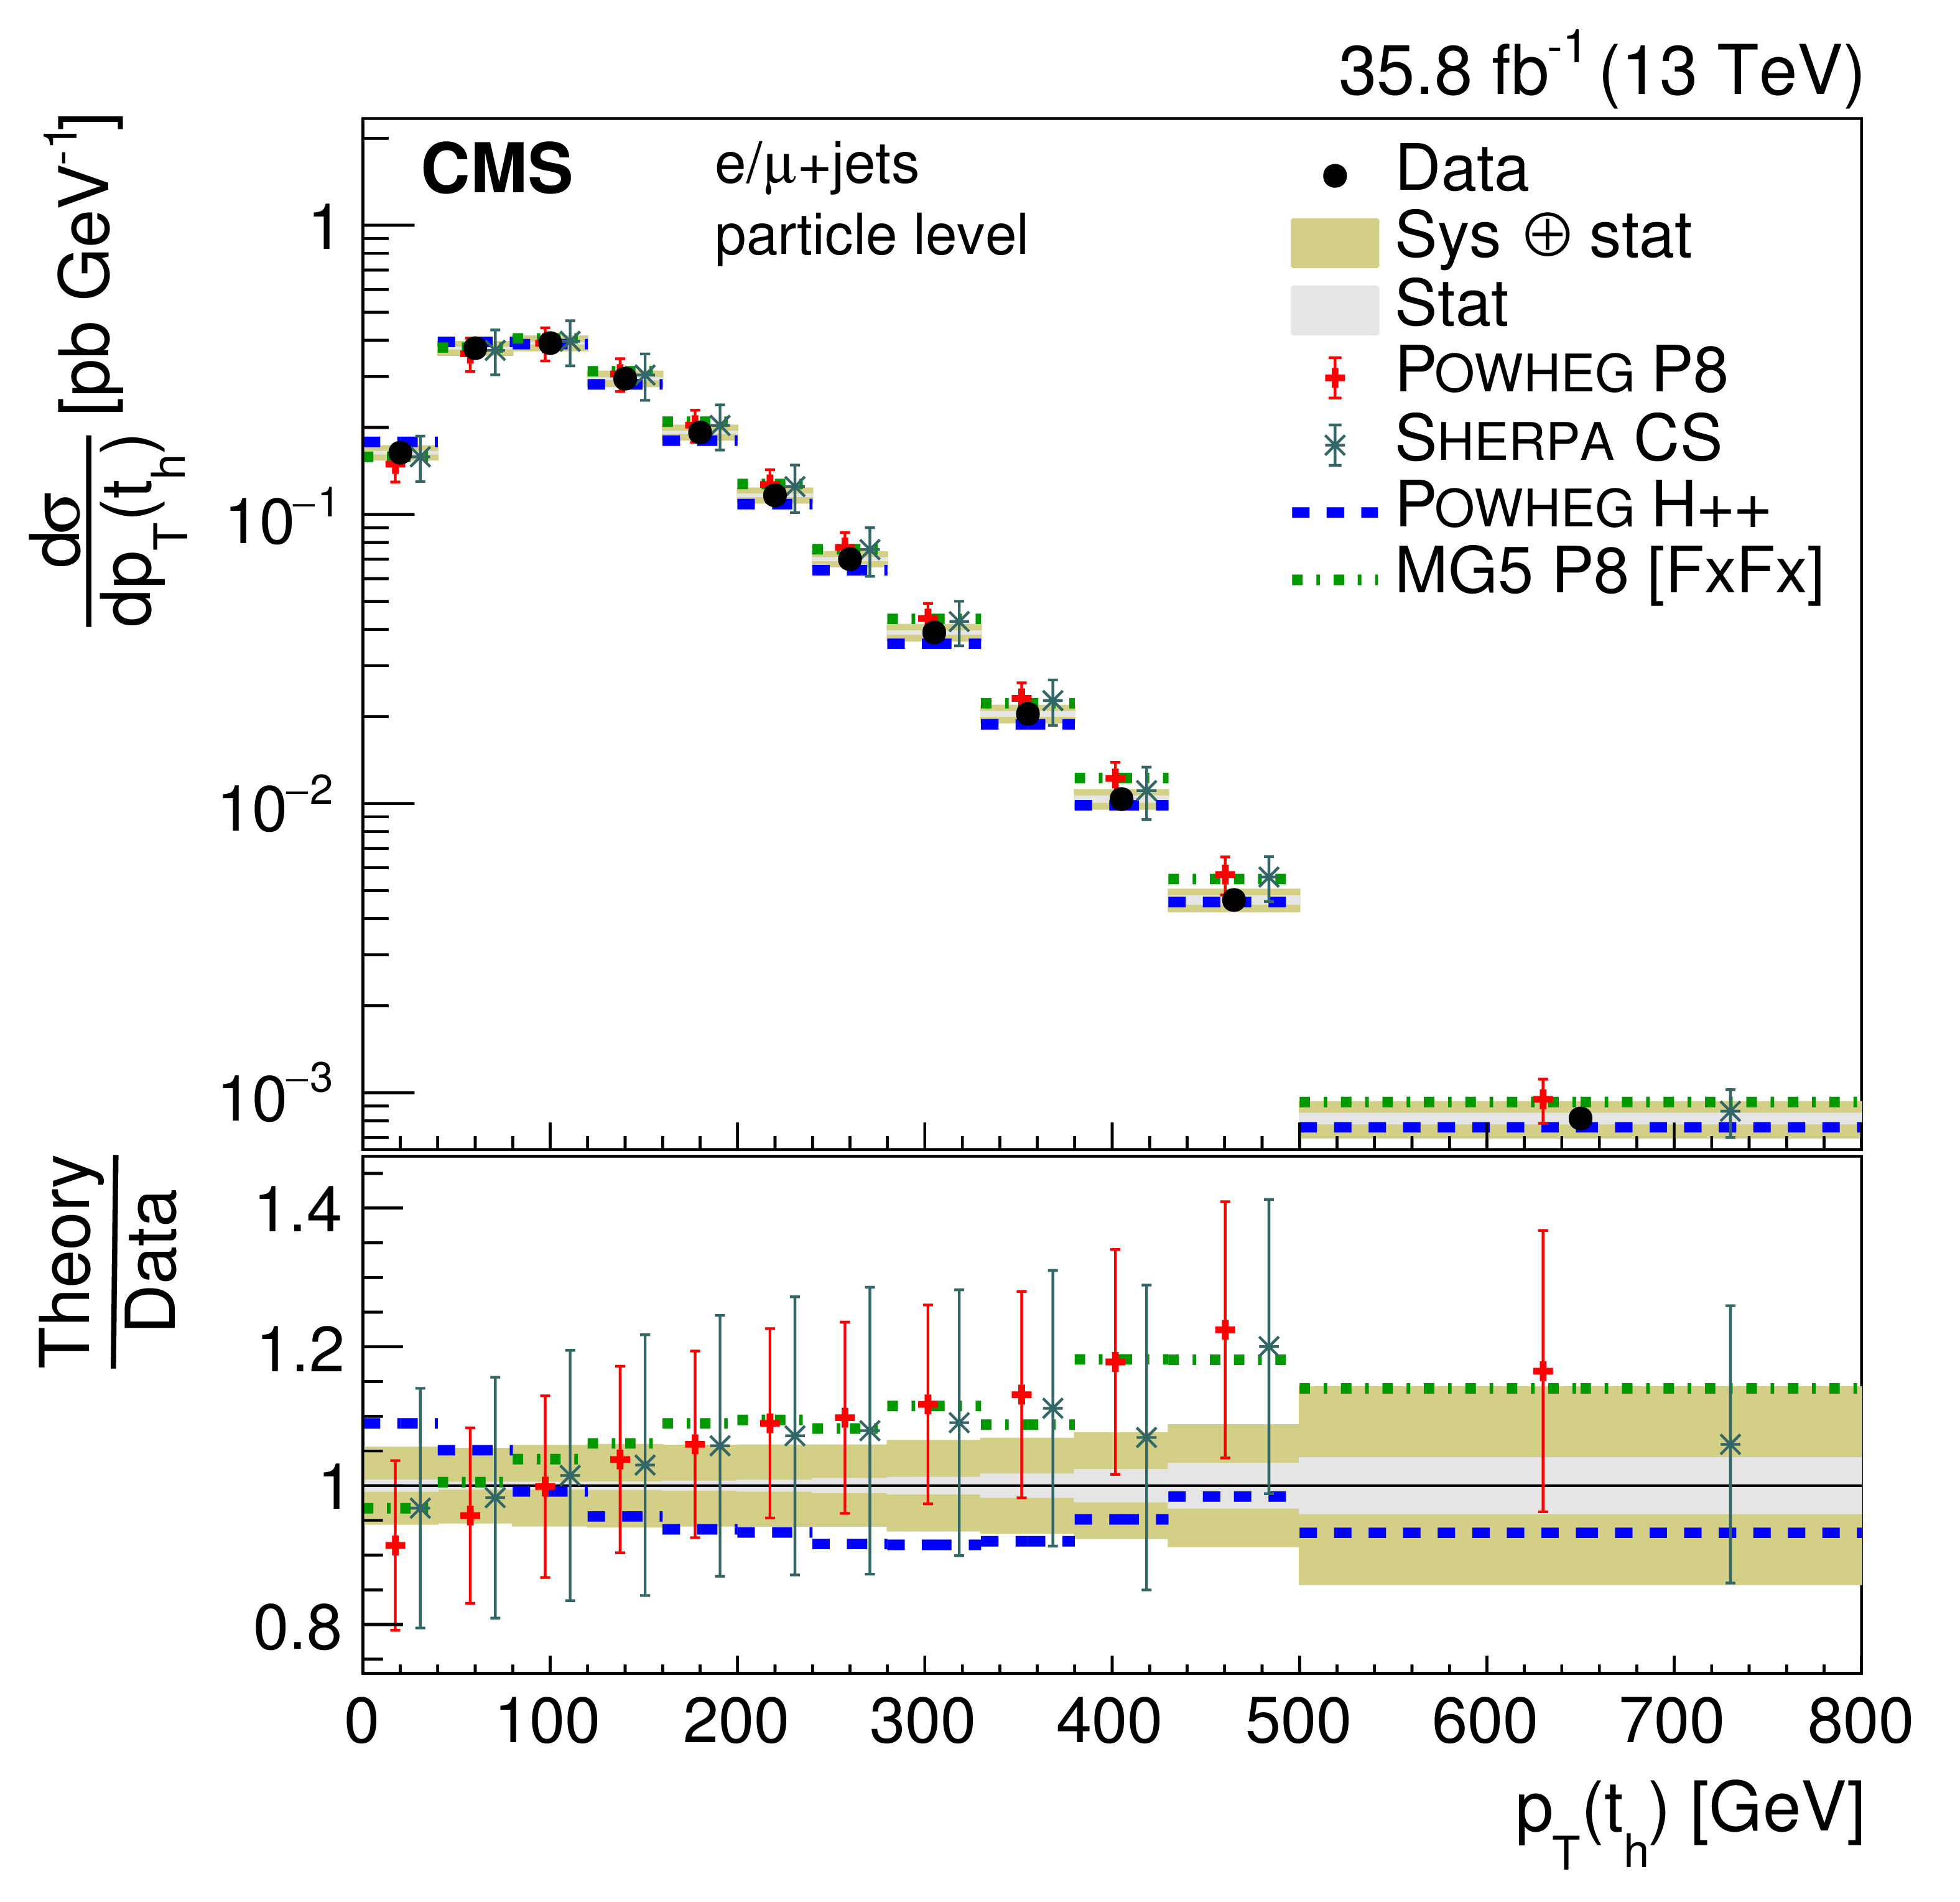
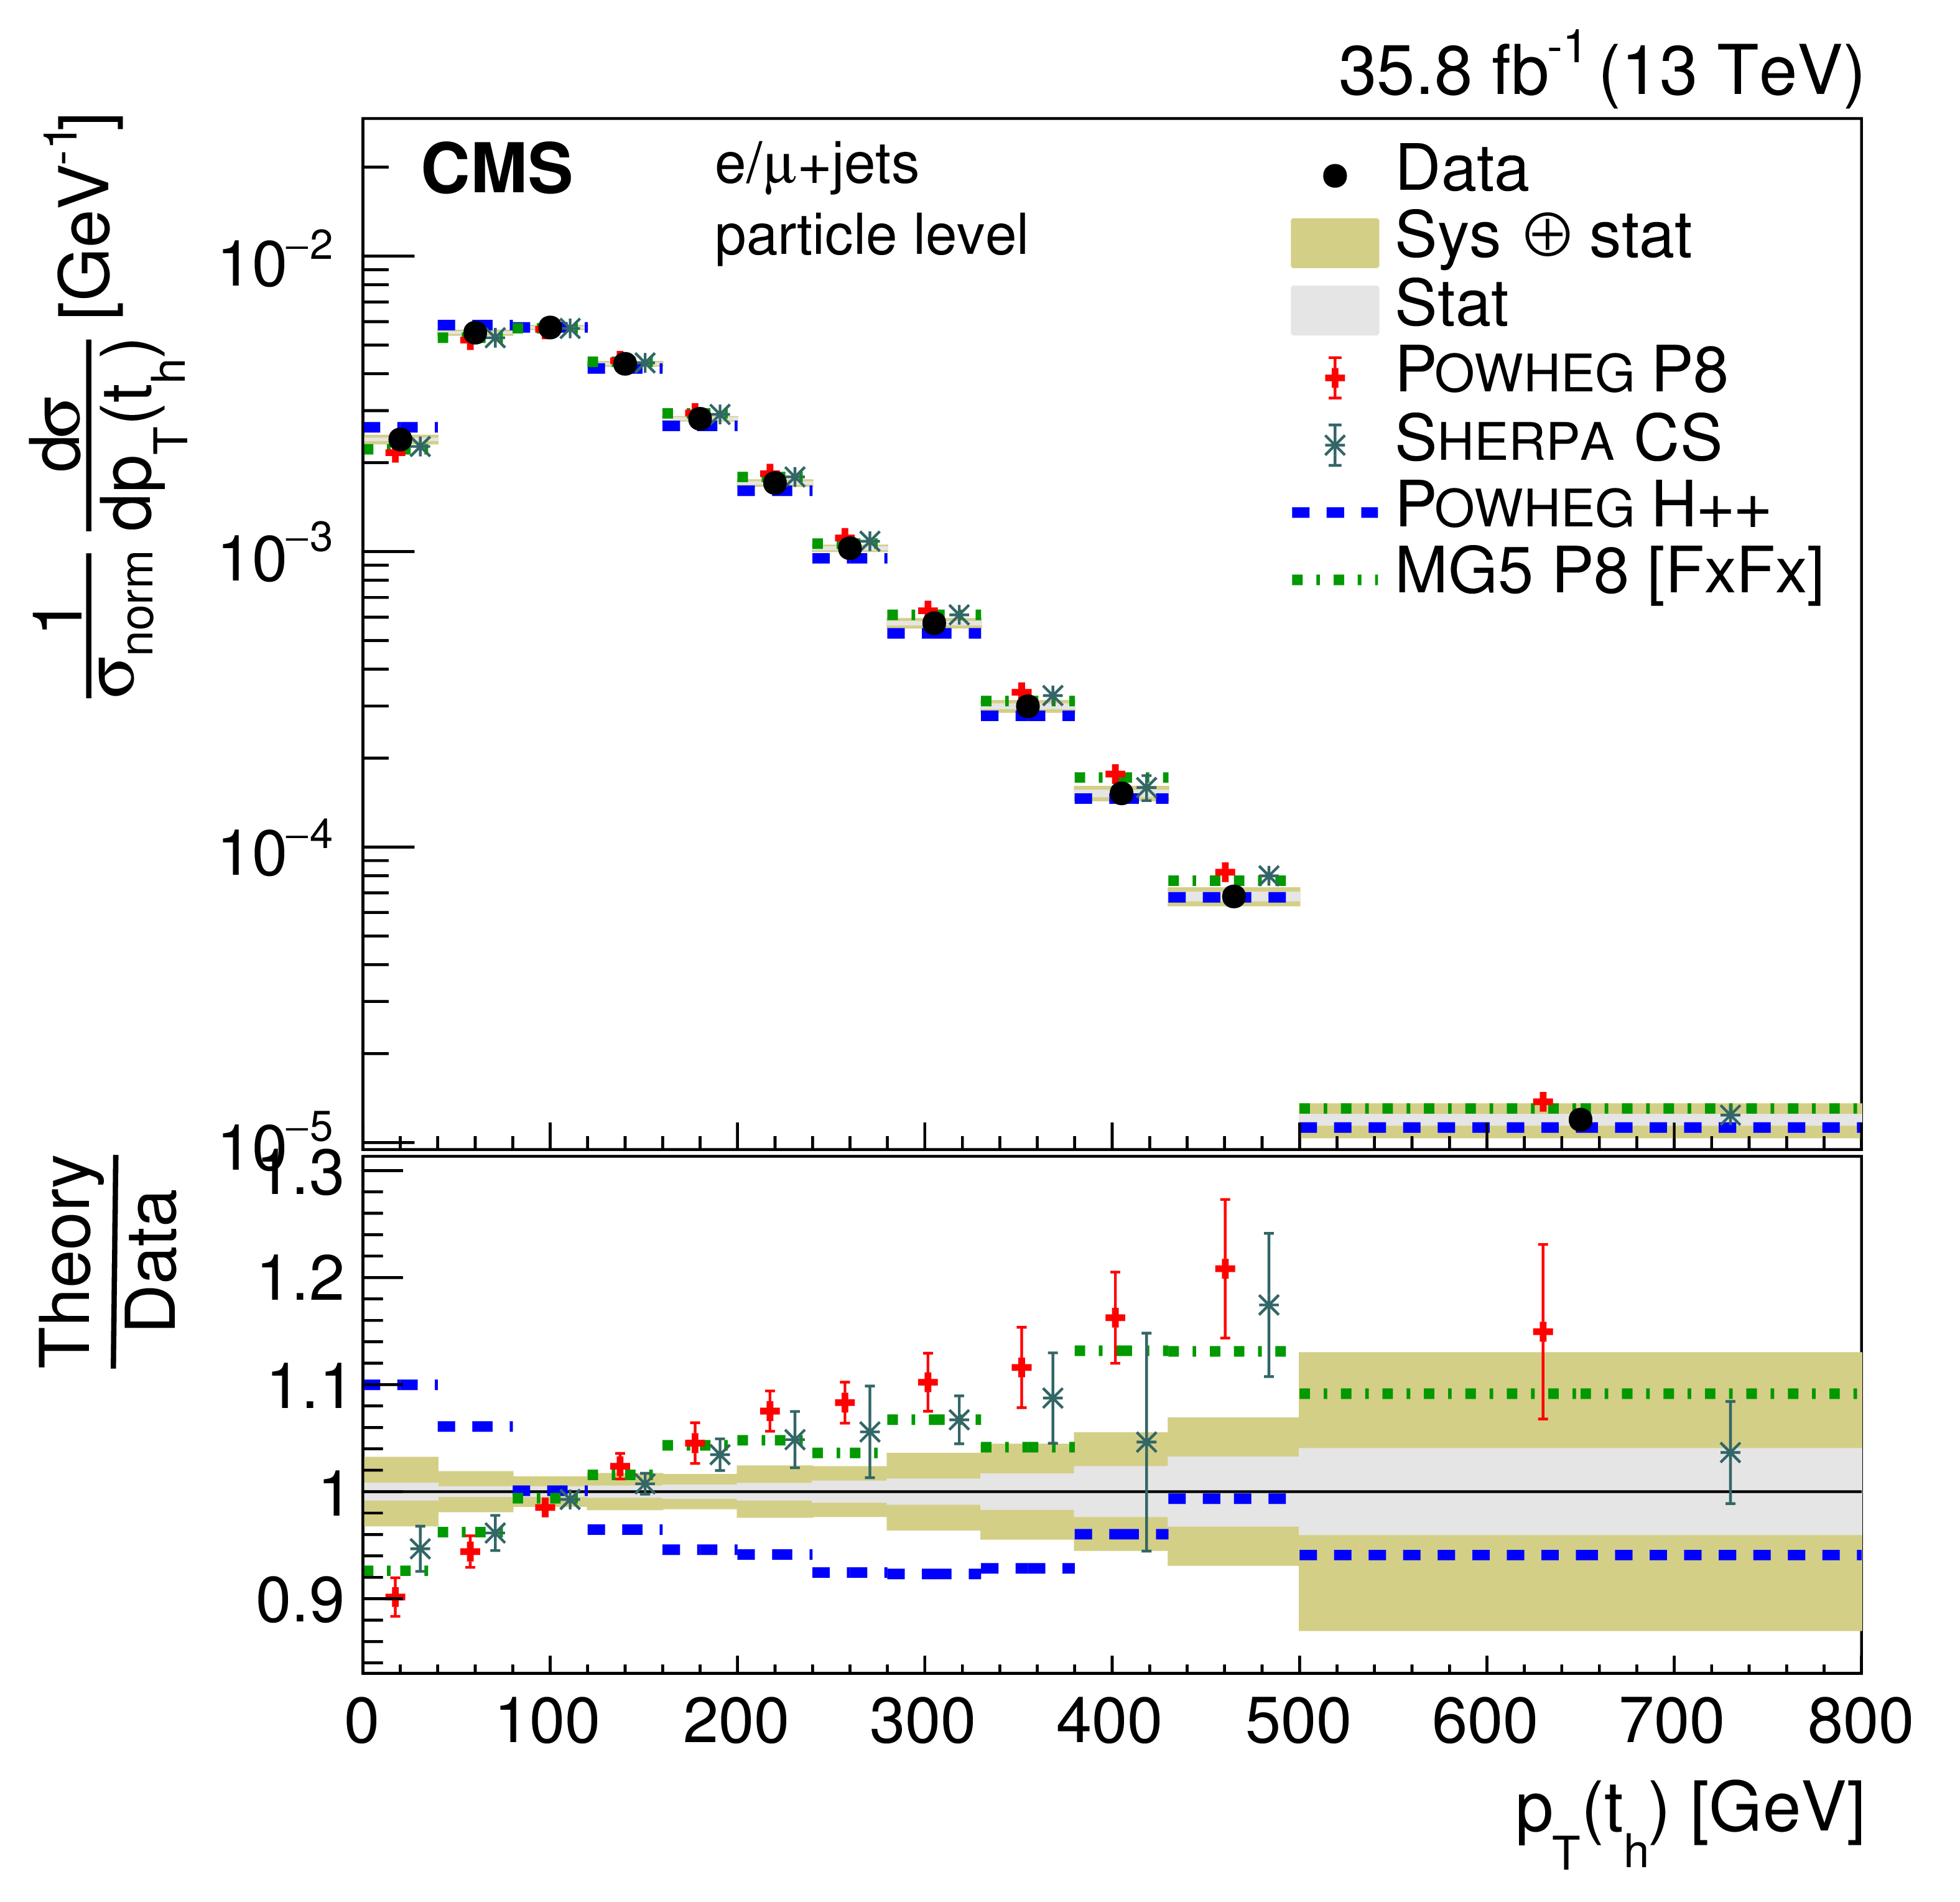
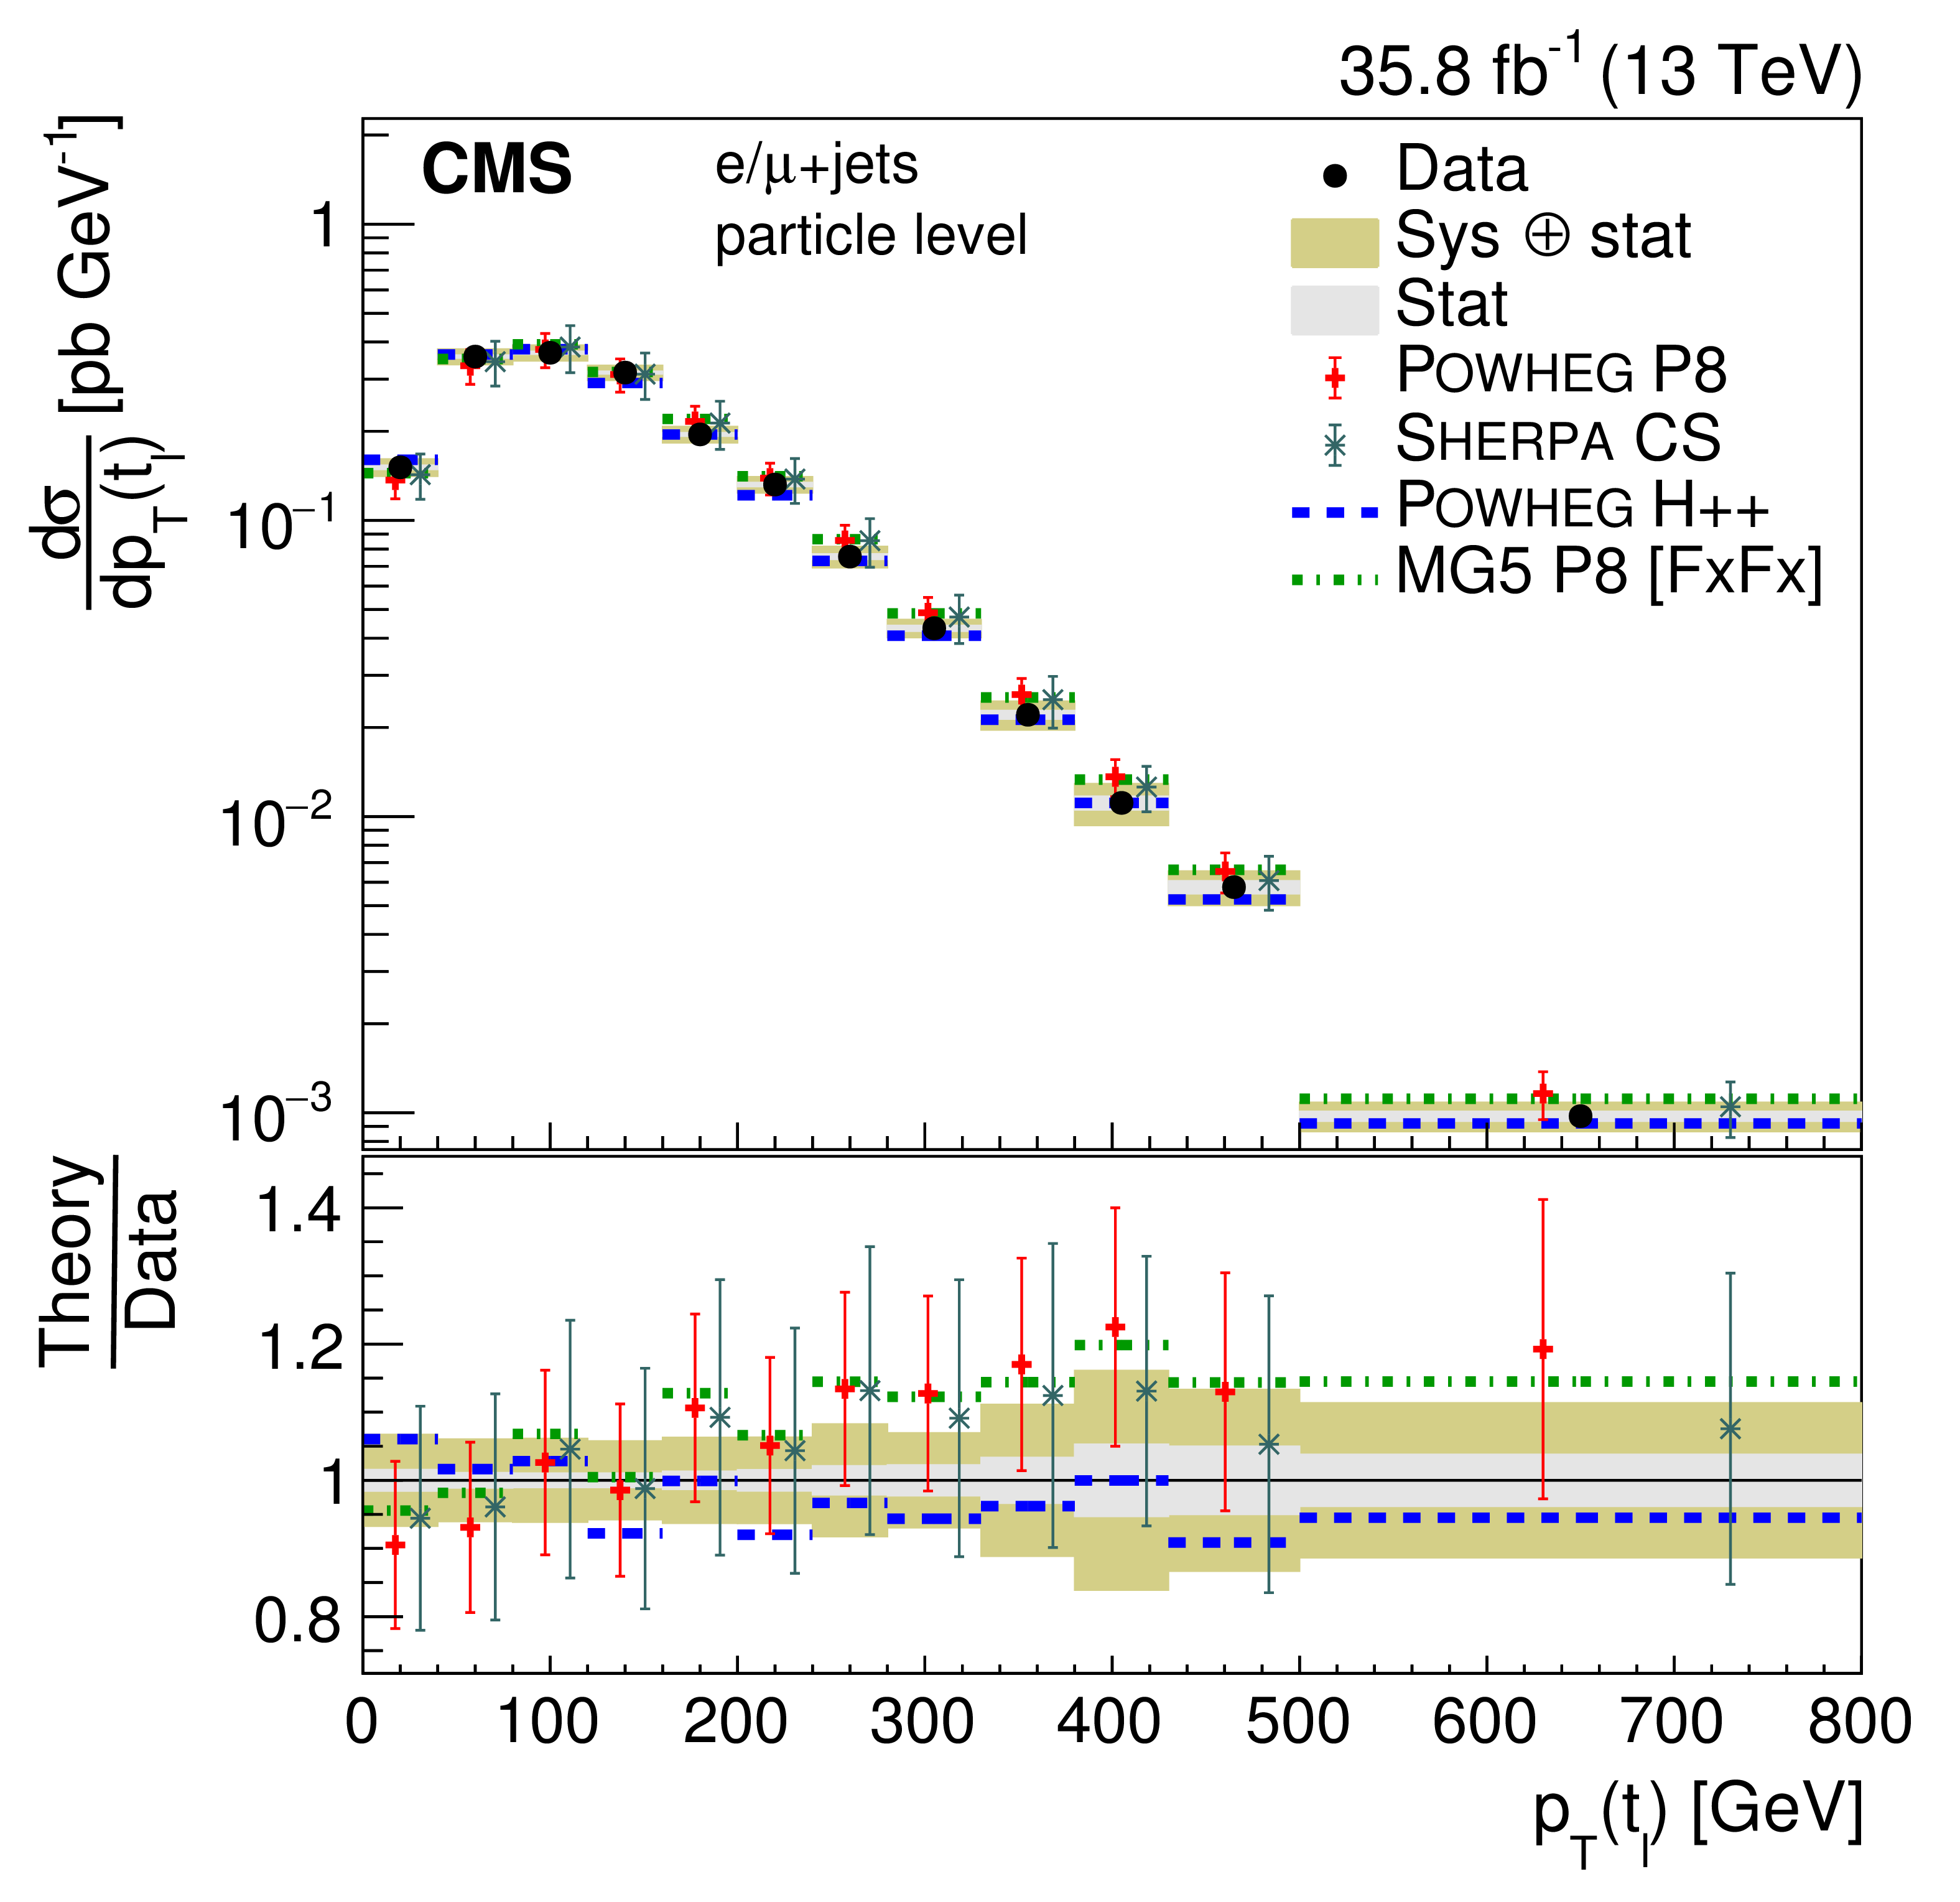
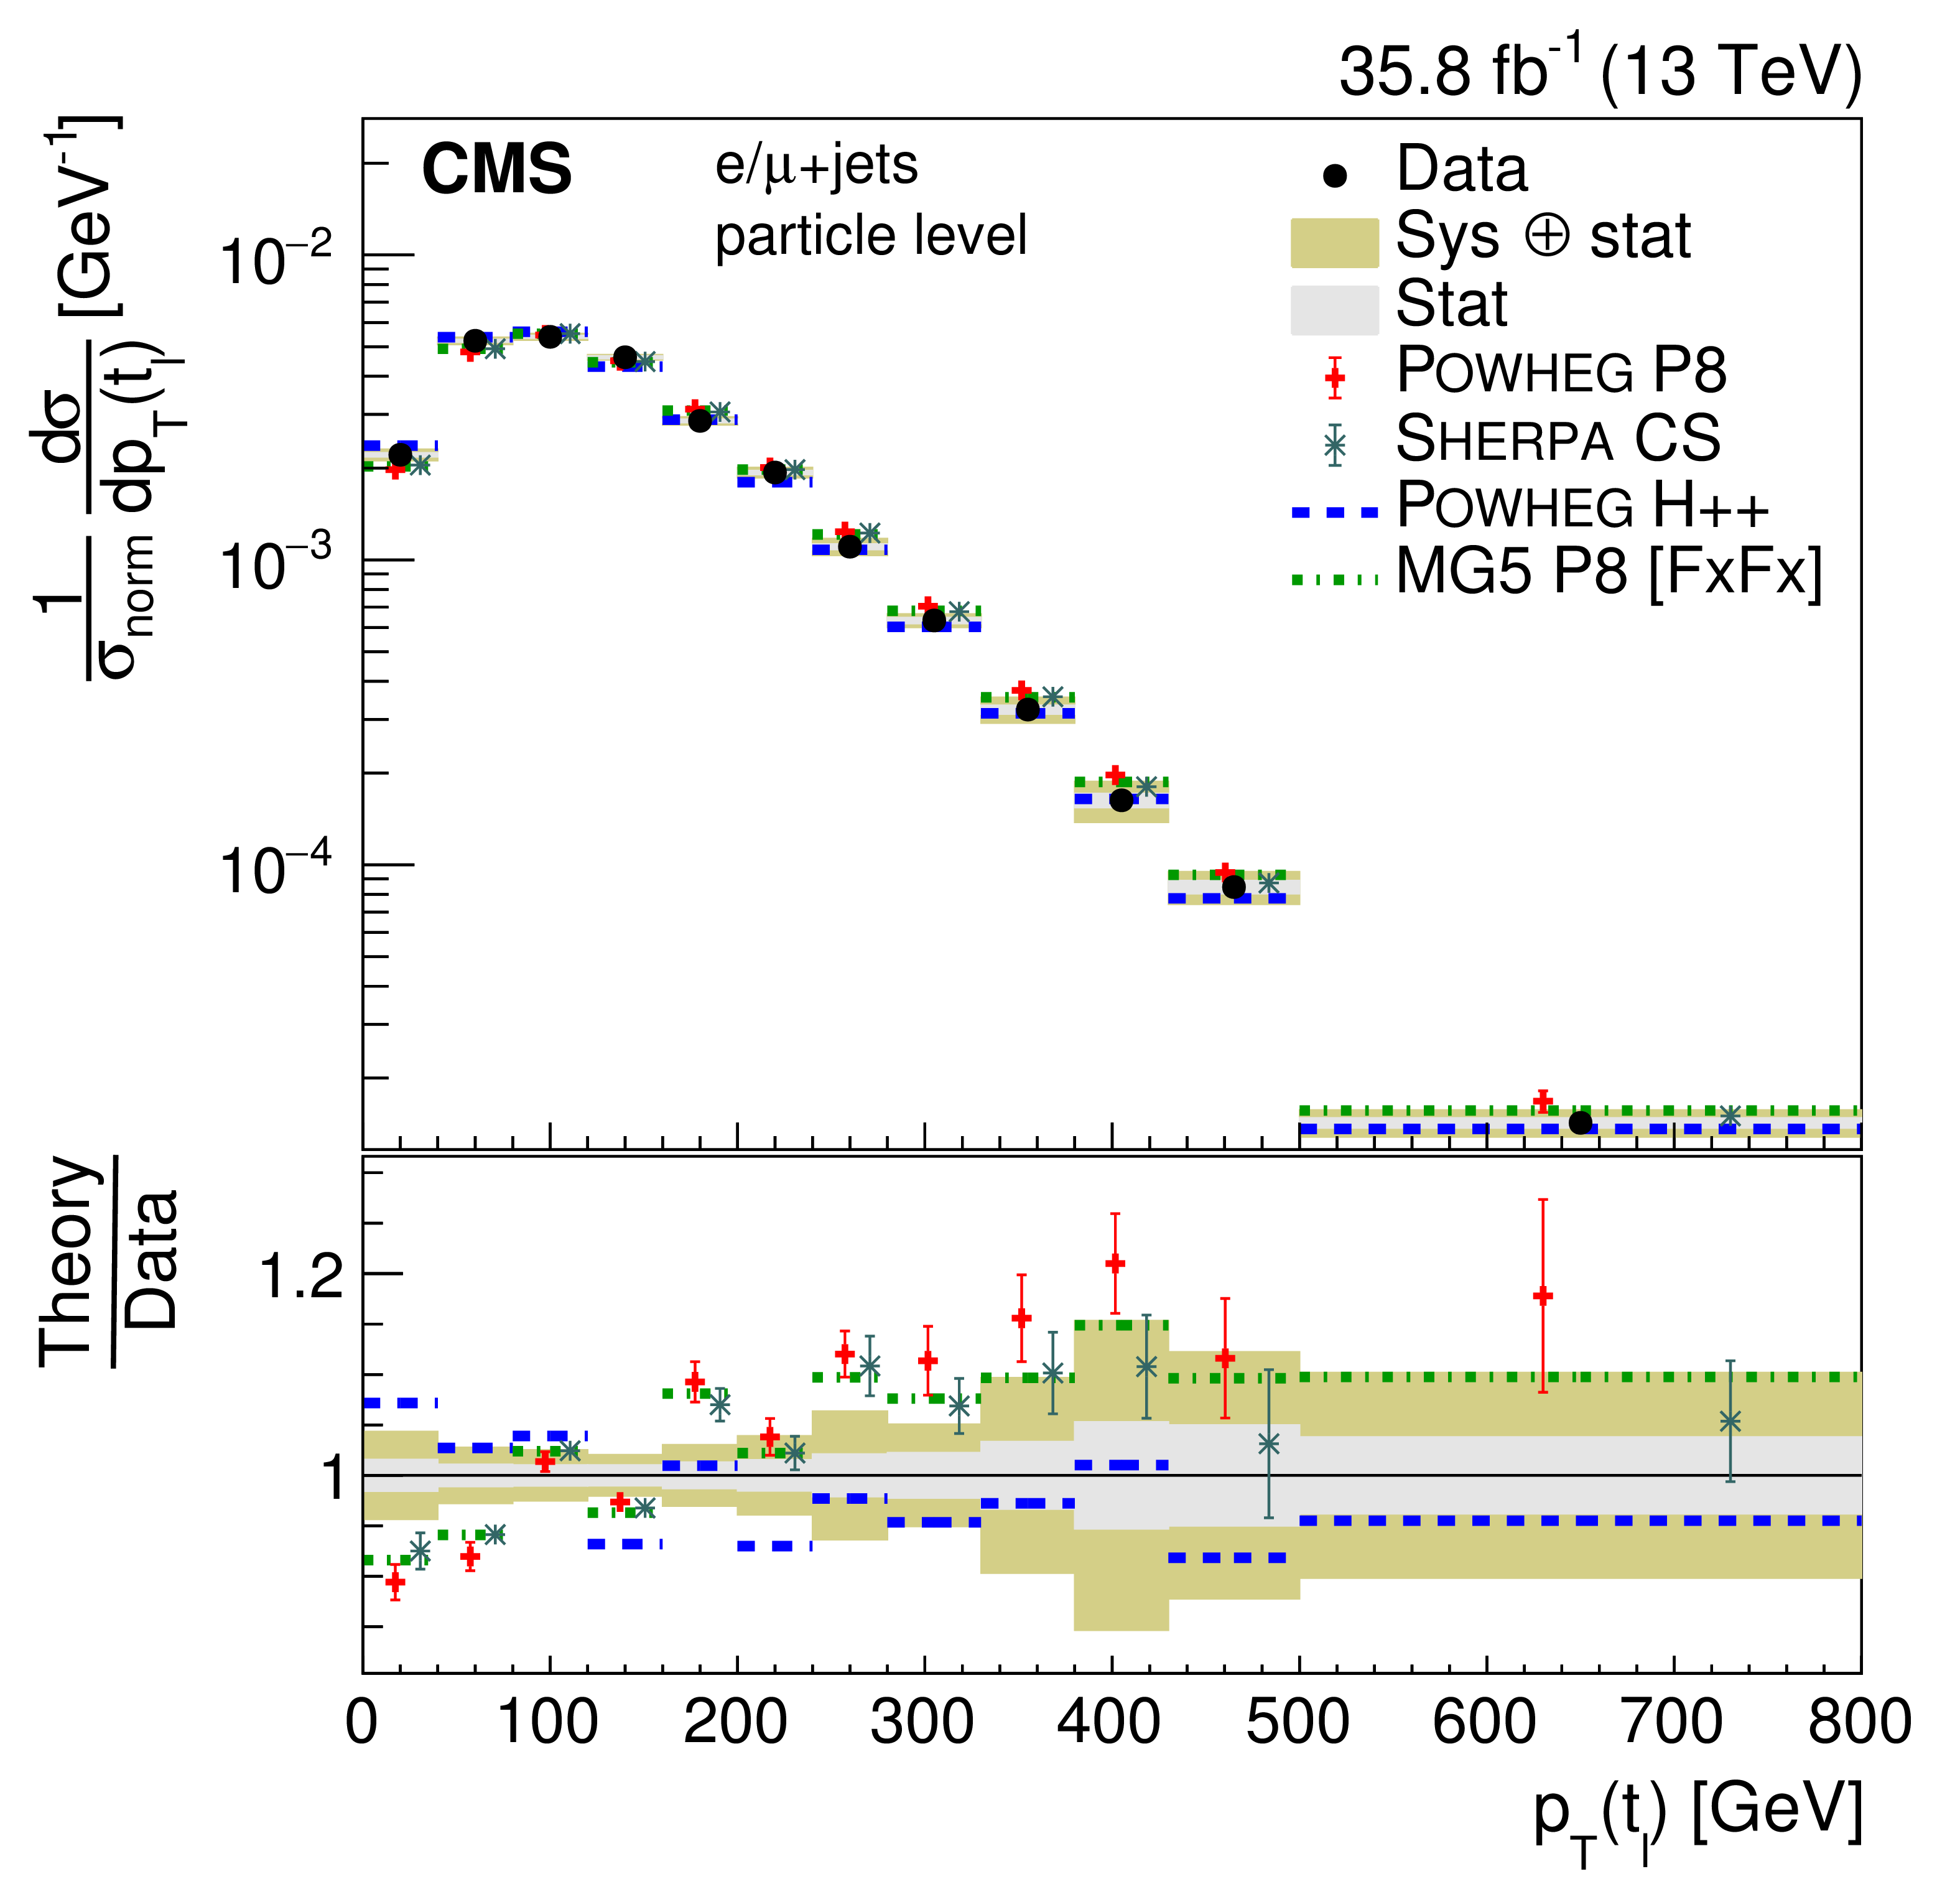
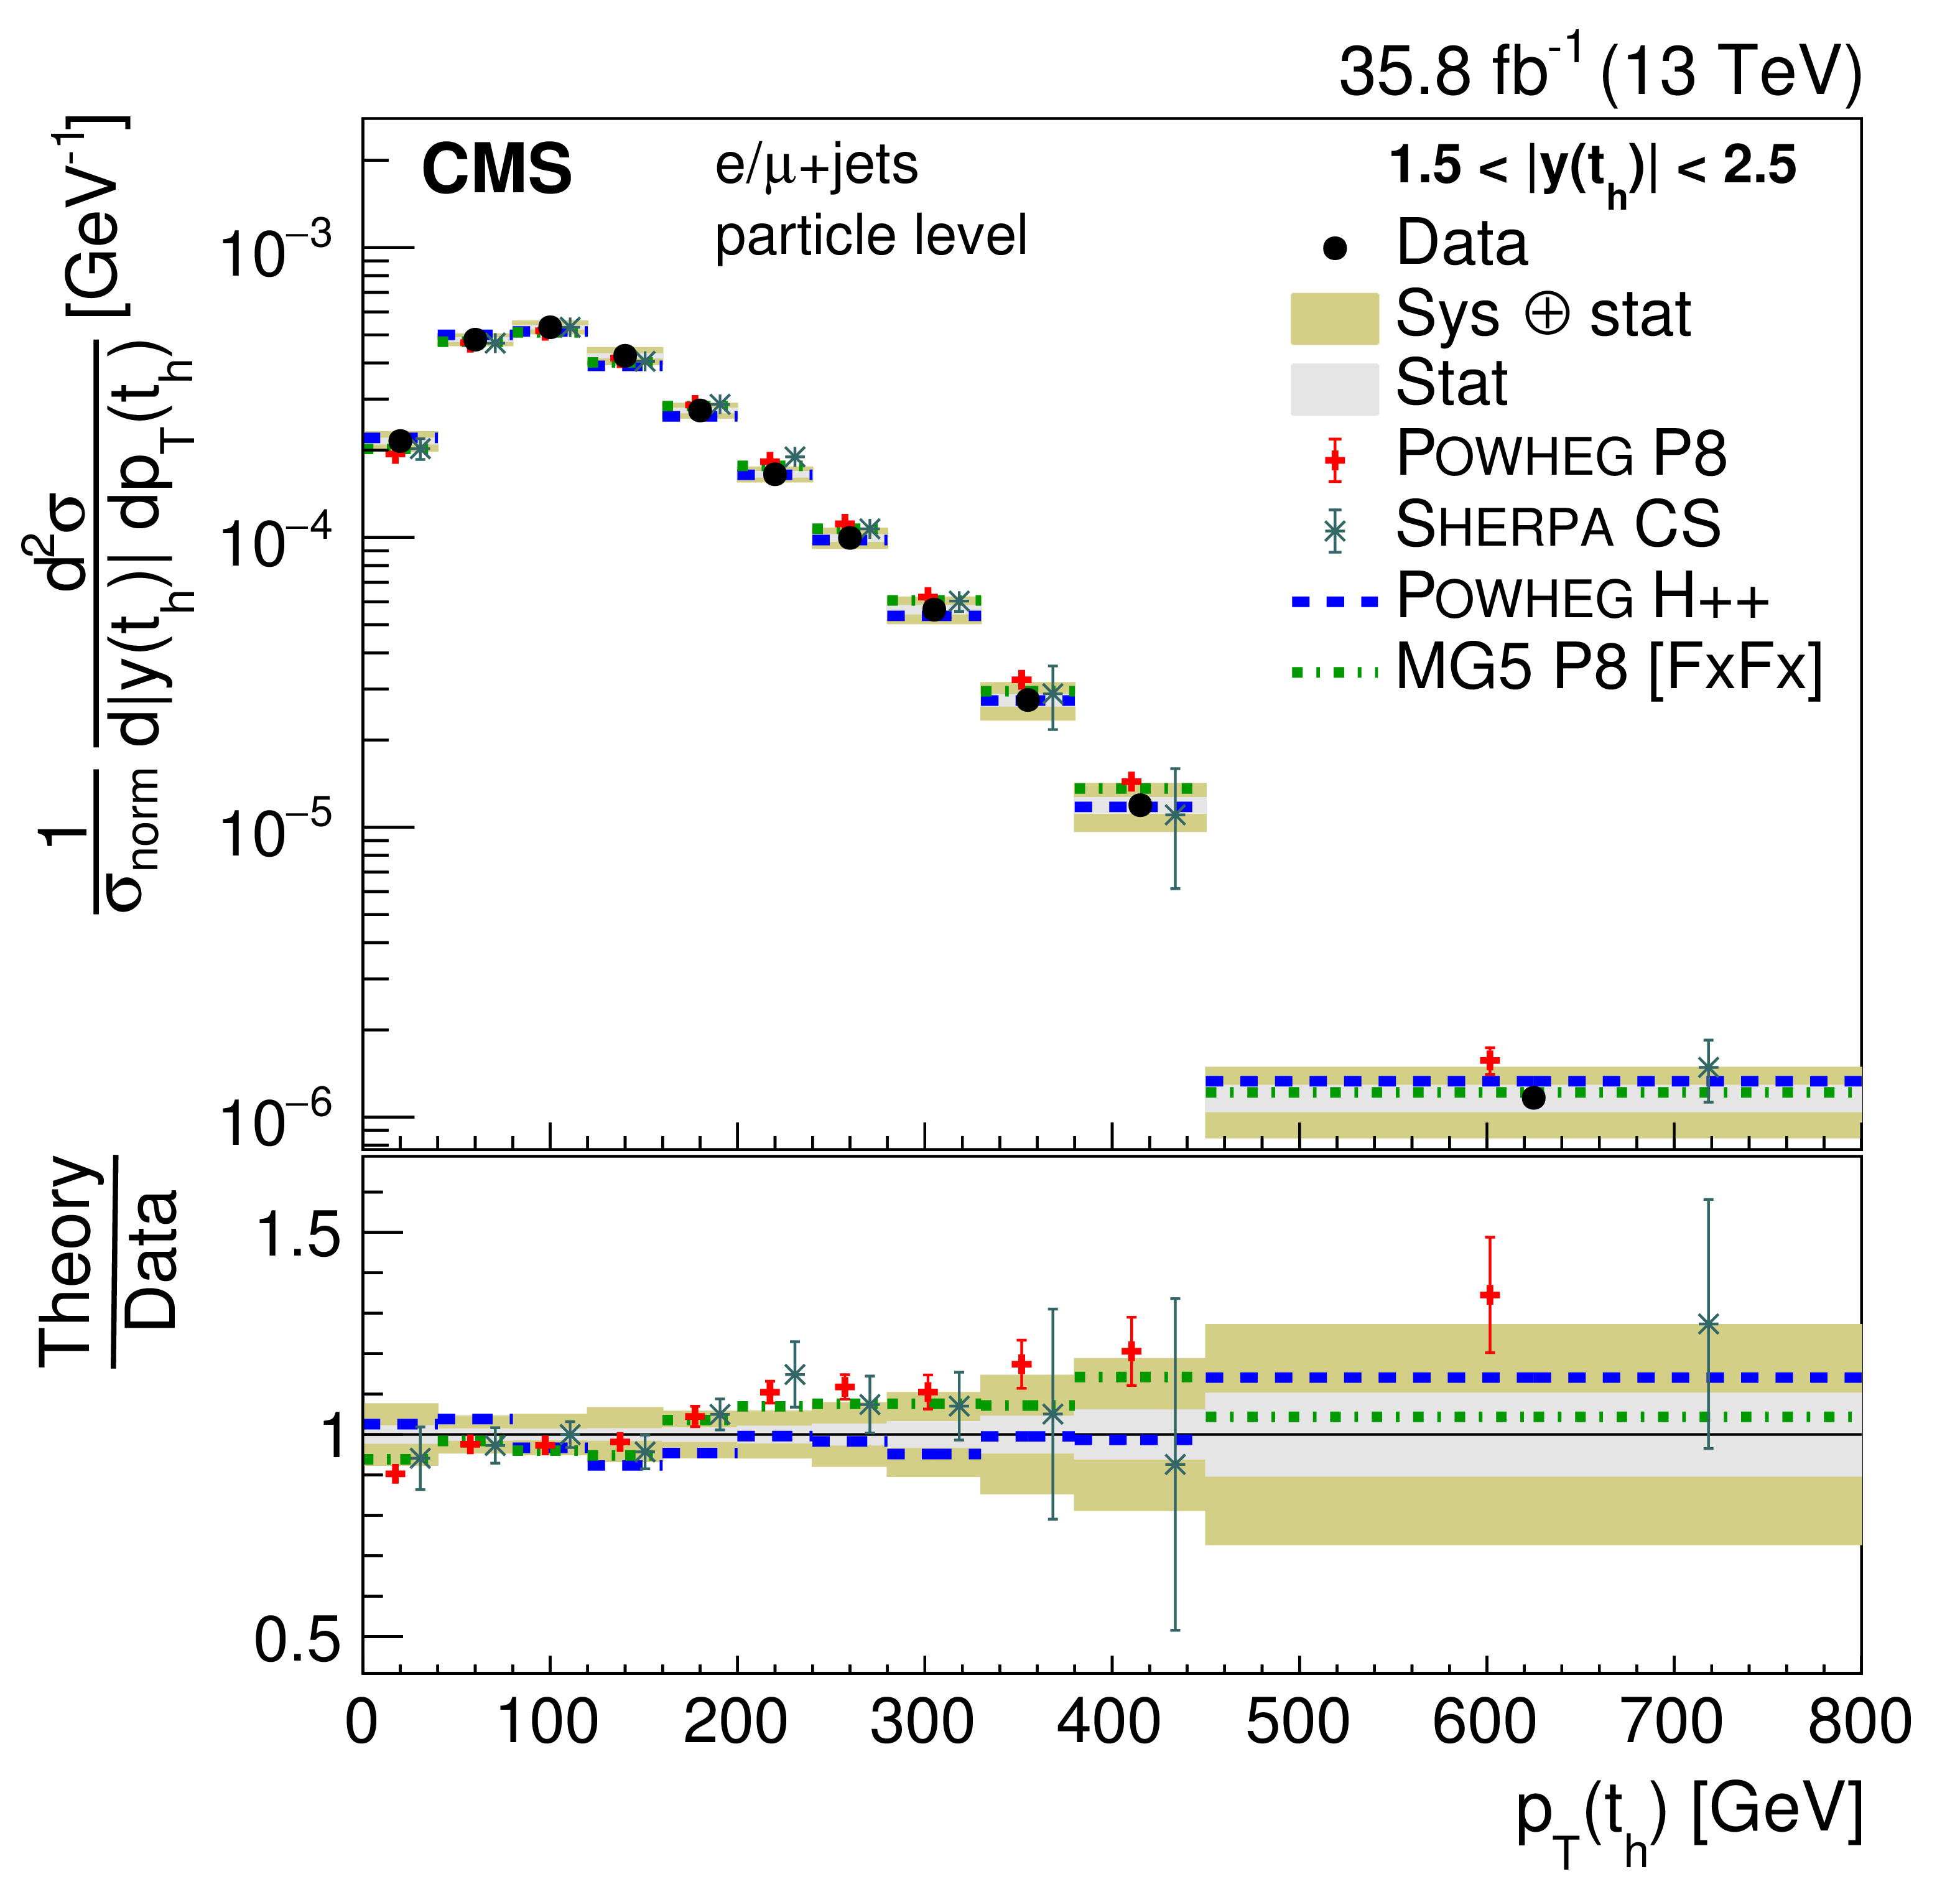
Absolute (left) and normalized (right) differential cross sections at the particle level as a function of $ {p_{\mathrm {T}}} ({\mathrm{t} _\mathrm {h}})$ (upper) and $ {p_{\mathrm {T}}} ({\mathrm{t} _\ell})$ (lower). The data are shown as points with light (dark) bands indicating the statistical (statistical and systematic) uncertainties. The cross sections are compared to the predictions of POWHEG combined with PYTHIA8 (P8) or HERWIG++ (H++) and the multiparton simulations MG5_aMC@NLO (MG5)+PYTHIA8 FxFx and SHERPA. The ratios of the various predictions to the measured cross sections are shown at the bottom of each panel. |
png pdf |
Figure 13-a:
Absolute (left) and normalized (right) differential cross sections at the particle level as a function of $ {p_{\mathrm {T}}} ({\mathrm{t} _\mathrm {h}})$ (upper) and $ {p_{\mathrm {T}}} ({\mathrm{t} _\ell})$ (lower). The data are shown as points with light (dark) bands indicating the statistical (statistical and systematic) uncertainties. The cross sections are compared to the predictions of POWHEG combined with PYTHIA8 (P8) or HERWIG++ (H++) and the multiparton simulations MG5_aMC@NLO (MG5)+PYTHIA8 FxFx and SHERPA. The ratios of the various predictions to the measured cross sections are shown at the bottom of each panel. |
png pdf |
Figure 13-b:
Absolute (left) and normalized (right) differential cross sections at the particle level as a function of $ {p_{\mathrm {T}}} ({\mathrm{t} _\mathrm {h}})$ (upper) and $ {p_{\mathrm {T}}} ({\mathrm{t} _\ell})$ (lower). The data are shown as points with light (dark) bands indicating the statistical (statistical and systematic) uncertainties. The cross sections are compared to the predictions of POWHEG combined with PYTHIA8 (P8) or HERWIG++ (H++) and the multiparton simulations MG5_aMC@NLO (MG5)+PYTHIA8 FxFx and SHERPA. The ratios of the various predictions to the measured cross sections are shown at the bottom of each panel. |
png pdf |
Figure 13-c:
Absolute (left) and normalized (right) differential cross sections at the particle level as a function of $ {p_{\mathrm {T}}} ({\mathrm{t} _\mathrm {h}})$ (upper) and $ {p_{\mathrm {T}}} ({\mathrm{t} _\ell})$ (lower). The data are shown as points with light (dark) bands indicating the statistical (statistical and systematic) uncertainties. The cross sections are compared to the predictions of POWHEG combined with PYTHIA8 (P8) or HERWIG++ (H++) and the multiparton simulations MG5_aMC@NLO (MG5)+PYTHIA8 FxFx and SHERPA. The ratios of the various predictions to the measured cross sections are shown at the bottom of each panel. |
png pdf |
Figure 13-d:
Absolute (left) and normalized (right) differential cross sections at the particle level as a function of $ {p_{\mathrm {T}}} ({\mathrm{t} _\mathrm {h}})$ (upper) and $ {p_{\mathrm {T}}} ({\mathrm{t} _\ell})$ (lower). The data are shown as points with light (dark) bands indicating the statistical (statistical and systematic) uncertainties. The cross sections are compared to the predictions of POWHEG combined with PYTHIA8 (P8) or HERWIG++ (H++) and the multiparton simulations MG5_aMC@NLO (MG5)+PYTHIA8 FxFx and SHERPA. The ratios of the various predictions to the measured cross sections are shown at the bottom of each panel. |
png pdf |
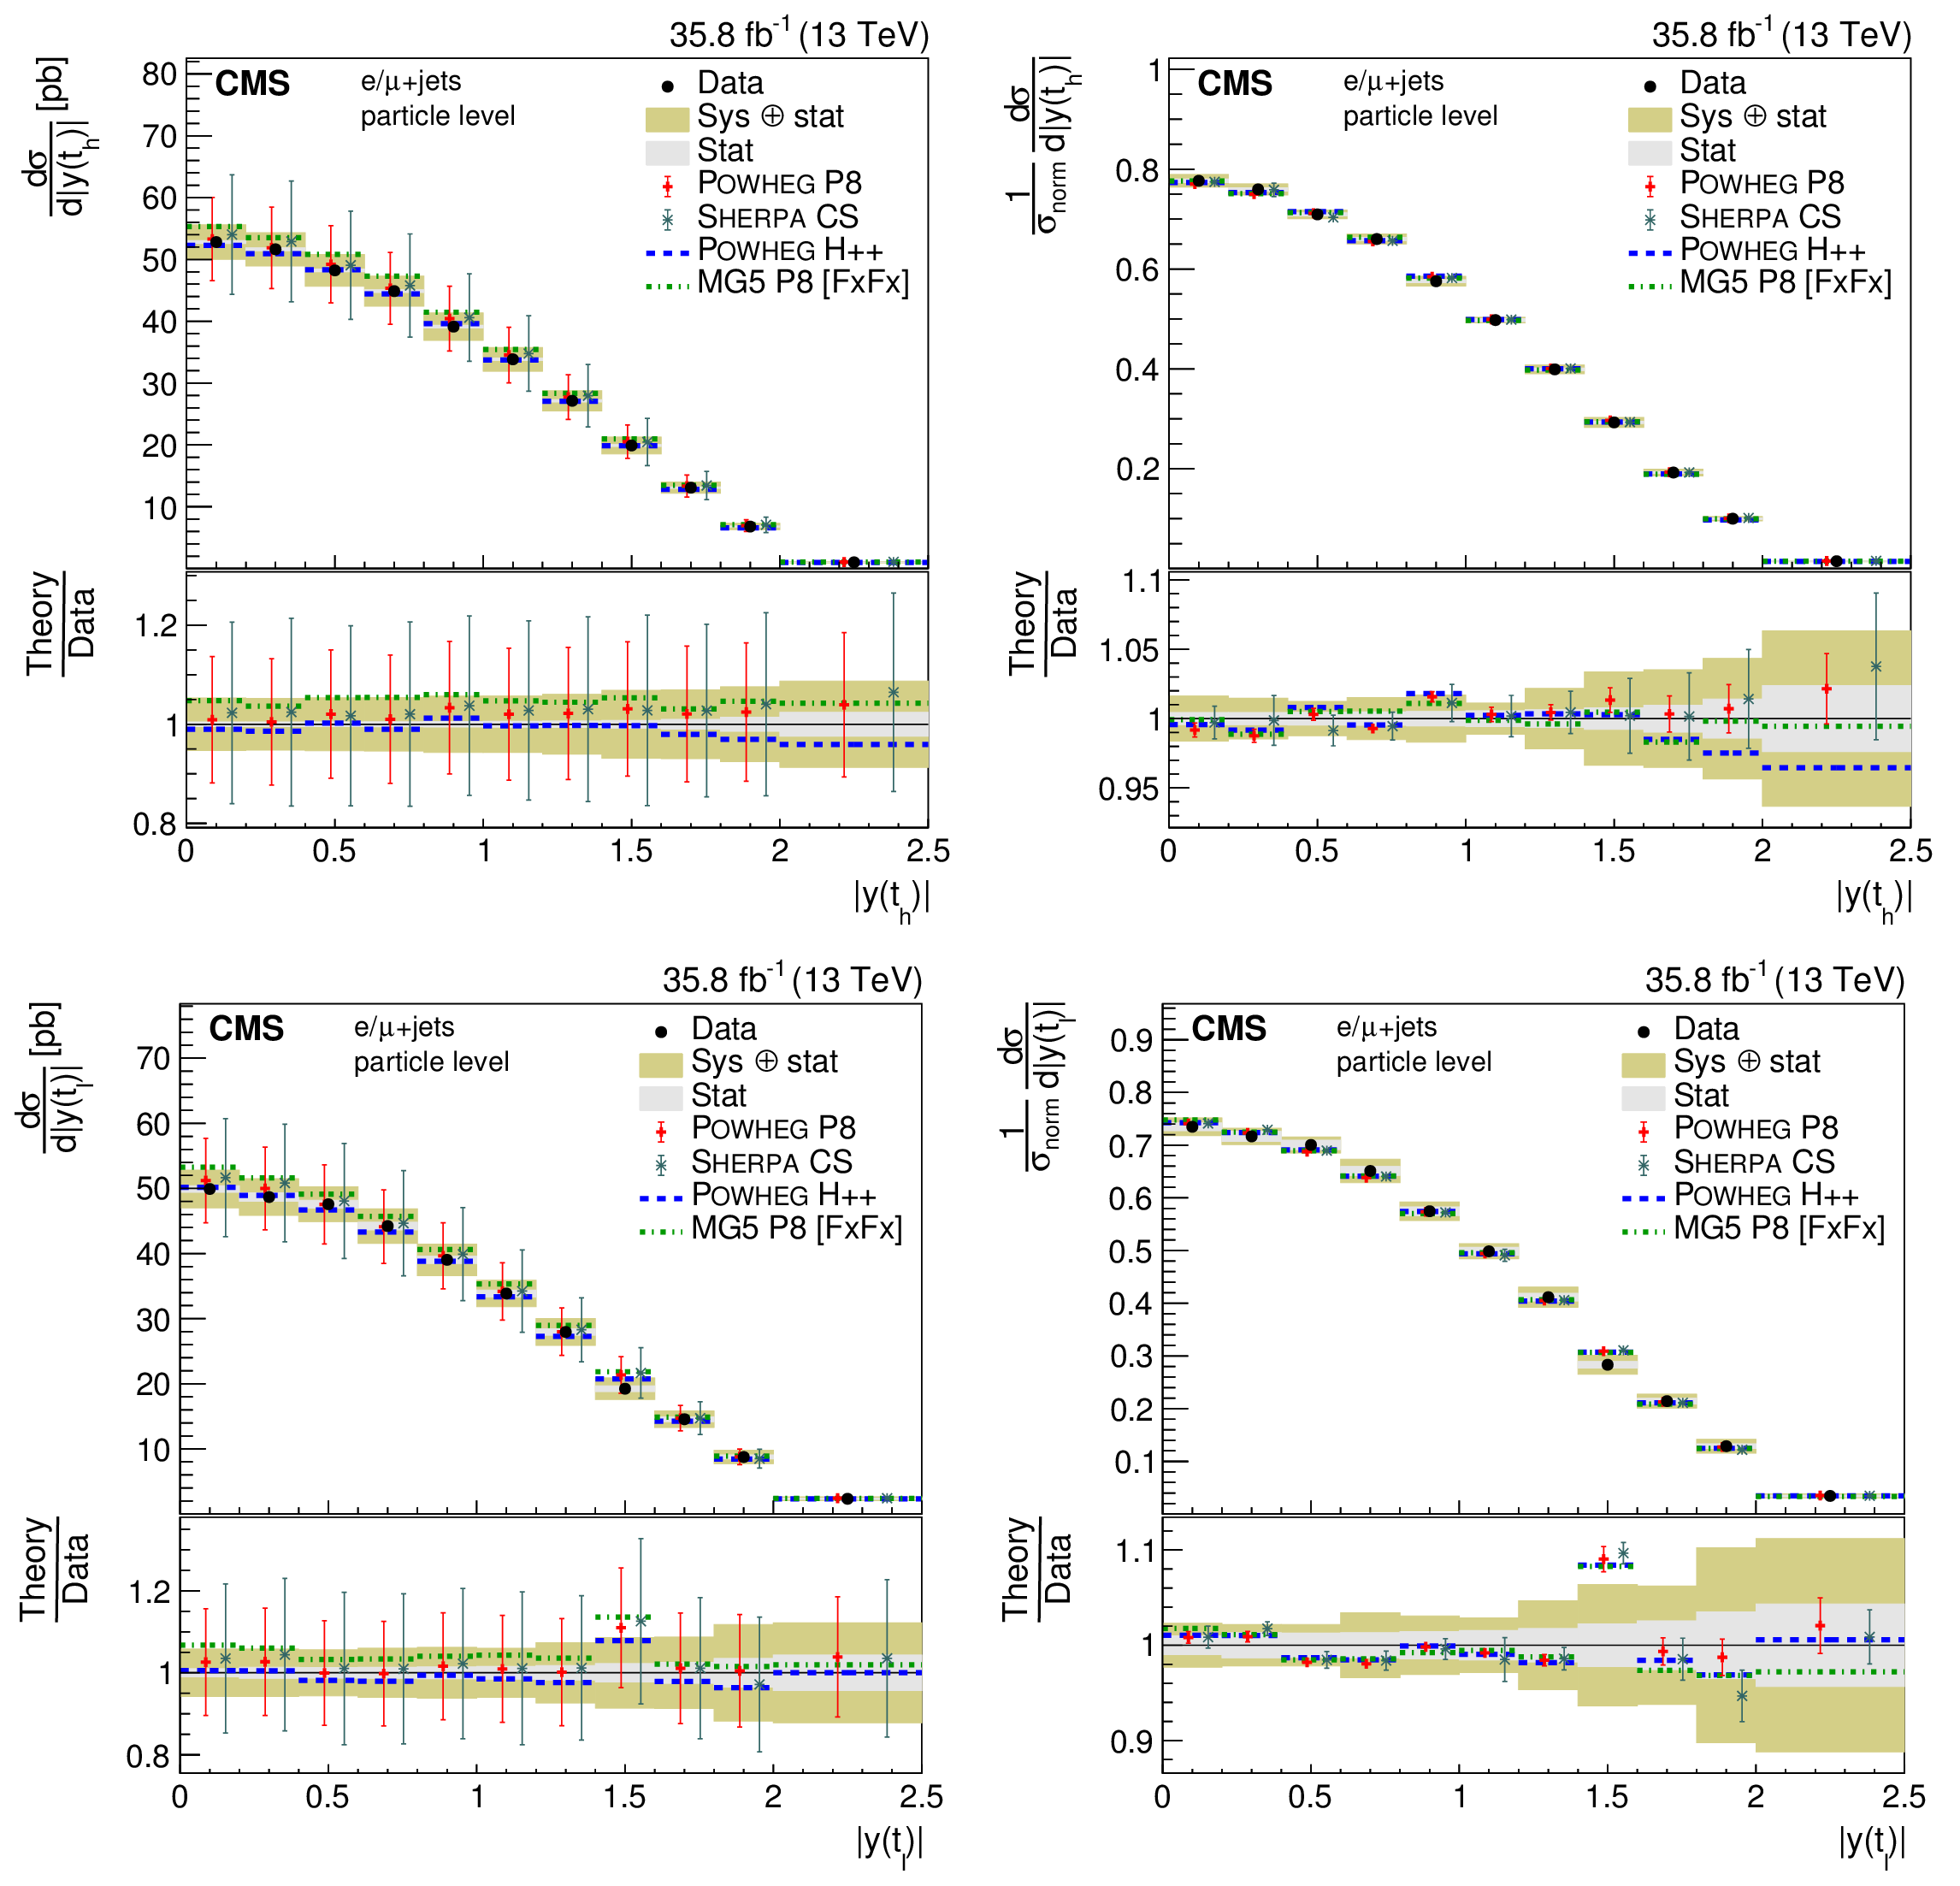
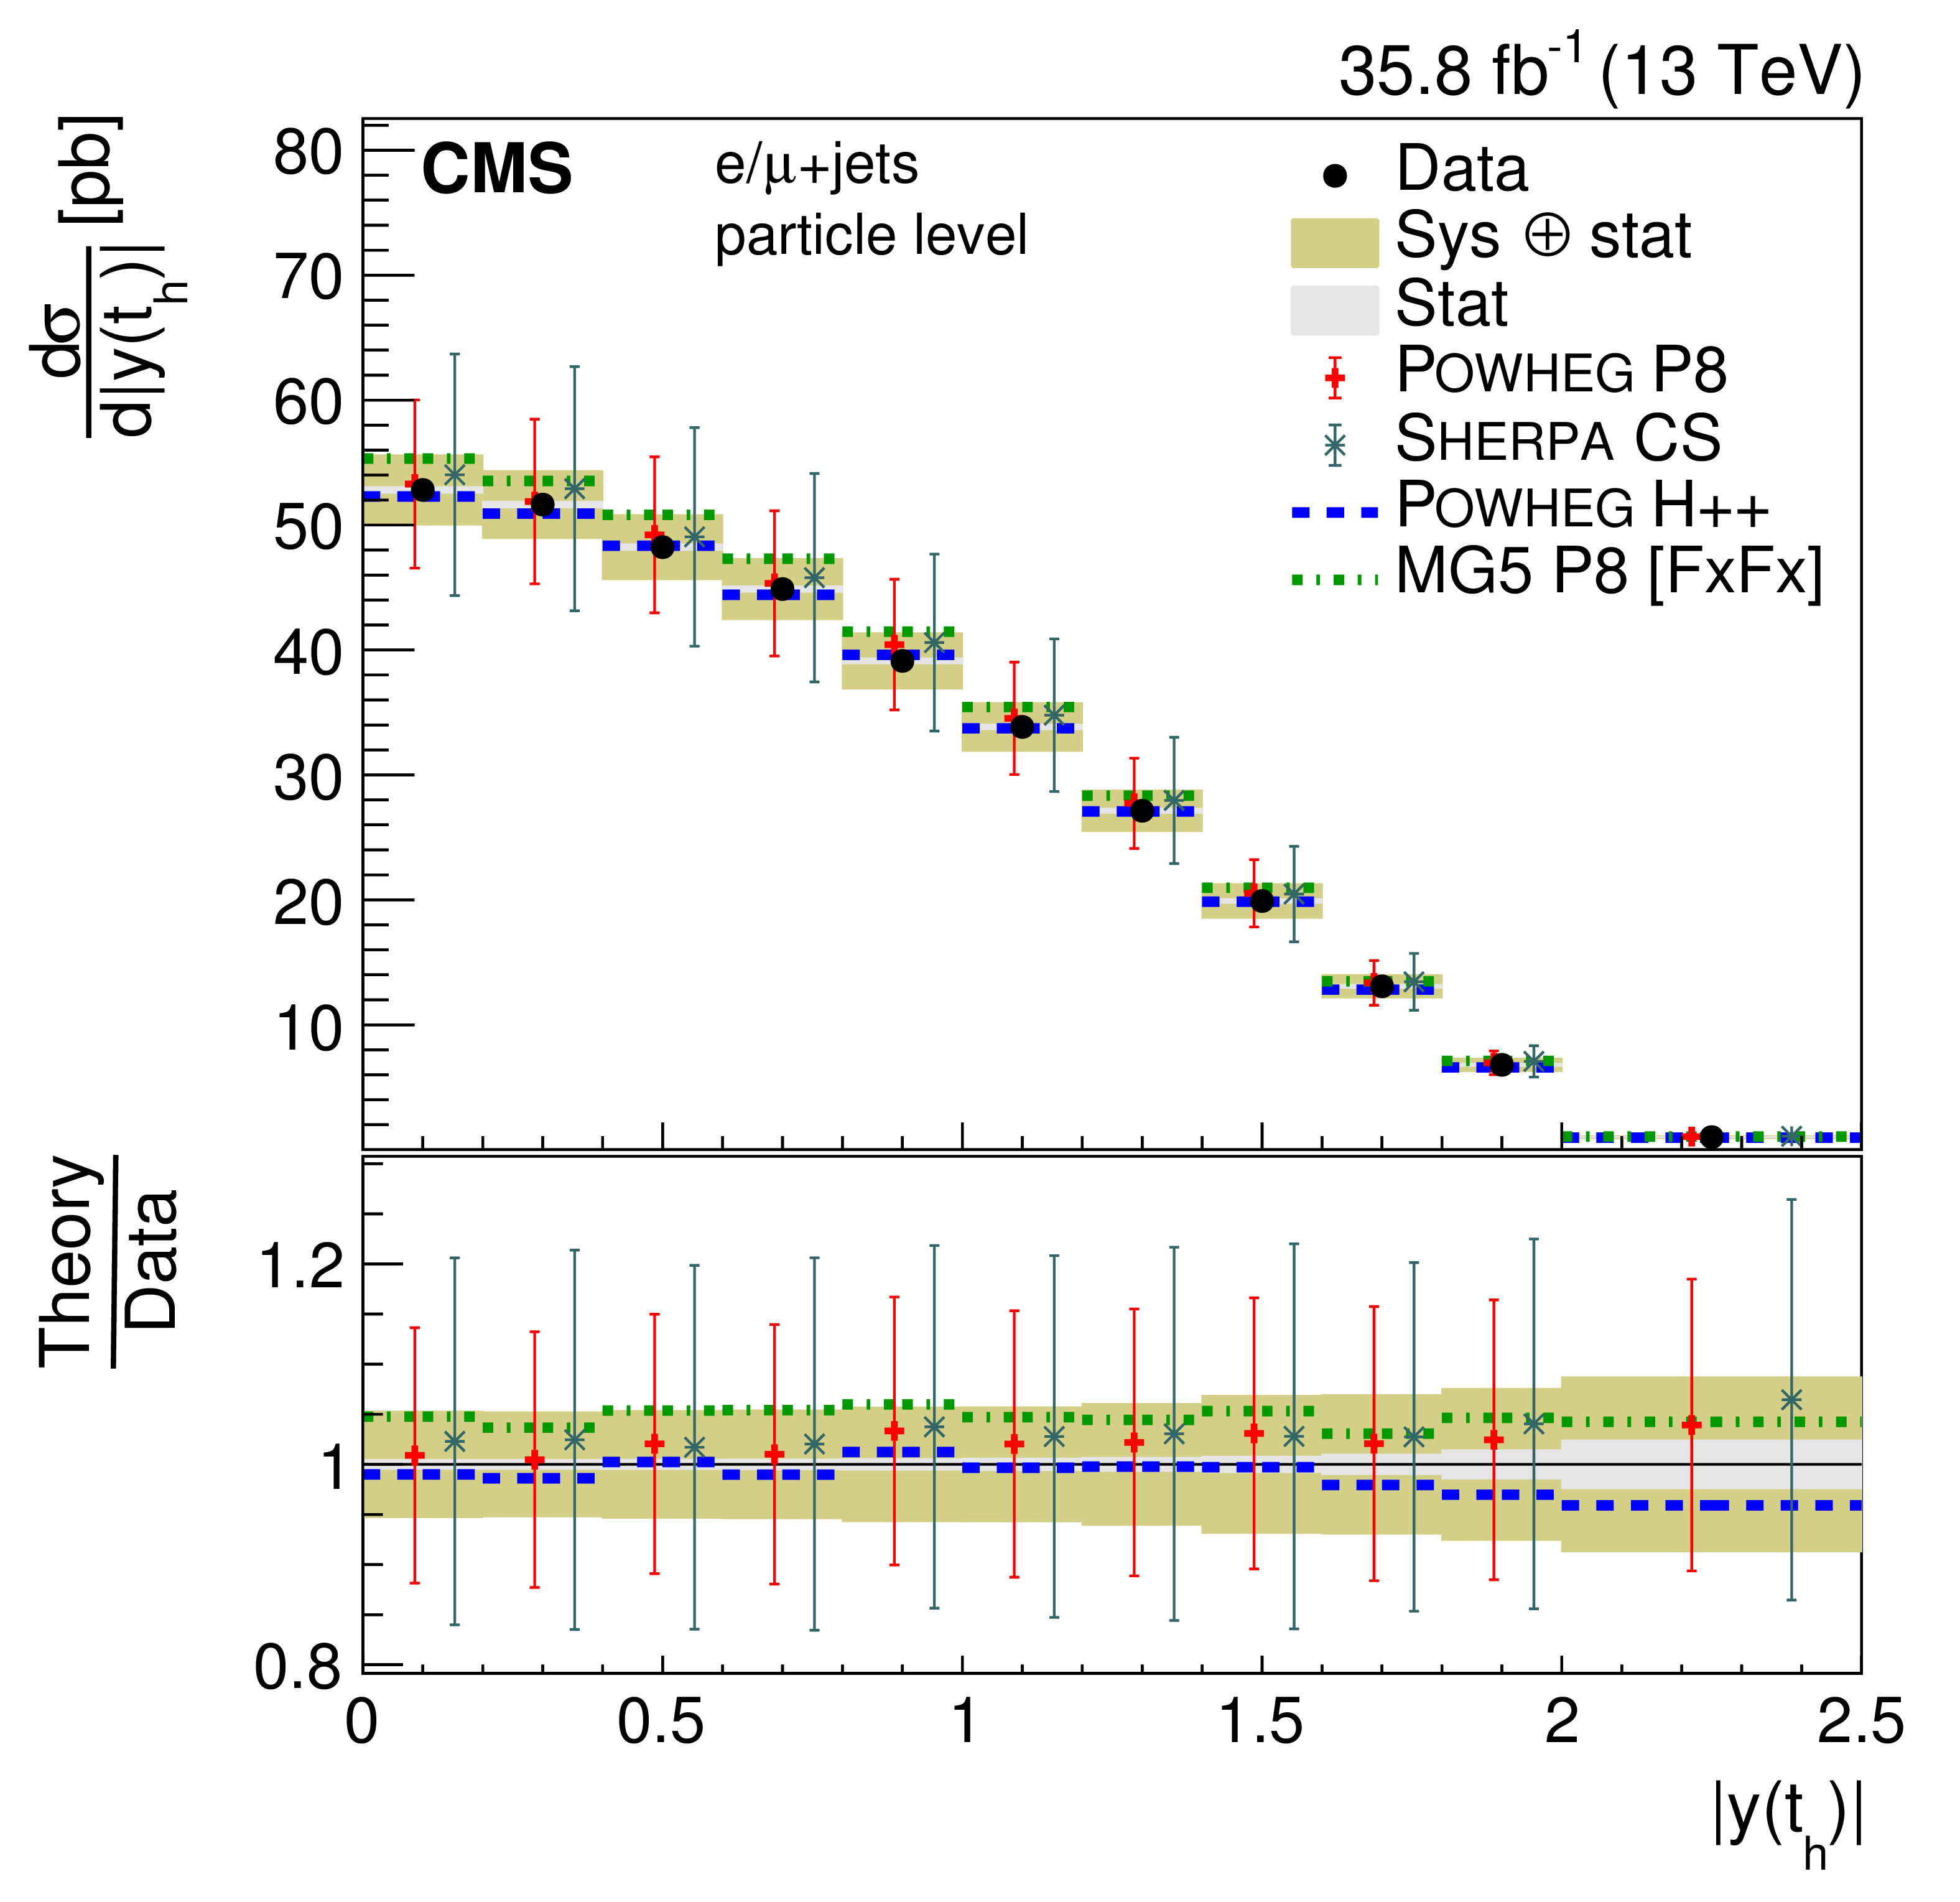
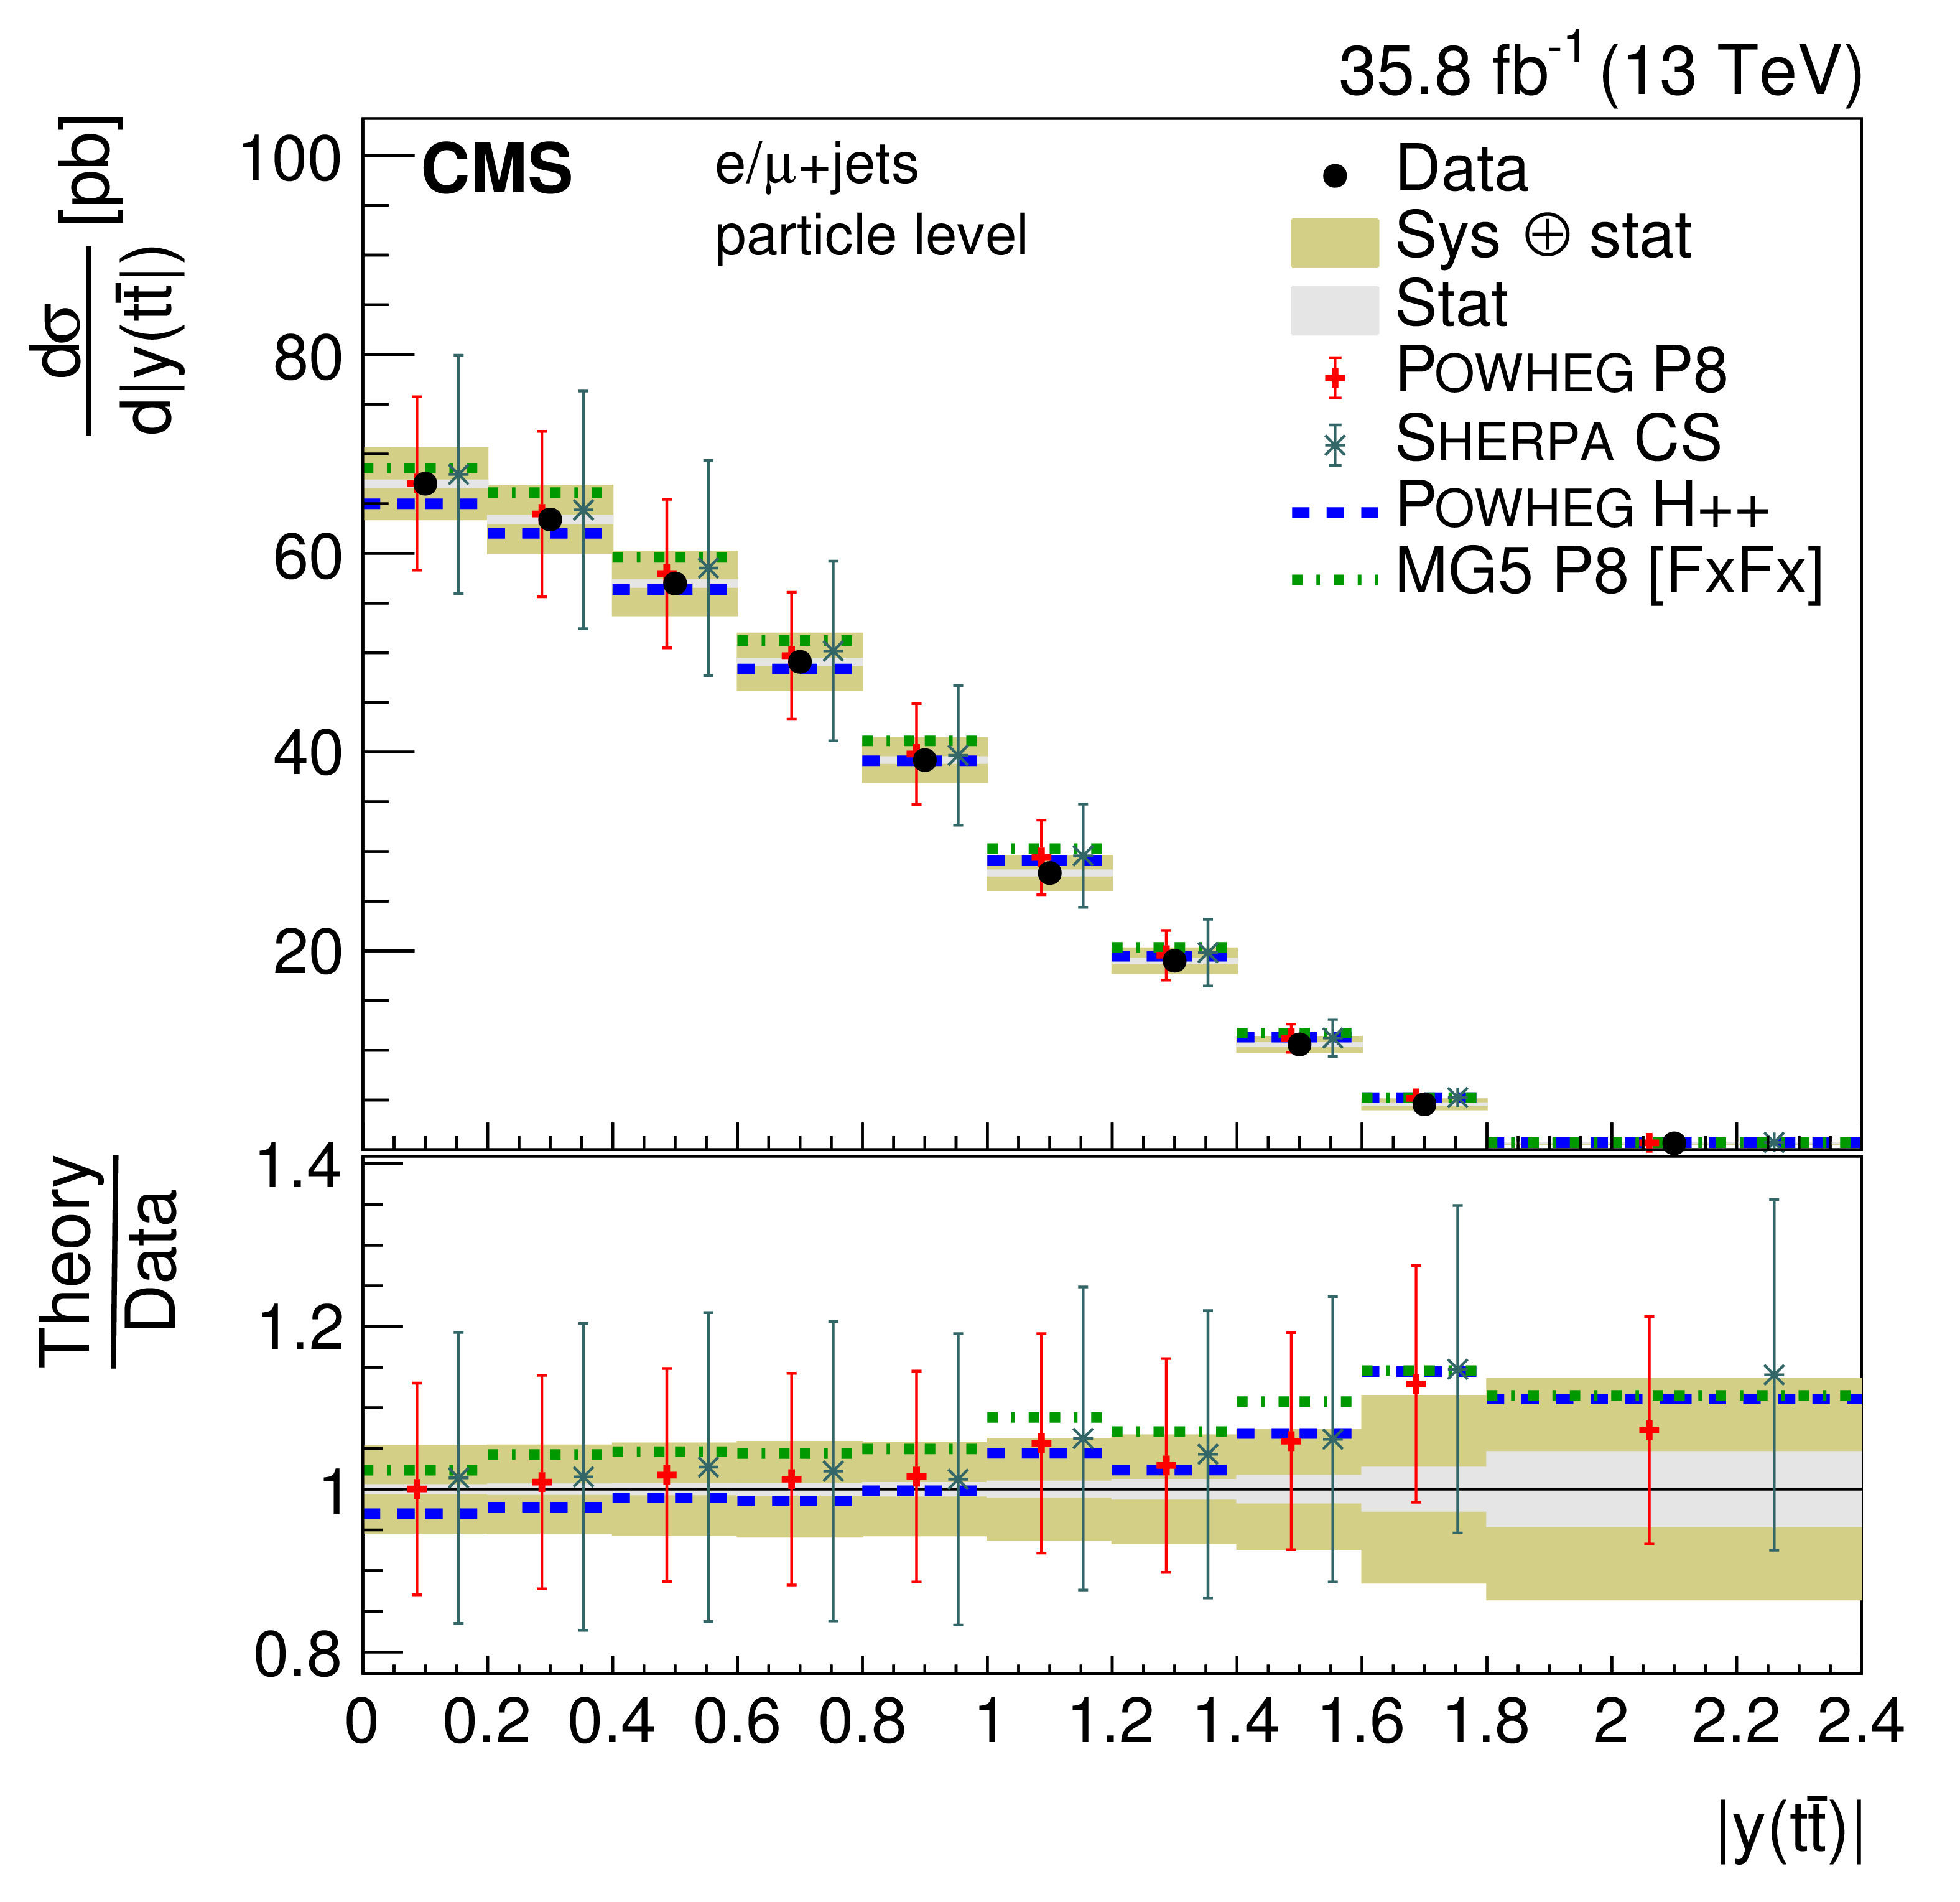
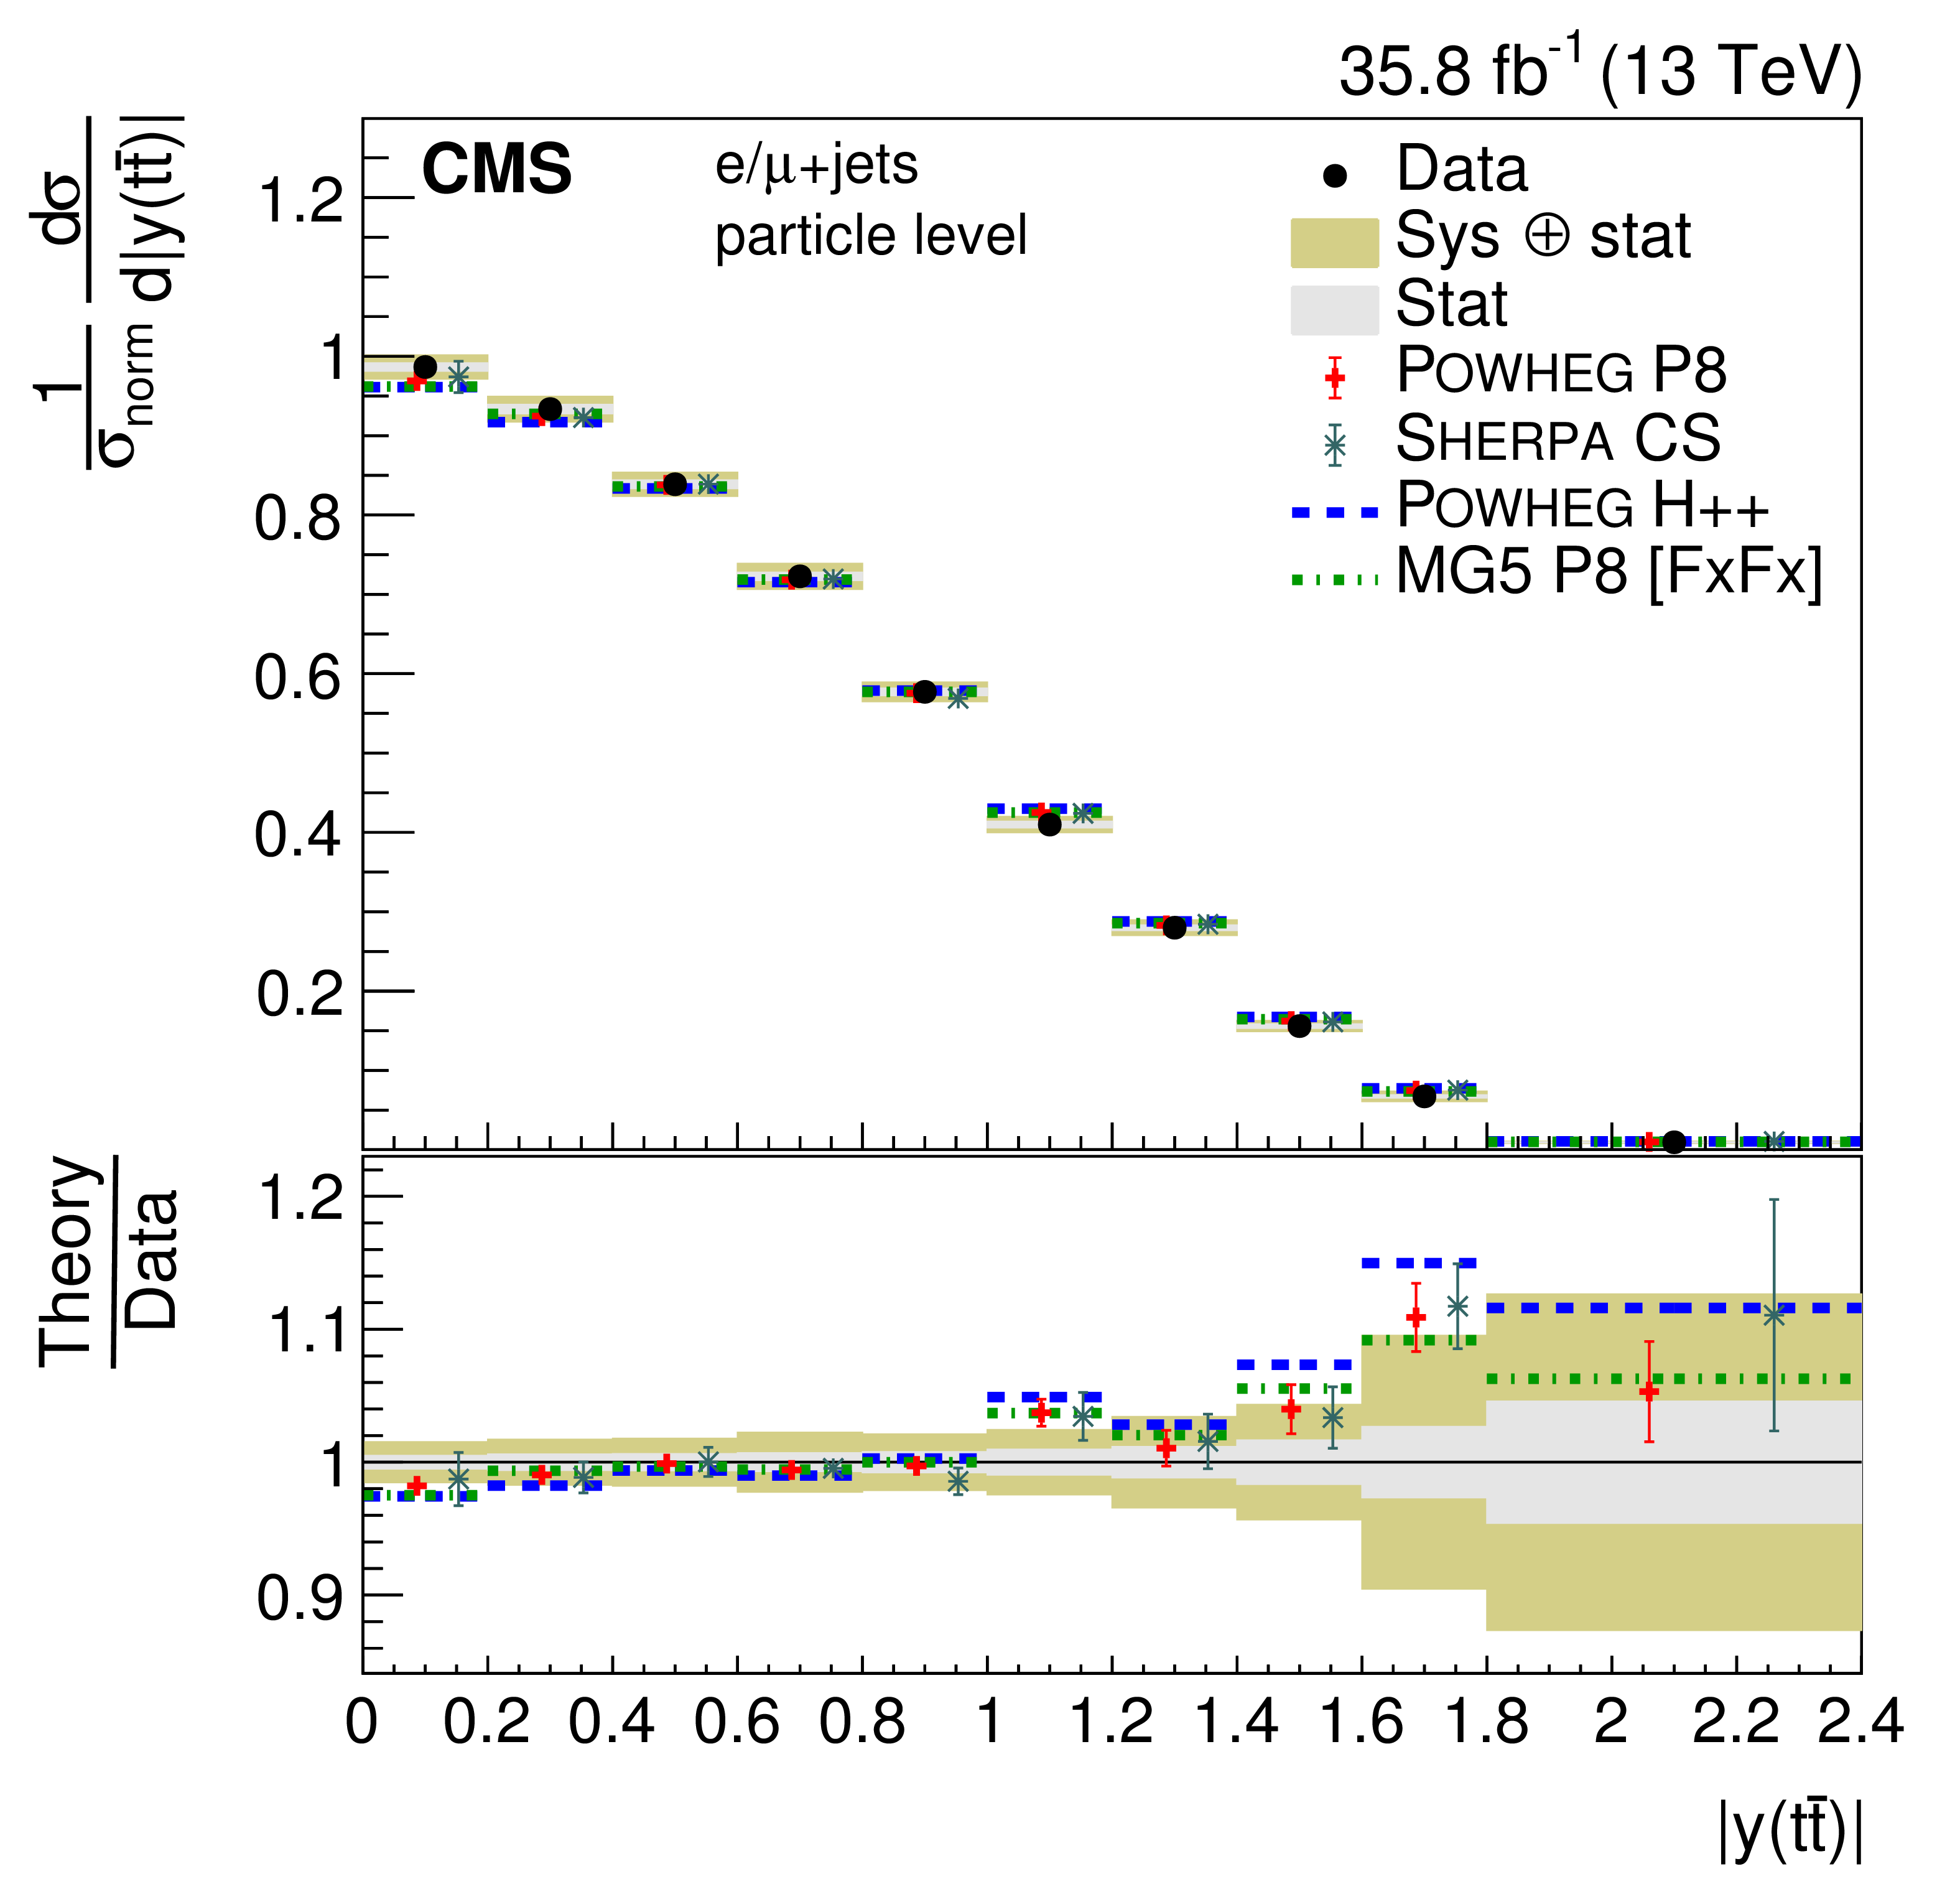
Figure 14:
Absolute (left) and normalized (right) differential cross sections at the particle level as a function of $ { | y({\mathrm{t} _\mathrm {h}}) | }$ (upper) and $ { | y({\mathrm{t} _\ell}) | }$ (lower). The data are shown as points with light (dark) bands indicating the statistical (statistical and systematic) uncertainties. The cross sections are compared to the predictions of POWHEG combined with PYTHIA8 (P8) or HERWIG++ (H++) and the multiparton simulations MG5_aMC@NLO (MG5)+PYTHIA8 FxFx and SHERPA. The ratios of the various predictions to the measured cross sections are shown at the bottom of each panel. |
png pdf |
Figure 14-a:
Absolute (left) and normalized (right) differential cross sections at the particle level as a function of $ { | y({\mathrm{t} _\mathrm {h}}) | }$ (upper) and $ { | y({\mathrm{t} _\ell}) | }$ (lower). The data are shown as points with light (dark) bands indicating the statistical (statistical and systematic) uncertainties. The cross sections are compared to the predictions of POWHEG combined with PYTHIA8 (P8) or HERWIG++ (H++) and the multiparton simulations MG5_aMC@NLO (MG5)+PYTHIA8 FxFx and SHERPA. The ratios of the various predictions to the measured cross sections are shown at the bottom of each panel. |

png pdf |
Figure 14-b:
Absolute (left) and normalized (right) differential cross sections at the particle level as a function of $ { | y({\mathrm{t} _\mathrm {h}}) | }$ (upper) and $ { | y({\mathrm{t} _\ell}) | }$ (lower). The data are shown as points with light (dark) bands indicating the statistical (statistical and systematic) uncertainties. The cross sections are compared to the predictions of POWHEG combined with PYTHIA8 (P8) or HERWIG++ (H++) and the multiparton simulations MG5_aMC@NLO (MG5)+PYTHIA8 FxFx and SHERPA. The ratios of the various predictions to the measured cross sections are shown at the bottom of each panel. |

png pdf |
Figure 14-c:
Absolute (left) and normalized (right) differential cross sections at the particle level as a function of $ { | y({\mathrm{t} _\mathrm {h}}) | }$ (upper) and $ { | y({\mathrm{t} _\ell}) | }$ (lower). The data are shown as points with light (dark) bands indicating the statistical (statistical and systematic) uncertainties. The cross sections are compared to the predictions of POWHEG combined with PYTHIA8 (P8) or HERWIG++ (H++) and the multiparton simulations MG5_aMC@NLO (MG5)+PYTHIA8 FxFx and SHERPA. The ratios of the various predictions to the measured cross sections are shown at the bottom of each panel. |
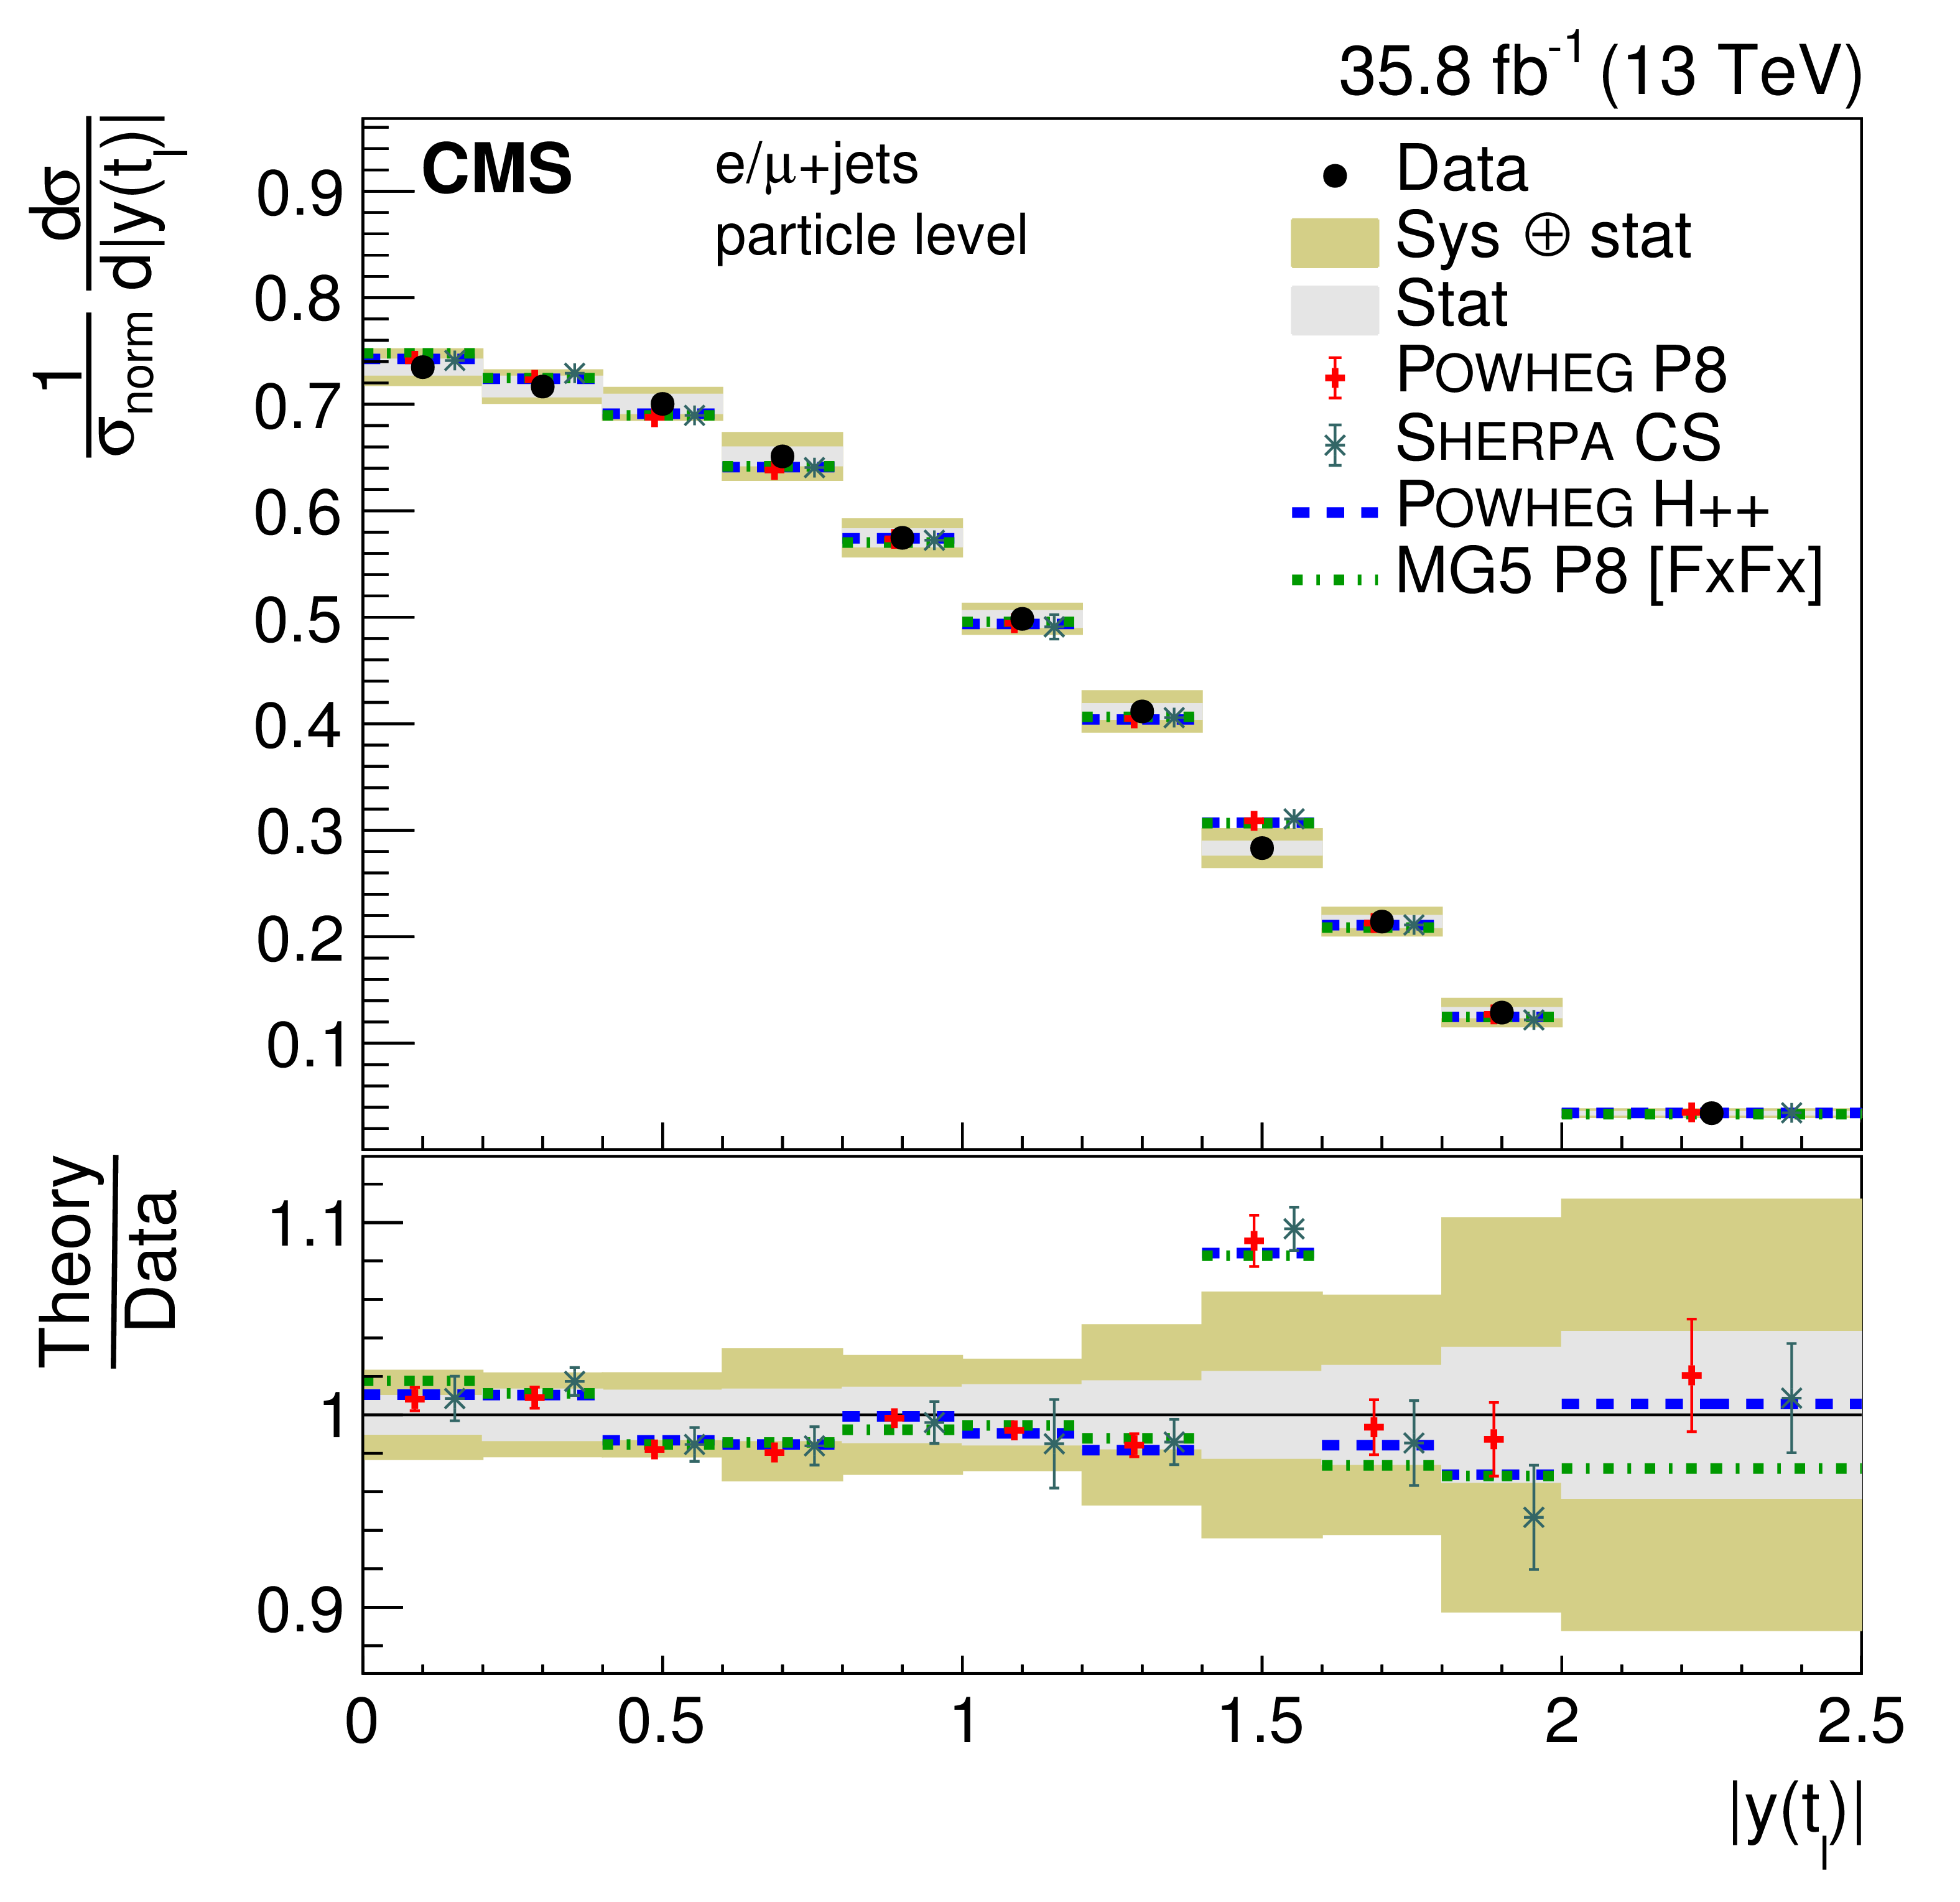
png pdf |
Figure 14-d:
Absolute (left) and normalized (right) differential cross sections at the particle level as a function of $ { | y({\mathrm{t} _\mathrm {h}}) | }$ (upper) and $ { | y({\mathrm{t} _\ell}) | }$ (lower). The data are shown as points with light (dark) bands indicating the statistical (statistical and systematic) uncertainties. The cross sections are compared to the predictions of POWHEG combined with PYTHIA8 (P8) or HERWIG++ (H++) and the multiparton simulations MG5_aMC@NLO (MG5)+PYTHIA8 FxFx and SHERPA. The ratios of the various predictions to the measured cross sections are shown at the bottom of each panel. |
png pdf |
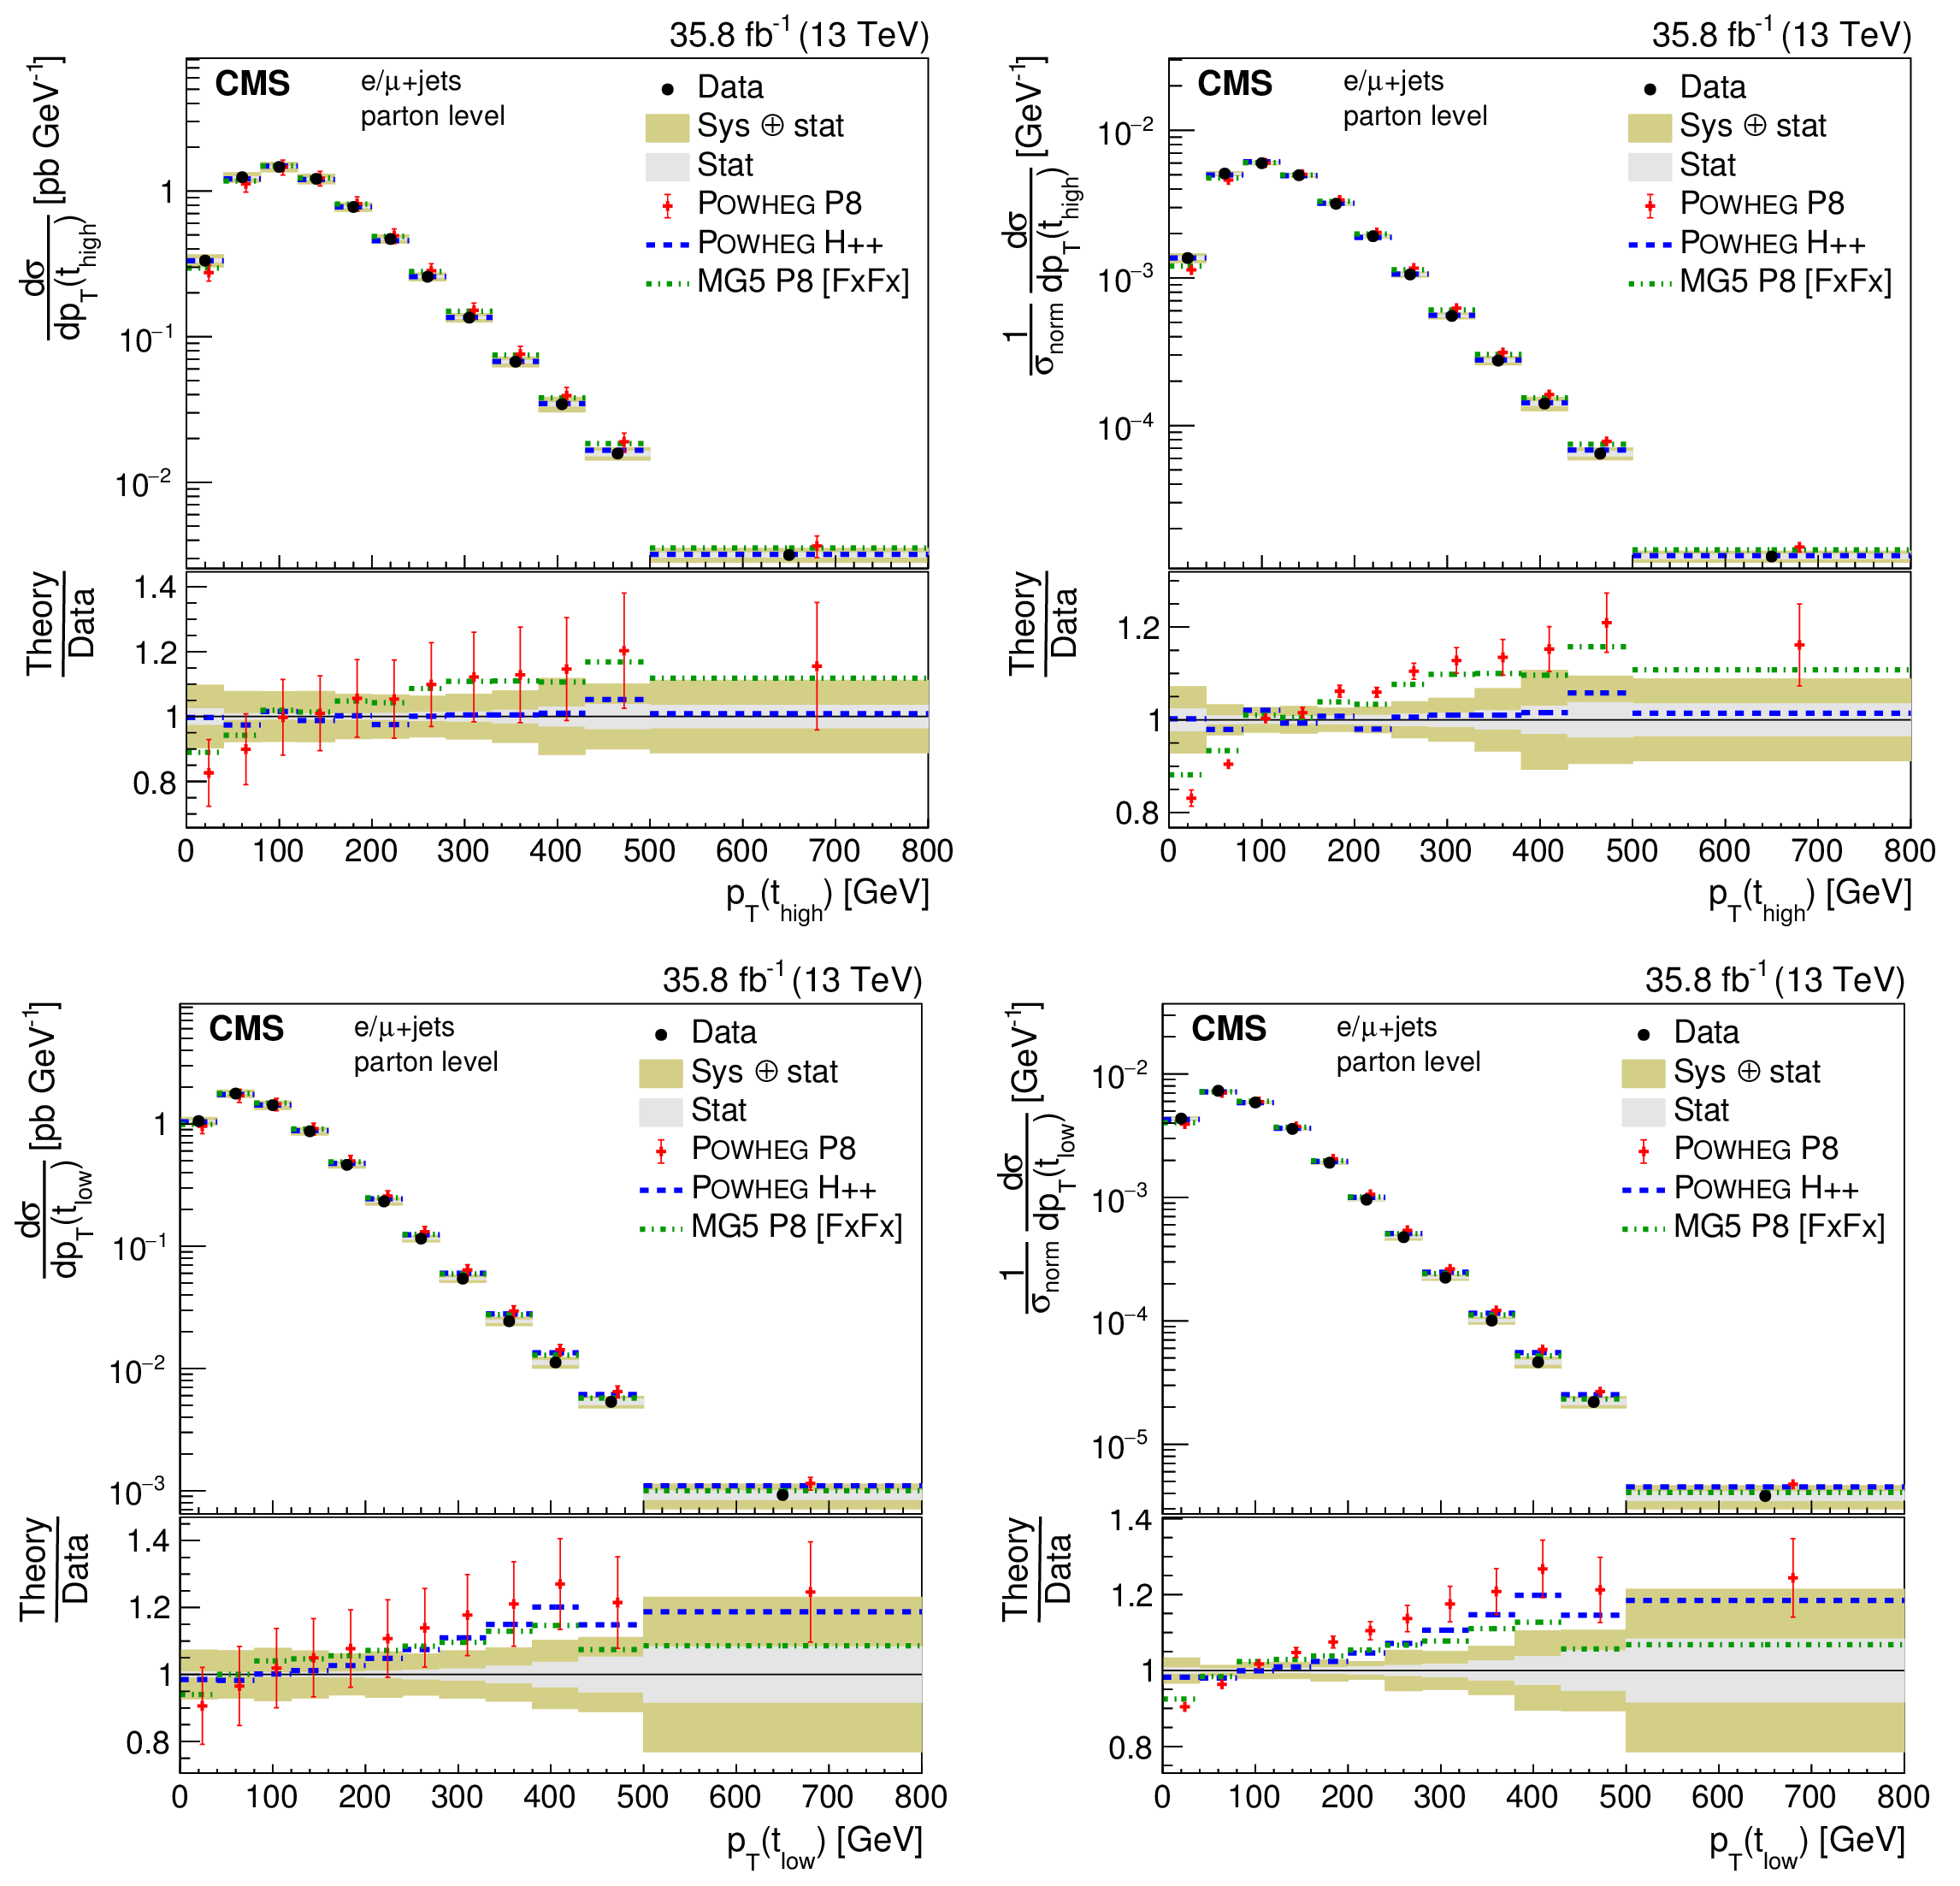
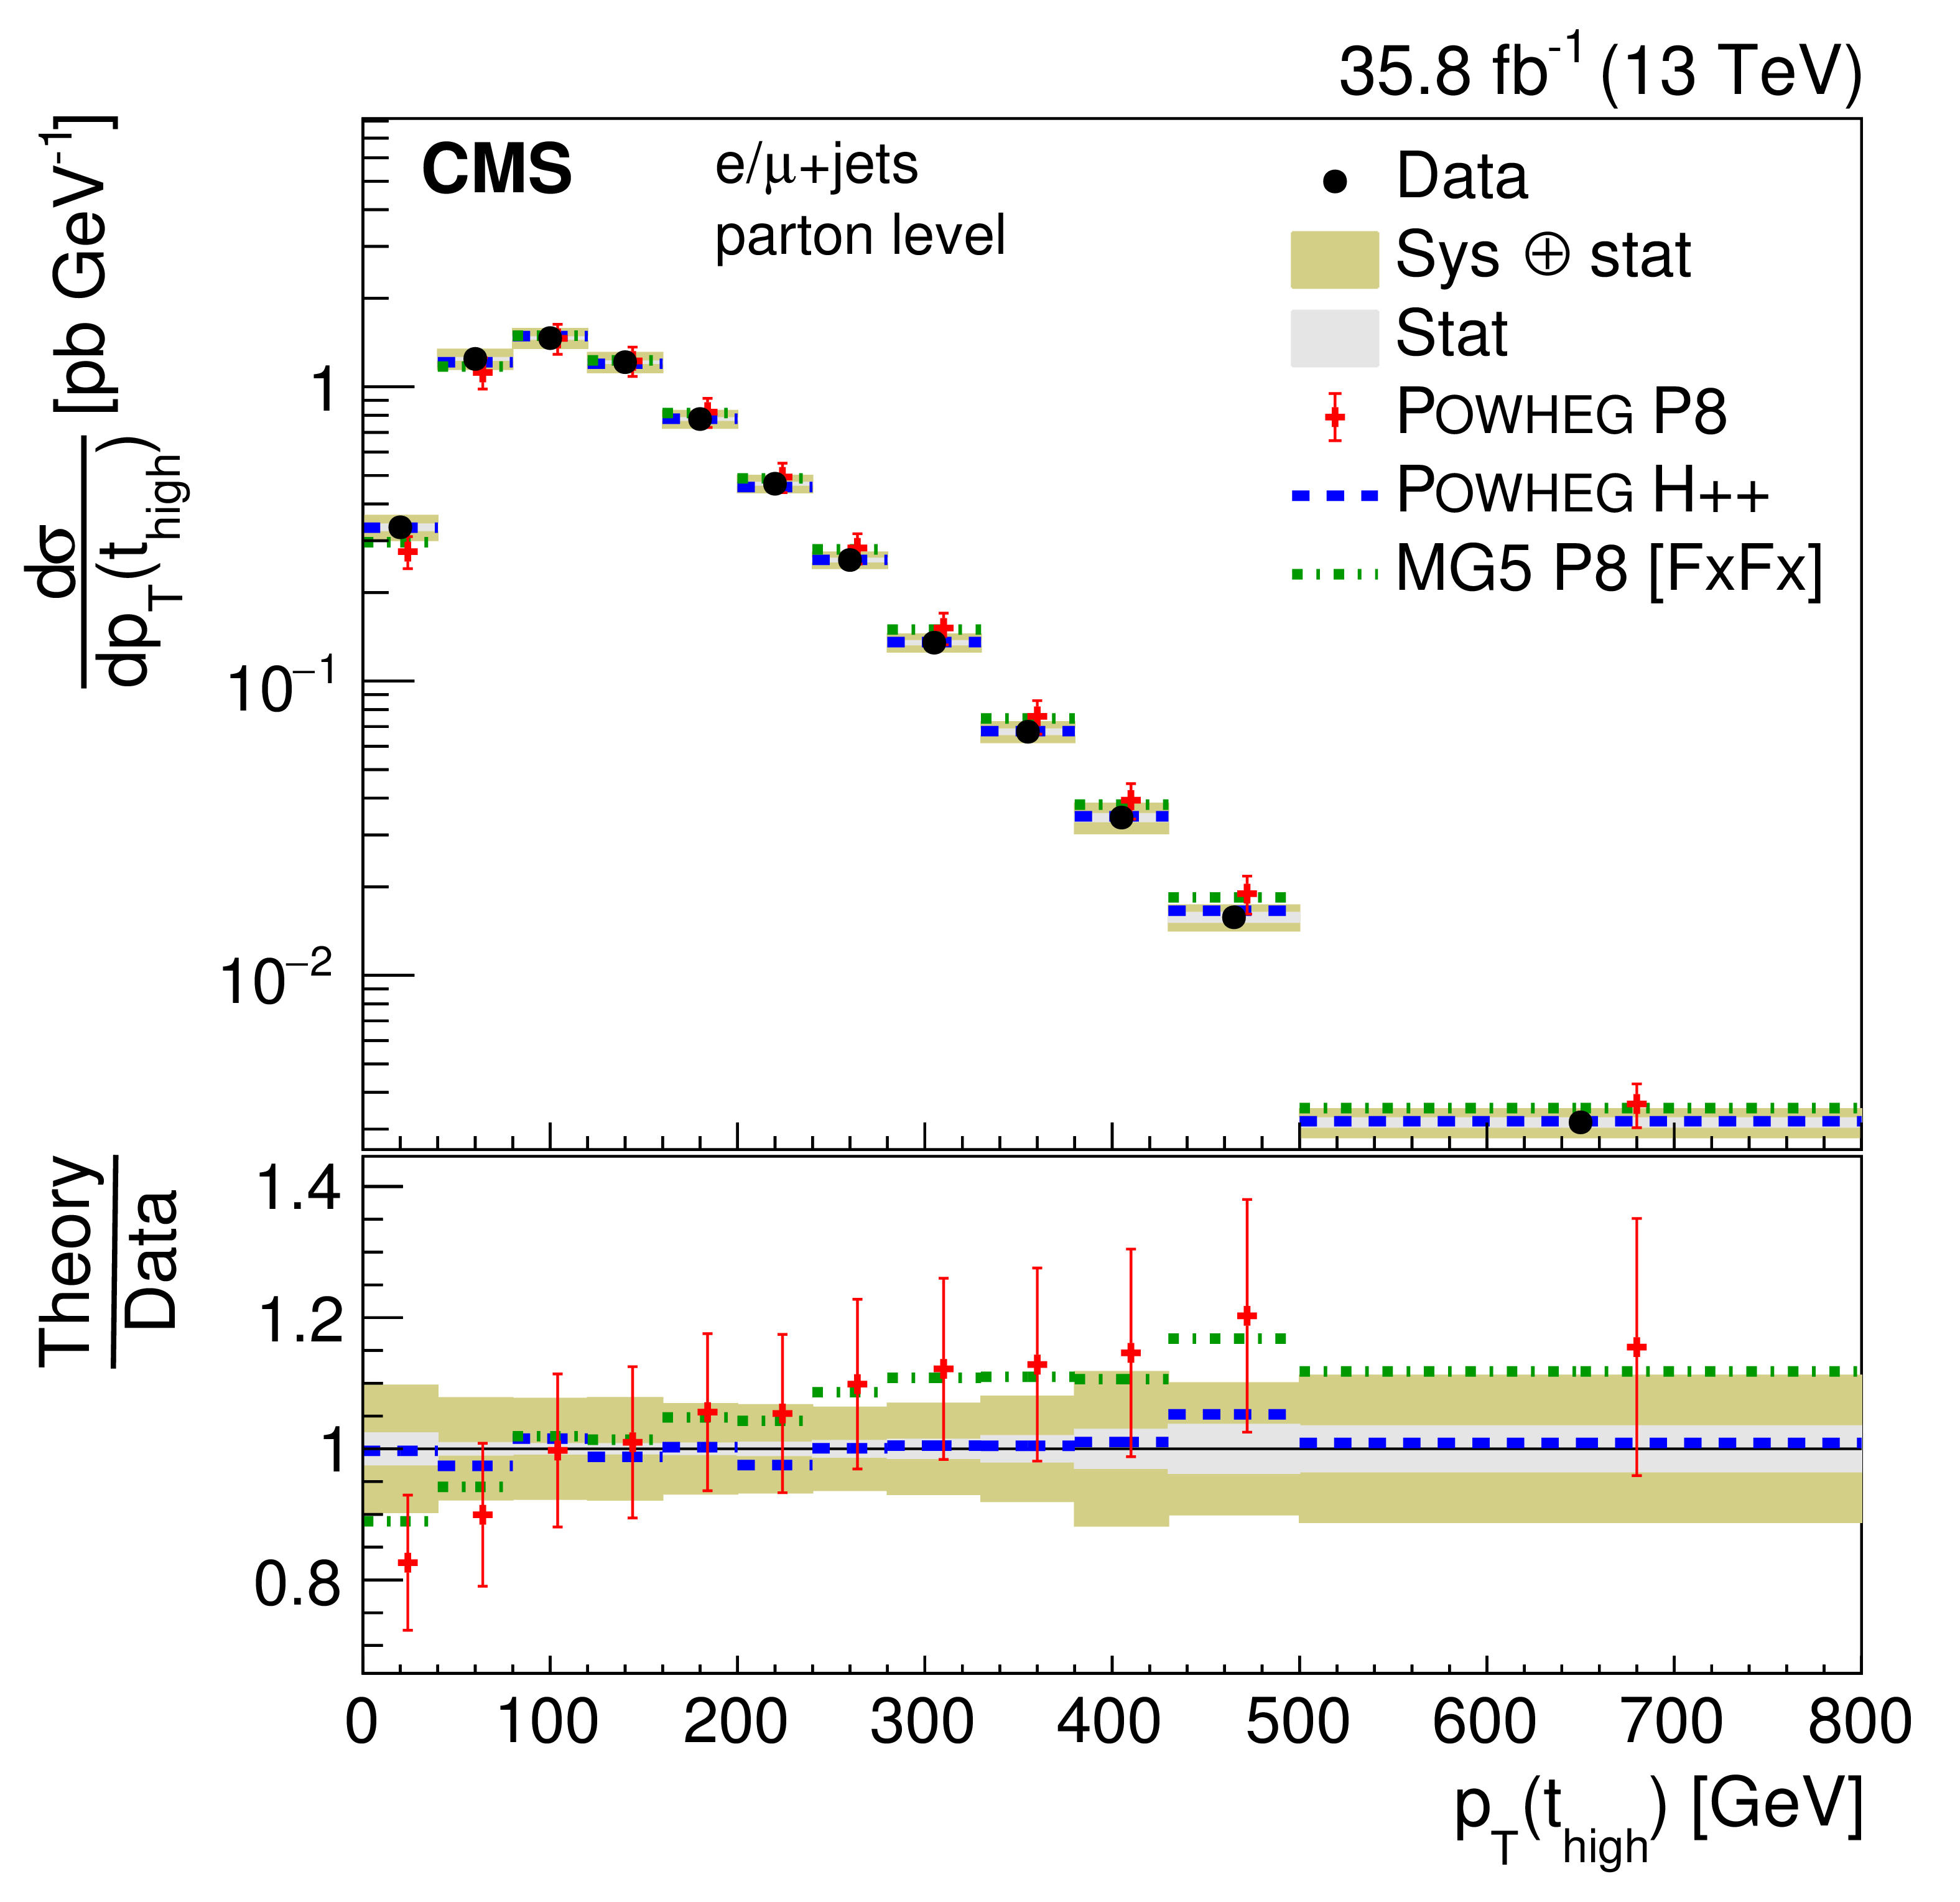
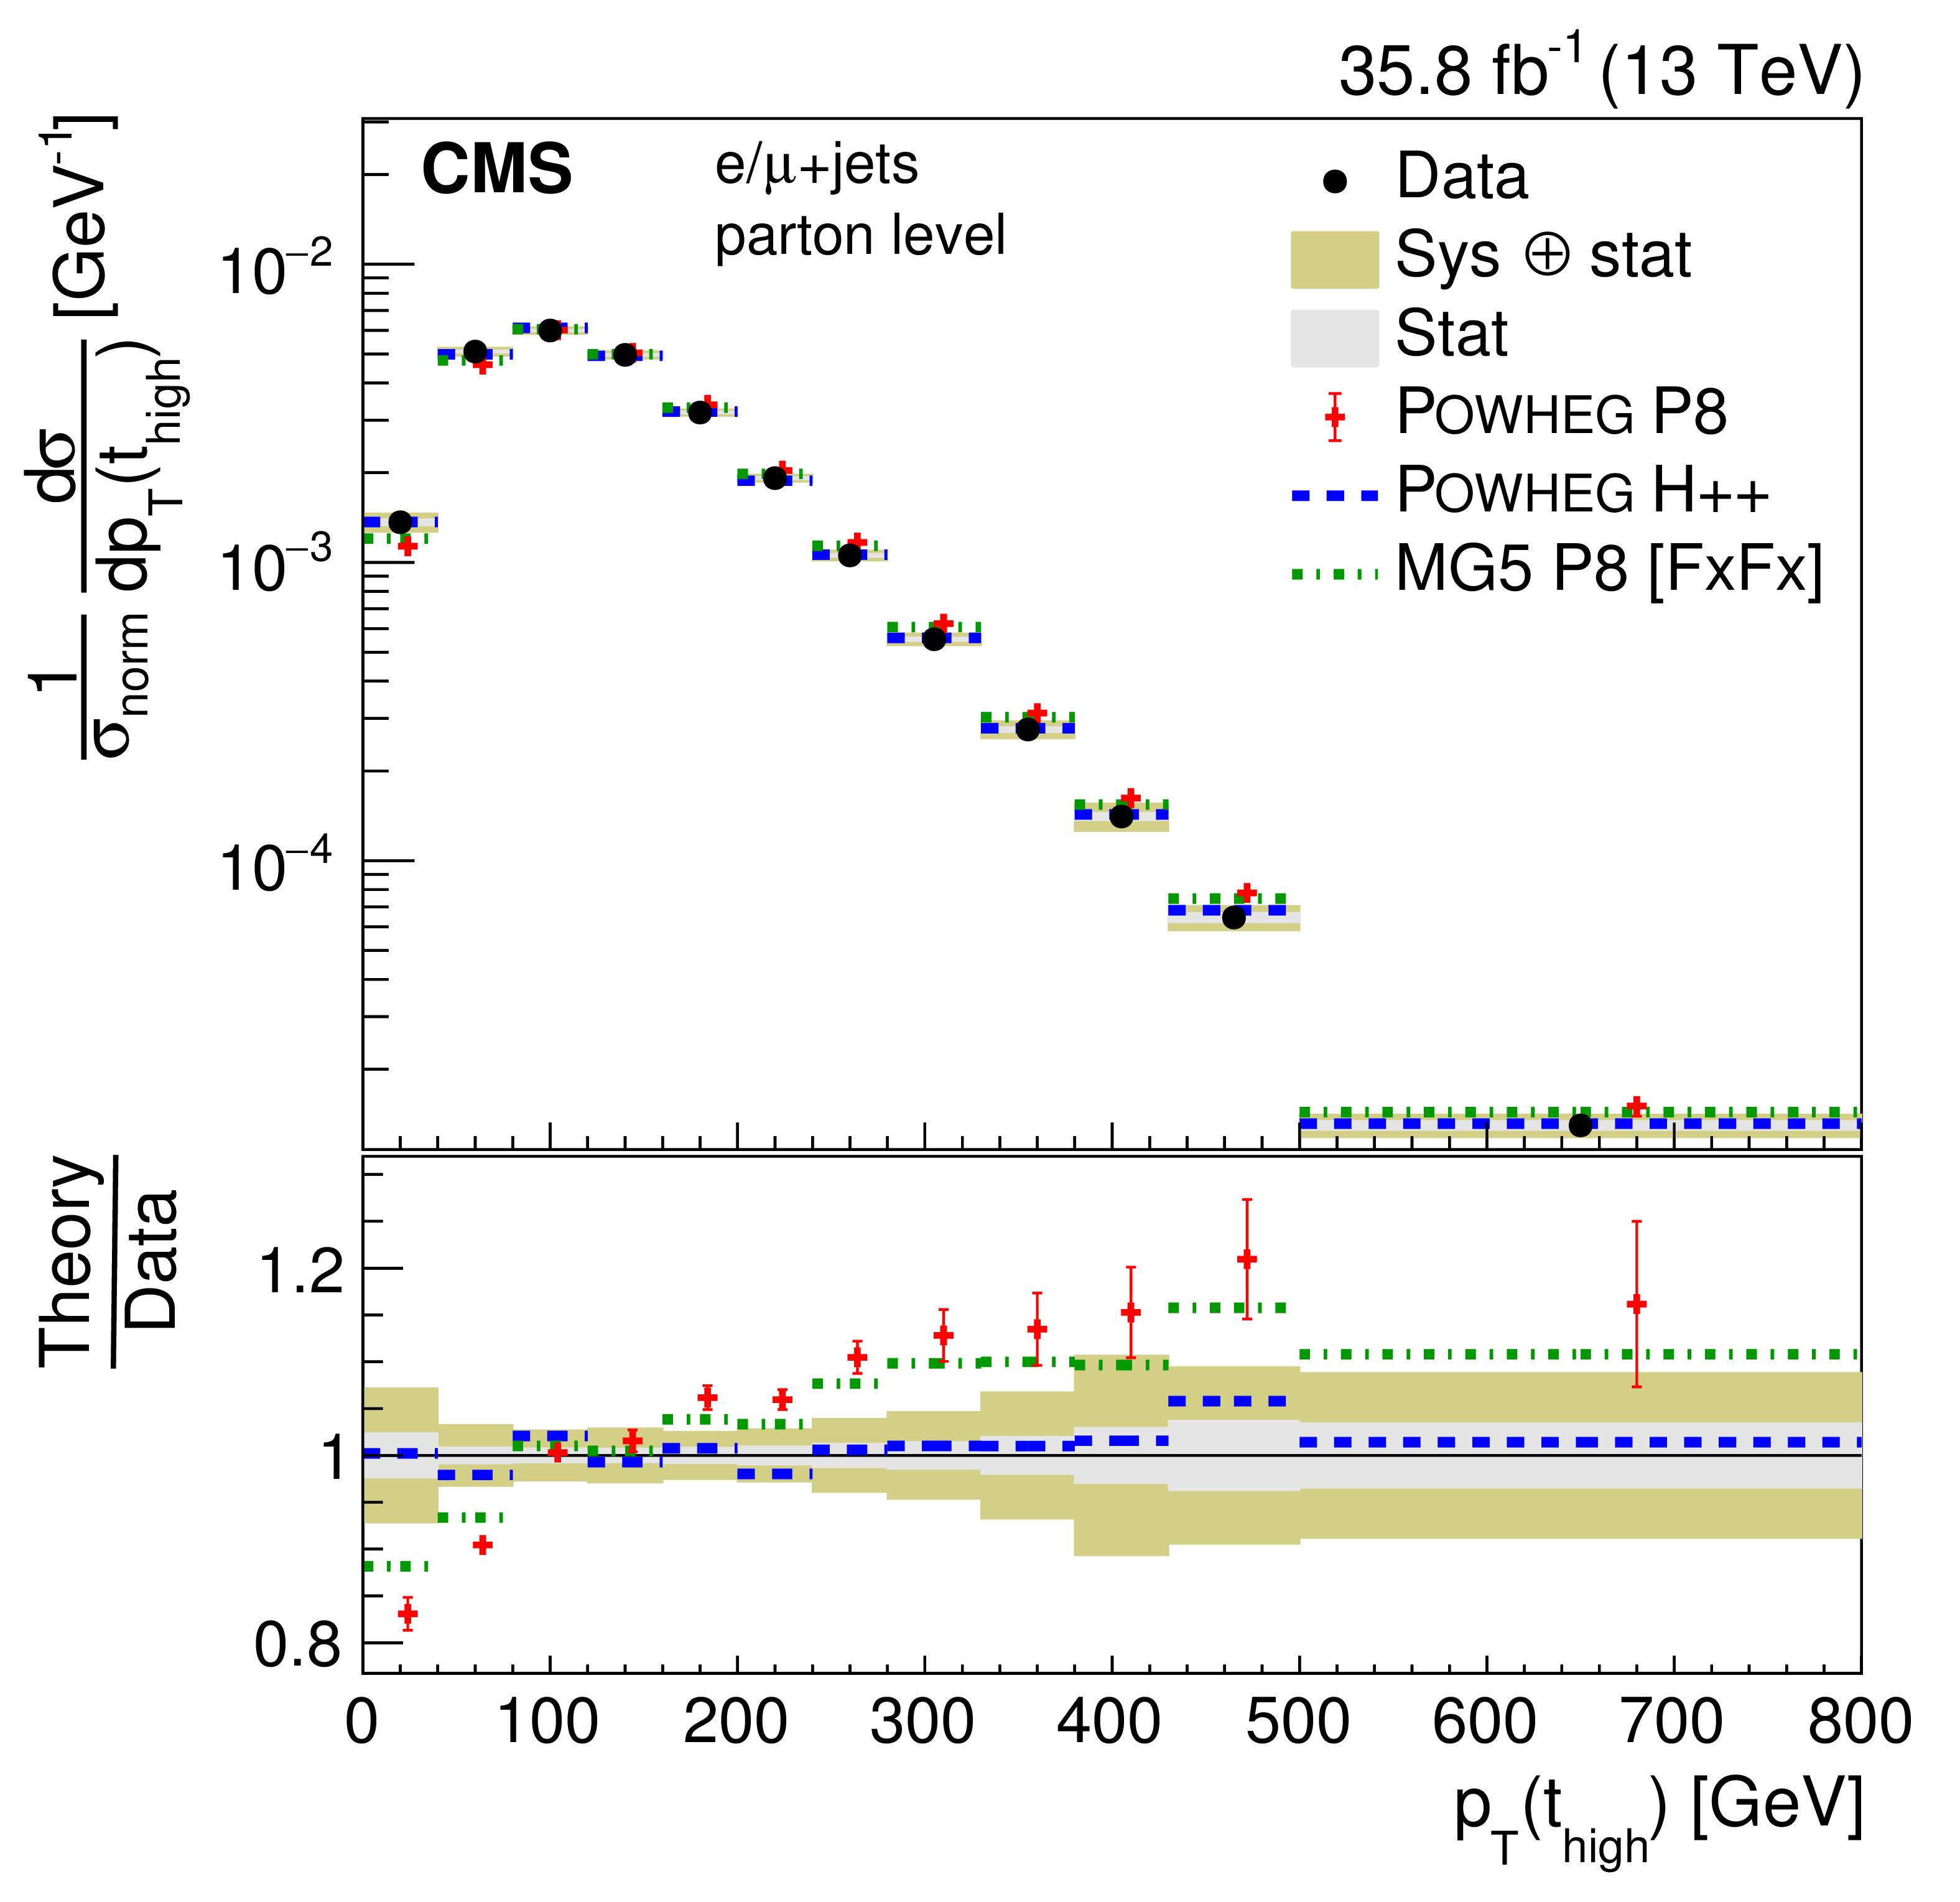
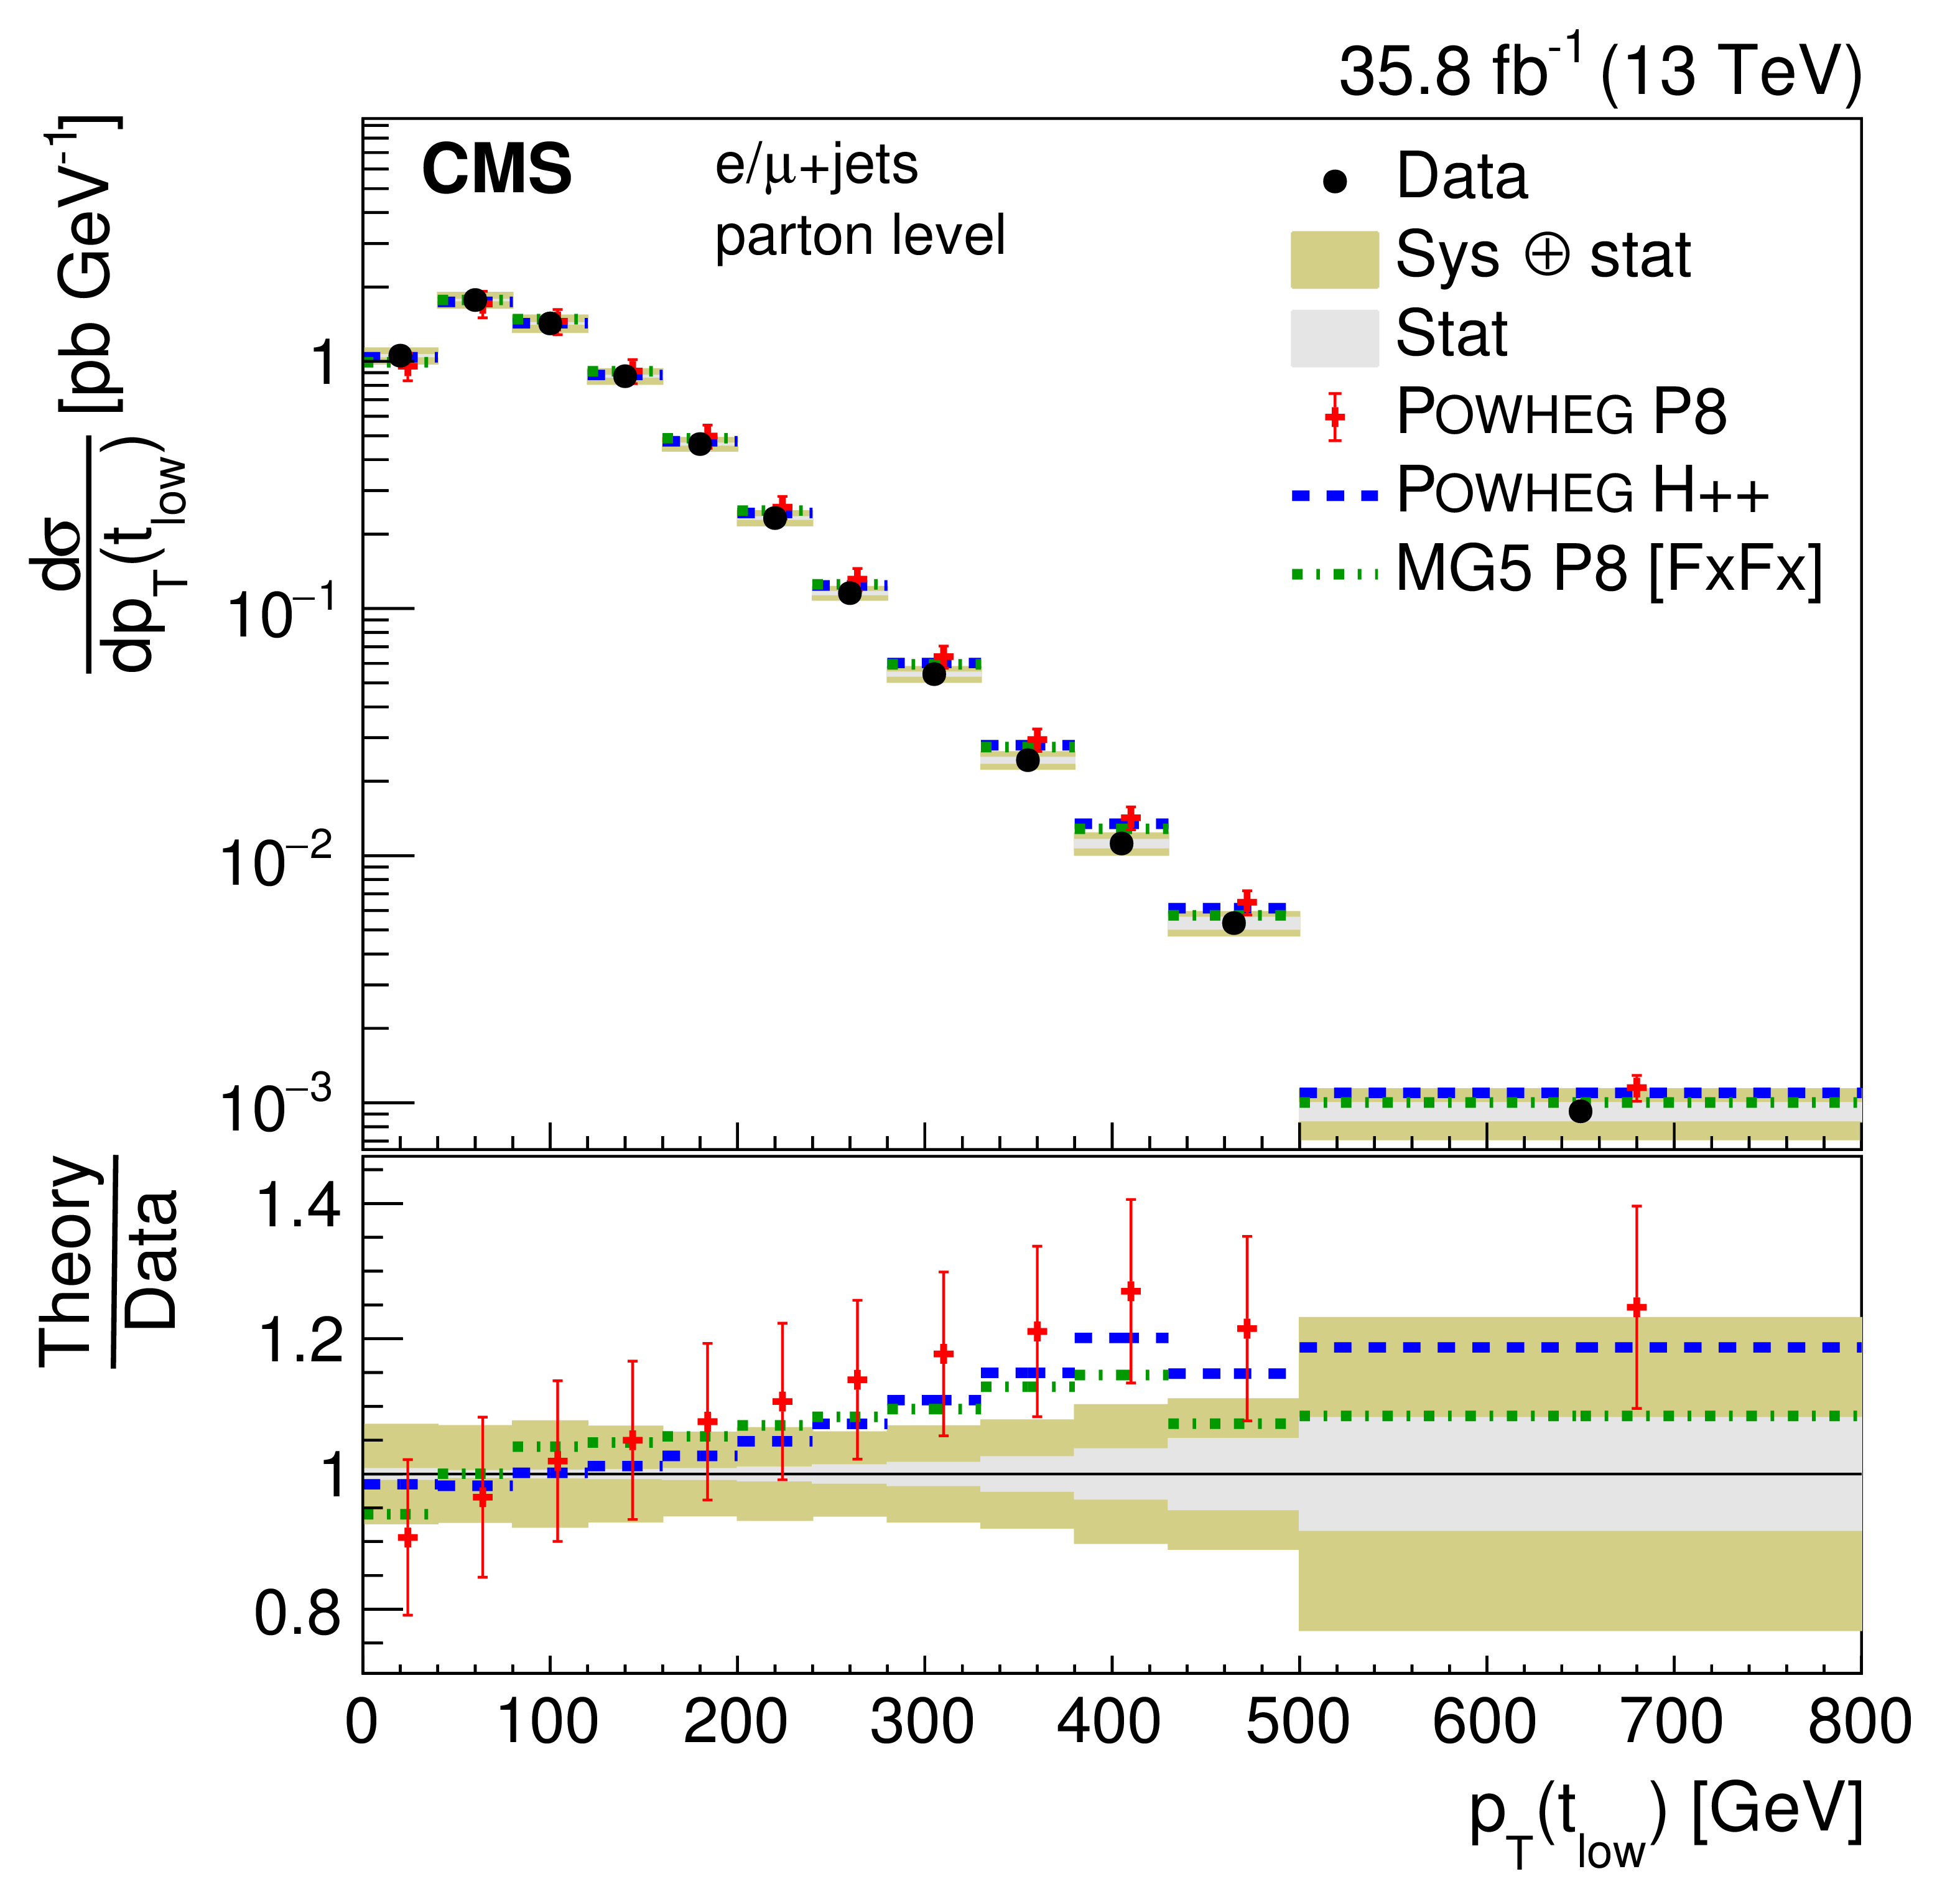
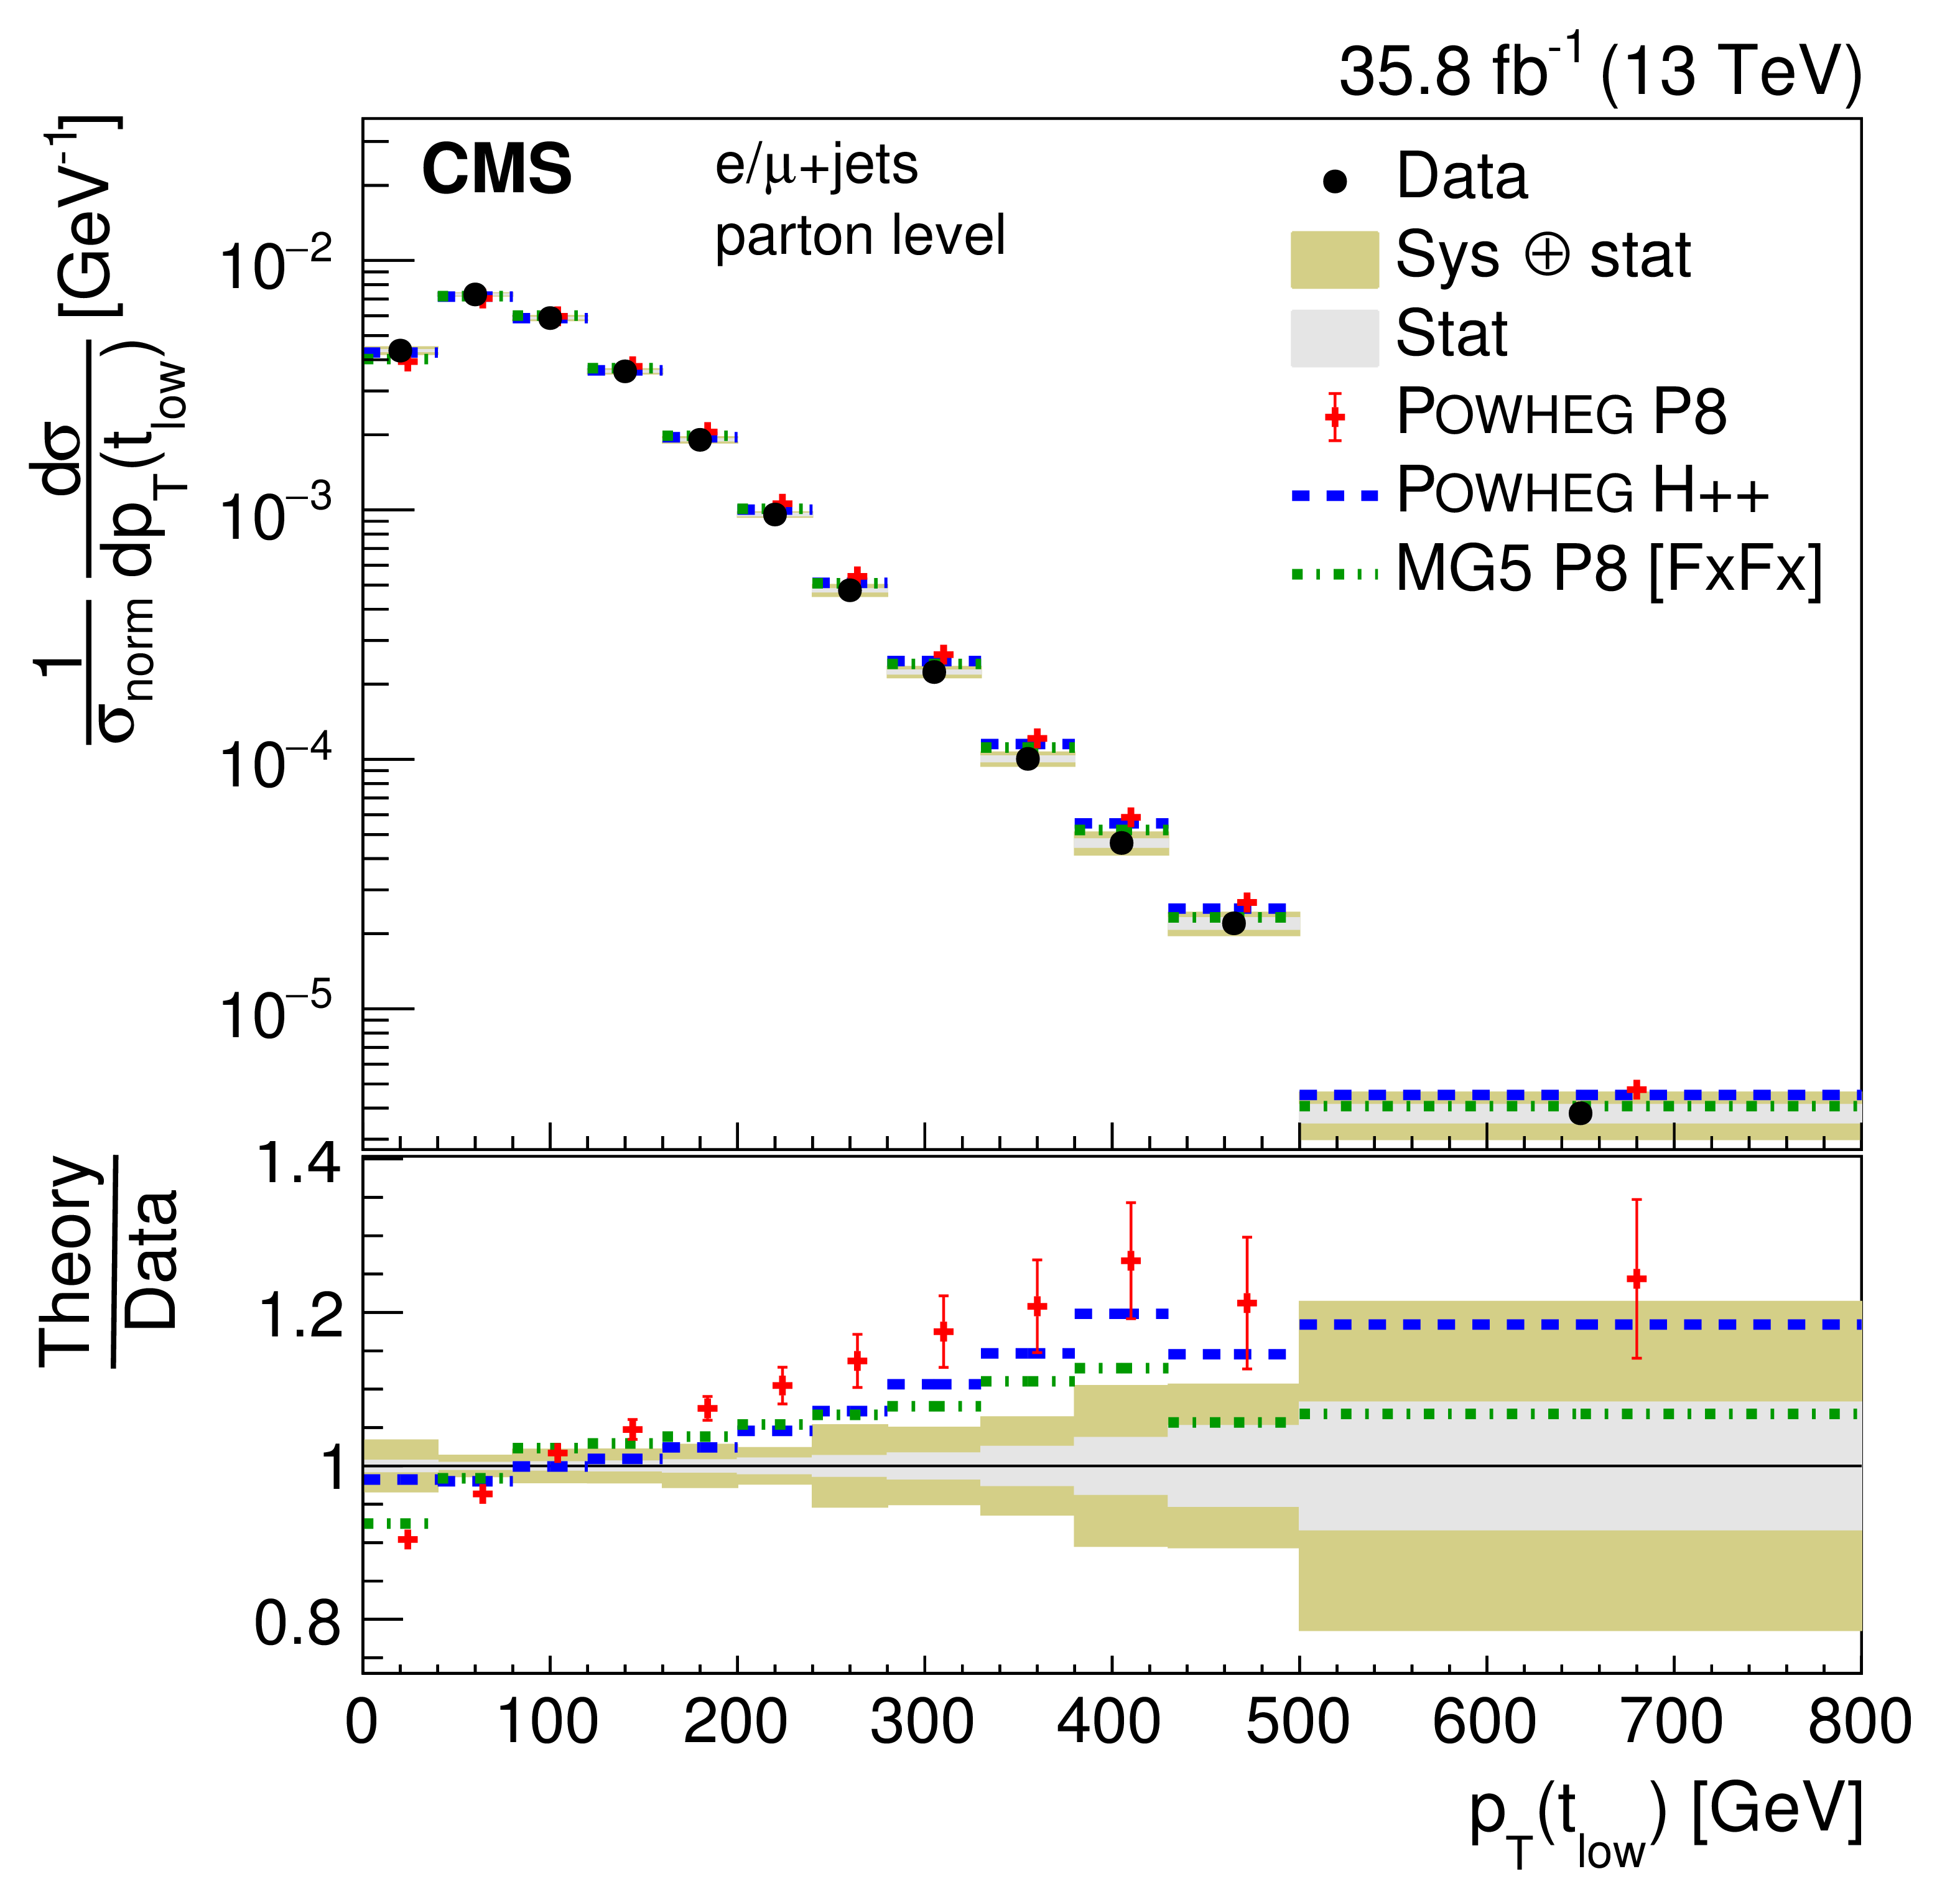
Figure 15:
Absolute (left) and normalized (right) differential cross sections at the parton level as a function of the transverse momentum of the top quark with the higher and lower $ {p_{\mathrm {T}}} $. The data are shown as points with light (dark) bands indicating the statistical (statistical and systematic) uncertainties. The data are shown as points with light (dark) bands indicating the statistical (statistical and systematic) uncertainties. The cross sections are compared to the predictions of POWHEG combined with PYTHIA8 (P8) or HERWIG++ (H++), and the multiparton simulation MG5_aMC@NLO (MG5)+PYTHIA8 FxFx. The ratios of the various predictions to the measured cross sections are shown at the bottom of each panel. |
png pdf |
Figure 15-a:
Absolute (left) and normalized (right) differential cross sections at the parton level as a function of the transverse momentum of the top quark with the higher and lower $ {p_{\mathrm {T}}} $. The data are shown as points with light (dark) bands indicating the statistical (statistical and systematic) uncertainties. The data are shown as points with light (dark) bands indicating the statistical (statistical and systematic) uncertainties. The cross sections are compared to the predictions of POWHEG combined with PYTHIA8 (P8) or HERWIG++ (H++), and the multiparton simulation MG5_aMC@NLO (MG5)+PYTHIA8 FxFx. The ratios of the various predictions to the measured cross sections are shown at the bottom of each panel. |
png pdf |
Figure 15-b:
Absolute (left) and normalized (right) differential cross sections at the parton level as a function of the transverse momentum of the top quark with the higher and lower $ {p_{\mathrm {T}}} $. The data are shown as points with light (dark) bands indicating the statistical (statistical and systematic) uncertainties. The data are shown as points with light (dark) bands indicating the statistical (statistical and systematic) uncertainties. The cross sections are compared to the predictions of POWHEG combined with PYTHIA8 (P8) or HERWIG++ (H++), and the multiparton simulation MG5_aMC@NLO (MG5)+PYTHIA8 FxFx. The ratios of the various predictions to the measured cross sections are shown at the bottom of each panel. |
png pdf |
Figure 15-c:
Absolute (left) and normalized (right) differential cross sections at the parton level as a function of the transverse momentum of the top quark with the higher and lower $ {p_{\mathrm {T}}} $. The data are shown as points with light (dark) bands indicating the statistical (statistical and systematic) uncertainties. The data are shown as points with light (dark) bands indicating the statistical (statistical and systematic) uncertainties. The cross sections are compared to the predictions of POWHEG combined with PYTHIA8 (P8) or HERWIG++ (H++), and the multiparton simulation MG5_aMC@NLO (MG5)+PYTHIA8 FxFx. The ratios of the various predictions to the measured cross sections are shown at the bottom of each panel. |
png pdf |
Figure 15-d:
Absolute (left) and normalized (right) differential cross sections at the parton level as a function of the transverse momentum of the top quark with the higher and lower $ {p_{\mathrm {T}}} $. The data are shown as points with light (dark) bands indicating the statistical (statistical and systematic) uncertainties. The data are shown as points with light (dark) bands indicating the statistical (statistical and systematic) uncertainties. The cross sections are compared to the predictions of POWHEG combined with PYTHIA8 (P8) or HERWIG++ (H++), and the multiparton simulation MG5_aMC@NLO (MG5)+PYTHIA8 FxFx. The ratios of the various predictions to the measured cross sections are shown at the bottom of each panel. |

png pdf |
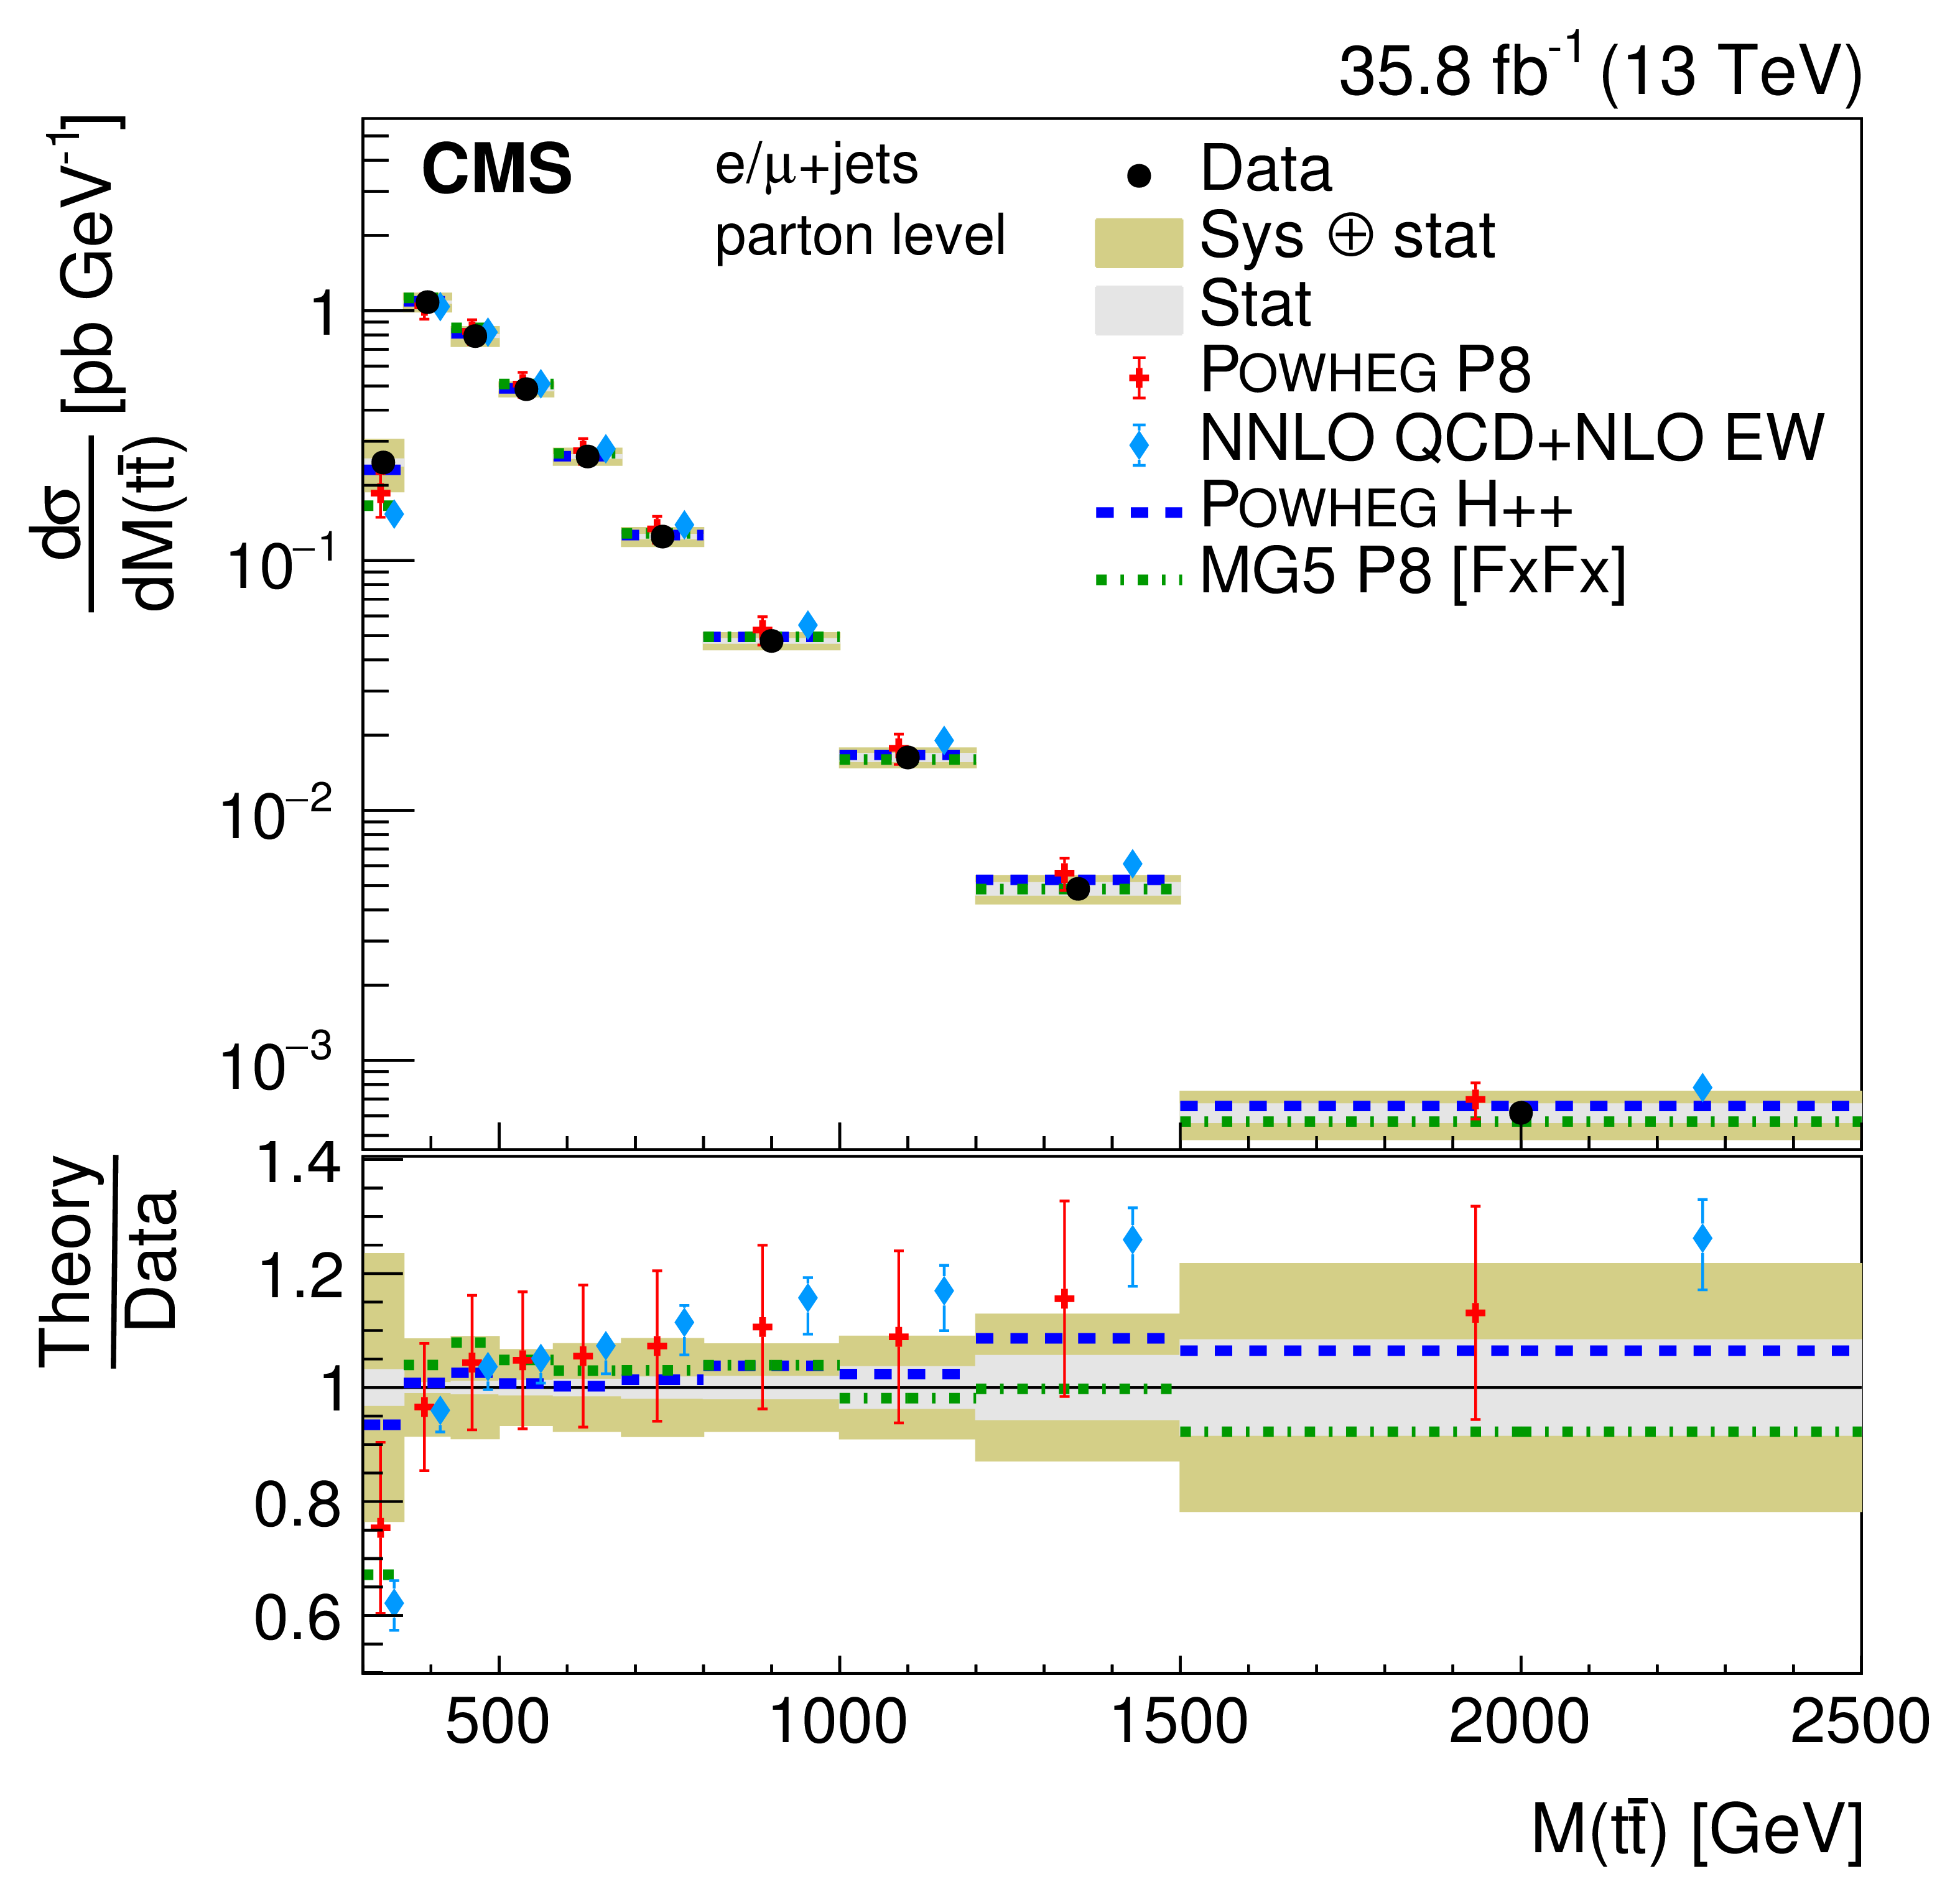
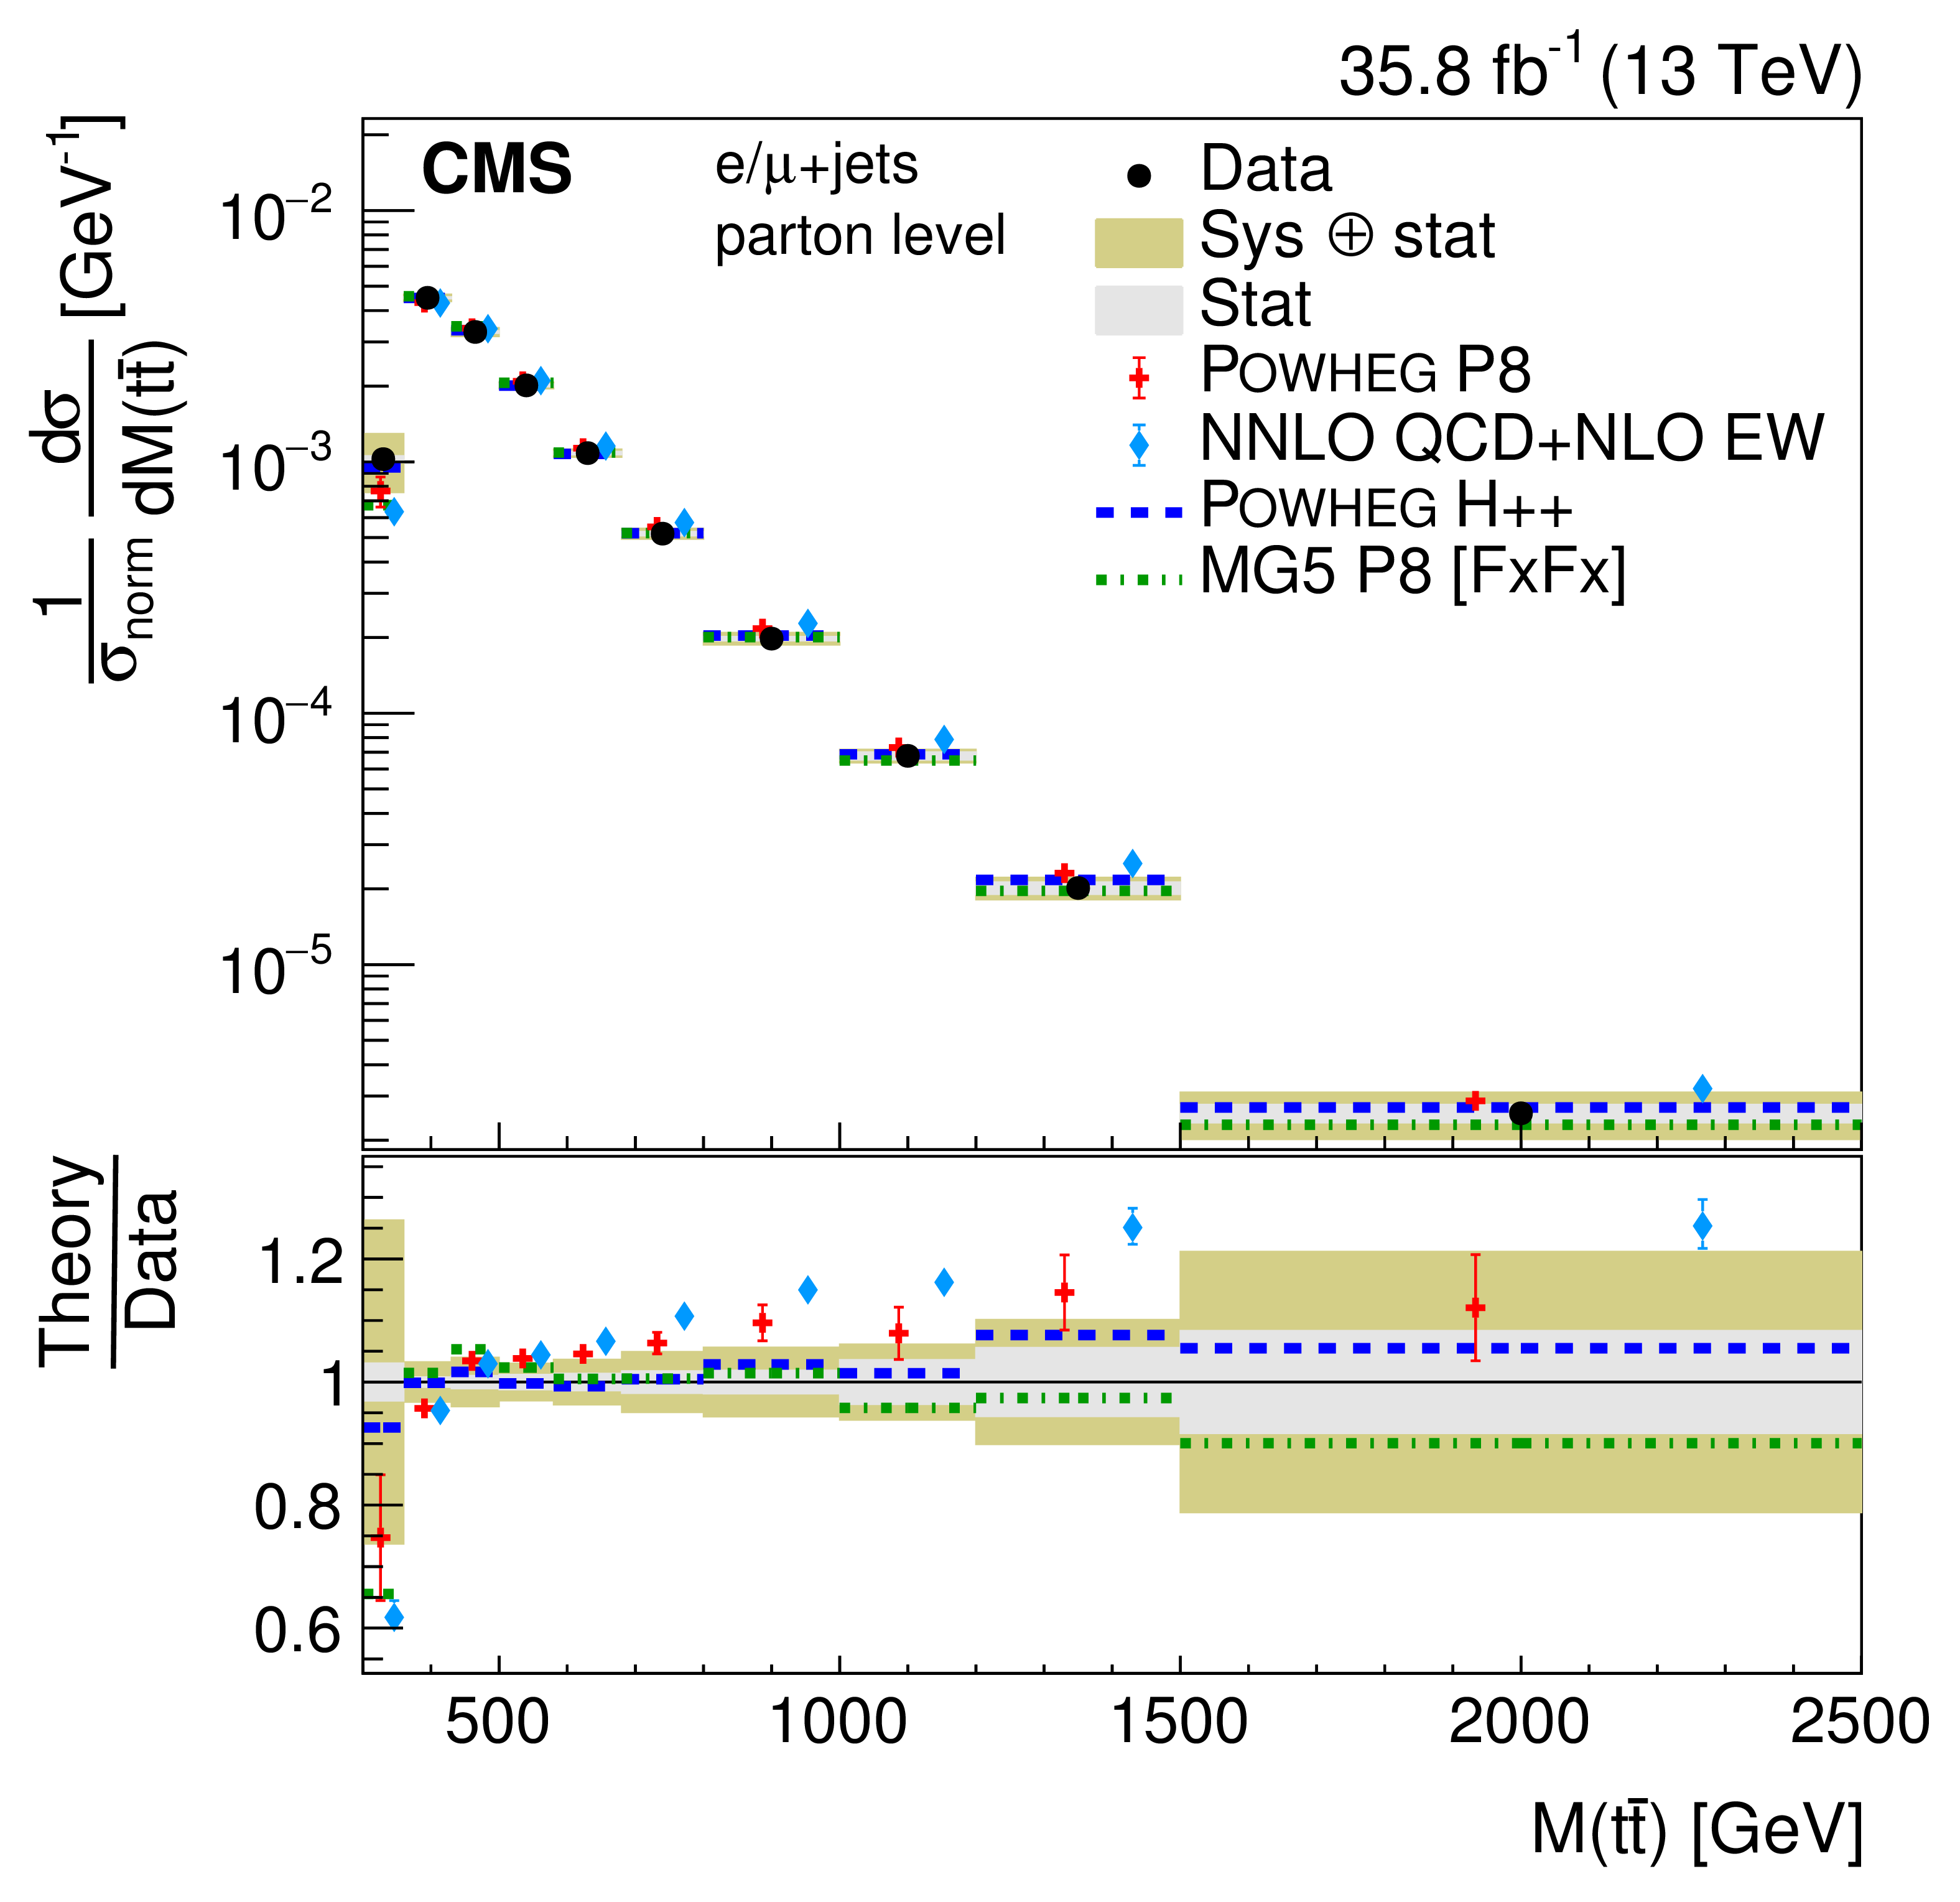
Figure 16:
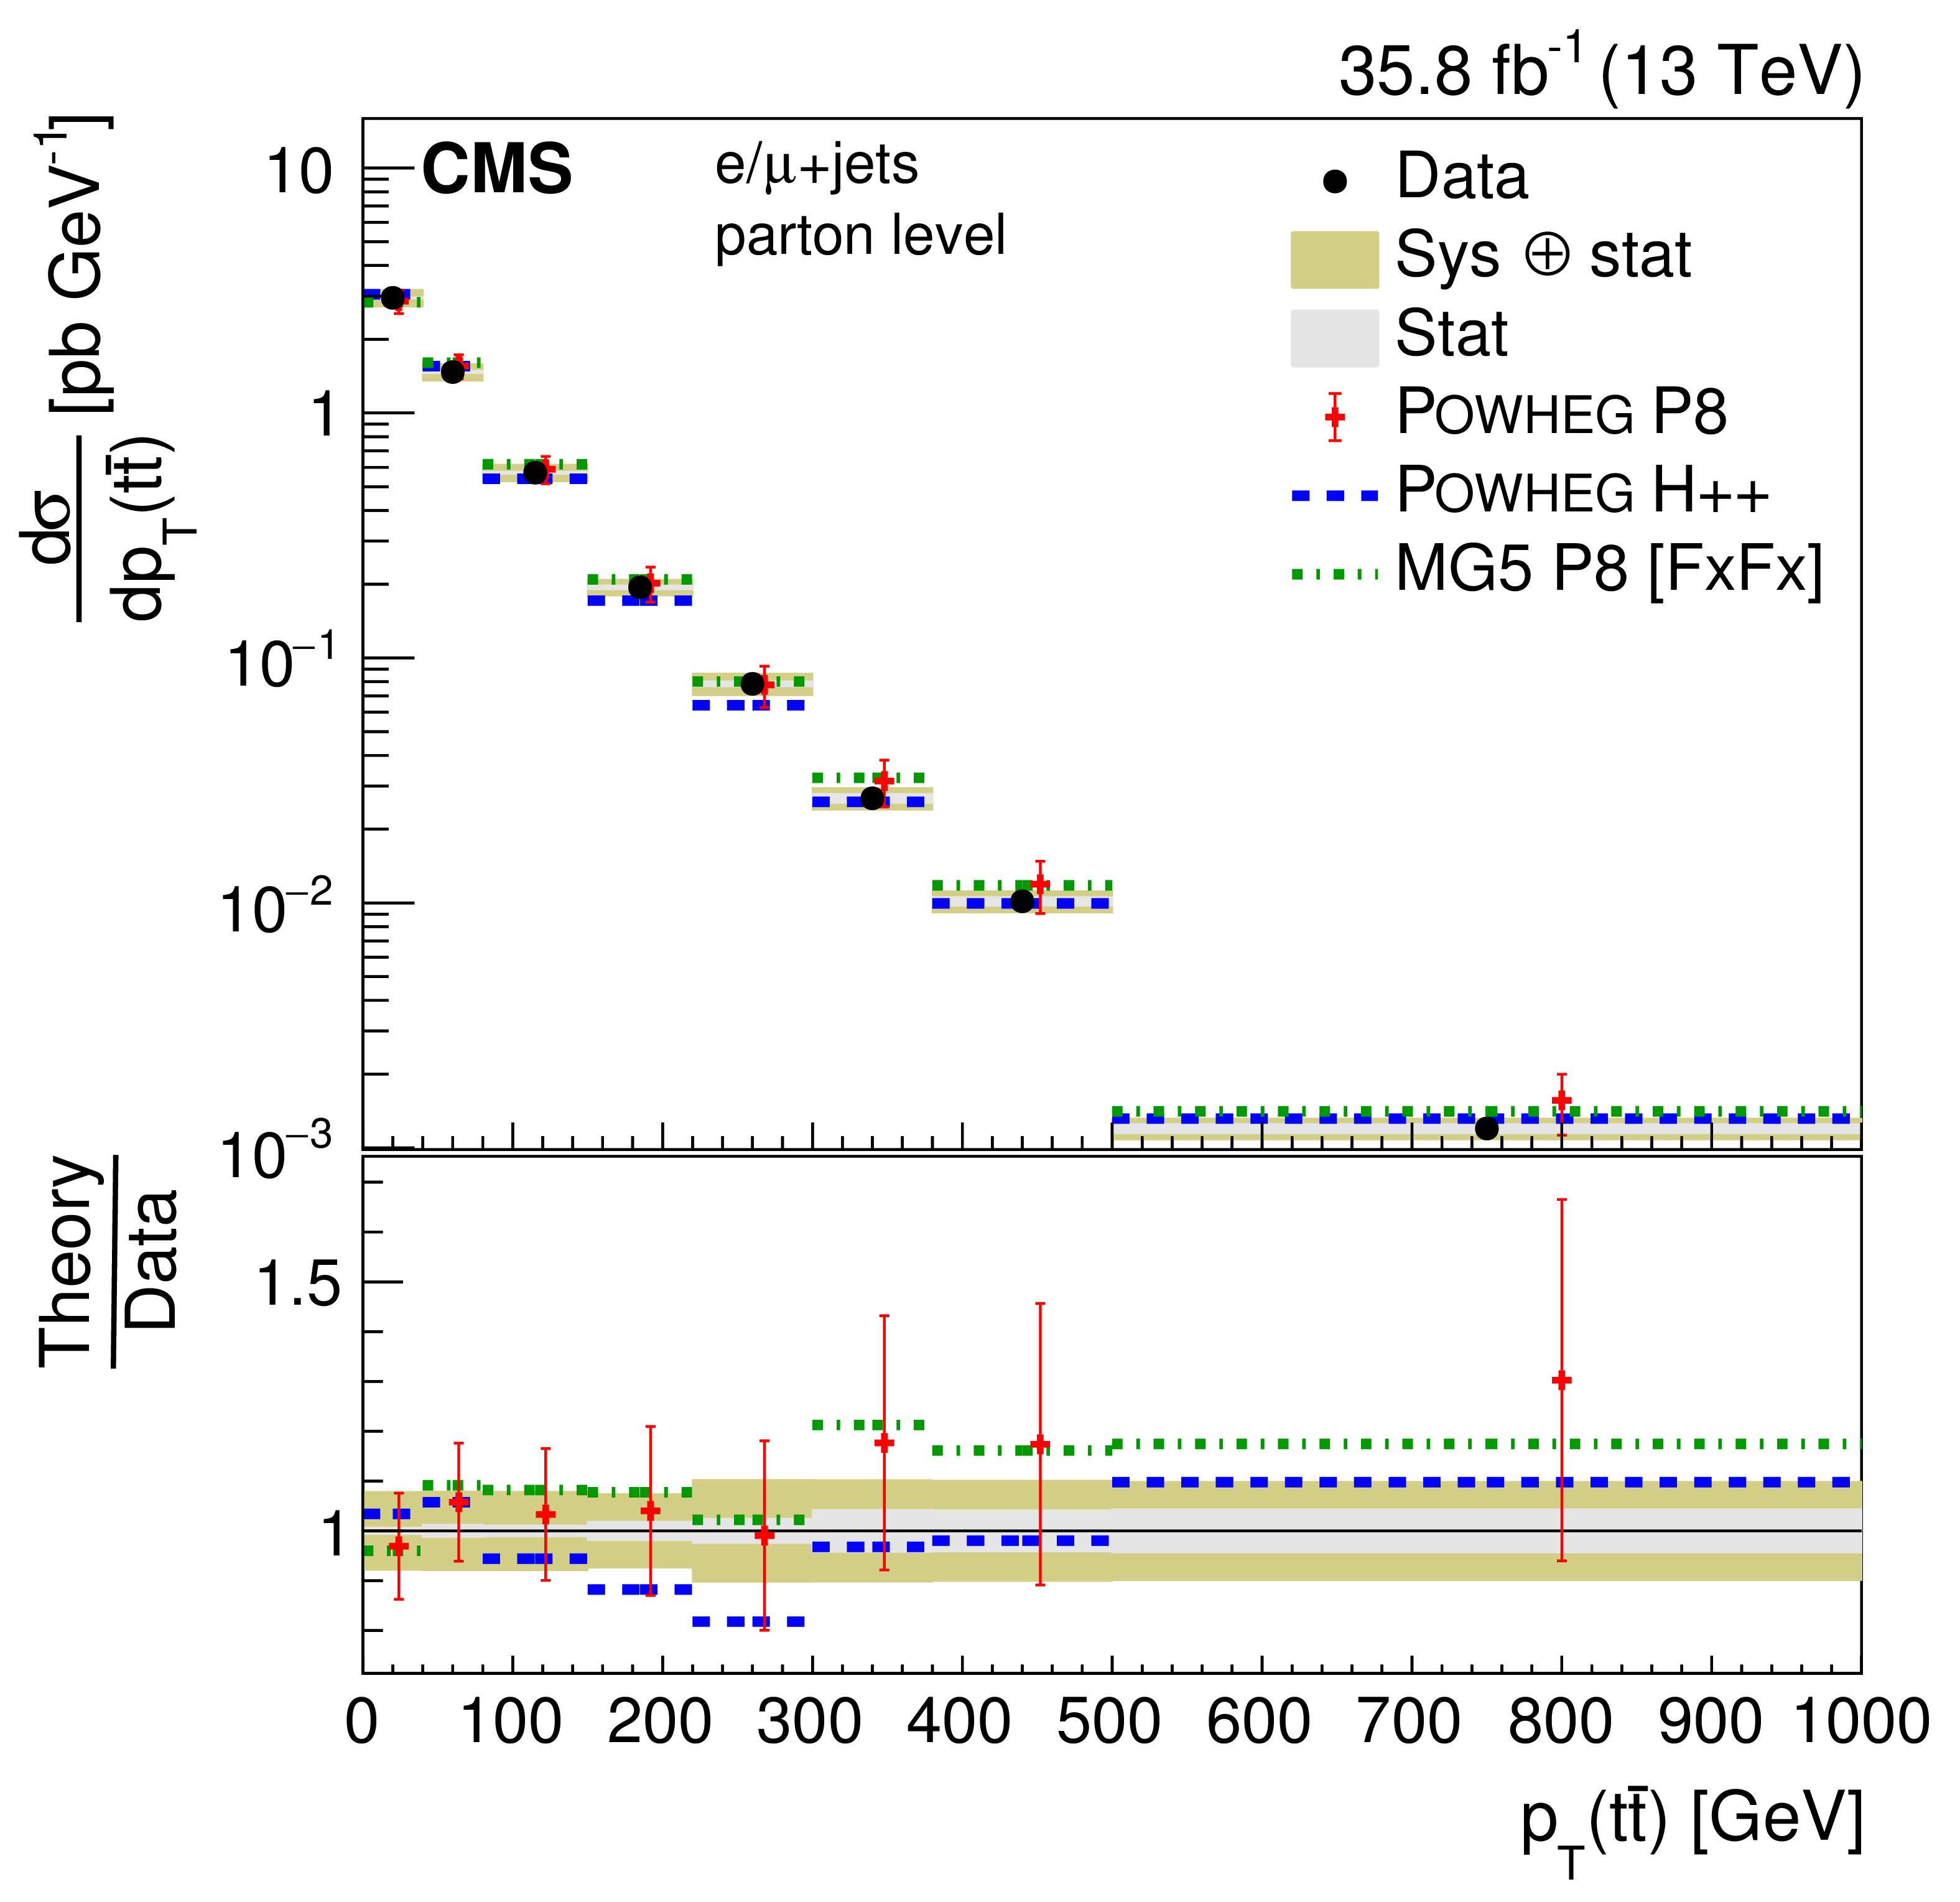
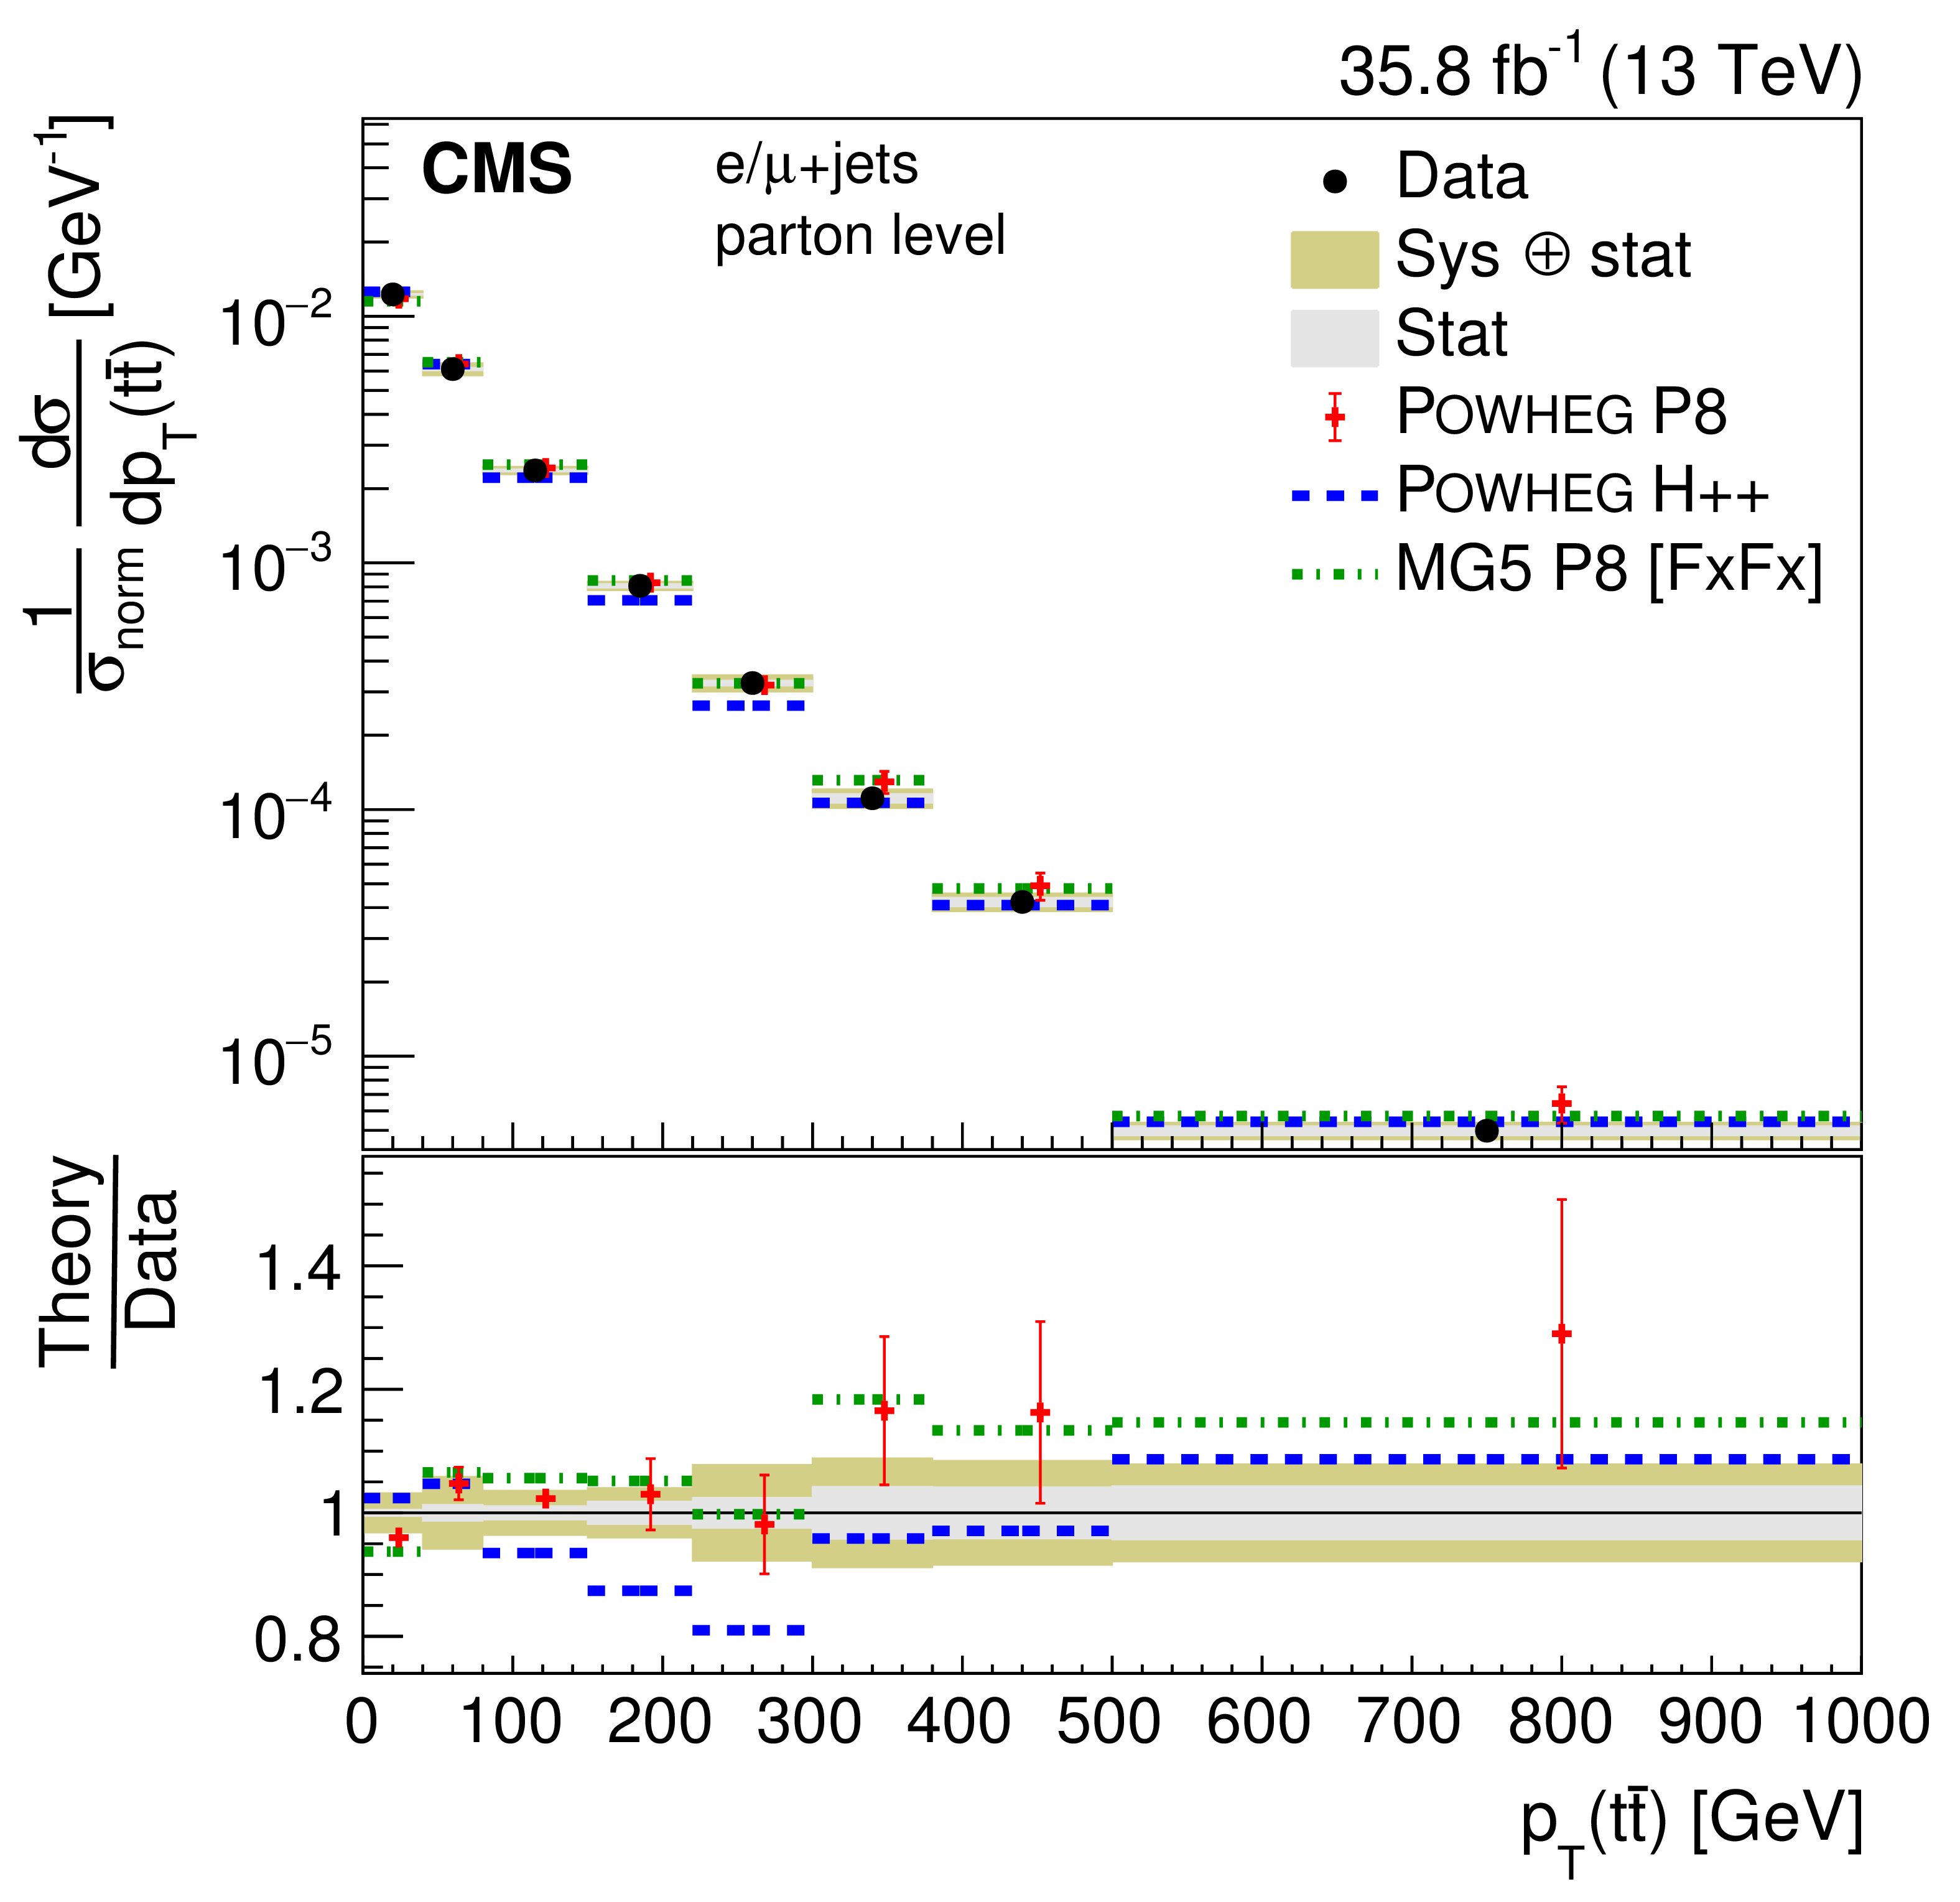
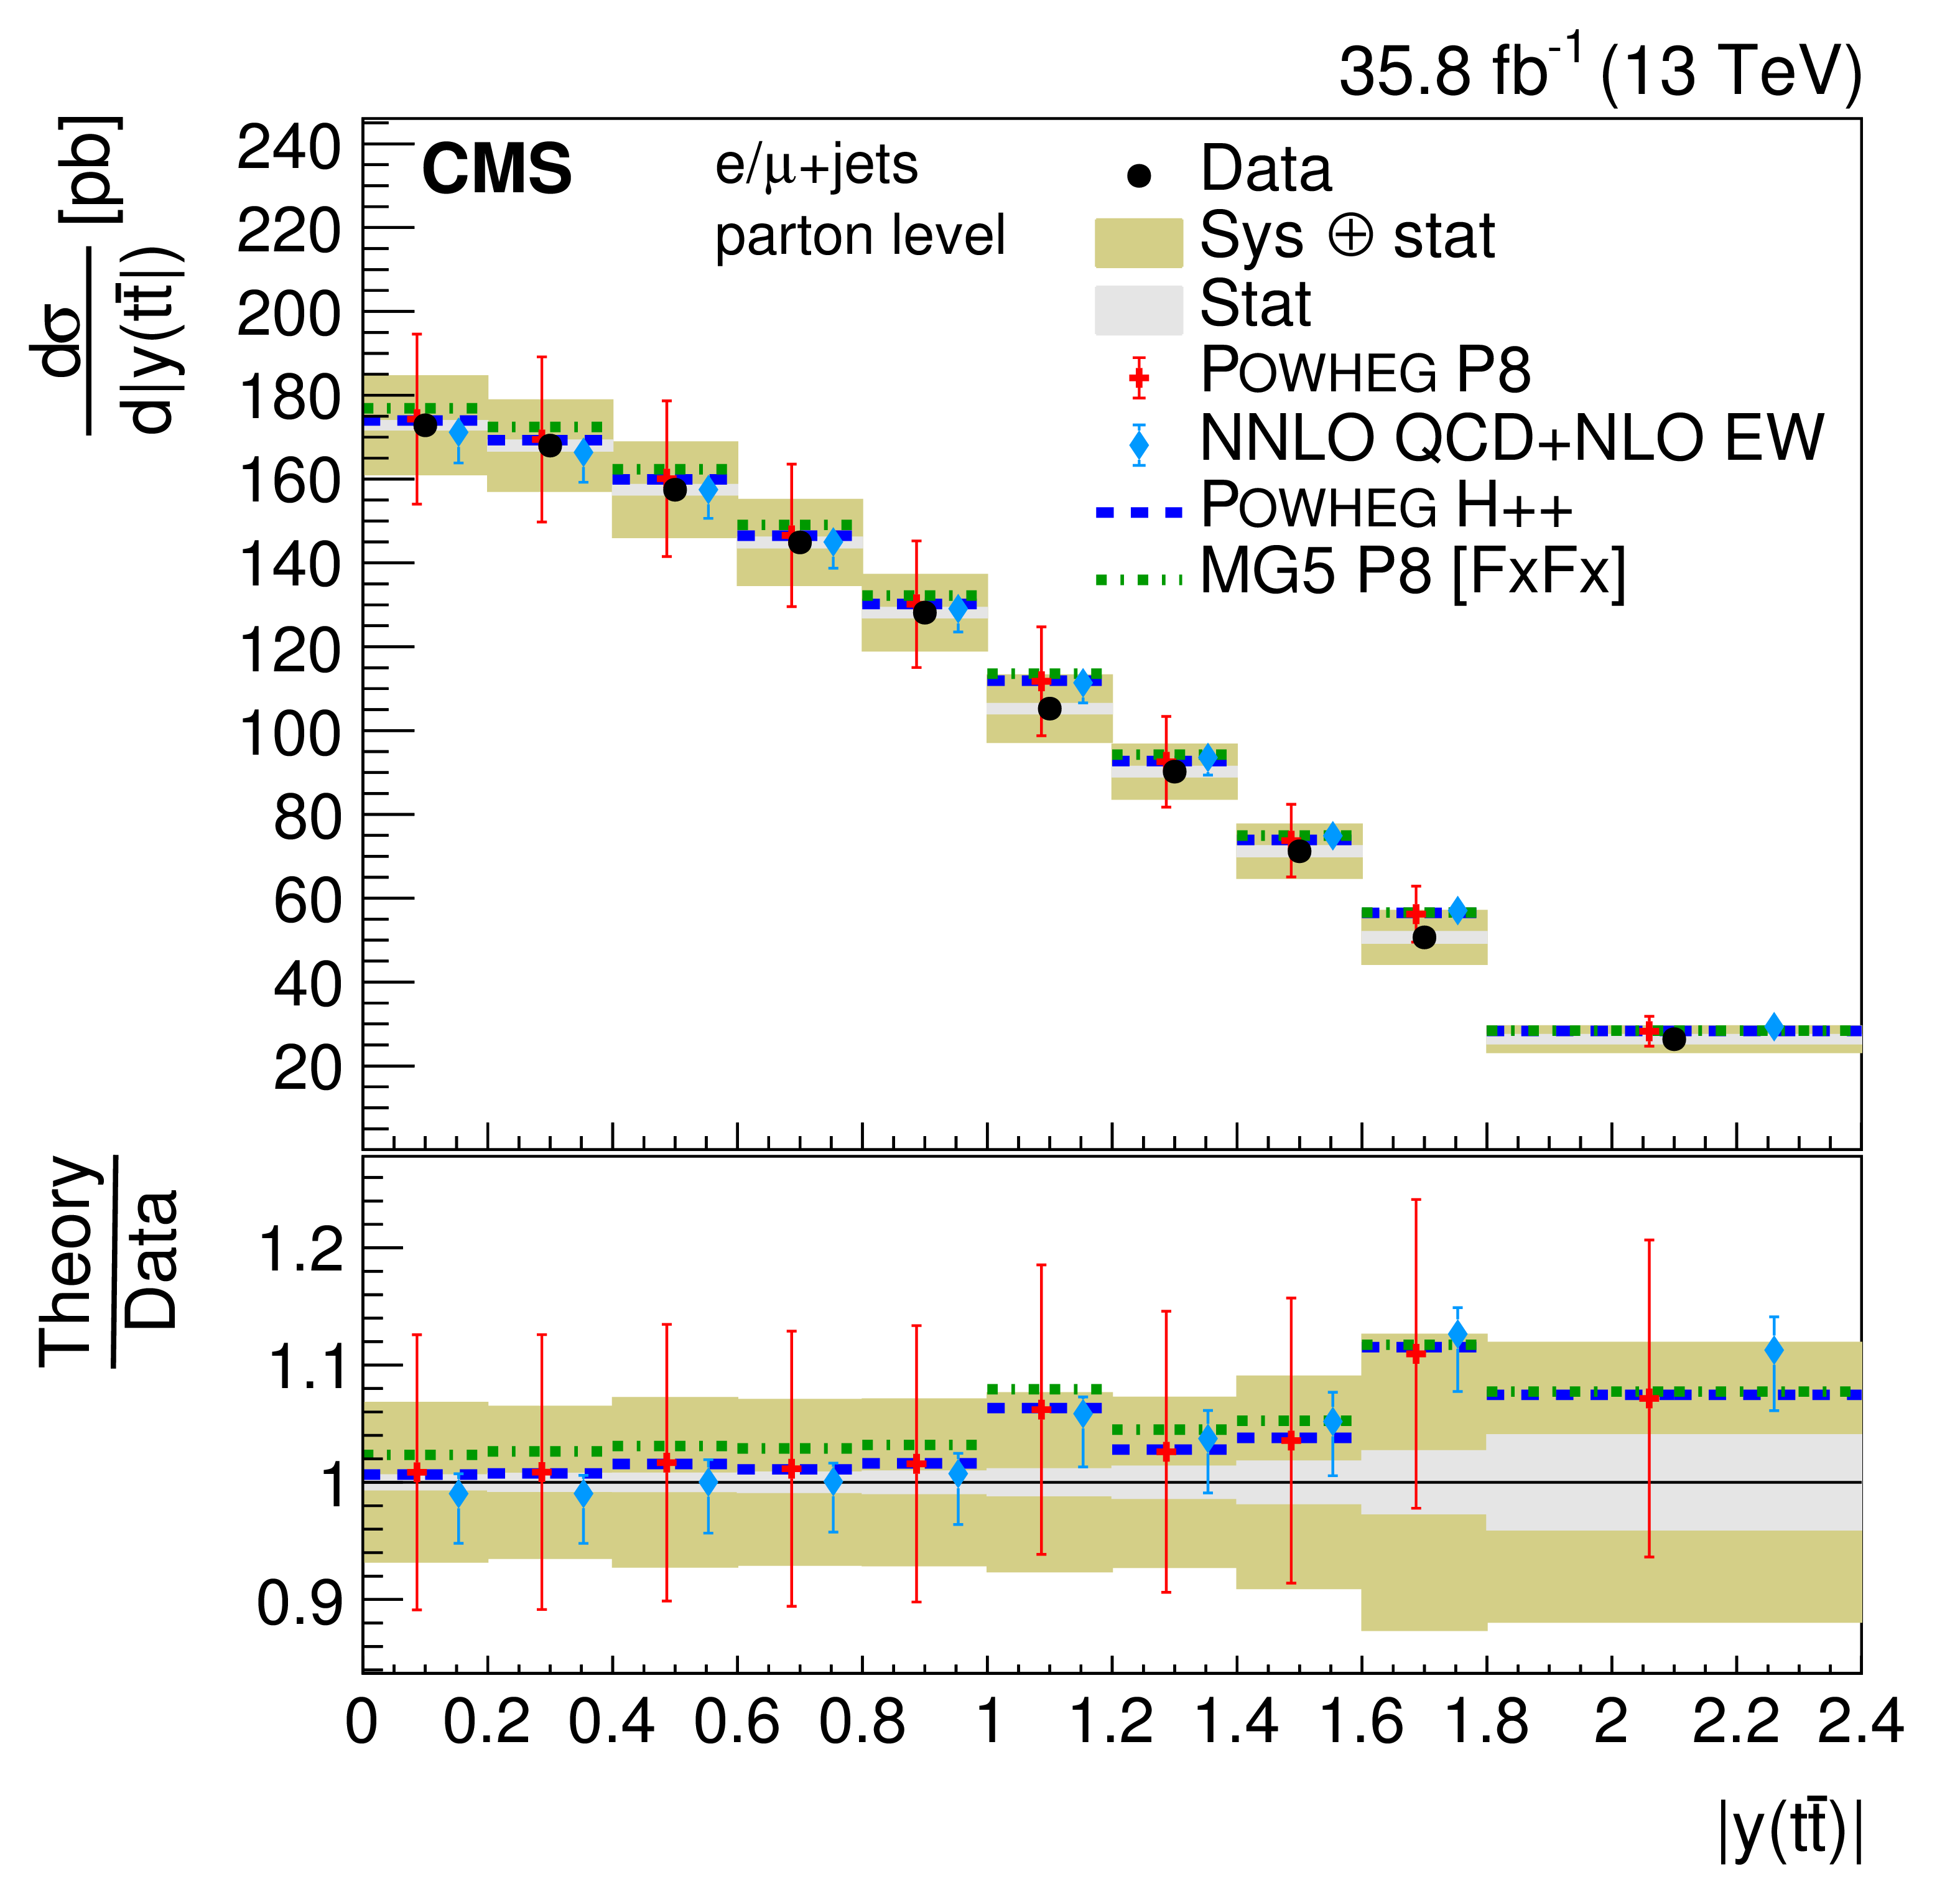
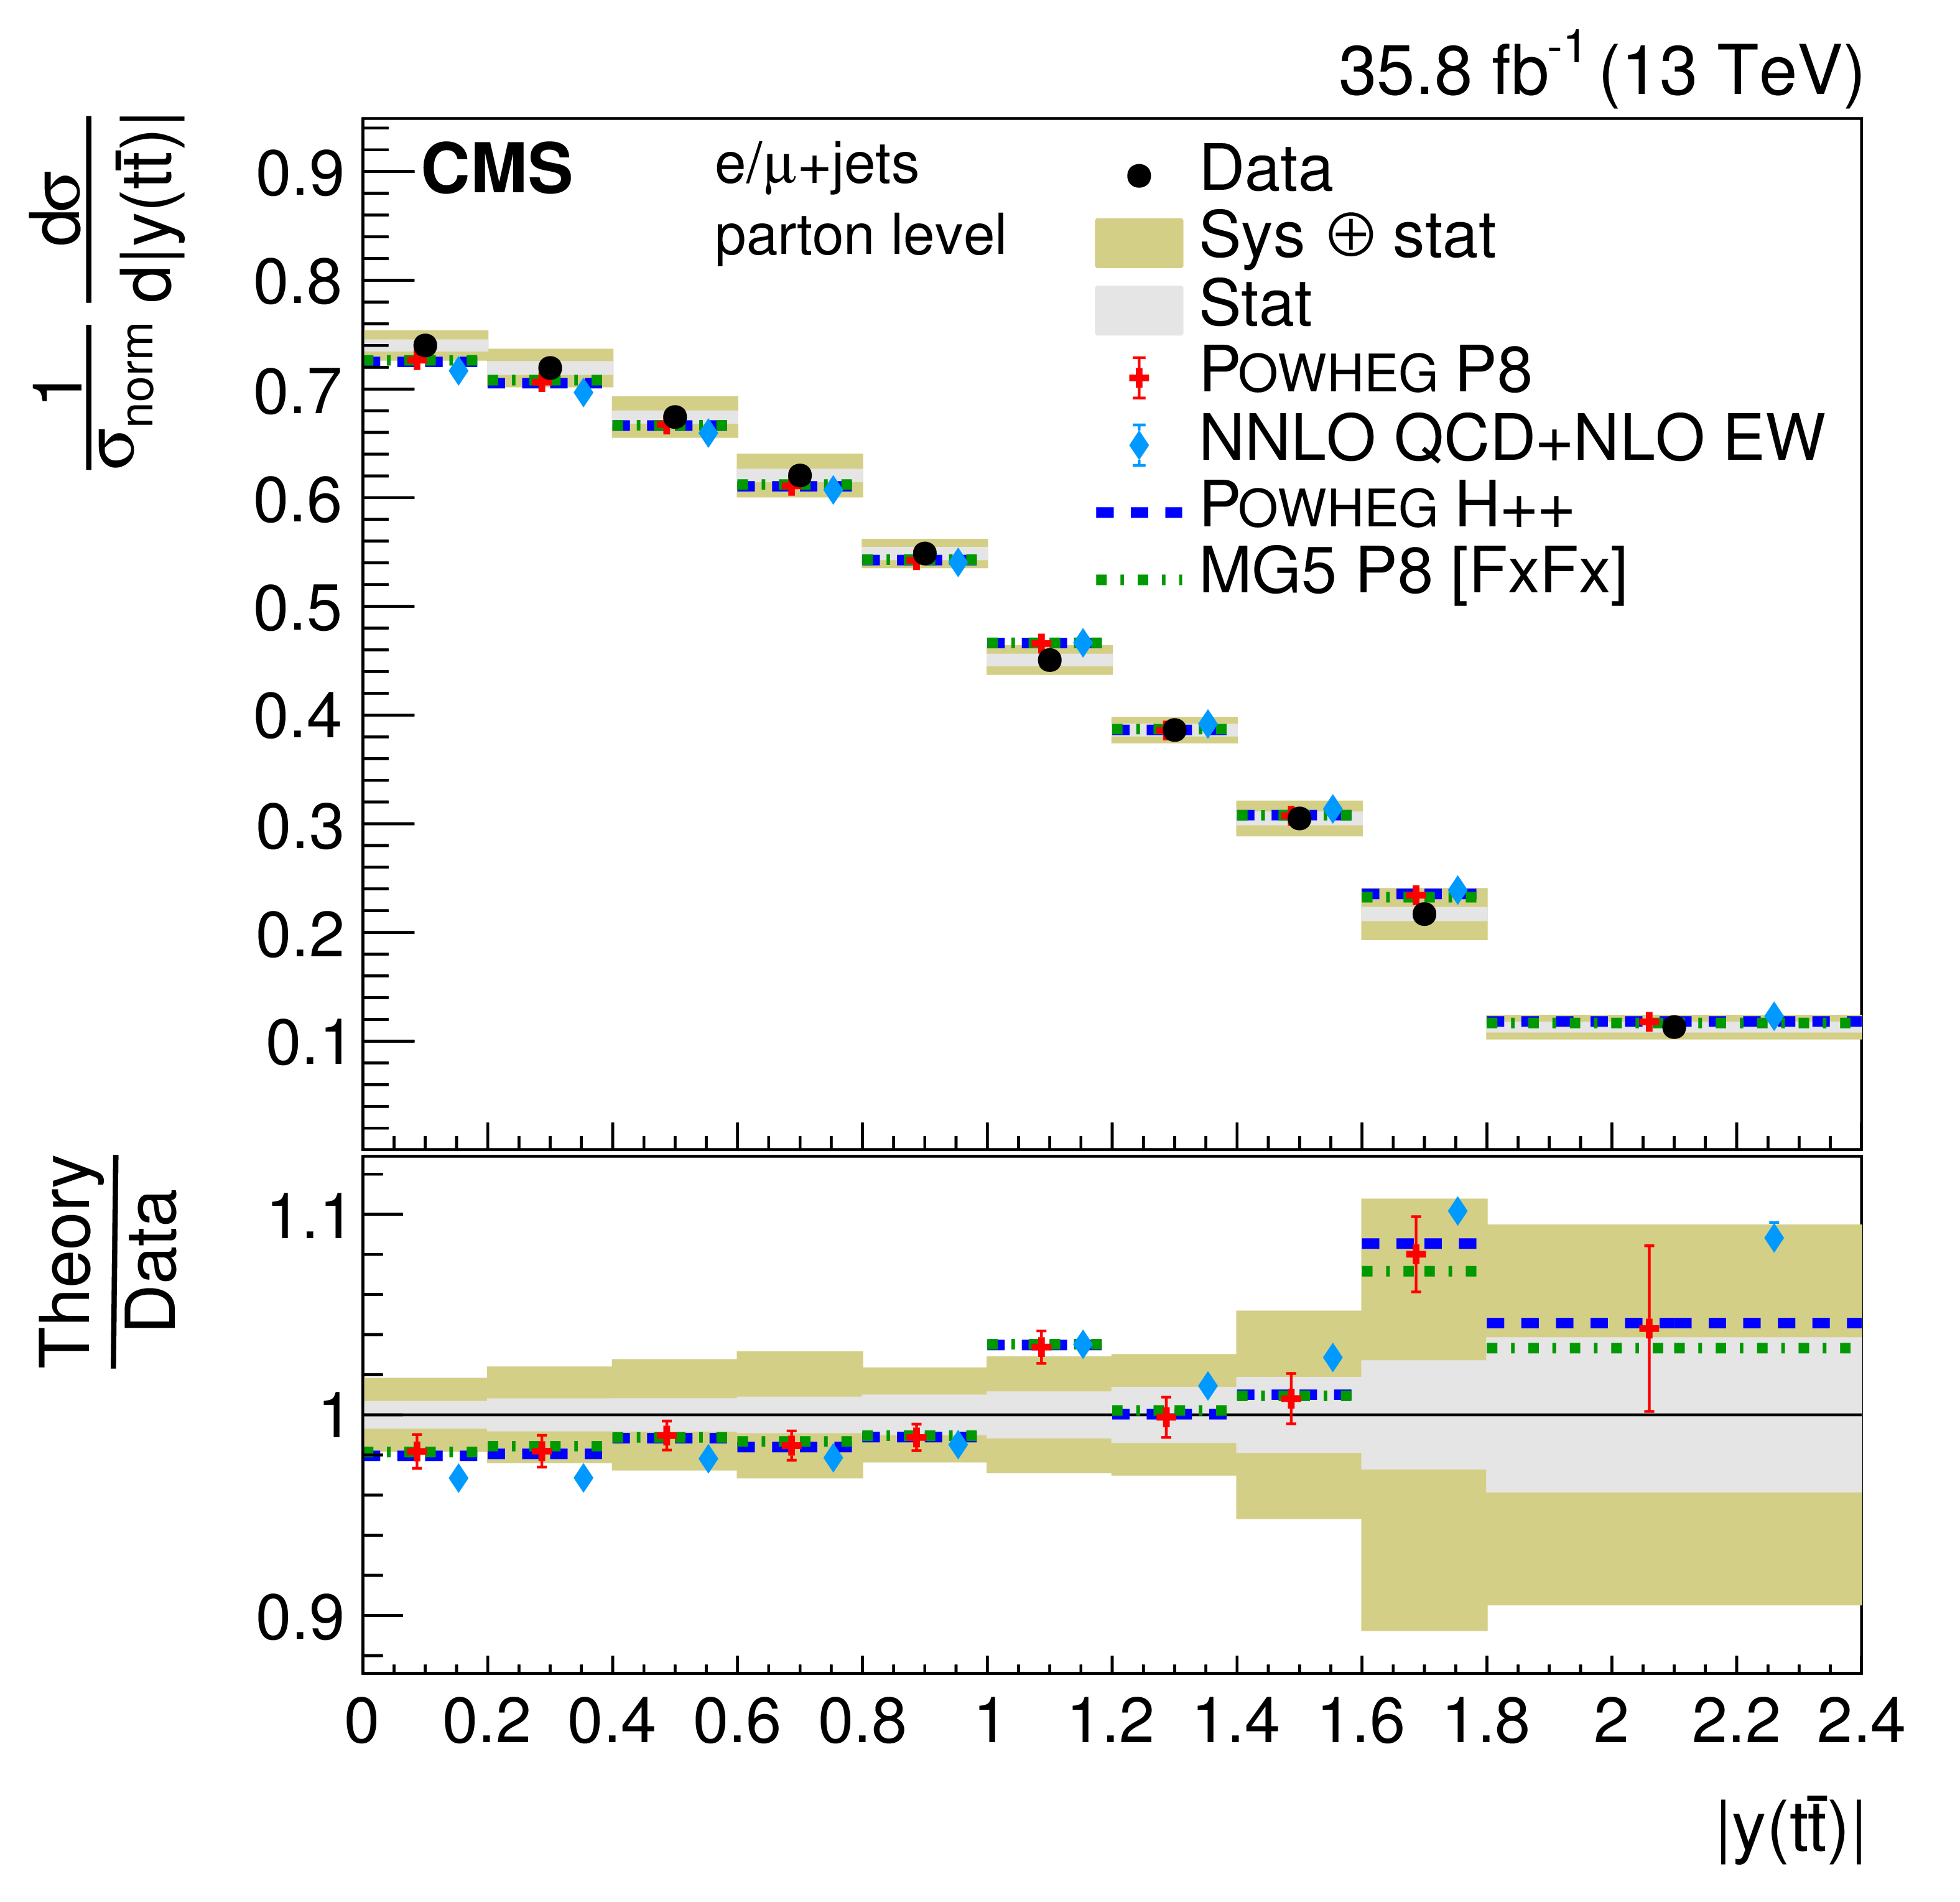
Absolute (left) and normalized (right) differential cross sections at the parton level as a function of $ {p_{\mathrm {T}}} ({\mathrm{t} \mathrm{\bar{t}}})$ (upper), $ { | y({\mathrm{t} \mathrm{\bar{t}}}) | }$ (middle), and $M({\mathrm{t} \mathrm{\bar{t}}})$ (lower). The data are shown as points with light (dark) bands indicating the statistical (statistical and systematic) uncertainties. The cross sections are compared to the predictions of POWHEG combined with PYTHIA8 (P8) or HERWIG++ (H++), the multiparton simulation MG5_aMC@NLO (MG5)+PYTHIA8 FxFx, and the NNLO QCD+NLO EW calculations. The ratios of the various predictions to the measured cross sections are shown at the bottom of each panel. |
png pdf |
Figure 16-a:
Absolute (left) and normalized (right) differential cross sections at the parton level as a function of $ {p_{\mathrm {T}}} ({\mathrm{t} \mathrm{\bar{t}}})$ (upper), $ { | y({\mathrm{t} \mathrm{\bar{t}}}) | }$ (middle), and $M({\mathrm{t} \mathrm{\bar{t}}})$ (lower). The data are shown as points with light (dark) bands indicating the statistical (statistical and systematic) uncertainties. The cross sections are compared to the predictions of POWHEG combined with PYTHIA8 (P8) or HERWIG++ (H++), the multiparton simulation MG5_aMC@NLO (MG5)+PYTHIA8 FxFx, and the NNLO QCD+NLO EW calculations. The ratios of the various predictions to the measured cross sections are shown at the bottom of each panel. |
png pdf |
Figure 16-b:
Absolute (left) and normalized (right) differential cross sections at the parton level as a function of $ {p_{\mathrm {T}}} ({\mathrm{t} \mathrm{\bar{t}}})$ (upper), $ { | y({\mathrm{t} \mathrm{\bar{t}}}) | }$ (middle), and $M({\mathrm{t} \mathrm{\bar{t}}})$ (lower). The data are shown as points with light (dark) bands indicating the statistical (statistical and systematic) uncertainties. The cross sections are compared to the predictions of POWHEG combined with PYTHIA8 (P8) or HERWIG++ (H++), the multiparton simulation MG5_aMC@NLO (MG5)+PYTHIA8 FxFx, and the NNLO QCD+NLO EW calculations. The ratios of the various predictions to the measured cross sections are shown at the bottom of each panel. |
png pdf |
Figure 16-c:
Absolute (left) and normalized (right) differential cross sections at the parton level as a function of $ {p_{\mathrm {T}}} ({\mathrm{t} \mathrm{\bar{t}}})$ (upper), $ { | y({\mathrm{t} \mathrm{\bar{t}}}) | }$ (middle), and $M({\mathrm{t} \mathrm{\bar{t}}})$ (lower). The data are shown as points with light (dark) bands indicating the statistical (statistical and systematic) uncertainties. The cross sections are compared to the predictions of POWHEG combined with PYTHIA8 (P8) or HERWIG++ (H++), the multiparton simulation MG5_aMC@NLO (MG5)+PYTHIA8 FxFx, and the NNLO QCD+NLO EW calculations. The ratios of the various predictions to the measured cross sections are shown at the bottom of each panel. |
png pdf |
Figure 16-d:
Absolute (left) and normalized (right) differential cross sections at the parton level as a function of $ {p_{\mathrm {T}}} ({\mathrm{t} \mathrm{\bar{t}}})$ (upper), $ { | y({\mathrm{t} \mathrm{\bar{t}}}) | }$ (middle), and $M({\mathrm{t} \mathrm{\bar{t}}})$ (lower). The data are shown as points with light (dark) bands indicating the statistical (statistical and systematic) uncertainties. The cross sections are compared to the predictions of POWHEG combined with PYTHIA8 (P8) or HERWIG++ (H++), the multiparton simulation MG5_aMC@NLO (MG5)+PYTHIA8 FxFx, and the NNLO QCD+NLO EW calculations. The ratios of the various predictions to the measured cross sections are shown at the bottom of each panel. |
png pdf |
Figure 16-e:
Absolute (left) and normalized (right) differential cross sections at the parton level as a function of $ {p_{\mathrm {T}}} ({\mathrm{t} \mathrm{\bar{t}}})$ (upper), $ { | y({\mathrm{t} \mathrm{\bar{t}}}) | }$ (middle), and $M({\mathrm{t} \mathrm{\bar{t}}})$ (lower). The data are shown as points with light (dark) bands indicating the statistical (statistical and systematic) uncertainties. The cross sections are compared to the predictions of POWHEG combined with PYTHIA8 (P8) or HERWIG++ (H++), the multiparton simulation MG5_aMC@NLO (MG5)+PYTHIA8 FxFx, and the NNLO QCD+NLO EW calculations. The ratios of the various predictions to the measured cross sections are shown at the bottom of each panel. |
png pdf |
Figure 16-f:
Absolute (left) and normalized (right) differential cross sections at the parton level as a function of $ {p_{\mathrm {T}}} ({\mathrm{t} \mathrm{\bar{t}}})$ (upper), $ { | y({\mathrm{t} \mathrm{\bar{t}}}) | }$ (middle), and $M({\mathrm{t} \mathrm{\bar{t}}})$ (lower). The data are shown as points with light (dark) bands indicating the statistical (statistical and systematic) uncertainties. The cross sections are compared to the predictions of POWHEG combined with PYTHIA8 (P8) or HERWIG++ (H++), the multiparton simulation MG5_aMC@NLO (MG5)+PYTHIA8 FxFx, and the NNLO QCD+NLO EW calculations. The ratios of the various predictions to the measured cross sections are shown at the bottom of each panel. |
png pdf |
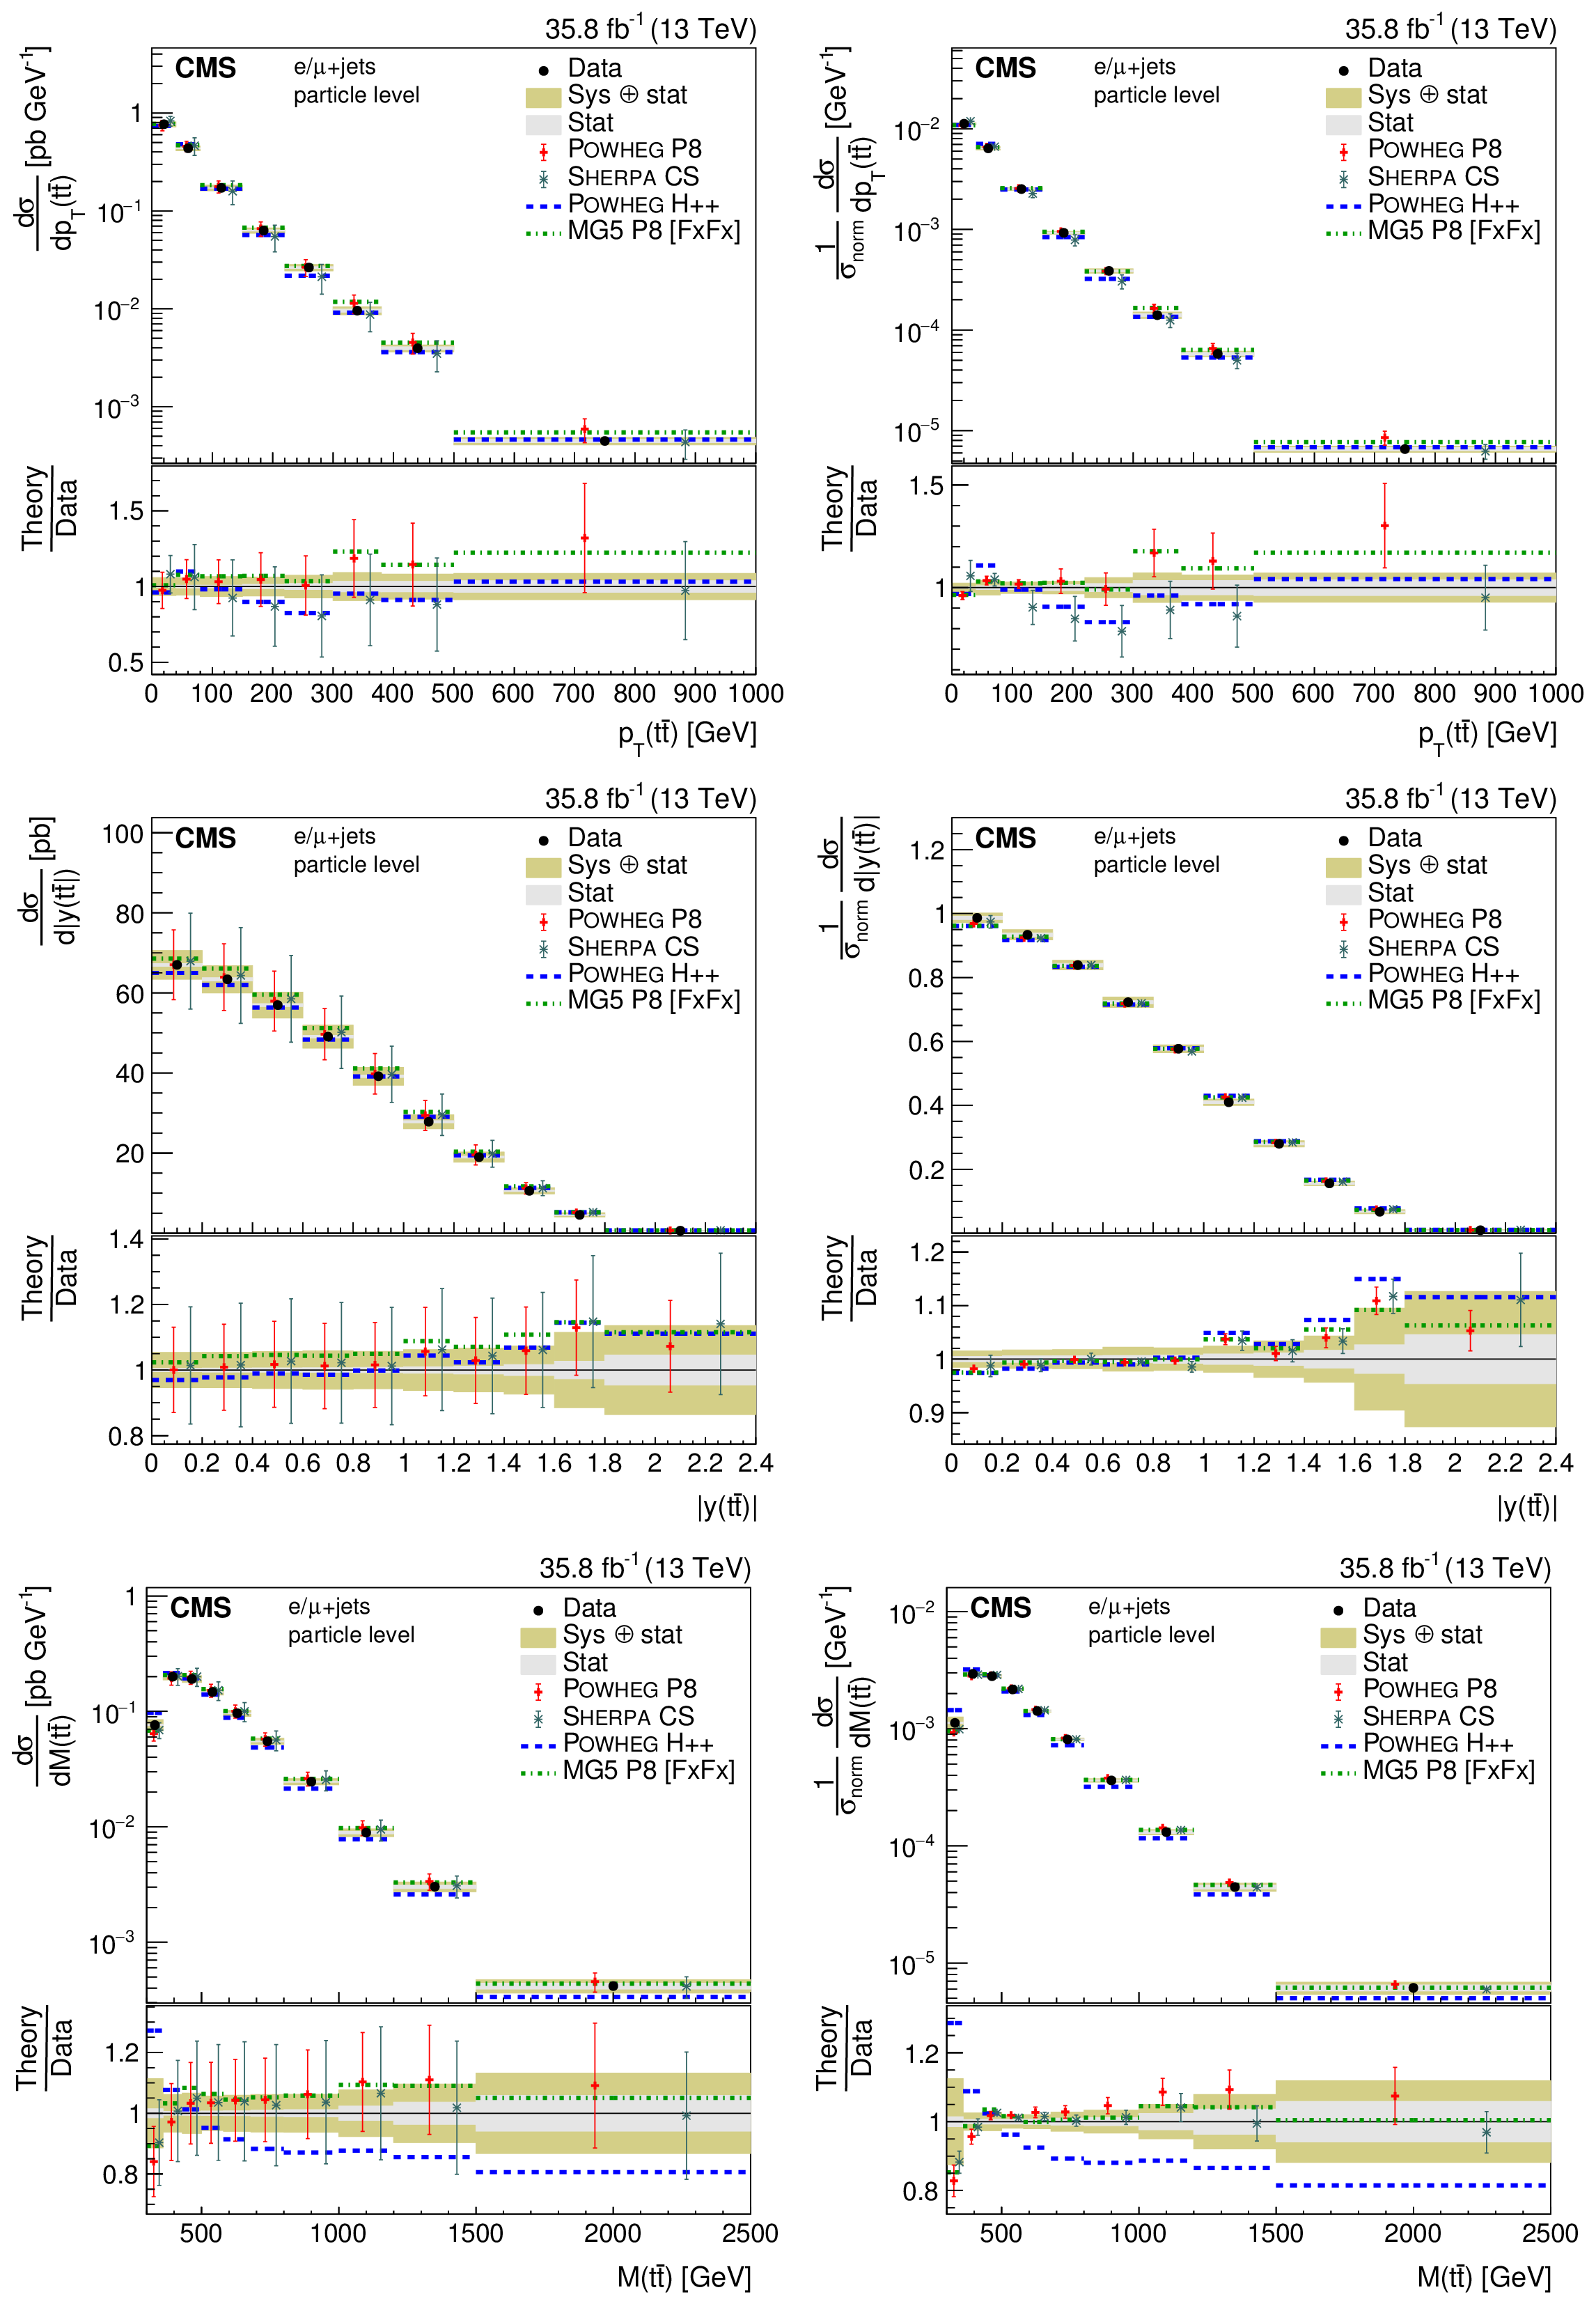
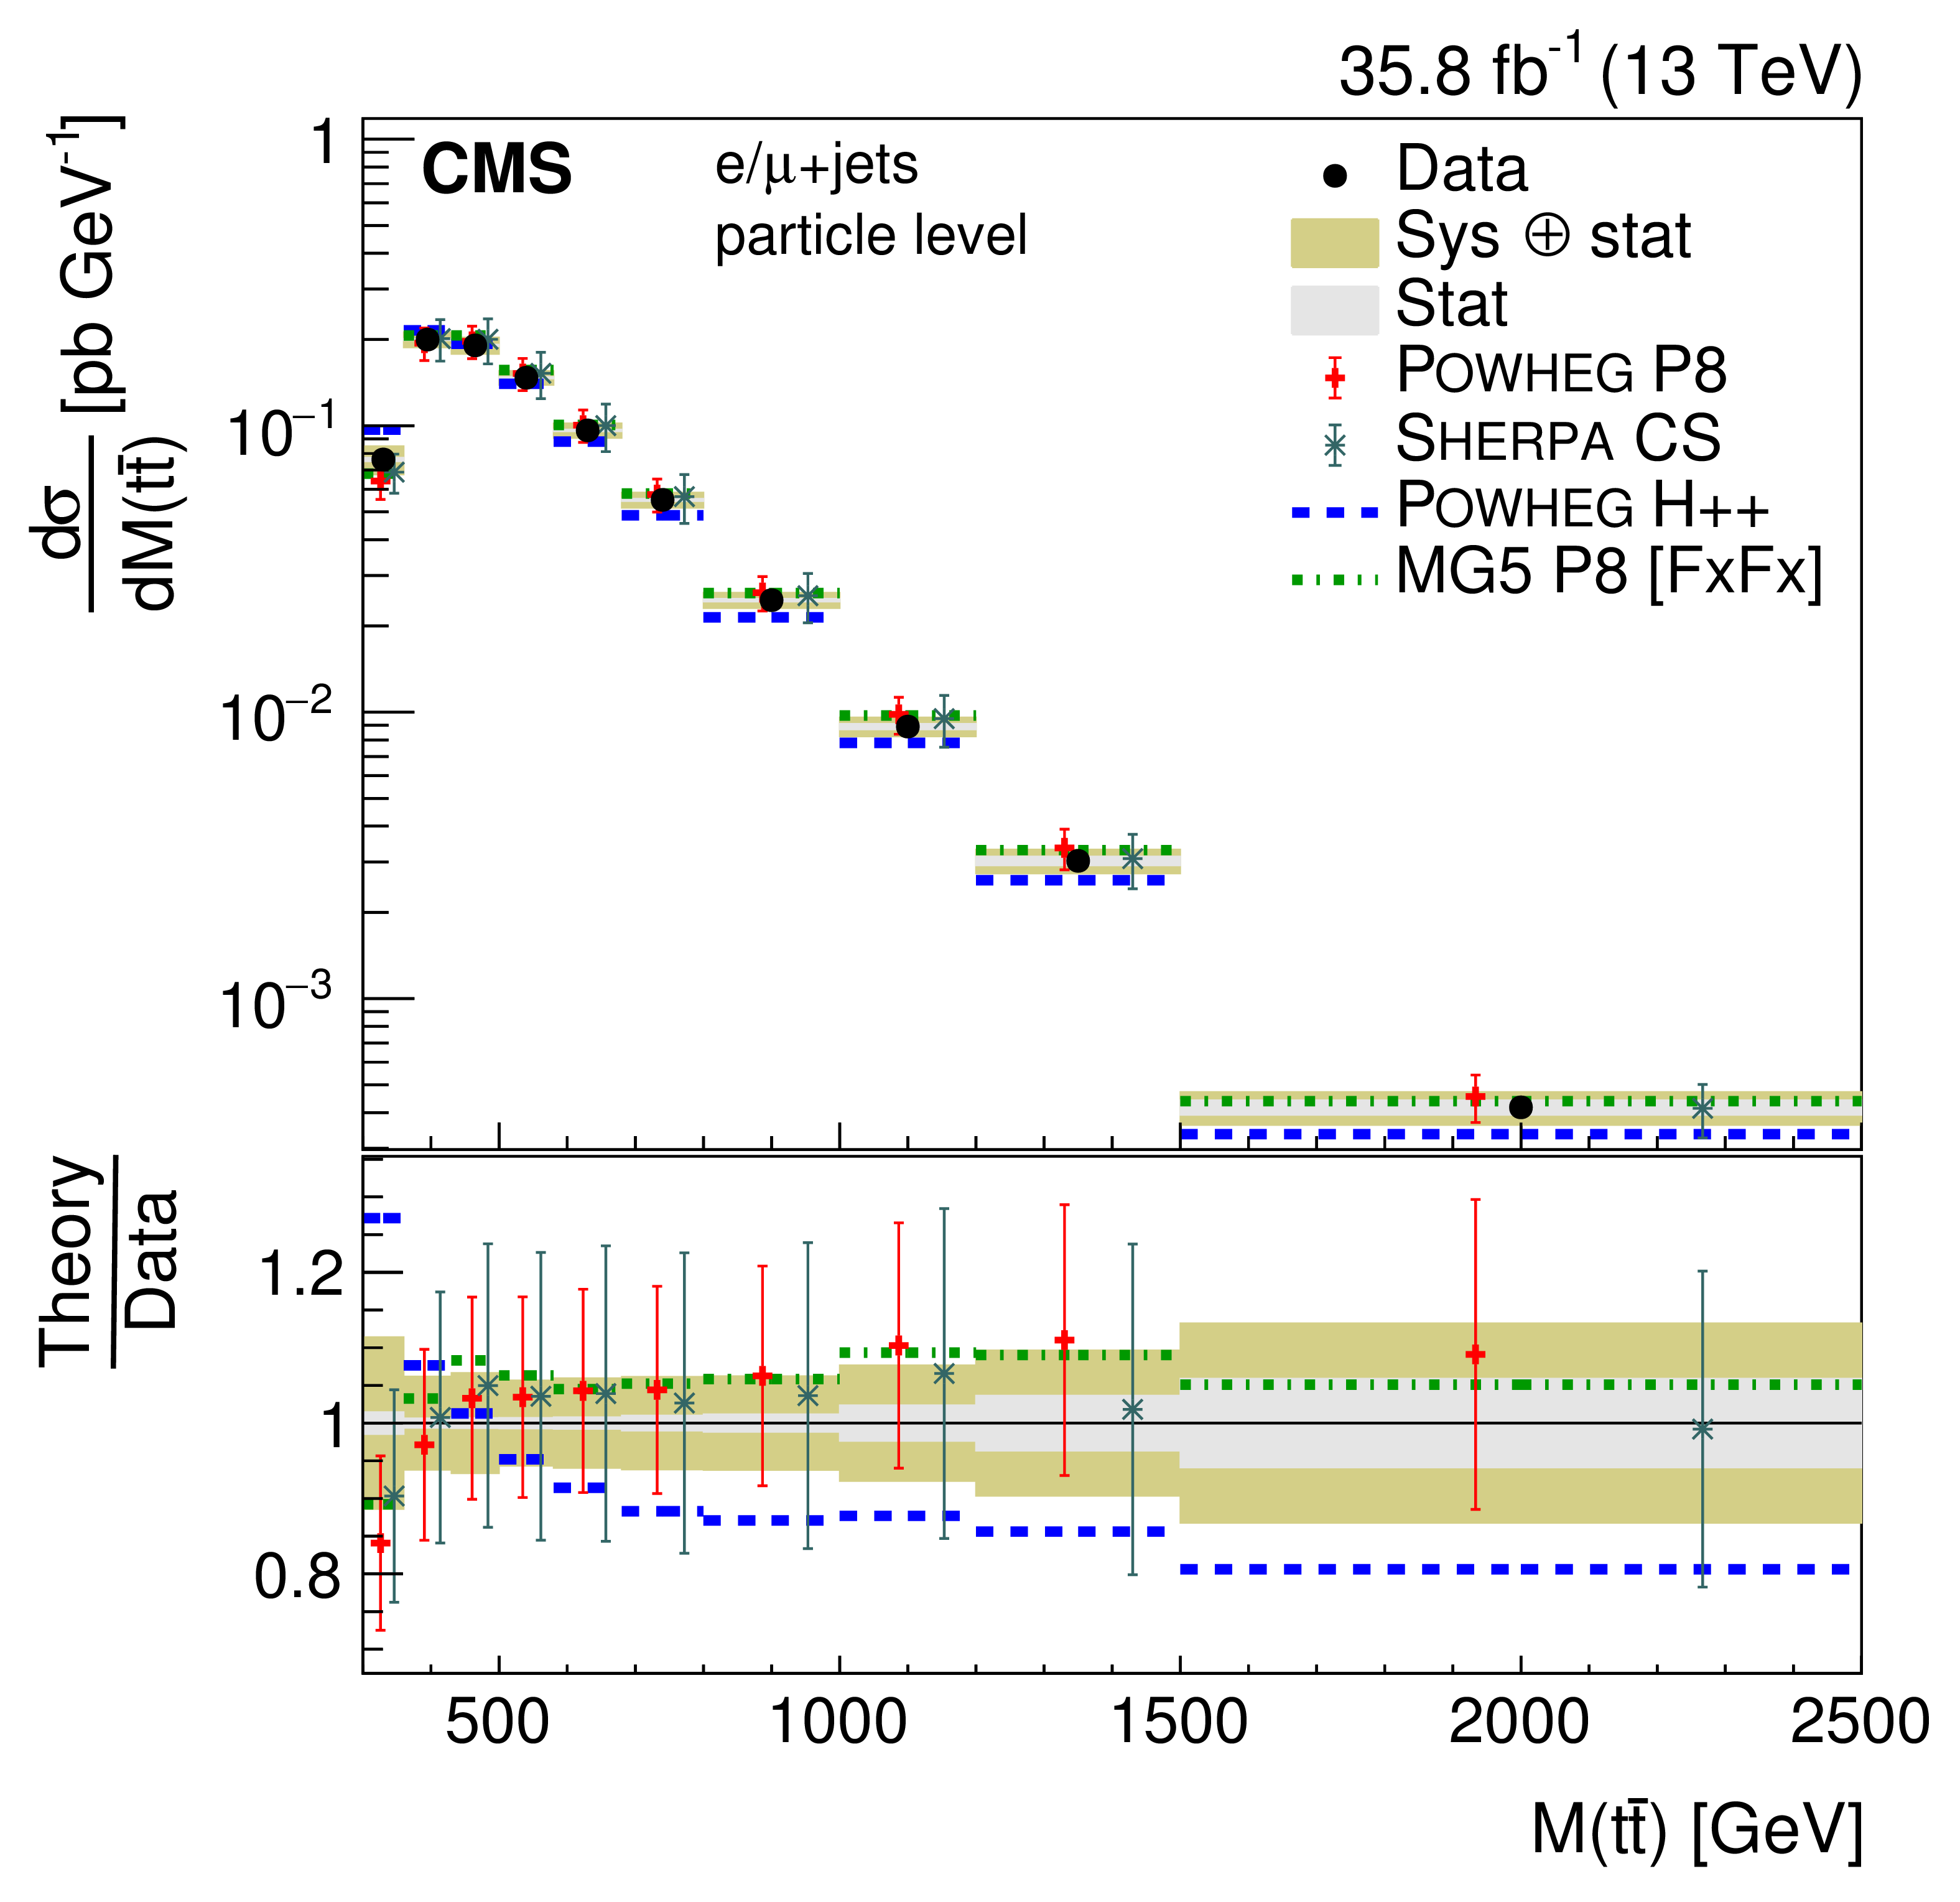
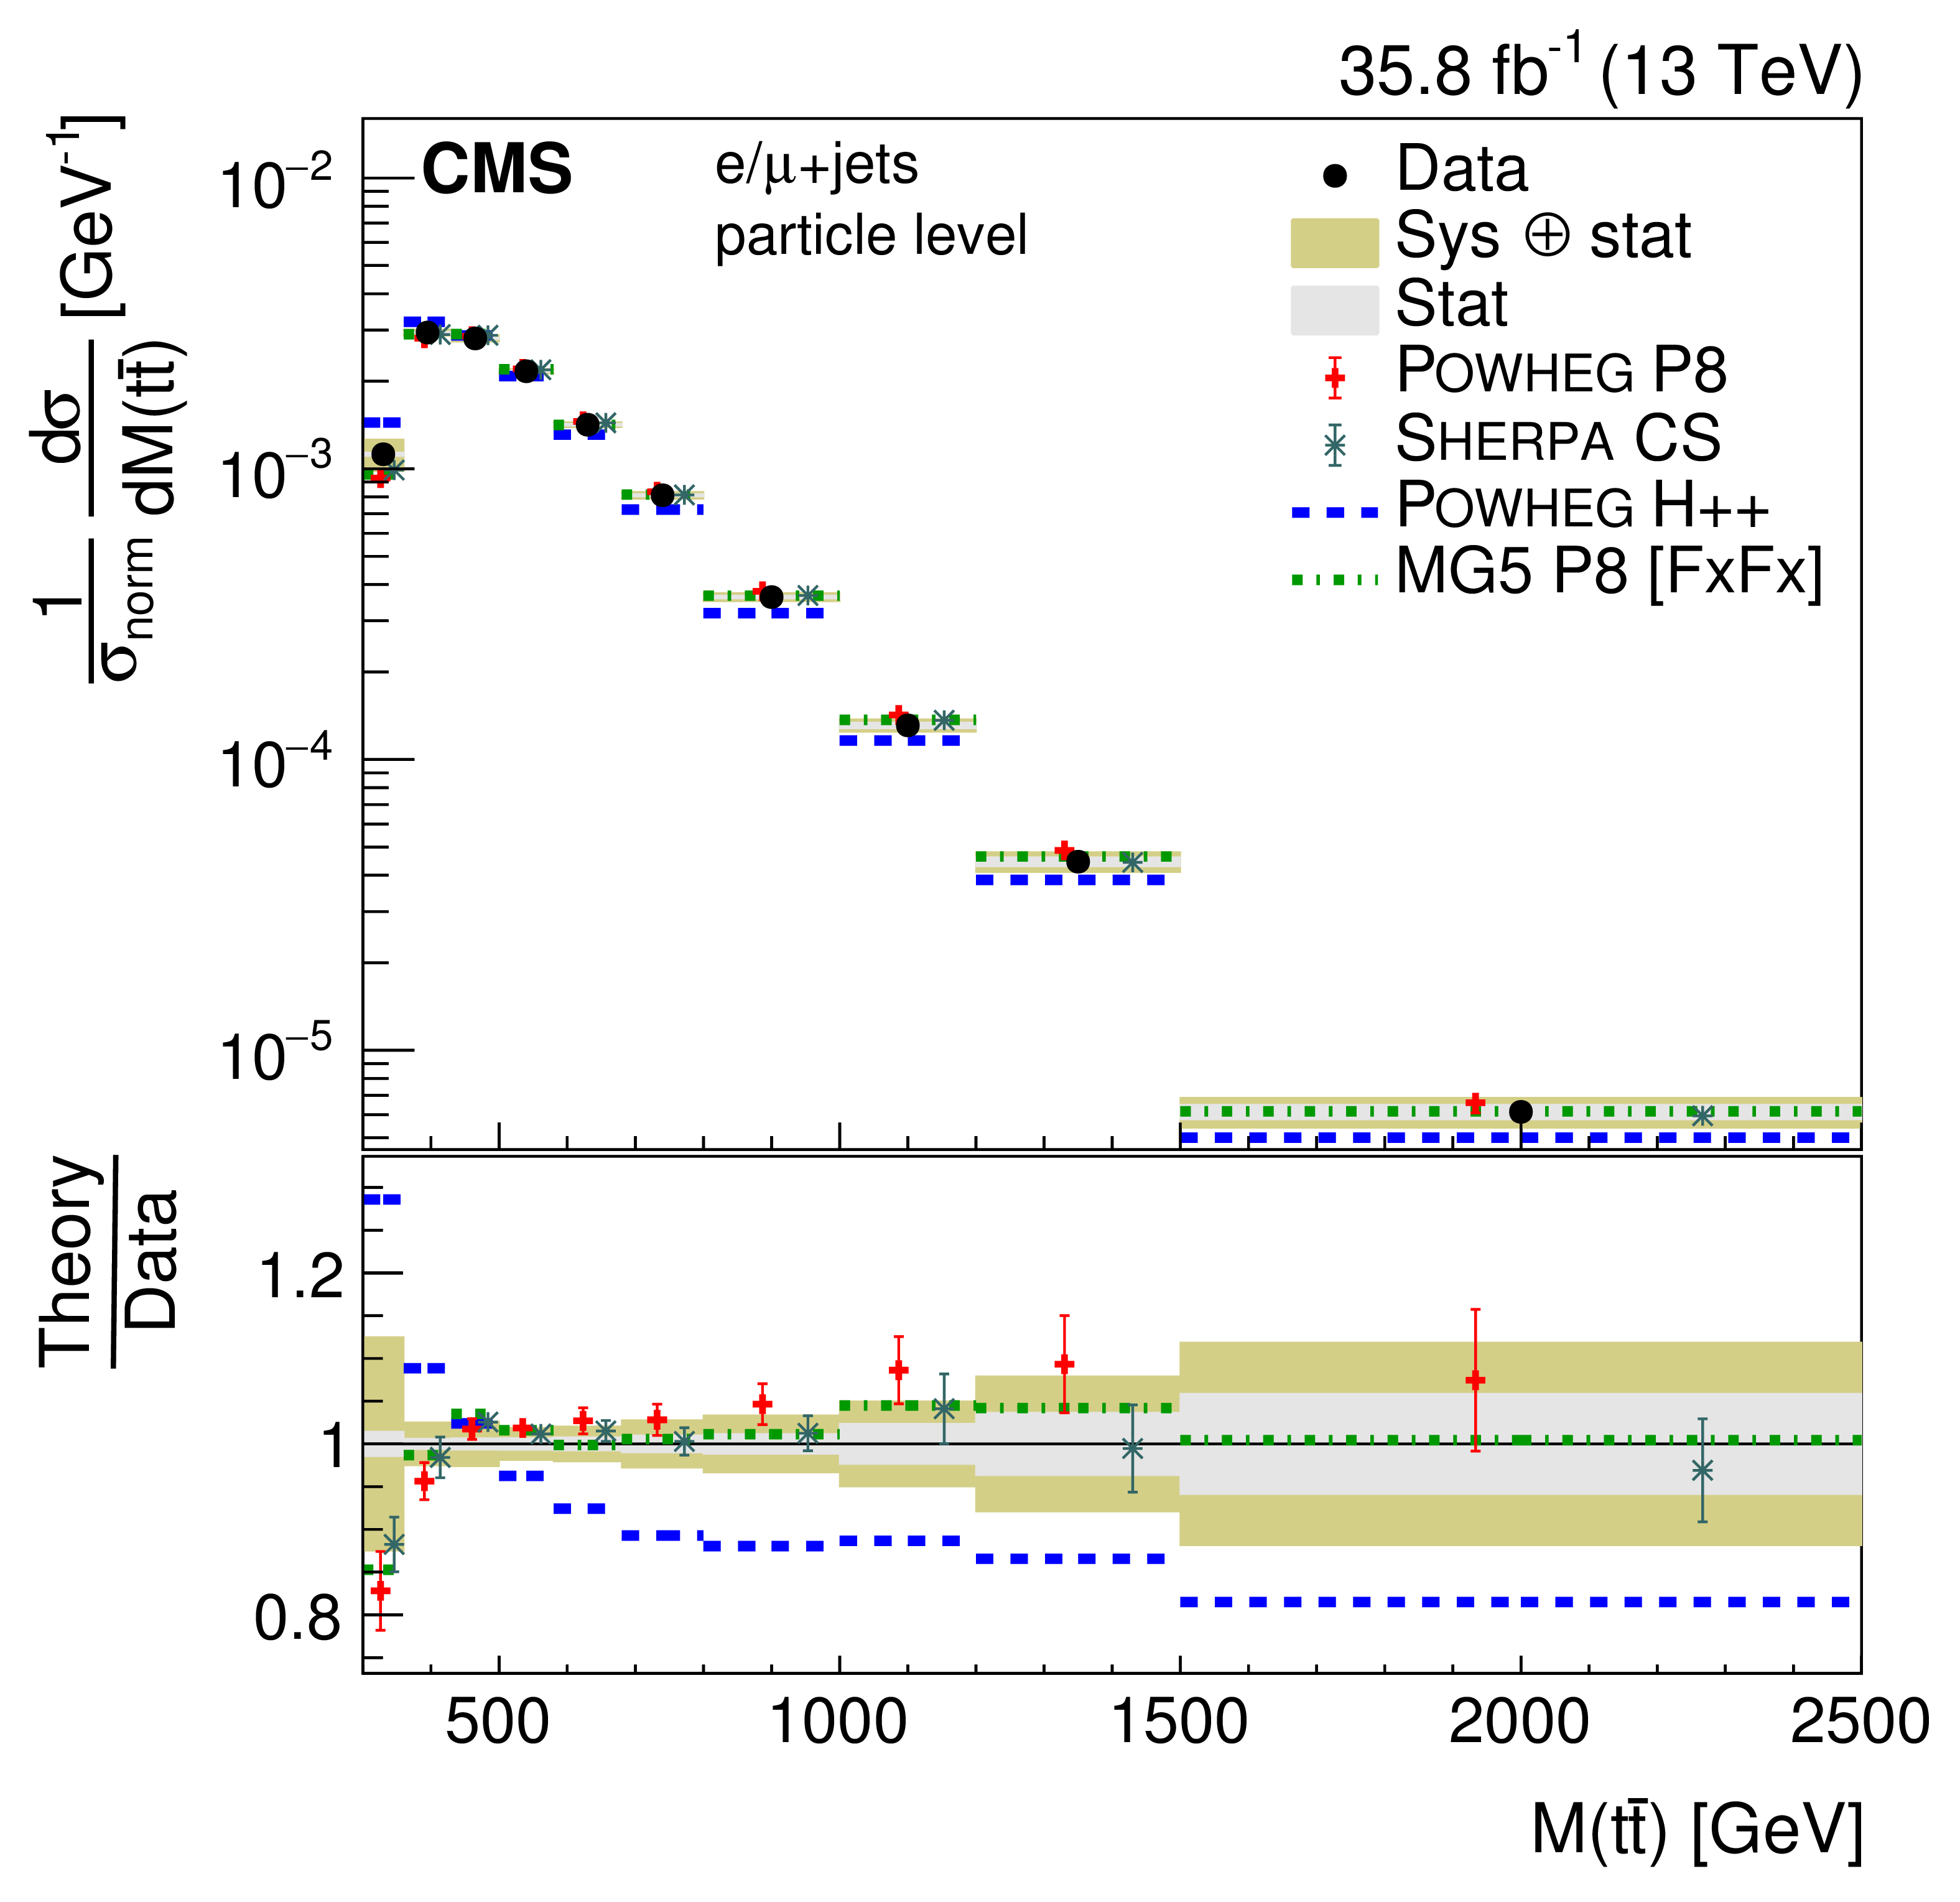
Figure 17:
Absolute (left) and normalized (right) differential cross sections at the particle level as a function of $ {p_{\mathrm {T}}} ({\mathrm{t} \mathrm{\bar{t}}})$ (upper), $ { | y({\mathrm{t} \mathrm{\bar{t}}}) | }$ (middle), and $M({\mathrm{t} \mathrm{\bar{t}}})$ (lower). The data are shown as points with light (dark) bands indicating the statistical (statistical and systematic) uncertainties. The cross sections are compared to the predictions of POWHEG combined with PYTHIA8 (P8) or HERWIG++ (H++) and the multiparton simulations MG5_aMC@NLO (MG5)+PYTHIA8 FxFx and SHERPA. The ratios of the various predictions to the measured cross sections are shown at the bottom of each panel. |

png pdf |
Figure 17-a:
Absolute (left) and normalized (right) differential cross sections at the particle level as a function of $ {p_{\mathrm {T}}} ({\mathrm{t} \mathrm{\bar{t}}})$ (upper), $ { | y({\mathrm{t} \mathrm{\bar{t}}}) | }$ (middle), and $M({\mathrm{t} \mathrm{\bar{t}}})$ (lower). The data are shown as points with light (dark) bands indicating the statistical (statistical and systematic) uncertainties. The cross sections are compared to the predictions of POWHEG combined with PYTHIA8 (P8) or HERWIG++ (H++) and the multiparton simulations MG5_aMC@NLO (MG5)+PYTHIA8 FxFx and SHERPA. The ratios of the various predictions to the measured cross sections are shown at the bottom of each panel. |

png pdf |
Figure 17-b:
Absolute (left) and normalized (right) differential cross sections at the particle level as a function of $ {p_{\mathrm {T}}} ({\mathrm{t} \mathrm{\bar{t}}})$ (upper), $ { | y({\mathrm{t} \mathrm{\bar{t}}}) | }$ (middle), and $M({\mathrm{t} \mathrm{\bar{t}}})$ (lower). The data are shown as points with light (dark) bands indicating the statistical (statistical and systematic) uncertainties. The cross sections are compared to the predictions of POWHEG combined with PYTHIA8 (P8) or HERWIG++ (H++) and the multiparton simulations MG5_aMC@NLO (MG5)+PYTHIA8 FxFx and SHERPA. The ratios of the various predictions to the measured cross sections are shown at the bottom of each panel. |
png pdf |
Figure 17-c:
Absolute (left) and normalized (right) differential cross sections at the particle level as a function of $ {p_{\mathrm {T}}} ({\mathrm{t} \mathrm{\bar{t}}})$ (upper), $ { | y({\mathrm{t} \mathrm{\bar{t}}}) | }$ (middle), and $M({\mathrm{t} \mathrm{\bar{t}}})$ (lower). The data are shown as points with light (dark) bands indicating the statistical (statistical and systematic) uncertainties. The cross sections are compared to the predictions of POWHEG combined with PYTHIA8 (P8) or HERWIG++ (H++) and the multiparton simulations MG5_aMC@NLO (MG5)+PYTHIA8 FxFx and SHERPA. The ratios of the various predictions to the measured cross sections are shown at the bottom of each panel. |
png pdf |
Figure 17-d:
Absolute (left) and normalized (right) differential cross sections at the particle level as a function of $ {p_{\mathrm {T}}} ({\mathrm{t} \mathrm{\bar{t}}})$ (upper), $ { | y({\mathrm{t} \mathrm{\bar{t}}}) | }$ (middle), and $M({\mathrm{t} \mathrm{\bar{t}}})$ (lower). The data are shown as points with light (dark) bands indicating the statistical (statistical and systematic) uncertainties. The cross sections are compared to the predictions of POWHEG combined with PYTHIA8 (P8) or HERWIG++ (H++) and the multiparton simulations MG5_aMC@NLO (MG5)+PYTHIA8 FxFx and SHERPA. The ratios of the various predictions to the measured cross sections are shown at the bottom of each panel. |
png pdf |
Figure 17-e:
Absolute (left) and normalized (right) differential cross sections at the particle level as a function of $ {p_{\mathrm {T}}} ({\mathrm{t} \mathrm{\bar{t}}})$ (upper), $ { | y({\mathrm{t} \mathrm{\bar{t}}}) | }$ (middle), and $M({\mathrm{t} \mathrm{\bar{t}}})$ (lower). The data are shown as points with light (dark) bands indicating the statistical (statistical and systematic) uncertainties. The cross sections are compared to the predictions of POWHEG combined with PYTHIA8 (P8) or HERWIG++ (H++) and the multiparton simulations MG5_aMC@NLO (MG5)+PYTHIA8 FxFx and SHERPA. The ratios of the various predictions to the measured cross sections are shown at the bottom of each panel. |
png pdf |
Figure 17-f:
Absolute (left) and normalized (right) differential cross sections at the particle level as a function of $ {p_{\mathrm {T}}} ({\mathrm{t} \mathrm{\bar{t}}})$ (upper), $ { | y({\mathrm{t} \mathrm{\bar{t}}}) | }$ (middle), and $M({\mathrm{t} \mathrm{\bar{t}}})$ (lower). The data are shown as points with light (dark) bands indicating the statistical (statistical and systematic) uncertainties. The cross sections are compared to the predictions of POWHEG combined with PYTHIA8 (P8) or HERWIG++ (H++) and the multiparton simulations MG5_aMC@NLO (MG5)+PYTHIA8 FxFx and SHERPA. The ratios of the various predictions to the measured cross sections are shown at the bottom of each panel. |
png pdf |
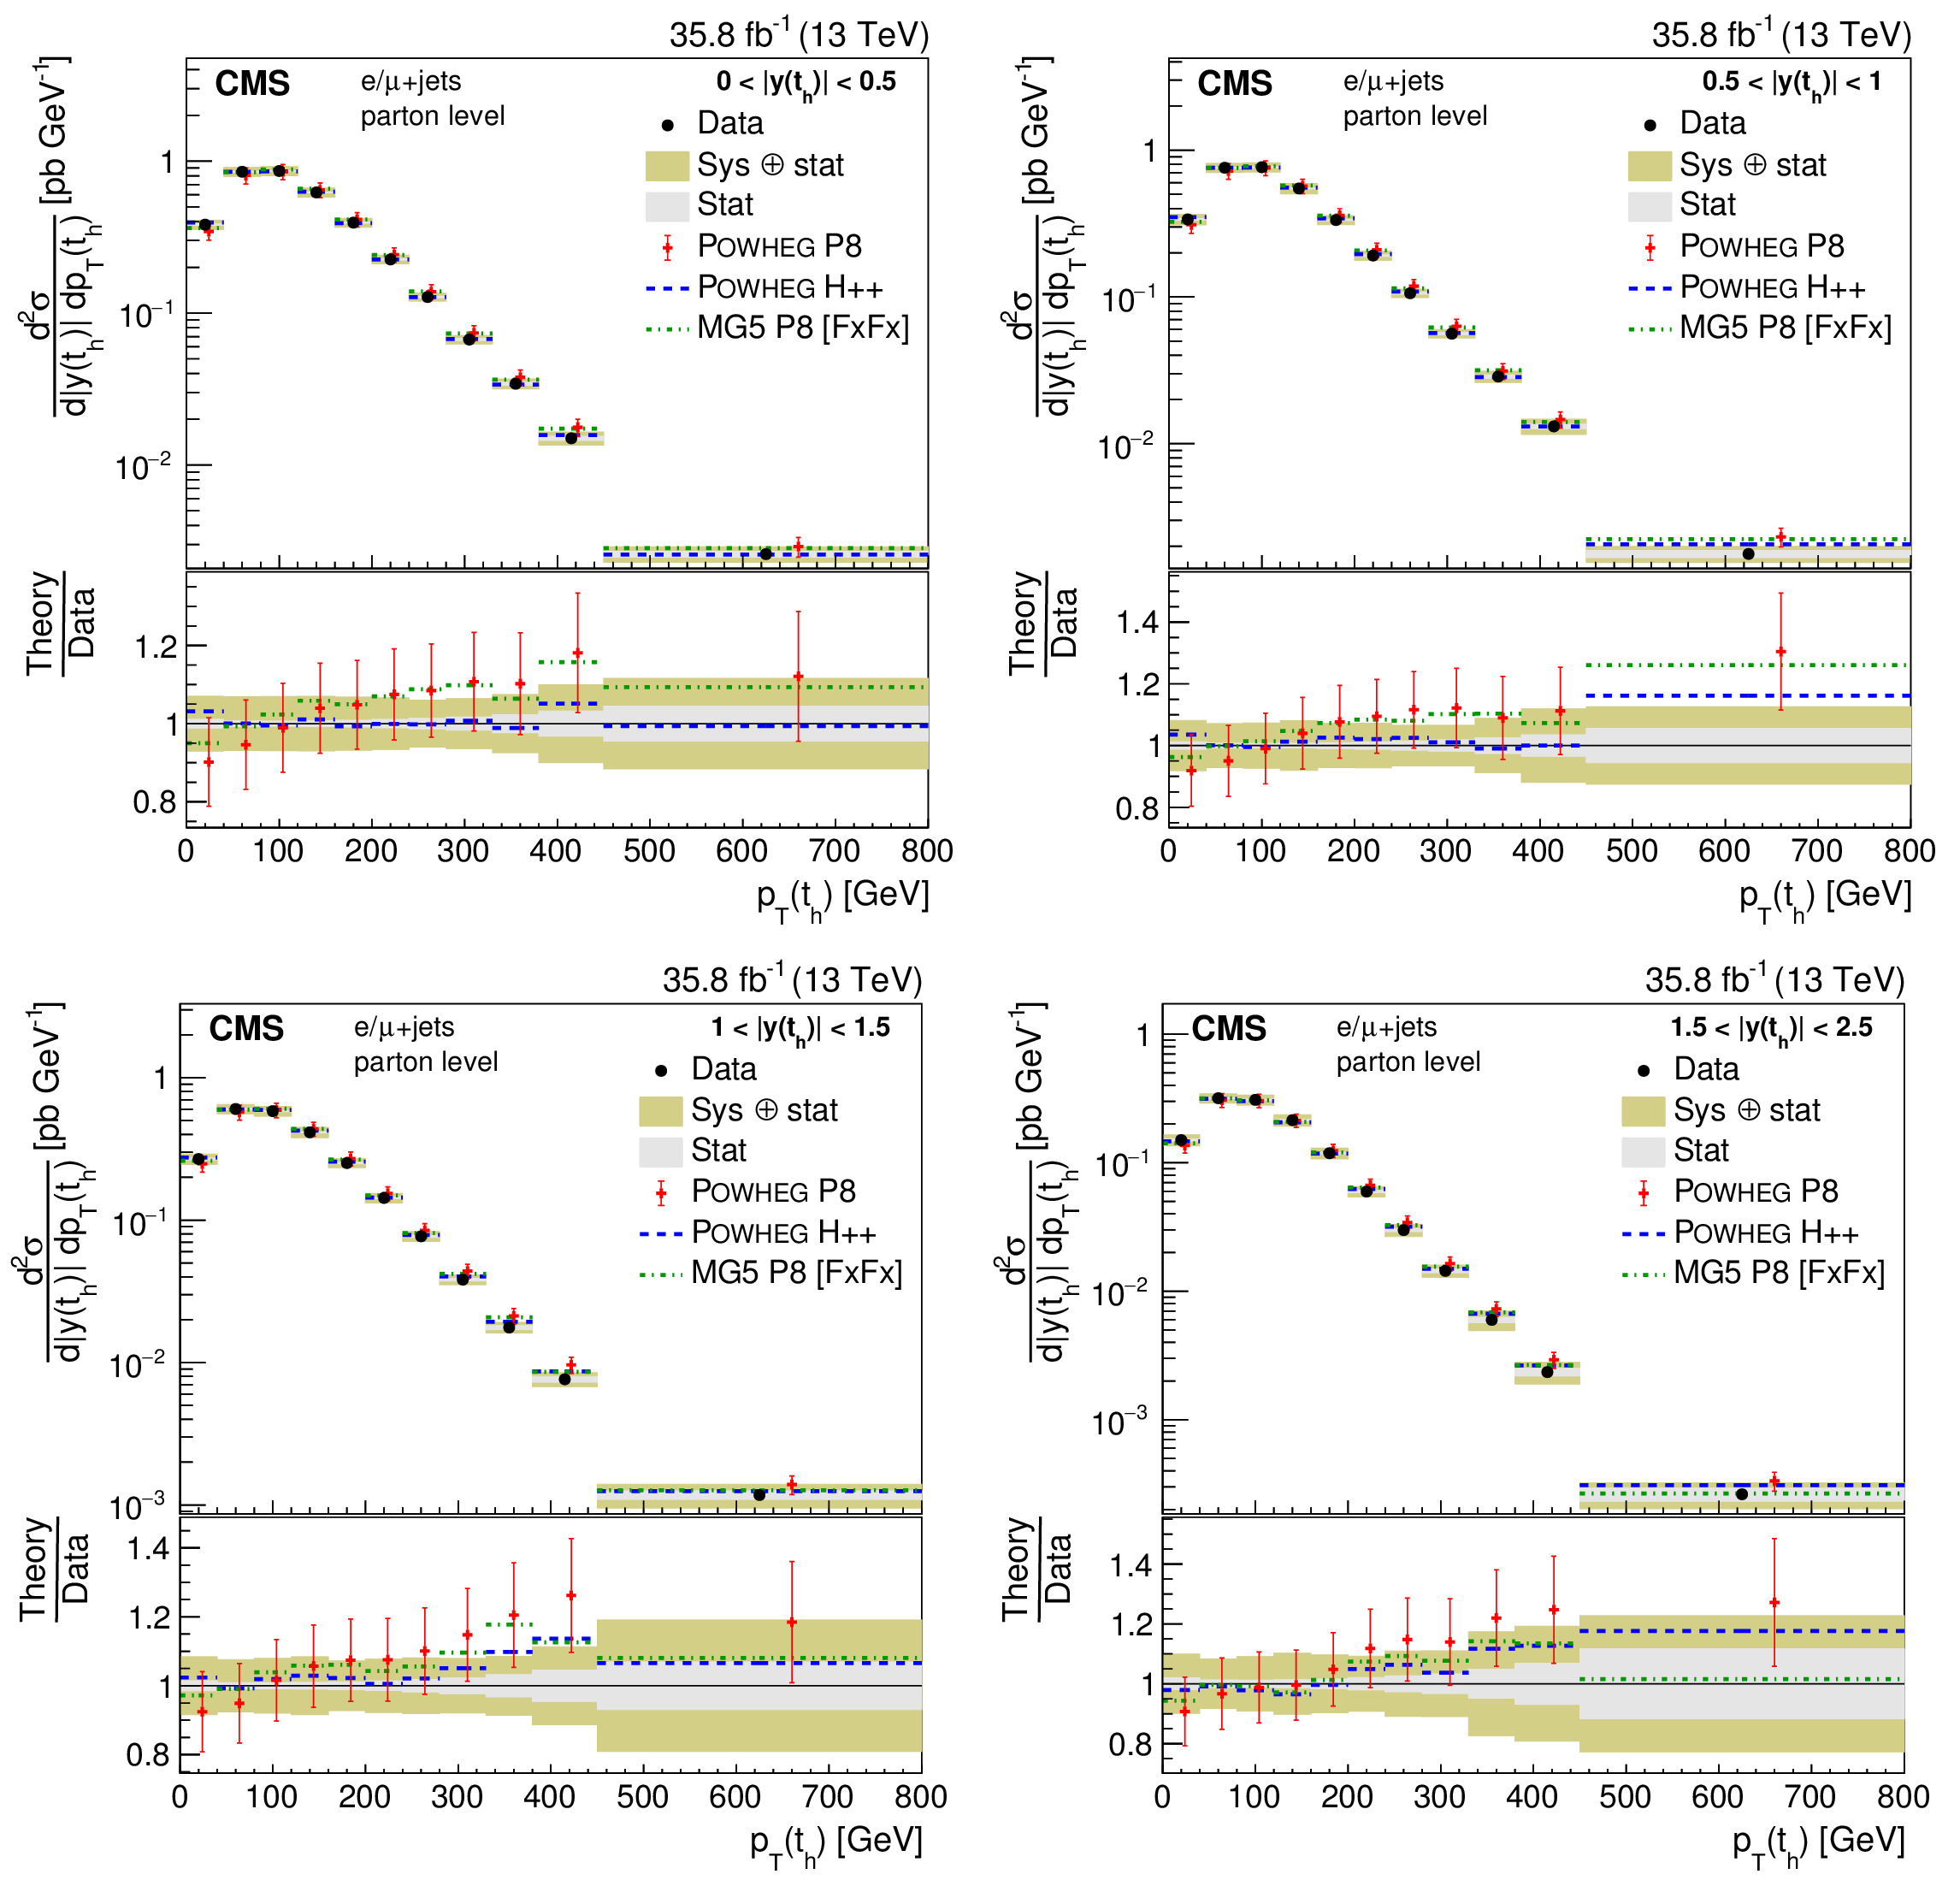
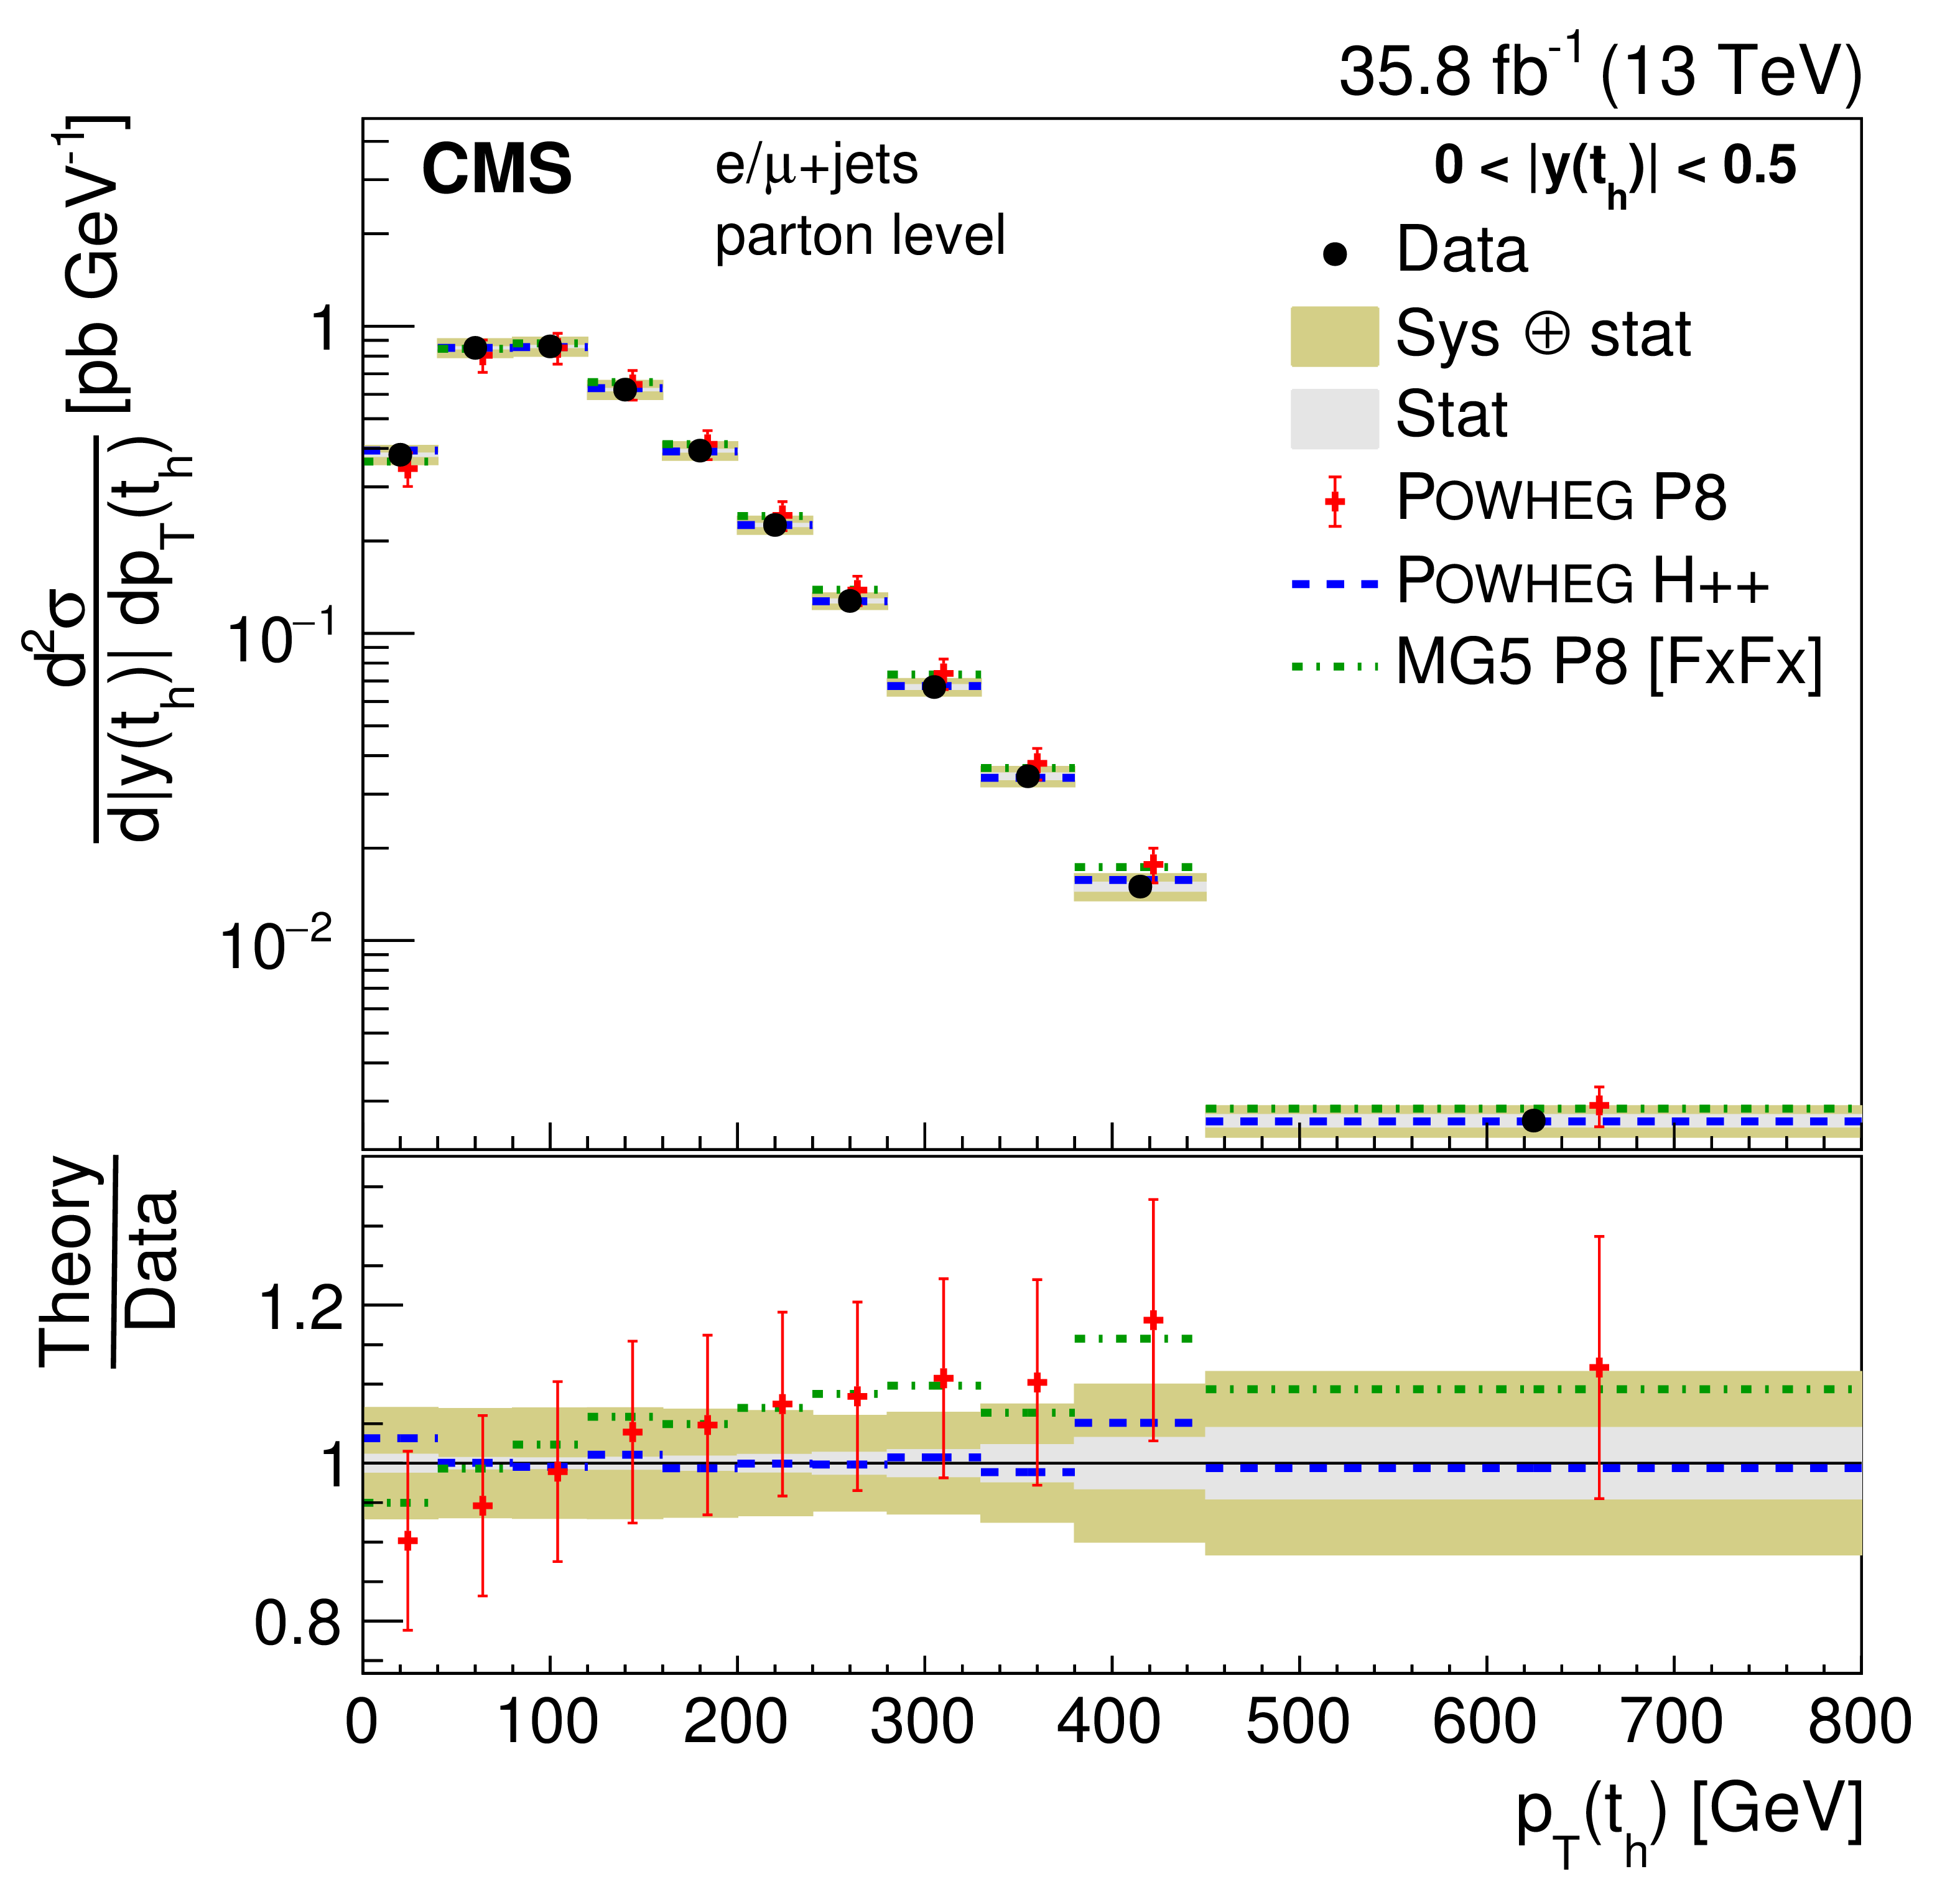
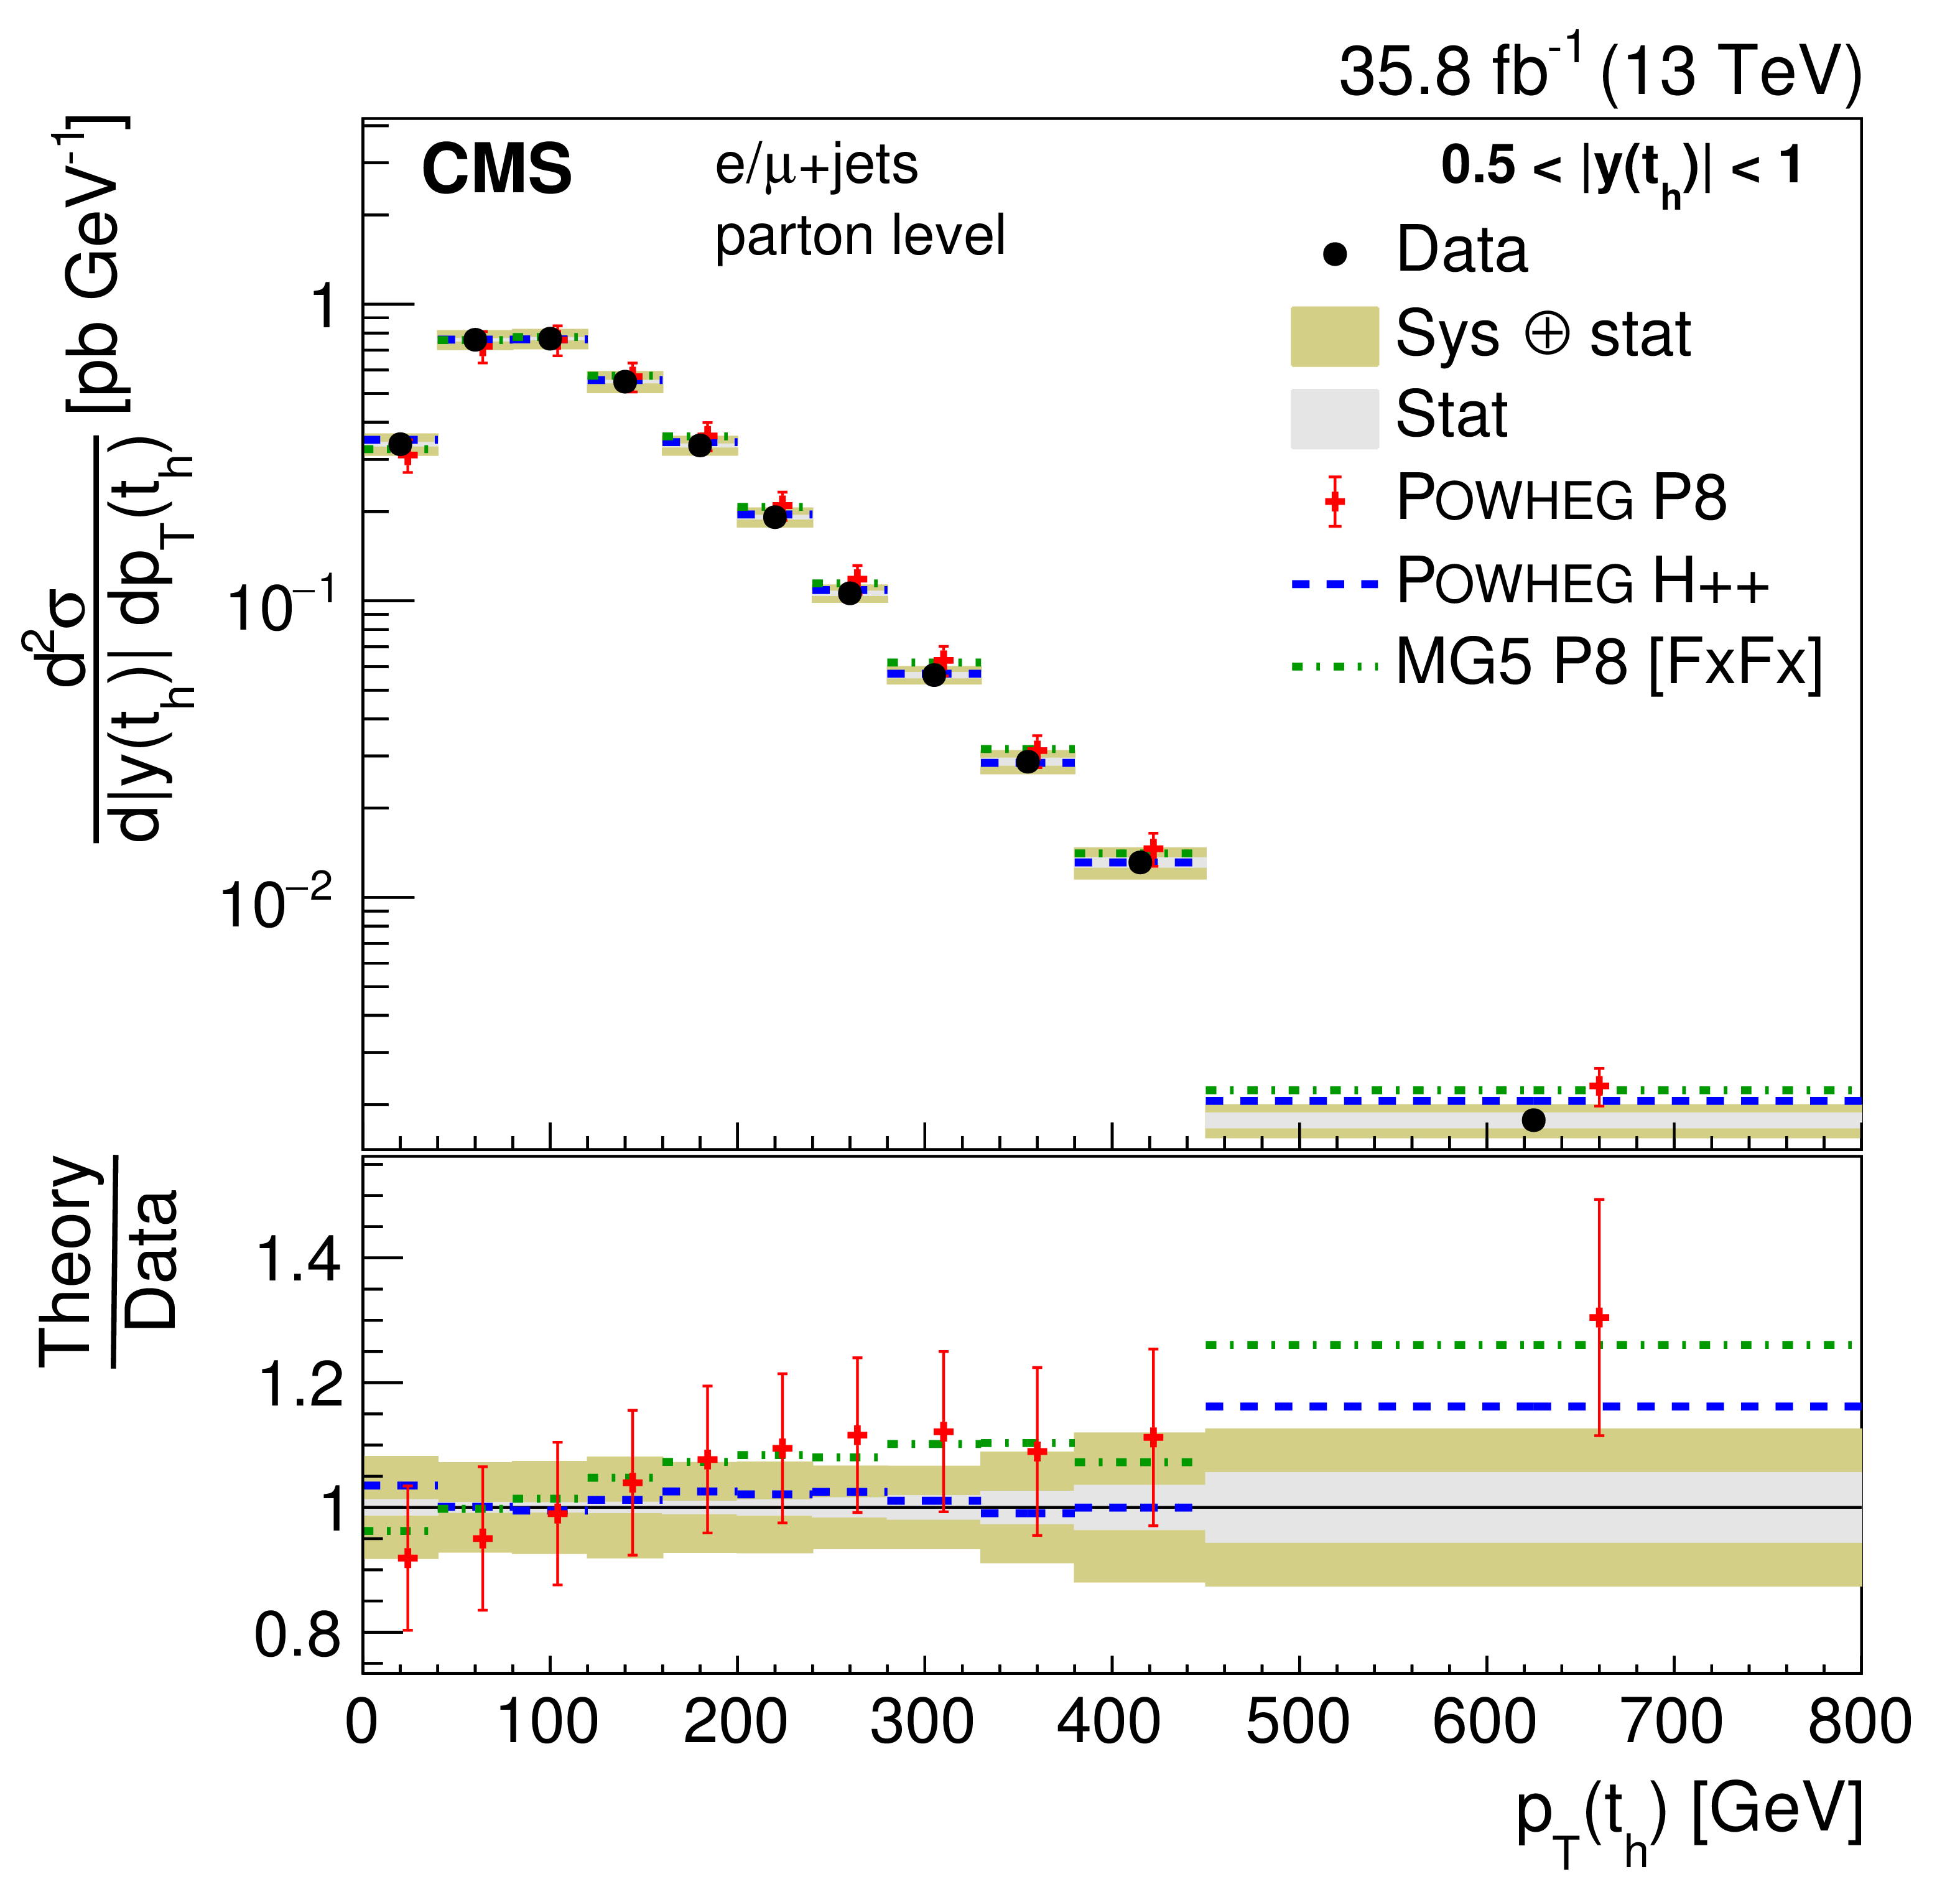
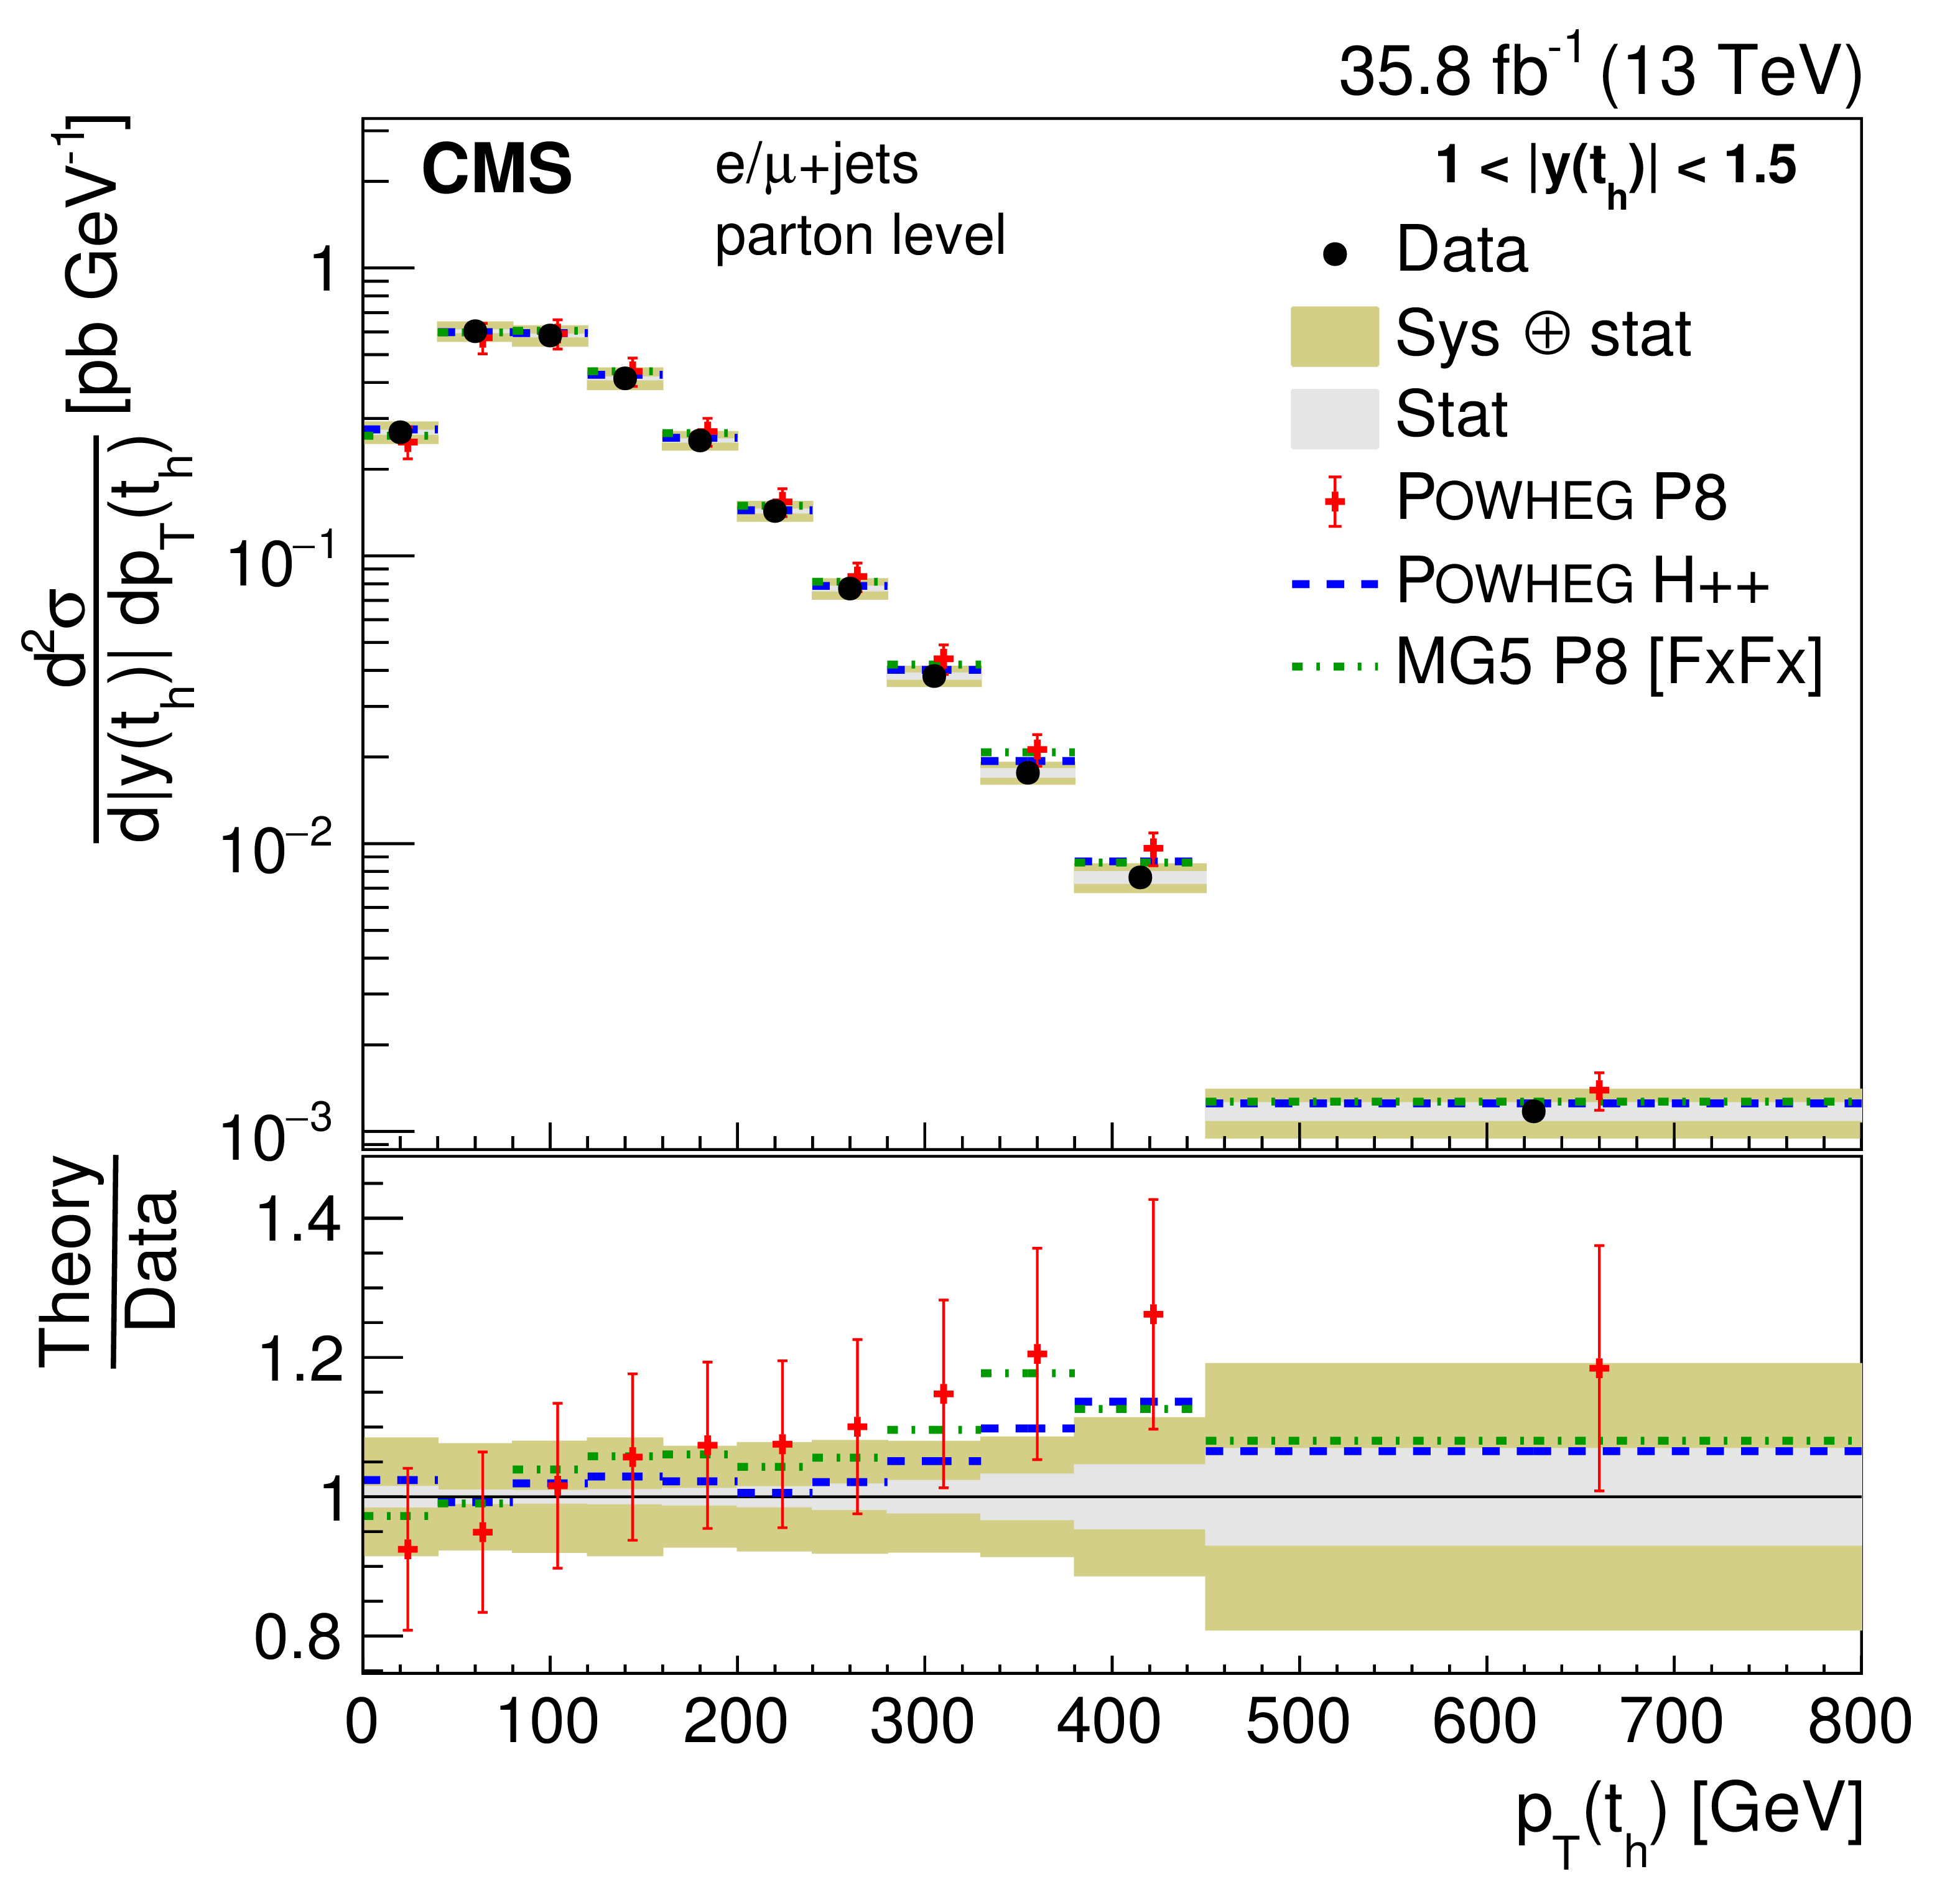
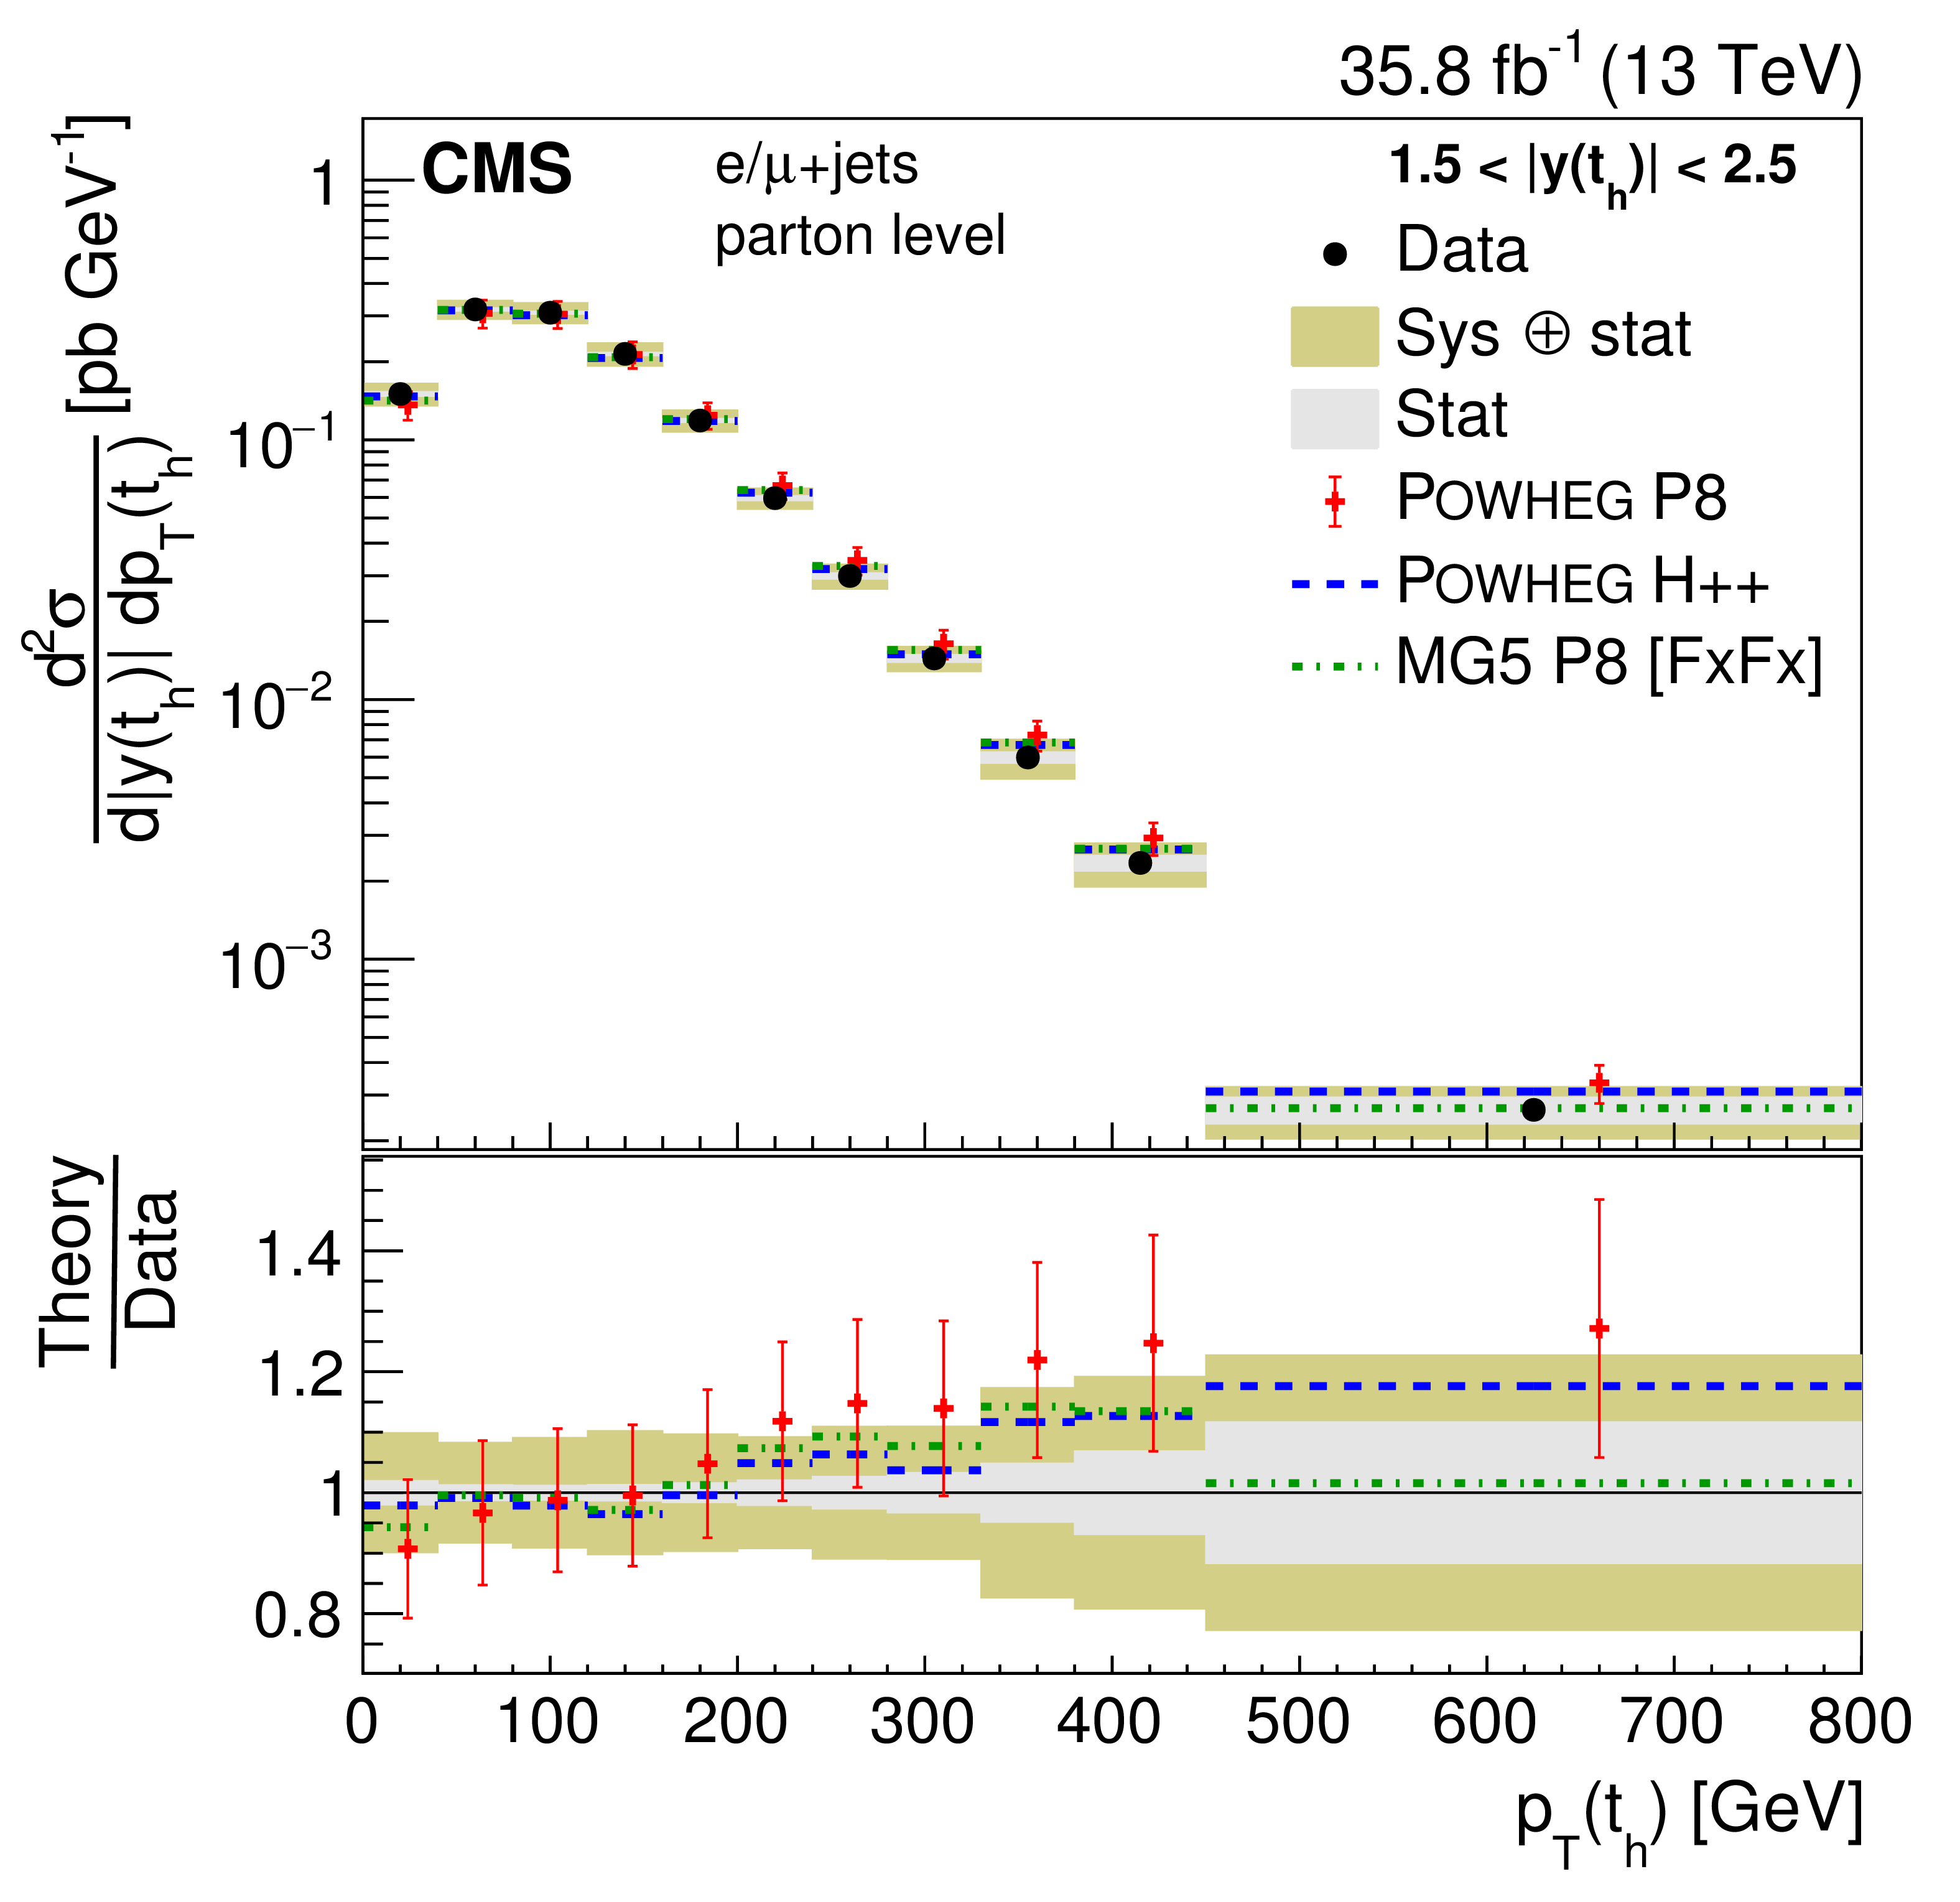
Figure 18:
Double-differential cross section at the parton level as a function of $ { | y({\mathrm{t} _\mathrm {h}}) | }$ vs. $ {p_{\mathrm {T}}} ({\mathrm{t} _\mathrm {h}})$. The data are shown as points with light (dark) bands indicating the statistical (statistical and systematic) uncertainties. The cross sections are compared to the predictions of POWHEG combined with PYTHIA8 (P8) or HERWIG++ (H++), and the multiparton simulation MG5_aMC@NLO (MG5)+PYTHIA8 FxFx. The ratios of the various predictions to the measured cross sections are shown at the bottom of each panel. |
png pdf |
Figure 18-a:
Double-differential cross section at the parton level as a function of $ { | y({\mathrm{t} _\mathrm {h}}) | }$ vs. $ {p_{\mathrm {T}}} ({\mathrm{t} _\mathrm {h}})$. The data are shown as points with light (dark) bands indicating the statistical (statistical and systematic) uncertainties. The cross sections are compared to the predictions of POWHEG combined with PYTHIA8 (P8) or HERWIG++ (H++), and the multiparton simulation MG5_aMC@NLO (MG5)+PYTHIA8 FxFx. The ratios of the various predictions to the measured cross sections are shown at the bottom of each panel. |
png pdf |
Figure 18-b:
Double-differential cross section at the parton level as a function of $ { | y({\mathrm{t} _\mathrm {h}}) | }$ vs. $ {p_{\mathrm {T}}} ({\mathrm{t} _\mathrm {h}})$. The data are shown as points with light (dark) bands indicating the statistical (statistical and systematic) uncertainties. The cross sections are compared to the predictions of POWHEG combined with PYTHIA8 (P8) or HERWIG++ (H++), and the multiparton simulation MG5_aMC@NLO (MG5)+PYTHIA8 FxFx. The ratios of the various predictions to the measured cross sections are shown at the bottom of each panel. |
png pdf |
Figure 18-c:
Double-differential cross section at the parton level as a function of $ { | y({\mathrm{t} _\mathrm {h}}) | }$ vs. $ {p_{\mathrm {T}}} ({\mathrm{t} _\mathrm {h}})$. The data are shown as points with light (dark) bands indicating the statistical (statistical and systematic) uncertainties. The cross sections are compared to the predictions of POWHEG combined with PYTHIA8 (P8) or HERWIG++ (H++), and the multiparton simulation MG5_aMC@NLO (MG5)+PYTHIA8 FxFx. The ratios of the various predictions to the measured cross sections are shown at the bottom of each panel. |
png pdf |
Figure 18-d:
Double-differential cross section at the parton level as a function of $ { | y({\mathrm{t} _\mathrm {h}}) | }$ vs. $ {p_{\mathrm {T}}} ({\mathrm{t} _\mathrm {h}})$. The data are shown as points with light (dark) bands indicating the statistical (statistical and systematic) uncertainties. The cross sections are compared to the predictions of POWHEG combined with PYTHIA8 (P8) or HERWIG++ (H++), and the multiparton simulation MG5_aMC@NLO (MG5)+PYTHIA8 FxFx. The ratios of the various predictions to the measured cross sections are shown at the bottom of each panel. |

png pdf |
Figure 19:
Normalized double-differential cross section at the parton level as a function of $ { | y({\mathrm{t} _\mathrm {h}}) | }$ vs. $ {p_{\mathrm {T}}} ({\mathrm{t} _\mathrm {h}})$. The data are shown as points with light (dark) bands indicating the statistical (statistical and systematic) uncertainties. The cross sections are compared to the predictions of POWHEG combined with PYTHIA8 (P8) or HERWIG++ (H++), and the multiparton simulation MG5_aMC@NLO (MG5)+PYTHIA8 FxFx. The ratios of the various predictions to the measured cross sections are shown at the bottom of each panel. |

png pdf |
Figure 19-a:
Normalized double-differential cross section at the parton level as a function of $ { | y({\mathrm{t} _\mathrm {h}}) | }$ vs. $ {p_{\mathrm {T}}} ({\mathrm{t} _\mathrm {h}})$. The data are shown as points with light (dark) bands indicating the statistical (statistical and systematic) uncertainties. The cross sections are compared to the predictions of POWHEG combined with PYTHIA8 (P8) or HERWIG++ (H++), and the multiparton simulation MG5_aMC@NLO (MG5)+PYTHIA8 FxFx. The ratios of the various predictions to the measured cross sections are shown at the bottom of each panel. |

png pdf |
Figure 19-b:
Normalized double-differential cross section at the parton level as a function of $ { | y({\mathrm{t} _\mathrm {h}}) | }$ vs. $ {p_{\mathrm {T}}} ({\mathrm{t} _\mathrm {h}})$. The data are shown as points with light (dark) bands indicating the statistical (statistical and systematic) uncertainties. The cross sections are compared to the predictions of POWHEG combined with PYTHIA8 (P8) or HERWIG++ (H++), and the multiparton simulation MG5_aMC@NLO (MG5)+PYTHIA8 FxFx. The ratios of the various predictions to the measured cross sections are shown at the bottom of each panel. |
png pdf |
Figure 19-c:
Normalized double-differential cross section at the parton level as a function of $ { | y({\mathrm{t} _\mathrm {h}}) | }$ vs. $ {p_{\mathrm {T}}} ({\mathrm{t} _\mathrm {h}})$. The data are shown as points with light (dark) bands indicating the statistical (statistical and systematic) uncertainties. The cross sections are compared to the predictions of POWHEG combined with PYTHIA8 (P8) or HERWIG++ (H++), and the multiparton simulation MG5_aMC@NLO (MG5)+PYTHIA8 FxFx. The ratios of the various predictions to the measured cross sections are shown at the bottom of each panel. |
png pdf |
Figure 19-d:
Normalized double-differential cross section at the parton level as a function of $ { | y({\mathrm{t} _\mathrm {h}}) | }$ vs. $ {p_{\mathrm {T}}} ({\mathrm{t} _\mathrm {h}})$. The data are shown as points with light (dark) bands indicating the statistical (statistical and systematic) uncertainties. The cross sections are compared to the predictions of POWHEG combined with PYTHIA8 (P8) or HERWIG++ (H++), and the multiparton simulation MG5_aMC@NLO (MG5)+PYTHIA8 FxFx. The ratios of the various predictions to the measured cross sections are shown at the bottom of each panel. |

png pdf |
Figure 20:
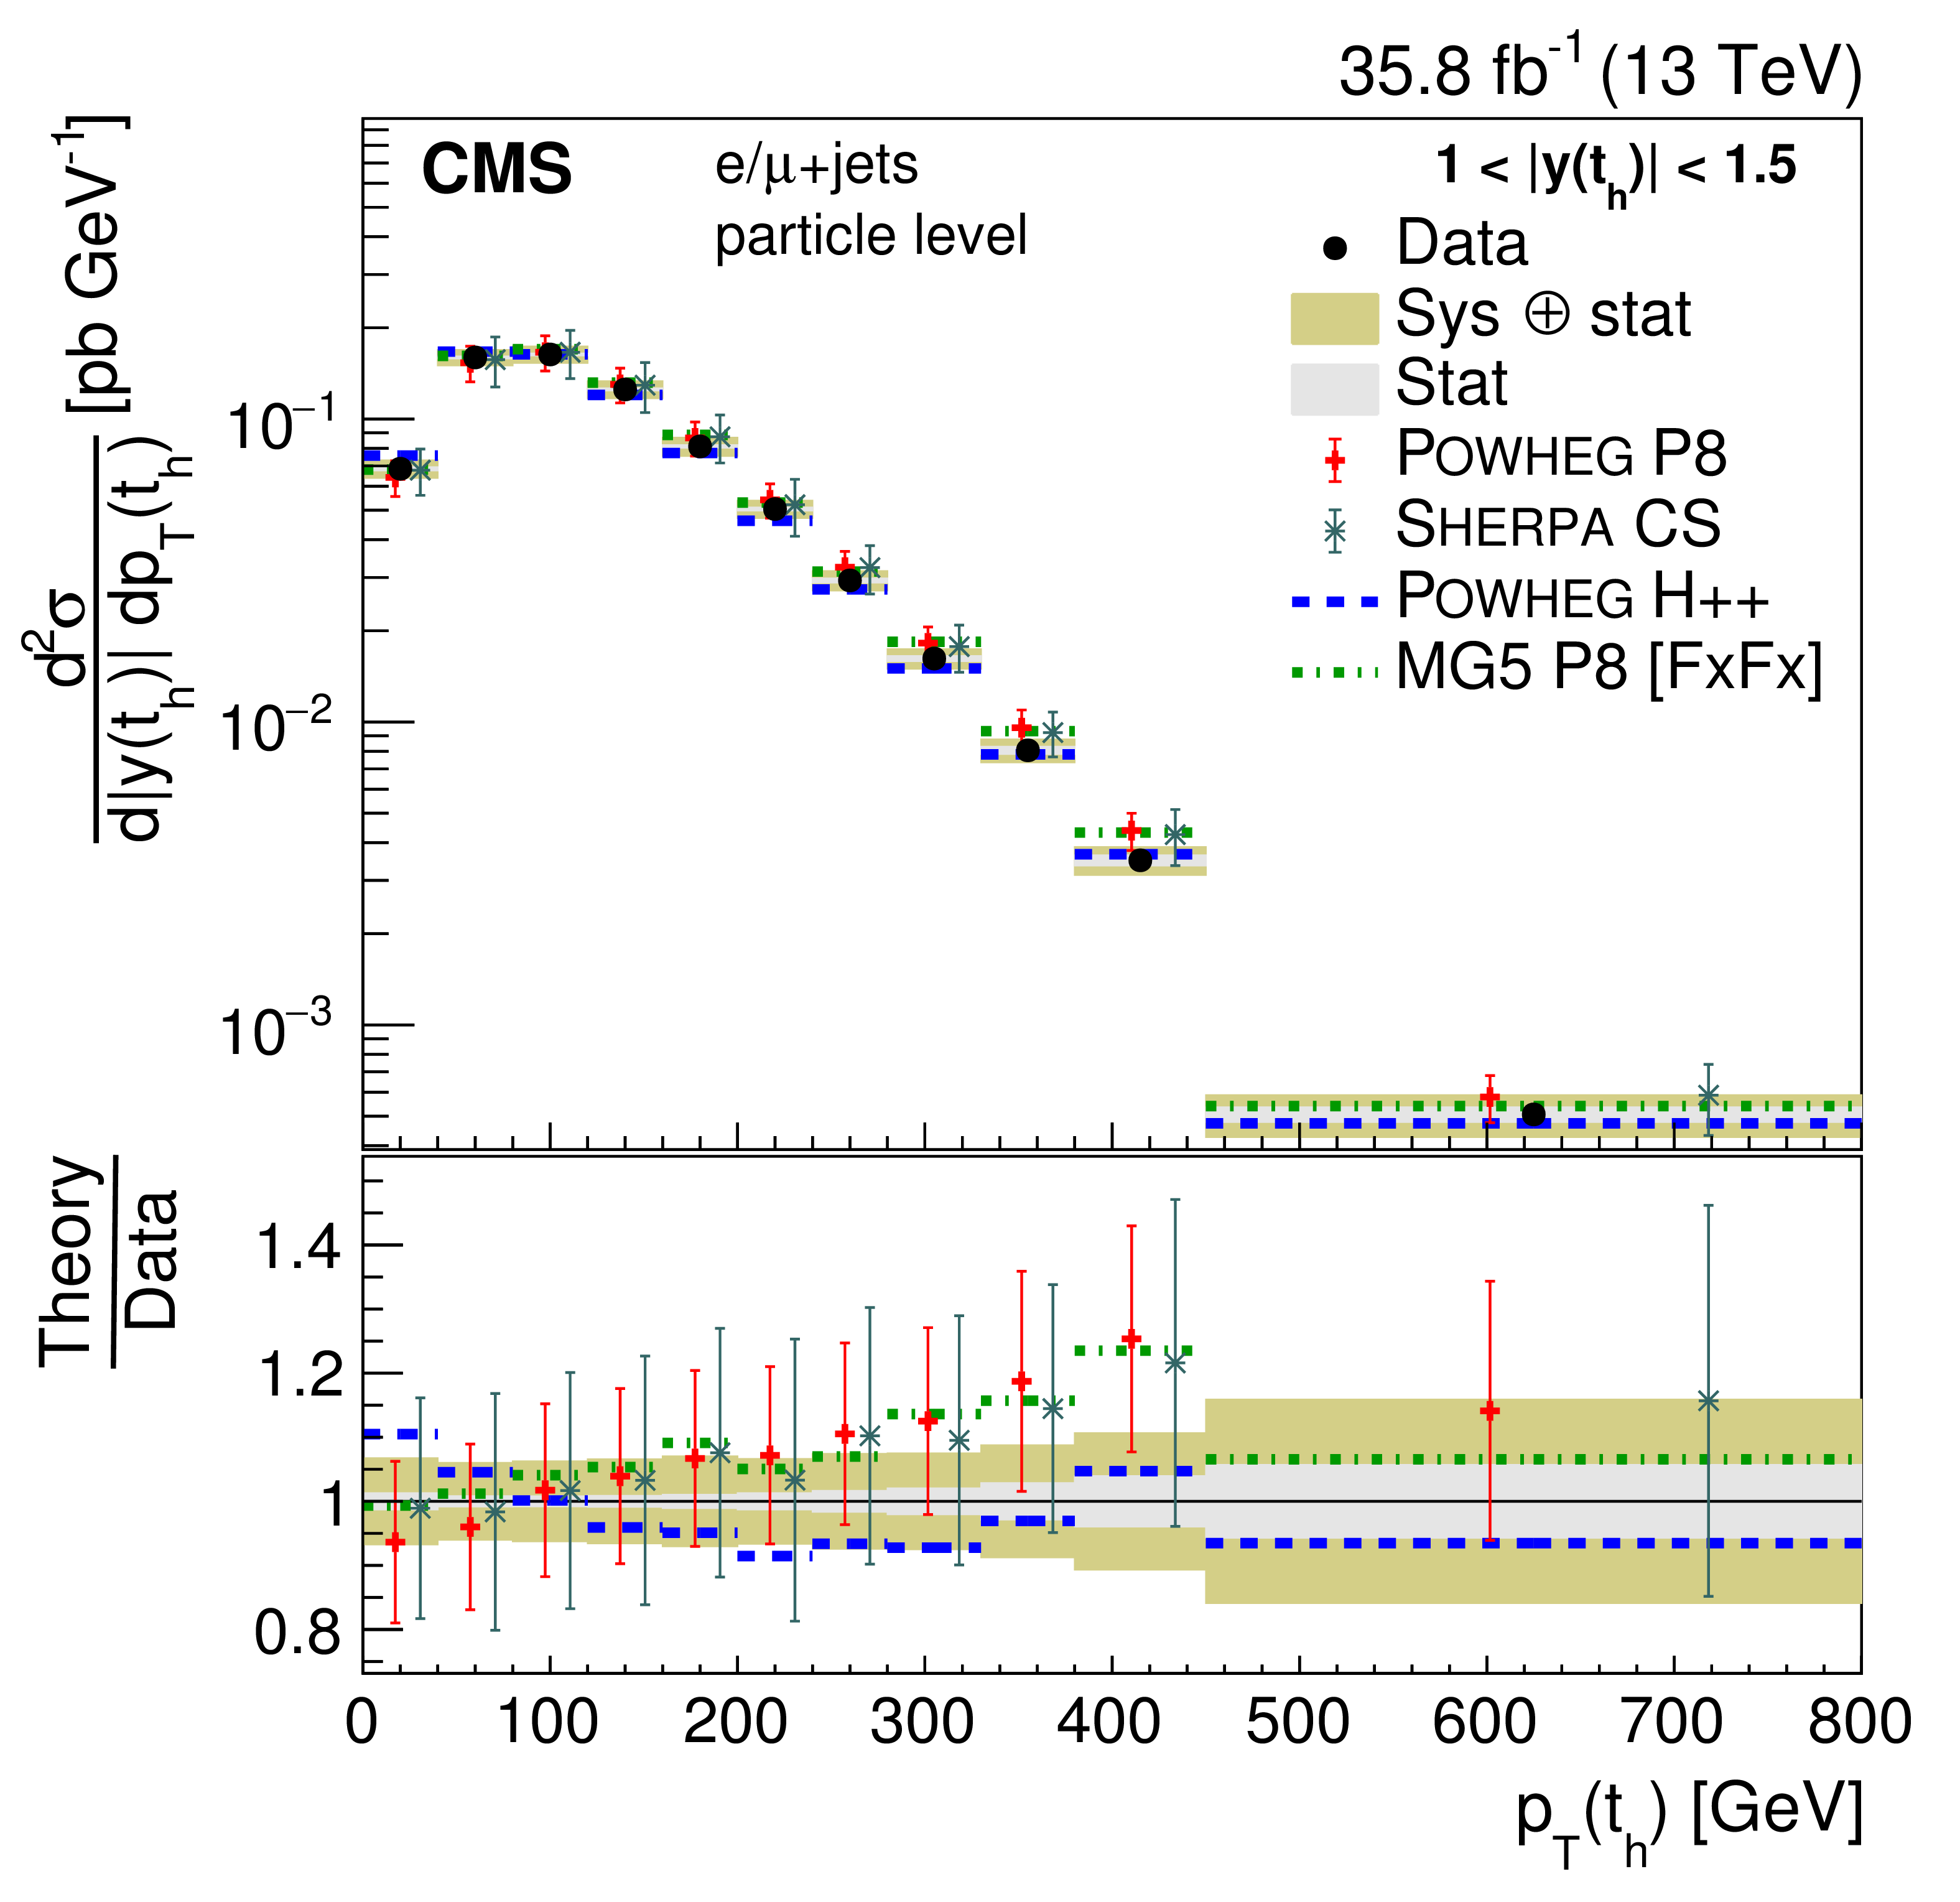
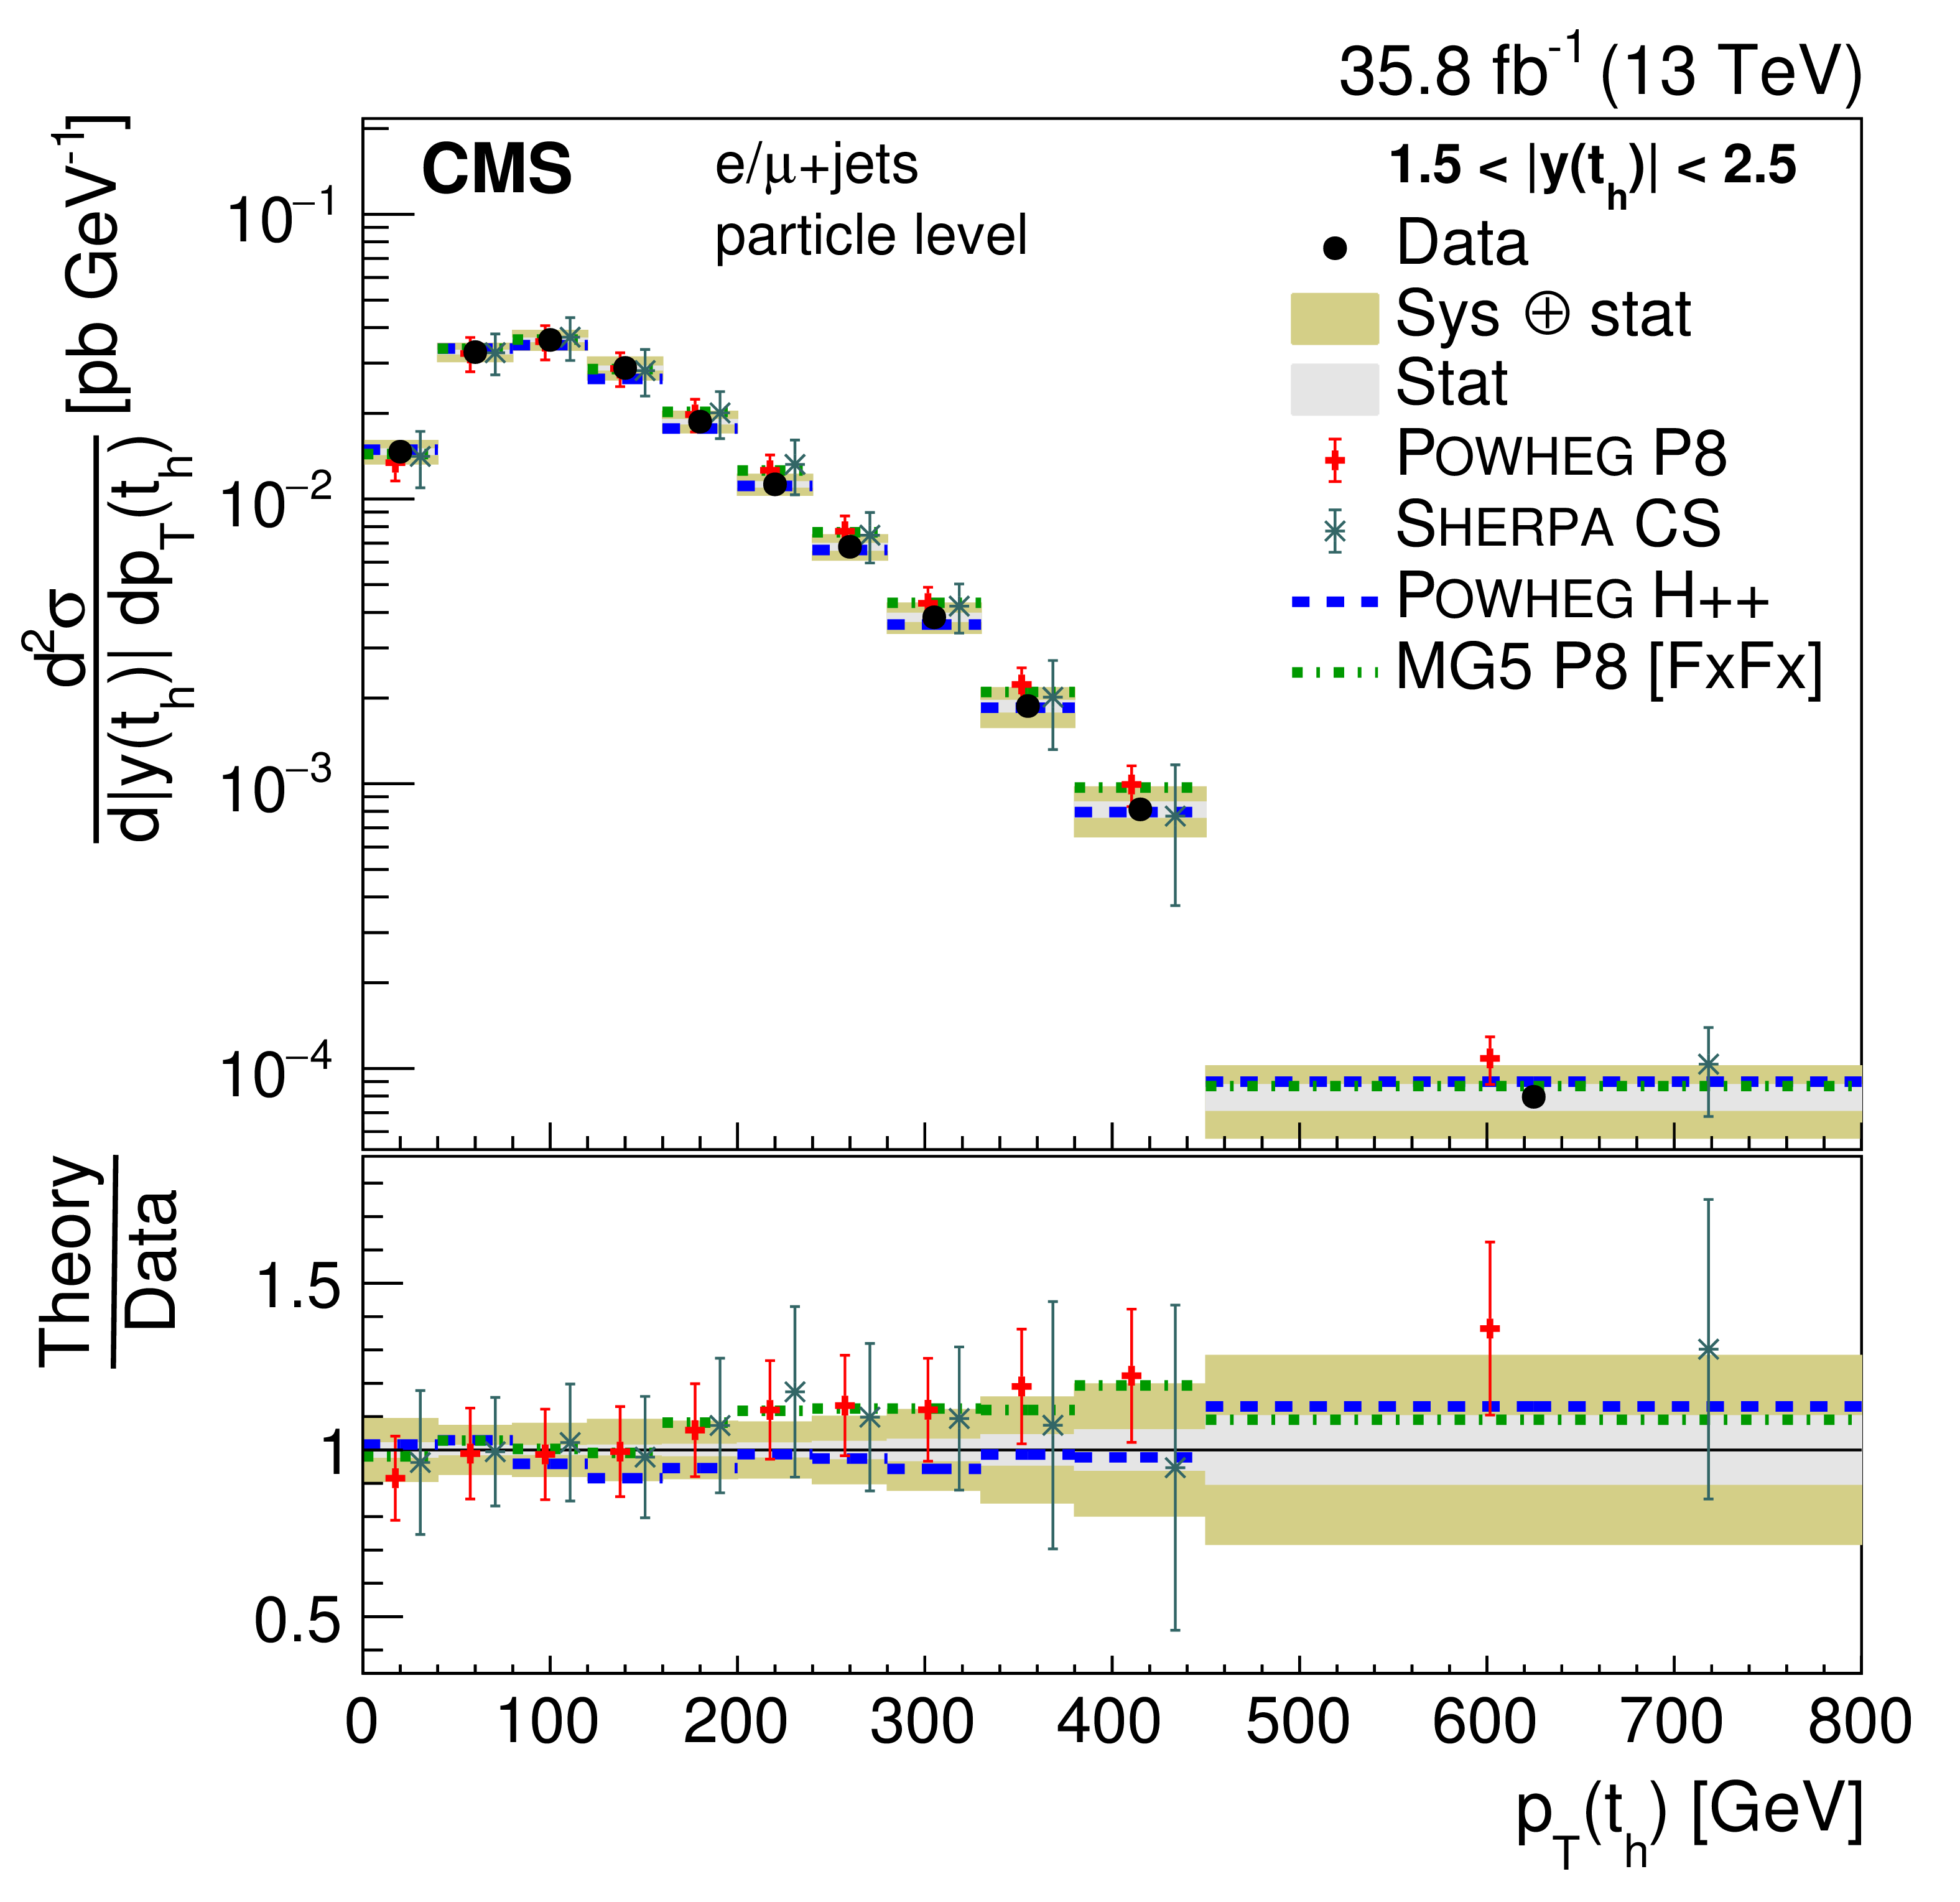
Double-differential cross section at the particle level as a function of $ { | y({\mathrm{t} _\mathrm {h}}) | }$ vs. $ {p_{\mathrm {T}}} ({\mathrm{t} _\mathrm {h}})$. The data are shown as points with light (dark) bands indicating the statistical (statistical and systematic) uncertainties. The cross sections are compared to the predictions of POWHEG combined with PYTHIA8 (P8) or HERWIG++ (H++) and the multiparton simulations MG5_aMC@NLO (MG5)+PYTHIA8 FxFx and SHERPA. The ratios of the various predictions to the measured cross sections are shown at the bottom of each panel. |

png pdf |
Figure 20-a:
Double-differential cross section at the particle level as a function of $ { | y({\mathrm{t} _\mathrm {h}}) | }$ vs. $ {p_{\mathrm {T}}} ({\mathrm{t} _\mathrm {h}})$. The data are shown as points with light (dark) bands indicating the statistical (statistical and systematic) uncertainties. The cross sections are compared to the predictions of POWHEG combined with PYTHIA8 (P8) or HERWIG++ (H++) and the multiparton simulations MG5_aMC@NLO (MG5)+PYTHIA8 FxFx and SHERPA. The ratios of the various predictions to the measured cross sections are shown at the bottom of each panel. |

png pdf |
Figure 20-b:
Double-differential cross section at the particle level as a function of $ { | y({\mathrm{t} _\mathrm {h}}) | }$ vs. $ {p_{\mathrm {T}}} ({\mathrm{t} _\mathrm {h}})$. The data are shown as points with light (dark) bands indicating the statistical (statistical and systematic) uncertainties. The cross sections are compared to the predictions of POWHEG combined with PYTHIA8 (P8) or HERWIG++ (H++) and the multiparton simulations MG5_aMC@NLO (MG5)+PYTHIA8 FxFx and SHERPA. The ratios of the various predictions to the measured cross sections are shown at the bottom of each panel. |
png pdf |
Figure 20-c:
Double-differential cross section at the particle level as a function of $ { | y({\mathrm{t} _\mathrm {h}}) | }$ vs. $ {p_{\mathrm {T}}} ({\mathrm{t} _\mathrm {h}})$. The data are shown as points with light (dark) bands indicating the statistical (statistical and systematic) uncertainties. The cross sections are compared to the predictions of POWHEG combined with PYTHIA8 (P8) or HERWIG++ (H++) and the multiparton simulations MG5_aMC@NLO (MG5)+PYTHIA8 FxFx and SHERPA. The ratios of the various predictions to the measured cross sections are shown at the bottom of each panel. |
png pdf |
Figure 20-d:
Double-differential cross section at the particle level as a function of $ { | y({\mathrm{t} _\mathrm {h}}) | }$ vs. $ {p_{\mathrm {T}}} ({\mathrm{t} _\mathrm {h}})$. The data are shown as points with light (dark) bands indicating the statistical (statistical and systematic) uncertainties. The cross sections are compared to the predictions of POWHEG combined with PYTHIA8 (P8) or HERWIG++ (H++) and the multiparton simulations MG5_aMC@NLO (MG5)+PYTHIA8 FxFx and SHERPA. The ratios of the various predictions to the measured cross sections are shown at the bottom of each panel. |
png pdf |
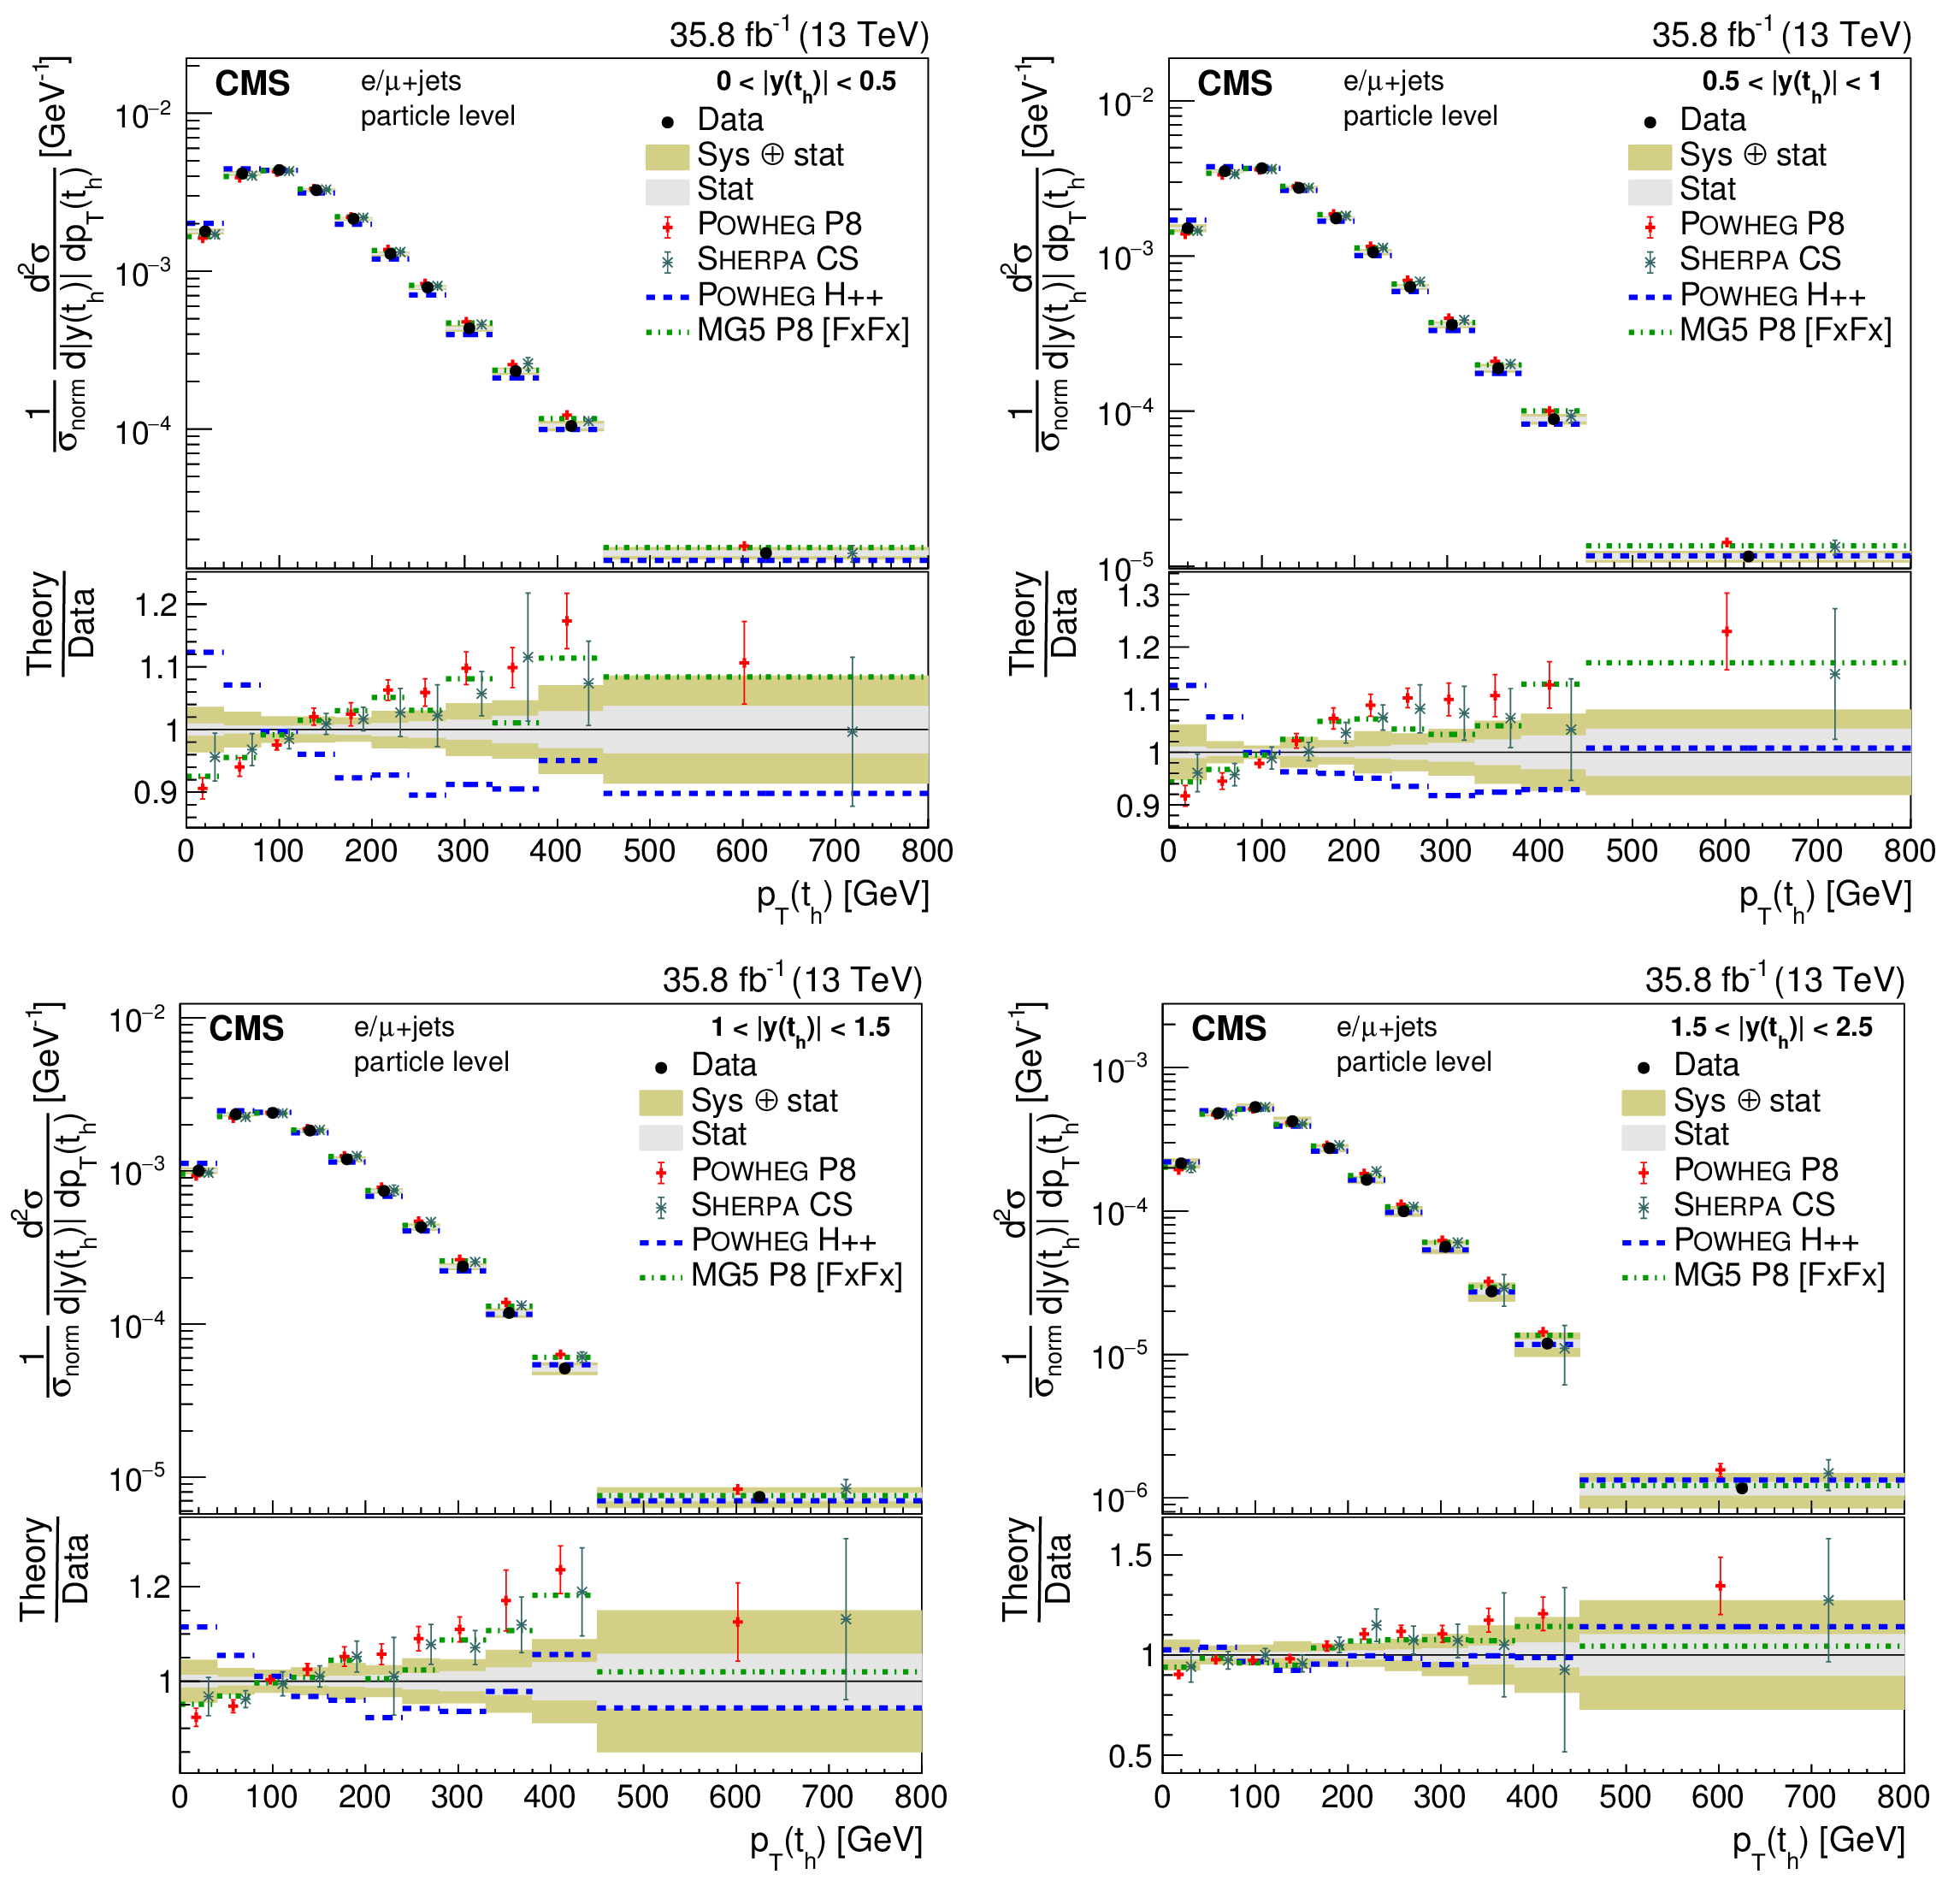
Figure 21:
Normalized double-differential cross section at the particle level as a function of $ { | y({\mathrm{t} _\mathrm {h}}) | }$ vs. $ {p_{\mathrm {T}}} ({\mathrm{t} _\mathrm {h}})$. The data are shown as points with light (dark) bands indicating the statistical (statistical and systematic) uncertainties. The cross sections are compared to the predictions of POWHEG combined with PYTHIA8 (P8) or HERWIG++ (H++) and the multiparton simulations MG5_aMC@NLO (MG5)+PYTHIA8 FxFx and SHERPA. The ratios of the various predictions to the measured cross sections are shown at the bottom of each panel. |
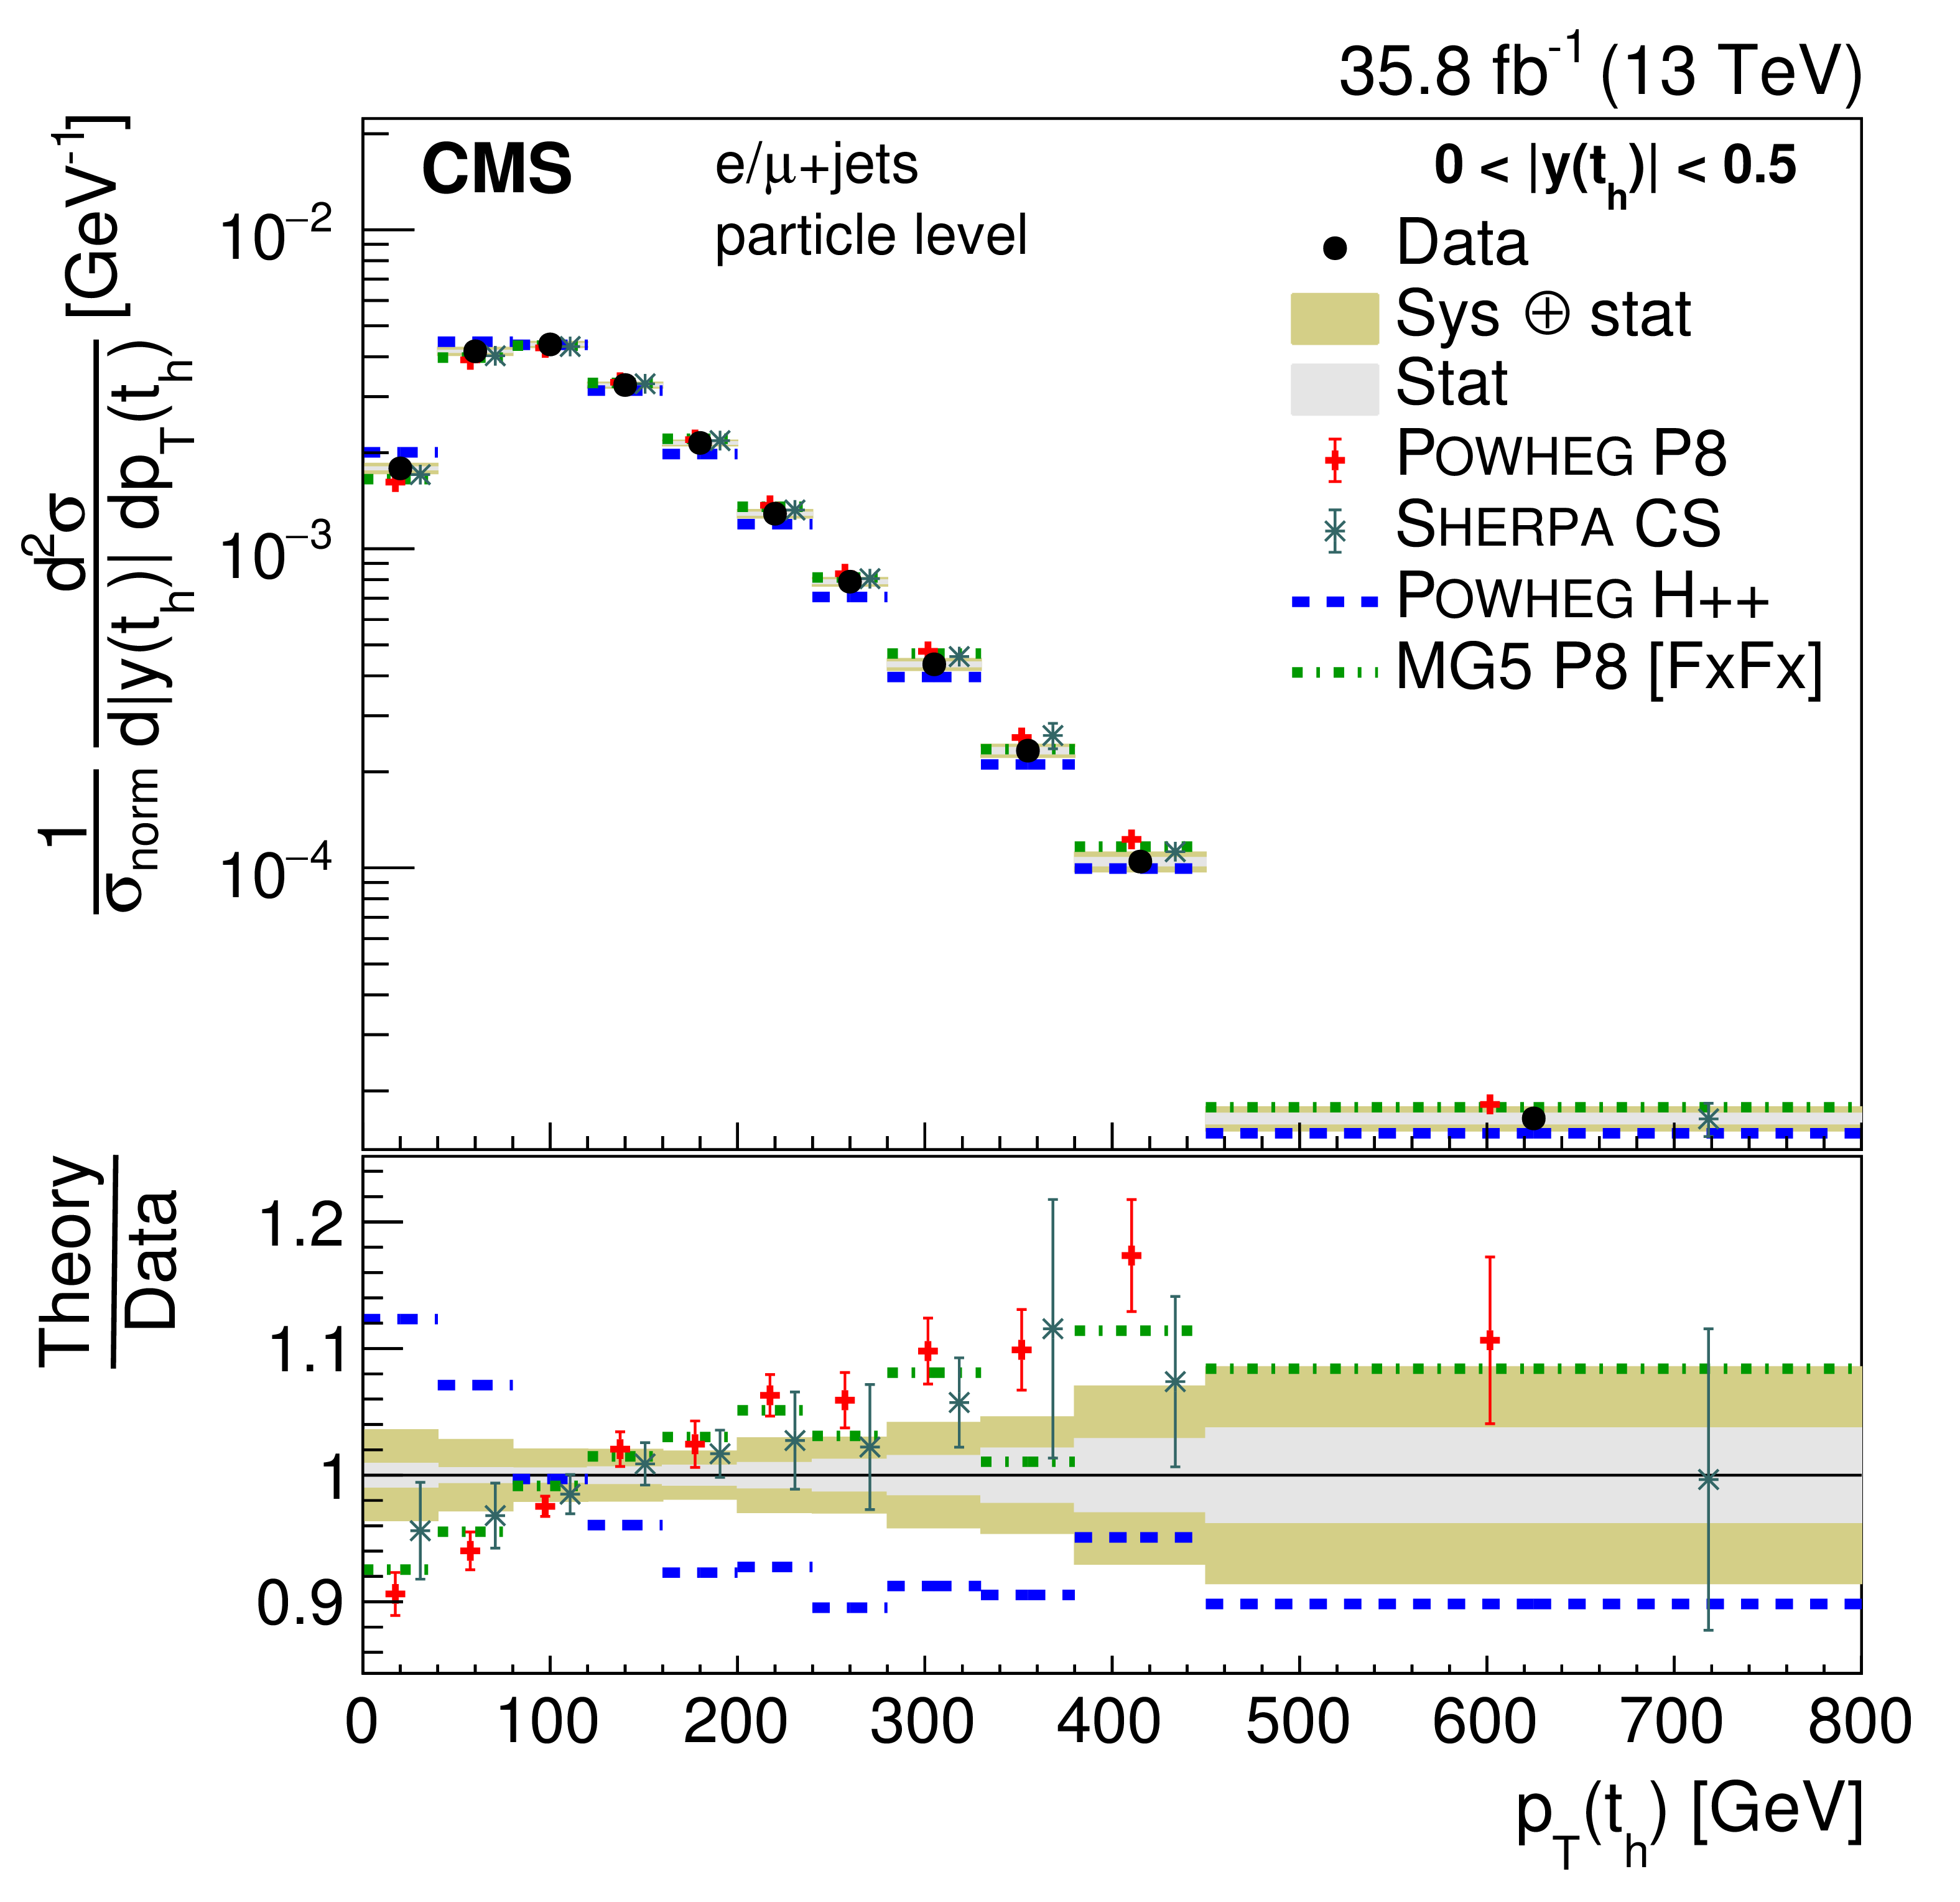
png pdf |
Figure 21-a:
Normalized double-differential cross section at the particle level as a function of $ { | y({\mathrm{t} _\mathrm {h}}) | }$ vs. $ {p_{\mathrm {T}}} ({\mathrm{t} _\mathrm {h}})$. The data are shown as points with light (dark) bands indicating the statistical (statistical and systematic) uncertainties. The cross sections are compared to the predictions of POWHEG combined with PYTHIA8 (P8) or HERWIG++ (H++) and the multiparton simulations MG5_aMC@NLO (MG5)+PYTHIA8 FxFx and SHERPA. The ratios of the various predictions to the measured cross sections are shown at the bottom of each panel. |
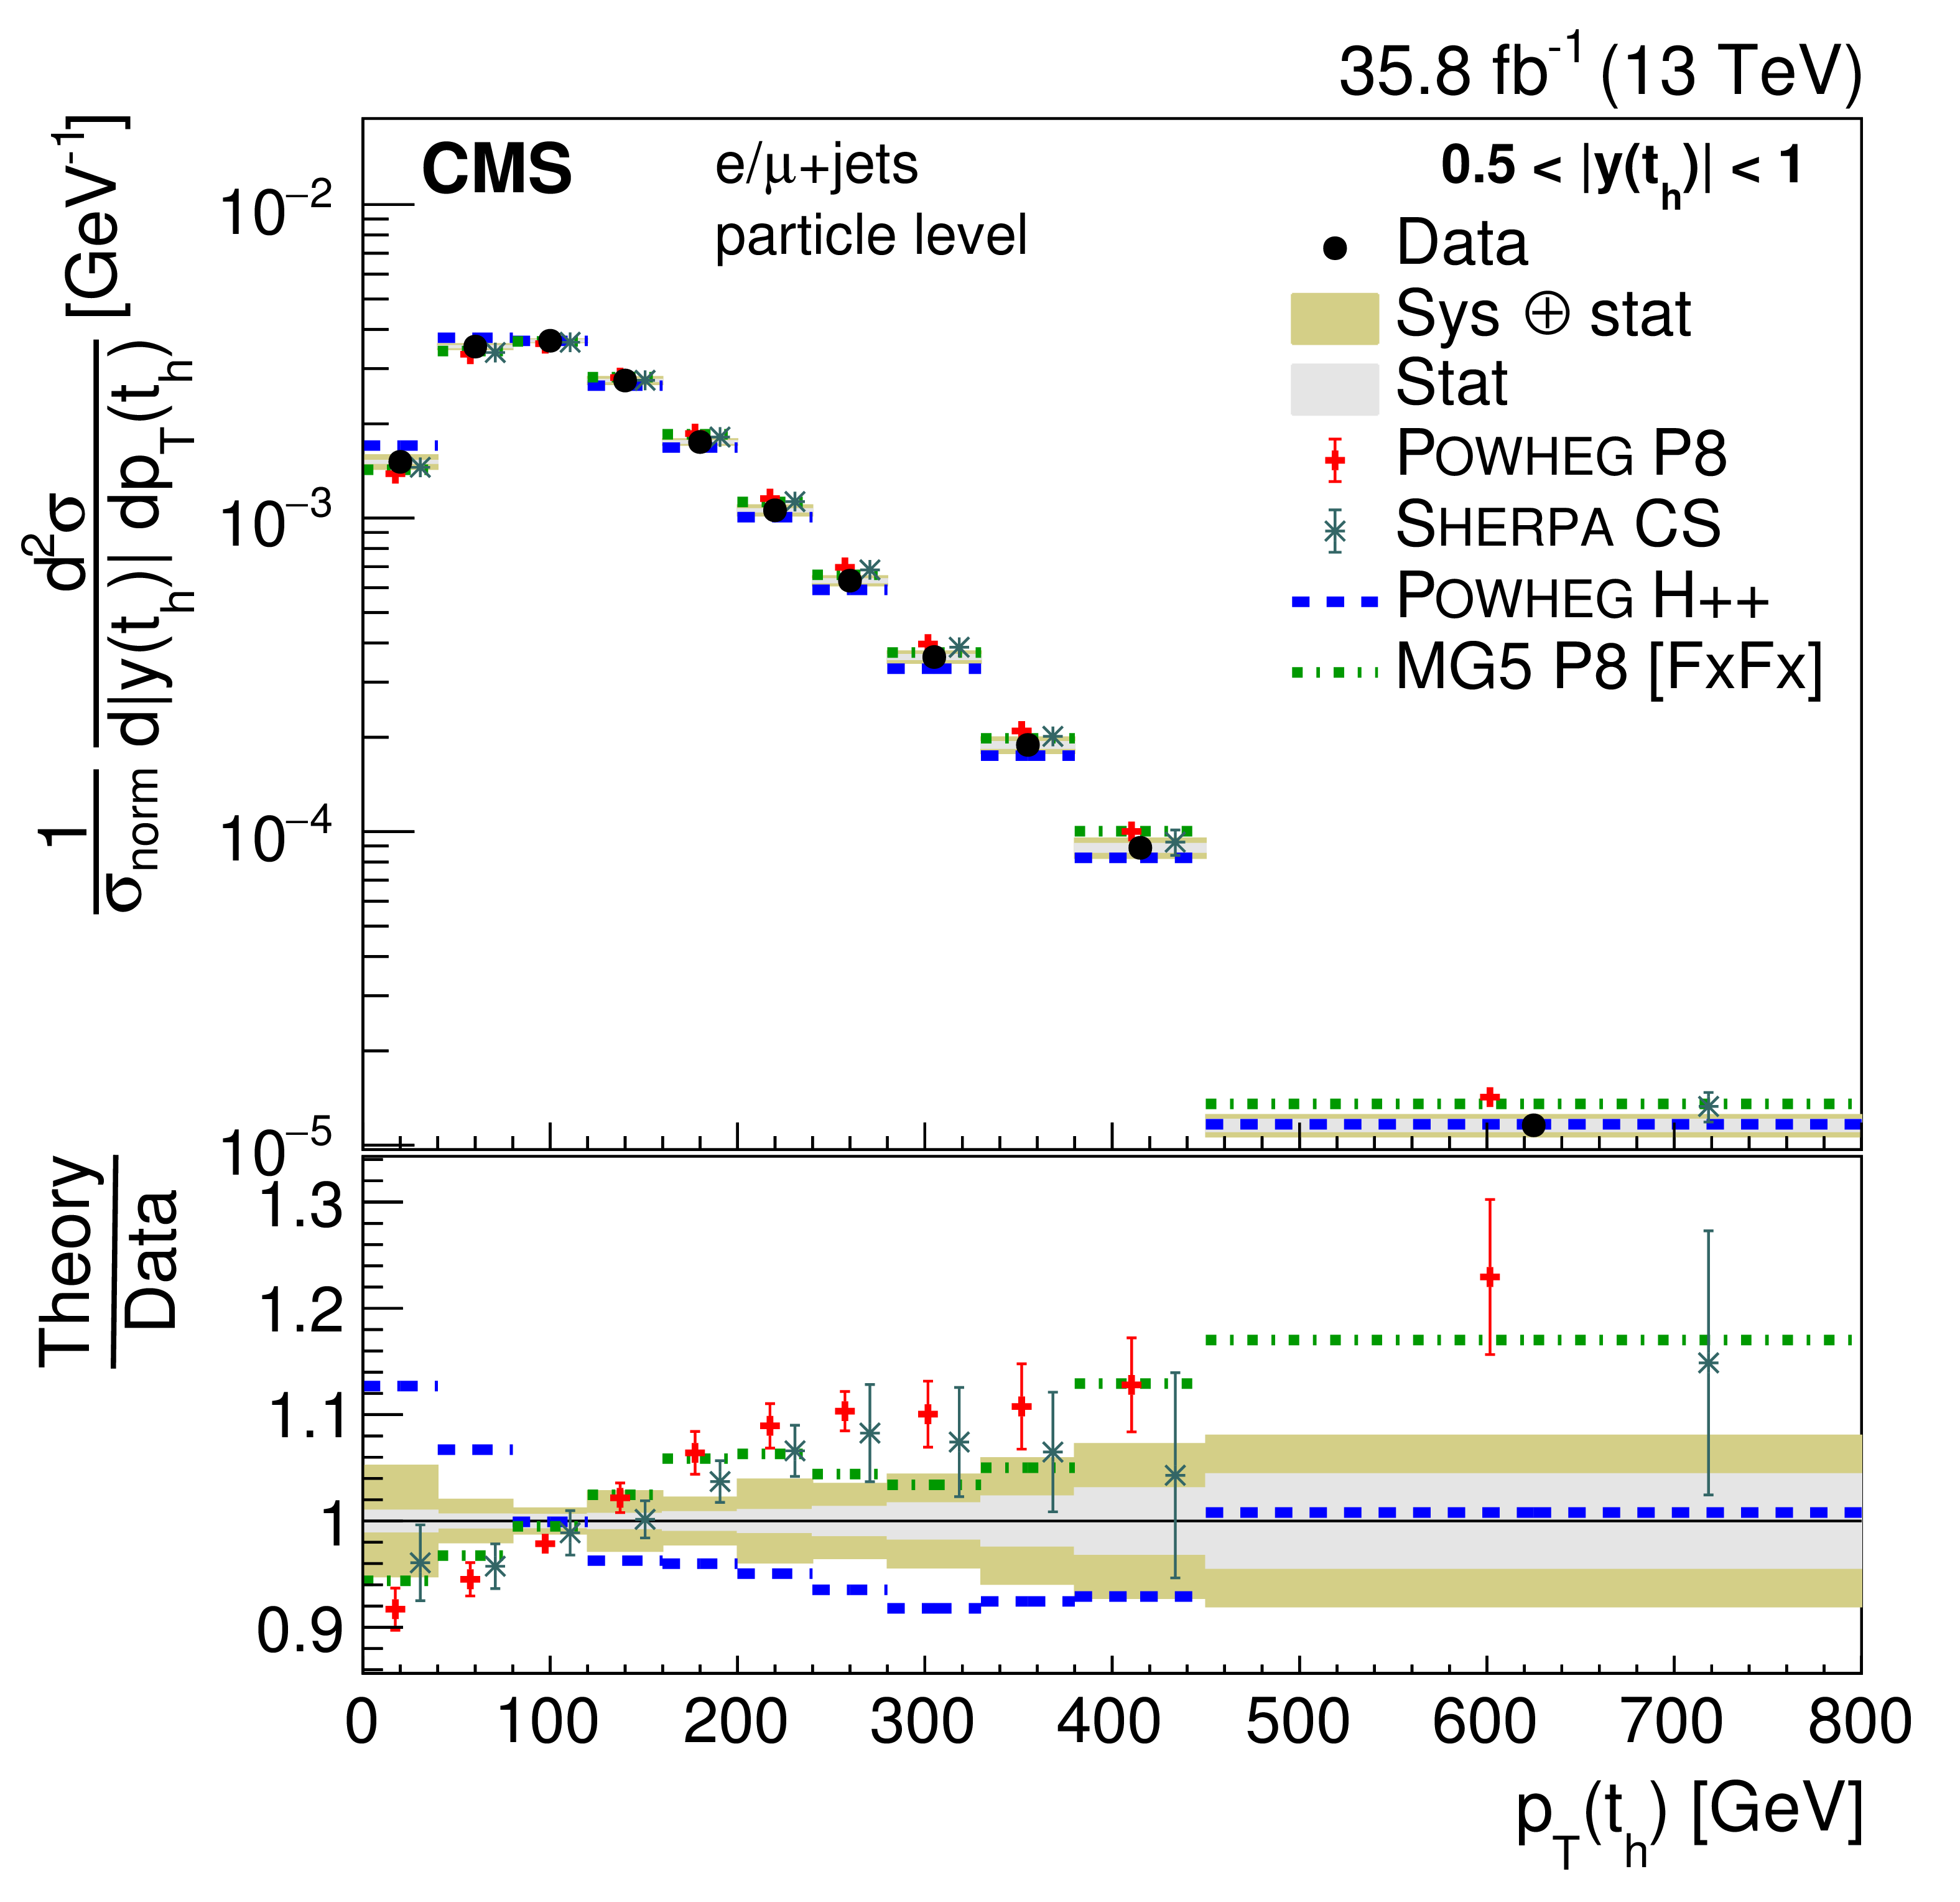
png pdf |
Figure 21-b:
Normalized double-differential cross section at the particle level as a function of $ { | y({\mathrm{t} _\mathrm {h}}) | }$ vs. $ {p_{\mathrm {T}}} ({\mathrm{t} _\mathrm {h}})$. The data are shown as points with light (dark) bands indicating the statistical (statistical and systematic) uncertainties. The cross sections are compared to the predictions of POWHEG combined with PYTHIA8 (P8) or HERWIG++ (H++) and the multiparton simulations MG5_aMC@NLO (MG5)+PYTHIA8 FxFx and SHERPA. The ratios of the various predictions to the measured cross sections are shown at the bottom of each panel. |
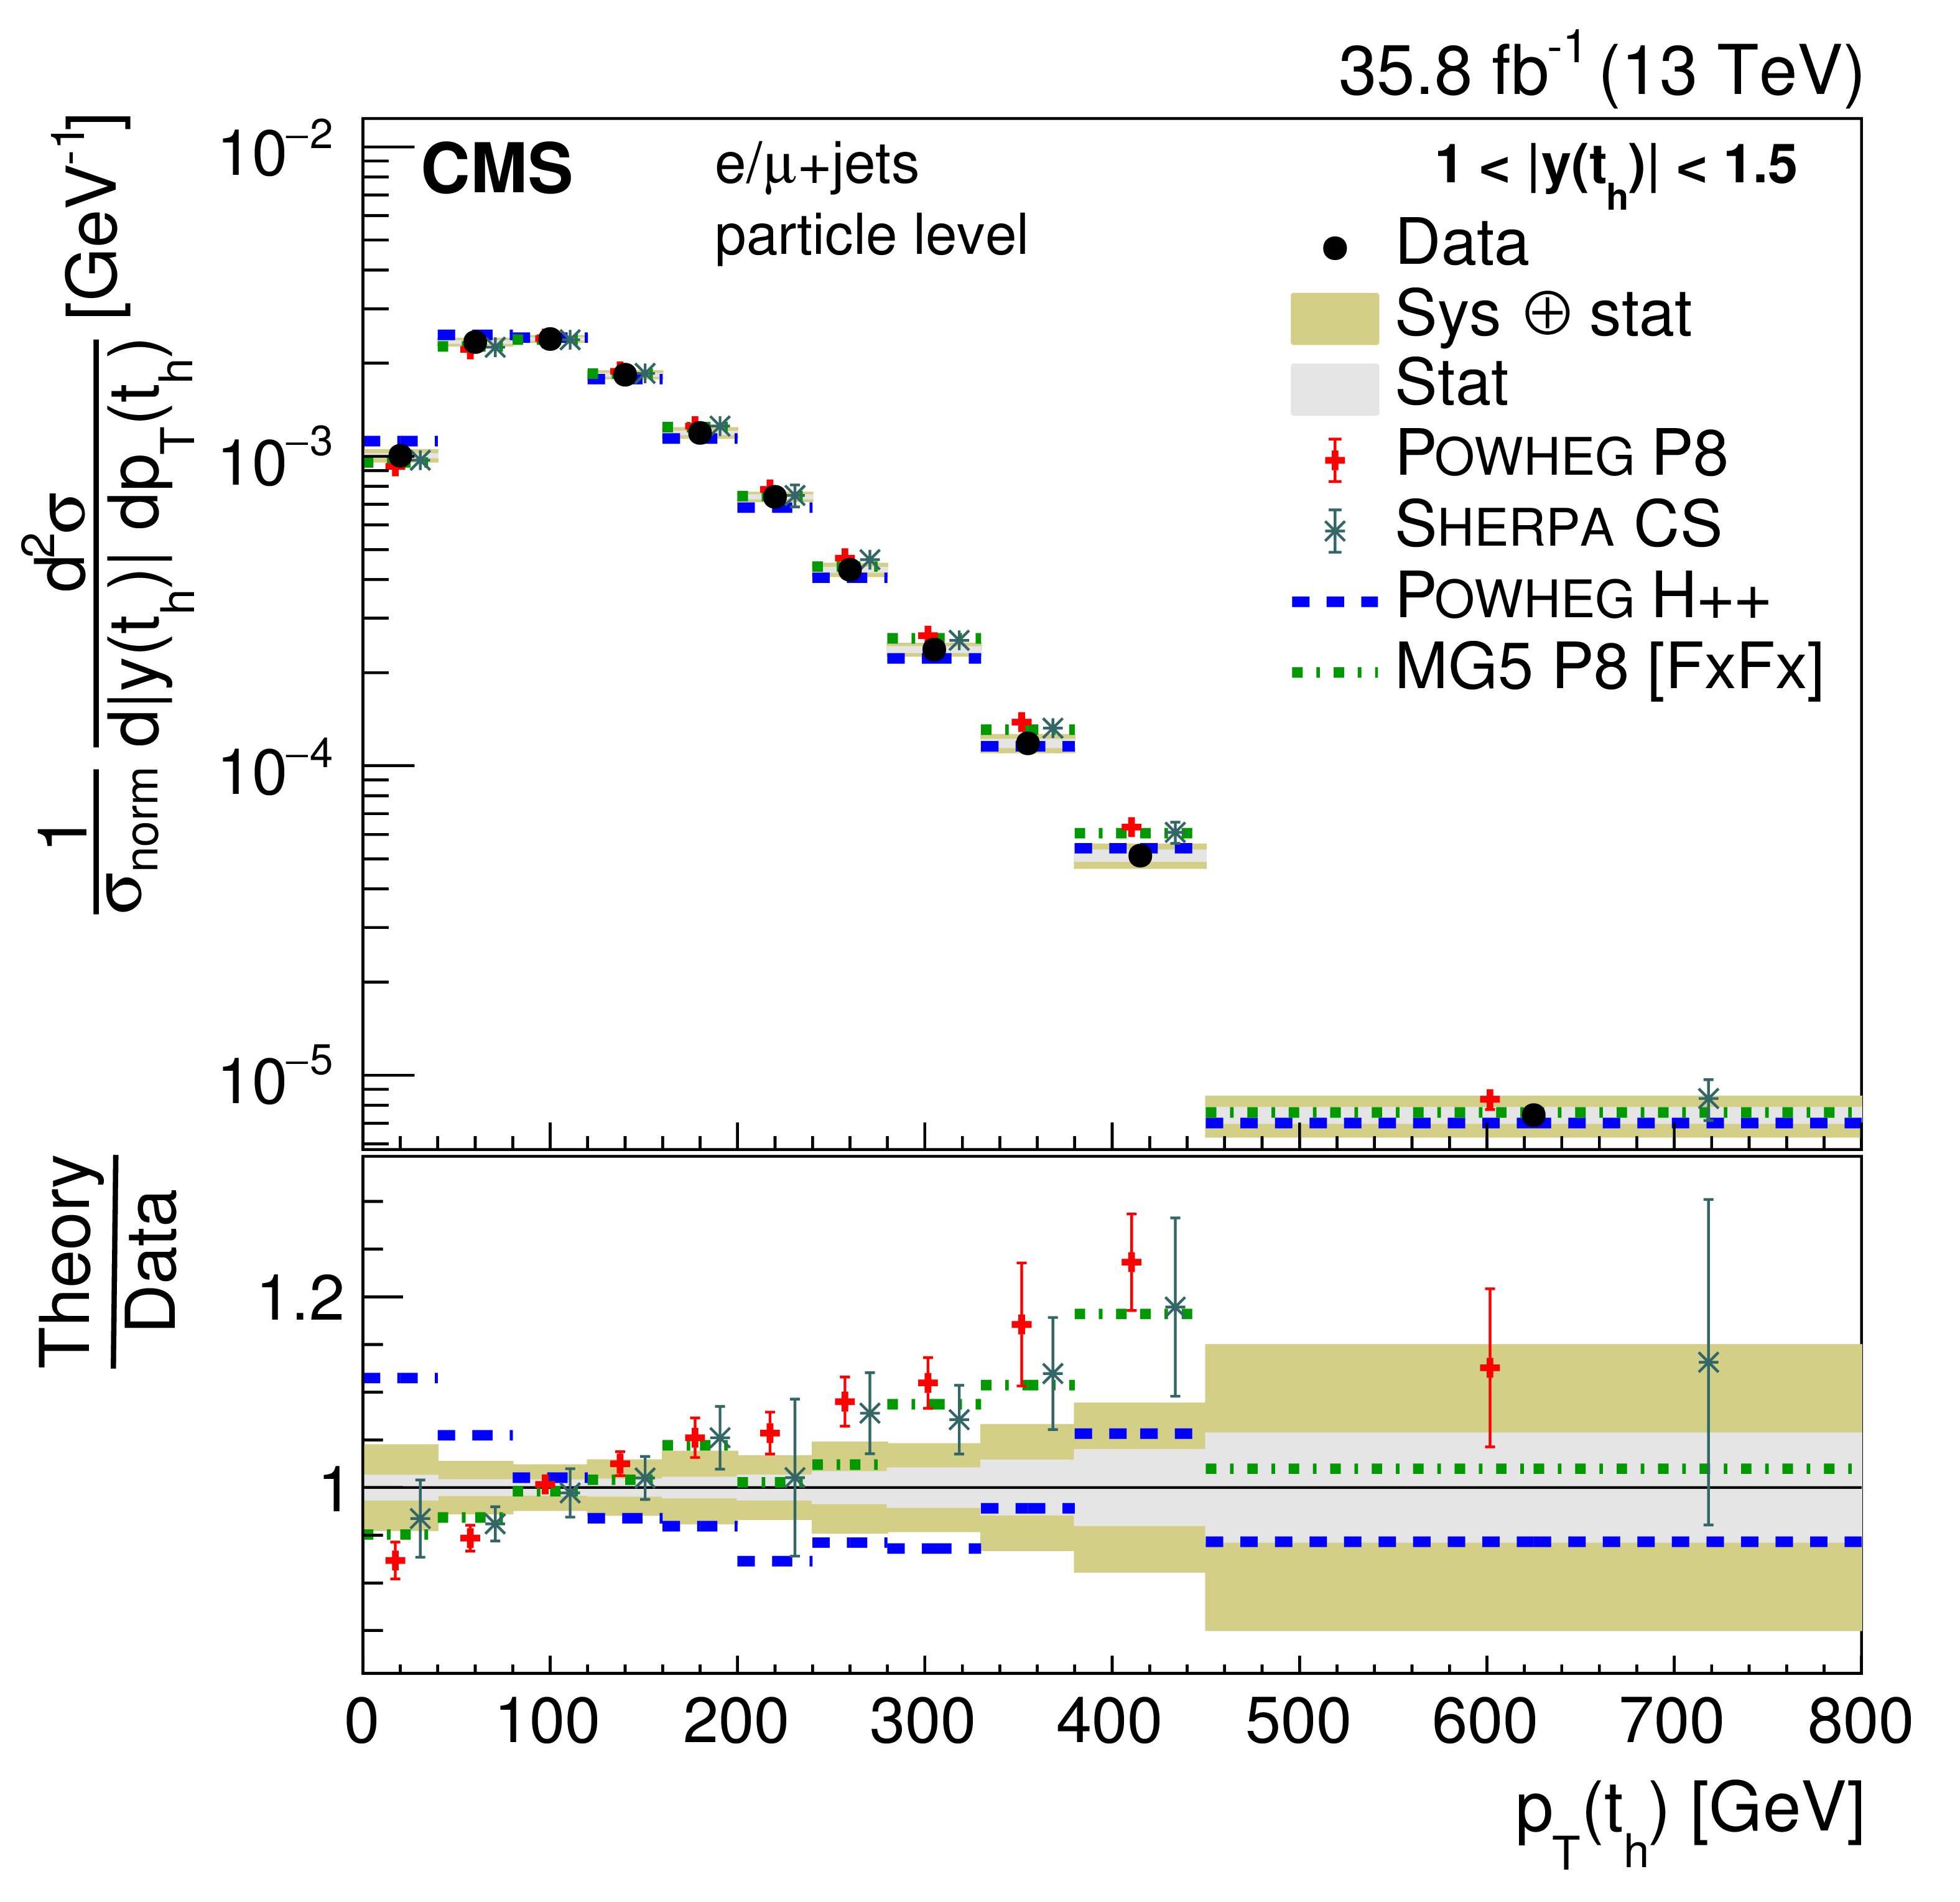
png pdf |
Figure 21-c:
Normalized double-differential cross section at the particle level as a function of $ { | y({\mathrm{t} _\mathrm {h}}) | }$ vs. $ {p_{\mathrm {T}}} ({\mathrm{t} _\mathrm {h}})$. The data are shown as points with light (dark) bands indicating the statistical (statistical and systematic) uncertainties. The cross sections are compared to the predictions of POWHEG combined with PYTHIA8 (P8) or HERWIG++ (H++) and the multiparton simulations MG5_aMC@NLO (MG5)+PYTHIA8 FxFx and SHERPA. The ratios of the various predictions to the measured cross sections are shown at the bottom of each panel. |
png pdf |
Figure 21-d:
Normalized double-differential cross section at the particle level as a function of $ { | y({\mathrm{t} _\mathrm {h}}) | }$ vs. $ {p_{\mathrm {T}}} ({\mathrm{t} _\mathrm {h}})$. The data are shown as points with light (dark) bands indicating the statistical (statistical and systematic) uncertainties. The cross sections are compared to the predictions of POWHEG combined with PYTHIA8 (P8) or HERWIG++ (H++) and the multiparton simulations MG5_aMC@NLO (MG5)+PYTHIA8 FxFx and SHERPA. The ratios of the various predictions to the measured cross sections are shown at the bottom of each panel. |
png pdf |
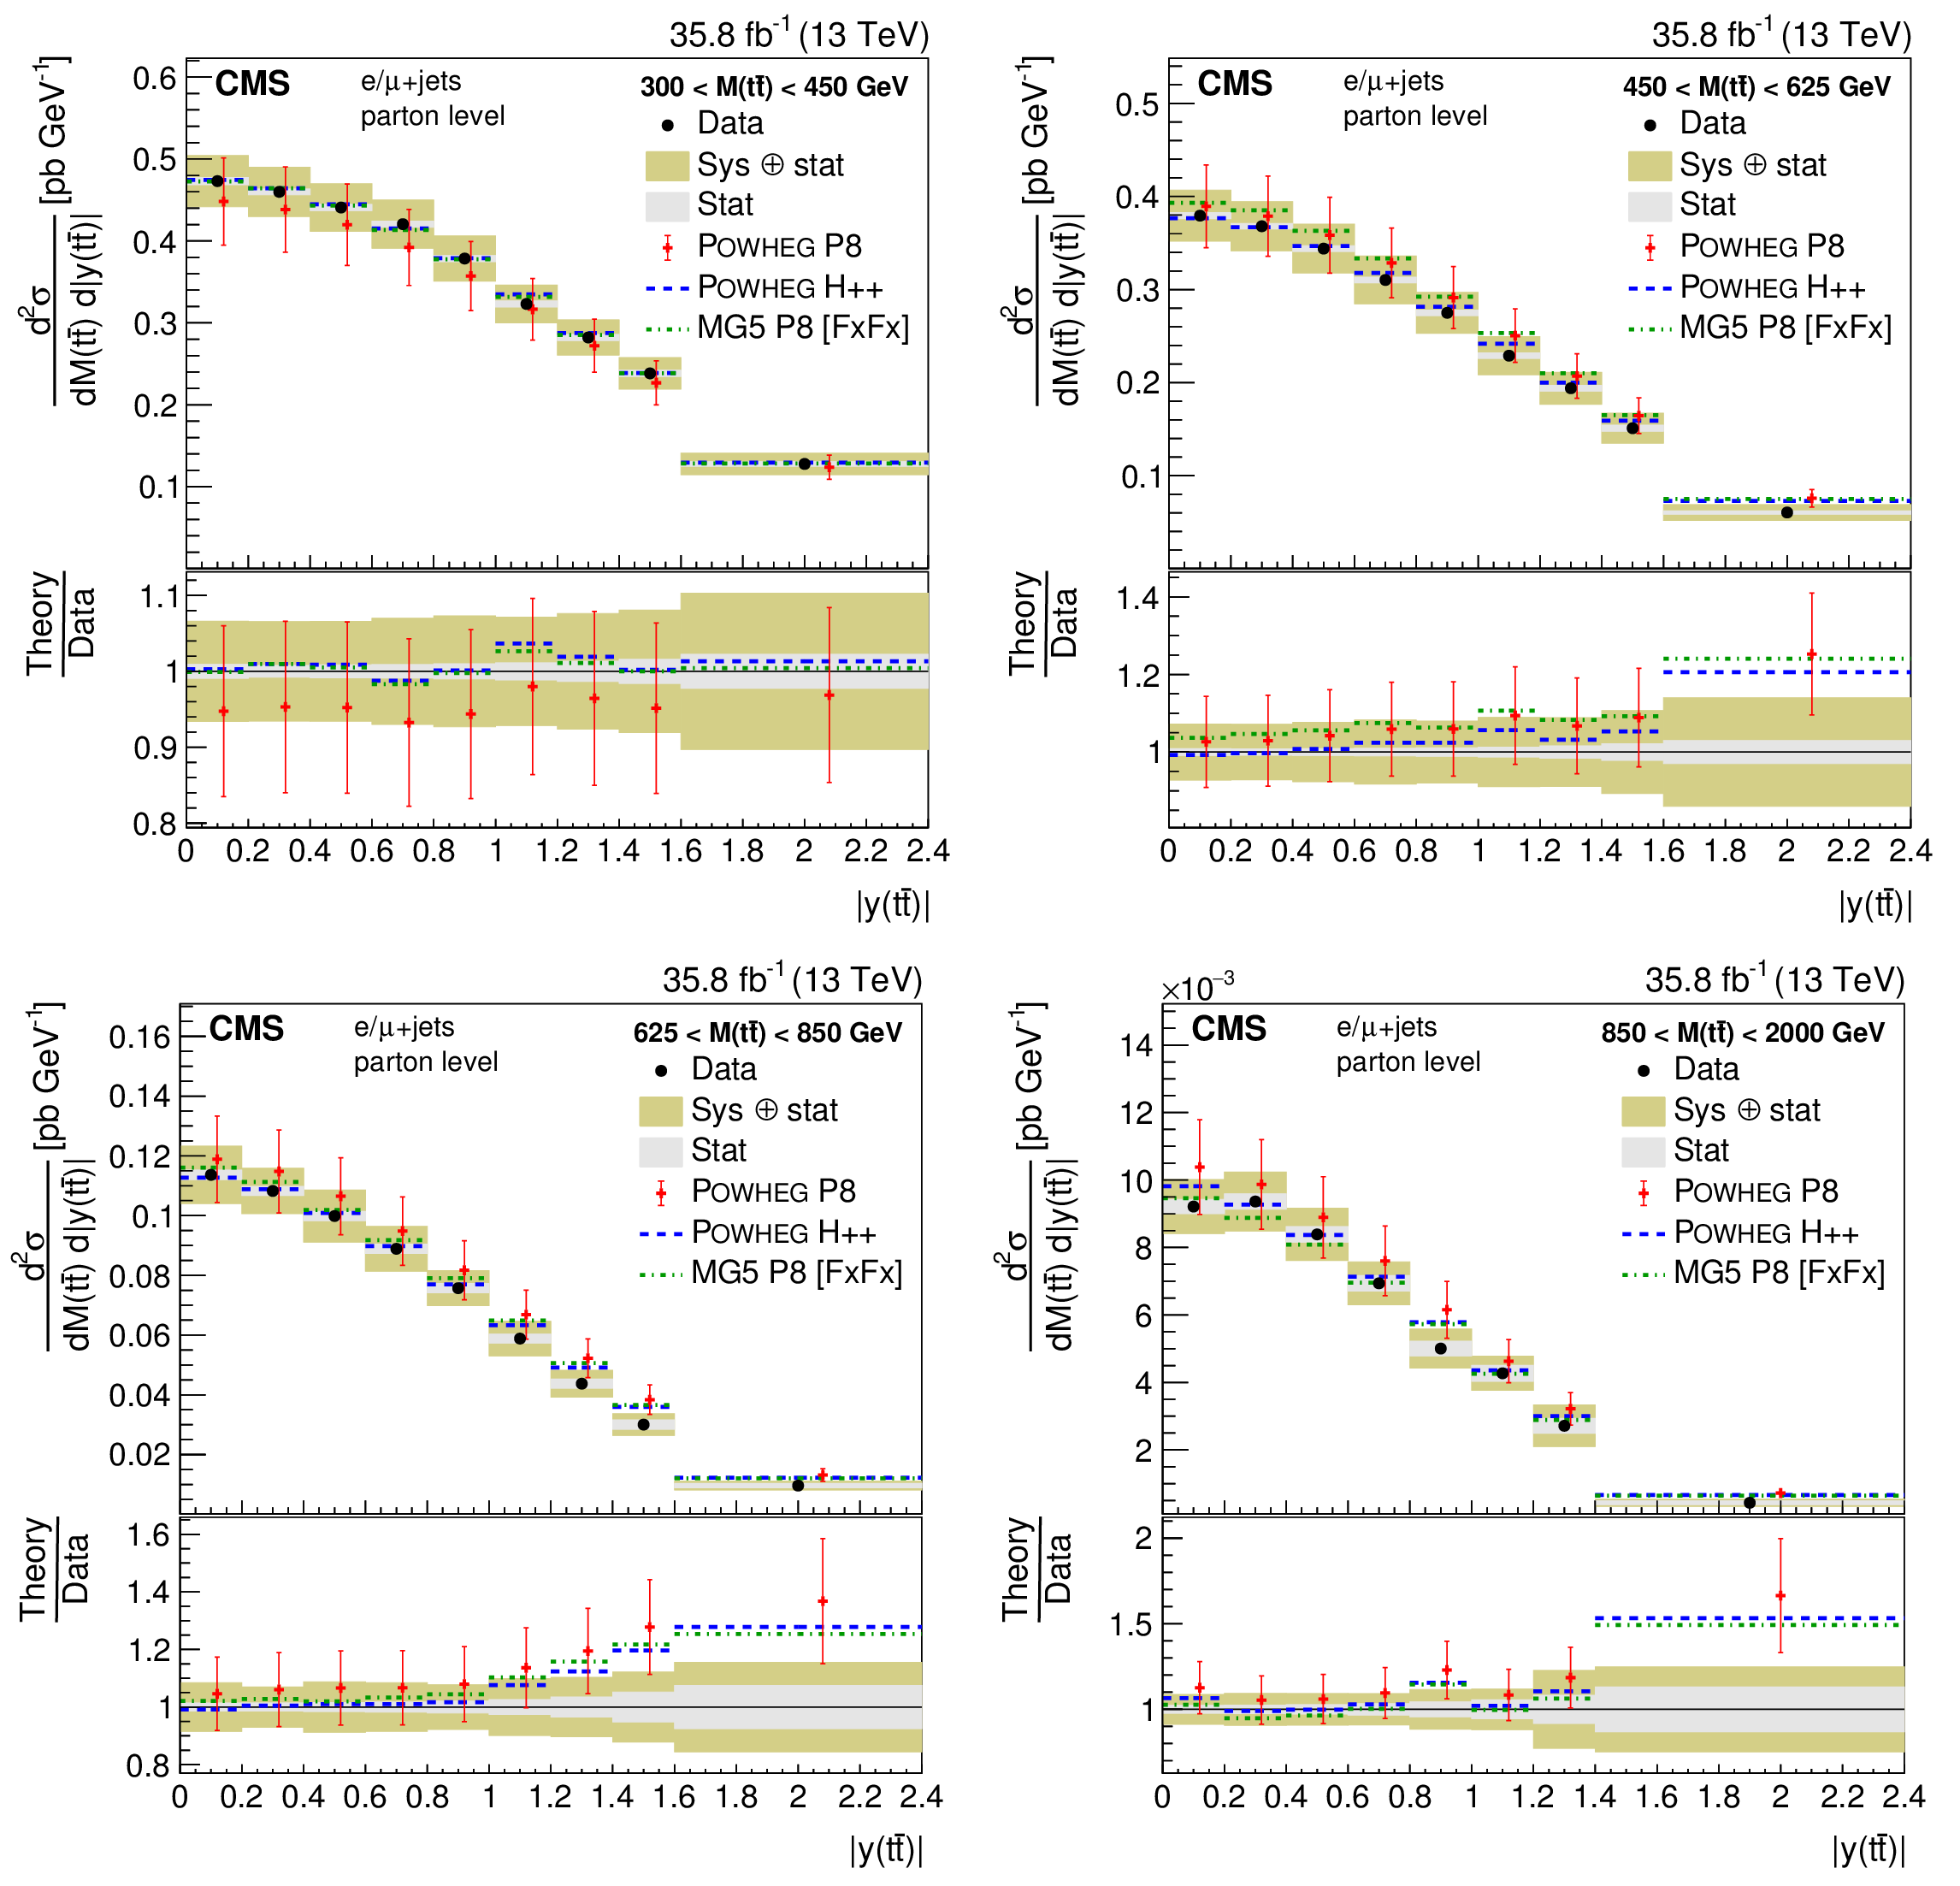
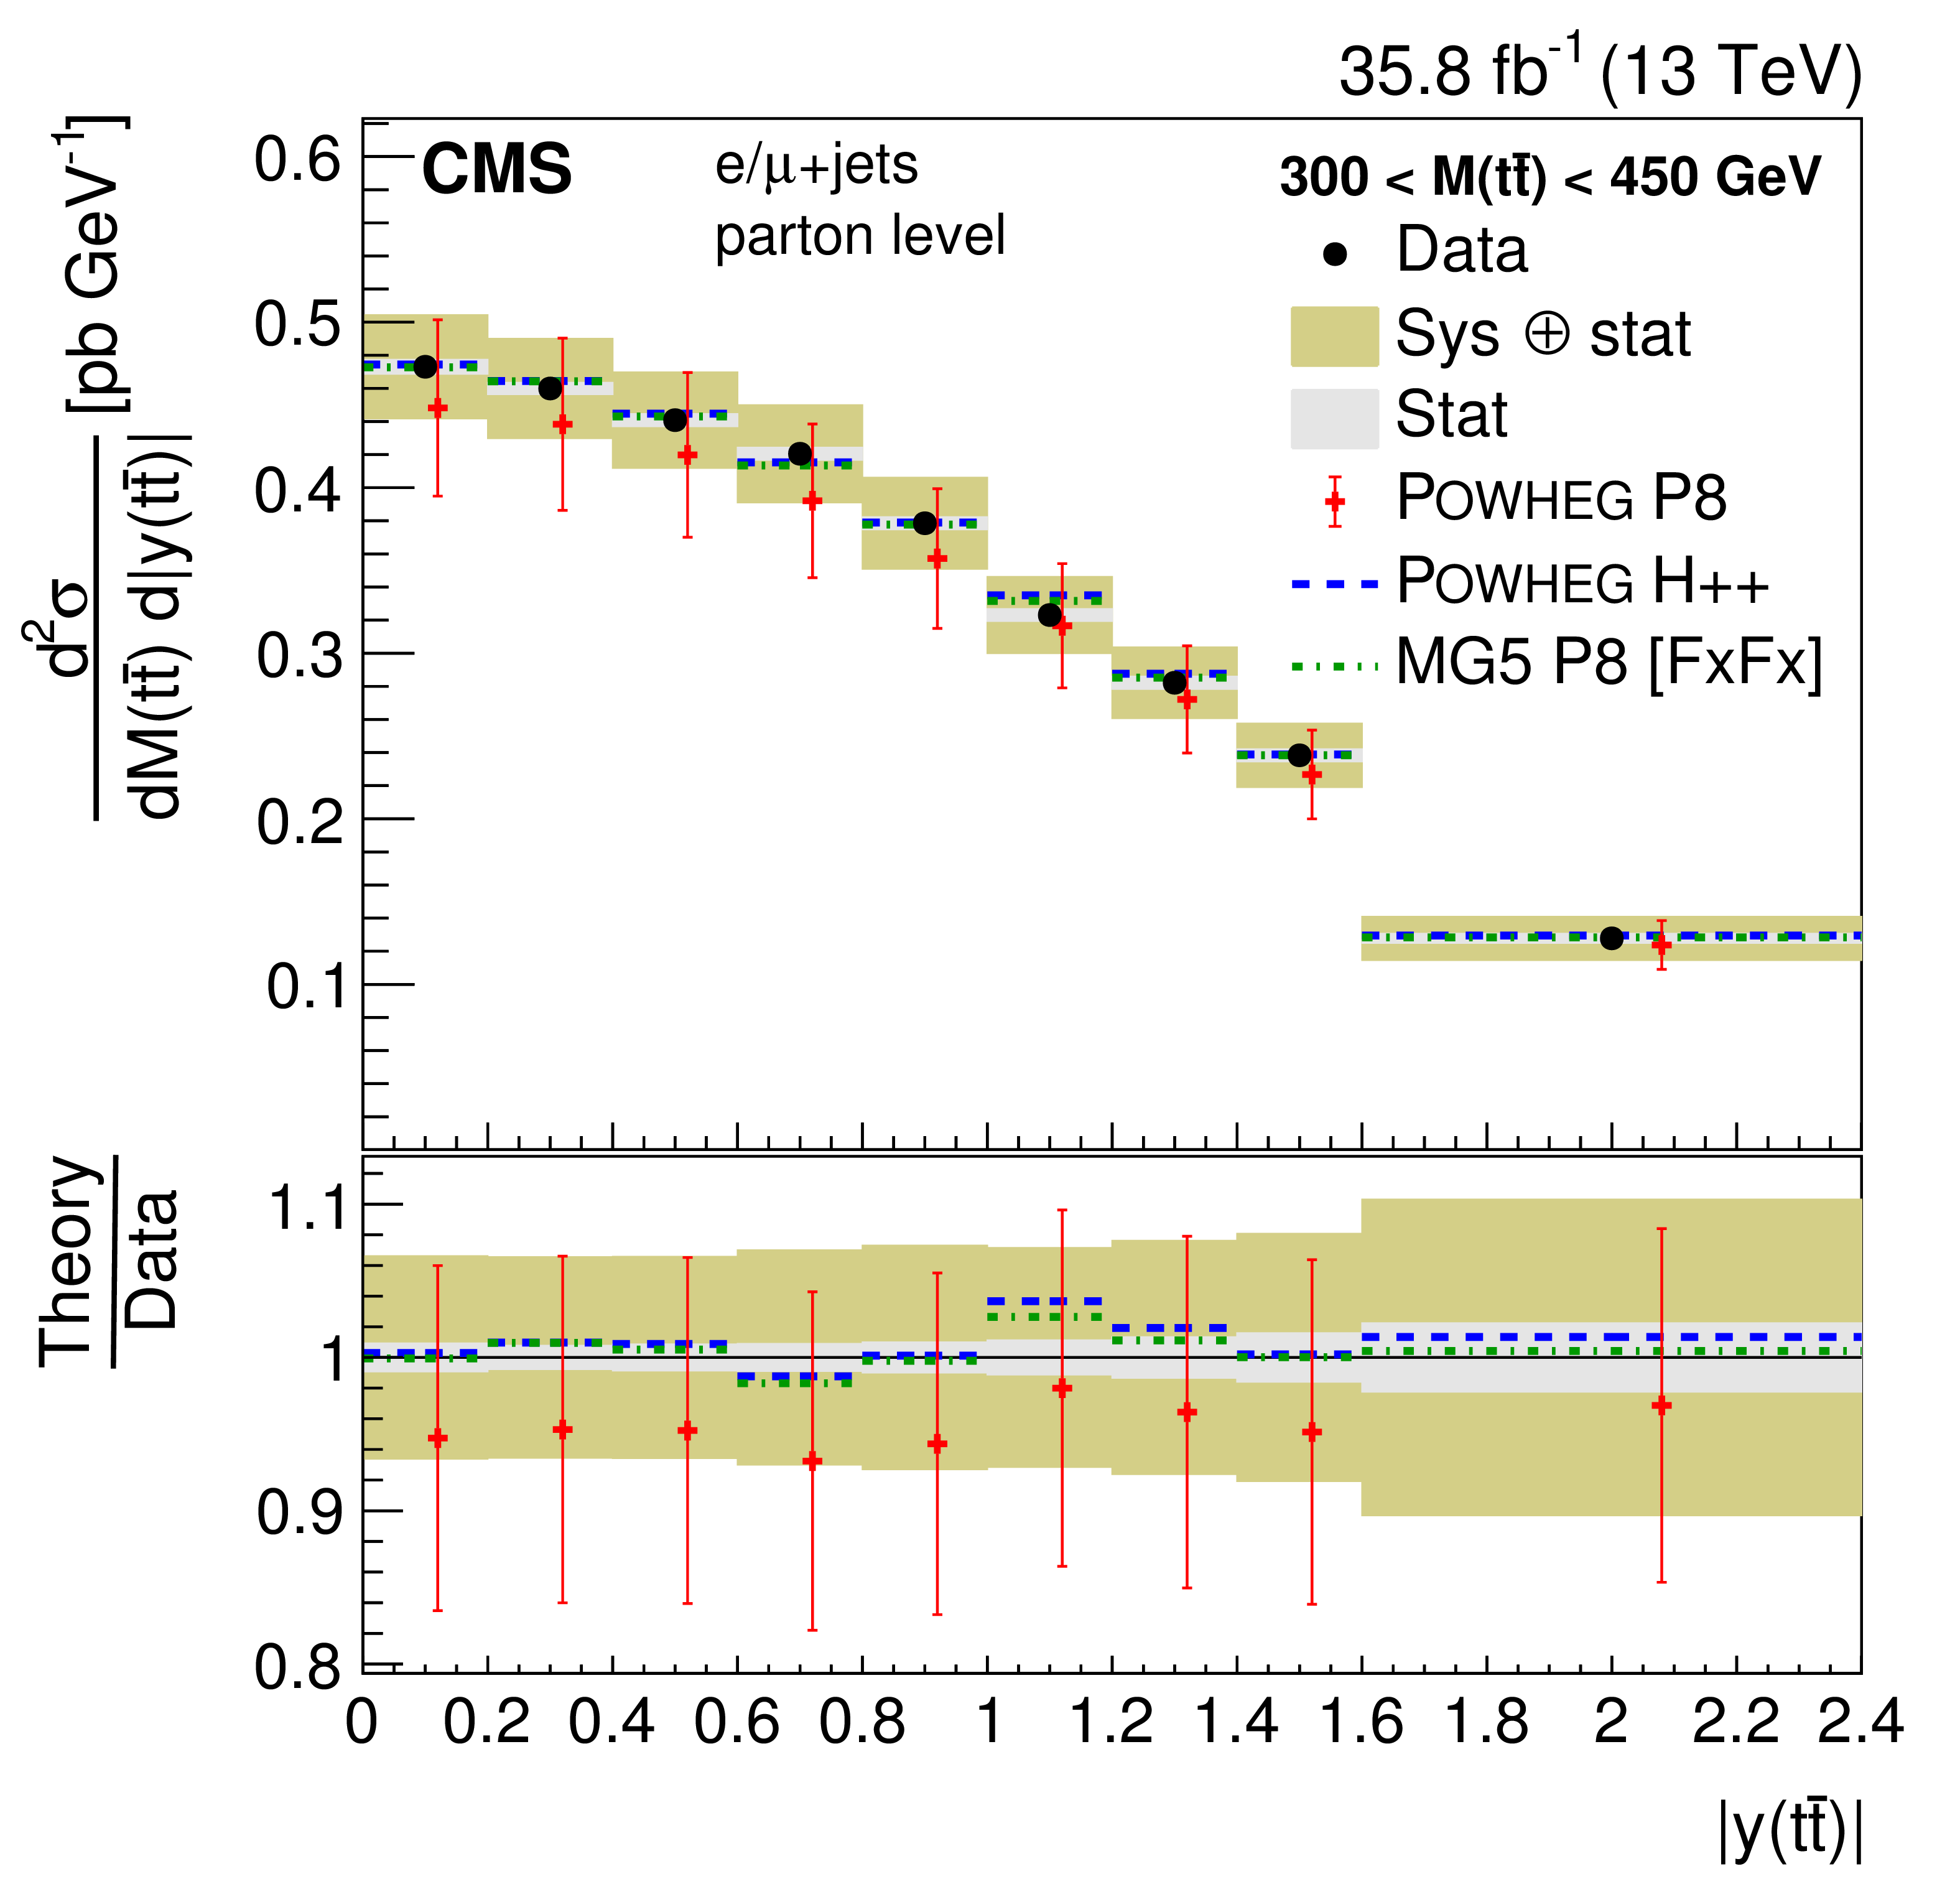
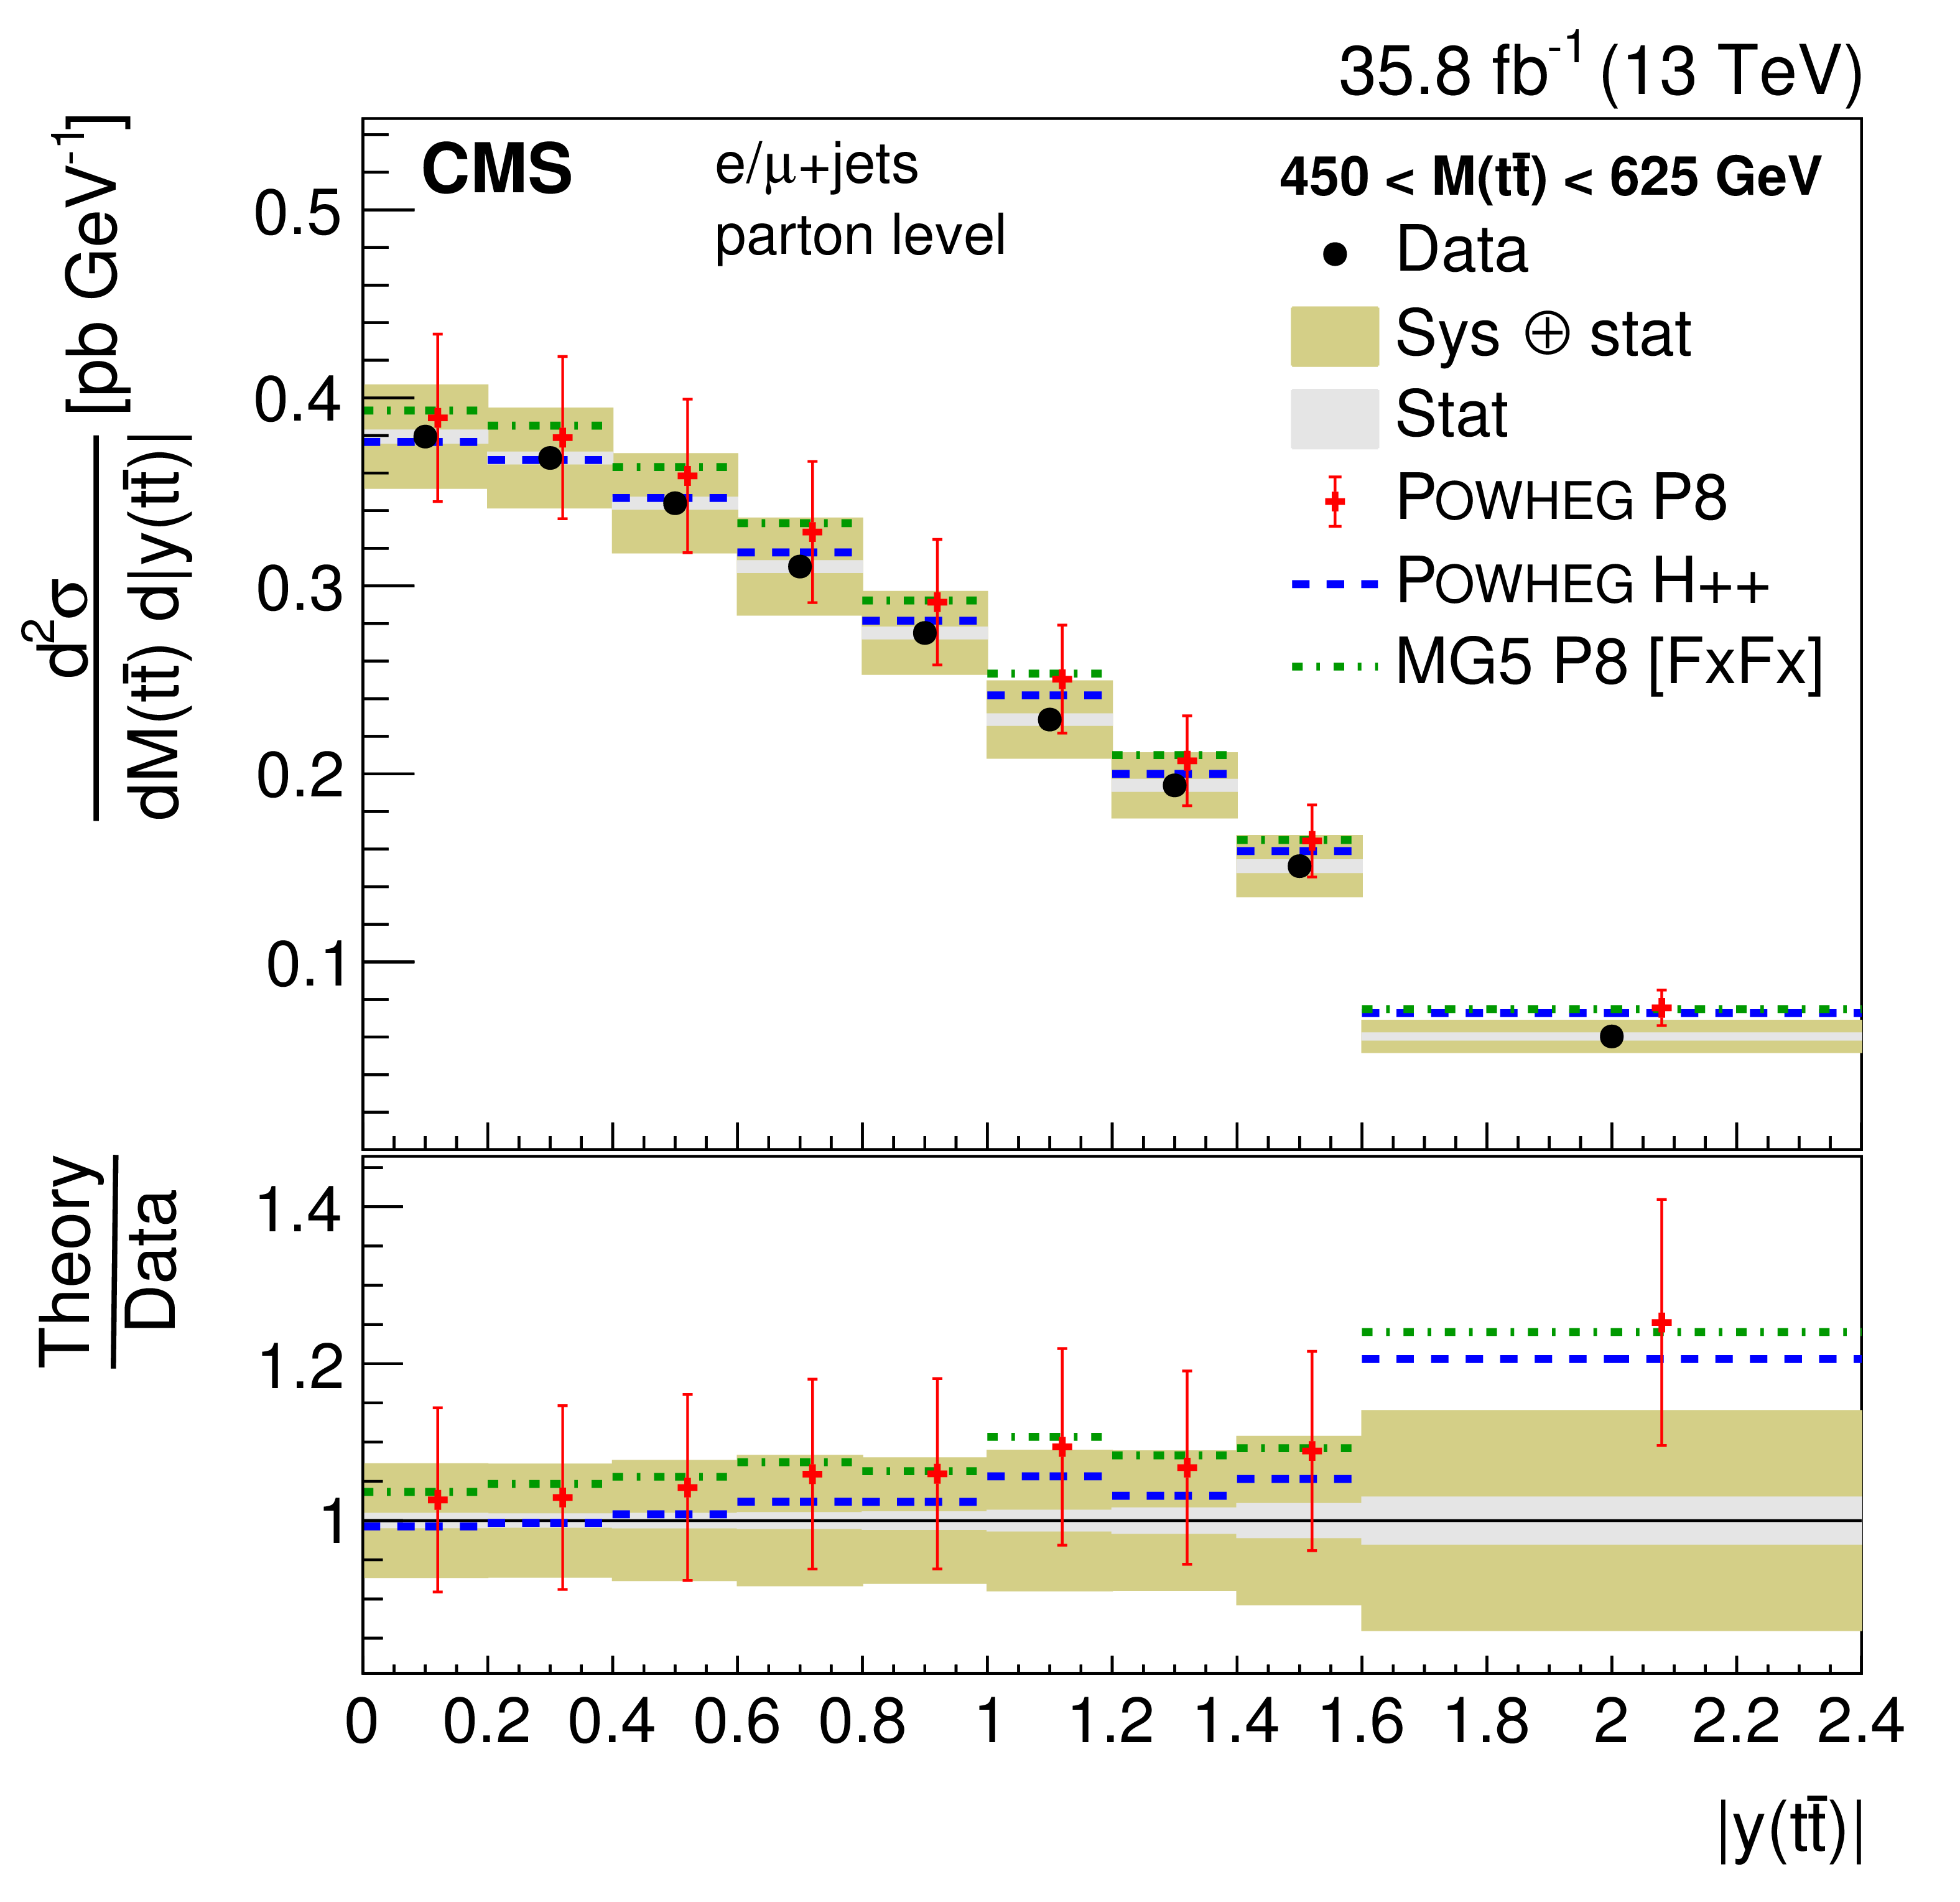
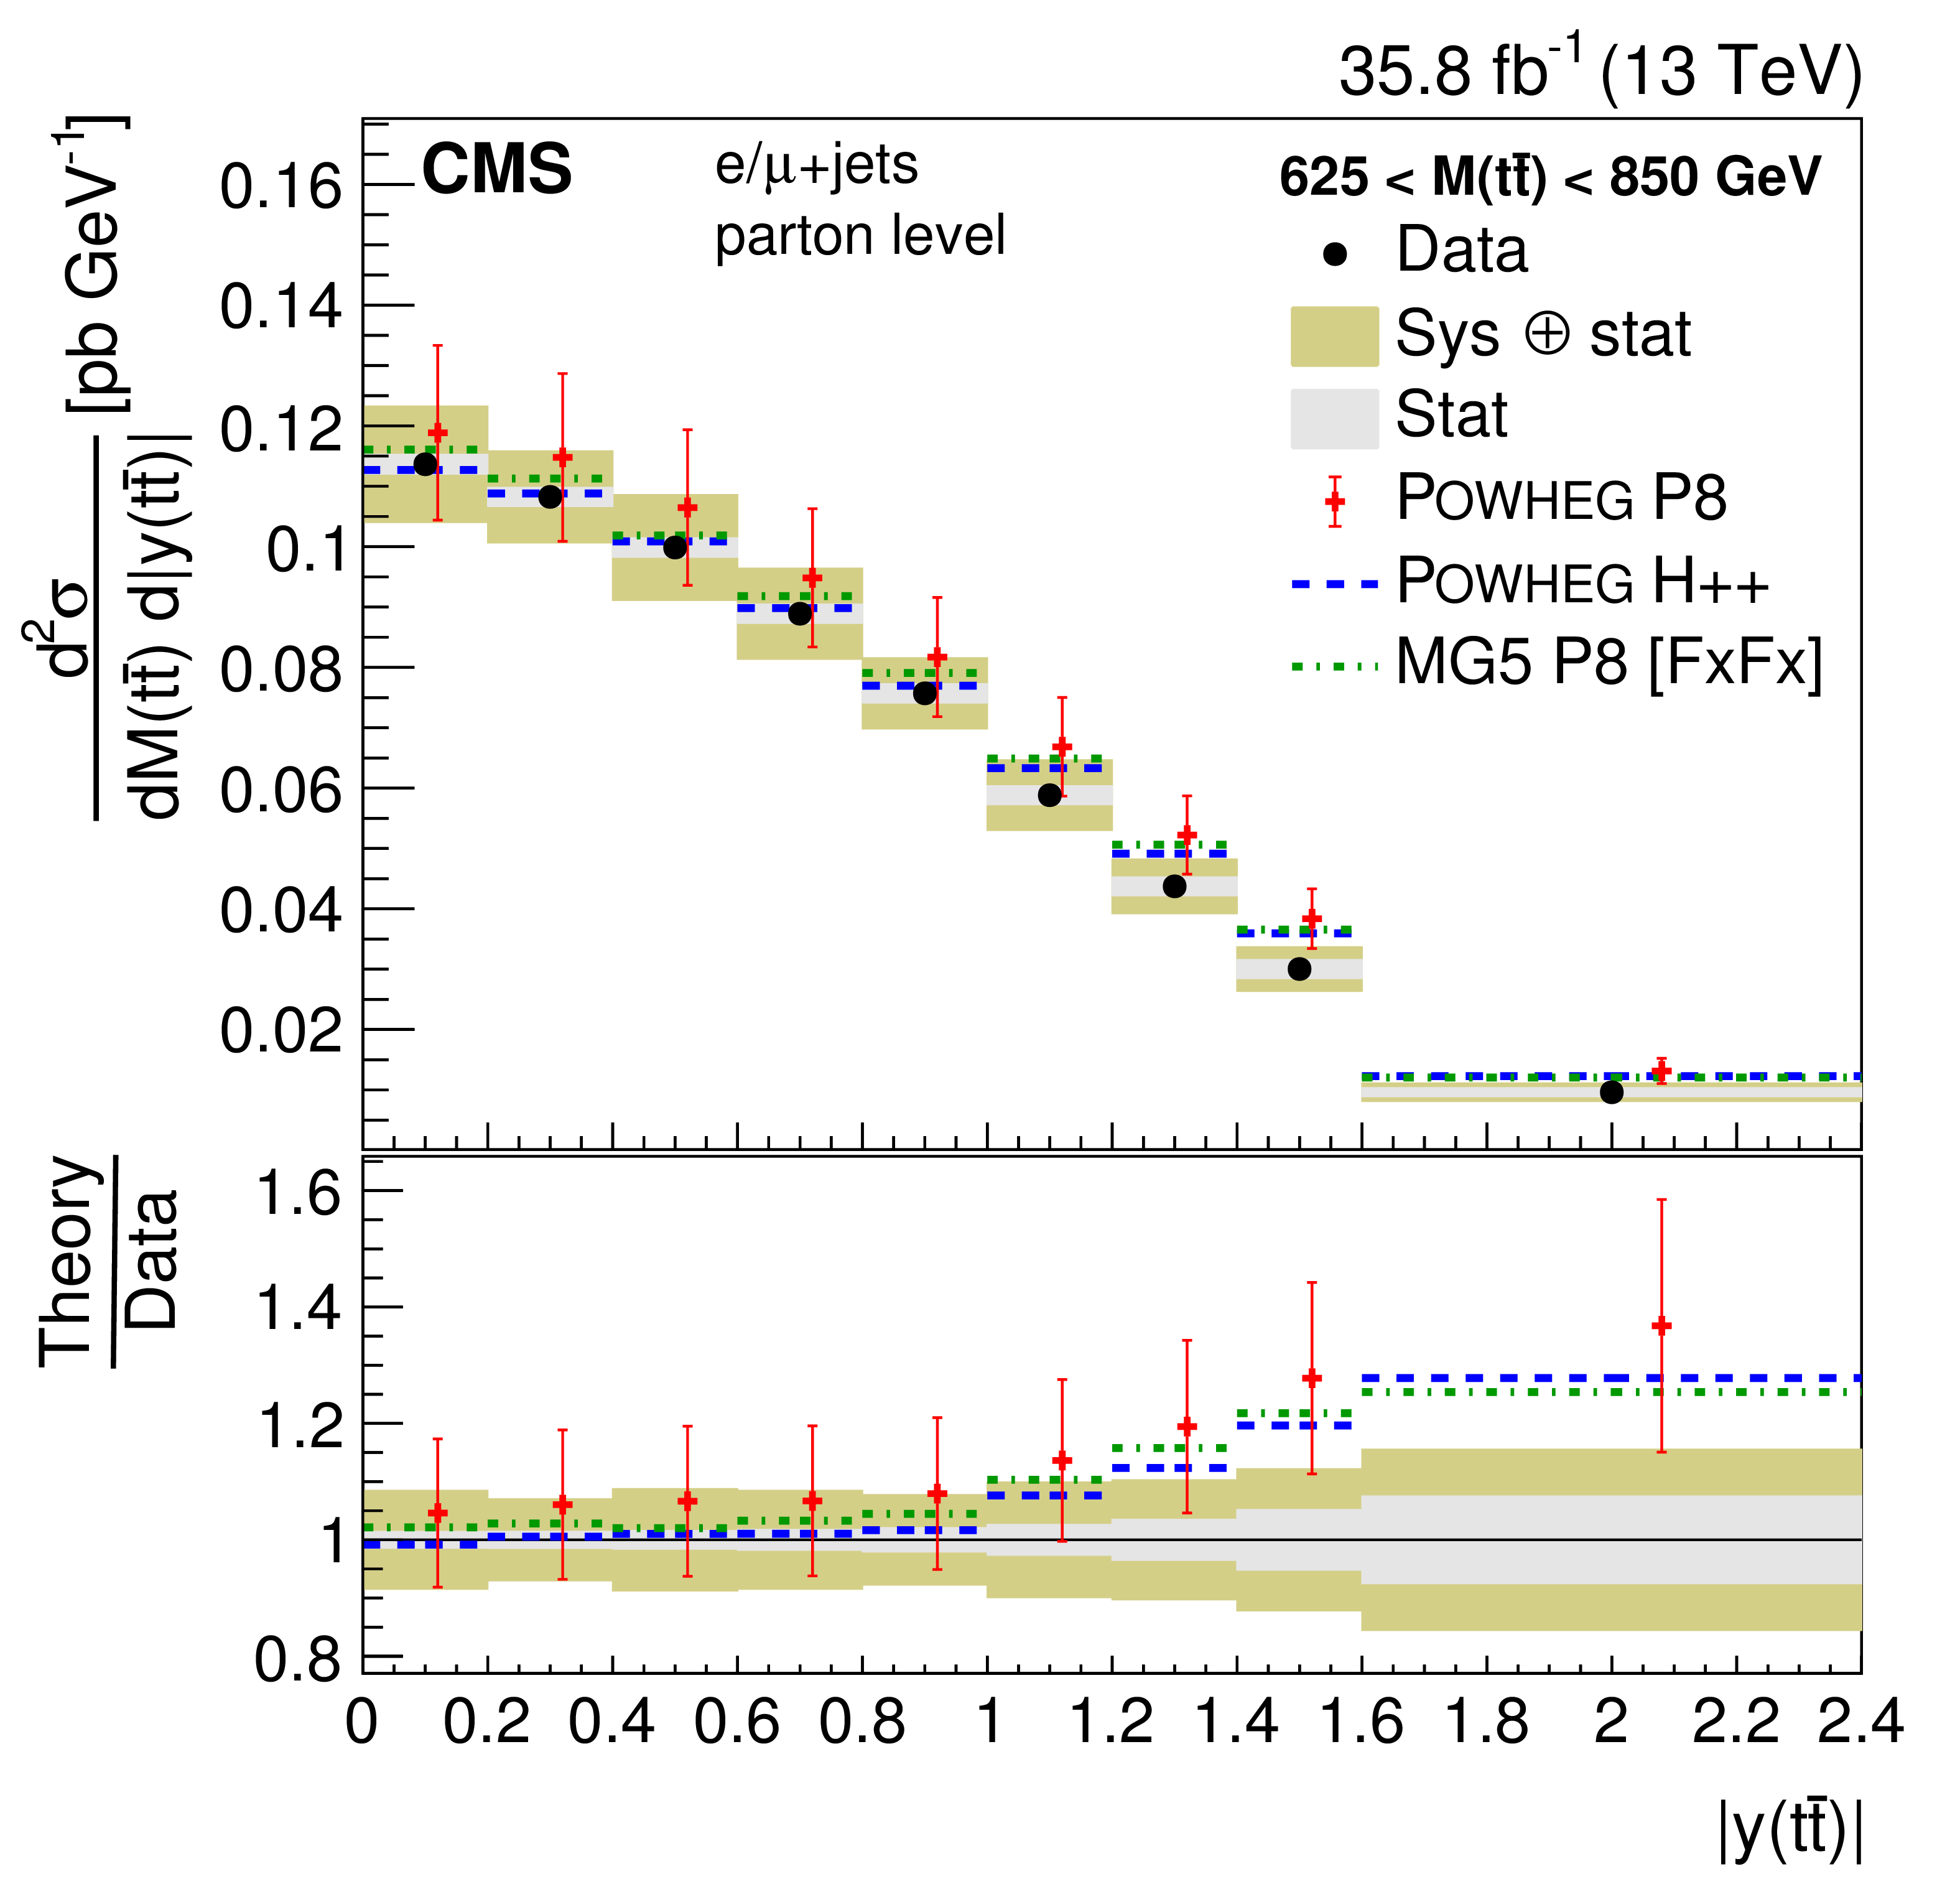
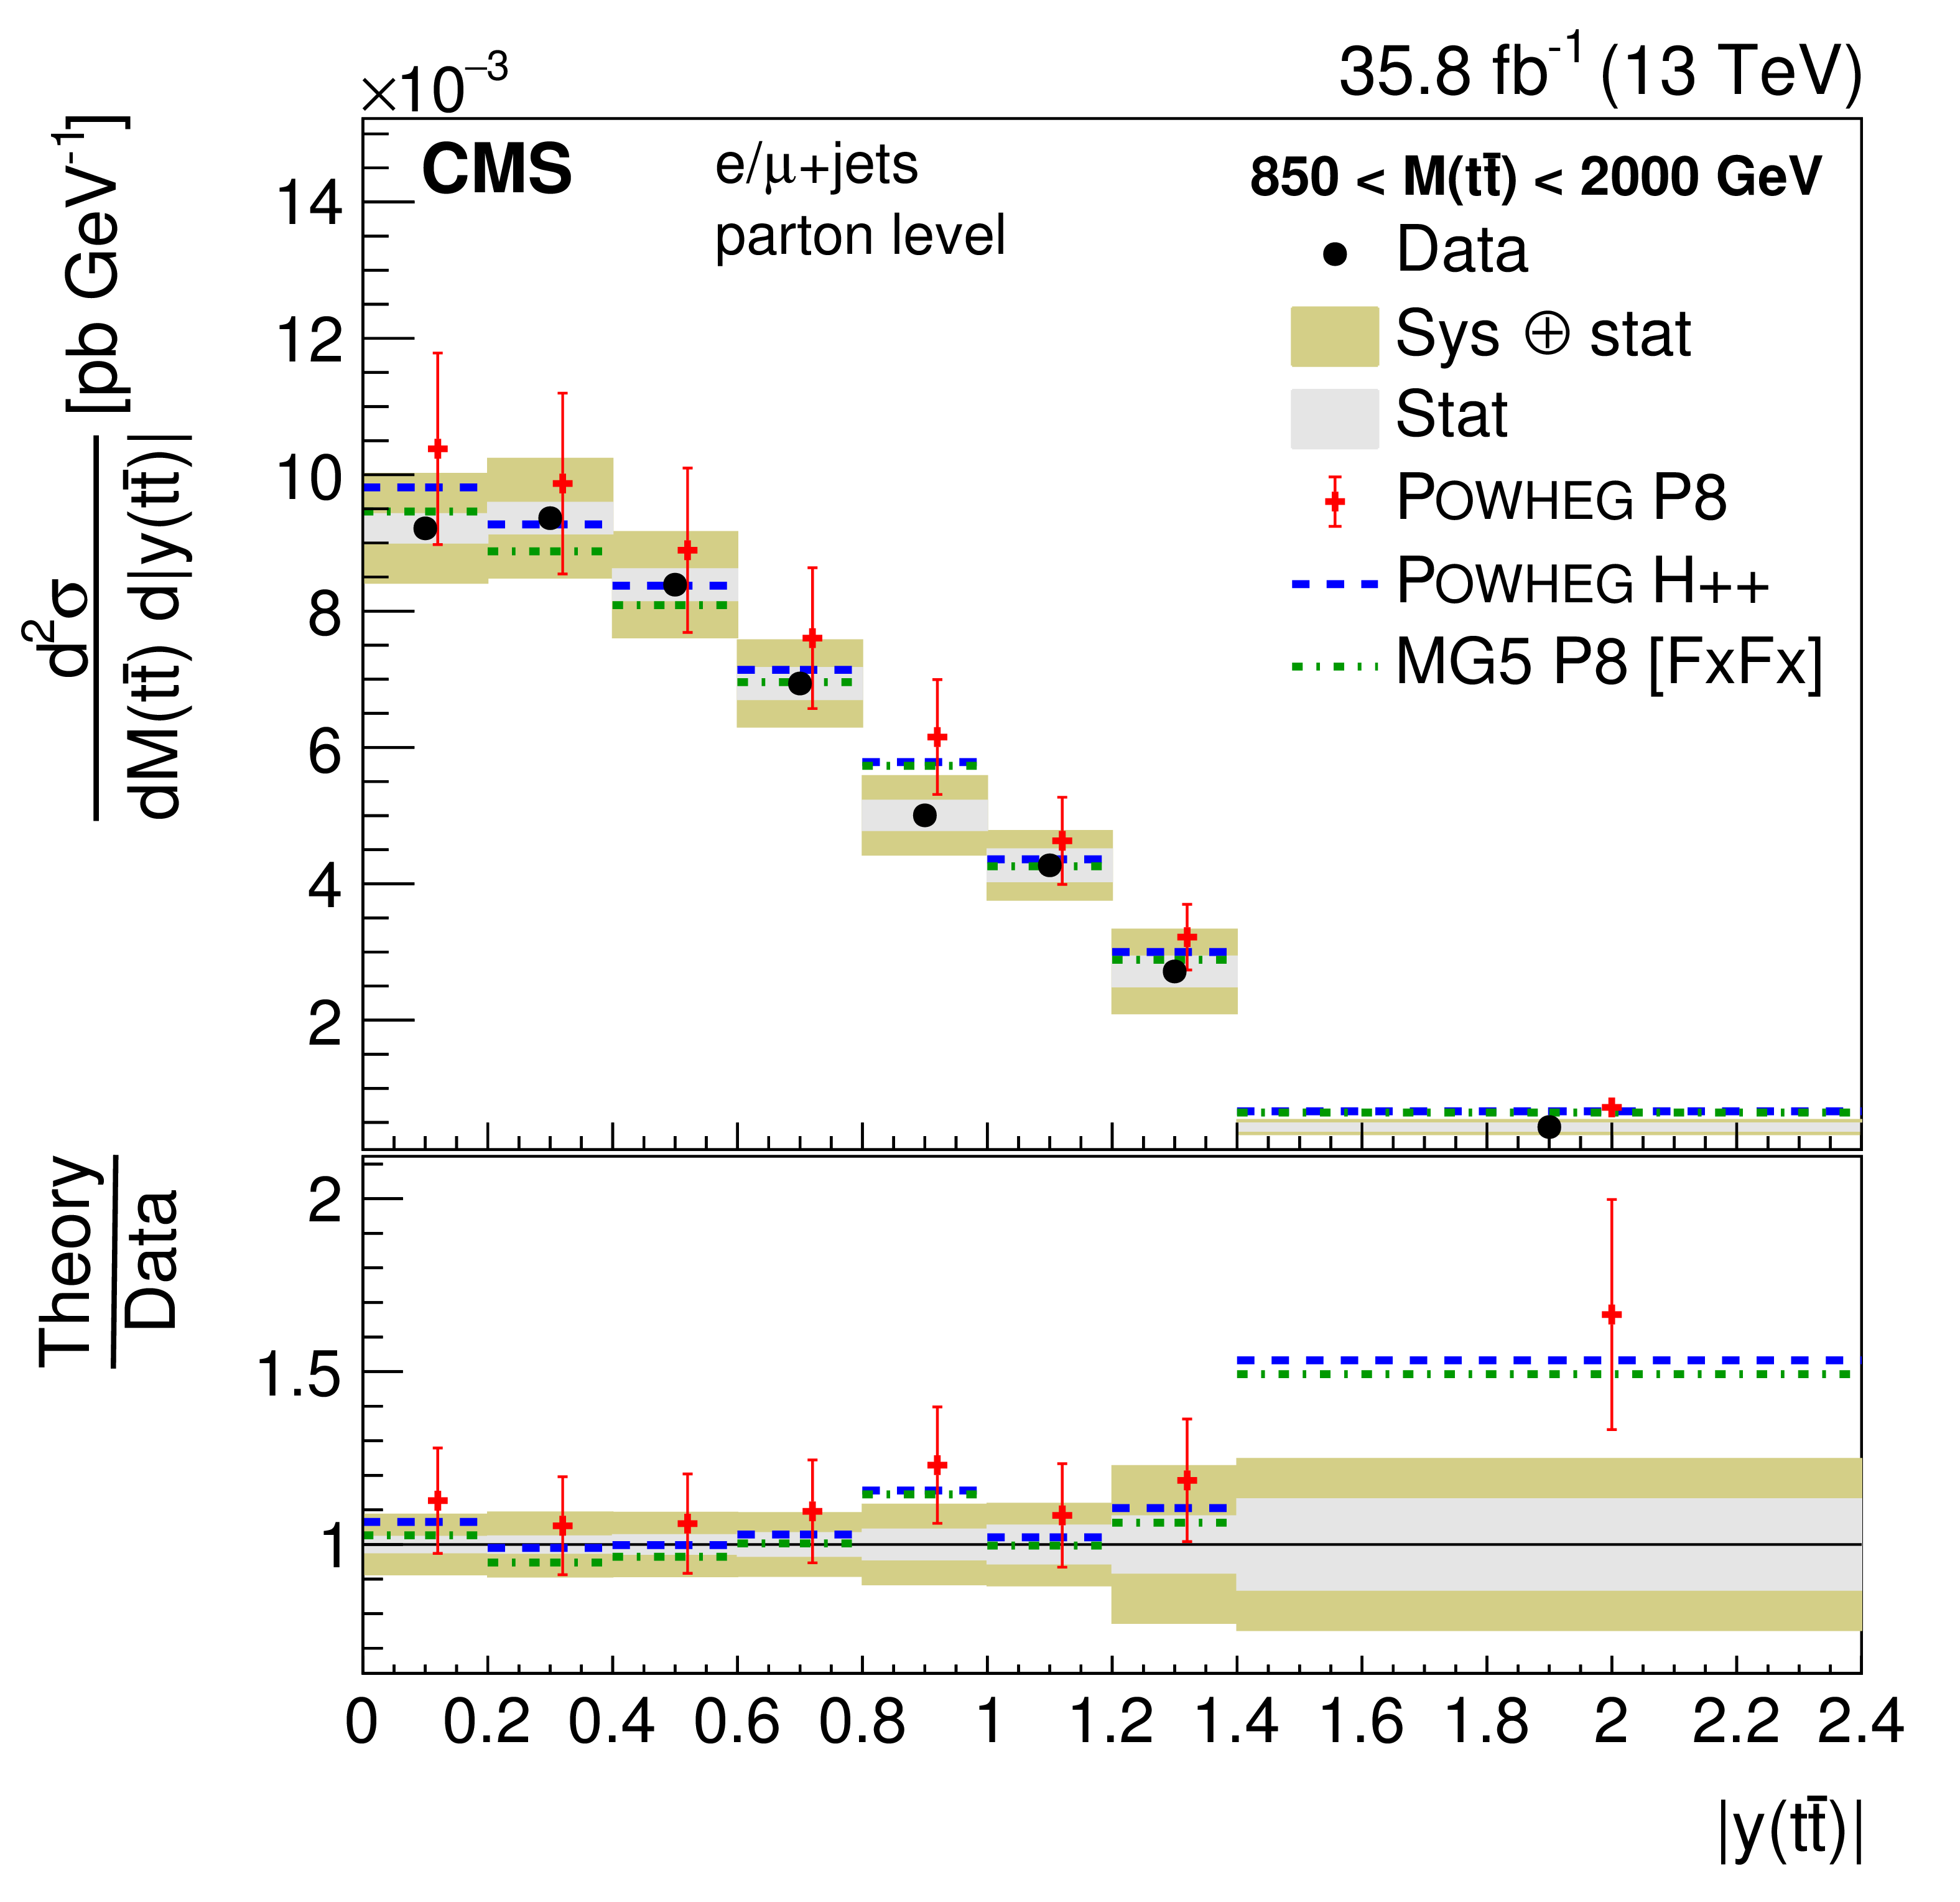
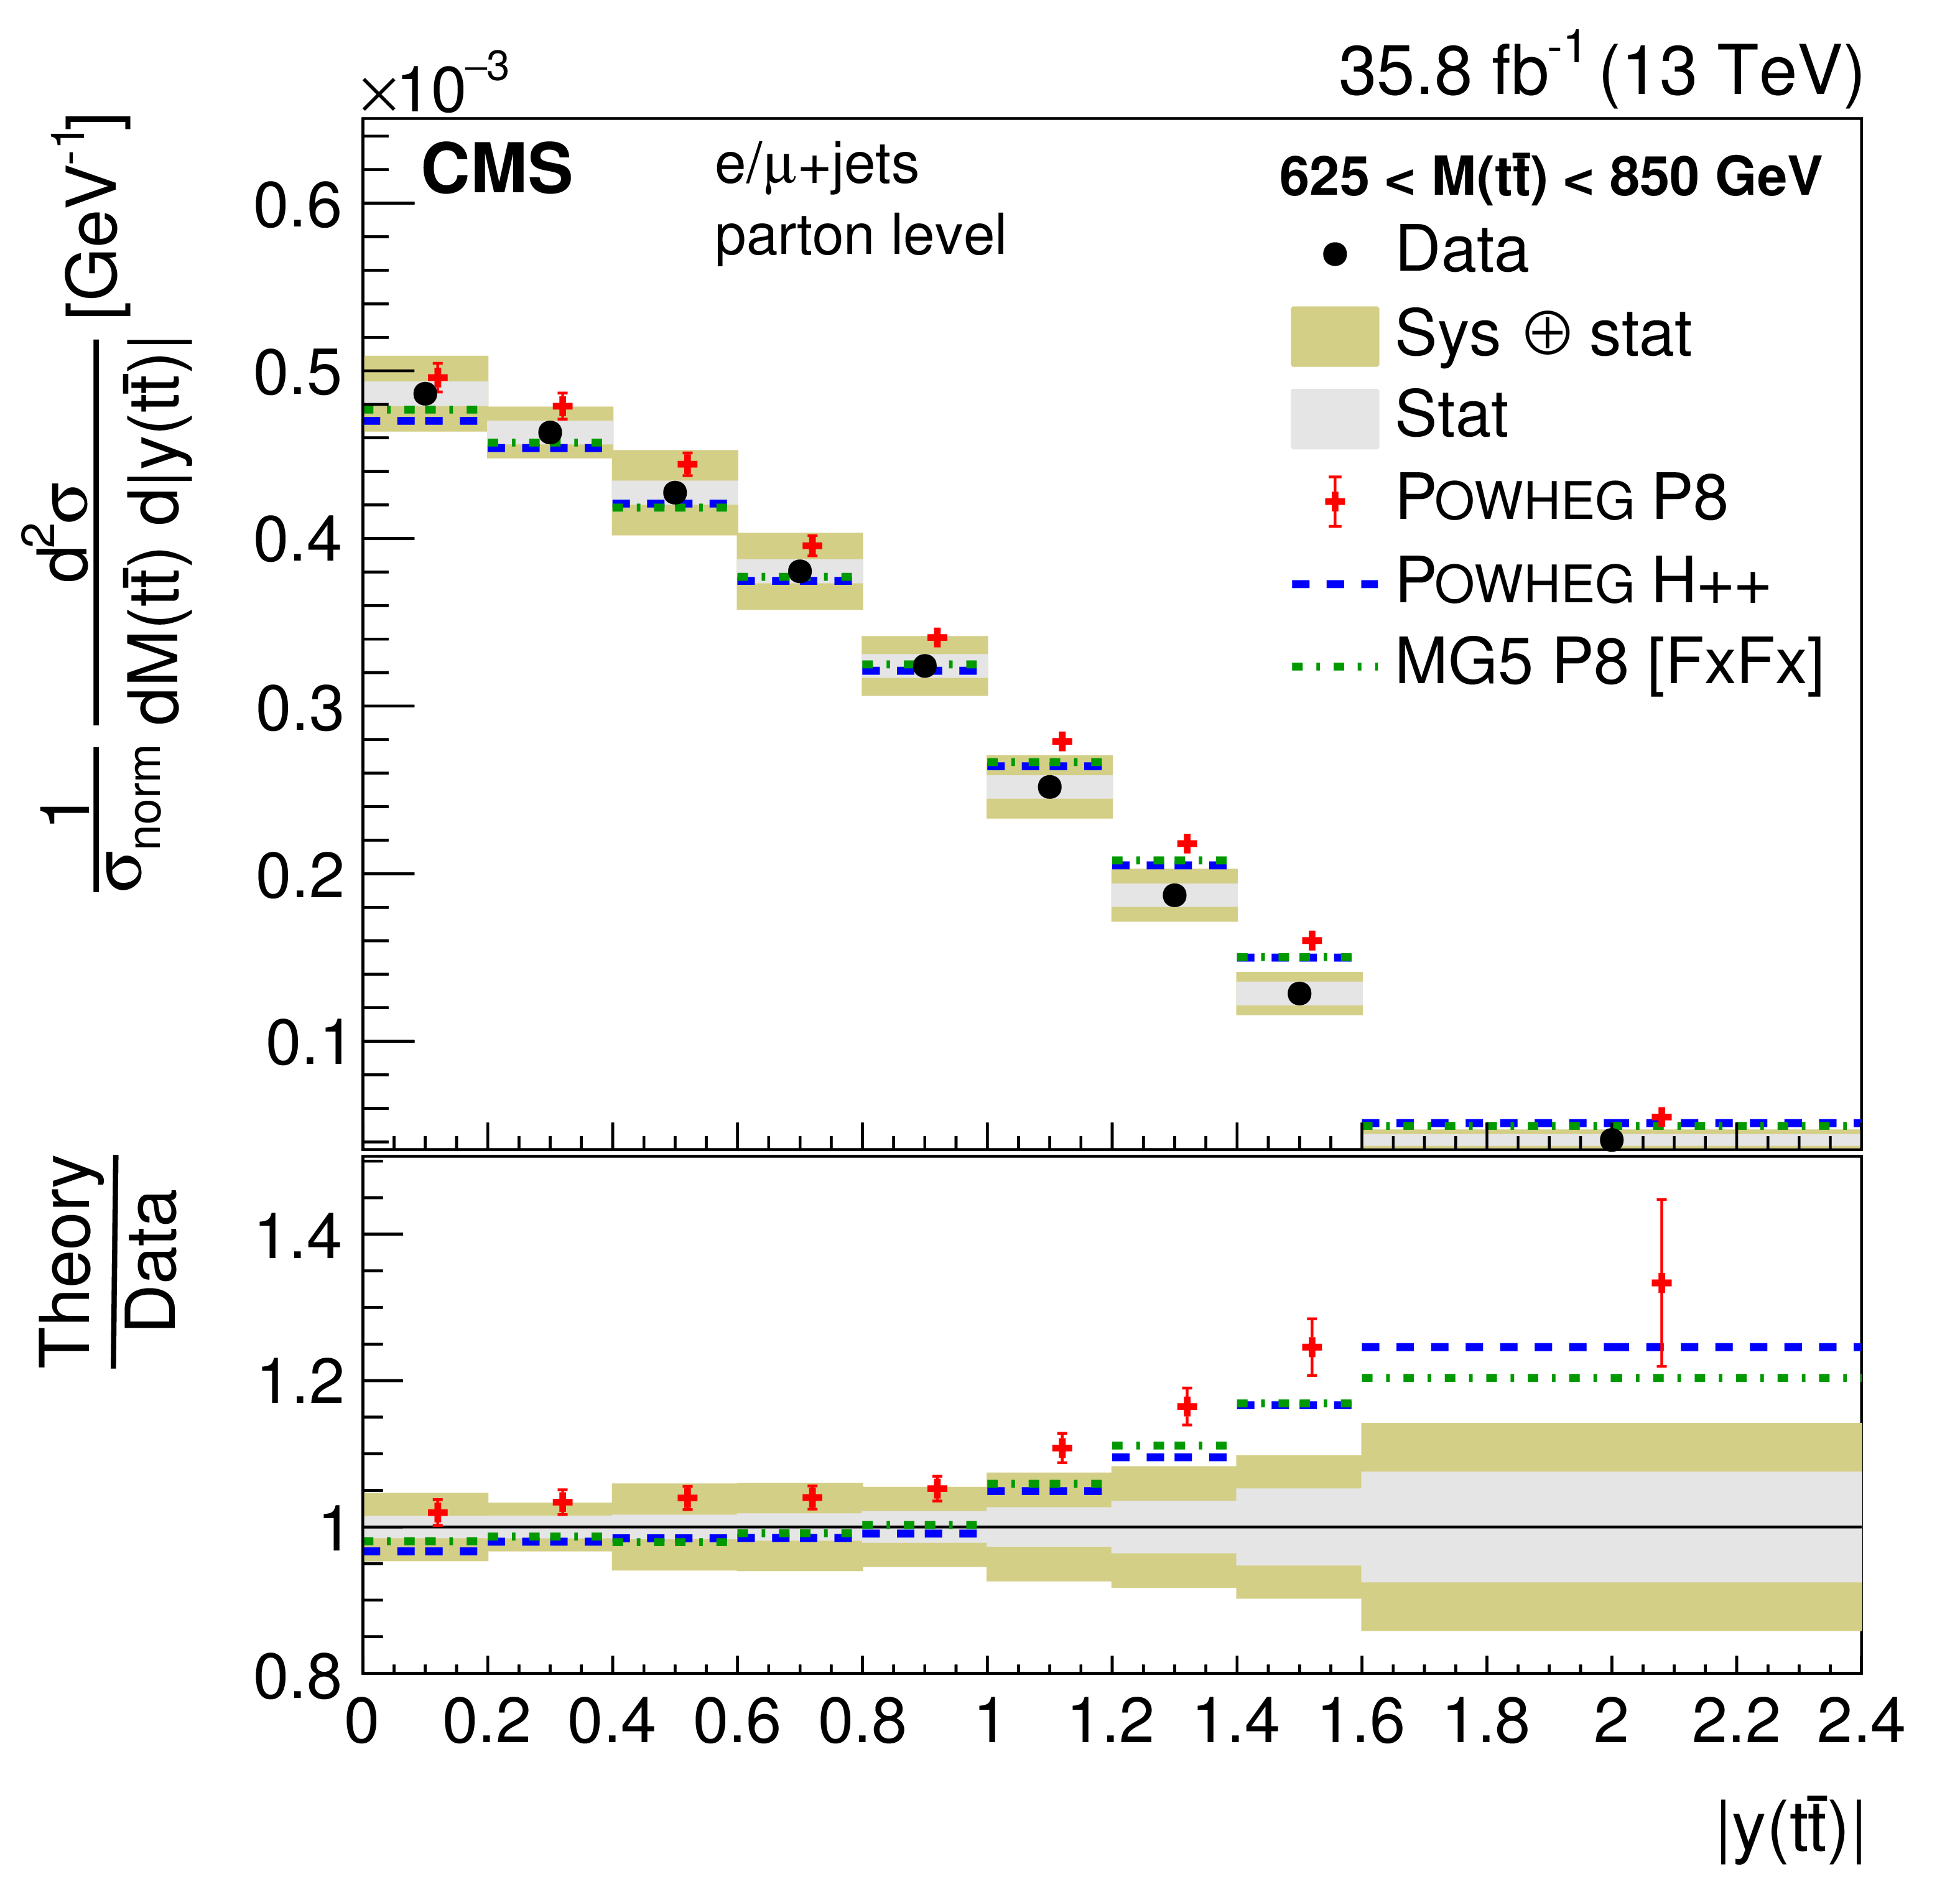
Figure 22:
Double-differential cross section at the parton level as a function of $M({\mathrm{t} \mathrm{\bar{t}}})$ vs. $ { | y({\mathrm{t} \mathrm{\bar{t}}}) | }$. The data are shown as points with light (dark) bands indicating the statistical (statistical and systematic) uncertainties. The cross sections are compared to the predictions of POWHEG combined with PYTHIA8 (P8) or HERWIG++ (H++), and the multiparton simulation MG5_aMC@NLO (MG5)+PYTHIA8 FxFx. The ratios of the various predictions to the measured cross sections are shown at the bottom of each panel. |
png pdf |
Figure 22-a:
Double-differential cross section at the parton level as a function of $M({\mathrm{t} \mathrm{\bar{t}}})$ vs. $ { | y({\mathrm{t} \mathrm{\bar{t}}}) | }$. The data are shown as points with light (dark) bands indicating the statistical (statistical and systematic) uncertainties. The cross sections are compared to the predictions of POWHEG combined with PYTHIA8 (P8) or HERWIG++ (H++), and the multiparton simulation MG5_aMC@NLO (MG5)+PYTHIA8 FxFx. The ratios of the various predictions to the measured cross sections are shown at the bottom of each panel. |
png pdf |
Figure 22-b:
Double-differential cross section at the parton level as a function of $M({\mathrm{t} \mathrm{\bar{t}}})$ vs. $ { | y({\mathrm{t} \mathrm{\bar{t}}}) | }$. The data are shown as points with light (dark) bands indicating the statistical (statistical and systematic) uncertainties. The cross sections are compared to the predictions of POWHEG combined with PYTHIA8 (P8) or HERWIG++ (H++), and the multiparton simulation MG5_aMC@NLO (MG5)+PYTHIA8 FxFx. The ratios of the various predictions to the measured cross sections are shown at the bottom of each panel. |
png pdf |
Figure 22-c:
Double-differential cross section at the parton level as a function of $M({\mathrm{t} \mathrm{\bar{t}}})$ vs. $ { | y({\mathrm{t} \mathrm{\bar{t}}}) | }$. The data are shown as points with light (dark) bands indicating the statistical (statistical and systematic) uncertainties. The cross sections are compared to the predictions of POWHEG combined with PYTHIA8 (P8) or HERWIG++ (H++), and the multiparton simulation MG5_aMC@NLO (MG5)+PYTHIA8 FxFx. The ratios of the various predictions to the measured cross sections are shown at the bottom of each panel. |
png pdf |
Figure 22-d:
Double-differential cross section at the parton level as a function of $M({\mathrm{t} \mathrm{\bar{t}}})$ vs. $ { | y({\mathrm{t} \mathrm{\bar{t}}}) | }$. The data are shown as points with light (dark) bands indicating the statistical (statistical and systematic) uncertainties. The cross sections are compared to the predictions of POWHEG combined with PYTHIA8 (P8) or HERWIG++ (H++), and the multiparton simulation MG5_aMC@NLO (MG5)+PYTHIA8 FxFx. The ratios of the various predictions to the measured cross sections are shown at the bottom of each panel. |
png pdf |
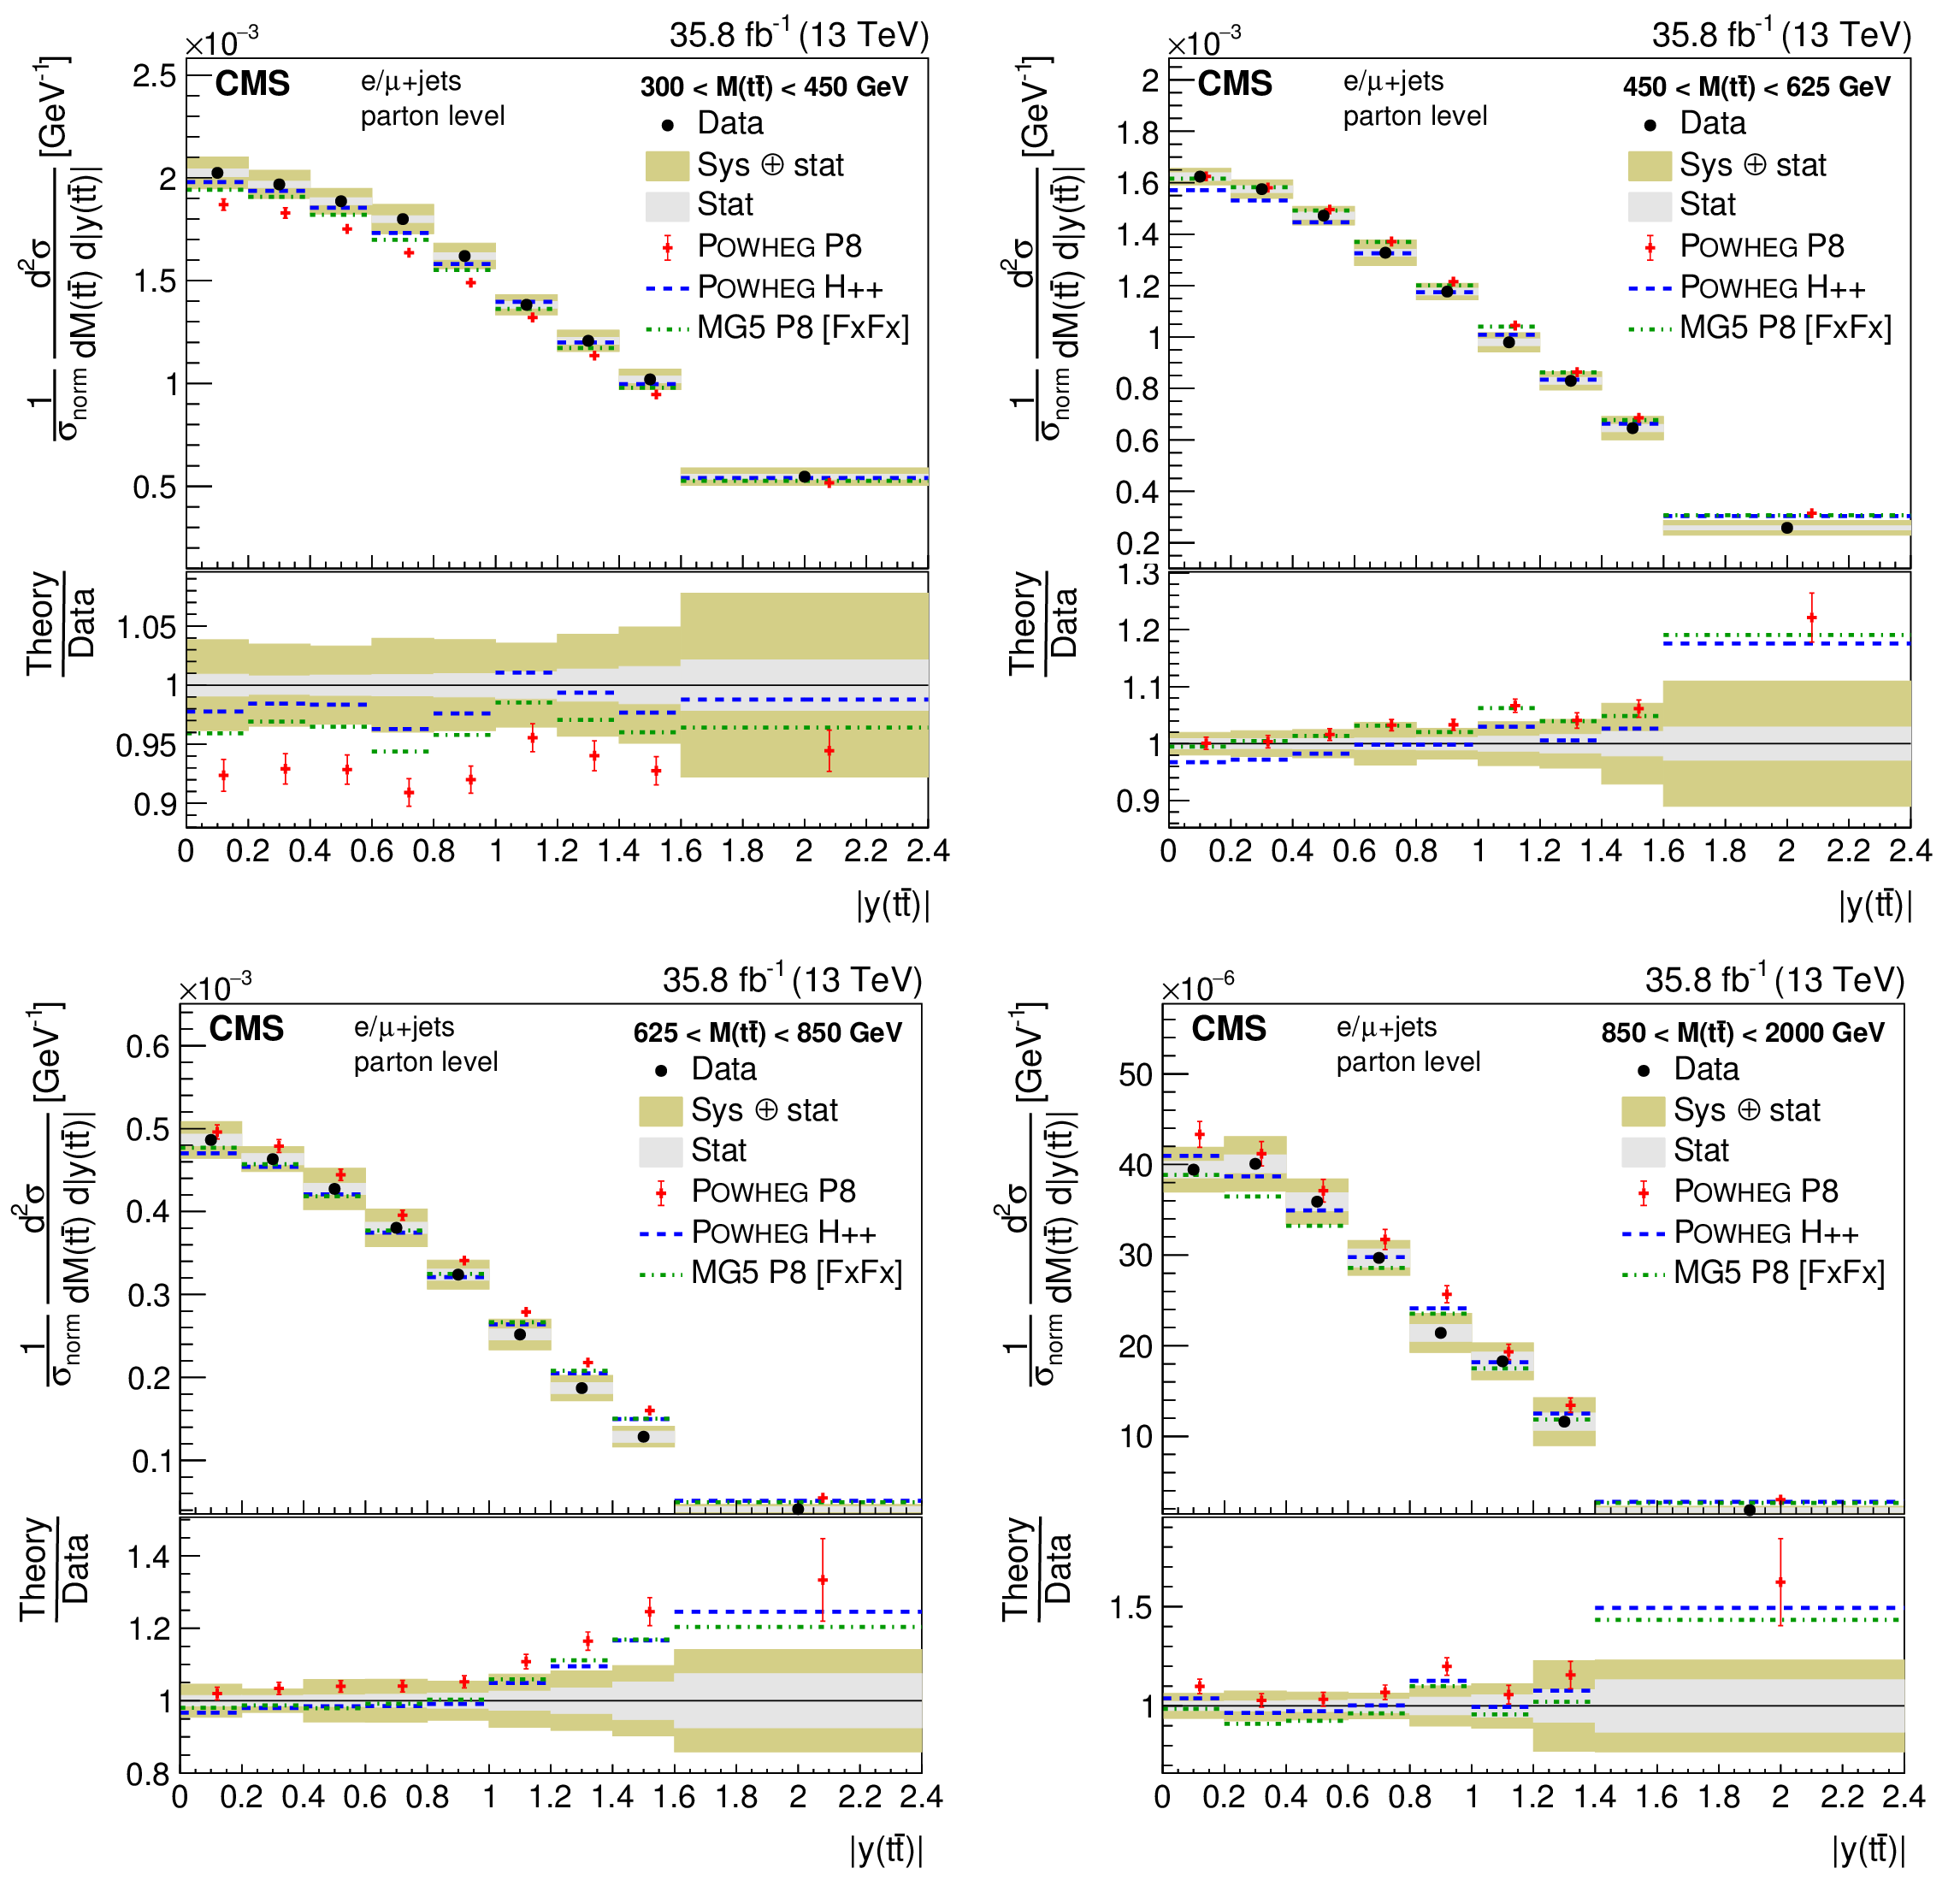
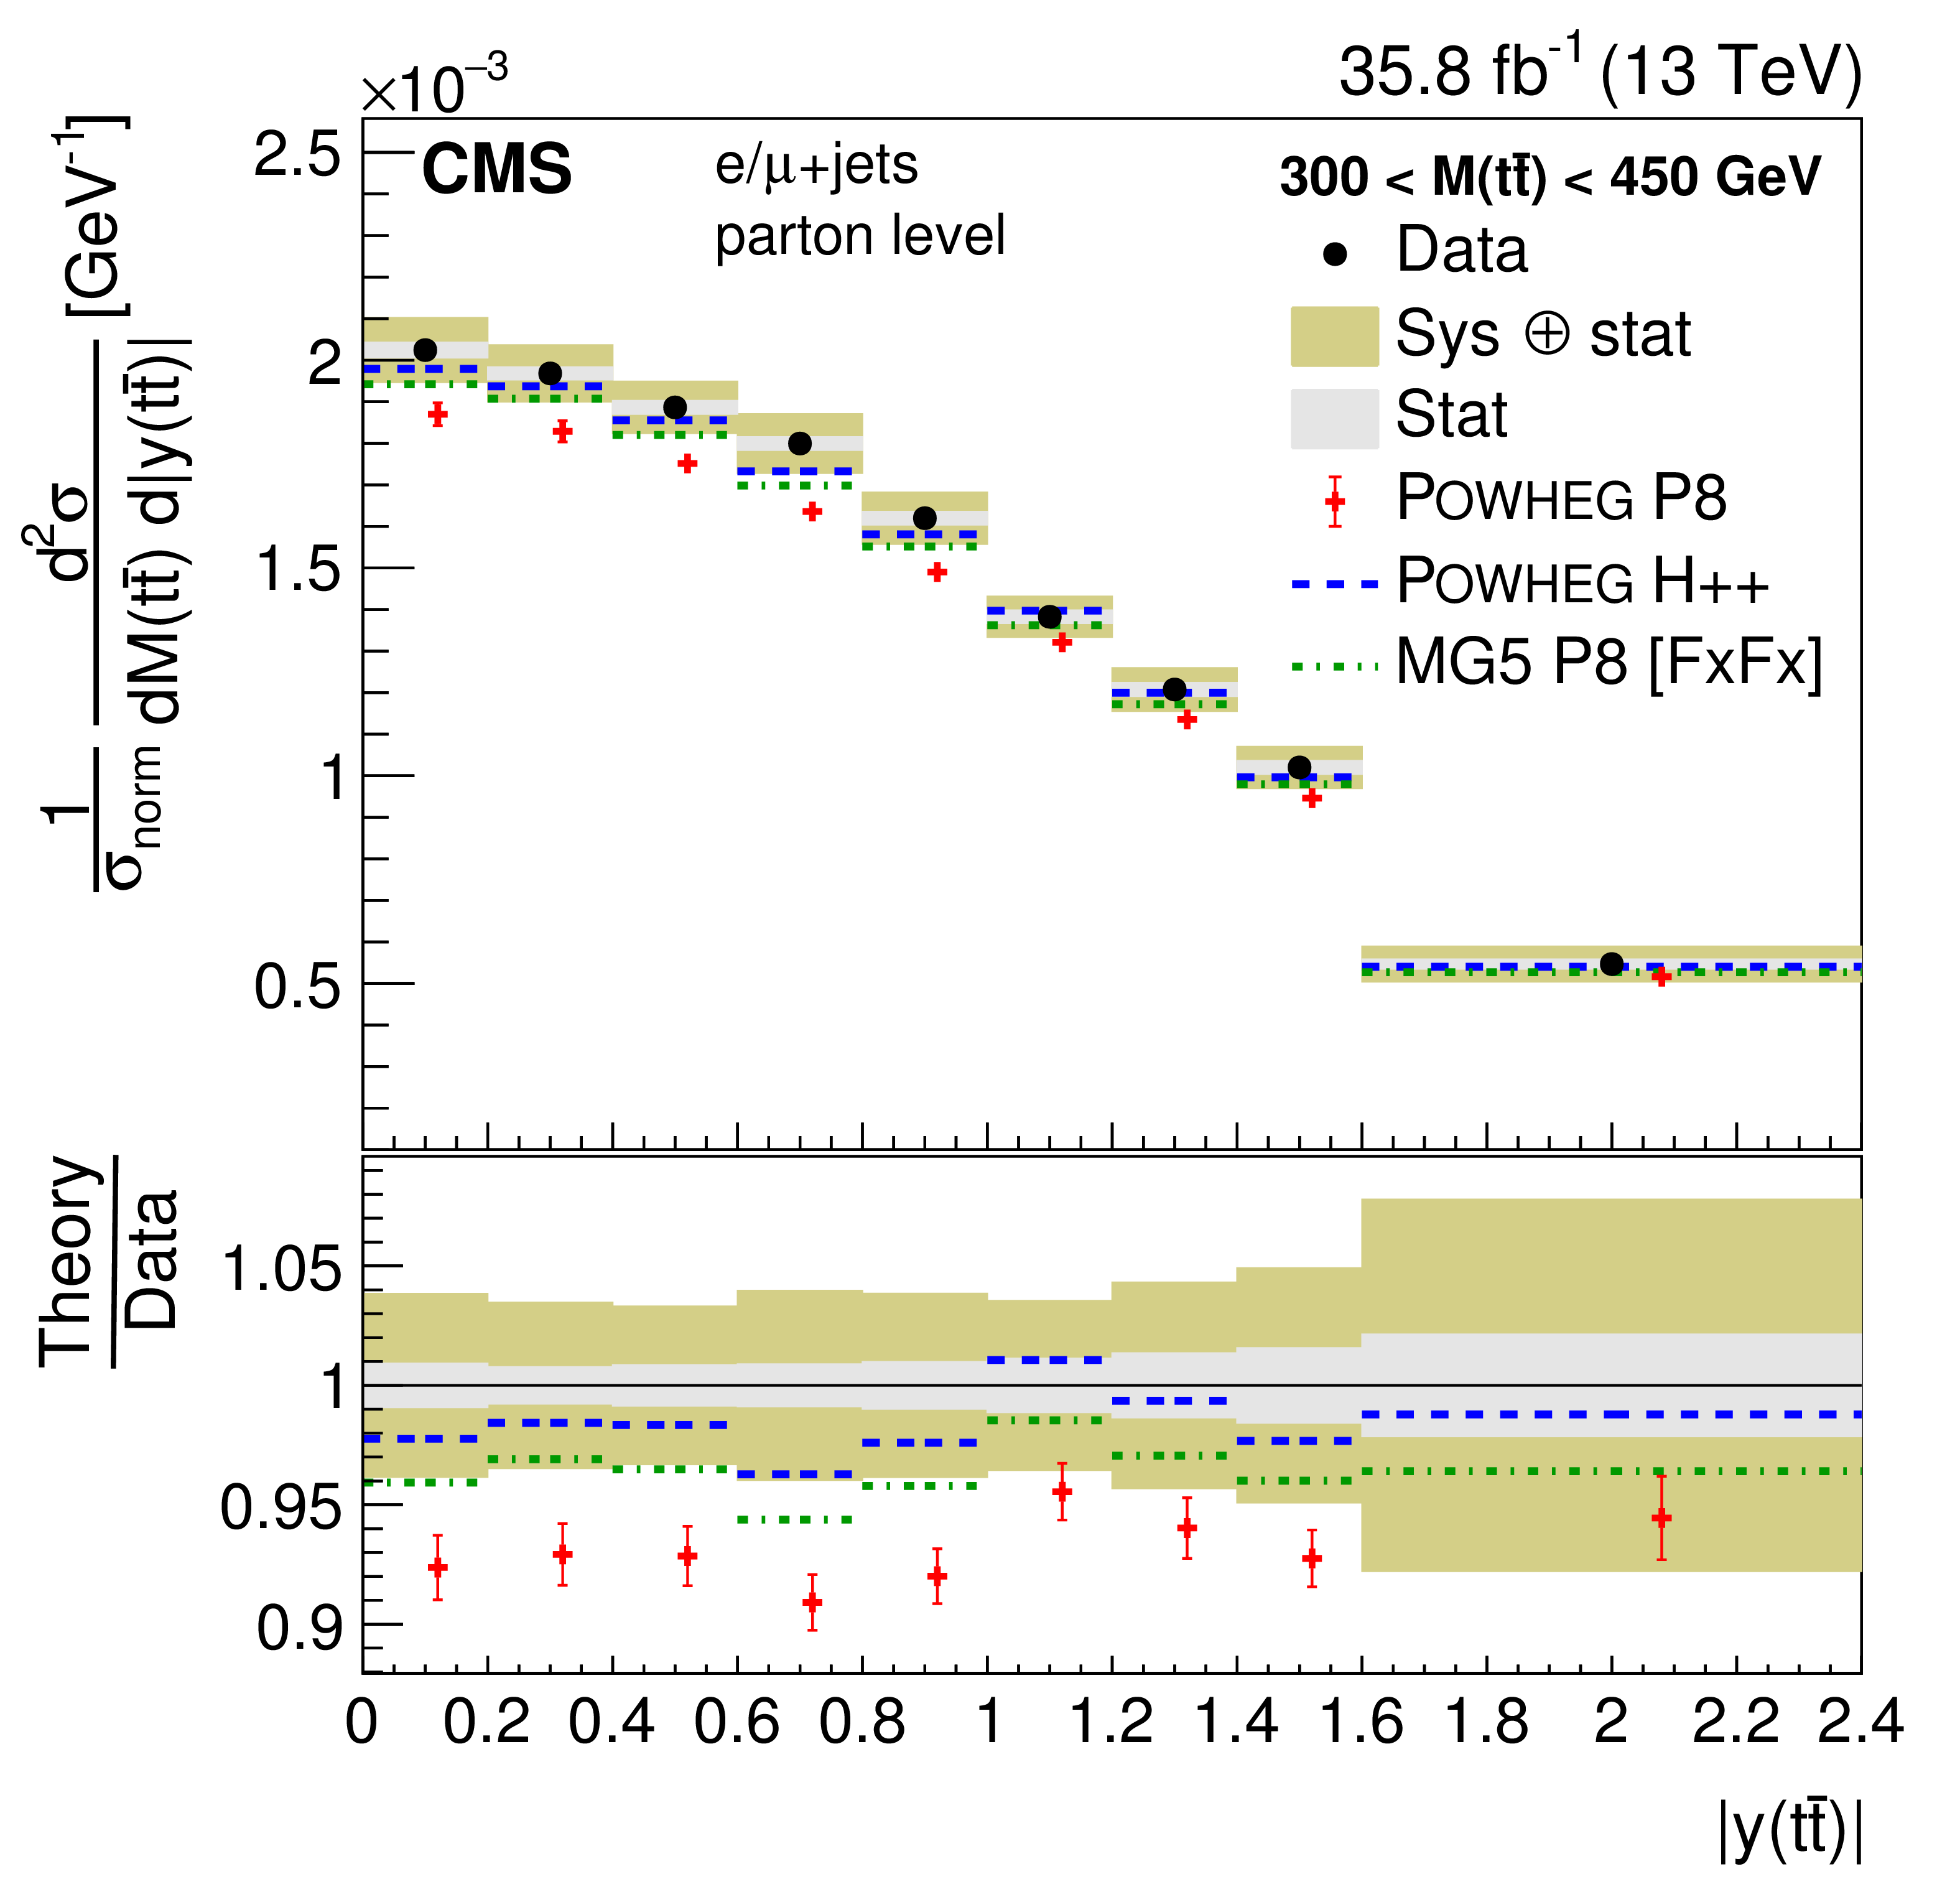
Figure 23:
Normalized double-differential cross section at the parton level as a function of $M({\mathrm{t} \mathrm{\bar{t}}})$ vs. $ { | y({\mathrm{t} \mathrm{\bar{t}}}) | }$. The data are shown as points with light (dark) bands indicating the statistical (statistical and systematic) uncertainties. The cross sections are compared to the predictions of POWHEG combined with PYTHIA8 (P8) or HERWIG++ (H++), and the multiparton simulation MG5_aMC@NLO (MG5)+PYTHIA8 FxFx. The ratios of the various predictions to the measured cross sections are shown at the bottom of each panel. |
png pdf |
Figure 23-a:
Normalized double-differential cross section at the parton level as a function of $M({\mathrm{t} \mathrm{\bar{t}}})$ vs. $ { | y({\mathrm{t} \mathrm{\bar{t}}}) | }$. The data are shown as points with light (dark) bands indicating the statistical (statistical and systematic) uncertainties. The cross sections are compared to the predictions of POWHEG combined with PYTHIA8 (P8) or HERWIG++ (H++), and the multiparton simulation MG5_aMC@NLO (MG5)+PYTHIA8 FxFx. The ratios of the various predictions to the measured cross sections are shown at the bottom of each panel. |

png pdf |
Figure 23-b:
Normalized double-differential cross section at the parton level as a function of $M({\mathrm{t} \mathrm{\bar{t}}})$ vs. $ { | y({\mathrm{t} \mathrm{\bar{t}}}) | }$. The data are shown as points with light (dark) bands indicating the statistical (statistical and systematic) uncertainties. The cross sections are compared to the predictions of POWHEG combined with PYTHIA8 (P8) or HERWIG++ (H++), and the multiparton simulation MG5_aMC@NLO (MG5)+PYTHIA8 FxFx. The ratios of the various predictions to the measured cross sections are shown at the bottom of each panel. |
png pdf |
Figure 23-c:
Normalized double-differential cross section at the parton level as a function of $M({\mathrm{t} \mathrm{\bar{t}}})$ vs. $ { | y({\mathrm{t} \mathrm{\bar{t}}}) | }$. The data are shown as points with light (dark) bands indicating the statistical (statistical and systematic) uncertainties. The cross sections are compared to the predictions of POWHEG combined with PYTHIA8 (P8) or HERWIG++ (H++), and the multiparton simulation MG5_aMC@NLO (MG5)+PYTHIA8 FxFx. The ratios of the various predictions to the measured cross sections are shown at the bottom of each panel. |
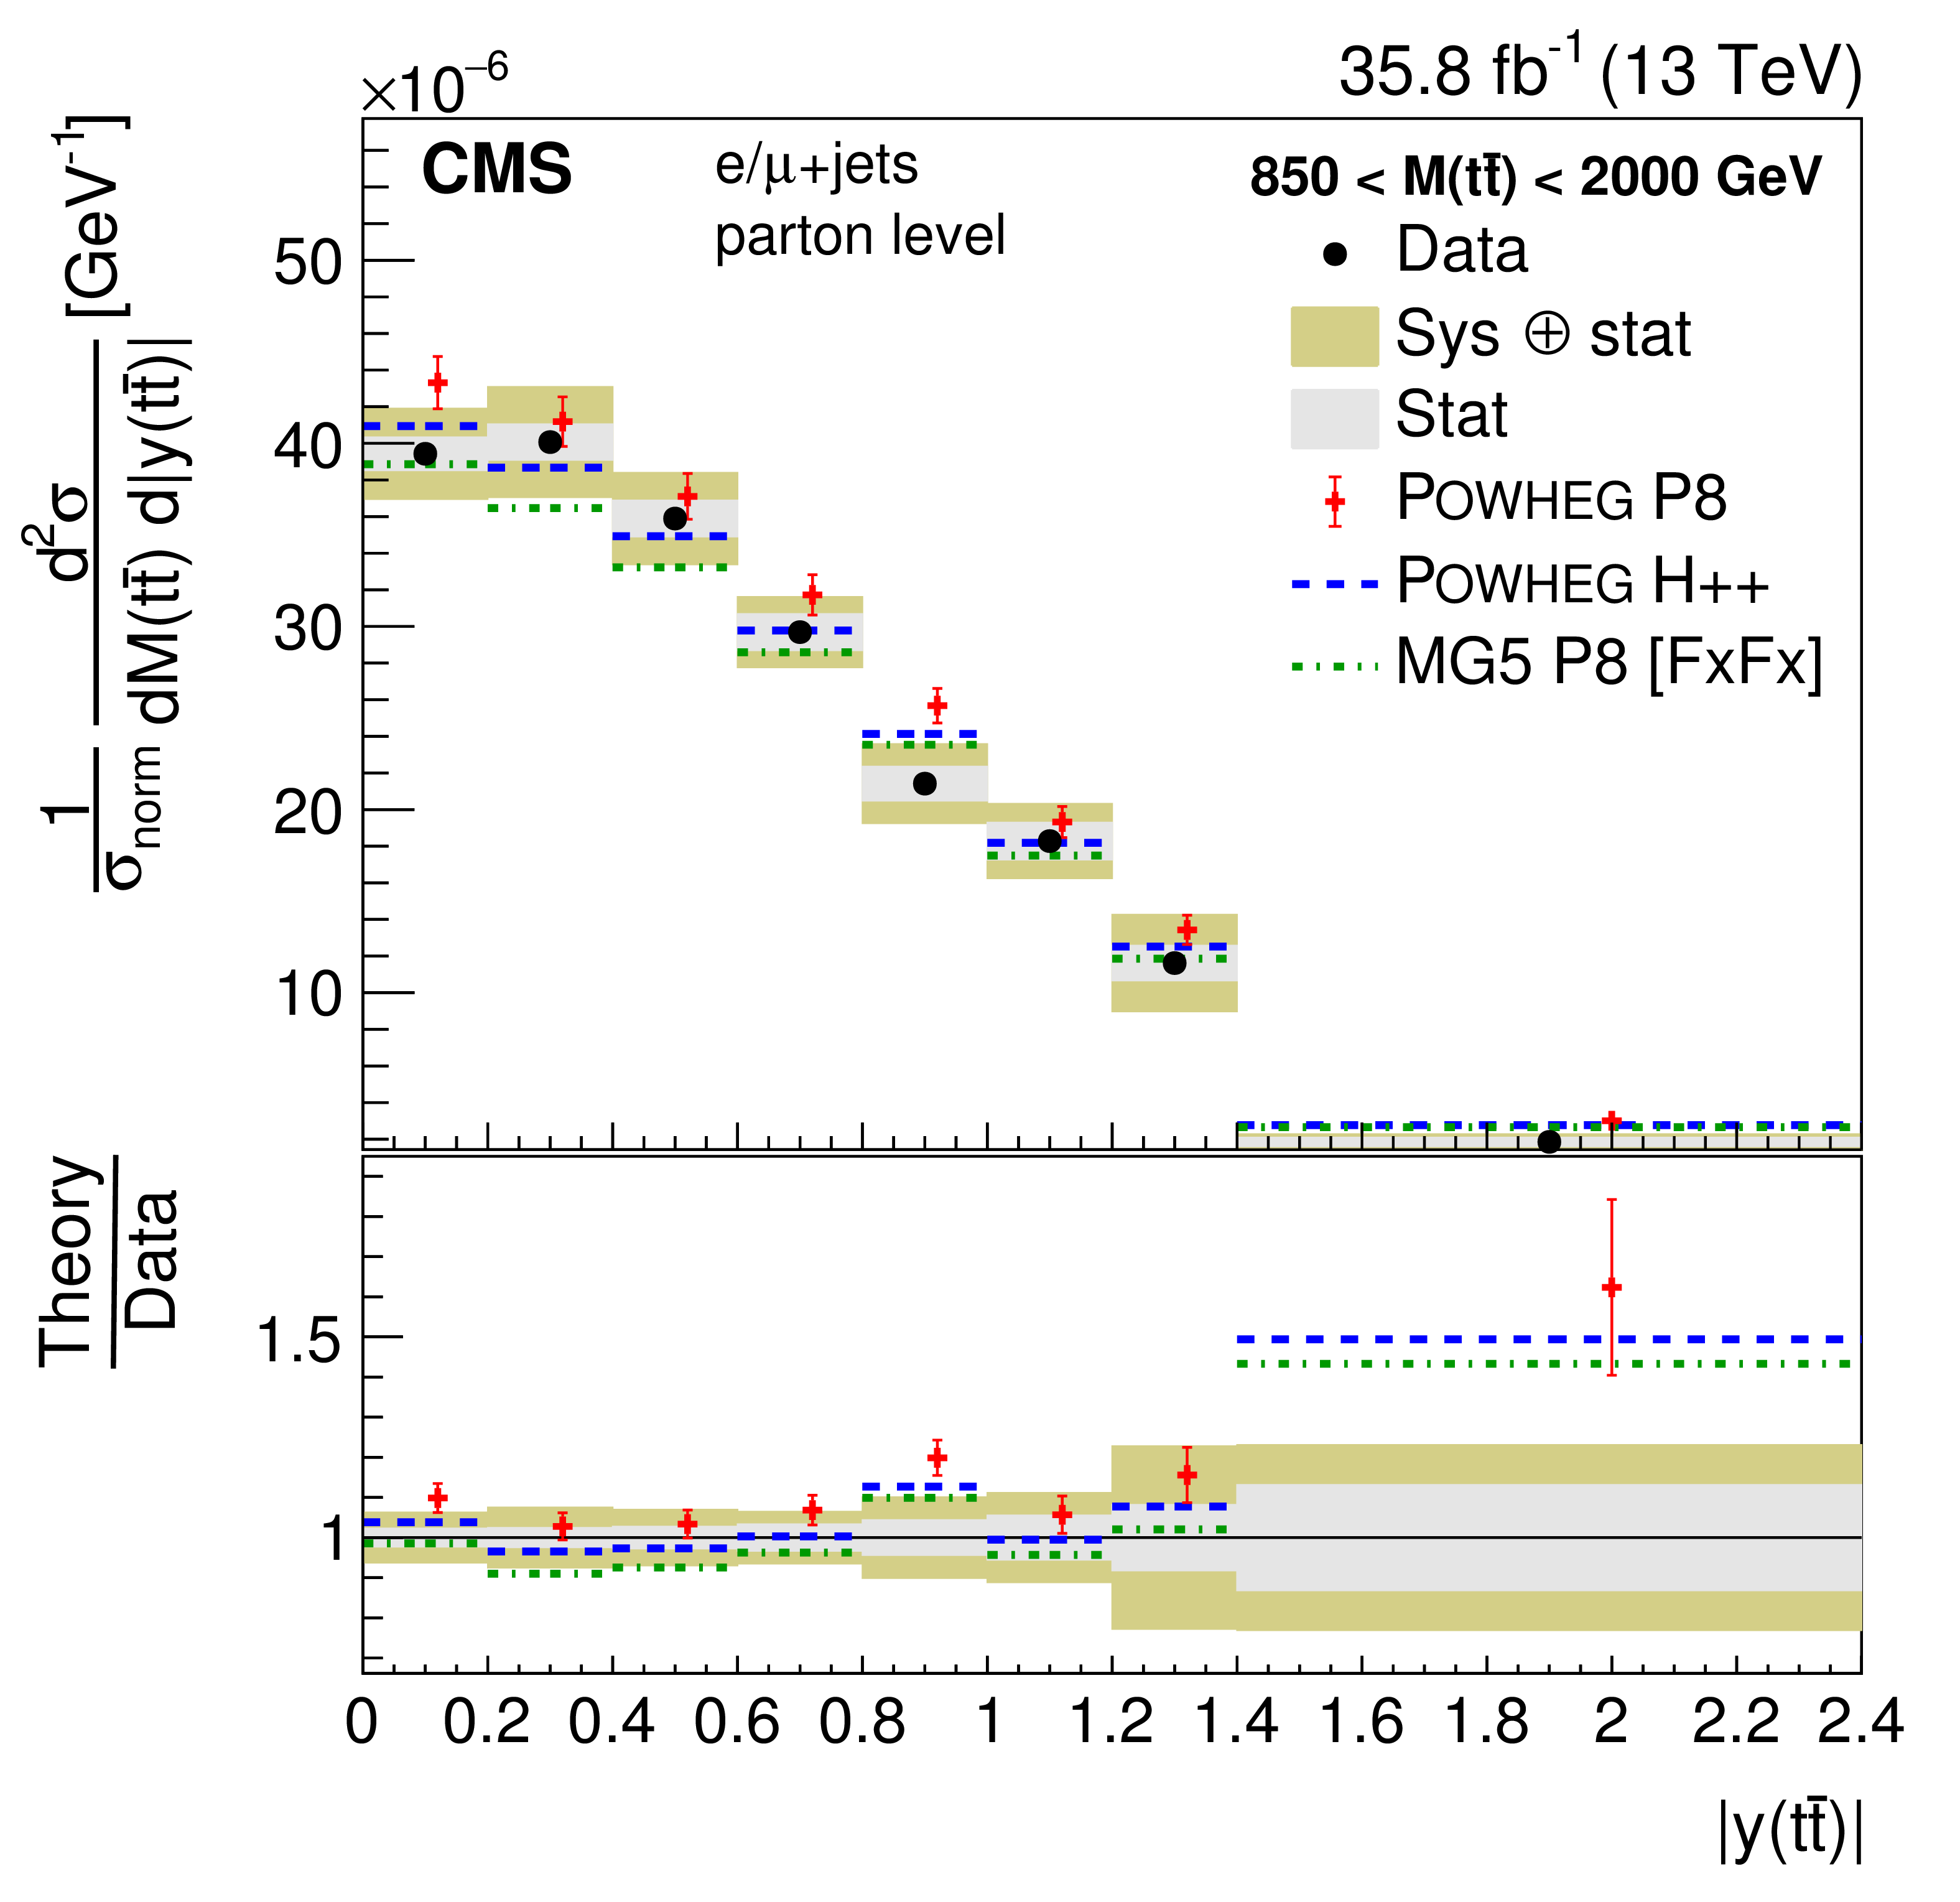
png pdf |
Figure 23-d:
Normalized double-differential cross section at the parton level as a function of $M({\mathrm{t} \mathrm{\bar{t}}})$ vs. $ { | y({\mathrm{t} \mathrm{\bar{t}}}) | }$. The data are shown as points with light (dark) bands indicating the statistical (statistical and systematic) uncertainties. The cross sections are compared to the predictions of POWHEG combined with PYTHIA8 (P8) or HERWIG++ (H++), and the multiparton simulation MG5_aMC@NLO (MG5)+PYTHIA8 FxFx. The ratios of the various predictions to the measured cross sections are shown at the bottom of each panel. |
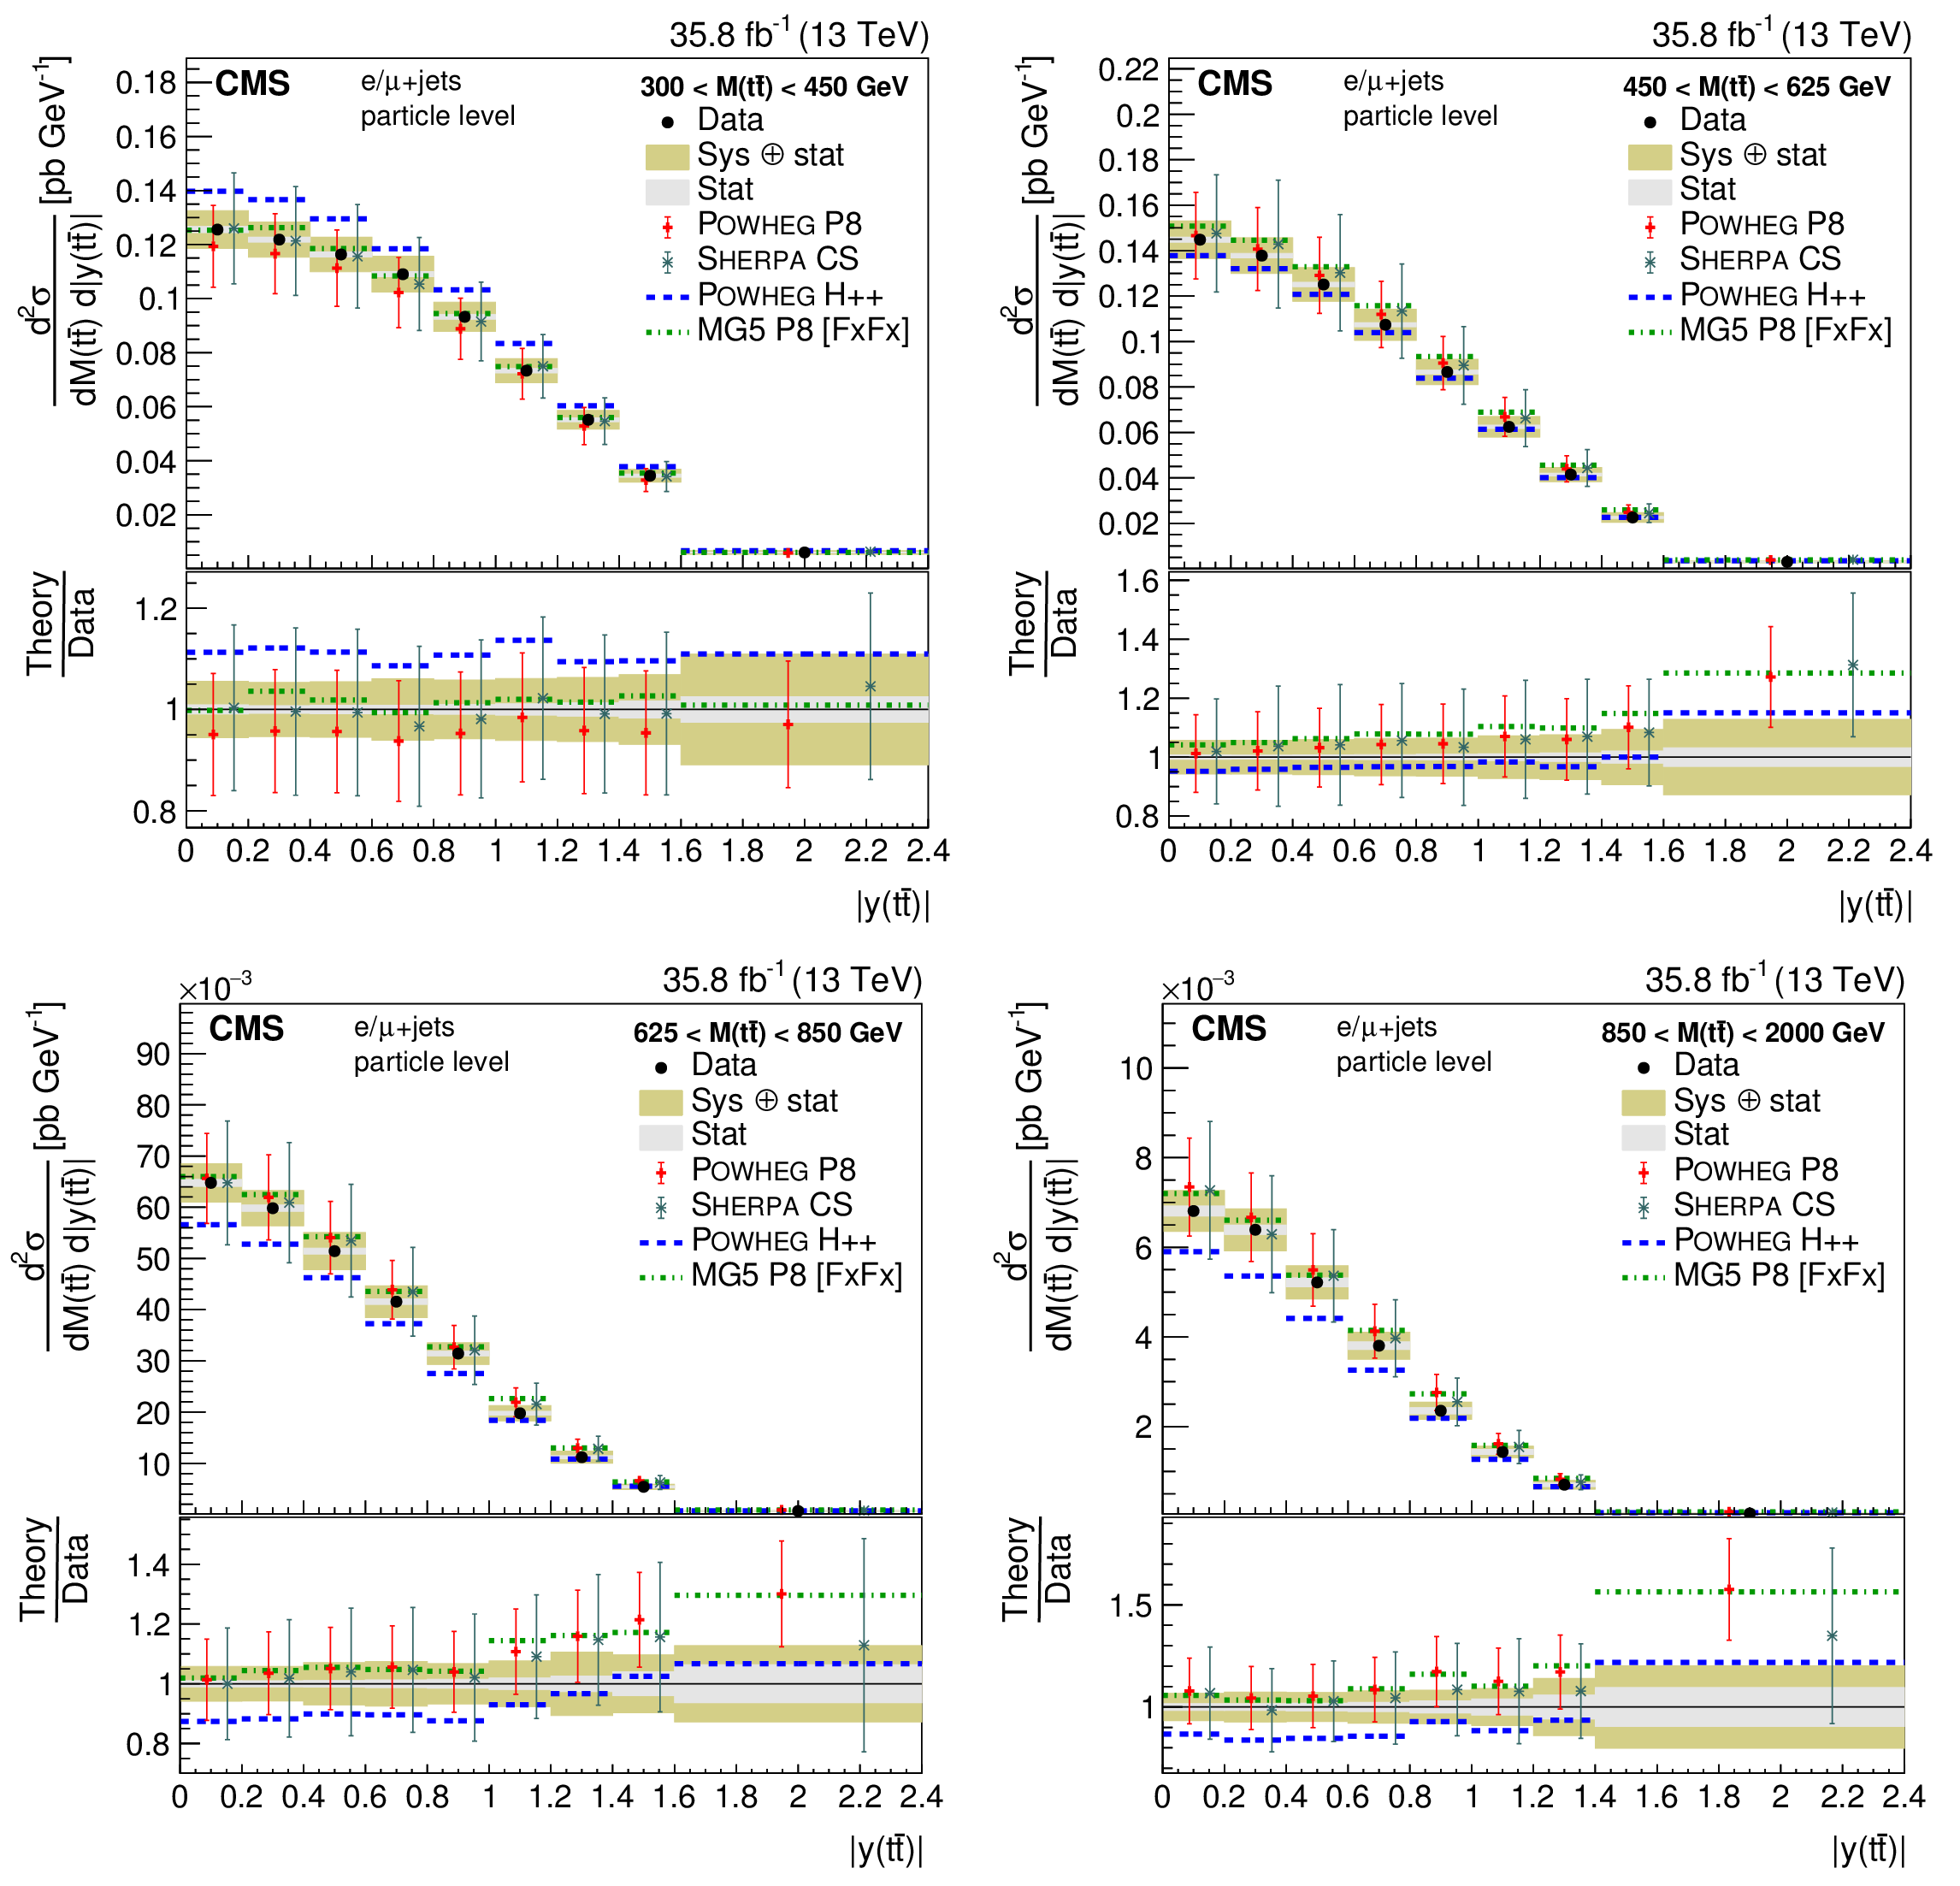
png pdf |
Figure 24:
Double-differential cross section at the particle level as a function of $M({\mathrm{t} \mathrm{\bar{t}}})$ vs. $ { | y({\mathrm{t} \mathrm{\bar{t}}}) | }$. The data are shown as points with light (dark) bands indicating the statistical (statistical and systematic) uncertainties. The cross sections are compared to the predictions of POWHEG combined with PYTHIA8 (P8) or HERWIG++ (H++) and the multiparton simulations MG5_aMC@NLO (MG5)+PYTHIA8 FxFx and SHERPA. The ratios of the various predictions to the measured cross sections are shown at the bottom of each panel. |
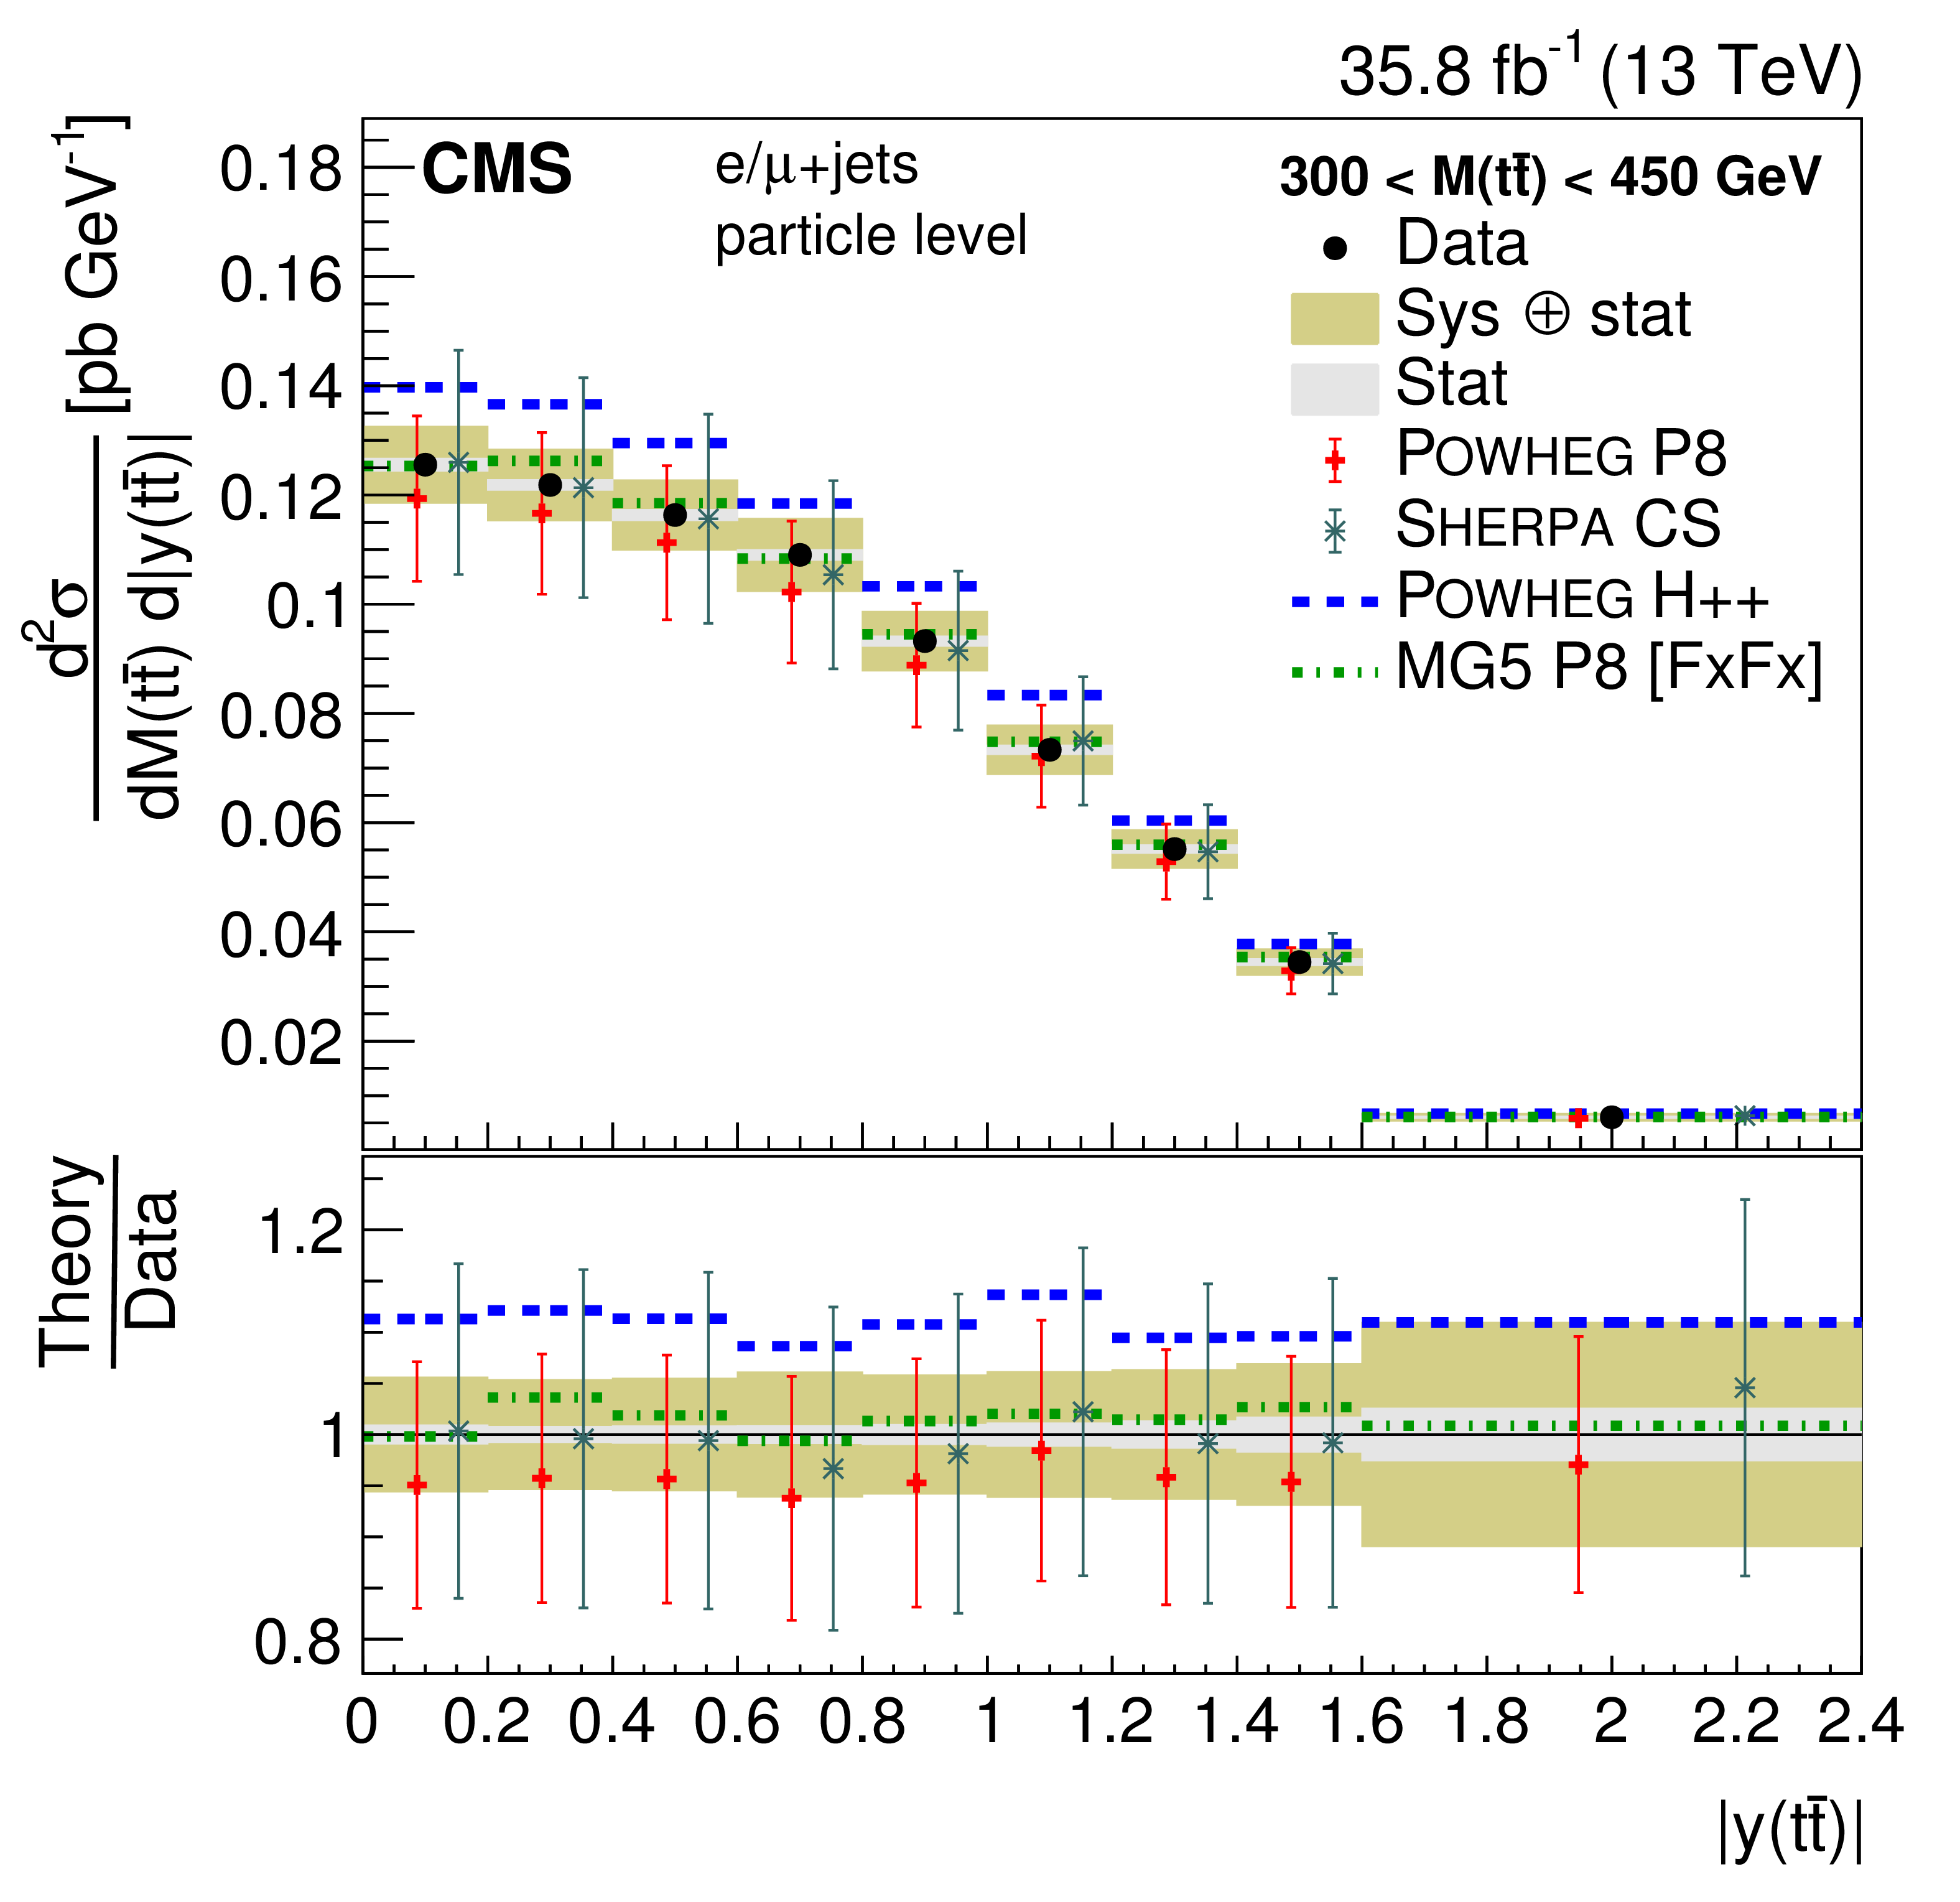
png pdf |
Figure 24-a:
Double-differential cross section at the particle level as a function of $M({\mathrm{t} \mathrm{\bar{t}}})$ vs. $ { | y({\mathrm{t} \mathrm{\bar{t}}}) | }$. The data are shown as points with light (dark) bands indicating the statistical (statistical and systematic) uncertainties. The cross sections are compared to the predictions of POWHEG combined with PYTHIA8 (P8) or HERWIG++ (H++) and the multiparton simulations MG5_aMC@NLO (MG5)+PYTHIA8 FxFx and SHERPA. The ratios of the various predictions to the measured cross sections are shown at the bottom of each panel. |
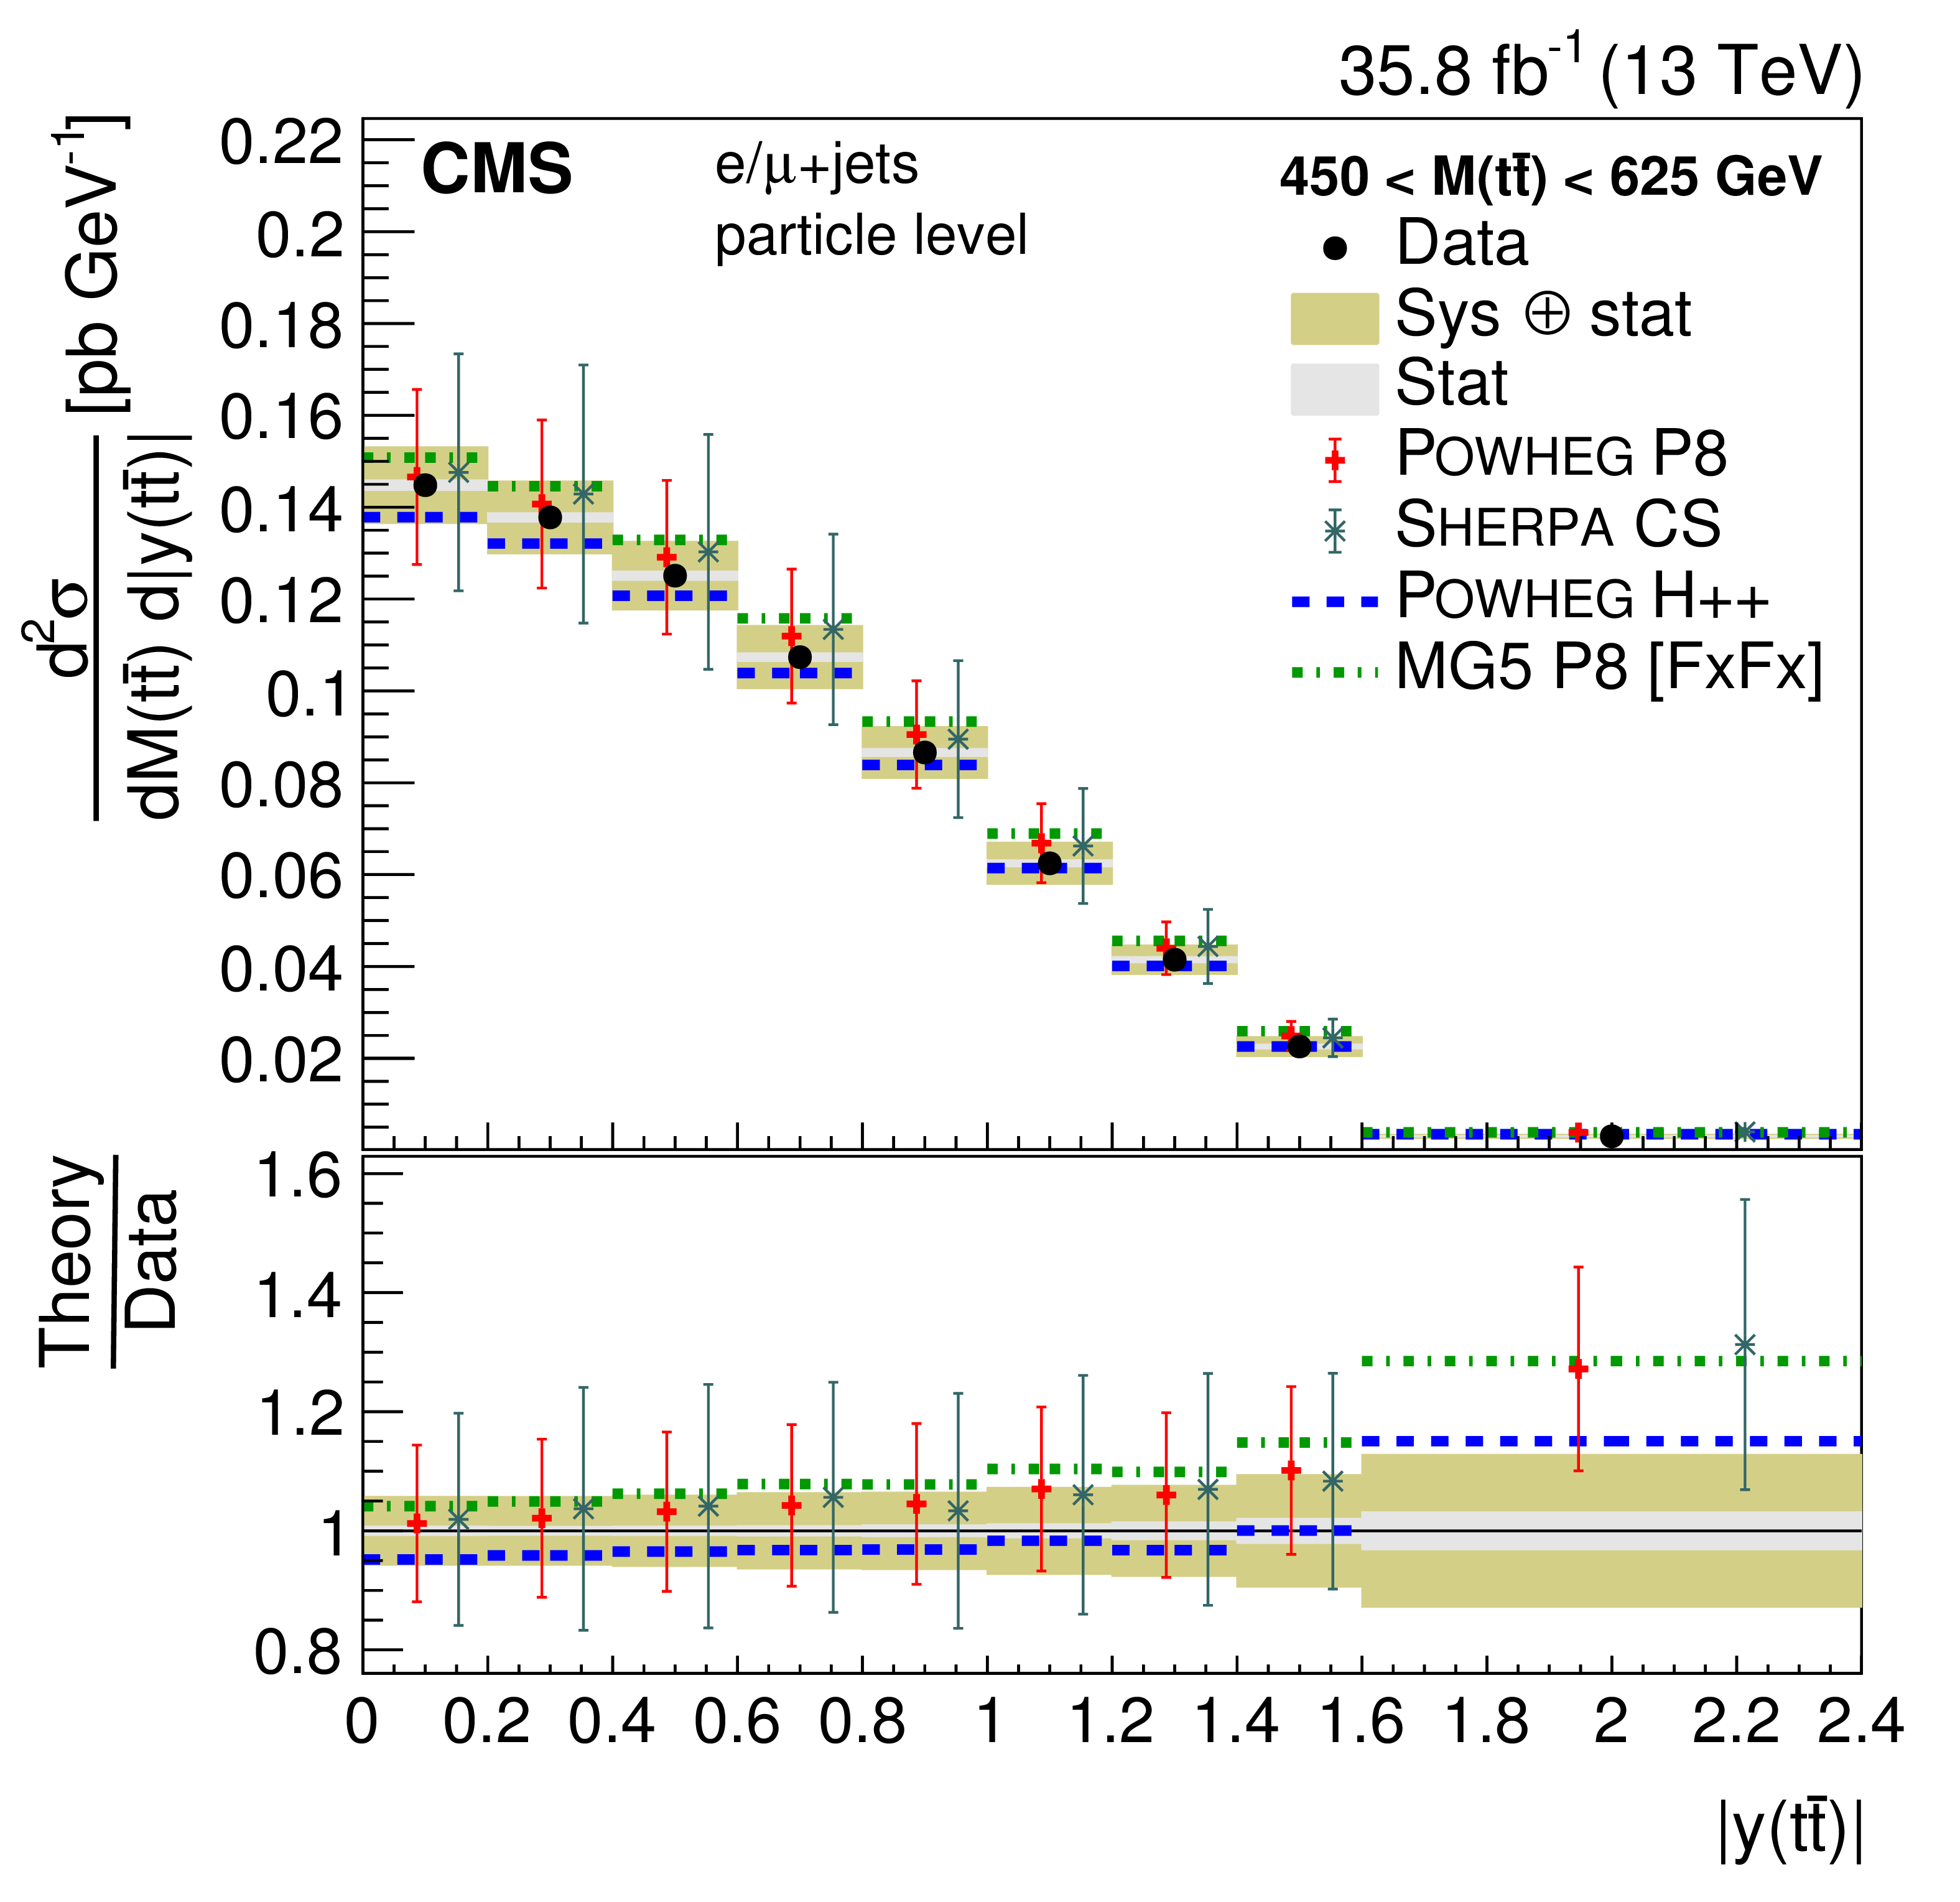
png pdf |
Figure 24-b:
Double-differential cross section at the particle level as a function of $M({\mathrm{t} \mathrm{\bar{t}}})$ vs. $ { | y({\mathrm{t} \mathrm{\bar{t}}}) | }$. The data are shown as points with light (dark) bands indicating the statistical (statistical and systematic) uncertainties. The cross sections are compared to the predictions of POWHEG combined with PYTHIA8 (P8) or HERWIG++ (H++) and the multiparton simulations MG5_aMC@NLO (MG5)+PYTHIA8 FxFx and SHERPA. The ratios of the various predictions to the measured cross sections are shown at the bottom of each panel. |
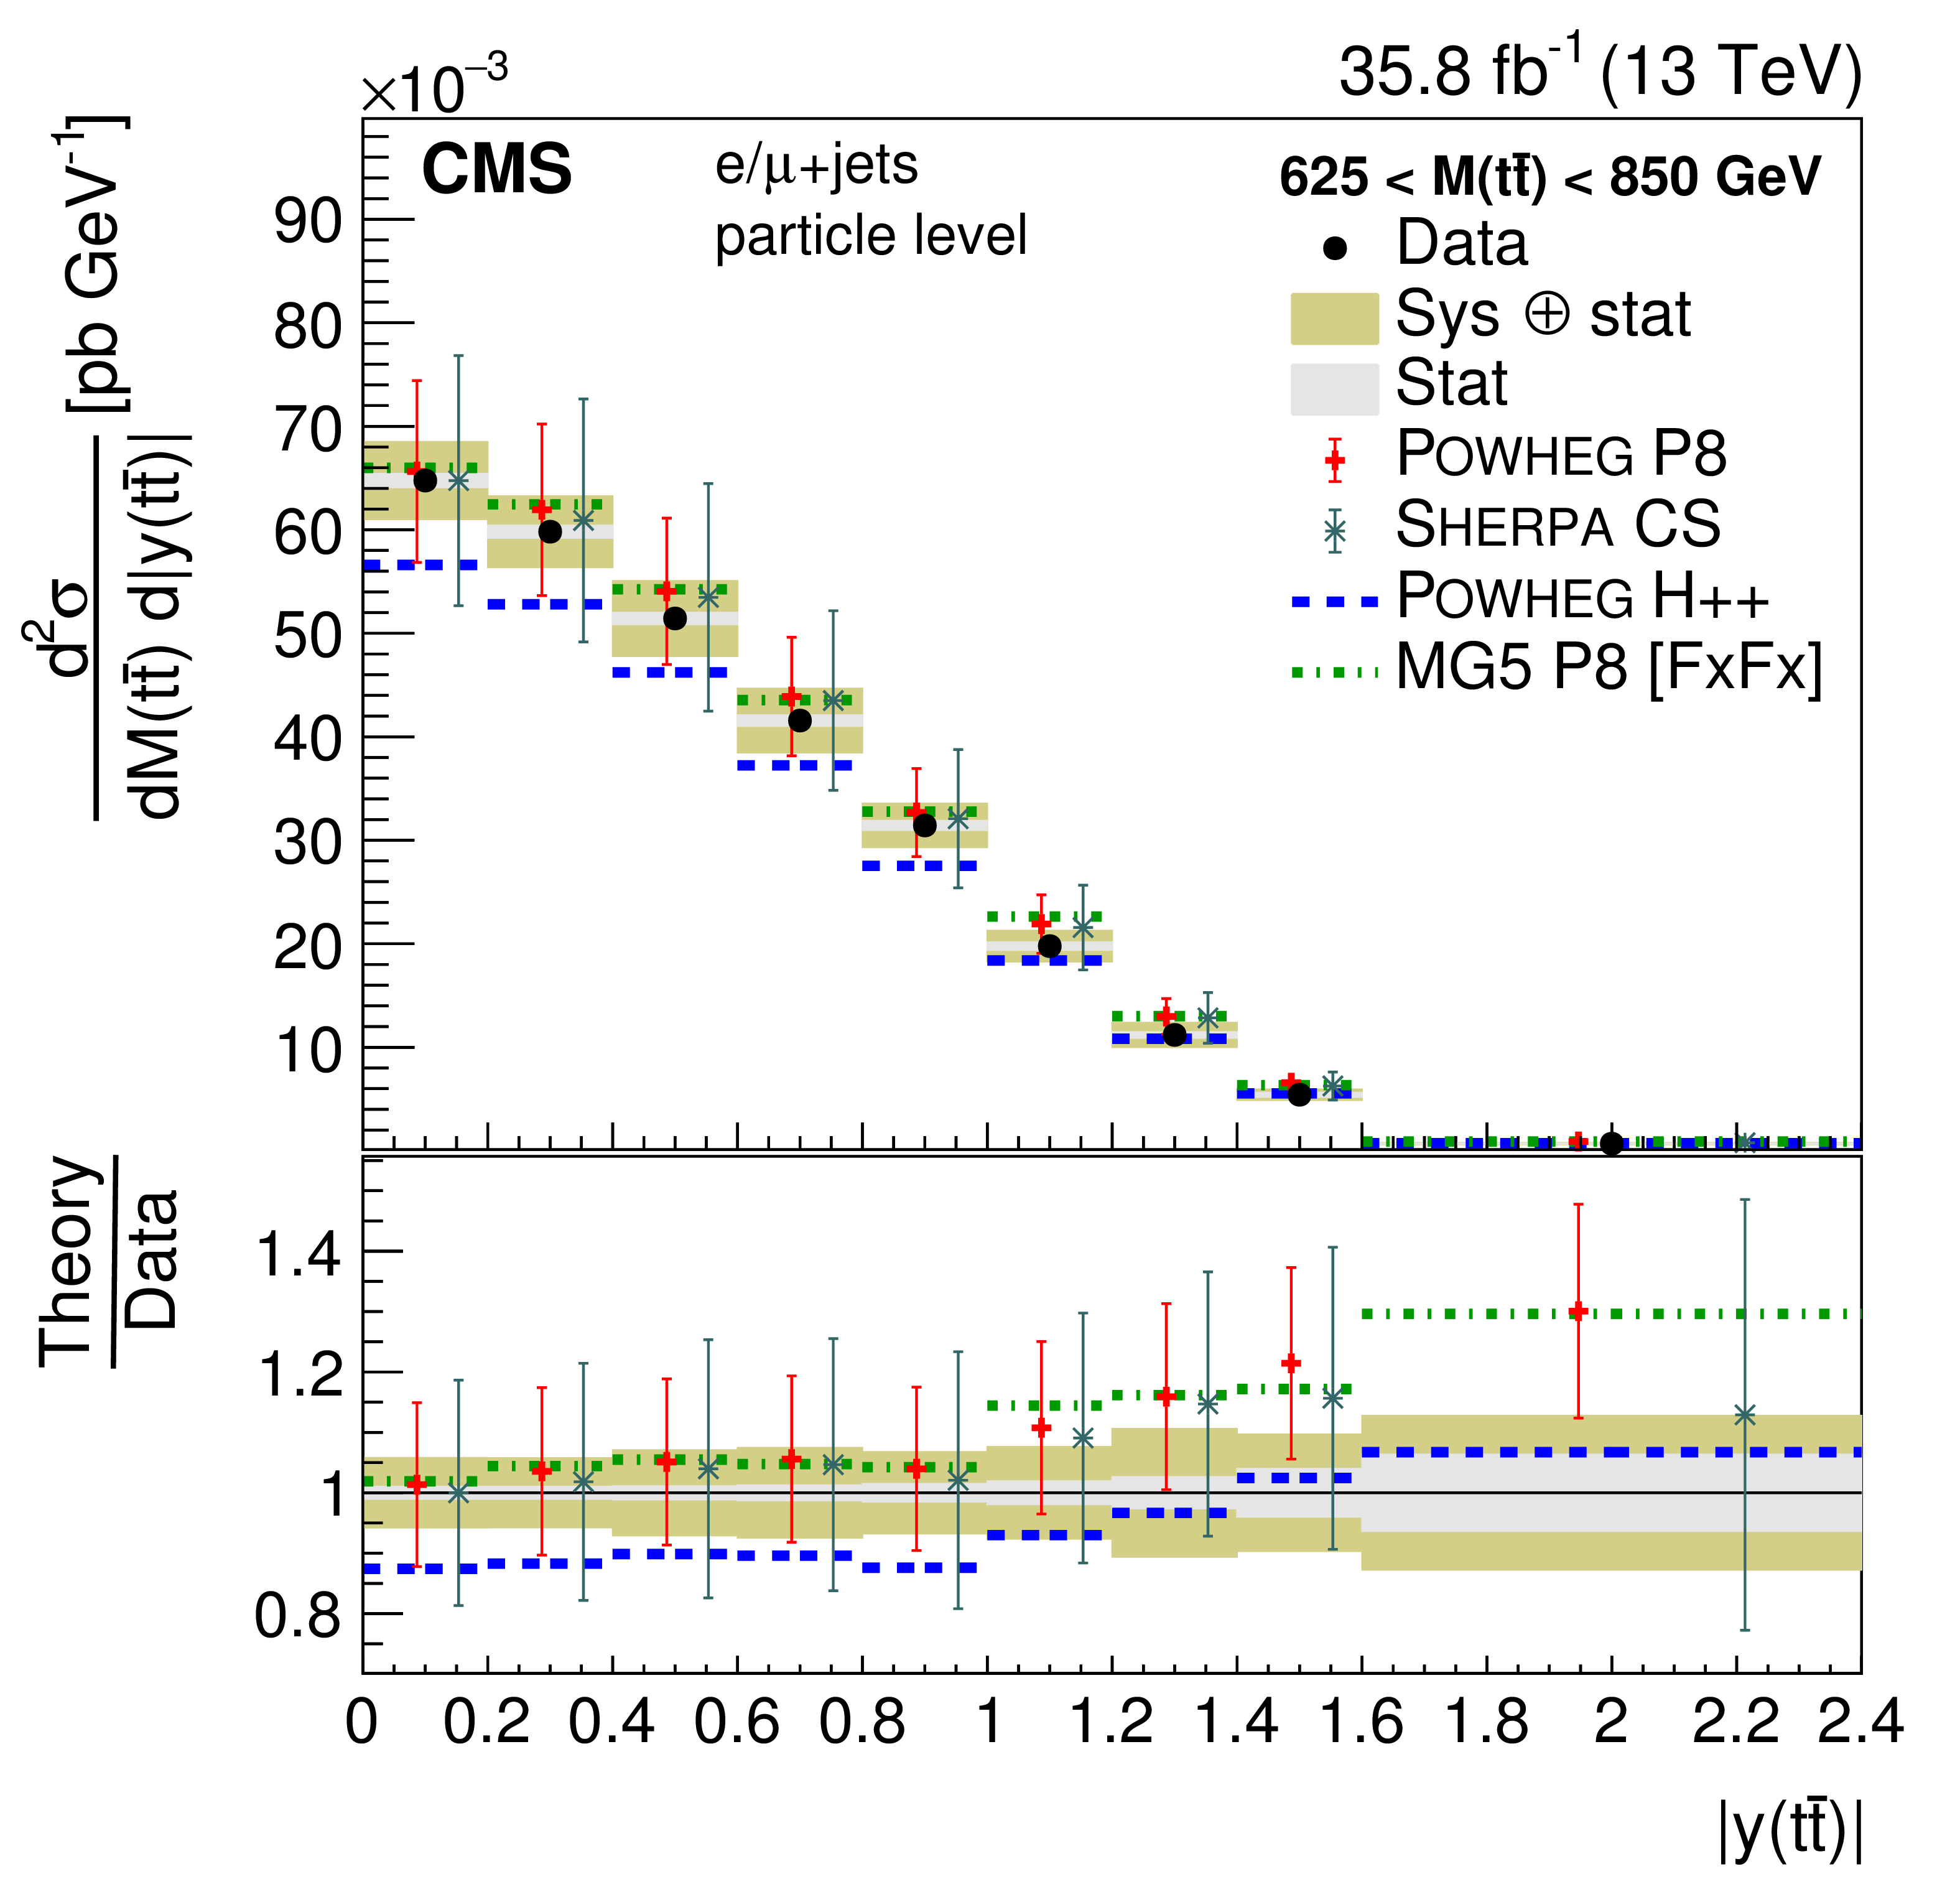
png pdf |
Figure 24-c:
Double-differential cross section at the particle level as a function of $M({\mathrm{t} \mathrm{\bar{t}}})$ vs. $ { | y({\mathrm{t} \mathrm{\bar{t}}}) | }$. The data are shown as points with light (dark) bands indicating the statistical (statistical and systematic) uncertainties. The cross sections are compared to the predictions of POWHEG combined with PYTHIA8 (P8) or HERWIG++ (H++) and the multiparton simulations MG5_aMC@NLO (MG5)+PYTHIA8 FxFx and SHERPA. The ratios of the various predictions to the measured cross sections are shown at the bottom of each panel. |
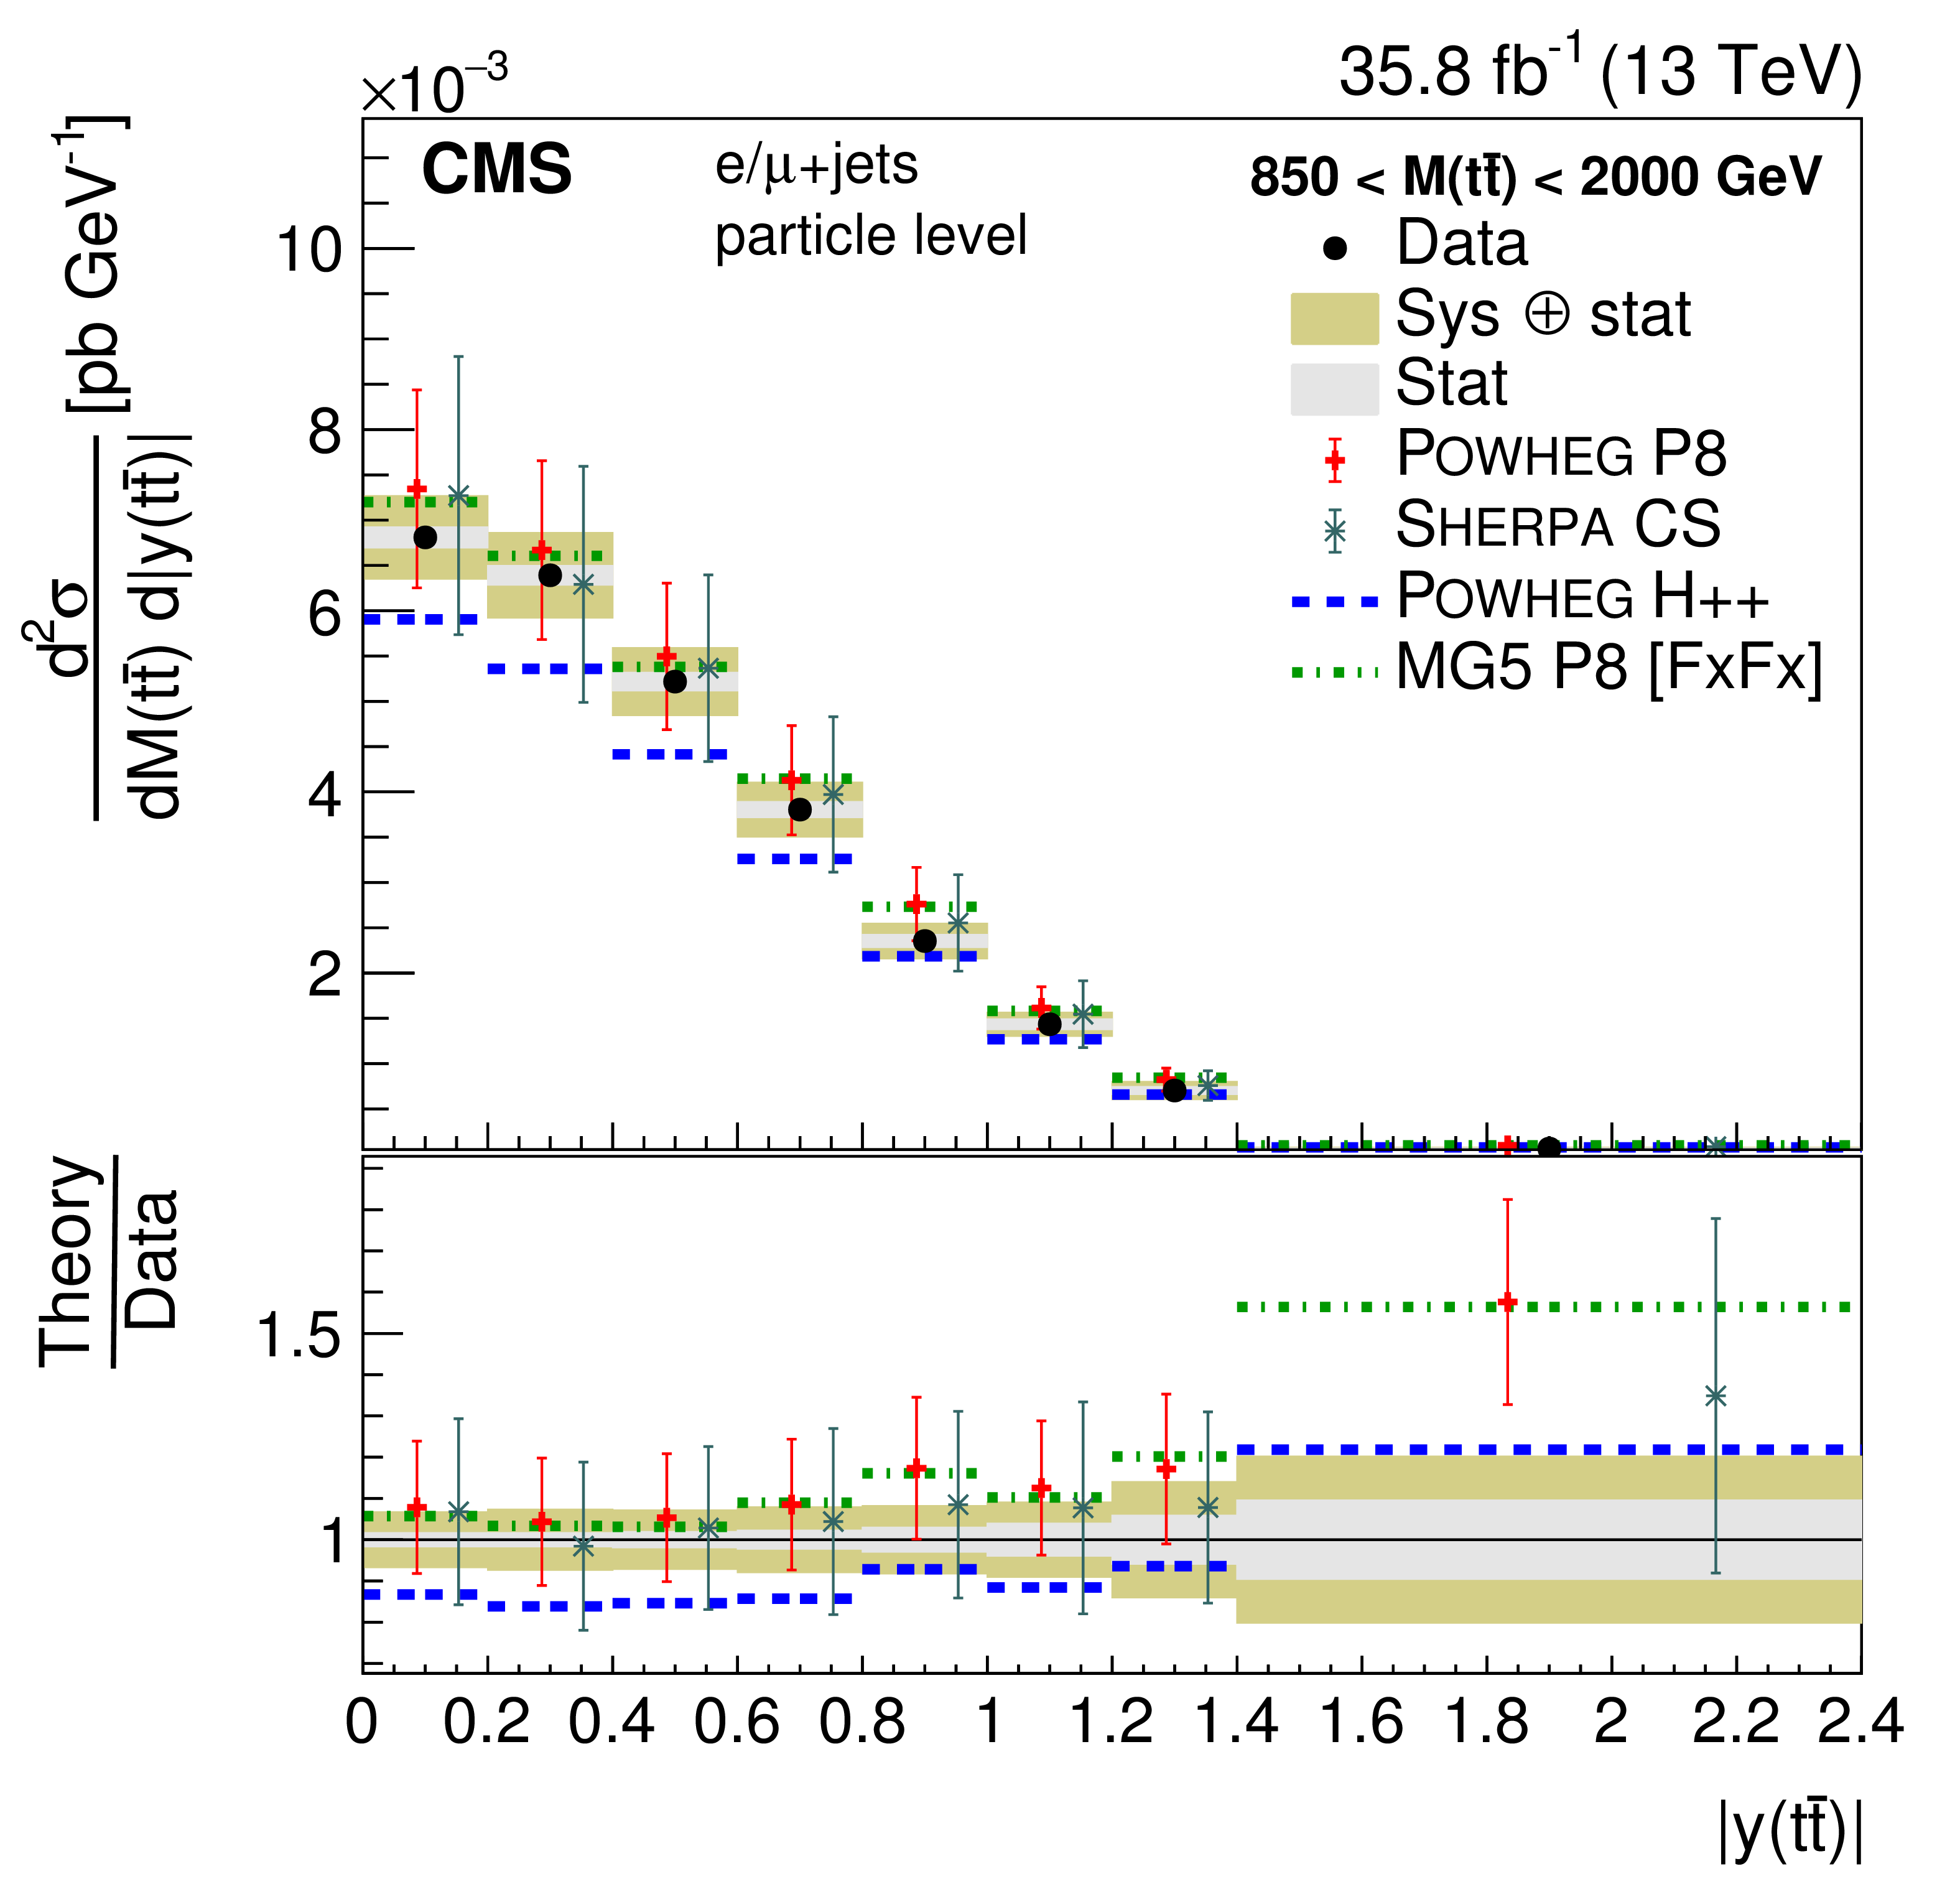
png pdf |
Figure 24-d:
Double-differential cross section at the particle level as a function of $M({\mathrm{t} \mathrm{\bar{t}}})$ vs. $ { | y({\mathrm{t} \mathrm{\bar{t}}}) | }$. The data are shown as points with light (dark) bands indicating the statistical (statistical and systematic) uncertainties. The cross sections are compared to the predictions of POWHEG combined with PYTHIA8 (P8) or HERWIG++ (H++) and the multiparton simulations MG5_aMC@NLO (MG5)+PYTHIA8 FxFx and SHERPA. The ratios of the various predictions to the measured cross sections are shown at the bottom of each panel. |

png pdf |
Figure 25:
Normalized double-differential cross section at the particle level as a function of $M({\mathrm{t} \mathrm{\bar{t}}})$ vs. $ { | y({\mathrm{t} \mathrm{\bar{t}}}) | }$. The data are shown as points with light (dark) bands indicating the statistical (statistical and systematic) uncertainties. The cross sections are compared to the predictions of POWHEG combined with PYTHIA8 (P8) or HERWIG++ (H++) and the multiparton simulations MG5_aMC@NLO (MG5)+PYTHIA8 FxFx and SHERPA. The ratios of the various predictions to the measured cross sections are shown at the bottom of each panel. |
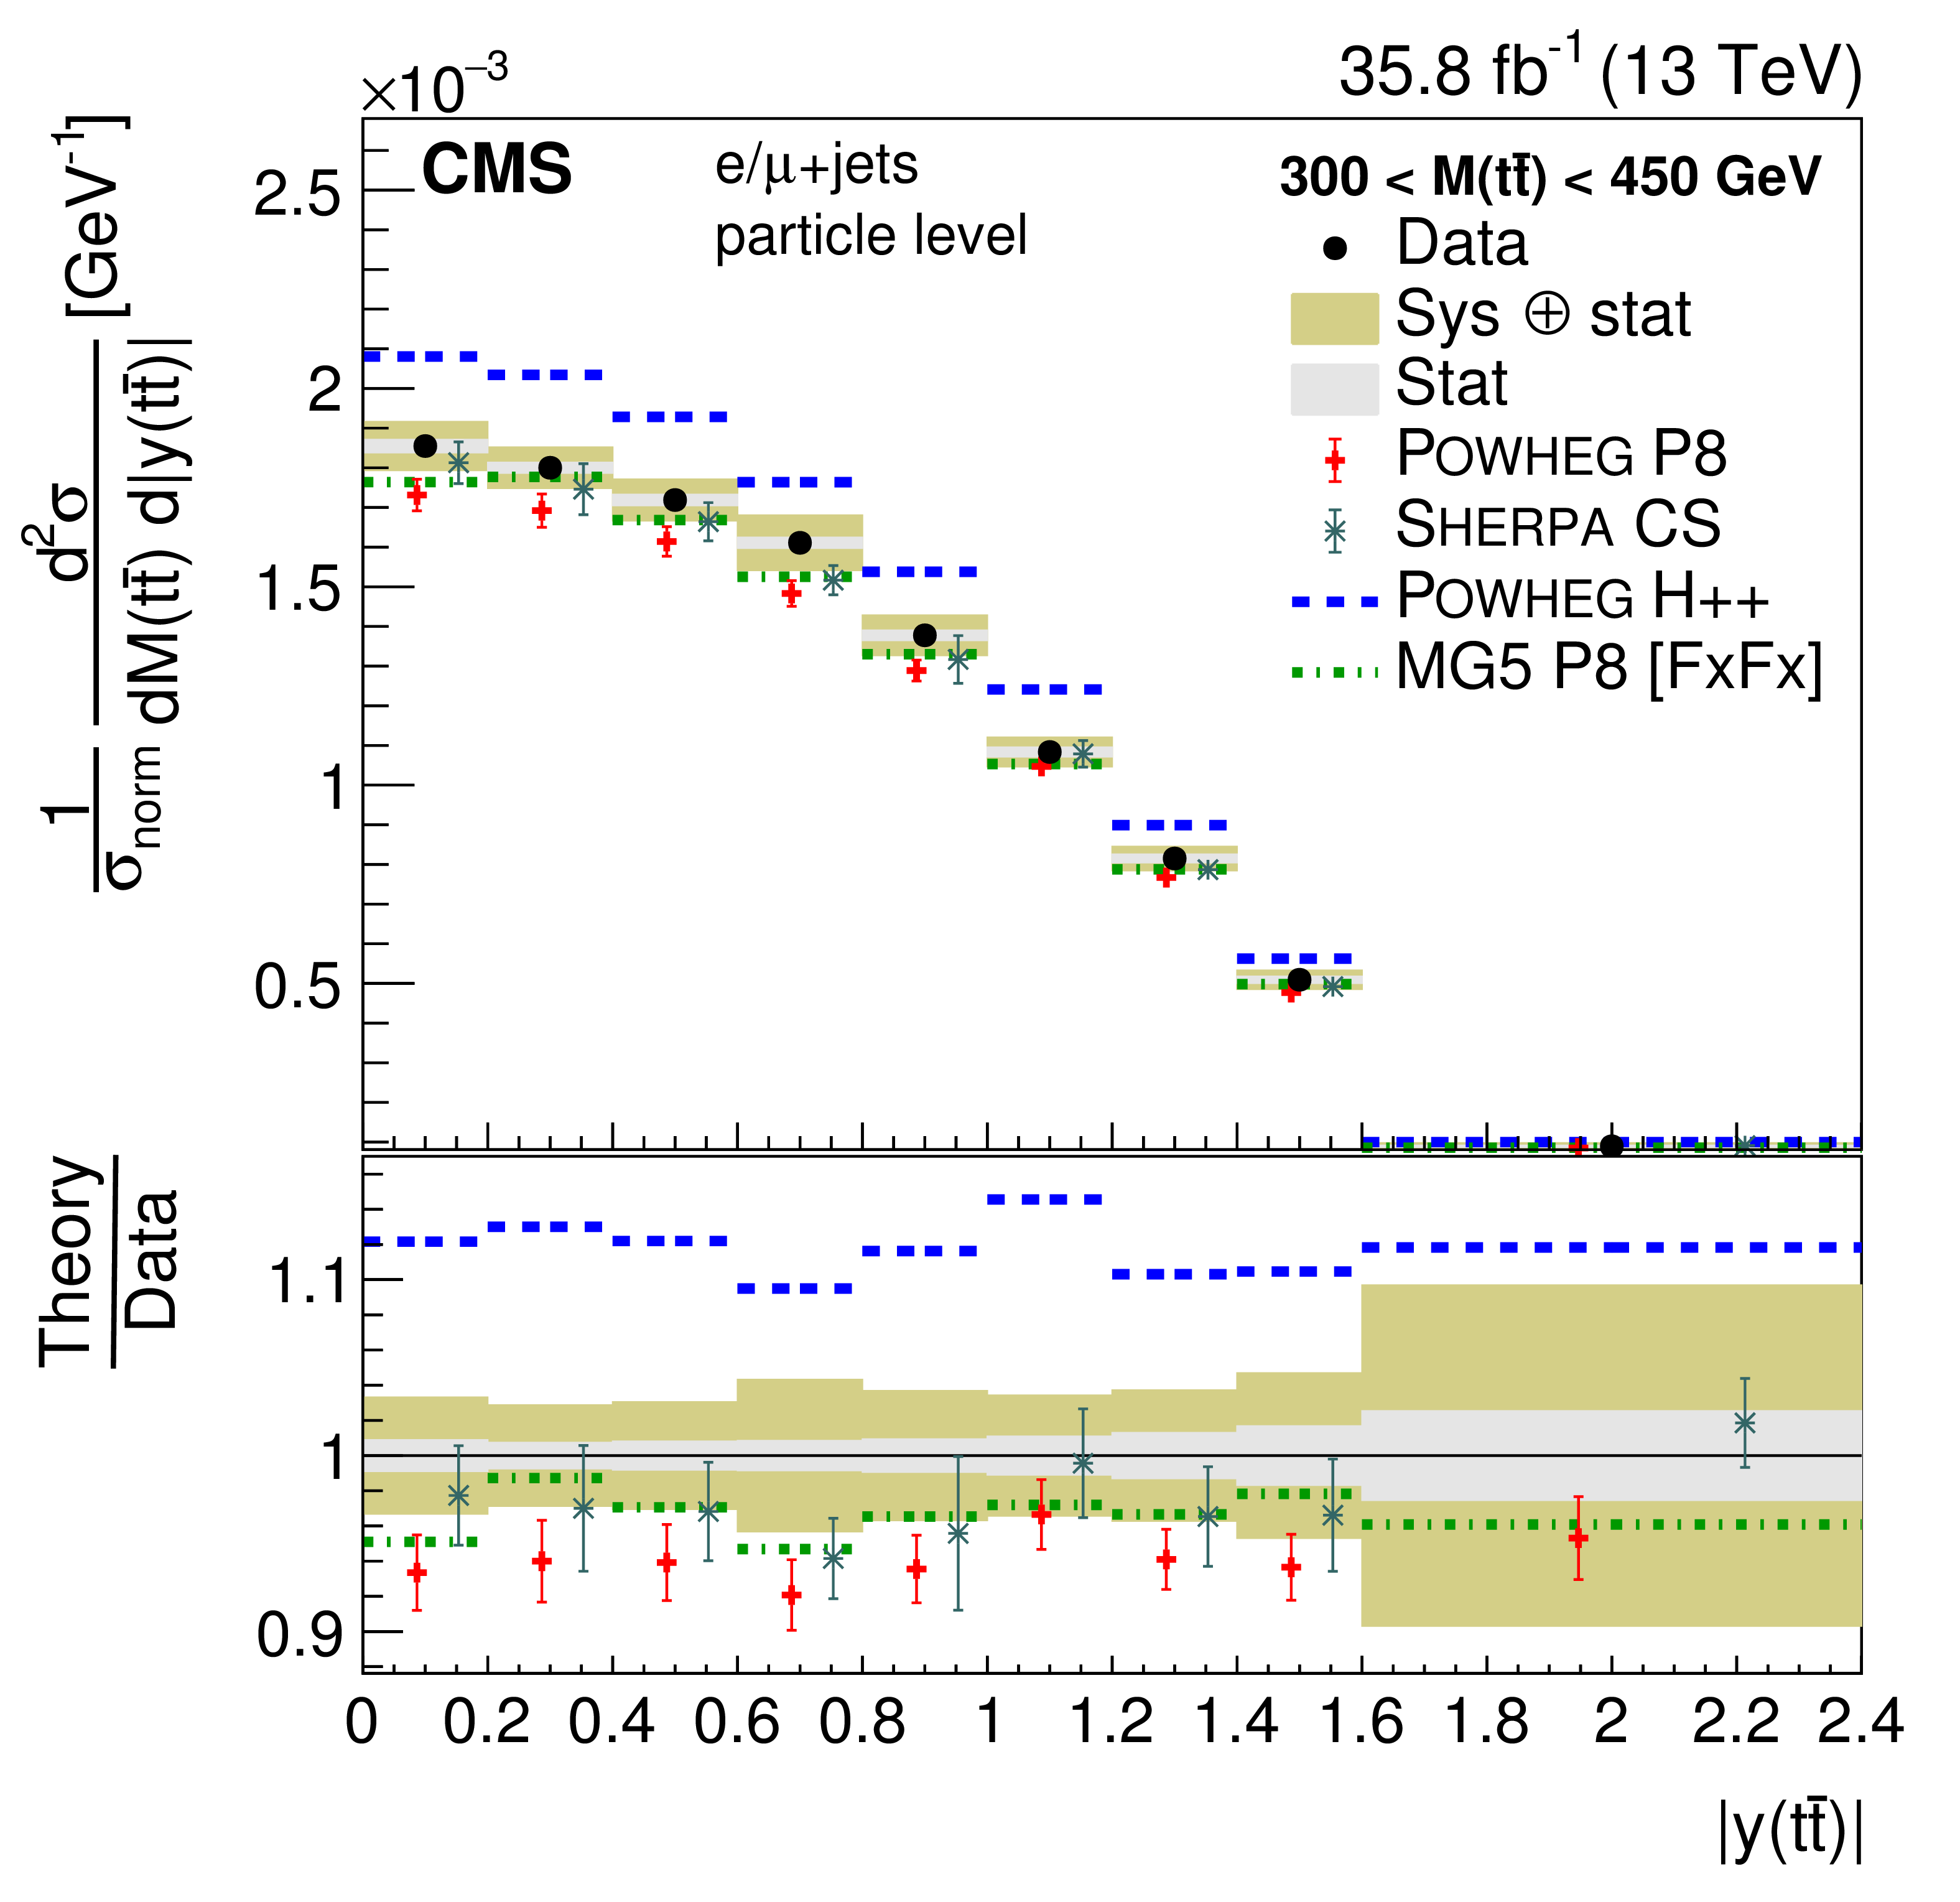
png pdf |
Figure 25-a:
Normalized double-differential cross section at the particle level as a function of $M({\mathrm{t} \mathrm{\bar{t}}})$ vs. $ { | y({\mathrm{t} \mathrm{\bar{t}}}) | }$. The data are shown as points with light (dark) bands indicating the statistical (statistical and systematic) uncertainties. The cross sections are compared to the predictions of POWHEG combined with PYTHIA8 (P8) or HERWIG++ (H++) and the multiparton simulations MG5_aMC@NLO (MG5)+PYTHIA8 FxFx and SHERPA. The ratios of the various predictions to the measured cross sections are shown at the bottom of each panel. |

png pdf |
Figure 25-b:
Normalized double-differential cross section at the particle level as a function of $M({\mathrm{t} \mathrm{\bar{t}}})$ vs. $ { | y({\mathrm{t} \mathrm{\bar{t}}}) | }$. The data are shown as points with light (dark) bands indicating the statistical (statistical and systematic) uncertainties. The cross sections are compared to the predictions of POWHEG combined with PYTHIA8 (P8) or HERWIG++ (H++) and the multiparton simulations MG5_aMC@NLO (MG5)+PYTHIA8 FxFx and SHERPA. The ratios of the various predictions to the measured cross sections are shown at the bottom of each panel. |
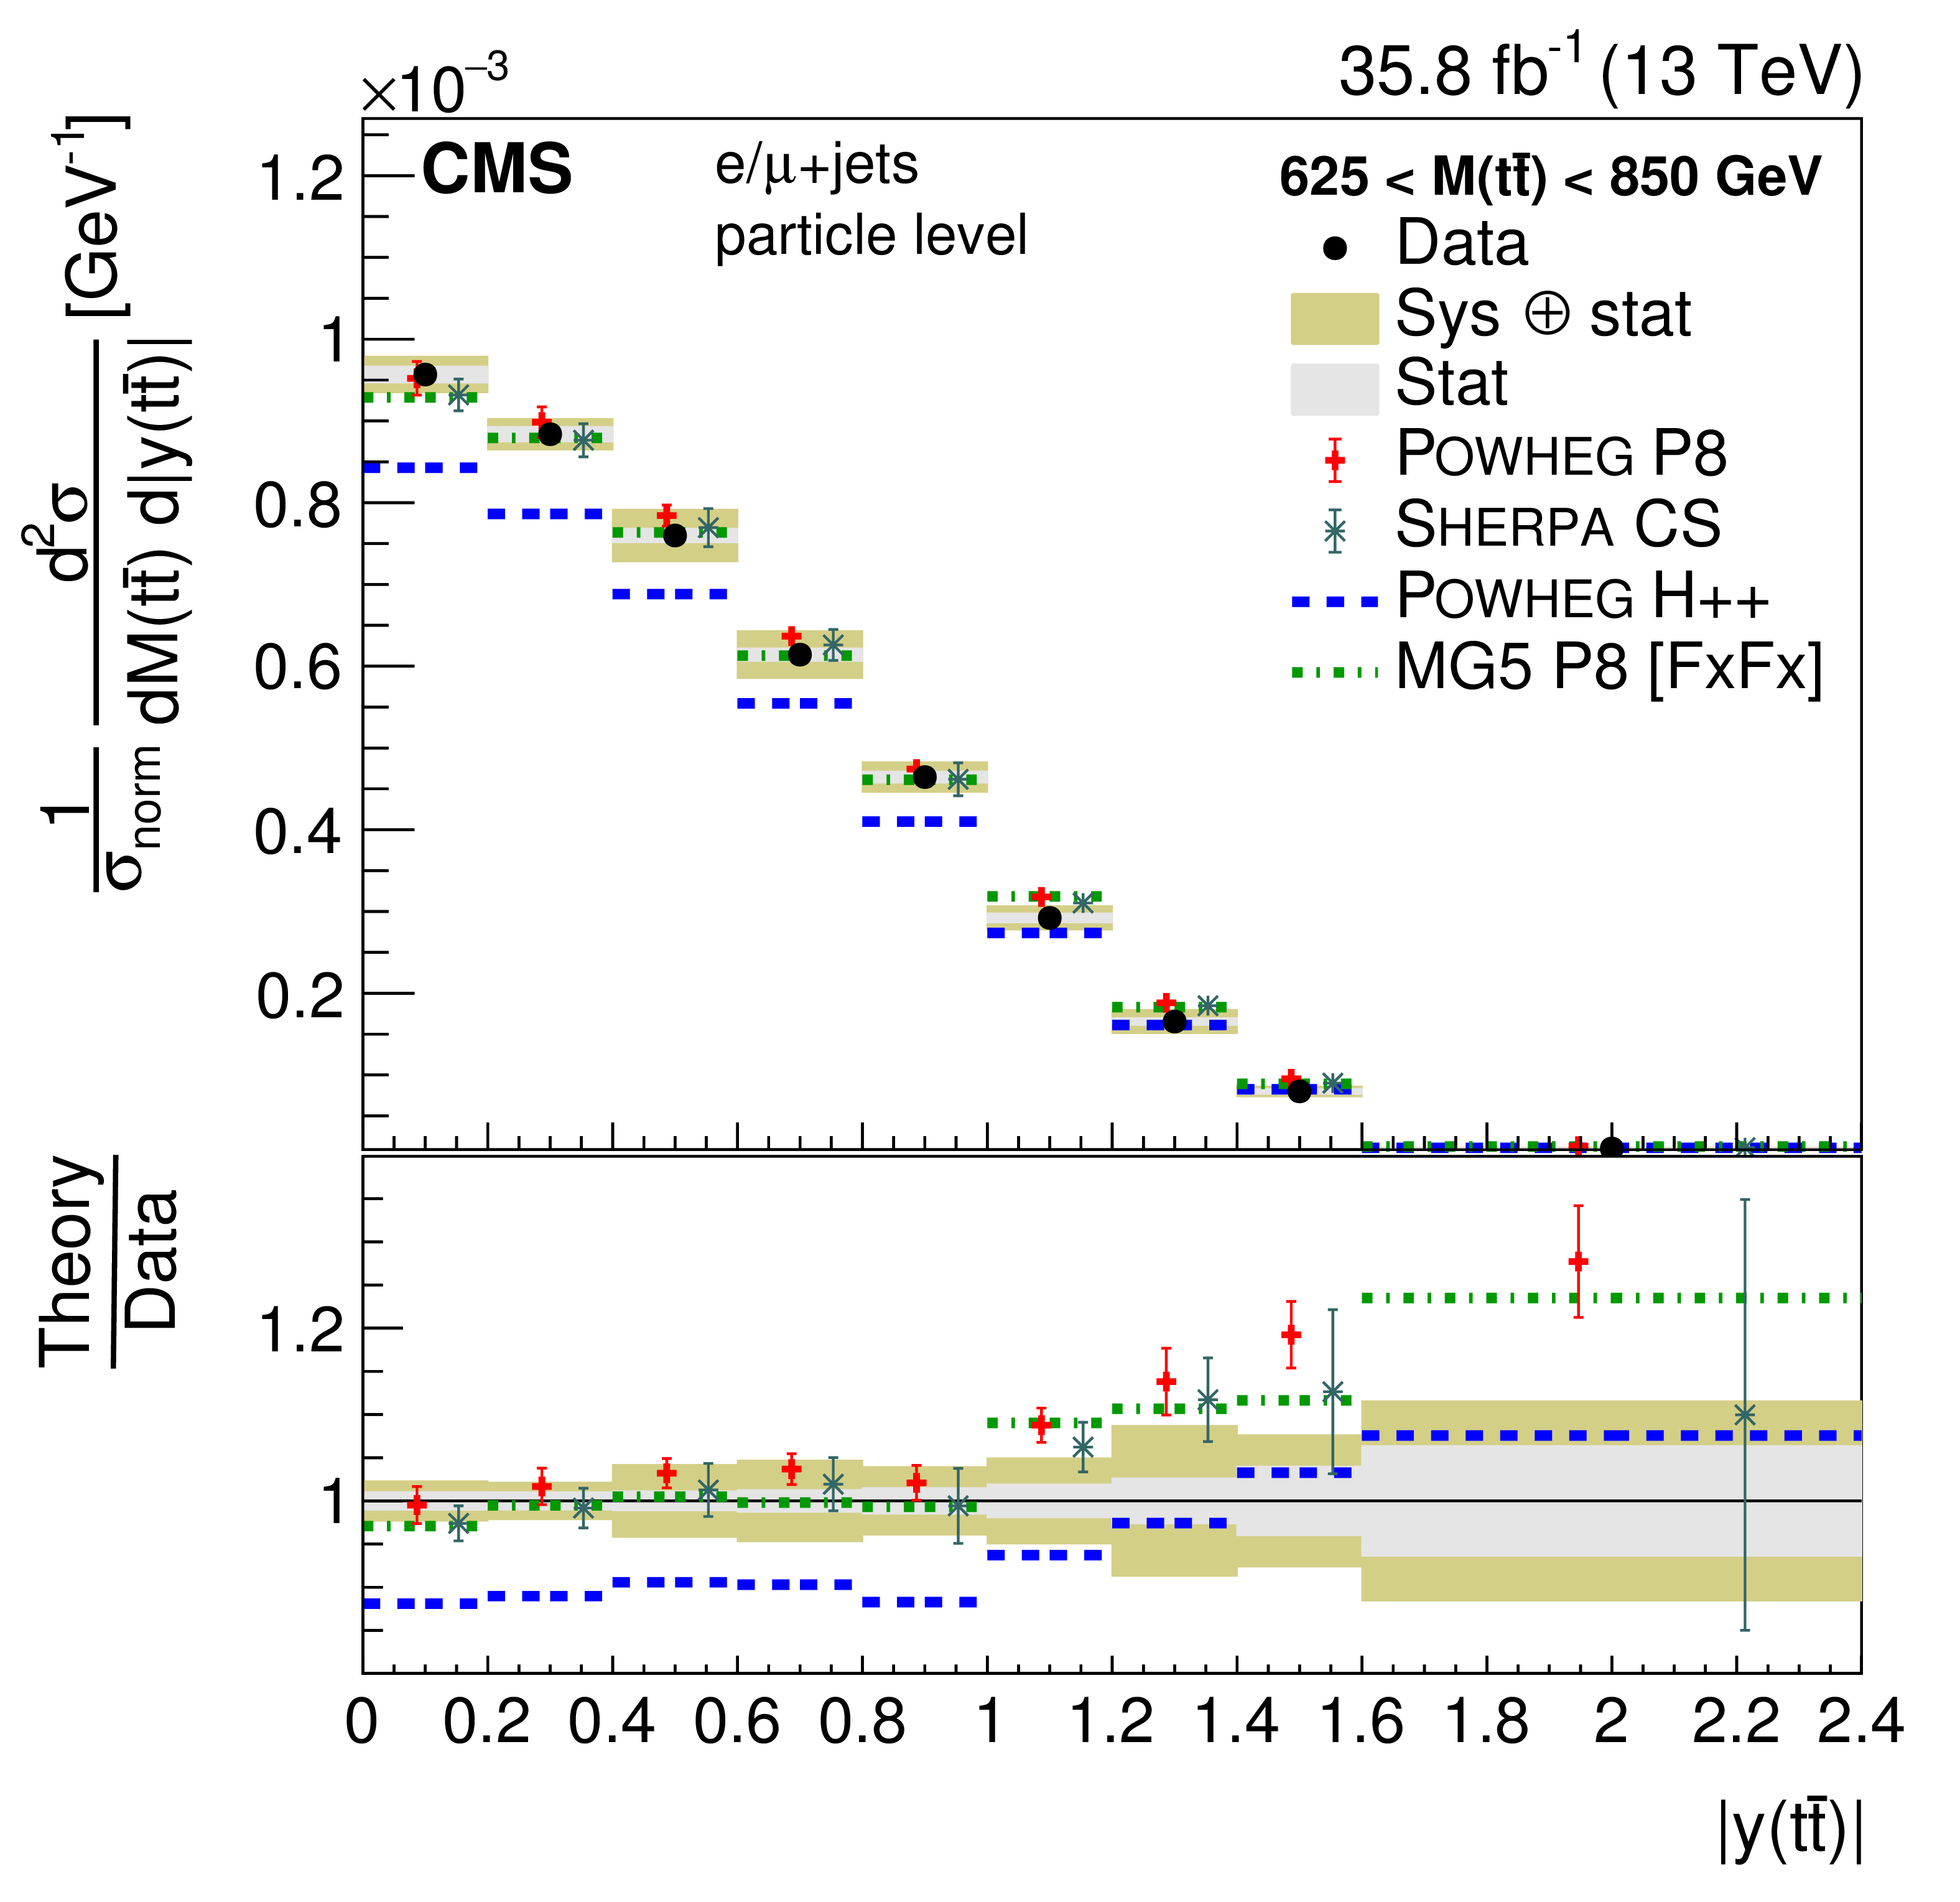
png pdf |
Figure 25-c:
Normalized double-differential cross section at the particle level as a function of $M({\mathrm{t} \mathrm{\bar{t}}})$ vs. $ { | y({\mathrm{t} \mathrm{\bar{t}}}) | }$. The data are shown as points with light (dark) bands indicating the statistical (statistical and systematic) uncertainties. The cross sections are compared to the predictions of POWHEG combined with PYTHIA8 (P8) or HERWIG++ (H++) and the multiparton simulations MG5_aMC@NLO (MG5)+PYTHIA8 FxFx and SHERPA. The ratios of the various predictions to the measured cross sections are shown at the bottom of each panel. |
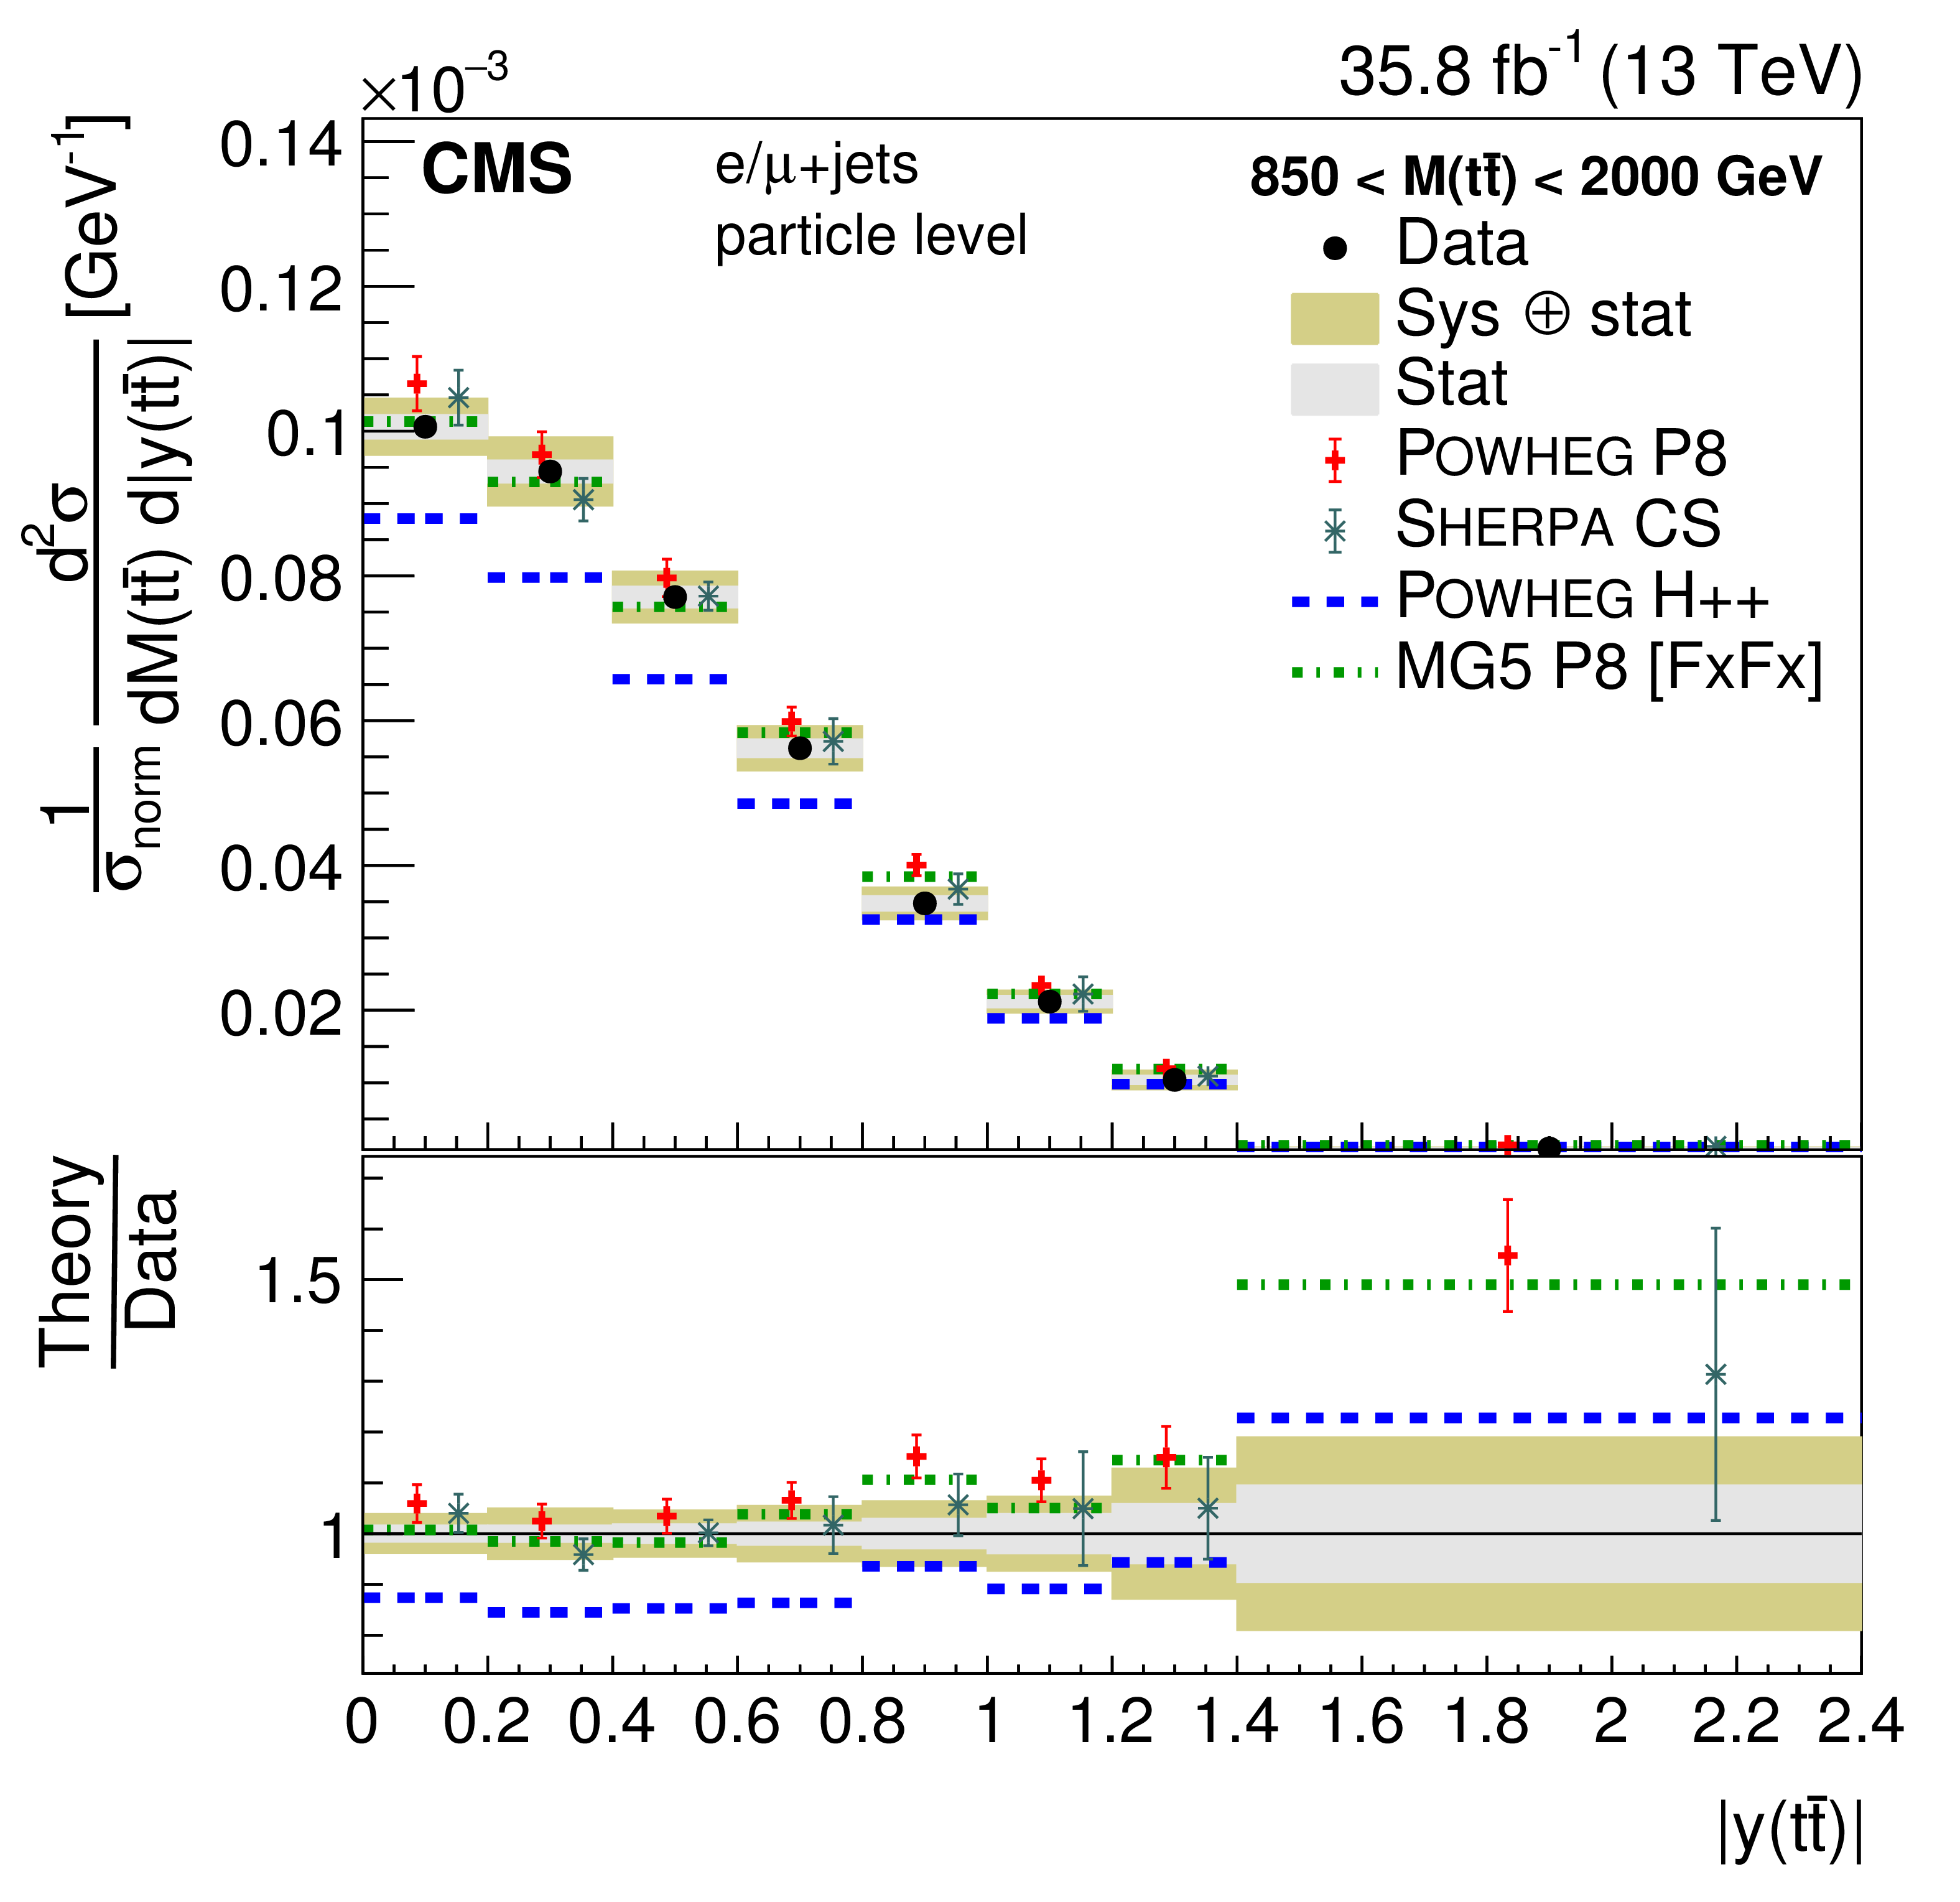
png pdf |
Figure 25-d:
Normalized double-differential cross section at the particle level as a function of $M({\mathrm{t} \mathrm{\bar{t}}})$ vs. $ { | y({\mathrm{t} \mathrm{\bar{t}}}) | }$. The data are shown as points with light (dark) bands indicating the statistical (statistical and systematic) uncertainties. The cross sections are compared to the predictions of POWHEG combined with PYTHIA8 (P8) or HERWIG++ (H++) and the multiparton simulations MG5_aMC@NLO (MG5)+PYTHIA8 FxFx and SHERPA. The ratios of the various predictions to the measured cross sections are shown at the bottom of each panel. |
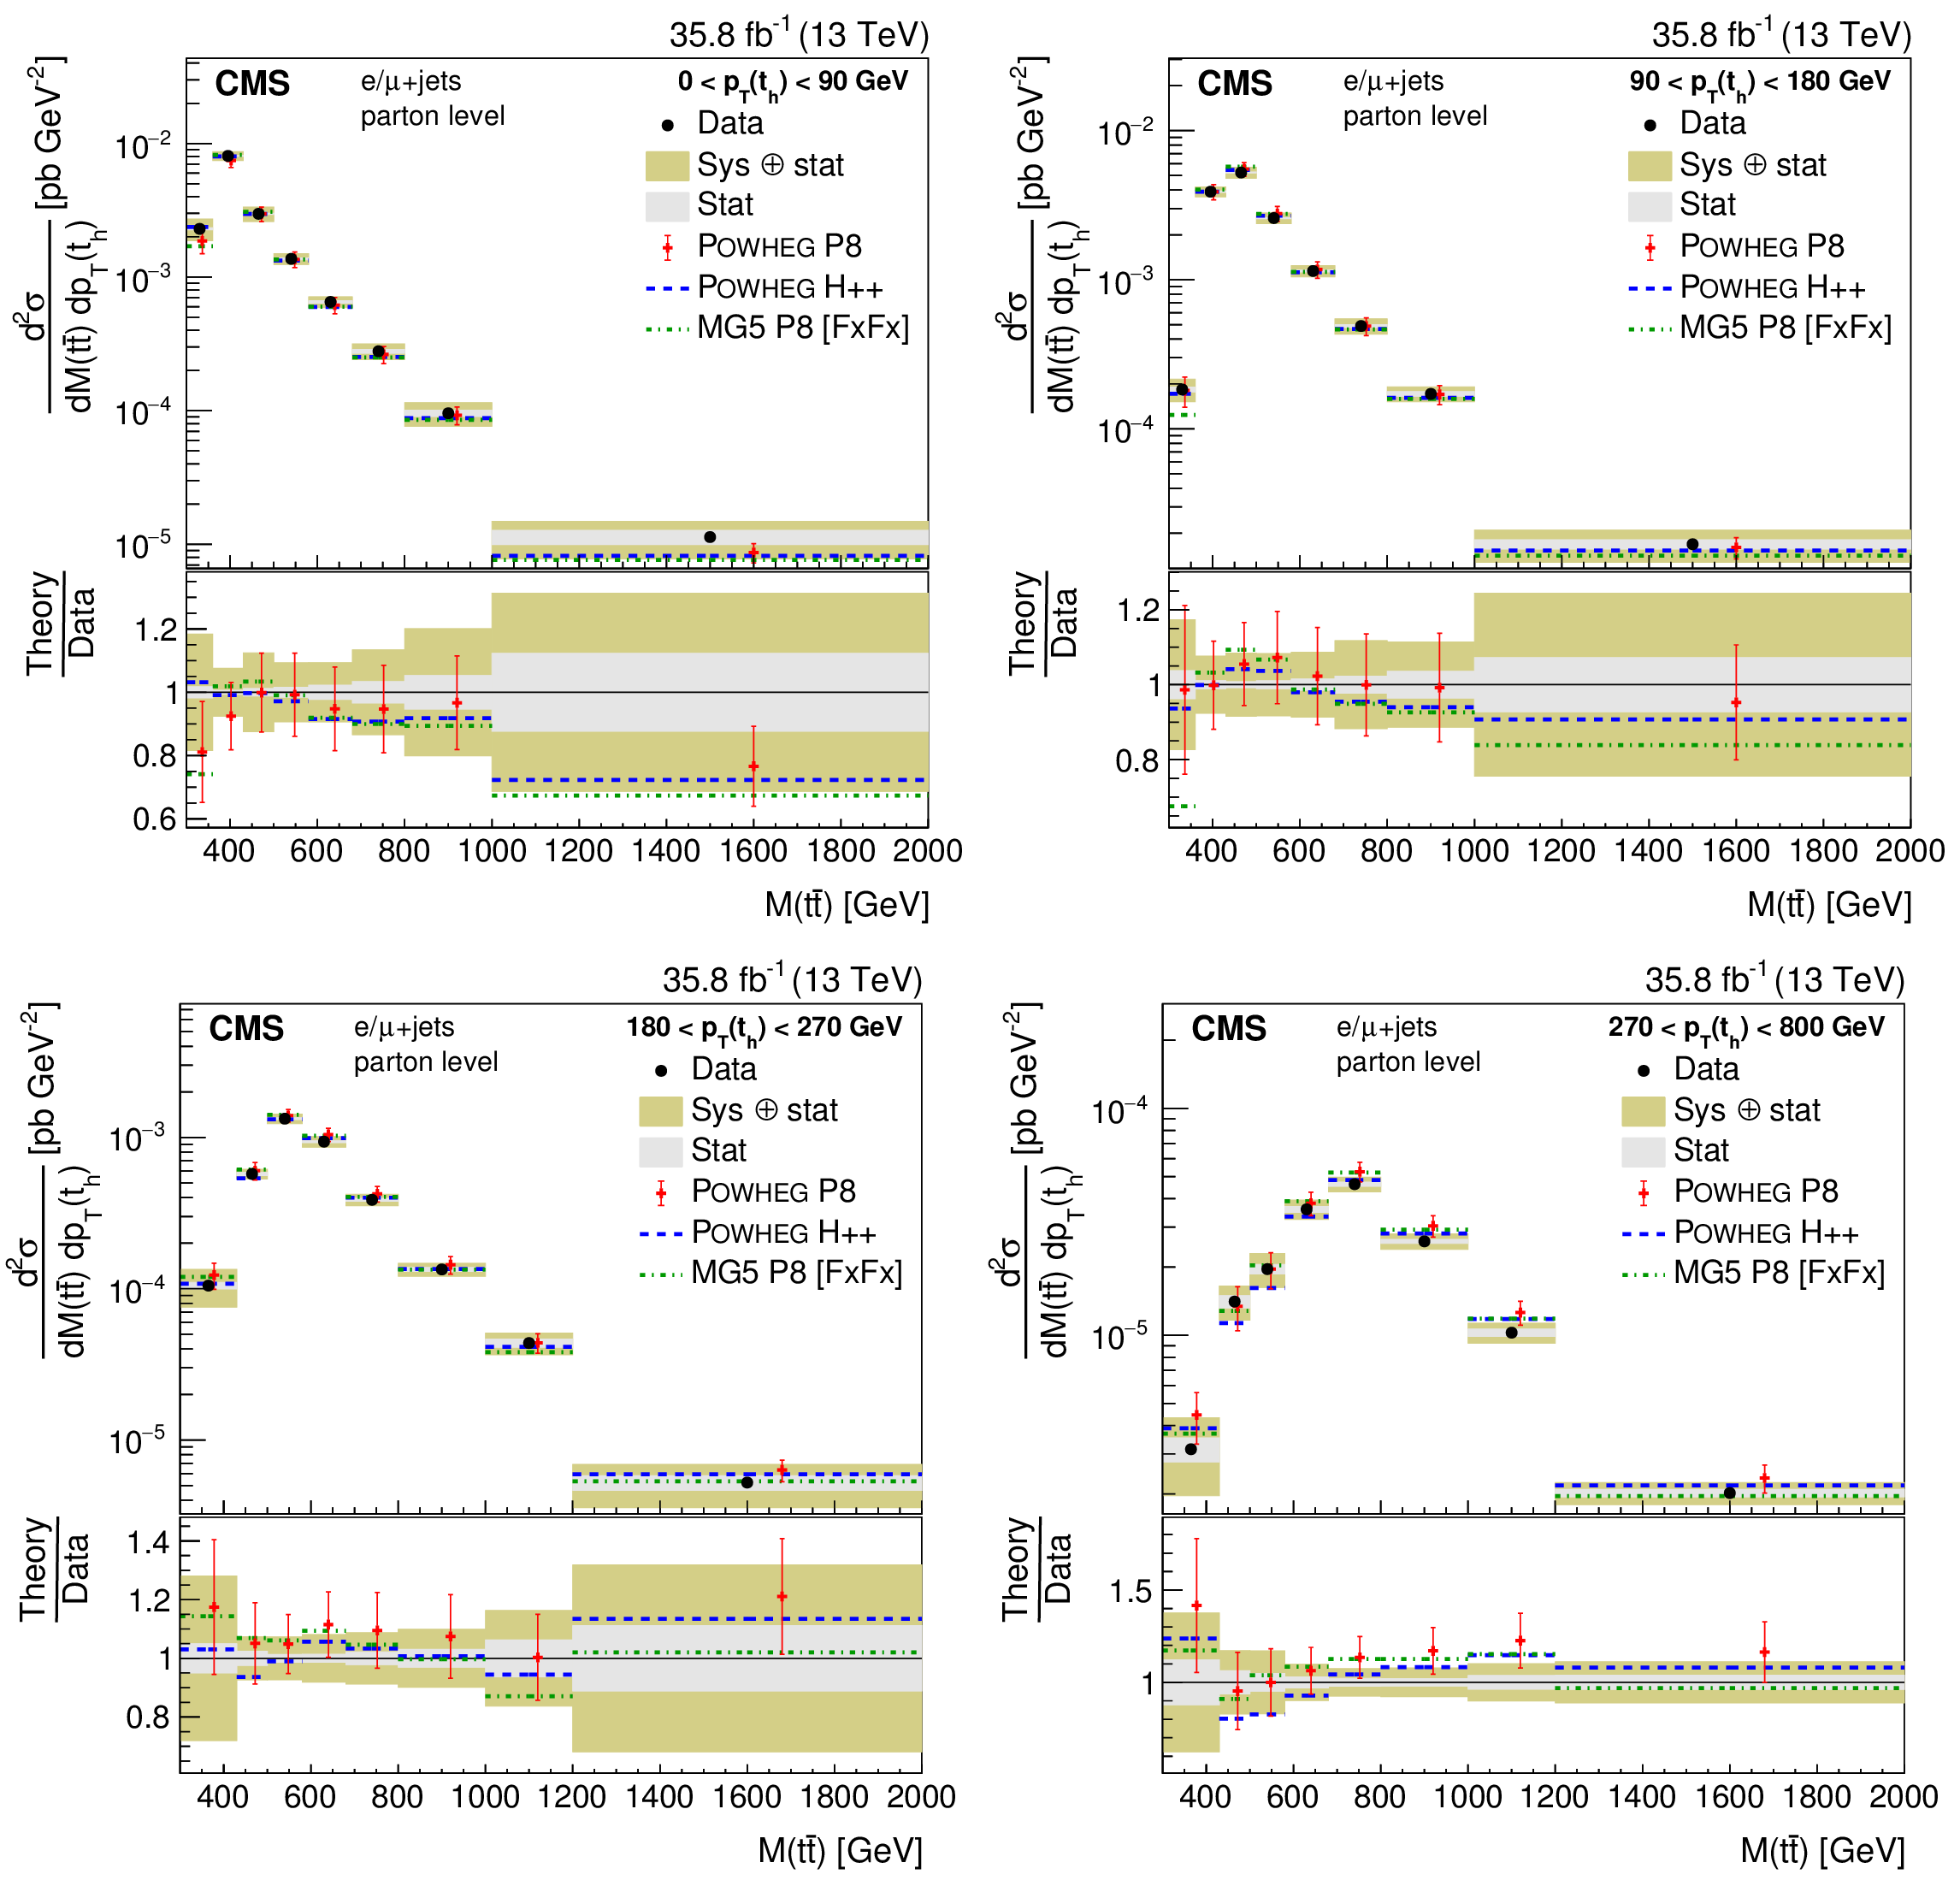
png pdf |
Figure 26:
Double-differential cross section at the parton level as a function of $ {p_{\mathrm {T}}} ({\mathrm{t} _\mathrm {h}})$ vs. $M({\mathrm{t} \mathrm{\bar{t}}})$. The data are shown as points with light (dark) bands indicating the statistical (statistical and systematic) uncertainties. The cross sections are compared to the predictions of POWHEG combined with PYTHIA8 (P8) or HERWIG++ (H++), and the multiparton simulation MG5_aMC@NLO (MG5)+PYTHIA8 FxFx. The ratios of the various predictions to the measured cross sections are shown at the bottom of each panel. |
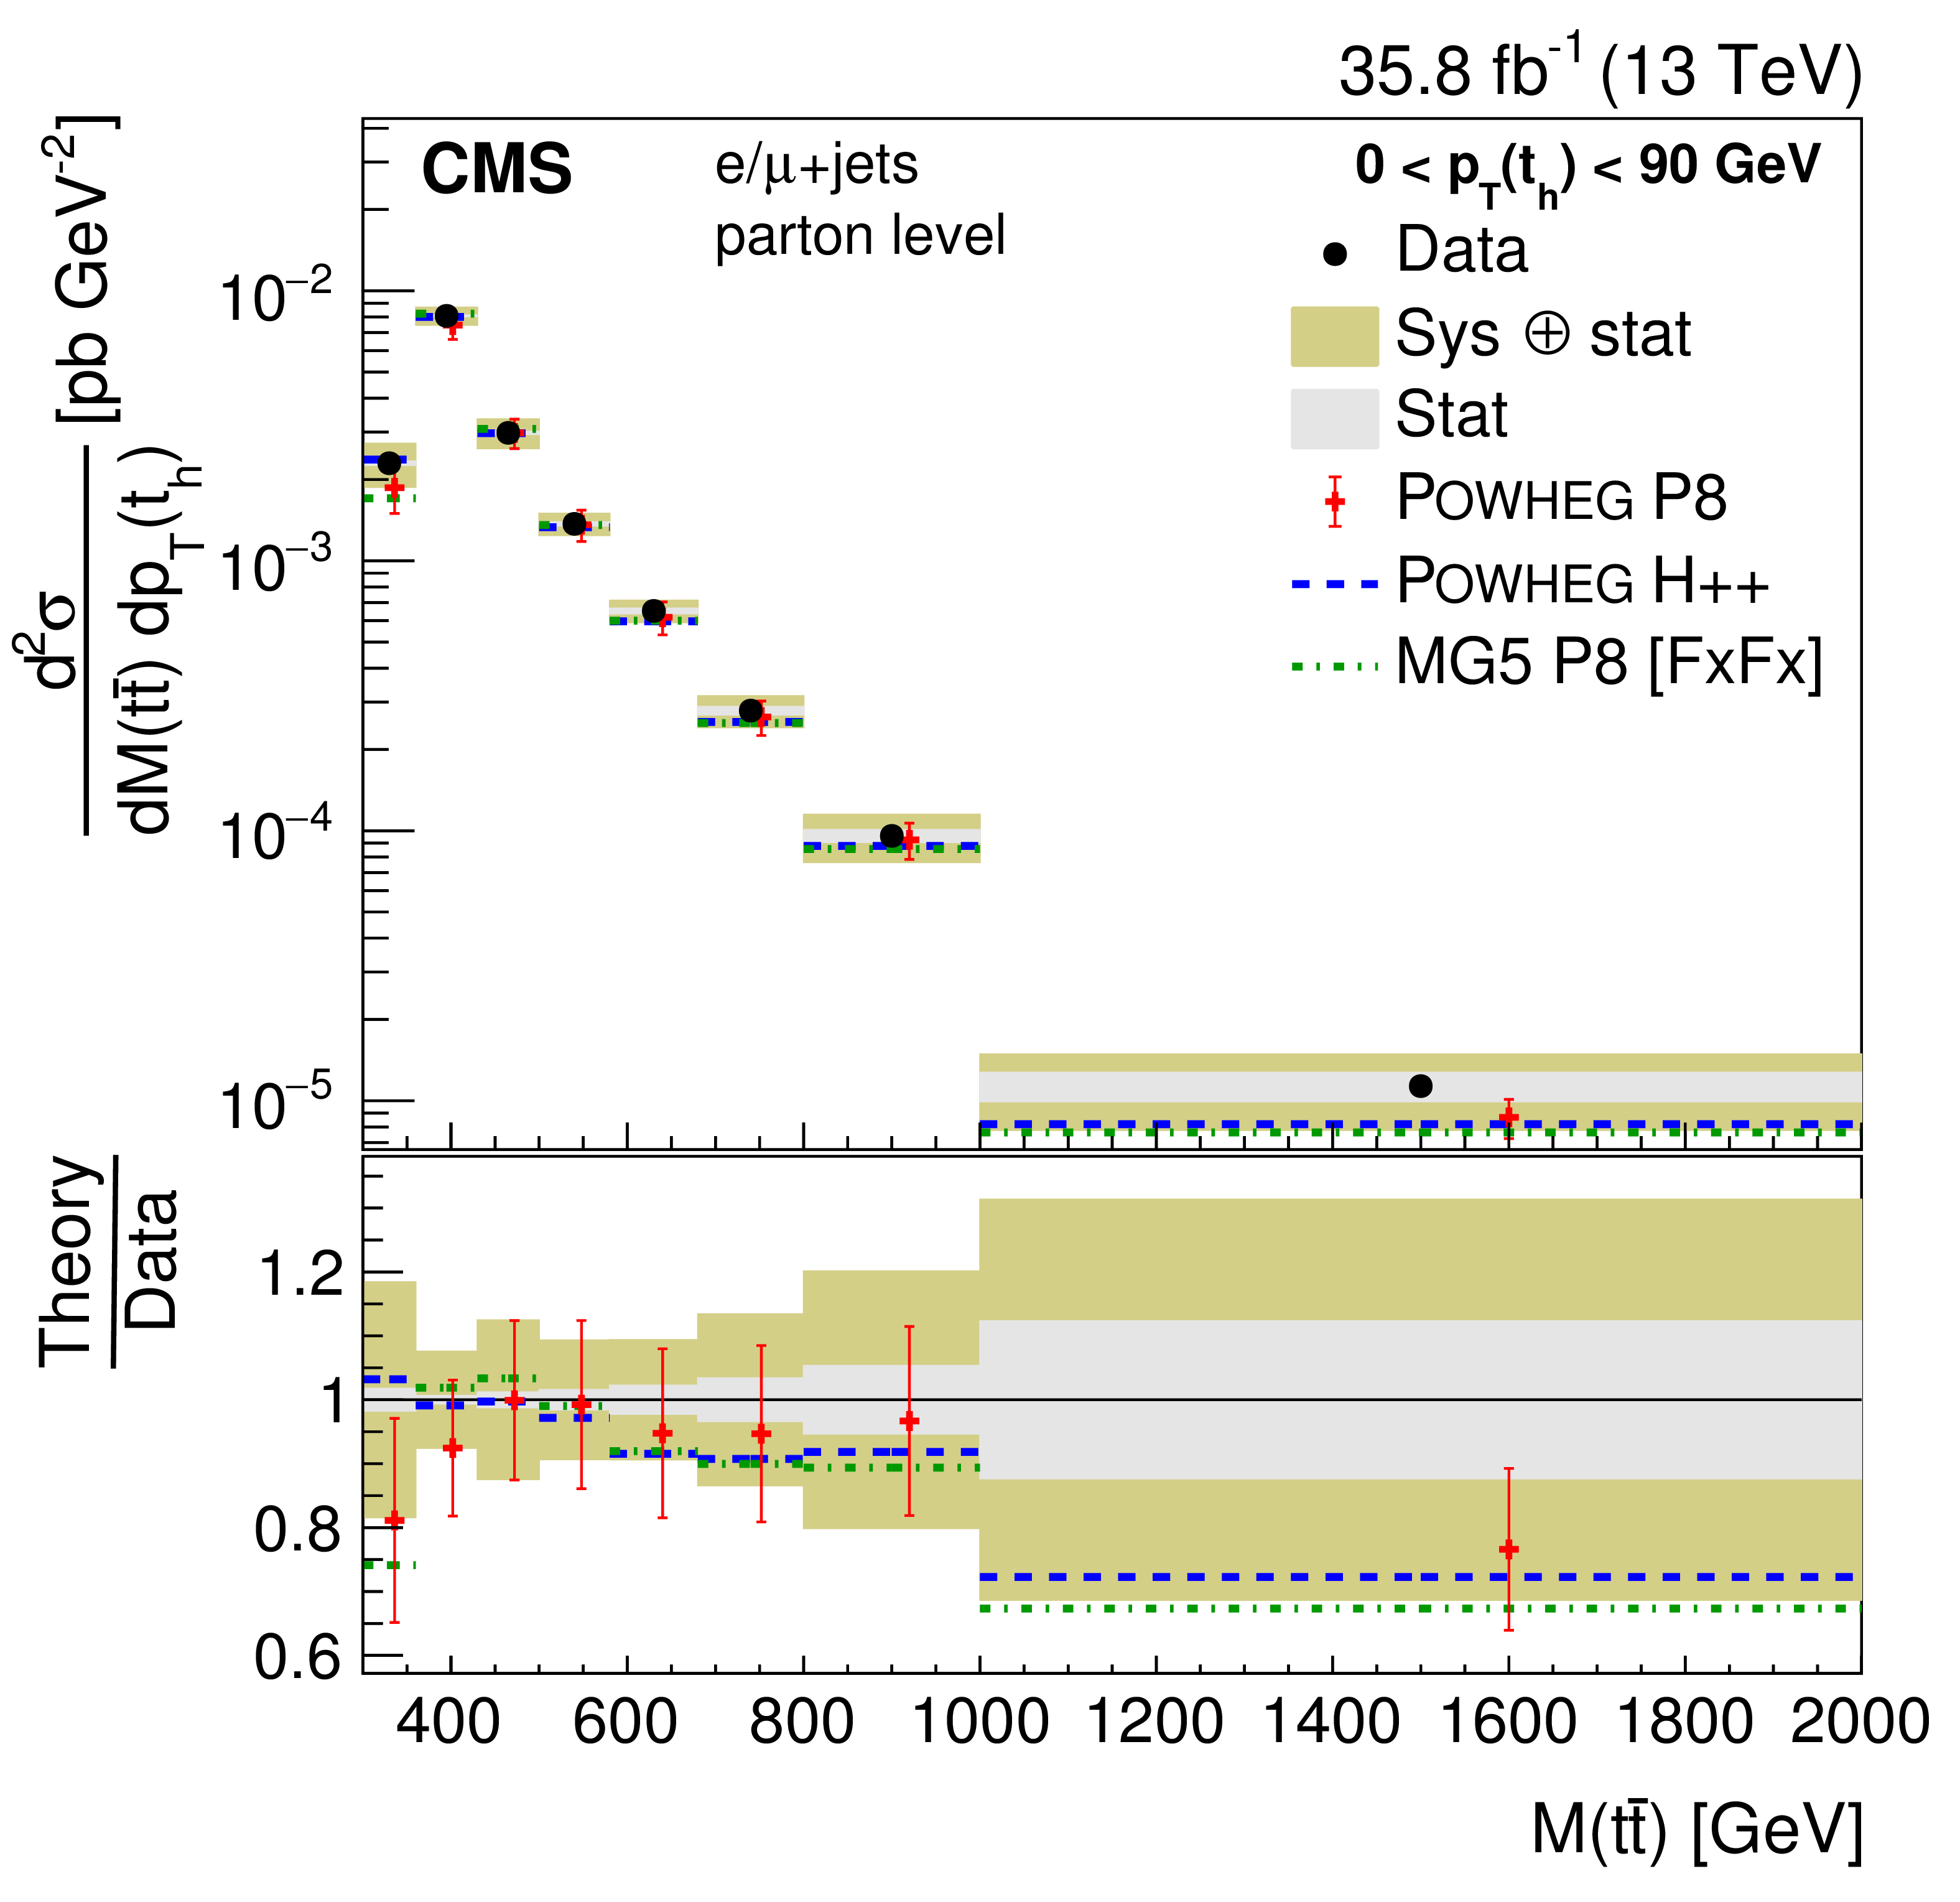
png pdf |
Figure 26-a:
Double-differential cross section at the parton level as a function of $ {p_{\mathrm {T}}} ({\mathrm{t} _\mathrm {h}})$ vs. $M({\mathrm{t} \mathrm{\bar{t}}})$. The data are shown as points with light (dark) bands indicating the statistical (statistical and systematic) uncertainties. The cross sections are compared to the predictions of POWHEG combined with PYTHIA8 (P8) or HERWIG++ (H++), and the multiparton simulation MG5_aMC@NLO (MG5)+PYTHIA8 FxFx. The ratios of the various predictions to the measured cross sections are shown at the bottom of each panel. |

png pdf |
Figure 26-b:
Double-differential cross section at the parton level as a function of $ {p_{\mathrm {T}}} ({\mathrm{t} _\mathrm {h}})$ vs. $M({\mathrm{t} \mathrm{\bar{t}}})$. The data are shown as points with light (dark) bands indicating the statistical (statistical and systematic) uncertainties. The cross sections are compared to the predictions of POWHEG combined with PYTHIA8 (P8) or HERWIG++ (H++), and the multiparton simulation MG5_aMC@NLO (MG5)+PYTHIA8 FxFx. The ratios of the various predictions to the measured cross sections are shown at the bottom of each panel. |
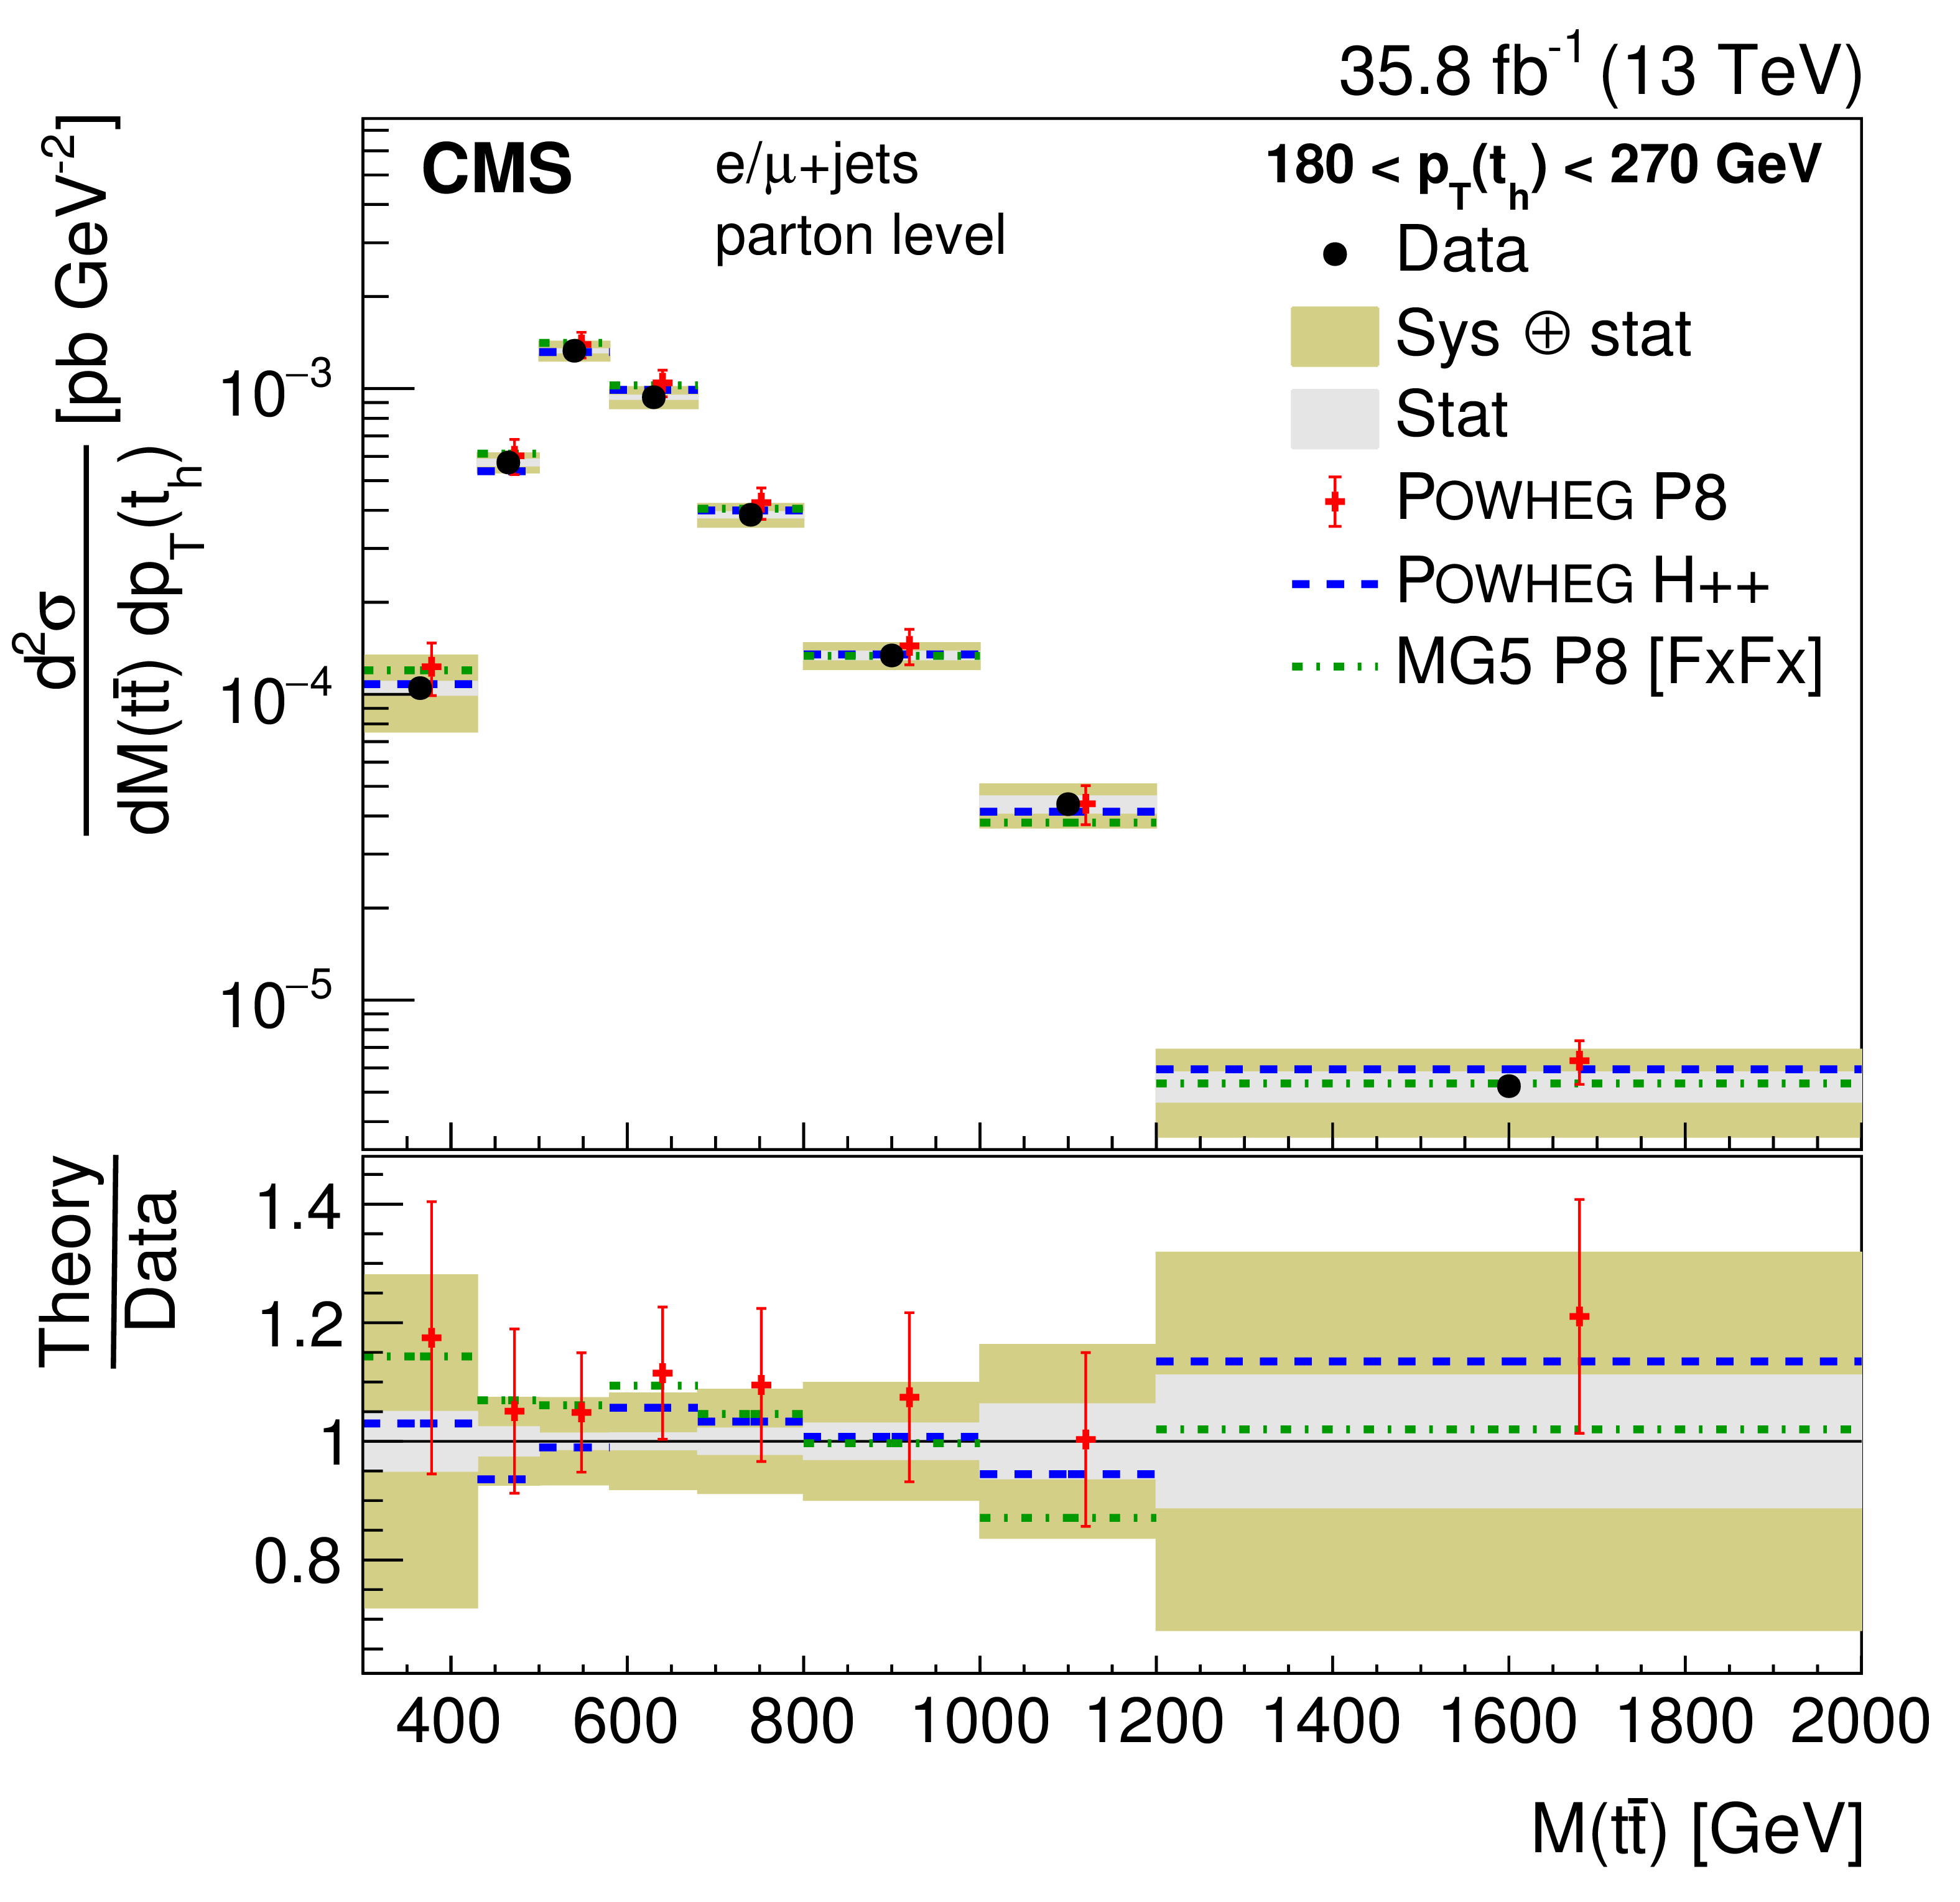
png pdf |
Figure 26-c:
Double-differential cross section at the parton level as a function of $ {p_{\mathrm {T}}} ({\mathrm{t} _\mathrm {h}})$ vs. $M({\mathrm{t} \mathrm{\bar{t}}})$. The data are shown as points with light (dark) bands indicating the statistical (statistical and systematic) uncertainties. The cross sections are compared to the predictions of POWHEG combined with PYTHIA8 (P8) or HERWIG++ (H++), and the multiparton simulation MG5_aMC@NLO (MG5)+PYTHIA8 FxFx. The ratios of the various predictions to the measured cross sections are shown at the bottom of each panel. |
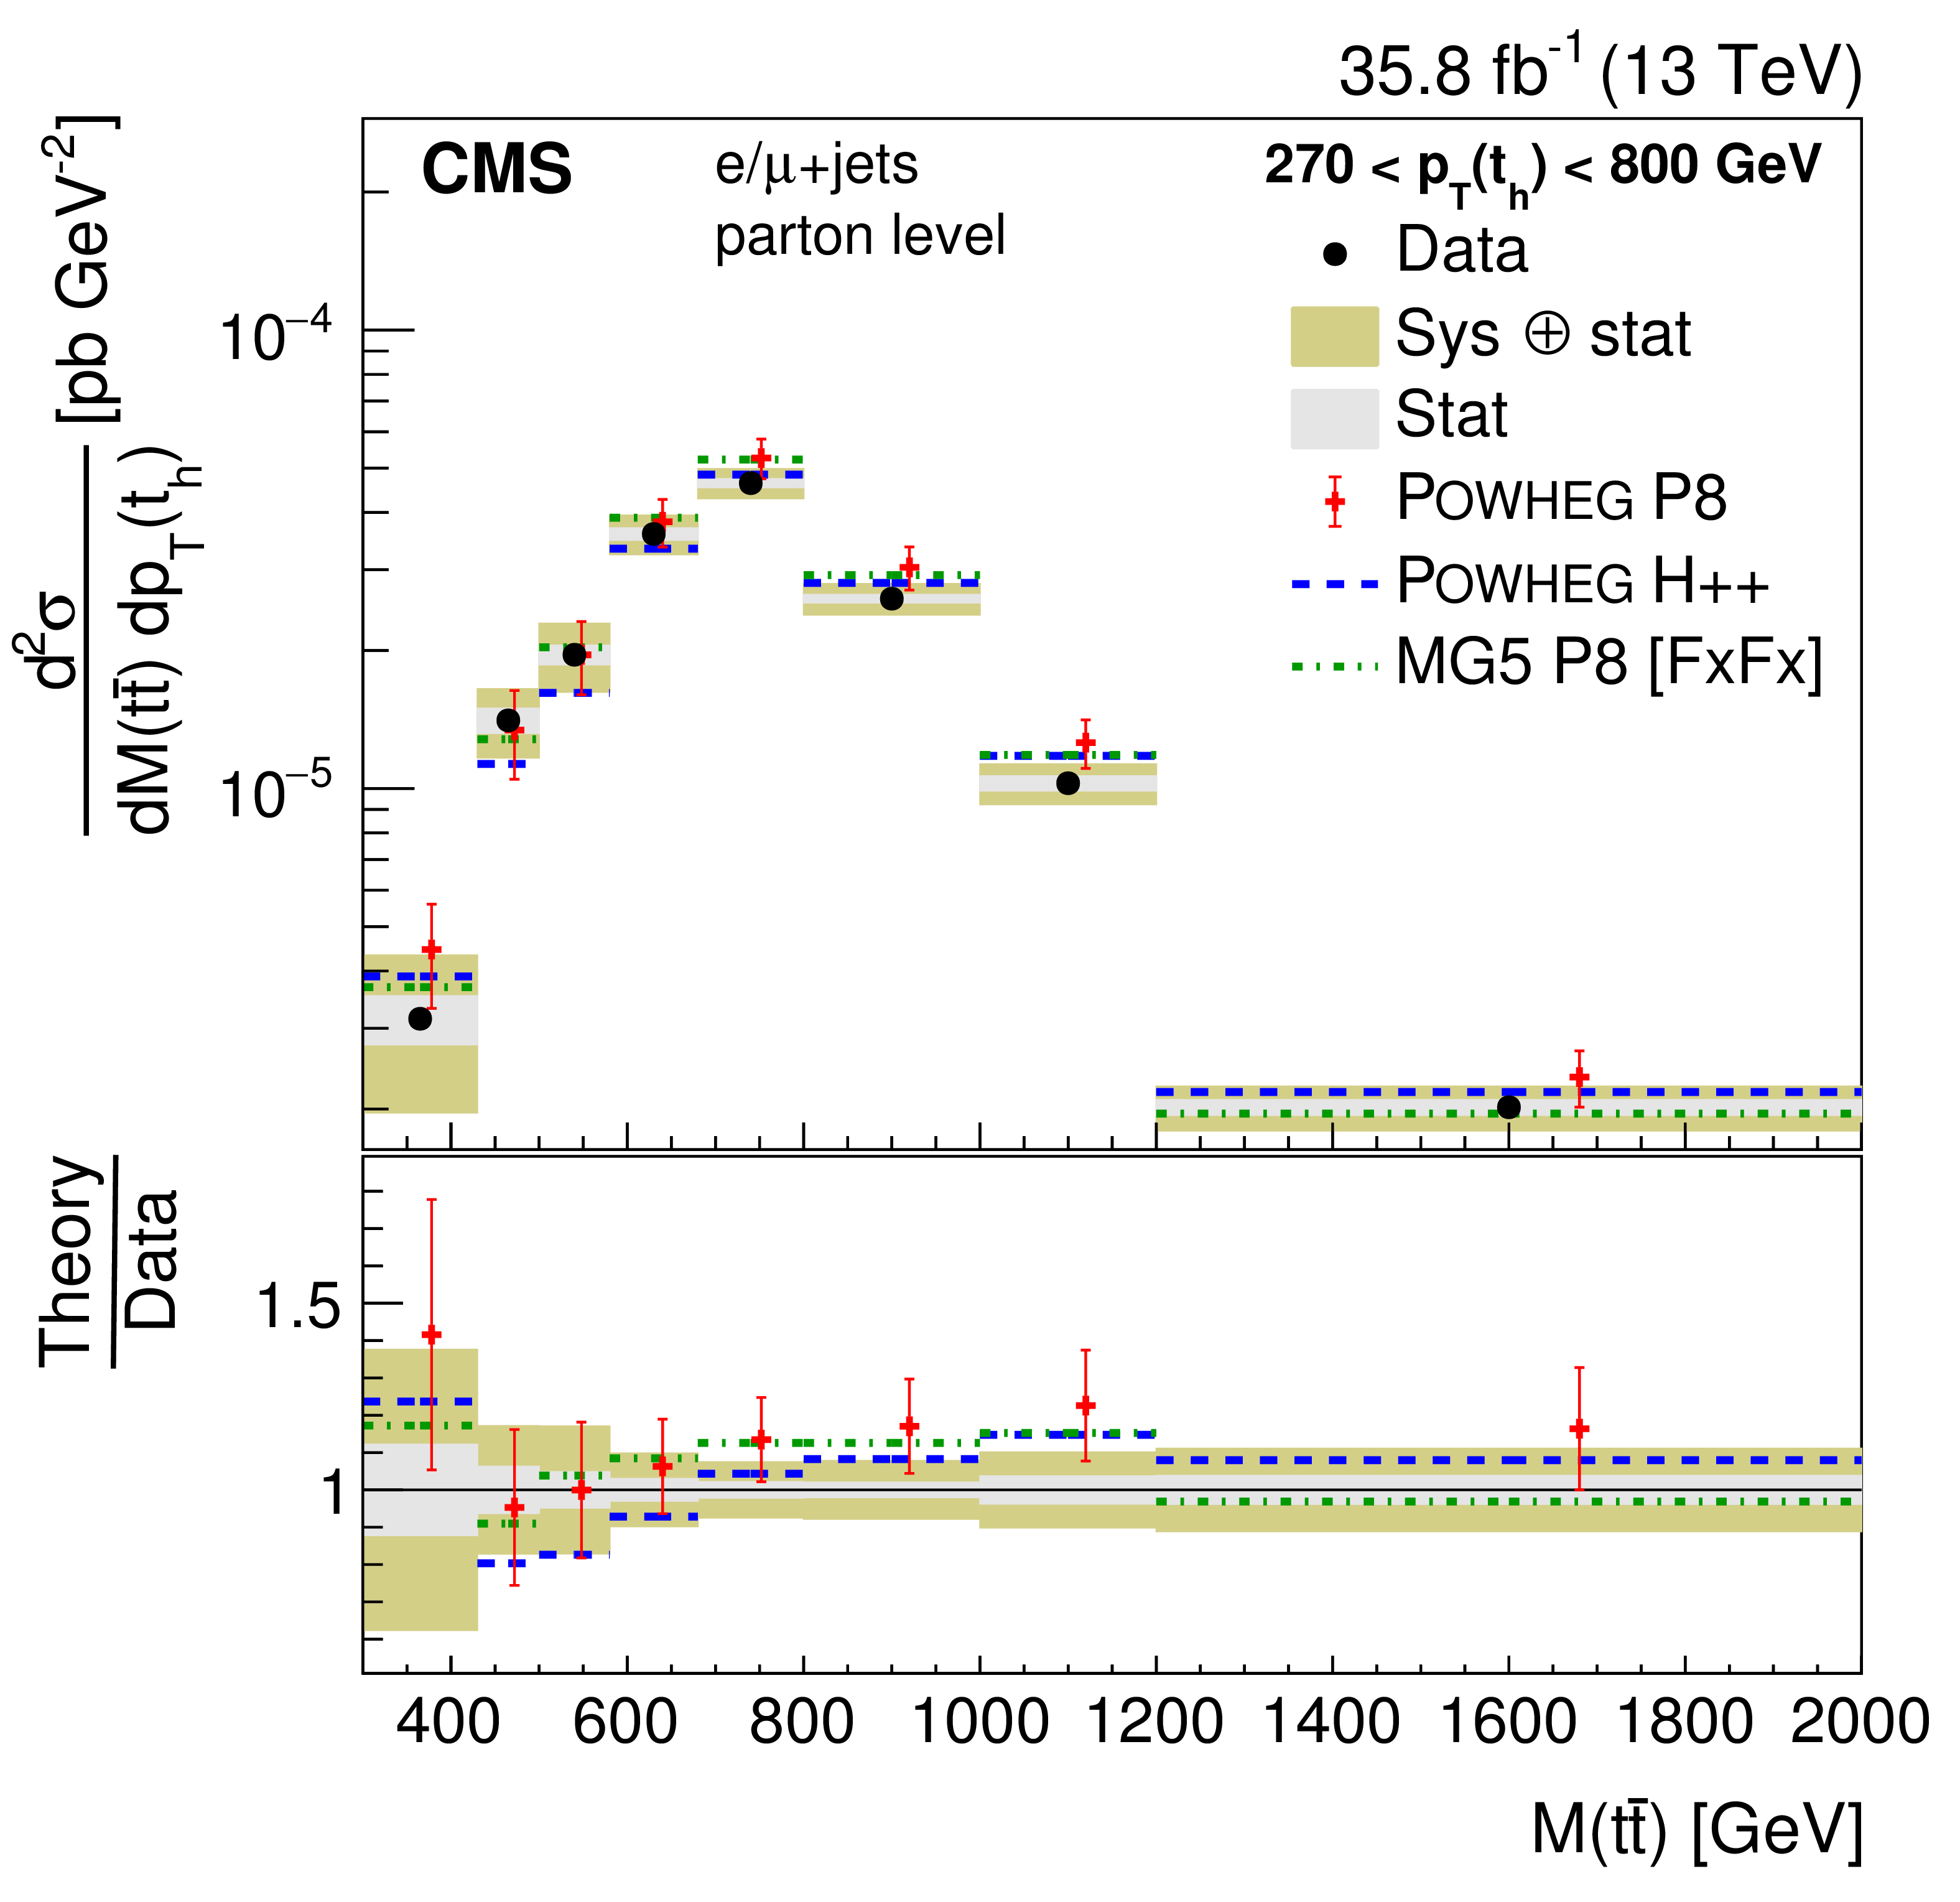
png pdf |
Figure 26-d:
Double-differential cross section at the parton level as a function of $ {p_{\mathrm {T}}} ({\mathrm{t} _\mathrm {h}})$ vs. $M({\mathrm{t} \mathrm{\bar{t}}})$. The data are shown as points with light (dark) bands indicating the statistical (statistical and systematic) uncertainties. The cross sections are compared to the predictions of POWHEG combined with PYTHIA8 (P8) or HERWIG++ (H++), and the multiparton simulation MG5_aMC@NLO (MG5)+PYTHIA8 FxFx. The ratios of the various predictions to the measured cross sections are shown at the bottom of each panel. |
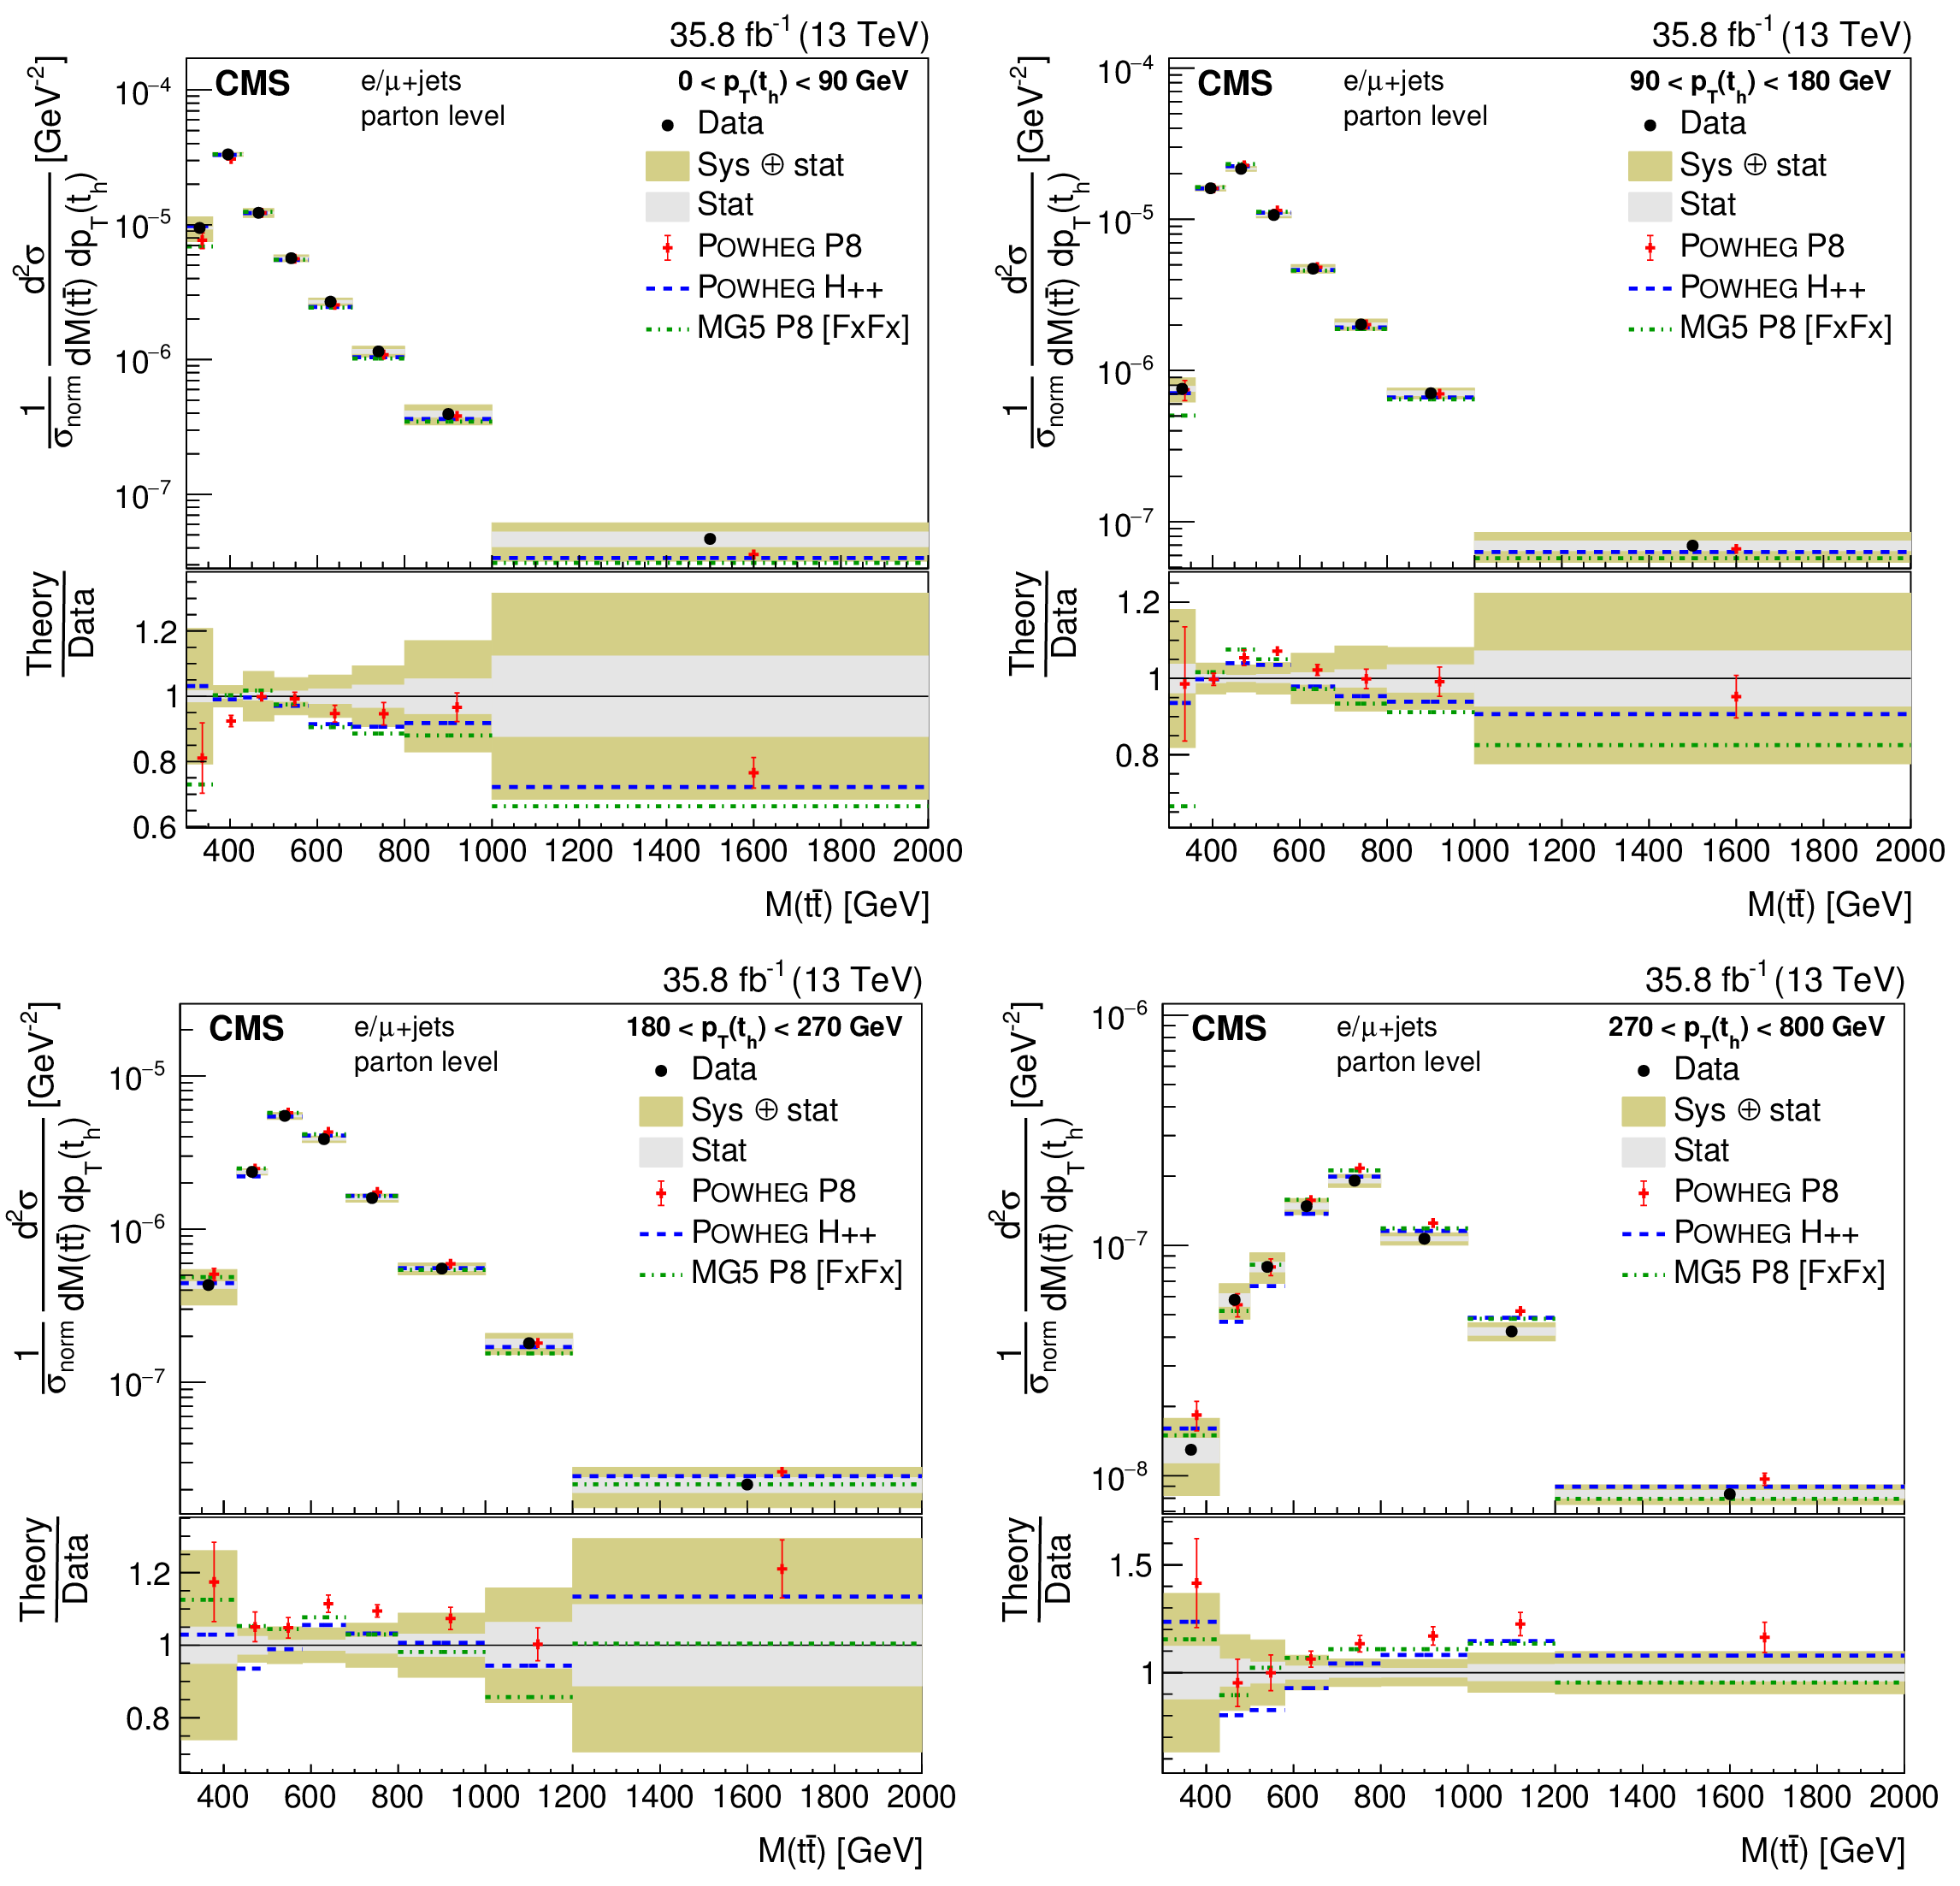
png pdf |
Figure 27:
Normalized double-differential cross section at the parton level as a function of $ {p_{\mathrm {T}}} ({\mathrm{t} _\mathrm {h}})$ vs. $M({\mathrm{t} \mathrm{\bar{t}}})$. The data are shown as points with light (dark) bands indicating the statistical (statistical and systematic) uncertainties. The cross sections are compared to the predictions of POWHEG combined with PYTHIA8 (P8) or HERWIG++ (H++), and the multiparton simulation MG5_aMC@NLO (MG5)+PYTHIA8 FxFx. The ratios of the various predictions to the measured cross sections are shown at the bottom of each panel. |
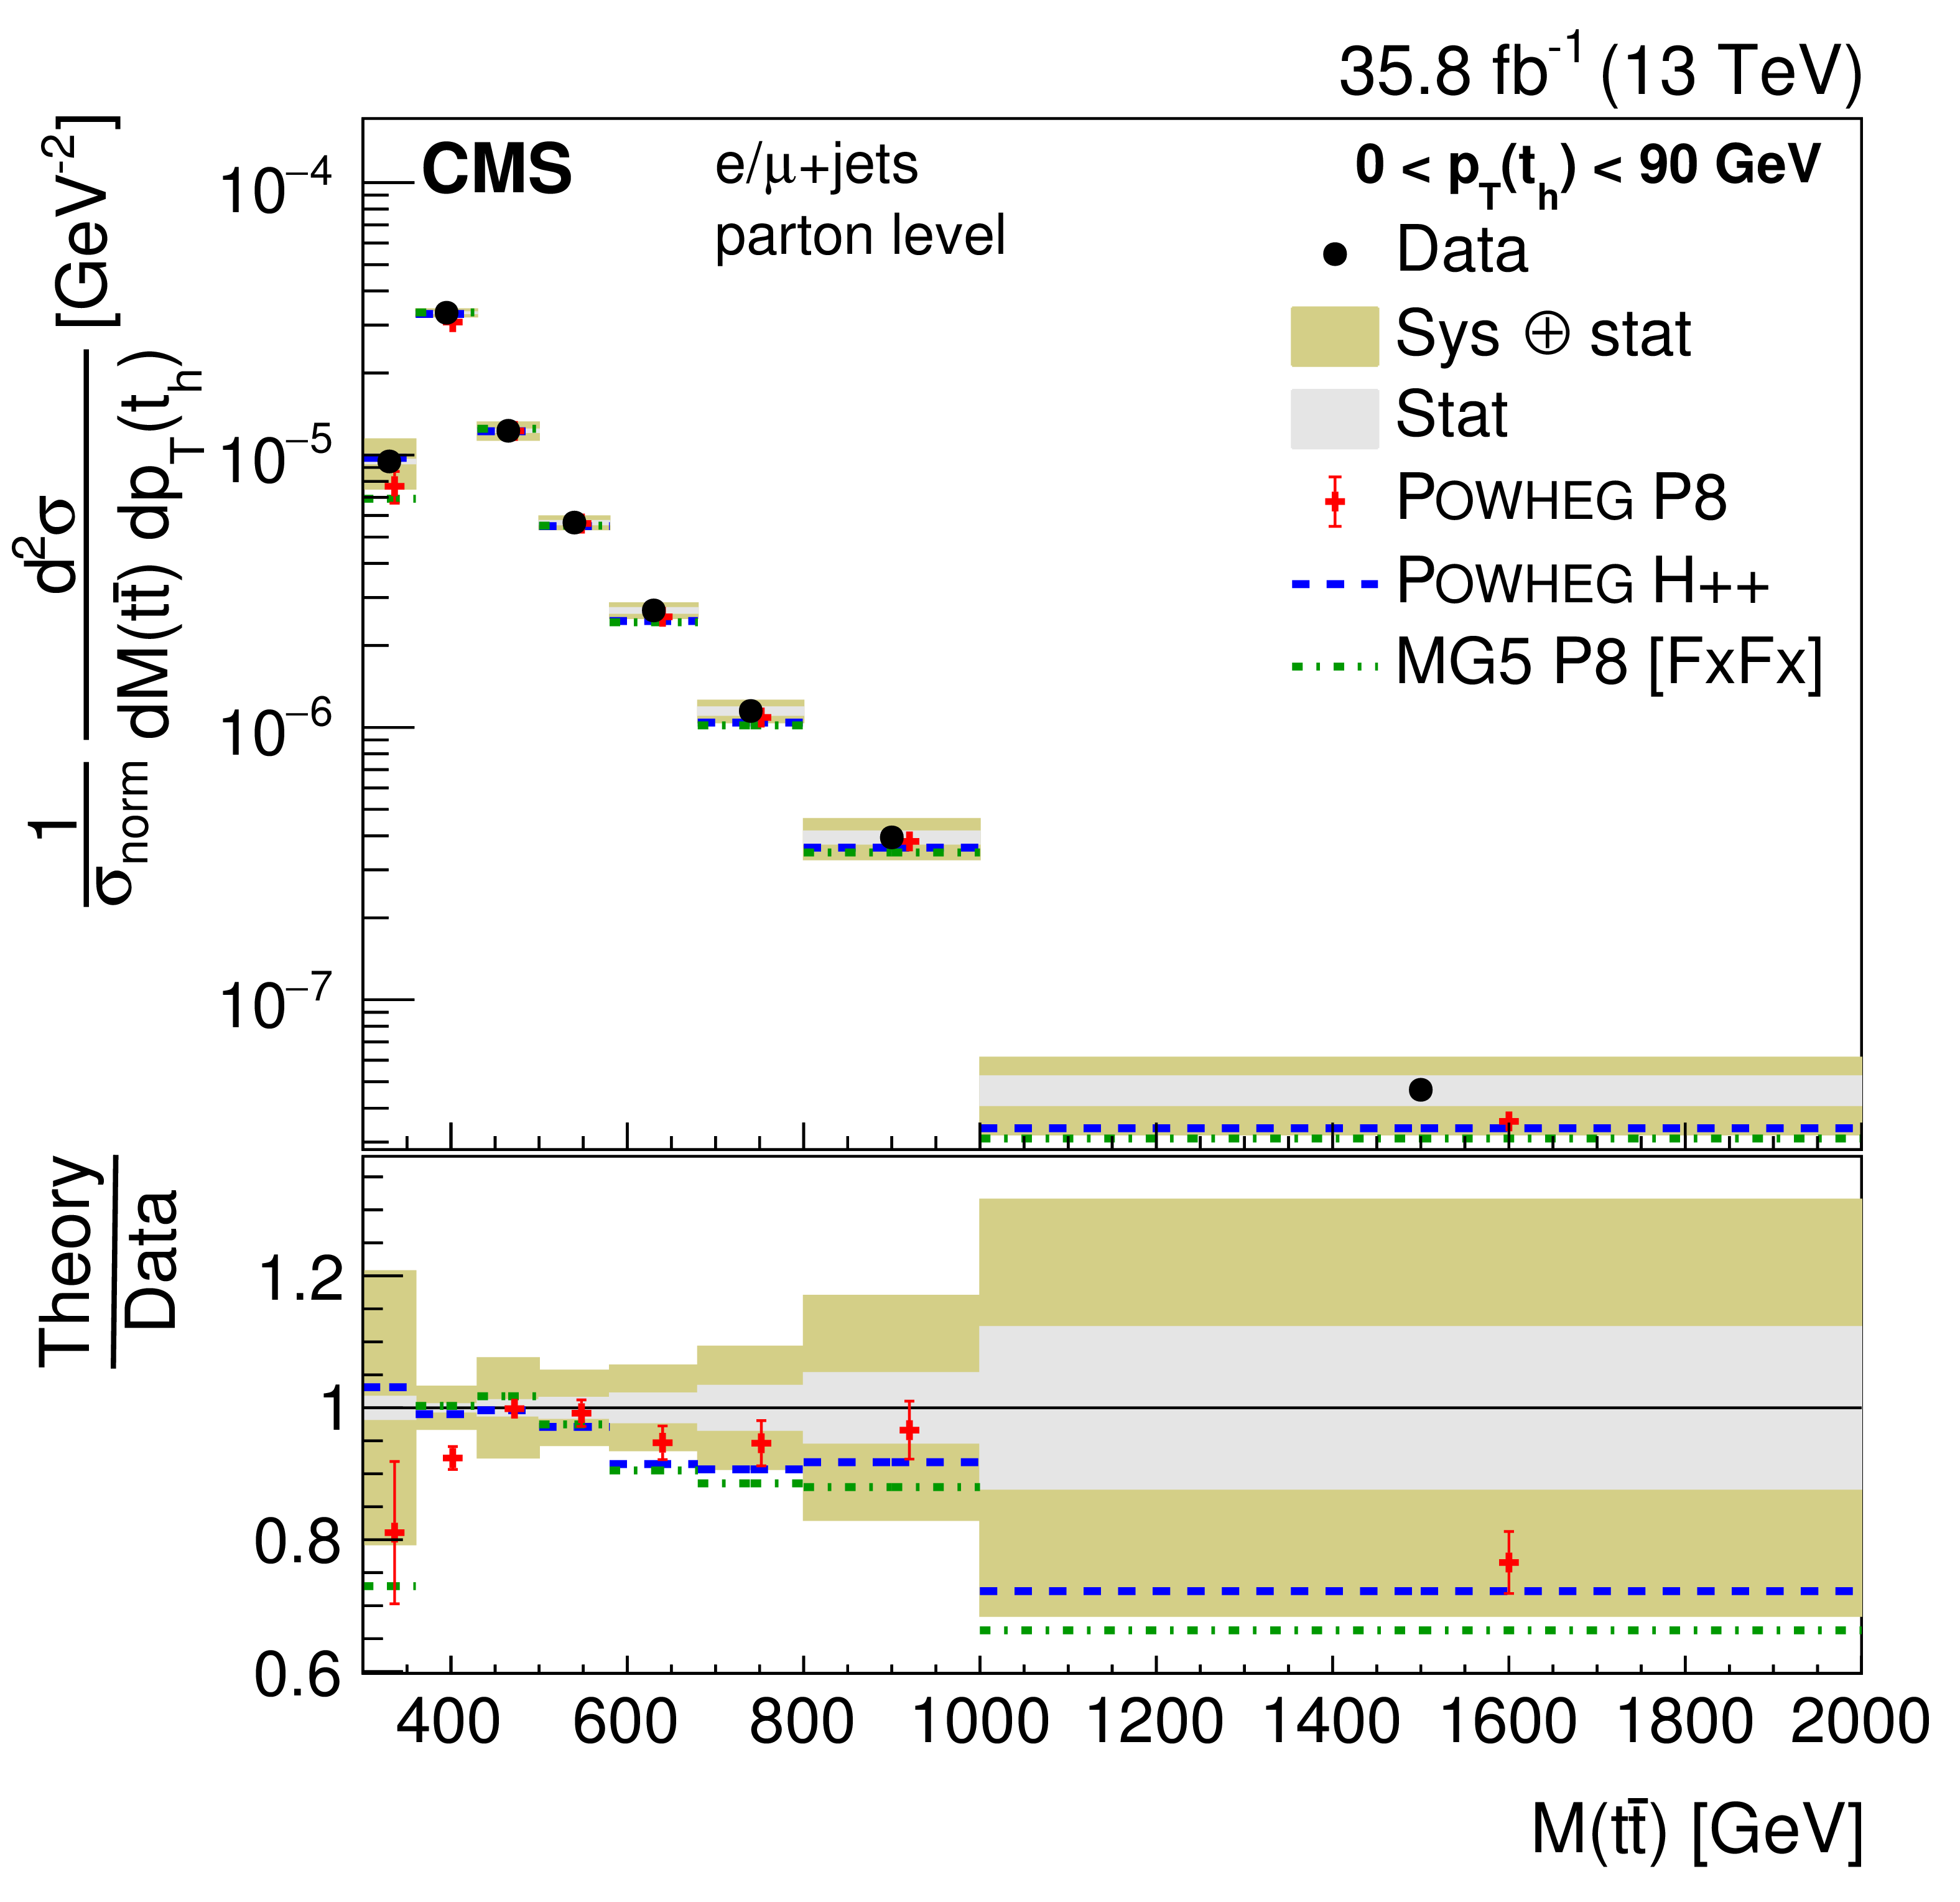
png pdf |
Figure 27-a:
Normalized double-differential cross section at the parton level as a function of $ {p_{\mathrm {T}}} ({\mathrm{t} _\mathrm {h}})$ vs. $M({\mathrm{t} \mathrm{\bar{t}}})$. The data are shown as points with light (dark) bands indicating the statistical (statistical and systematic) uncertainties. The cross sections are compared to the predictions of POWHEG combined with PYTHIA8 (P8) or HERWIG++ (H++), and the multiparton simulation MG5_aMC@NLO (MG5)+PYTHIA8 FxFx. The ratios of the various predictions to the measured cross sections are shown at the bottom of each panel. |
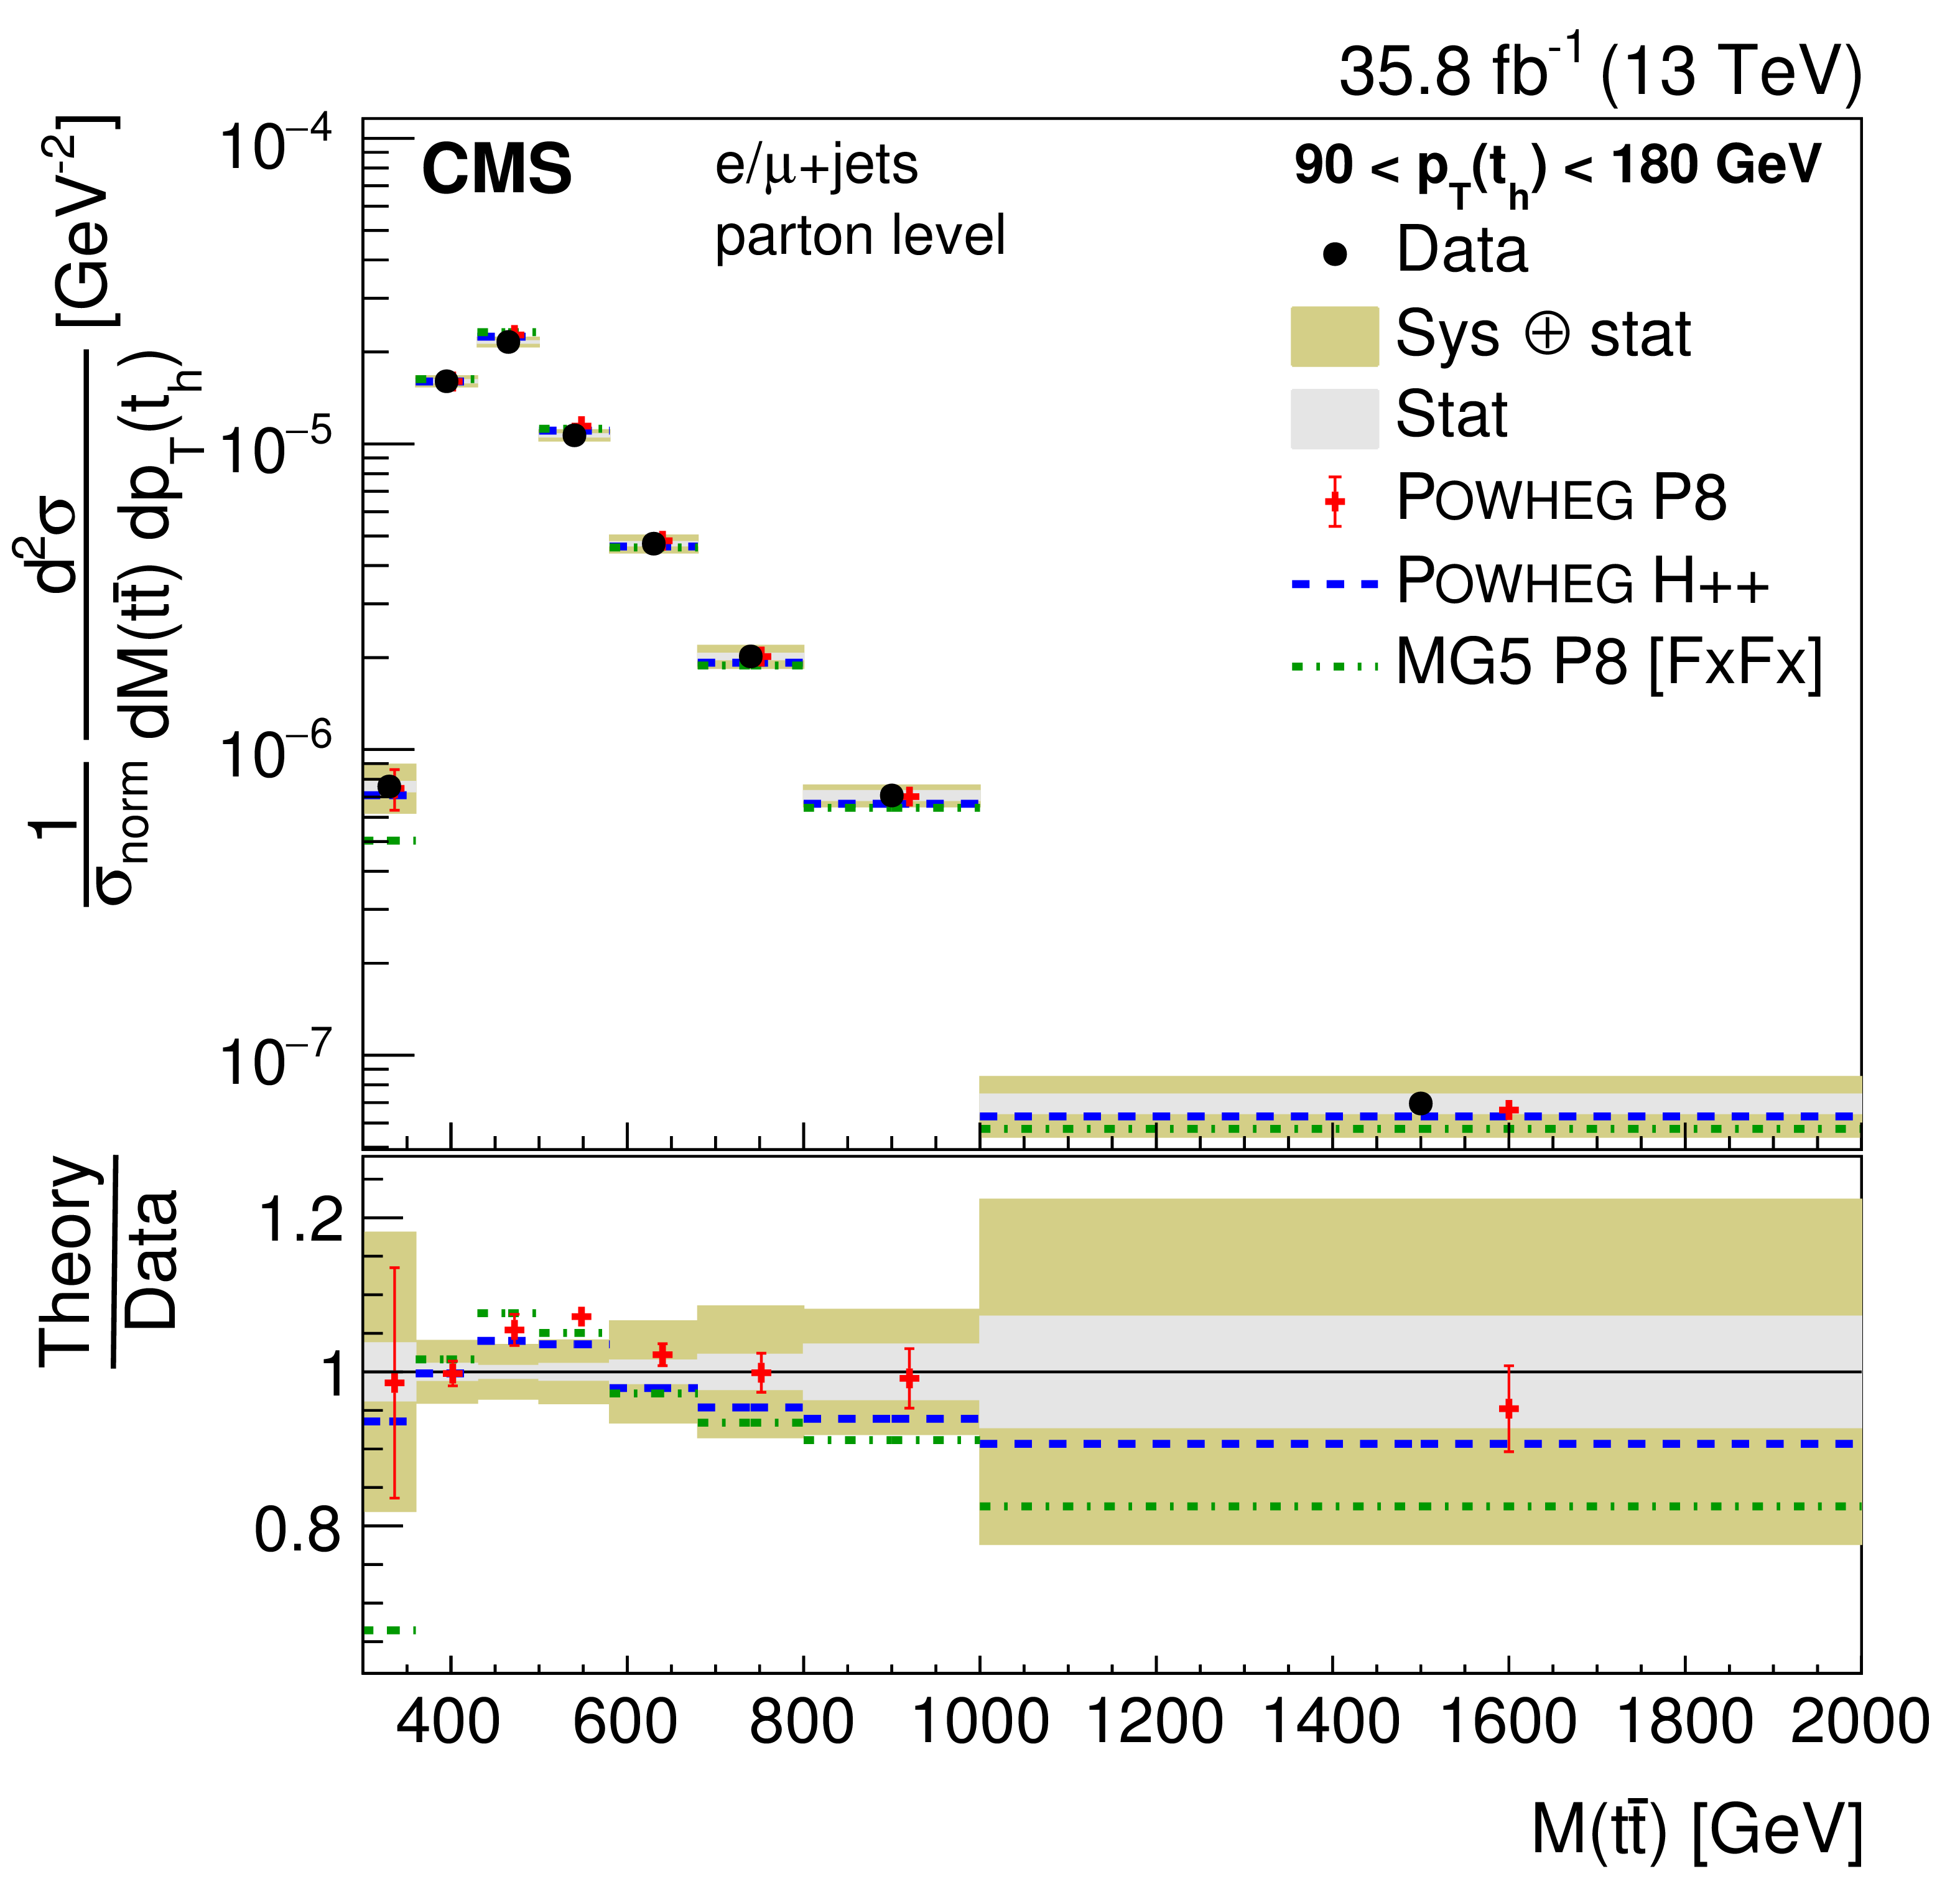
png pdf |
Figure 27-b:
Normalized double-differential cross section at the parton level as a function of $ {p_{\mathrm {T}}} ({\mathrm{t} _\mathrm {h}})$ vs. $M({\mathrm{t} \mathrm{\bar{t}}})$. The data are shown as points with light (dark) bands indicating the statistical (statistical and systematic) uncertainties. The cross sections are compared to the predictions of POWHEG combined with PYTHIA8 (P8) or HERWIG++ (H++), and the multiparton simulation MG5_aMC@NLO (MG5)+PYTHIA8 FxFx. The ratios of the various predictions to the measured cross sections are shown at the bottom of each panel. |
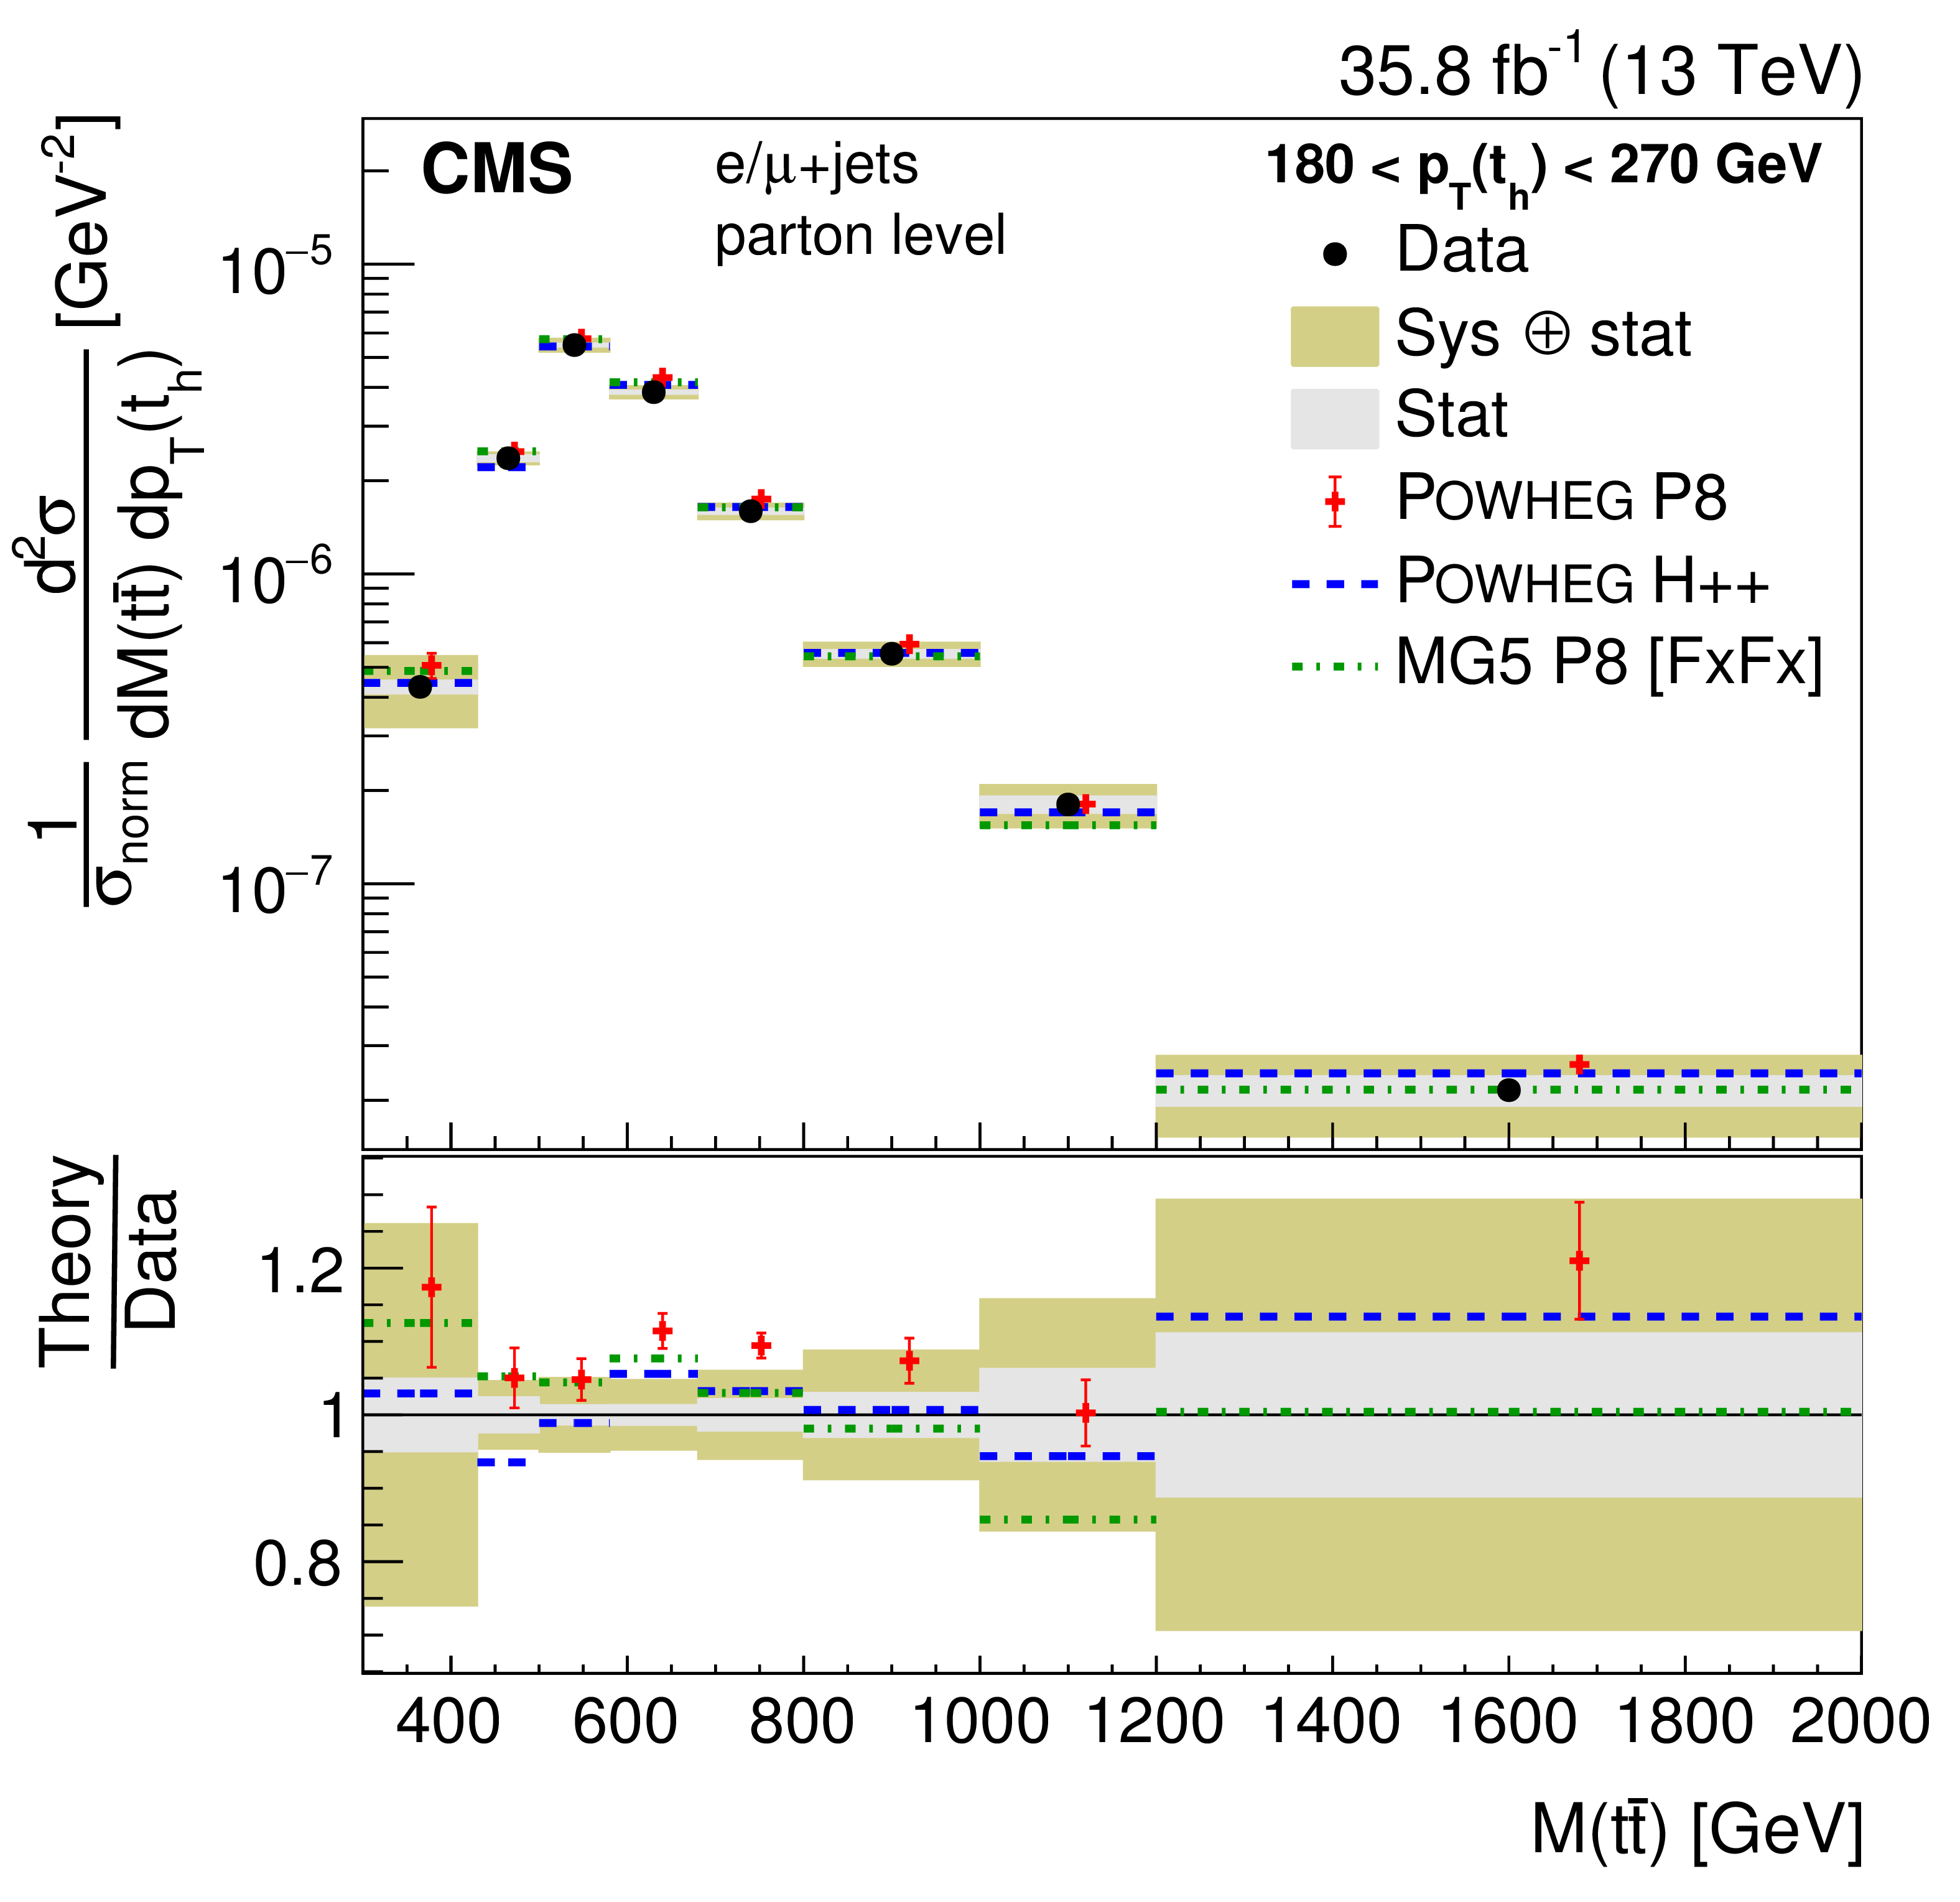
png pdf |
Figure 27-c:
Normalized double-differential cross section at the parton level as a function of $ {p_{\mathrm {T}}} ({\mathrm{t} _\mathrm {h}})$ vs. $M({\mathrm{t} \mathrm{\bar{t}}})$. The data are shown as points with light (dark) bands indicating the statistical (statistical and systematic) uncertainties. The cross sections are compared to the predictions of POWHEG combined with PYTHIA8 (P8) or HERWIG++ (H++), and the multiparton simulation MG5_aMC@NLO (MG5)+PYTHIA8 FxFx. The ratios of the various predictions to the measured cross sections are shown at the bottom of each panel. |
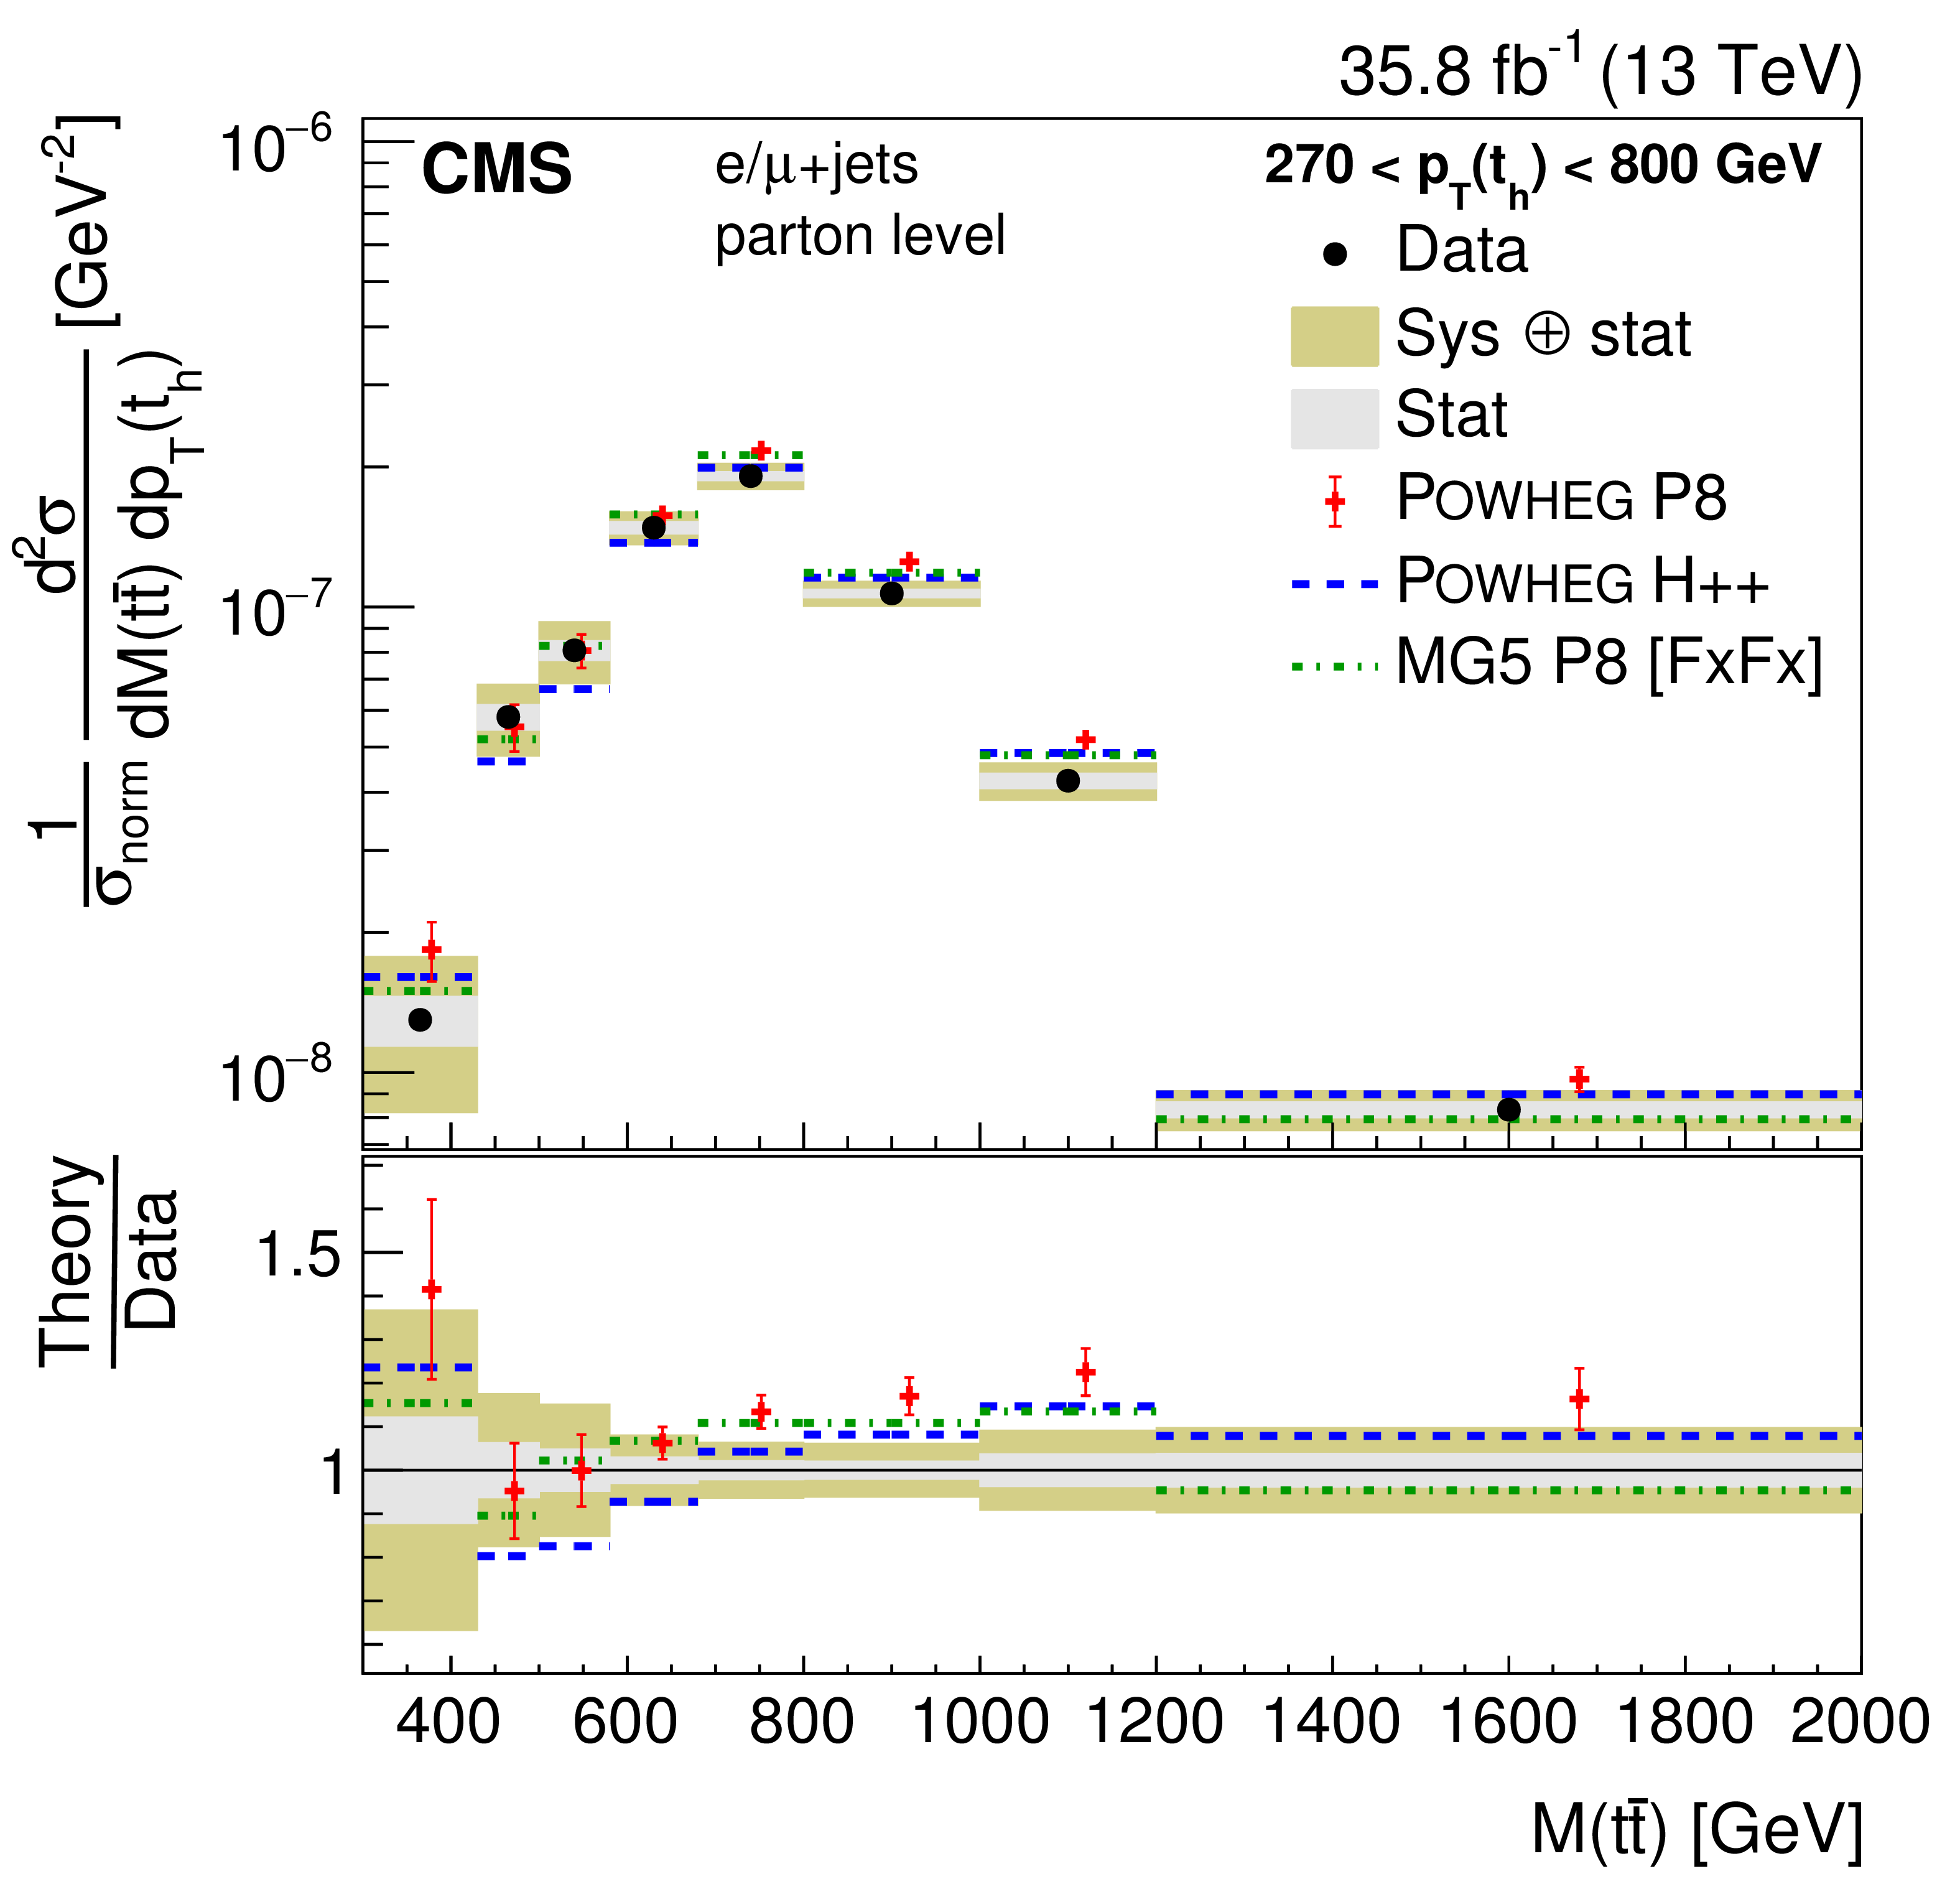
png pdf |
Figure 27-d:
Normalized double-differential cross section at the parton level as a function of $ {p_{\mathrm {T}}} ({\mathrm{t} _\mathrm {h}})$ vs. $M({\mathrm{t} \mathrm{\bar{t}}})$. The data are shown as points with light (dark) bands indicating the statistical (statistical and systematic) uncertainties. The cross sections are compared to the predictions of POWHEG combined with PYTHIA8 (P8) or HERWIG++ (H++), and the multiparton simulation MG5_aMC@NLO (MG5)+PYTHIA8 FxFx. The ratios of the various predictions to the measured cross sections are shown at the bottom of each panel. |
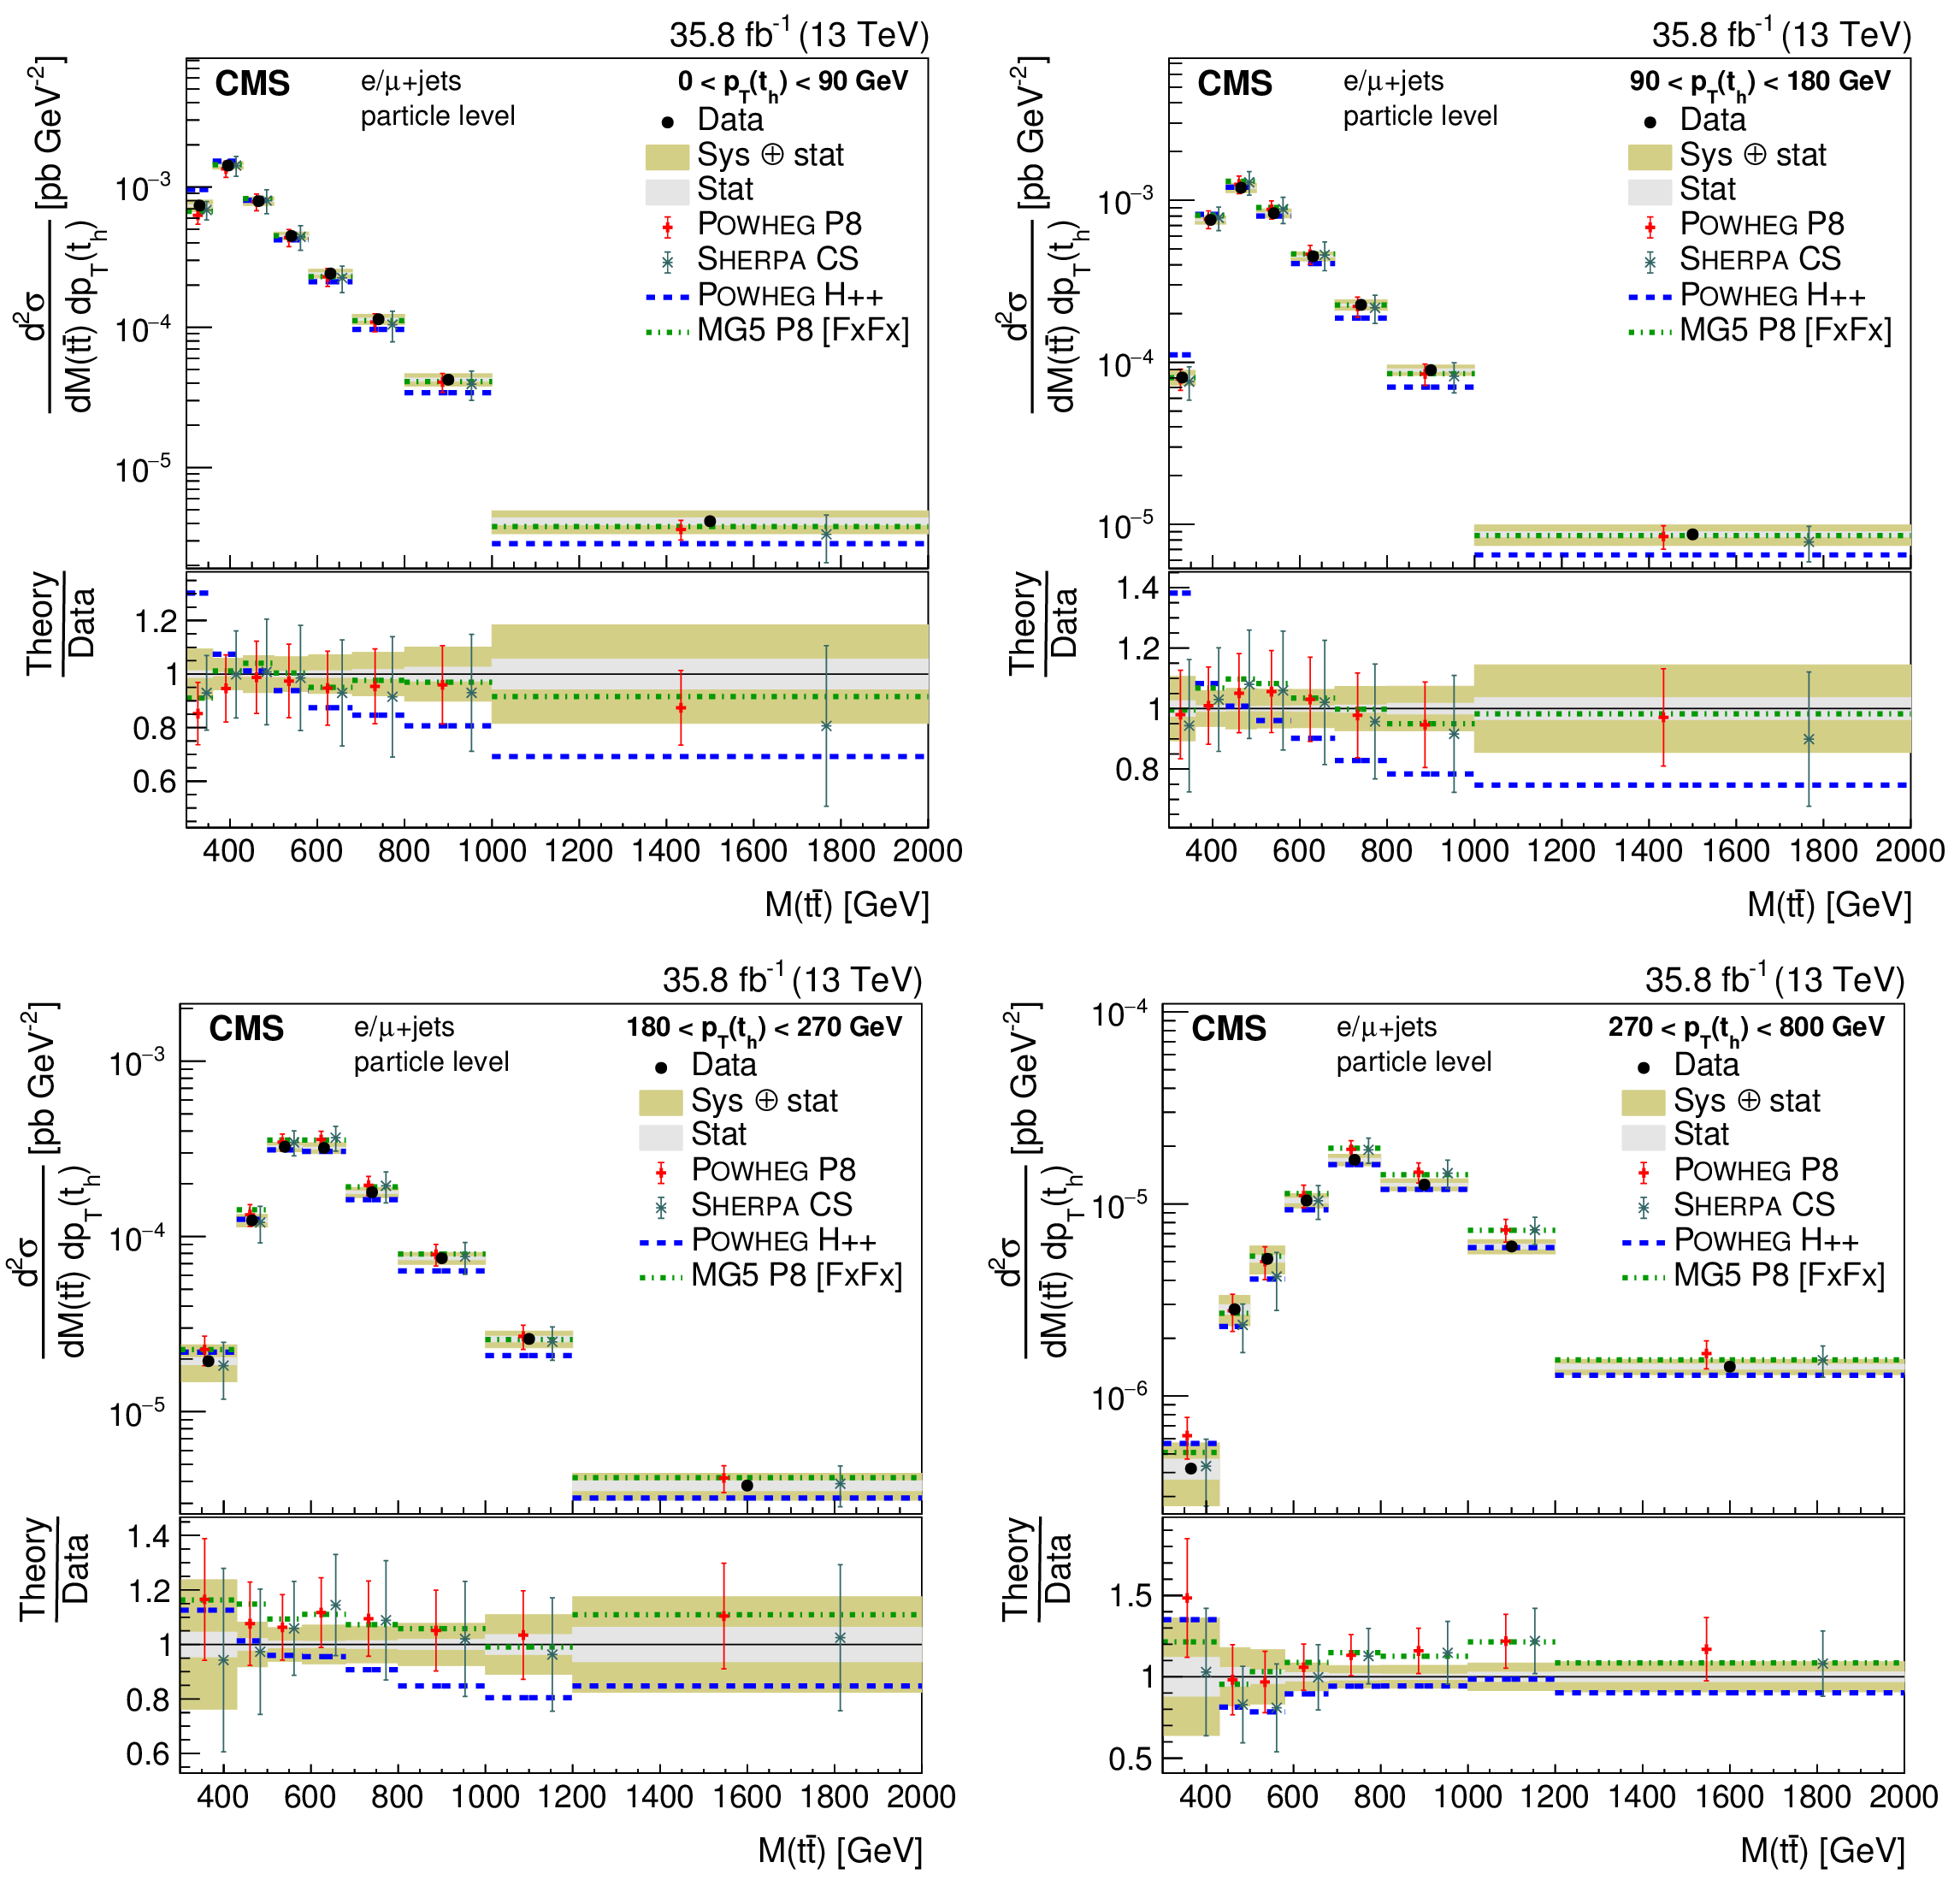
png pdf |
Figure 28:
Double-differential cross section at the particle level as a function of $ {p_{\mathrm {T}}} ({\mathrm{t} _\mathrm {h}})$ vs. $M({\mathrm{t} \mathrm{\bar{t}}})$. The data are shown as points with light (dark) bands indicating the statistical (statistical and systematic) uncertainties. The cross sections are compared to the predictions of POWHEG combined with PYTHIA8 (P8) or HERWIG++ (H++) and the multiparton simulations MG5_aMC@NLO (MG5)+PYTHIA8 FxFx and SHERPA. The ratios of the various predictions to the measured cross sections are shown at the bottom of each panel. |

png pdf |
Figure 28-a:
Double-differential cross section at the particle level as a function of $ {p_{\mathrm {T}}} ({\mathrm{t} _\mathrm {h}})$ vs. $M({\mathrm{t} \mathrm{\bar{t}}})$. The data are shown as points with light (dark) bands indicating the statistical (statistical and systematic) uncertainties. The cross sections are compared to the predictions of POWHEG combined with PYTHIA8 (P8) or HERWIG++ (H++) and the multiparton simulations MG5_aMC@NLO (MG5)+PYTHIA8 FxFx and SHERPA. The ratios of the various predictions to the measured cross sections are shown at the bottom of each panel. |
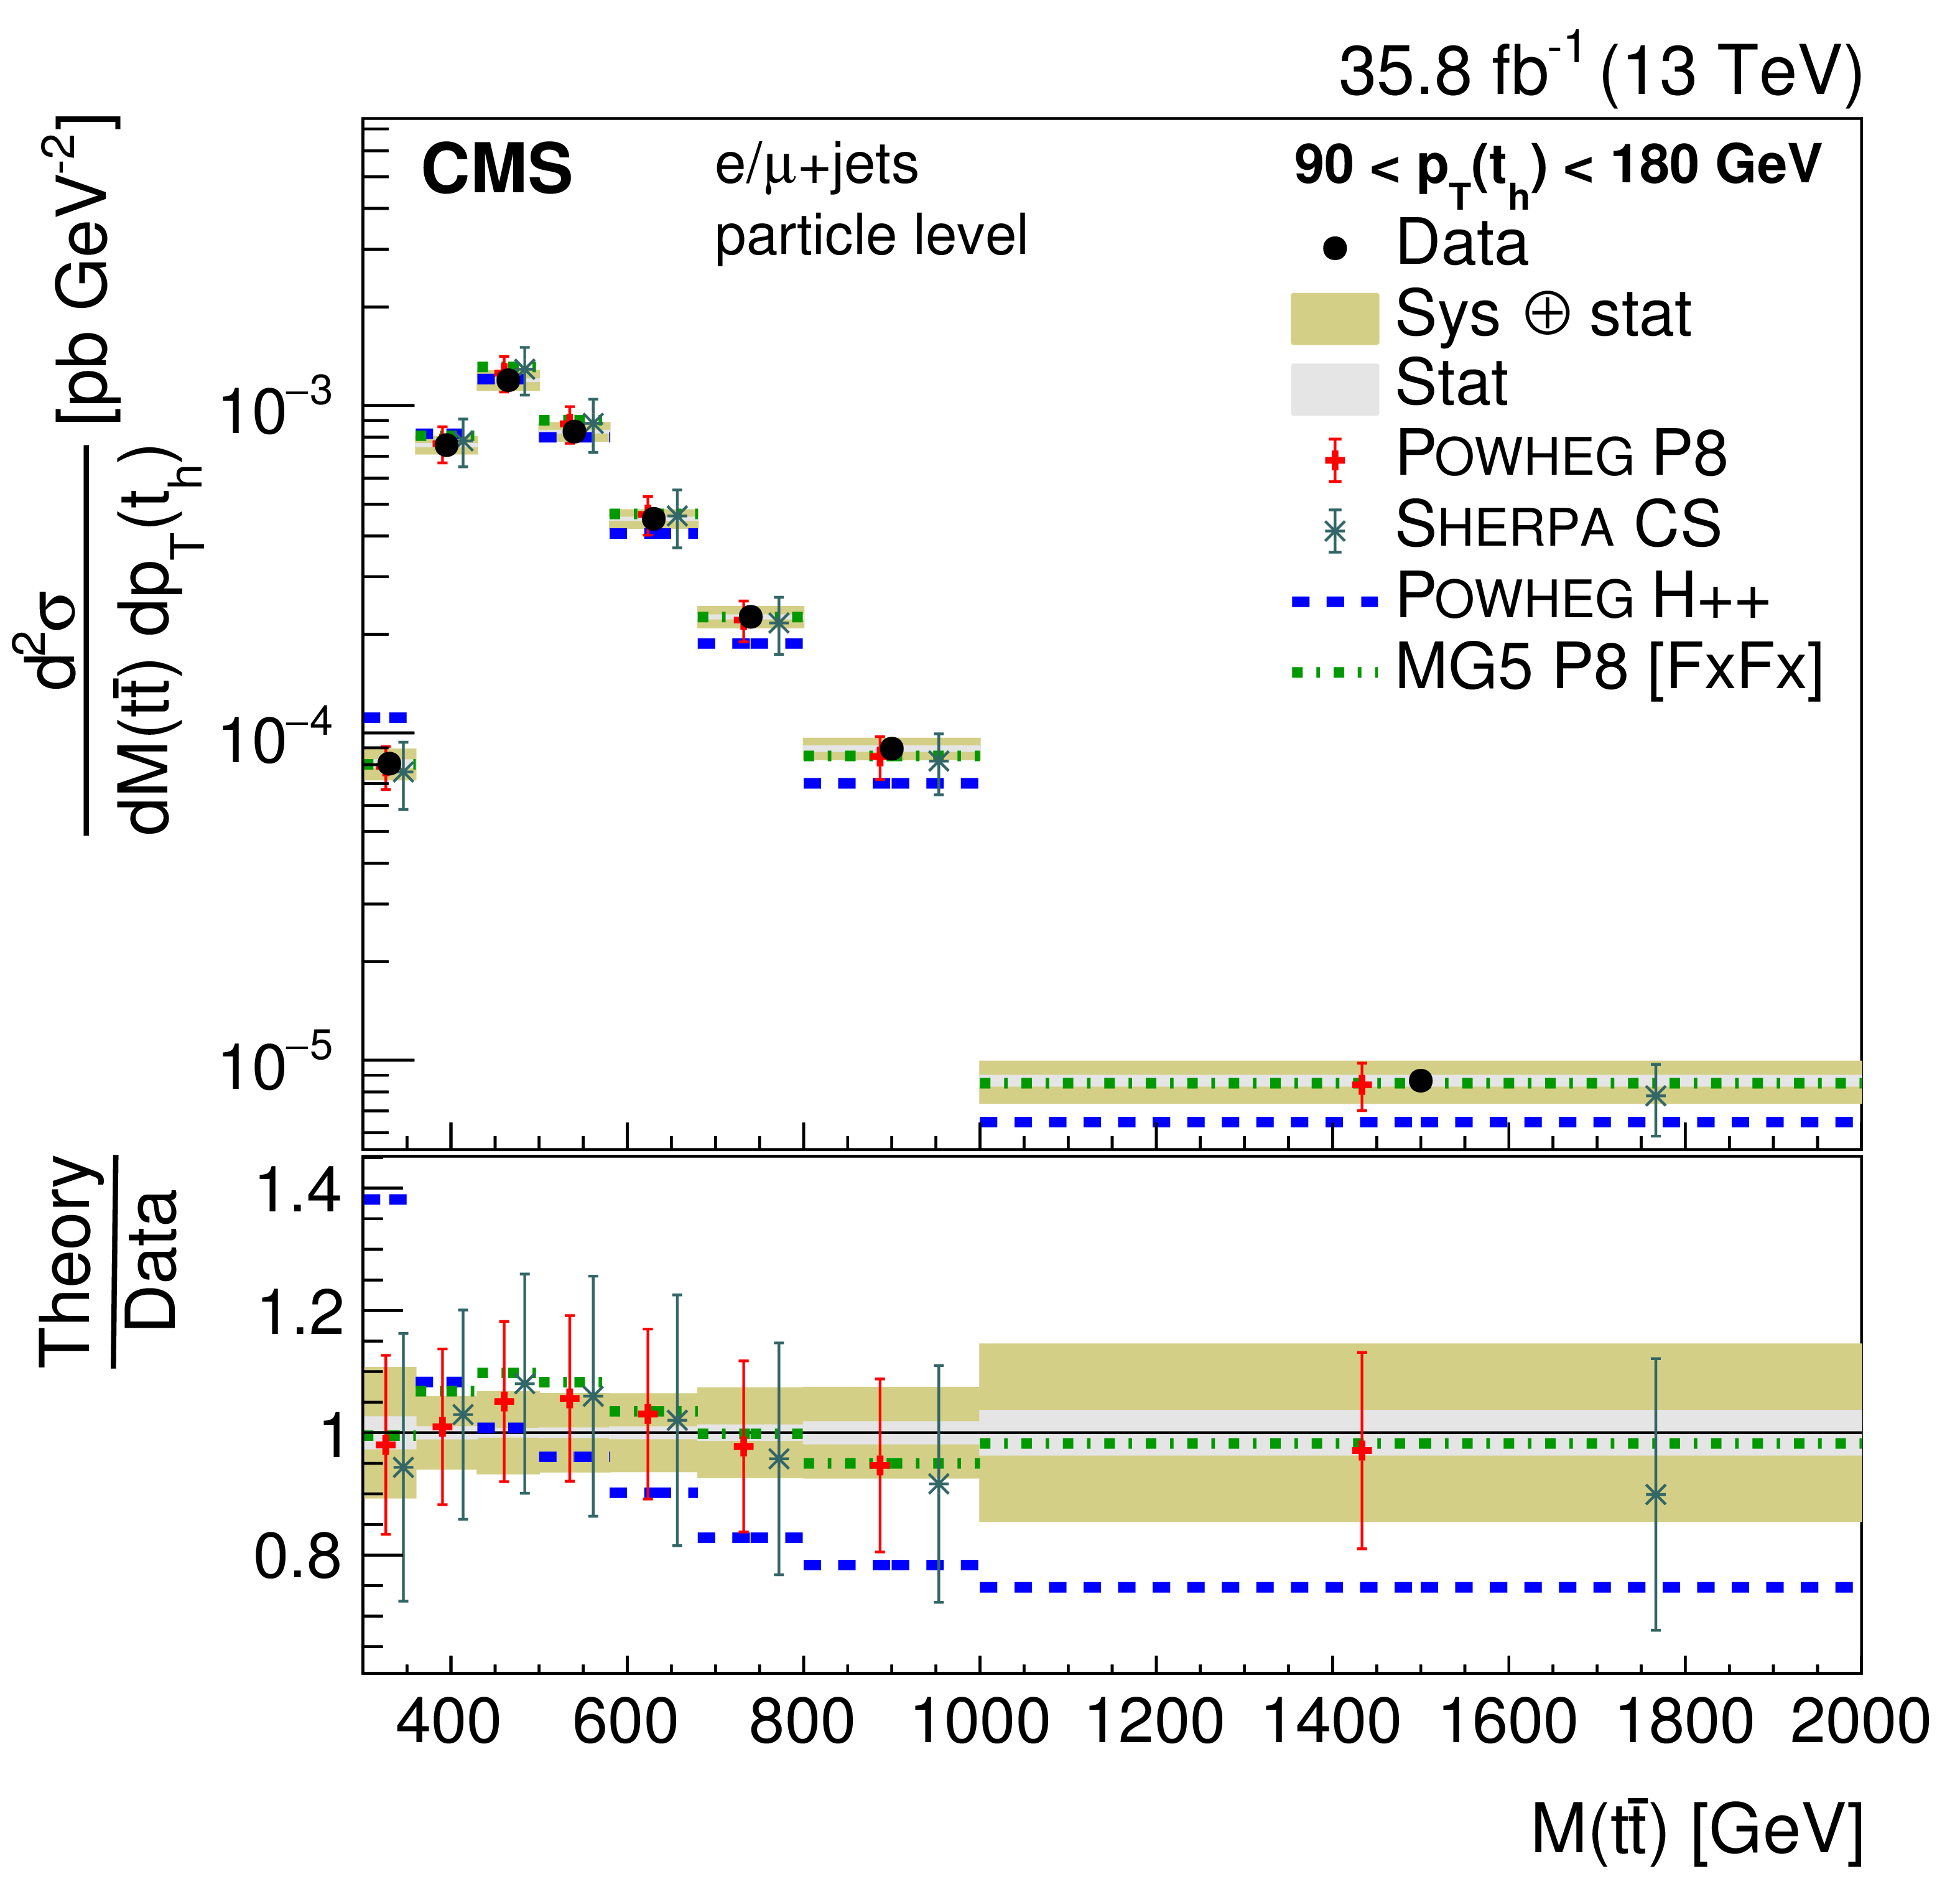
png pdf |
Figure 28-b:
Double-differential cross section at the particle level as a function of $ {p_{\mathrm {T}}} ({\mathrm{t} _\mathrm {h}})$ vs. $M({\mathrm{t} \mathrm{\bar{t}}})$. The data are shown as points with light (dark) bands indicating the statistical (statistical and systematic) uncertainties. The cross sections are compared to the predictions of POWHEG combined with PYTHIA8 (P8) or HERWIG++ (H++) and the multiparton simulations MG5_aMC@NLO (MG5)+PYTHIA8 FxFx and SHERPA. The ratios of the various predictions to the measured cross sections are shown at the bottom of each panel. |
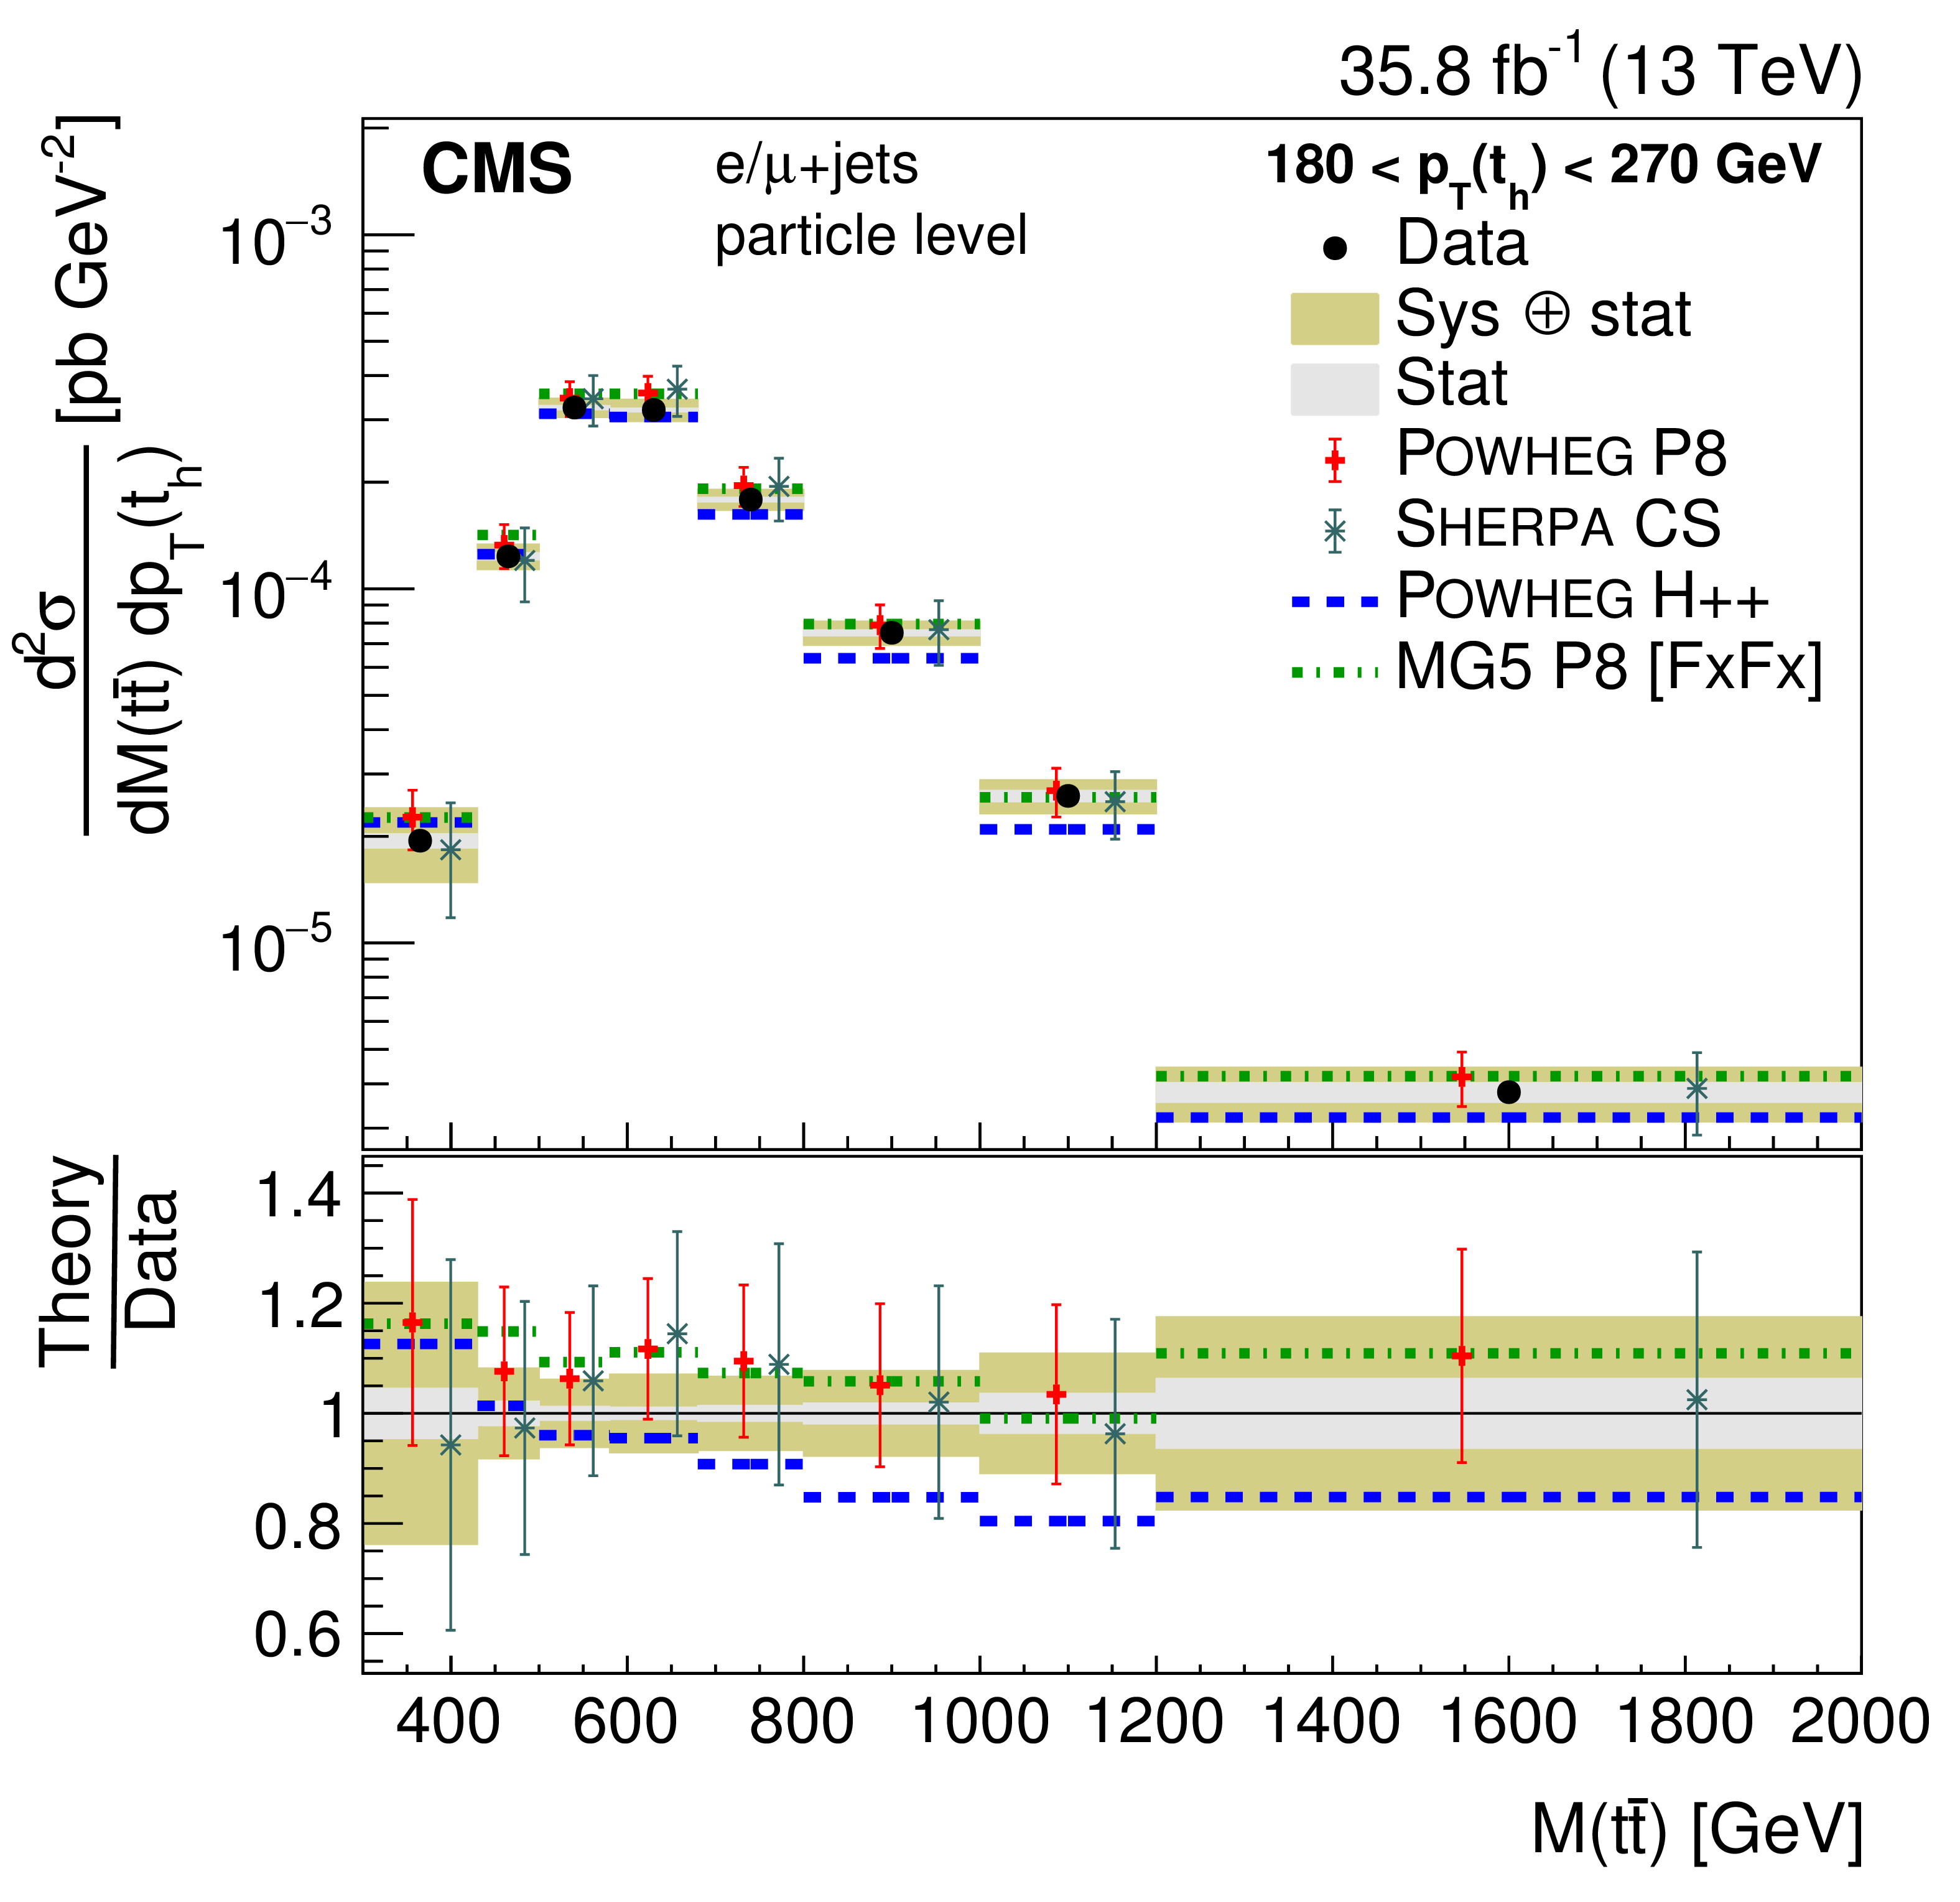
png pdf |
Figure 28-c:
Double-differential cross section at the particle level as a function of $ {p_{\mathrm {T}}} ({\mathrm{t} _\mathrm {h}})$ vs. $M({\mathrm{t} \mathrm{\bar{t}}})$. The data are shown as points with light (dark) bands indicating the statistical (statistical and systematic) uncertainties. The cross sections are compared to the predictions of POWHEG combined with PYTHIA8 (P8) or HERWIG++ (H++) and the multiparton simulations MG5_aMC@NLO (MG5)+PYTHIA8 FxFx and SHERPA. The ratios of the various predictions to the measured cross sections are shown at the bottom of each panel. |
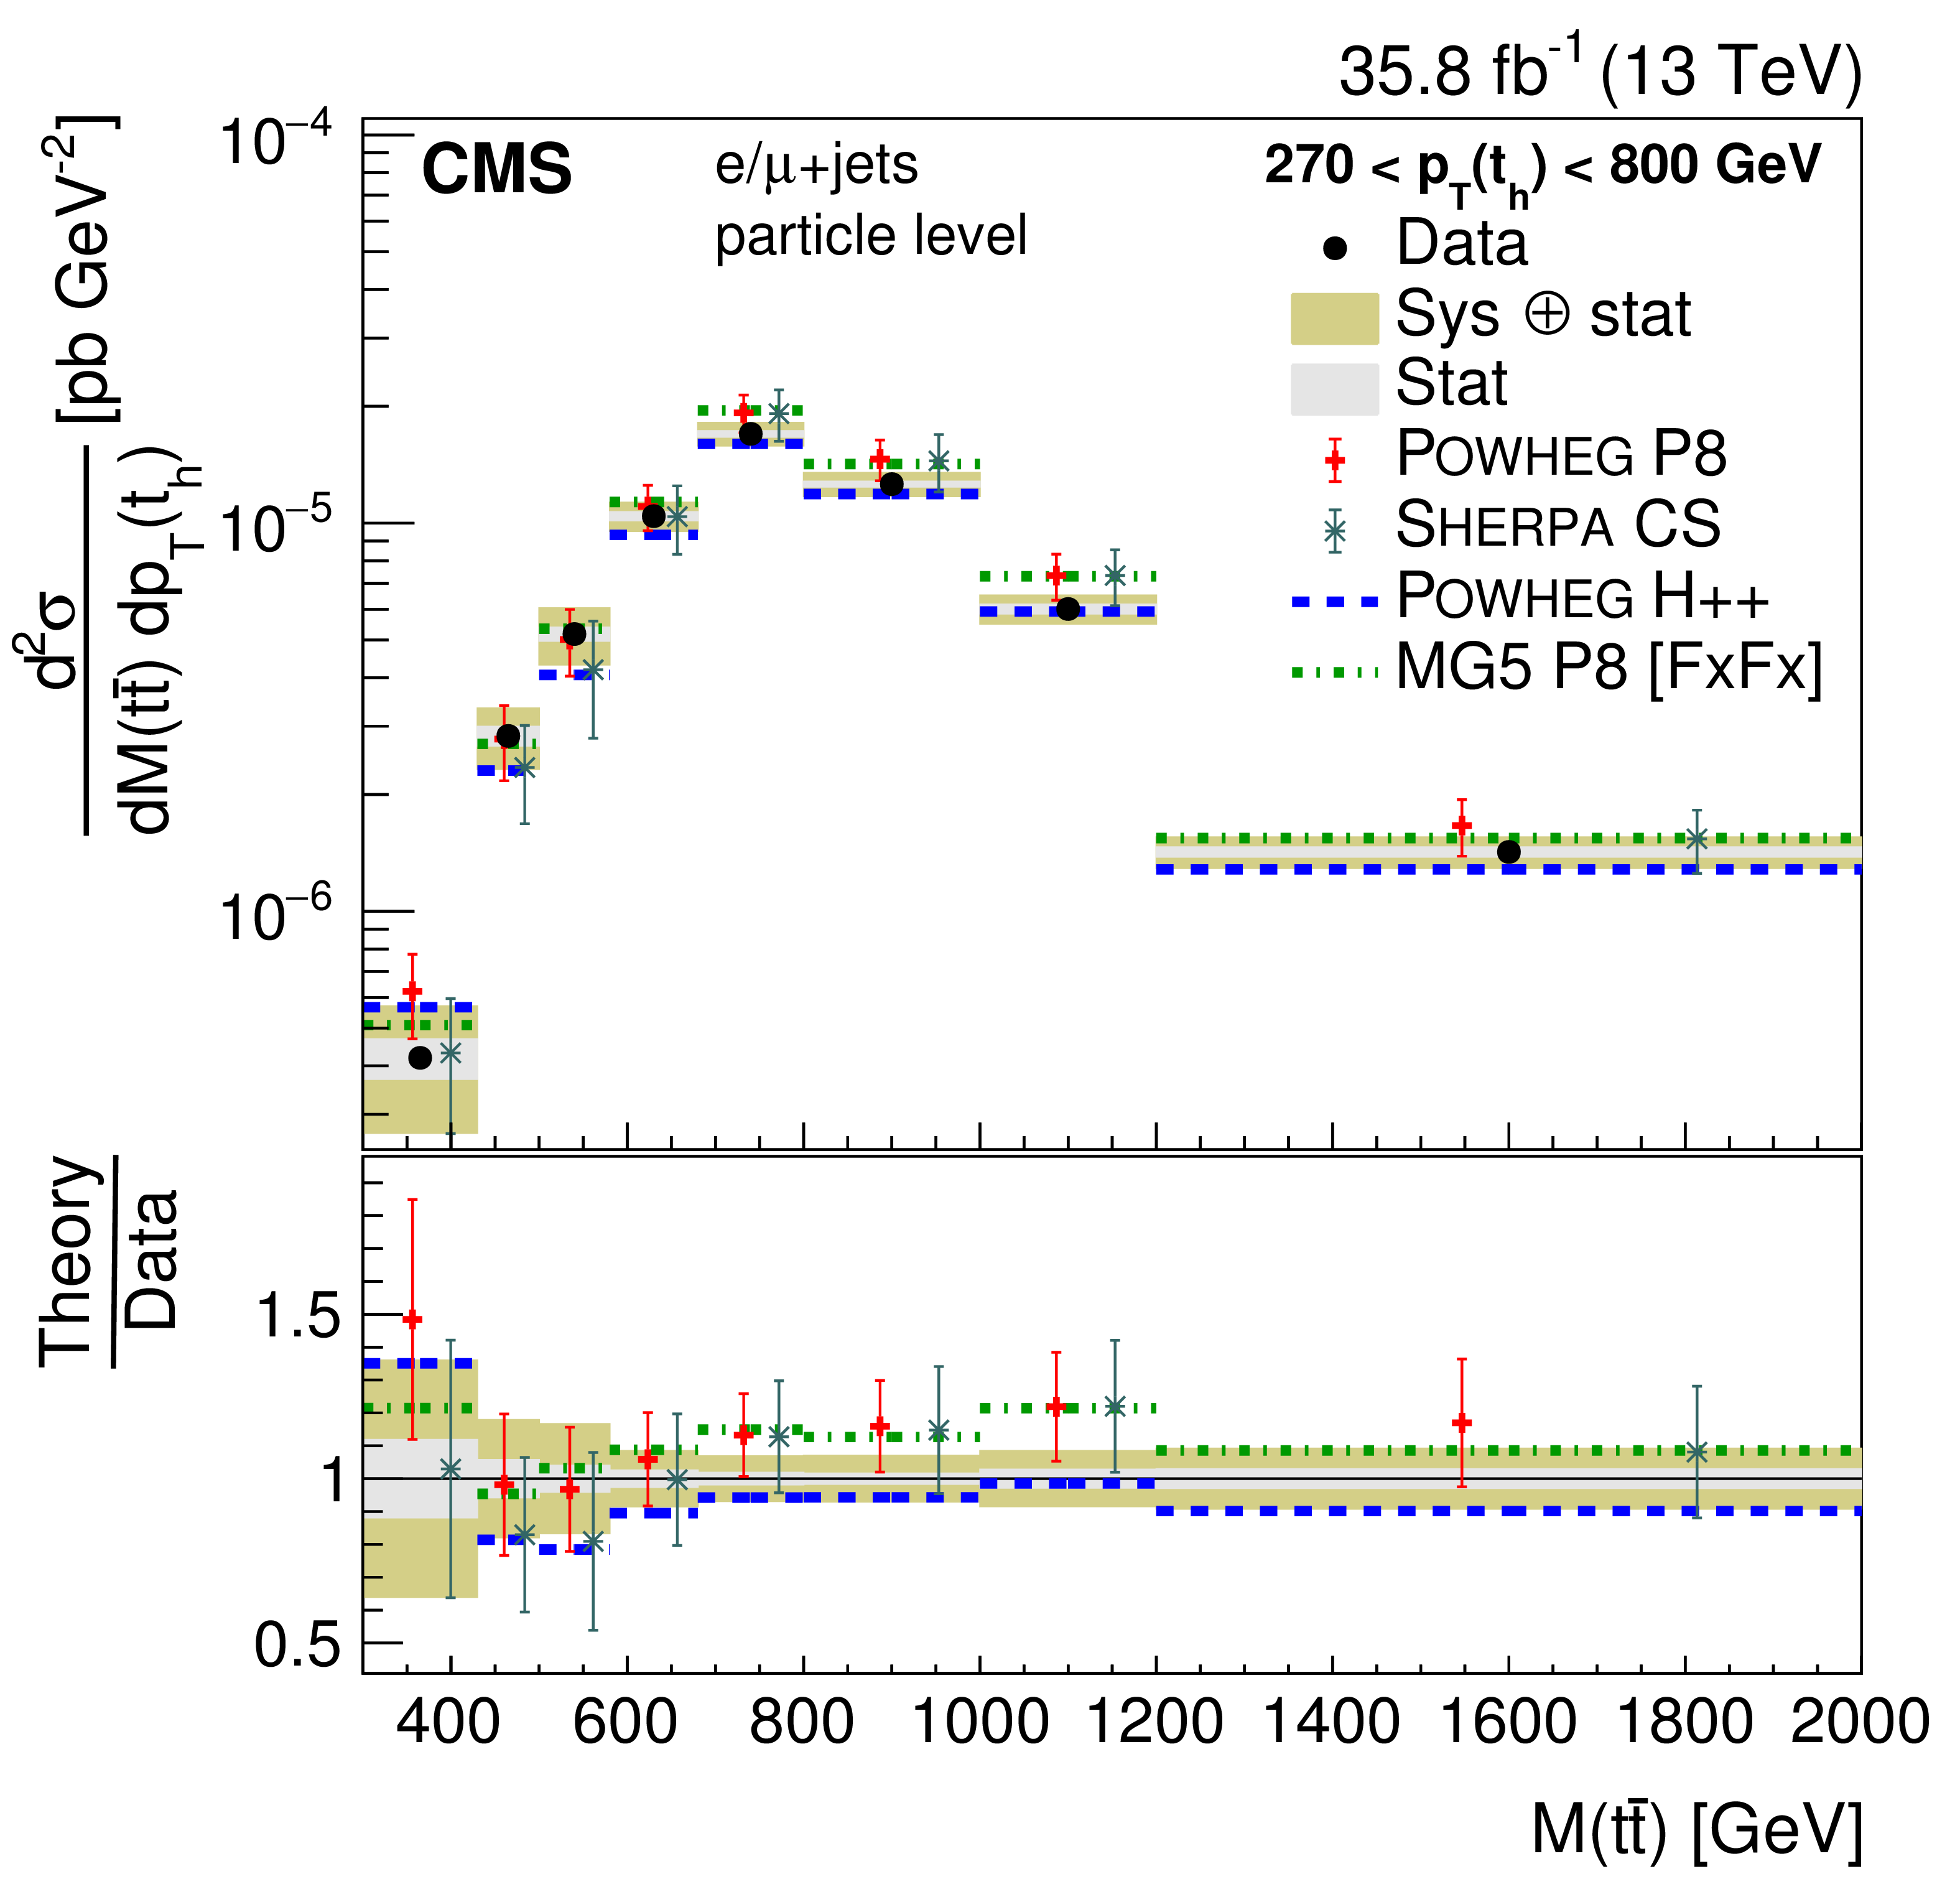
png pdf |
Figure 28-d:
Double-differential cross section at the particle level as a function of $ {p_{\mathrm {T}}} ({\mathrm{t} _\mathrm {h}})$ vs. $M({\mathrm{t} \mathrm{\bar{t}}})$. The data are shown as points with light (dark) bands indicating the statistical (statistical and systematic) uncertainties. The cross sections are compared to the predictions of POWHEG combined with PYTHIA8 (P8) or HERWIG++ (H++) and the multiparton simulations MG5_aMC@NLO (MG5)+PYTHIA8 FxFx and SHERPA. The ratios of the various predictions to the measured cross sections are shown at the bottom of each panel. |
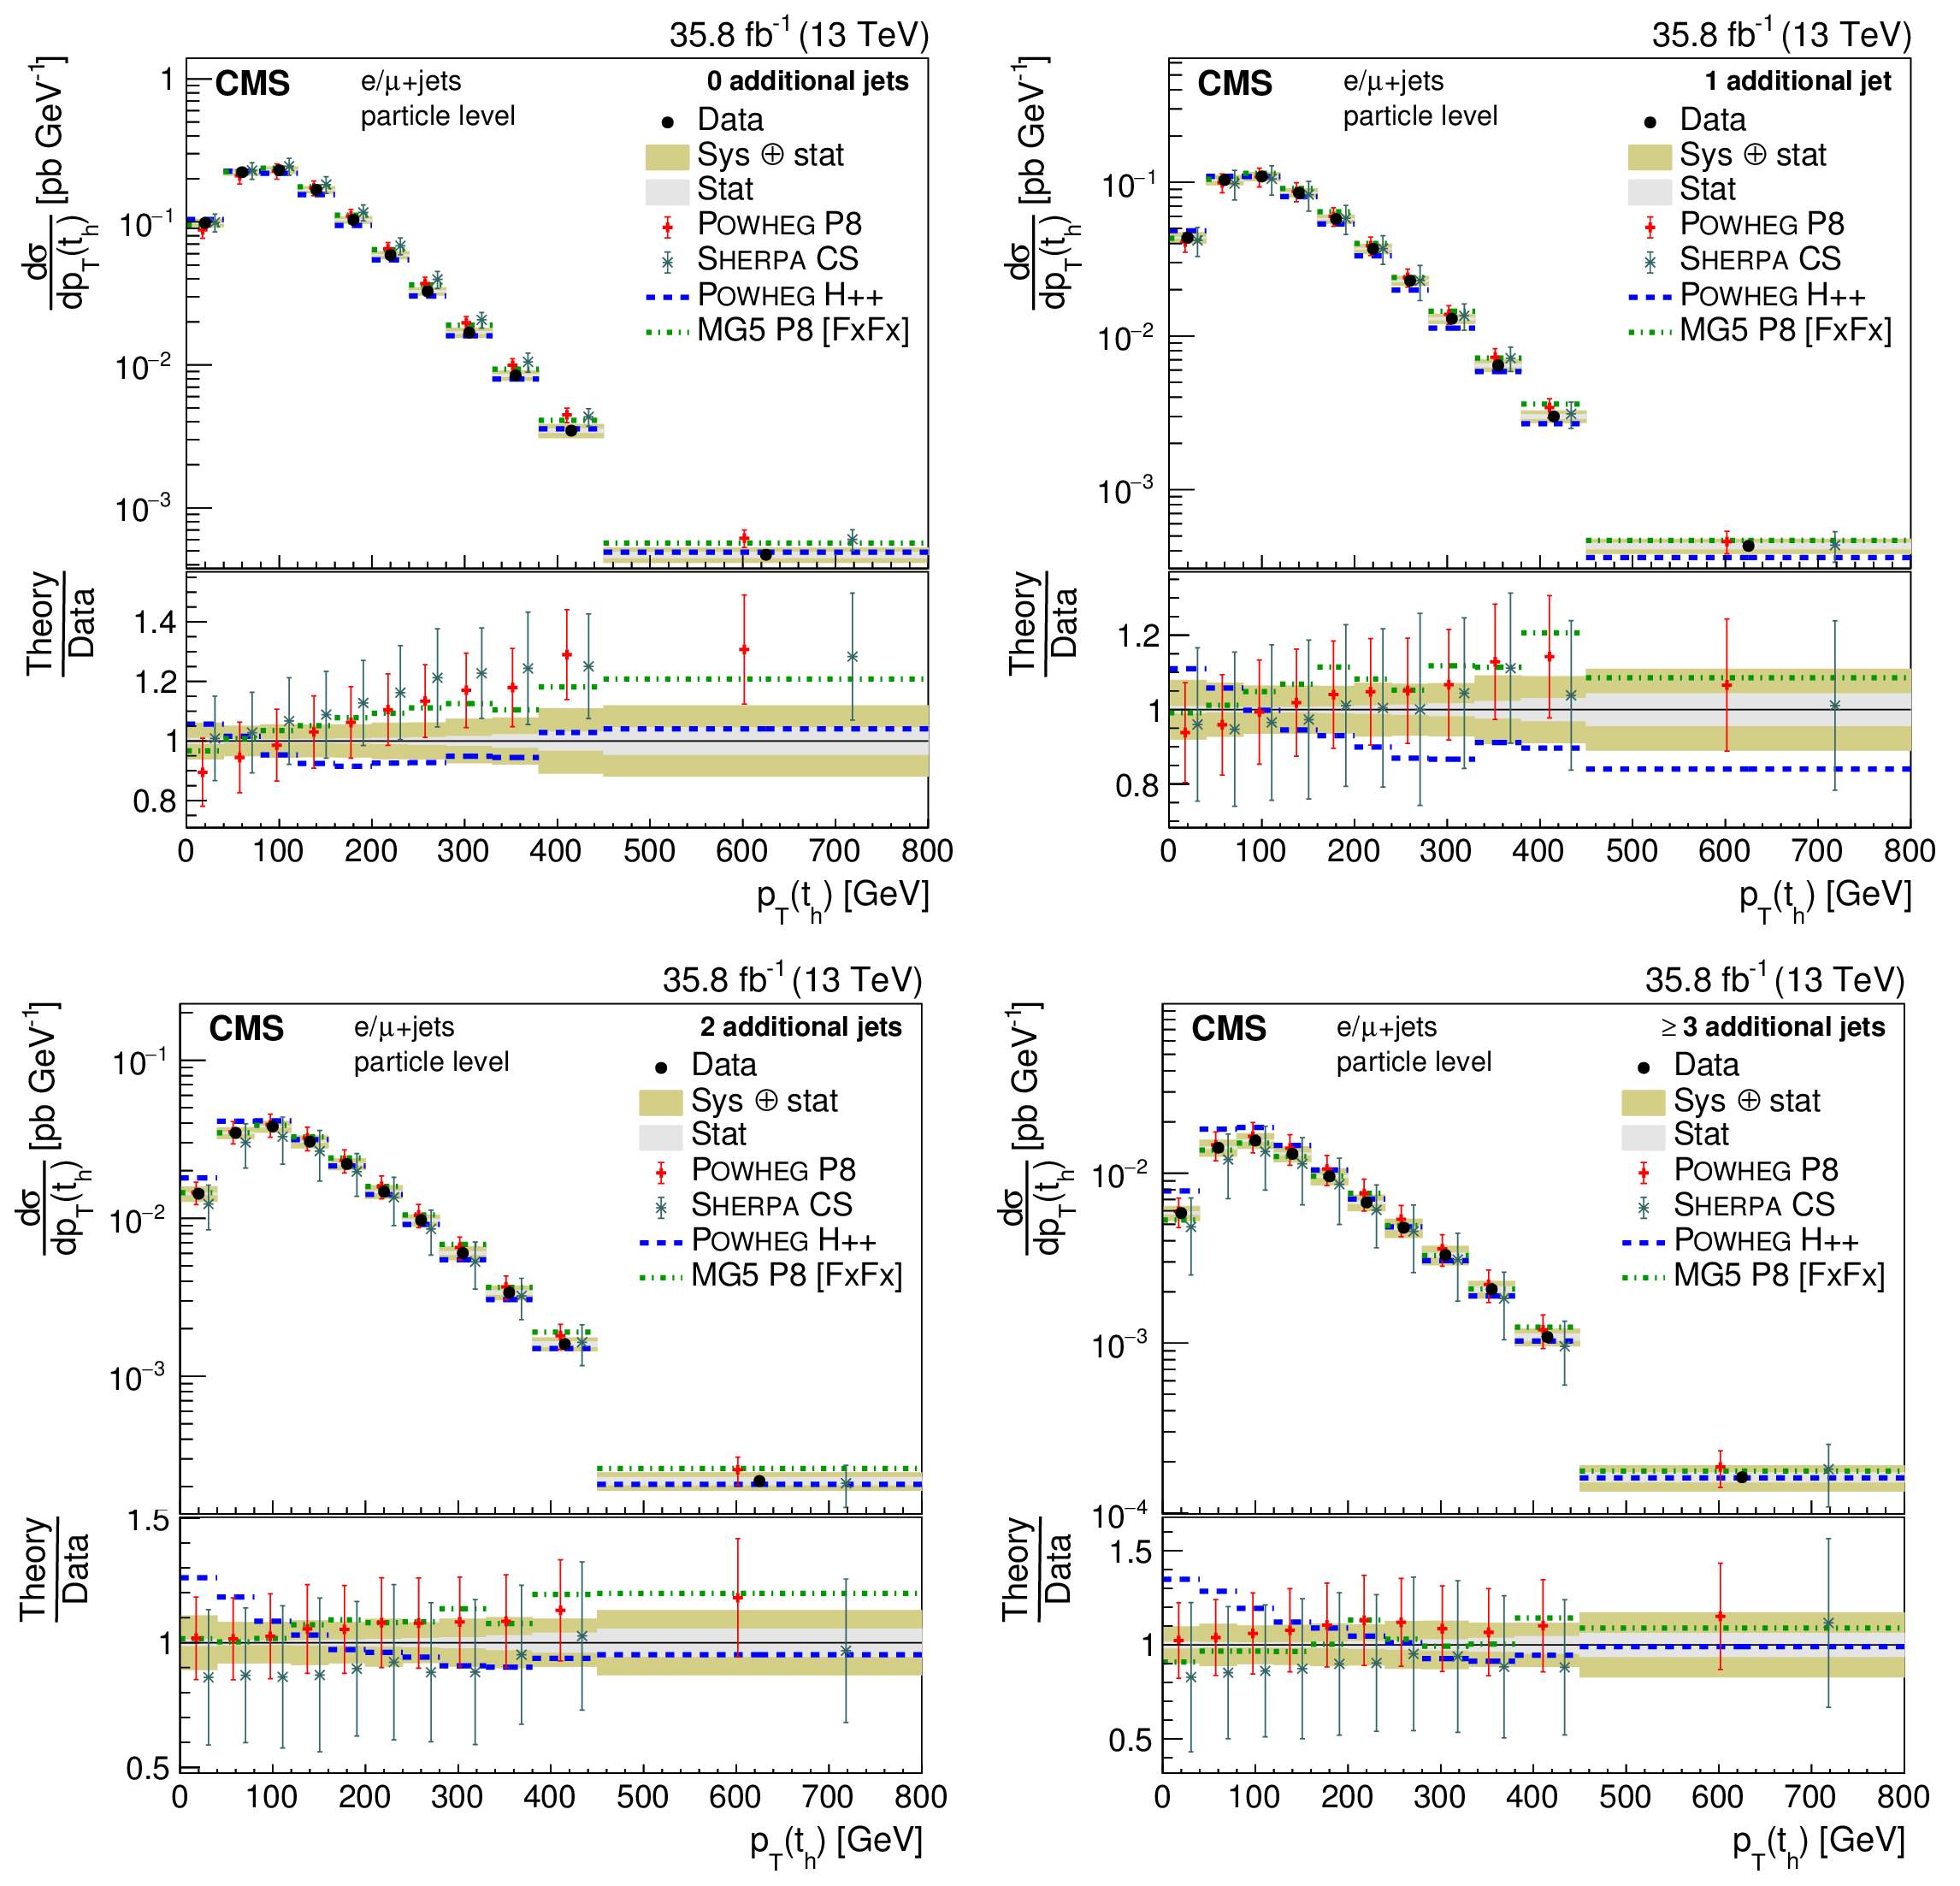
png pdf |
Figure 30:
Differential cross sections at the particle level as a function of $ {p_{\mathrm {T}}} ({\mathrm{t} _\mathrm {h}})$ in bins of the number of additional jets. The data are shown as points with light (dark) bands indicating the statistical (statistical and systematic) uncertainties. The cross sections are compared to the predictions of POWHEG combined with PYTHIA8 (P8) or HERWIG++ (H++) and the multiparton simulations MG5_aMC@NLO (MG5)+PYTHIA8 FxFx and SHERPA. The ratios of the various predictions to the measured cross sections are shown at the bottom of each panel. |
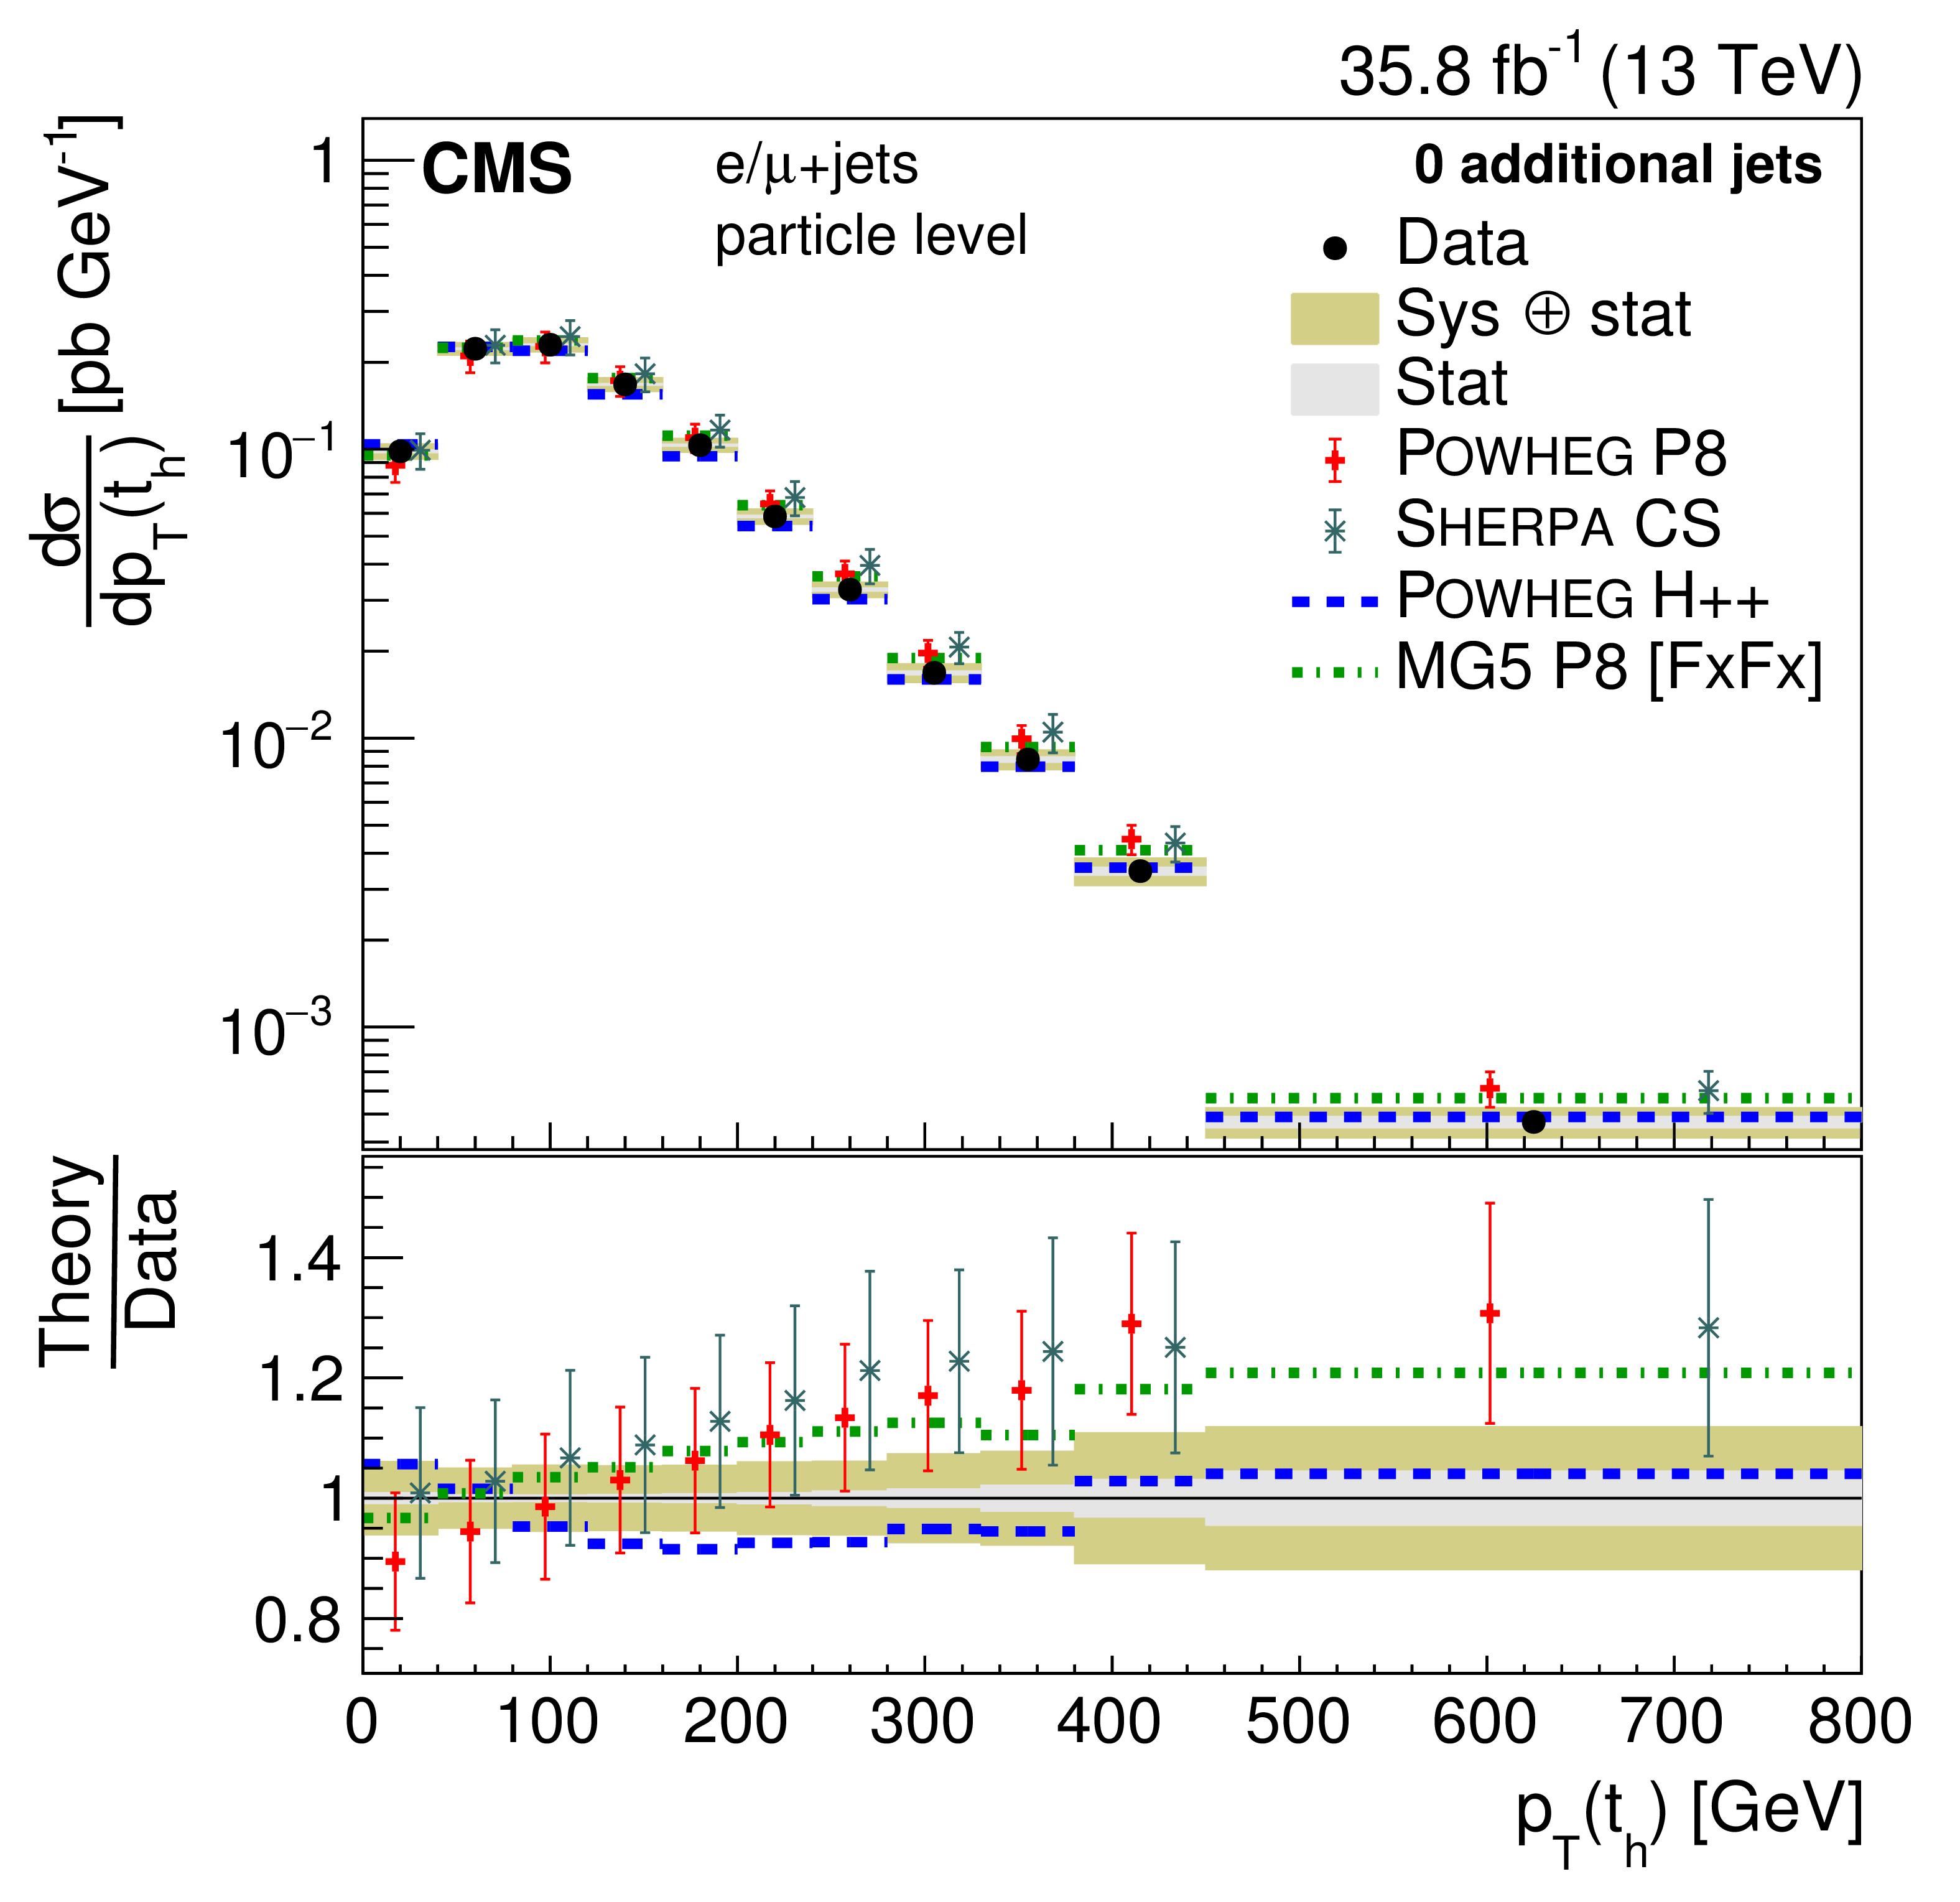
png pdf |
Figure 30-a:
Differential cross sections at the particle level as a function of $ {p_{\mathrm {T}}} ({\mathrm{t} _\mathrm {h}})$ in bins of the number of additional jets. The data are shown as points with light (dark) bands indicating the statistical (statistical and systematic) uncertainties. The cross sections are compared to the predictions of POWHEG combined with PYTHIA8 (P8) or HERWIG++ (H++) and the multiparton simulations MG5_aMC@NLO (MG5)+PYTHIA8 FxFx and SHERPA. The ratios of the various predictions to the measured cross sections are shown at the bottom of each panel. |

png pdf |
Figure 30-b:
Differential cross sections at the particle level as a function of $ {p_{\mathrm {T}}} ({\mathrm{t} _\mathrm {h}})$ in bins of the number of additional jets. The data are shown as points with light (dark) bands indicating the statistical (statistical and systematic) uncertainties. The cross sections are compared to the predictions of POWHEG combined with PYTHIA8 (P8) or HERWIG++ (H++) and the multiparton simulations MG5_aMC@NLO (MG5)+PYTHIA8 FxFx and SHERPA. The ratios of the various predictions to the measured cross sections are shown at the bottom of each panel. |
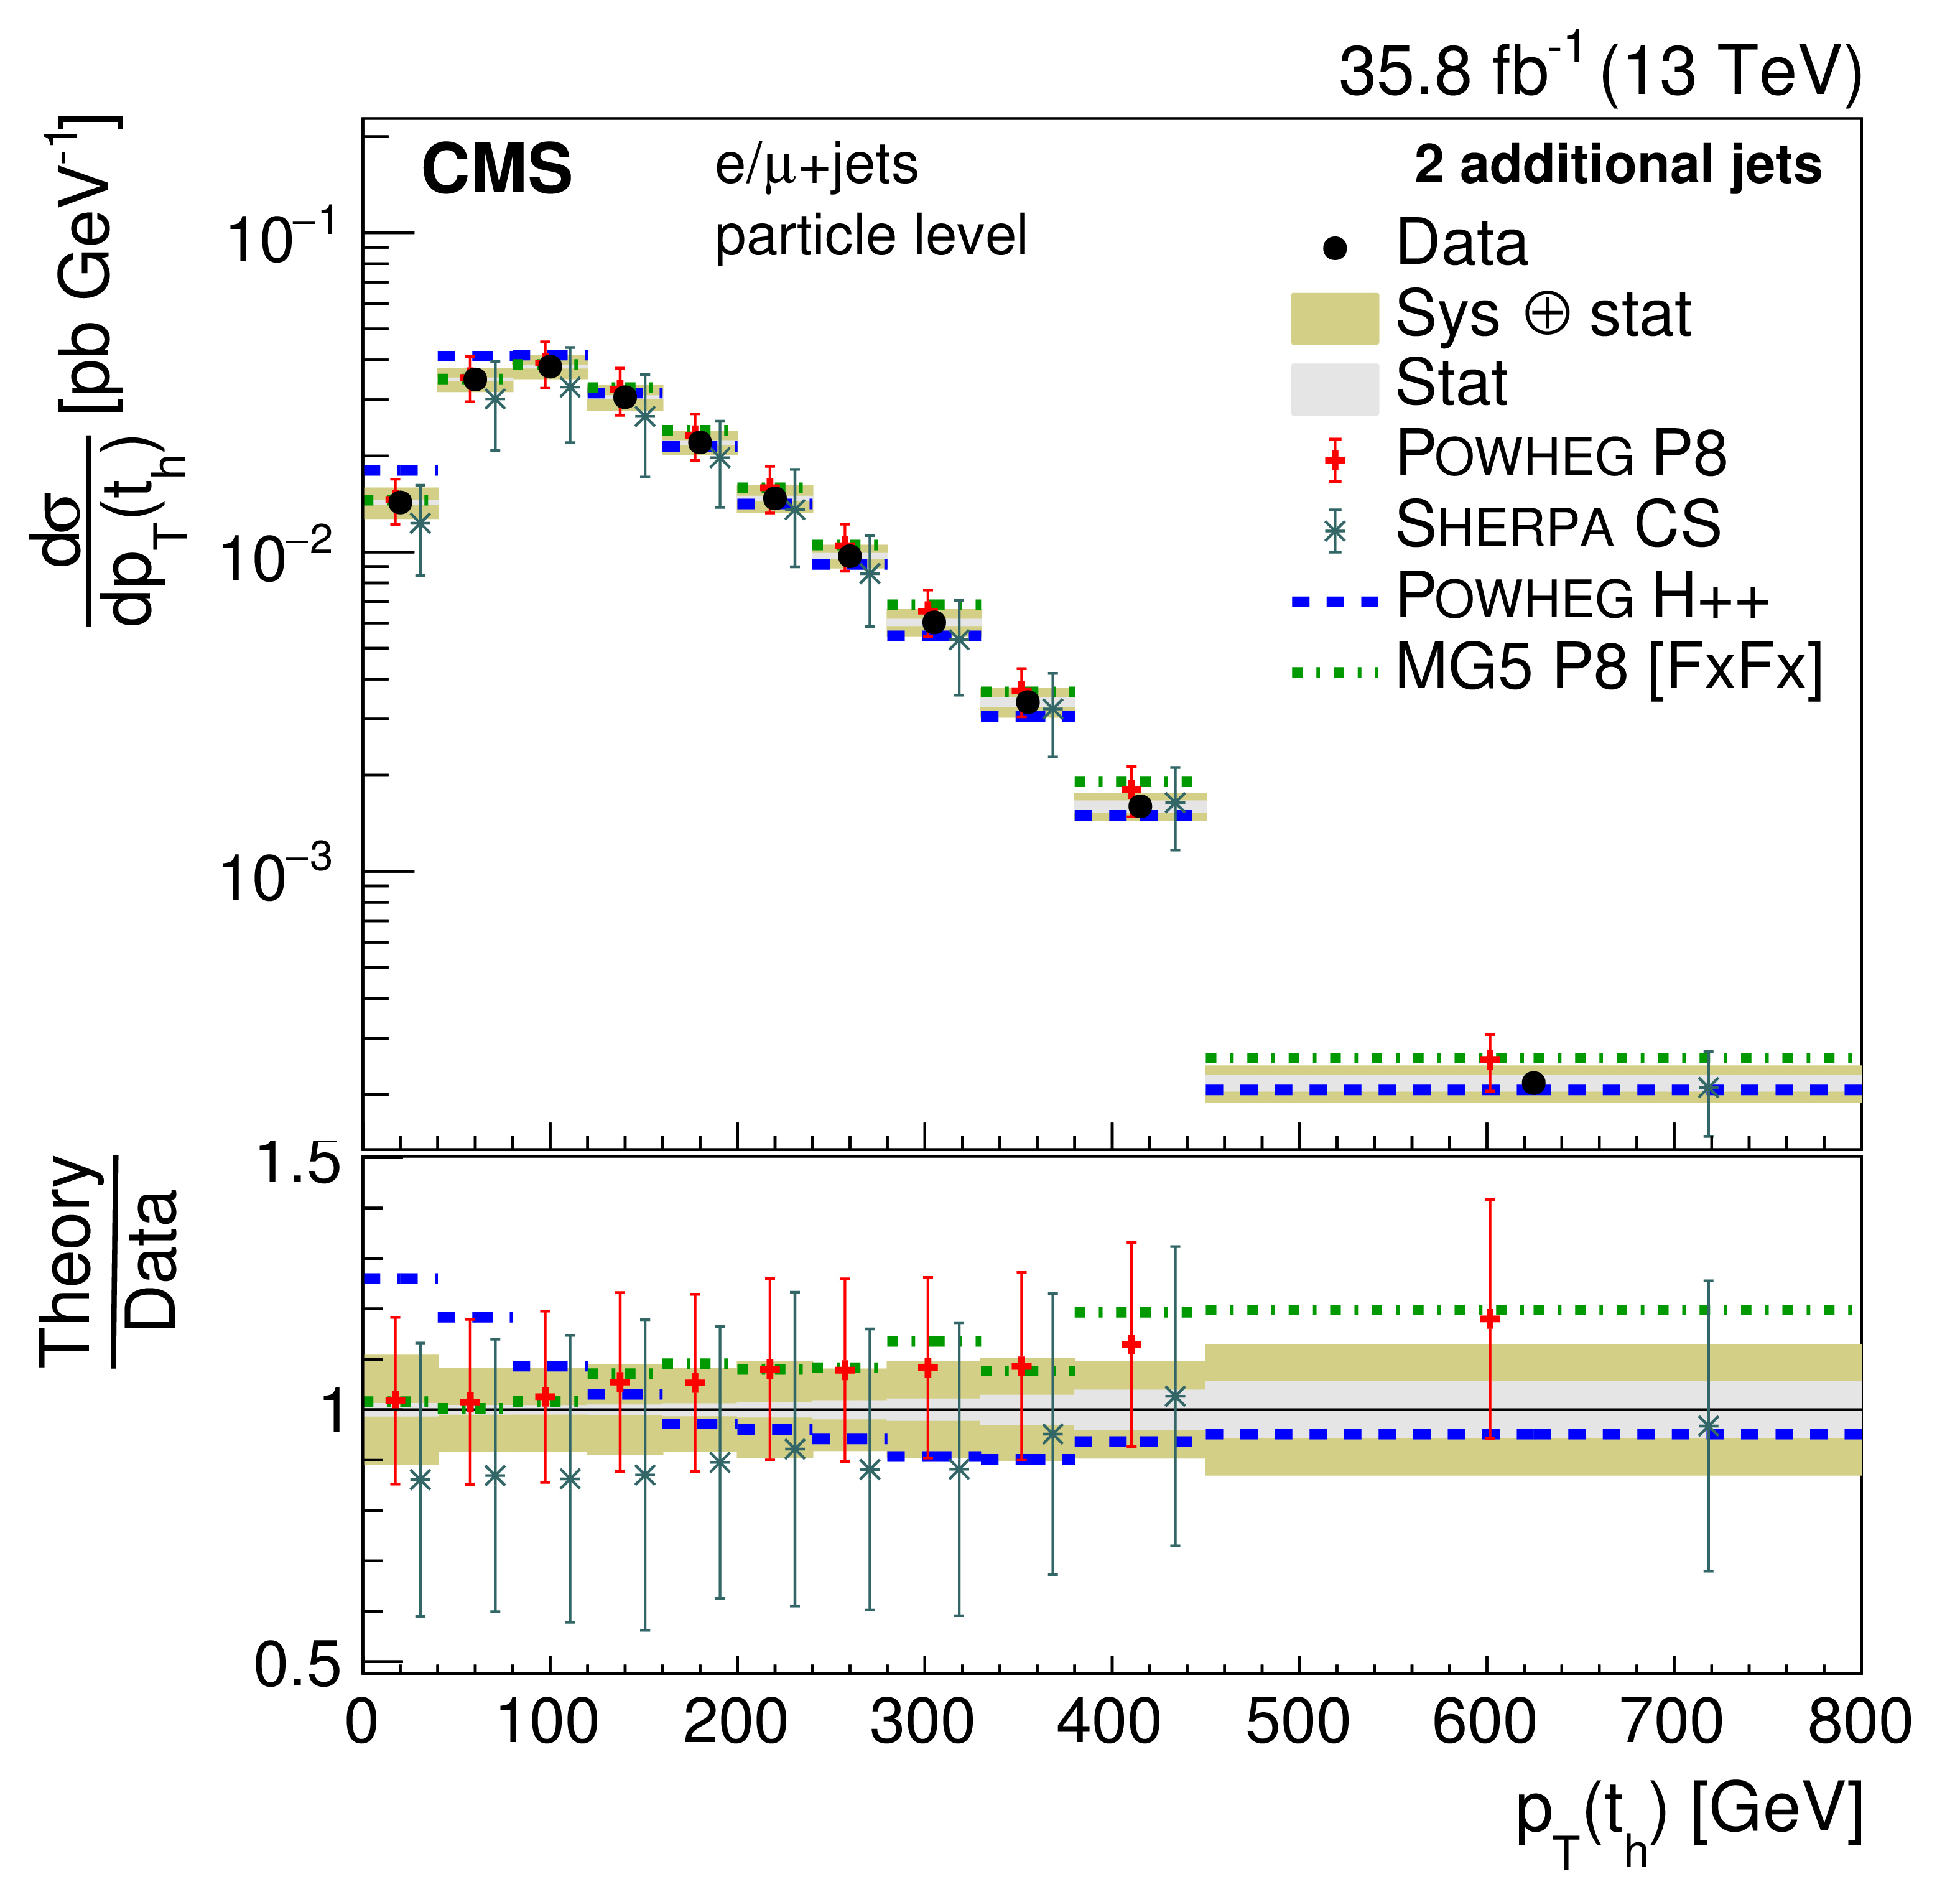
png pdf |
Figure 30-c:
Differential cross sections at the particle level as a function of $ {p_{\mathrm {T}}} ({\mathrm{t} _\mathrm {h}})$ in bins of the number of additional jets. The data are shown as points with light (dark) bands indicating the statistical (statistical and systematic) uncertainties. The cross sections are compared to the predictions of POWHEG combined with PYTHIA8 (P8) or HERWIG++ (H++) and the multiparton simulations MG5_aMC@NLO (MG5)+PYTHIA8 FxFx and SHERPA. The ratios of the various predictions to the measured cross sections are shown at the bottom of each panel. |
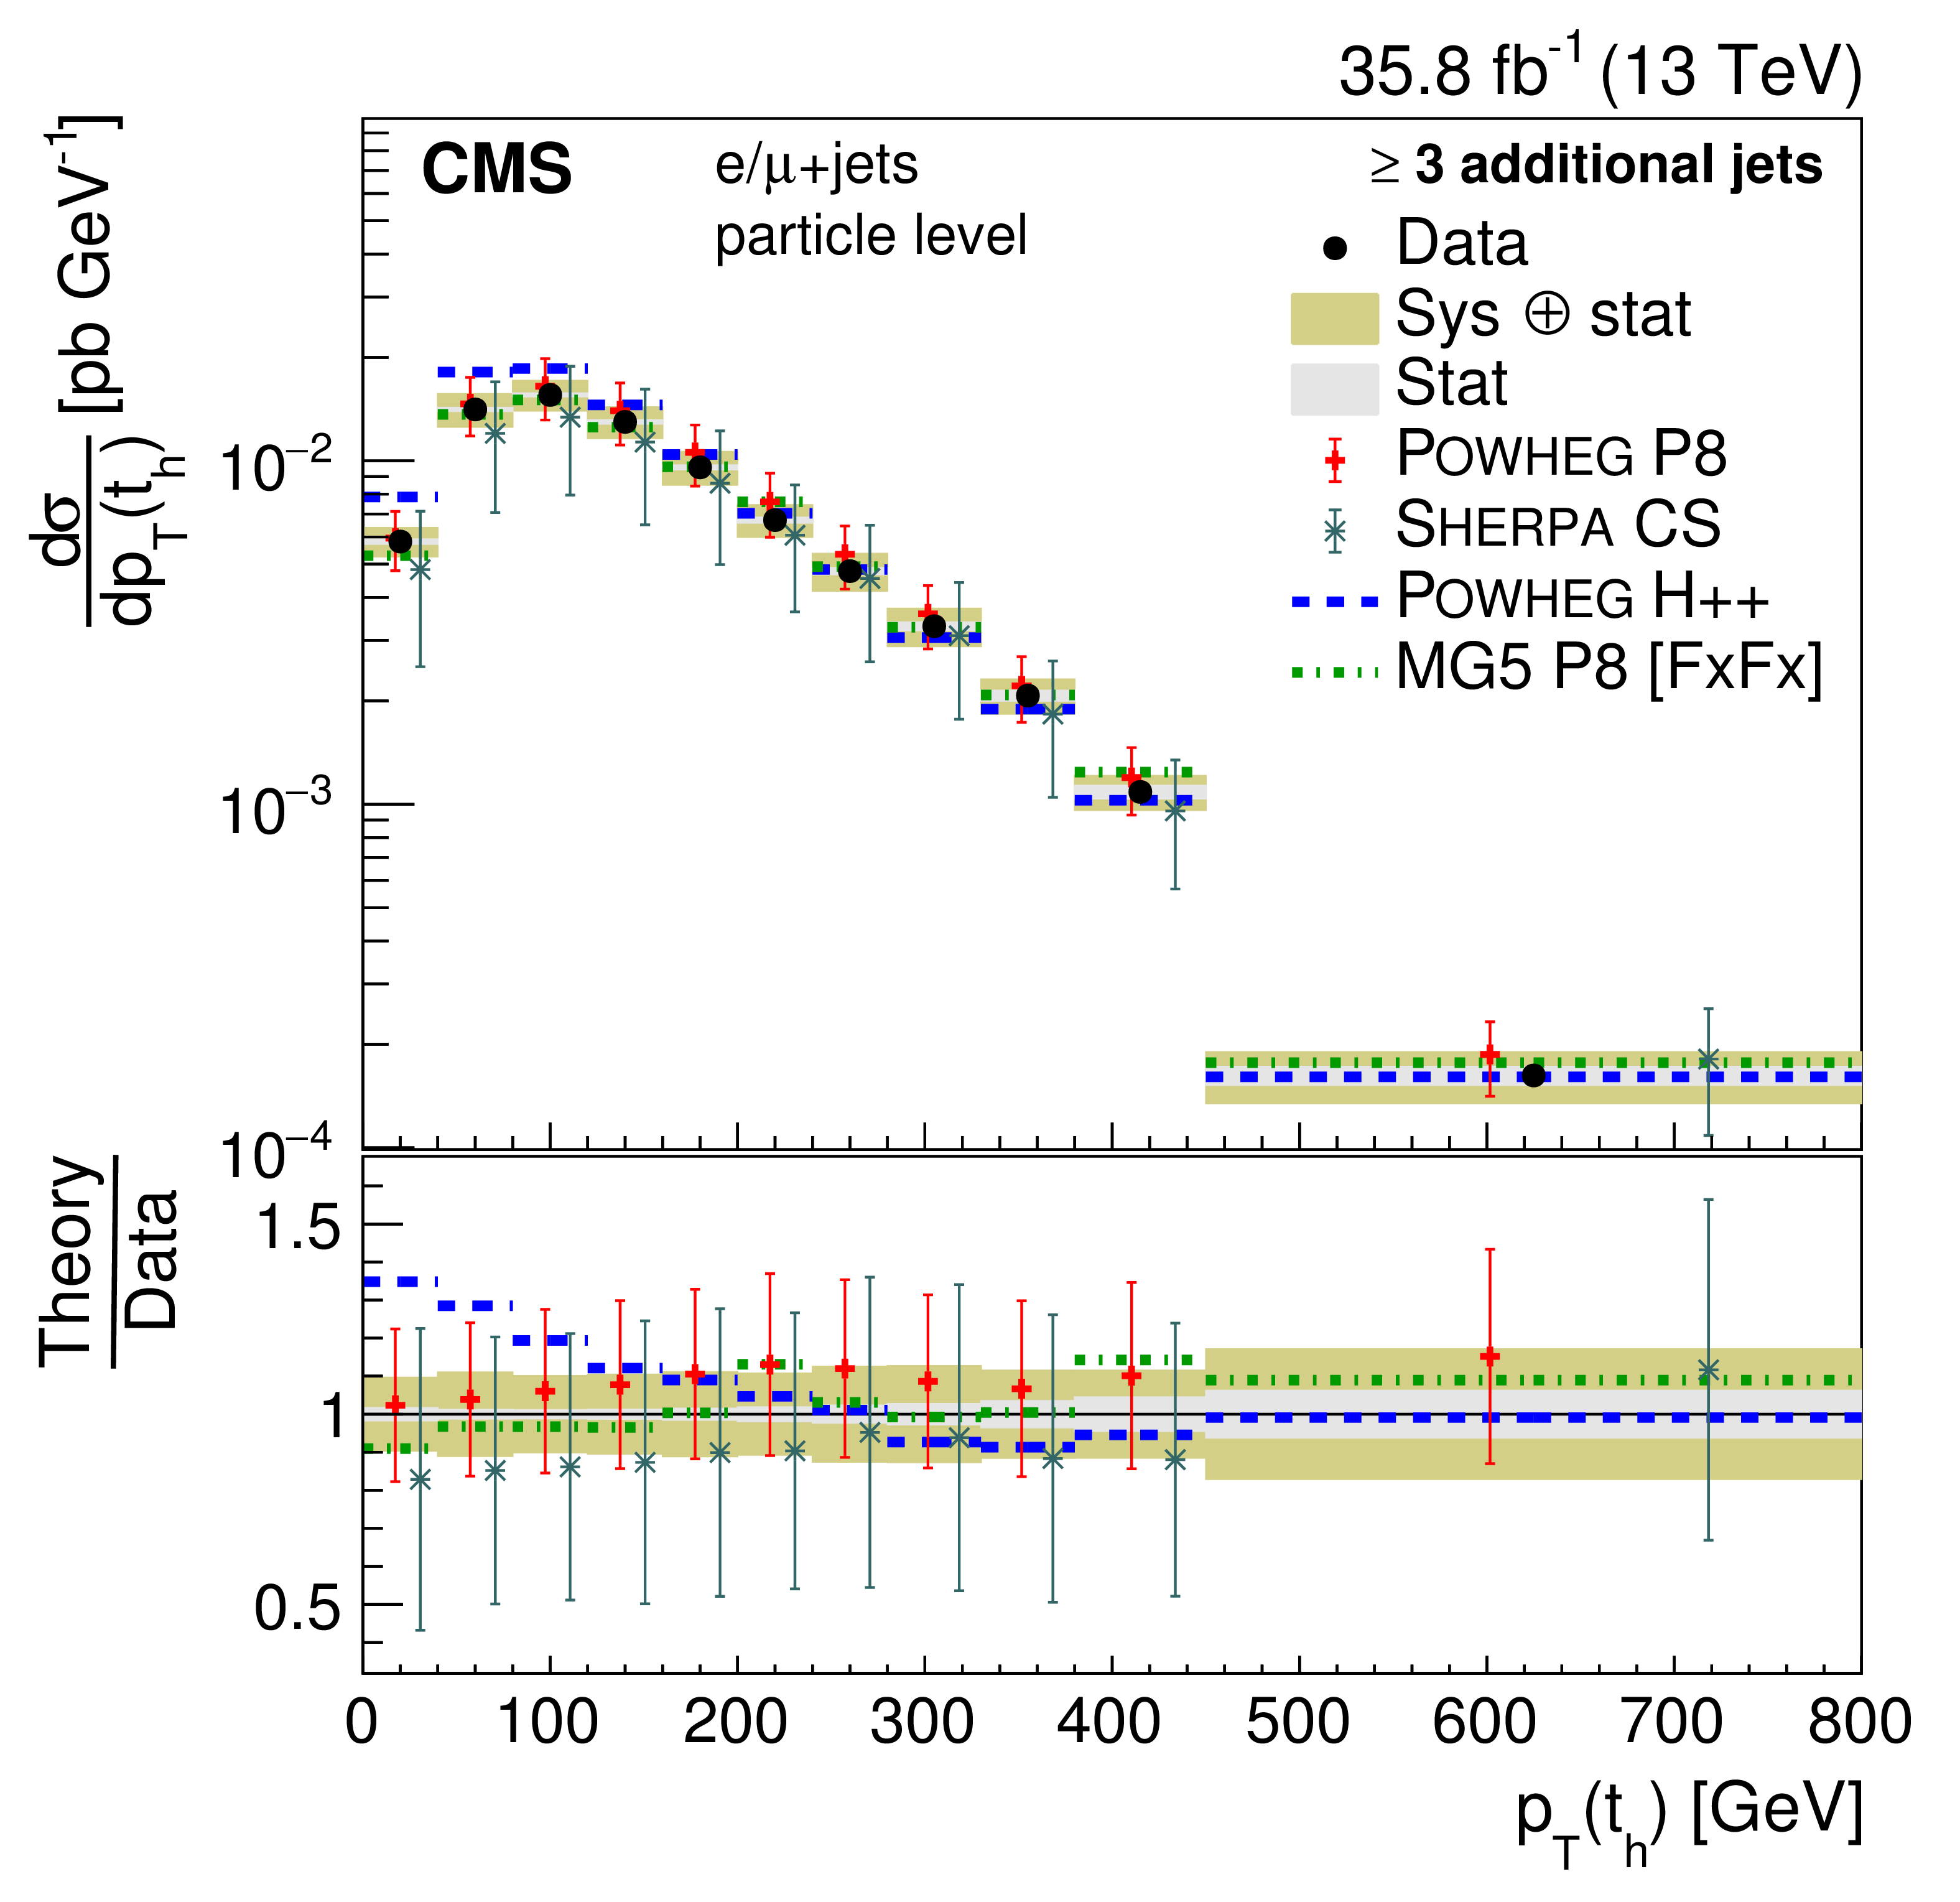
png pdf |
Figure 30-d:
Differential cross sections at the particle level as a function of $ {p_{\mathrm {T}}} ({\mathrm{t} _\mathrm {h}})$ in bins of the number of additional jets. The data are shown as points with light (dark) bands indicating the statistical (statistical and systematic) uncertainties. The cross sections are compared to the predictions of POWHEG combined with PYTHIA8 (P8) or HERWIG++ (H++) and the multiparton simulations MG5_aMC@NLO (MG5)+PYTHIA8 FxFx and SHERPA. The ratios of the various predictions to the measured cross sections are shown at the bottom of each panel. |
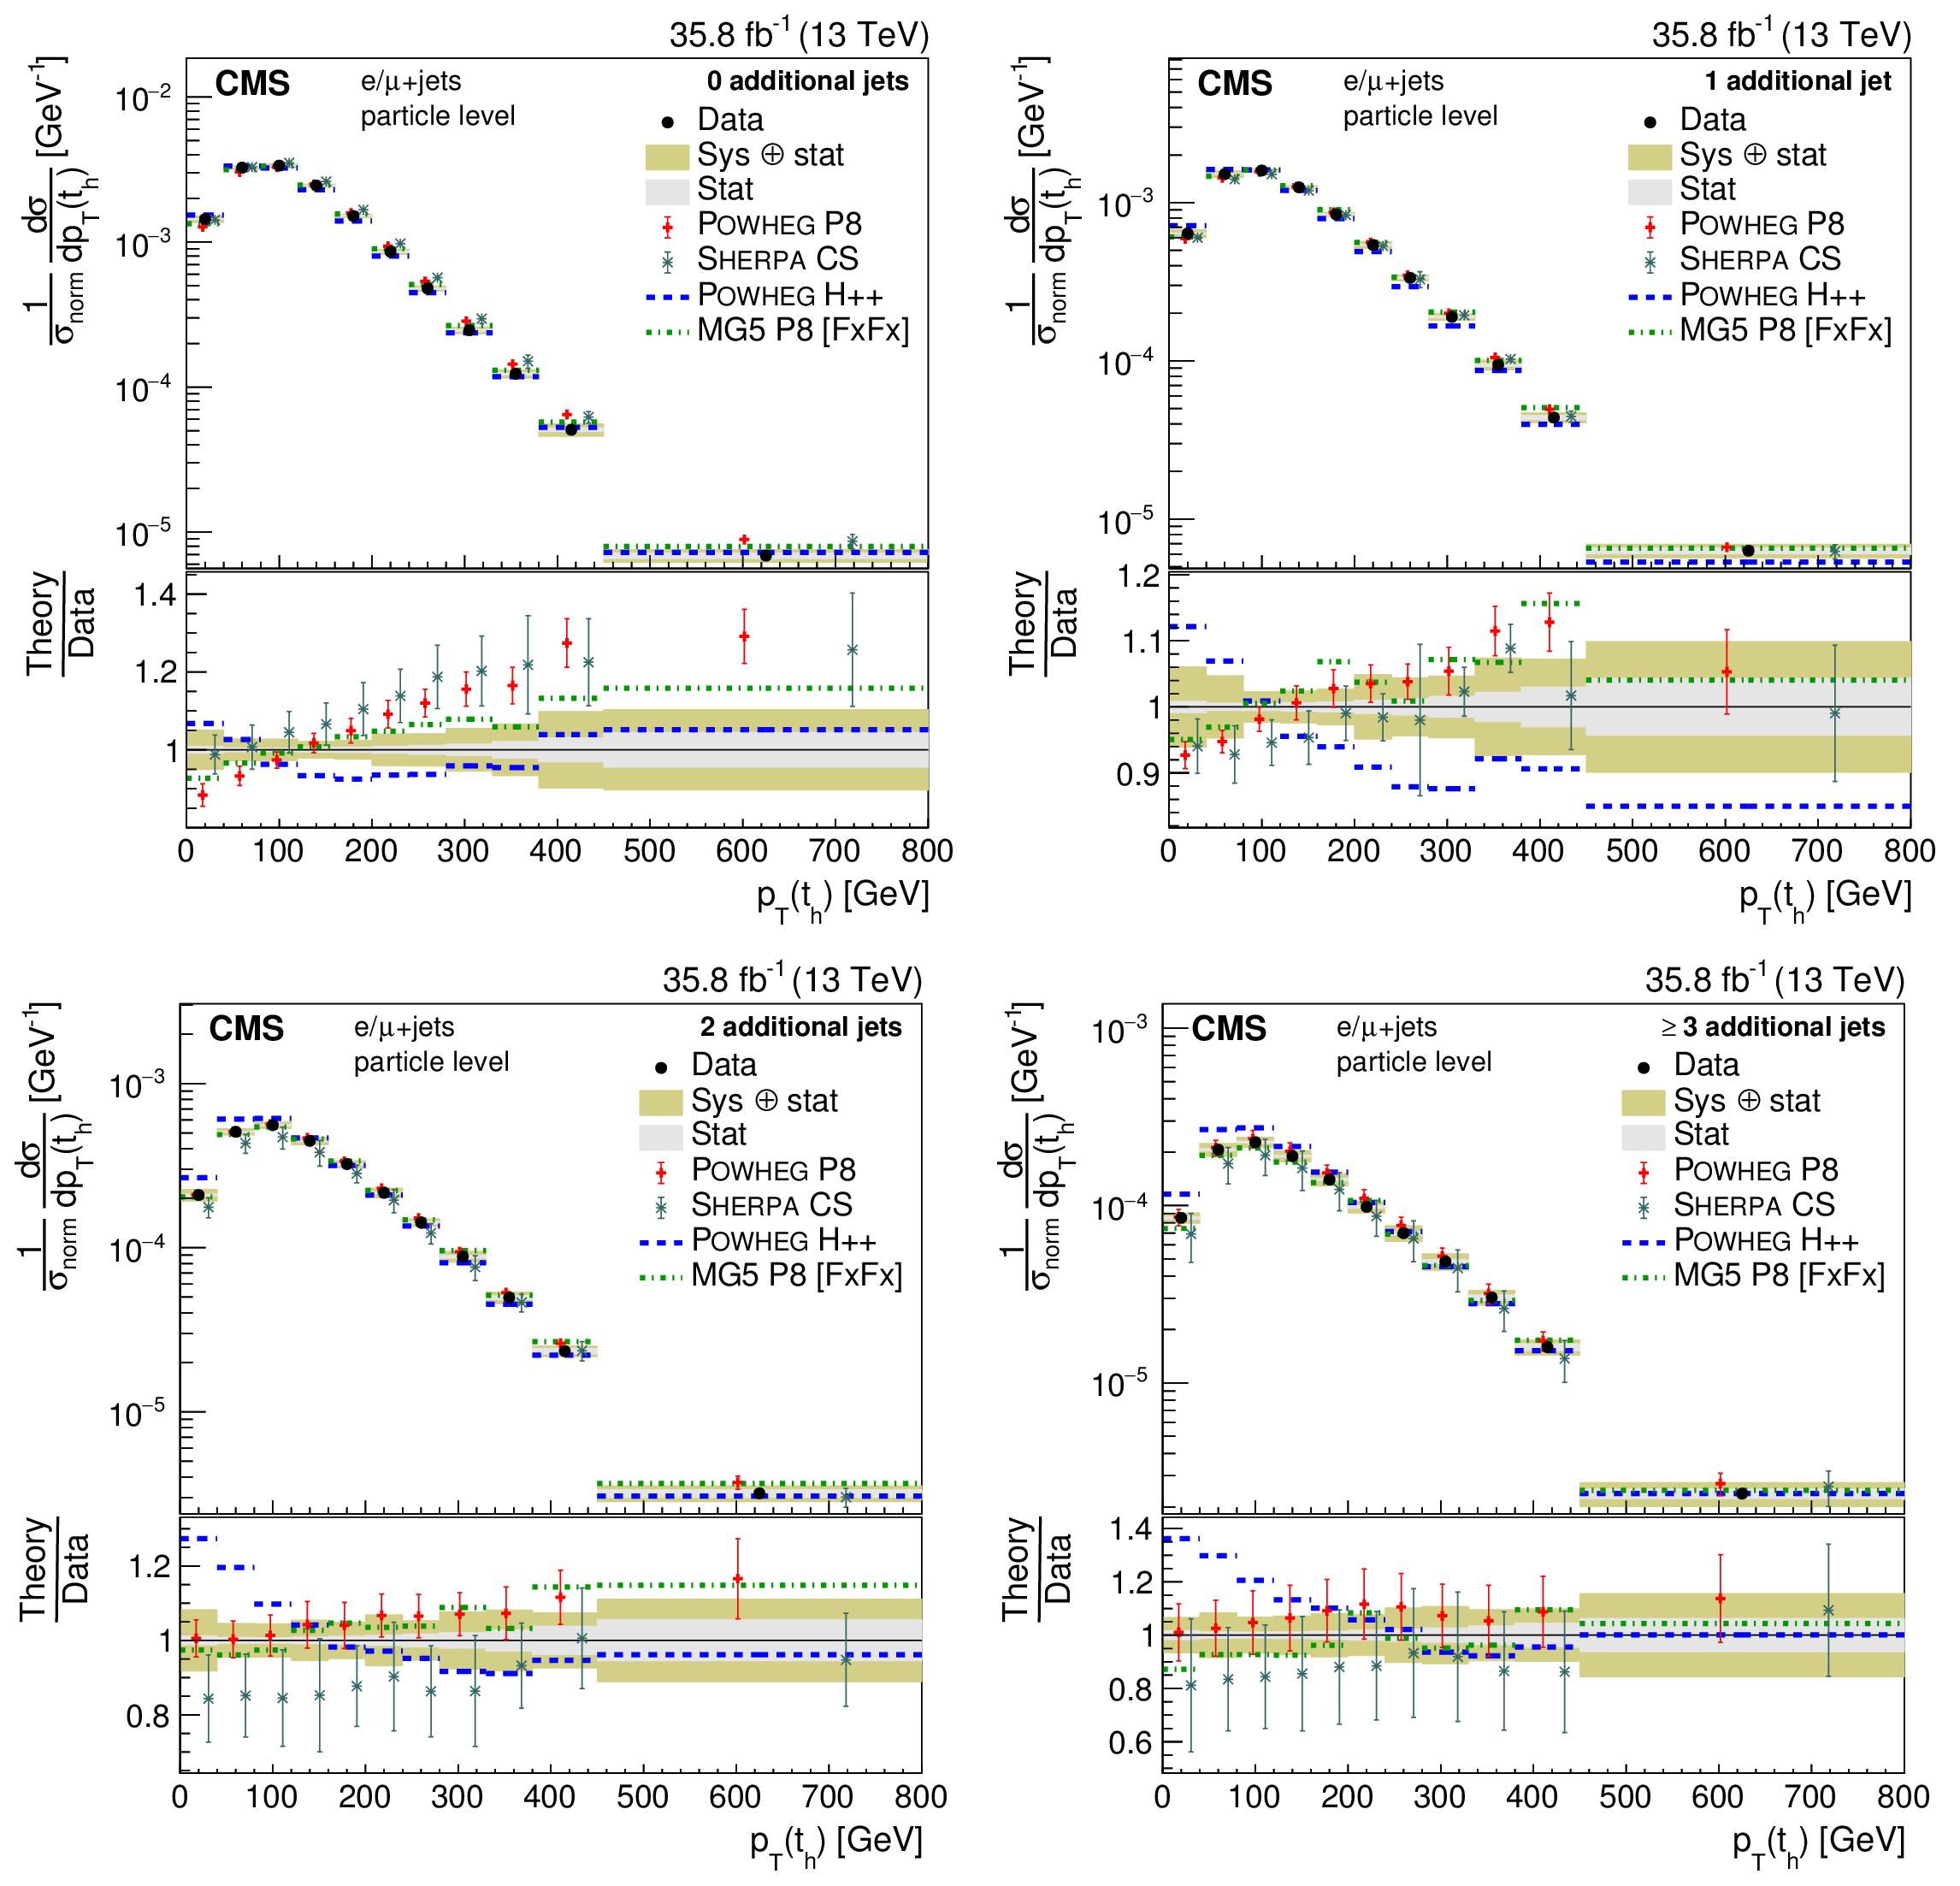
png pdf |
Figure 31:
Differential cross sections at the particle level normalized to the sum of the cross sections $\sigma _\text {norm}$ in the measured ranges as a function of $ {p_{\mathrm {T}}} ({\mathrm{t} _\mathrm {h}})$ in bins of the number of additional jets. The data are shown as points with light (dark) bands indicating the statistical (statistical and systematic) uncertainties. The cross sections are compared to the predictions of POWHEG combined with PYTHIA8 (P8) or HERWIG++ (H++) and the multiparton simulations MG5_aMC@NLO (MG5)+PYTHIA8 FxFx and SHERPA. The ratios of the various predictions to the measured cross sections are shown at the bottom of each panel. |
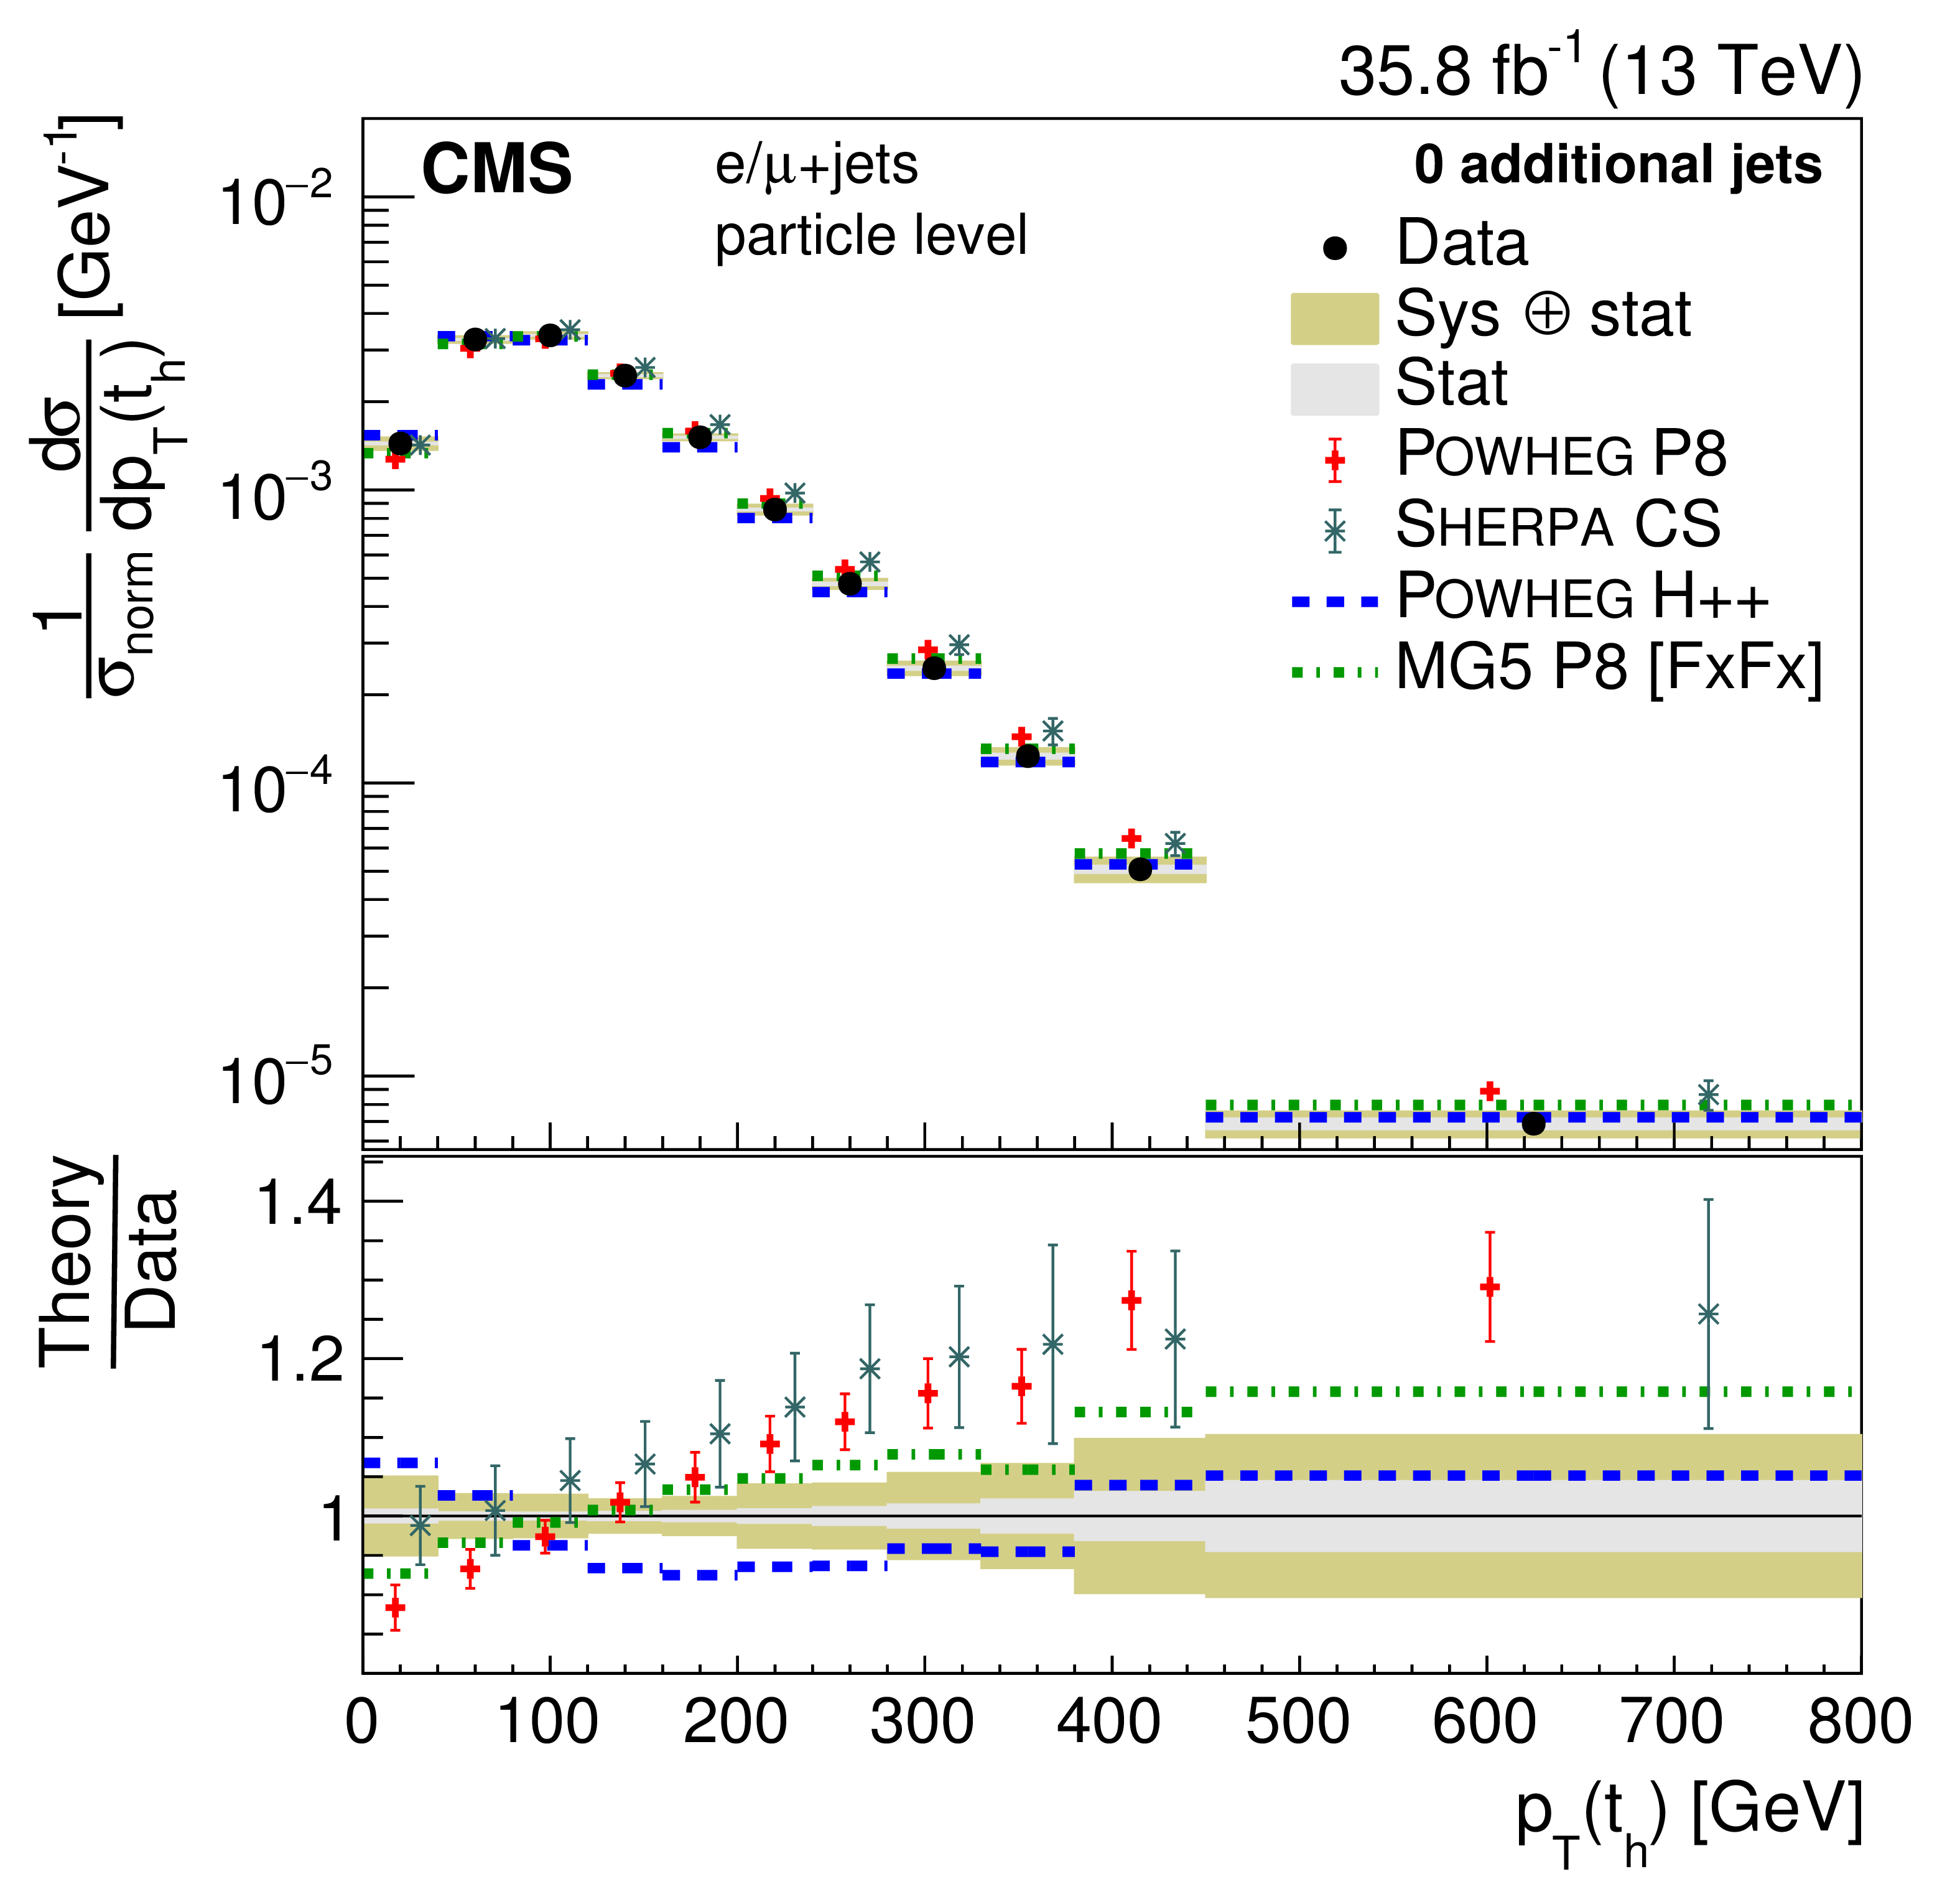
png pdf |
Figure 31-a:
Differential cross sections at the particle level normalized to the sum of the cross sections $\sigma _\text {norm}$ in the measured ranges as a function of $ {p_{\mathrm {T}}} ({\mathrm{t} _\mathrm {h}})$ in bins of the number of additional jets. The data are shown as points with light (dark) bands indicating the statistical (statistical and systematic) uncertainties. The cross sections are compared to the predictions of POWHEG combined with PYTHIA8 (P8) or HERWIG++ (H++) and the multiparton simulations MG5_aMC@NLO (MG5)+PYTHIA8 FxFx and SHERPA. The ratios of the various predictions to the measured cross sections are shown at the bottom of each panel. |
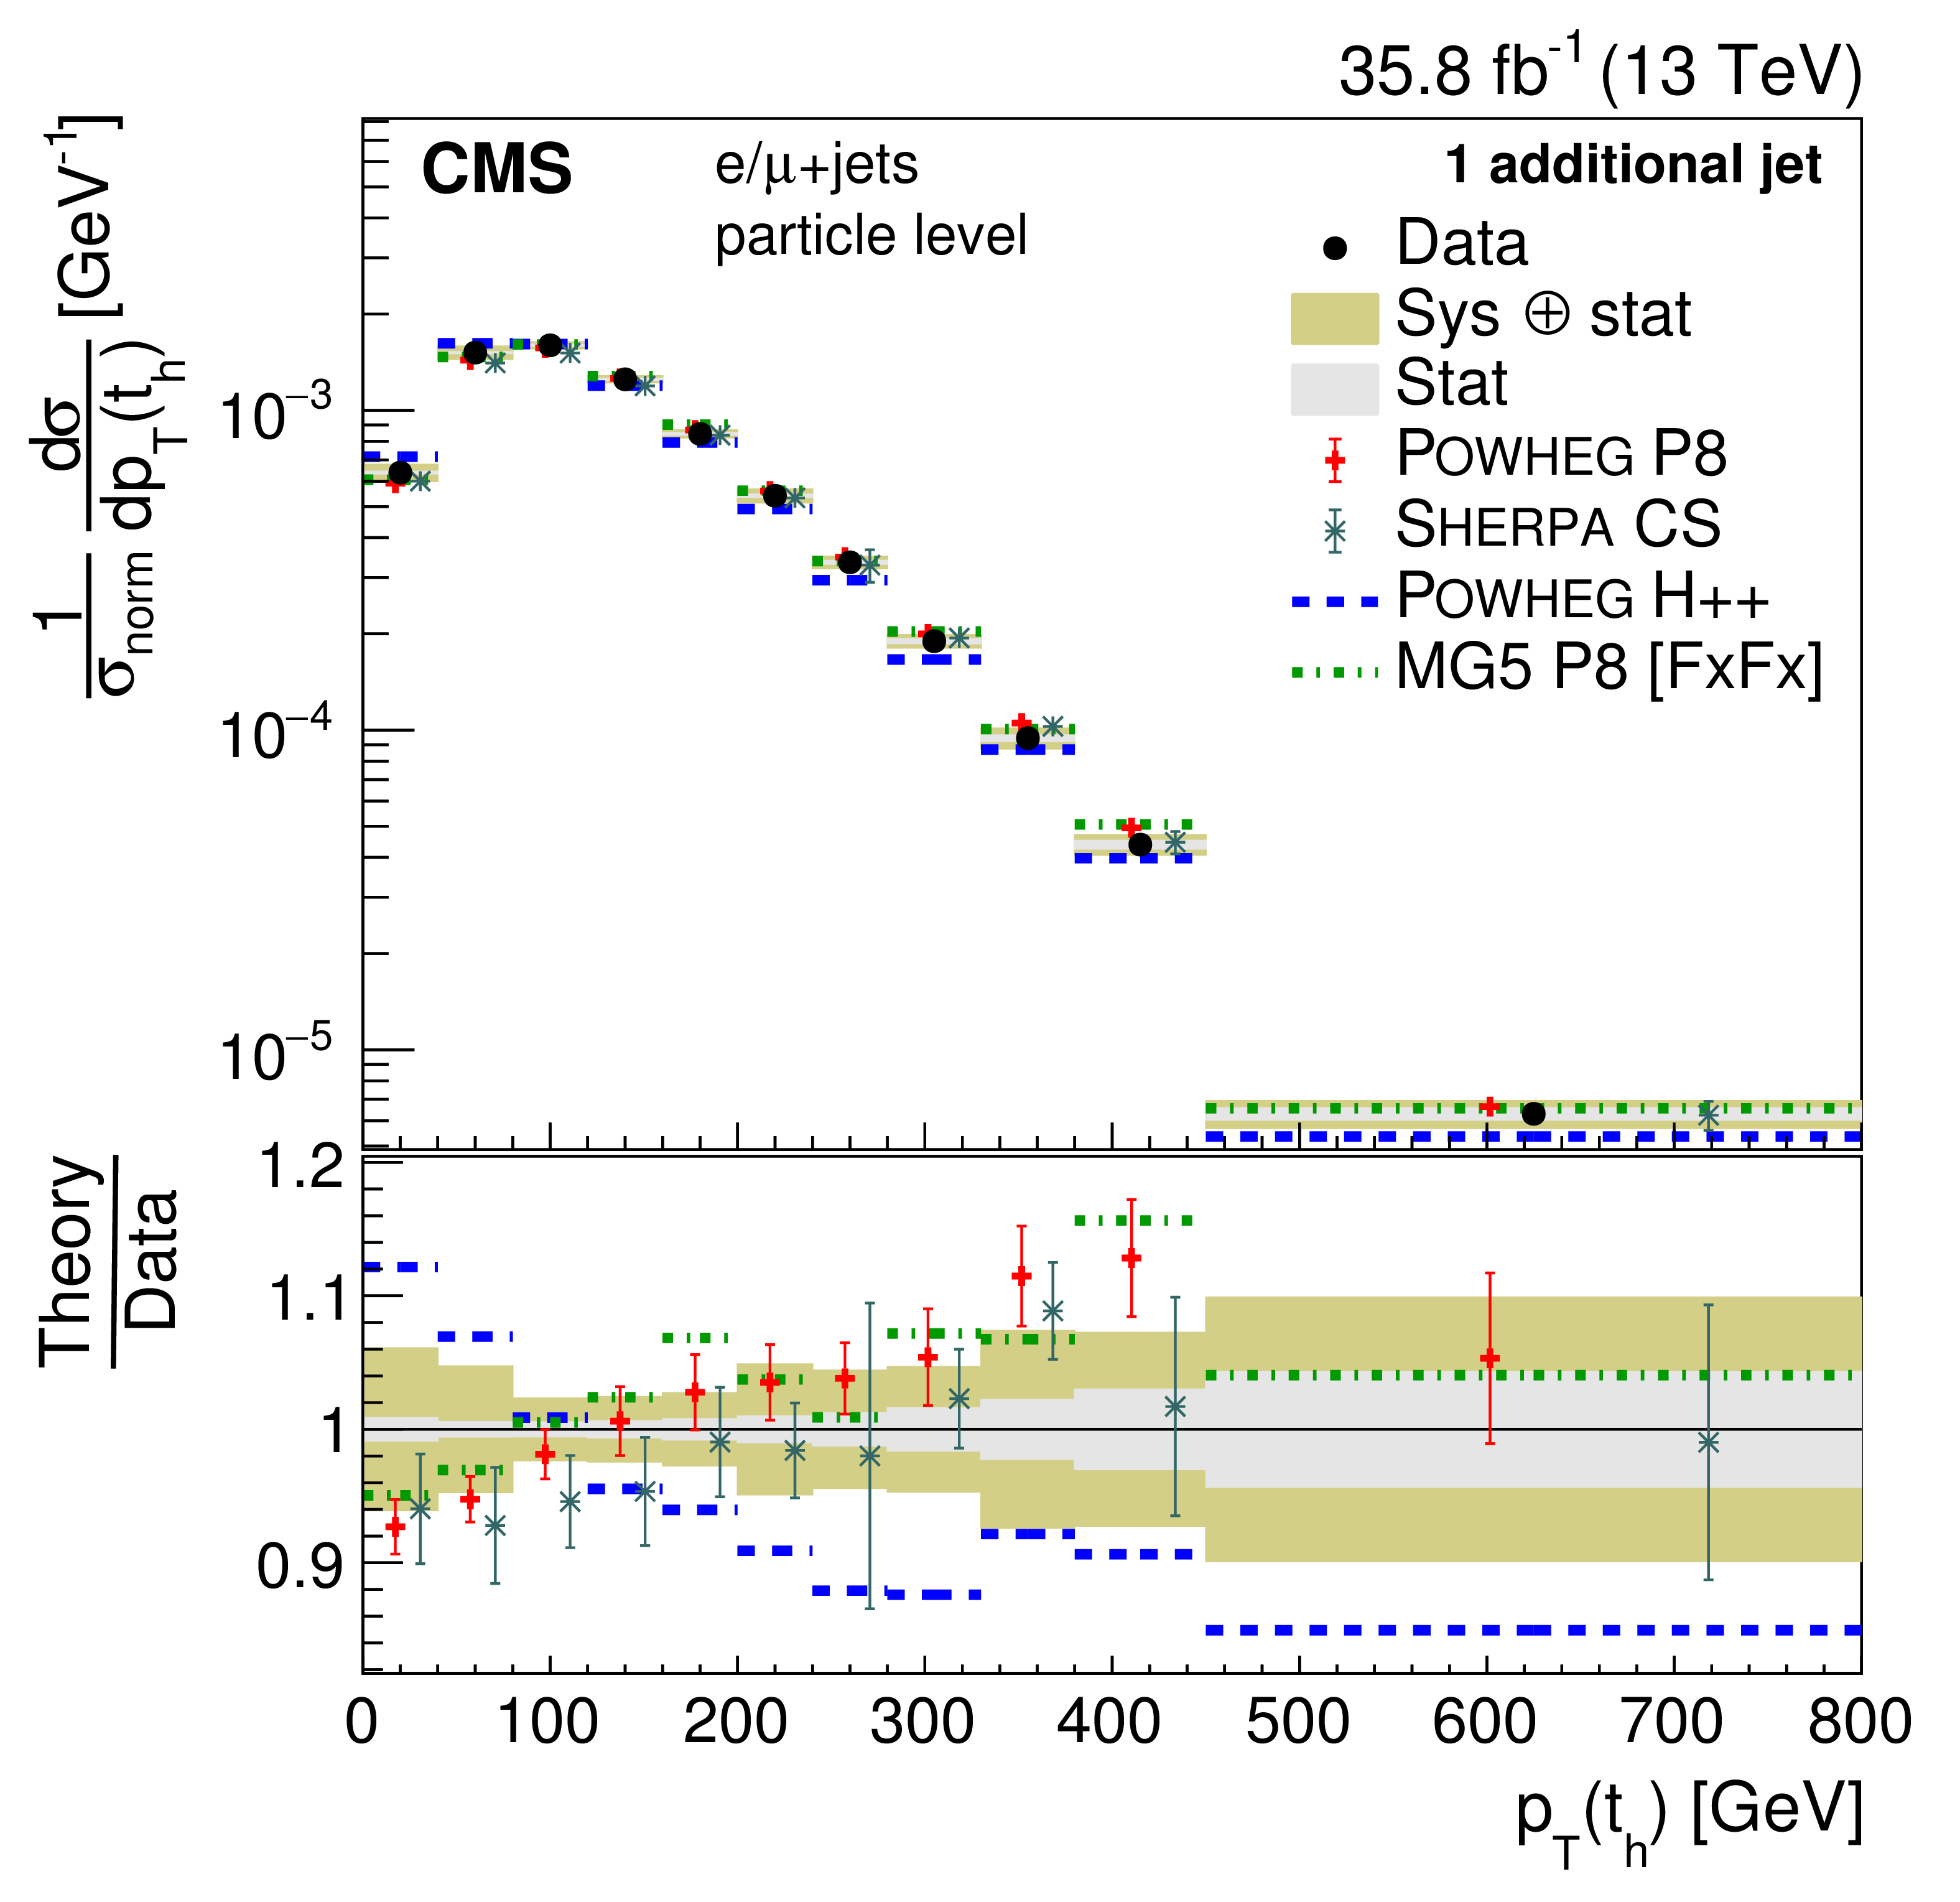
png pdf |
Figure 31-b:
Differential cross sections at the particle level normalized to the sum of the cross sections $\sigma _\text {norm}$ in the measured ranges as a function of $ {p_{\mathrm {T}}} ({\mathrm{t} _\mathrm {h}})$ in bins of the number of additional jets. The data are shown as points with light (dark) bands indicating the statistical (statistical and systematic) uncertainties. The cross sections are compared to the predictions of POWHEG combined with PYTHIA8 (P8) or HERWIG++ (H++) and the multiparton simulations MG5_aMC@NLO (MG5)+PYTHIA8 FxFx and SHERPA. The ratios of the various predictions to the measured cross sections are shown at the bottom of each panel. |
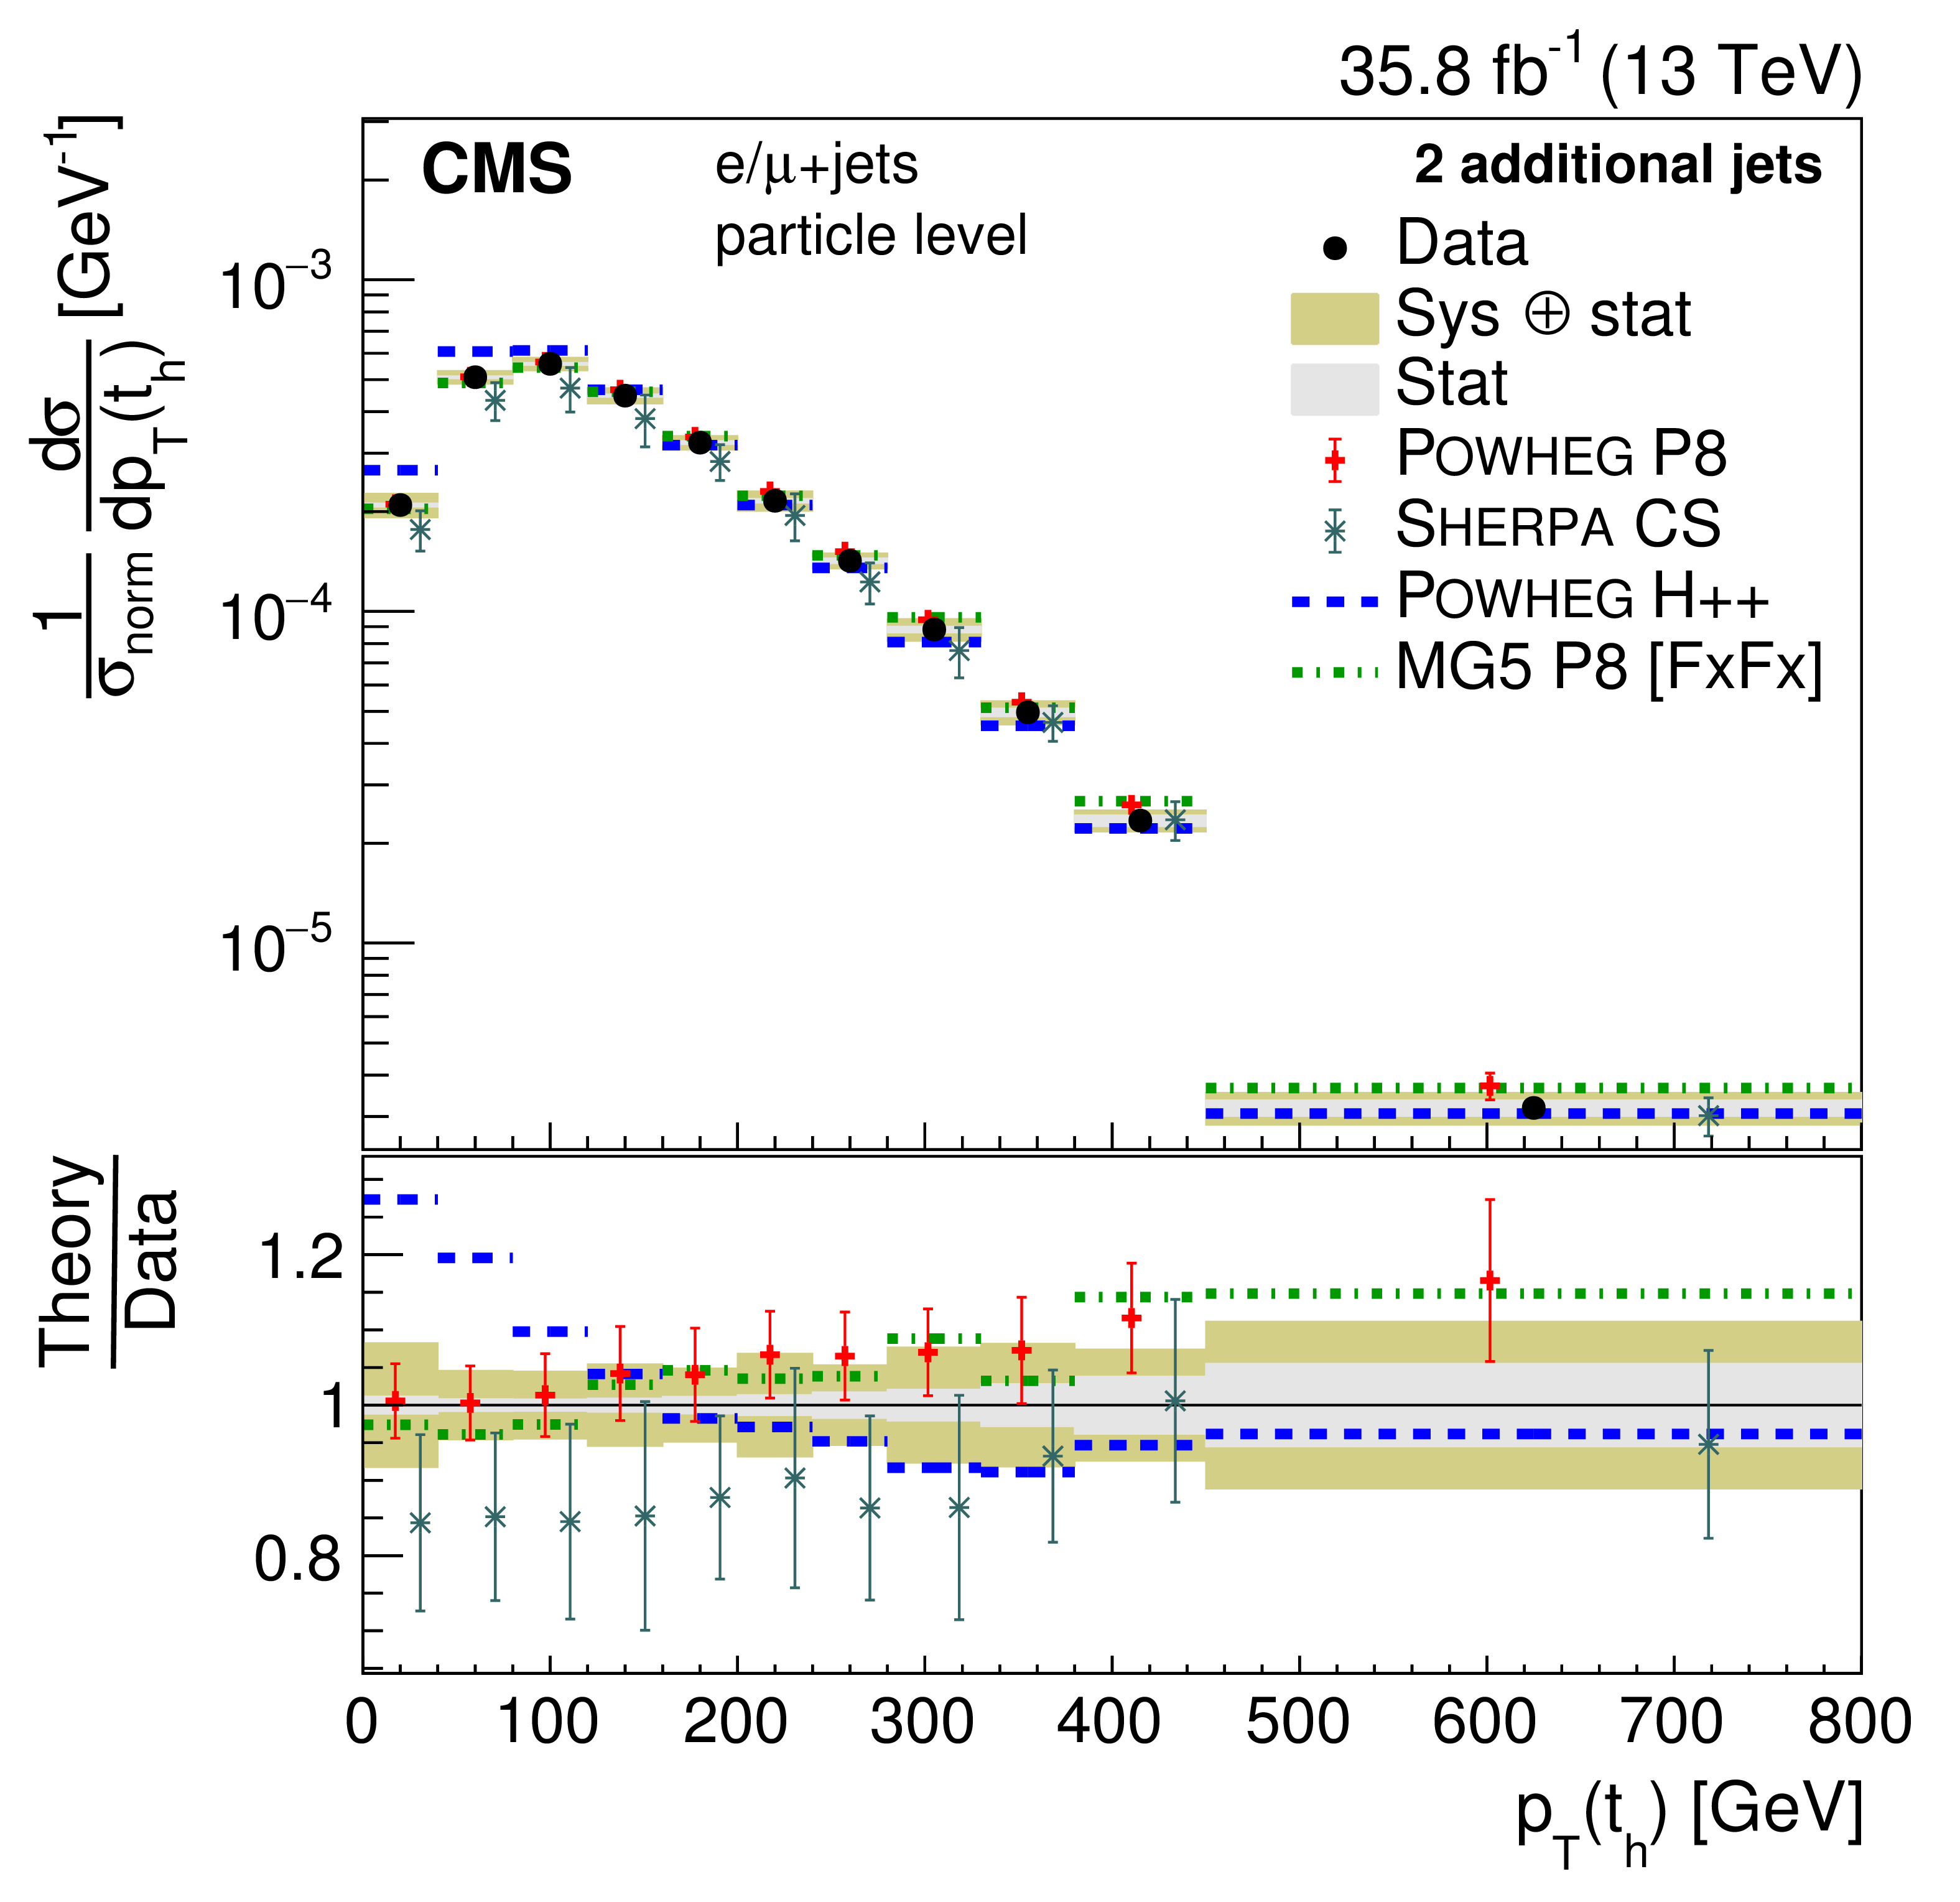
png pdf |
Figure 31-c:
Differential cross sections at the particle level normalized to the sum of the cross sections $\sigma _\text {norm}$ in the measured ranges as a function of $ {p_{\mathrm {T}}} ({\mathrm{t} _\mathrm {h}})$ in bins of the number of additional jets. The data are shown as points with light (dark) bands indicating the statistical (statistical and systematic) uncertainties. The cross sections are compared to the predictions of POWHEG combined with PYTHIA8 (P8) or HERWIG++ (H++) and the multiparton simulations MG5_aMC@NLO (MG5)+PYTHIA8 FxFx and SHERPA. The ratios of the various predictions to the measured cross sections are shown at the bottom of each panel. |
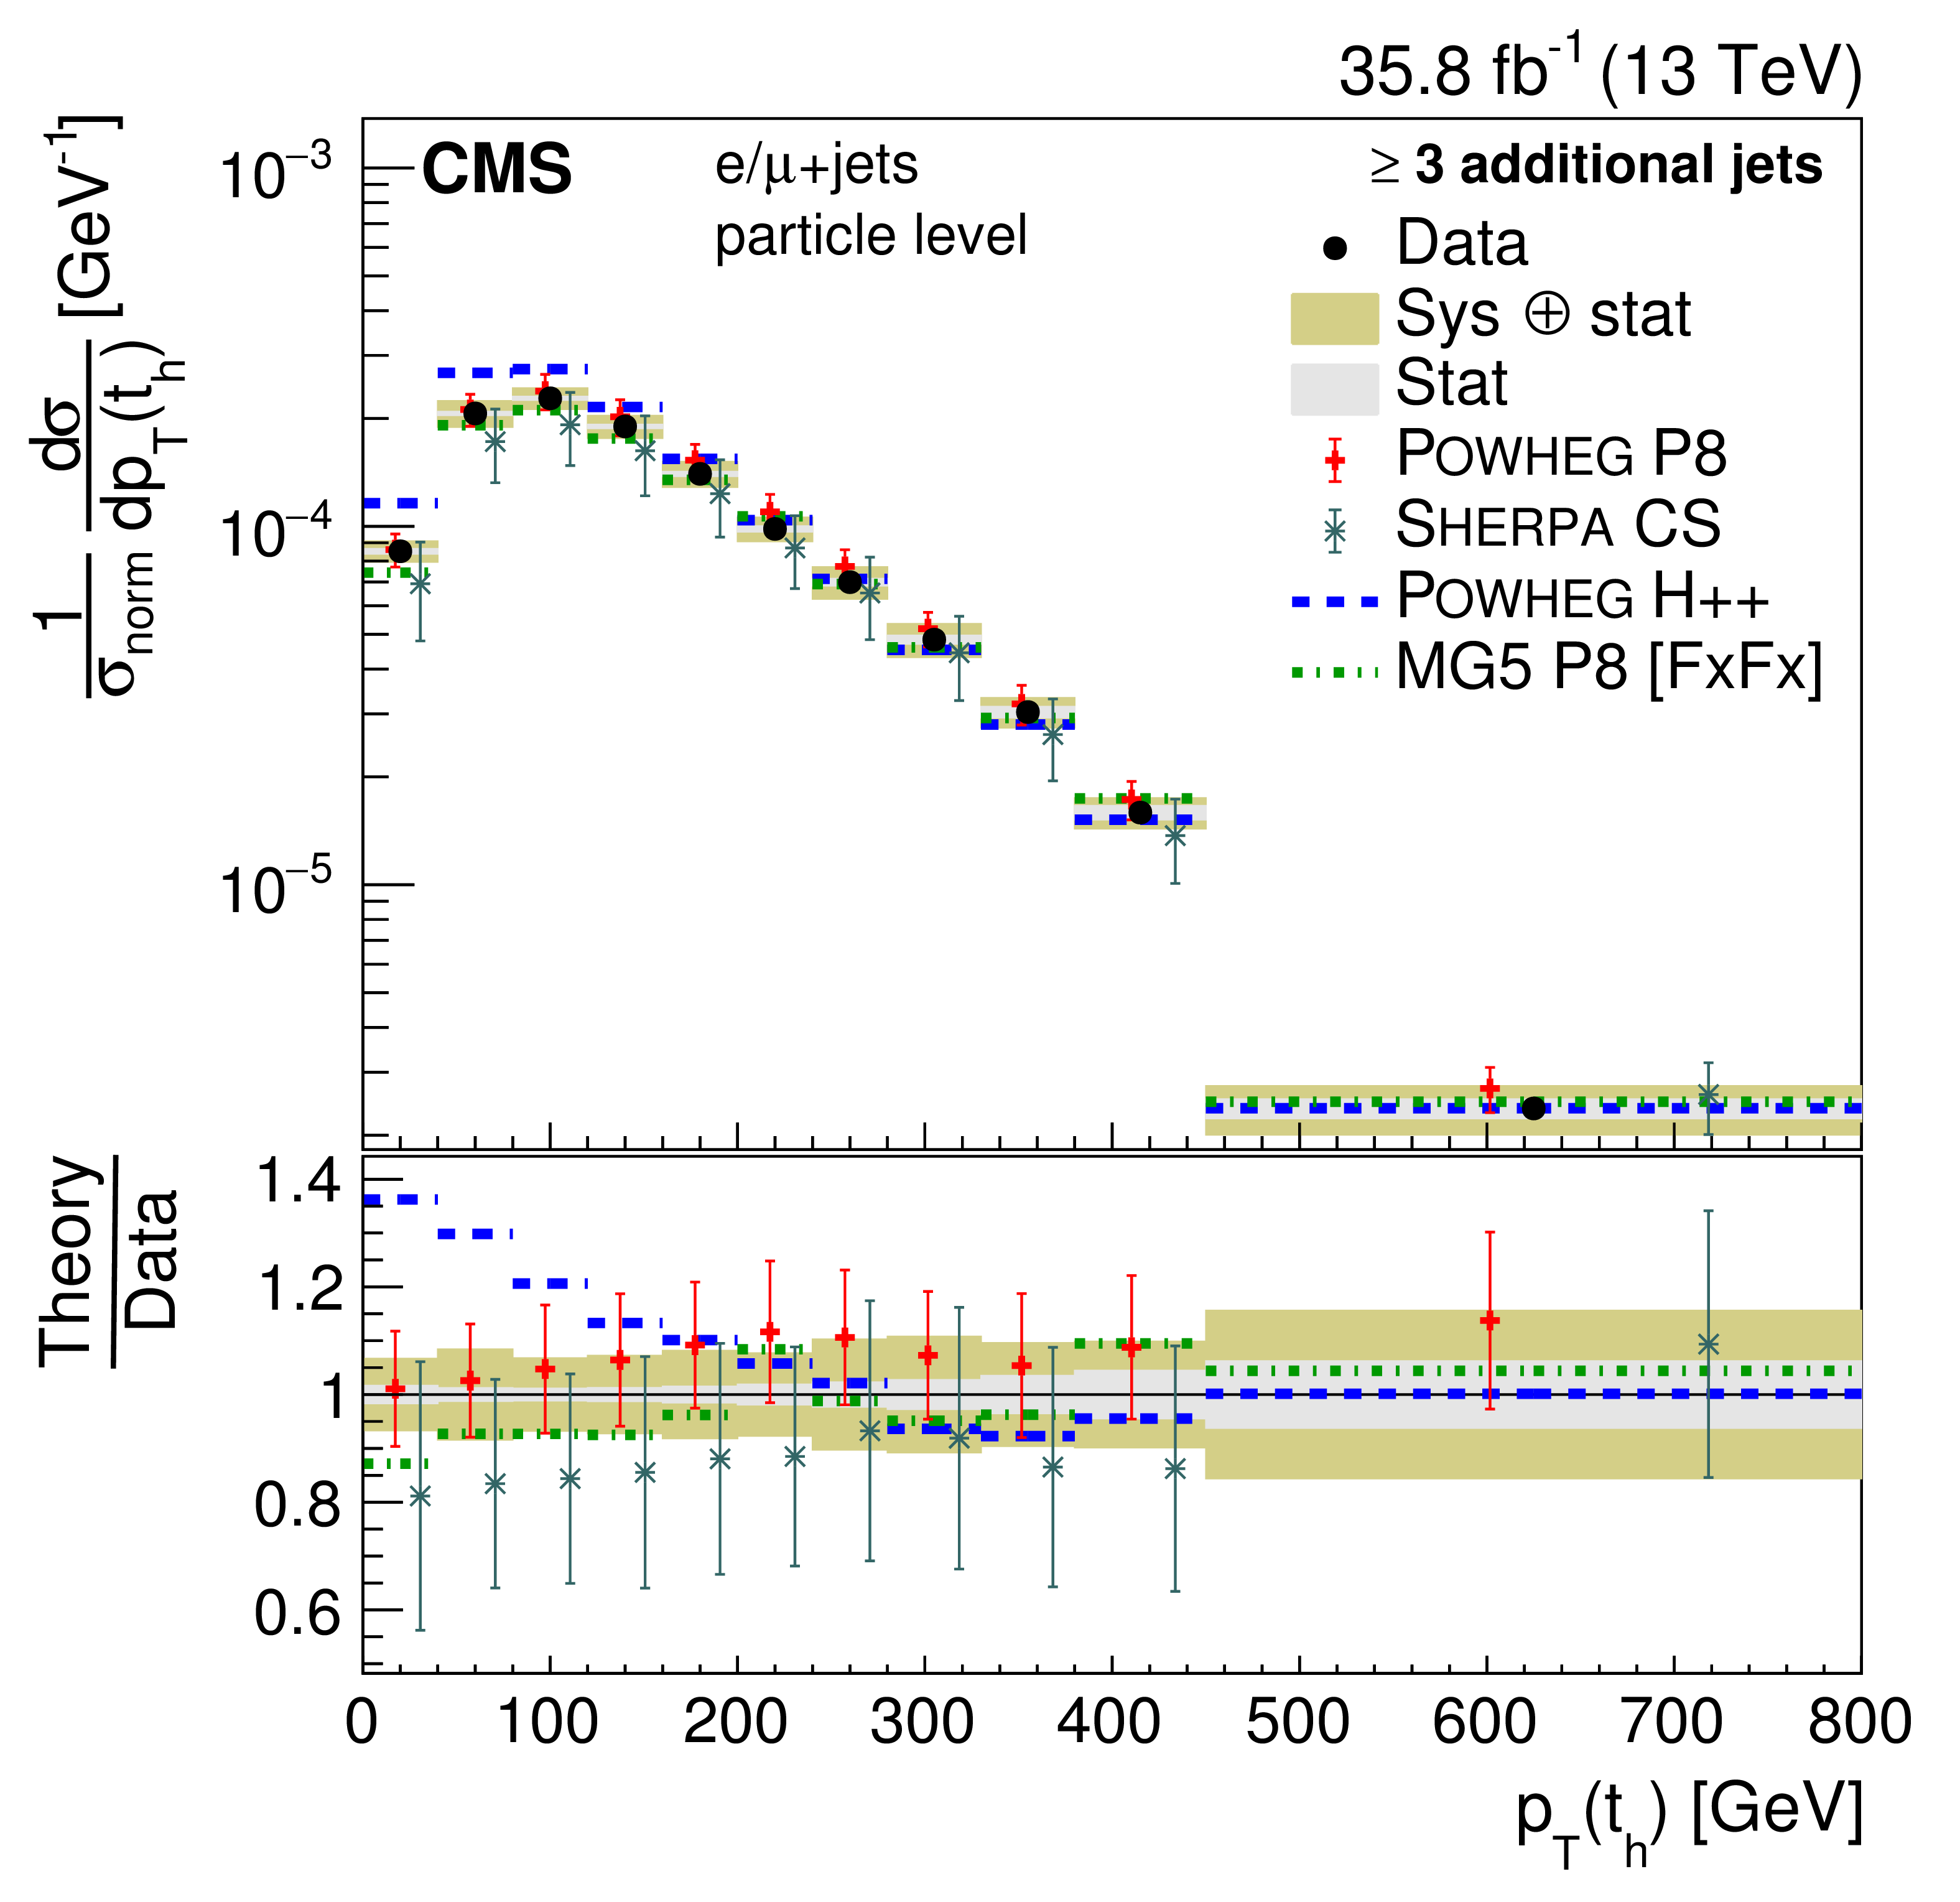
png pdf |
Figure 31-d:
Differential cross sections at the particle level normalized to the sum of the cross sections $\sigma _\text {norm}$ in the measured ranges as a function of $ {p_{\mathrm {T}}} ({\mathrm{t} _\mathrm {h}})$ in bins of the number of additional jets. The data are shown as points with light (dark) bands indicating the statistical (statistical and systematic) uncertainties. The cross sections are compared to the predictions of POWHEG combined with PYTHIA8 (P8) or HERWIG++ (H++) and the multiparton simulations MG5_aMC@NLO (MG5)+PYTHIA8 FxFx and SHERPA. The ratios of the various predictions to the measured cross sections are shown at the bottom of each panel. |
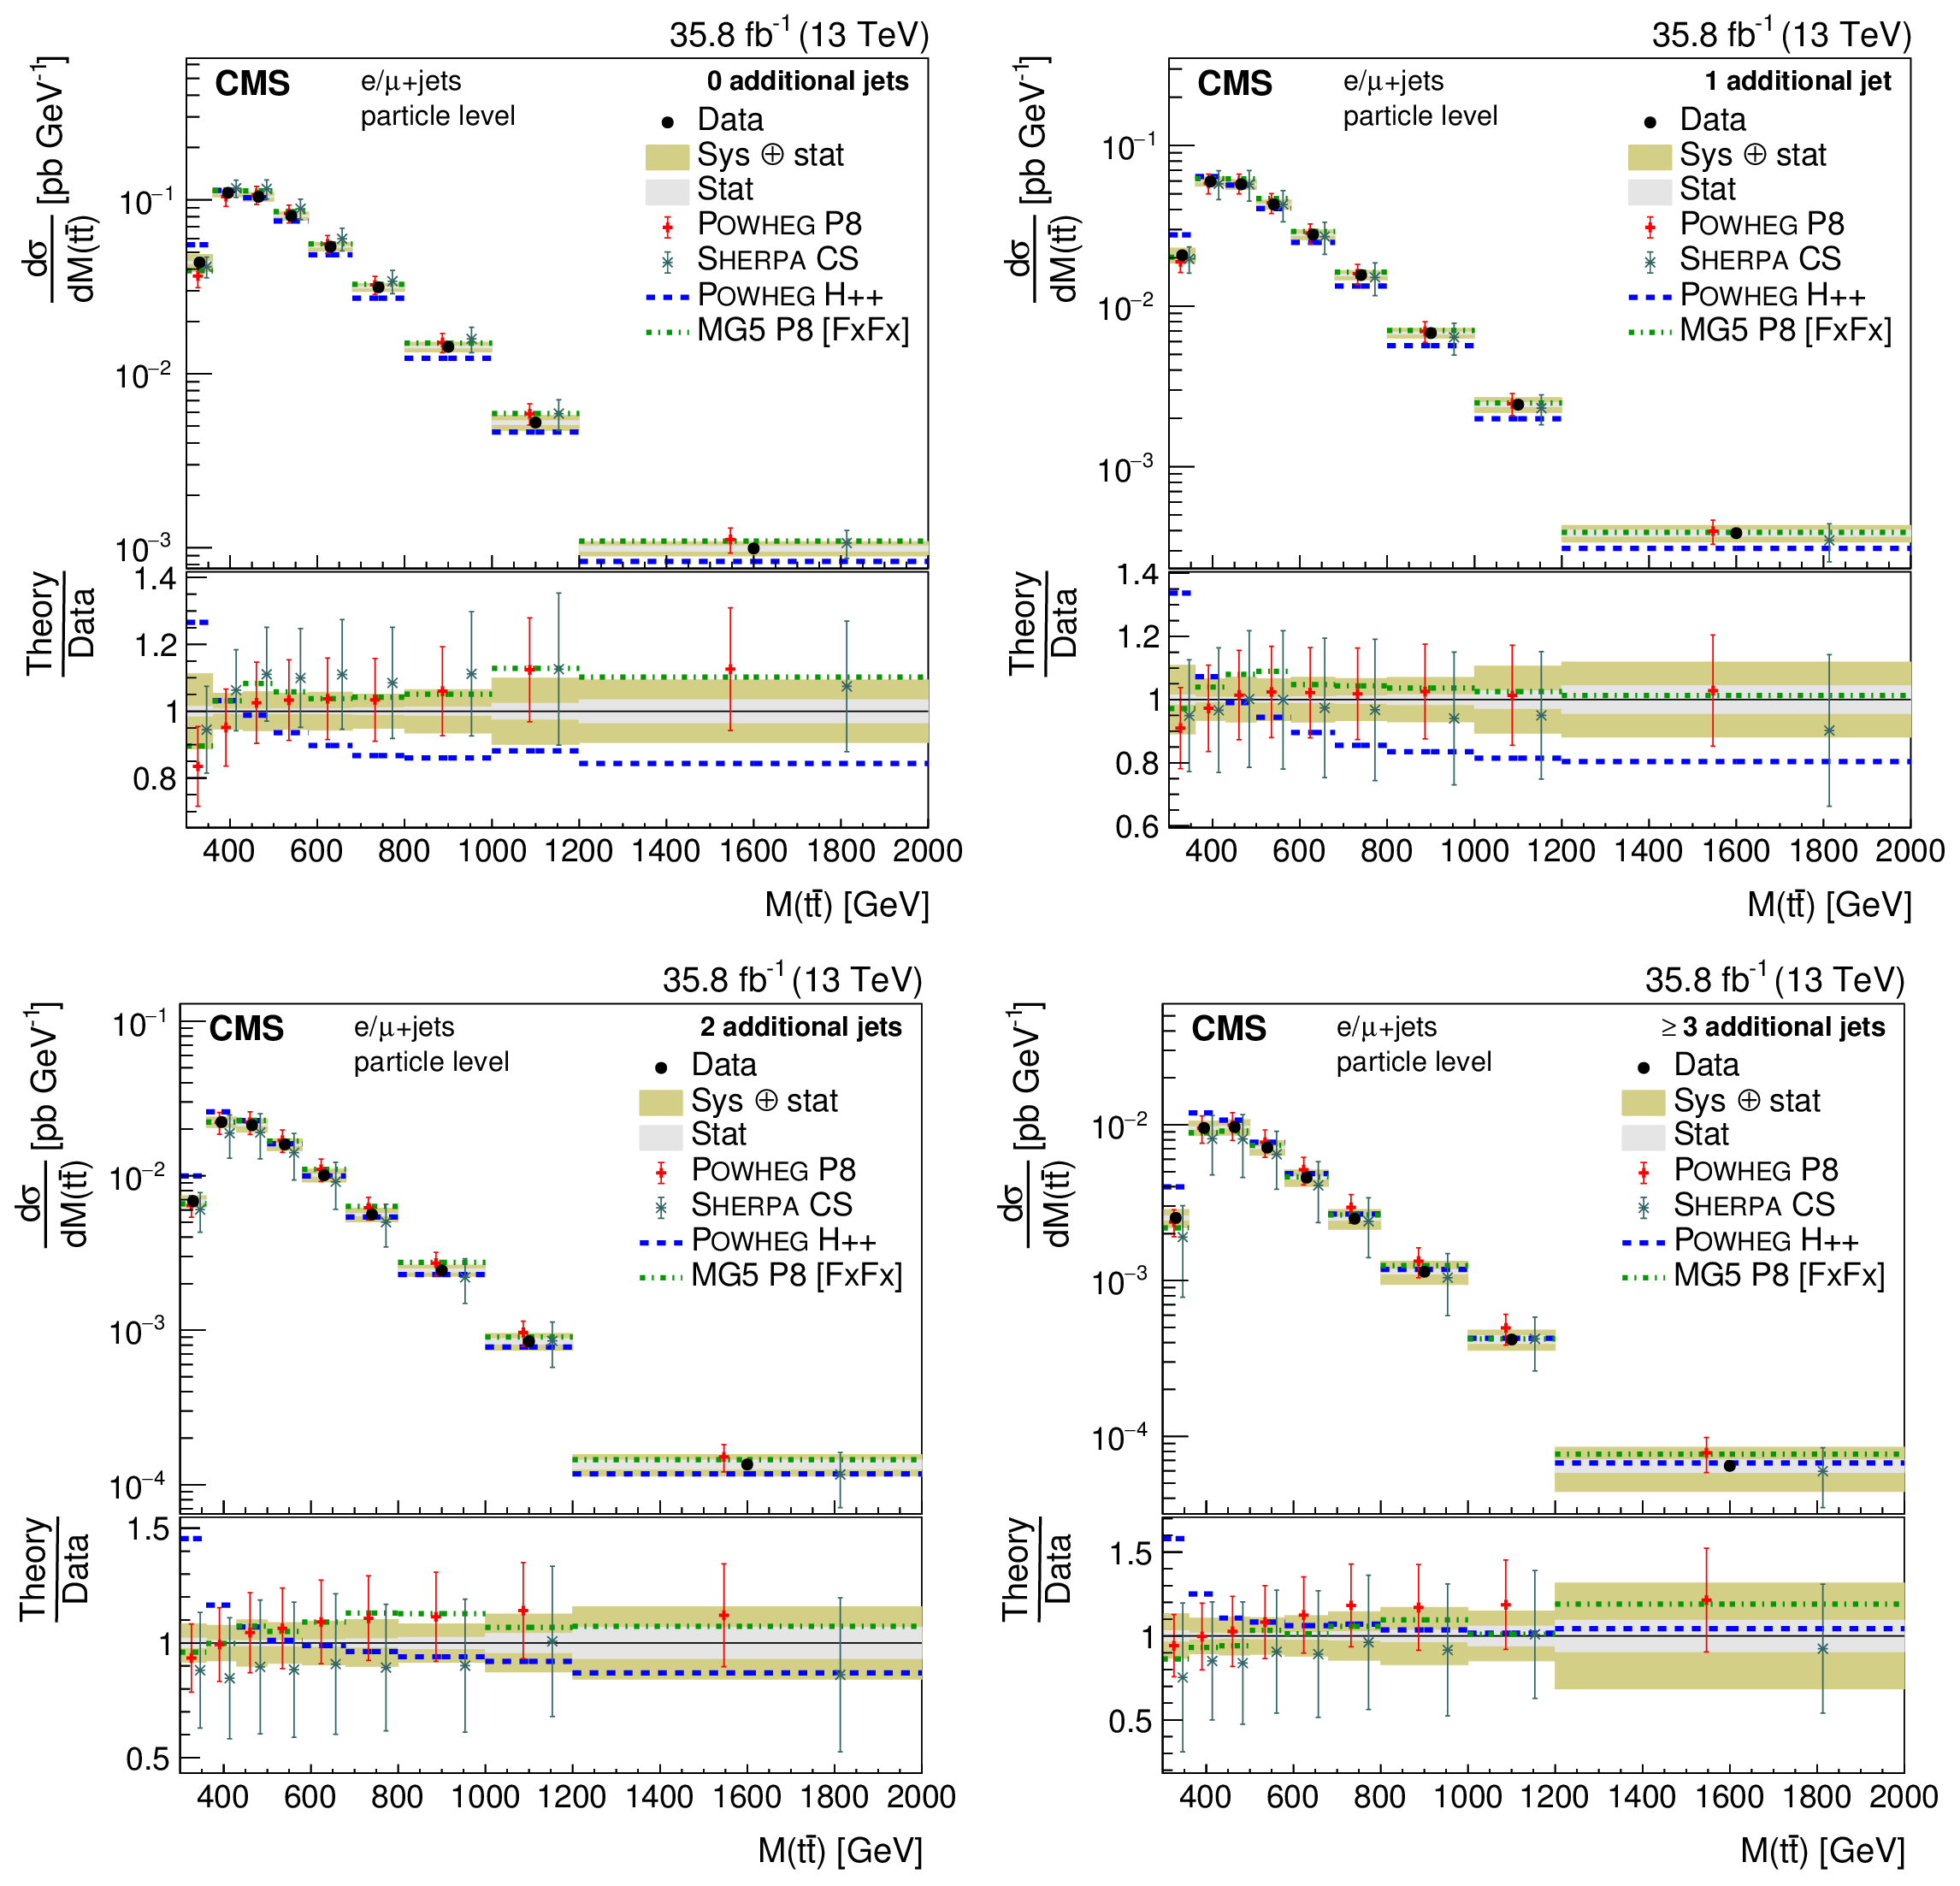
png pdf |
Figure 32:
Differential cross sections at the particle level as a function of $M({\mathrm{t} \mathrm{\bar{t}}})$ in bins of the number of additional jets. The data are shown as points with light (dark) bands indicating the statistical (statistical and systematic) uncertainties. The cross sections are compared to the predictions of POWHEG combined with PYTHIA8 (P8) or HERWIG++ (H++) and the multiparton simulations MG5_aMC@NLO (MG5)+PYTHIA8 FxFx and SHERPA. The ratios of the various predictions to the measured cross sections are shown at the bottom of each panel. |
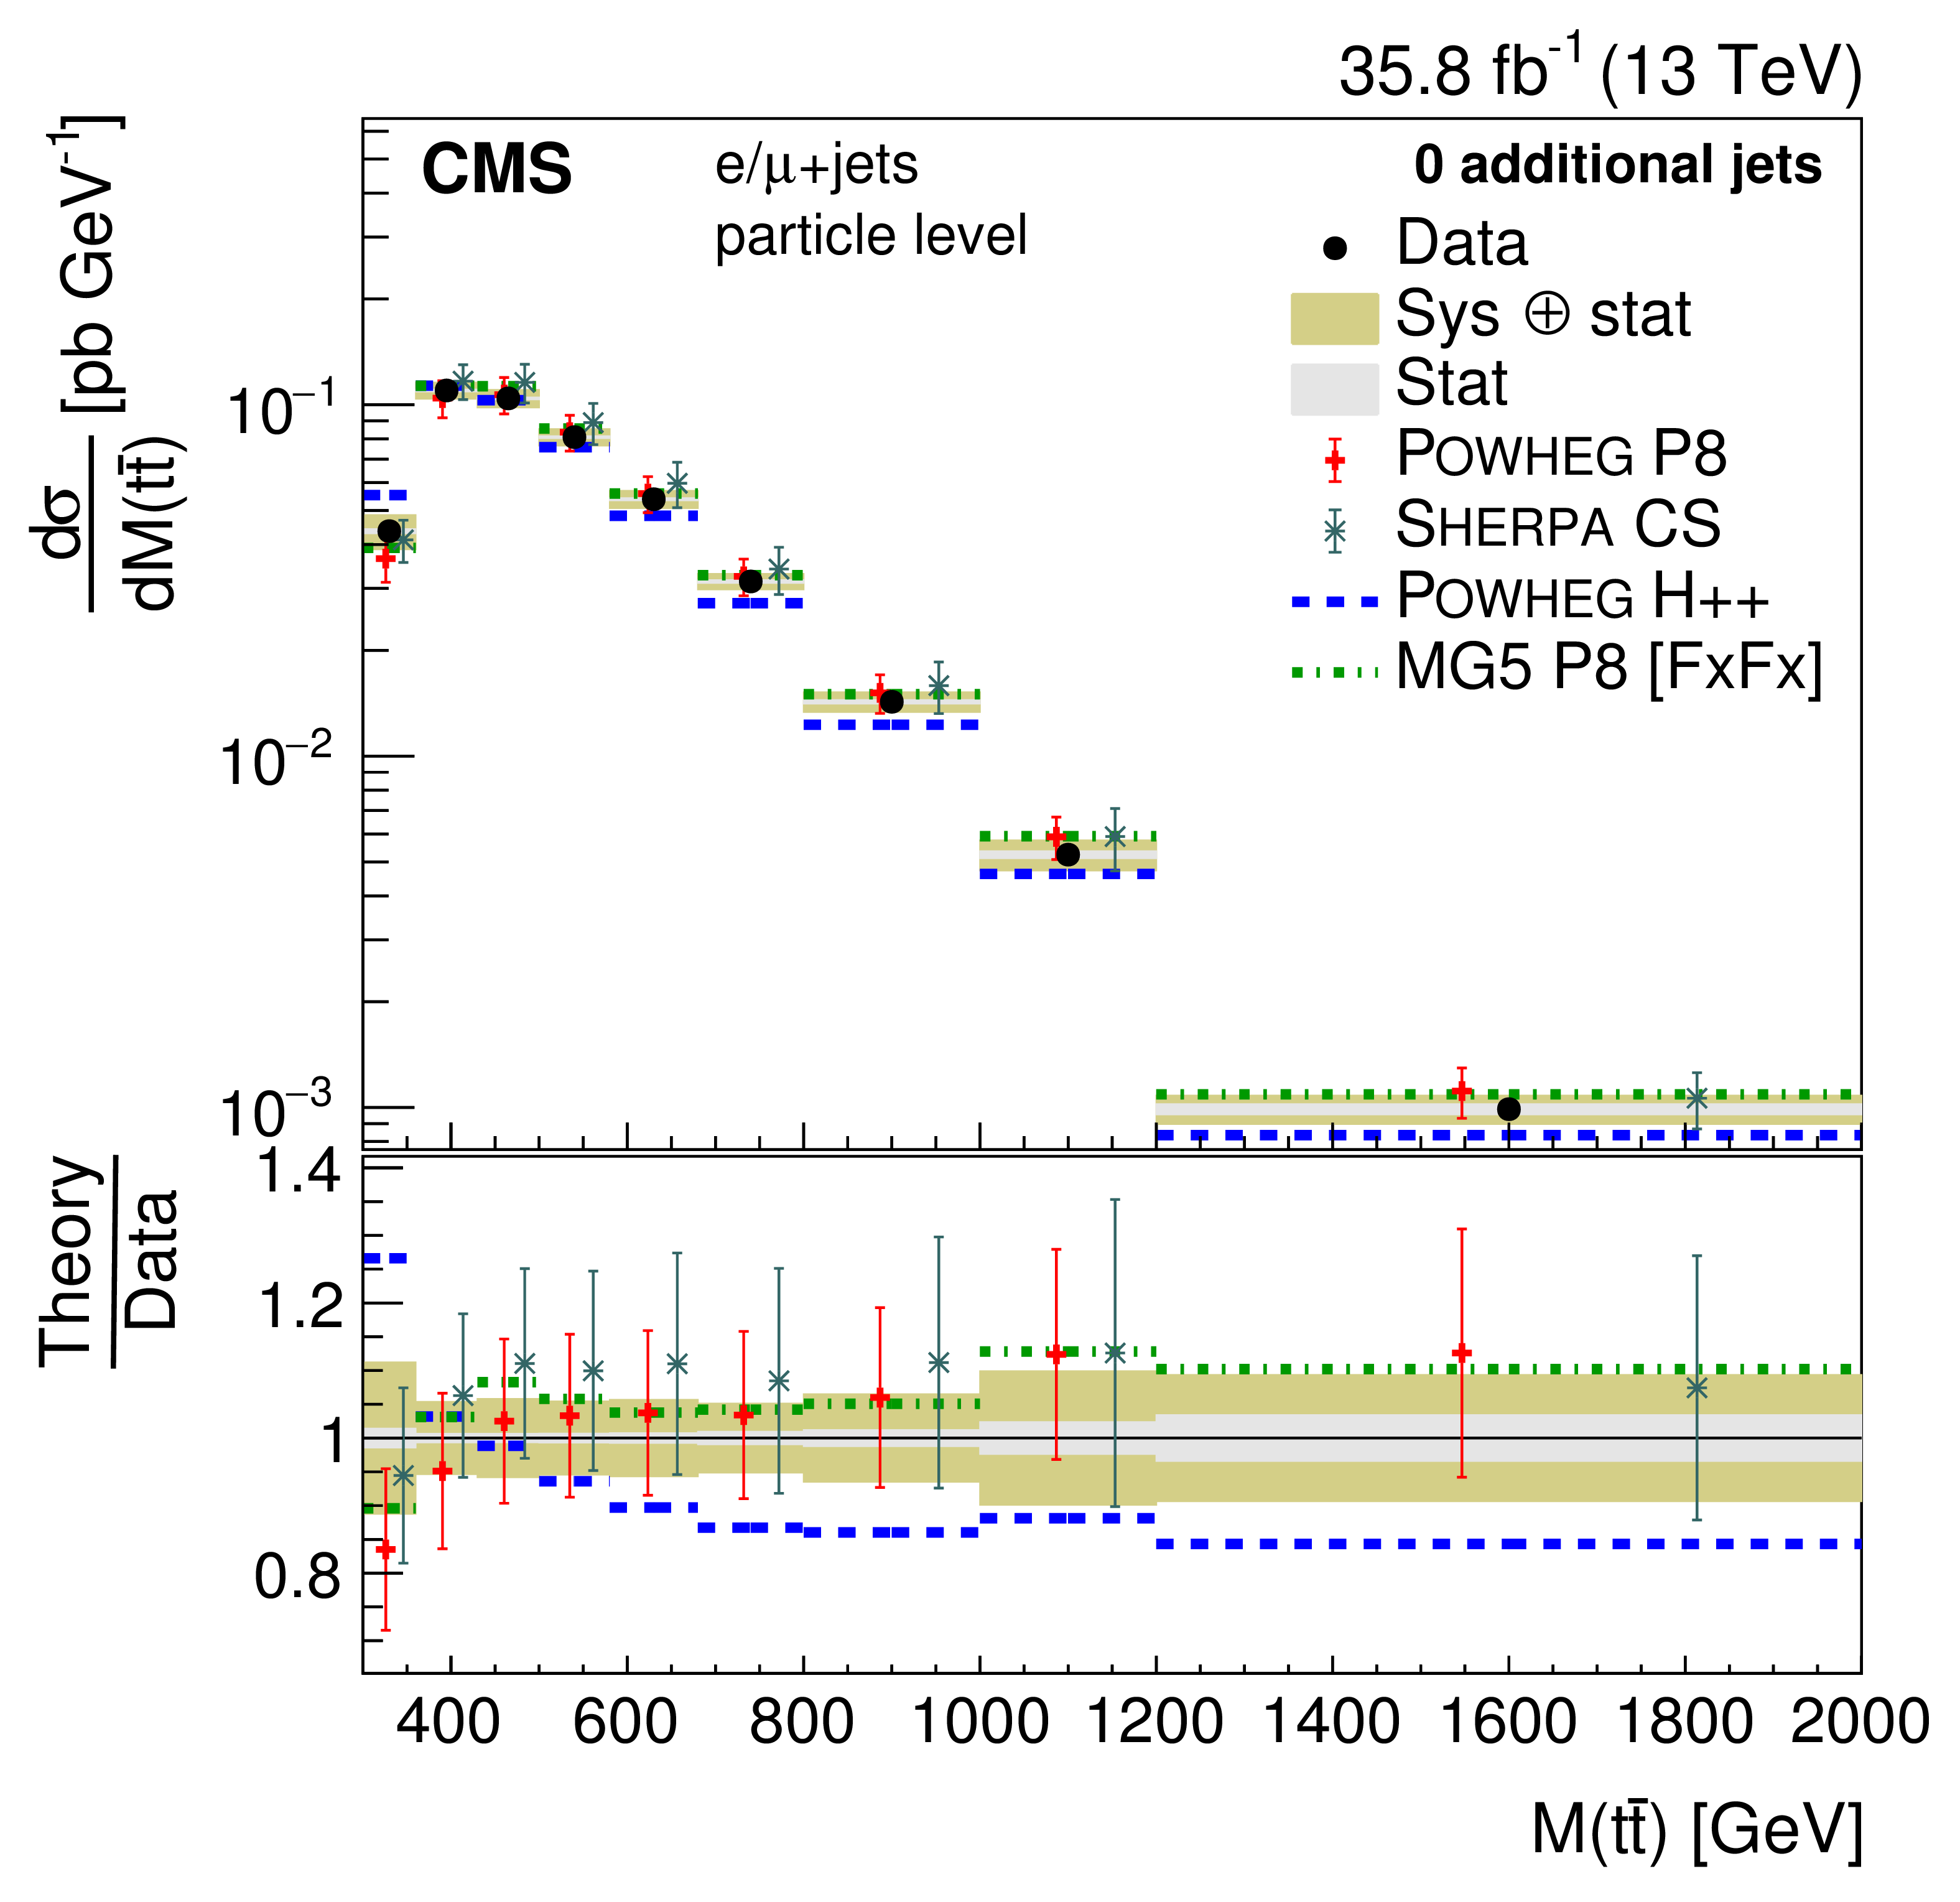
png pdf |
Figure 32-a:
Differential cross sections at the particle level as a function of $M({\mathrm{t} \mathrm{\bar{t}}})$ in bins of the number of additional jets. The data are shown as points with light (dark) bands indicating the statistical (statistical and systematic) uncertainties. The cross sections are compared to the predictions of POWHEG combined with PYTHIA8 (P8) or HERWIG++ (H++) and the multiparton simulations MG5_aMC@NLO (MG5)+PYTHIA8 FxFx and SHERPA. The ratios of the various predictions to the measured cross sections are shown at the bottom of each panel. |
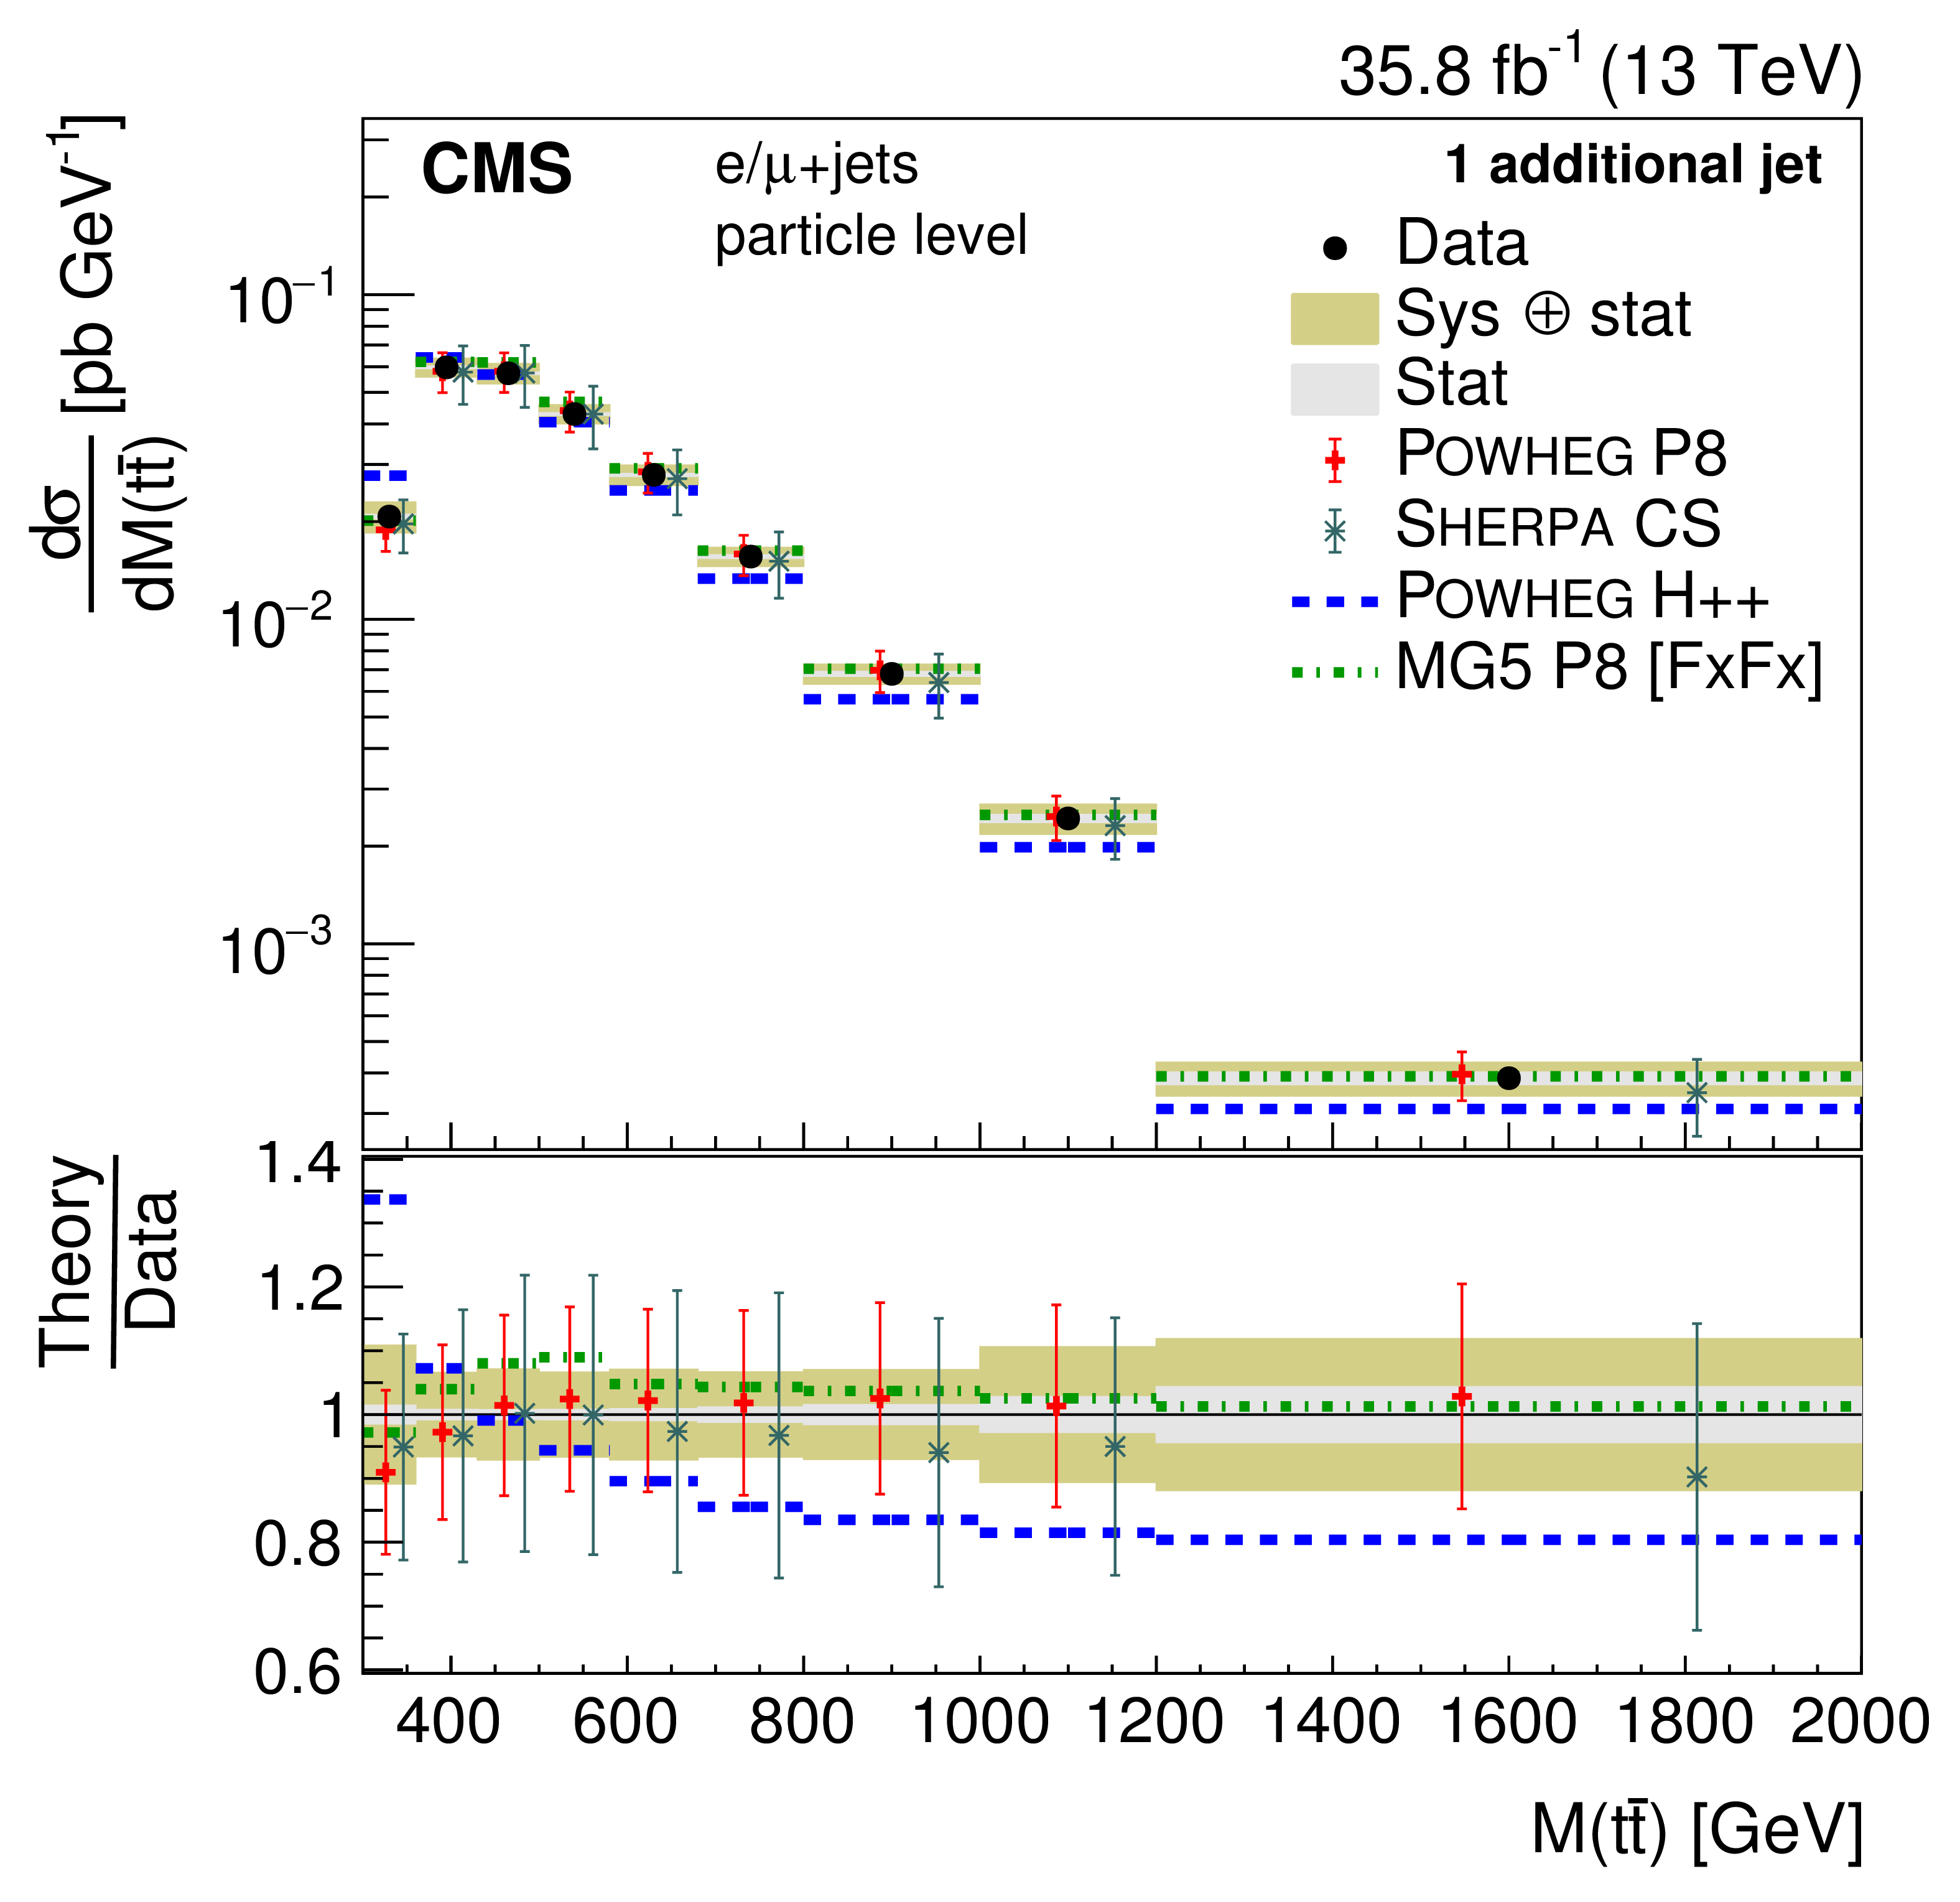
png pdf |
Figure 32-b:
Differential cross sections at the particle level as a function of $M({\mathrm{t} \mathrm{\bar{t}}})$ in bins of the number of additional jets. The data are shown as points with light (dark) bands indicating the statistical (statistical and systematic) uncertainties. The cross sections are compared to the predictions of POWHEG combined with PYTHIA8 (P8) or HERWIG++ (H++) and the multiparton simulations MG5_aMC@NLO (MG5)+PYTHIA8 FxFx and SHERPA. The ratios of the various predictions to the measured cross sections are shown at the bottom of each panel. |
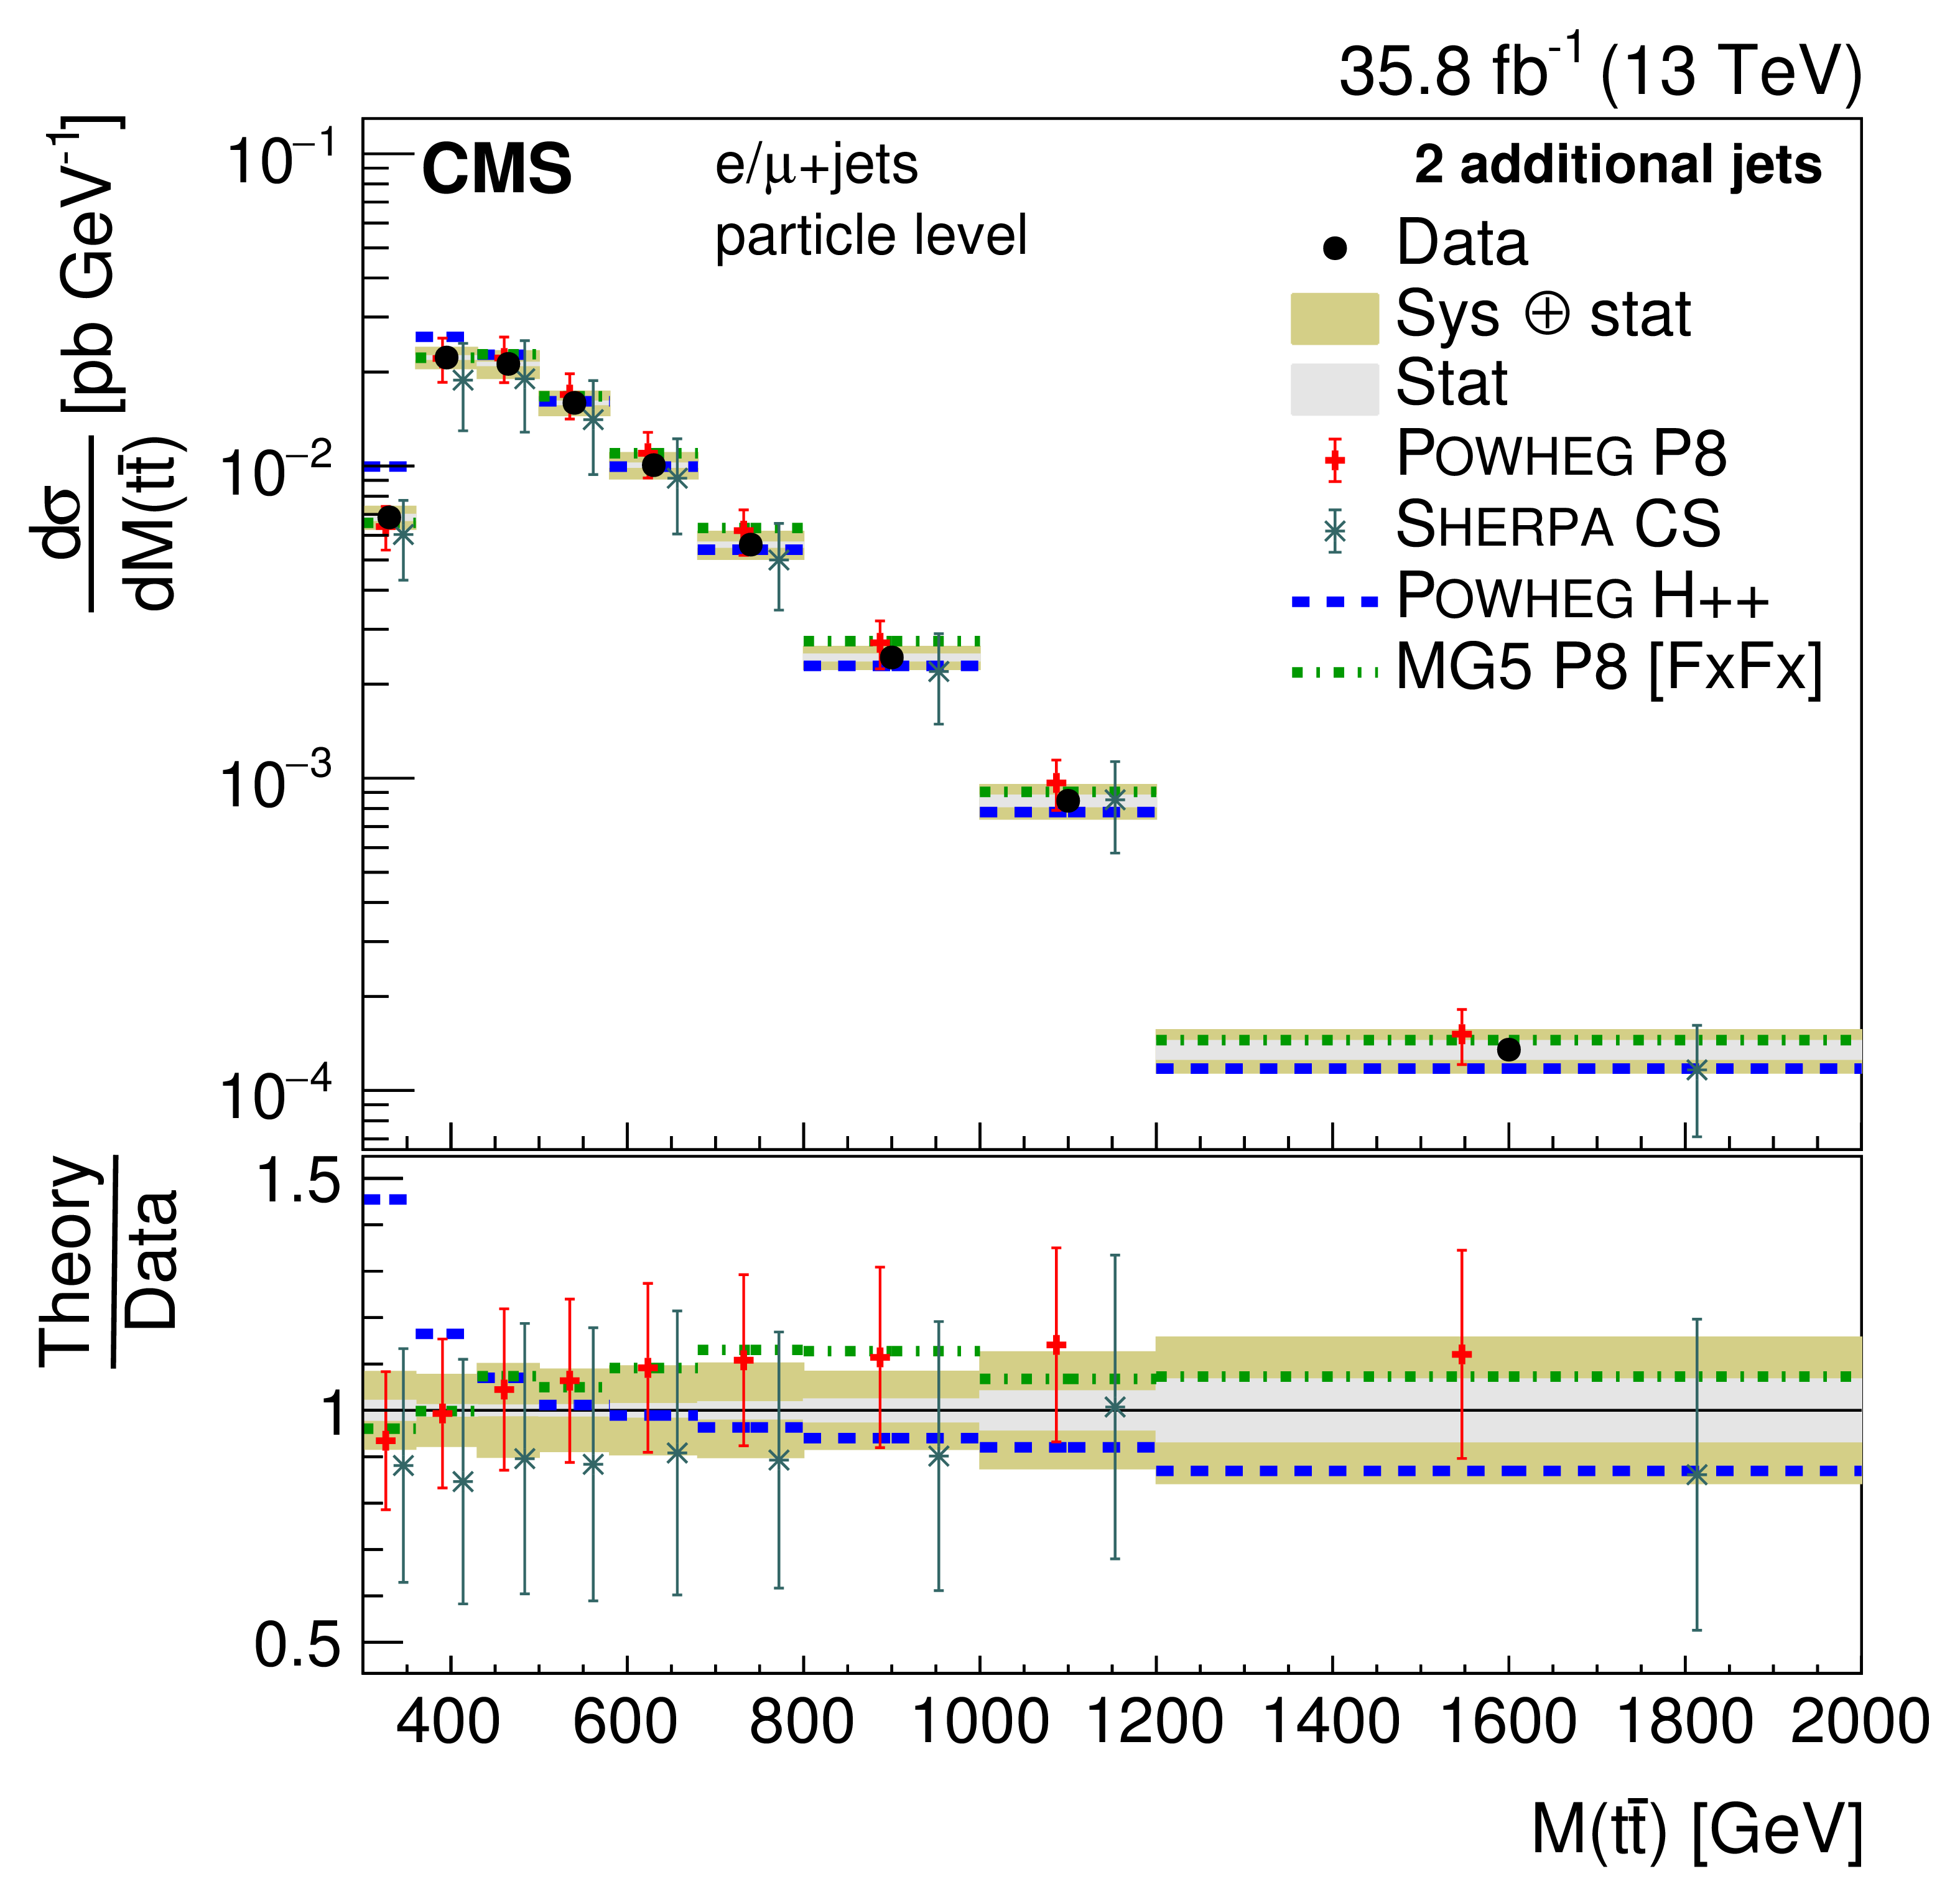
png pdf |
Figure 32-c:
Differential cross sections at the particle level as a function of $M({\mathrm{t} \mathrm{\bar{t}}})$ in bins of the number of additional jets. The data are shown as points with light (dark) bands indicating the statistical (statistical and systematic) uncertainties. The cross sections are compared to the predictions of POWHEG combined with PYTHIA8 (P8) or HERWIG++ (H++) and the multiparton simulations MG5_aMC@NLO (MG5)+PYTHIA8 FxFx and SHERPA. The ratios of the various predictions to the measured cross sections are shown at the bottom of each panel. |
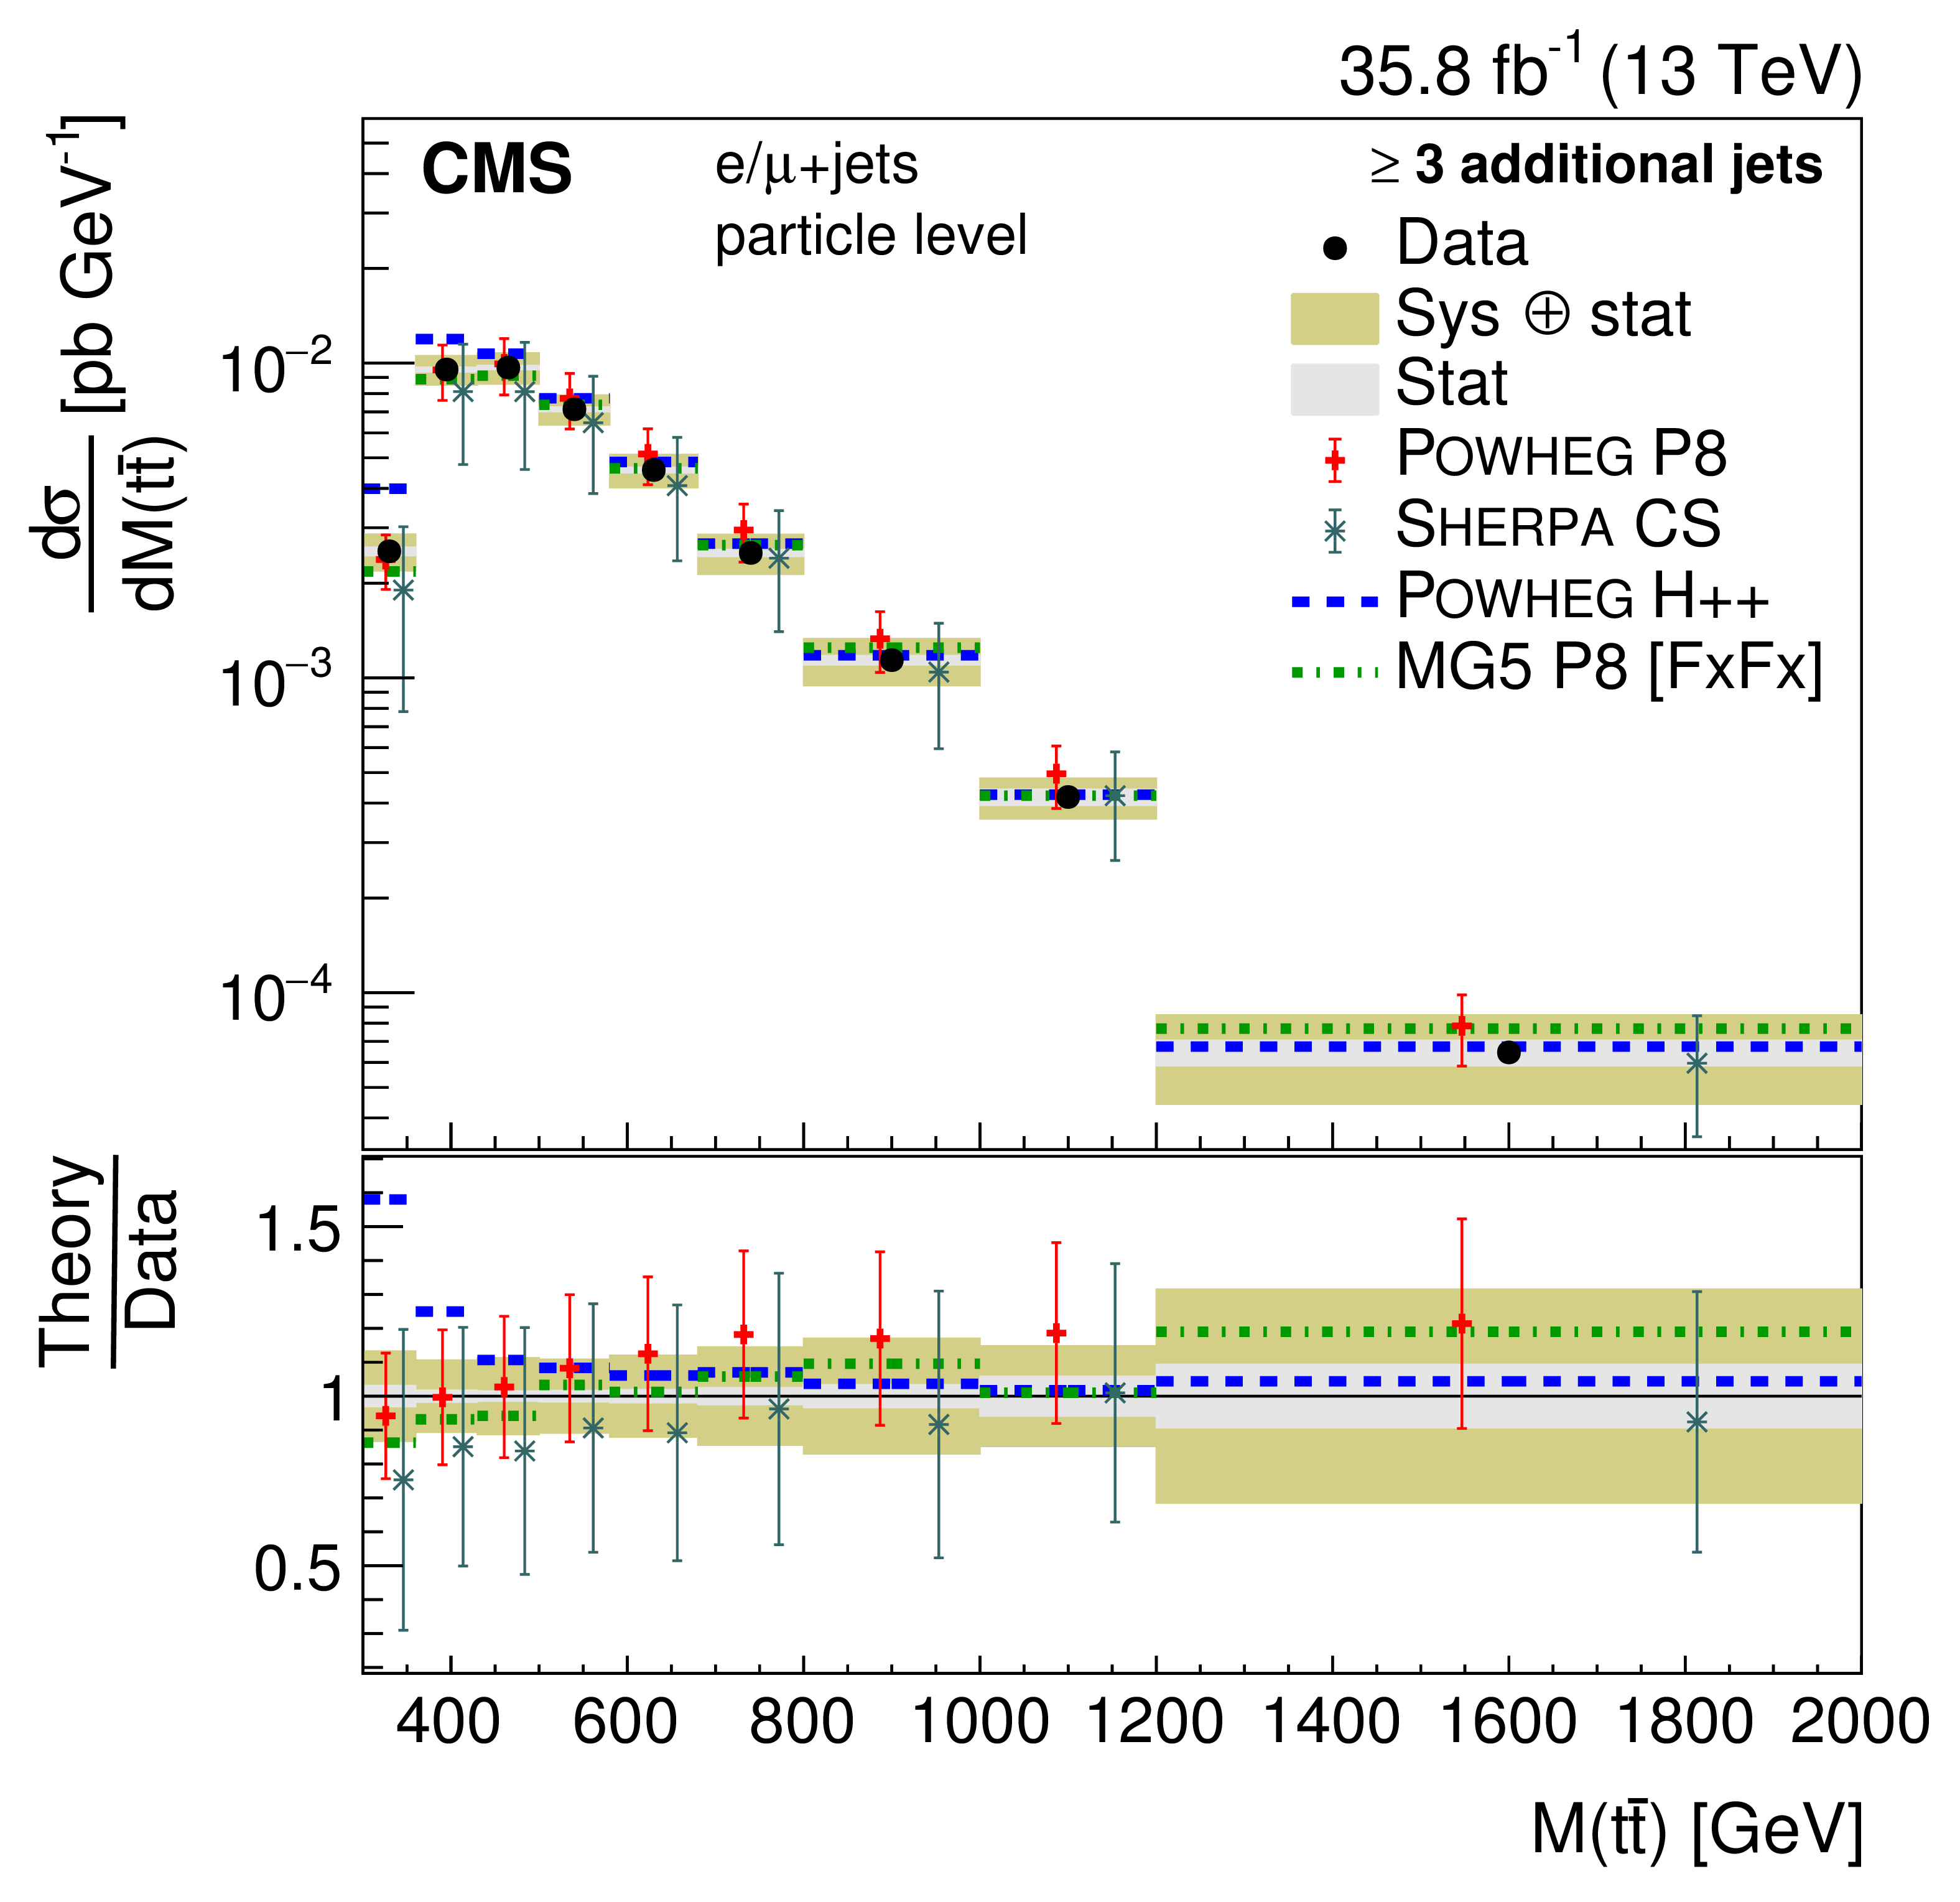
png pdf |
Figure 32-d:
Differential cross sections at the particle level as a function of $M({\mathrm{t} \mathrm{\bar{t}}})$ in bins of the number of additional jets. The data are shown as points with light (dark) bands indicating the statistical (statistical and systematic) uncertainties. The cross sections are compared to the predictions of POWHEG combined with PYTHIA8 (P8) or HERWIG++ (H++) and the multiparton simulations MG5_aMC@NLO (MG5)+PYTHIA8 FxFx and SHERPA. The ratios of the various predictions to the measured cross sections are shown at the bottom of each panel. |
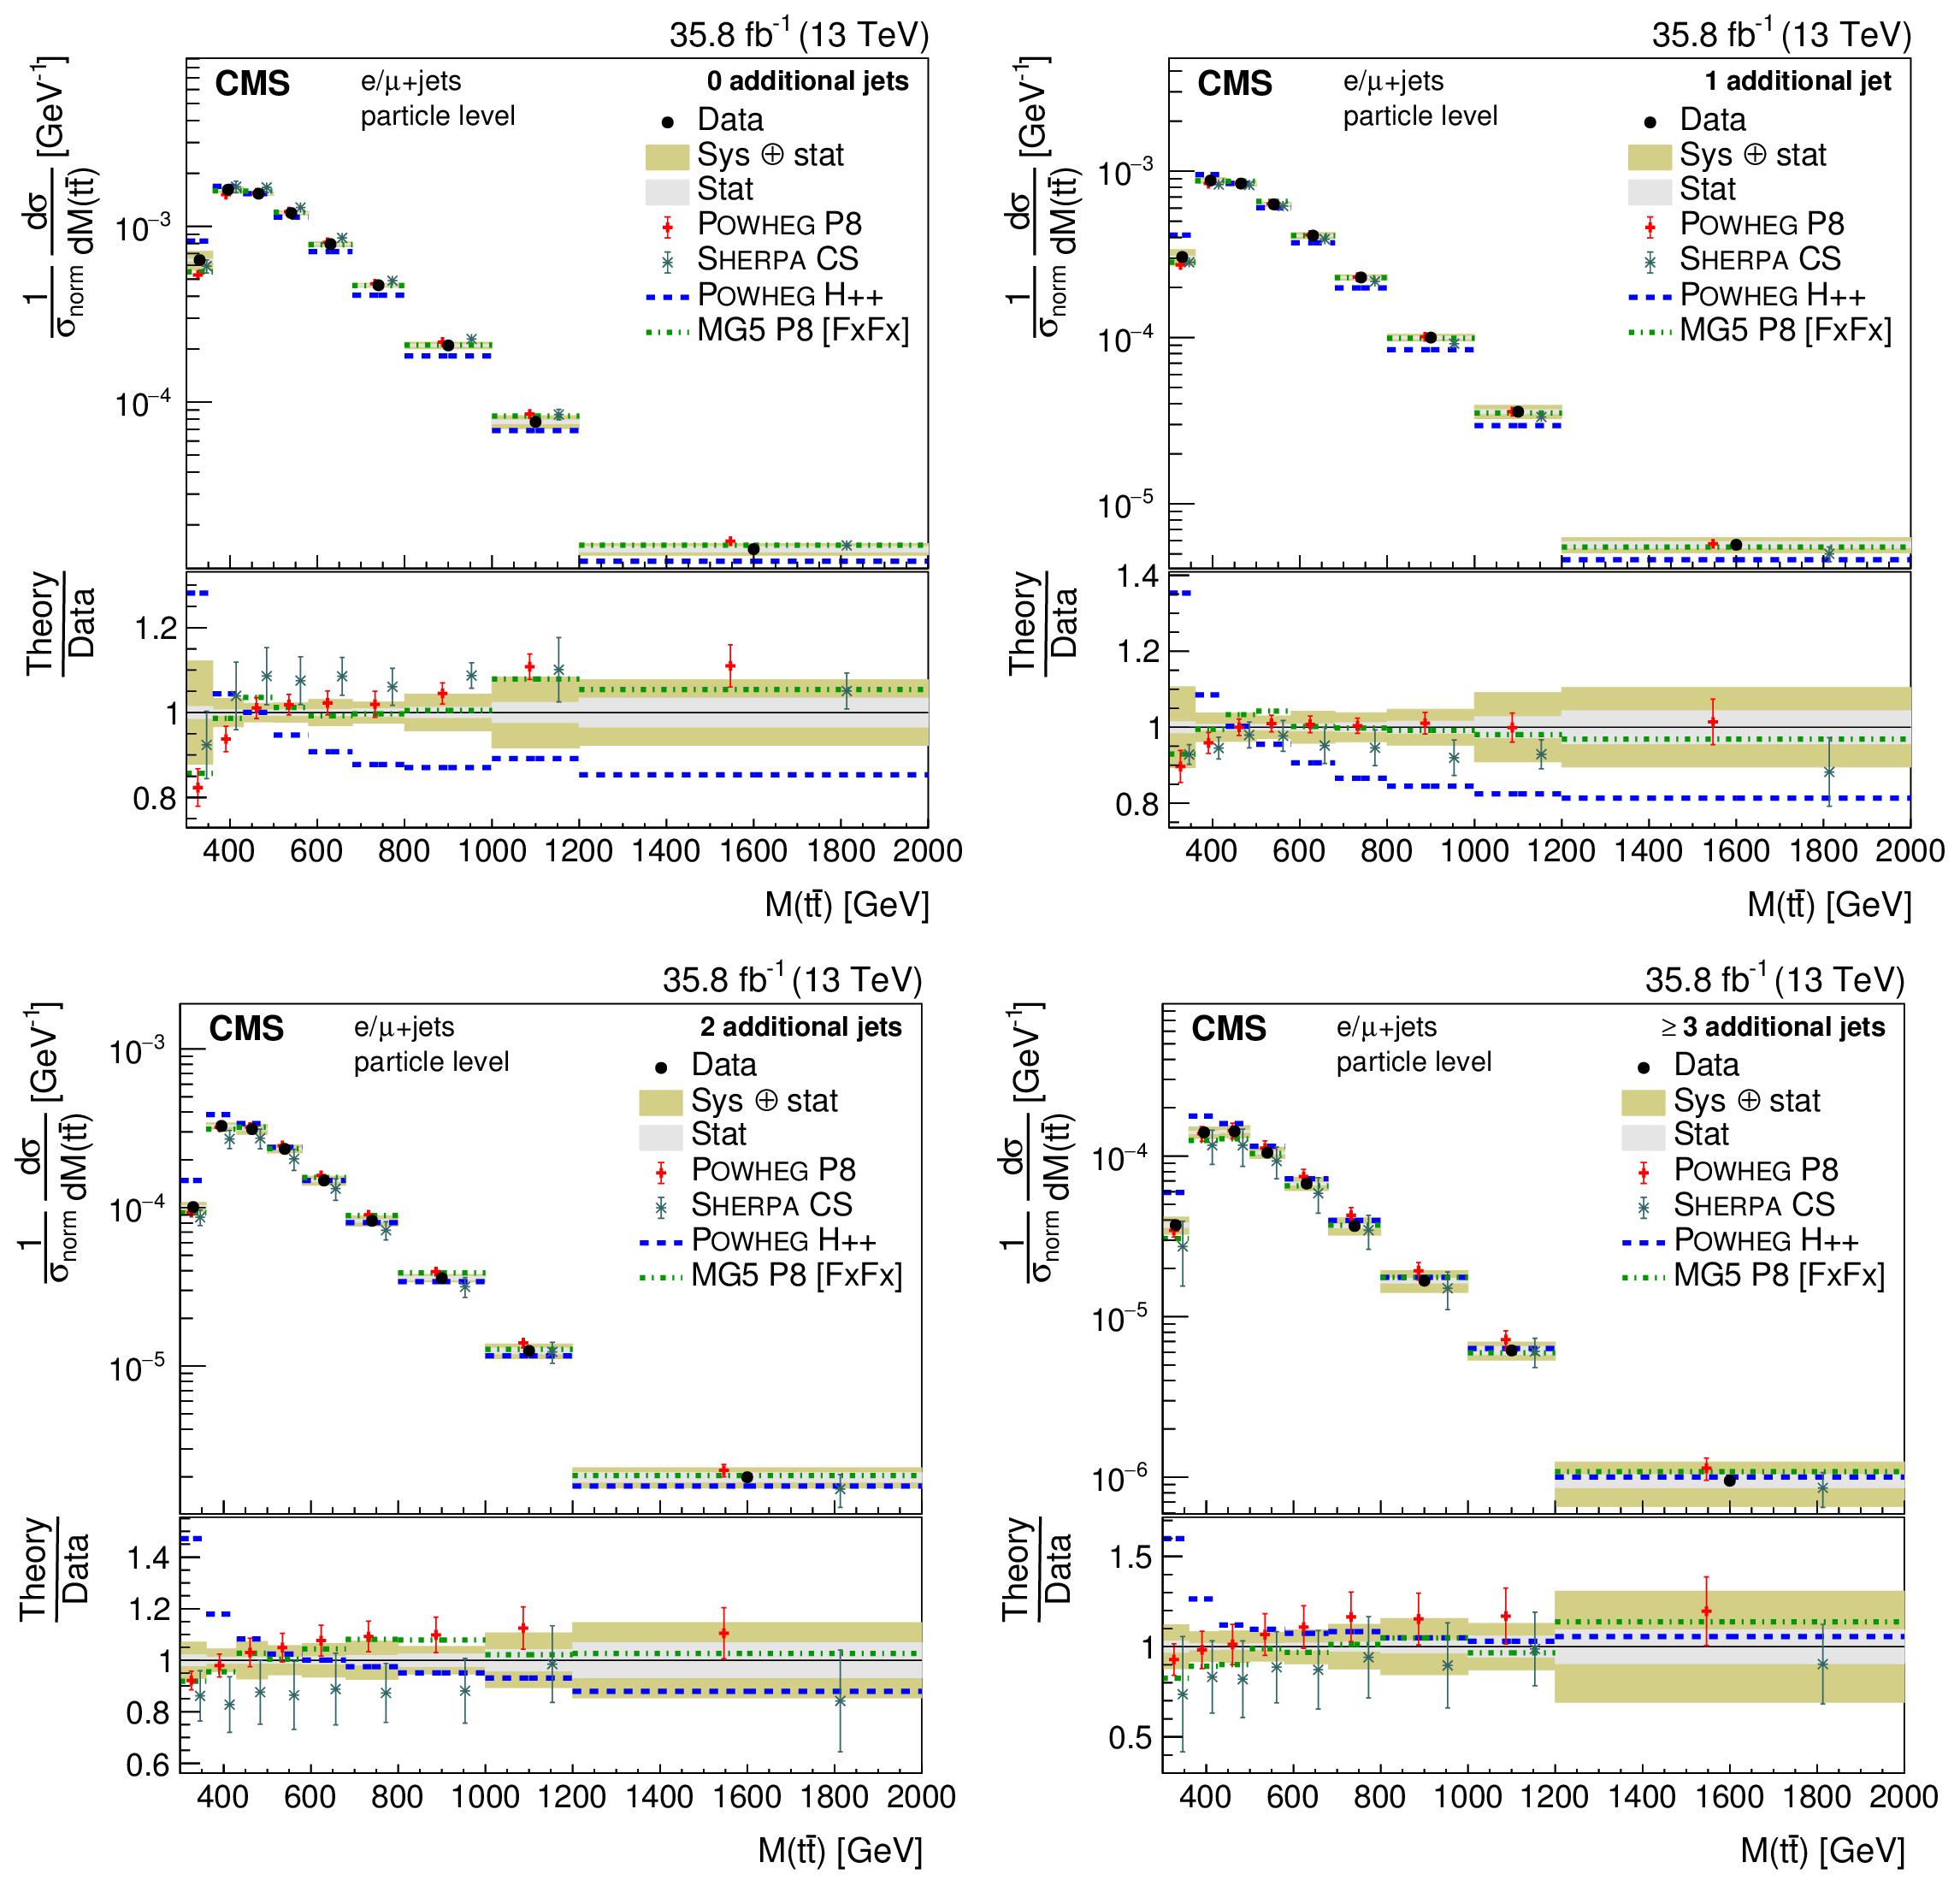
png pdf |
Figure 33:
Differential cross sections at the particle level normalized to the sum of the cross sections $\sigma _\text {norm}$ in the measured ranges as a function of $M({\mathrm{t} \mathrm{\bar{t}}})$ in bins of the number of additional jets. The data are shown as points with light (dark) bands indicating the statistical (statistical and systematic) uncertainties. The cross sections are compared to the predictions of POWHEG combined with PYTHIA8 (P8) or HERWIG++ (H++) and the multiparton simulations MG5_aMC@NLO (MG5)+PYTHIA8 FxFx and SHERPA. The ratios of the various predictions to the measured cross sections are shown at the bottom of each panel. |

png pdf |
Figure 33-a:
Differential cross sections at the particle level normalized to the sum of the cross sections $\sigma _\text {norm}$ in the measured ranges as a function of $M({\mathrm{t} \mathrm{\bar{t}}})$ in bins of the number of additional jets. The data are shown as points with light (dark) bands indicating the statistical (statistical and systematic) uncertainties. The cross sections are compared to the predictions of POWHEG combined with PYTHIA8 (P8) or HERWIG++ (H++) and the multiparton simulations MG5_aMC@NLO (MG5)+PYTHIA8 FxFx and SHERPA. The ratios of the various predictions to the measured cross sections are shown at the bottom of each panel. |
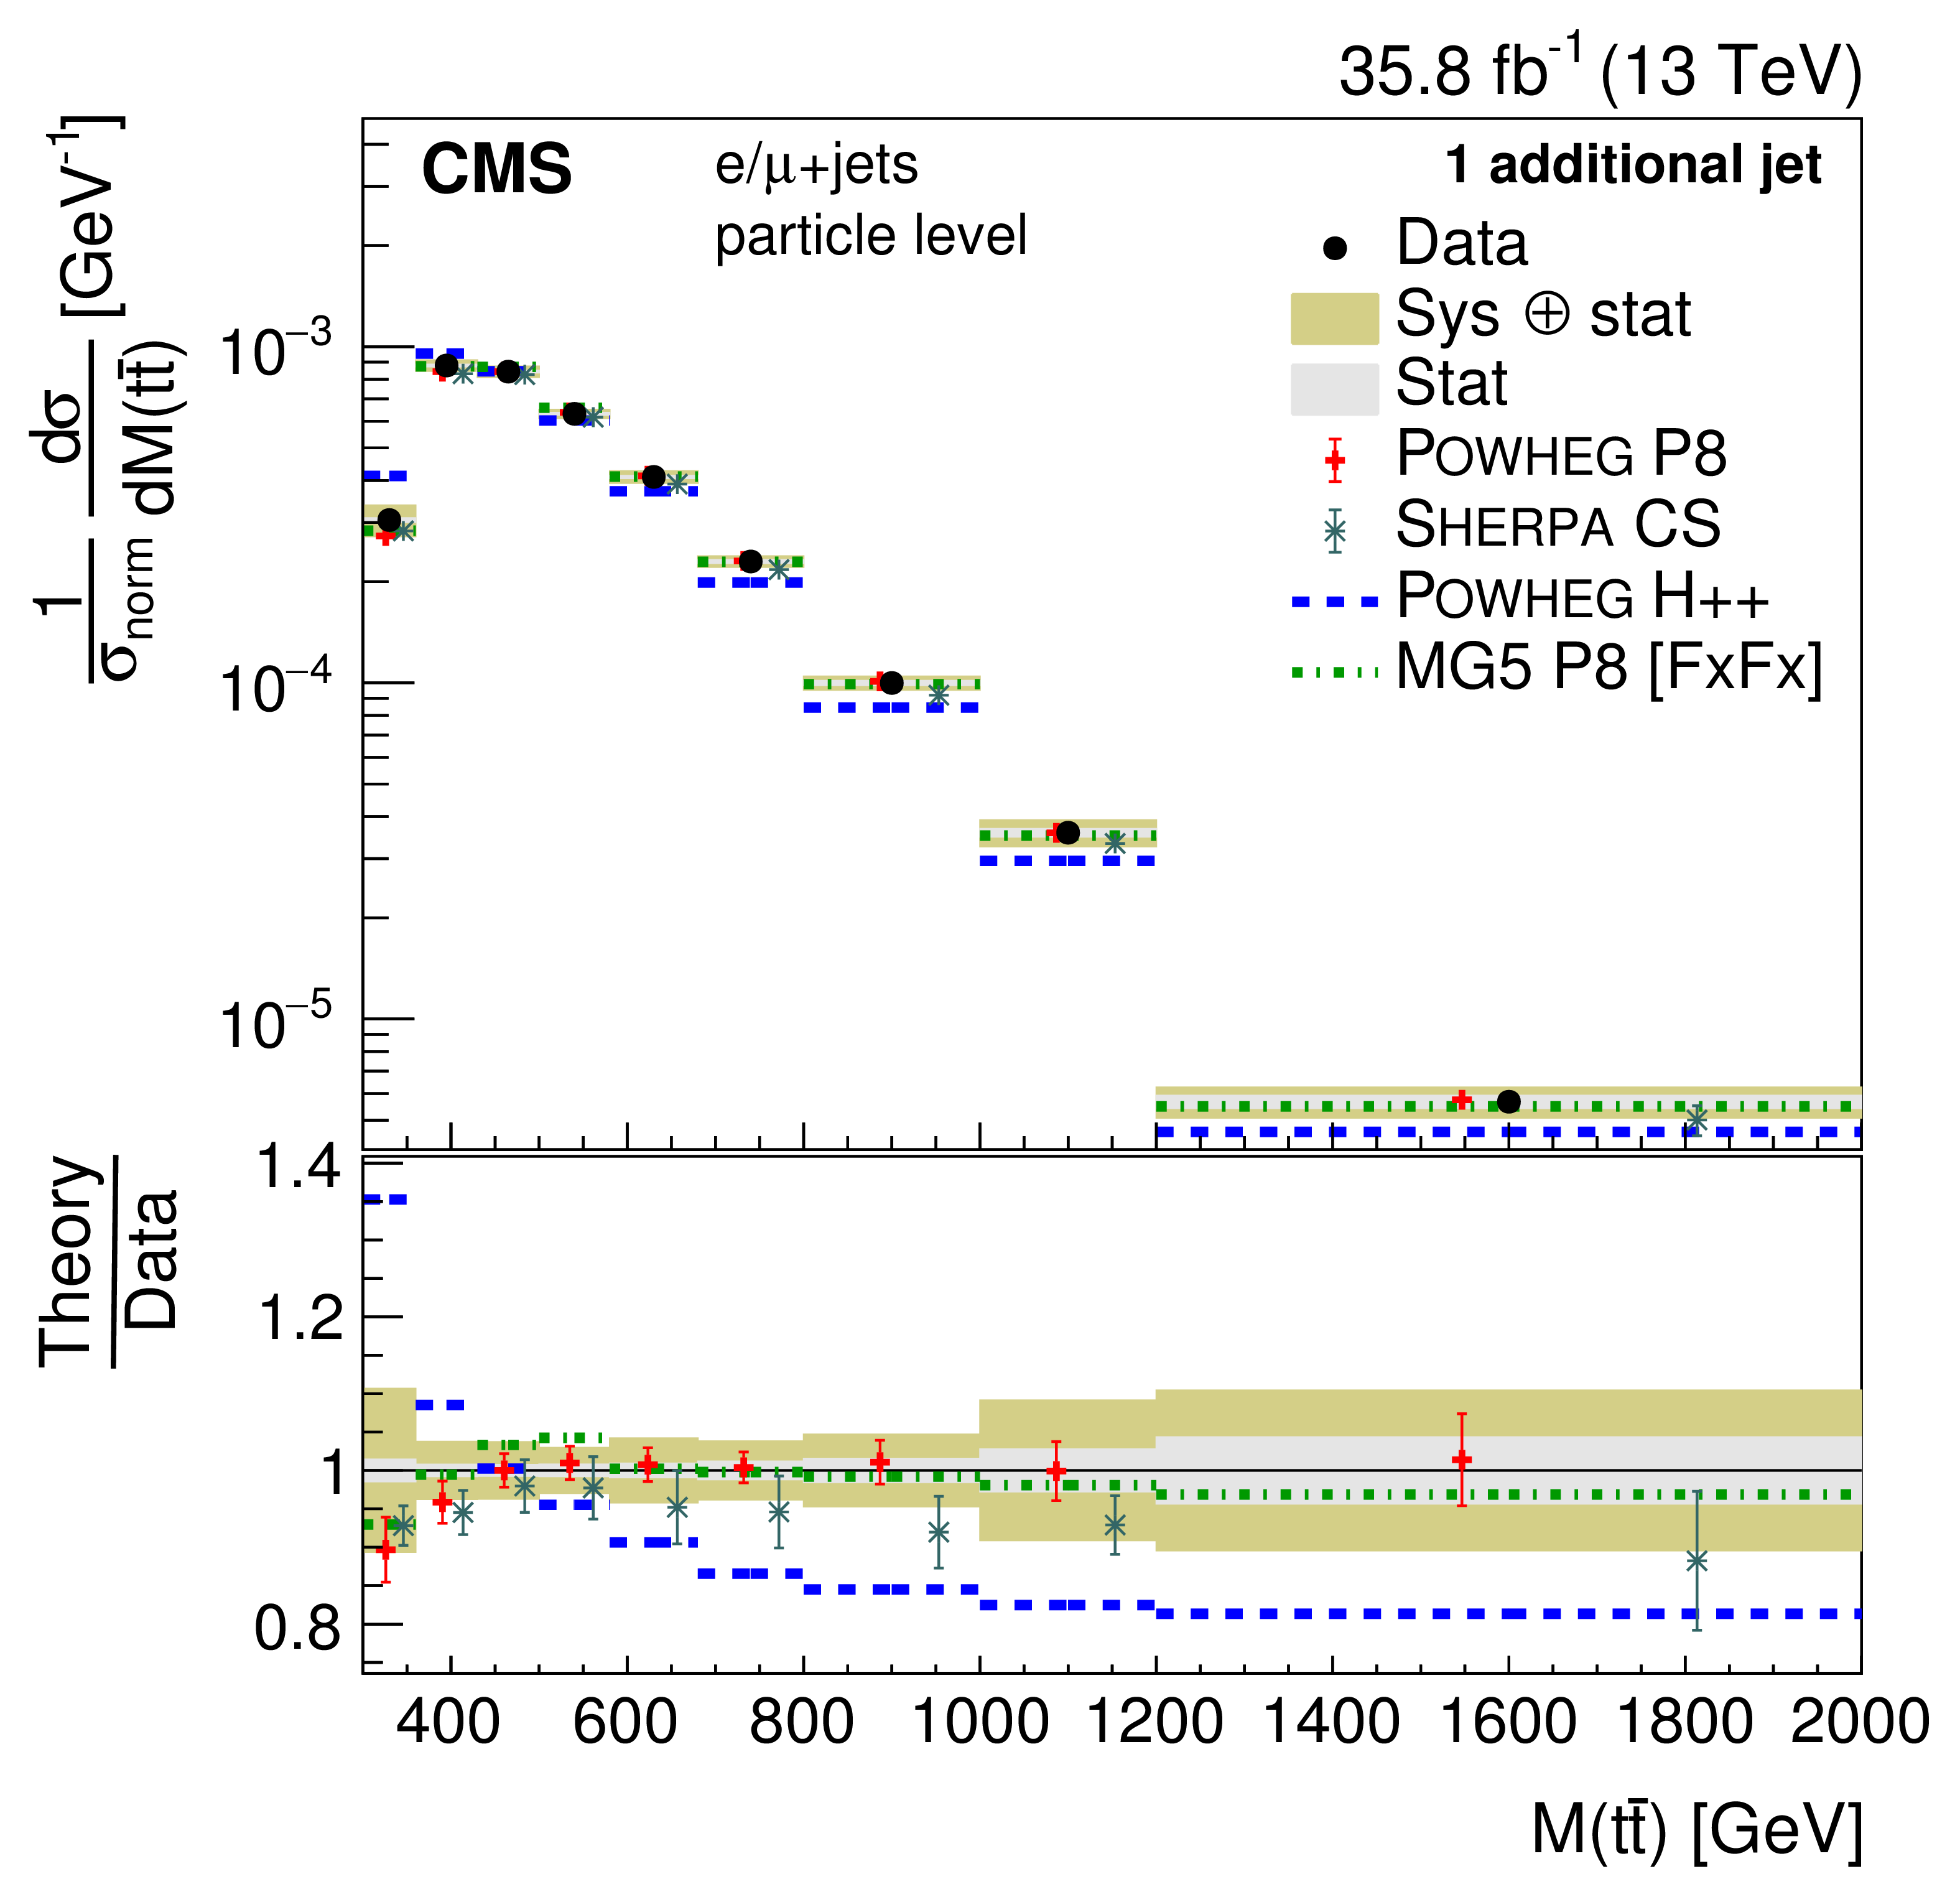
png pdf |
Figure 33-b:
Differential cross sections at the particle level normalized to the sum of the cross sections $\sigma _\text {norm}$ in the measured ranges as a function of $M({\mathrm{t} \mathrm{\bar{t}}})$ in bins of the number of additional jets. The data are shown as points with light (dark) bands indicating the statistical (statistical and systematic) uncertainties. The cross sections are compared to the predictions of POWHEG combined with PYTHIA8 (P8) or HERWIG++ (H++) and the multiparton simulations MG5_aMC@NLO (MG5)+PYTHIA8 FxFx and SHERPA. The ratios of the various predictions to the measured cross sections are shown at the bottom of each panel. |
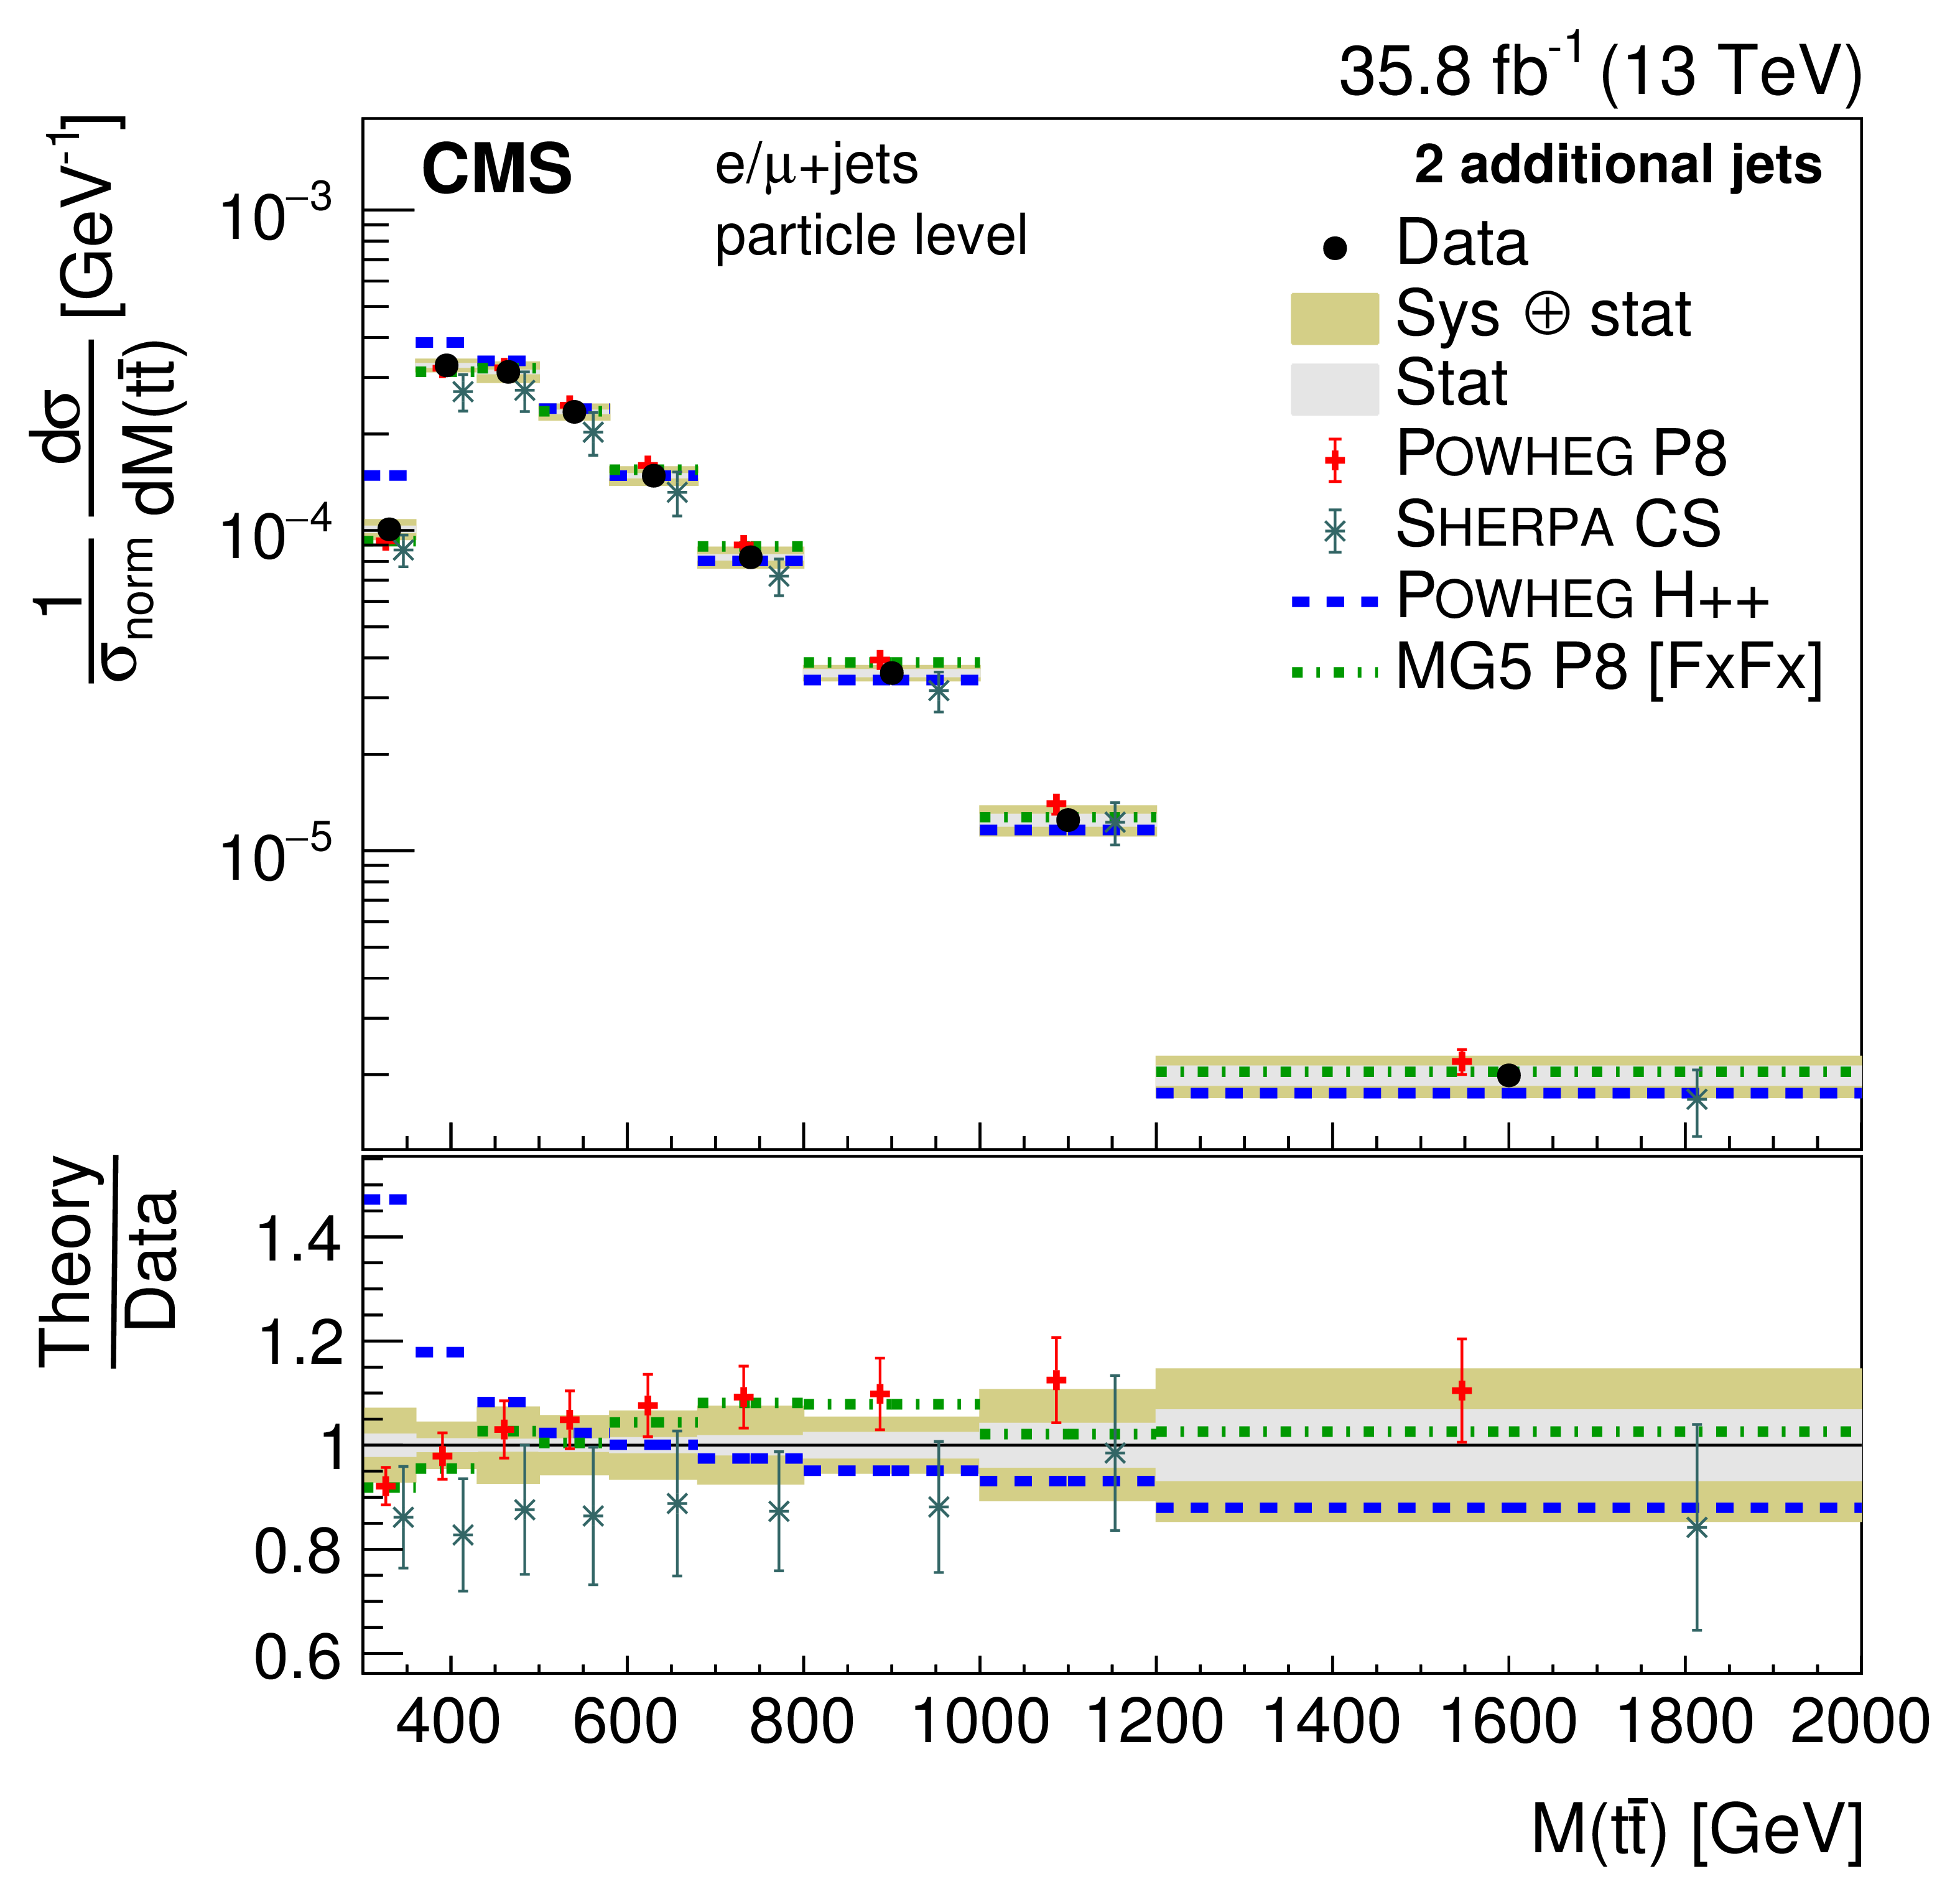
png pdf |
Figure 33-c:
Differential cross sections at the particle level normalized to the sum of the cross sections $\sigma _\text {norm}$ in the measured ranges as a function of $M({\mathrm{t} \mathrm{\bar{t}}})$ in bins of the number of additional jets. The data are shown as points with light (dark) bands indicating the statistical (statistical and systematic) uncertainties. The cross sections are compared to the predictions of POWHEG combined with PYTHIA8 (P8) or HERWIG++ (H++) and the multiparton simulations MG5_aMC@NLO (MG5)+PYTHIA8 FxFx and SHERPA. The ratios of the various predictions to the measured cross sections are shown at the bottom of each panel. |
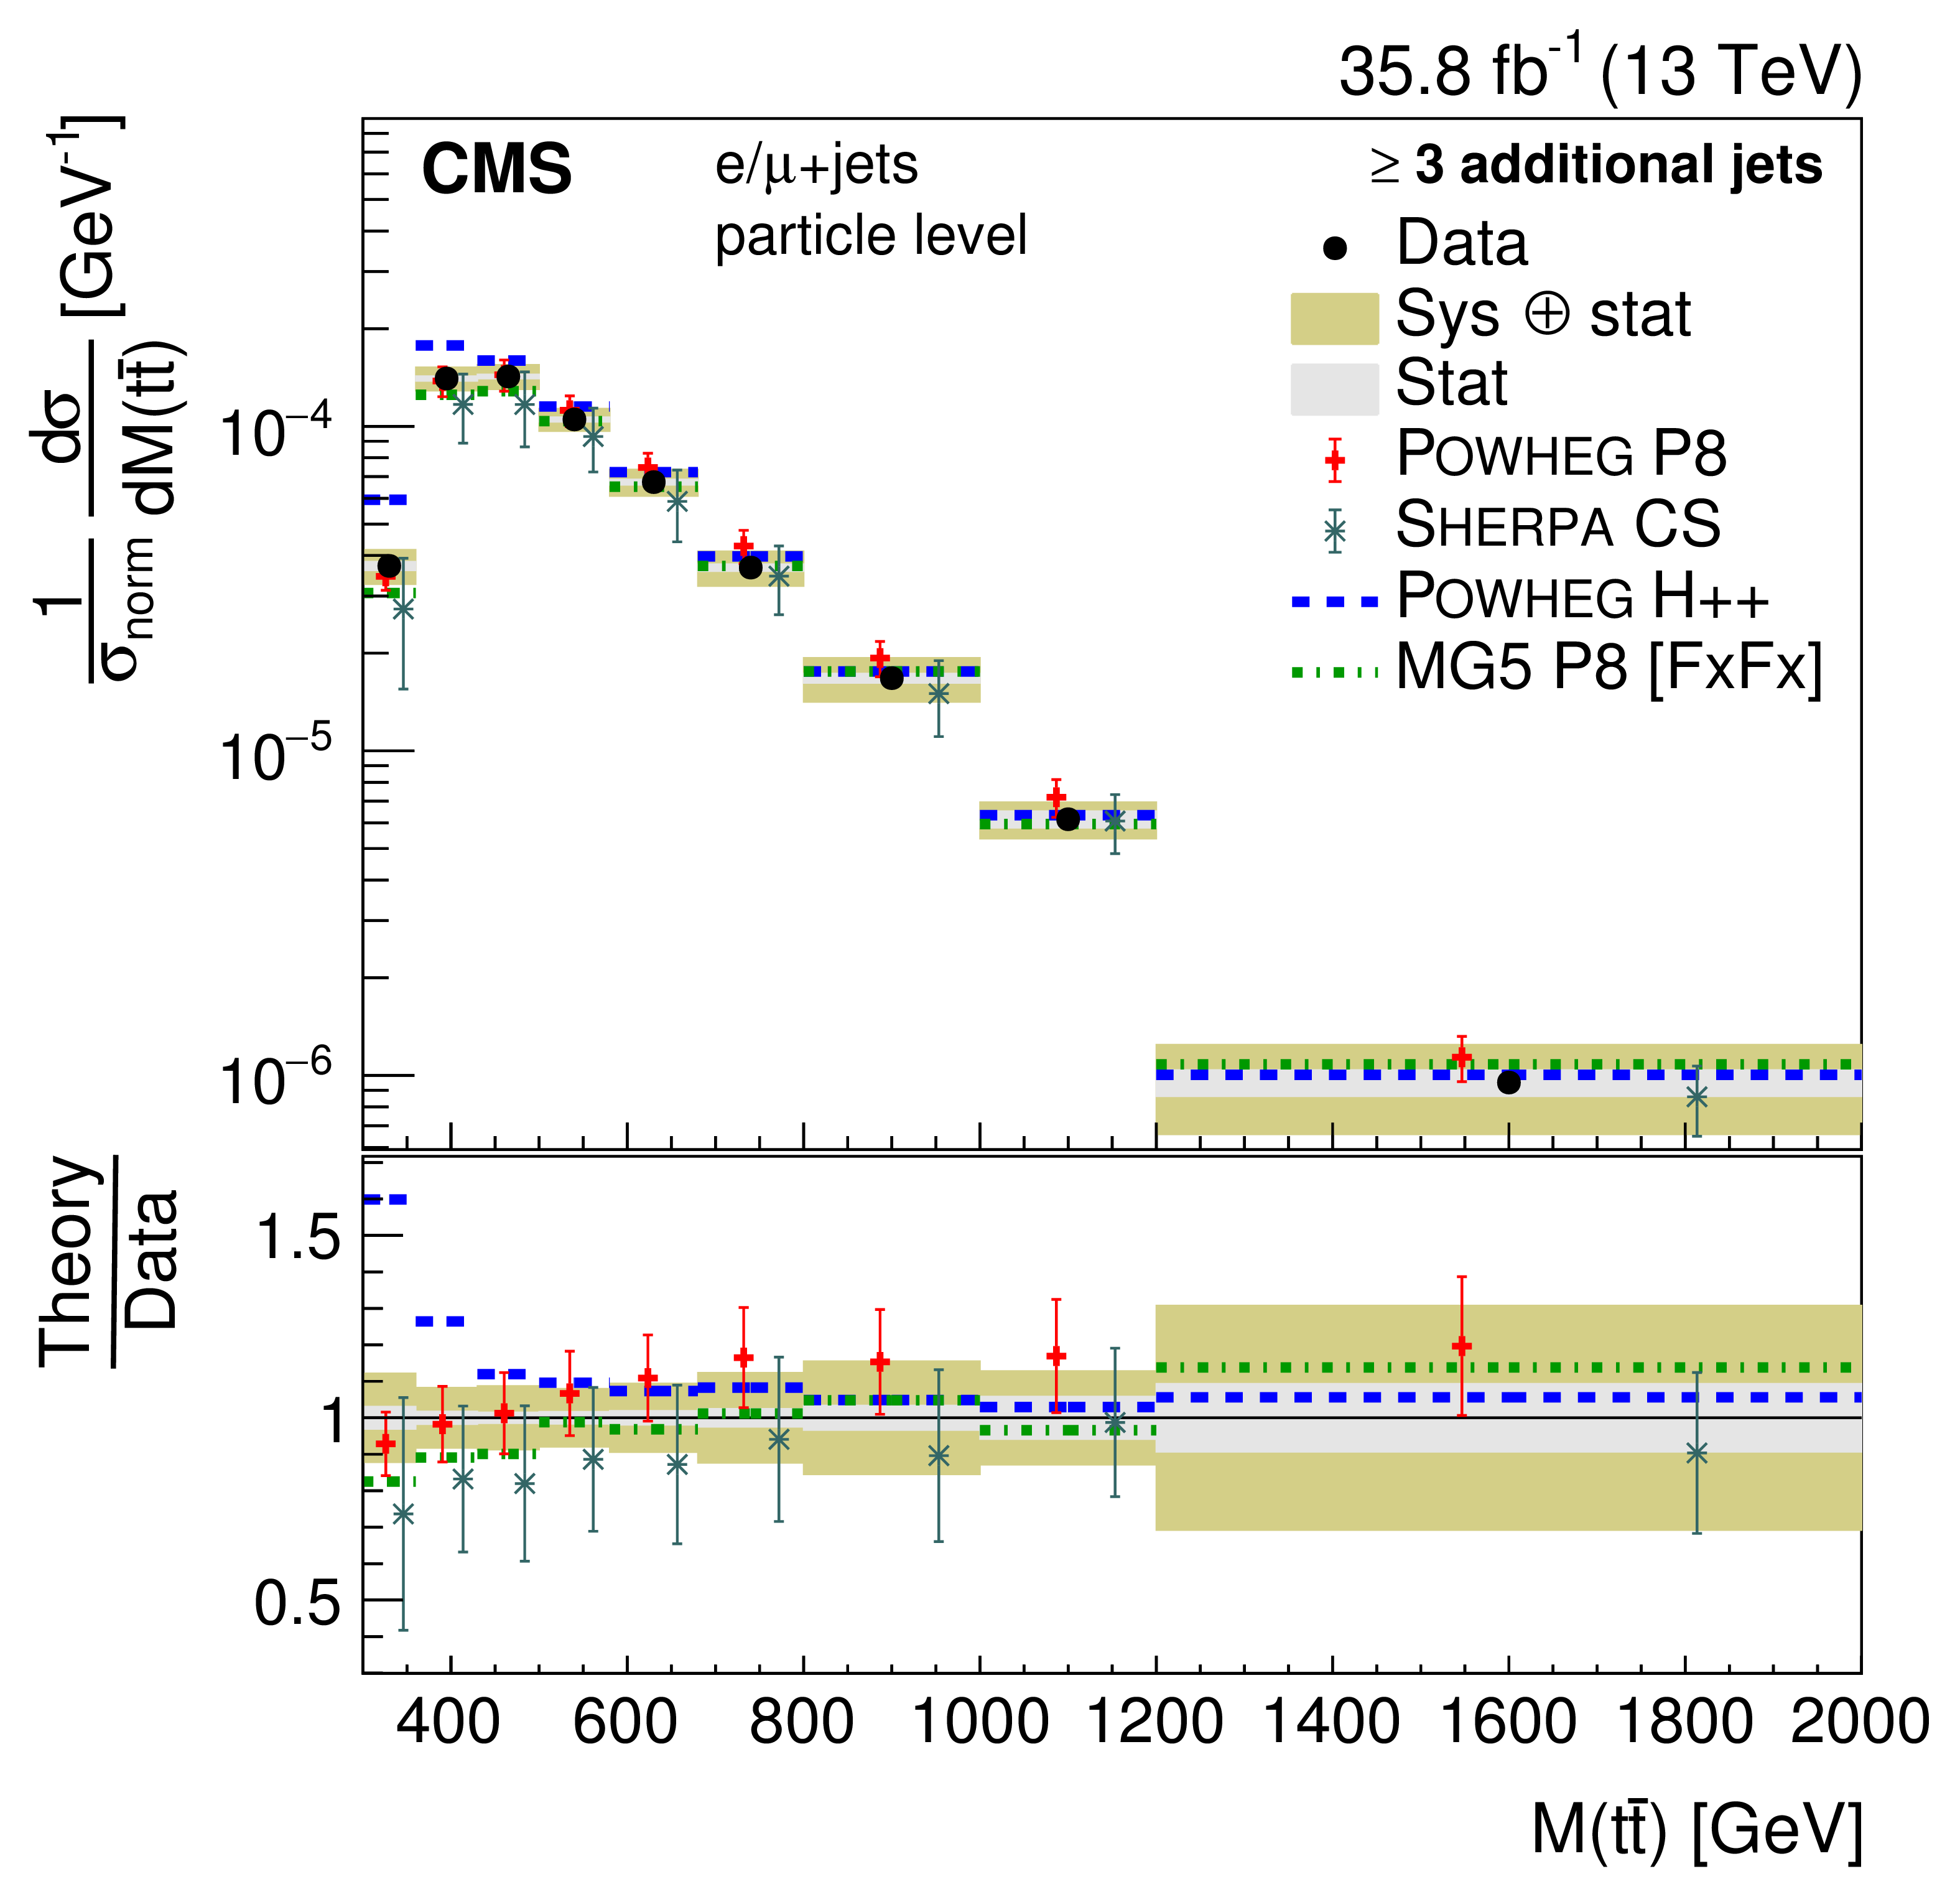
png pdf |
Figure 33-d:
Differential cross sections at the particle level normalized to the sum of the cross sections $\sigma _\text {norm}$ in the measured ranges as a function of $M({\mathrm{t} \mathrm{\bar{t}}})$ in bins of the number of additional jets. The data are shown as points with light (dark) bands indicating the statistical (statistical and systematic) uncertainties. The cross sections are compared to the predictions of POWHEG combined with PYTHIA8 (P8) or HERWIG++ (H++) and the multiparton simulations MG5_aMC@NLO (MG5)+PYTHIA8 FxFx and SHERPA. The ratios of the various predictions to the measured cross sections are shown at the bottom of each panel. |

png pdf |
Figure 34:
Differential cross sections at the particle level as a function of $ {p_{\mathrm {T}}} ({\mathrm{t} \mathrm{\bar{t}}})$ in bins of the number of additional jets. The data are shown as points with light (dark) bands indicating the statistical (statistical and systematic) uncertainties. The cross sections are compared to the predictions of POWHEG combined with PYTHIA8 (P8) or HERWIG++ (H++) and the multiparton simulations MG5_aMC@NLO (MG5)+PYTHIA8 FxFx and SHERPA. The ratios of the various predictions to the measured cross sections are shown at the bottom of each panel. |
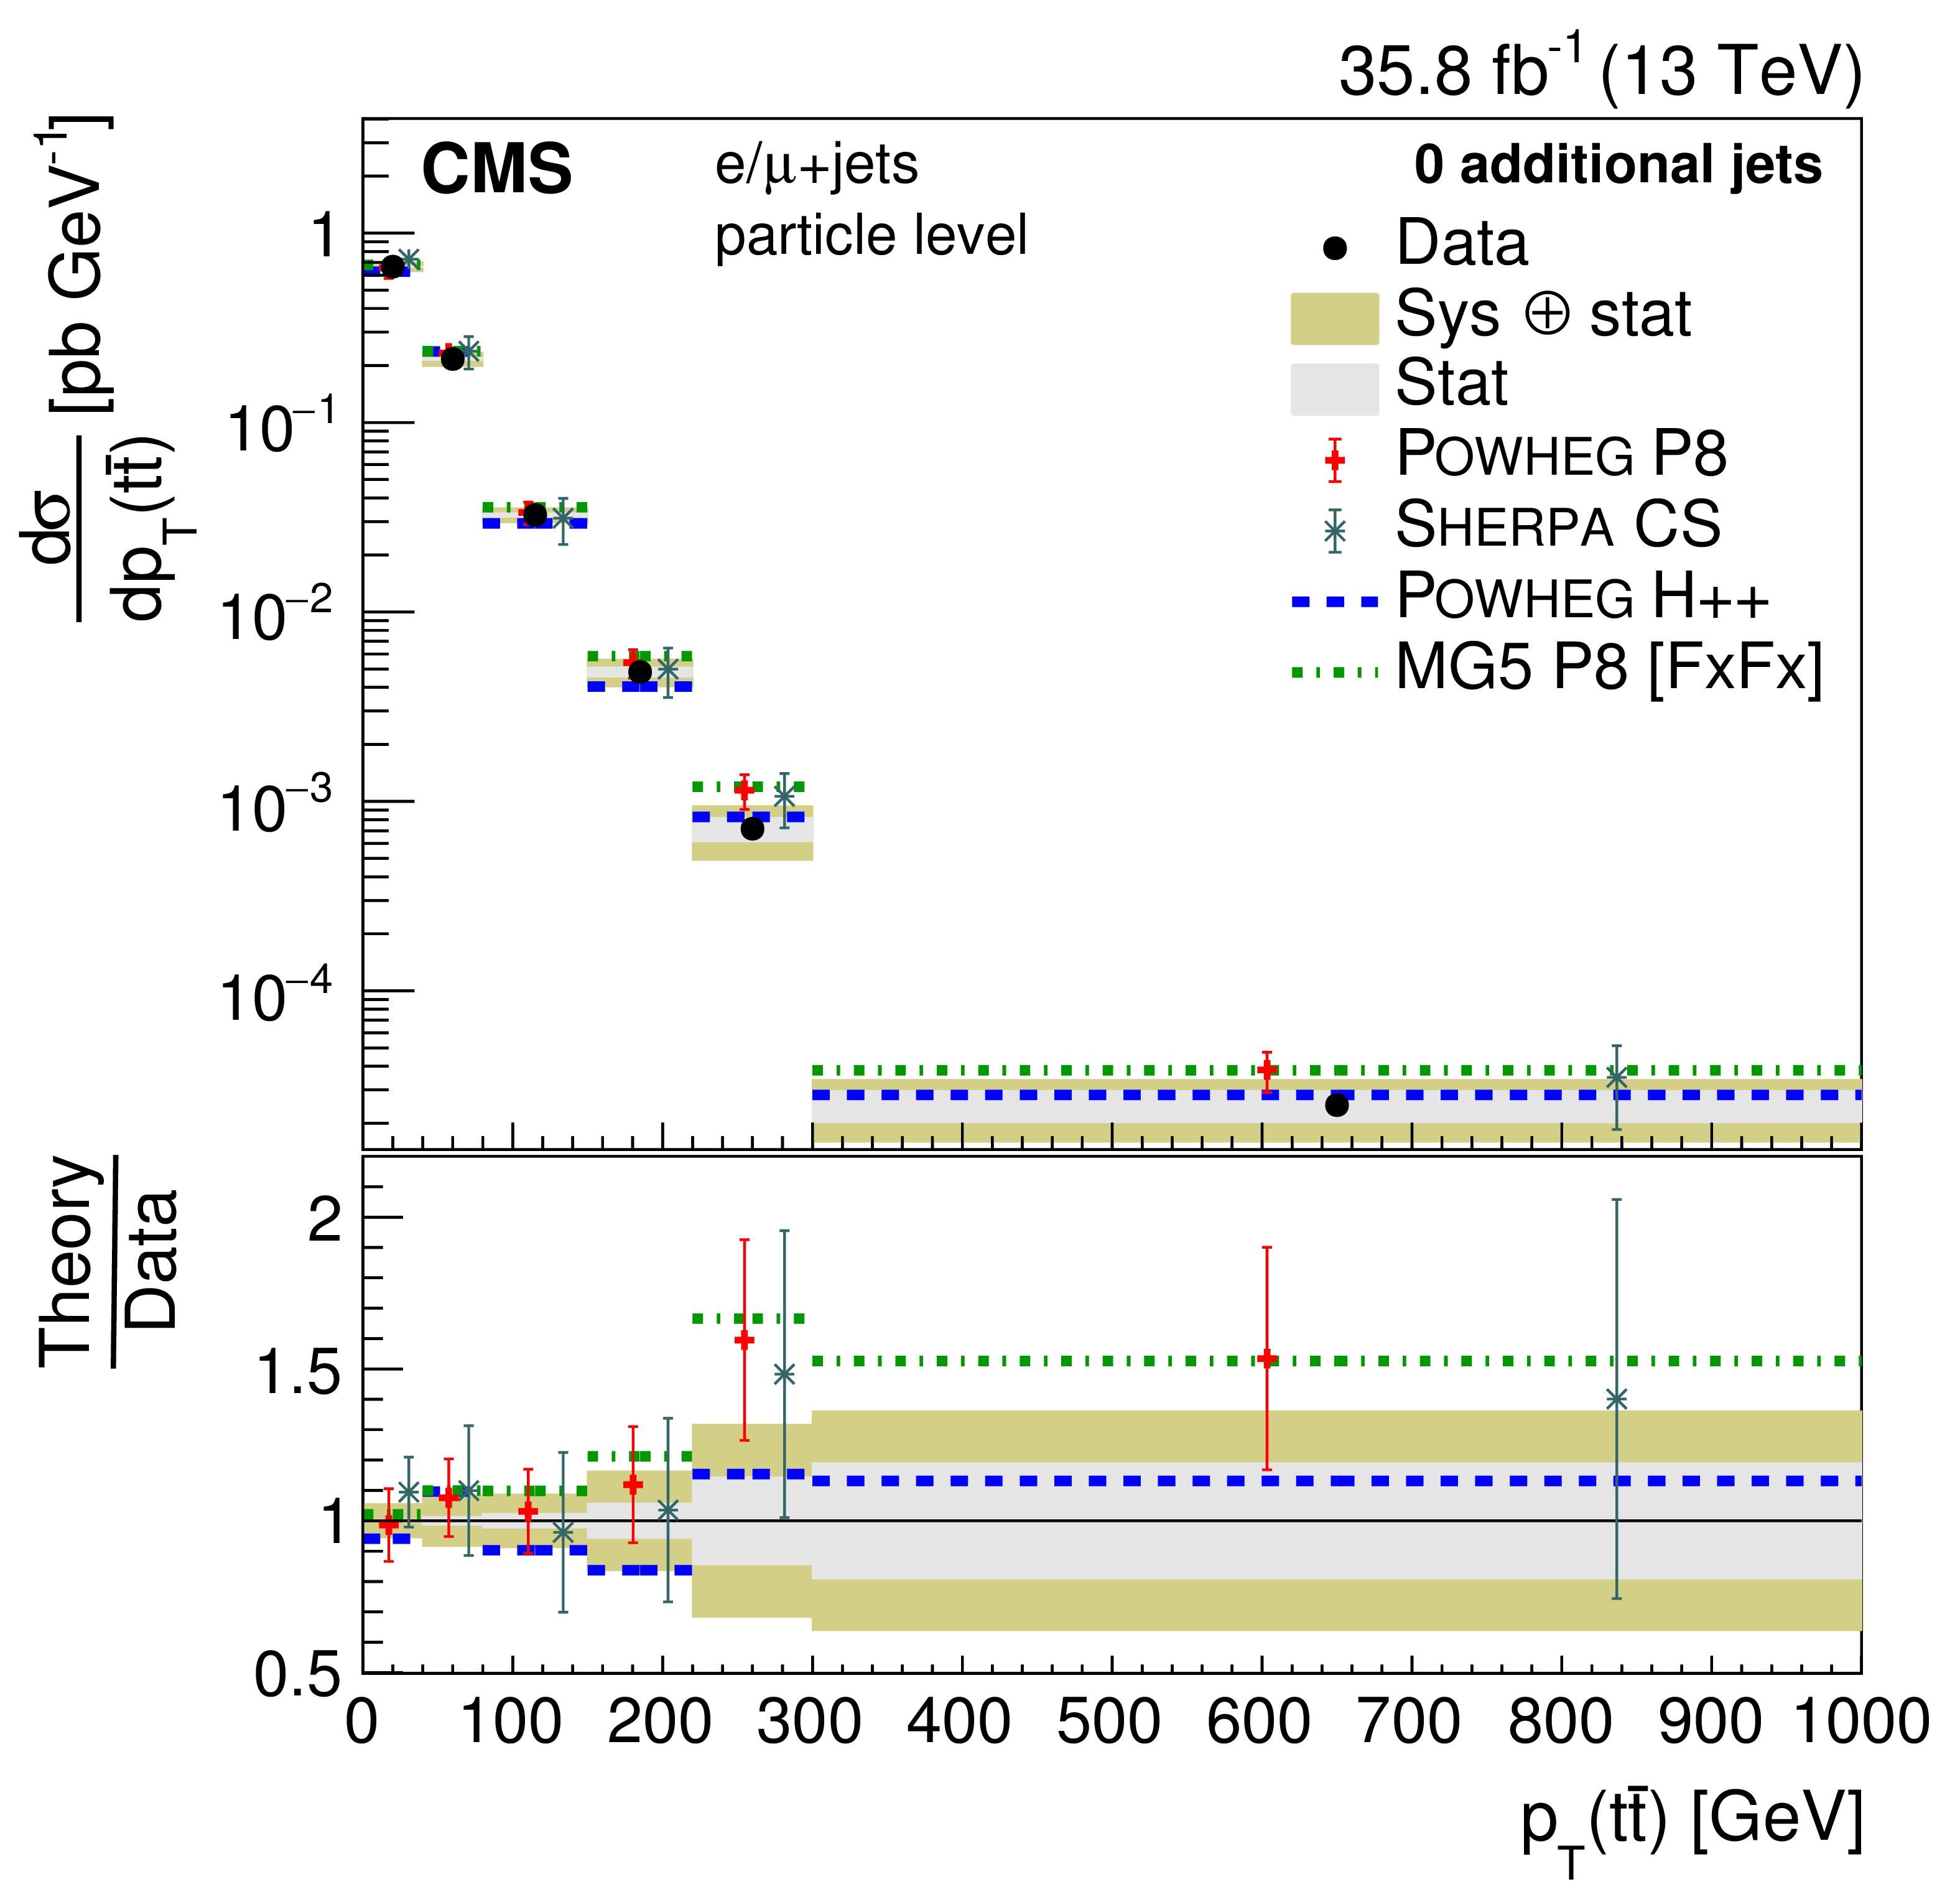
png pdf |
Figure 34-a:
Differential cross sections at the particle level as a function of $ {p_{\mathrm {T}}} ({\mathrm{t} \mathrm{\bar{t}}})$ in bins of the number of additional jets. The data are shown as points with light (dark) bands indicating the statistical (statistical and systematic) uncertainties. The cross sections are compared to the predictions of POWHEG combined with PYTHIA8 (P8) or HERWIG++ (H++) and the multiparton simulations MG5_aMC@NLO (MG5)+PYTHIA8 FxFx and SHERPA. The ratios of the various predictions to the measured cross sections are shown at the bottom of each panel. |
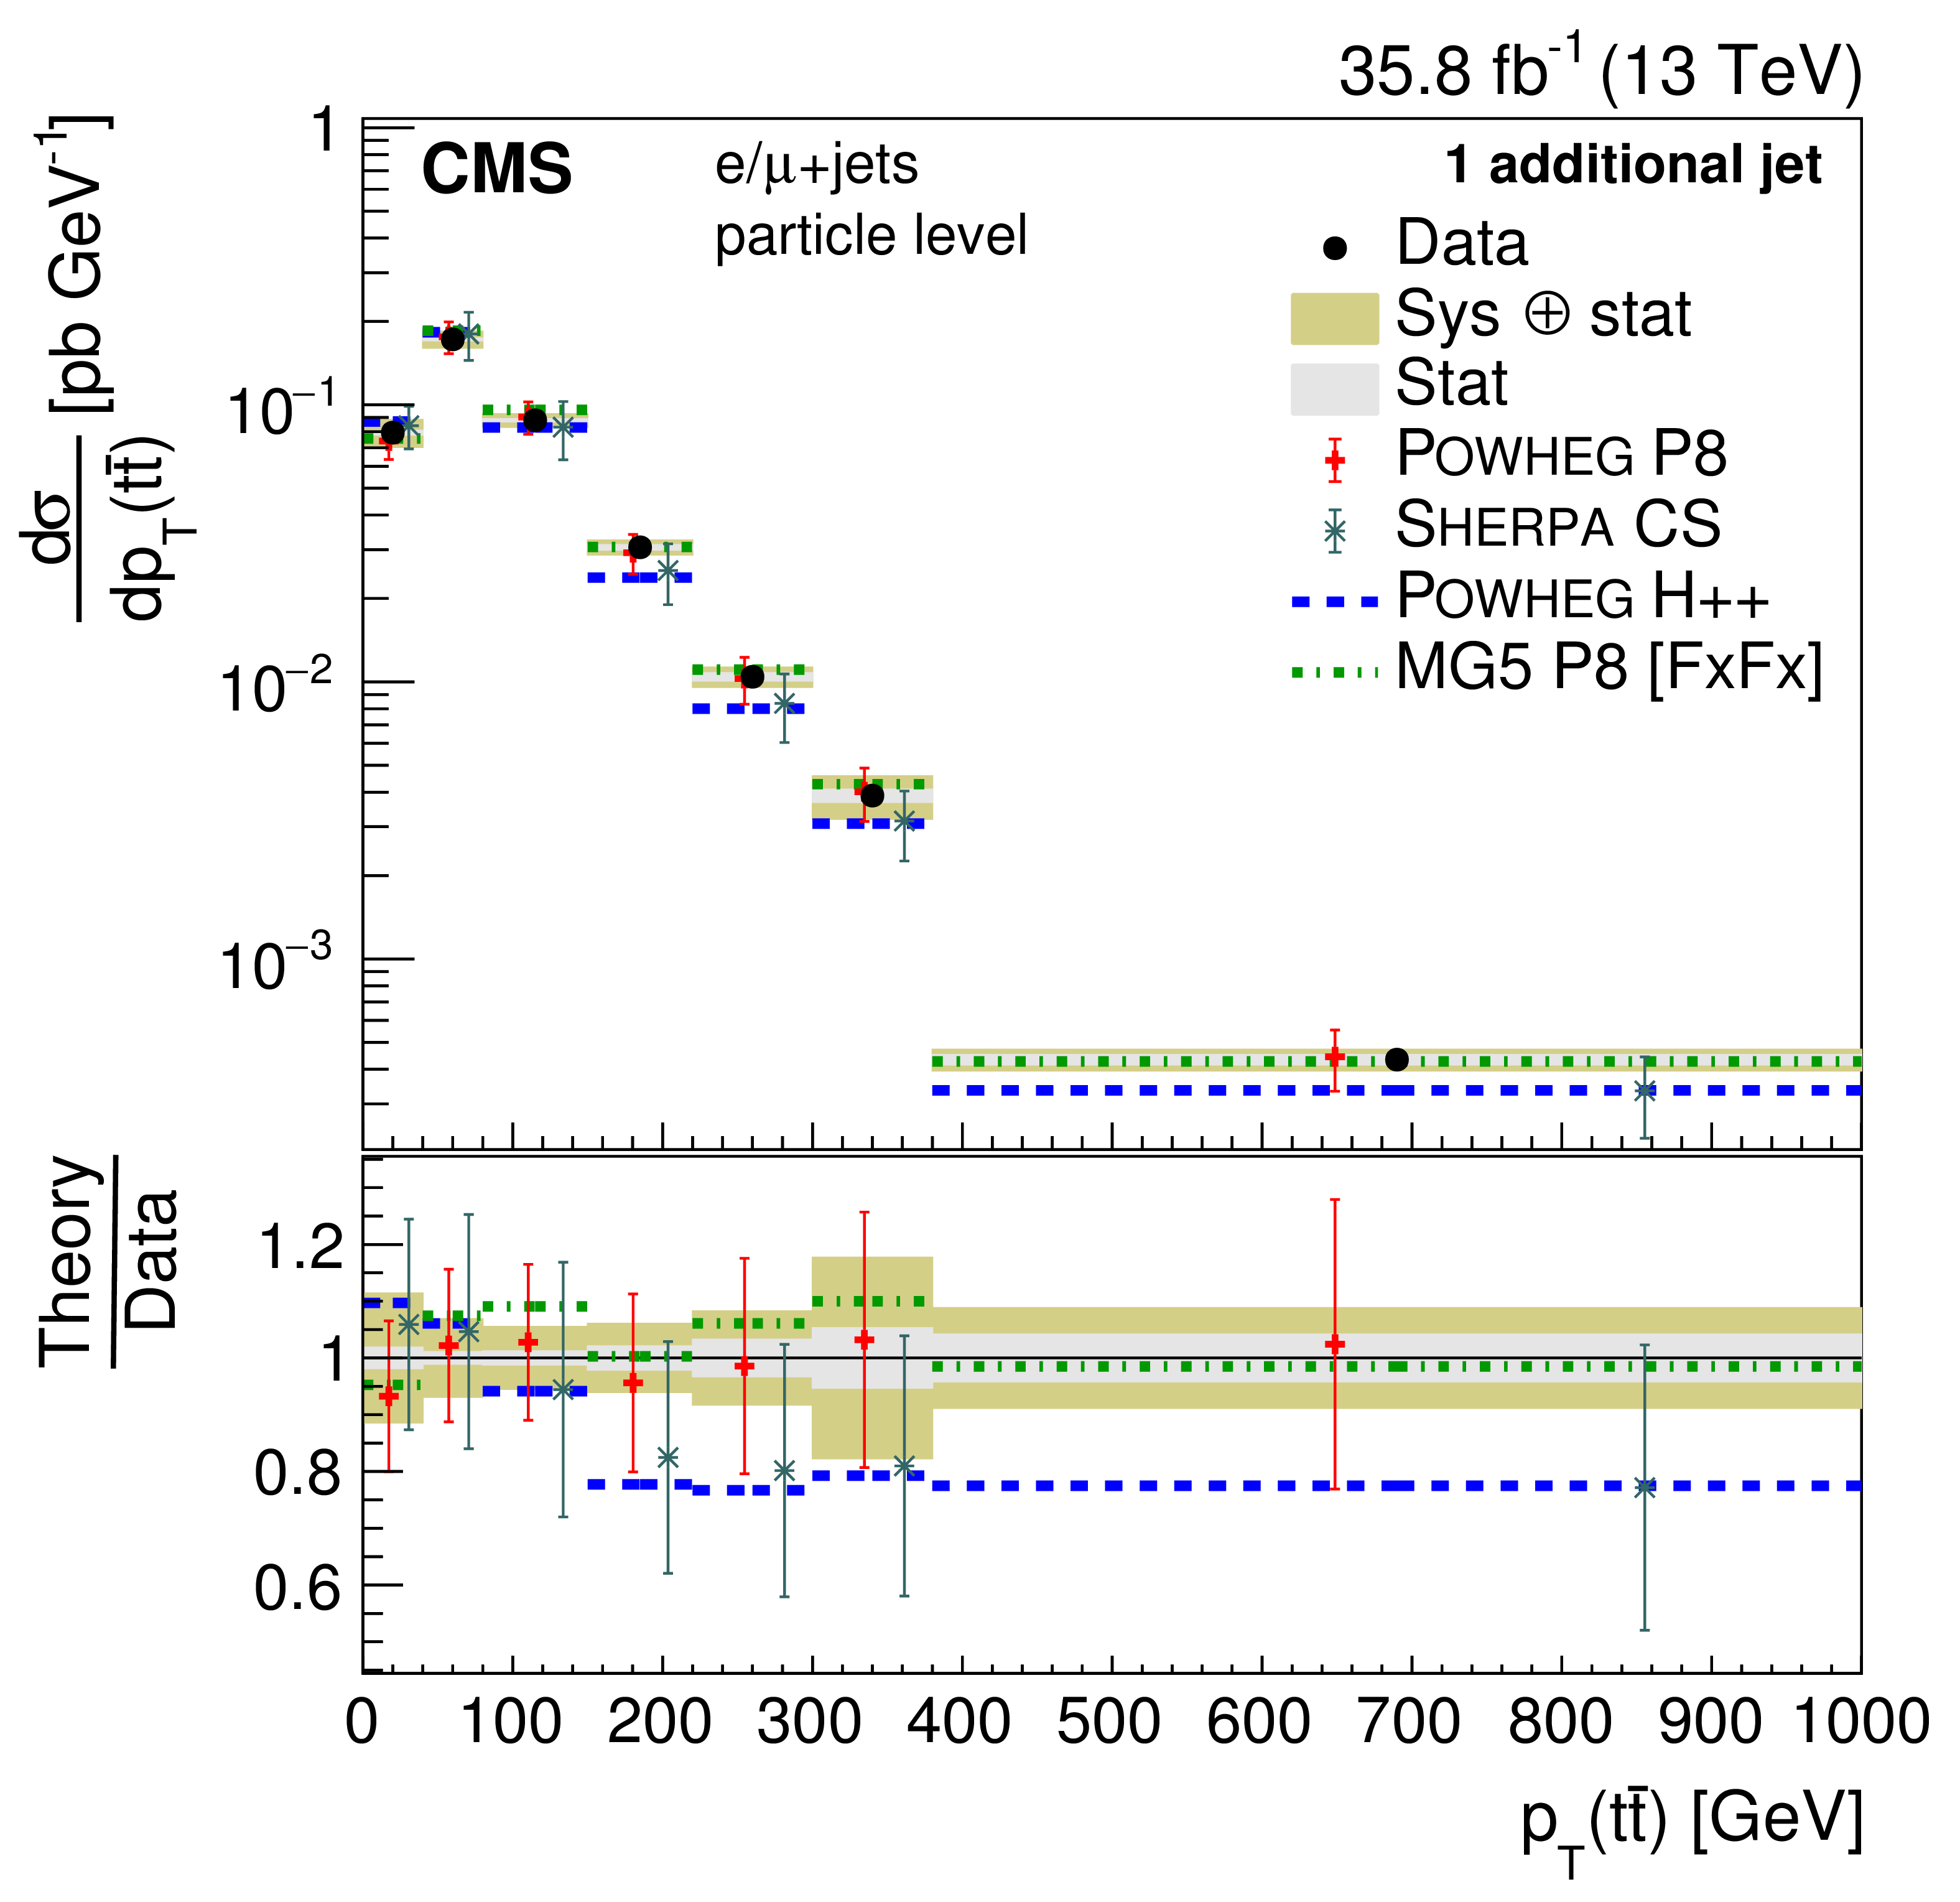
png pdf |
Figure 34-b:
Differential cross sections at the particle level as a function of $ {p_{\mathrm {T}}} ({\mathrm{t} \mathrm{\bar{t}}})$ in bins of the number of additional jets. The data are shown as points with light (dark) bands indicating the statistical (statistical and systematic) uncertainties. The cross sections are compared to the predictions of POWHEG combined with PYTHIA8 (P8) or HERWIG++ (H++) and the multiparton simulations MG5_aMC@NLO (MG5)+PYTHIA8 FxFx and SHERPA. The ratios of the various predictions to the measured cross sections are shown at the bottom of each panel. |

png pdf |
Figure 34-c:
Differential cross sections at the particle level as a function of $ {p_{\mathrm {T}}} ({\mathrm{t} \mathrm{\bar{t}}})$ in bins of the number of additional jets. The data are shown as points with light (dark) bands indicating the statistical (statistical and systematic) uncertainties. The cross sections are compared to the predictions of POWHEG combined with PYTHIA8 (P8) or HERWIG++ (H++) and the multiparton simulations MG5_aMC@NLO (MG5)+PYTHIA8 FxFx and SHERPA. The ratios of the various predictions to the measured cross sections are shown at the bottom of each panel. |

png pdf |
Figure 34-d:
Differential cross sections at the particle level as a function of $ {p_{\mathrm {T}}} ({\mathrm{t} \mathrm{\bar{t}}})$ in bins of the number of additional jets. The data are shown as points with light (dark) bands indicating the statistical (statistical and systematic) uncertainties. The cross sections are compared to the predictions of POWHEG combined with PYTHIA8 (P8) or HERWIG++ (H++) and the multiparton simulations MG5_aMC@NLO (MG5)+PYTHIA8 FxFx and SHERPA. The ratios of the various predictions to the measured cross sections are shown at the bottom of each panel. |
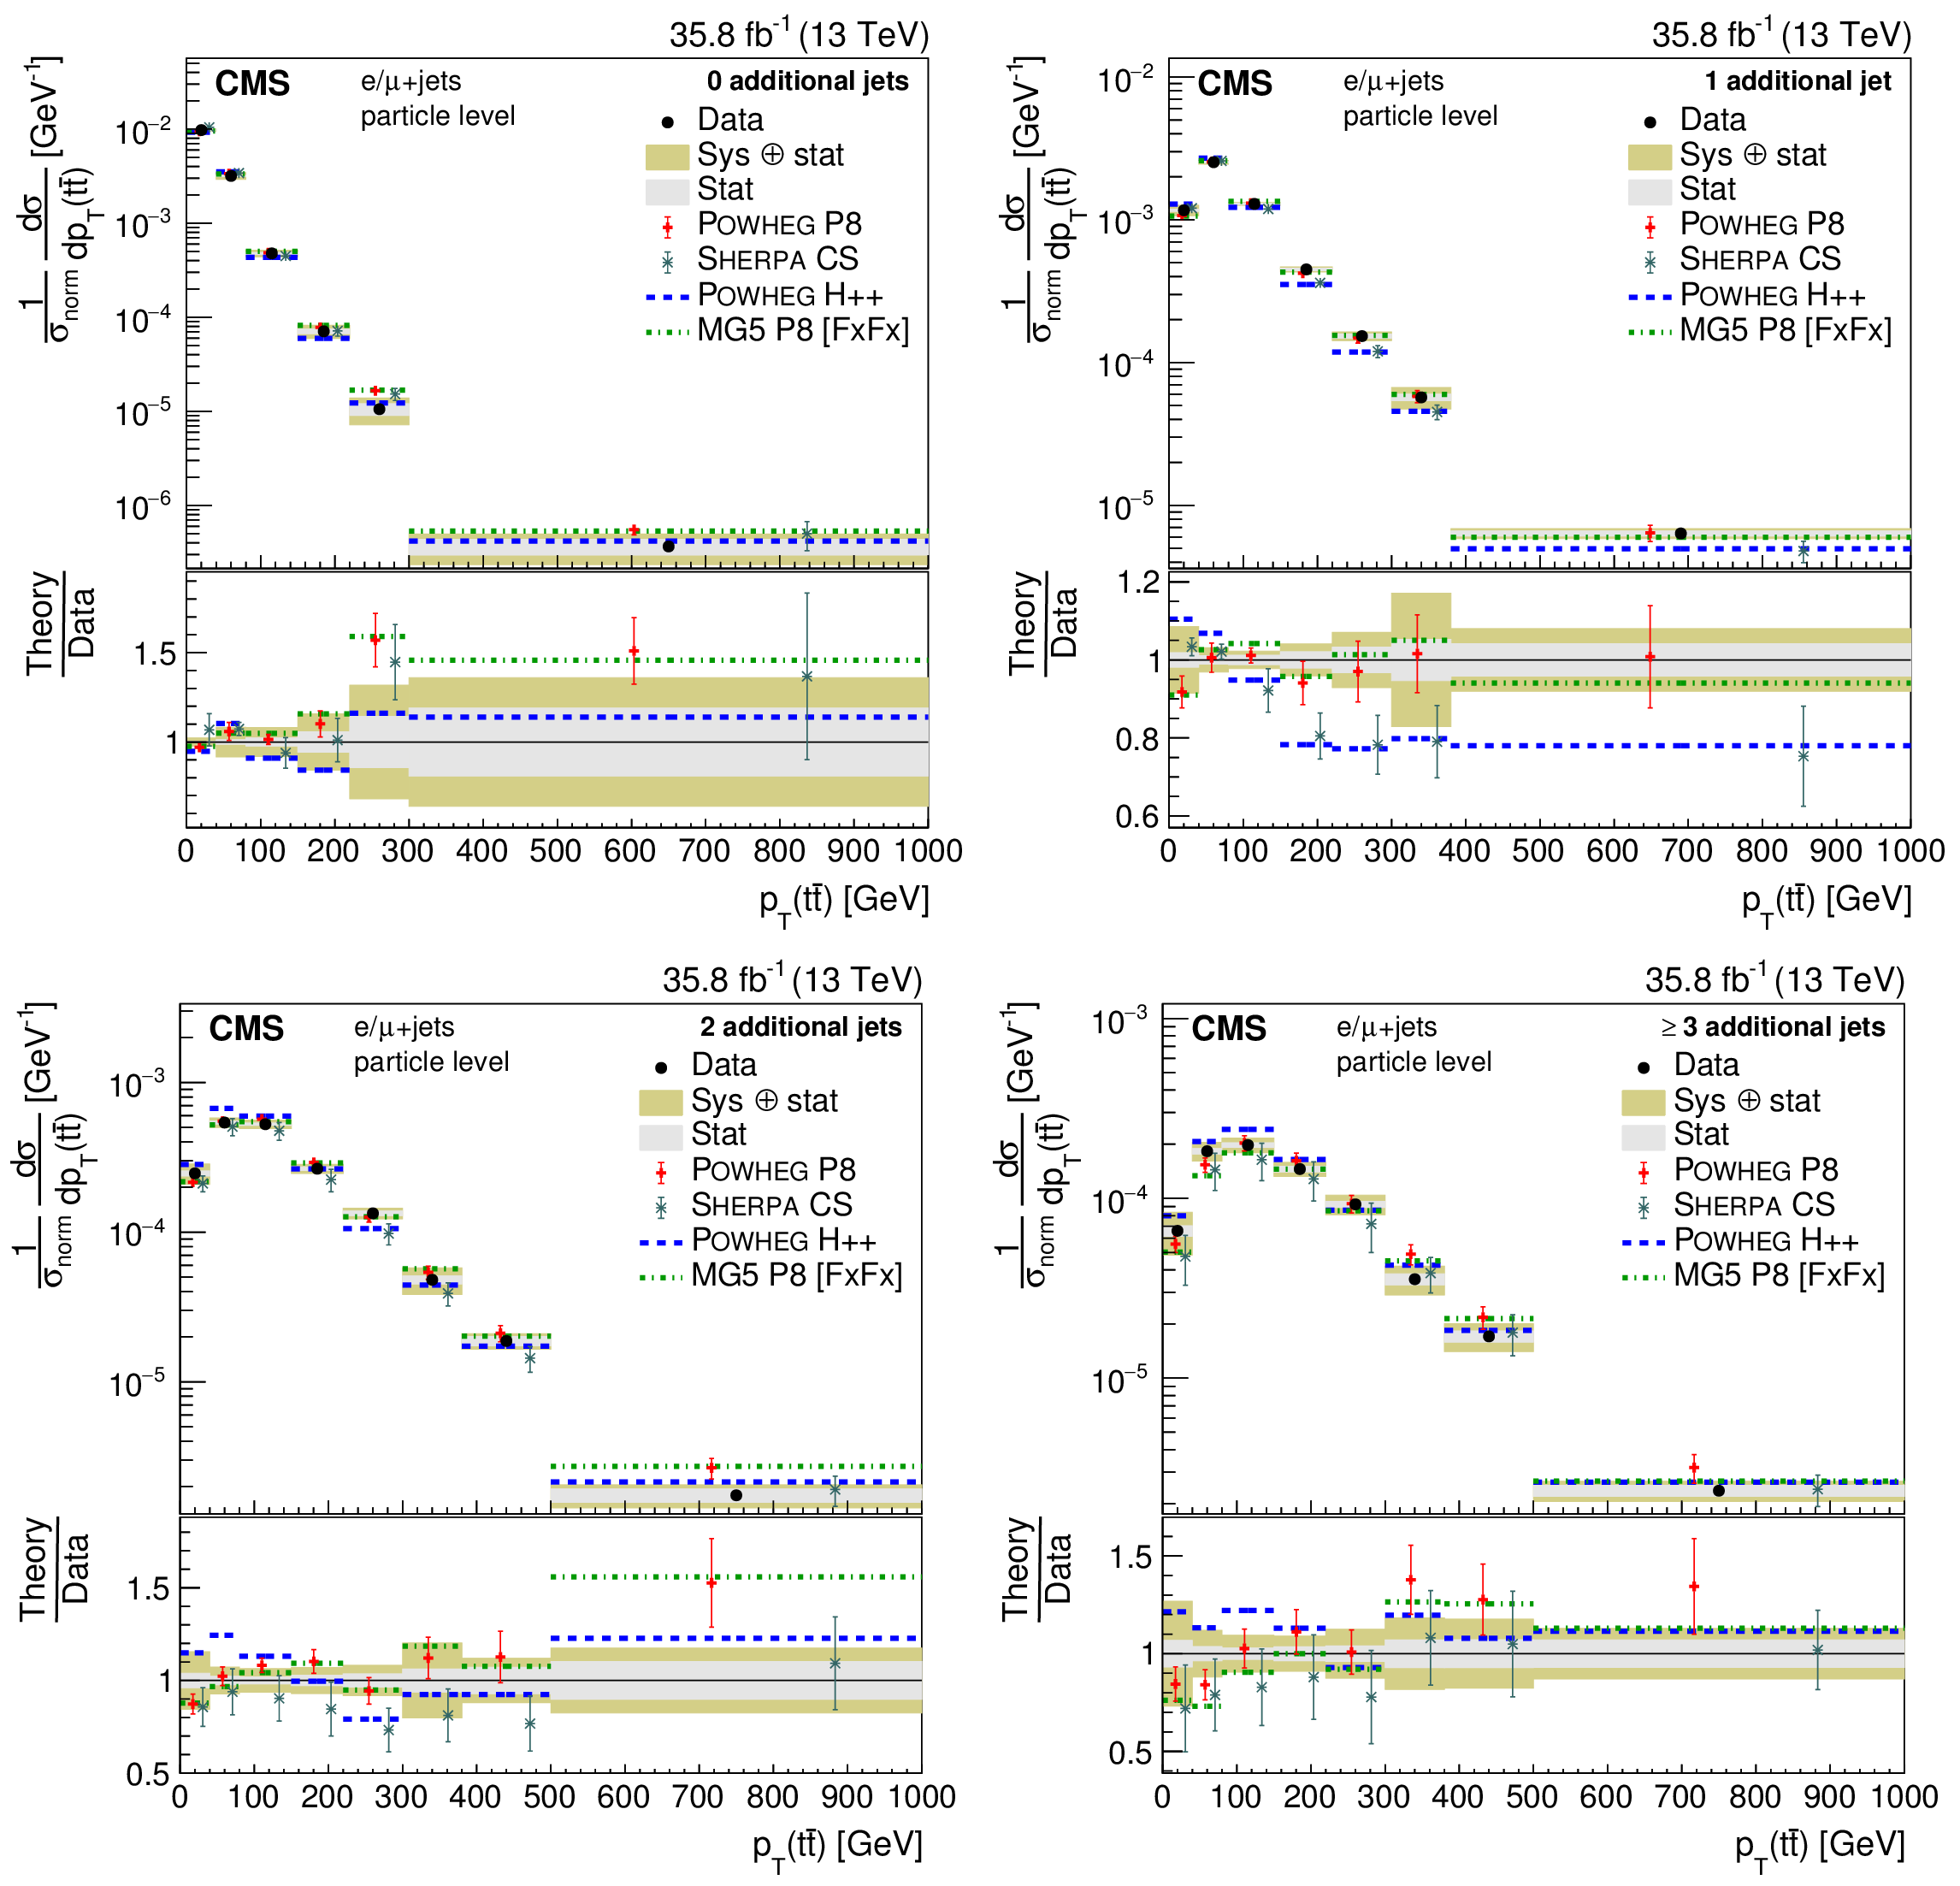
png pdf |
Figure 35:
Differential cross sections at the particle level normalized to the sum of the cross sections $\sigma _\text {norm}$ in the measured ranges as a function of $ {p_{\mathrm {T}}} ({\mathrm{t} \mathrm{\bar{t}}})$ in bins of the number of additional jets. The data are shown as points with light (dark) bands indicating the statistical (statistical and systematic) uncertainties. The cross sections are compared to the predictions of POWHEG combined with PYTHIA8 (P8) or HERWIG++ (H++) and the multiparton simulations MG5_aMC@NLO (MG5)+PYTHIA8 FxFx and SHERPA. The ratios of the various predictions to the measured cross sections are shown at the bottom of each panel. |

png pdf |
Figure 35-a:
Differential cross sections at the particle level normalized to the sum of the cross sections $\sigma _\text {norm}$ in the measured ranges as a function of $ {p_{\mathrm {T}}} ({\mathrm{t} \mathrm{\bar{t}}})$ in bins of the number of additional jets. The data are shown as points with light (dark) bands indicating the statistical (statistical and systematic) uncertainties. The cross sections are compared to the predictions of POWHEG combined with PYTHIA8 (P8) or HERWIG++ (H++) and the multiparton simulations MG5_aMC@NLO (MG5)+PYTHIA8 FxFx and SHERPA. The ratios of the various predictions to the measured cross sections are shown at the bottom of each panel. |

png pdf |
Figure 35-b:
Differential cross sections at the particle level normalized to the sum of the cross sections $\sigma _\text {norm}$ in the measured ranges as a function of $ {p_{\mathrm {T}}} ({\mathrm{t} \mathrm{\bar{t}}})$ in bins of the number of additional jets. The data are shown as points with light (dark) bands indicating the statistical (statistical and systematic) uncertainties. The cross sections are compared to the predictions of POWHEG combined with PYTHIA8 (P8) or HERWIG++ (H++) and the multiparton simulations MG5_aMC@NLO (MG5)+PYTHIA8 FxFx and SHERPA. The ratios of the various predictions to the measured cross sections are shown at the bottom of each panel. |
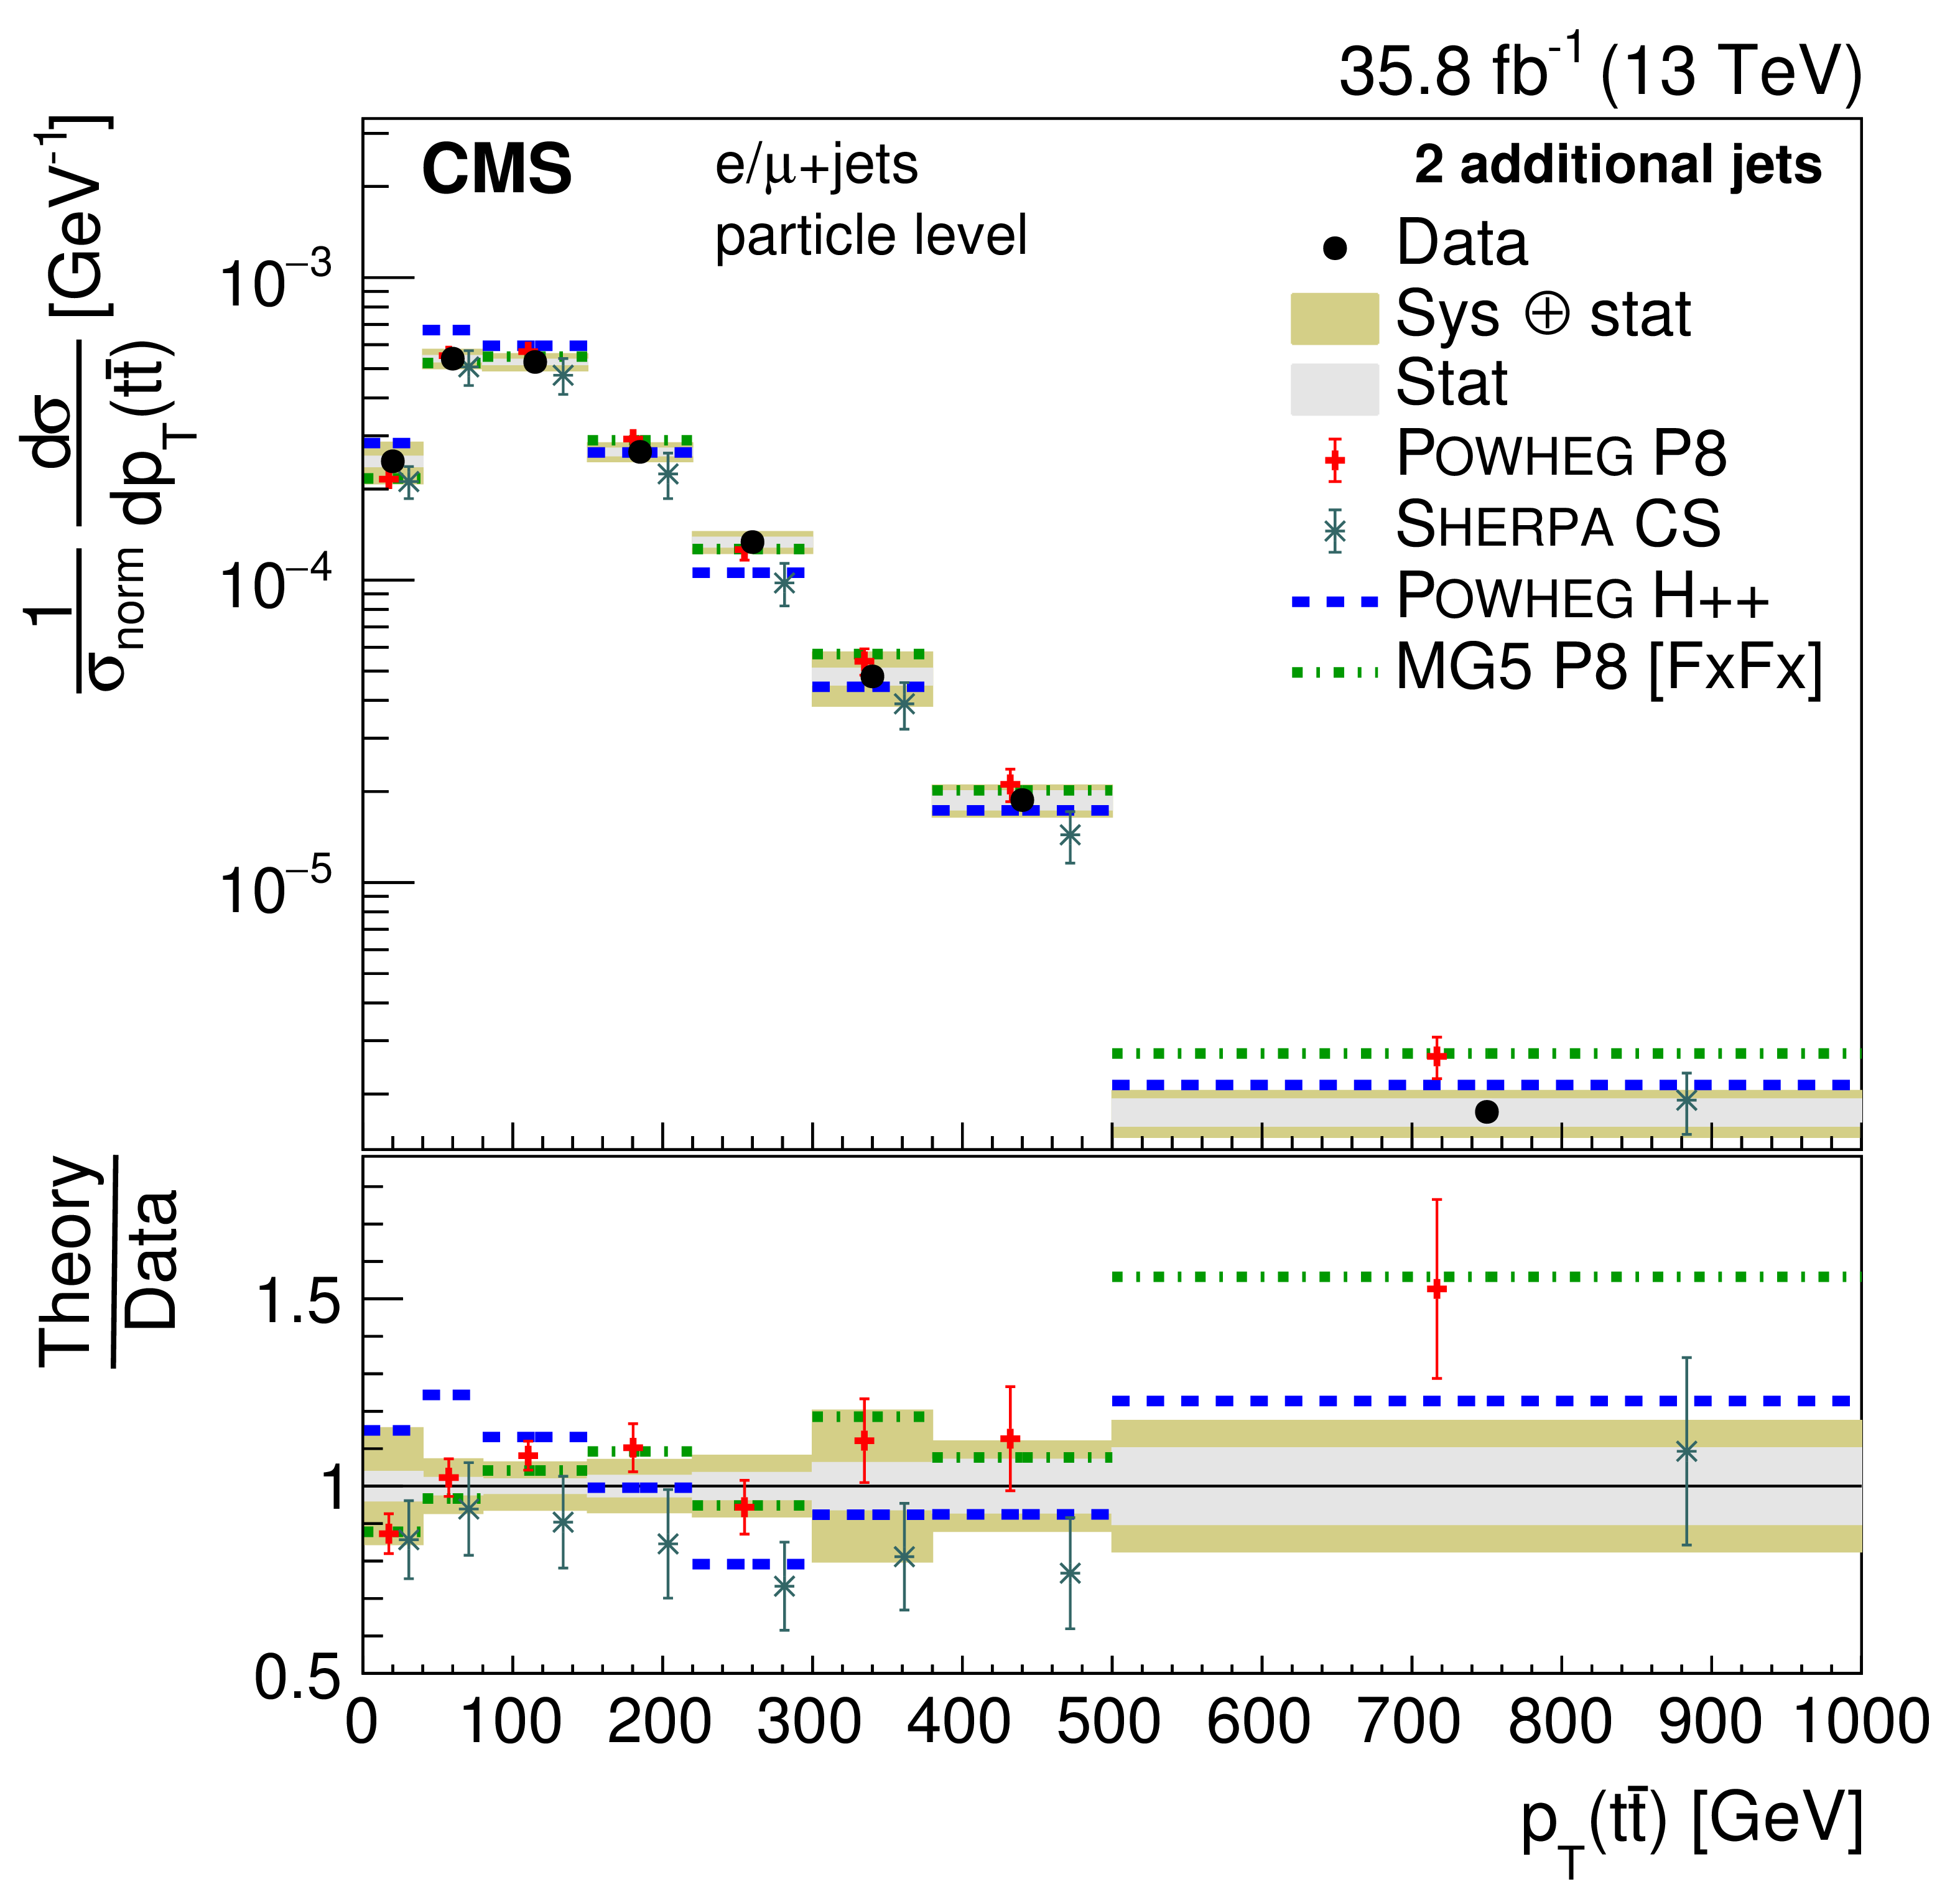
png pdf |
Figure 35-c:
Differential cross sections at the particle level normalized to the sum of the cross sections $\sigma _\text {norm}$ in the measured ranges as a function of $ {p_{\mathrm {T}}} ({\mathrm{t} \mathrm{\bar{t}}})$ in bins of the number of additional jets. The data are shown as points with light (dark) bands indicating the statistical (statistical and systematic) uncertainties. The cross sections are compared to the predictions of POWHEG combined with PYTHIA8 (P8) or HERWIG++ (H++) and the multiparton simulations MG5_aMC@NLO (MG5)+PYTHIA8 FxFx and SHERPA. The ratios of the various predictions to the measured cross sections are shown at the bottom of each panel. |
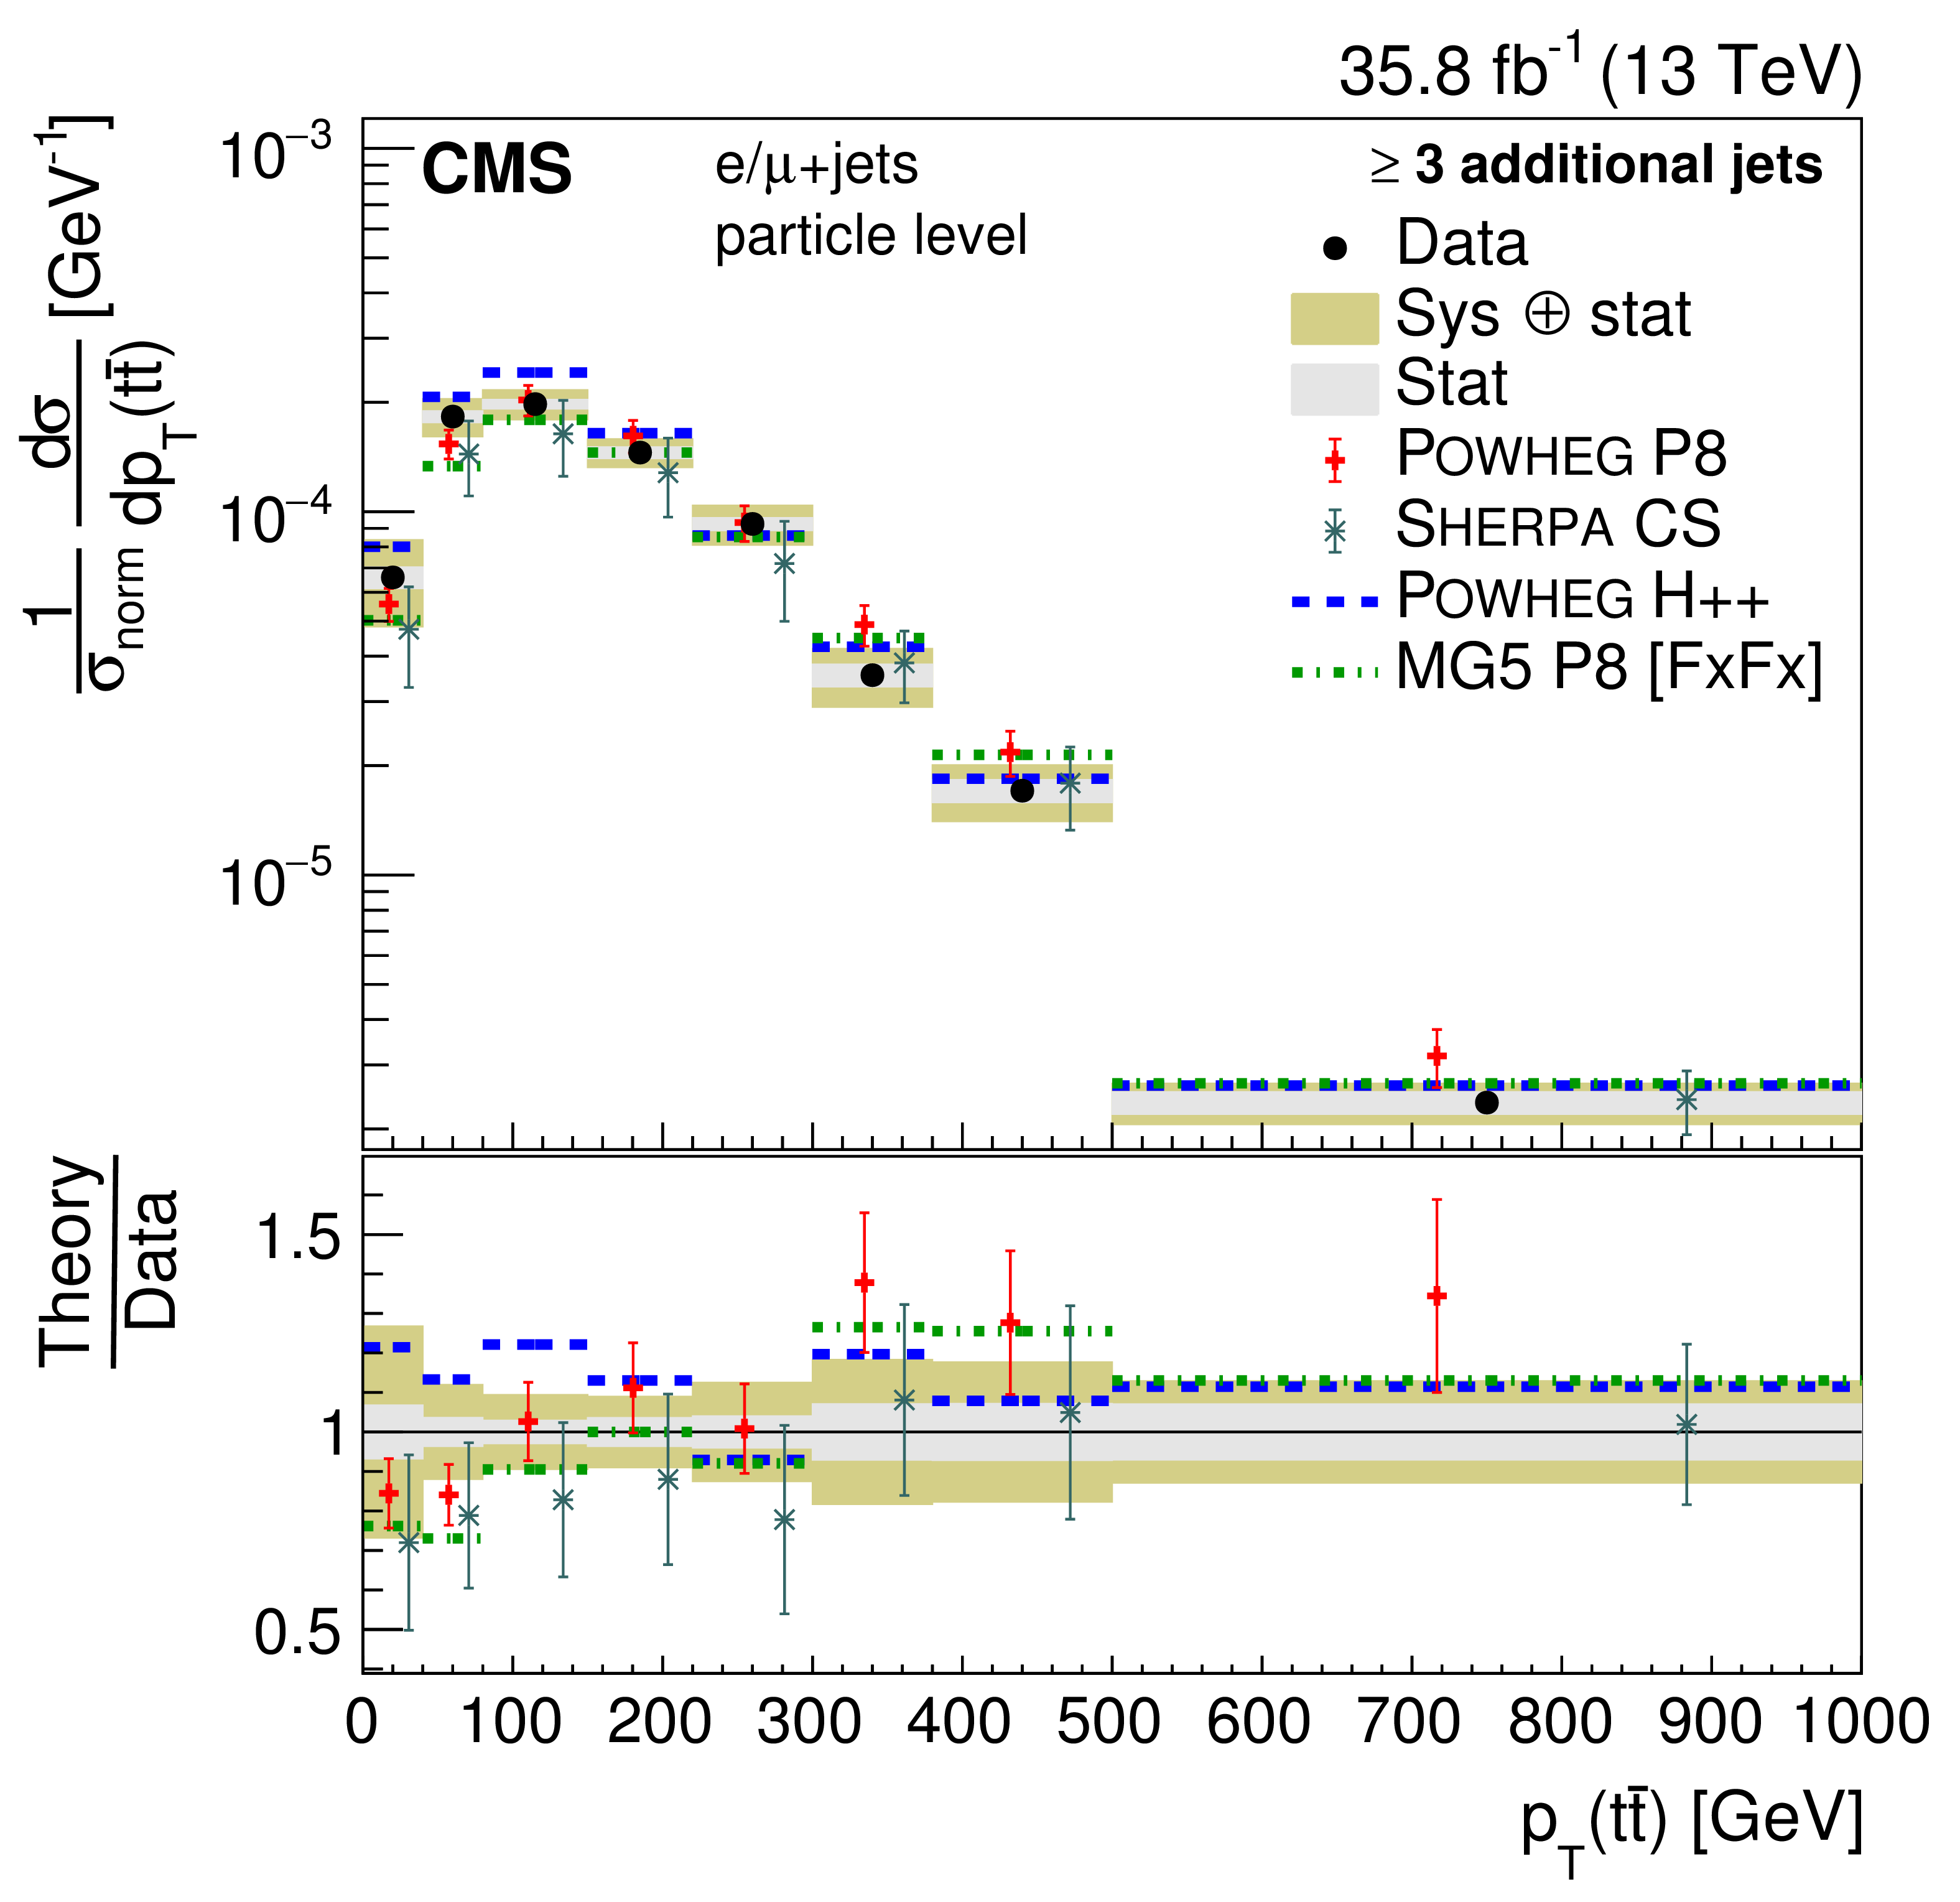
png pdf |
Figure 35-d:
Differential cross sections at the particle level normalized to the sum of the cross sections $\sigma _\text {norm}$ in the measured ranges as a function of $ {p_{\mathrm {T}}} ({\mathrm{t} \mathrm{\bar{t}}})$ in bins of the number of additional jets. The data are shown as points with light (dark) bands indicating the statistical (statistical and systematic) uncertainties. The cross sections are compared to the predictions of POWHEG combined with PYTHIA8 (P8) or HERWIG++ (H++) and the multiparton simulations MG5_aMC@NLO (MG5)+PYTHIA8 FxFx and SHERPA. The ratios of the various predictions to the measured cross sections are shown at the bottom of each panel. |
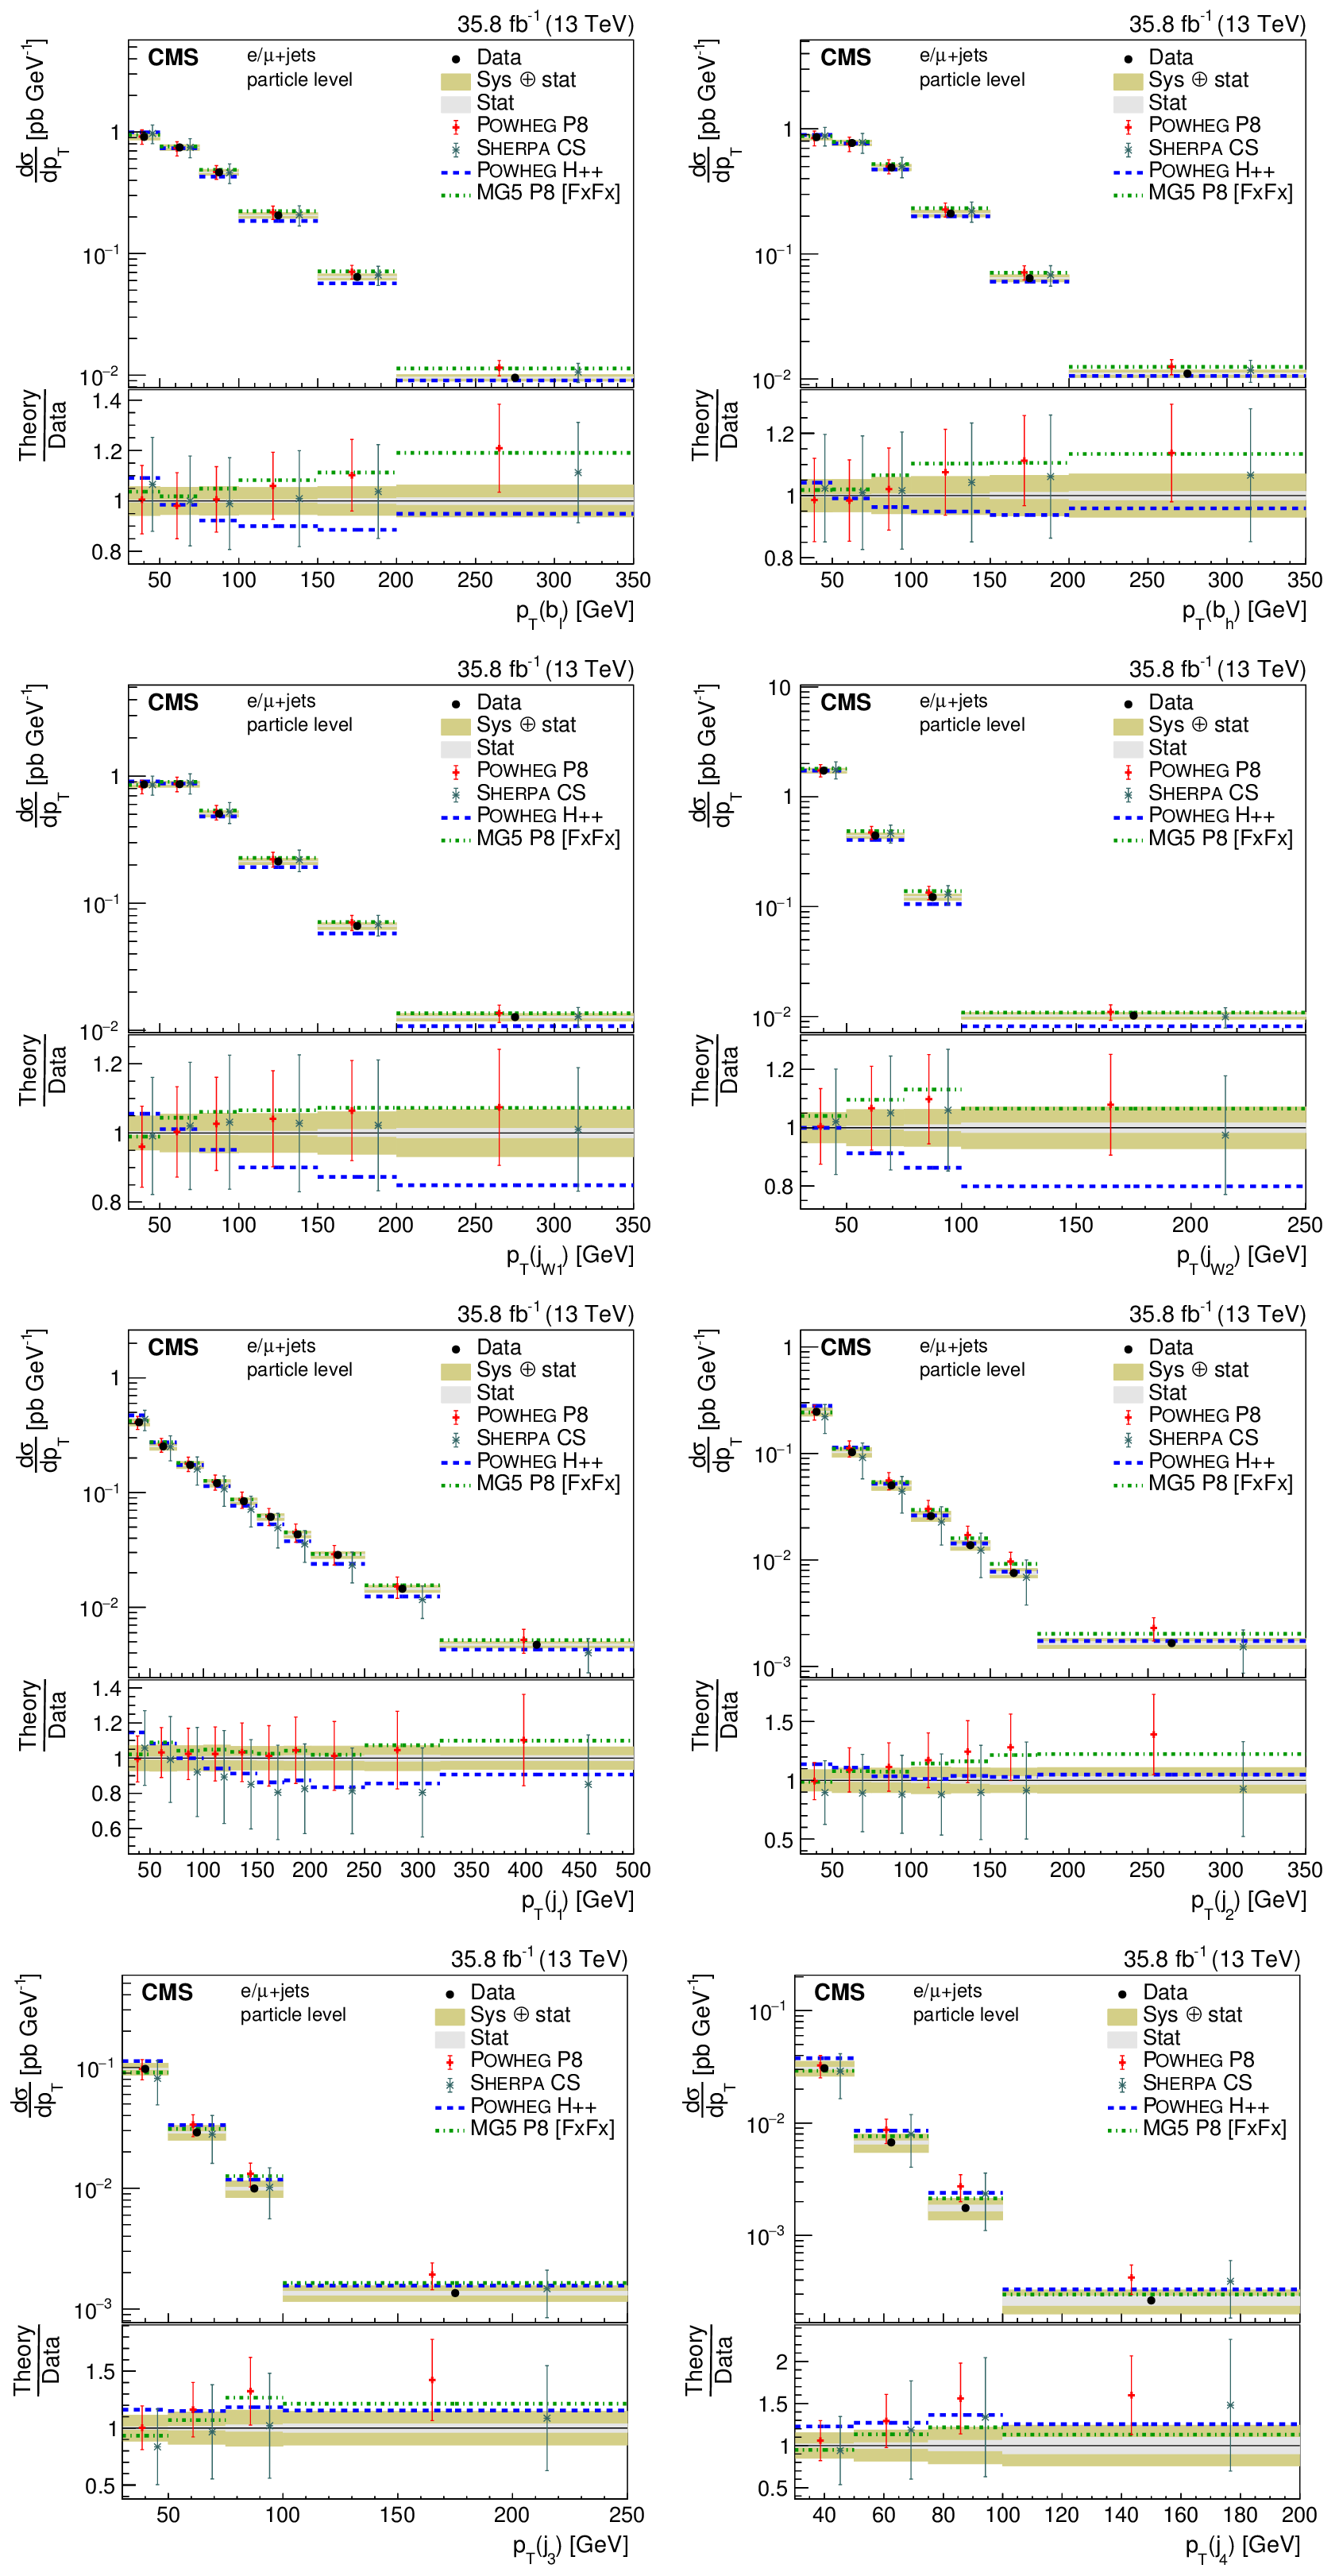
png pdf |
Figure 36:
Differential cross section at the particle level as a function of jet $ {p_{\mathrm {T}}} $. The upper two rows show the $ {p_{\mathrm {T}}} $ distributions for the jets in the $ {\mathrm{t} \mathrm{\bar{t}}} $ system, the lower two rows the distribution for additional jets. The data are shown as points with light (dark) bands indicating the statistical (statistical and systematic) uncertainties. The cross sections are compared to the predictions of POWHEG combined with PYTHIA8 (P8) or HERWIG++ (H++) and the multiparton simulations MG5_aMC@NLO (MG5)+PYTHIA8 FxFx and SHERPA. The ratios of the predictions to the measured cross sections are shown at the bottom of each panel. |

png pdf |
Figure 36-a:
Differential cross section at the particle level as a function of jet $ {p_{\mathrm {T}}} $. The upper two rows show the $ {p_{\mathrm {T}}} $ distributions for the jets in the $ {\mathrm{t} \mathrm{\bar{t}}} $ system, the lower two rows the distribution for additional jets. The data are shown as points with light (dark) bands indicating the statistical (statistical and systematic) uncertainties. The cross sections are compared to the predictions of POWHEG combined with PYTHIA8 (P8) or HERWIG++ (H++) and the multiparton simulations MG5_aMC@NLO (MG5)+PYTHIA8 FxFx and SHERPA. The ratios of the predictions to the measured cross sections are shown at the bottom of each panel. |

png pdf |
Figure 36-b:
Differential cross section at the particle level as a function of jet $ {p_{\mathrm {T}}} $. The upper two rows show the $ {p_{\mathrm {T}}} $ distributions for the jets in the $ {\mathrm{t} \mathrm{\bar{t}}} $ system, the lower two rows the distribution for additional jets. The data are shown as points with light (dark) bands indicating the statistical (statistical and systematic) uncertainties. The cross sections are compared to the predictions of POWHEG combined with PYTHIA8 (P8) or HERWIG++ (H++) and the multiparton simulations MG5_aMC@NLO (MG5)+PYTHIA8 FxFx and SHERPA. The ratios of the predictions to the measured cross sections are shown at the bottom of each panel. |
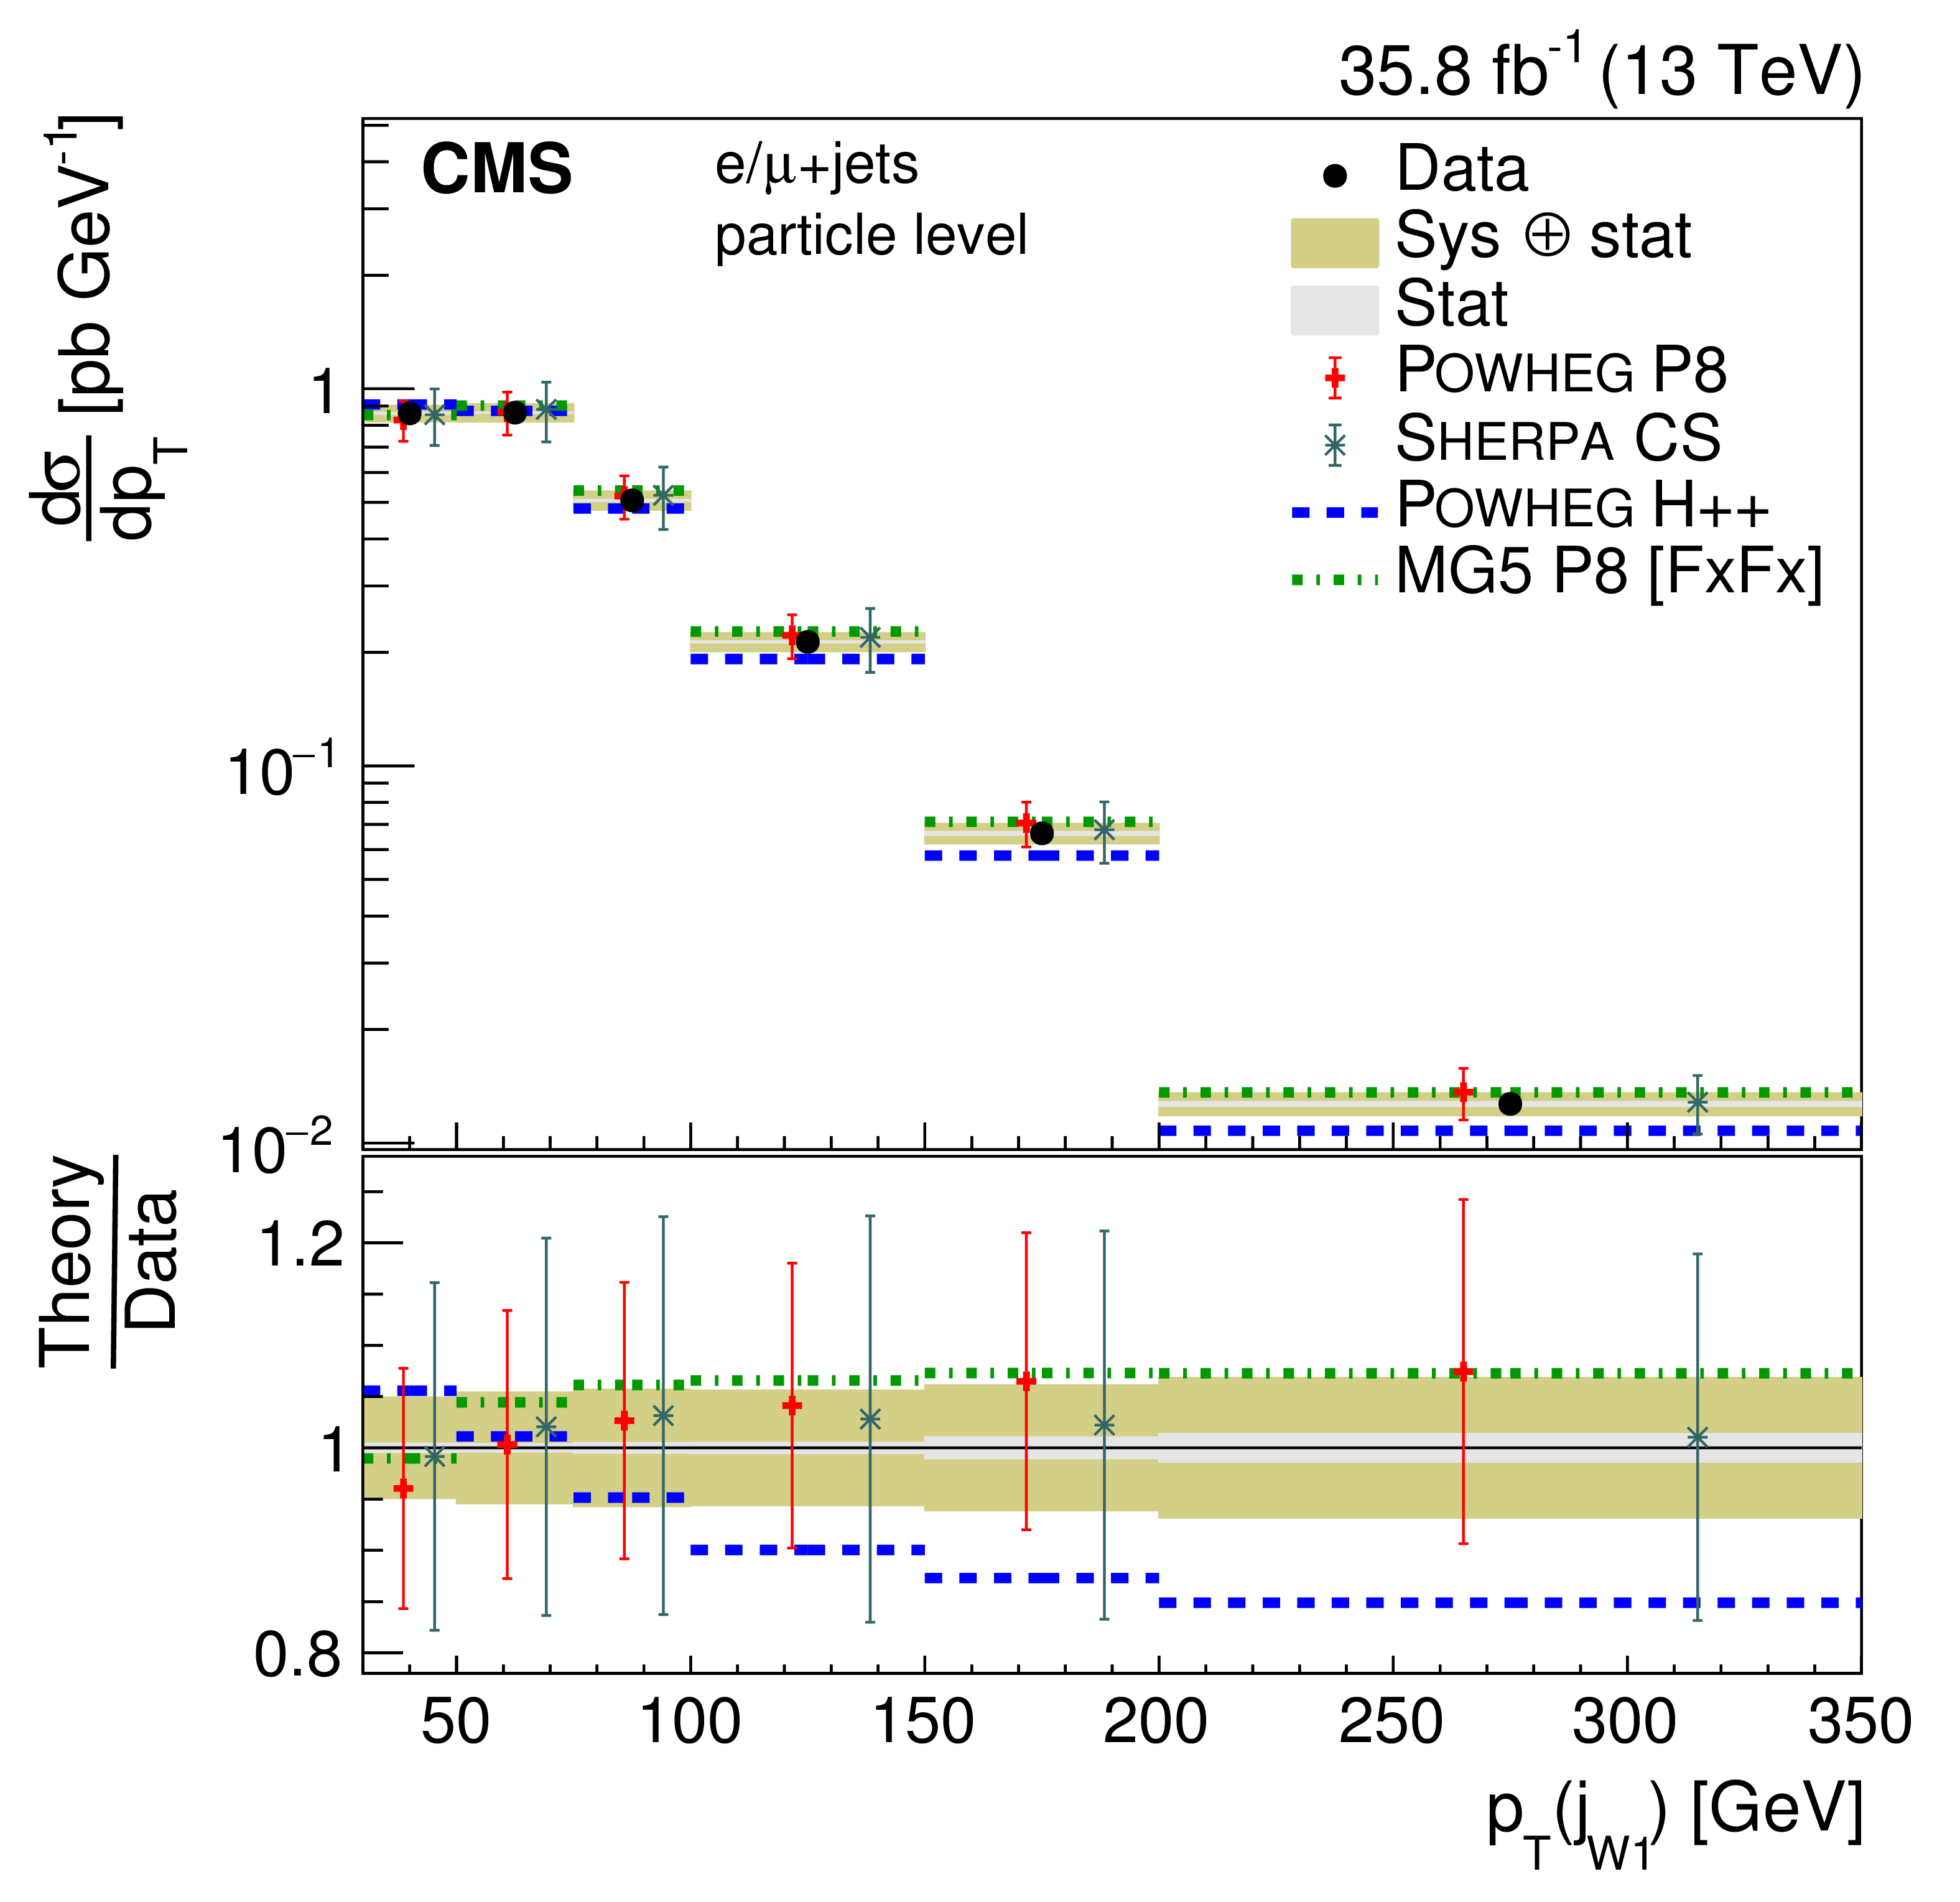
png pdf |
Figure 36-c:
Differential cross section at the particle level as a function of jet $ {p_{\mathrm {T}}} $. The upper two rows show the $ {p_{\mathrm {T}}} $ distributions for the jets in the $ {\mathrm{t} \mathrm{\bar{t}}} $ system, the lower two rows the distribution for additional jets. The data are shown as points with light (dark) bands indicating the statistical (statistical and systematic) uncertainties. The cross sections are compared to the predictions of POWHEG combined with PYTHIA8 (P8) or HERWIG++ (H++) and the multiparton simulations MG5_aMC@NLO (MG5)+PYTHIA8 FxFx and SHERPA. The ratios of the predictions to the measured cross sections are shown at the bottom of each panel. |
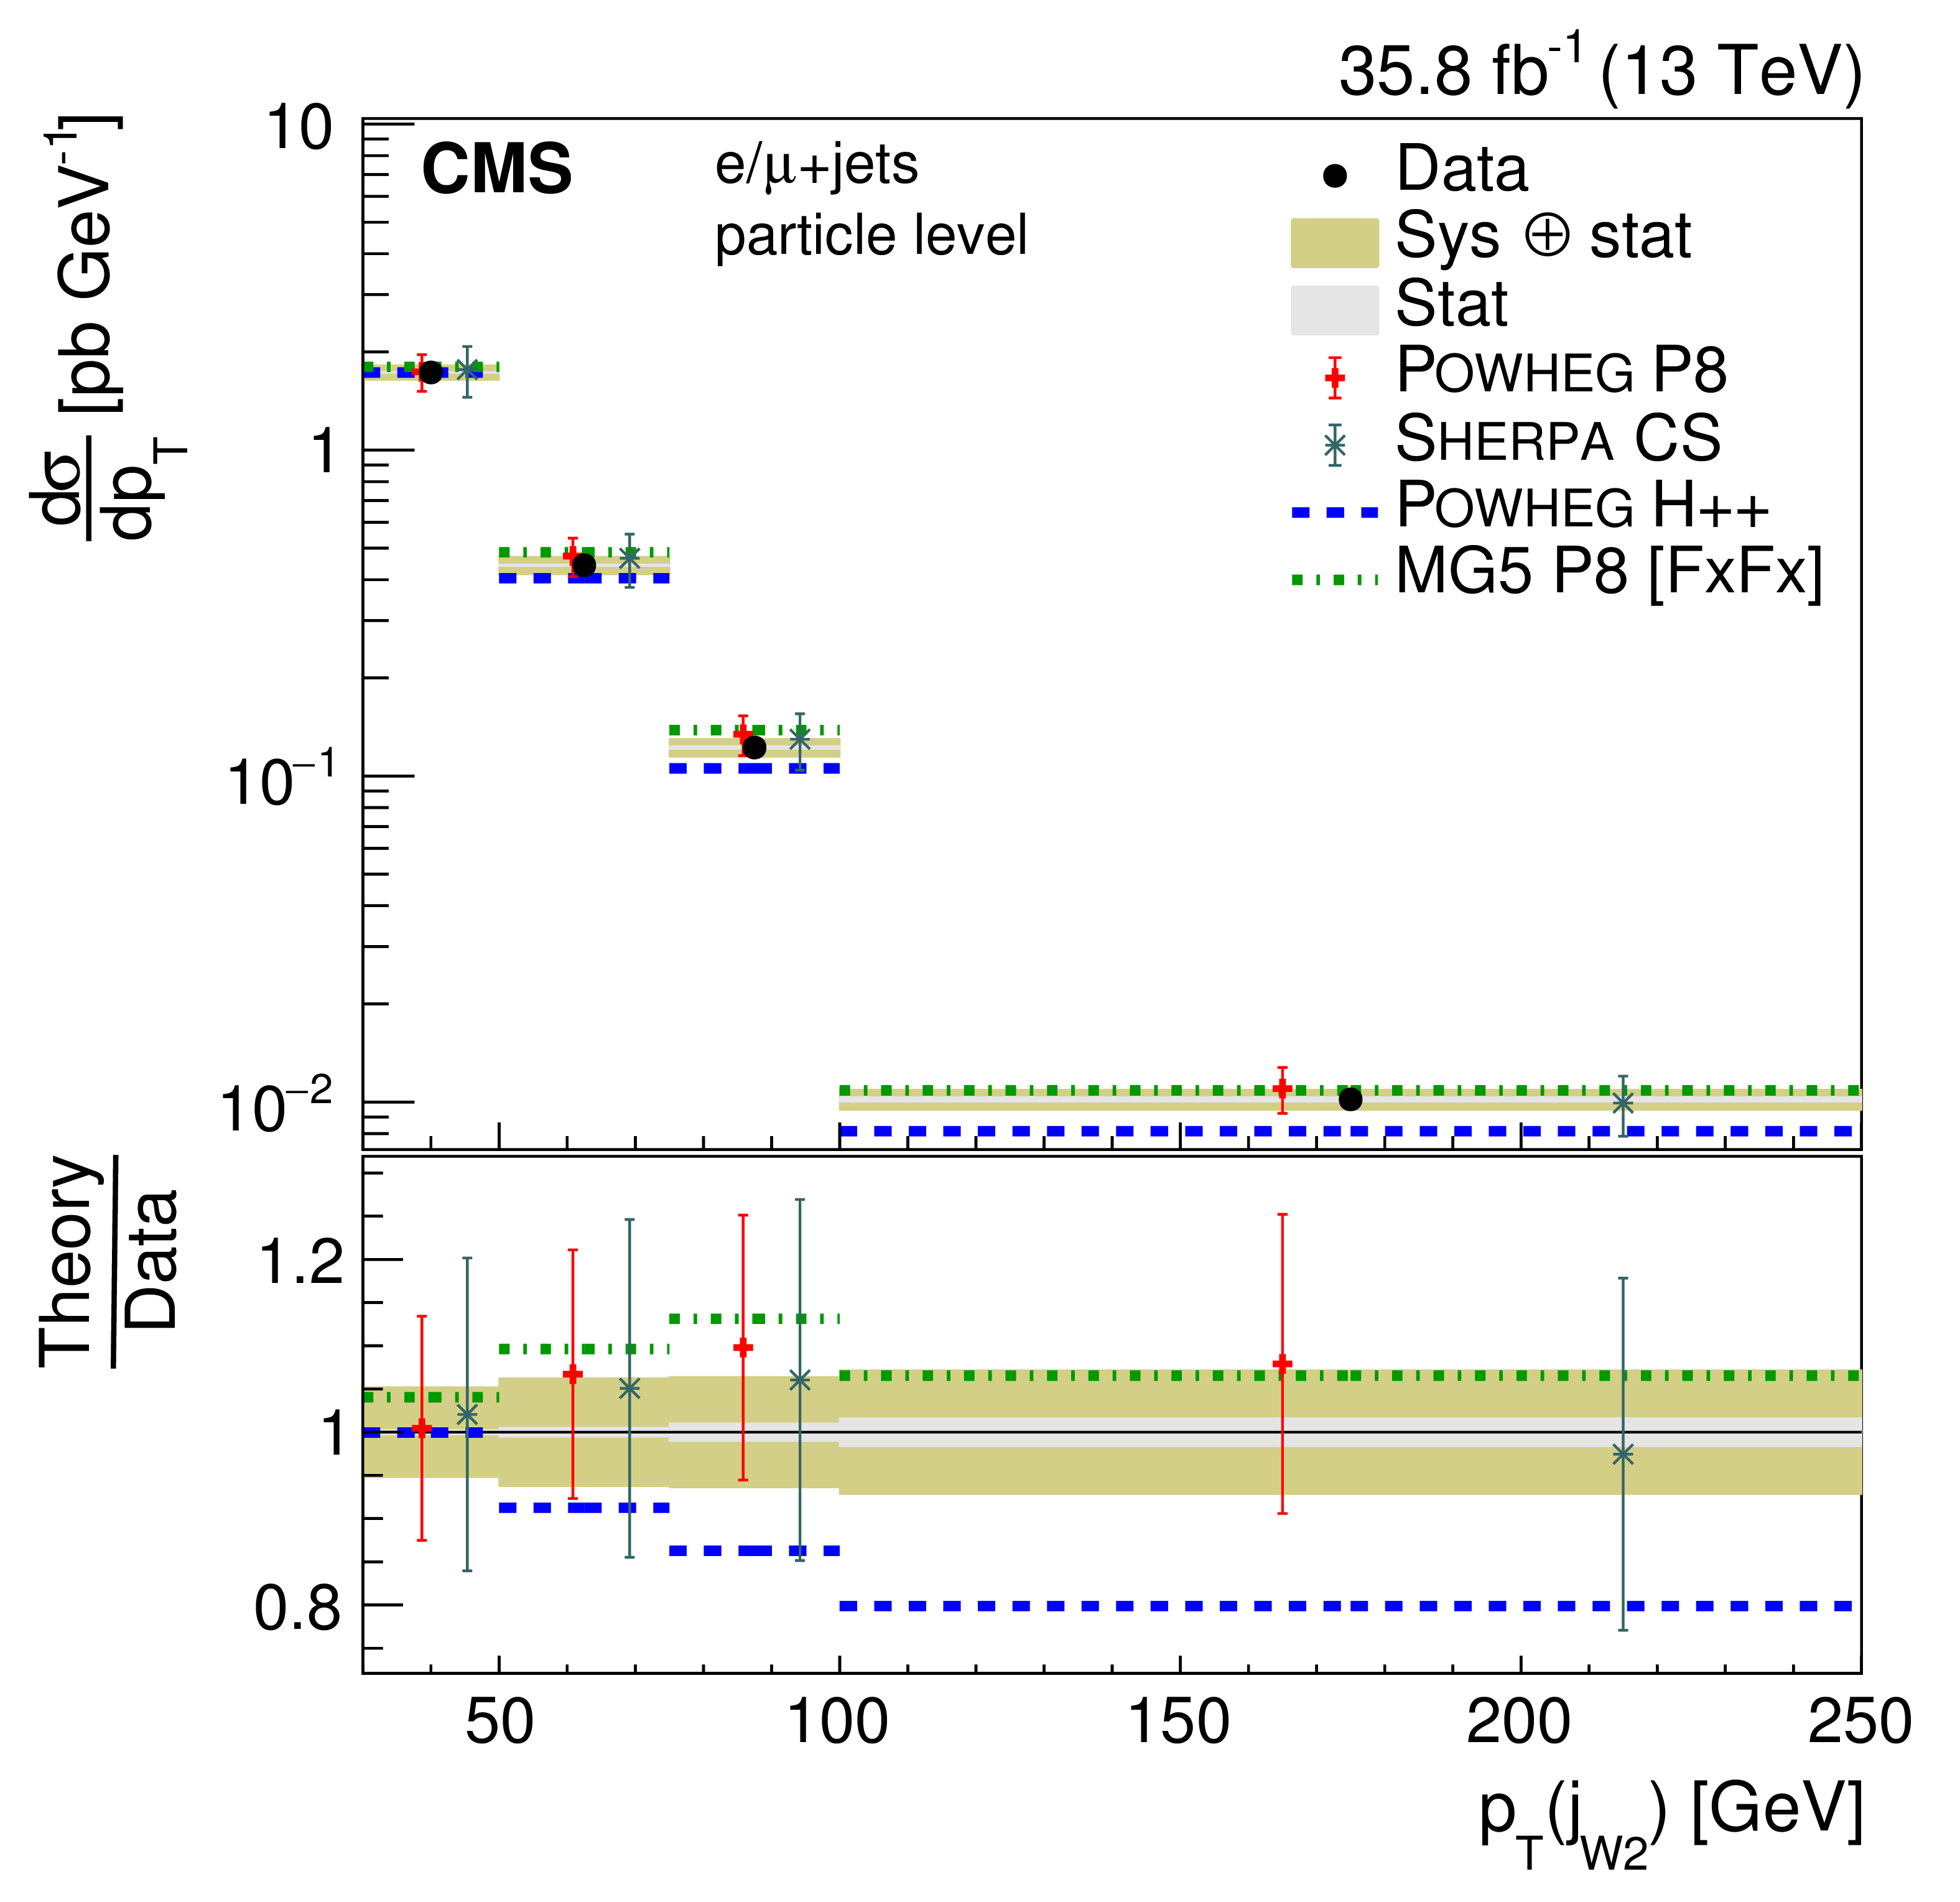
png pdf |
Figure 36-d:
Differential cross section at the particle level as a function of jet $ {p_{\mathrm {T}}} $. The upper two rows show the $ {p_{\mathrm {T}}} $ distributions for the jets in the $ {\mathrm{t} \mathrm{\bar{t}}} $ system, the lower two rows the distribution for additional jets. The data are shown as points with light (dark) bands indicating the statistical (statistical and systematic) uncertainties. The cross sections are compared to the predictions of POWHEG combined with PYTHIA8 (P8) or HERWIG++ (H++) and the multiparton simulations MG5_aMC@NLO (MG5)+PYTHIA8 FxFx and SHERPA. The ratios of the predictions to the measured cross sections are shown at the bottom of each panel. |
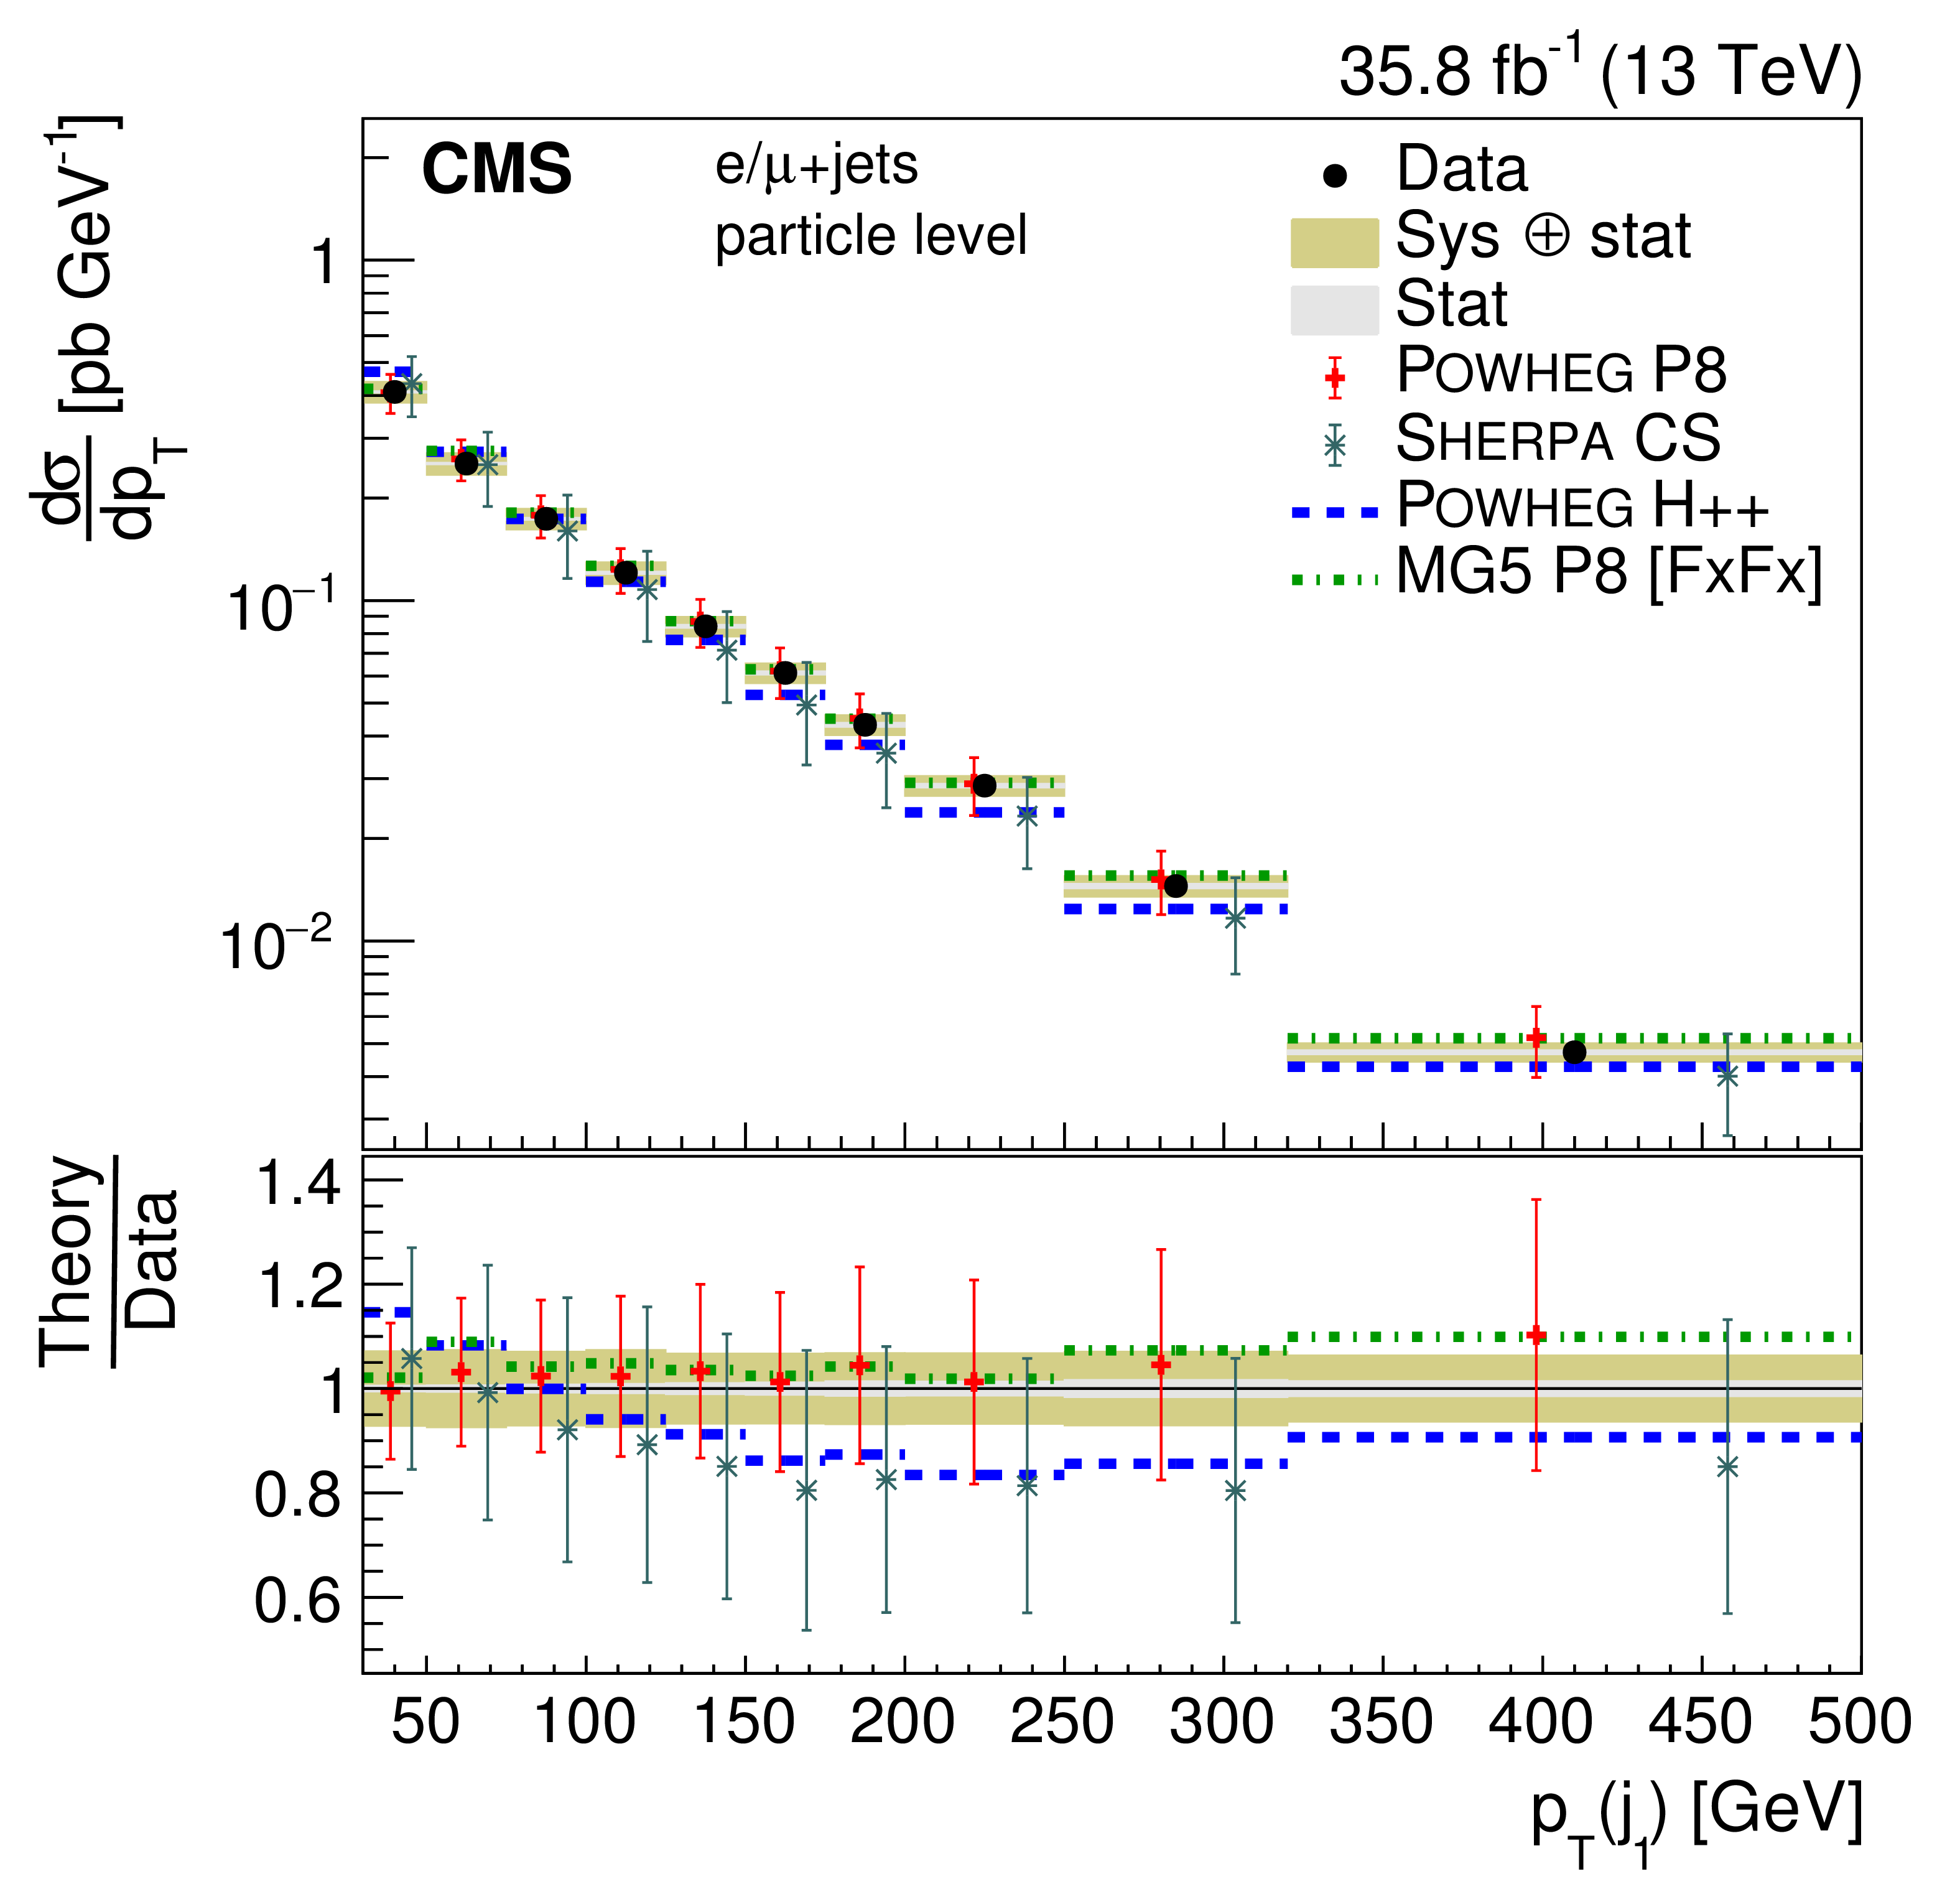
png pdf |
Figure 36-e:
Differential cross section at the particle level as a function of jet $ {p_{\mathrm {T}}} $. The upper two rows show the $ {p_{\mathrm {T}}} $ distributions for the jets in the $ {\mathrm{t} \mathrm{\bar{t}}} $ system, the lower two rows the distribution for additional jets. The data are shown as points with light (dark) bands indicating the statistical (statistical and systematic) uncertainties. The cross sections are compared to the predictions of POWHEG combined with PYTHIA8 (P8) or HERWIG++ (H++) and the multiparton simulations MG5_aMC@NLO (MG5)+PYTHIA8 FxFx and SHERPA. The ratios of the predictions to the measured cross sections are shown at the bottom of each panel. |
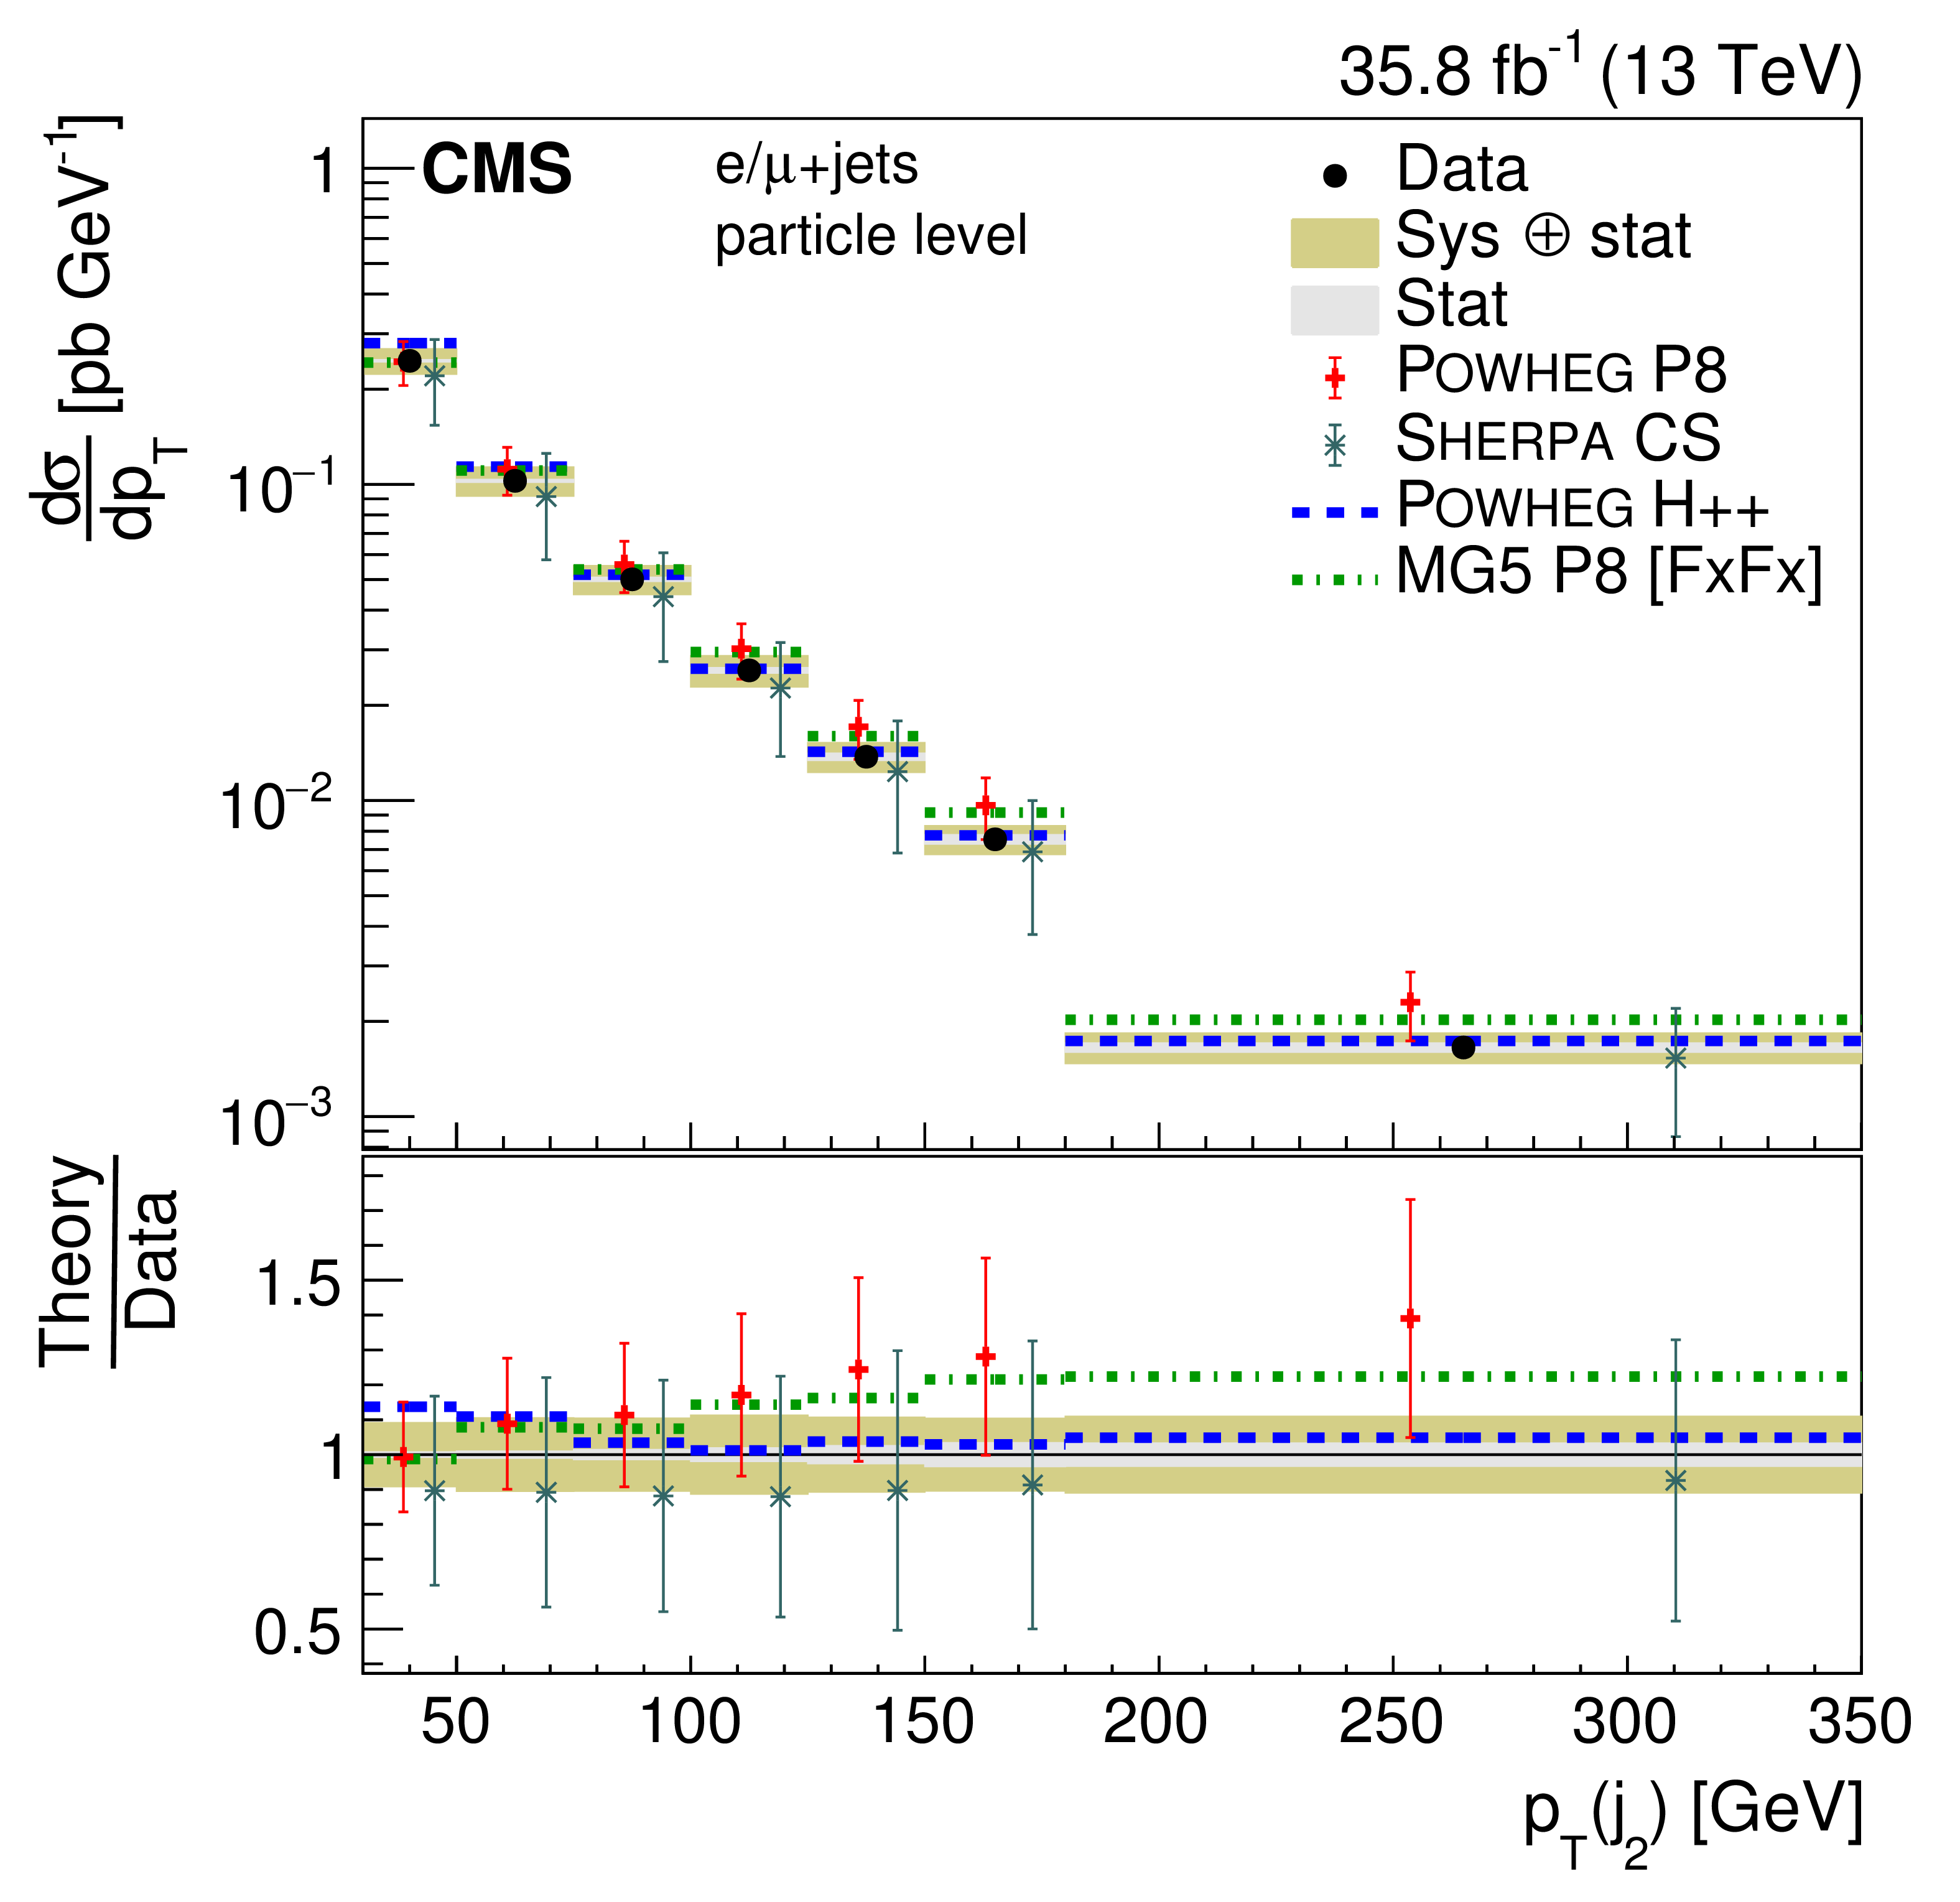
png pdf |
Figure 36-f:
Differential cross section at the particle level as a function of jet $ {p_{\mathrm {T}}} $. The upper two rows show the $ {p_{\mathrm {T}}} $ distributions for the jets in the $ {\mathrm{t} \mathrm{\bar{t}}} $ system, the lower two rows the distribution for additional jets. The data are shown as points with light (dark) bands indicating the statistical (statistical and systematic) uncertainties. The cross sections are compared to the predictions of POWHEG combined with PYTHIA8 (P8) or HERWIG++ (H++) and the multiparton simulations MG5_aMC@NLO (MG5)+PYTHIA8 FxFx and SHERPA. The ratios of the predictions to the measured cross sections are shown at the bottom of each panel. |
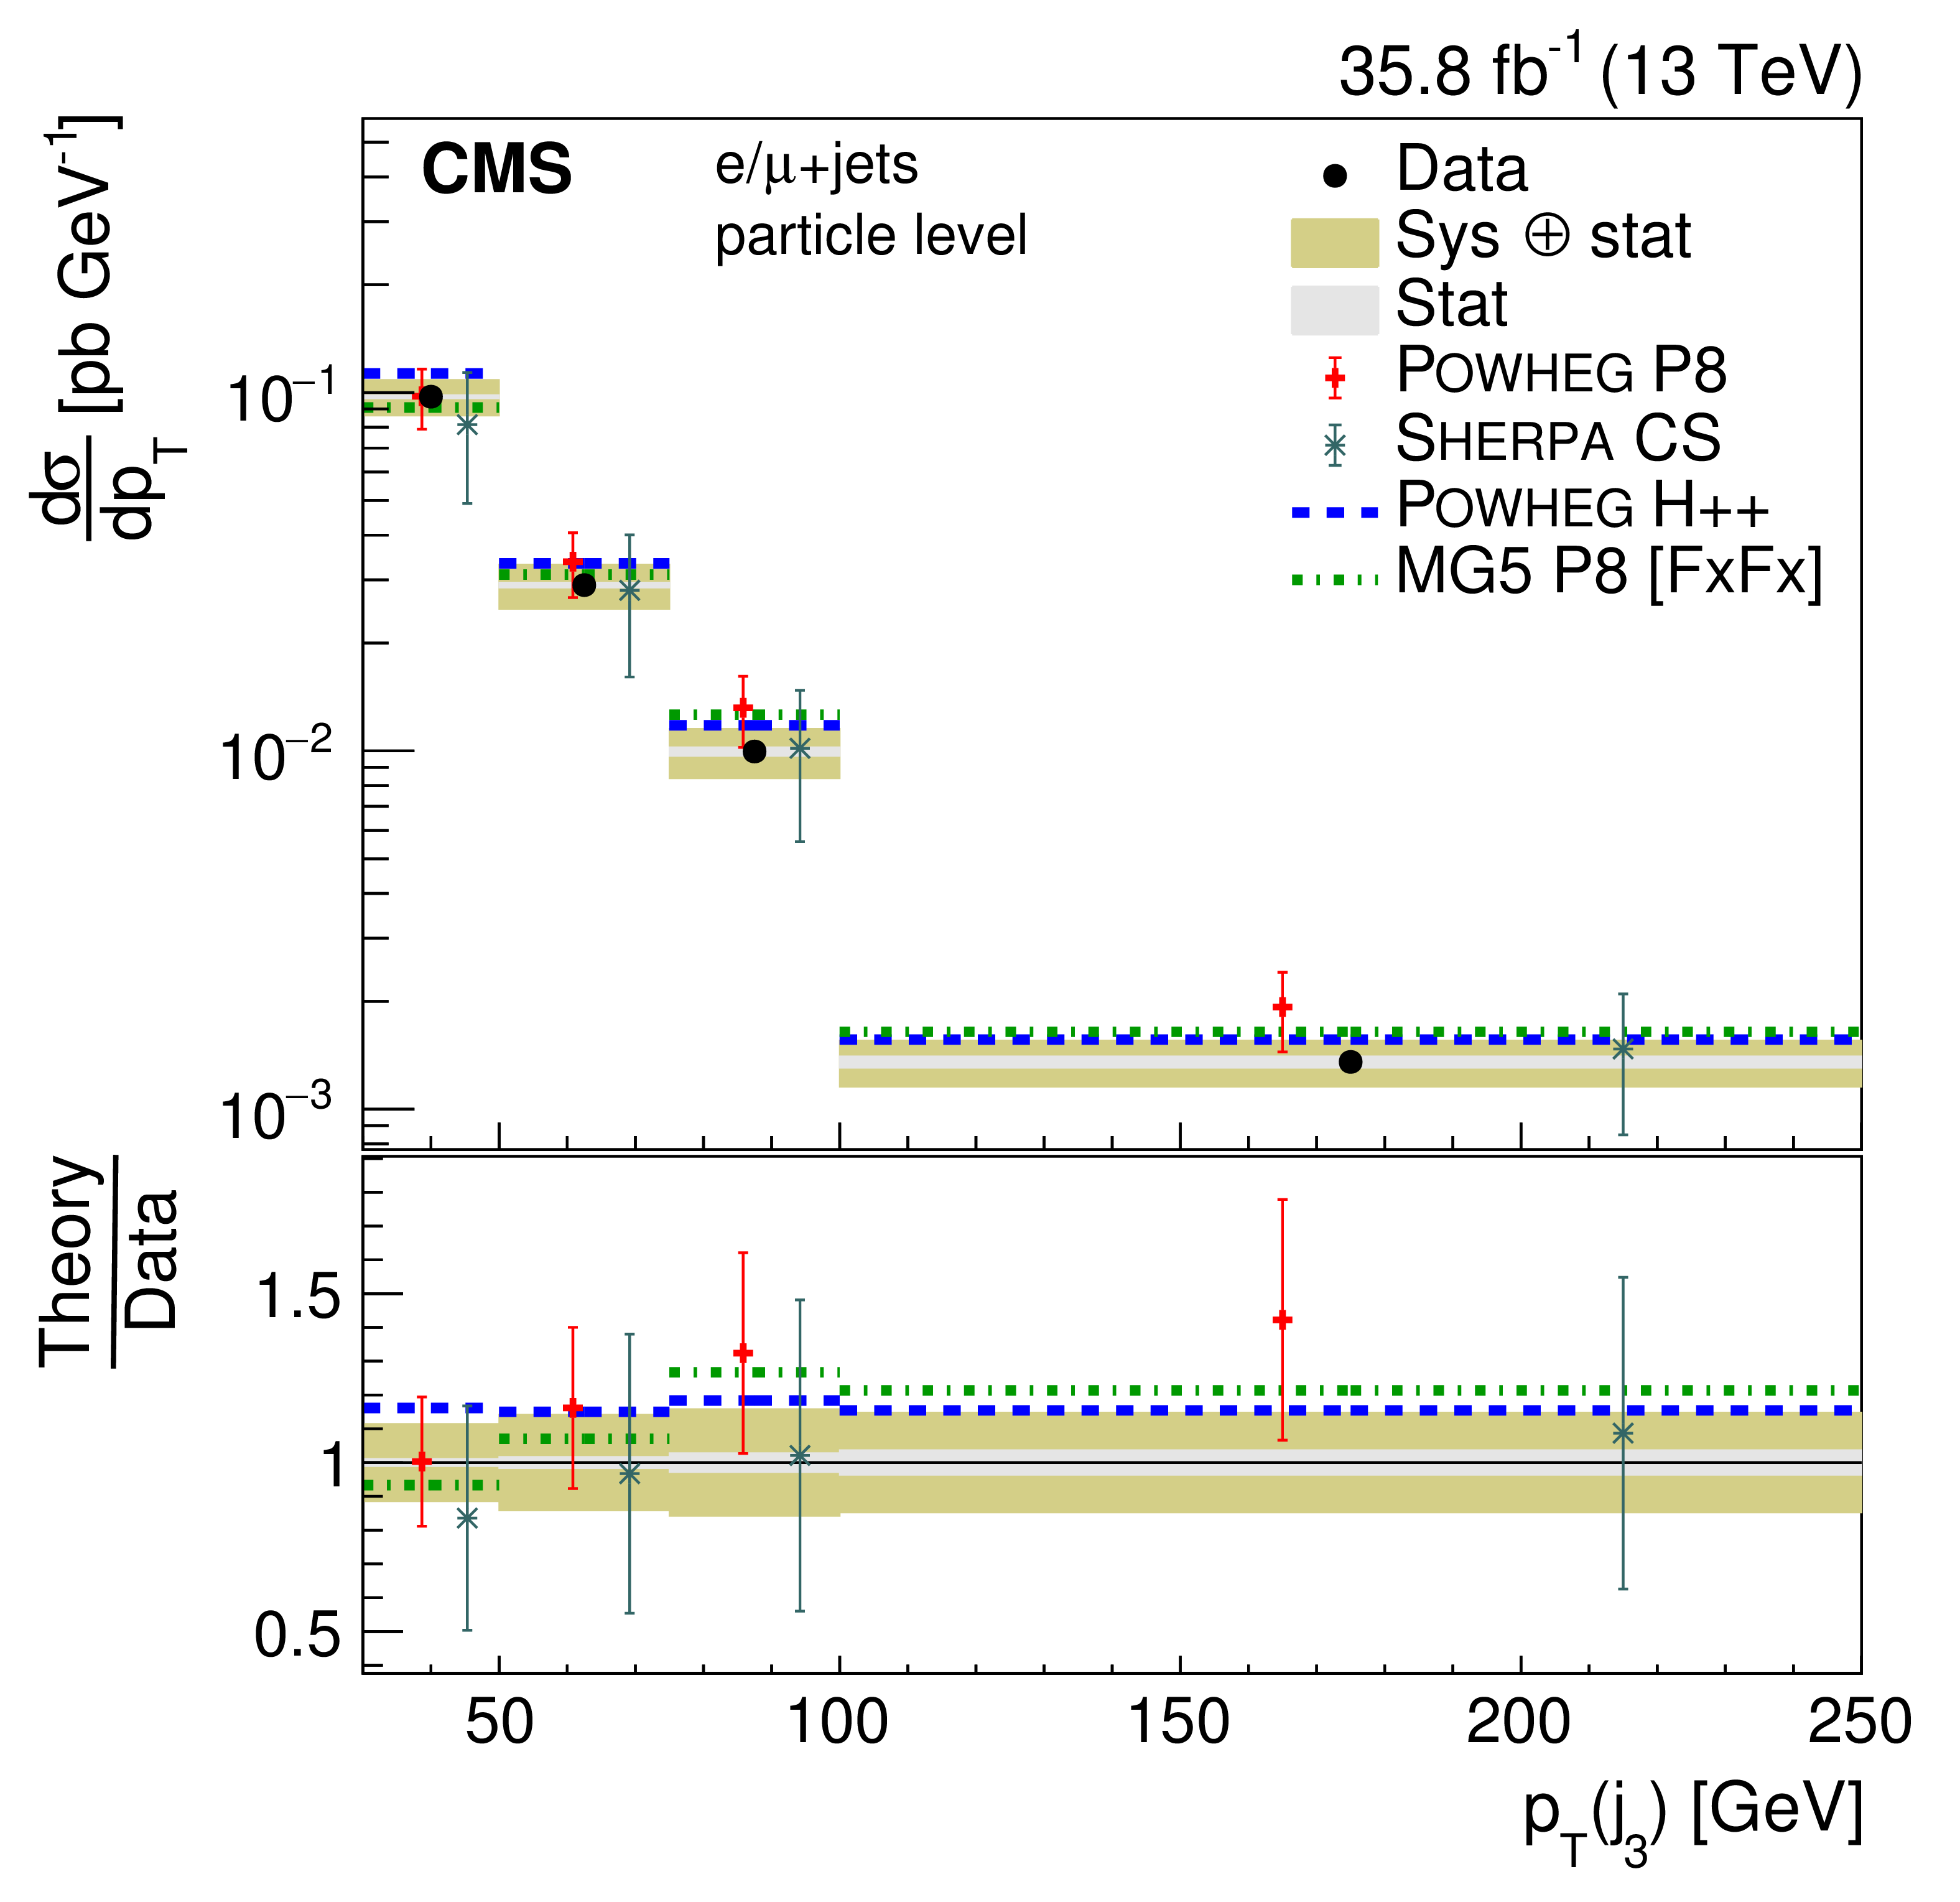
png pdf |
Figure 36-g:
Differential cross section at the particle level as a function of jet $ {p_{\mathrm {T}}} $. The upper two rows show the $ {p_{\mathrm {T}}} $ distributions for the jets in the $ {\mathrm{t} \mathrm{\bar{t}}} $ system, the lower two rows the distribution for additional jets. The data are shown as points with light (dark) bands indicating the statistical (statistical and systematic) uncertainties. The cross sections are compared to the predictions of POWHEG combined with PYTHIA8 (P8) or HERWIG++ (H++) and the multiparton simulations MG5_aMC@NLO (MG5)+PYTHIA8 FxFx and SHERPA. The ratios of the predictions to the measured cross sections are shown at the bottom of each panel. |
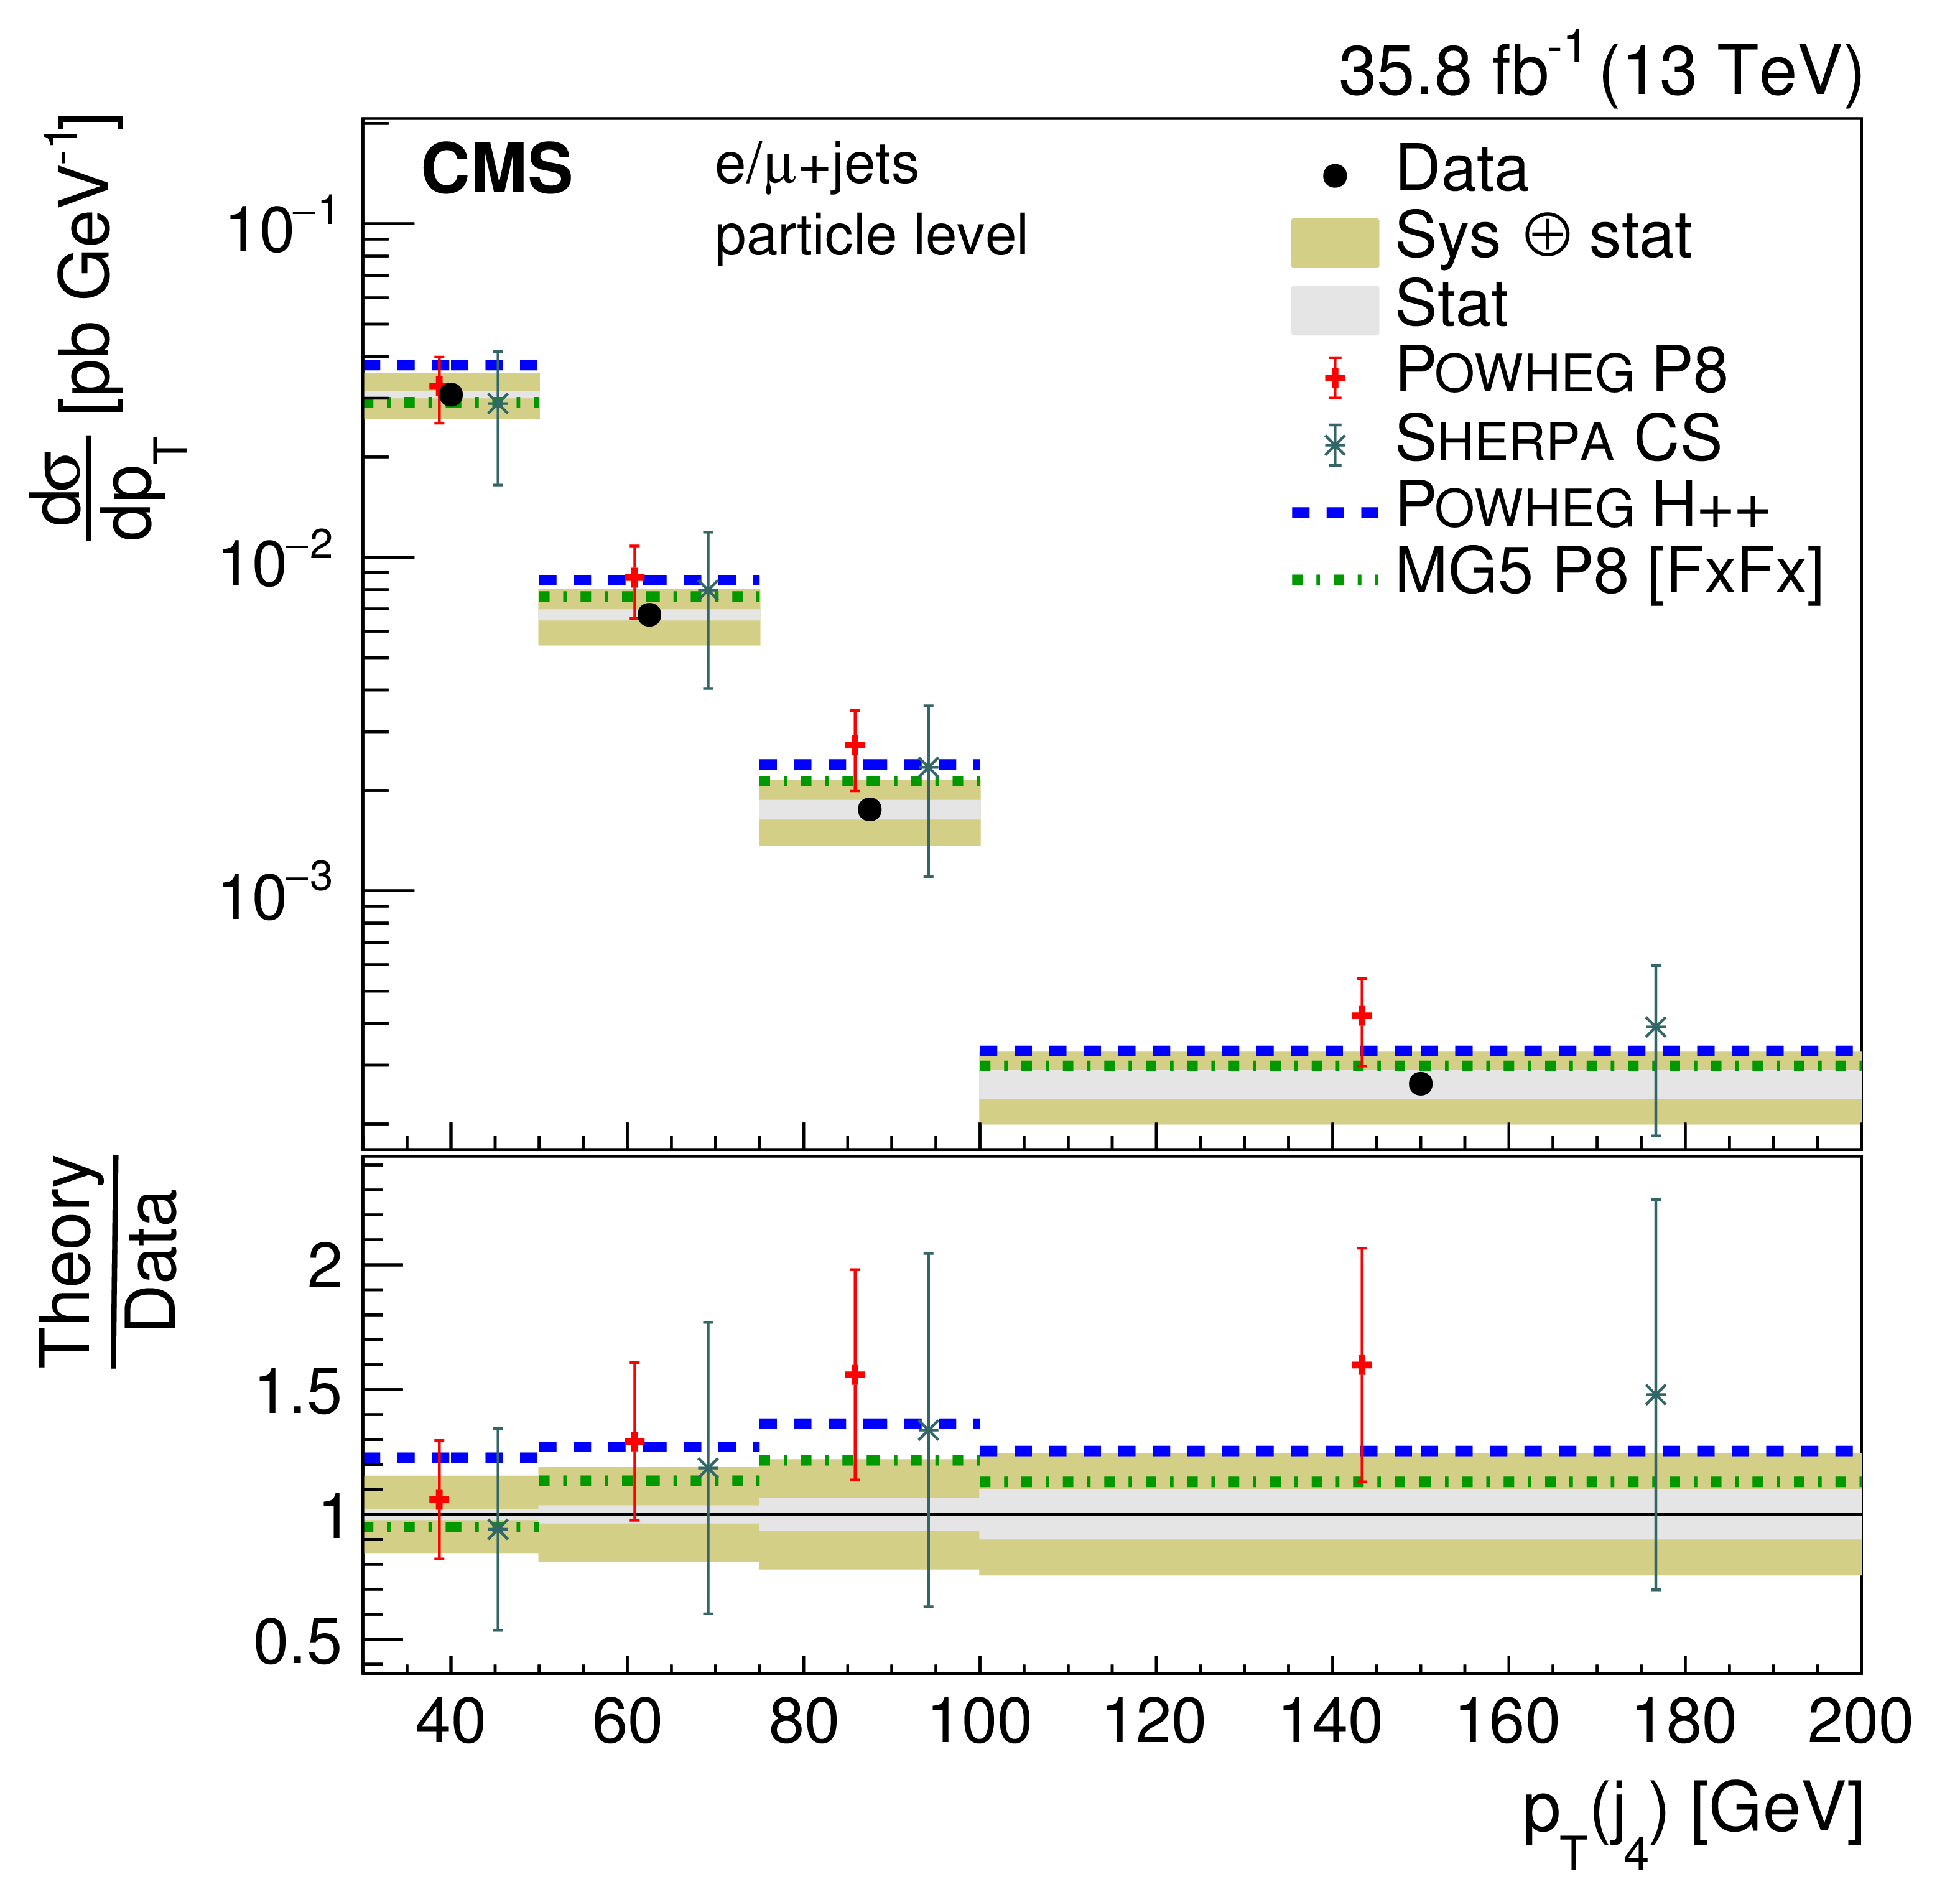
png pdf |
Figure 36-h:
Differential cross section at the particle level as a function of jet $ {p_{\mathrm {T}}} $. The upper two rows show the $ {p_{\mathrm {T}}} $ distributions for the jets in the $ {\mathrm{t} \mathrm{\bar{t}}} $ system, the lower two rows the distribution for additional jets. The data are shown as points with light (dark) bands indicating the statistical (statistical and systematic) uncertainties. The cross sections are compared to the predictions of POWHEG combined with PYTHIA8 (P8) or HERWIG++ (H++) and the multiparton simulations MG5_aMC@NLO (MG5)+PYTHIA8 FxFx and SHERPA. The ratios of the predictions to the measured cross sections are shown at the bottom of each panel. |
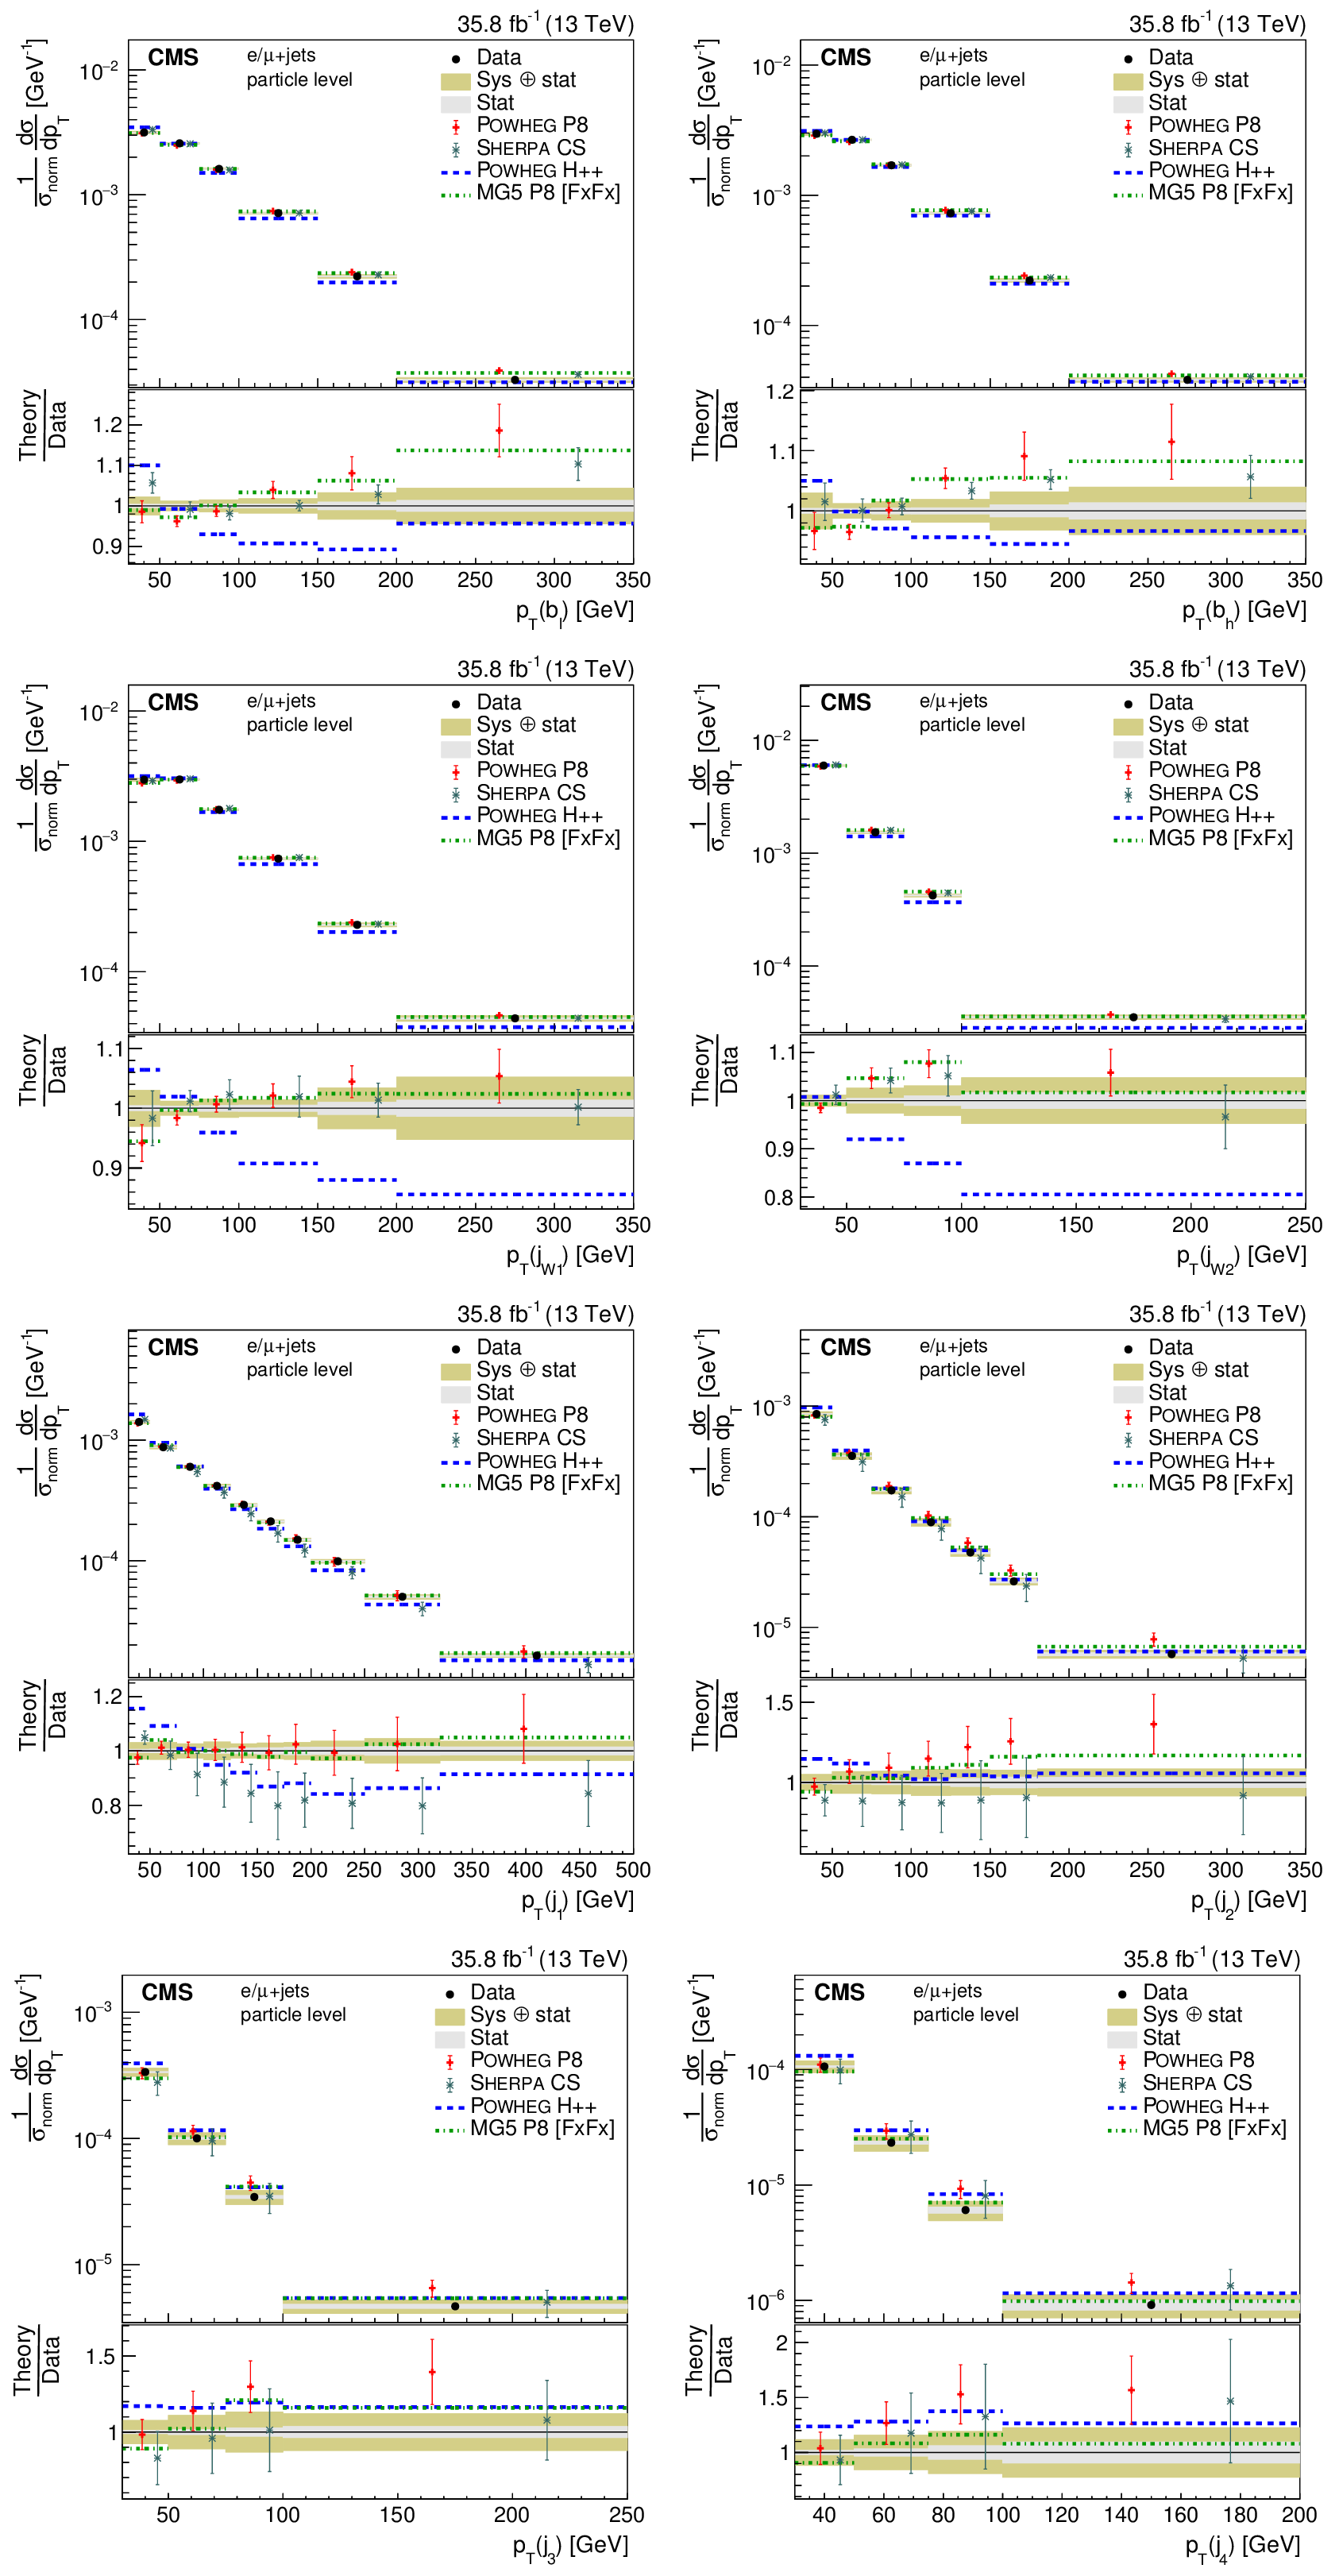
png pdf |
Figure 37:
Normalized differential cross section at the particle level as a function of jet $ {p_{\mathrm {T}}} $. The upper two rows show the $ {p_{\mathrm {T}}} $ distributions for the jets in the $ {\mathrm{t} \mathrm{\bar{t}}} $ system, the lower two rows the distribution for additional jets. The data are shown as points with light (dark) bands indicating the statistical (statistical and systematic) uncertainties. The cross sections are compared to the predictions of POWHEG combined with PYTHIA8 (P8) or HERWIG++ (H++) and the multiparton simulations MG5_aMC@NLO (MG5)+PYTHIA8 FxFx and SHERPA. The ratios of the predictions to the measured cross sections are shown at the bottom of each panel. |
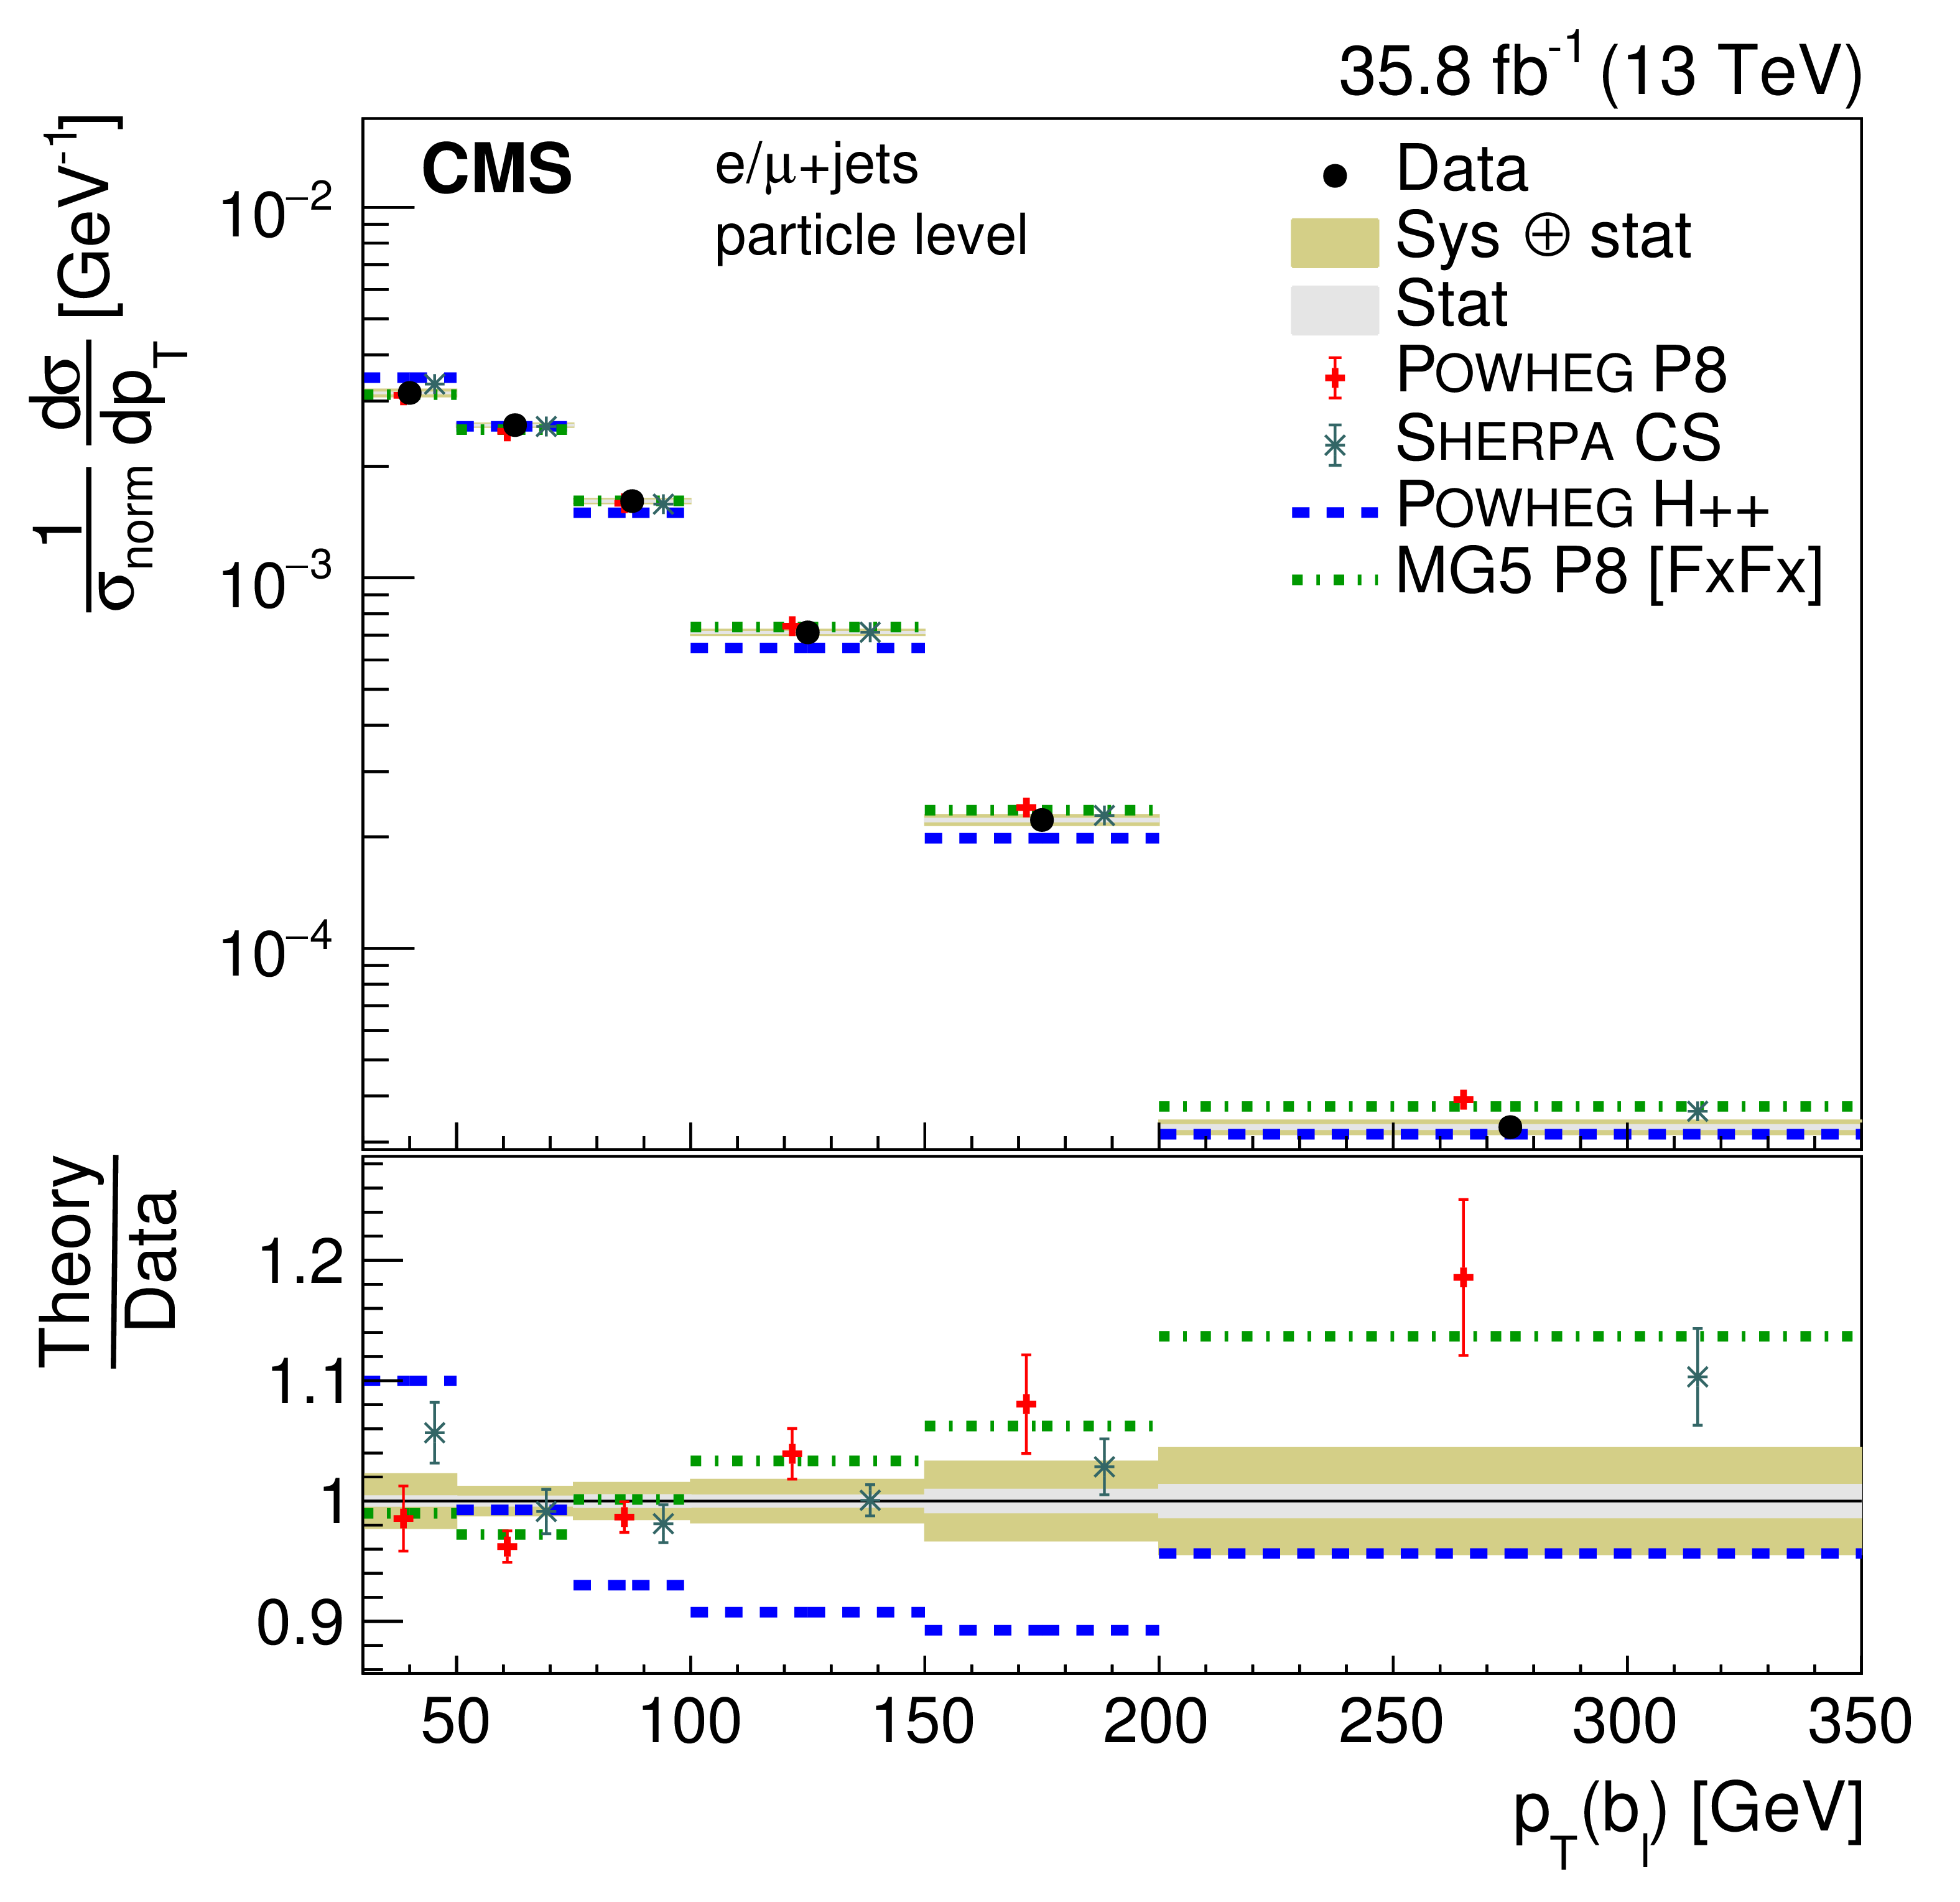
png pdf |
Figure 37-a:
Normalized differential cross section at the particle level as a function of jet $ {p_{\mathrm {T}}} $. The upper two rows show the $ {p_{\mathrm {T}}} $ distributions for the jets in the $ {\mathrm{t} \mathrm{\bar{t}}} $ system, the lower two rows the distribution for additional jets. The data are shown as points with light (dark) bands indicating the statistical (statistical and systematic) uncertainties. The cross sections are compared to the predictions of POWHEG combined with PYTHIA8 (P8) or HERWIG++ (H++) and the multiparton simulations MG5_aMC@NLO (MG5)+PYTHIA8 FxFx and SHERPA. The ratios of the predictions to the measured cross sections are shown at the bottom of each panel. |
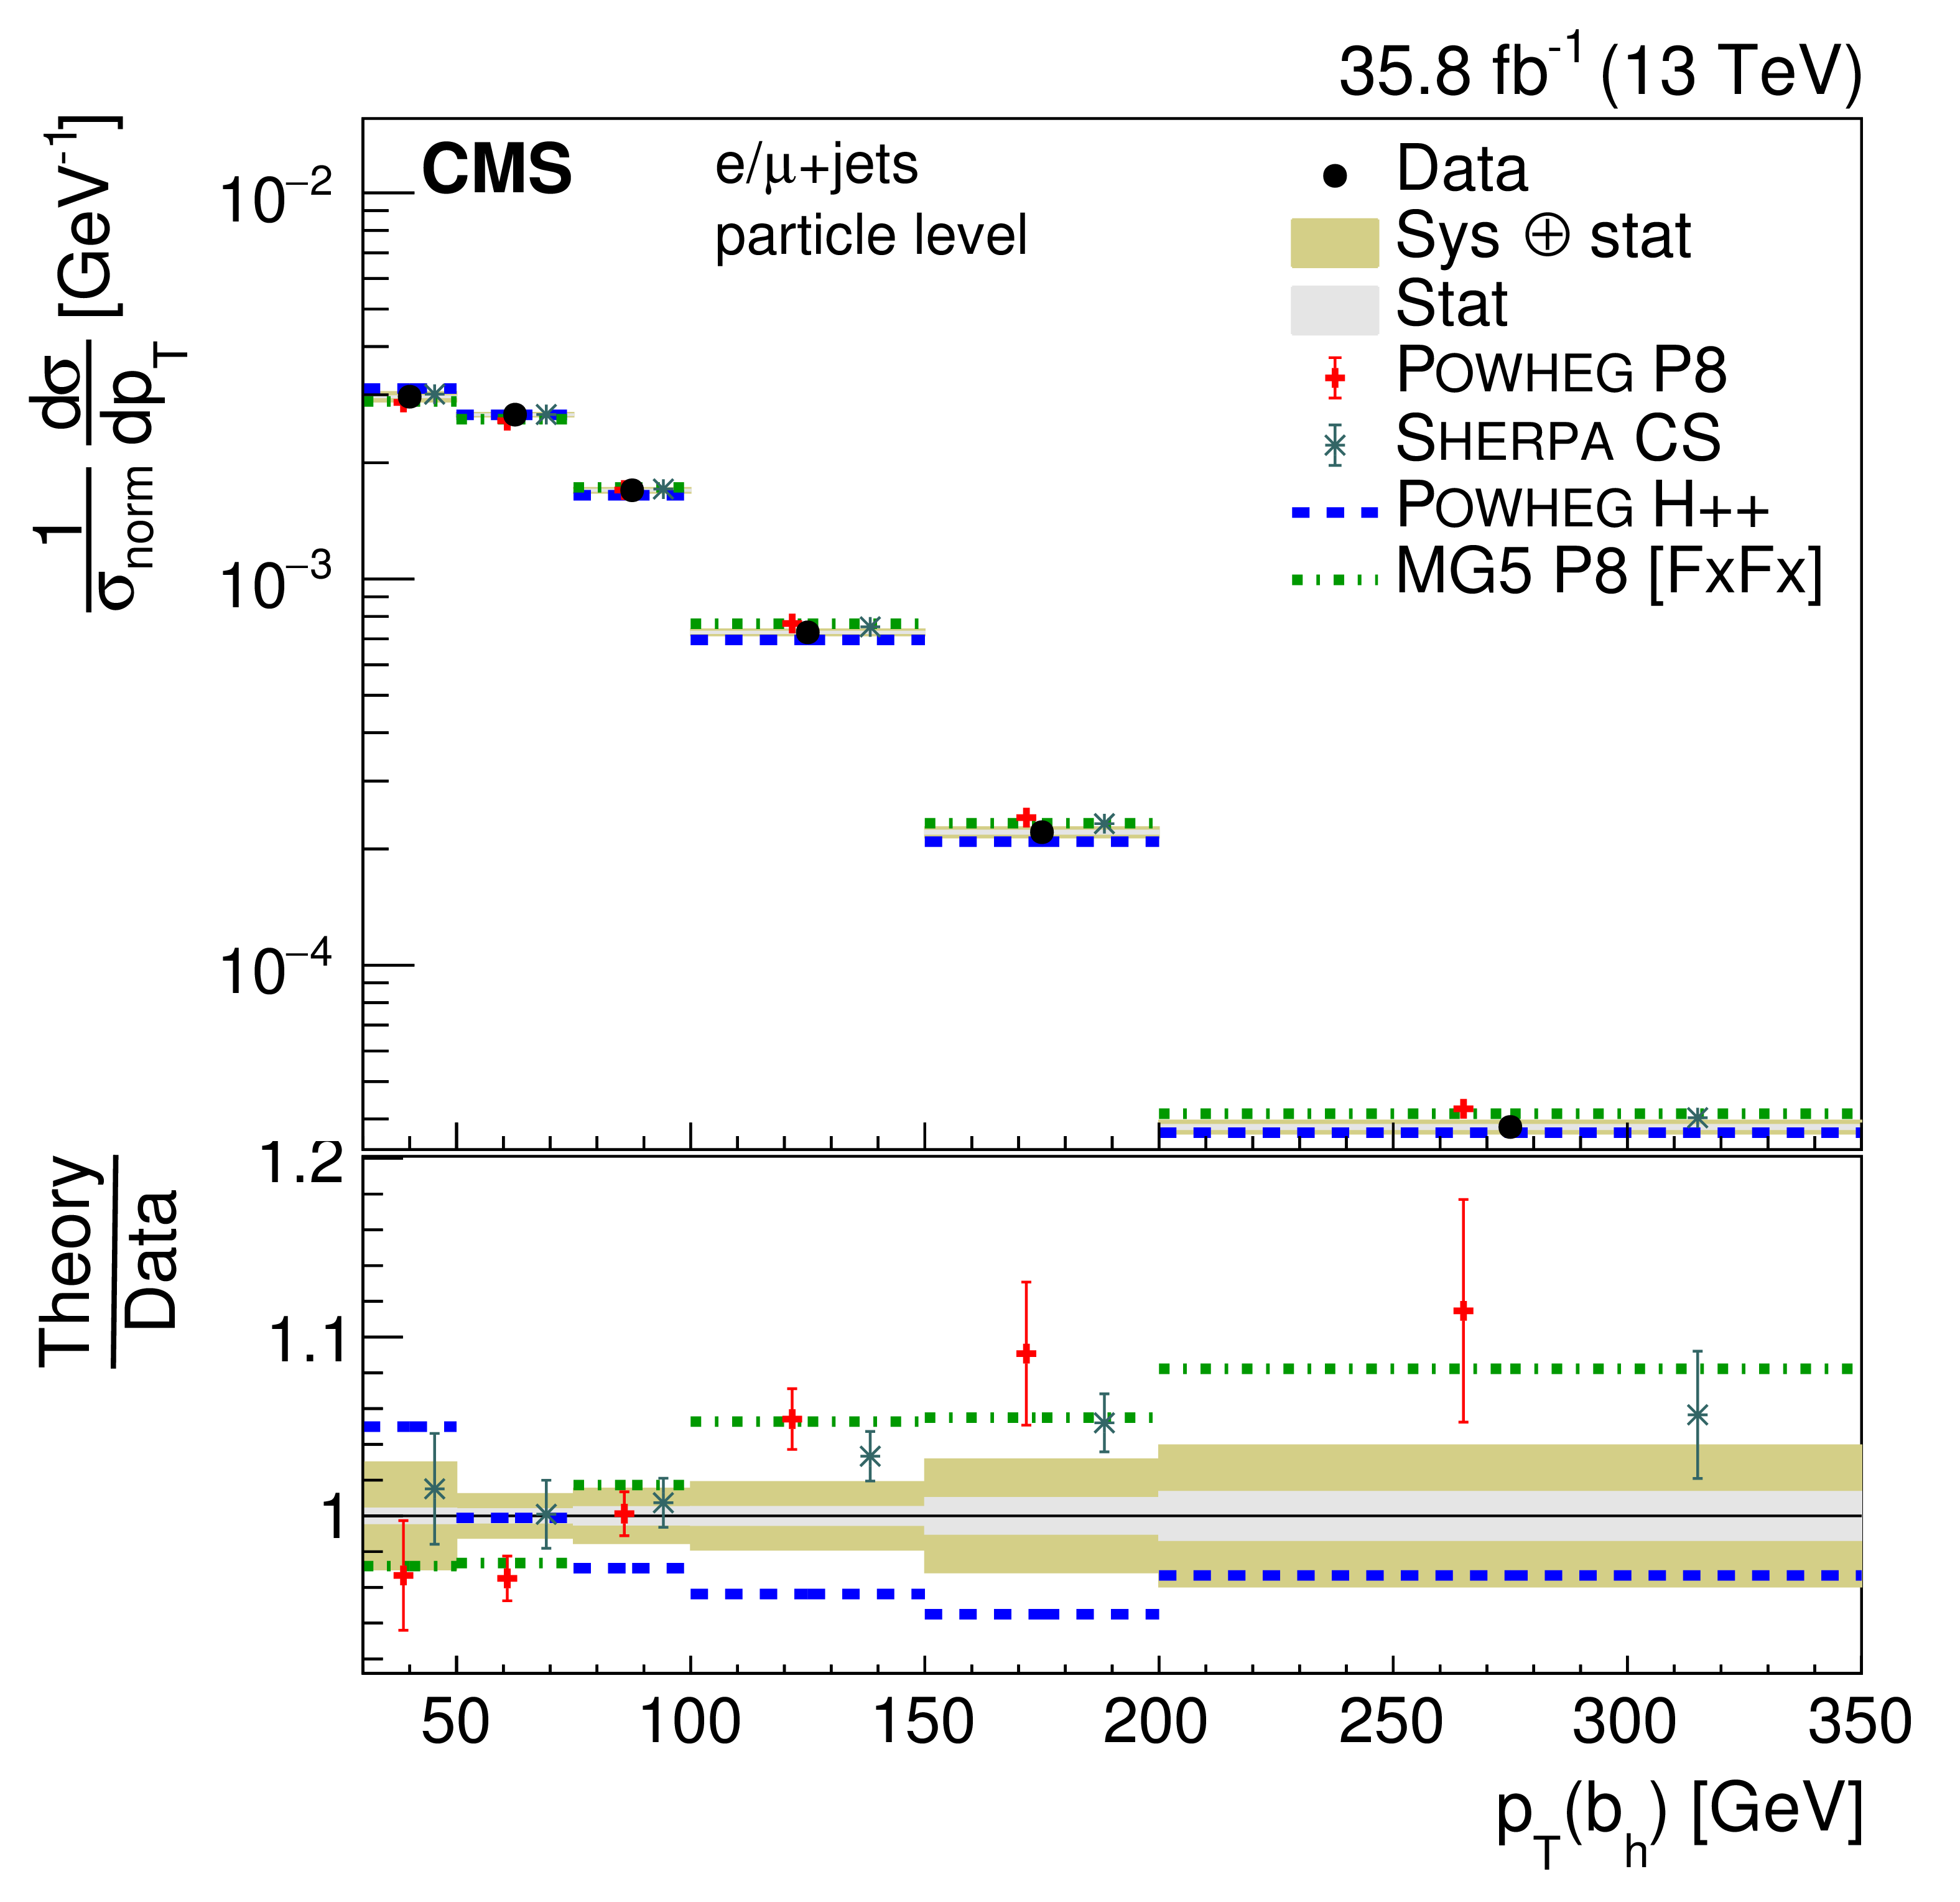
png pdf |
Figure 37-b:
Normalized differential cross section at the particle level as a function of jet $ {p_{\mathrm {T}}} $. The upper two rows show the $ {p_{\mathrm {T}}} $ distributions for the jets in the $ {\mathrm{t} \mathrm{\bar{t}}} $ system, the lower two rows the distribution for additional jets. The data are shown as points with light (dark) bands indicating the statistical (statistical and systematic) uncertainties. The cross sections are compared to the predictions of POWHEG combined with PYTHIA8 (P8) or HERWIG++ (H++) and the multiparton simulations MG5_aMC@NLO (MG5)+PYTHIA8 FxFx and SHERPA. The ratios of the predictions to the measured cross sections are shown at the bottom of each panel. |
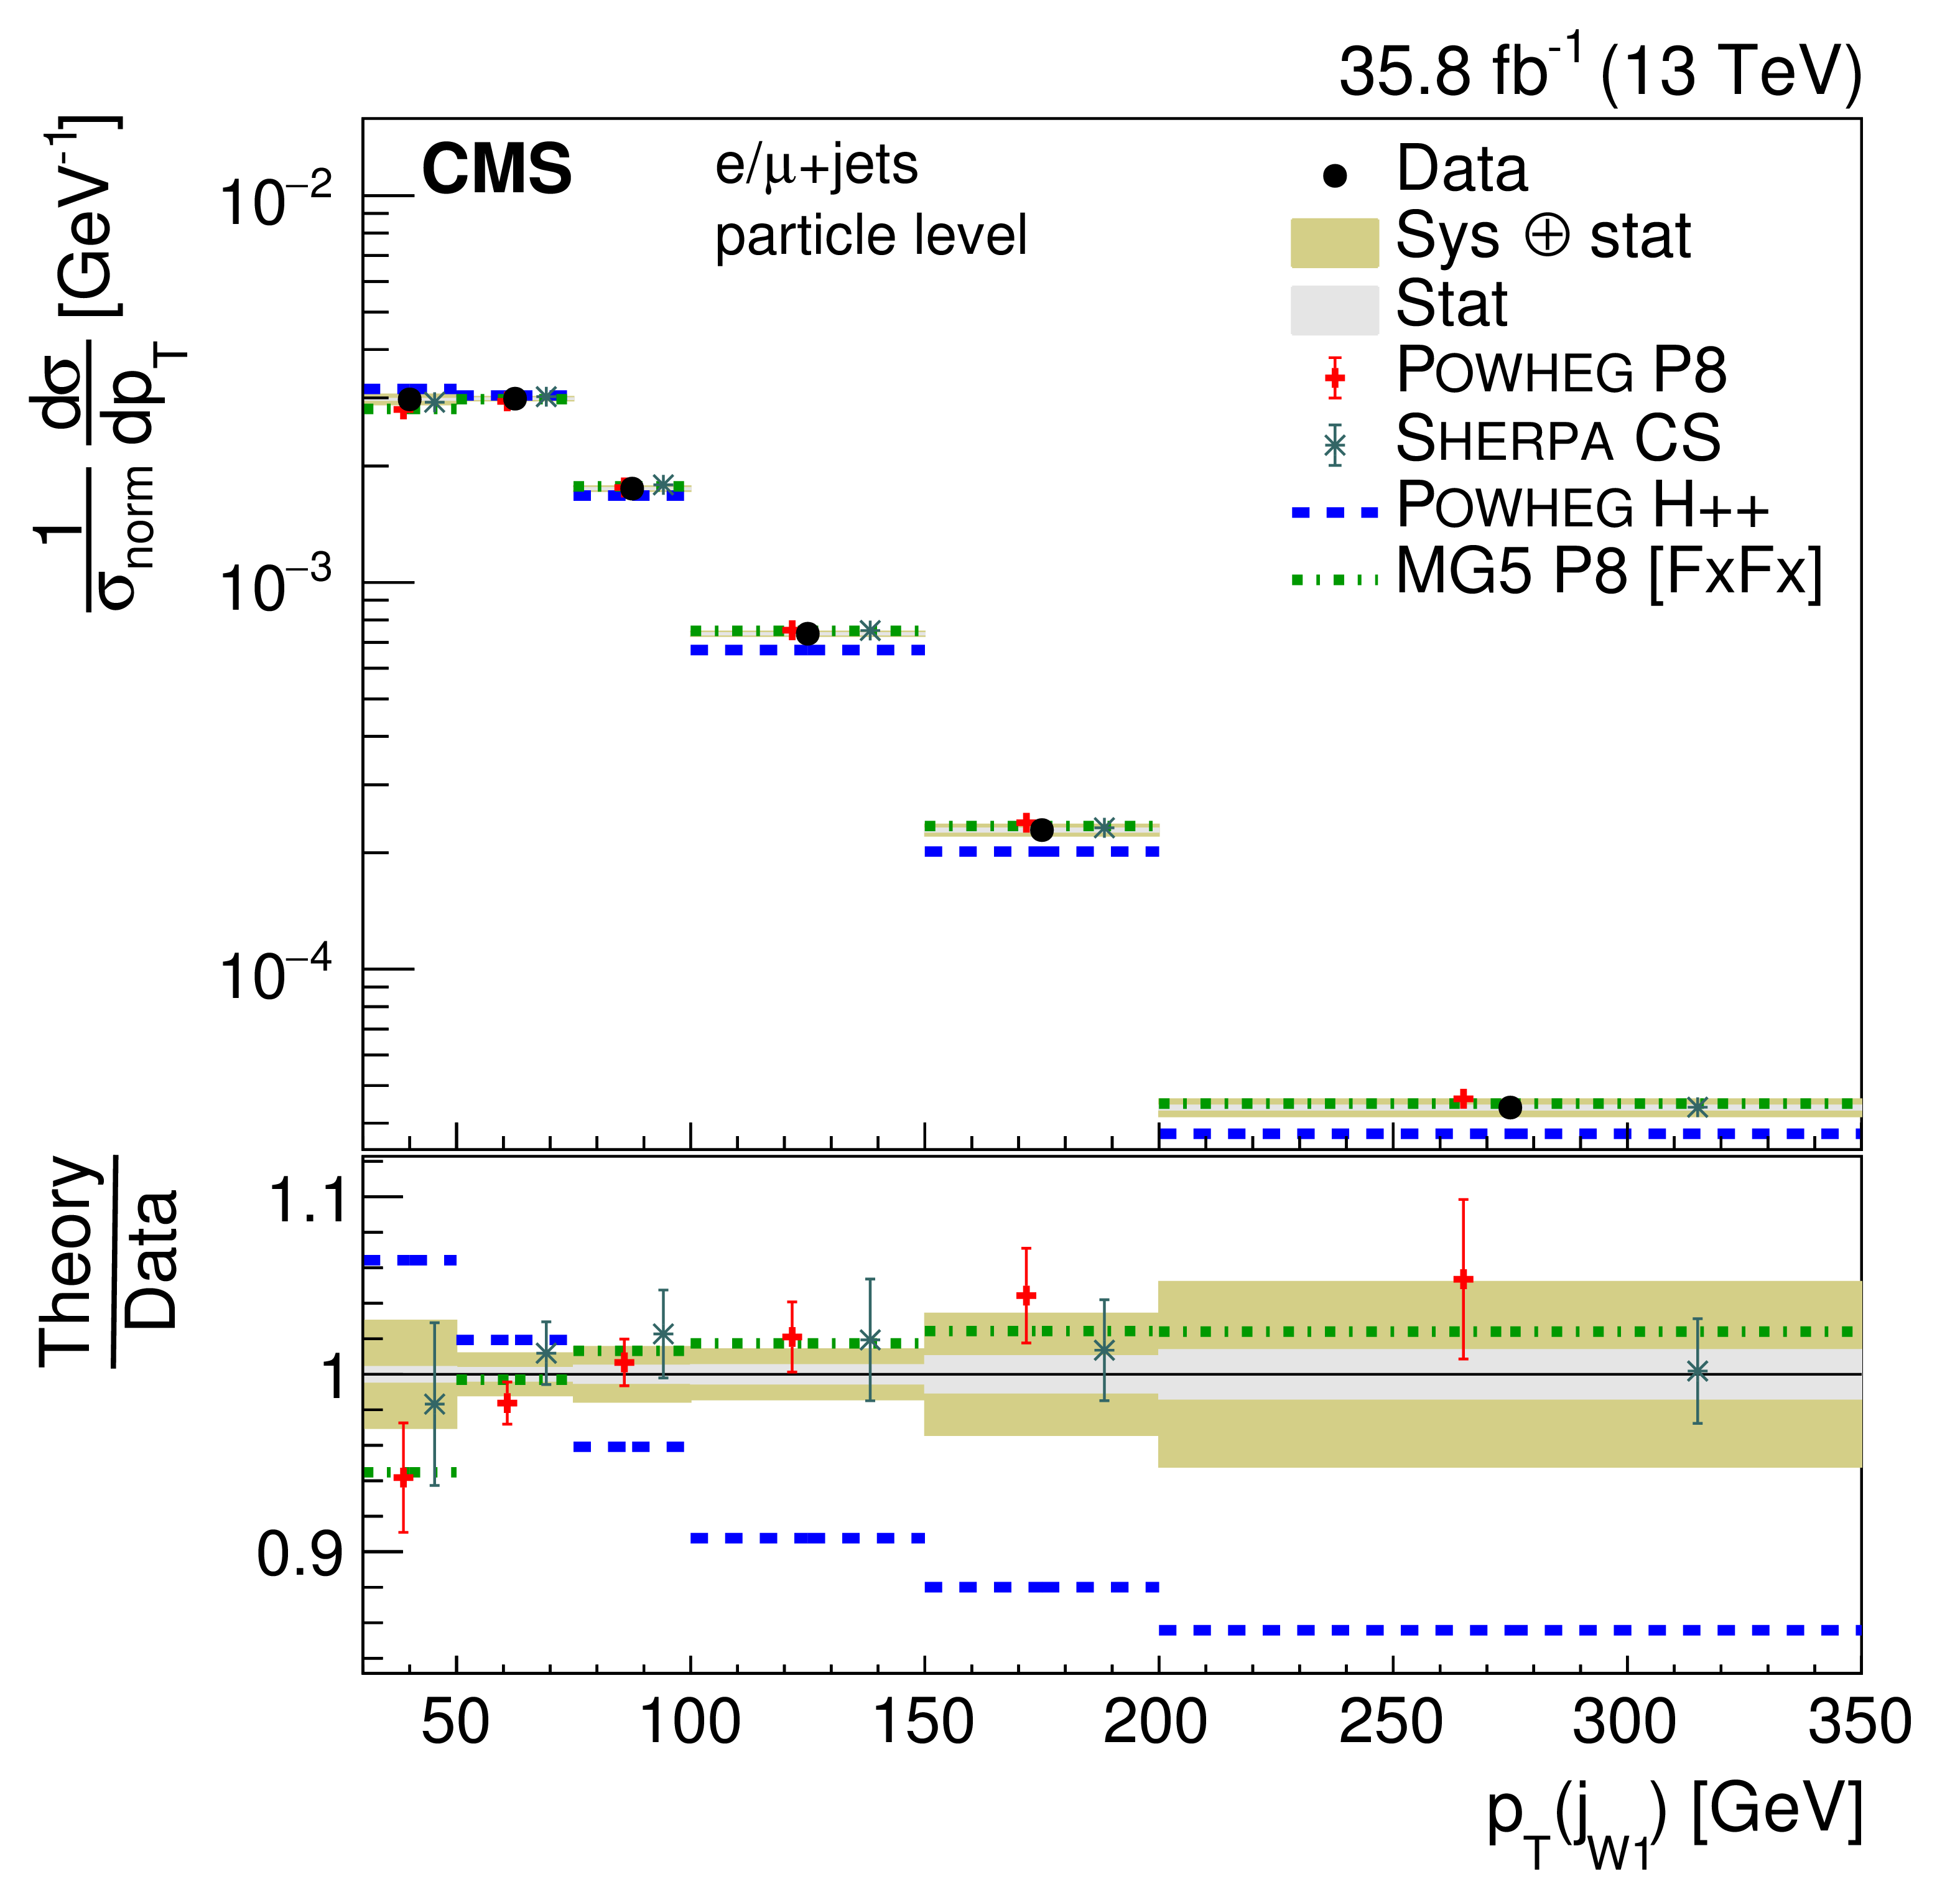
png pdf |
Figure 37-c:
Normalized differential cross section at the particle level as a function of jet $ {p_{\mathrm {T}}} $. The upper two rows show the $ {p_{\mathrm {T}}} $ distributions for the jets in the $ {\mathrm{t} \mathrm{\bar{t}}} $ system, the lower two rows the distribution for additional jets. The data are shown as points with light (dark) bands indicating the statistical (statistical and systematic) uncertainties. The cross sections are compared to the predictions of POWHEG combined with PYTHIA8 (P8) or HERWIG++ (H++) and the multiparton simulations MG5_aMC@NLO (MG5)+PYTHIA8 FxFx and SHERPA. The ratios of the predictions to the measured cross sections are shown at the bottom of each panel. |
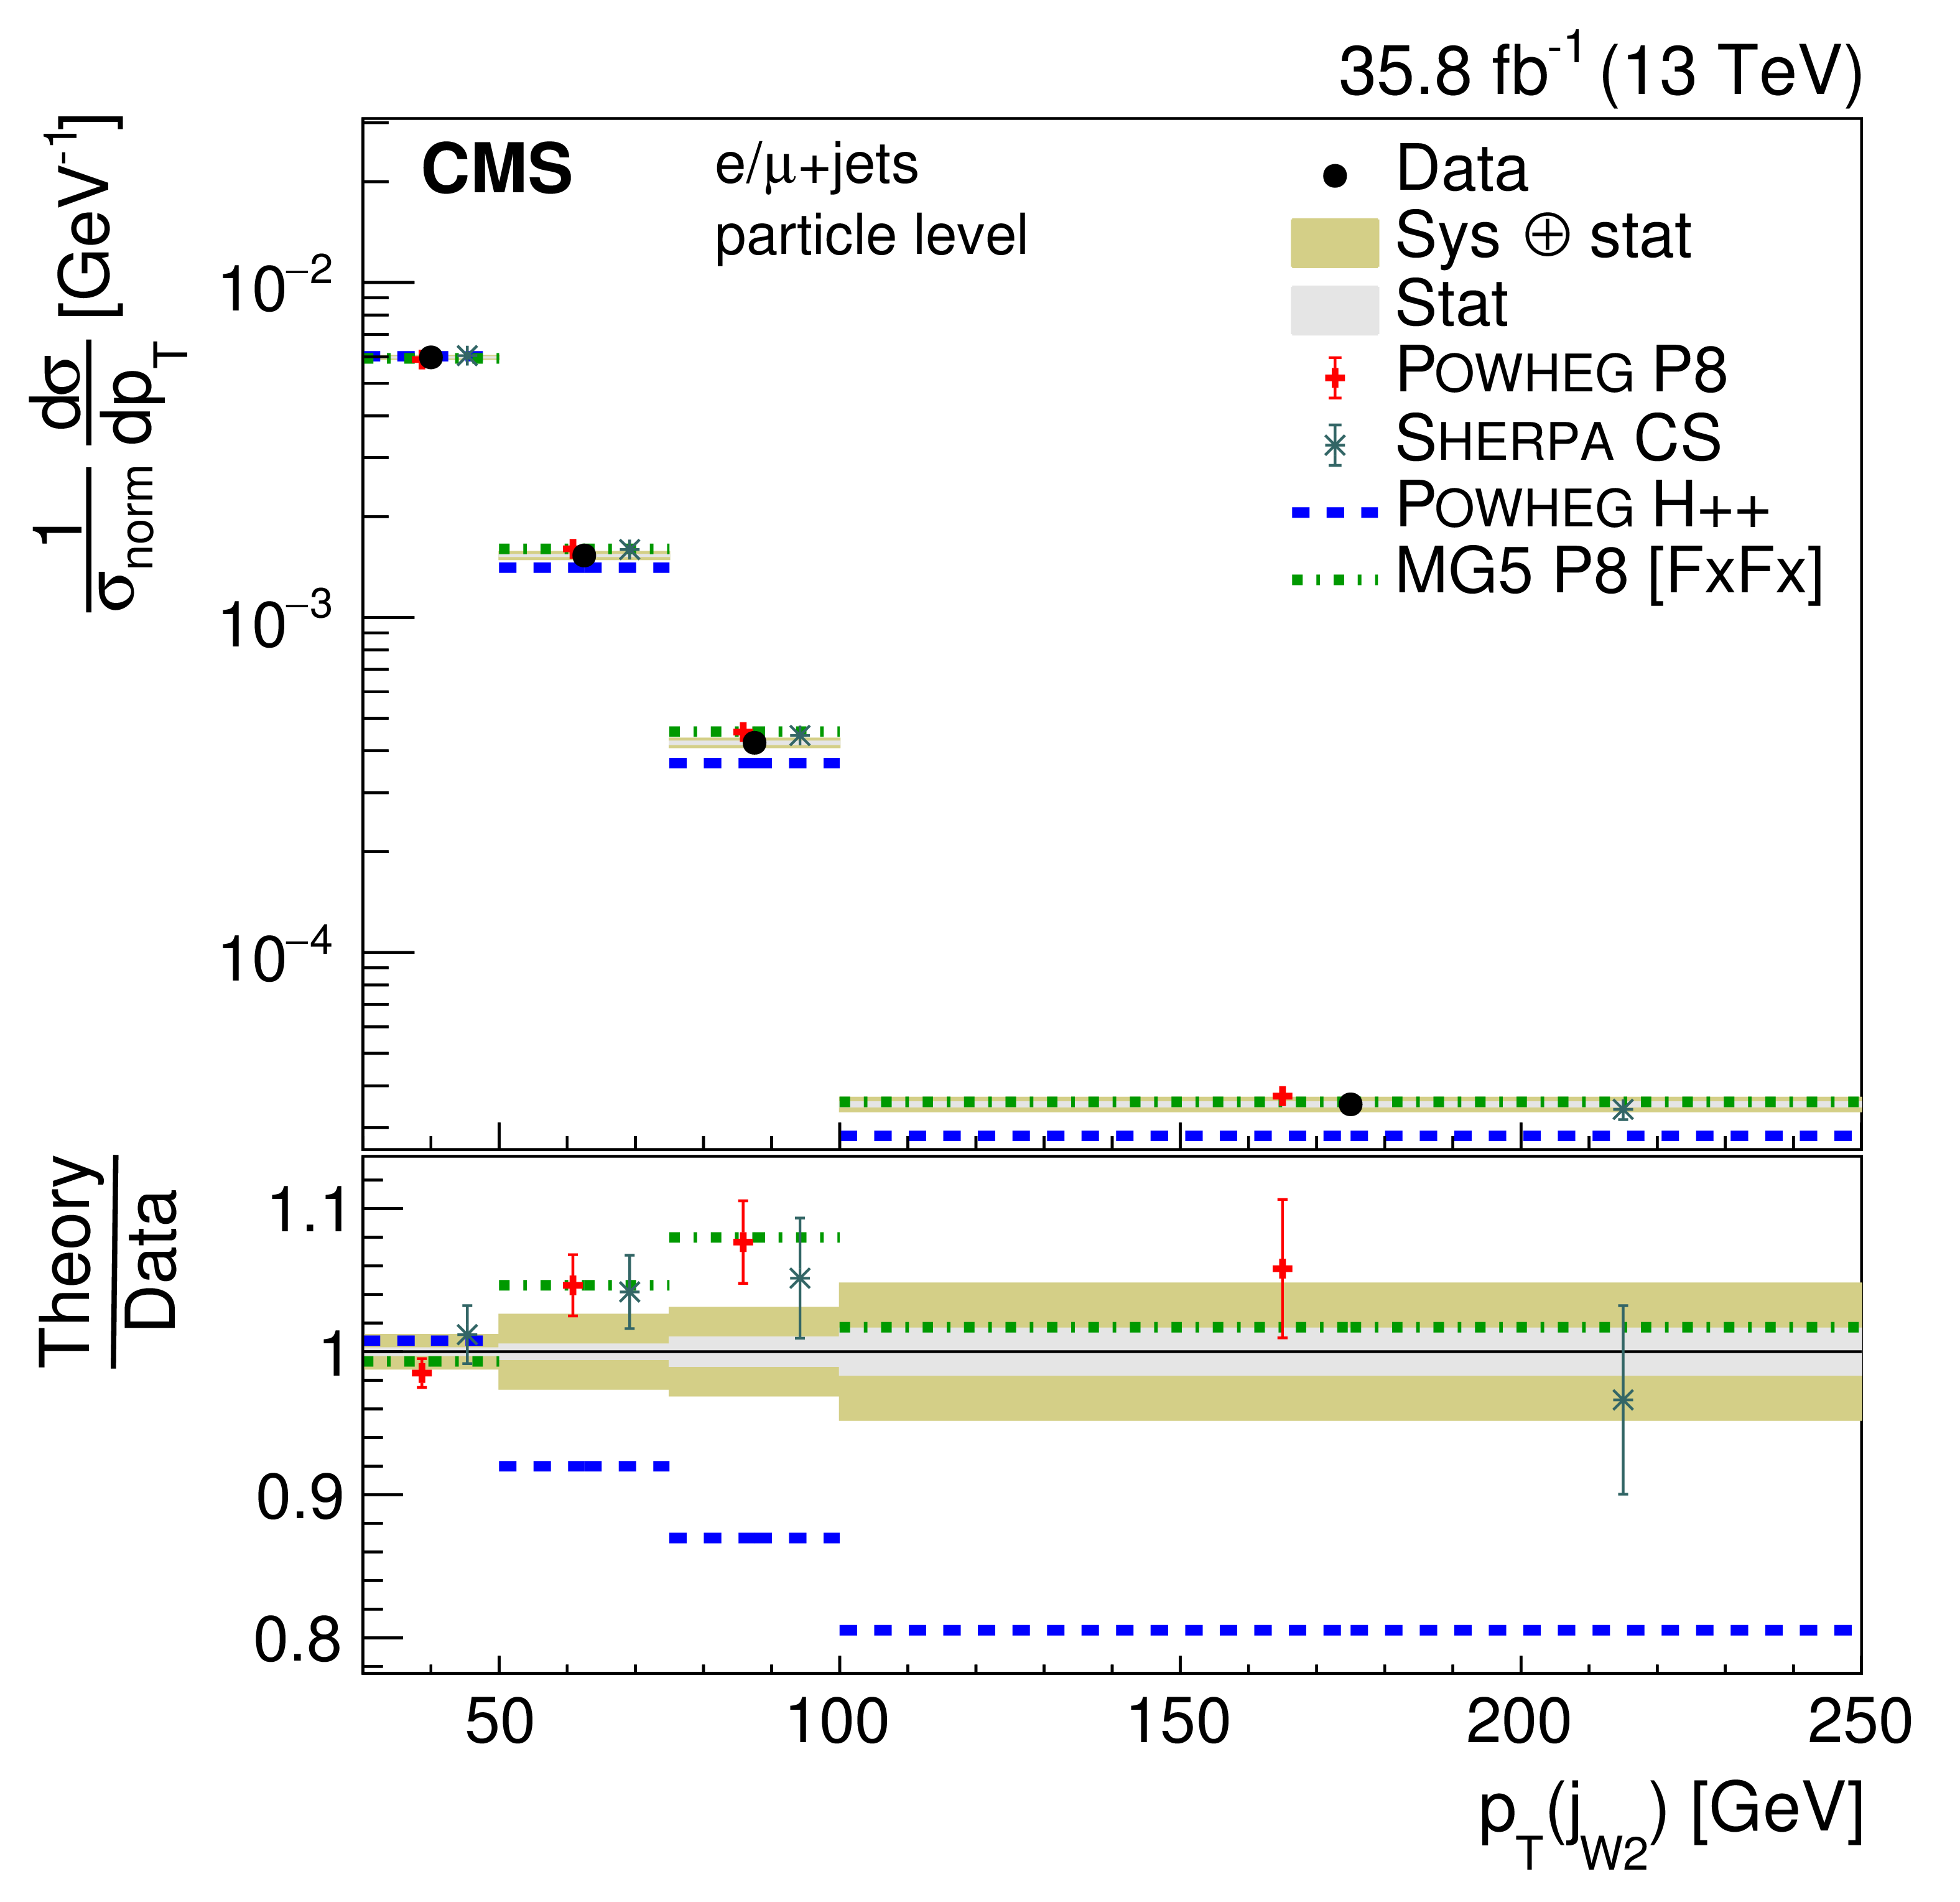
png pdf |
Figure 37-d:
Normalized differential cross section at the particle level as a function of jet $ {p_{\mathrm {T}}} $. The upper two rows show the $ {p_{\mathrm {T}}} $ distributions for the jets in the $ {\mathrm{t} \mathrm{\bar{t}}} $ system, the lower two rows the distribution for additional jets. The data are shown as points with light (dark) bands indicating the statistical (statistical and systematic) uncertainties. The cross sections are compared to the predictions of POWHEG combined with PYTHIA8 (P8) or HERWIG++ (H++) and the multiparton simulations MG5_aMC@NLO (MG5)+PYTHIA8 FxFx and SHERPA. The ratios of the predictions to the measured cross sections are shown at the bottom of each panel. |
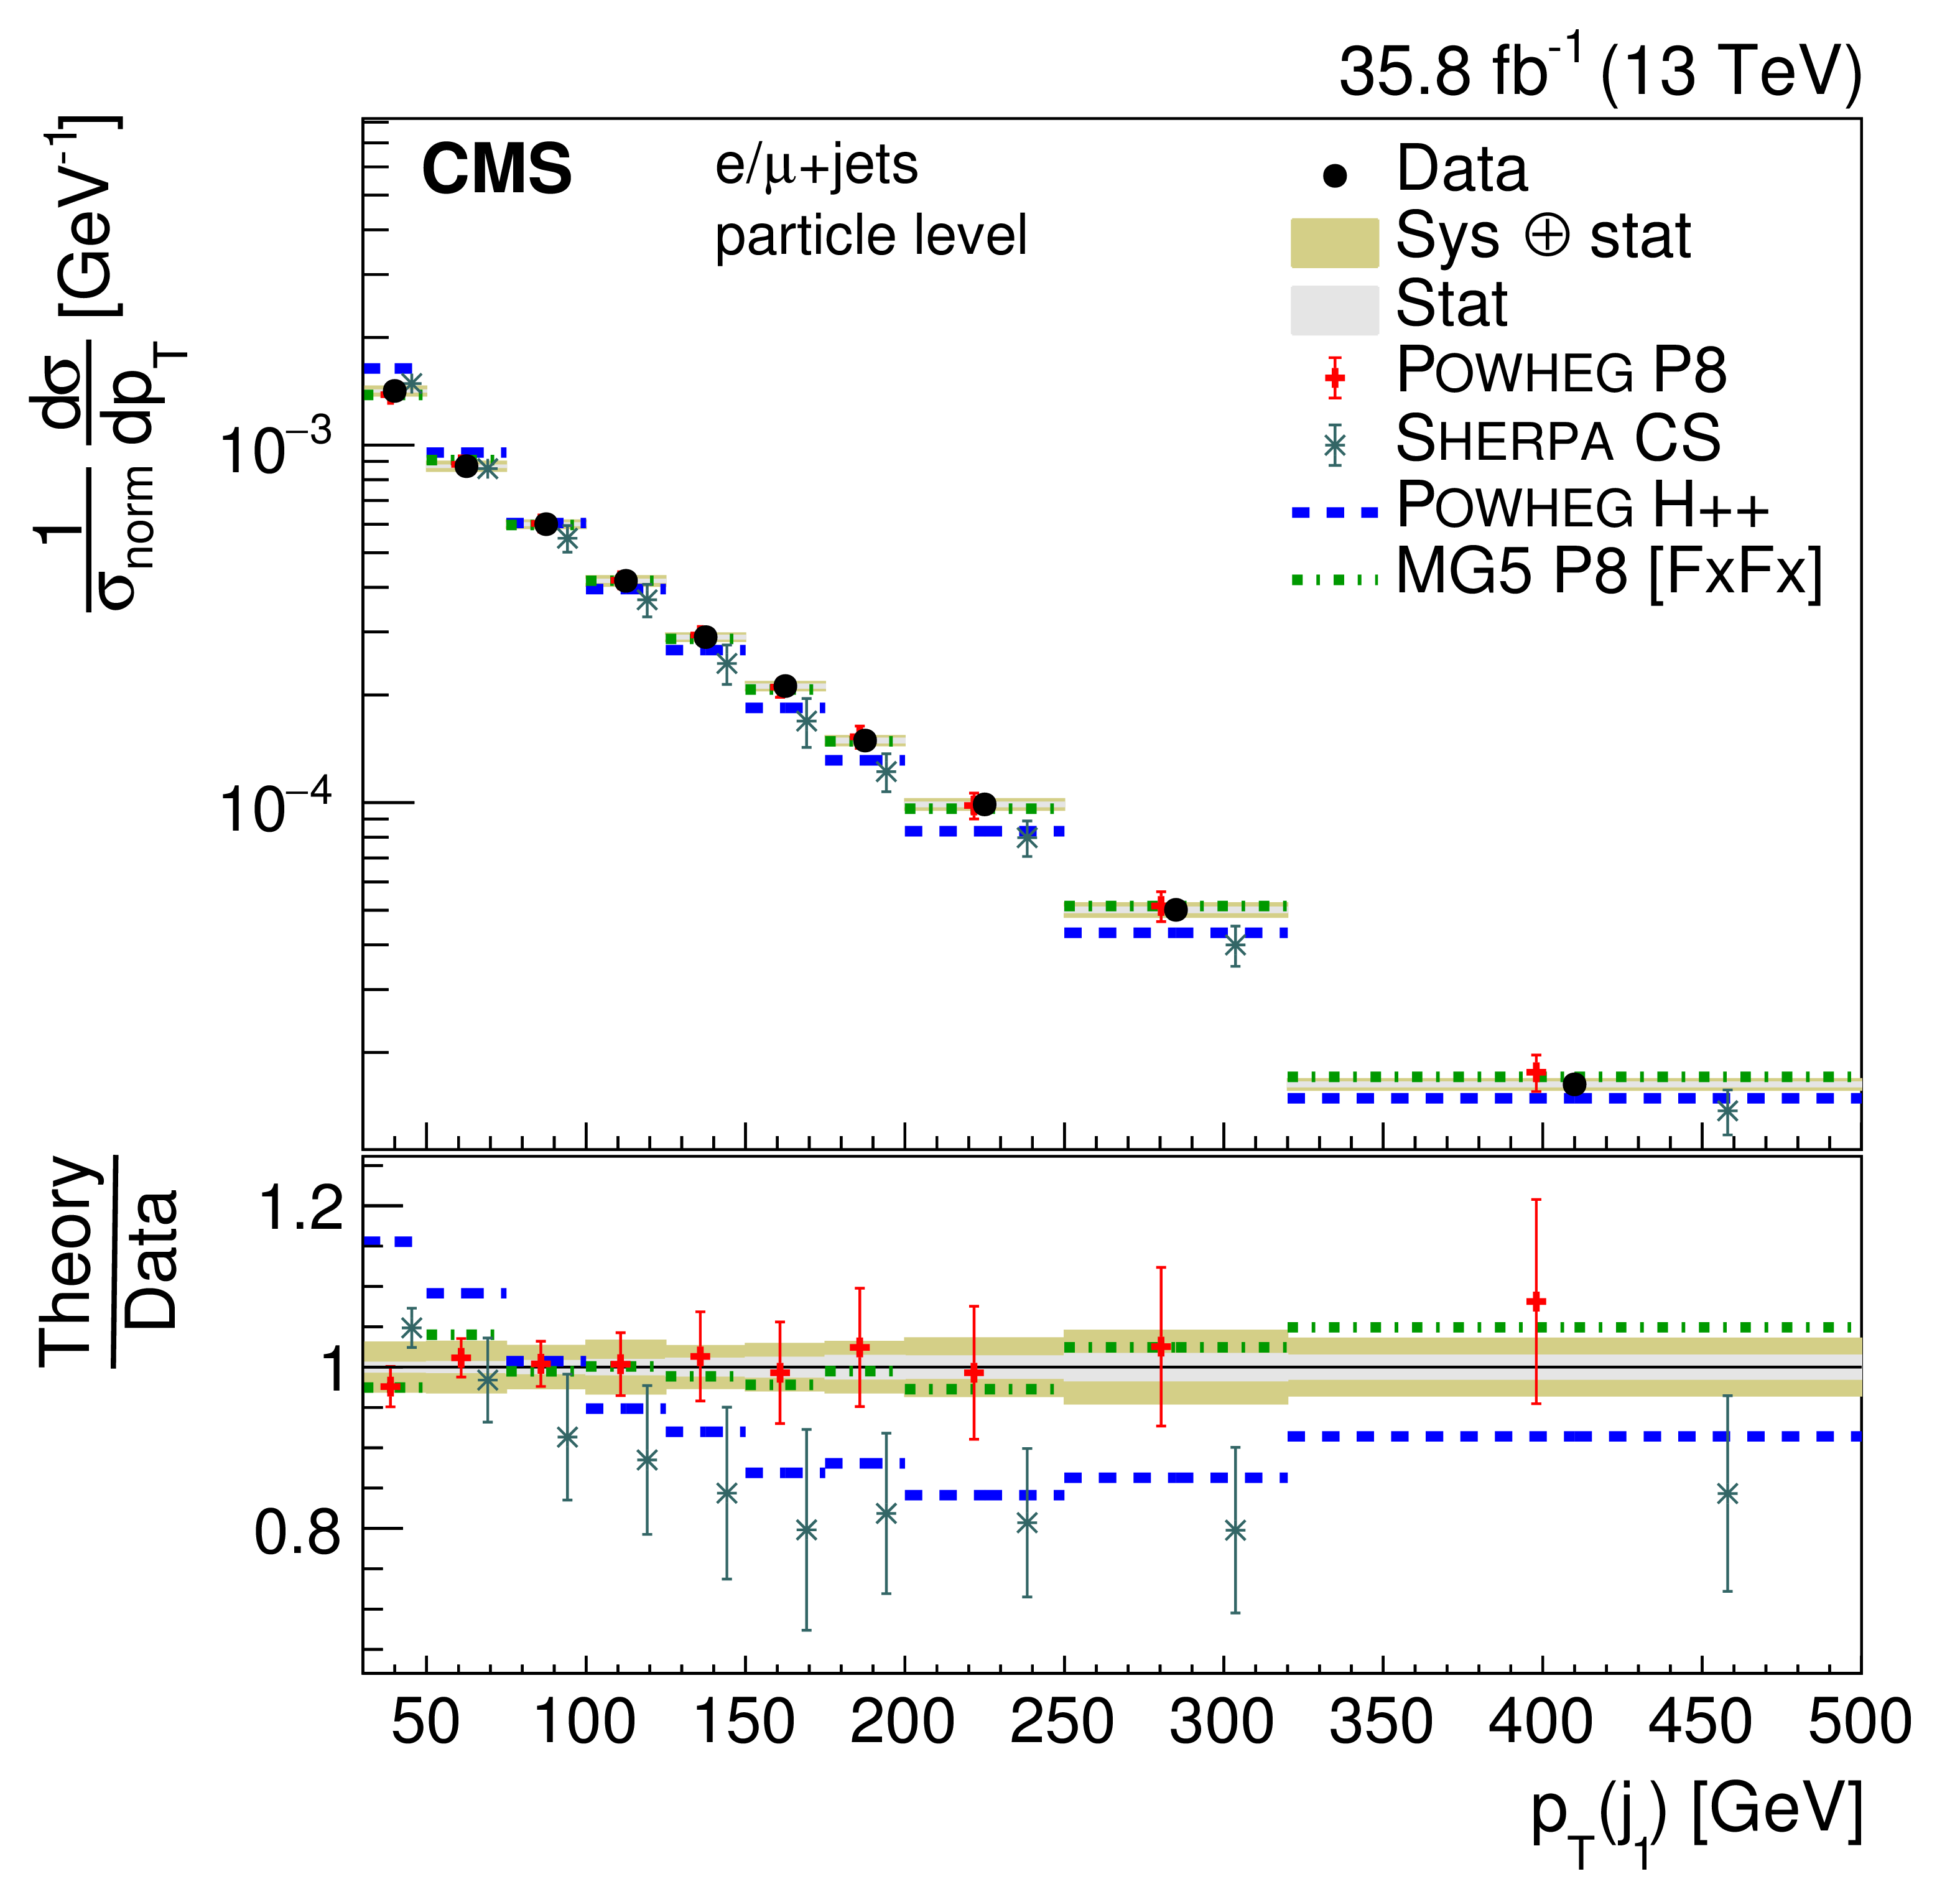
png pdf |
Figure 37-e:
Normalized differential cross section at the particle level as a function of jet $ {p_{\mathrm {T}}} $. The upper two rows show the $ {p_{\mathrm {T}}} $ distributions for the jets in the $ {\mathrm{t} \mathrm{\bar{t}}} $ system, the lower two rows the distribution for additional jets. The data are shown as points with light (dark) bands indicating the statistical (statistical and systematic) uncertainties. The cross sections are compared to the predictions of POWHEG combined with PYTHIA8 (P8) or HERWIG++ (H++) and the multiparton simulations MG5_aMC@NLO (MG5)+PYTHIA8 FxFx and SHERPA. The ratios of the predictions to the measured cross sections are shown at the bottom of each panel. |

png pdf |
Figure 37-f:
Normalized differential cross section at the particle level as a function of jet $ {p_{\mathrm {T}}} $. The upper two rows show the $ {p_{\mathrm {T}}} $ distributions for the jets in the $ {\mathrm{t} \mathrm{\bar{t}}} $ system, the lower two rows the distribution for additional jets. The data are shown as points with light (dark) bands indicating the statistical (statistical and systematic) uncertainties. The cross sections are compared to the predictions of POWHEG combined with PYTHIA8 (P8) or HERWIG++ (H++) and the multiparton simulations MG5_aMC@NLO (MG5)+PYTHIA8 FxFx and SHERPA. The ratios of the predictions to the measured cross sections are shown at the bottom of each panel. |
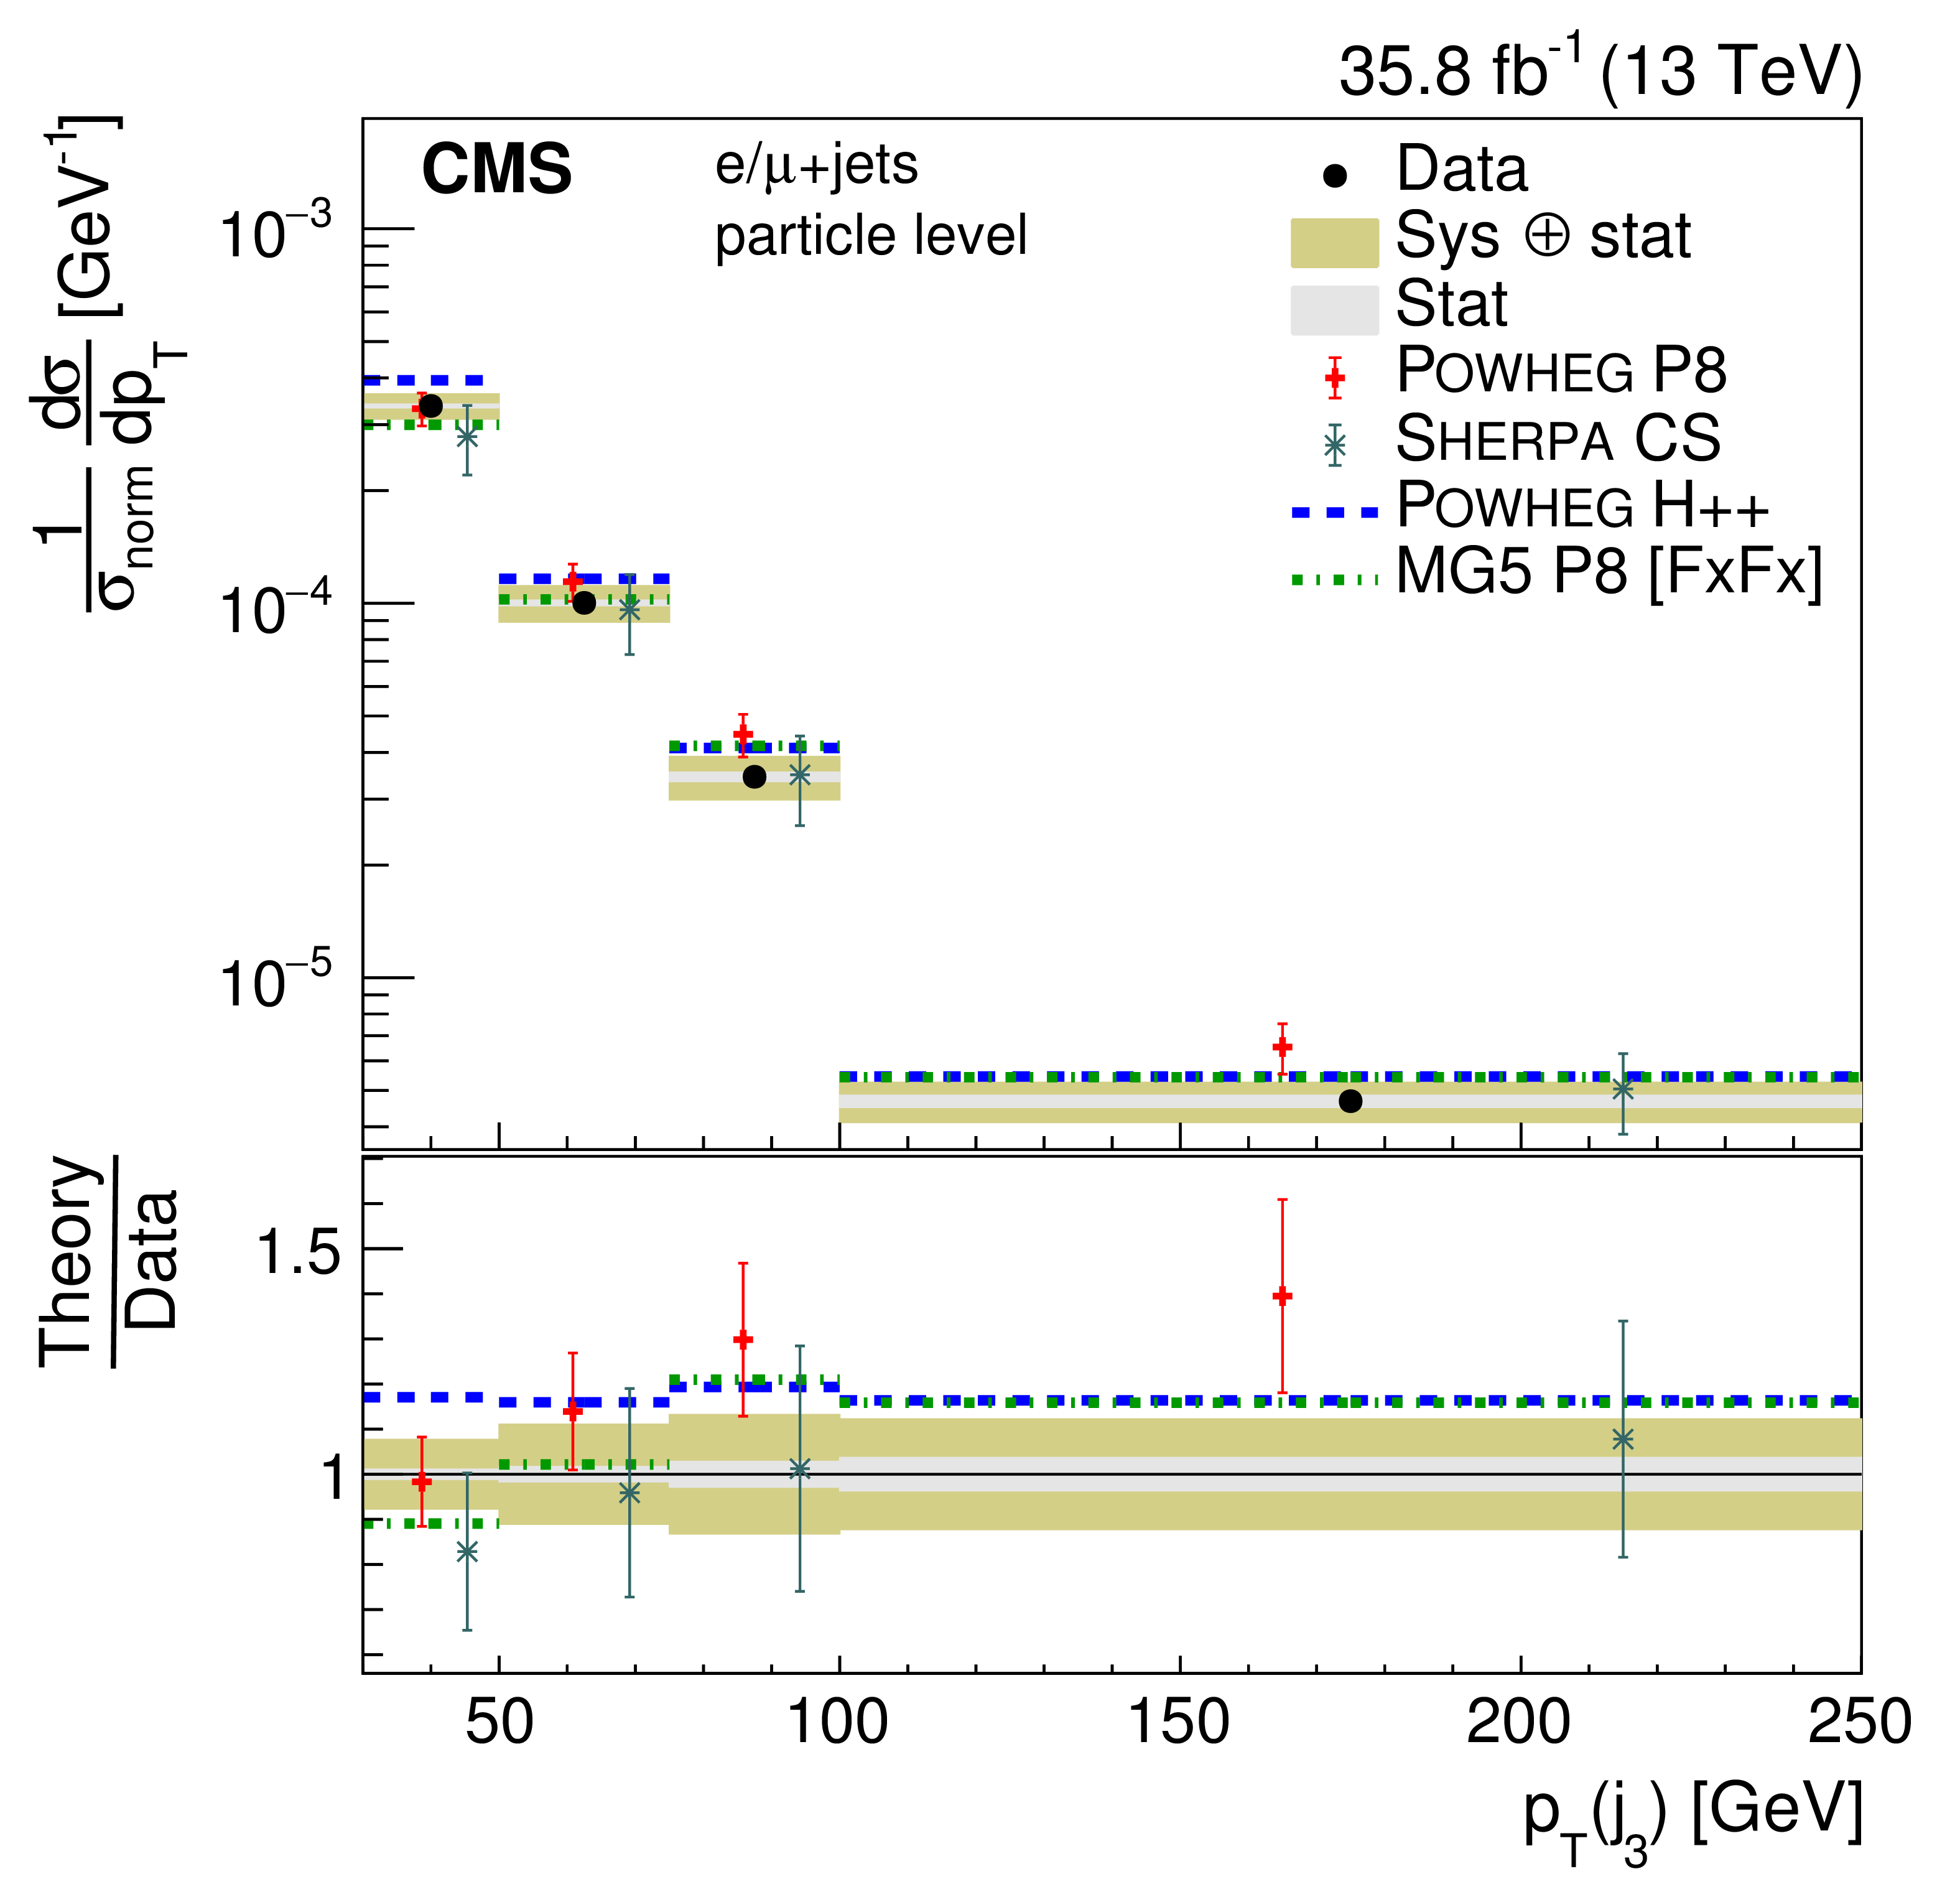
png pdf |
Figure 37-g:
Normalized differential cross section at the particle level as a function of jet $ {p_{\mathrm {T}}} $. The upper two rows show the $ {p_{\mathrm {T}}} $ distributions for the jets in the $ {\mathrm{t} \mathrm{\bar{t}}} $ system, the lower two rows the distribution for additional jets. The data are shown as points with light (dark) bands indicating the statistical (statistical and systematic) uncertainties. The cross sections are compared to the predictions of POWHEG combined with PYTHIA8 (P8) or HERWIG++ (H++) and the multiparton simulations MG5_aMC@NLO (MG5)+PYTHIA8 FxFx and SHERPA. The ratios of the predictions to the measured cross sections are shown at the bottom of each panel. |
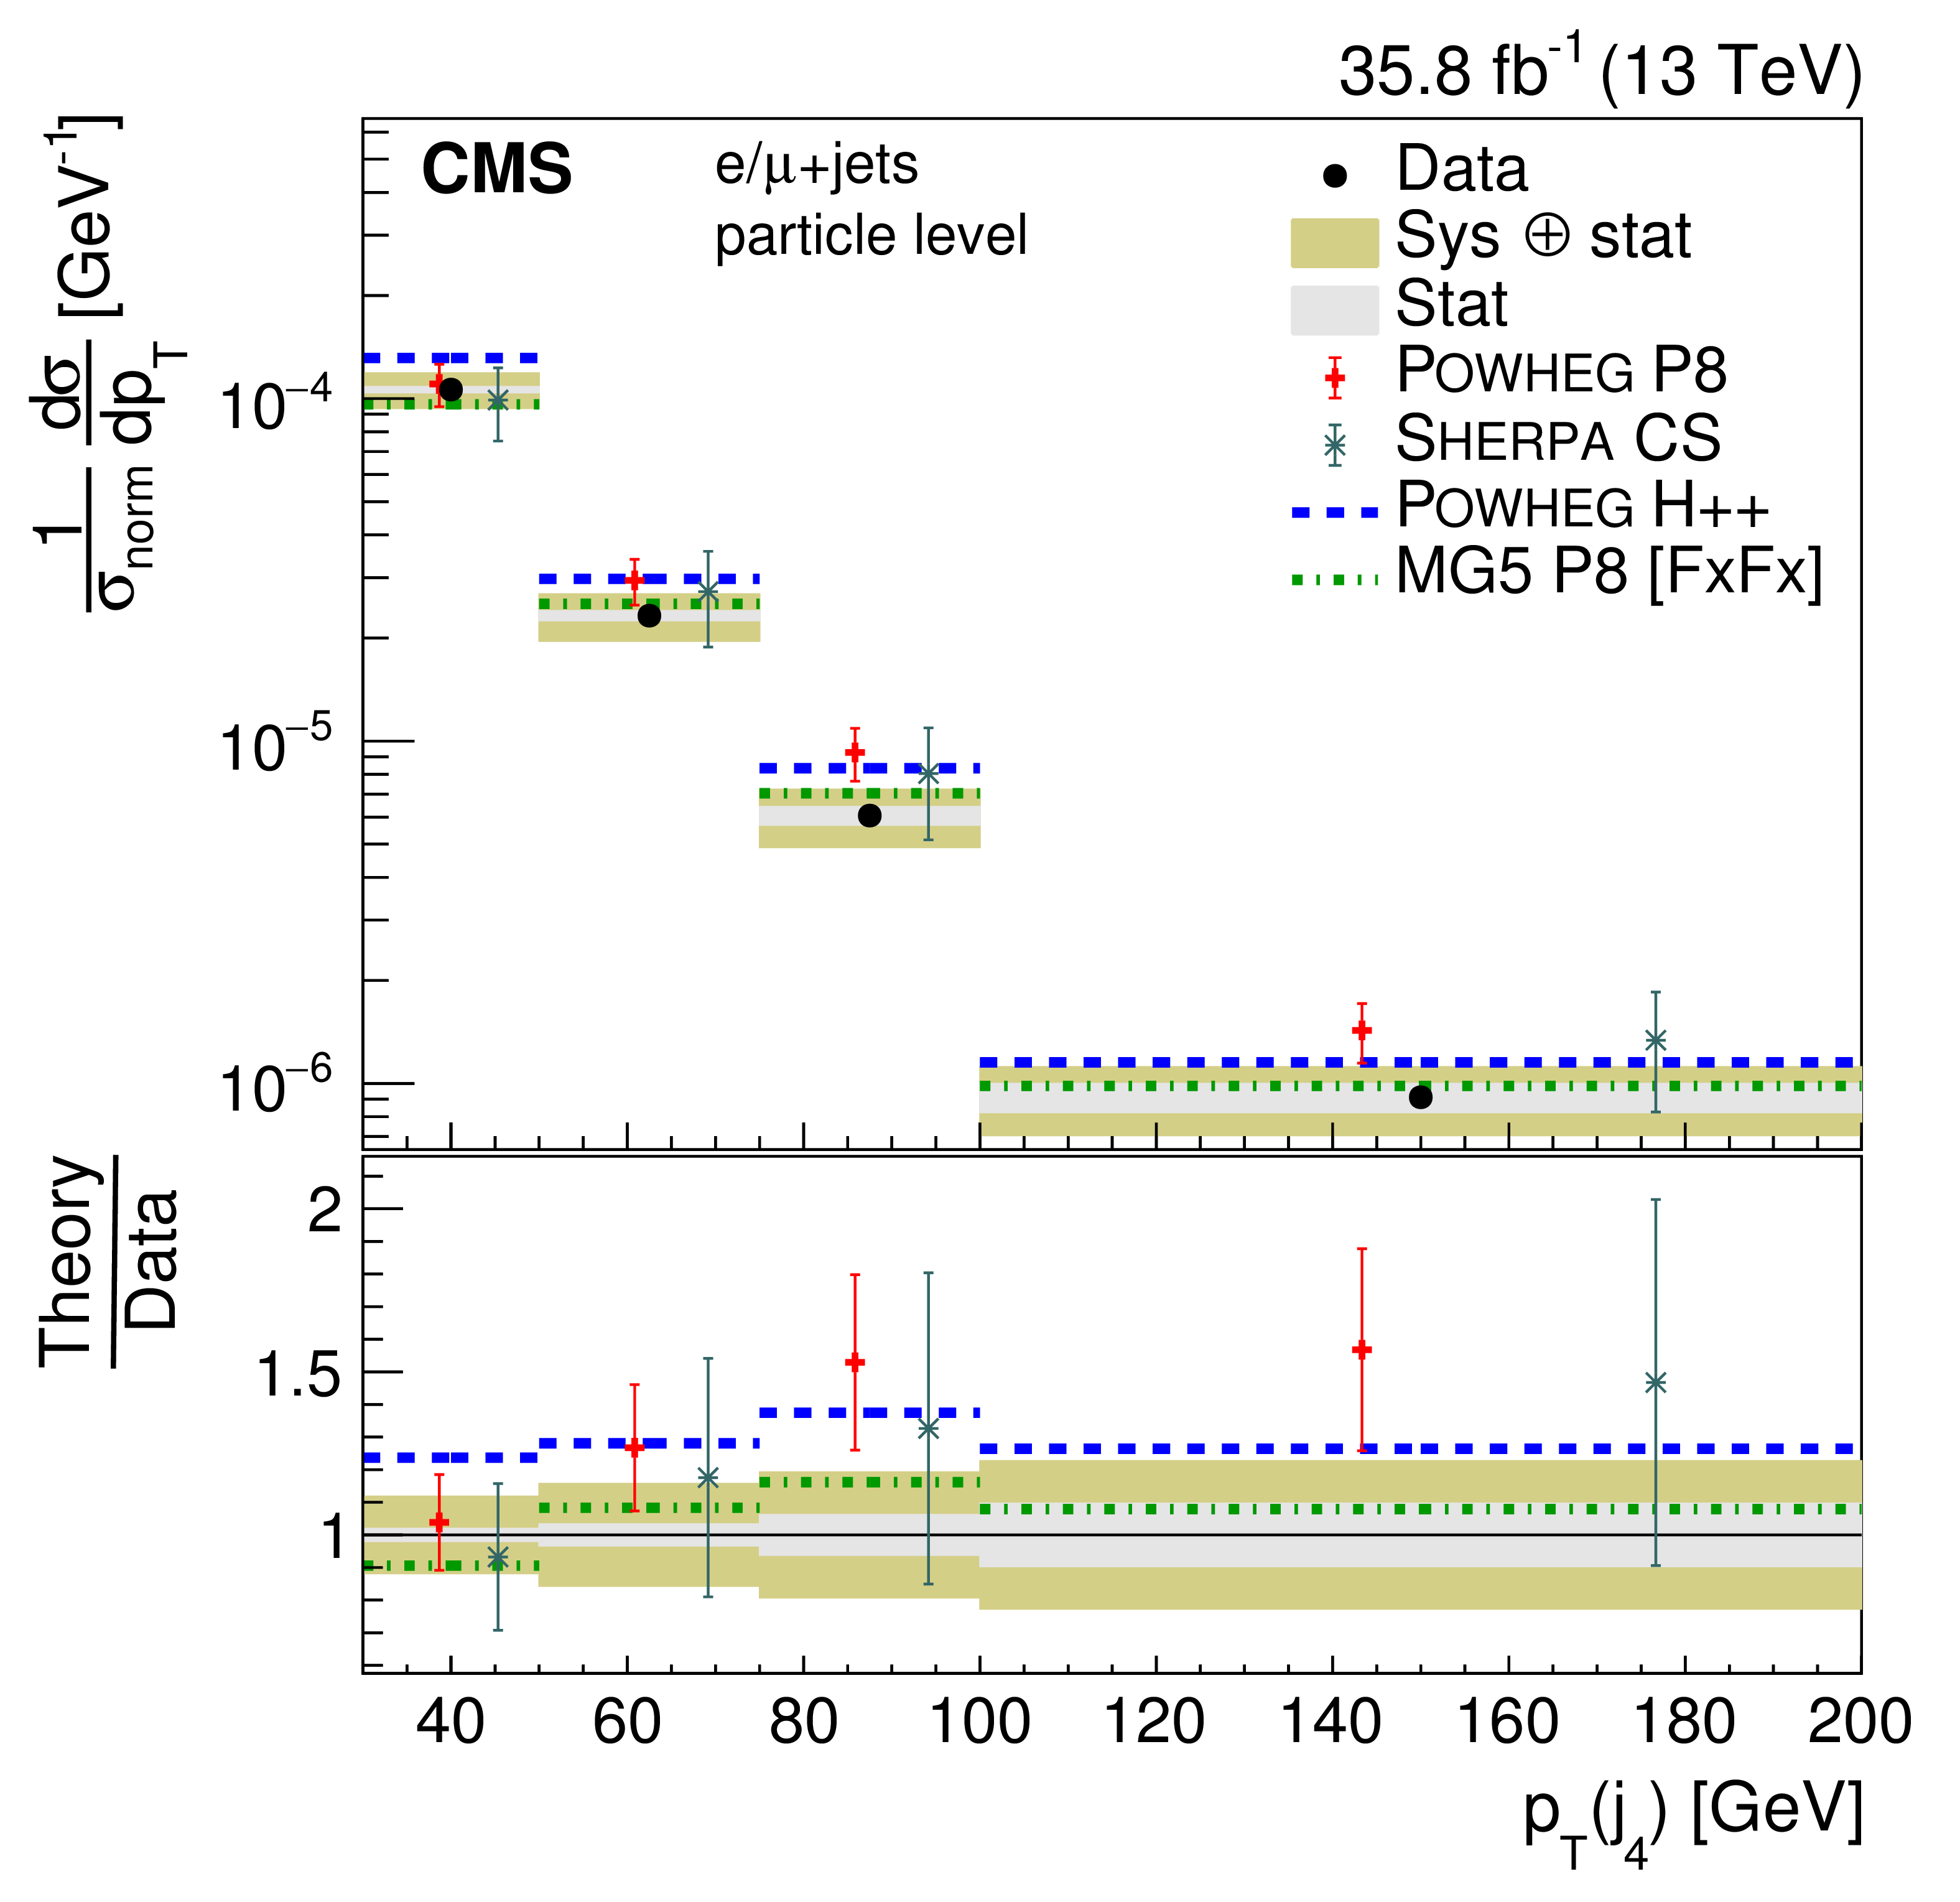
png pdf |
Figure 37-h:
Normalized differential cross section at the particle level as a function of jet $ {p_{\mathrm {T}}} $. The upper two rows show the $ {p_{\mathrm {T}}} $ distributions for the jets in the $ {\mathrm{t} \mathrm{\bar{t}}} $ system, the lower two rows the distribution for additional jets. The data are shown as points with light (dark) bands indicating the statistical (statistical and systematic) uncertainties. The cross sections are compared to the predictions of POWHEG combined with PYTHIA8 (P8) or HERWIG++ (H++) and the multiparton simulations MG5_aMC@NLO (MG5)+PYTHIA8 FxFx and SHERPA. The ratios of the predictions to the measured cross sections are shown at the bottom of each panel. |
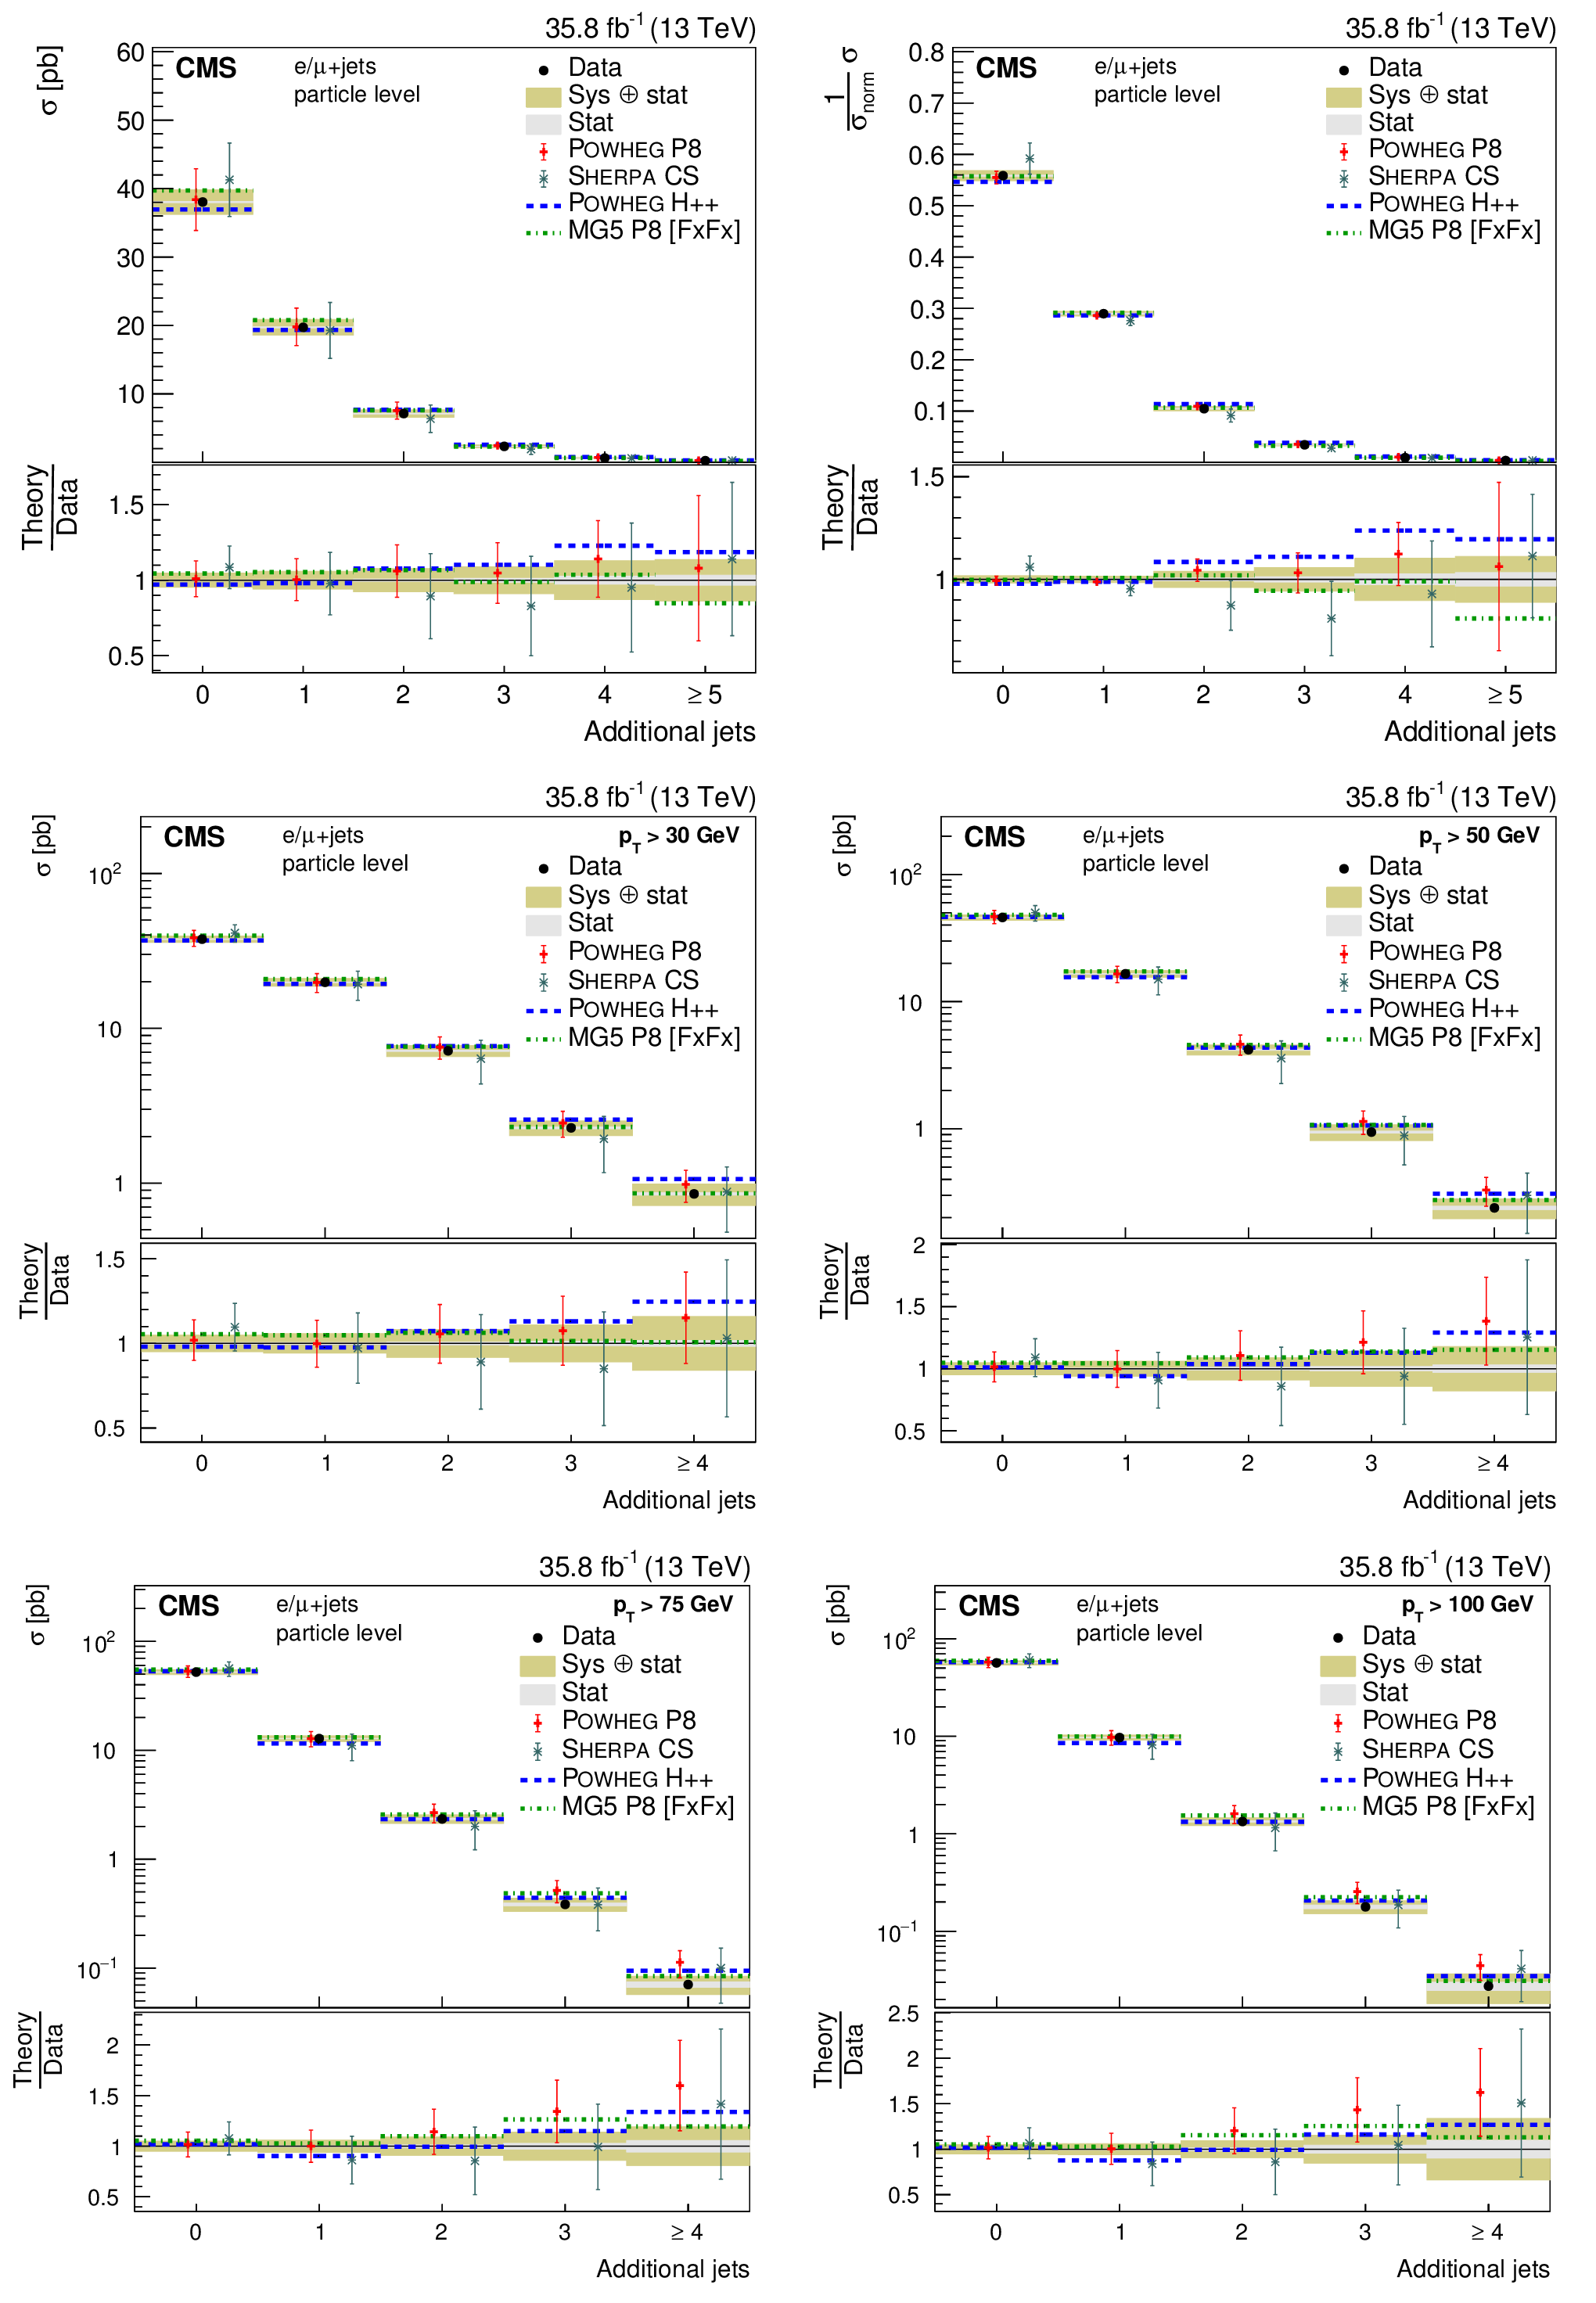
png pdf |
Figure 38:
Upper: absolute (left) and normalized (right) cross sections of jet multiplicities. Middle, lower: absolute cross sections of jet multiplicities for various thresholds of the jet $ {p_{\mathrm {T}}} $. The data are shown as points with light (dark) bands indicating the statistical (statistical and systematic) uncertainties. The cross sections are compared to the predictions of POWHEG combined with PYTHIA8 (P8) or HERWIG++ (H++) and the multiparton simulations MG5_aMC@NLO (MG5)+PYTHIA8 FxFx and SHERPA. The ratios of the predictions to the measured cross sections are shown at the bottom of each panel. |

png pdf |
Figure 38-a:
Upper: absolute (left) and normalized (right) cross sections of jet multiplicities. Middle, lower: absolute cross sections of jet multiplicities for various thresholds of the jet $ {p_{\mathrm {T}}} $. The data are shown as points with light (dark) bands indicating the statistical (statistical and systematic) uncertainties. The cross sections are compared to the predictions of POWHEG combined with PYTHIA8 (P8) or HERWIG++ (H++) and the multiparton simulations MG5_aMC@NLO (MG5)+PYTHIA8 FxFx and SHERPA. The ratios of the predictions to the measured cross sections are shown at the bottom of each panel. |
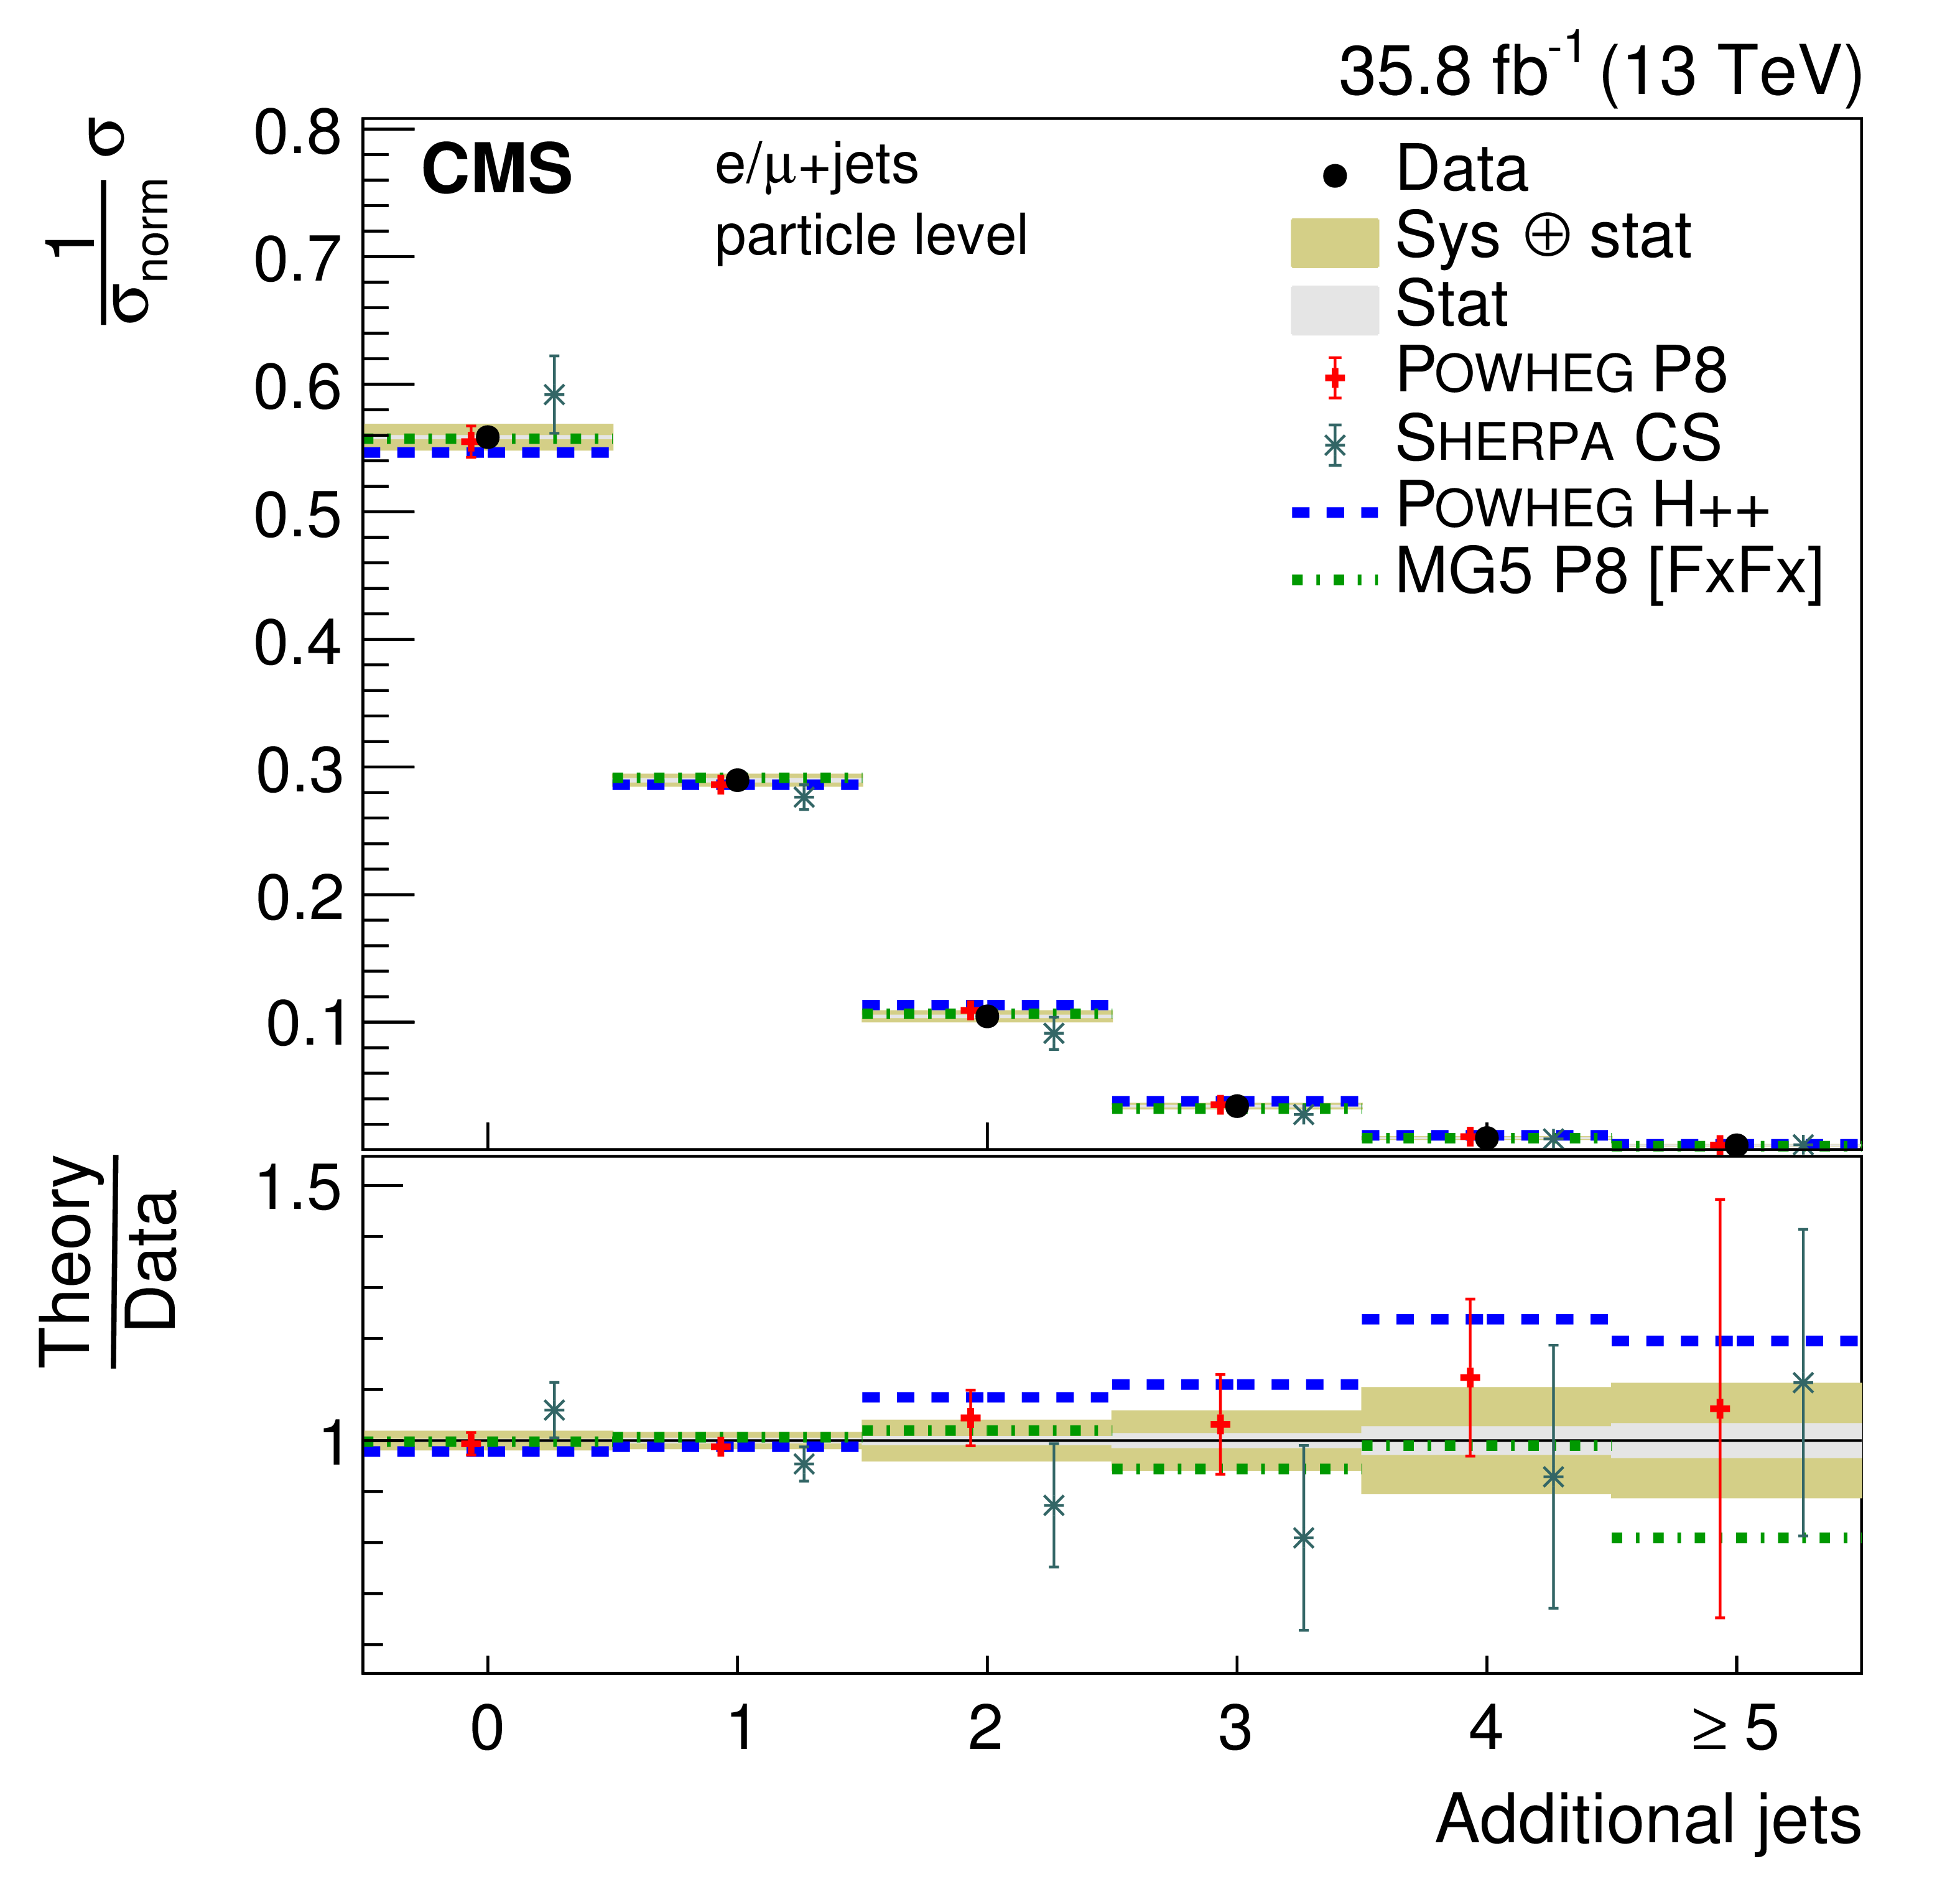
png pdf |
Figure 38-b:
Upper: absolute (left) and normalized (right) cross sections of jet multiplicities. Middle, lower: absolute cross sections of jet multiplicities for various thresholds of the jet $ {p_{\mathrm {T}}} $. The data are shown as points with light (dark) bands indicating the statistical (statistical and systematic) uncertainties. The cross sections are compared to the predictions of POWHEG combined with PYTHIA8 (P8) or HERWIG++ (H++) and the multiparton simulations MG5_aMC@NLO (MG5)+PYTHIA8 FxFx and SHERPA. The ratios of the predictions to the measured cross sections are shown at the bottom of each panel. |
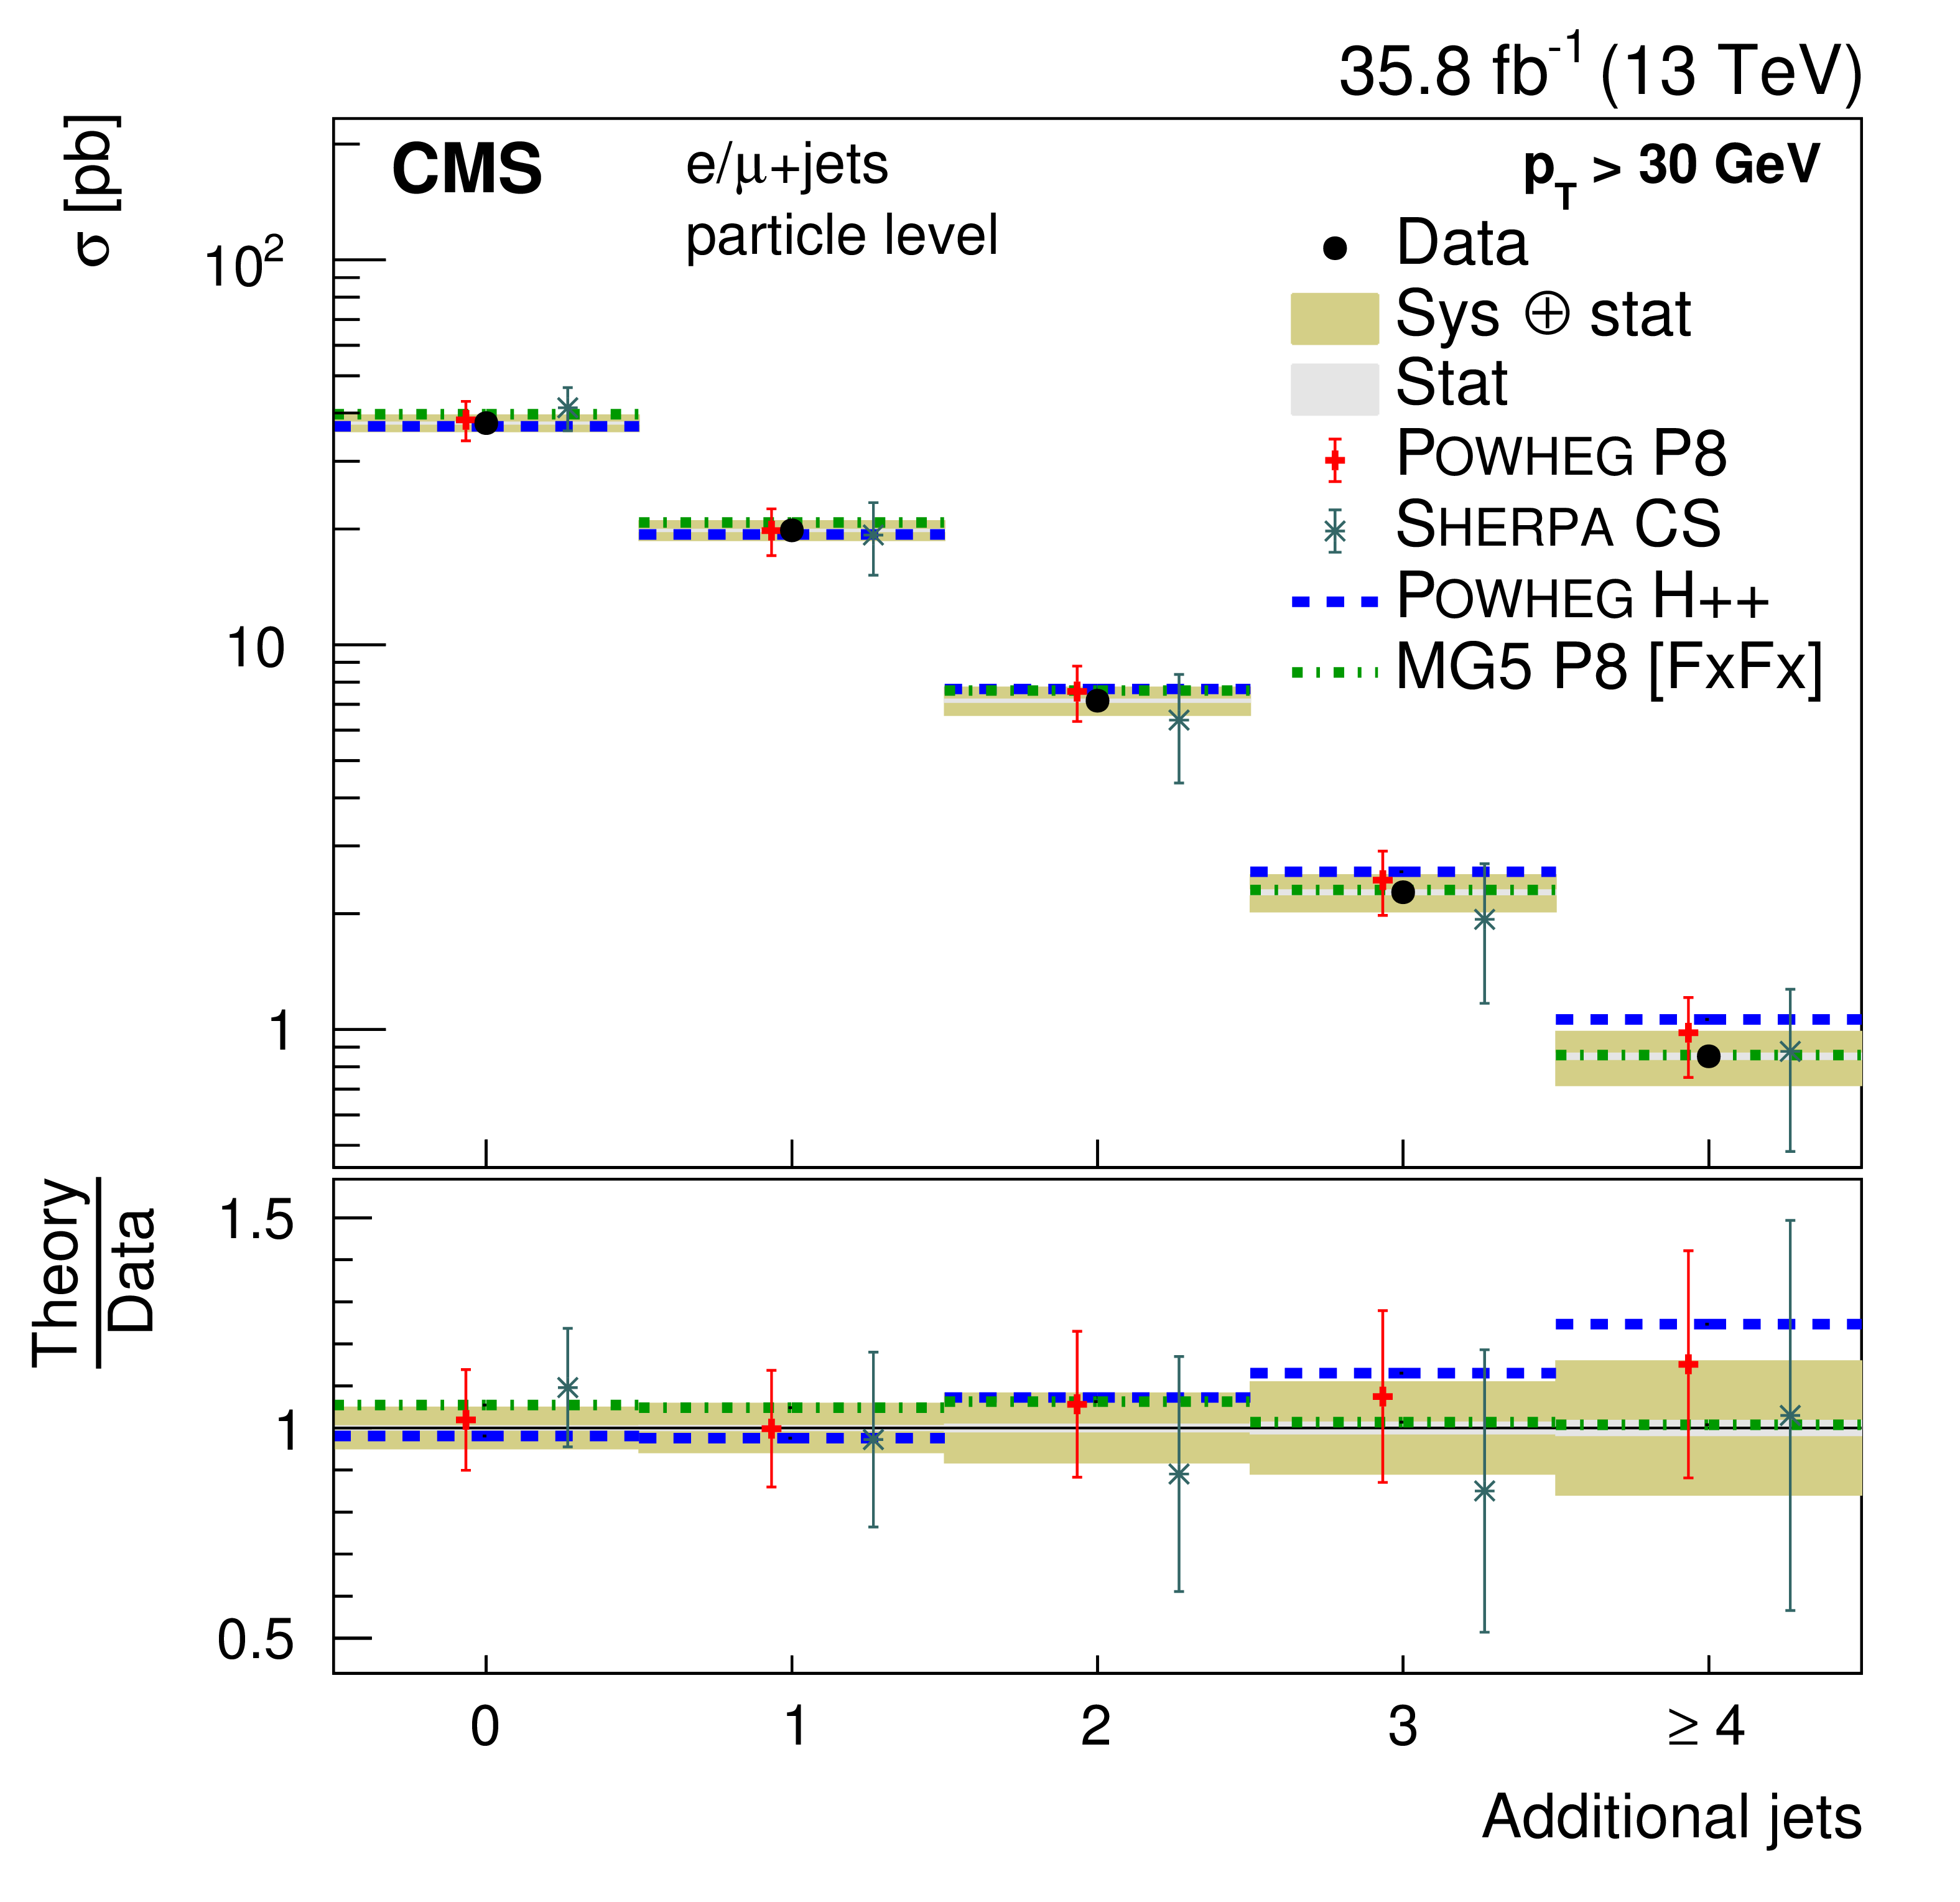
png pdf |
Figure 38-c:
Upper: absolute (left) and normalized (right) cross sections of jet multiplicities. Middle, lower: absolute cross sections of jet multiplicities for various thresholds of the jet $ {p_{\mathrm {T}}} $. The data are shown as points with light (dark) bands indicating the statistical (statistical and systematic) uncertainties. The cross sections are compared to the predictions of POWHEG combined with PYTHIA8 (P8) or HERWIG++ (H++) and the multiparton simulations MG5_aMC@NLO (MG5)+PYTHIA8 FxFx and SHERPA. The ratios of the predictions to the measured cross sections are shown at the bottom of each panel. |
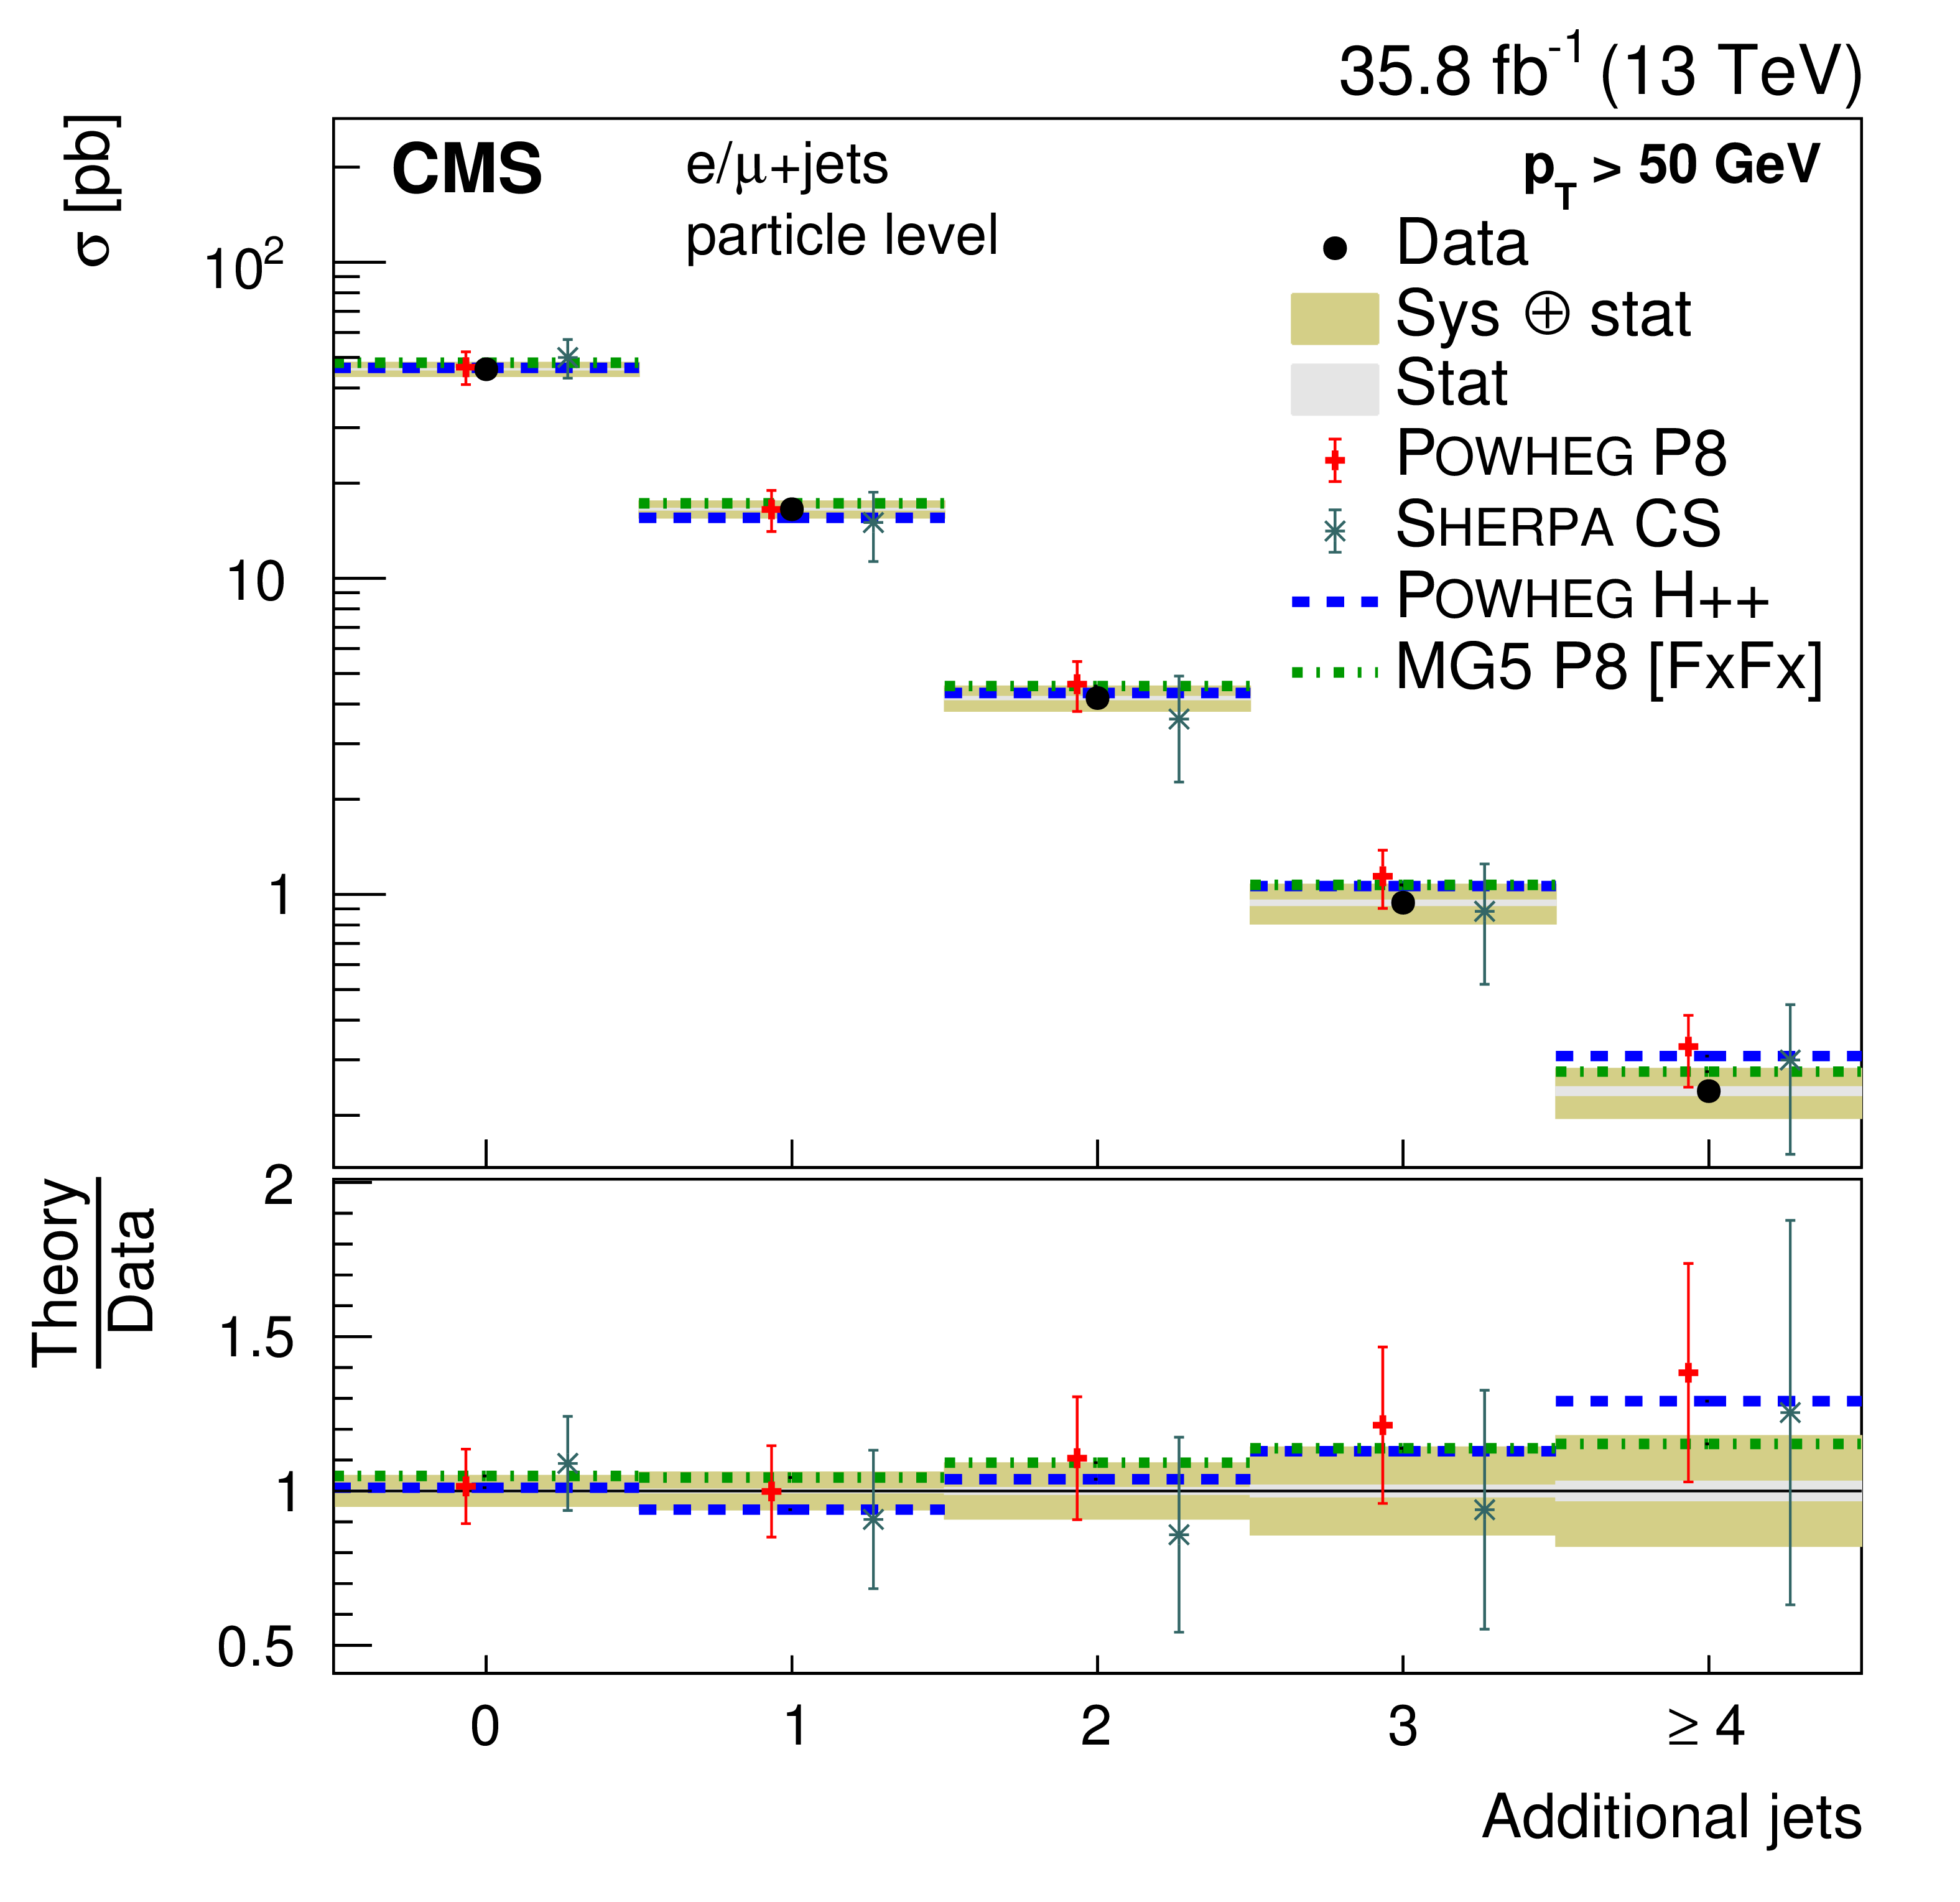
png pdf |
Figure 38-d:
Upper: absolute (left) and normalized (right) cross sections of jet multiplicities. Middle, lower: absolute cross sections of jet multiplicities for various thresholds of the jet $ {p_{\mathrm {T}}} $. The data are shown as points with light (dark) bands indicating the statistical (statistical and systematic) uncertainties. The cross sections are compared to the predictions of POWHEG combined with PYTHIA8 (P8) or HERWIG++ (H++) and the multiparton simulations MG5_aMC@NLO (MG5)+PYTHIA8 FxFx and SHERPA. The ratios of the predictions to the measured cross sections are shown at the bottom of each panel. |
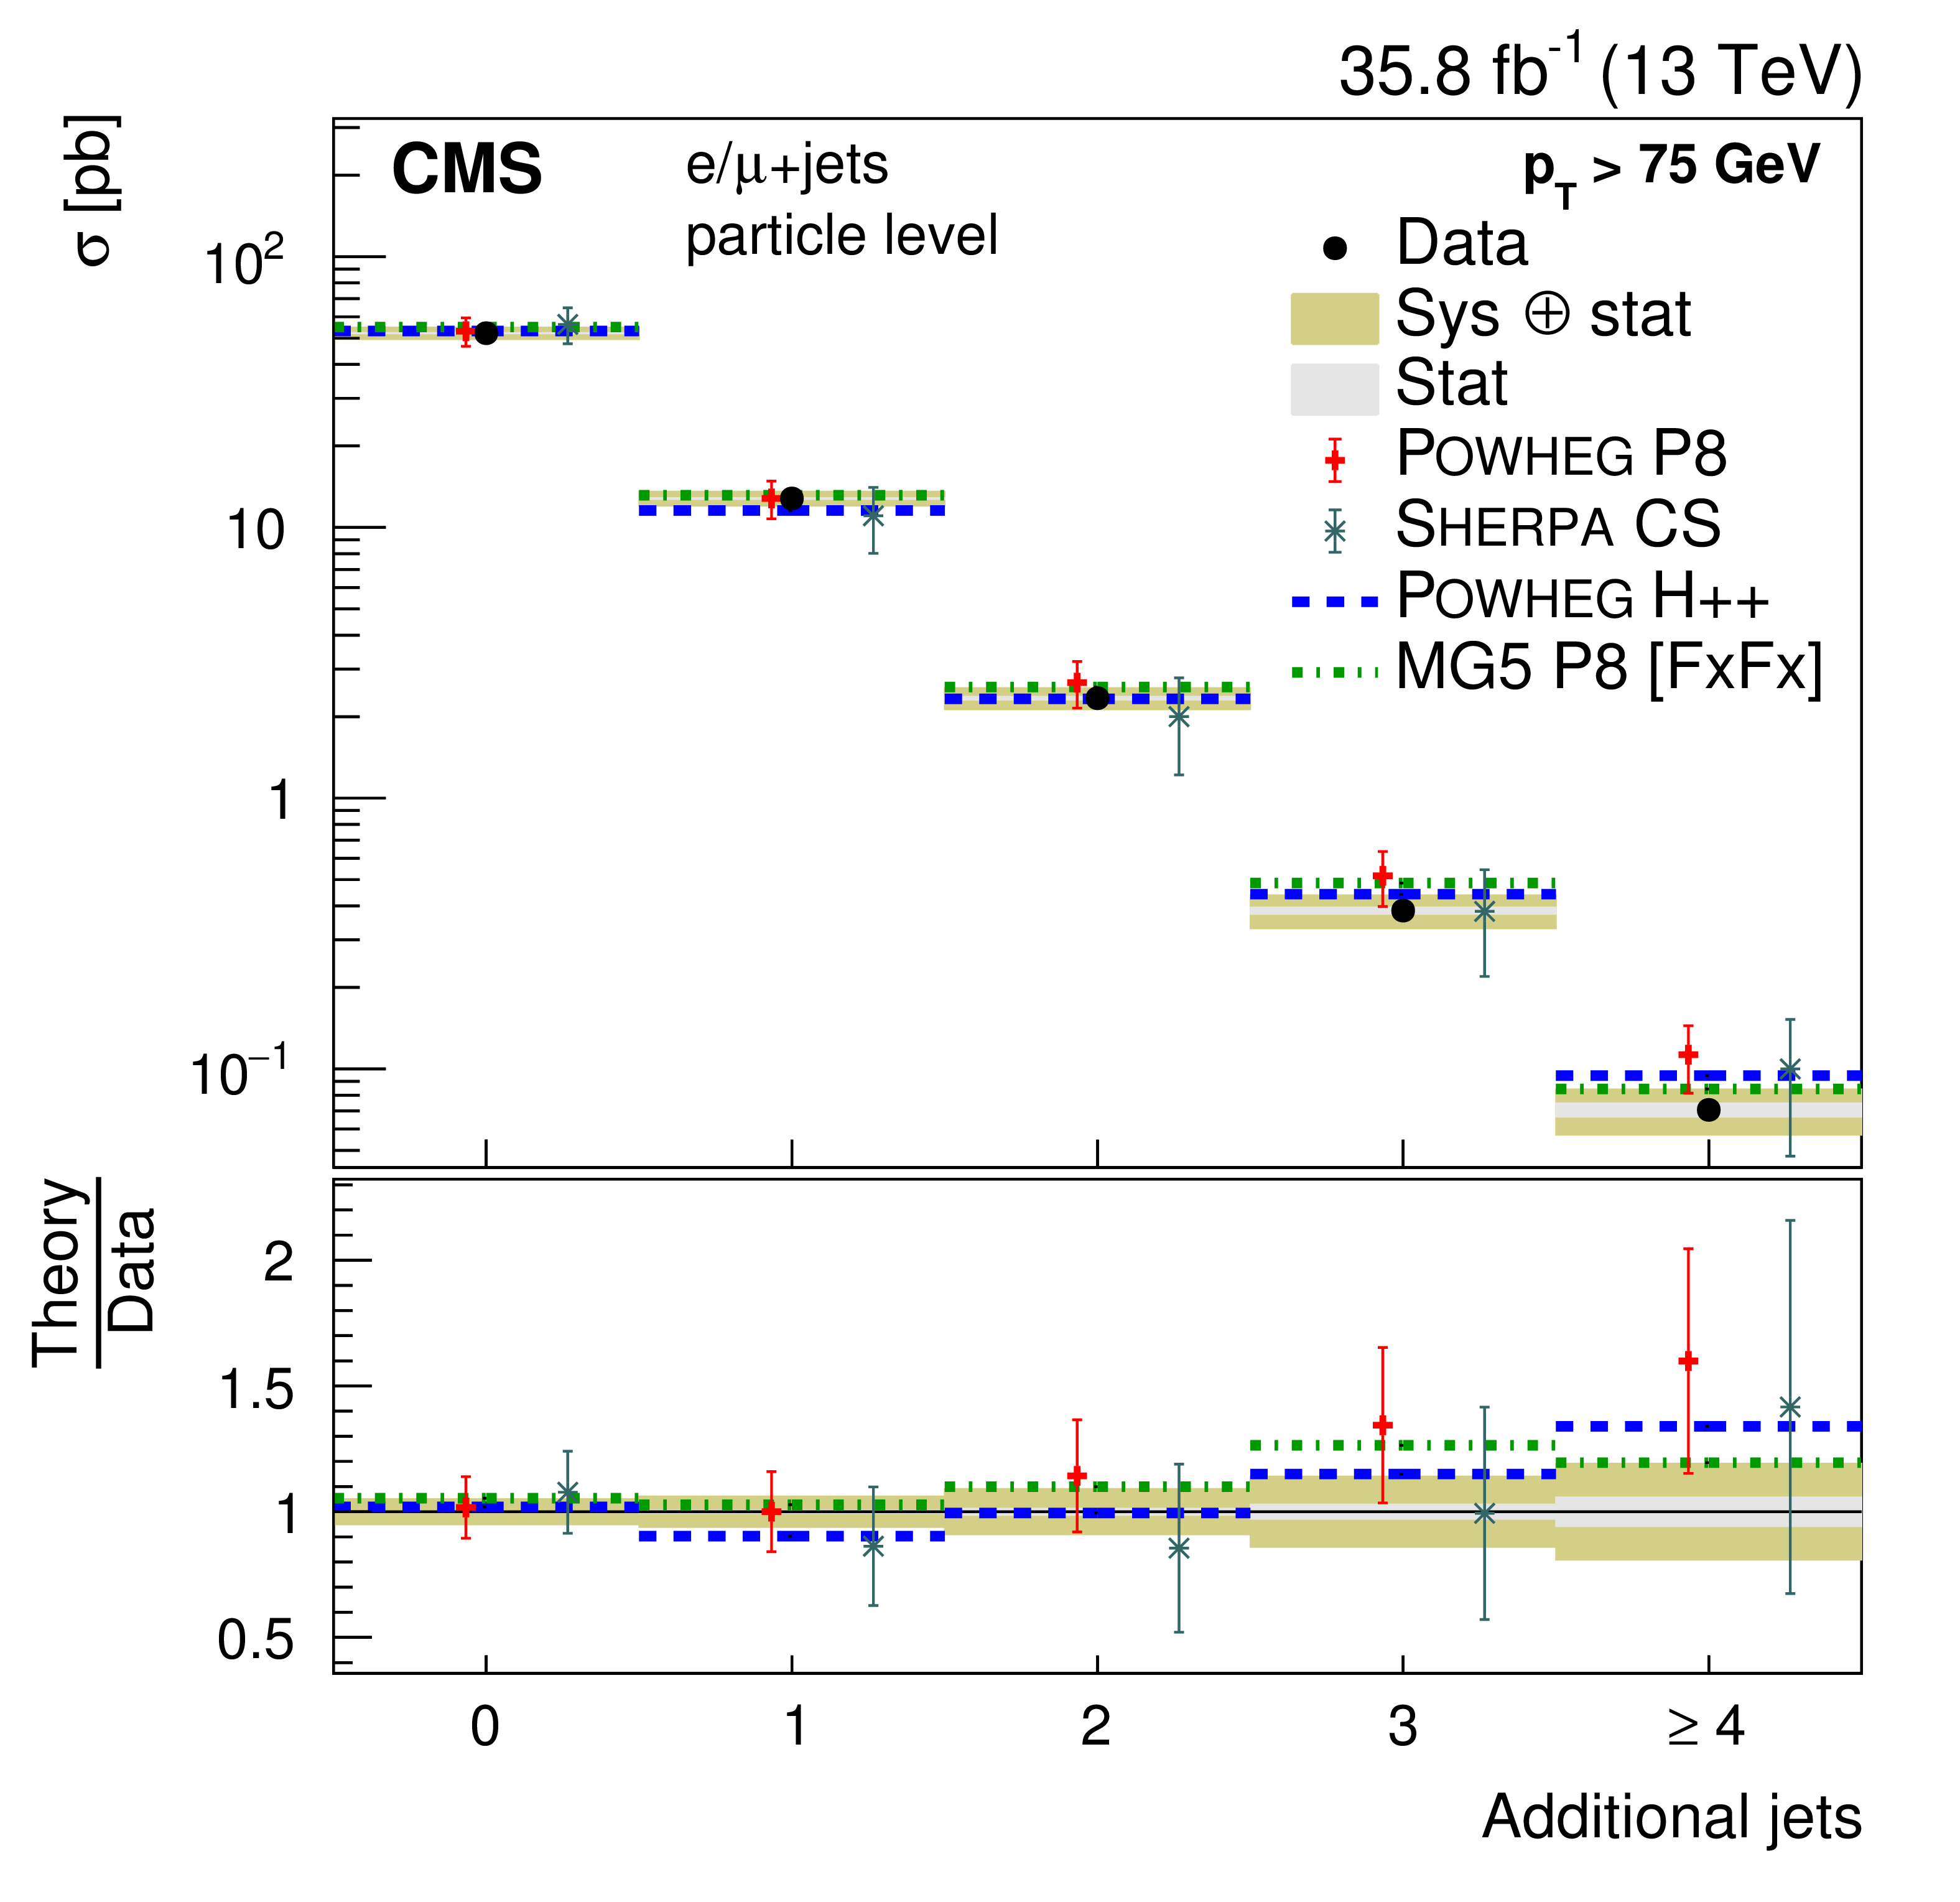
png pdf |
Figure 38-e:
Upper: absolute (left) and normalized (right) cross sections of jet multiplicities. Middle, lower: absolute cross sections of jet multiplicities for various thresholds of the jet $ {p_{\mathrm {T}}} $. The data are shown as points with light (dark) bands indicating the statistical (statistical and systematic) uncertainties. The cross sections are compared to the predictions of POWHEG combined with PYTHIA8 (P8) or HERWIG++ (H++) and the multiparton simulations MG5_aMC@NLO (MG5)+PYTHIA8 FxFx and SHERPA. The ratios of the predictions to the measured cross sections are shown at the bottom of each panel. |
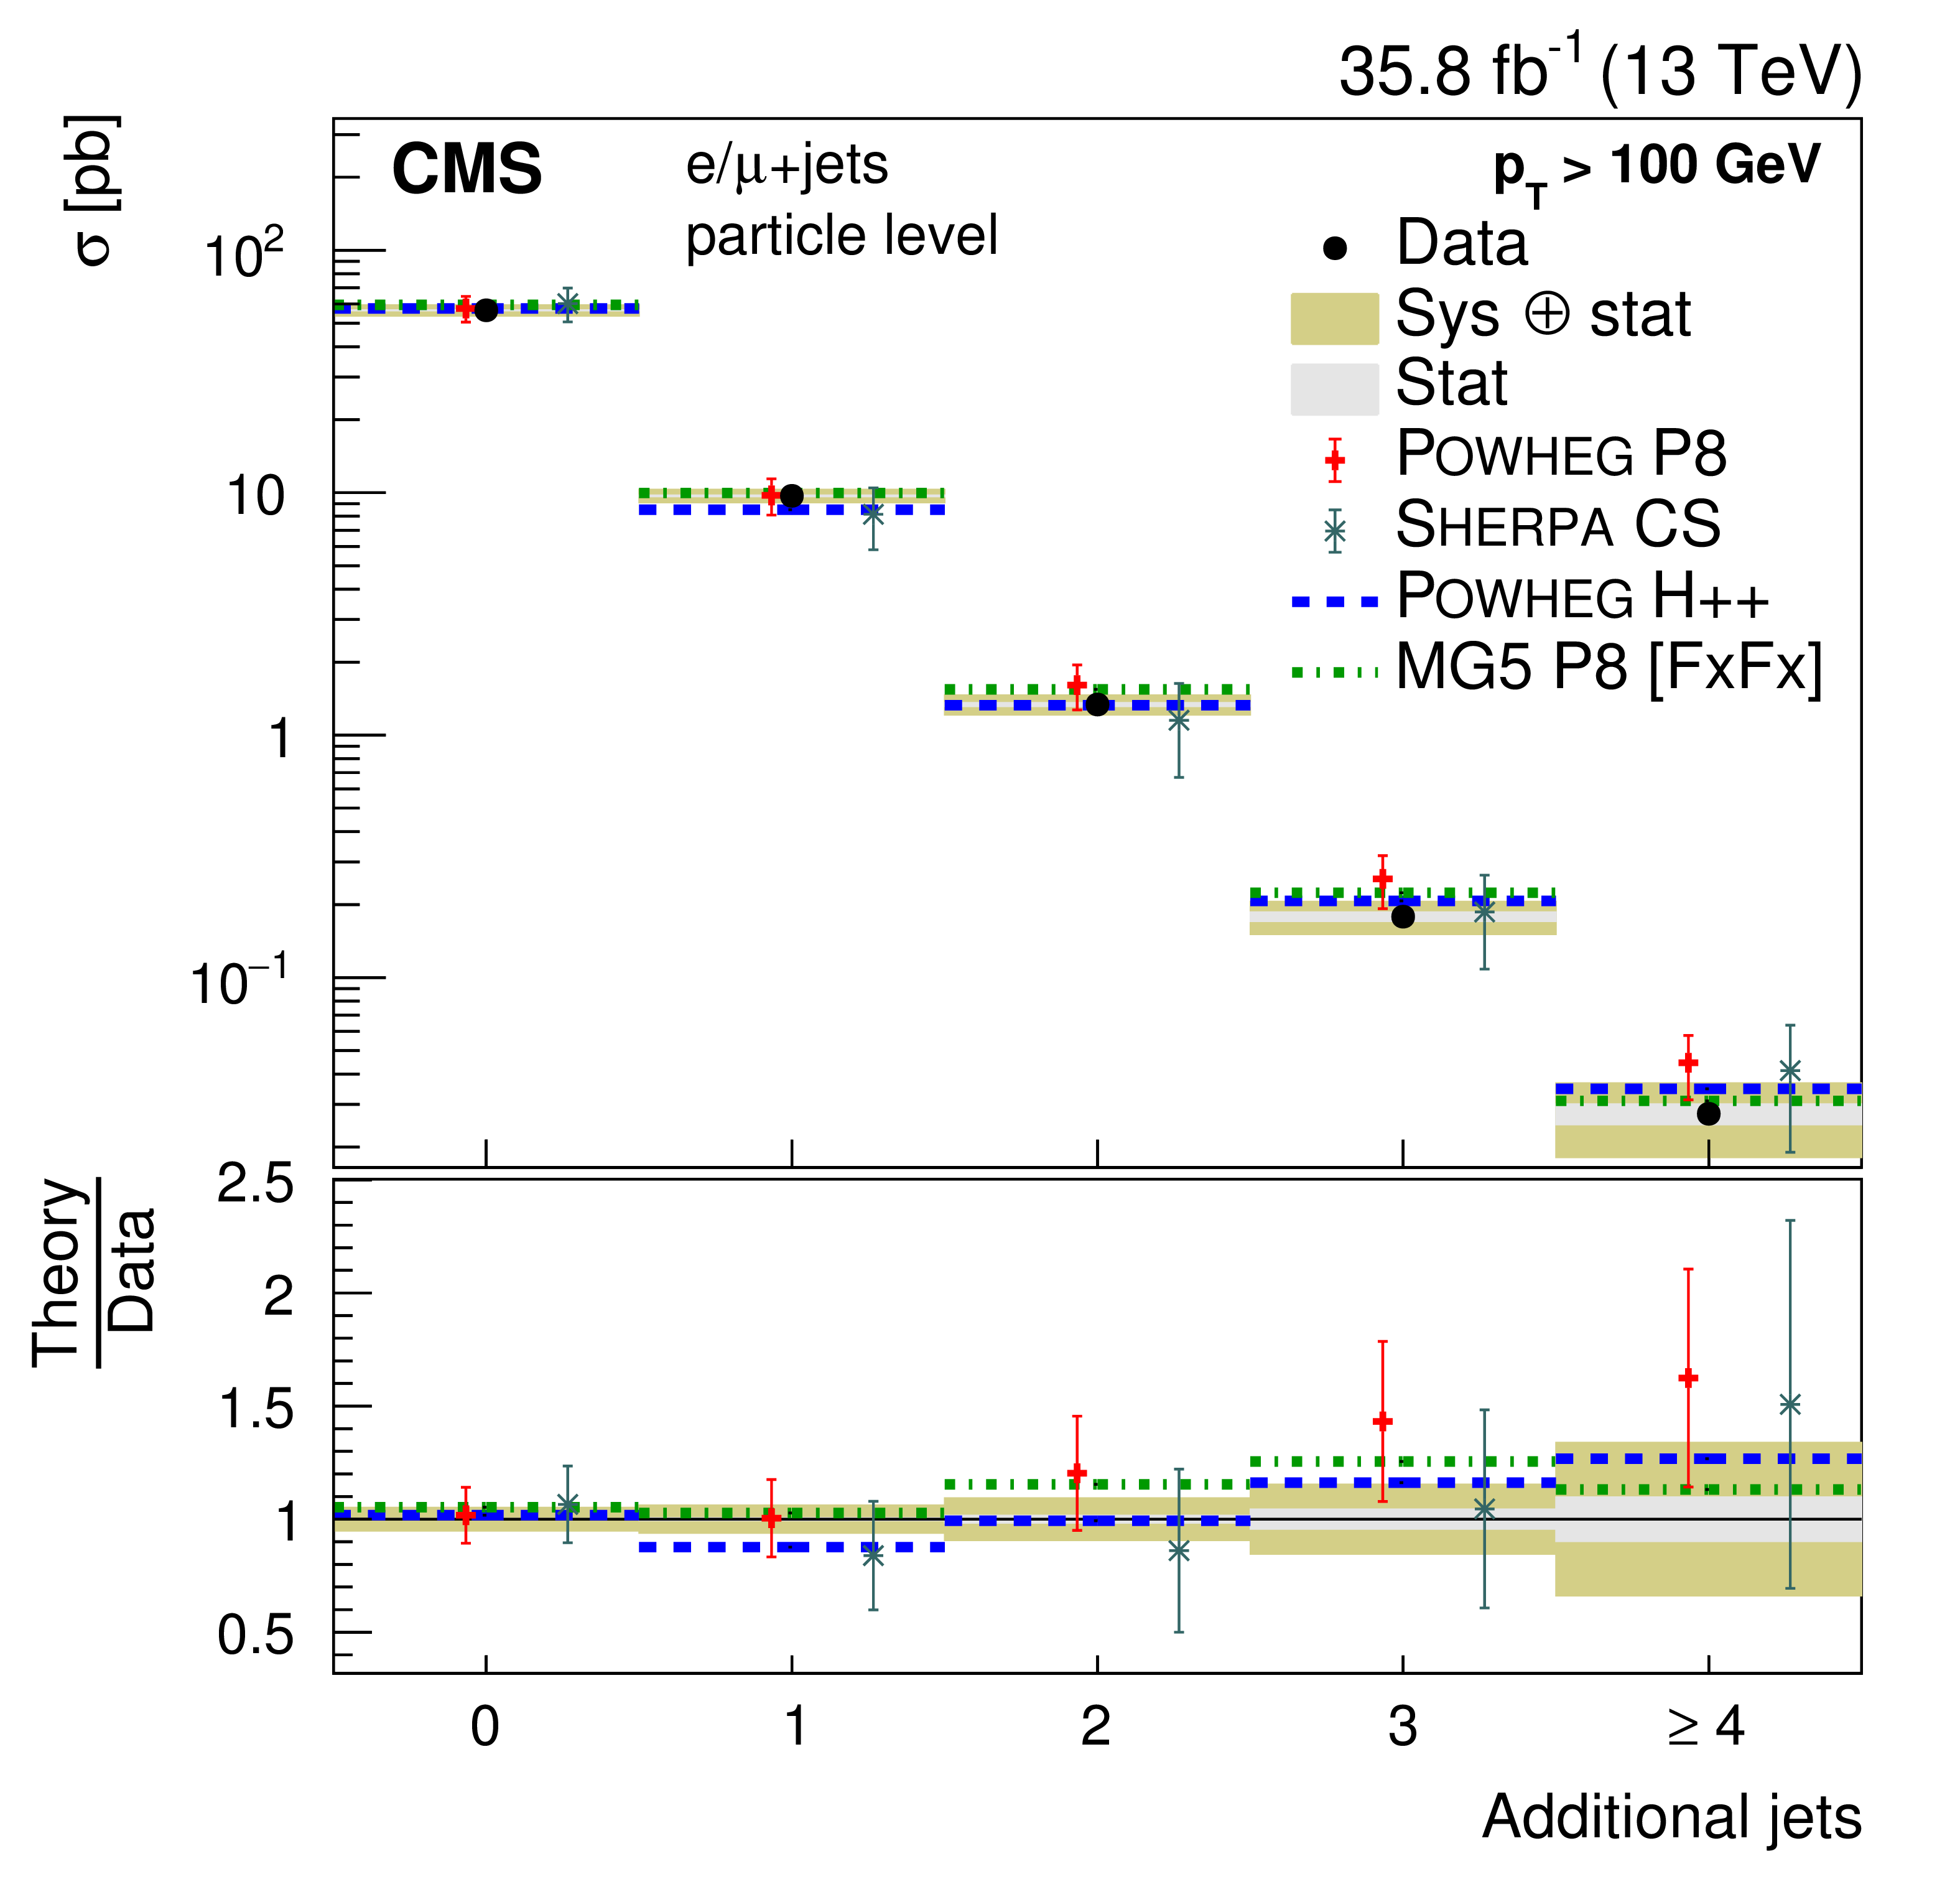
png pdf |
Figure 38-f:
Upper: absolute (left) and normalized (right) cross sections of jet multiplicities. Middle, lower: absolute cross sections of jet multiplicities for various thresholds of the jet $ {p_{\mathrm {T}}} $. The data are shown as points with light (dark) bands indicating the statistical (statistical and systematic) uncertainties. The cross sections are compared to the predictions of POWHEG combined with PYTHIA8 (P8) or HERWIG++ (H++) and the multiparton simulations MG5_aMC@NLO (MG5)+PYTHIA8 FxFx and SHERPA. The ratios of the predictions to the measured cross sections are shown at the bottom of each panel. |
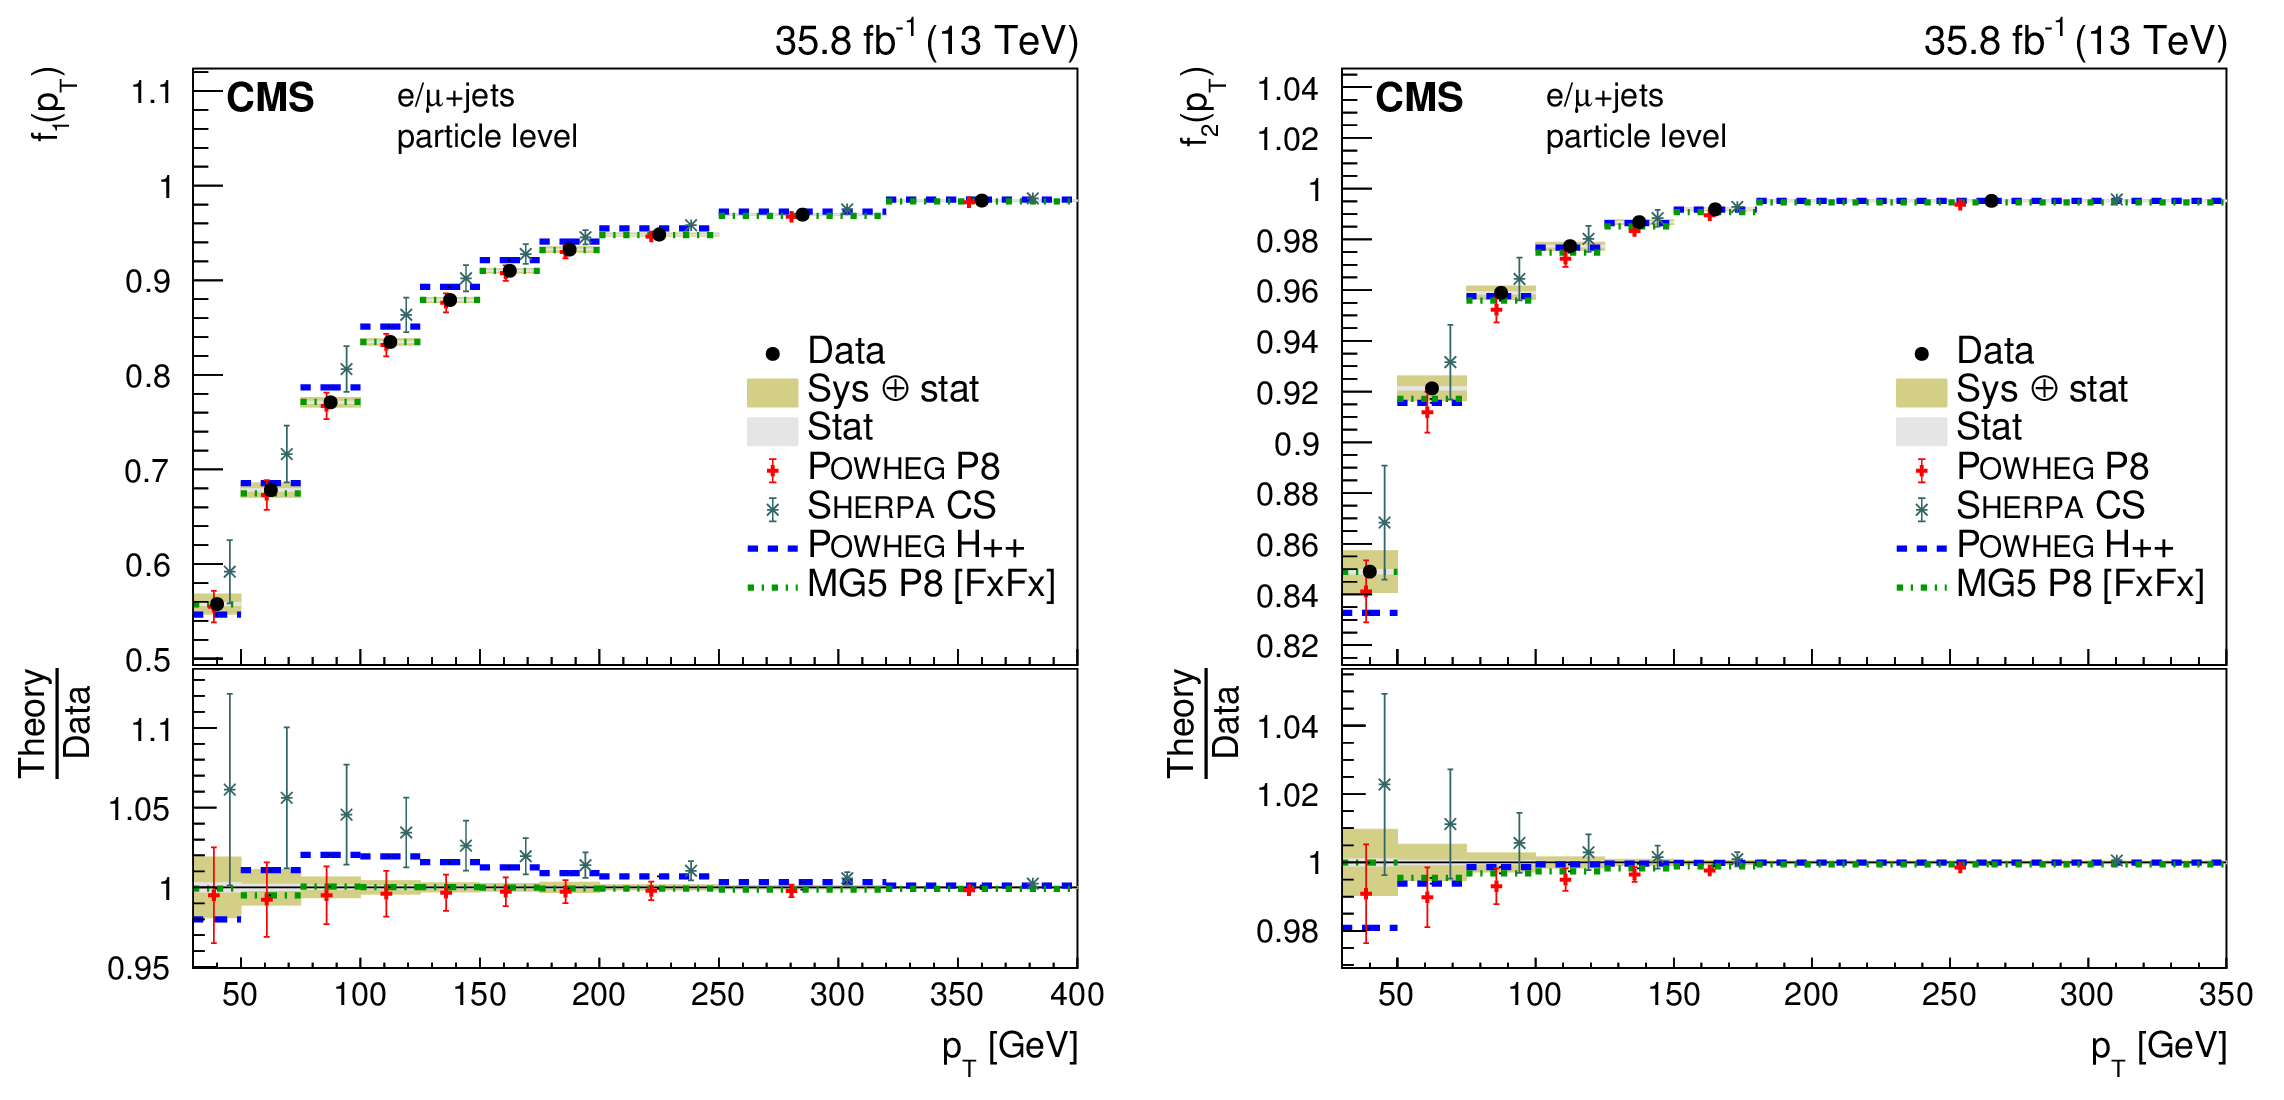
png pdf |
Figure 39:
Distributions of the gap fractions $f_1({p_{\mathrm {T}}})$ and $f_2({p_{\mathrm {T}}})$. The data are shown as points with light (dark) bands indicating the statistical (statistical and systematic) uncertainties. The measurements are compared to the predictions of POWHEG combined with PYTHIA8 (P8) or HERWIG++ (H++) and the multiparton simulations MG5_aMC@NLO (MG5)+PYTHIA8 FxFx and SHERPA. The ratios of the predictions to the measured cross sections are shown at the bottom of each panel. |
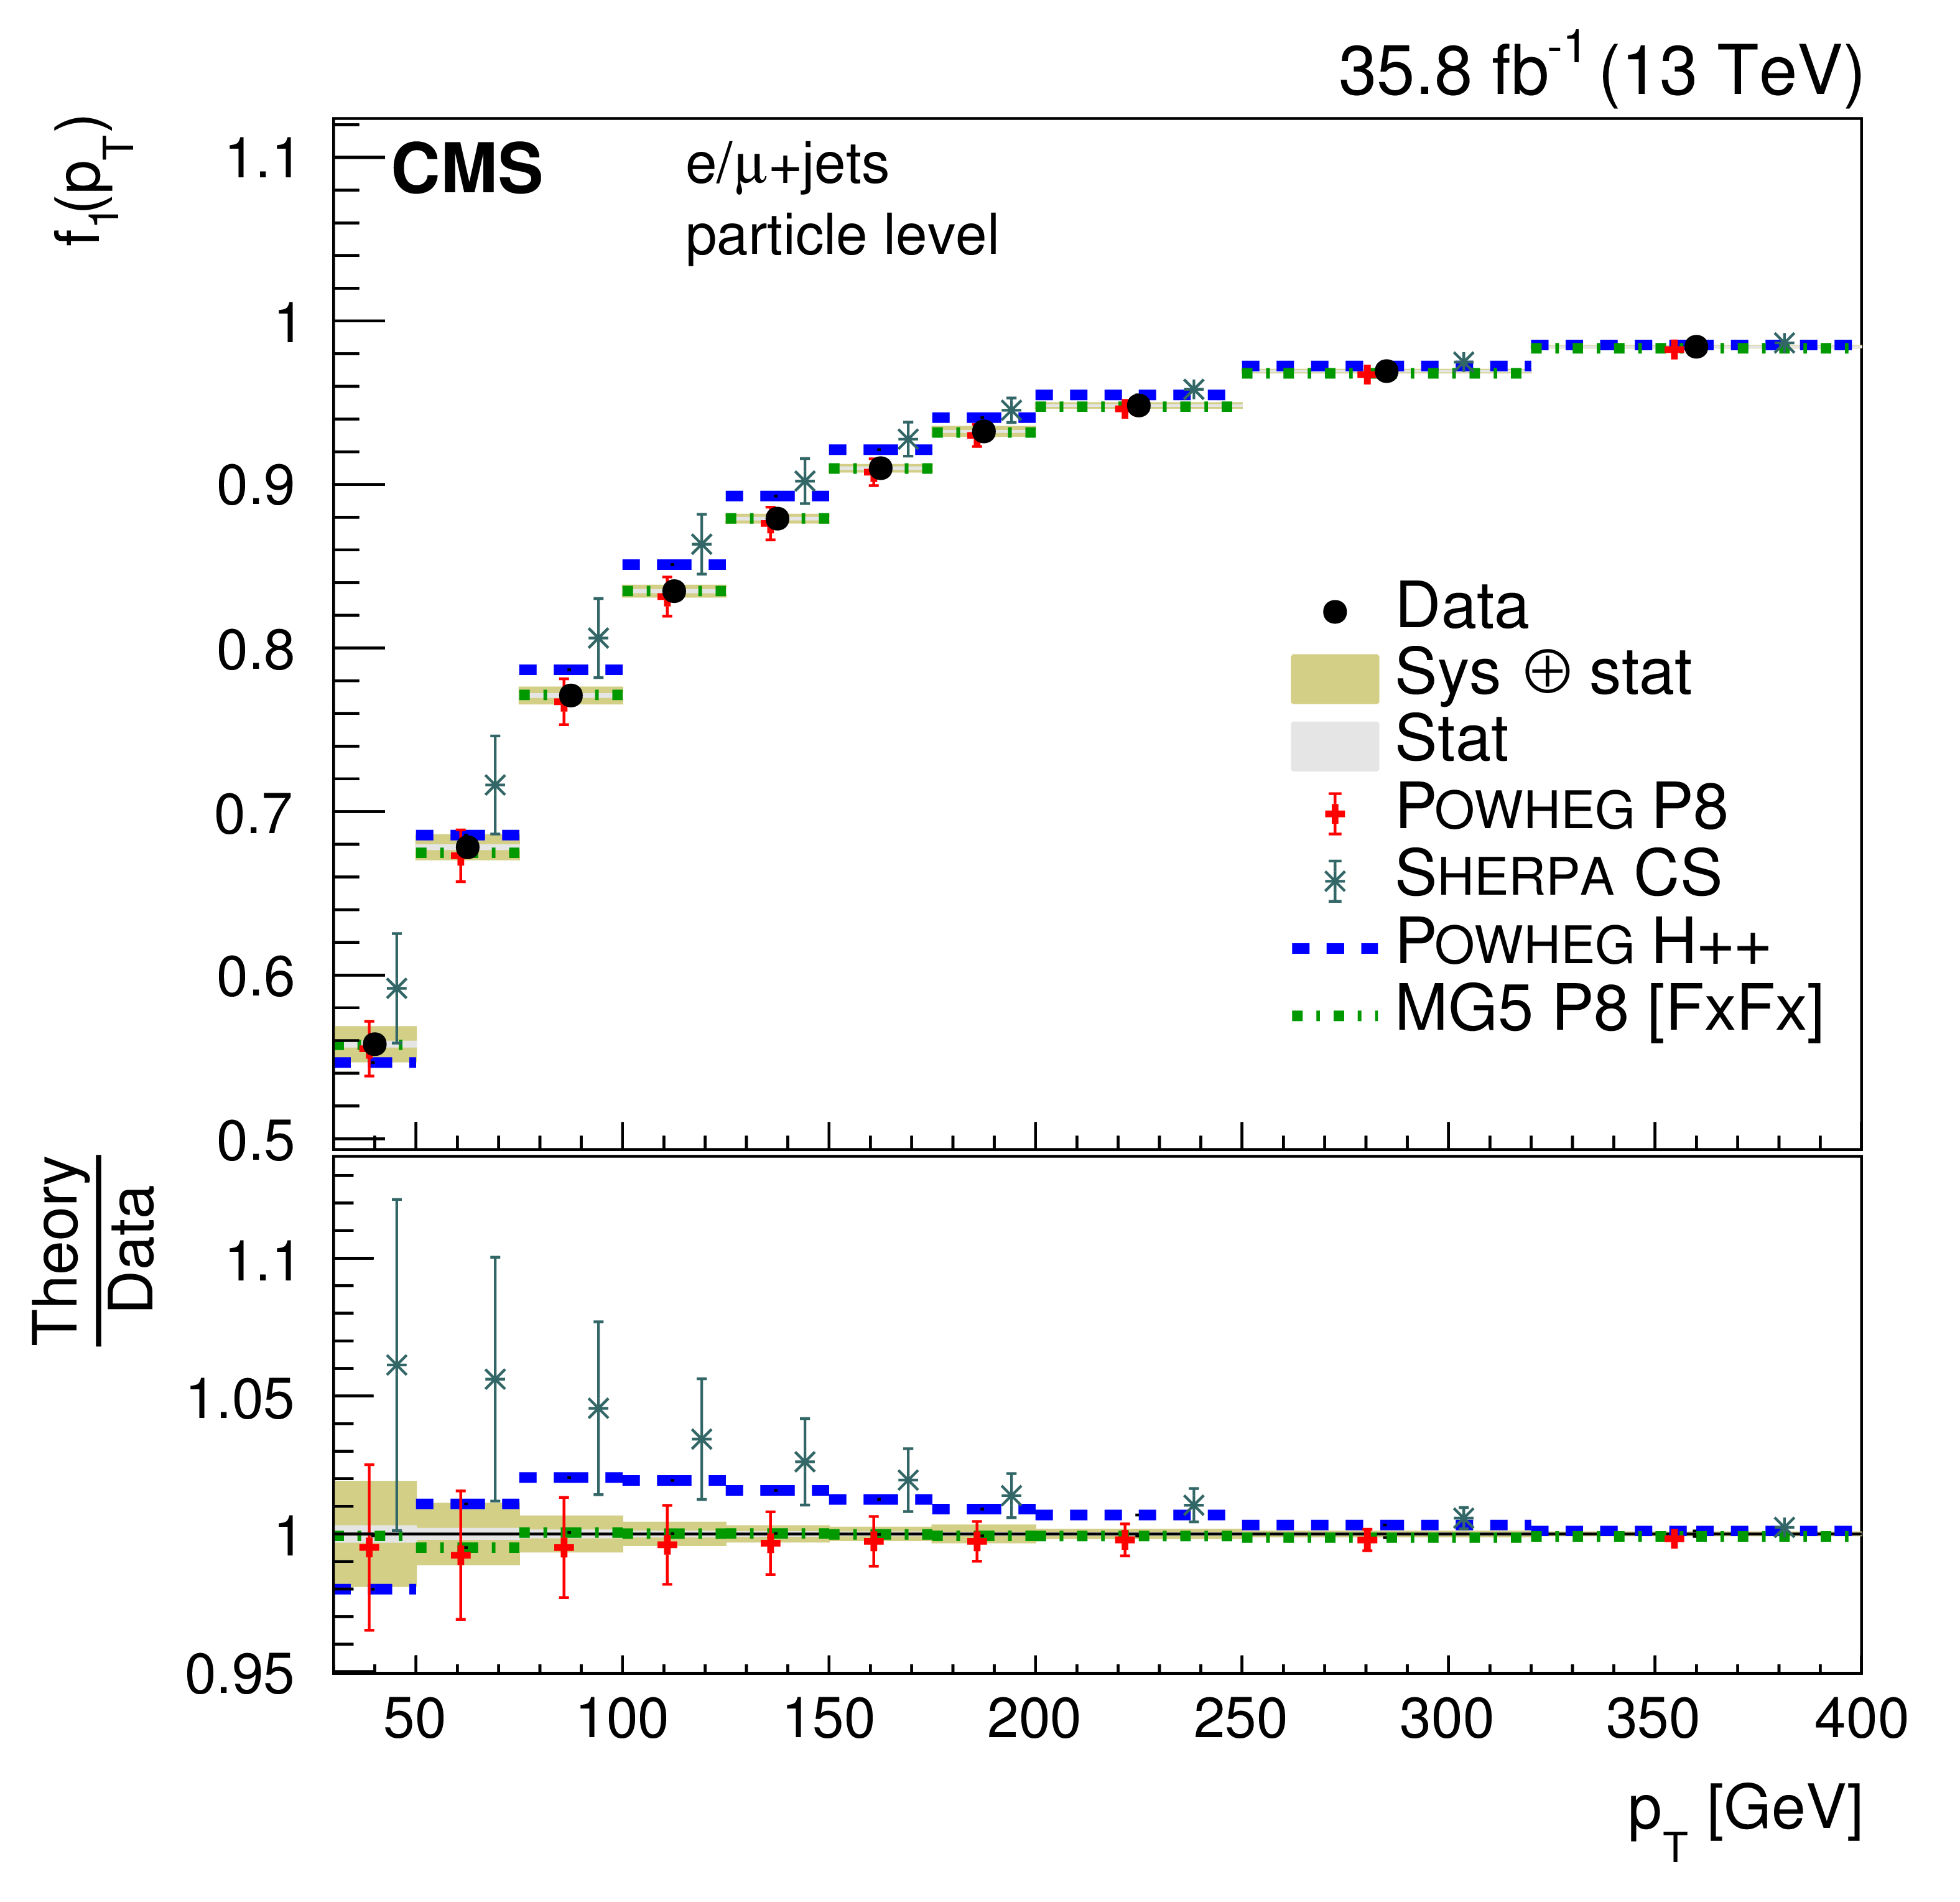
png pdf |
Figure 39-a:
Distributions of the gap fractions $f_1({p_{\mathrm {T}}})$ and $f_2({p_{\mathrm {T}}})$. The data are shown as points with light (dark) bands indicating the statistical (statistical and systematic) uncertainties. The measurements are compared to the predictions of POWHEG combined with PYTHIA8 (P8) or HERWIG++ (H++) and the multiparton simulations MG5_aMC@NLO (MG5)+PYTHIA8 FxFx and SHERPA. The ratios of the predictions to the measured cross sections are shown at the bottom of each panel. |
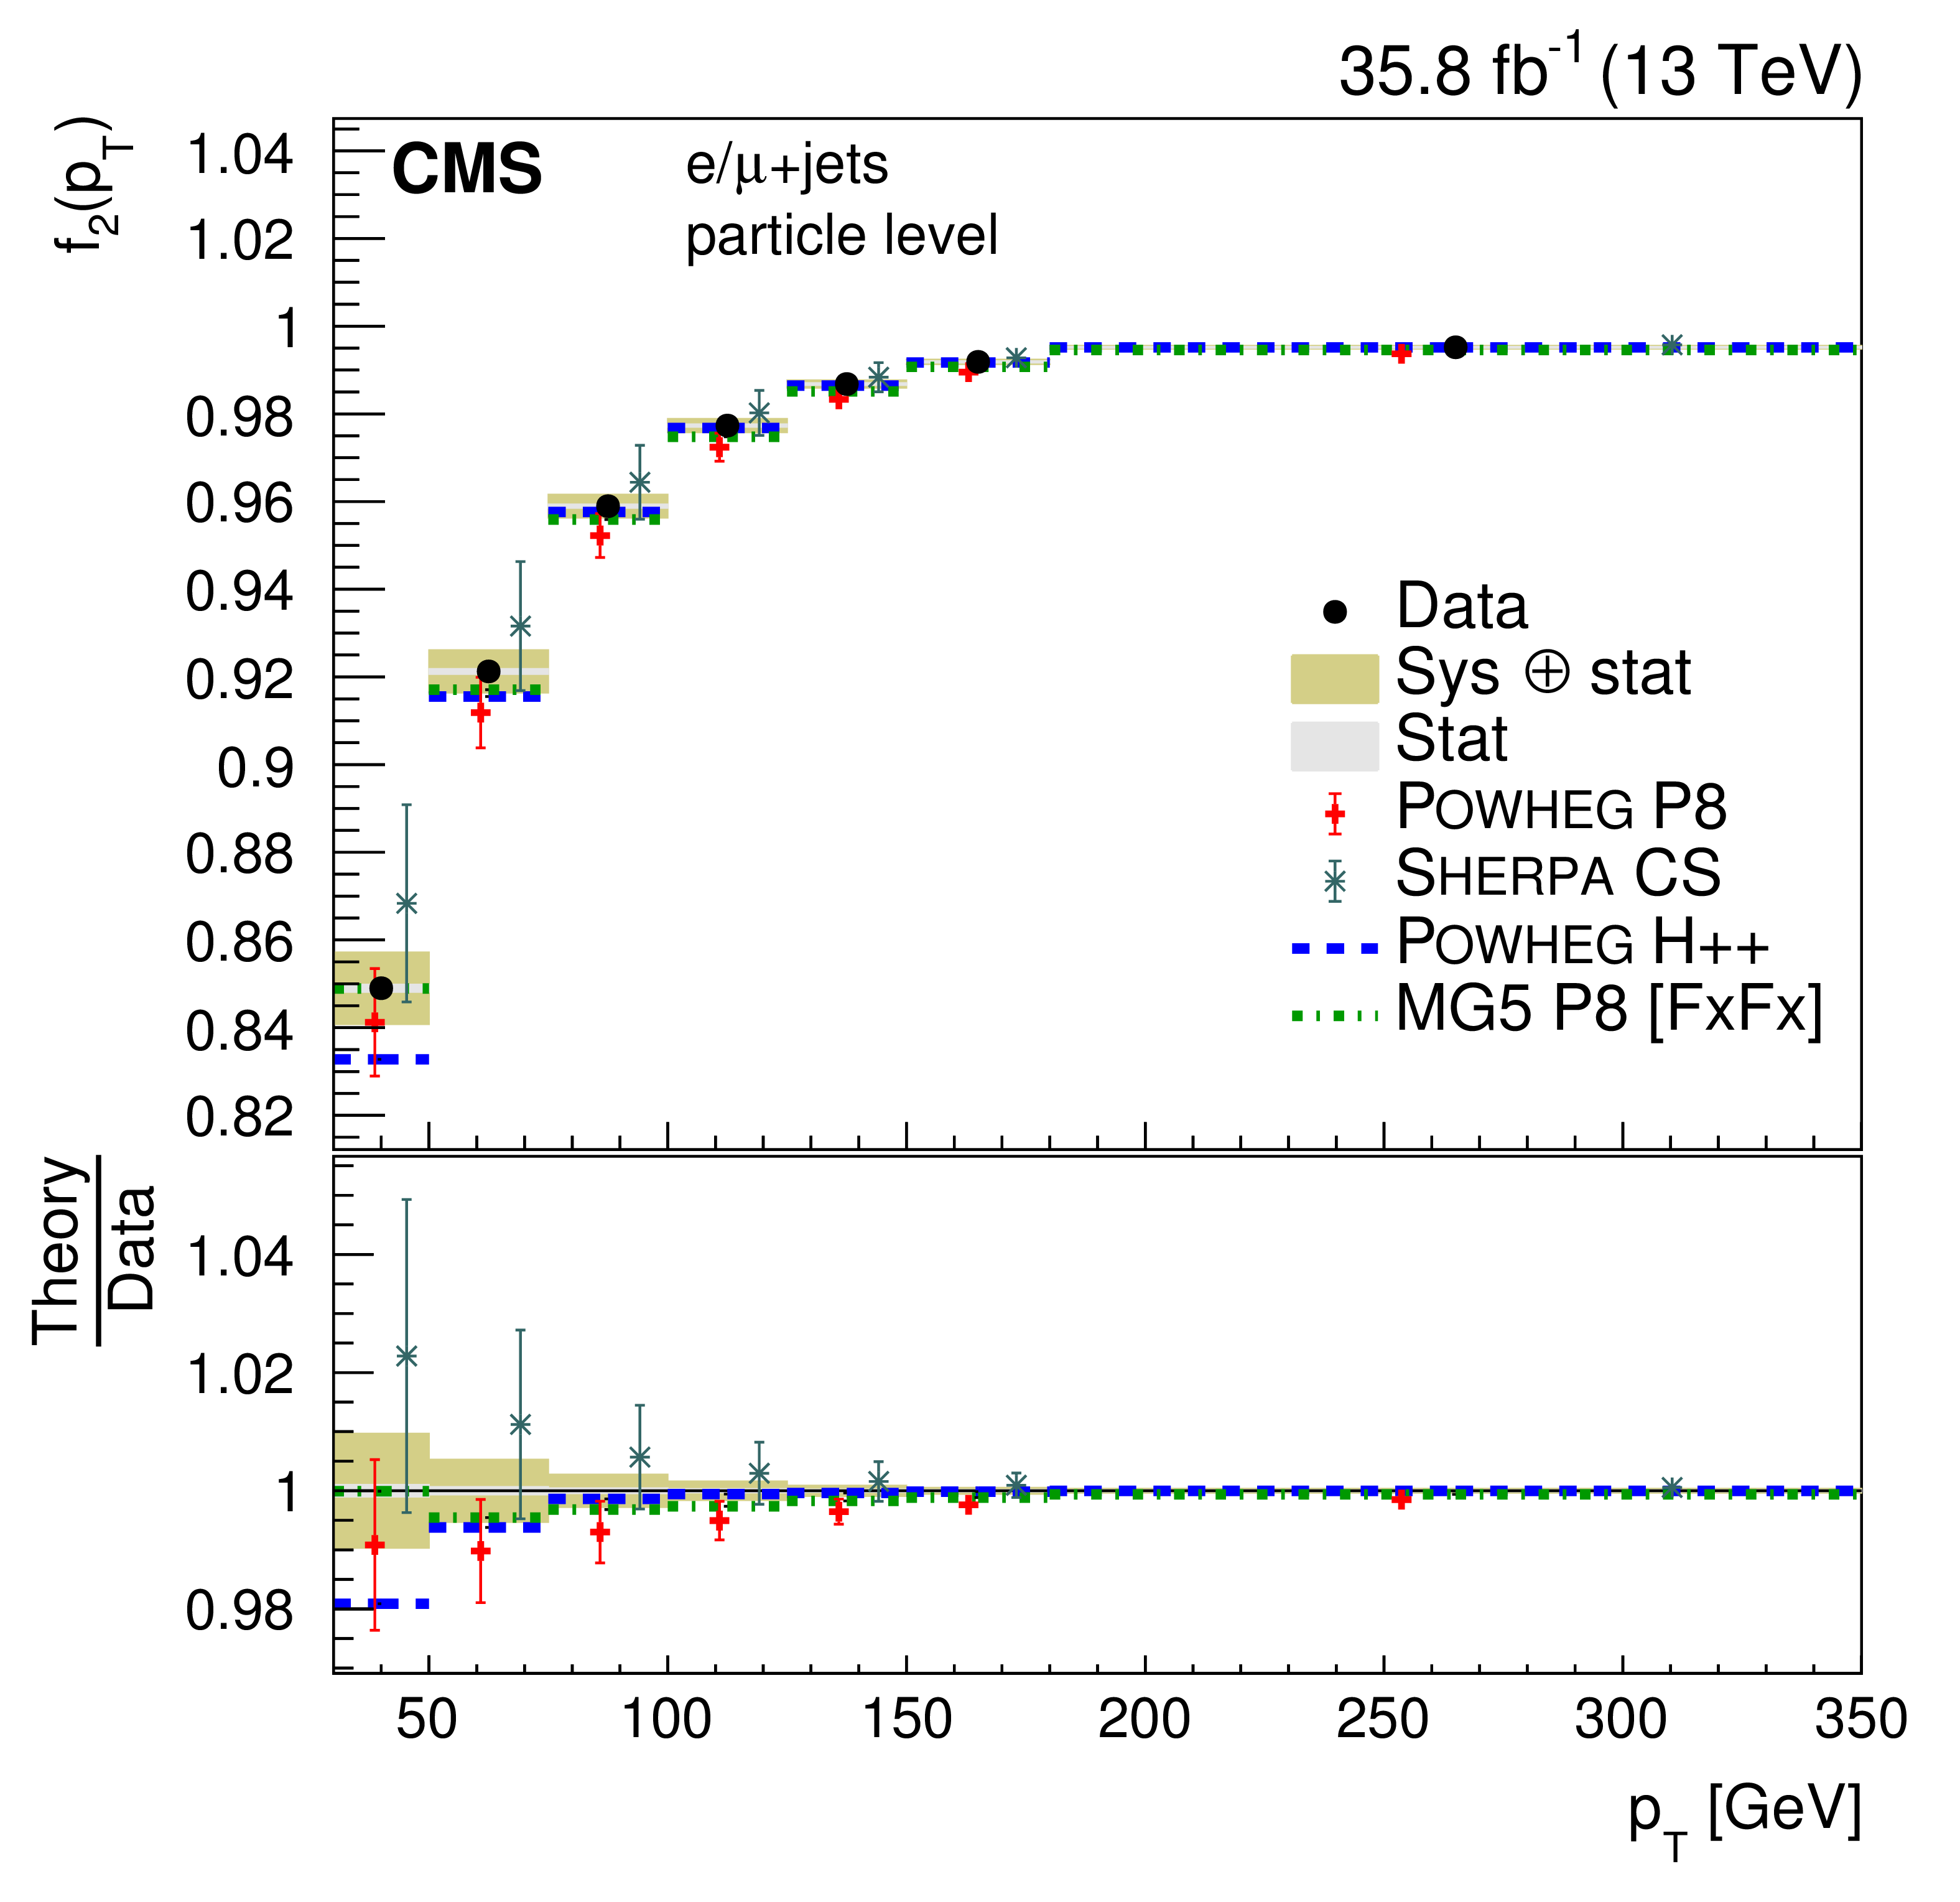
png pdf |
Figure 39-b:
Distributions of the gap fractions $f_1({p_{\mathrm {T}}})$ and $f_2({p_{\mathrm {T}}})$. The data are shown as points with light (dark) bands indicating the statistical (statistical and systematic) uncertainties. The measurements are compared to the predictions of POWHEG combined with PYTHIA8 (P8) or HERWIG++ (H++) and the multiparton simulations MG5_aMC@NLO (MG5)+PYTHIA8 FxFx and SHERPA. The ratios of the predictions to the measured cross sections are shown at the bottom of each panel. |
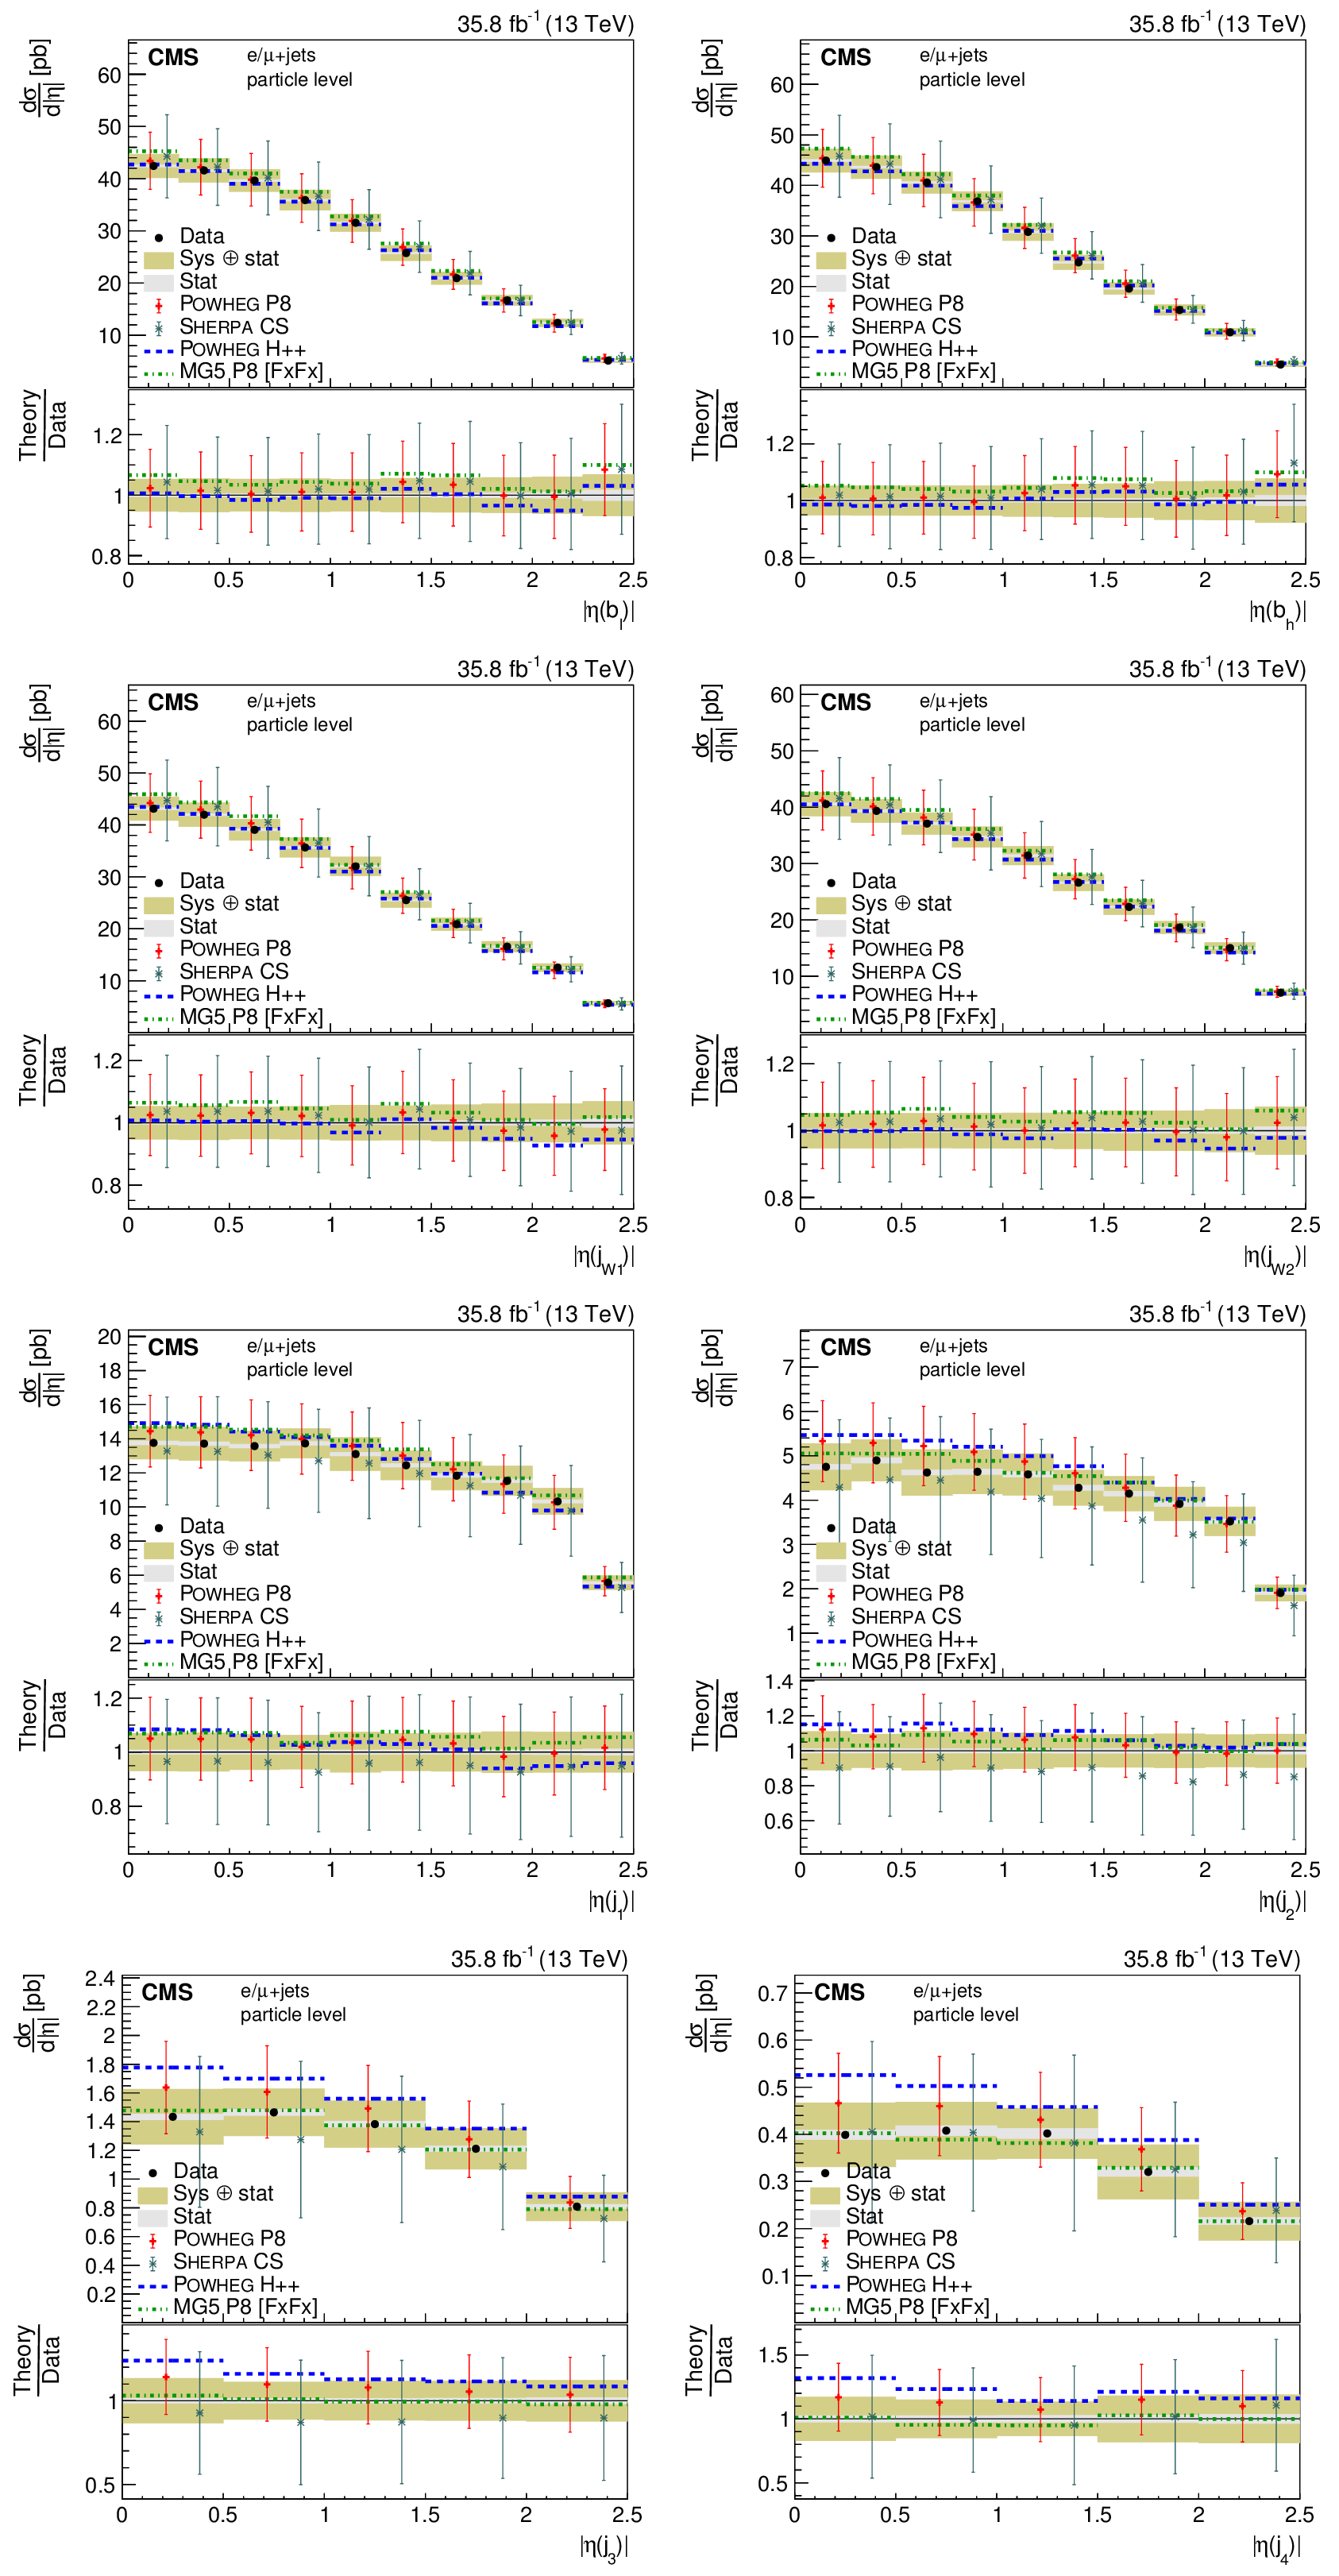
png pdf |
Figure 40:
Differential cross section at the particle level as a function of jet $ { | \eta | }$. The upper two rows show the $ { | \eta | }$ distributions for the jets in the $ {\mathrm{t} \mathrm{\bar{t}}} $ system, the lower two rows the distributions for additional jets. The data are shown as points with light (dark) bands indicating the statistical (statistical and systematic) uncertainties. The cross sections are compared to the predictions of POWHEG combined with PYTHIA8 (P8) or HERWIG++ (H++) and the multiparton simulations MG5_aMC@NLO (MG5)+PYTHIA8 FxFx and SHERPA. The ratios of the predictions to the measured cross sections are shown at the bottom of each panel. |
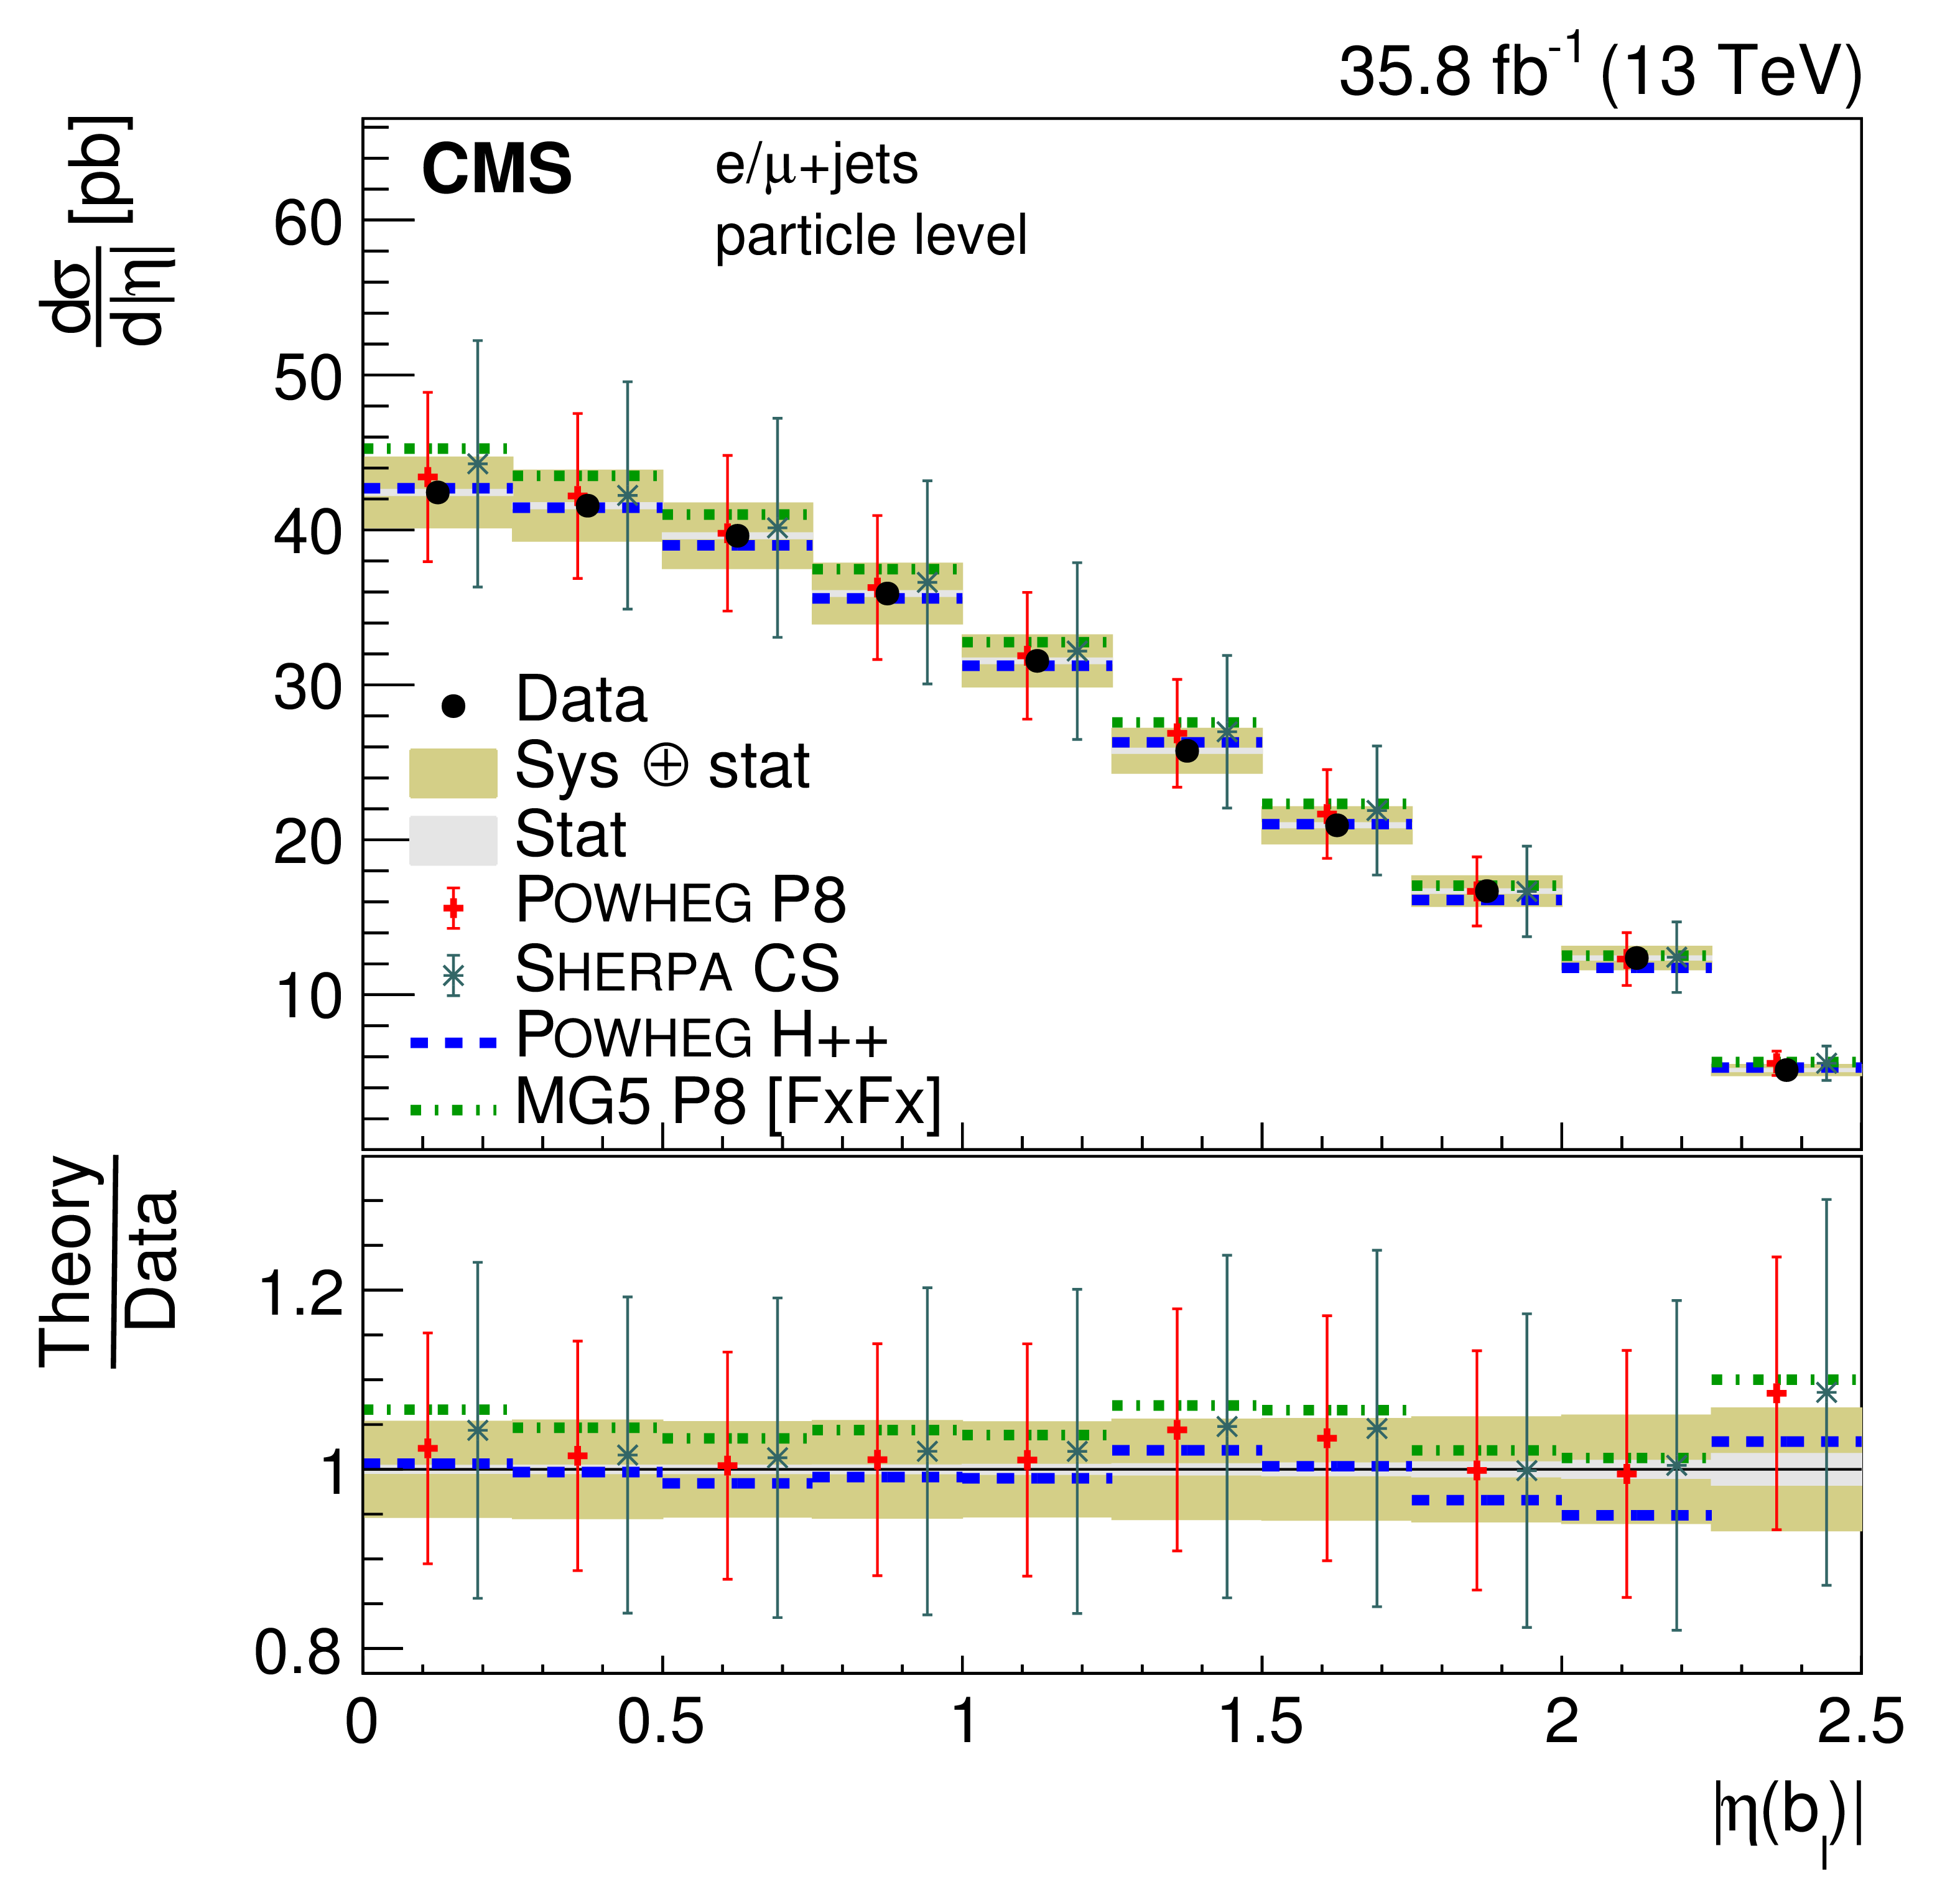
png pdf |
Figure 40-a:
Differential cross section at the particle level as a function of jet $ { | \eta | }$. The upper two rows show the $ { | \eta | }$ distributions for the jets in the $ {\mathrm{t} \mathrm{\bar{t}}} $ system, the lower two rows the distributions for additional jets. The data are shown as points with light (dark) bands indicating the statistical (statistical and systematic) uncertainties. The cross sections are compared to the predictions of POWHEG combined with PYTHIA8 (P8) or HERWIG++ (H++) and the multiparton simulations MG5_aMC@NLO (MG5)+PYTHIA8 FxFx and SHERPA. The ratios of the predictions to the measured cross sections are shown at the bottom of each panel. |
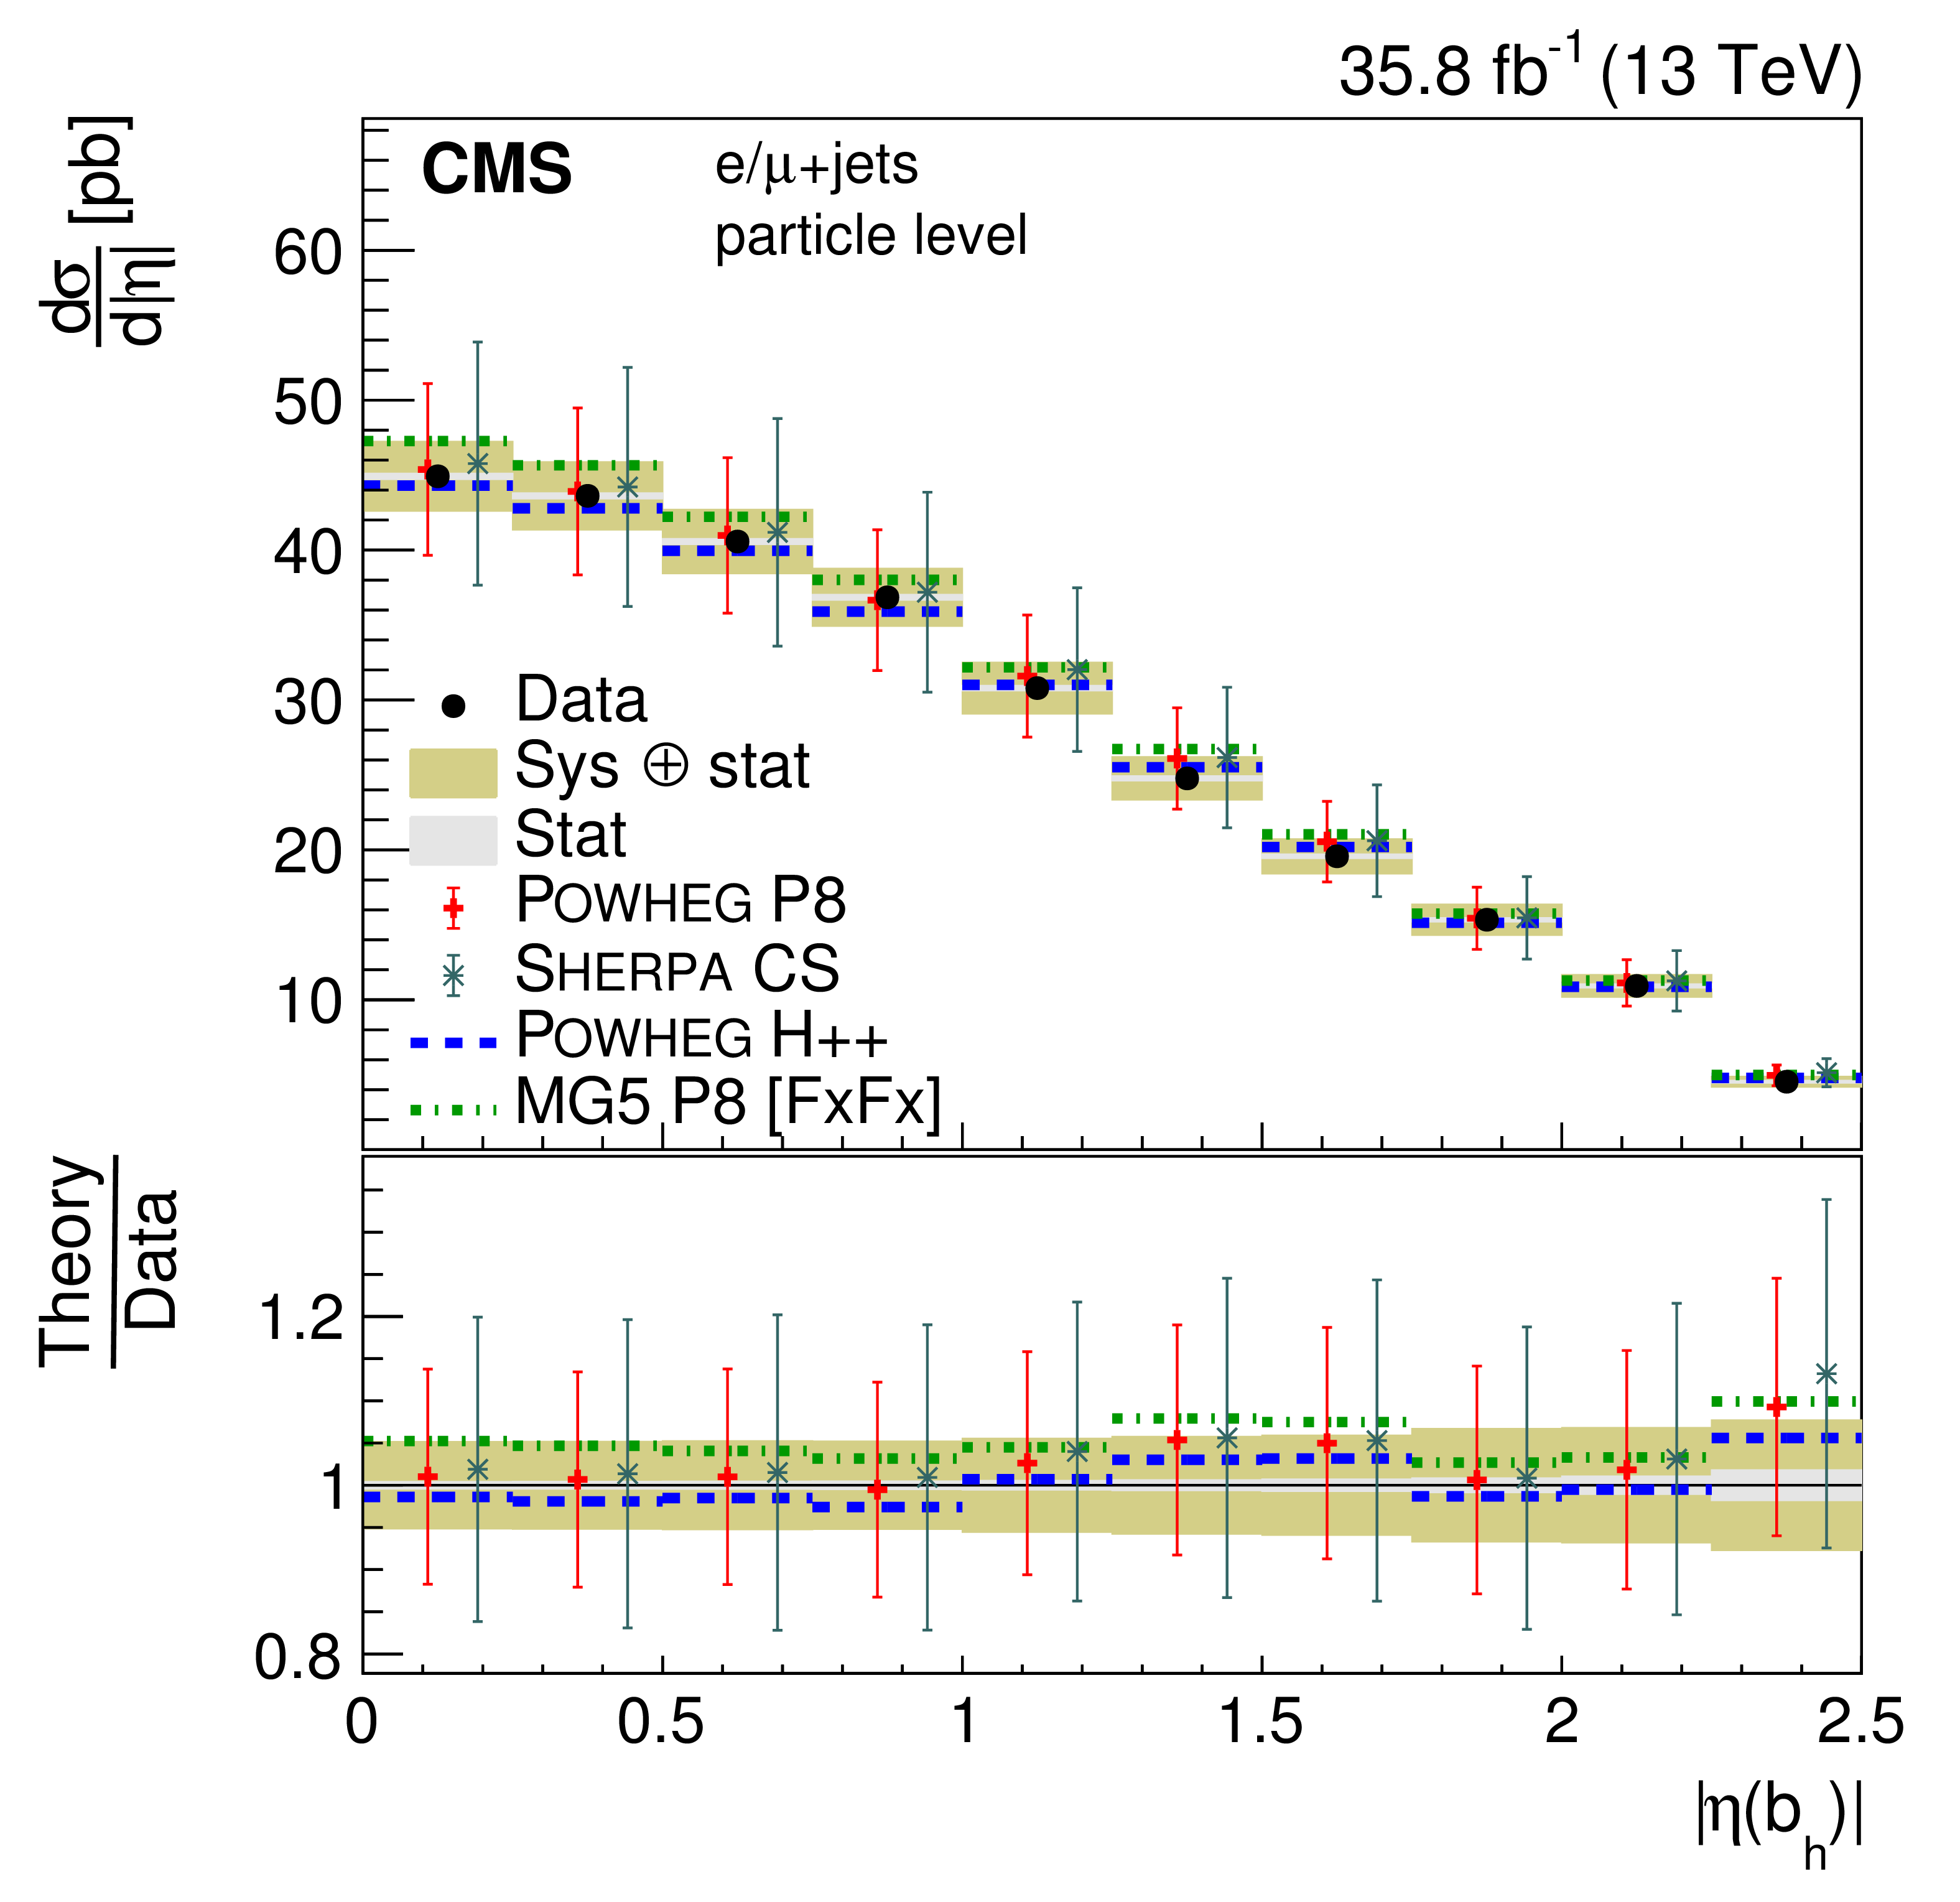
png pdf |
Figure 40-b:
Differential cross section at the particle level as a function of jet $ { | \eta | }$. The upper two rows show the $ { | \eta | }$ distributions for the jets in the $ {\mathrm{t} \mathrm{\bar{t}}} $ system, the lower two rows the distributions for additional jets. The data are shown as points with light (dark) bands indicating the statistical (statistical and systematic) uncertainties. The cross sections are compared to the predictions of POWHEG combined with PYTHIA8 (P8) or HERWIG++ (H++) and the multiparton simulations MG5_aMC@NLO (MG5)+PYTHIA8 FxFx and SHERPA. The ratios of the predictions to the measured cross sections are shown at the bottom of each panel. |

png pdf |
Figure 40-c:
Differential cross section at the particle level as a function of jet $ { | \eta | }$. The upper two rows show the $ { | \eta | }$ distributions for the jets in the $ {\mathrm{t} \mathrm{\bar{t}}} $ system, the lower two rows the distributions for additional jets. The data are shown as points with light (dark) bands indicating the statistical (statistical and systematic) uncertainties. The cross sections are compared to the predictions of POWHEG combined with PYTHIA8 (P8) or HERWIG++ (H++) and the multiparton simulations MG5_aMC@NLO (MG5)+PYTHIA8 FxFx and SHERPA. The ratios of the predictions to the measured cross sections are shown at the bottom of each panel. |
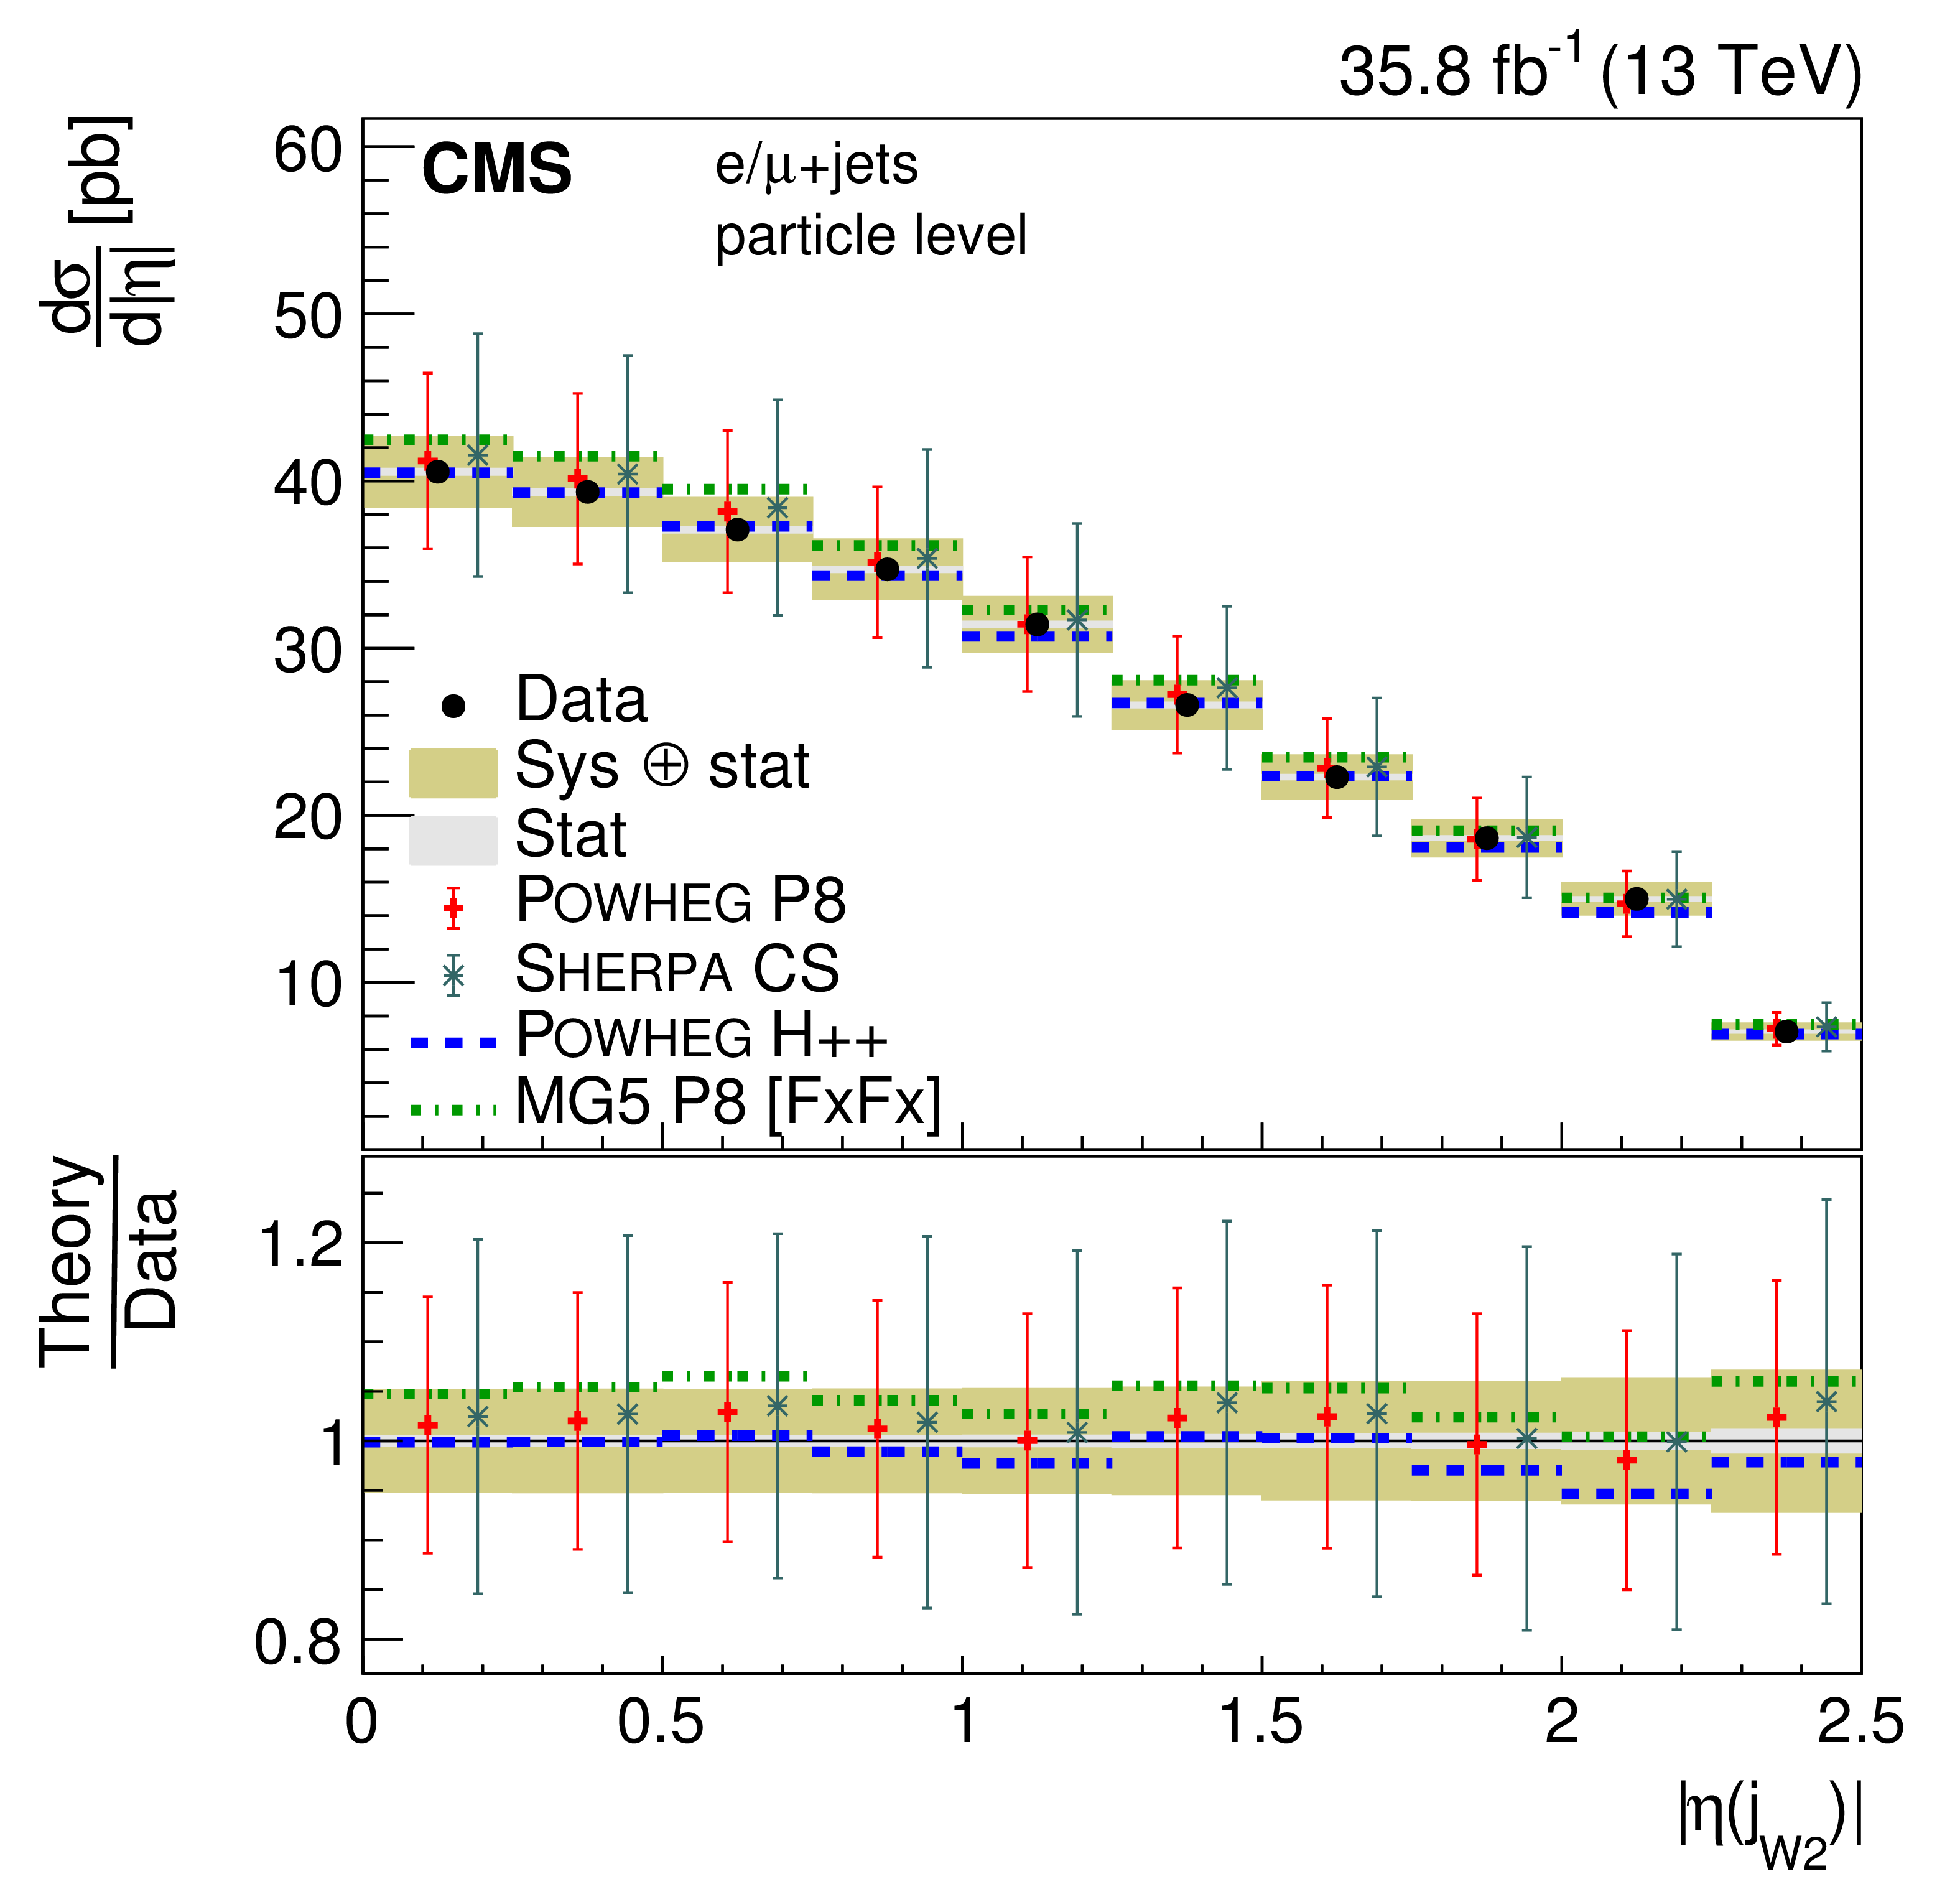
png pdf |
Figure 40-d:
Differential cross section at the particle level as a function of jet $ { | \eta | }$. The upper two rows show the $ { | \eta | }$ distributions for the jets in the $ {\mathrm{t} \mathrm{\bar{t}}} $ system, the lower two rows the distributions for additional jets. The data are shown as points with light (dark) bands indicating the statistical (statistical and systematic) uncertainties. The cross sections are compared to the predictions of POWHEG combined with PYTHIA8 (P8) or HERWIG++ (H++) and the multiparton simulations MG5_aMC@NLO (MG5)+PYTHIA8 FxFx and SHERPA. The ratios of the predictions to the measured cross sections are shown at the bottom of each panel. |
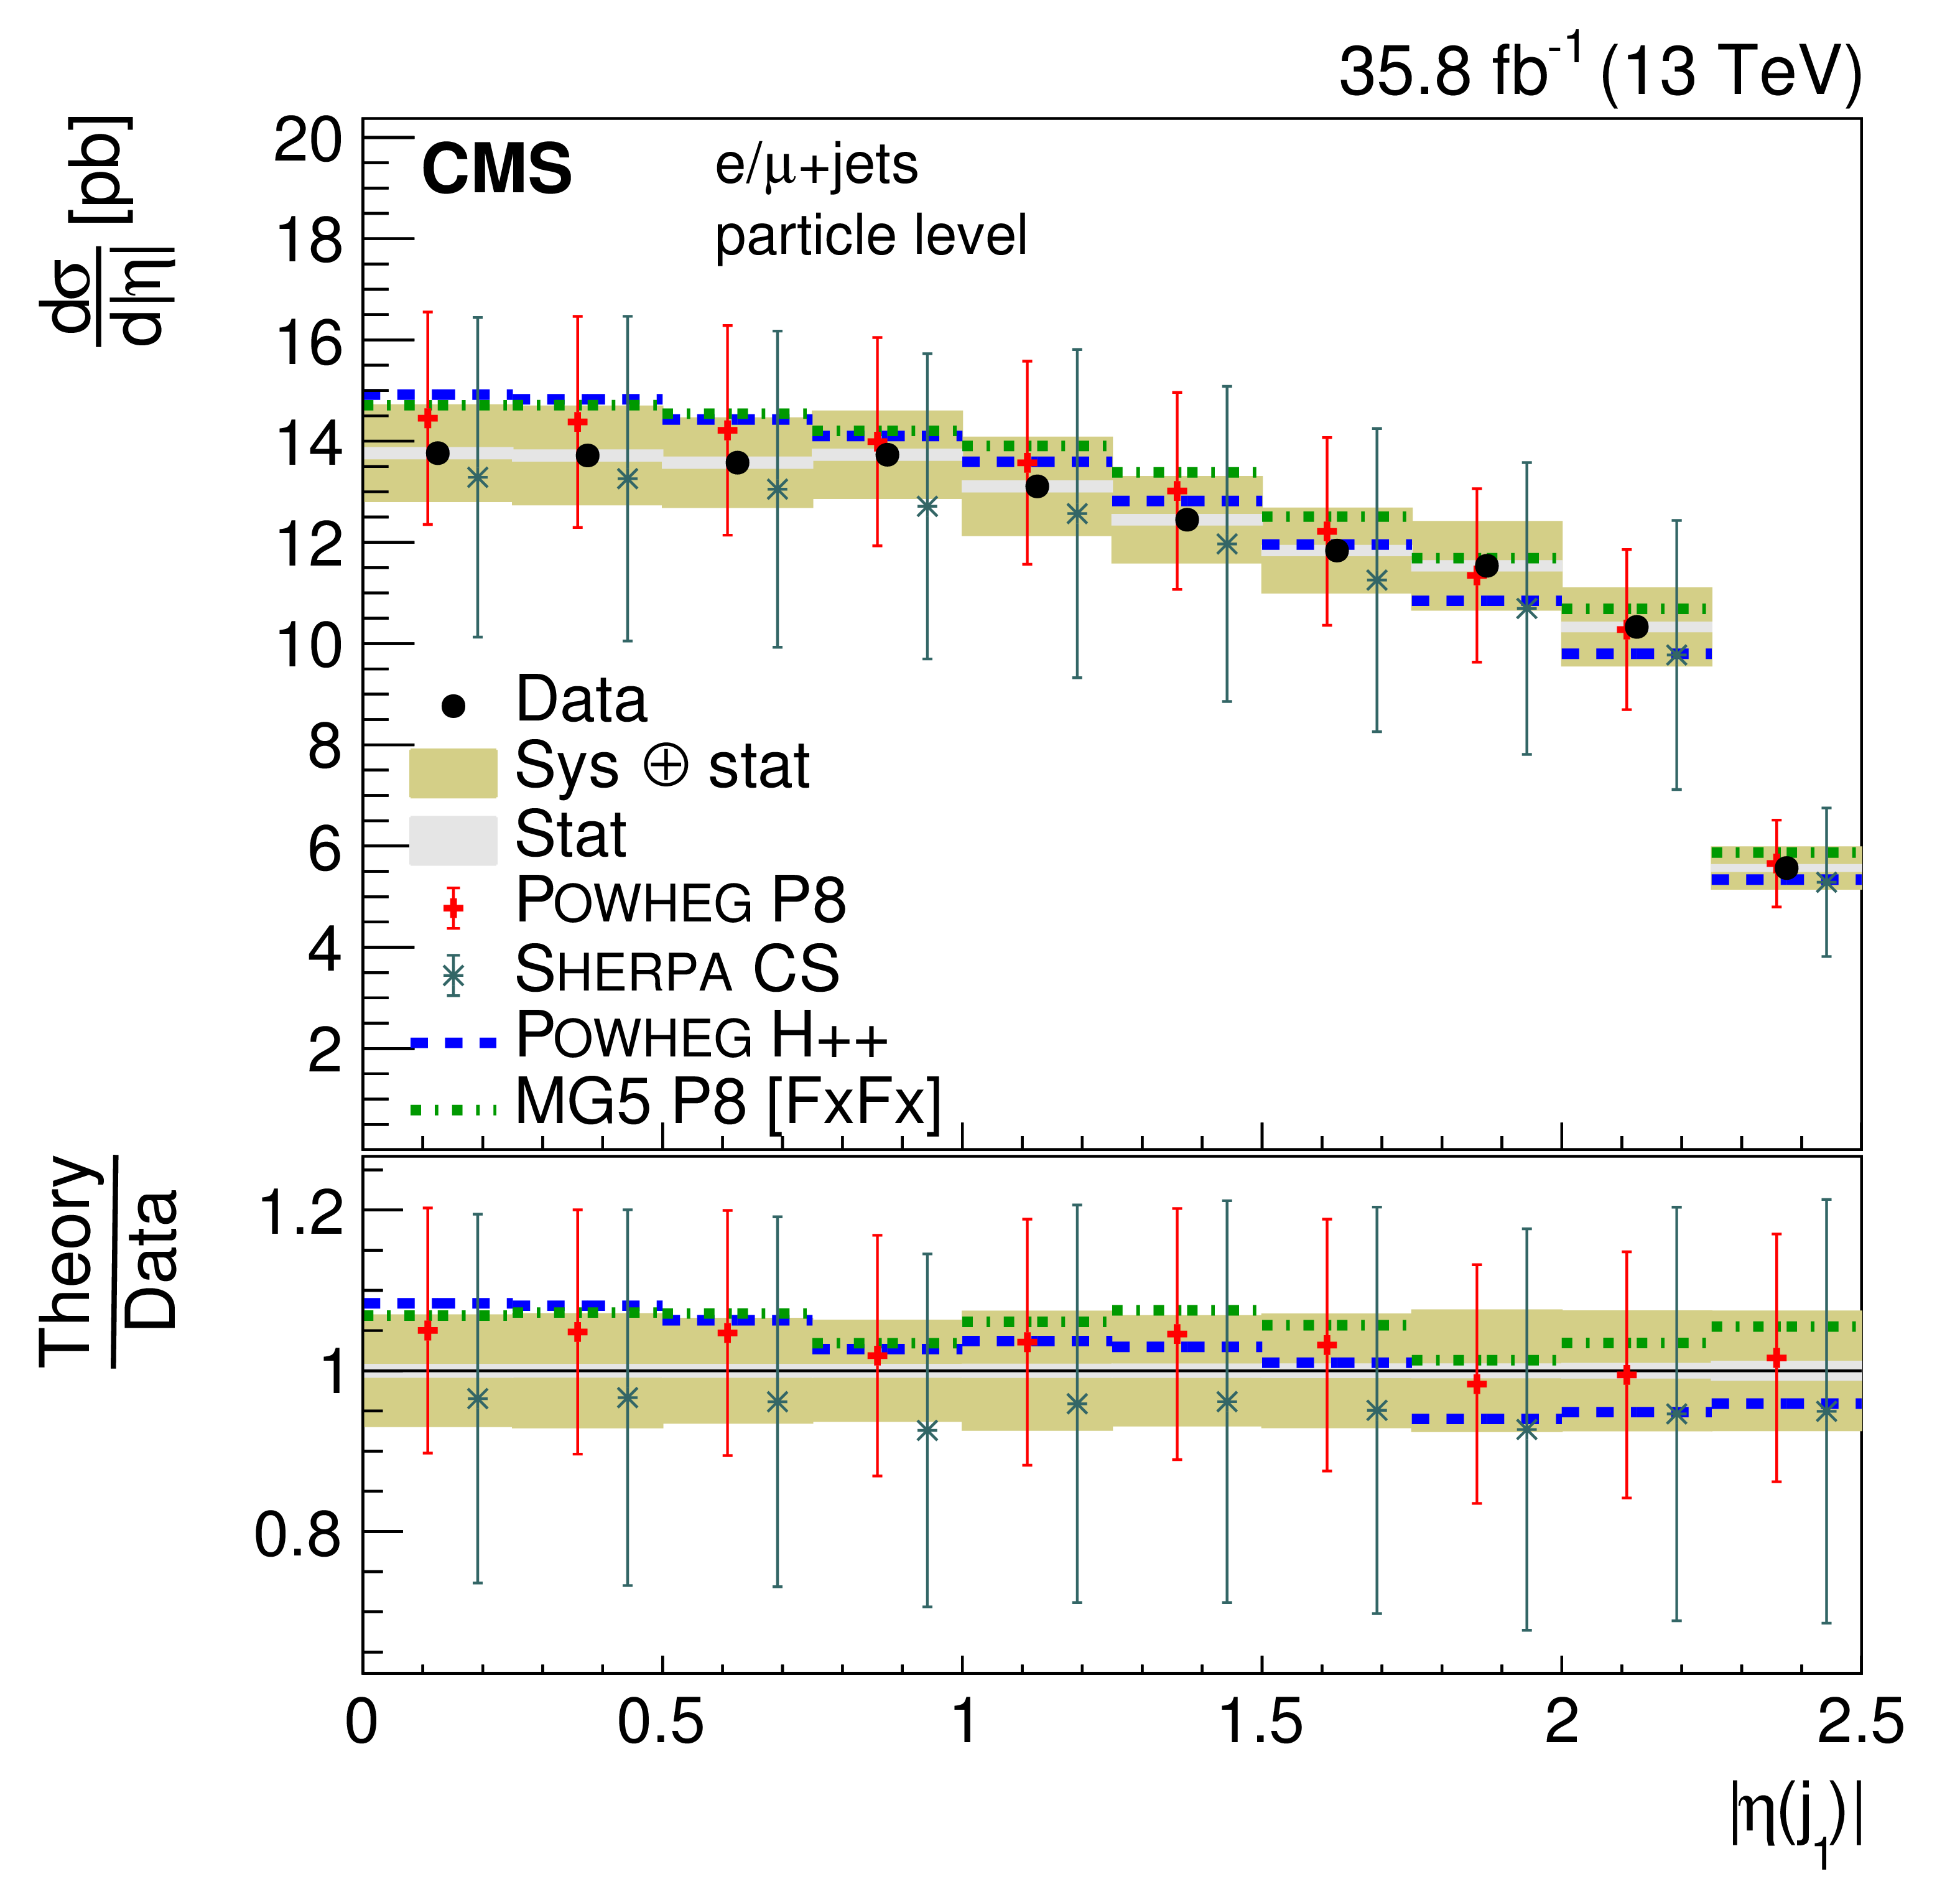
png pdf |
Figure 40-e:
Differential cross section at the particle level as a function of jet $ { | \eta | }$. The upper two rows show the $ { | \eta | }$ distributions for the jets in the $ {\mathrm{t} \mathrm{\bar{t}}} $ system, the lower two rows the distributions for additional jets. The data are shown as points with light (dark) bands indicating the statistical (statistical and systematic) uncertainties. The cross sections are compared to the predictions of POWHEG combined with PYTHIA8 (P8) or HERWIG++ (H++) and the multiparton simulations MG5_aMC@NLO (MG5)+PYTHIA8 FxFx and SHERPA. The ratios of the predictions to the measured cross sections are shown at the bottom of each panel. |

png pdf |
Figure 40-f:
Differential cross section at the particle level as a function of jet $ { | \eta | }$. The upper two rows show the $ { | \eta | }$ distributions for the jets in the $ {\mathrm{t} \mathrm{\bar{t}}} $ system, the lower two rows the distributions for additional jets. The data are shown as points with light (dark) bands indicating the statistical (statistical and systematic) uncertainties. The cross sections are compared to the predictions of POWHEG combined with PYTHIA8 (P8) or HERWIG++ (H++) and the multiparton simulations MG5_aMC@NLO (MG5)+PYTHIA8 FxFx and SHERPA. The ratios of the predictions to the measured cross sections are shown at the bottom of each panel. |
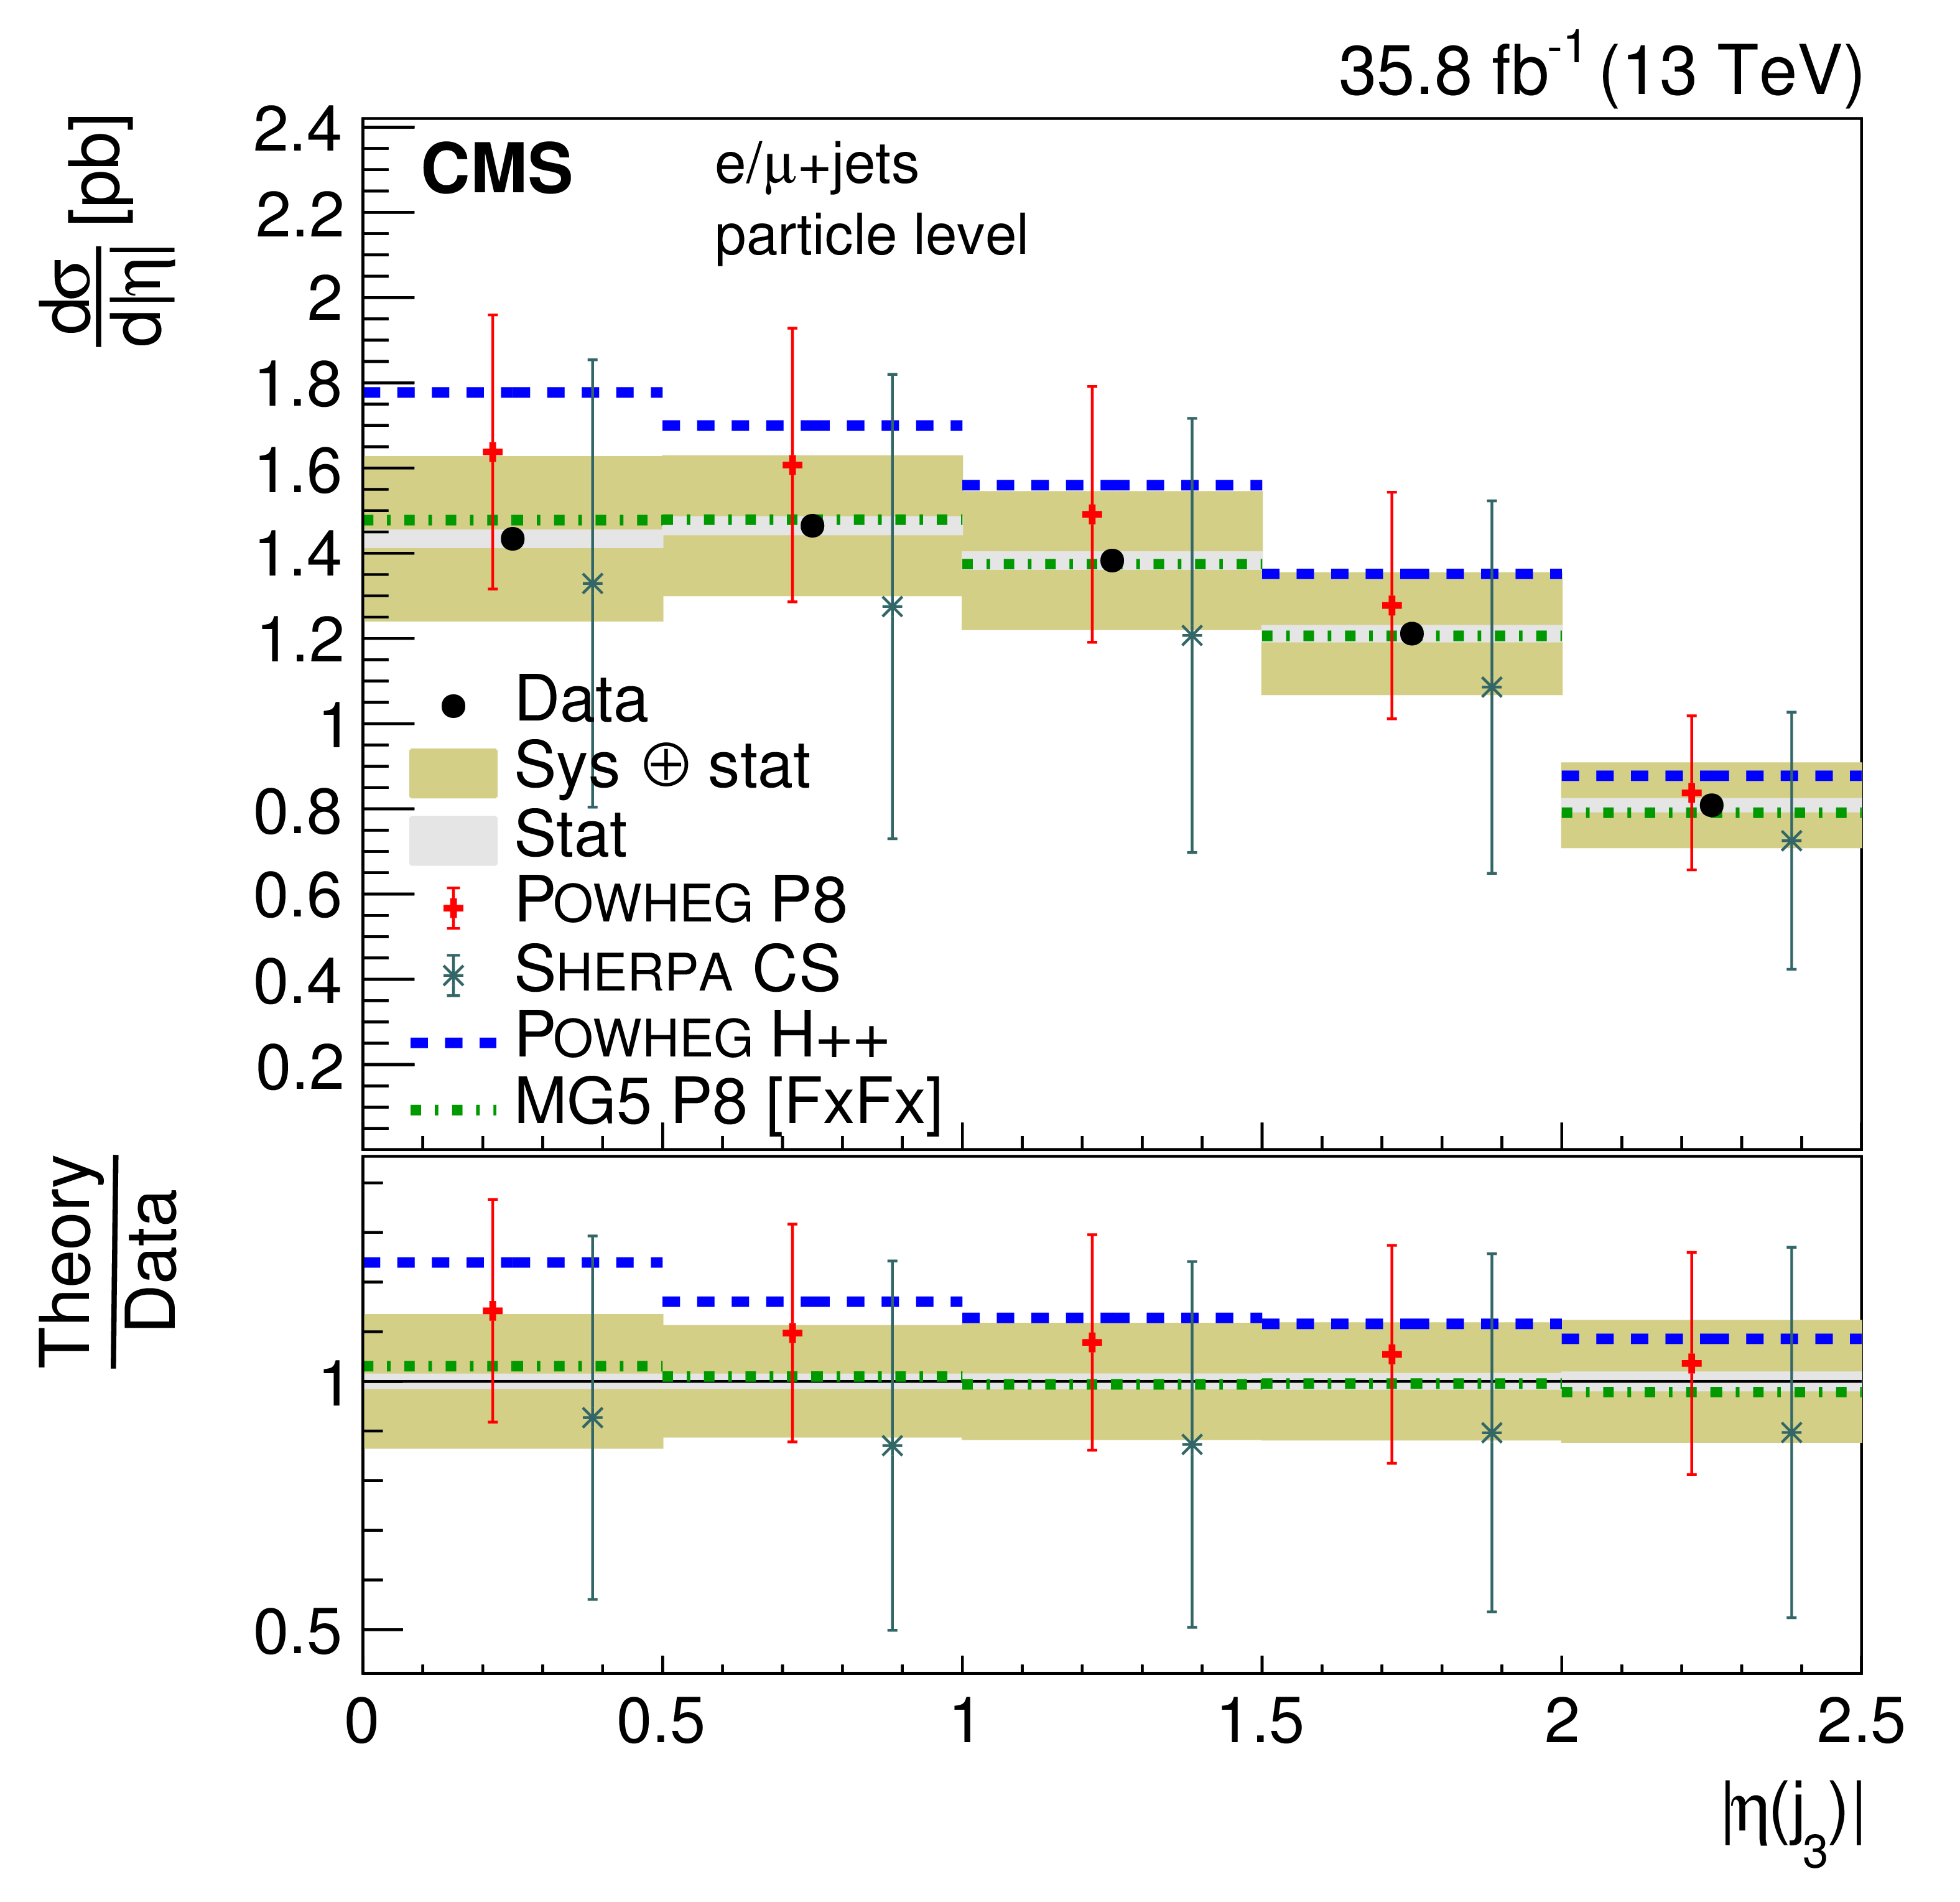
png pdf |
Figure 40-g:
Differential cross section at the particle level as a function of jet $ { | \eta | }$. The upper two rows show the $ { | \eta | }$ distributions for the jets in the $ {\mathrm{t} \mathrm{\bar{t}}} $ system, the lower two rows the distributions for additional jets. The data are shown as points with light (dark) bands indicating the statistical (statistical and systematic) uncertainties. The cross sections are compared to the predictions of POWHEG combined with PYTHIA8 (P8) or HERWIG++ (H++) and the multiparton simulations MG5_aMC@NLO (MG5)+PYTHIA8 FxFx and SHERPA. The ratios of the predictions to the measured cross sections are shown at the bottom of each panel. |
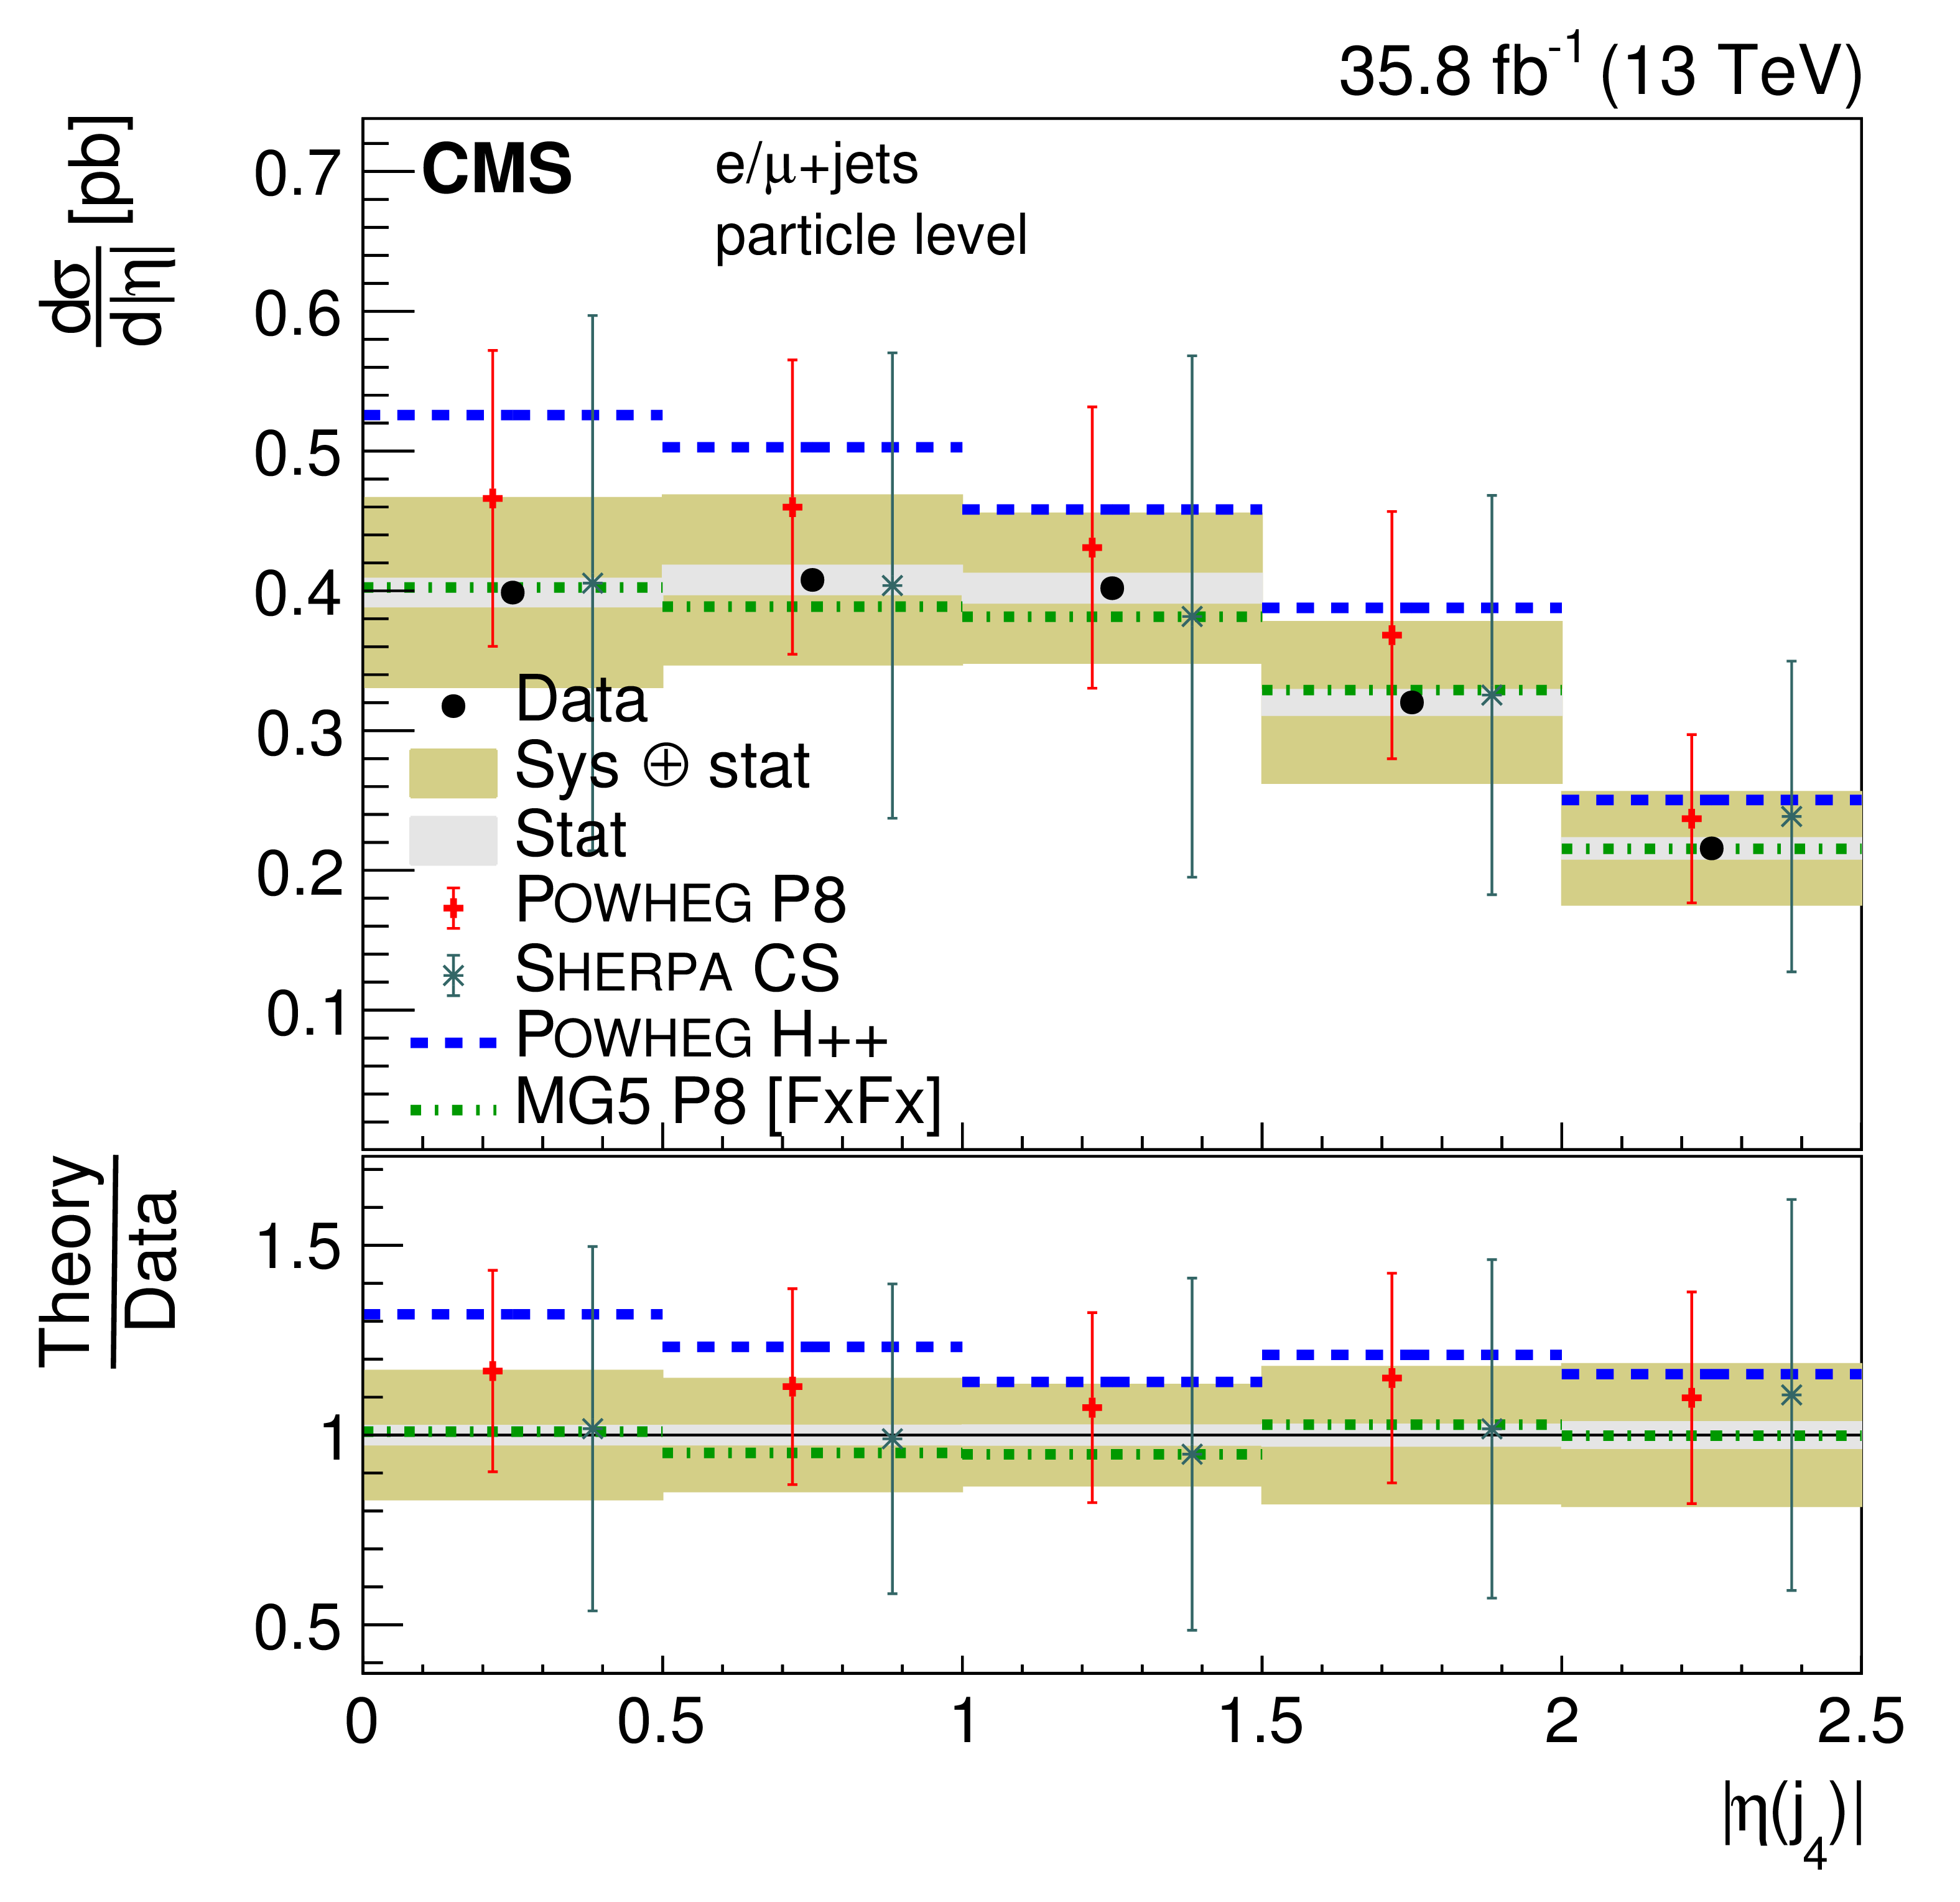
png pdf |
Figure 40-h:
Differential cross section at the particle level as a function of jet $ { | \eta | }$. The upper two rows show the $ { | \eta | }$ distributions for the jets in the $ {\mathrm{t} \mathrm{\bar{t}}} $ system, the lower two rows the distributions for additional jets. The data are shown as points with light (dark) bands indicating the statistical (statistical and systematic) uncertainties. The cross sections are compared to the predictions of POWHEG combined with PYTHIA8 (P8) or HERWIG++ (H++) and the multiparton simulations MG5_aMC@NLO (MG5)+PYTHIA8 FxFx and SHERPA. The ratios of the predictions to the measured cross sections are shown at the bottom of each panel. |
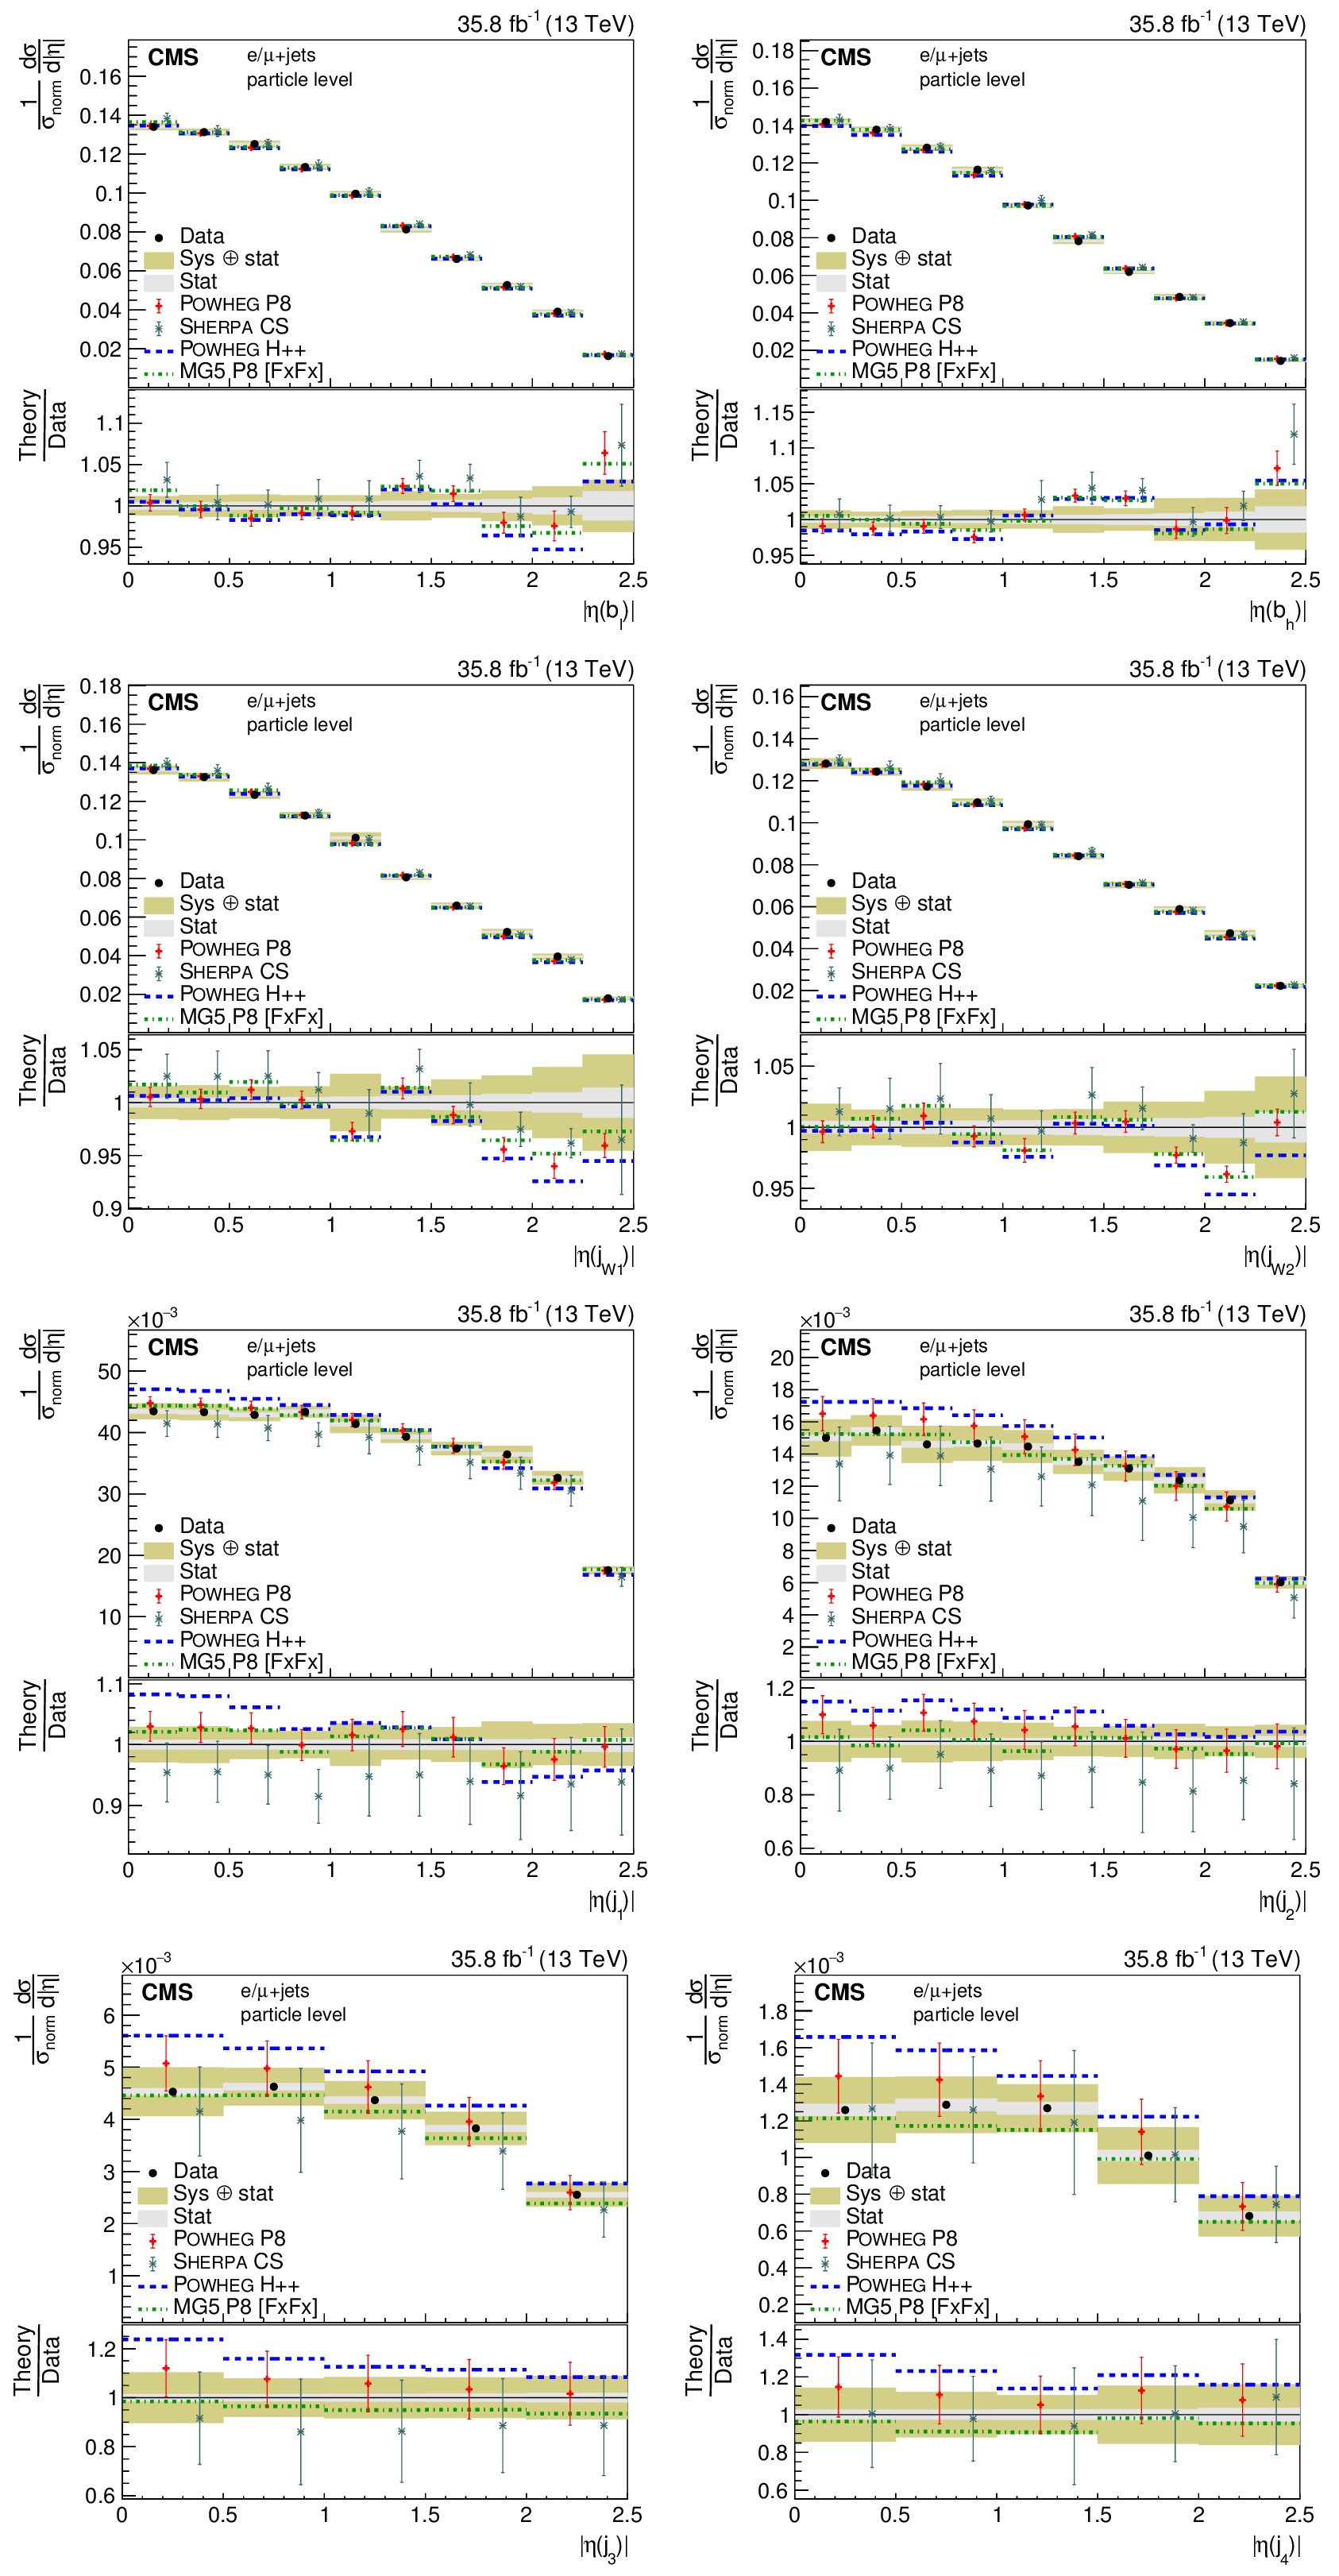
png pdf |
Figure 41:
Normalized differential cross section at the particle level as a function of jet $ { | \eta | }$. The upper two rows show the $ { | \eta | }$ distributions for the jets in the $ {\mathrm{t} \mathrm{\bar{t}}} $ system, the lower two rows the distributions for additional jets. The data are shown as points with light (dark) bands indicating the statistical (statistical and systematic) uncertainties. The cross sections are compared to the predictions of POWHEG combined with PYTHIA8 (P8) or HERWIG++ (H++) and the multiparton simulations MG5_aMC@NLO (MG5)+PYTHIA8 FxFx and SHERPA. The ratios of the predictions to the measured cross sections are shown at the bottom of each panel. |
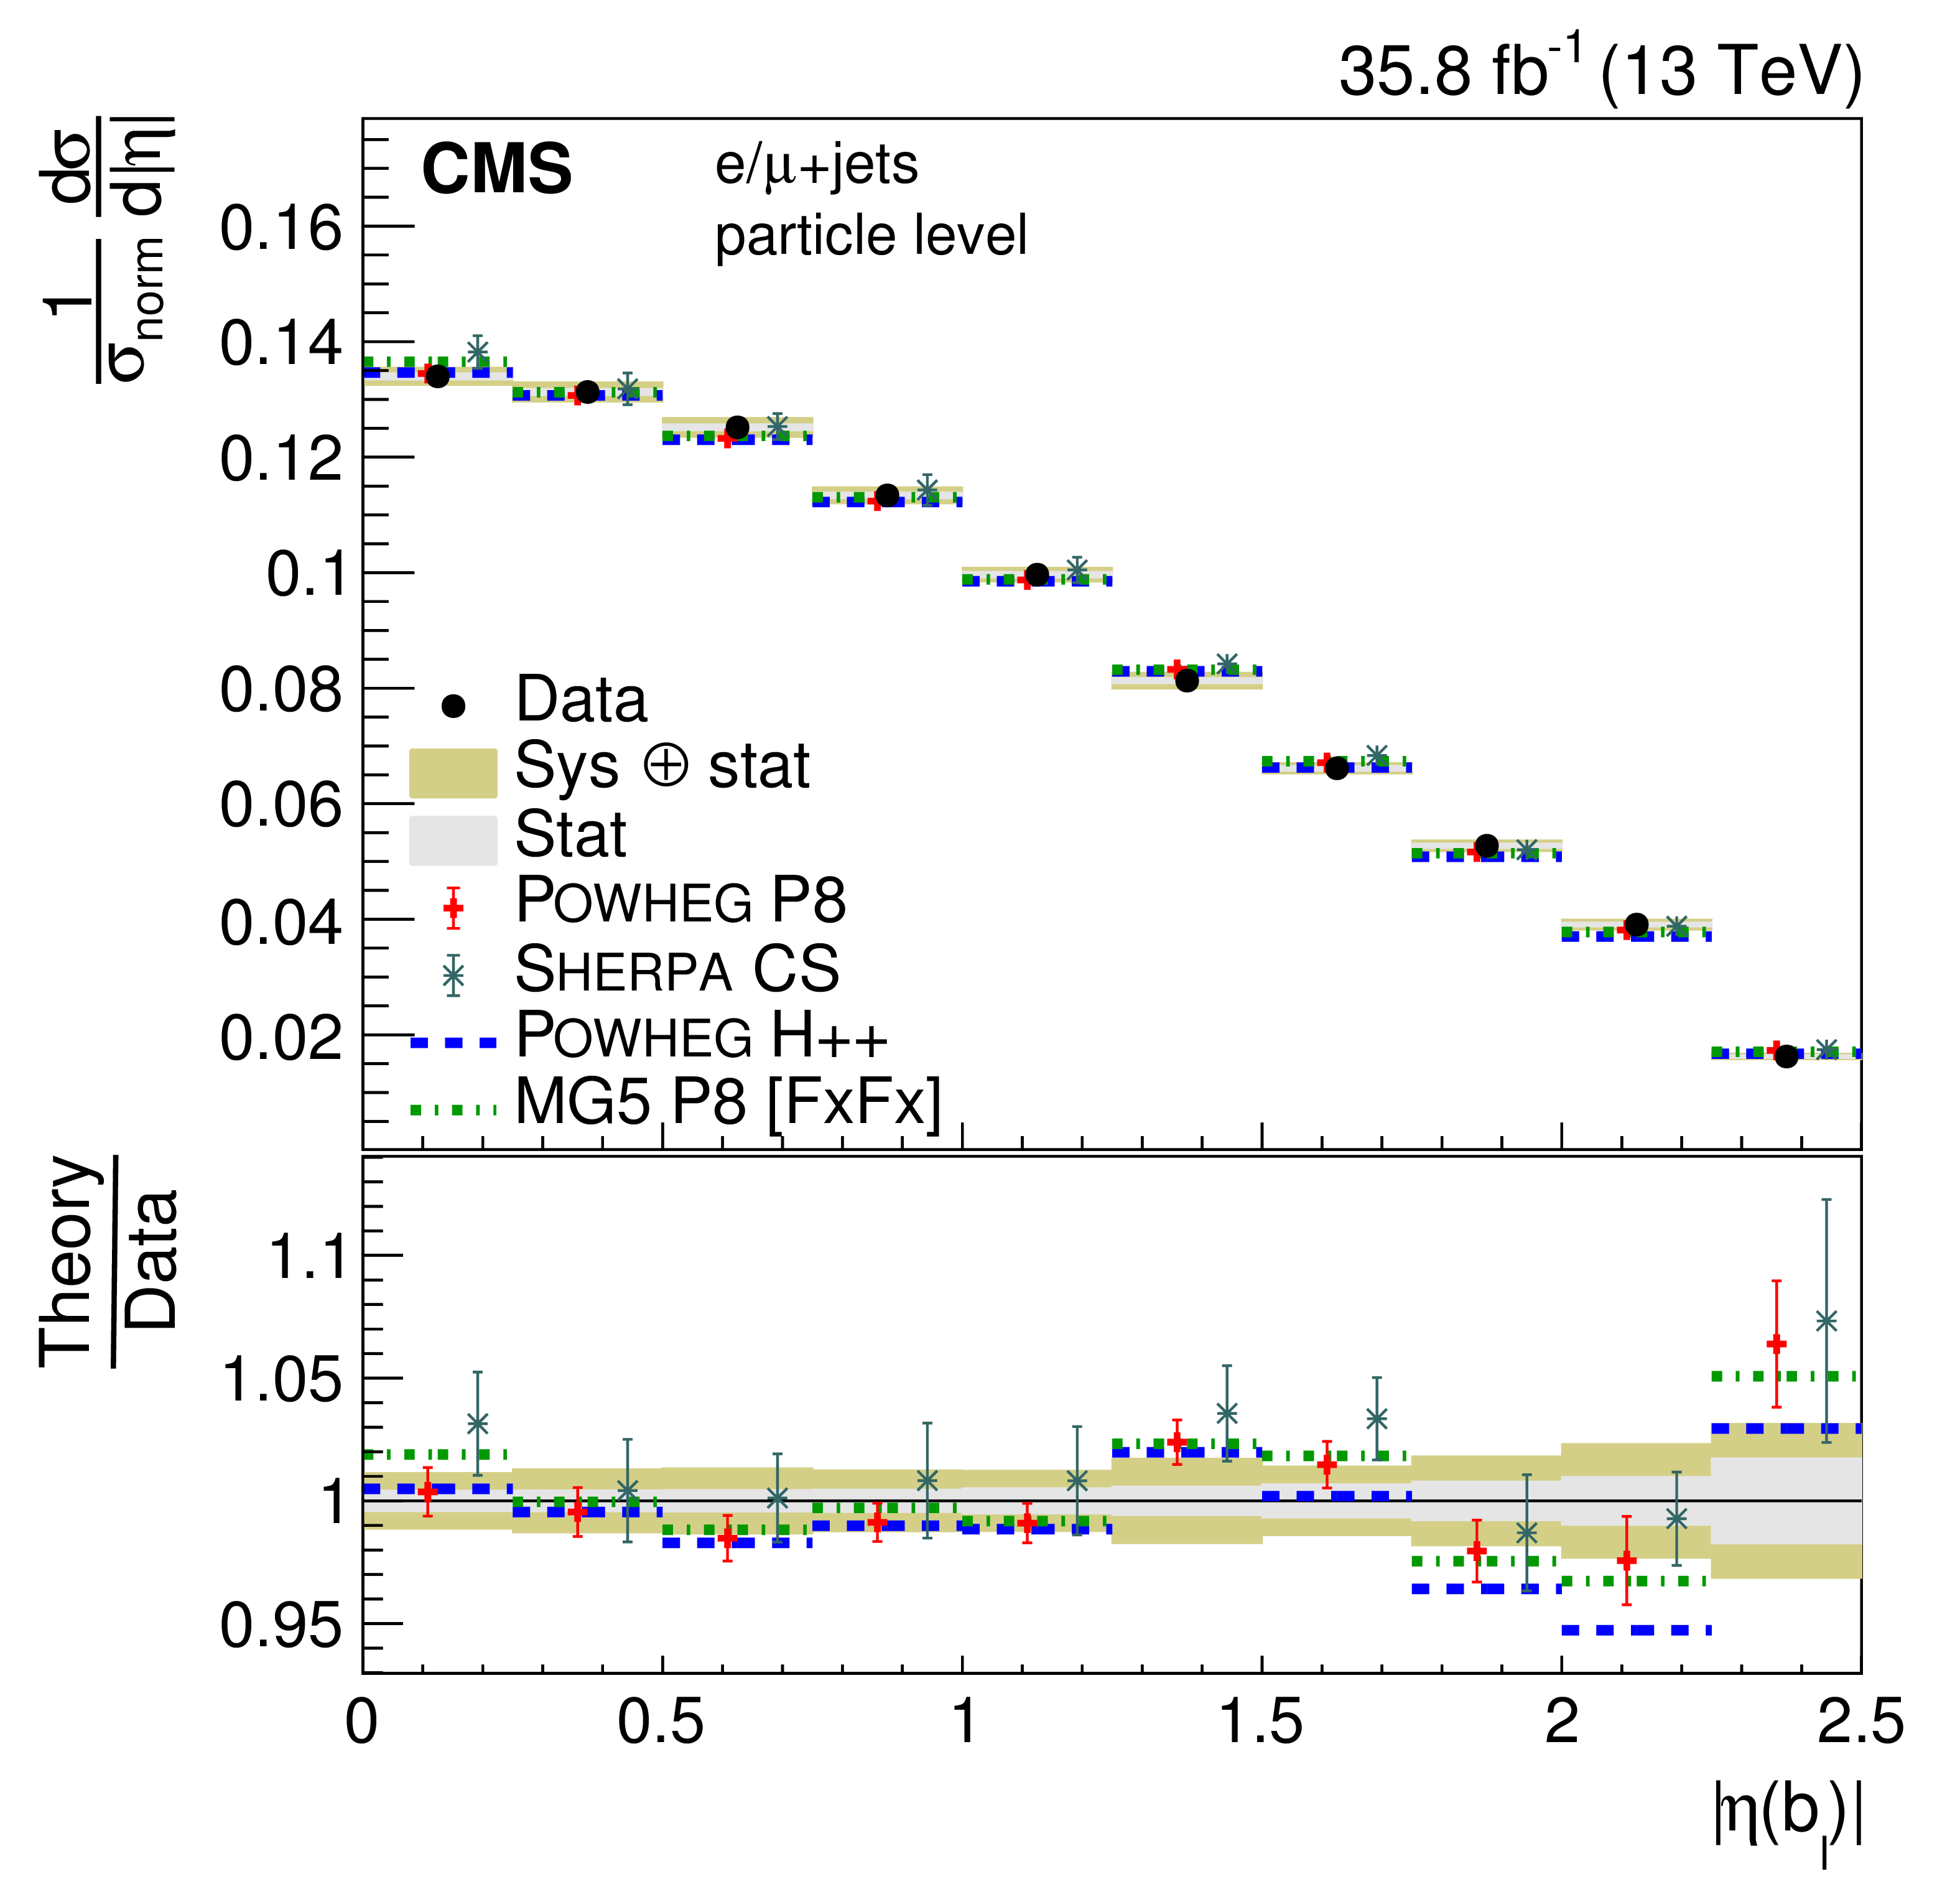
png pdf |
Figure 41-a:
Normalized differential cross section at the particle level as a function of jet $ { | \eta | }$. The upper two rows show the $ { | \eta | }$ distributions for the jets in the $ {\mathrm{t} \mathrm{\bar{t}}} $ system, the lower two rows the distributions for additional jets. The data are shown as points with light (dark) bands indicating the statistical (statistical and systematic) uncertainties. The cross sections are compared to the predictions of POWHEG combined with PYTHIA8 (P8) or HERWIG++ (H++) and the multiparton simulations MG5_aMC@NLO (MG5)+PYTHIA8 FxFx and SHERPA. The ratios of the predictions to the measured cross sections are shown at the bottom of each panel. |
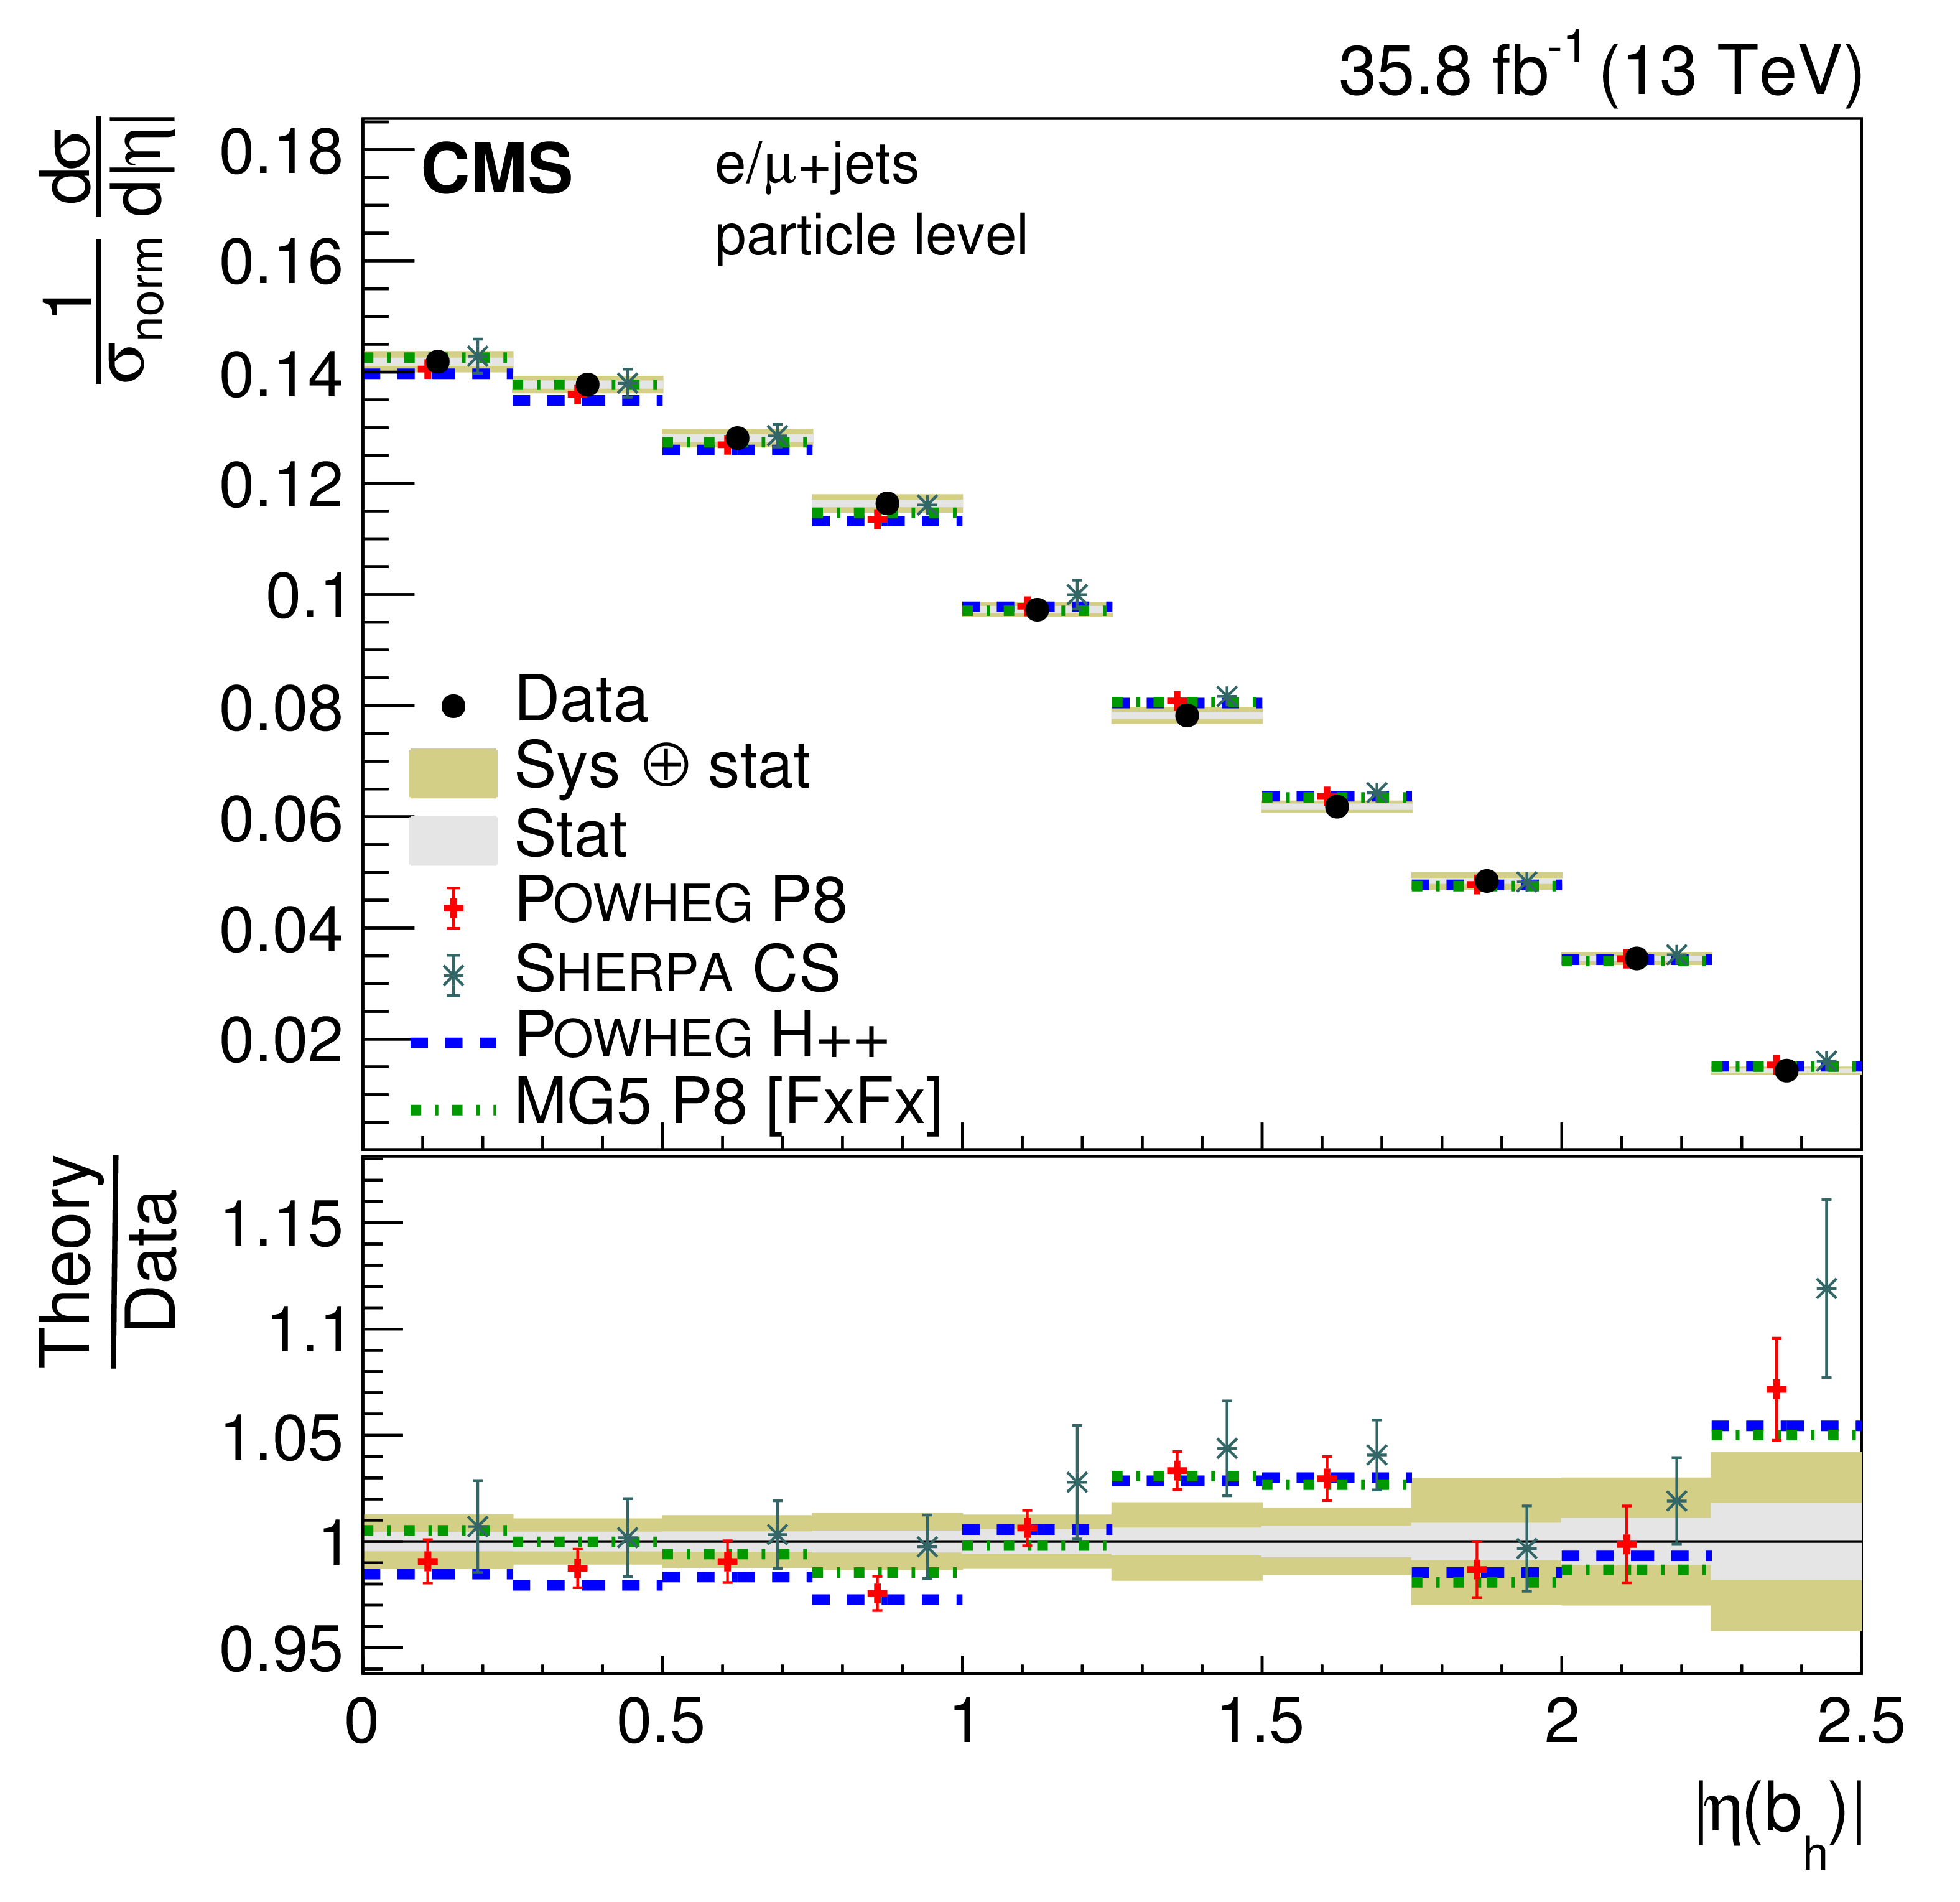
png pdf |
Figure 41-b:
Normalized differential cross section at the particle level as a function of jet $ { | \eta | }$. The upper two rows show the $ { | \eta | }$ distributions for the jets in the $ {\mathrm{t} \mathrm{\bar{t}}} $ system, the lower two rows the distributions for additional jets. The data are shown as points with light (dark) bands indicating the statistical (statistical and systematic) uncertainties. The cross sections are compared to the predictions of POWHEG combined with PYTHIA8 (P8) or HERWIG++ (H++) and the multiparton simulations MG5_aMC@NLO (MG5)+PYTHIA8 FxFx and SHERPA. The ratios of the predictions to the measured cross sections are shown at the bottom of each panel. |
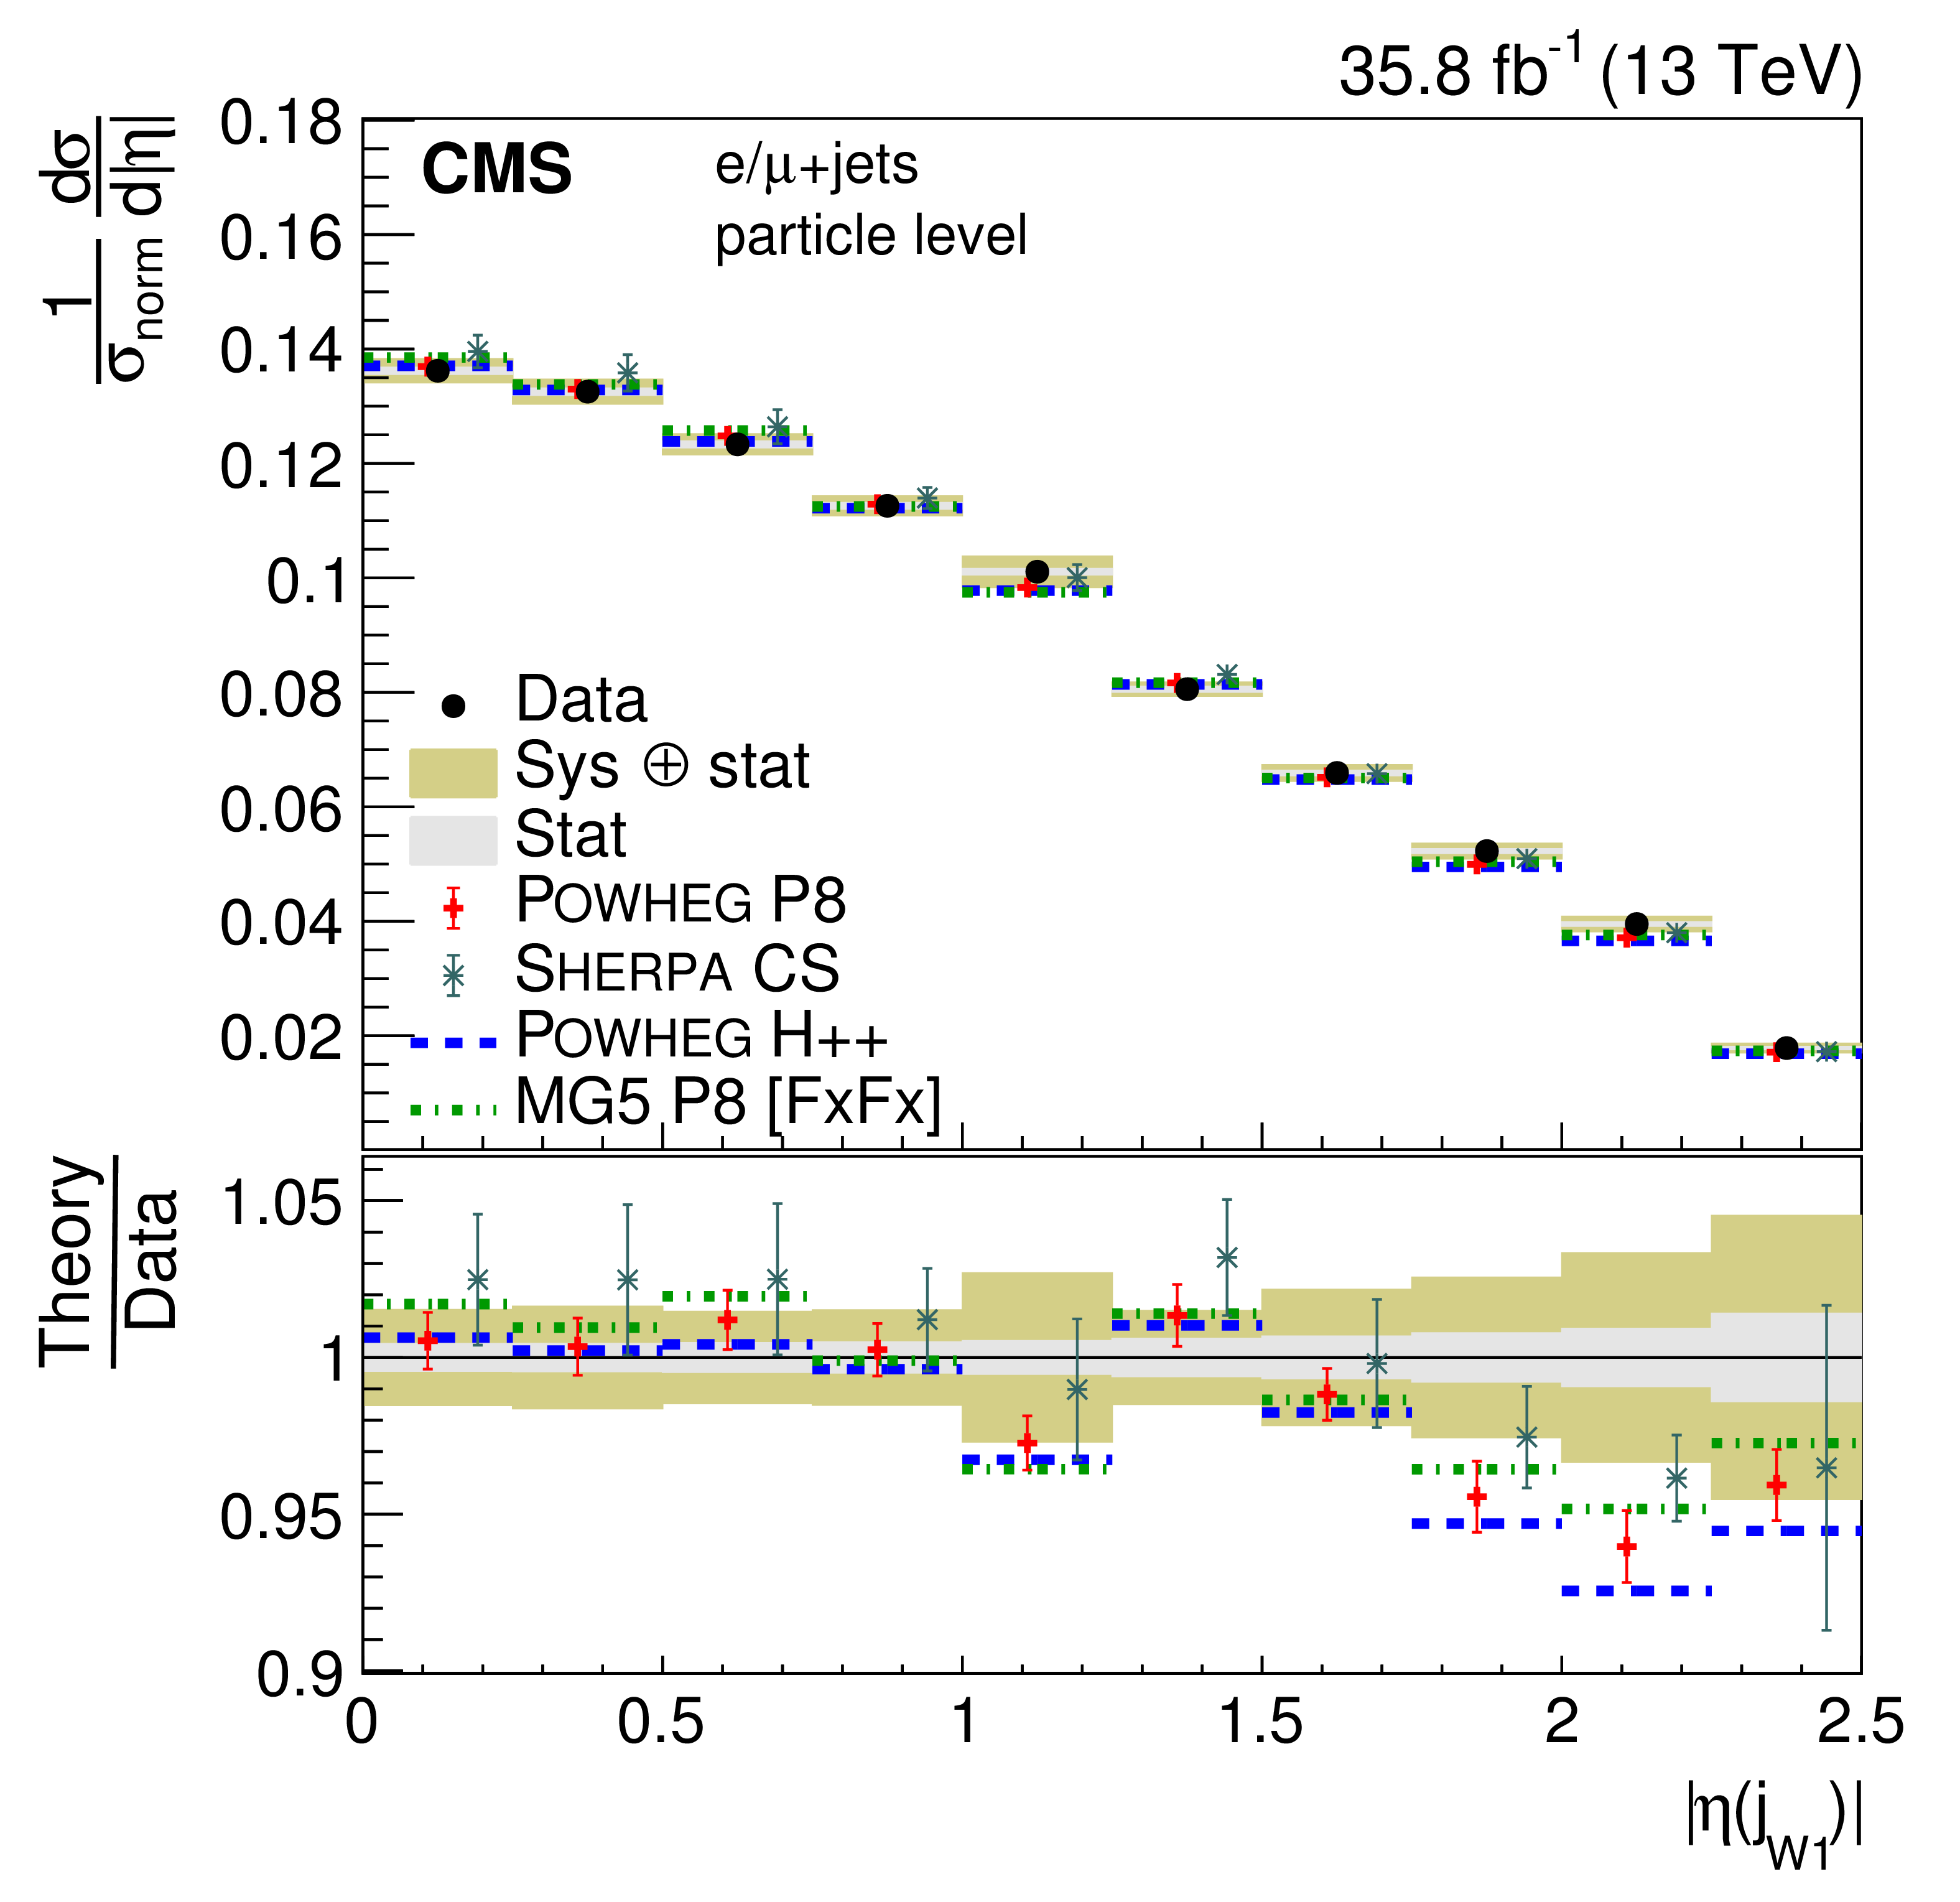
png pdf |
Figure 41-c:
Normalized differential cross section at the particle level as a function of jet $ { | \eta | }$. The upper two rows show the $ { | \eta | }$ distributions for the jets in the $ {\mathrm{t} \mathrm{\bar{t}}} $ system, the lower two rows the distributions for additional jets. The data are shown as points with light (dark) bands indicating the statistical (statistical and systematic) uncertainties. The cross sections are compared to the predictions of POWHEG combined with PYTHIA8 (P8) or HERWIG++ (H++) and the multiparton simulations MG5_aMC@NLO (MG5)+PYTHIA8 FxFx and SHERPA. The ratios of the predictions to the measured cross sections are shown at the bottom of each panel. |
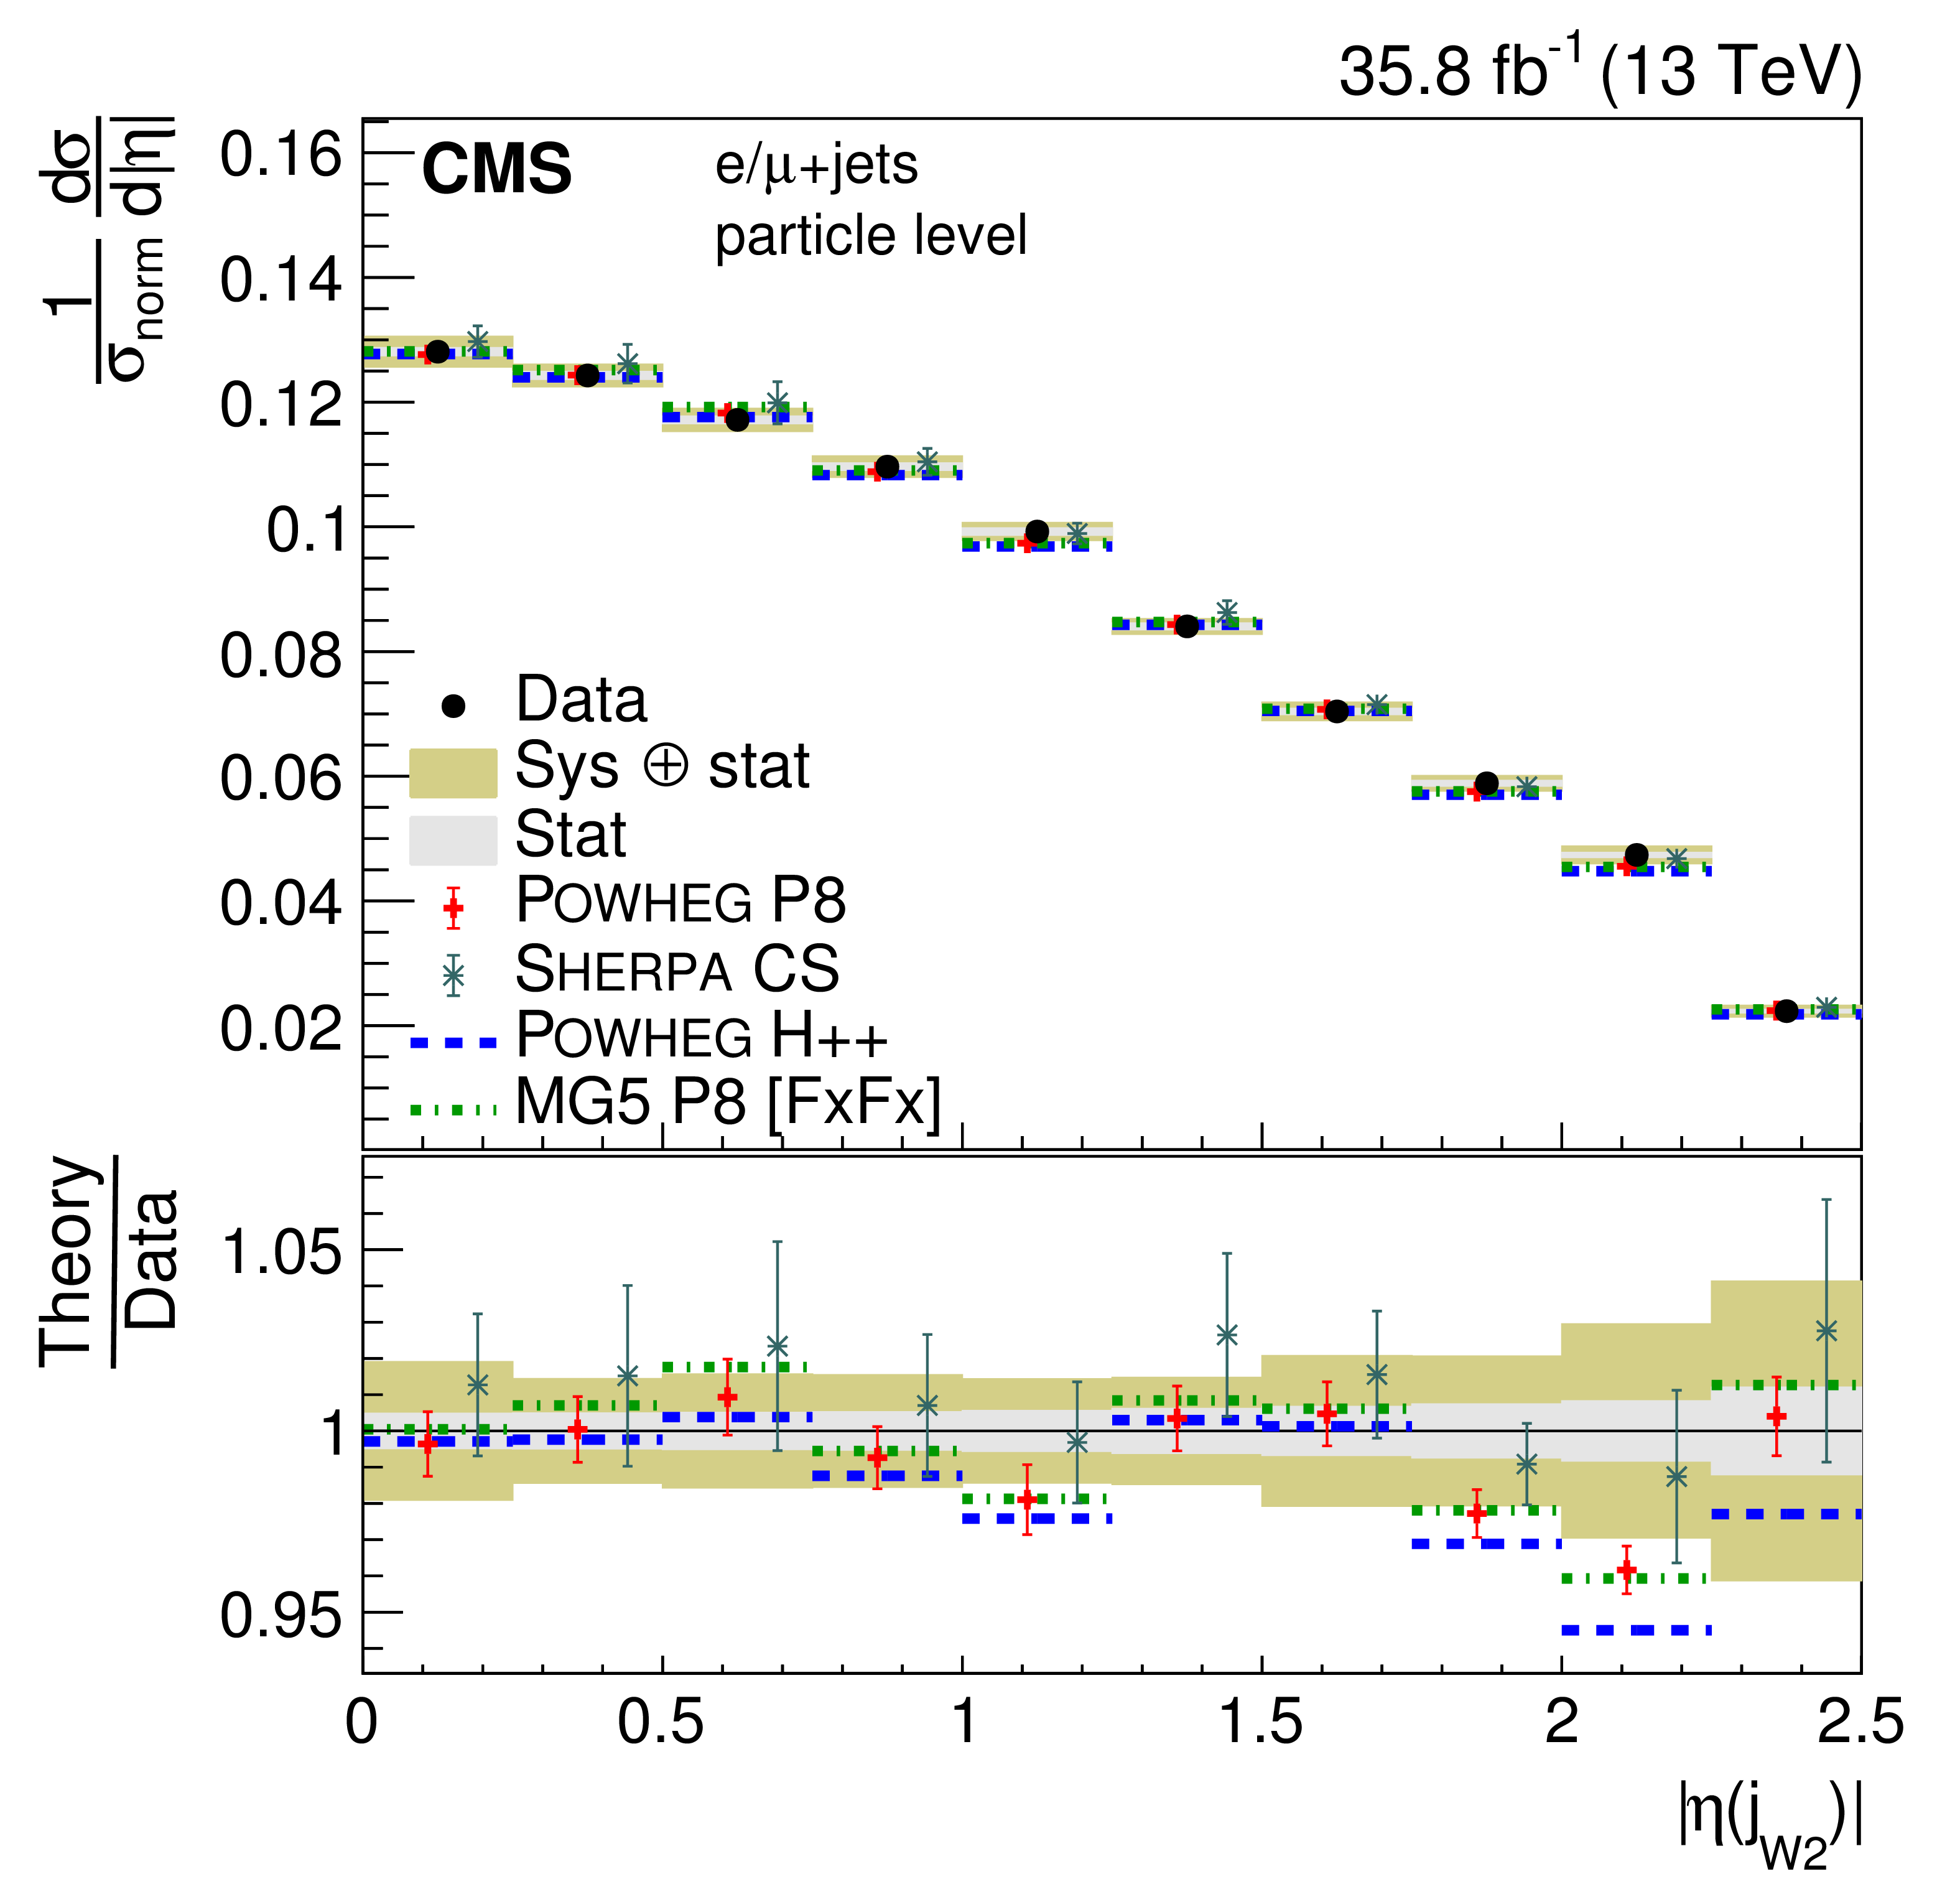
png pdf |
Figure 41-d:
Normalized differential cross section at the particle level as a function of jet $ { | \eta | }$. The upper two rows show the $ { | \eta | }$ distributions for the jets in the $ {\mathrm{t} \mathrm{\bar{t}}} $ system, the lower two rows the distributions for additional jets. The data are shown as points with light (dark) bands indicating the statistical (statistical and systematic) uncertainties. The cross sections are compared to the predictions of POWHEG combined with PYTHIA8 (P8) or HERWIG++ (H++) and the multiparton simulations MG5_aMC@NLO (MG5)+PYTHIA8 FxFx and SHERPA. The ratios of the predictions to the measured cross sections are shown at the bottom of each panel. |
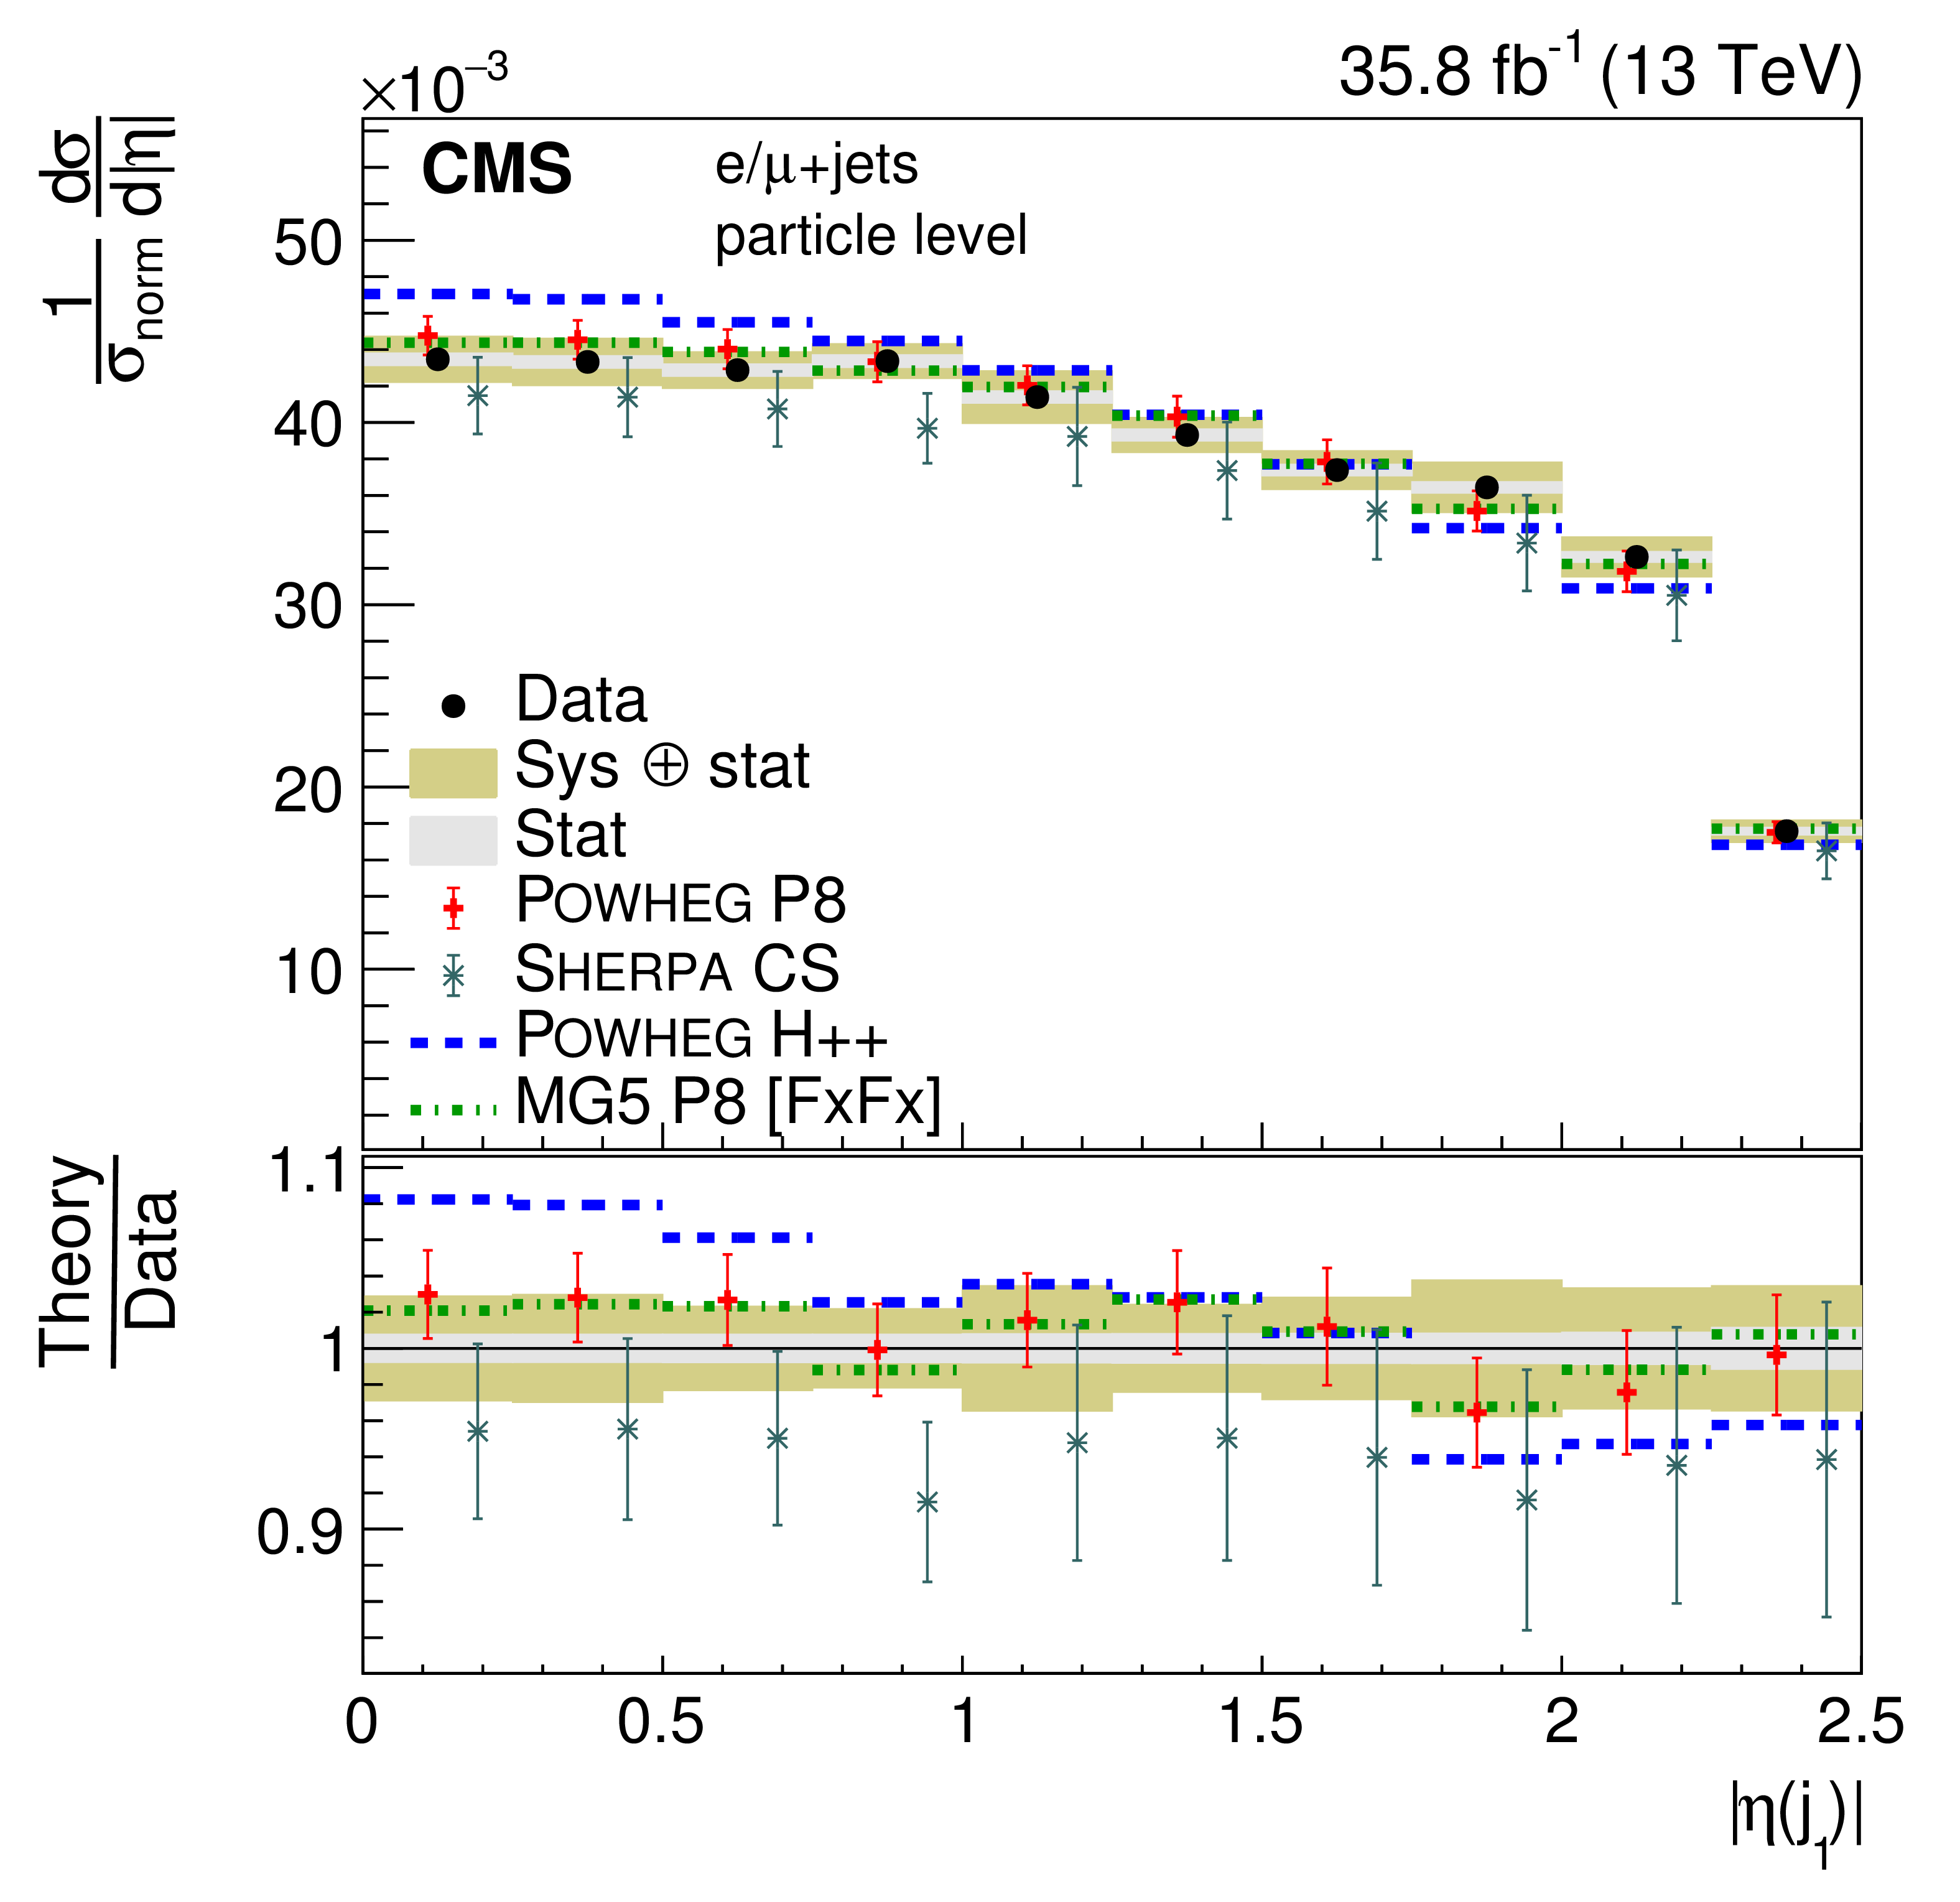
png pdf |
Figure 41-e:
Normalized differential cross section at the particle level as a function of jet $ { | \eta | }$. The upper two rows show the $ { | \eta | }$ distributions for the jets in the $ {\mathrm{t} \mathrm{\bar{t}}} $ system, the lower two rows the distributions for additional jets. The data are shown as points with light (dark) bands indicating the statistical (statistical and systematic) uncertainties. The cross sections are compared to the predictions of POWHEG combined with PYTHIA8 (P8) or HERWIG++ (H++) and the multiparton simulations MG5_aMC@NLO (MG5)+PYTHIA8 FxFx and SHERPA. The ratios of the predictions to the measured cross sections are shown at the bottom of each panel. |
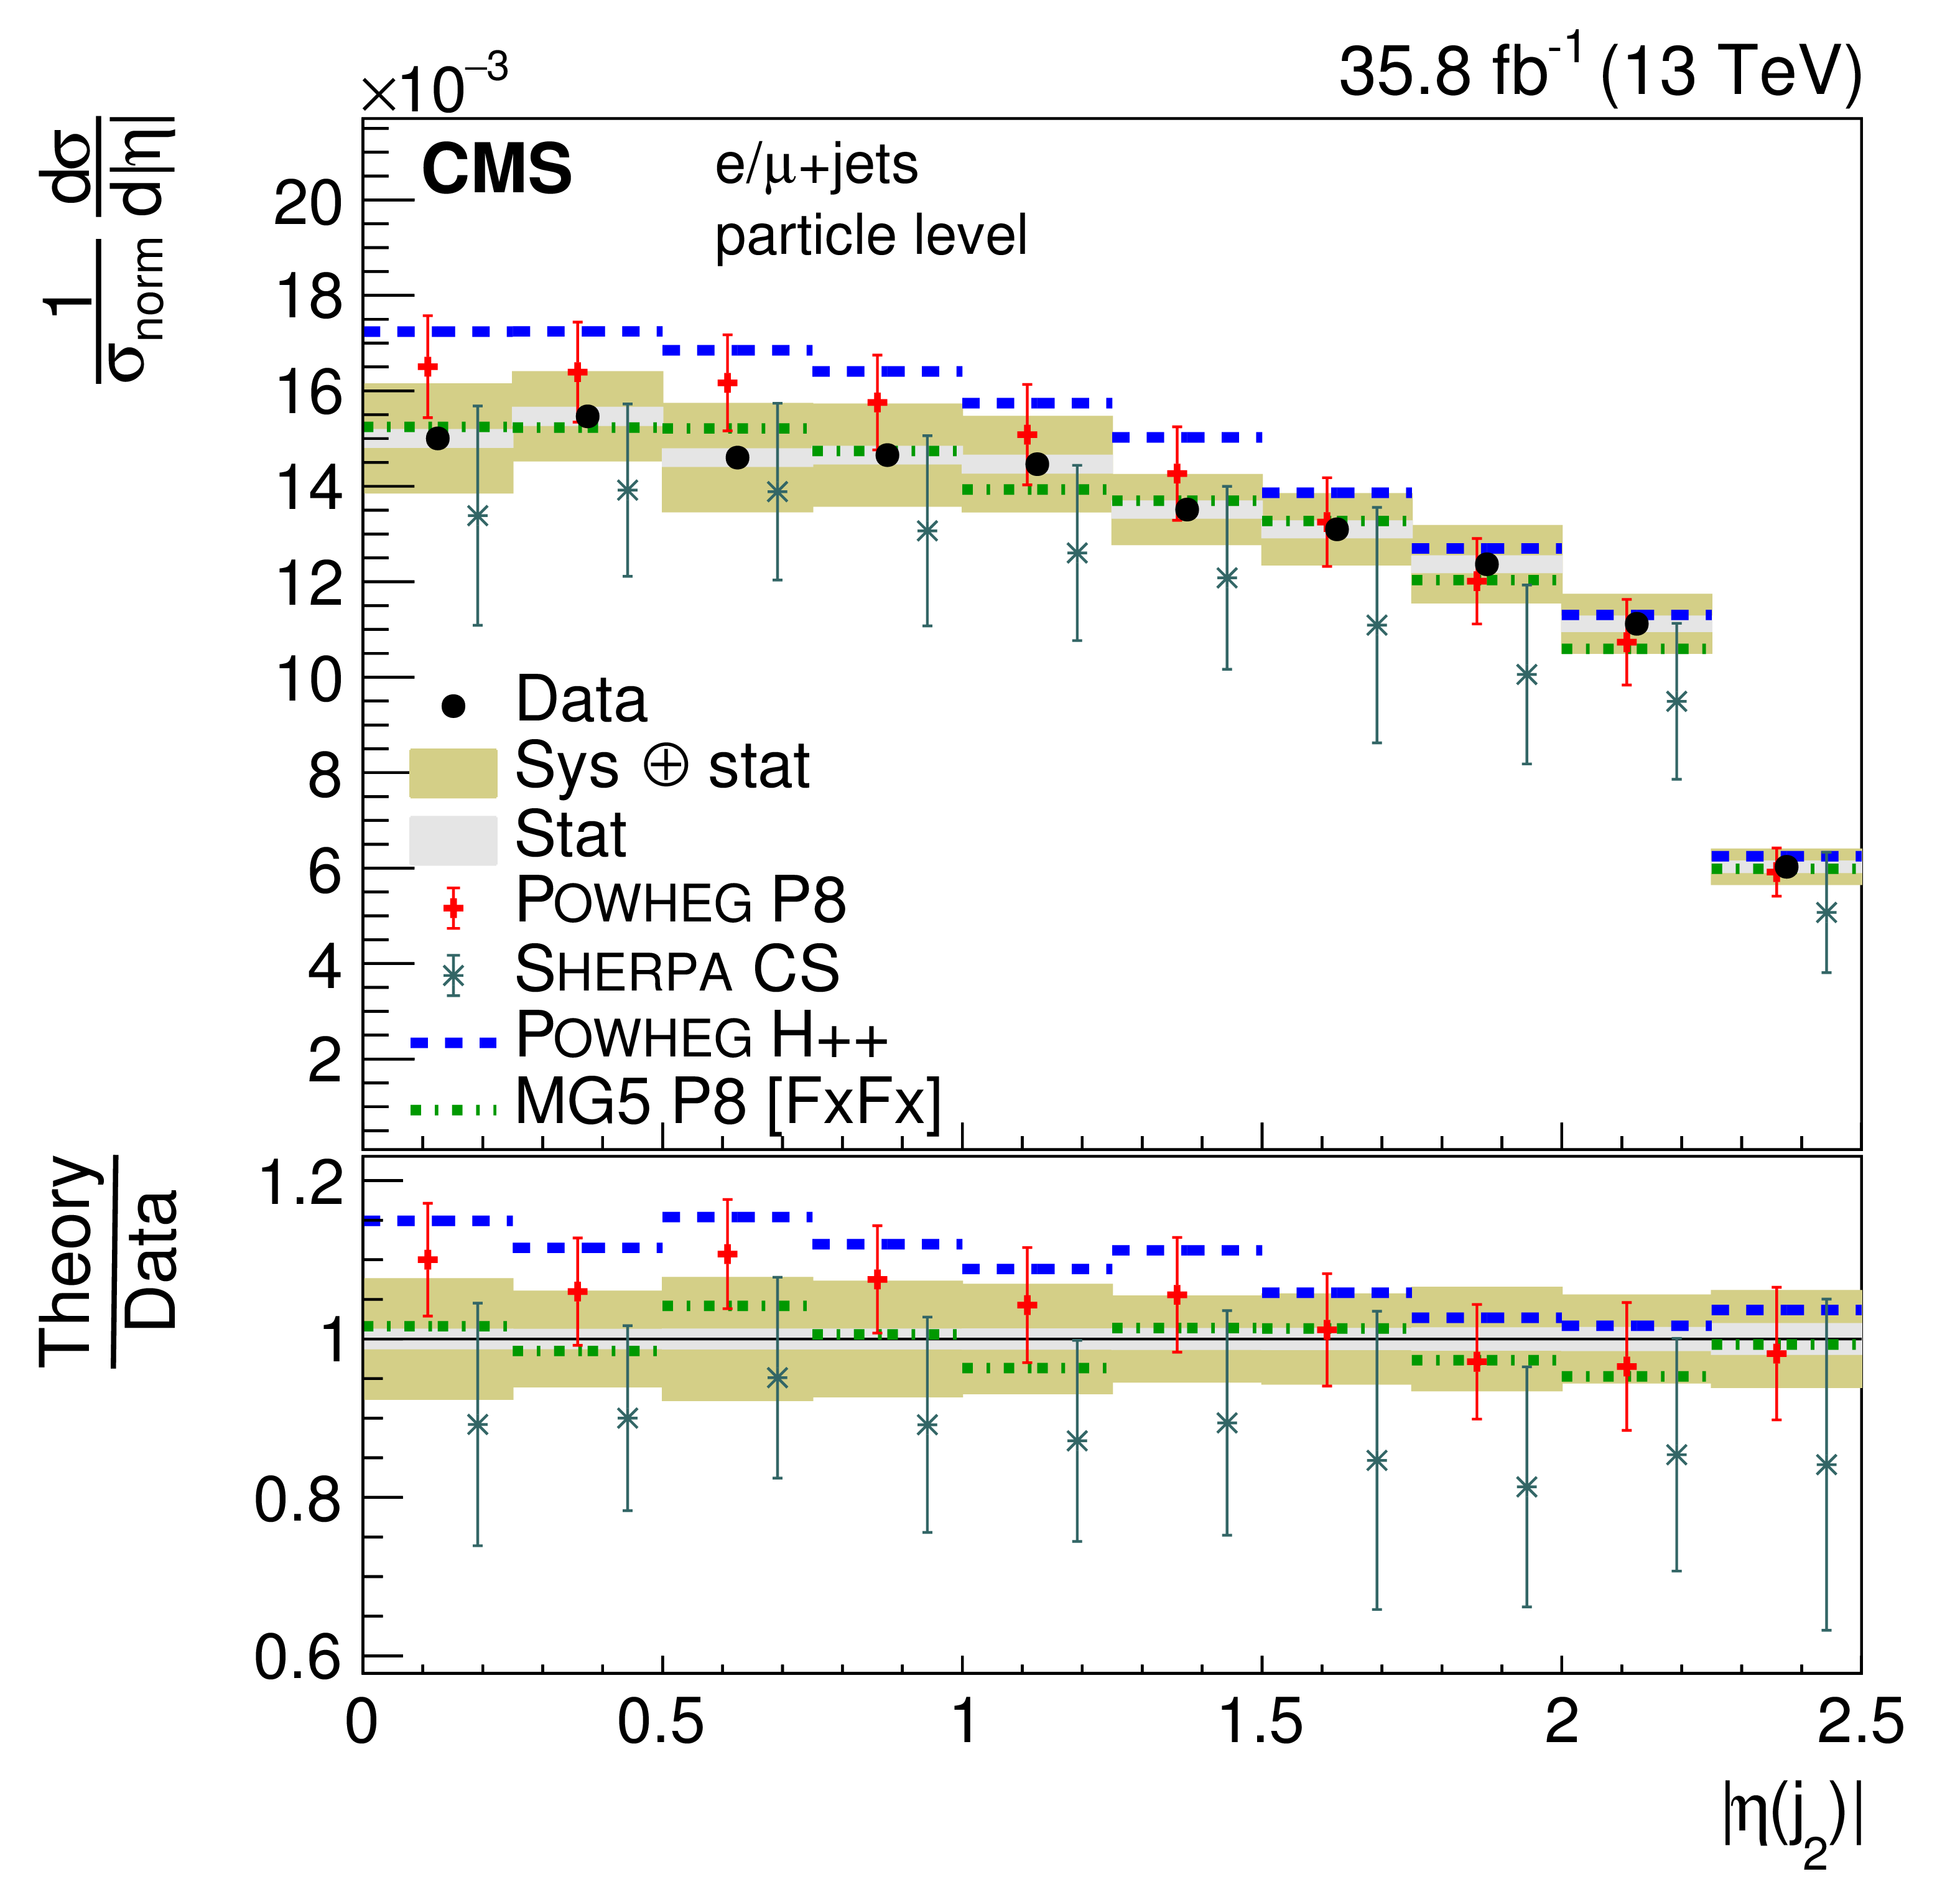
png pdf |
Figure 41-f:
Normalized differential cross section at the particle level as a function of jet $ { | \eta | }$. The upper two rows show the $ { | \eta | }$ distributions for the jets in the $ {\mathrm{t} \mathrm{\bar{t}}} $ system, the lower two rows the distributions for additional jets. The data are shown as points with light (dark) bands indicating the statistical (statistical and systematic) uncertainties. The cross sections are compared to the predictions of POWHEG combined with PYTHIA8 (P8) or HERWIG++ (H++) and the multiparton simulations MG5_aMC@NLO (MG5)+PYTHIA8 FxFx and SHERPA. The ratios of the predictions to the measured cross sections are shown at the bottom of each panel. |
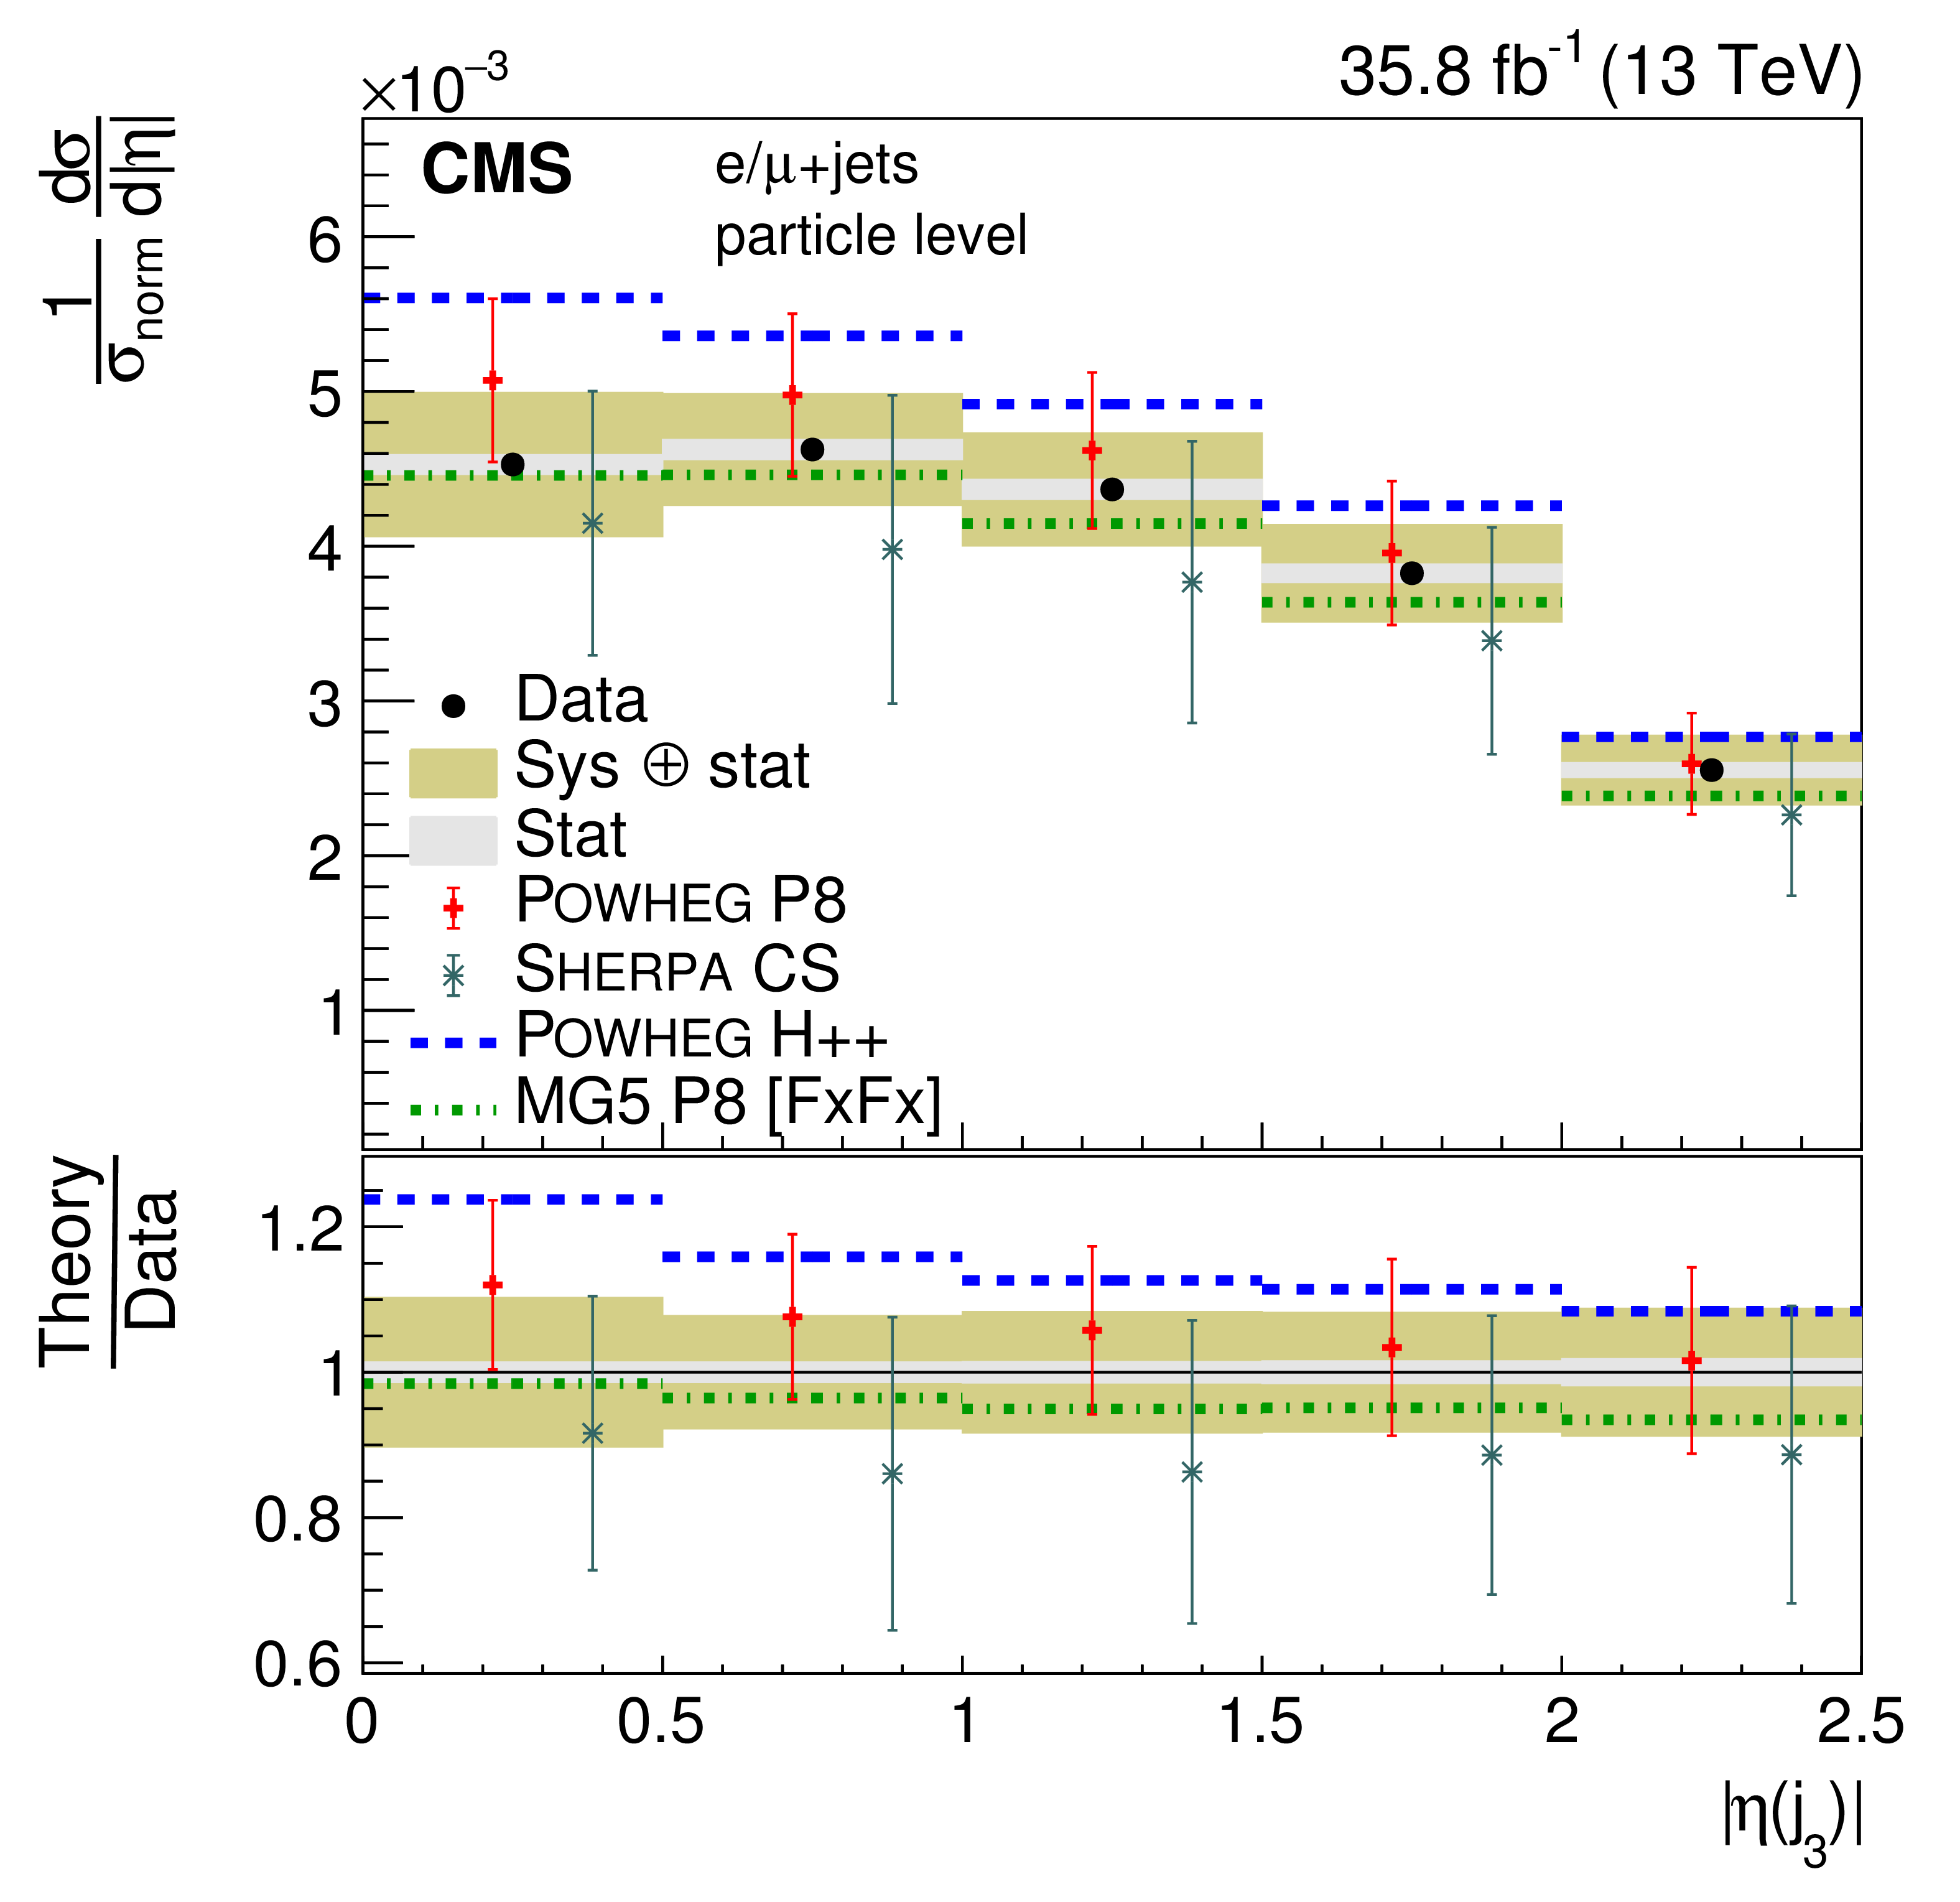
png pdf |
Figure 41-g:
Normalized differential cross section at the particle level as a function of jet $ { | \eta | }$. The upper two rows show the $ { | \eta | }$ distributions for the jets in the $ {\mathrm{t} \mathrm{\bar{t}}} $ system, the lower two rows the distributions for additional jets. The data are shown as points with light (dark) bands indicating the statistical (statistical and systematic) uncertainties. The cross sections are compared to the predictions of POWHEG combined with PYTHIA8 (P8) or HERWIG++ (H++) and the multiparton simulations MG5_aMC@NLO (MG5)+PYTHIA8 FxFx and SHERPA. The ratios of the predictions to the measured cross sections are shown at the bottom of each panel. |
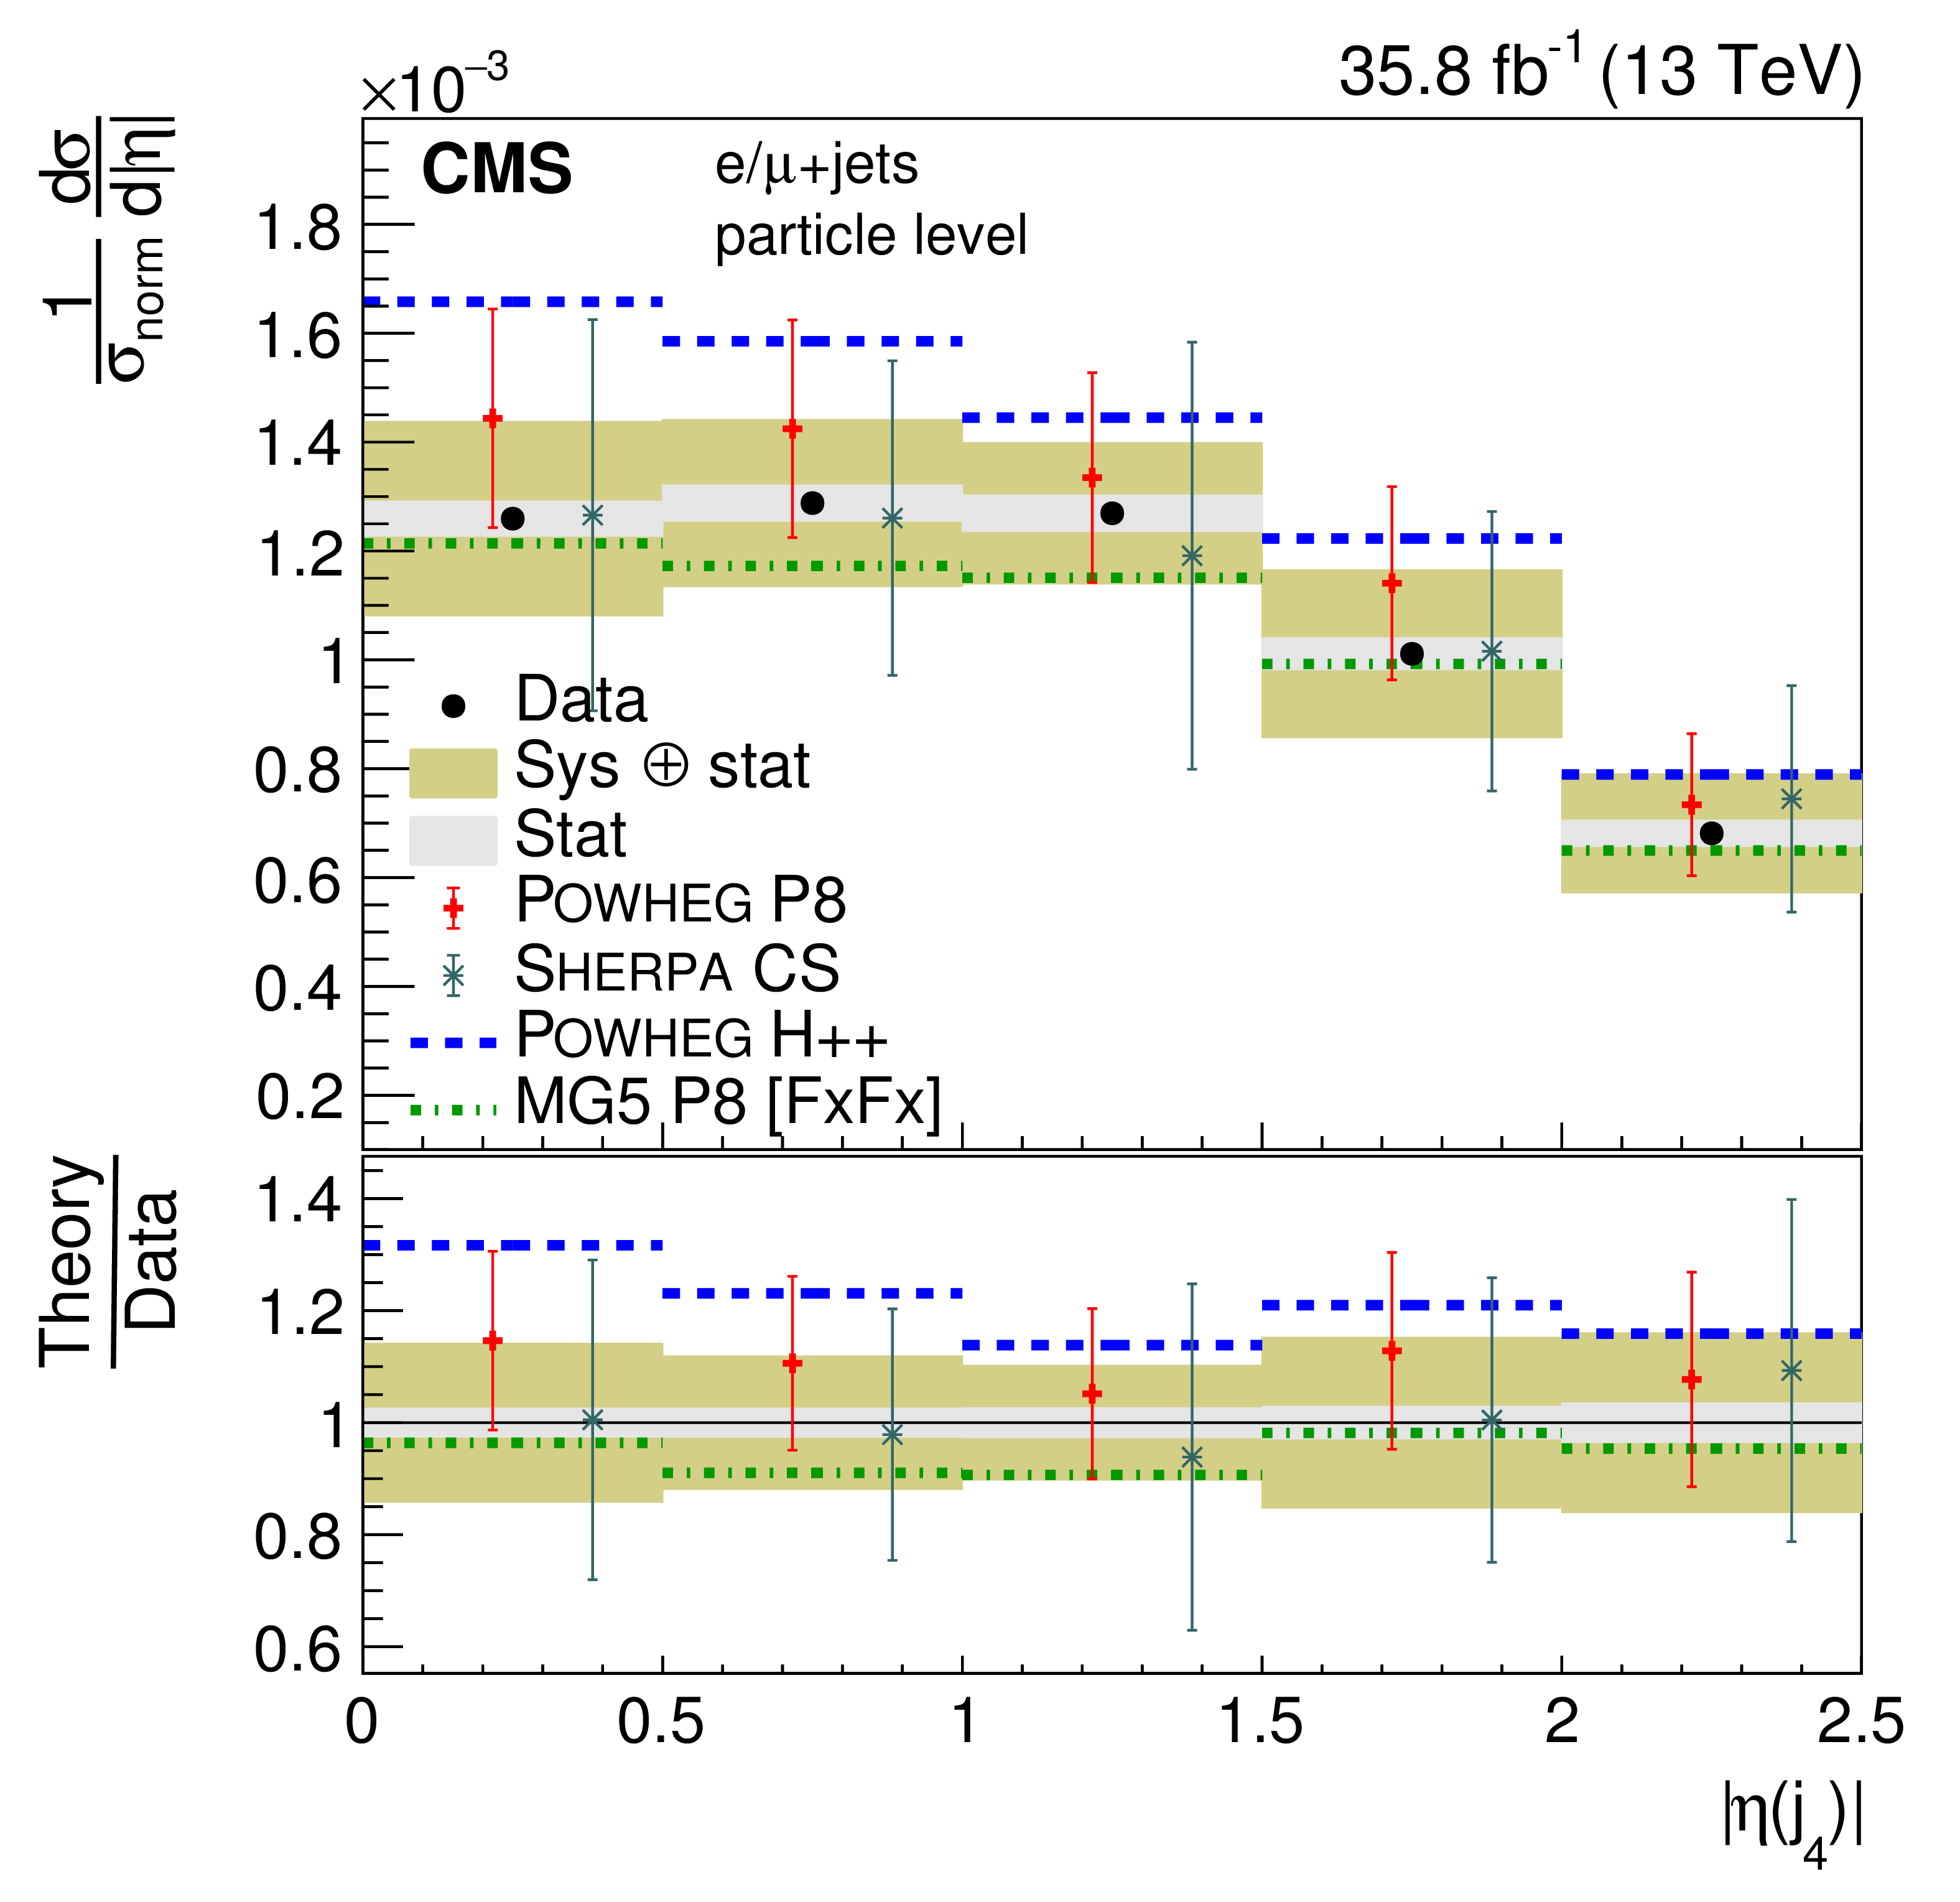
png pdf |
Figure 41-h:
Normalized differential cross section at the particle level as a function of jet $ { | \eta | }$. The upper two rows show the $ { | \eta | }$ distributions for the jets in the $ {\mathrm{t} \mathrm{\bar{t}}} $ system, the lower two rows the distributions for additional jets. The data are shown as points with light (dark) bands indicating the statistical (statistical and systematic) uncertainties. The cross sections are compared to the predictions of POWHEG combined with PYTHIA8 (P8) or HERWIG++ (H++) and the multiparton simulations MG5_aMC@NLO (MG5)+PYTHIA8 FxFx and SHERPA. The ratios of the predictions to the measured cross sections are shown at the bottom of each panel. |

png pdf |
Figure 42:
Differential cross section at the particle level as a function of jet $ {\Delta R_{\mathrm {j}_\mathrm{t}}} $. The upper two rows show the $ {\Delta R_{\mathrm {j}_\mathrm{t}}} $ distributions for the jets in the $ {\mathrm{t} \mathrm{\bar{t}}} $ system, the lower two rows the distribution for additional jets. The data are shown as points with light (dark) bands indicating the statistical (statistical and systematic) uncertainties. The cross sections are compared to the predictions of POWHEG combined with PYTHIA8 (P8) or HERWIG++ (H++) and the multiparton simulations MG5_aMC@NLO (MG5)+PYTHIA8 FxFx and SHERPA. The ratios of the predictions to the measured cross sections are shown at the bottom of each panel. |
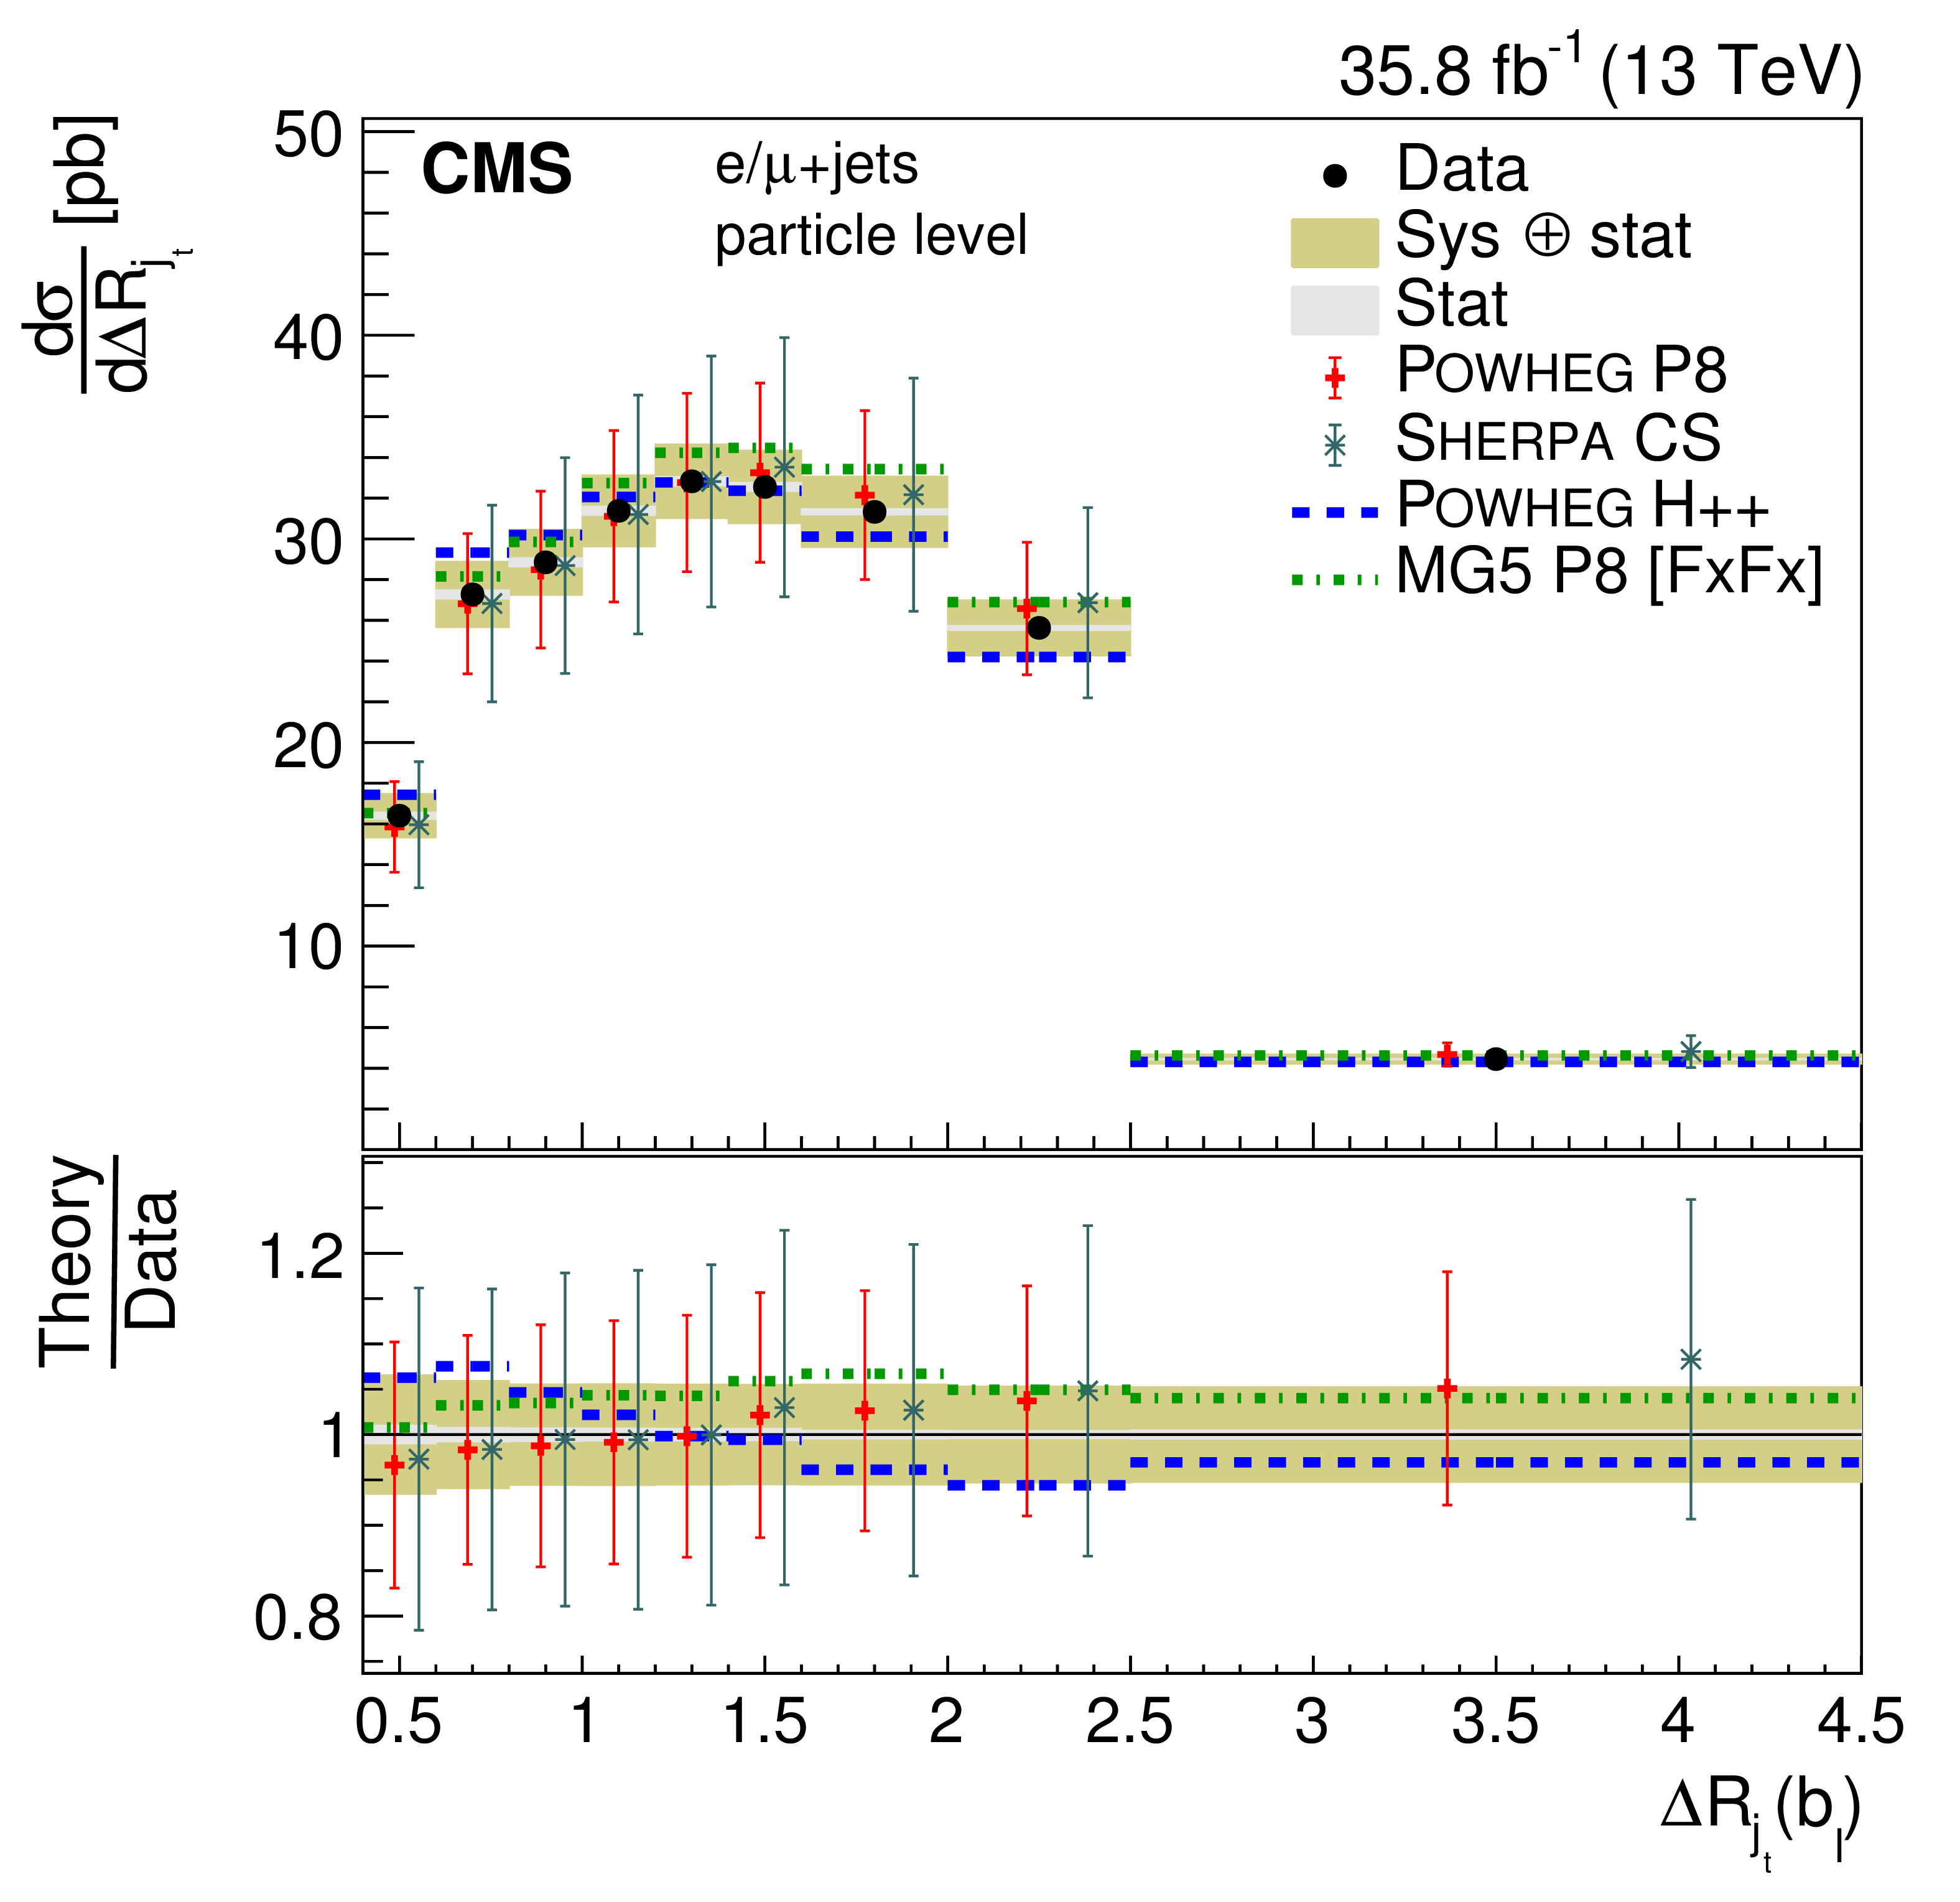
png pdf |
Figure 42-a:
Differential cross section at the particle level as a function of jet $ {\Delta R_{\mathrm {j}_\mathrm{t}}} $. The upper two rows show the $ {\Delta R_{\mathrm {j}_\mathrm{t}}} $ distributions for the jets in the $ {\mathrm{t} \mathrm{\bar{t}}} $ system, the lower two rows the distribution for additional jets. The data are shown as points with light (dark) bands indicating the statistical (statistical and systematic) uncertainties. The cross sections are compared to the predictions of POWHEG combined with PYTHIA8 (P8) or HERWIG++ (H++) and the multiparton simulations MG5_aMC@NLO (MG5)+PYTHIA8 FxFx and SHERPA. The ratios of the predictions to the measured cross sections are shown at the bottom of each panel. |
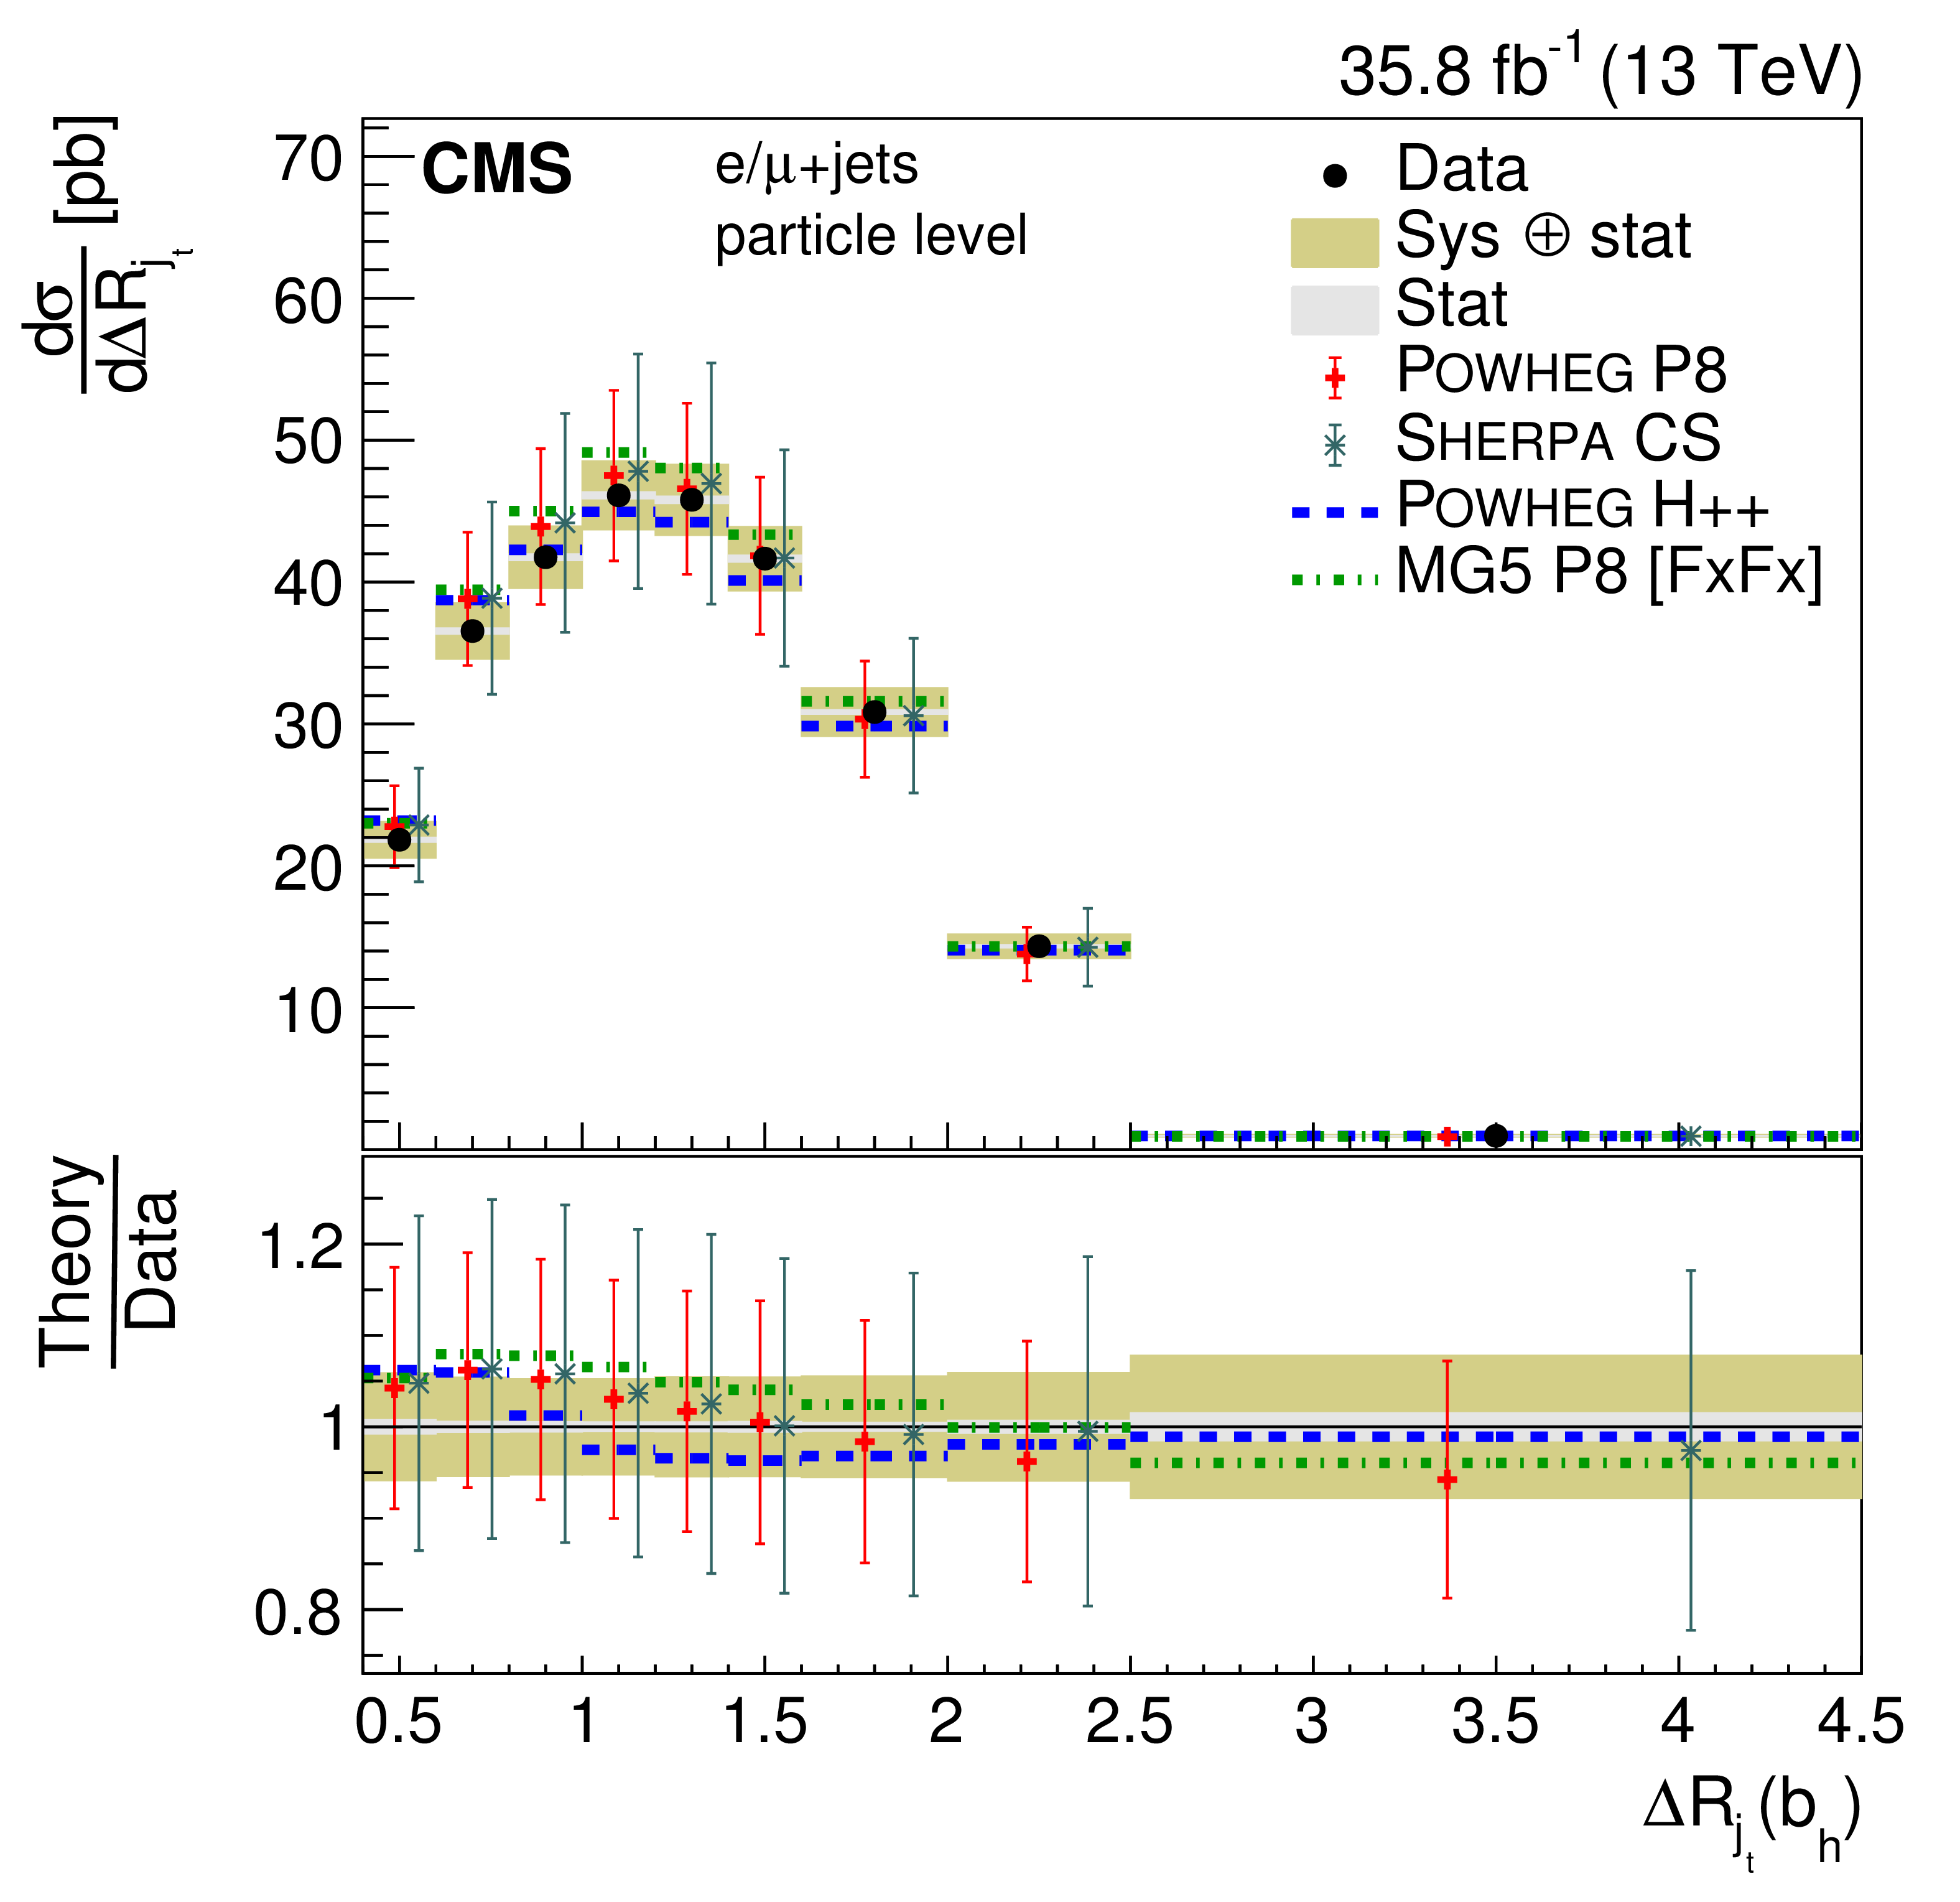
png pdf |
Figure 42-b:
Differential cross section at the particle level as a function of jet $ {\Delta R_{\mathrm {j}_\mathrm{t}}} $. The upper two rows show the $ {\Delta R_{\mathrm {j}_\mathrm{t}}} $ distributions for the jets in the $ {\mathrm{t} \mathrm{\bar{t}}} $ system, the lower two rows the distribution for additional jets. The data are shown as points with light (dark) bands indicating the statistical (statistical and systematic) uncertainties. The cross sections are compared to the predictions of POWHEG combined with PYTHIA8 (P8) or HERWIG++ (H++) and the multiparton simulations MG5_aMC@NLO (MG5)+PYTHIA8 FxFx and SHERPA. The ratios of the predictions to the measured cross sections are shown at the bottom of each panel. |
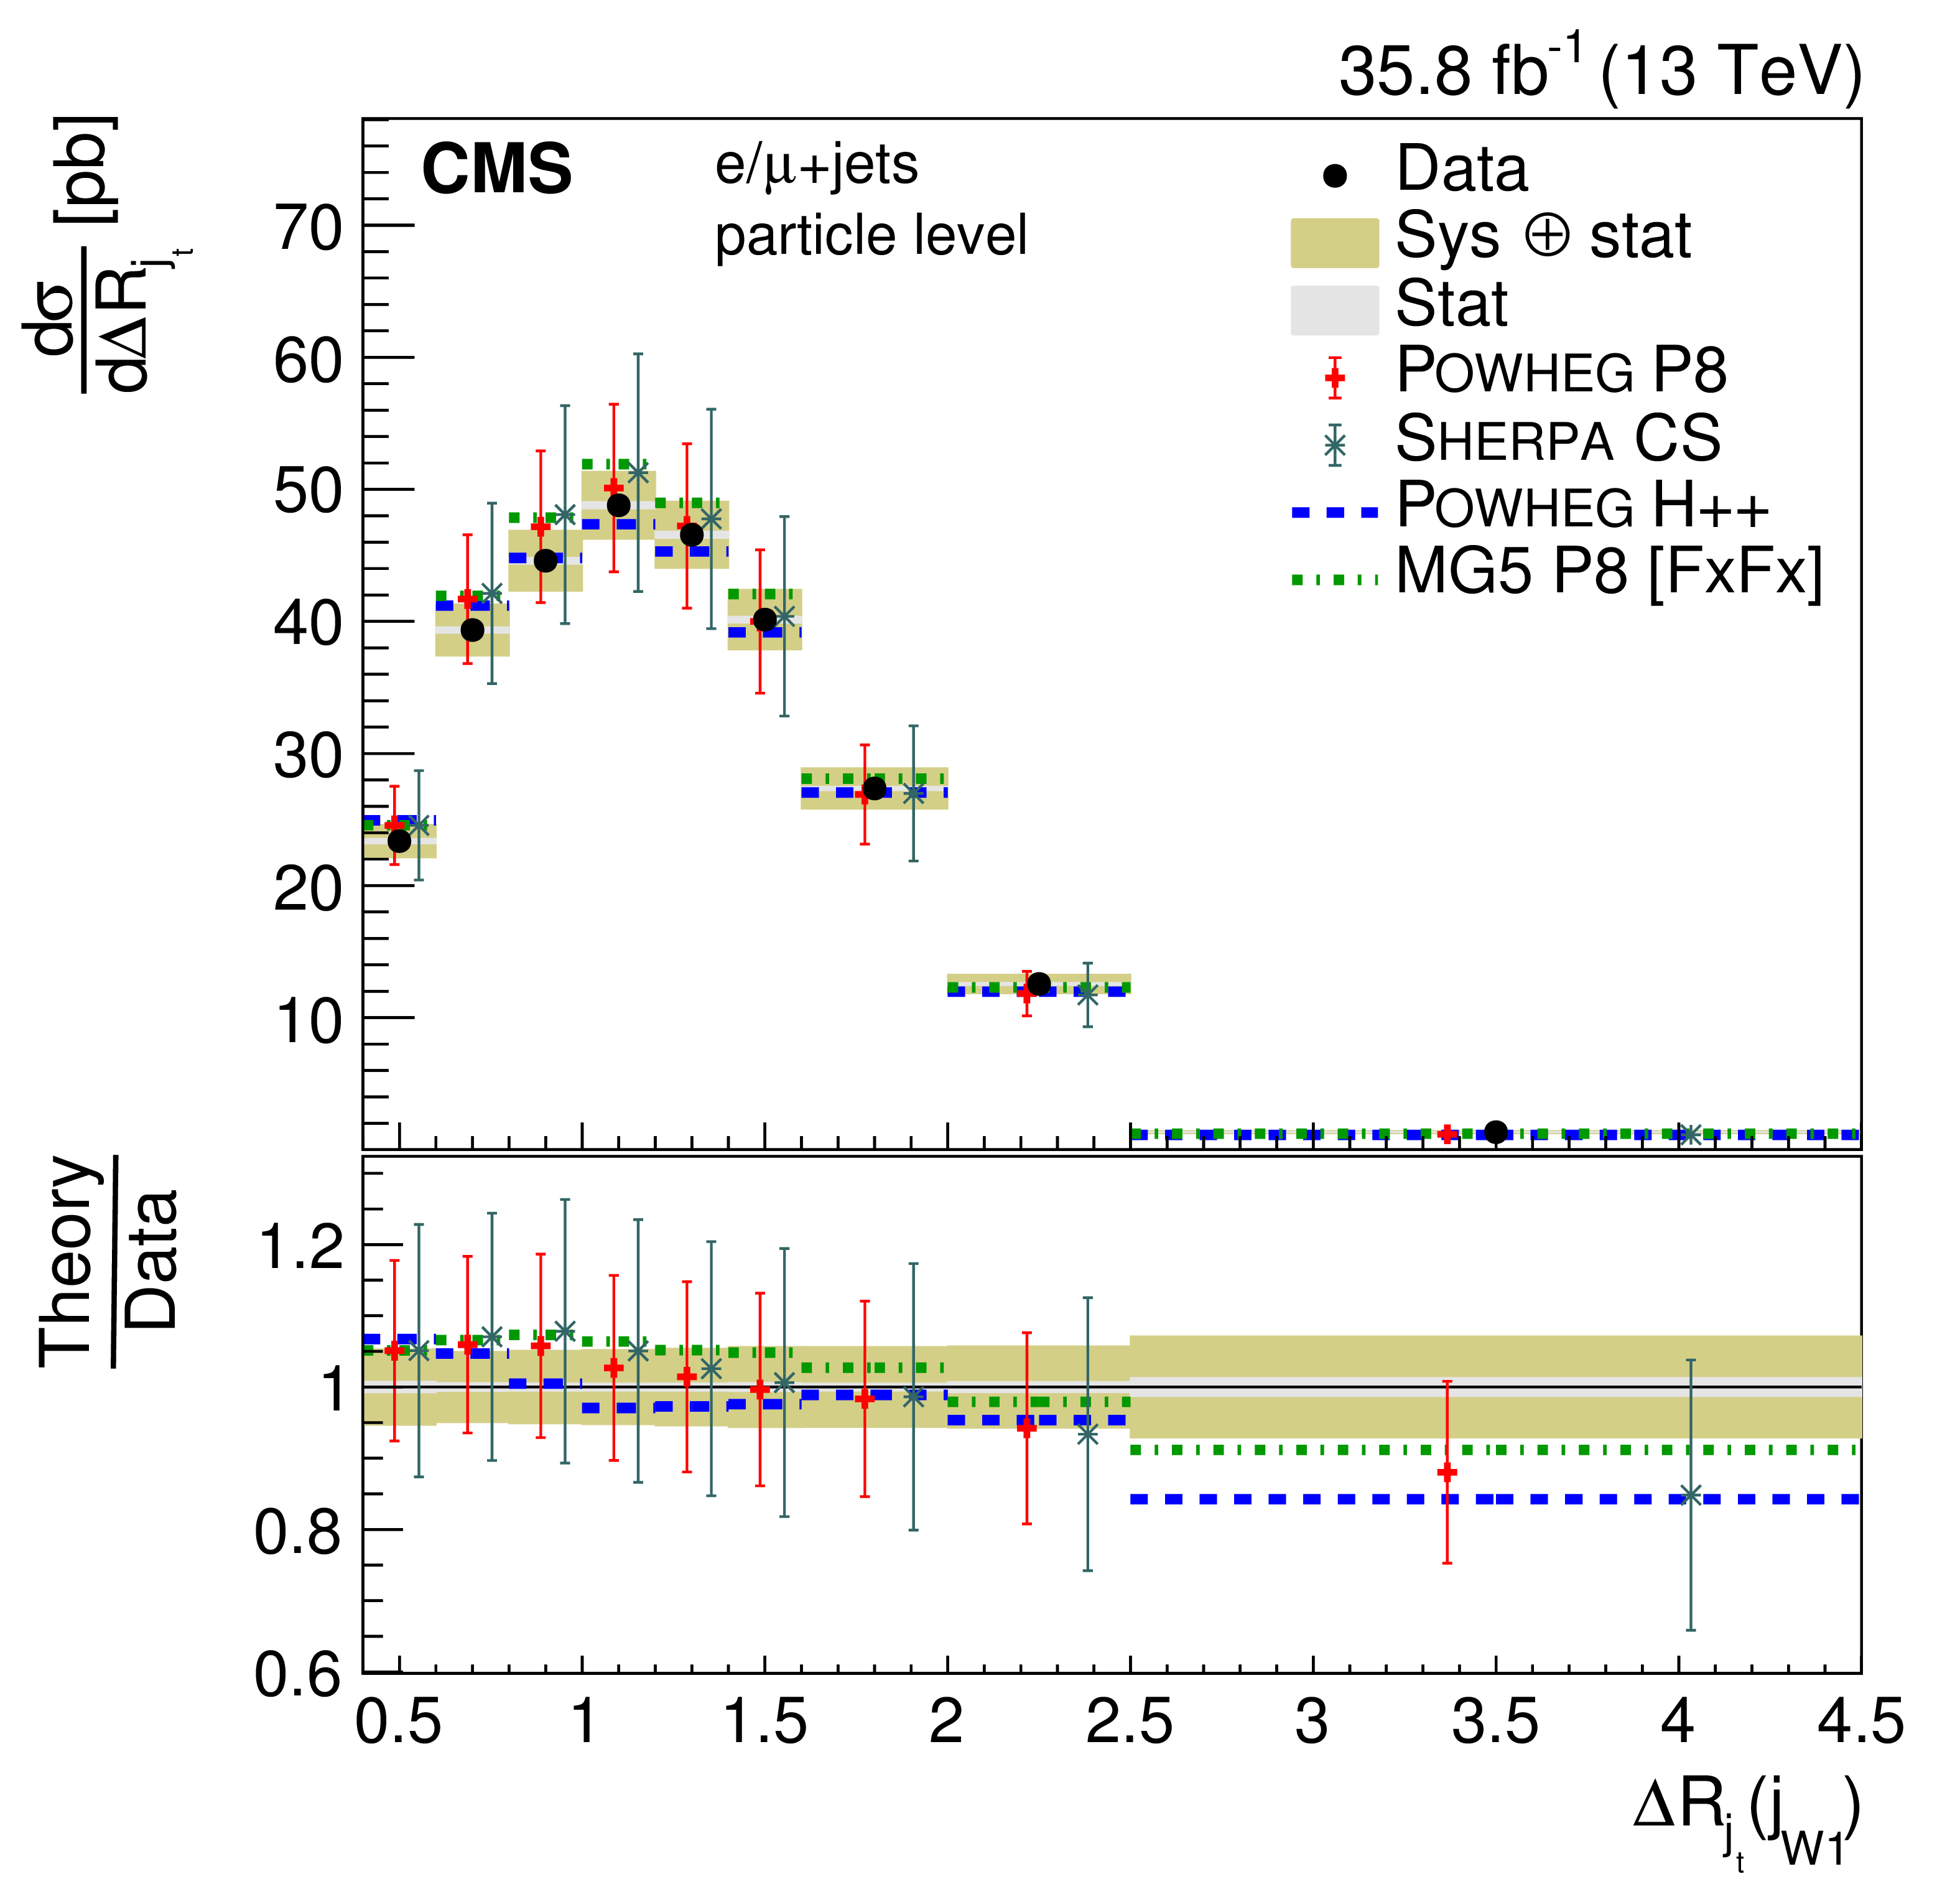
png pdf |
Figure 42-c:
Differential cross section at the particle level as a function of jet $ {\Delta R_{\mathrm {j}_\mathrm{t}}} $. The upper two rows show the $ {\Delta R_{\mathrm {j}_\mathrm{t}}} $ distributions for the jets in the $ {\mathrm{t} \mathrm{\bar{t}}} $ system, the lower two rows the distribution for additional jets. The data are shown as points with light (dark) bands indicating the statistical (statistical and systematic) uncertainties. The cross sections are compared to the predictions of POWHEG combined with PYTHIA8 (P8) or HERWIG++ (H++) and the multiparton simulations MG5_aMC@NLO (MG5)+PYTHIA8 FxFx and SHERPA. The ratios of the predictions to the measured cross sections are shown at the bottom of each panel. |
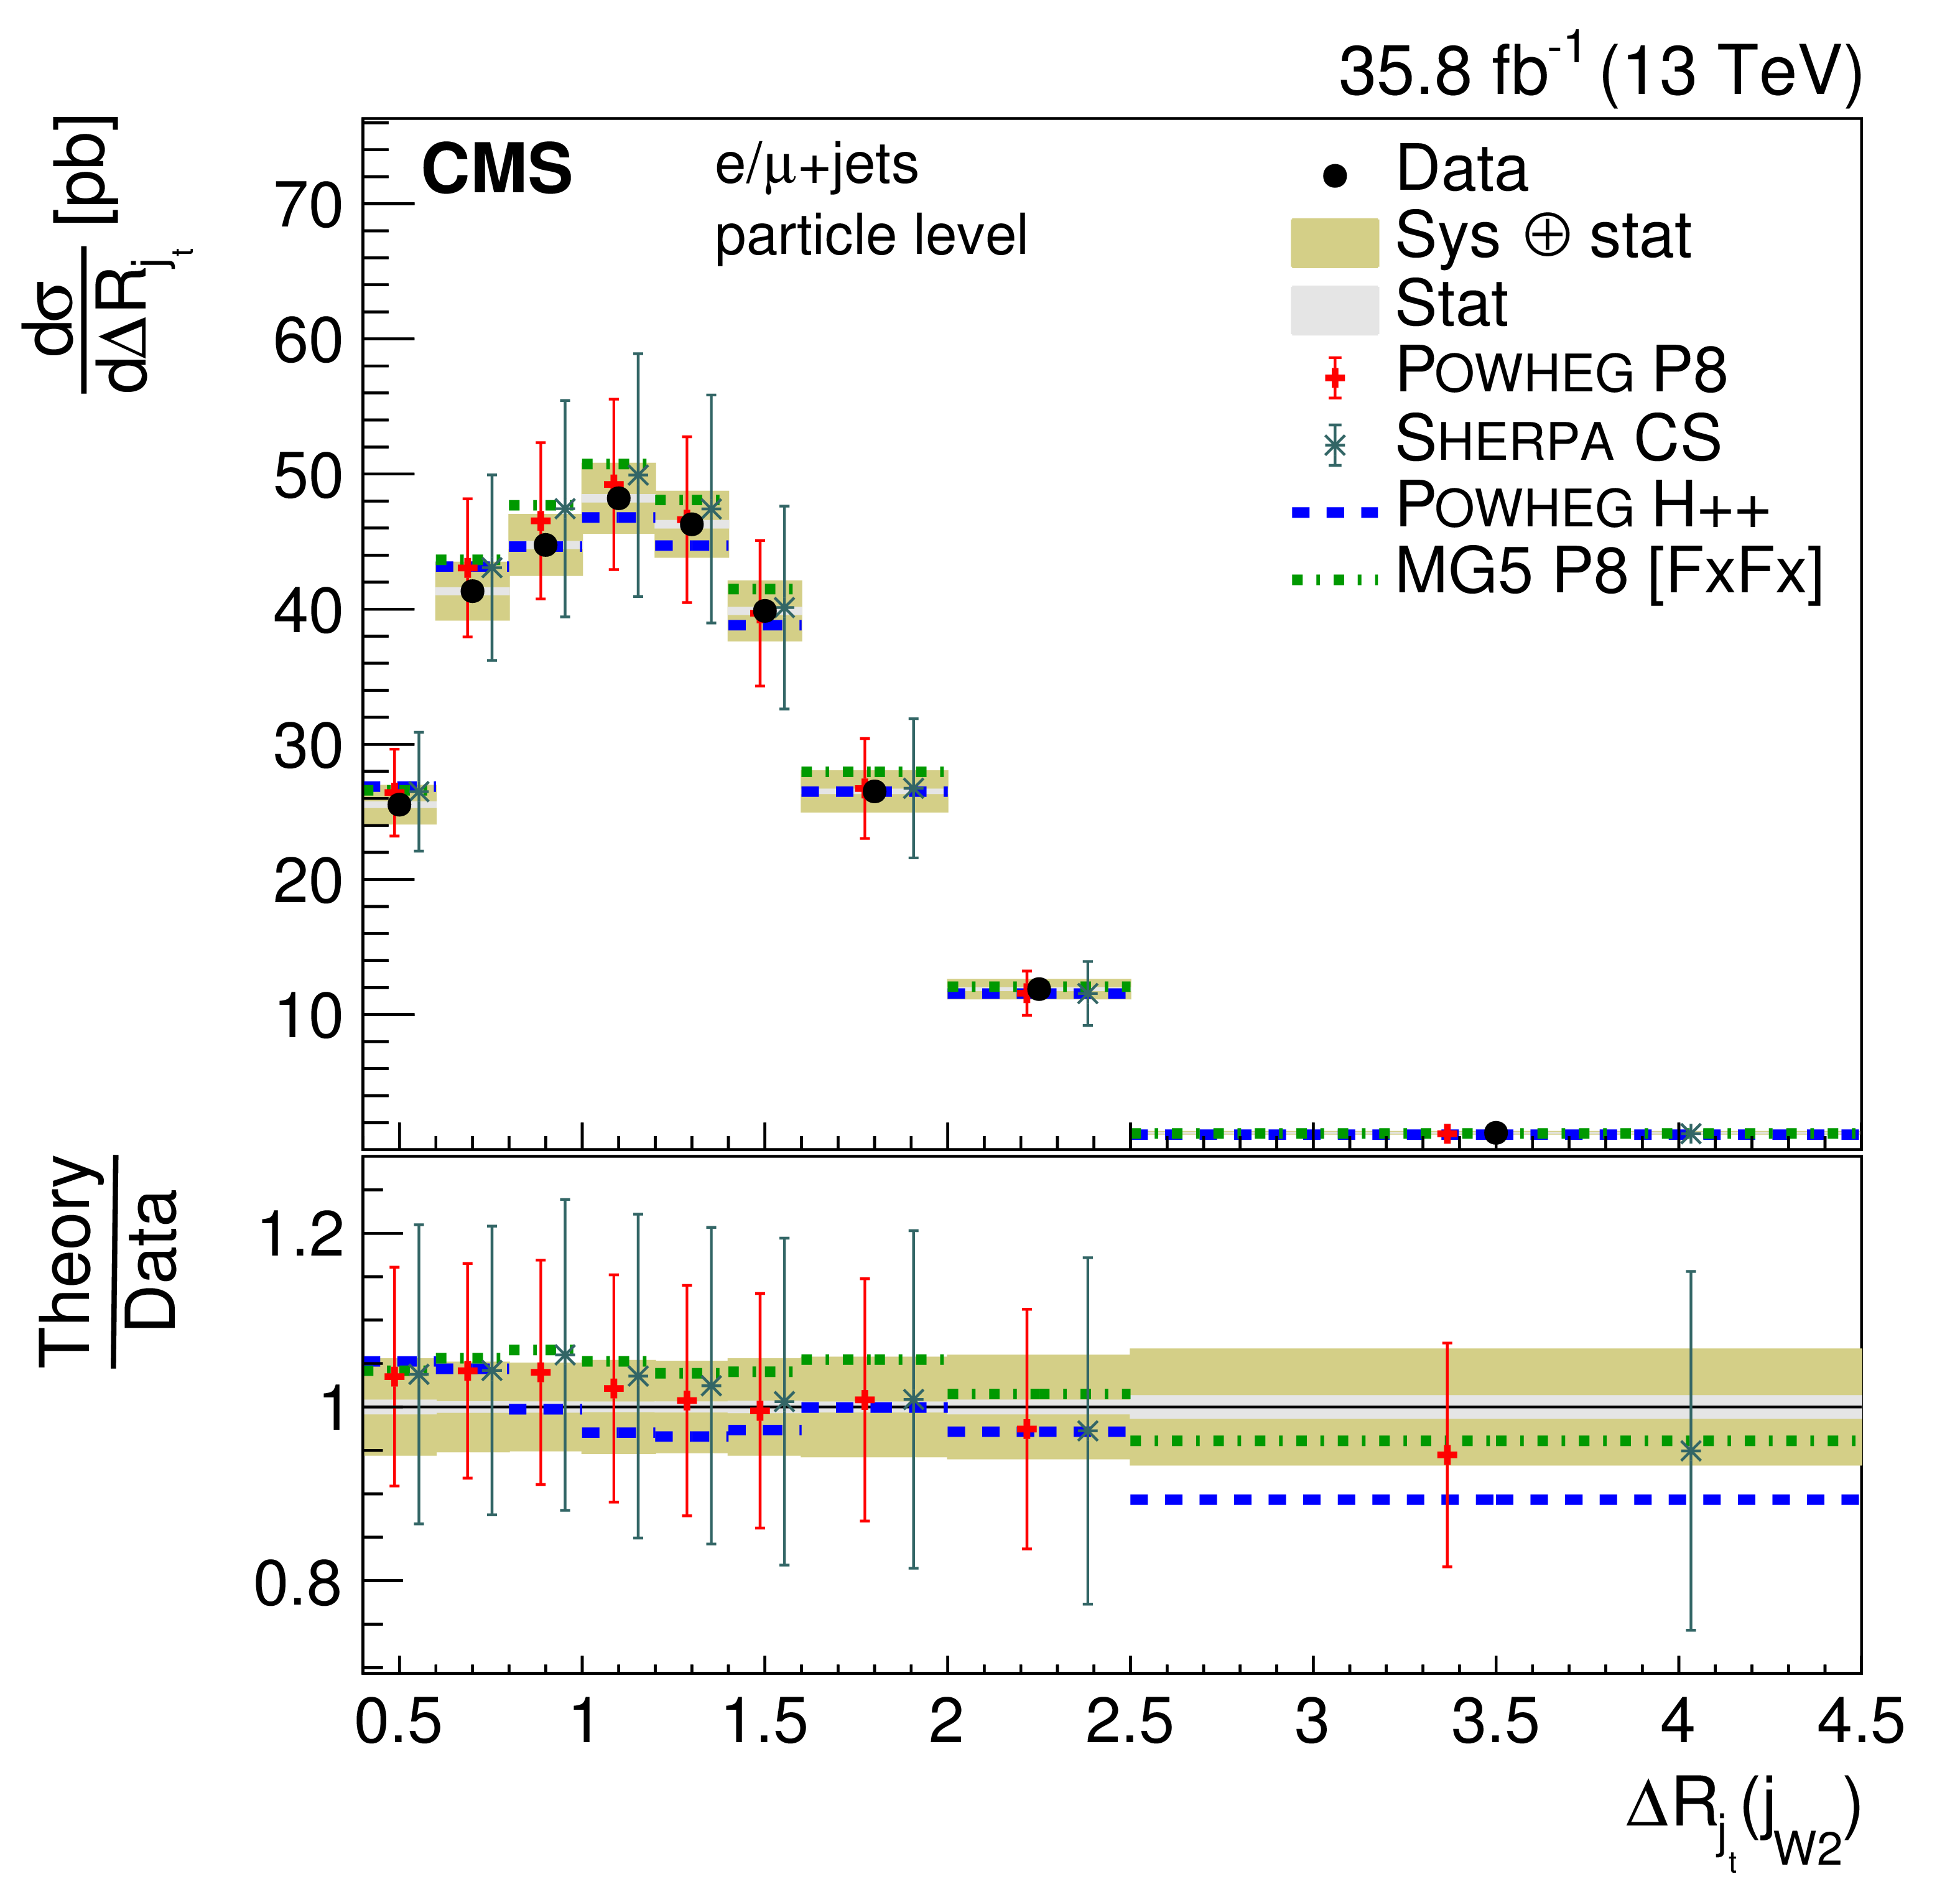
png pdf |
Figure 42-d:
Differential cross section at the particle level as a function of jet $ {\Delta R_{\mathrm {j}_\mathrm{t}}} $. The upper two rows show the $ {\Delta R_{\mathrm {j}_\mathrm{t}}} $ distributions for the jets in the $ {\mathrm{t} \mathrm{\bar{t}}} $ system, the lower two rows the distribution for additional jets. The data are shown as points with light (dark) bands indicating the statistical (statistical and systematic) uncertainties. The cross sections are compared to the predictions of POWHEG combined with PYTHIA8 (P8) or HERWIG++ (H++) and the multiparton simulations MG5_aMC@NLO (MG5)+PYTHIA8 FxFx and SHERPA. The ratios of the predictions to the measured cross sections are shown at the bottom of each panel. |

png pdf |
Figure 42-e:
Differential cross section at the particle level as a function of jet $ {\Delta R_{\mathrm {j}_\mathrm{t}}} $. The upper two rows show the $ {\Delta R_{\mathrm {j}_\mathrm{t}}} $ distributions for the jets in the $ {\mathrm{t} \mathrm{\bar{t}}} $ system, the lower two rows the distribution for additional jets. The data are shown as points with light (dark) bands indicating the statistical (statistical and systematic) uncertainties. The cross sections are compared to the predictions of POWHEG combined with PYTHIA8 (P8) or HERWIG++ (H++) and the multiparton simulations MG5_aMC@NLO (MG5)+PYTHIA8 FxFx and SHERPA. The ratios of the predictions to the measured cross sections are shown at the bottom of each panel. |
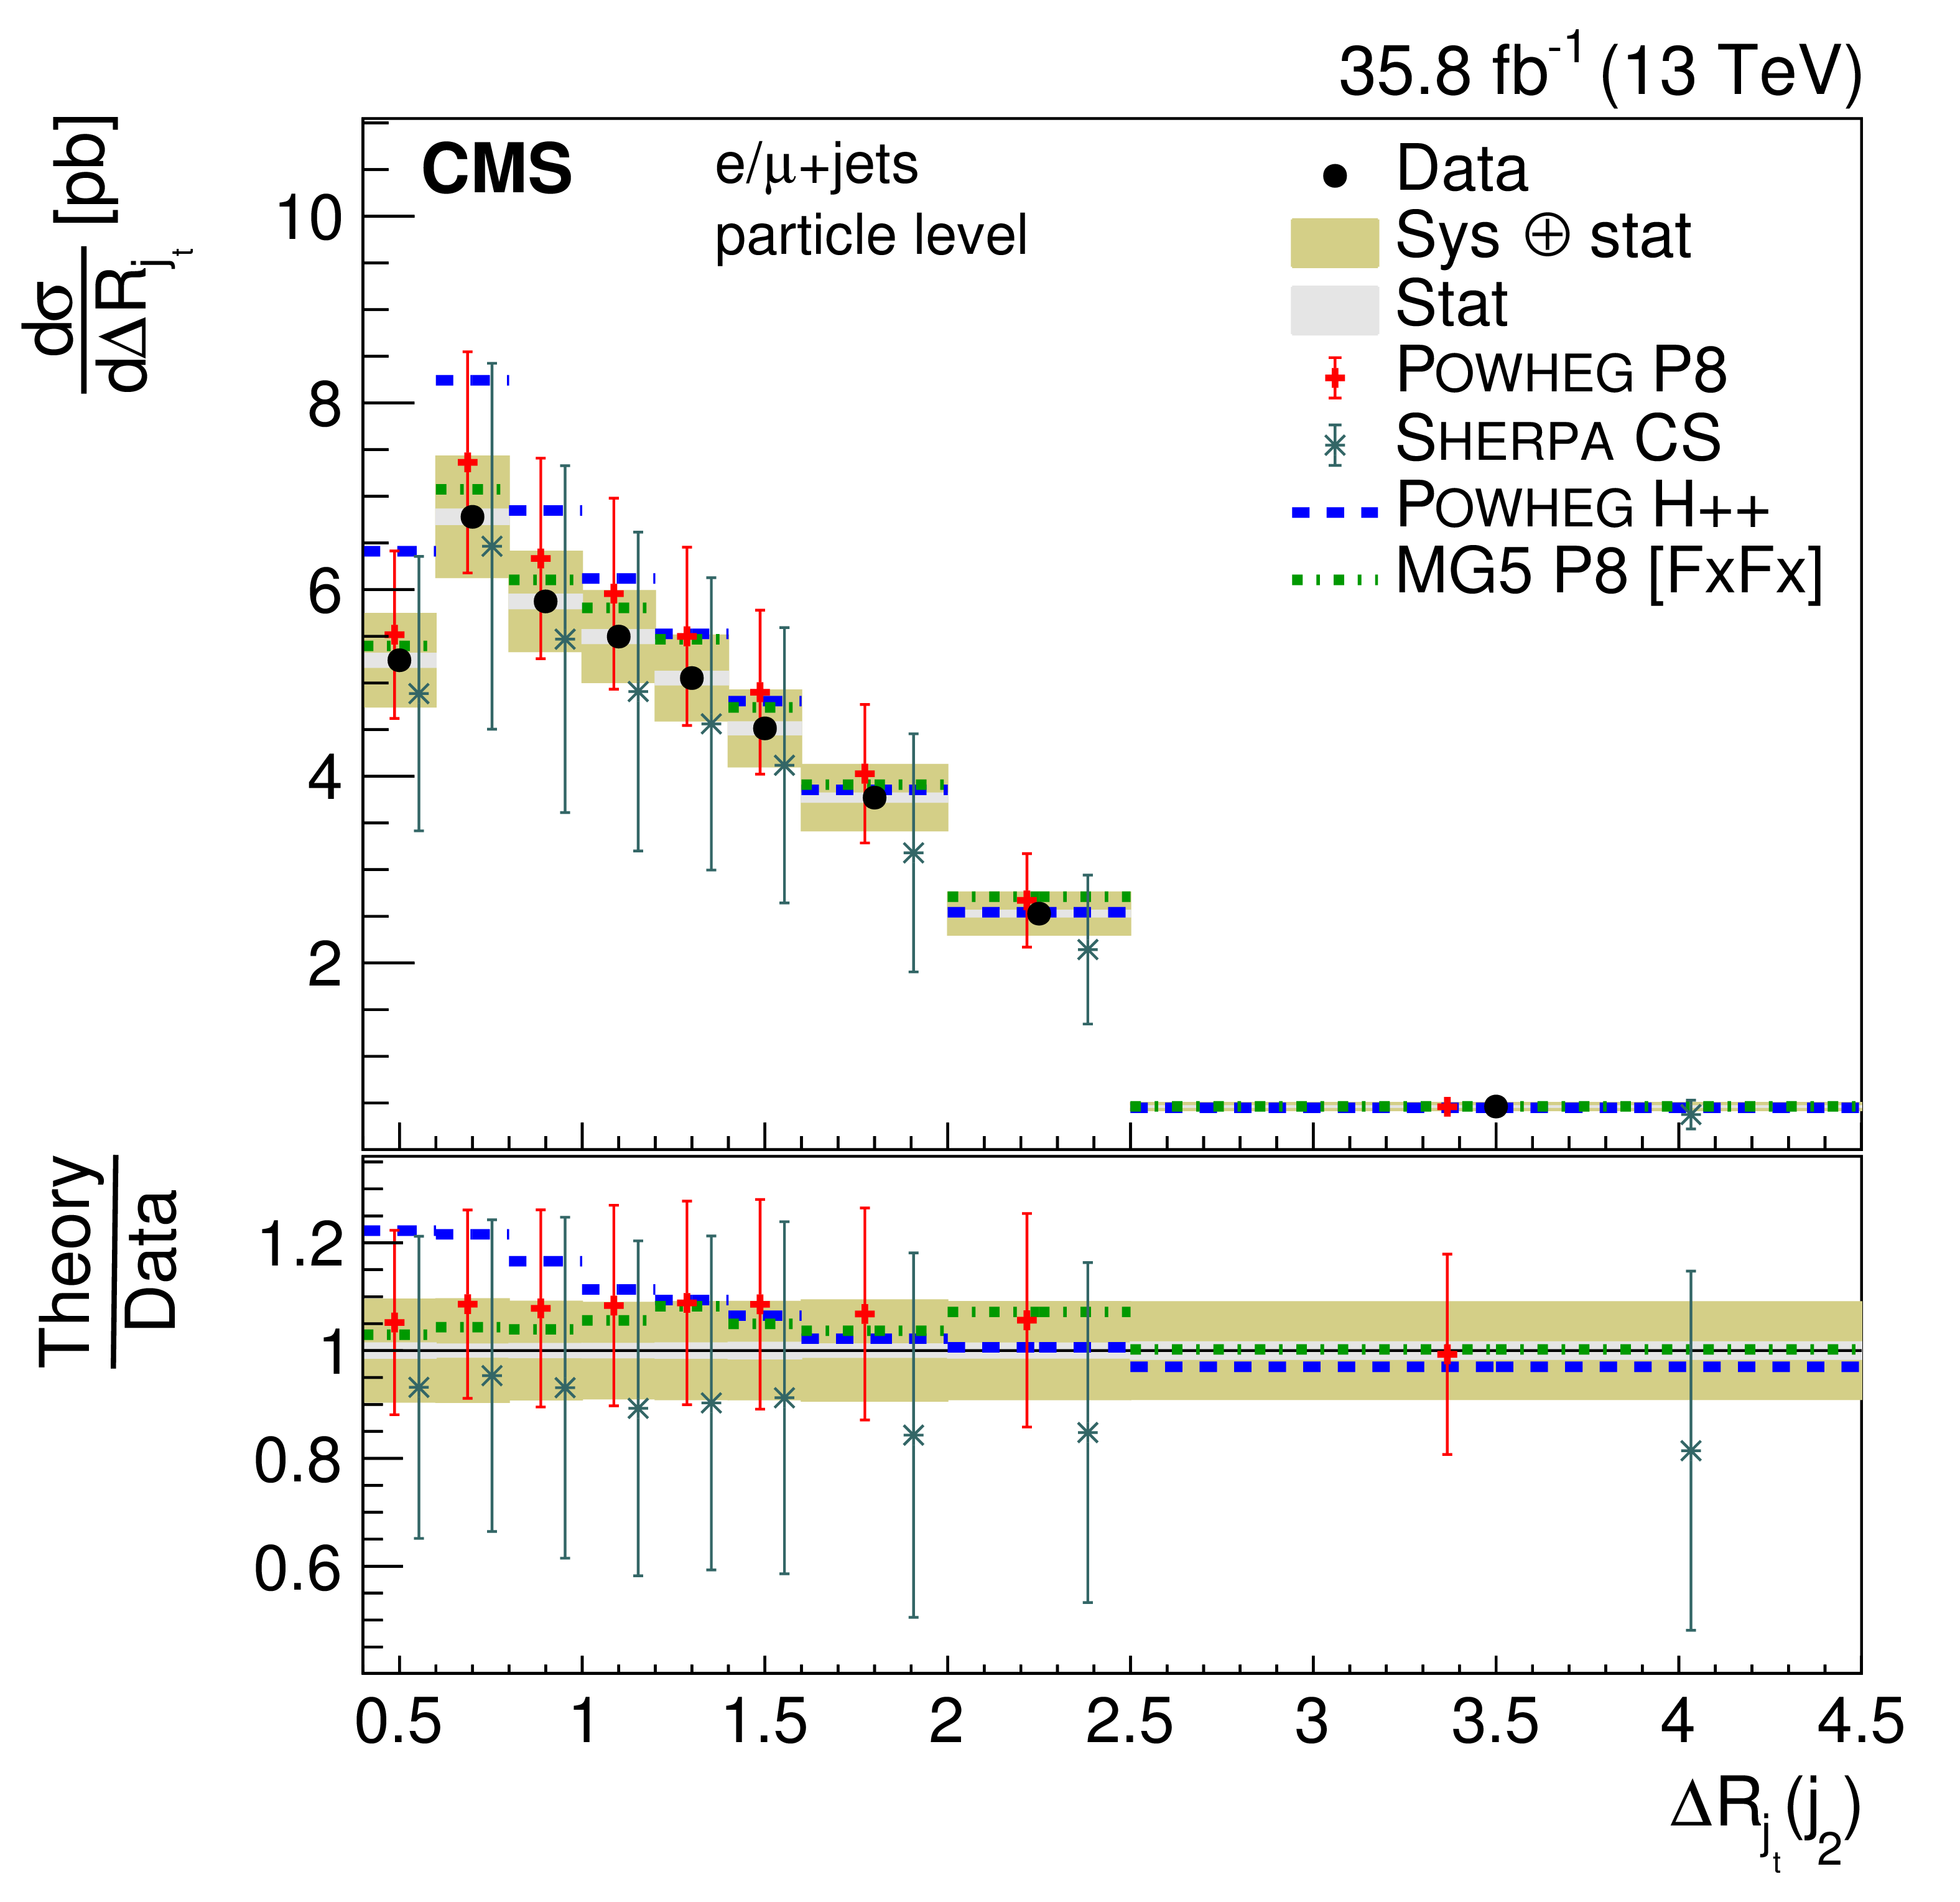
png pdf |
Figure 42-f:
Differential cross section at the particle level as a function of jet $ {\Delta R_{\mathrm {j}_\mathrm{t}}} $. The upper two rows show the $ {\Delta R_{\mathrm {j}_\mathrm{t}}} $ distributions for the jets in the $ {\mathrm{t} \mathrm{\bar{t}}} $ system, the lower two rows the distribution for additional jets. The data are shown as points with light (dark) bands indicating the statistical (statistical and systematic) uncertainties. The cross sections are compared to the predictions of POWHEG combined with PYTHIA8 (P8) or HERWIG++ (H++) and the multiparton simulations MG5_aMC@NLO (MG5)+PYTHIA8 FxFx and SHERPA. The ratios of the predictions to the measured cross sections are shown at the bottom of each panel. |

png pdf |
Figure 42-g:
Differential cross section at the particle level as a function of jet $ {\Delta R_{\mathrm {j}_\mathrm{t}}} $. The upper two rows show the $ {\Delta R_{\mathrm {j}_\mathrm{t}}} $ distributions for the jets in the $ {\mathrm{t} \mathrm{\bar{t}}} $ system, the lower two rows the distribution for additional jets. The data are shown as points with light (dark) bands indicating the statistical (statistical and systematic) uncertainties. The cross sections are compared to the predictions of POWHEG combined with PYTHIA8 (P8) or HERWIG++ (H++) and the multiparton simulations MG5_aMC@NLO (MG5)+PYTHIA8 FxFx and SHERPA. The ratios of the predictions to the measured cross sections are shown at the bottom of each panel. |

png pdf |
Figure 42-h:
Differential cross section at the particle level as a function of jet $ {\Delta R_{\mathrm {j}_\mathrm{t}}} $. The upper two rows show the $ {\Delta R_{\mathrm {j}_\mathrm{t}}} $ distributions for the jets in the $ {\mathrm{t} \mathrm{\bar{t}}} $ system, the lower two rows the distribution for additional jets. The data are shown as points with light (dark) bands indicating the statistical (statistical and systematic) uncertainties. The cross sections are compared to the predictions of POWHEG combined with PYTHIA8 (P8) or HERWIG++ (H++) and the multiparton simulations MG5_aMC@NLO (MG5)+PYTHIA8 FxFx and SHERPA. The ratios of the predictions to the measured cross sections are shown at the bottom of each panel. |

png pdf |
Figure 43:
Normalized differential cross section at the particle level as a function of jet $ {\Delta R_{\mathrm {j}_\mathrm{t}}} $. The upper two rows show the $ {\Delta R_{\mathrm {j}_\mathrm{t}}} $ distributions for the jets in the $ {\mathrm{t} \mathrm{\bar{t}}} $ system, the lower two rows the distribution for additional jets. The data are shown as points with light (dark) bands indicating the statistical (statistical and systematic) uncertainties. The cross sections are compared to the predictions of POWHEG combined with PYTHIA8 (P8) or HERWIG++ (H++) and the multiparton simulations MG5_aMC@NLO (MG5)+PYTHIA8 FxFx and SHERPA. The ratios of the predictions to the measured cross sections are shown at the bottom of each panel. |
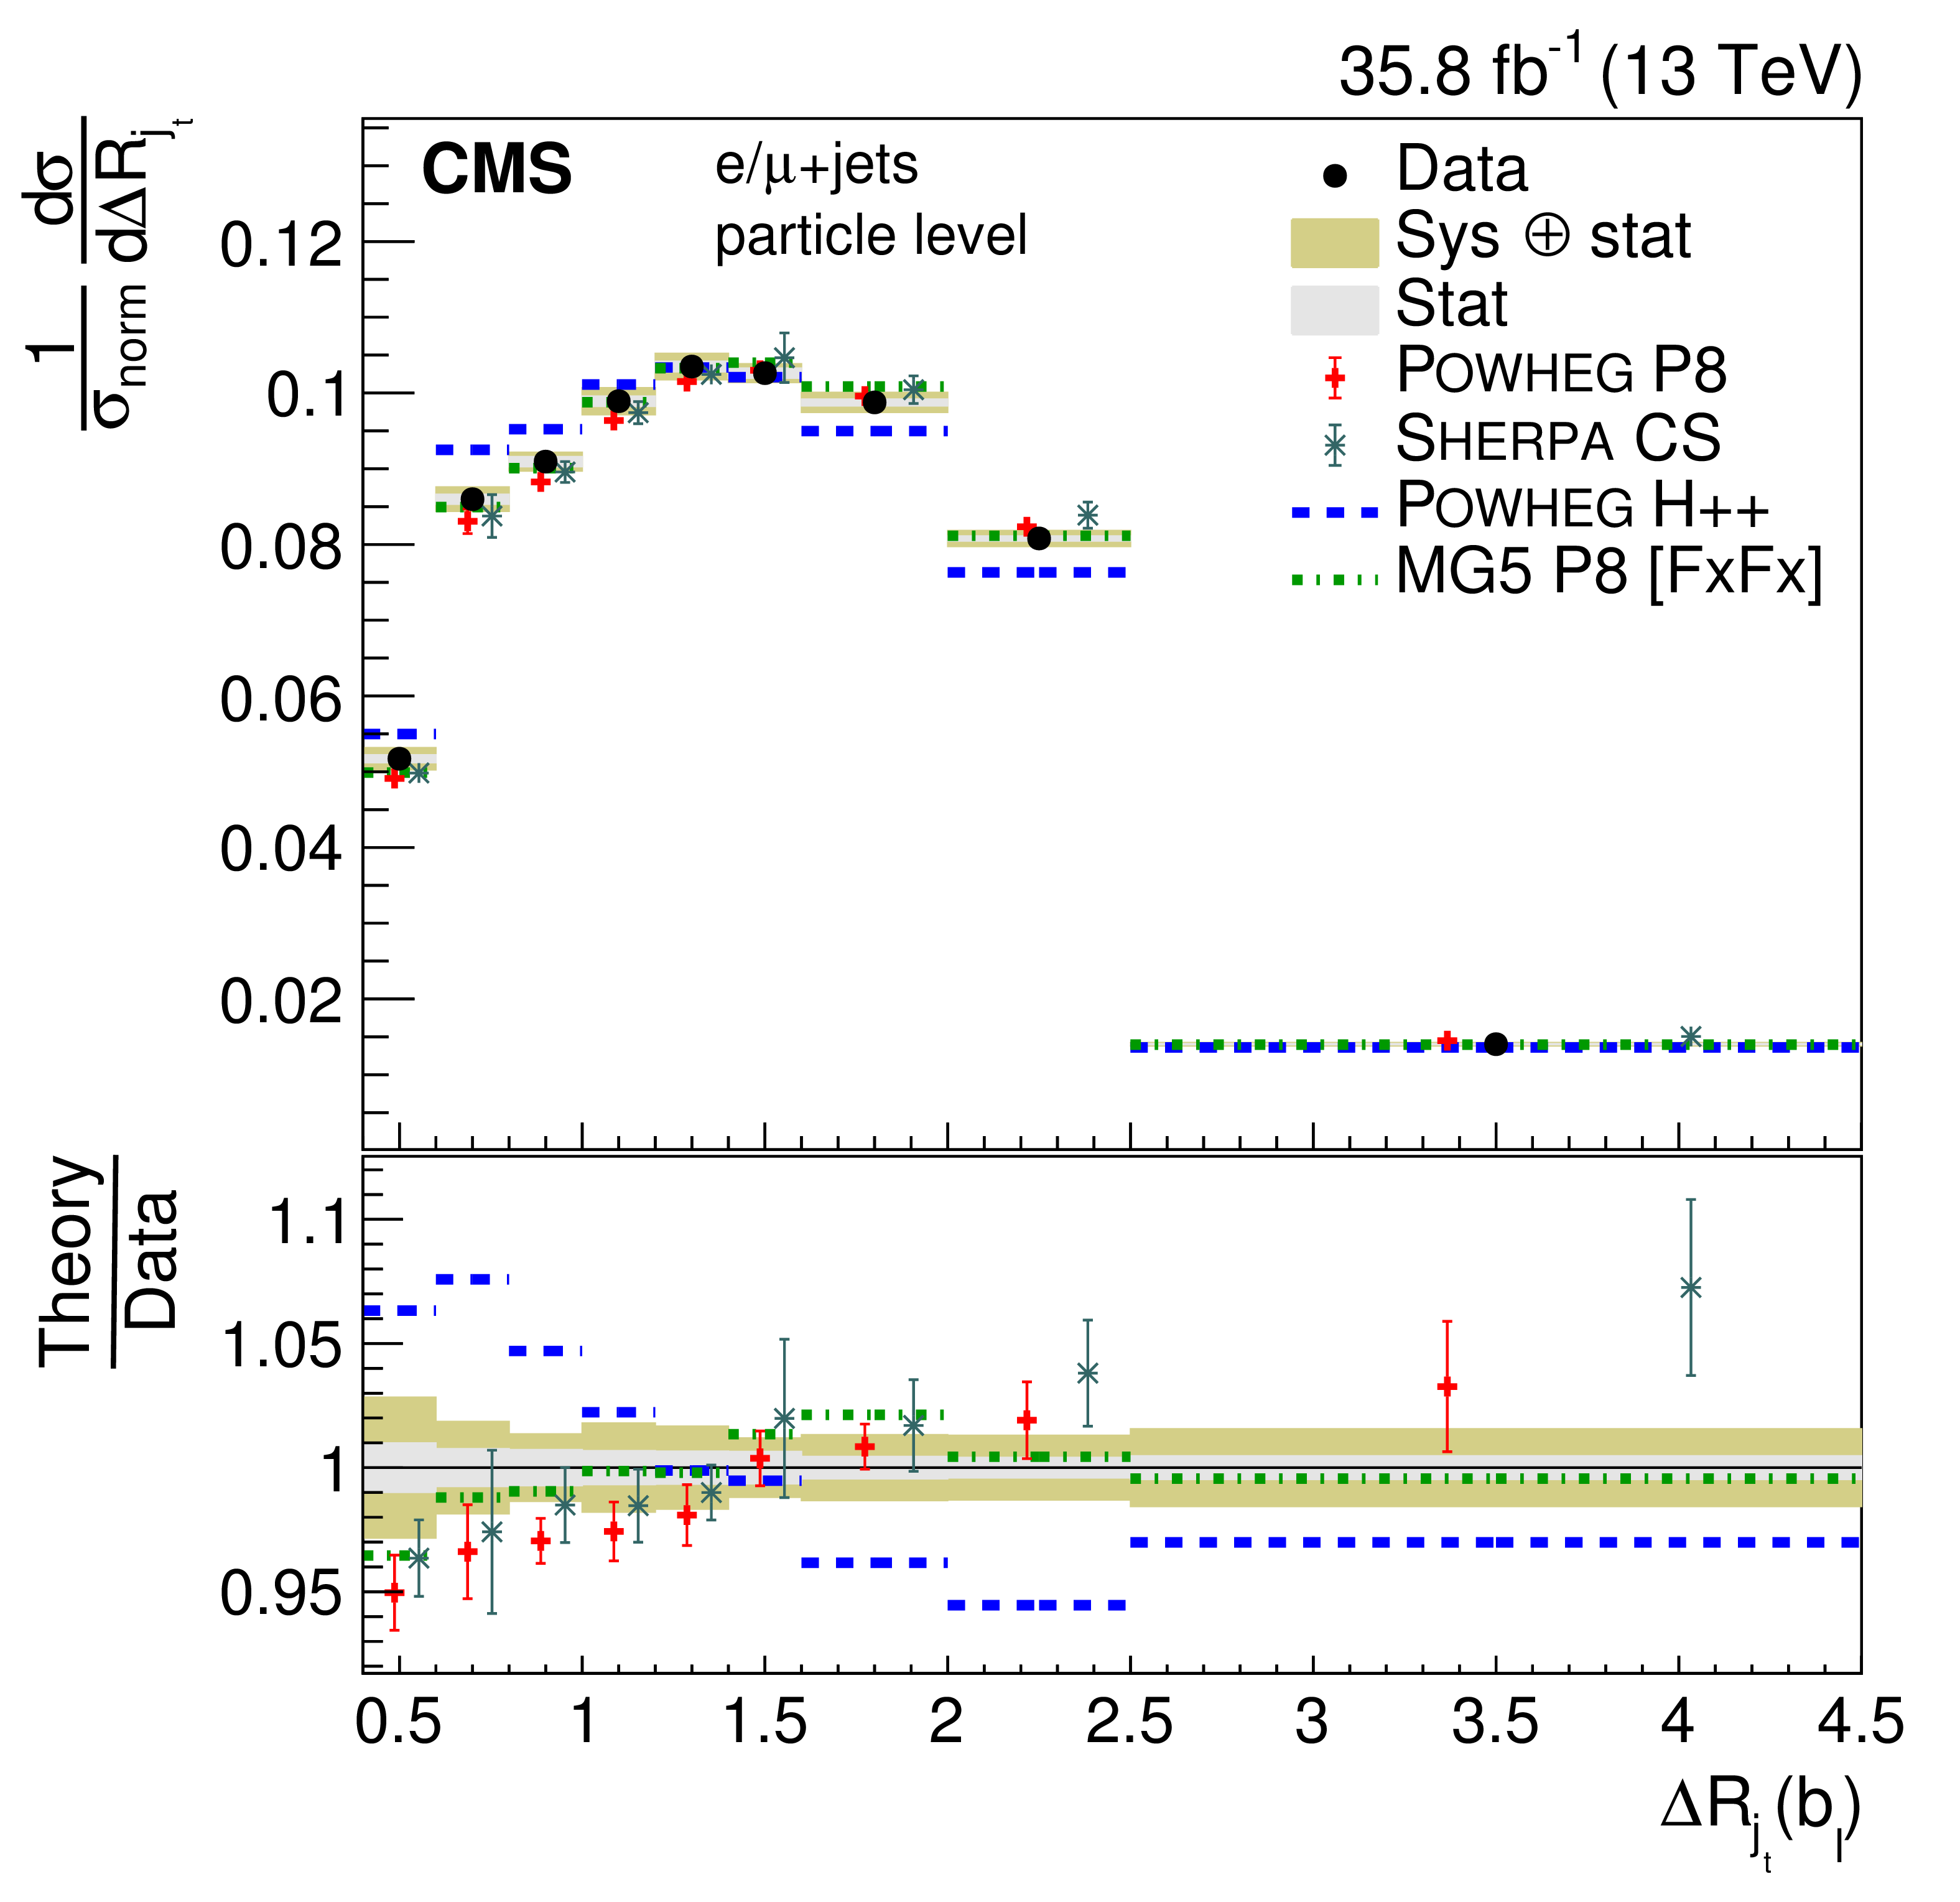
png pdf |
Figure 43-a:
Normalized differential cross section at the particle level as a function of jet $ {\Delta R_{\mathrm {j}_\mathrm{t}}} $. The upper two rows show the $ {\Delta R_{\mathrm {j}_\mathrm{t}}} $ distributions for the jets in the $ {\mathrm{t} \mathrm{\bar{t}}} $ system, the lower two rows the distribution for additional jets. The data are shown as points with light (dark) bands indicating the statistical (statistical and systematic) uncertainties. The cross sections are compared to the predictions of POWHEG combined with PYTHIA8 (P8) or HERWIG++ (H++) and the multiparton simulations MG5_aMC@NLO (MG5)+PYTHIA8 FxFx and SHERPA. The ratios of the predictions to the measured cross sections are shown at the bottom of each panel. |
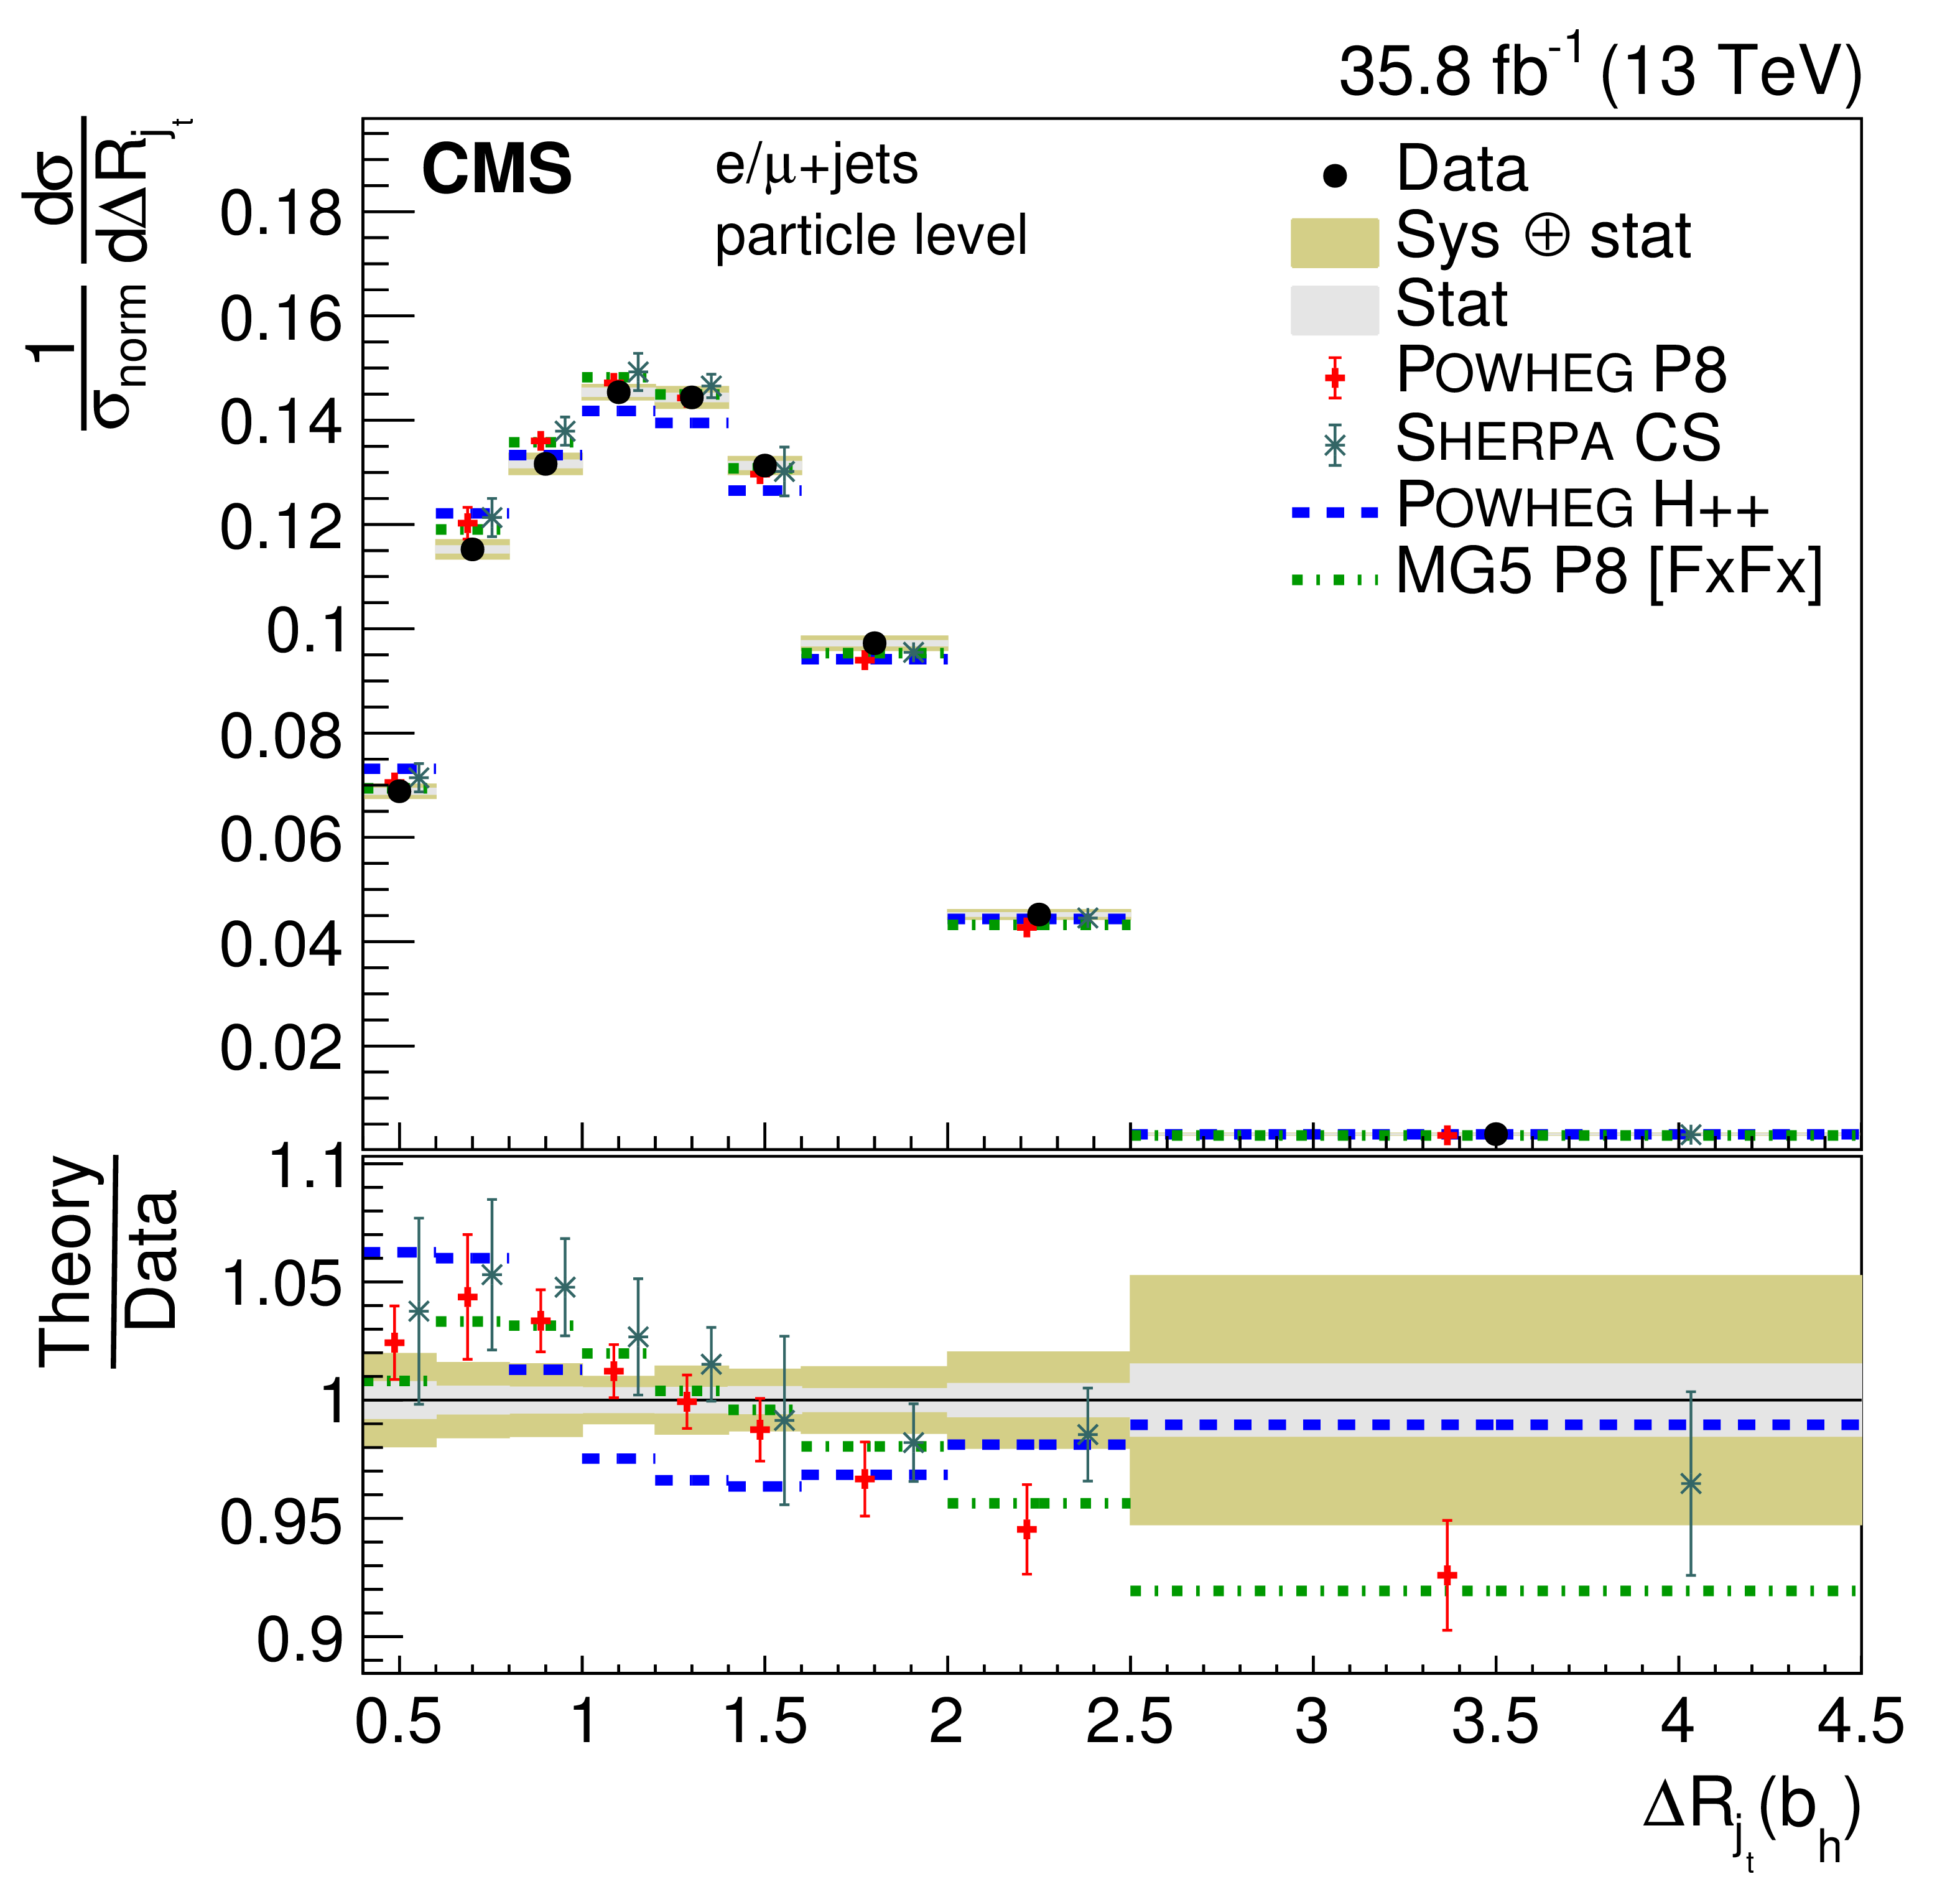
png pdf |
Figure 43-b:
Normalized differential cross section at the particle level as a function of jet $ {\Delta R_{\mathrm {j}_\mathrm{t}}} $. The upper two rows show the $ {\Delta R_{\mathrm {j}_\mathrm{t}}} $ distributions for the jets in the $ {\mathrm{t} \mathrm{\bar{t}}} $ system, the lower two rows the distribution for additional jets. The data are shown as points with light (dark) bands indicating the statistical (statistical and systematic) uncertainties. The cross sections are compared to the predictions of POWHEG combined with PYTHIA8 (P8) or HERWIG++ (H++) and the multiparton simulations MG5_aMC@NLO (MG5)+PYTHIA8 FxFx and SHERPA. The ratios of the predictions to the measured cross sections are shown at the bottom of each panel. |
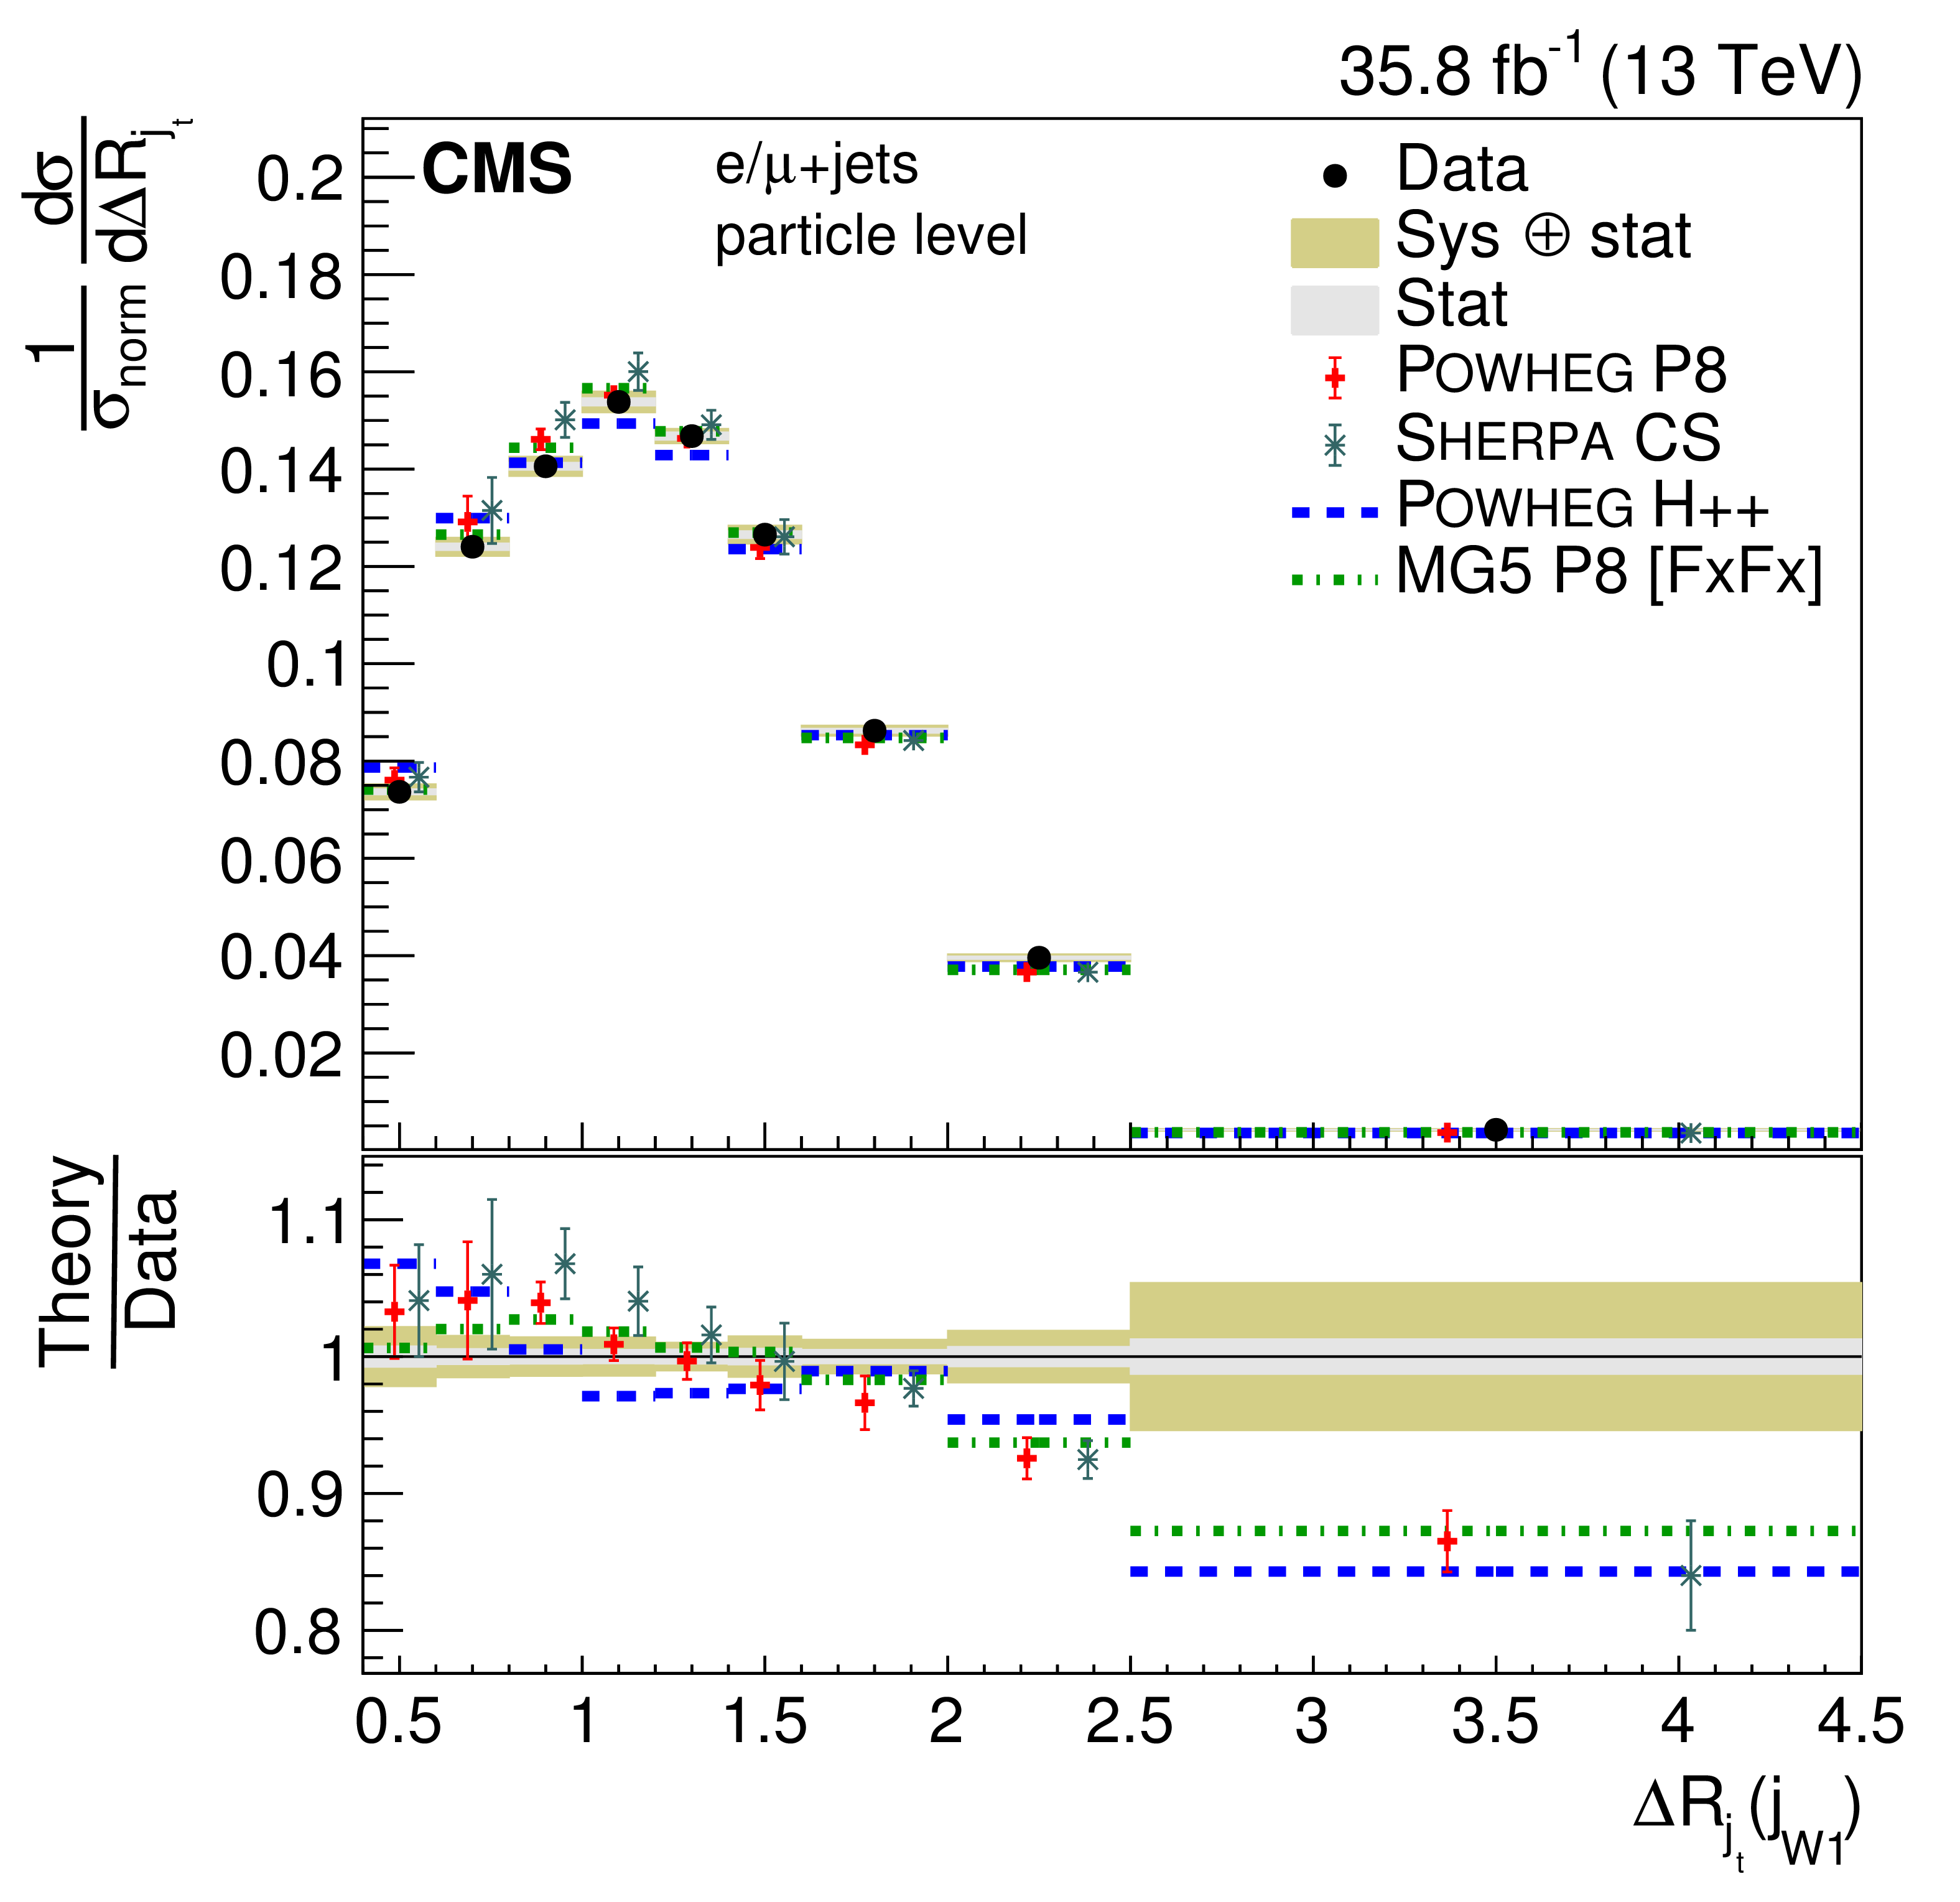
png pdf |
Figure 43-c:
Normalized differential cross section at the particle level as a function of jet $ {\Delta R_{\mathrm {j}_\mathrm{t}}} $. The upper two rows show the $ {\Delta R_{\mathrm {j}_\mathrm{t}}} $ distributions for the jets in the $ {\mathrm{t} \mathrm{\bar{t}}} $ system, the lower two rows the distribution for additional jets. The data are shown as points with light (dark) bands indicating the statistical (statistical and systematic) uncertainties. The cross sections are compared to the predictions of POWHEG combined with PYTHIA8 (P8) or HERWIG++ (H++) and the multiparton simulations MG5_aMC@NLO (MG5)+PYTHIA8 FxFx and SHERPA. The ratios of the predictions to the measured cross sections are shown at the bottom of each panel. |
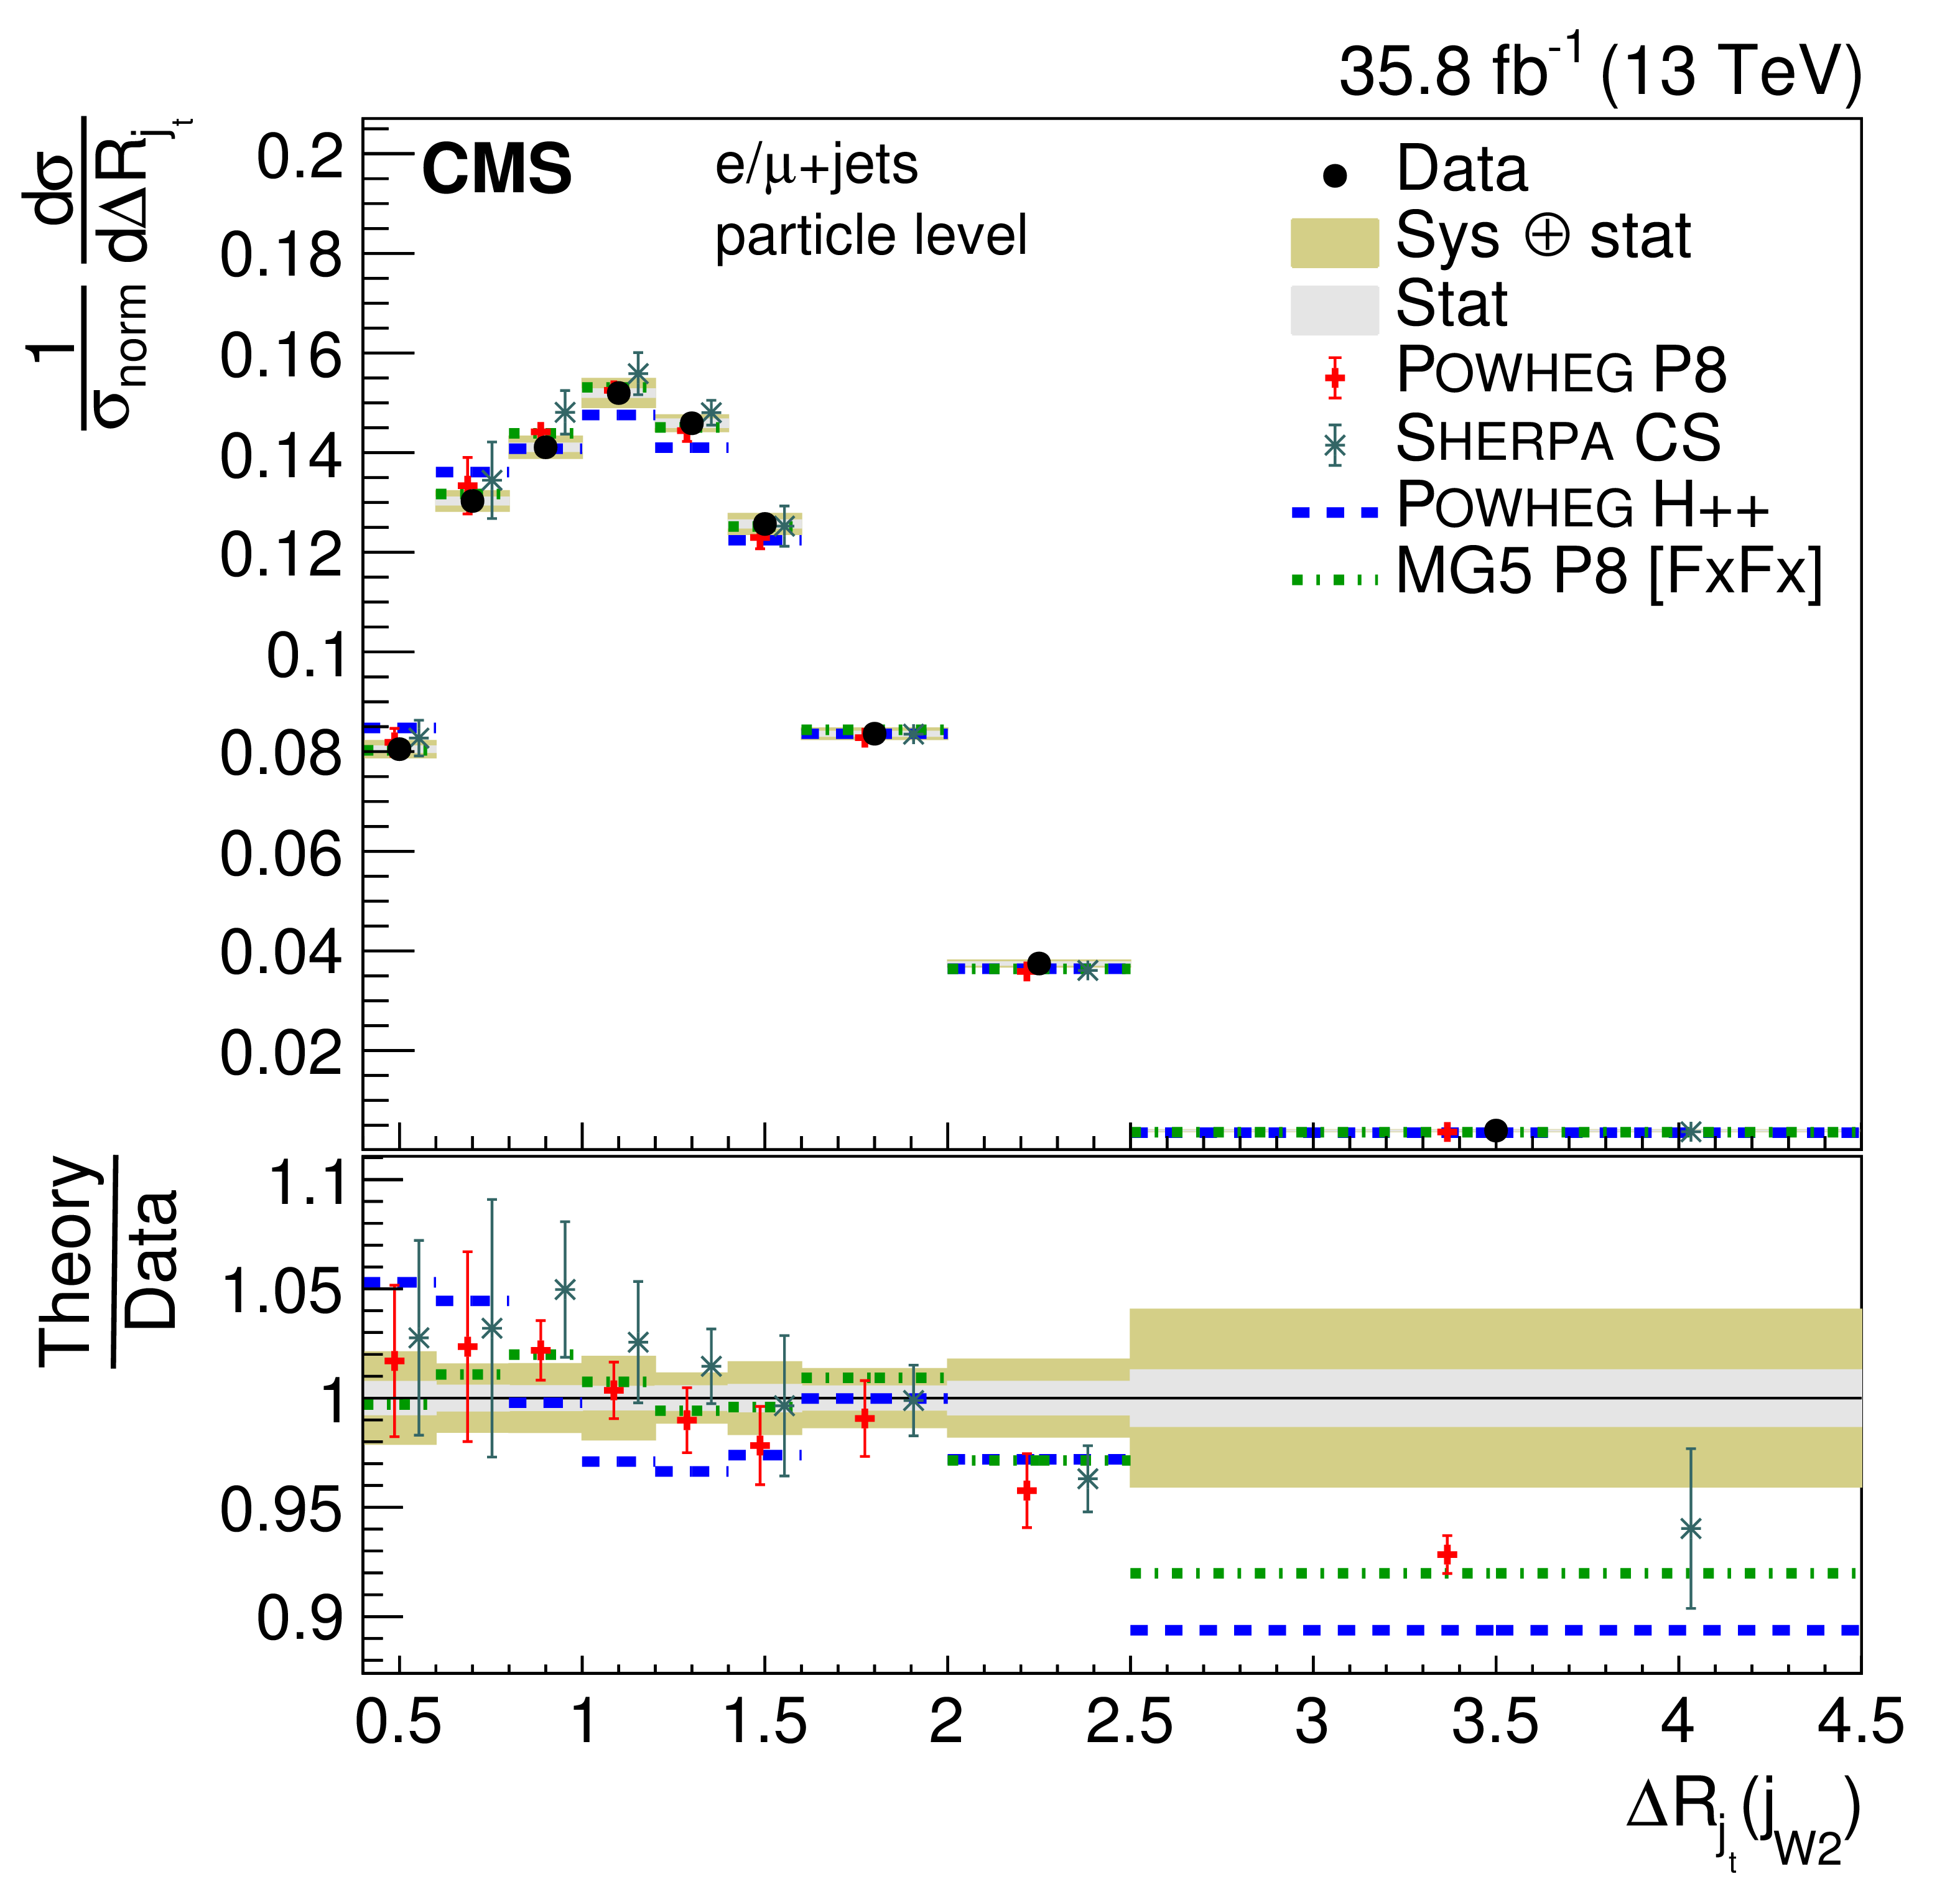
png pdf |
Figure 43-d:
Normalized differential cross section at the particle level as a function of jet $ {\Delta R_{\mathrm {j}_\mathrm{t}}} $. The upper two rows show the $ {\Delta R_{\mathrm {j}_\mathrm{t}}} $ distributions for the jets in the $ {\mathrm{t} \mathrm{\bar{t}}} $ system, the lower two rows the distribution for additional jets. The data are shown as points with light (dark) bands indicating the statistical (statistical and systematic) uncertainties. The cross sections are compared to the predictions of POWHEG combined with PYTHIA8 (P8) or HERWIG++ (H++) and the multiparton simulations MG5_aMC@NLO (MG5)+PYTHIA8 FxFx and SHERPA. The ratios of the predictions to the measured cross sections are shown at the bottom of each panel. |
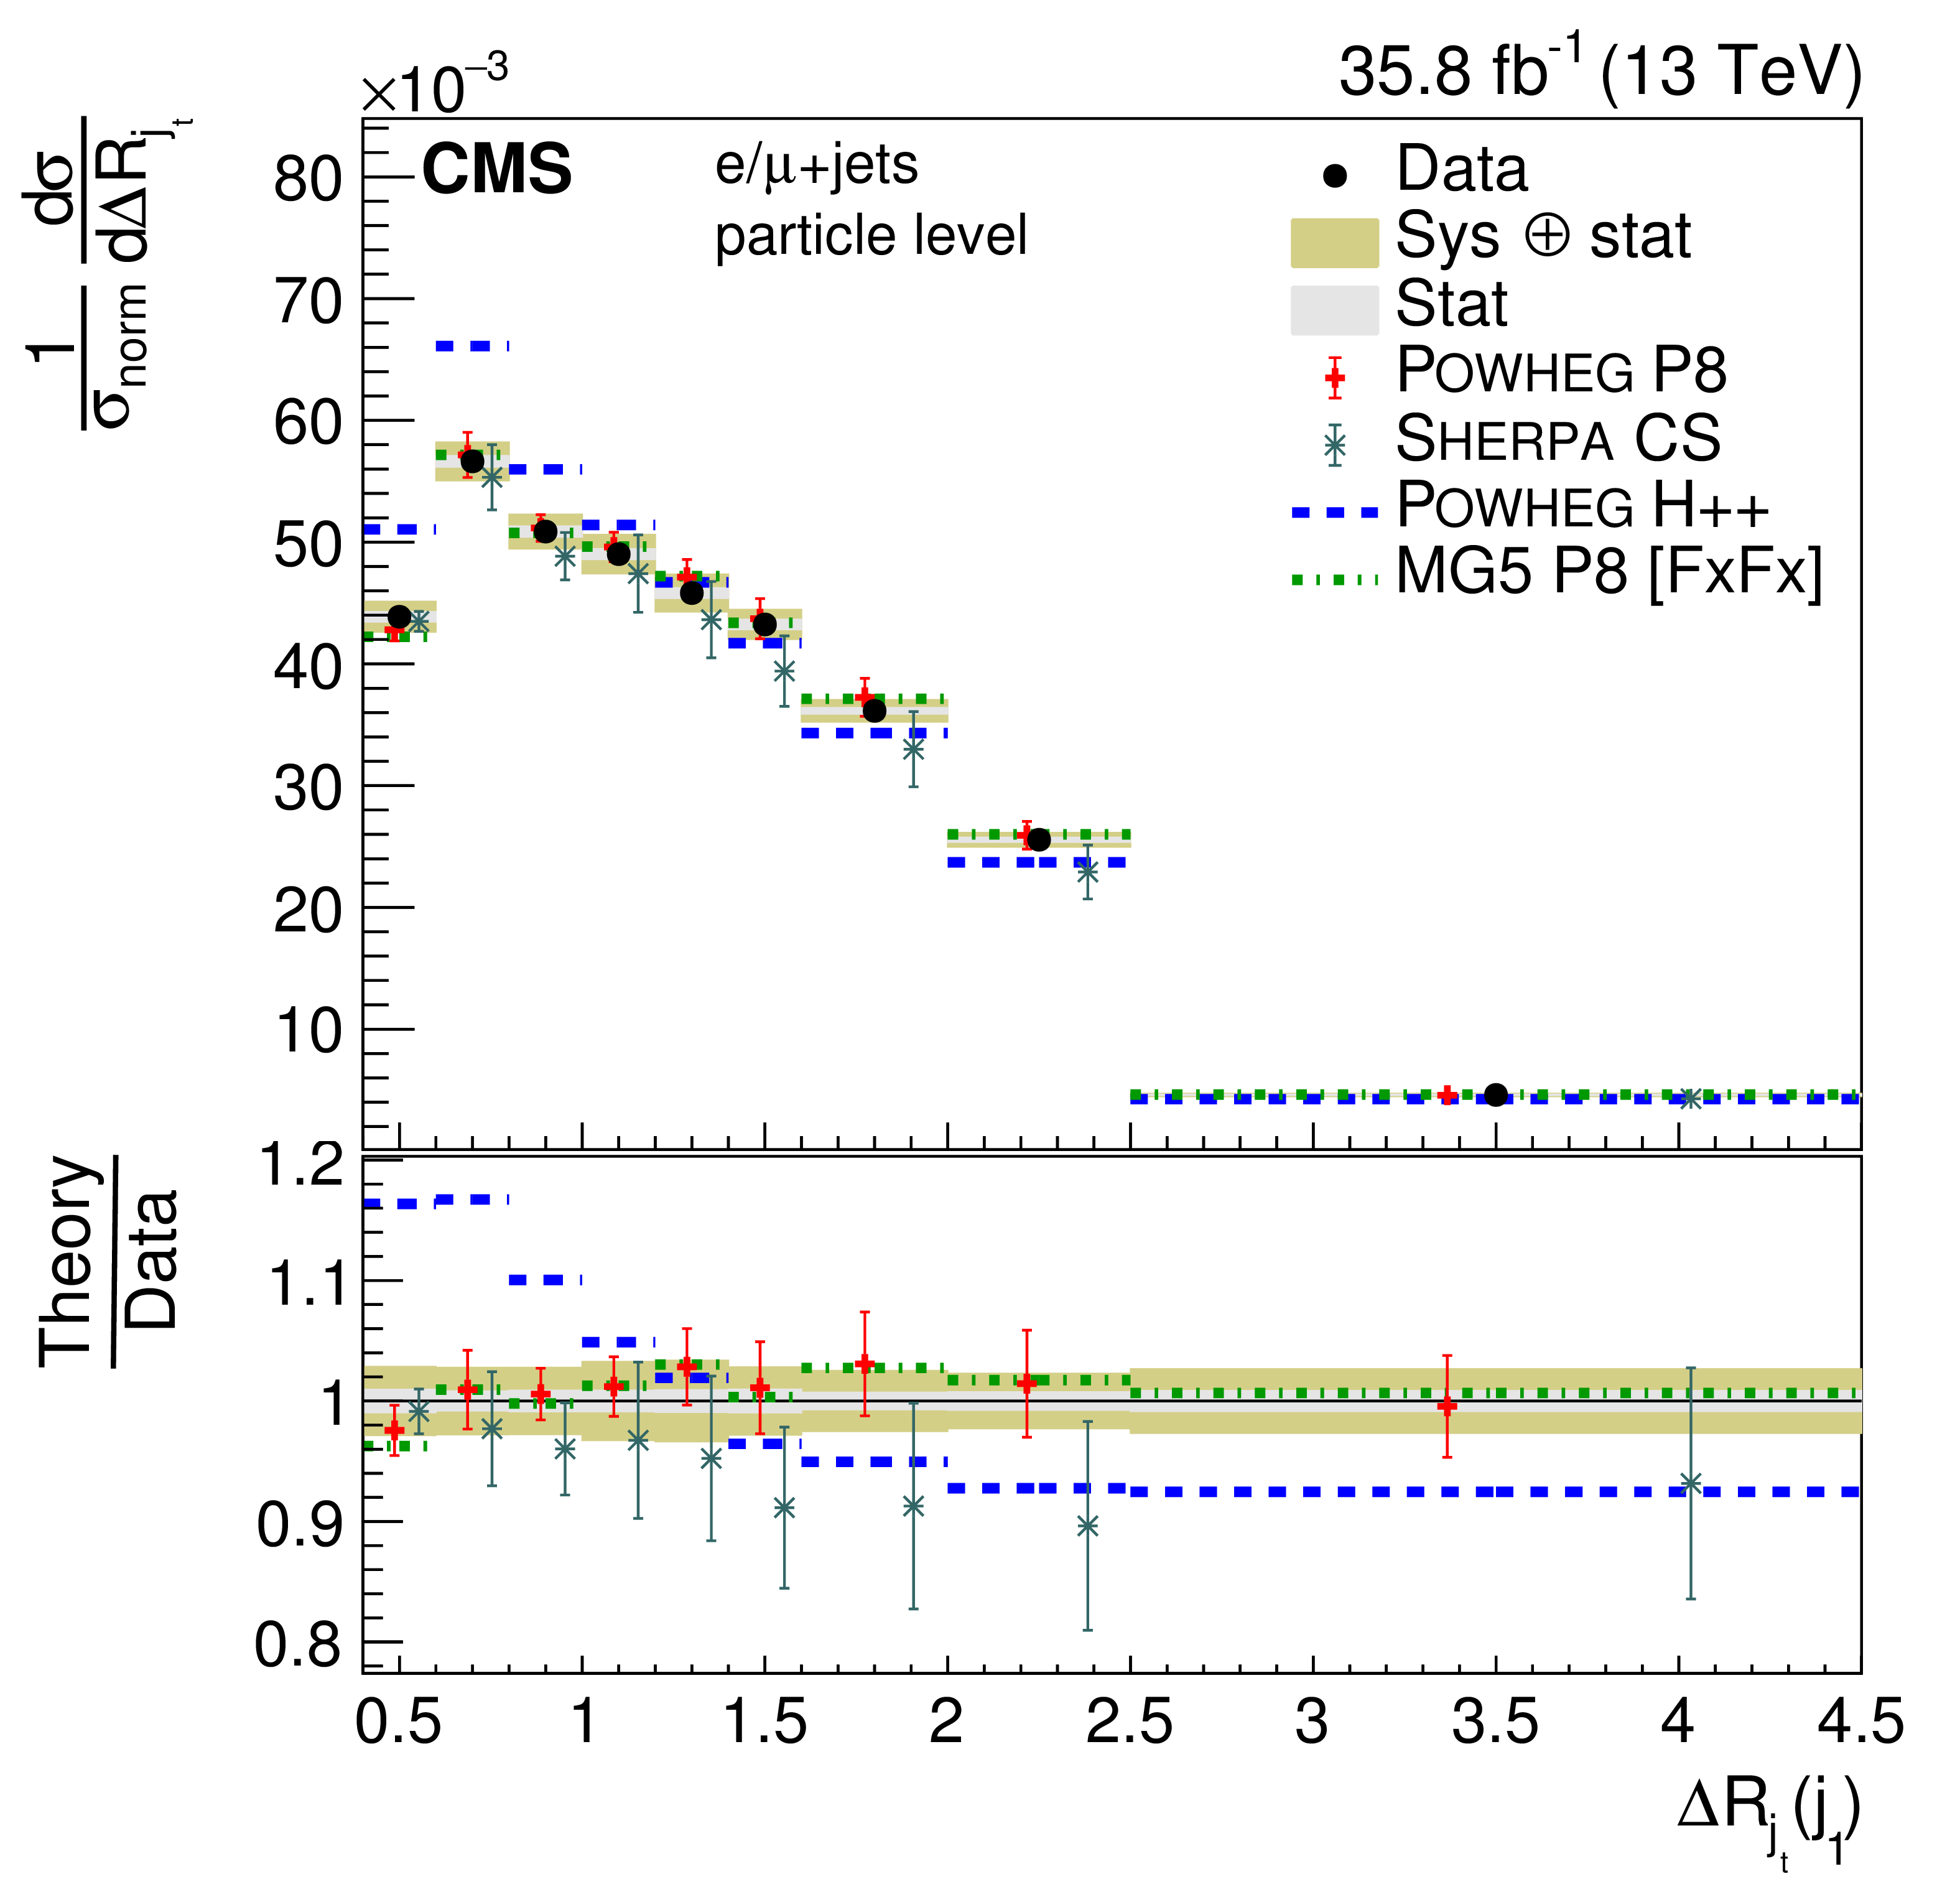
png pdf |
Figure 43-e:
Normalized differential cross section at the particle level as a function of jet $ {\Delta R_{\mathrm {j}_\mathrm{t}}} $. The upper two rows show the $ {\Delta R_{\mathrm {j}_\mathrm{t}}} $ distributions for the jets in the $ {\mathrm{t} \mathrm{\bar{t}}} $ system, the lower two rows the distribution for additional jets. The data are shown as points with light (dark) bands indicating the statistical (statistical and systematic) uncertainties. The cross sections are compared to the predictions of POWHEG combined with PYTHIA8 (P8) or HERWIG++ (H++) and the multiparton simulations MG5_aMC@NLO (MG5)+PYTHIA8 FxFx and SHERPA. The ratios of the predictions to the measured cross sections are shown at the bottom of each panel. |
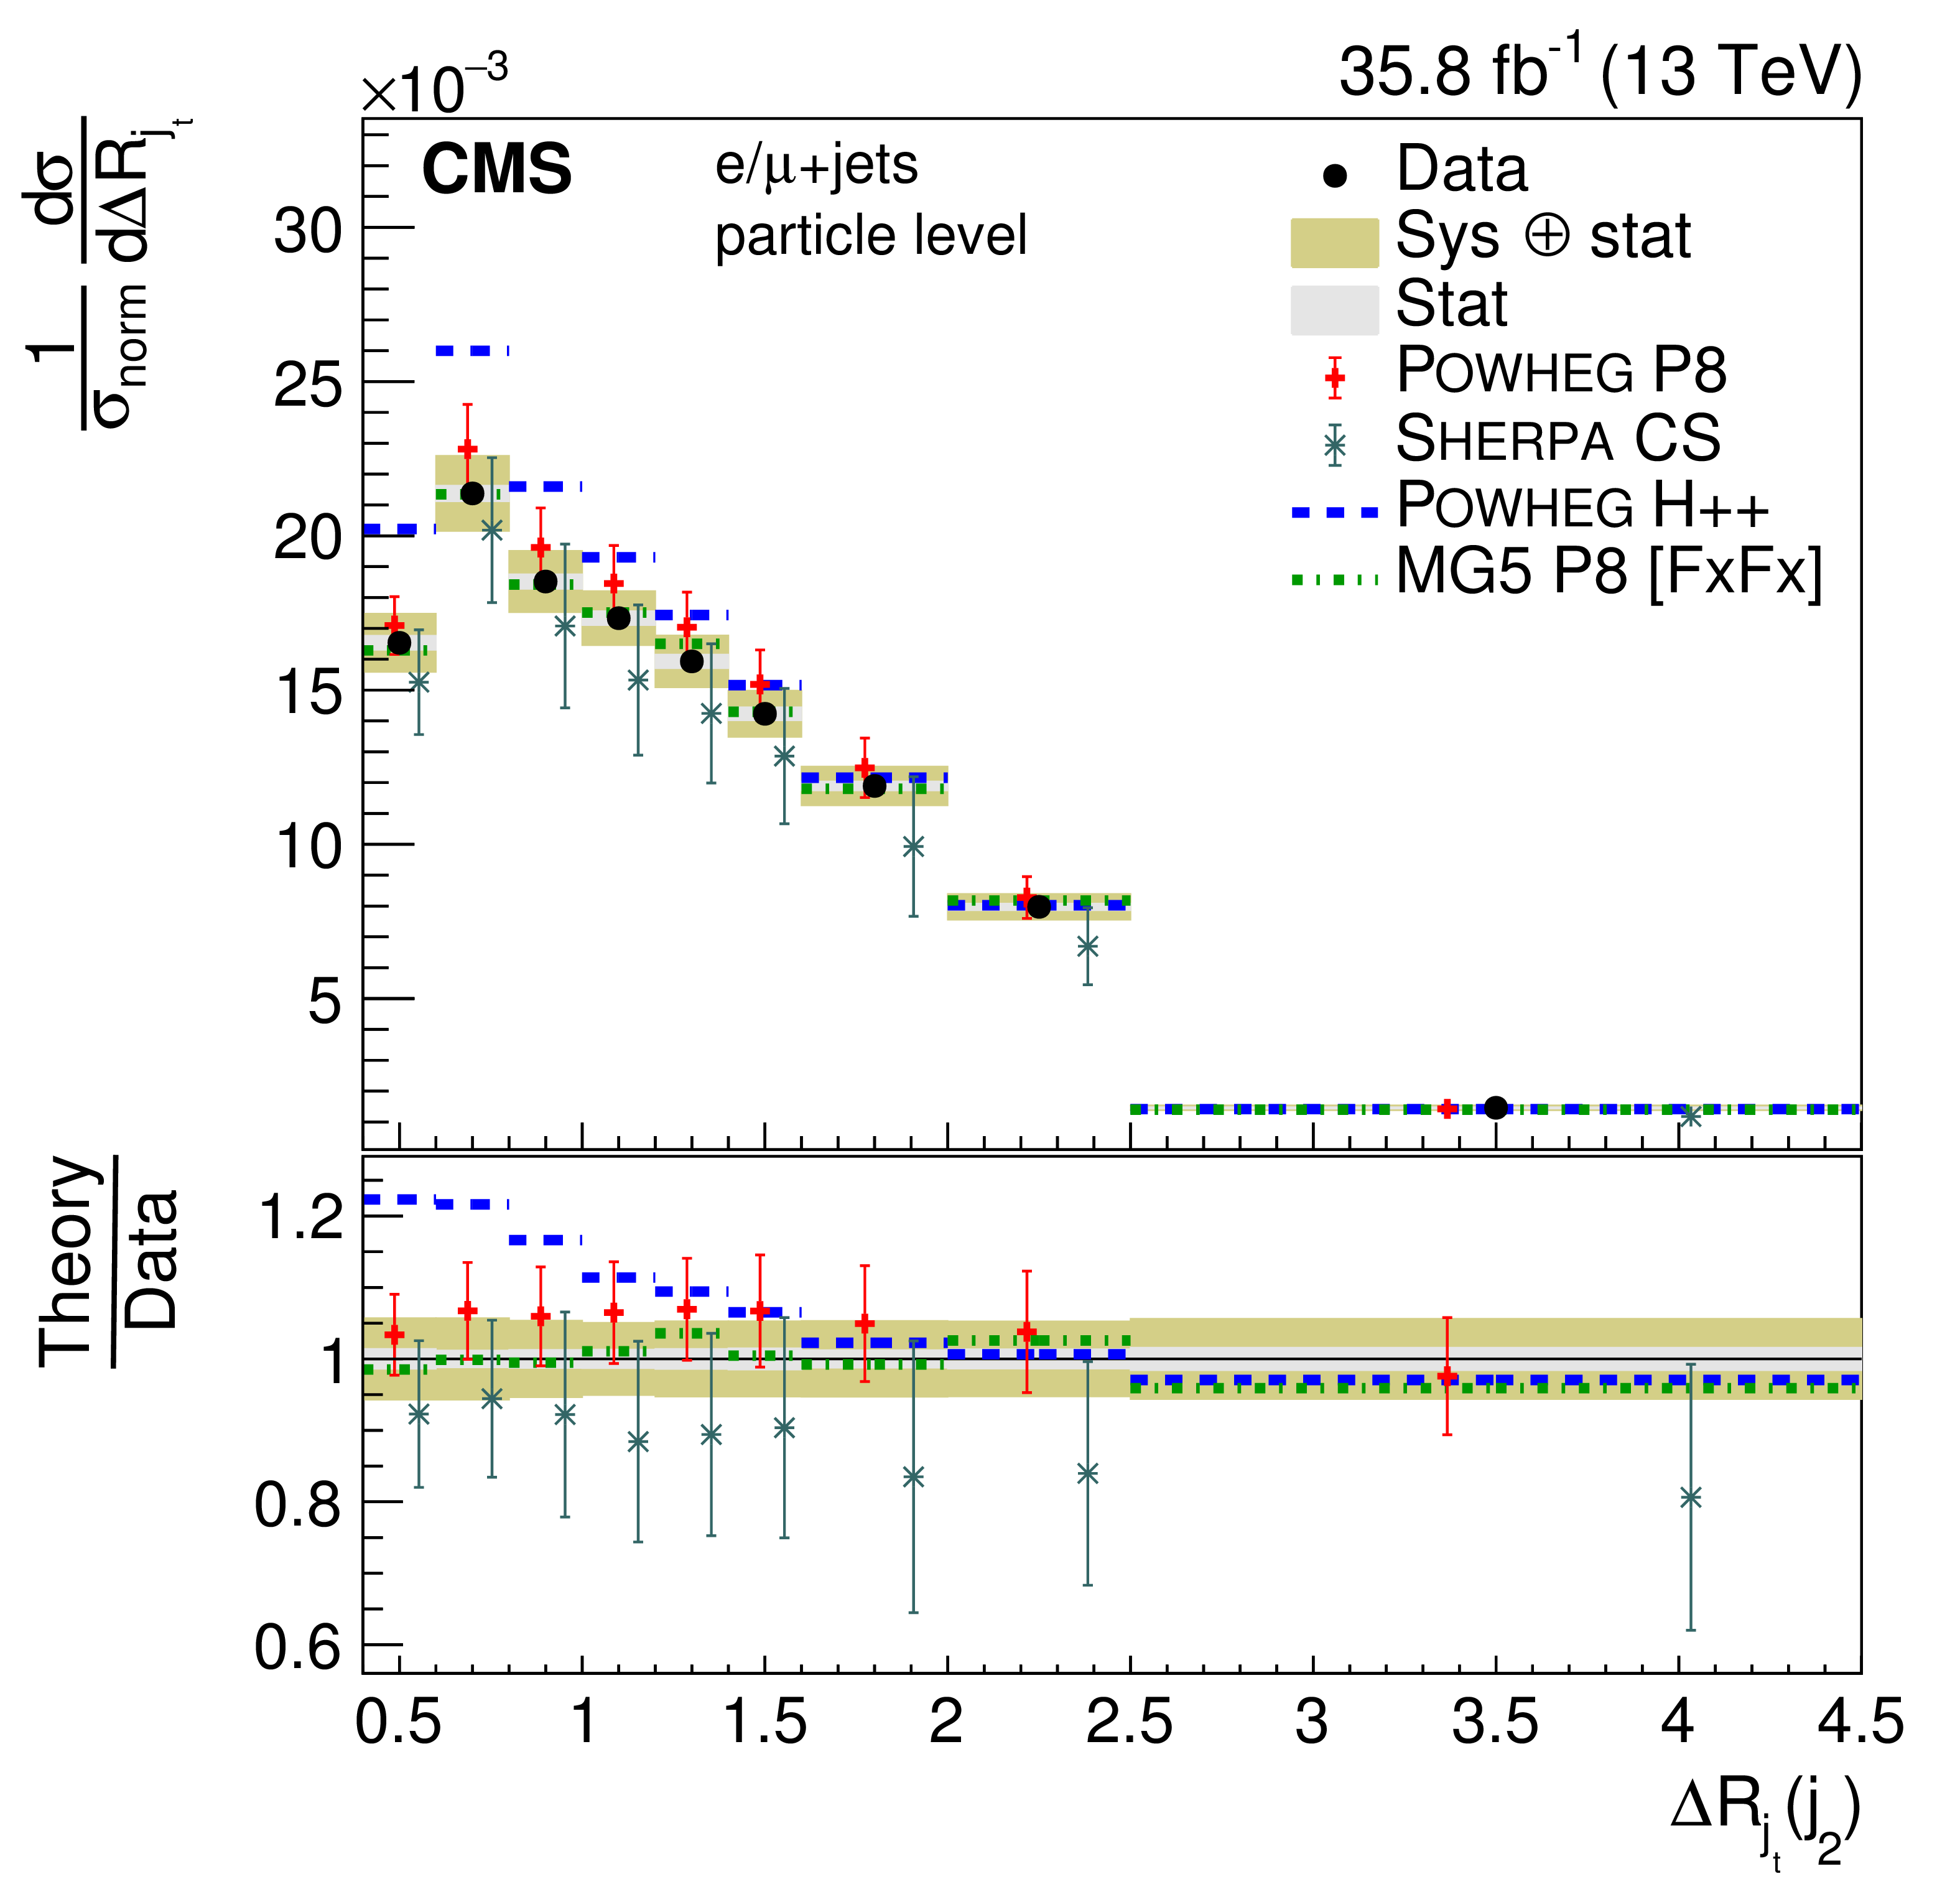
png pdf |
Figure 43-f:
Normalized differential cross section at the particle level as a function of jet $ {\Delta R_{\mathrm {j}_\mathrm{t}}} $. The upper two rows show the $ {\Delta R_{\mathrm {j}_\mathrm{t}}} $ distributions for the jets in the $ {\mathrm{t} \mathrm{\bar{t}}} $ system, the lower two rows the distribution for additional jets. The data are shown as points with light (dark) bands indicating the statistical (statistical and systematic) uncertainties. The cross sections are compared to the predictions of POWHEG combined with PYTHIA8 (P8) or HERWIG++ (H++) and the multiparton simulations MG5_aMC@NLO (MG5)+PYTHIA8 FxFx and SHERPA. The ratios of the predictions to the measured cross sections are shown at the bottom of each panel. |
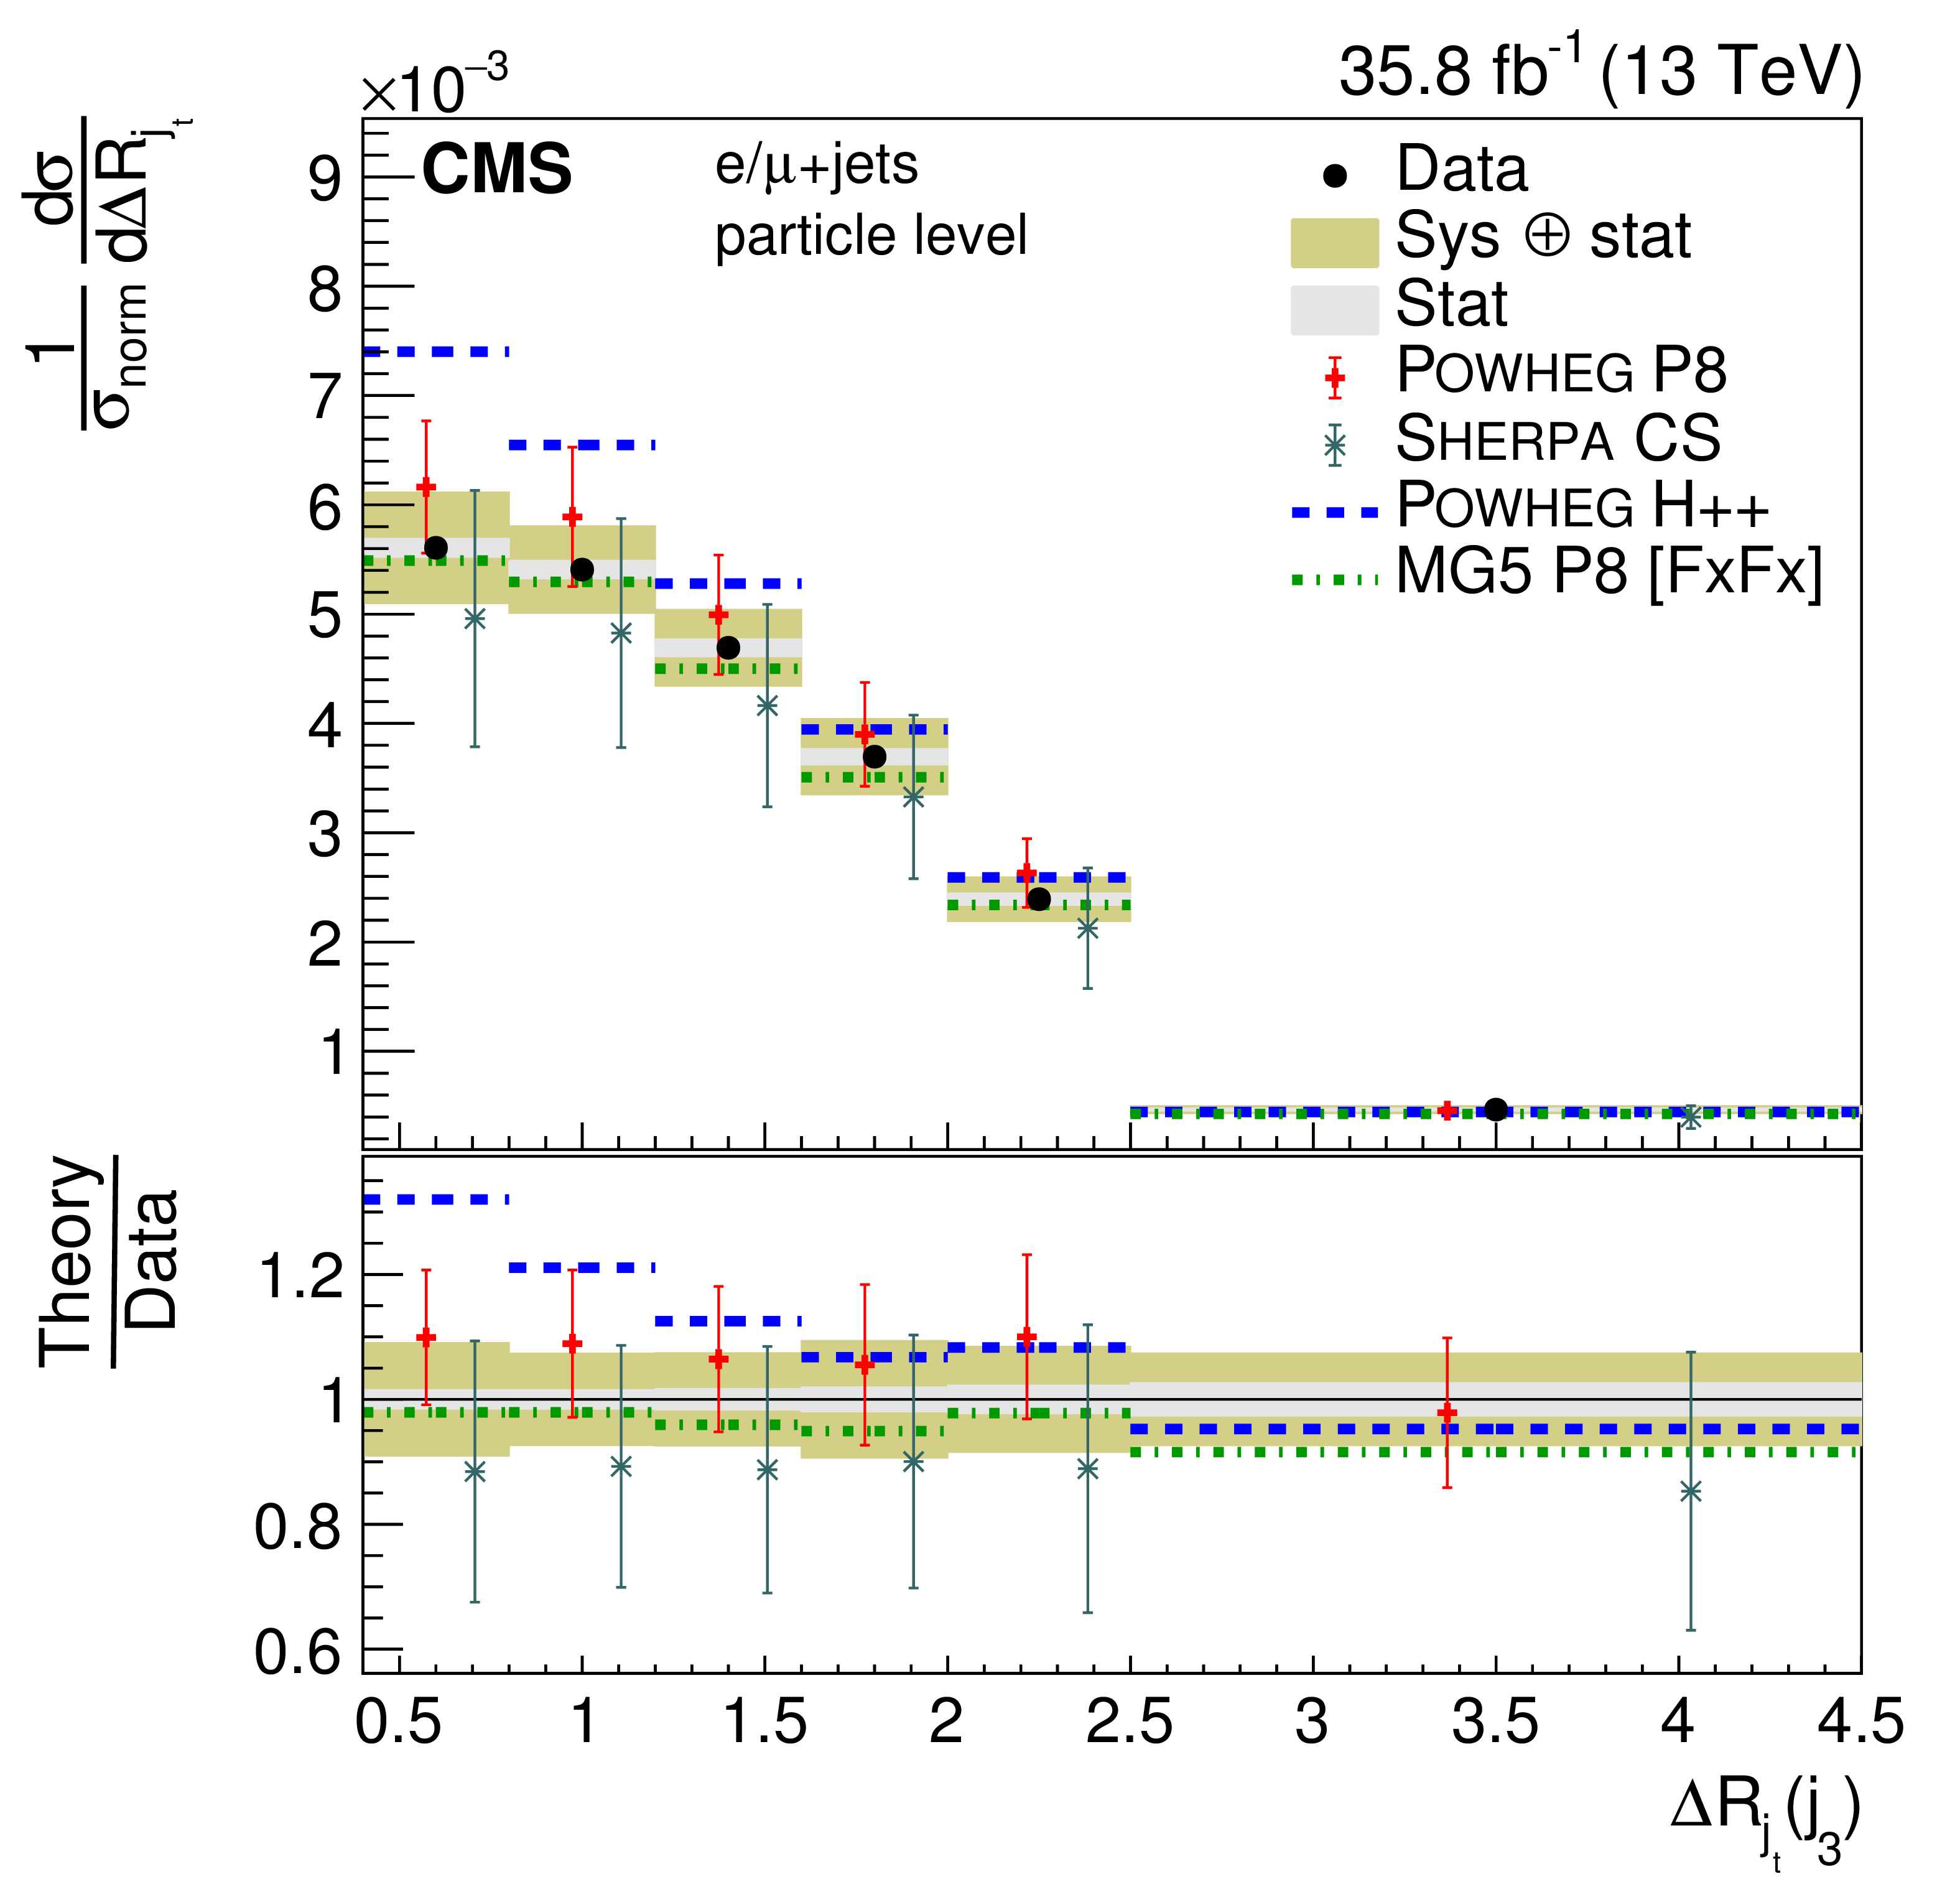
png pdf |
Figure 43-g:
Normalized differential cross section at the particle level as a function of jet $ {\Delta R_{\mathrm {j}_\mathrm{t}}} $. The upper two rows show the $ {\Delta R_{\mathrm {j}_\mathrm{t}}} $ distributions for the jets in the $ {\mathrm{t} \mathrm{\bar{t}}} $ system, the lower two rows the distribution for additional jets. The data are shown as points with light (dark) bands indicating the statistical (statistical and systematic) uncertainties. The cross sections are compared to the predictions of POWHEG combined with PYTHIA8 (P8) or HERWIG++ (H++) and the multiparton simulations MG5_aMC@NLO (MG5)+PYTHIA8 FxFx and SHERPA. The ratios of the predictions to the measured cross sections are shown at the bottom of each panel. |
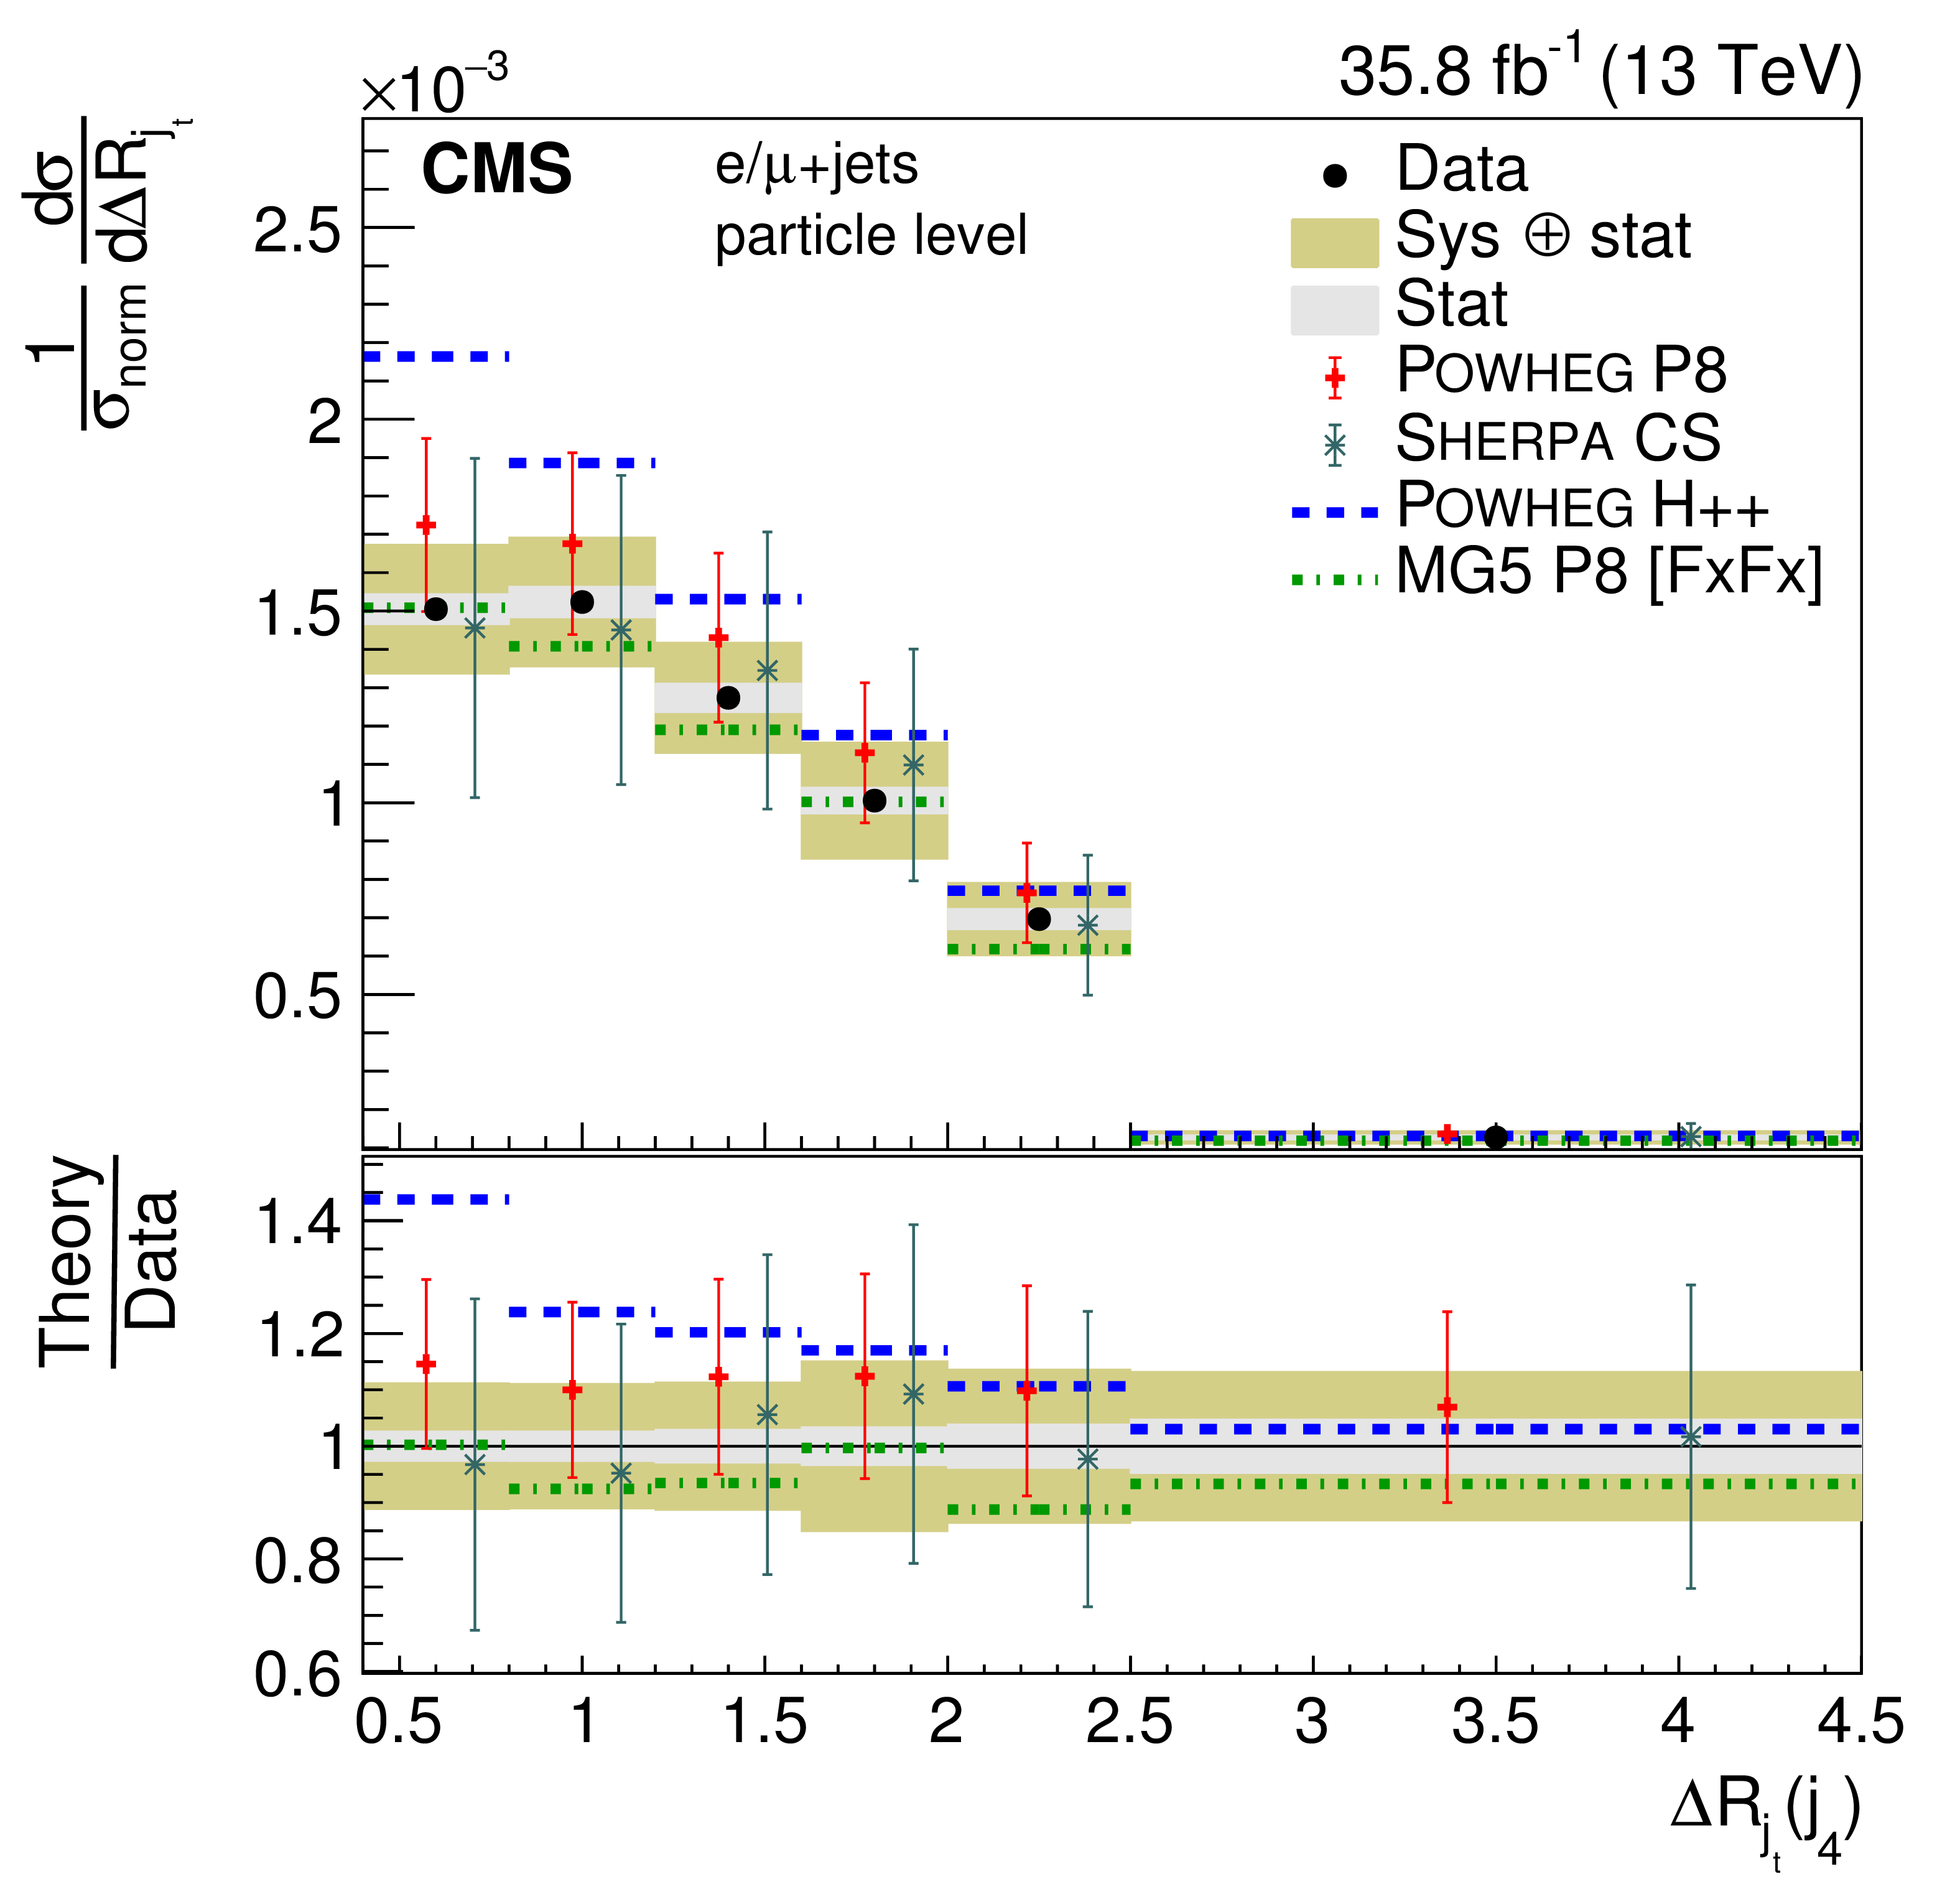
png pdf |
Figure 43-h:
Normalized differential cross section at the particle level as a function of jet $ {\Delta R_{\mathrm {j}_\mathrm{t}}} $. The upper two rows show the $ {\Delta R_{\mathrm {j}_\mathrm{t}}} $ distributions for the jets in the $ {\mathrm{t} \mathrm{\bar{t}}} $ system, the lower two rows the distribution for additional jets. The data are shown as points with light (dark) bands indicating the statistical (statistical and systematic) uncertainties. The cross sections are compared to the predictions of POWHEG combined with PYTHIA8 (P8) or HERWIG++ (H++) and the multiparton simulations MG5_aMC@NLO (MG5)+PYTHIA8 FxFx and SHERPA. The ratios of the predictions to the measured cross sections are shown at the bottom of each panel. |
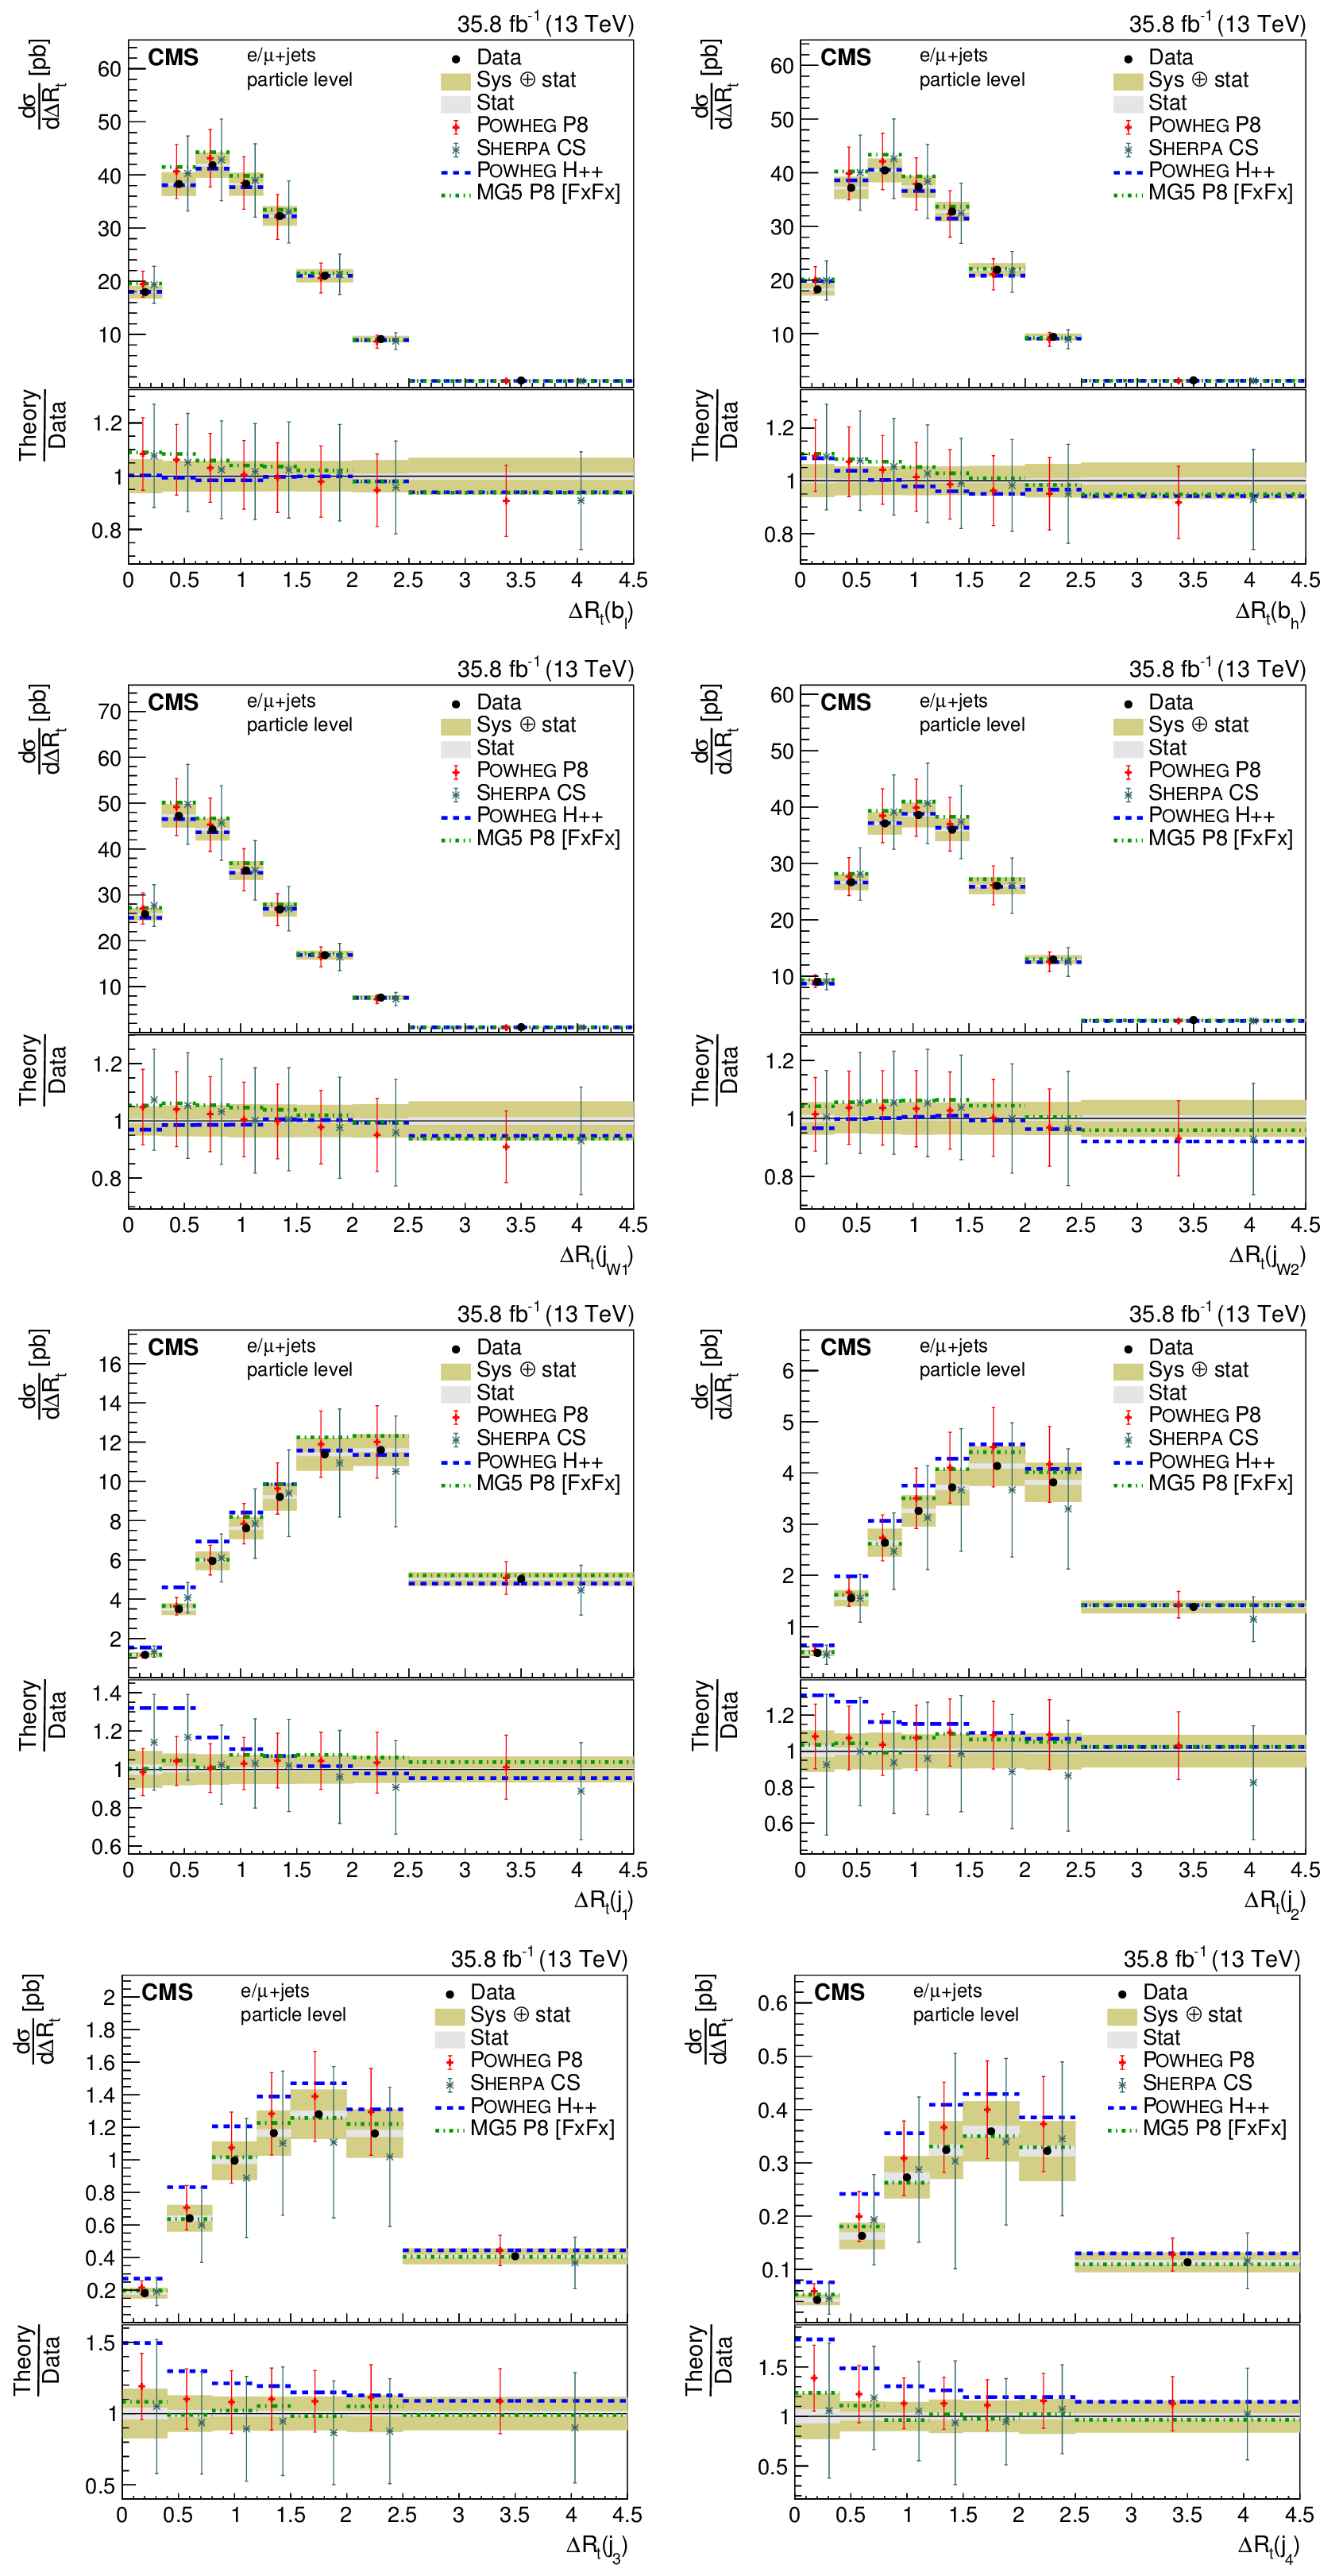
png pdf |
Figure 44:
Differential cross section at the particle level as a function of $ {\Delta R_{\mathrm{t}}} $. The upper two rows show the $ {\Delta R_{\mathrm{t}}} $ distributions for the jets in the $ {\mathrm{t} \mathrm{\bar{t}}} $ system, the lower two rows the distribution for additional jets. The data are shown as points with light (dark) bands indicating the statistical (statistical and systematic) uncertainties. The cross sections are compared to the predictions of POWHEG combined with PYTHIA8 (P8) or HERWIG++ (H++) and the multiparton simulations MG5_aMC@NLO (MG5)+PYTHIA8 FxFx and SHERPA. The ratios of the predictions to the measured cross sections are shown at the bottom of each panel. |

png pdf |
Figure 44-a:
Differential cross section at the particle level as a function of $ {\Delta R_{\mathrm{t}}} $. The upper two rows show the $ {\Delta R_{\mathrm{t}}} $ distributions for the jets in the $ {\mathrm{t} \mathrm{\bar{t}}} $ system, the lower two rows the distribution for additional jets. The data are shown as points with light (dark) bands indicating the statistical (statistical and systematic) uncertainties. The cross sections are compared to the predictions of POWHEG combined with PYTHIA8 (P8) or HERWIG++ (H++) and the multiparton simulations MG5_aMC@NLO (MG5)+PYTHIA8 FxFx and SHERPA. The ratios of the predictions to the measured cross sections are shown at the bottom of each panel. |
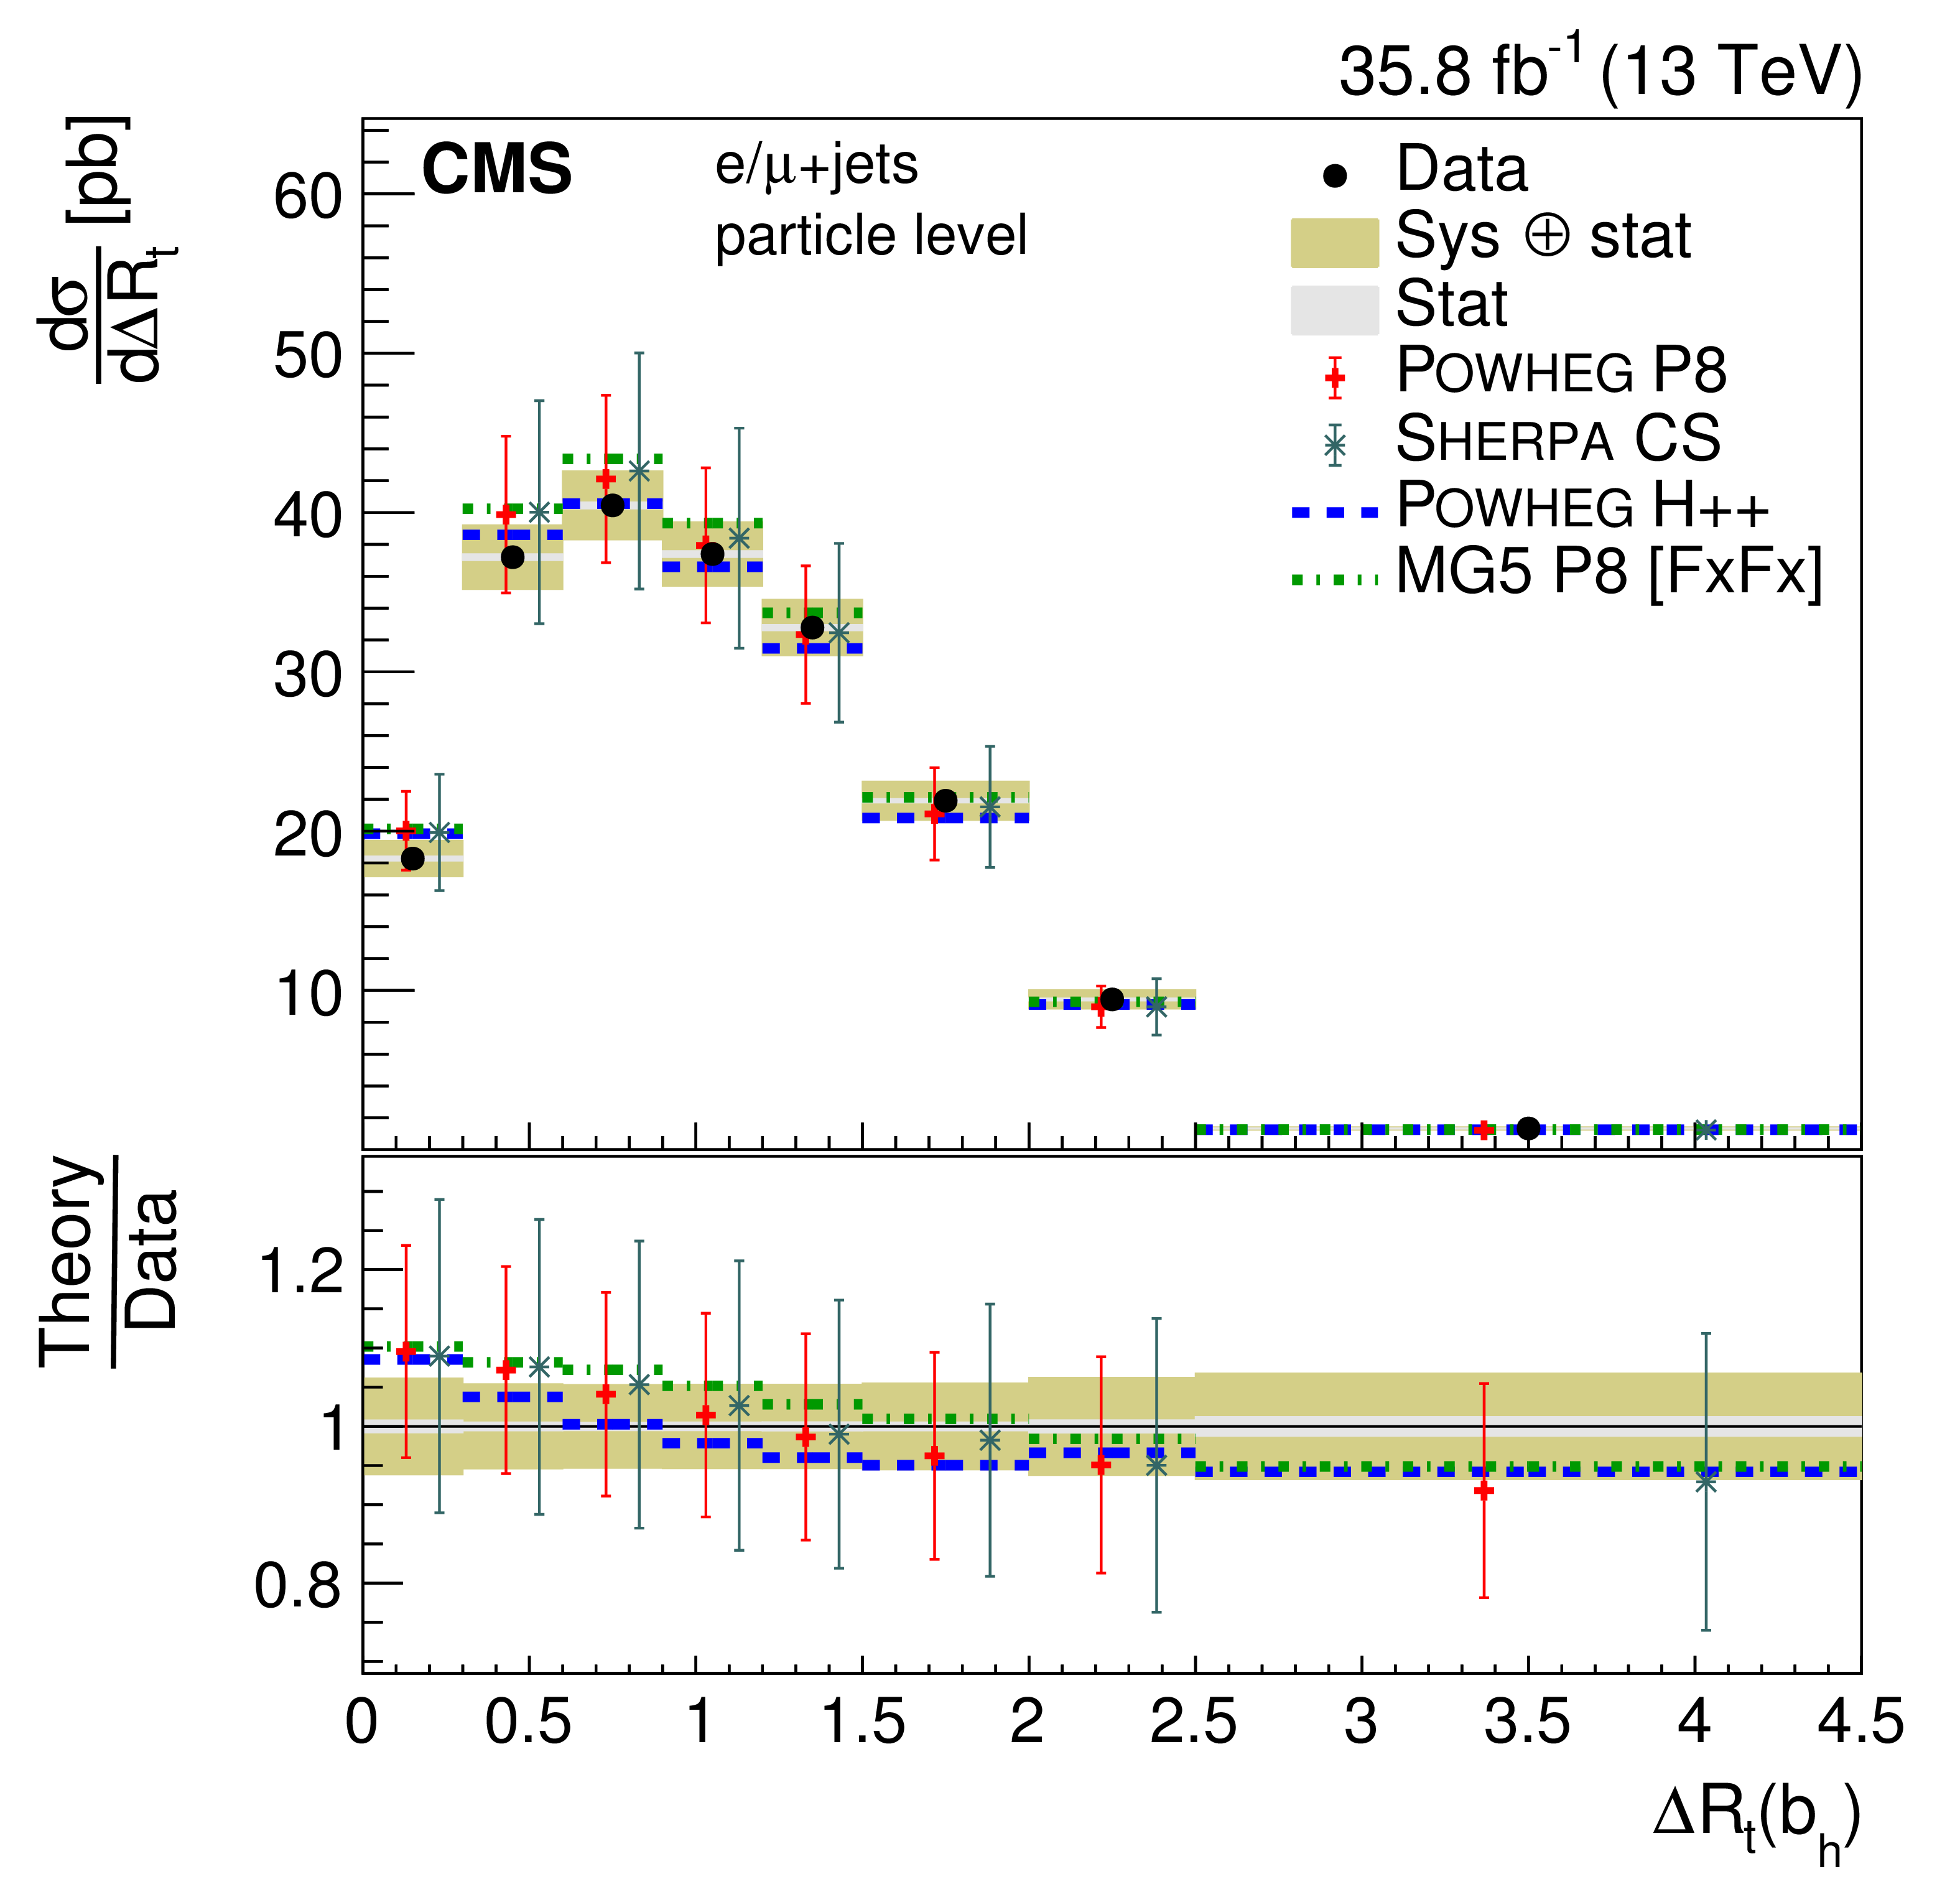
png pdf |
Figure 44-b:
Differential cross section at the particle level as a function of $ {\Delta R_{\mathrm{t}}} $. The upper two rows show the $ {\Delta R_{\mathrm{t}}} $ distributions for the jets in the $ {\mathrm{t} \mathrm{\bar{t}}} $ system, the lower two rows the distribution for additional jets. The data are shown as points with light (dark) bands indicating the statistical (statistical and systematic) uncertainties. The cross sections are compared to the predictions of POWHEG combined with PYTHIA8 (P8) or HERWIG++ (H++) and the multiparton simulations MG5_aMC@NLO (MG5)+PYTHIA8 FxFx and SHERPA. The ratios of the predictions to the measured cross sections are shown at the bottom of each panel. |
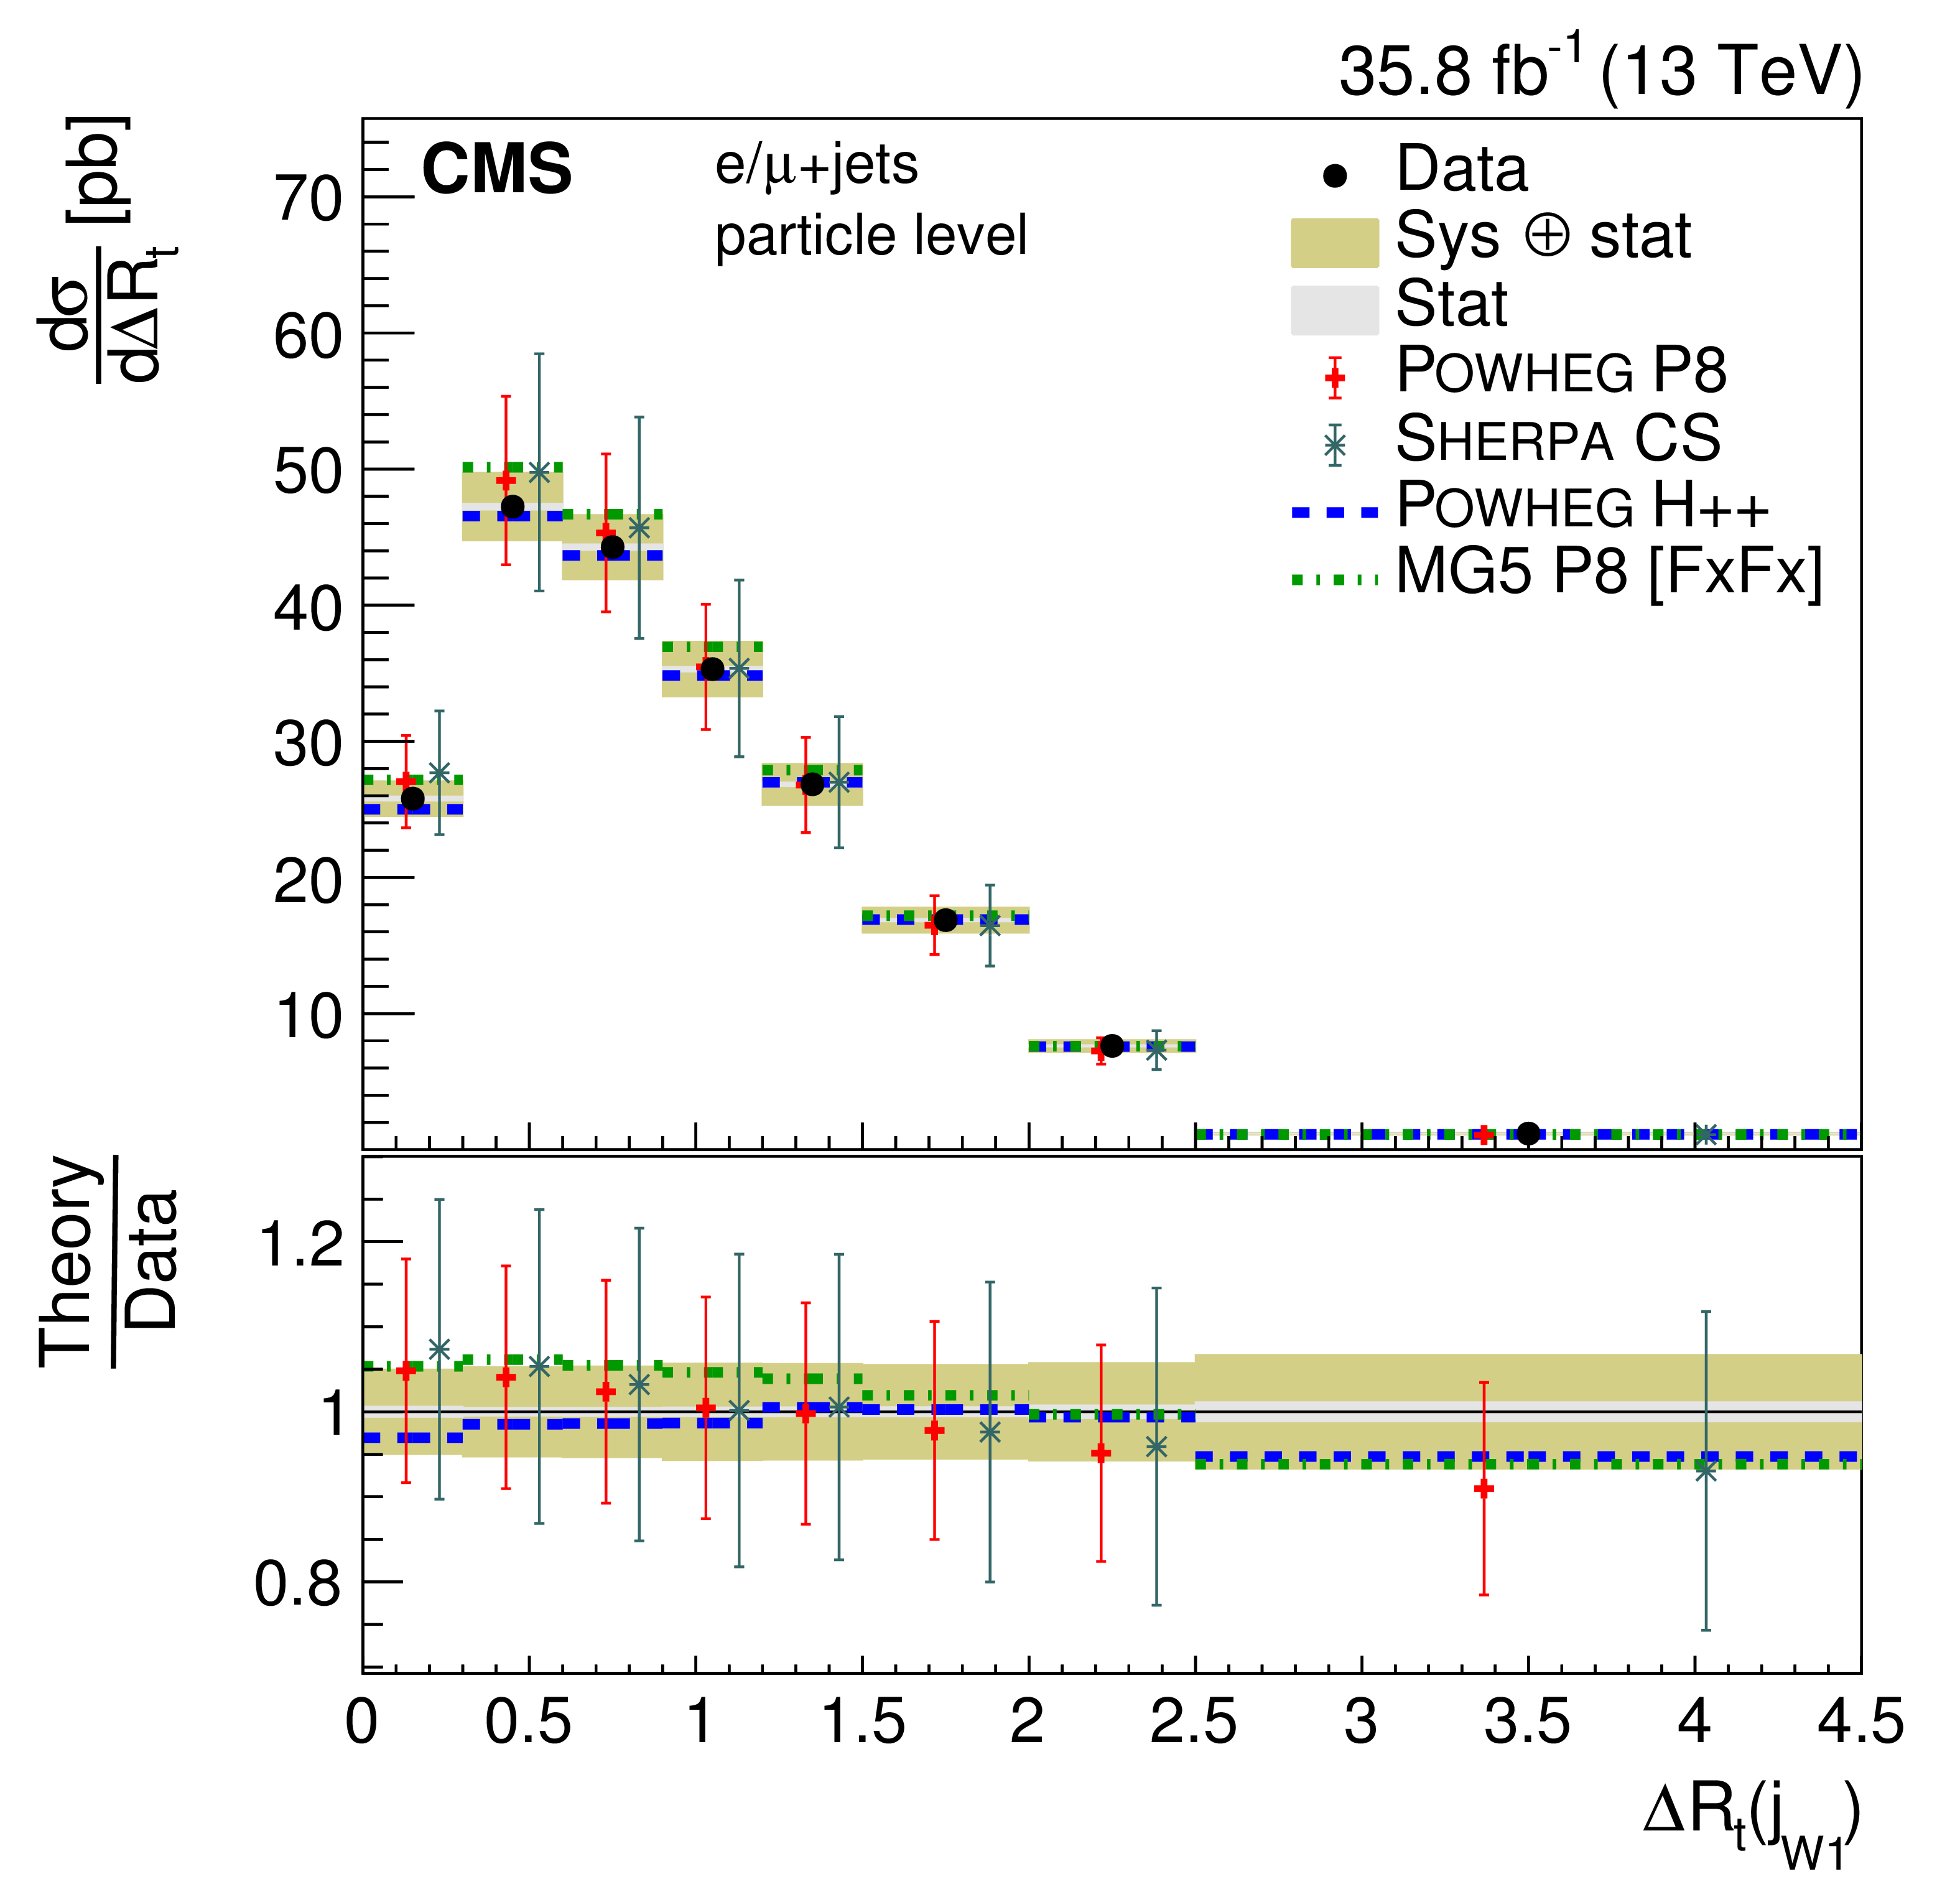
png pdf |
Figure 44-c:
Differential cross section at the particle level as a function of $ {\Delta R_{\mathrm{t}}} $. The upper two rows show the $ {\Delta R_{\mathrm{t}}} $ distributions for the jets in the $ {\mathrm{t} \mathrm{\bar{t}}} $ system, the lower two rows the distribution for additional jets. The data are shown as points with light (dark) bands indicating the statistical (statistical and systematic) uncertainties. The cross sections are compared to the predictions of POWHEG combined with PYTHIA8 (P8) or HERWIG++ (H++) and the multiparton simulations MG5_aMC@NLO (MG5)+PYTHIA8 FxFx and SHERPA. The ratios of the predictions to the measured cross sections are shown at the bottom of each panel. |
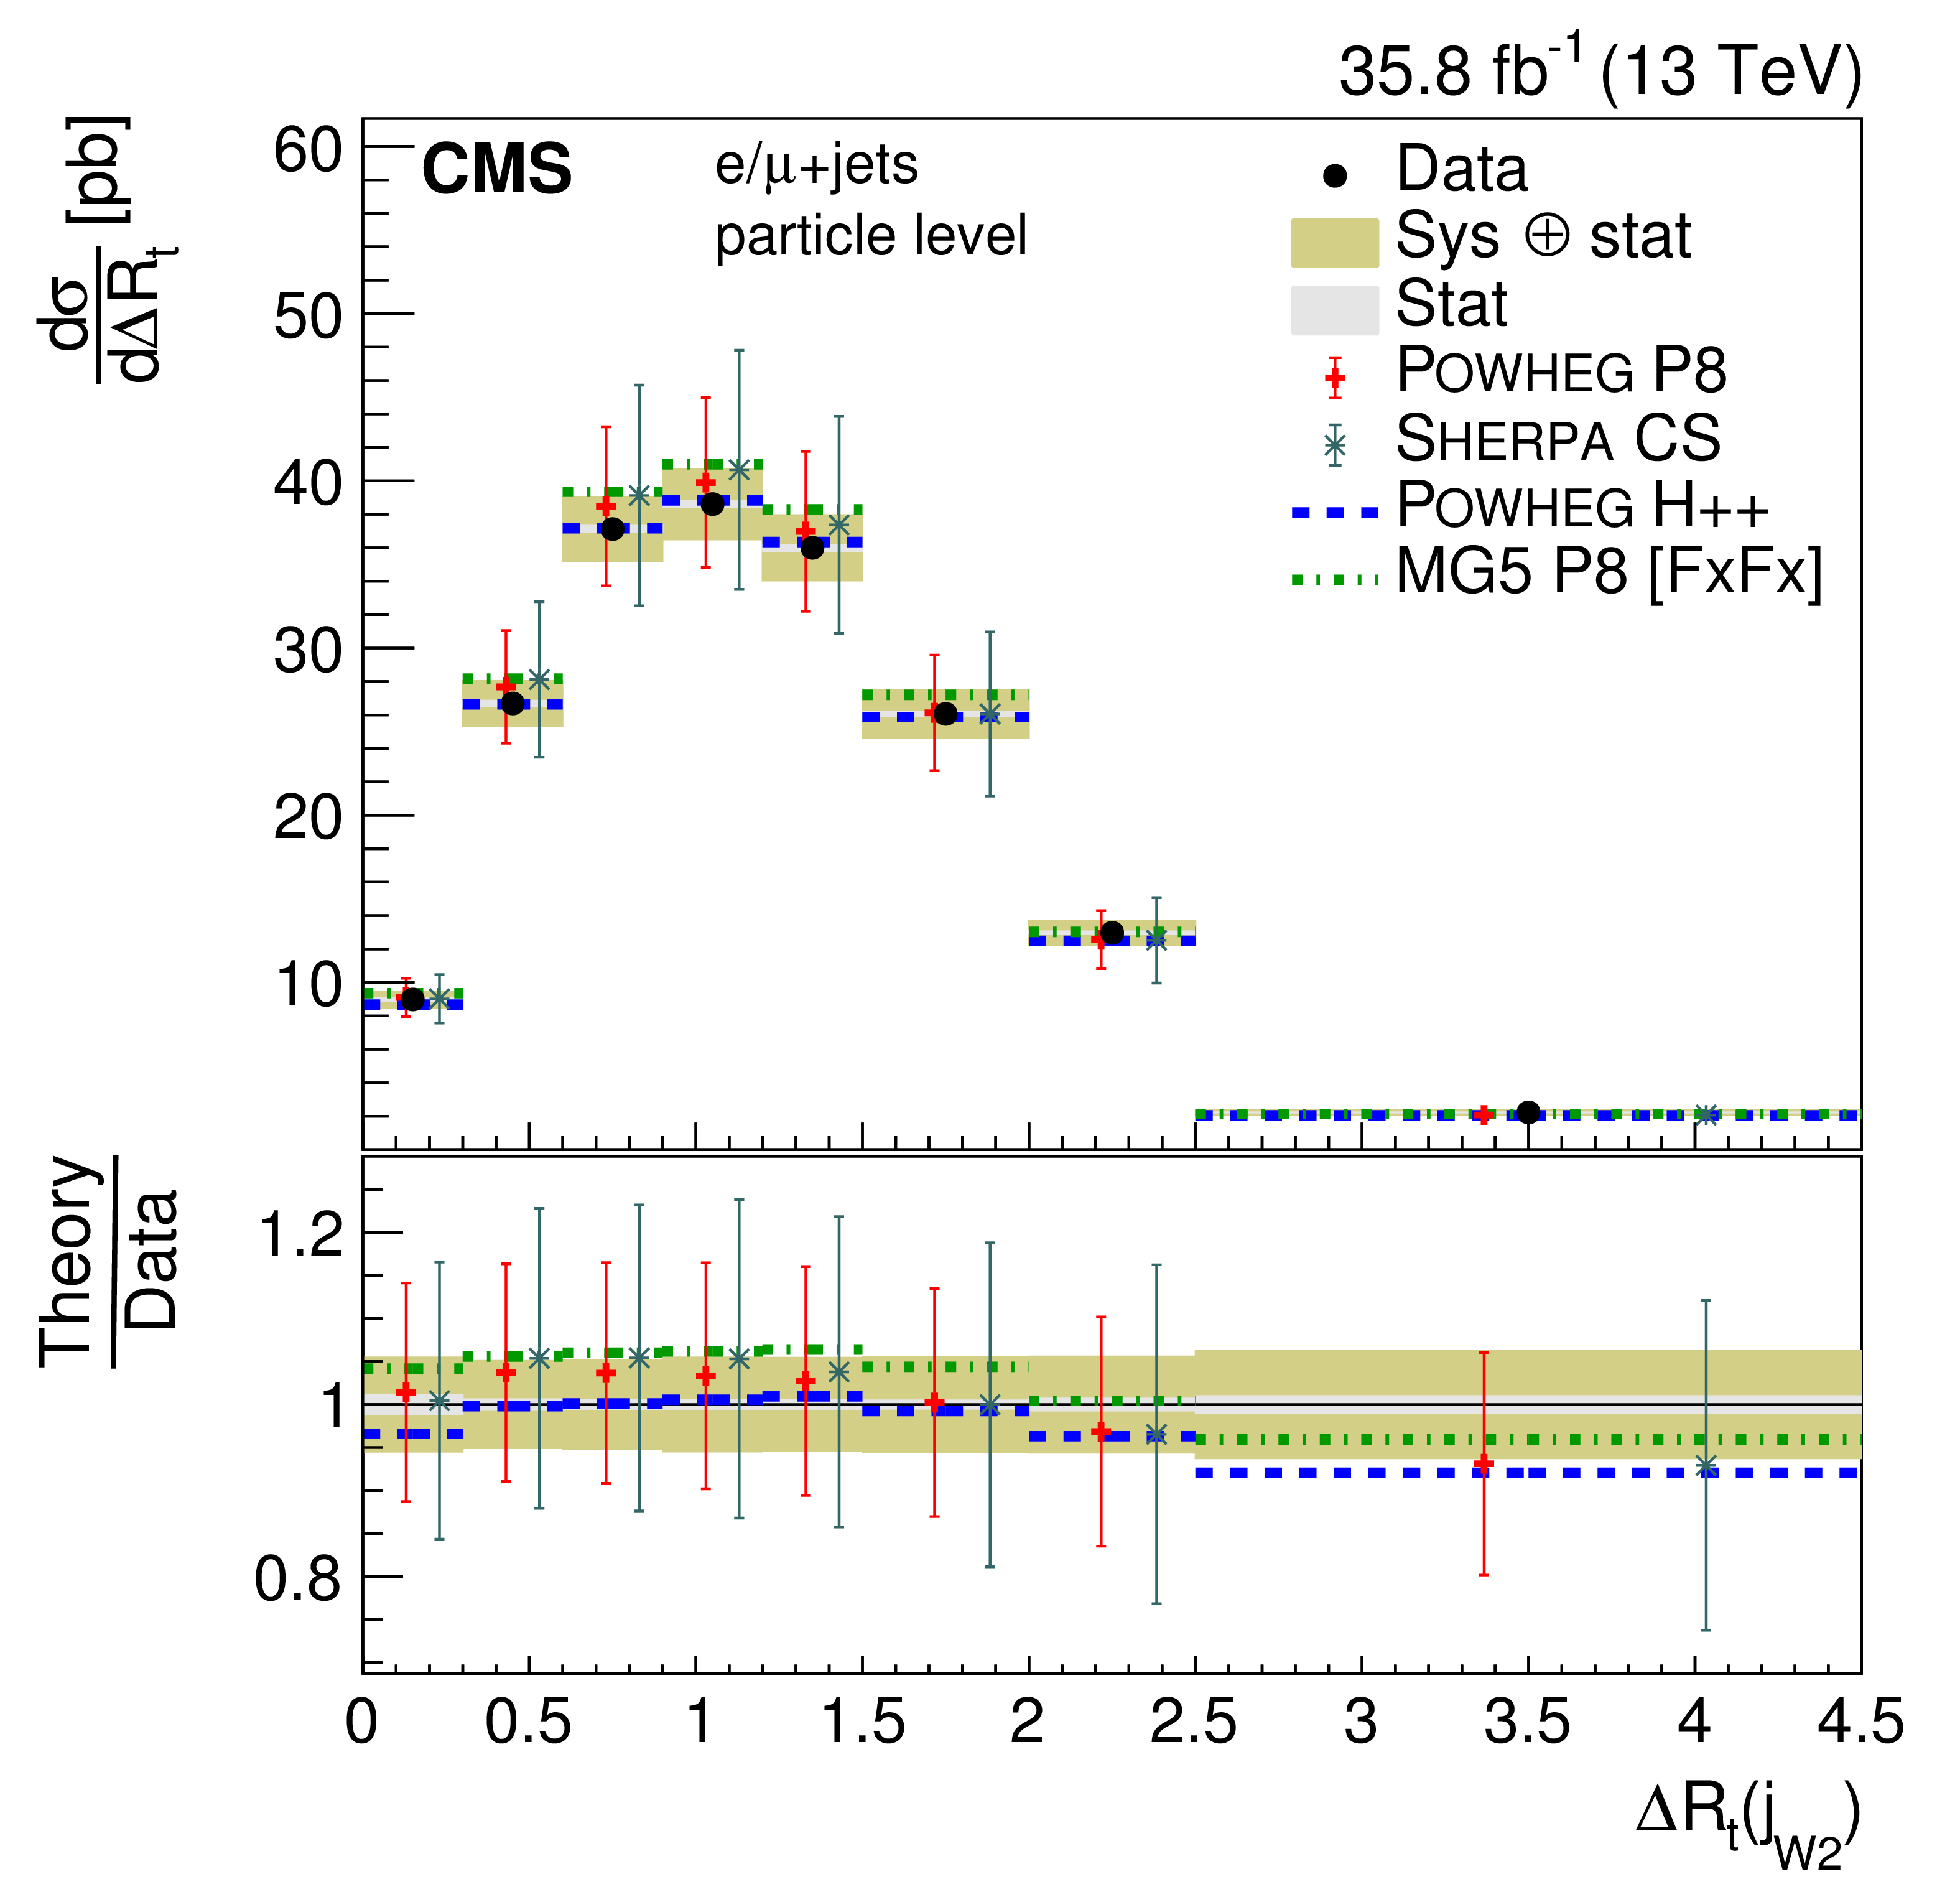
png pdf |
Figure 44-d:
Differential cross section at the particle level as a function of $ {\Delta R_{\mathrm{t}}} $. The upper two rows show the $ {\Delta R_{\mathrm{t}}} $ distributions for the jets in the $ {\mathrm{t} \mathrm{\bar{t}}} $ system, the lower two rows the distribution for additional jets. The data are shown as points with light (dark) bands indicating the statistical (statistical and systematic) uncertainties. The cross sections are compared to the predictions of POWHEG combined with PYTHIA8 (P8) or HERWIG++ (H++) and the multiparton simulations MG5_aMC@NLO (MG5)+PYTHIA8 FxFx and SHERPA. The ratios of the predictions to the measured cross sections are shown at the bottom of each panel. |
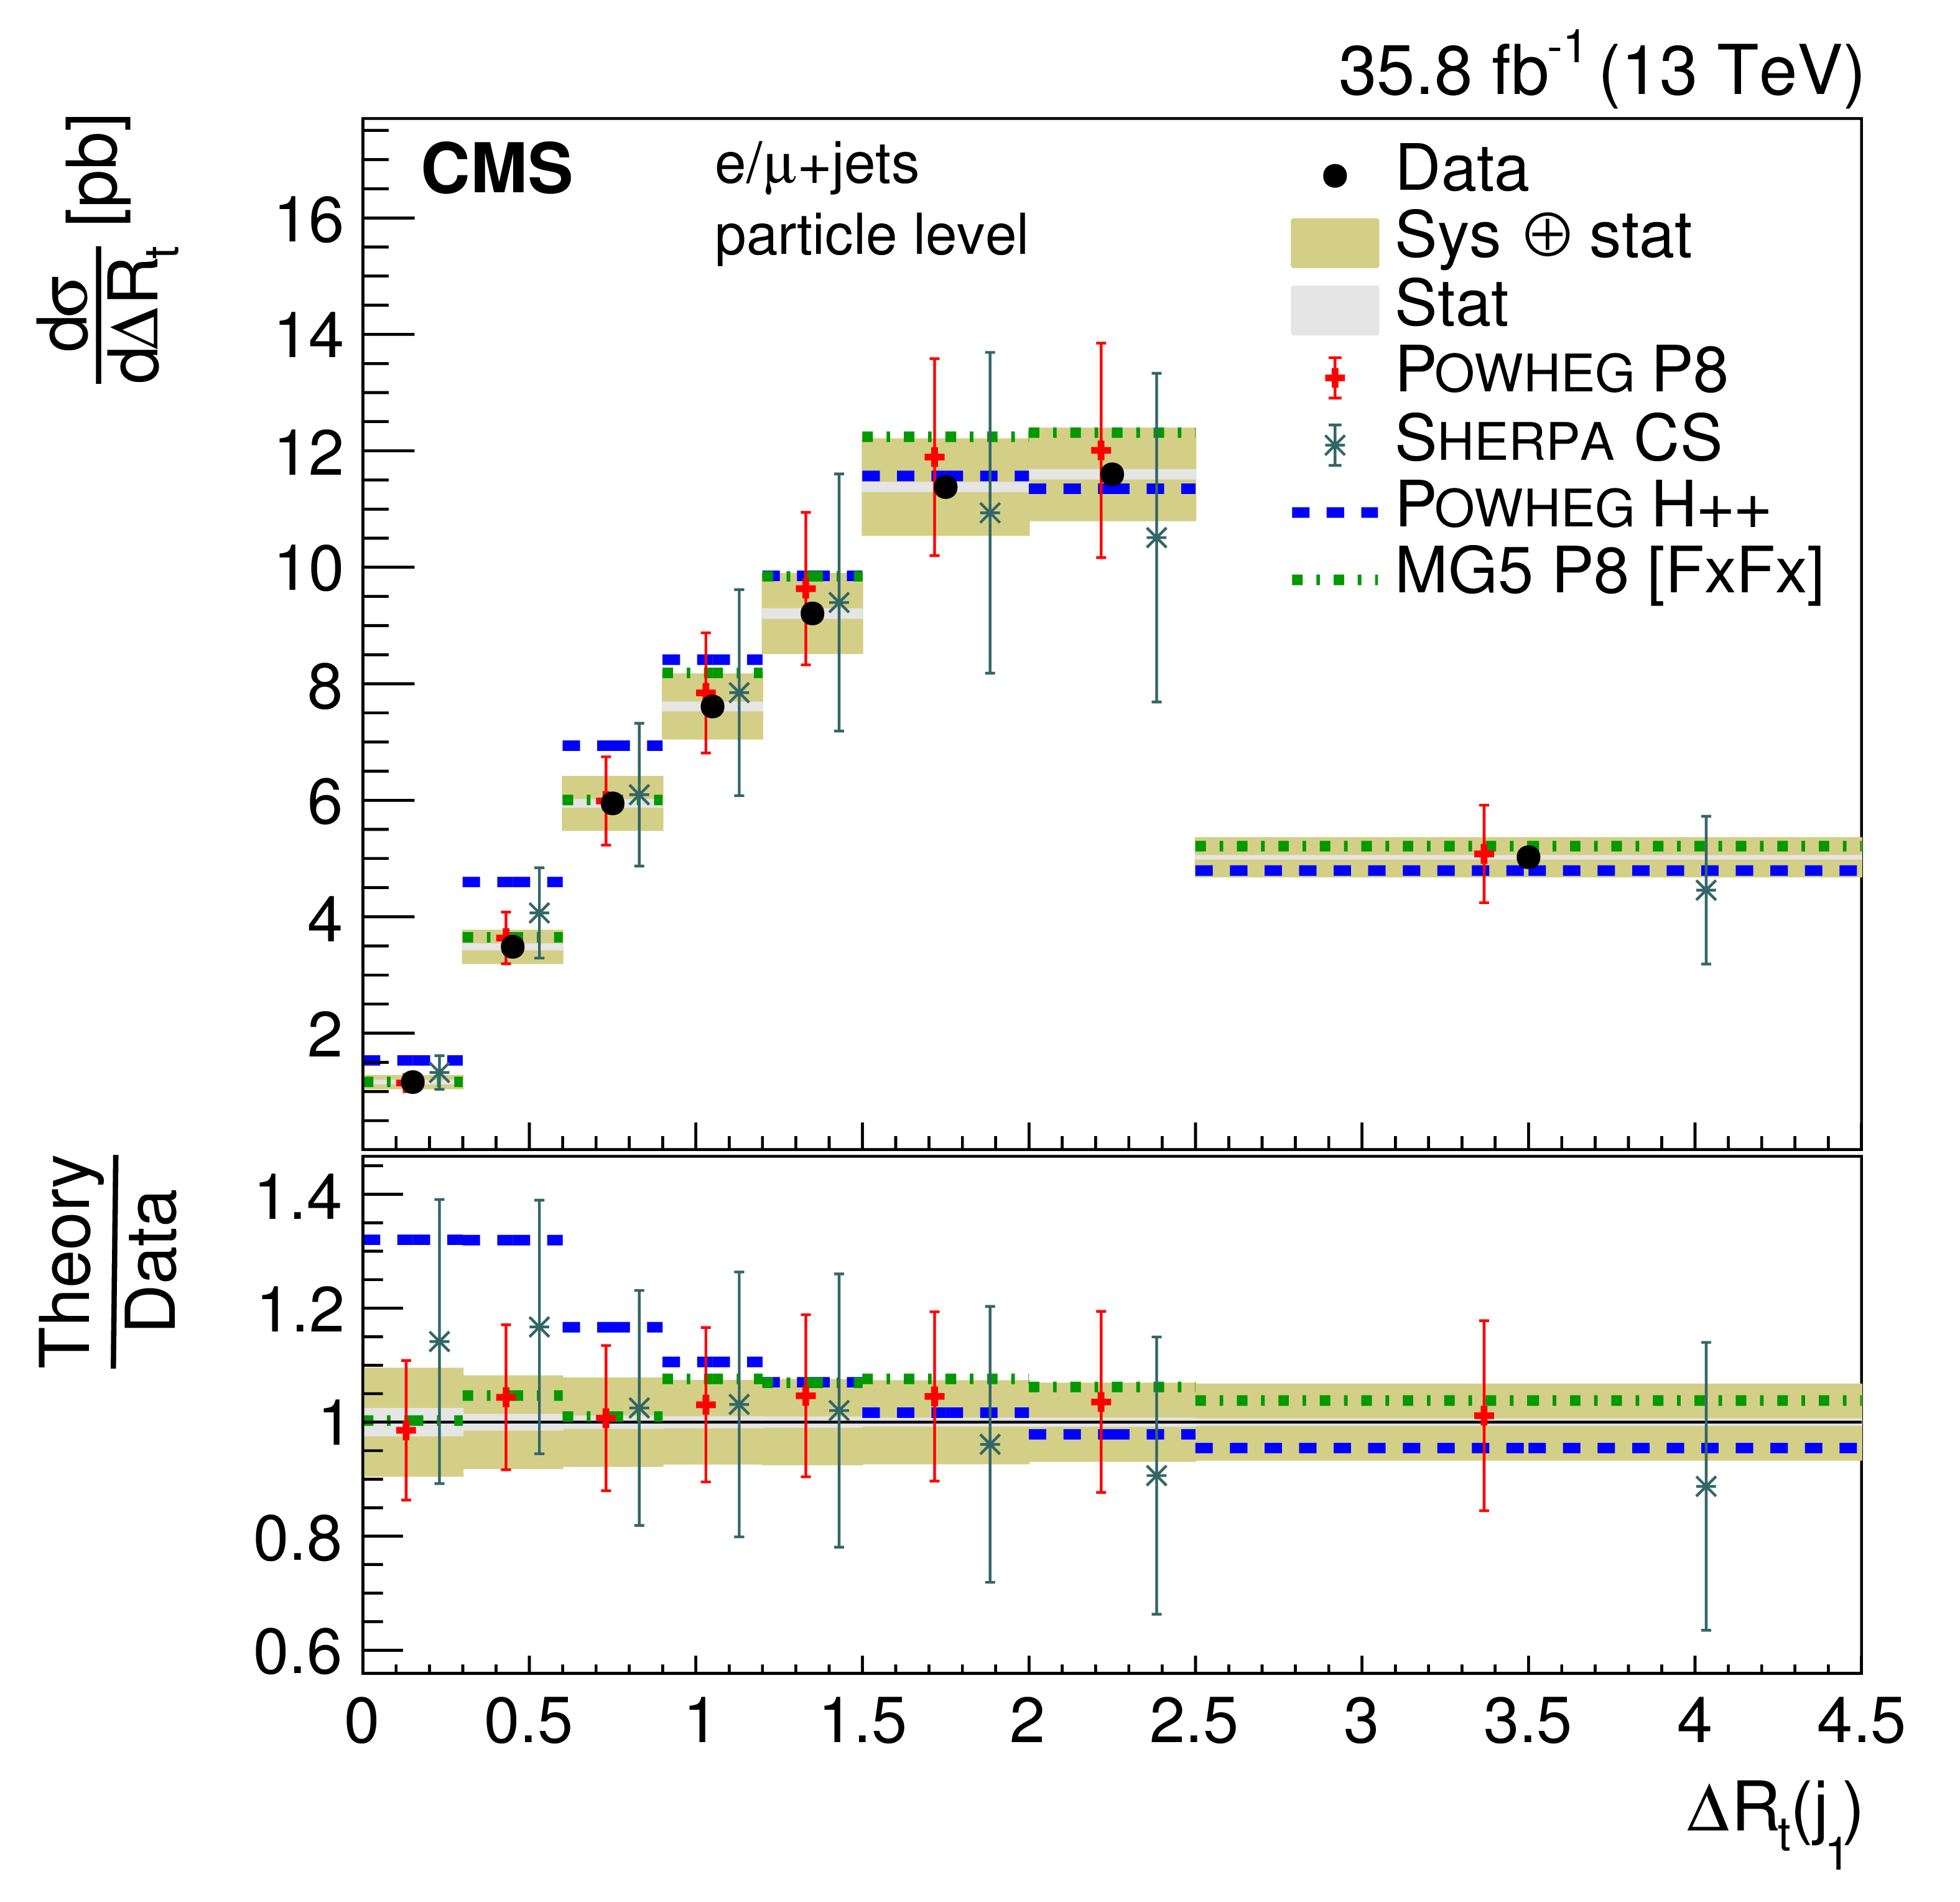
png pdf |
Figure 44-e:
Differential cross section at the particle level as a function of $ {\Delta R_{\mathrm{t}}} $. The upper two rows show the $ {\Delta R_{\mathrm{t}}} $ distributions for the jets in the $ {\mathrm{t} \mathrm{\bar{t}}} $ system, the lower two rows the distribution for additional jets. The data are shown as points with light (dark) bands indicating the statistical (statistical and systematic) uncertainties. The cross sections are compared to the predictions of POWHEG combined with PYTHIA8 (P8) or HERWIG++ (H++) and the multiparton simulations MG5_aMC@NLO (MG5)+PYTHIA8 FxFx and SHERPA. The ratios of the predictions to the measured cross sections are shown at the bottom of each panel. |
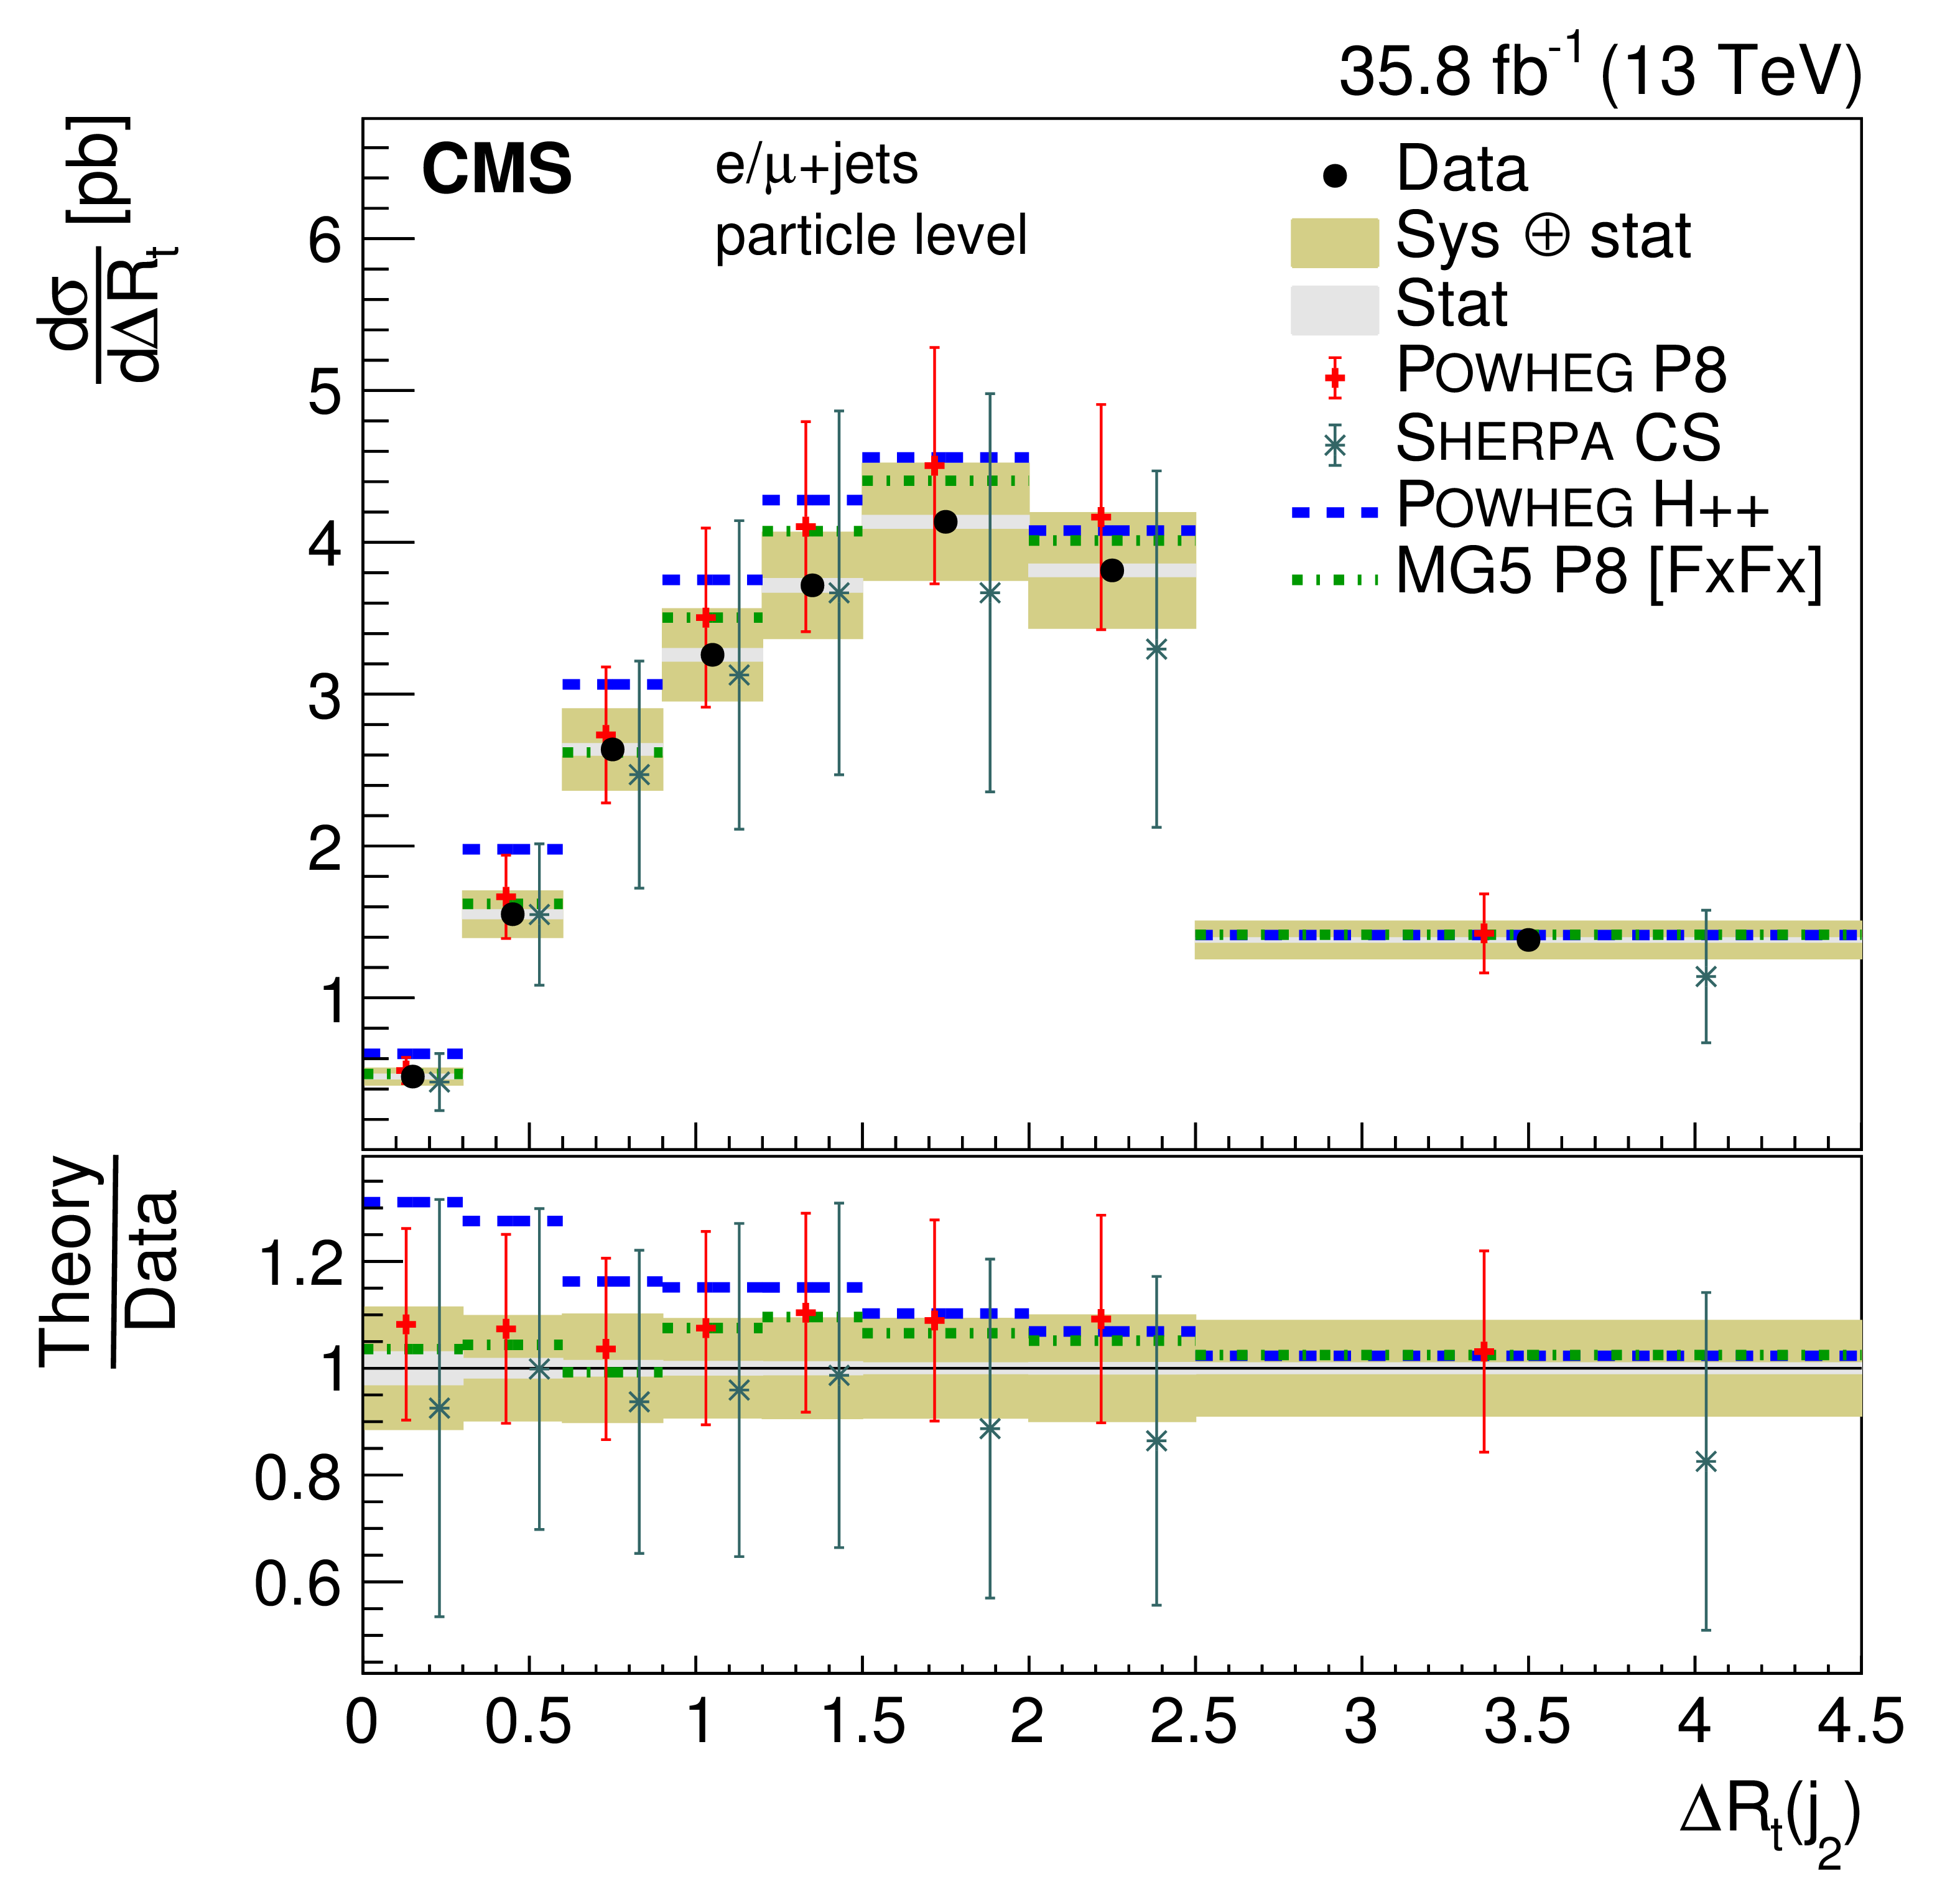
png pdf |
Figure 44-f:
Differential cross section at the particle level as a function of $ {\Delta R_{\mathrm{t}}} $. The upper two rows show the $ {\Delta R_{\mathrm{t}}} $ distributions for the jets in the $ {\mathrm{t} \mathrm{\bar{t}}} $ system, the lower two rows the distribution for additional jets. The data are shown as points with light (dark) bands indicating the statistical (statistical and systematic) uncertainties. The cross sections are compared to the predictions of POWHEG combined with PYTHIA8 (P8) or HERWIG++ (H++) and the multiparton simulations MG5_aMC@NLO (MG5)+PYTHIA8 FxFx and SHERPA. The ratios of the predictions to the measured cross sections are shown at the bottom of each panel. |

png pdf |
Figure 44-g:
Differential cross section at the particle level as a function of $ {\Delta R_{\mathrm{t}}} $. The upper two rows show the $ {\Delta R_{\mathrm{t}}} $ distributions for the jets in the $ {\mathrm{t} \mathrm{\bar{t}}} $ system, the lower two rows the distribution for additional jets. The data are shown as points with light (dark) bands indicating the statistical (statistical and systematic) uncertainties. The cross sections are compared to the predictions of POWHEG combined with PYTHIA8 (P8) or HERWIG++ (H++) and the multiparton simulations MG5_aMC@NLO (MG5)+PYTHIA8 FxFx and SHERPA. The ratios of the predictions to the measured cross sections are shown at the bottom of each panel. |
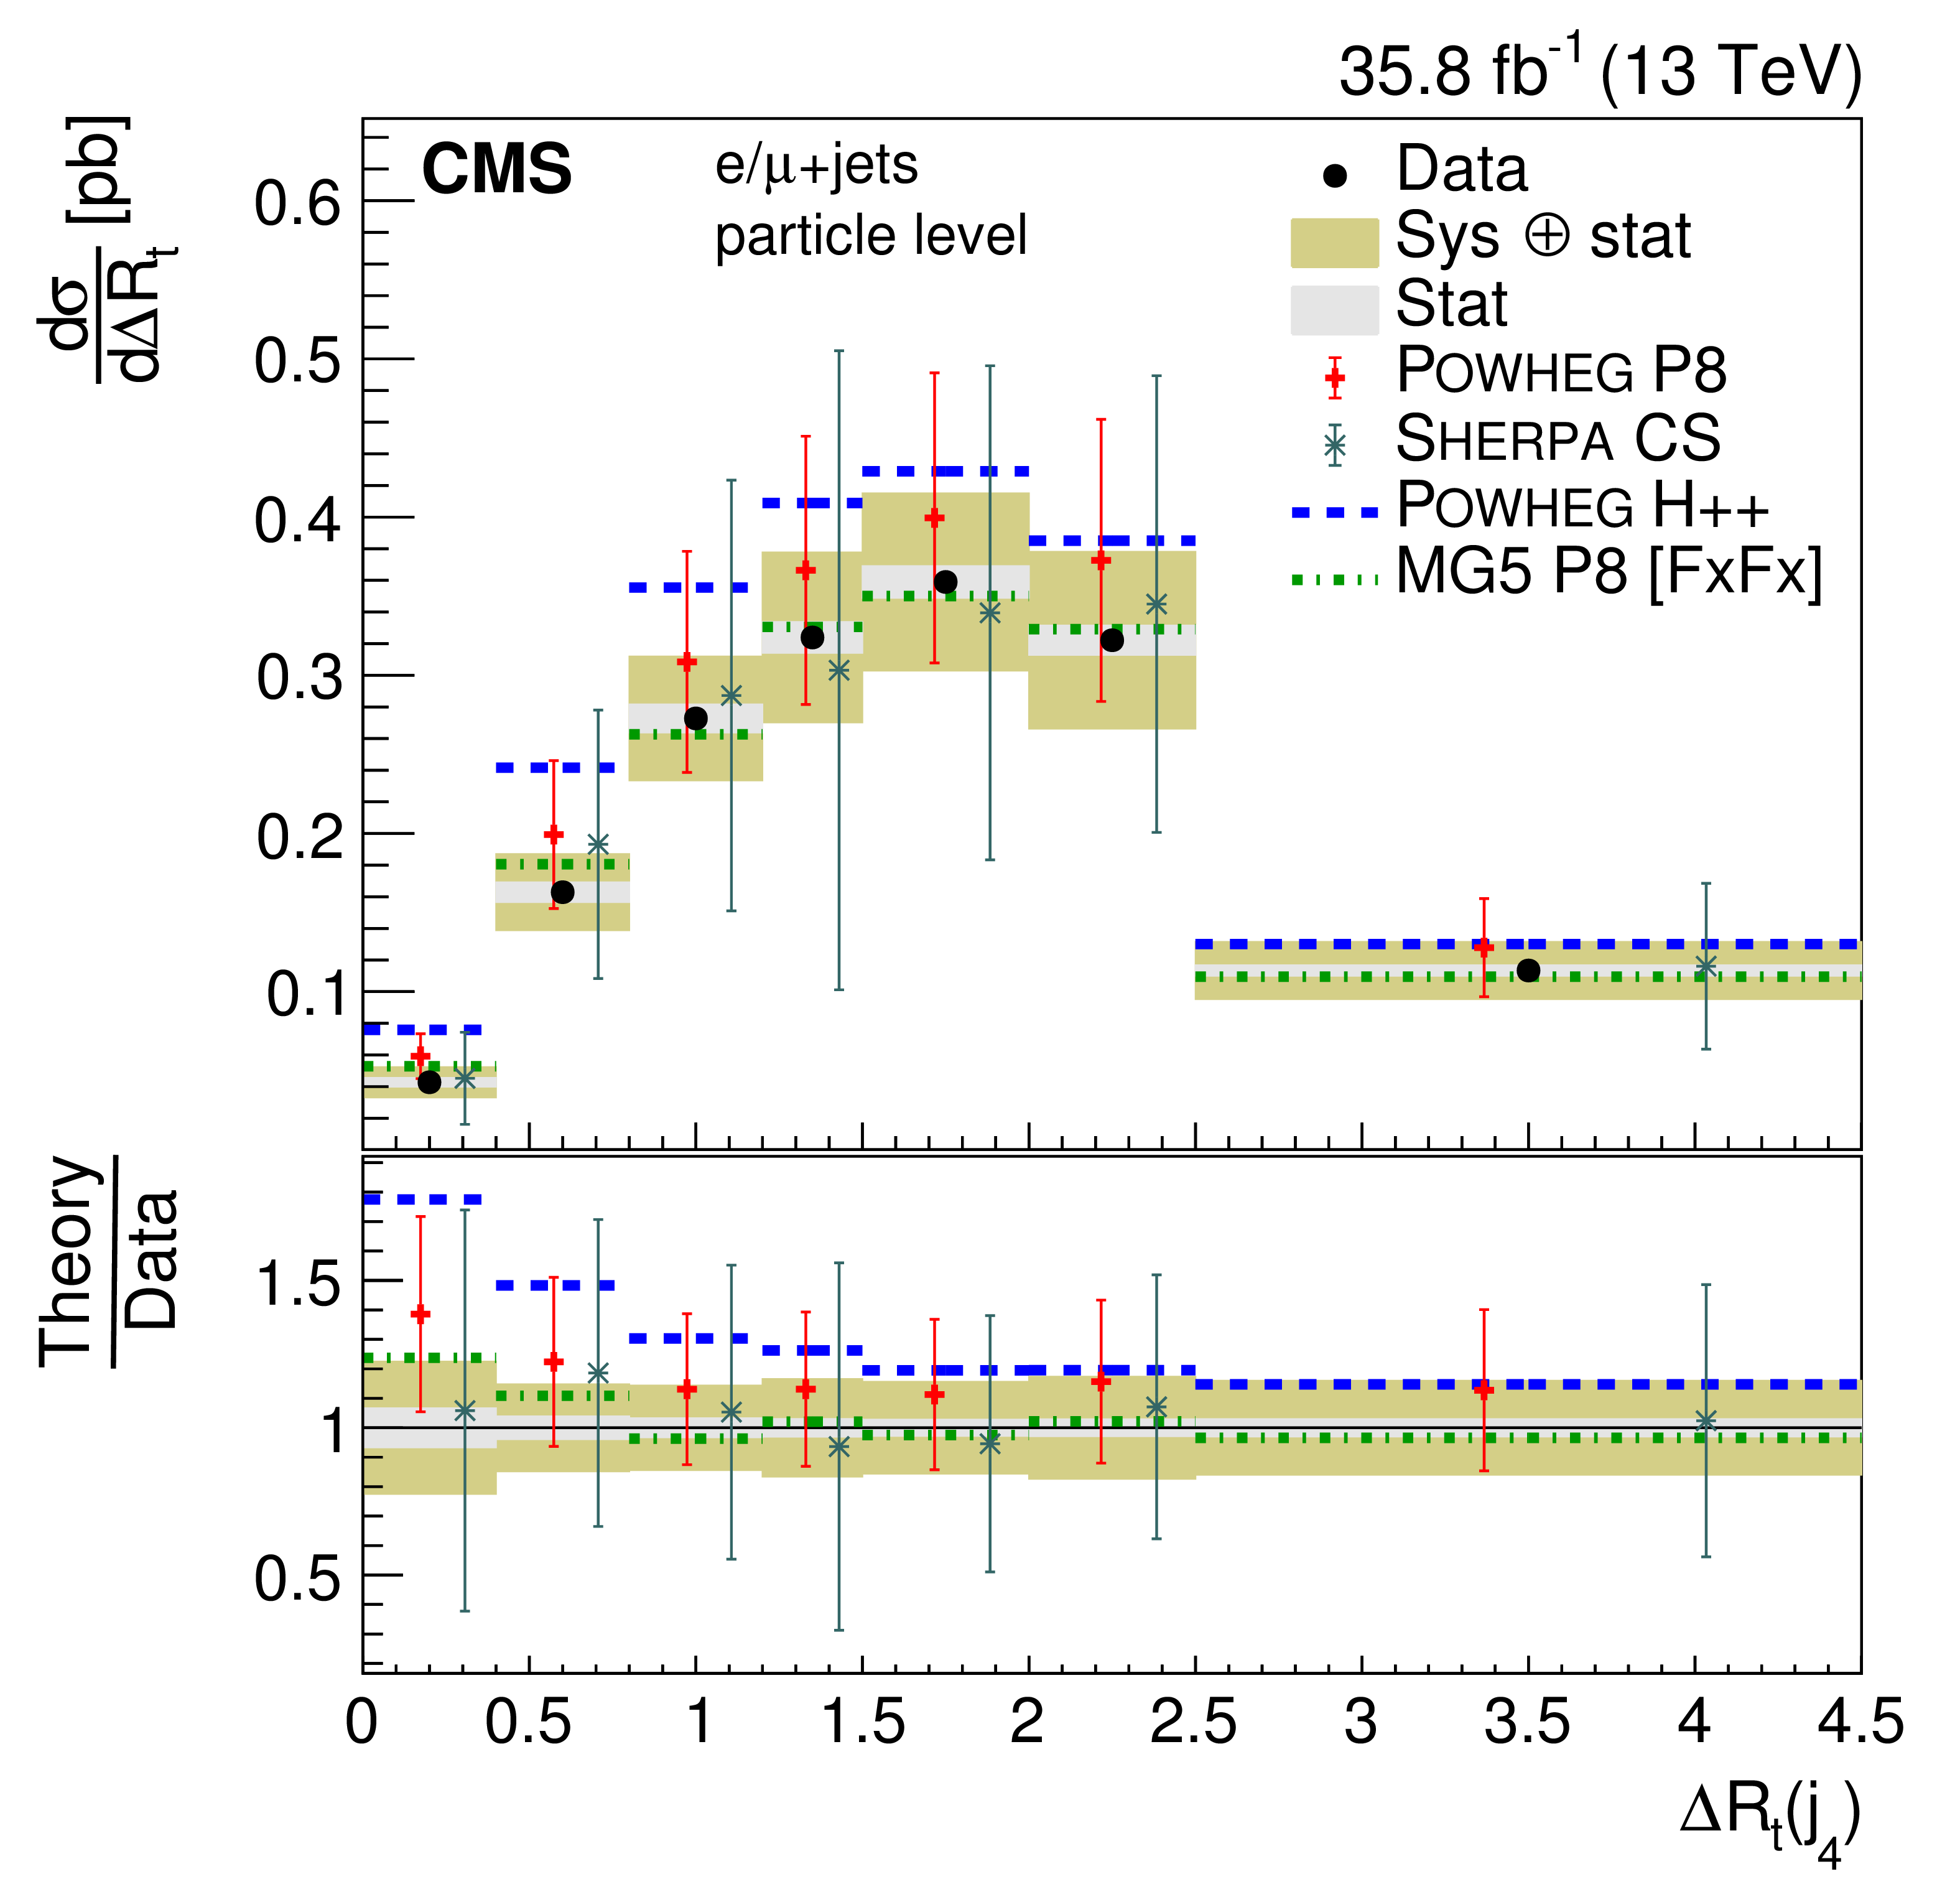
png pdf |
Figure 44-h:
Differential cross section at the particle level as a function of $ {\Delta R_{\mathrm{t}}} $. The upper two rows show the $ {\Delta R_{\mathrm{t}}} $ distributions for the jets in the $ {\mathrm{t} \mathrm{\bar{t}}} $ system, the lower two rows the distribution for additional jets. The data are shown as points with light (dark) bands indicating the statistical (statistical and systematic) uncertainties. The cross sections are compared to the predictions of POWHEG combined with PYTHIA8 (P8) or HERWIG++ (H++) and the multiparton simulations MG5_aMC@NLO (MG5)+PYTHIA8 FxFx and SHERPA. The ratios of the predictions to the measured cross sections are shown at the bottom of each panel. |
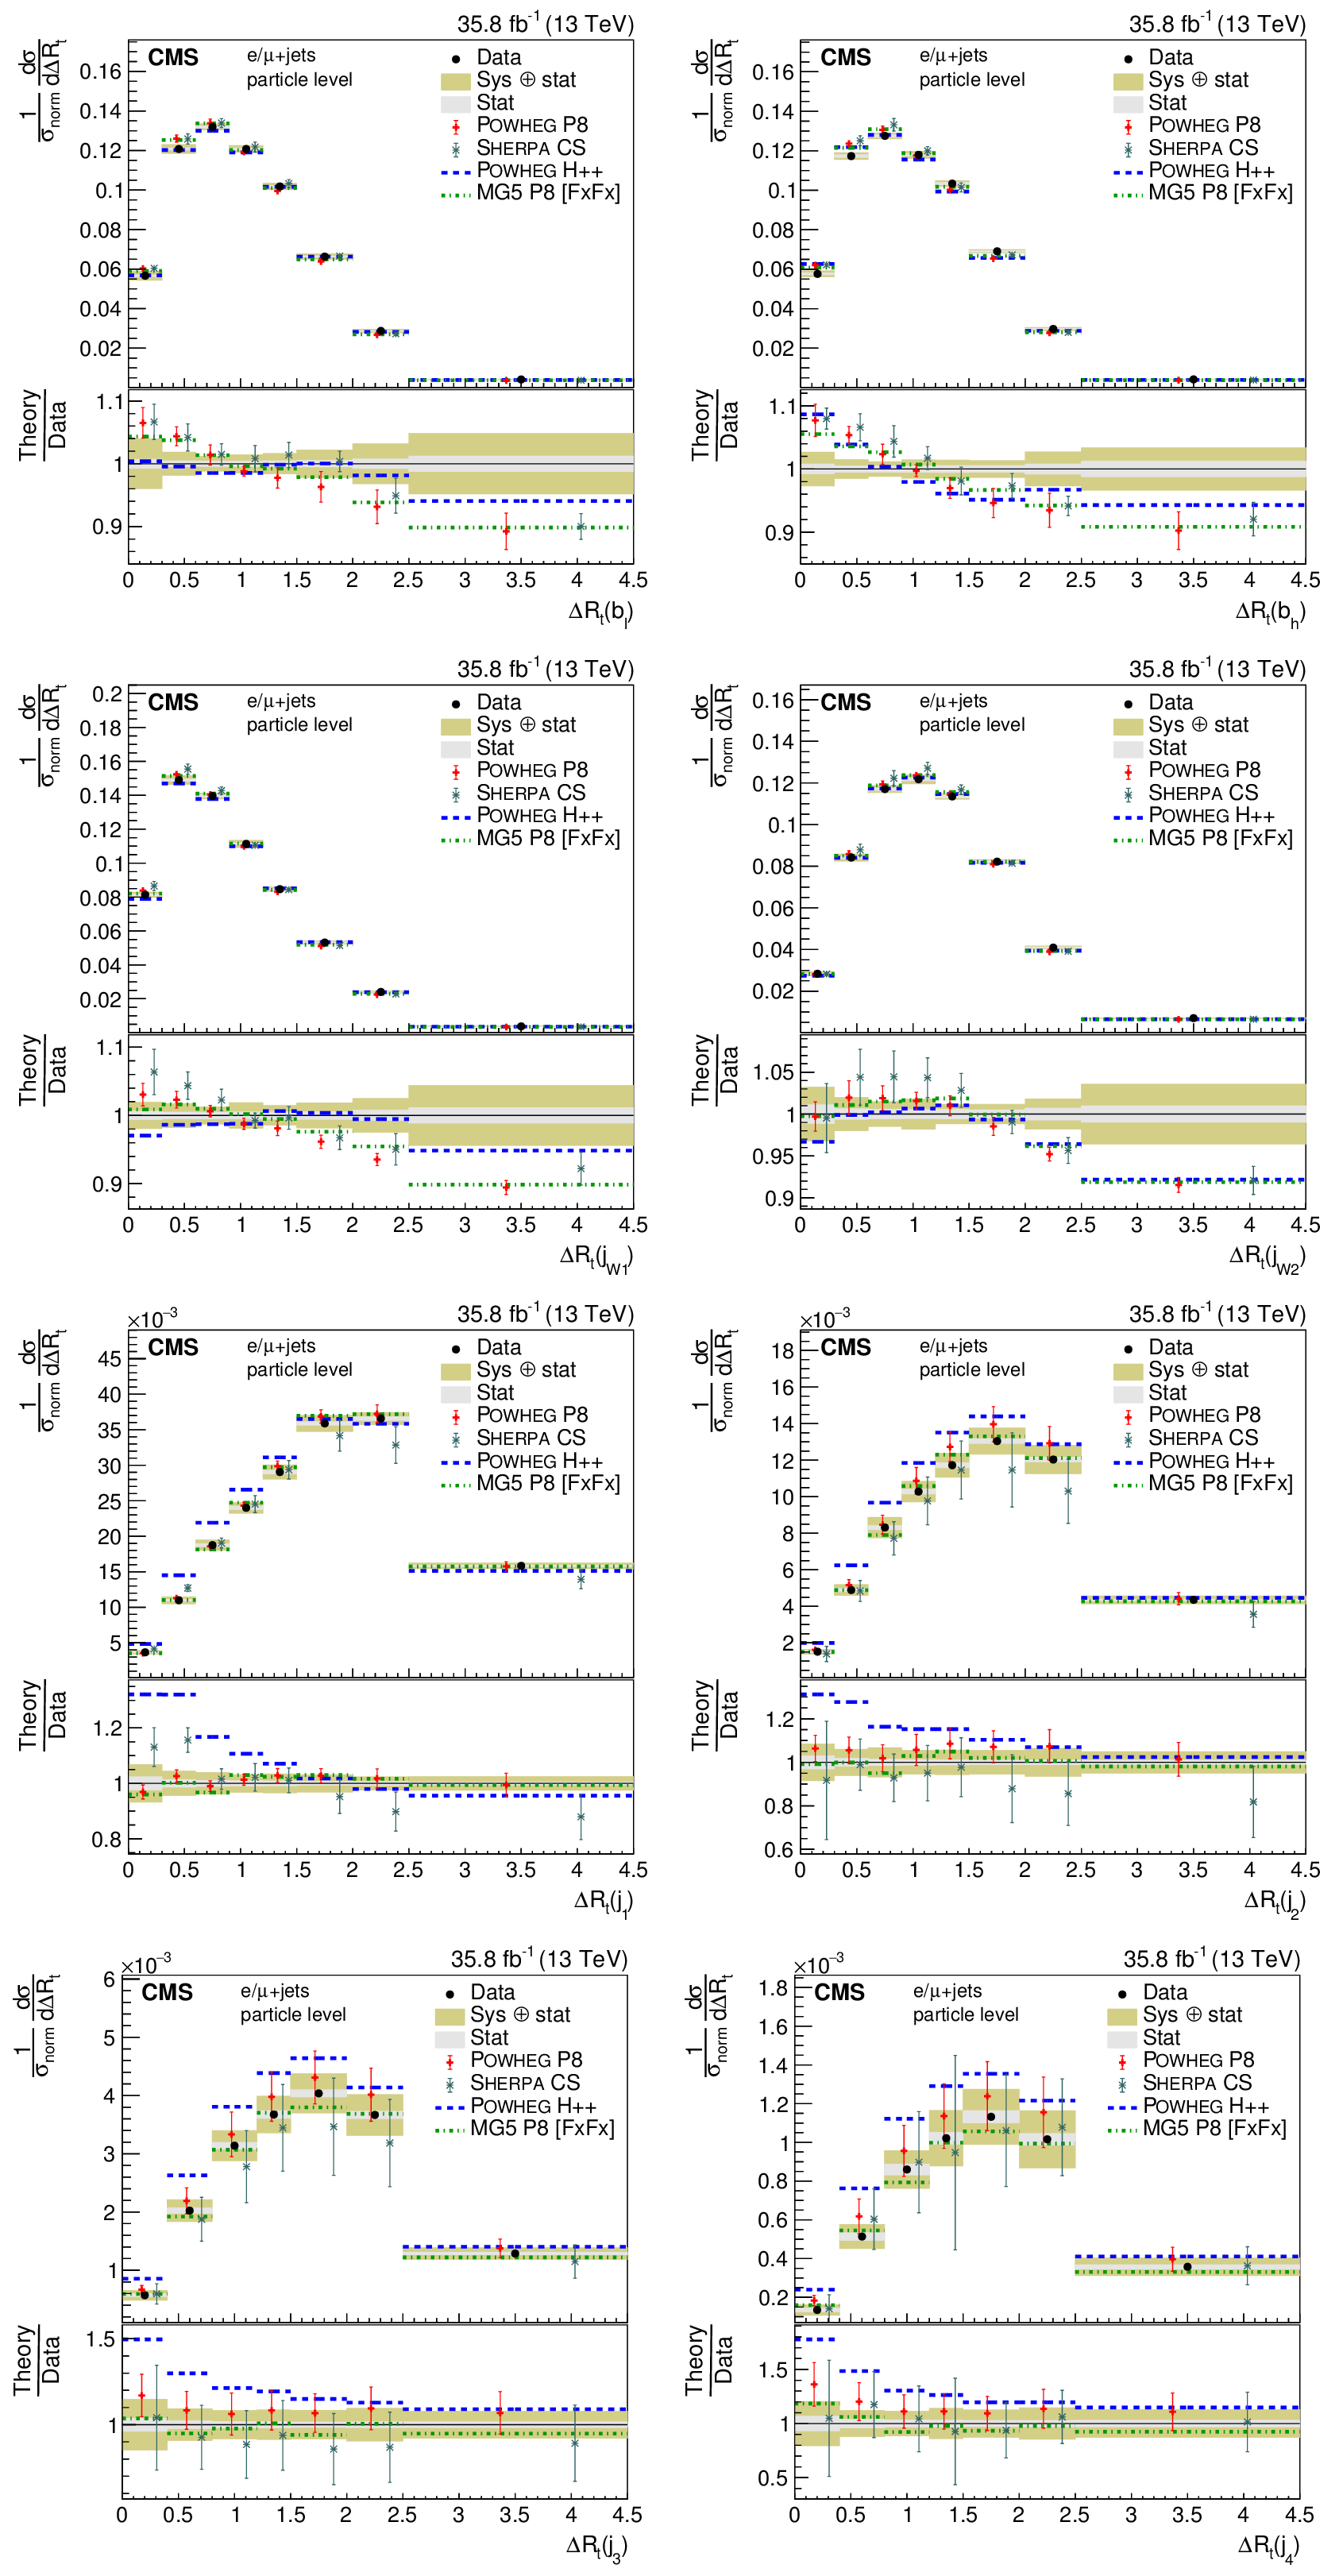
png pdf |
Figure 45:
Normalized differential cross section at the particle level as a function of $ {\Delta R_{\mathrm{t}}} $. The upper two rows show the $ {\Delta R_{\mathrm{t}}} $ distributions for the jets in the $ {\mathrm{t} \mathrm{\bar{t}}} $ system, the lower two rows the distribution for additional jets. The data are shown as points with light (dark) bands indicating the statistical (statistical and systematic) uncertainties. The cross sections are compared to the predictions of POWHEG combined with PYTHIA8 (P8) or HERWIG++ (H++) and the multiparton simulations MG5_aMC@NLO (MG5)+PYTHIA8 FxFx and SHERPA. The ratios of the predictions to the measured cross sections are shown at the bottom of each panel. |
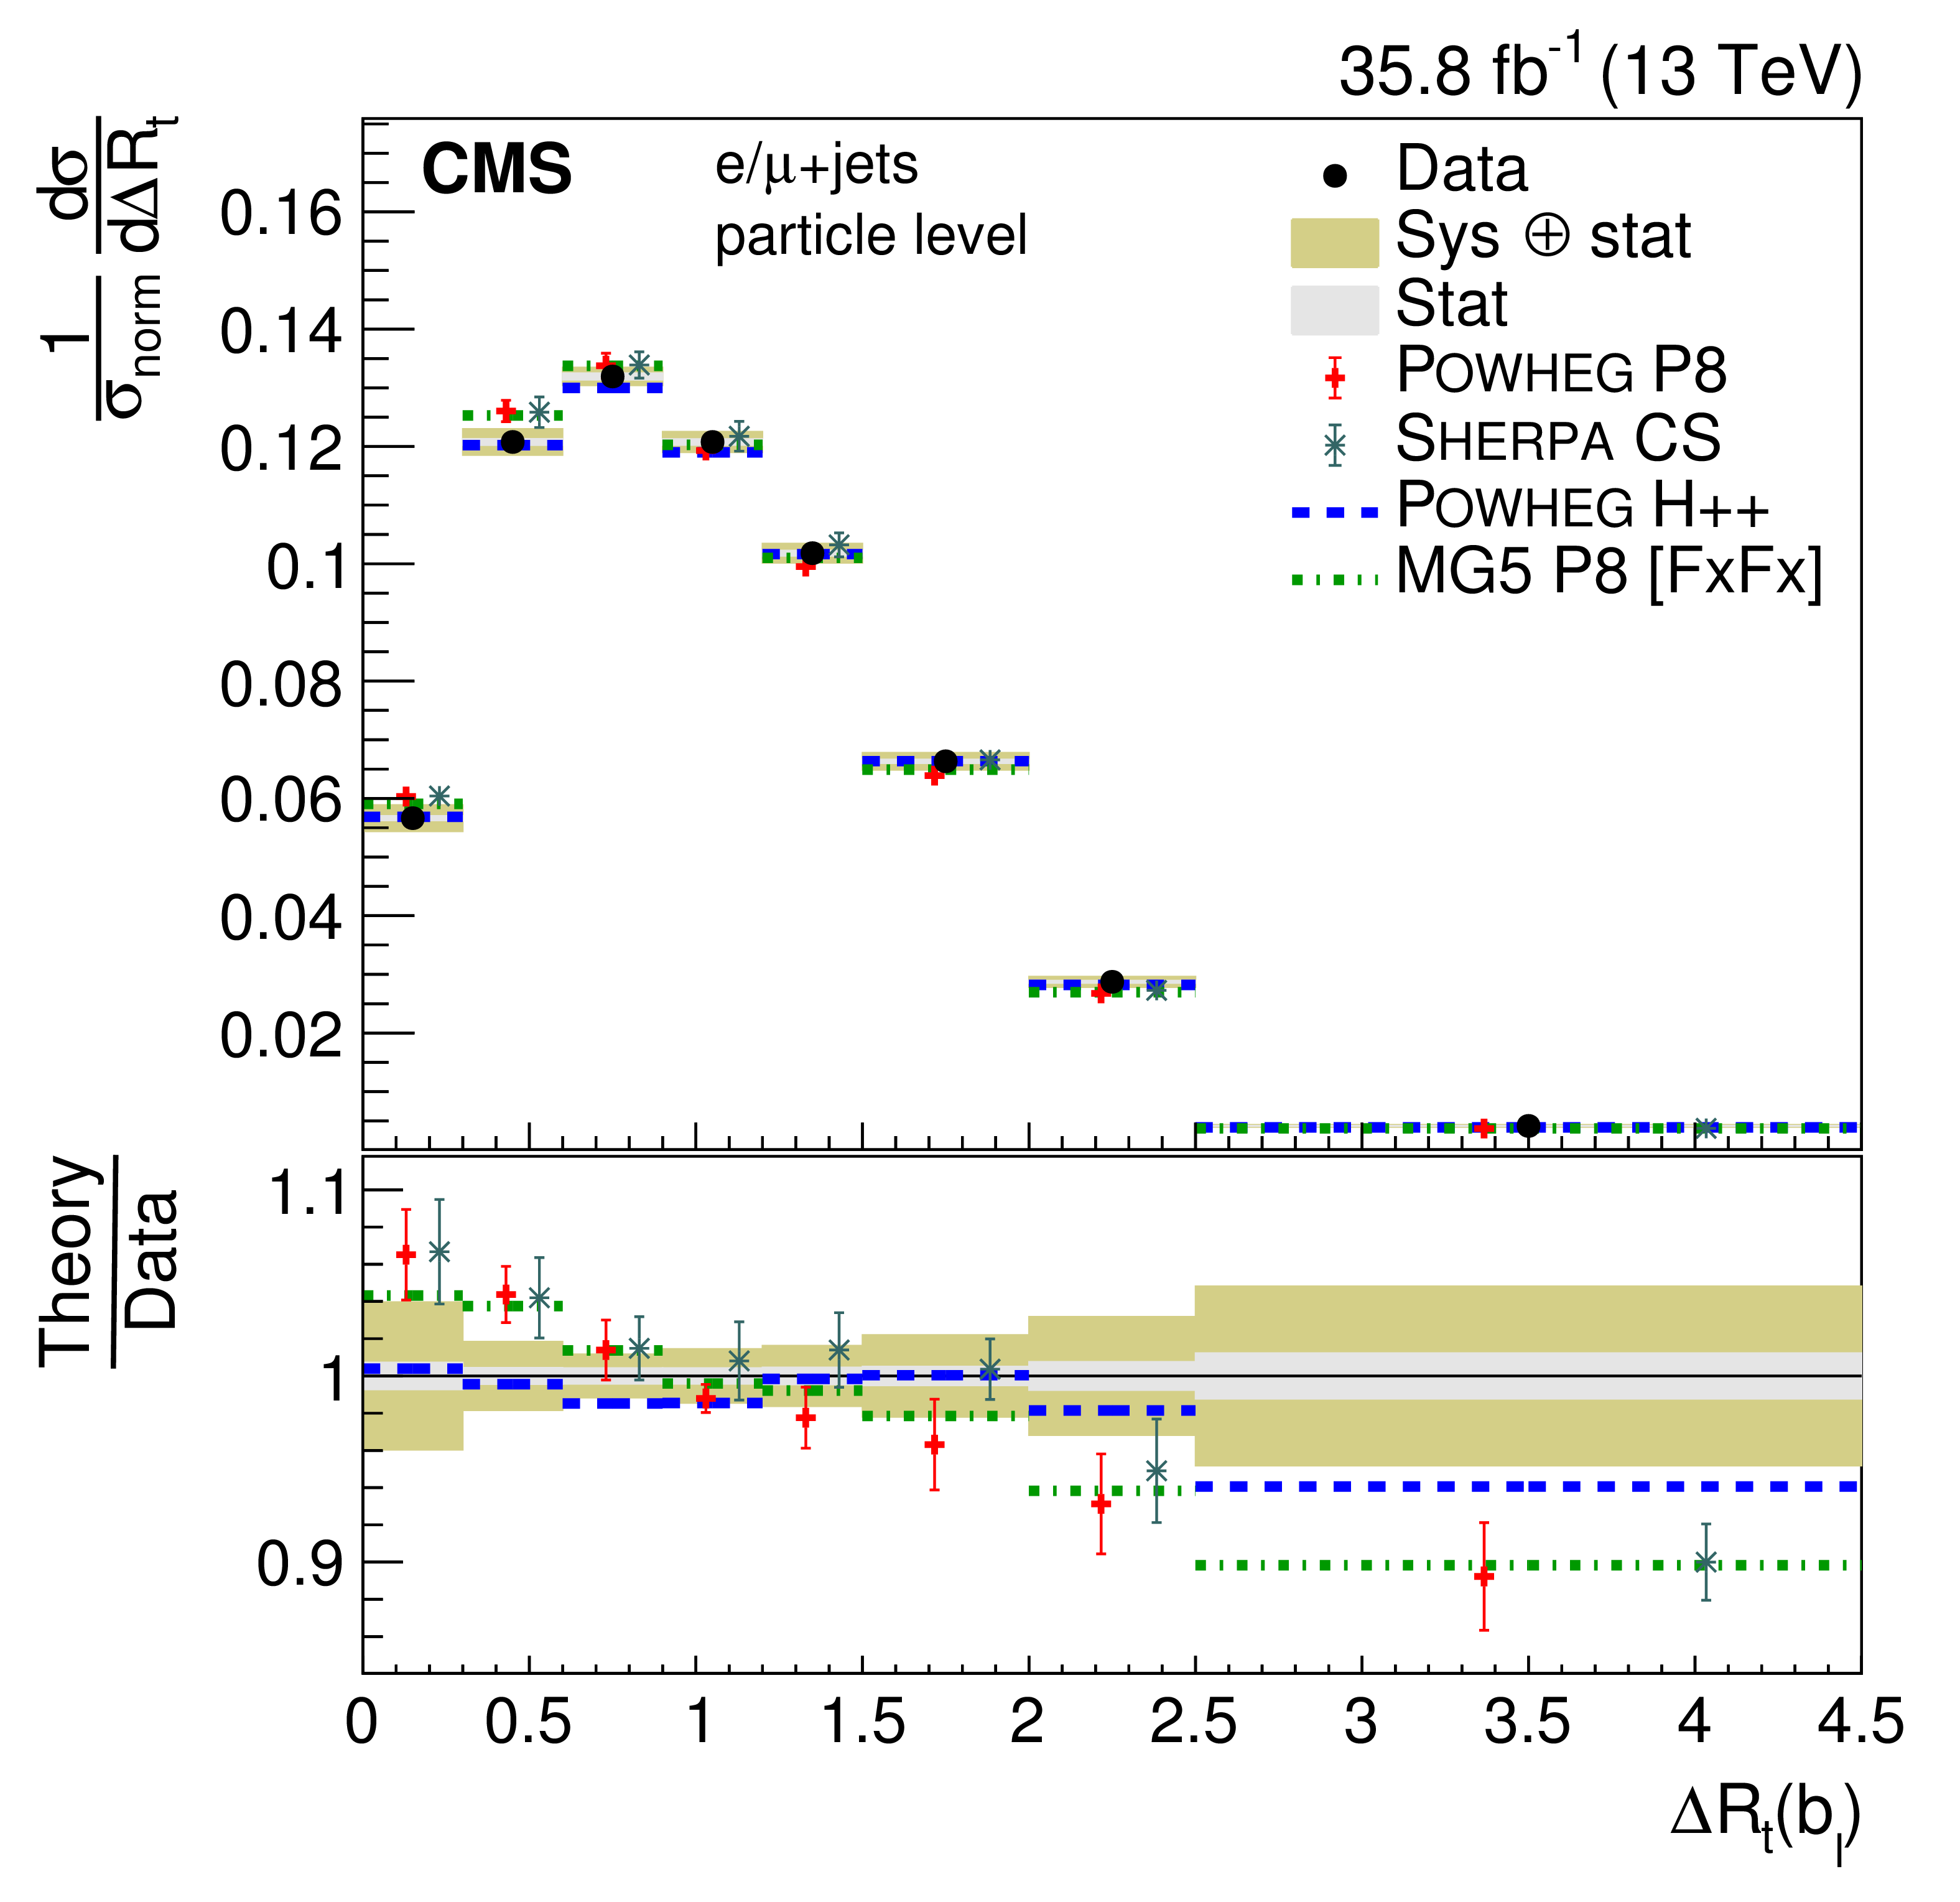
png pdf |
Figure 45-a:
Normalized differential cross section at the particle level as a function of $ {\Delta R_{\mathrm{t}}} $. The upper two rows show the $ {\Delta R_{\mathrm{t}}} $ distributions for the jets in the $ {\mathrm{t} \mathrm{\bar{t}}} $ system, the lower two rows the distribution for additional jets. The data are shown as points with light (dark) bands indicating the statistical (statistical and systematic) uncertainties. The cross sections are compared to the predictions of POWHEG combined with PYTHIA8 (P8) or HERWIG++ (H++) and the multiparton simulations MG5_aMC@NLO (MG5)+PYTHIA8 FxFx and SHERPA. The ratios of the predictions to the measured cross sections are shown at the bottom of each panel. |
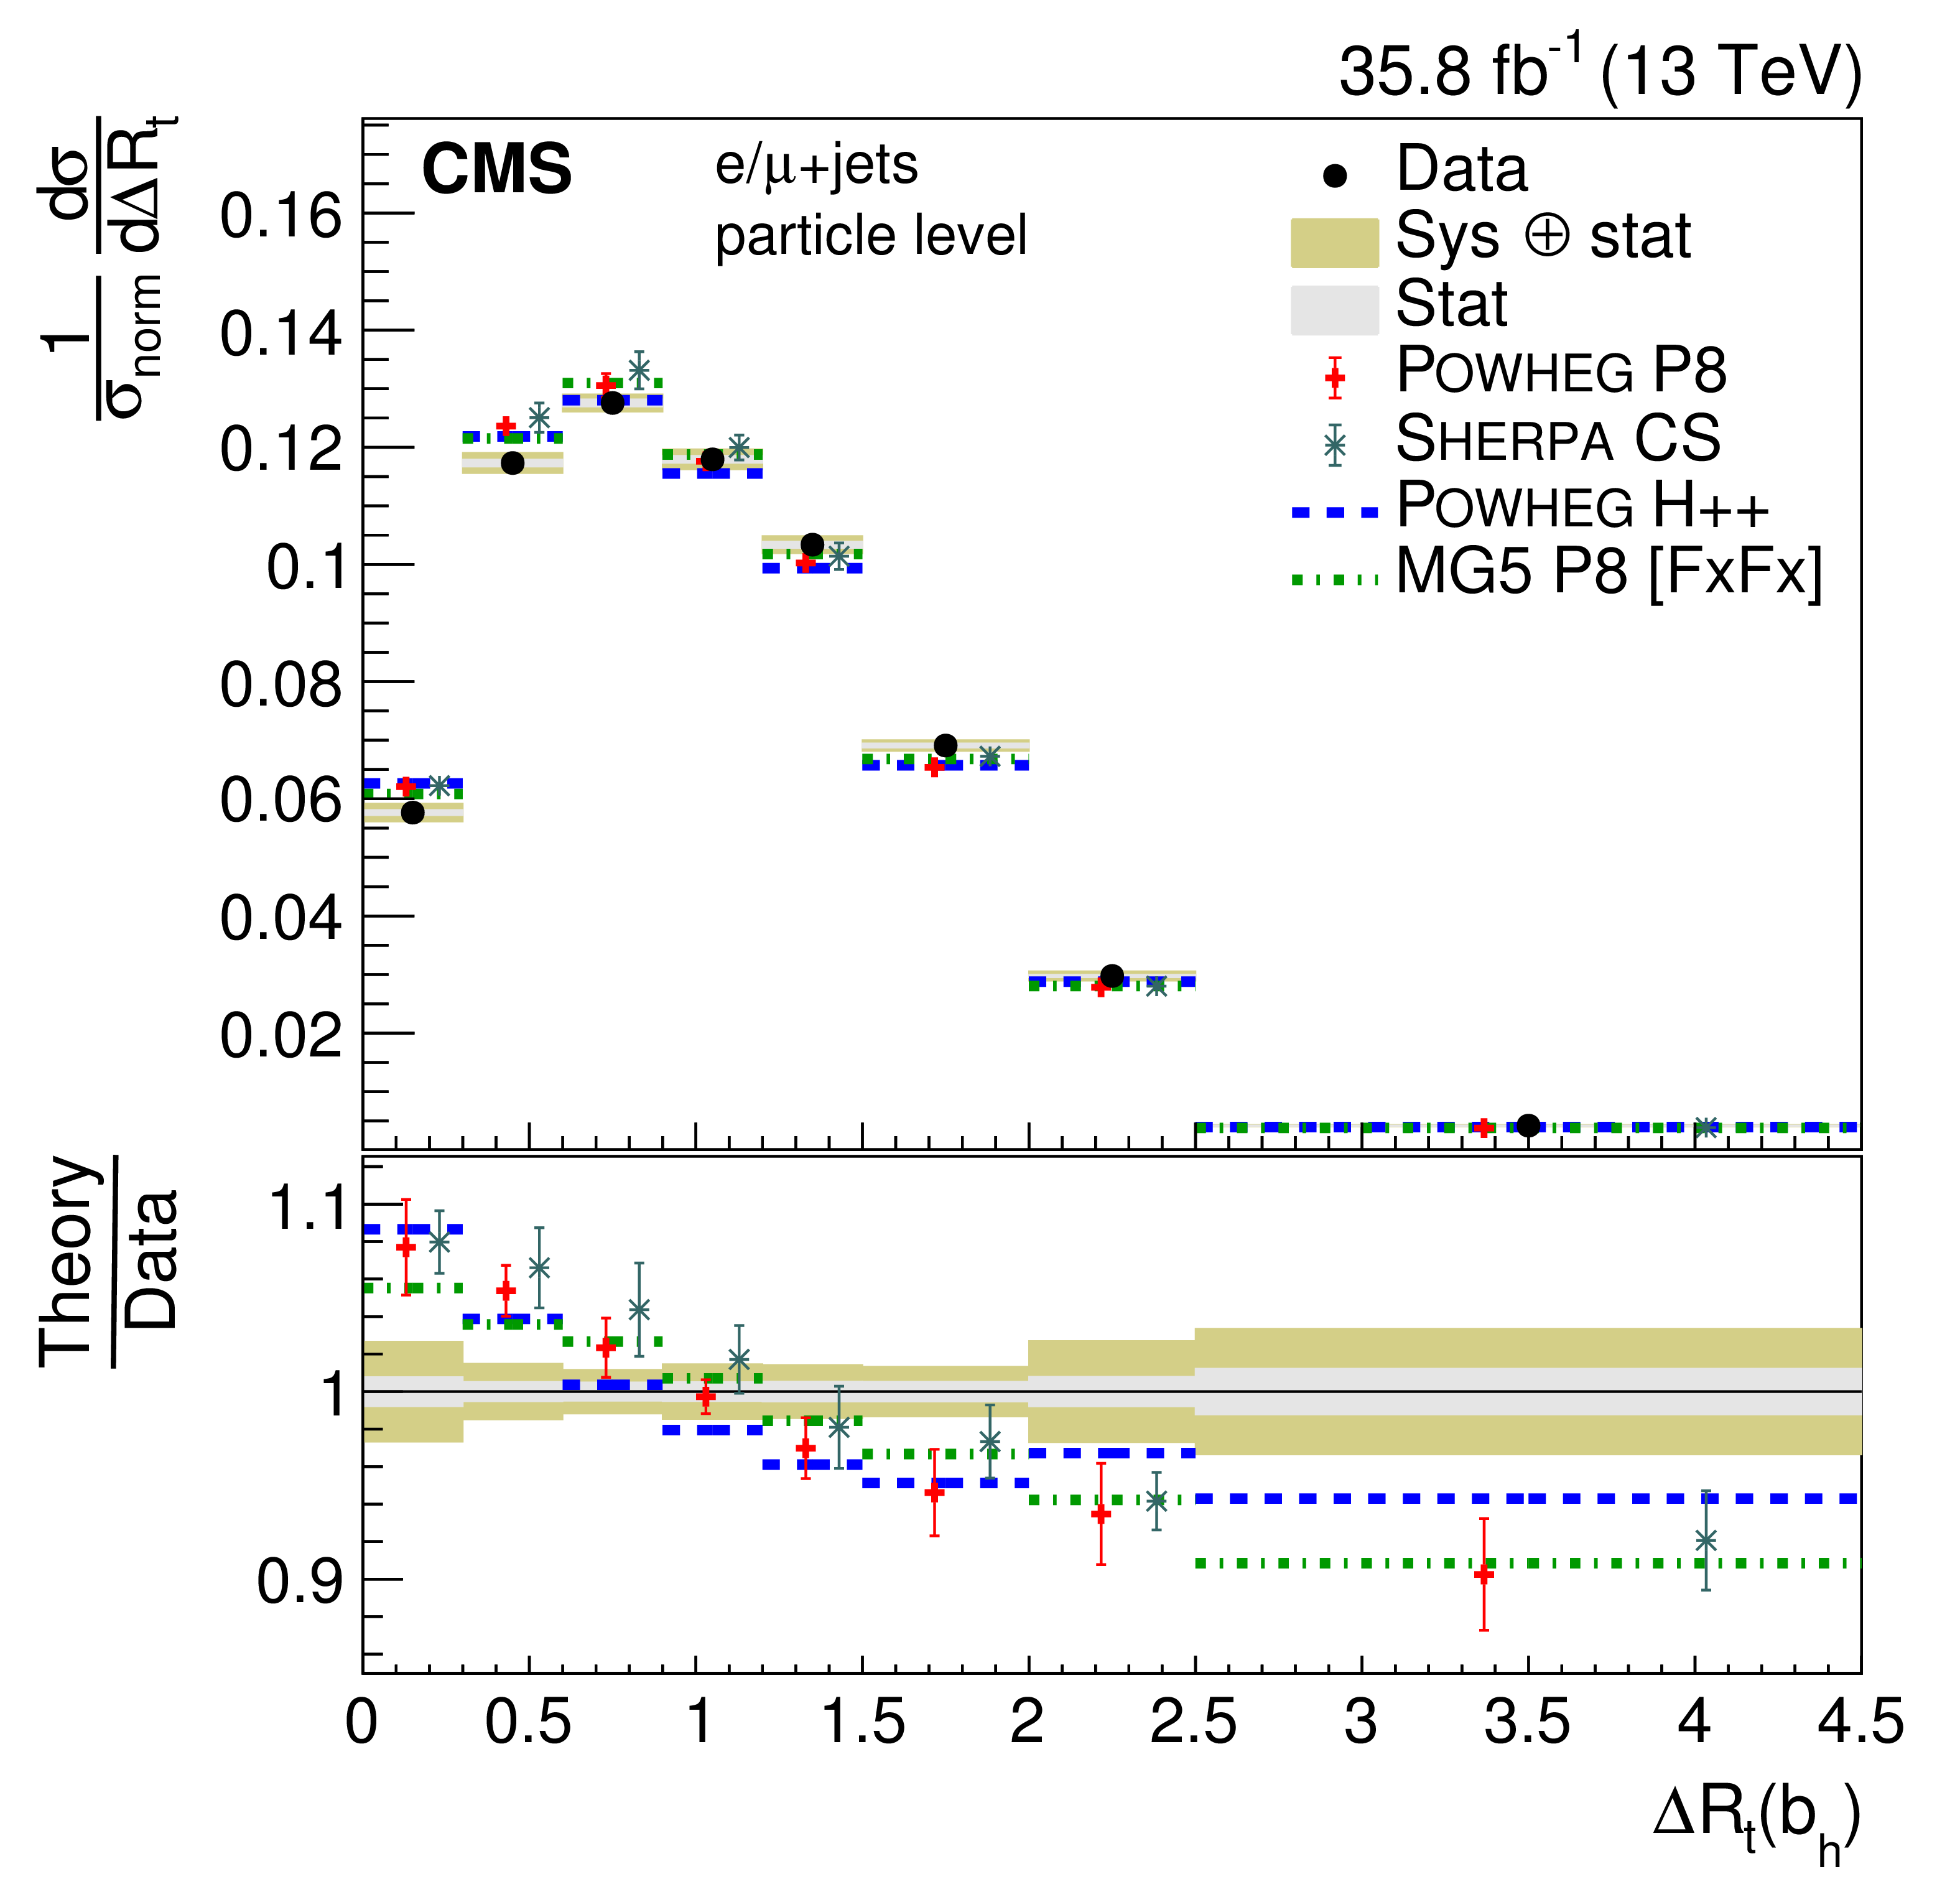
png pdf |
Figure 45-b:
Normalized differential cross section at the particle level as a function of $ {\Delta R_{\mathrm{t}}} $. The upper two rows show the $ {\Delta R_{\mathrm{t}}} $ distributions for the jets in the $ {\mathrm{t} \mathrm{\bar{t}}} $ system, the lower two rows the distribution for additional jets. The data are shown as points with light (dark) bands indicating the statistical (statistical and systematic) uncertainties. The cross sections are compared to the predictions of POWHEG combined with PYTHIA8 (P8) or HERWIG++ (H++) and the multiparton simulations MG5_aMC@NLO (MG5)+PYTHIA8 FxFx and SHERPA. The ratios of the predictions to the measured cross sections are shown at the bottom of each panel. |
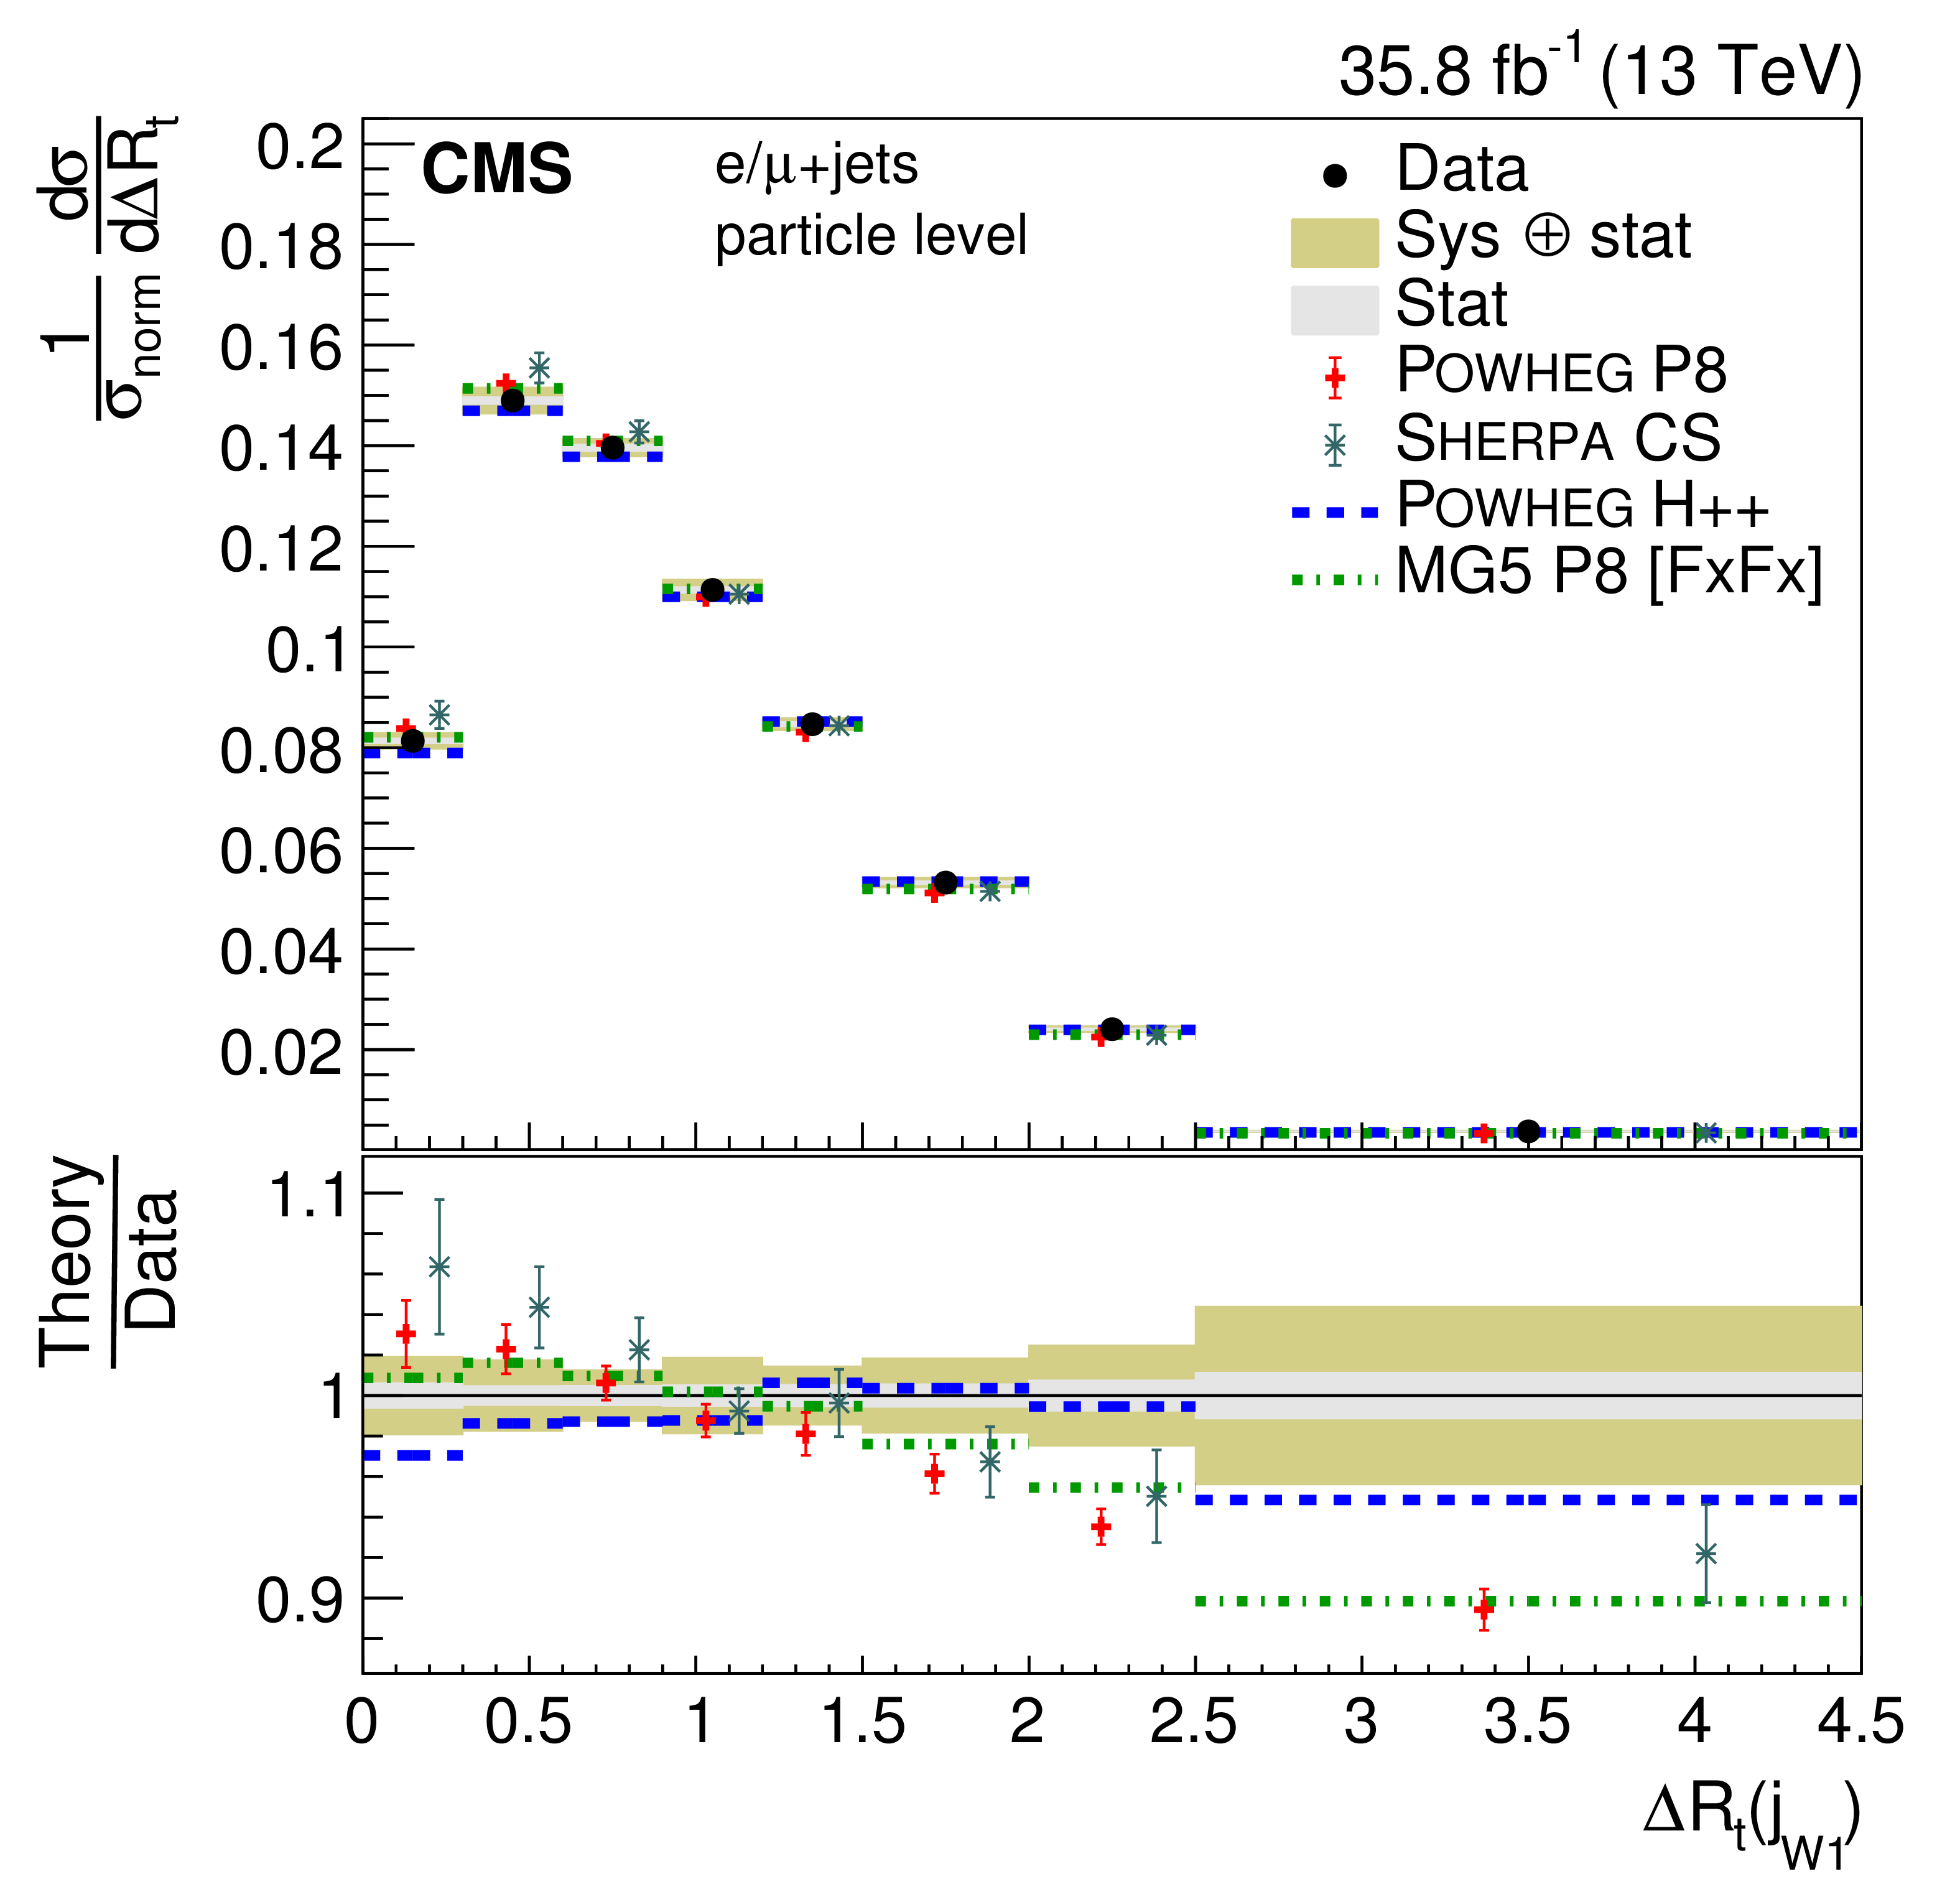
png pdf |
Figure 45-c:
Normalized differential cross section at the particle level as a function of $ {\Delta R_{\mathrm{t}}} $. The upper two rows show the $ {\Delta R_{\mathrm{t}}} $ distributions for the jets in the $ {\mathrm{t} \mathrm{\bar{t}}} $ system, the lower two rows the distribution for additional jets. The data are shown as points with light (dark) bands indicating the statistical (statistical and systematic) uncertainties. The cross sections are compared to the predictions of POWHEG combined with PYTHIA8 (P8) or HERWIG++ (H++) and the multiparton simulations MG5_aMC@NLO (MG5)+PYTHIA8 FxFx and SHERPA. The ratios of the predictions to the measured cross sections are shown at the bottom of each panel. |
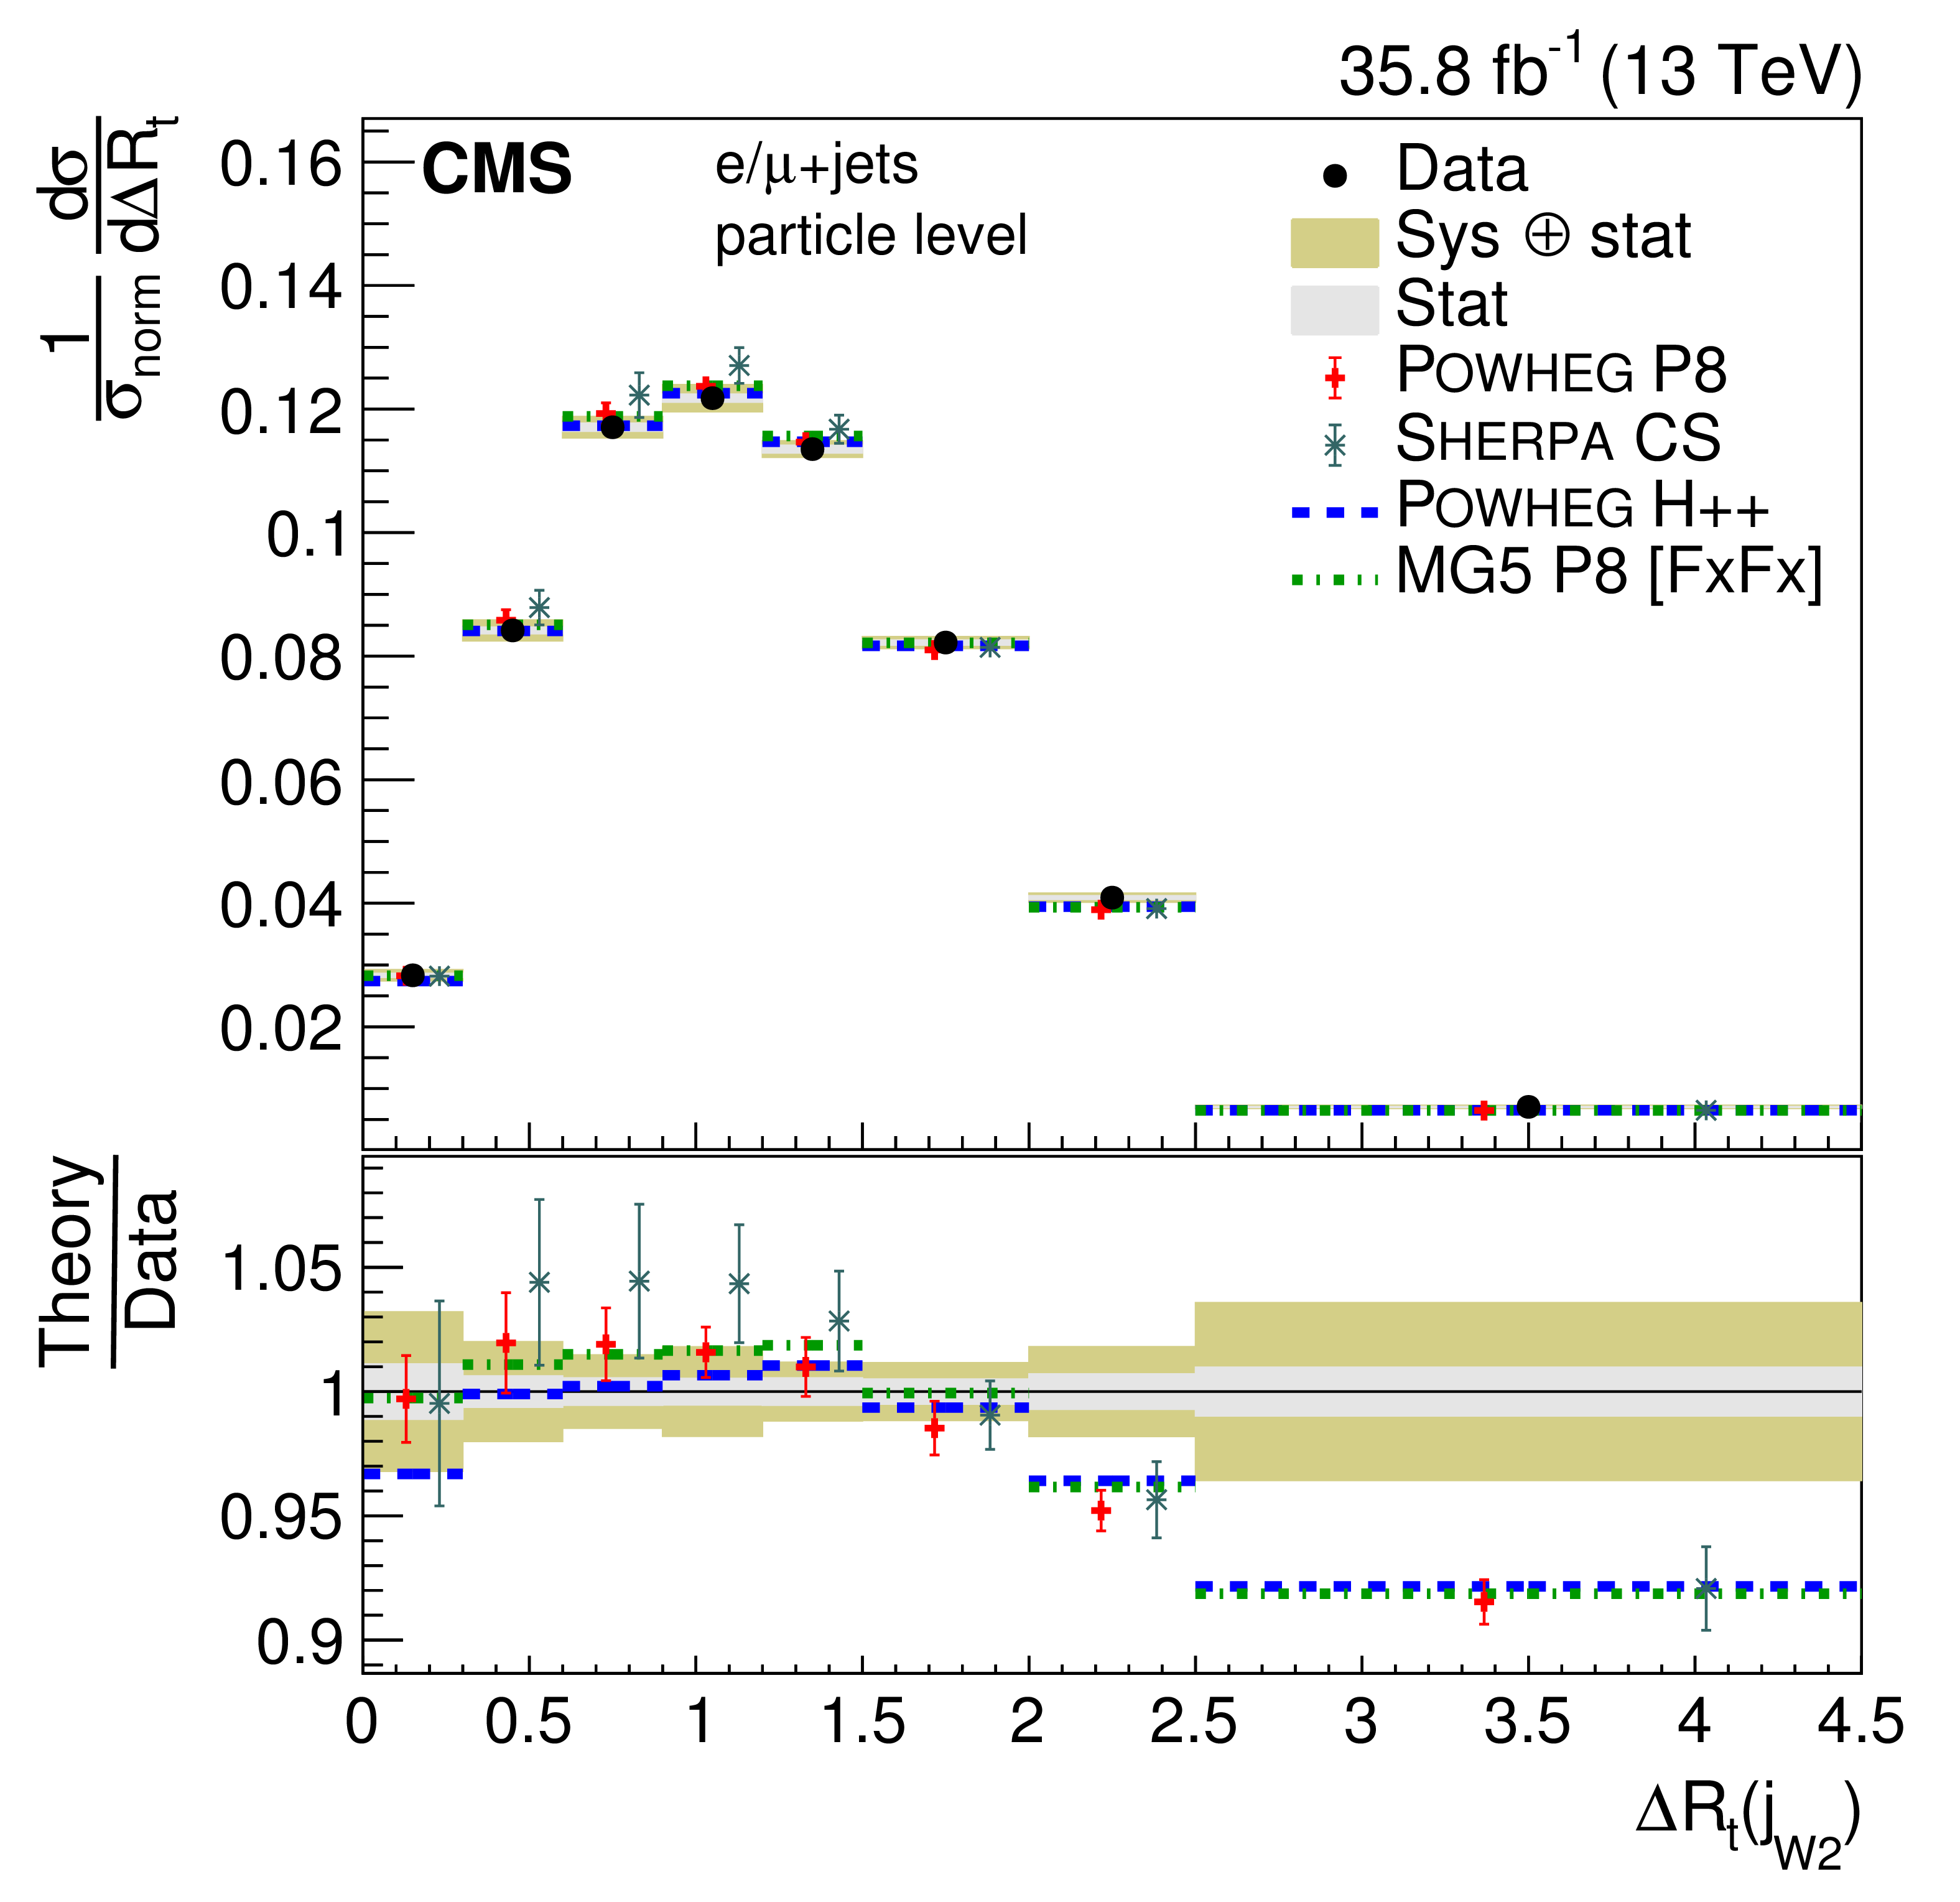
png pdf |
Figure 45-d:
Normalized differential cross section at the particle level as a function of $ {\Delta R_{\mathrm{t}}} $. The upper two rows show the $ {\Delta R_{\mathrm{t}}} $ distributions for the jets in the $ {\mathrm{t} \mathrm{\bar{t}}} $ system, the lower two rows the distribution for additional jets. The data are shown as points with light (dark) bands indicating the statistical (statistical and systematic) uncertainties. The cross sections are compared to the predictions of POWHEG combined with PYTHIA8 (P8) or HERWIG++ (H++) and the multiparton simulations MG5_aMC@NLO (MG5)+PYTHIA8 FxFx and SHERPA. The ratios of the predictions to the measured cross sections are shown at the bottom of each panel. |
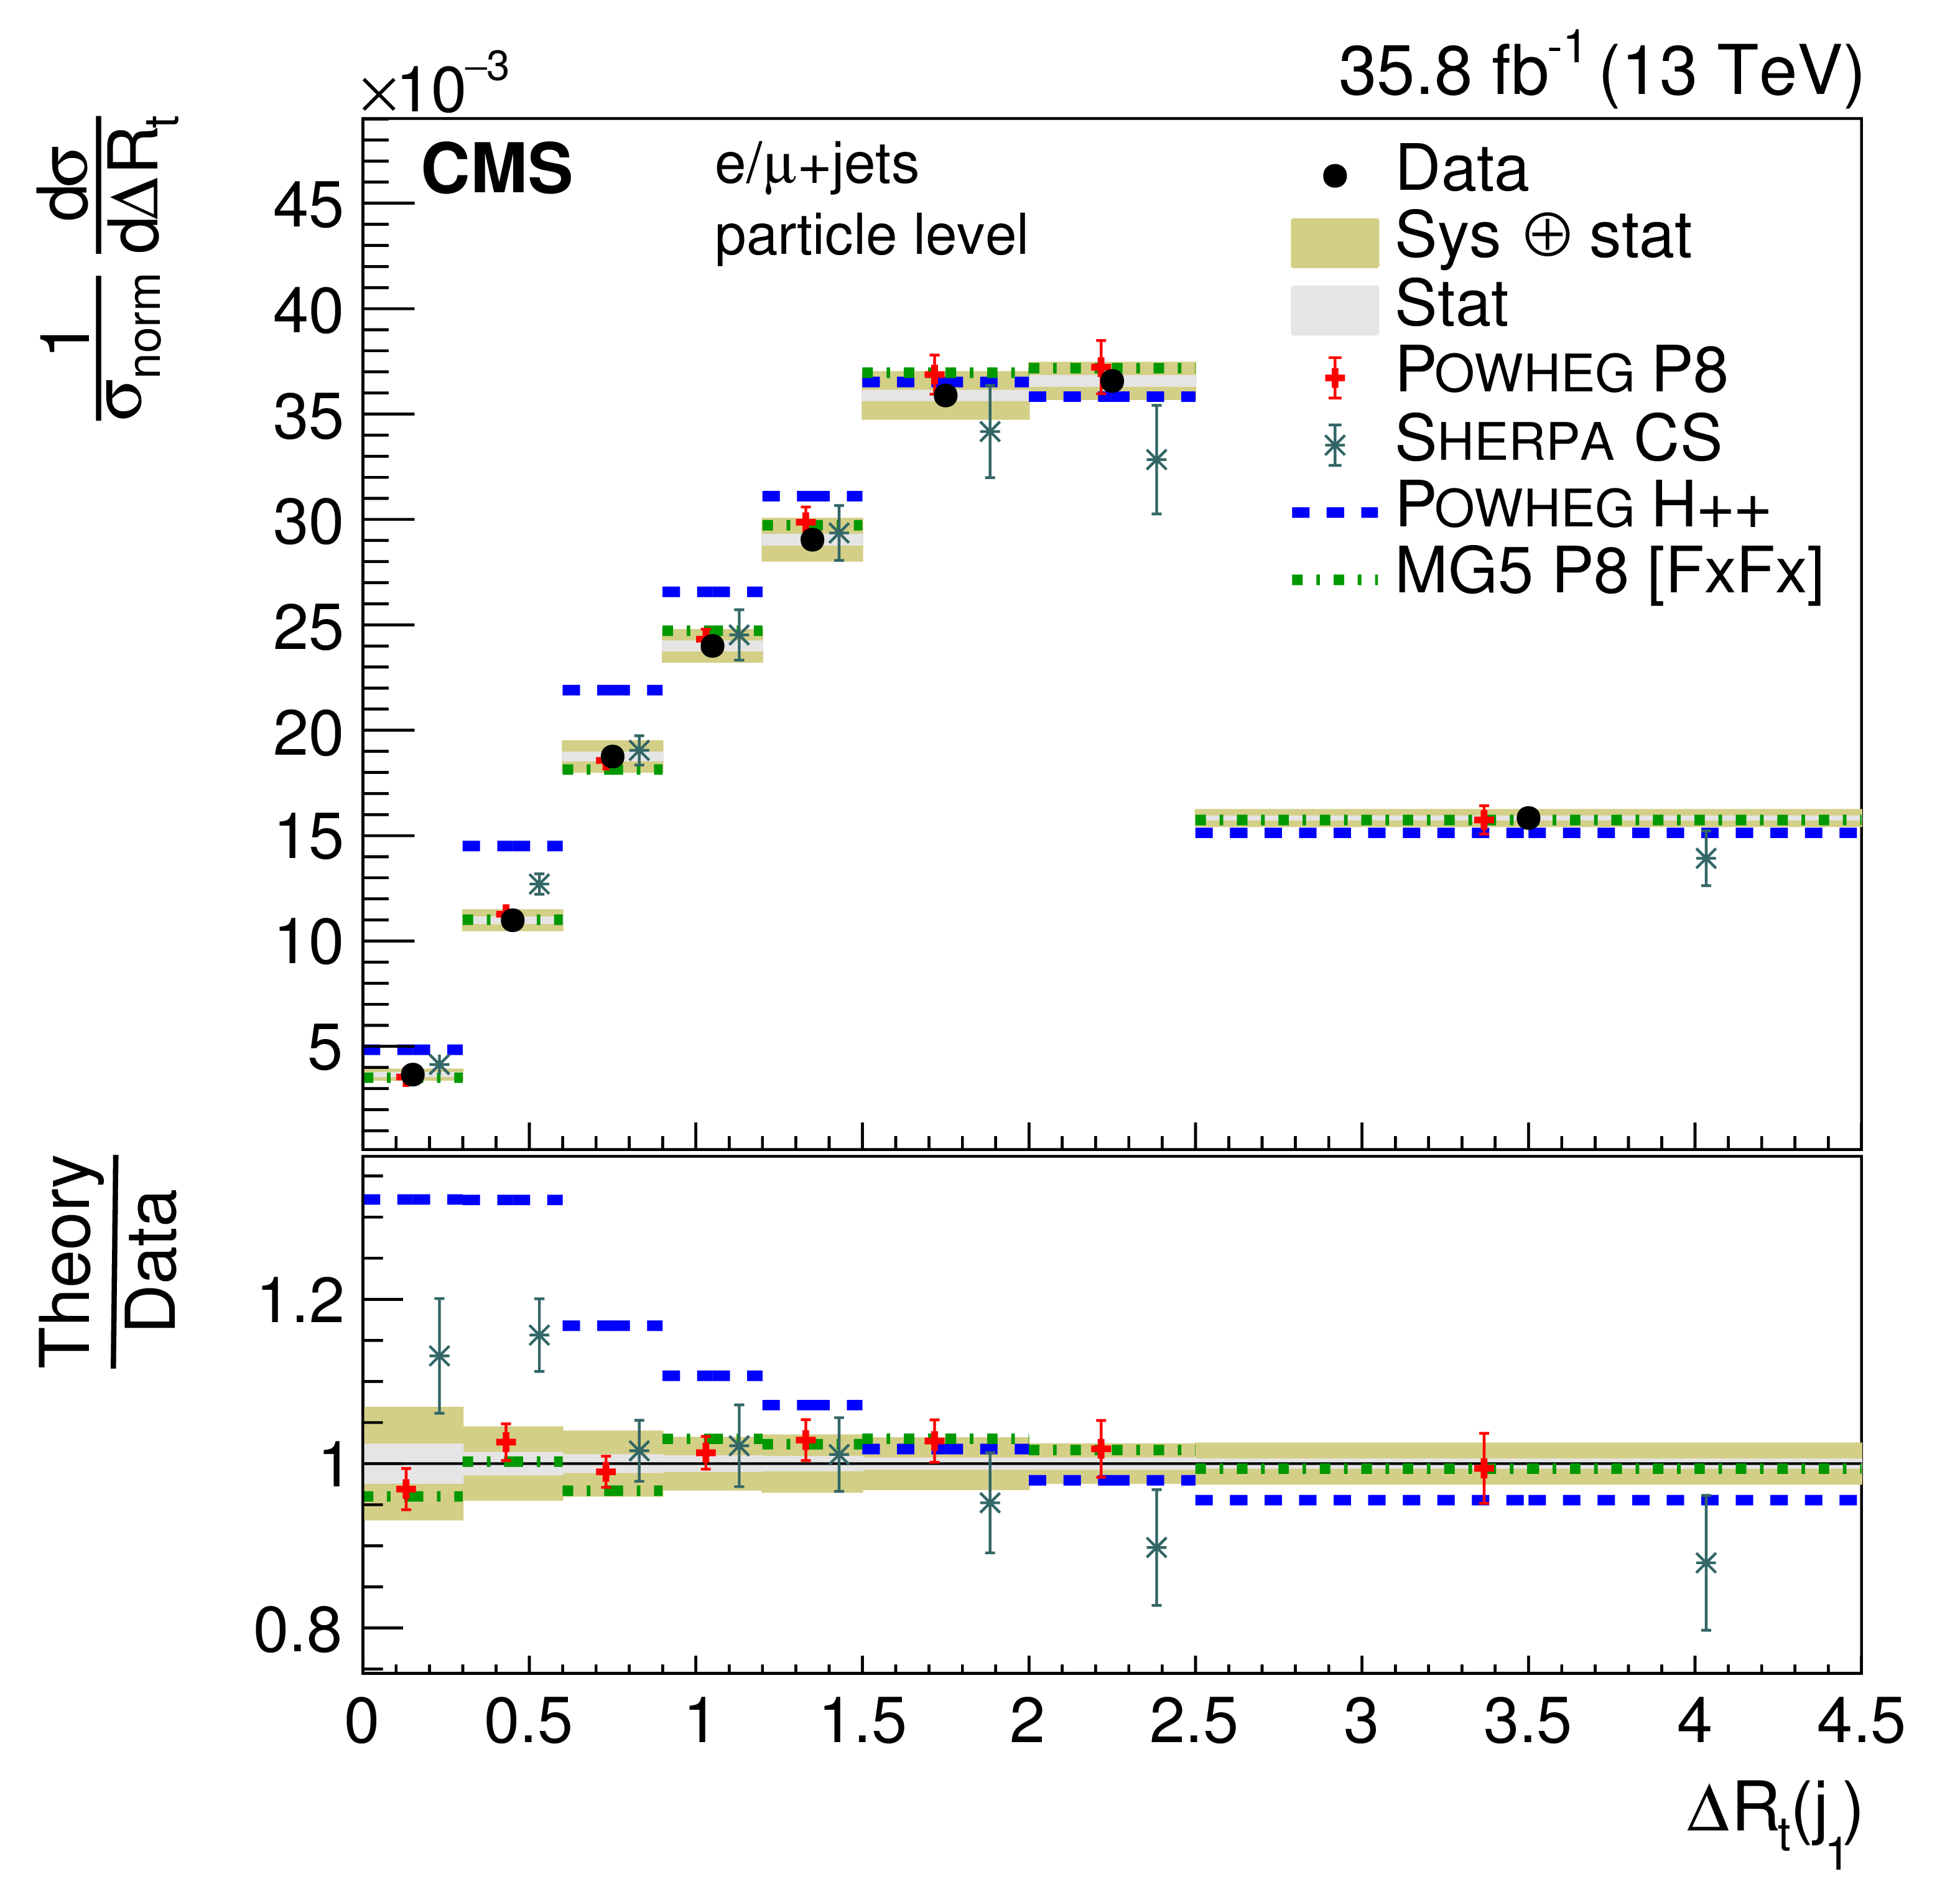
png pdf |
Figure 45-e:
Normalized differential cross section at the particle level as a function of $ {\Delta R_{\mathrm{t}}} $. The upper two rows show the $ {\Delta R_{\mathrm{t}}} $ distributions for the jets in the $ {\mathrm{t} \mathrm{\bar{t}}} $ system, the lower two rows the distribution for additional jets. The data are shown as points with light (dark) bands indicating the statistical (statistical and systematic) uncertainties. The cross sections are compared to the predictions of POWHEG combined with PYTHIA8 (P8) or HERWIG++ (H++) and the multiparton simulations MG5_aMC@NLO (MG5)+PYTHIA8 FxFx and SHERPA. The ratios of the predictions to the measured cross sections are shown at the bottom of each panel. |

png pdf |
Figure 45-f:
Normalized differential cross section at the particle level as a function of $ {\Delta R_{\mathrm{t}}} $. The upper two rows show the $ {\Delta R_{\mathrm{t}}} $ distributions for the jets in the $ {\mathrm{t} \mathrm{\bar{t}}} $ system, the lower two rows the distribution for additional jets. The data are shown as points with light (dark) bands indicating the statistical (statistical and systematic) uncertainties. The cross sections are compared to the predictions of POWHEG combined with PYTHIA8 (P8) or HERWIG++ (H++) and the multiparton simulations MG5_aMC@NLO (MG5)+PYTHIA8 FxFx and SHERPA. The ratios of the predictions to the measured cross sections are shown at the bottom of each panel. |
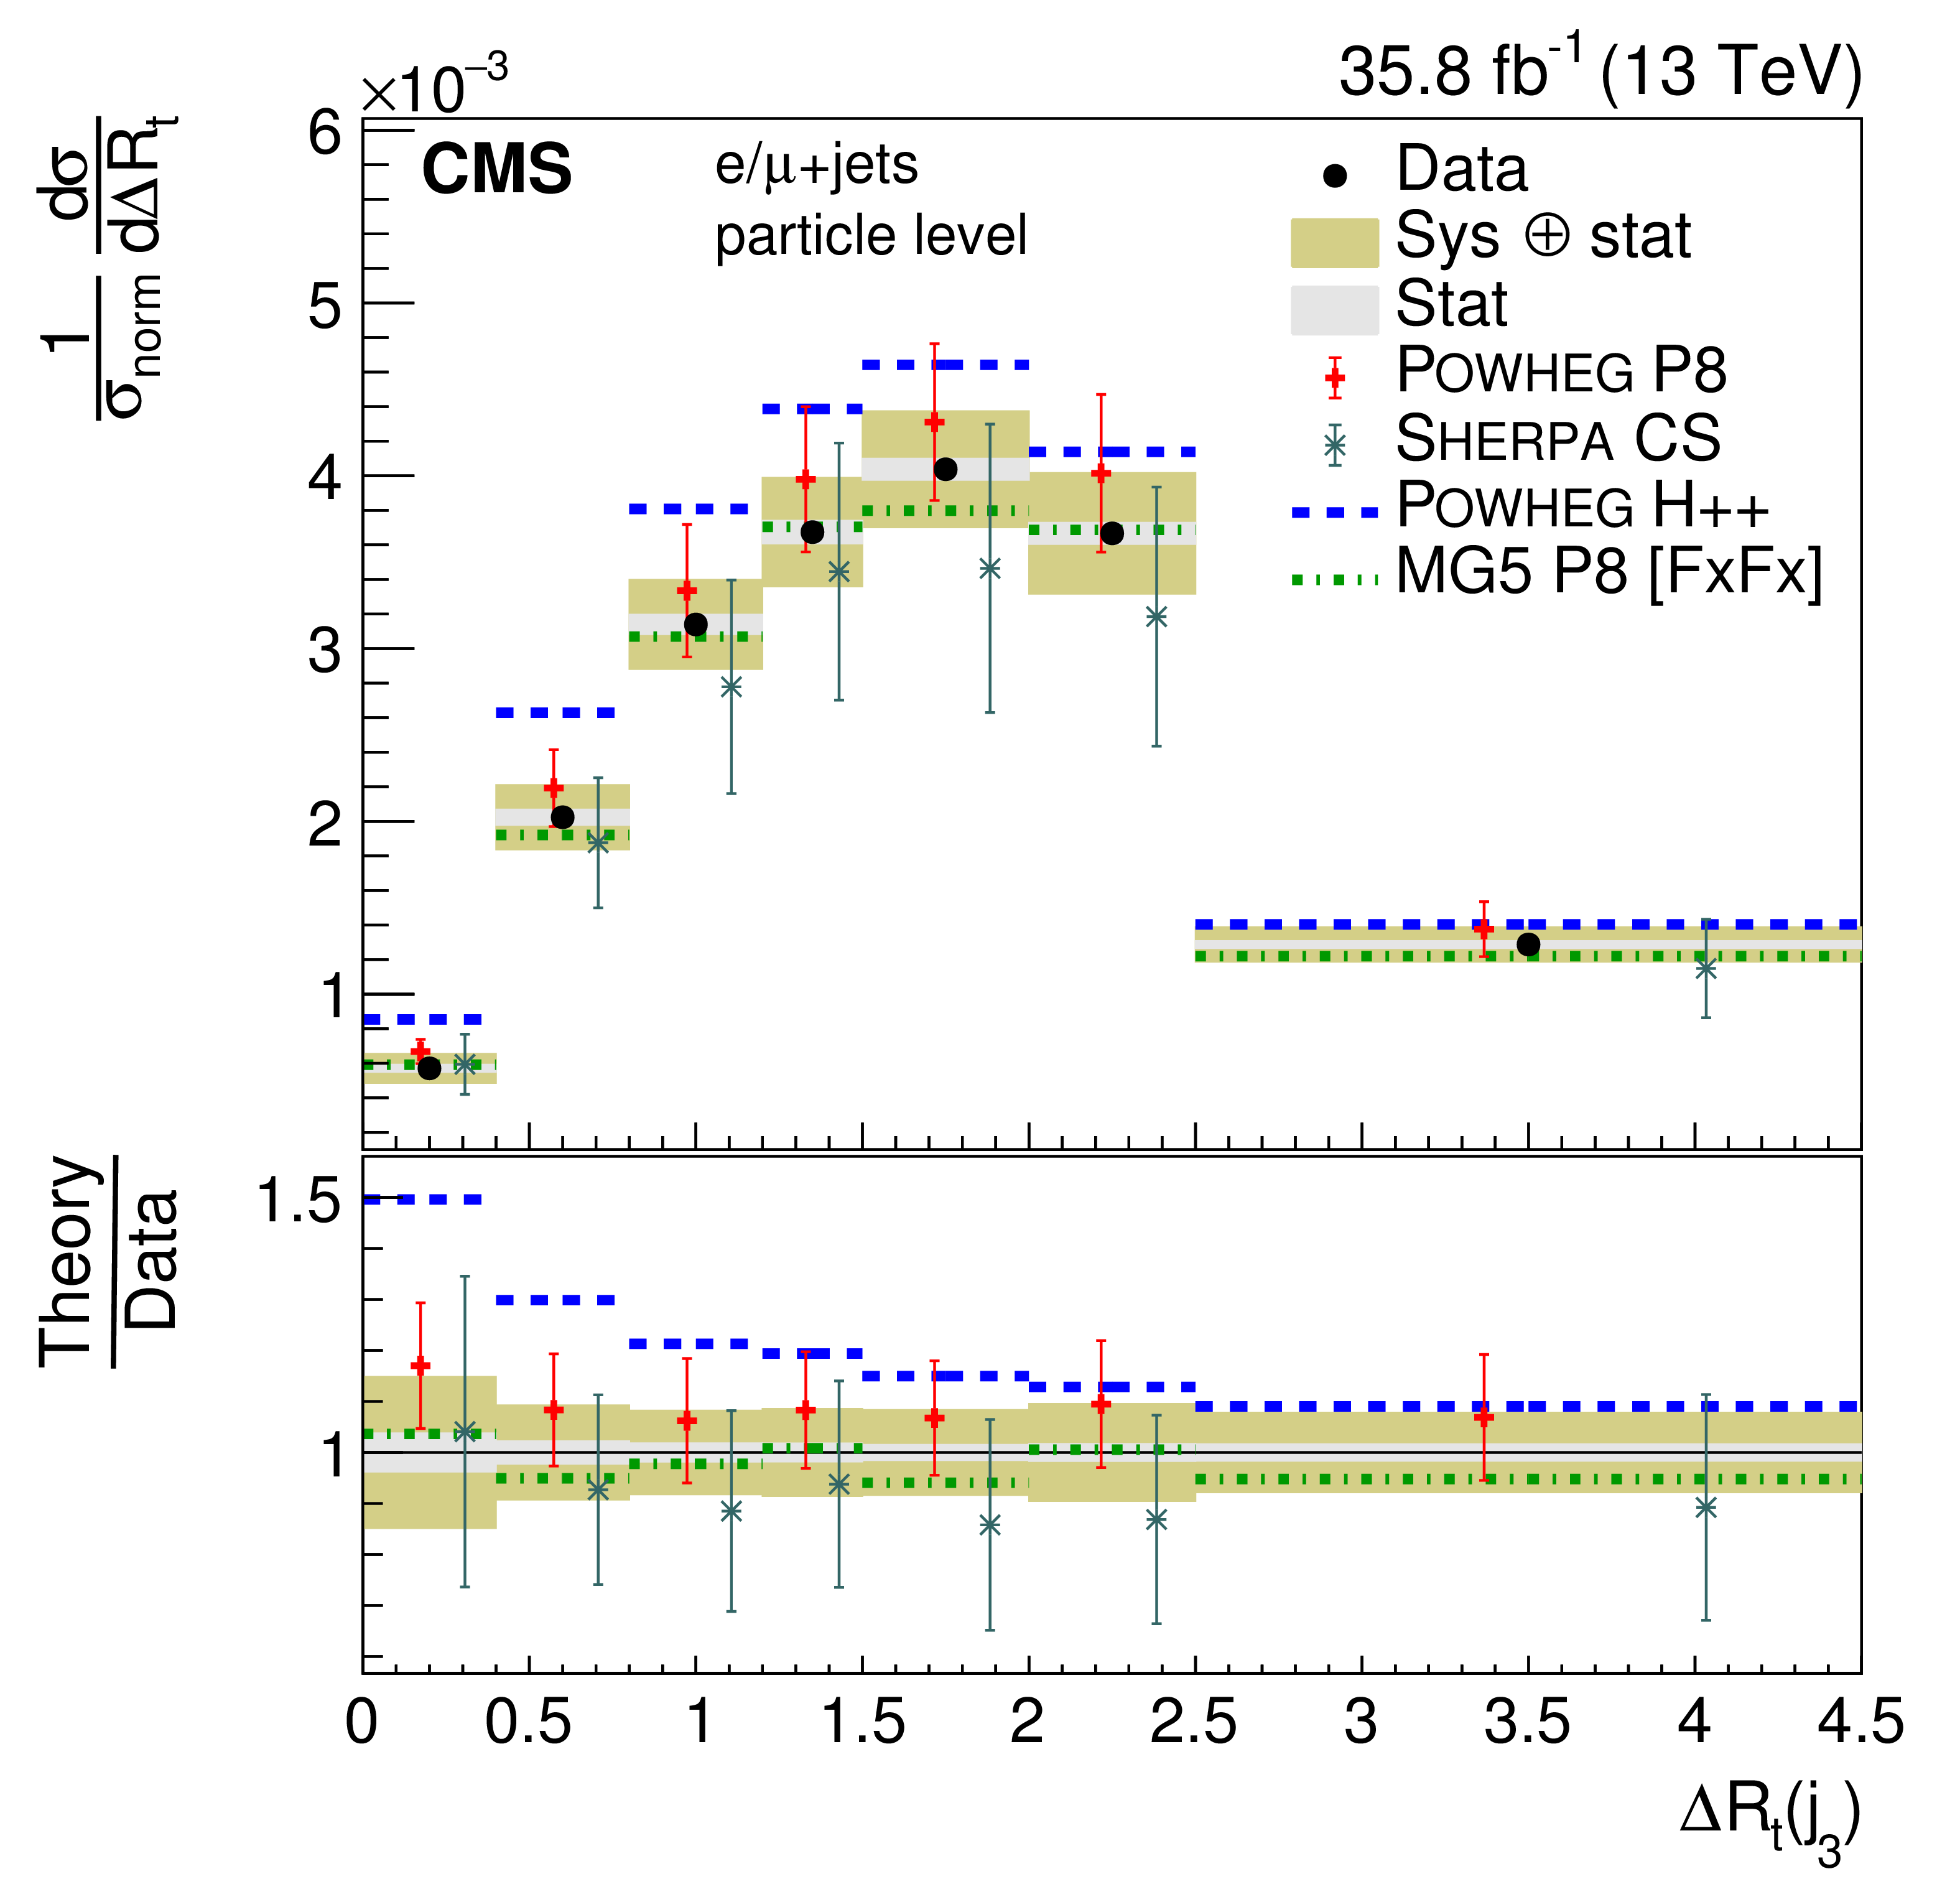
png pdf |
Figure 45-g:
Normalized differential cross section at the particle level as a function of $ {\Delta R_{\mathrm{t}}} $. The upper two rows show the $ {\Delta R_{\mathrm{t}}} $ distributions for the jets in the $ {\mathrm{t} \mathrm{\bar{t}}} $ system, the lower two rows the distribution for additional jets. The data are shown as points with light (dark) bands indicating the statistical (statistical and systematic) uncertainties. The cross sections are compared to the predictions of POWHEG combined with PYTHIA8 (P8) or HERWIG++ (H++) and the multiparton simulations MG5_aMC@NLO (MG5)+PYTHIA8 FxFx and SHERPA. The ratios of the predictions to the measured cross sections are shown at the bottom of each panel. |
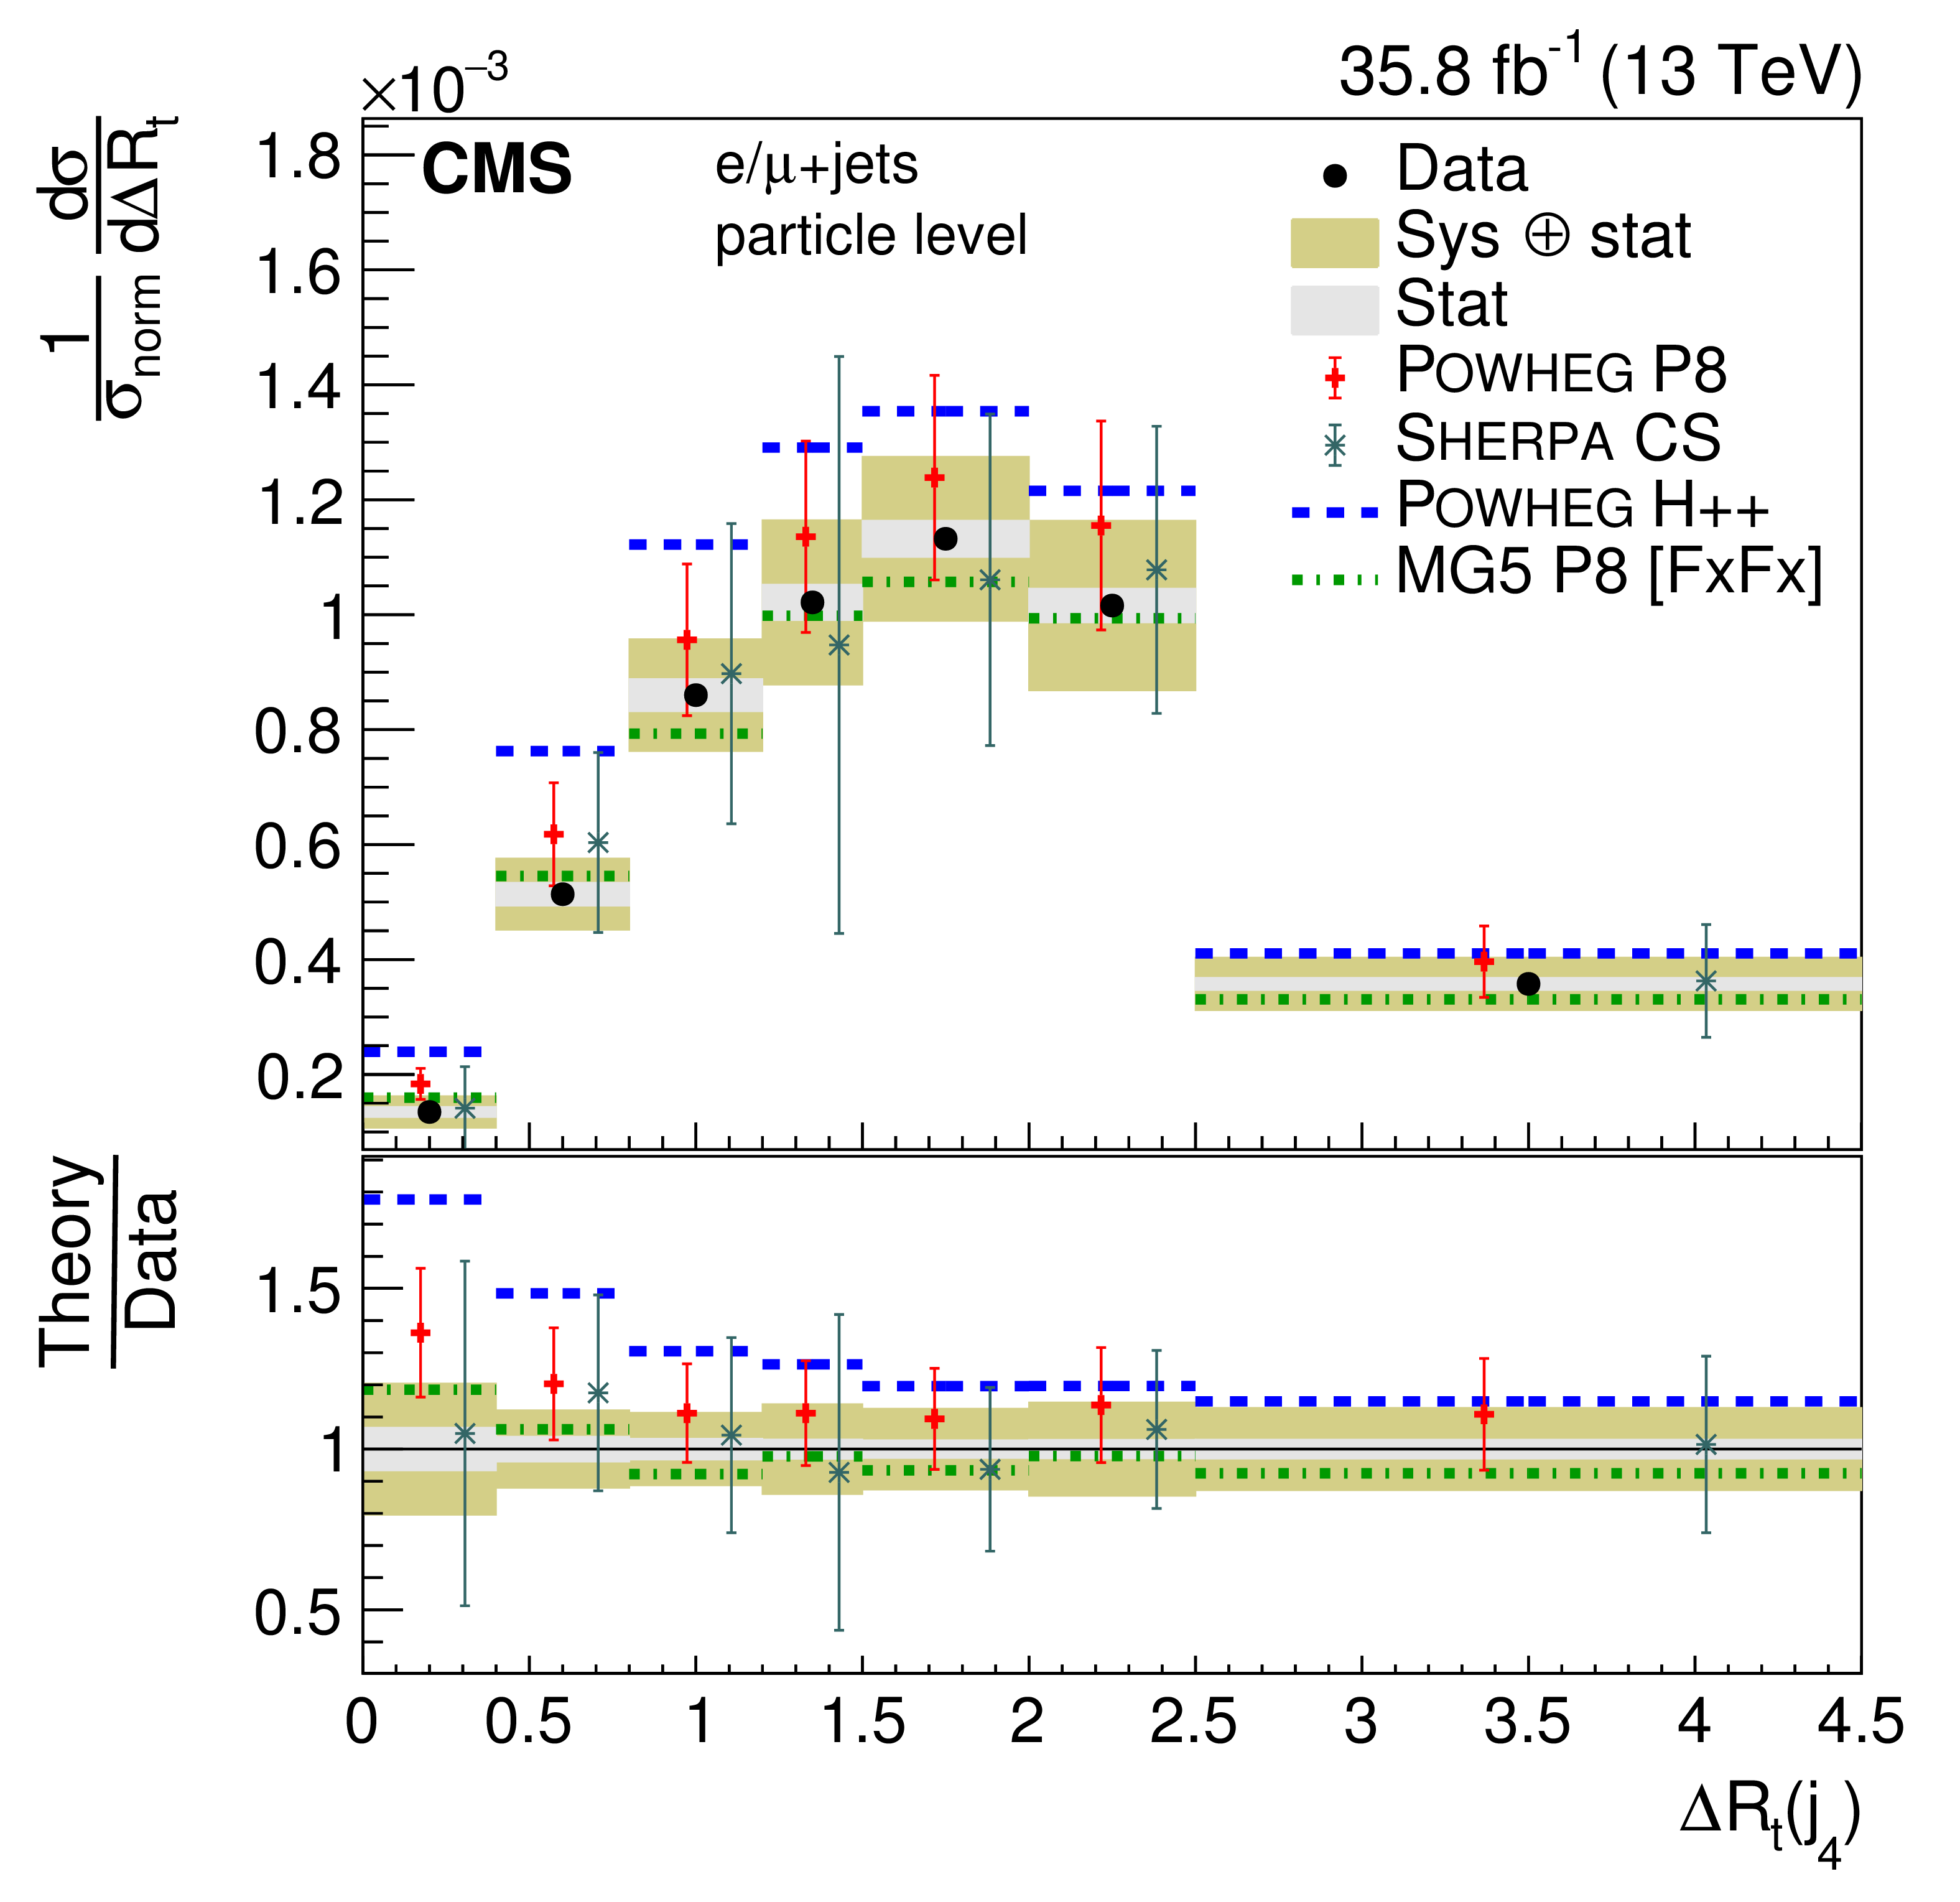
png pdf |
Figure 45-h:
Normalized differential cross section at the particle level as a function of $ {\Delta R_{\mathrm{t}}} $. The upper two rows show the $ {\Delta R_{\mathrm{t}}} $ distributions for the jets in the $ {\mathrm{t} \mathrm{\bar{t}}} $ system, the lower two rows the distribution for additional jets. The data are shown as points with light (dark) bands indicating the statistical (statistical and systematic) uncertainties. The cross sections are compared to the predictions of POWHEG combined with PYTHIA8 (P8) or HERWIG++ (H++) and the multiparton simulations MG5_aMC@NLO (MG5)+PYTHIA8 FxFx and SHERPA. The ratios of the predictions to the measured cross sections are shown at the bottom of each panel. |
| Tables | |
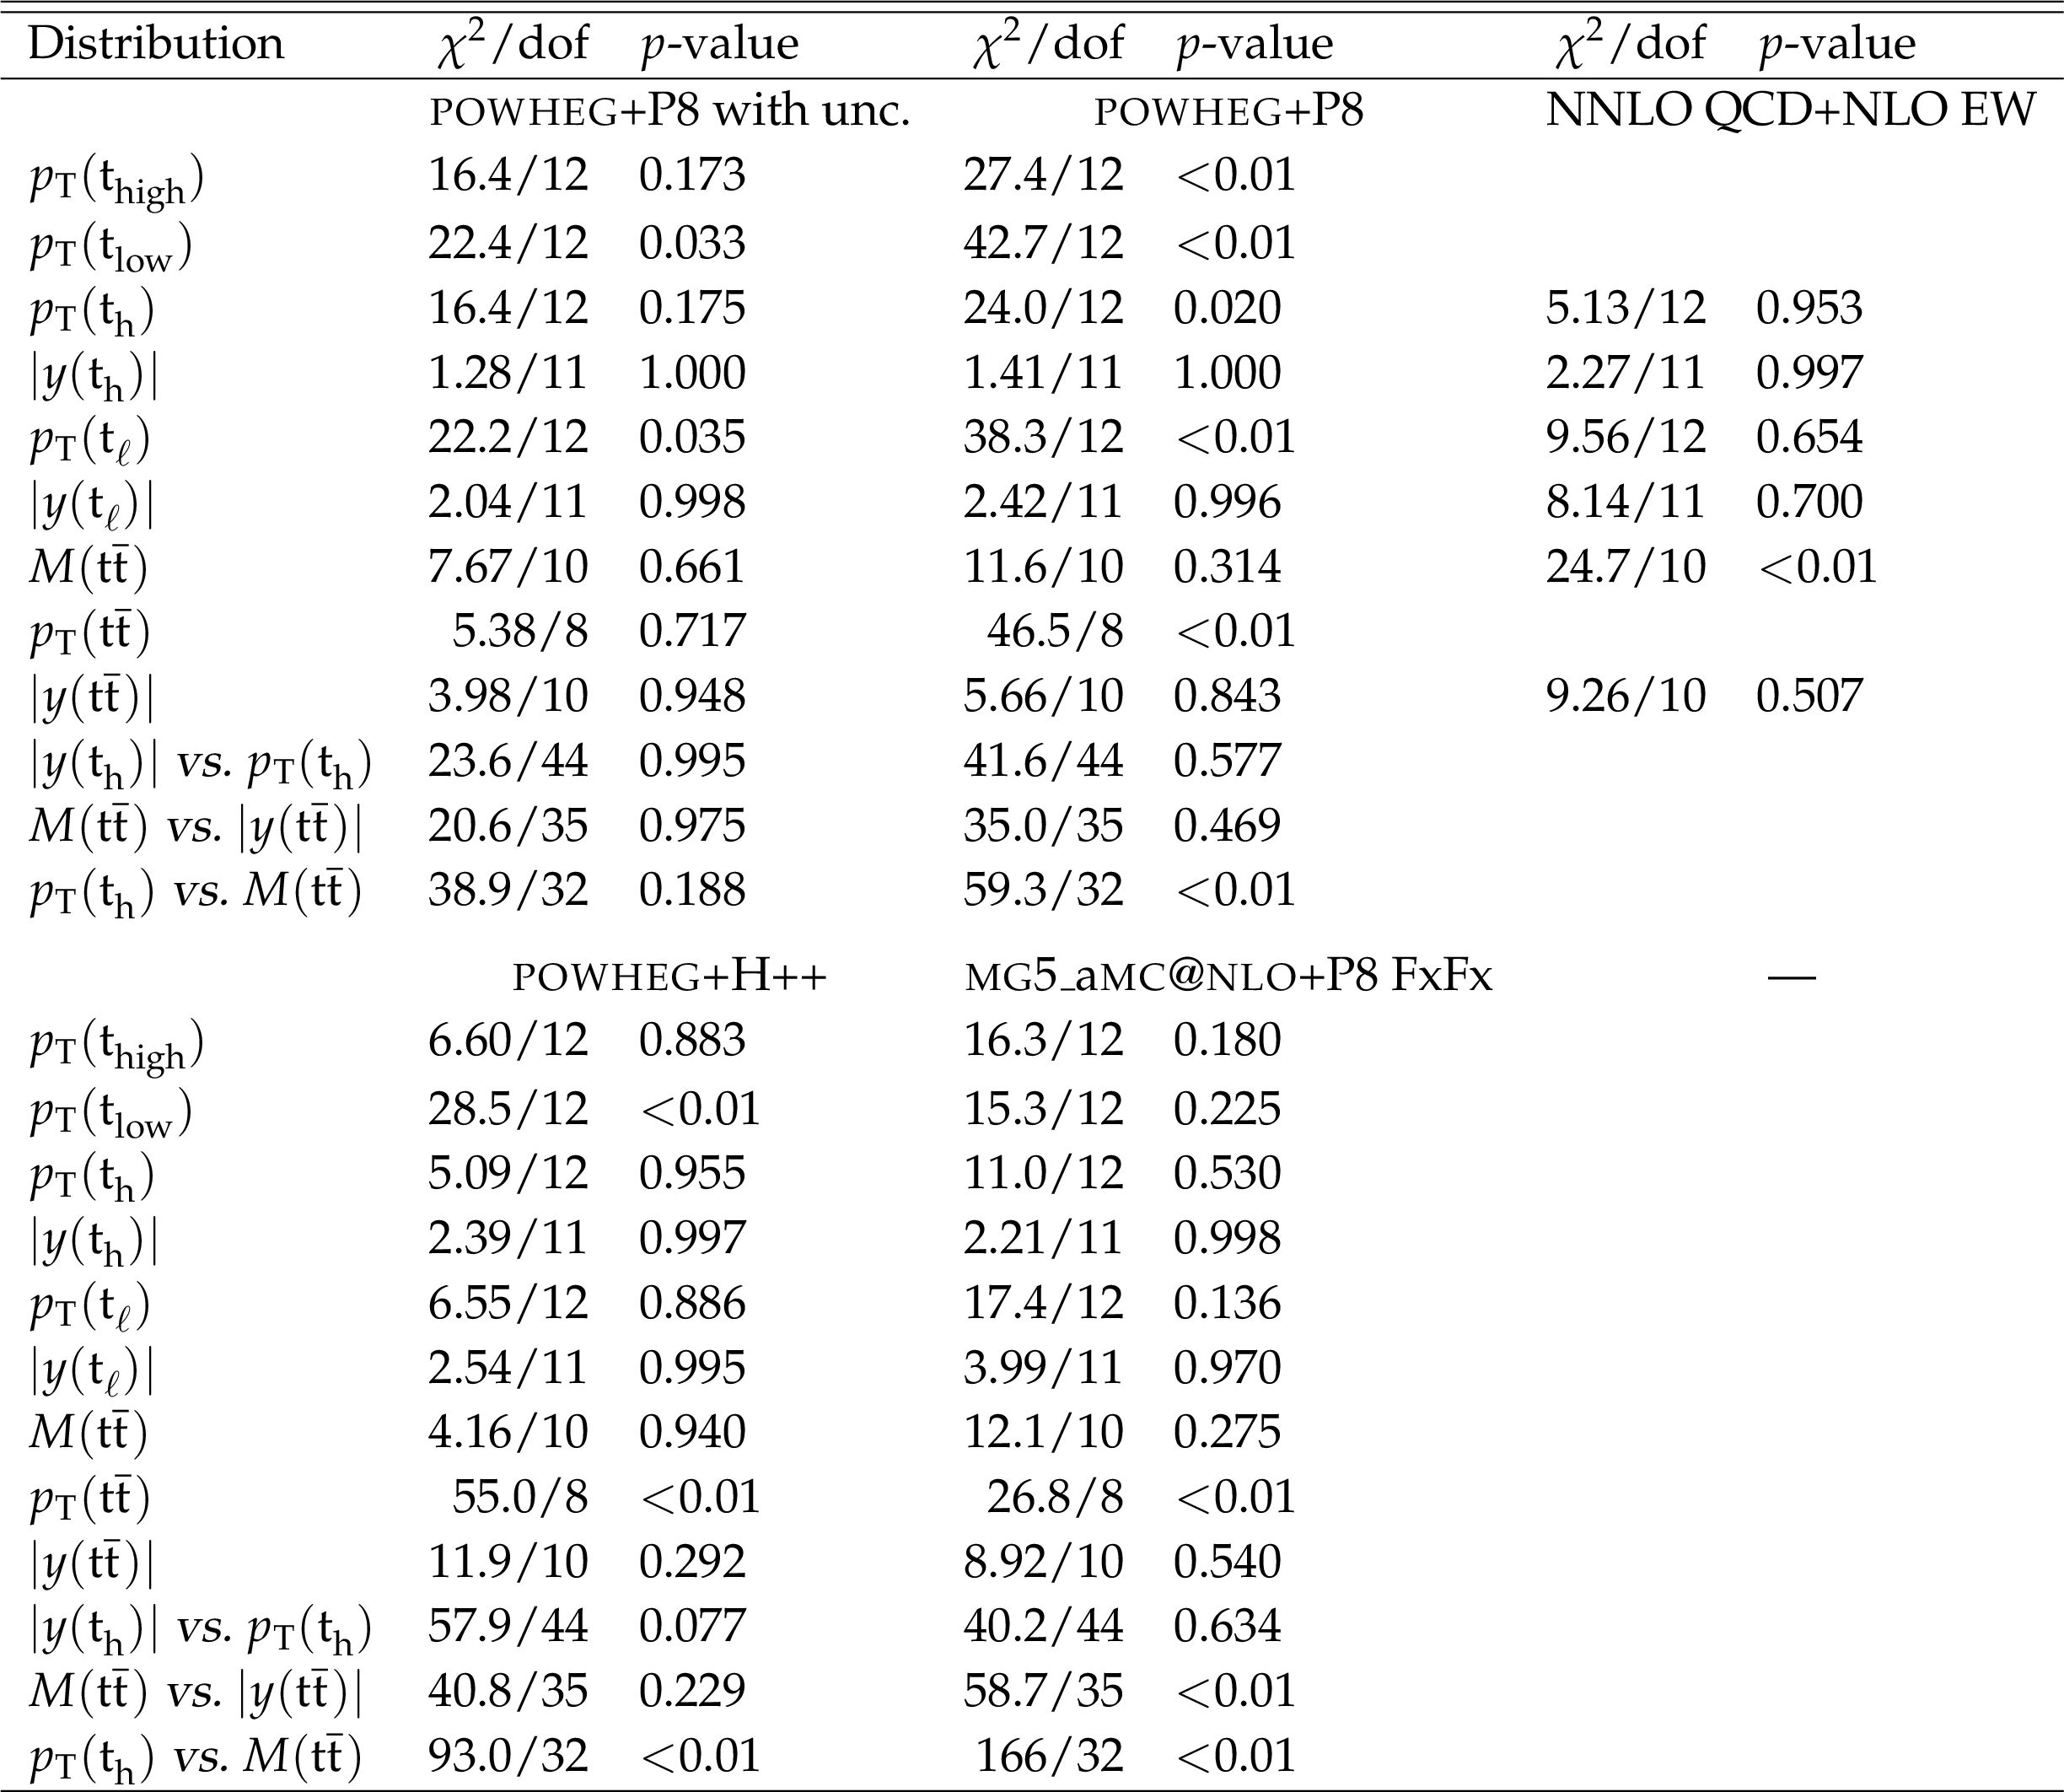
png pdf |
Table 1:
Comparison between the measured absolute differential cross sections at the parton level and the predictions of POWHEG combined with PYTHIA8 (P8) or HERWIG++ (H++), the multiparton simulation MG5_aMC@NLO FxFx, and the NNLO QCD+NLO EW calculations. The compatibility with the POWHEG+PYTHIA8 prediction is also calculated including its theoretical uncertainties (with unc.), while those are not taken into account for the other comparisons. The results of the $\chi ^2$ tests are listed, together with the numbers of degrees of freedom (dof) and the corresponding $p$-values. |
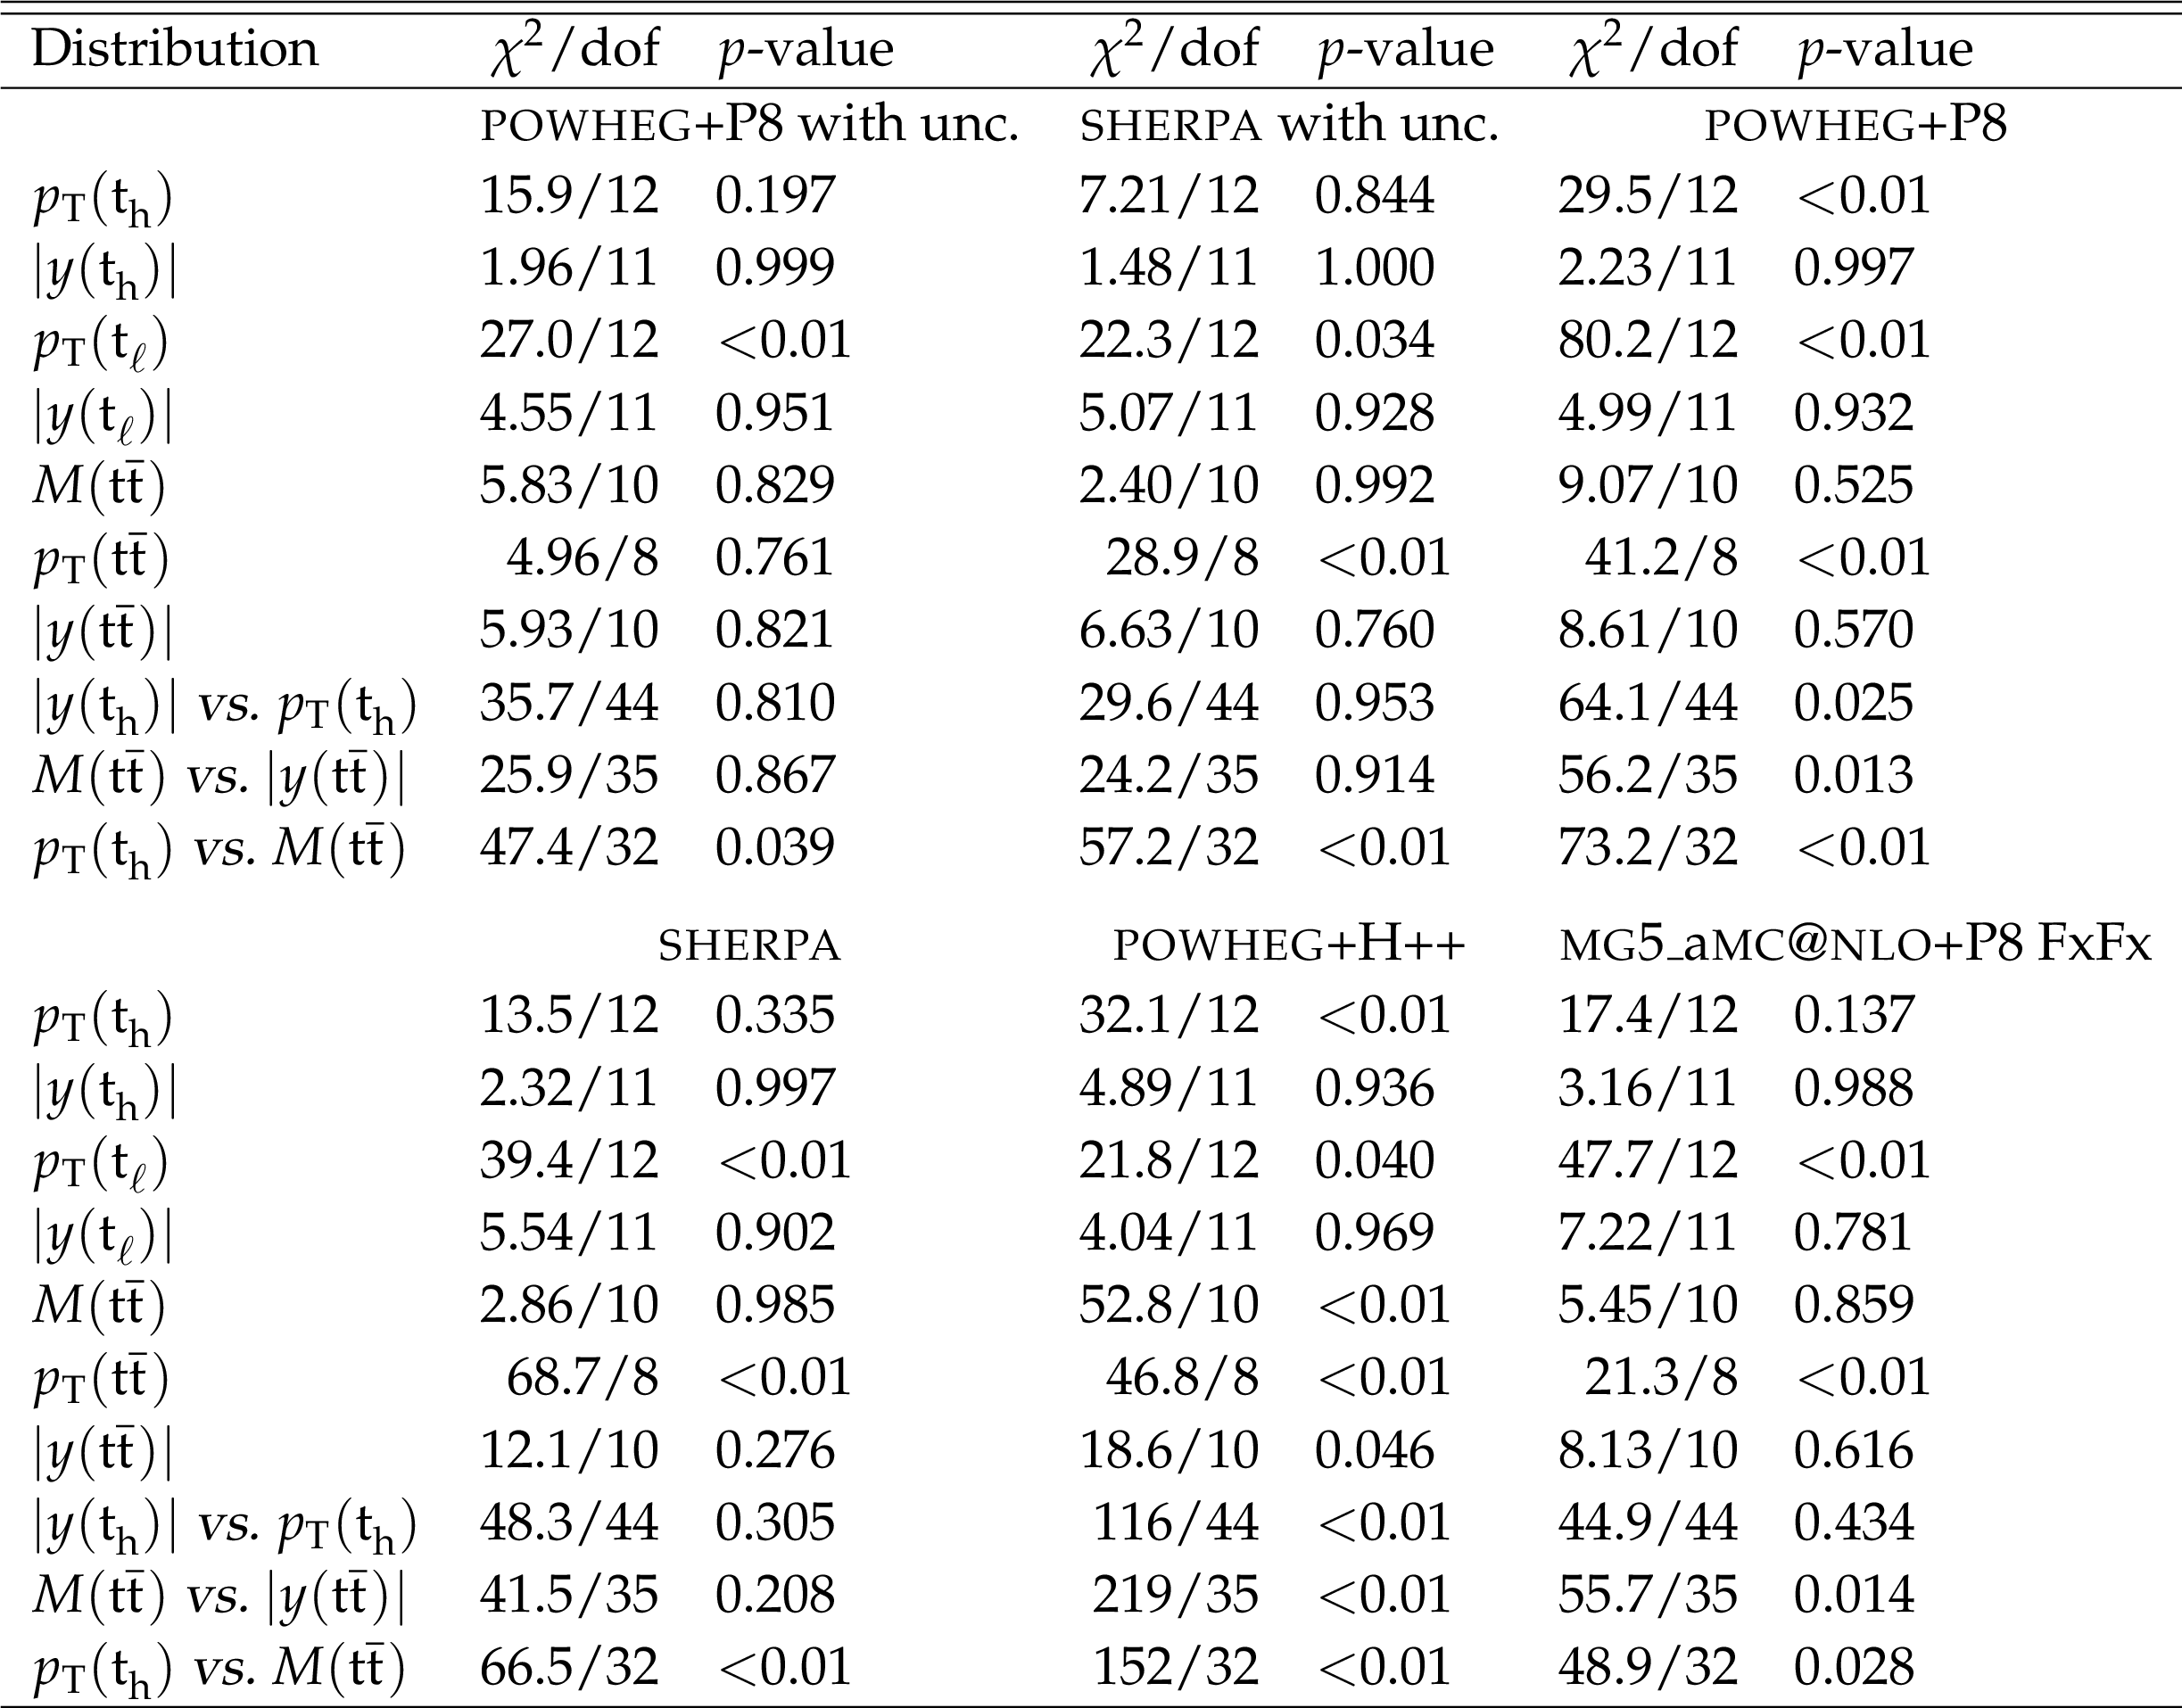
png pdf |
Table 3:
Comparison between the measured absolute differential cross sections at the particle level and the predictions of POWHEG combined with PYTHIA8 (P8) or HERWIG++ (H++) and the multiparton simulations of MG5_aMC@NLO FxFx and SHERPA. The compatibilities with the POWHEG+PYTHIA8 and the SHERPA predictions are also calculated including their theoretical uncertainties (with unc.), while those are not taken into account for the other comparisons. The results of the $\chi ^2$ tests are listed, together with the numbers of degrees of freedom (dof) and the corresponding $p$-values. |
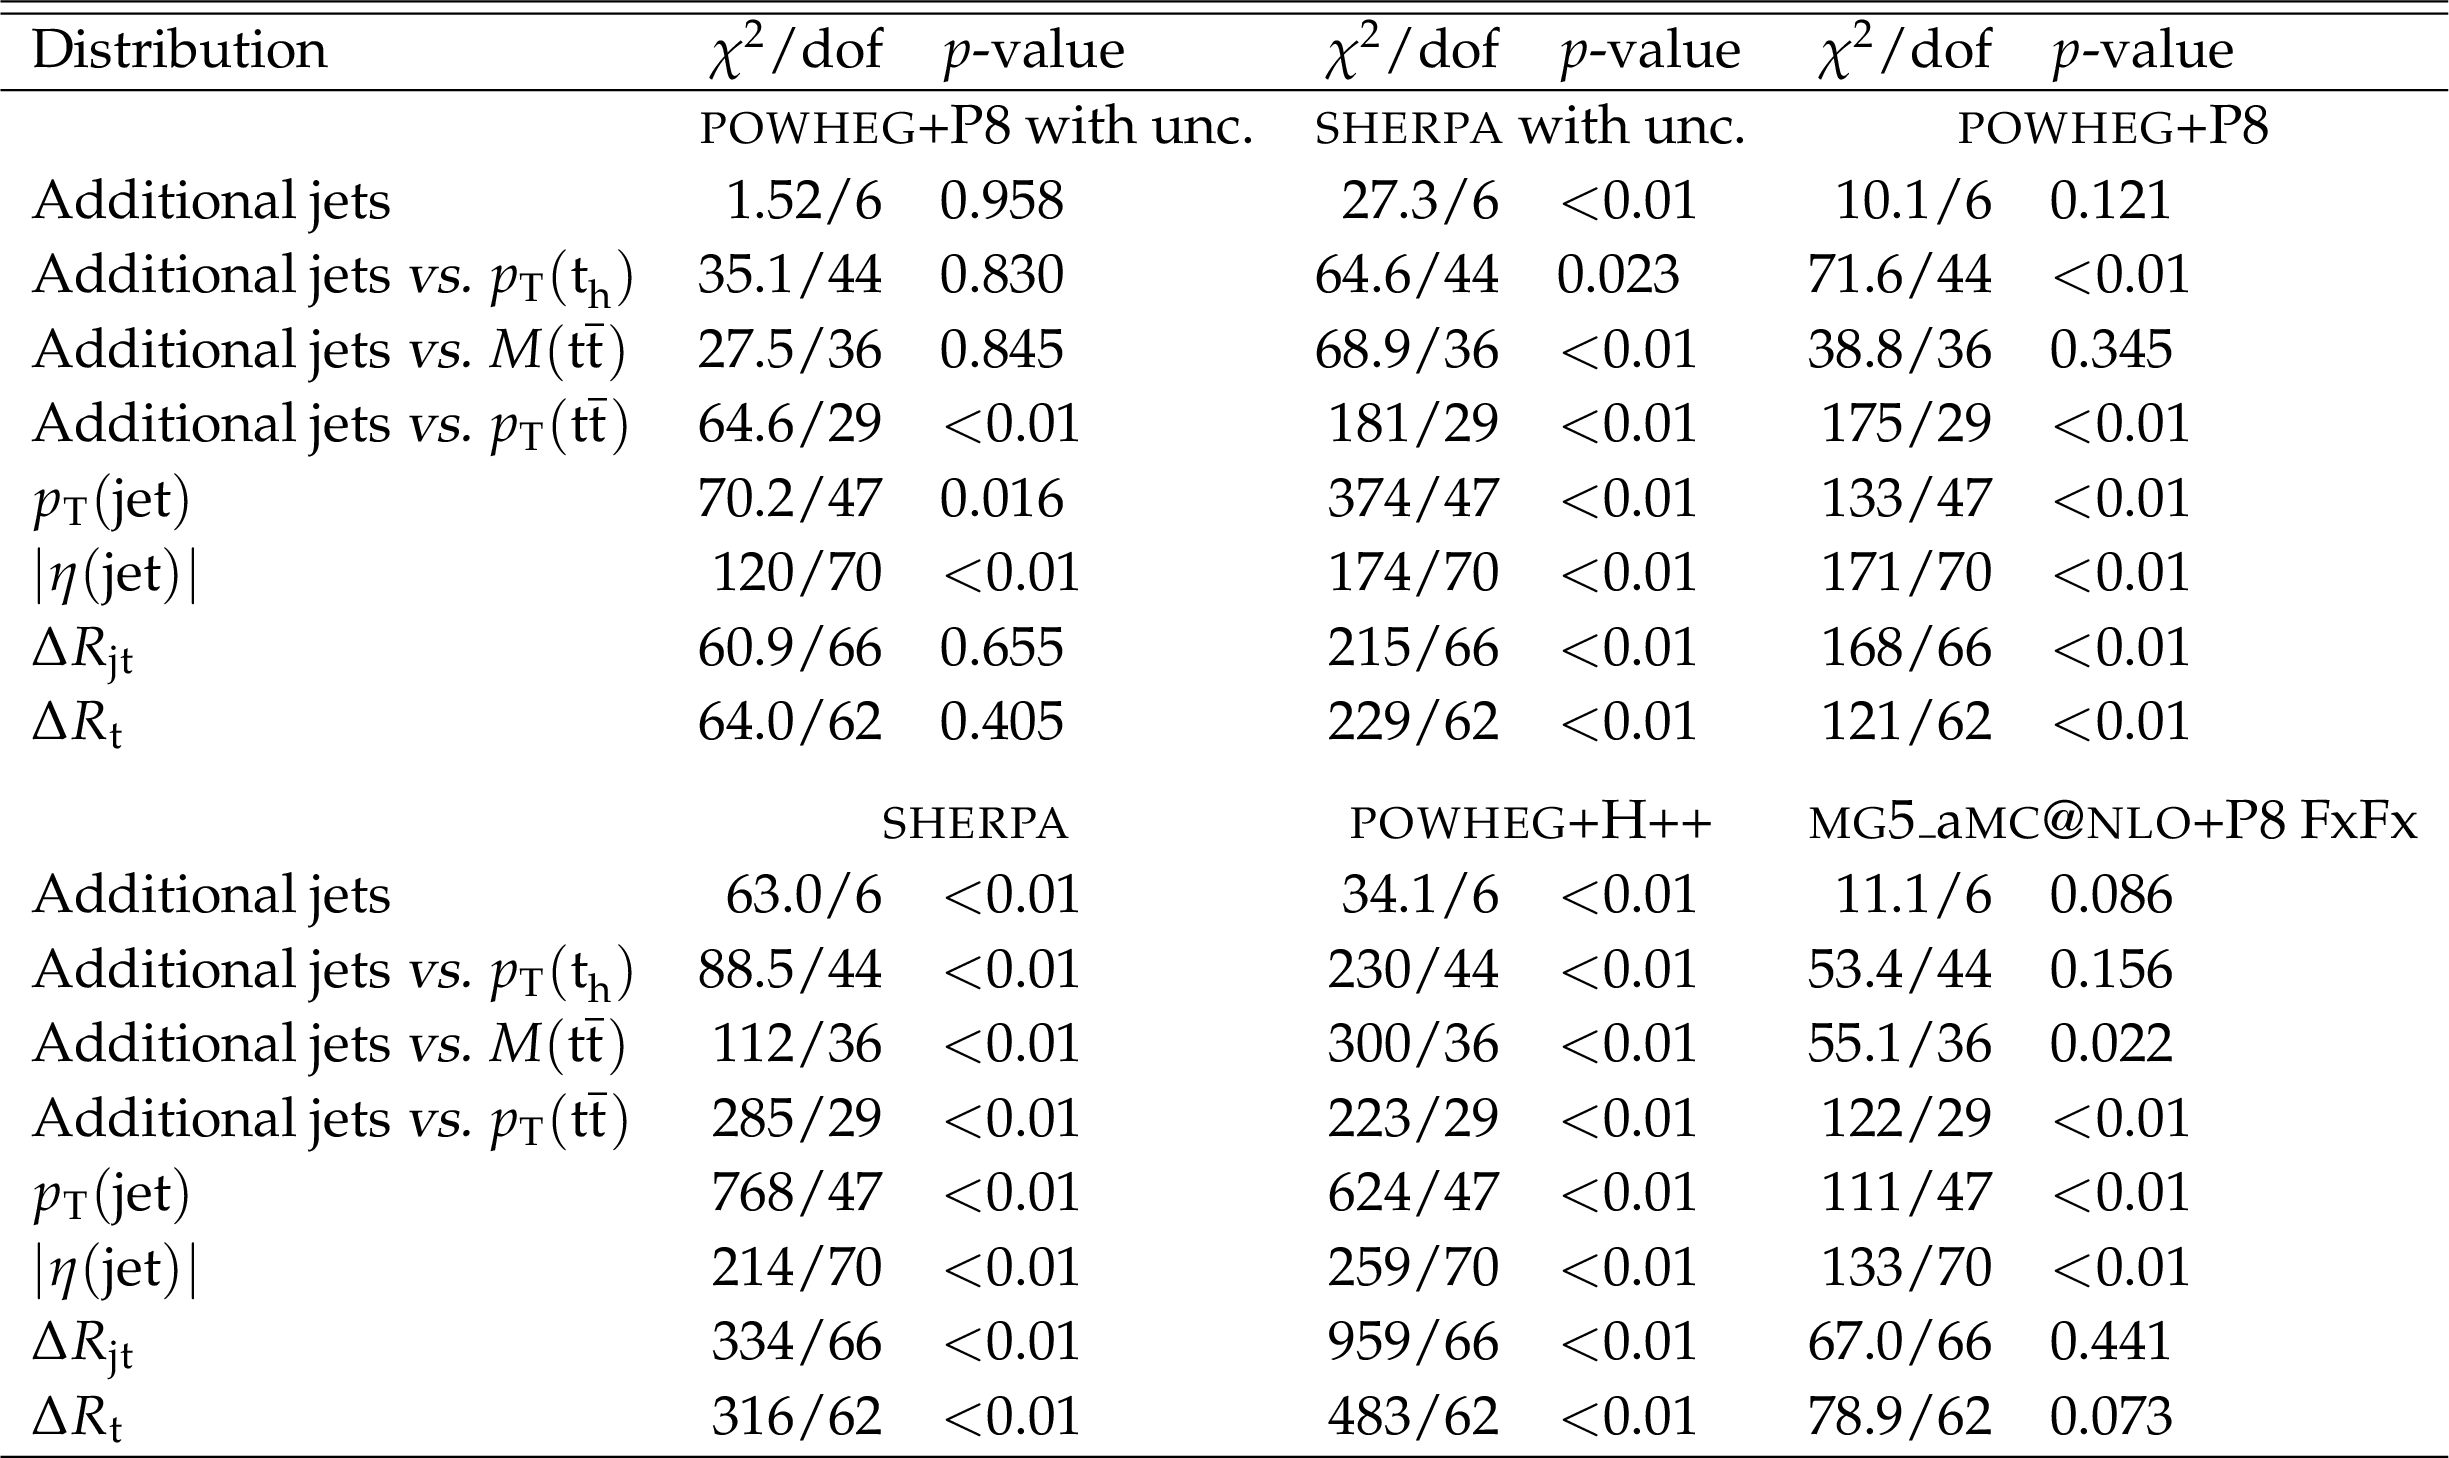
png pdf |
Table 5:
Comparison between the absolute measurements involving multiplicities and kinematic properties of jets and the predictions of POWHEG combined with PYTHIA8 (P8) or HERWIG++ (H++) and the multiparton simulations of MG5_aMC@NLO FxFx and SHERPA. The compatibilities with the POWHEG+PYTHIA8 and the SHERPA predictions are also calculated including their theoretical uncertainties (with unc.), while those are not taken into account for the other comparisons. The results of the $\chi ^2$ tests are listed, together with the numbers of degrees of freedom (dof) and the corresponding $p$-values. The rows labeled as "Additional jets'' refer to the measurement of the cross section as a function of jet multiplicities for up to five additional jets with $ {p_{\mathrm {T}}} > $ 30 GeV (Fig. 38 upper row). |

png pdf |
Table 6:
Comparison between the normalized measurements involving multiplicities and kinematic properties of jets and the predictions of POWHEG combined with PYTHIA8 (P8) or HERWIG++ (H++) and the multiparton simulations of MG5_aMC@NLO FxFx and SHERPA. The compatibilities with the POWHEG+PYTHIA8 and the SHERPA predictions are also calculated including their theoretical uncertainties (with unc.), while those are not taken into account for the other comparisons. The results of the $\chi ^2$ tests are listed, together with the numbers of degrees of freedom (dof) and the corresponding $p$-values. The rows labeled as "Additional jets'' refer to the measurement of the cross section as a function of jet multiplicities for up to five additional jets with $ {p_{\mathrm {T}}} > $ 30 GeV (Fig. 38 upper row). |
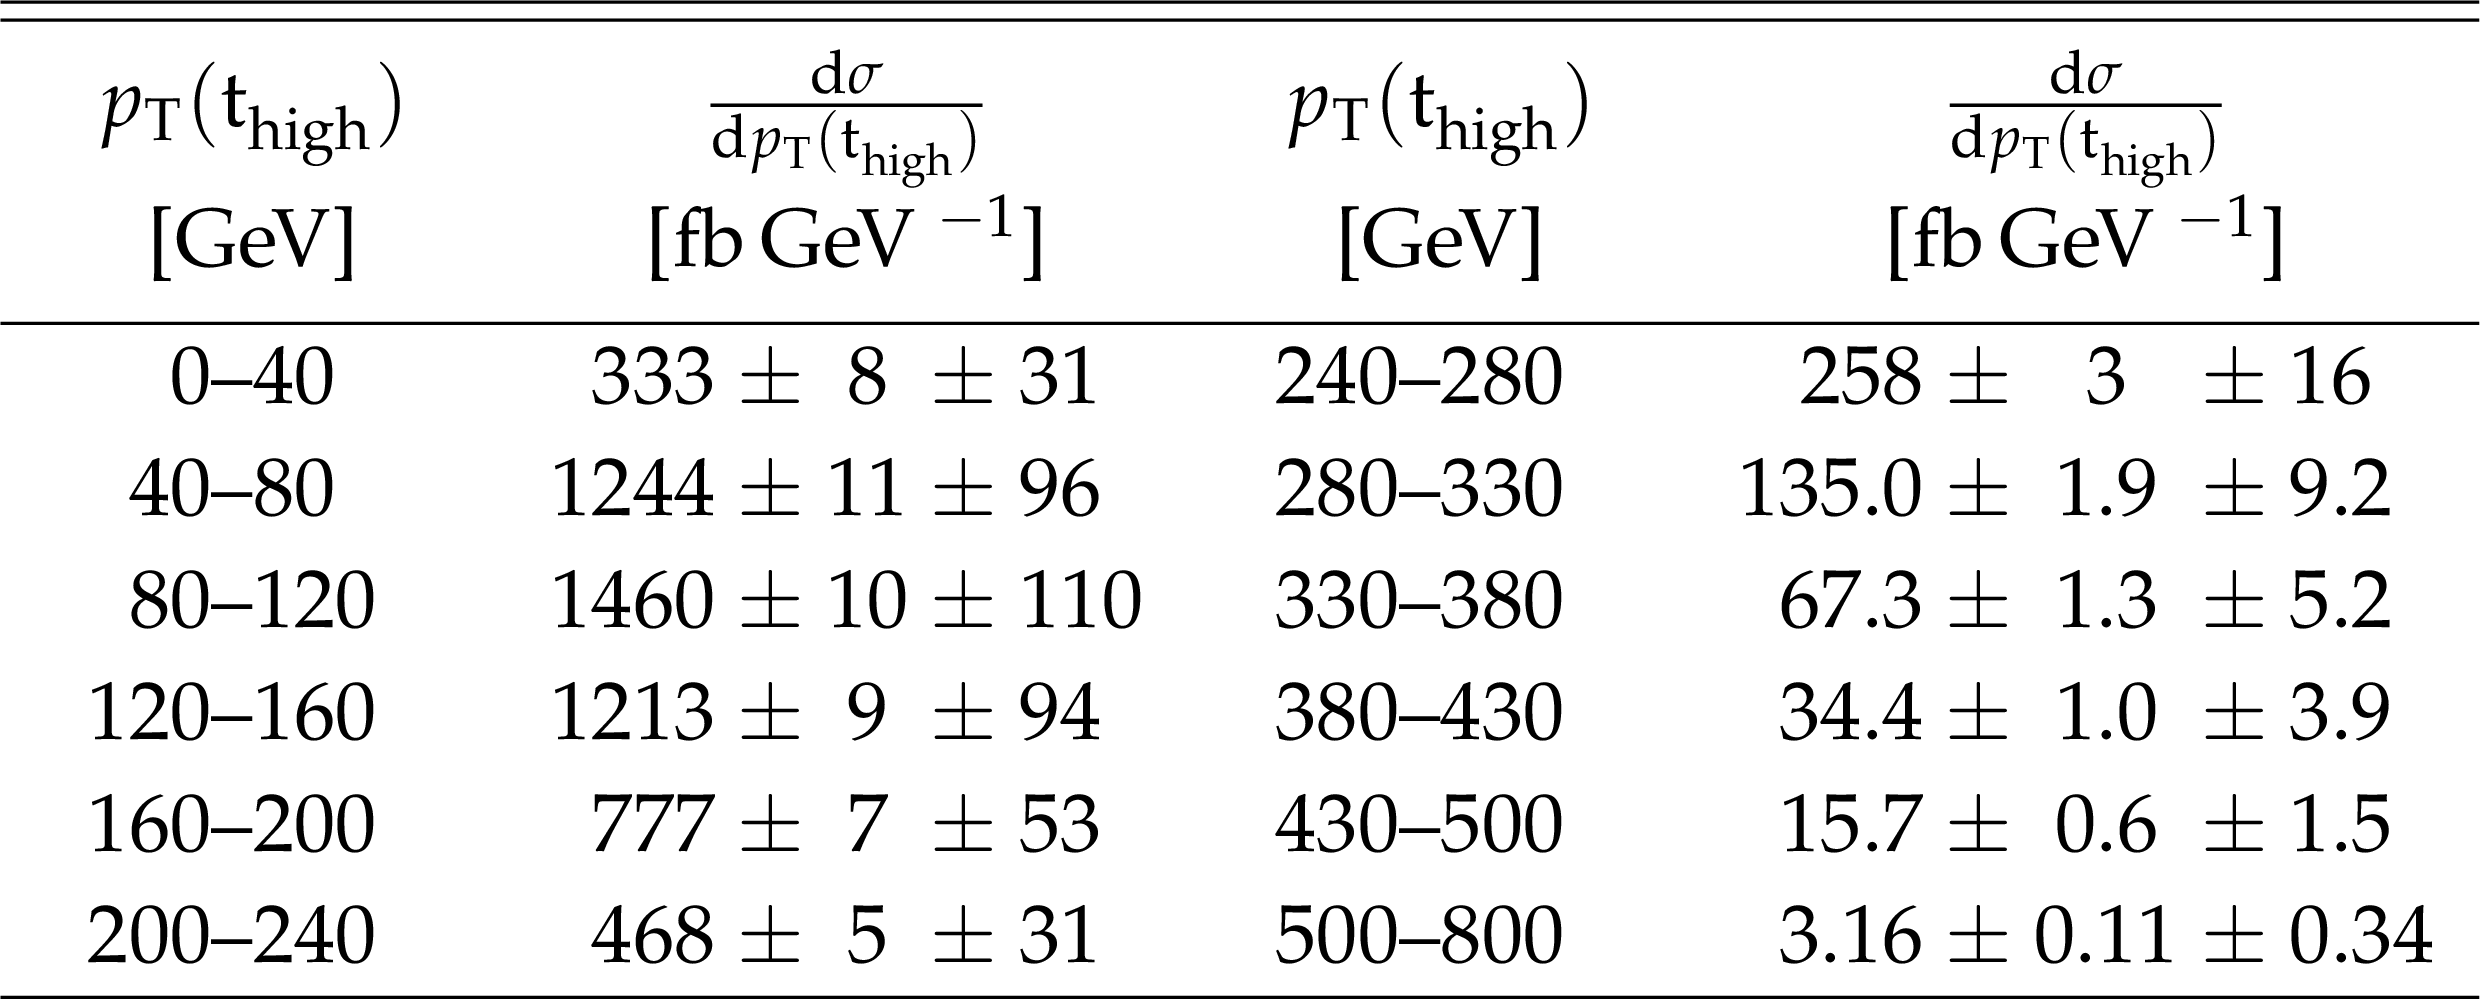
png pdf |
Table 7:
Differential cross section at the parton level as a function of $ {p_{\mathrm {T}}} (\mathrm{t} _\text {high})$. The values are shown together with their statistical and systematic uncertainties. |
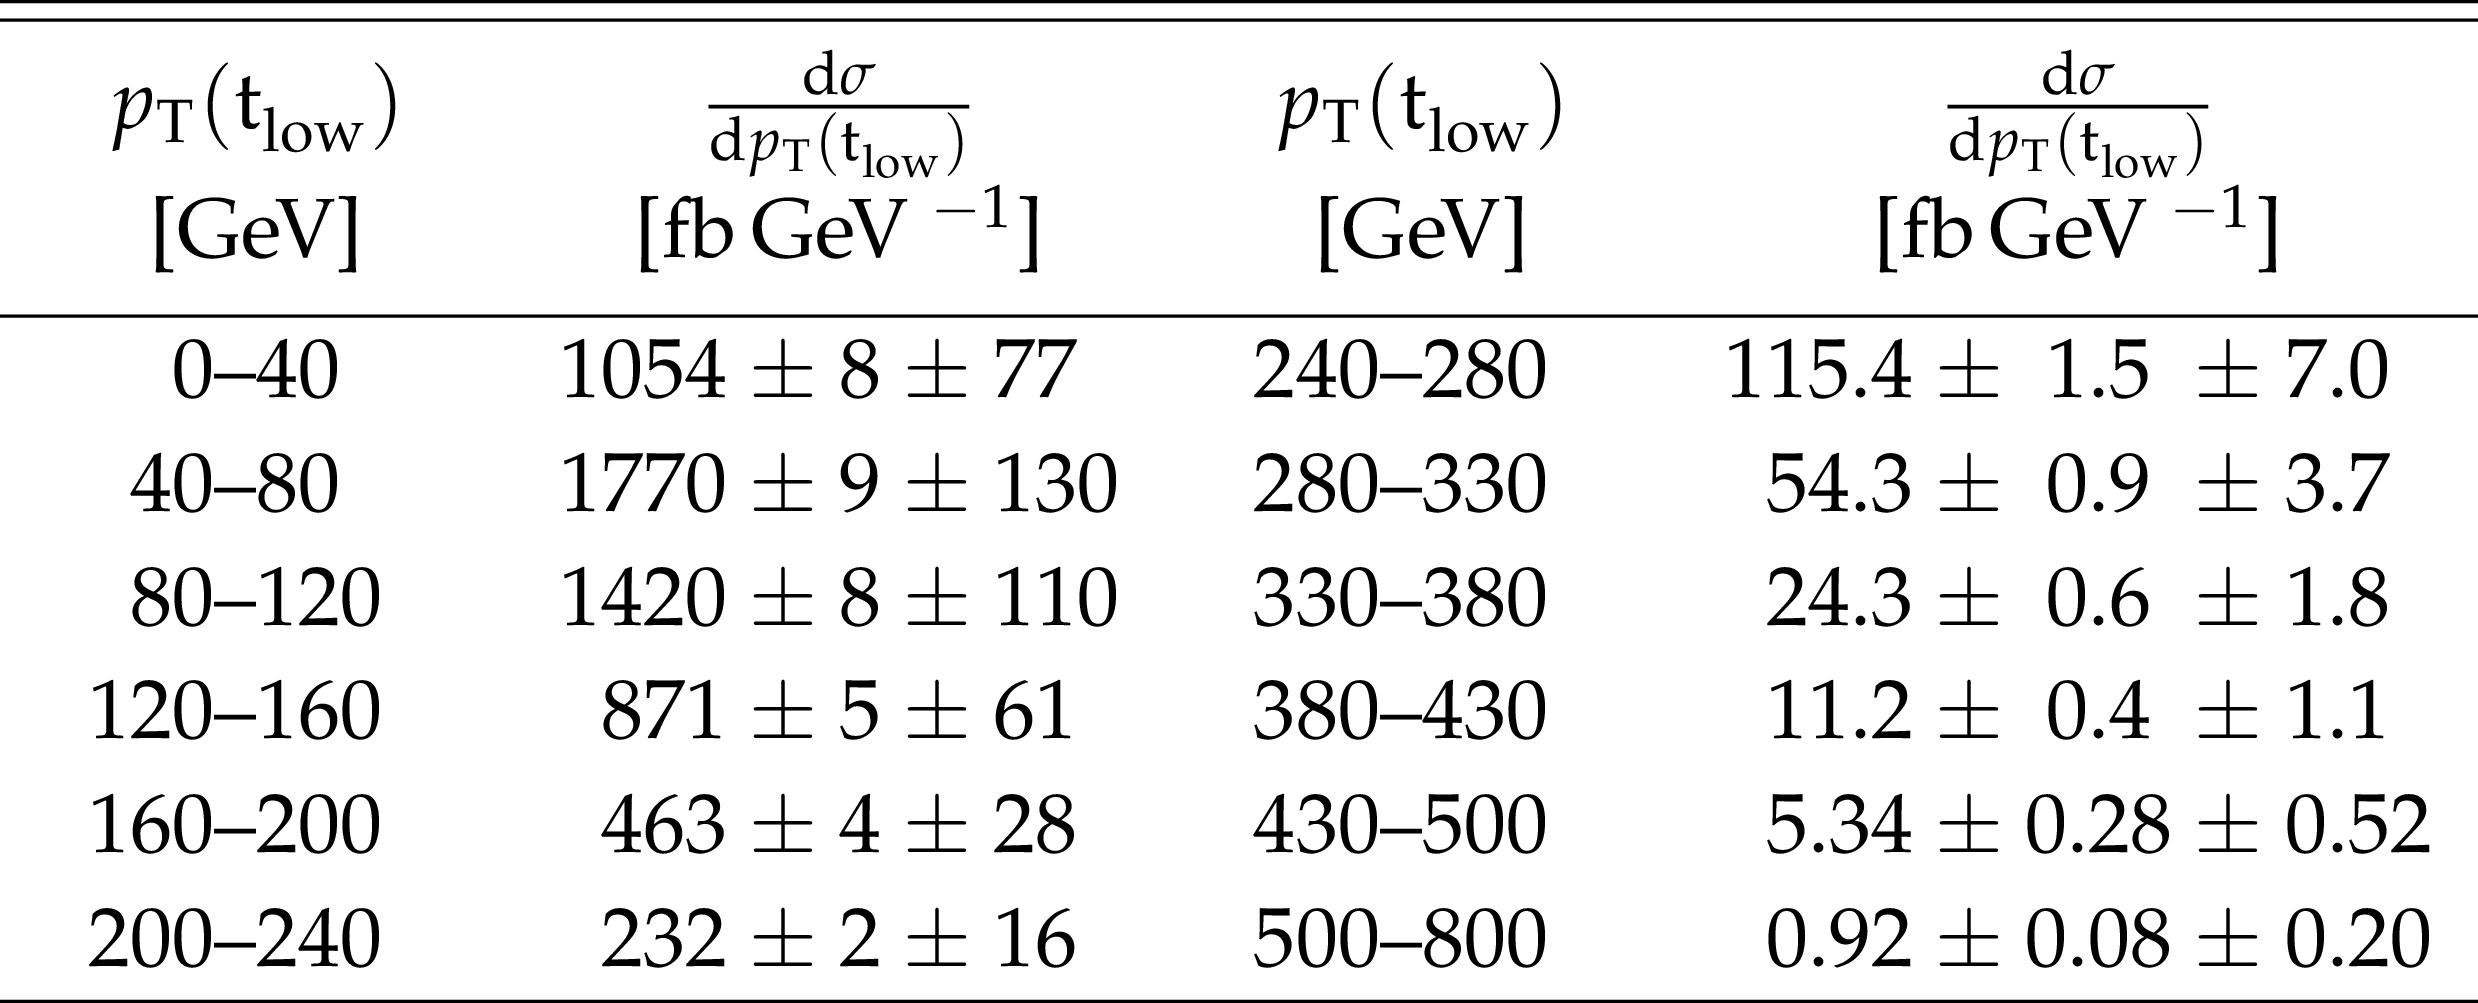
png pdf |
Table 8:
Differential cross section at the parton level as a function of $ {p_{\mathrm {T}}} (\mathrm{t} _\text {low})$. The values are shown together with their statistical and systematic uncertainties. |
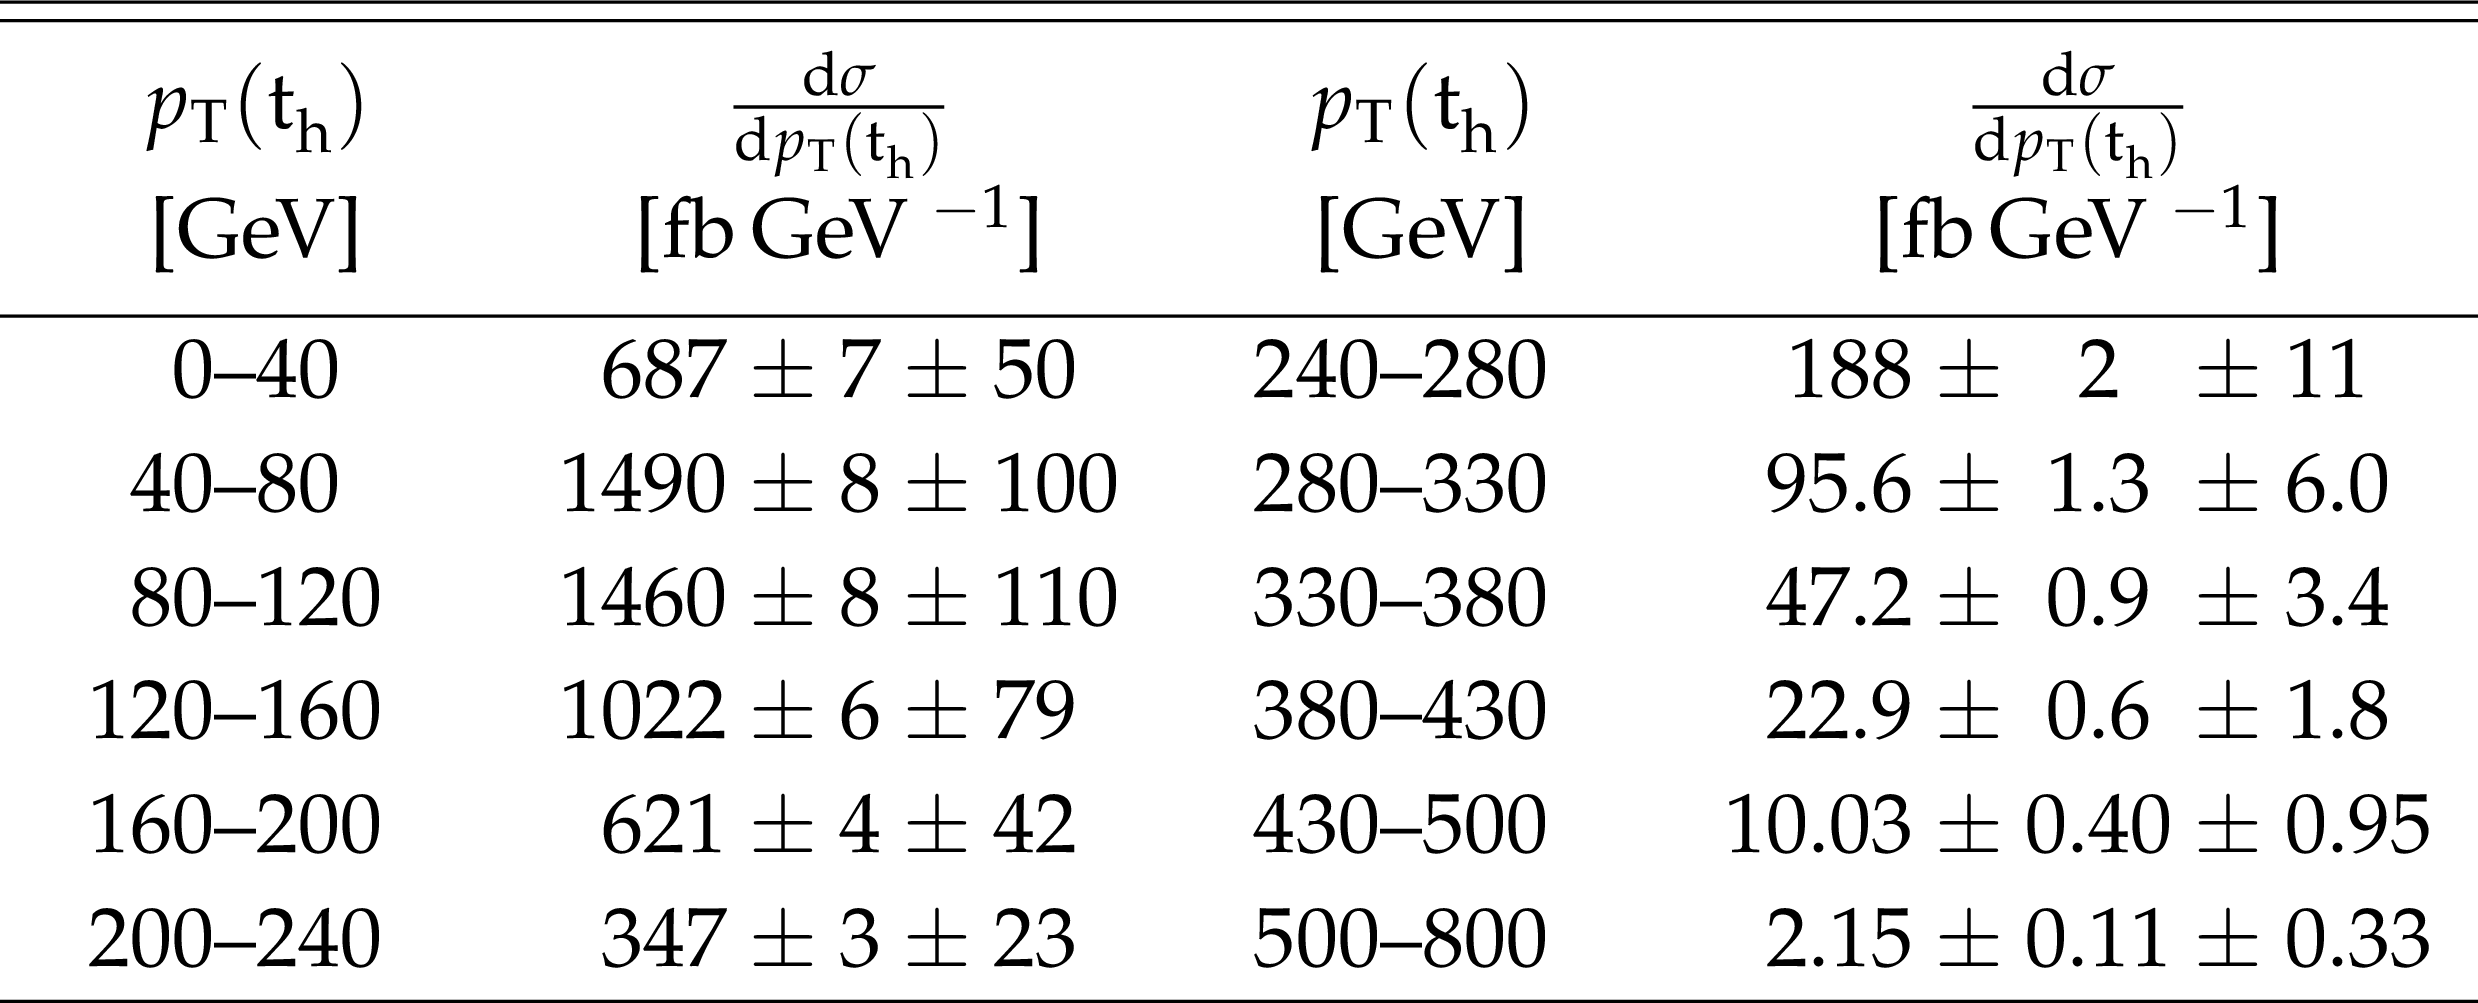
png pdf |
Table 9:
Differential cross section at the parton level as a function of $ {p_{\mathrm {T}}} ({\mathrm{t} _\mathrm {h}})$. The values are shown together with their statistical and systematic uncertainties. |
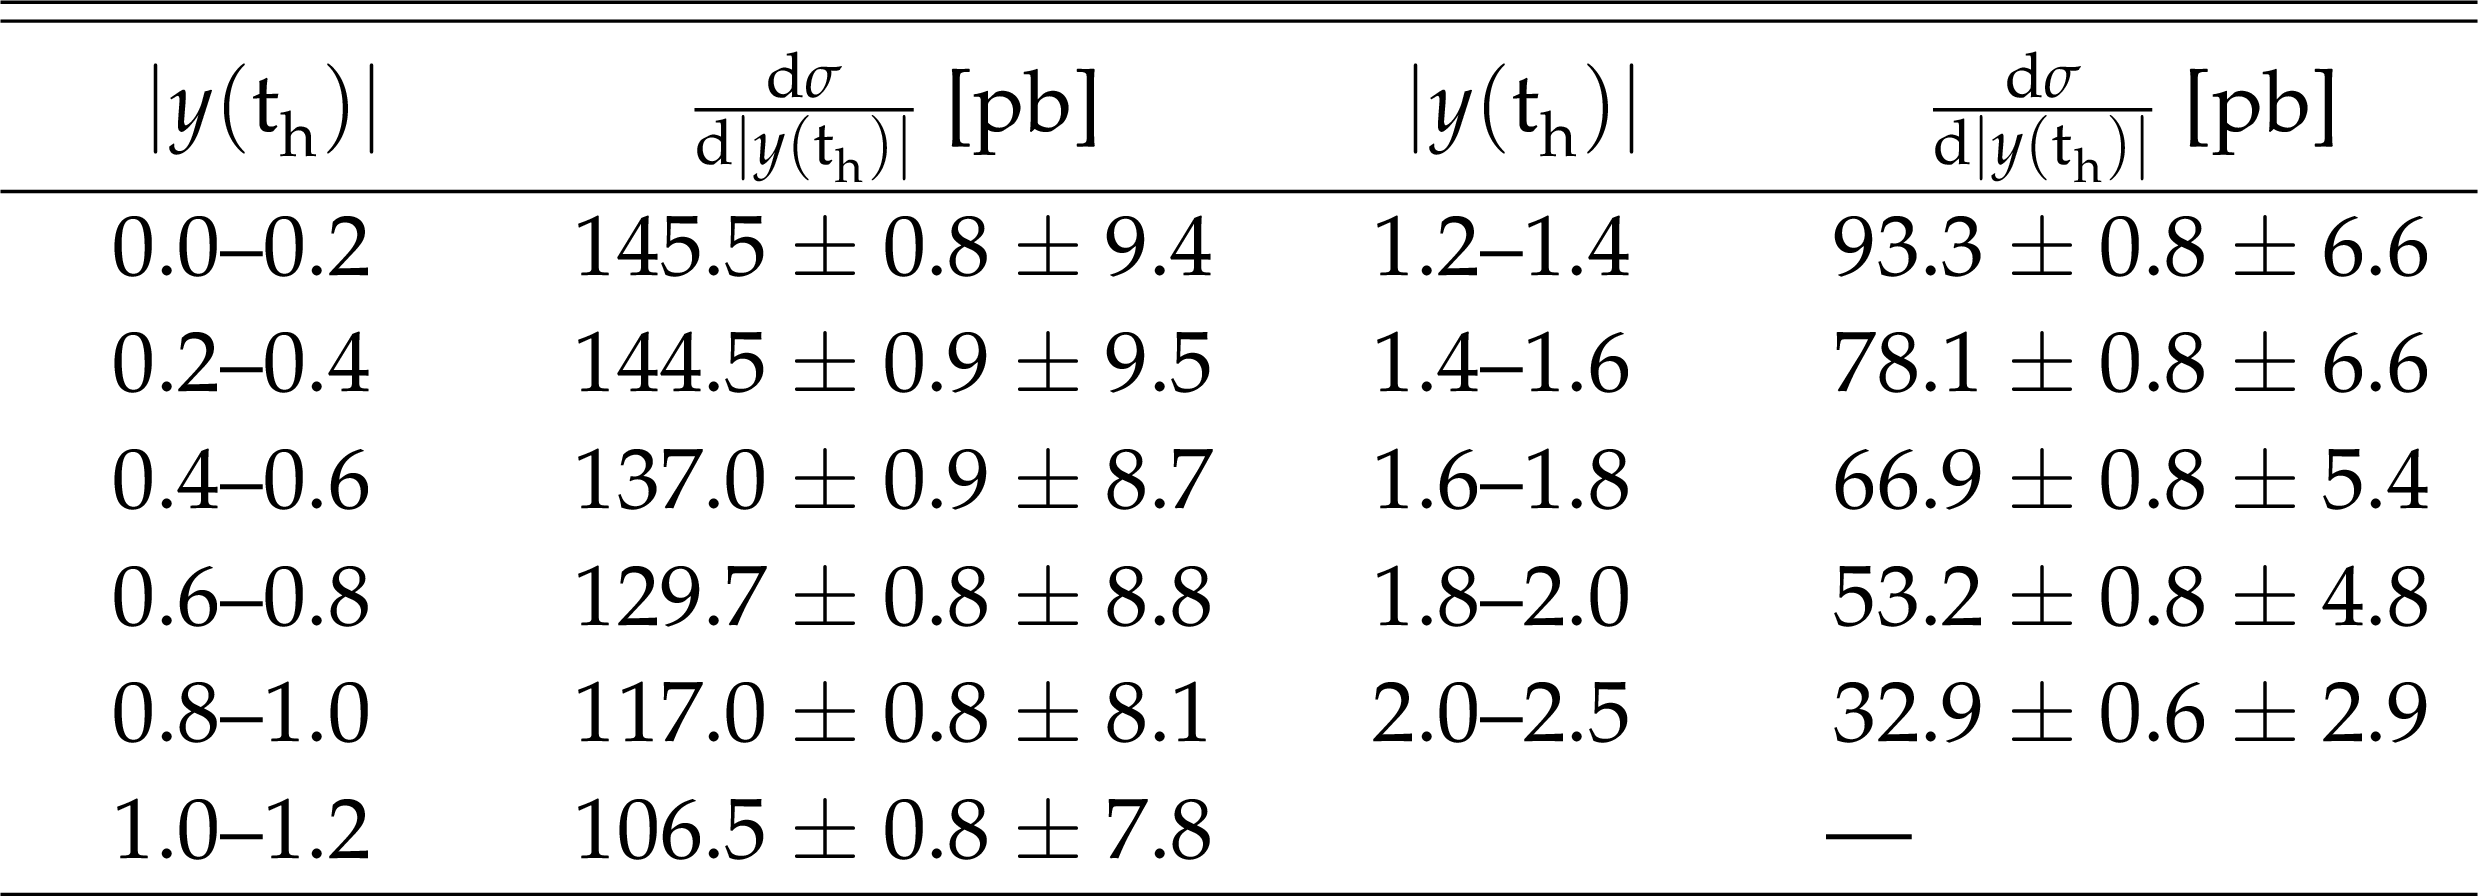
png pdf |
Table 10:
Differential cross section at the parton level as a function of $ { | y({\mathrm{t} _\mathrm {h}}) | }$. The values are shown together with their statistical and systematic uncertainties. |
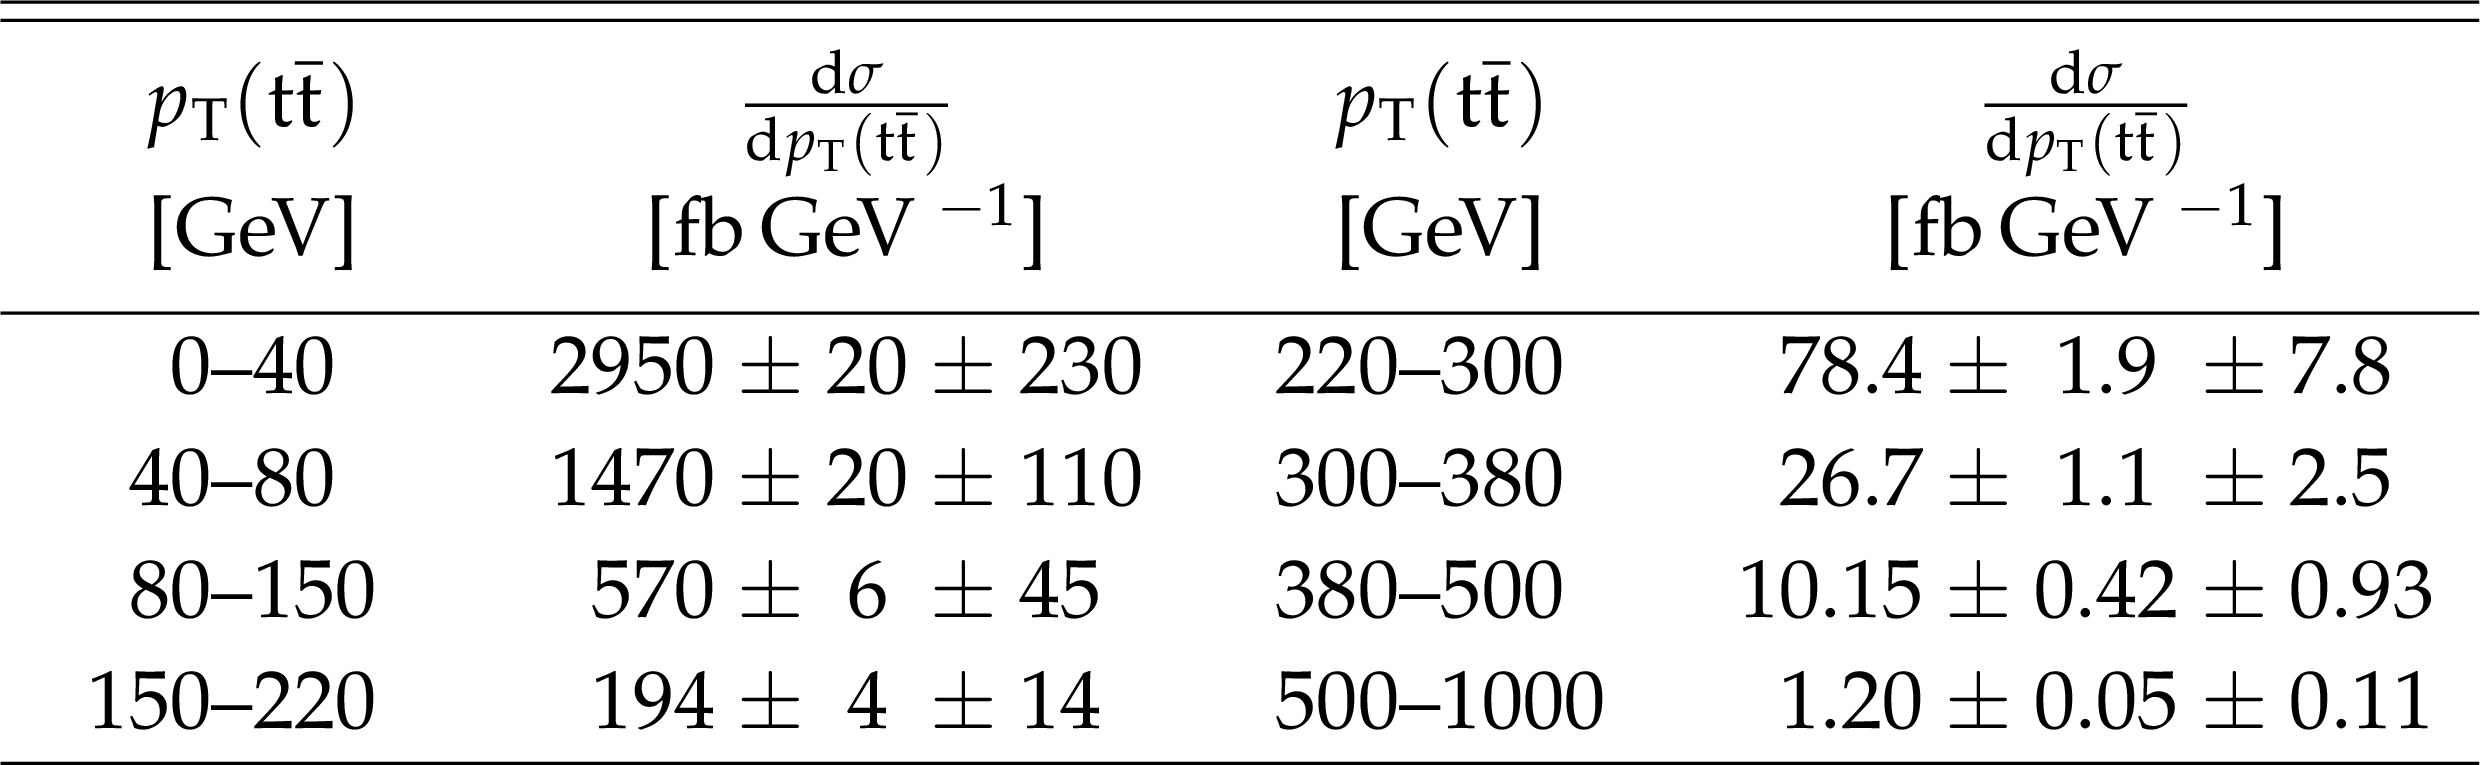
png pdf |
Table 11:
Differential cross section at the parton level as a function of $ {p_{\mathrm {T}}} ({\mathrm{t} \mathrm{\bar{t}}})$. The values are shown together with their statistical and systematic uncertainties. |

png pdf |
Table 12:
Differential cross section at the parton level as a function of $ { | y({\mathrm{t} \mathrm{\bar{t}}}) | }$. The values are shown together with their statistical and systematic uncertainties. |
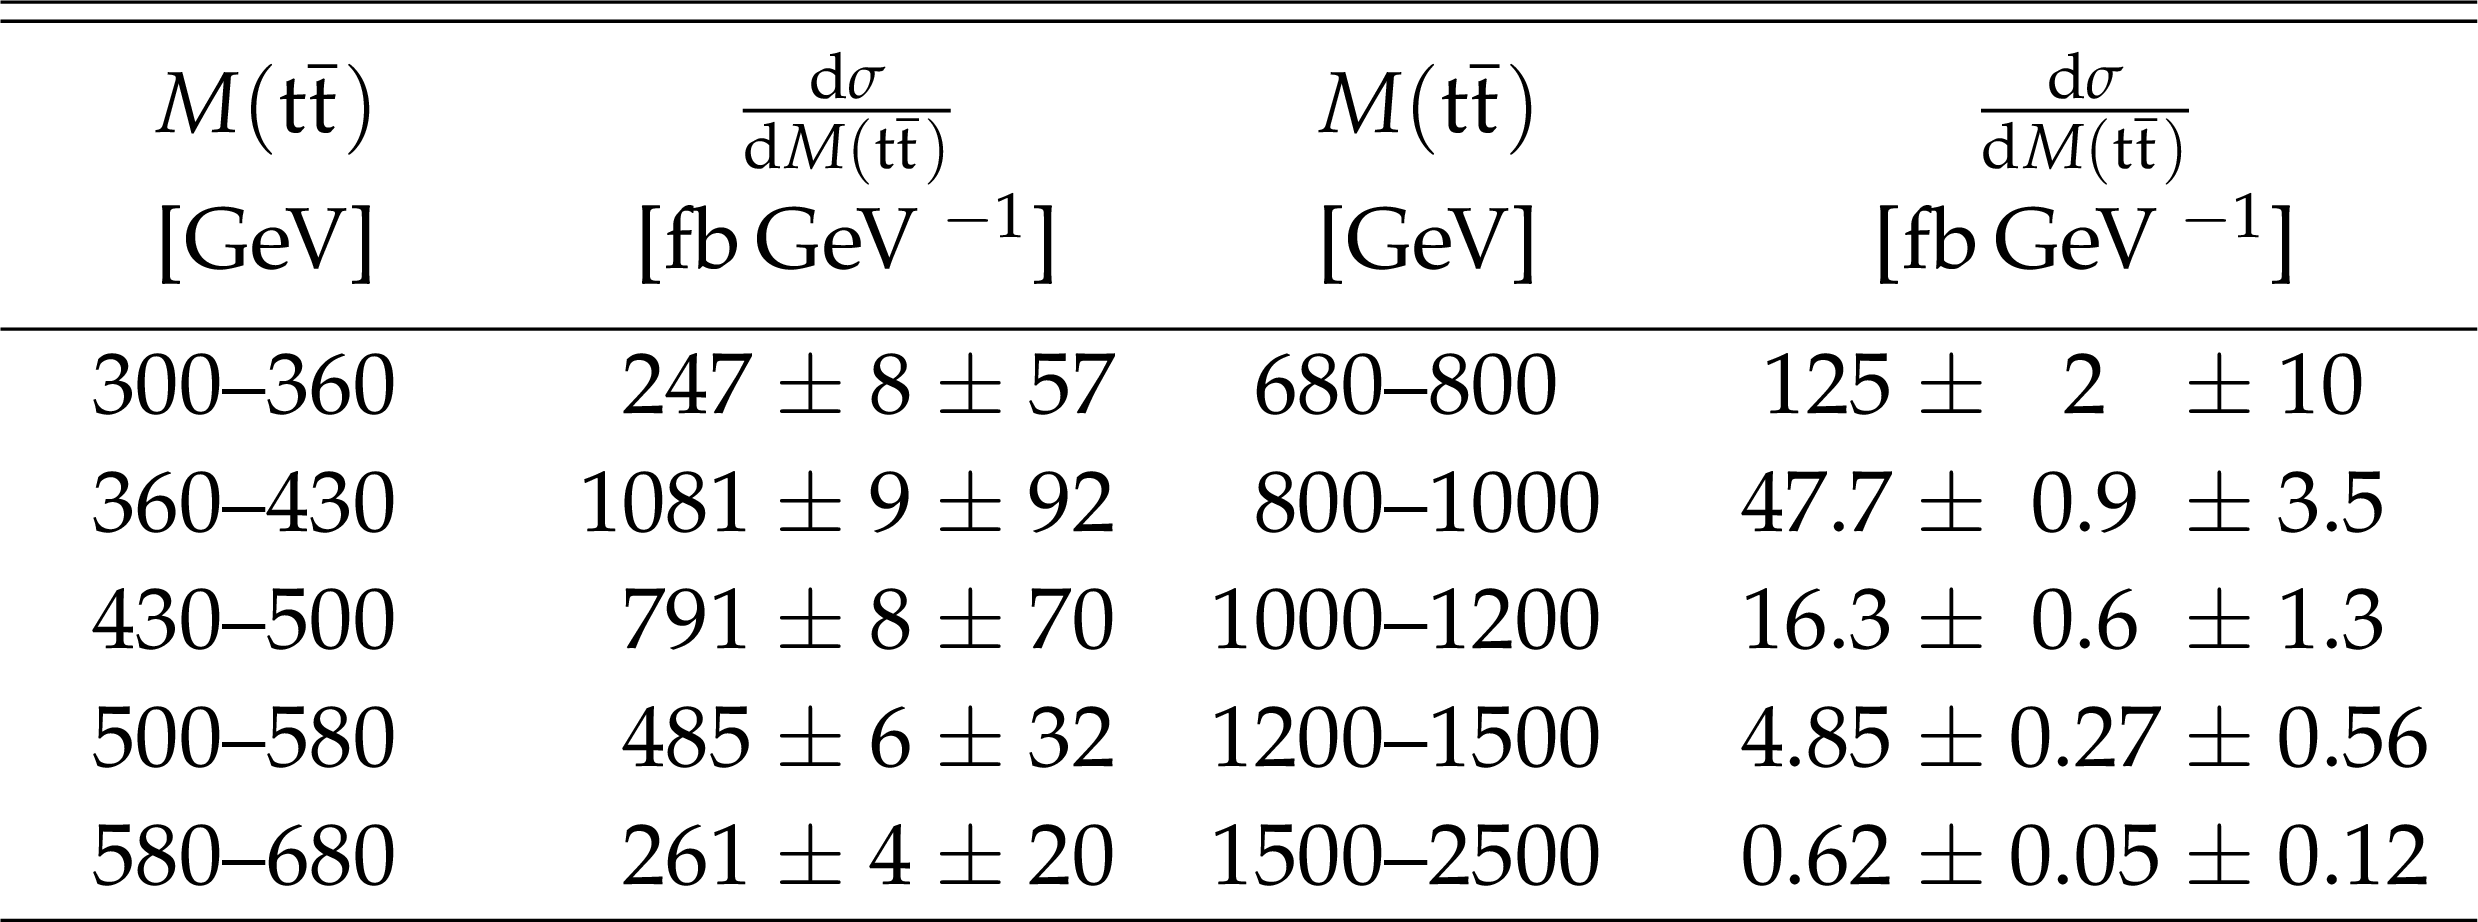
png pdf |
Table 13:
Differential cross section at the parton level as a function of $M({\mathrm{t} \mathrm{\bar{t}}})$. The values are shown together with their statistical and systematic uncertainties. |
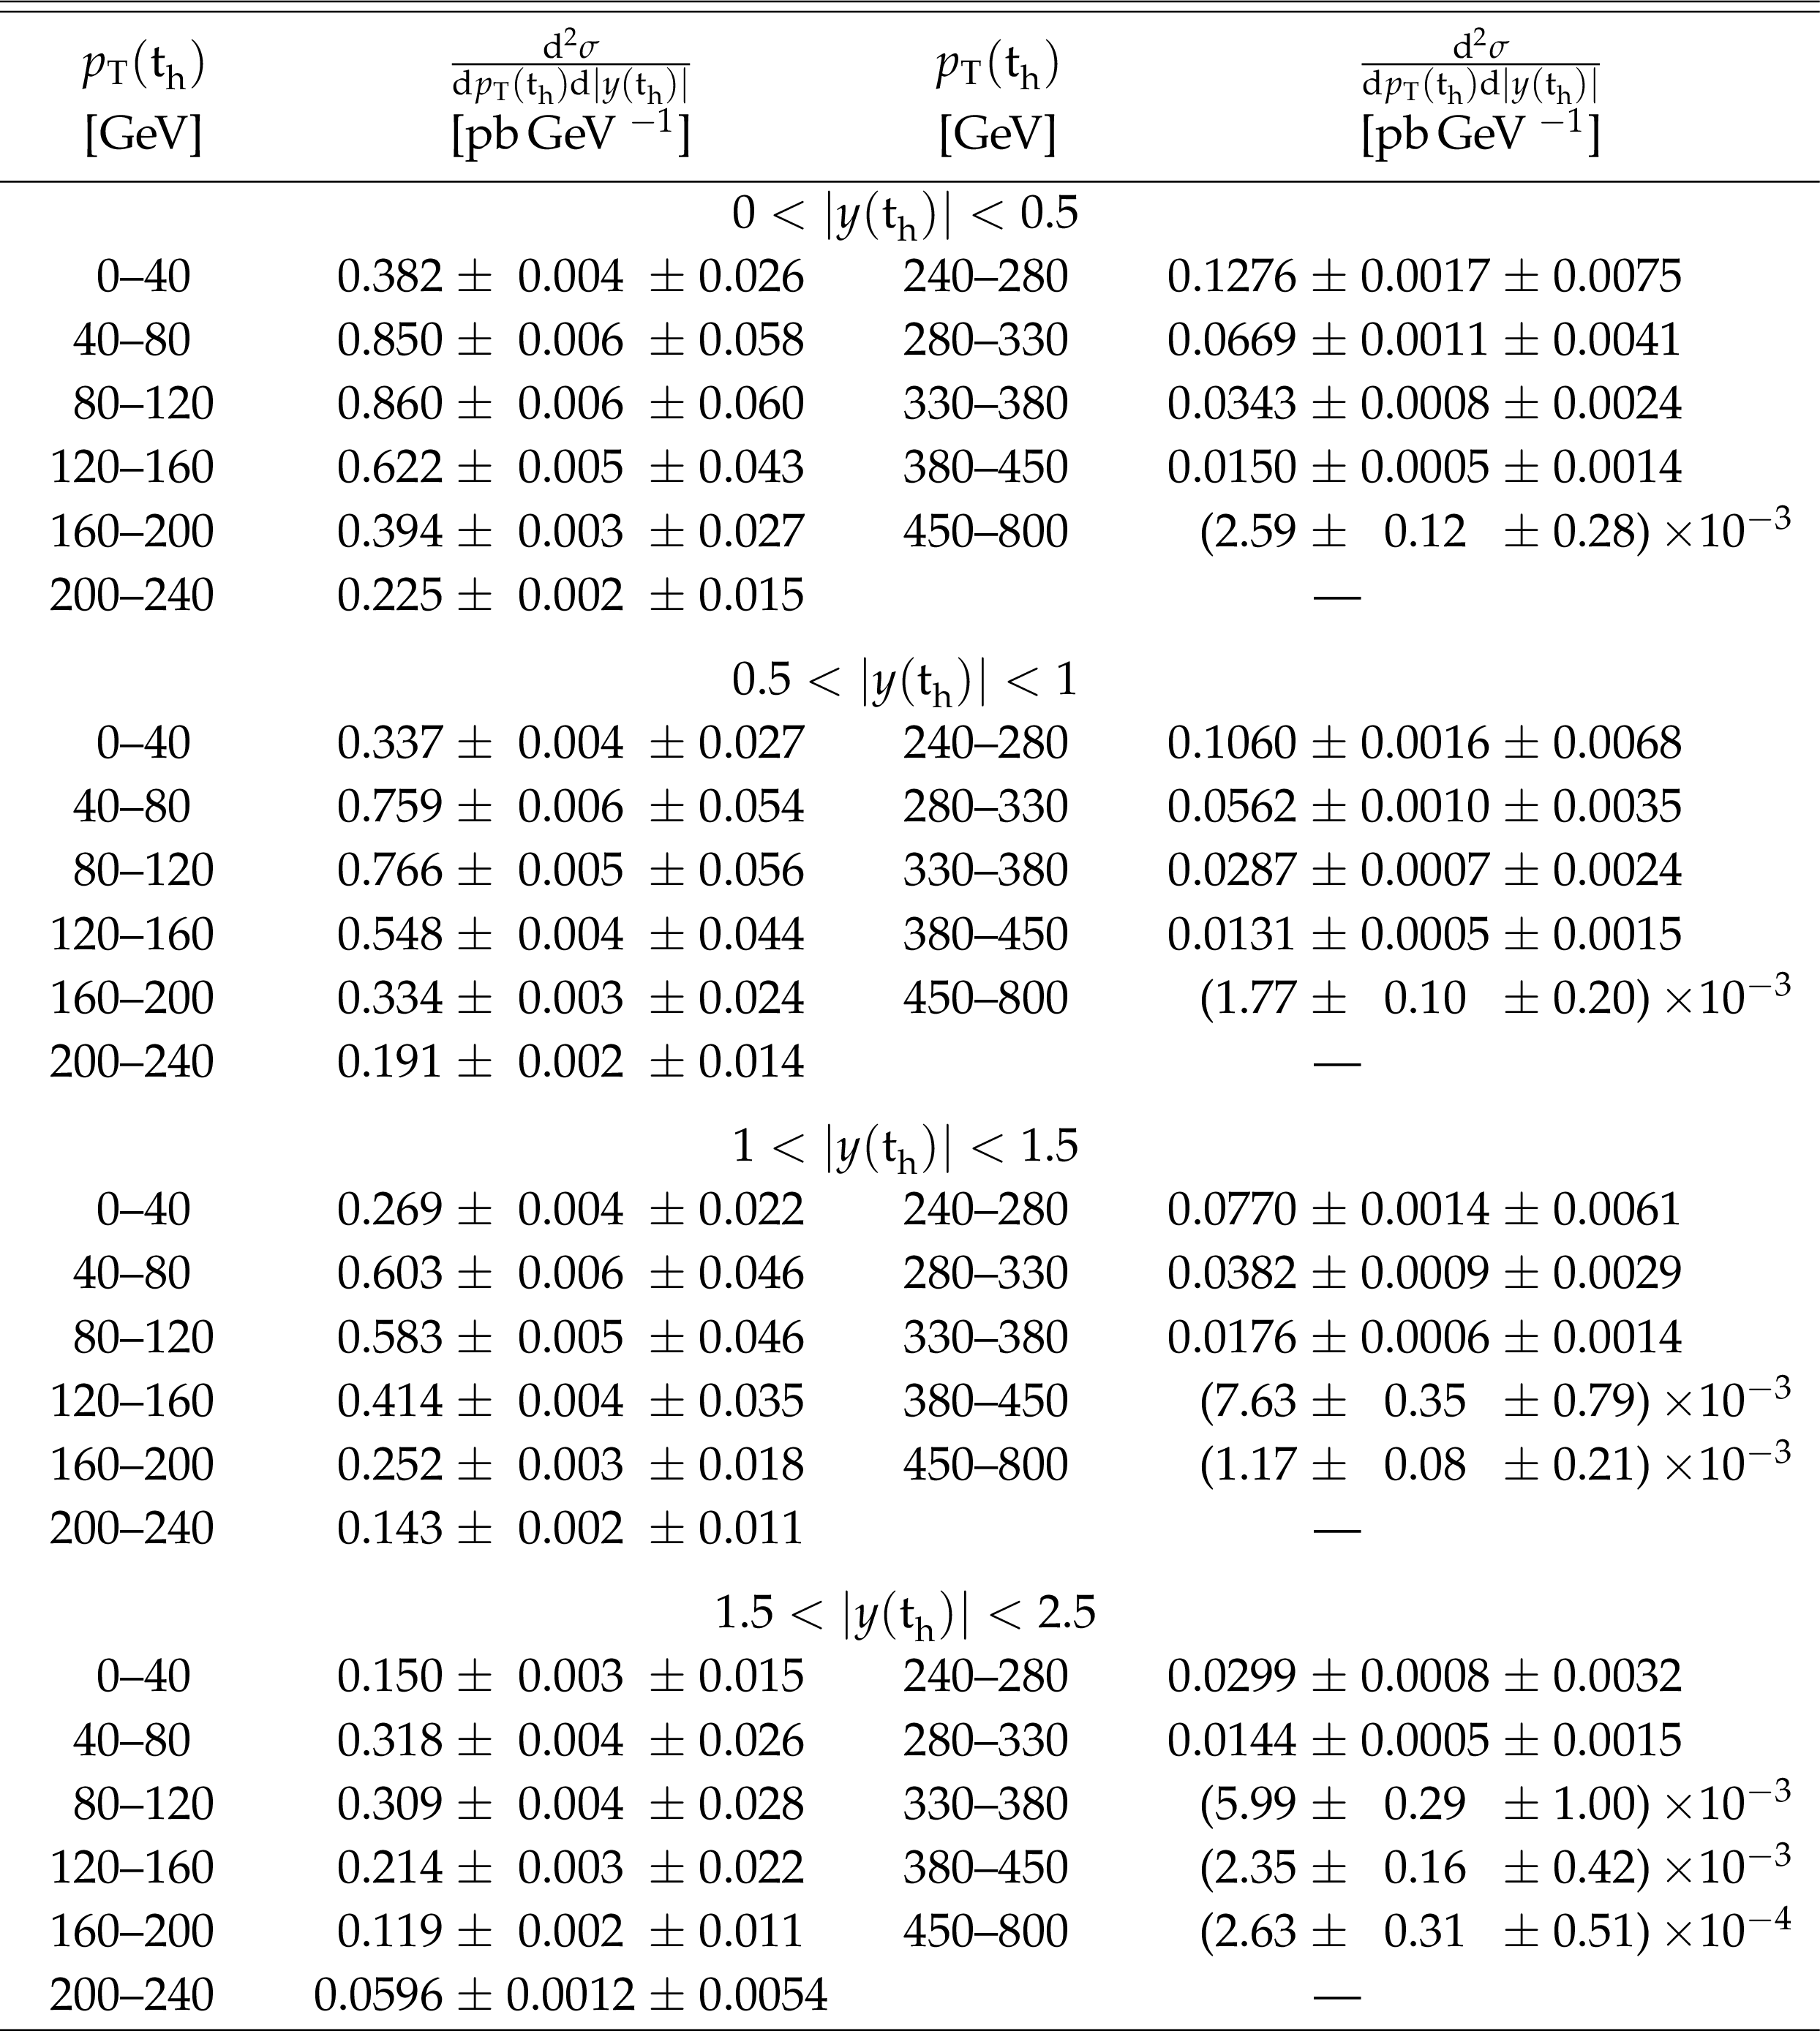
png pdf |
Table 14:
Double-differential cross section at the parton level as a function of $ { | y({\mathrm{t} _\mathrm {h}}) | }$ vs. $ {p_{\mathrm {T}}} ({\mathrm{t} _\mathrm {h}})$. The values are shown together with their statistical and systematic uncertainties. |

png pdf |
Table 15:
Double-differential cross section at the parton level as a function of $M({\mathrm{t} \mathrm{\bar{t}}})$ vs. $ { | y({\mathrm{t} \mathrm{\bar{t}}}) | }$. The values are shown together with their statistical and systematic uncertainties. |
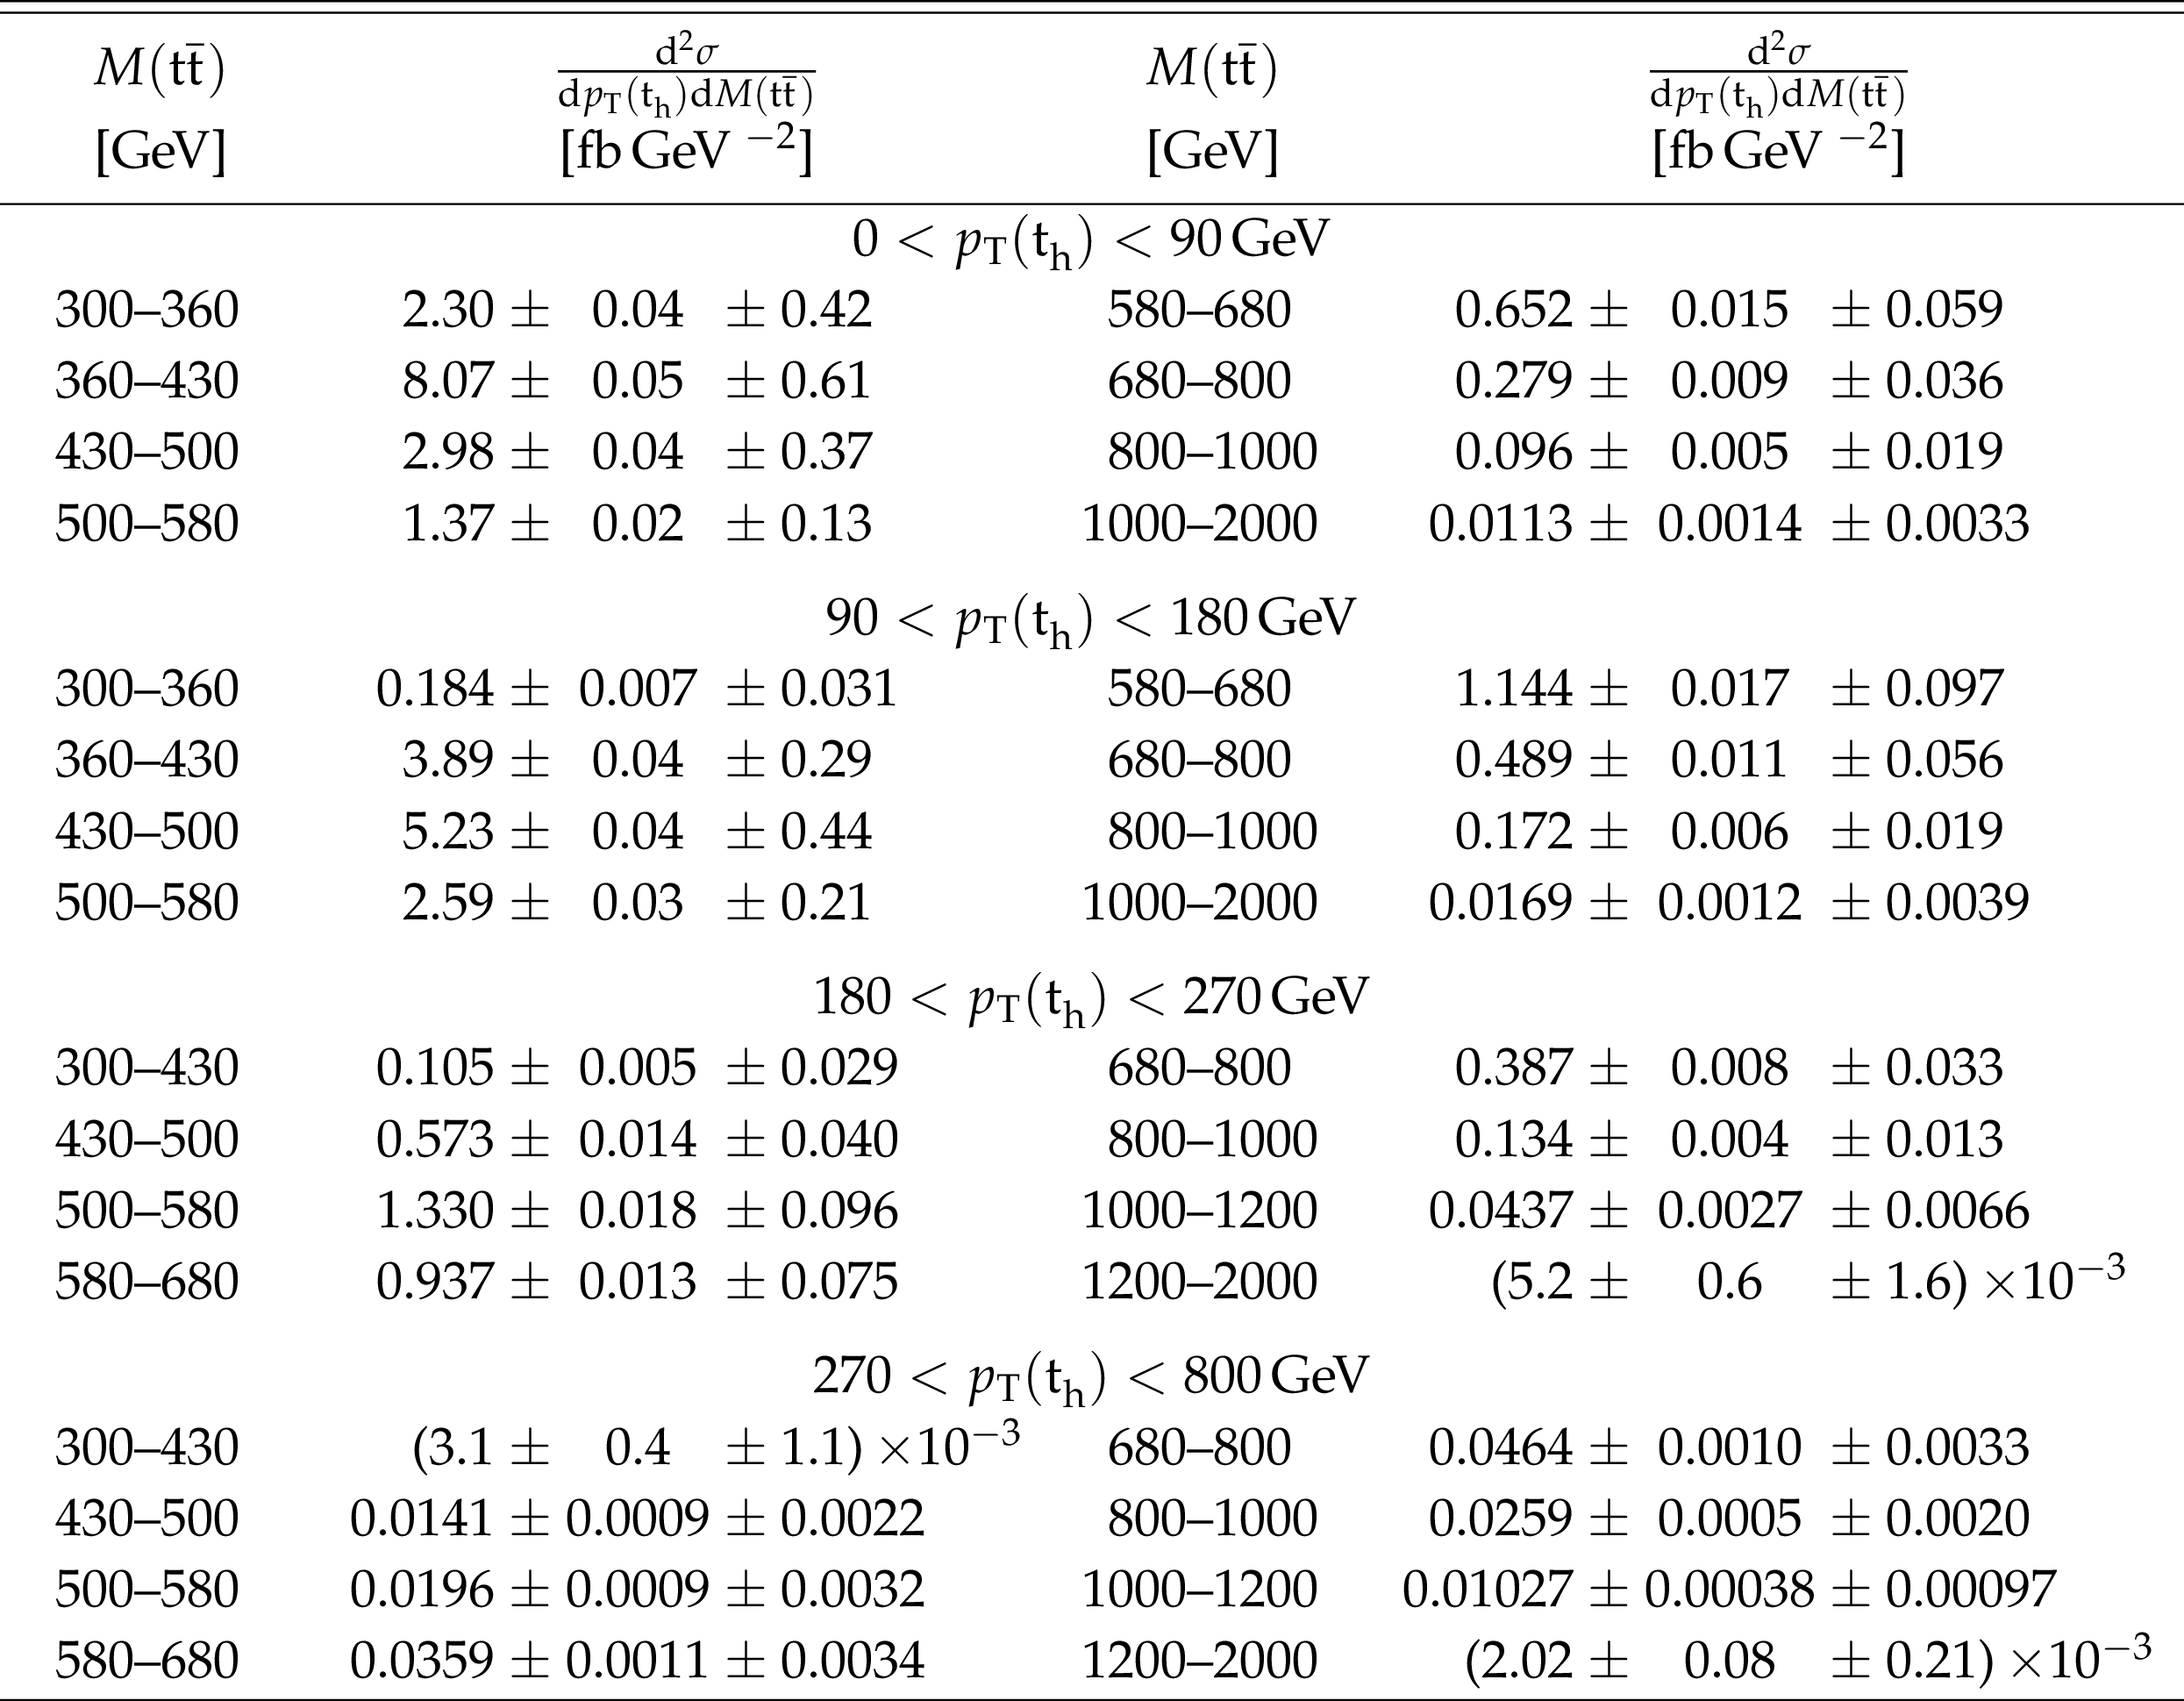
png pdf |
Table 16:
Double-differential cross section at the parton level as a function of $ {p_{\mathrm {T}}} ({\mathrm{t} _\mathrm {h}})$ vs. $M({\mathrm{t} \mathrm{\bar{t}}})$. The values are shown together with their statistical and systematic uncertainties. |

png pdf |
Table 17:
Differential cross section at the particle level as a function of $ {p_{\mathrm {T}}} ({\mathrm{t} _\mathrm {h}})$. The values are shown together with their statistical and systematic uncertainties. |
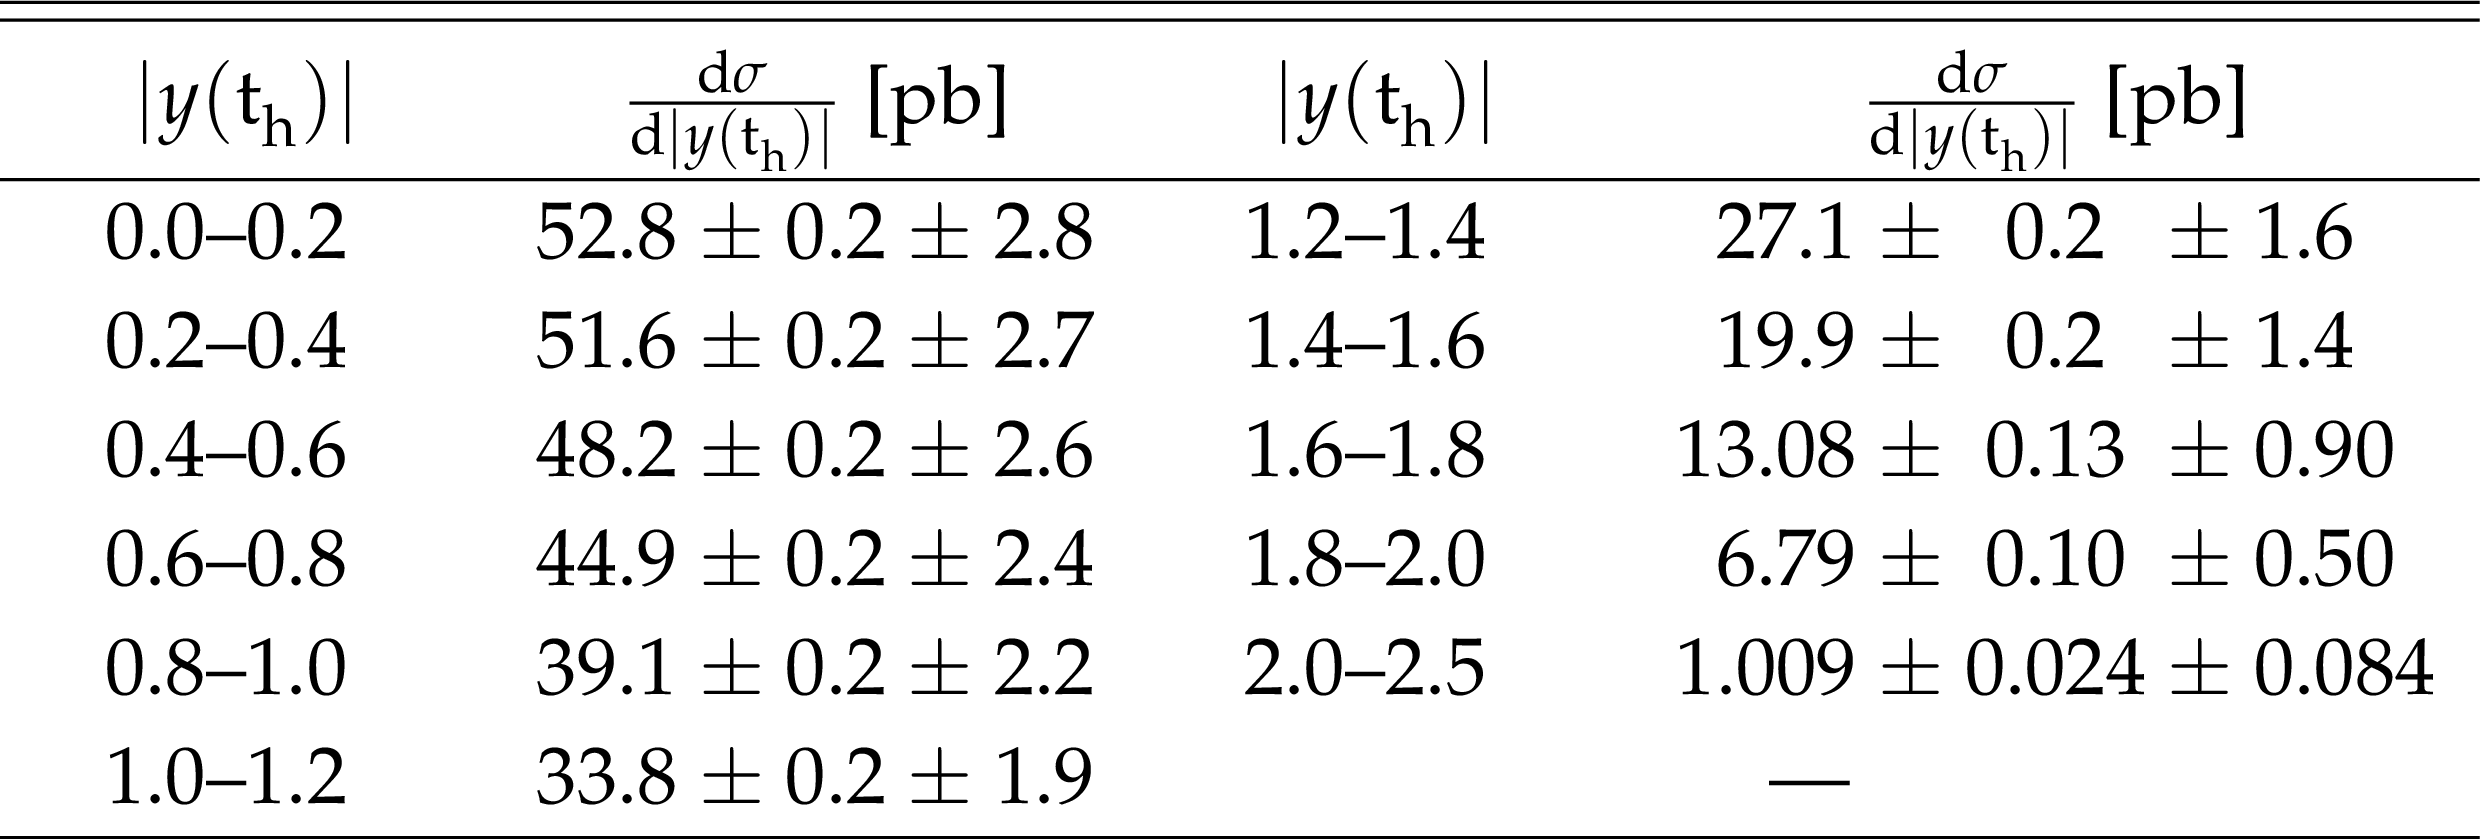
png pdf |
Table 18:
Differential cross section at the particle level as a function of $ { | y({\mathrm{t} _\mathrm {h}}) | }$. The values are shown together with their statistical and systematic uncertainties. |
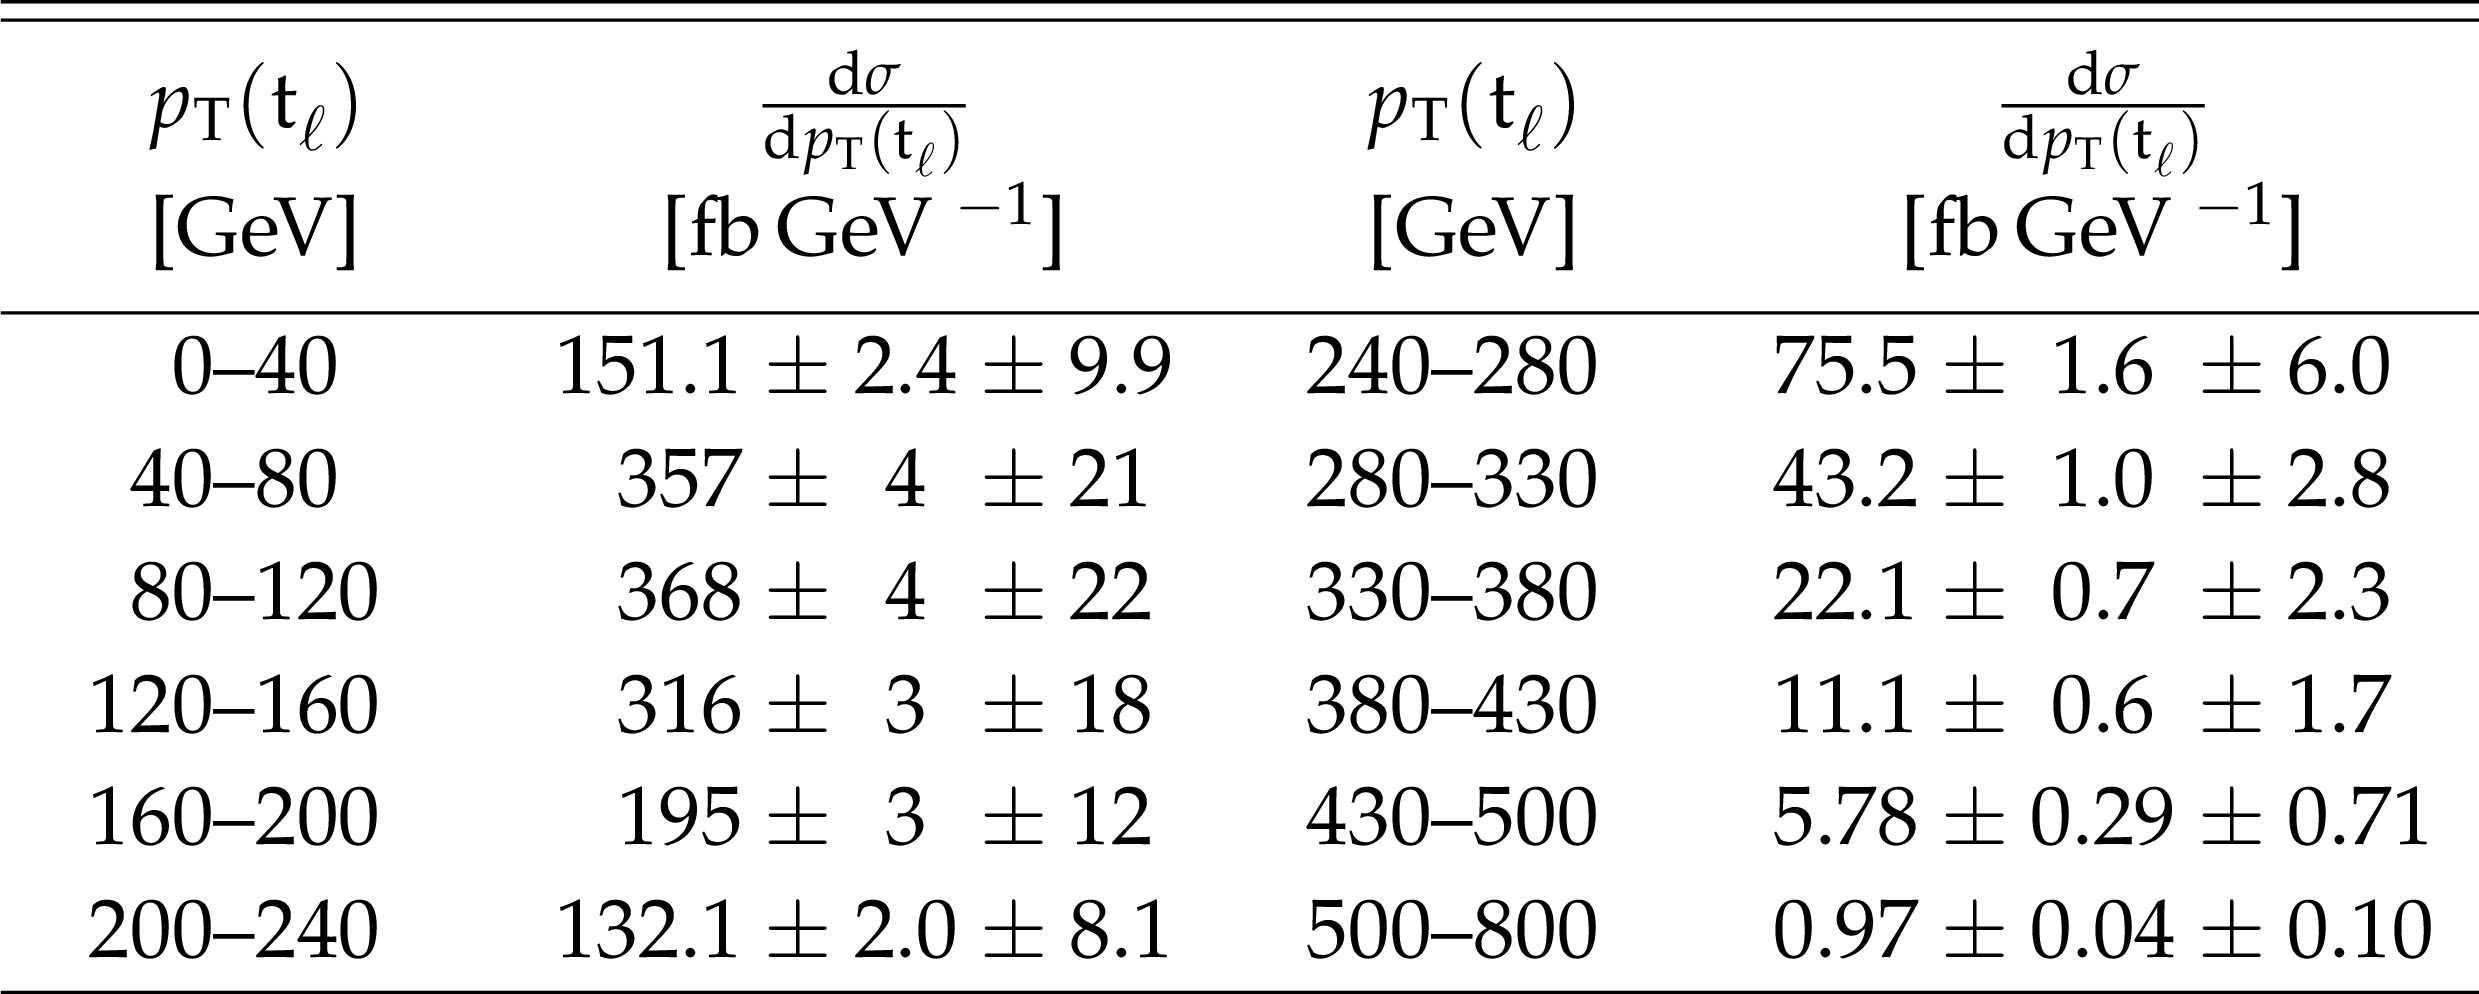
png pdf |
Table 19:
Differential cross section at the particle level as a function of $ {p_{\mathrm {T}}} ({\mathrm{t} _\ell})$. The values are shown together with their statistical and systematic uncertainties. |

png pdf |
Table 20:
Differential cross section at the particle level as a function of $ { | y({\mathrm{t} _\ell}) | }$. The values are shown together with their statistical and systematic uncertainties. |

png pdf |
Table 21:
Differential cross section at the particle level as a function of $ {p_{\mathrm {T}}} ({\mathrm{t} \mathrm{\bar{t}}})$. The values are shown together with their statistical and systematic uncertainties. |

png pdf |
Table 22:
Differential cross section at the particle level as a function of $ { | y({\mathrm{t} \mathrm{\bar{t}}}) | }$. The values are shown together with their statistical and systematic uncertainties. |

png pdf |
Table 23:
Differential cross section at the particle level as a function of $M({\mathrm{t} \mathrm{\bar{t}}})$. The values are shown together with their statistical and systematic uncertainties. |
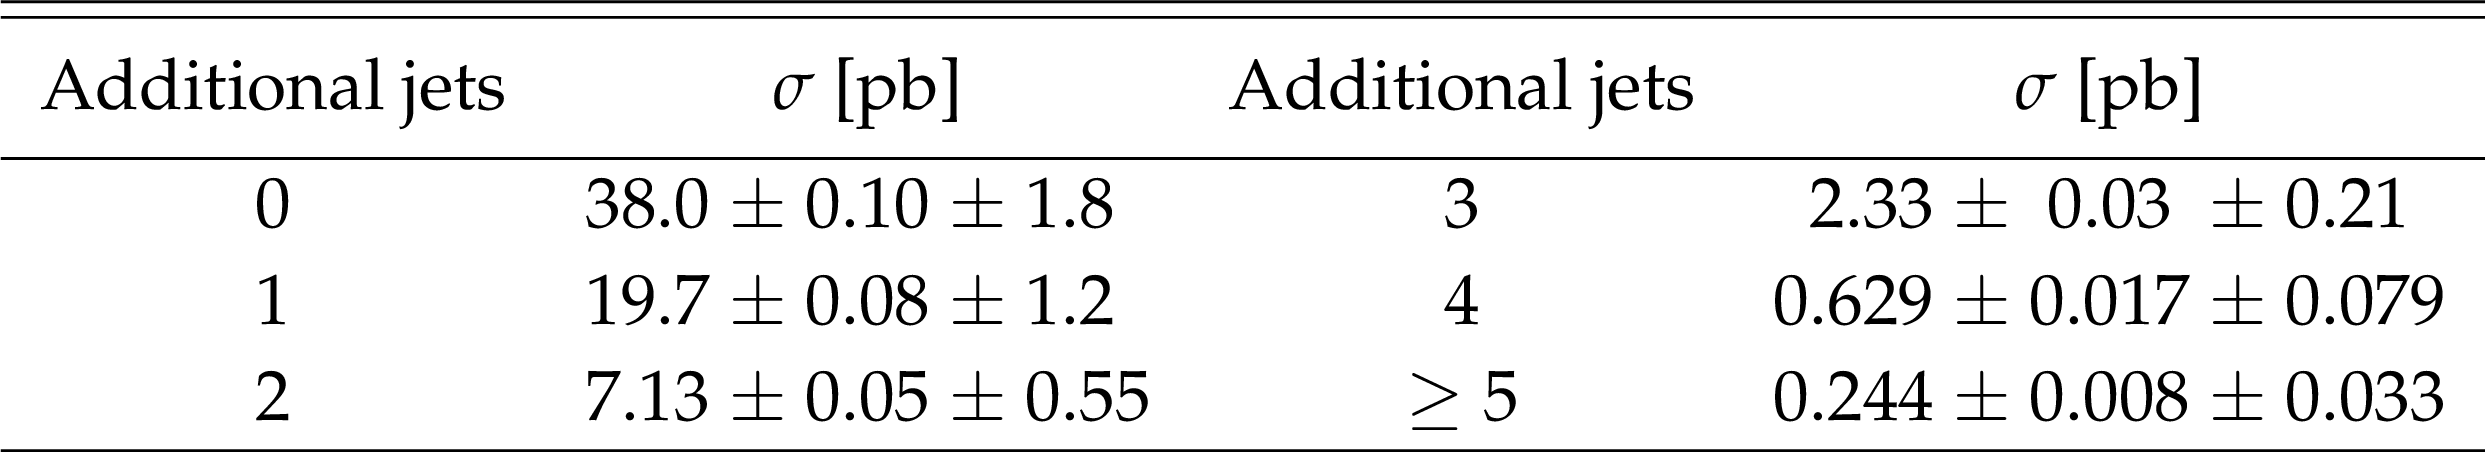
png pdf |
Table 24:
Cross sections at the particle level for different numbers of additional jets. The values are shown together with their statistical and systematic uncertainties. |
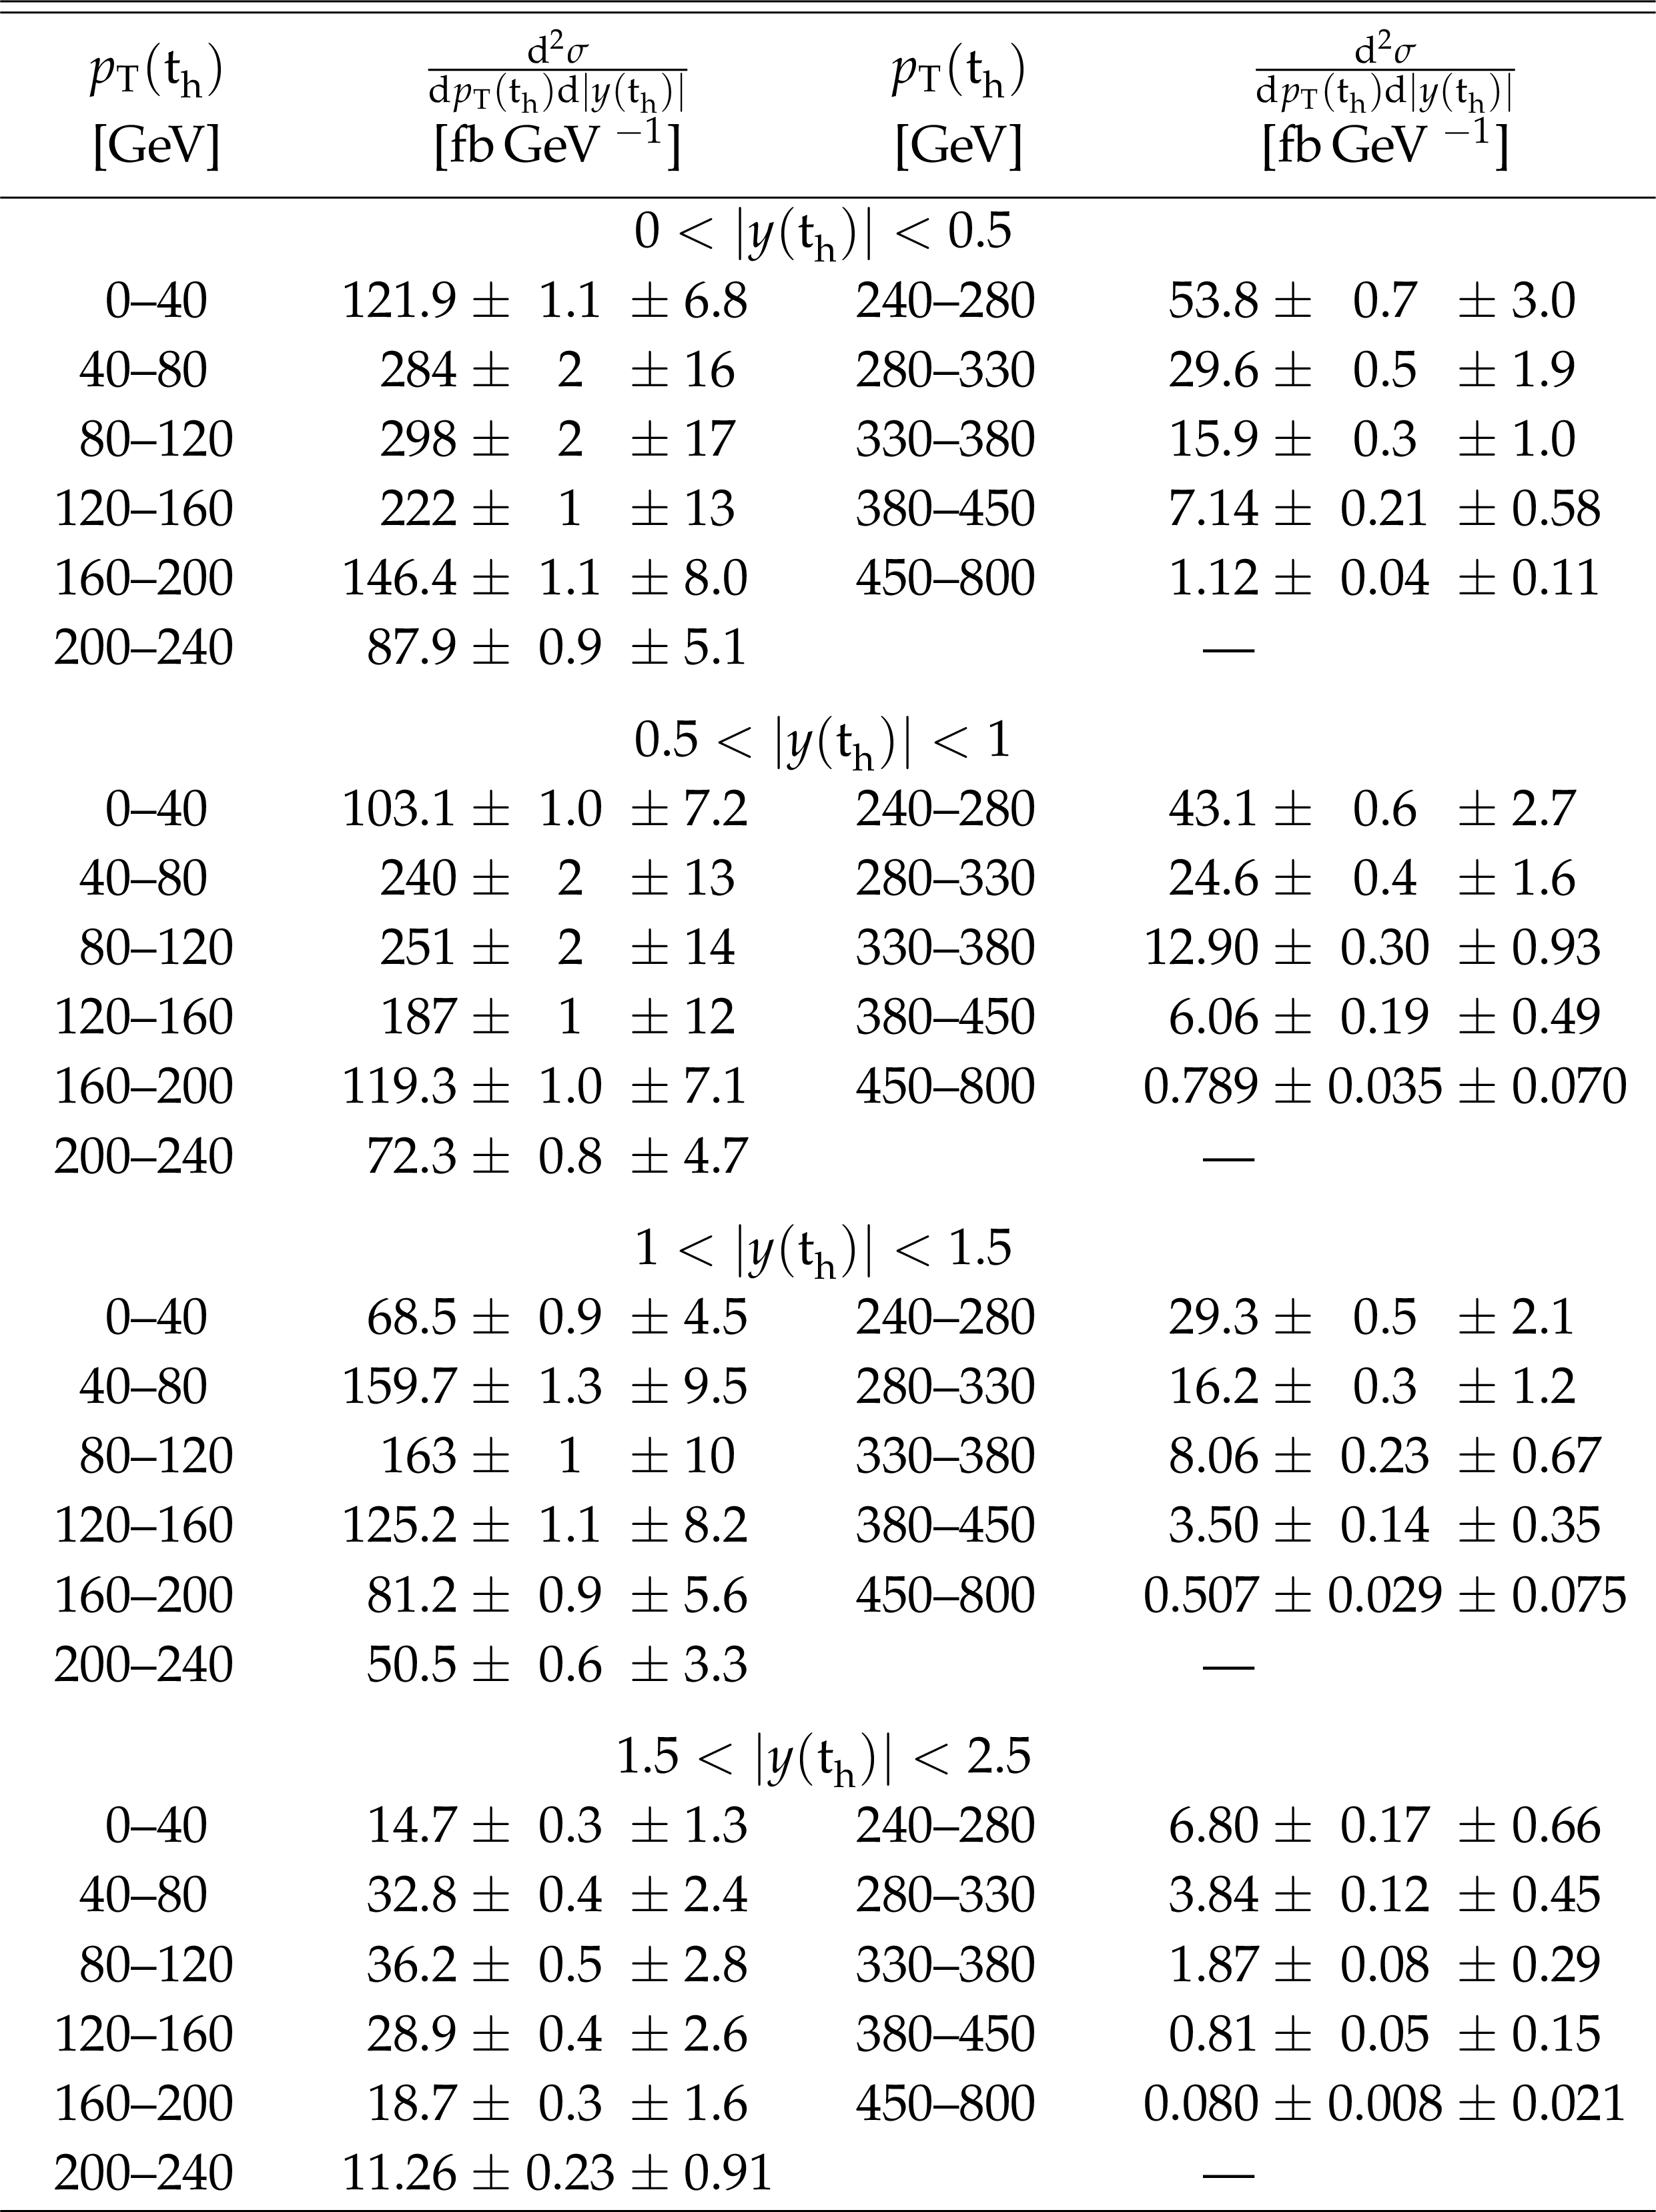
png pdf |
Table 25:
Double-differential cross section at the particle level as a function of $ { | y({\mathrm{t} _\mathrm {h}}) | }$ vs. $ {p_{\mathrm {T}}} ({\mathrm{t} _\mathrm {h}})$. The values are shown together with their statistical and systematic uncertainties. |

png pdf |
Table 26:
Double-differential cross section at the particle level as a function of $M({\mathrm{t} \mathrm{\bar{t}}})$ vs. $ { | y({\mathrm{t} \mathrm{\bar{t}}}) | }$. The values are shown together with their statistical and systematic uncertainties. |
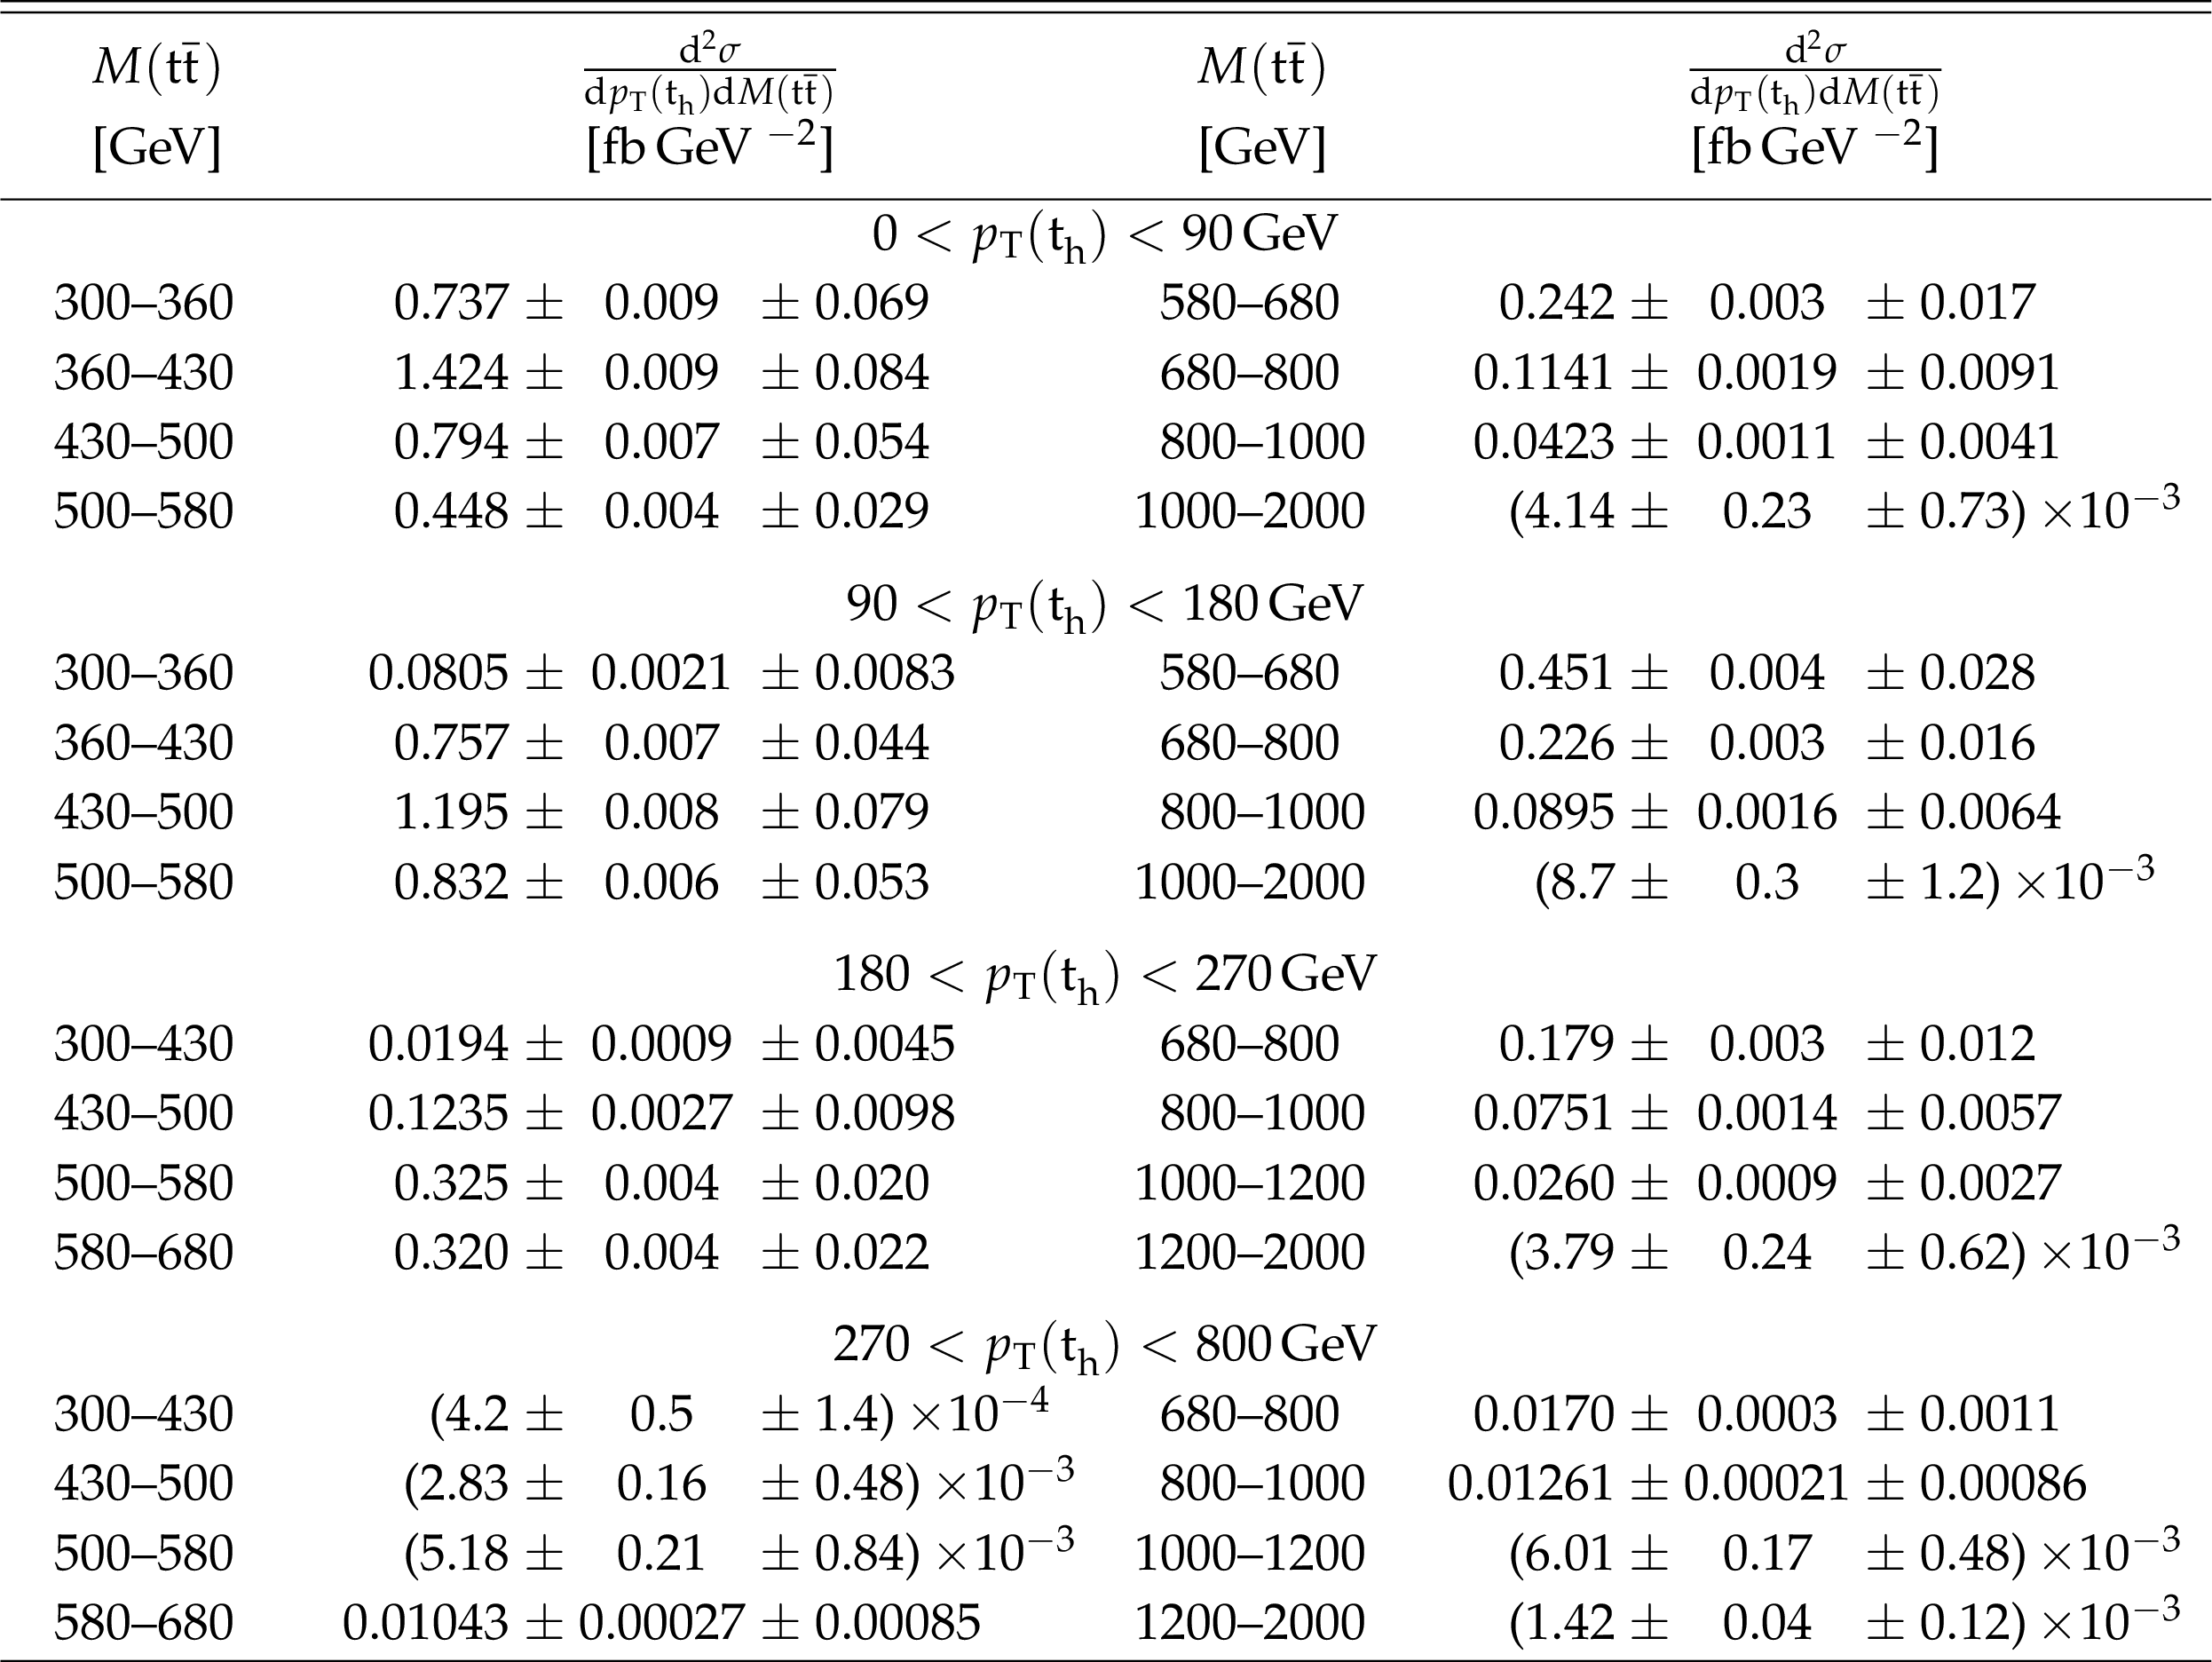
png pdf |
Table 27:
Double-differential cross section at the particle level as a function of $ {p_{\mathrm {T}}} ({\mathrm{t} _\mathrm {h}})$ vs. $M({\mathrm{t} \mathrm{\bar{t}}})$. The values are shown together with their statistical and systematic uncertainties. |

png pdf |
Table 28:
Differential cross sections at the particle level as a function of $ {p_{\mathrm {T}}} ({\mathrm{t} _\mathrm {h}})$ for different numbers of additional jets. The values are shown together with their statistical and systematic uncertainties. |

png pdf |
Table 29:
Differential cross sections at the particle level as a function of $ {p_{\mathrm {T}}} ({\mathrm{t} \mathrm{\bar{t}}})$ for different numbers of additional jets. The values are shown together with their statistical and systematic uncertainties. |
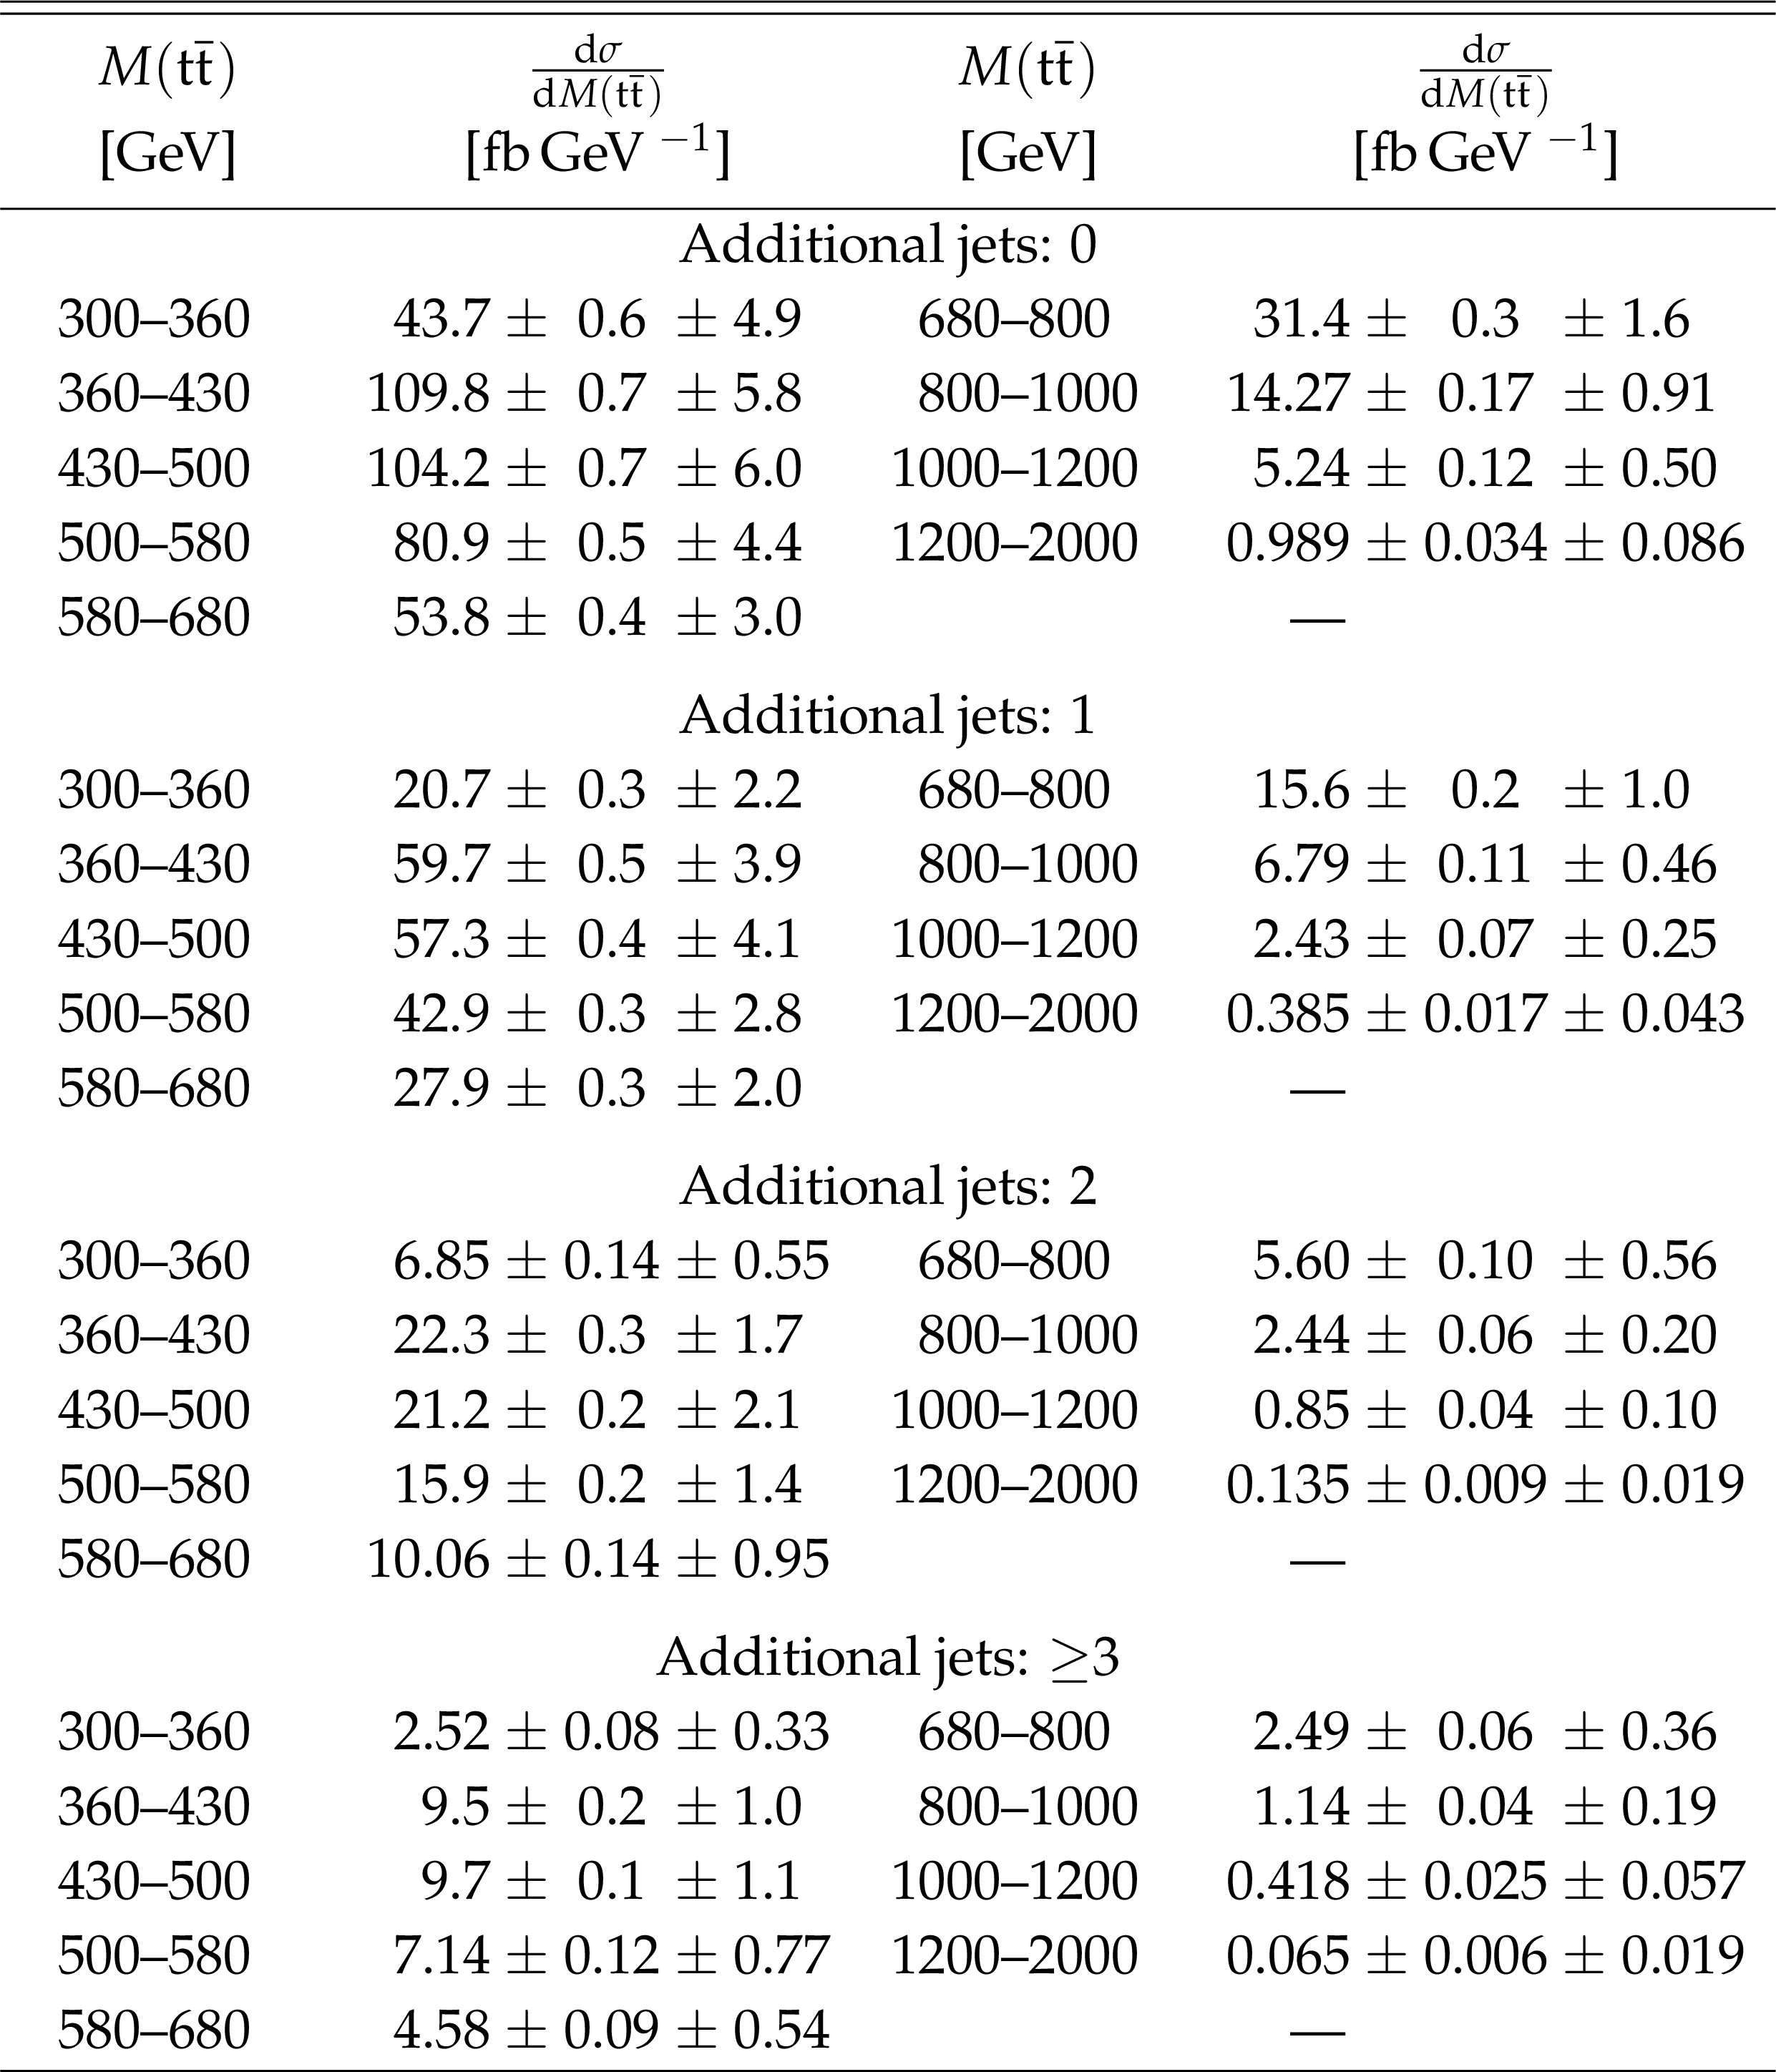
png pdf |
Table 30:
Differential cross sections at the particle level as a function of $M({\mathrm{t} \mathrm{\bar{t}}})$ for different numbers of additional jets. The values are shown together with their statistical and systematic uncertainties. |
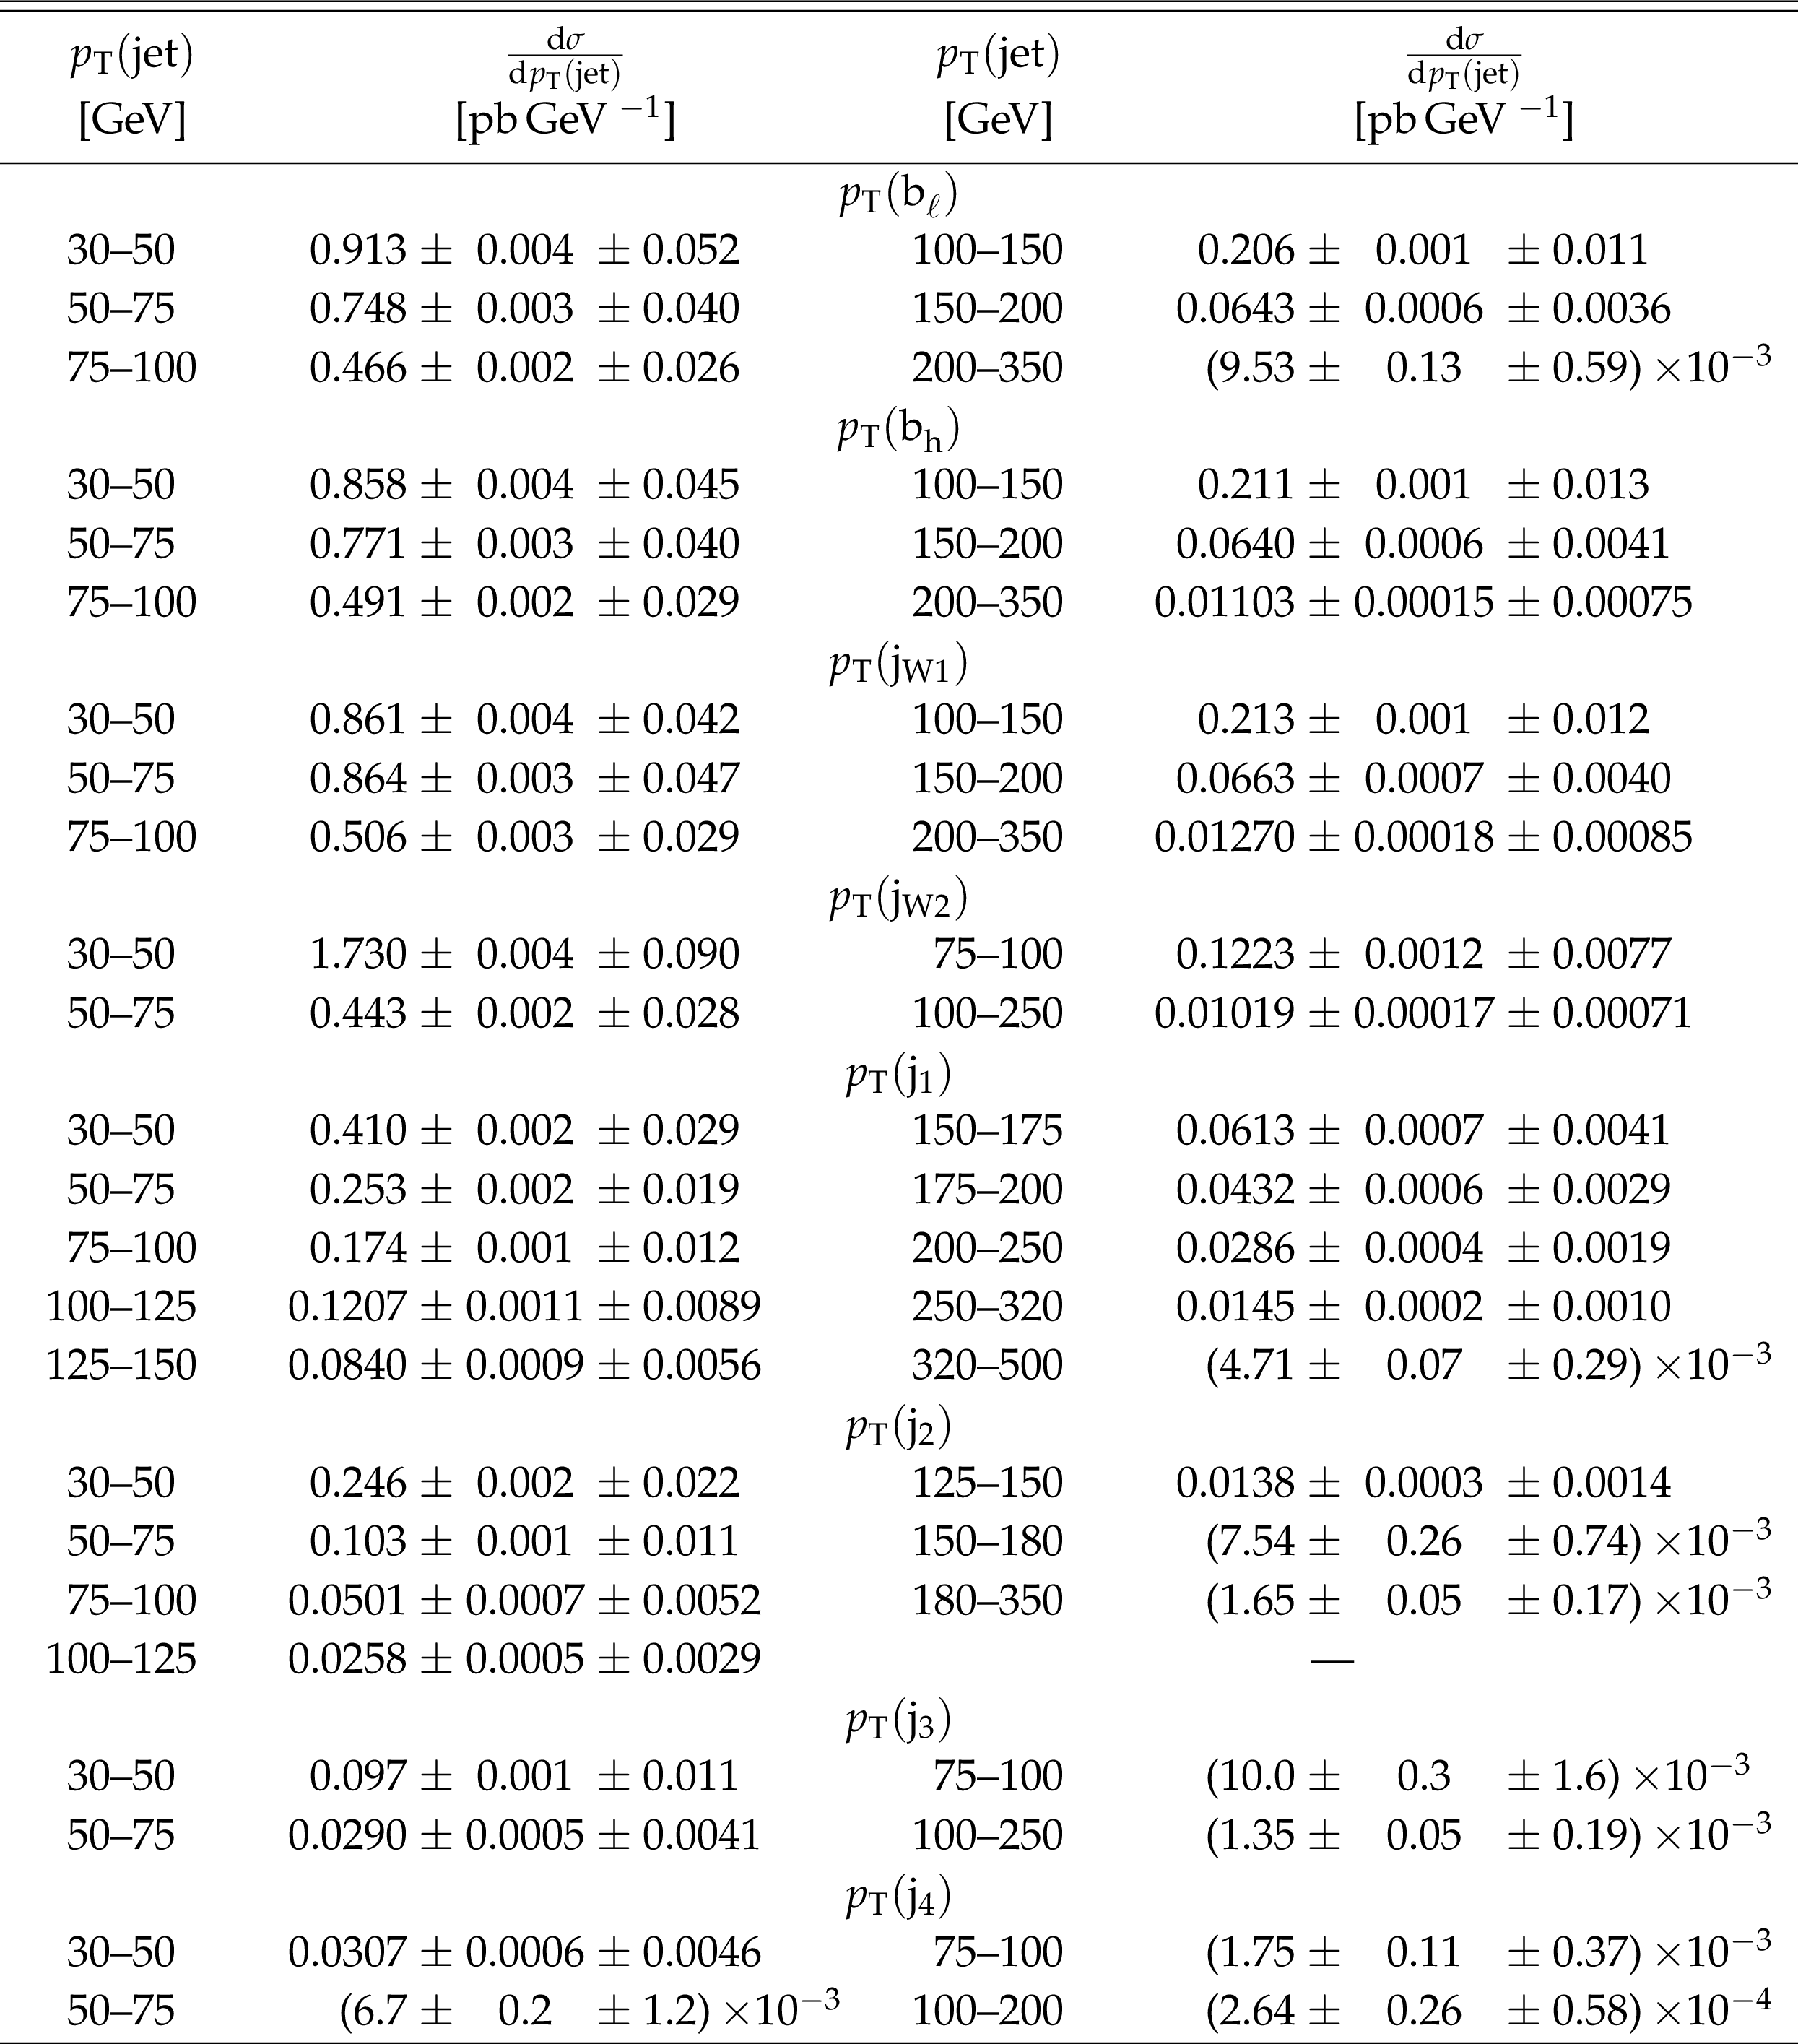
png pdf |
Table 31:
Differential cross sections at the particle level as a function of $ {p_{\mathrm {T}}} (\mathrm {jet})$ for jets. The values are shown together with their statistical and systematic uncertainties. |
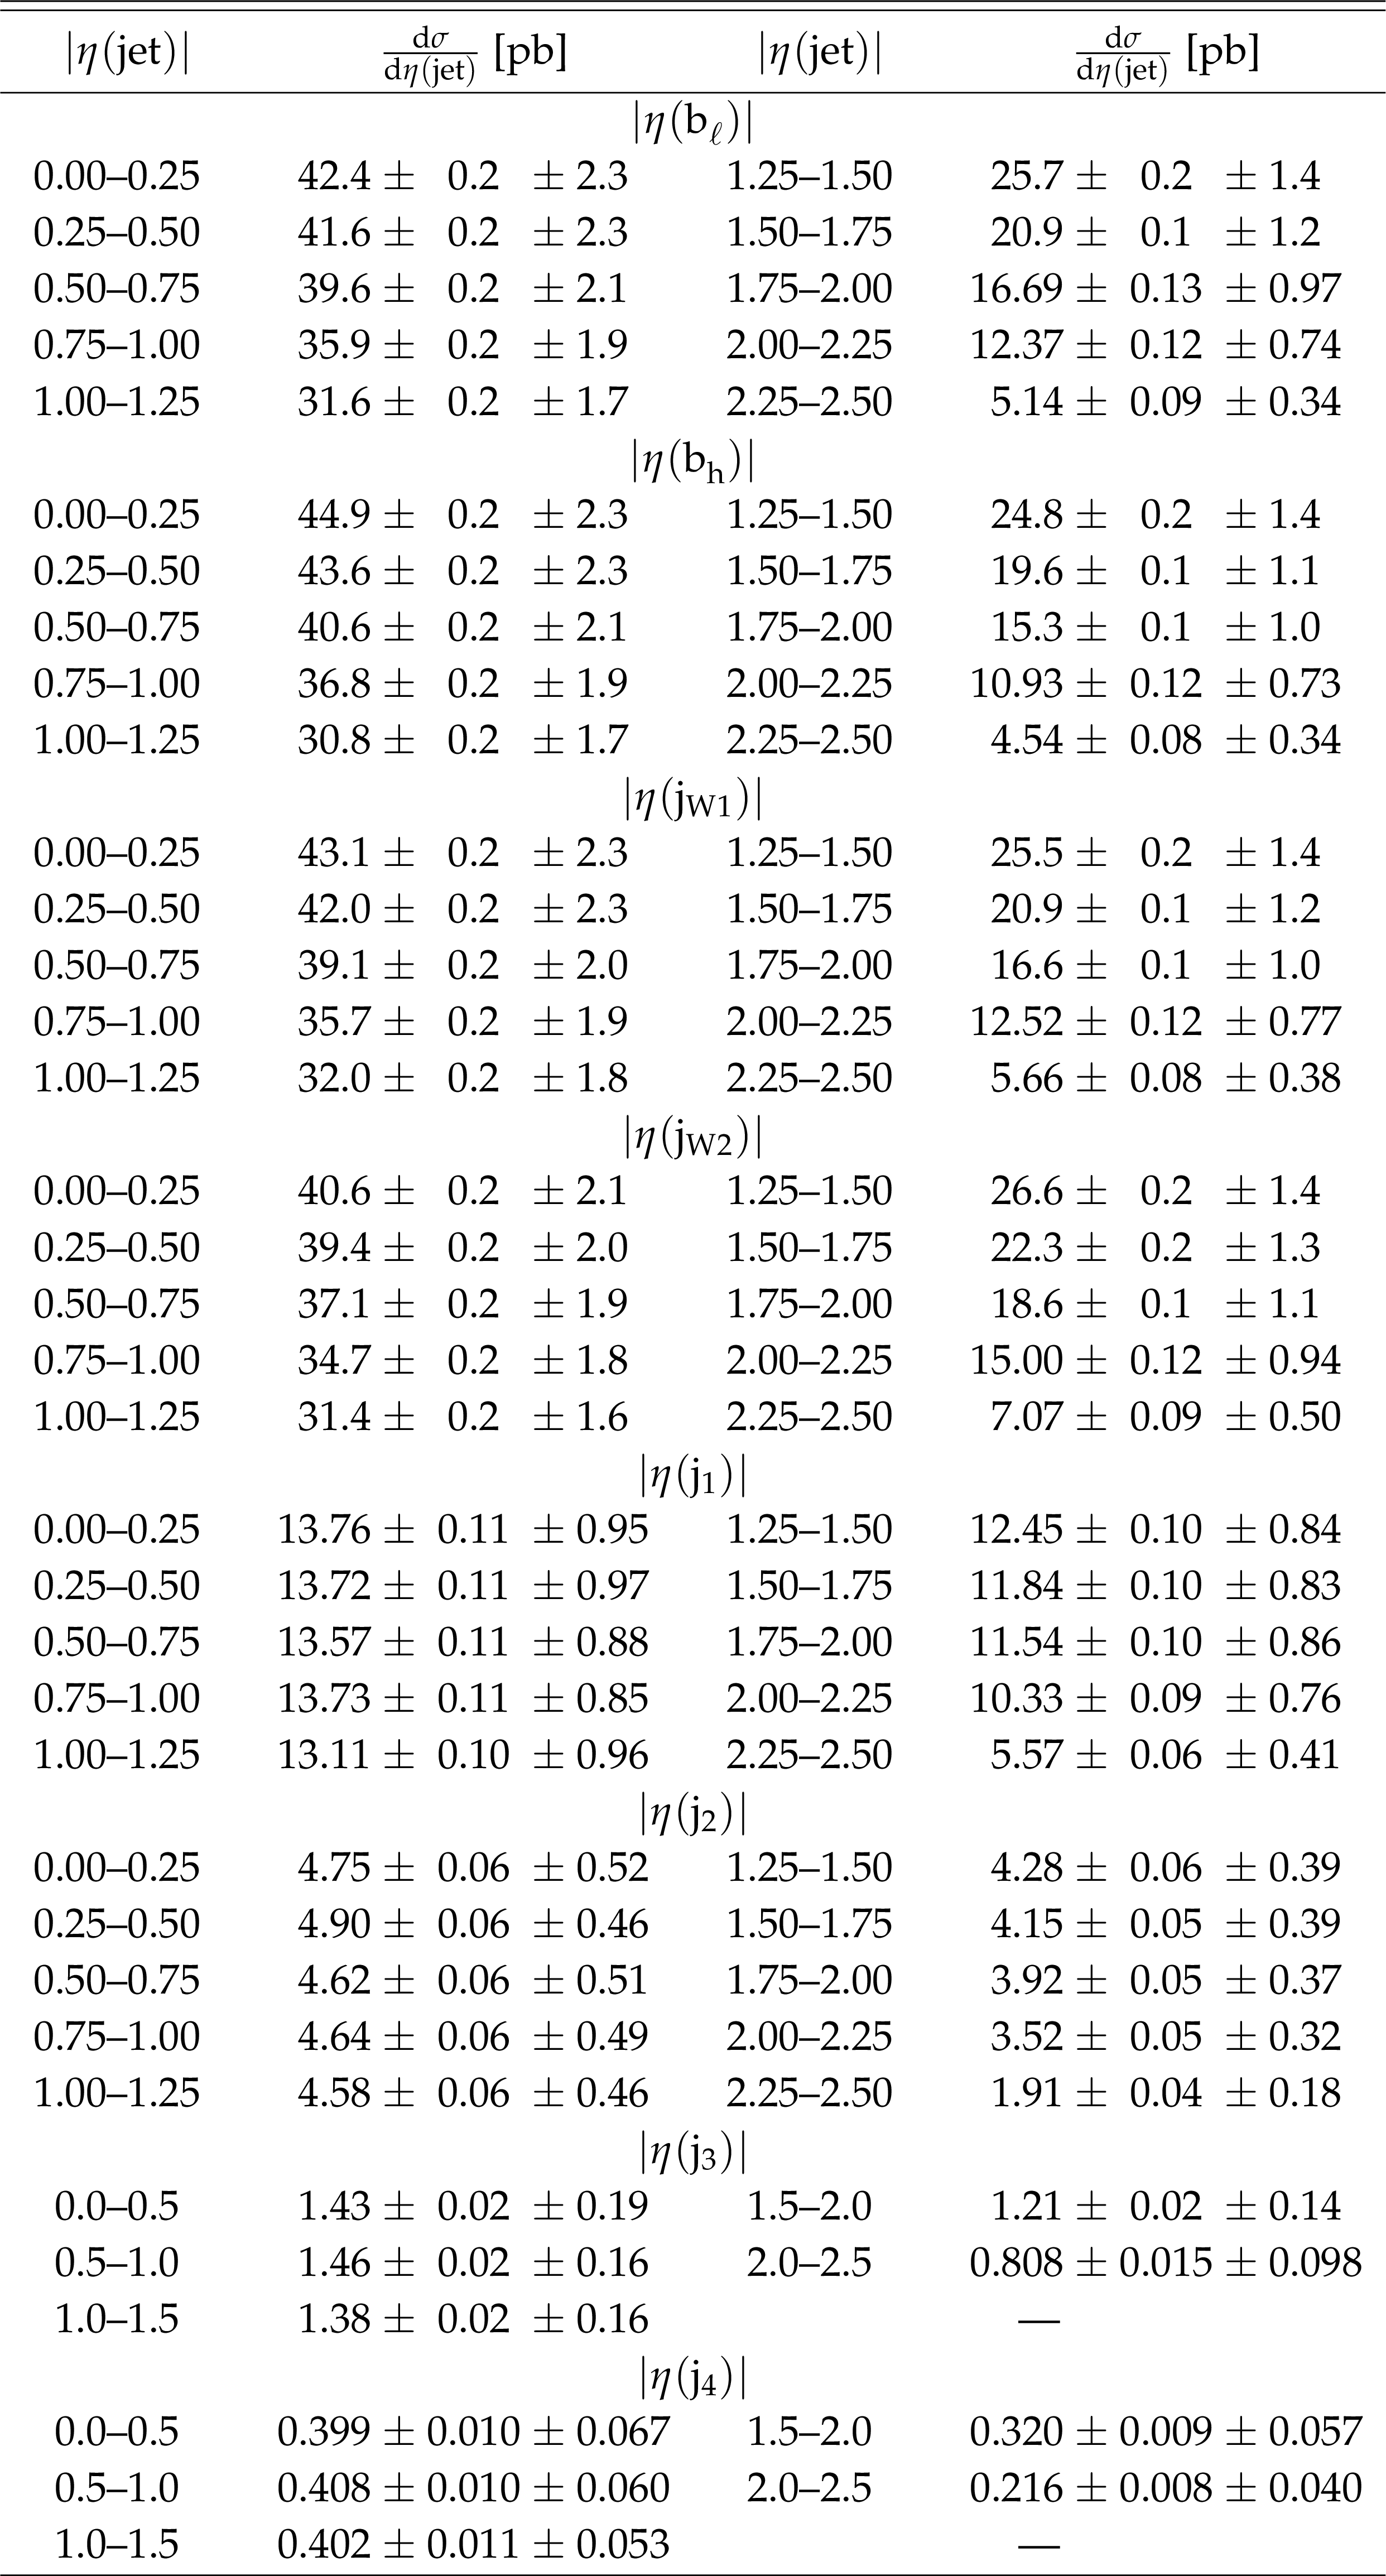
png pdf |
Table 32:
Differential cross sections at the particle level as a function of $ { | \eta (\text {jet}) | }$ for jets. The values are shown together with their statistical and systematic uncertainties. |
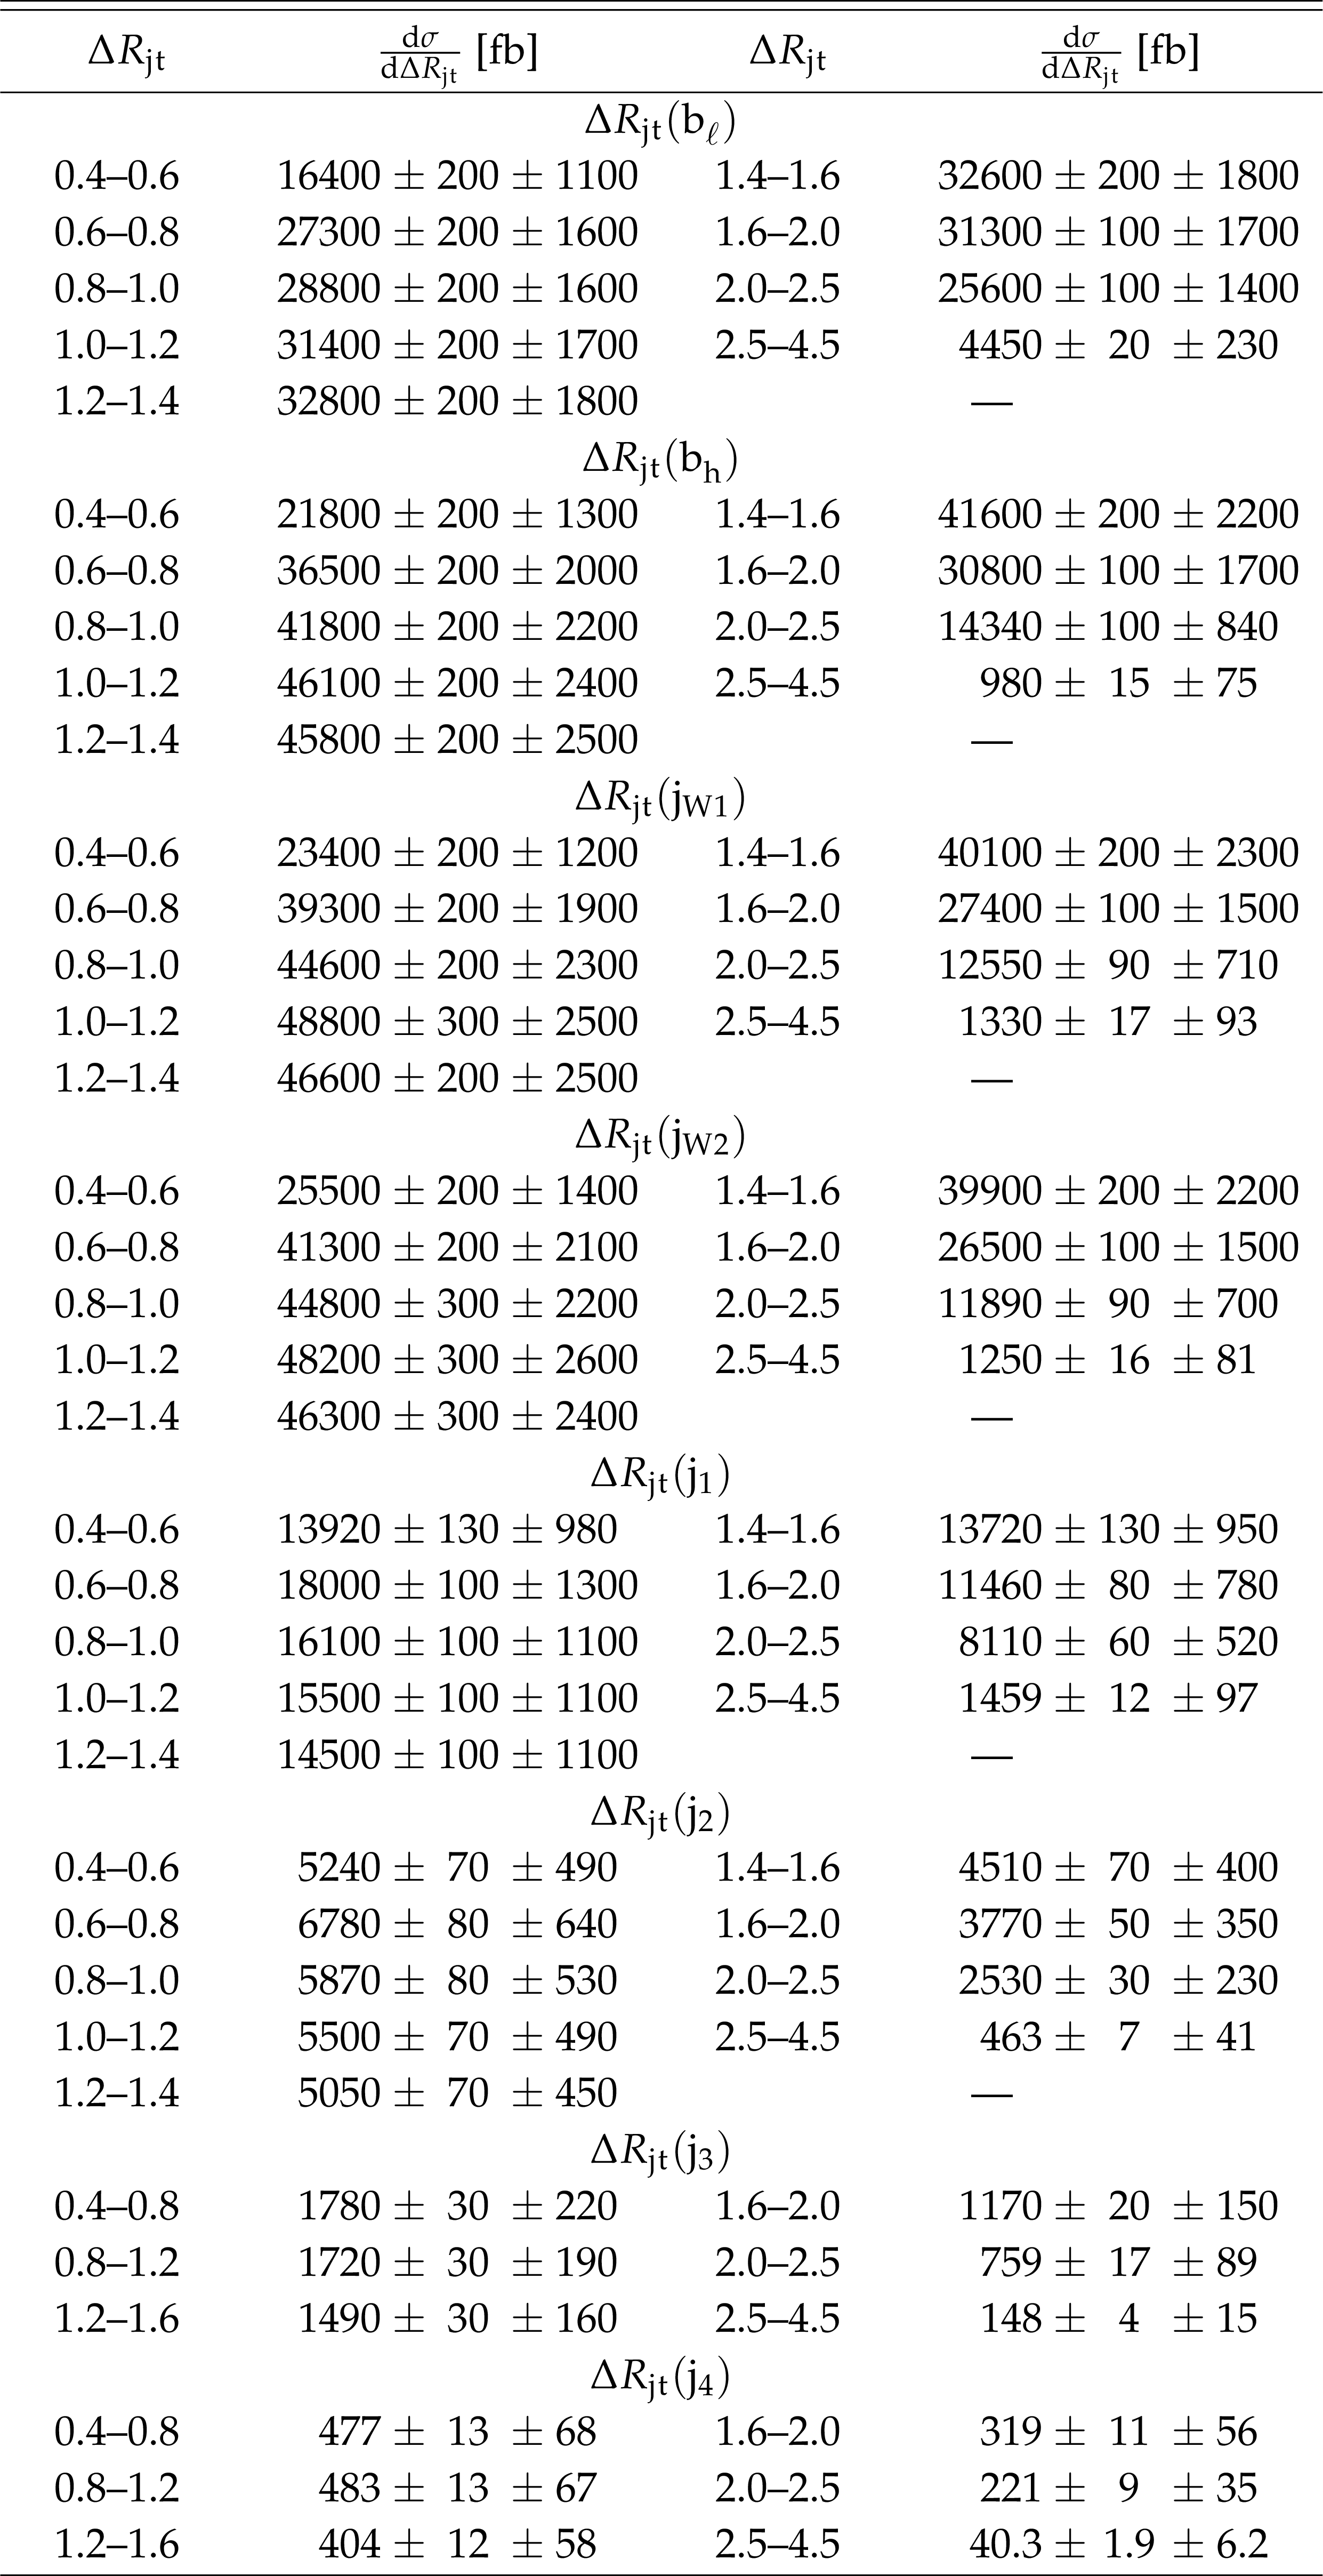
png pdf |
Table 33:
Differential cross sections at the particle level as a function of $ {\Delta R_{\mathrm {j}_\mathrm{t}}} $ for jets. The values are shown together with their statistical and systematic uncertainties. |
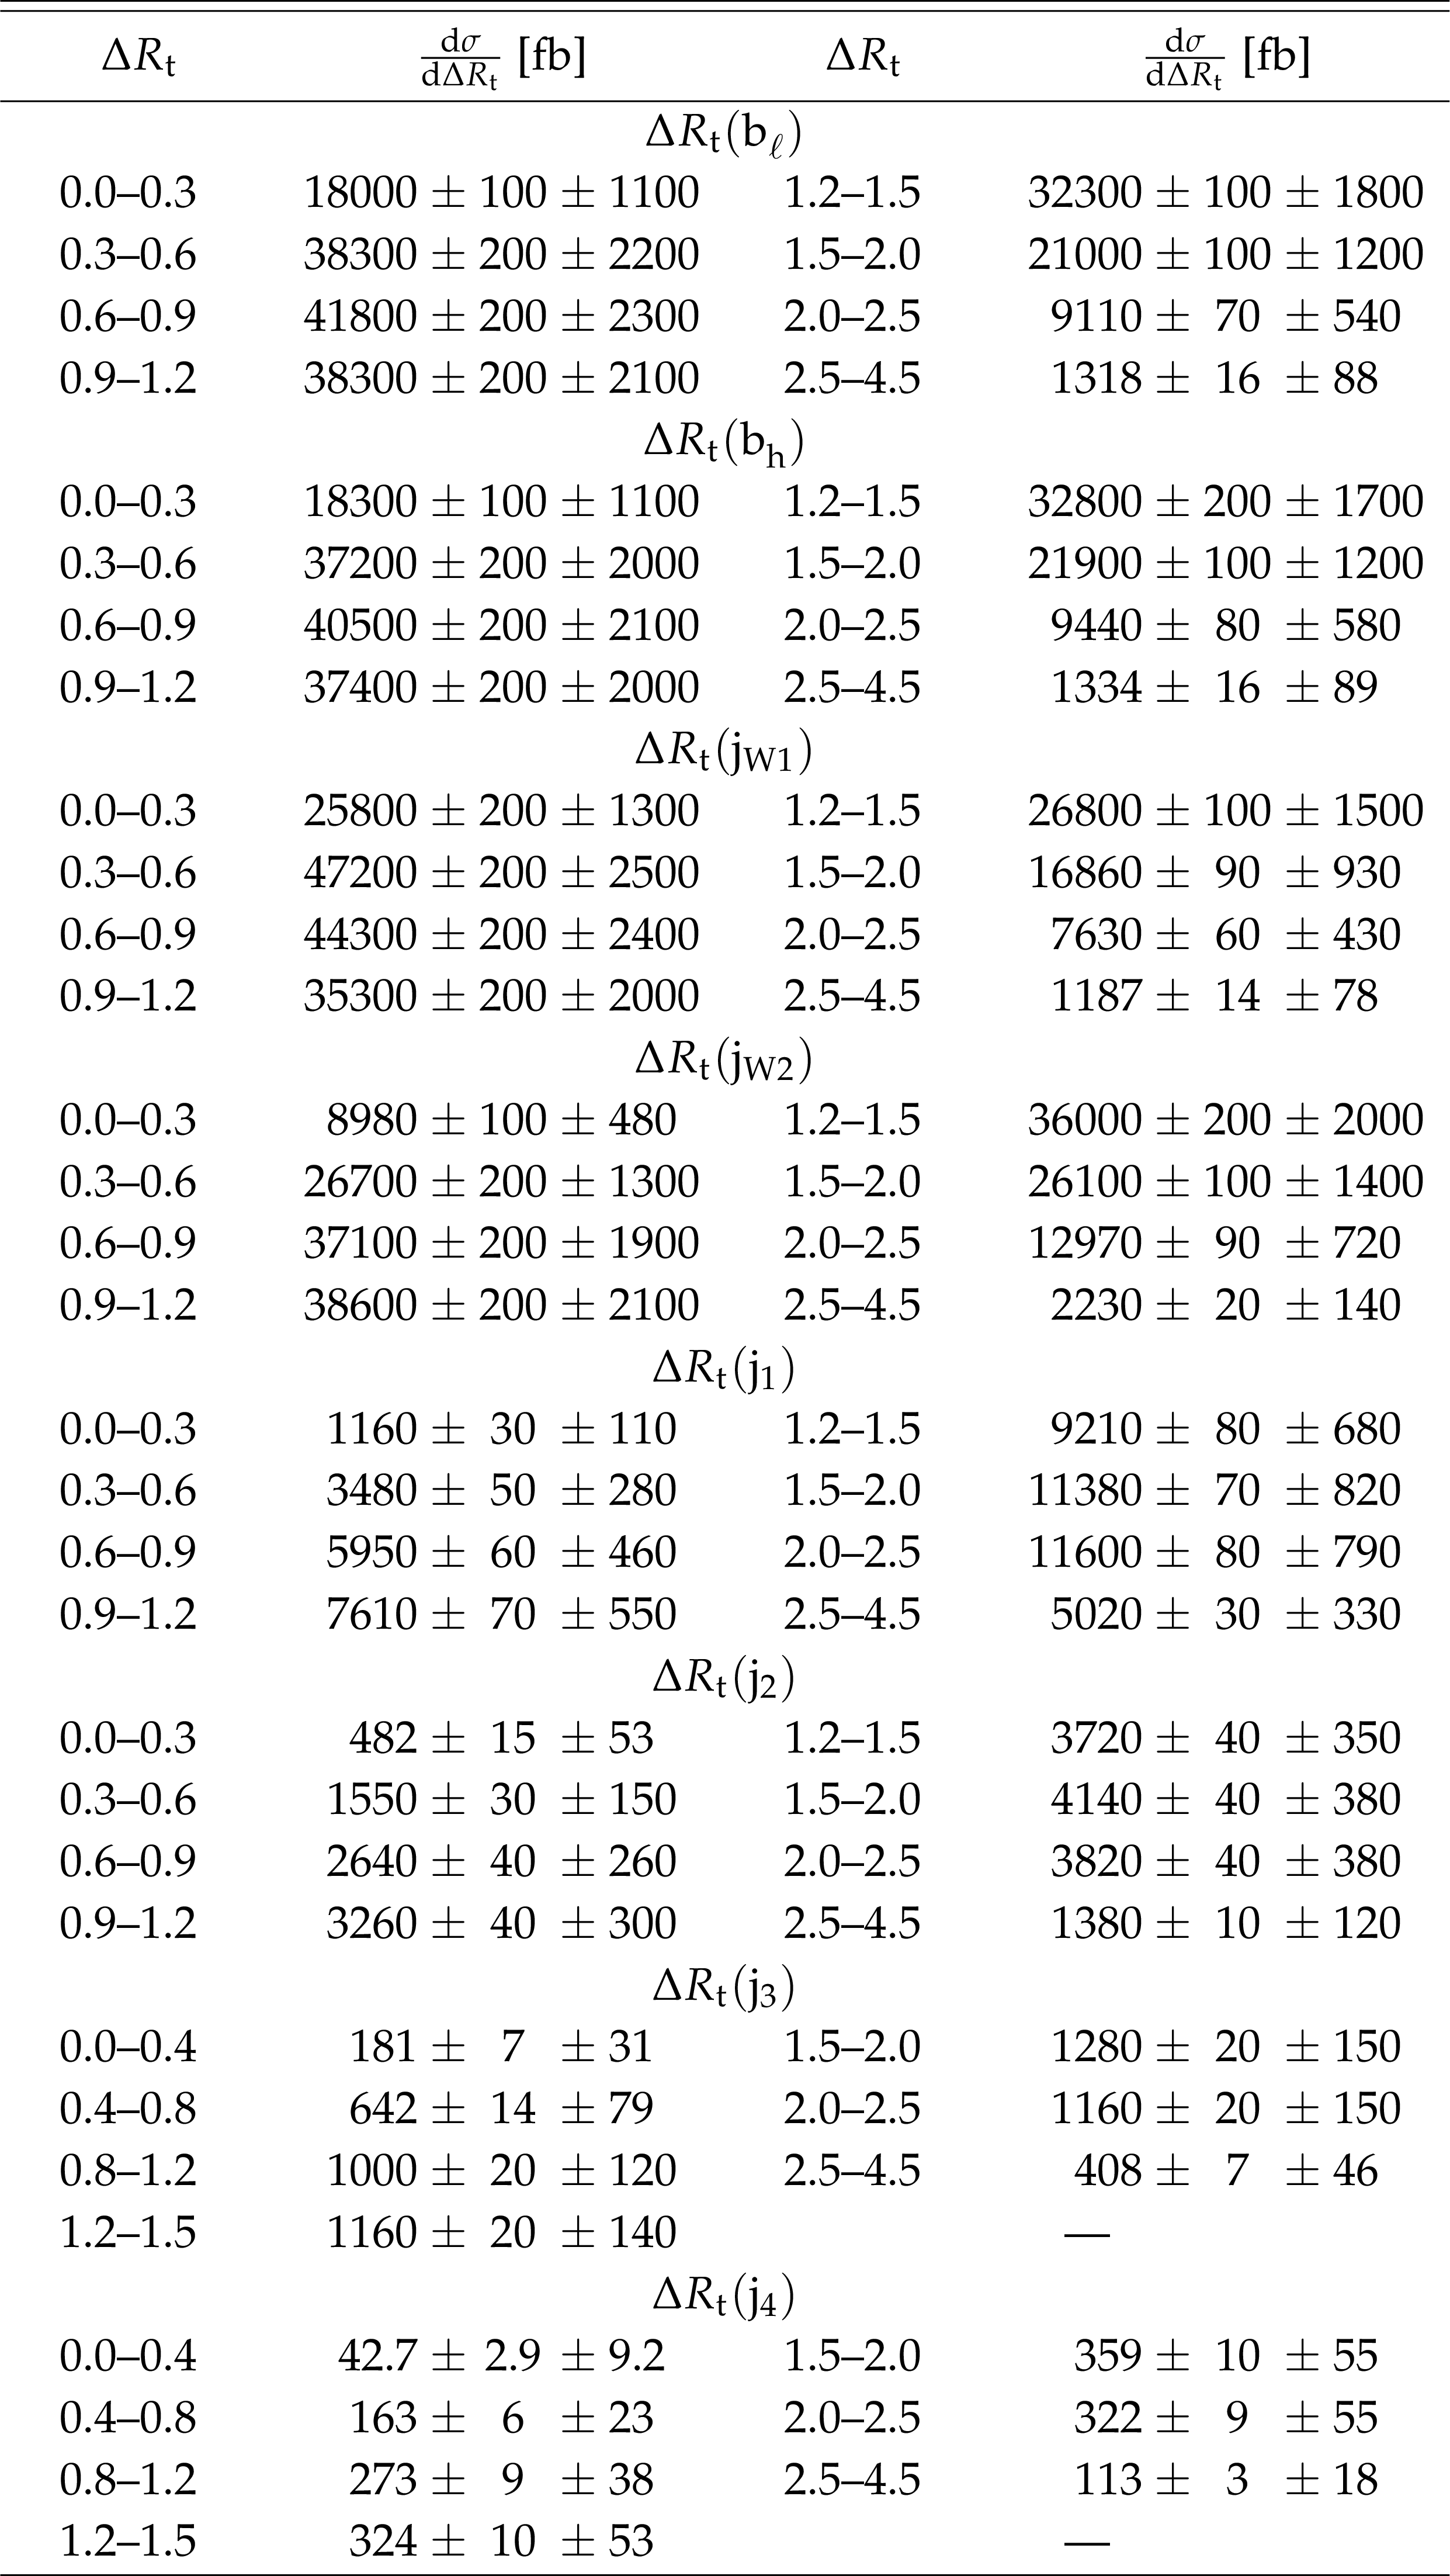
png pdf |
Table 34:
Differential cross sections at the particle level as a function of $ {\Delta R_{\mathrm{t}}} $ for jets. The values are shown together with their statistical and systematic uncertainties. |
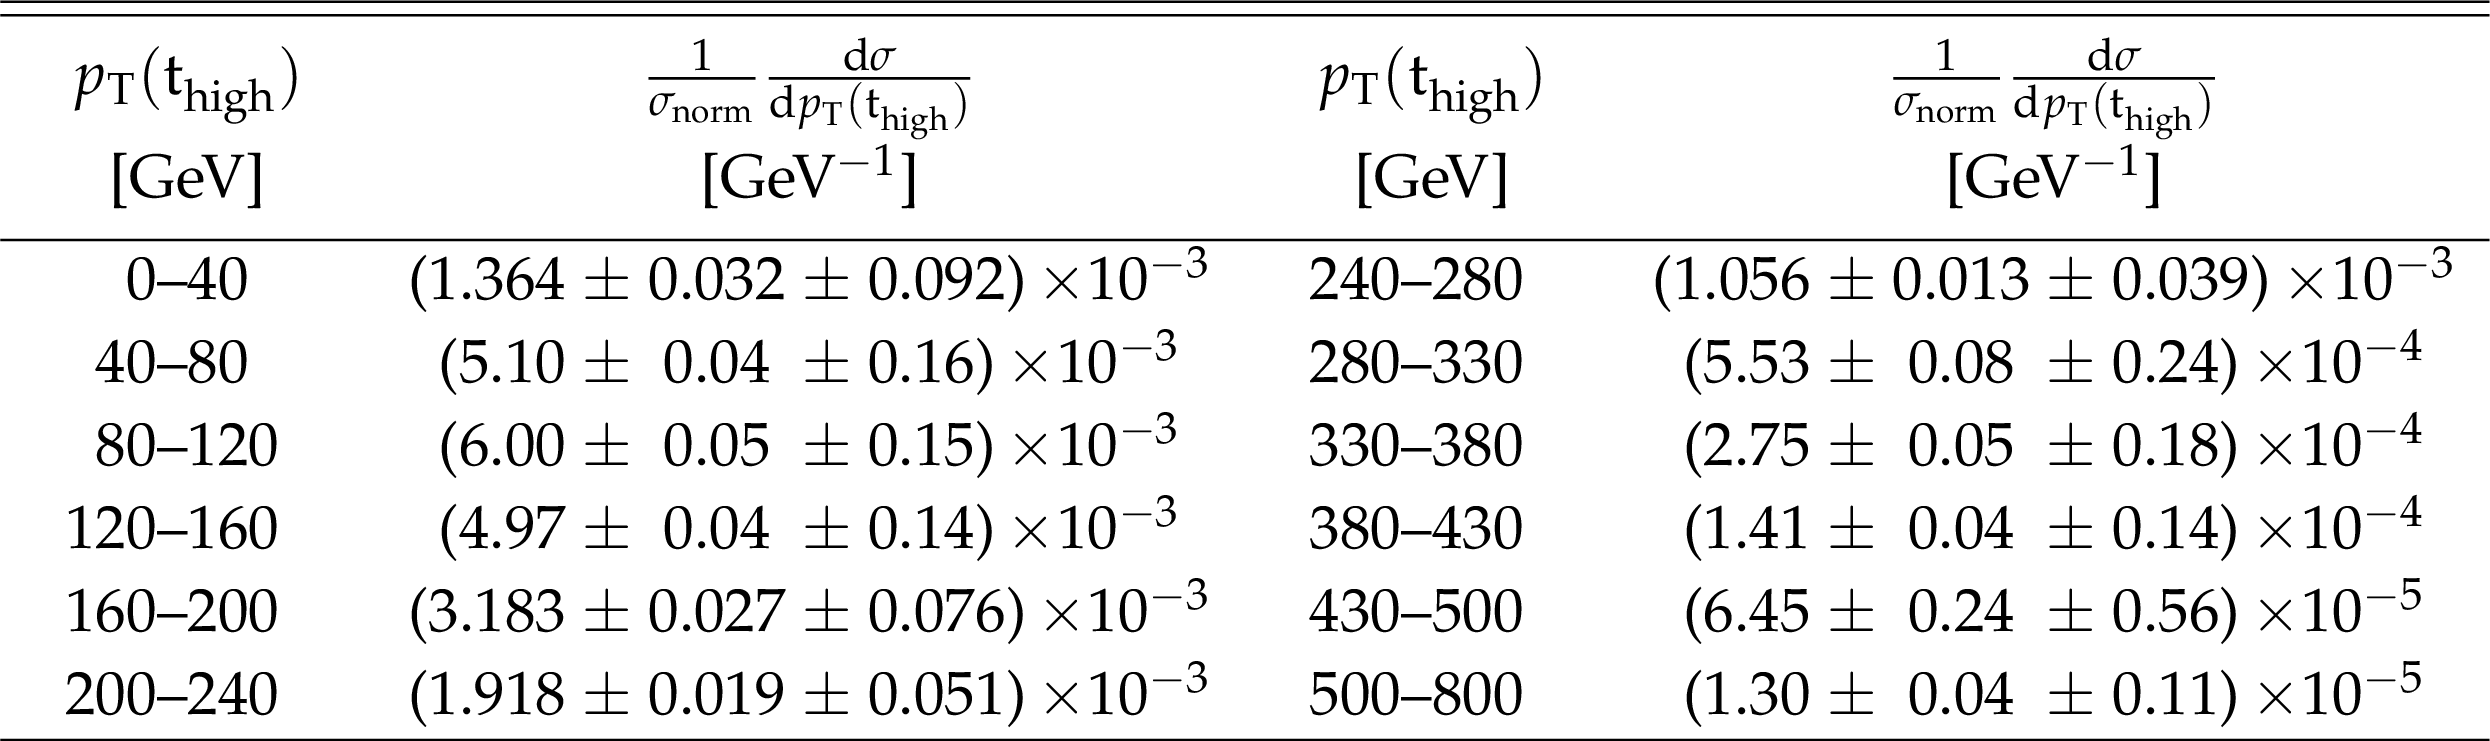
png pdf |
Table 35:
Differential cross section at the parton level as a function of $ {p_{\mathrm {T}}} (\mathrm{t} _\text {high})$ normalized to the cross section $\sigma _\text {norm}$ in the measured range. The values are shown together with their statistical and systematic uncertainties. |
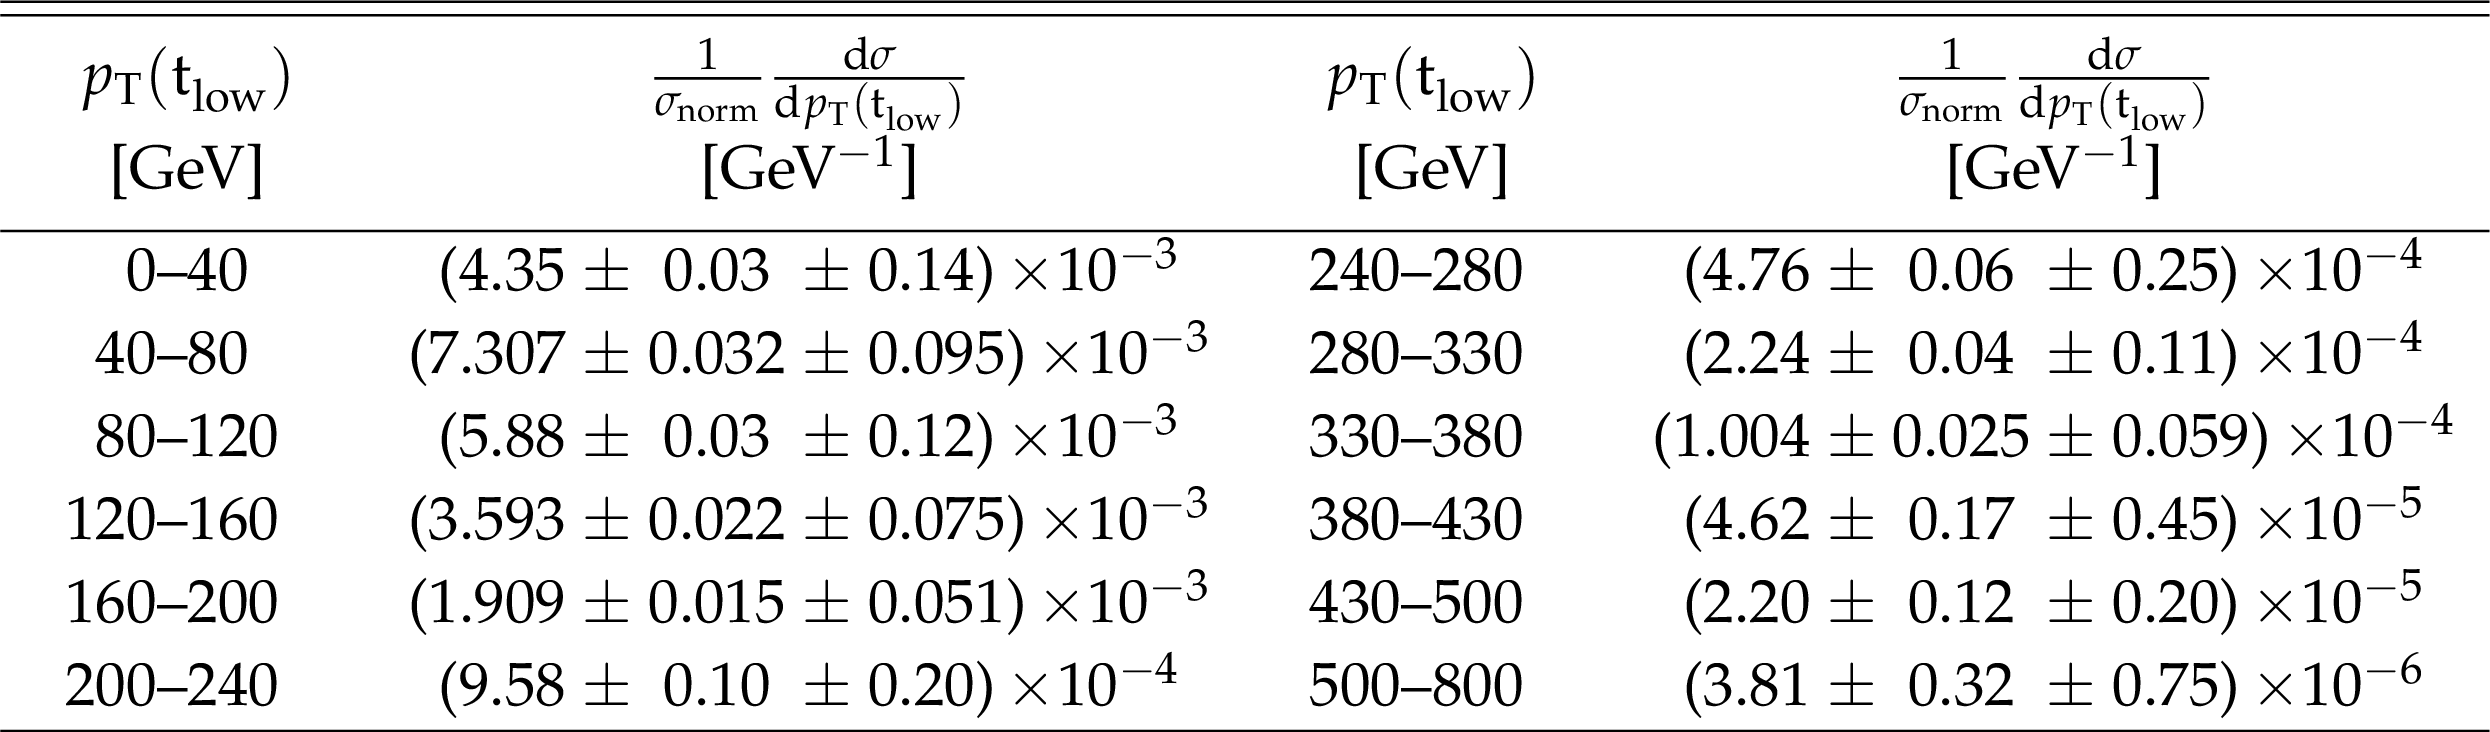
png pdf |
Table 36:
Differential cross section at the parton level as a function of $ {p_{\mathrm {T}}} (\mathrm{t} _\text {low})$ normalized to the cross section $\sigma _\text {norm}$ in the measured range. The values are shown together with their statistical and systematic uncertainties. |

png pdf |
Table 37:
Differential cross section at the parton level as a function of $ {p_{\mathrm {T}}} ({\mathrm{t} _\mathrm {h}})$ normalized to the cross section $\sigma _\text {norm}$ in the measured range. The values are shown together with their statistical and systematic uncertainties. |
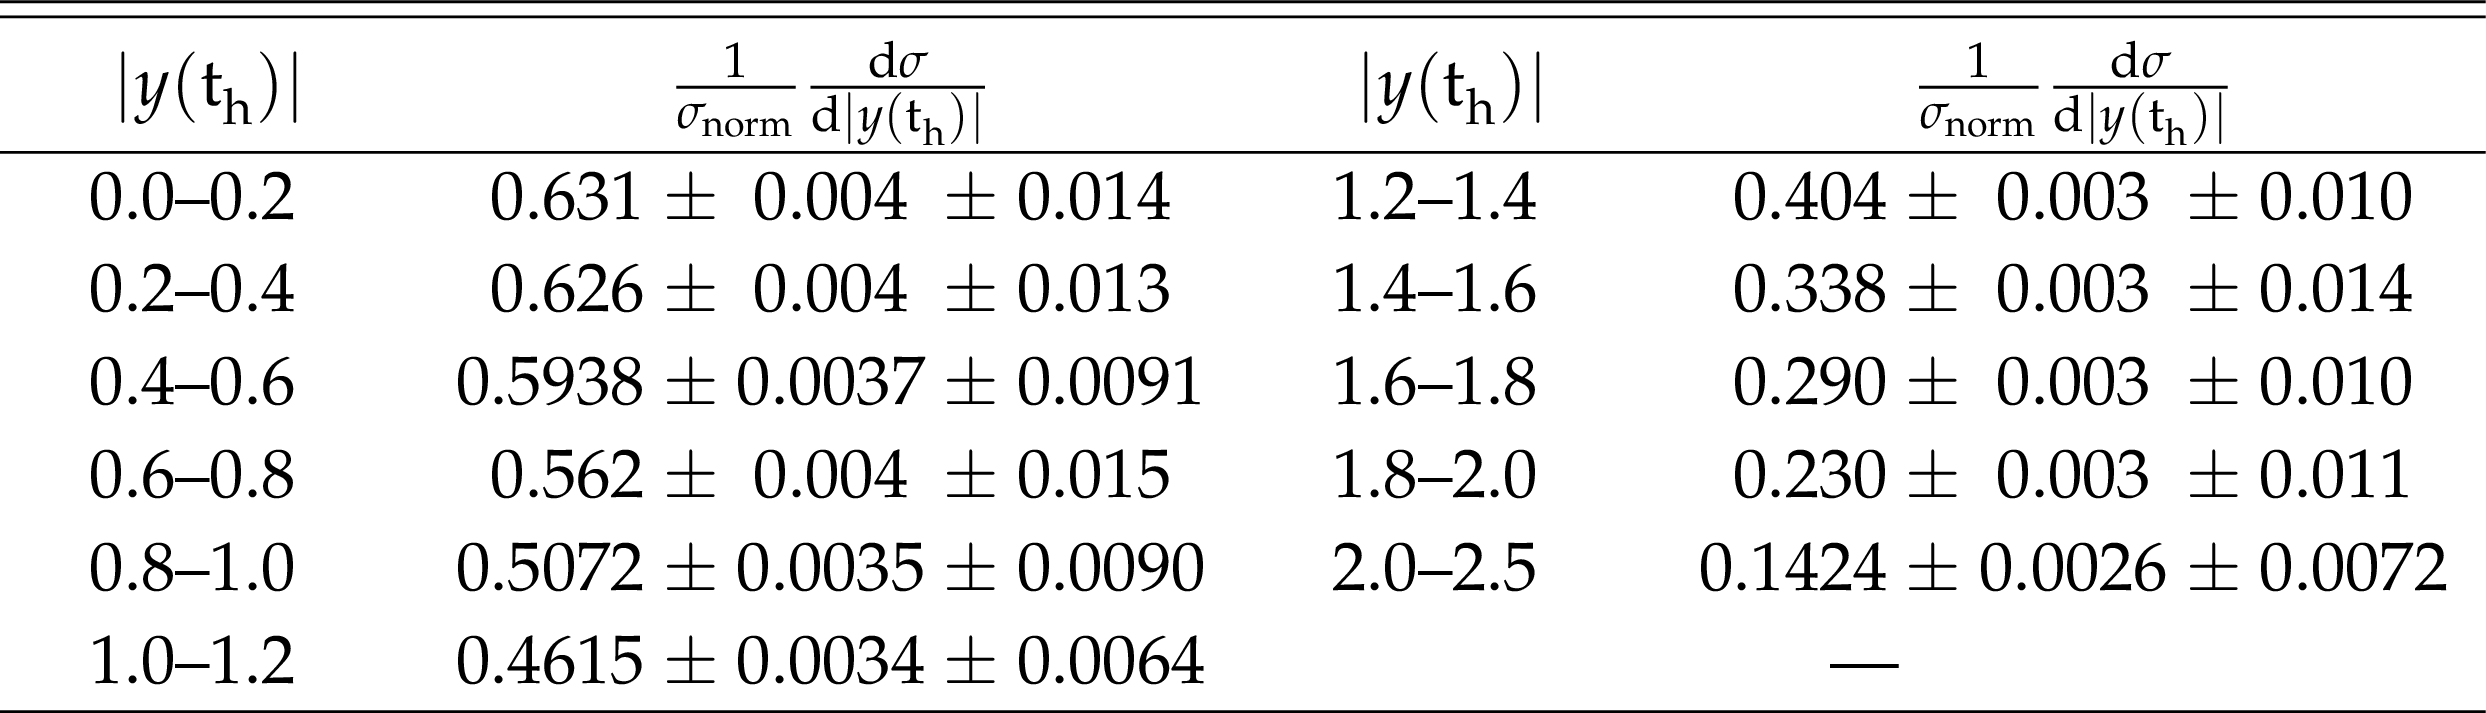
png pdf |
Table 38:
Differential cross section at the parton level as a function of $ { | y({\mathrm{t} _\mathrm {h}}) | }$ normalized to the cross section $\sigma _\text {norm}$ in the measured range. The values are shown together with their statistical and systematic uncertainties. |
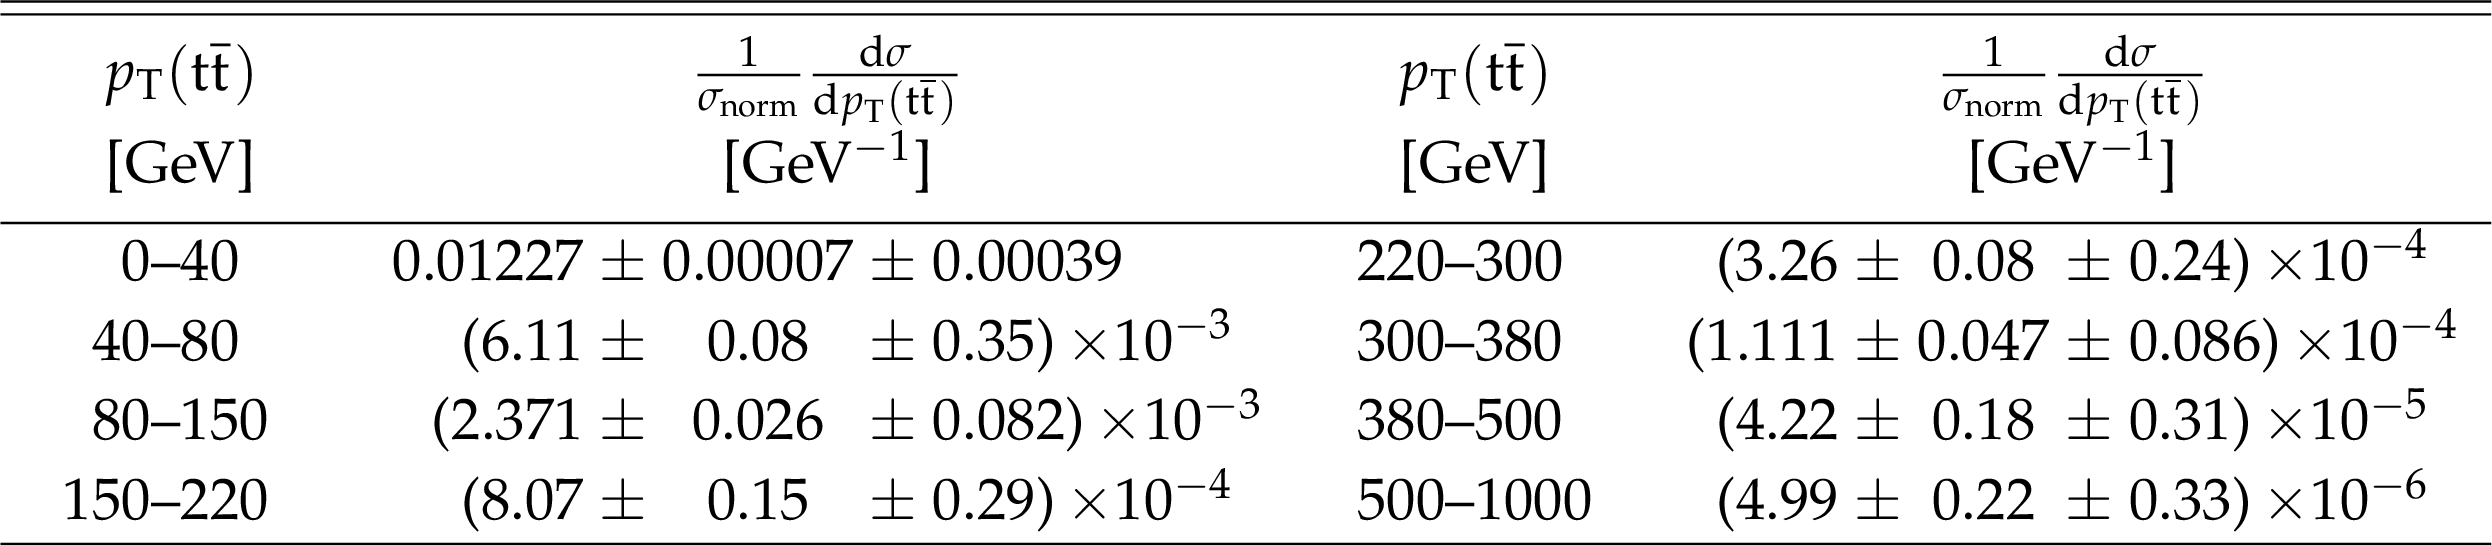
png pdf |
Table 39:
Differential cross section at the parton level as a function of $ {p_{\mathrm {T}}} ({\mathrm{t} \mathrm{\bar{t}}})$ normalized to the cross section $\sigma _\text {norm}$ in the measured range. The values are shown together with their statistical and systematic uncertainties. |
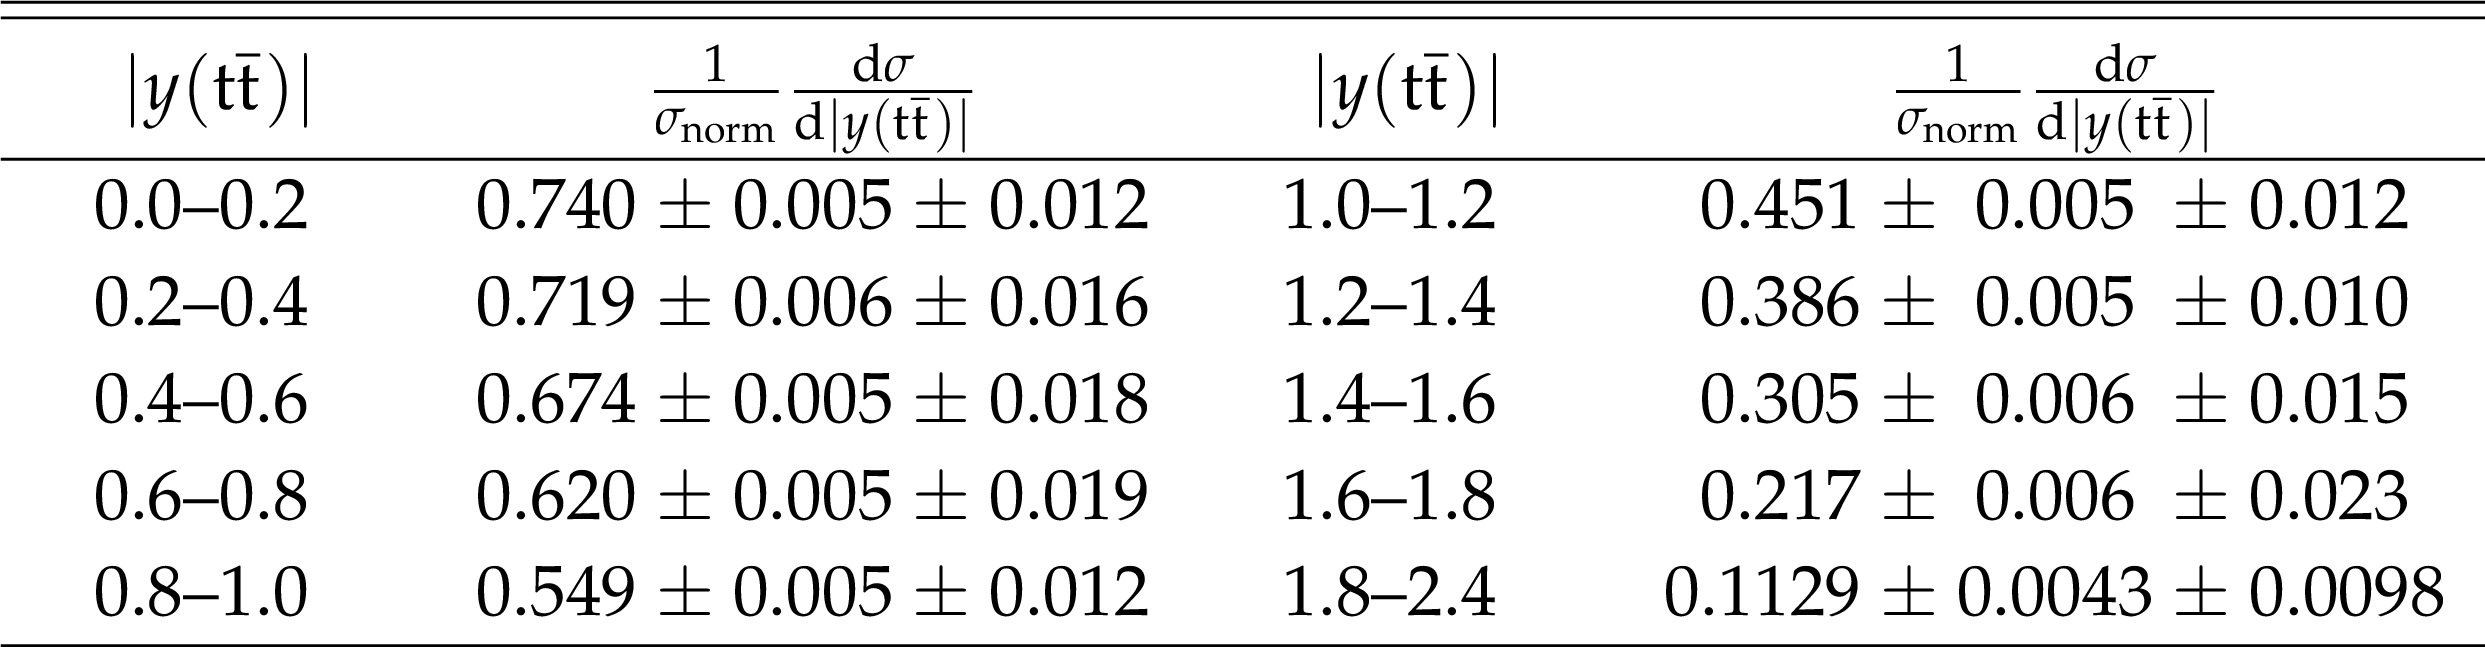
png pdf |
Table 40:
Differential cross section at the parton level as a function of $ { | y({\mathrm{t} \mathrm{\bar{t}}}) | }$ normalized to the cross section $\sigma _\text {norm}$ in the measured range. The values are shown together with their statistical and systematic uncertainties. |
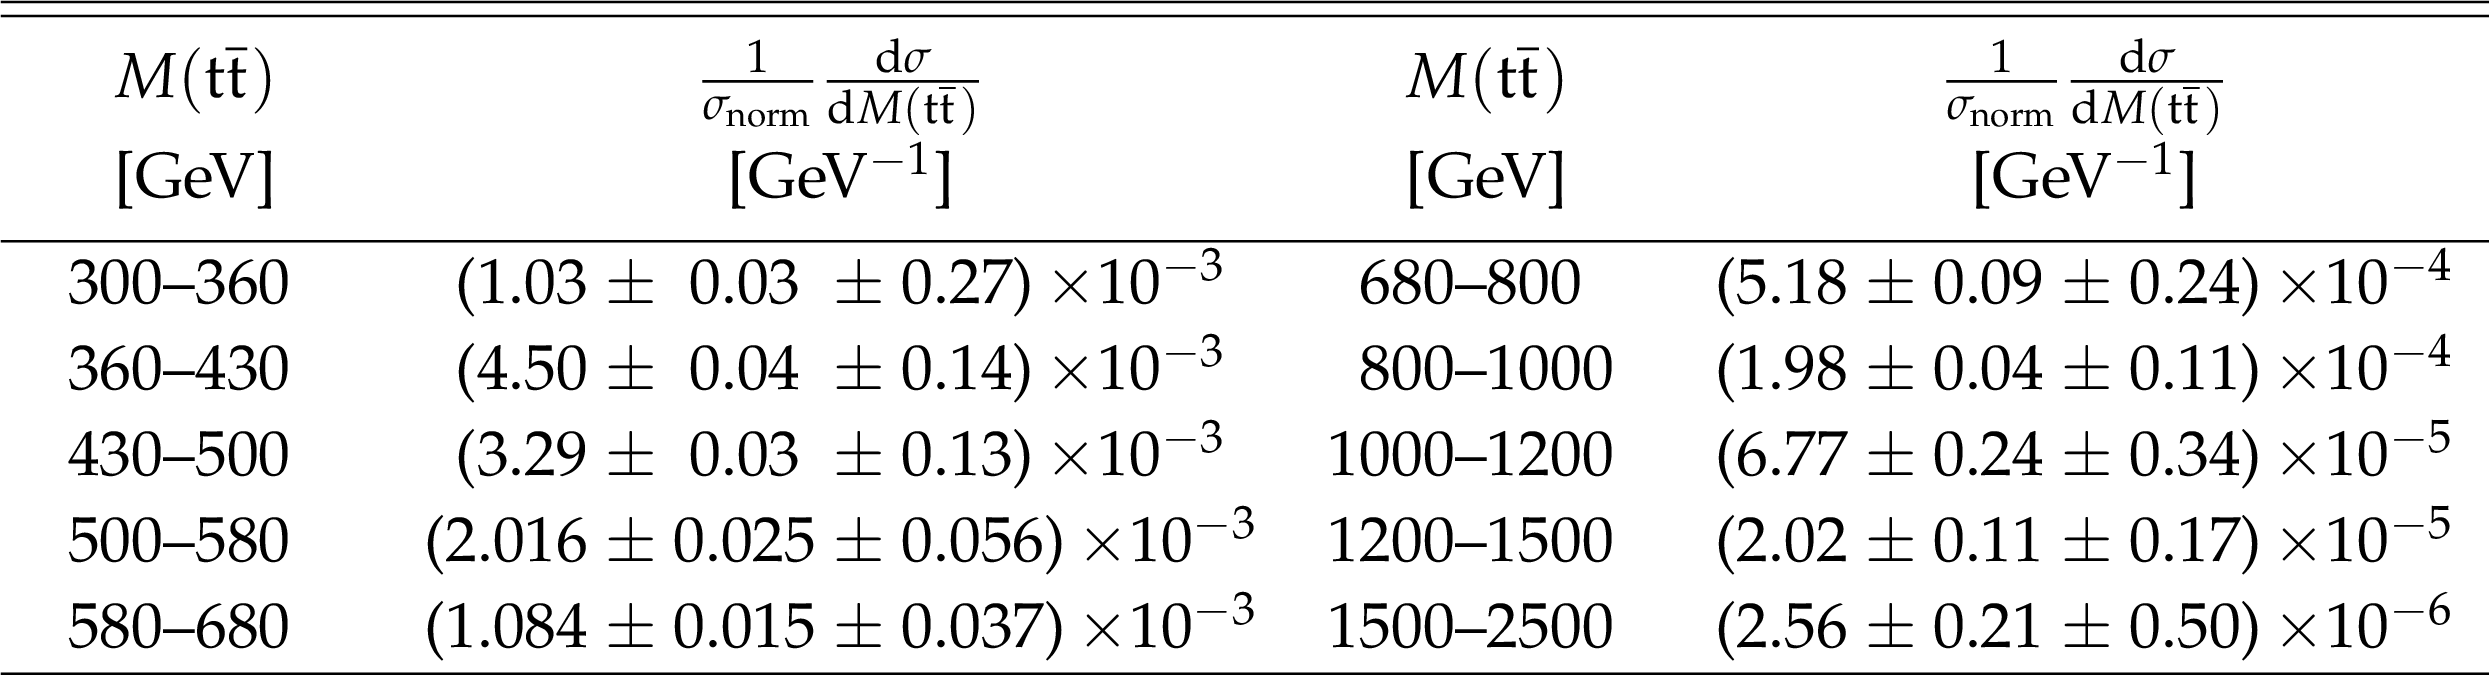
png pdf |
Table 41:
Differential cross section at the parton level as a function of $M({\mathrm{t} \mathrm{\bar{t}}})$ normalized to the cross section $\sigma _\text {norm}$ in the measured range. The values are shown together with their statistical and systematic uncertainties. |

png pdf |
Table 42:
Double-differential cross section at the parton level as a function of $ { | y({\mathrm{t} _\mathrm {h}}) | }$ vs. $ {p_{\mathrm {T}}} ({\mathrm{t} _\mathrm {h}})$ normalized to the cross section $\sigma _\text {norm}$ in the measured in the two-dimensional range. The values are shown together with their statistical and systematic uncertainties. |
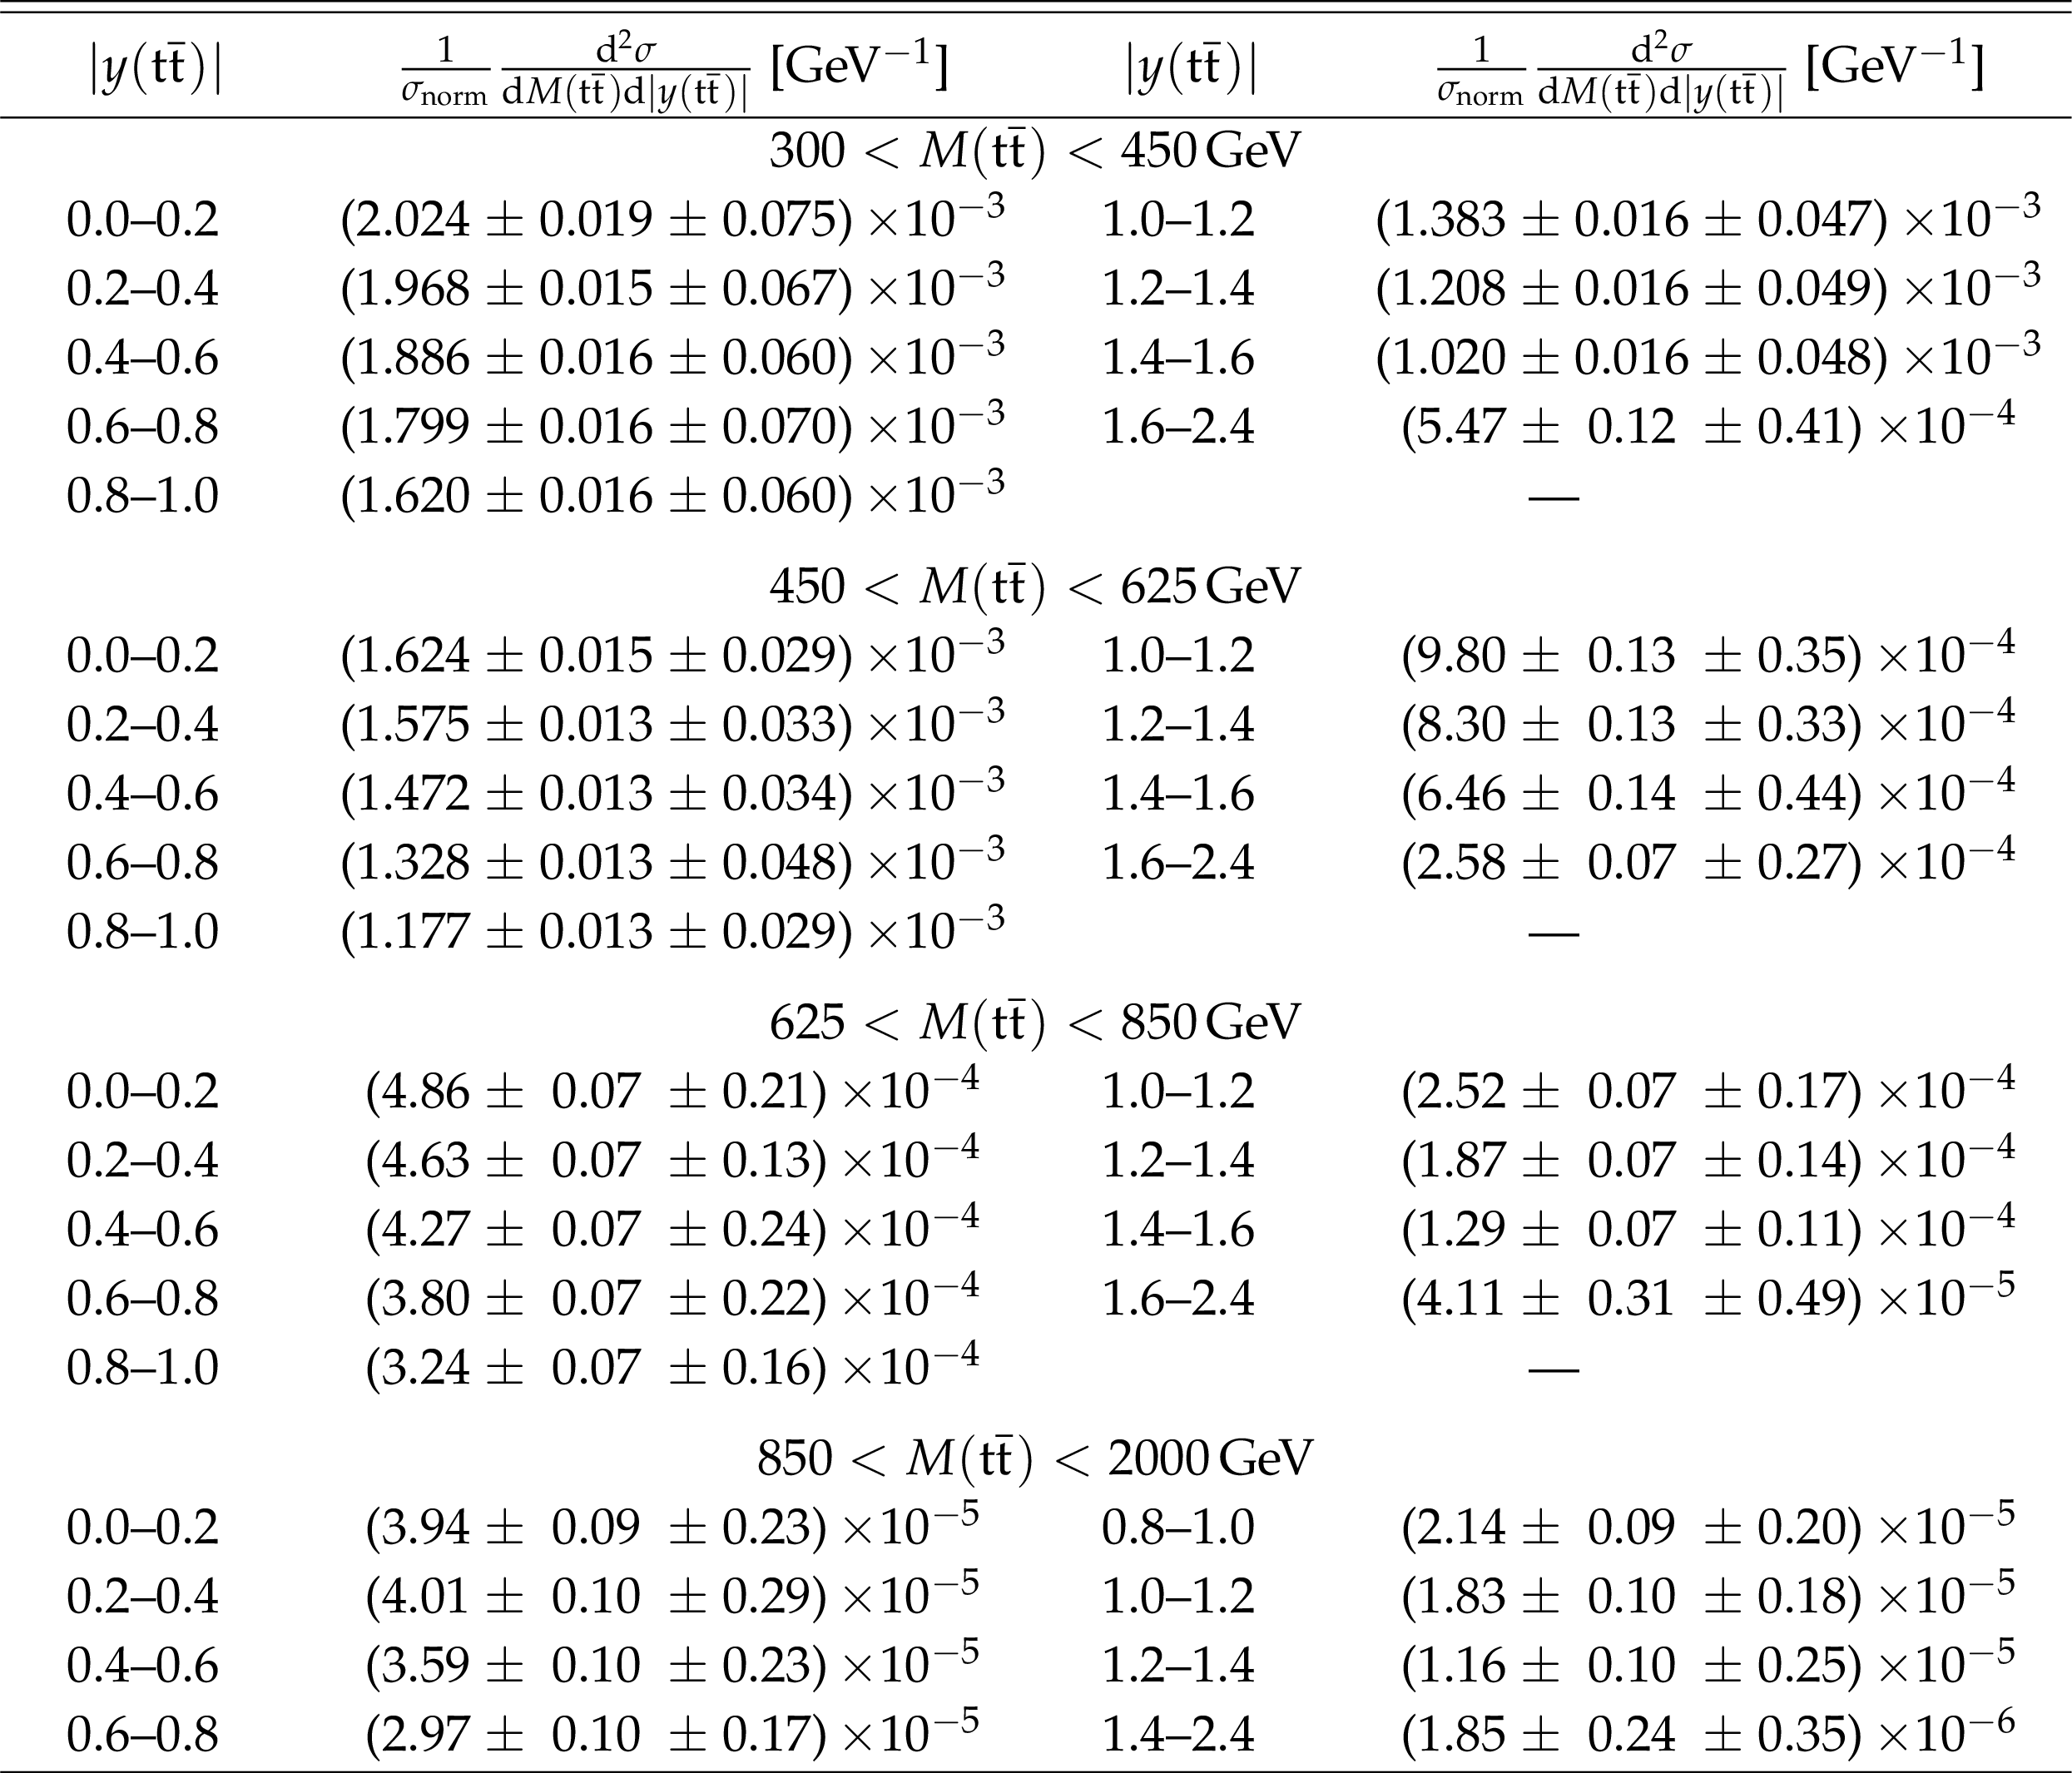
png pdf |
Table 43:
Double-differential cross section at the parton level as a function of $M({\mathrm{t} \mathrm{\bar{t}}})$ vs. $ { | y({\mathrm{t} \mathrm{\bar{t}}}) | }$ normalized to the cross section $\sigma _\text {norm}$ in the measured in the two-dimensional range. The values are shown together with their statistical and systematic uncertainties. |
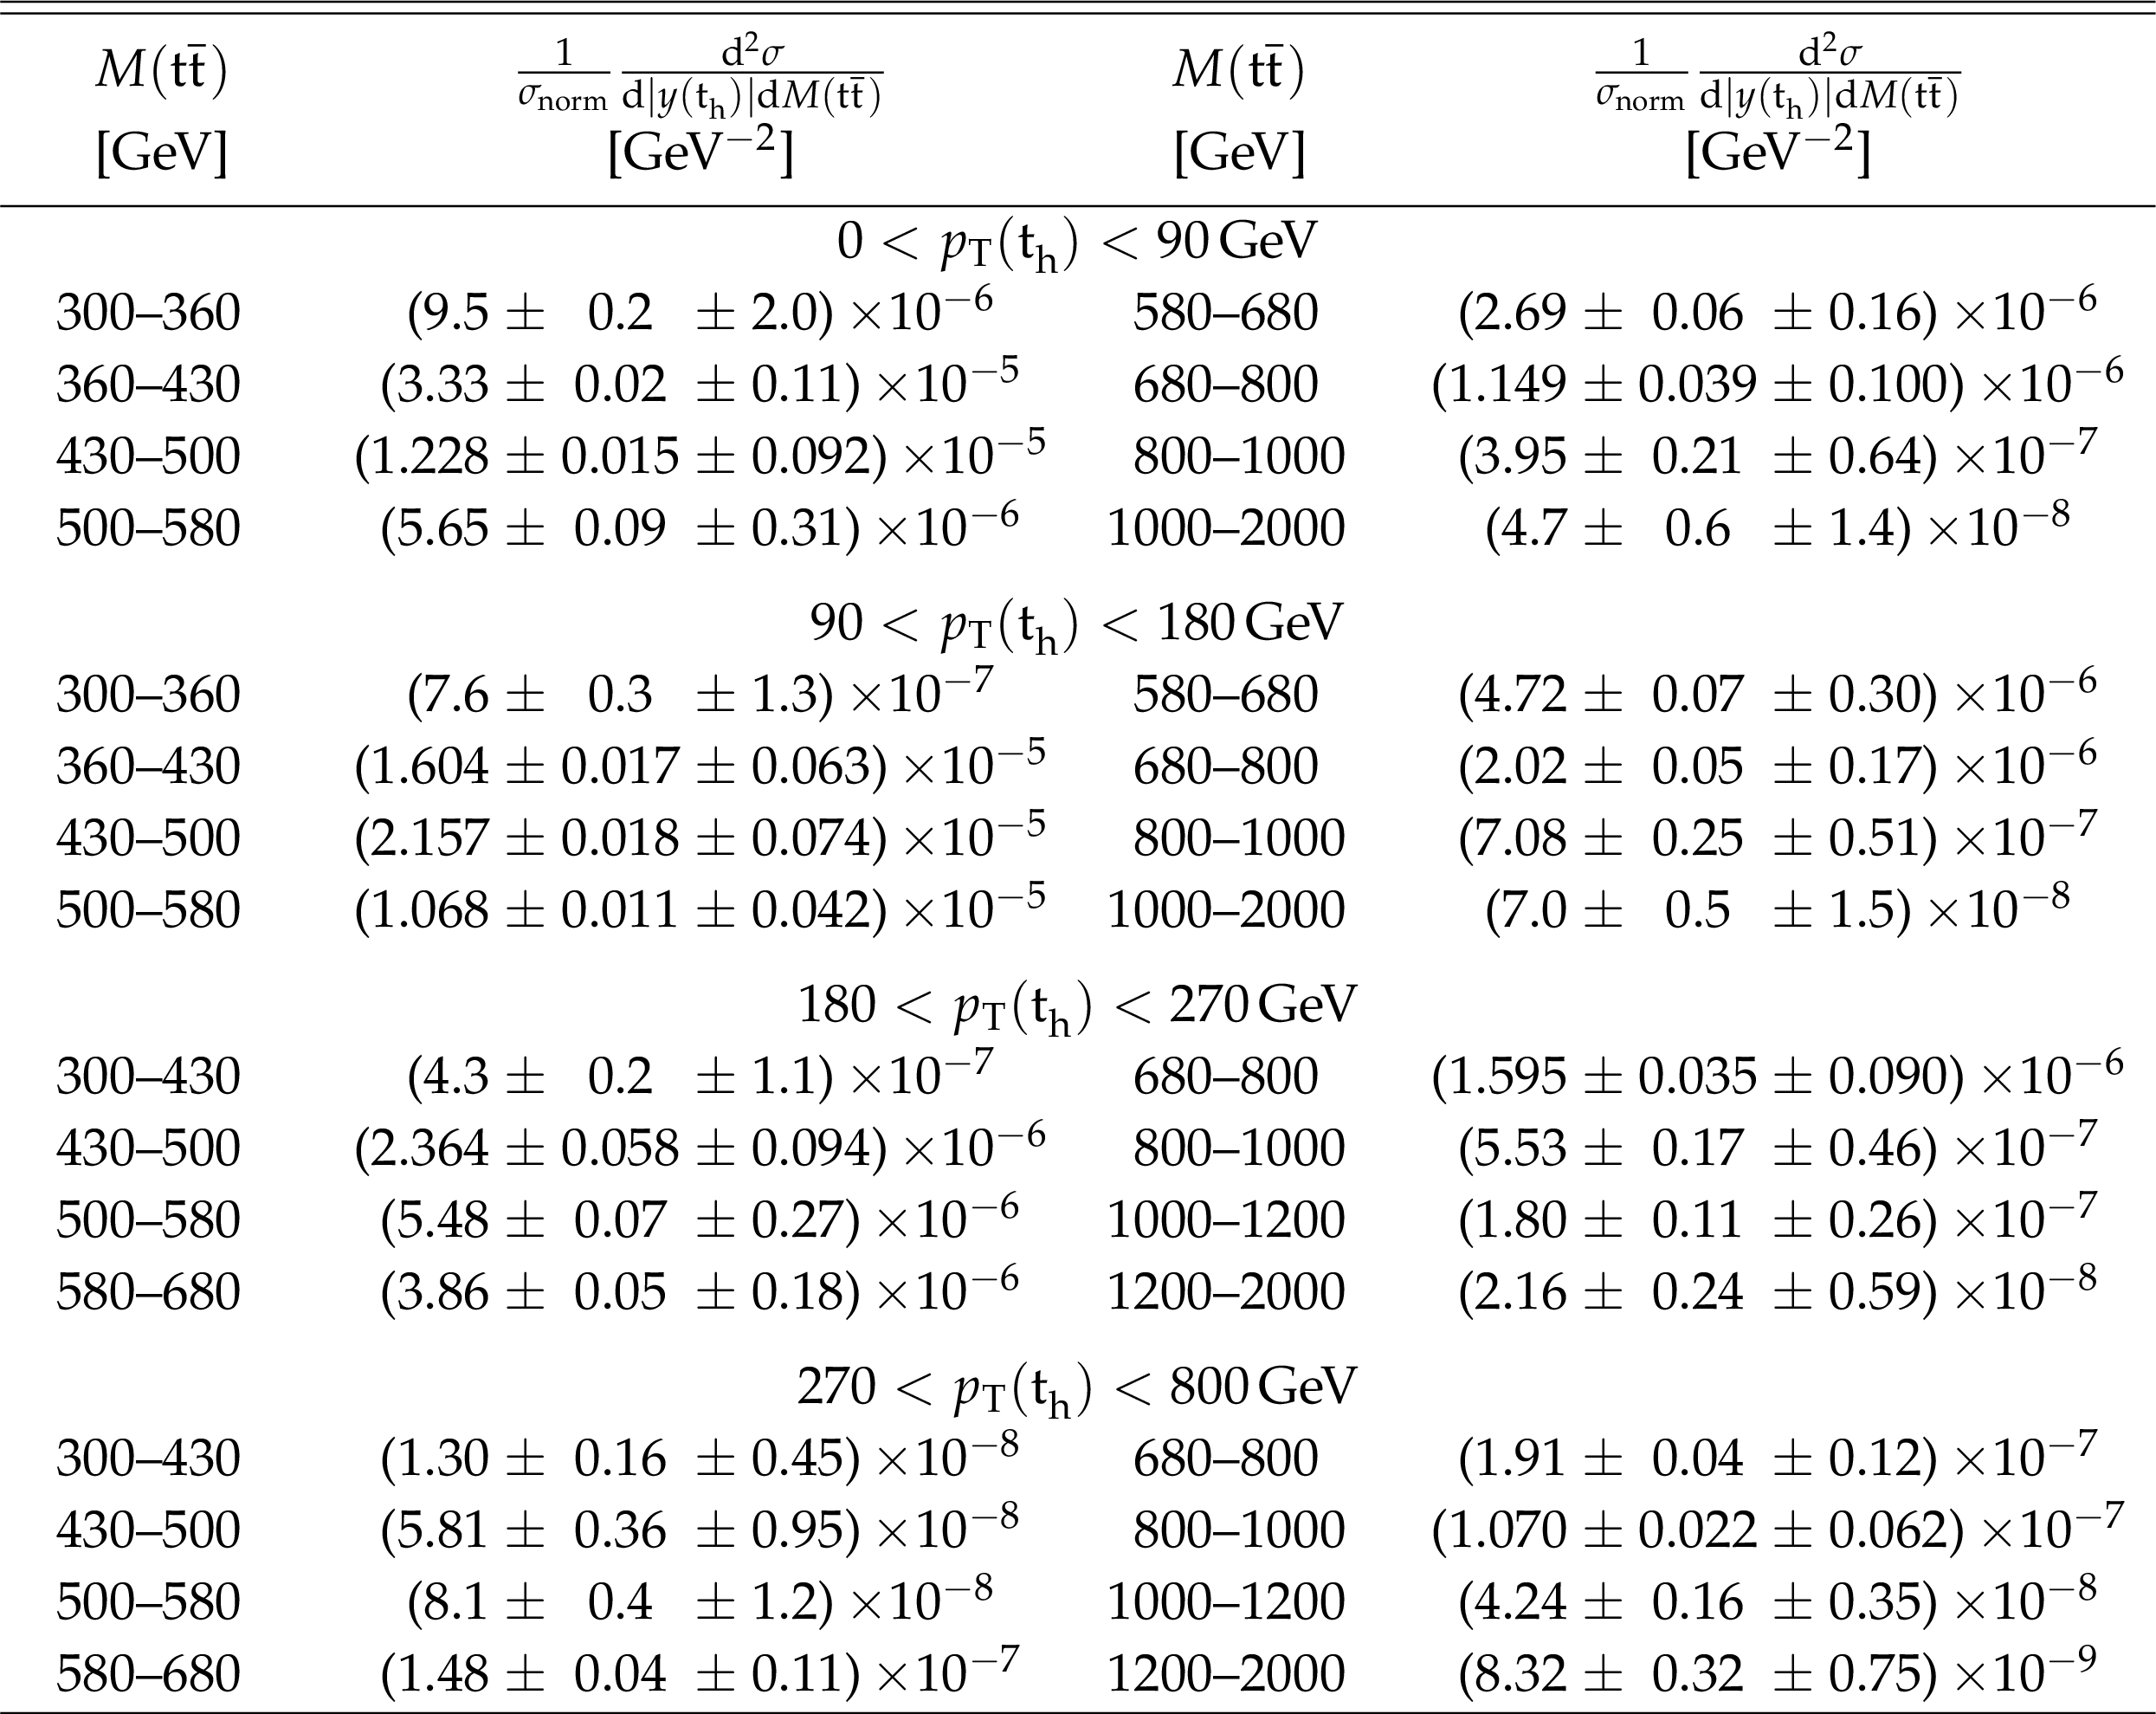
png pdf |
Table 44:
Double-differential cross section at the parton level as a function of $ {p_{\mathrm {T}}} ({\mathrm{t} _\mathrm {h}})$ vs. $M({\mathrm{t} \mathrm{\bar{t}}})$ normalized to the cross section $\sigma _\text {norm}$ in the measured in the two-dimensional range. The values are shown together with their statistical and systematic uncertainties. |
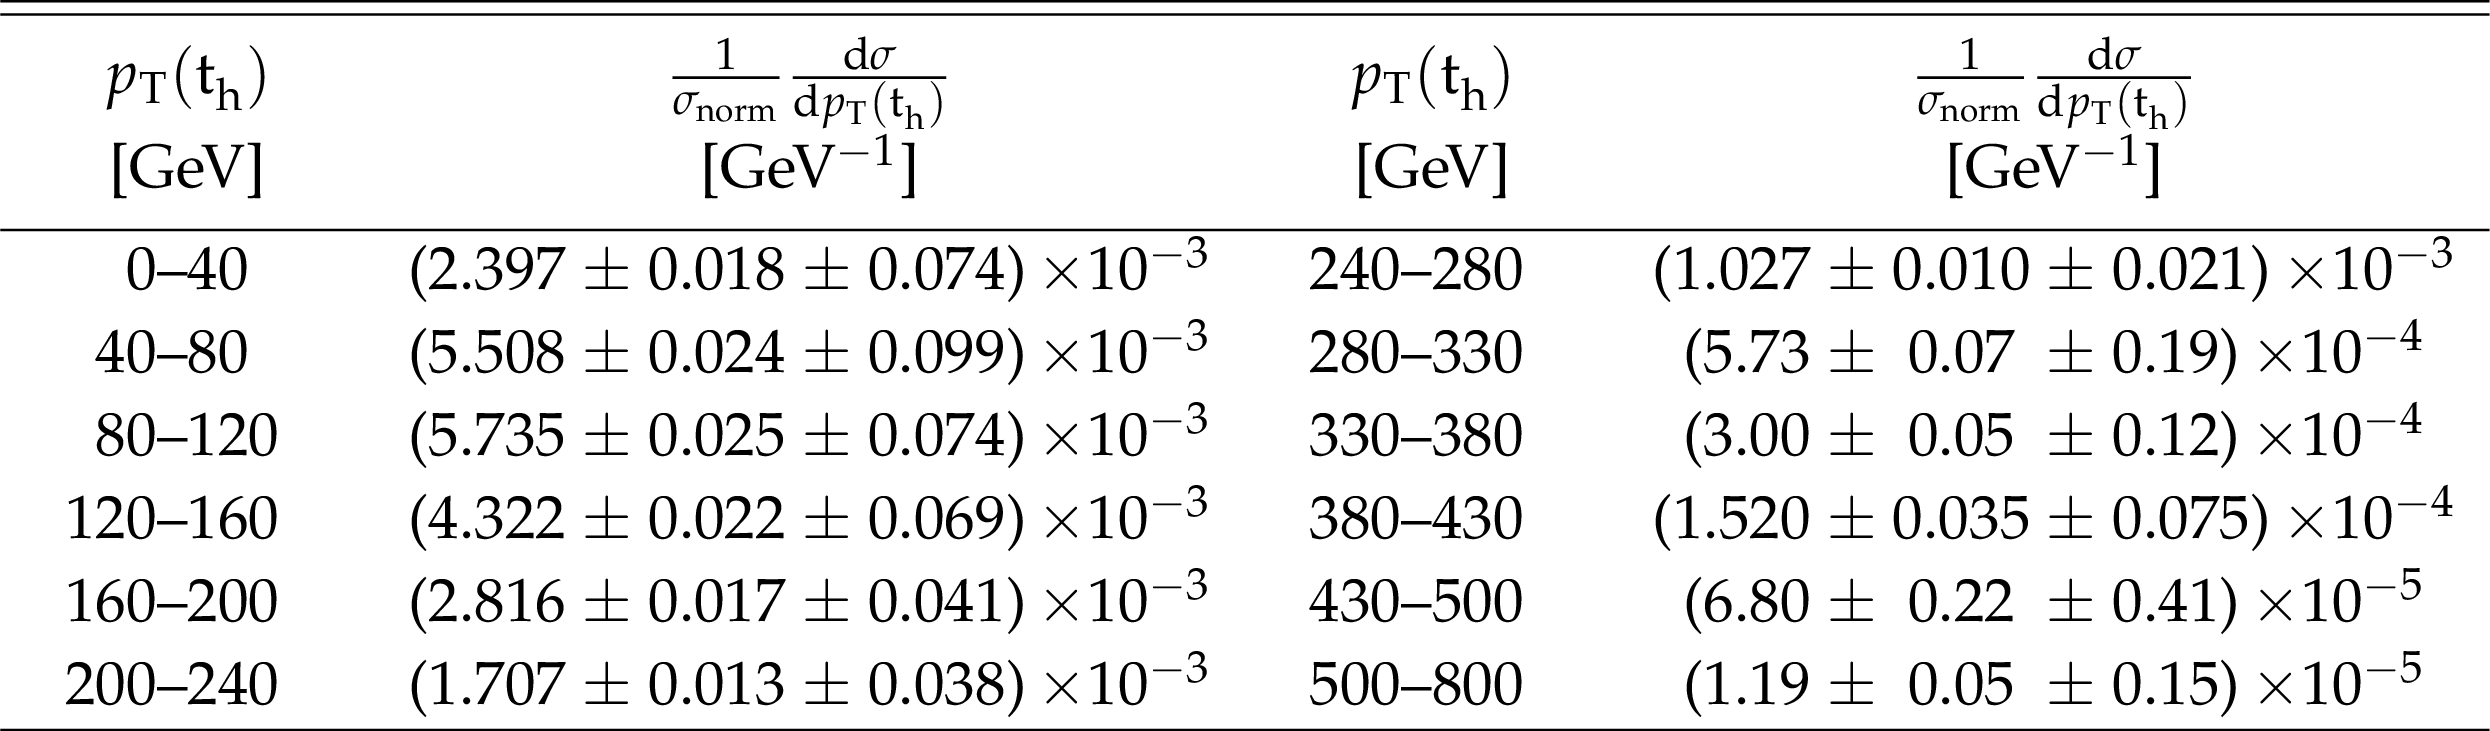
png pdf |
Table 45:
Differential cross section at the particle level as a function of $ {p_{\mathrm {T}}} ({\mathrm{t} _\mathrm {h}})$ normalized to the cross section $\sigma _\text {norm}$ in the measured range. The values are shown together with their statistical and systematic uncertainties. |
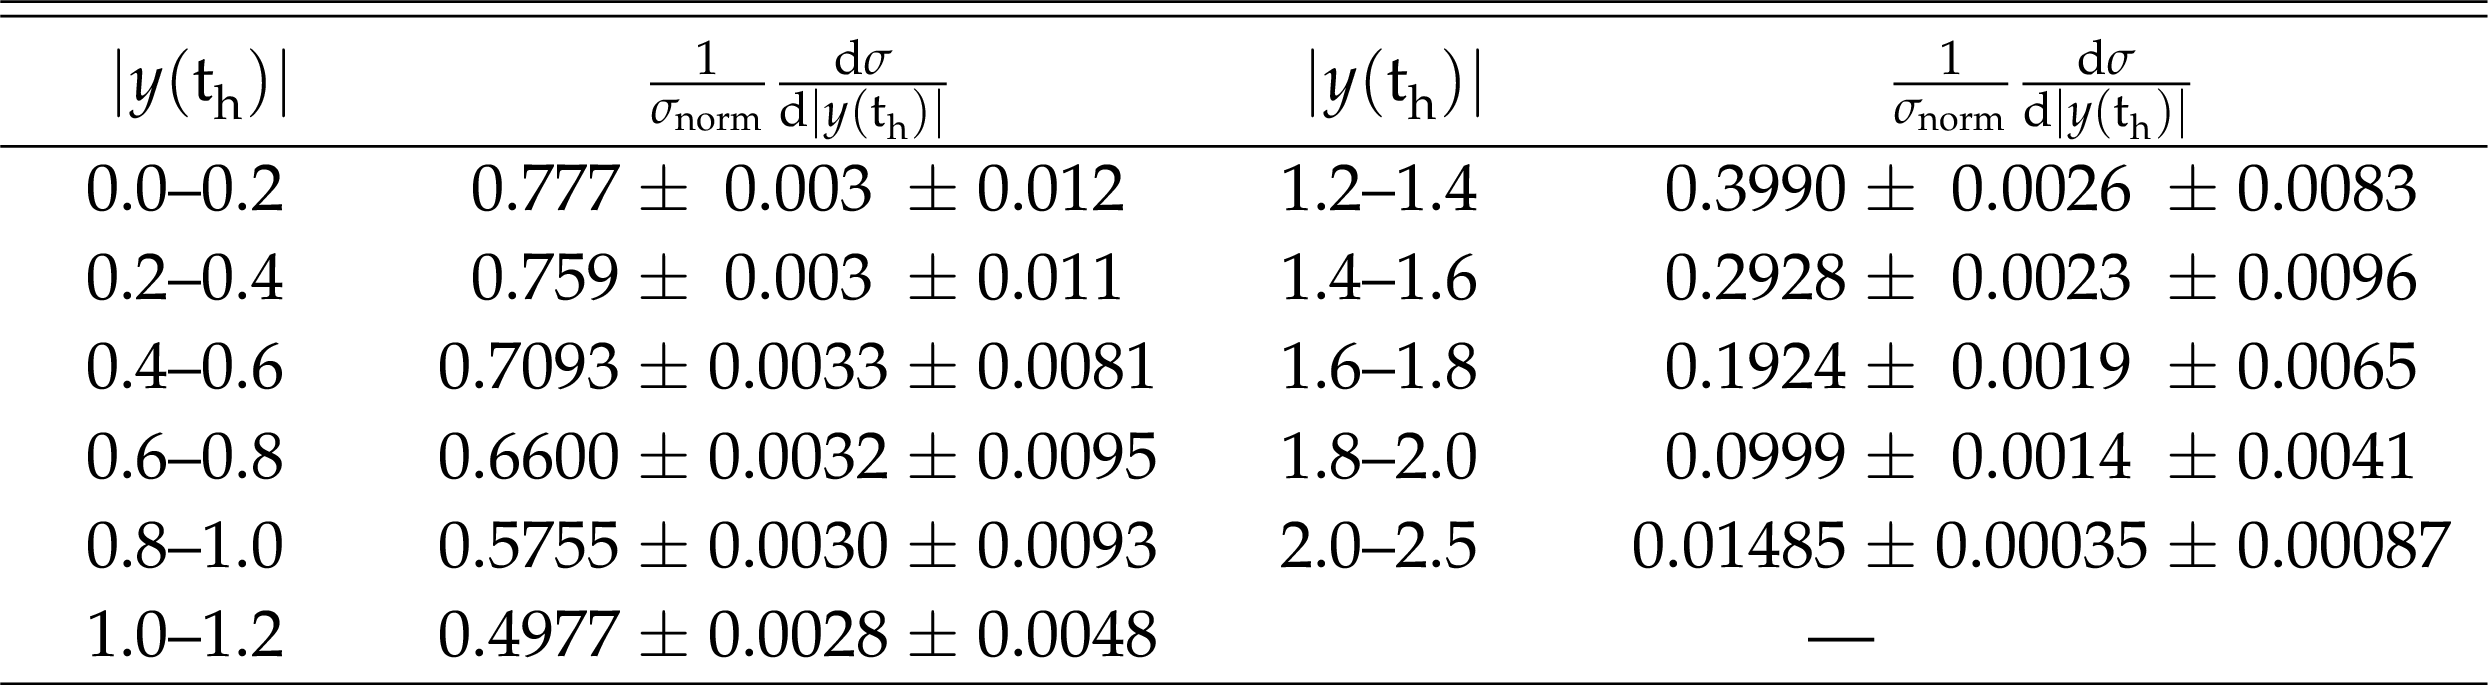
png pdf |
Table 46:
Differential cross section at the particle level as a function of $ { | y({\mathrm{t} _\mathrm {h}}) | }$ normalized to the cross section $\sigma _\text {norm}$ in the measured range. The values are shown together with their statistical and systematic uncertainties. |
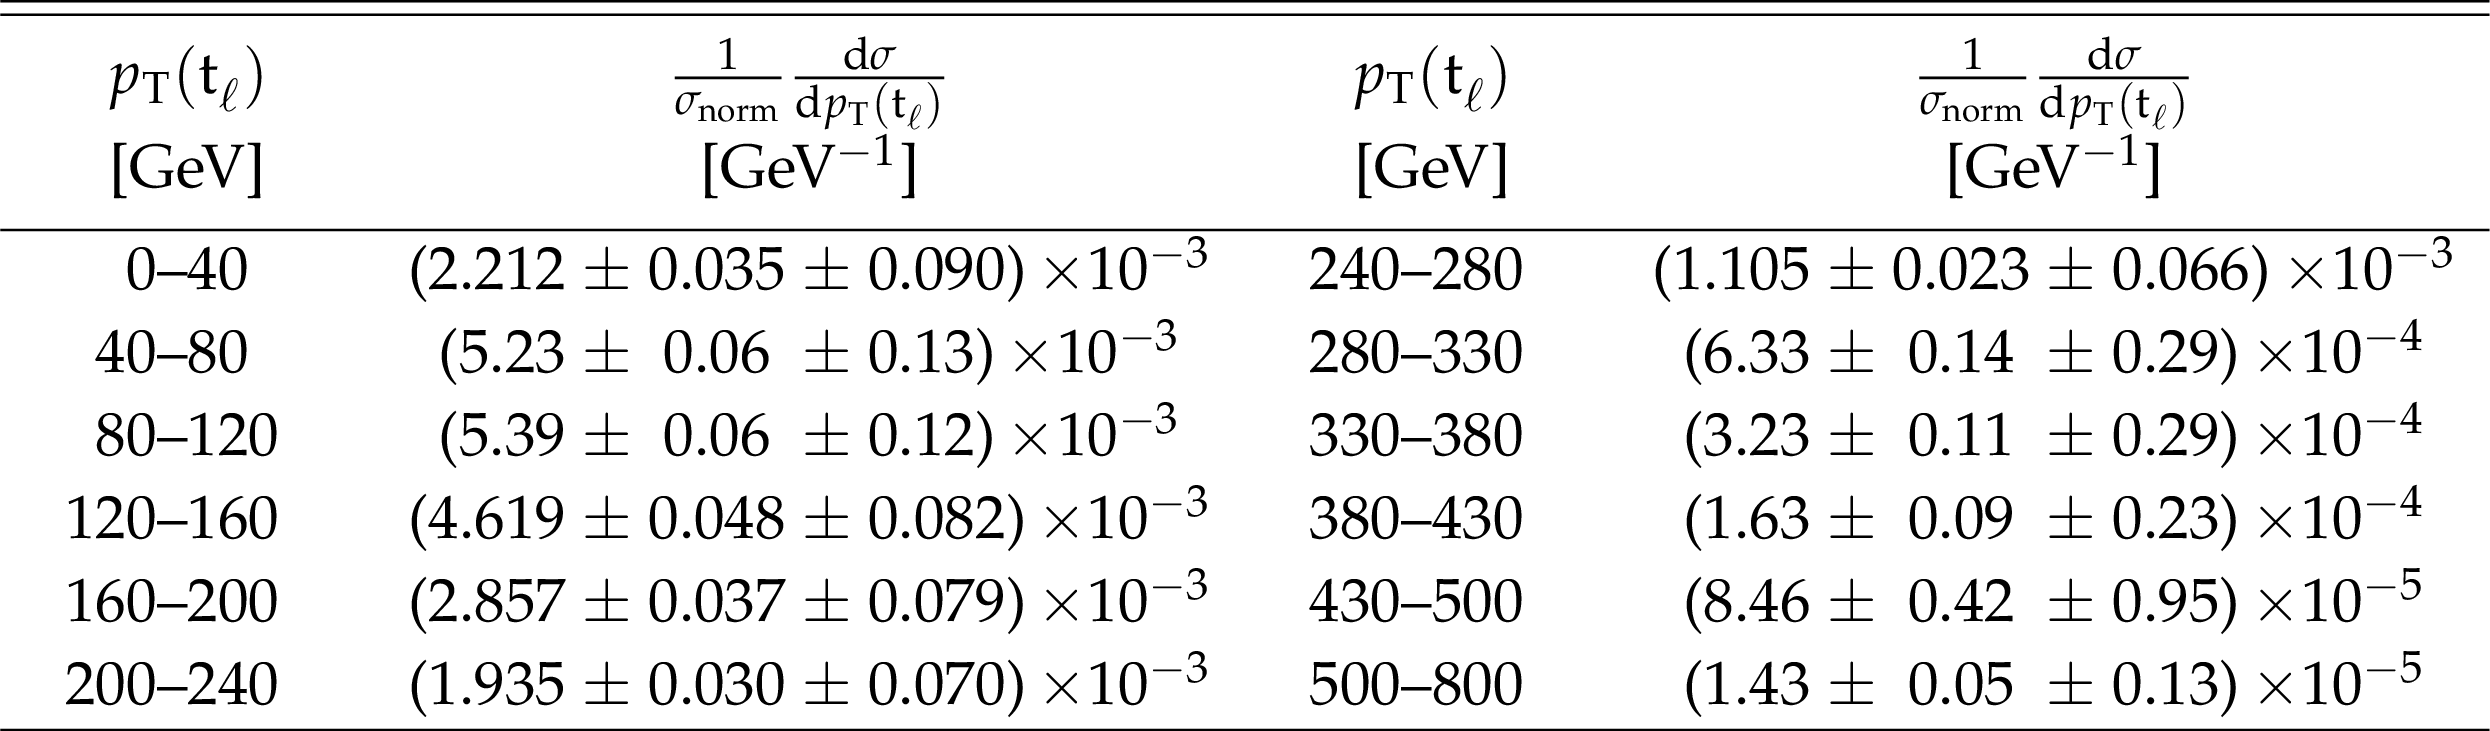
png pdf |
Table 47:
Differential cross section at the particle level as a function of $ {p_{\mathrm {T}}} ({\mathrm{t} _\ell})$ normalized to the cross section $\sigma _\text {norm}$ in the measured range. The values are shown together with their statistical and systematic uncertainties. |
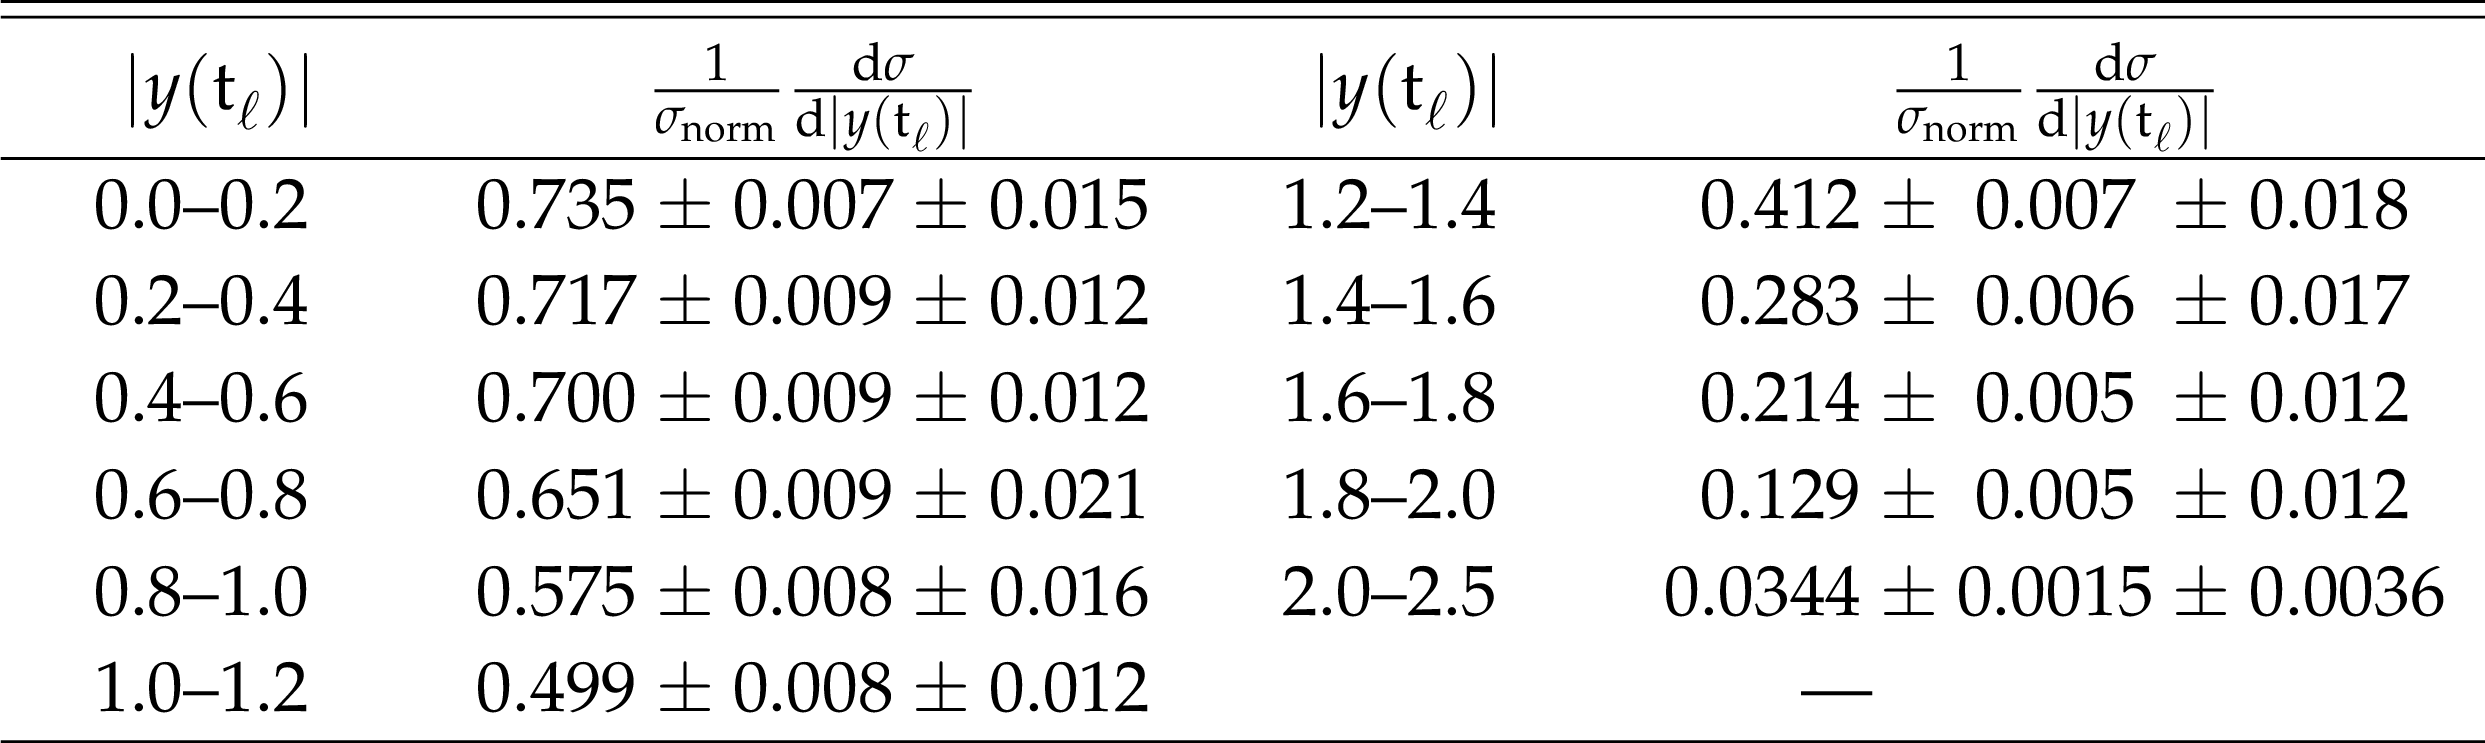
png pdf |
Table 48:
Differential cross section at the particle level as a function of $ { | y({\mathrm{t} _\ell}) | }$ normalized to the cross section $\sigma _\text {norm}$ in the measured range. The values are shown together with their statistical and systematic uncertainties. |
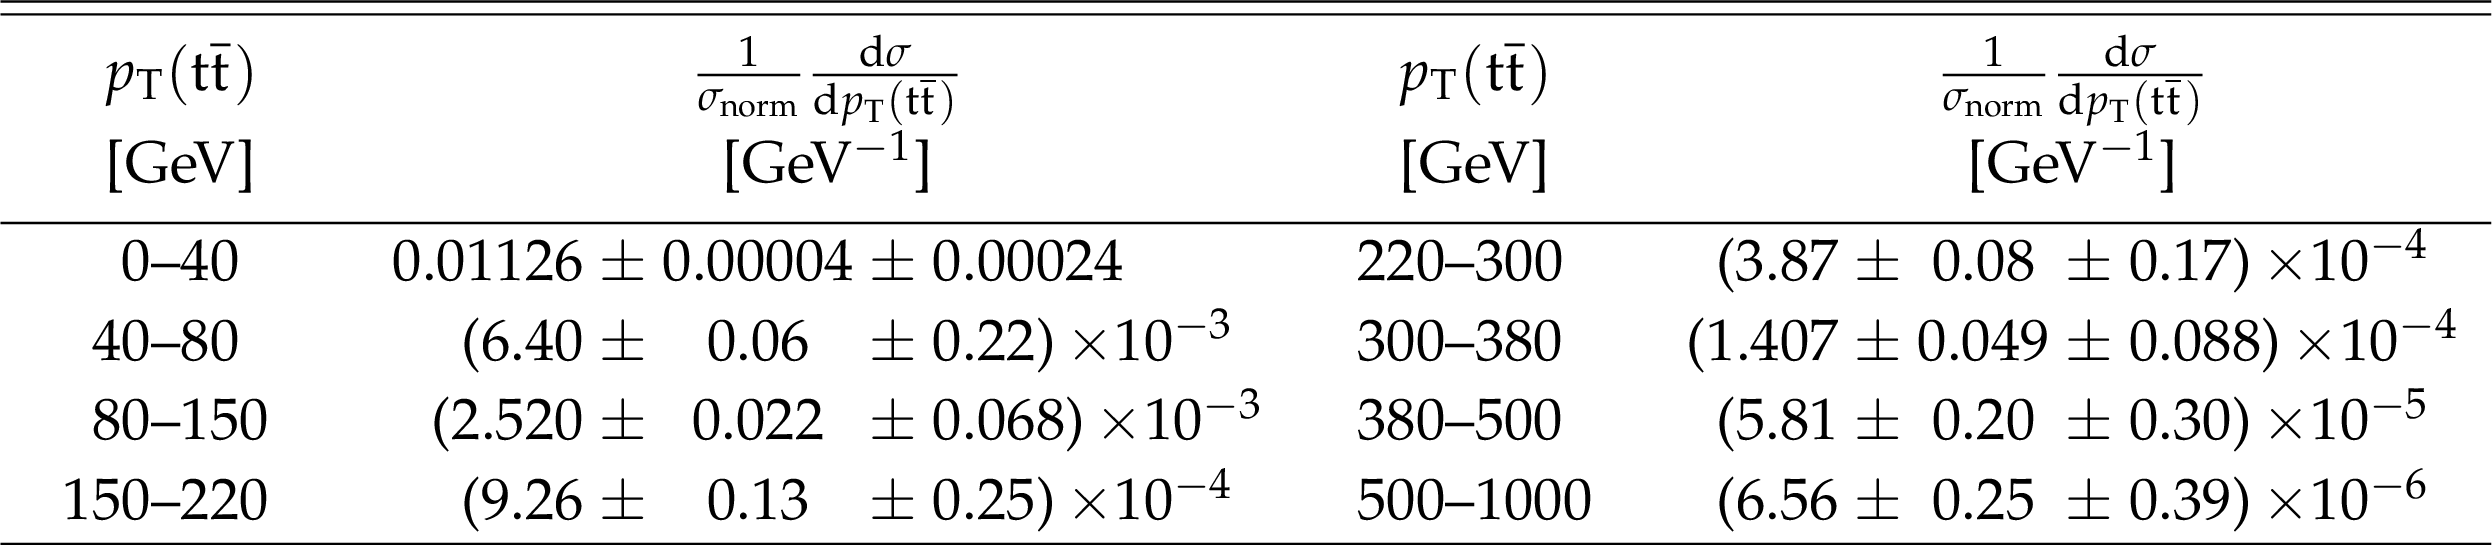
png pdf |
Table 49:
Differential cross section at the particle level as a function of $ {p_{\mathrm {T}}} ({\mathrm{t} \mathrm{\bar{t}}})$ normalized to the cross section $\sigma _\text {norm}$ in the measured range. The values are shown together with their statistical and systematic uncertainties. |

png pdf |
Table 50:
Differential cross section at the particle level as a function of $ { | y({\mathrm{t} \mathrm{\bar{t}}}) | }$ normalized to the cross section $\sigma _\text {norm}$ in the measured range. The values are shown together with their statistical and systematic uncertainties. |

png pdf |
Table 51:
Differential cross section at the particle level as a function of $M({\mathrm{t} \mathrm{\bar{t}}})$ normalized to the cross section $\sigma _\text {norm}$ in the measured range. The values are shown together with their statistical and systematic uncertainties. |
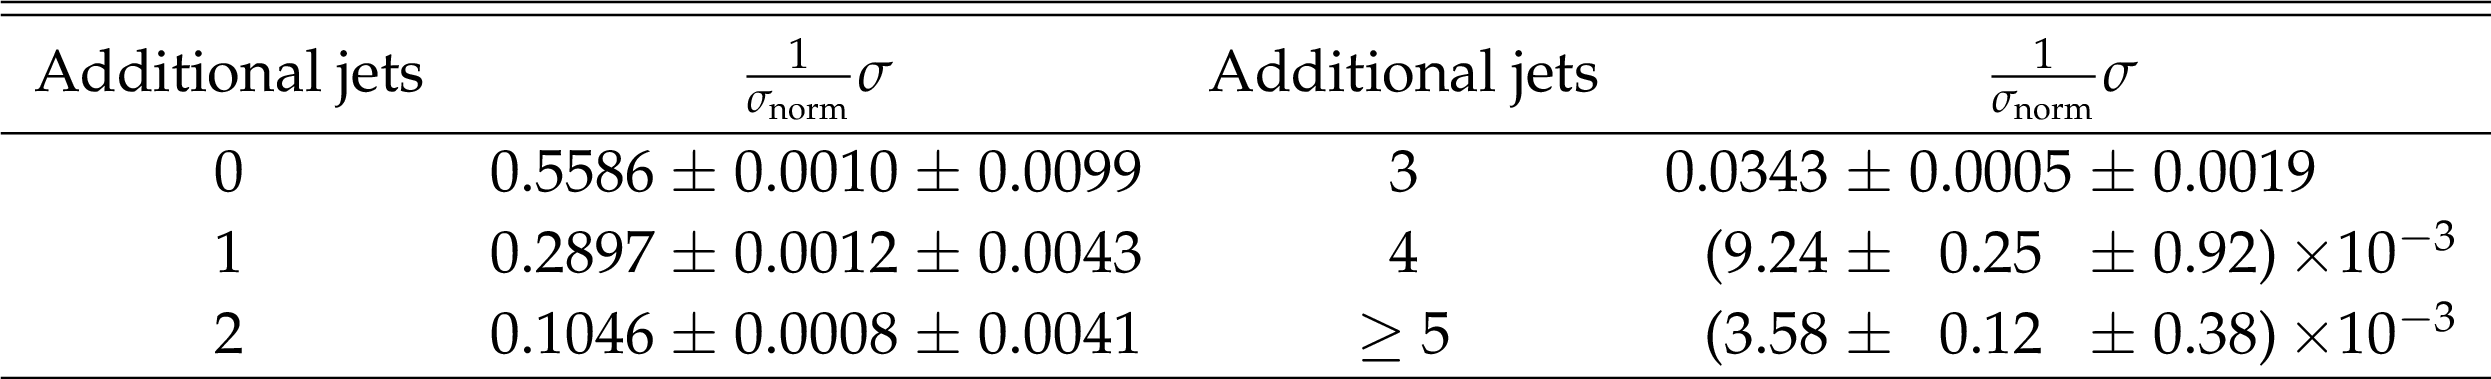
png pdf |
Table 52:
Cross sections at the particle level for different numbers of additional jets normalized to the cross section $\sigma _\text {norm}$ in the measured range. The values are shown together with their statistical and systematic uncertainties. |
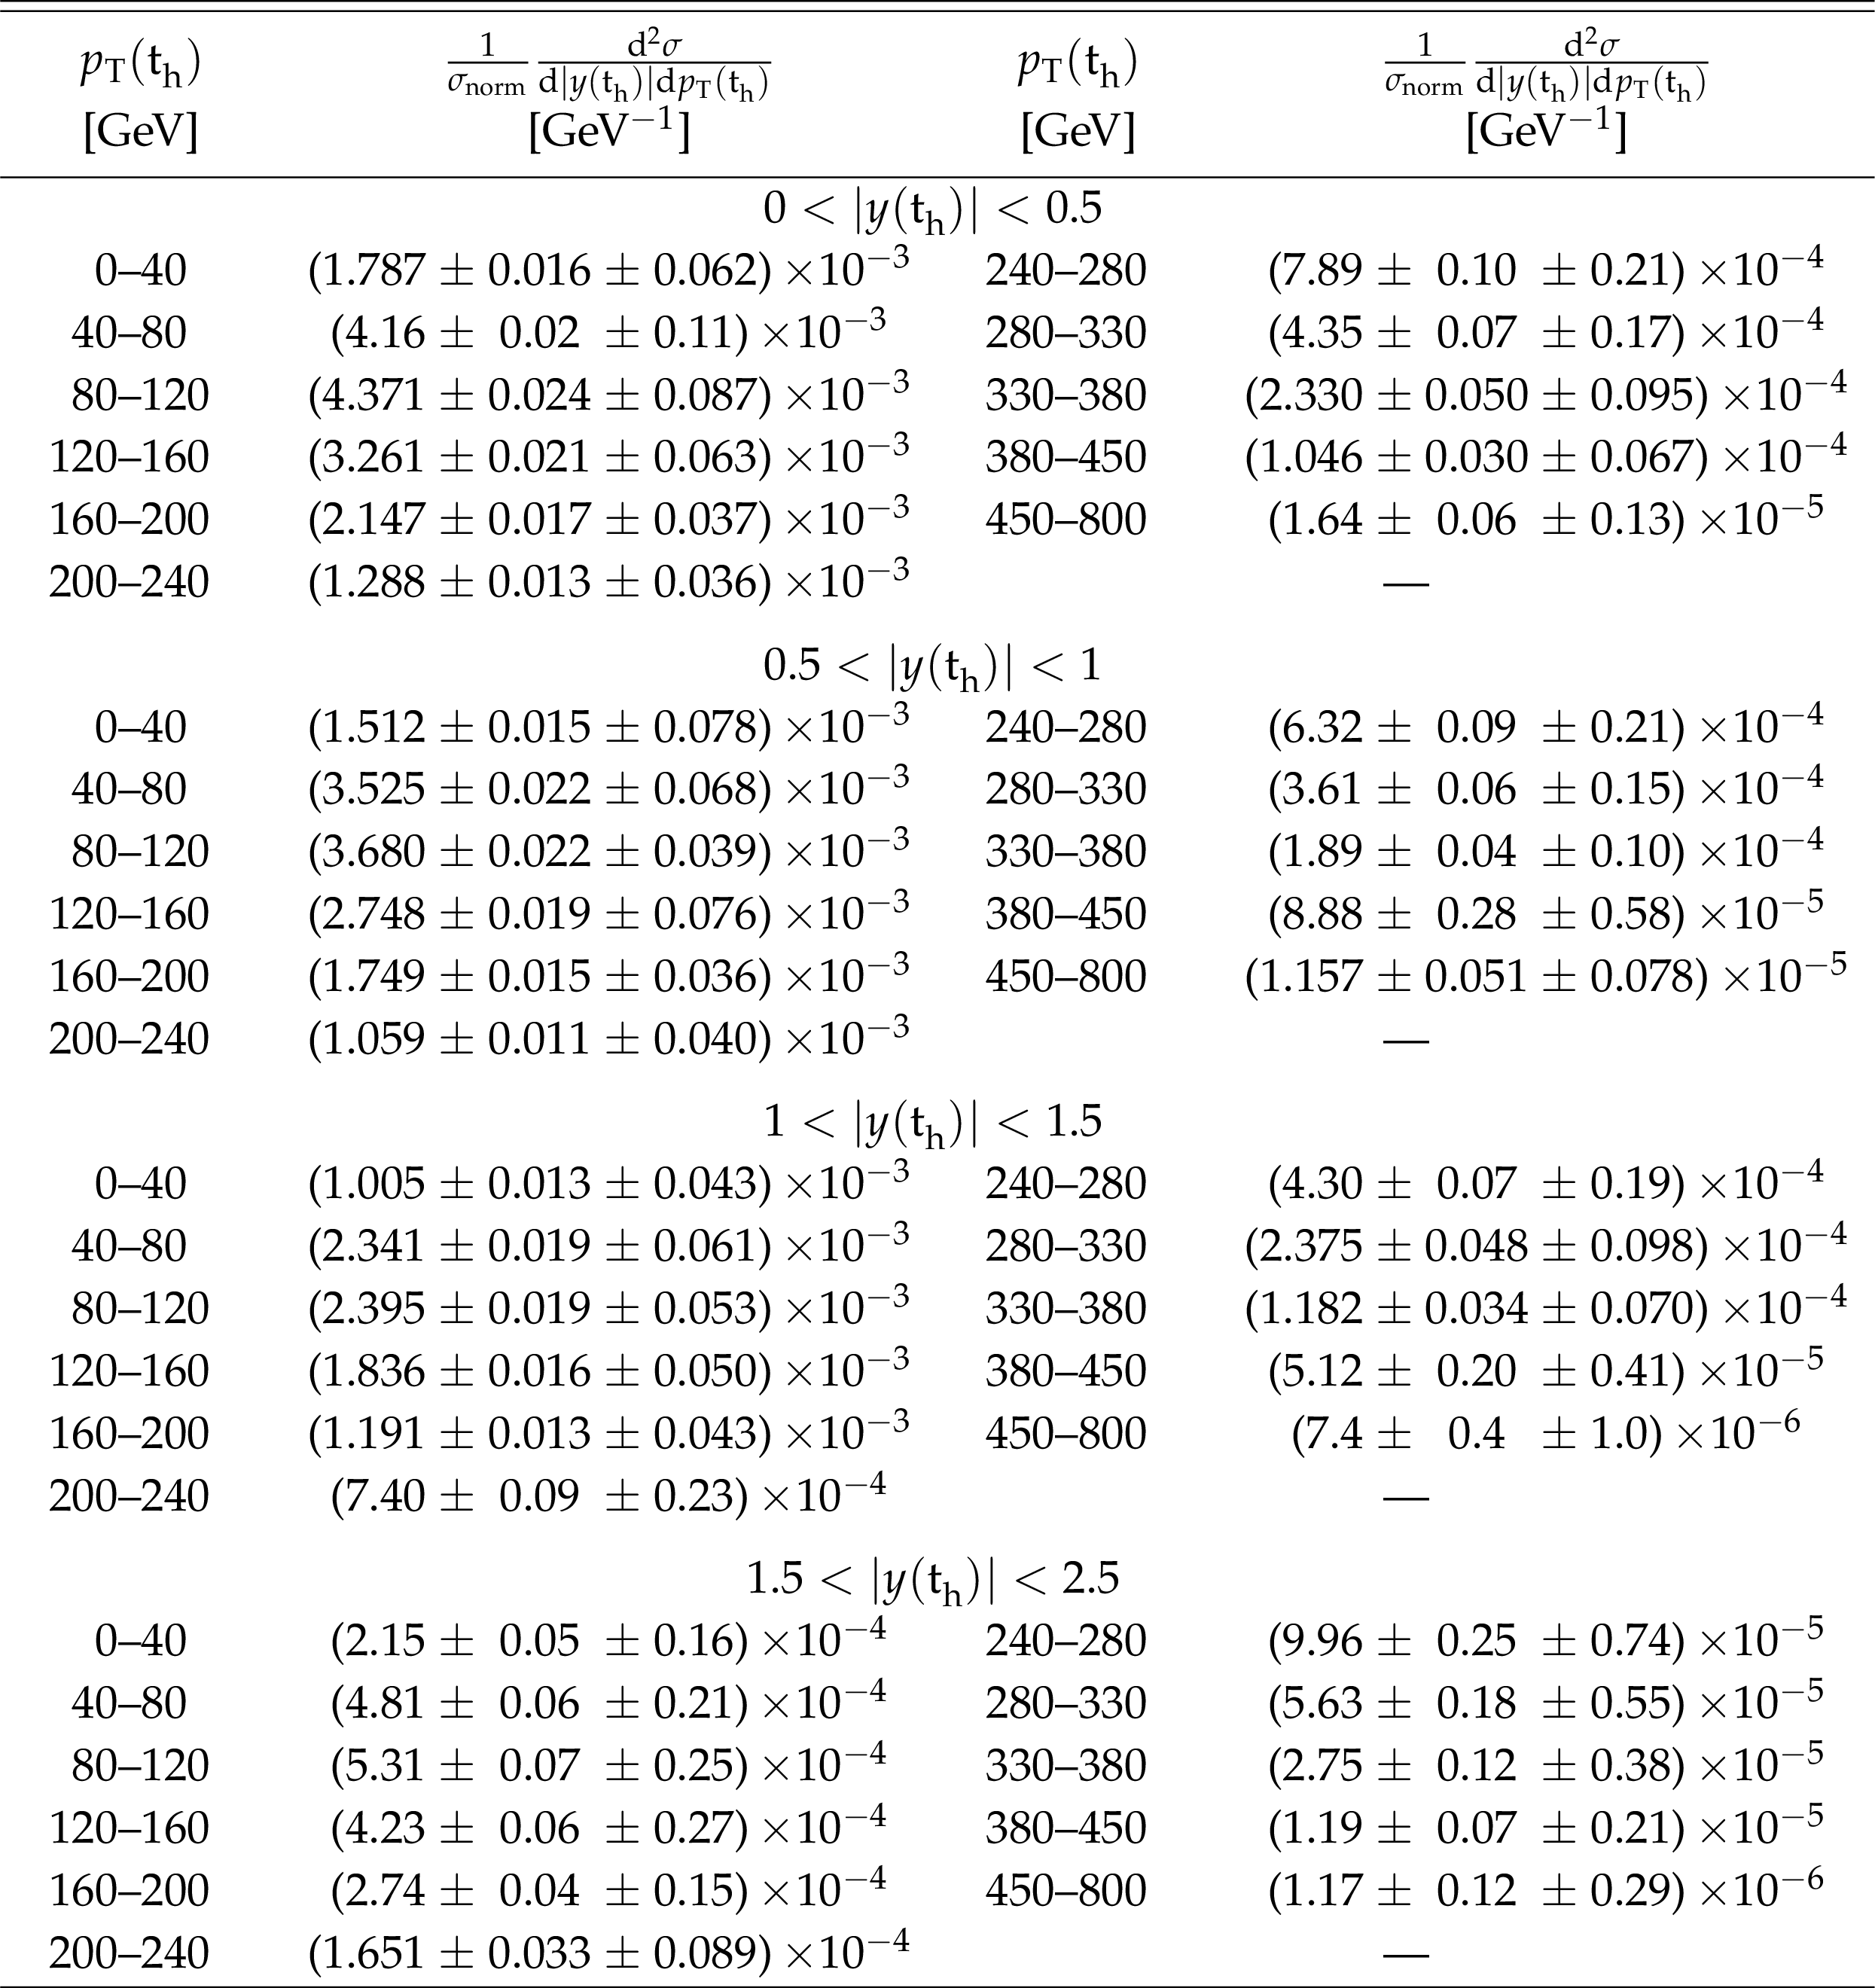
png pdf |
Table 53:
Double-differential cross section at the particle level as a function of $ { | y({\mathrm{t} _\mathrm {h}}) | }$ vs. $ {p_{\mathrm {T}}} ({\mathrm{t} _\mathrm {h}})$ normalized to the cross section $\sigma _\text {norm}$ in the measured in the two-dimensional range. The values are shown together with their statistical and systematic uncertainties. |

png pdf |
Table 54:
Double-differential cross section at the particle level as a function of $M({\mathrm{t} \mathrm{\bar{t}}})$ vs. $ { | y({\mathrm{t} \mathrm{\bar{t}}}) | }$ normalized to the cross section $\sigma _\text {norm}$ in the measured in the two-dimensional range. The values are shown together with their statistical and systematic uncertainties. |
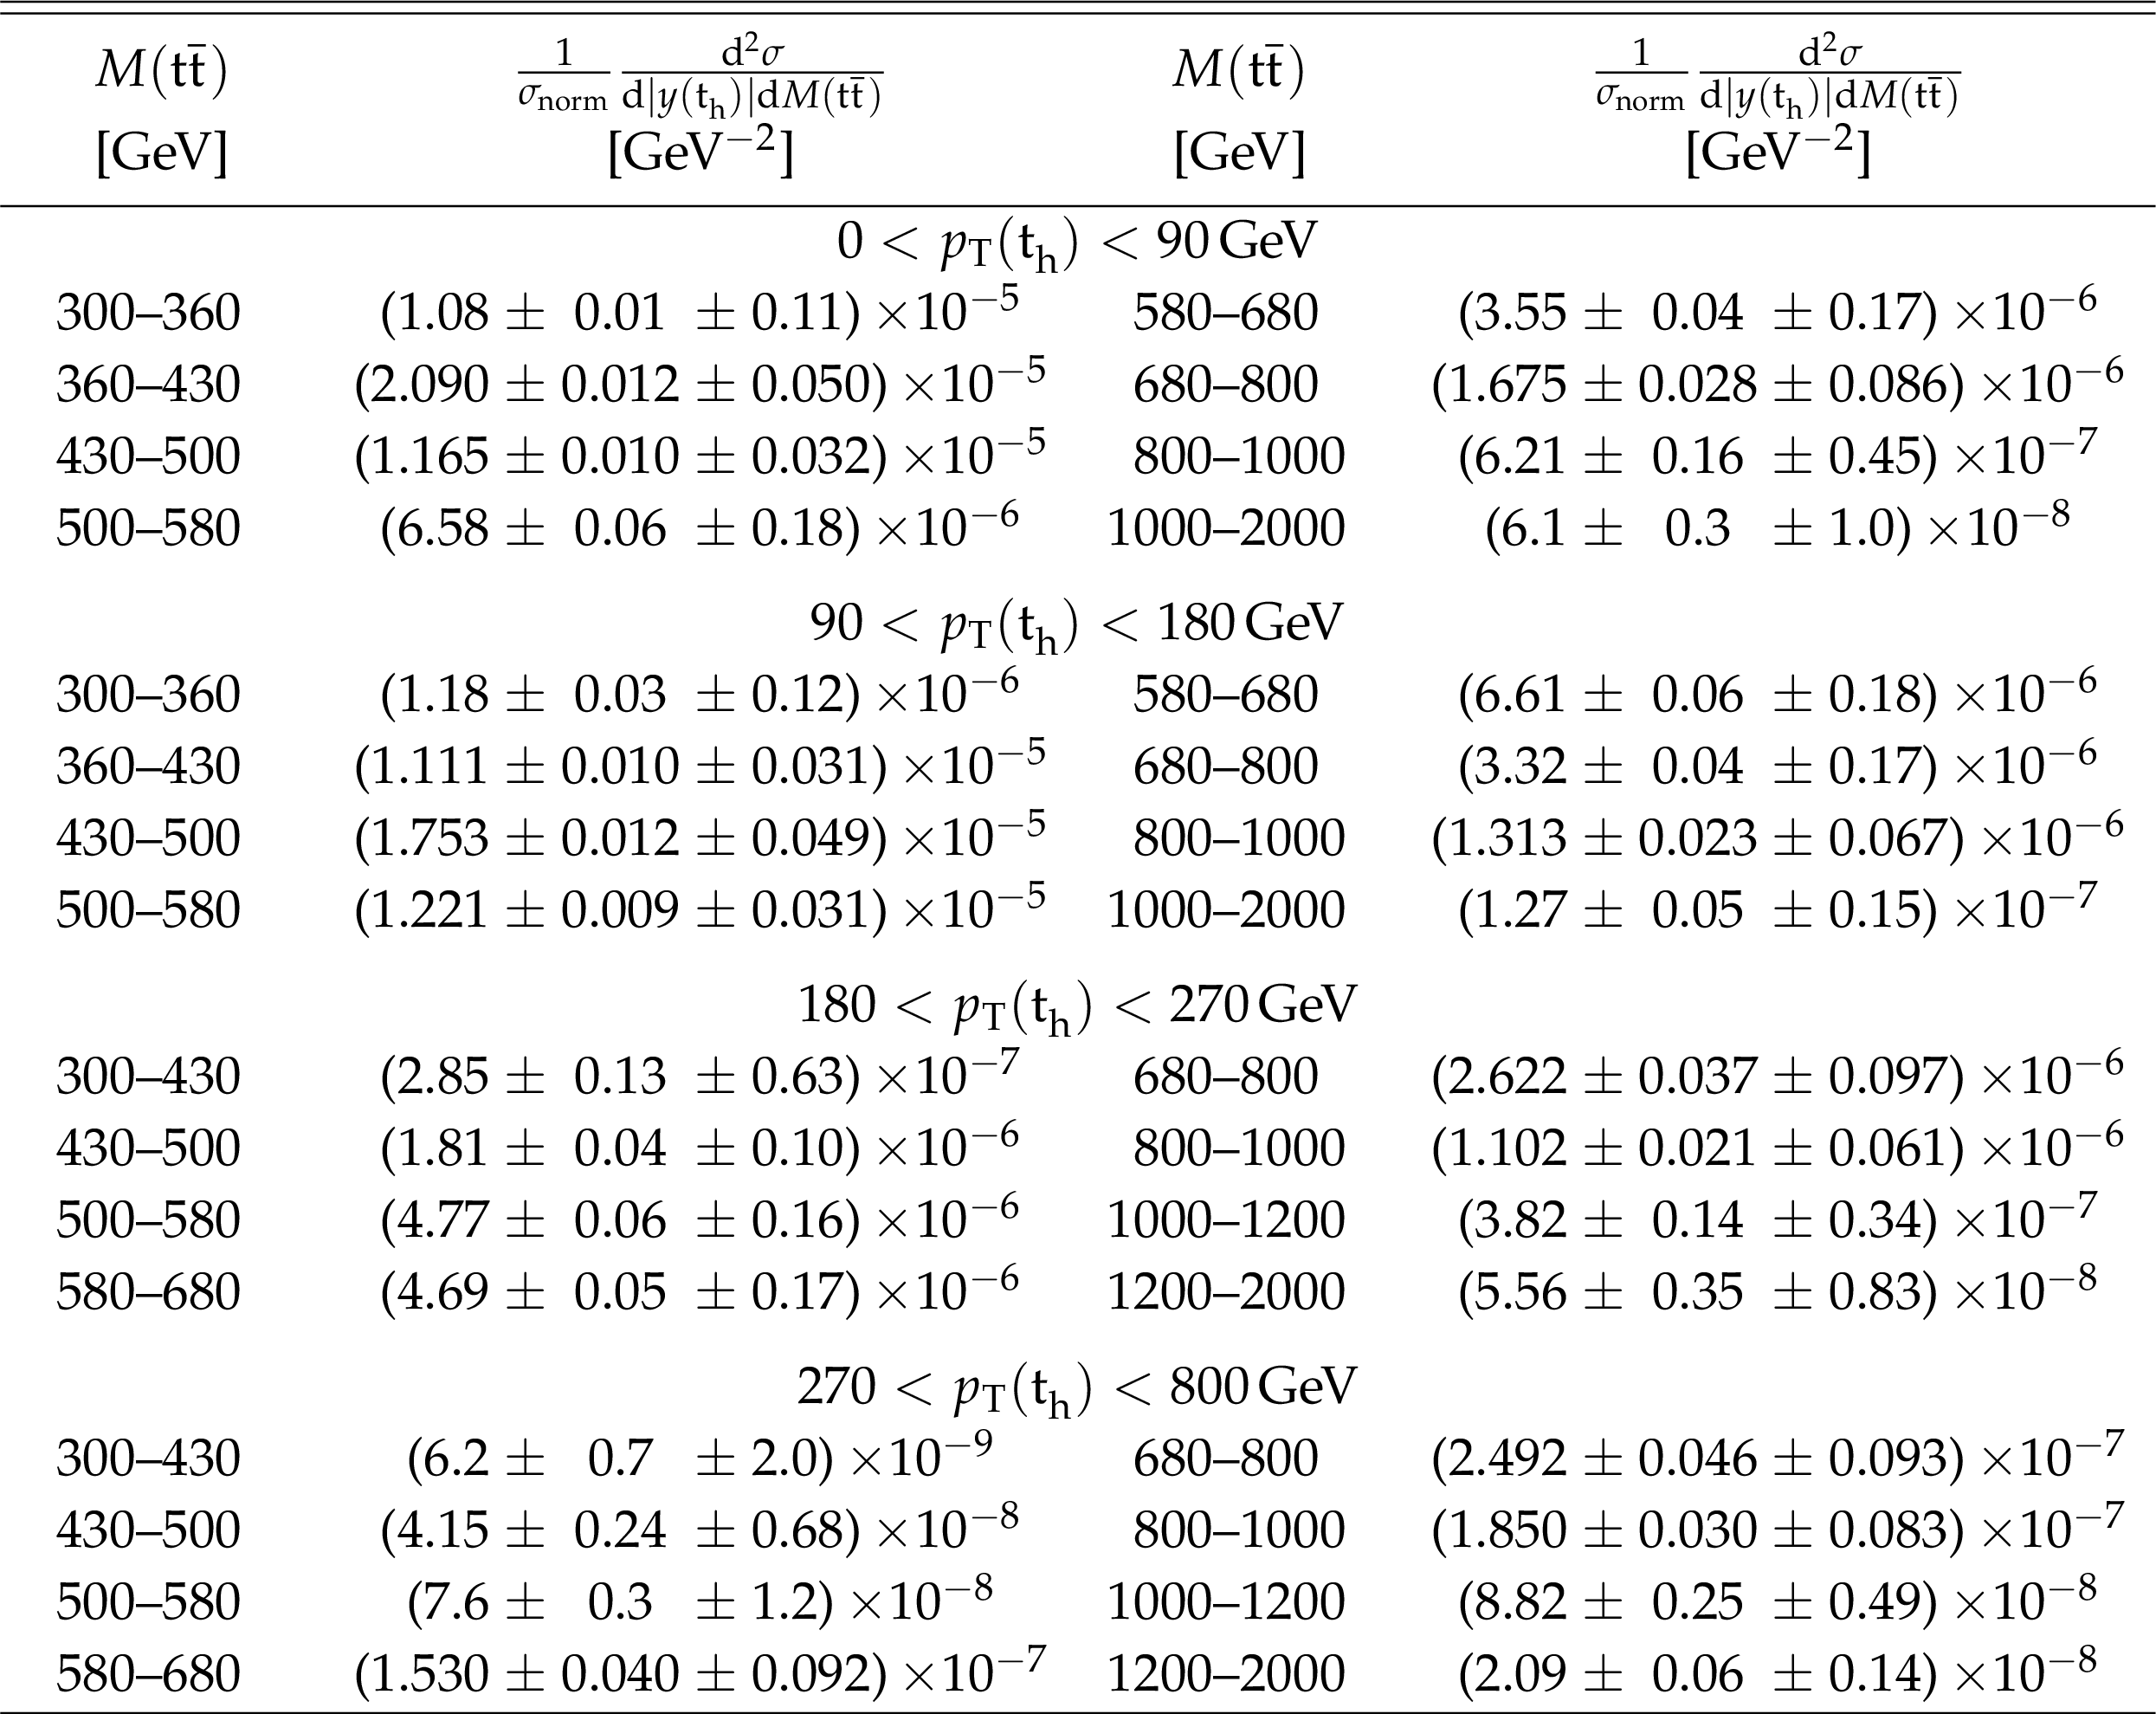
png pdf |
Table 55:
Double-differential cross section at the particle level as a function of $ {p_{\mathrm {T}}} ({\mathrm{t} _\mathrm {h}})$ vs. $M({\mathrm{t} \mathrm{\bar{t}}})$ normalized to the cross section $\sigma _\text {norm}$ in the measured in the two-dimensional range. The values are shown together with their statistical and systematic uncertainties. |
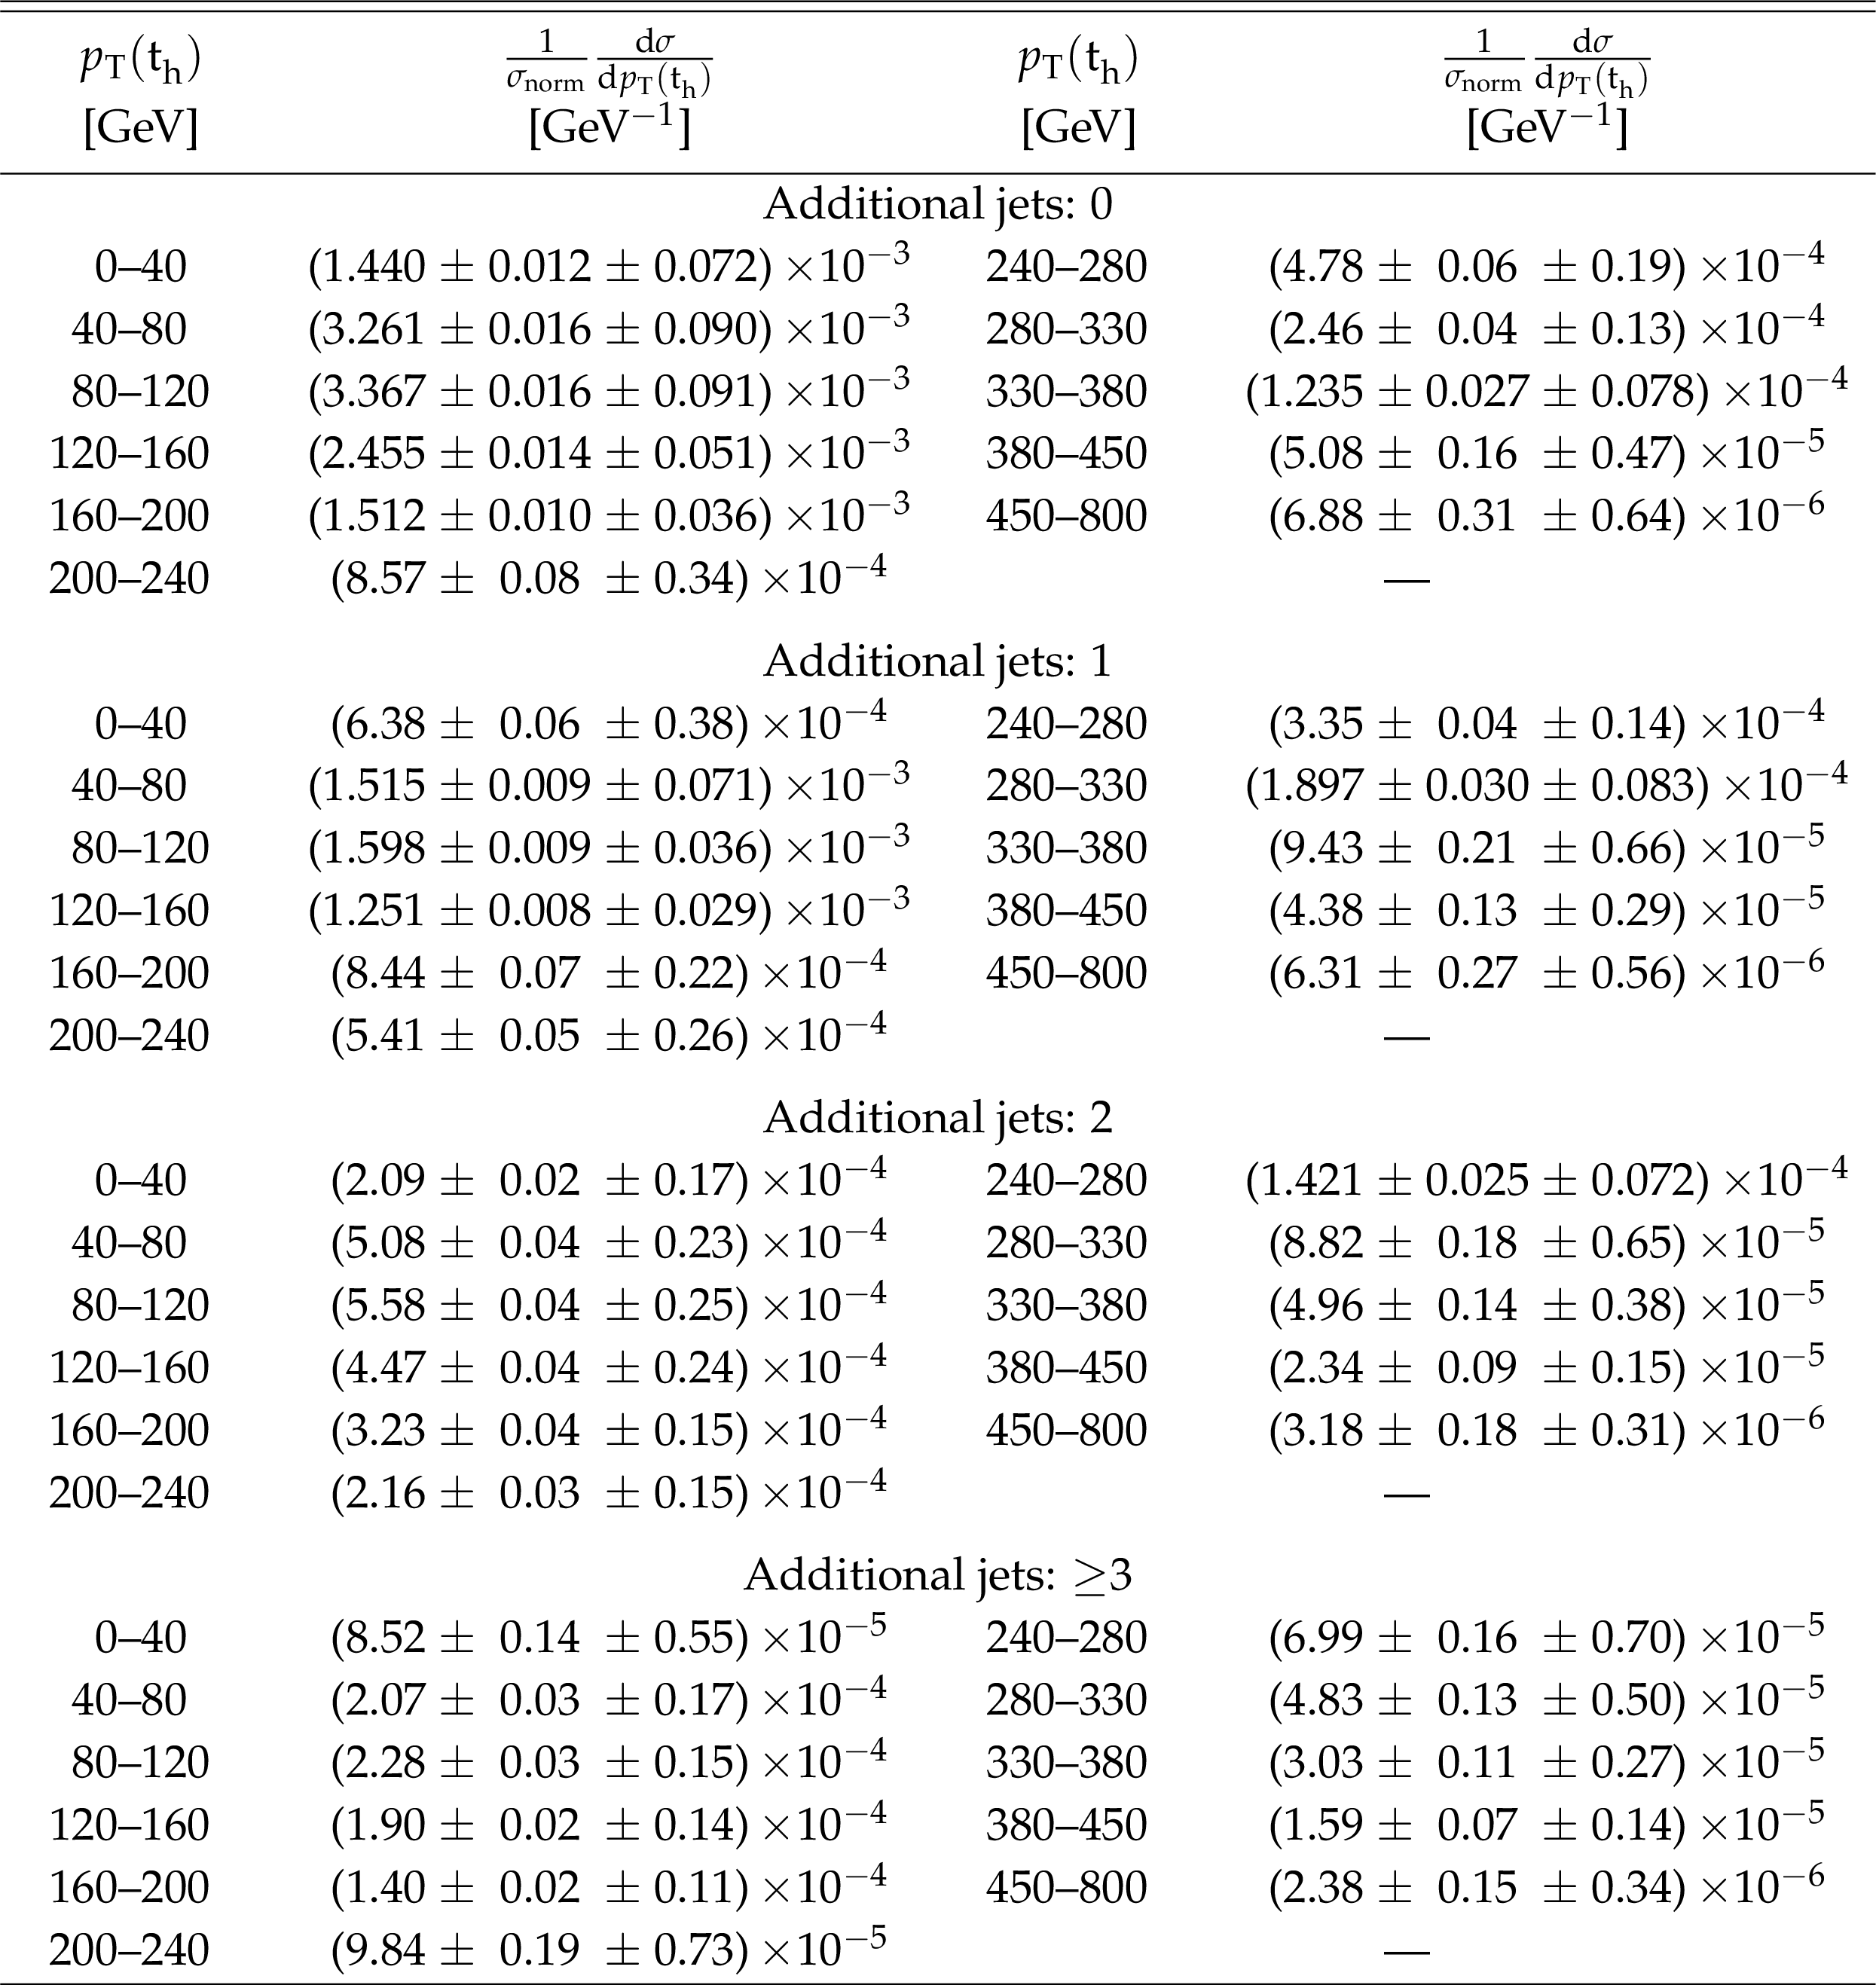
png pdf |
Table 56:
Differential cross sections at the particle level as a function of $ {p_{\mathrm {T}}} ({\mathrm{t} _\mathrm {h}})$ for different numbers of additional jets normalized to the sum of the cross sections $\sigma _\text {norm}$ in the measured ranges. The values are shown together with their statistical and systematic uncertainties. |
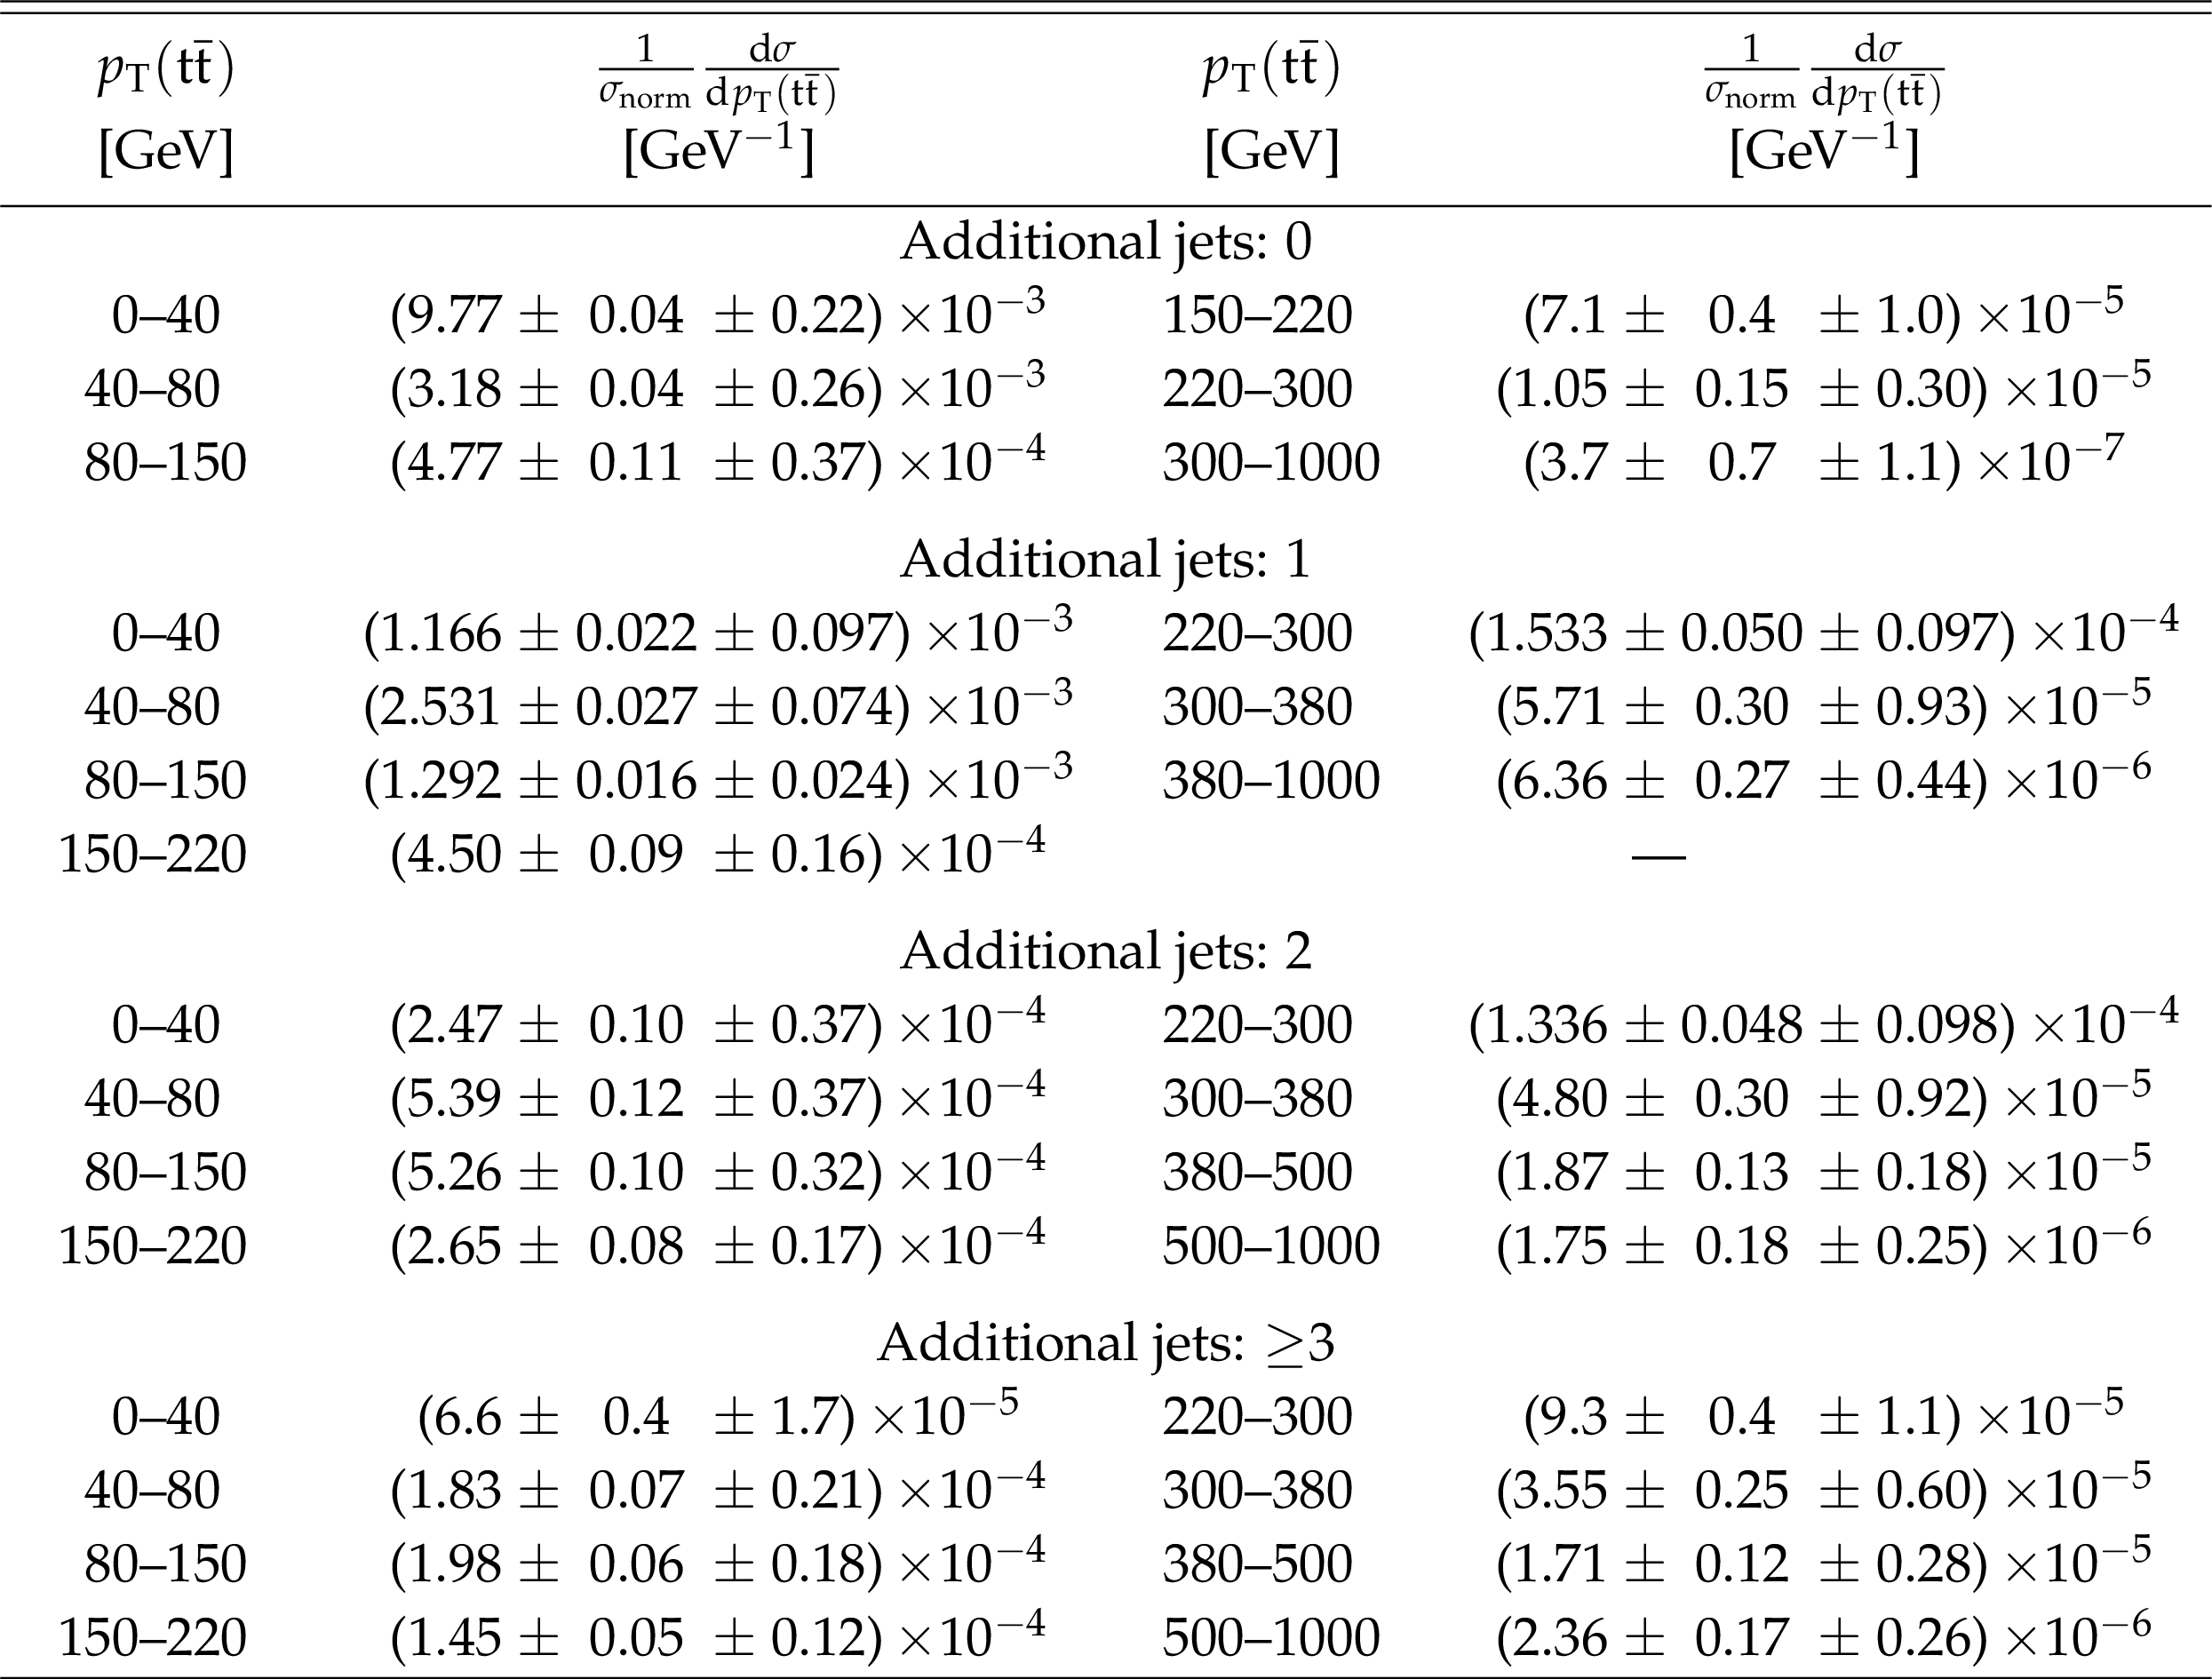
png pdf |
Table 57:
Differential cross sections at the particle level as a function of $ {p_{\mathrm {T}}} ({\mathrm{t} \mathrm{\bar{t}}})$ for different numbers of additional jets normalized to the sum of the cross sections $\sigma _\text {norm}$ in the measured ranges. The values are shown together with their statistical and systematic uncertainties. |
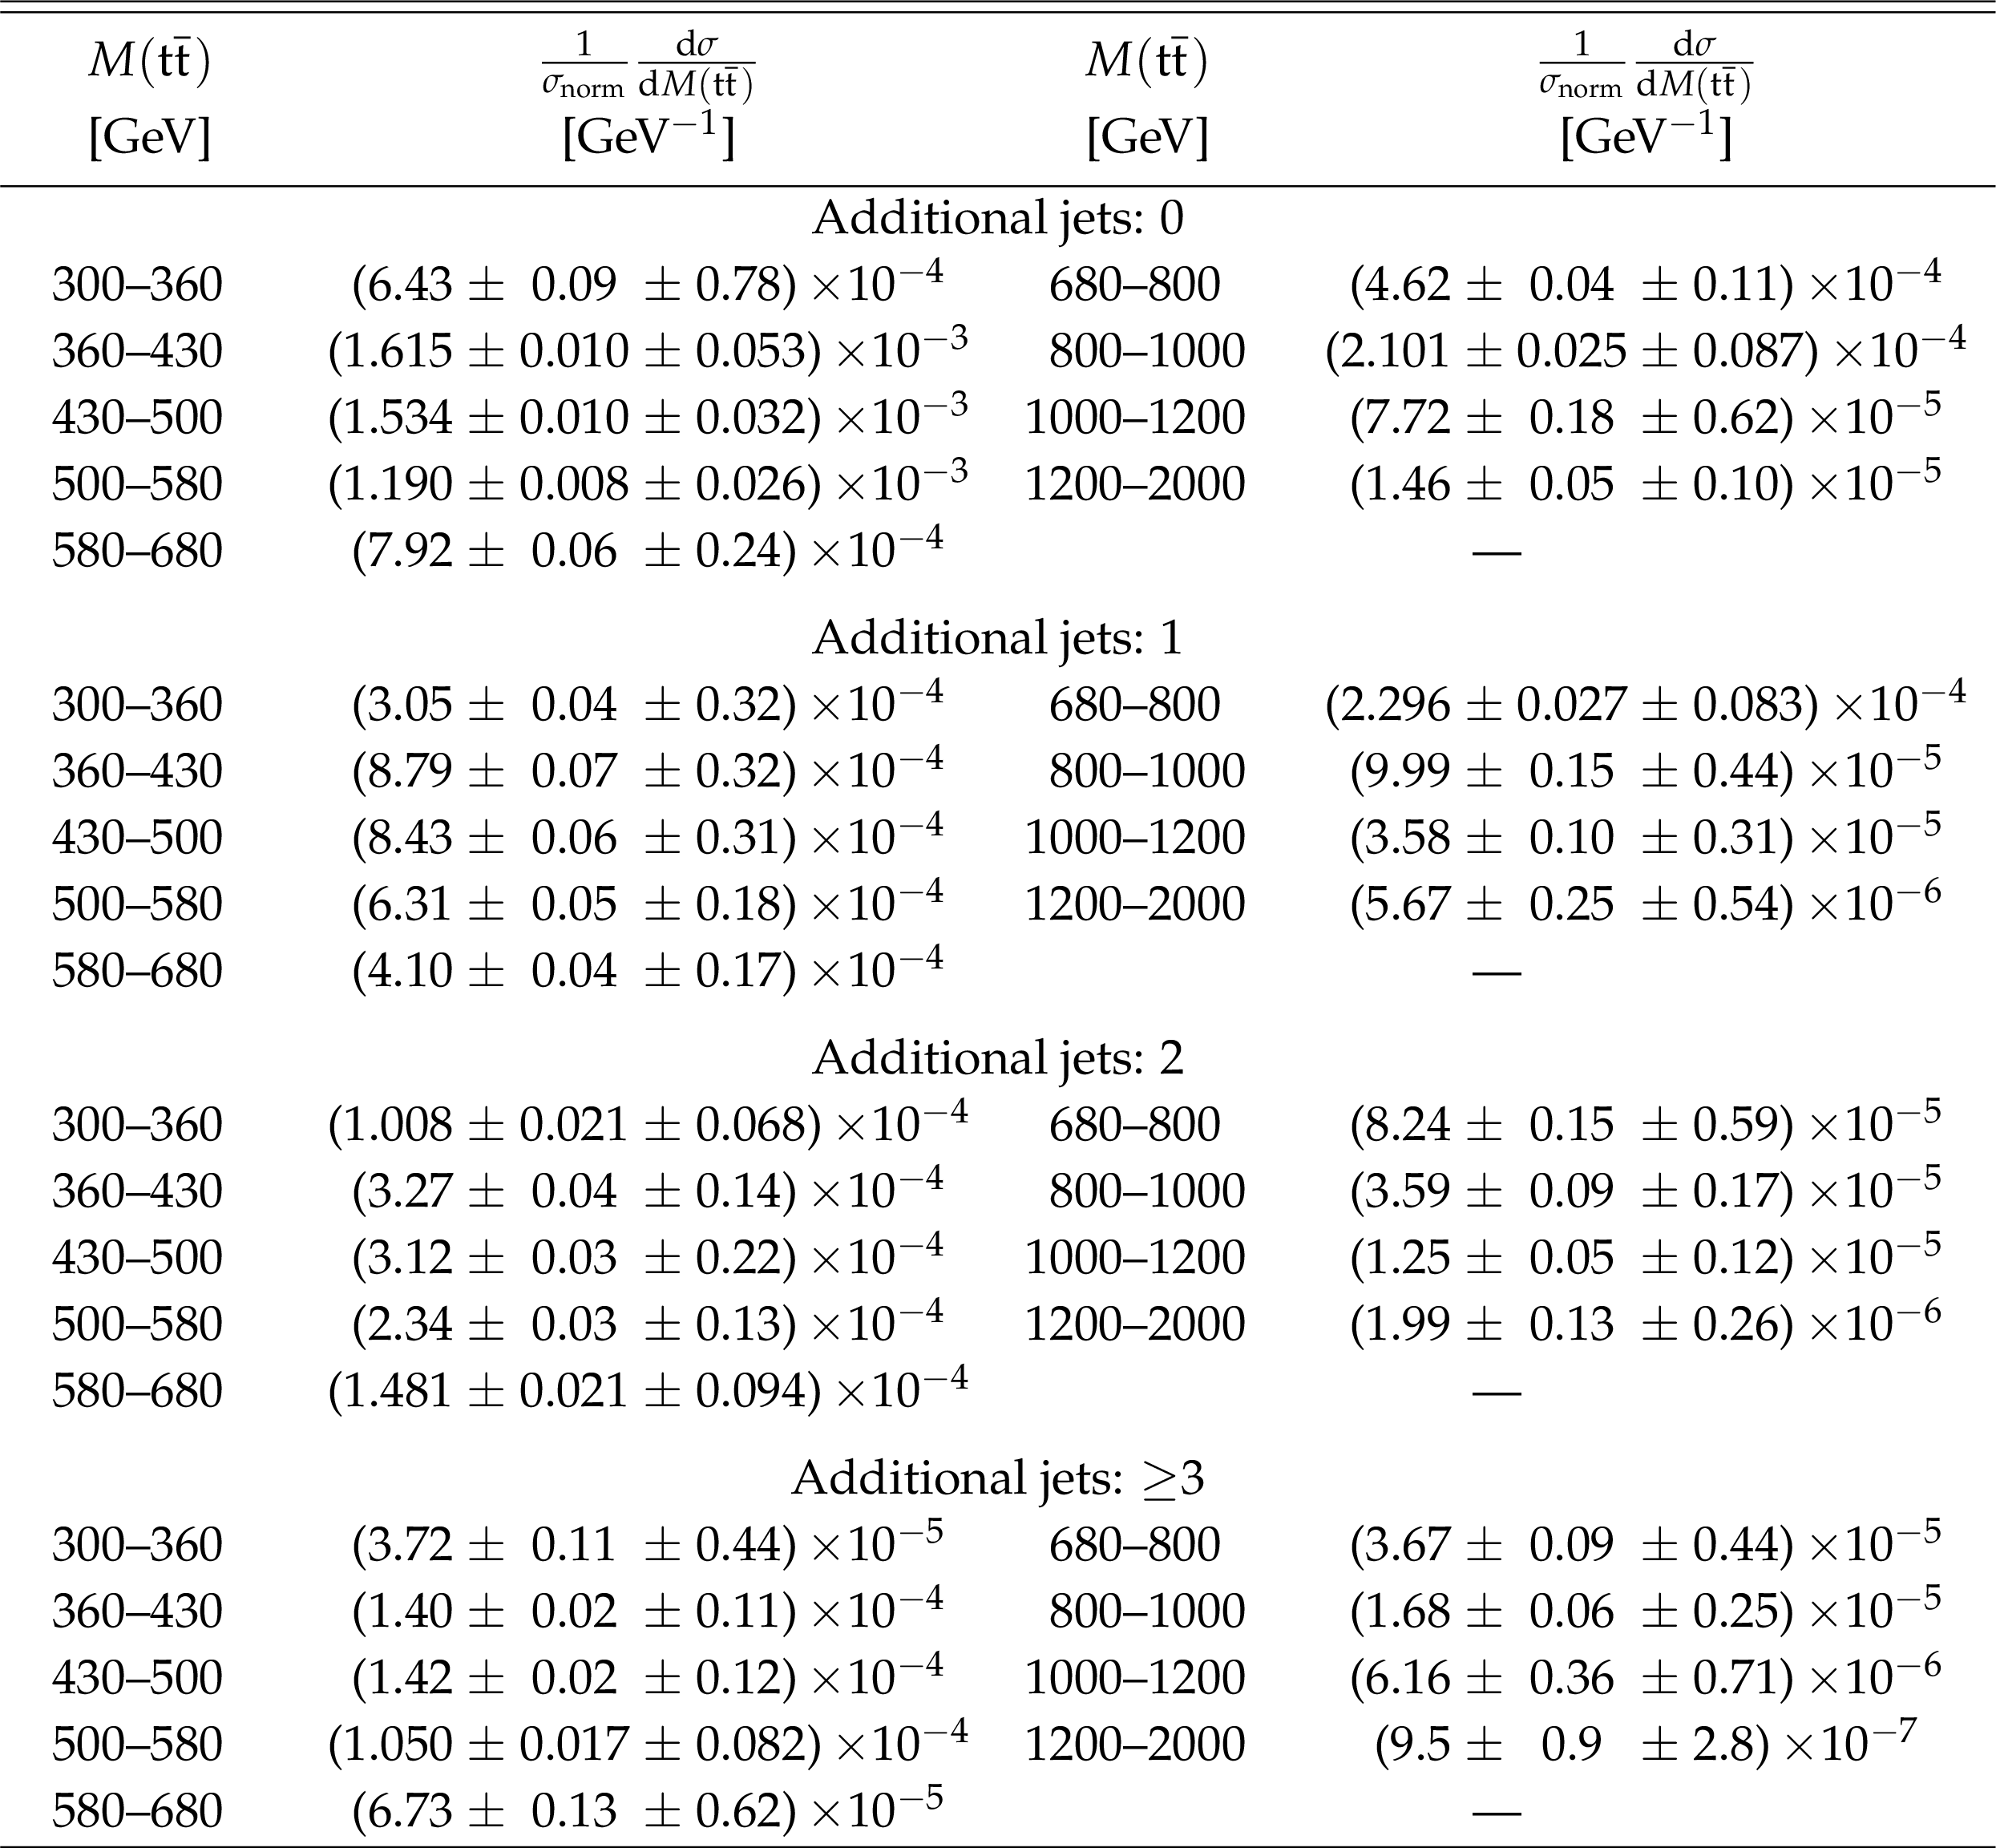
png pdf |
Table 58:
Differential cross sections at the particle level as a function of $M({\mathrm{t} \mathrm{\bar{t}}})$ for different numbers of additional jets normalized to the sum of the cross sections $\sigma _\text {norm}$ in the measured ranges. The values are shown together with their statistical and systematic uncertainties. |
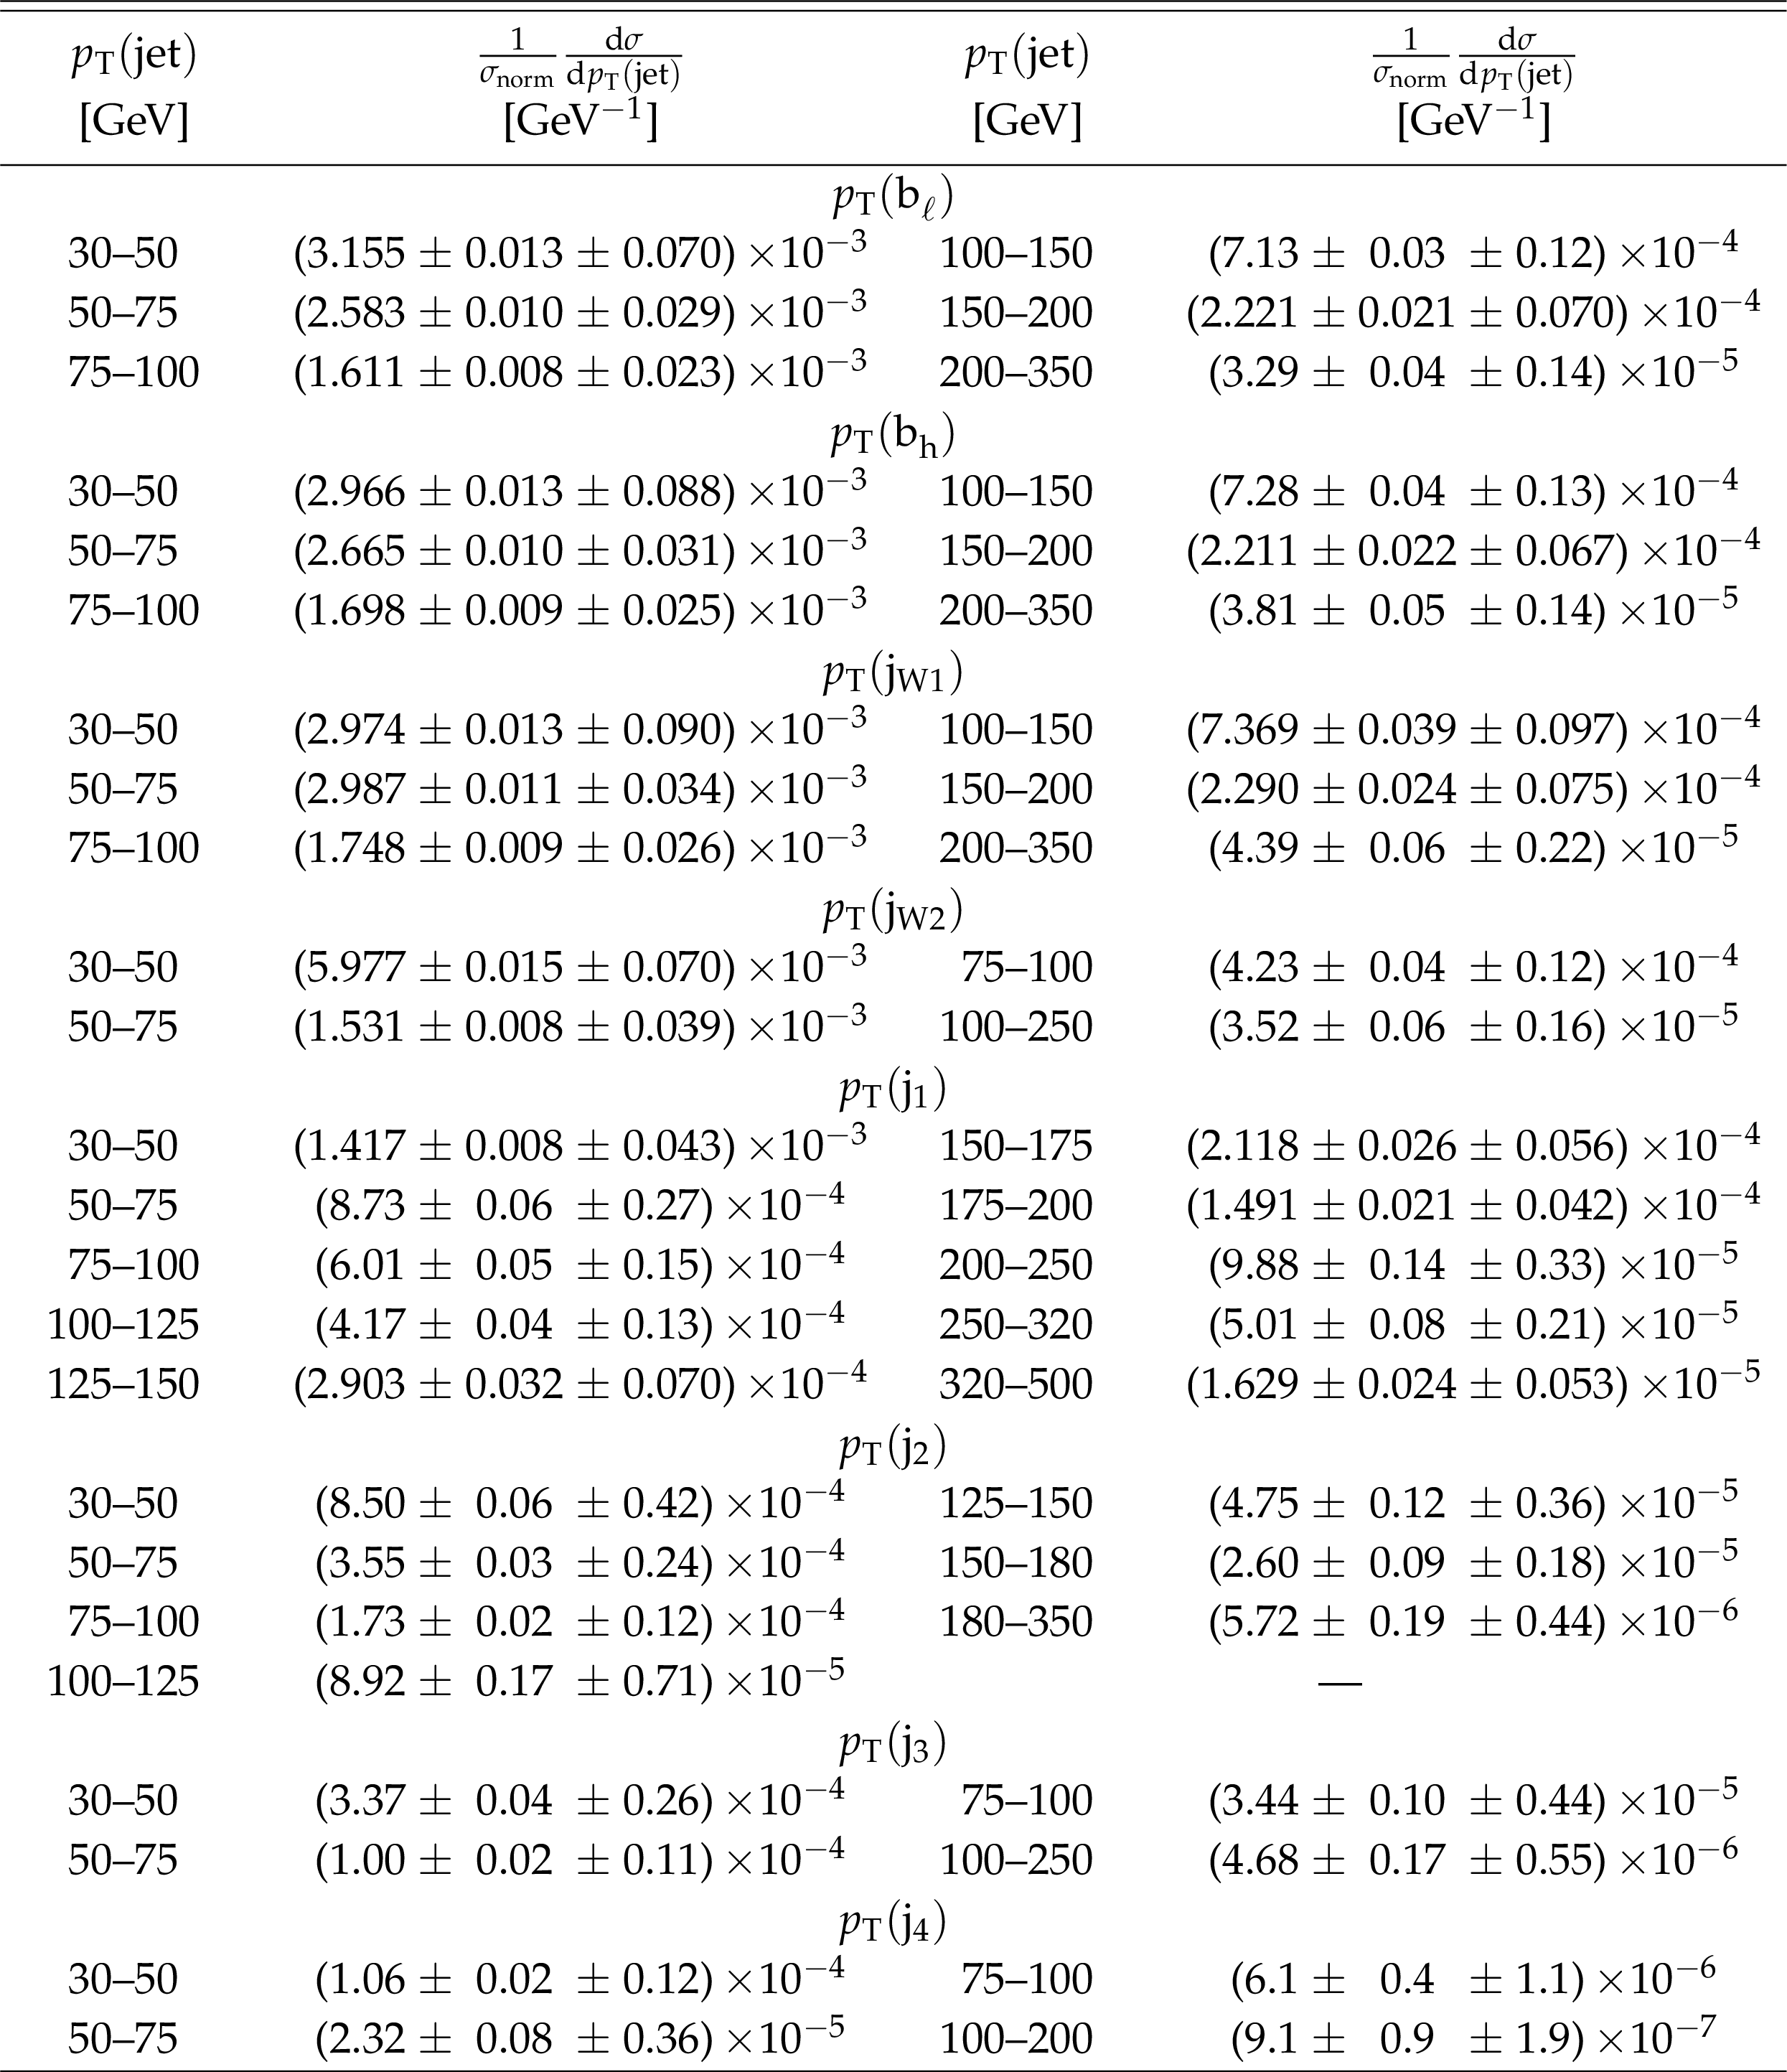
png pdf |
Table 59:
Differential cross sections at the particle level as a function of $ {p_{\mathrm {T}}} (\mathrm {jet})$ of jets normalized to the sum of the cross sections $\sigma _\text {norm}$ of all jets in the measured ranges. The values are shown together with their statistical and systematic uncertainties. |
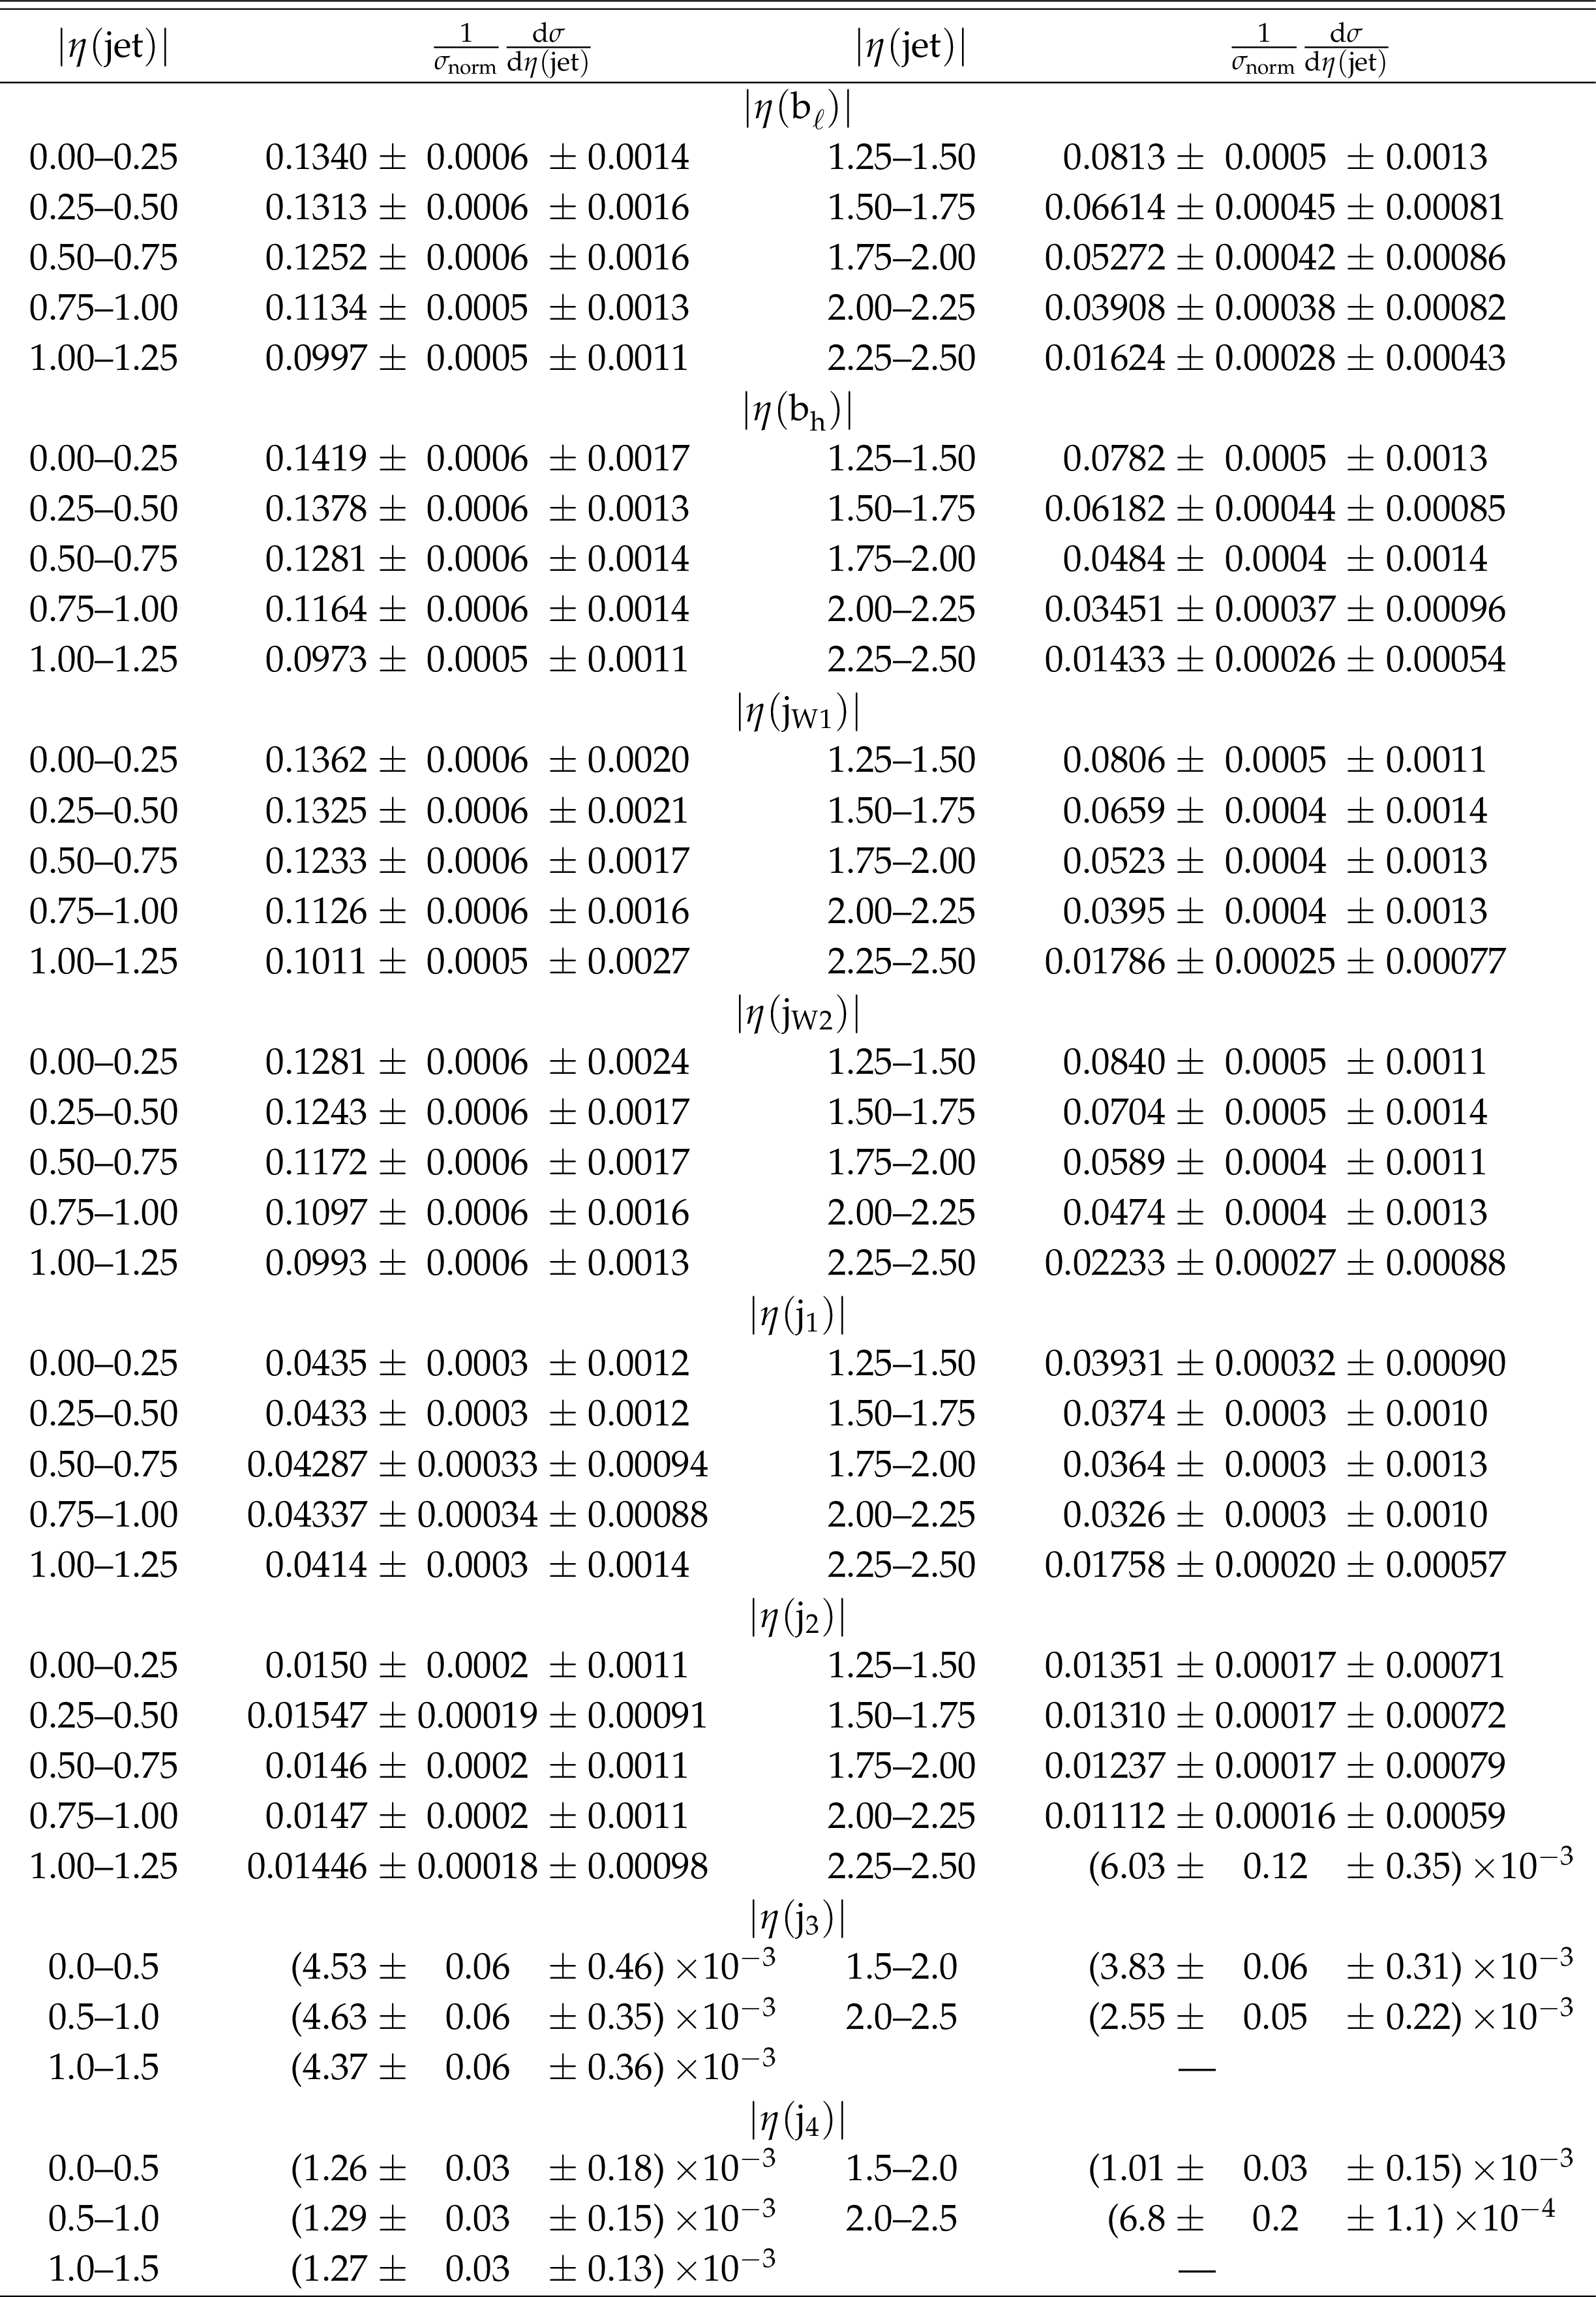
png pdf |
Table 60:
Differential cross sections at the particle level as a function of $ { | \eta (\text {jet}) | }$ of jets normalized to the sum of the cross sections $\sigma _\text {norm}$ of all jets in the measured ranges. The values are shown together with their statistical and systematic uncertainties. |
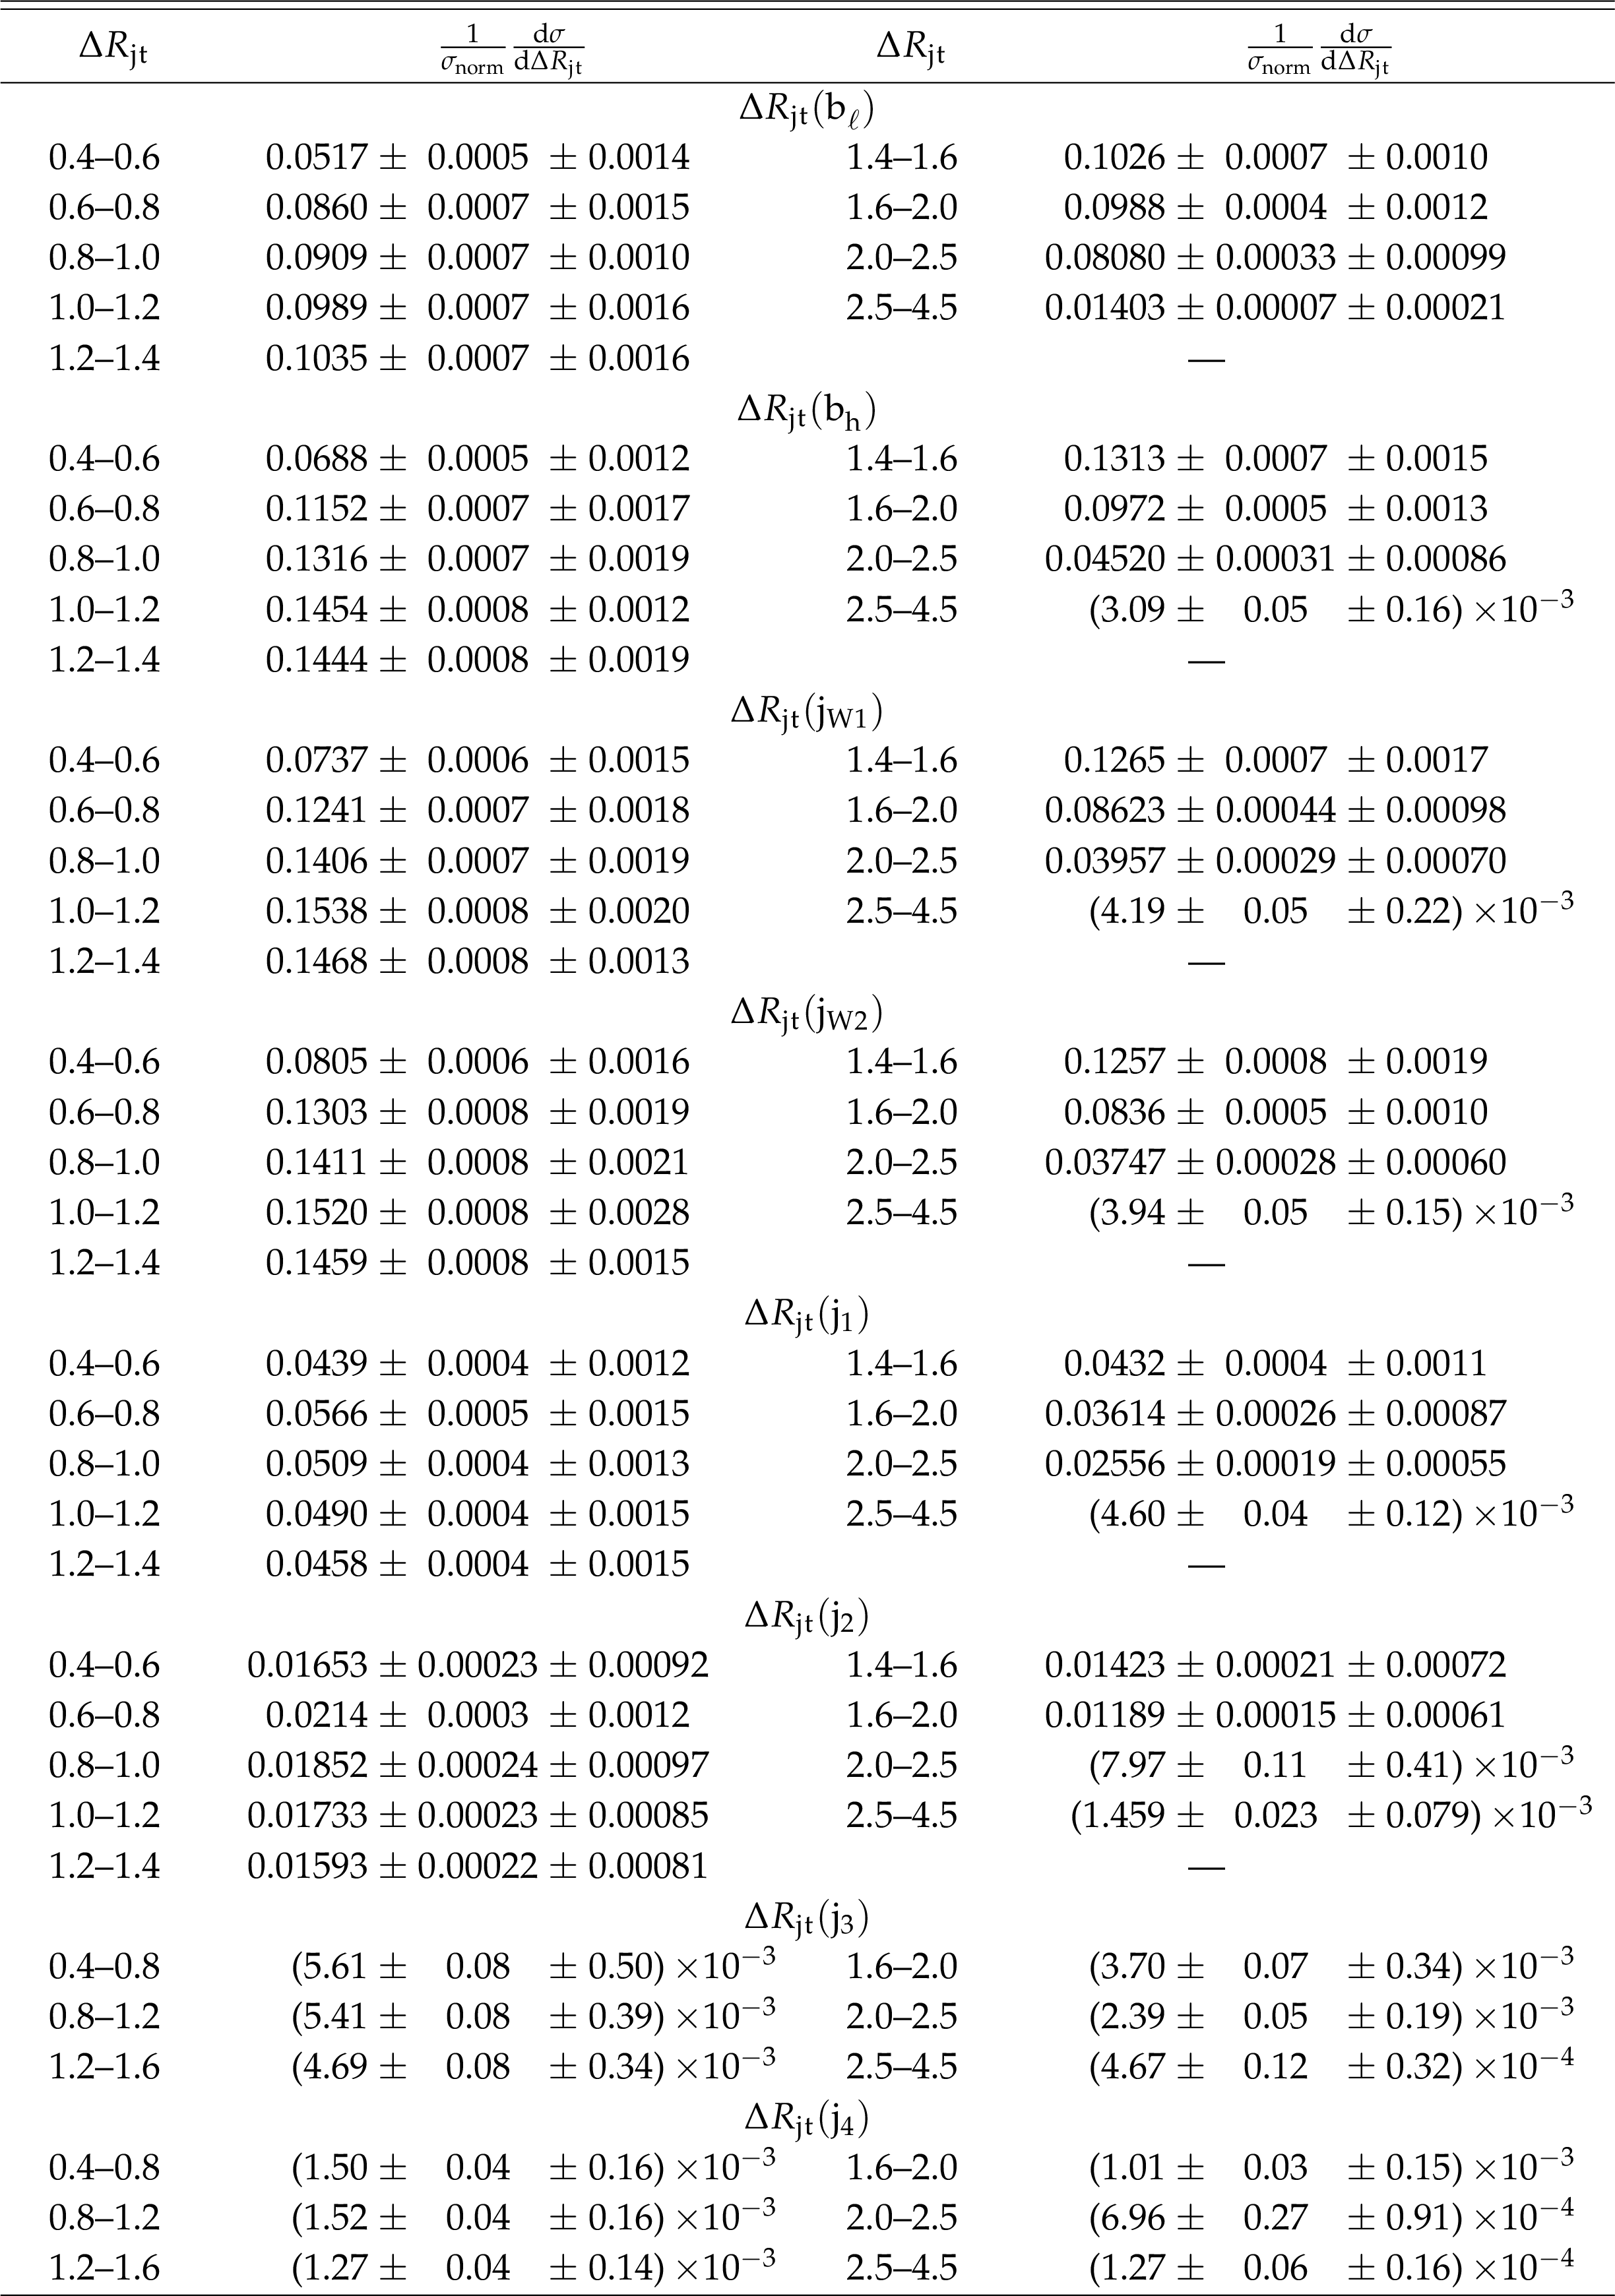
png pdf |
Table 61:
Differential cross sections at the particle level as a function of $ {\Delta R_{\mathrm {j}_\mathrm{t}}} $ of jets normalized to the sum of the cross sections $\sigma _\text {norm}$ of all jets in the measured ranges. The values are shown together with their statistical and systematic uncertainties. |
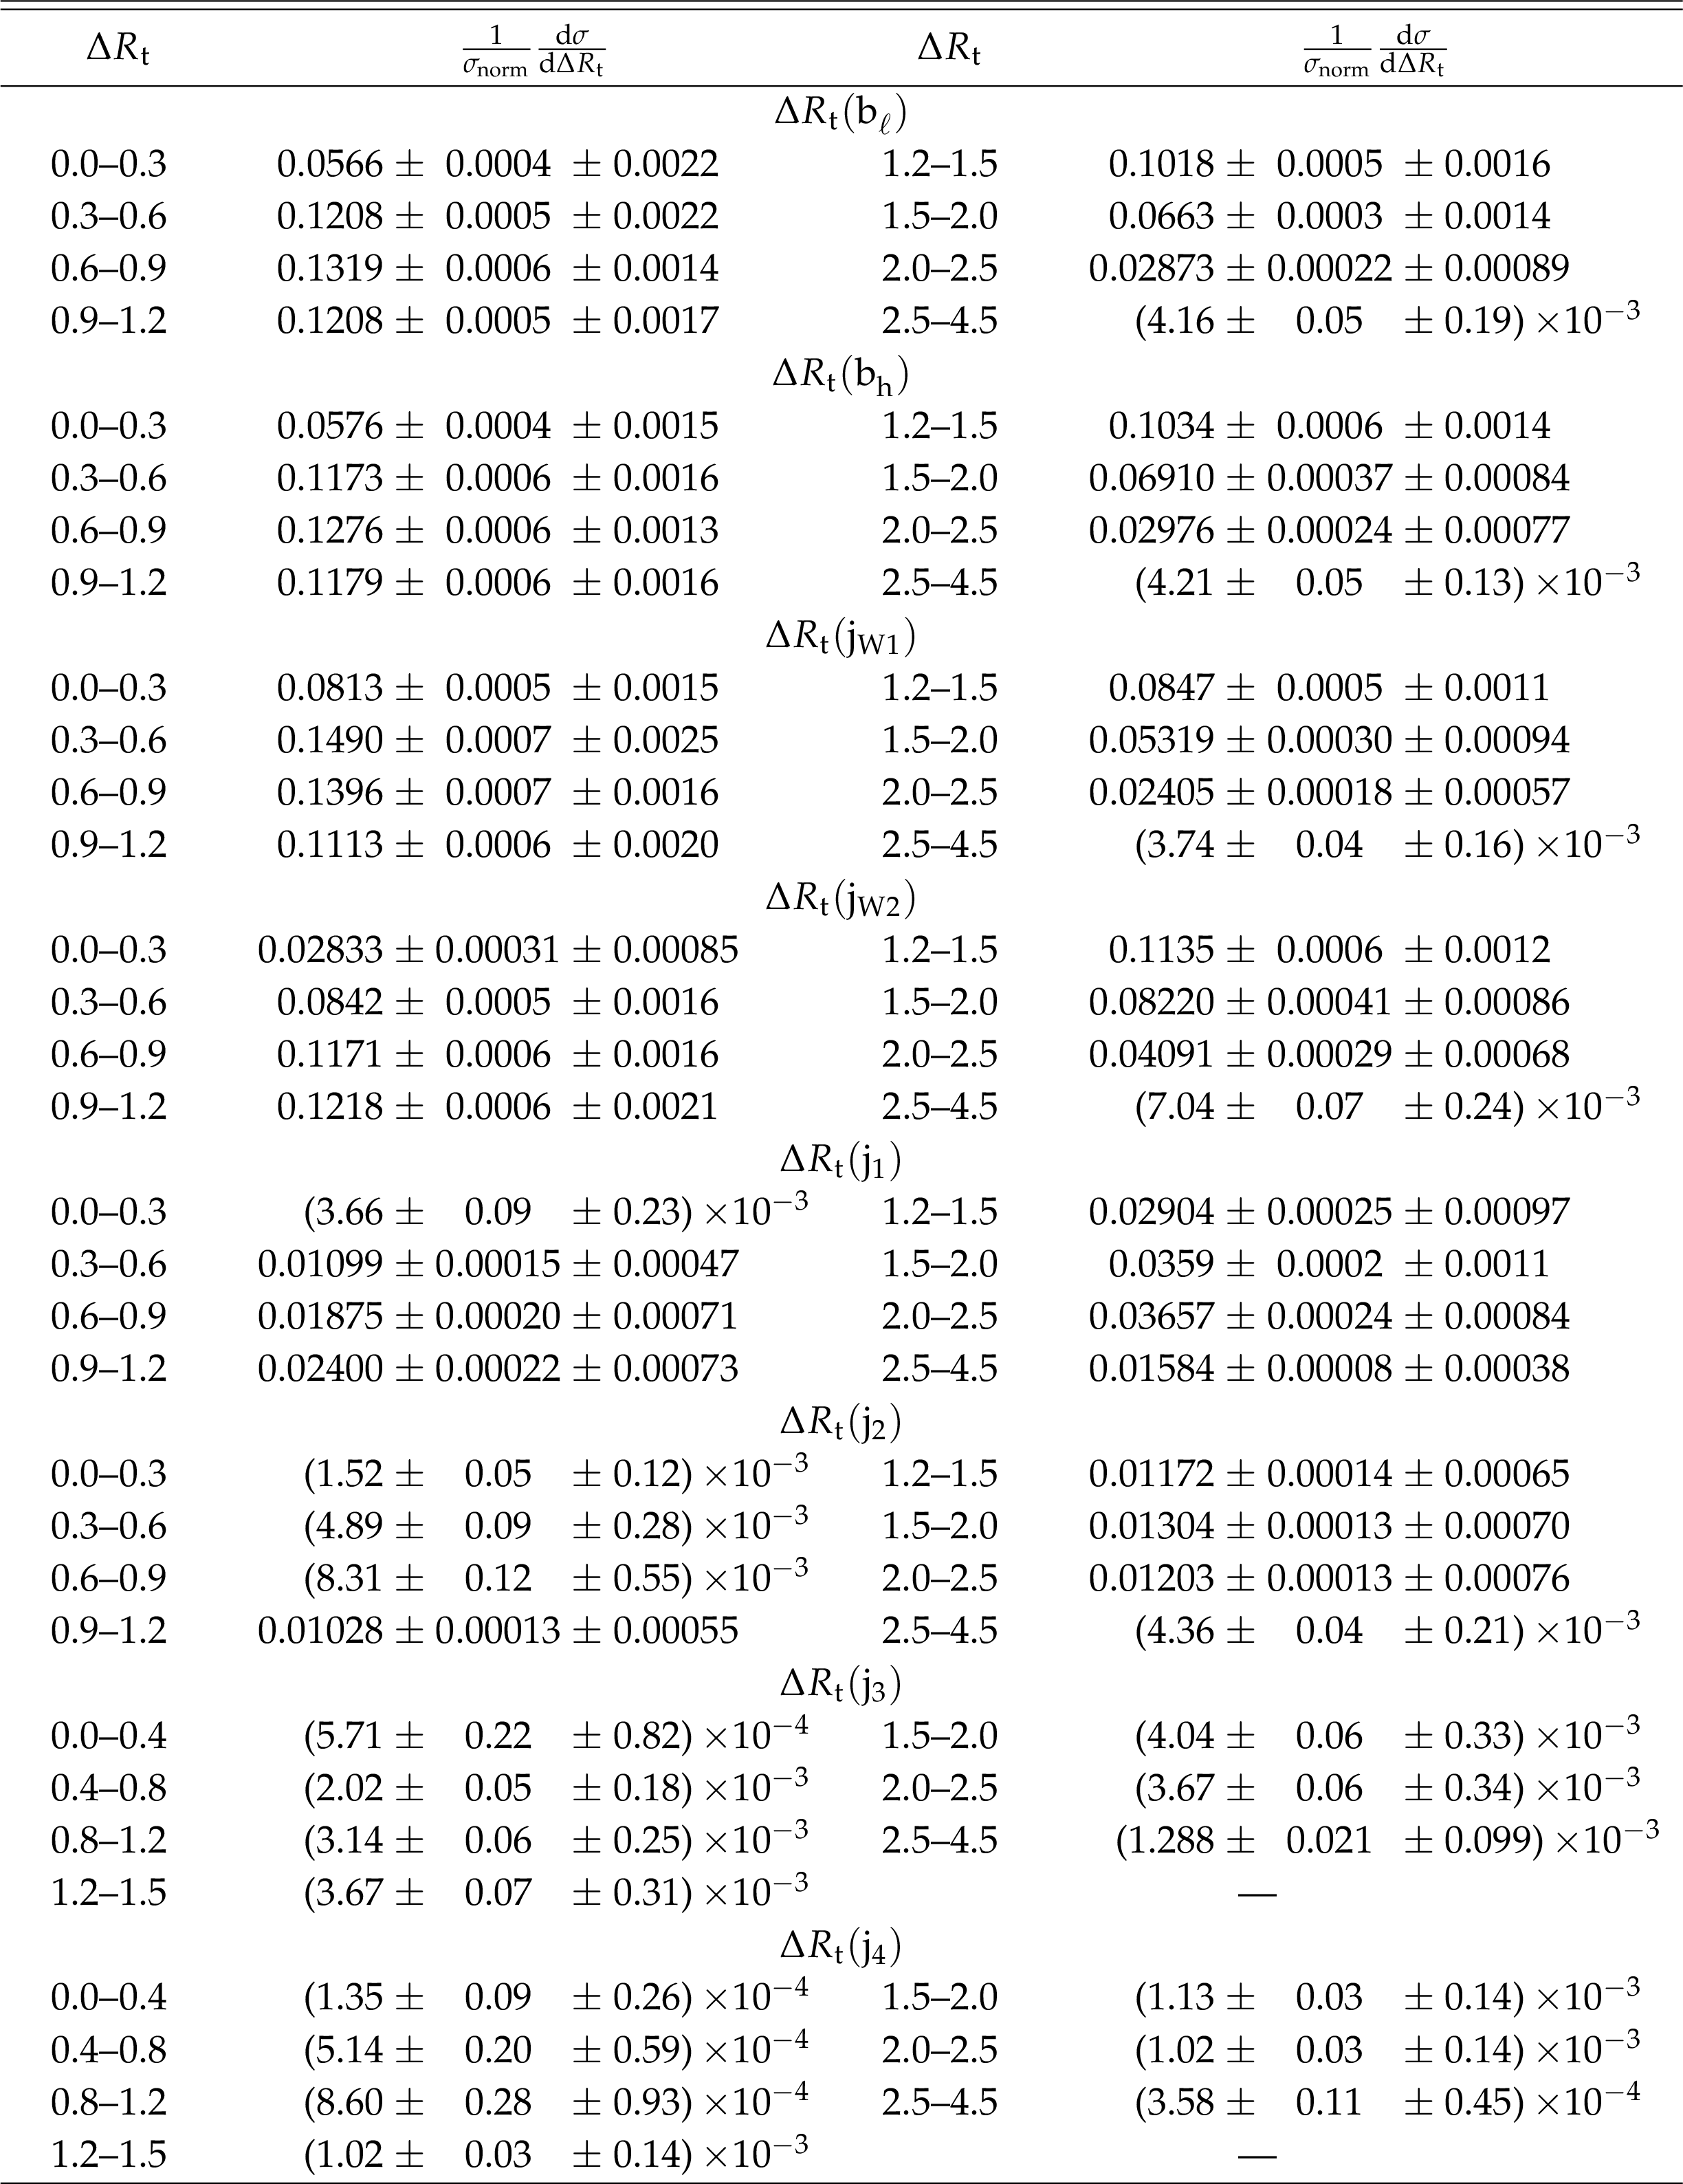
png pdf |
Table 62:
Differential cross sections at the particle level as a function of $ {\Delta R_{\mathrm{t}}} $ of jets normalized to the sum of the cross sections $\sigma _\text {norm}$ of all jets in the measured ranges. The values are shown together with their statistical and systematic uncertainties. |
| Summary |
|
Measurements of the absolute and normalized differential and double-differential cross sections for $ \mathrm{t\bar{t}} $ production in proton-proton collisions at $\sqrt{s} = $ 13 TeV have been presented. The data correspond to an integrated luminosity of 35.8 fb$^{-1}$ recorded by the CMS experiment. The $ \mathrm{t\bar{t}} $ production cross section is measured in the $ \ell $+jets channels at the parton and particle levels as a function of the transverse momentum $ {p_{\mathrm{T}}} $ and absolute rapidity $| y |$ of the top quarks and $ {p_{\mathrm{T}}} $, $| y |$, and invariant mass of the $ \mathrm{t\bar{t}} $ system. In addition, at the particle level detailed studies of multiplicities and kinematic properties of the jets in $ \mathrm{t\bar{t}} $ events are performed. The dominant sources of uncertainty are the jet energy scale uncertainties on the experimental side and parton shower modeling on the theoretical side. The results are compared to several standard model predictions that use different methods and approximations for their calculations. The simulations of POWHEG+PYTHIA8 and SHERPA, for which theoretical uncertainties are considered, describe most of the studied kinematic distributions of the top quark and the $ \mathrm{t\bar{t}} $ system reasonably well. The largest deviation is the measurement of a softer $ {p_{\mathrm{T}}} $ spectrum of the top quarks compared to all the predictions. This has also been observed in other measurements [5-10,13,14,18]. Most of the kinematic distributions and multiplicities of additional jets are modeled reasonably well by POWHEG+PYTHIA8, however, this description of additional jets relies on the phenomenological model of the parton shower with tuned parameters. With the selected settings SHERPA fails to describe most of these distributions. Comparisons of the measurements to the central values of all tested models, ignoring their theoretical uncertainties, result in low $p$-values for many distributions related to the $ {p_{\mathrm{T}}} $ of the top quarks or the $ \mathrm{t\bar{t}} $ system, and for the kinematic distributions and multiplicities of additional jets. |
| Additional Figures | |
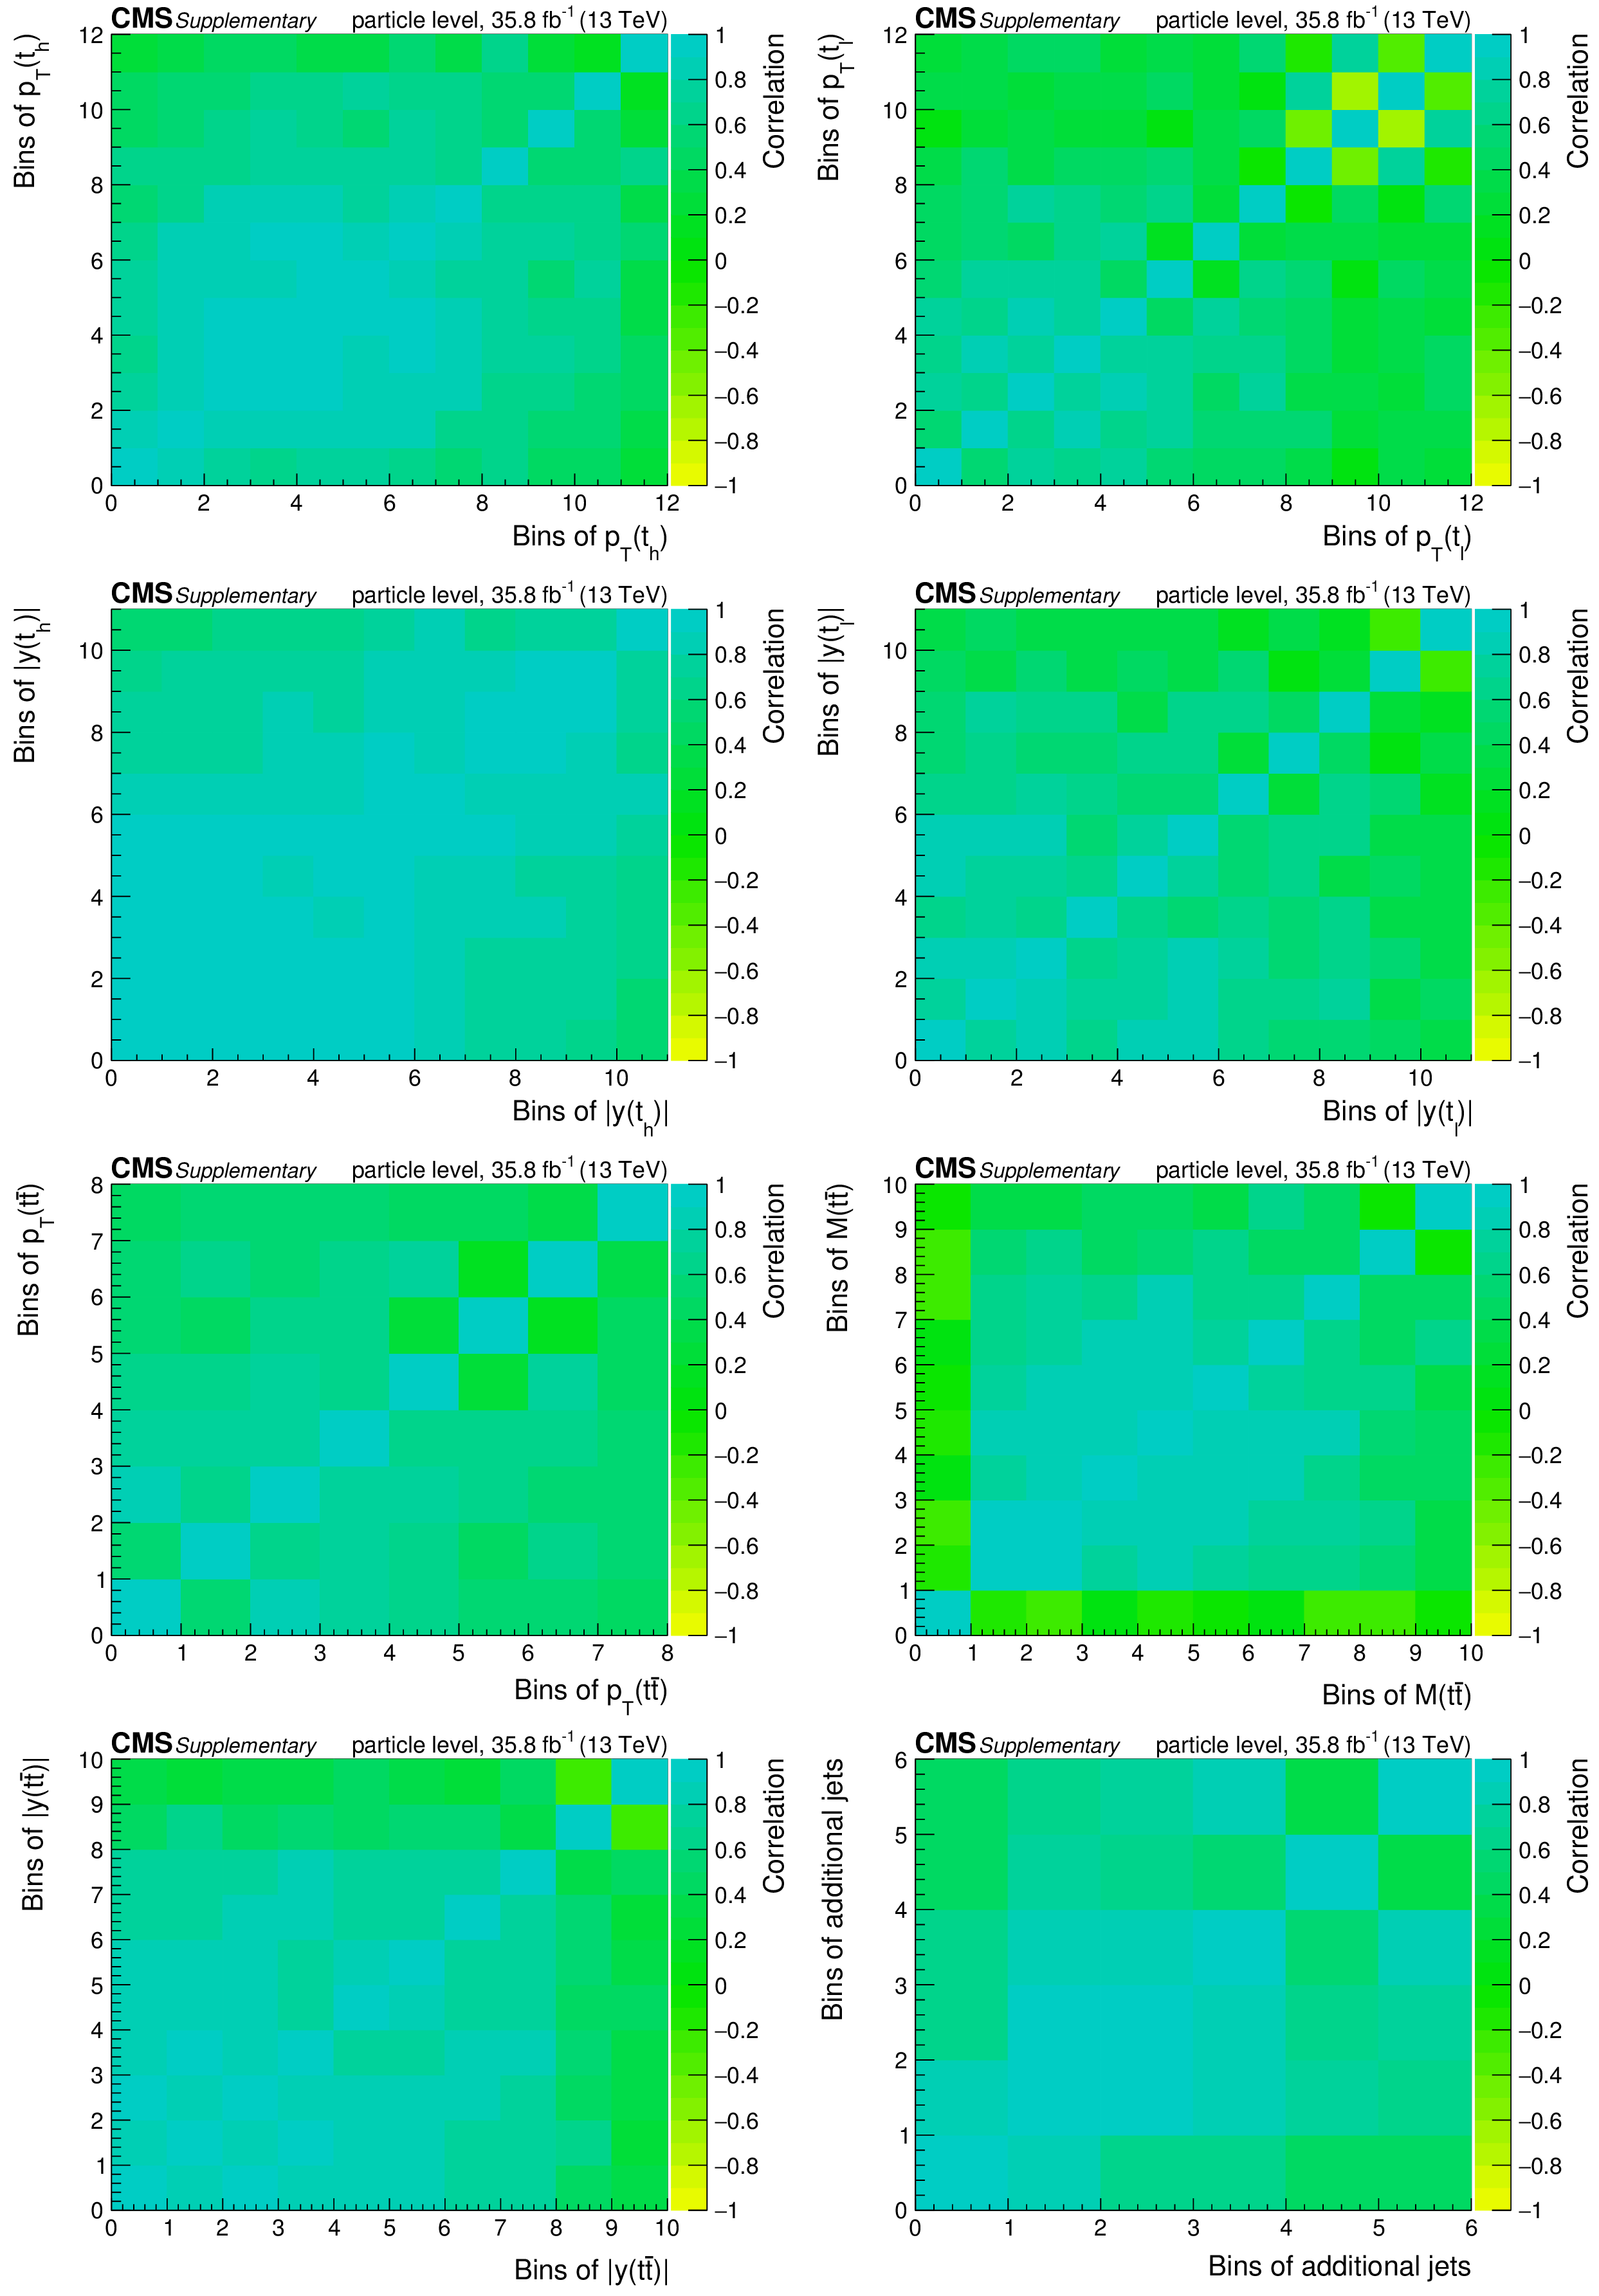
png pdf |
Additional Figure 1:
Correlations among the bins in the differential cross section measurements at particle level. |
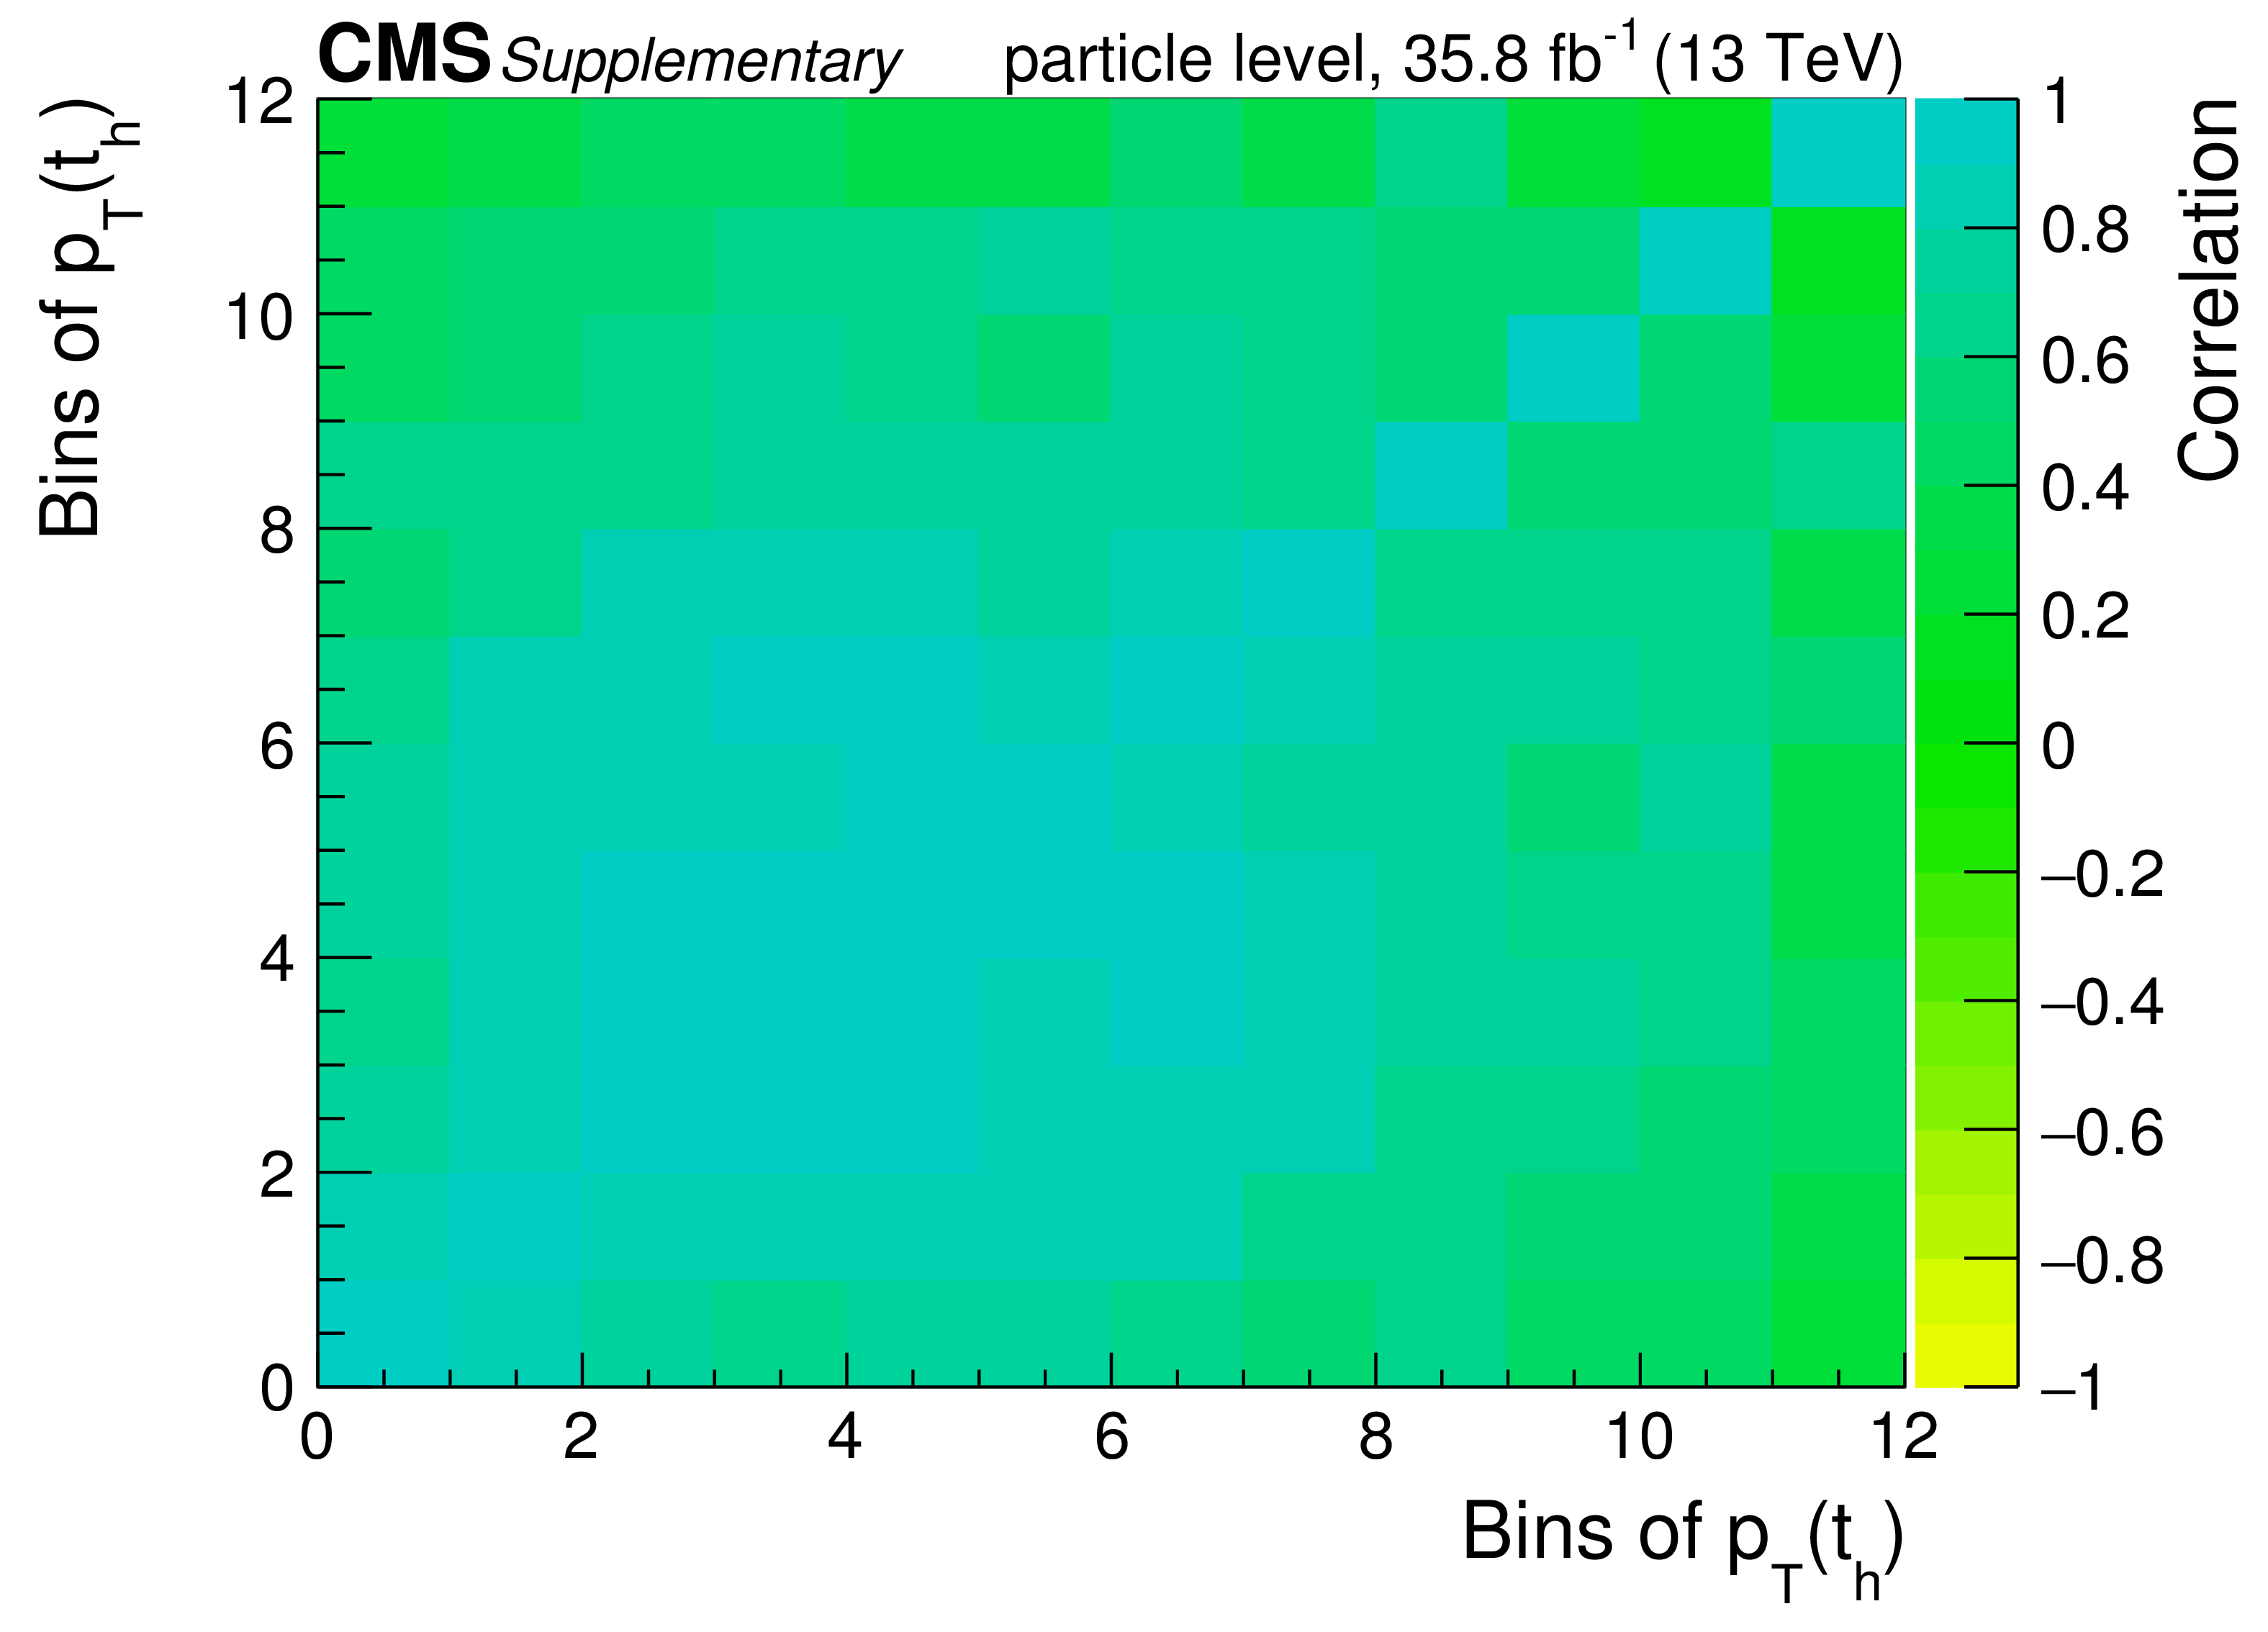
png pdf |
Additional Figure 1-a:
Correlations among the bins in the differential cross section measurements at particle level. |

png pdf |
Additional Figure 1-b:
Correlations among the bins in the differential cross section measurements at particle level. |

png pdf |
Additional Figure 1-c:
Correlations among the bins in the differential cross section measurements at particle level. |
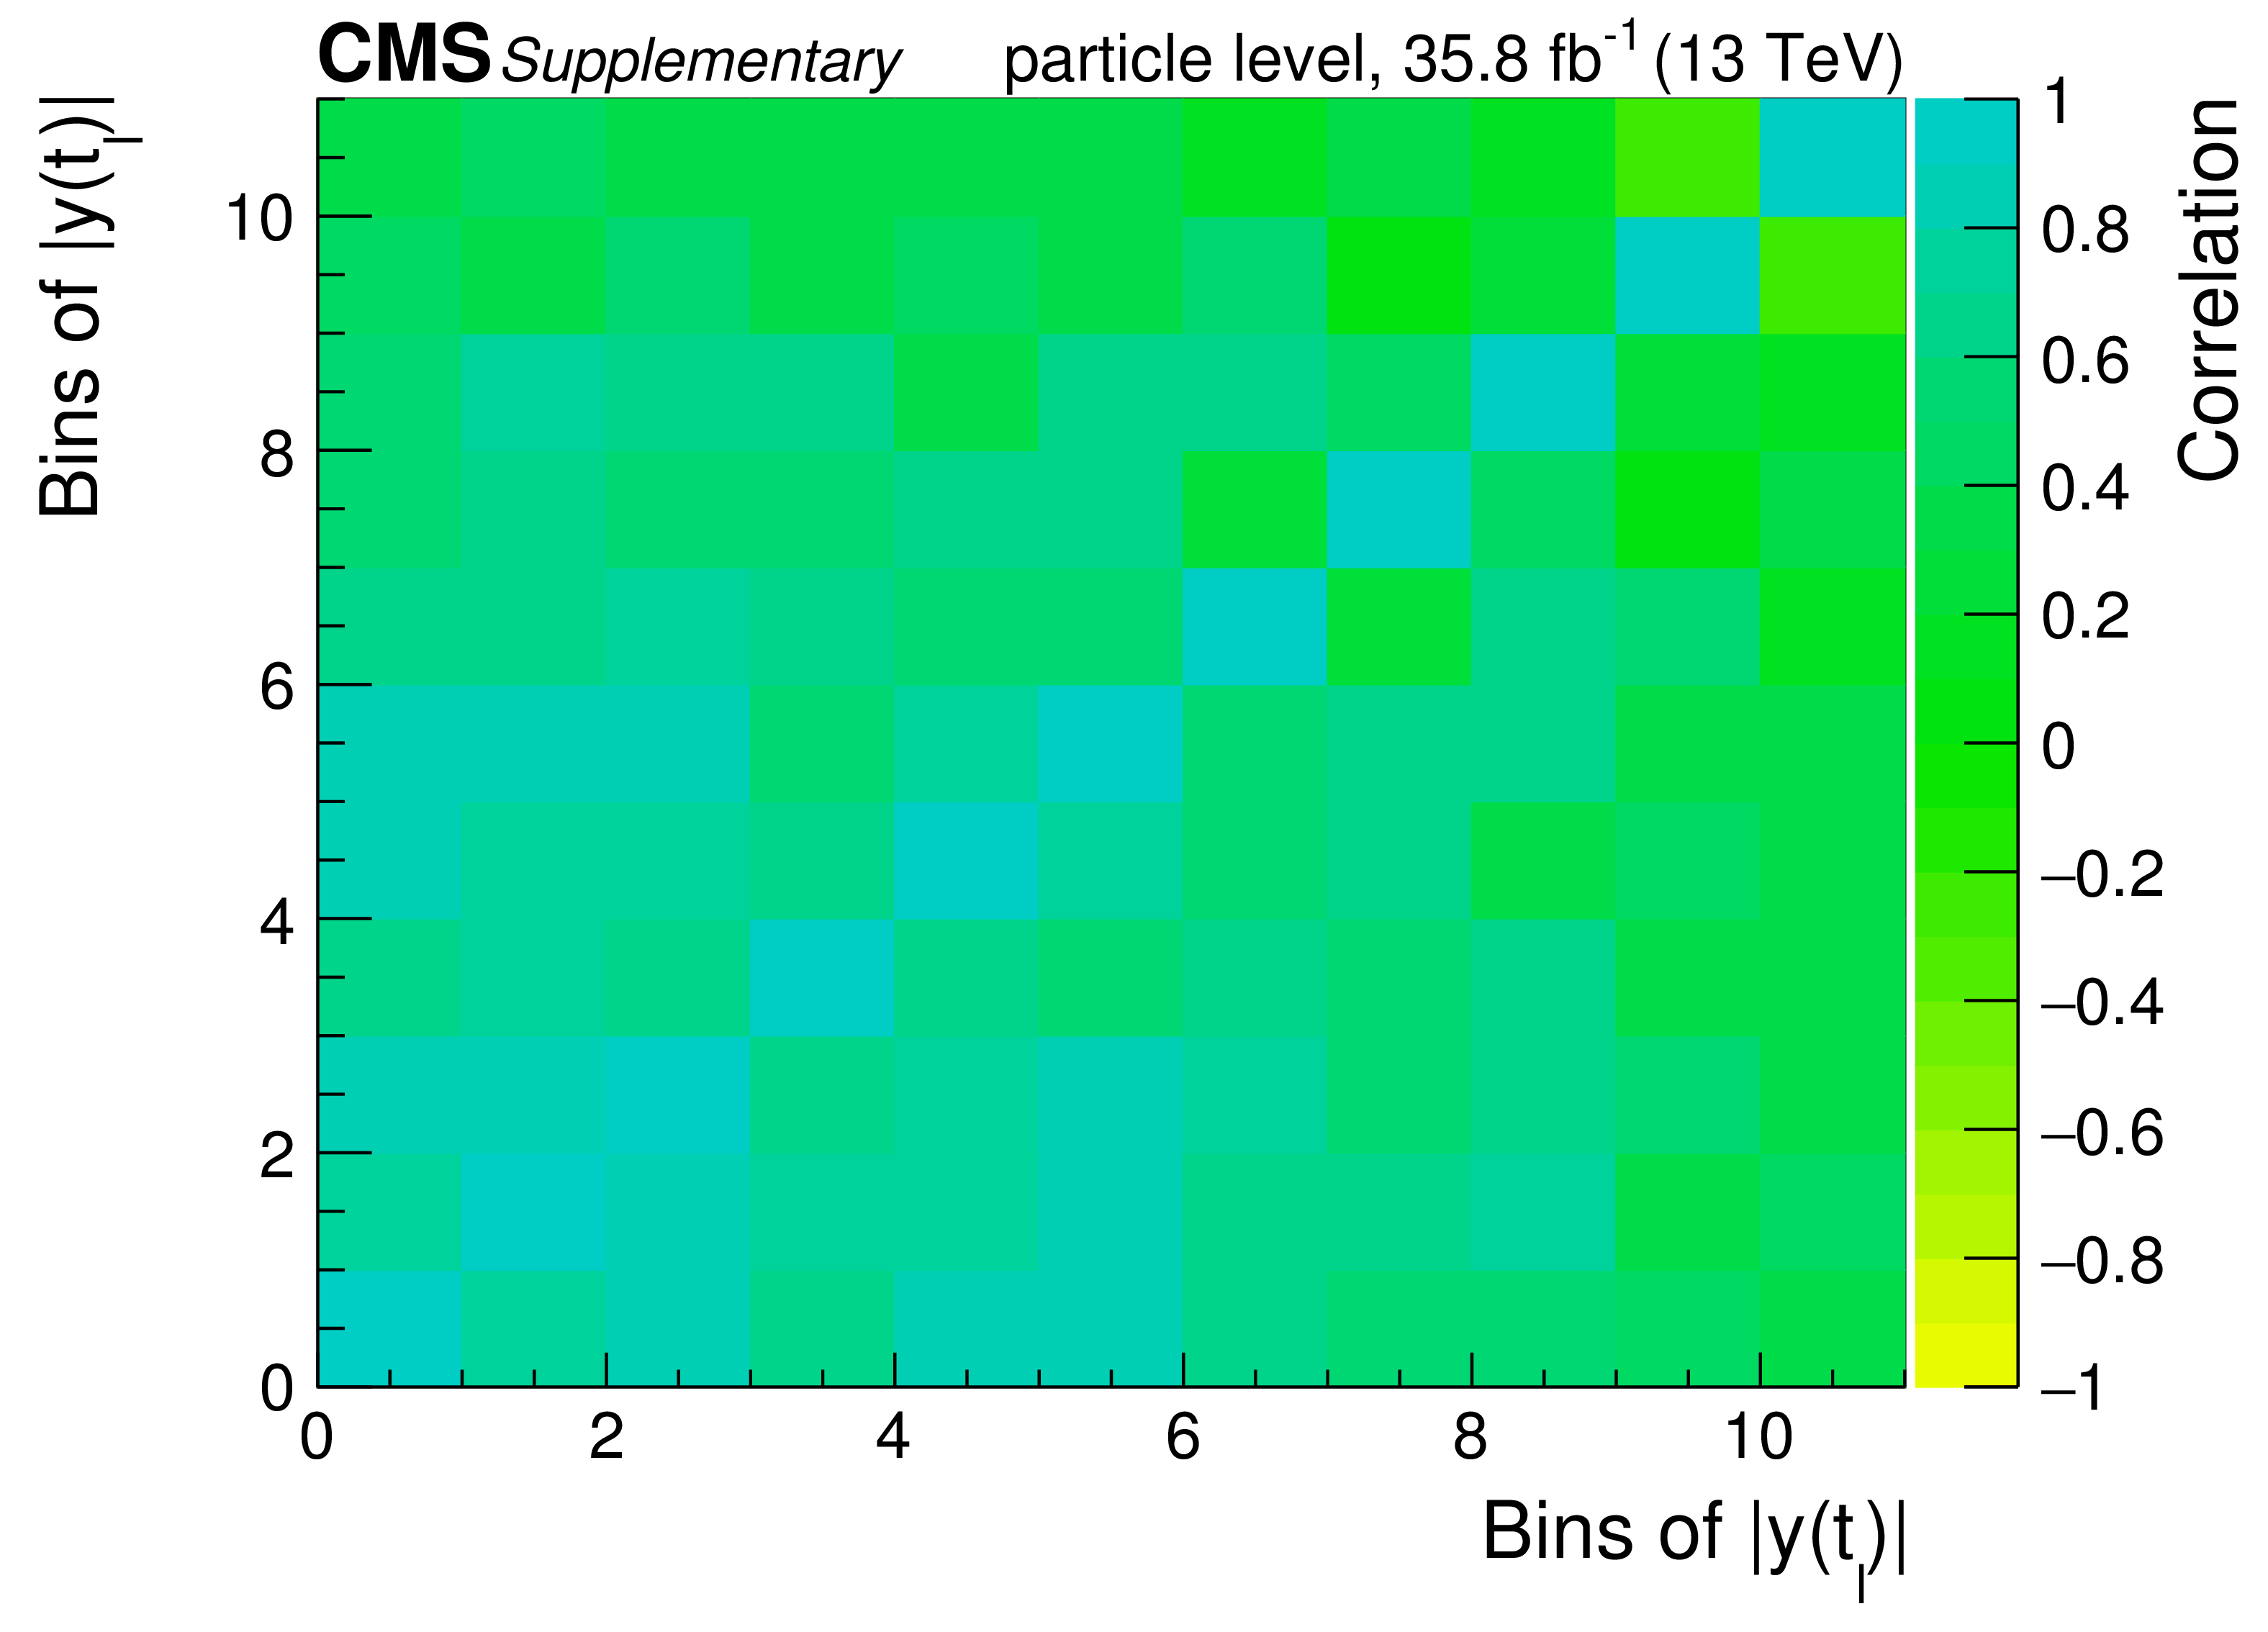
png pdf |
Additional Figure 1-d:
Correlations among the bins in the differential cross section measurements at particle level. |

png pdf |
Additional Figure 1-e:
Correlations among the bins in the differential cross section measurements at particle level. |
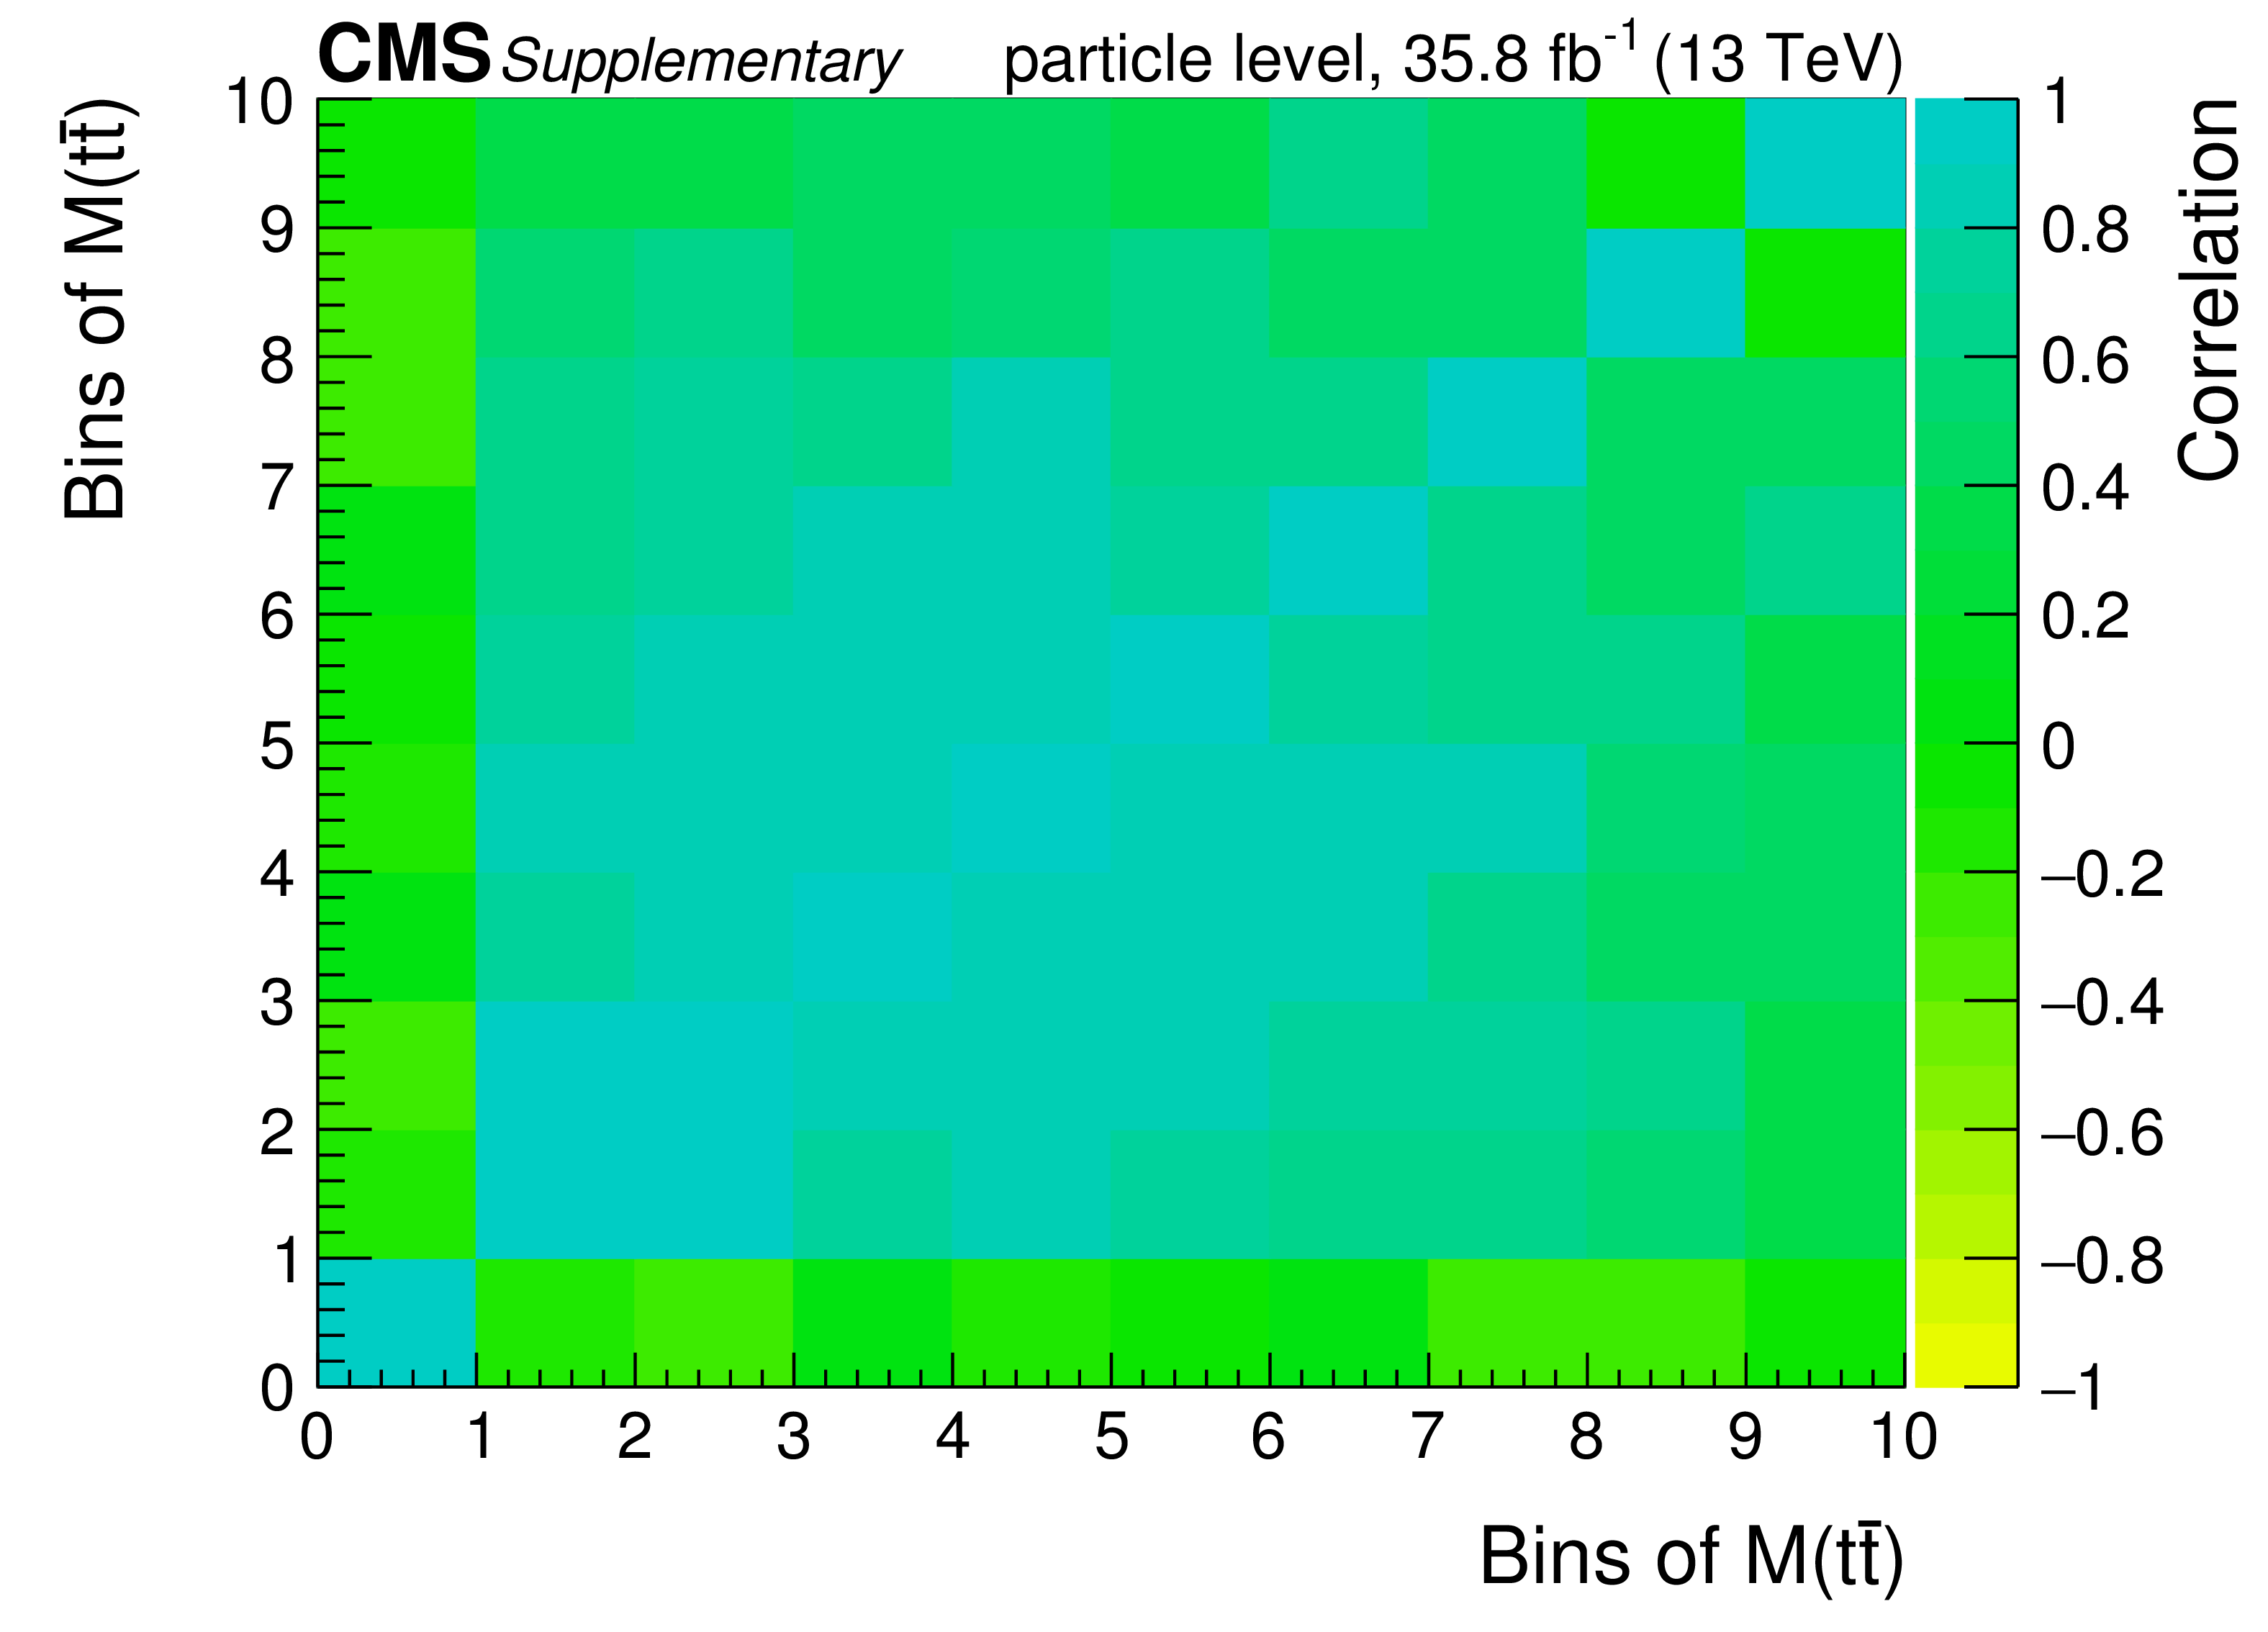
png pdf |
Additional Figure 1-f:
Correlations among the bins in the differential cross section measurements at particle level. |
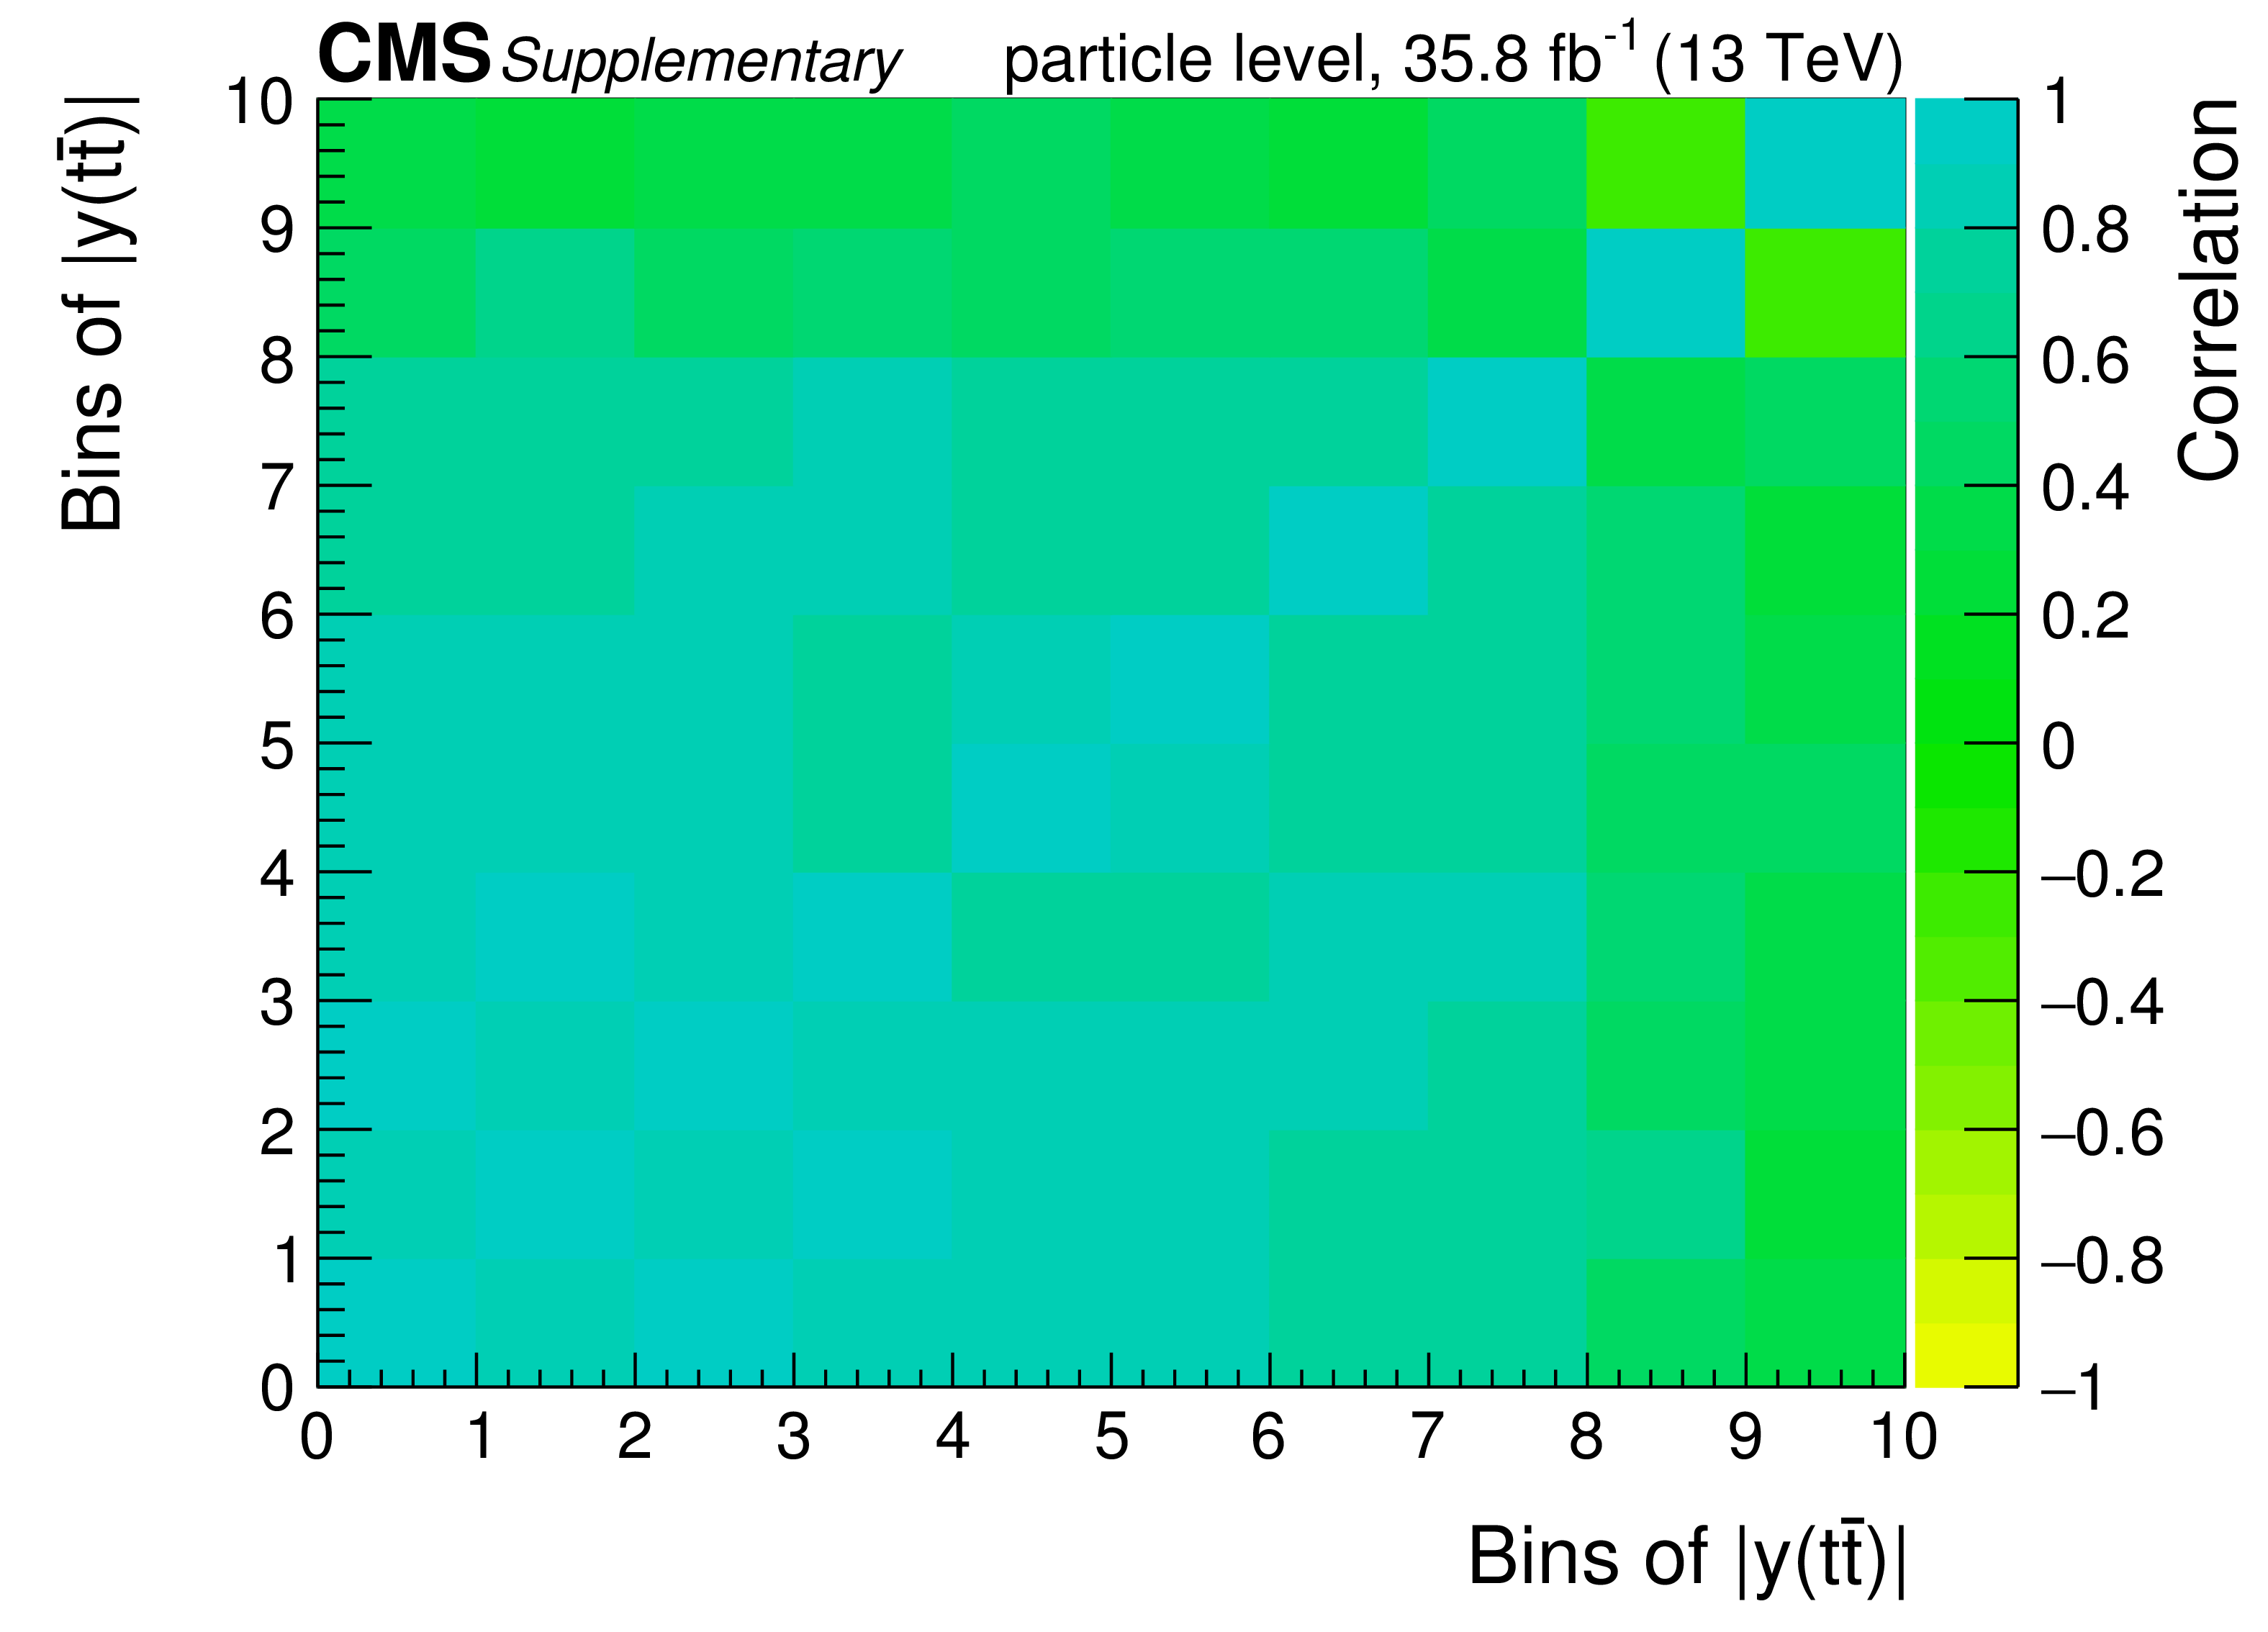
png pdf |
Additional Figure 1-g:
Correlations among the bins in the differential cross section measurements at particle level. |
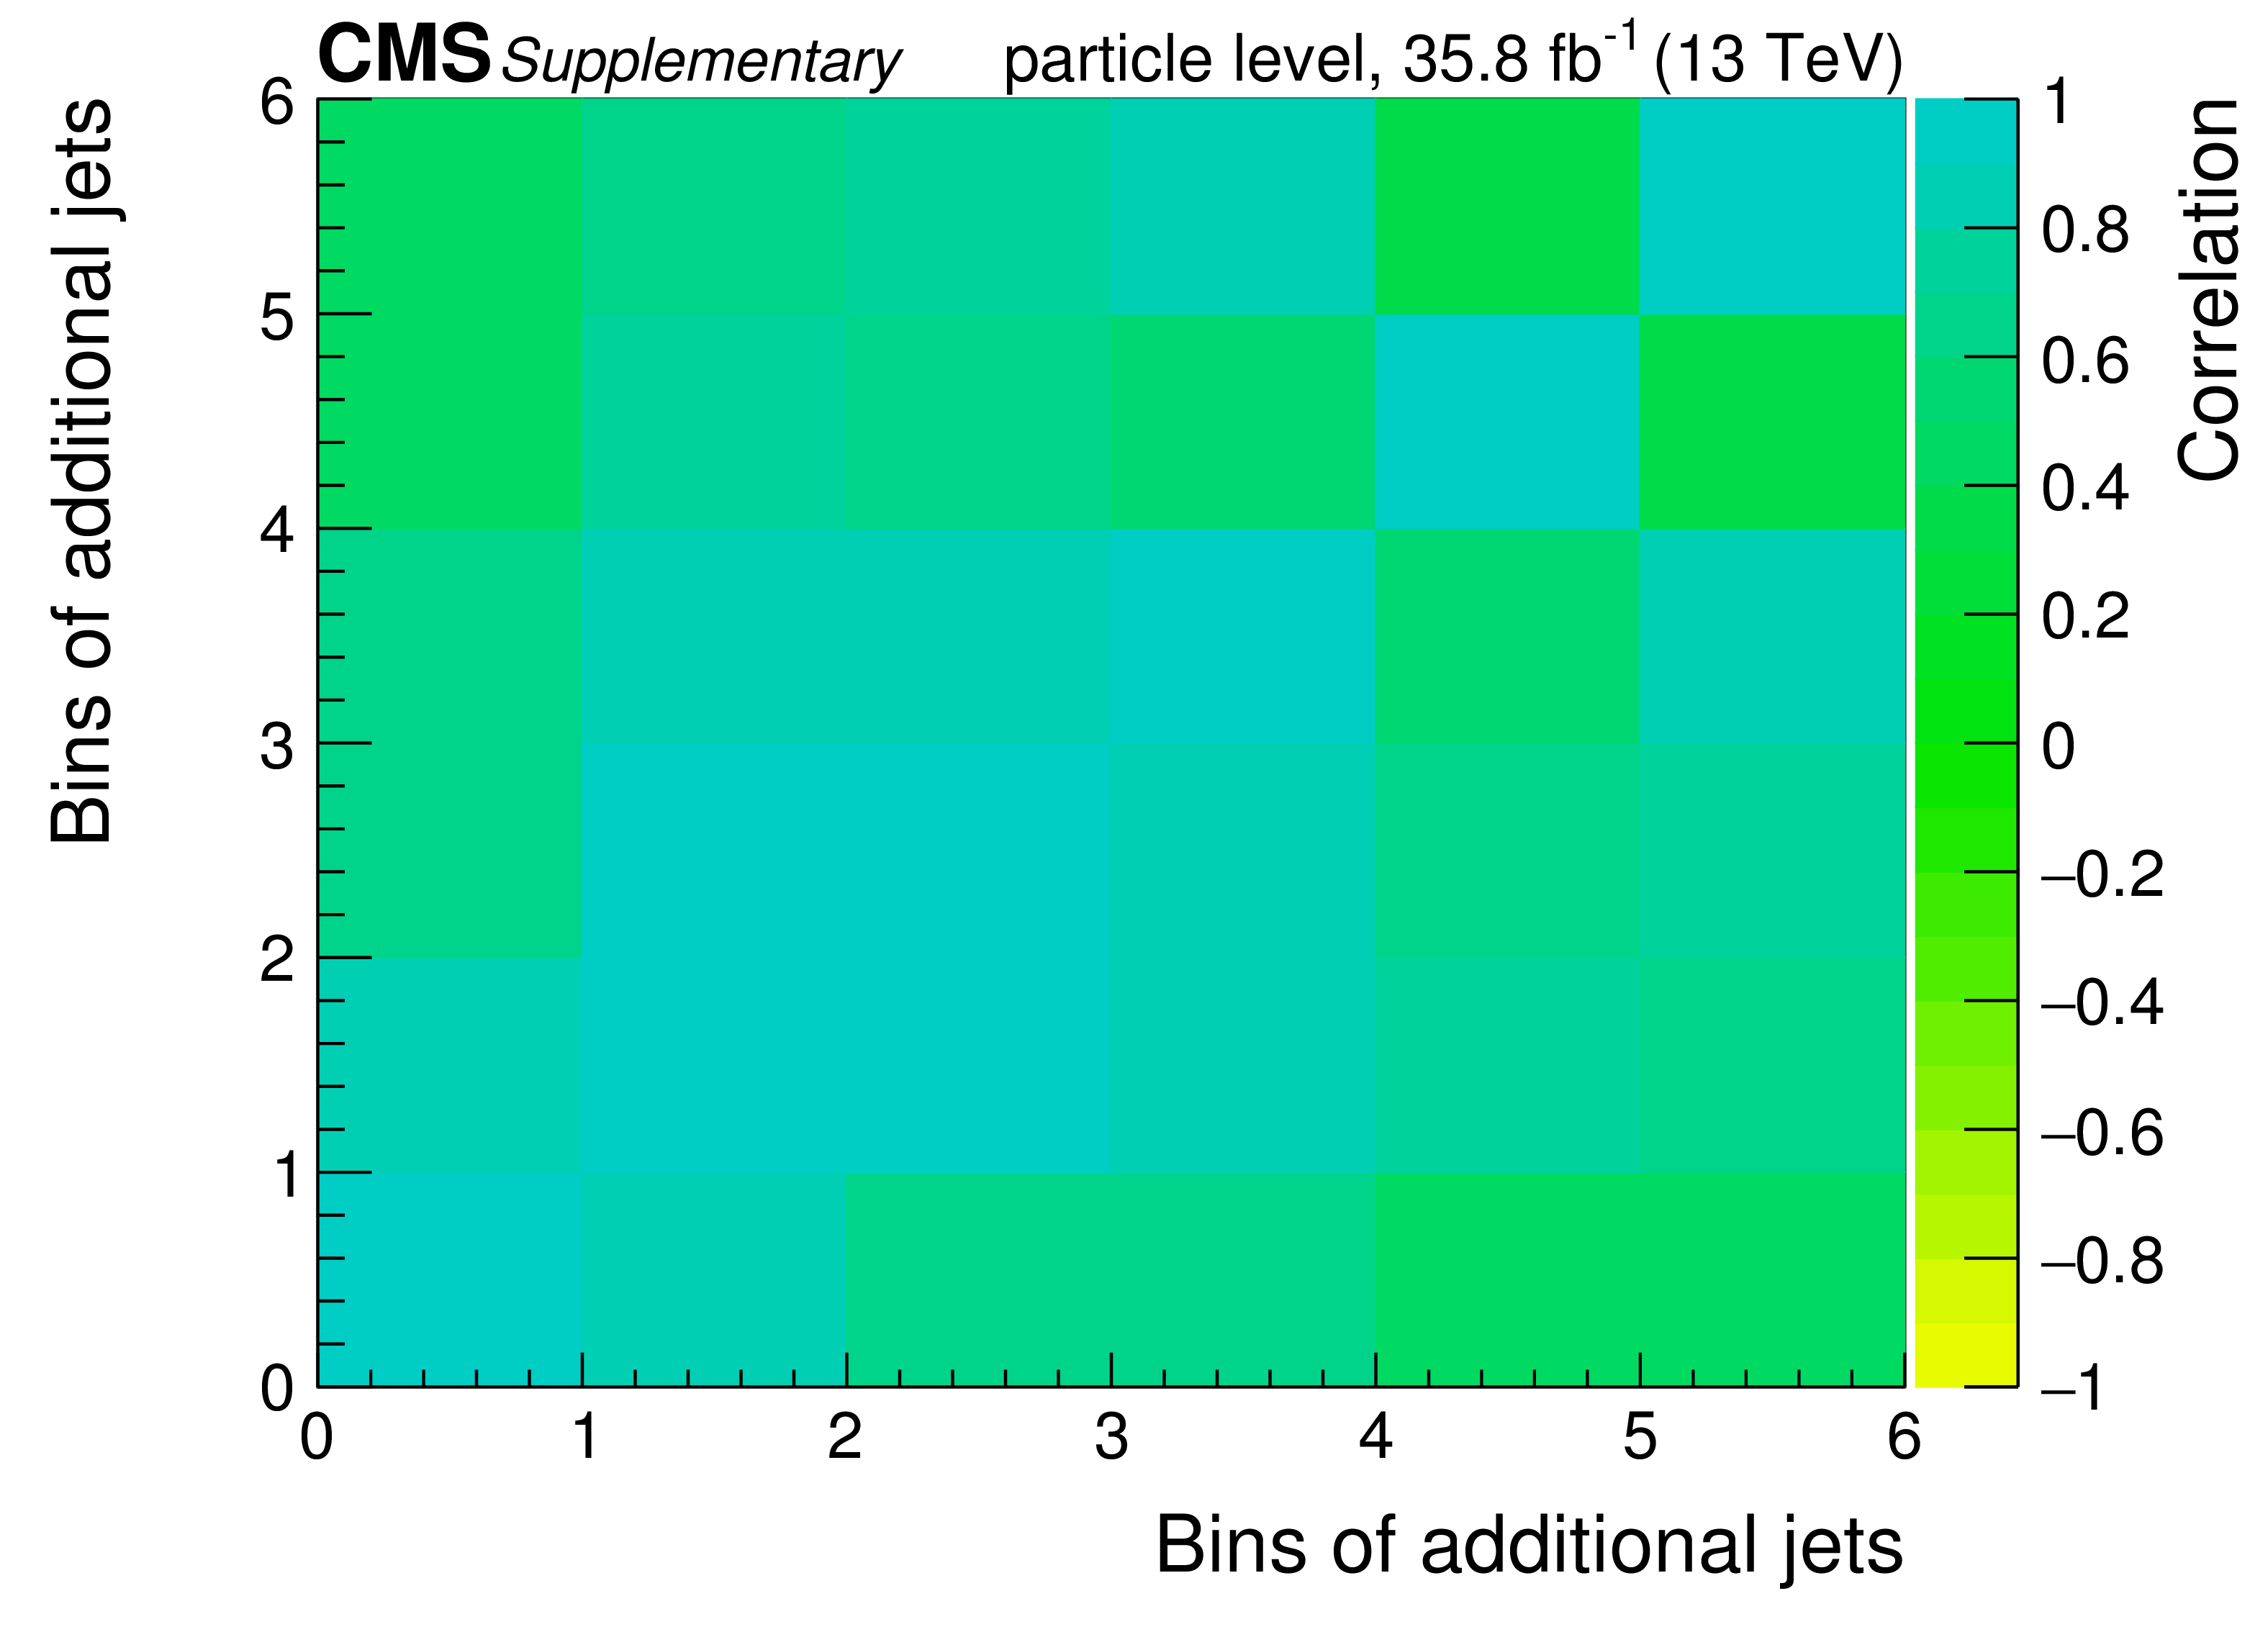
png pdf |
Additional Figure 1-h:
Correlations among the bins in the differential cross section measurements at particle level. |
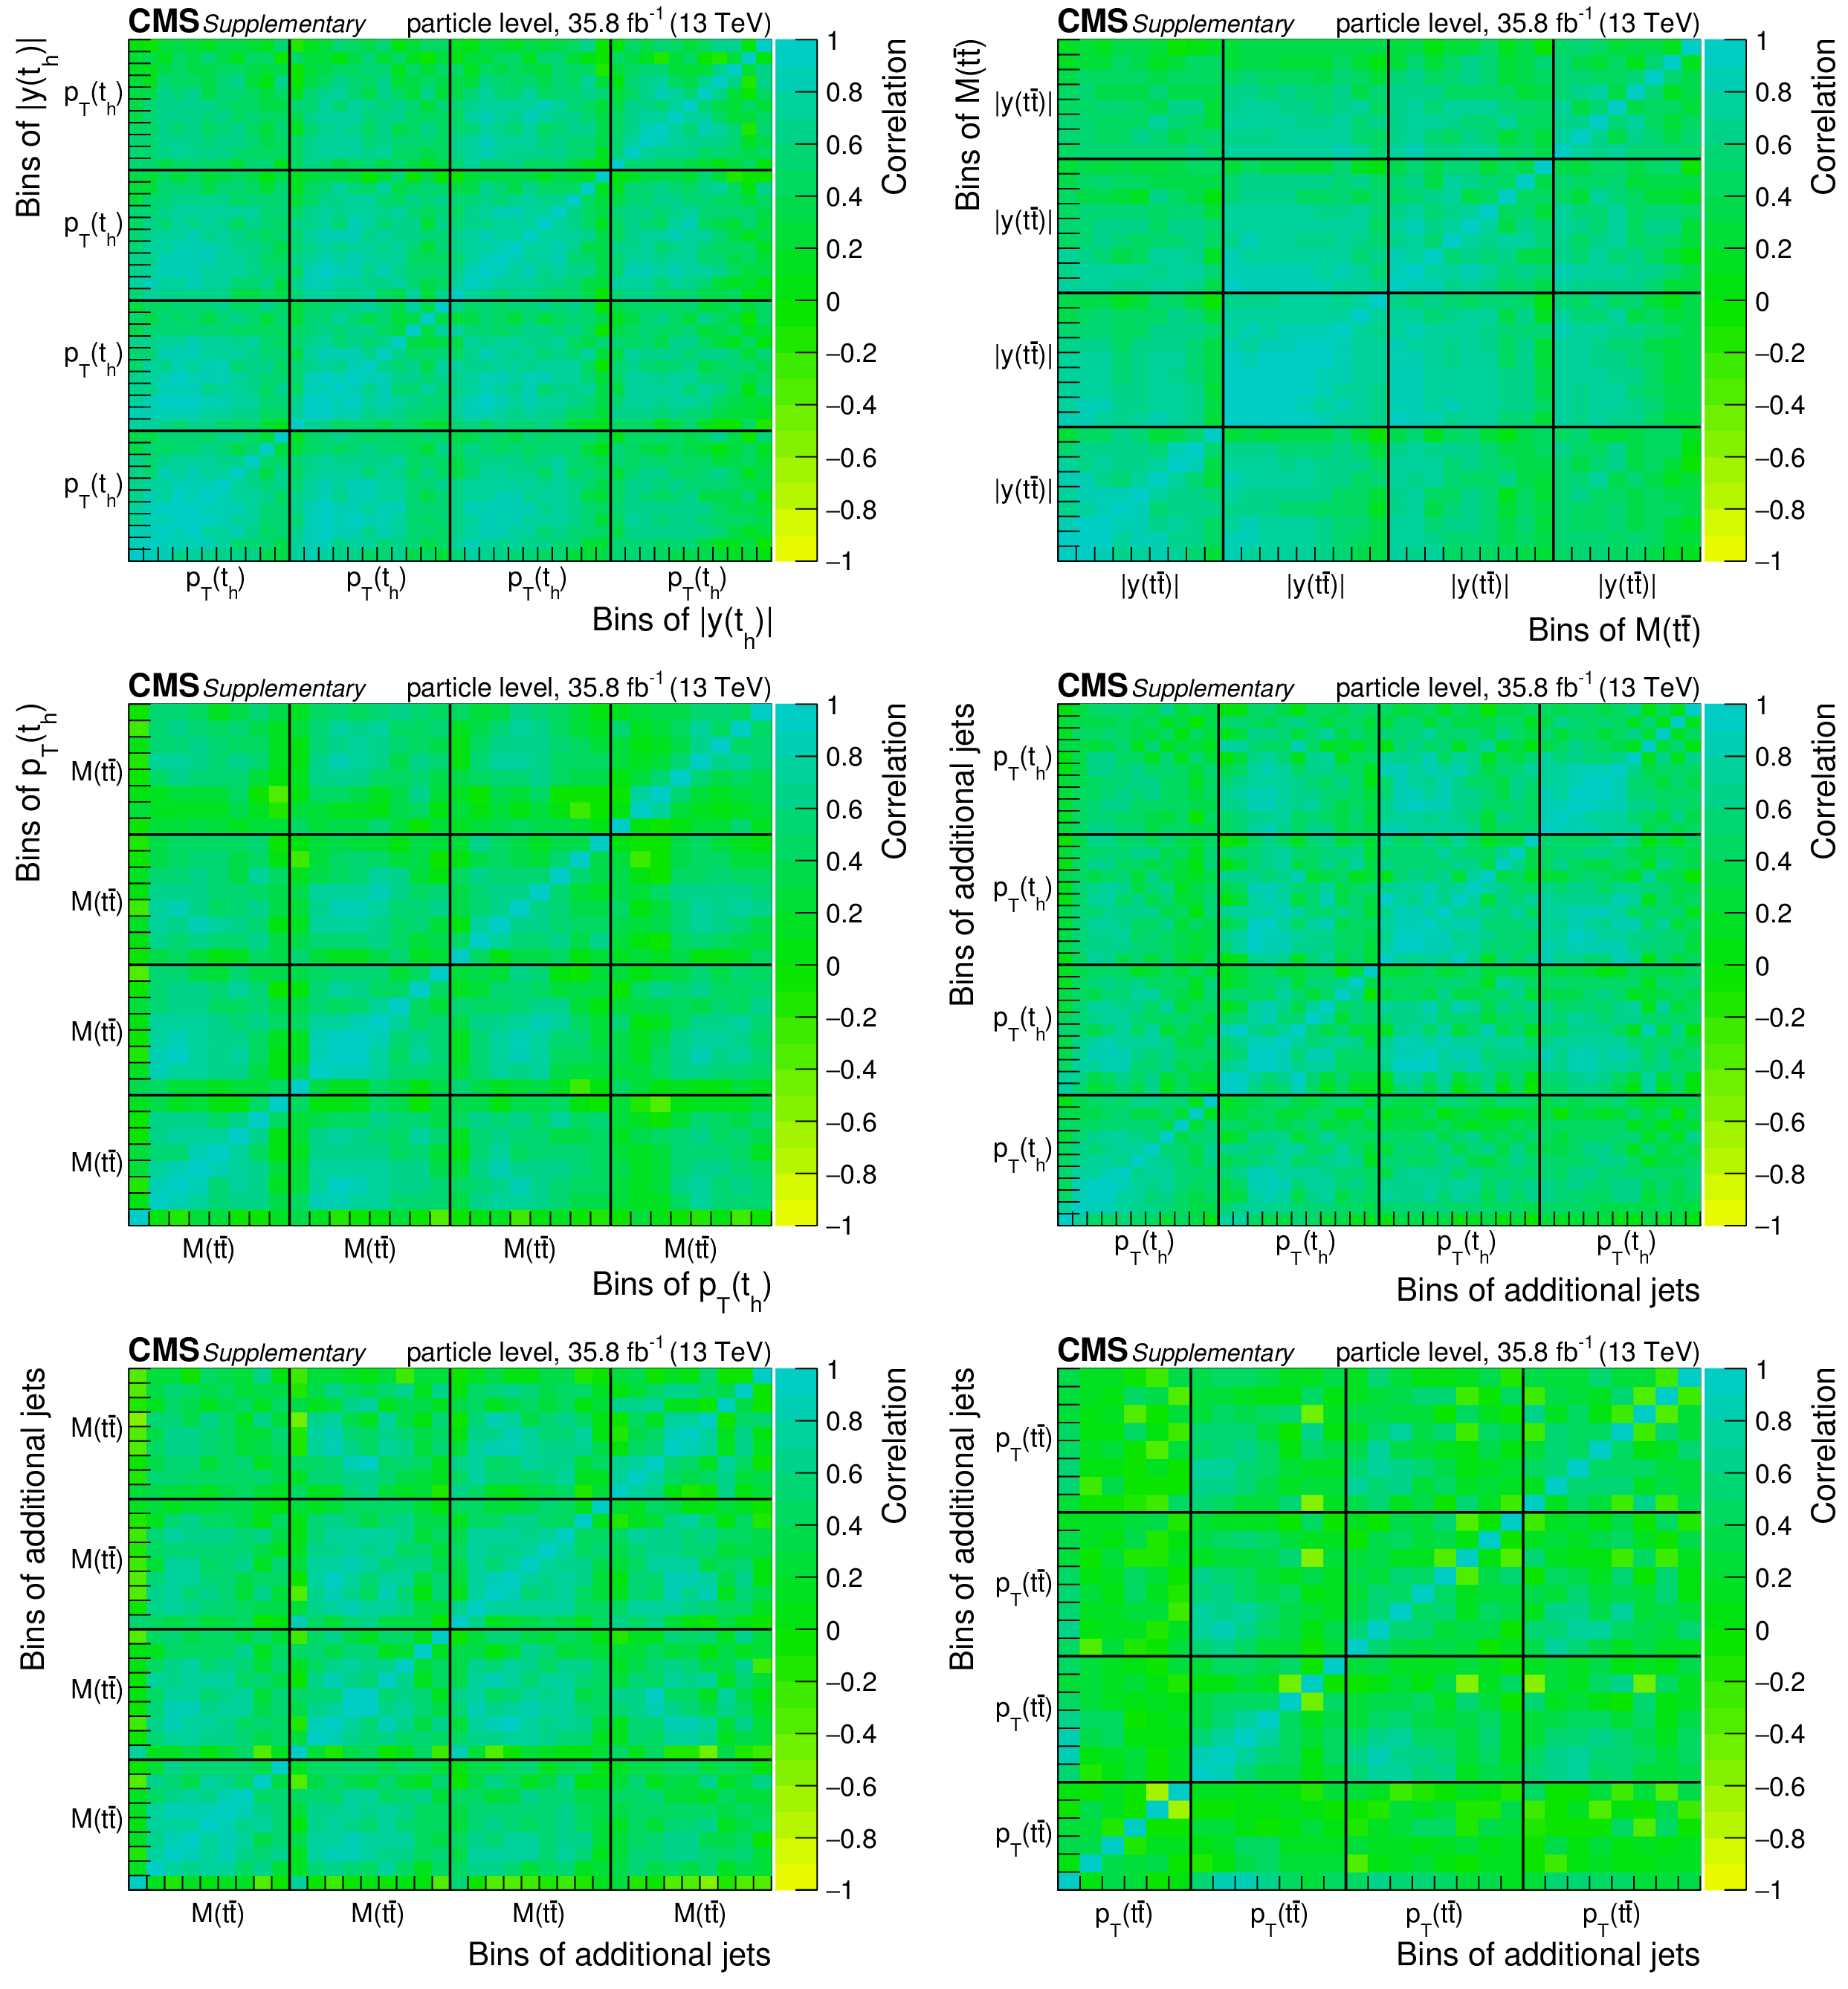
png pdf |
Additional Figure 2:
Correlations among the bins in the double-differential cross section measurements at particle level. |
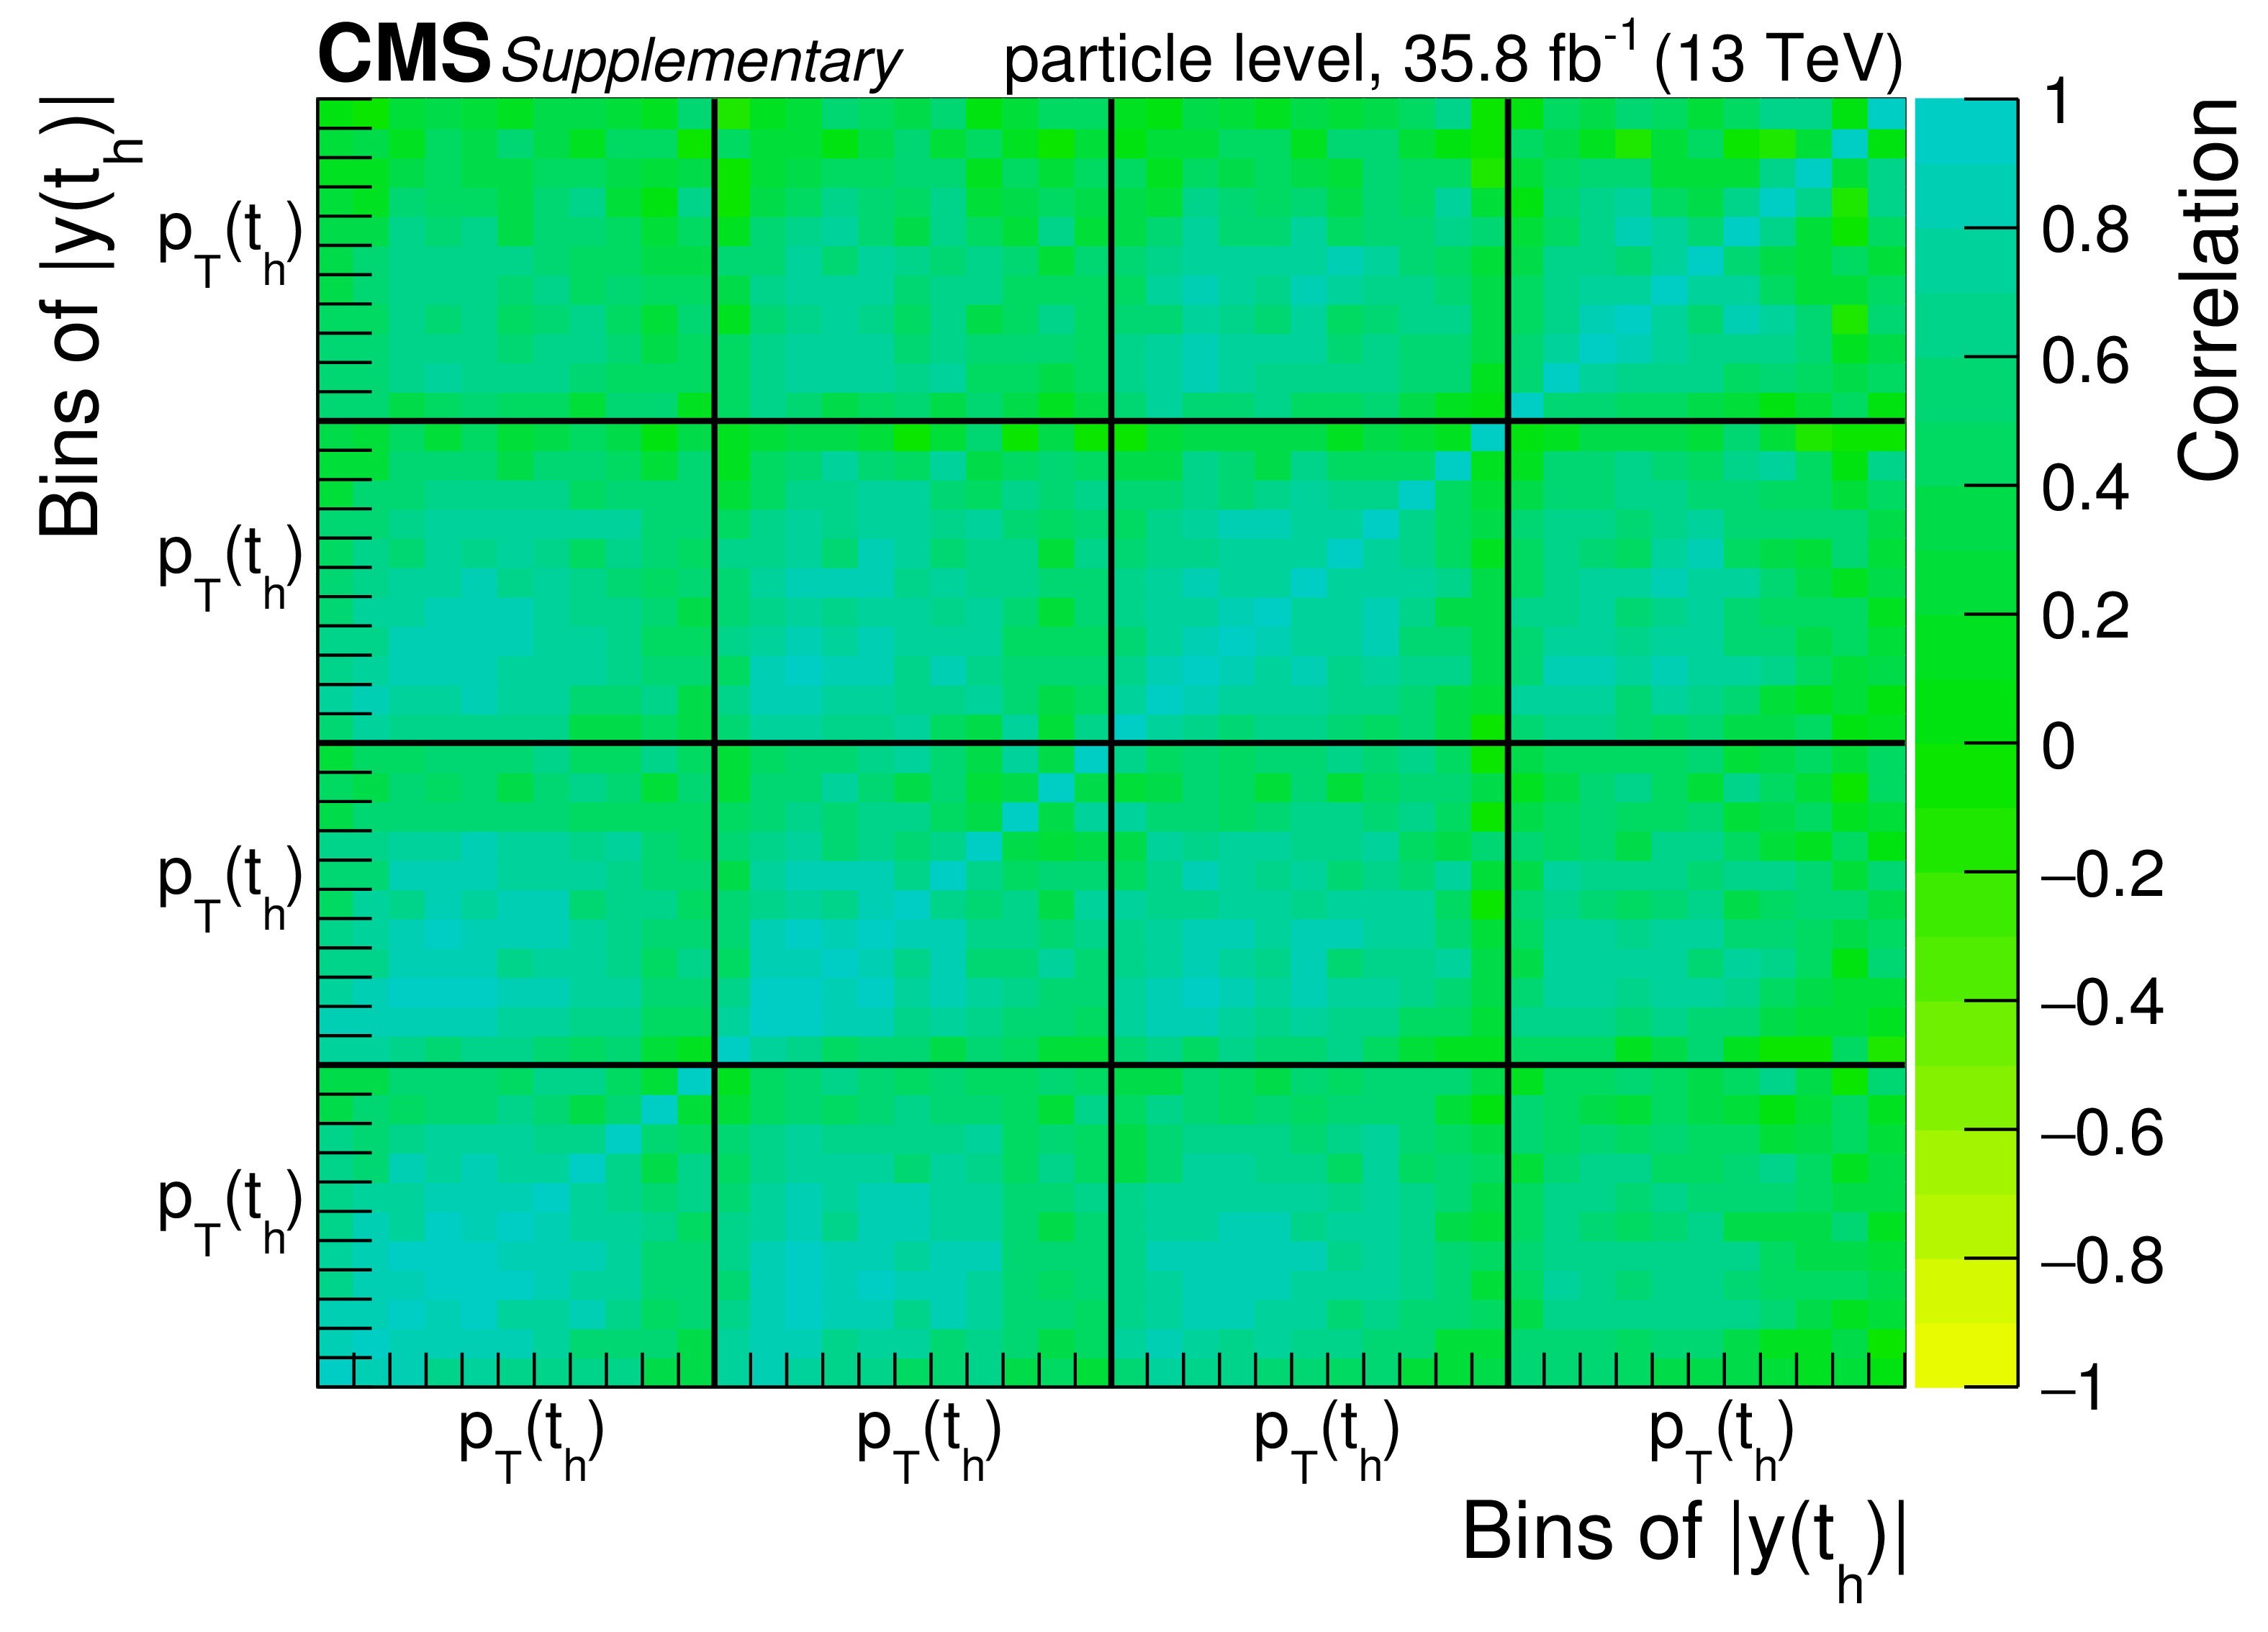
png pdf |
Additional Figure 2-a:
Correlations among the bins in the double-differential cross section measurements at particle level. |
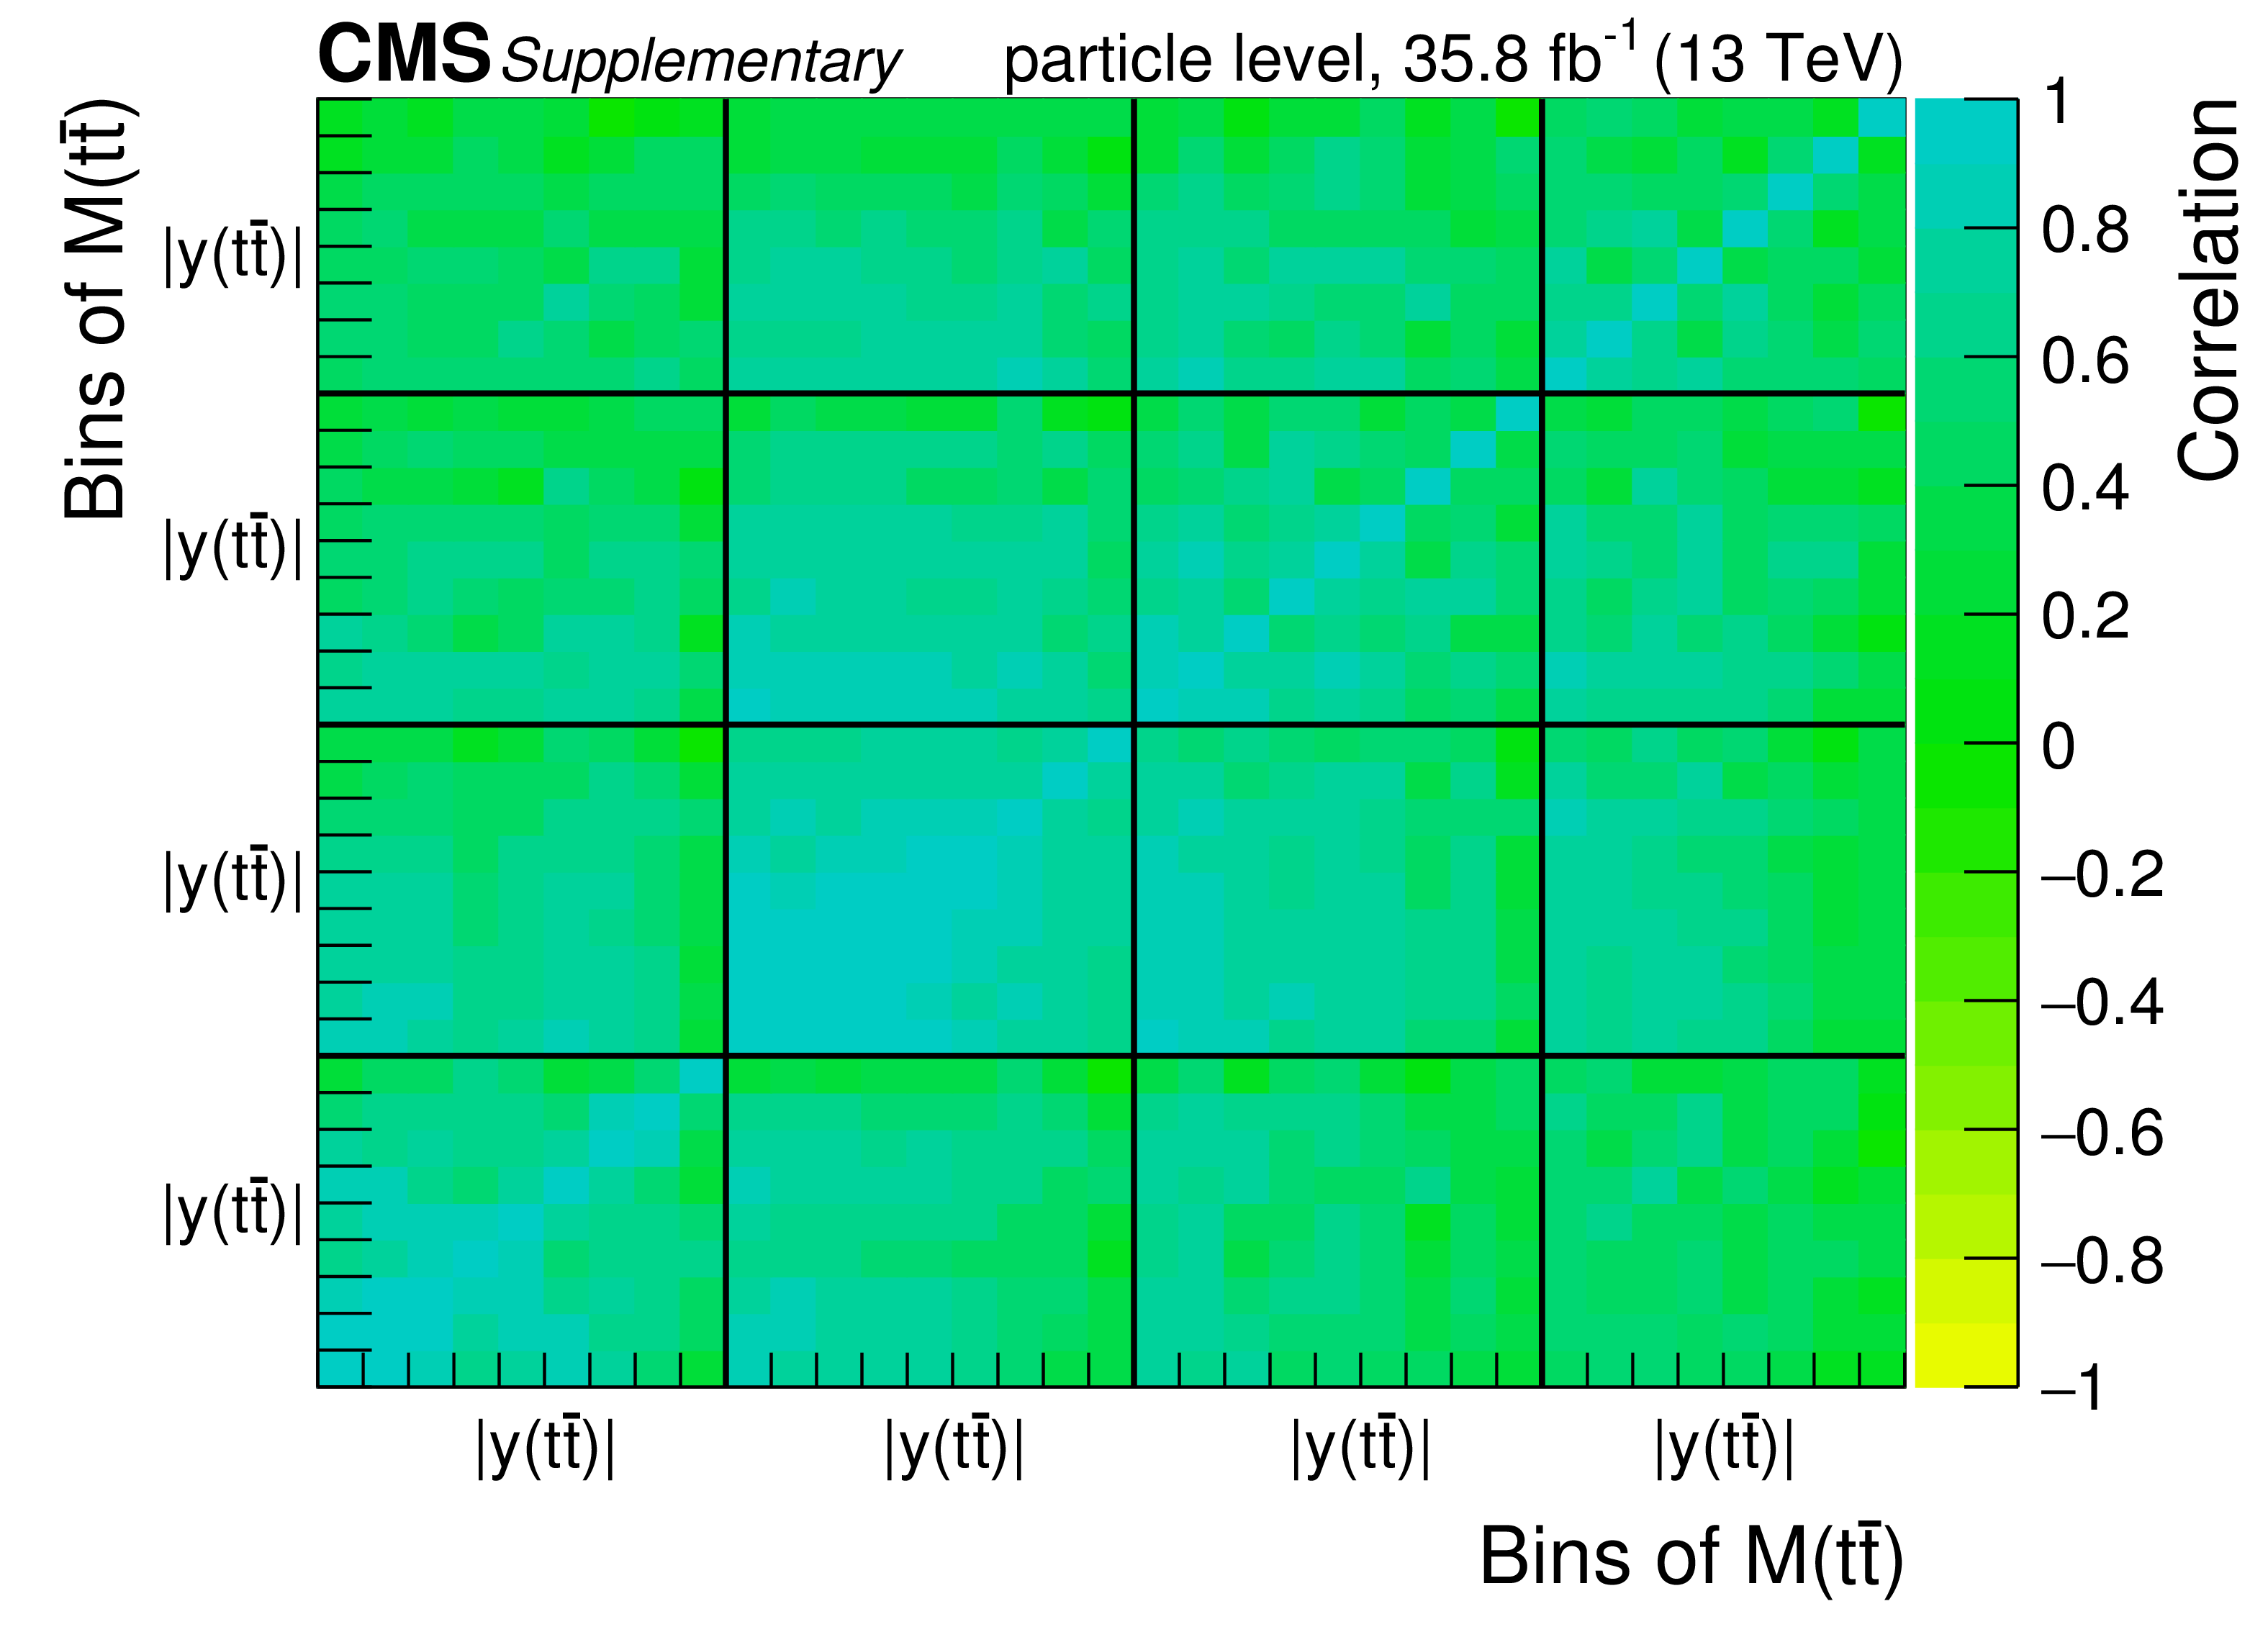
png pdf |
Additional Figure 2-b:
Correlations among the bins in the double-differential cross section measurements at particle level. |
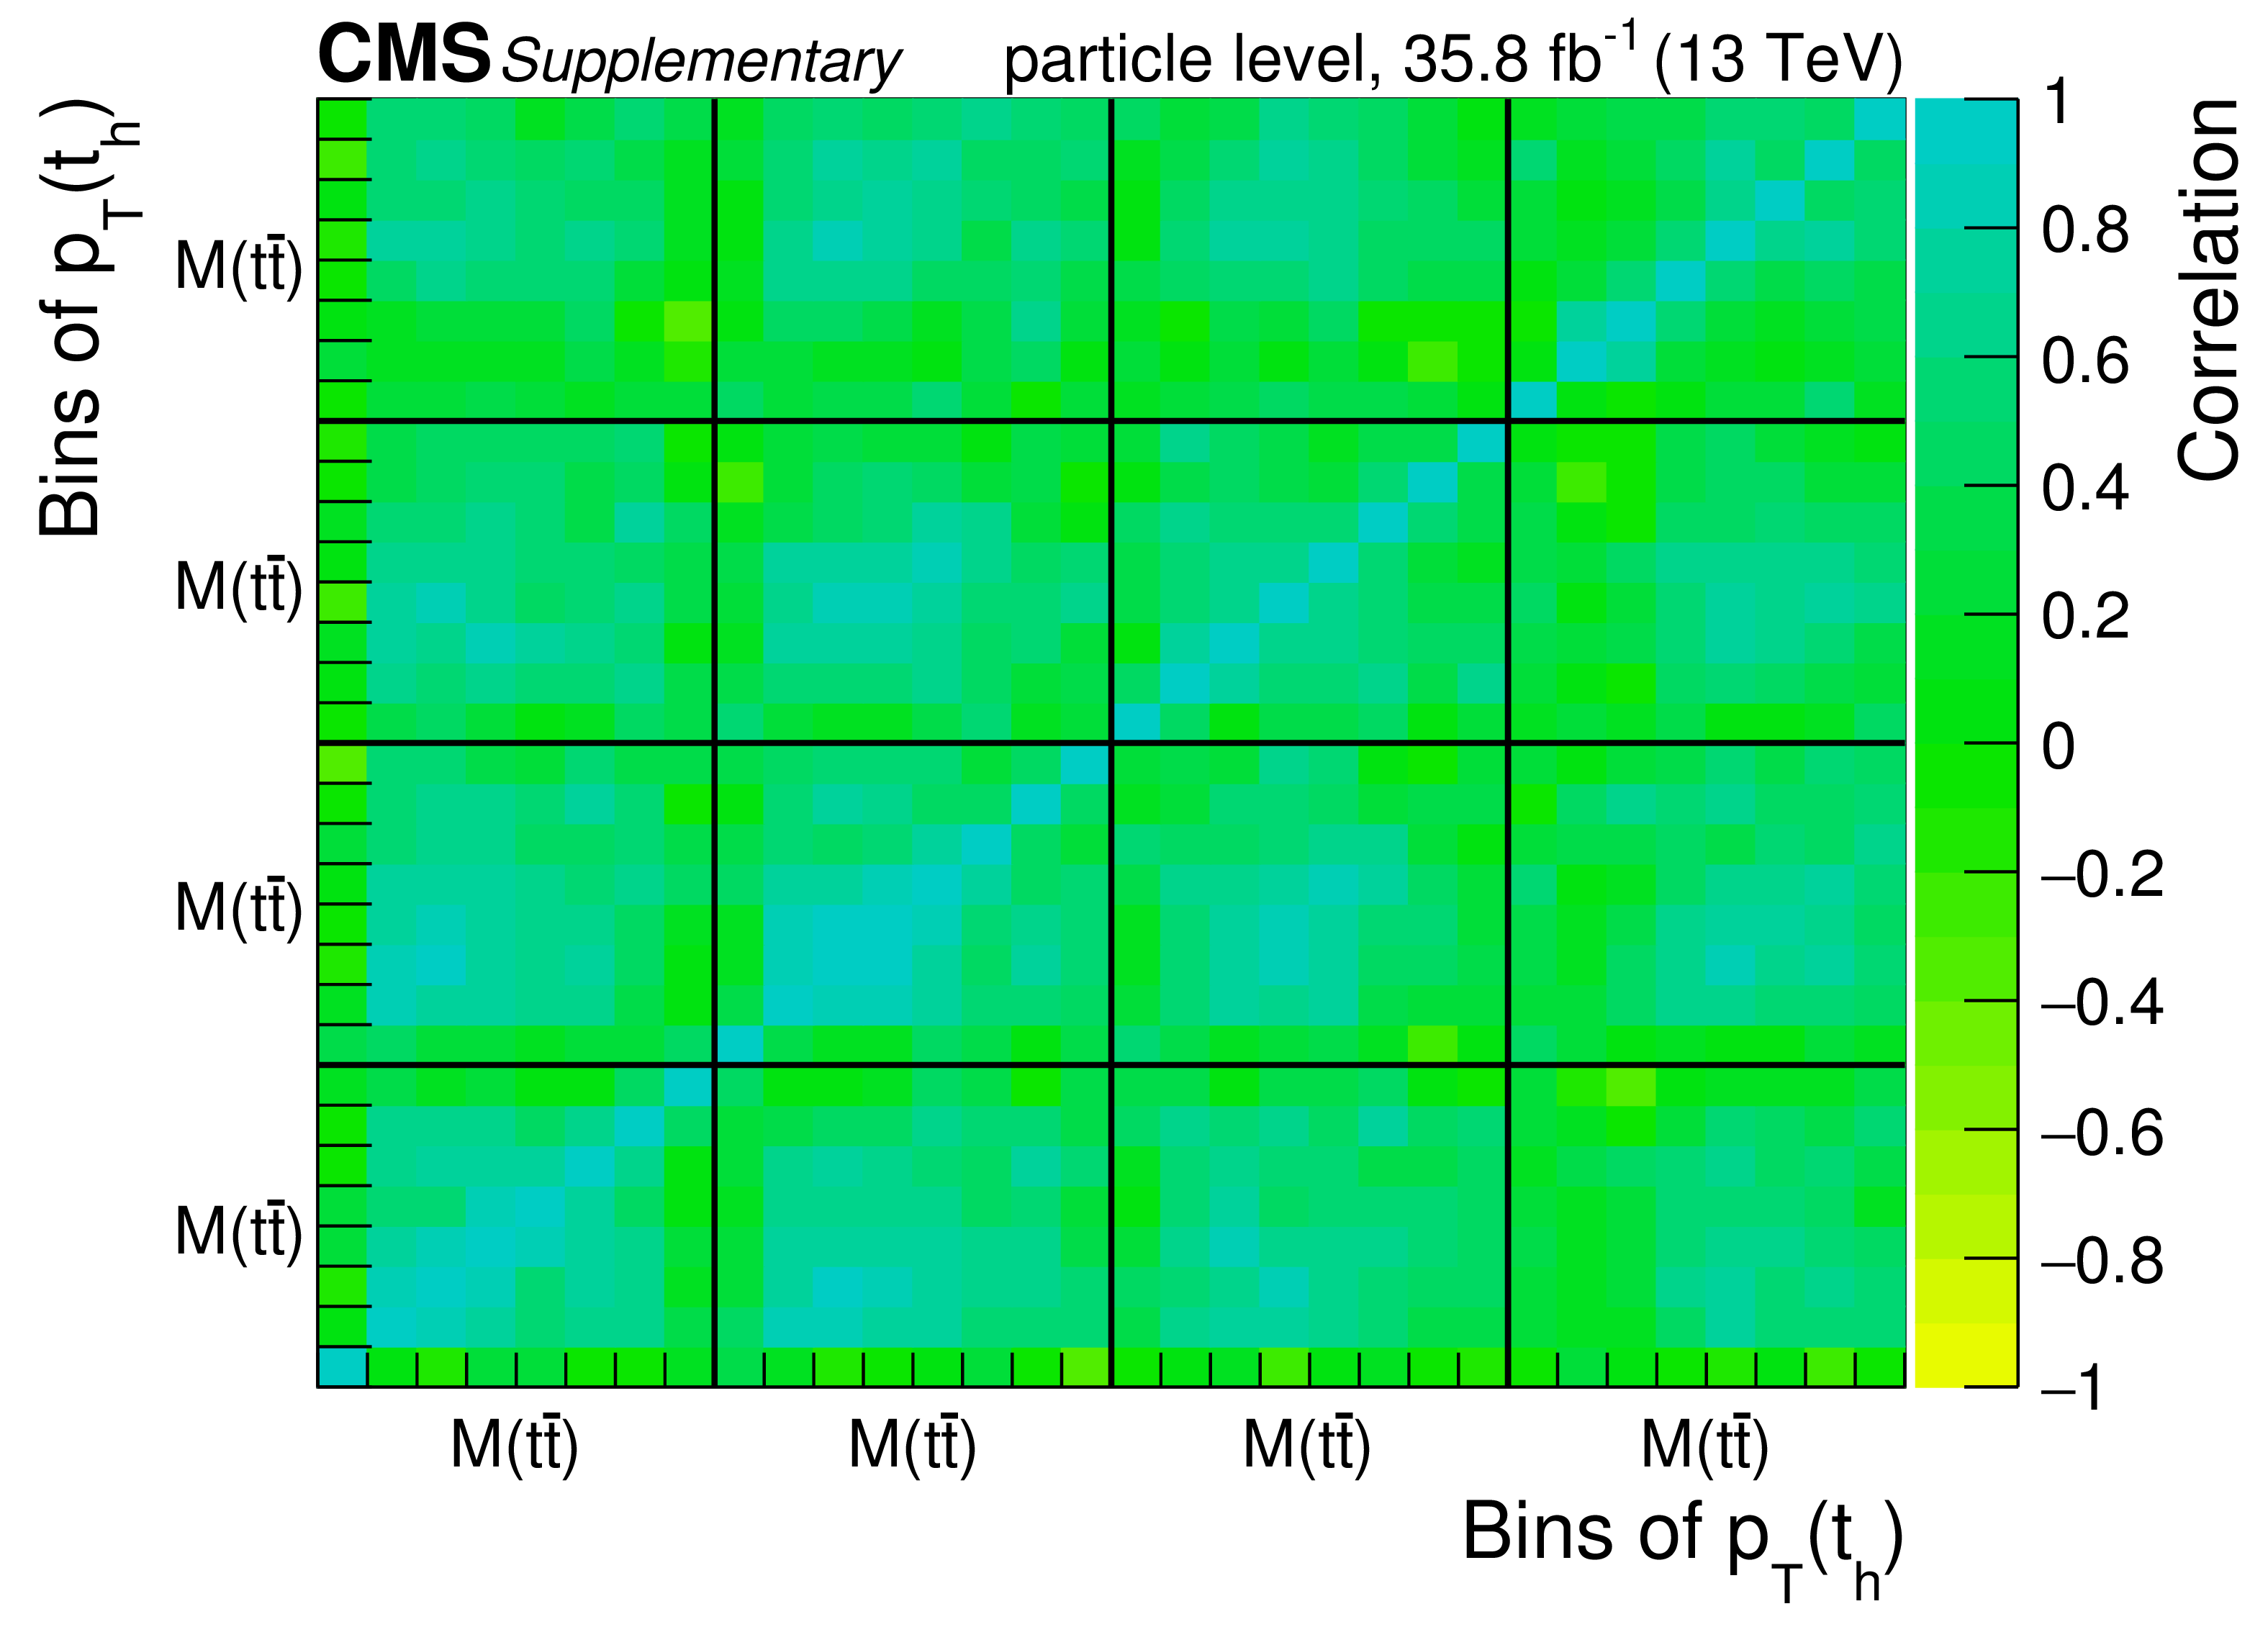
png pdf |
Additional Figure 2-c:
Correlations among the bins in the double-differential cross section measurements at particle level. |
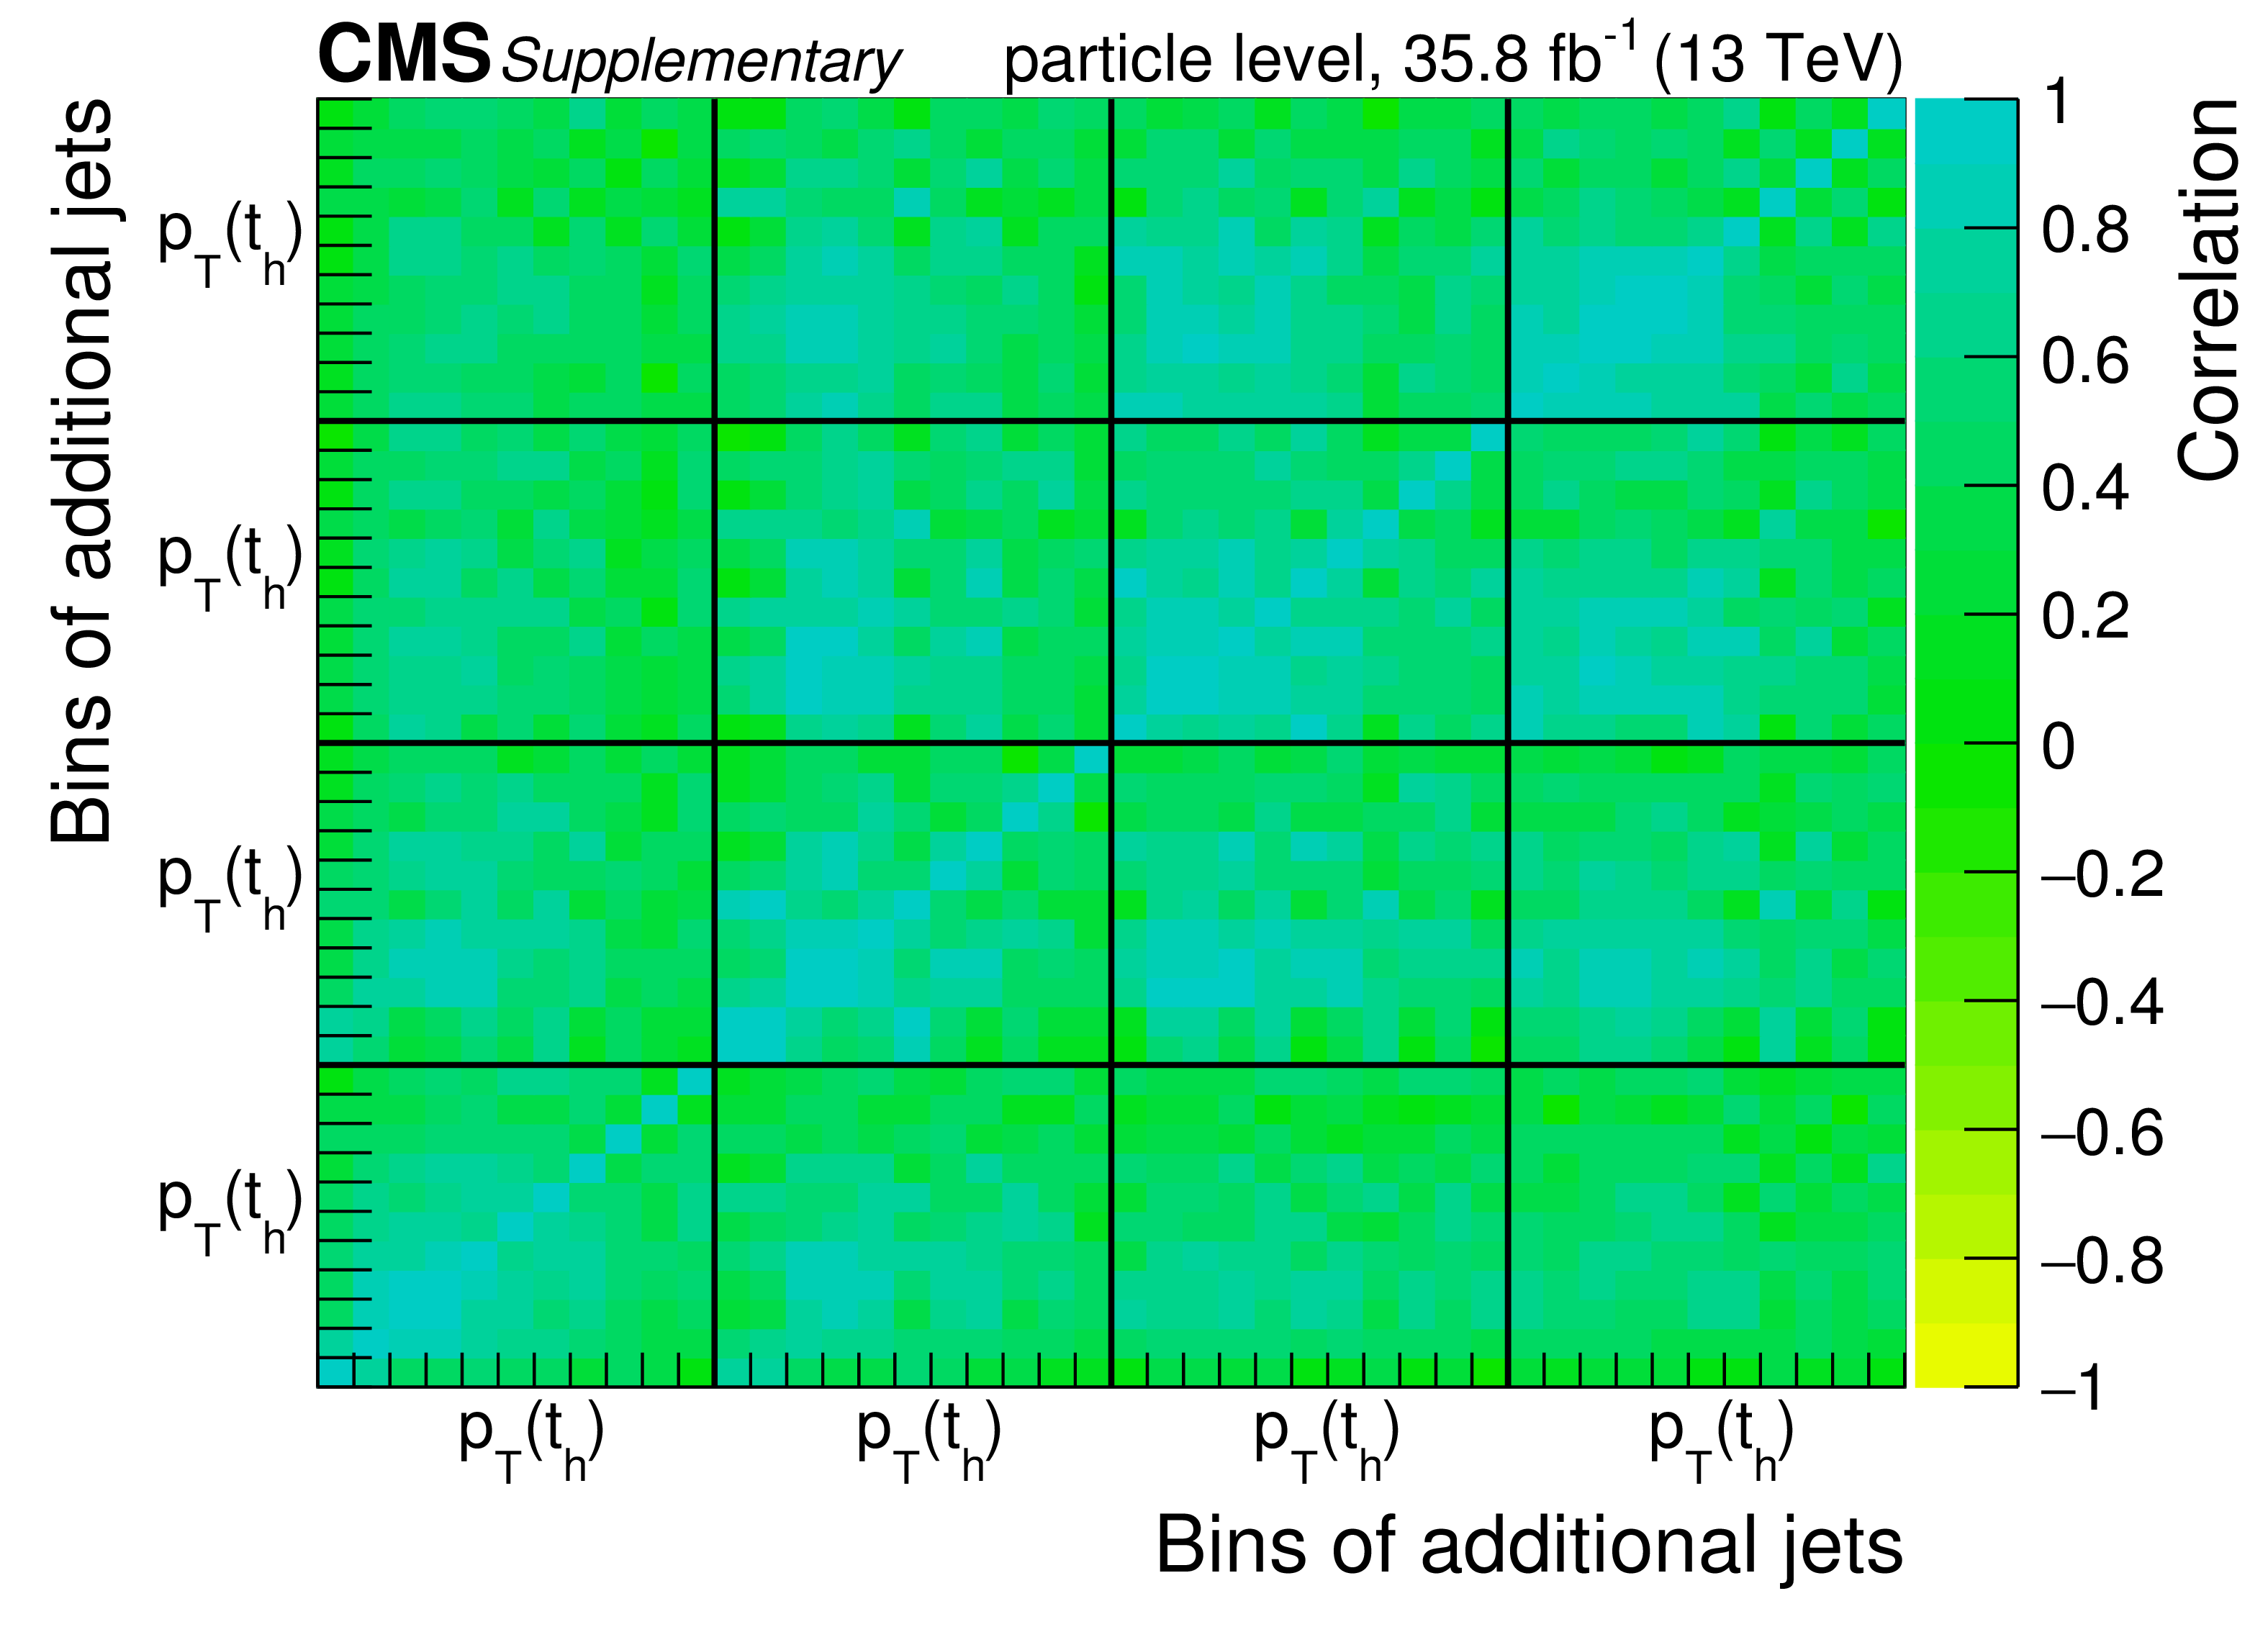
png pdf |
Additional Figure 2-d:
Correlations among the bins in the double-differential cross section measurements at particle level. |
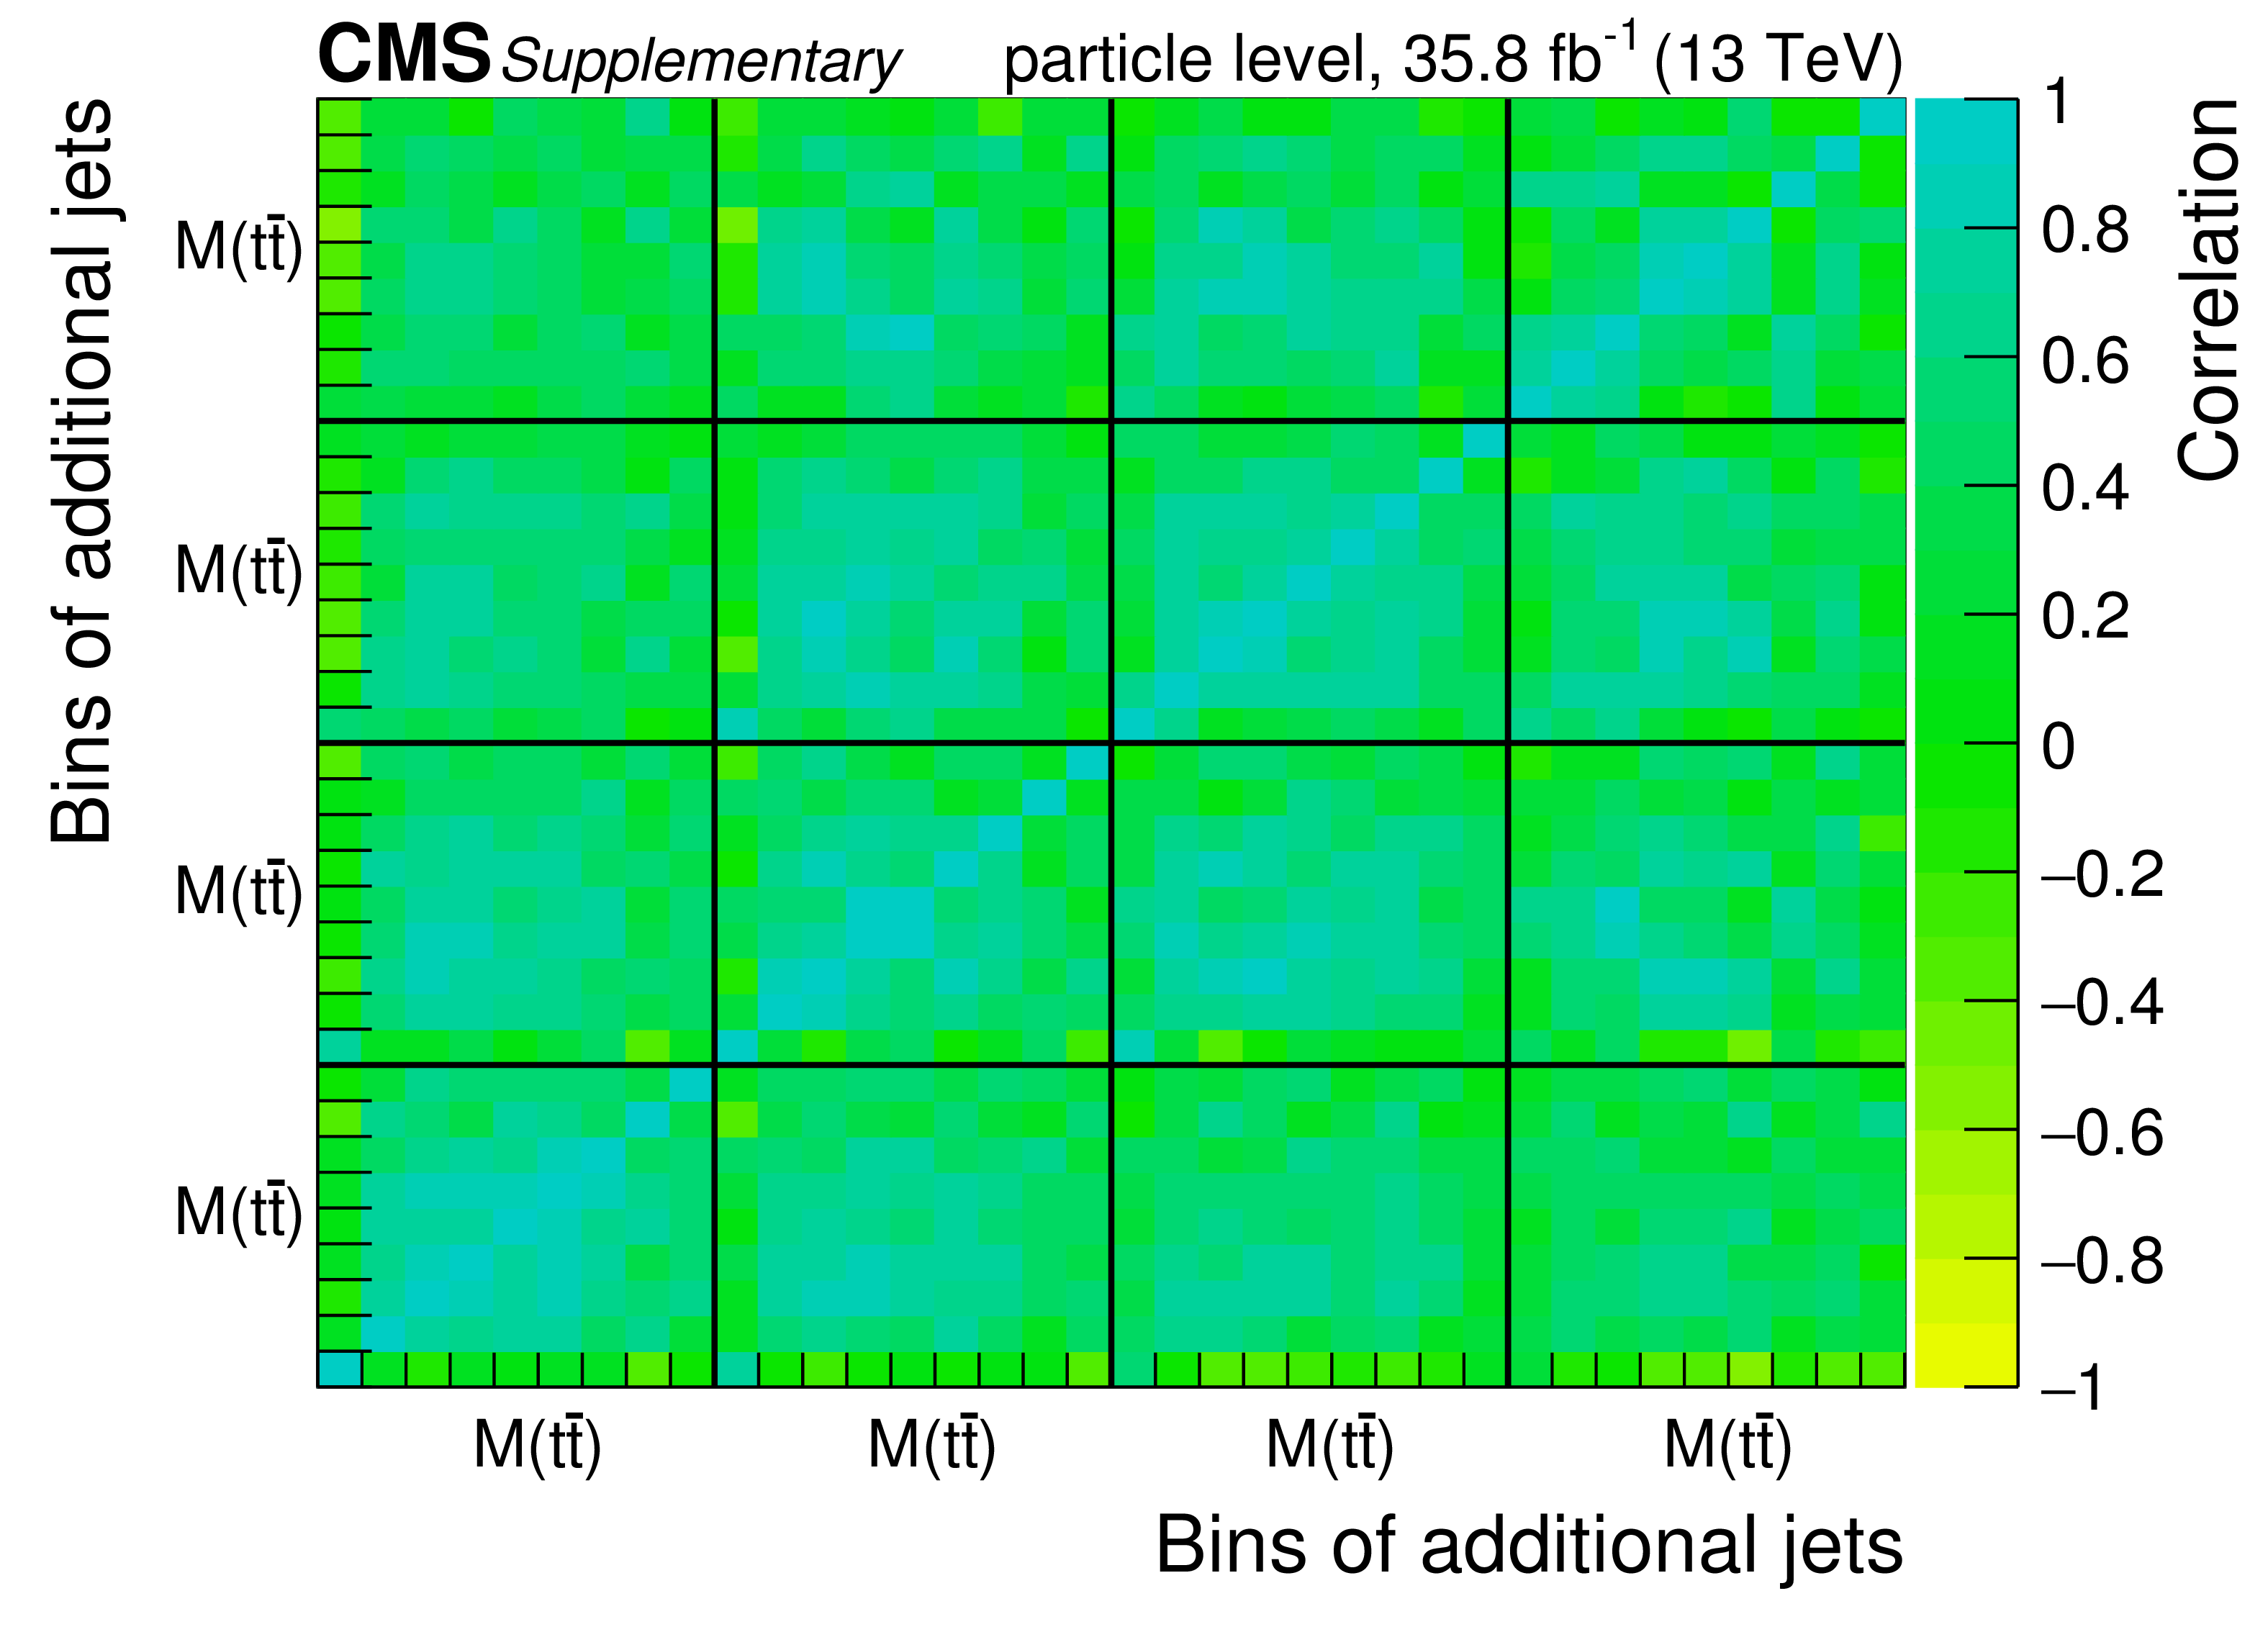
png pdf |
Additional Figure 2-e:
Correlations among the bins in the double-differential cross section measurements at particle level. |
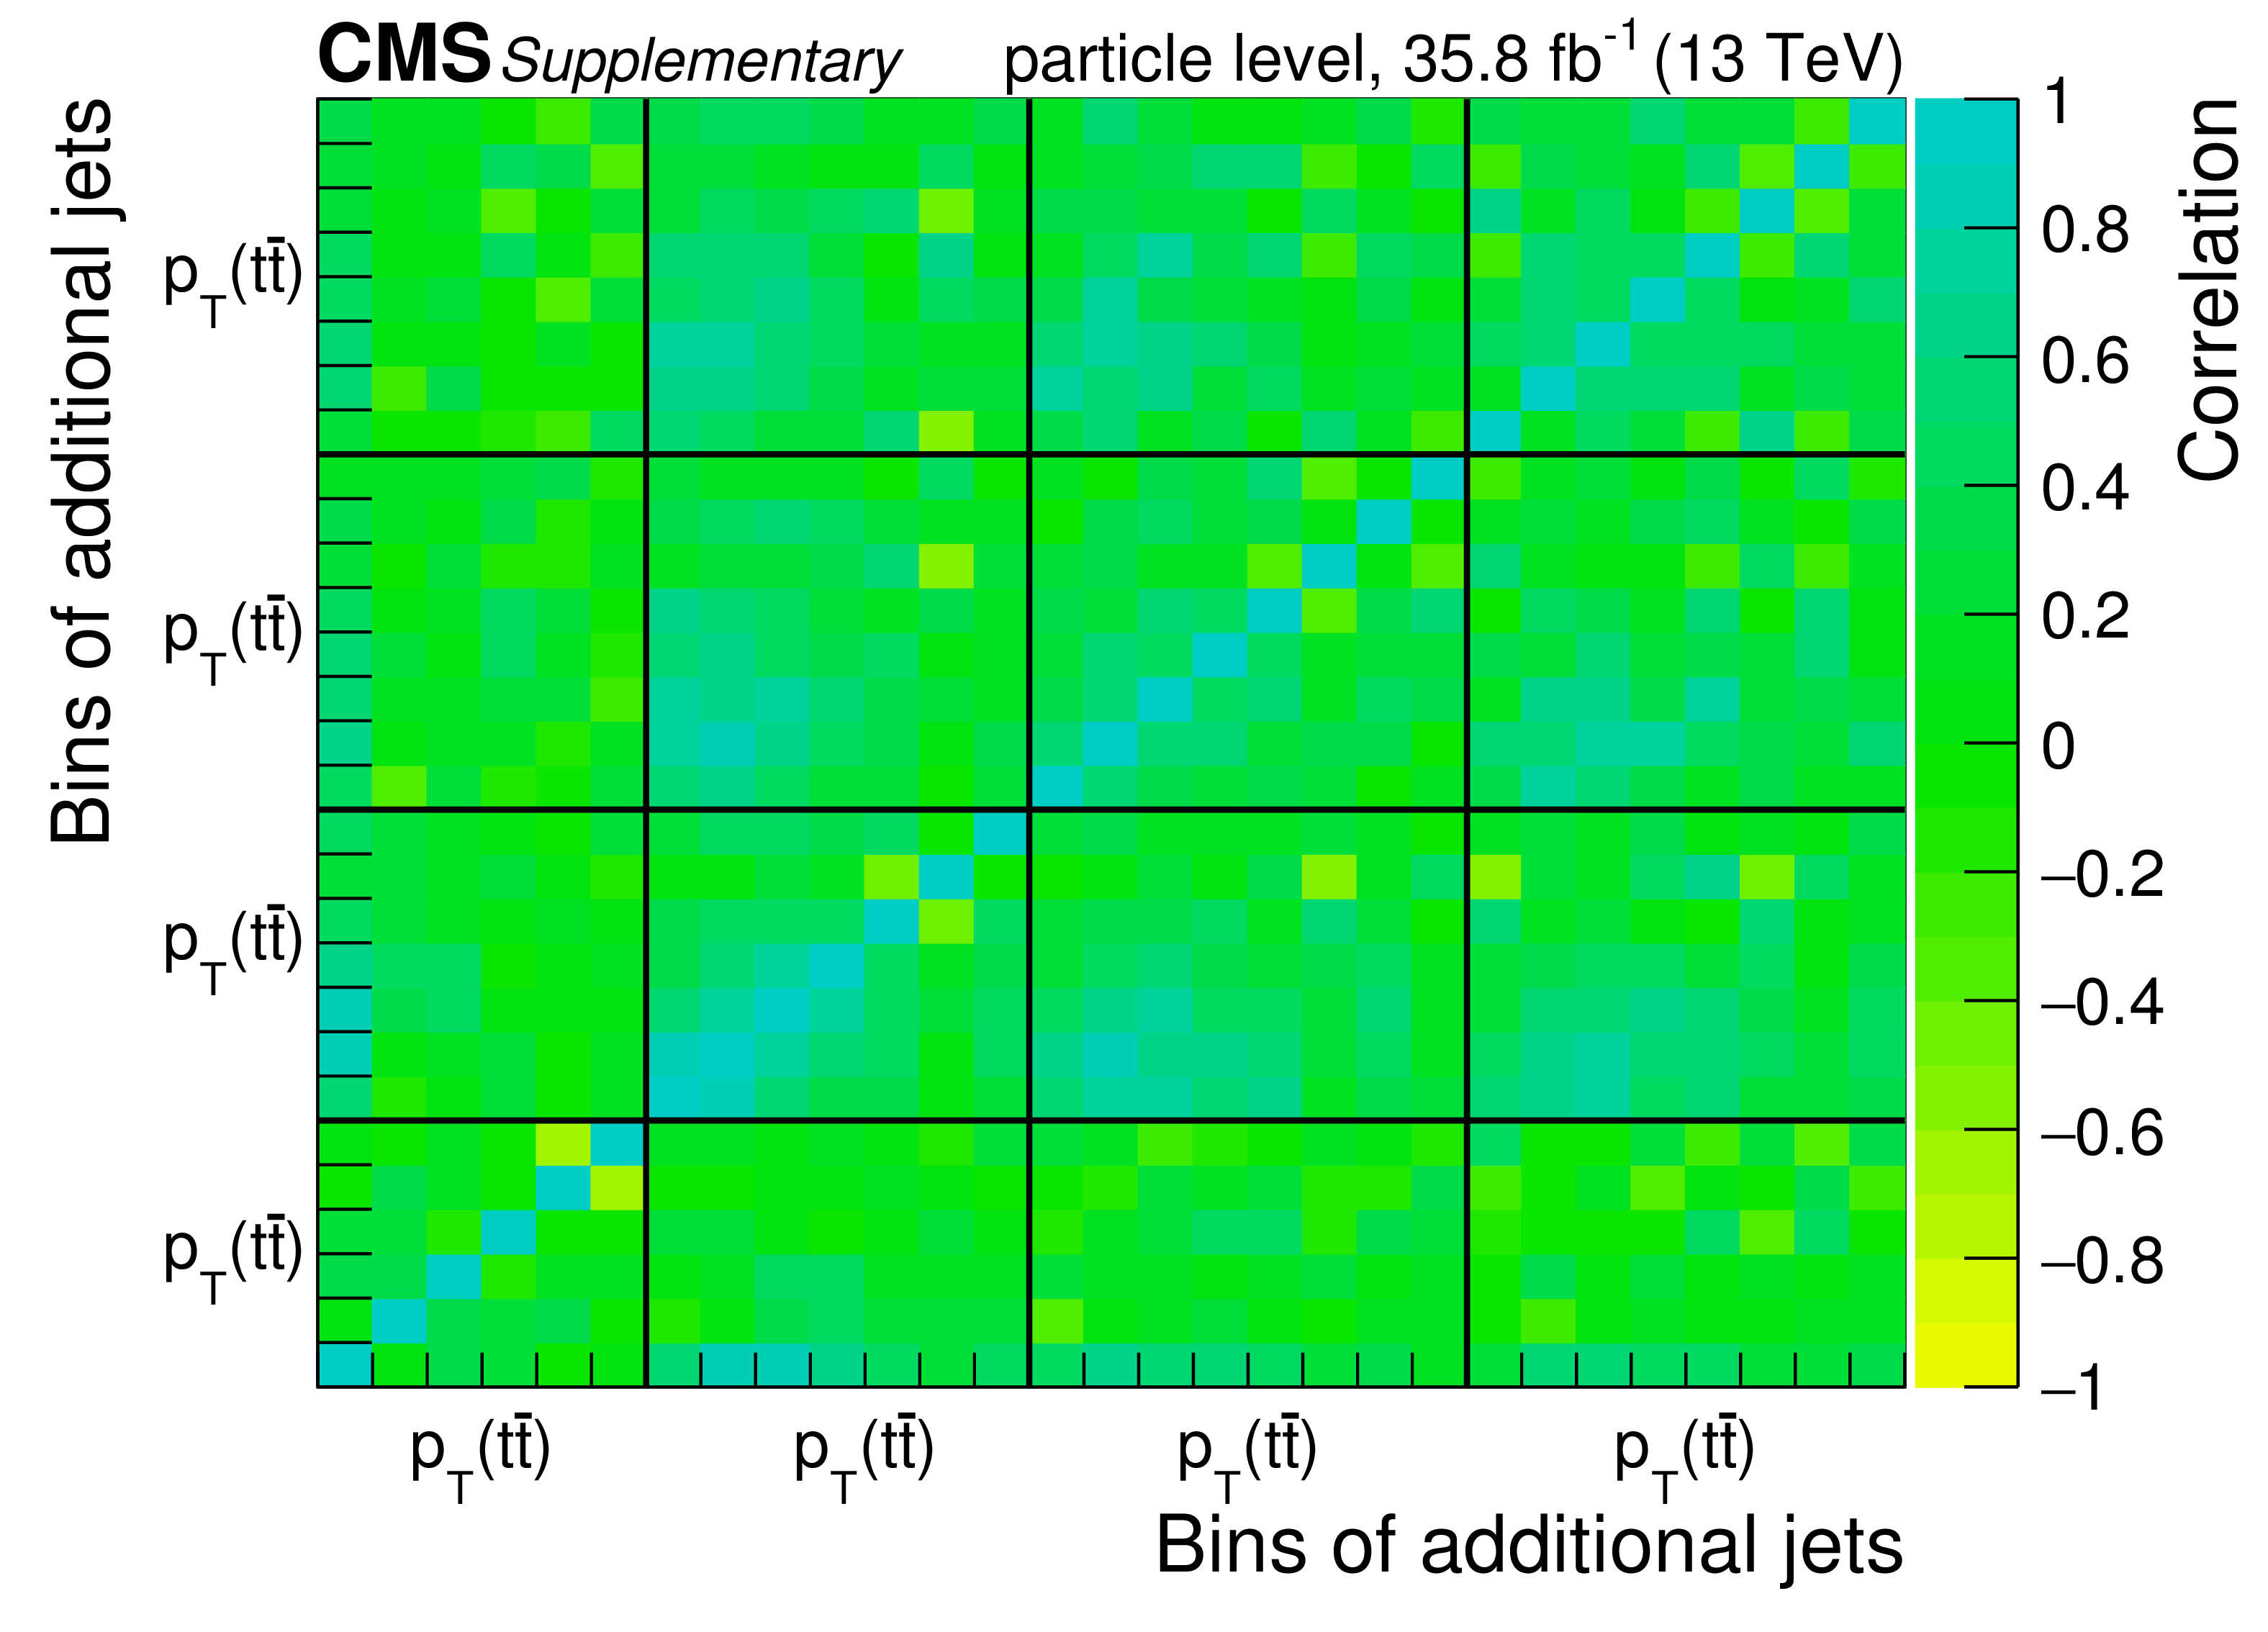
png pdf |
Additional Figure 2-f:
Correlations among the bins in the double-differential cross section measurements at particle level. |
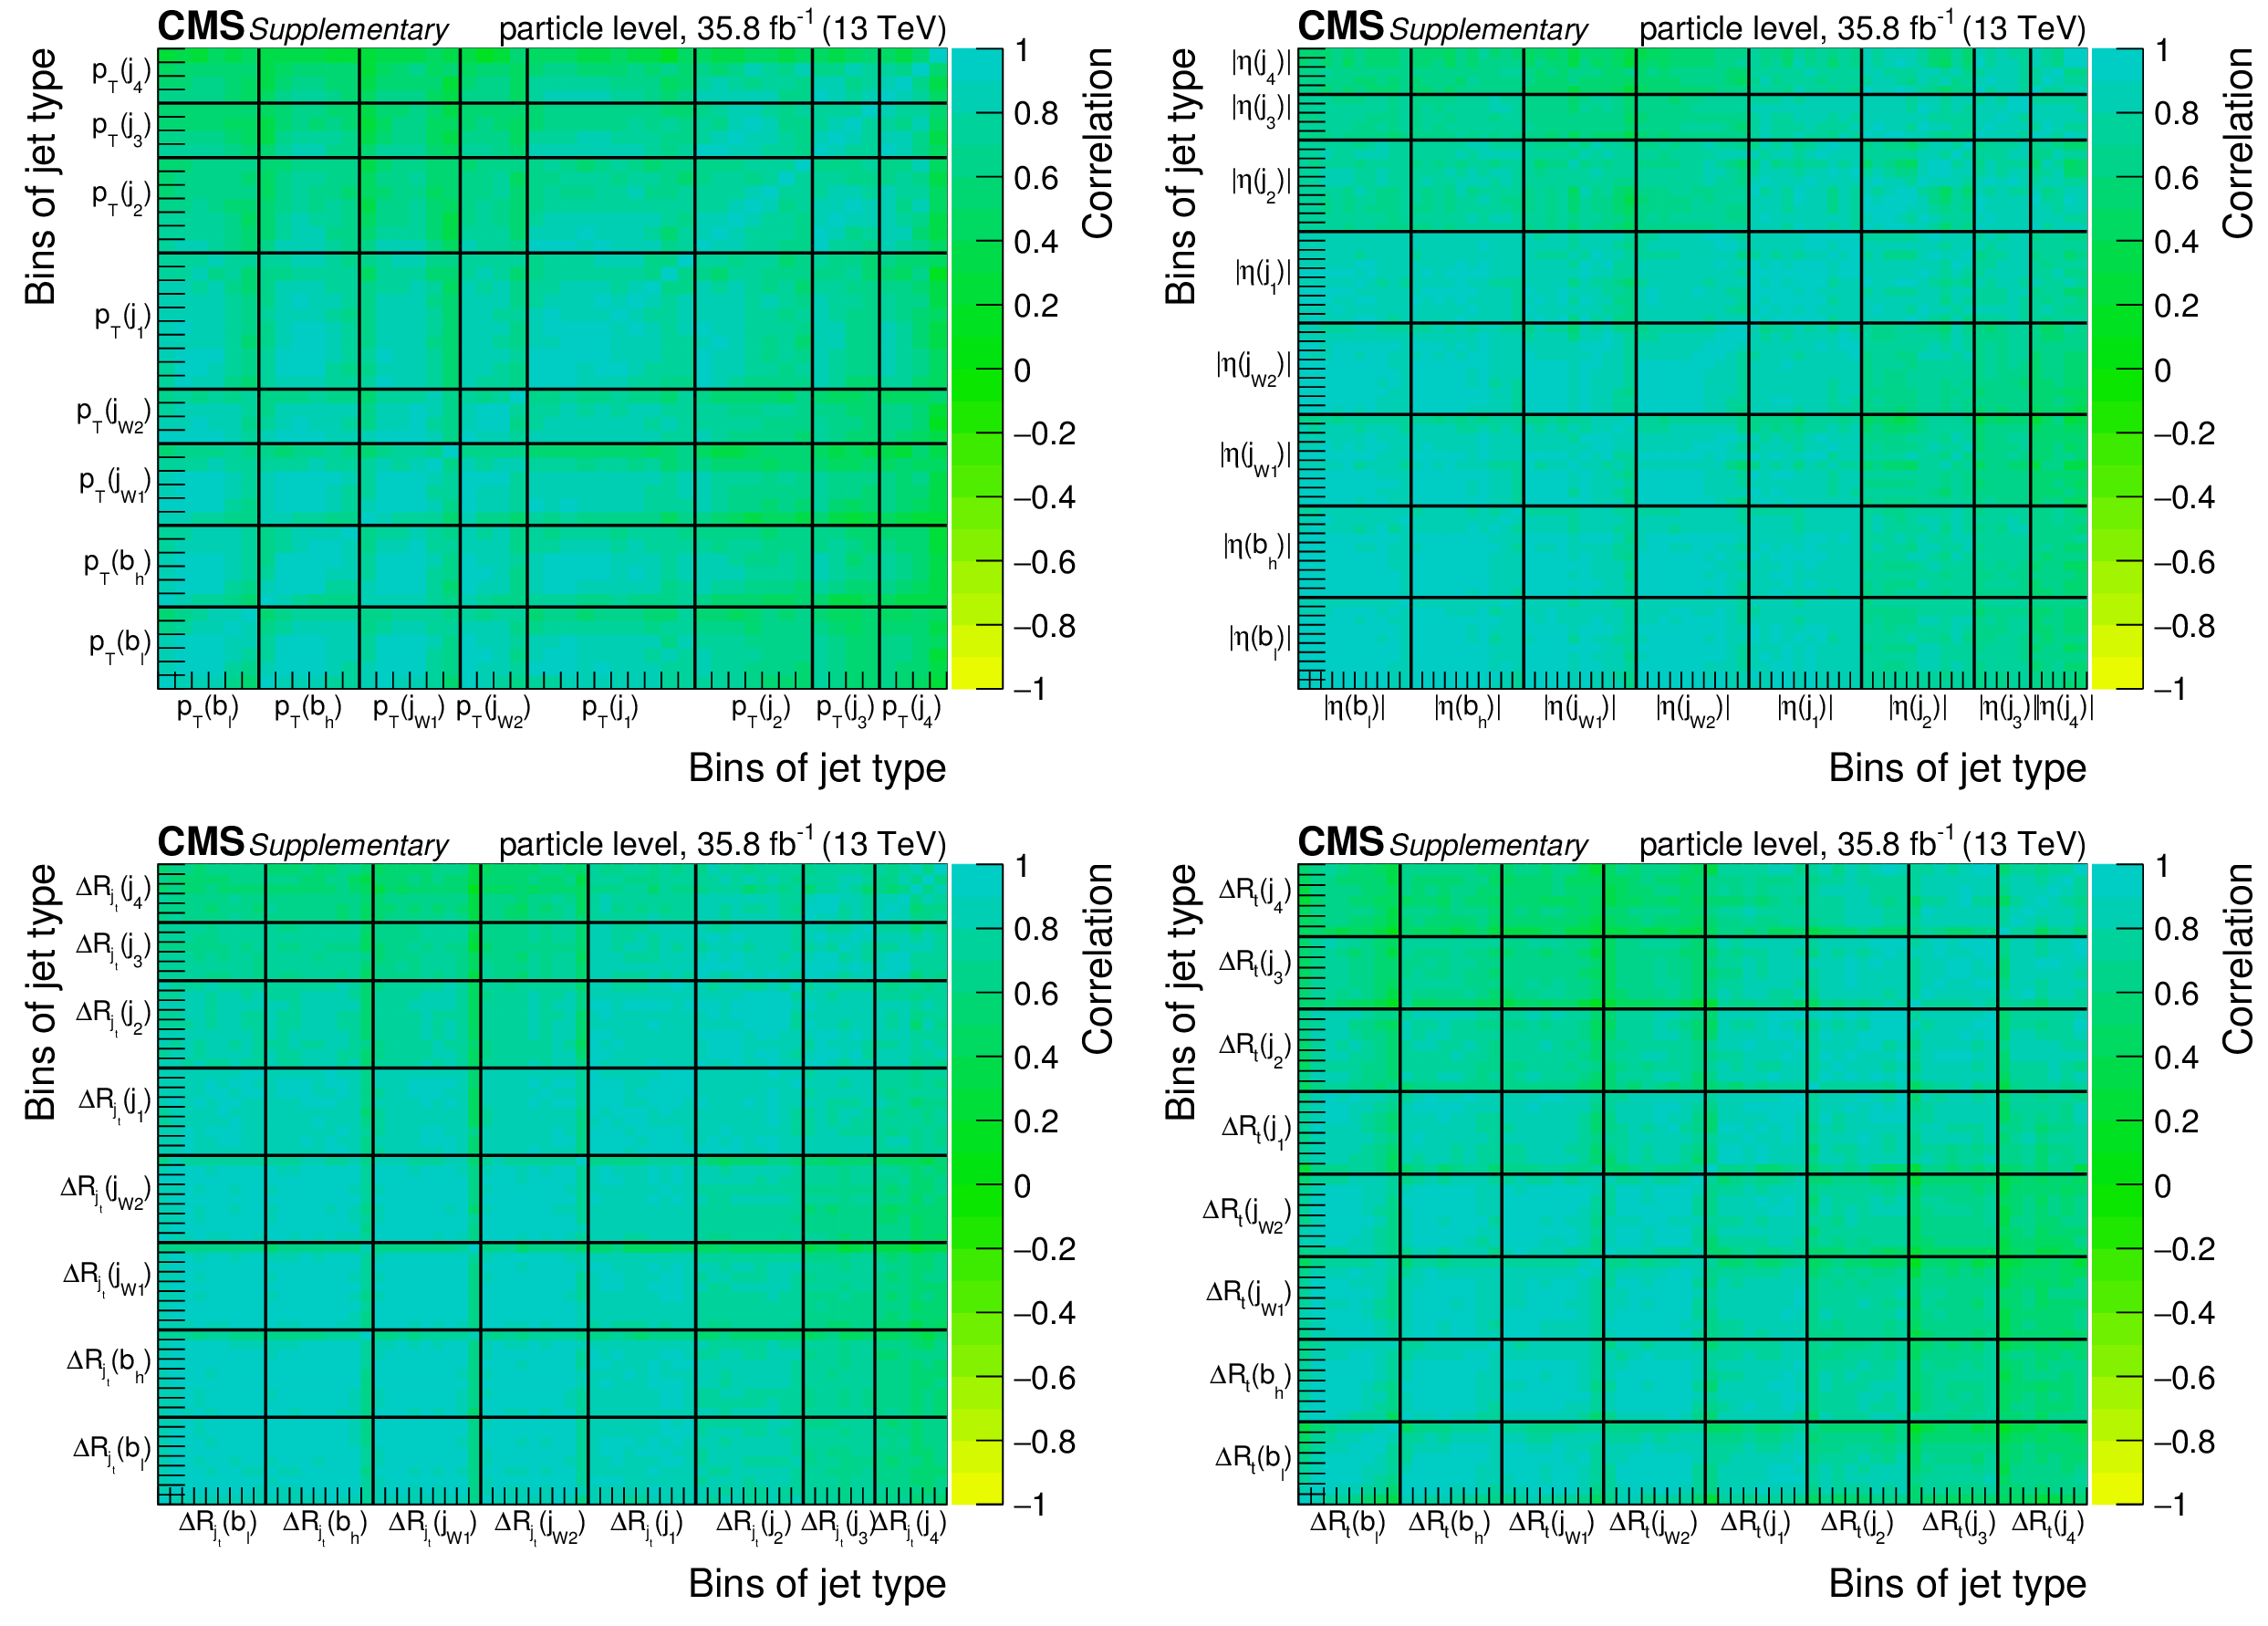
png pdf |
Additional Figure 3:
Correlations among the bins in the cross section measurements of jet kinematical properties at particle level. |

png pdf |
Additional Figure 3-a:
Correlations among the bins in the cross section measurements of jet kinematical properties at particle level. |

png pdf |
Additional Figure 3-b:
Correlations among the bins in the cross section measurements of jet kinematical properties at particle level. |
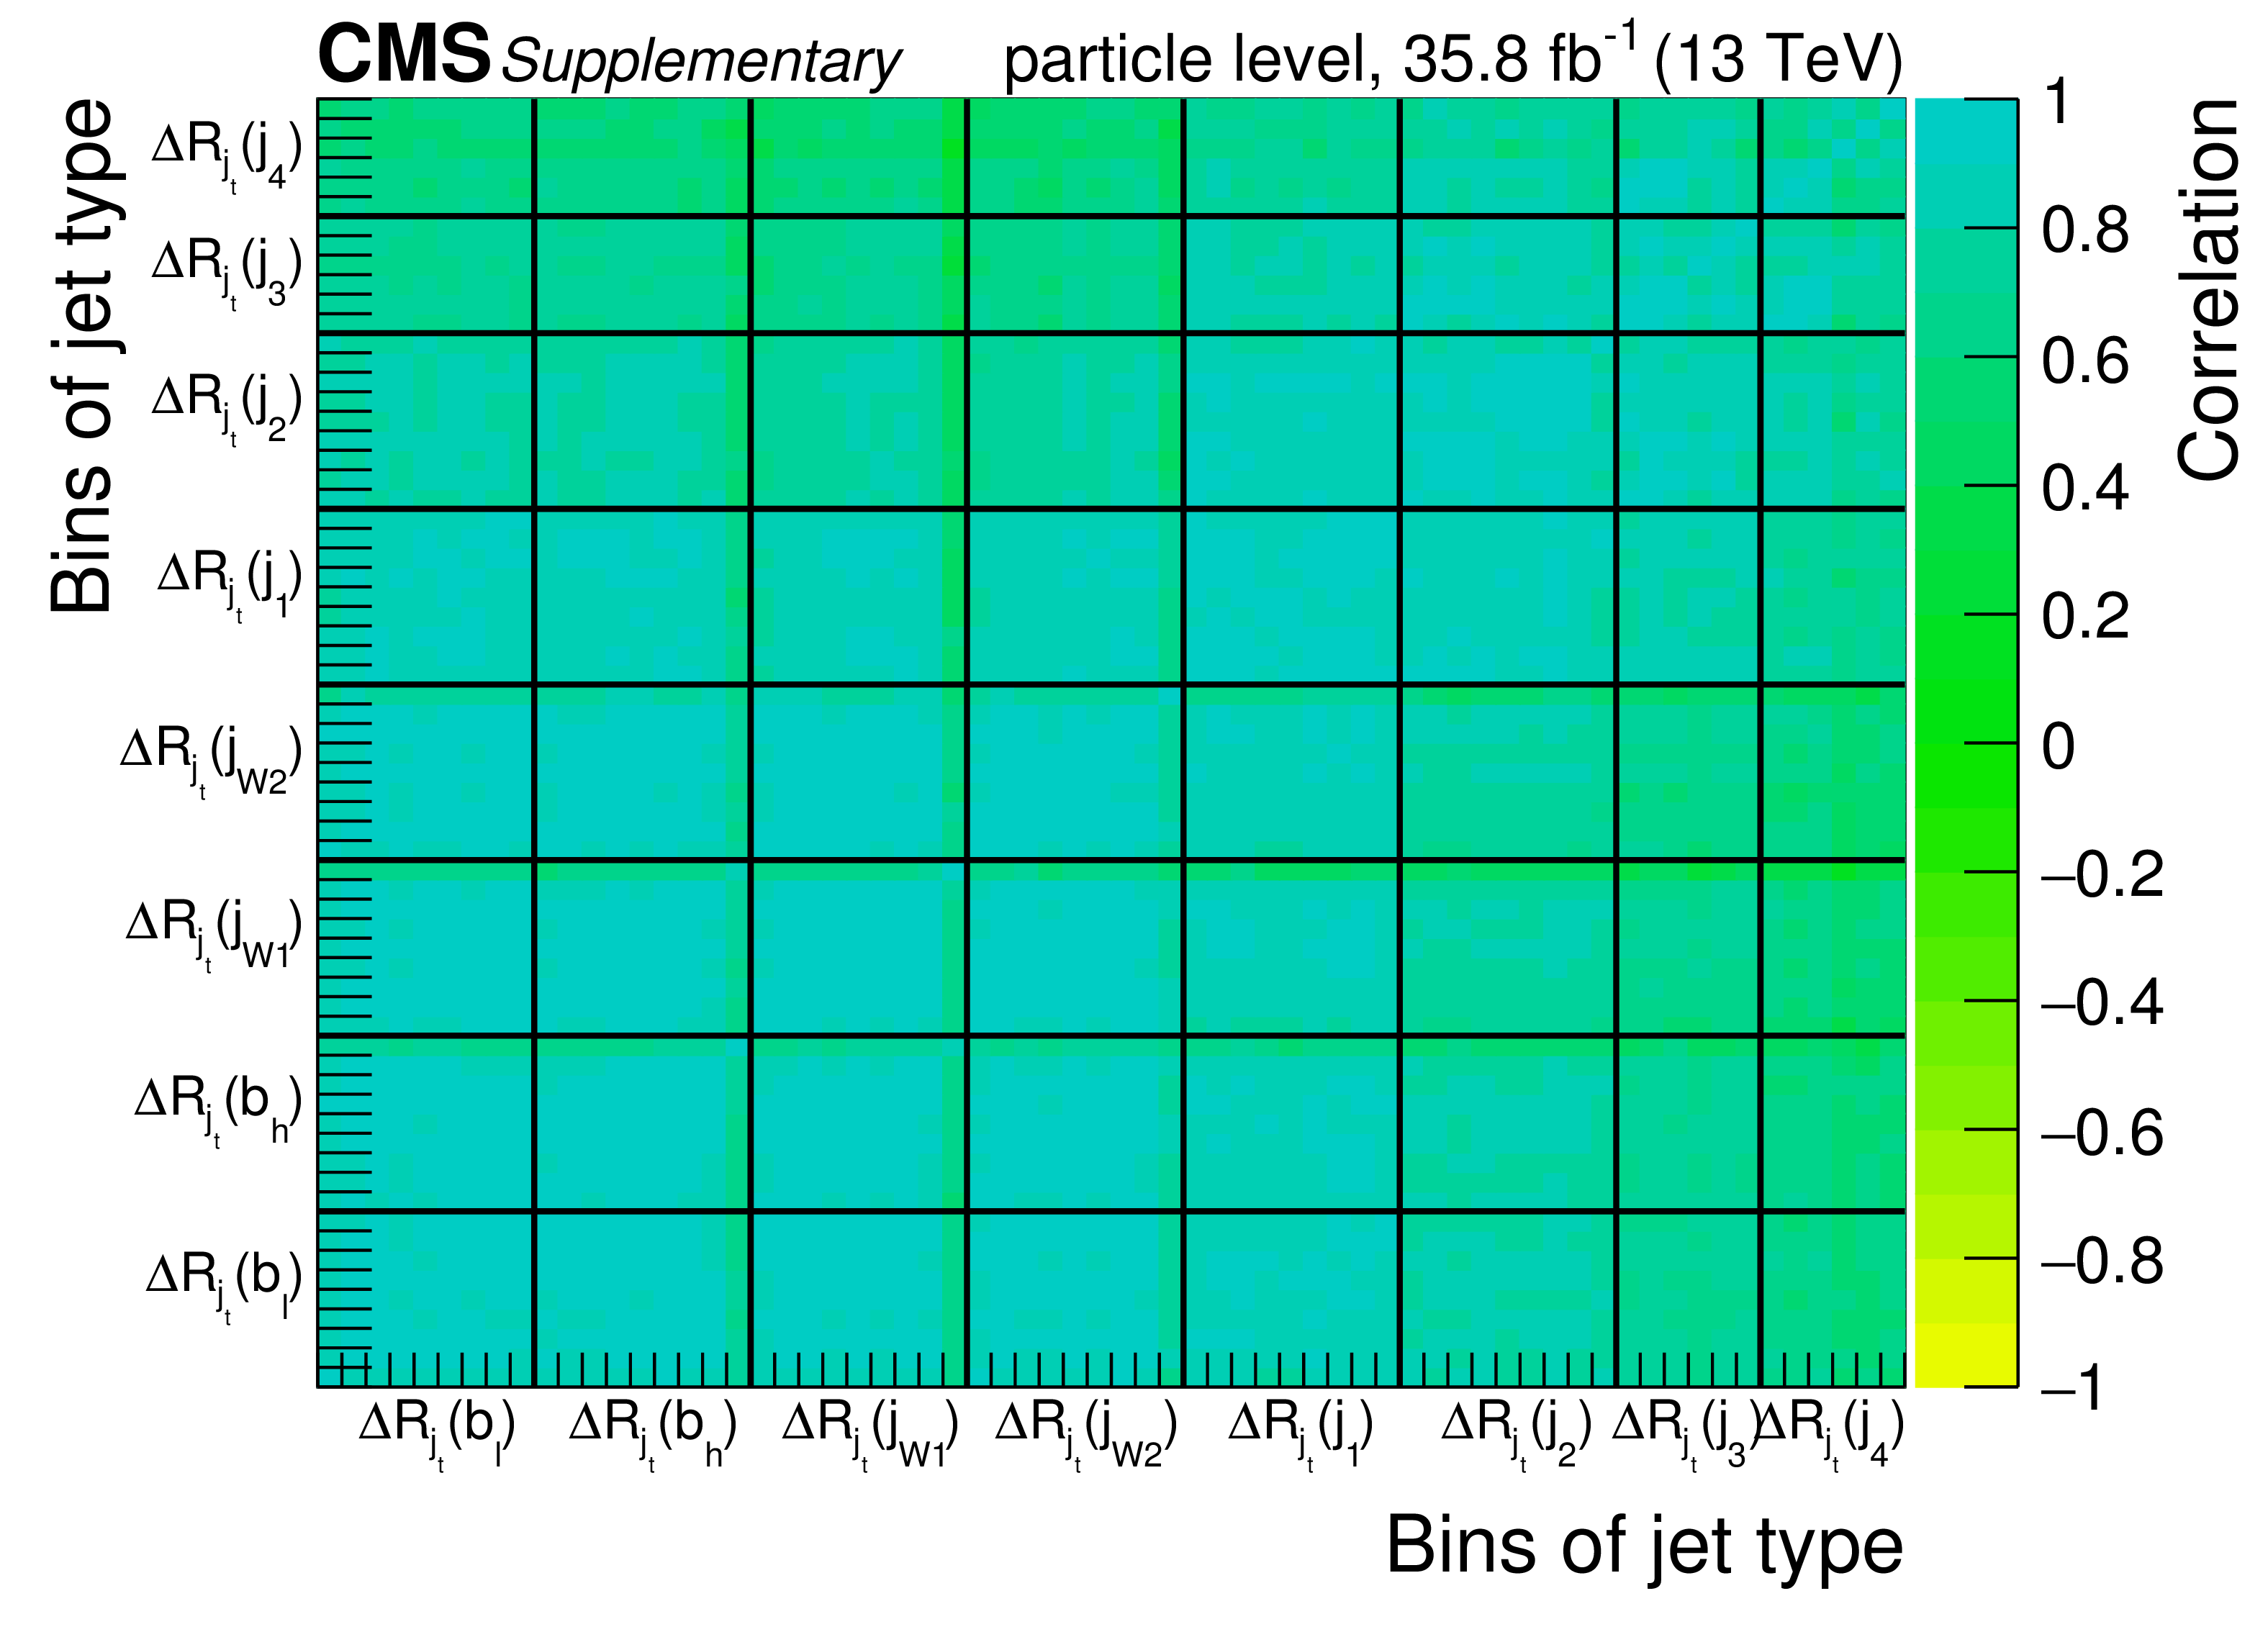
png pdf |
Additional Figure 3-c:
Correlations among the bins in the cross section measurements of jet kinematical properties at particle level. |

png pdf |
Additional Figure 3-d:
Correlations among the bins in the cross section measurements of jet kinematical properties at particle level. |

png pdf |
Additional Figure 4:
Correlations among the bins in the differential cross section measurements at parton level. |
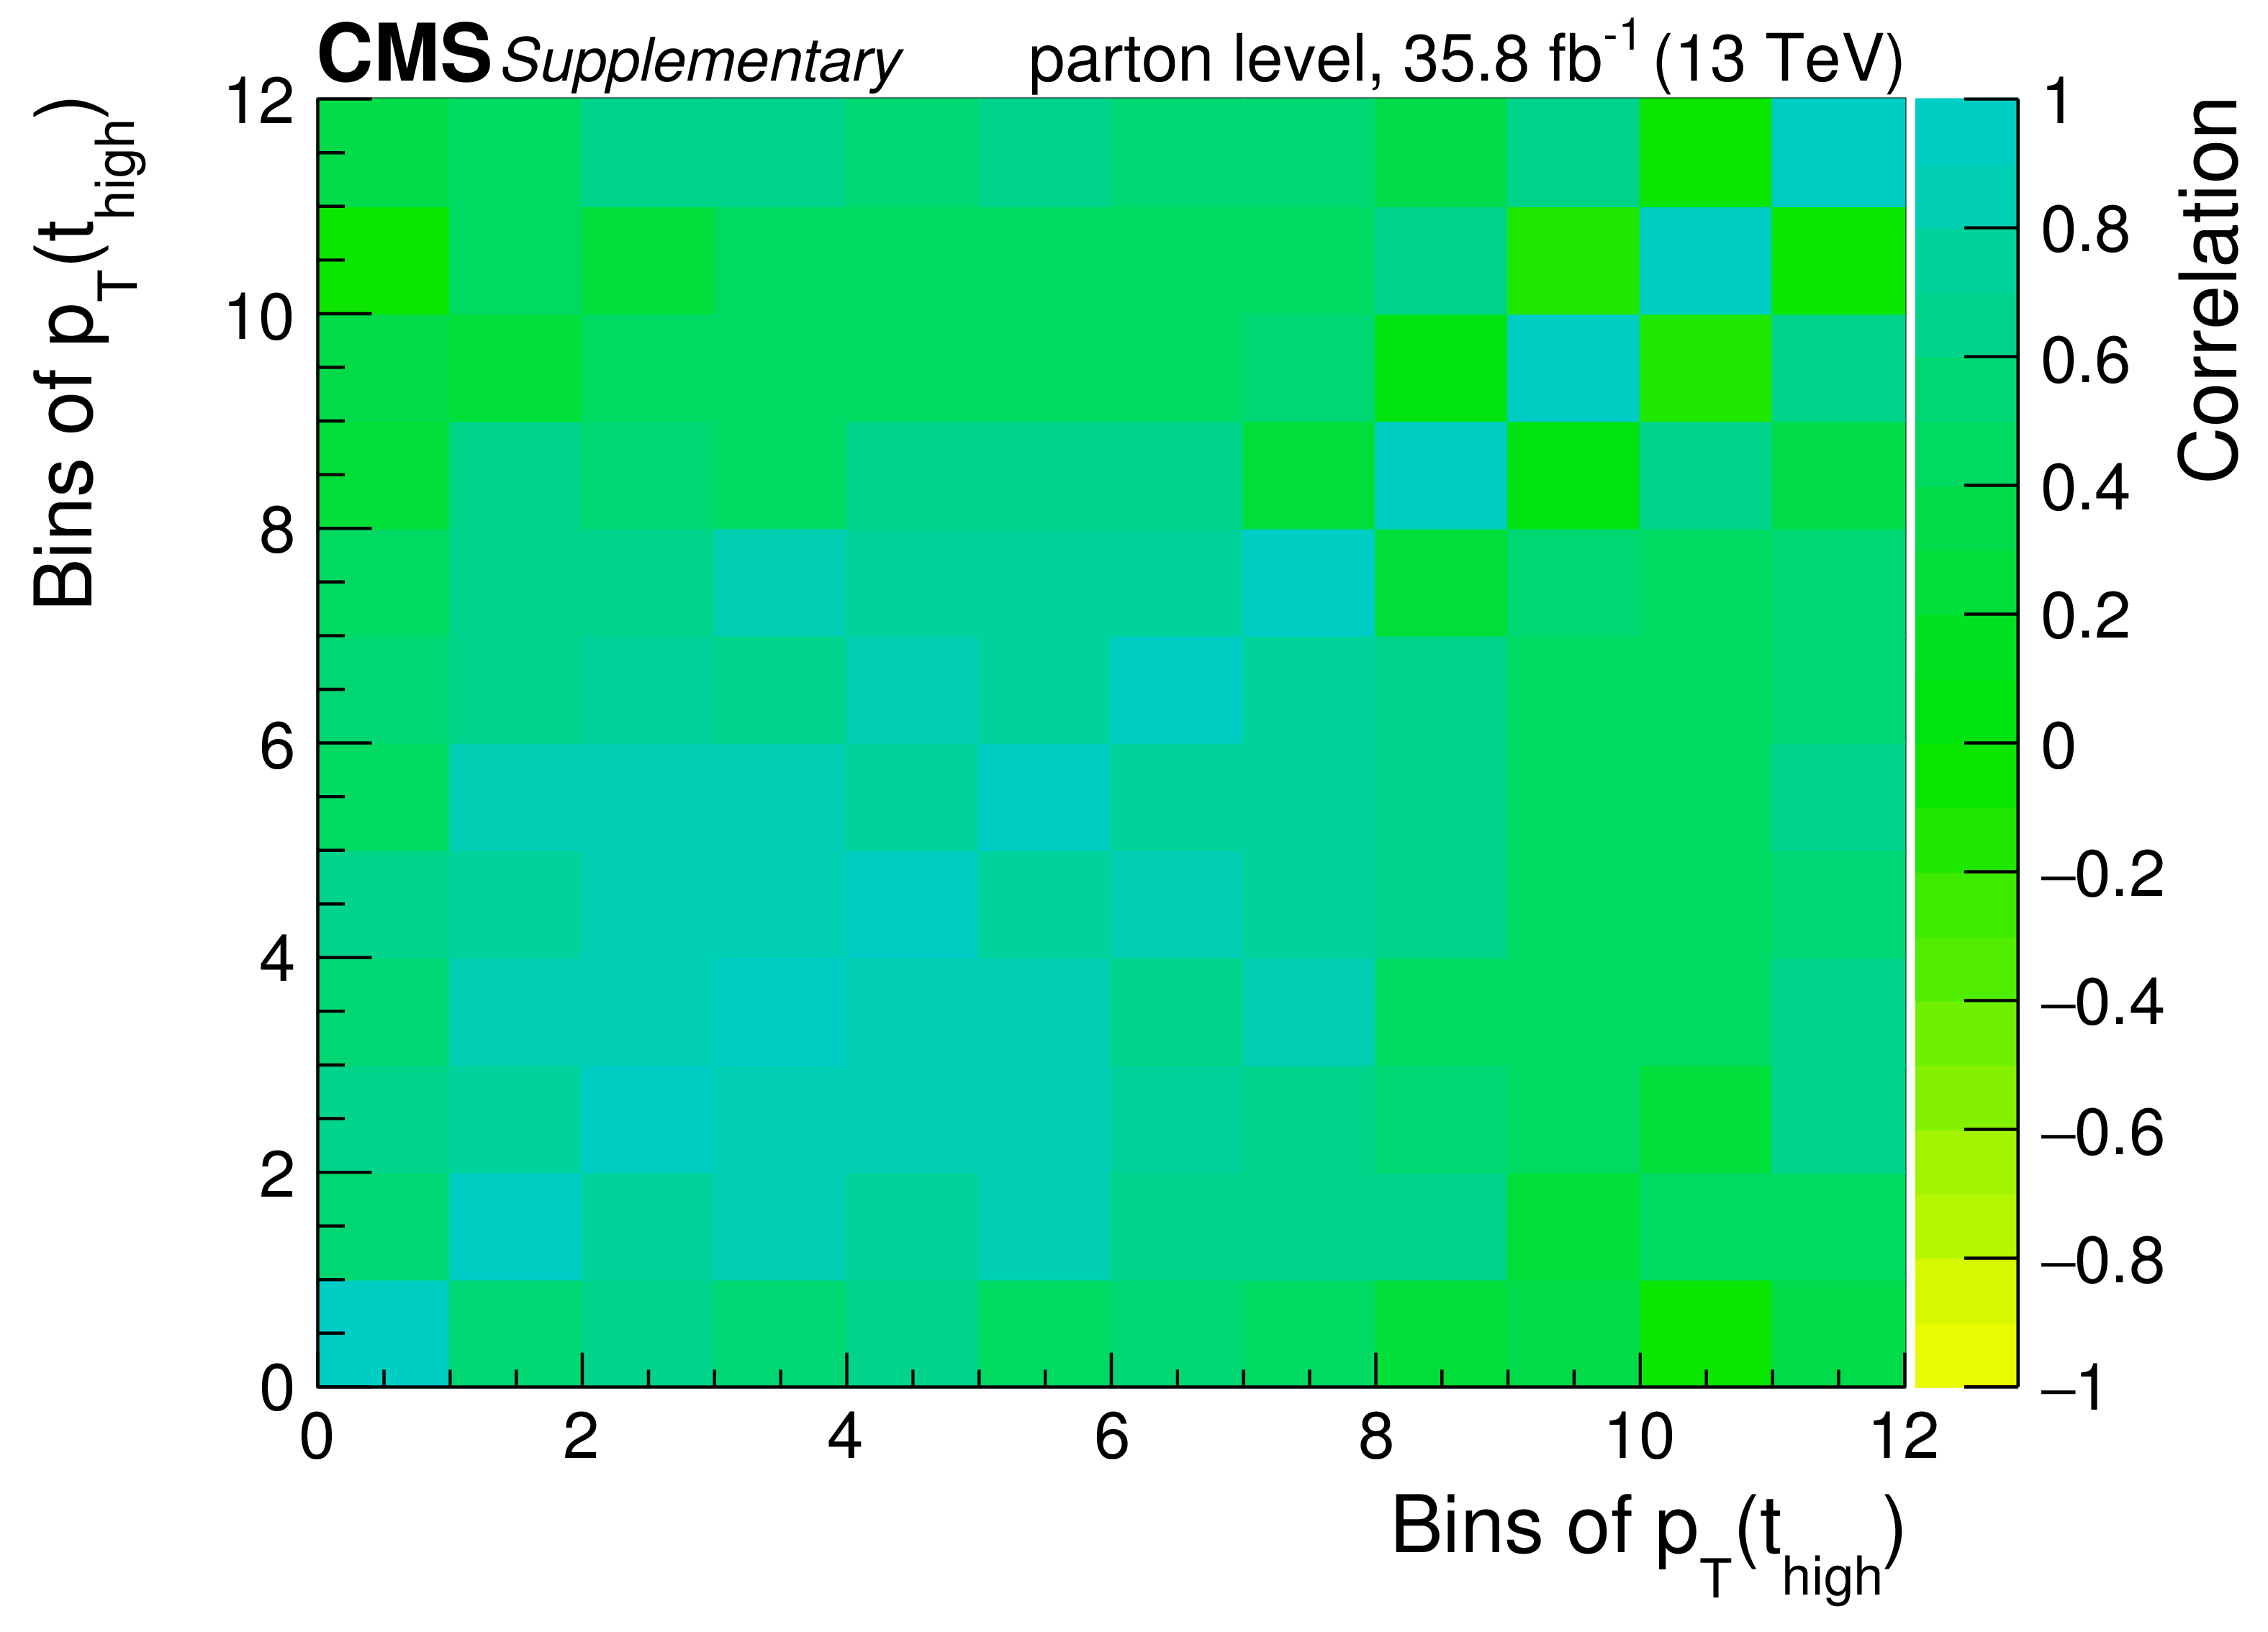
png pdf |
Additional Figure 4-a:
Correlations among the bins in the differential cross section measurements at parton level. |
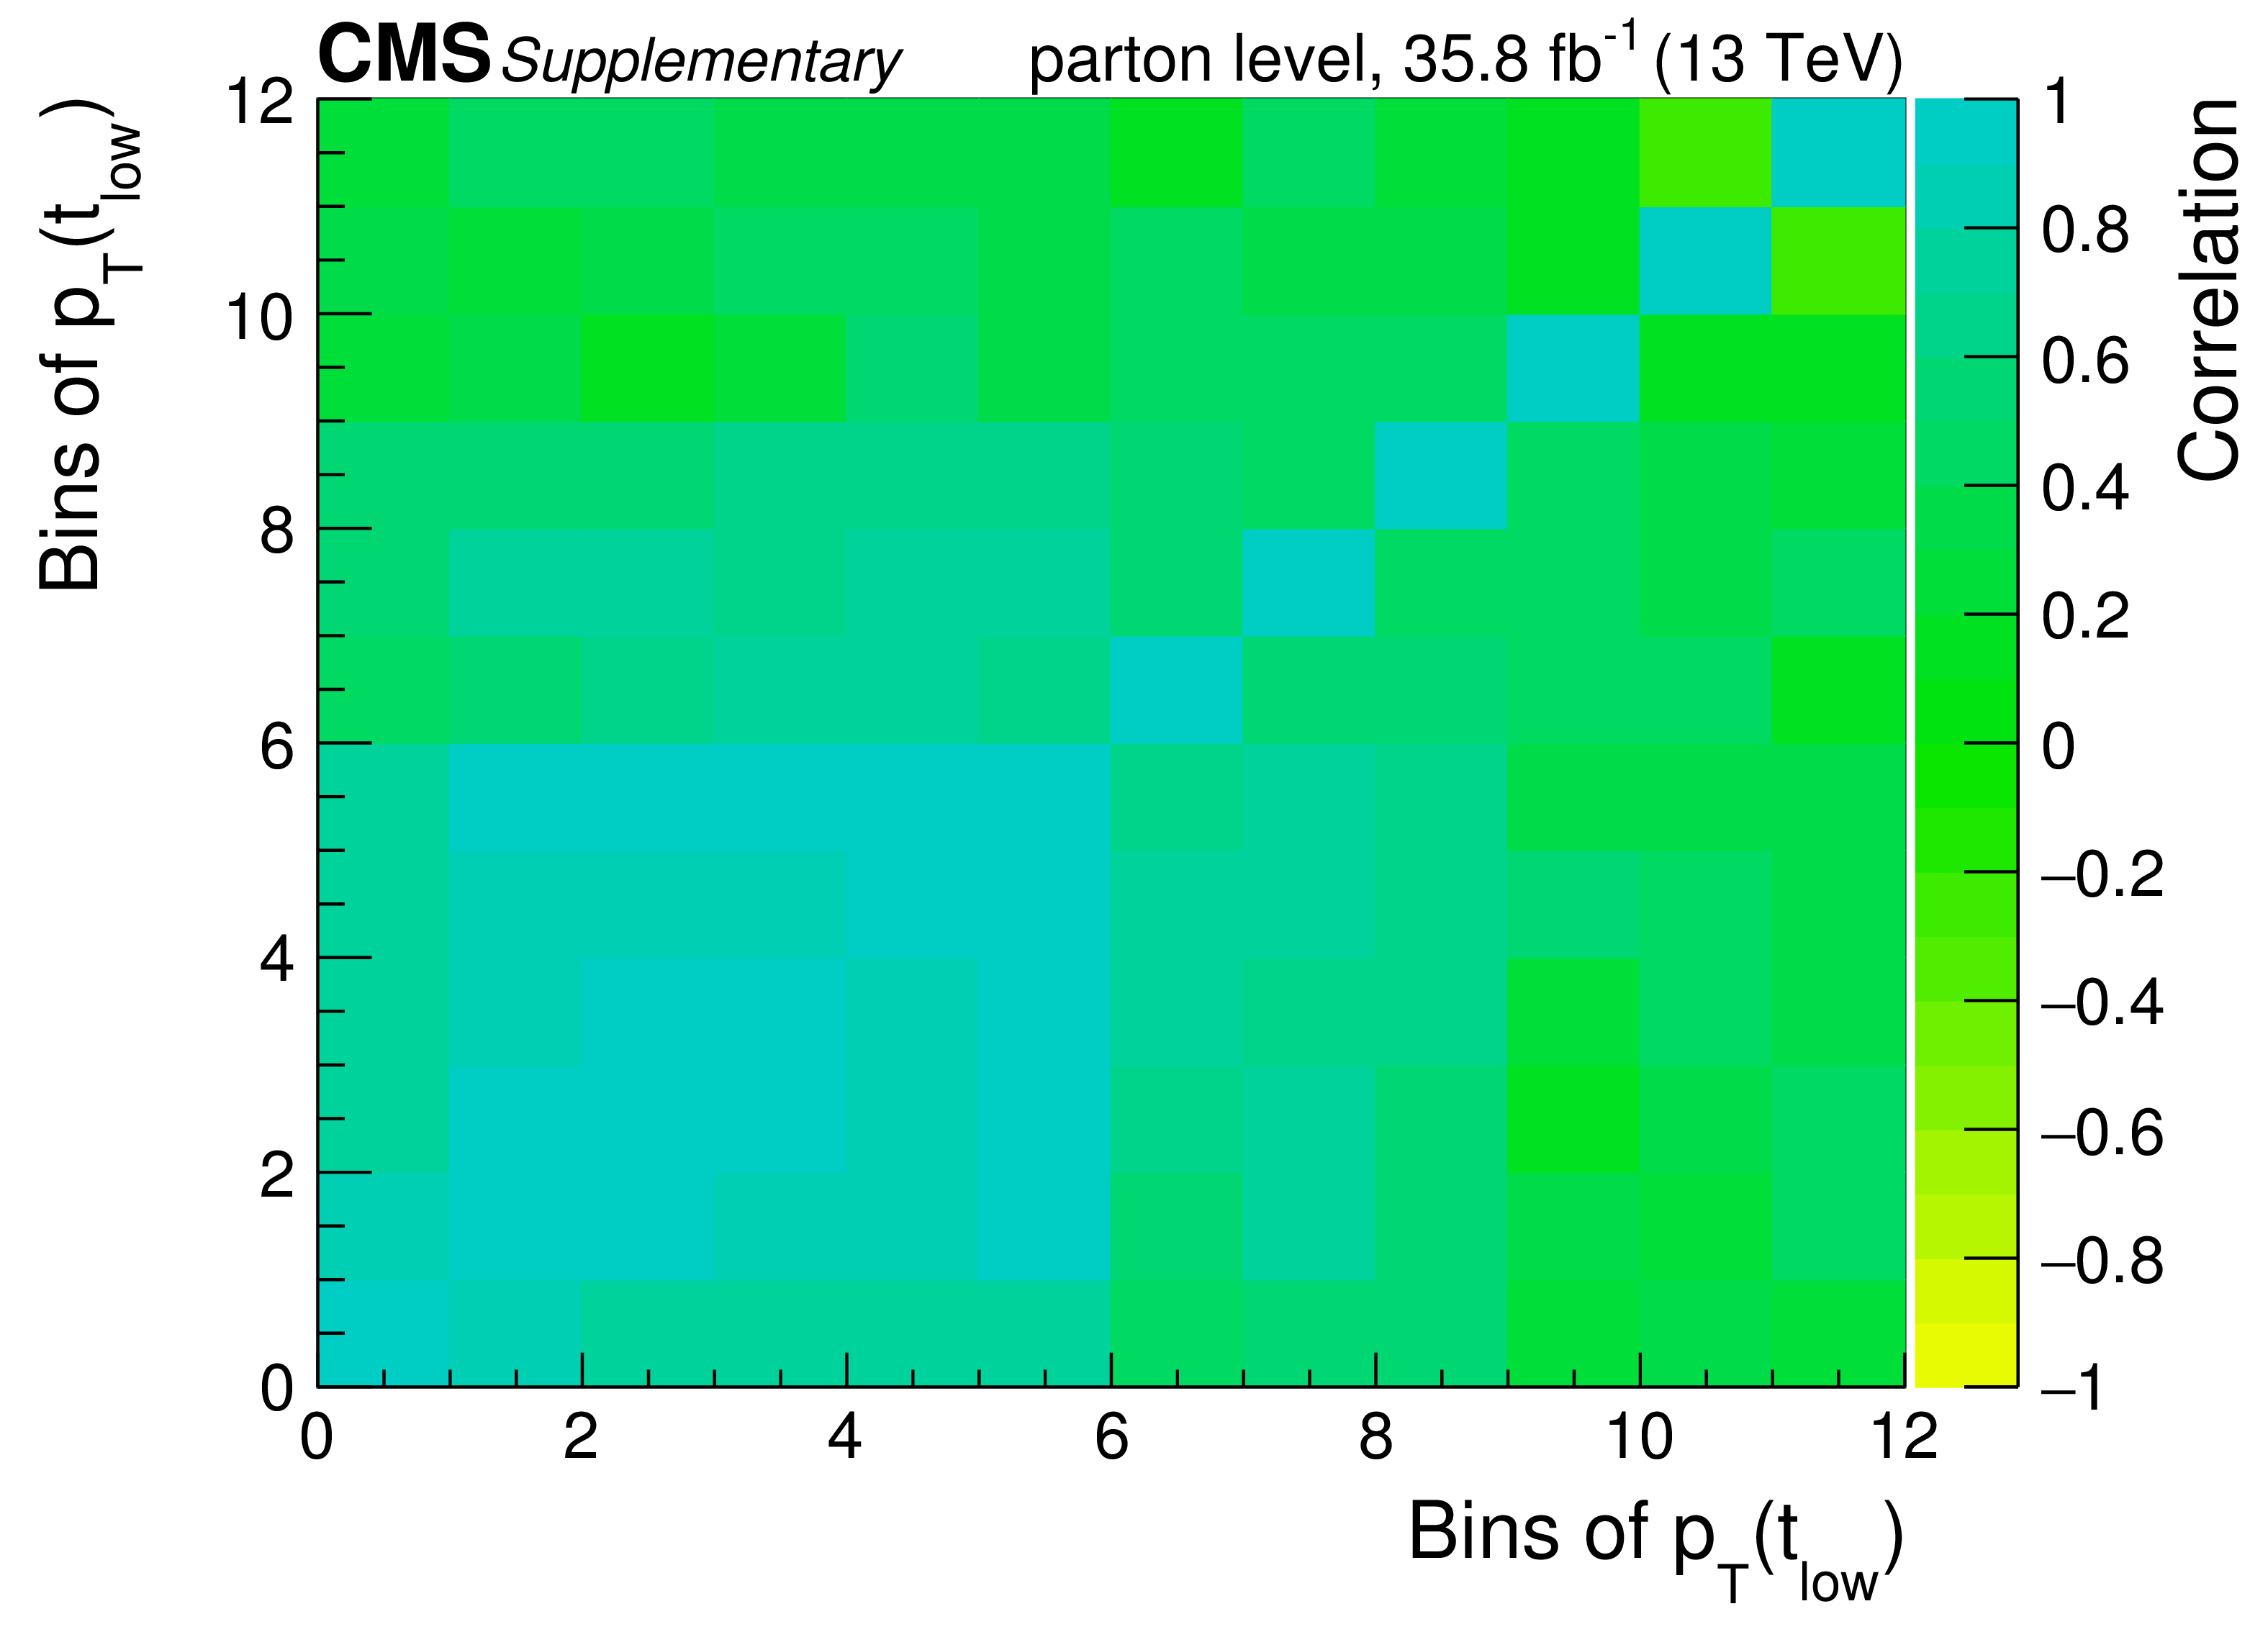
png pdf |
Additional Figure 4-b:
Correlations among the bins in the differential cross section measurements at parton level. |
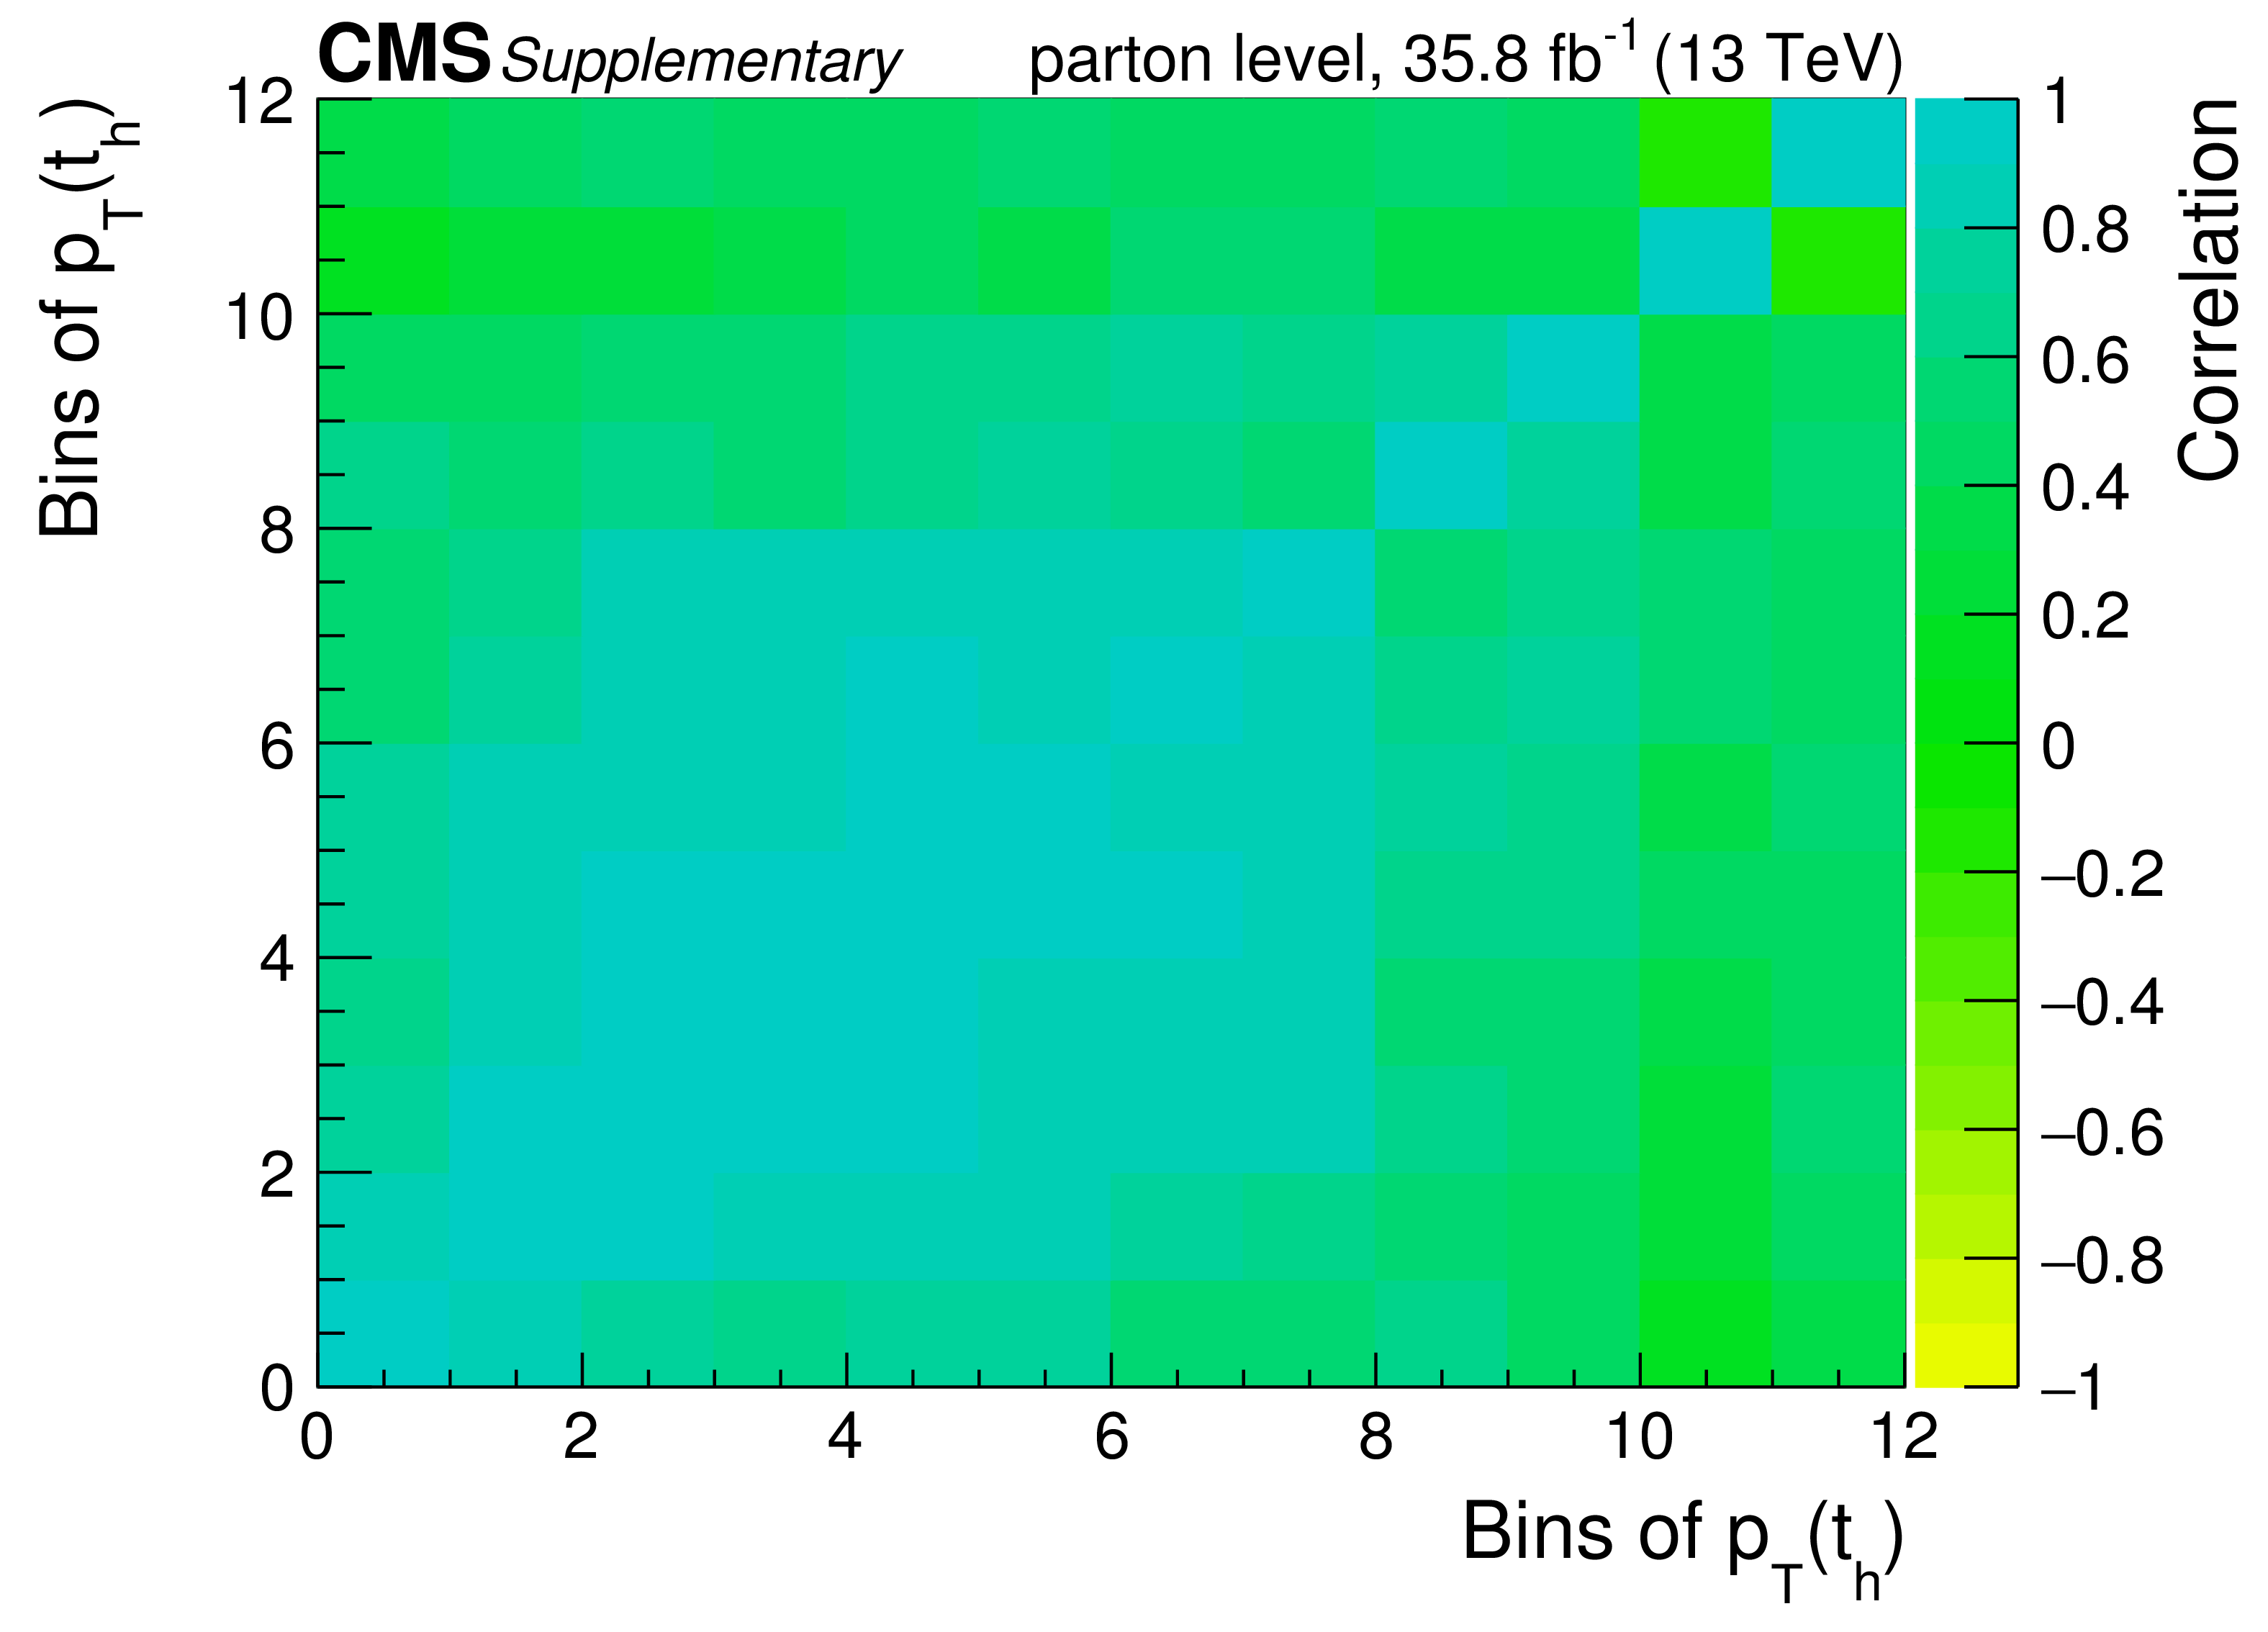
png pdf |
Additional Figure 4-c:
Correlations among the bins in the differential cross section measurements at parton level. |
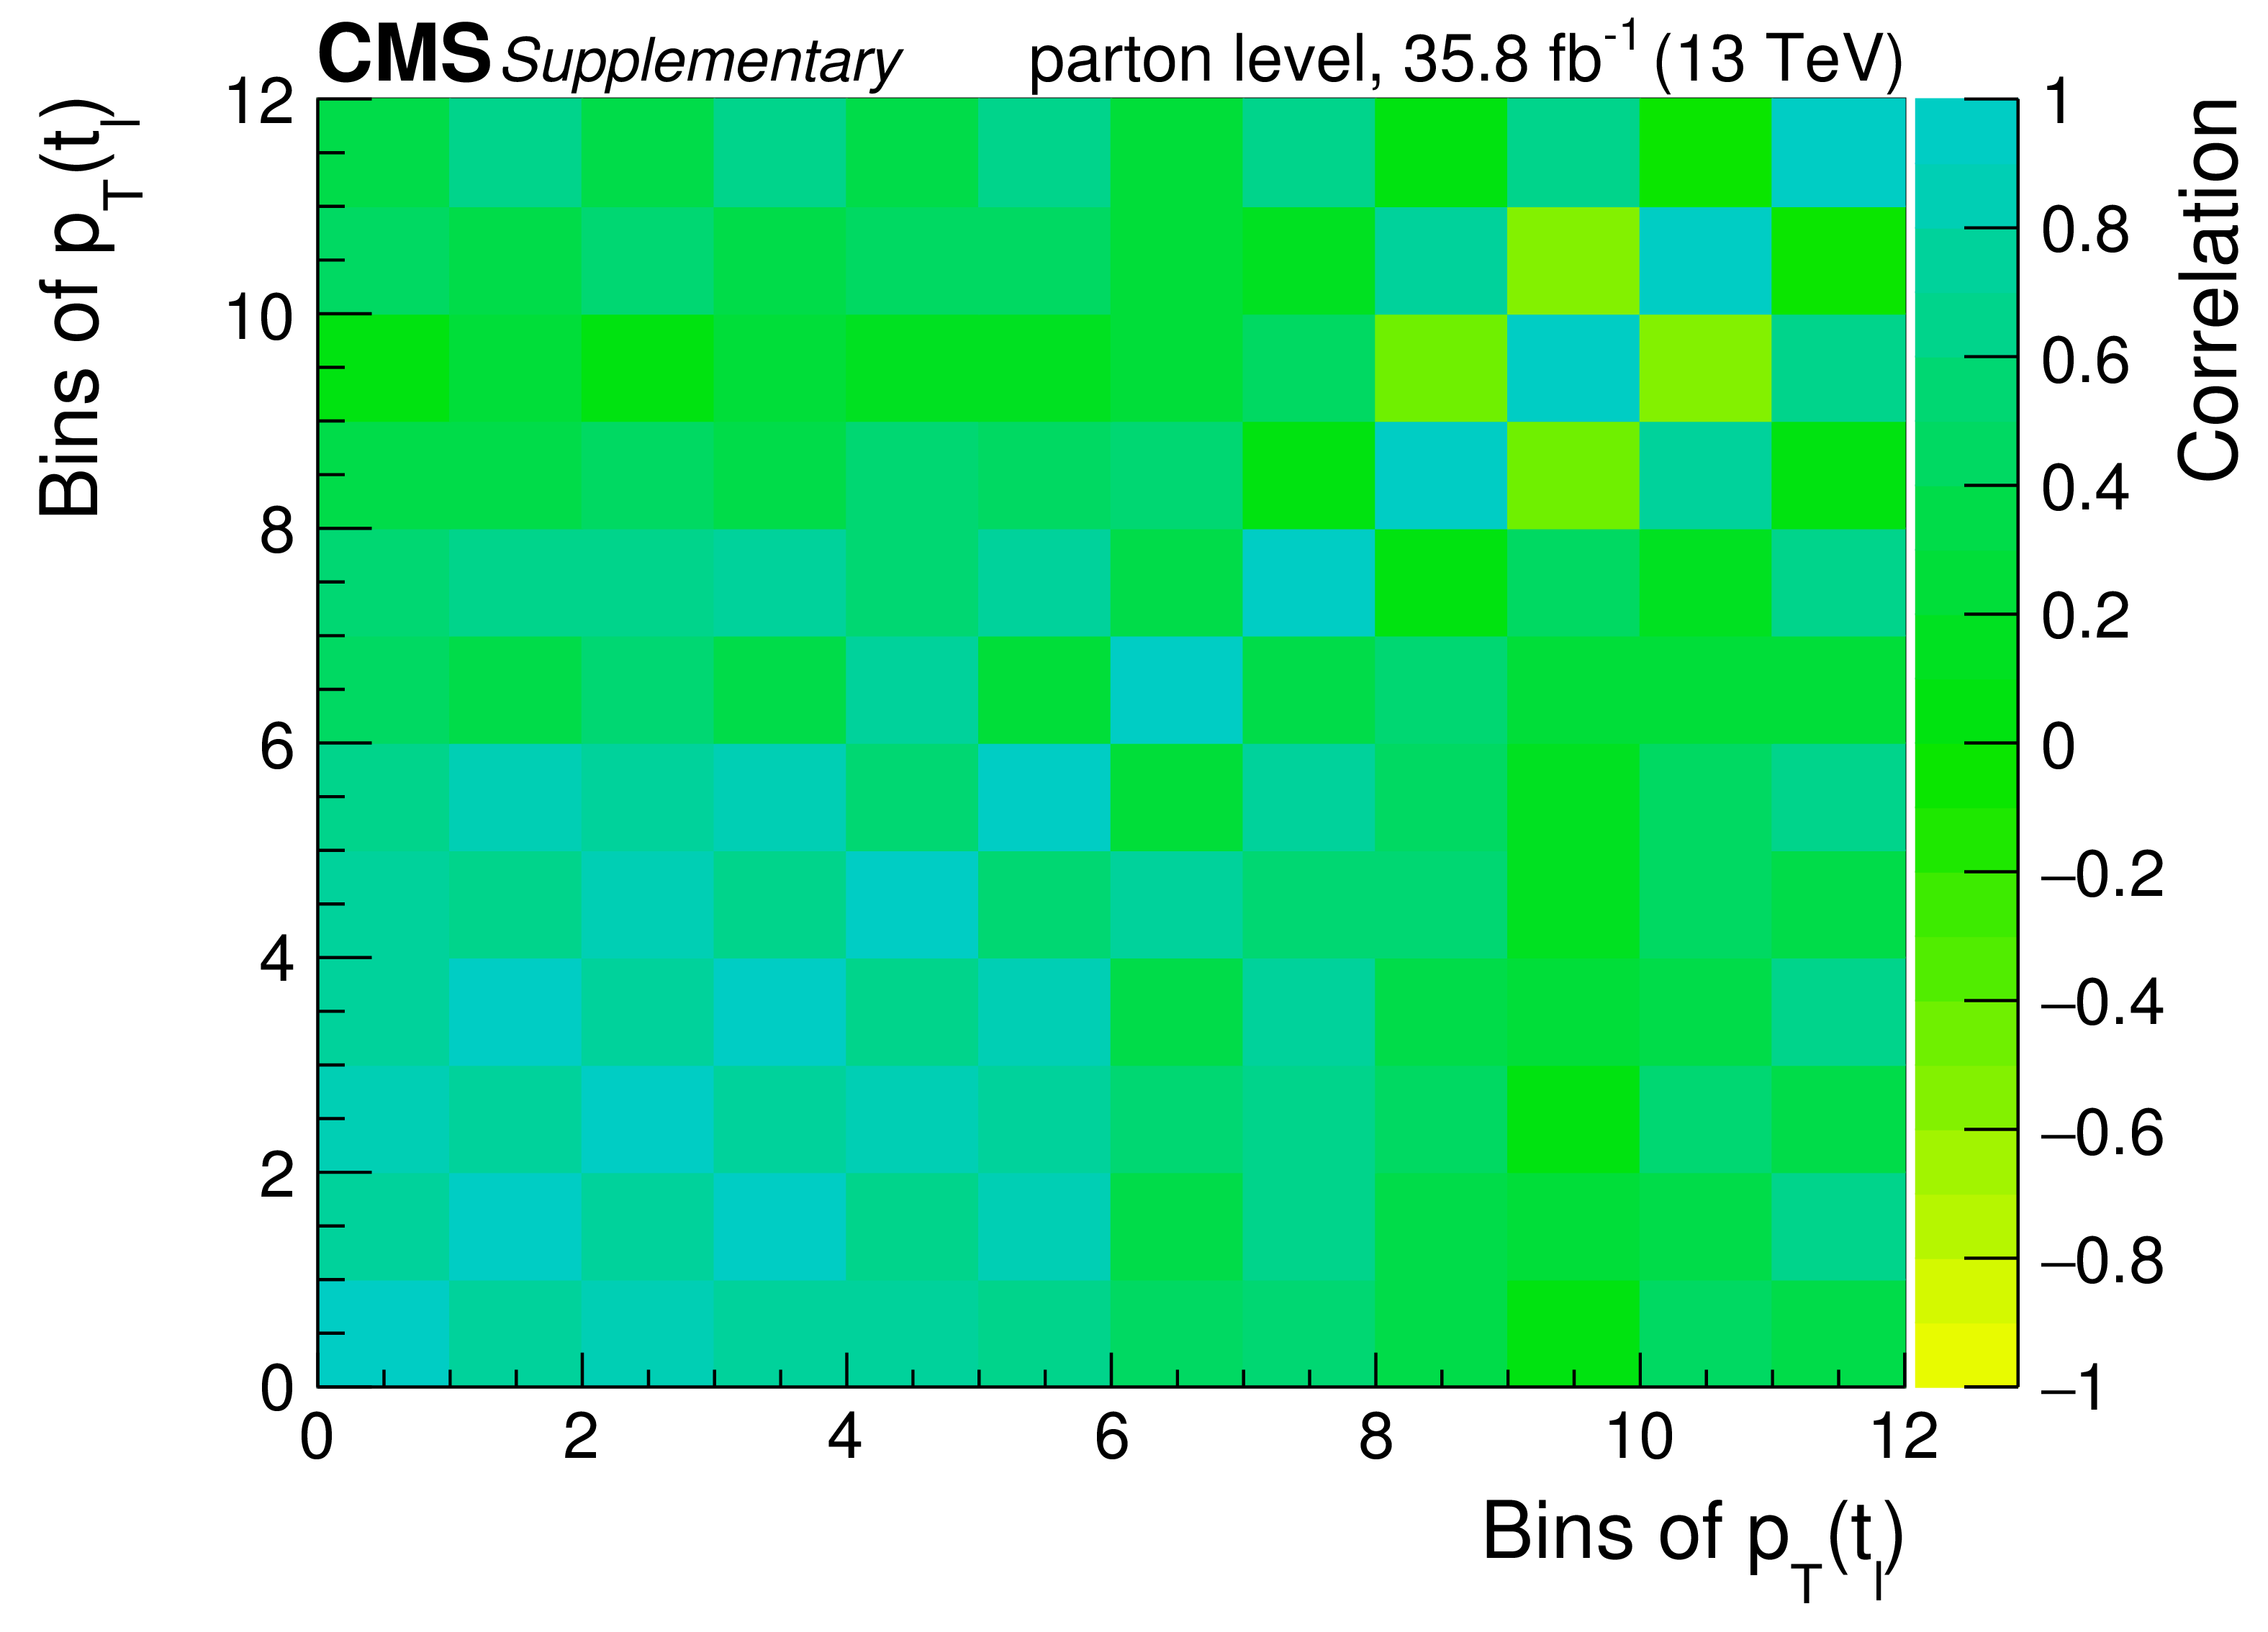
png pdf |
Additional Figure 4-d:
Correlations among the bins in the differential cross section measurements at parton level. |
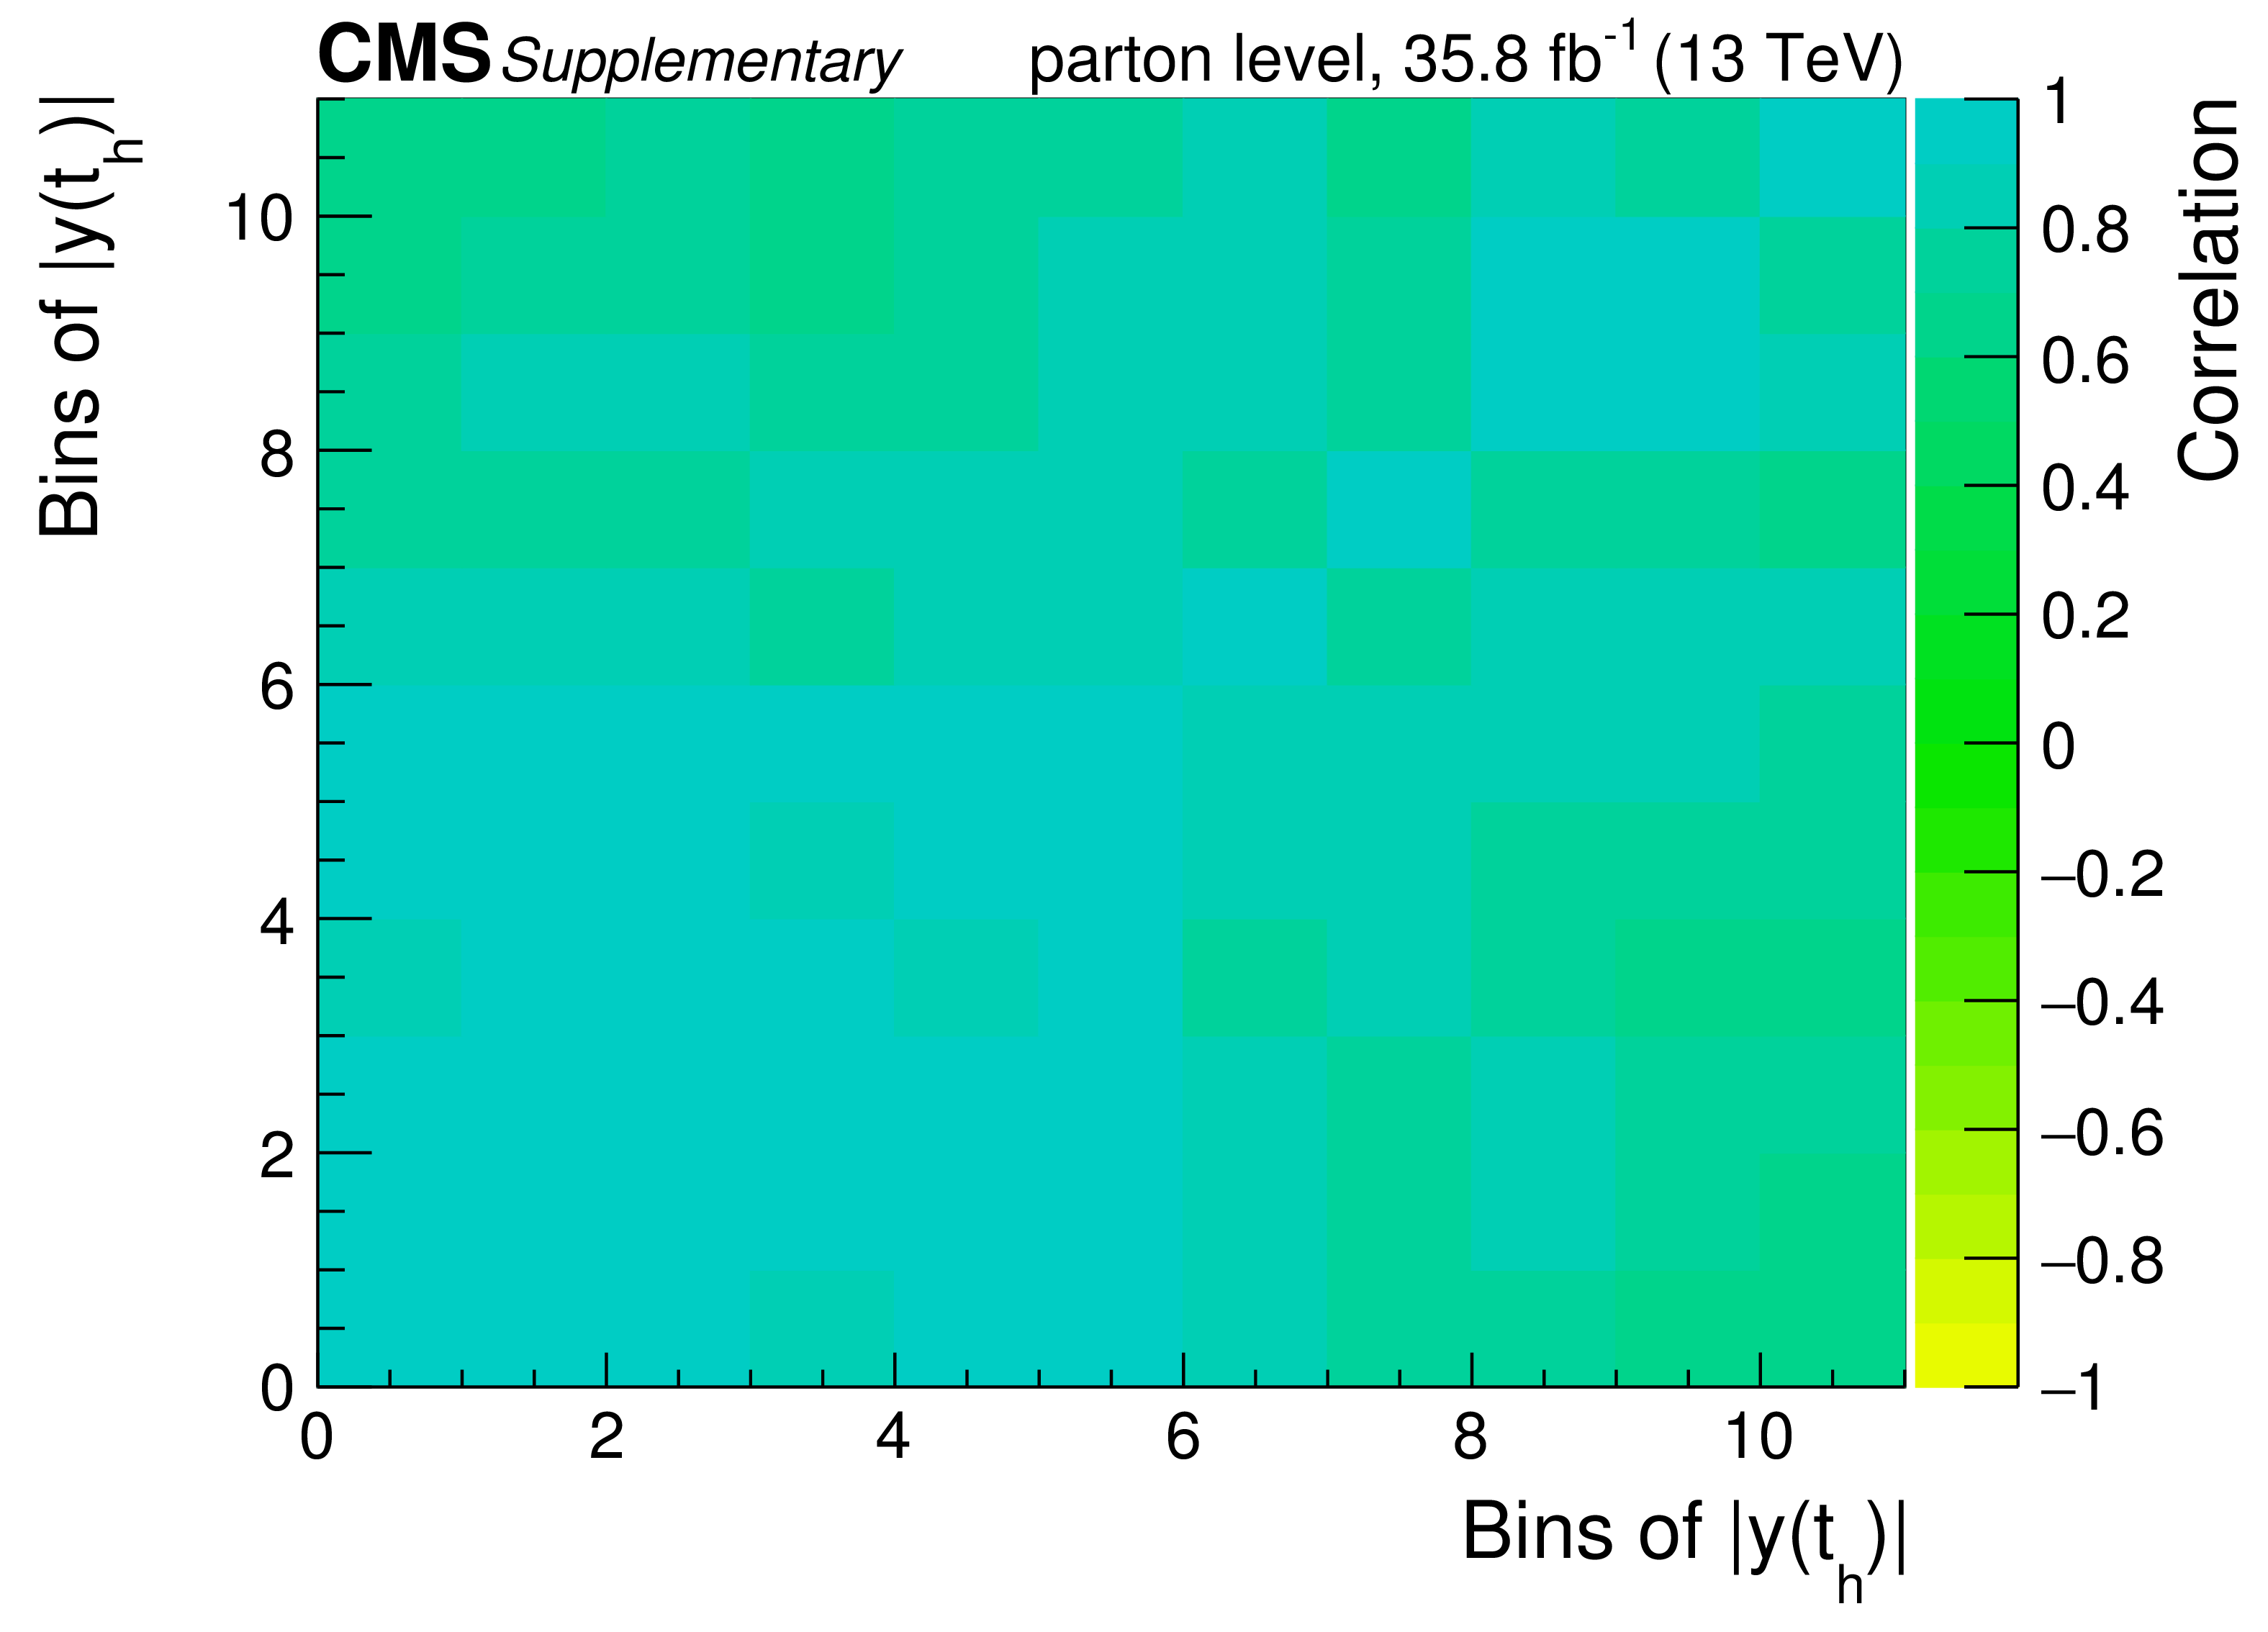
png pdf |
Additional Figure 4-e:
Correlations among the bins in the differential cross section measurements at parton level. |

png pdf |
Additional Figure 4-f:
Correlations among the bins in the differential cross section measurements at parton level. |
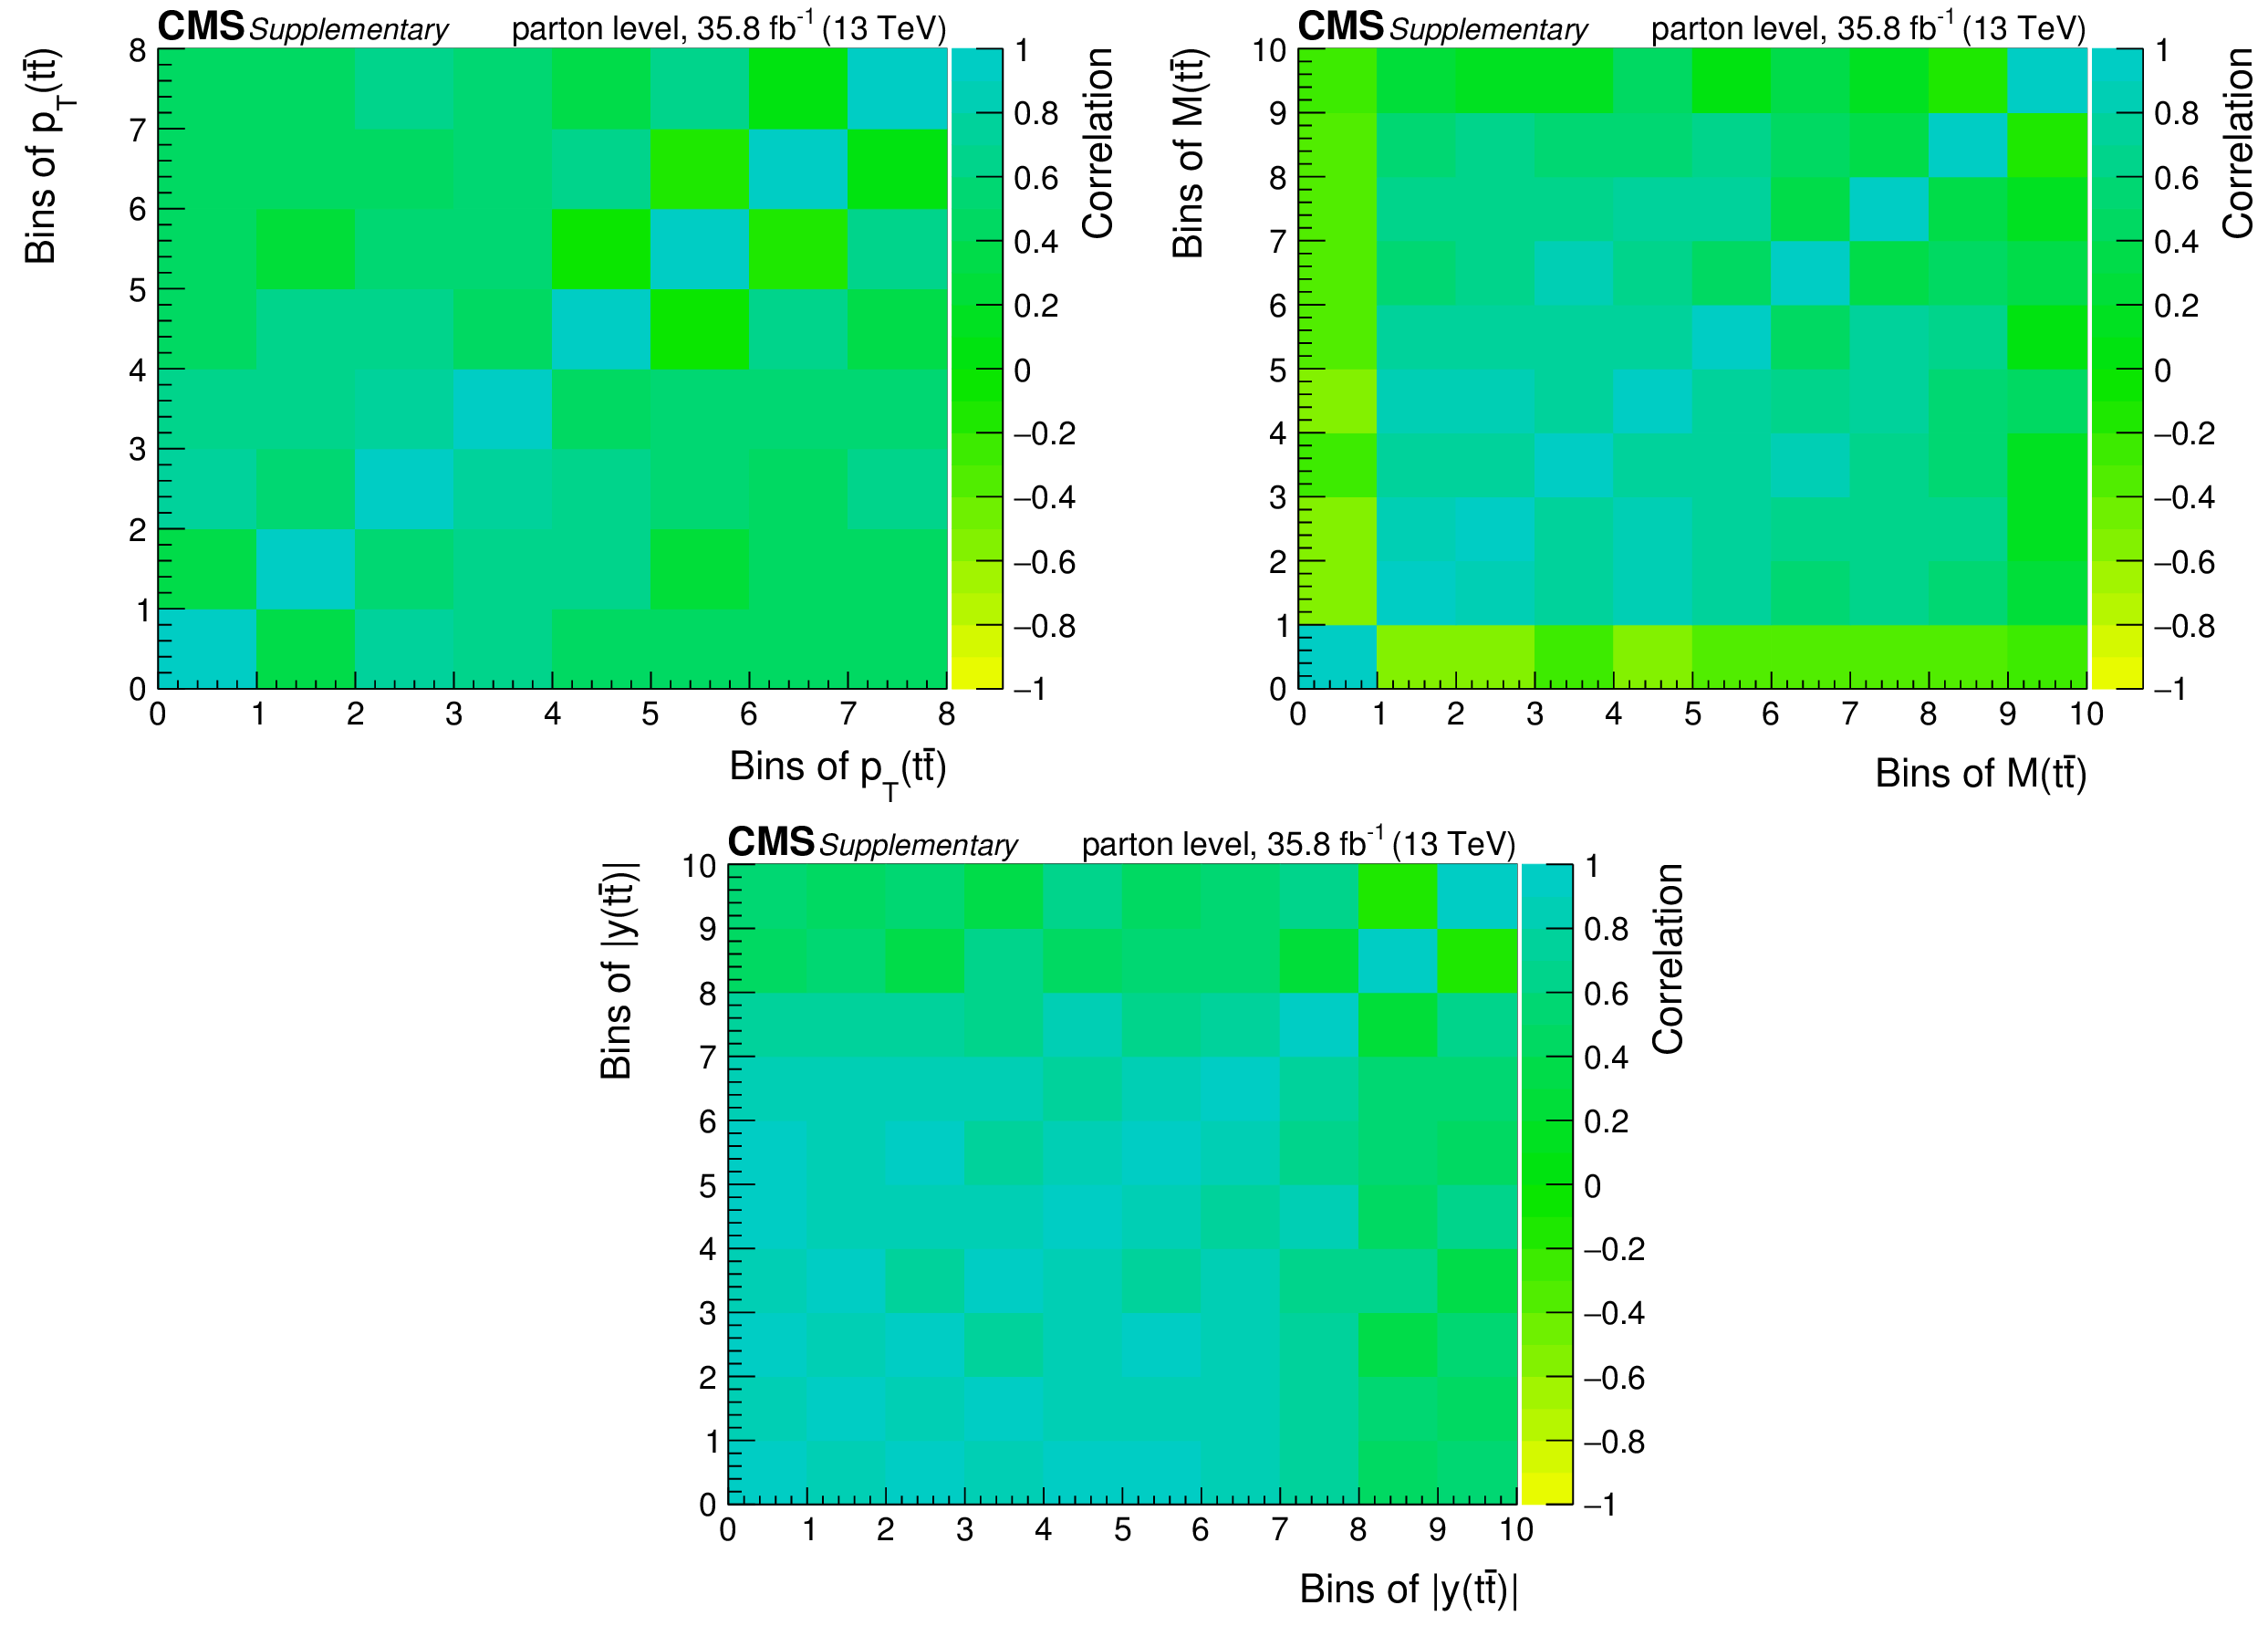
png pdf |
Additional Figure 5:
Correlations among the bins in the differential cross section measurements at parton level. |
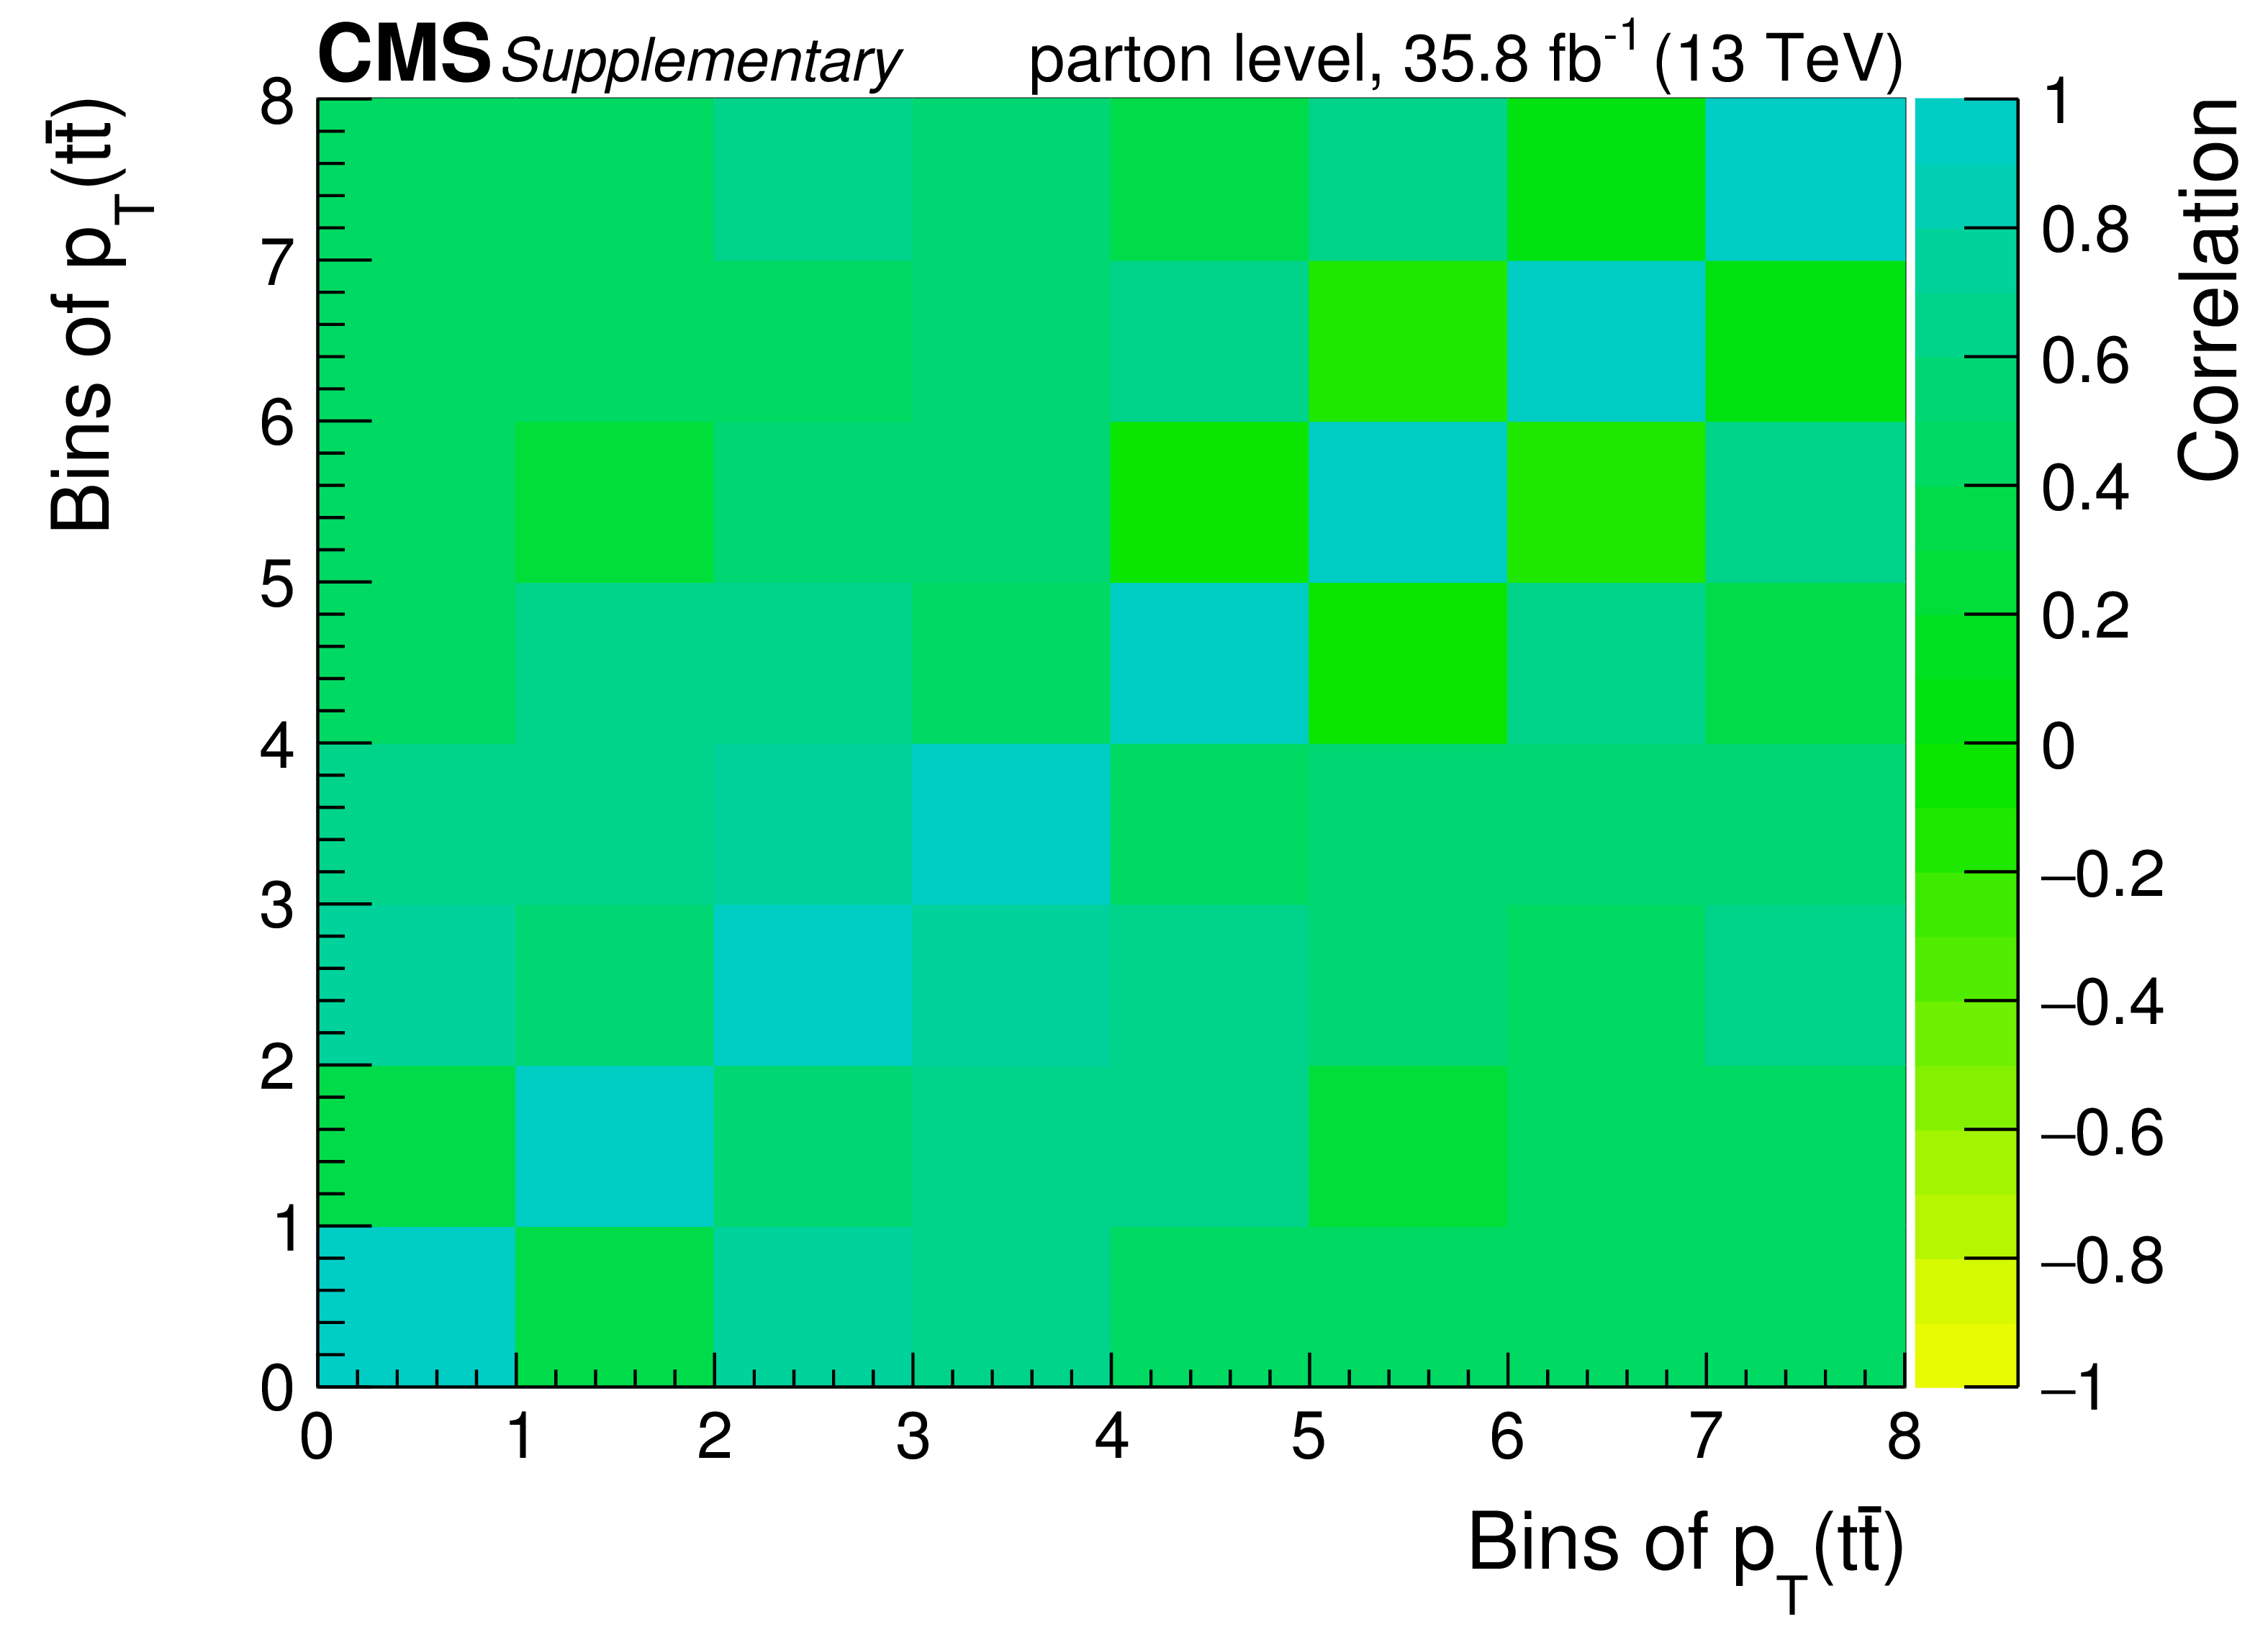
png pdf |
Additional Figure 5-a:
Correlations among the bins in the differential cross section measurements at parton level. |
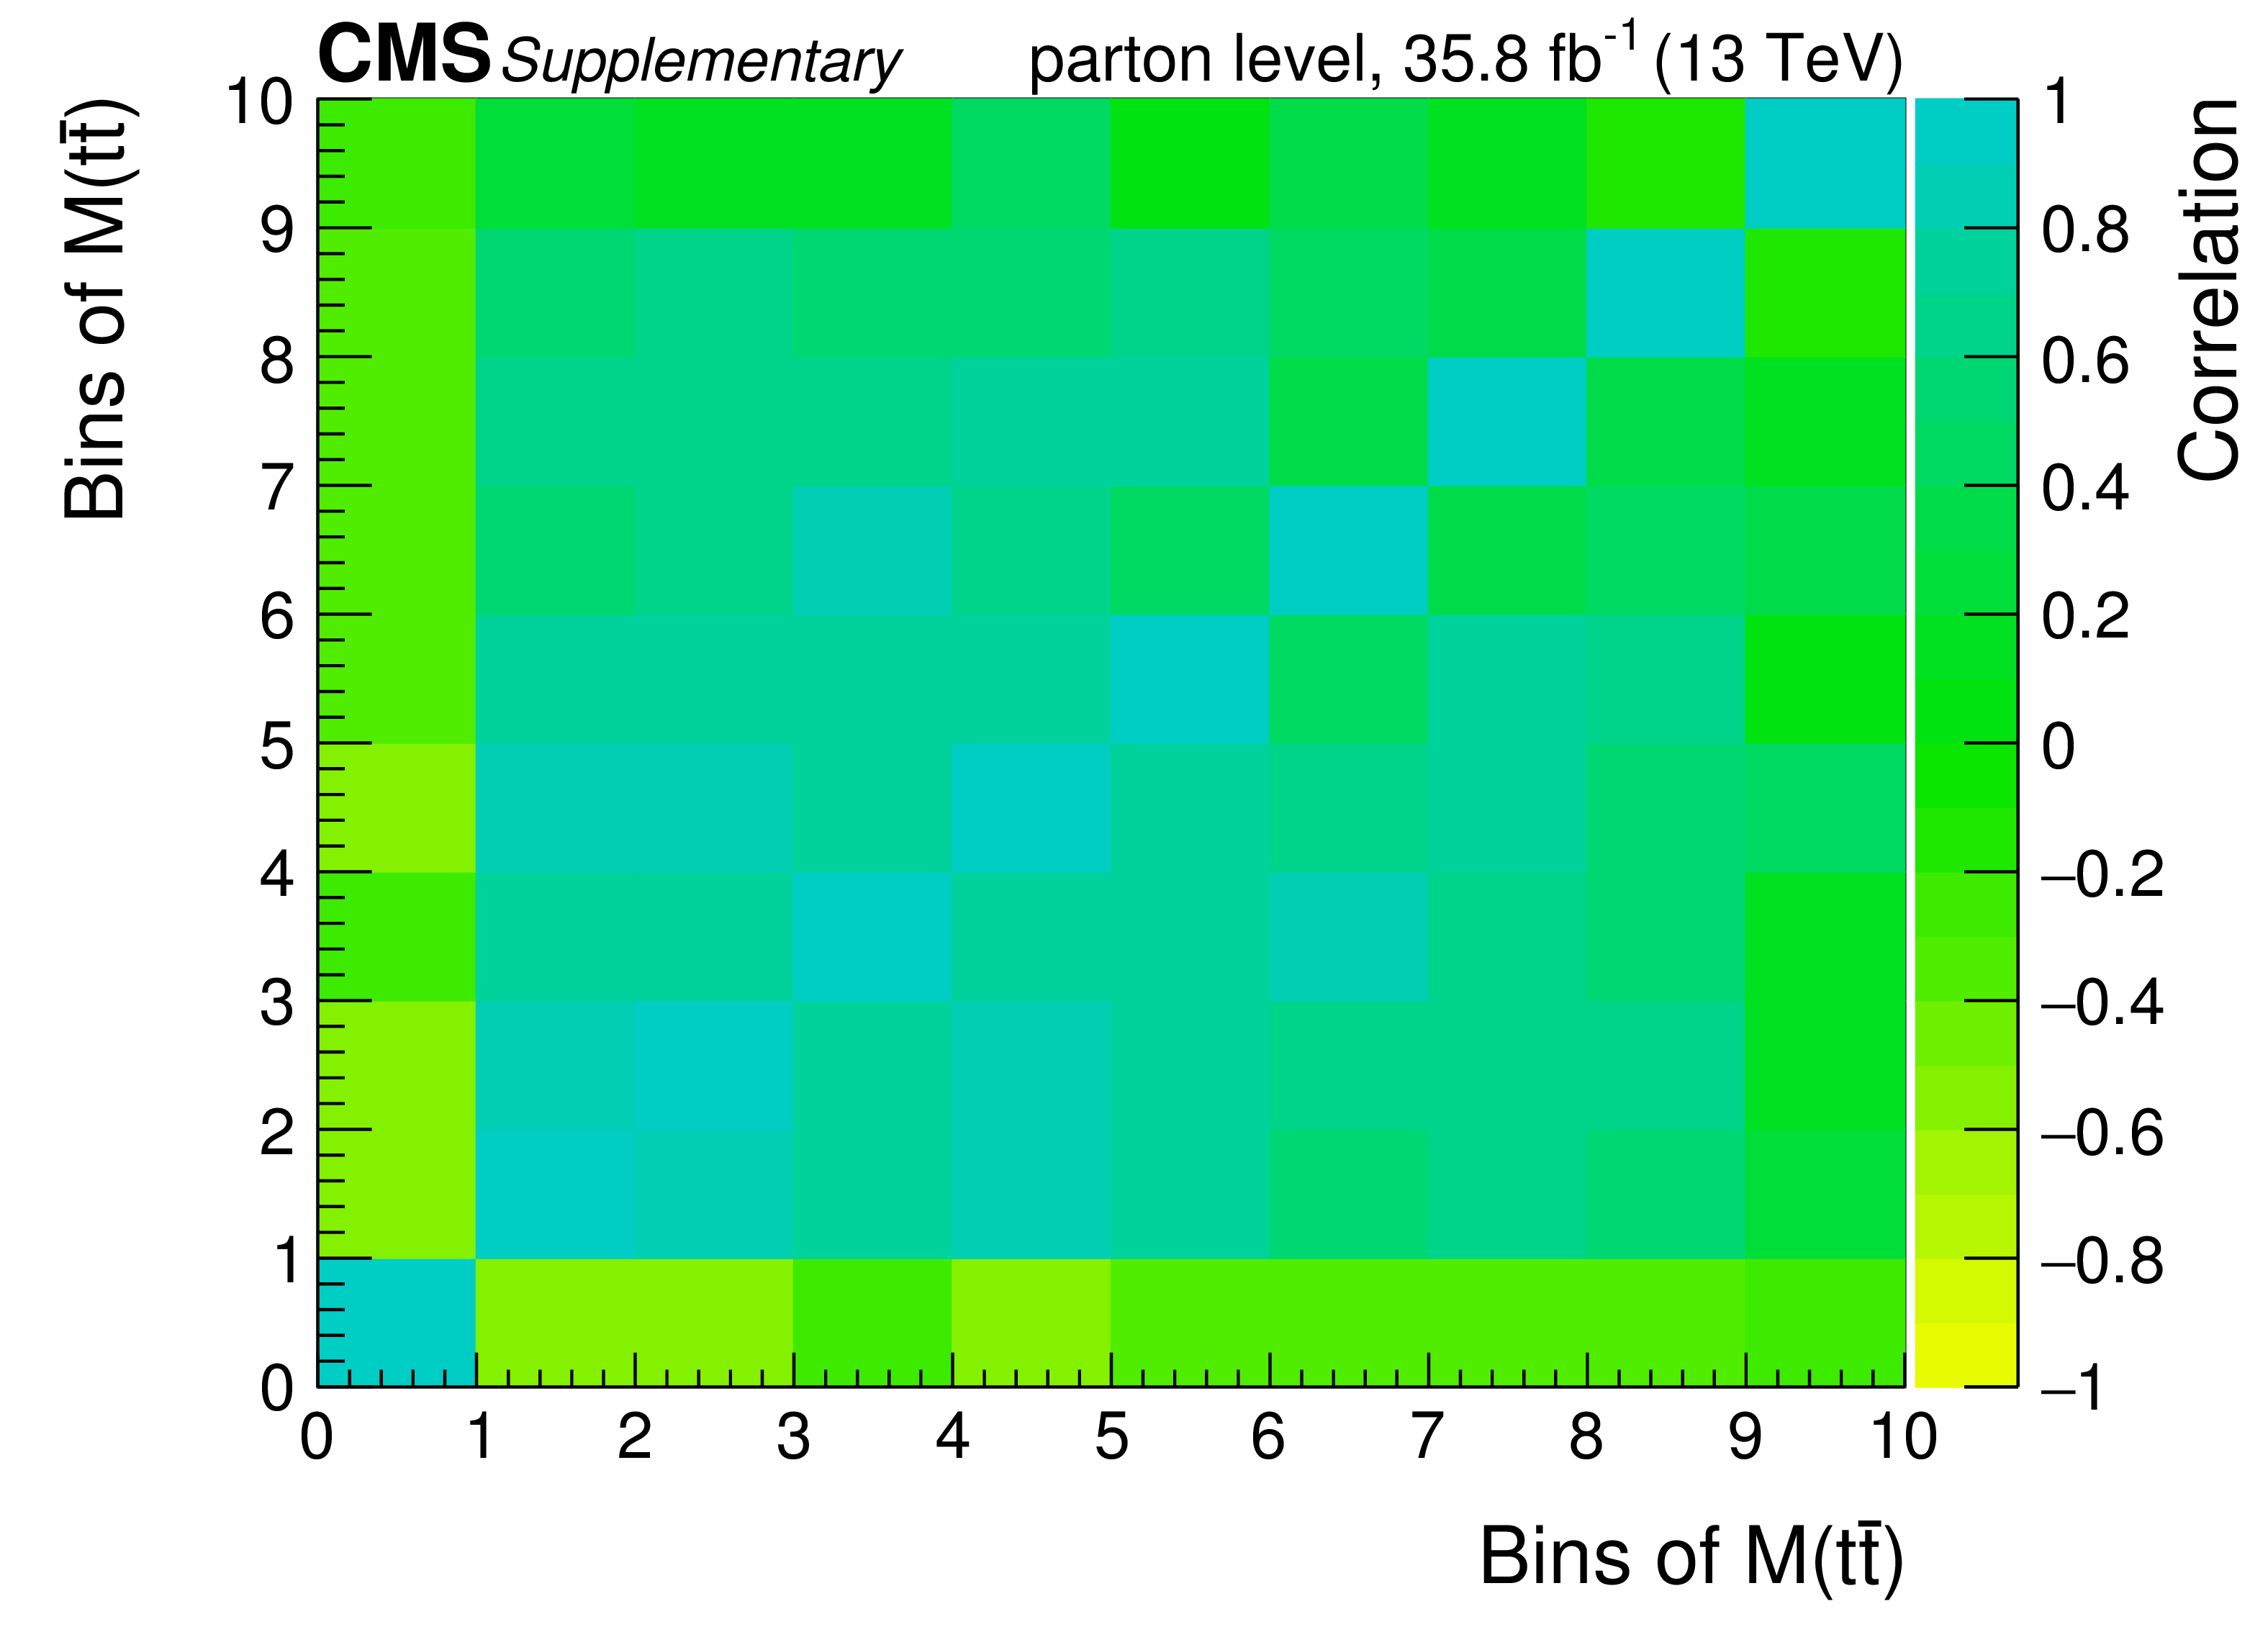
png pdf |
Additional Figure 5-b:
Correlations among the bins in the differential cross section measurements at parton level. |

png pdf |
Additional Figure 5-c:
Correlations among the bins in the differential cross section measurements at parton level. |
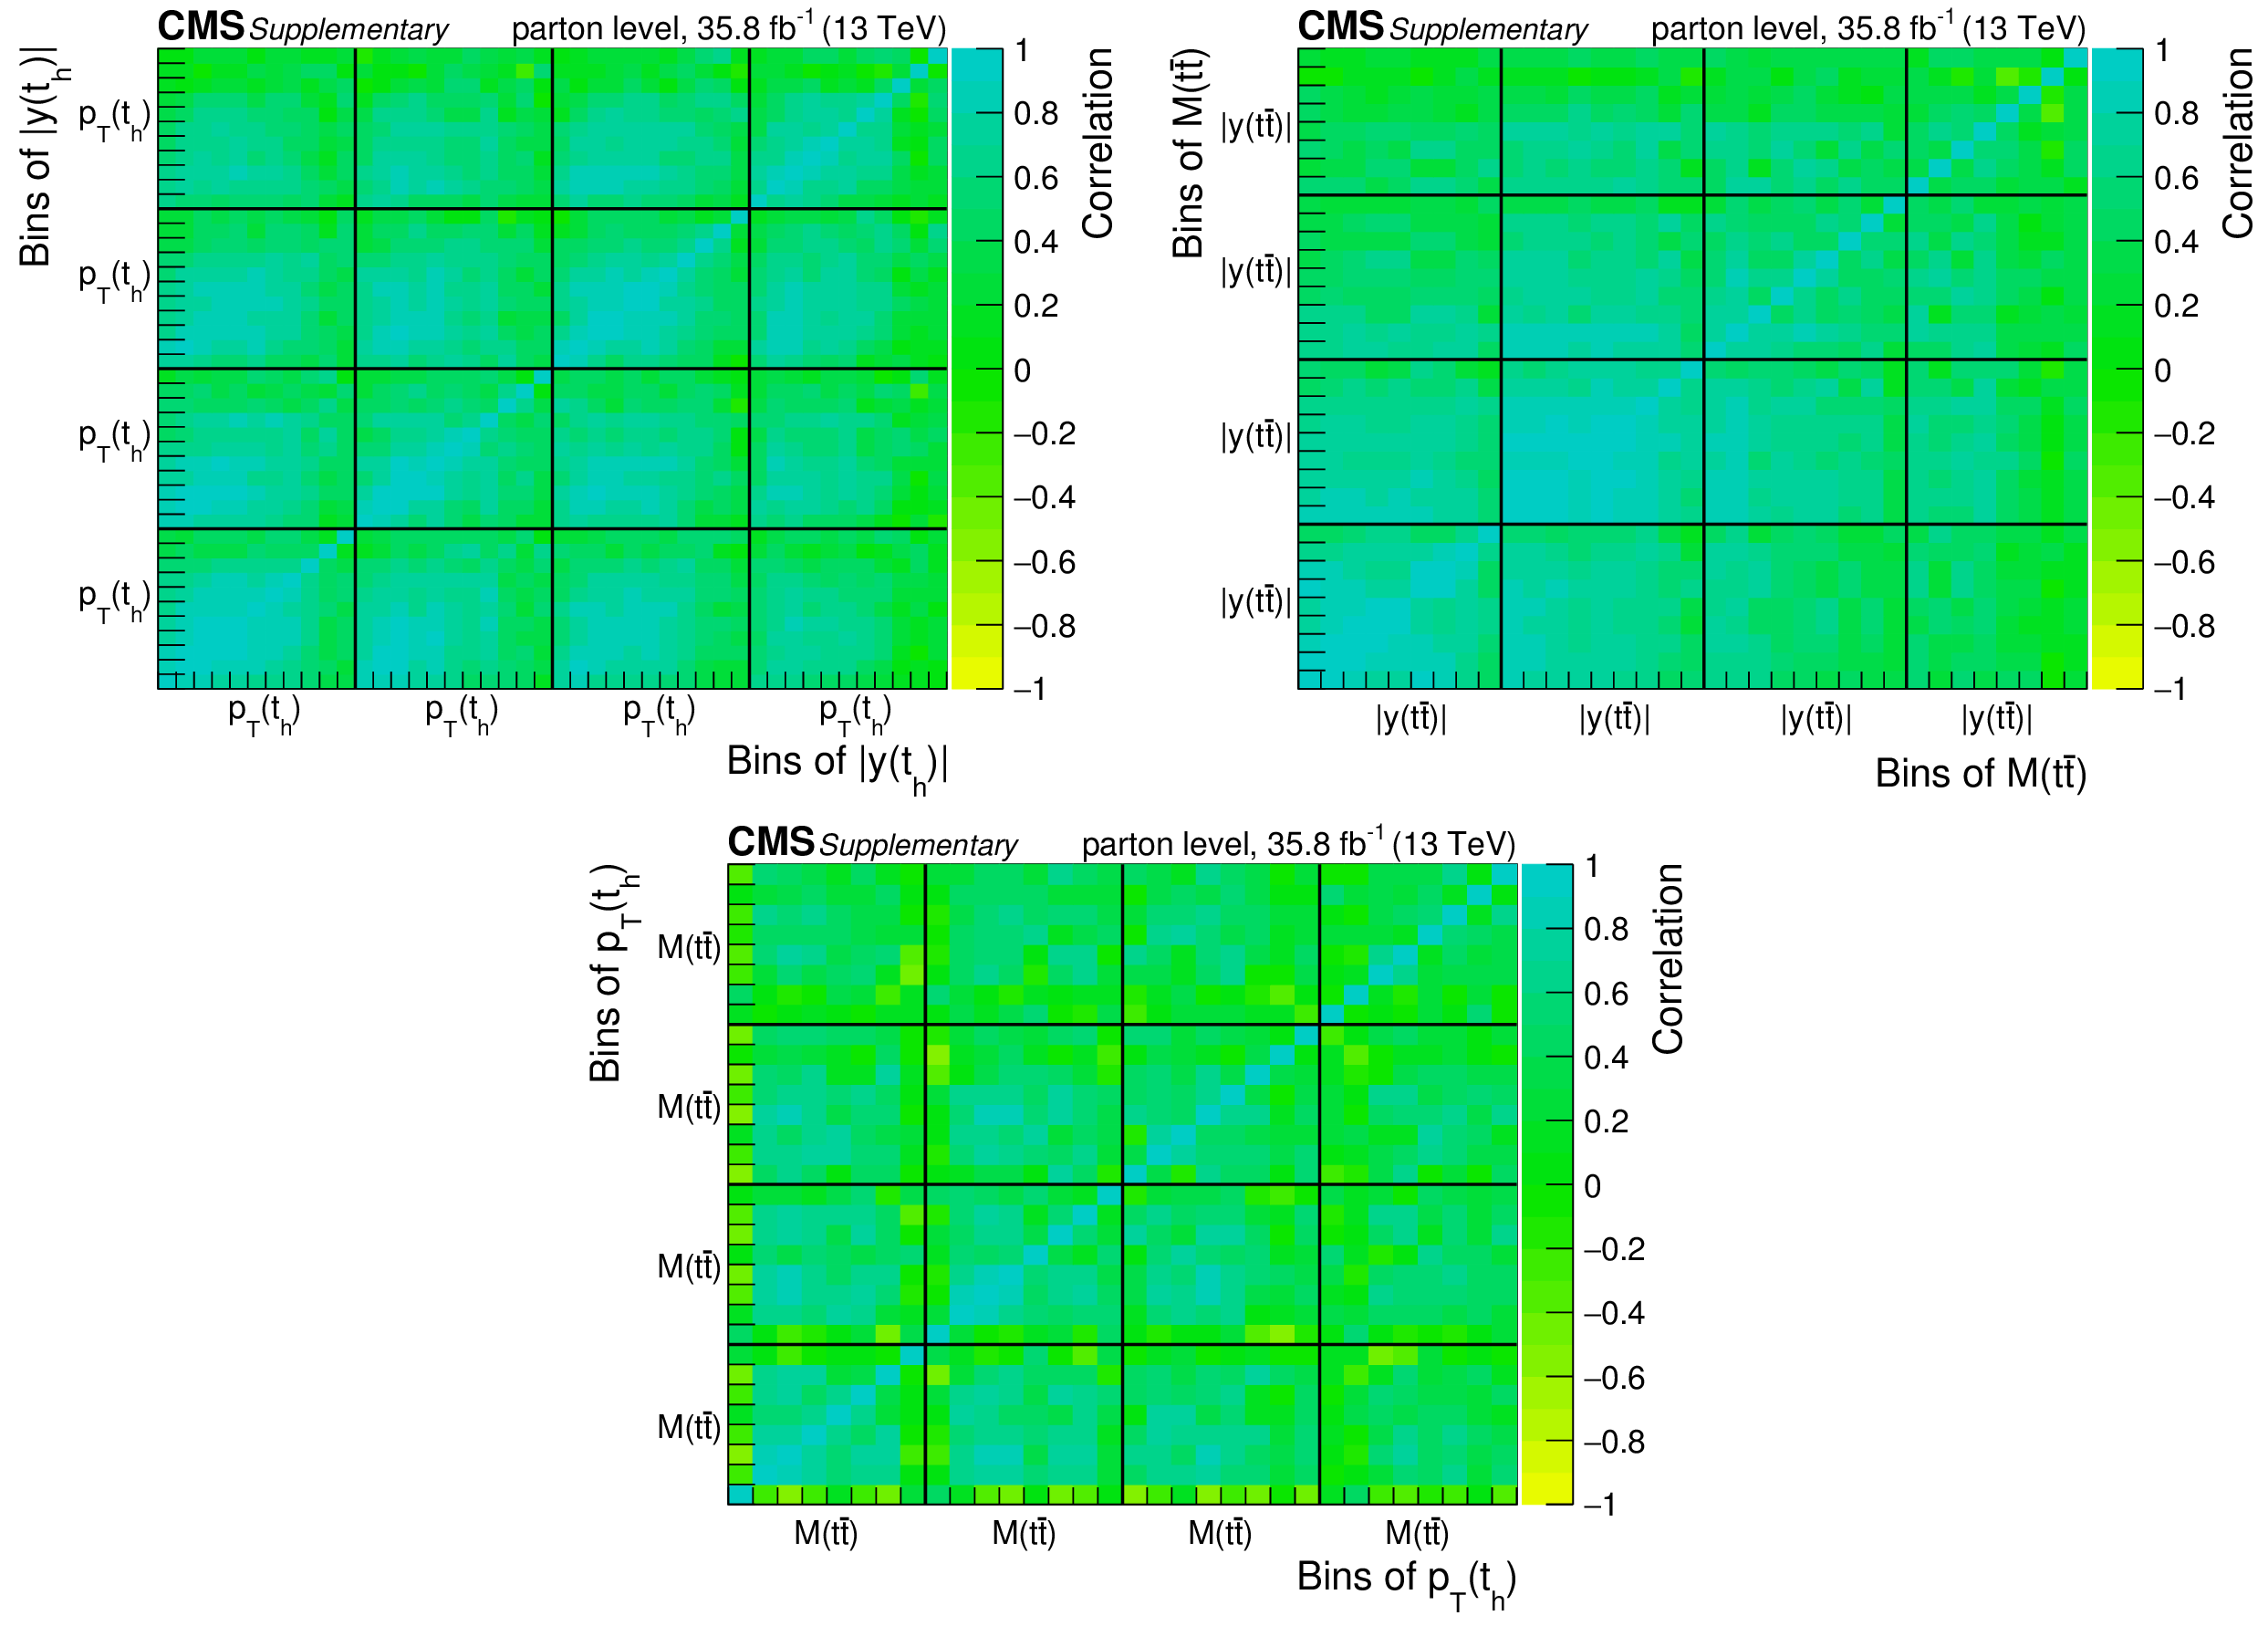
png pdf |
Additional Figure 6:
Correlations among the bins in the double-differential cross section measurements at parton level. |

png pdf |
Additional Figure 6-a:
Correlations among the bins in the double-differential cross section measurements at parton level. |
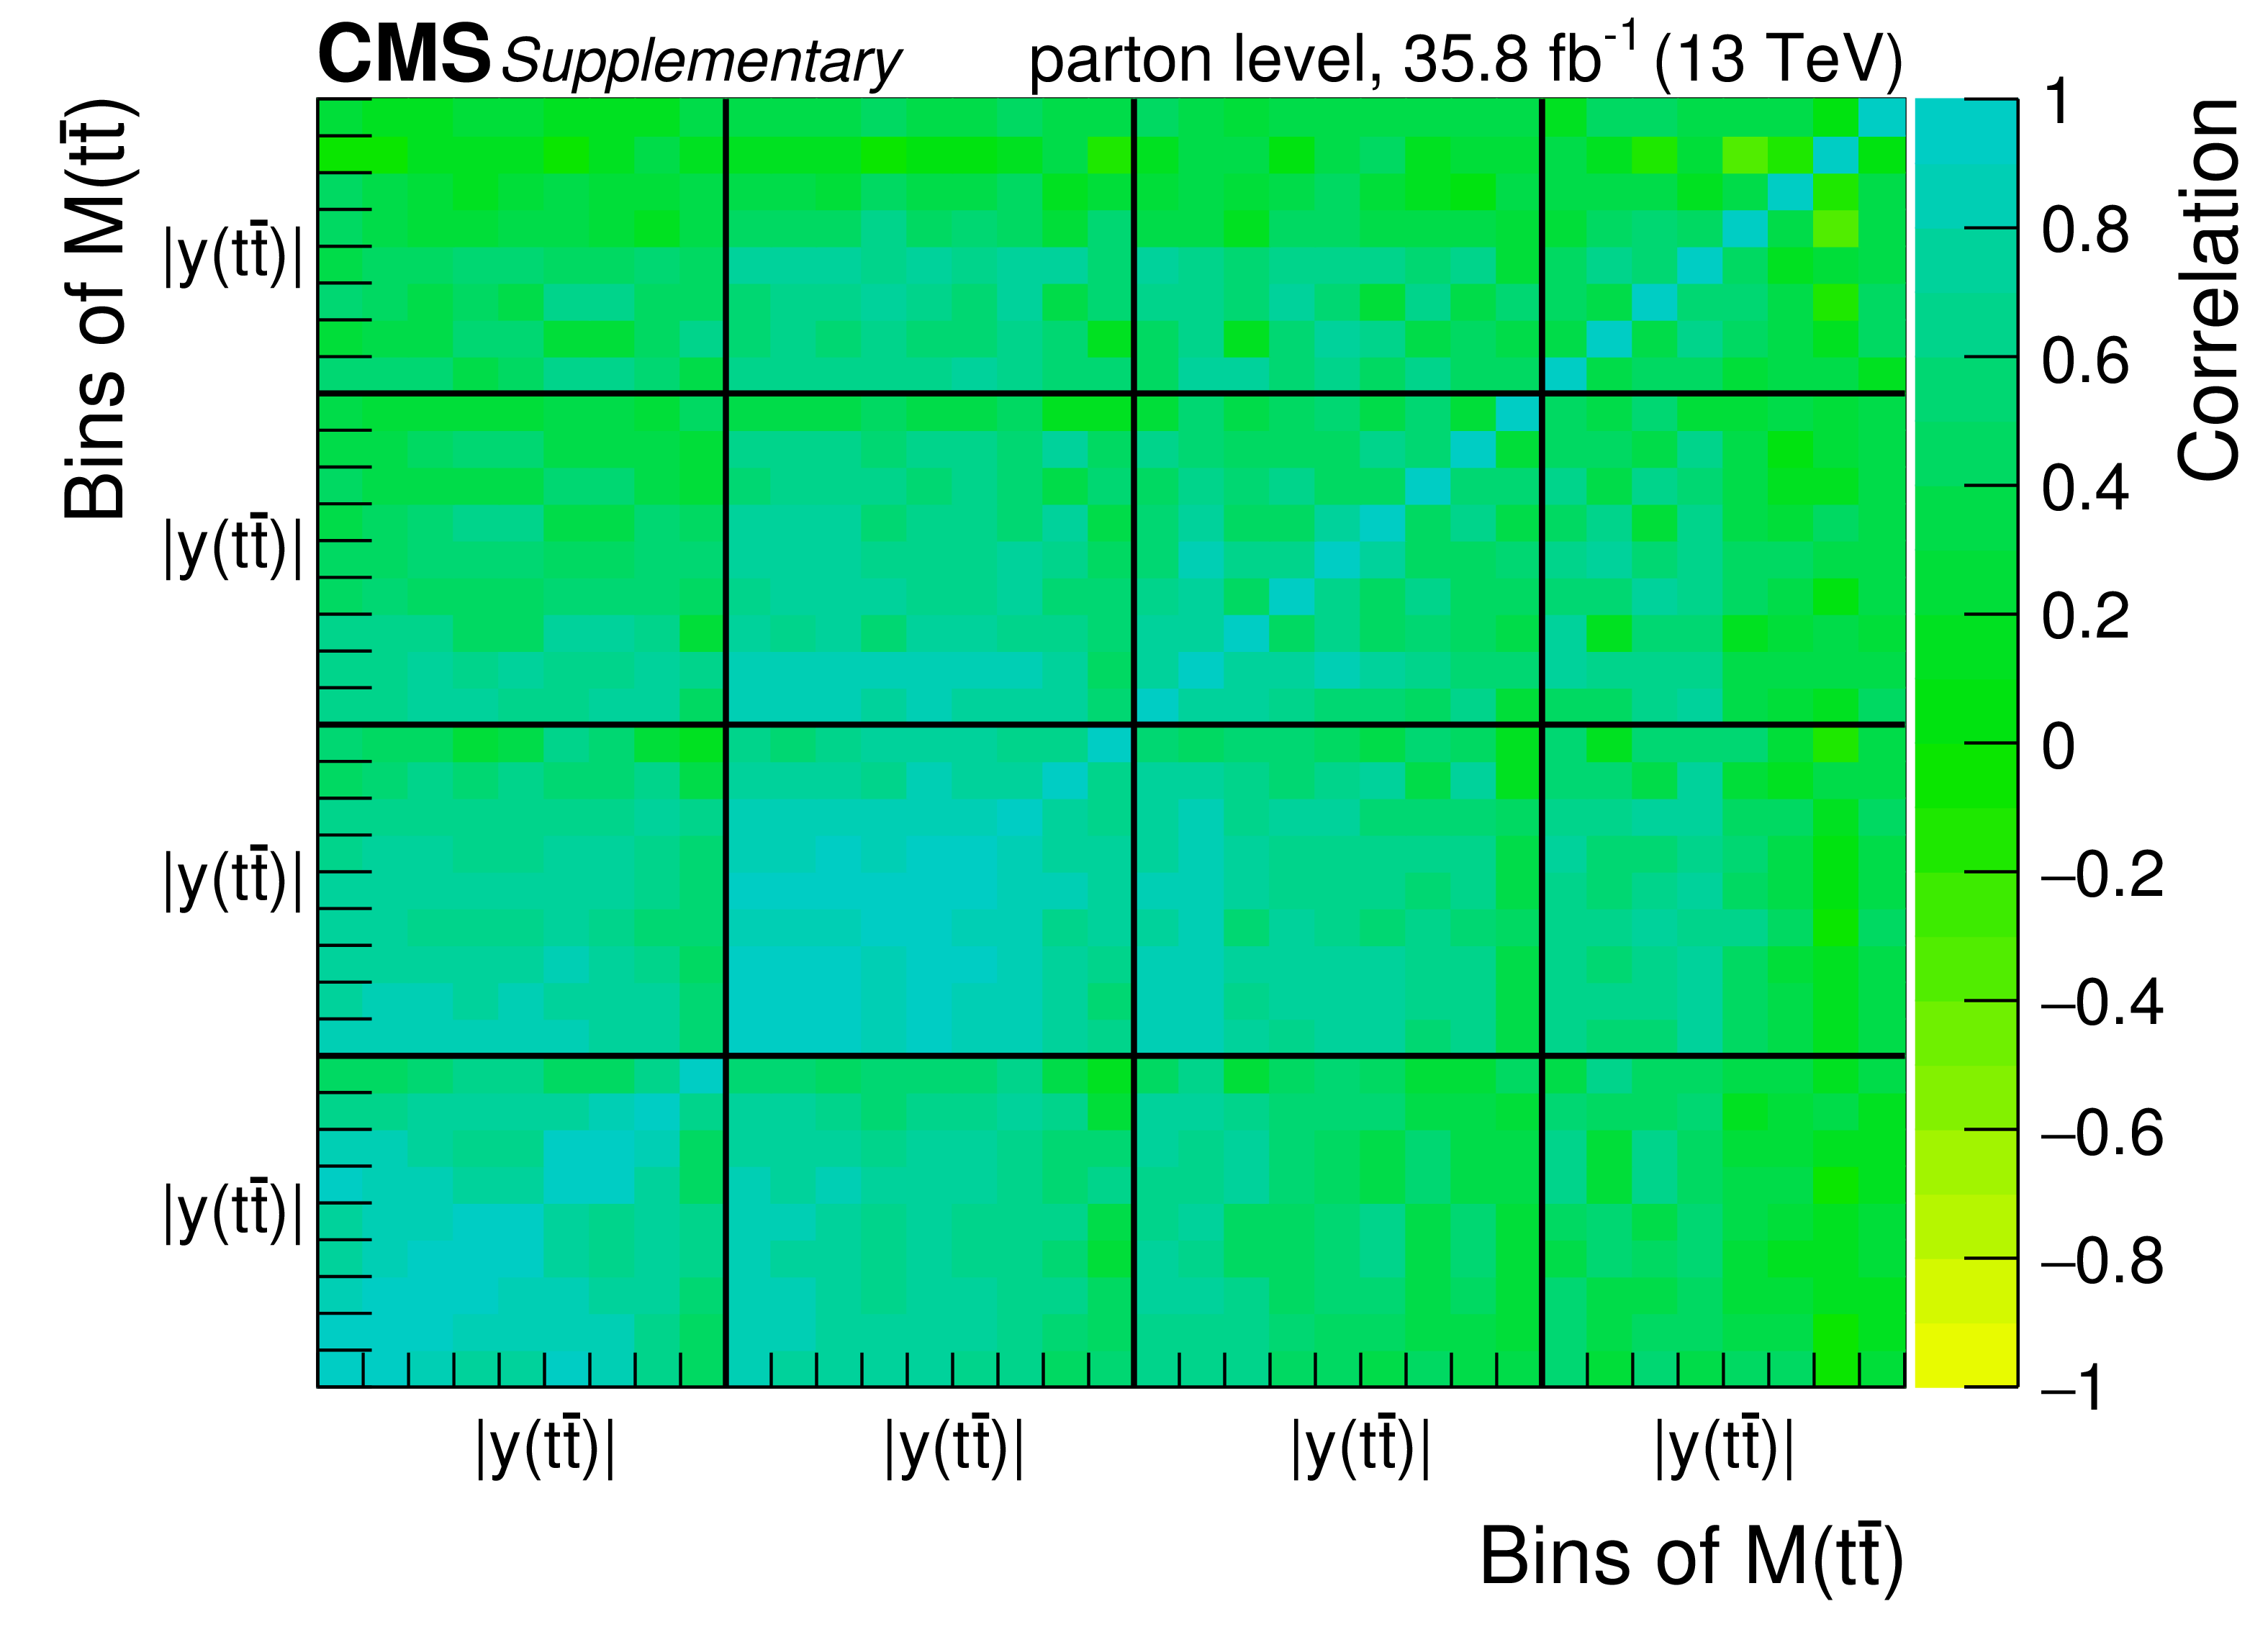
png pdf |
Additional Figure 6-b:
Correlations among the bins in the double-differential cross section measurements at parton level. |
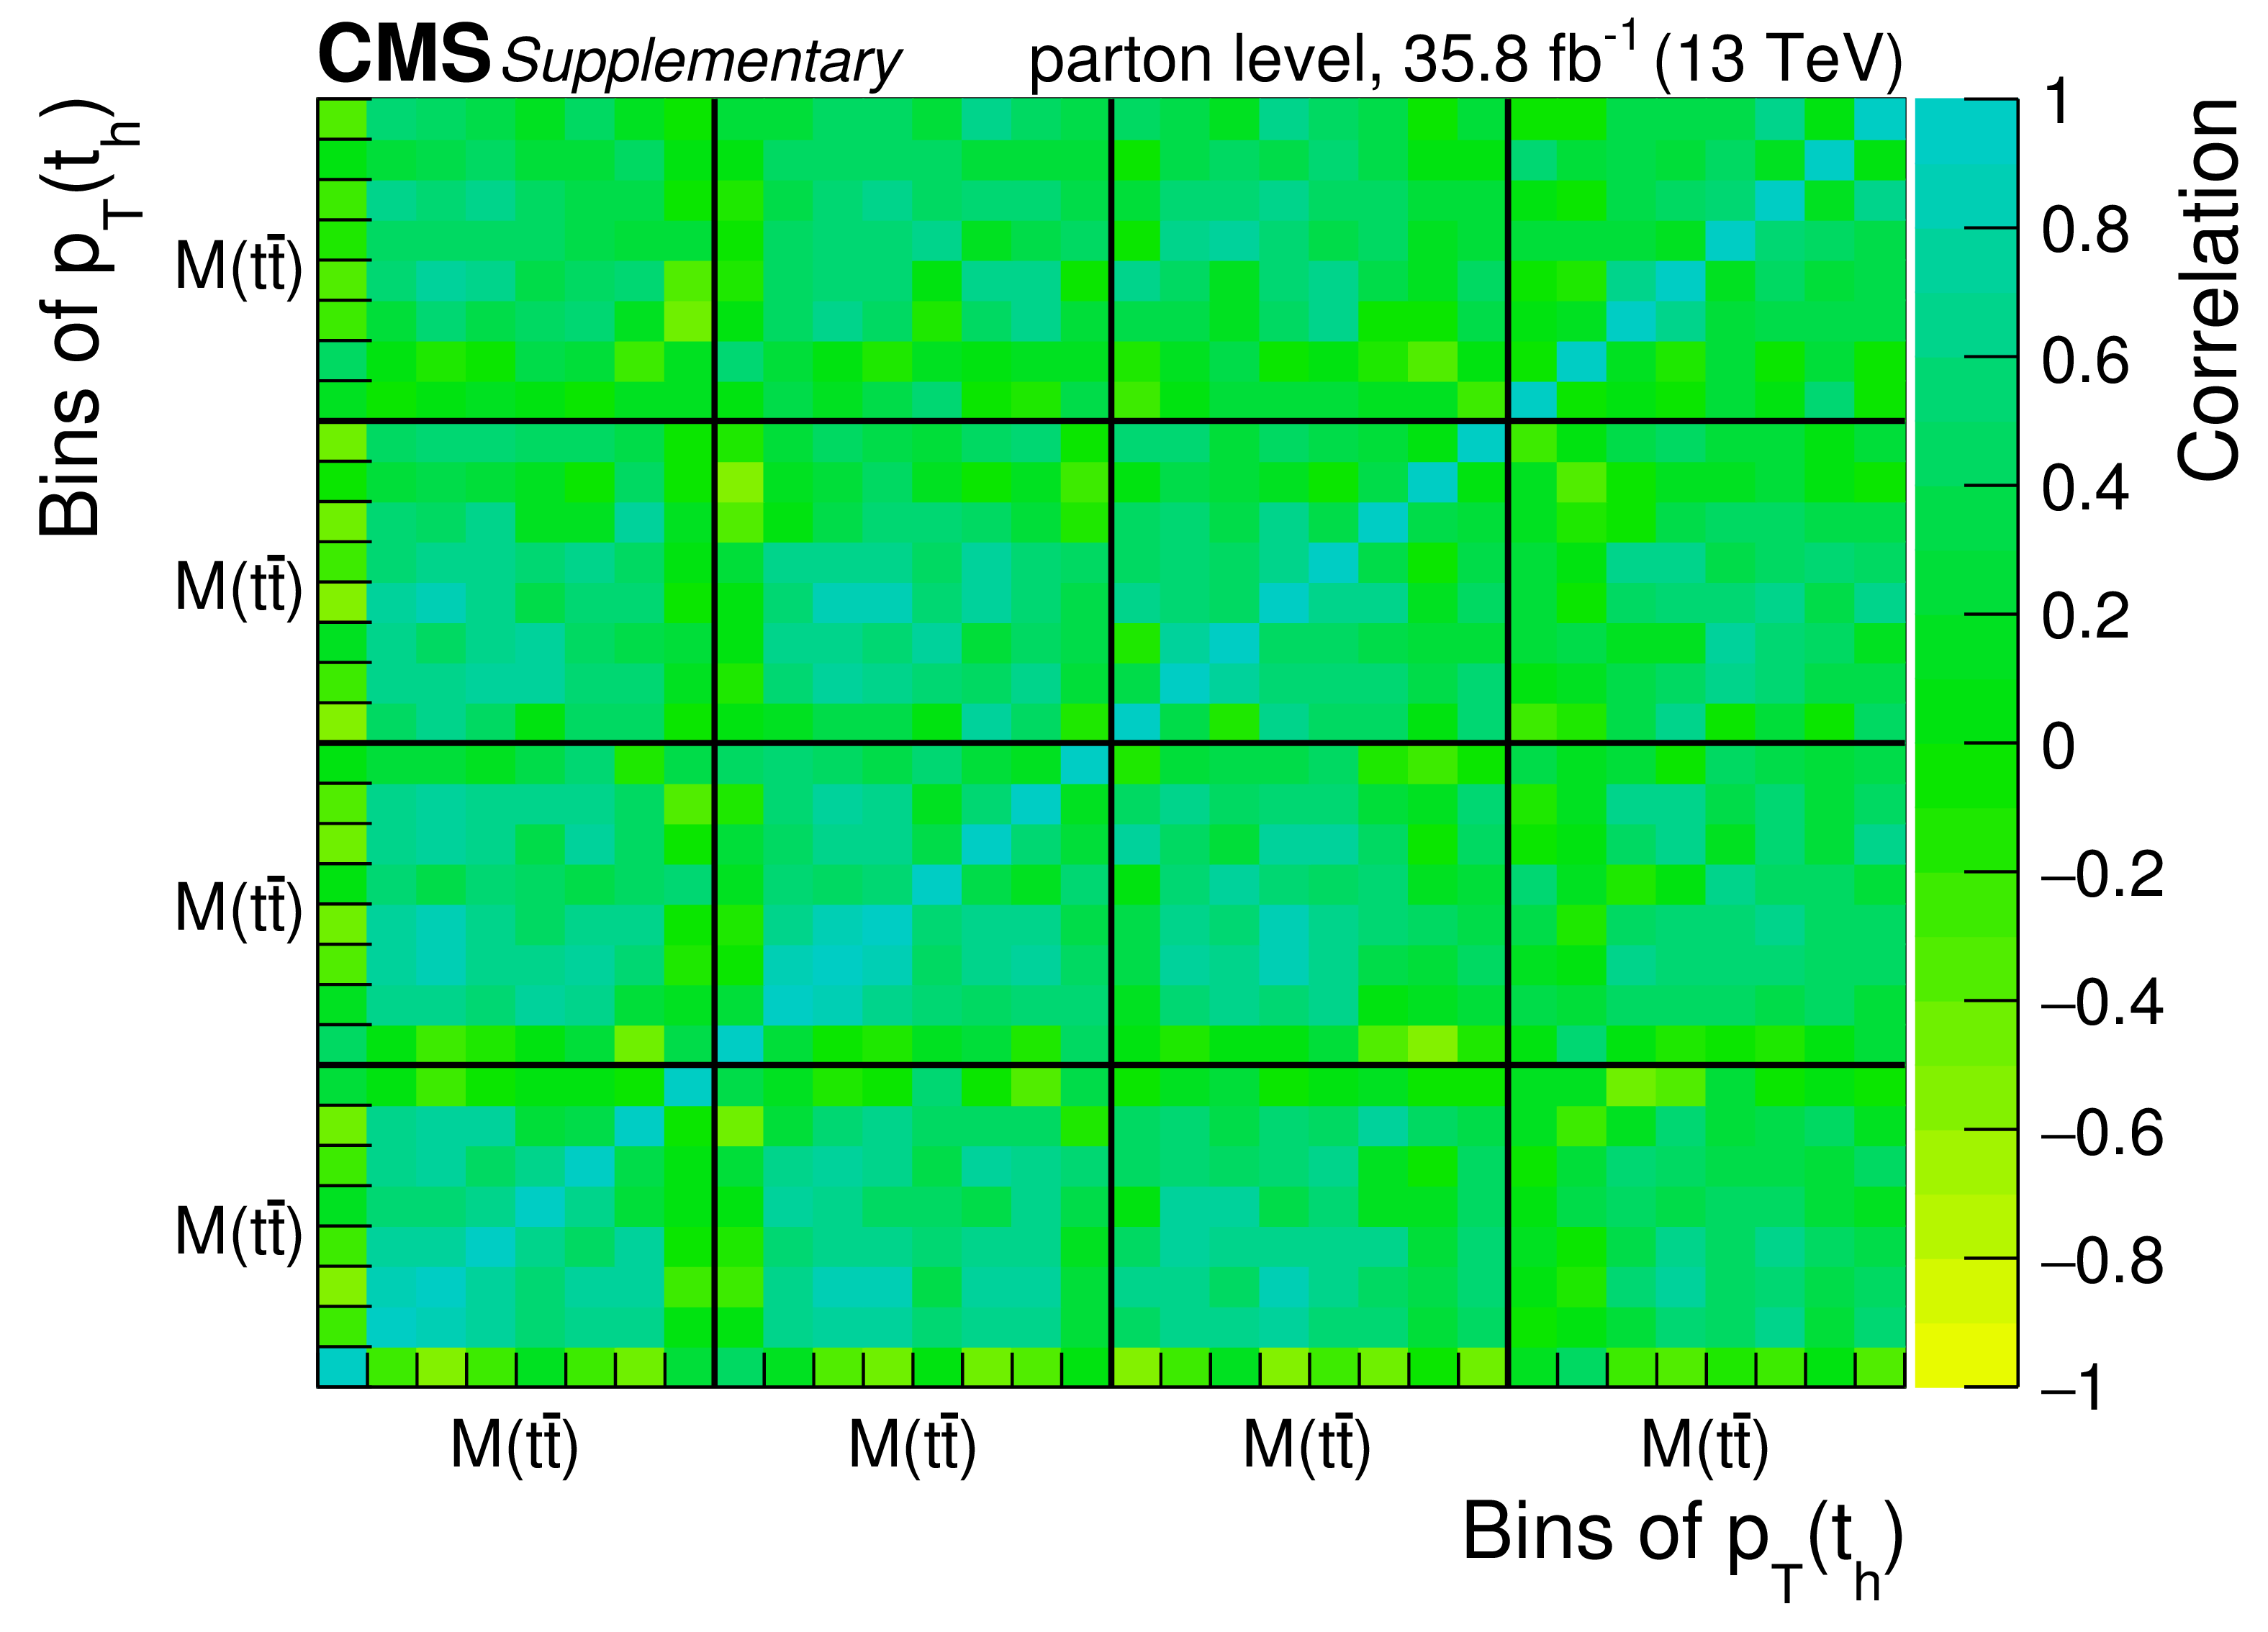
png pdf |
Additional Figure 6-c:
Correlations among the bins in the double-differential cross section measurements at parton level. |
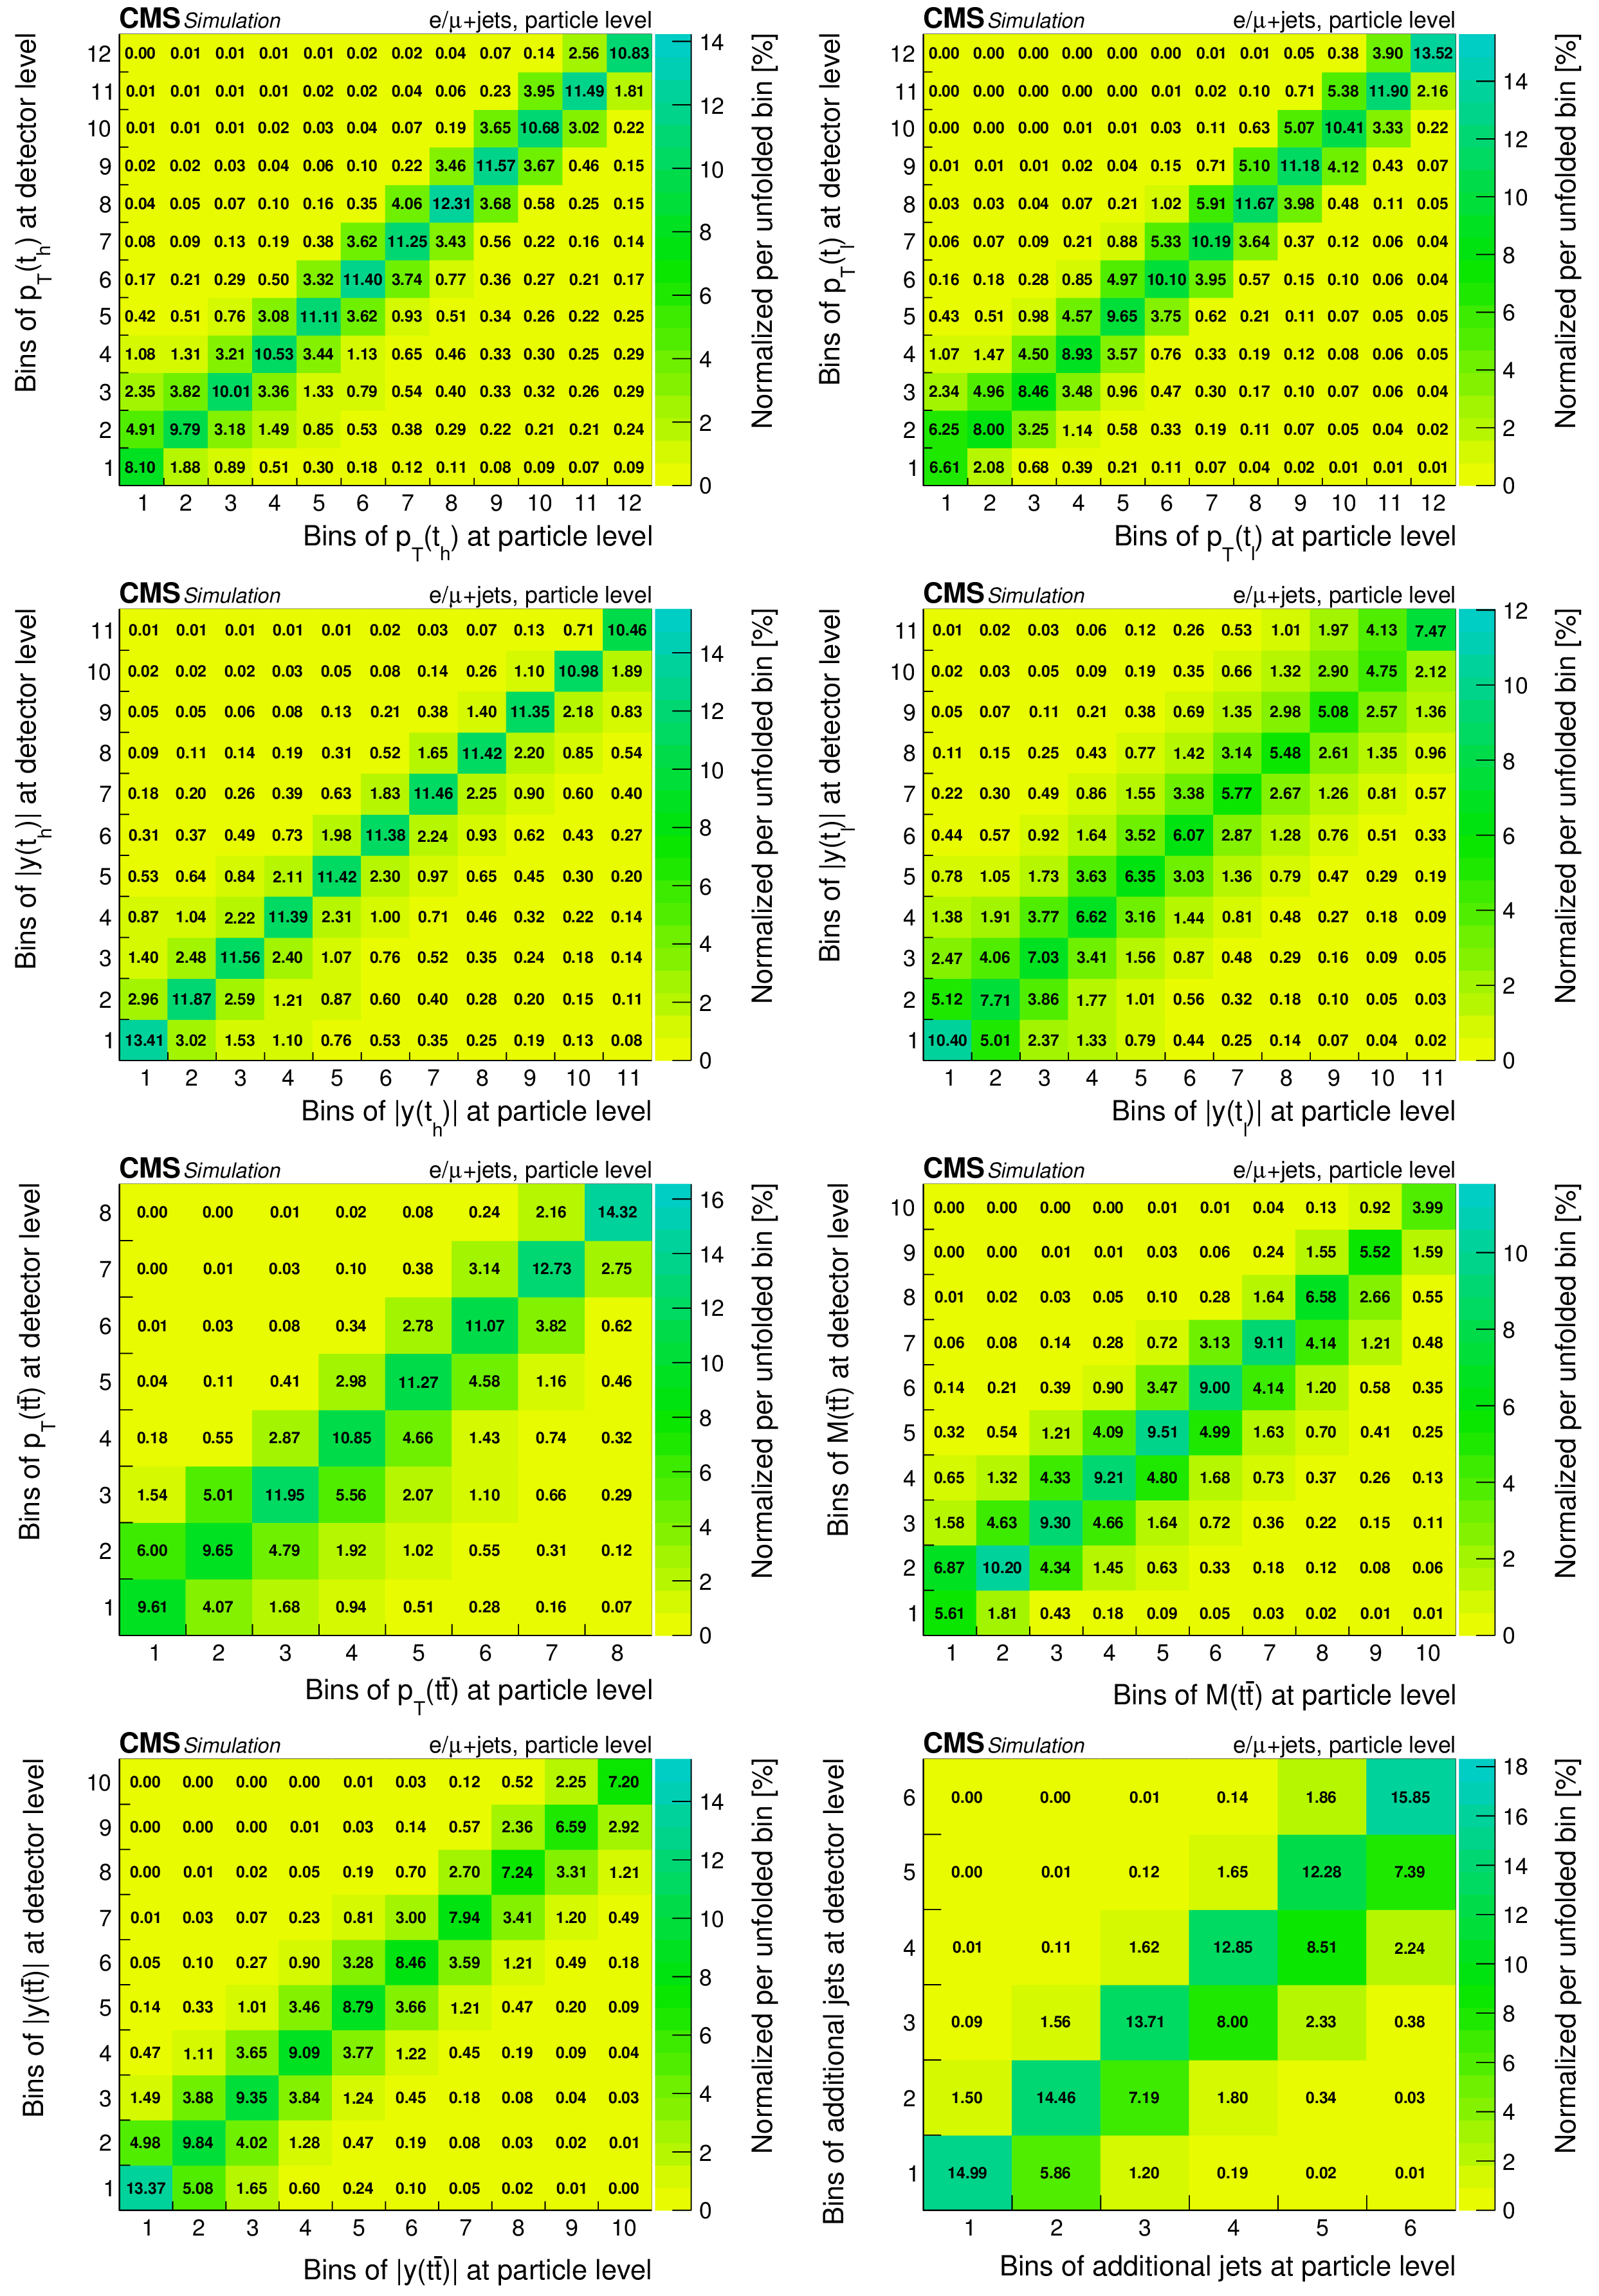
png pdf |
Additional Figure 7:
Migrations among the bins in the differential cross section measurements at particle level. |

png pdf |
Additional Figure 7-a:
Migrations among the bins in the differential cross section measurements at particle level. |
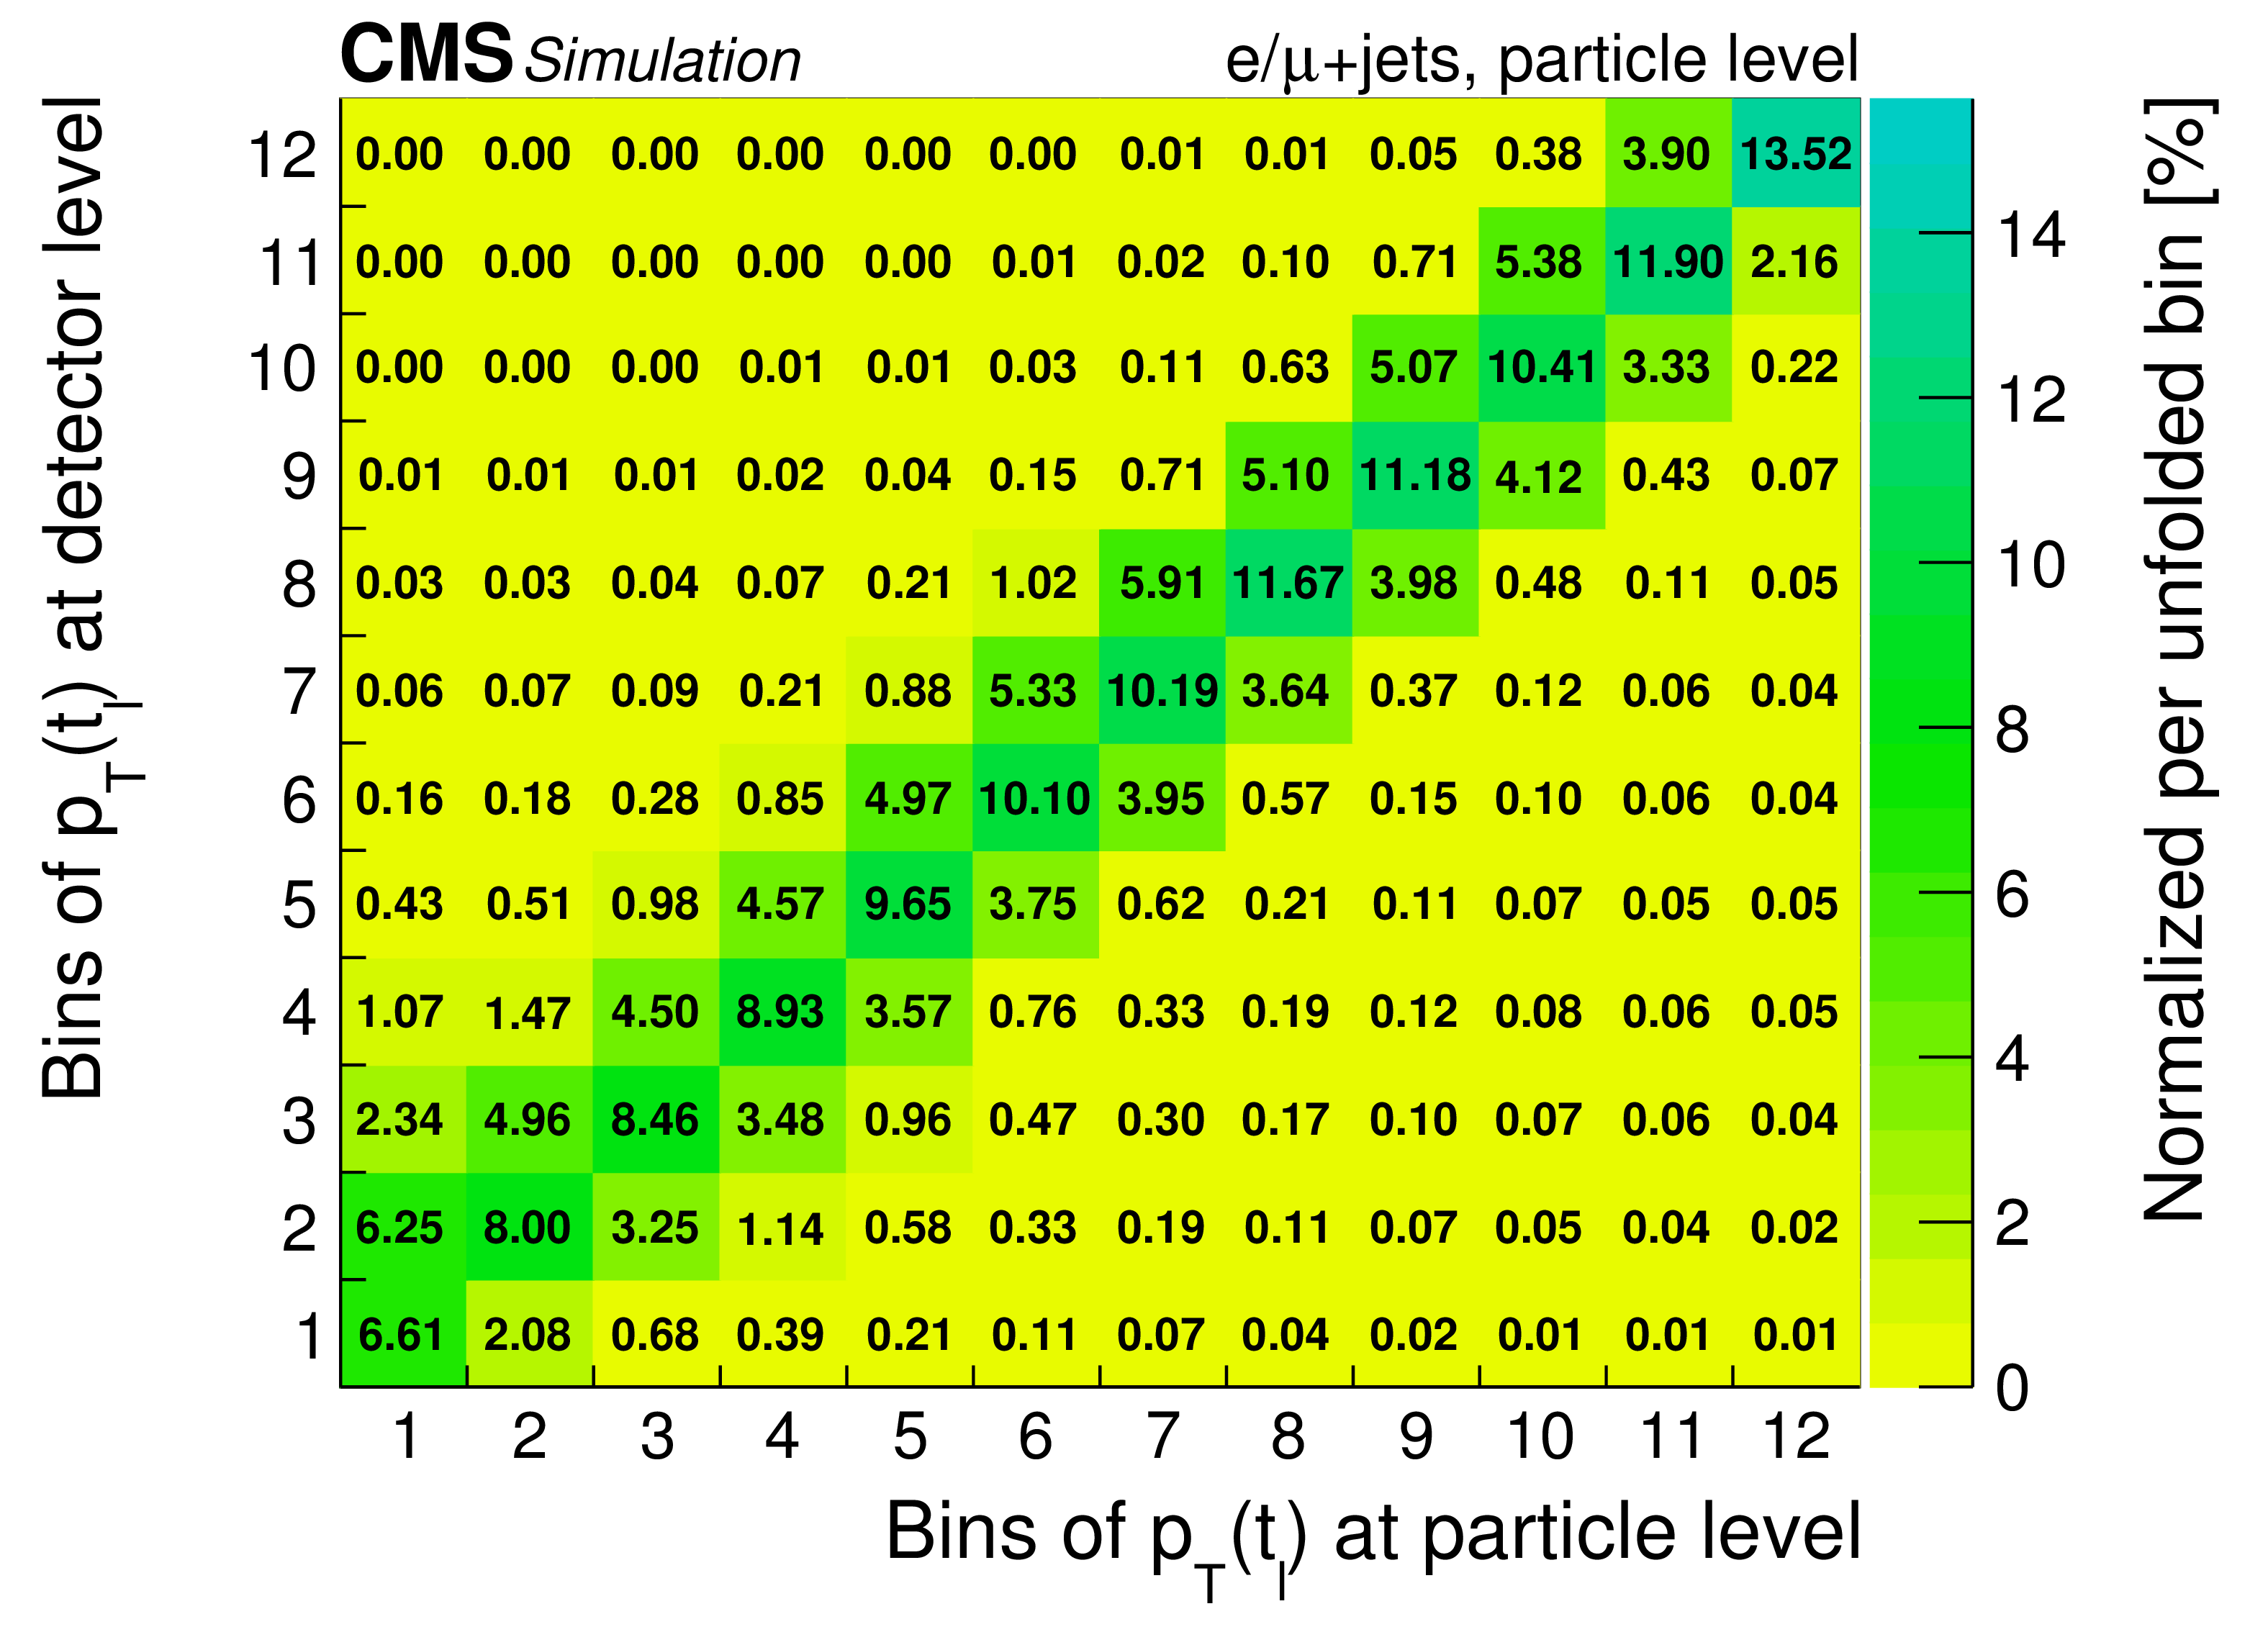
png pdf |
Additional Figure 7-b:
Migrations among the bins in the differential cross section measurements at particle level. |
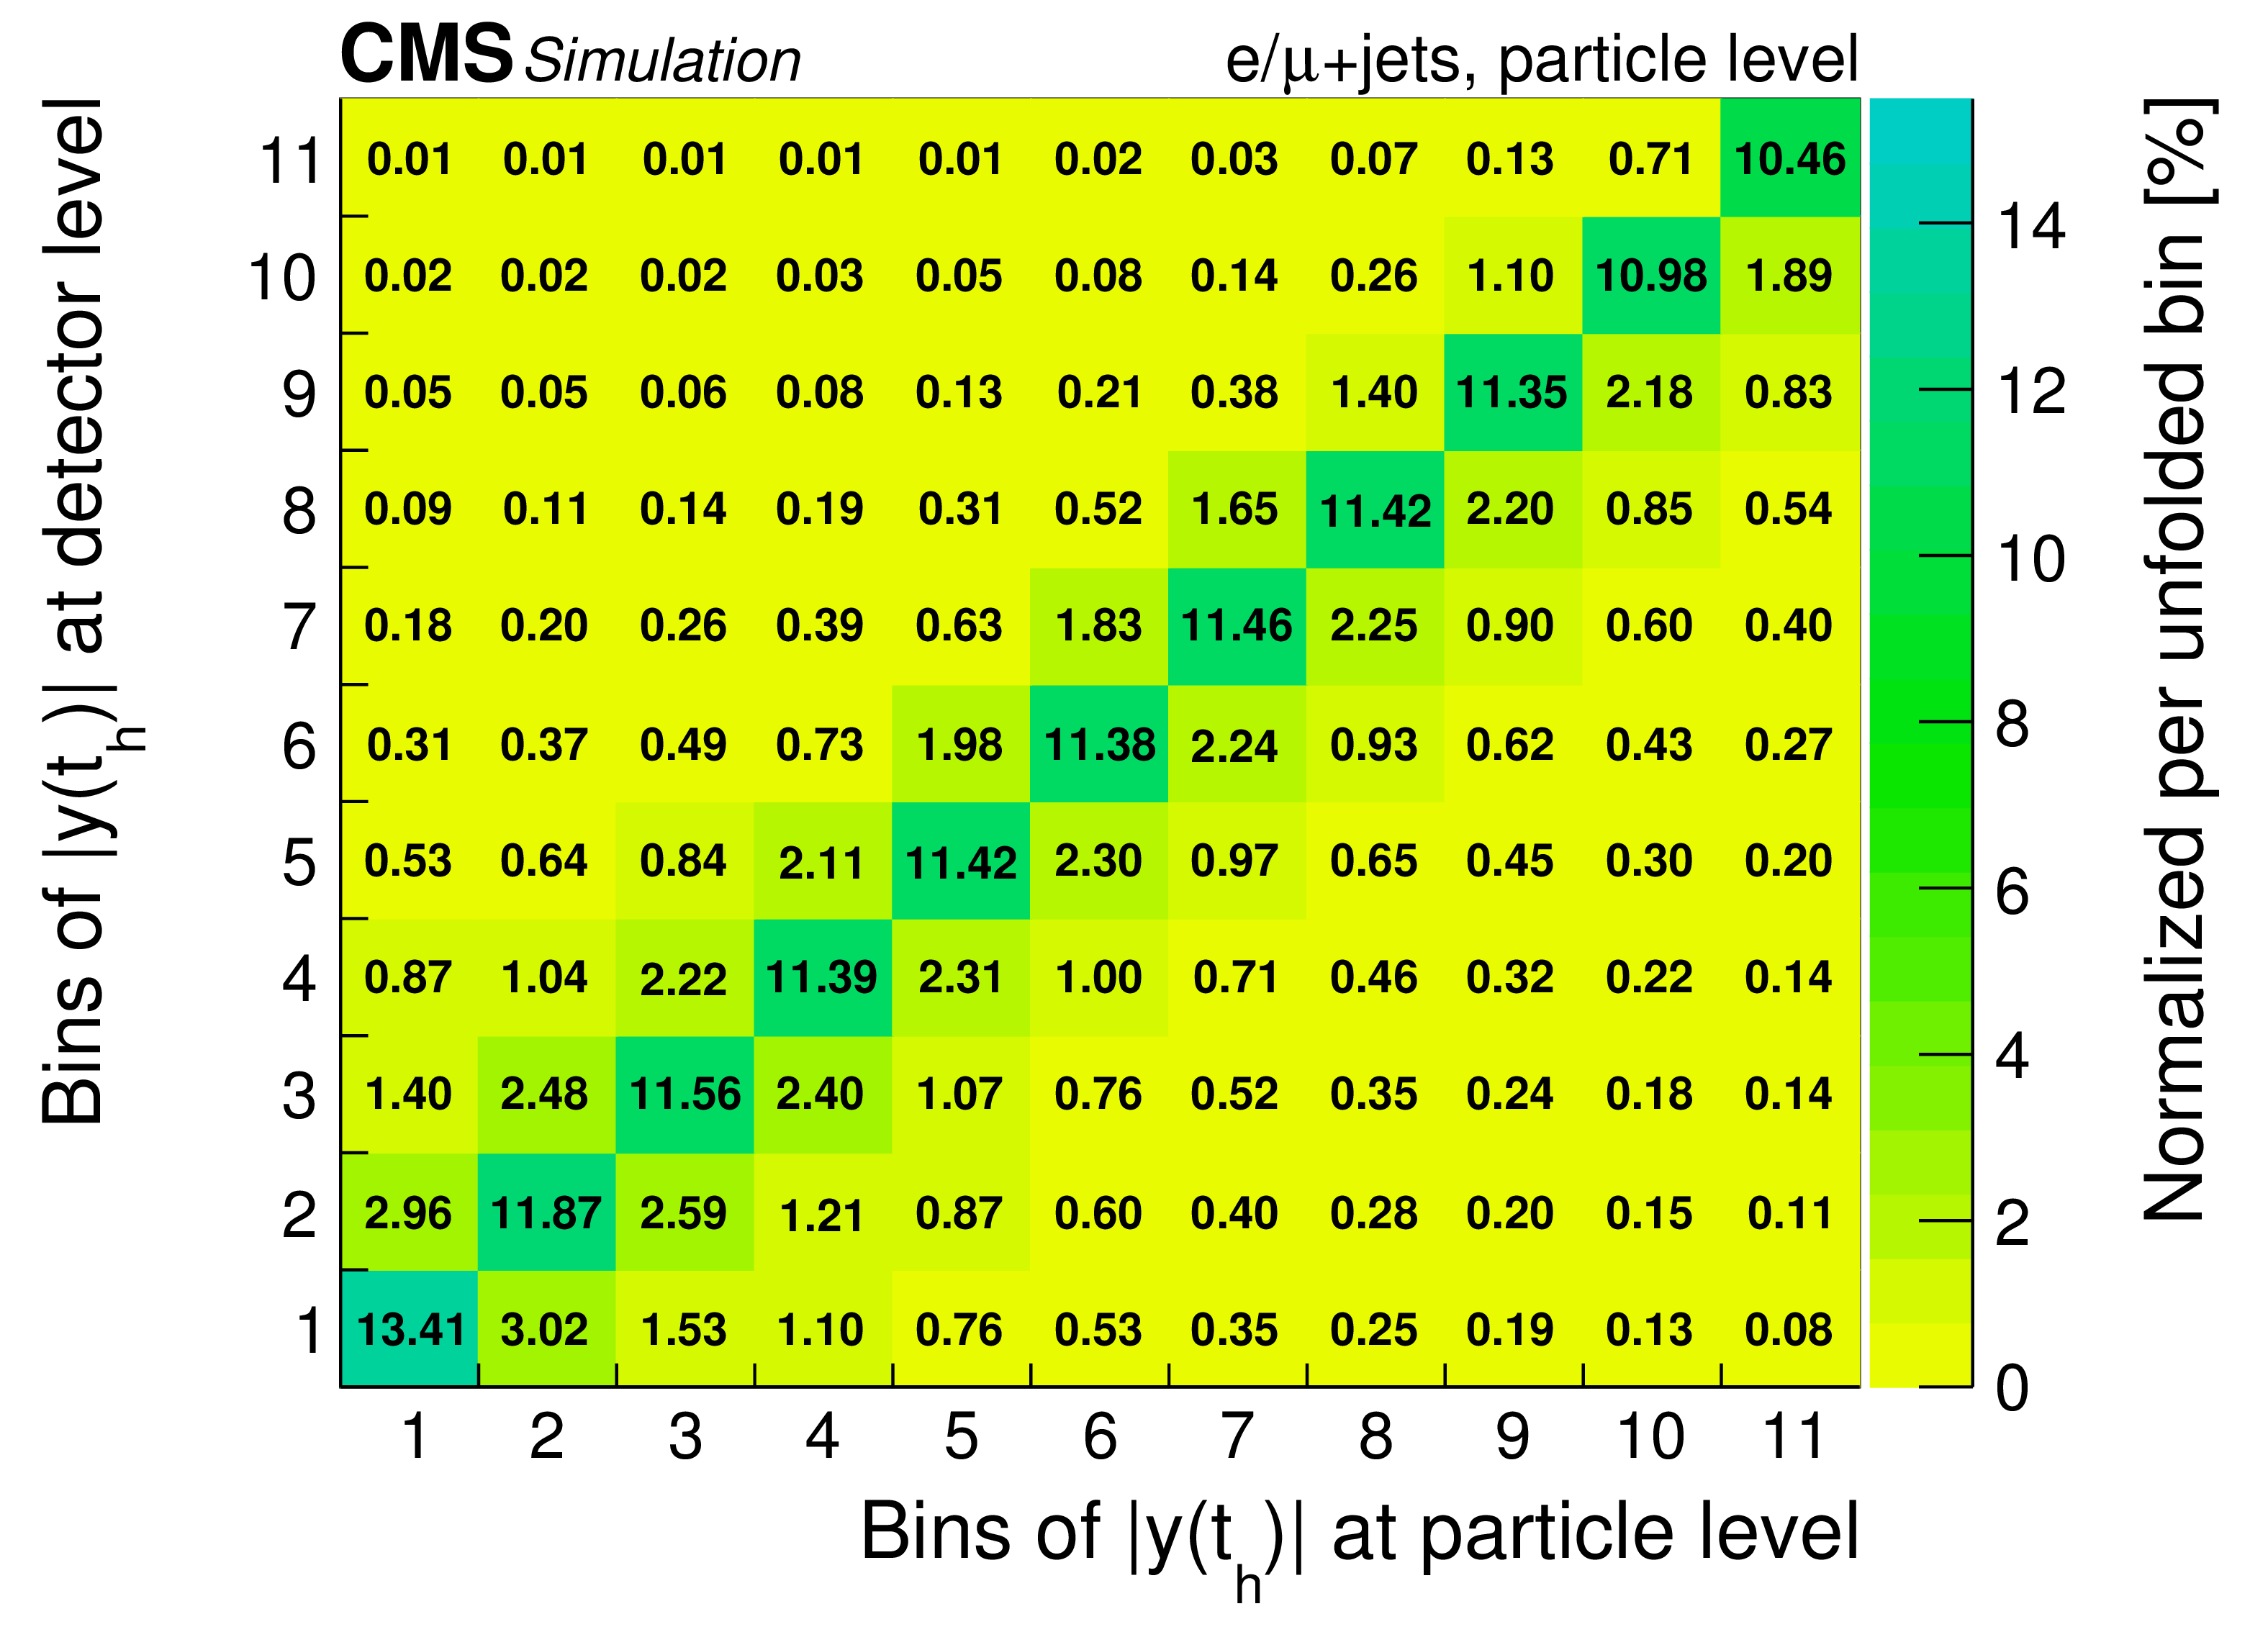
png pdf |
Additional Figure 7-c:
Migrations among the bins in the differential cross section measurements at particle level. |
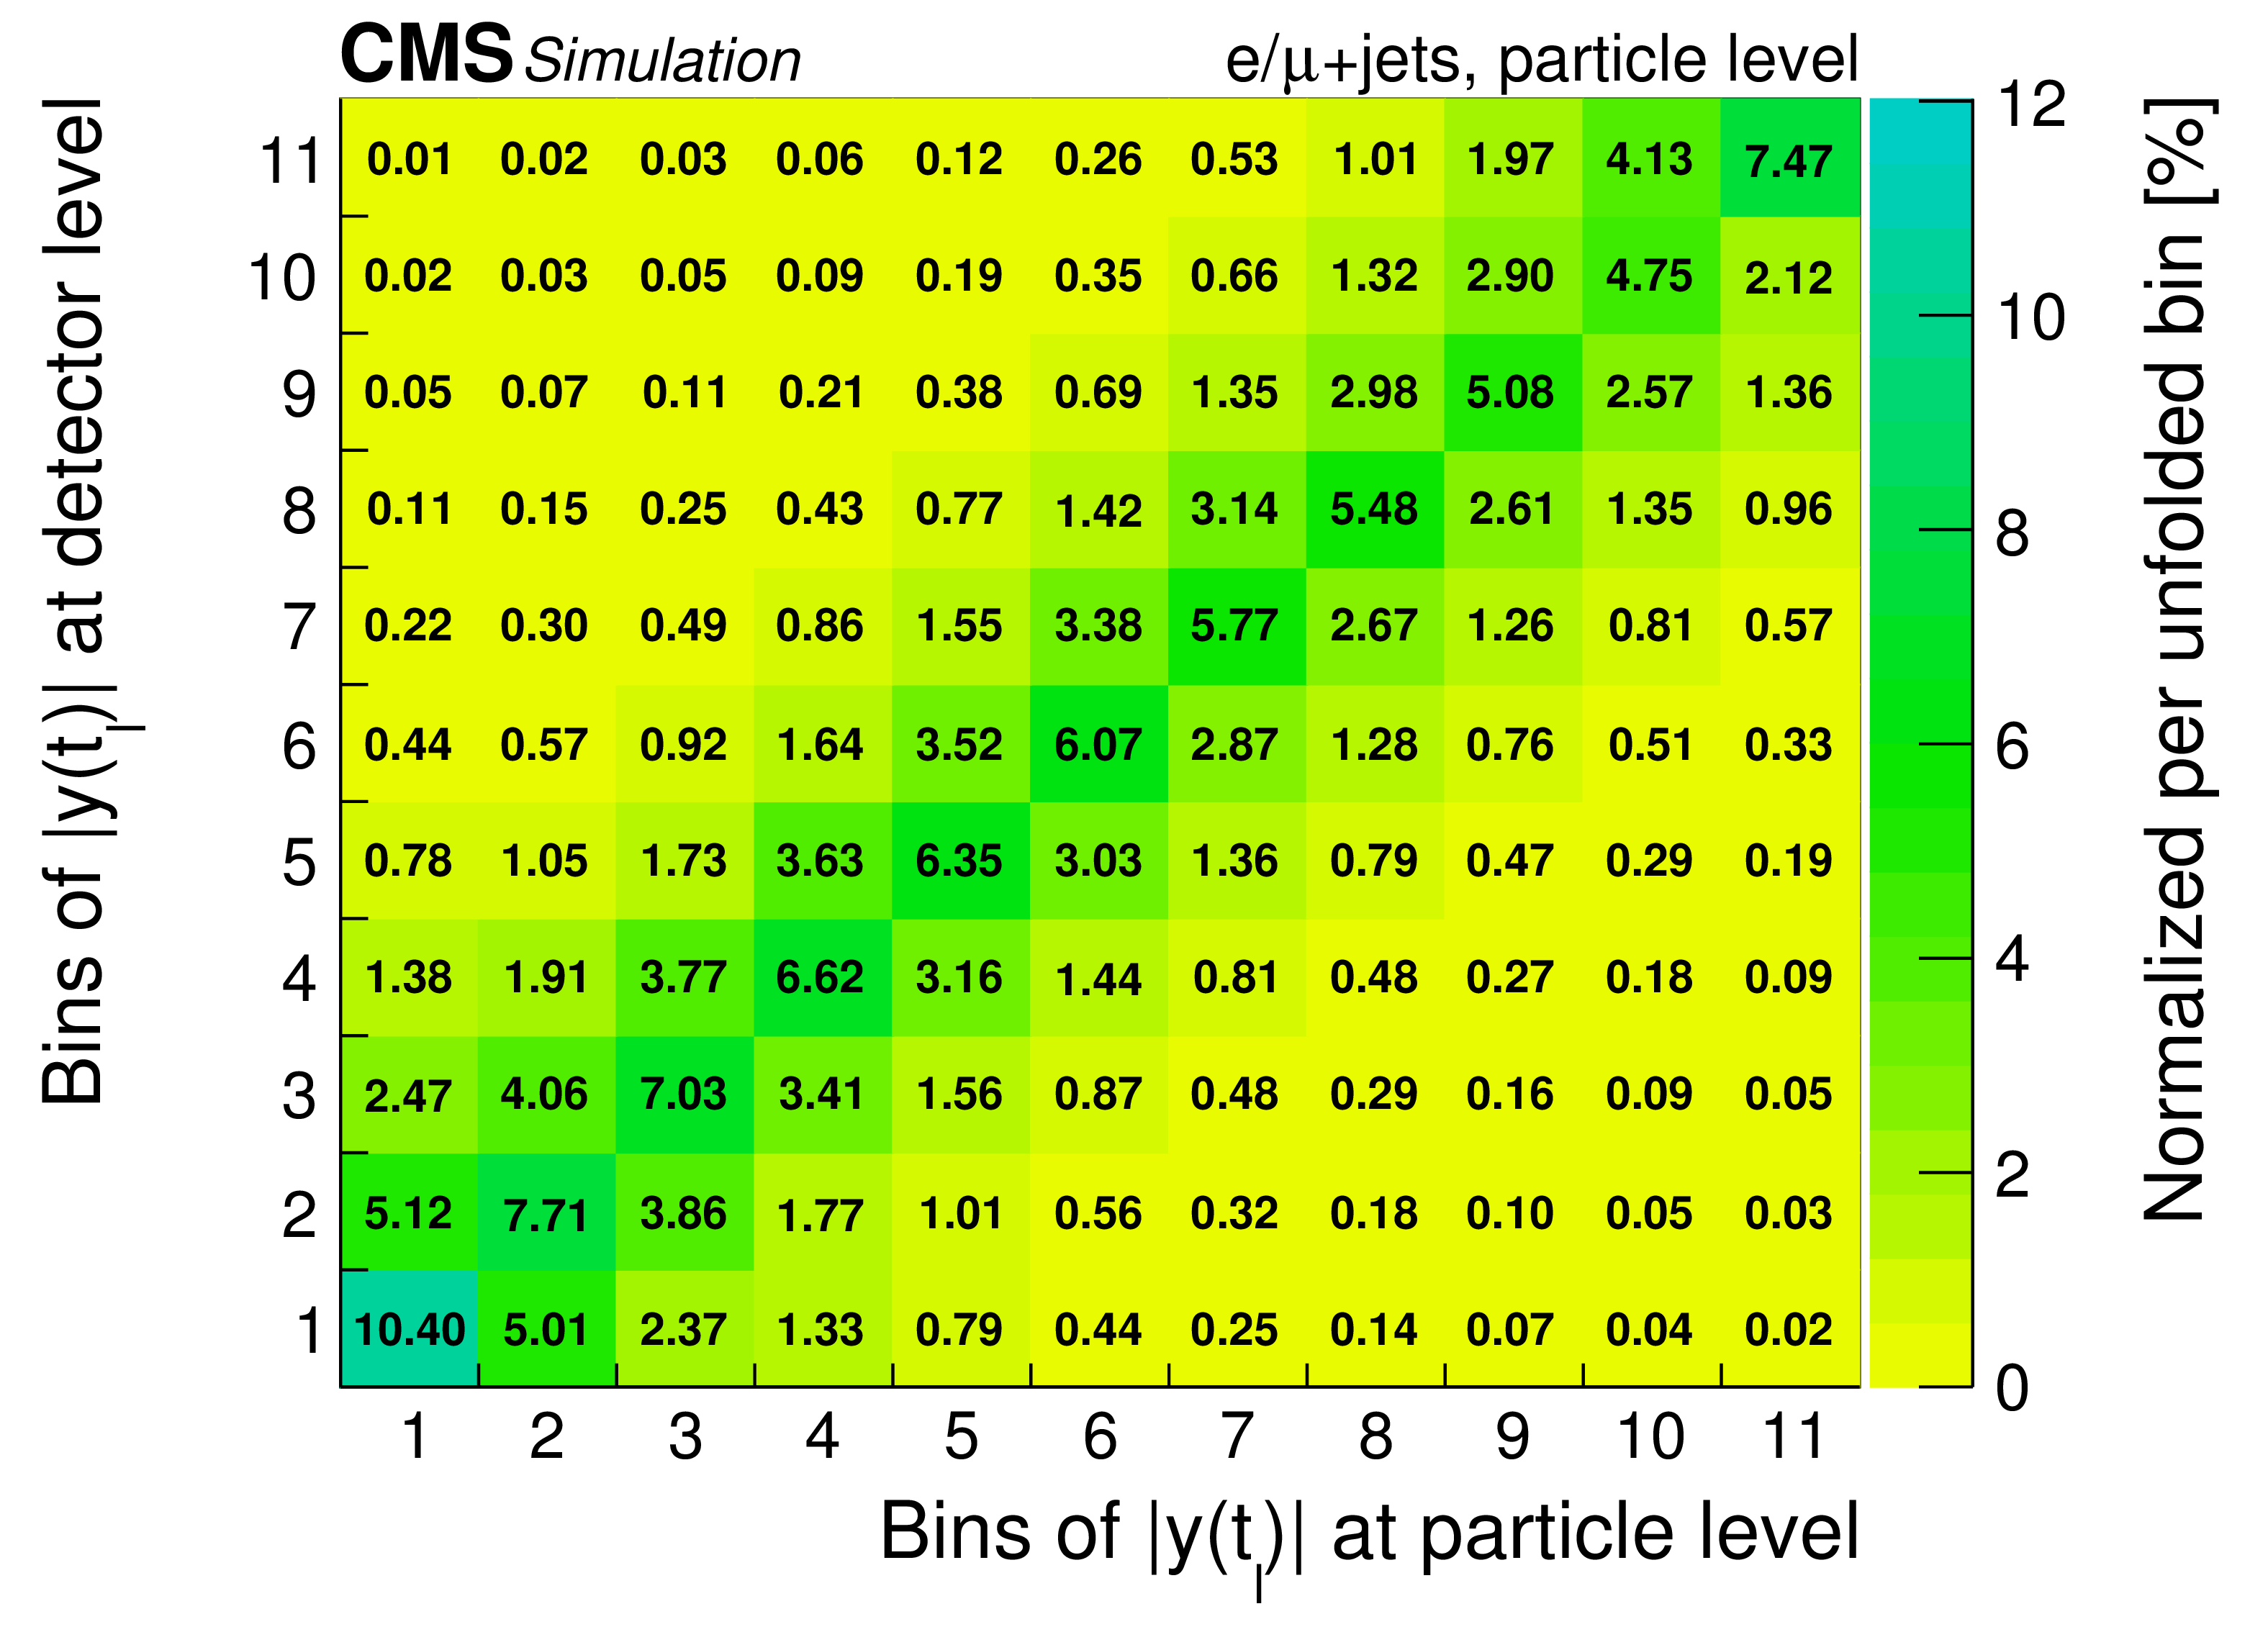
png pdf |
Additional Figure 7-d:
Migrations among the bins in the differential cross section measurements at particle level. |
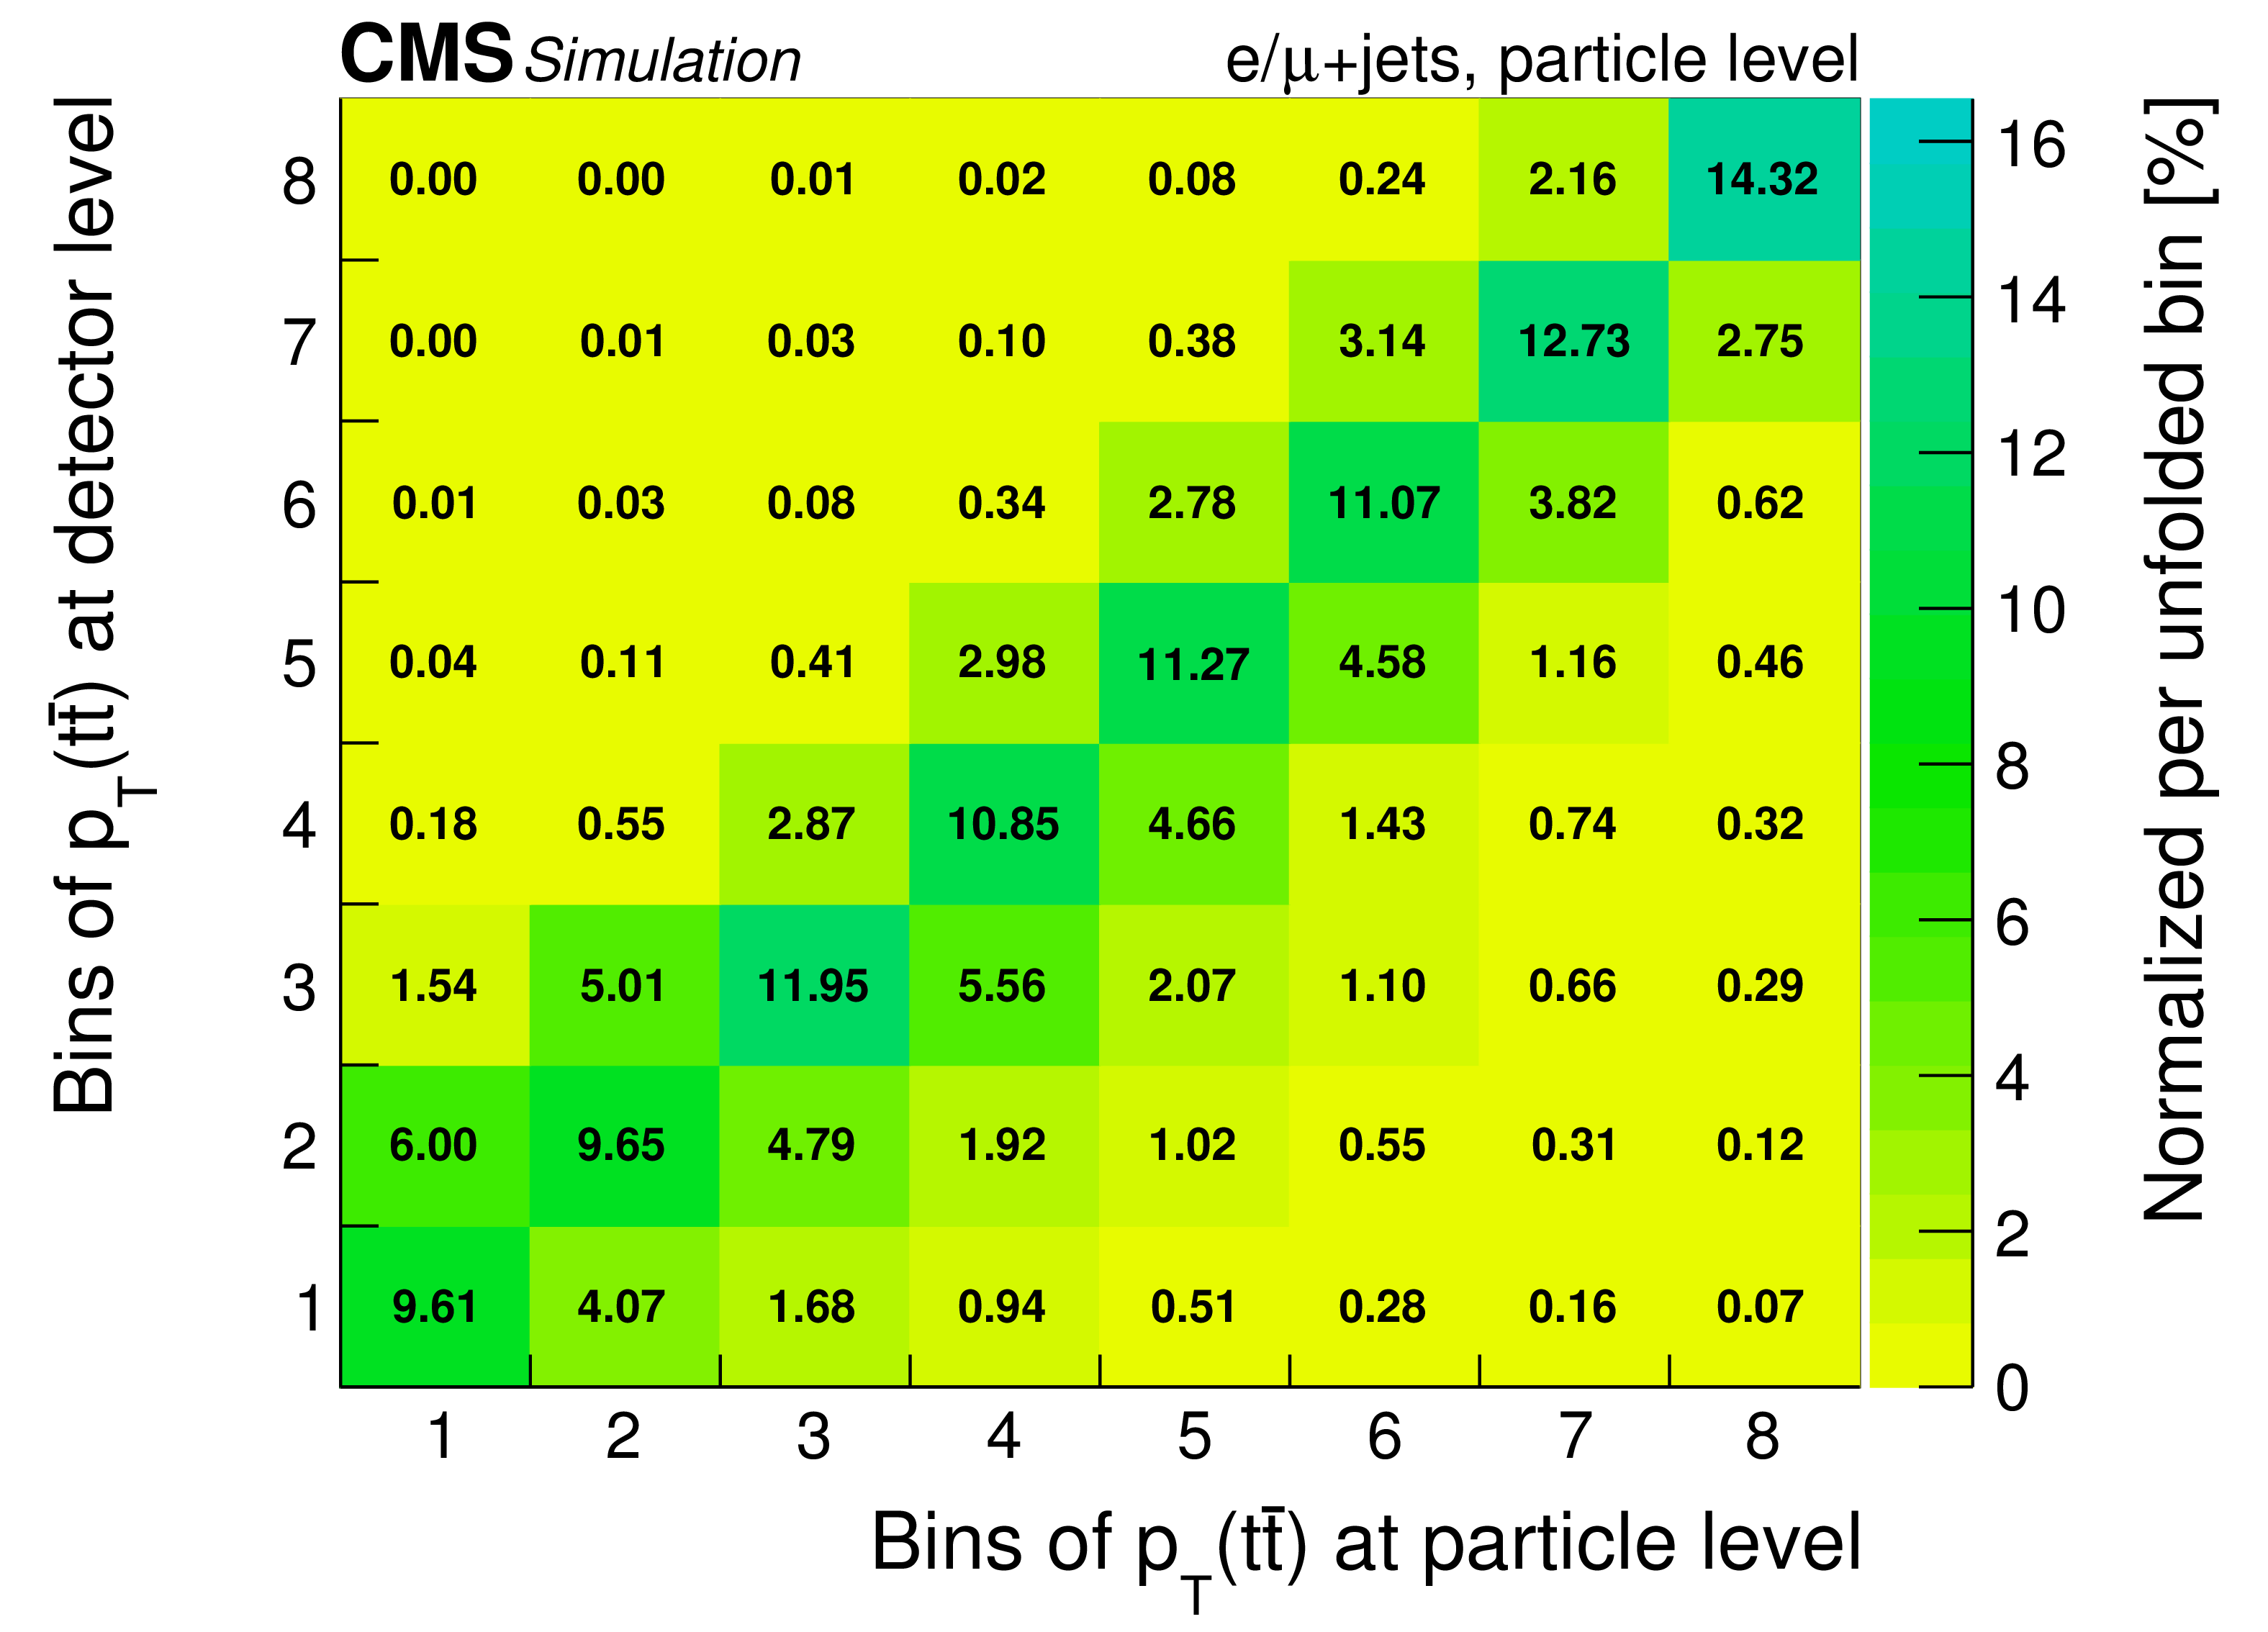
png pdf |
Additional Figure 7-e:
Migrations among the bins in the differential cross section measurements at particle level. |
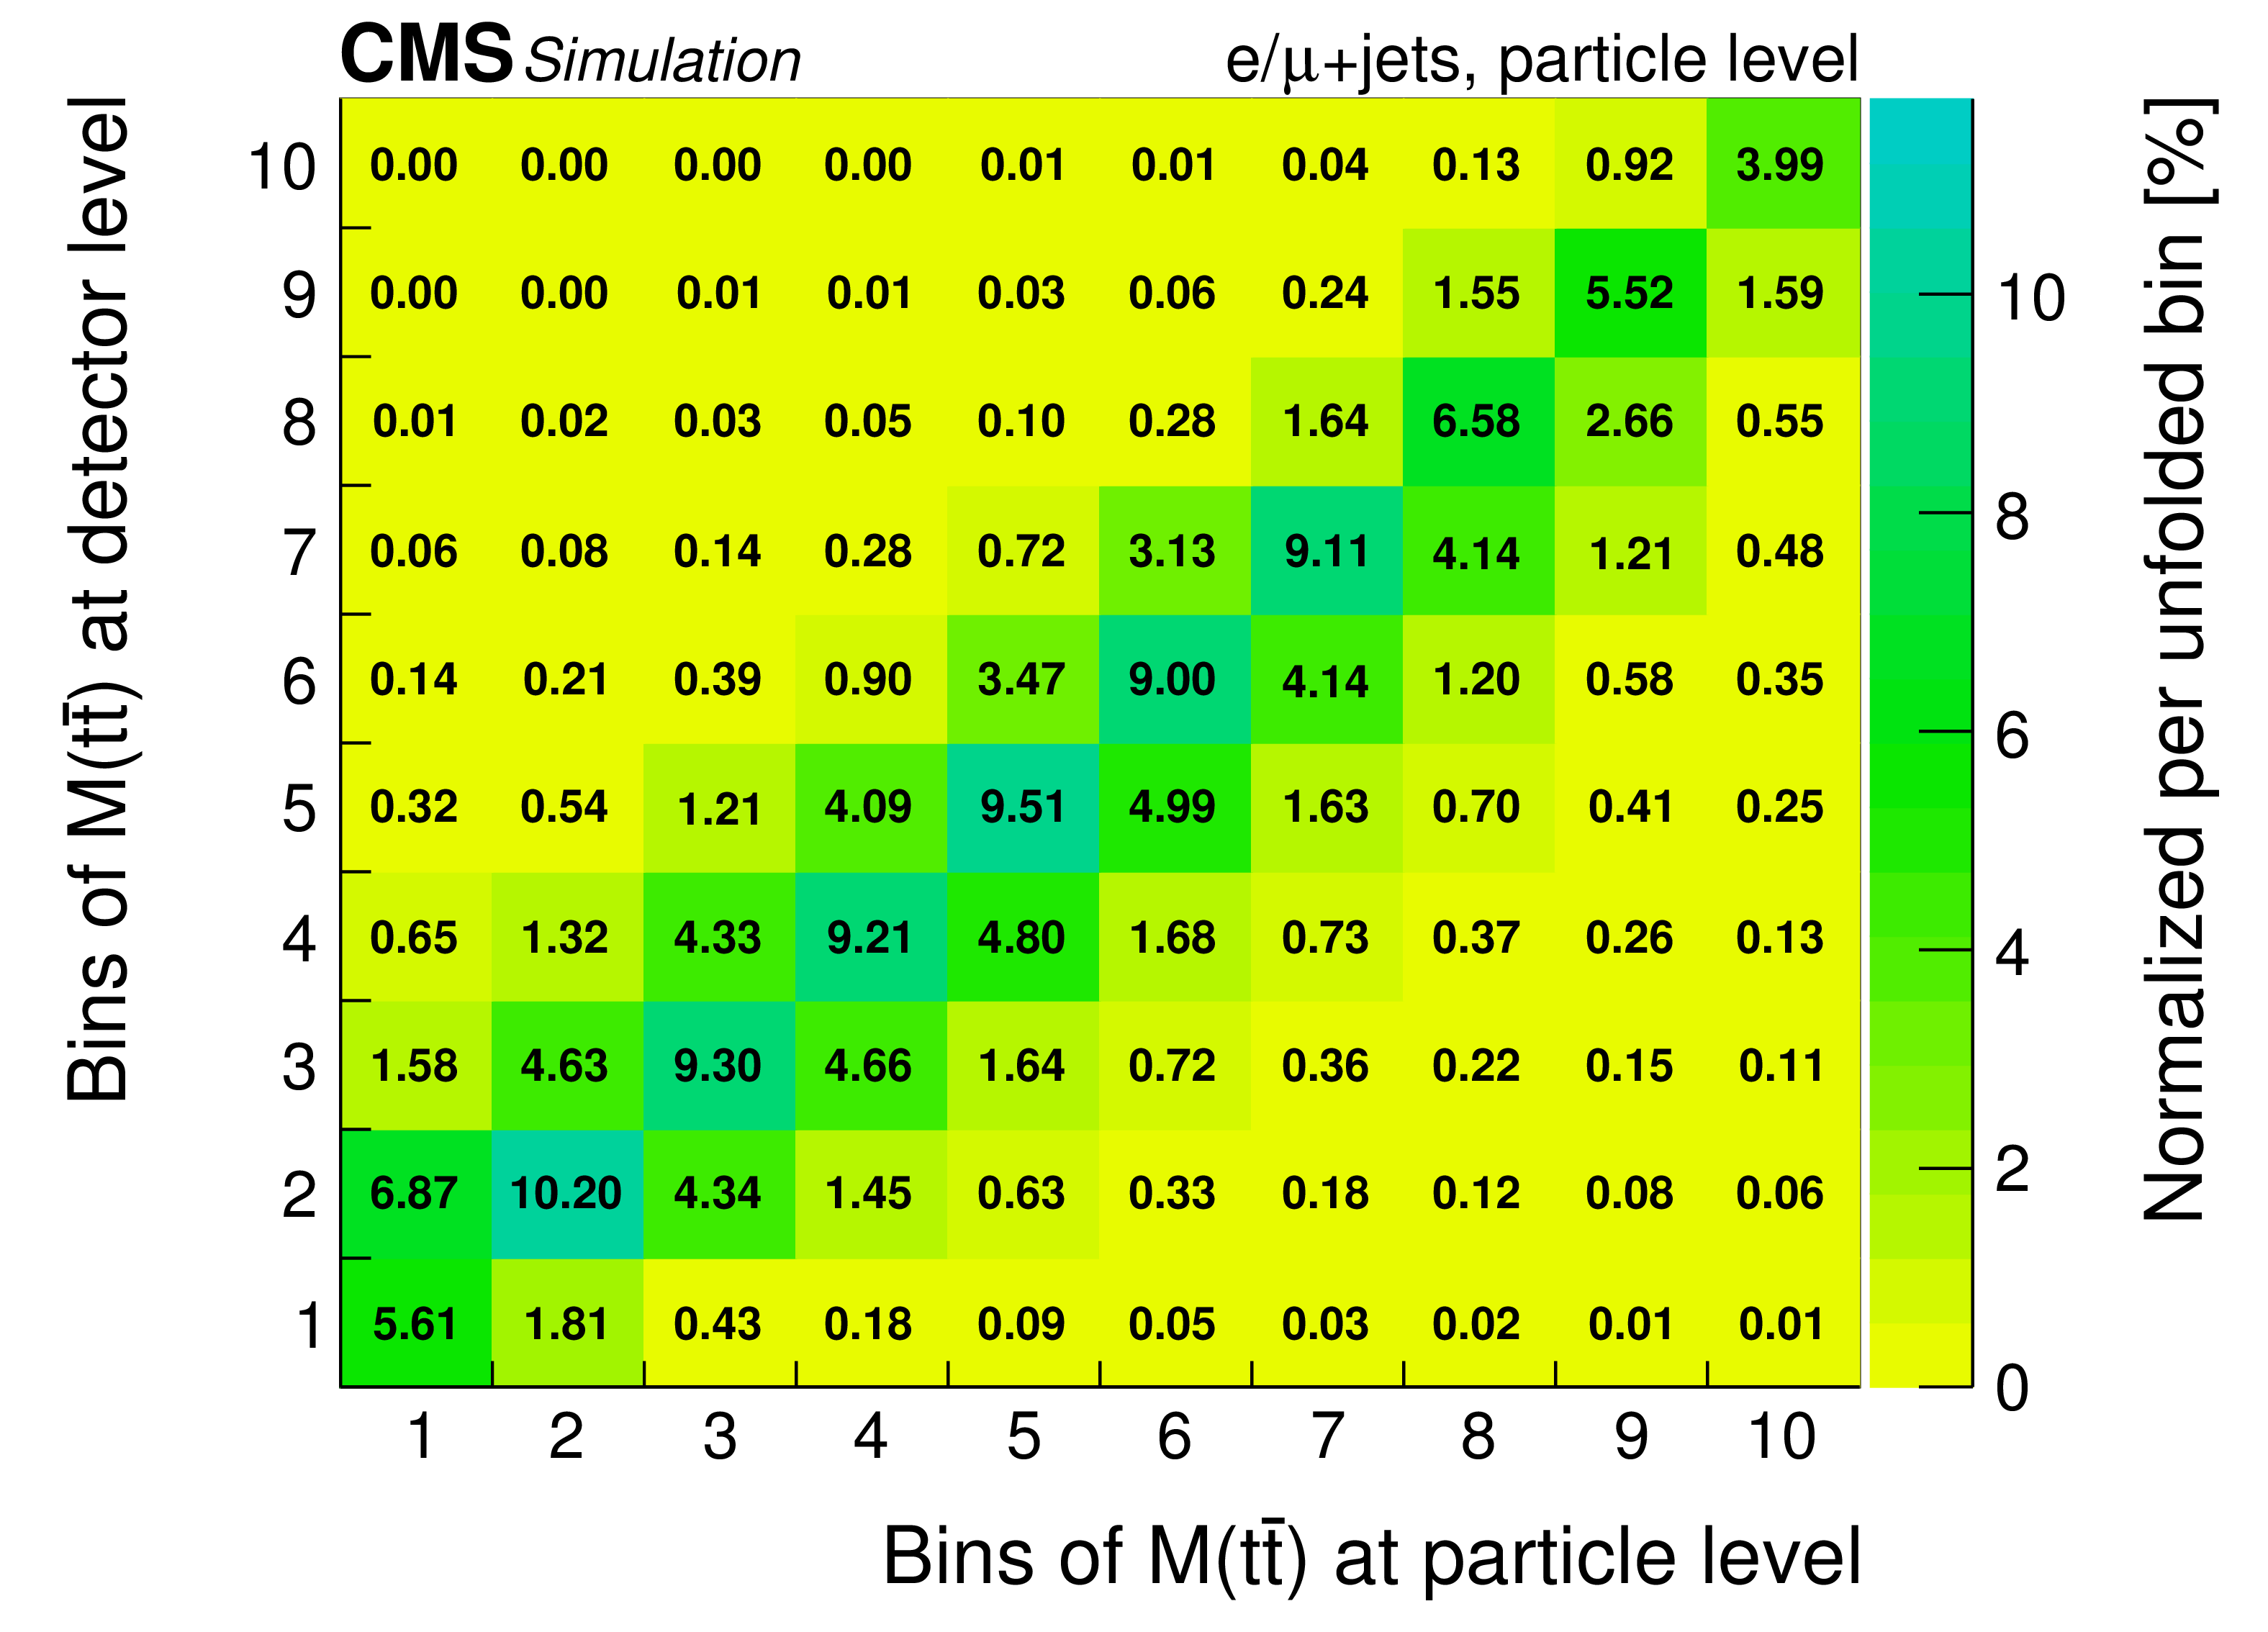
png pdf |
Additional Figure 7-f:
Migrations among the bins in the differential cross section measurements at particle level. |
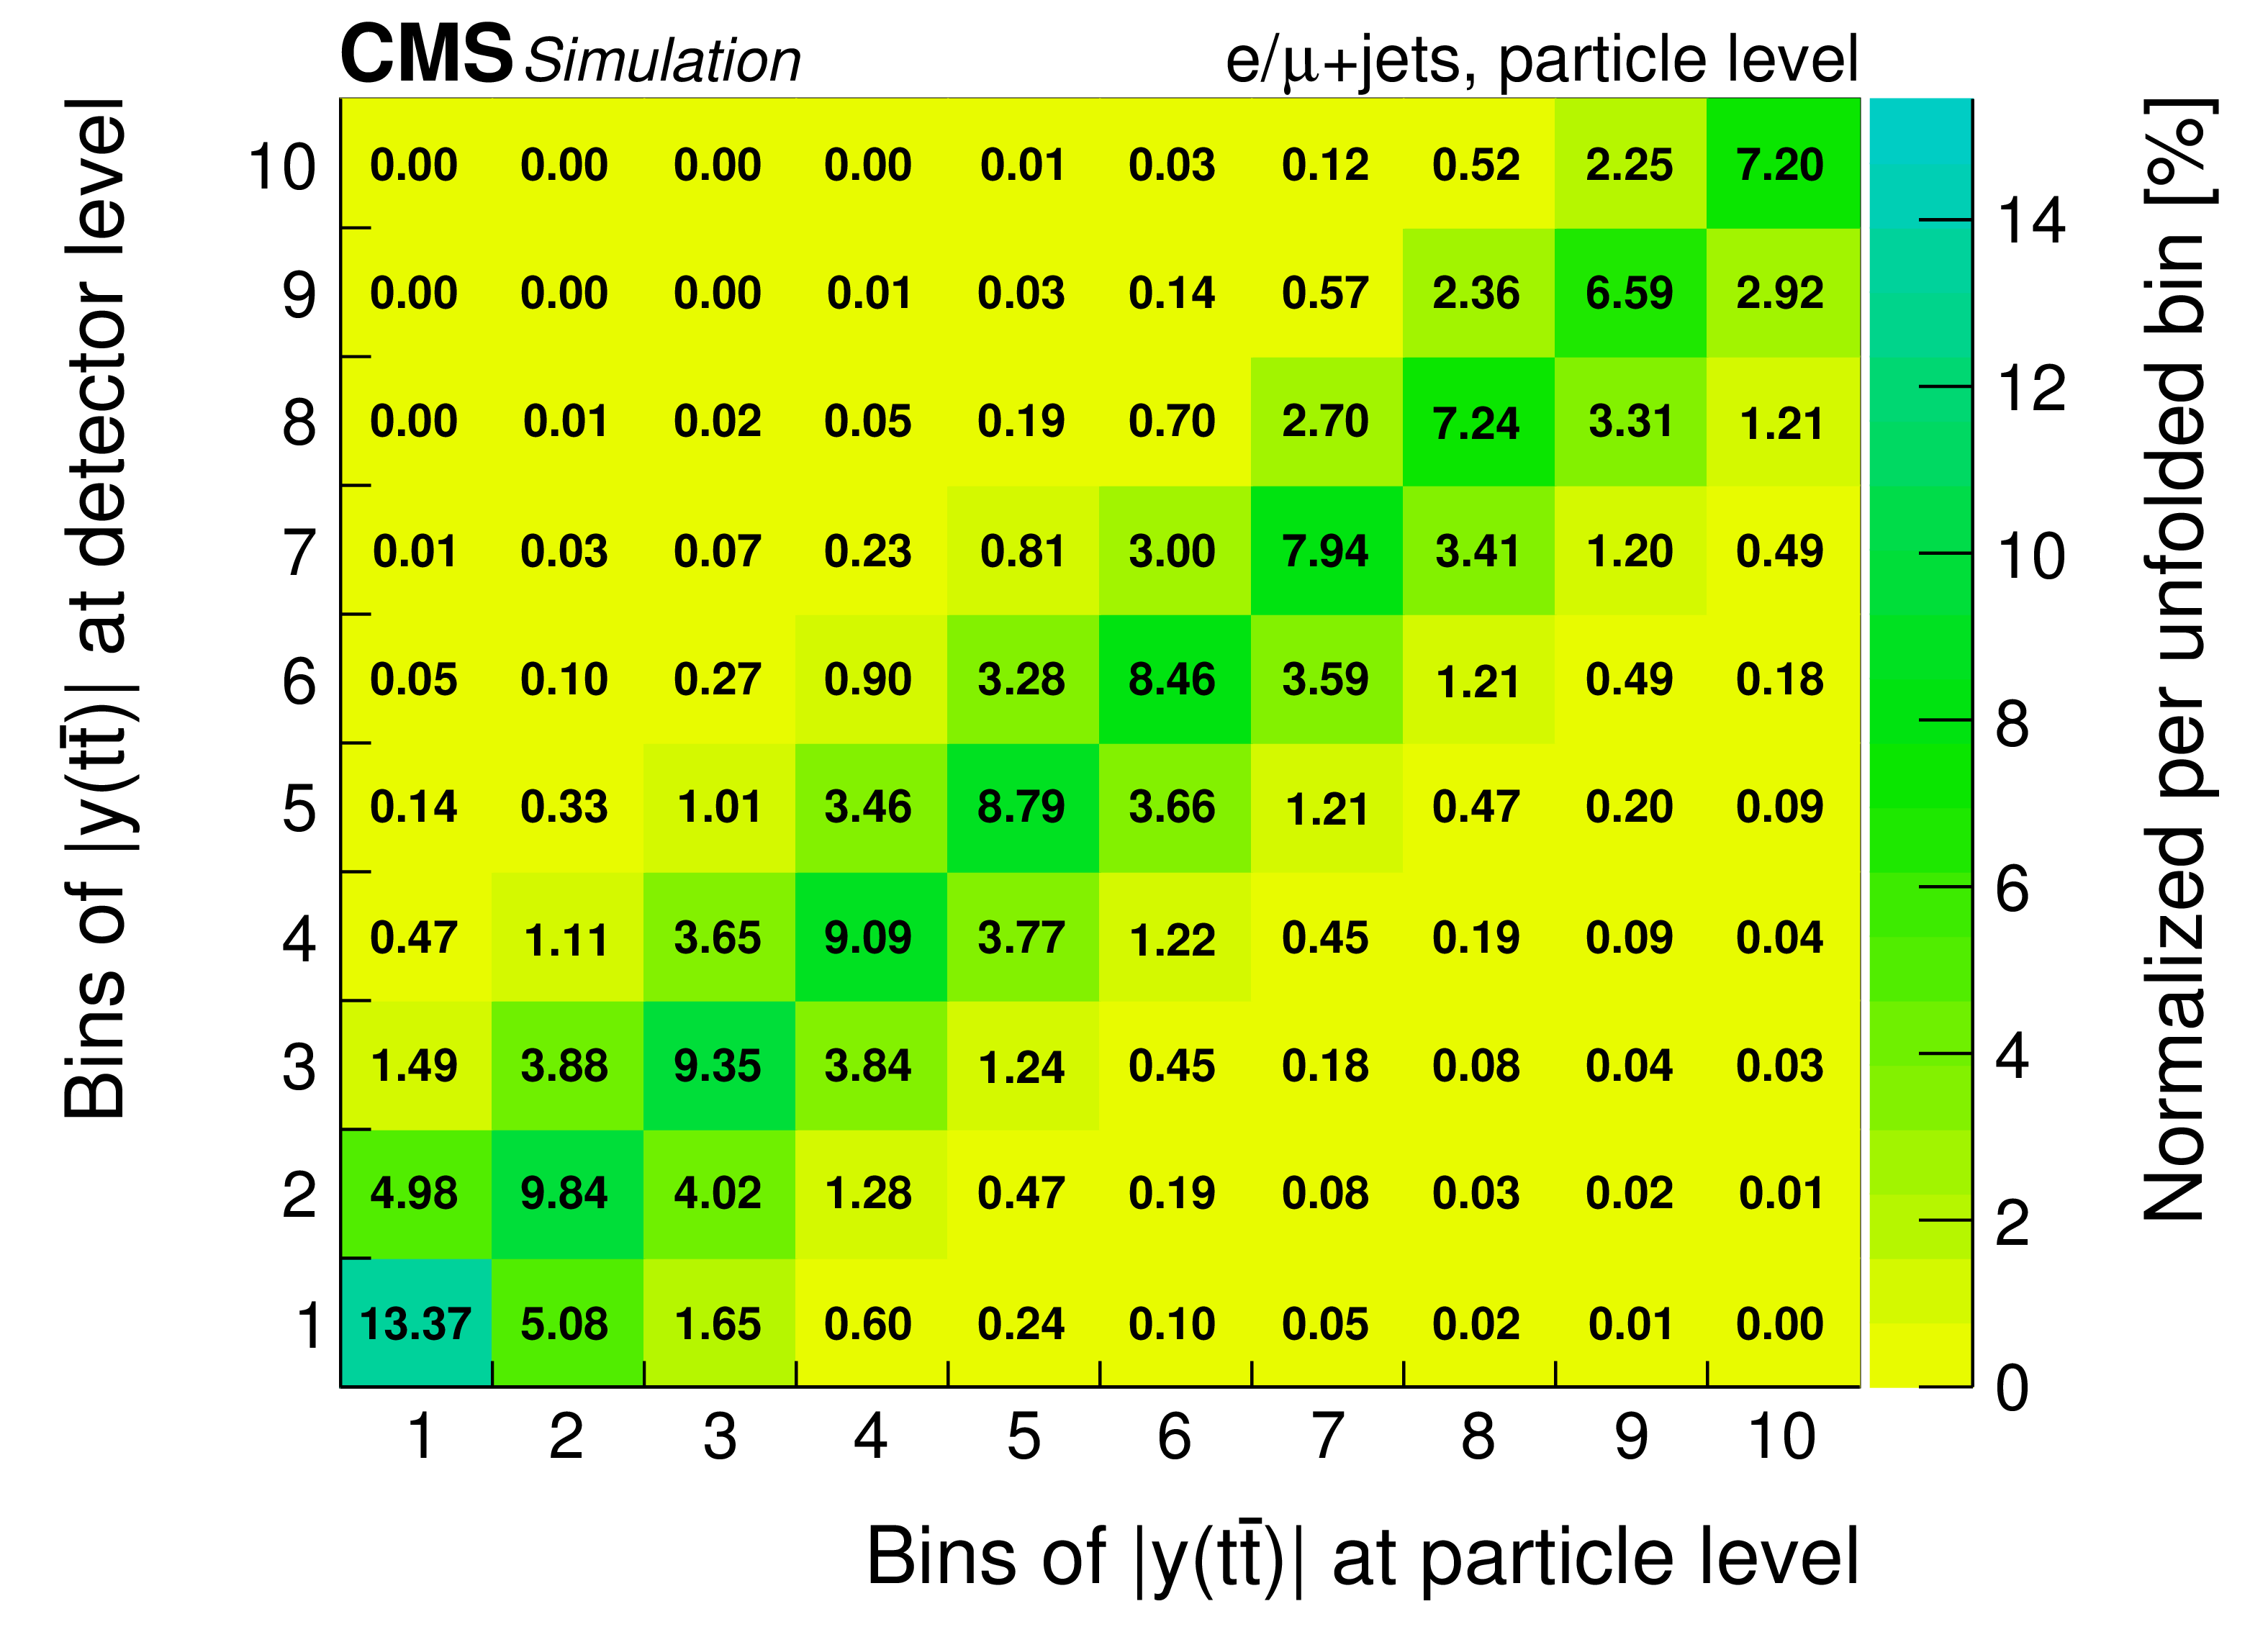
png pdf |
Additional Figure 7-g:
Migrations among the bins in the differential cross section measurements at particle level. |
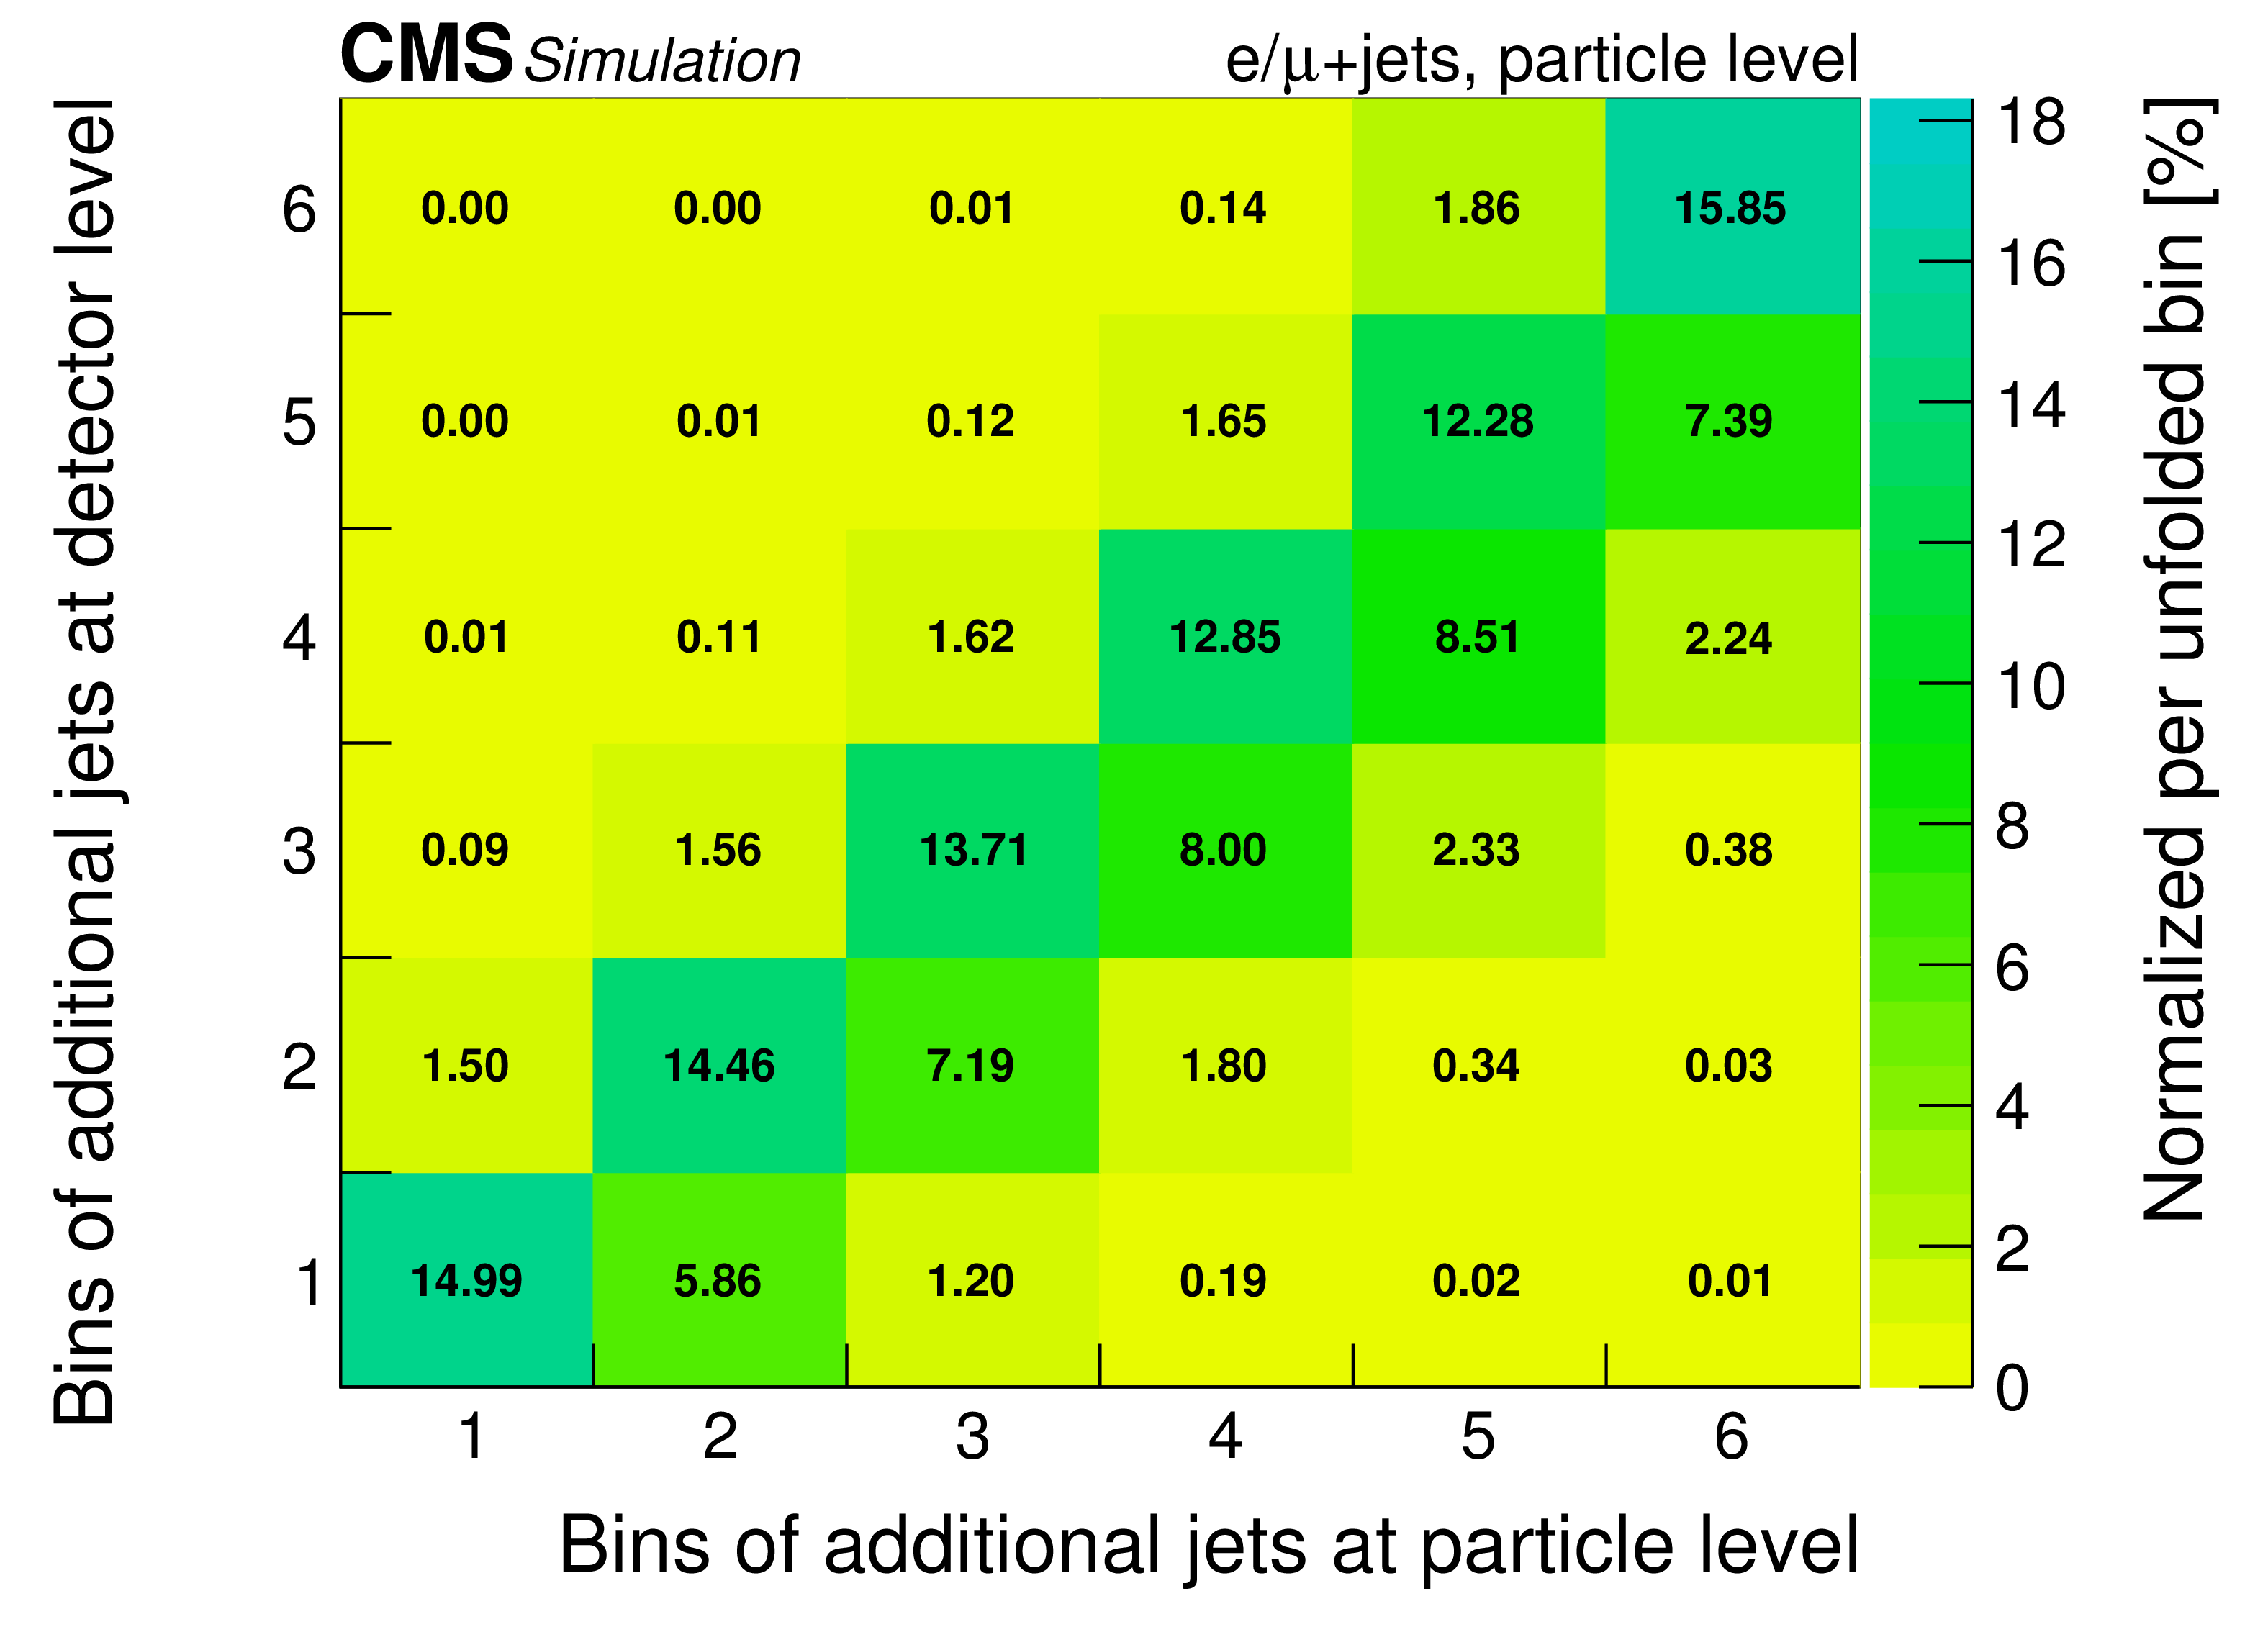
png pdf |
Additional Figure 7-h:
Migrations among the bins in the differential cross section measurements at particle level. |
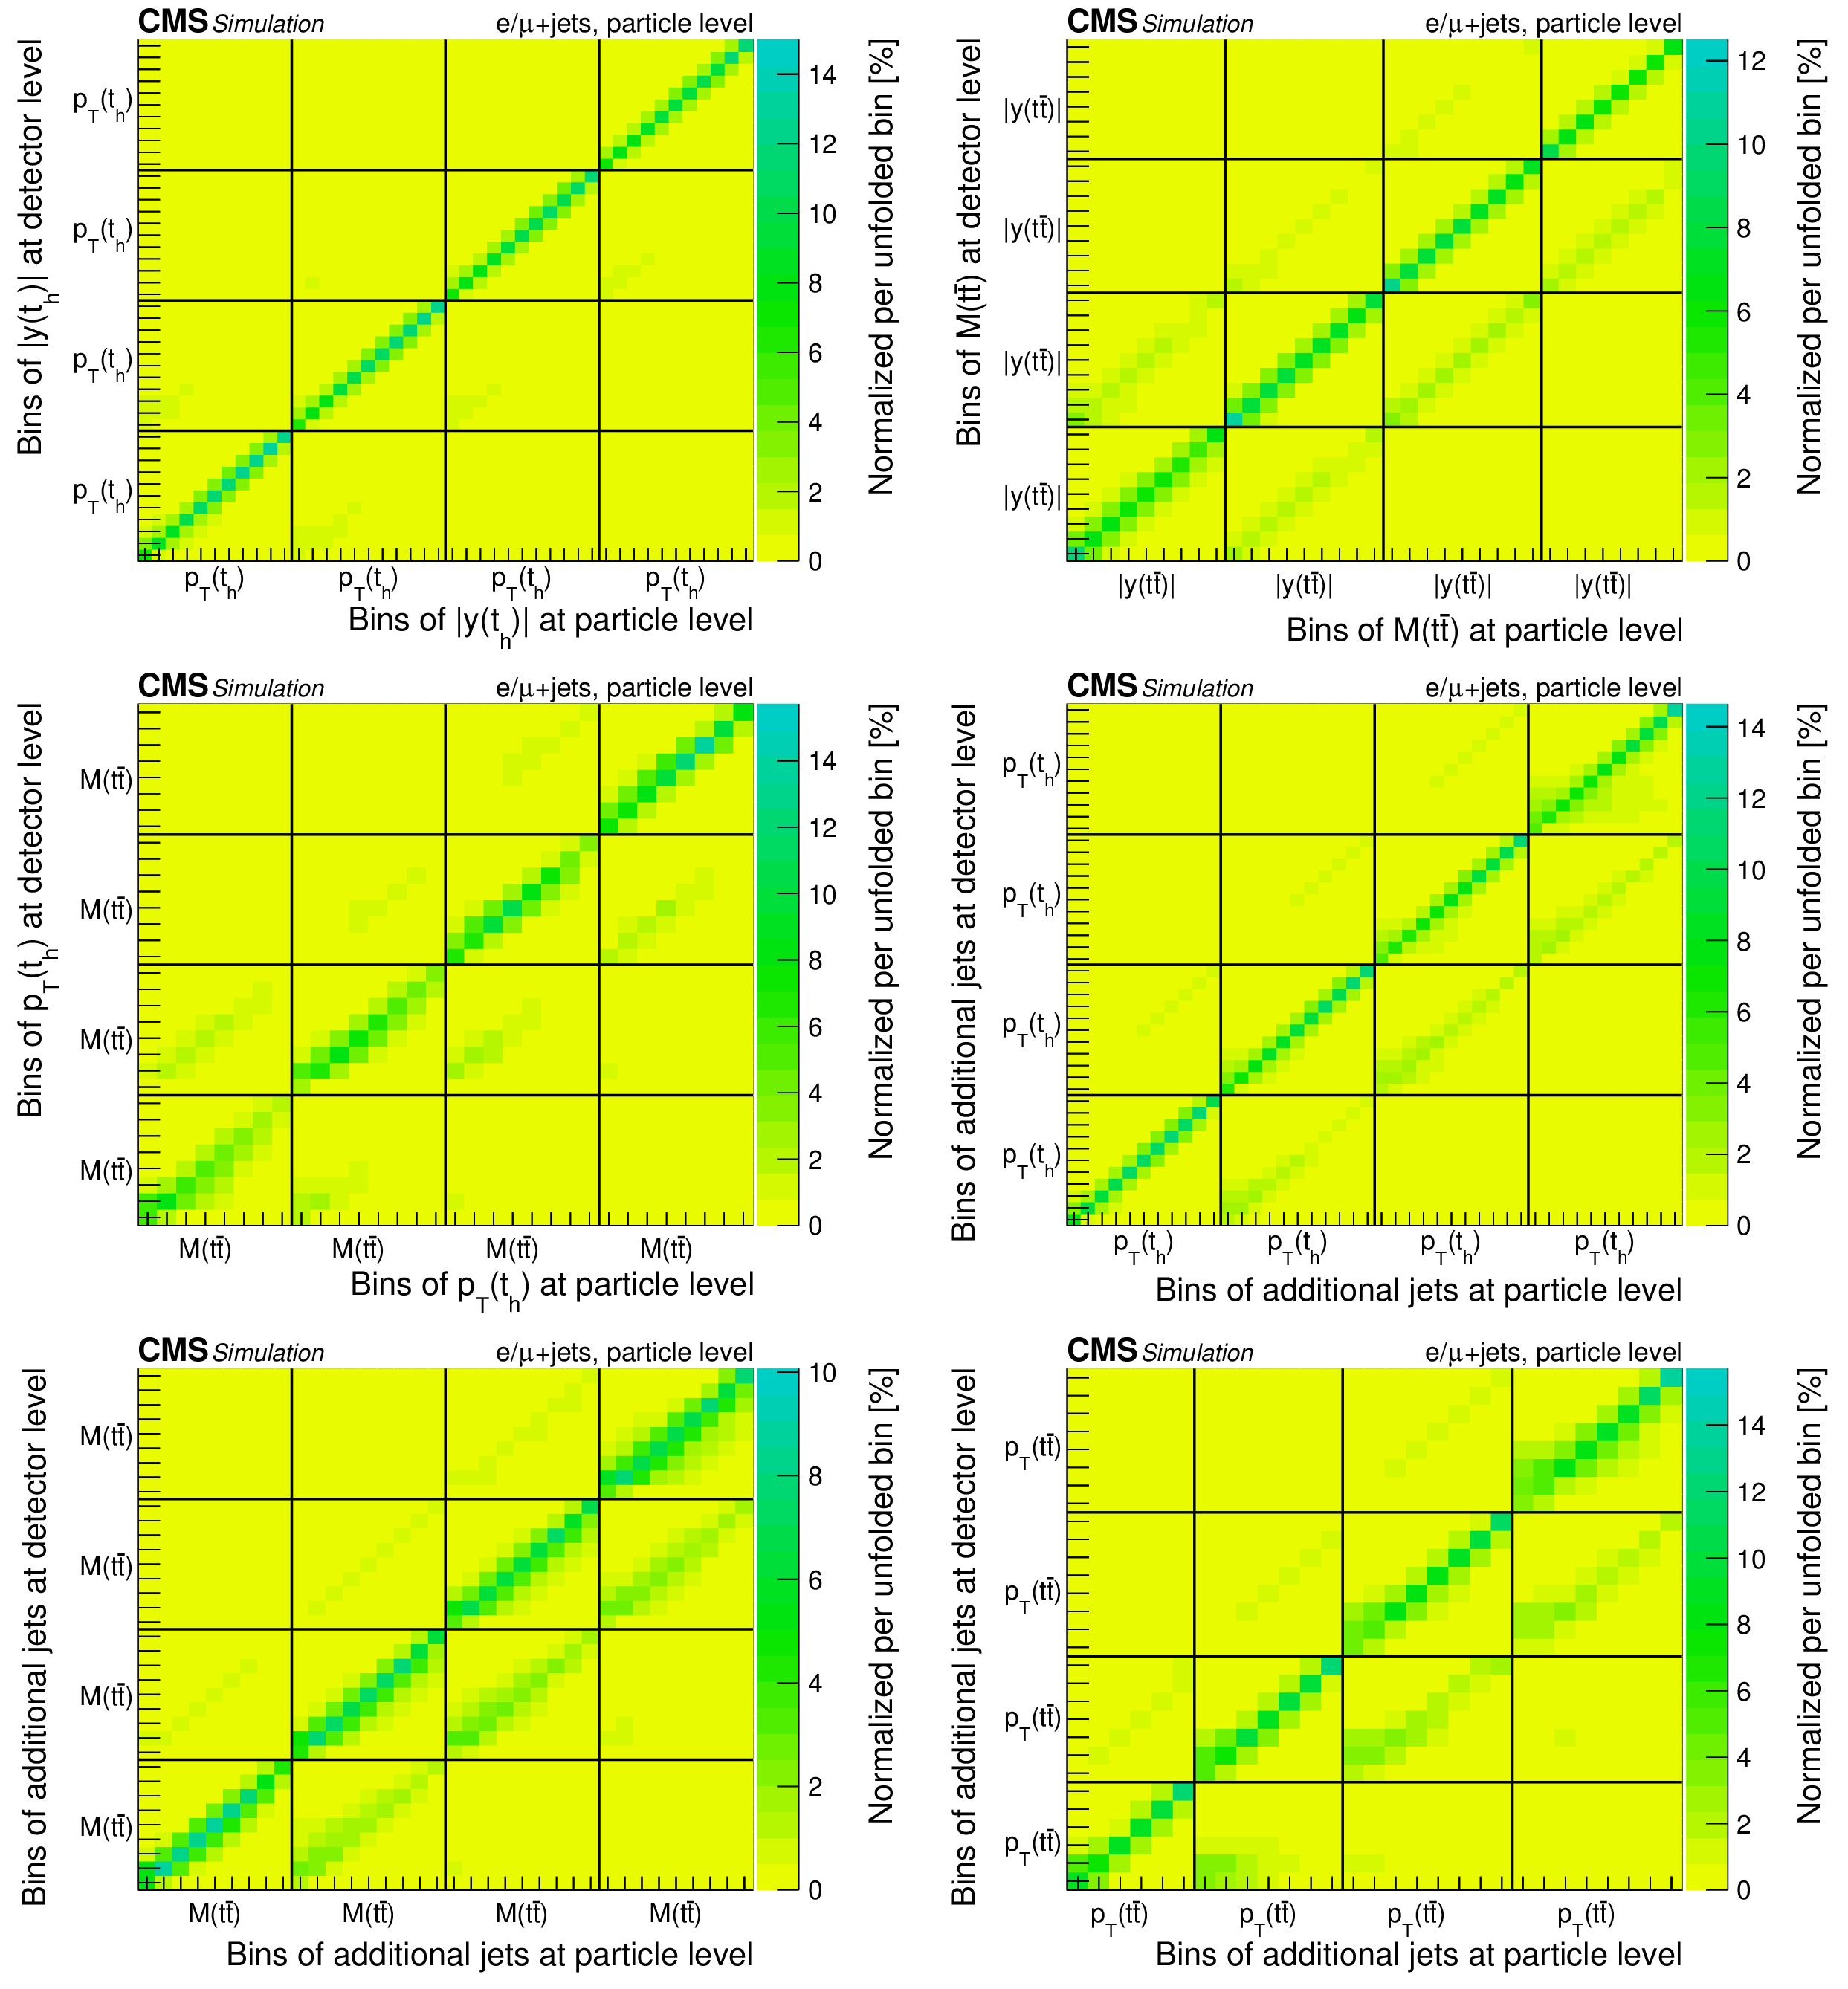
png pdf |
Additional Figure 8:
Migrations among the bins in the double-differential cross section measurements at particle level. |
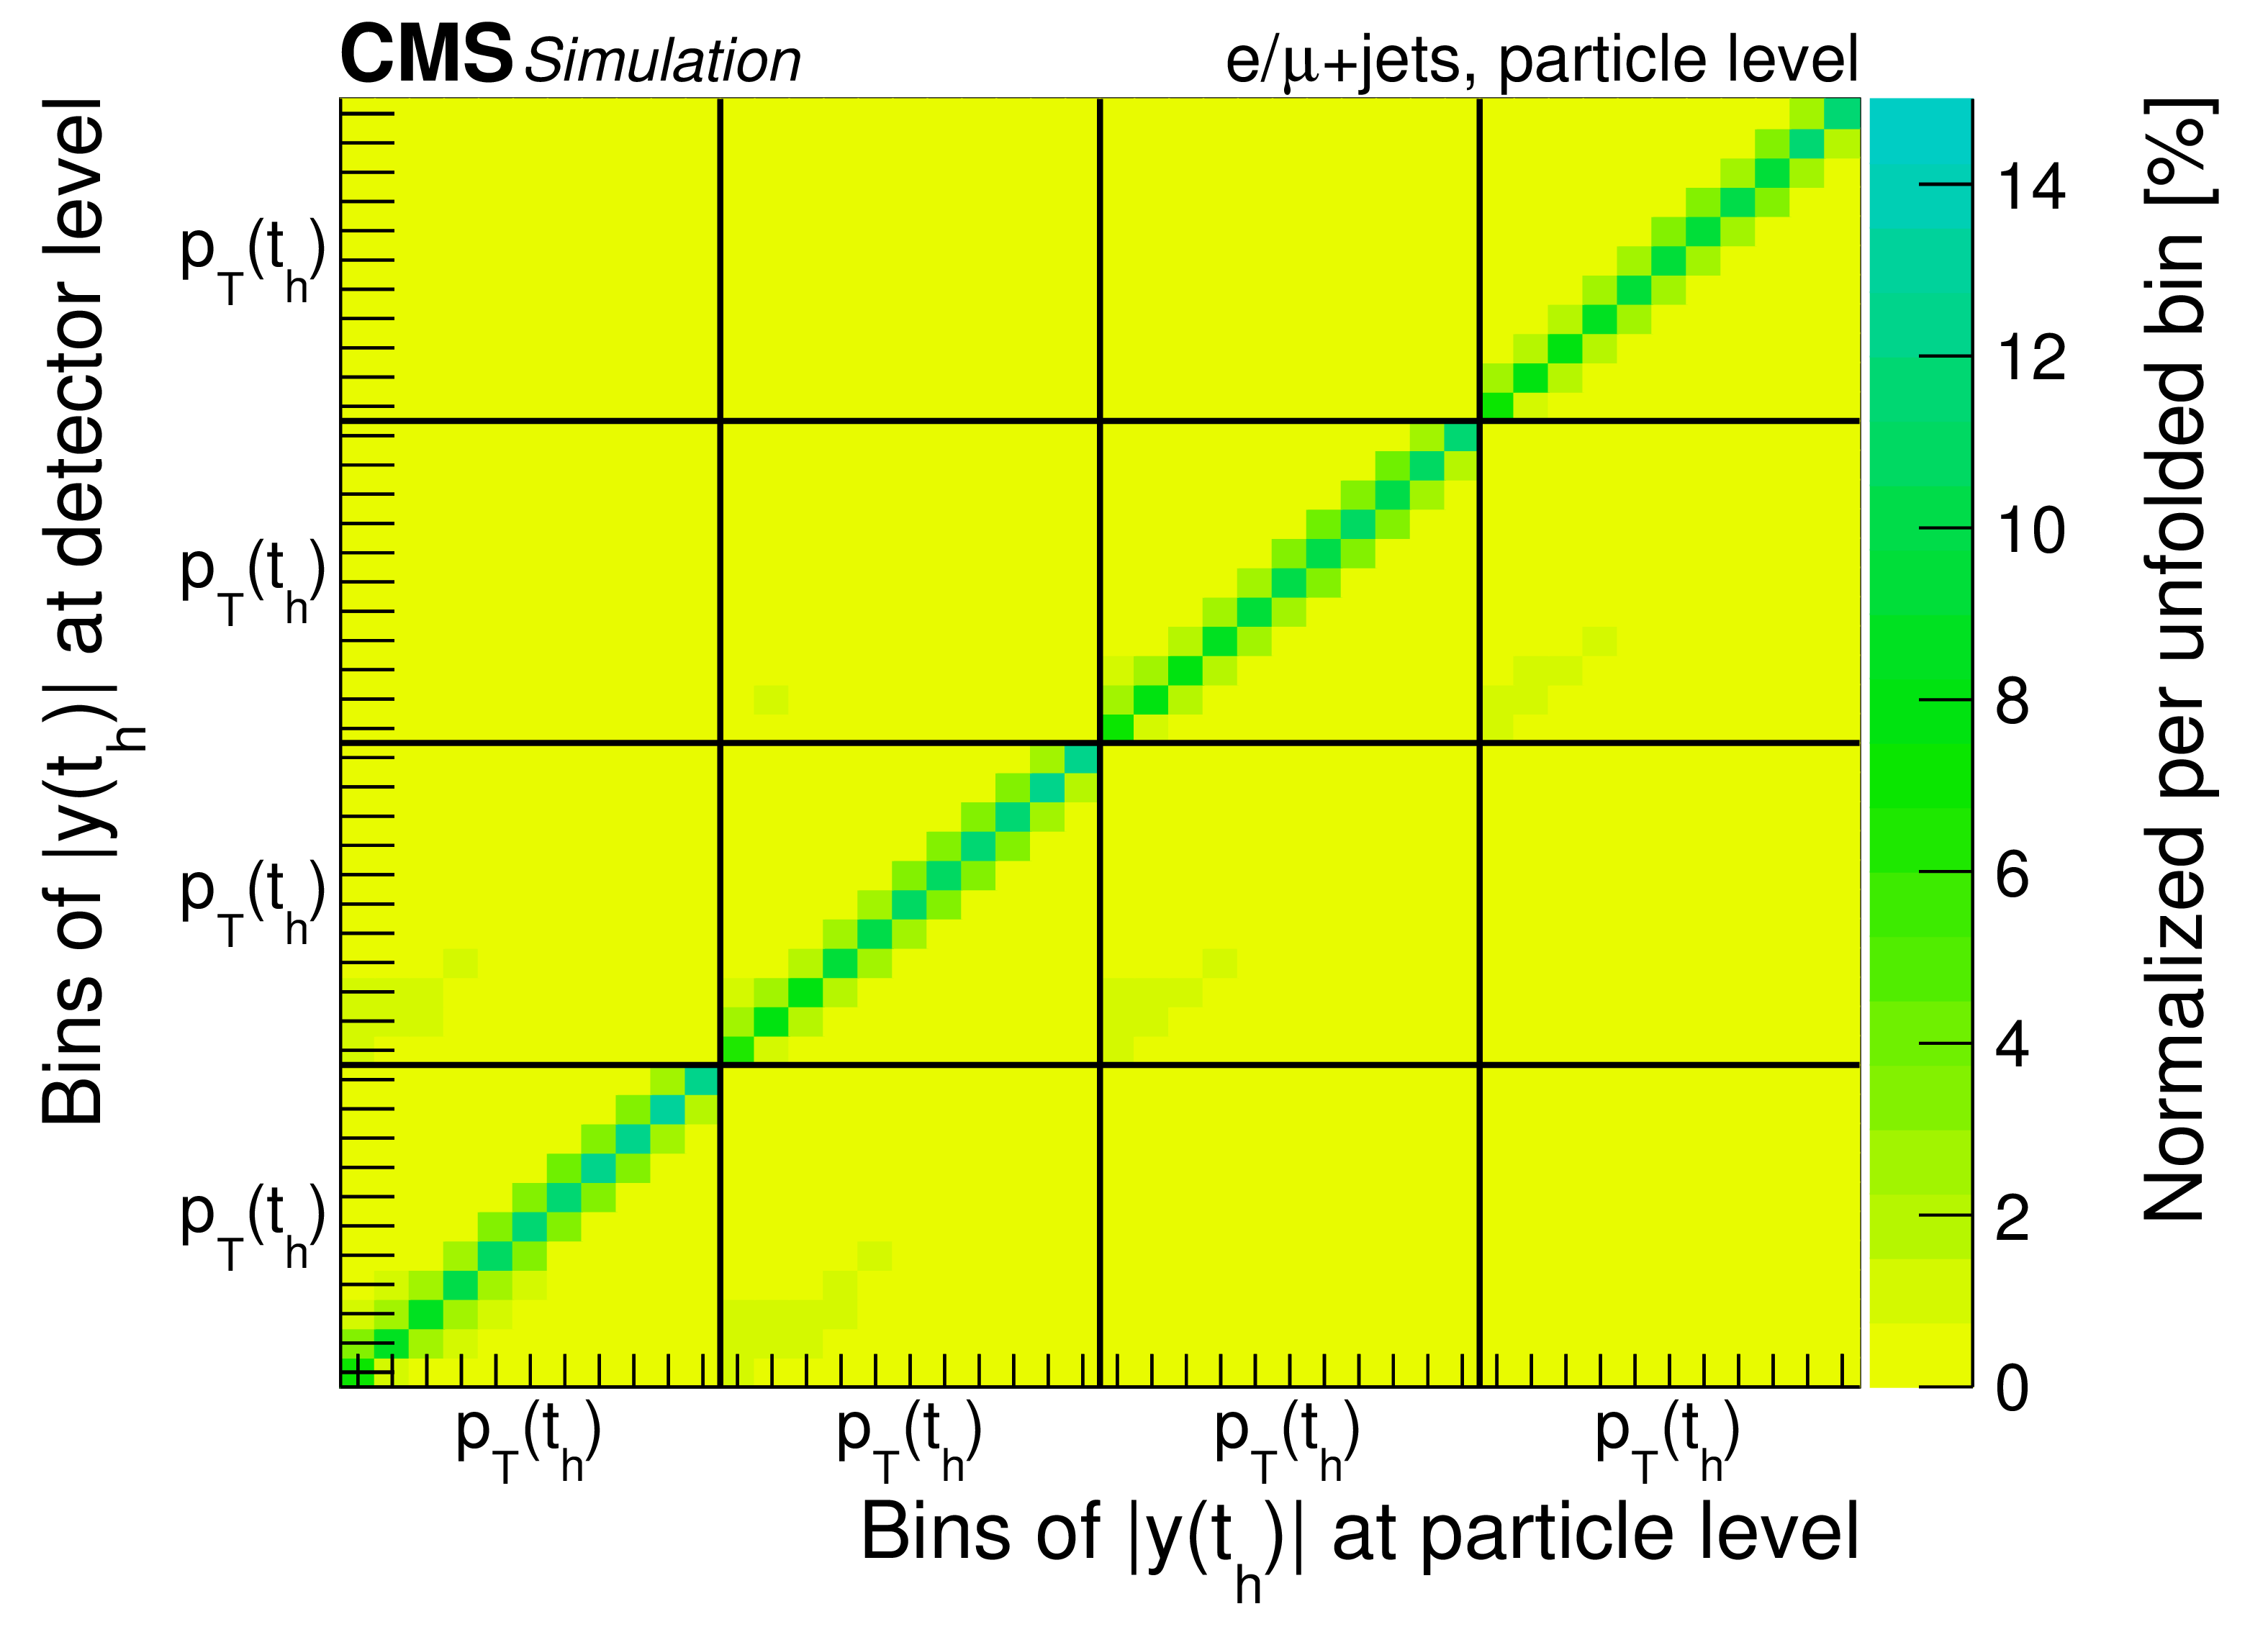
png pdf |
Additional Figure 8-a:
Migrations among the bins in the double-differential cross section measurements at particle level. |
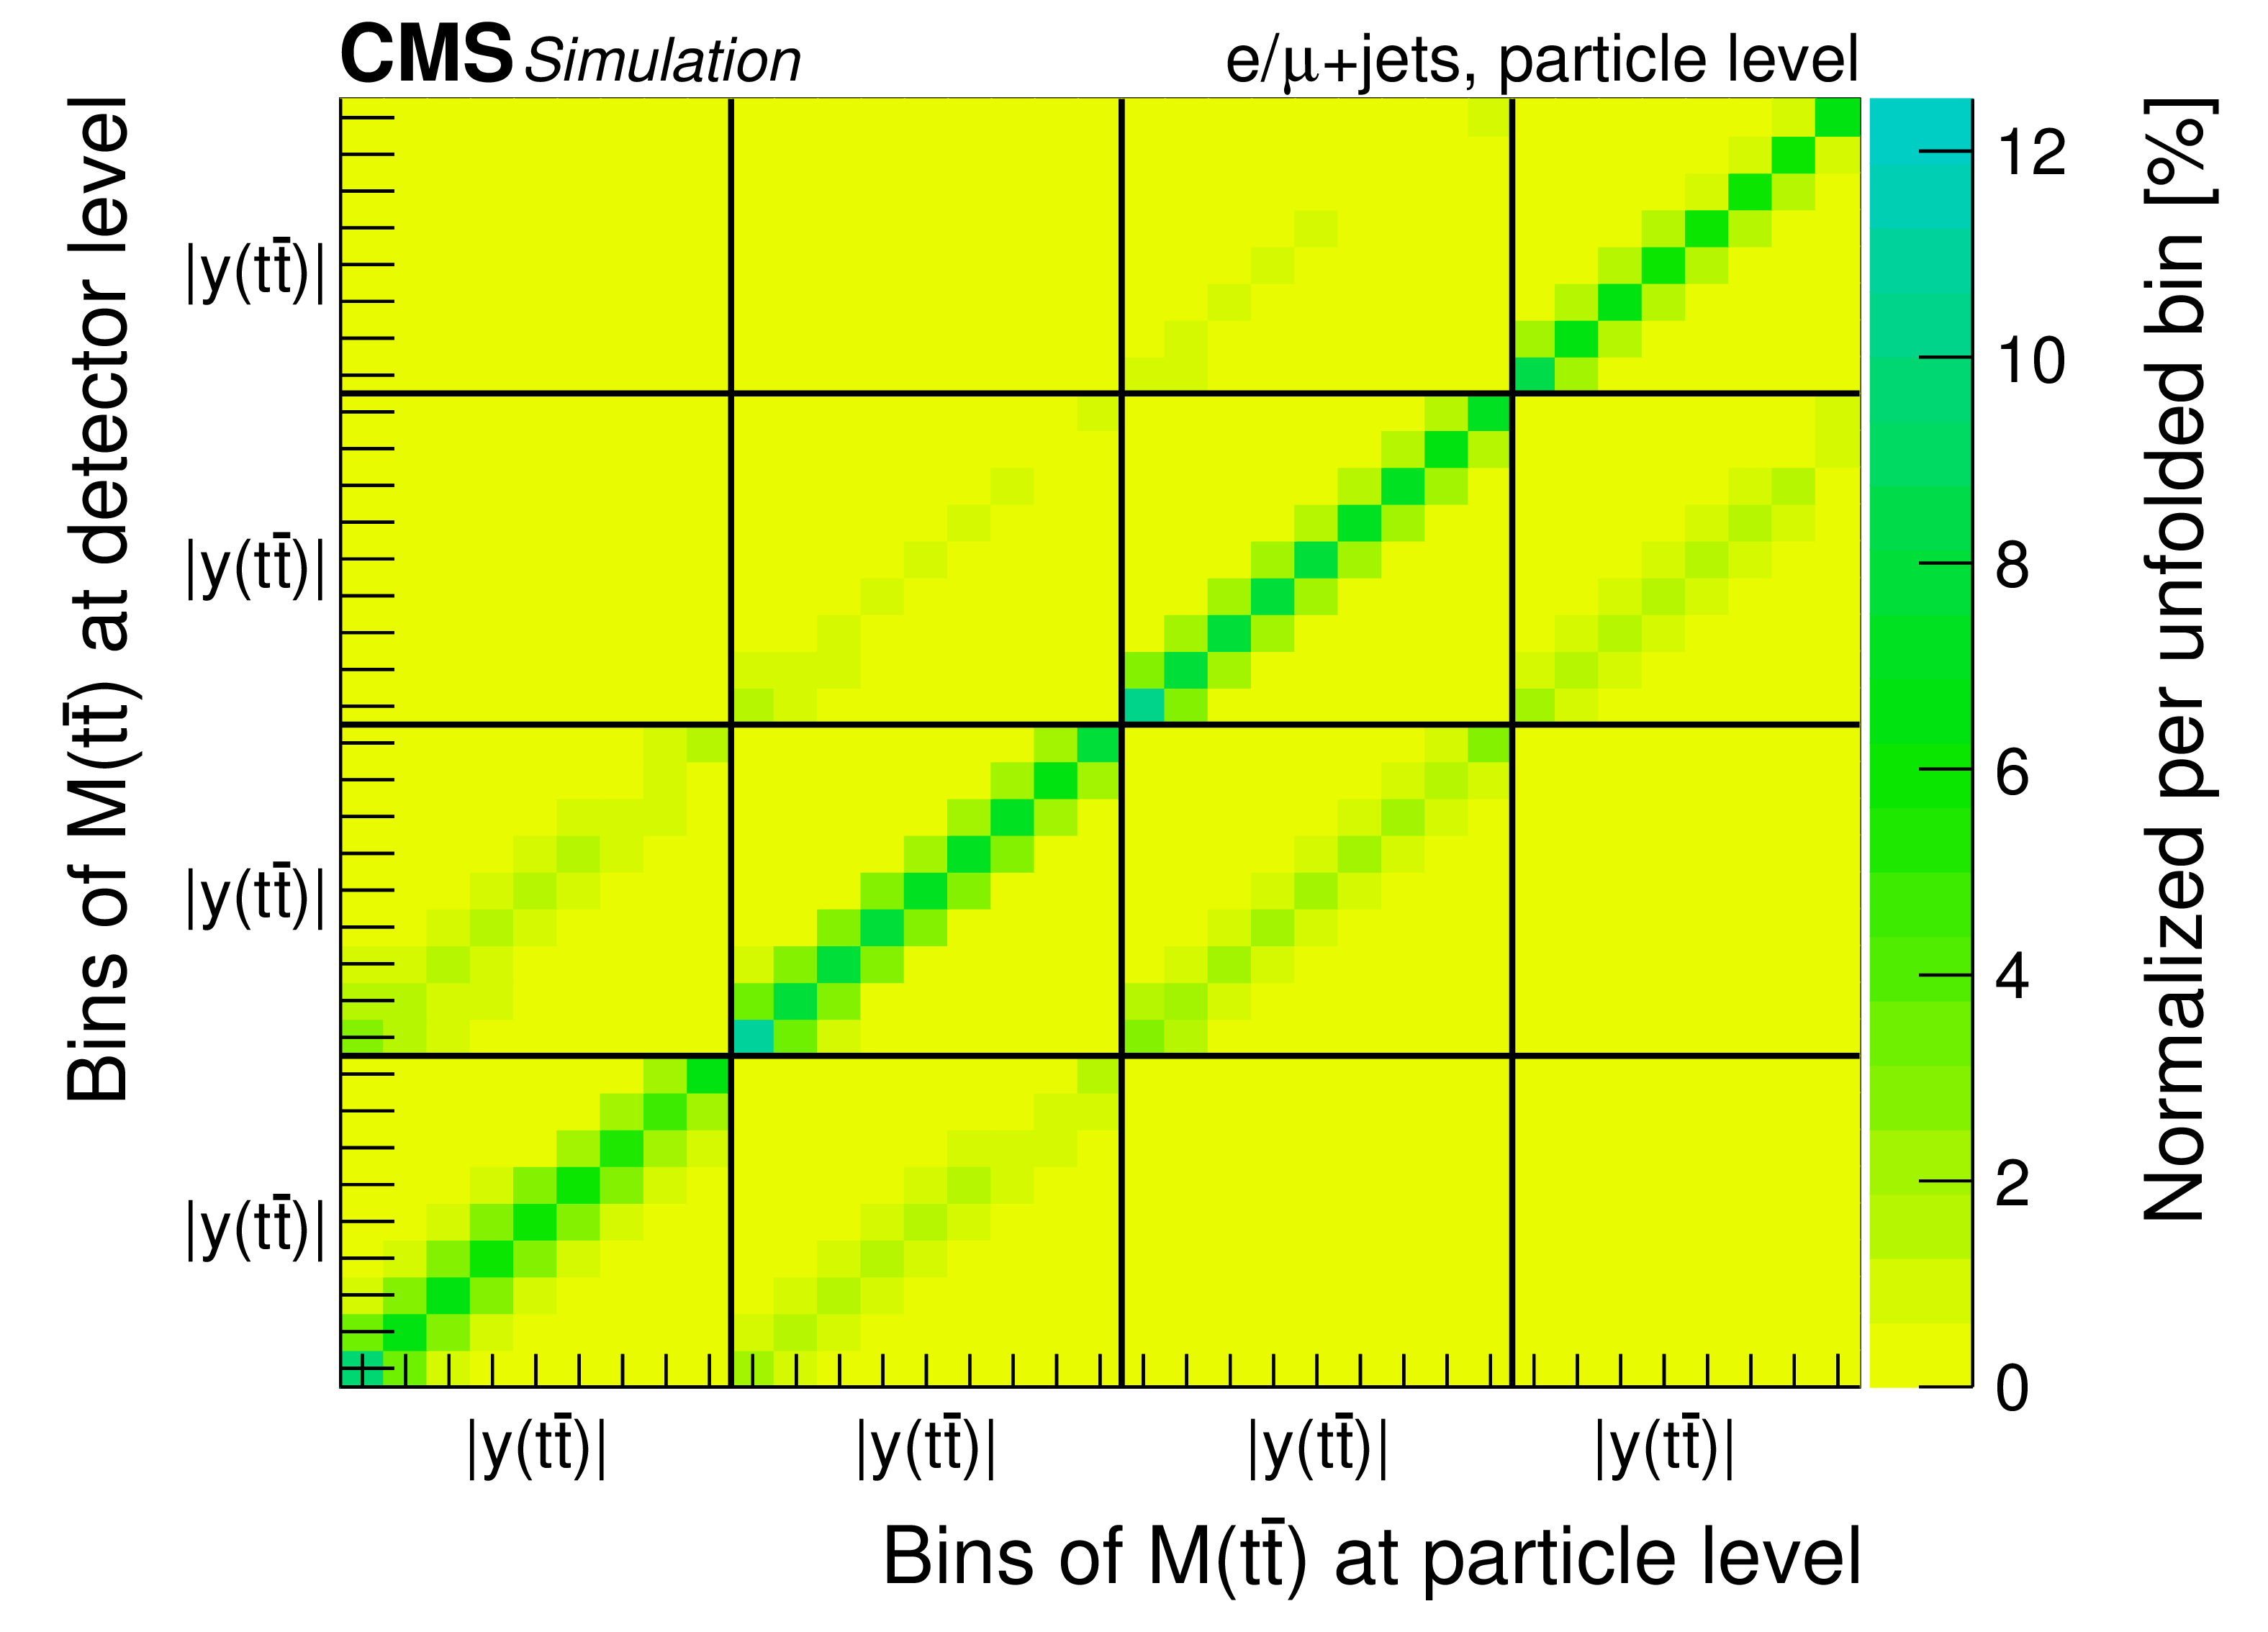
png pdf |
Additional Figure 8-b:
Migrations among the bins in the double-differential cross section measurements at particle level. |
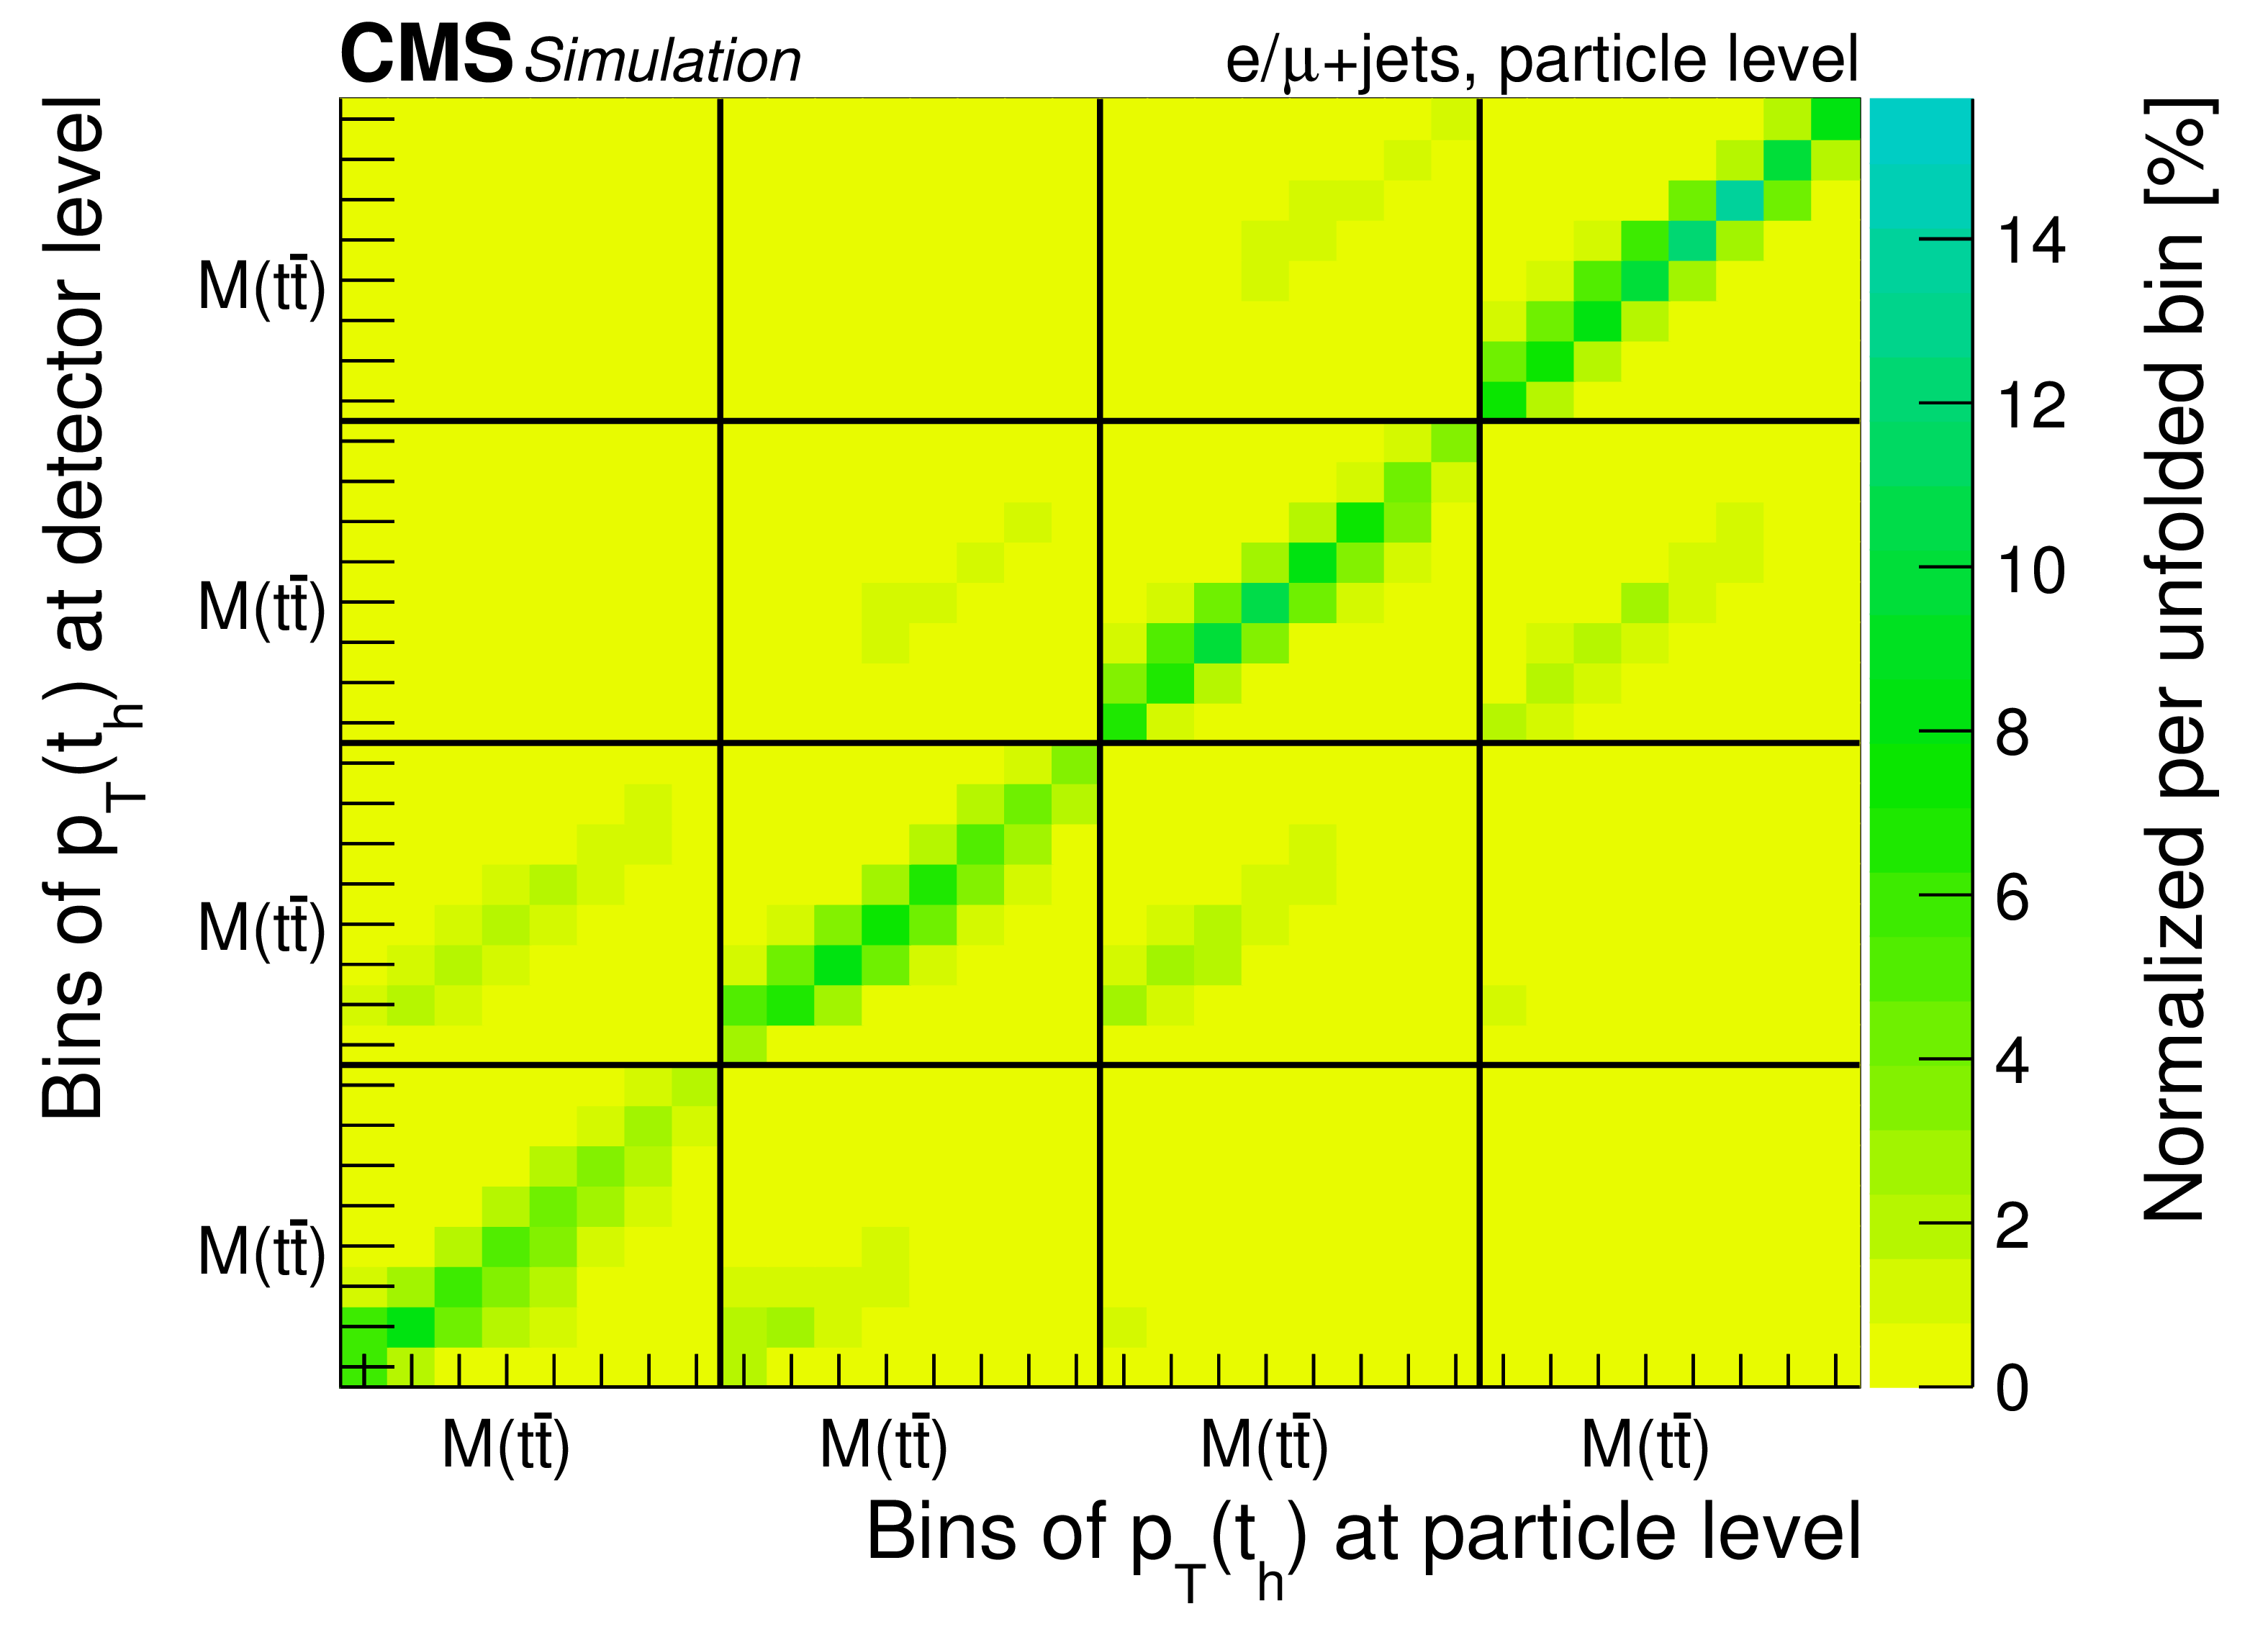
png pdf |
Additional Figure 8-c:
Migrations among the bins in the double-differential cross section measurements at particle level. |
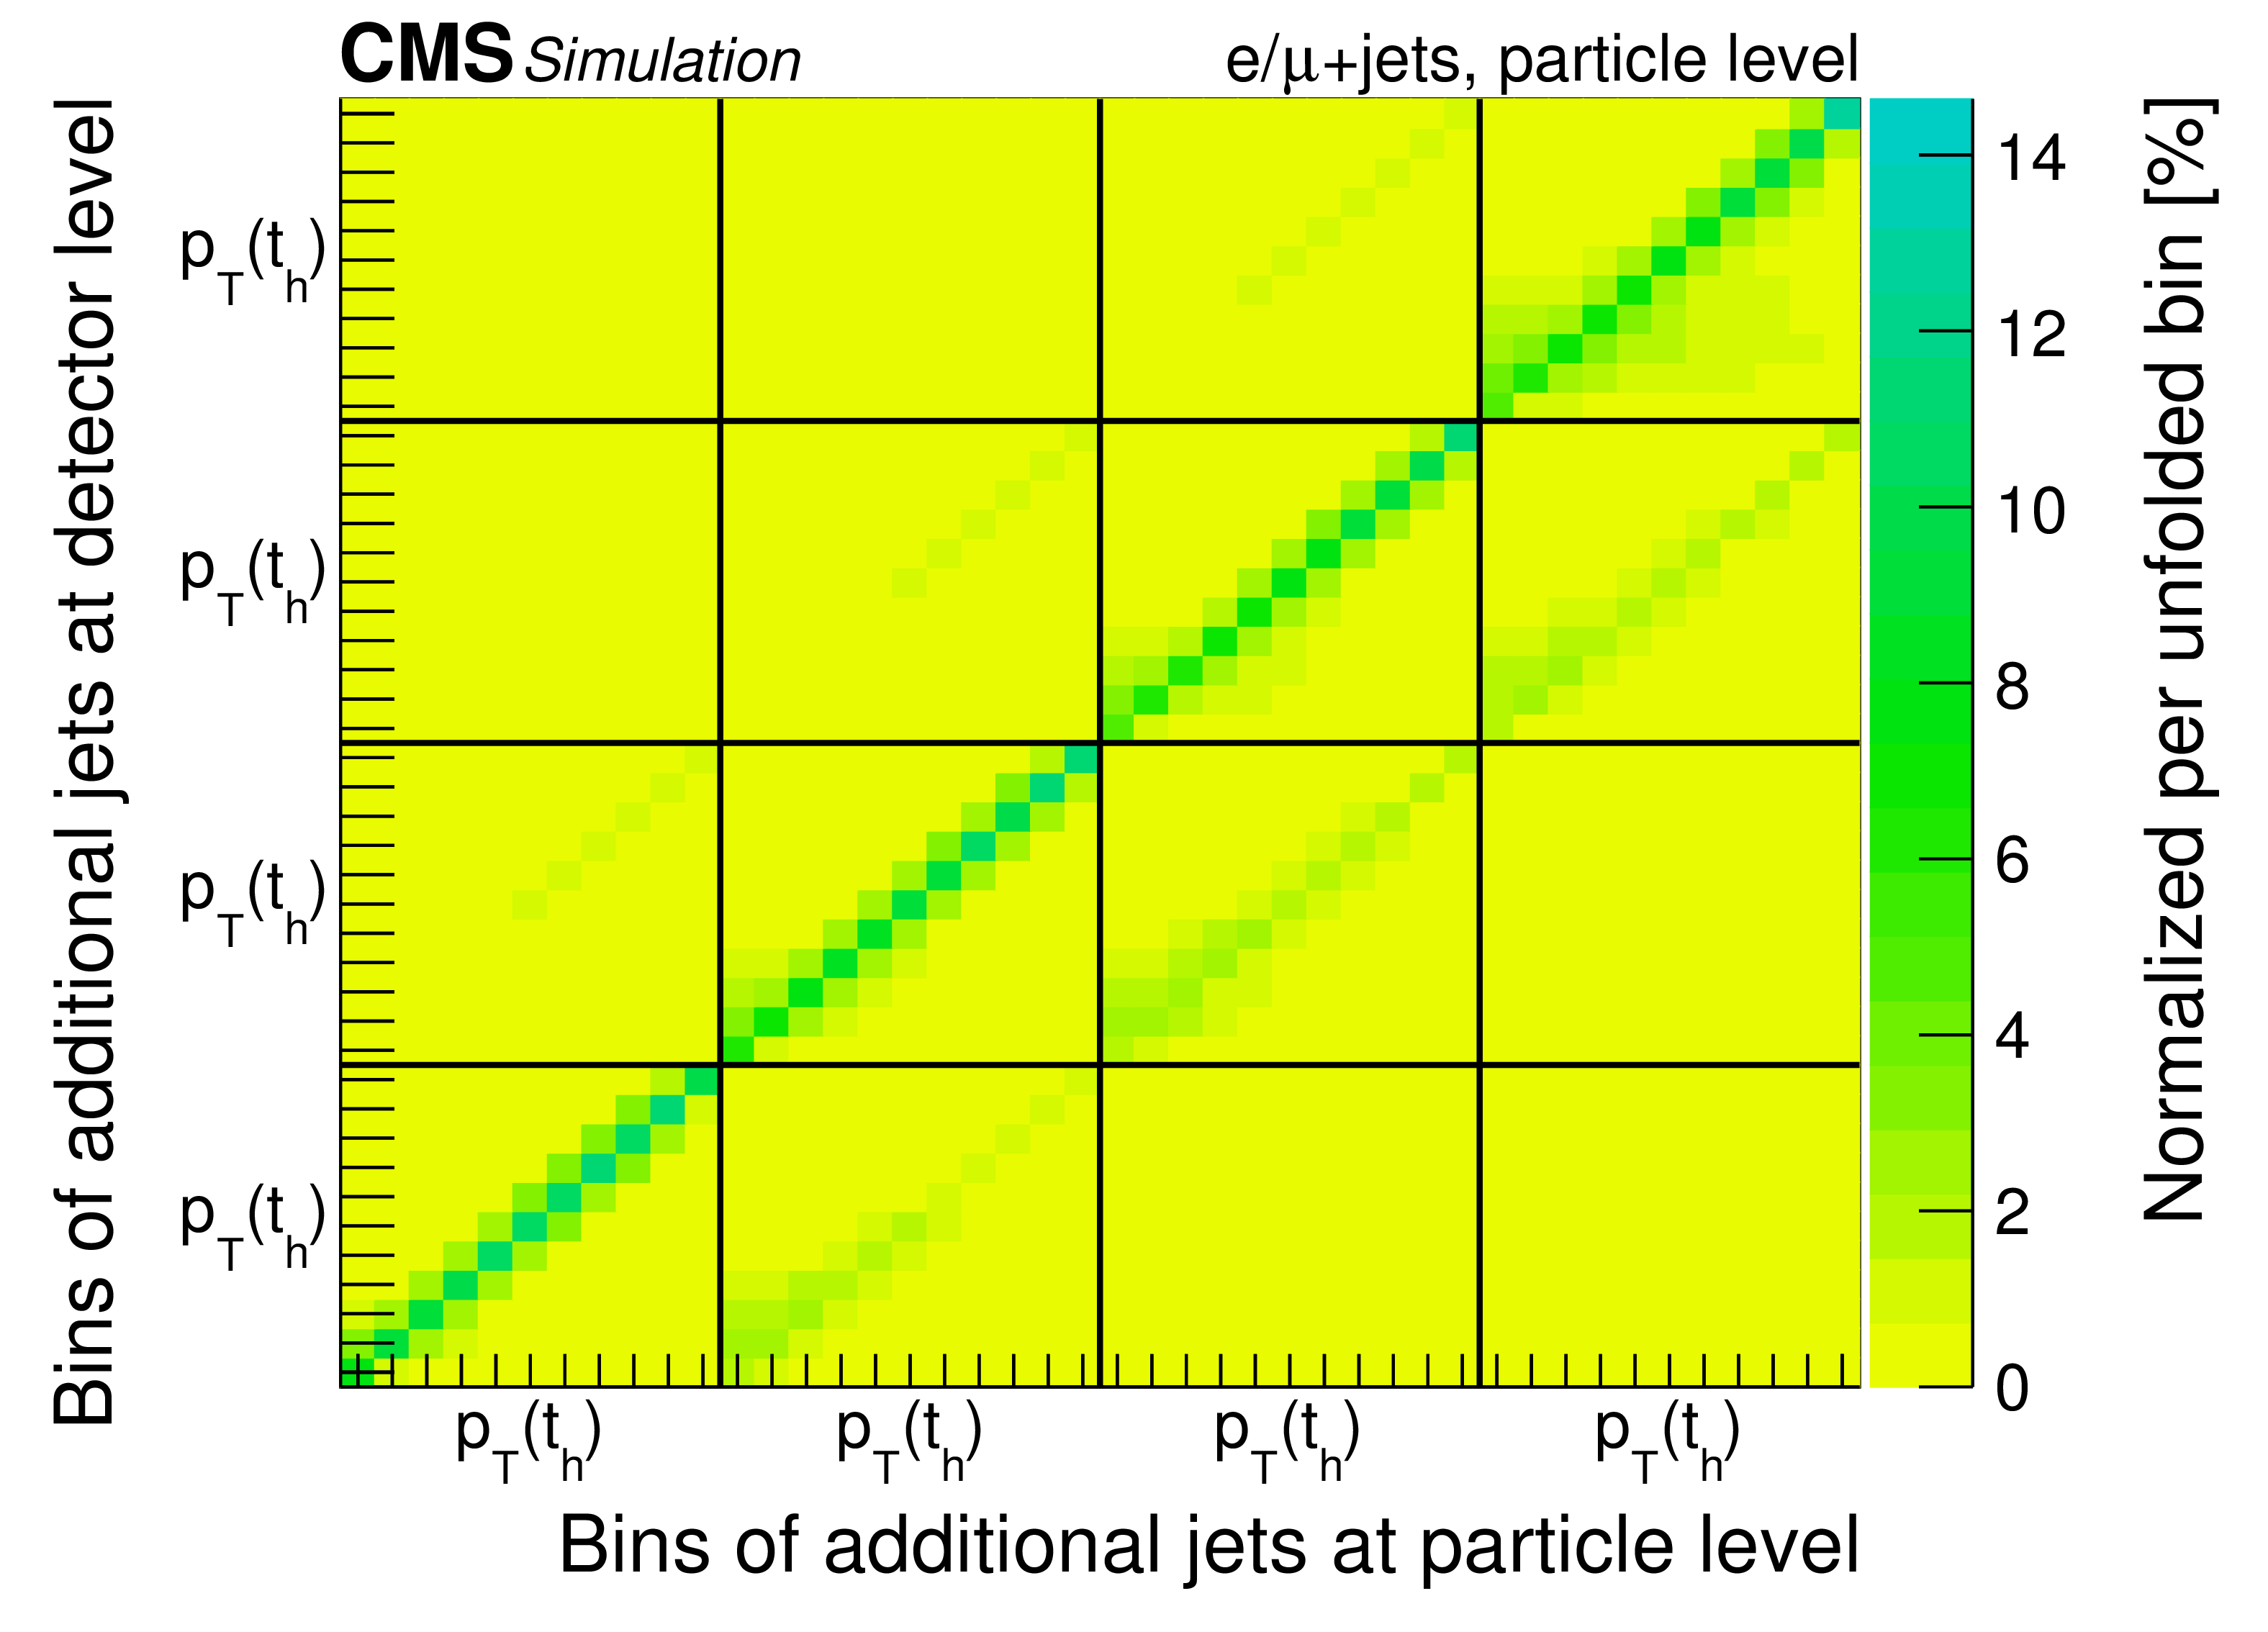
png pdf |
Additional Figure 8-d:
Migrations among the bins in the double-differential cross section measurements at particle level. |
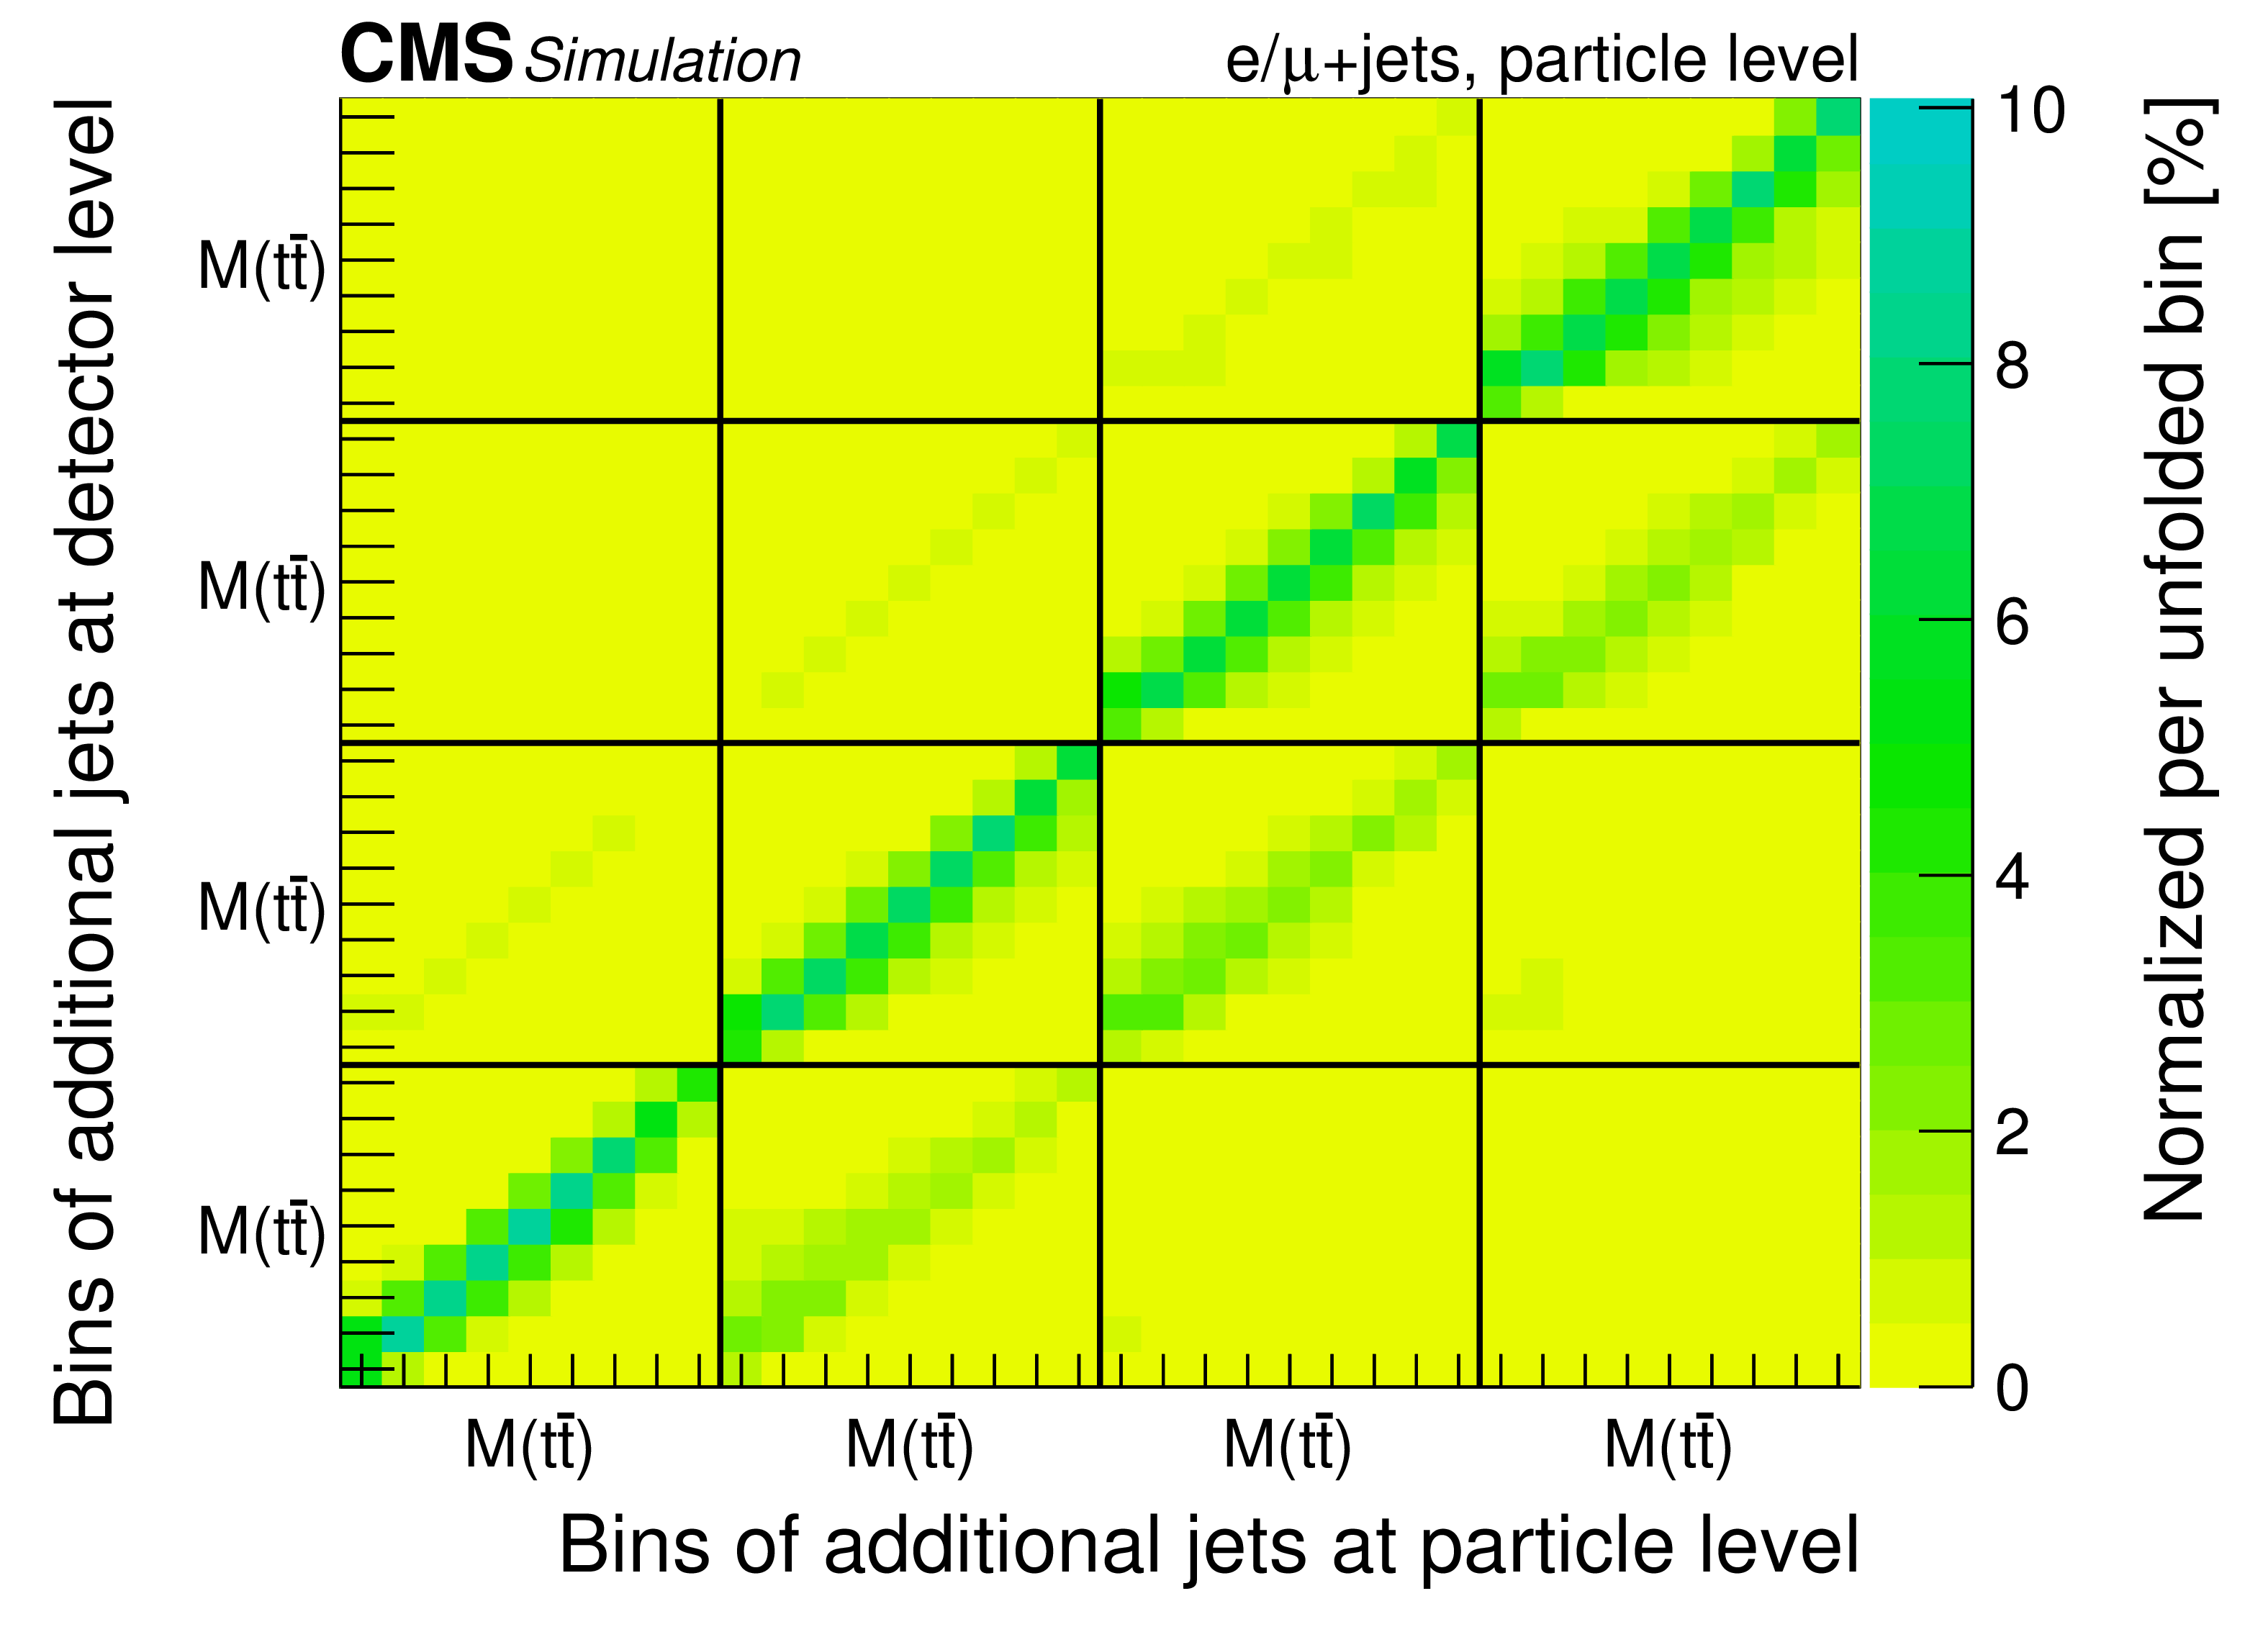
png pdf |
Additional Figure 8-e:
Migrations among the bins in the double-differential cross section measurements at particle level. |
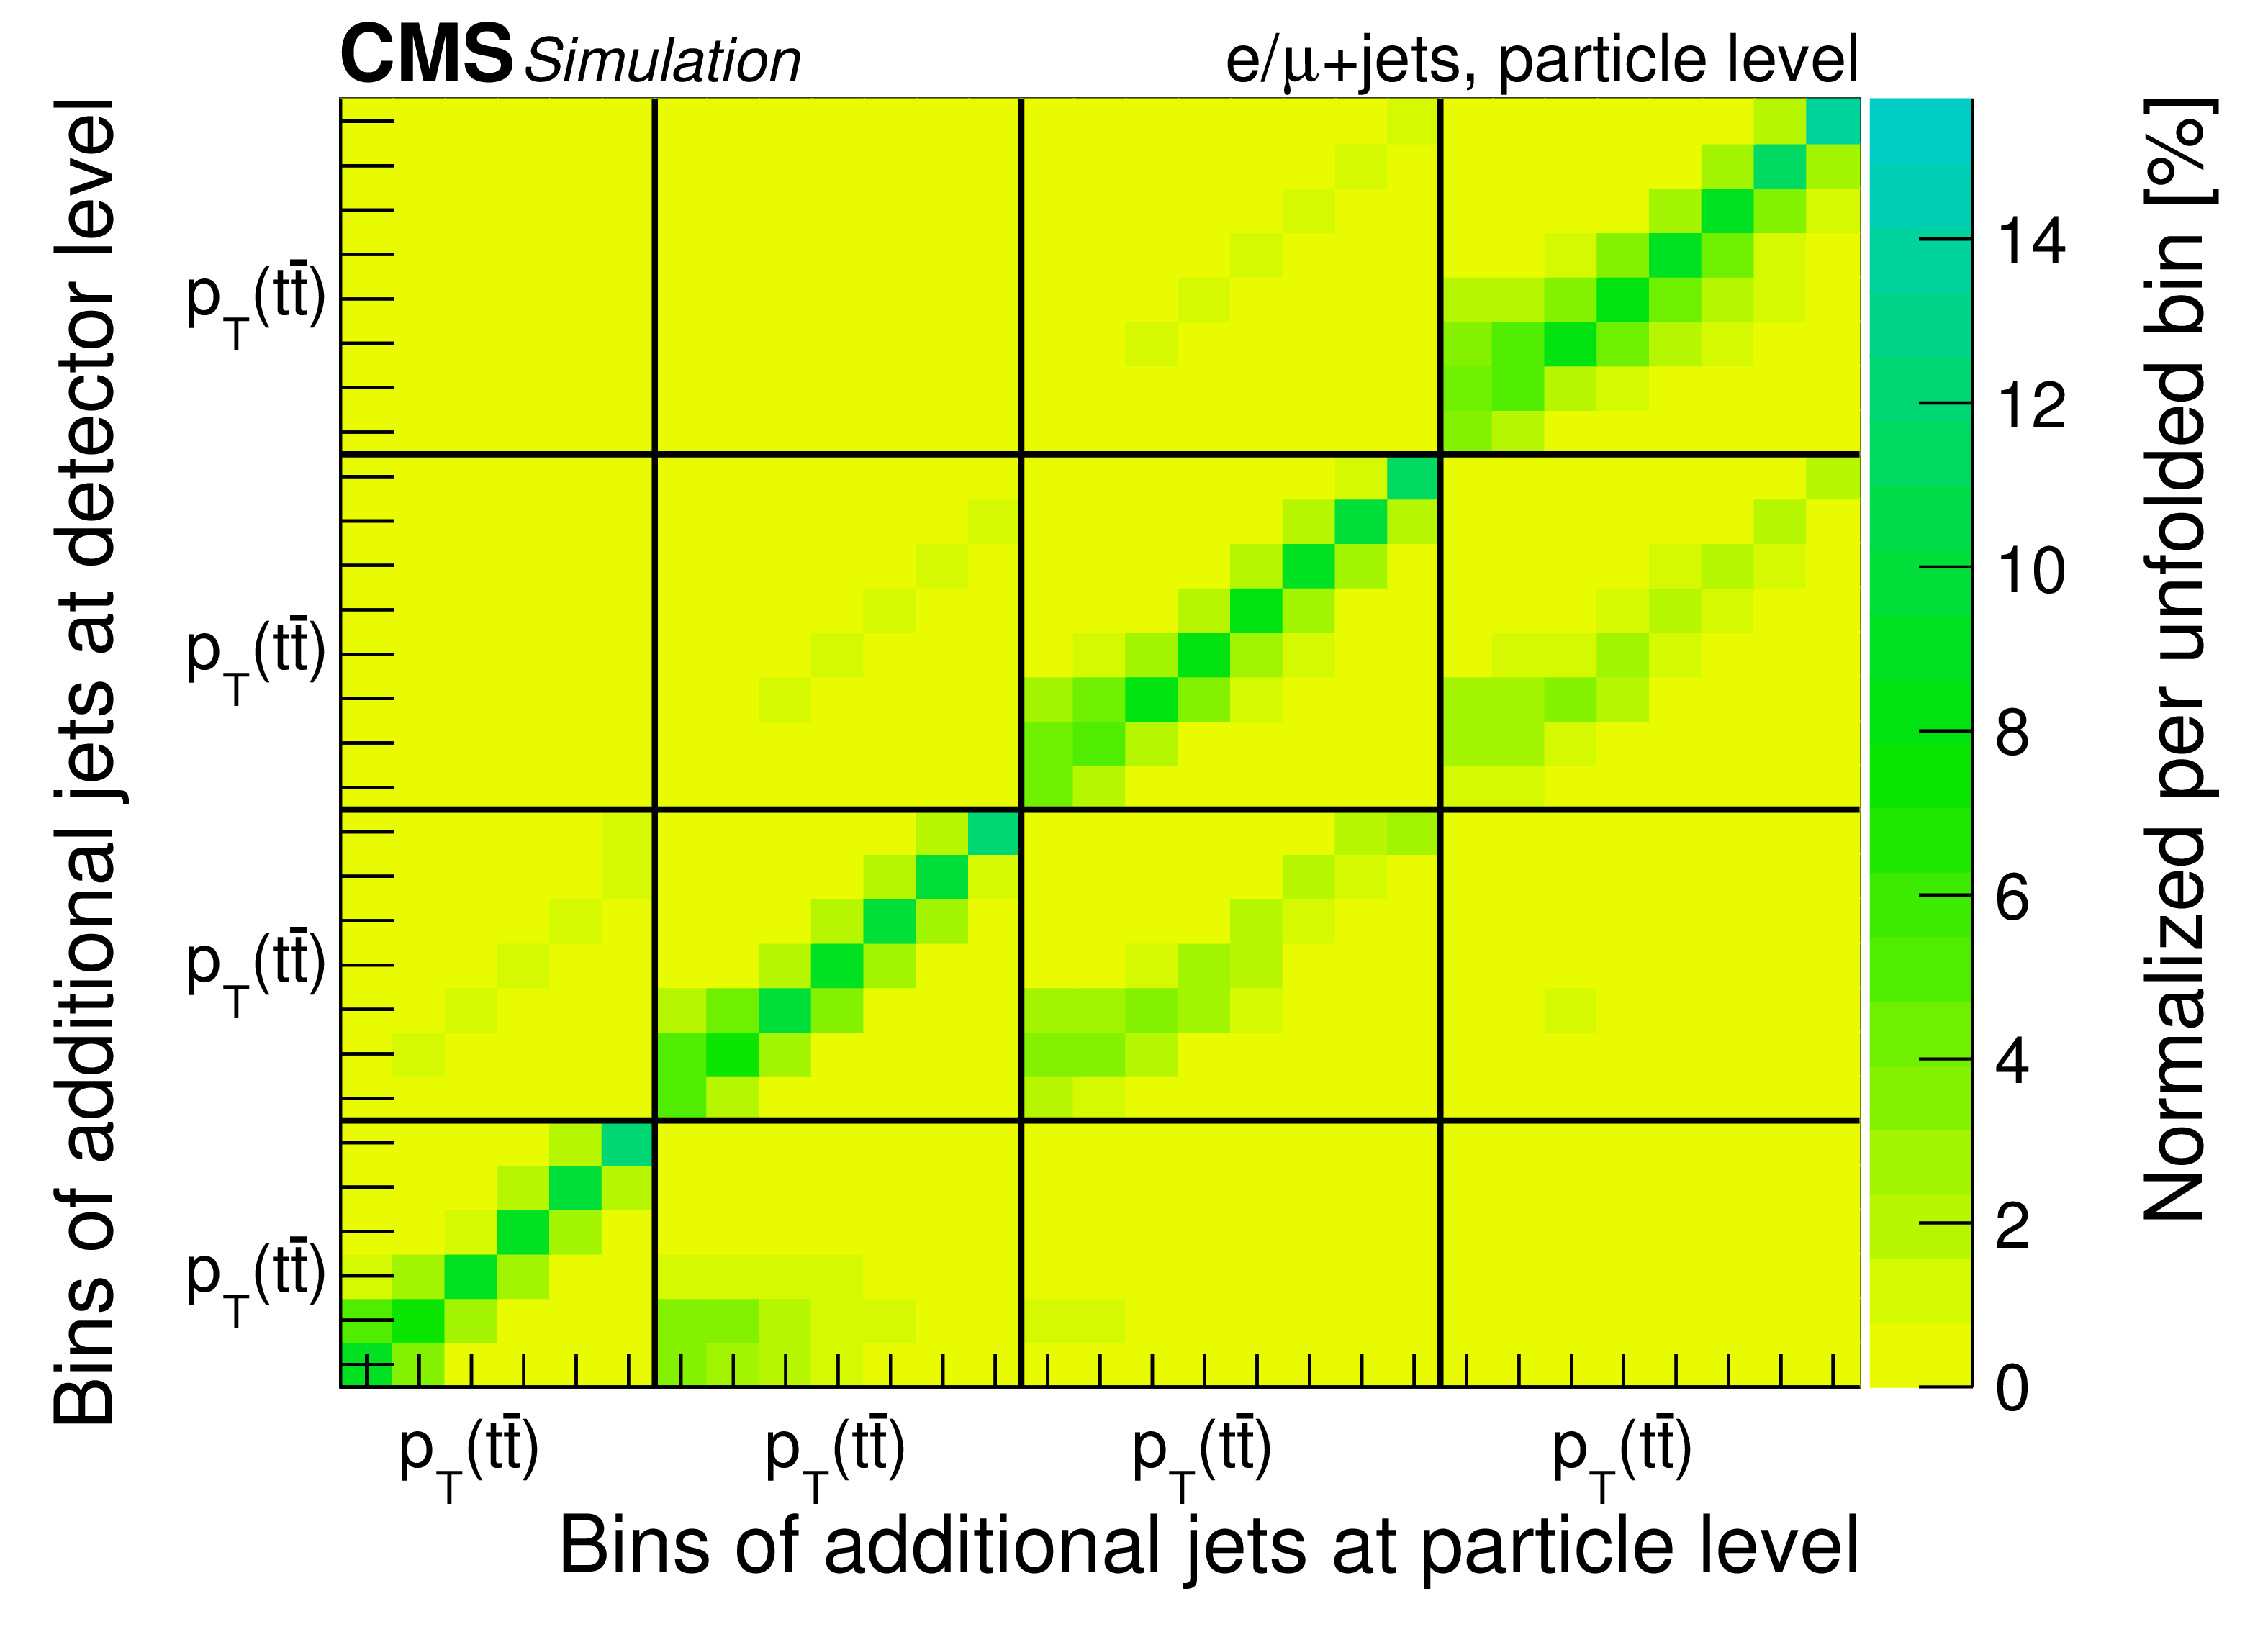
png pdf |
Additional Figure 8-f:
Migrations among the bins in the double-differential cross section measurements at particle level. |
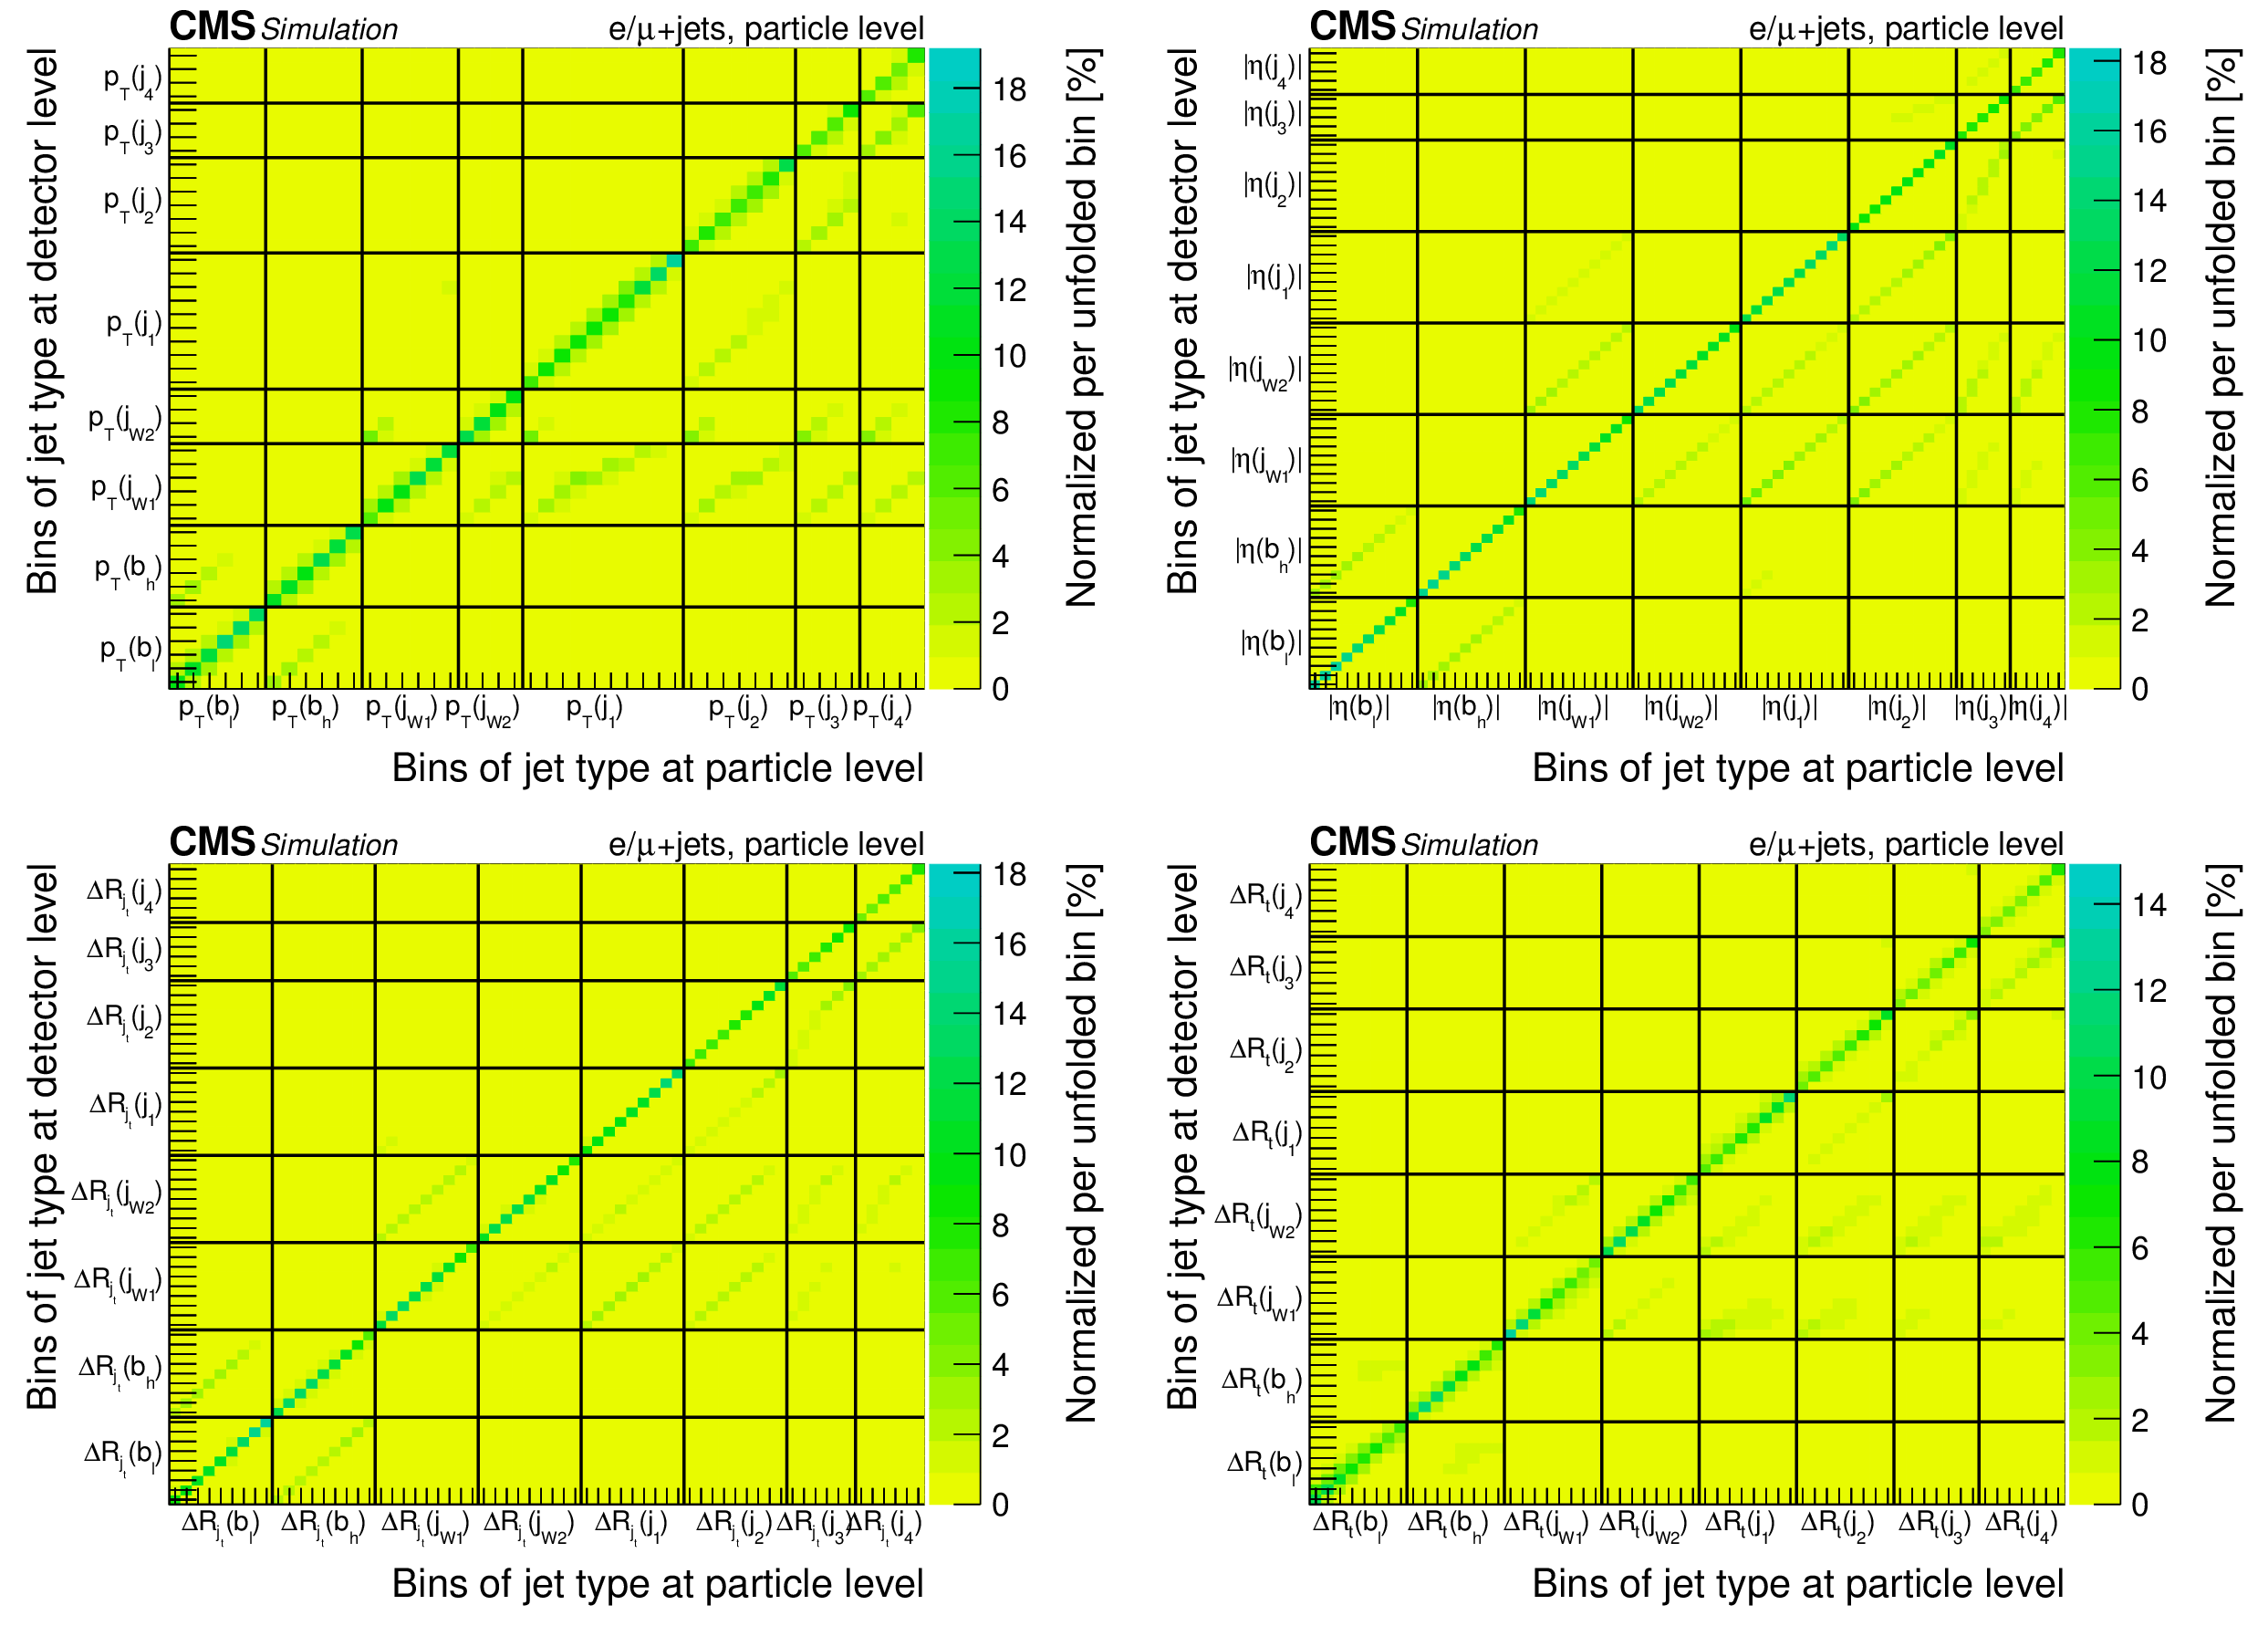
png pdf |
Additional Figure 9:
Migrations among the bins in the cross section measurements of jet kinematical properties at particle level. |

png pdf |
Additional Figure 9-a:
Migrations among the bins in the cross section measurements of jet kinematical properties at particle level. |
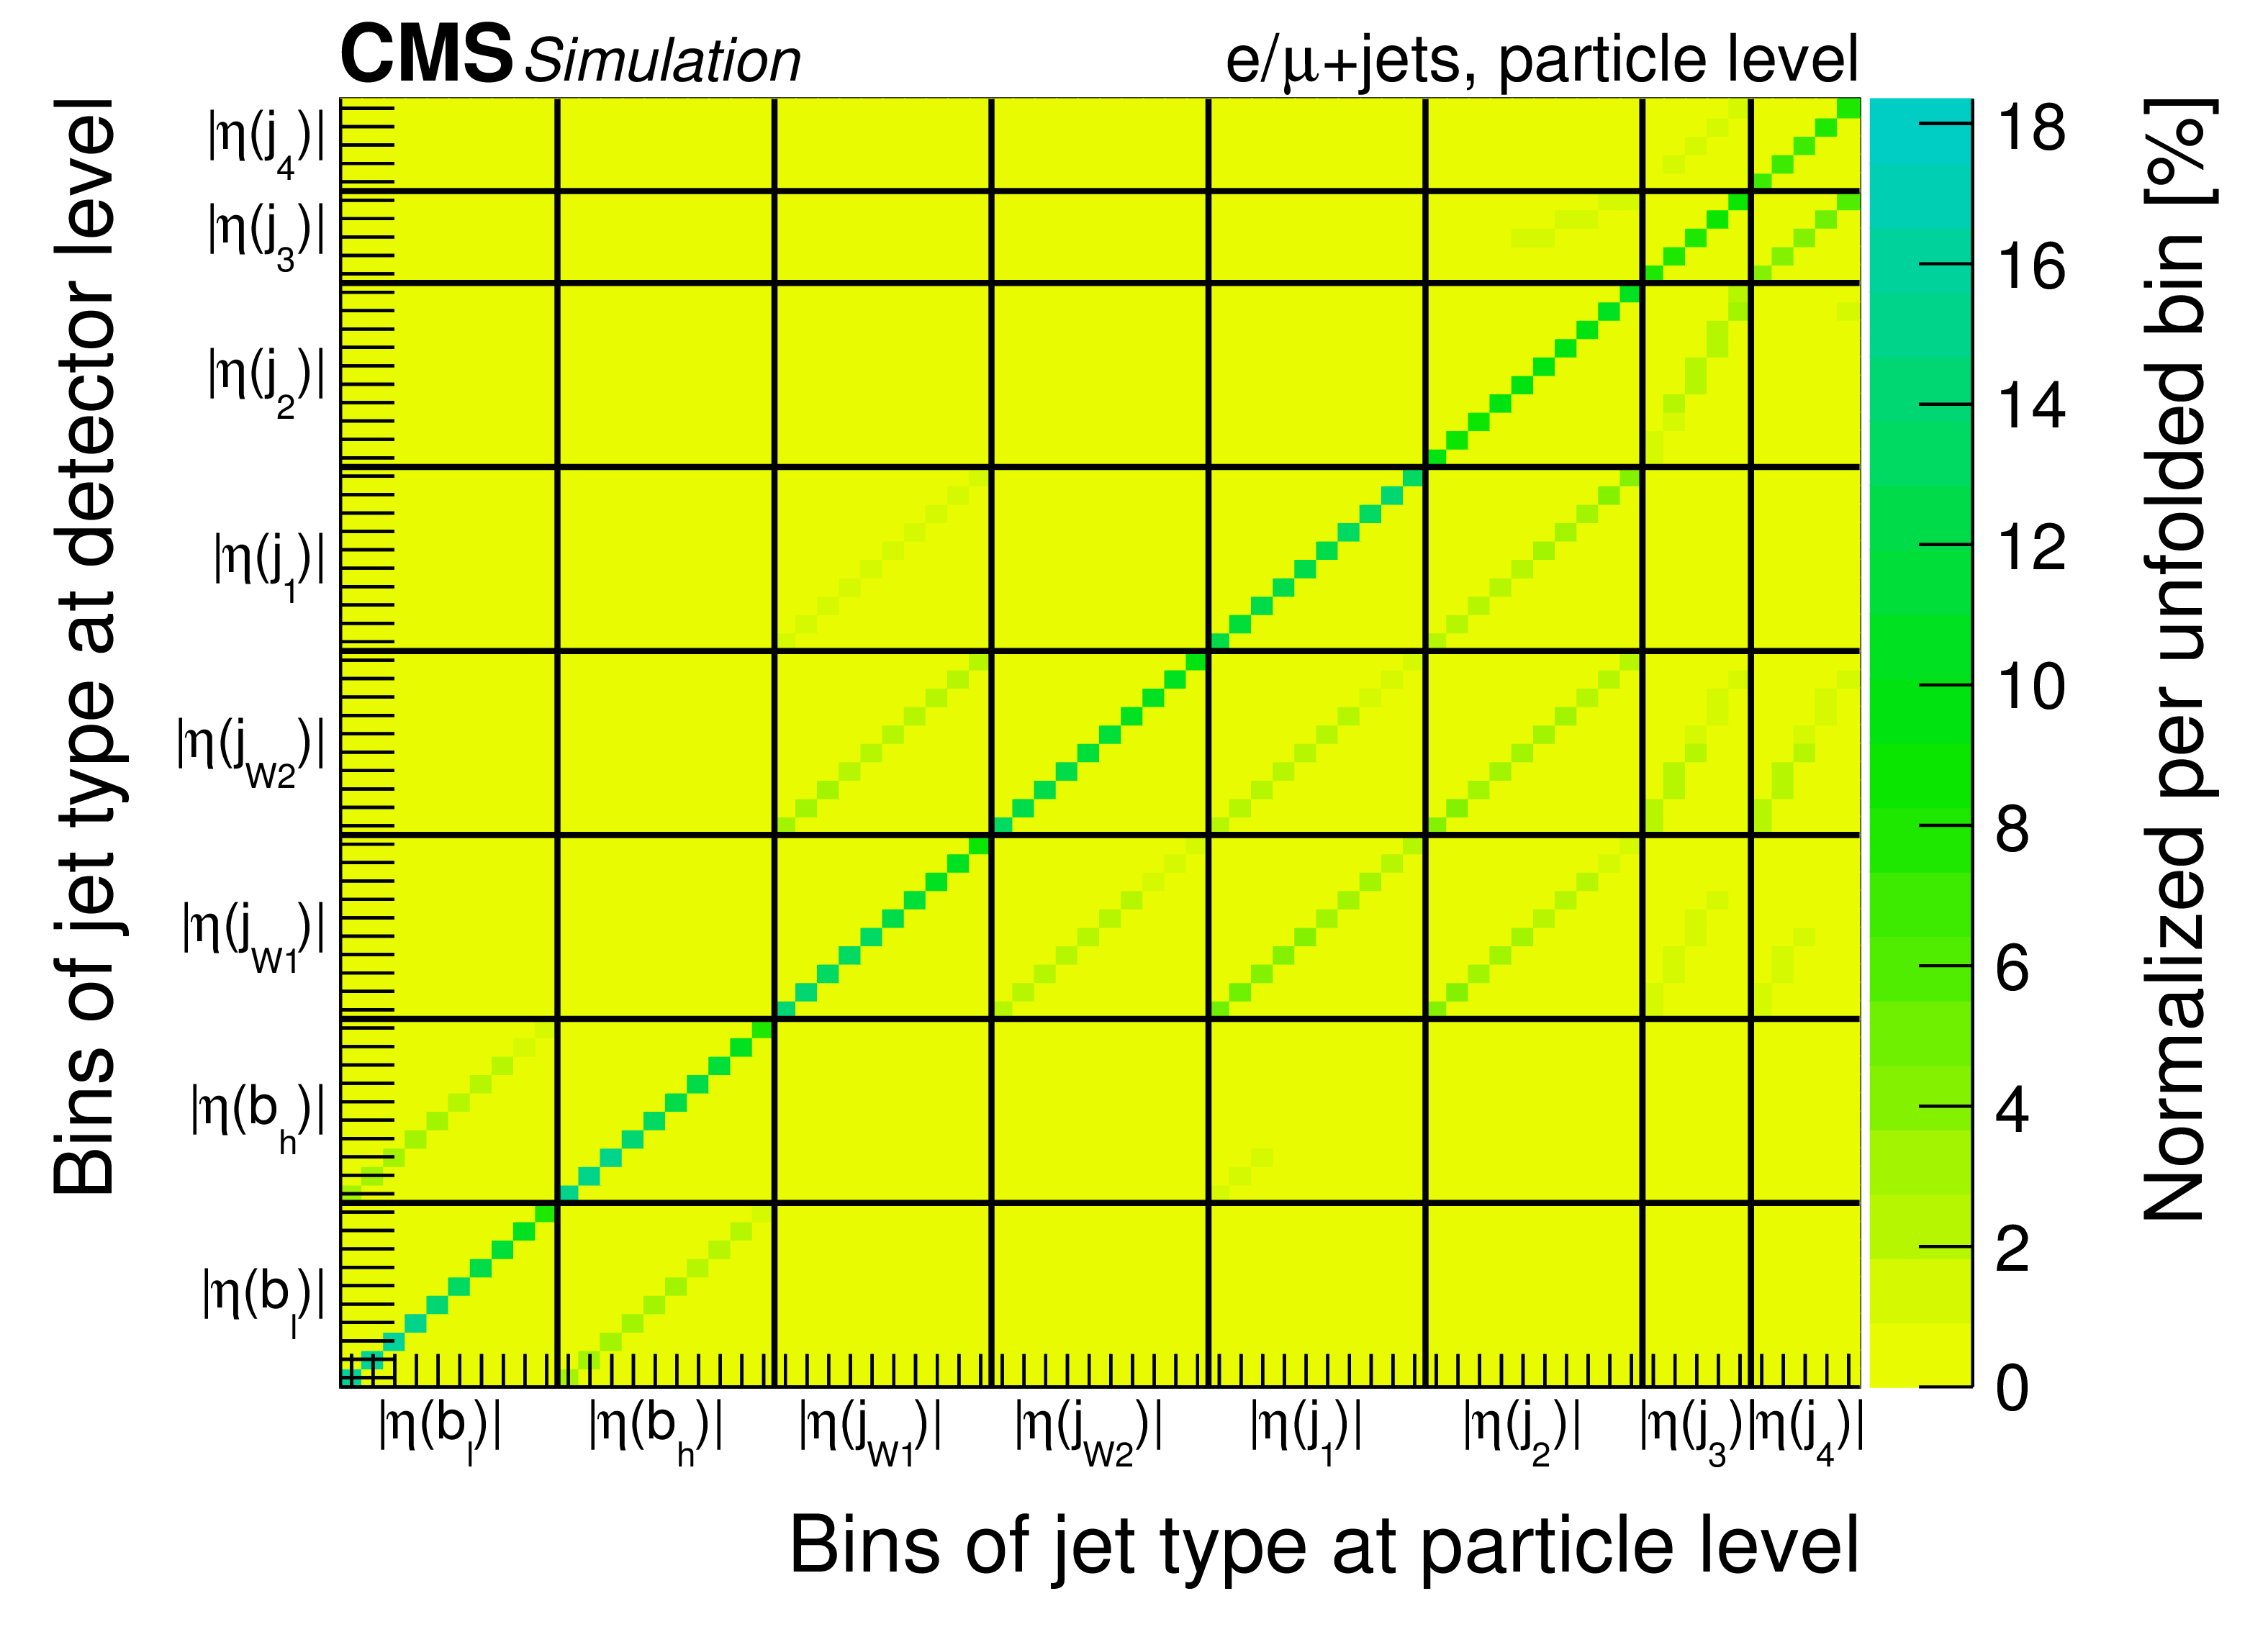
png pdf |
Additional Figure 9-b:
Migrations among the bins in the cross section measurements of jet kinematical properties at particle level. |
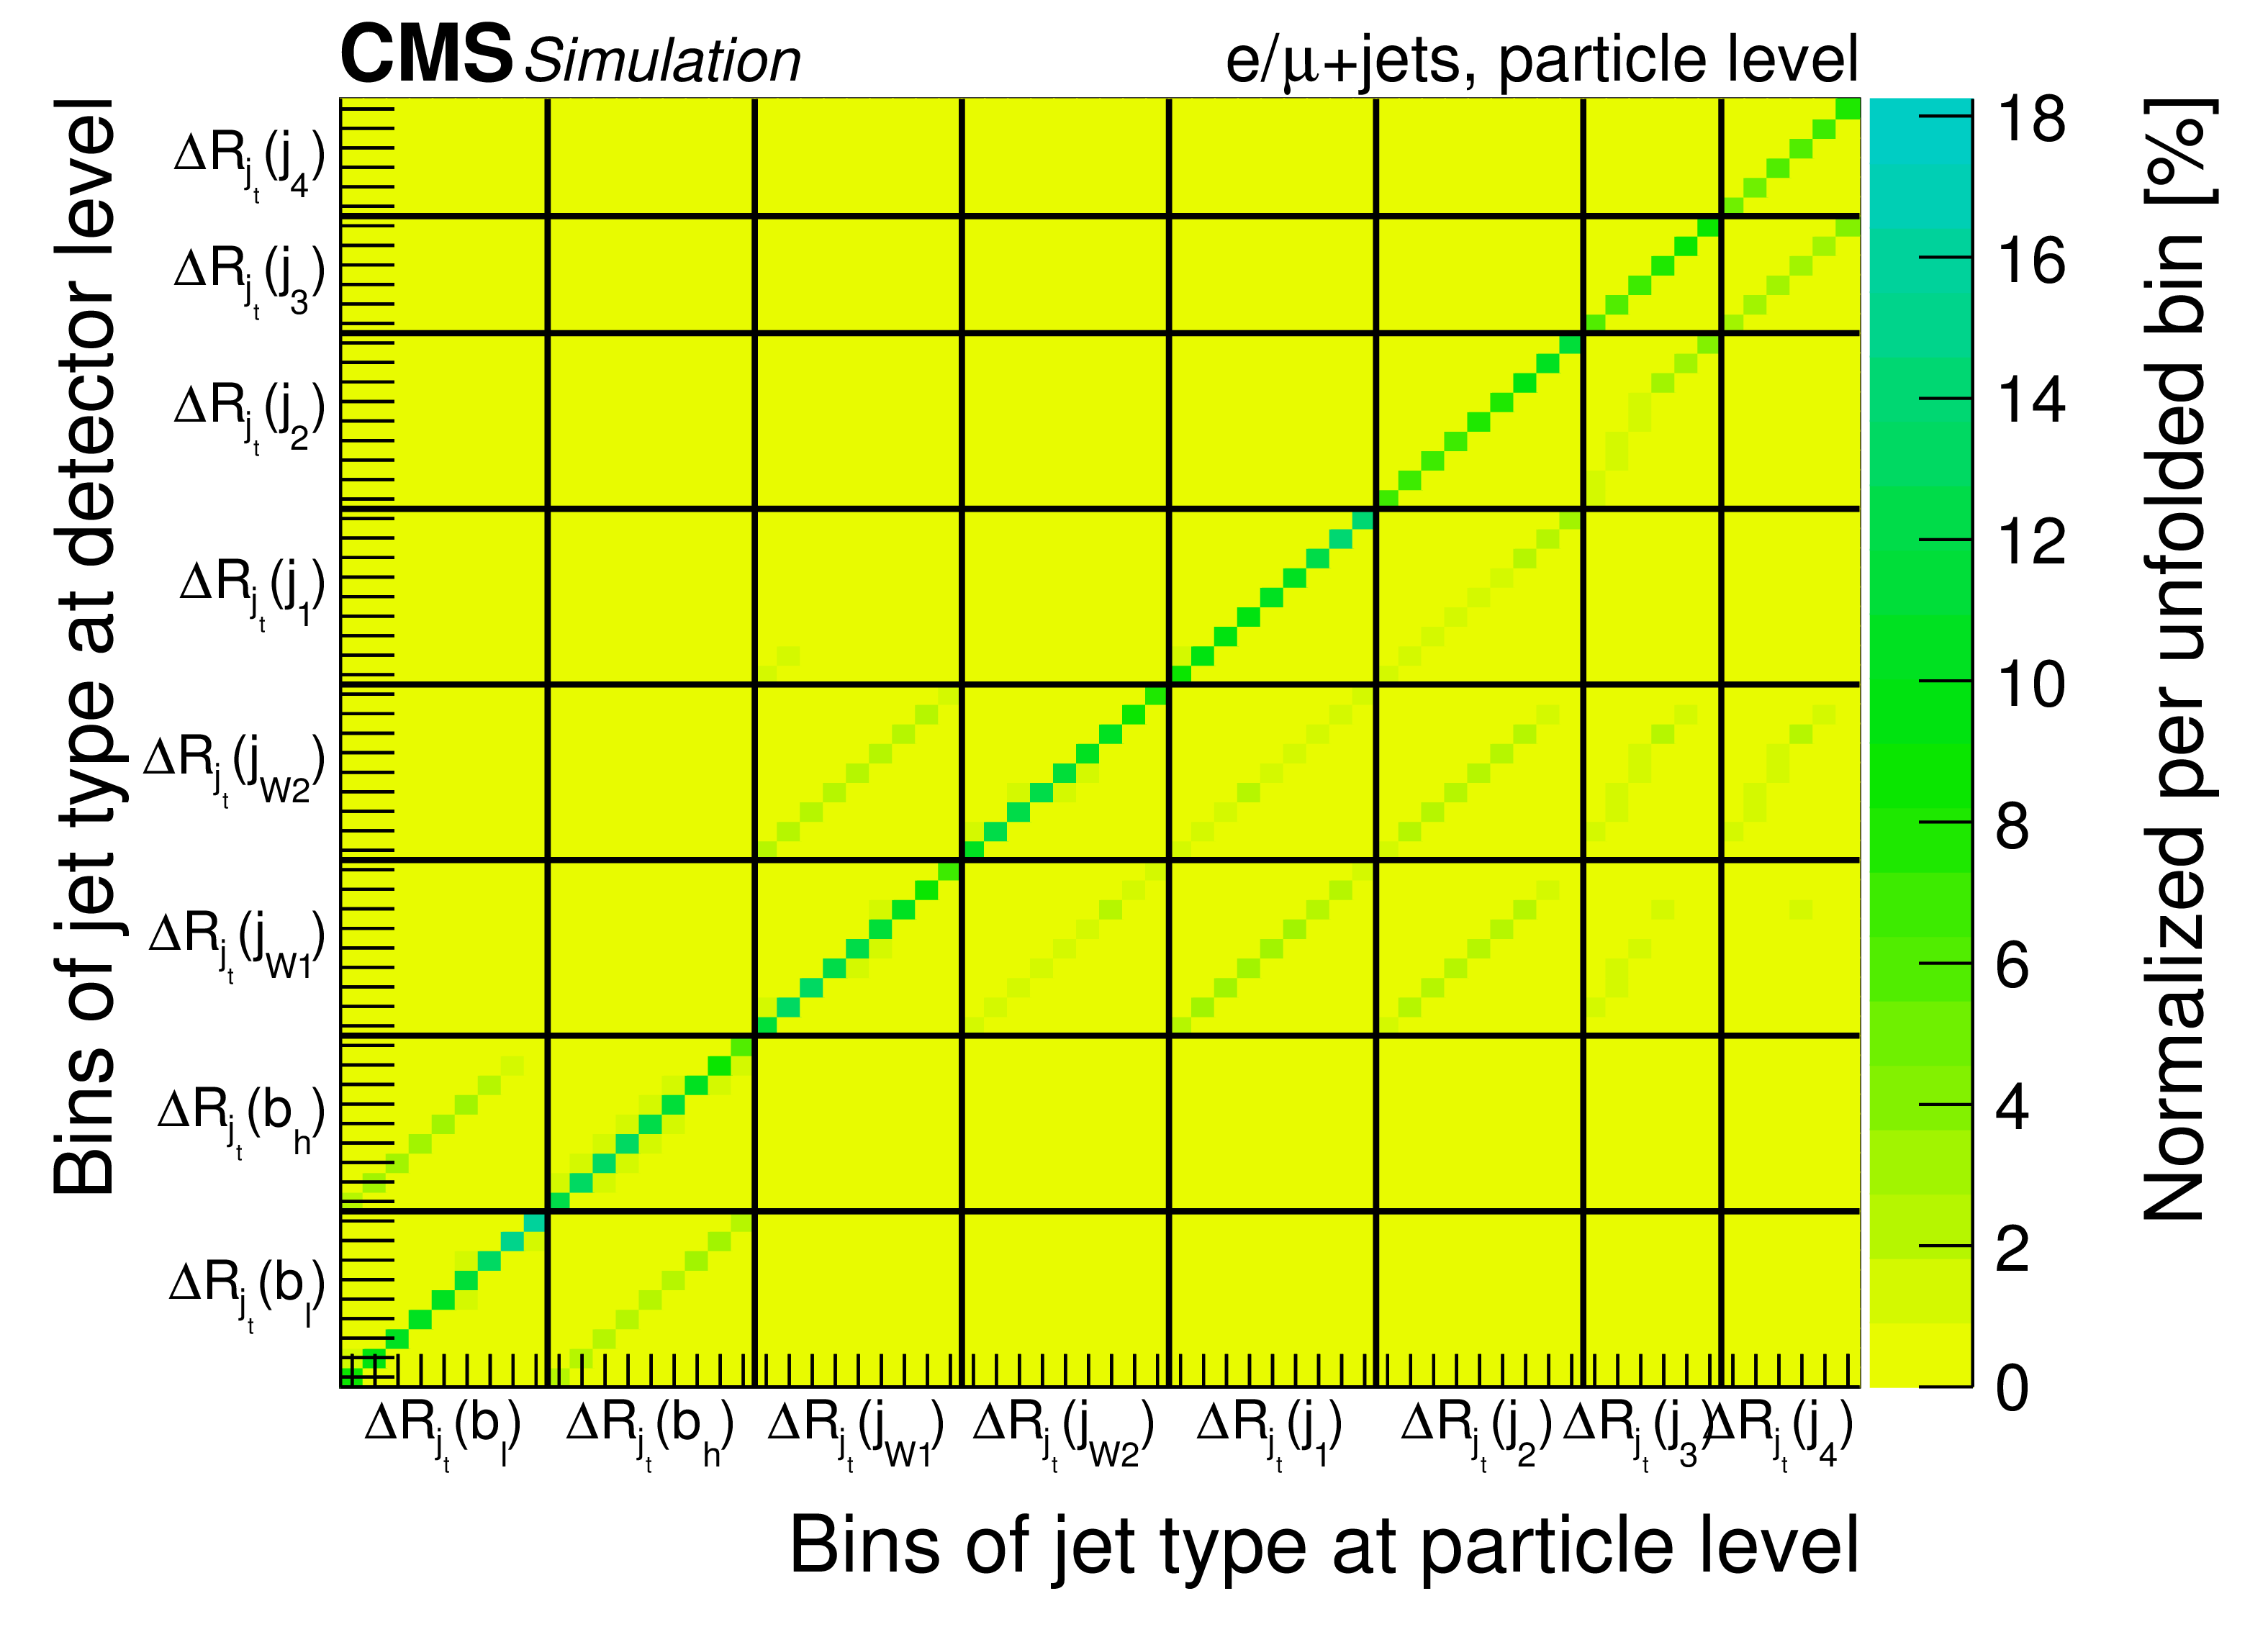
png pdf |
Additional Figure 9-c:
Migrations among the bins in the cross section measurements of jet kinematical properties at particle level. |
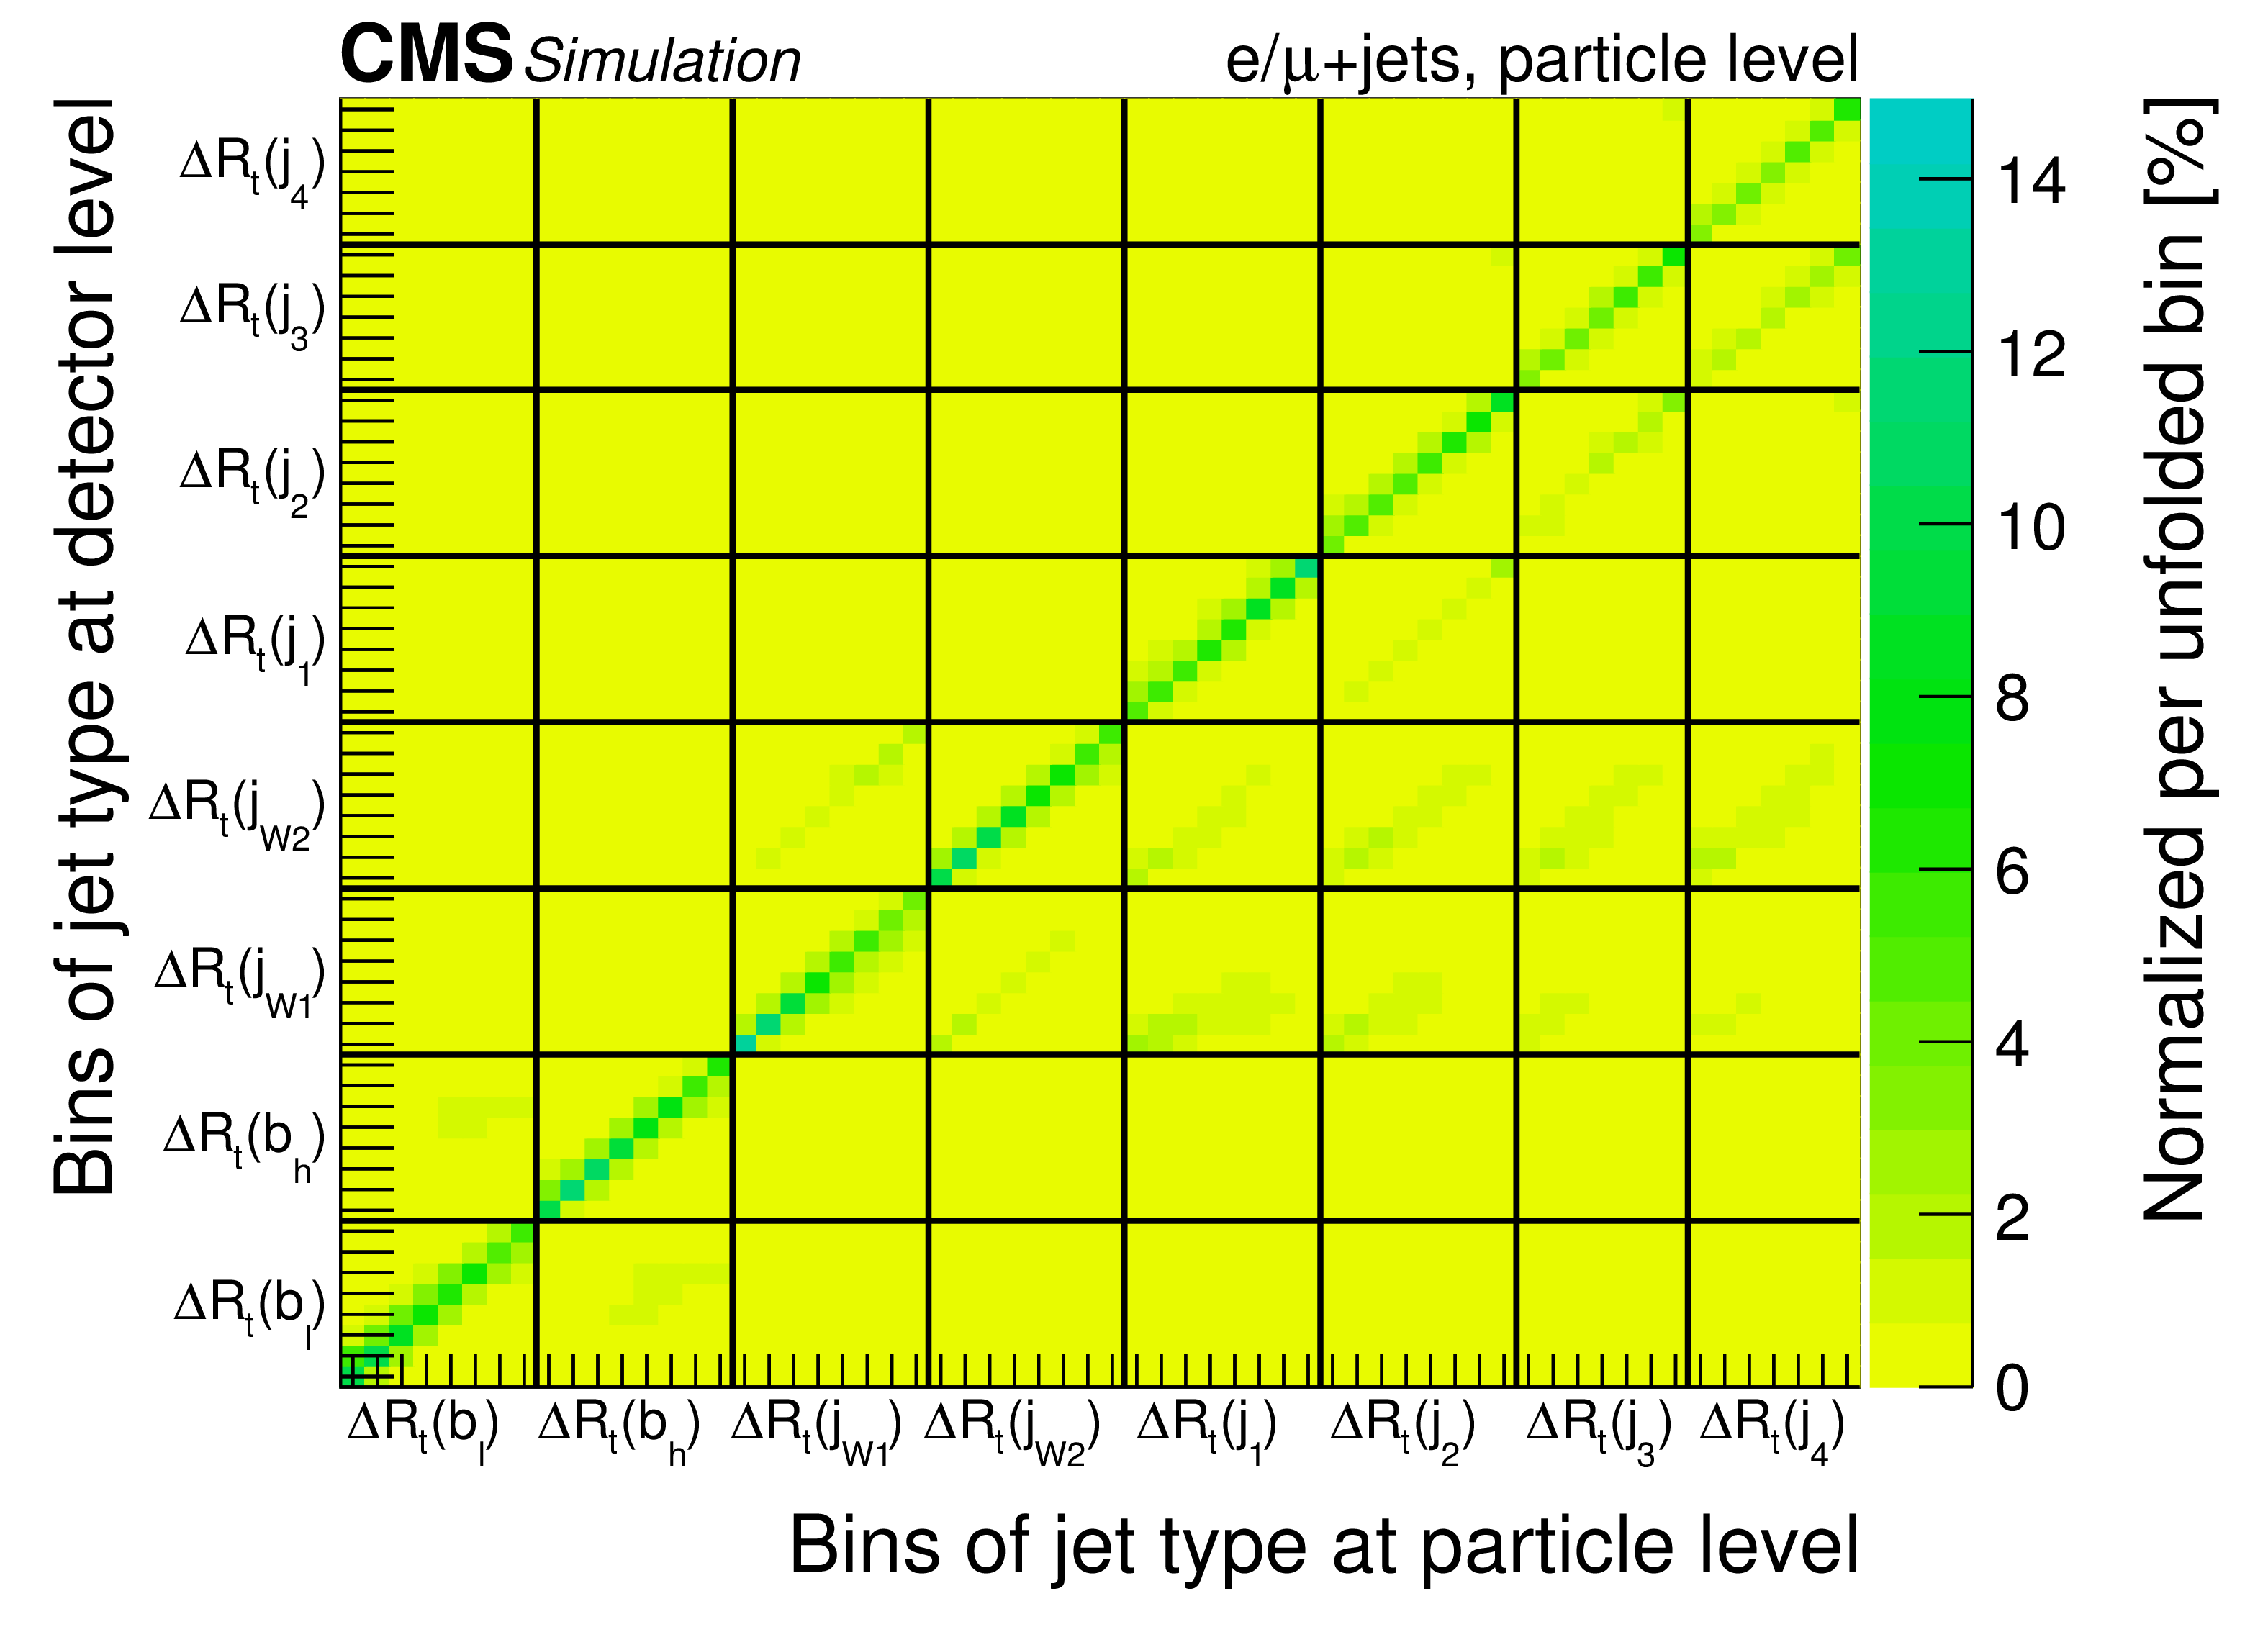
png pdf |
Additional Figure 9-d:
Migrations among the bins in the cross section measurements of jet kinematical properties at particle level. |
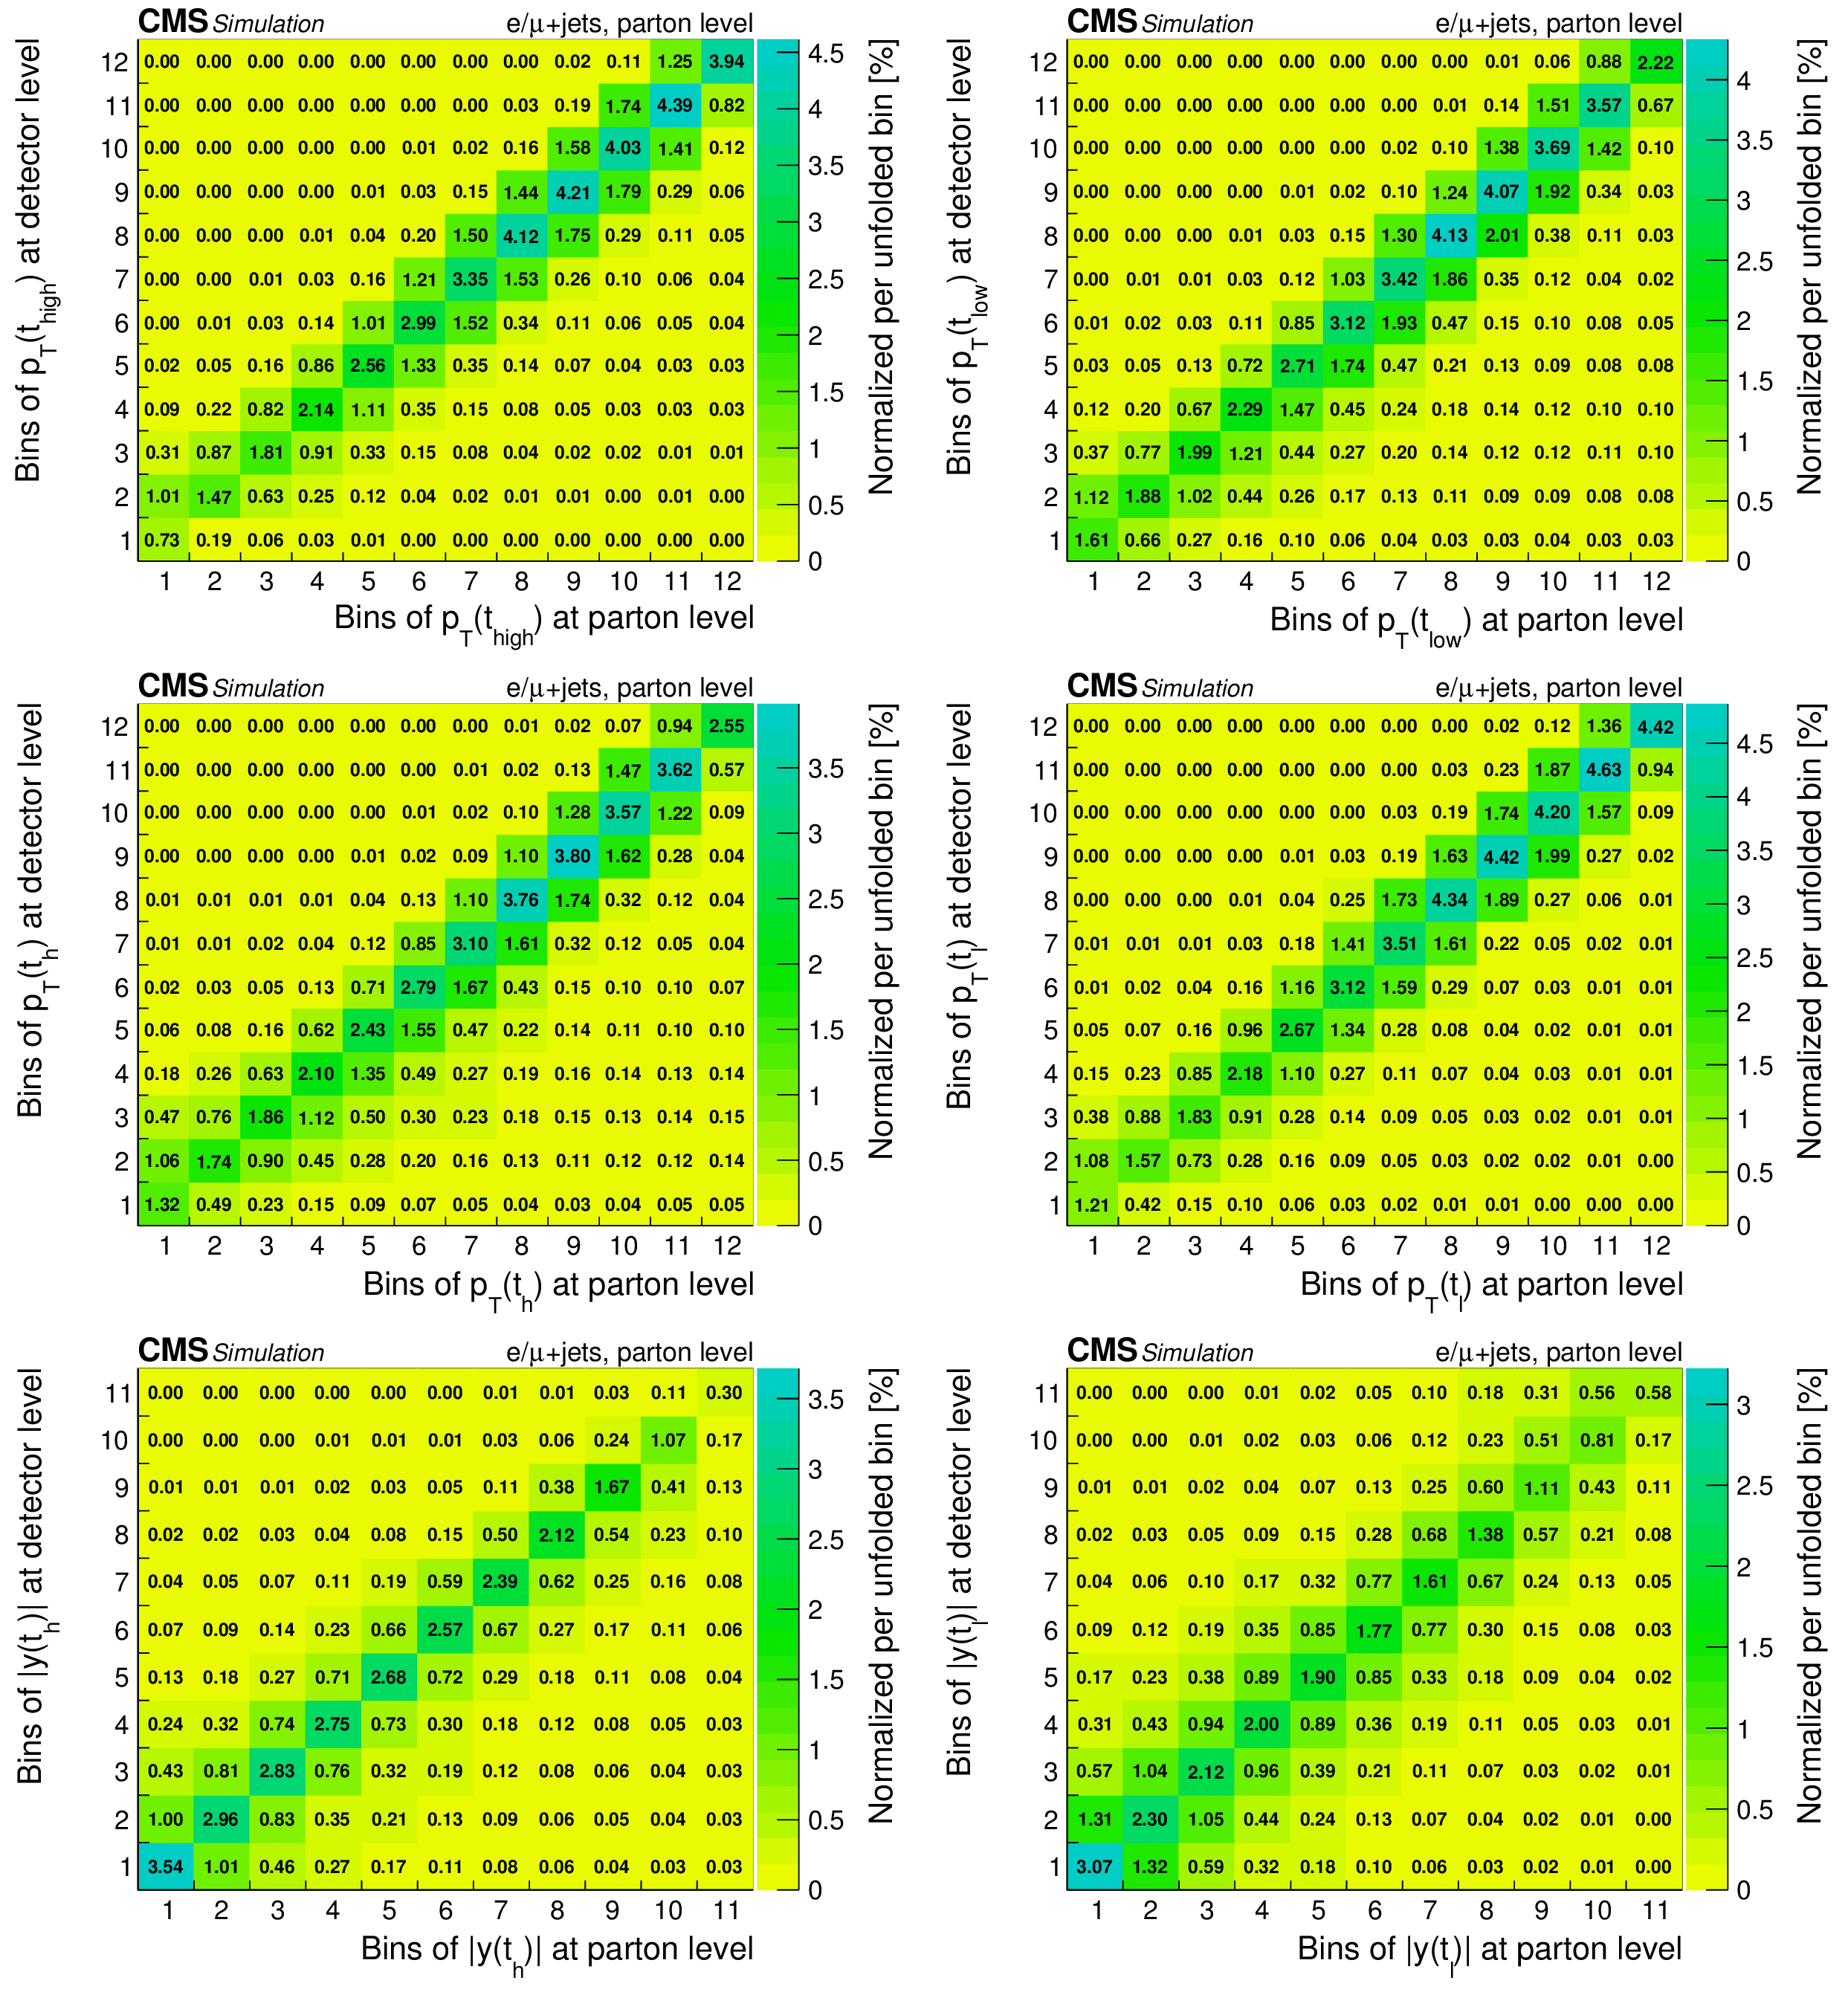
png pdf |
Additional Figure 10:
Migrations among the bins in the differential cross section measurements at parton level. |
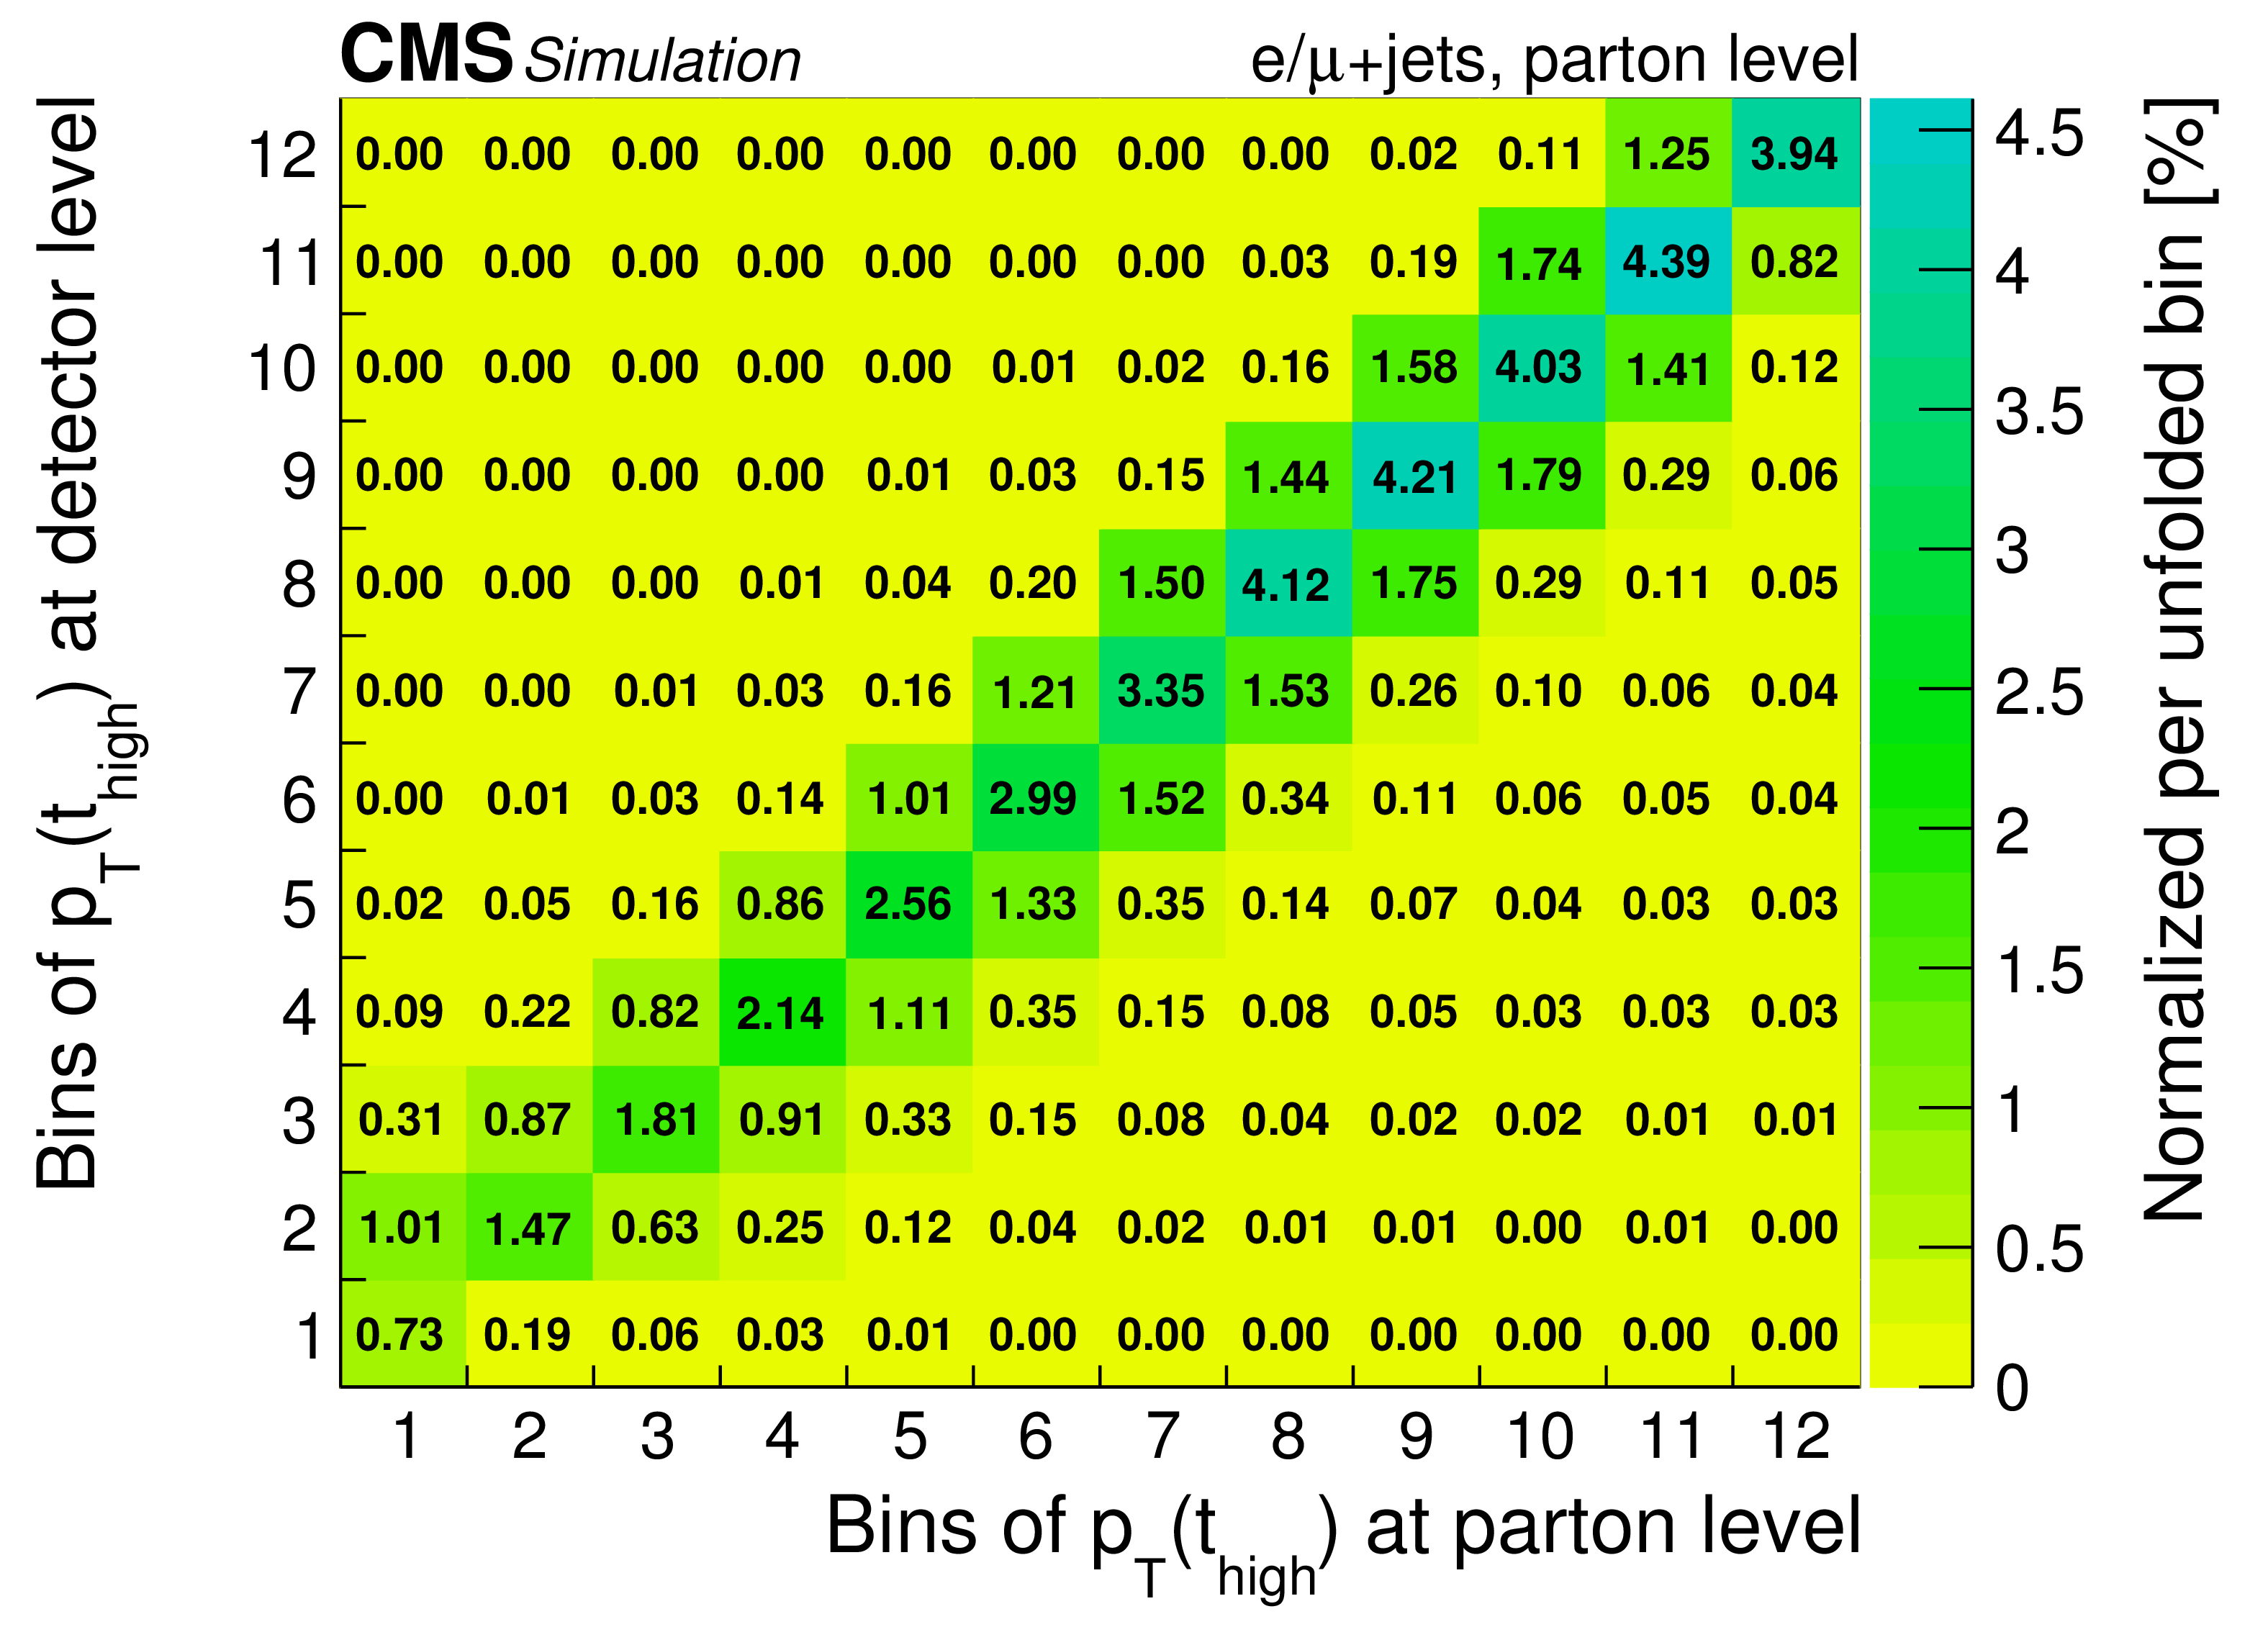
png pdf |
Additional Figure 10-a:
Migrations among the bins in the differential cross section measurements at parton level. |
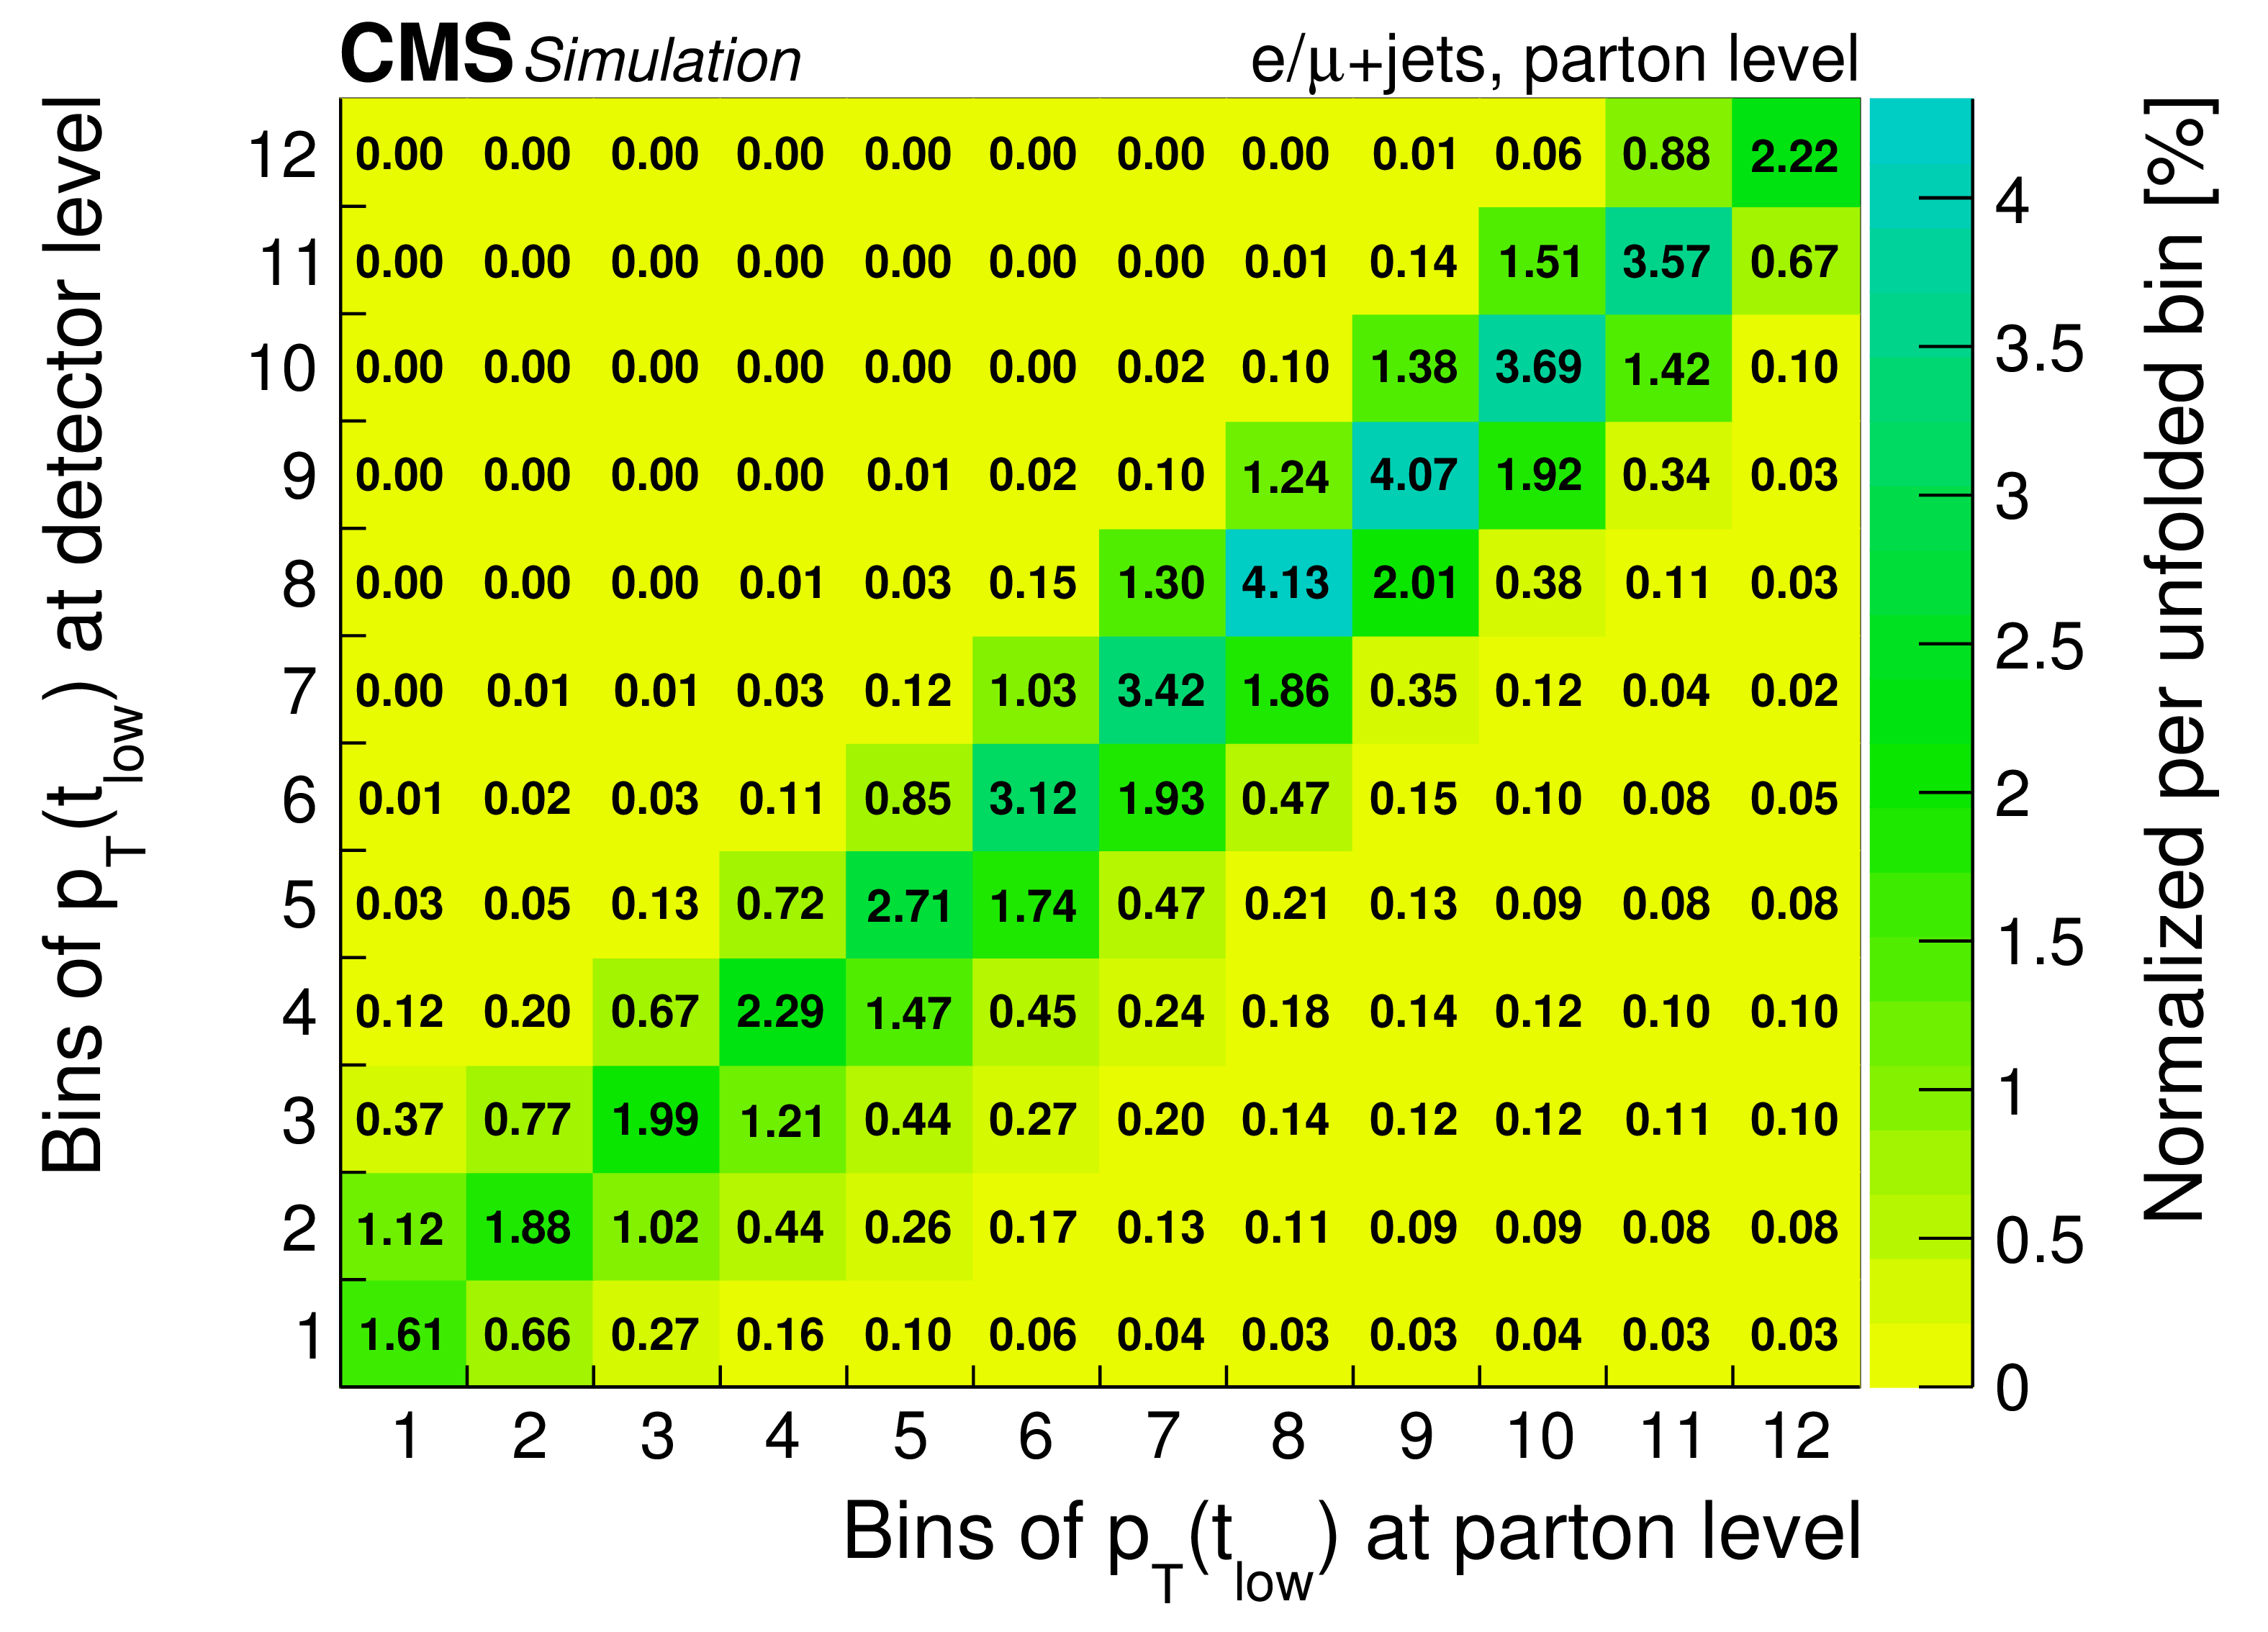
png pdf |
Additional Figure 10-b:
Migrations among the bins in the differential cross section measurements at parton level. |
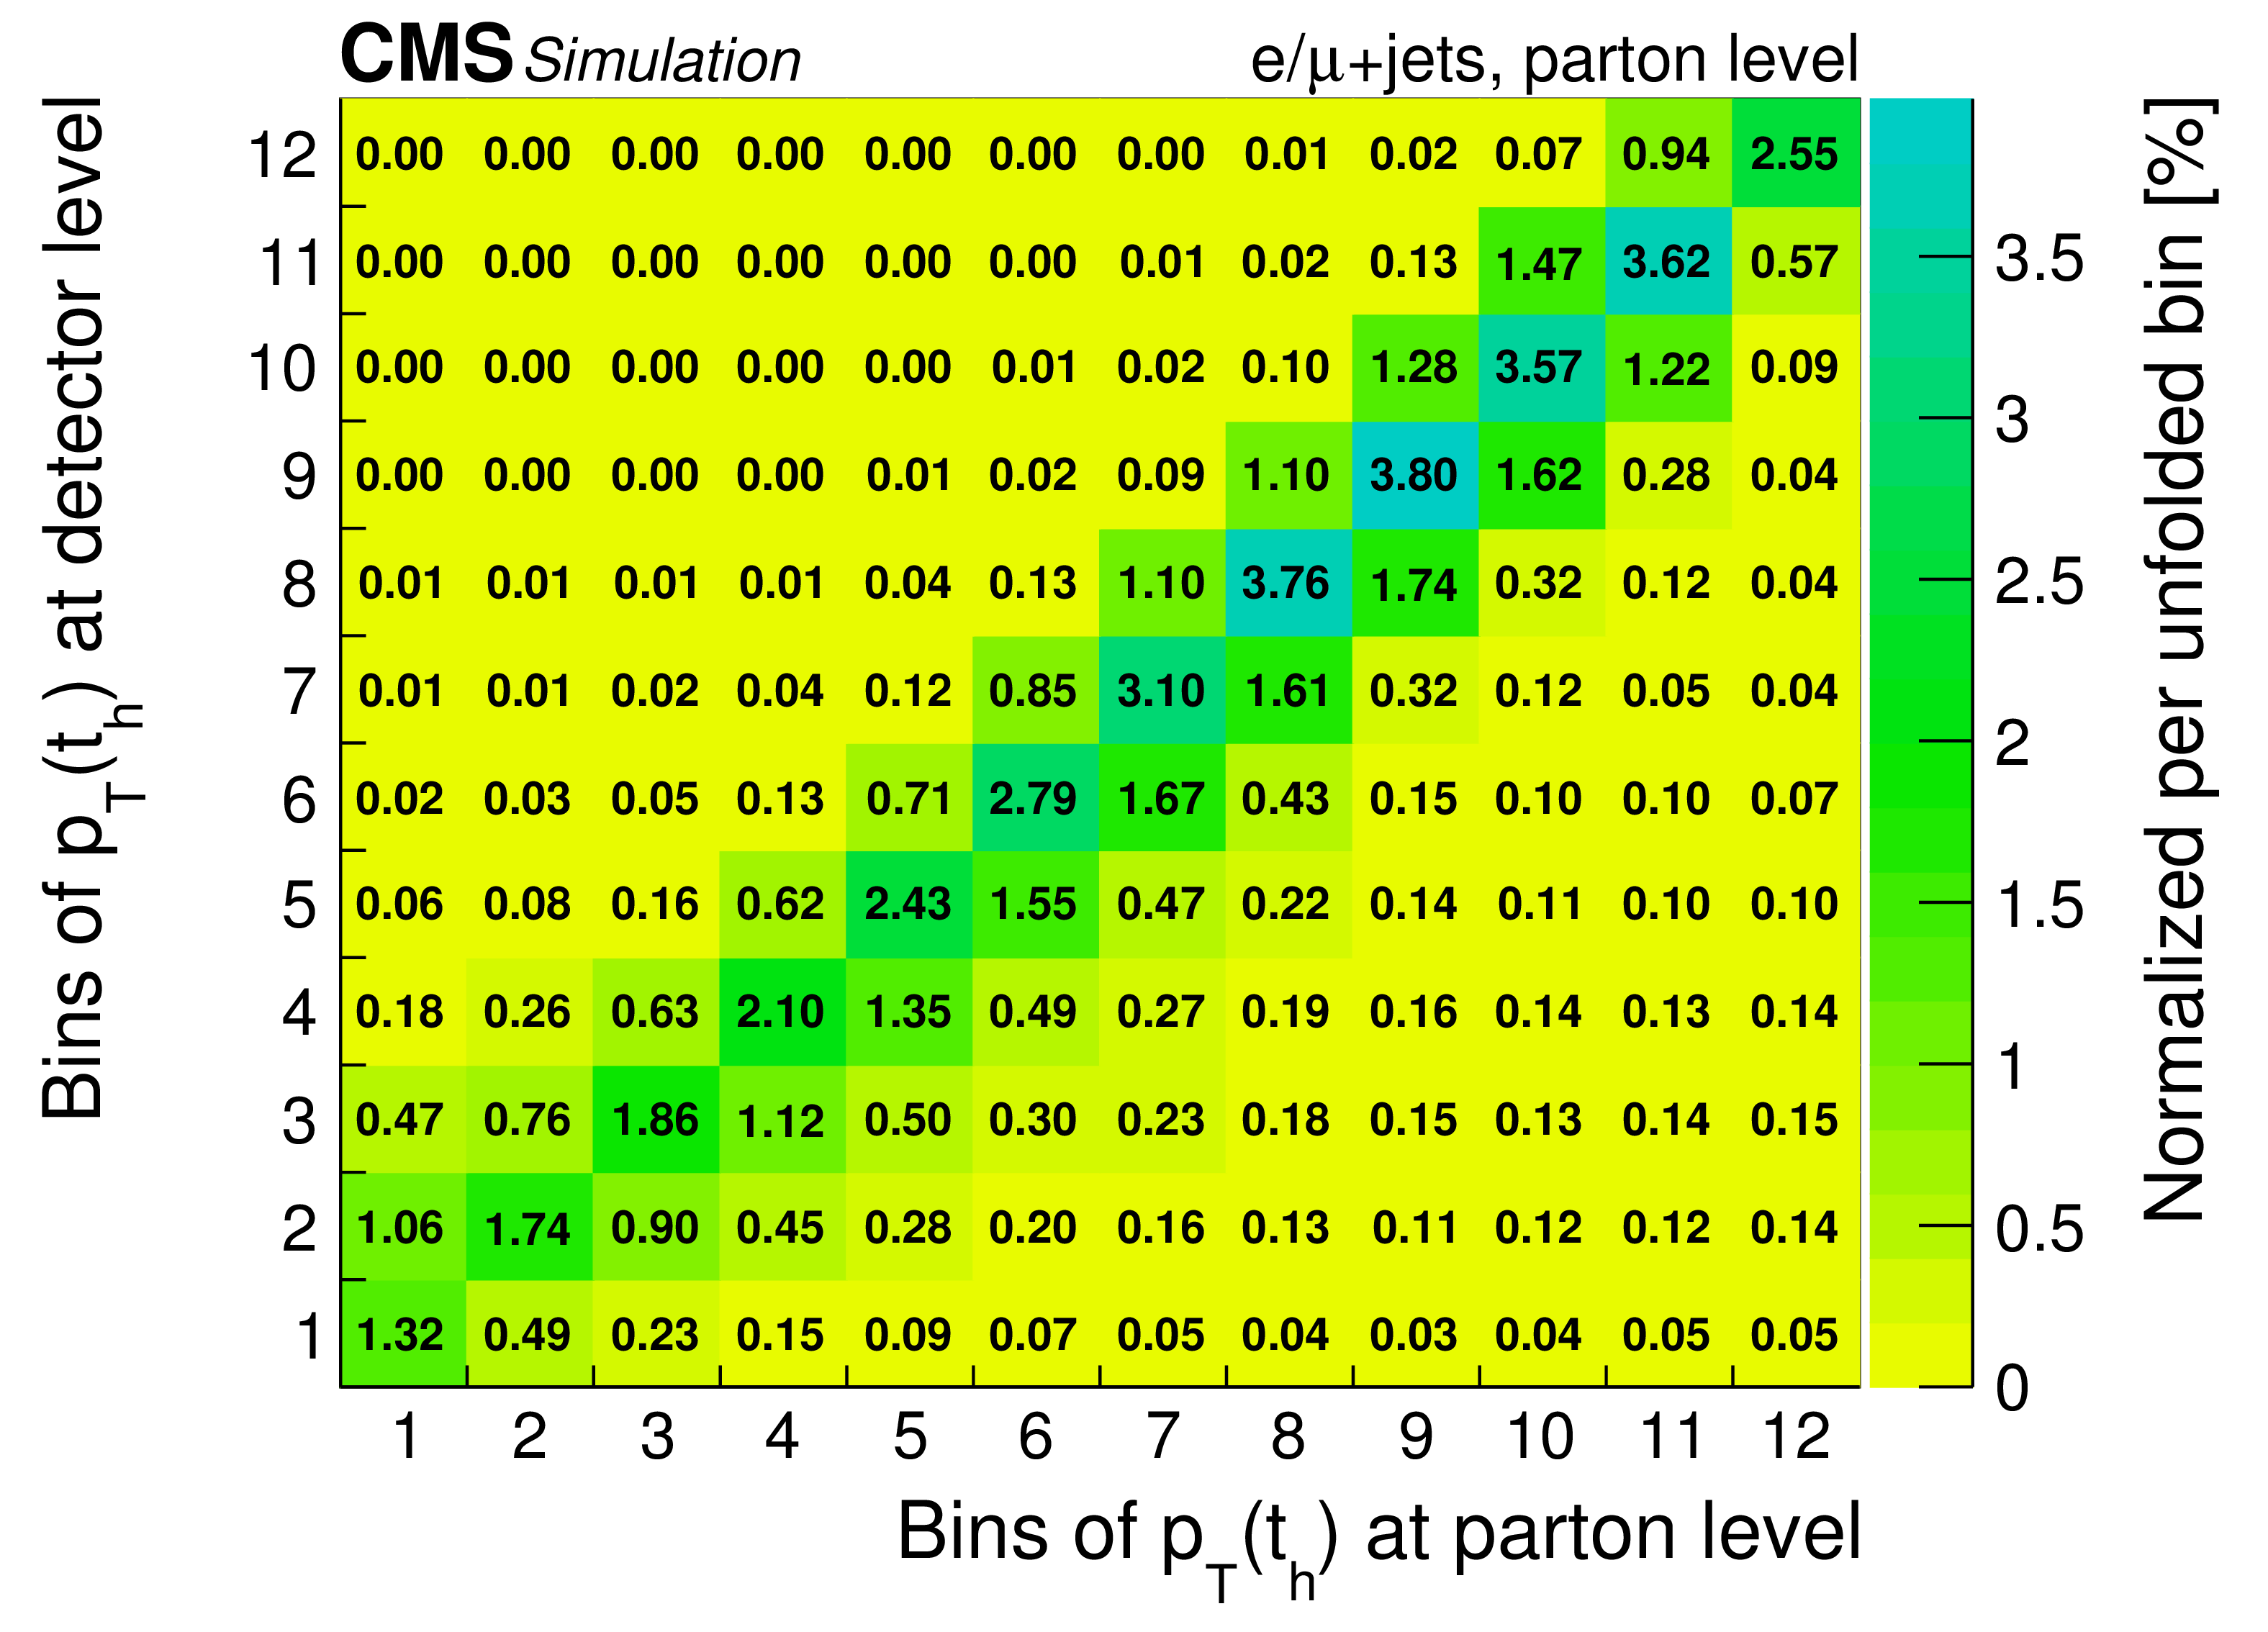
png pdf |
Additional Figure 10-c:
Migrations among the bins in the differential cross section measurements at parton level. |
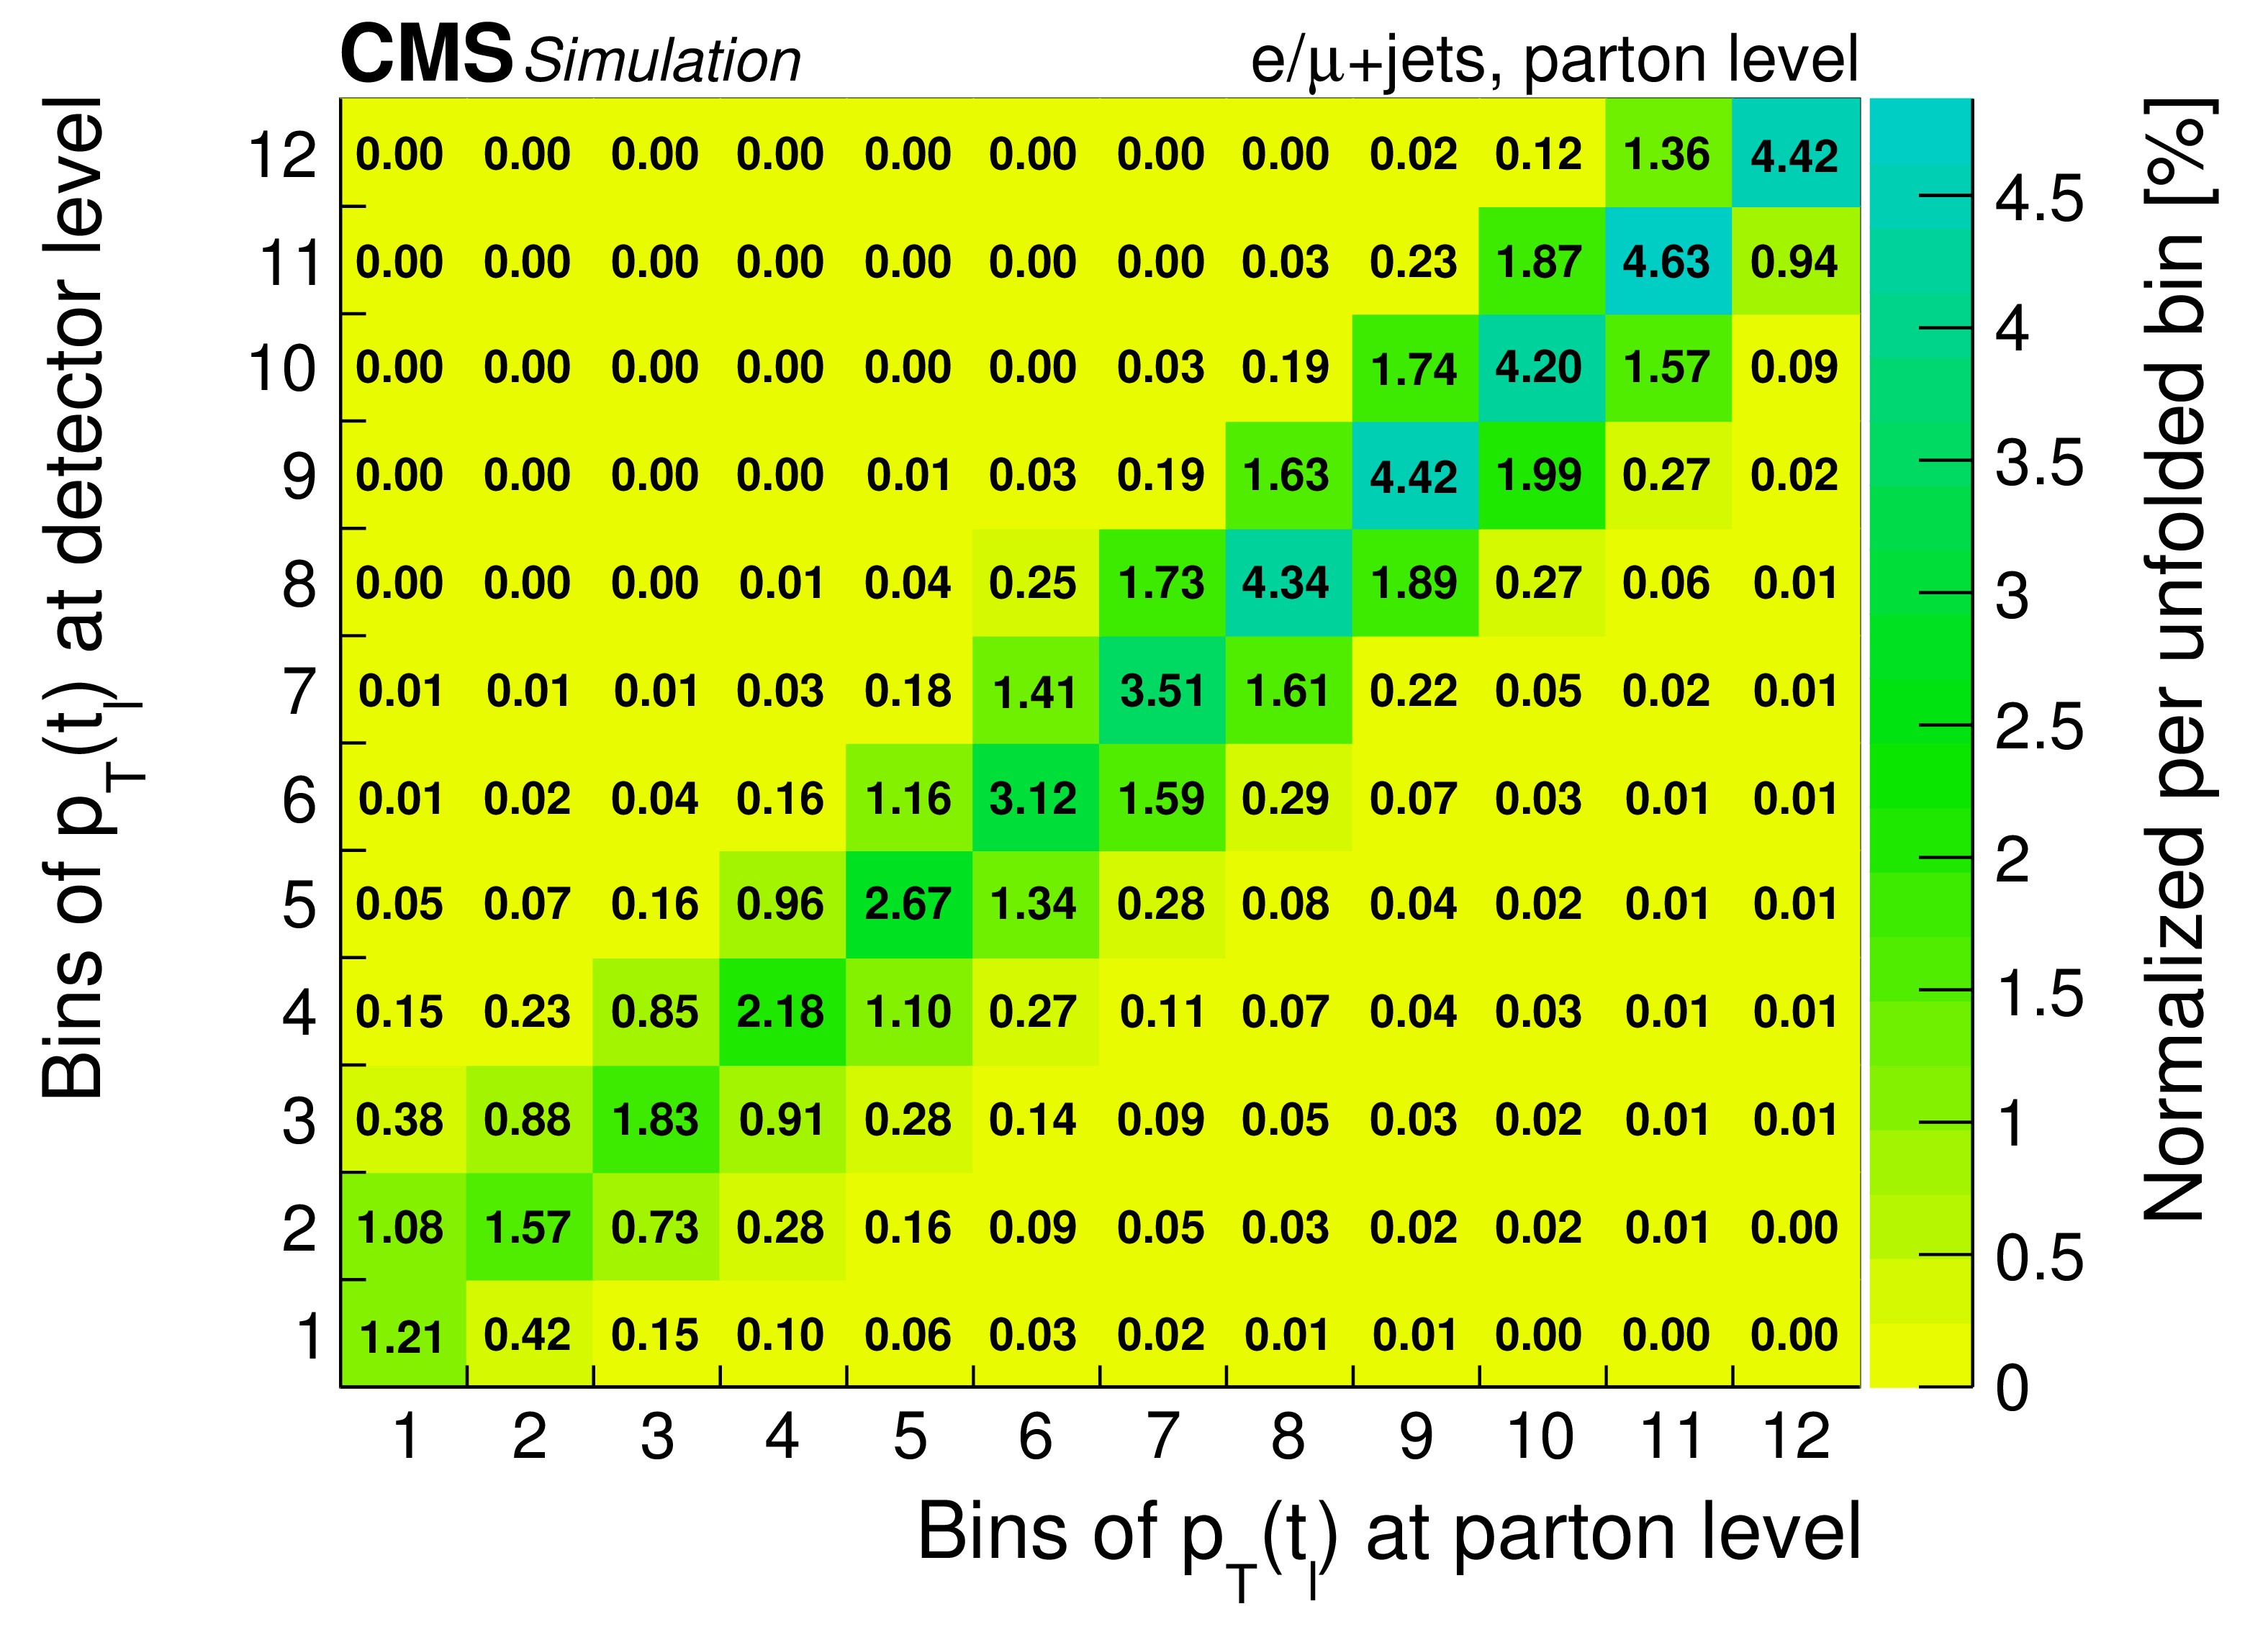
png pdf |
Additional Figure 10-d:
Migrations among the bins in the differential cross section measurements at parton level. |
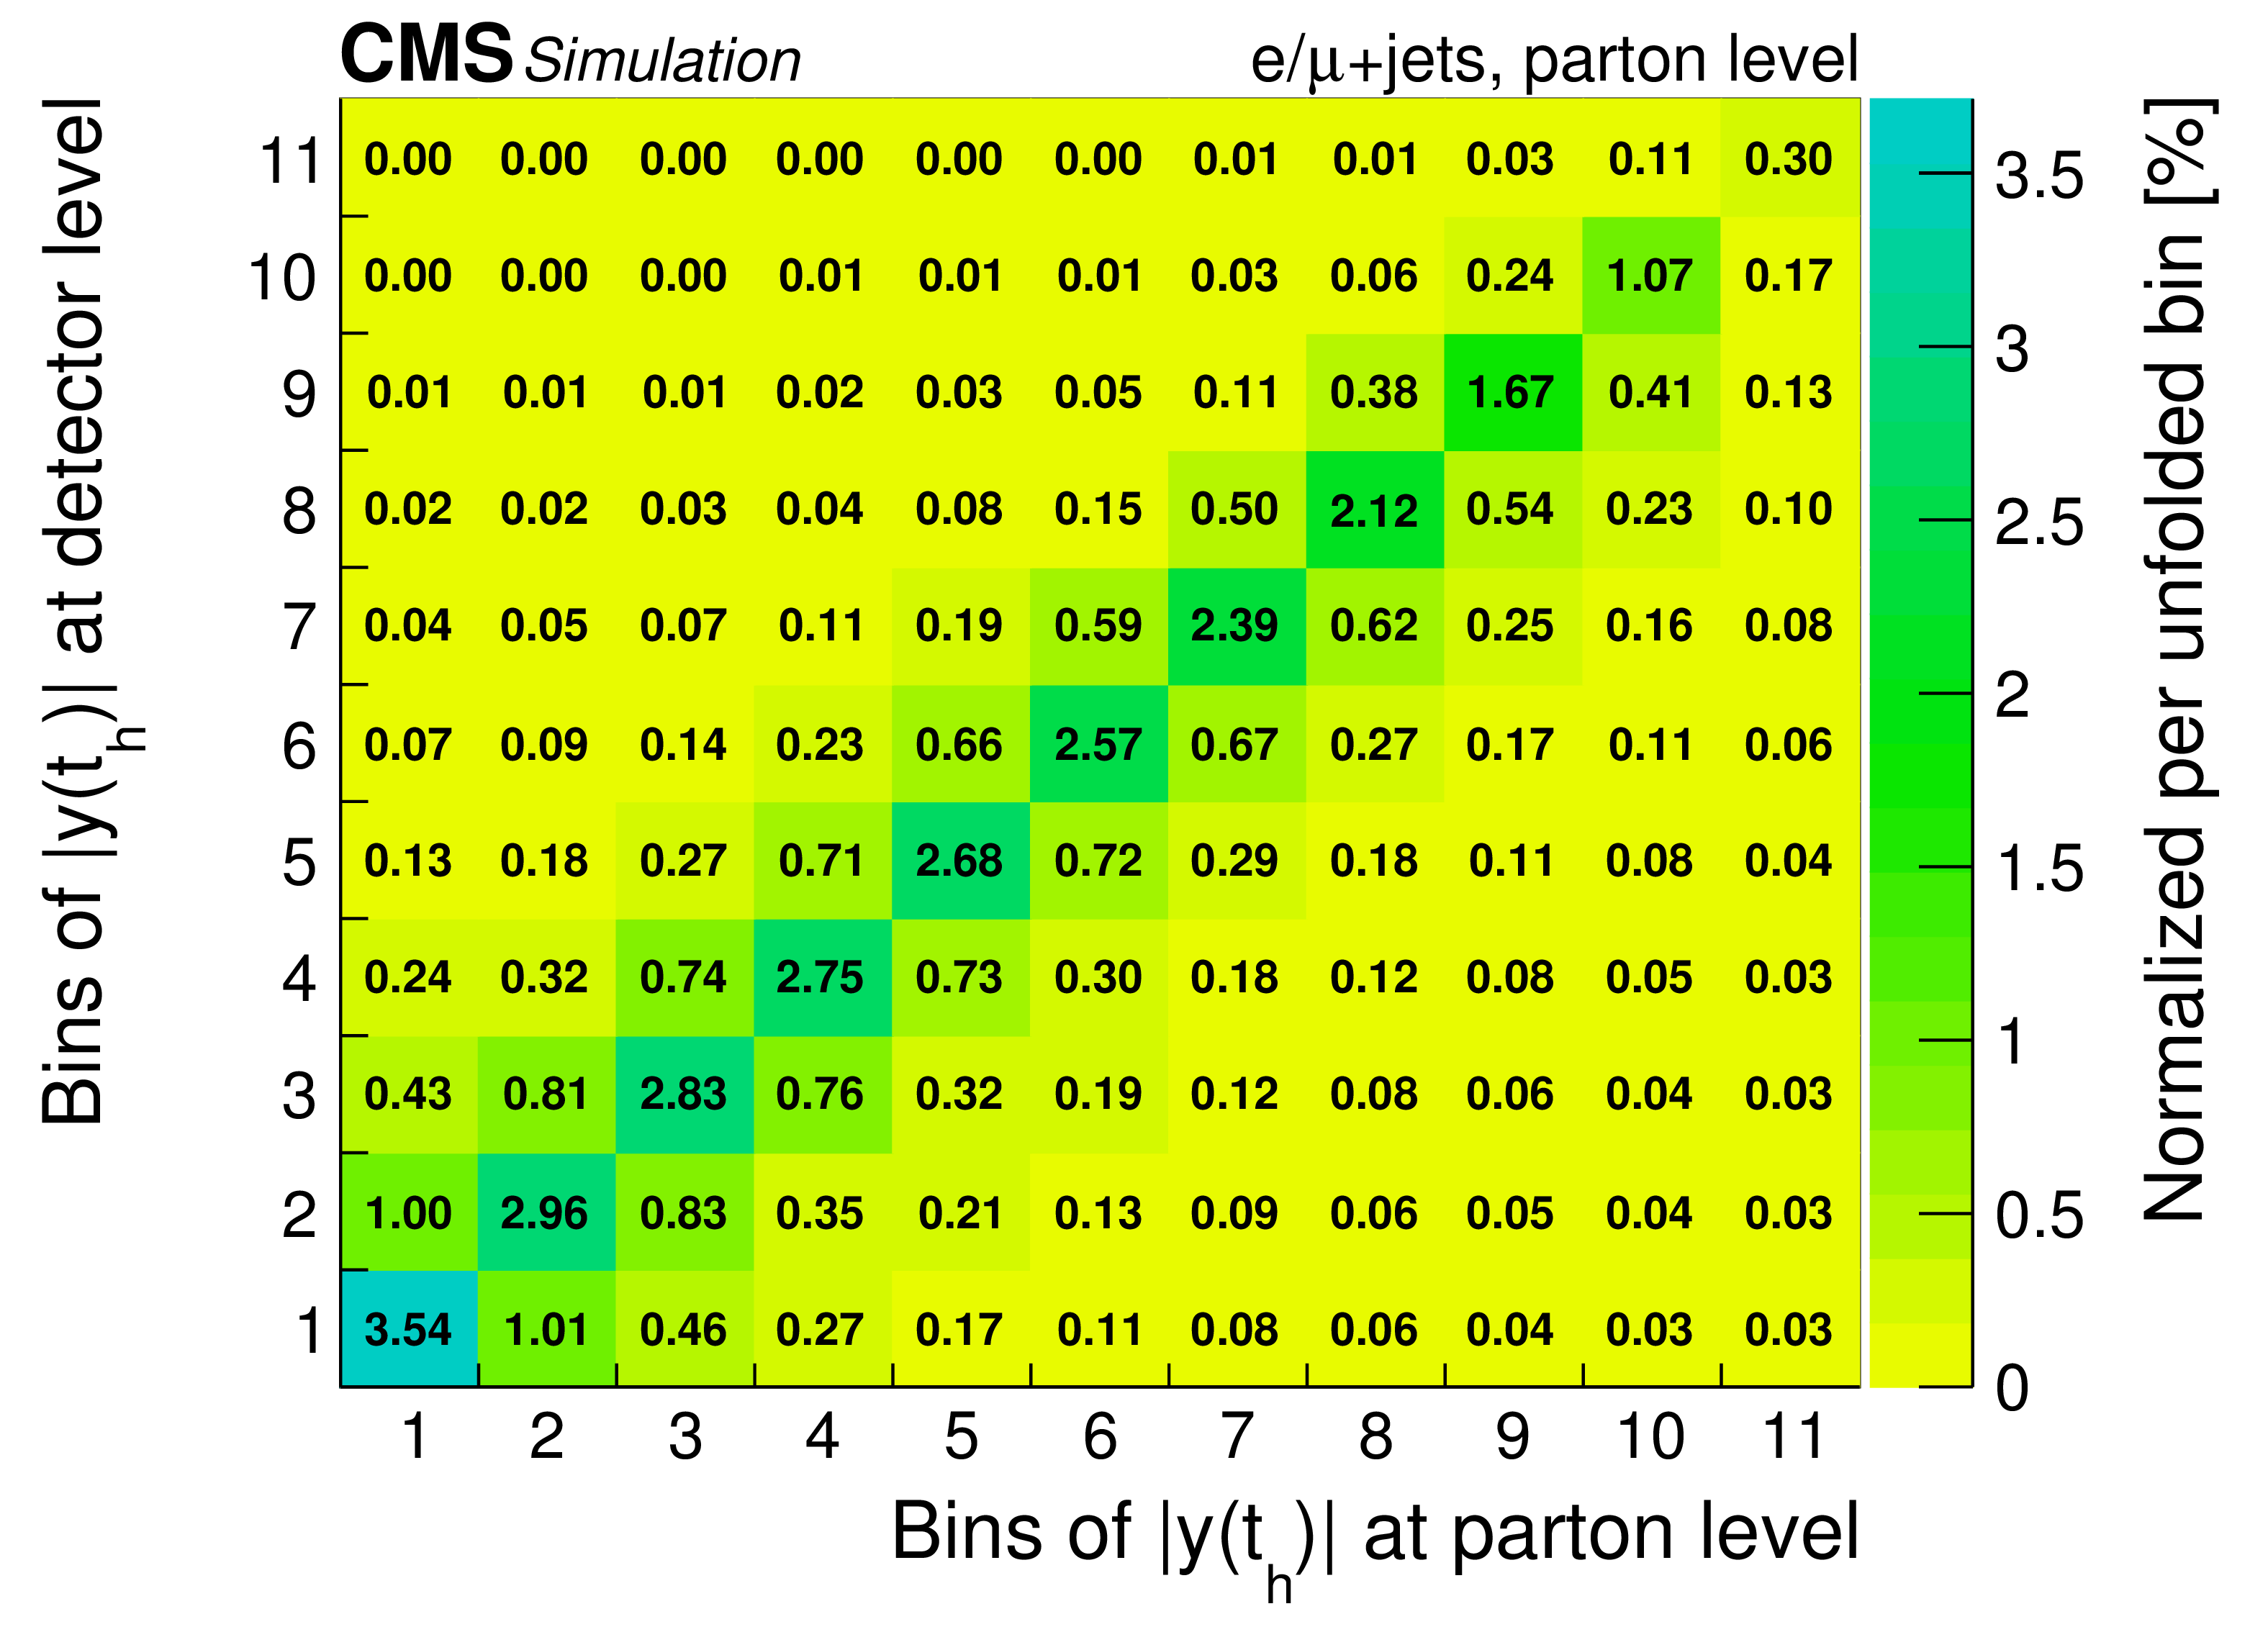
png pdf |
Additional Figure 10-e:
Migrations among the bins in the differential cross section measurements at parton level. |
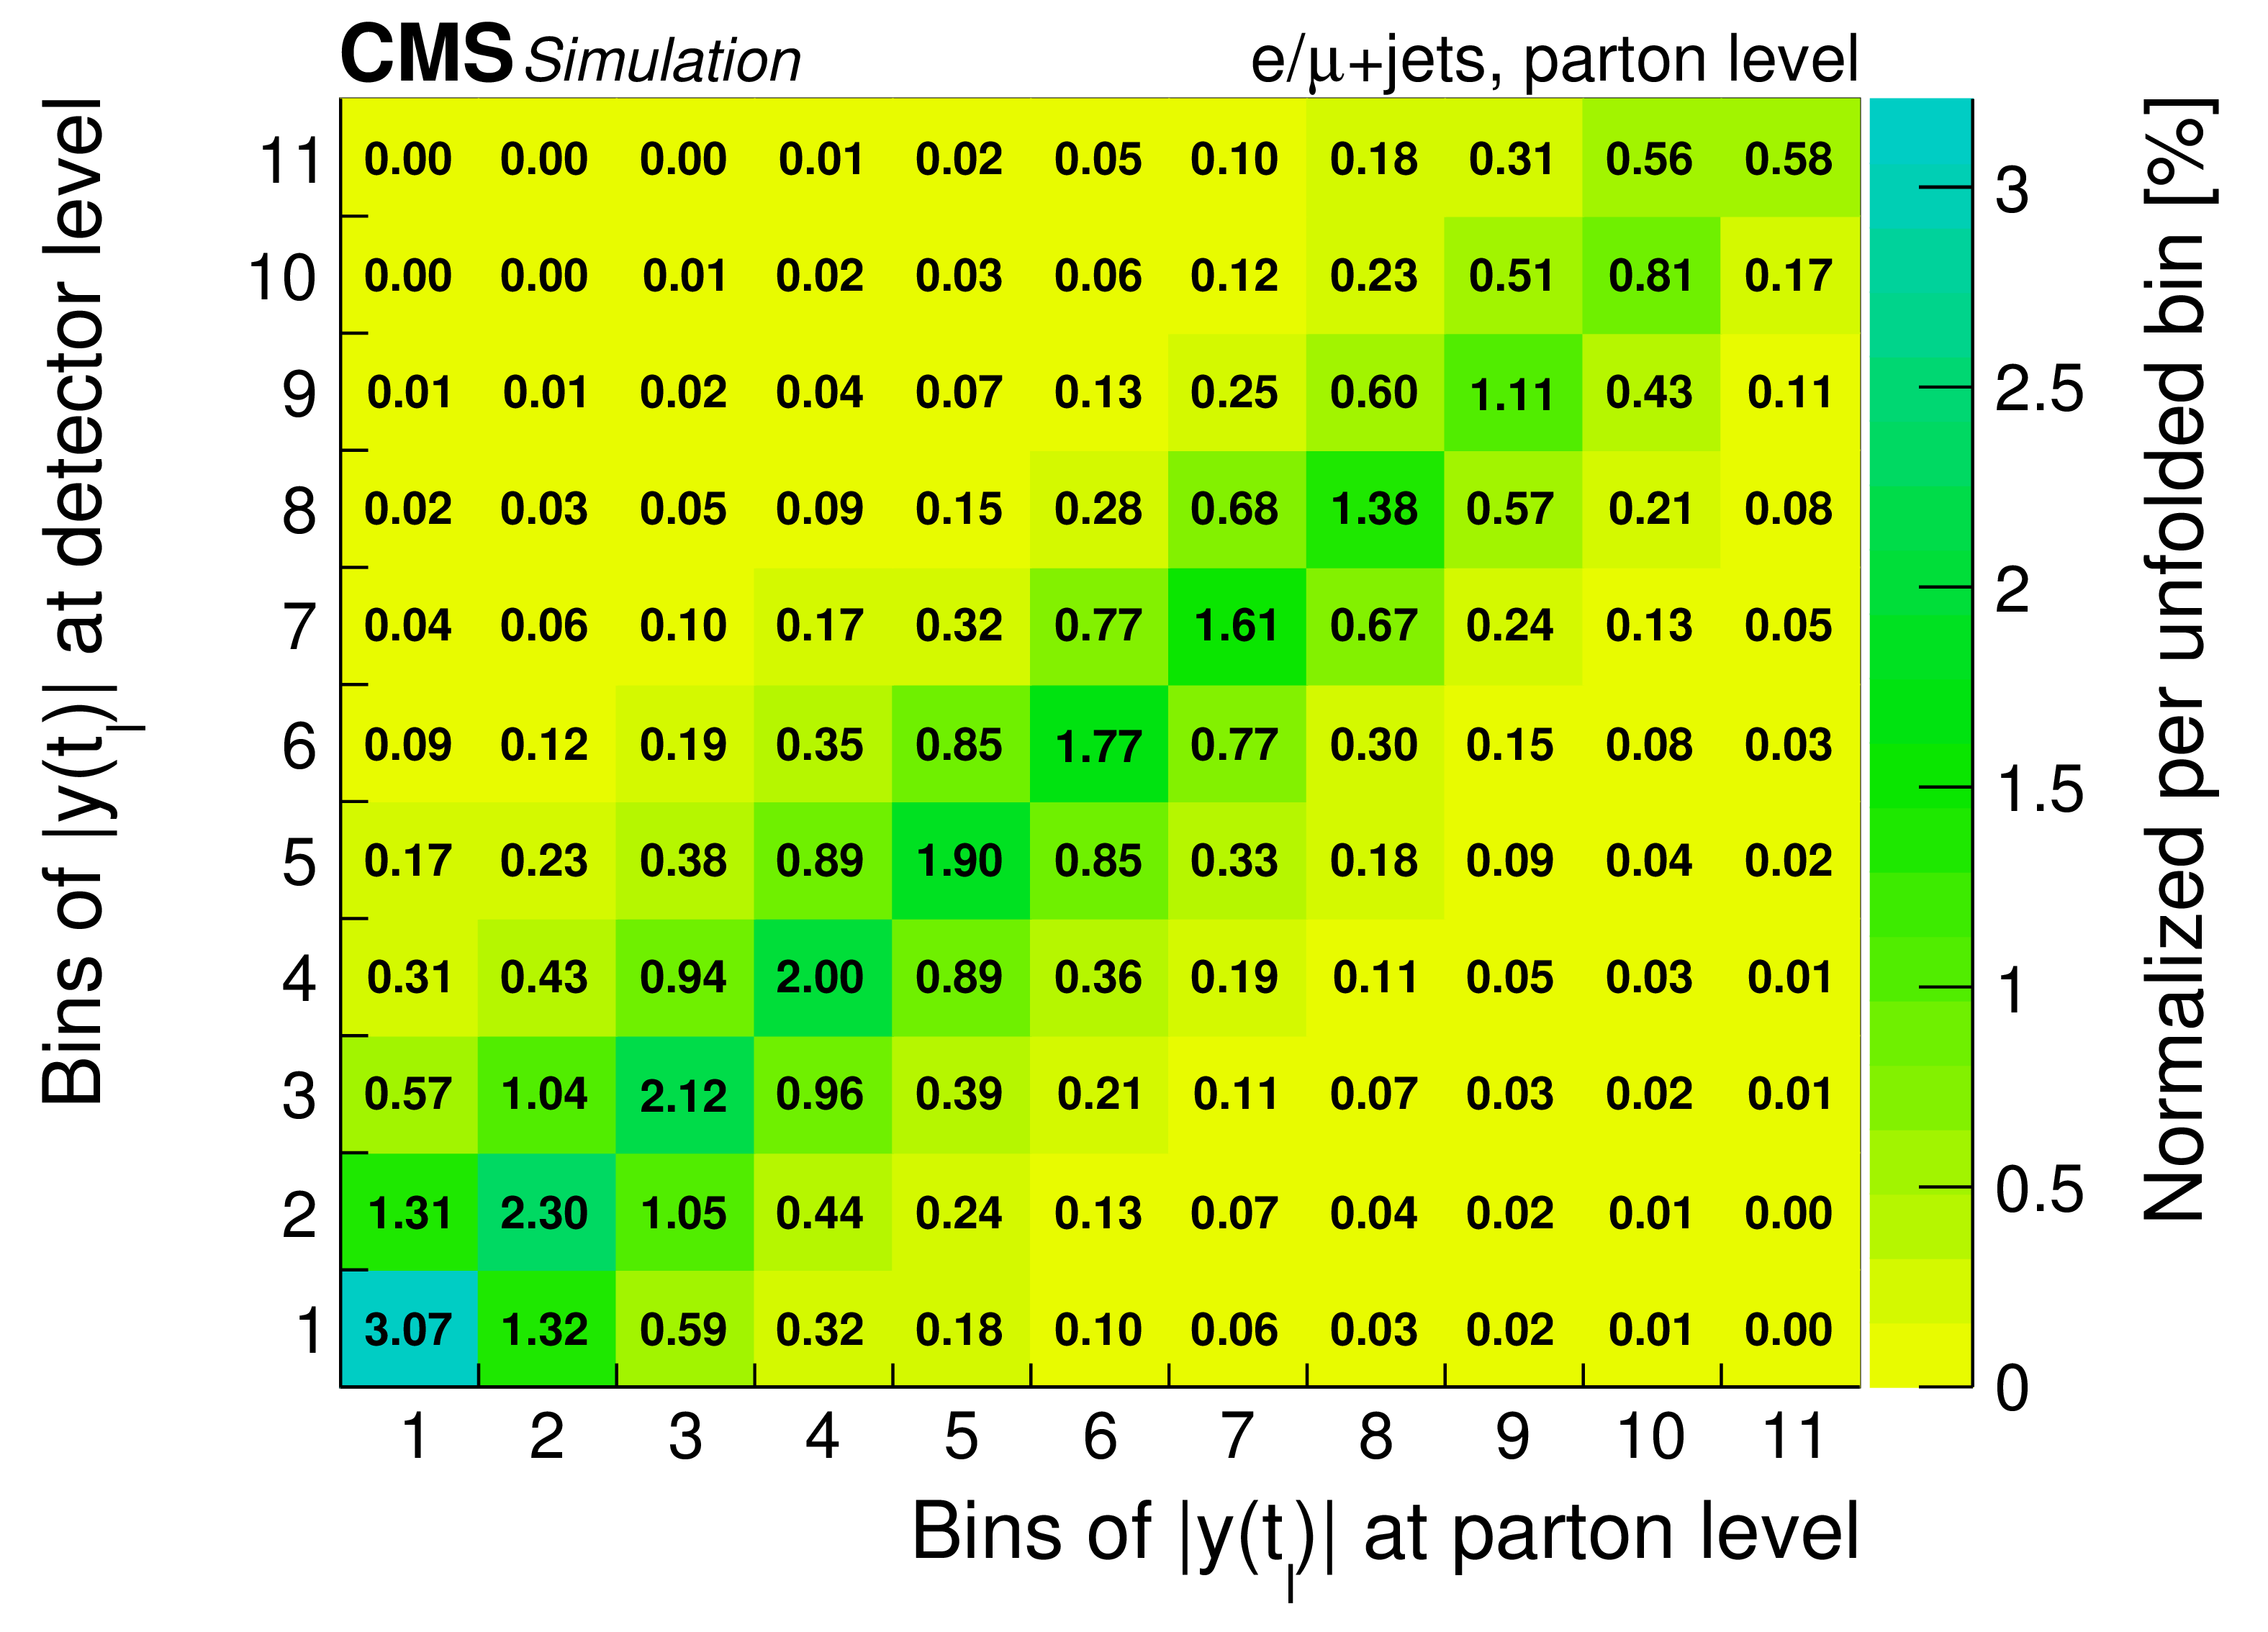
png pdf |
Additional Figure 10-f:
Migrations among the bins in the differential cross section measurements at parton level. |
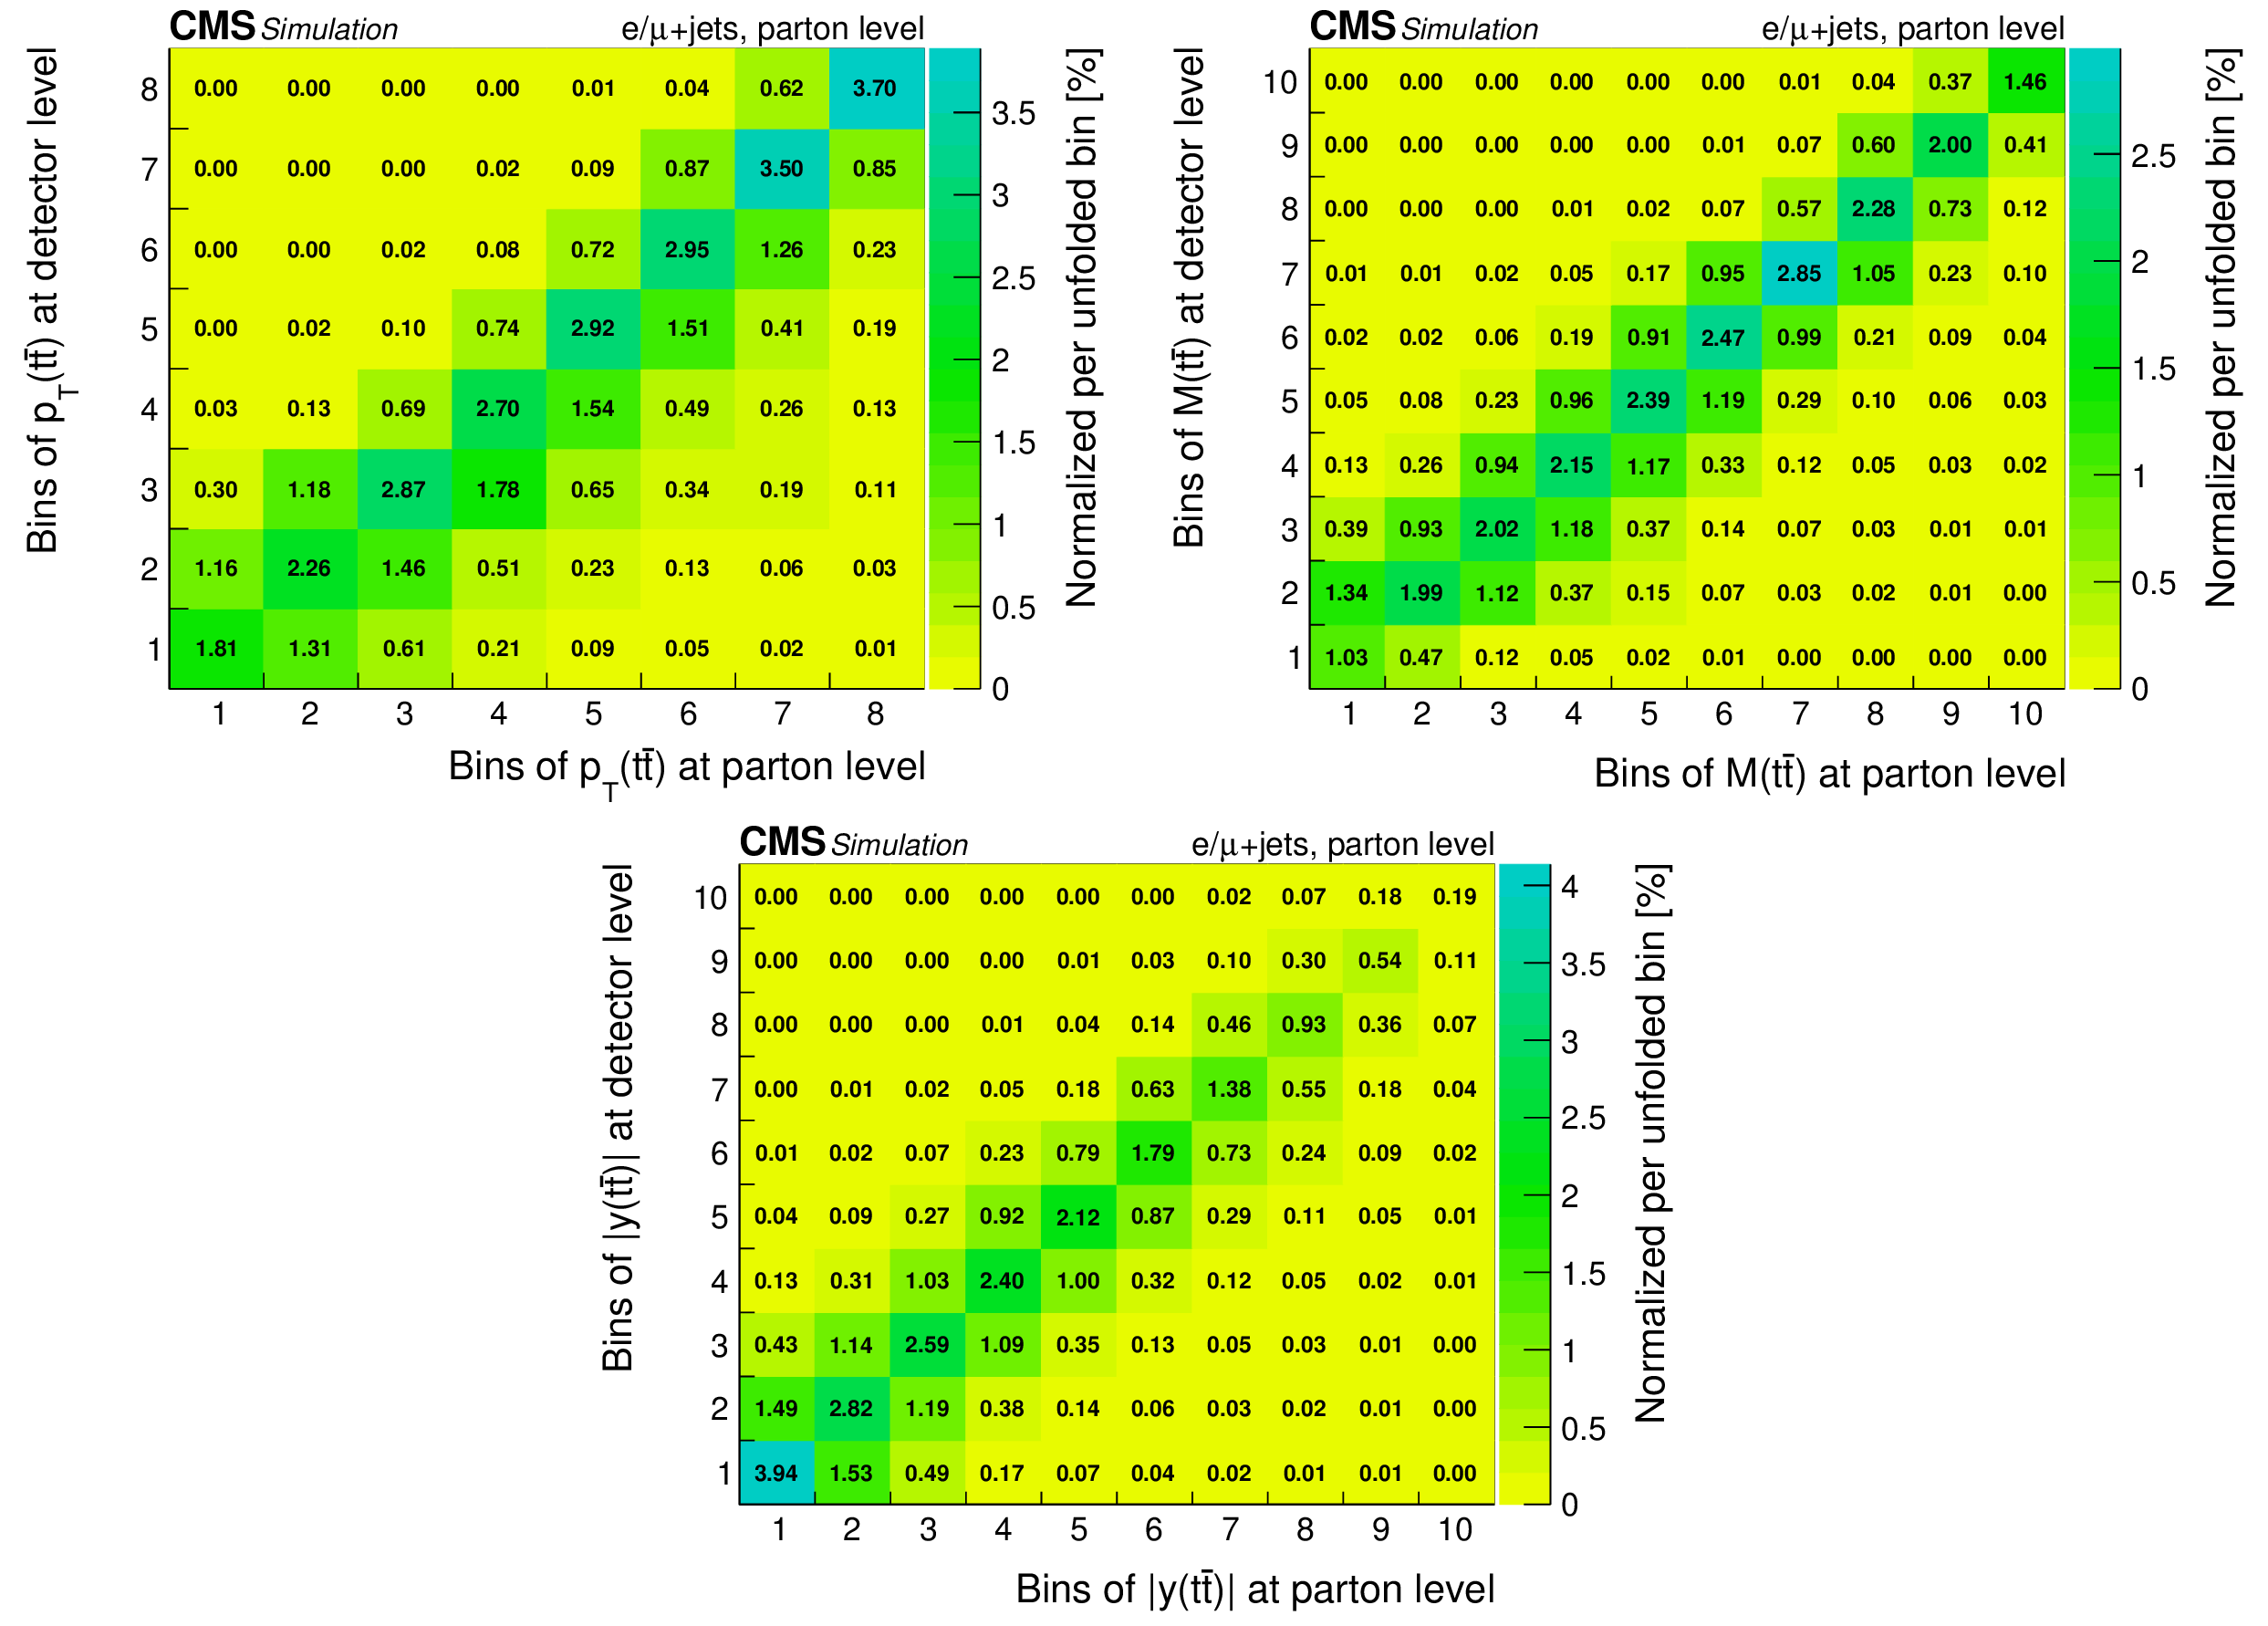
png pdf |
Additional Figure 11:
Migrations among the bins in the differential cross section measurements at parton level. |

png pdf |
Additional Figure 11-a:
Migrations among the bins in the differential cross section measurements at parton level. |
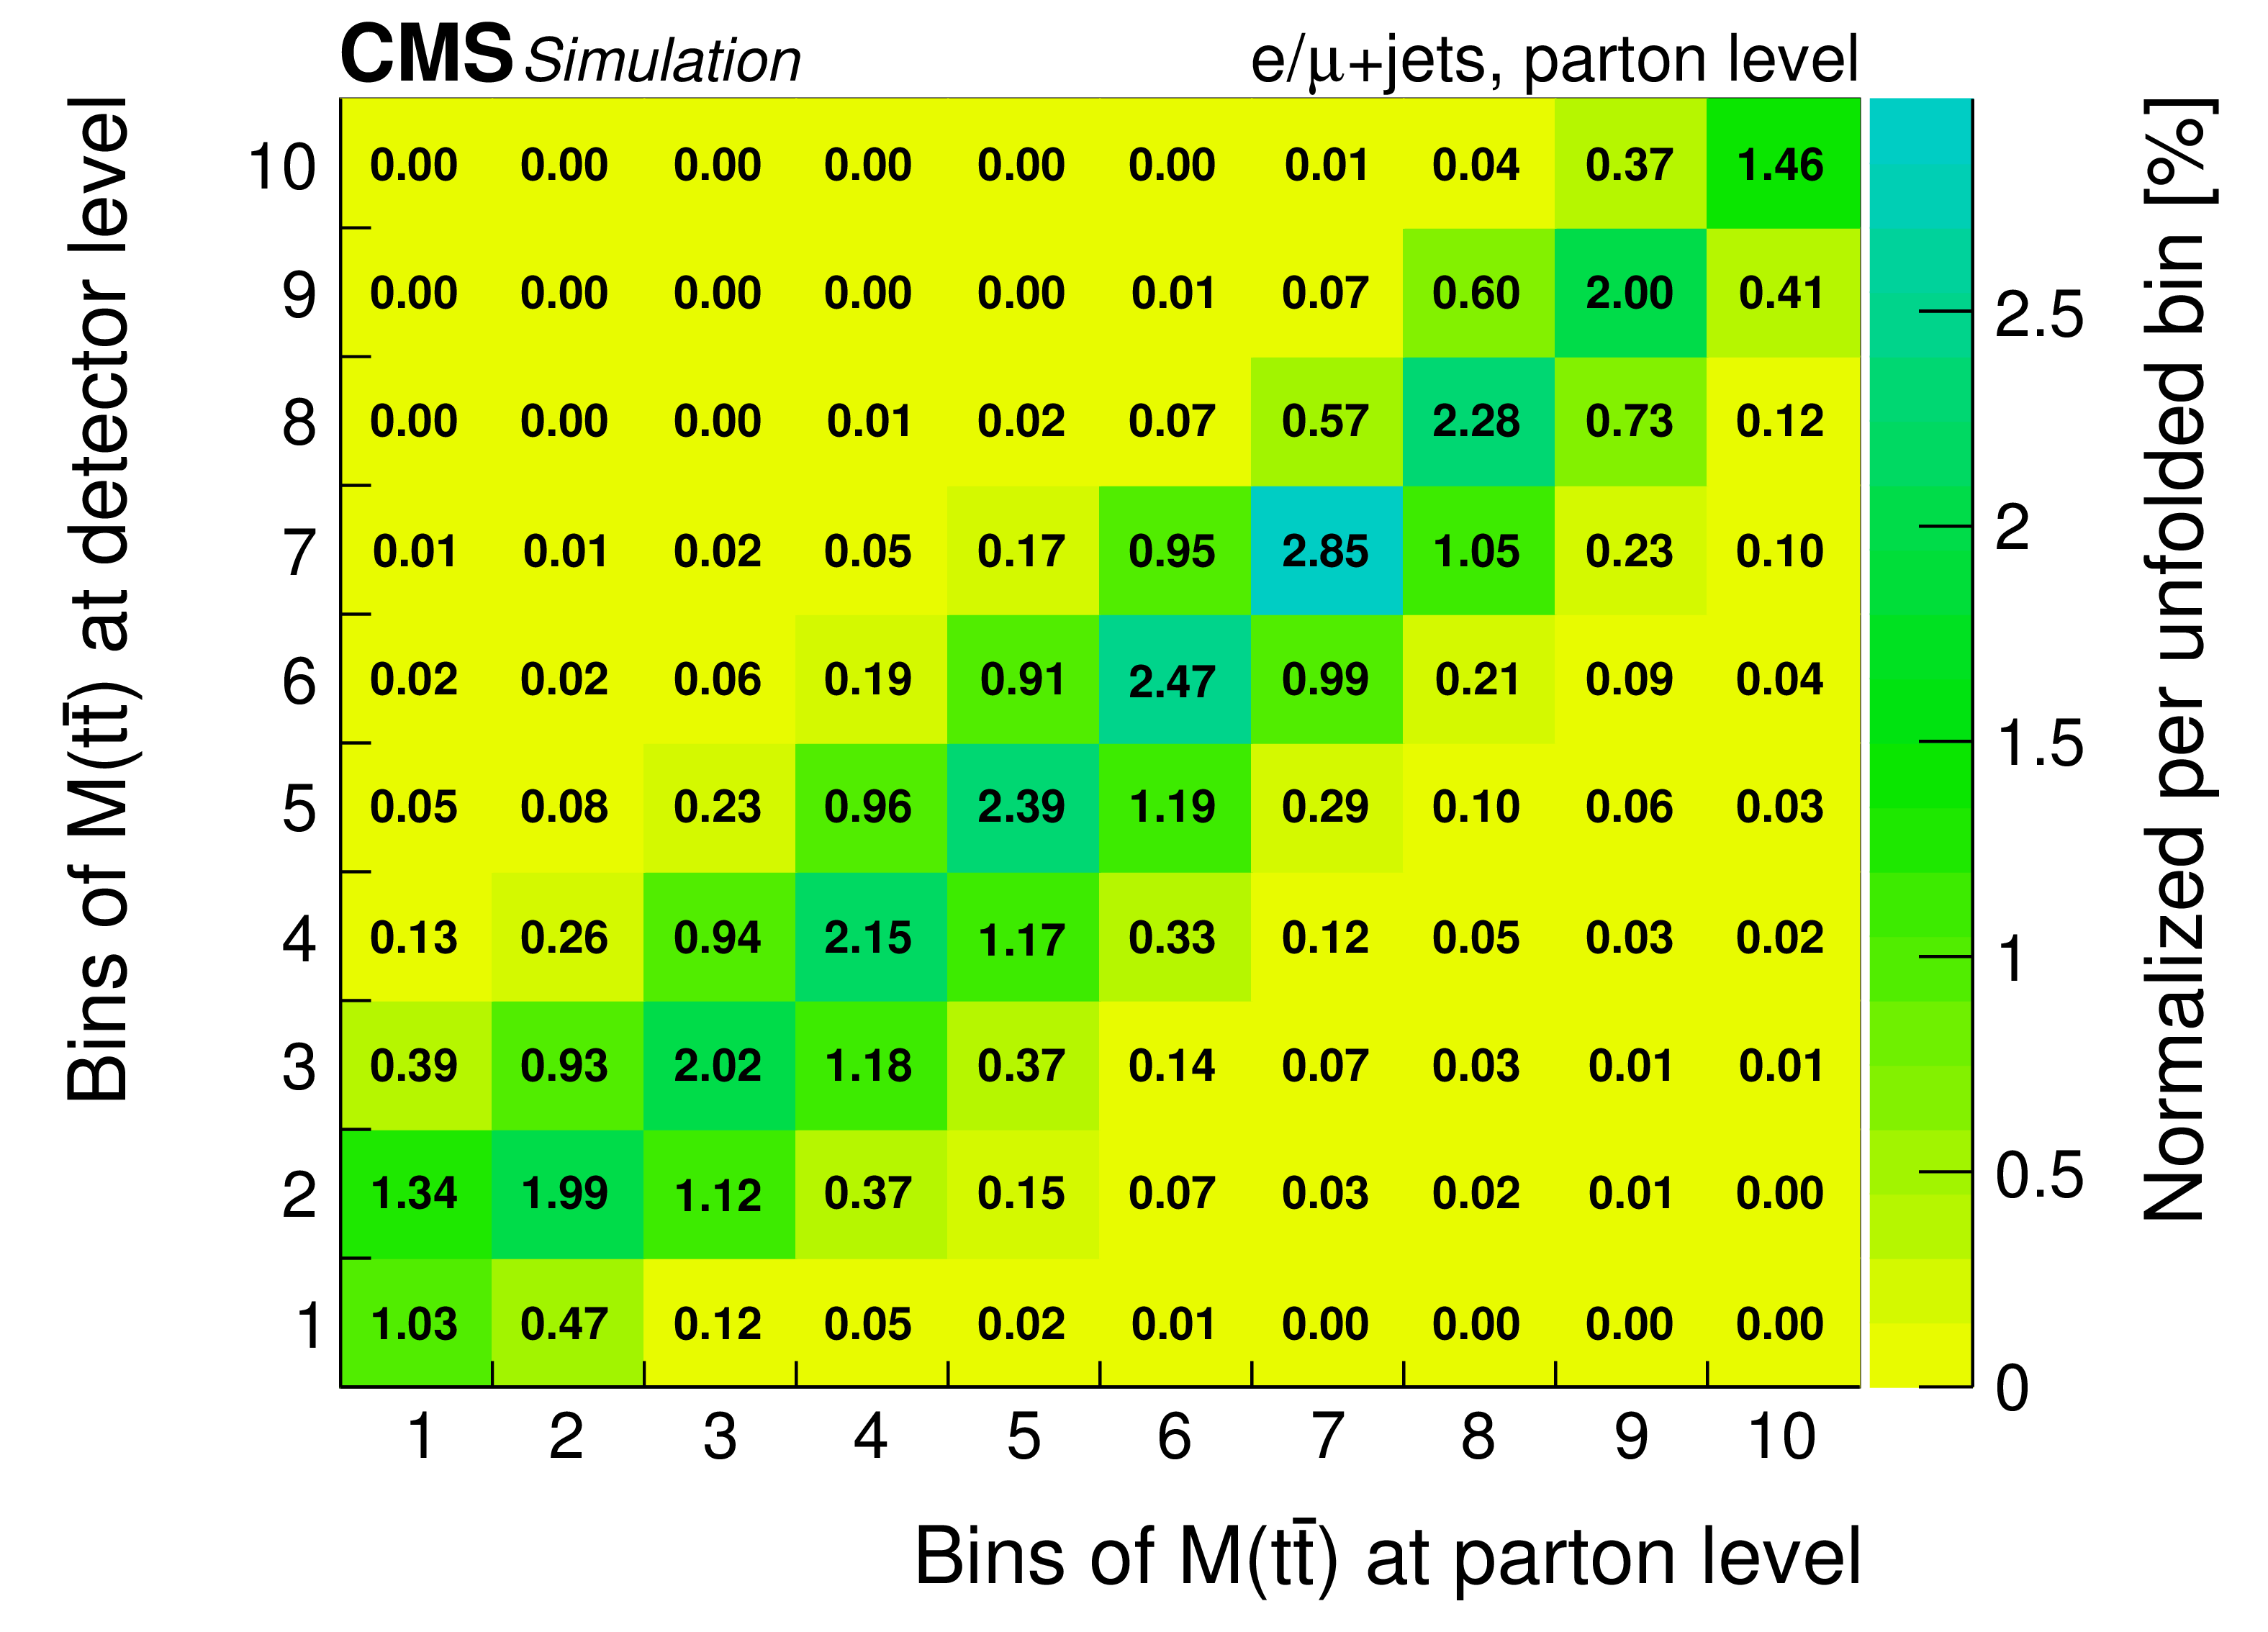
png pdf |
Additional Figure 11-b:
Migrations among the bins in the differential cross section measurements at parton level. |
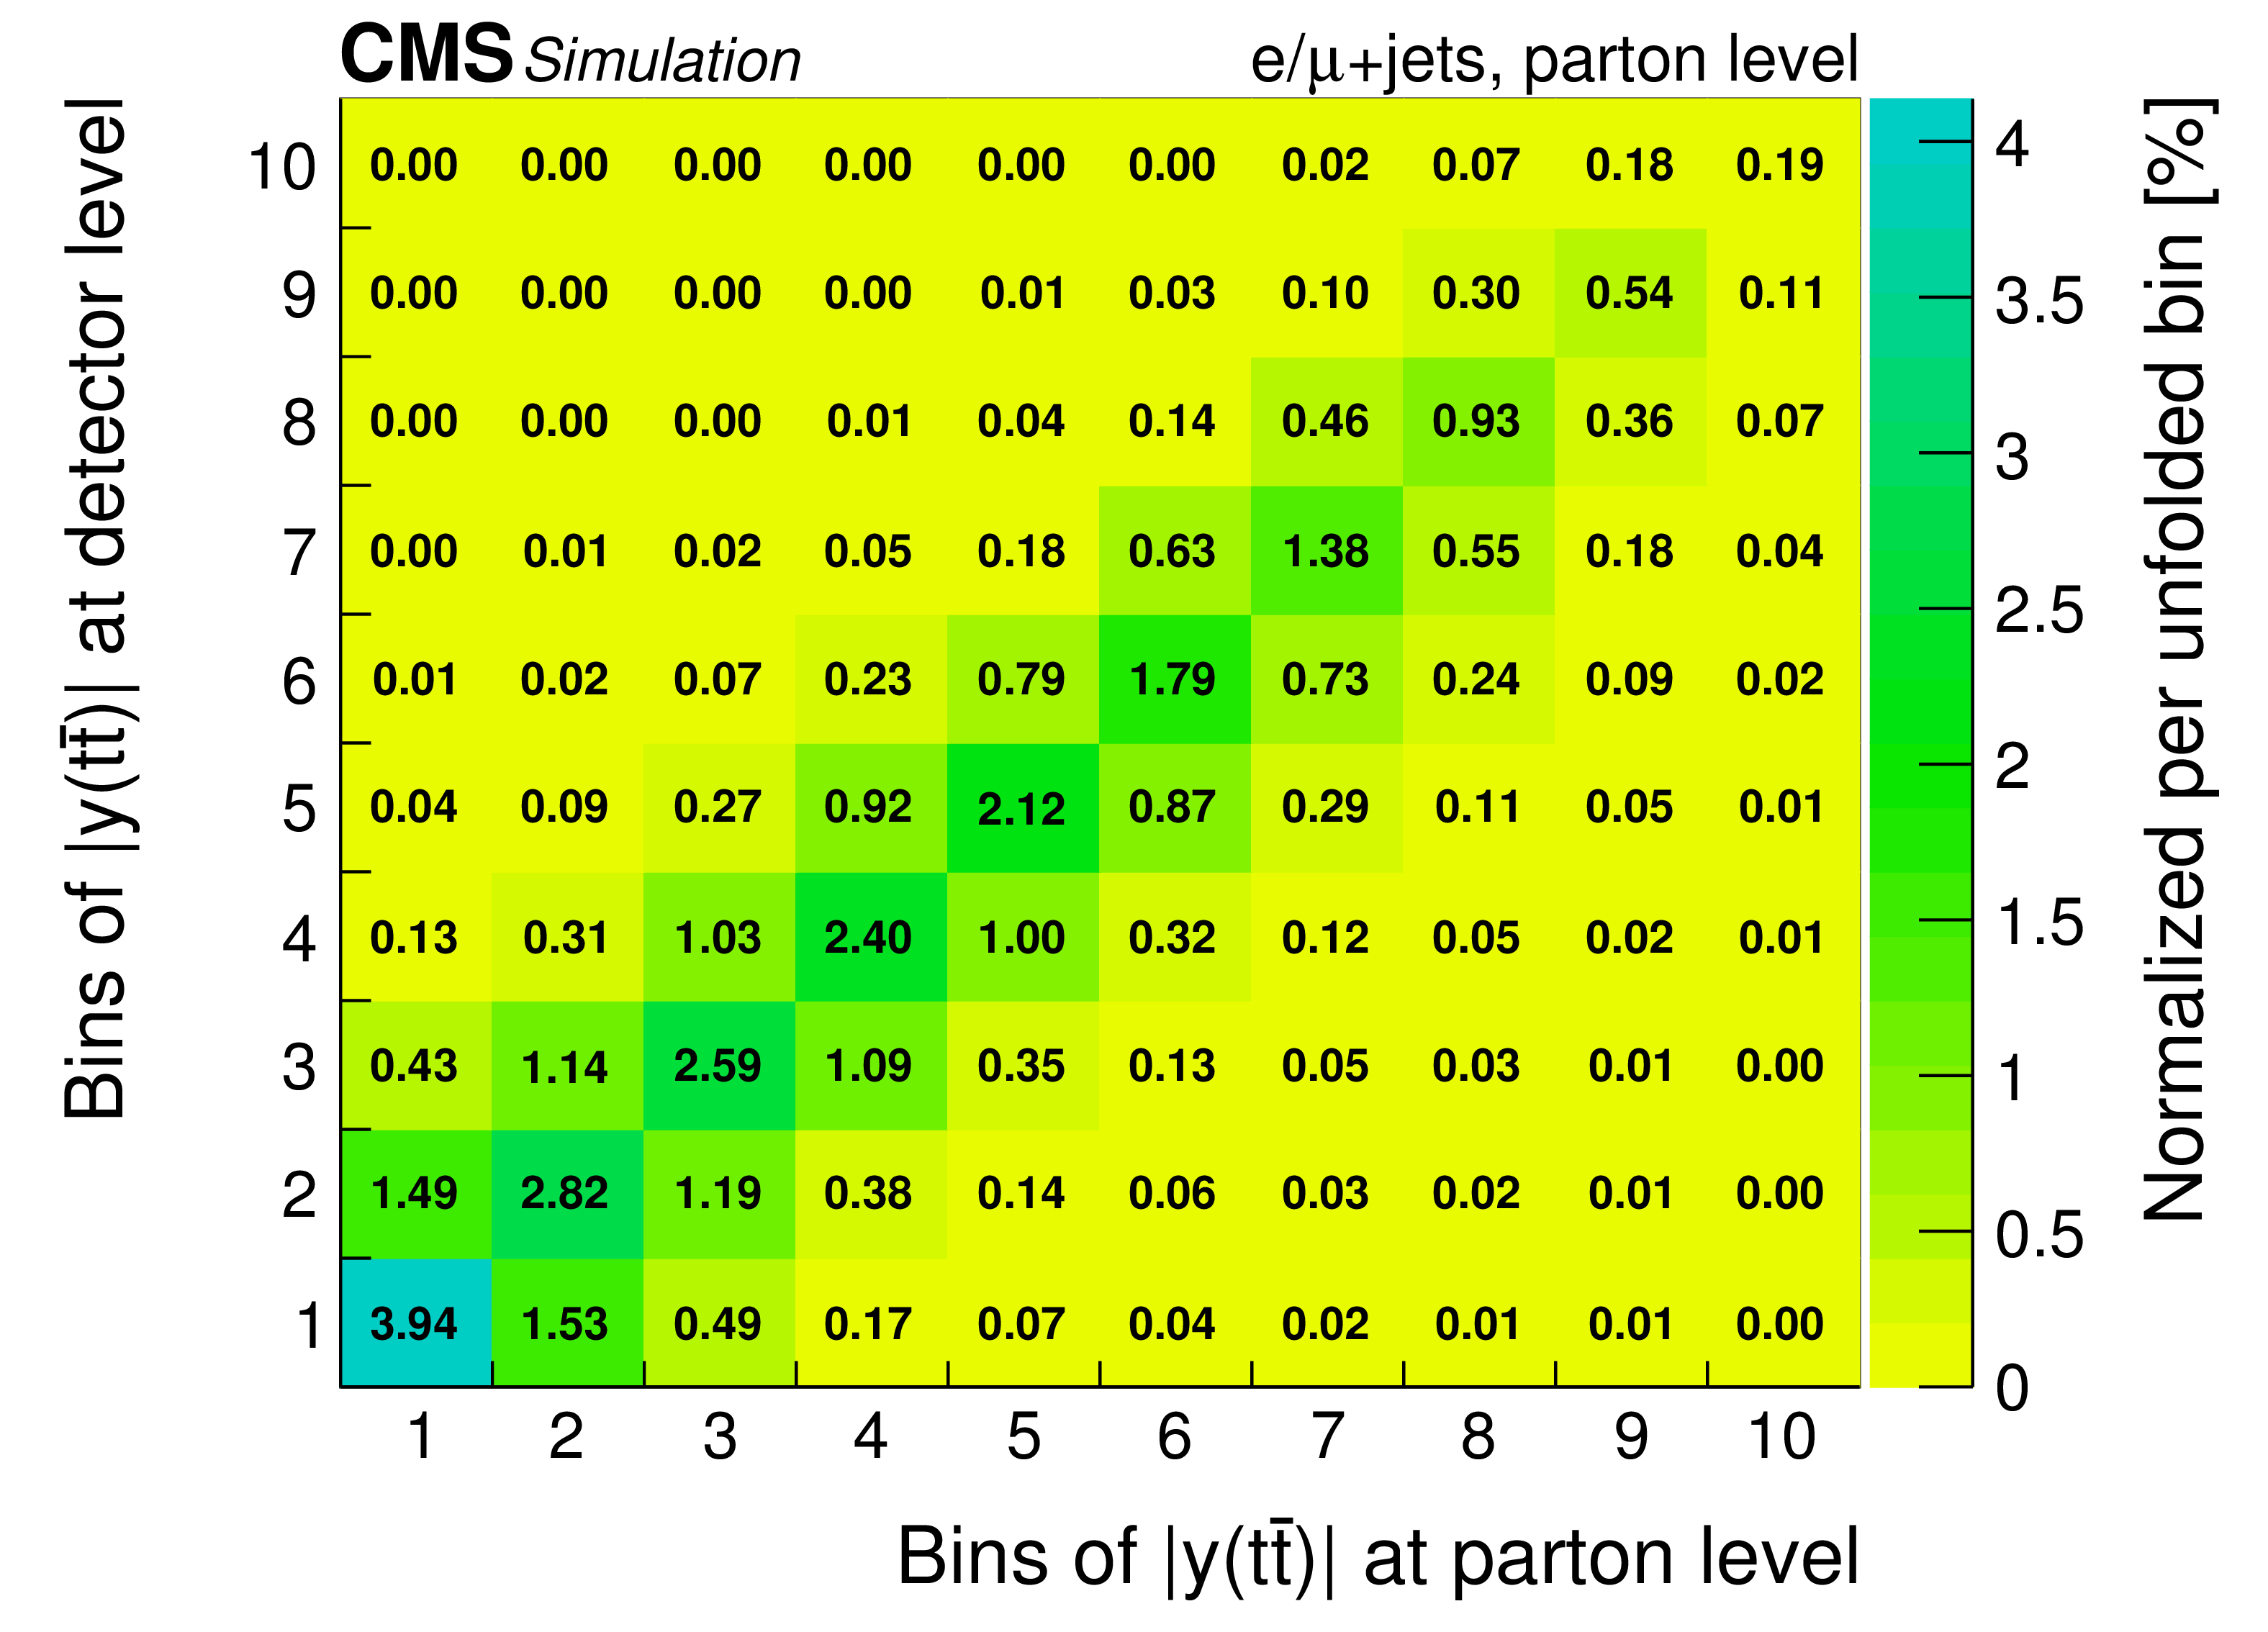
png pdf |
Additional Figure 11-c:
Migrations among the bins in the differential cross section measurements at parton level. |

png pdf |
Additional Figure 12:
Migrations among the bins in the double-differential cross section measurements at parton level. |

png pdf |
Additional Figure 12-a:
Migrations among the bins in the double-differential cross section measurements at parton level. |
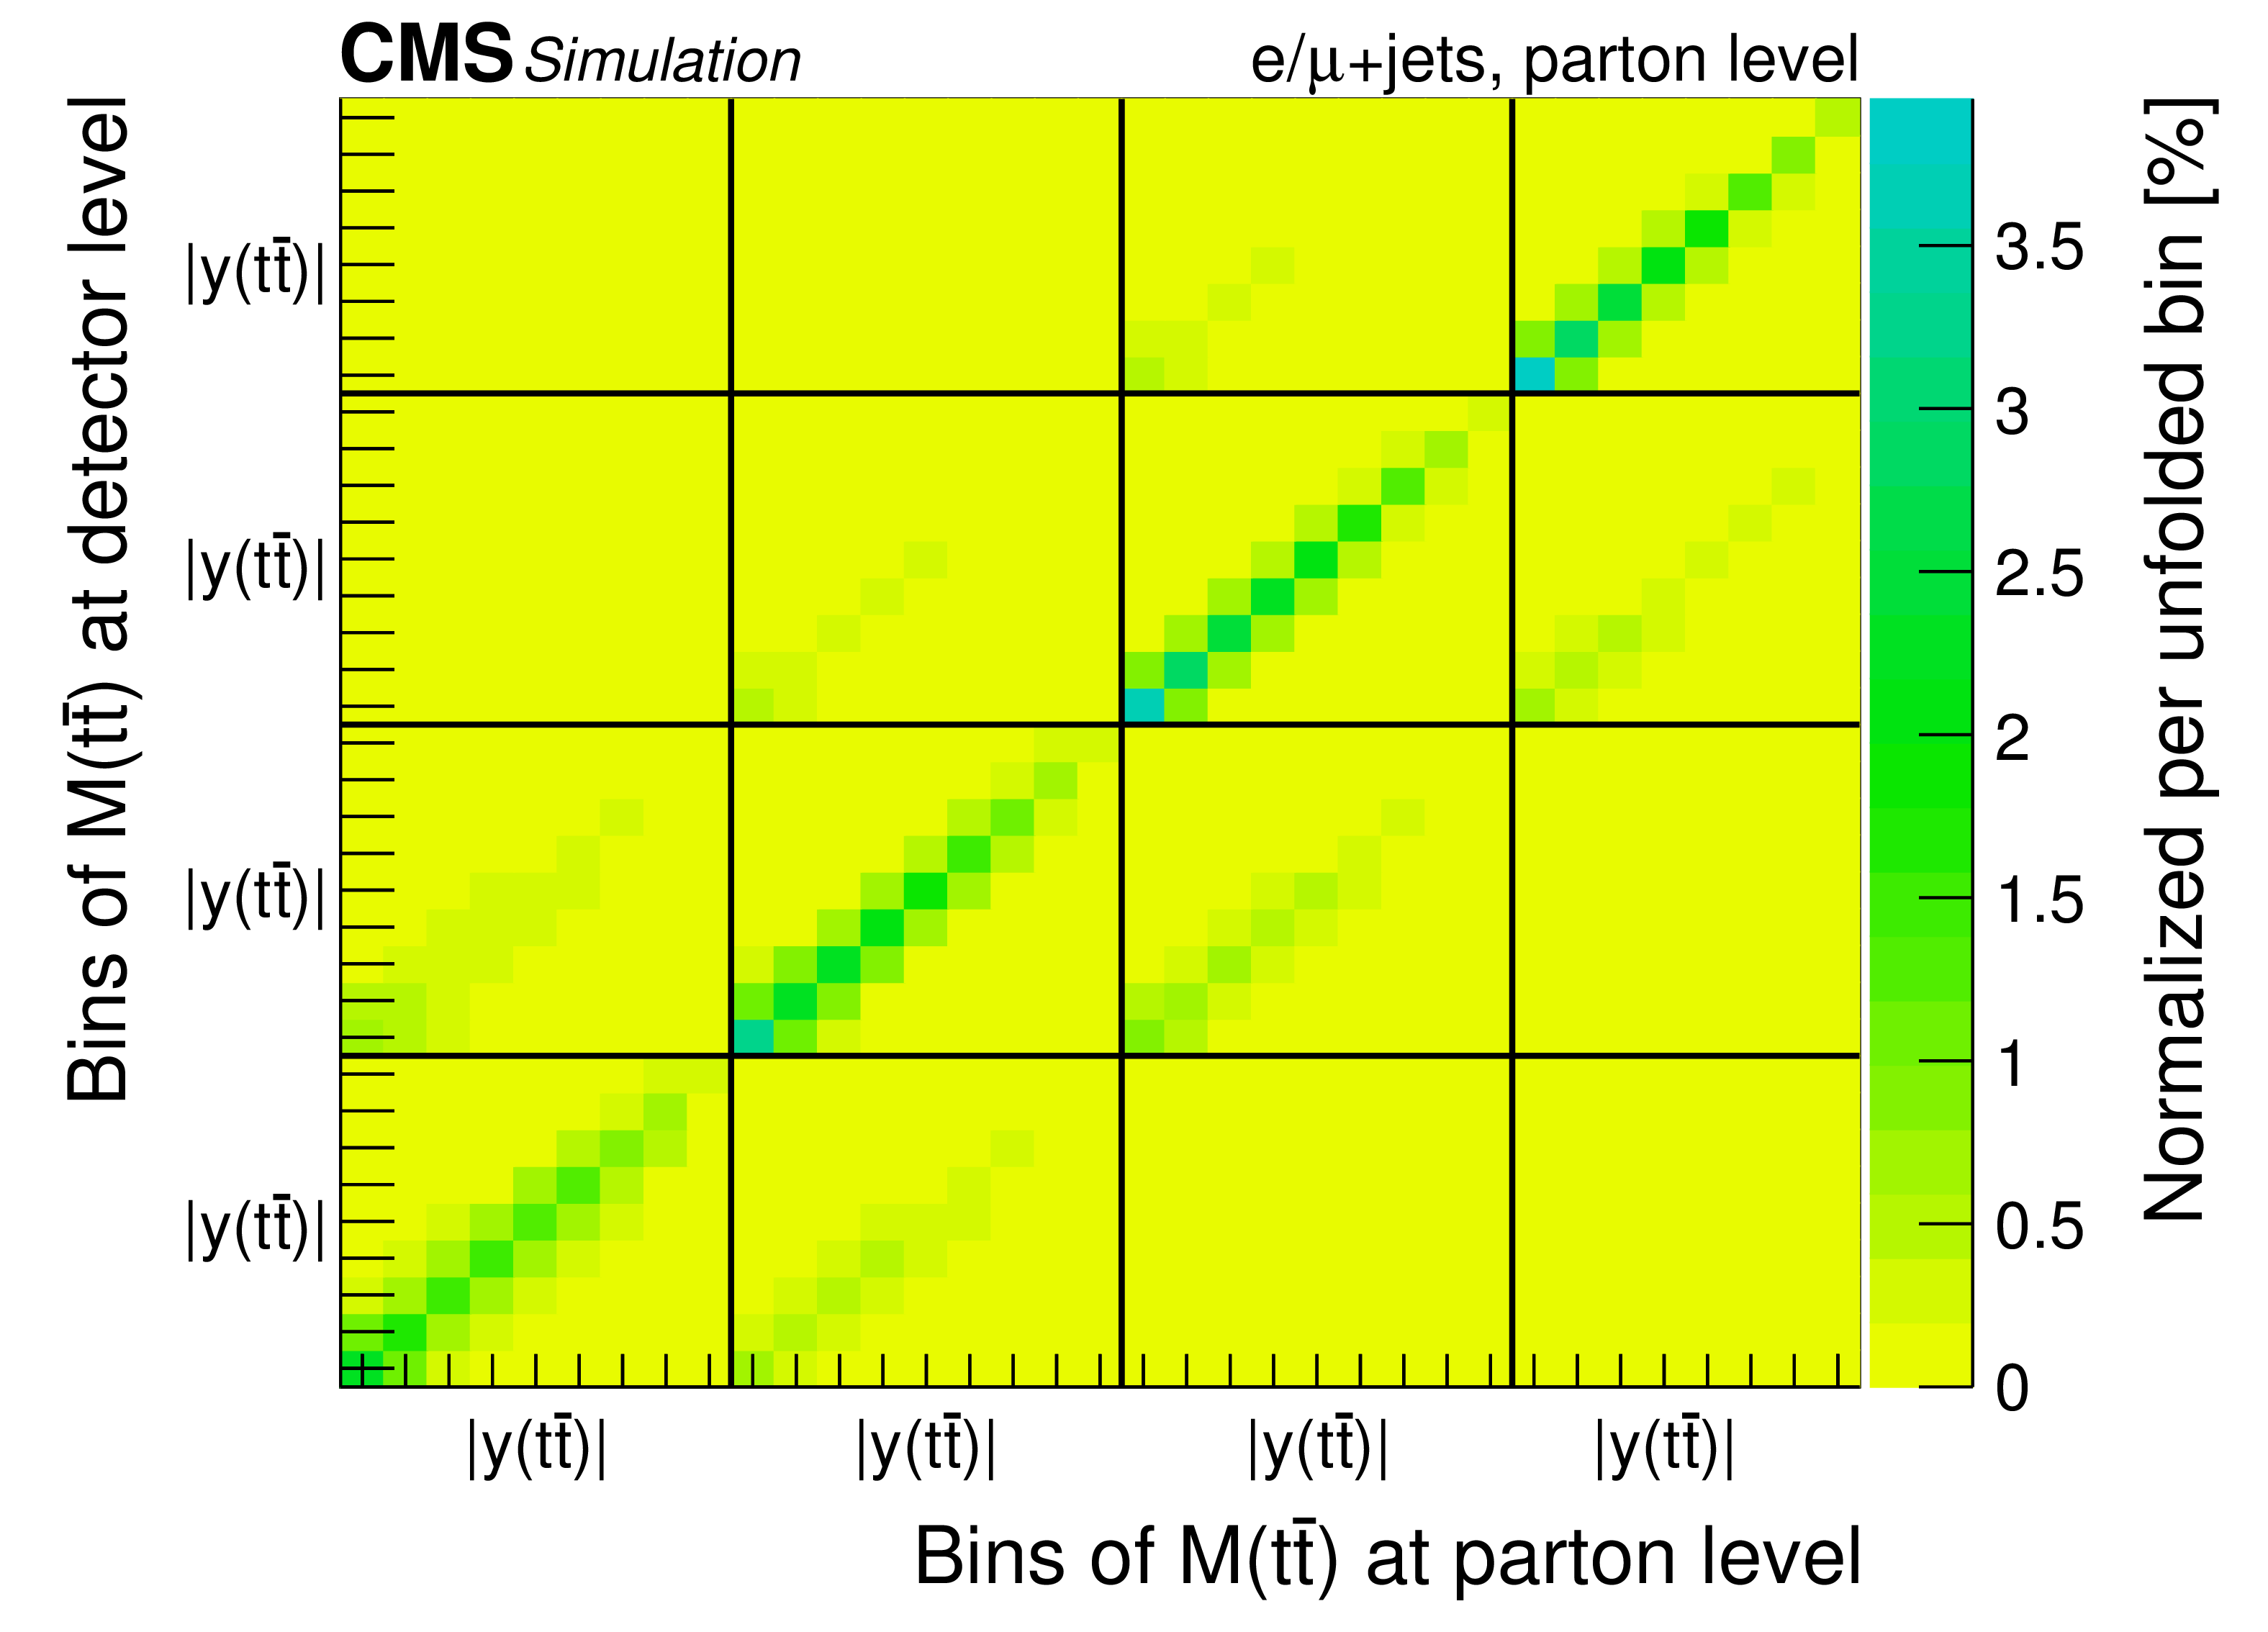
png pdf |
Additional Figure 12-b:
Migrations among the bins in the double-differential cross section measurements at parton level. |

png pdf |
Additional Figure 12-c:
Migrations among the bins in the double-differential cross section measurements at parton level. |
| References | ||||
| 1 | M. Czakon et al. | Top-pair production at the LHC through NNLO QCD and NLO EW | JHEP 10 (2017) 186 | 1705.04105 |
| 2 | CMS Collaboration | CMS Luminosity measurement for the 2016 data taking period | CMS-PAS-LUM-17-001 | CMS-PAS-LUM-17-001 |
| 3 | CMS Collaboration | Measurement of differential top-quark pair production cross sections in pp collisions at $ \sqrt{s}= $ 7 TeV | EPJC 73 (2013) 2339 | CMS-TOP-11-013 1211.2220 |
| 4 | ATLAS Collaboration | Differential top-antitop cross-section measurements as a function of observables constructed from final-state particles using pp collisions at $ \sqrt{s}= $ 7 TeV in the ATLAS detector | JHEP 06 (2015) 100 | 1502.05923 |
| 5 | CMS Collaboration | Measurement of the differential cross section for top quark pair production in pp collisions at $ \sqrt{s} = $ 8 TeV | EPJC 75 (2015) 542 | CMS-TOP-12-028 1505.04480 |
| 6 | ATLAS Collaboration | Measurements of top-quark pair differential cross-sections in the lepton+jets channel in pp collisions at $ \sqrt{s}= $ 8 TeV using the ATLAS detector | EPJC 76 (2016) 538 | 1511.04716 |
| 7 | ATLAS Collaboration | Measurement of the differential cross-section of highly boosted top quarks as a function of their transverse momentum in $ \sqrt{s} = $ 8 TeV proton-proton collisions using the ATLAS detector | PRD 93 (2016) 032009 | 1510.03818 |
| 8 | CMS Collaboration | Measurement of the $ \mathrm{t\bar{t}} $ production cross section in the all-jets final state in pp collisions at $ \sqrt{s}= $ 8 TeV | EPJC 76 (2016) 128 | CMS-TOP-14-018 1509.06076 |
| 9 | CMS Collaboration | Measurement of the integrated and differential $ \mathrm{t \bar{t}} $ production cross sections for high-$ p_{\mathrm{T}} $ top quarks in pp collisions at $ \sqrt{s} = $ 8 TeV | PRD 94 (2016) 072002 | CMS-TOP-14-012 1605.00116 |
| 10 | ATLAS Collaboration | Measurement of top quark pair differential cross-sections in the dilepton channel in pp collisions at $ \sqrt{s} = $ 7 and 8 TeV with ATLAS | PRD 94 (2016) 092003 | 1607.07281 |
| 11 | CMS Collaboration | Measurement of double-differential cross sections for top quark pair production in pp collisions at $ \sqrt{s} = $ 8 TeV and impact on parton distribution functions | EPJC 77 (2017) 459 | CMS-TOP-14-013 1703.01630 |
| 12 | ATLAS Collaboration | Measurement of jet activity produced in top-quark events with an electron, a muon and two b-tagged jets in the final state in pp collisions at $ \sqrt{s}= $ 13 TeV with the ATLAS detector | EPJC 77 (2017) 220 | 1610.09978 |
| 13 | ATLAS Collaboration | Measurements of top-quark pair differential cross-sections in the e$ \mu $ channel in pp collisions at $ \sqrt{s} = $ 13 TeV using the ATLAS detector | EPJC 77 (2017) 292 | 1612.05220 |
| 14 | CMS Collaboration | Measurement of normalized differential $ \mathrm{t \bar{t}} $ cross sections in the dilepton channel from pp collisions at $ \sqrt{s} = $ 13 TeV. | Submitted to \it JHEP | CMS-TOP-16-007 1708.07638 |
| 15 | CMS Collaboration | Measurement of the differential cross sections for top quark pair production as a function of kinematic event variables in pp collisions at $ \sqrt{s}= $ 7 and 8 TeV | PRD 94 (2016) 052006 | CMS-TOP-12-042 1607.00837 |
| 16 | CMS Collaboration | Measurement of $ \mathrm {t}\overline{\mathrm {t}} $ production with additional jet activity, including b quark jets, in the dilepton decay channel using pp collisions at $ \sqrt{s} = $ 8 TeV | EPJC 76 (2016) 379 | CMS-TOP-12-041 1510.03072 |
| 17 | ATLAS Collaboration | Measurement of jet activity in top quark events using the e$ \mu $ final state with two b-tagged jets in pp collisions at $ \sqrt{s}= $ 8 TeV with the ATLAS detector | JHEP 09 (2016) 074 | 1606.09490 |
| 18 | CMS Collaboration | Measurement of differential cross sections for top quark pair production using the lepton+jets final state in proton-proton collisions at 13 TeV | PRD 95 (2017) 092001 | CMS-TOP-16-008 1610.04191 |
| 19 | P. Nason | A new method for combining NLO QCD with shower Monte Carlo algorithms | JHEP 11 (2004) 040 | hep-ph/0409146 |
| 20 | S. Frixione, P. Nason, and C. Oleari | Matching NLO QCD computations with parton shower simulations: the POWHEG method | JHEP 11 (2007) 070 | 0709.2092 |
| 21 | S. Alioli, P. Nason, C. Oleari, and E. Re | A general framework for implementing NLO calculations in shower Monte Carlo programs: the POWHEG BOX | JHEP 06 (2010) 043 | 1002.2581 |
| 22 | J. M. Campbell, R. K. Ellis, P. Nason, and E. Re | Top-pair production and decay at NLO matched with parton showers | JHEP 04 (2015) 114 | 1412.1828 |
| 23 | T. Sjostrand, S. Mrenna, and P. Skands | PYTHIA 6.4 physics and manual | JHEP 05 (2006) 026 | hep-ph/0603175 |
| 24 | T. Sjostrand, S. Mrenna, and P. Skands | A brief introduction to PYTHIA 8.1 | CPC 178 (2008) 852 | 0710.3820 |
| 25 | P. Skands, S. Carrazza, and J. Rojo | Tuning PYTHIA 8.1: the Monash 2013 tune | EPJC 74 (2014) 3024 | 1404.5630 |
| 26 | CMS Collaboration | Investigations of the impact of the parton shower tuning in PYTHIA 8 in the modelling of $ \mathrm{t\overline{t}} $ at $ \sqrt{s}= $ 8 and 13 TeV | CMS-PAS-TOP-16-021 | CMS-PAS-TOP-16-021 |
| 27 | M. Bahr et al. | HERWIG++ physics and manual | EPJC 58 (2008) 639 | 0803.0883 |
| 28 | M. H. Seymour and A. Siodmok | Constraining MPI models using $ \sigma_{eff} $ and recent Tevatron and LHC underlying event data | JHEP 10 (2013) 113 | 1307.5015 |
| 29 | J. Alwall et al. | The automated computation of tree-level and next-to-leading order differential cross sections, and their matching to parton shower simulations | JHEP 07 (2014) 079 | 1405.0301 |
| 30 | R. Frederix and S. Frixione | Merging meets matching in MC@NLO | JHEP 12 (2012) 061 | 1209.6215 |
| 31 | NNPDF Collaboration | Parton distributions for the LHC Run II | JHEP 04 (2015) 040 | 1410.8849 |
| 32 | M. Czakon and A. Mitov | Top++: A program for the calculation of the top-pair cross-section at hadron colliders | CPC 185 (2014) 2930 | 1112.5675 |
| 33 | E. Re | Single-top Wt-channel production matched with parton showers using the POWHEG method | EPJC 71 (2011) 1547 | 1009.2450 |
| 34 | Y. Li and F. Petriello | Combining QCD and electroweak corrections to dilepton production in FEWZ | PRD 86 (2012) 094034 | 1208.5967 |
| 35 | P. Kant et al. | HatHor for single top-quark production: Updated predictions and uncertainty estimates for single top-quark production in hadronic collisions | CPC 191 (2015) 74 | 1406.4403 |
| 36 | N. Kidonakis | NNLL threshold resummation for top-pair and single-top production | Phys. Part. Nucl. 45 (2014) 714 | 1210.7813 |
| 37 | GEANT4 Collaboration | GEANT4--a simulation toolkit | NIMA 506 (2003) 250 | |
| 38 | CMS Collaboration | Object definitions for top quark analyses at the particle level | CDS | |
| 39 | M. Cacciari, G. P. Salam, and G. Soyez | The anti-$ k_\mathrm{t} $ jet clustering algorithm | JHEP 04 (2008) 063 | 0802.1189 |
| 40 | M. Cacciari, G. P. Salam, and G. Soyez | FastJet user manual | EPJC 72 (2012) 1896 | 1111.6097 |
| 41 | Particle Data Group, C. Patrignani et al. | Review of particle physics | CPC 40 (2016) 100001 | |
| 42 | CMS Collaboration | The CMS experiment at the CERN LHC | JINST 3 (2008) S08004 | CMS-00-001 |
| 43 | CMS Collaboration | Particle-flow reconstruction and global event description with the CMS detector | JINST 12 (2017) P10003 | CMS-PRF-14-001 1706.04965 |
| 44 | CMS Collaboration | Measurements of inclusive $ W $ and $ Z $ cross sections in pp collisions at $ \sqrt{s}= $ 7 TeV | JHEP 01 (2011) 080 | CMS-EWK-10-002 1012.2466 |
| 45 | CMS Collaboration | Performance of CMS muon reconstruction in pp collision events at $ \sqrt{s} = $ 7 TeV | JINST 7 (2012) P10002 | CMS-MUO-10-004 1206.4071 |
| 46 | CMS Collaboration | Performance of electron reconstruction and selection with the CMS detector in proton-proton collisions at $ \sqrt{s} = $ 8 TeV | JINST 10 (2015) P06005 | CMS-EGM-13-001 1502.02701 |
| 47 | CMS Collaboration | Jet energy scale and resolution in the CMS experiment in pp collisions at 8 TeV | JINST 12 (2017) P02014 | CMS-JME-13-004 1607.03663 |
| 48 | CMS Collaboration | Identification of heavy-flavour jets with the CMS detector in pp collisions at 13 TeV | Submitted to \it JINST | CMS-BTV-16-002 1712.07158 |
| 49 | B. A. Betchart, R. Demina, and A. Harel | Analytic solutions for neutrino momenta in decay of top quarks | NIMA 736 (2014) 169 | 1305.1878 |
| 50 | G. D'Agostini | A multidimensional unfolding method based on Bayes' theorem | NIMA 362 (1995) 487 | |
| 51 | CMS Collaboration | Identification of b quark jets at the CMS experiment in the LHC Run 2 | CMS-PAS-BTV-15-001 | CMS-PAS-BTV-15-001 |
| 52 | ATLAS Collaboration | Measurement of the inelastic proton-proton cross section at $ \sqrt{s} = $ 13 TeV with the ATLAS detector at the LHC | PRL 117 (2016) 182002 | 1606.02625 |
| 53 | ALEPH Collaboration | Study of the fragmentation of b quarks into B mesons at the Z peak | PLB 512 (2001) 30 | hep-ex/0106051 |
| 54 | OPAL Collaboration | Inclusive analysis of the b quark fragmentation function in Z decays at LEP | EPJC 29 (2003) 463 | hep-ex/0210031 |
| 55 | DELPHI Collaboration | A study of the b-quark fragmentation function with the DELPHI detector at LEP I and an averaged distribution obtained at the Z pole | EPJC 71 (2011) 1557 | 1102.4748 |
| 56 | SLD Collaboration | Measurement of the b quark fragmentation function in Z$ ^0 $ decays | PRD 65 (2002) 092006 | hep-ex/0202031 |
| 57 | ATLAS, CDF, CMS and D0 Collaborations | First combination of Tevatron and LHC measurements of the top-quark mass | 1403.4427 | |
| 58 | A. Manohar, P. Nason, G. P. Salam, and G. Zanderighi | How bright is the proton? A precise determination of the photon parton distribution function | PRL 117 (2016) 242002 | 1607.04266 |
| 59 | T. Gleisberg et al. | Event generation with SHERPA 1.1 | JHEP 02 (2009) 007 | 0811.4622 |
| 60 | Cascioli, F. and Maierhofer, P. and Pozzorini, S. | Scattering amplitudes with open loops | PRL 108 (2012) 111601 | 1111.5206 |
| 61 | S. Schumann and F. Krauss | A parton shower algorithm based on Catani-Seymour dipole factorisation | JHEP 03 (2008) 038 | 0709.1027 |
|
|
Compact Muon Solenoid LHC, CERN |
|

|

|

|

|

|