

Compact Muon Solenoid
LHC, CERN
| CMS-B2G-16-029 ; CERN-EP-2018-015 | ||
| Search for a heavy resonance decaying to a pair of vector bosons in the lepton plus merged jet final state at $\sqrt{s} = $ 13 TeV | ||
| CMS Collaboration | ||
| 26 February 2018 | ||
| JHEP 05 (2018) 088 | ||
| Abstract: A search for a new heavy particle decaying to a pair of vector bosons (WW or WZ) is presented using data from the CMS detector corresponding to an integrated luminosity of 35.9 fb$^{-1}$ collected in proton-proton collisions at a centre-of-mass energy of 13 TeV in 2016. One of the bosons is required to be a W boson decaying to $\mathrm{e}\nu$ or $\mu\nu$, while the other boson is required to be reconstructed as a single massive jet with substructure compatible with that of a highly-energetic quark pair from a W or Z boson decay. The search is performed in the resonance mass range between 1.0 and 4.5 TeV. The largest deviation from the background-only hypothesis is observed for a mass near 1.4 TeV and corresponds to a local significance of 2.5 standard deviations. The result is interpreted as an upper bound on the resonance production cross section. Comparing the excluded cross section values and the expectations from theoretical calculations in the bulk graviton and heavy vector triplet models, spin-2 WW resonances with mass smaller than 1.07 TeV and spin-1 WZ resonances lighter than 3.05 TeV, respectively, are excluded at 95% confidence level. | ||
| Links: e-print arXiv:1802.09407 [hep-ex] (PDF) ; CDS record ; inSPIRE record ; HepData record ; CADI line (restricted) ; | ||
| Figures | Summary | Additional Figures | References | CMS Publications |
|---|
| Figures | |
png pdf |
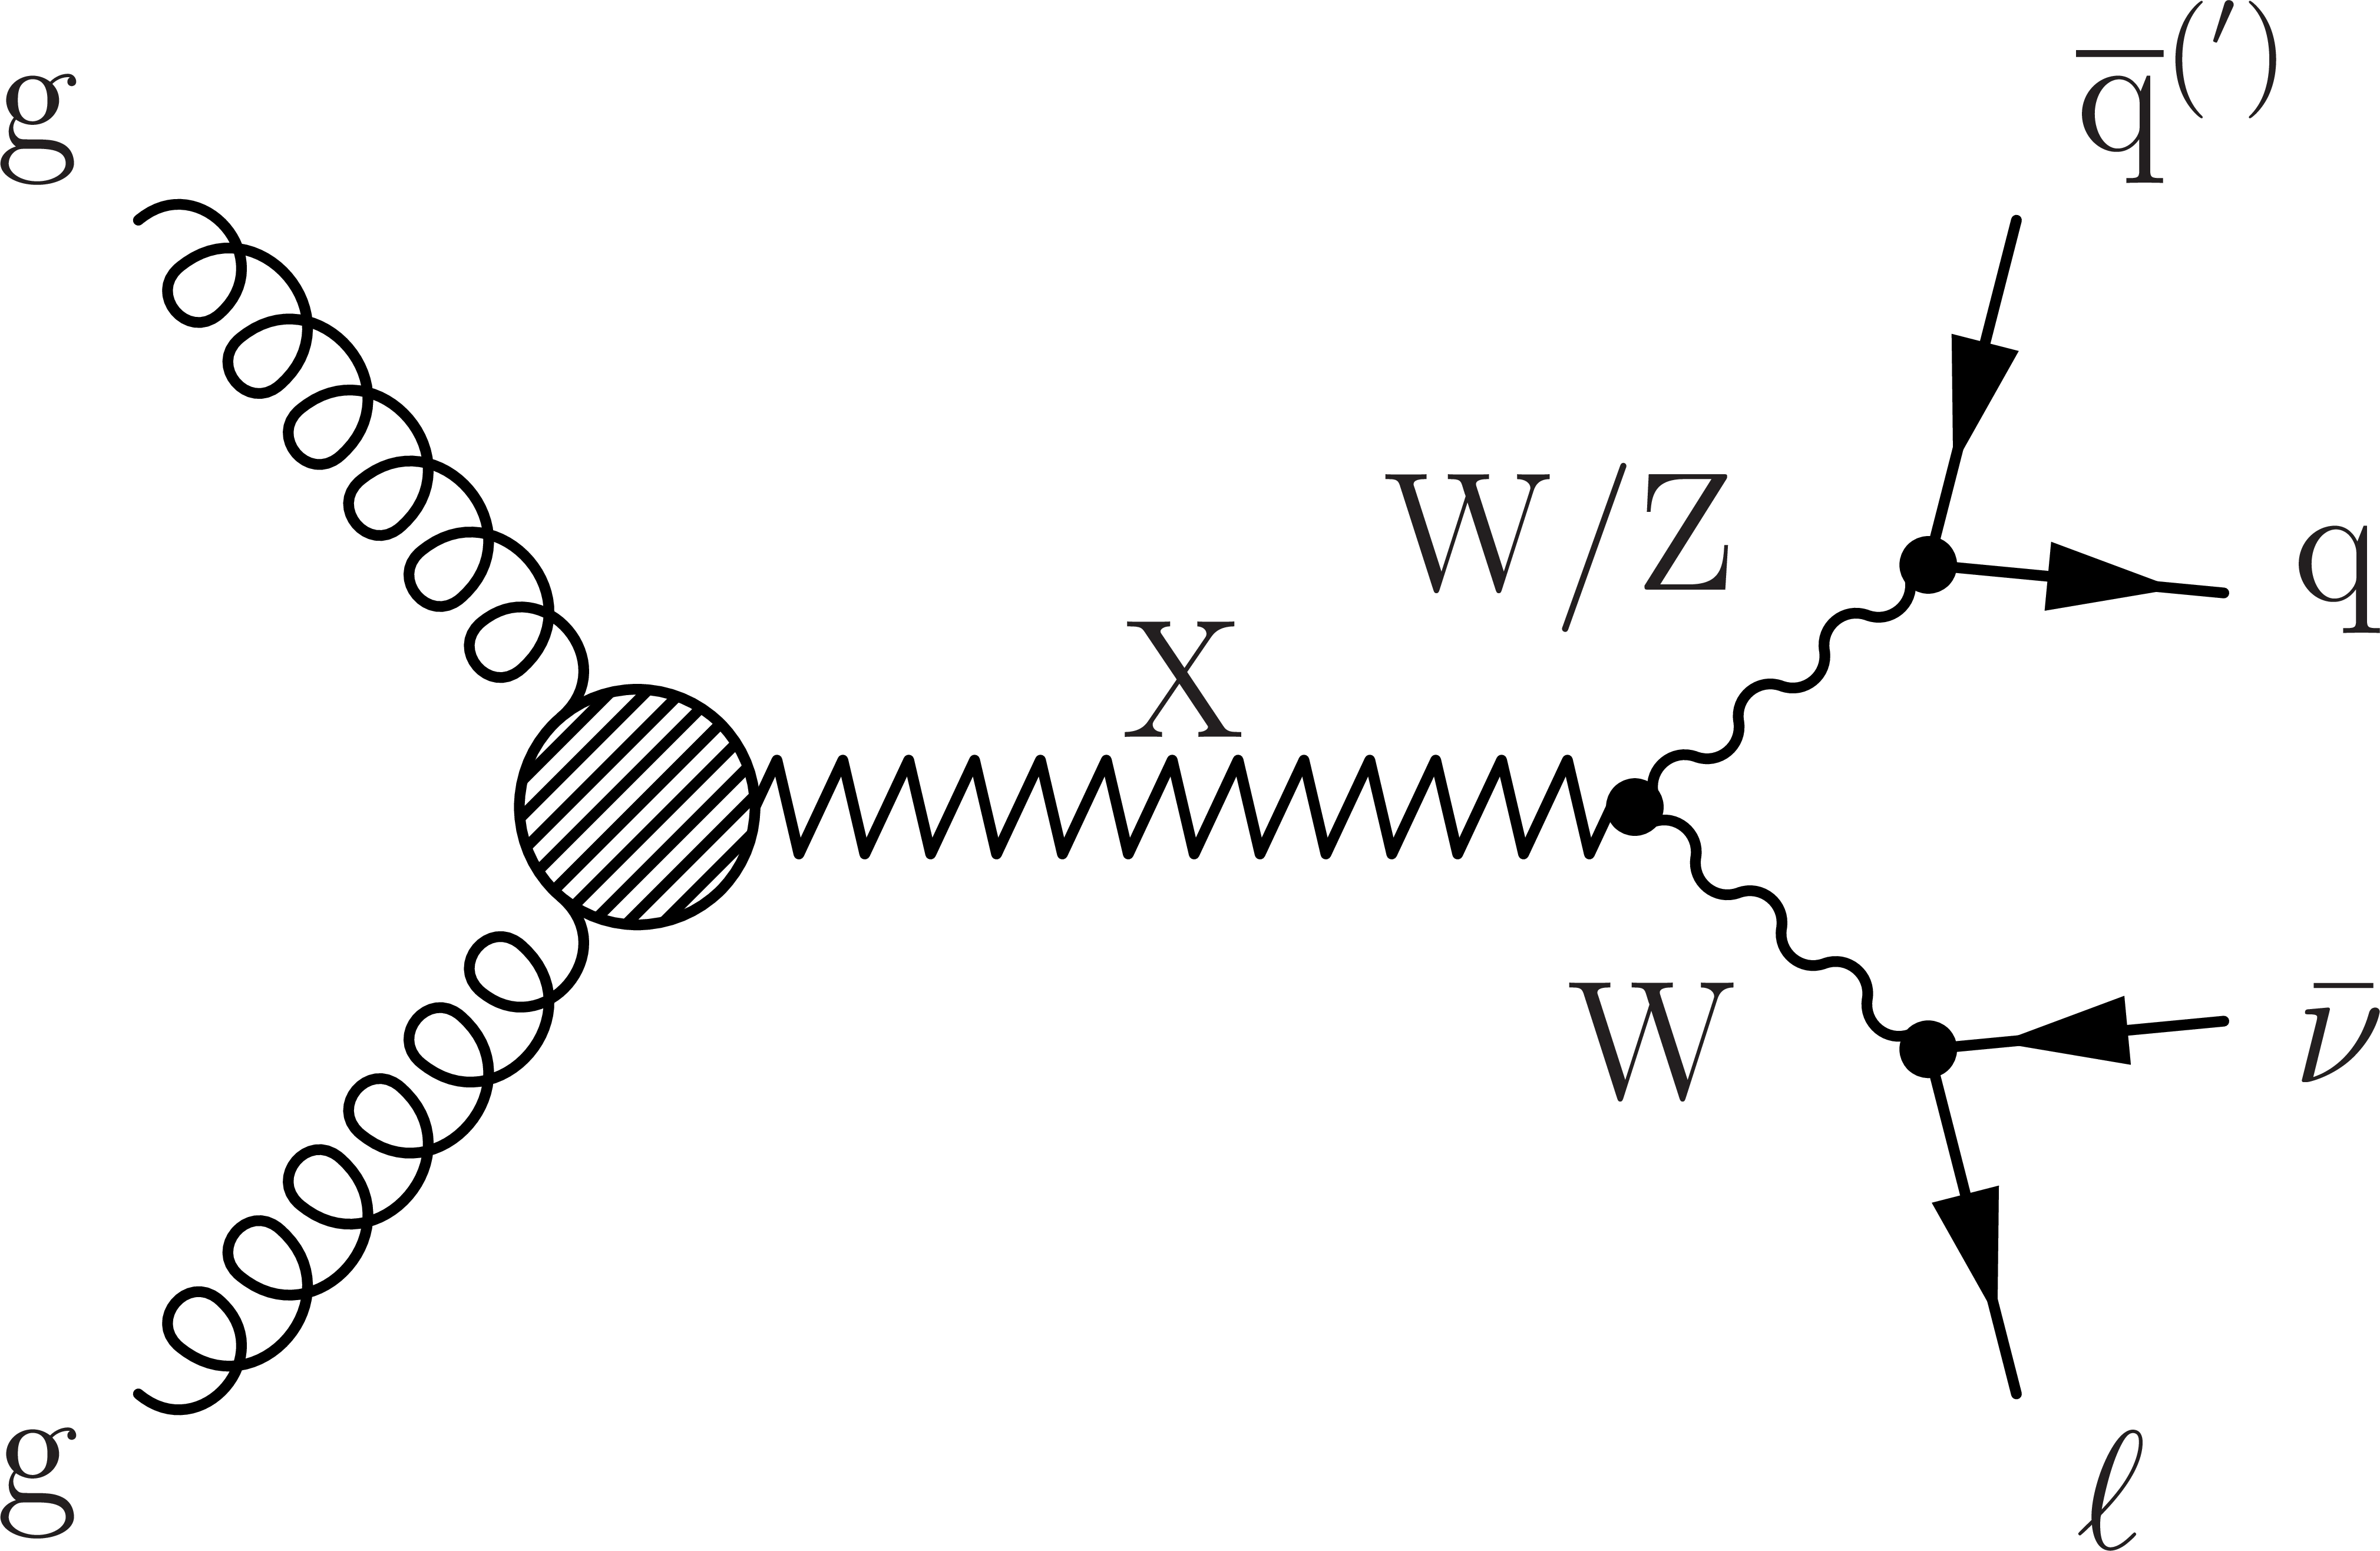
Figure 1:
A Feynman diagram for the production of a generic resonance X decaying to the $ {\mathrm {W}} {\mathrm {W}}/ {\mathrm {W}} {\mathrm {Z}} \to \ell \nu {\mathrm {q}} {\mathrm {\overline {q}}}^{(')}$ final state. |

png pdf |
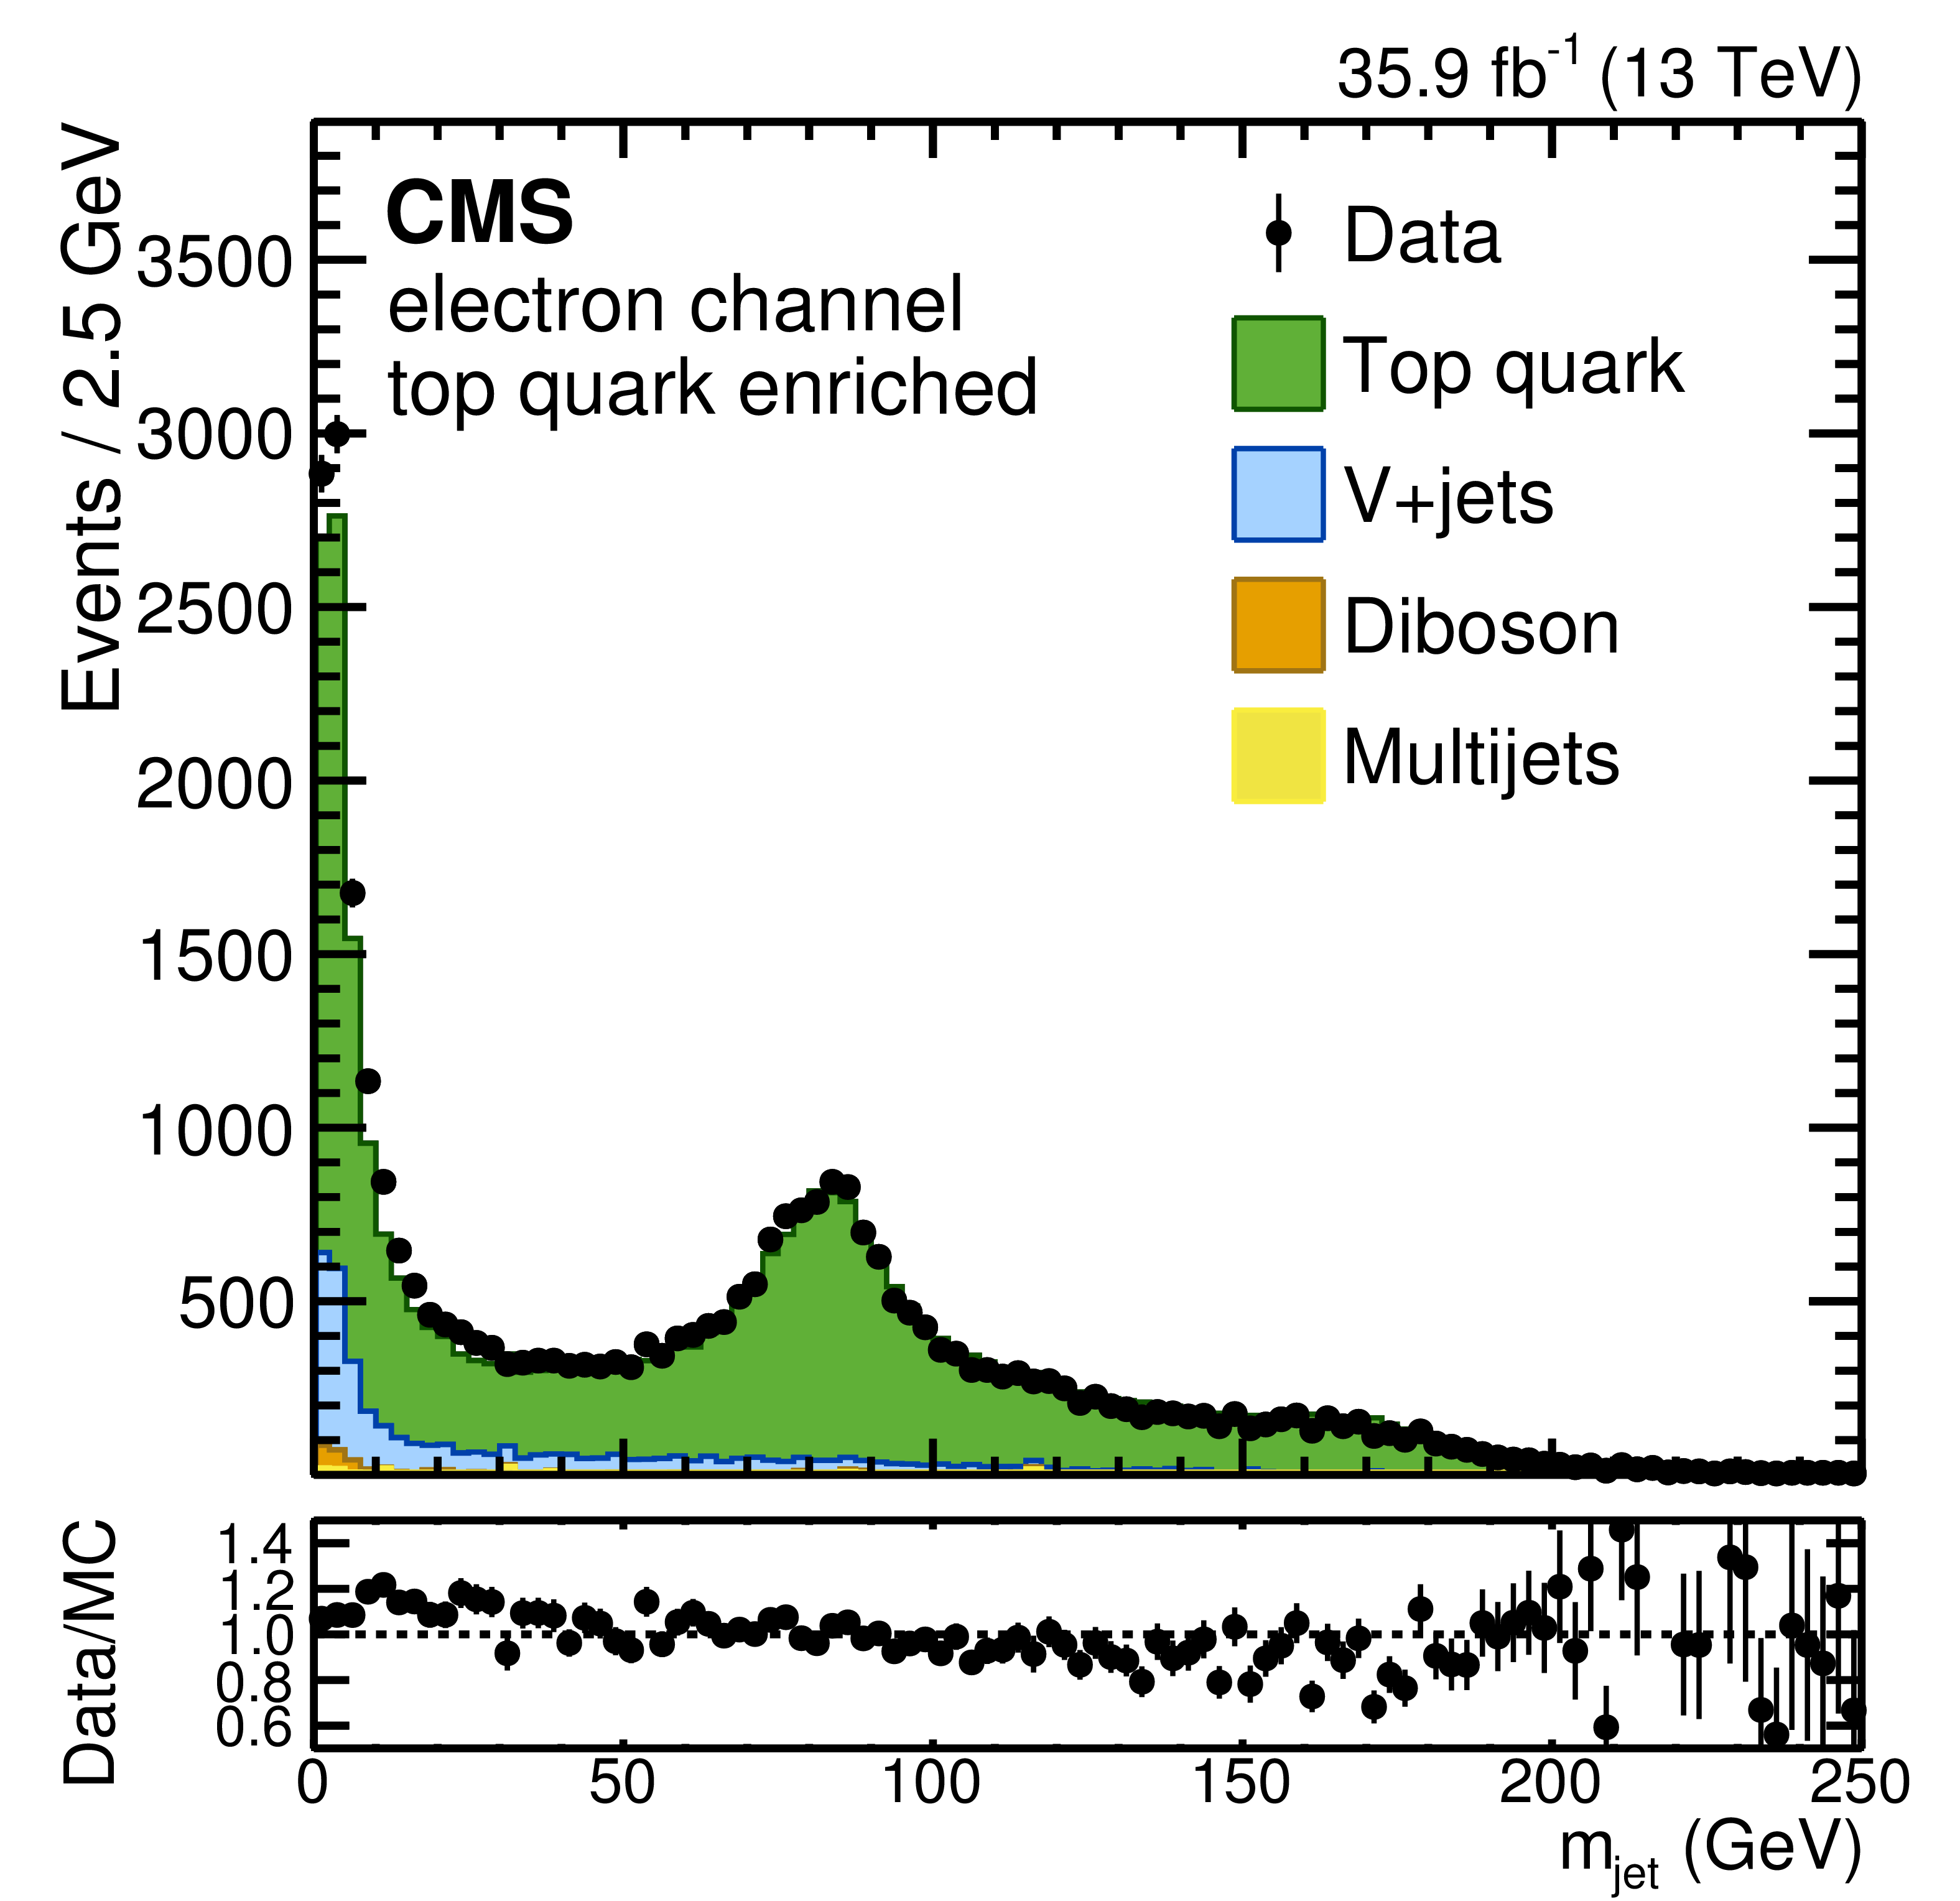
Figure 2:
Jet soft-drop mass (left) and $N$-subjettiness ratio $ {\tau _{21}}$ (right) for data and simulated events in the top quark enriched region in the electron channel. The contribution labelled as "Top quark" includes ${{\mathrm {t}\overline {\mathrm {t}}}} $ and single top processes, and the "V+jets" contribution is dominated by W+jets events with a small contribution from Z+jets events. The vertical bars correspond to the statistical uncertainties of the data. |
png pdf |
Figure 2-a:
Jet soft-drop mass for data and simulated events in the top quark enriched region in the electron channel. The contribution labelled as "Top quark" includes ${{\mathrm {t}\overline {\mathrm {t}}}} $ and single top processes, and the "V+jets" contribution is dominated by W+jets events with a small contribution from Z+jets events. The vertical bars correspond to the statistical uncertainties of the data. |
png pdf |
Figure 2-b:
$N$-subjettiness ratio $ {\tau _{21}}$ for data and simulated events in the top quark enriched region in the electron channel. The contribution labelled as "Top quark" includes ${{\mathrm {t}\overline {\mathrm {t}}}} $ and single top processes, and the "V+jets" contribution is dominated by W+jets events with a small contribution from Z+jets events. The vertical bars correspond to the statistical uncertainties of the data. |
png pdf |
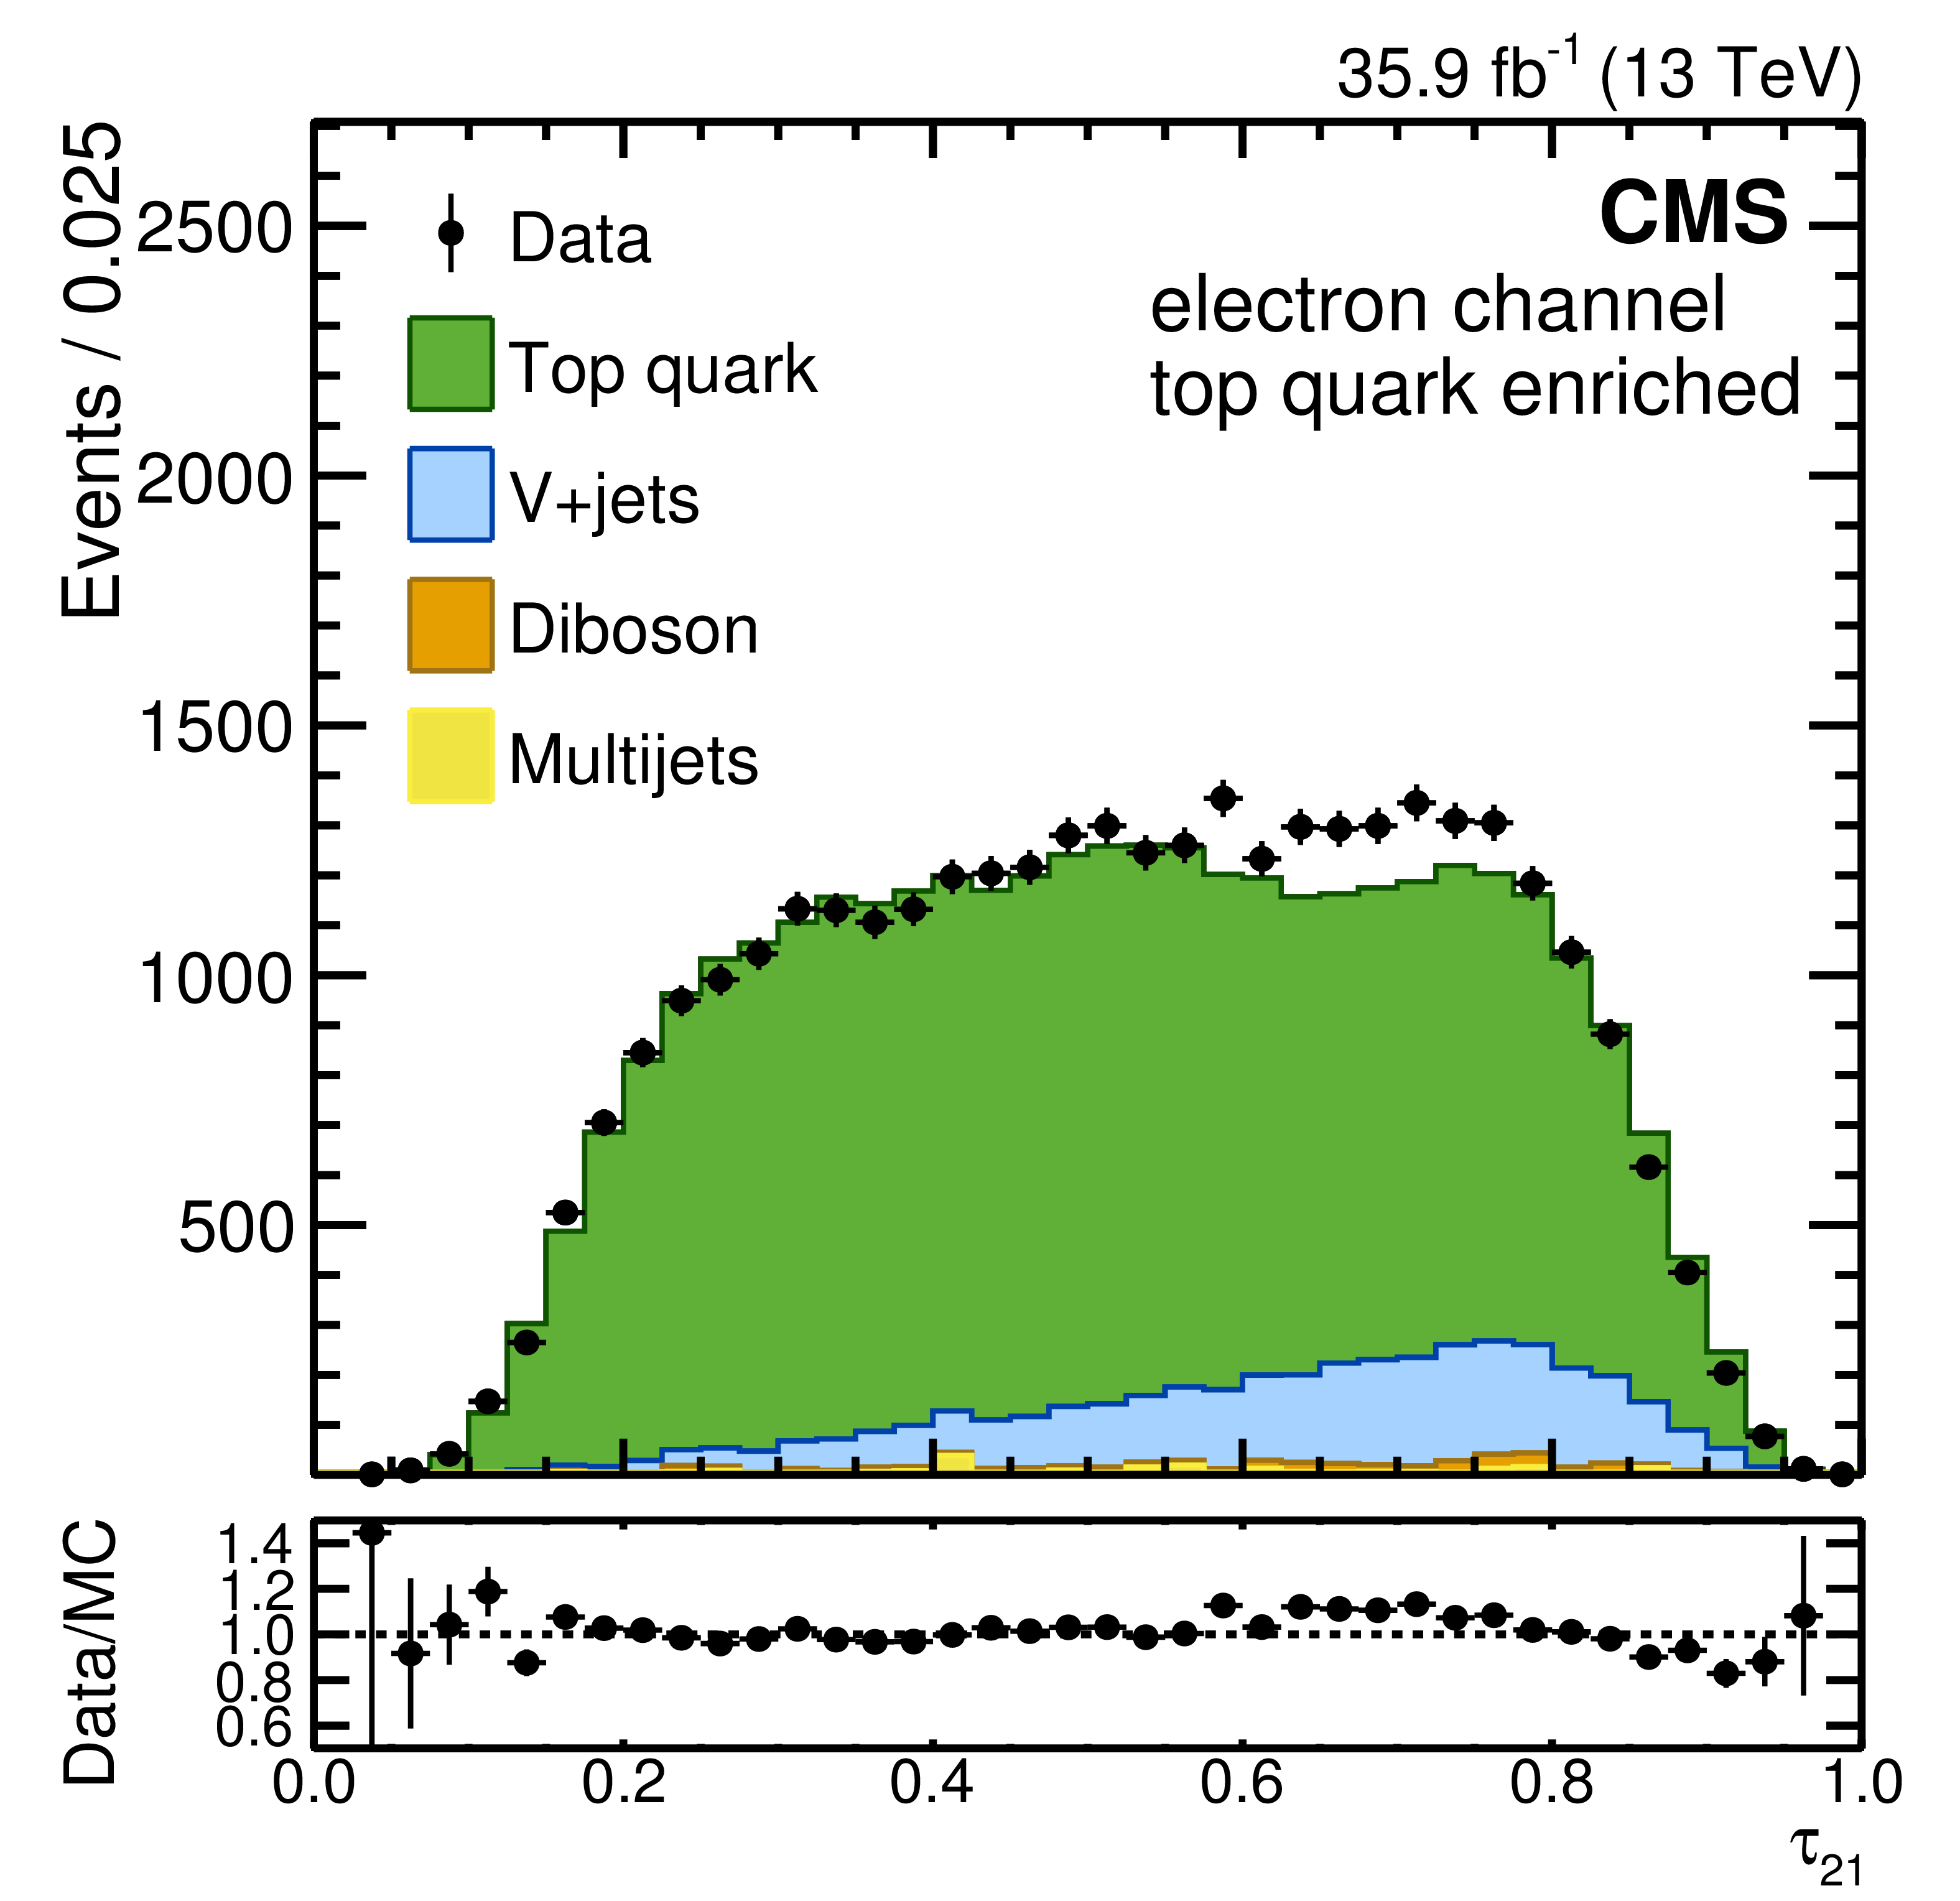
Figure 3:
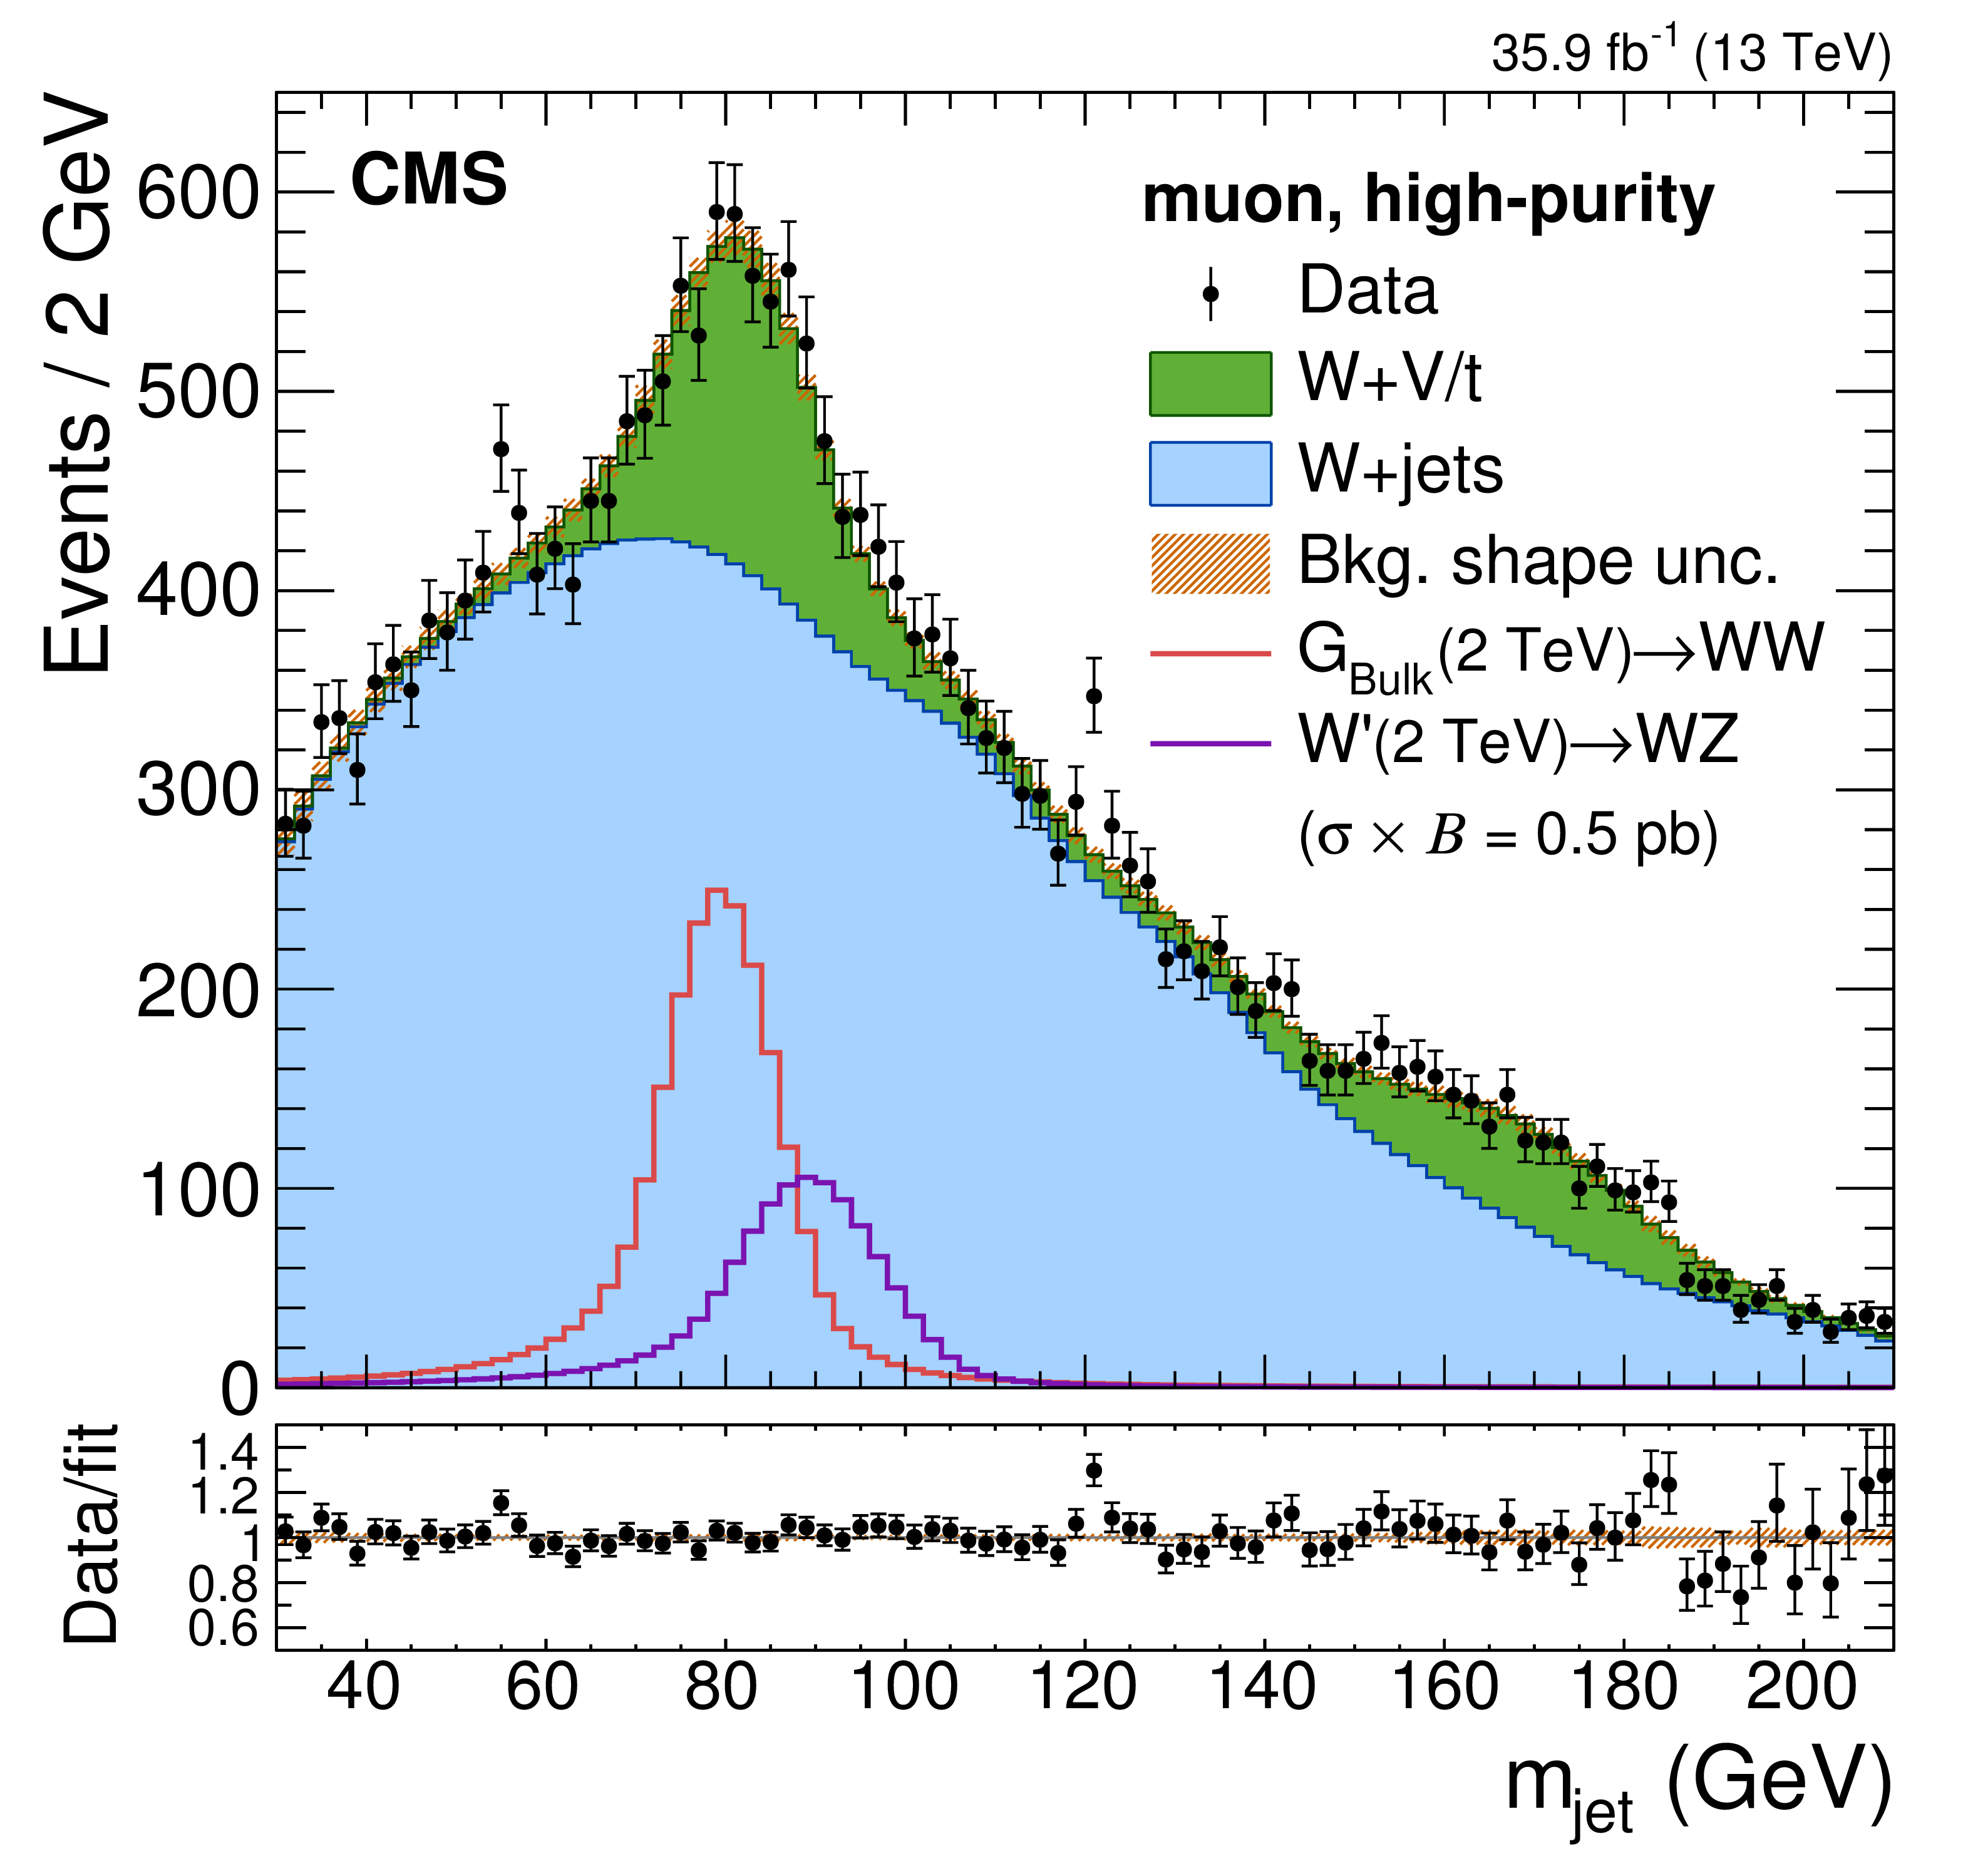
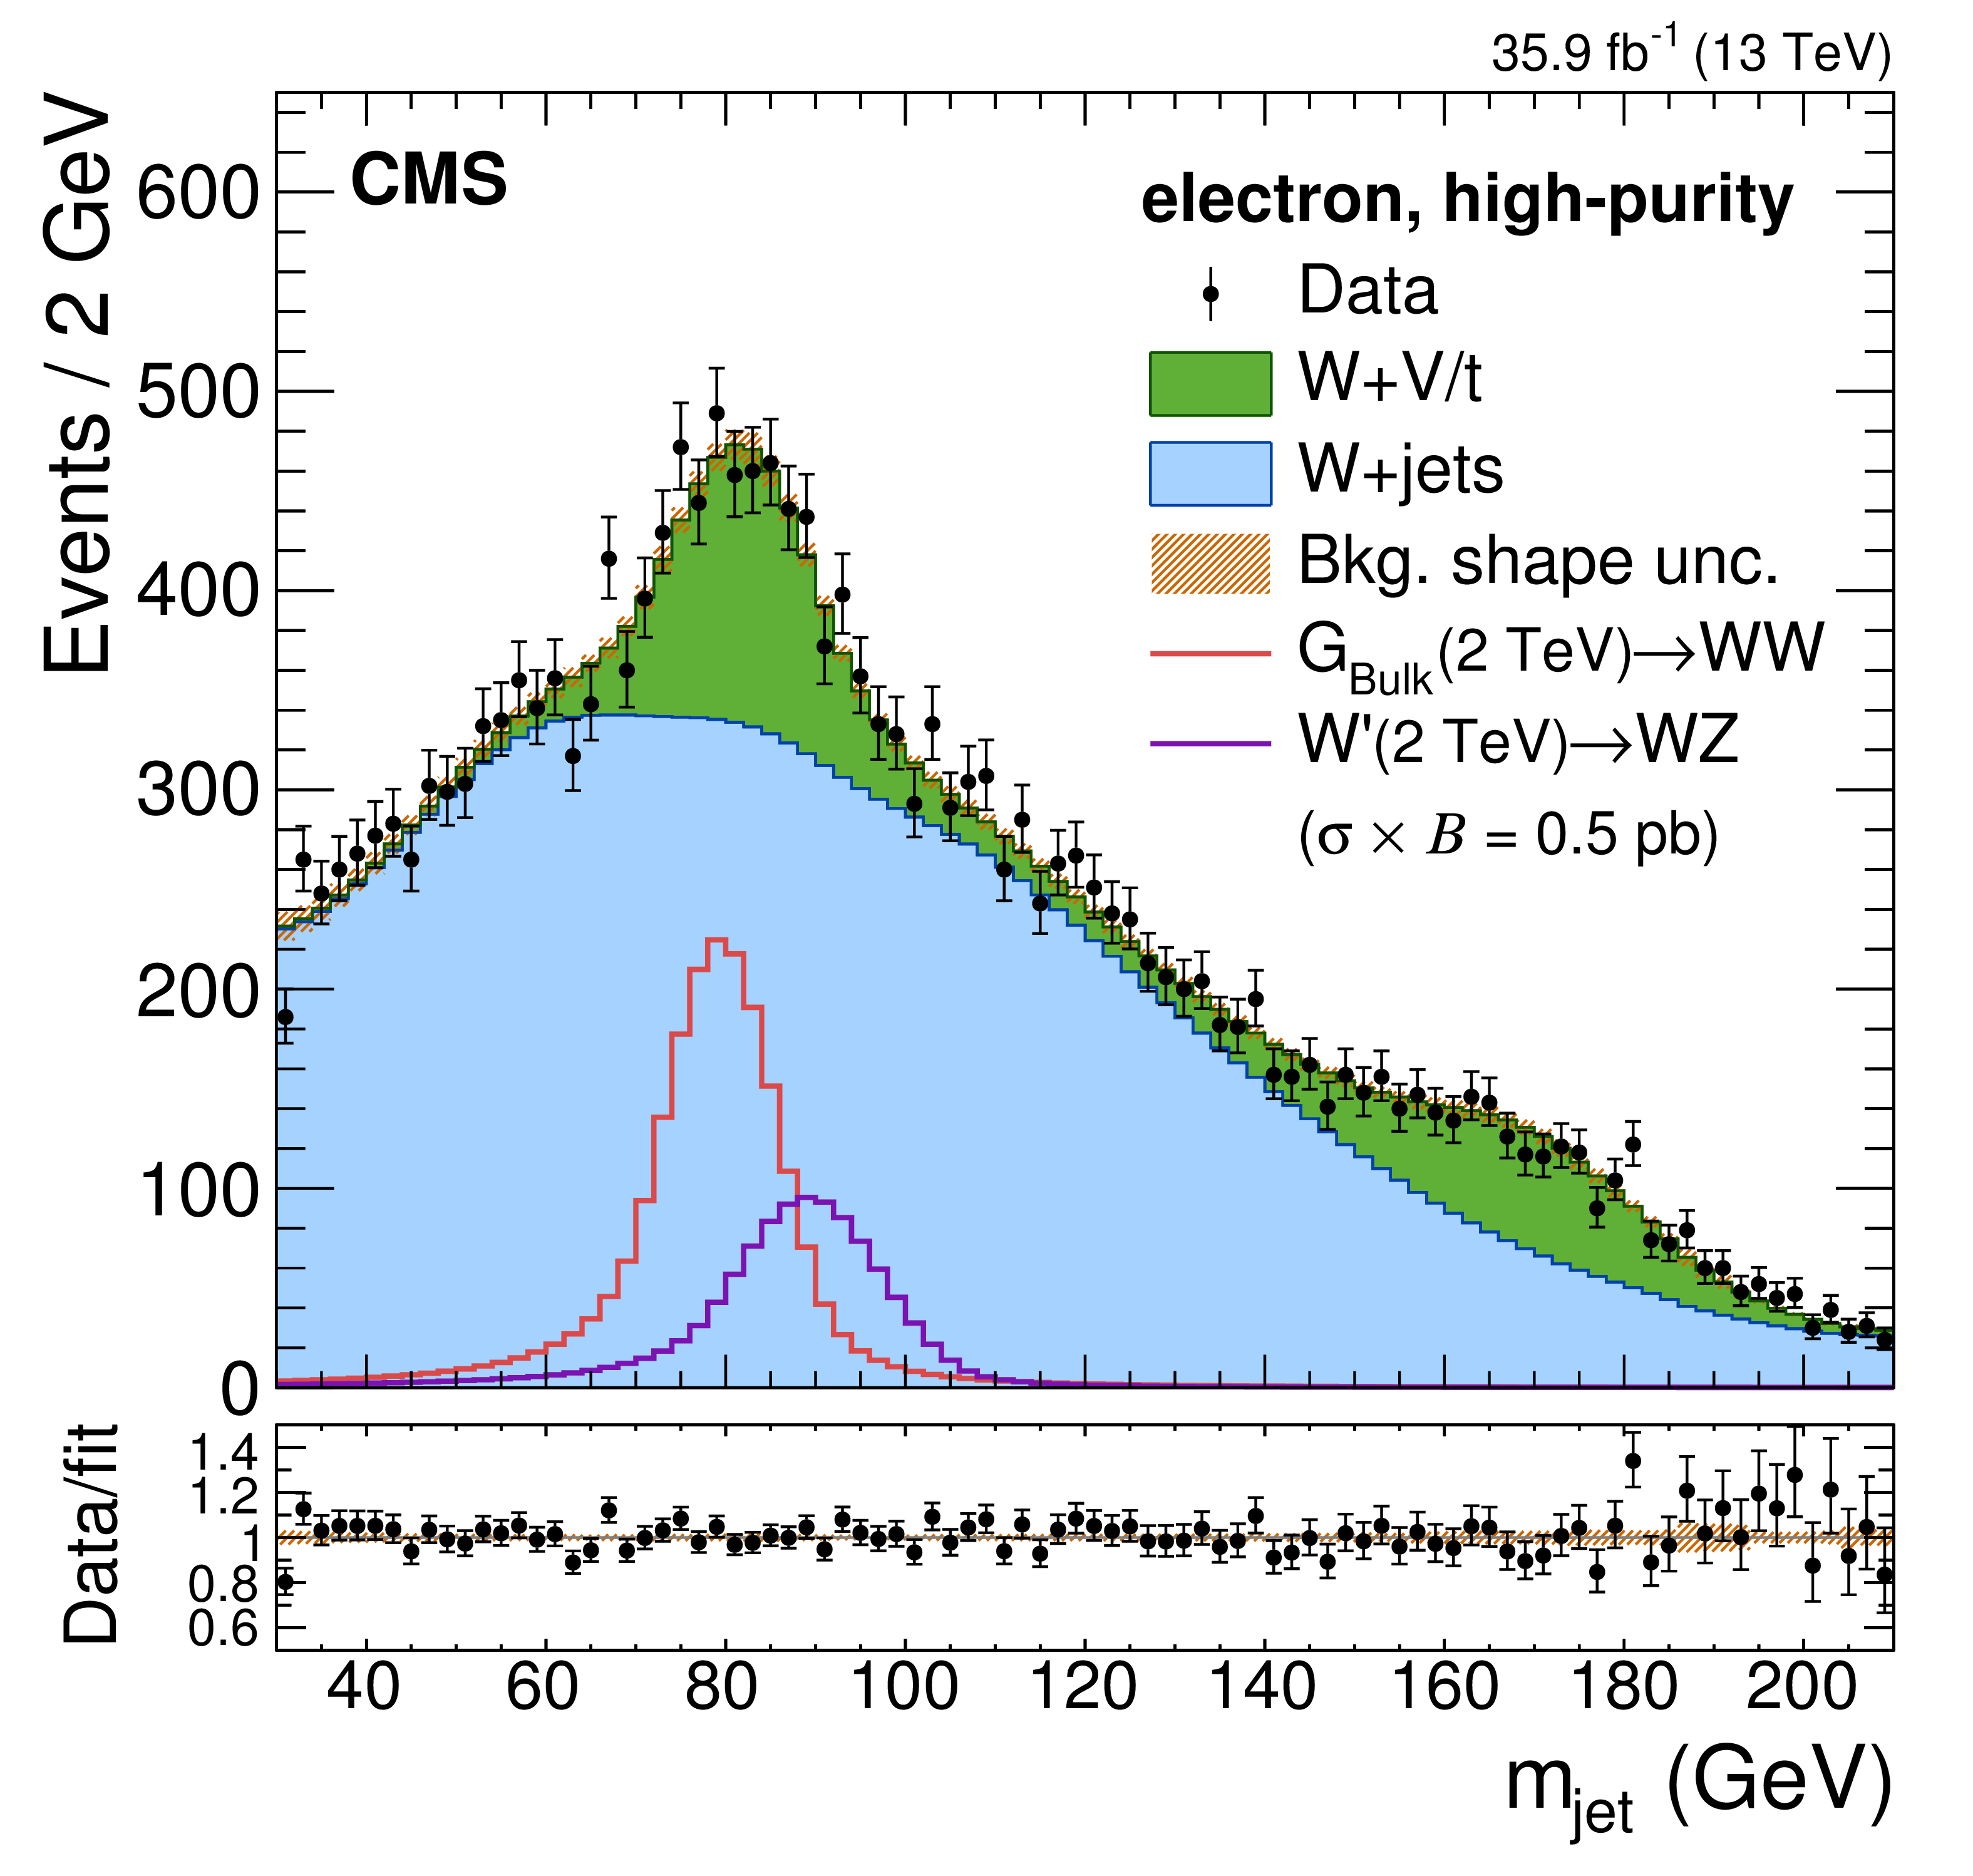
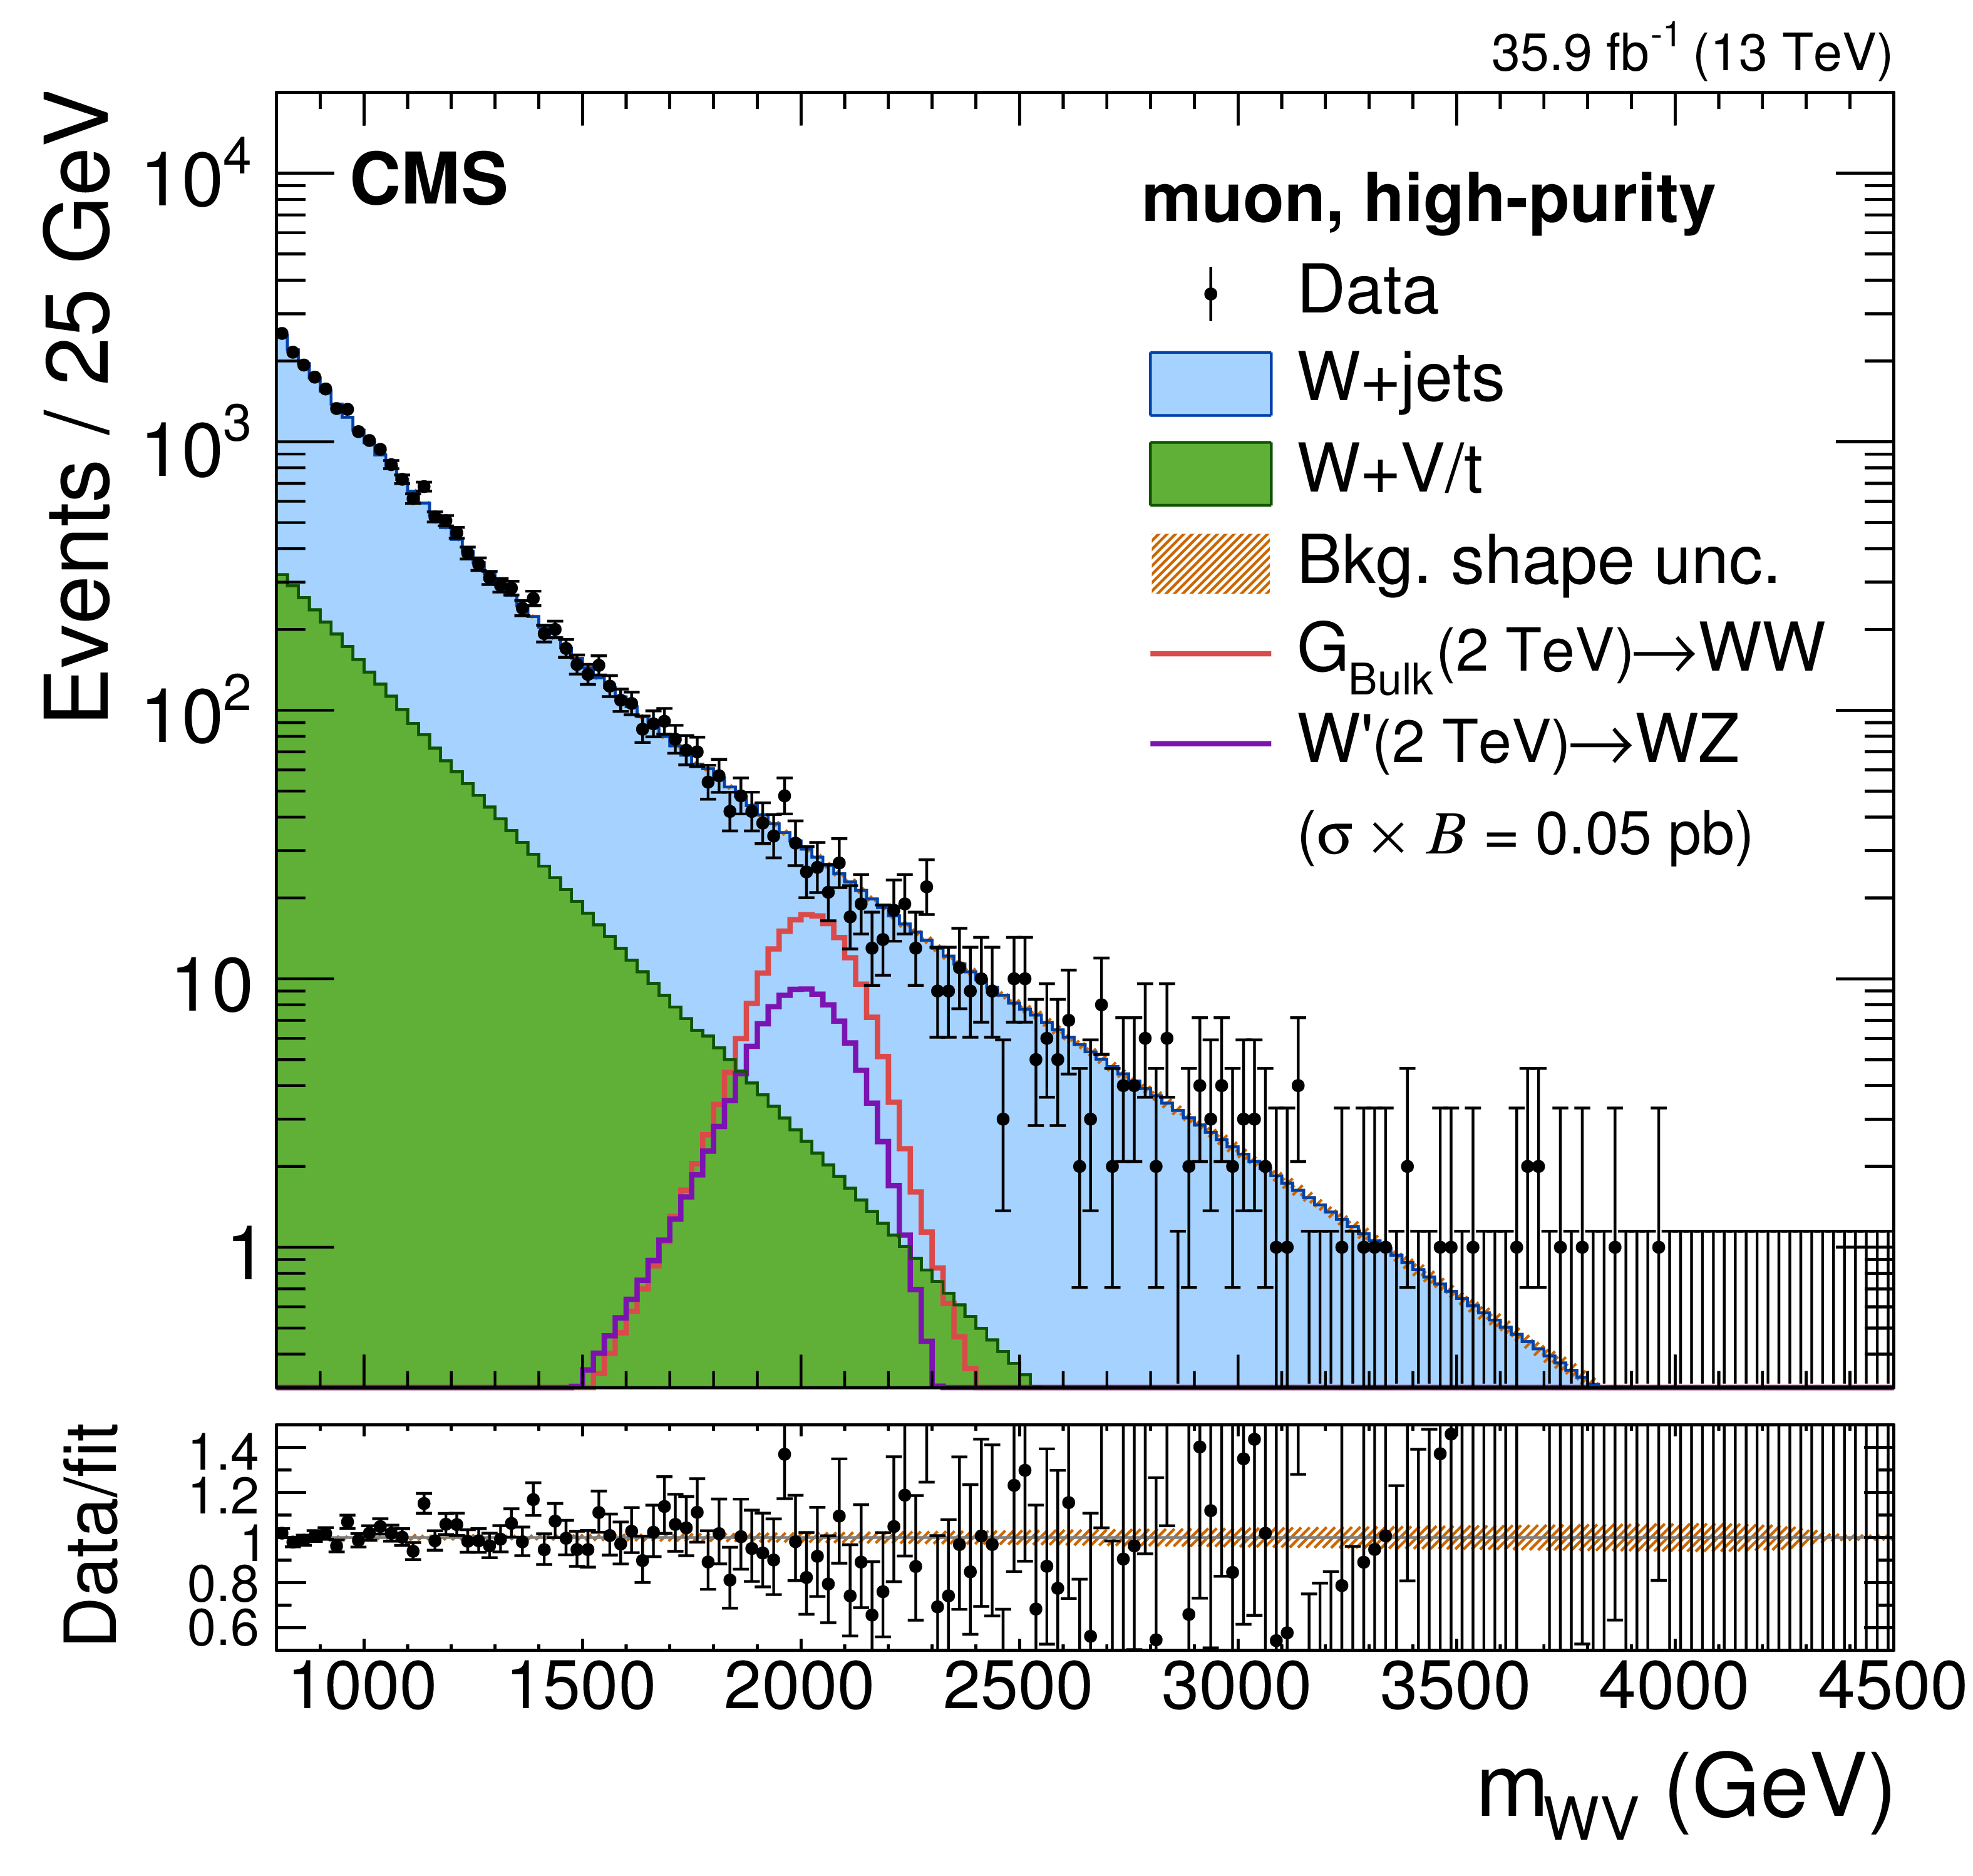
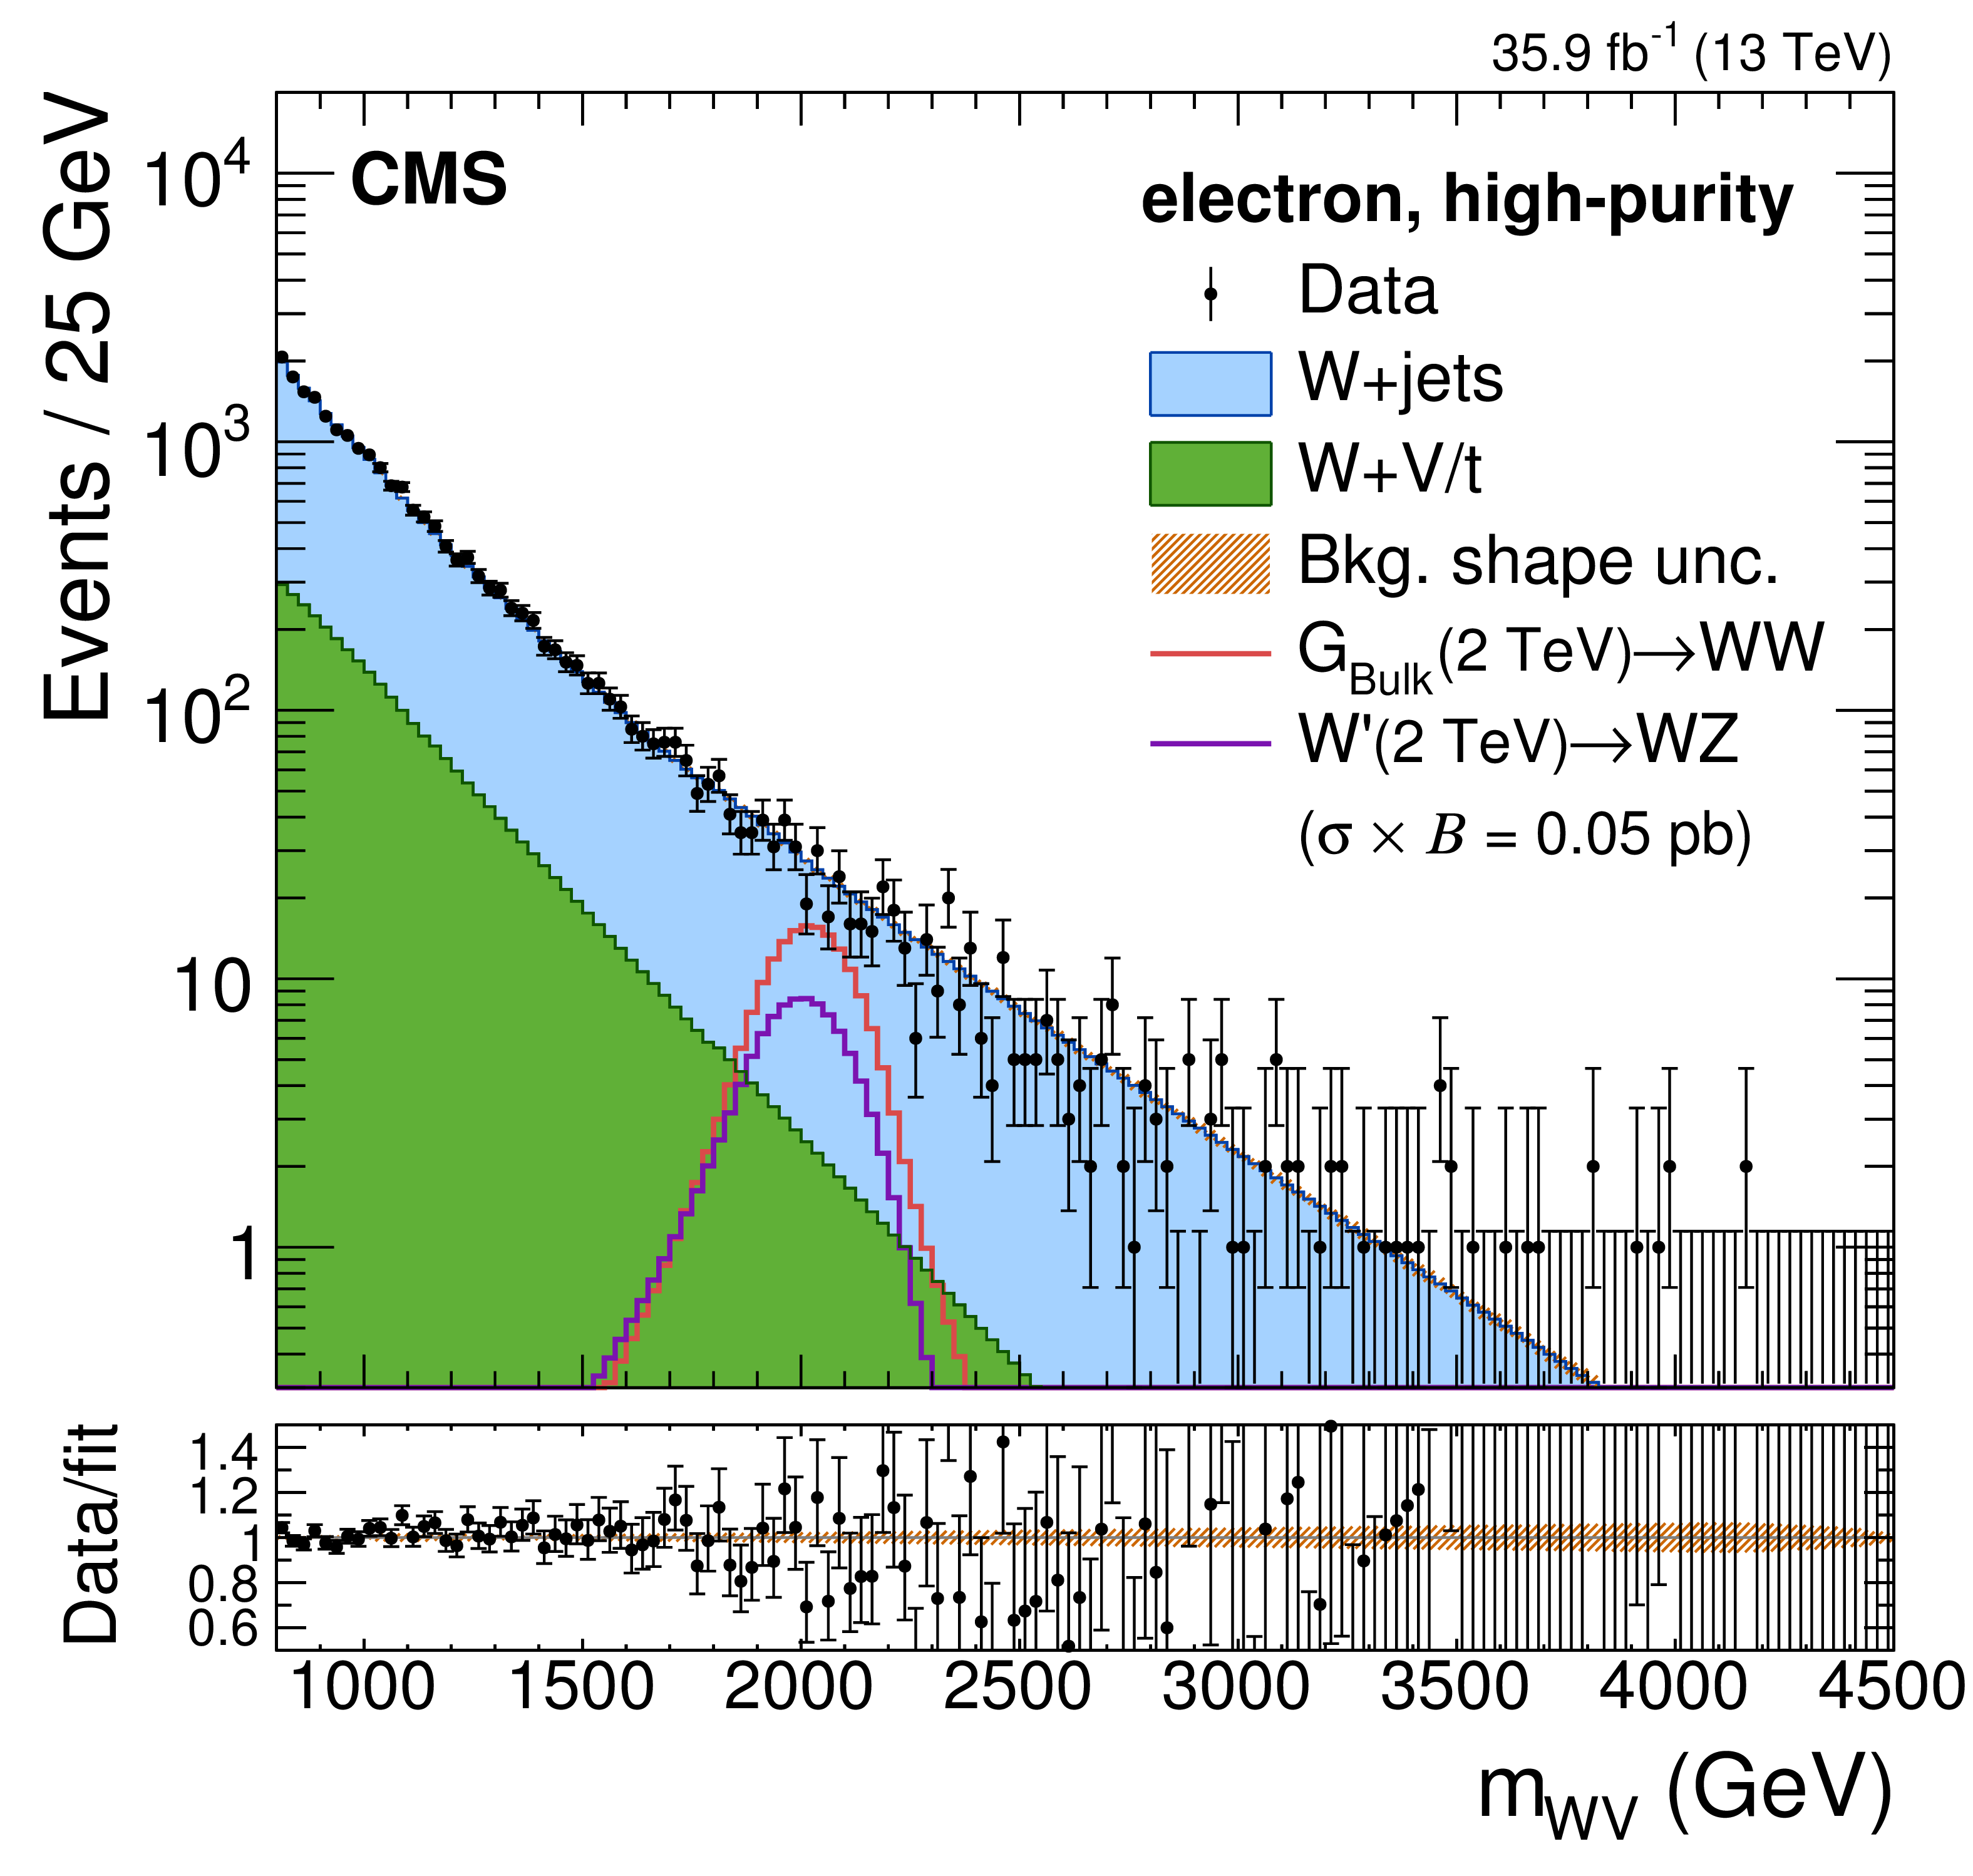
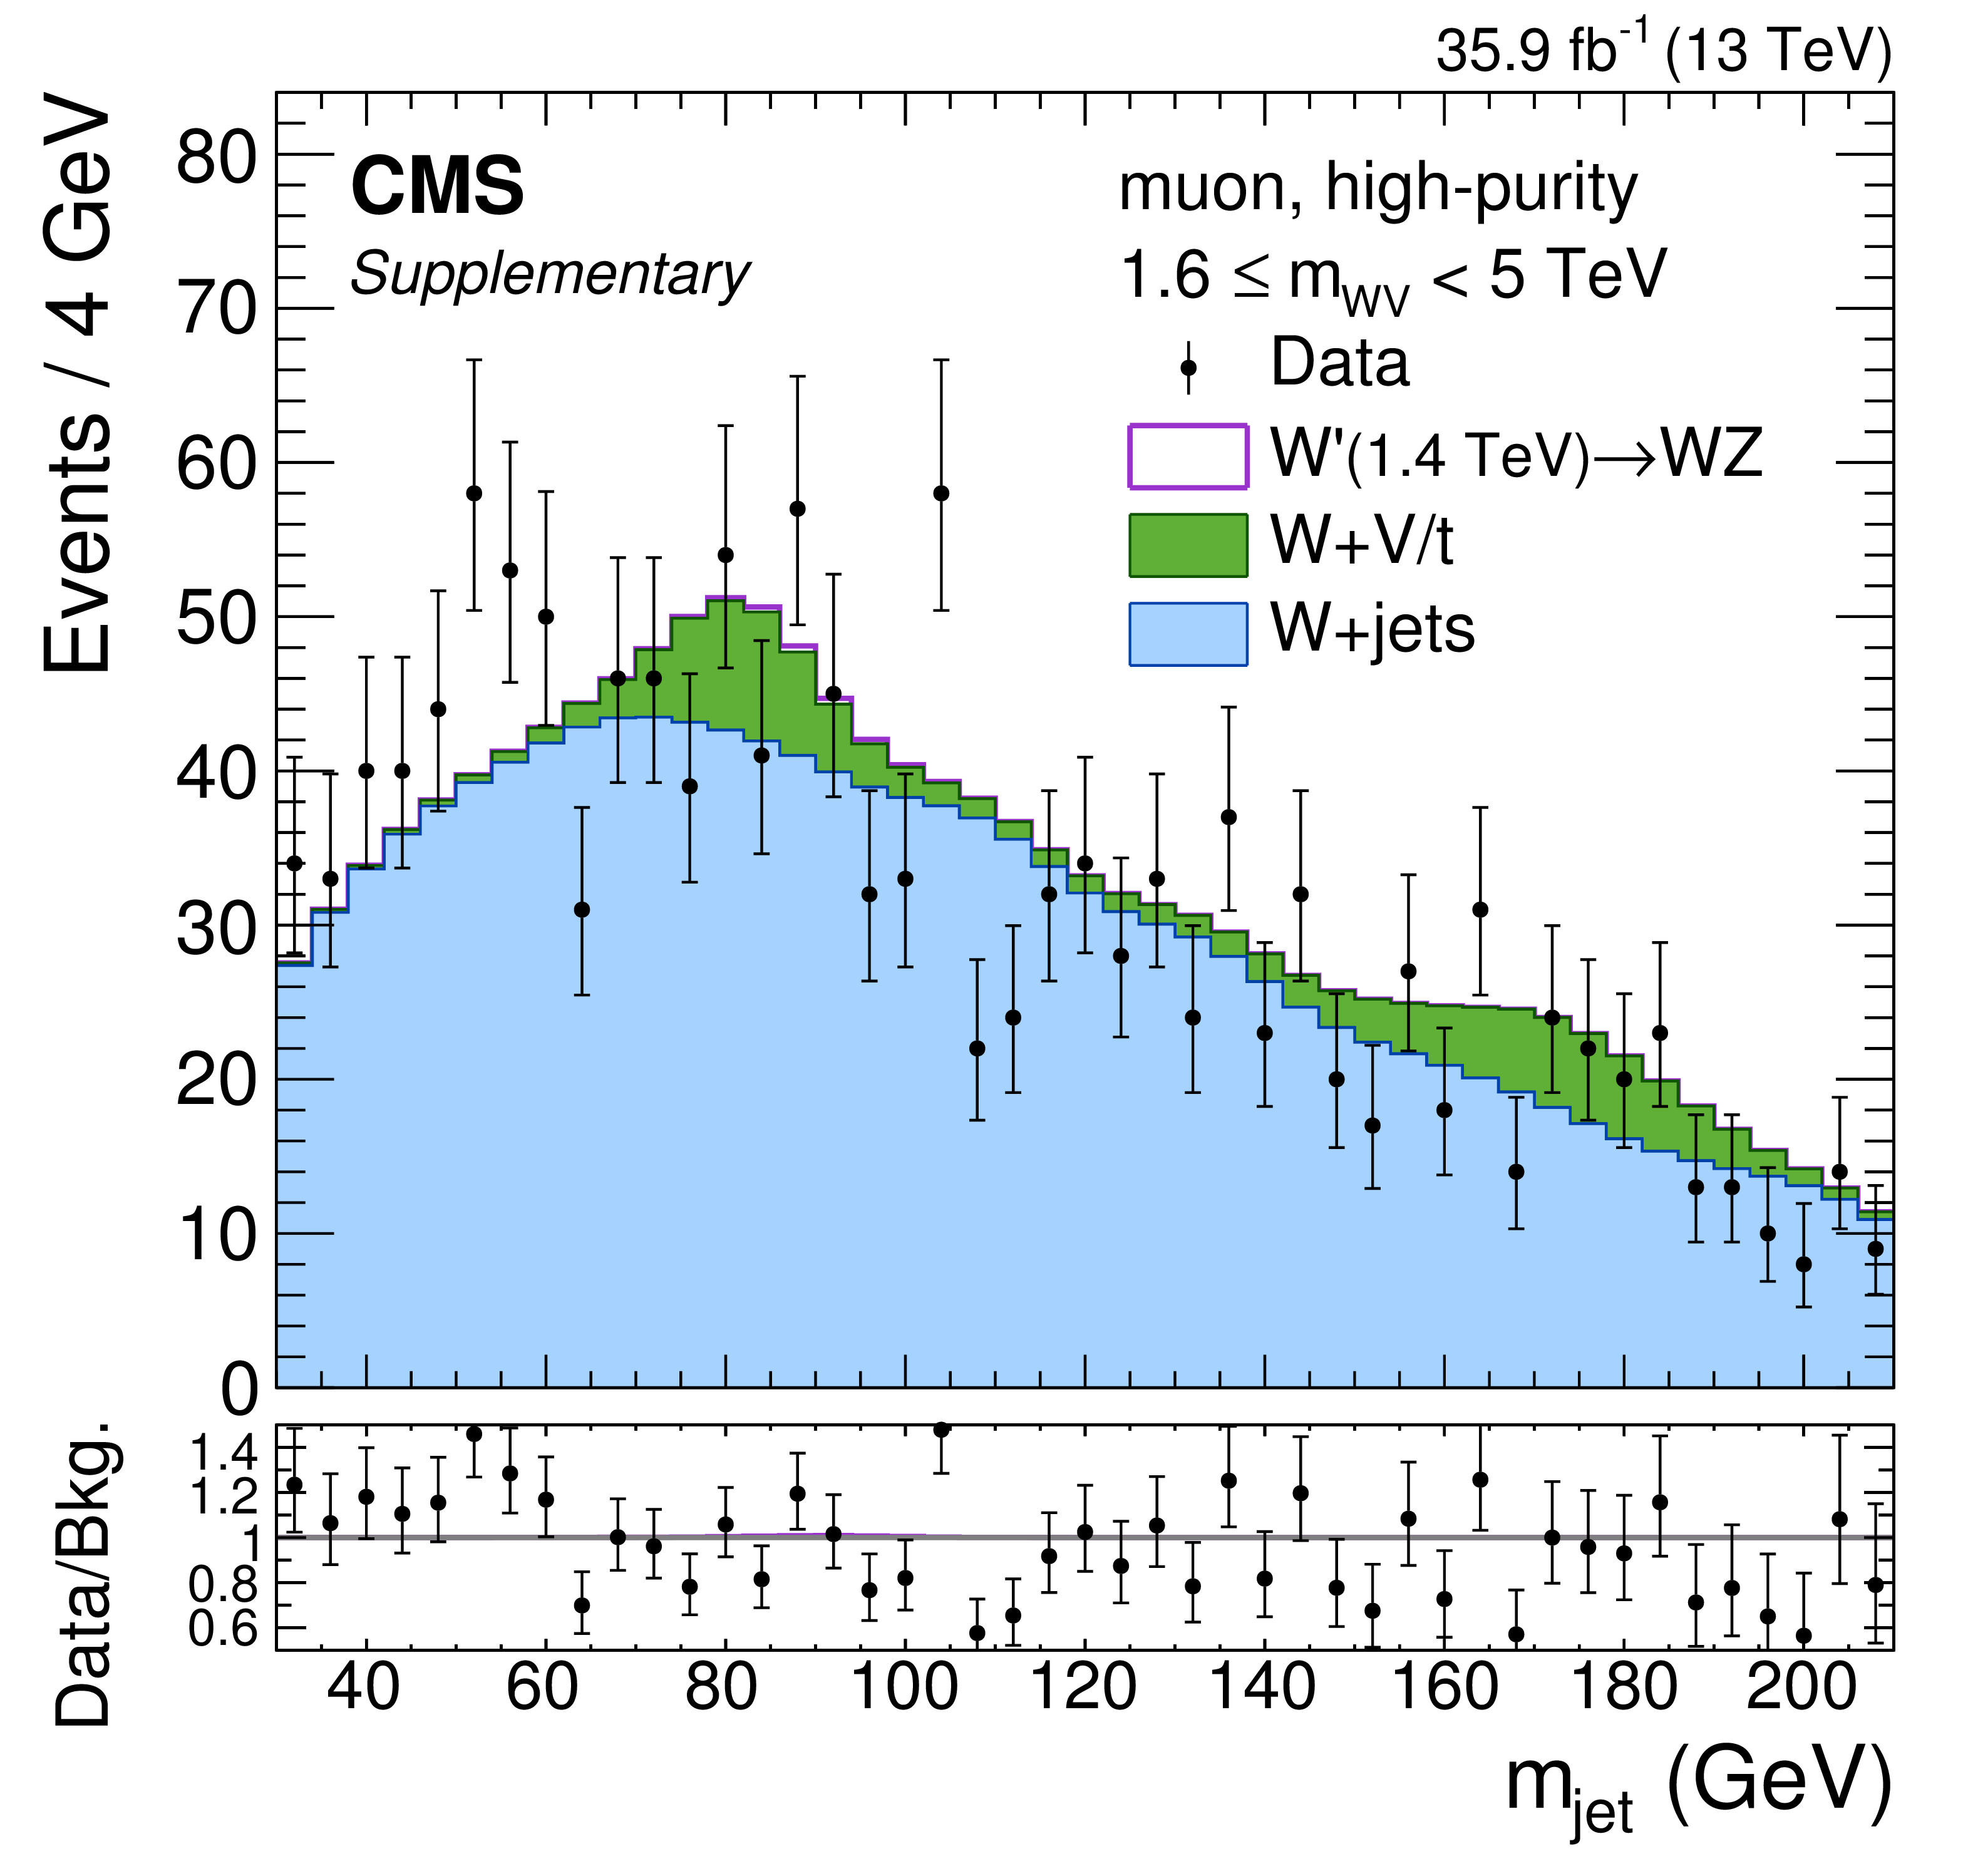
Comparison between the fit result and data distributions of $ {m_{\text {jet}}}$ (upper) and $ {m_{{\mathrm {W}} \mathrm {V}}} $ (lower) in the muon HP (left) and electron HP (right) category. The background shape uncertainty is shown as a shaded band, and the statistical uncertainties of the data are shown as vertical bars. No events are observed with $ {m_{{\mathrm {W}} \mathrm {V}}} > $ 4.5 TeV. Example signal distributions are overlaid, using an arbitrary normalization that is different in the upper and lower plots. |
png pdf |
Figure 3-a:
Comparison between the fit result and data distributions of $ {m_{\text {jet}}}$ in the muon HP category. The background shape uncertainty is shown as a shaded band, and the statistical uncertainties of the data are shown as vertical bars. No events are observed with $ {m_{{\mathrm {W}} \mathrm {V}}} > $ 4.5 TeV. Example signal distributions are overlaid, using an arbitrary normalization that is different in the upper and lower plots. |
png pdf |
Figure 3-b:
Comparison between the fit result and data distributions of $ {m_{\text {jet}}}$ in the electron HP category. The background shape uncertainty is shown as a shaded band, and the statistical uncertainties of the data are shown as vertical bars. No events are observed with $ {m_{{\mathrm {W}} \mathrm {V}}} > $ 4.5 TeV. Example signal distributions are overlaid, using an arbitrary normalization that is different in the upper and lower plots. |
png pdf |
Figure 3-c:
Comparison between the fit result and data distributions of $ {m_{{\mathrm {W}} \mathrm {V}}} $ in the muon HP category. The background shape uncertainty is shown as a shaded band, and the statistical uncertainties of the data are shown as vertical bars. No events are observed with $ {m_{{\mathrm {W}} \mathrm {V}}} > $ 4.5 TeV. Example signal distributions are overlaid, using an arbitrary normalization that is different in the upper and lower plots. |
png pdf |
Figure 3-d:
Comparison between the fit result and data distributions of $ {m_{{\mathrm {W}} \mathrm {V}}} $ in the electron HP category. The background shape uncertainty is shown as a shaded band, and the statistical uncertainties of the data are shown as vertical bars. No events are observed with $ {m_{{\mathrm {W}} \mathrm {V}}} > $ 4.5 TeV. Example signal distributions are overlaid, using an arbitrary normalization that is different in the upper and lower plots. |

png pdf |
Figure 4:
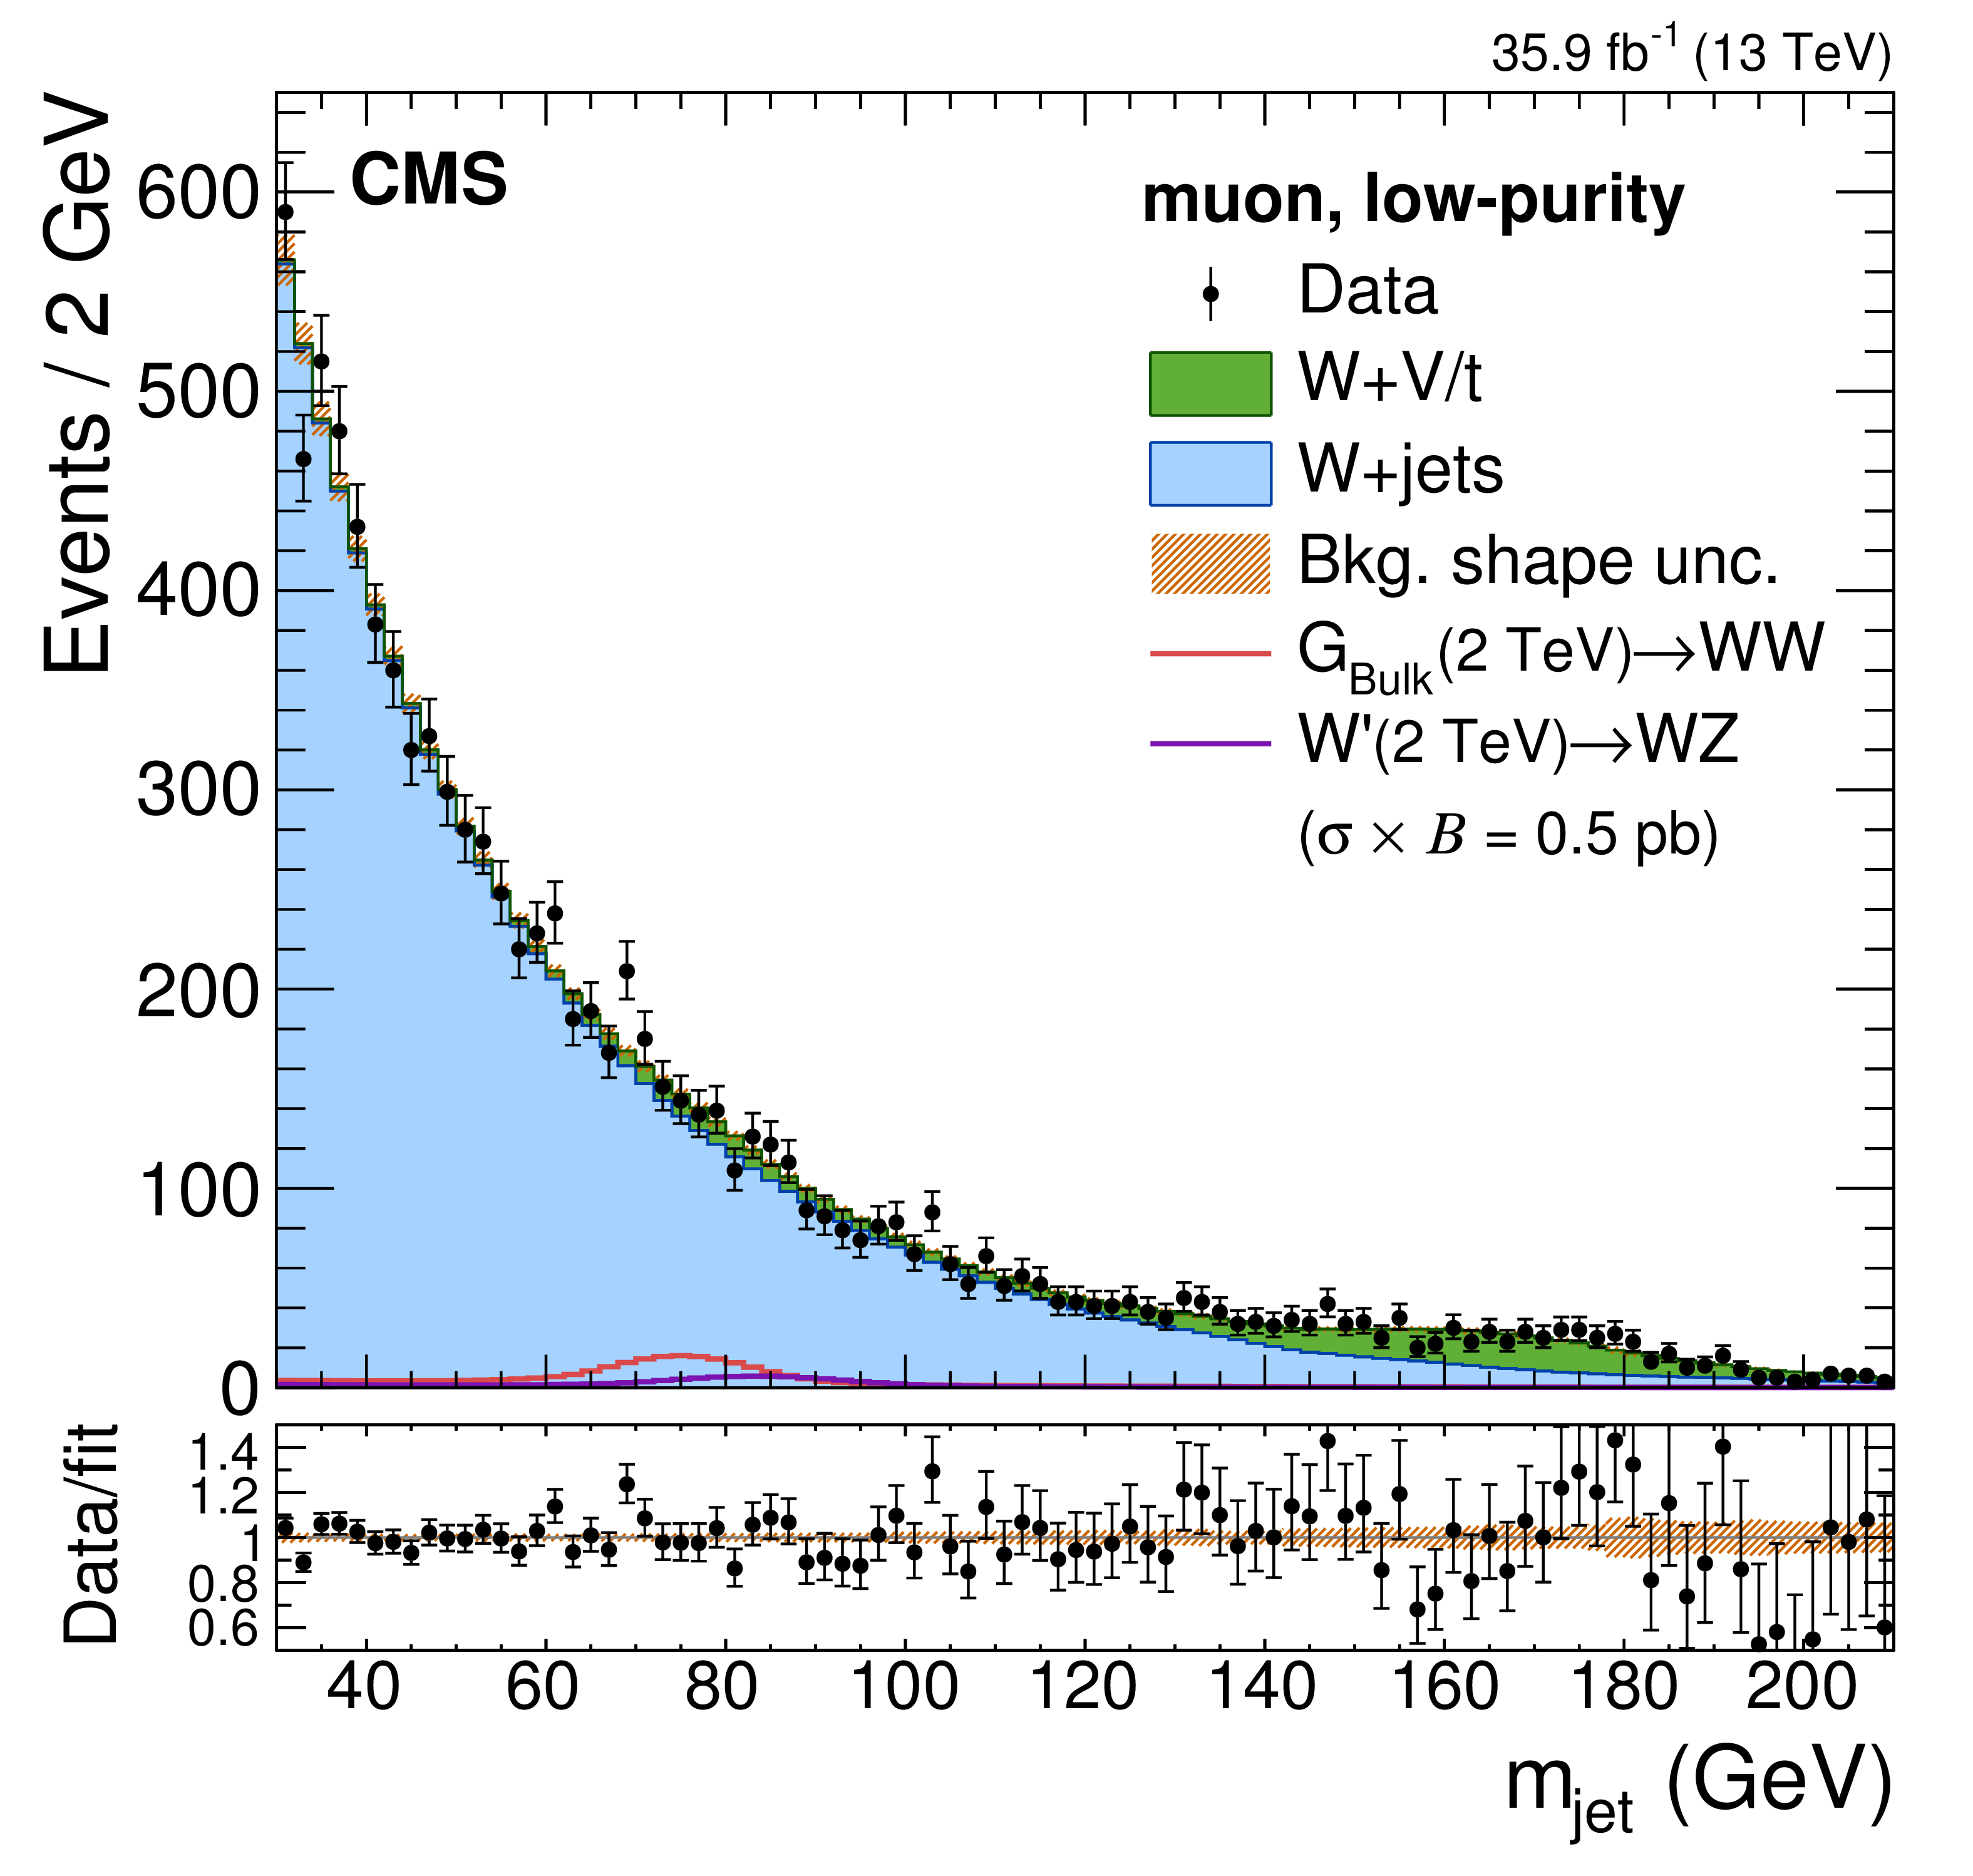
Comparison between the fit result and data distributions of $ {m_{\text {jet}}}$ (upper) and $ {m_{{\mathrm {W}} \mathrm {V}}} $ (lower) in the muon LP (left) and electron LP (right) category. The background shape uncertainty is shown as a shaded band, and the statistical uncertainties of the data are shown as vertical bars. No events are observed with $ {m_{{\mathrm {W}} \mathrm {V}}} > $ 4.5 TeV. Example signal distributions are overlaid, using an arbitrary normalization that is different in the upper and lower plots. |
png pdf |
Figure 4-a:
Comparison between the fit result and data distributions of $ {m_{\text {jet}}}$ in the muon LP category. The background shape uncertainty is shown as a shaded band, and the statistical uncertainties of the data are shown as vertical bars. No events are observed with $ {m_{{\mathrm {W}} \mathrm {V}}} > $ 4.5 TeV. Example signal distributions are overlaid, using an arbitrary normalization that is different in the upper and lower plots. |
png pdf |
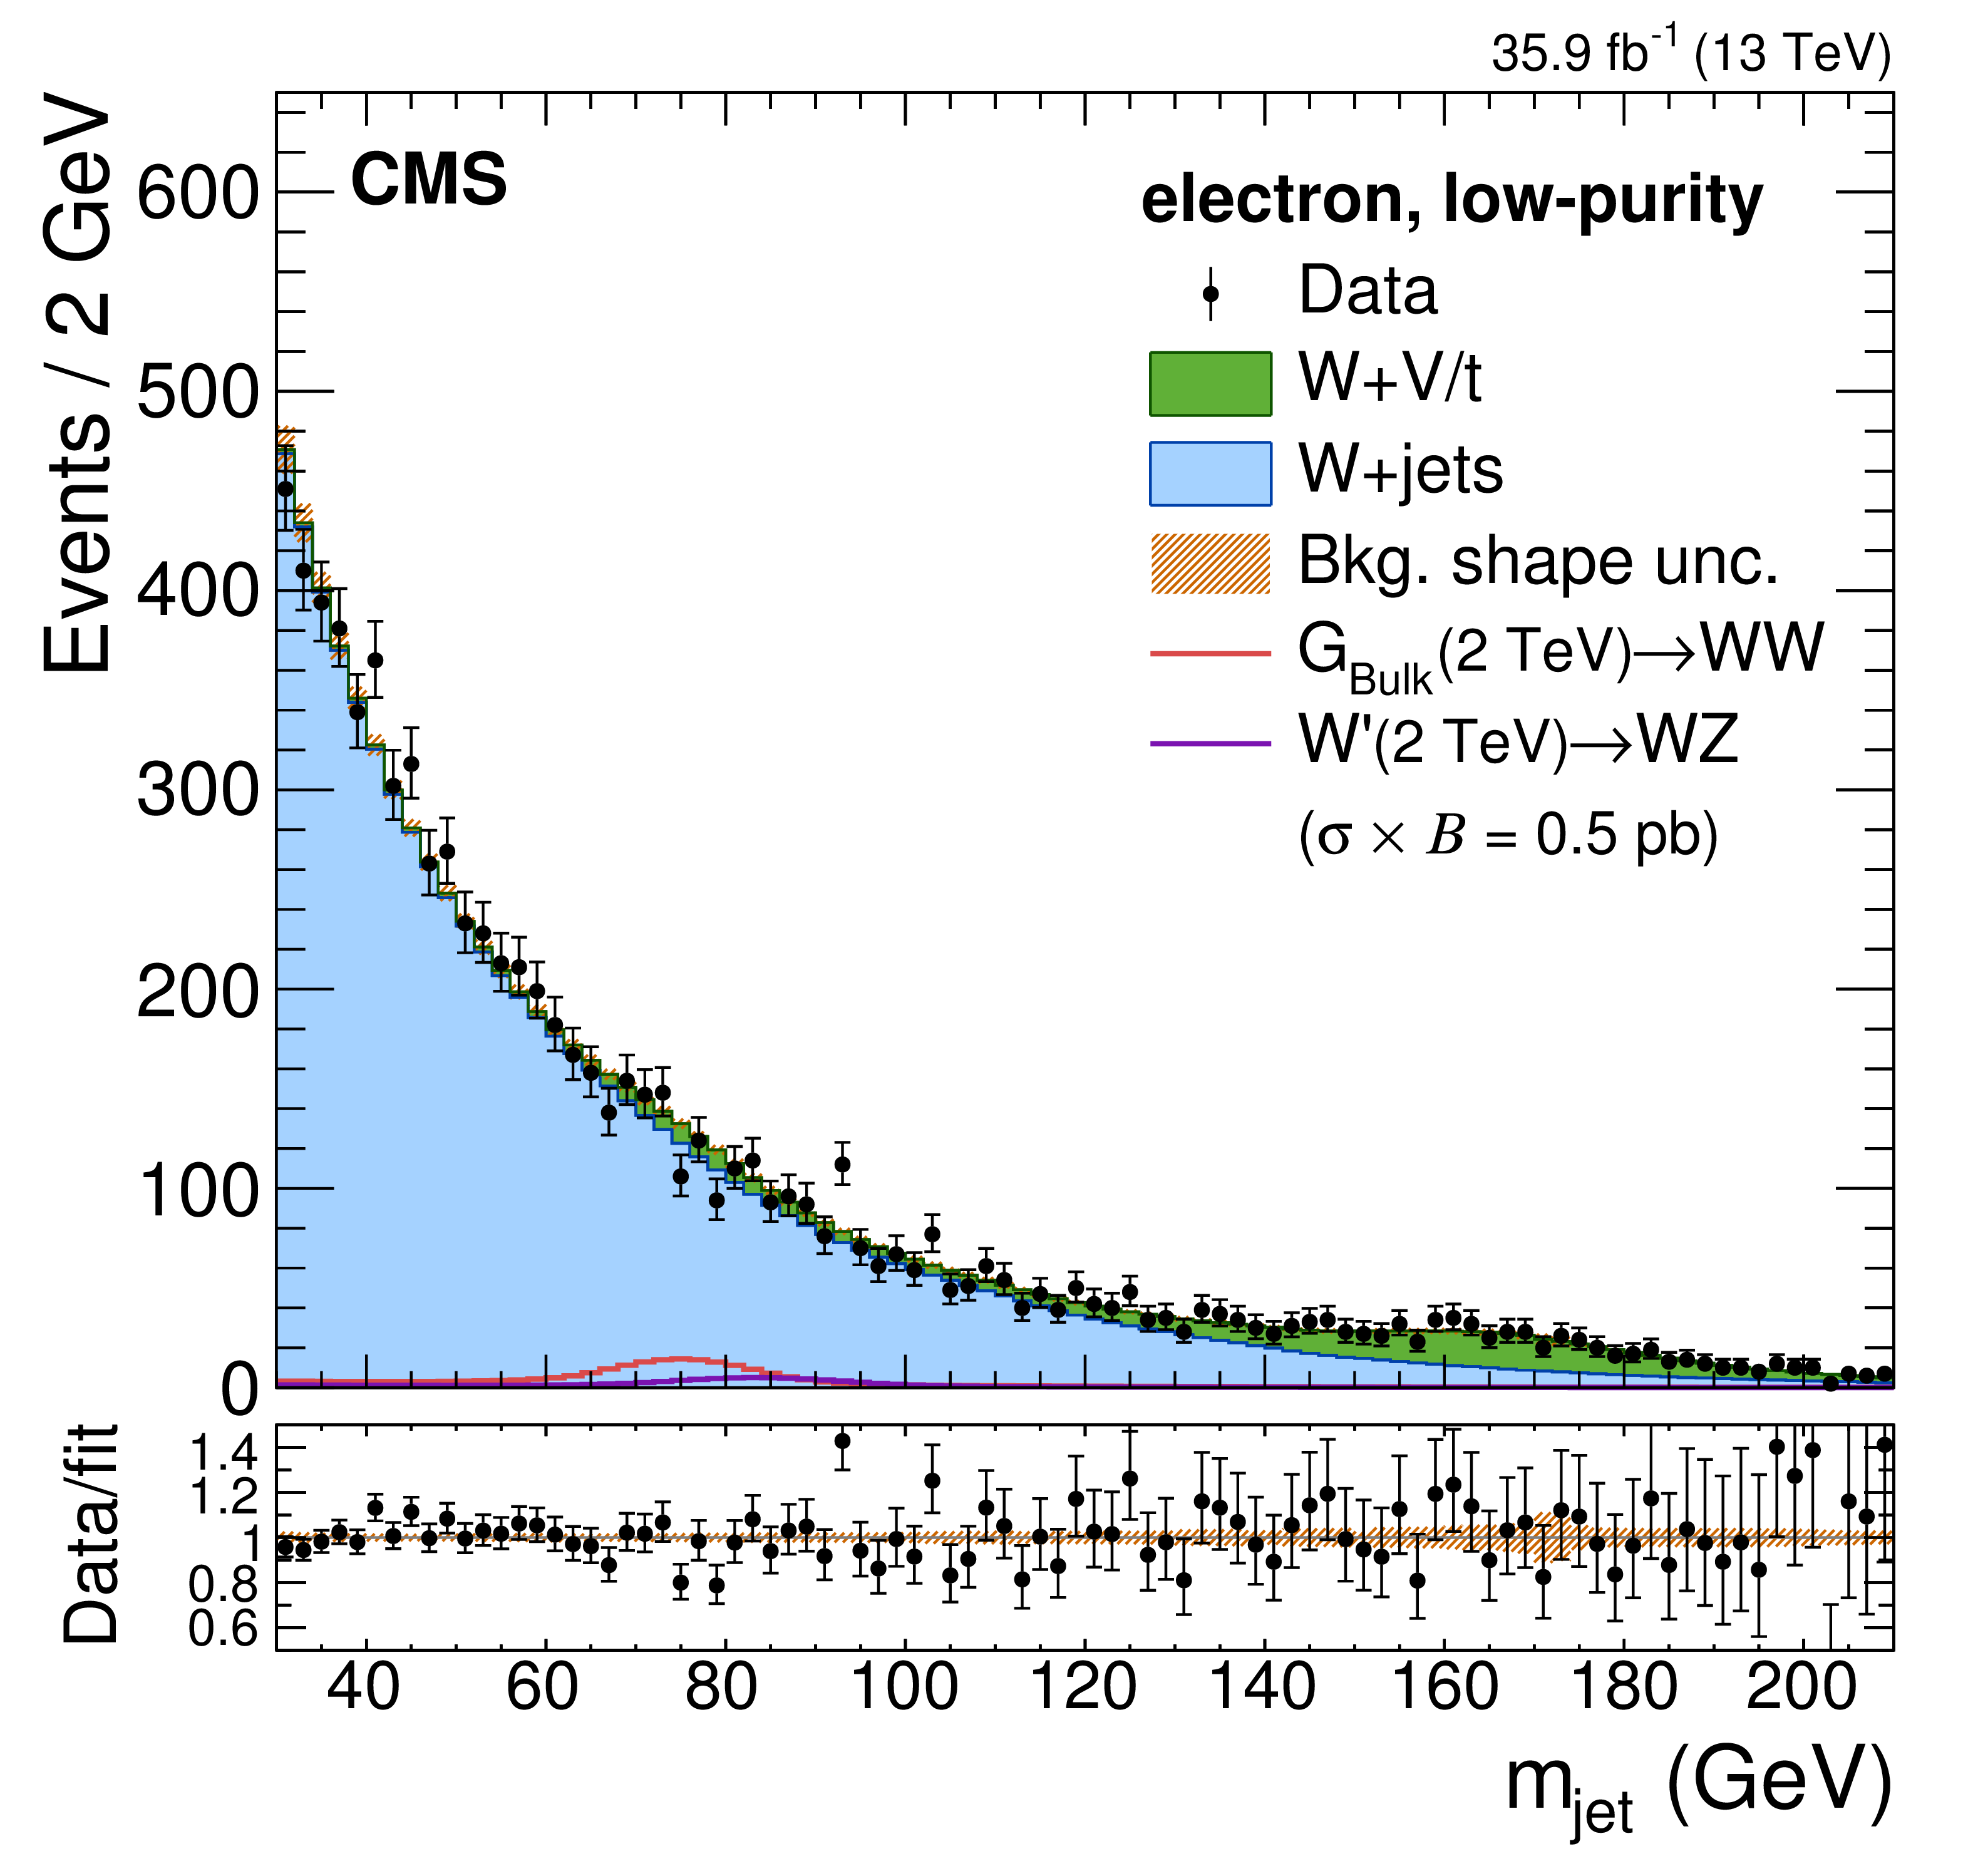
Figure 4-b:
Comparison between the fit result and data distributions of $ {m_{\text {jet}}}$ in the electron LP category. The background shape uncertainty is shown as a shaded band, and the statistical uncertainties of the data are shown as vertical bars. No events are observed with $ {m_{{\mathrm {W}} \mathrm {V}}} > $ 4.5 TeV. Example signal distributions are overlaid, using an arbitrary normalization that is different in the upper and lower plots. |
png pdf |
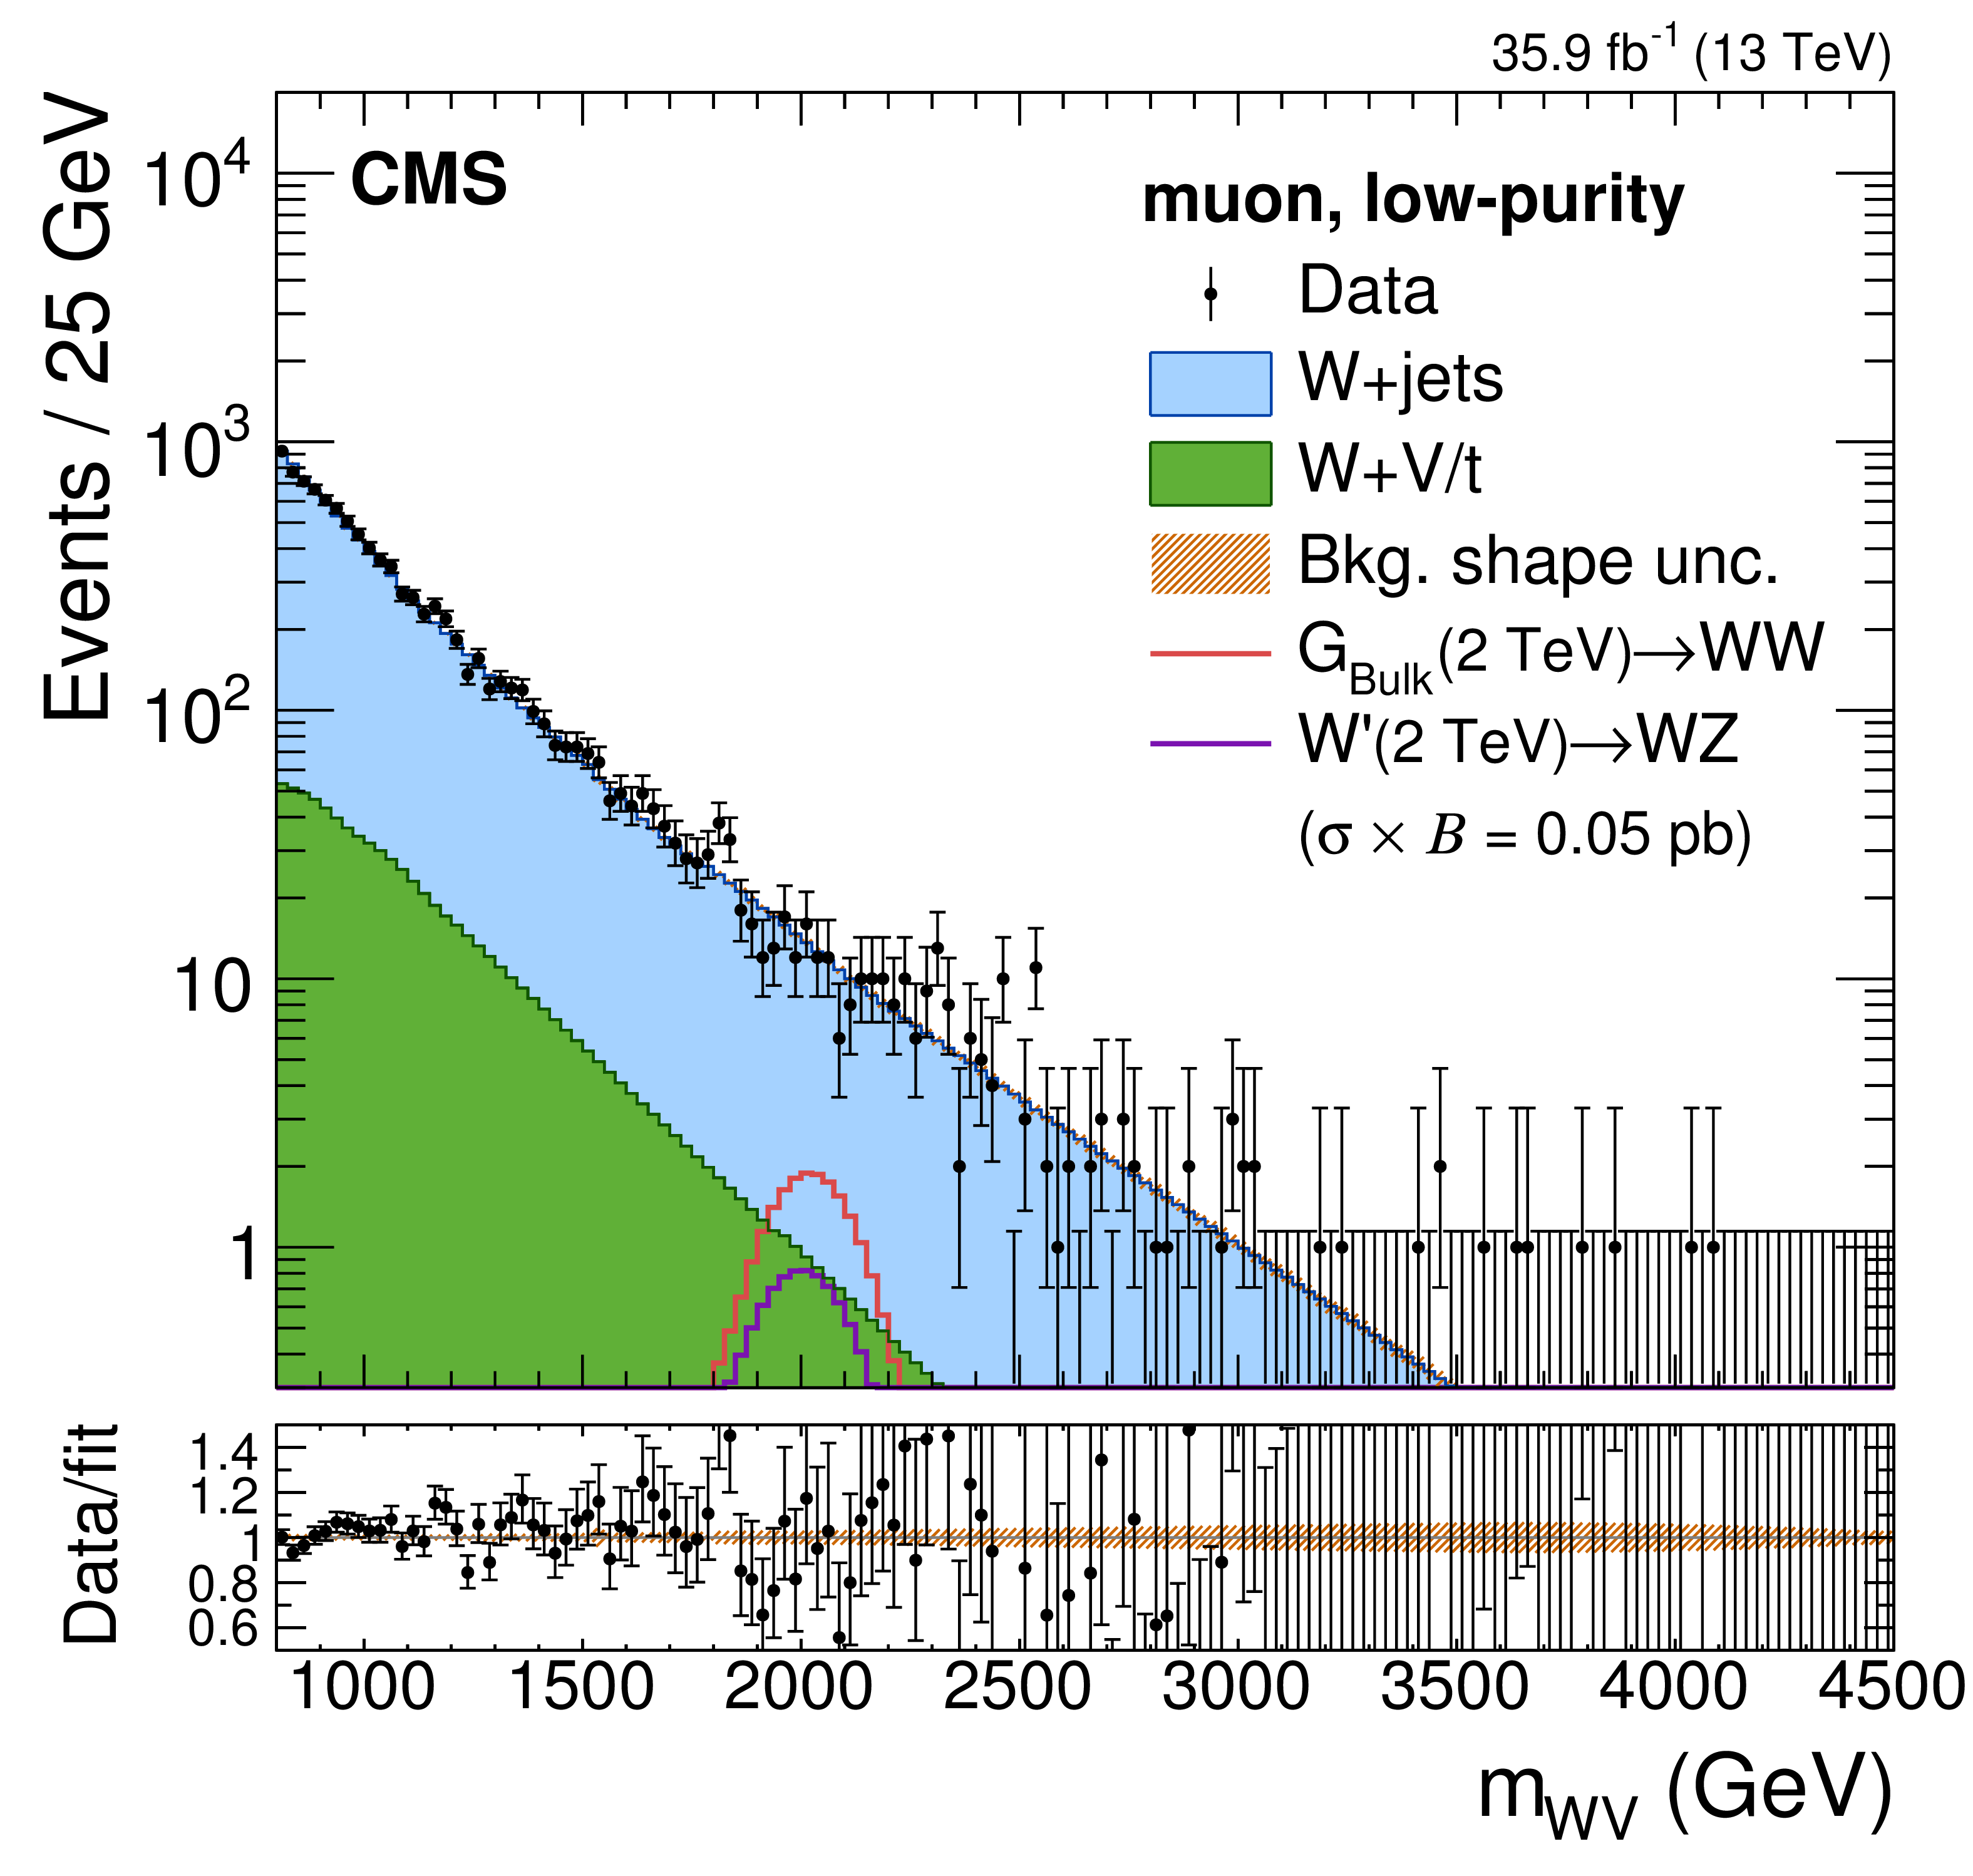
Figure 4-c:
Comparison between the fit result and data distributions of $ {m_{{\mathrm {W}} \mathrm {V}}} $ in the muon LP category. The background shape uncertainty is shown as a shaded band, and the statistical uncertainties of the data are shown as vertical bars. No events are observed with $ {m_{{\mathrm {W}} \mathrm {V}}} > $ 4.5 TeV. Example signal distributions are overlaid, using an arbitrary normalization that is different in the upper and lower plots. |

png pdf |
Figure 4-d:
Comparison between the fit result and data distributions of $ {m_{{\mathrm {W}} \mathrm {V}}} $ in the electron LP category. The background shape uncertainty is shown as a shaded band, and the statistical uncertainties of the data are shown as vertical bars. No events are observed with $ {m_{{\mathrm {W}} \mathrm {V}}} > $ 4.5 TeV. Example signal distributions are overlaid, using an arbitrary normalization that is different in the upper and lower plots. |
png pdf |
Figure 5:
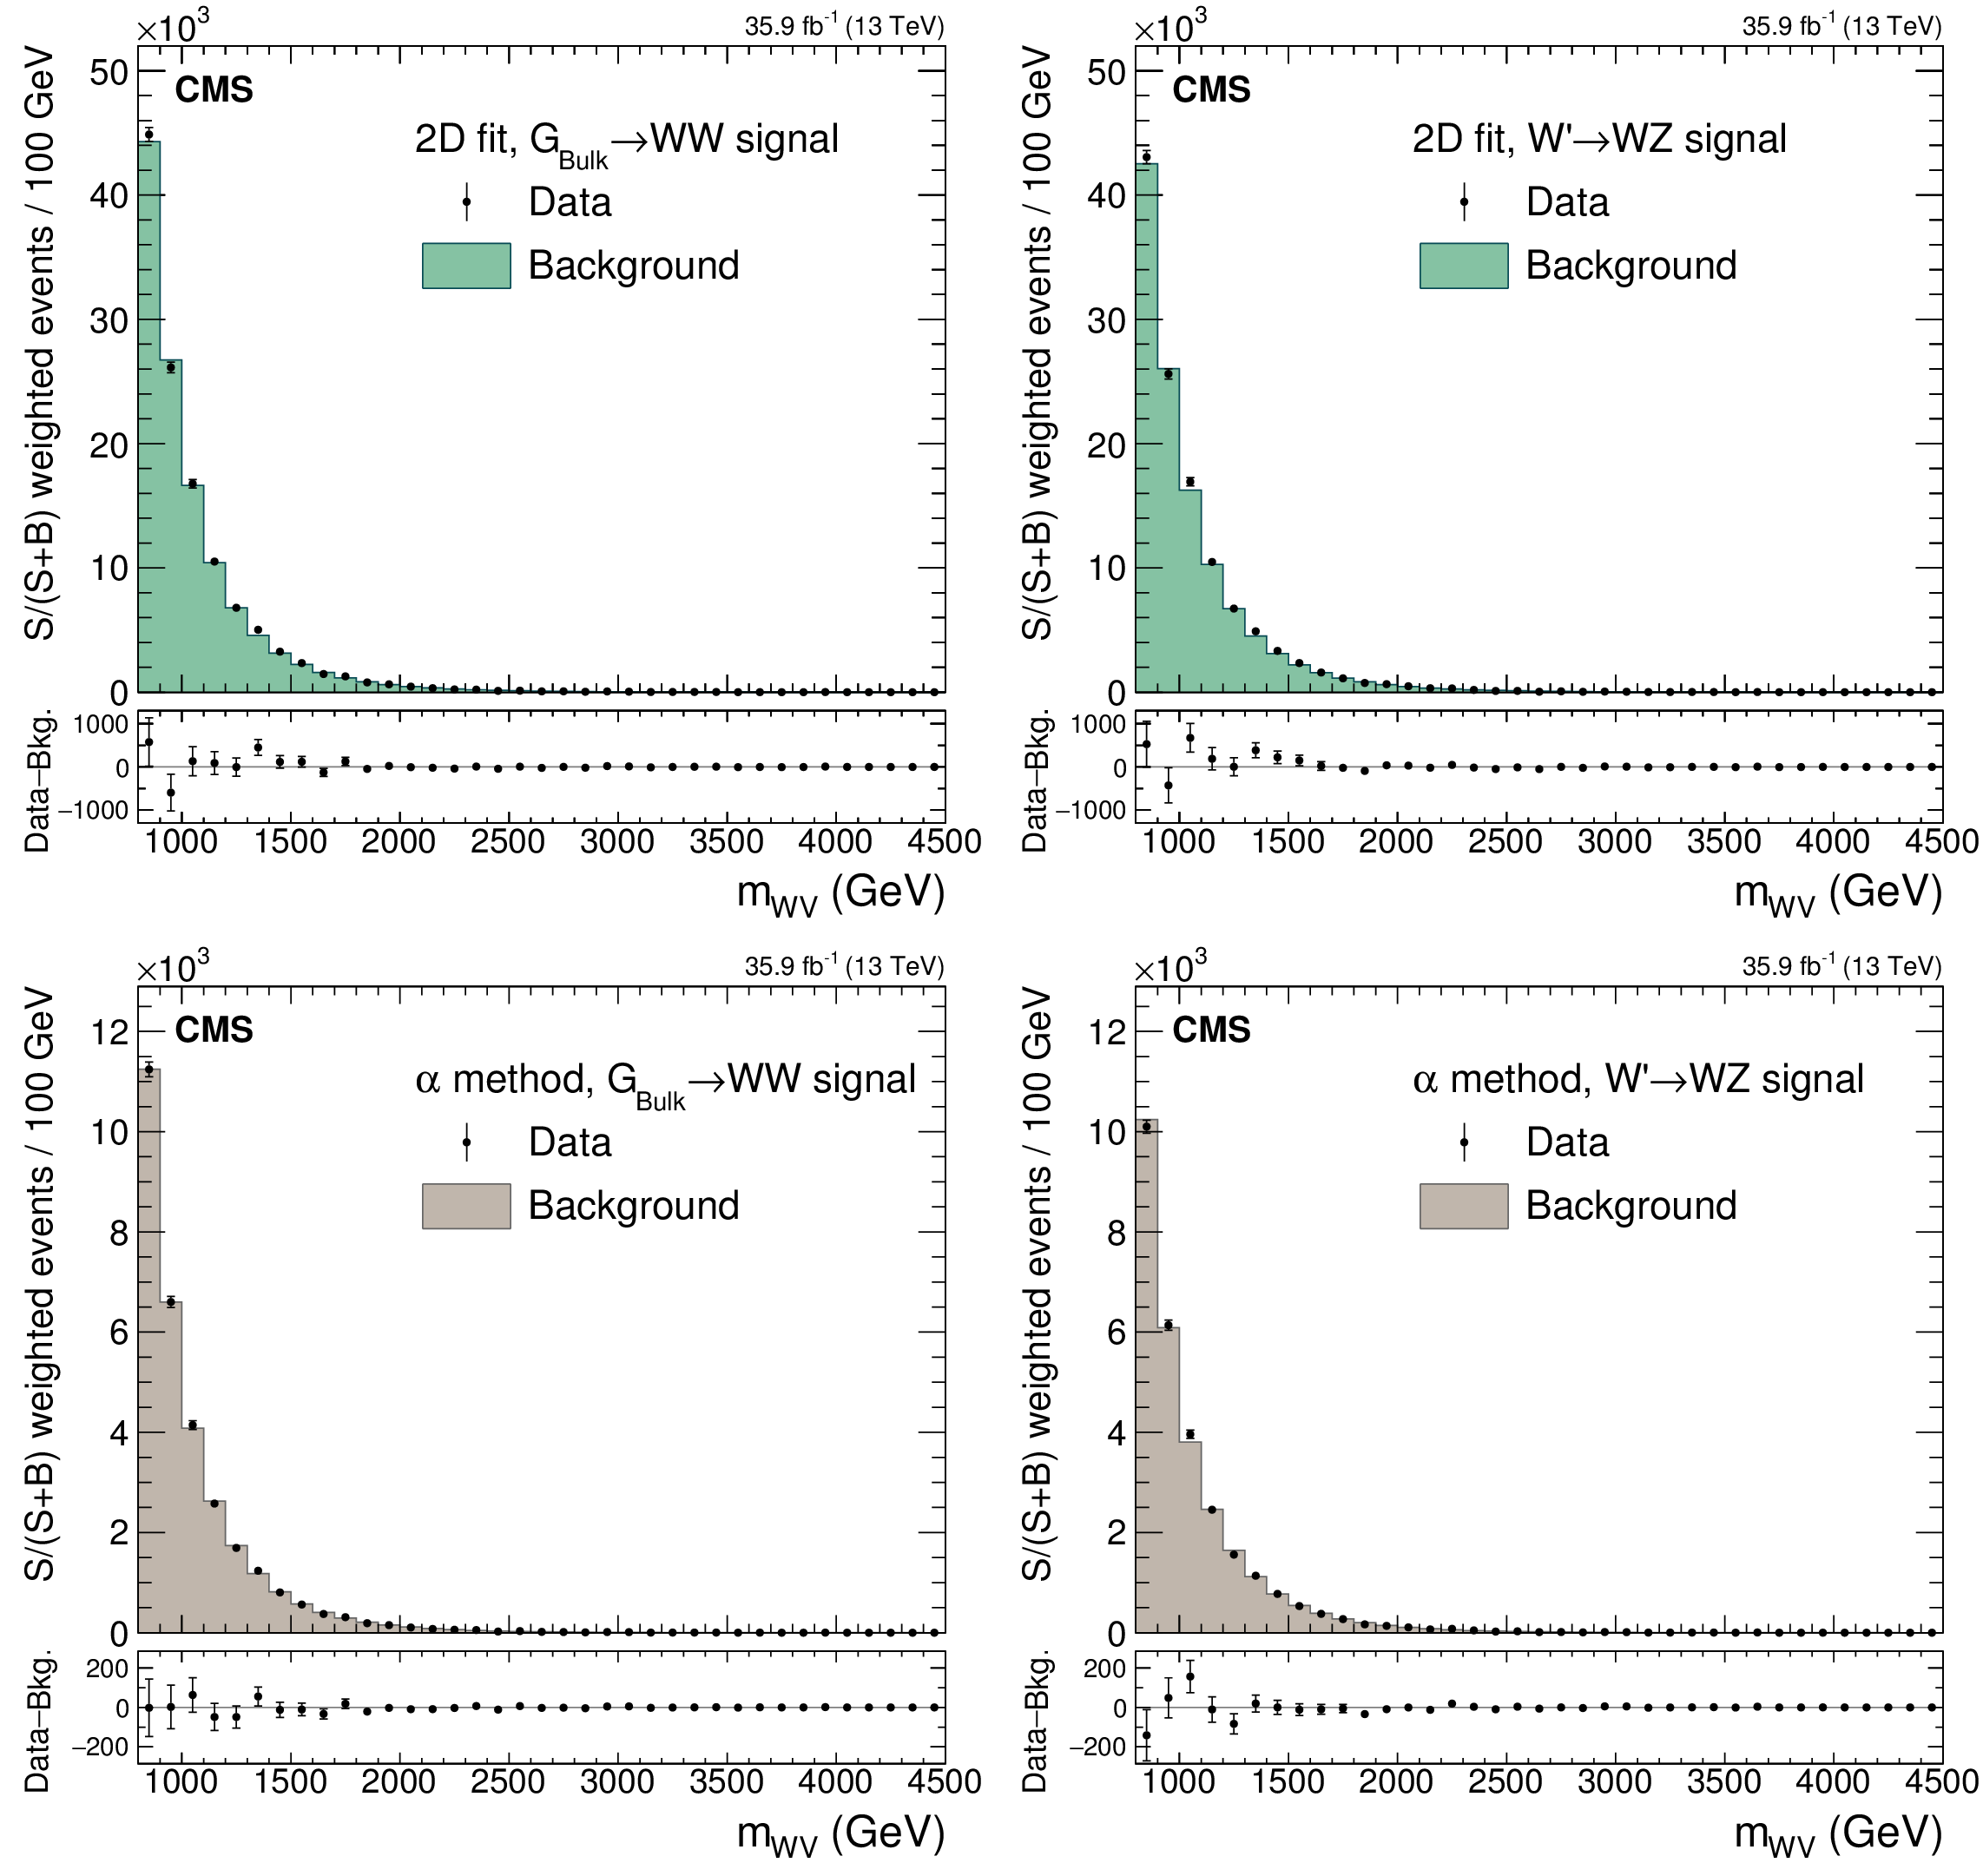
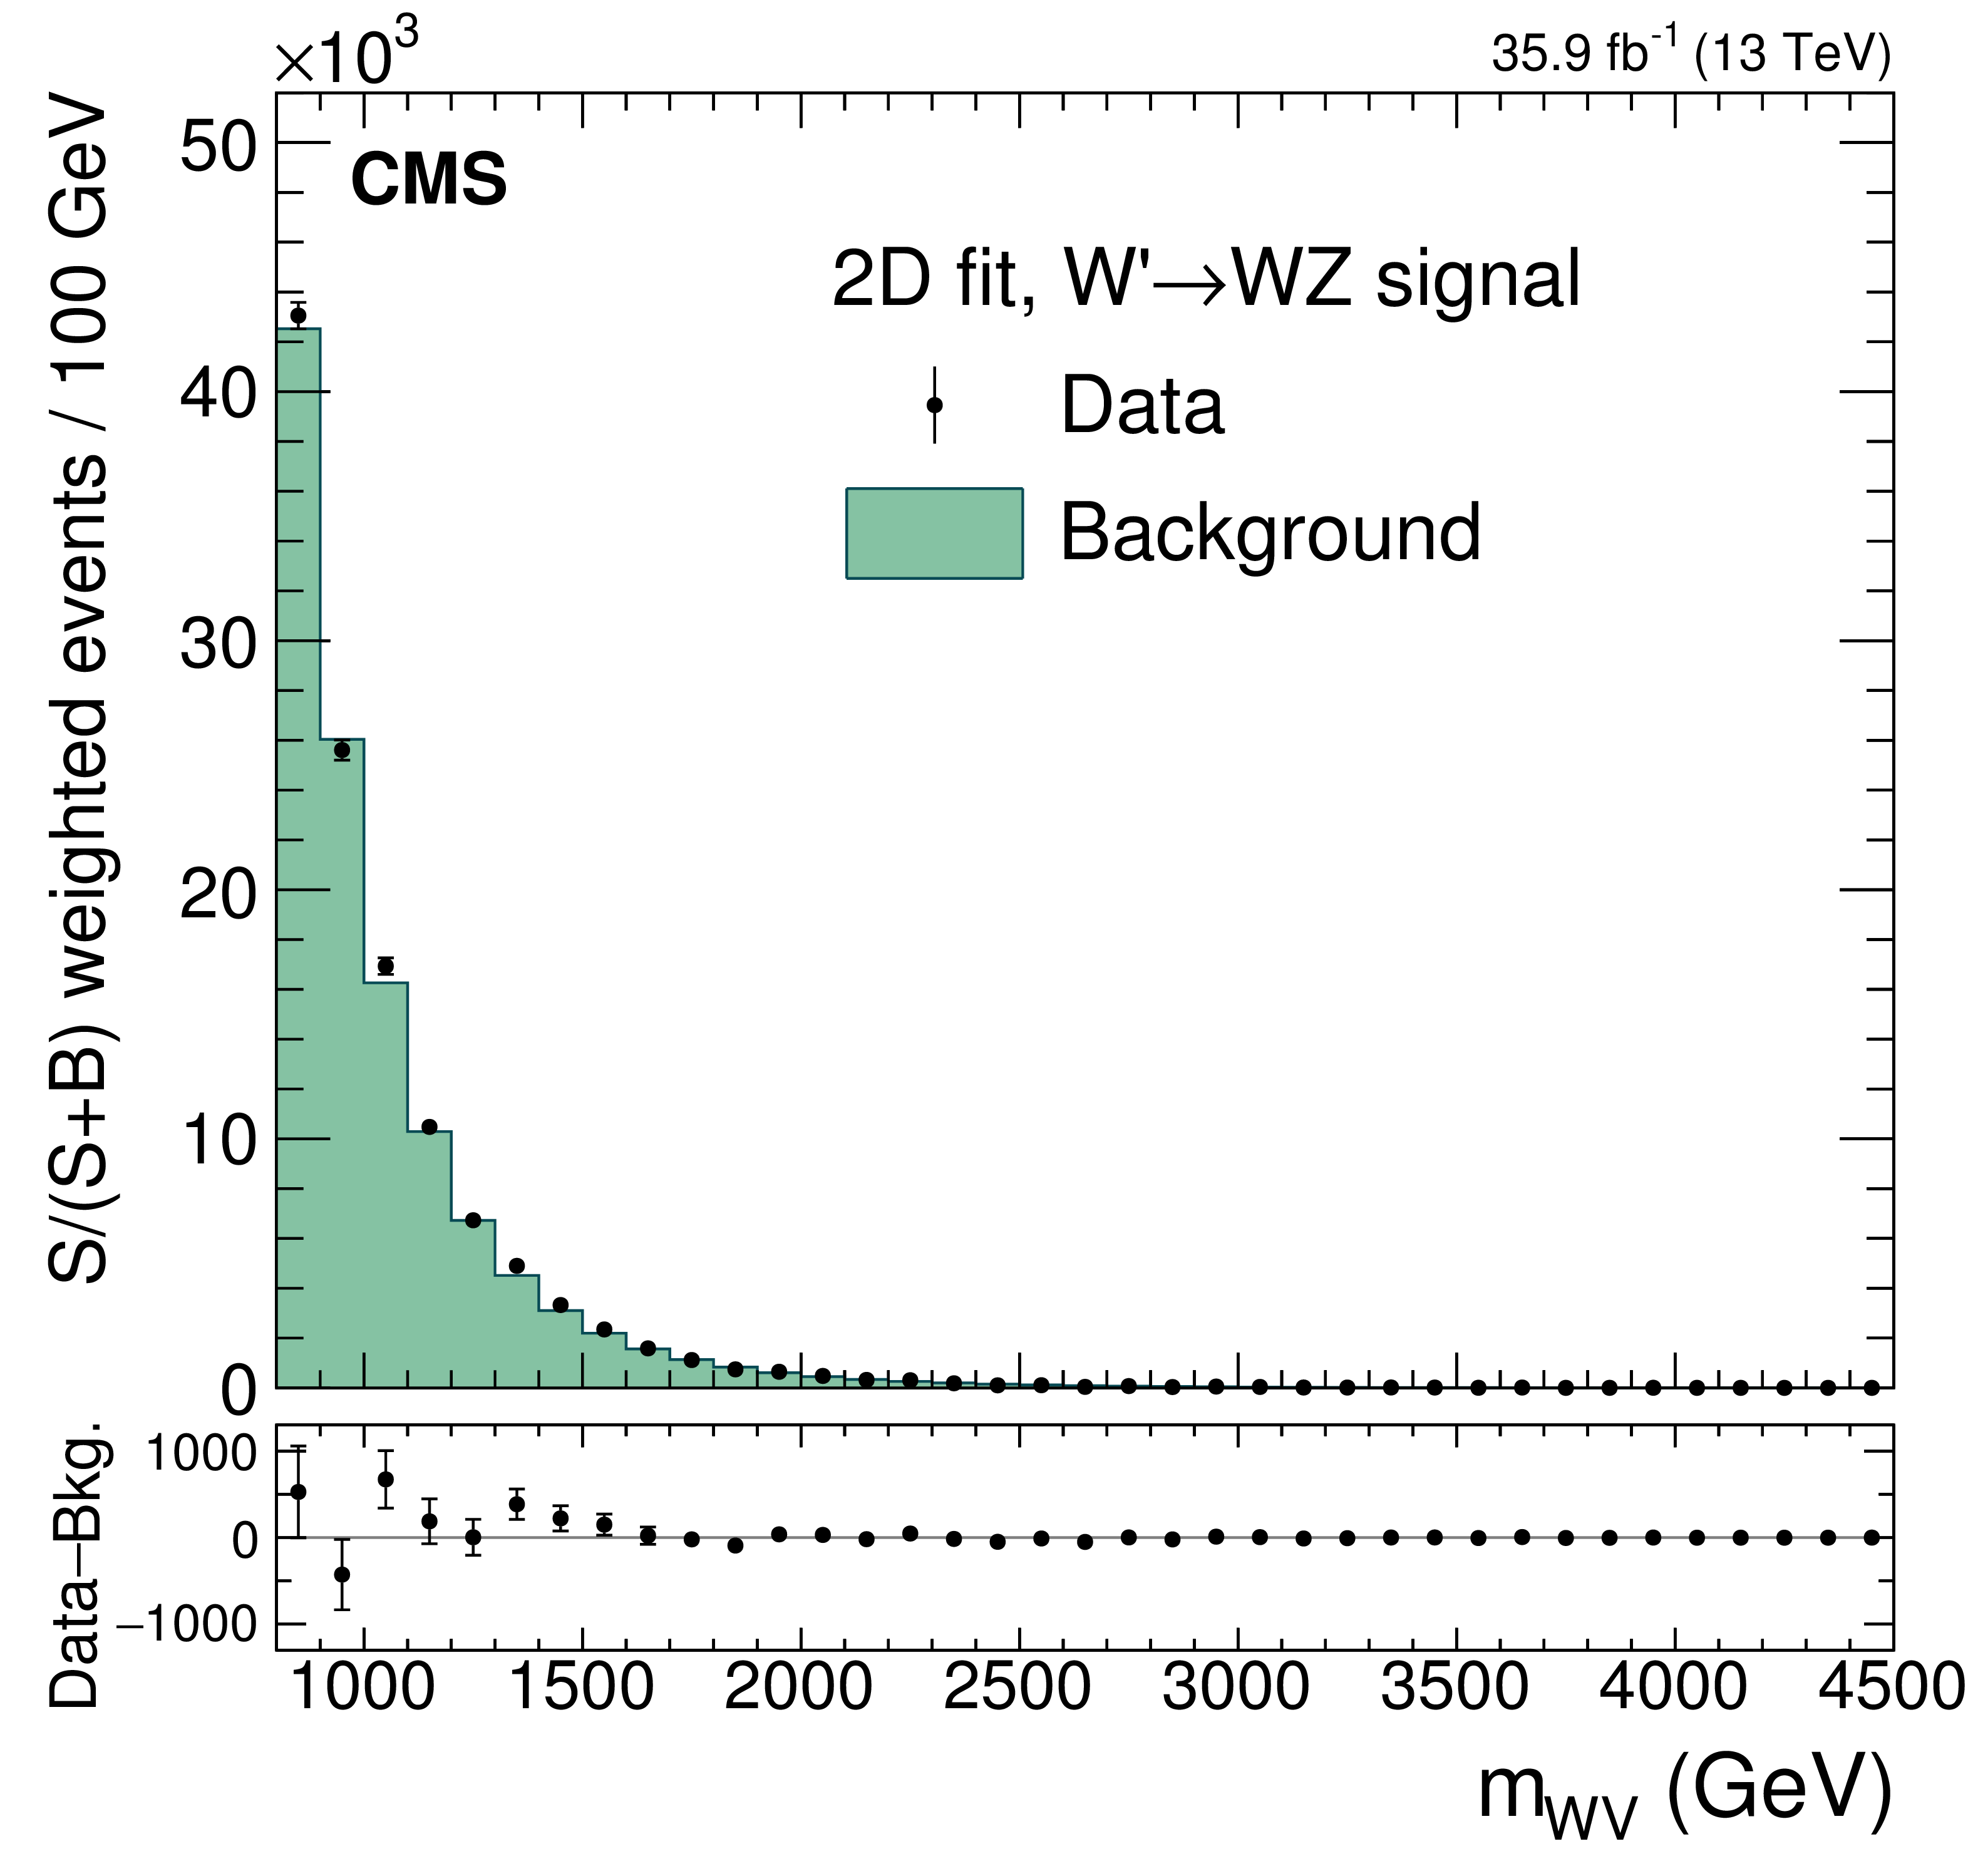
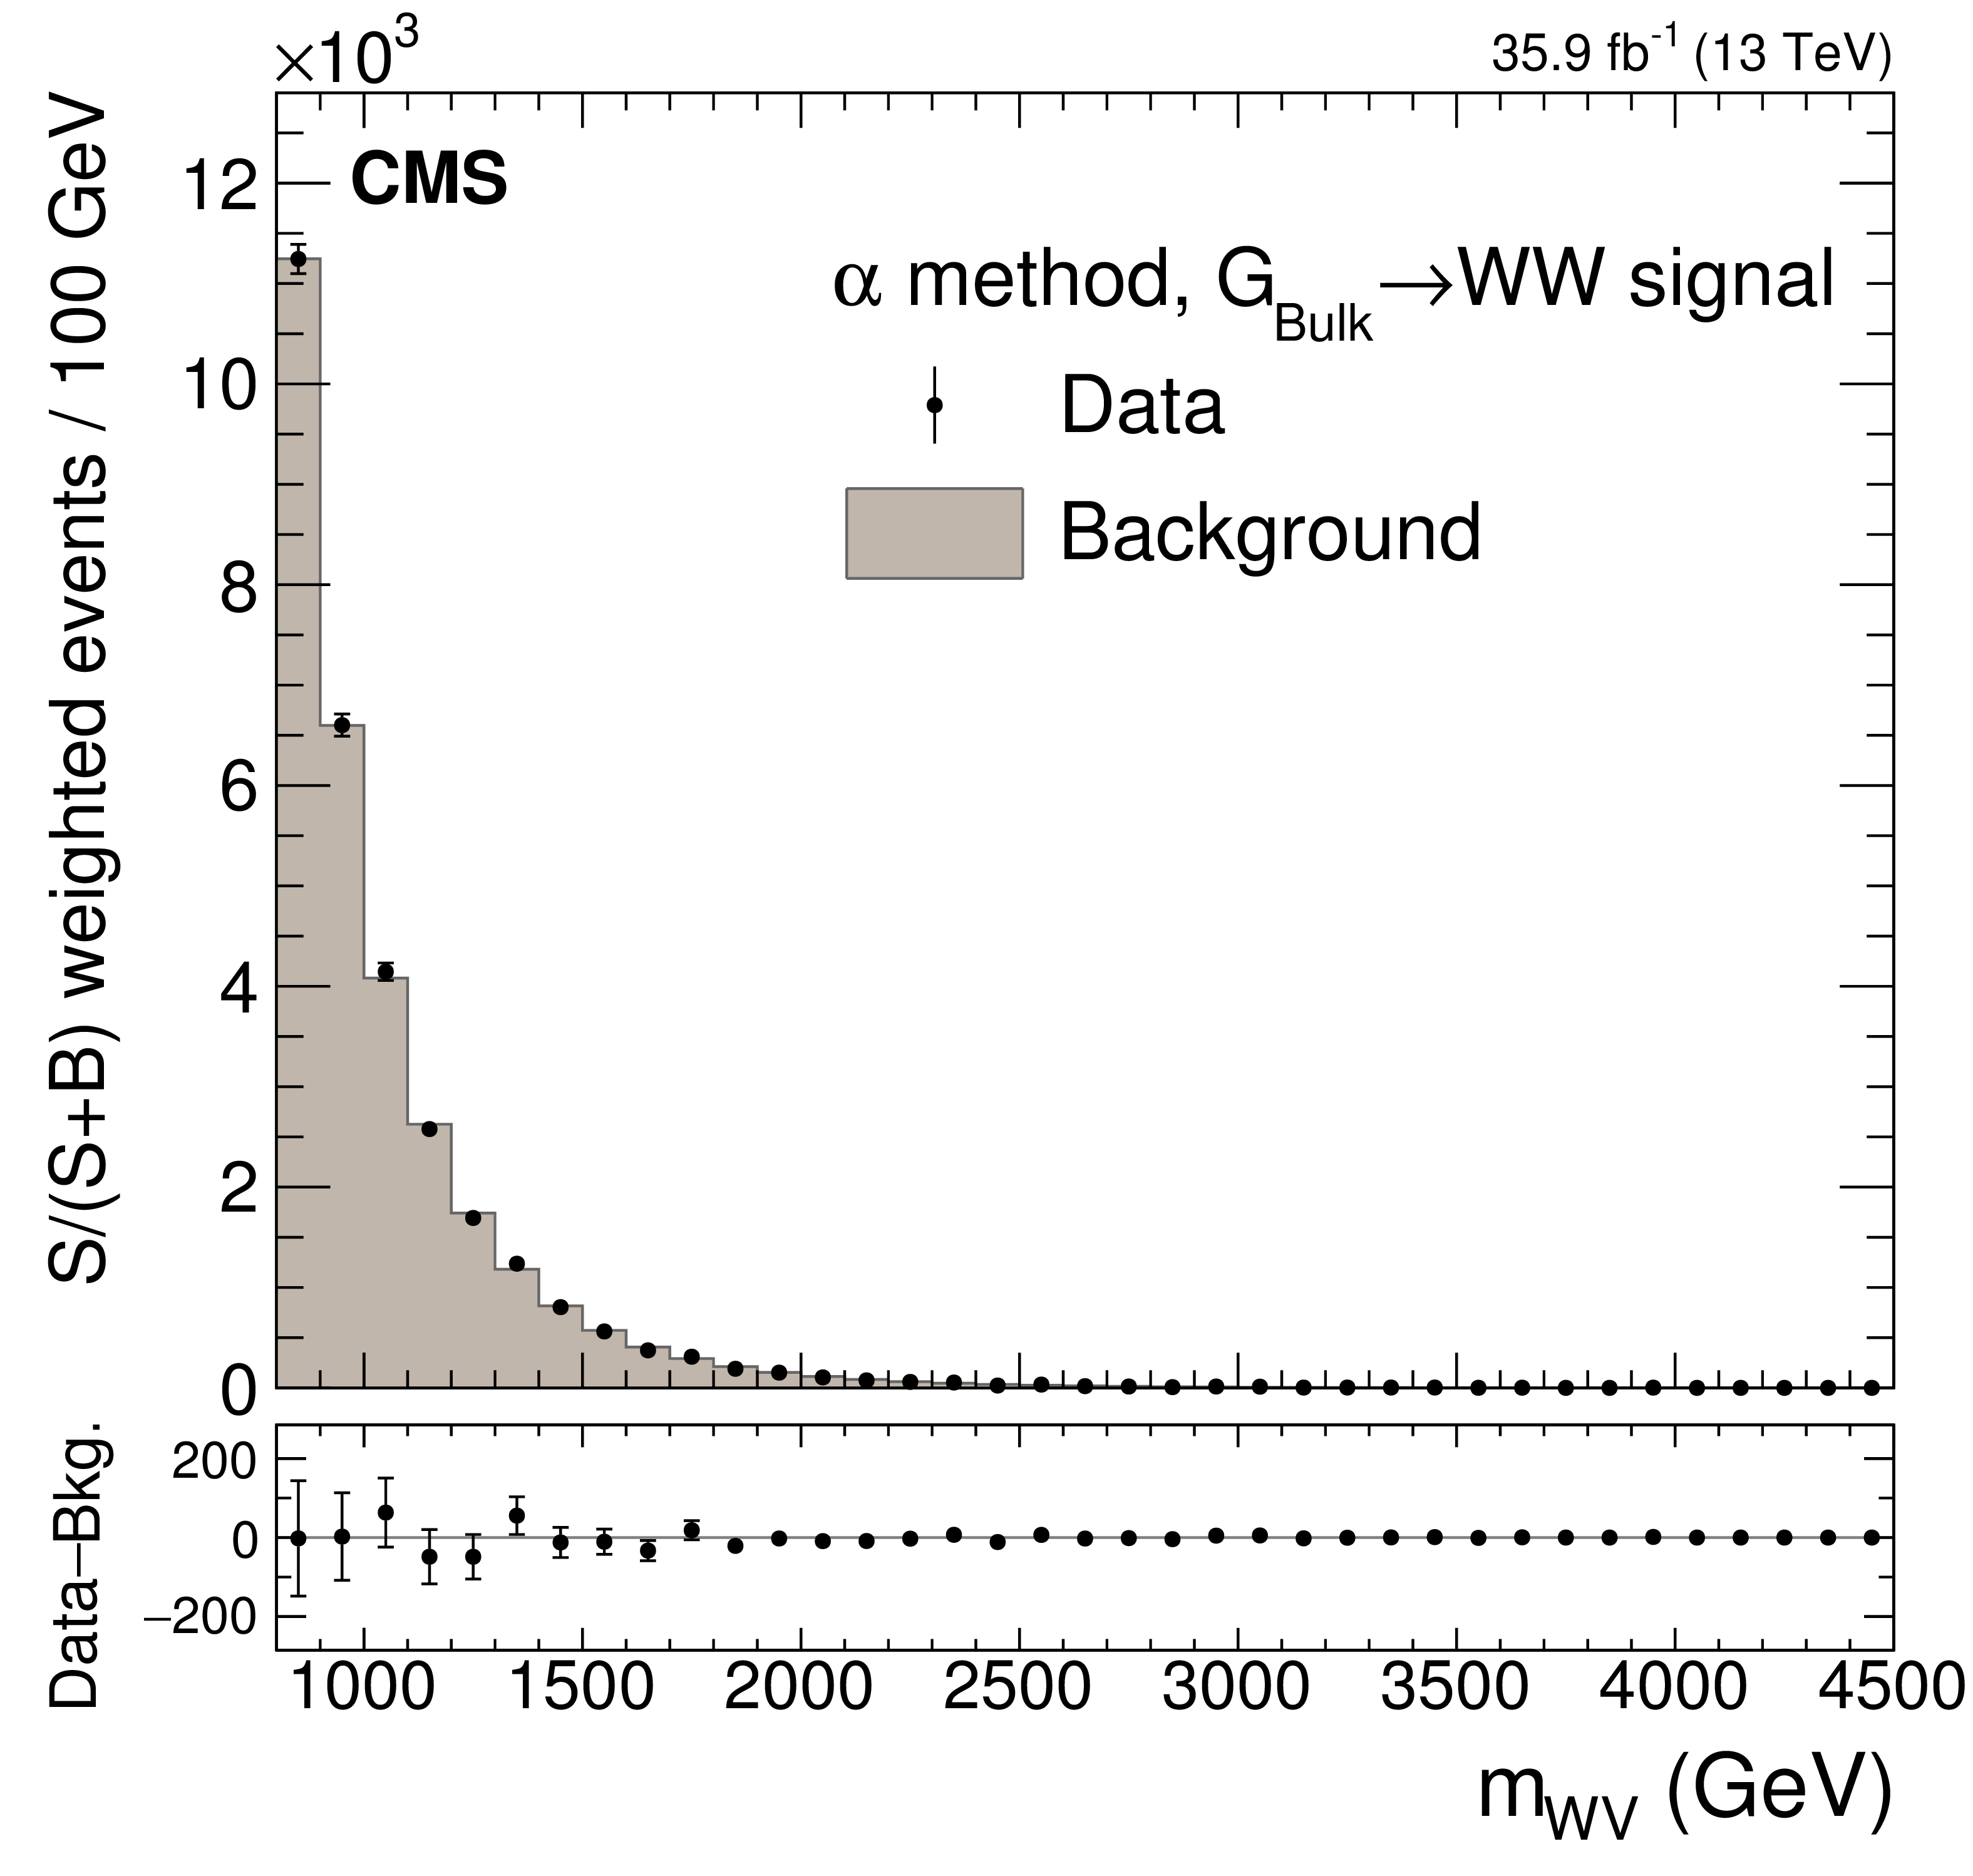
S/(S+B) event-weighted distributions of the resonance mass for the ${{{\mathrm {G}} _{\text {bulk}}}} \to {\mathrm {W}} {\mathrm {W}}$ signal (left) and $ {\mathrm {W}'} \to {\mathrm {W}} {\mathrm {Z}} $ signal (right) for the 2D fit (upper) and the $\alpha $ method (lower). The lower panels show the differences between the weighted data and the weighted fit results. The vertical bars correspond to the statistical uncertainties of the data. |

png pdf |
Figure 5-a:
S/(S+B) event-weighted distributions of the resonance mass for the ${{{\mathrm {G}} _{\text {bulk}}}} \to {\mathrm {W}} {\mathrm {W}}$ signal for the 2D fit. The lower panel shows the differences between the weighted data and the weighted fit results. The vertical bars correspond to the statistical uncertainties of the data. |
png pdf |
Figure 5-b:
S/(S+B) event-weighted distributions of the resonance mass for the $ {\mathrm {W}'} \to {\mathrm {W}} {\mathrm {Z}} $ signal for the 2D fit. The lower panel shows the differences between the weighted data and the weighted fit results. The vertical bars correspond to the statistical uncertainties of the data. |
png pdf |
Figure 5-c:
S/(S+B) event-weighted distributions of the resonance mass for the ${{{\mathrm {G}} _{\text {bulk}}}} \to {\mathrm {W}} {\mathrm {W}}$ signal for $\alpha $ method. The lower panel shows the differences between the weighted data and the weighted fit results. The vertical bars correspond to the statistical uncertainties of the data. |

png pdf |
Figure 5-d:
S/(S+B) event-weighted distributions of the resonance mass for the $ {\mathrm {W}'} \to {\mathrm {W}} {\mathrm {Z}} $ signal for the $\alpha $ method. The lower panel shows the differences between the weighted data and the weighted fit results. The vertical bars correspond to the statistical uncertainties of the data. |
png pdf |
Figure 6:
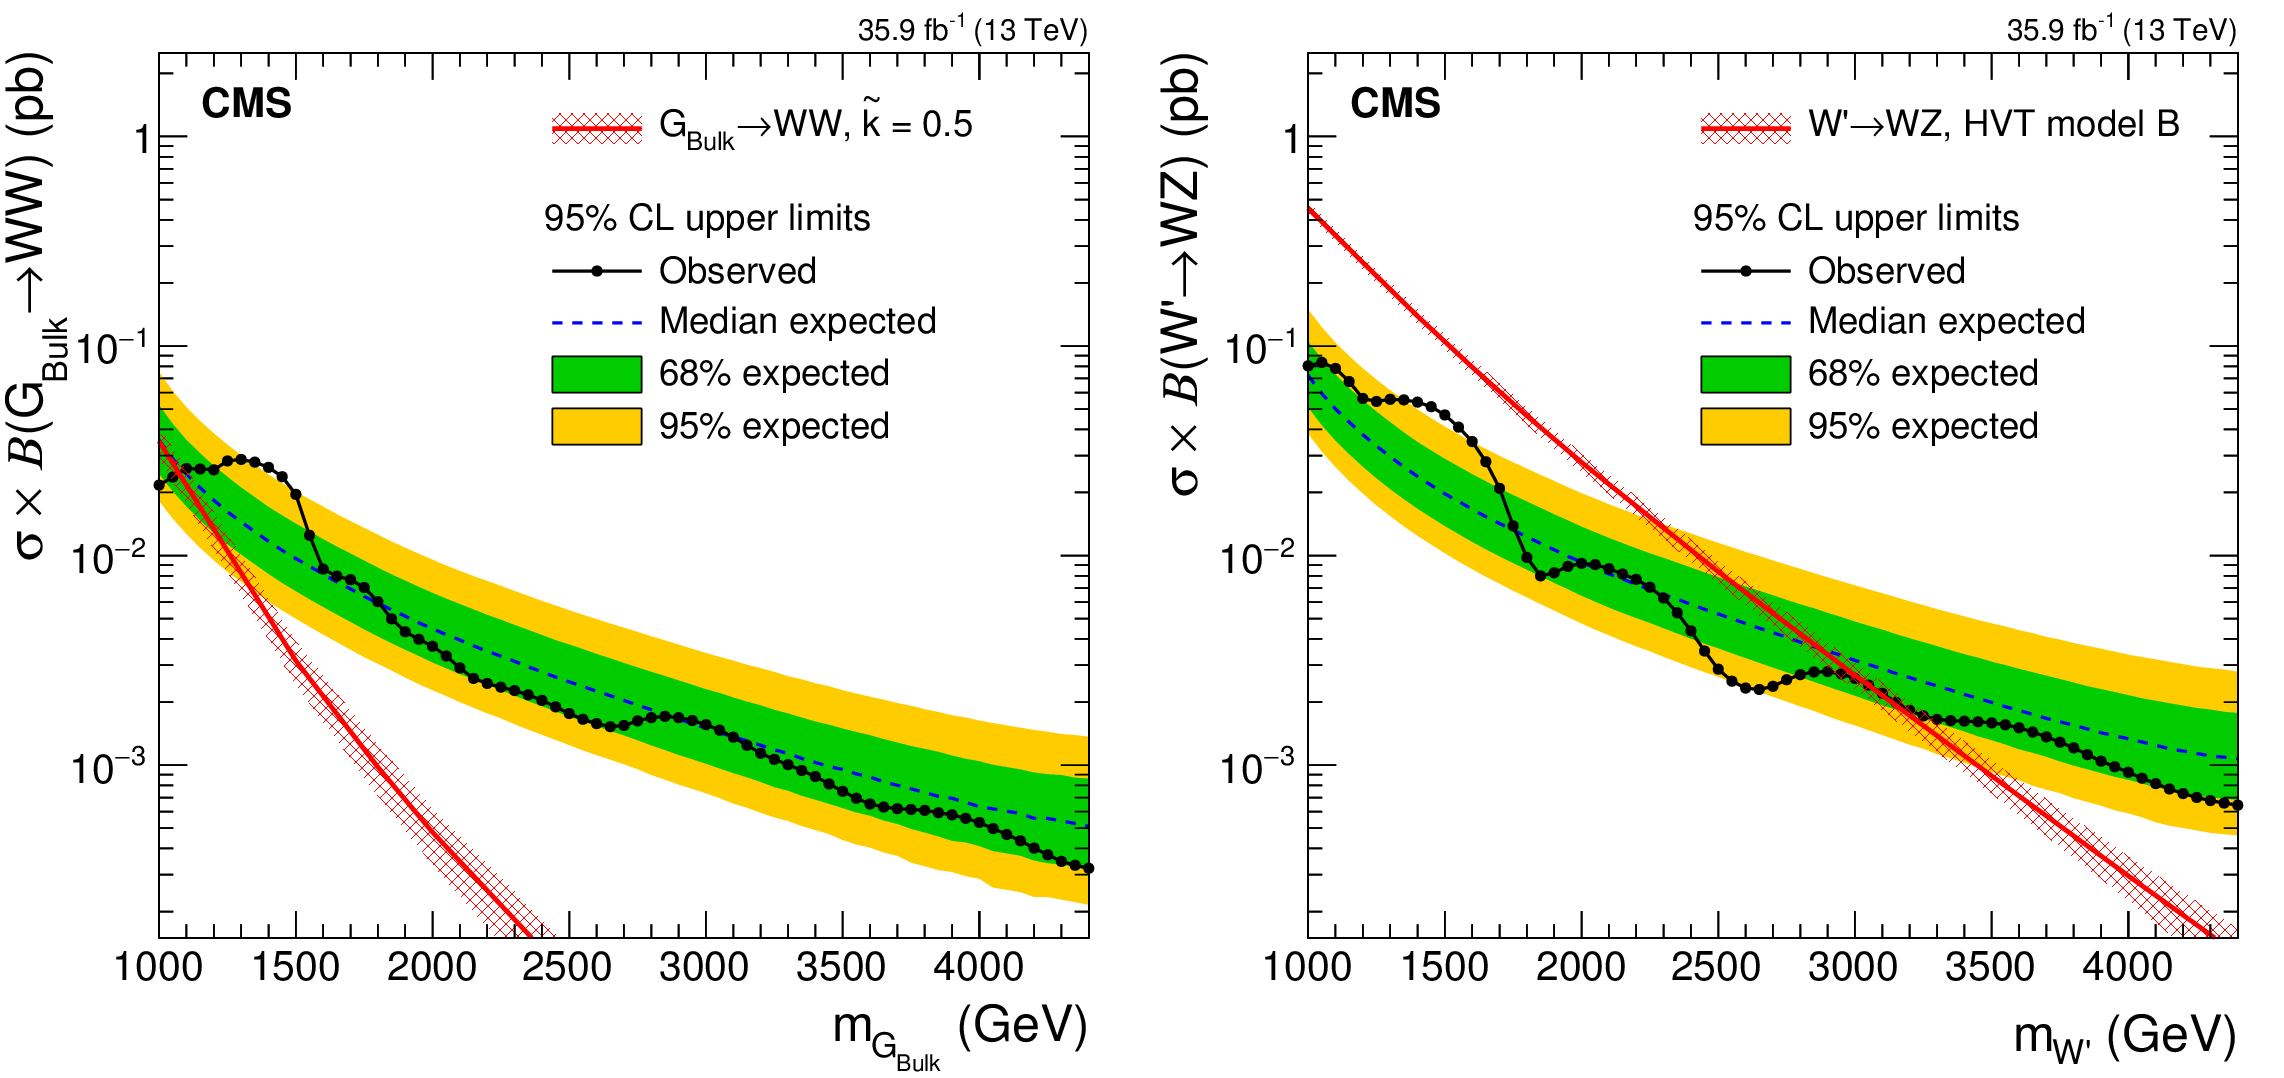
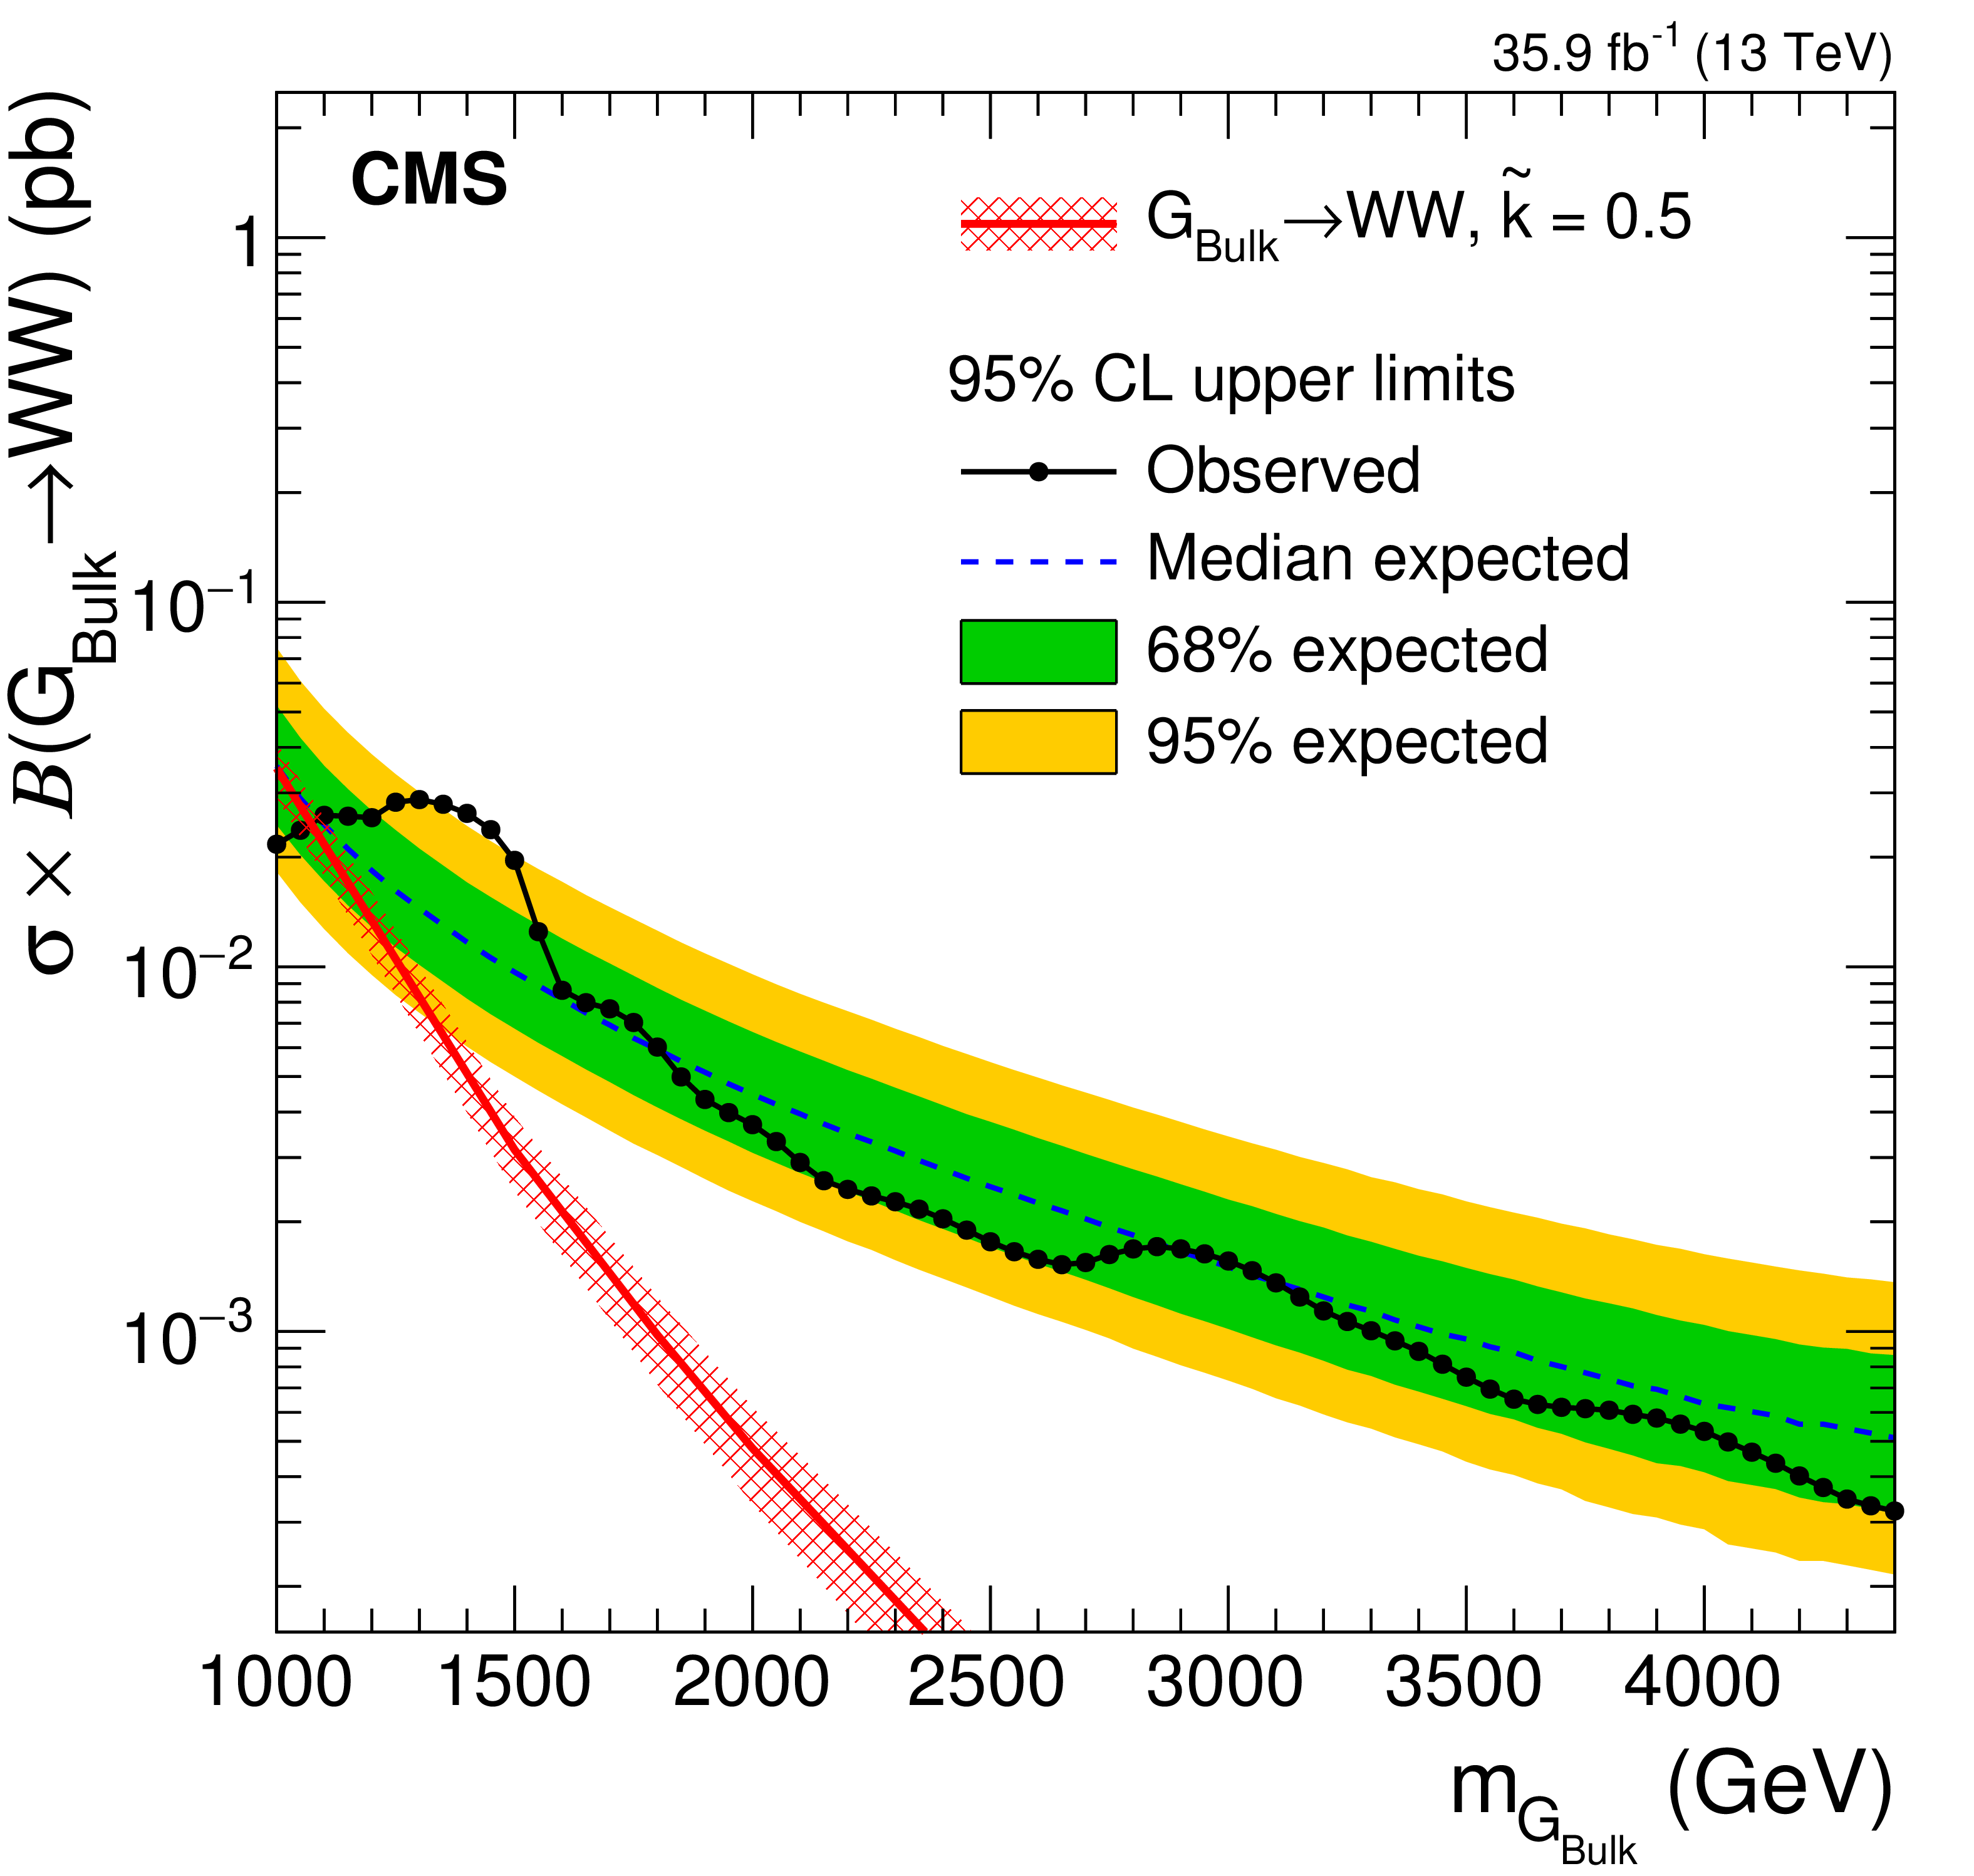
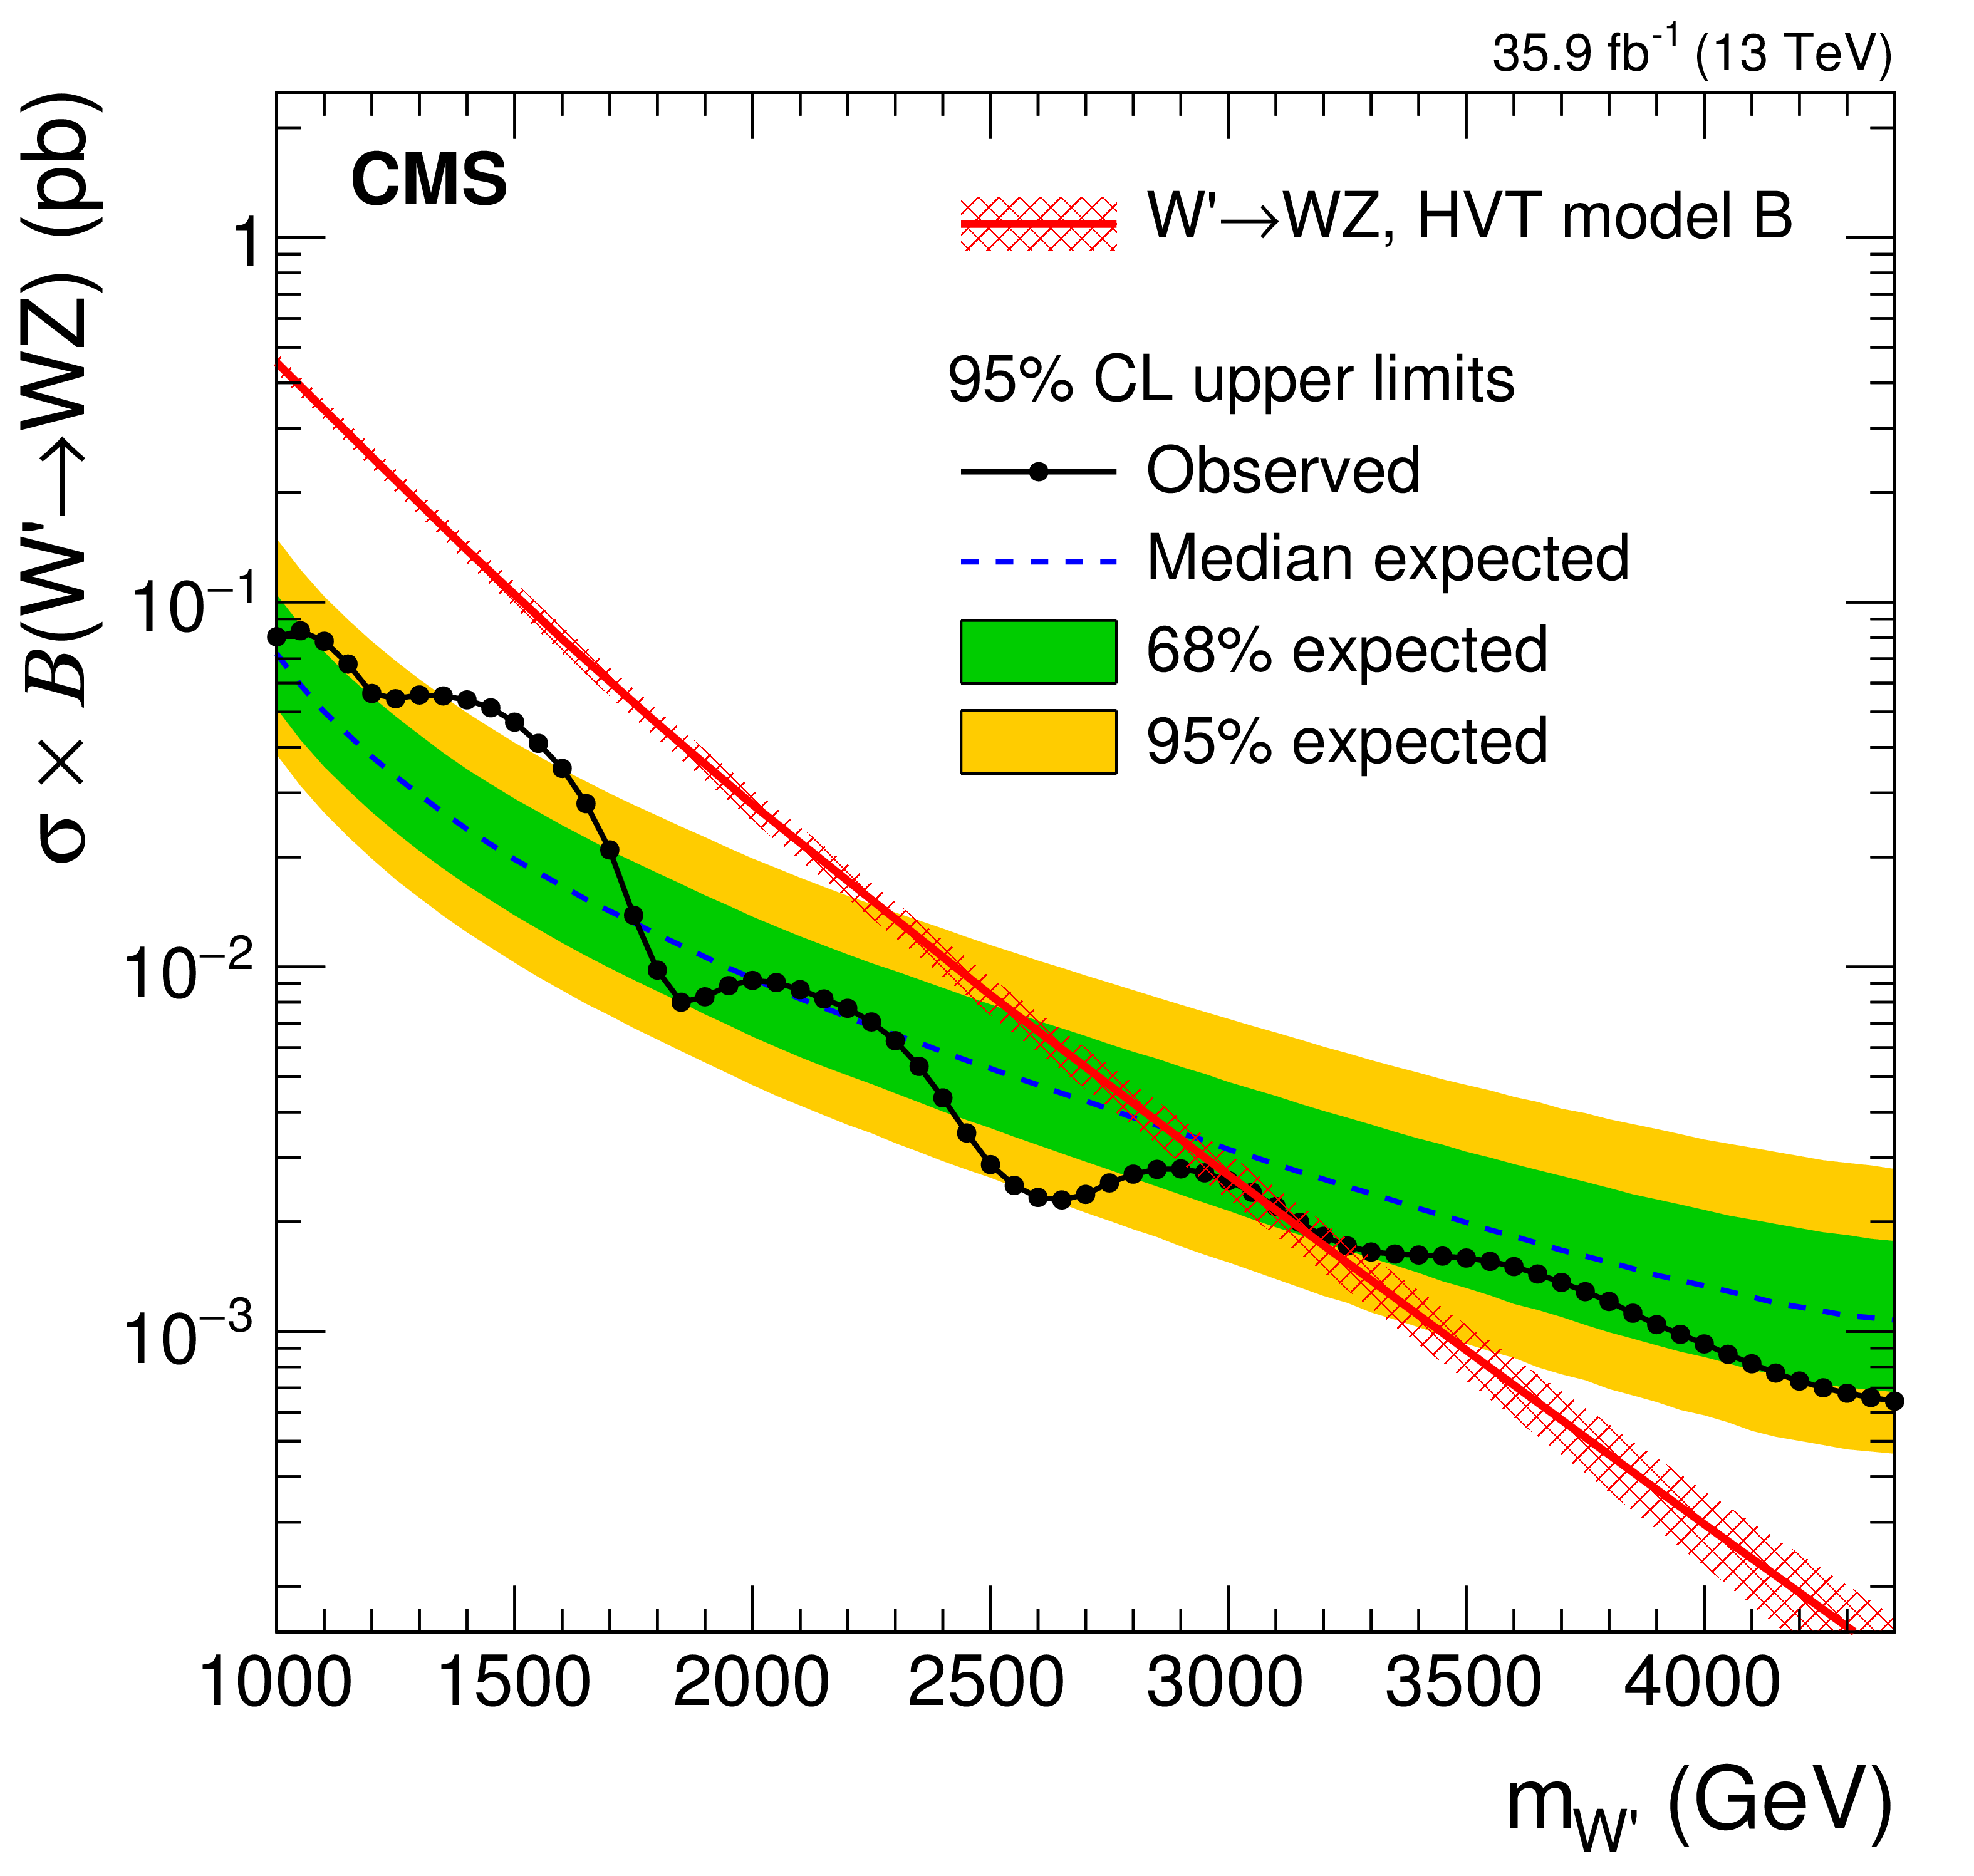
Exclusion limits on the product of the production cross section and the branching fraction for a new spin-2 resonance decaying to WW (left) and for a new spin-1 resonance decaying to WZ (right), as a function of the resonance mass hypothesis. Signal cross section uncertainties are shown as red cross-hatched bands. |
png pdf |
Figure 6-a:
Exclusion limits on the product of the production cross section and the branching fraction for a new spin-2 resonance decaying to WW, as a function of the resonance mass hypothesis. Signal cross section uncertainties are shown as a red cross-hatched band. |
png pdf |
Figure 6-b:
Exclusion limits on the product of the production cross section and the branching fraction for a new spin-1 resonance decaying to WZ, as a function of the resonance mass hypothesis. Signal cross section uncertainties are shown as a red cross-hatched band. |
| Summary |
| A search for a new heavy resonance decaying to a pair of vector bosons is performed in events with one muon or electron and a massive jet. Using the $N$-subjettiness ratio ${\tau_{21}}$, massive jets are tagged as highly energetic vector bosons (V = W, Z) decaying to quark pairs. The soft-drop mass is used as an estimate of the V-jet mass. The lepton momentum and missing transverse momentum are used to reconstruct the momentum of the $\mathrm{W} \to \ell \nu$ boson candidate, constraining the invariant mass of the $\ell \nu$ pair to the W boson mass value. A novel signal extraction technique is introduced based on a simultaneous fit of the V-jet mass and the diboson mass, and improves the search sensitivity compared to the method employed in previous versions of this analysis. No significant evidence of a new signal is found. The results are interpreted in terms of upper limits on the production cross section of new resonances decaying to WW and WZ final states. The observed limits for a WW resonance range from 29 fb at 1.3 TeV to 0.32 fb at 4.4 TeV, while for a WZ resonance they range from 84 fb at 1.05 TeV to 0.64 fb at 4.4 TeV. Comparing the excluded cross section values to the expectations from theoretical calculations, spin-2 bulk graviton resonances decaying to WW with mass smaller than 1.07 TeV and W' $ \to $ WZ resonances lighter than 3.05 TeV are excluded at 95% CL. |
| Additional Figures | |
png pdf |
Additional Figure 1:
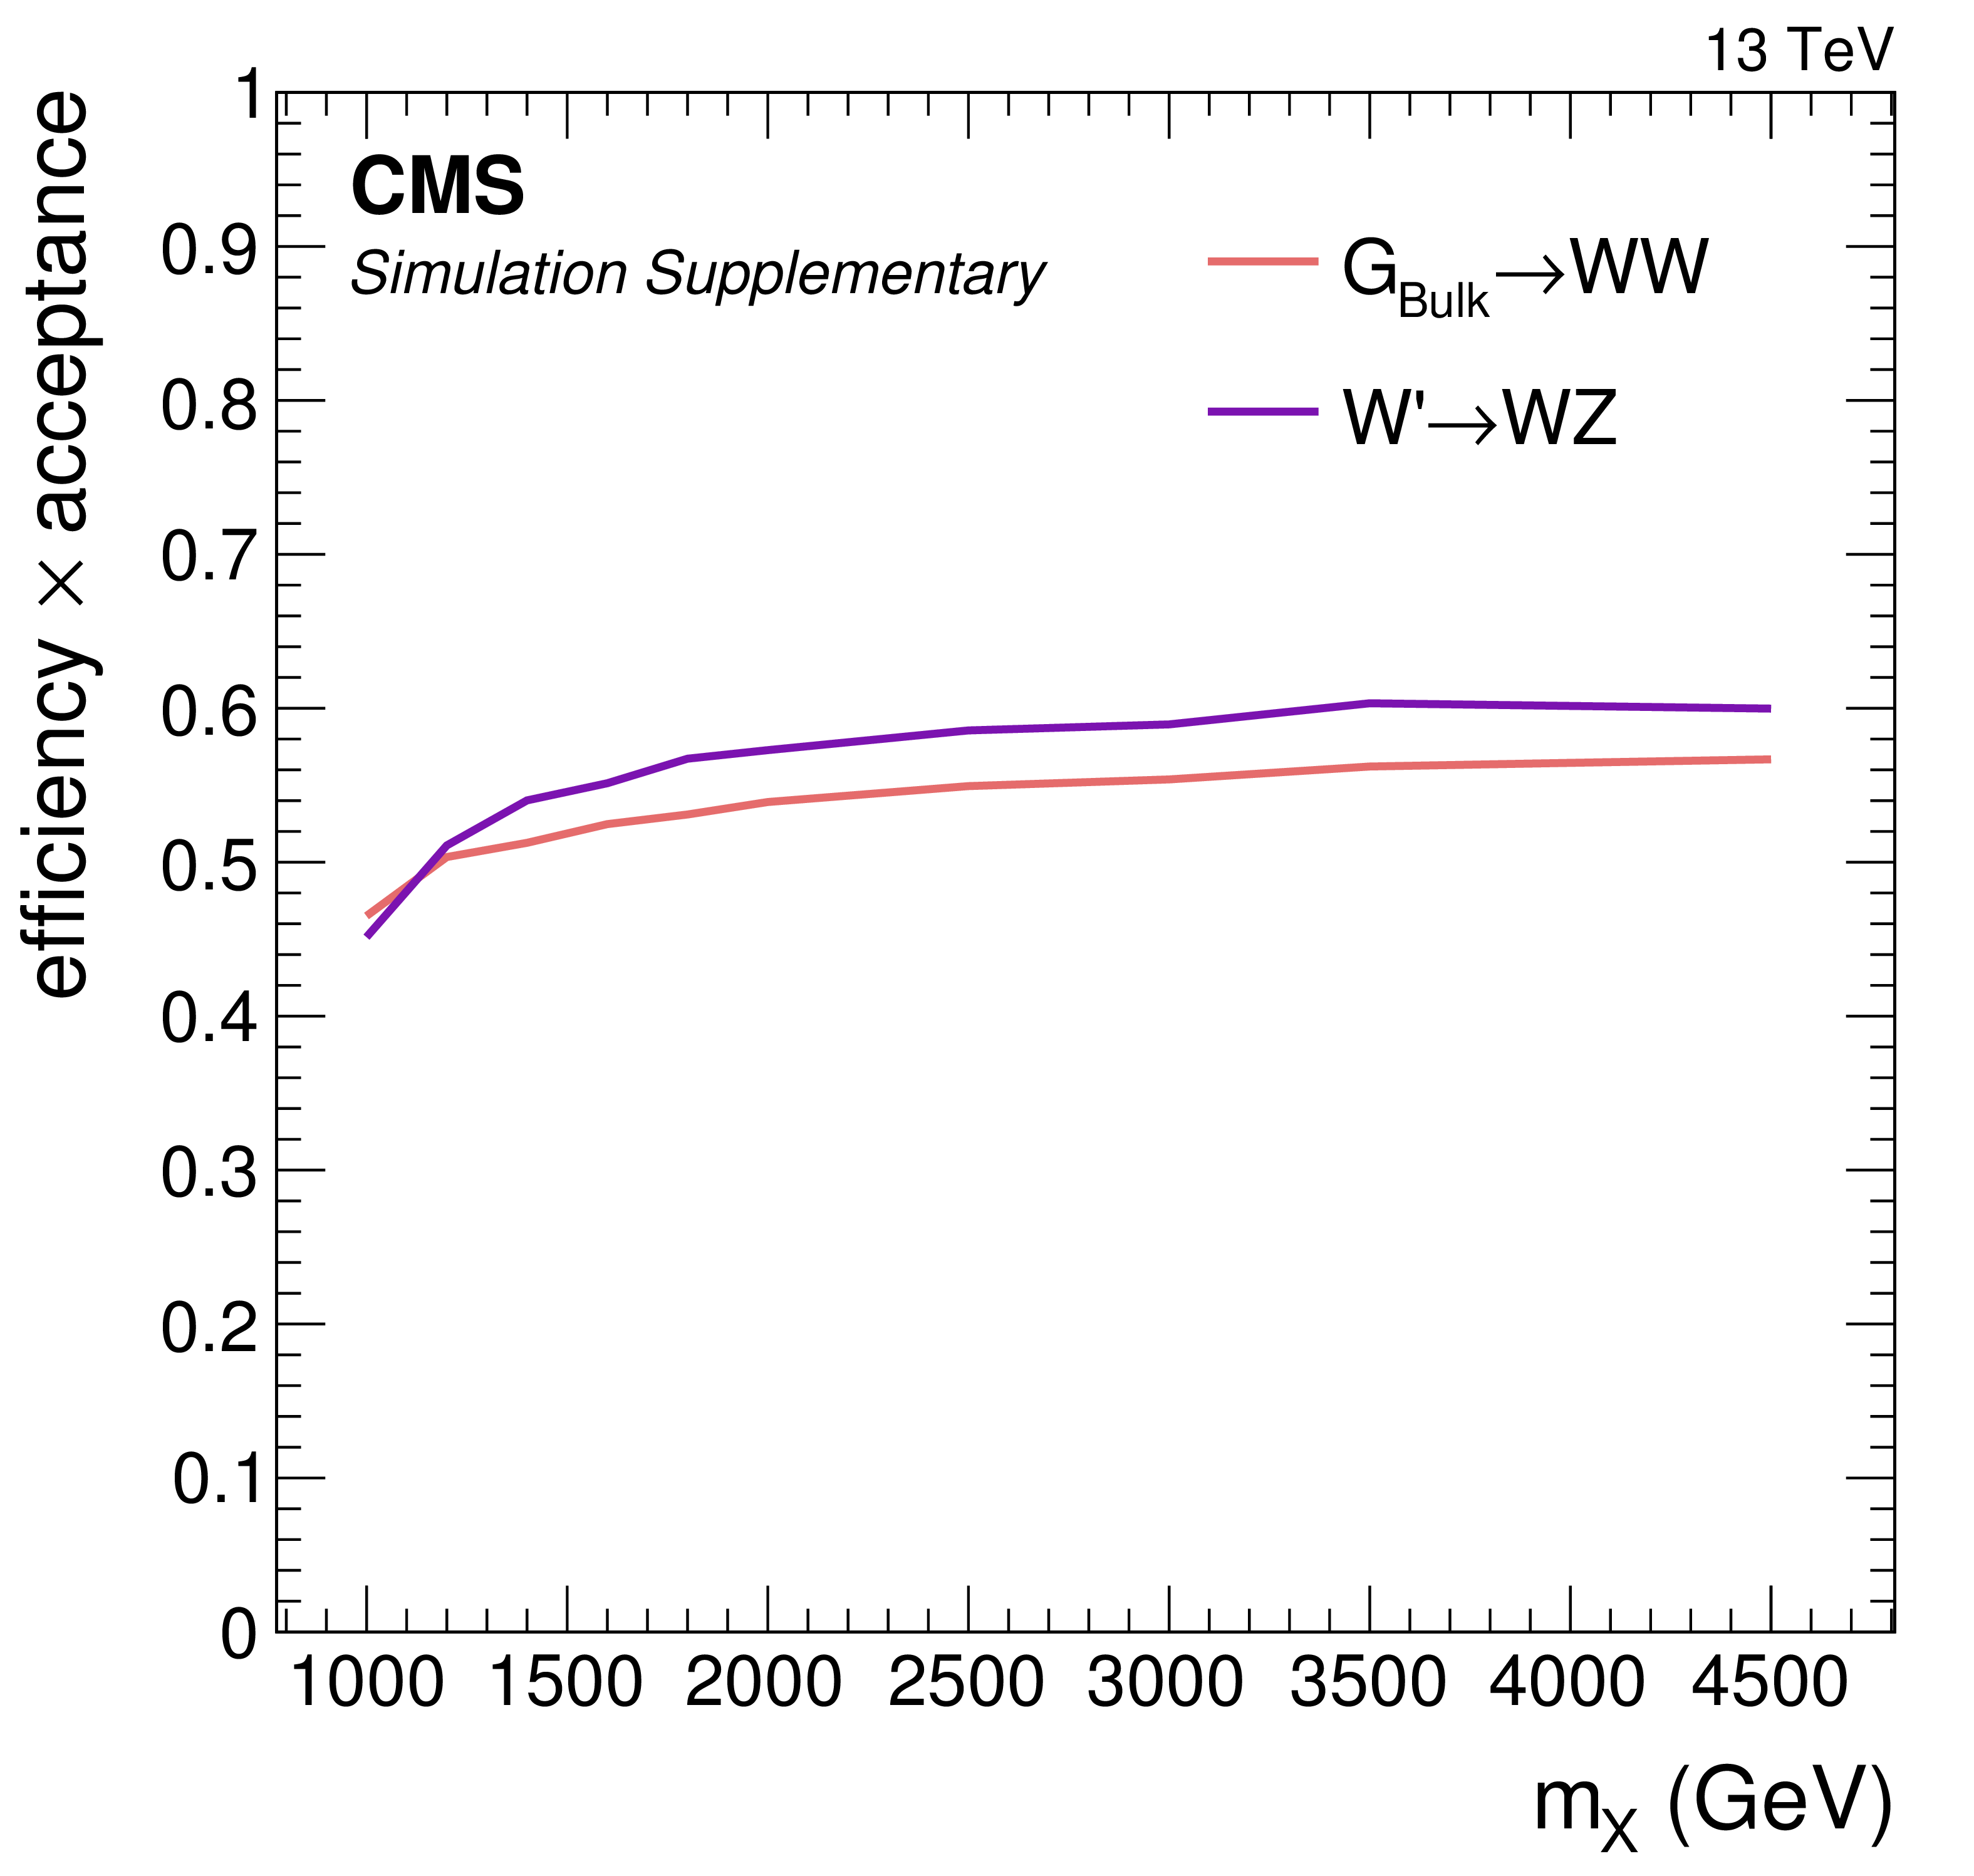
Signal selection efficiency times acceptance as a function of resonance mass for a spin-2 bulk graviton decaying to WW and a spin-1 W' decaying to WZ. |
png pdf |
Additional Figure 2:
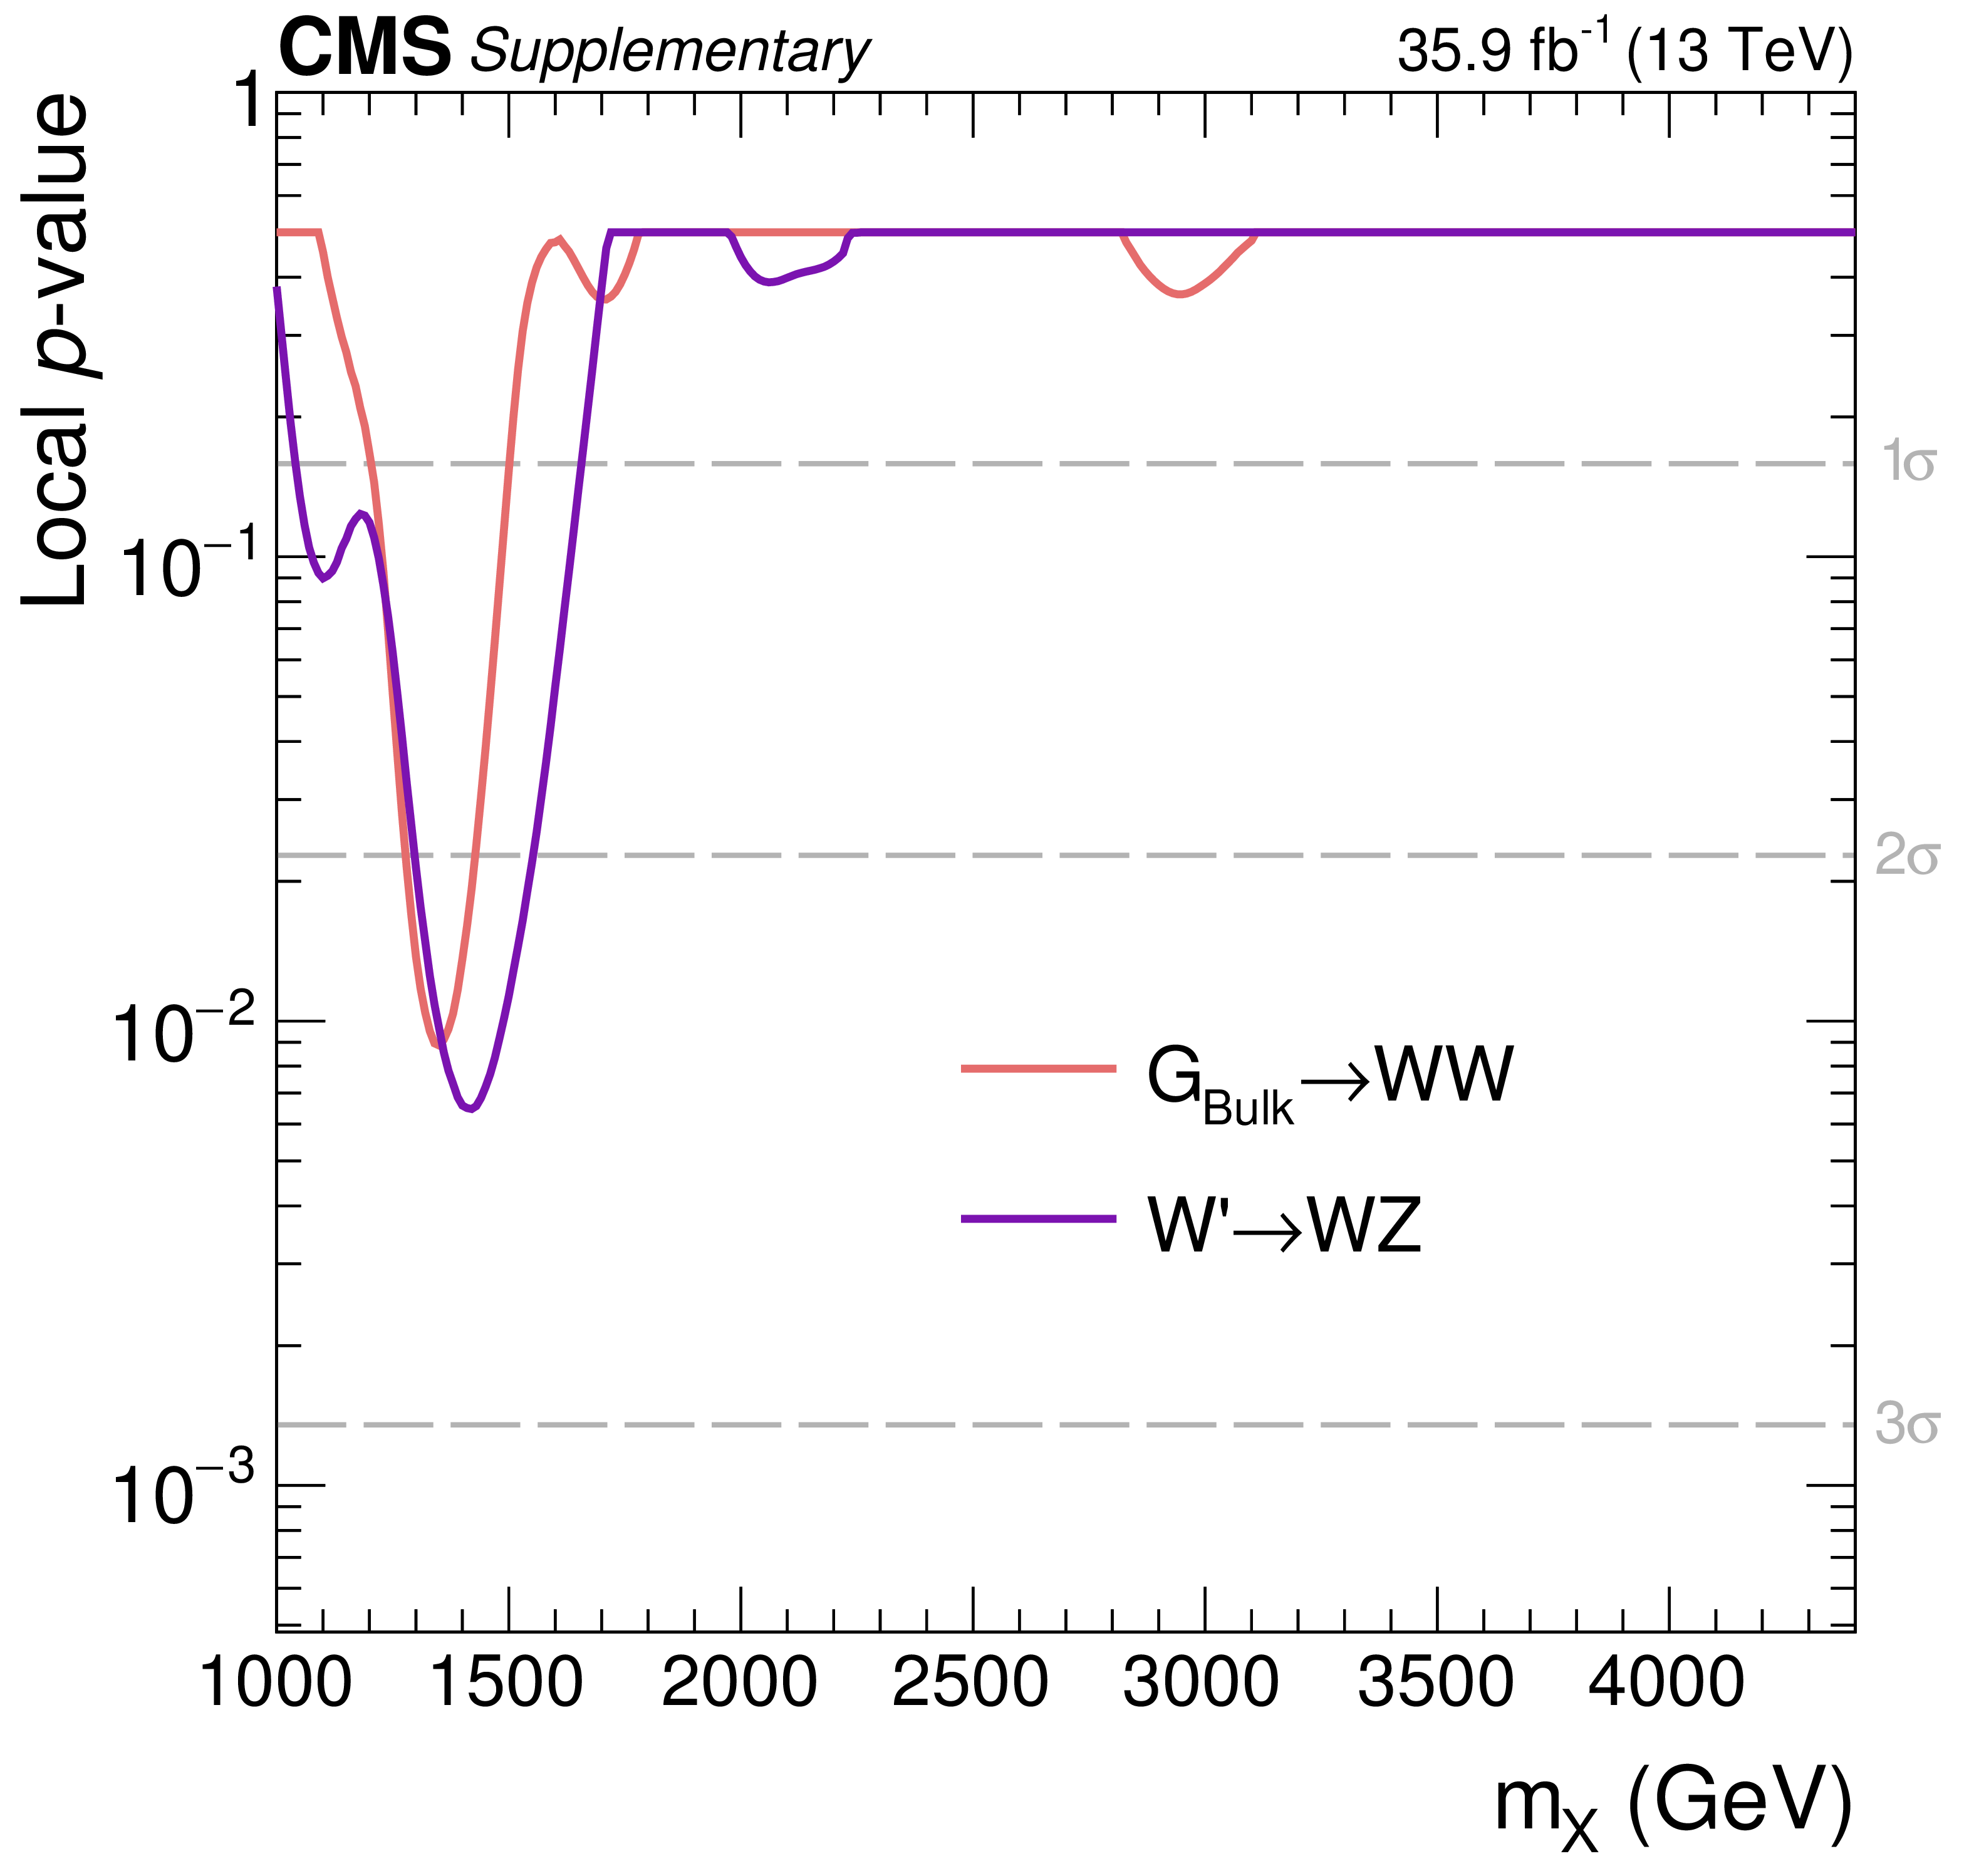
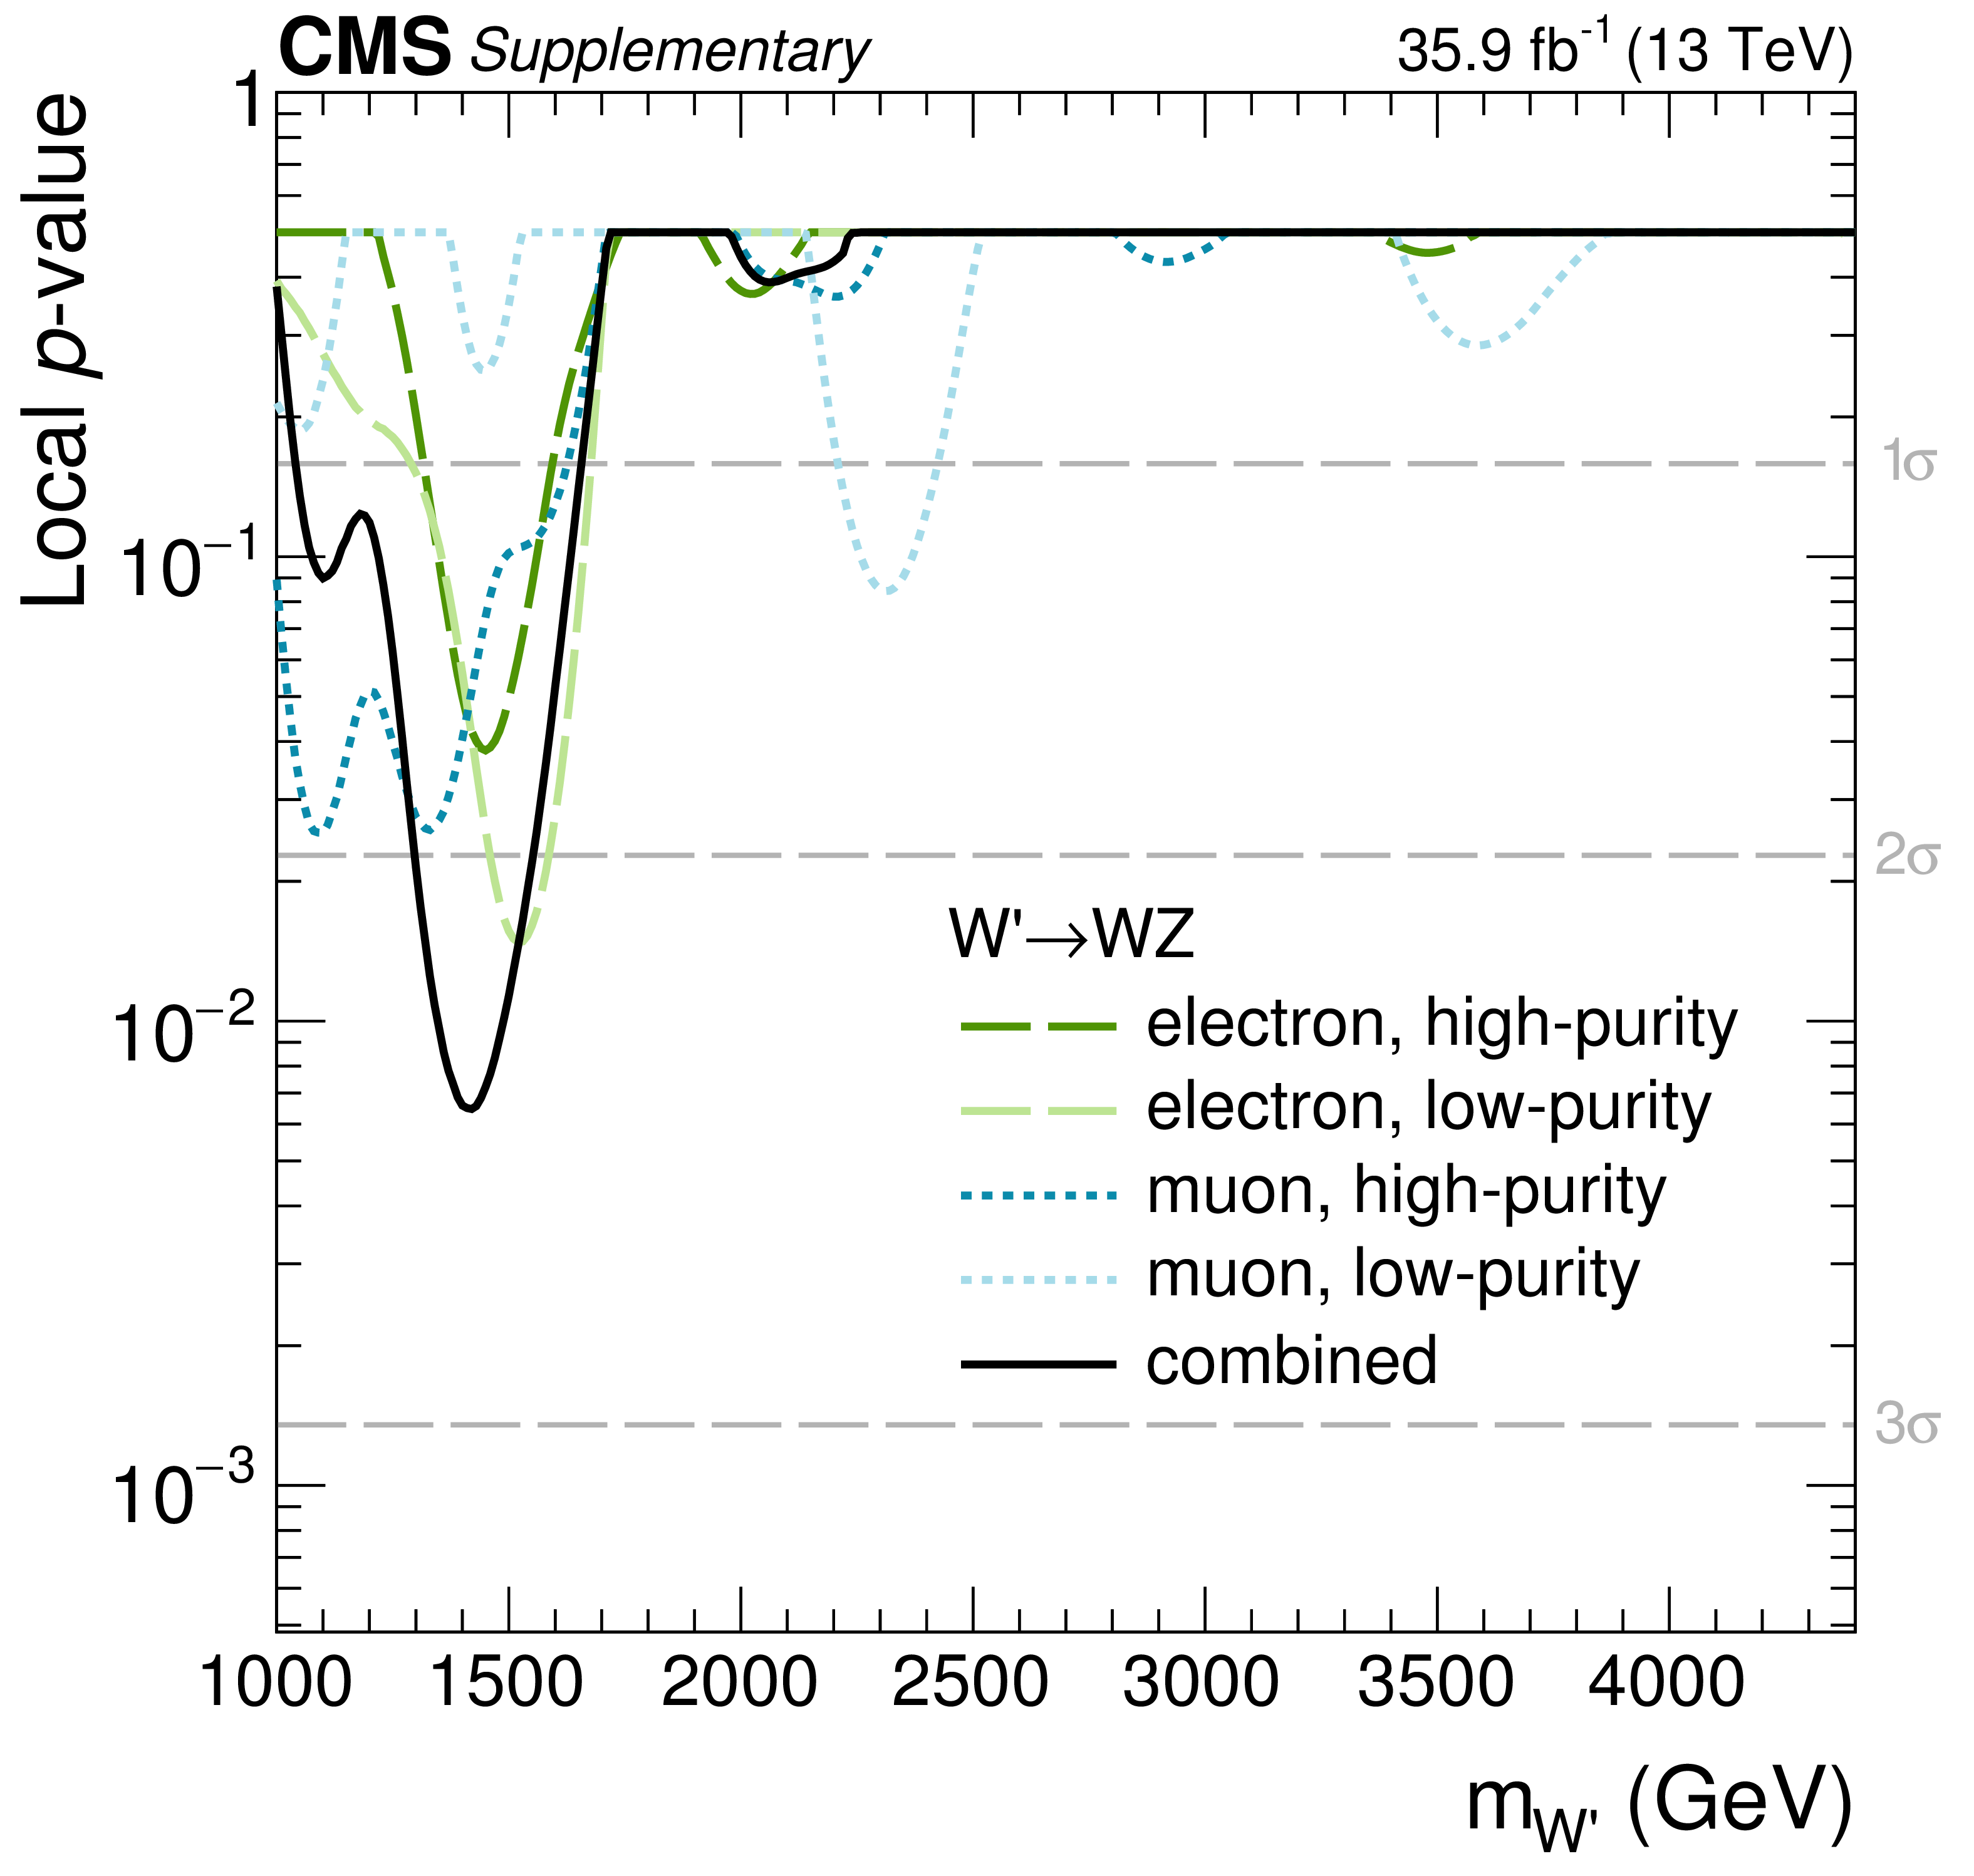
Local $p$-value as a function of resonance mass for a spin-2 bulk graviton decaying to WW and a spin-1 W' decaying to WZ. |
png pdf |
Additional Figure 3:
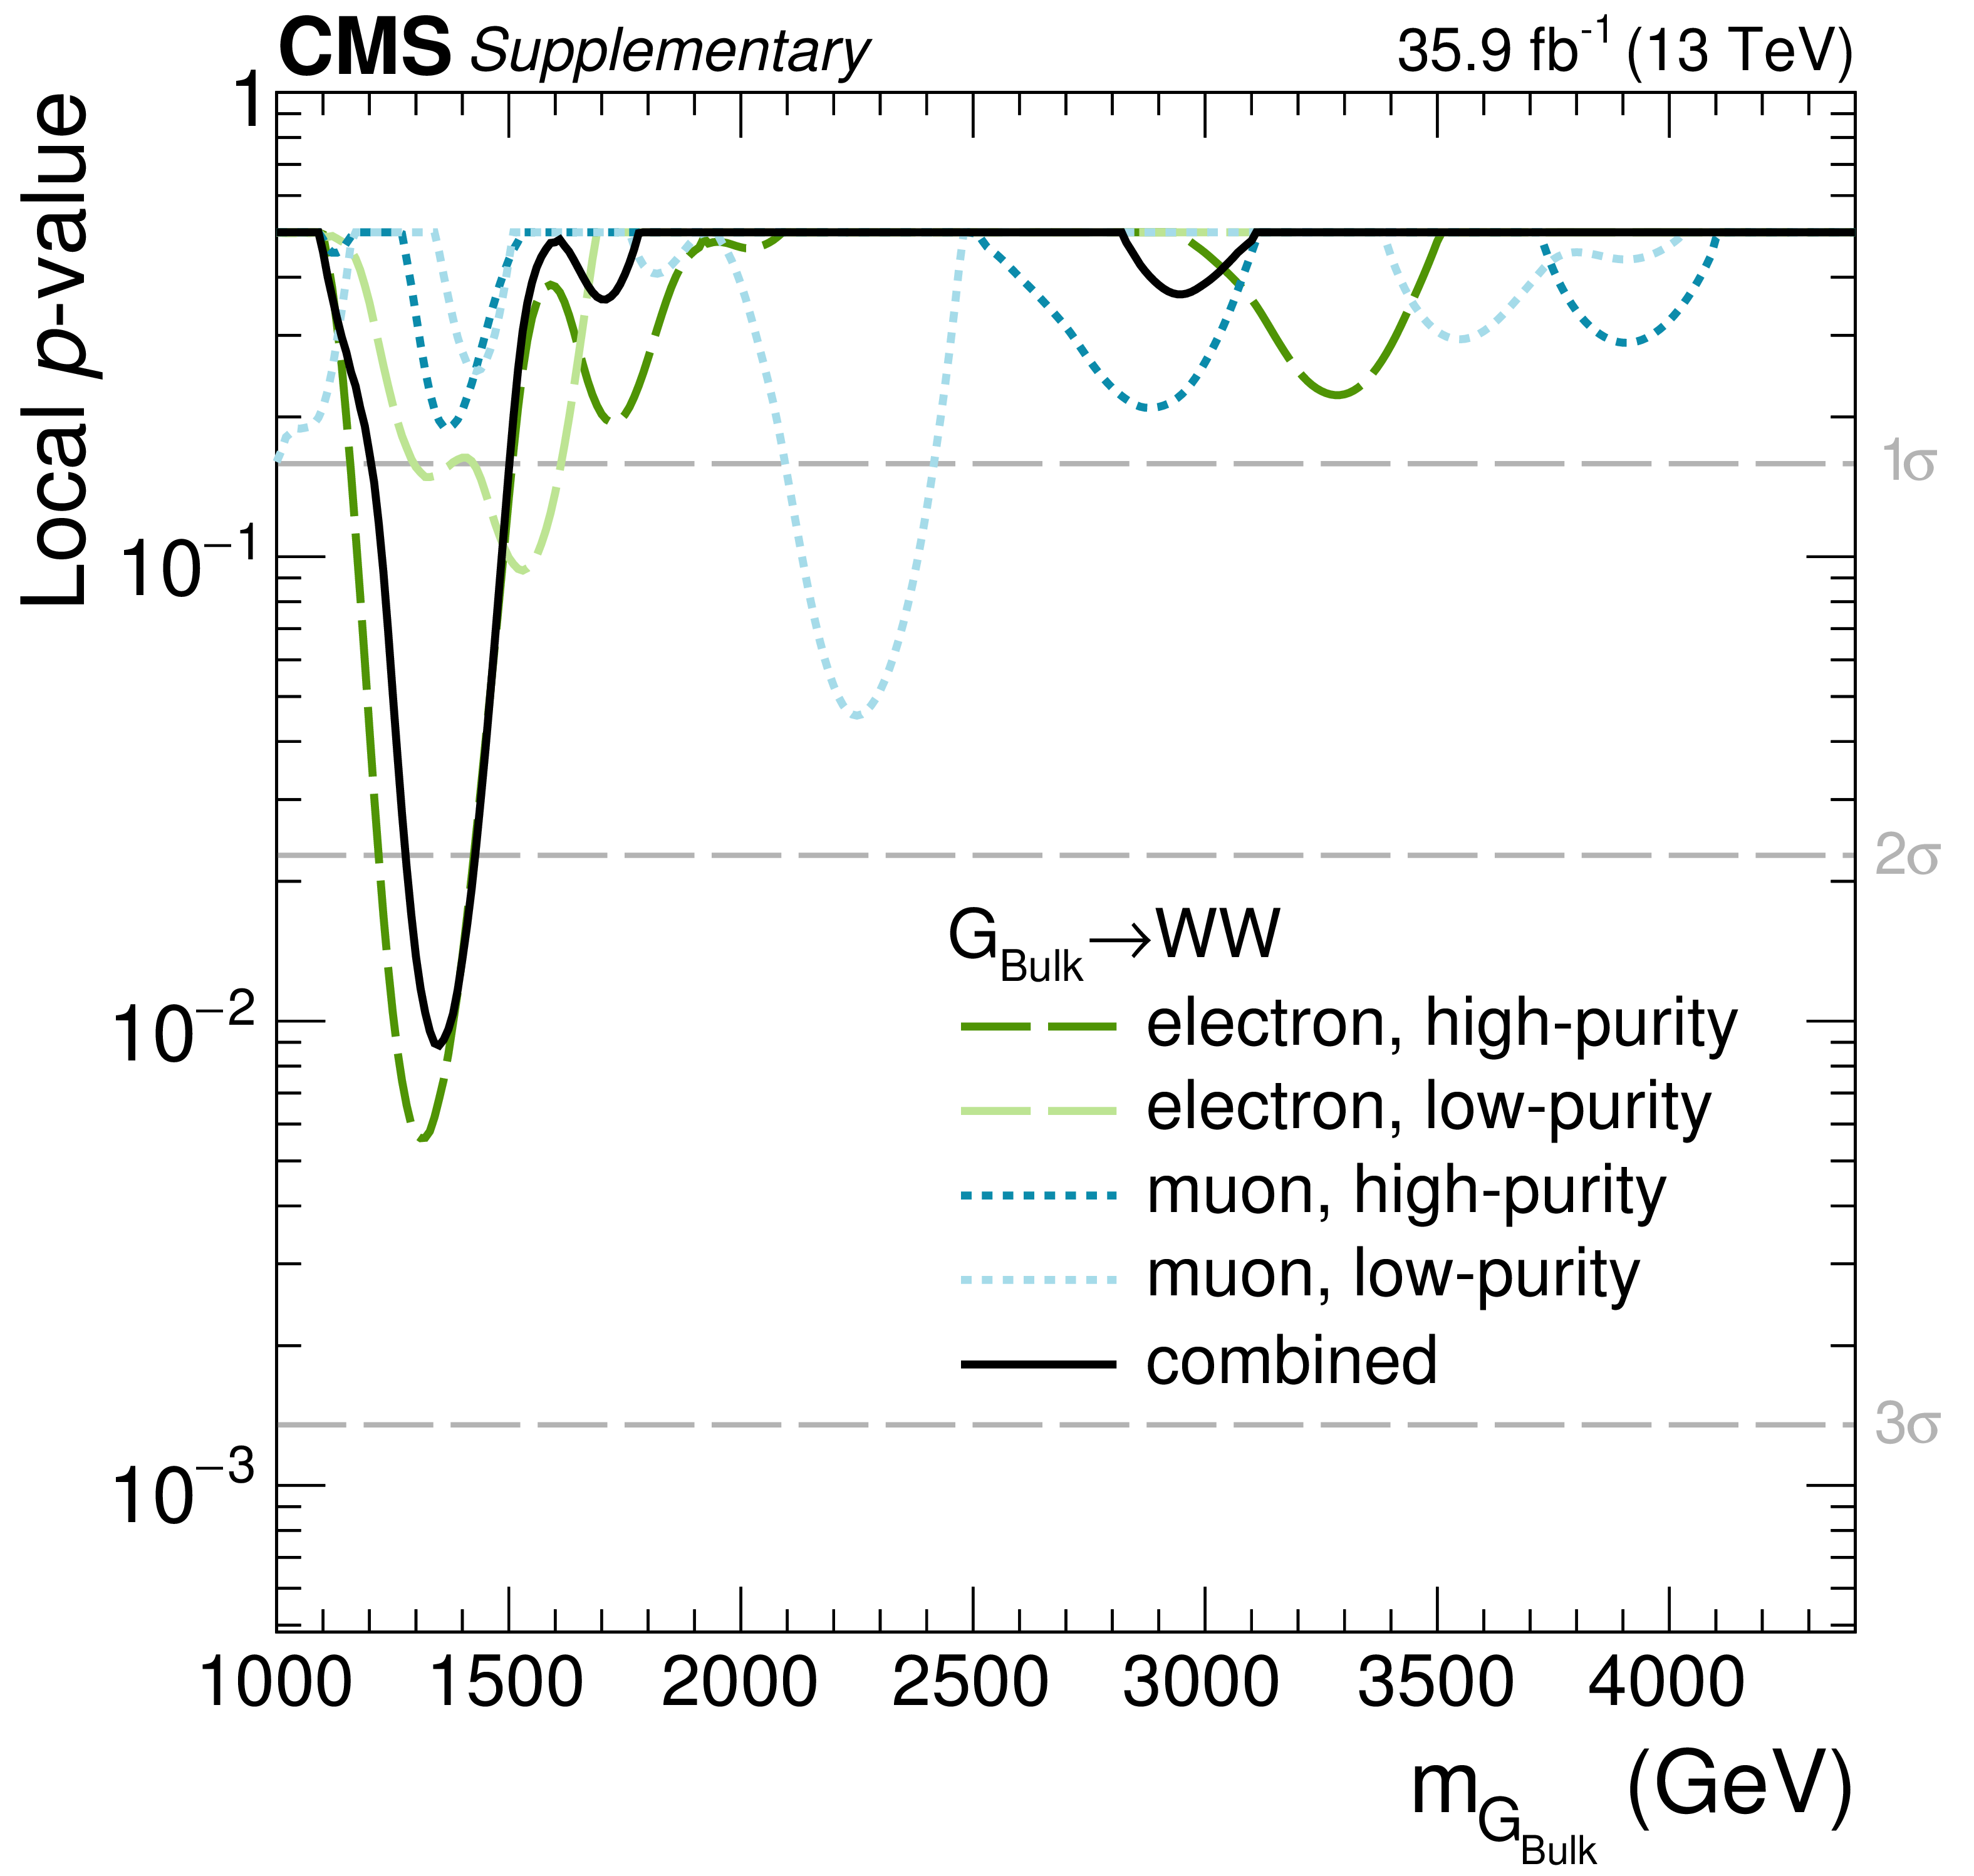
Local $p$-value as a function of resonance mass for the different analysis categories and their combination for a spin-2 bulk graviton decaying to WW. |
png pdf |
Additional Figure 4:
Local $p$-value as a function of resonance mass for the different analysis categories and their combination for a spin-1 W' decaying to WZ. |
png pdf |
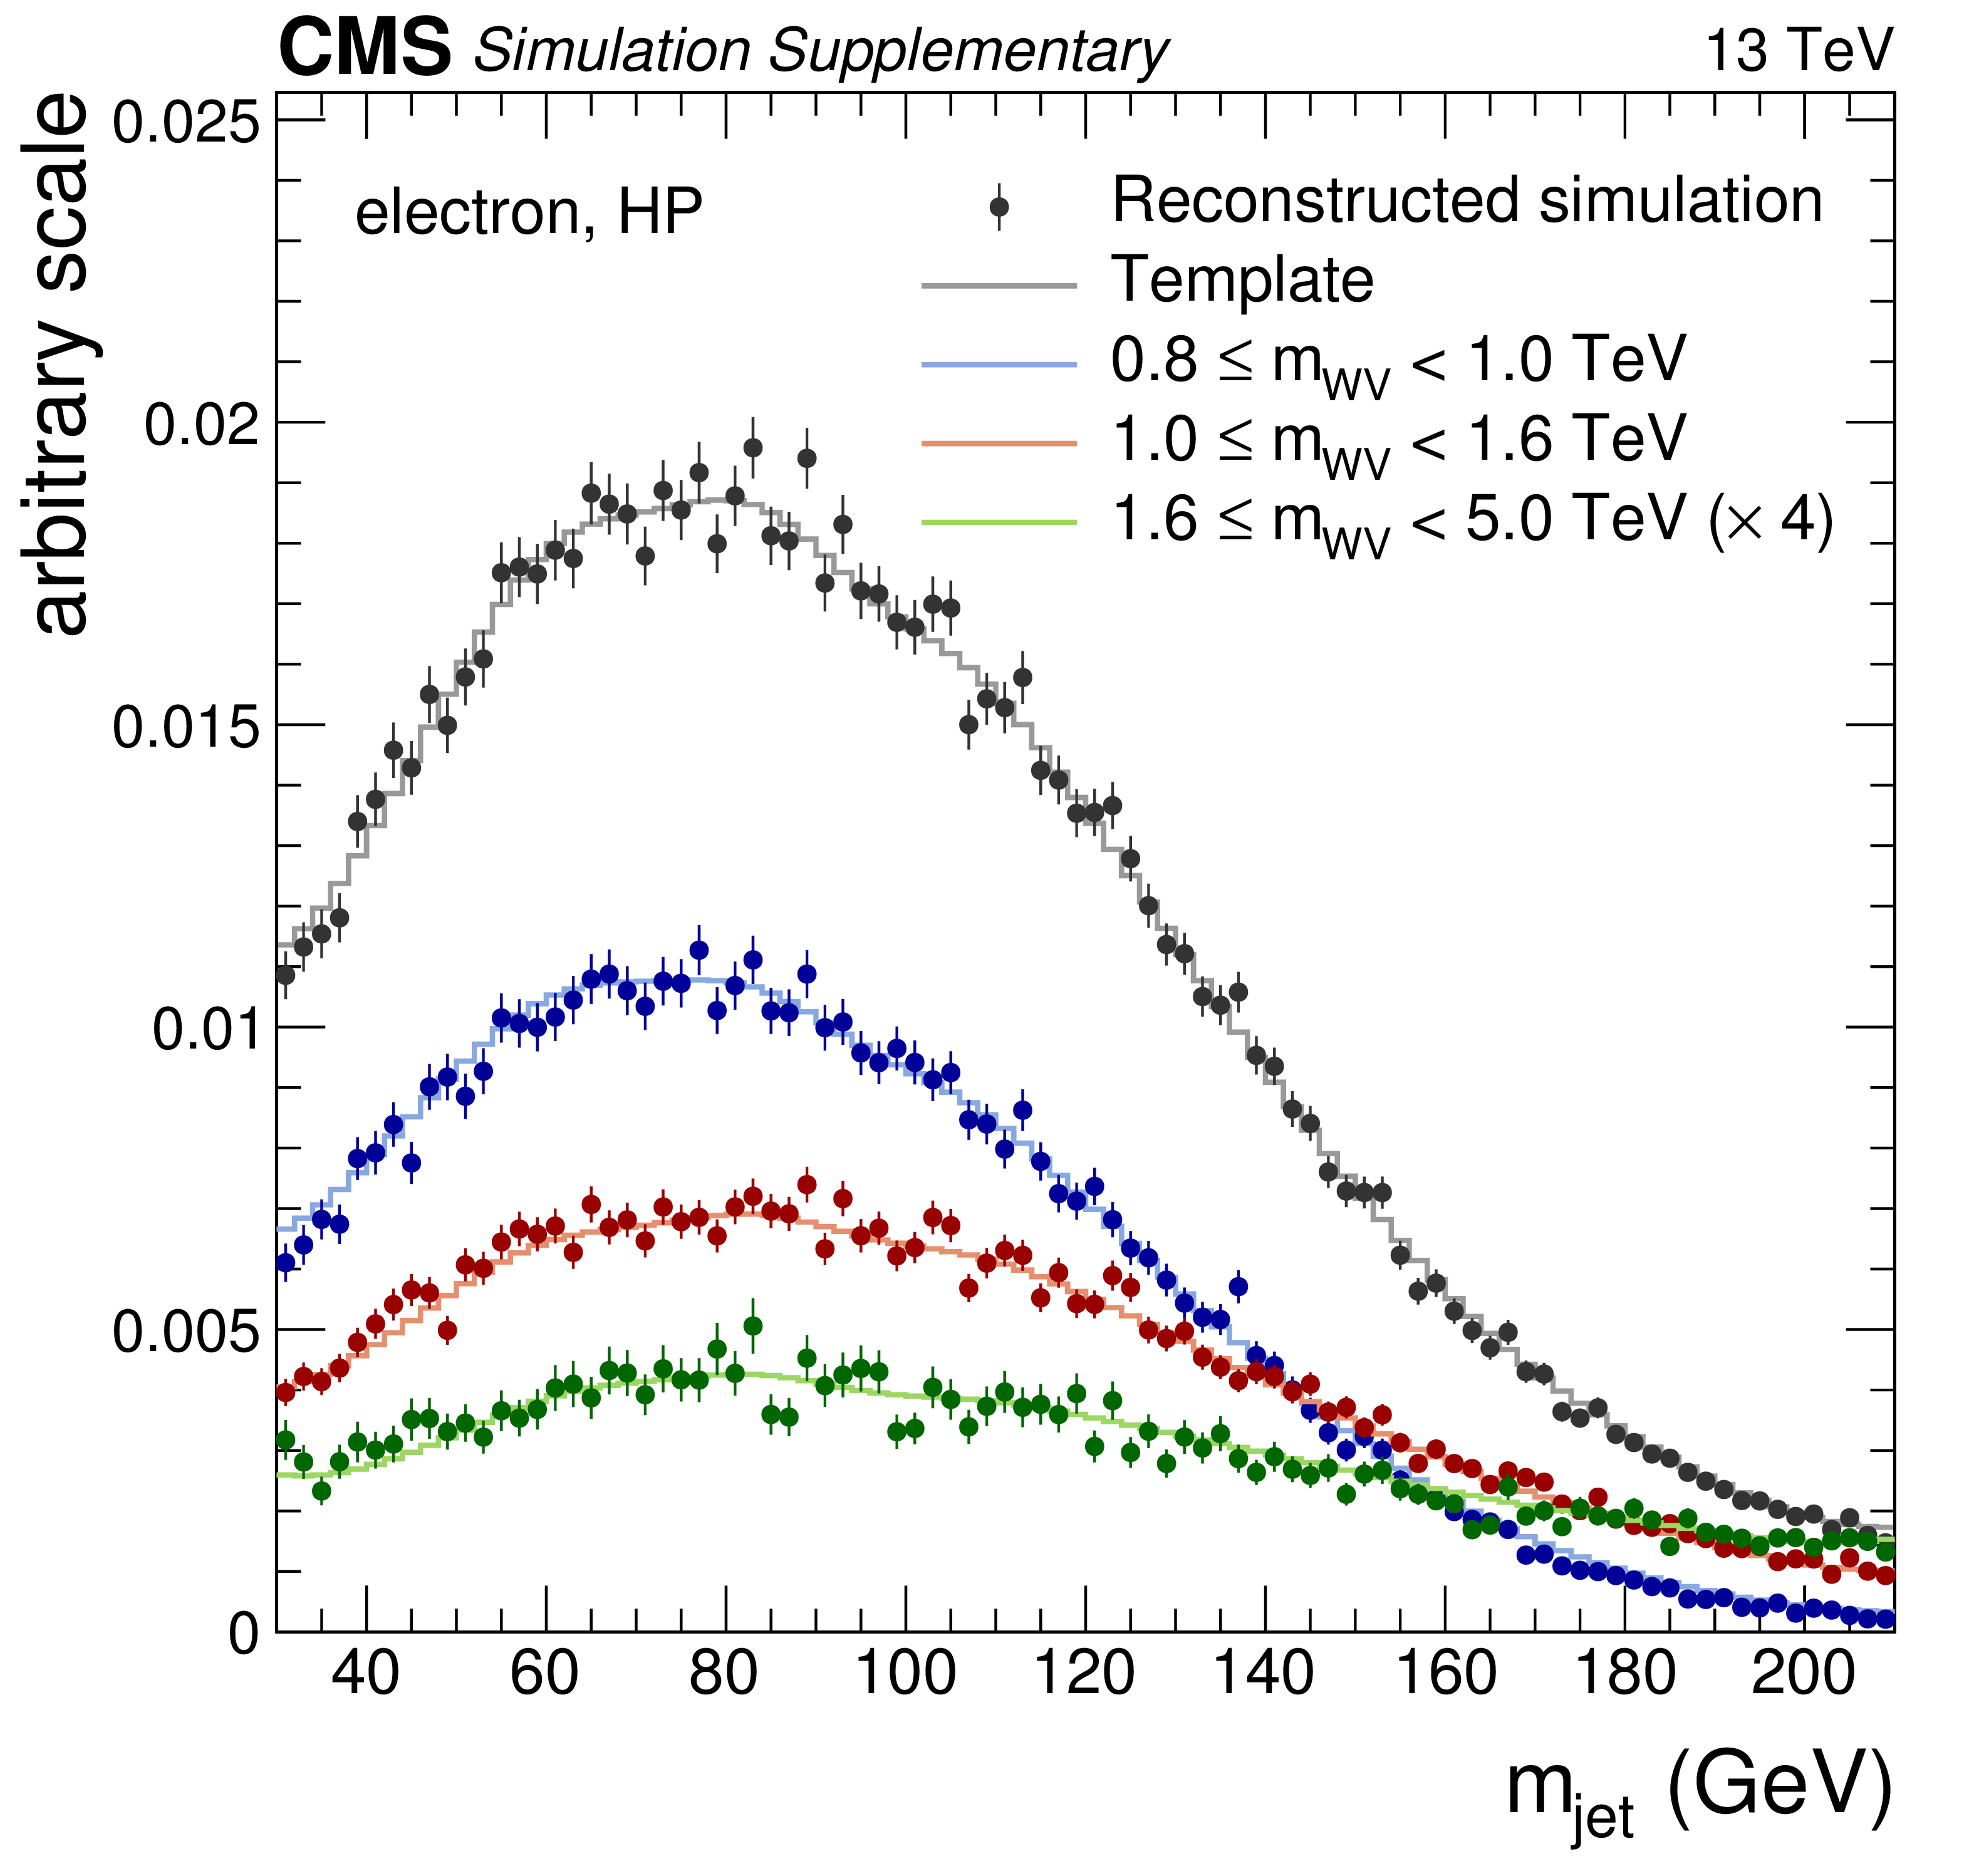
Additional Figure 5:
$m_{\text {jet}}$-projection of the W+jets template and reconstructed simulation in the electron channel, high-purity category, for different $m_{\mathrm {WV}}$ ranges. |
png pdf |
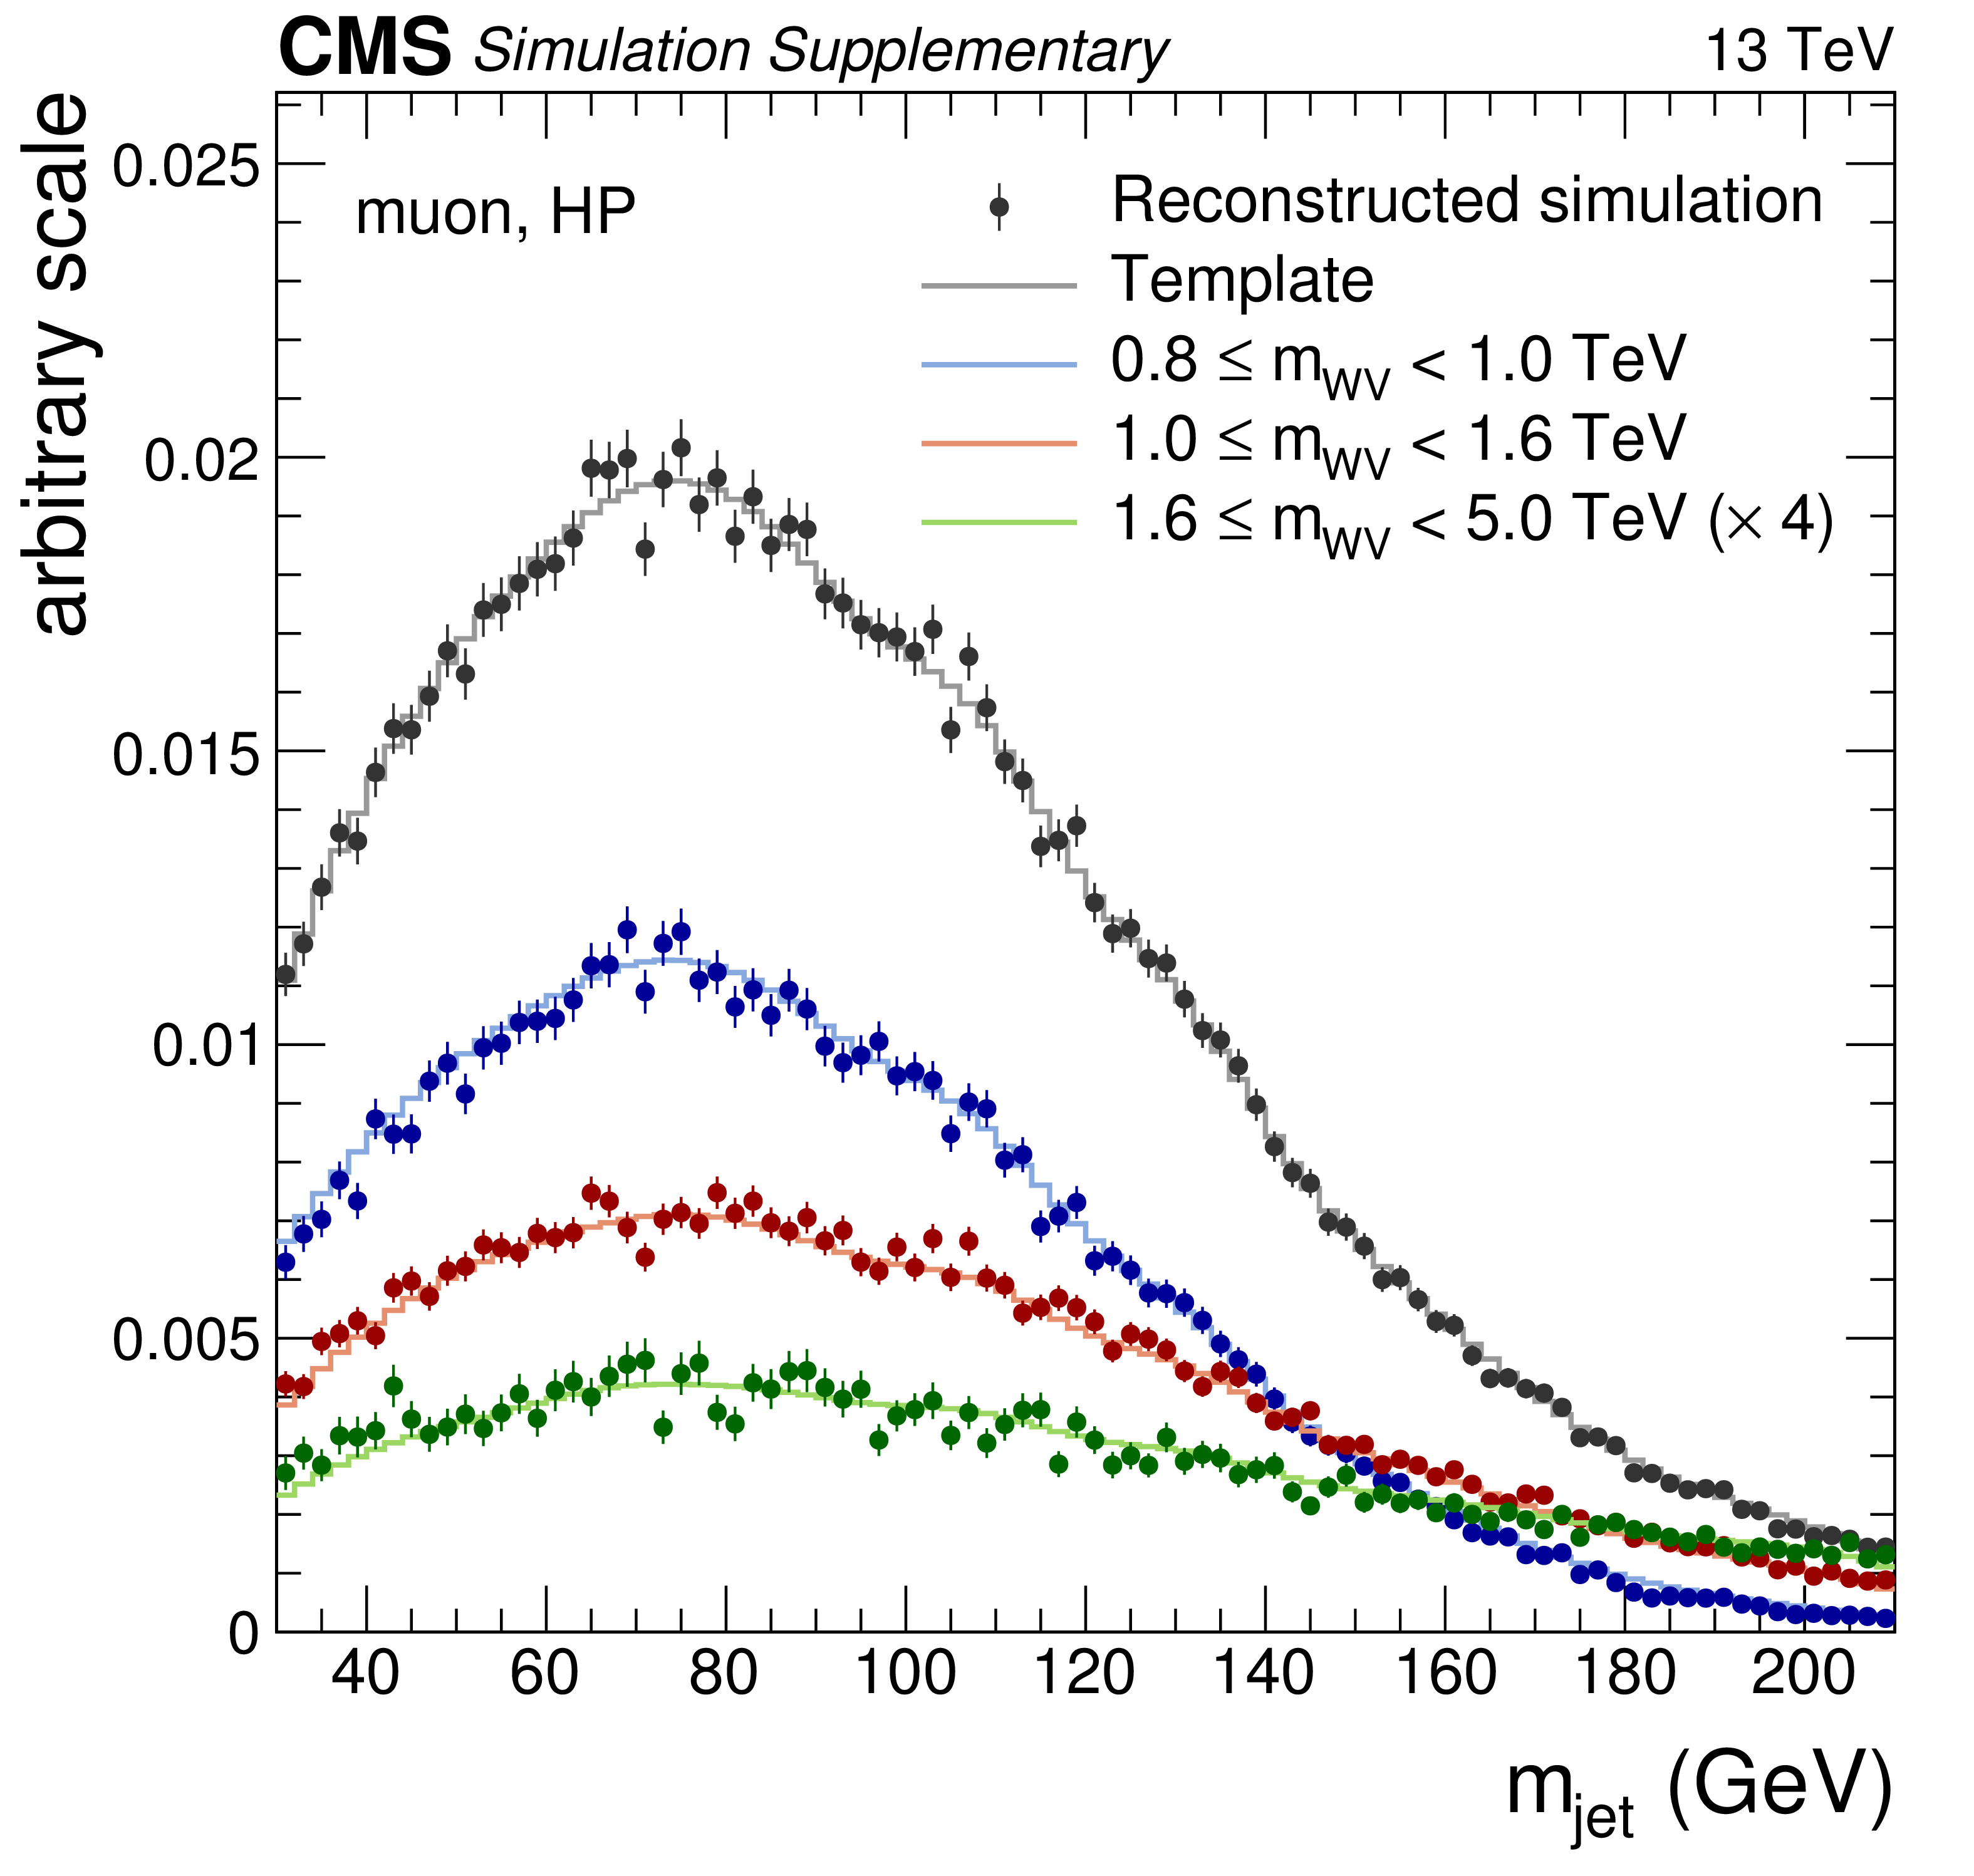
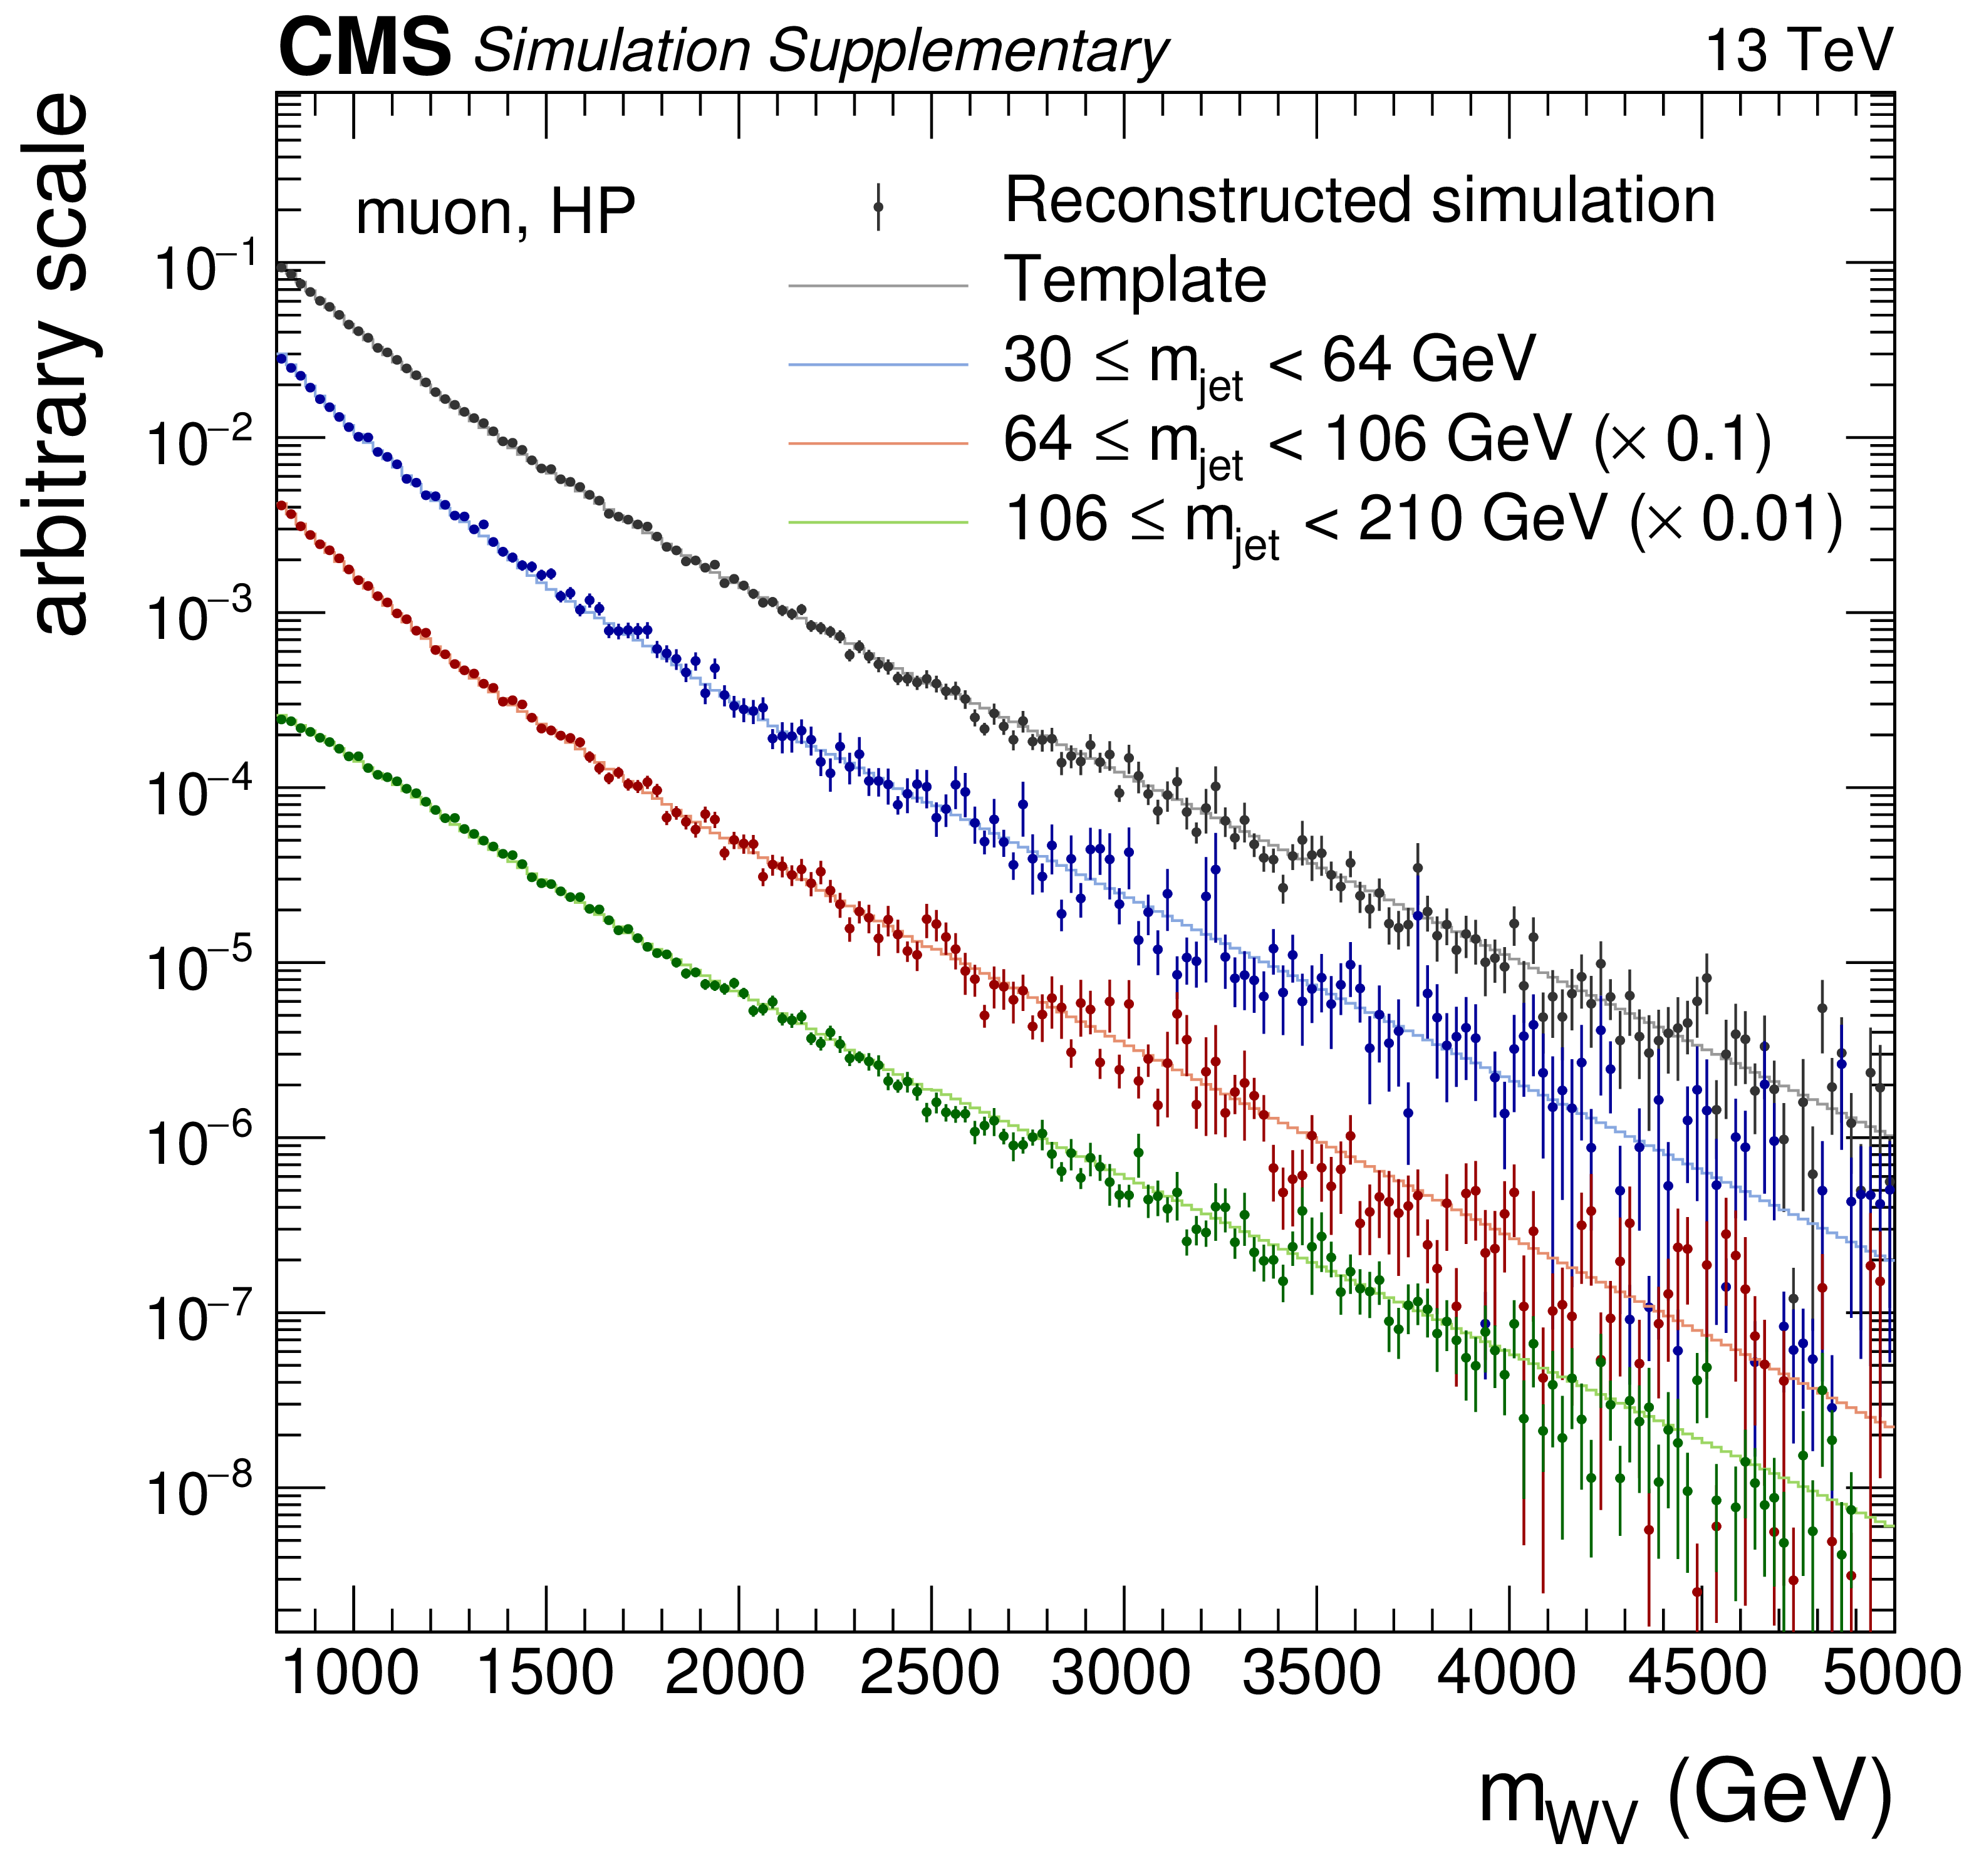
Additional Figure 6:
$m_{\text {jet}}$-projection of the W+jets template and reconstructed simulation in the muon channel, high-purity category, for different $m_{\mathrm {WV}}$ ranges. |

png pdf |
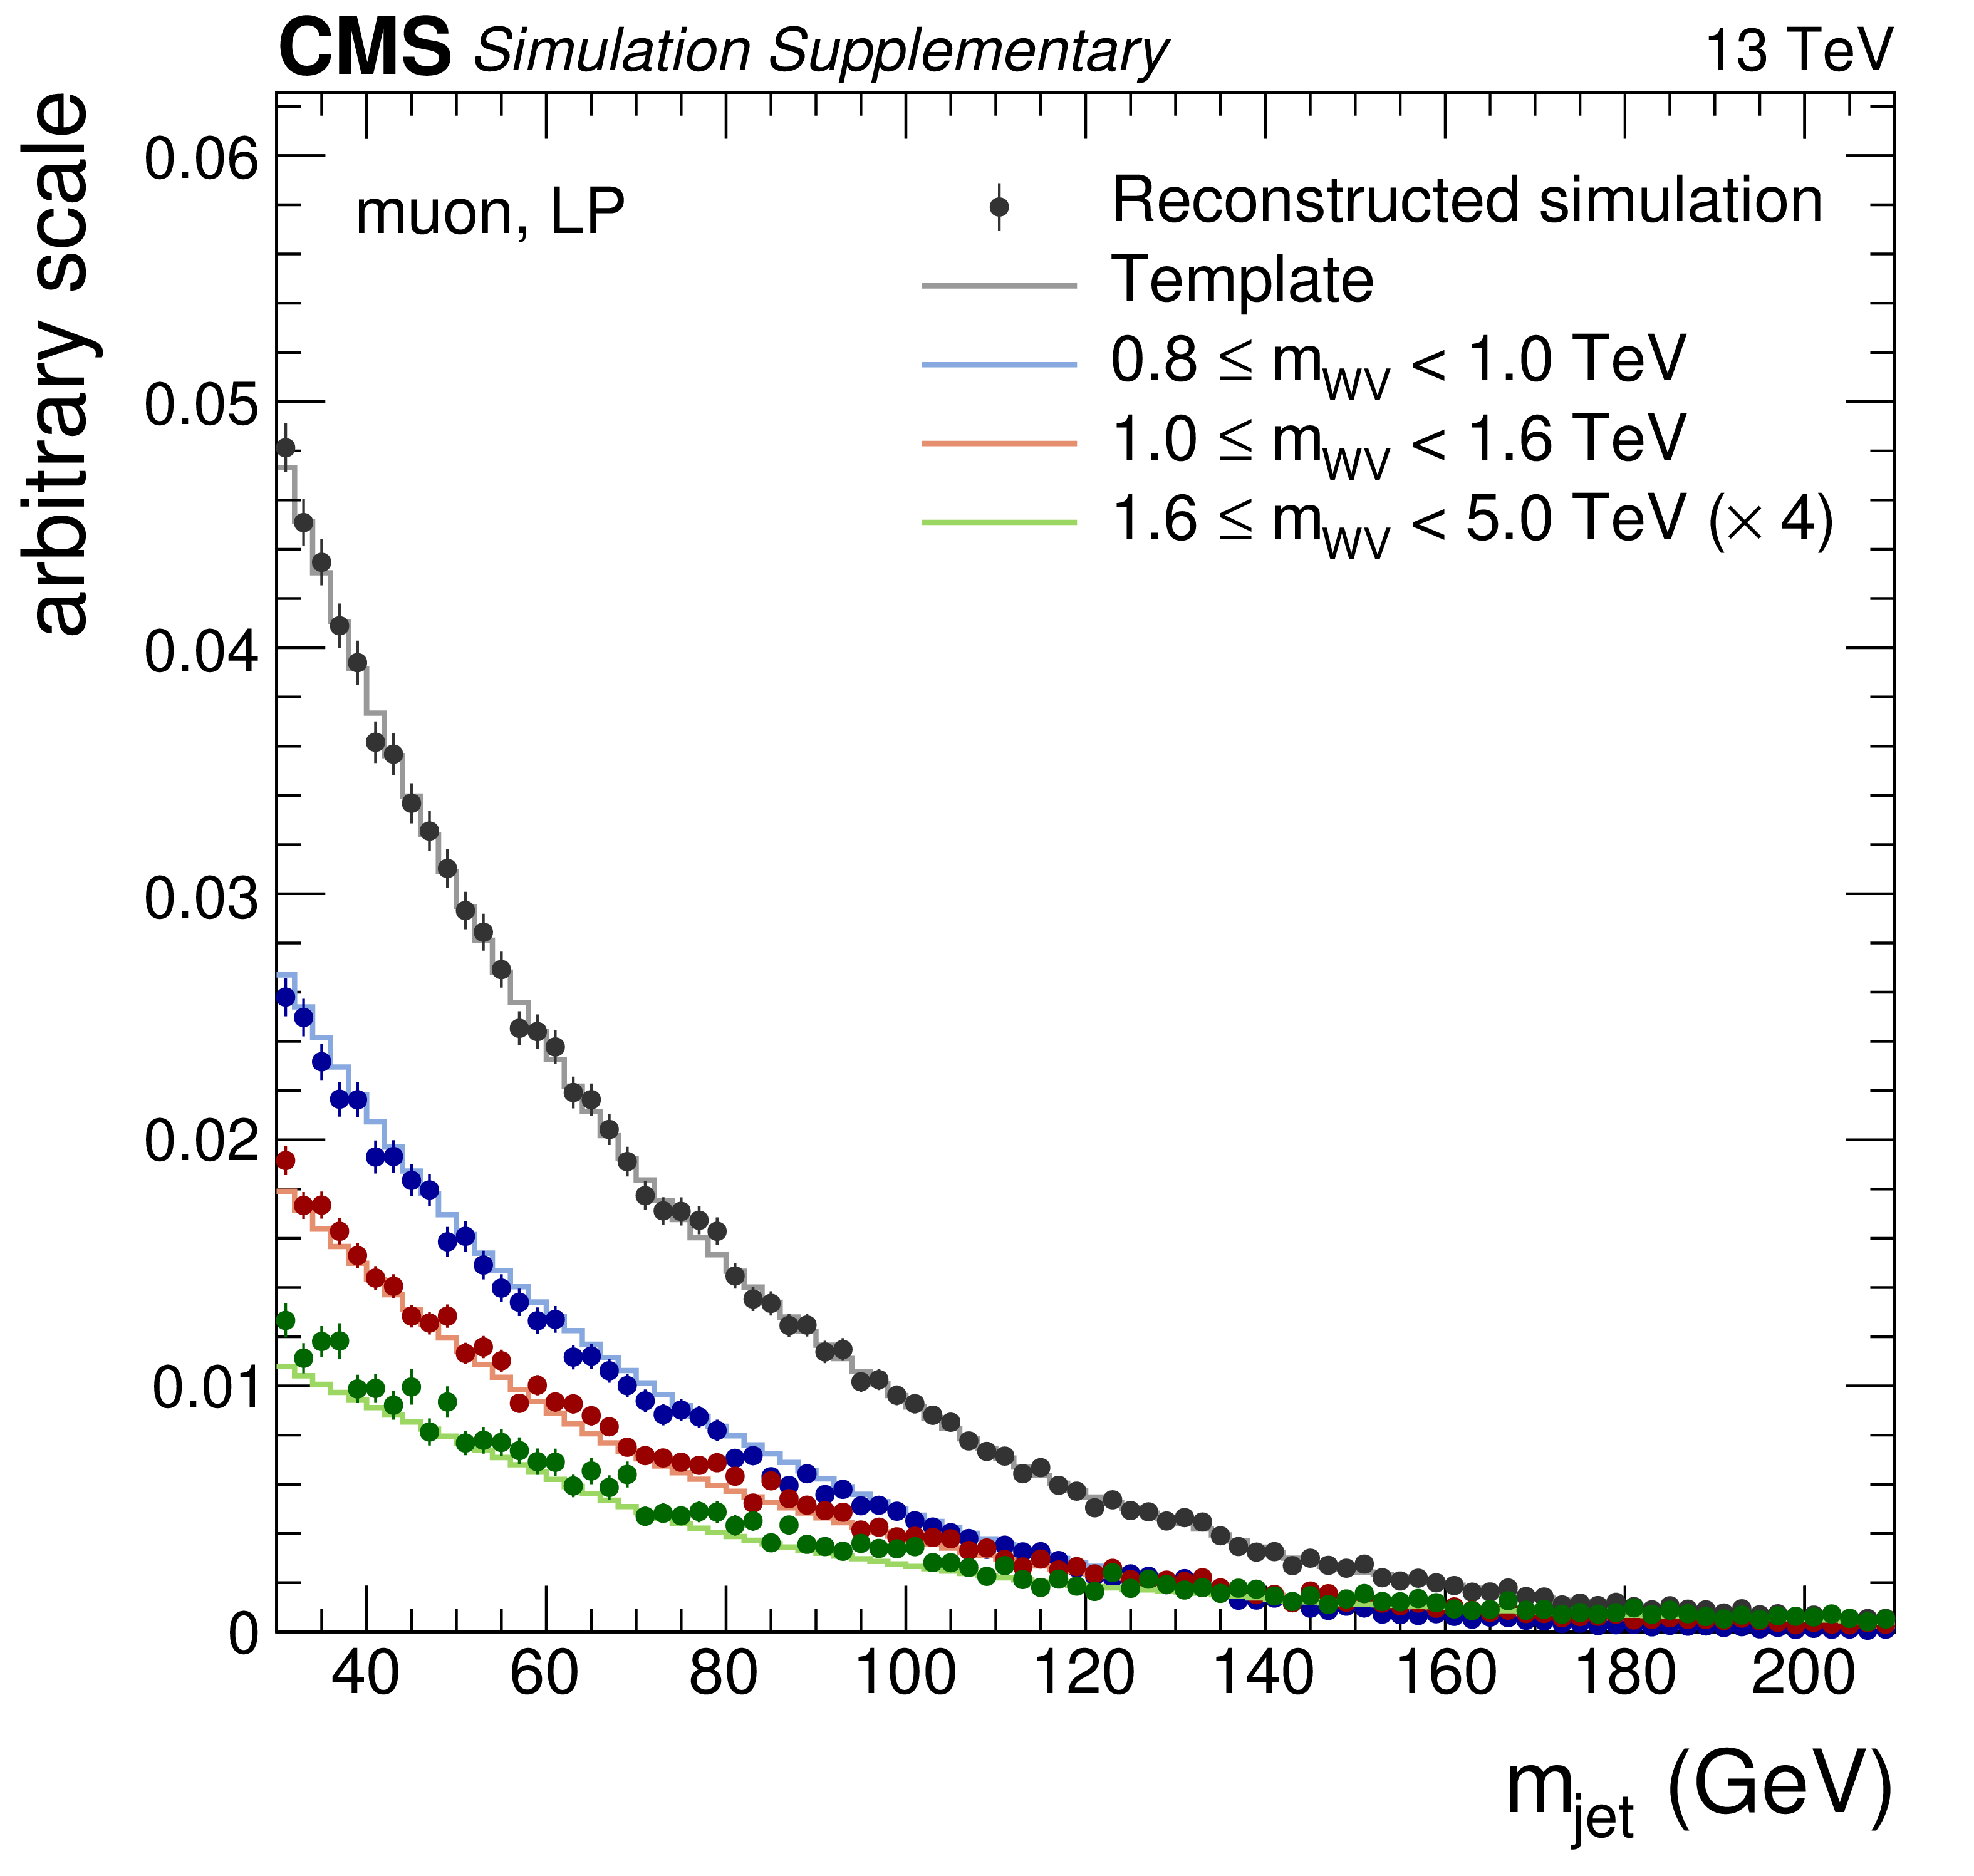
Additional Figure 7:
$m_{\text {jet}}$-projection of the W+jets template and reconstructed simulation in the electron channel, low-purity category, for different $m_{\mathrm {WV}}$ ranges. |
png pdf |
Additional Figure 8:
$m_{\text {jet}}$-projection of the W+jets template and reconstructed simulation in the muon channel, low-purity category, for different $m_{\mathrm {WV}}$ ranges. |

png pdf |
Additional Figure 9:
$m_{\mathrm {WV}}$-projection of the W+jets template and reconstructed simulation in the electron channel, high-purity category, for different $m_{\text {jet}}$ ranges. |
png pdf |
Additional Figure 10:
$m_{\mathrm {WV}}$-projection of the W+jets template and reconstructed simulation in the muon channel, high-purity category, for different $m_{\text {jet}}$ ranges. |
png pdf |
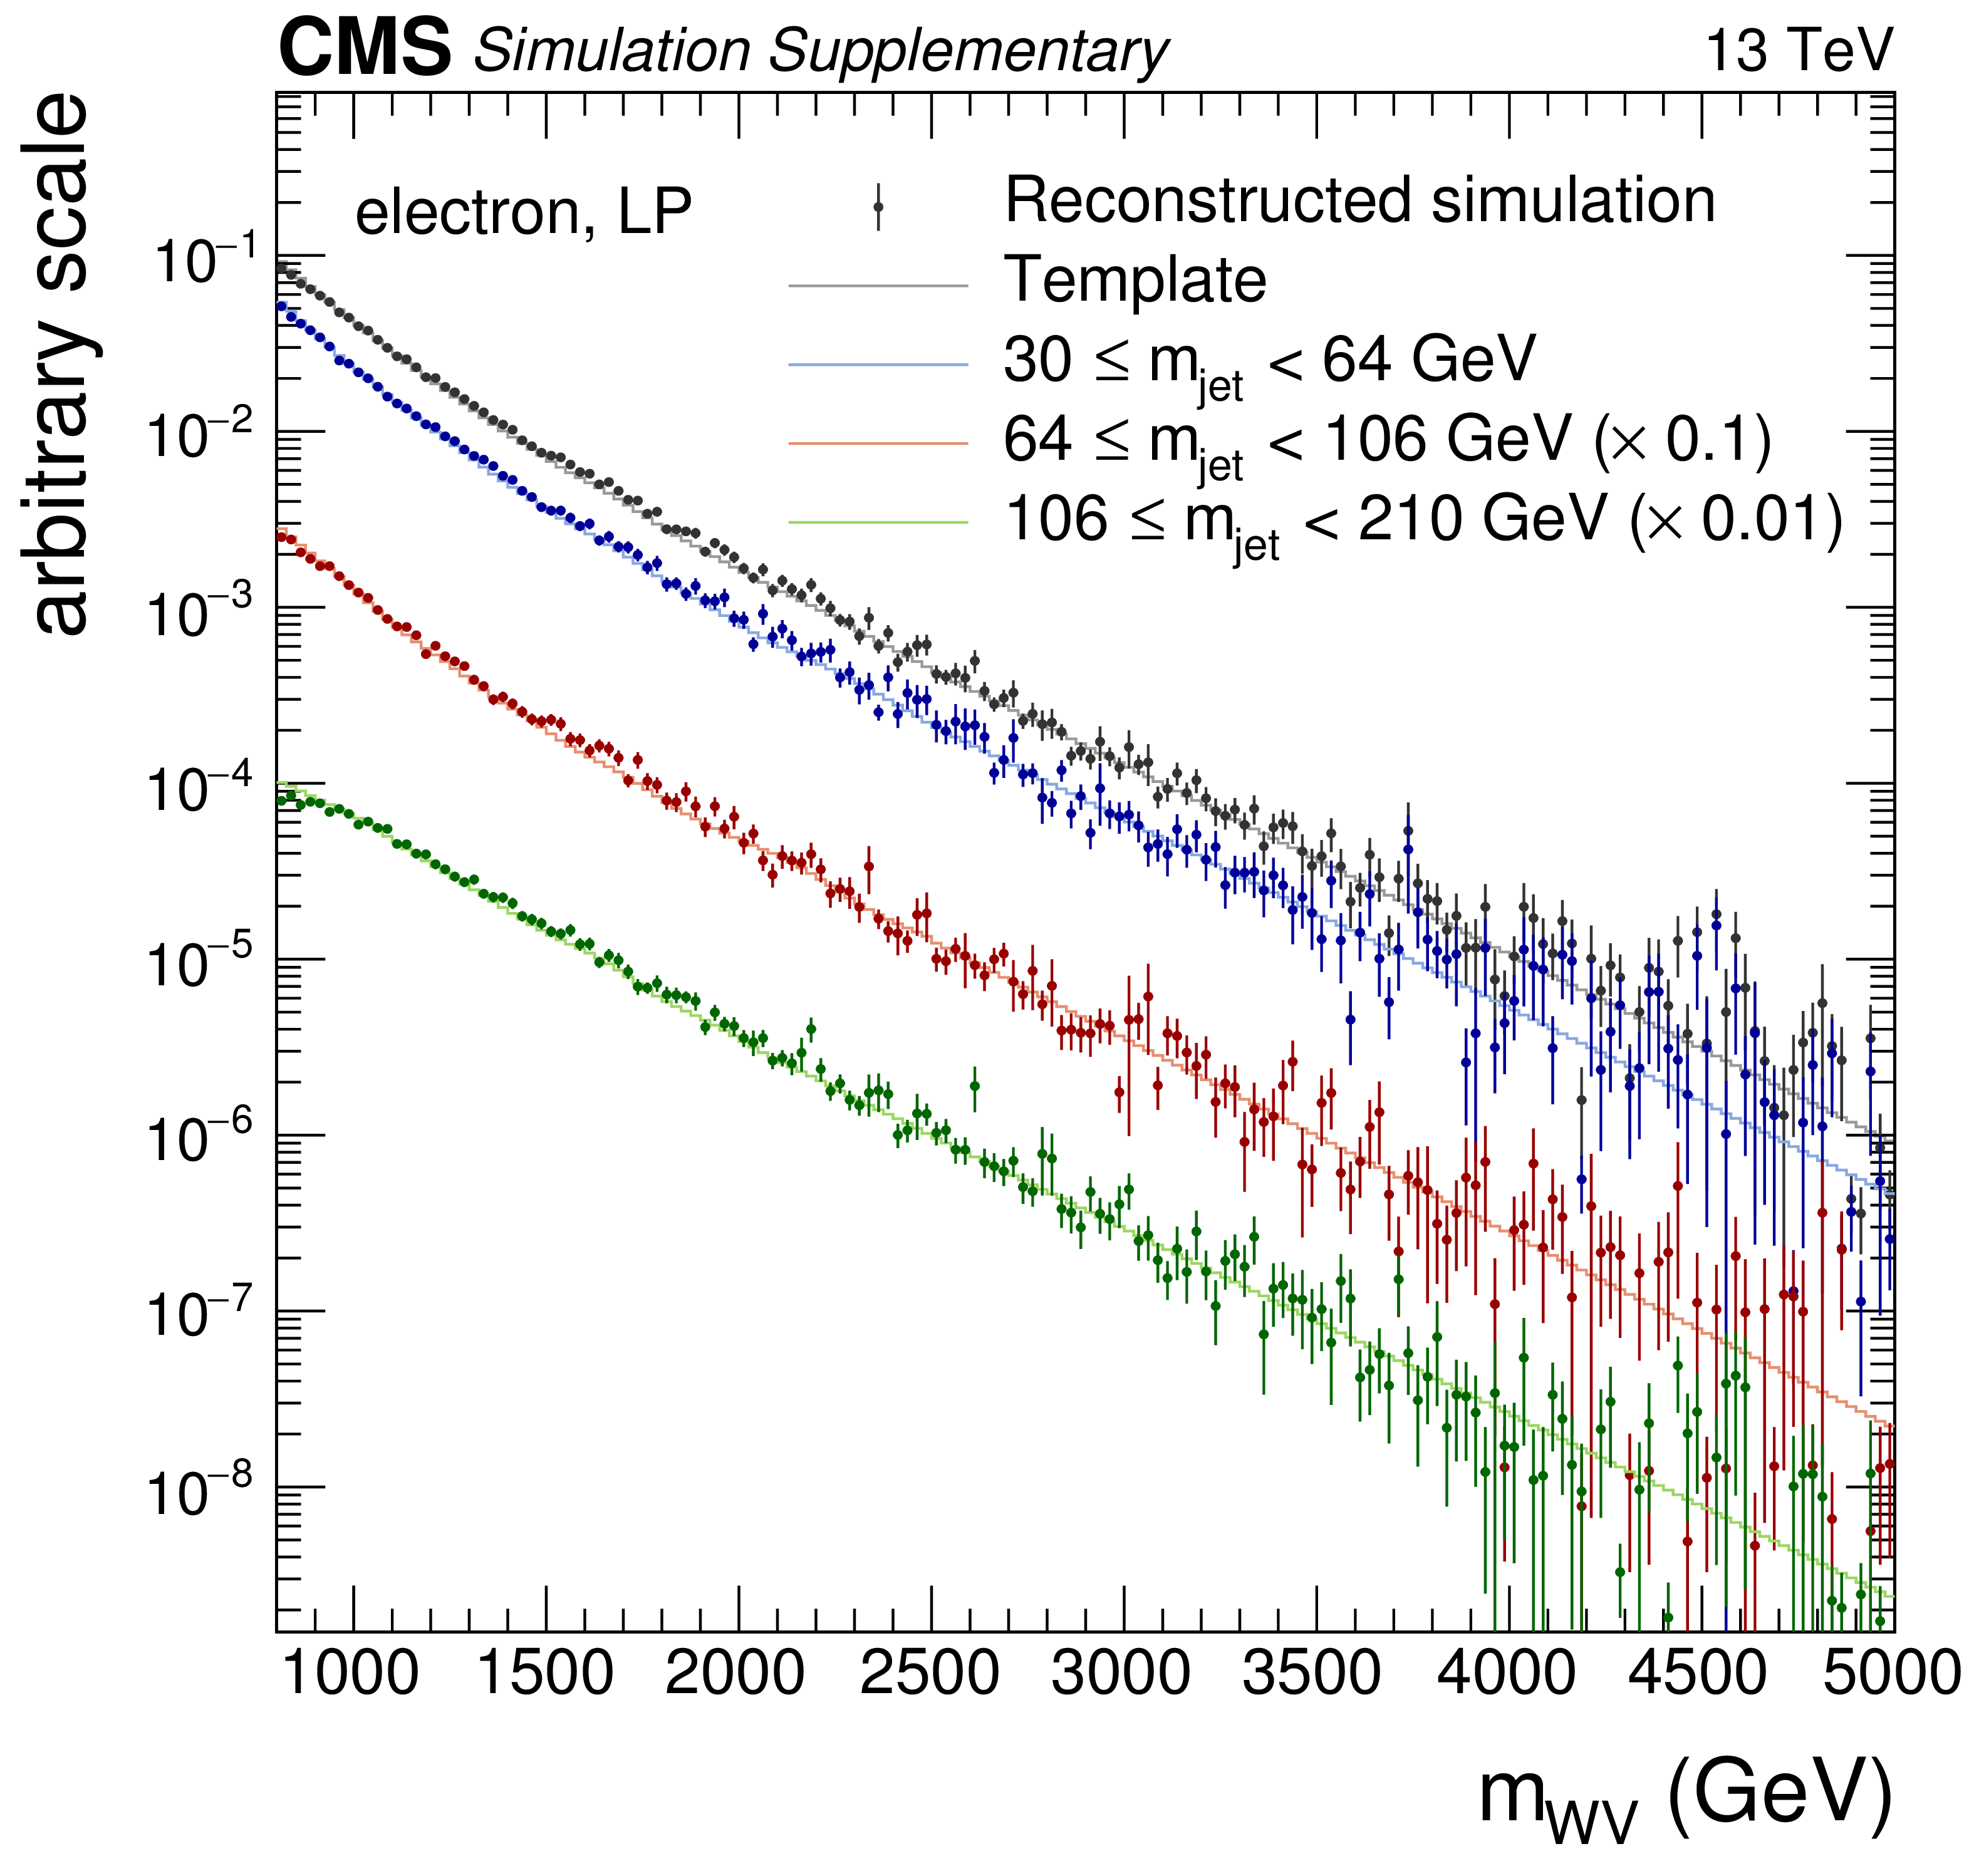
Additional Figure 11:
$m_{\mathrm {WV}}$-projection of the W+jets template and reconstructed simulation in the electron channel, low-purity category, for different $m_{\text {jet}}$ ranges. |
png pdf |
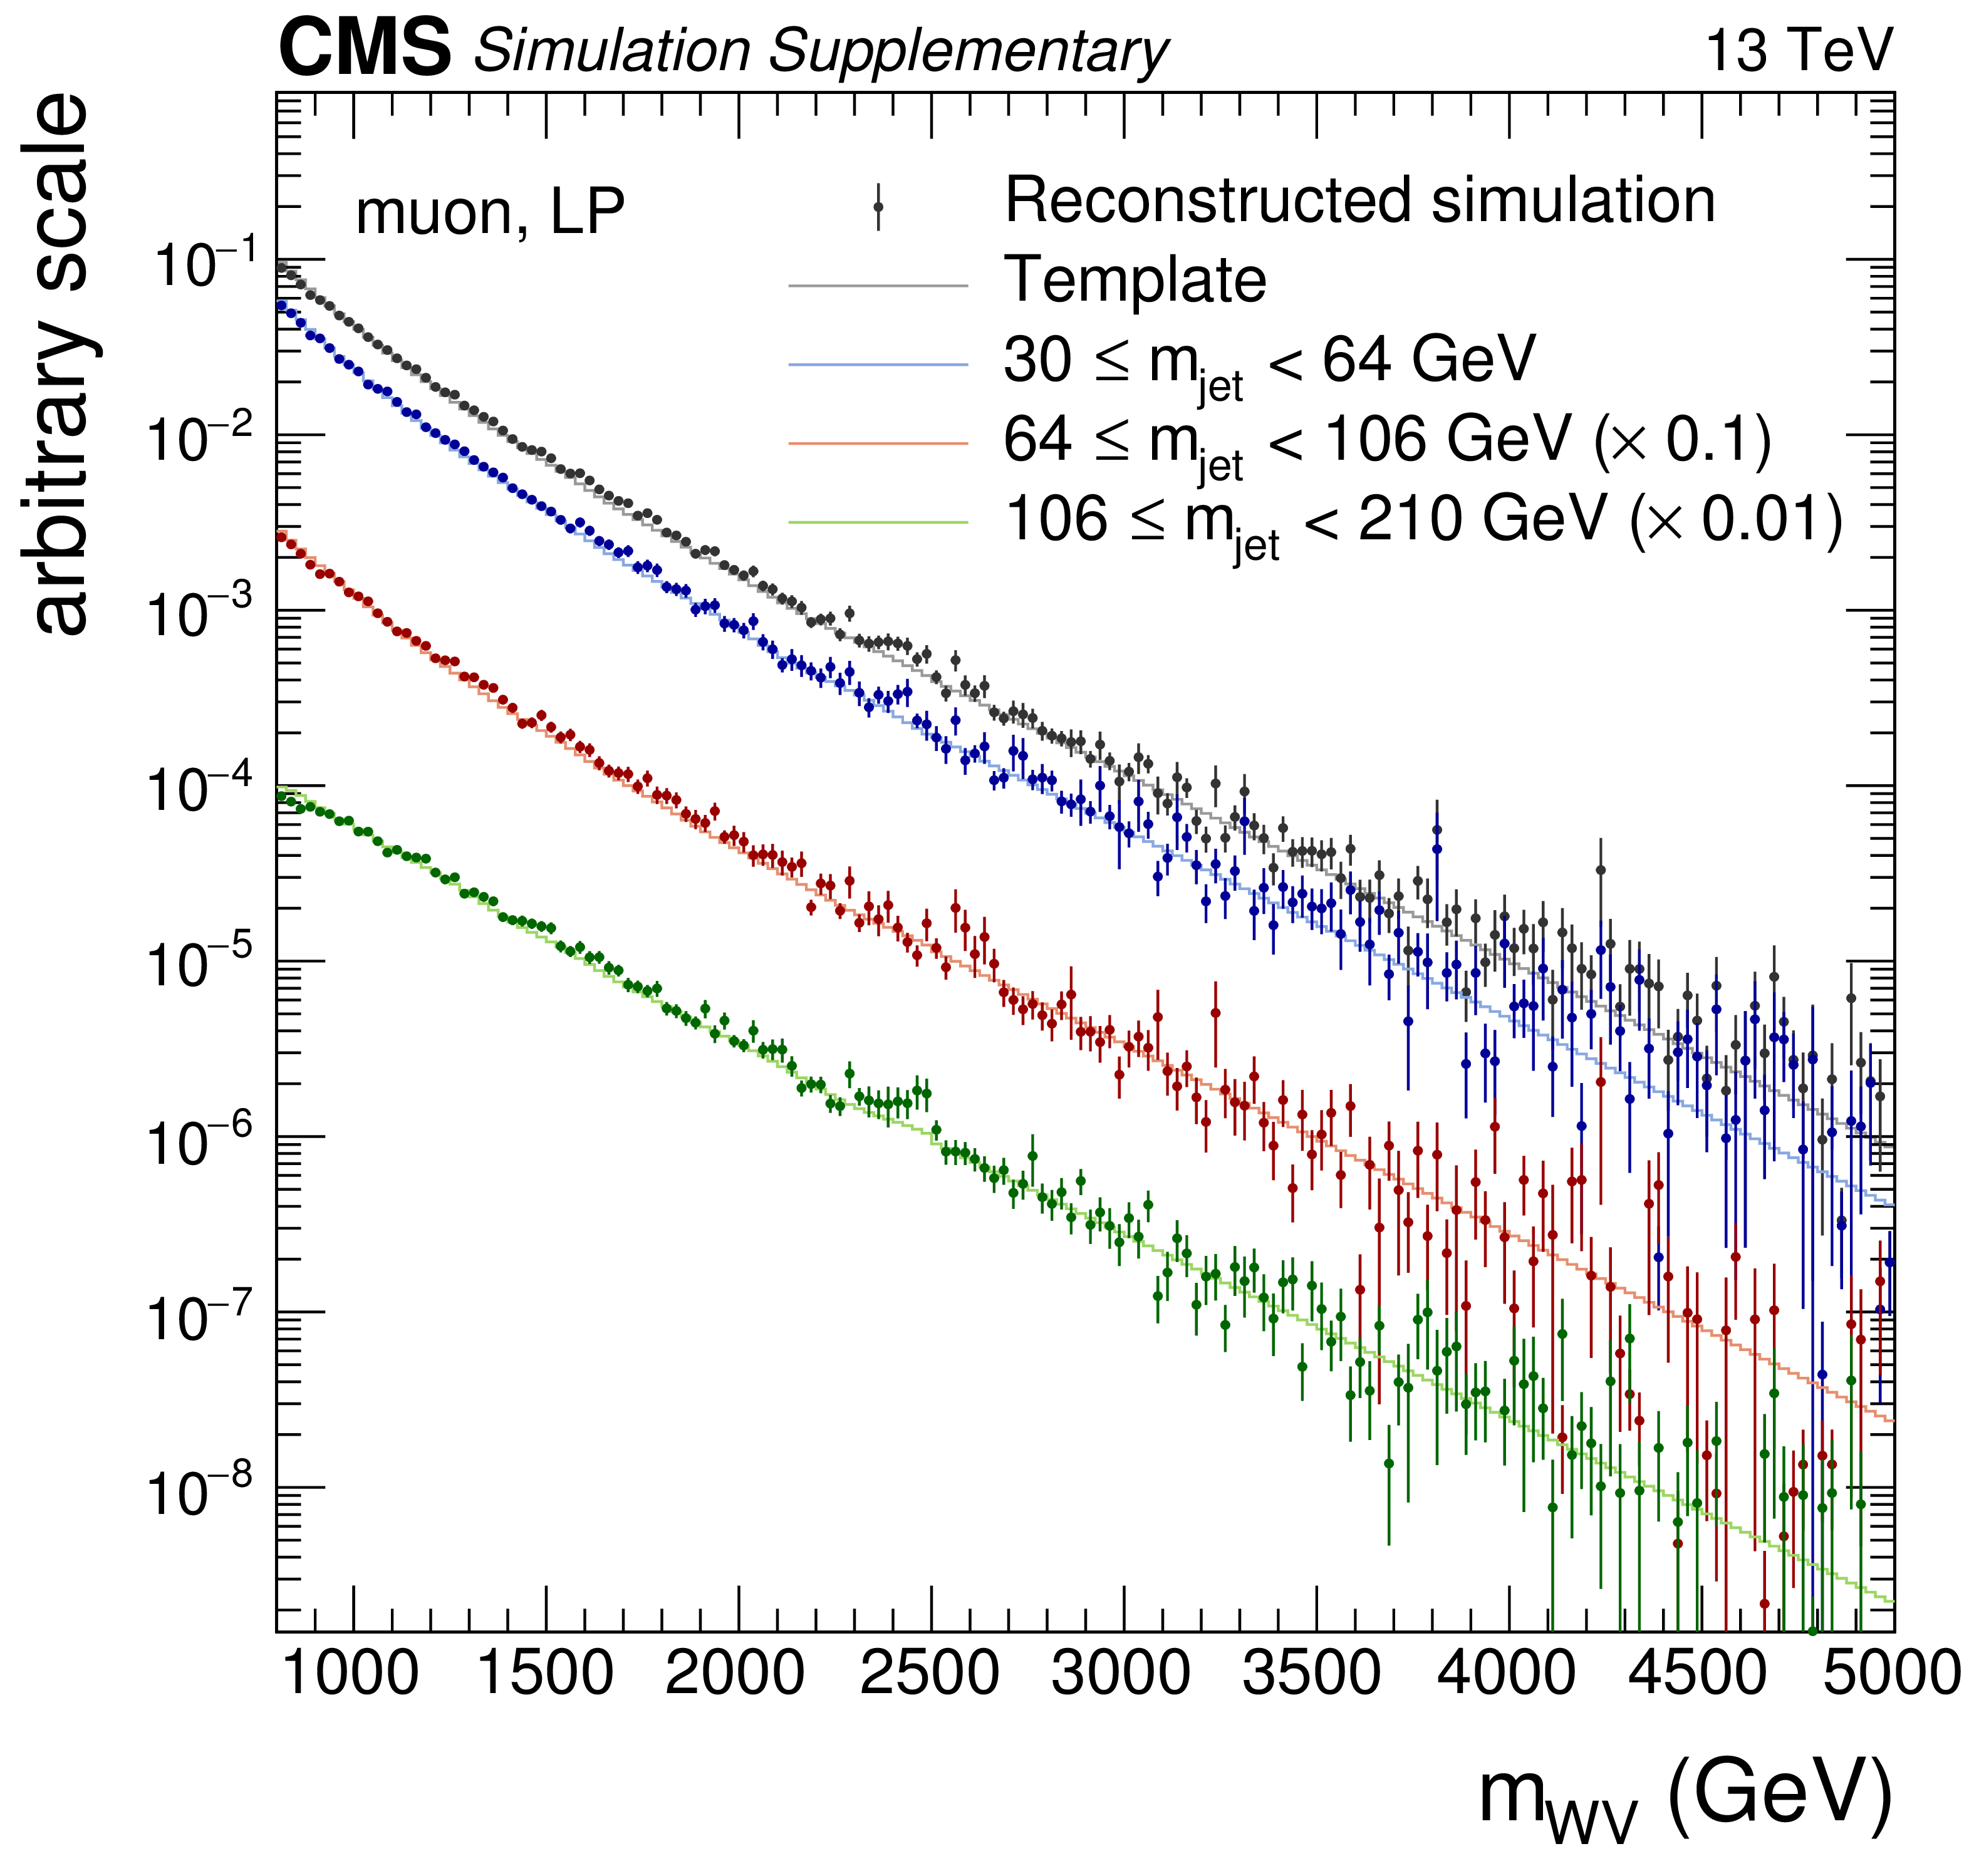
Additional Figure 12:
$m_{\mathrm {WV}}$-projection of the W+jets template and reconstructed simulation in the muon channel, low-purity category, for different $m_{\text {jet}}$ ranges. |
png pdf |
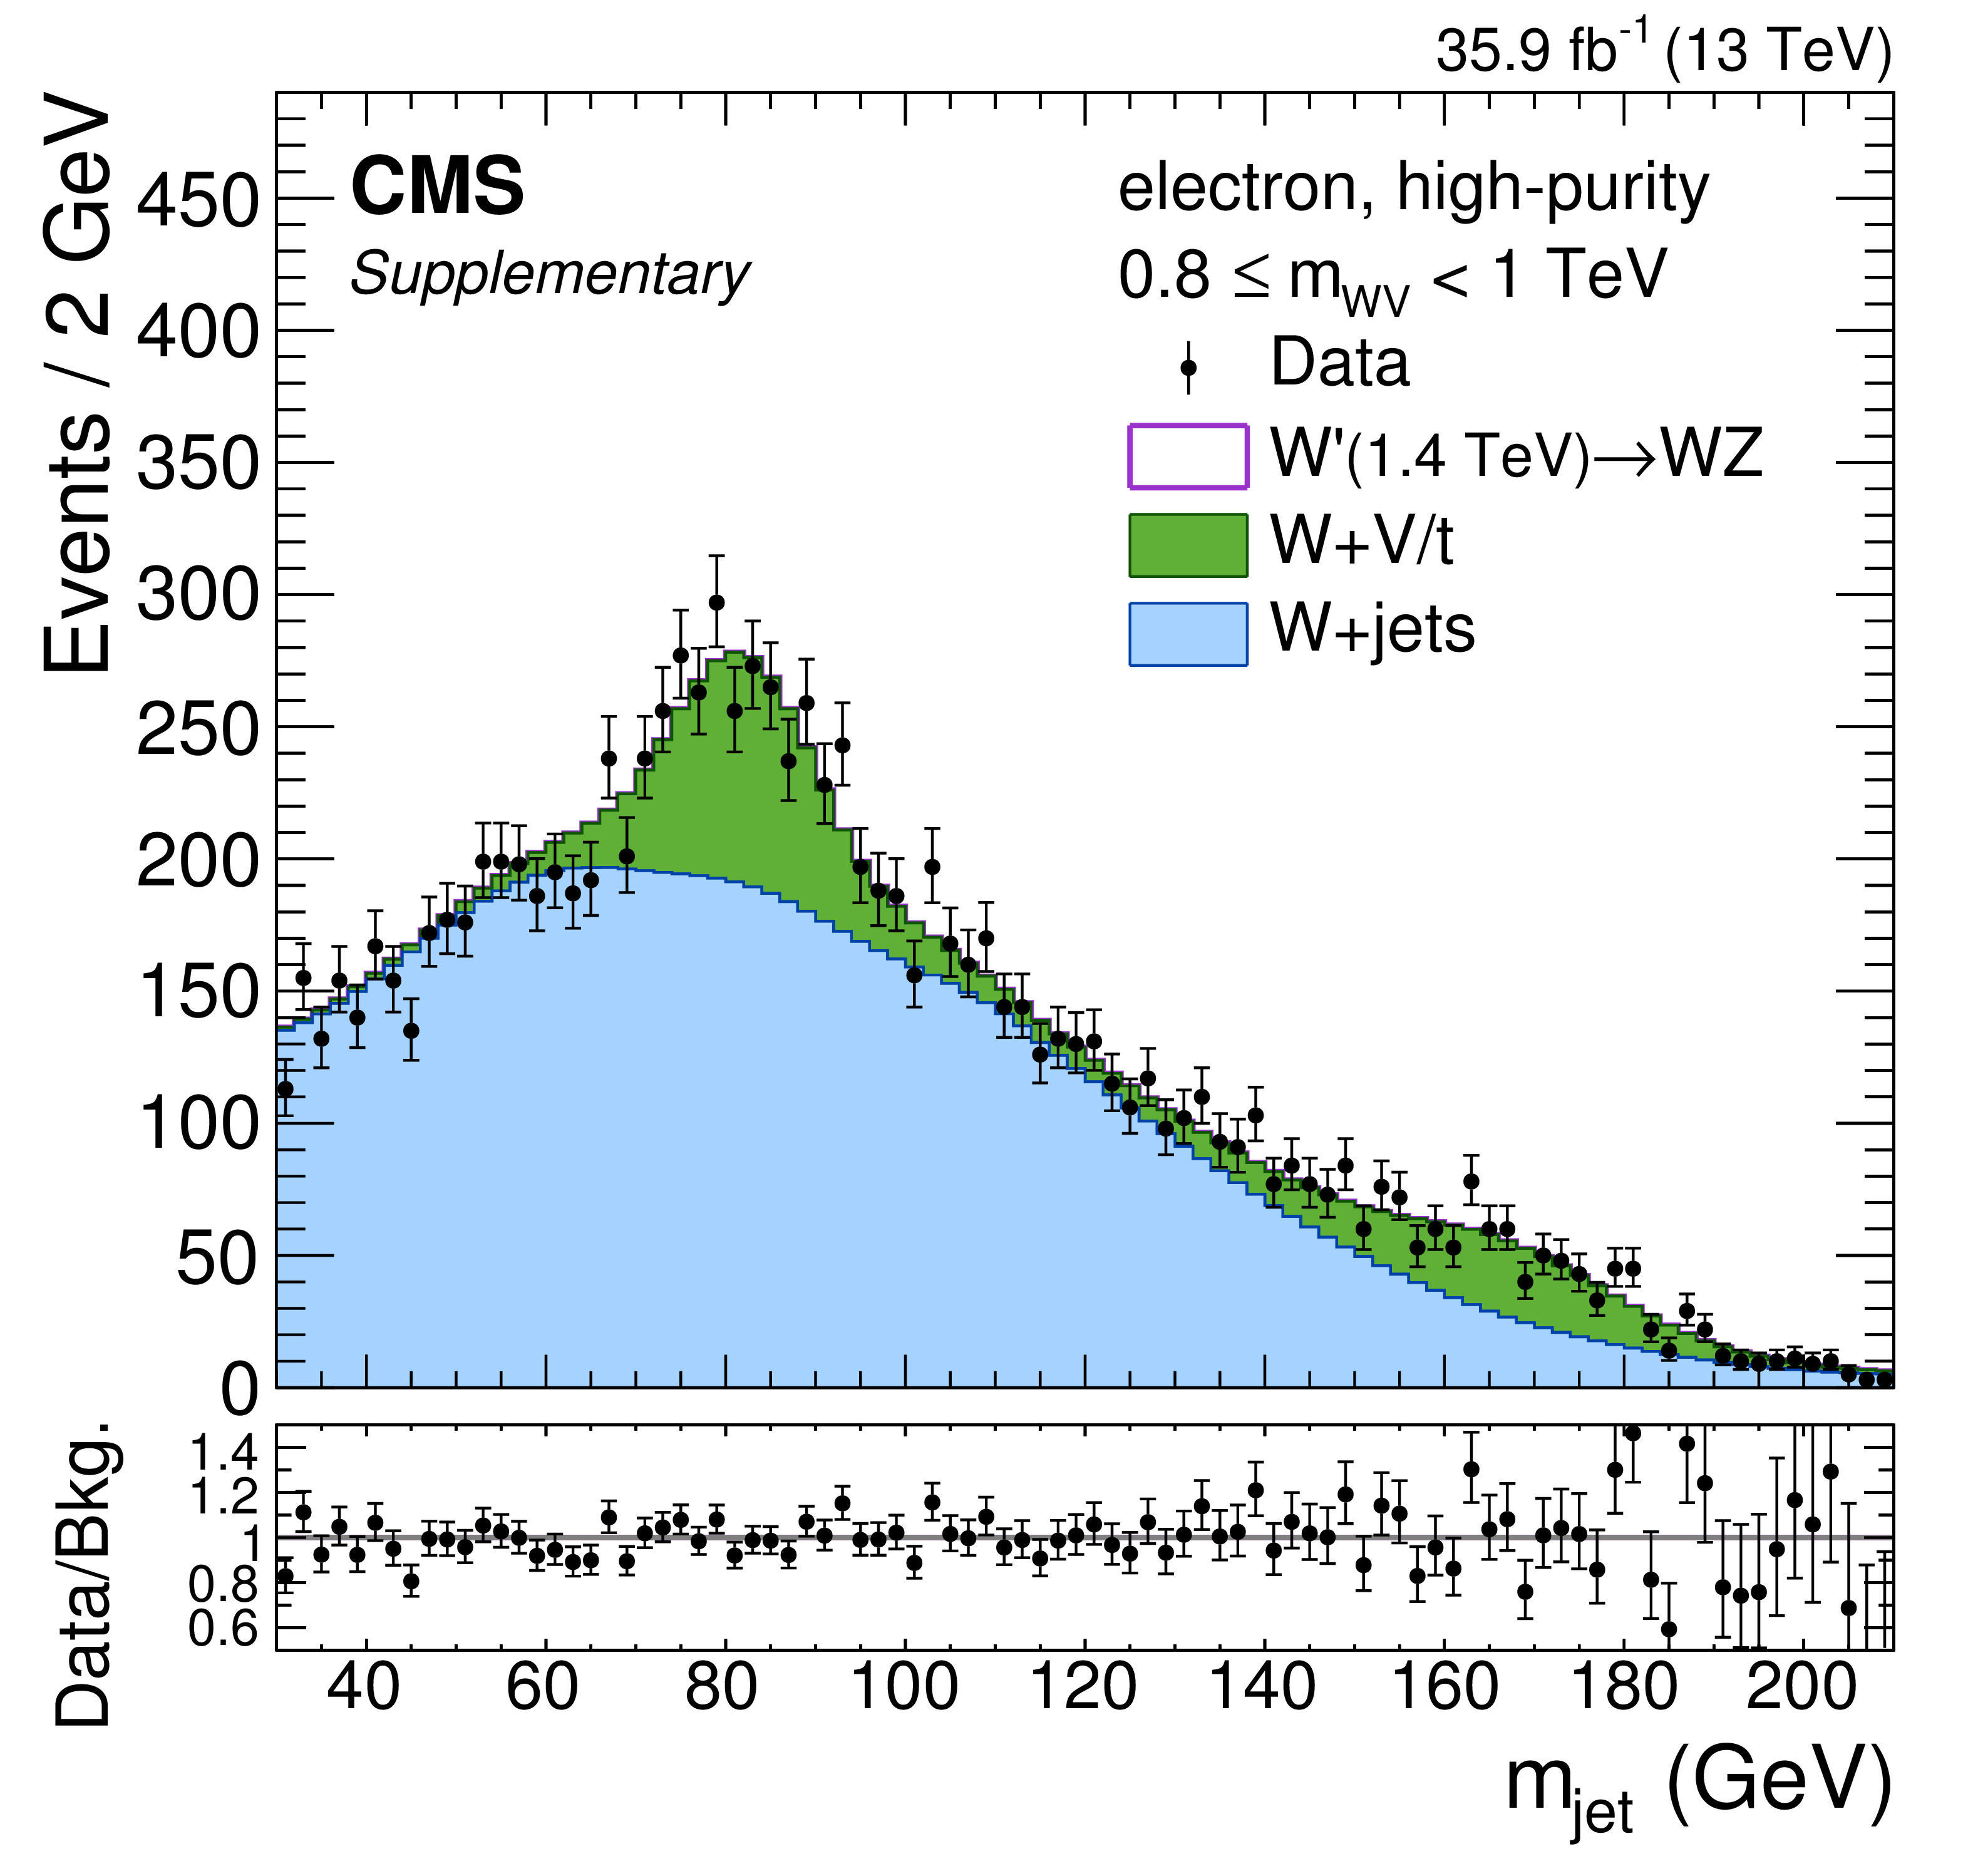
Additional Figure 13:
$m_{\text {jet}}$-projection of the signal-plus-background fit result for a $\mathrm {W'} \rightarrow \mathrm {WZ}$ signal of mass 1.4 TeV and data distributions in the range 0.8 $ \leq m_{\mathrm {WV}} < $ 1 TeV in the electron channel, high-purity category. In the bottom panel, the markers show the ratio of the data to the estimated background, and the violet line the ratio of signal+background to background. |
png pdf |
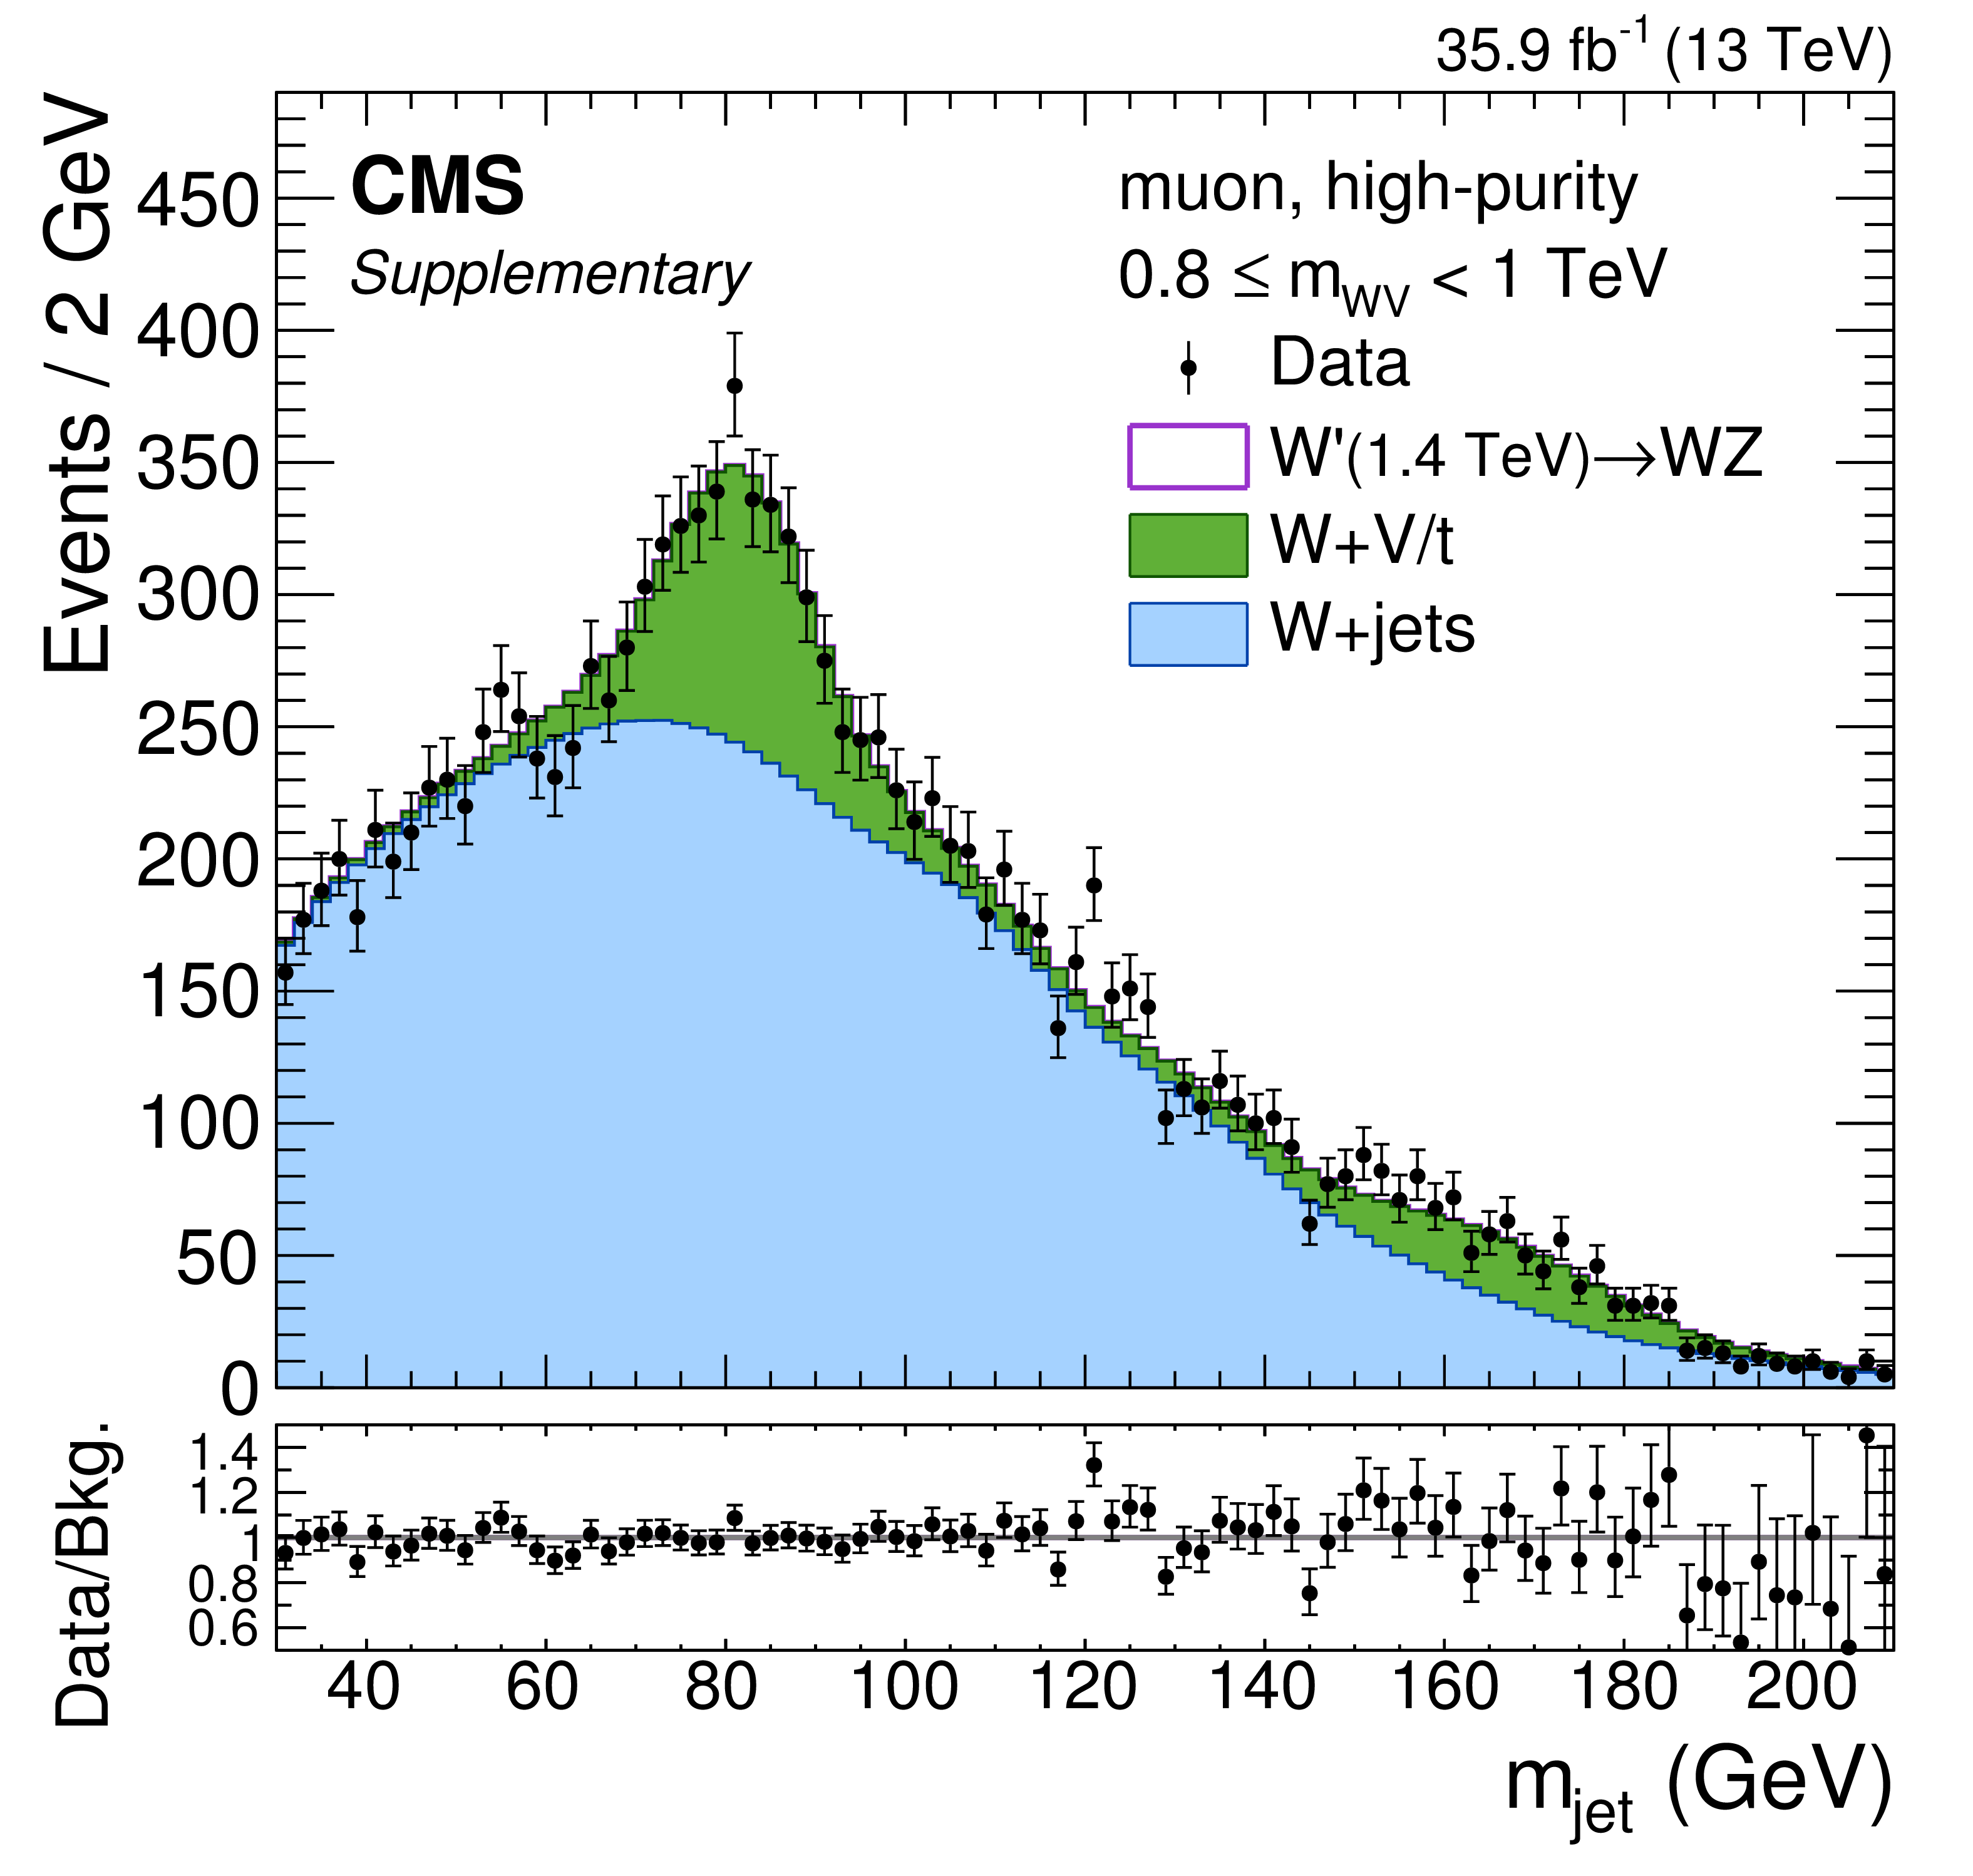
Additional Figure 14:
$m_{\text {jet}}$-projection of the signal-plus-background fit result for a $\mathrm {W'} \rightarrow \mathrm {WZ}$ signal of mass 1.4 TeV and data distributions in the range 0.8 $ \leq m_{\mathrm {WV}} < $ 1 TeV in the muon channel, high-purity category. In the bottom panel, the markers show the ratio of the data to the estimated background, and the violet line the ratio of signal+background to background. |
png pdf |
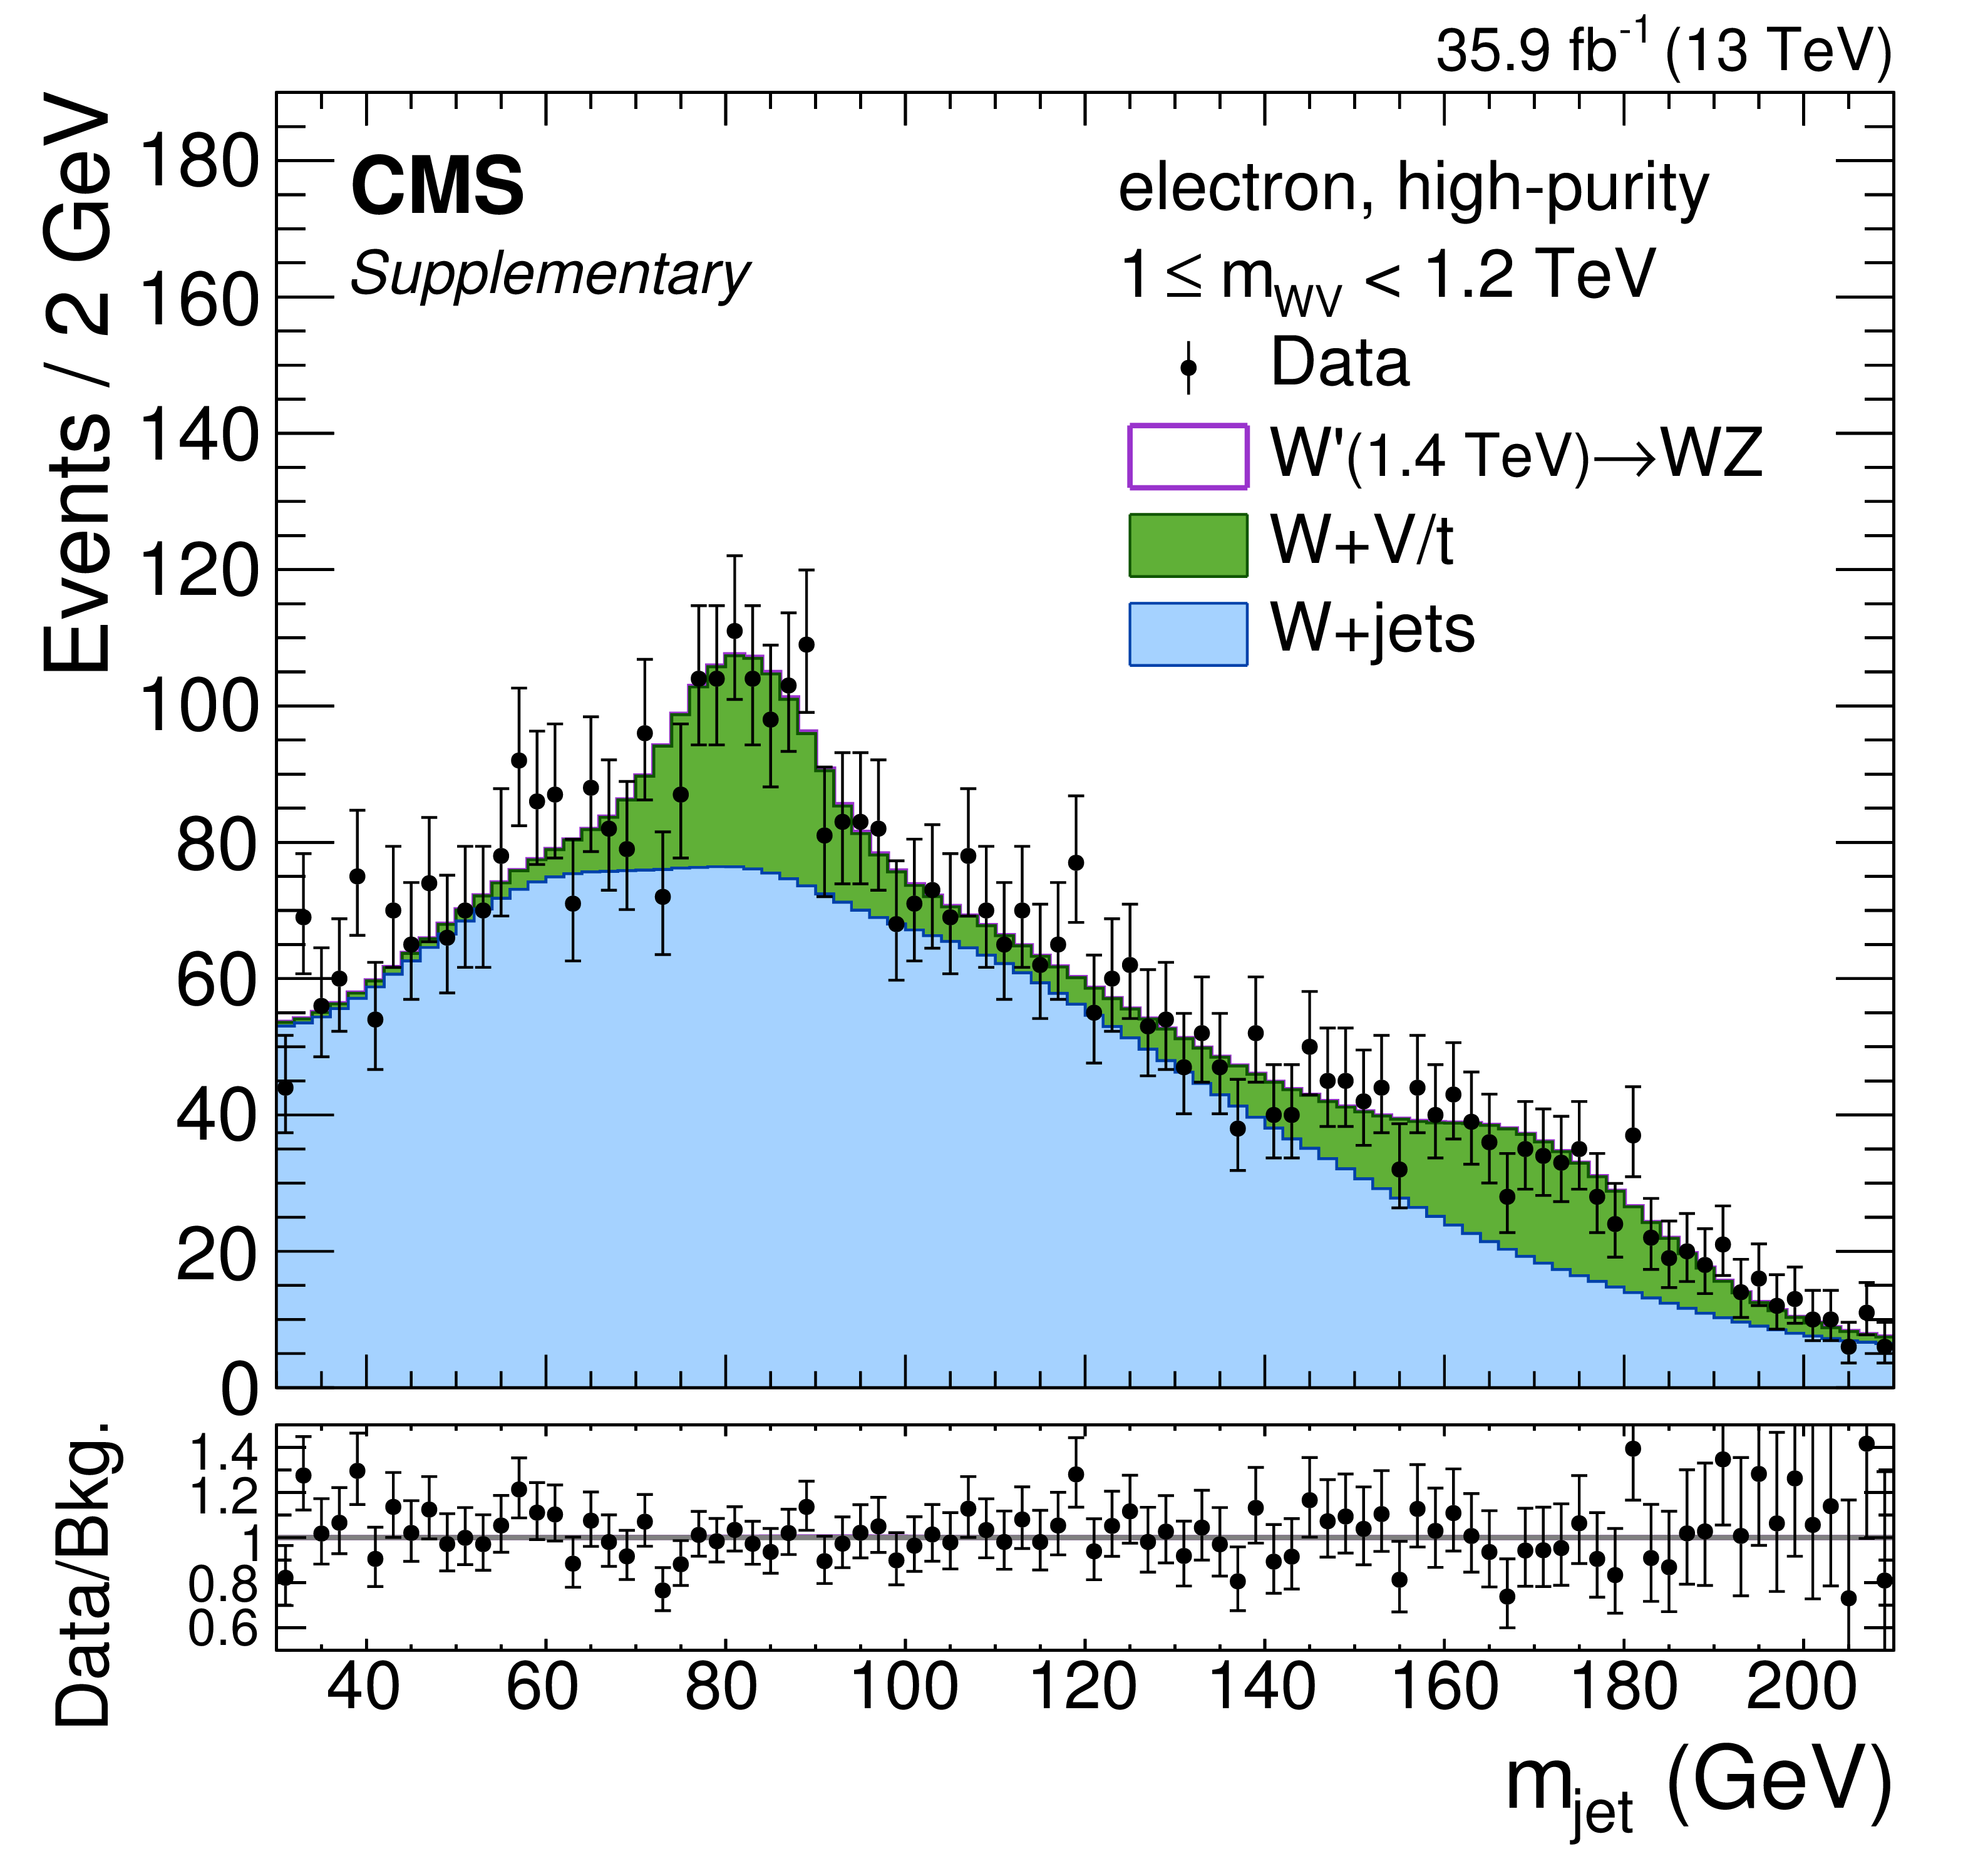
Additional Figure 15:
$m_{\text {jet}}$-projection of the signal-plus-background fit result for a $\mathrm {W'} \rightarrow \mathrm {WZ}$ signal of mass 1.4 TeV and data distributions in the range 1 $ \leq m_{\mathrm {WV}} < $ 1.2 TeV in the electron channel, high-purity category. In the bottom panel, the markers show the ratio of the data to the estimated background, and the violet line the ratio of signal+background to background. |

png pdf |
Additional Figure 16:
$m_{\text {jet}}$-projection of the signal-plus-background fit result for a $\mathrm {W'} \rightarrow \mathrm {WZ}$ signal of mass 1.4 TeV and data distributions in the range 1 $ \leq m_{\mathrm {WV}} < $ 1.2 TeV in the muon channel, high-purity category. In the bottom panel, the markers show the ratio of the data to the estimated background, and the violet line the ratio of signal+background to background. |
png pdf |
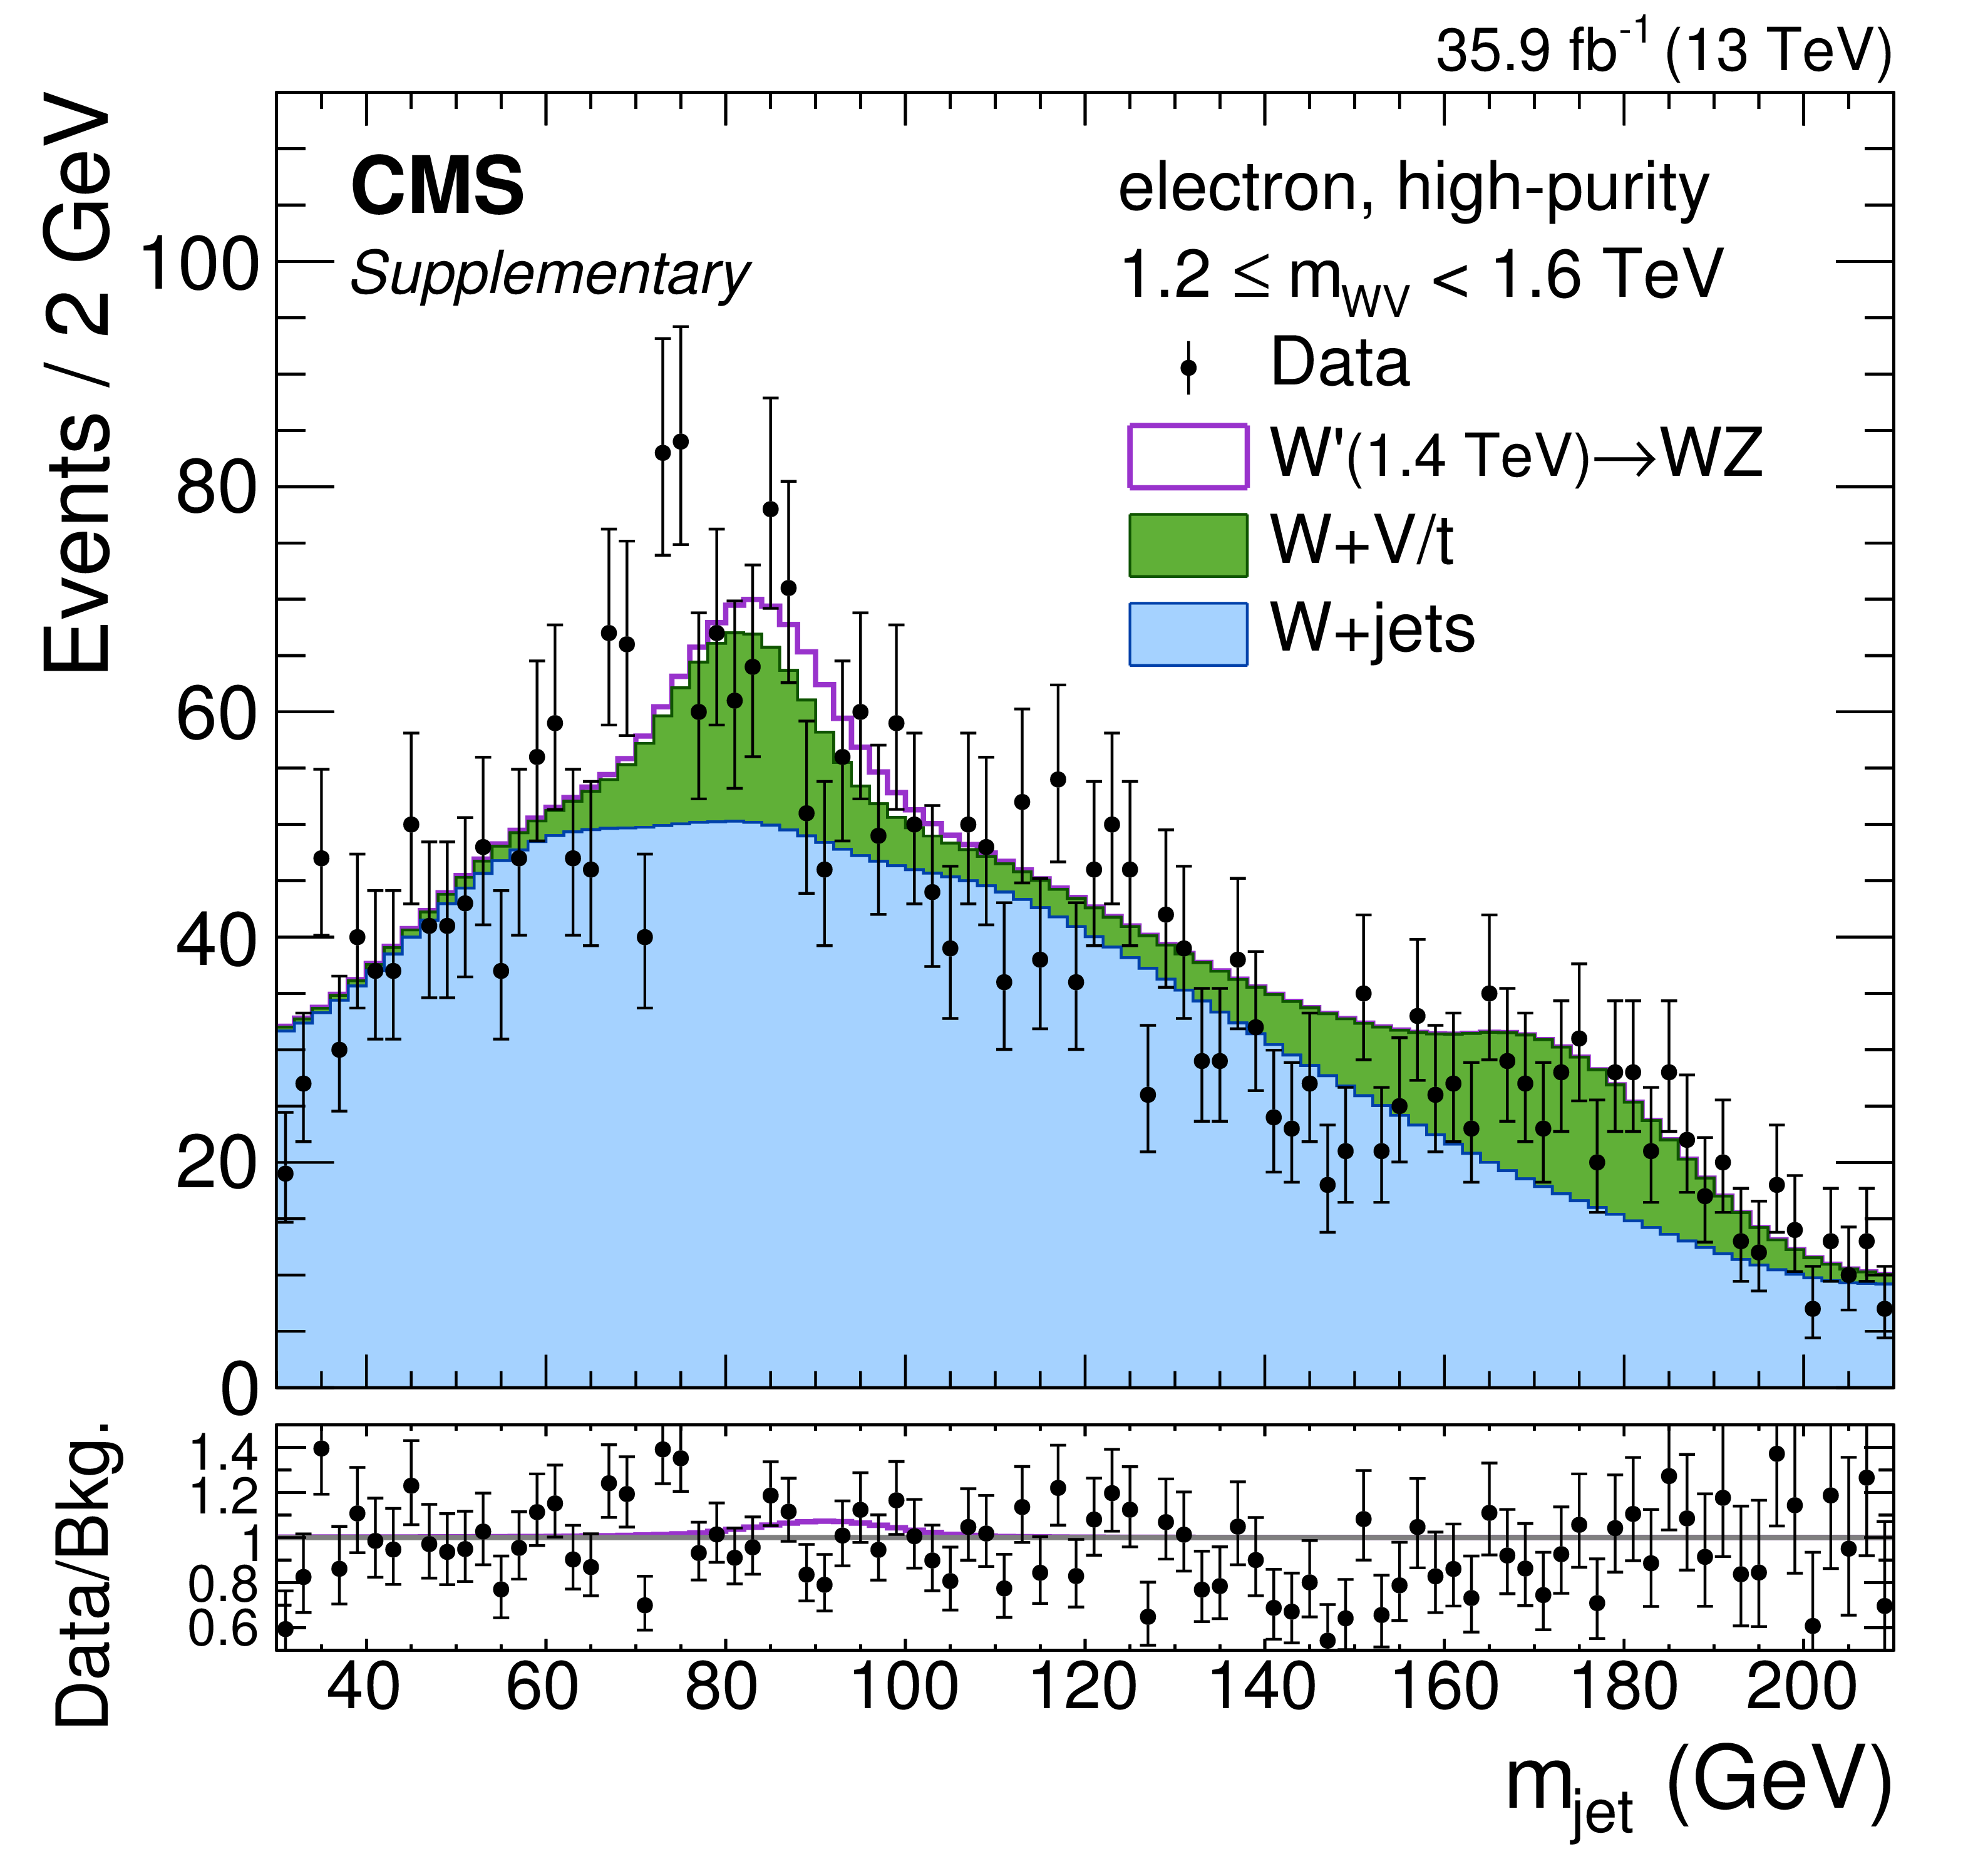
Additional Figure 17:
$m_{\text {jet}}$-projection of the signal-plus-background fit result for a $\mathrm {W'} \rightarrow \mathrm {WZ}$ signal of mass 1.4 TeV and data distributions in the range 1.2 $ \leq m_{\mathrm {WV}} < $ 1.6 TeV in the electron channel, high-purity category. In the bottom panel, the markers show the ratio of the data to the estimated background, and the violet line the ratio of signal+background to background. |
png pdf |
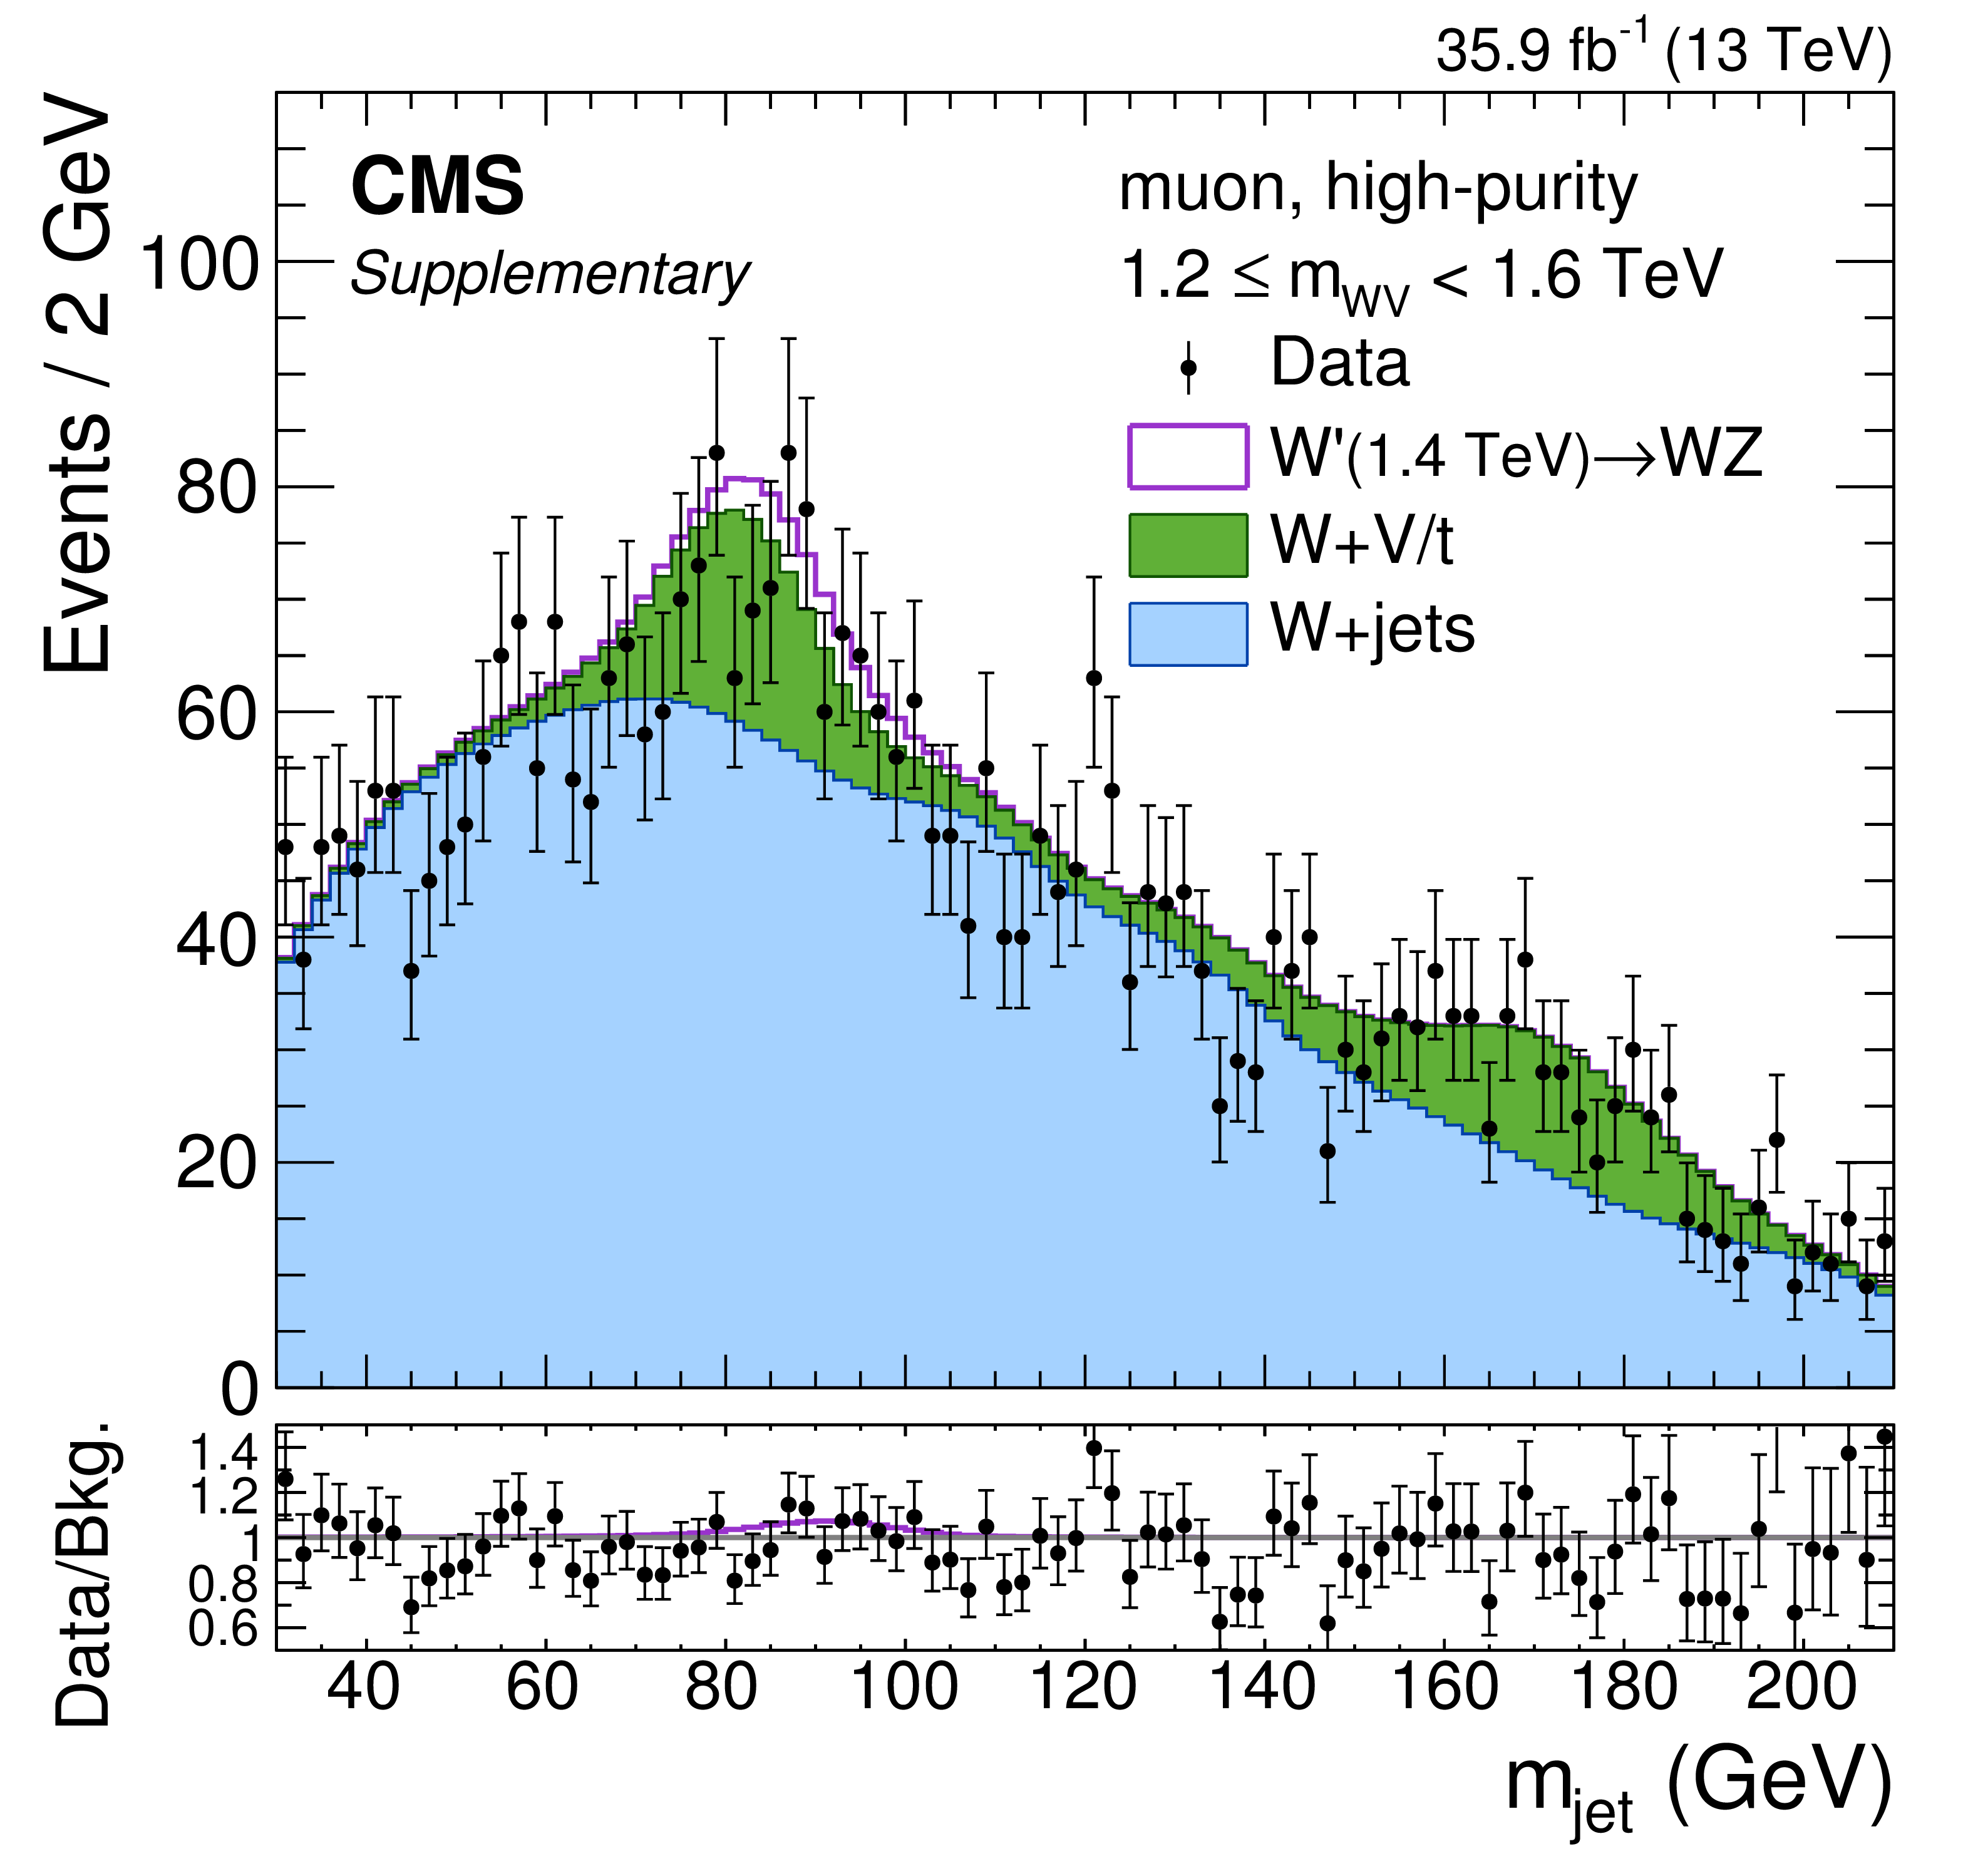
Additional Figure 18:
$m_{\text {jet}}$-projection of the signal-plus-background fit result for a $\mathrm {W'} \rightarrow \mathrm {WZ}$ signal of mass 1.4 TeV and data distributions in the range 1.2 $ \leq m_{\mathrm {WV}} < $ 1.6 TeV in the muon channel, high-purity category. In the bottom panel, the markers show the ratio of the data to the estimated background, and the violet line the ratio of signal+background to background. |

png pdf |
Additional Figure 19:
$m_{\text {jet}}$-projection of the signal-plus-background fit result for a $\mathrm {W'} \rightarrow \mathrm {WZ}$ signal of mass 1.4 TeV and data distributions in the range 1.6 $ \leq m_{\mathrm {WV}} < $ 5 TeV in the electron channel, high-purity category. In the bottom panel, the markers show the ratio of the data to the estimated background, and the violet line the ratio of signal+background to background. |
png pdf |
Additional Figure 20:
$m_{\text {jet}}$-projection of the signal-plus-background fit result for a $\mathrm {W'} \rightarrow \mathrm {WZ}$ signal of mass 1.4 TeV and data distributions in the range 1.6 $ \leq m_{\mathrm {WV}} < $ 5 TeV in the muon channel, high-purity category. In the bottom panel, the markers show the ratio of the data to the estimated background, and the violet line the ratio of signal+background to background. |
| References | ||||
| 1 | ATLAS Collaboration | Observation of a new particle in the search for the standard model Higgs boson with the ATLAS detector at the LHC | PLB 716 (2012) 1 | 1207.7214 |
| 2 | CMS Collaboration | Observation of a new boson at a mass of 125 GeV with the CMS experiment at the LHC | PLB 716 (2012) 30 | CMS-HIG-12-028 1207.7235 |
| 3 | CMS Collaboration | Observation of a new boson with mass near 125 GeV in pp collisions at $ \sqrt{s} = $ 7 and 8 TeV | JHEP 06 (2013) 081 | CMS-HIG-12-036 1303.4571 |
| 4 | S. L. Glashow | Partial symmetries of weak interactions | NP 22 (1961) 579 | |
| 5 | A. Salam and J. C. Ward | Electromagnetic and weak interactions | PL13 (1964) 168 | |
| 6 | S. Weinberg | A model of leptons | PRL 19 (1967) 1264 | |
| 7 | L. Susskind | Dynamics of spontaneous symmetry breaking in the Weinberg-Salam theory | PRD 20 (1979) 2619 | |
| 8 | G. 't Hooft | Naturalness, chiral symmetry, and spontaneous chiral symmetry breaking | NATO Sci. Ser. B 59 (1980) 135 | |
| 9 | R. Barbieri and G. F. Giudice | Upper bounds on supersymmetric particle masses | NPB 306 (1988) 63 | |
| 10 | G. F. Giudice | Naturally speaking: The naturalness criterion and physics at the LHC | in Perspectives on LHC physics 2008 | 0801.2562 |
| 11 | L. Randall and R. Sundrum | A large mass hierarchy from a small extra dimension | PRL 83 (1999) 3370 | hep-ph/9905221 |
| 12 | L. Randall and R. Sundrum | An alternative to compactification | PRL 83 (1999) 4690 | hep-th/9906064 |
| 13 | K. Agashe, H. Davoudiasl, G. Perez, and A. Soni | Warped gravitons at the LHC and beyond | PRD 76 (2007) 036006 | hep-ph/0701186 |
| 14 | A. L. Fitzpatrick, J. Kaplan, L. Randall, and L.-T. Wang | Searching for the Kaluza-Klein graviton in bulk RS models | JHEP 09 (2007) 013 | hep-ph/0701150 |
| 15 | K. Agashe, R. Contino, and A. Pomarol | The minimal composite Higgs model | NPB 719 (2005) 165 | hep-ph/0412089 |
| 16 | R. Contino, Y. Nomura, and A. Pomarol | Higgs as a holographic pseudo-Goldstone boson | NPB 671 (2003) 148 | hep-ph/0306259 |
| 17 | R. Contino, T. Kramer, M. Son, and R. Sundrum | Warped/composite phenomenology simplified | JHEP 05 (2007) 074 | hep-ph/0612180 |
| 18 | K. Lane and L. Pritchett | The light composite Higgs boson in strong extended technicolor | JHEP 06 (2017) 140 | 1604.07085 |
| 19 | CMS Collaboration | Search for massive resonances in dijet systems containing jets tagged as W or Z boson decays in pp collisions at $ \sqrt{s} = $ 8 TeV | JHEP 08 (2014) 173 | CMS-EXO-12-024 1405.1994 |
| 20 | CMS Collaboration | Search for massive resonances decaying into pairs of boosted bosons in semi-leptonic final states at $ \sqrt{s} = $ 8 TeV | JHEP 08 (2014) 174 | CMS-EXO-13-009 1405.3447 |
| 21 | CMS Collaboration | Search for a massive resonance decaying into a Higgs boson and a W or Z boson in hadronic final states in proton-proton collisions at $ \sqrt{s}=$ 8 TeV | JHEP 02 (2016) 145 | CMS-EXO-14-009 1506.01443 |
| 22 | CMS Collaboration | Search for narrow high-mass resonances in proton-proton collisions at $ \sqrt{s} = $ 8 TeV decaying to a Z and a Higgs boson | PLB 748 (2015) 255 | CMS-EXO-13-007 1502.04994 |
| 23 | CMS Collaboration | Search for massive WH resonances decaying into the $ \ell \nu\mathrm{b\bar{b}} $ final state at $ \sqrt{s}=$ 8 TeV | EPJC 76 (2016) 237 | CMS-EXO-14-010 1601.06431 |
| 24 | CMS Collaboration | Search for heavy resonances decaying to two Higgs bosons in final states containing four b quarks | EPJC 76 (2016) 371 | CMS-EXO-12-053 1602.08762 |
| 25 | CMS Collaboration | Search for massive resonances decaying into WW, WZ or ZZ bosons in proton-proton collisions at $ \sqrt{s} = $ 13 TeV | JHEP 03 (2017) 162 | CMS-B2G-16-004 1612.09159 |
| 26 | CMS Collaboration | Search for heavy resonances decaying into a vector boson and a Higgs boson in final states with charged leptons, neutrinos, and b quarks | PLB 768 (2017) 137 | CMS-B2G-16-003 1610.08066 |
| 27 | ATLAS Collaboration | Combination of searches for WW, WZ, and ZZ resonances in pp collisions at $ \sqrt{s} = $ 8 TeV with the ATLAS detector | PLB 755 (2016) 285 | 1512.05099 |
| 28 | ATLAS Collaboration | Search for high-mass diboson resonances with boson-tagged jets in proton-proton collisions at $ \sqrt{s}=$ 8 TeV with the ATLAS detector | JHEP 12 (2015) 055 | 1506.00962 |
| 29 | ATLAS Collaboration | Search for a new resonance decaying to a W or Z boson and a Higgs boson in the $ \ell\ell / \ell {\nu} / {\nu\nu} + \mathrm{b\bar{b}}{} $ final states with the ATLAS detector | EPJC 75 (2015) 263 | 1503.08089 |
| 30 | ATLAS Collaboration | Search for production of WW/WZ resonances decaying to a lepton, neutrino and jets in pp collisions at $ \sqrt{s}=$ 8 TeV with the ATLAS detector | EPJC 75 (2015) 209 | 1503.04677 |
| 31 | ATLAS Collaboration | Search for resonant diboson production in the $ \ell\ell \mathrm{ q \bar{q} } $ final state in pp collisions at $ \sqrt{s} = $ 8 TeV with the ATLAS detector | EPJC 75 (2015) 69 | 1409.6190 |
| 32 | ATLAS Collaboration | Search for new resonances decaying to a W or Z boson and a Higgs boson in the $ \ell^+ \ell^- \mathrm{b\bar{b}}{} $, $ \ell {\nu}\mathrm{b\bar{b}}{} $, and $ {\nu\overline{\nu}} \mathrm{b\bar{b}}{} $ channels with pp collisions at $ \sqrt s = $ 13 TeV with the ATLAS detector | PLB 765 (2017) 32 | 1607.05621 |
| 33 | ATLAS Collaboration | Searches for heavy diboson resonances in pp collisions at $ \sqrt{s}=$ 13 TeV with the ATLAS detector | JHEP 09 (2016) 173 | 1606.04833 |
| 34 | D. Pappadopulo, A. Thamm, R. Torre, and A. Wulzer | Heavy vector triplets: Bridging theory and data | JHEP 09 (2014) 060 | 1402.4431 |
| 35 | ATLAS Collaboration | Search for WW/WZ resonance production in $ \ell{\nu}{\mathrm{q}}{\mathrm{q}} $ final states in pp collisions at $ \sqrt{s} = $ 13 TeV with the ATLAS detector | Submitted to JHEP | 1710.07235 |
| 36 | CMS Collaboration | The CMS experiment at the CERN LHC | JINST 3 (2008) S08004 | CMS-00-001 |
| 37 | A. Oliveira | Gravity particles from warped extra dimensions, predictions for LHC | 1404.0102 | |
| 38 | B. Bellazzini, C. Csaki, and J. Serra | Composite Higgses | EPJC 74 (2014) 2766 | 1401.2457 |
| 39 | R. Contino, D. Marzocca, D. Pappadopulo, and R. Rattazzi | On the effect of resonances in composite Higgs phenomenology | JHEP 10 (2011) 081 | 1109.1570 |
| 40 | D. Marzocca, M. Serone, and J. Shu | General composite Higgs models | JHEP 08 (2012) 013 | 1205.0770 |
| 41 | D. Greco and D. Liu | Hunting composite vector resonances at the LHC: naturalness facing data | JHEP 12 (2014) 126 | 1410.2883 |
| 42 | J. Alwall et al. | The automated computation of tree-level and next-to-leading order differential cross sections, and their matching to parton shower simulations | JHEP 07 (2014) 079 | 1405.0301 |
| 43 | Y. Li and F. Petriello | Combining QCD and electroweak corrections to dilepton production in $ FEWZ $ | PRD 86 (2012) 094034 | 1208.5967 |
| 44 | S. Kallweit et al. | NLO QCD+EW predictions for V+jets including off-shell vector-boson decays and multijet merging | JHEP 04 (2016) 021 | 1511.08692 |
| 45 | P. Nason | A new method for combining NLO QCD with shower Monte Carlo algorithms | JHEP 11 (2004) 040 | hep-ph/0409146 |
| 46 | S. Frixione, P. Nason, and C. Oleari | Matching NLO QCD computations with parton shower simulations: the POWHEG method | JHEP 11 (2007) 070 | 0709.2092 |
| 47 | S. Alioli, P. Nason, C. Oleari, and E. Re | A general framework for implementing NLO calculations in shower Monte Carlo programs: the POWHEG BOX | JHEP 06 (2010) 043 | 1002.2581 |
| 48 | S. Alioli, P. Nason, C. Oleari, and E. Re | NLO single-top production matched with shower in POWHEG: s- and t-channel contributions | JHEP 09 (2009) 111 | 0907.4076 |
| 49 | E. Re | Single-top Wt-channel production matched with parton showers using the POWHEG method | EPJC 71 (2011) 1547 | 1009.2450 |
| 50 | S. Alioli, S.-O. Moch, and P. Uwer | Hadronic top-quark pair-production with one jet and parton showering | JHEP 01 (2012) 137 | 1110.5251 |
| 51 | M. Czakon and A. Mitov | Top++: A program for the calculation of the top-pair cross-section at hadron colliders | CPC 185 (2014) 2930 | 1112.5675 |
| 52 | R. Frederix and S. Frixione | Merging meets matching in $ MCatNLO $ | JHEP 12 (2012) 061 | 1209.6215 |
| 53 | J. M. Campbell, R. K. Ellis, and C. Williams | Vector boson pair production at the LHC | JHEP 07 (2011) 018 | 1105.0020 |
| 54 | J. M. Campbell and R. K. Ellis | Top-quark processes at NLO in production and decay | JPG 42 (2015) 015005 | 1204.1513 |
| 55 | J. M. Campbell, R. K. Ellis, and F. Tramontano | Single top production and decay at next-to-leading order | PRD 70 (2004) 094012 | hep-ph/0408158 |
| 56 | T. Sjostrand, S. Mrenna, and P. Z. Skands | PYTHIA 6.4 physics and manual | JHEP 05 (2006) 026 | hep-ph/0603175 |
| 57 | T. Sjostrand, S. Mrenna, and P. Z. Skands | A brief introduction to PYTHIA 8.1 | CPC 178 (2008) 852 | 0710.3820 |
| 58 | P. Skands, S. Carrazza, and J. Rojo | Tuning PYTHIA 8.1: the Monash 2013 tune | EPJC 74 (2014) 3024 | 1404.5630 |
| 59 | CMS Collaboration | Event generator tunes obtained from underlying event and multiparton scattering measurements | EPJC 76 (2016) 155 | CMS-GEN-14-001 1512.00815 |
| 60 | R. D. Ball et al. | Impact of heavy quark masses on parton distributions and LHC phenomenology | NPB 849 (2011) 296 | 1101.1300 |
| 61 | GEANT4 Collaboration | GEANT4--a simulation toolkit | NIMA 506 (2003) 250 | |
| 62 | CMS Collaboration | Measurements of inclusive W and Z cross sections in pp collisions at $ \sqrt{s}=$ 7 TeV | JHEP 01 (2011) 080 | CMS-EWK-10-002 1012.2466 |
| 63 | CMS Collaboration | Identification of heavy-flavour jets with the CMS detector in pp collisions at 13 TeV | Submitted to \it JINST | CMS-BTV-16-002 1712.07158 |
| 64 | CMS Collaboration | Particle-flow reconstruction and global event description with the CMS detector | JINST 12 (2017) P10003 | CMS-PRF-14-001 1706.04965 |
| 65 | CMS Collaboration | The CMS trigger system | JINST 12 (2017) P01020 | CMS-TRG-12-001 1609.02366 |
| 66 | CMS Collaboration | Performance of electron reconstruction and selection with the CMS detector in proton-proton collisions at $ \sqrt{s} = $ 8 TeV | JINST 10 (2015) P06005 | CMS-EGM-13-001 1502.02701 |
| 67 | CMS Collaboration | Performance of CMS muon reconstruction in pp collision events at $ \sqrt{s}=$ 7 TeV | JINST 7 (2012) P10002 | CMS-MUO-10-004 1206.4071 |
| 68 | M. Cacciari, G. P. Salam, and G. Soyez | The anti-$ k_{t} $ jet clustering algorithm | JHEP 04 (2008) 063 | 0802.1189 |
| 69 | M. Cacciari, G. P. Salam, and G. Soyez | FastJet user manual | EPJC 72 (2012) 1896 | 1111.6097 |
| 70 | CMS Collaboration | Jet energy scale and resolution in the CMS experiment in pp collisions at 8 TeV | JINST 12 (2017) P02014 | CMS-JME-13-004 1607.03663 |
| 71 | D. Bertolini, P. Harris, M. Low, and N. Tran | Pileup per particle identification | JHEP 10 (2014) 059 | 1407.6013 |
| 72 | CMS Collaboration | Jet algorithms performance in 13 TeV data | CMS-PAS-JME-16-003 | CMS-PAS-JME-16-003 |
| 73 | CMS Collaboration | Performance of missing energy reconstruction in 13 TeV pp collision data using the CMS detector | CMS-PAS-JME-16-004 | CMS-PAS-JME-16-004 |
| 74 | J. Thaler and K. Van Tilburg | Identifying boosted objects with $ N $-subjettiness | JHEP 03 (2011) 015 | 1011.2268 |
| 75 | M. Dasgupta, A. Fregoso, S. Marzani, and G. P. Salam | Towards an understanding of jet substructure | JHEP 09 (2013) 029 | 1307.0007 |
| 76 | J. M. Butterworth, A. R. Davison, M. Rubin, and G. P. Salam | Jet substructure as a new Higgs search channel at the LHC | PRL 100 (2008) 242001 | 0802.2470 |
| 77 | A. J. Larkoski, S. Marzani, G. Soyez, and J. Thaler | Soft drop | JHEP 05 (2014) 146 | 1402.2657 |
| 78 | M. J. Oreglia | A study of the reactions $\psi' \to \gamma\gamma \psi$ | PhD thesis, Stanford University, 1980 SLAC Report SLAC-R-236, see Appendix D | |
| 79 | J. Gaiser | Charmonium Spectroscopy From Radiative Decays of the $\mathrm{J}/\psi$ | PhD thesis, SLAC | |
| 80 | K. S. Cranmer | Kernel estimation in high-energy physics | CPC 136 (2001) 198 | hep-ex/0011057 |
| 81 | CMS Collaboration | CMS luminosity measurements for the 2016 data taking period | CMS-PAS-LUM-17-001 | CMS-PAS-LUM-17-001 |
| 82 | M. Cacciari et al. | The $ \mathrm{t\bar{t}} $ cross-section at 1.8 TeV and 1.96 TeV: $A study of the systematics due to parton densities and scale dependence | JHEP 04 (2004) 068 | hep-ph/0303085 |
| 83 | S. Catani, D. de Florian, M. Grazzini, and P. Nason | Soft gluon resummation for Higgs boson production at hadron colliders | JHEP 07 (2003) 028 | hep-ph/0306211 |
| 84 | S. Baker and R. D. Cousins | Clarification of the use of chi square and likelihood functions in fits to histograms | NIM221 (1984) 437 | |
| 85 | G. Cowan, K. Cranmer, E. Gross, and O. Vitells | Asymptotic formulae for likelihood-based tests of new physics | EPJC 71 (2011) 1554 | 1007.1727 |
| 86 | T. Junk | Confidence level computation for combining searches with small statistics | NIMA 434 (1999) 435 | hep-ex/9902006 |
| 87 | A. L. Read | Presentation of search results: The CLs technique | JPG 28 (2002) 2693 | |
|
|
Compact Muon Solenoid LHC, CERN |
|

|

|

|

|

|