

Compact Muon Solenoid
LHC, CERN
| CMS-B2G-19-003 ; CERN-EP-2021-044 | ||
| Search for a heavy resonance decaying to a top quark and a W boson at $\sqrt{s} = $ 13 TeV in the fully hadronic final state | ||
| CMS Collaboration | ||
| 26 April 2021 | ||
| JHEP 12 (2021) 106 | ||
| Abstract: A search for a heavy resonance decaying to a top quark and a W boson in the fully hadronic final state is presented. The analysis is performed using data from proton-proton collisions at a center-of-mass energy of 13 TeV, corresponding to an integrated luminosity of 137 fb$^{-1}$ recorded by the CMS experiment at the LHC. The search is focused on heavy resonances, where the decay products of each top quark or W boson are expected to be reconstructed as a single, large-radius jet with a distinct substructure. The production of an excited bottom quark, ${\mathrm{b}^\ast} $, is used as a benchmark when setting limits on the cross section for a heavy resonance decaying to a top quark and a W boson. The hypotheses of ${\mathrm{b}^\ast} $ quarks with left-handed, right-handed, and vector-like chiralities are excluded at 95% confidence level for masses below 2.6, 2.8, and 3.1 TeV, respectively. These are the most stringent limits on the ${\mathrm{b}^\ast} $ quark mass to date, extending the previous best limits by almost a factor of two. | ||
| Links: e-print arXiv:2104.12853 [hep-ex] (PDF) ; CDS record ; inSPIRE record ; HepData record ; CADI line (restricted) ; | ||
| Figures | |
png pdf |
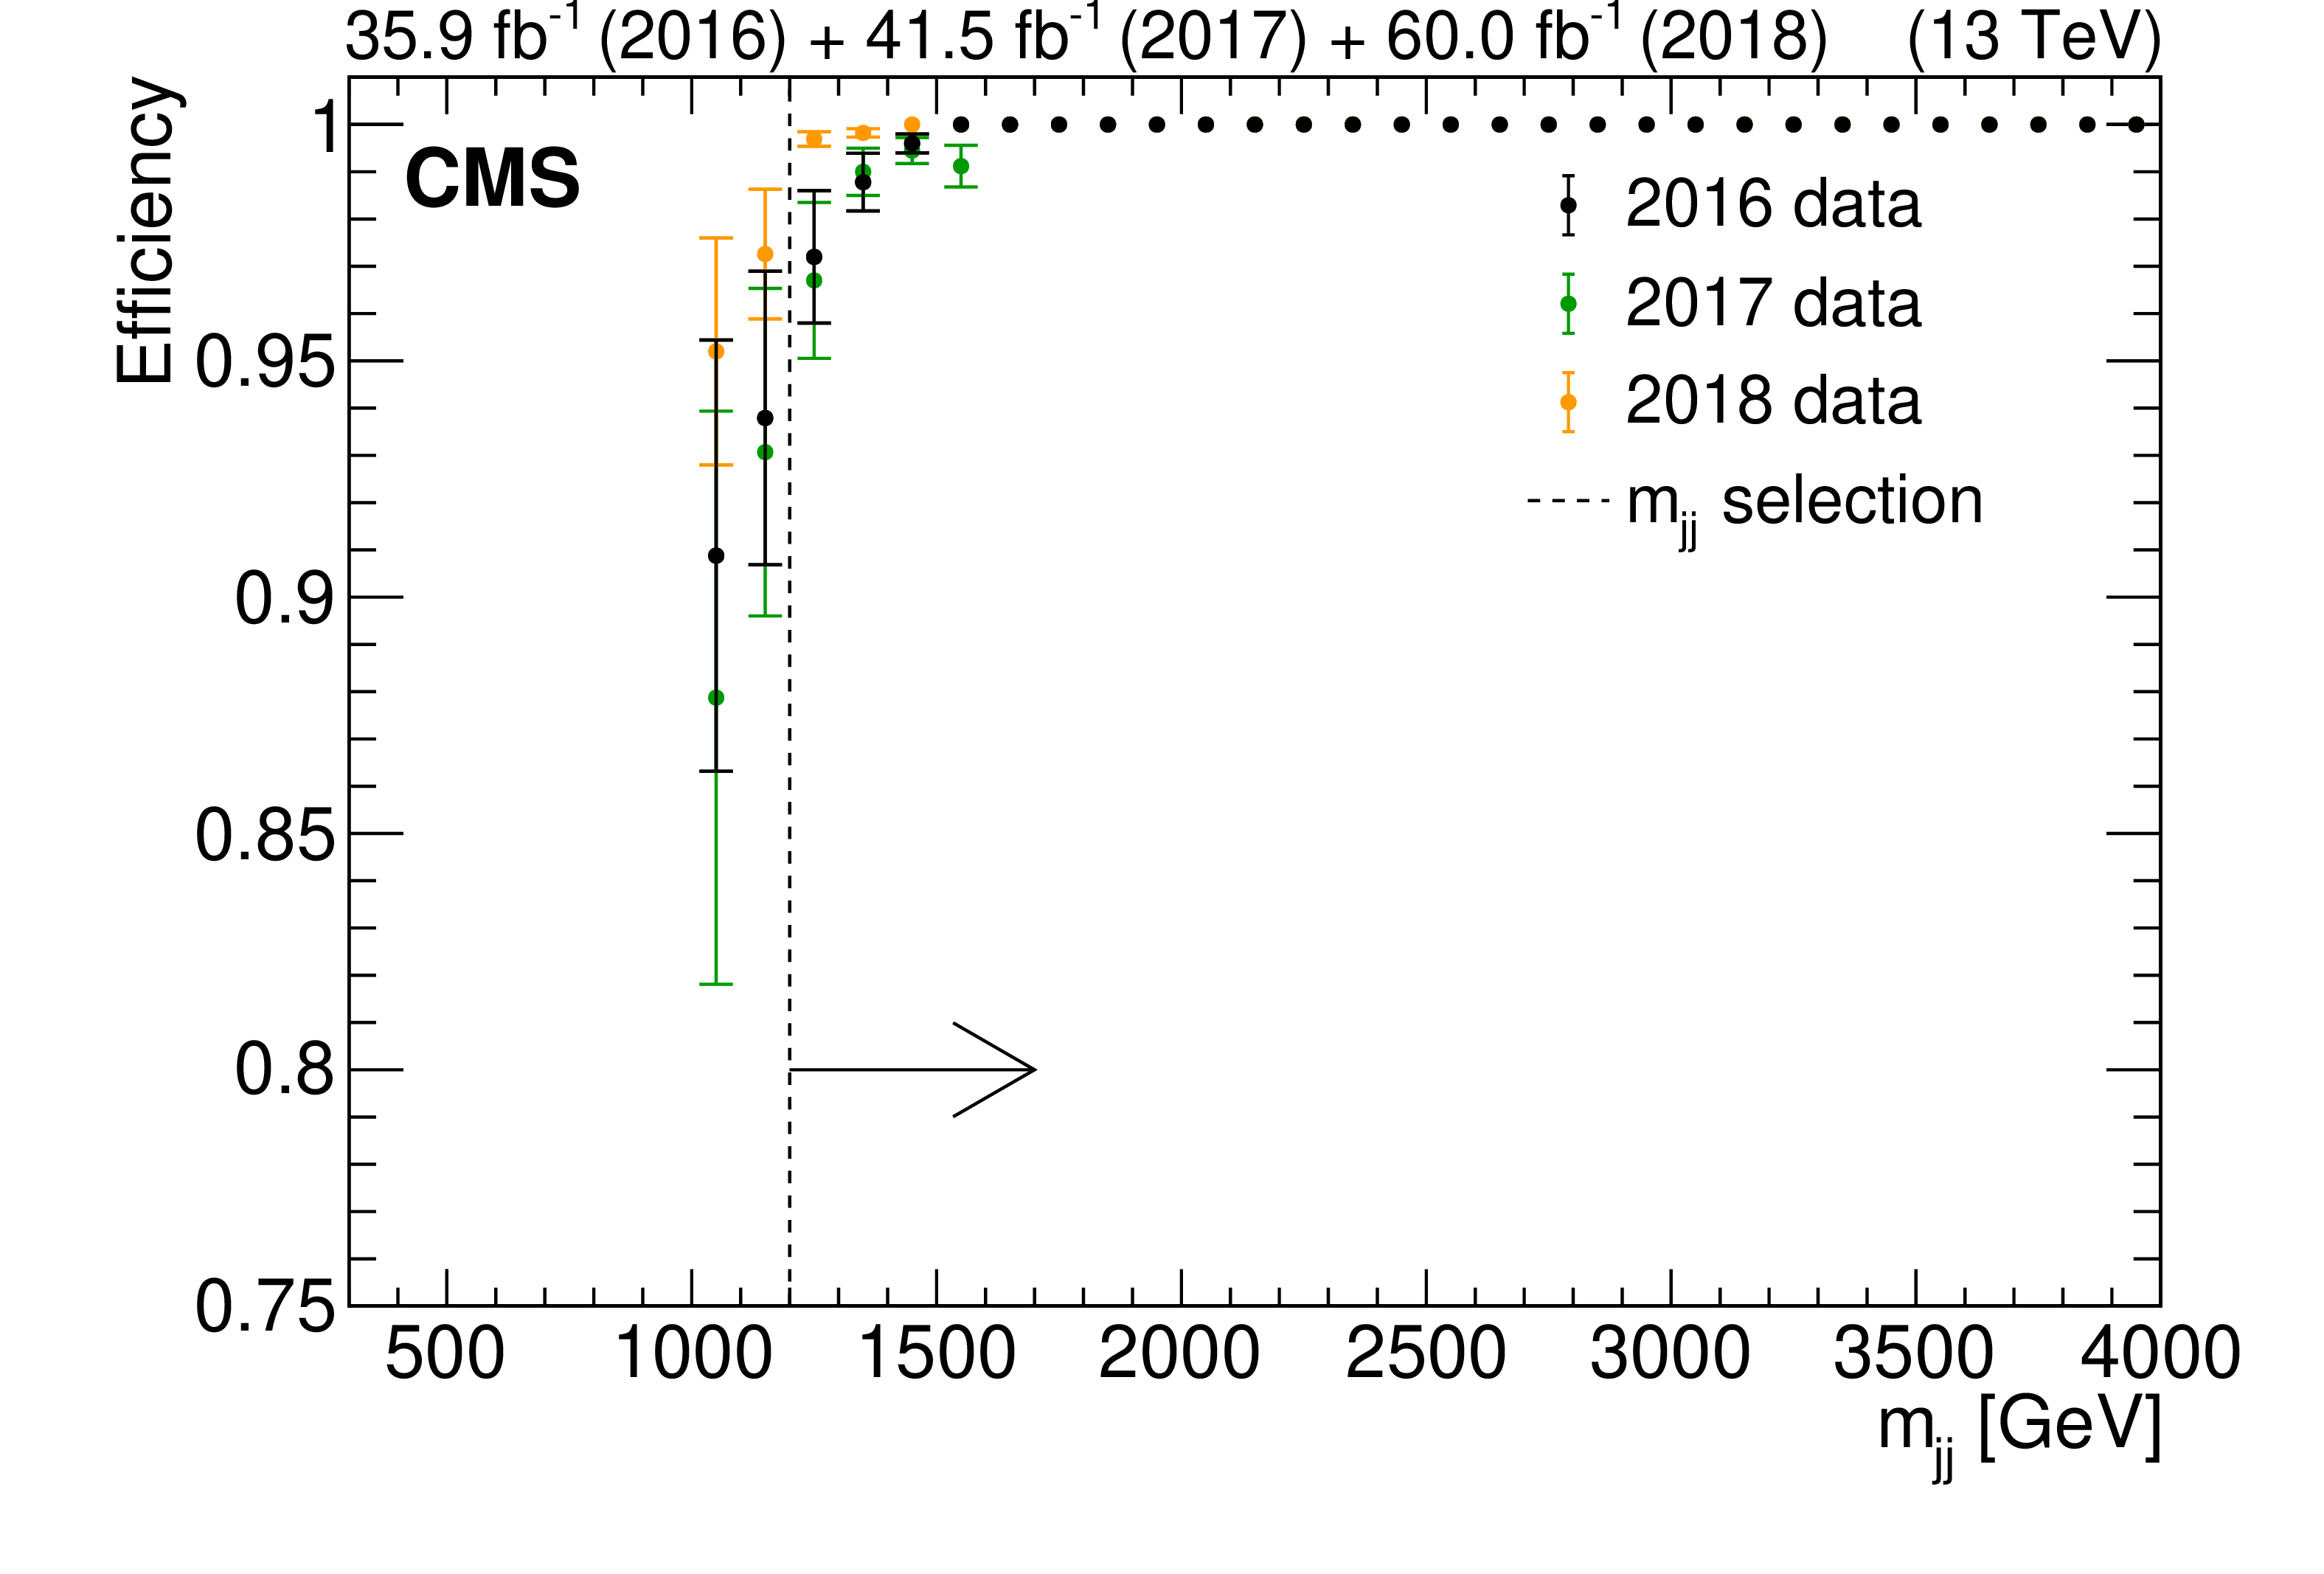
Figure 1:
The efficiency of the full trigger selection as a function of $ {m_{\mathrm {jj}}} $, shown separately for 2016, 2017, and 2018 data. The minimum $ {m_{\mathrm {jj}}} $ considered in the analysis is 1200 GeV and is marked with a dashed line and an arrow. The efficiency below $ {m_{\mathrm {jj}}} $ of 1000 GeV is not measured. The points for 2017 and 2018 data are not visible in the plateau because they are overlapped by the points for 2016 data. |
png pdf |
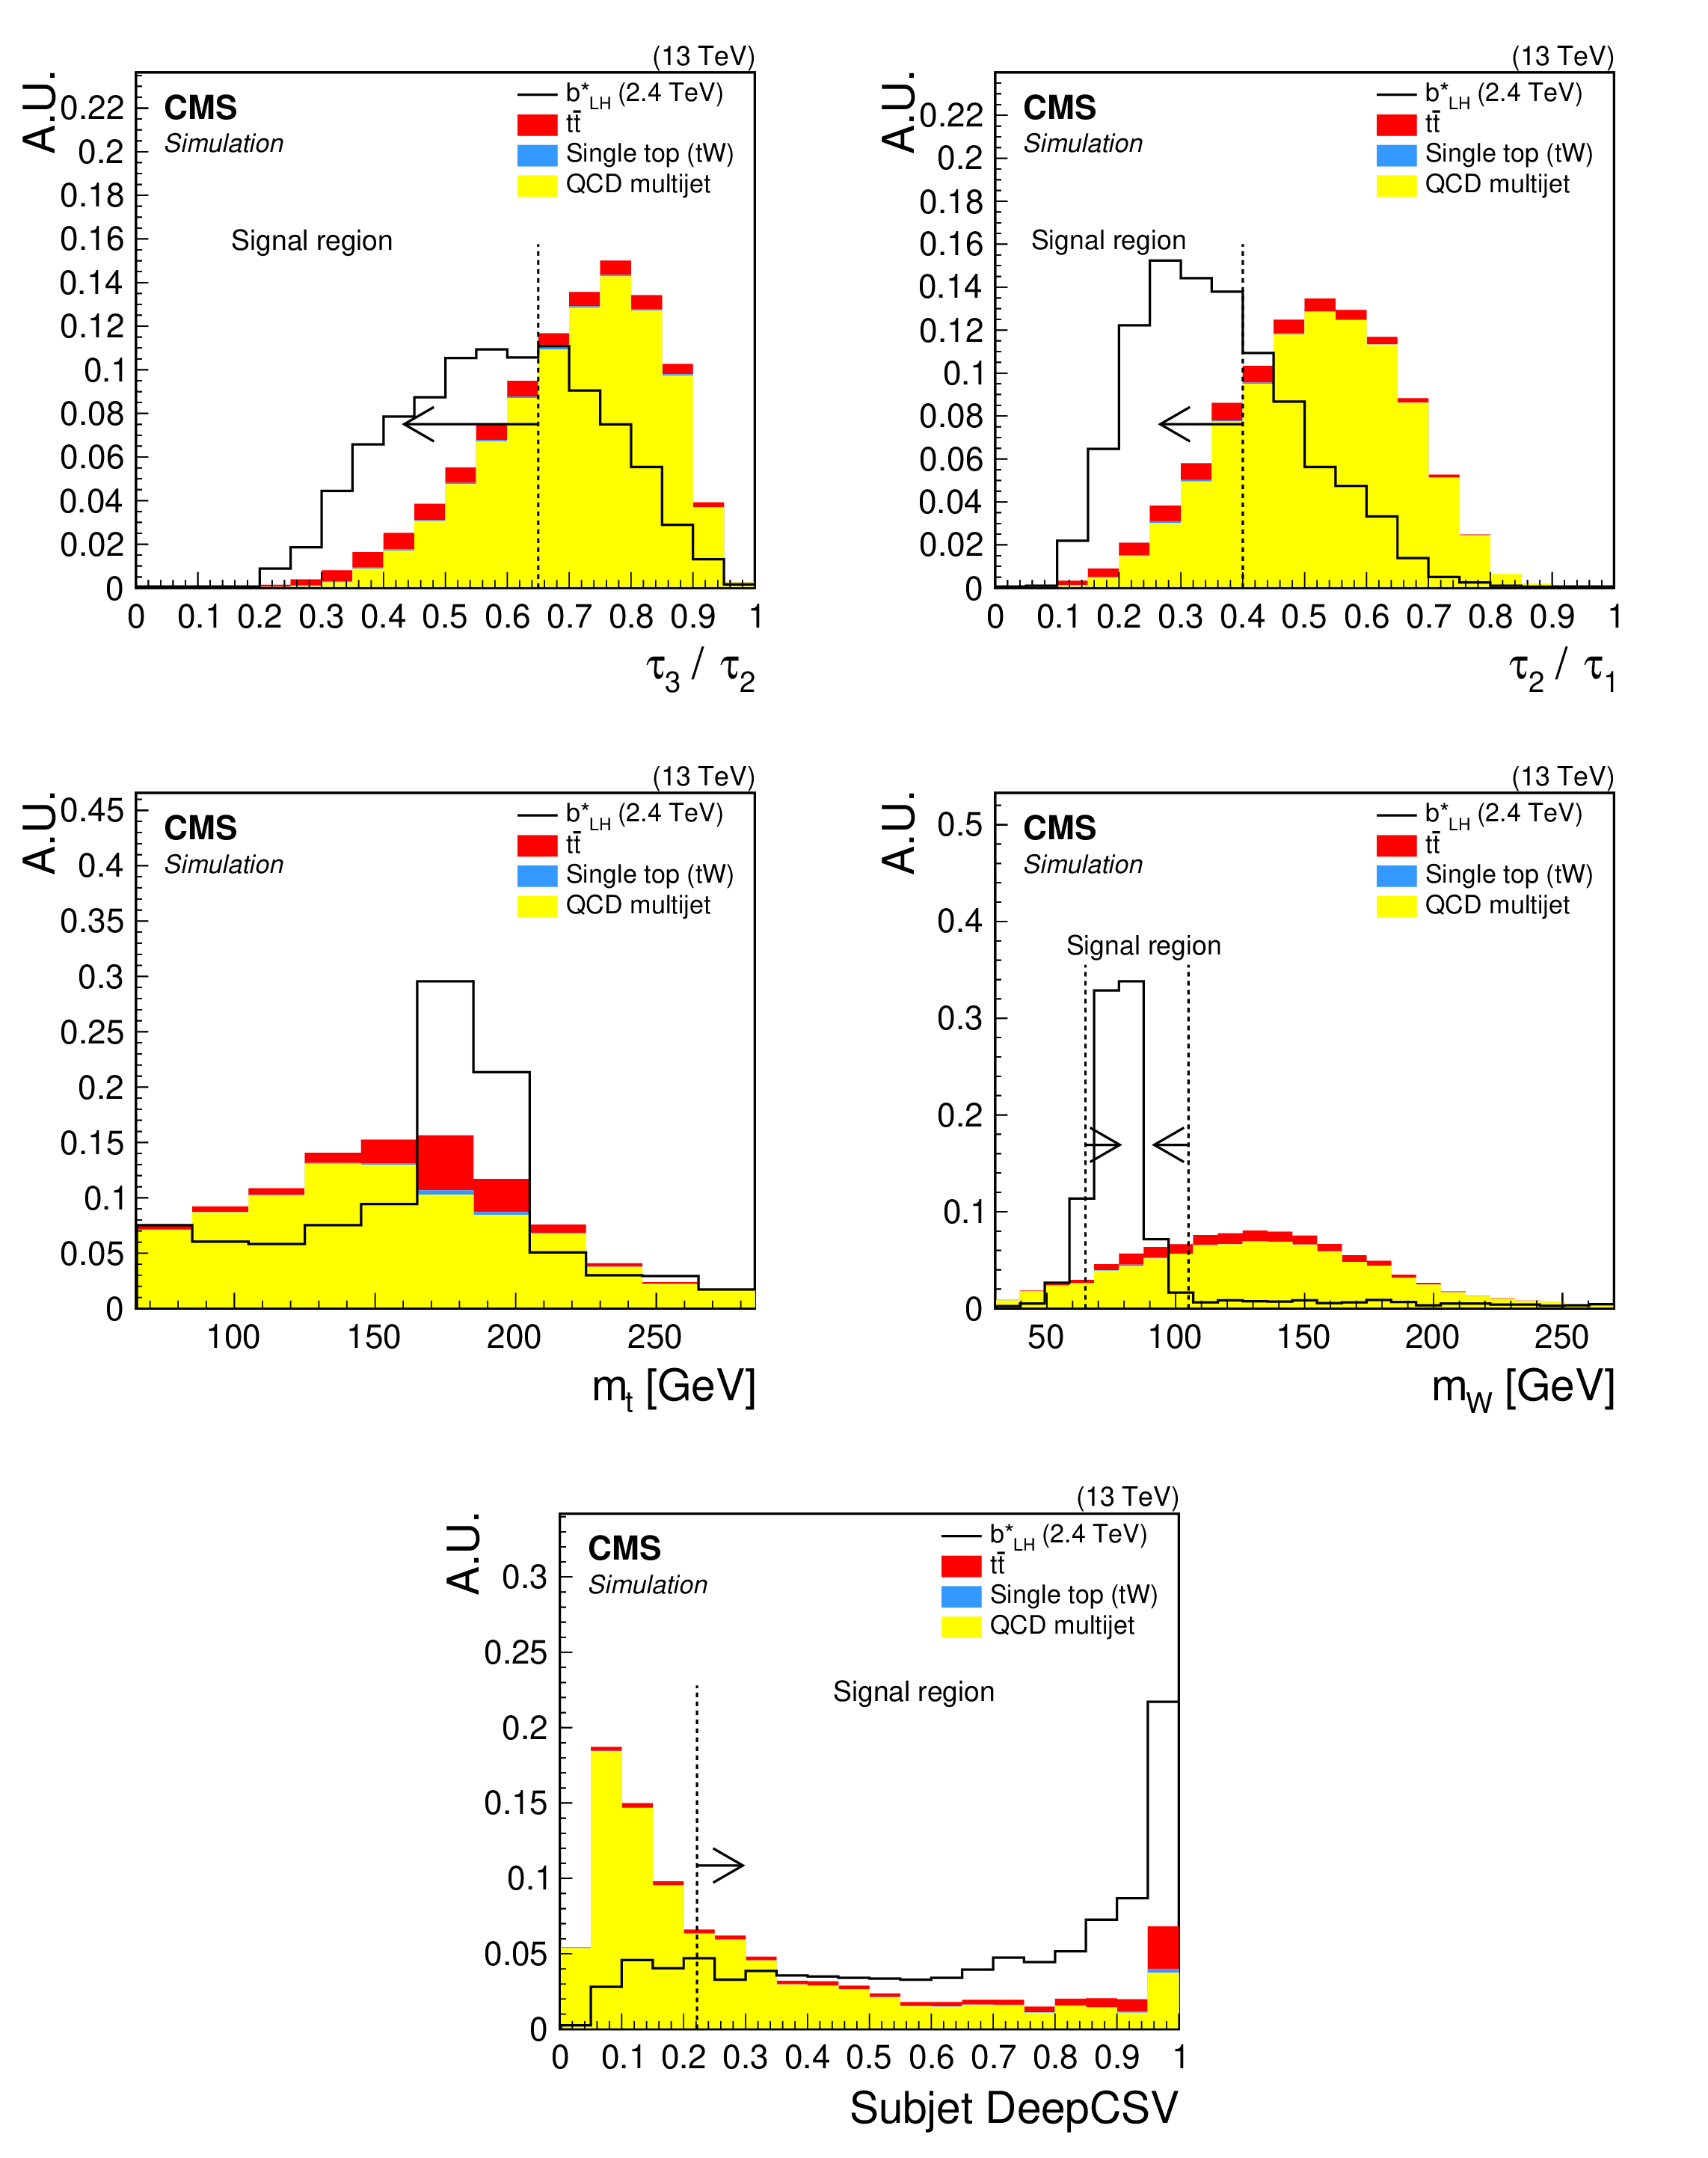
Figure 2:
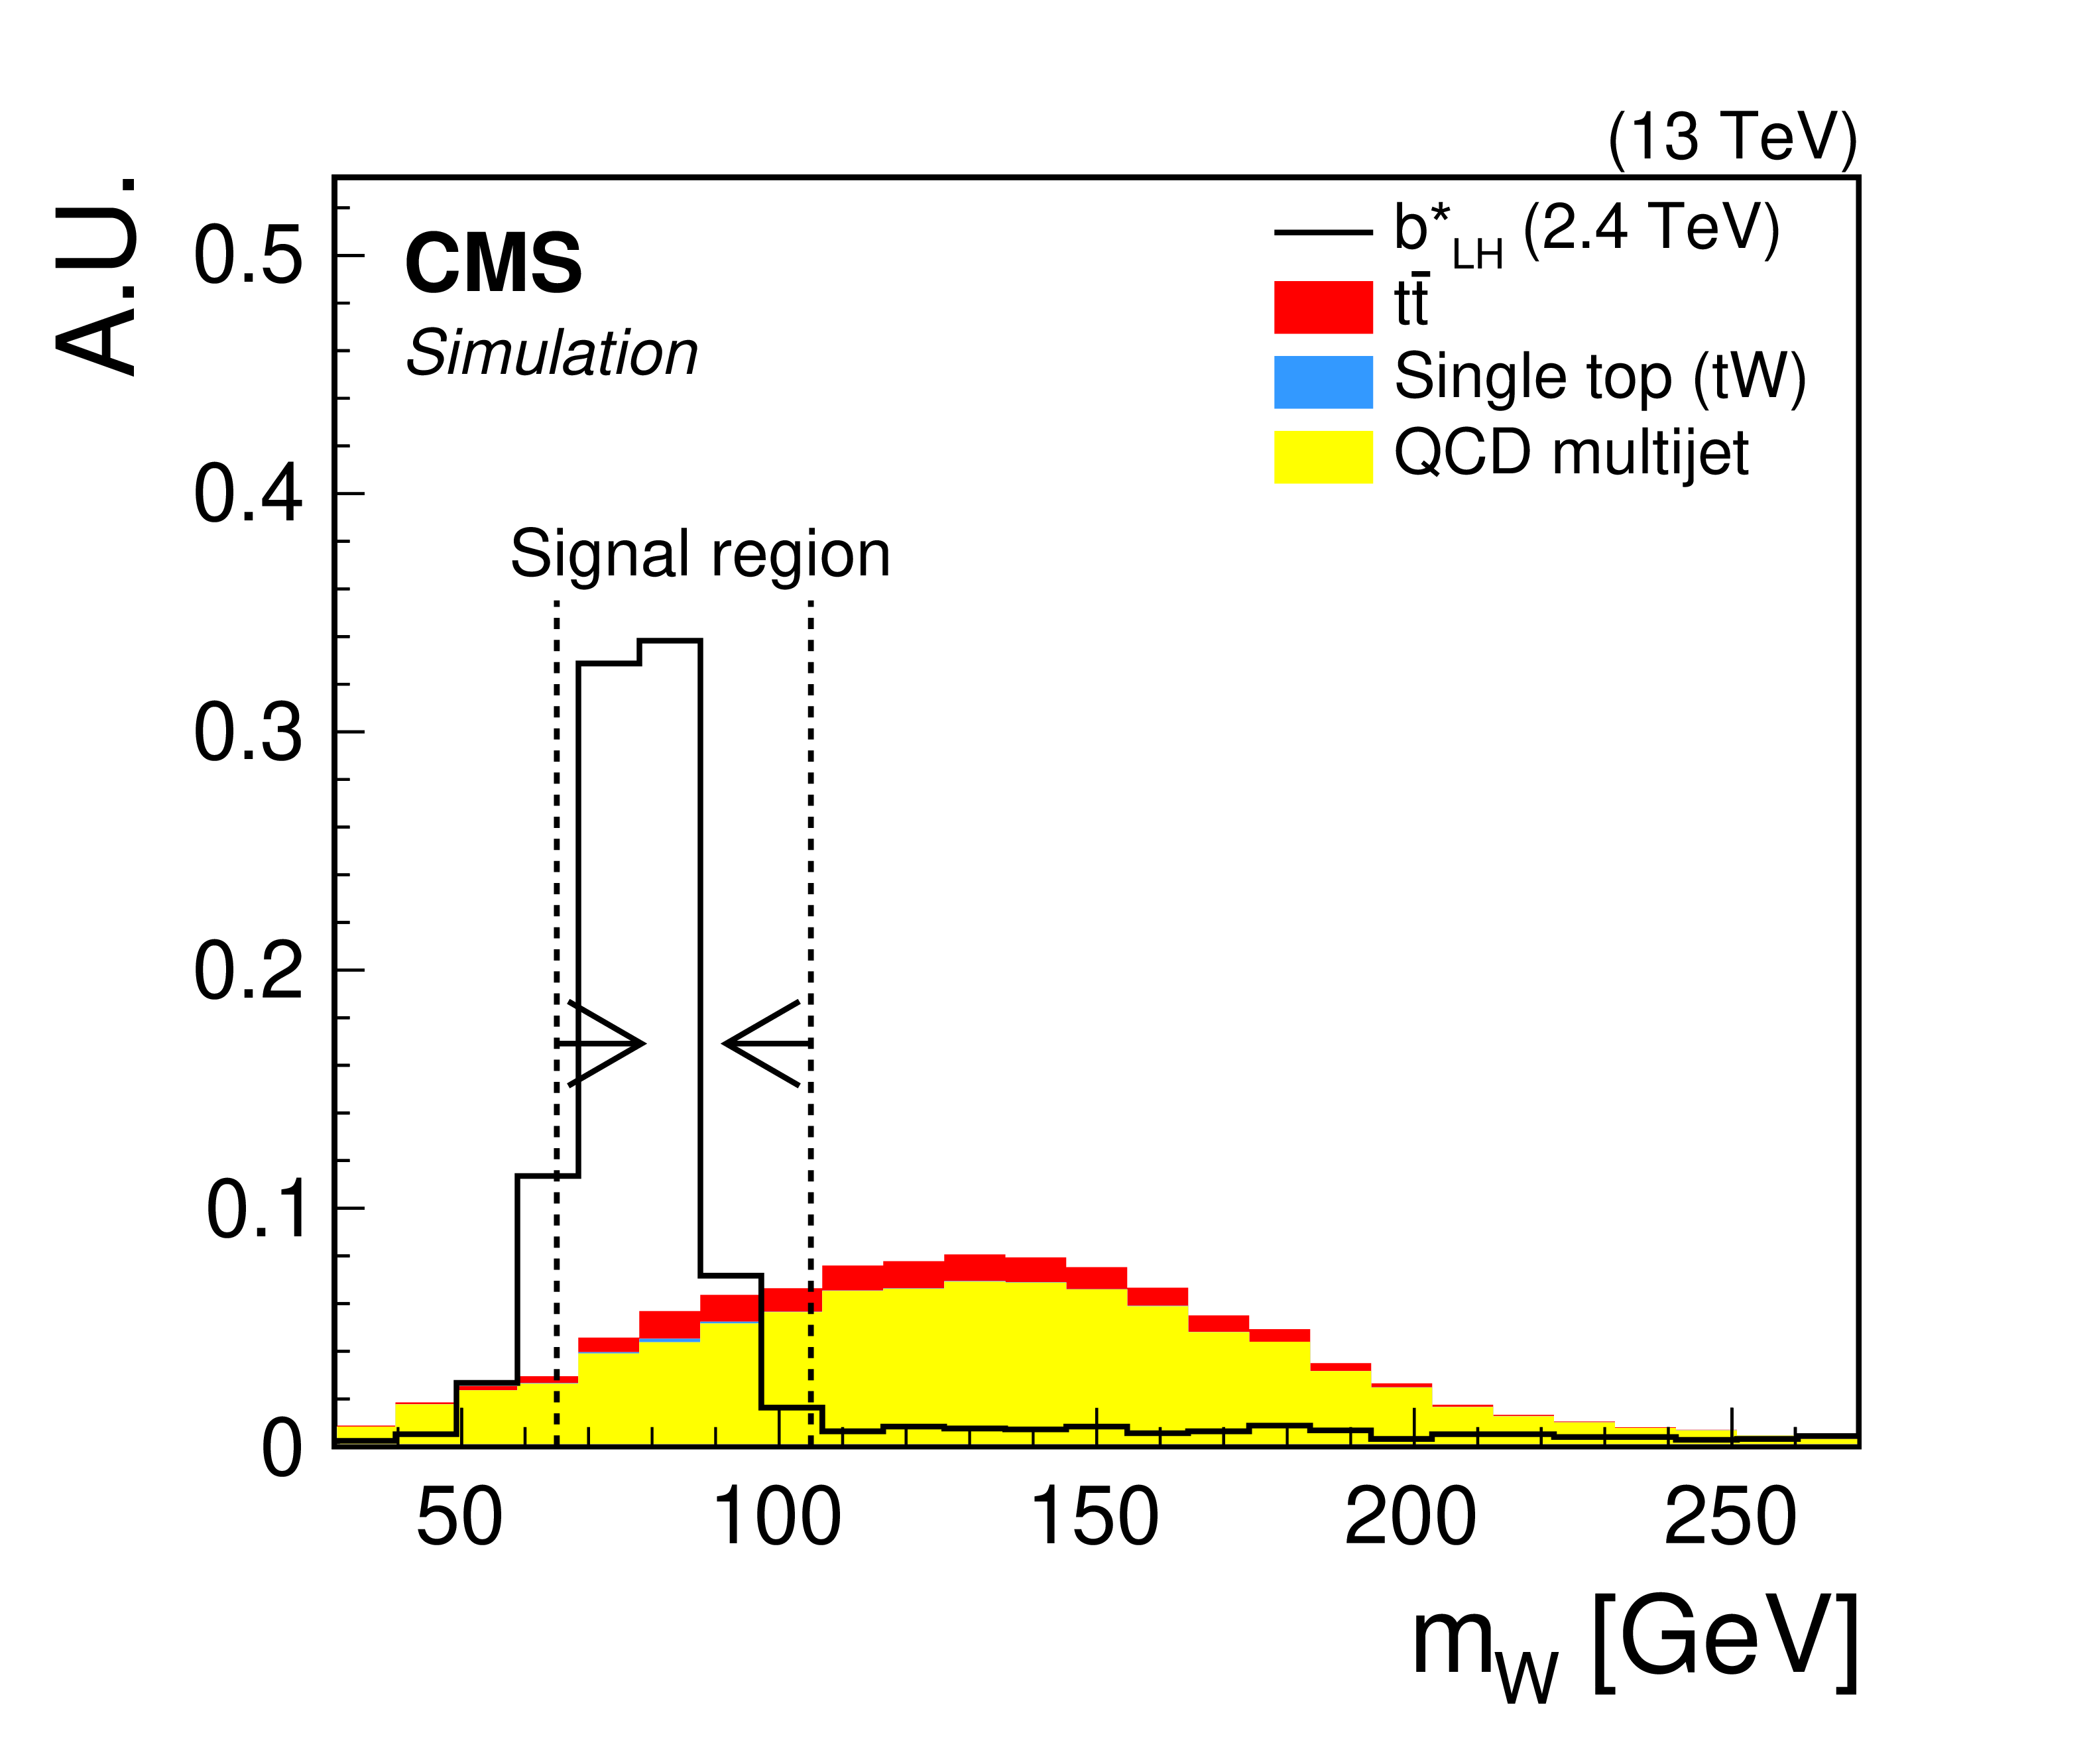
The distributions of the discrimination variables used for W and top tagging for simulation samples. These plots show the top jet $\tau _3/\tau _2$ (upper left), the W jet $\tau _2/\tau _1$ (upper right), the top tag soft-drop mass (middle left), the W tag soft-drop mass (middle right), and the subjet b-tagging discriminant (lower). The $ {\mathrm{b} ^\ast} $ signal sample is represented with the solid line. The area of the total background contribution and the area of the signal component are separately normalized to unity. All analysis selections are applied with the exception of the variable being plotted. Also shown are vertical dashed lines and arrows, which indicate the optimized selection used for events in the signal region. For the $ {\mathrm{b} ^\ast} $ signal sample, the top tag soft-drop mass spectrum exhibits a resonance near the W mass, which is comprised of W jets that have been misidentified as top jets. |
png pdf |
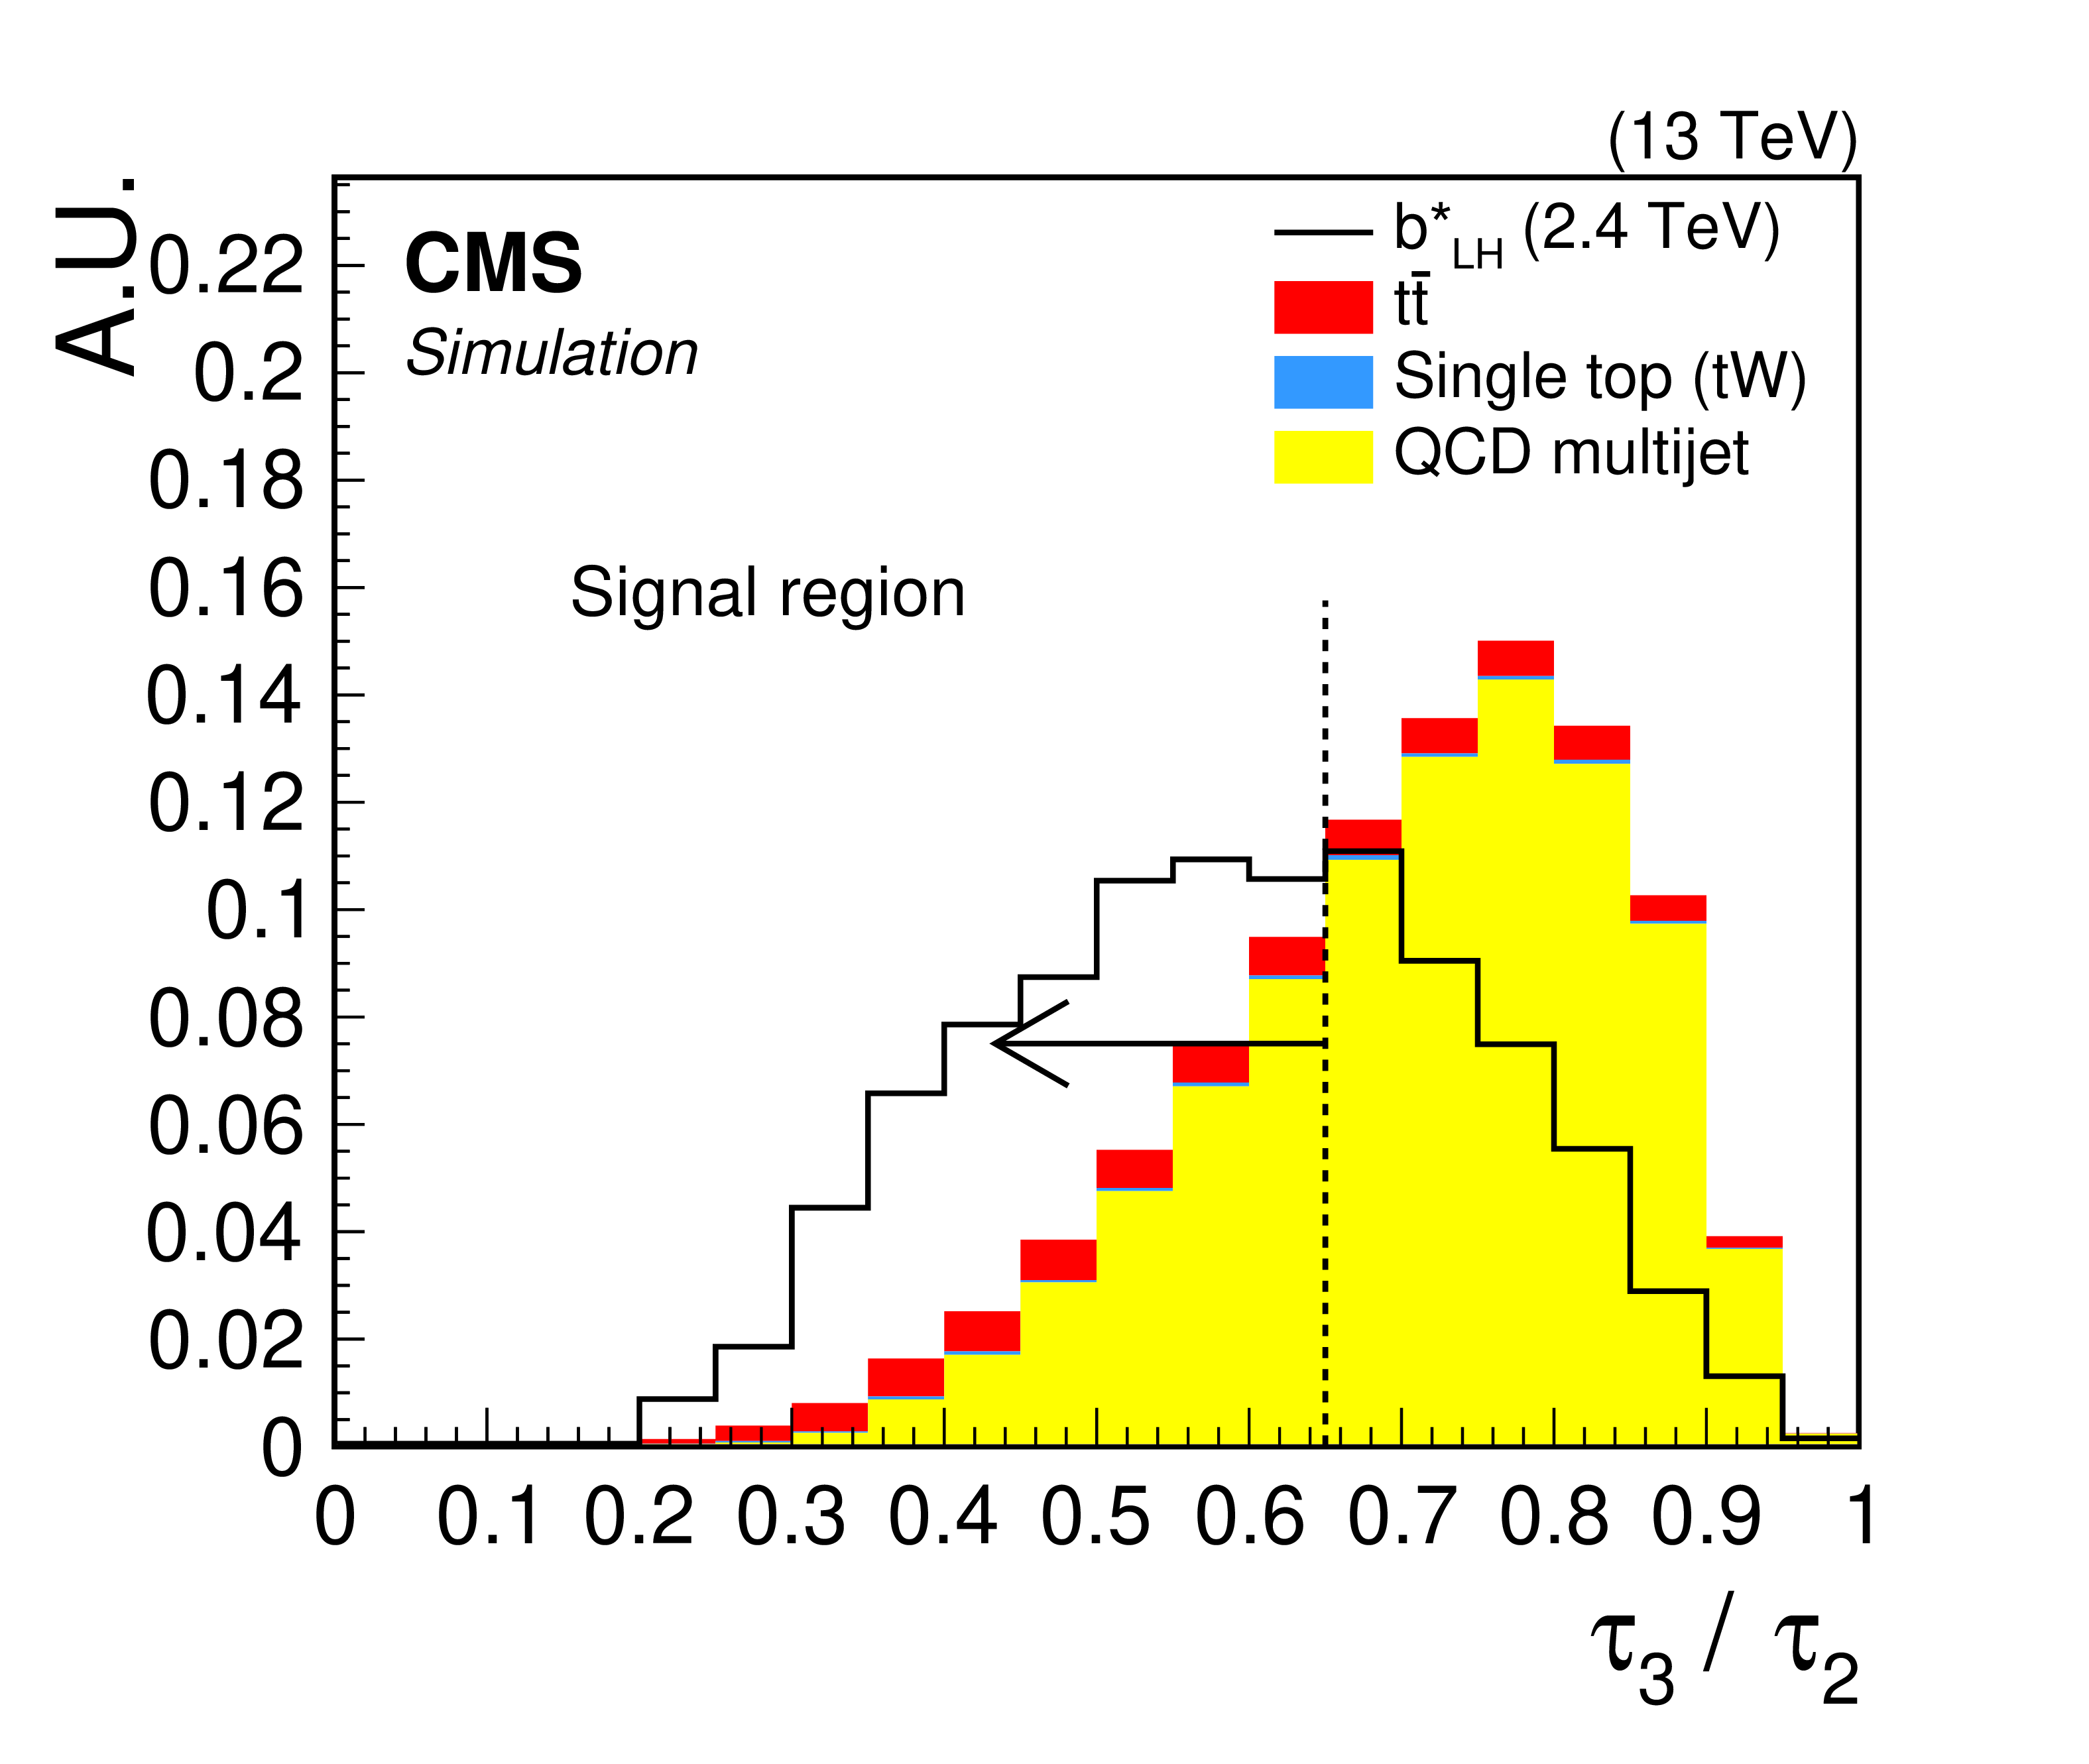
Figure 2-a:
Distribution of the top jet $\tau _3/\tau _2$ for simulation samples. This discrimination variable is used for W and top tagging. The $ {\mathrm{b} ^\ast} $ signal sample is represented with the solid line. The area of the total background contribution and the area of the signal component are separately normalized to unity. All analysis selections are applied with the exception of the variable being plotted. Also shown are vertical dashed lines and arrows, which indicate the optimized selection used for events in the signal region. |
png pdf |
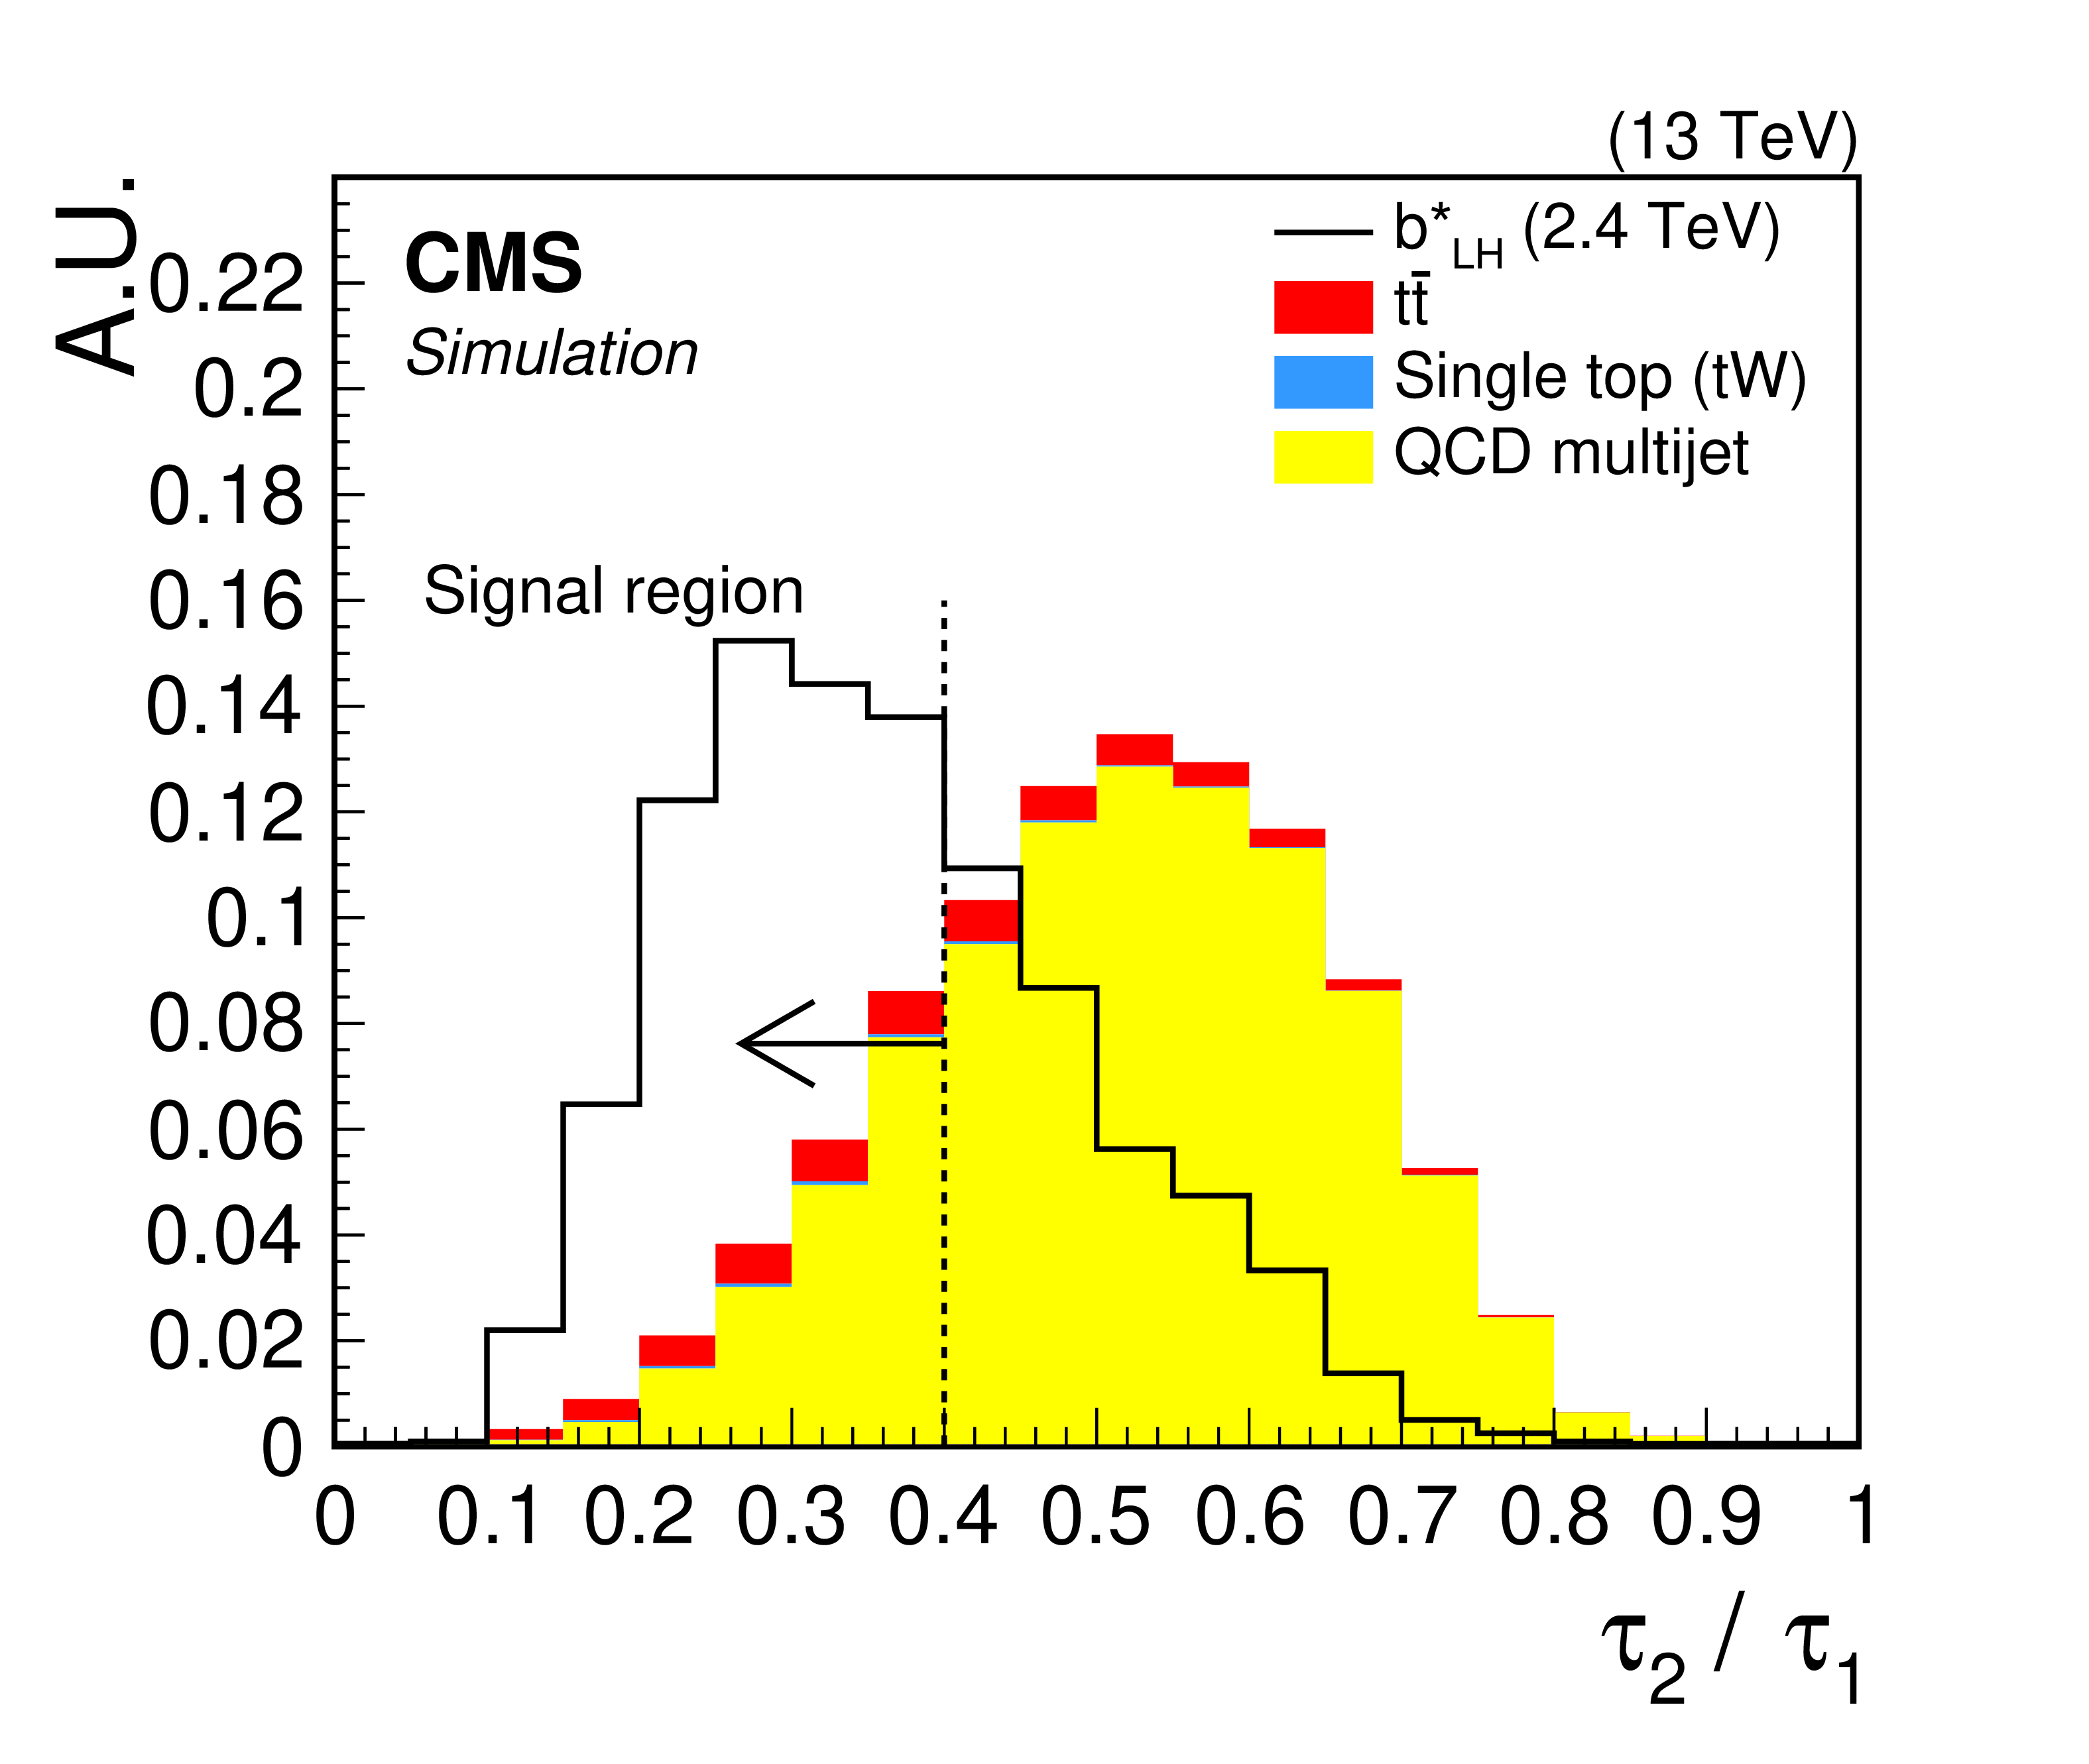
Figure 2-b:
Distribution of the W jet $\tau _2/\tau _1$ for simulation samples. This discrimination variable is used for W and top tagging.The $ {\mathrm{b} ^\ast} $ signal sample is represented with the solid line. The area of the total background contribution and the area of the signal component are separately normalized to unity. All analysis selections are applied with the exception of the variable being plotted. Also shown are vertical dashed lines and arrows, which indicate the optimized selection used for events in the signal region. |

png pdf |
Figure 2-c:
Distribution of the top tag soft-drop mass for simulation samples. This discrimination variable is used for W and top tagging.The $ {\mathrm{b} ^\ast} $ signal sample is represented with the solid line. The area of the total background contribution and the area of the signal component are separately normalized to unity. All analysis selections are applied with the exception of the variable being plotted. Also shown are vertical dashed lines and arrows, which indicate the optimized selection used for events in the signal region. For the $ {\mathrm{b} ^\ast} $ signal sample, the top tag soft-drop mass spectrum exhibits a resonance near the W mass, which is comprised of W jets that have been misidentified as top jets. |
png pdf |
Figure 2-d:
Distribution of the W tag soft-drop mass for simulation samples. This discrimination variable is used for W and top tagging. The $ {\mathrm{b} ^\ast} $ signal sample is represented with the solid line. The area of the total background contribution and the area of the signal component are separately normalized to unity. All analysis selections are applied with the exception of the variable being plotted. Also shown are vertical dashed lines and arrows, which indicate the optimized selection used for events in the signal region. |

png pdf |
Figure 2-e:
Distribution of the subjet b-tagging discriminant for simulation samples. This discrimination variable is used for W and top tagging. The $ {\mathrm{b} ^\ast} $ signal sample is represented with the solid line. The area of the total background contribution and the area of the signal component are separately normalized to unity. All analysis selections are applied with the exception of the variable being plotted. Also shown are vertical dashed lines and arrows, which indicate the optimized selection used for events in the signal region. |
png pdf |
Figure 3:
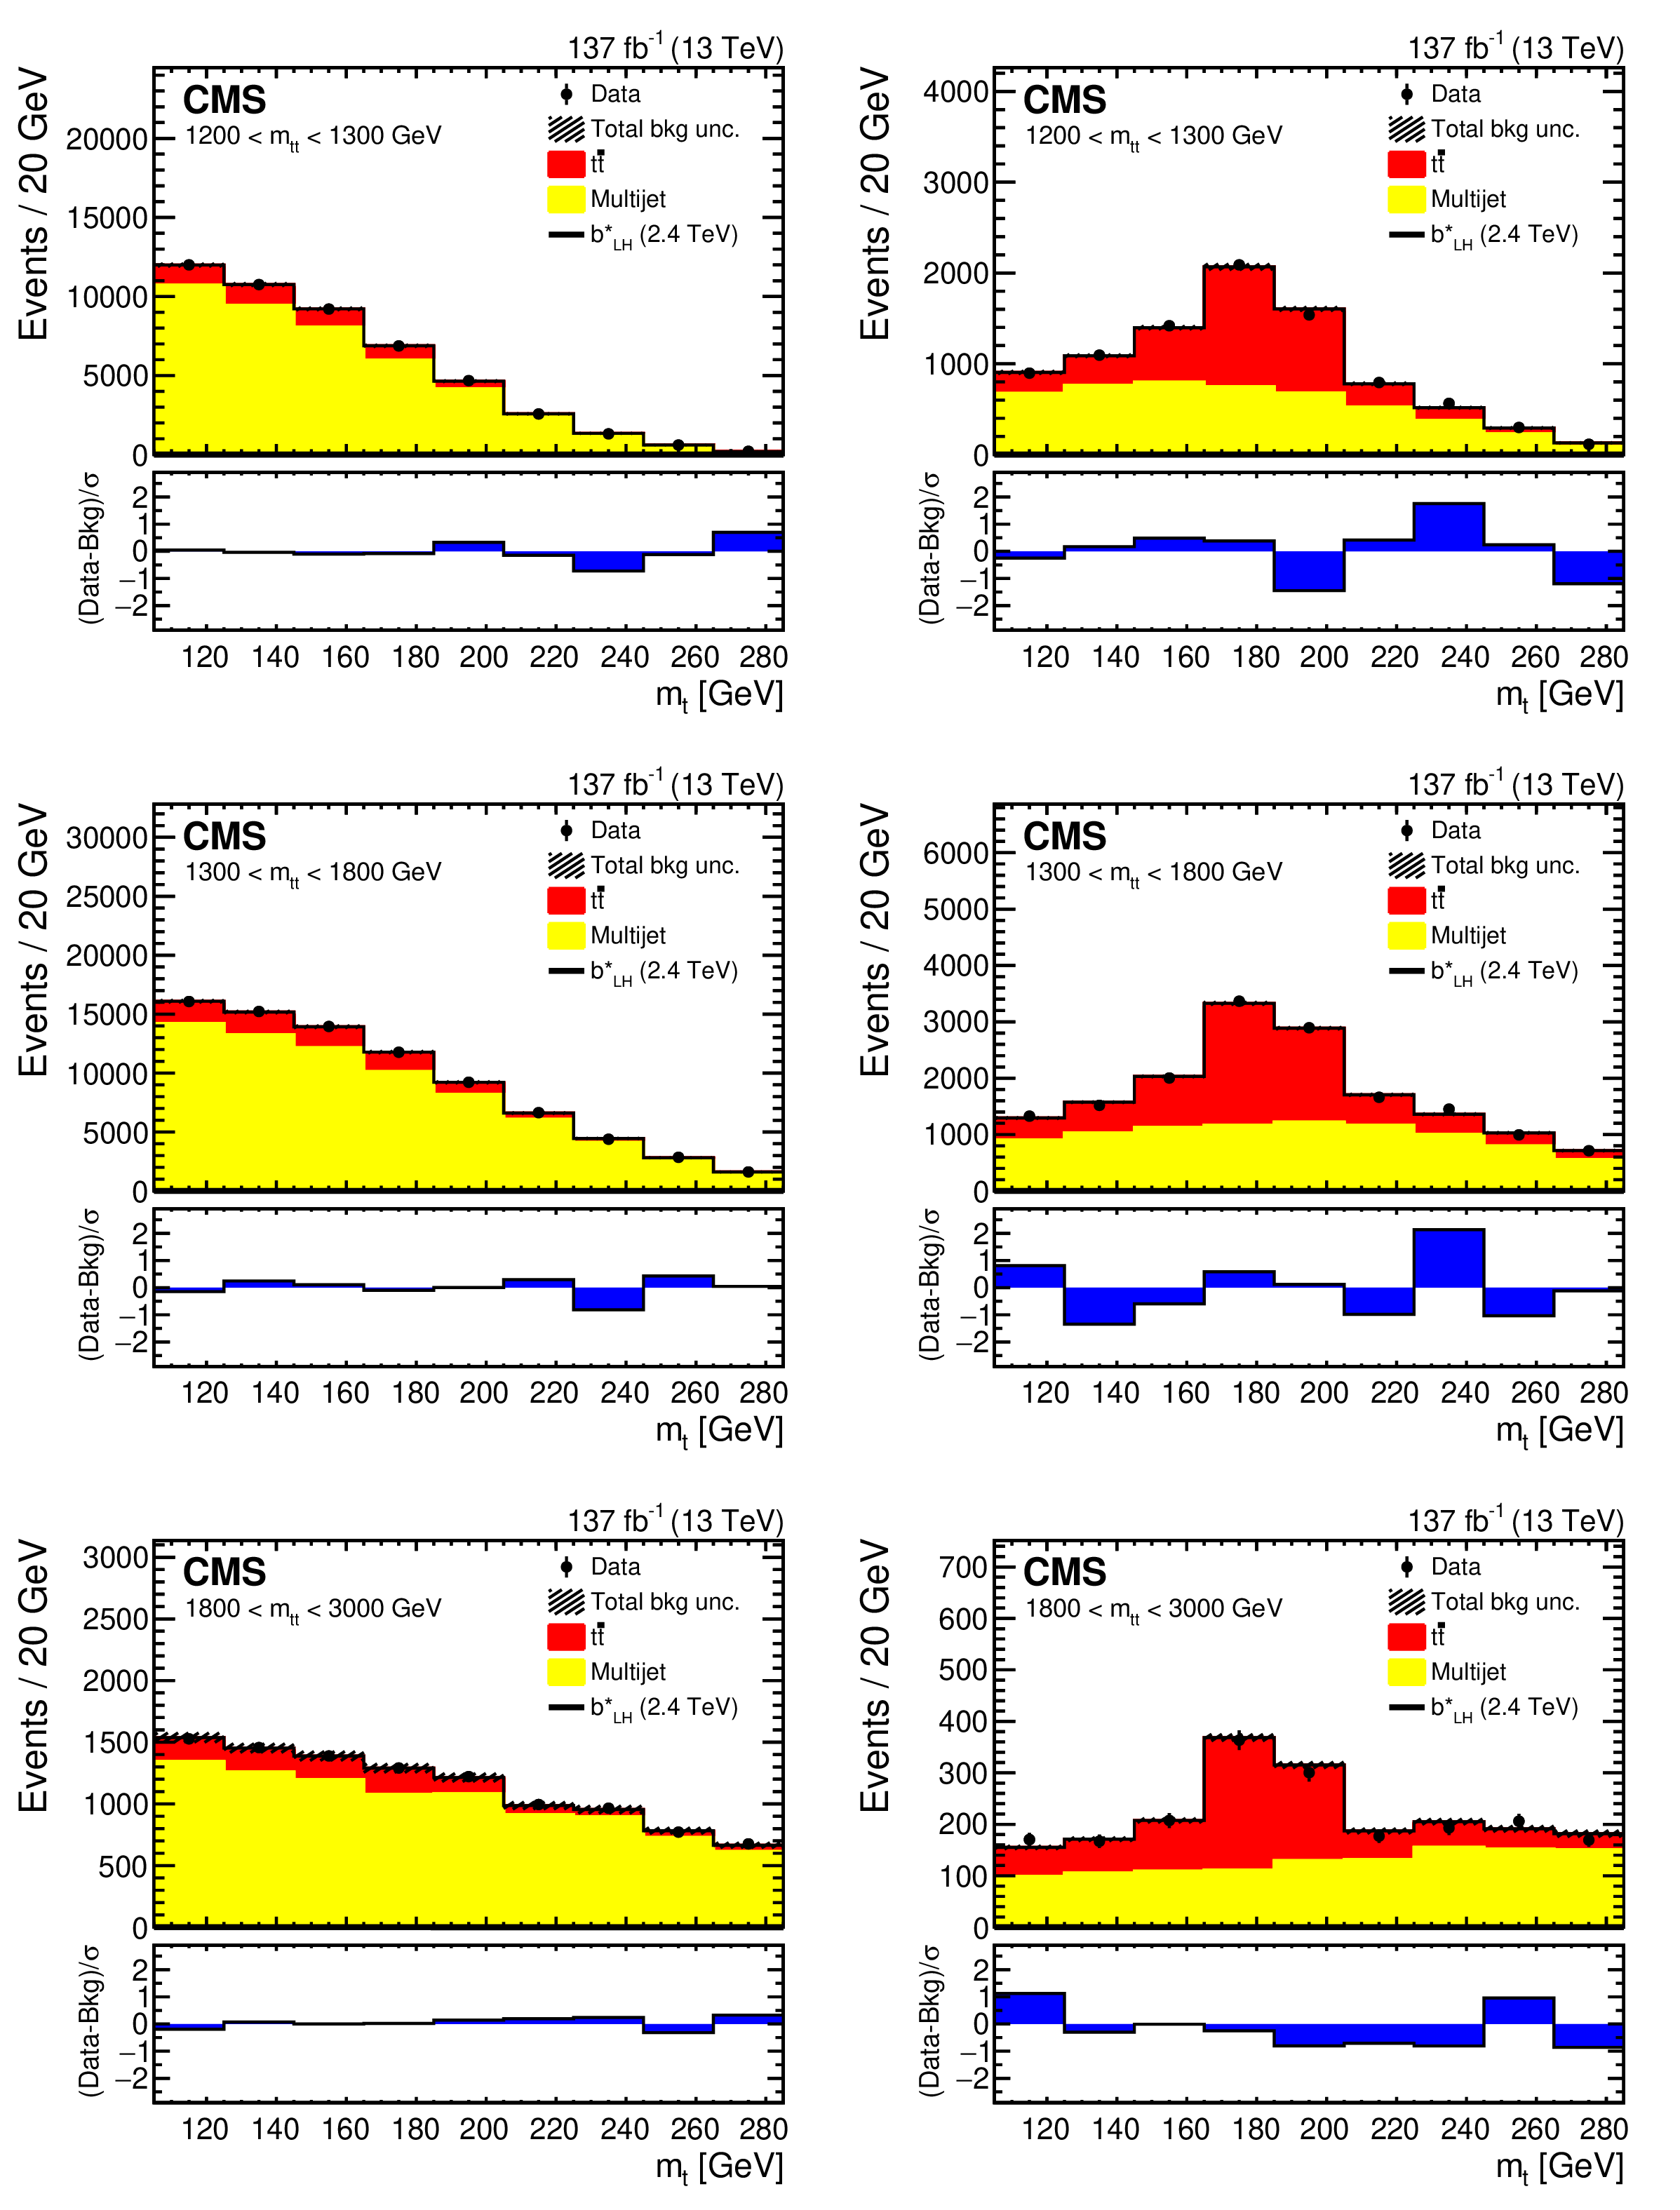
Distributions of $ {m_{\mathrm{t}}} $ in the ${\mathrm{t} {}\mathrm{\bar{t}}}$ measurement region for three intervals of $ {m_{\mathrm{t} \mathrm{t}}} $: 1200-1300 GeV (upper), 1300-1800 GeV (middle), 1800-3000 GeV (lower). The data are shown by points with error bars and the individual background contributions by filled histograms. The signal is not visible because the contamination in this region is negligible. The barely visible shaded region is the uncertainty in the total background estimate. The left and right columns show distributions for events with a jet failing and passing the top tagging requirement, respectively. The lower panels of each figure show the pull, as a function of $ {m_{\mathrm{t}}} $, defined as the difference between the number of events observed in the data and the predicted background, divided by their combined uncertainty. |
png pdf |
Figure 4:
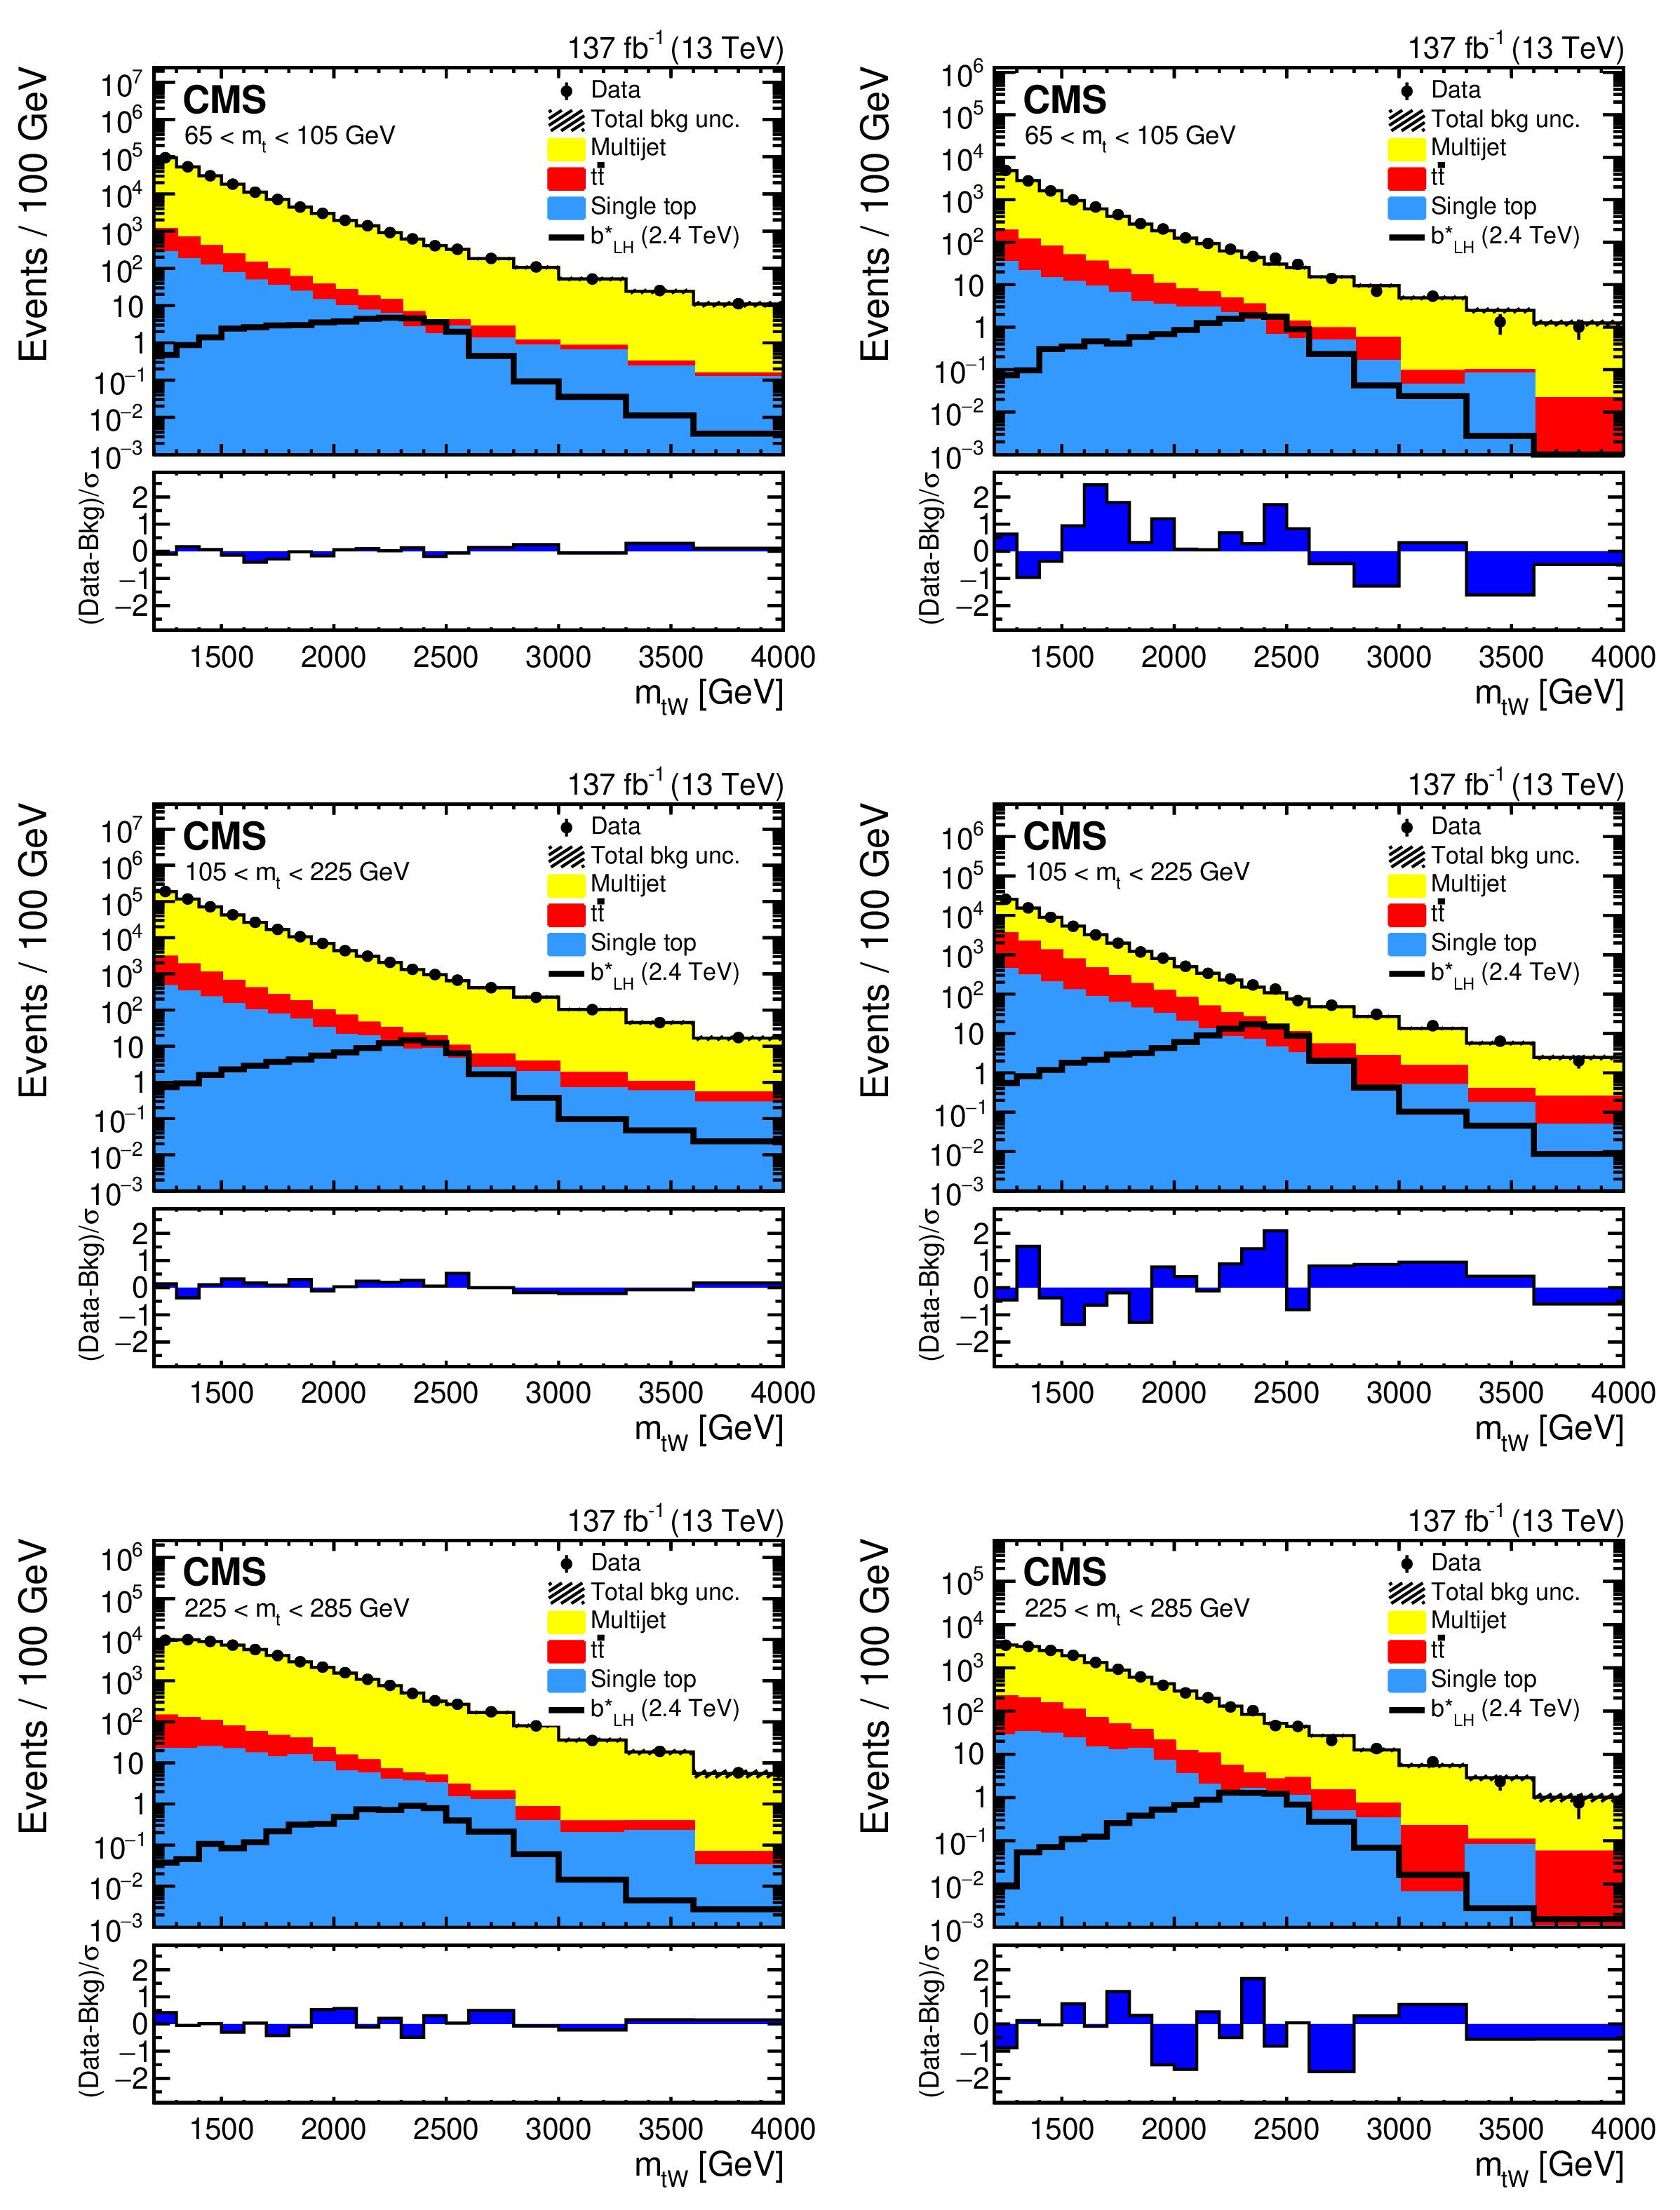
Distributions of $ {m_{{\mathrm{t} \mathrm{W}}}} $ in the $ {\mathrm{b} ^\ast} $ signal region for three intervals of $ {m_{\mathrm{t}}} $: 65-105 GeV (upper), 105-225 GeV (middle), and 225-285 GeV (lower). The data are shown by points with error bars, the individual background contributions by filled histograms, and a 2.4 TeV $ {\mathrm{b} ^\ast _{\mathrm {LH}}} $ signal is shown as a solid line. The barely visible shaded region is the uncertainty in the total background estimate. The left and right columns show distributions for events with a jet failing and passing the top tagging requirement, respectively. The lower panels of each figure show the pull, as a function of $ {m_{{\mathrm{t} \mathrm{W}}}} $, defined as the difference between the number of events observed in the data and the predicted background, divided by their combined uncertainty. |
png pdf |
Figure 5:
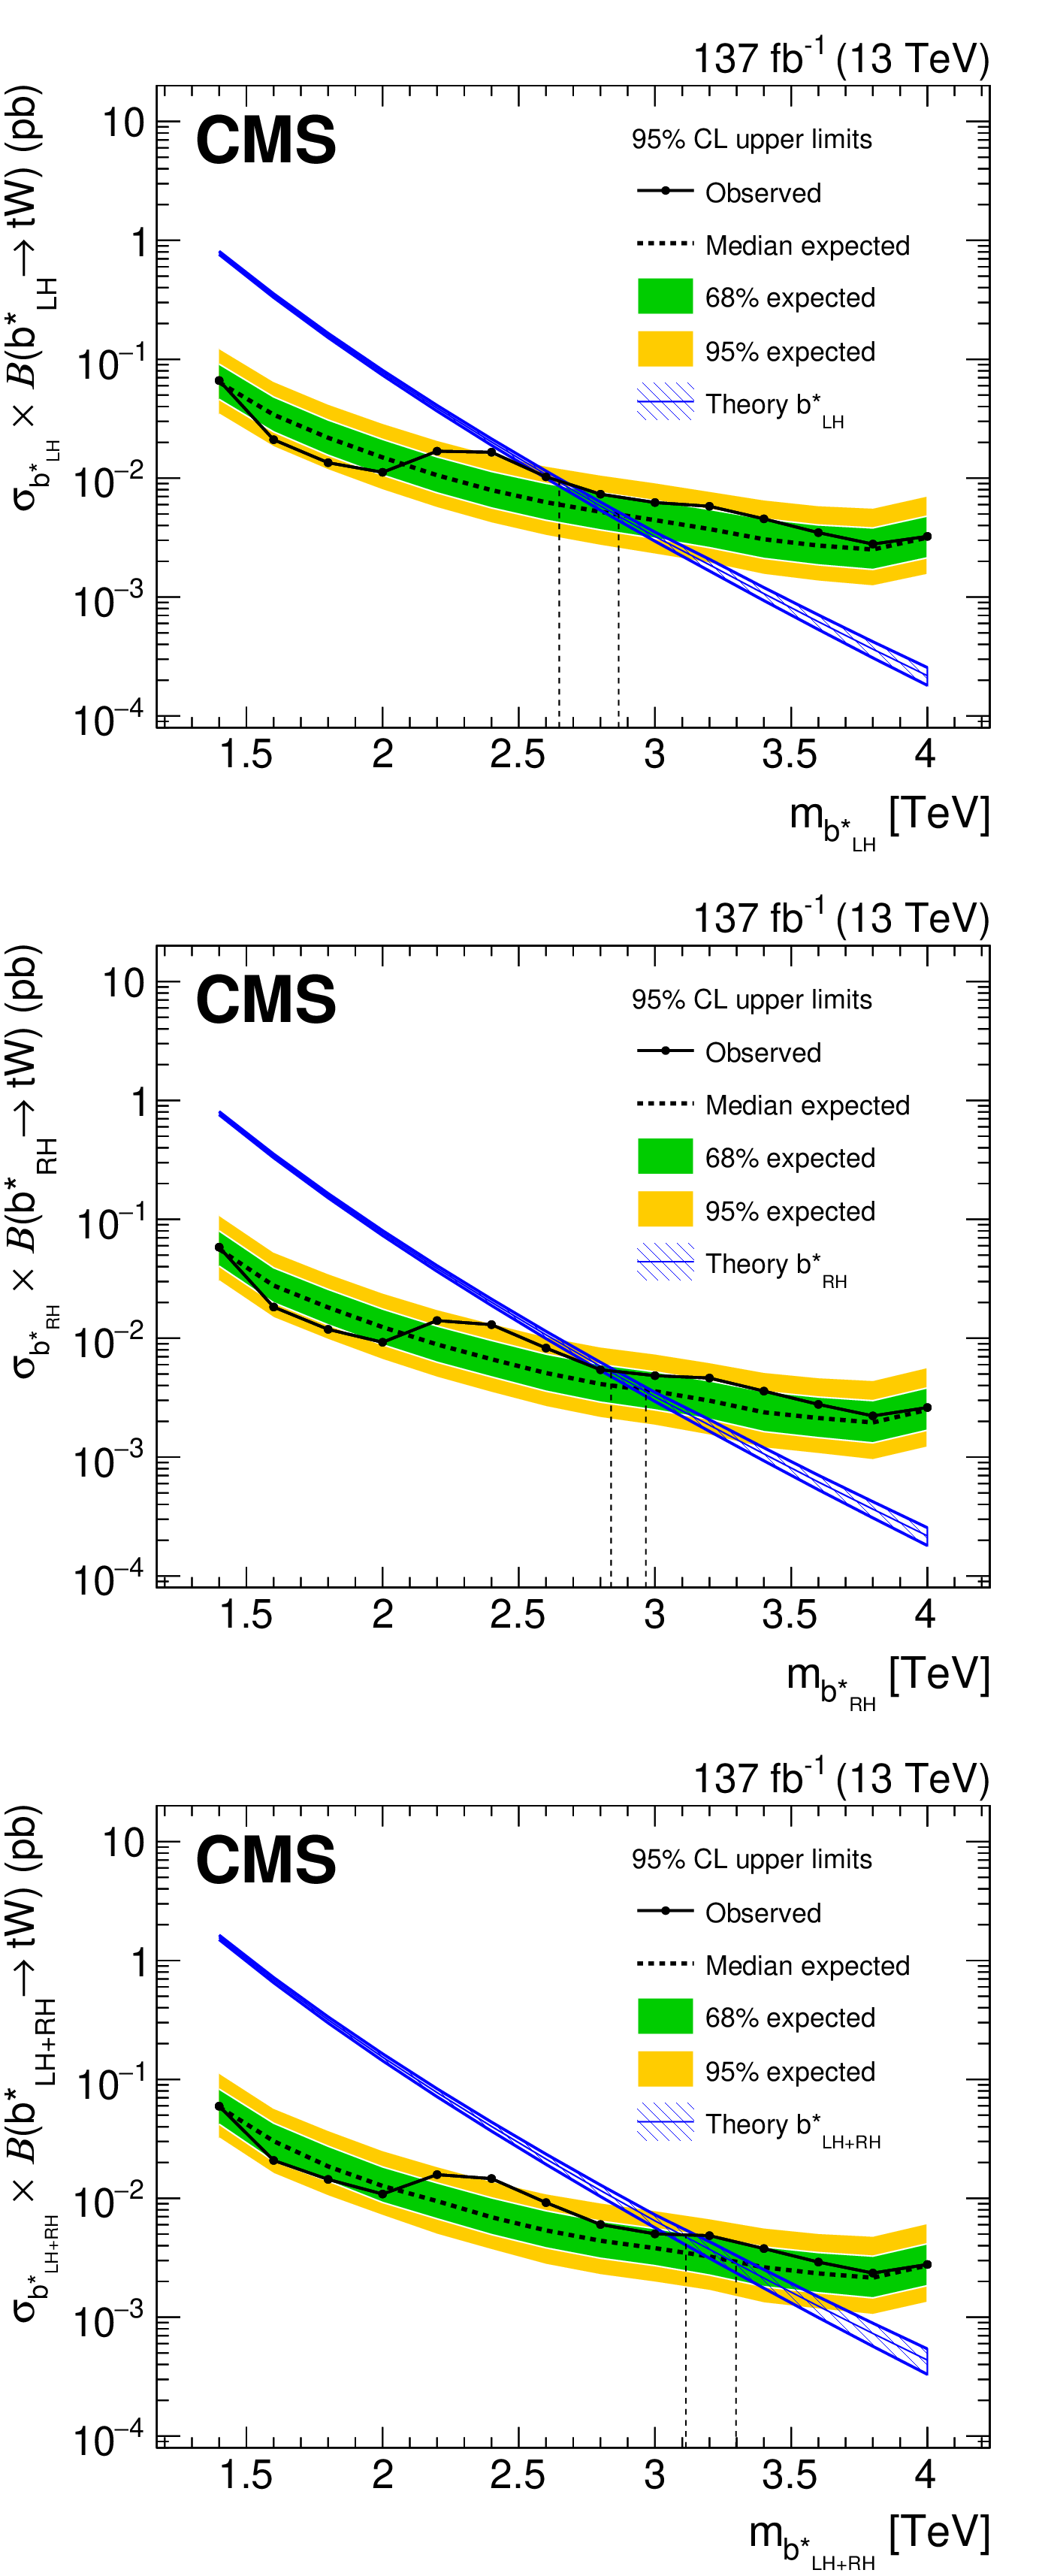
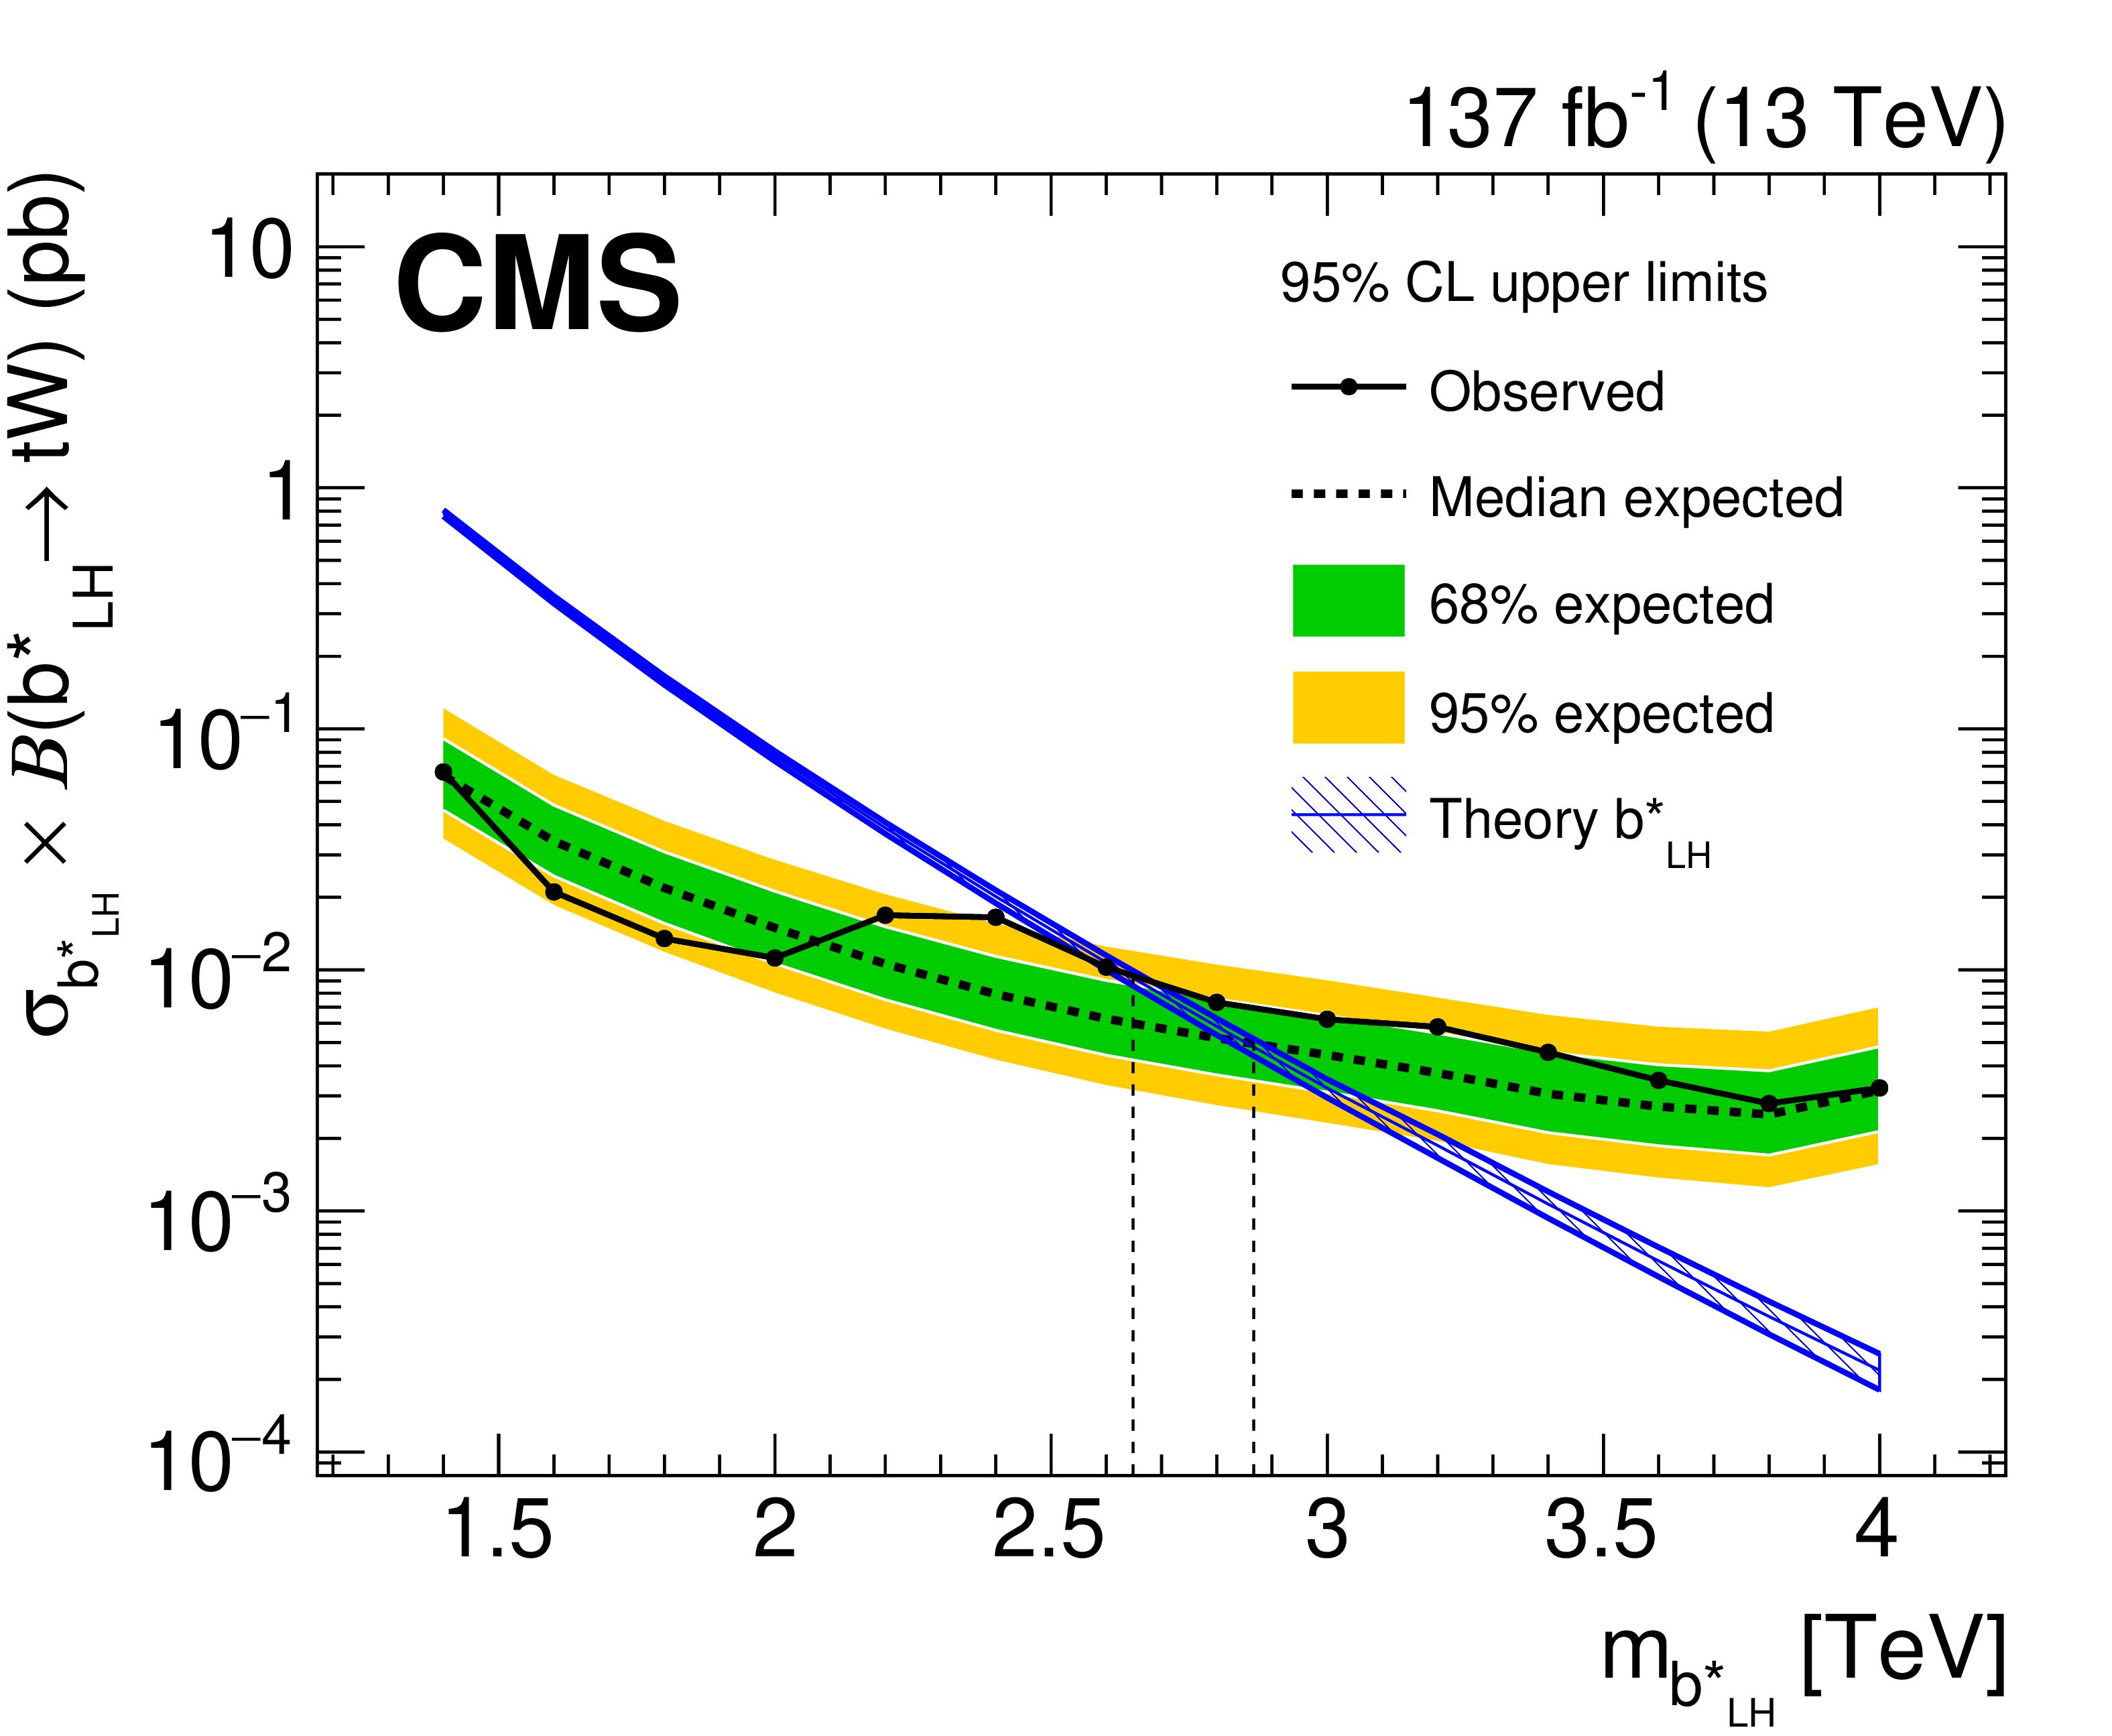
Upper limits on the product of the cross section and branching fraction at 95% CL for a $ {\mathrm{b} ^\ast _{\mathrm {LH}}} $ (upper), $ {\mathrm{b} ^\ast _{\mathrm {RH}}} $ (middle), and $ {\mathrm{b} ^\ast _{\mathrm {LH+RH}}} $ (lower) quark as a function of the $ {\mathrm{b} ^\ast} $ quark mass. The expected (dashed) and observed (dot-solid) limits, as well as the $ {\mathrm{b} ^\ast} $ quark theoretical cross sections (shaded-solid), are shown. The vertical dashed lines indicate the intersection of the theoretical cross sections with the expected and observed limits. The inner and outer shaded areas around the expected limits show the 68% and 95% CL intervals, respectively. |
png pdf |
Figure 5-a:
Upper limits on the product of the cross section and branching fraction at 95% CL for a $ {\mathrm{b} ^\ast _{\mathrm {LH}}} $ quark as a function of the $ {\mathrm{b} ^\ast} $ quark mass. The expected (dashed) and observed (dot-solid) limits, as well as the $ {\mathrm{b} ^\ast} $ quark theoretical cross sections (shaded-solid), are shown. The vertical dashed lines indicate the intersection of the theoretical cross sections with the expected and observed limits. The inner and outer shaded areas around the expected limits show the 68% and 95% CL intervals, respectively. |

png pdf |
Figure 5-b:
Upper limits on the product of the cross section and branching fraction at 95% CL for a $ {\mathrm{b} ^\ast _{\mathrm {RH}}} $ quark as a function of the $ {\mathrm{b} ^\ast} $ quark mass. The expected (dashed) and observed (dot-solid) limits, as well as the $ {\mathrm{b} ^\ast} $ quark theoretical cross sections (shaded-solid), are shown. The vertical dashed lines indicate the intersection of the theoretical cross sections with the expected and observed limits. The inner and outer shaded areas around the expected limits show the 68% and 95% CL intervals, respectively. |

png pdf |
Figure 5-c:
Upper limits on the product of the cross section and branching fraction at 95% CL for a $ {\mathrm{b} ^\ast _{\mathrm {LH+RH}}} $ quark as a function of the $ {\mathrm{b} ^\ast} $ quark mass. The expected (dashed) and observed (dot-solid) limits, as well as the $ {\mathrm{b} ^\ast} $ quark theoretical cross sections (shaded-solid), are shown. The vertical dashed lines indicate the intersection of the theoretical cross sections with the expected and observed limits. The inner and outer shaded areas around the expected limits show the 68% and 95% CL intervals, respectively. |
png pdf |
Figure 6:
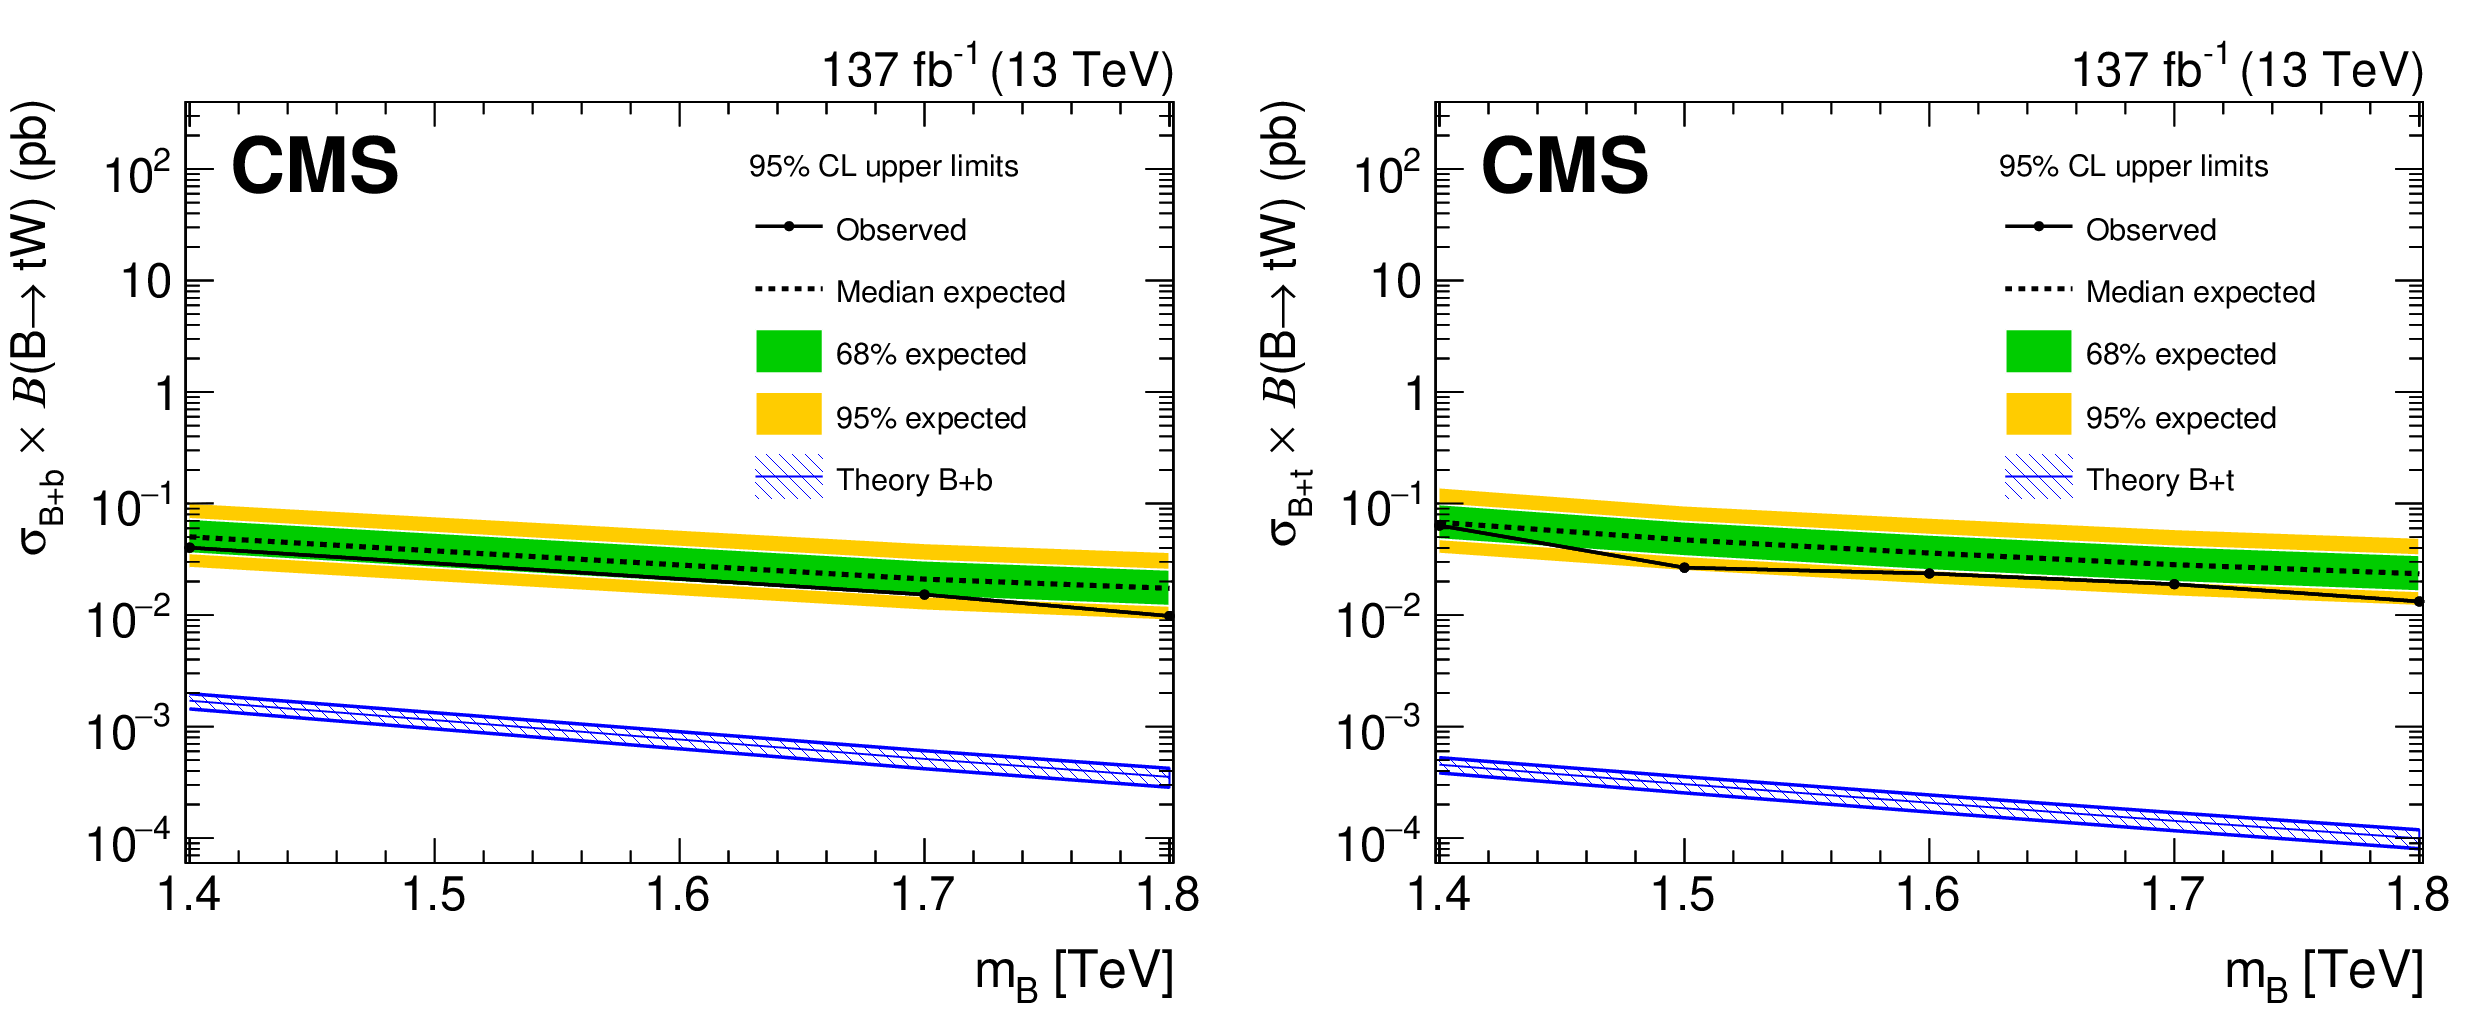
Upper limits on the product of the cross section and branching fraction at 95% CL for a B produced in association with a bottom quark (left) and top quark (right) as a function of the B quark mass. The expected (dashed) and observed (dot-solid) limits, as well as the B quark theoretical cross sections (shaded-solid), are shown. The inner and outer shaded areas around the expected limits show the 68% and 95% CL intervals, respectively. |
png pdf |
Figure 6-a:
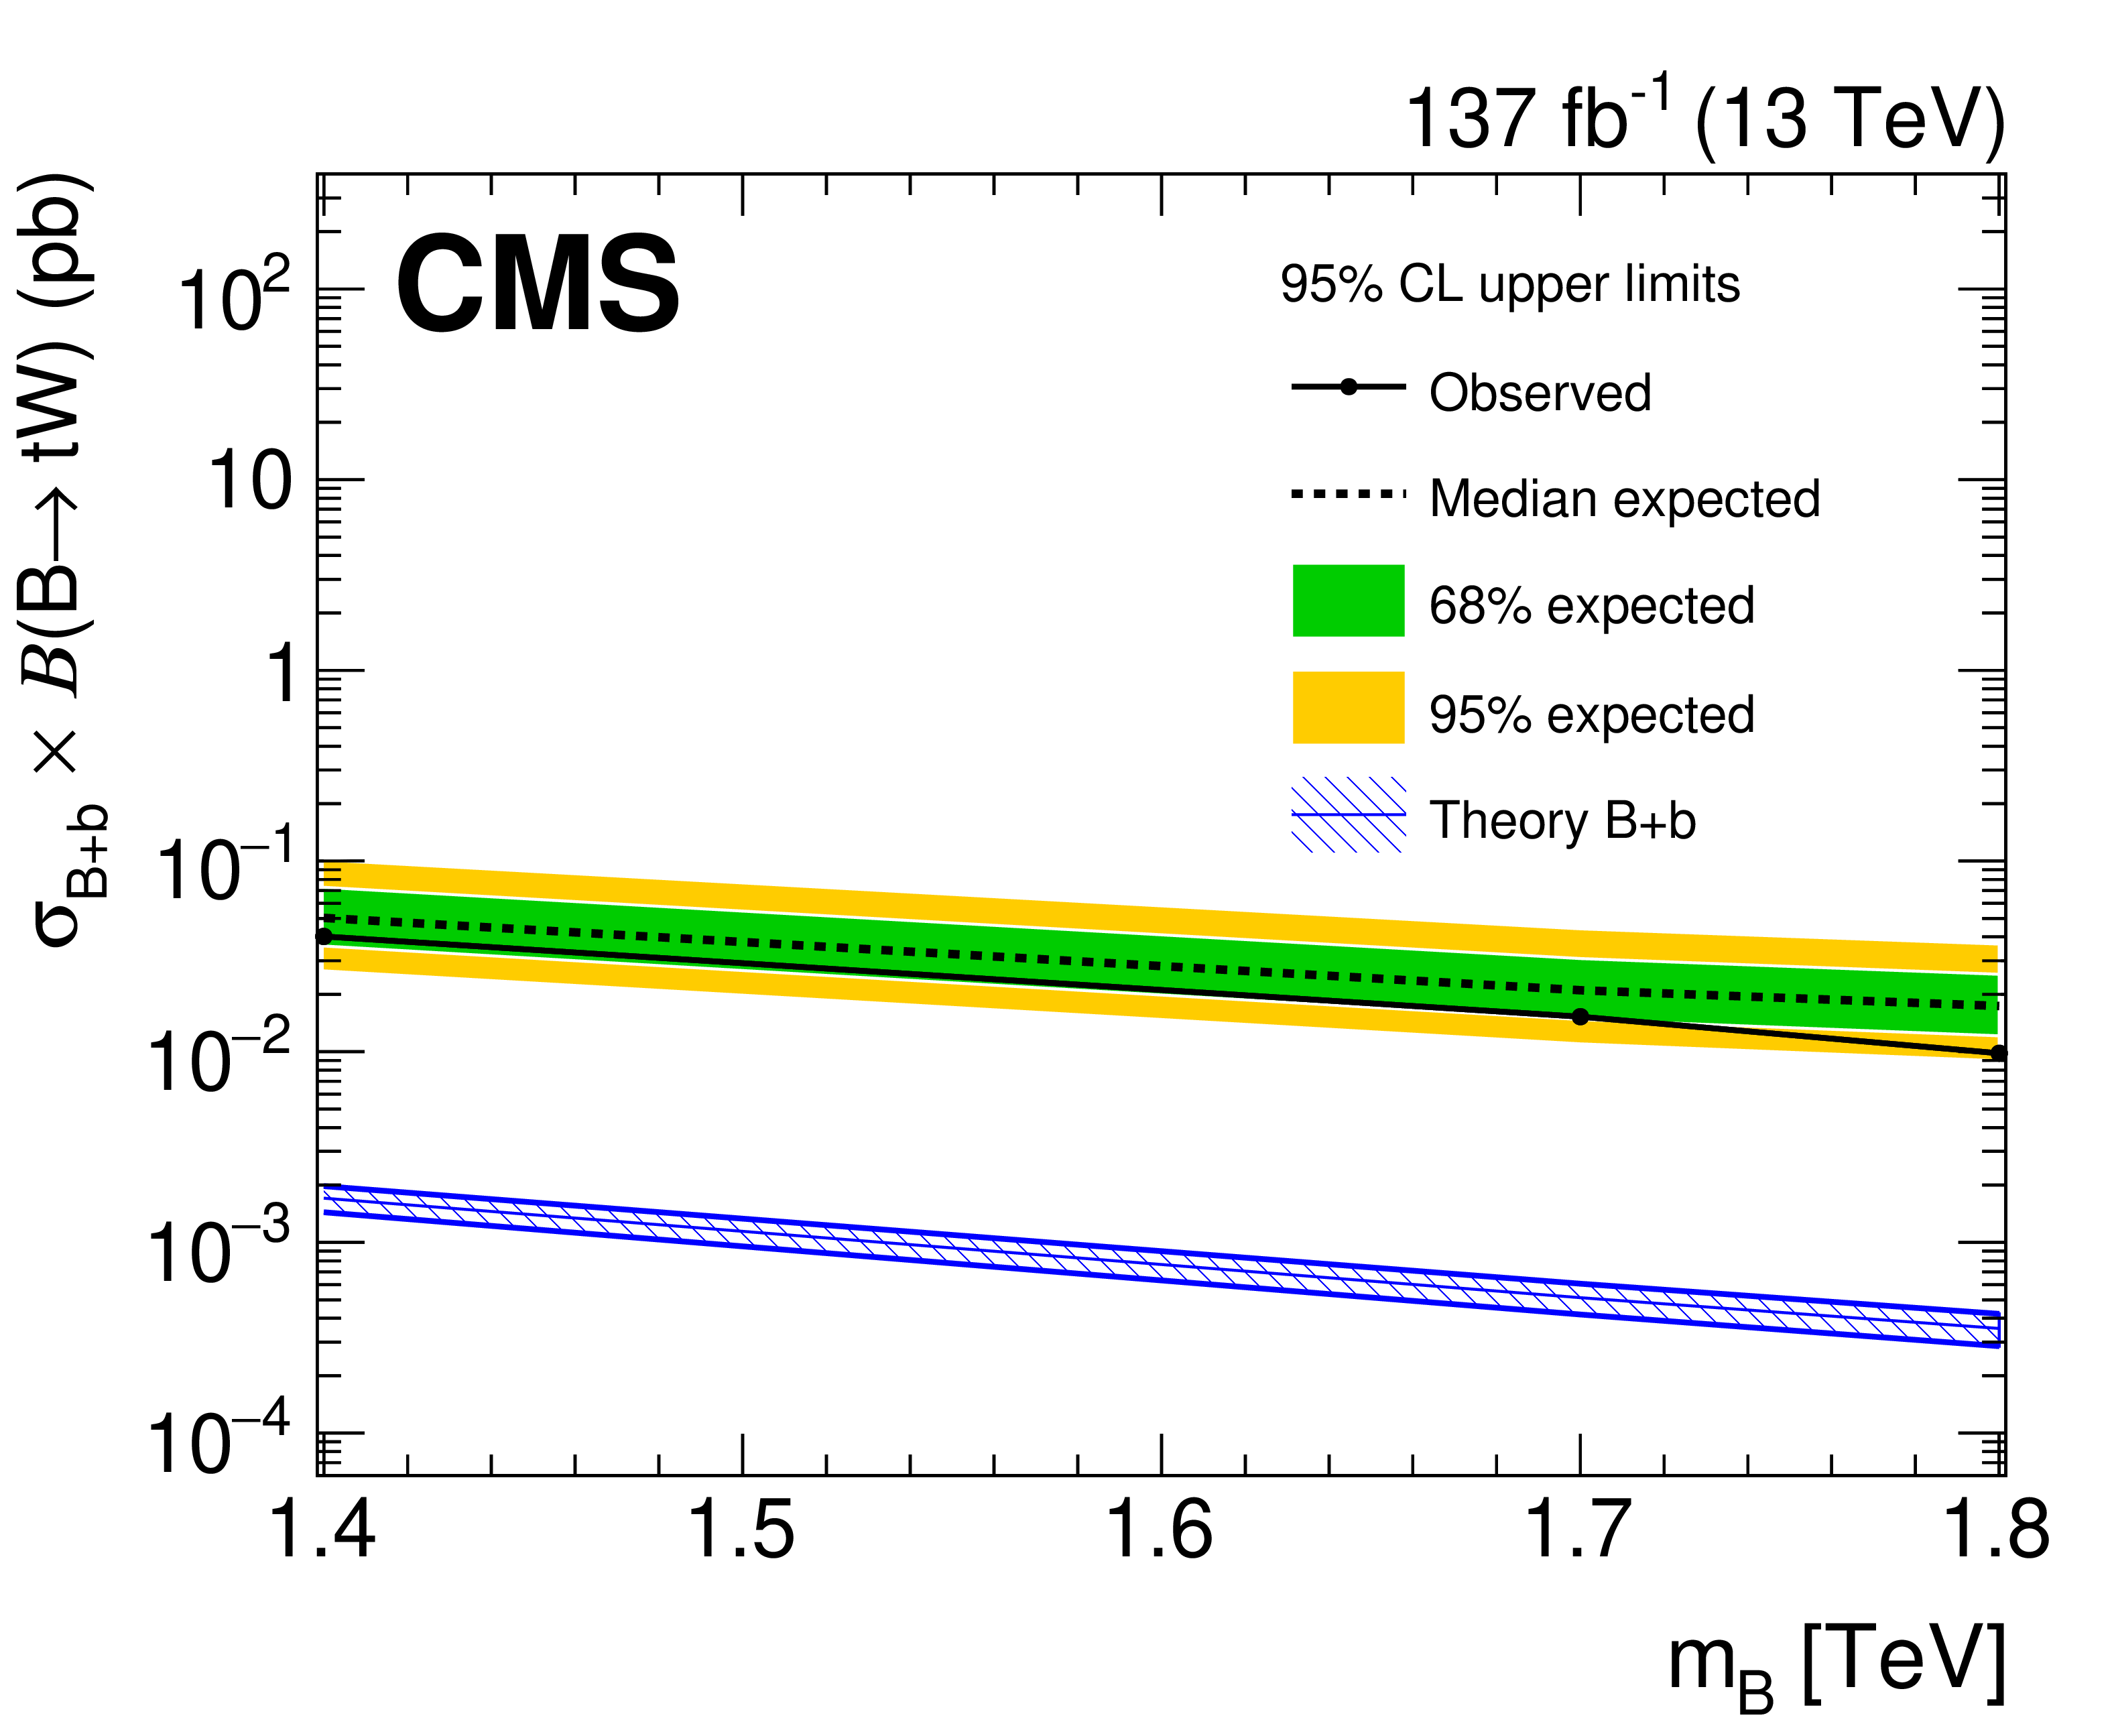
Upper limits on the product of the cross section and branching fraction at 95% CL for a B produced in association with a bottom quark as a function of the B quark mass. The expected (dashed) and observed (dot-solid) limits, as well as the B quark theoretical cross sections (shaded-solid), are shown. The inner and outer shaded areas around the expected limits show the 68% and 95% CL intervals, respectively. |
png pdf |
Figure 6-b:
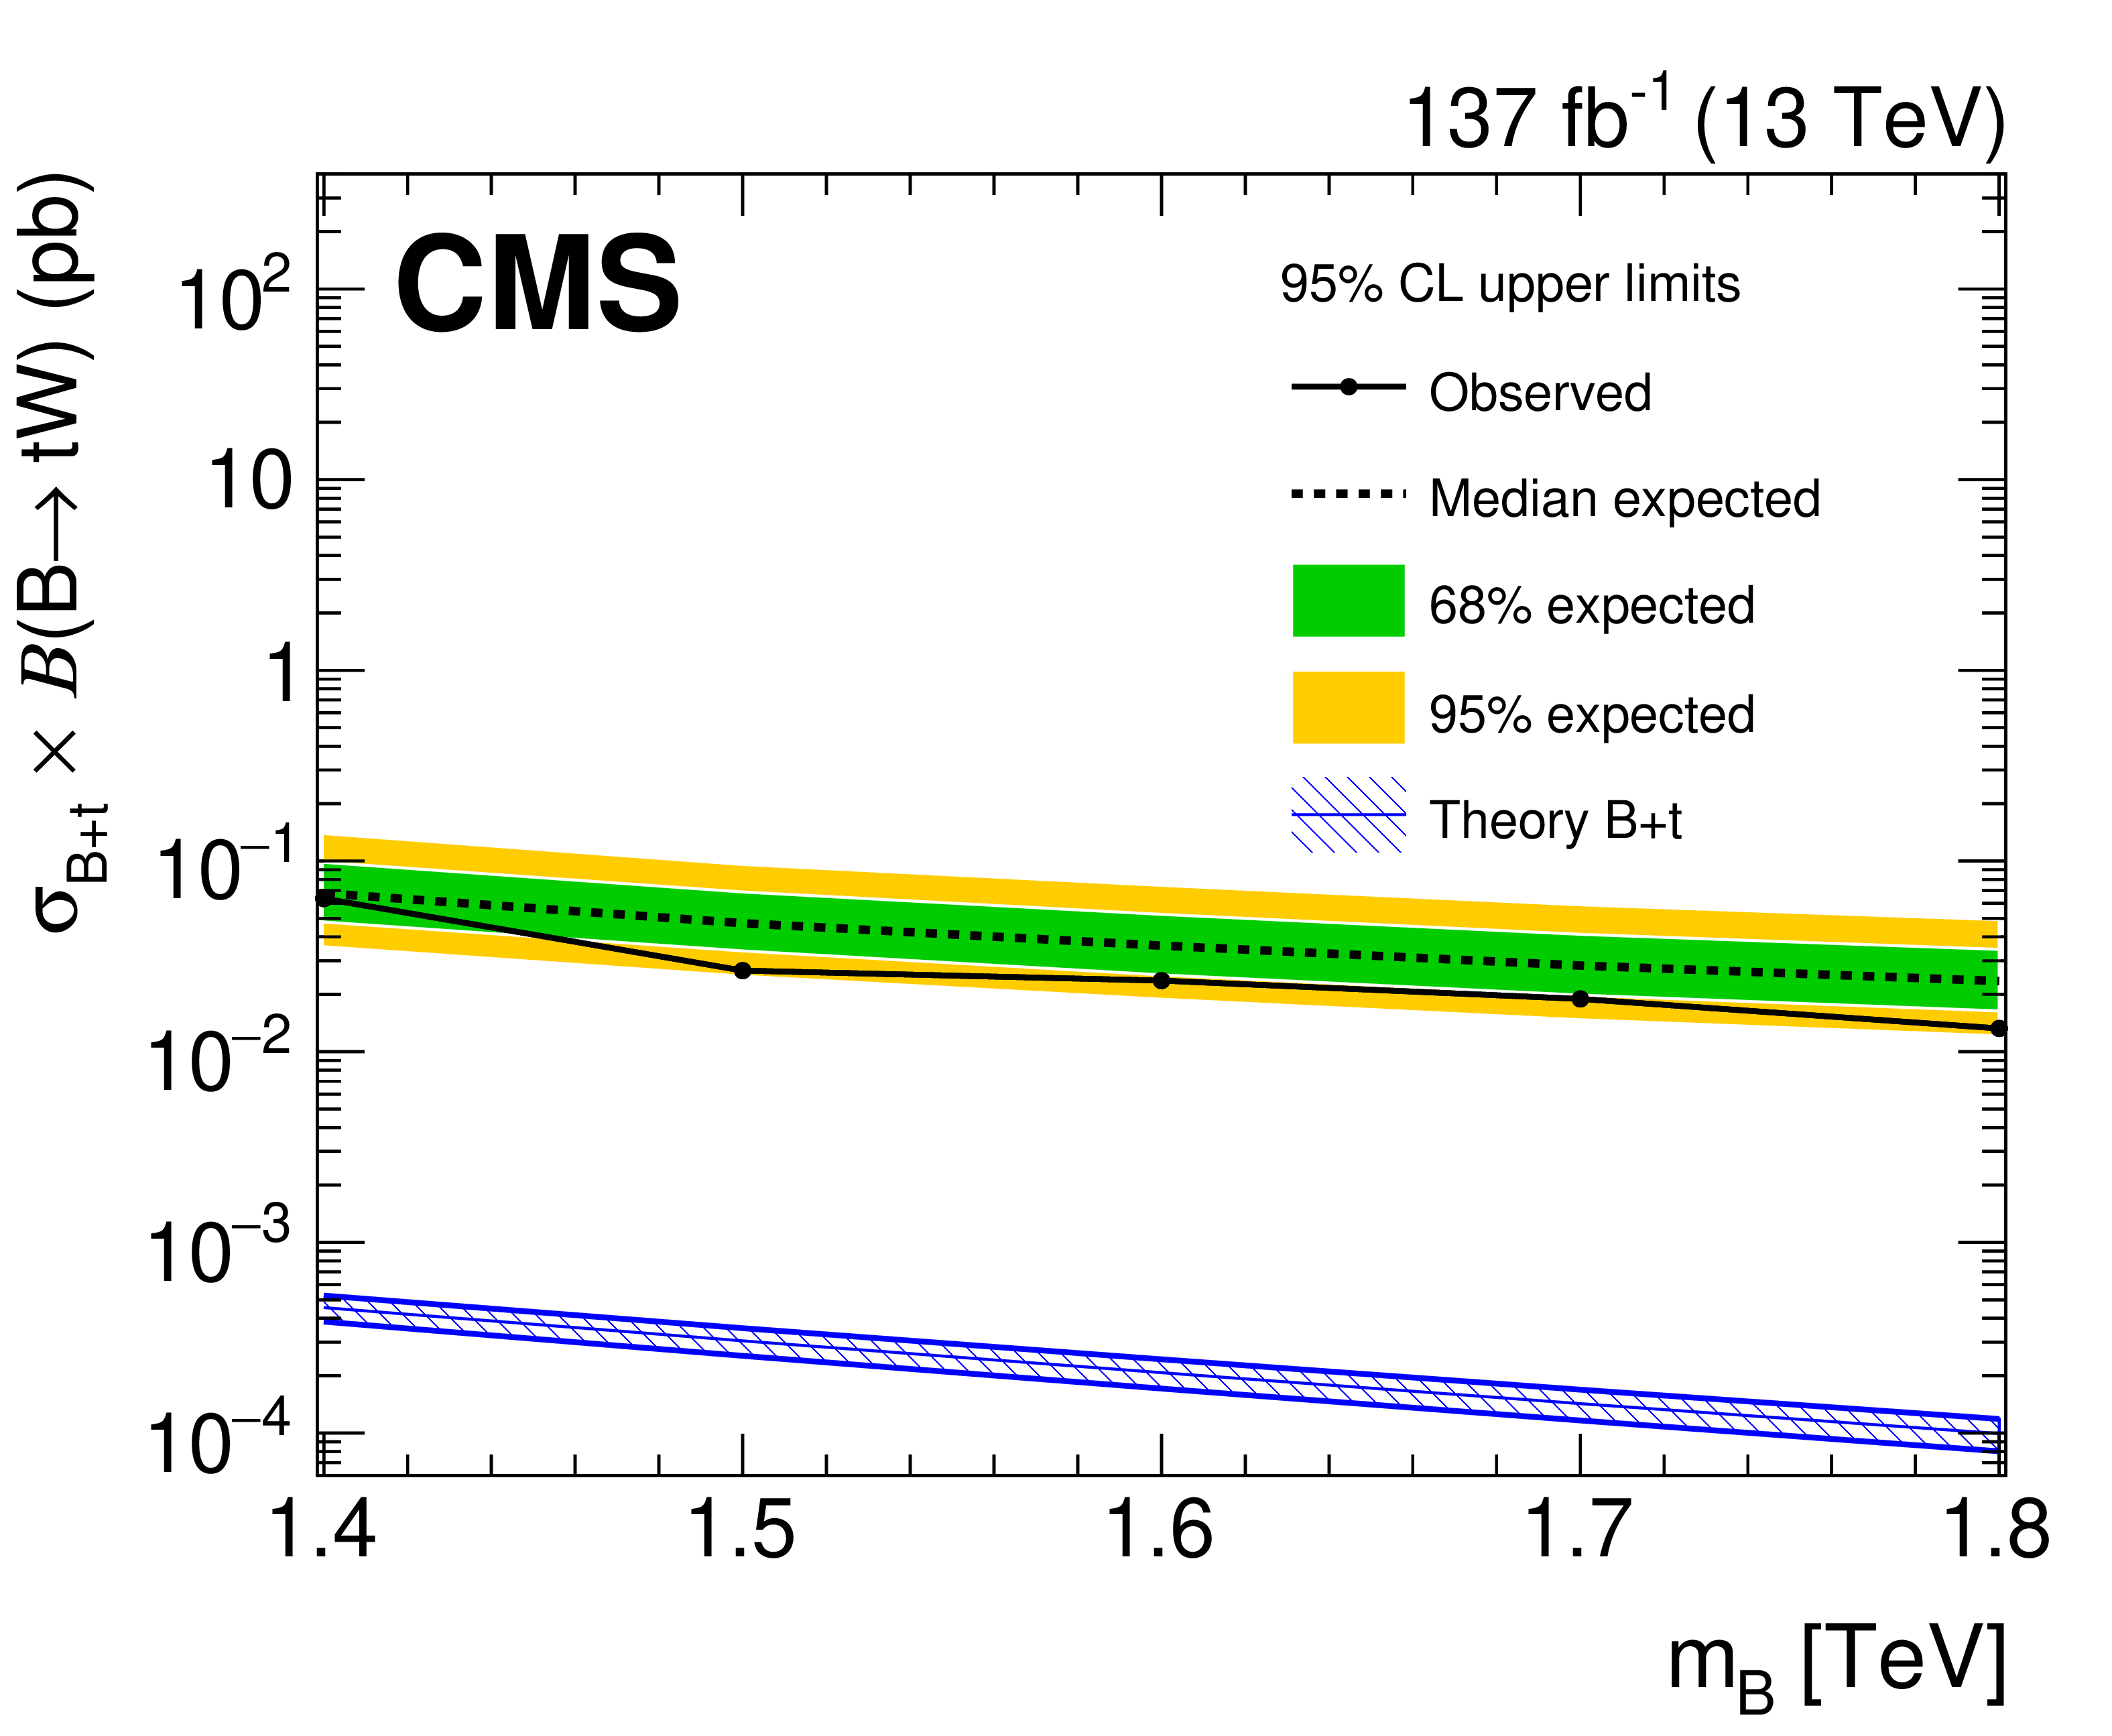
Upper limits on the product of the cross section and branching fraction at 95% CL for a B produced in association with a top quark as a function of the B quark mass. The expected (dashed) and observed (dot-solid) limits, as well as the B quark theoretical cross sections (shaded-solid), are shown. The inner and outer shaded areas around the expected limits show the 68% and 95% CL intervals, respectively. |
| Tables | |

png pdf |
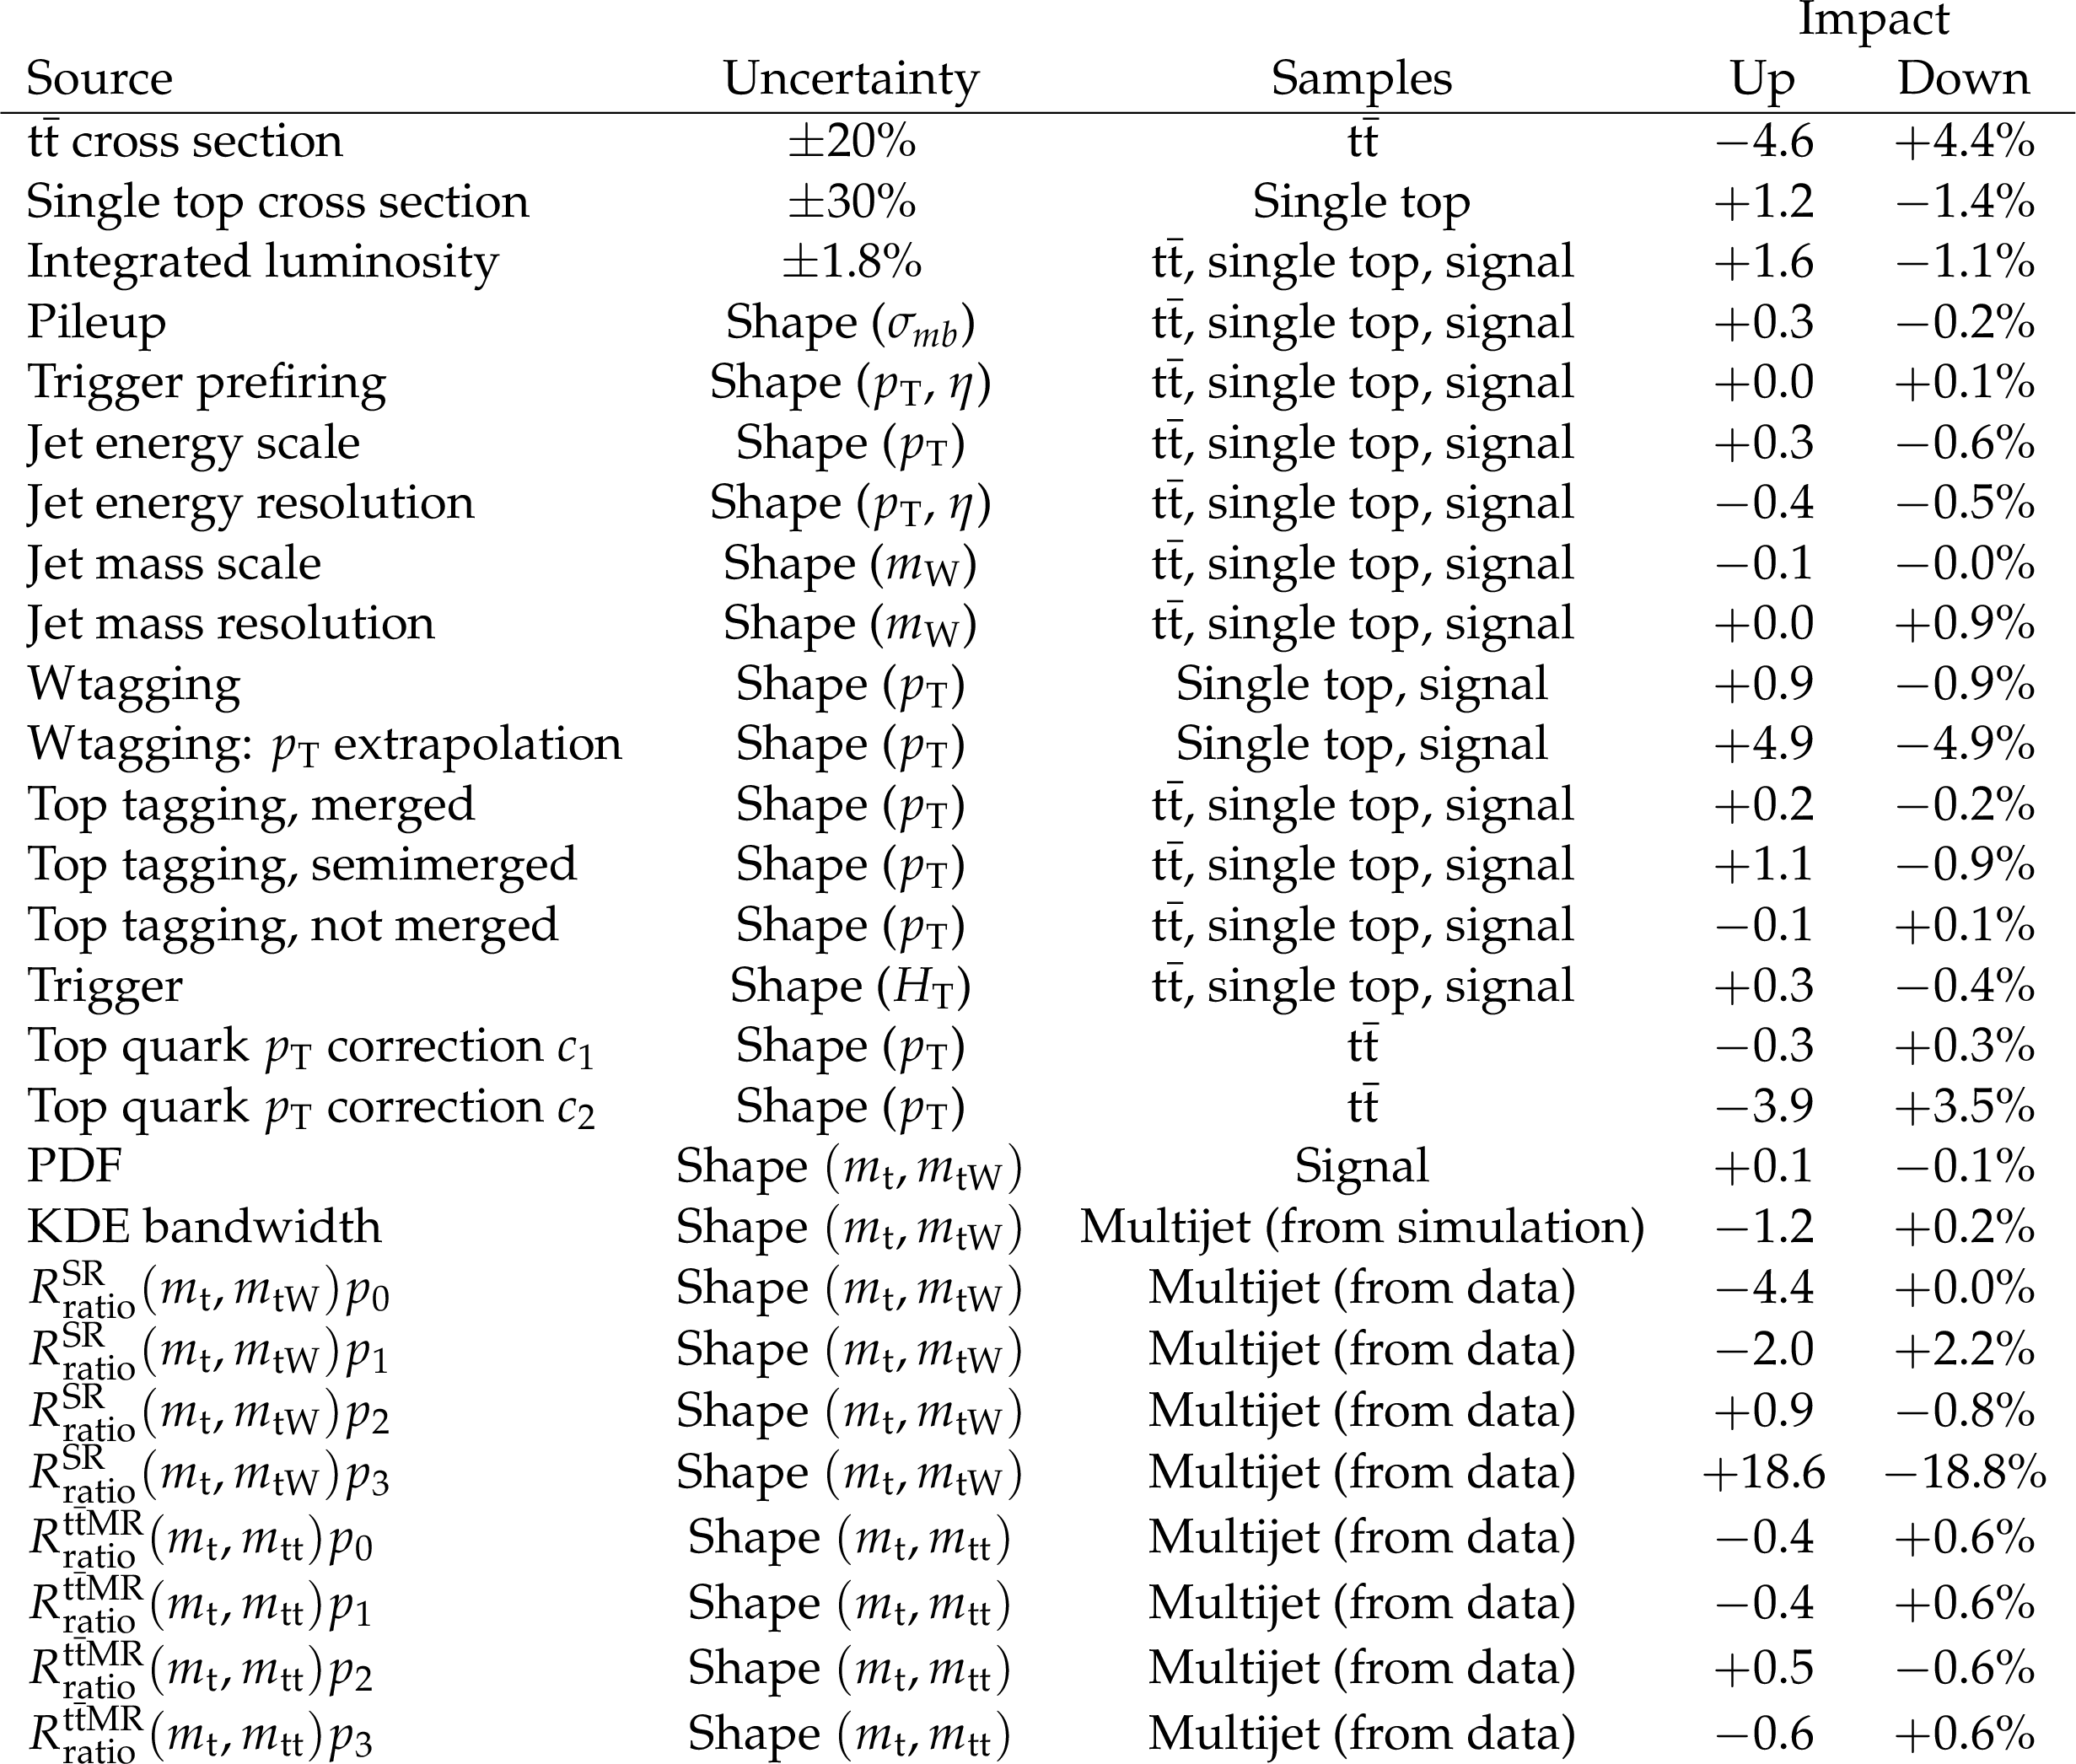
Table 1:
A summary of the four selection regions considered in the likelihood fit to data. The columns indicate the possible jet tag for the jet considered in the preselection while the rows indicate the possible classification of the second jet when using the top tagging algorithm. |
png pdf |
Table 2:
Sources of uncertainty that are taken into account in the statistical analysis of the data. The sources affecting the normalization are given with their percentage uncertainties, while the sources affecting the shape are listed as "Shape'' together with the dependent parameter. The rightmost column indicates the impact of the parameter on the 2.4 TeV b* signal strength when the parameter is changed "up'' and "down'' by one standard deviation from its post-fit value. For parameters where the uncertainties are uncorrelated between data-taking years, the average impact is calculated. An impact of $+$0.0 ($-$0.0) denotes an impact that is less (greater) than 0.1 ($-$0.1) but greater (less) than 0. |
| Summary |
|
A search for a heavy resonance decaying to a top quark and a W boson in the fully hadronic final state has been presented. The analysis uses proton-proton collision data at a center-of-mass energy of 13 TeV corresponding to an integrated luminosity of 137 fb$^{-1}$ , collected by the CMS experiment at the LHC during 2016-2018. This analysis considers the explicit case where the heavy resonance is an excited bottom quark, ${\mathrm{b}^\ast} $. The search evaluates ${\mathrm{b}^\ast} $ quark masses greater than 1.2 TeV, which result in highly Lorentz-boosted top quarks and W bosons that are reconstructed as single jets. Using jet substructure algorithms designed to distinguish heavy resonance decays from light-quark and gluon jets, the top quark and W boson decays are identified as a top quark jet and a W boson jet, respectively. The background processes in the analysis are a result of multijet processes from the strong interaction, $\mathrm{t\bar{t}}$ production, and single top quark (tW-channel) production. The search is performed using a two-dimensional binned likelihood fit to the data that allows all backgrounds to be fit simultaneously. The multijet component in the signal region is estimated via a two-dimensional transfer function method that uses a multijet-enriched control region. The $\mathrm{t\bar{t}}$ and single top background estimates are determined via a template fit to data. In particular, a dedicated $\mathrm{t\bar{t}}$ measurement region is used to constrain the shape and yield of the $\mathrm{t\bar{t}}$ background. No statistically significant deviation from the standard model expectation is observed. The hypotheses of ${\mathrm{b}^\ast} $ quarks with left-handed, right-handed, and vector-like chiralities are excluded at 95% confidence level for masses below 2.6, 2.8, and 3.1 TeV, respectively. These are the most stringent limits on the ${\mathrm{b}^\ast} $ quark mass to date, extending the previous best mass limits by almost a factor of two. |
| References | ||||
| 1 | U. Baur, M. Spira, and P. M. Zerwas | Excited-quark and -lepton production at hadron colliders | PRD 42 (1990) 815 | |
| 2 | T. M. P. Tait and C.-P. Yuan | Single top quark production as a window to physics beyond the standard model | PRD 63 (2000) 014018 | hep-ph/0007298 |
| 3 | C. Cheung, A. L. Fitzpatrick, and L. Randall | Sequestering CP violation and GIM-violation with warped extra dimensions | JHEP 01 (2008) 069 | 0711.4421 |
| 4 | A. L. Fitzpatrick, G. Perez, and L. Randall | Flavor anarchy in a Randall-Sundrum model with 5D minimal flavor violation and a low Kaluza-Klein scale | PRL 100 (2008) 171604 | 0710.1869 |
| 5 | C. Bini, R. Contino, and N. Vignaroli | Heavy-light decay topologies as a new strategy to discover a heavy gluon | JHEP 01 (2012) 157 | 1110.6058 |
| 6 | N. Vignaroli | Discovering the composite Higgs through the decay of a heavy fermion | JHEP 07 (2012) 158 | 1204.0468 |
| 7 | N. Vignaroli | $ \Delta F = $ 1 constraints on composite Higgs models with left-right parity | PRD 86 (2012) 115011 | 1204.0478 |
| 8 | CMS Collaboration | The CMS experiment at the CERN LHC | JINST 3 (2008) S08004. | CMS-00-001 |
| 9 | J. W. Nutter, R. Schwienhorst, D. G. E. Walker, and J.-H. Yu | Single top production as a probe of B' quarks | PRD 86 (2012) 094006 | 1207.5179 |
| 10 | ATLAS Collaboration | Search for single $ \textrm{b}^* $-quark production with the ATLAS detector at $ \sqrt{s}= $ 7 TeV | PLB 721 (2013) 171 | 1301.1583 |
| 11 | CMS Collaboration | Search for the production of an excited bottom quark decaying to tW in proton-proton collisions at $ \sqrt{s}= $ 8 TeV | JHEP 01 (2016) 166 | CMS-B2G-14-005 1509.08141 |
| 12 | CMS Collaboration | Search for resonances and quantum black holes using dijet mass spectra in proton-proton collisions at $ \sqrt{s} = $ 8 TeV | PRD 91 (2015) 052009 | CMS-EXO-12-059 1501.04198 |
| 13 | A. J. Larkoski, I. Moult, and B. Nachman | Jet substructure at the Large Hadron Collider: A review of recent advances in theory and machine learning | Phys. Rep. 841 (2020) 1 | 1709.04464 |
| 14 | R. Kogler et al. | Jet substructure at the Large Hadron Collider | Rev. Mod. Phys. 91 (2019) 045003 | 1803.06991 |
| 15 | J. A. Aguilar-Saavedra, R. Benbrik, S. Heinemeyer, and M. P\'uerez-Victoria | Handbook of vectorlike quarks: Mixing and single production | PRD 88 (2013) 094010 | 1306.0572 |
| 16 | A. De Simone, O. Matsedonskyi, R. Rattazzi, and A. Wulzer | A first top partner hunter's guide | JHEP 04 (2013) 004 | 1211.5663 |
| 17 | CMS Collaboration | The CMS trigger system | JINST 12 (2017) P01020 | CMS-TRG-12-001 1609.02366 |
| 18 | D. Krohn, J. Thaler, and L.-T. Wang | Jet Trimming | JHEP 02 (2010) 084 | 0912.1342 |
| 19 | CMS Collaboration | Measurements of $ \mathrm{t\overline{t}} $ differential cross sections in proton-proton collisions at $ \sqrt{s}= $ 13 TeV using events containing two leptons | JHEP 02 (2019) 149 | CMS-TOP-17-014 1811.06625 |
| 20 | CMS Collaboration | Measurement of differential cross sections for top quark pair production using the lepton+jets final state in proton-proton collisions at 13 TeV | PRD 95 (2017) 092001 | CMS-TOP-16-008 1610.04191 |
| 21 | E. Re | Single-top Wt-channel production matched with parton showers using the POWHEG method | EPJC 71 (2011) 1547 | 1009.2450 |
| 22 | P. Nason | A new method for combining NLO QCD with shower Monte Carlo algorithms | JHEP 11 (2004) 040 | hep-ph/0409146 |
| 23 | S. Frixione, P. Nason, and C. Oleari | Matching NLO QCD computations with parton shower simulations: The POWHEG method | JHEP 11 (2007) 070 | 0709.2092 |
| 24 | S. Alioli, P. Nason, C. Oleari, and E. Re | A general framework for implementing NLO calculations in shower Monte Carlo programs: The POWHEG BOX | JHEP 06 (2010) 043 | 1002.2581 |
| 25 | S. Frixione, G. Ridolfi, and P. Nason | A positive-weight next-to-leading-order Monte Carlo for heavy flavour hadroproduction | JHEP 09 (2007) 126 | 0707.3088 |
| 26 | J. Alwall et al. | The automated computation of tree-level and next-to-leading order differential cross sections, and their matching to parton shower simulations | JHEP 07 (2014) 079 | 1405.0301 |
| 27 | T. Sjostrand et al. | An introduction to PYTHIA 8.2 | CPC 191 (2015) 159 | 1410.3012 |
| 28 | NNPDF Collaboration | Parton distributions for the LHC Run II | JHEP 04 (2015) 040 | 1410.8849 |
| 29 | CMS Collaboration | Event generator tunes obtained from underlying event and multiparton scattering measurements | EPJC 76 (2016) 155 | CMS-GEN-14-001 1512.00815 |
| 30 | NNPDF Collaboration | Parton distributions from high-precision collider data | EPJC 77 (2017) 663 | 1706.00428 |
| 31 | CMS Collaboration | Extraction and validation of a new set of CMS PYTHIA8 tunes from underlying-event measurements | EPJC 80 (2020) 4 | CMS-GEN-17-001 1903.12179 |
| 32 | GEANT4 Collaboration | GEANT4--a simulation toolkit | NIMA 506 (2003) 250 | |
| 33 | ATLAS Collaboration | Measurement of the inelastic proton-proton cross section at $ \sqrt{s} = $ 13 TeV with the ATLAS Detector at the LHC | PRL 117 (2016) 182002 | 1606.02625 |
| 34 | CMS Collaboration | Measurement of the inelastic proton-proton cross section at $ \sqrt{s}= $ 13 TeV | JHEP 07 (2018) 161 | CMS-FSQ-15-005 1802.02613 |
| 35 | M. Cacciari, G. P. Salam, and G. Soyez | The anti-$ {k_{\mathrm{T}}} $ jet clustering algorithm | JHEP 04 (2008) 063 | 0802.1189 |
| 36 | M. Cacciari, G. P. Salam, and G. Soyez | FastJet user manual | EPJC 72 (2012) 1896 | 1111.6097 |
| 37 | CMS Collaboration | Particle-flow reconstruction and global event description with the CMS detector | JINST 12 (2017) P10003 | CMS-PRF-14-001 1706.04965 |
| 38 | D. Bertolini, P. Harris, M. Low, and N. Tran | Pileup per particle identification | JHEP 10 (2014) 059 | 1407.6013 |
| 39 | CMS Collaboration | Pileup mitigation at CMS in 13 TeV data | JINST 15 (2020) P09018 | CMS-JME-18-001 2003.00503 |
| 40 | CMS Collaboration | Jet energy scale and resolution in the CMS experiment in pp collisions at 8 TeV | JINST 12 (2017) P02014 | CMS-JME-13-004 1607.03663 |
| 41 | CMS Collaboration | Jet algorithms performance in 13 TeV data | CMS-PAS-JME-16-003 | CMS-PAS-JME-16-003 |
| 42 | A. J. Larkoski, S. Marzani, G. Soyez, and J. Thaler | Soft drop | JHEP 05 (2014) 146 | 1402.2657 |
| 43 | M. Dasgupta, A. Fregoso, S. Marzani, and G. P. Salam | Towards an understanding of jet substructure | JHEP 09 (2013) 029 | 1307.0007 |
| 44 | J. M. Butterworth, A. R. Davison, M. Rubin, and G. P. Salam | Jet substructure as a new Higgs search channel at the LHC | PRL 100 (2008) 242001 | 0802.2470 |
| 45 | Particle Data Group, P. A. Zyla et al. | Review of particle physics | Prog. Theor. Exp. Phys. 2020 (2020) 083C01 | |
| 46 | J. Thaler and K. Van Tilburg | Identifying boosted objects with $ N $-subjettiness | JHEP 03 (2011) 015 | 1011.2268 |
| 47 | J. Thaler and K. Van Tilburg | Maximizing boosted top identification by minimizing $ N $-subjettiness | JHEP 02 (2012) 093 | 1108.2701 |
| 48 | CMS Collaboration | Identification of heavy-flavour jets with the CMS detector in pp collisions at 13 TeV | JINST 13 (2018) P05011 | CMS-BTV-16-002 1712.07158 |
| 49 | CMS Collaboration | Identification of heavy, energetic, hadronically decaying particles using machine-learning techniques | JINST 15 (2020) P06005 | CMS-JME-18-002 2004.08262 |
| 50 | R. A. Fisher | On the interpretation of $ \chi^2 $ from contingency tables, and the calculation of p | J. Royal Stat. Soc. 85 (1922) 87 | |
| 51 | K. S. Cranmer | Kernel estimation in high-energy physics | CPC 136 (2001) 198 | hep-ex/0011057 |
| 52 | CMS Collaboration | CMS luminosity measurements for the 2016 data taking period | CMS-PAS-LUM-17-001 | CMS-PAS-LUM-17-001 |
| 53 | CMS Collaboration | CMS luminosity measurement for the 2017 data-taking period at $ \sqrt{s} = $ 13 TeV | CMS-PAS-LUM-17-004 | CMS-PAS-LUM-17-004 |
| 54 | CMS Collaboration | CMS luminosity measurement for the 2018 data-taking period at $ \sqrt{s} = $ 13 TeV | CMS-PAS-LUM-18-002 | CMS-PAS-LUM-18-002 |
| 55 | J. Butterworth et al. | PDF4LHC recommendations for LHC Run II | JPG 43 (2016) 023001 | 1510.03865 |
| 56 | S. Baker and R. D. Cousins | Clarification of the use of chi square and likelihood functions in fits to histograms | NIM221 (1984) 437 | |
| 57 | J. K. Lindsey | Parametric statistical inference | Oxford University Press, New York | |
| 58 | G. Cowan, K. Cranmer, E. Gross, and O. Vitells | Asymptotic formulae for likelihood-based tests of new physics | EPJC 71 (2011) 1554 | 1007.1727 |
| 59 | CMS Collaboration | Search for high mass dijet resonances with a new background prediction method in proton-proton collisions at $ \sqrt{s} = $ 13 TeV | JHEP 05 (2020) 033 | CMS-EXO-19-012 1911.03947 |
| 60 | CMS Collaboration | Search for single production of vector-like quarks decaying to a top quark and a W boson in proton-proton collisions at $ \sqrt{s} = $ 13 TeV | EPJC 79 (2019) 90 | CMS-B2G-17-018 1809.08597 |
|
|
Compact Muon Solenoid LHC, CERN |
|

|

|

|

|

|