

Compact Muon Solenoid
LHC, CERN
| CMS-TOP-17-014 ; CERN-EP-2018-252 | ||
| Measurements of $ \mathrm{t\bar{t}} $ differential cross sections in proton-proton collisions at $\sqrt{s} = $ 13 TeV using events containing two leptons | ||
| CMS Collaboration | ||
| 17 November 2018 | ||
| JHEP 02 (2019) 149 | ||
| Abstract: Measurements of differential top quark pair $ \mathrm{t\bar{t}} $ cross sections using events produced in proton-proton collisions at a centre-of-mass energy of 13 TeV containing two oppositely charged leptons are presented. The data were recorded by the CMS experiment at the CERN LHC in 2016 and correspond to an integrated luminosity of 35.9 fb$^{-1}$. The differential cross sections are presented as functions of kinematic observables of the top quarks and their decay products, the $ \mathrm{t\bar{t}} $ system, and the total number of jets in the event. The differential cross sections are defined both with particle-level objects in a fiducial phase space close to that of the detector acceptance and with parton-level top quarks in the full phase space. All results are compared with standard model predictions from Monte Carlo simulations with next-to-leading-order (NLO) accuracy in quantum chromodynamics (QCD) at matrix-element level interfaced to parton-shower simulations. Where possible, parton-level results are compared to calculations with beyond-NLO precision in QCD. Significant disagreement is observed between data and all predictions for several observables. The measurements are used to constrain the top quark chromomagnetic dipole moment in an effective field theory framework at NLO in QCD and to extract $ \mathrm{t\bar{t}} $ and leptonic charge asymmetries. | ||
| Links: e-print arXiv:1811.06625 [hep-ex] (PDF) ; CDS record ; inSPIRE record ; HepData record ; CADI line (restricted) ; | ||
| Figures & Tables | Summary | Additional Figures | References | CMS Publications |
|---|
| Figures | |

png pdf |
Figure 1:
Distributions of the b jet (upper left), and total jet (upper right) multiplicities, and the $ {p_{\mathrm {T}}} $ of the leptons (lower left), and b jets (lower right) are shown for data (points) and simulation (histograms). The vertical bars on the points represent the statistical uncertainties in the data. The hatched regions correspond to the systematic uncertainties in the signal and backgrounds, as described in Section 5. The lower panel of each plot shows the ratio of the data to the predictions from simulation. |

png pdf |
Figure 1-a:
Distributions of the b jet (upper left), and total jet (upper right) multiplicities, and the $ {p_{\mathrm {T}}} $ of the leptons (lower left), and b jets (lower right) are shown for data (points) and simulation (histograms). The vertical bars on the points represent the statistical uncertainties in the data. The hatched regions correspond to the systematic uncertainties in the signal and backgrounds, as described in Section 5. The lower panel of each plot shows the ratio of the data to the predictions from simulation. |

png pdf |
Figure 1-b:
Distributions of the b jet (upper left), and total jet (upper right) multiplicities, and the $ {p_{\mathrm {T}}} $ of the leptons (lower left), and b jets (lower right) are shown for data (points) and simulation (histograms). The vertical bars on the points represent the statistical uncertainties in the data. The hatched regions correspond to the systematic uncertainties in the signal and backgrounds, as described in Section 5. The lower panel of each plot shows the ratio of the data to the predictions from simulation. |

png pdf |
Figure 1-c:
Distributions of the b jet (upper left), and total jet (upper right) multiplicities, and the $ {p_{\mathrm {T}}} $ of the leptons (lower left), and b jets (lower right) are shown for data (points) and simulation (histograms). The vertical bars on the points represent the statistical uncertainties in the data. The hatched regions correspond to the systematic uncertainties in the signal and backgrounds, as described in Section 5. The lower panel of each plot shows the ratio of the data to the predictions from simulation. |

png pdf |
Figure 1-d:
Distributions of the b jet (upper left), and total jet (upper right) multiplicities, and the $ {p_{\mathrm {T}}} $ of the leptons (lower left), and b jets (lower right) are shown for data (points) and simulation (histograms). The vertical bars on the points represent the statistical uncertainties in the data. The hatched regions correspond to the systematic uncertainties in the signal and backgrounds, as described in Section 5. The lower panel of each plot shows the ratio of the data to the predictions from simulation. |

png pdf |
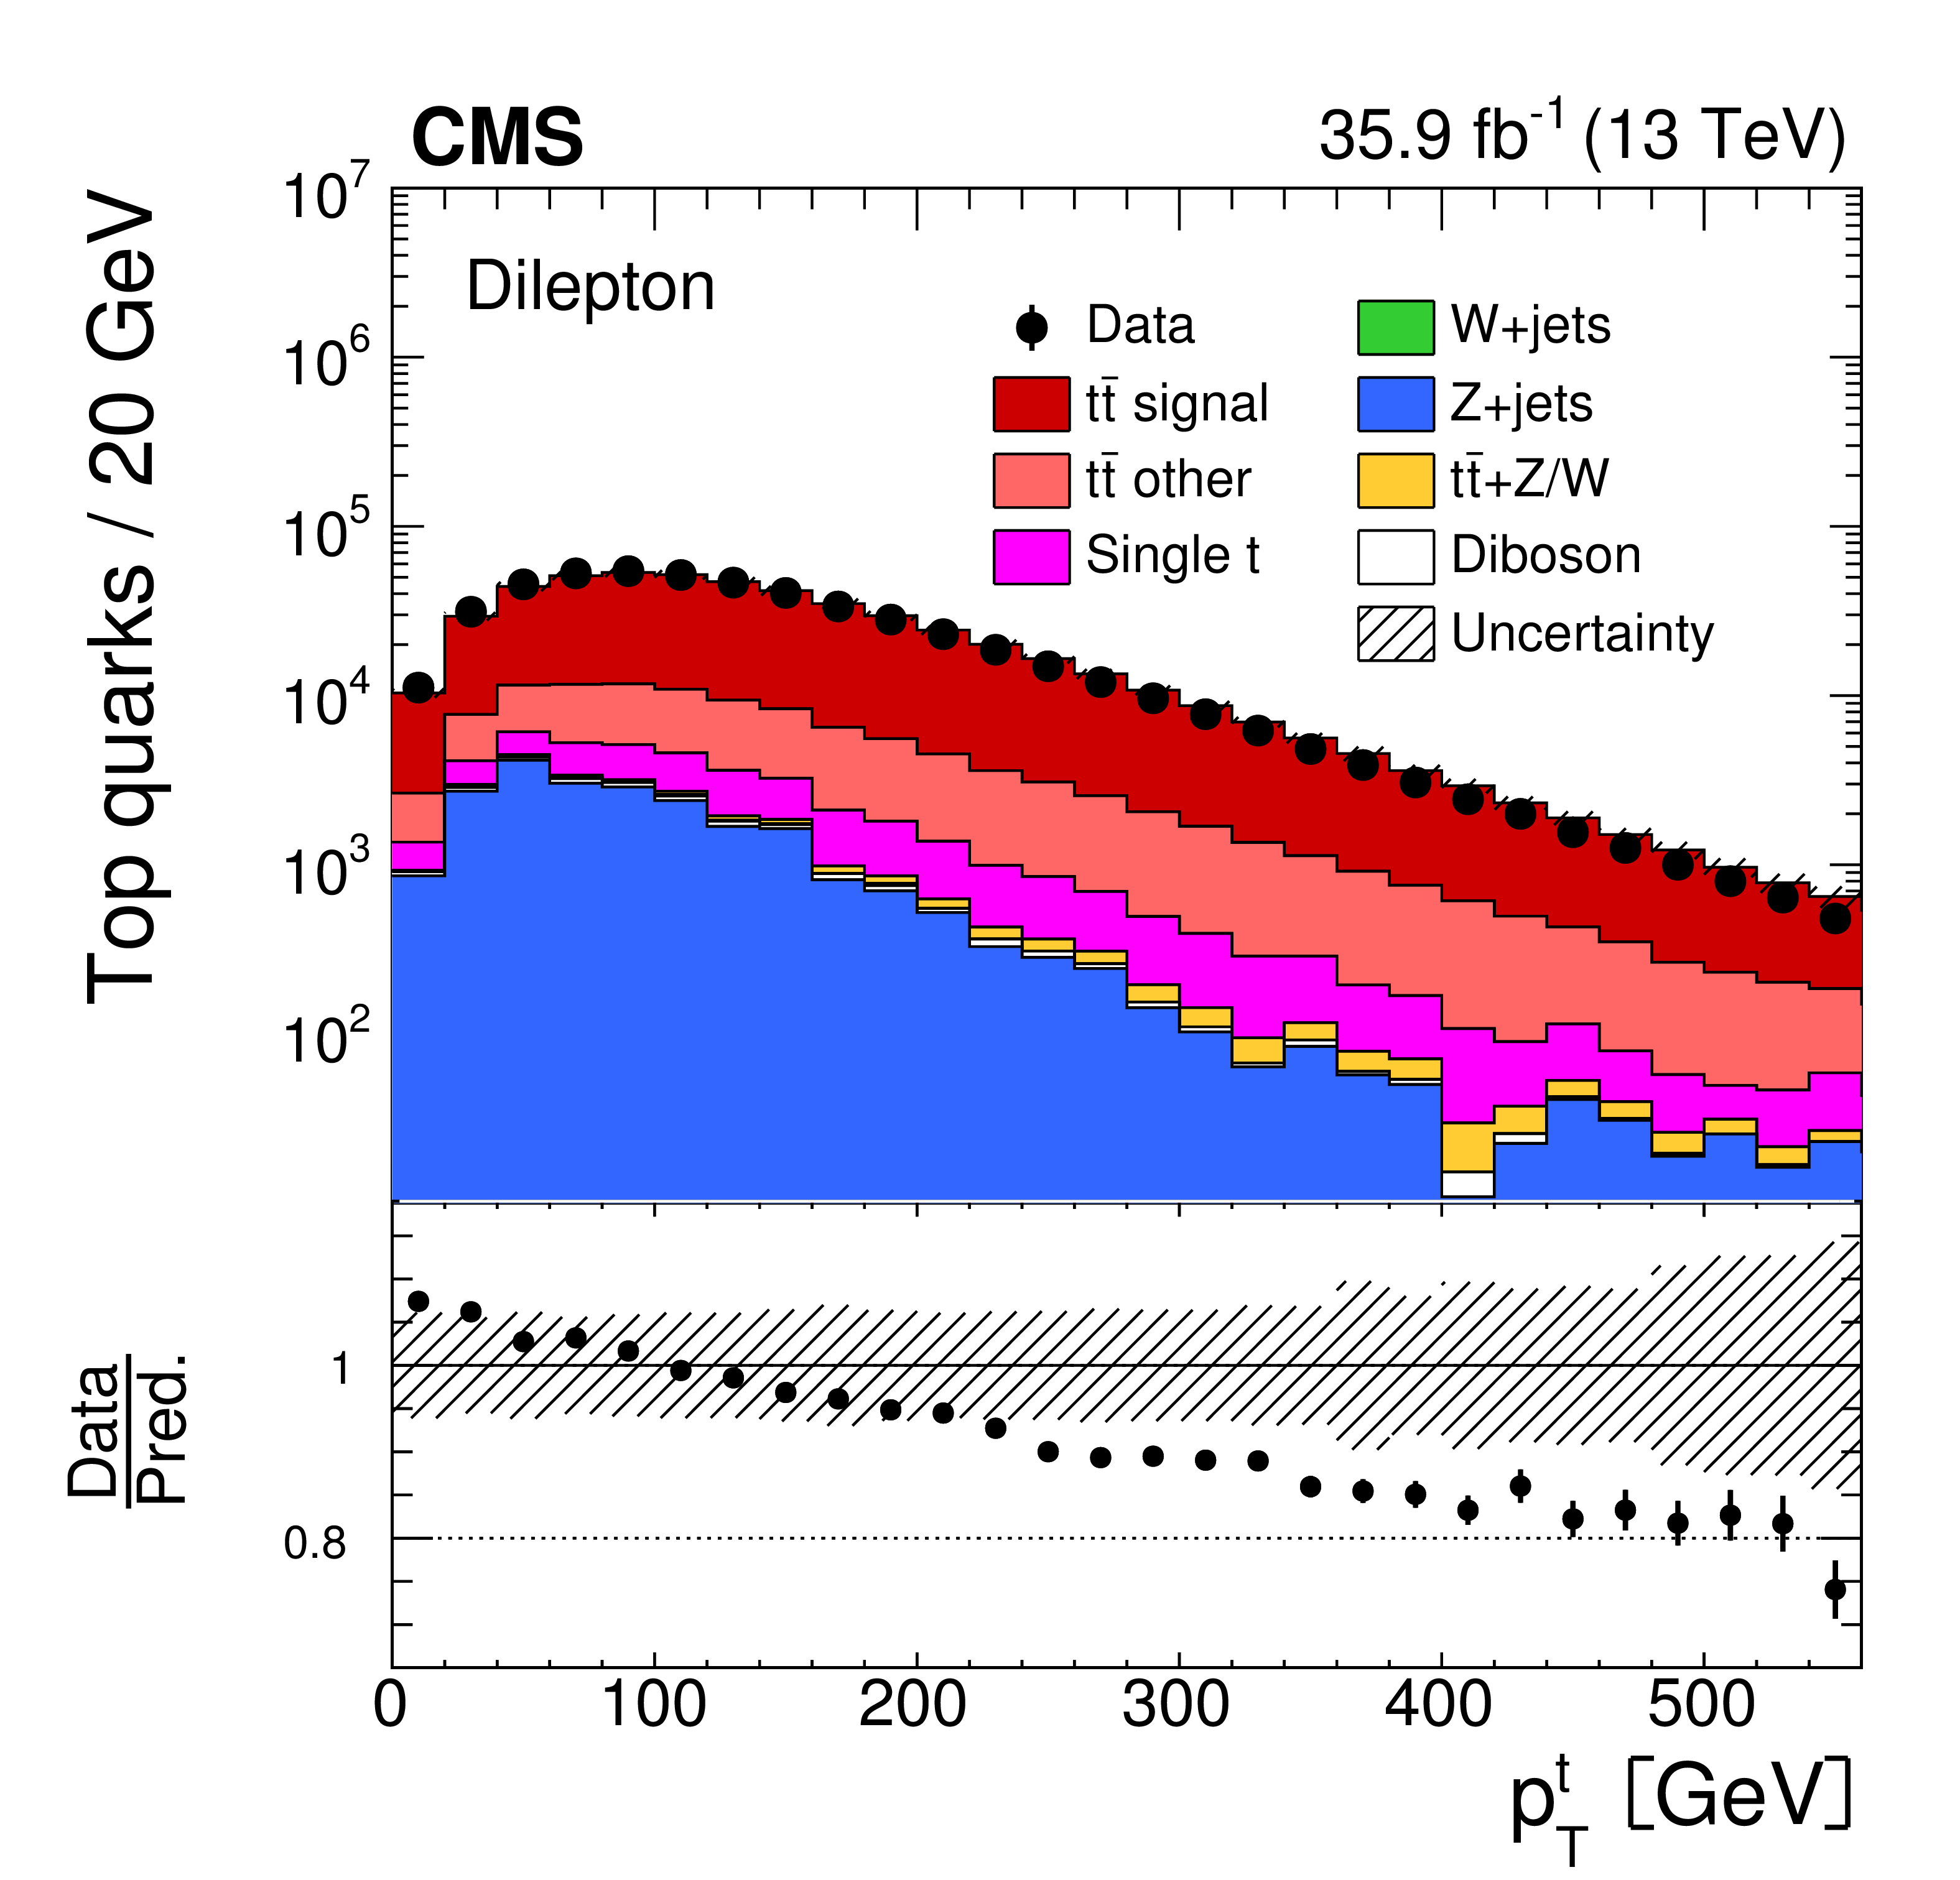
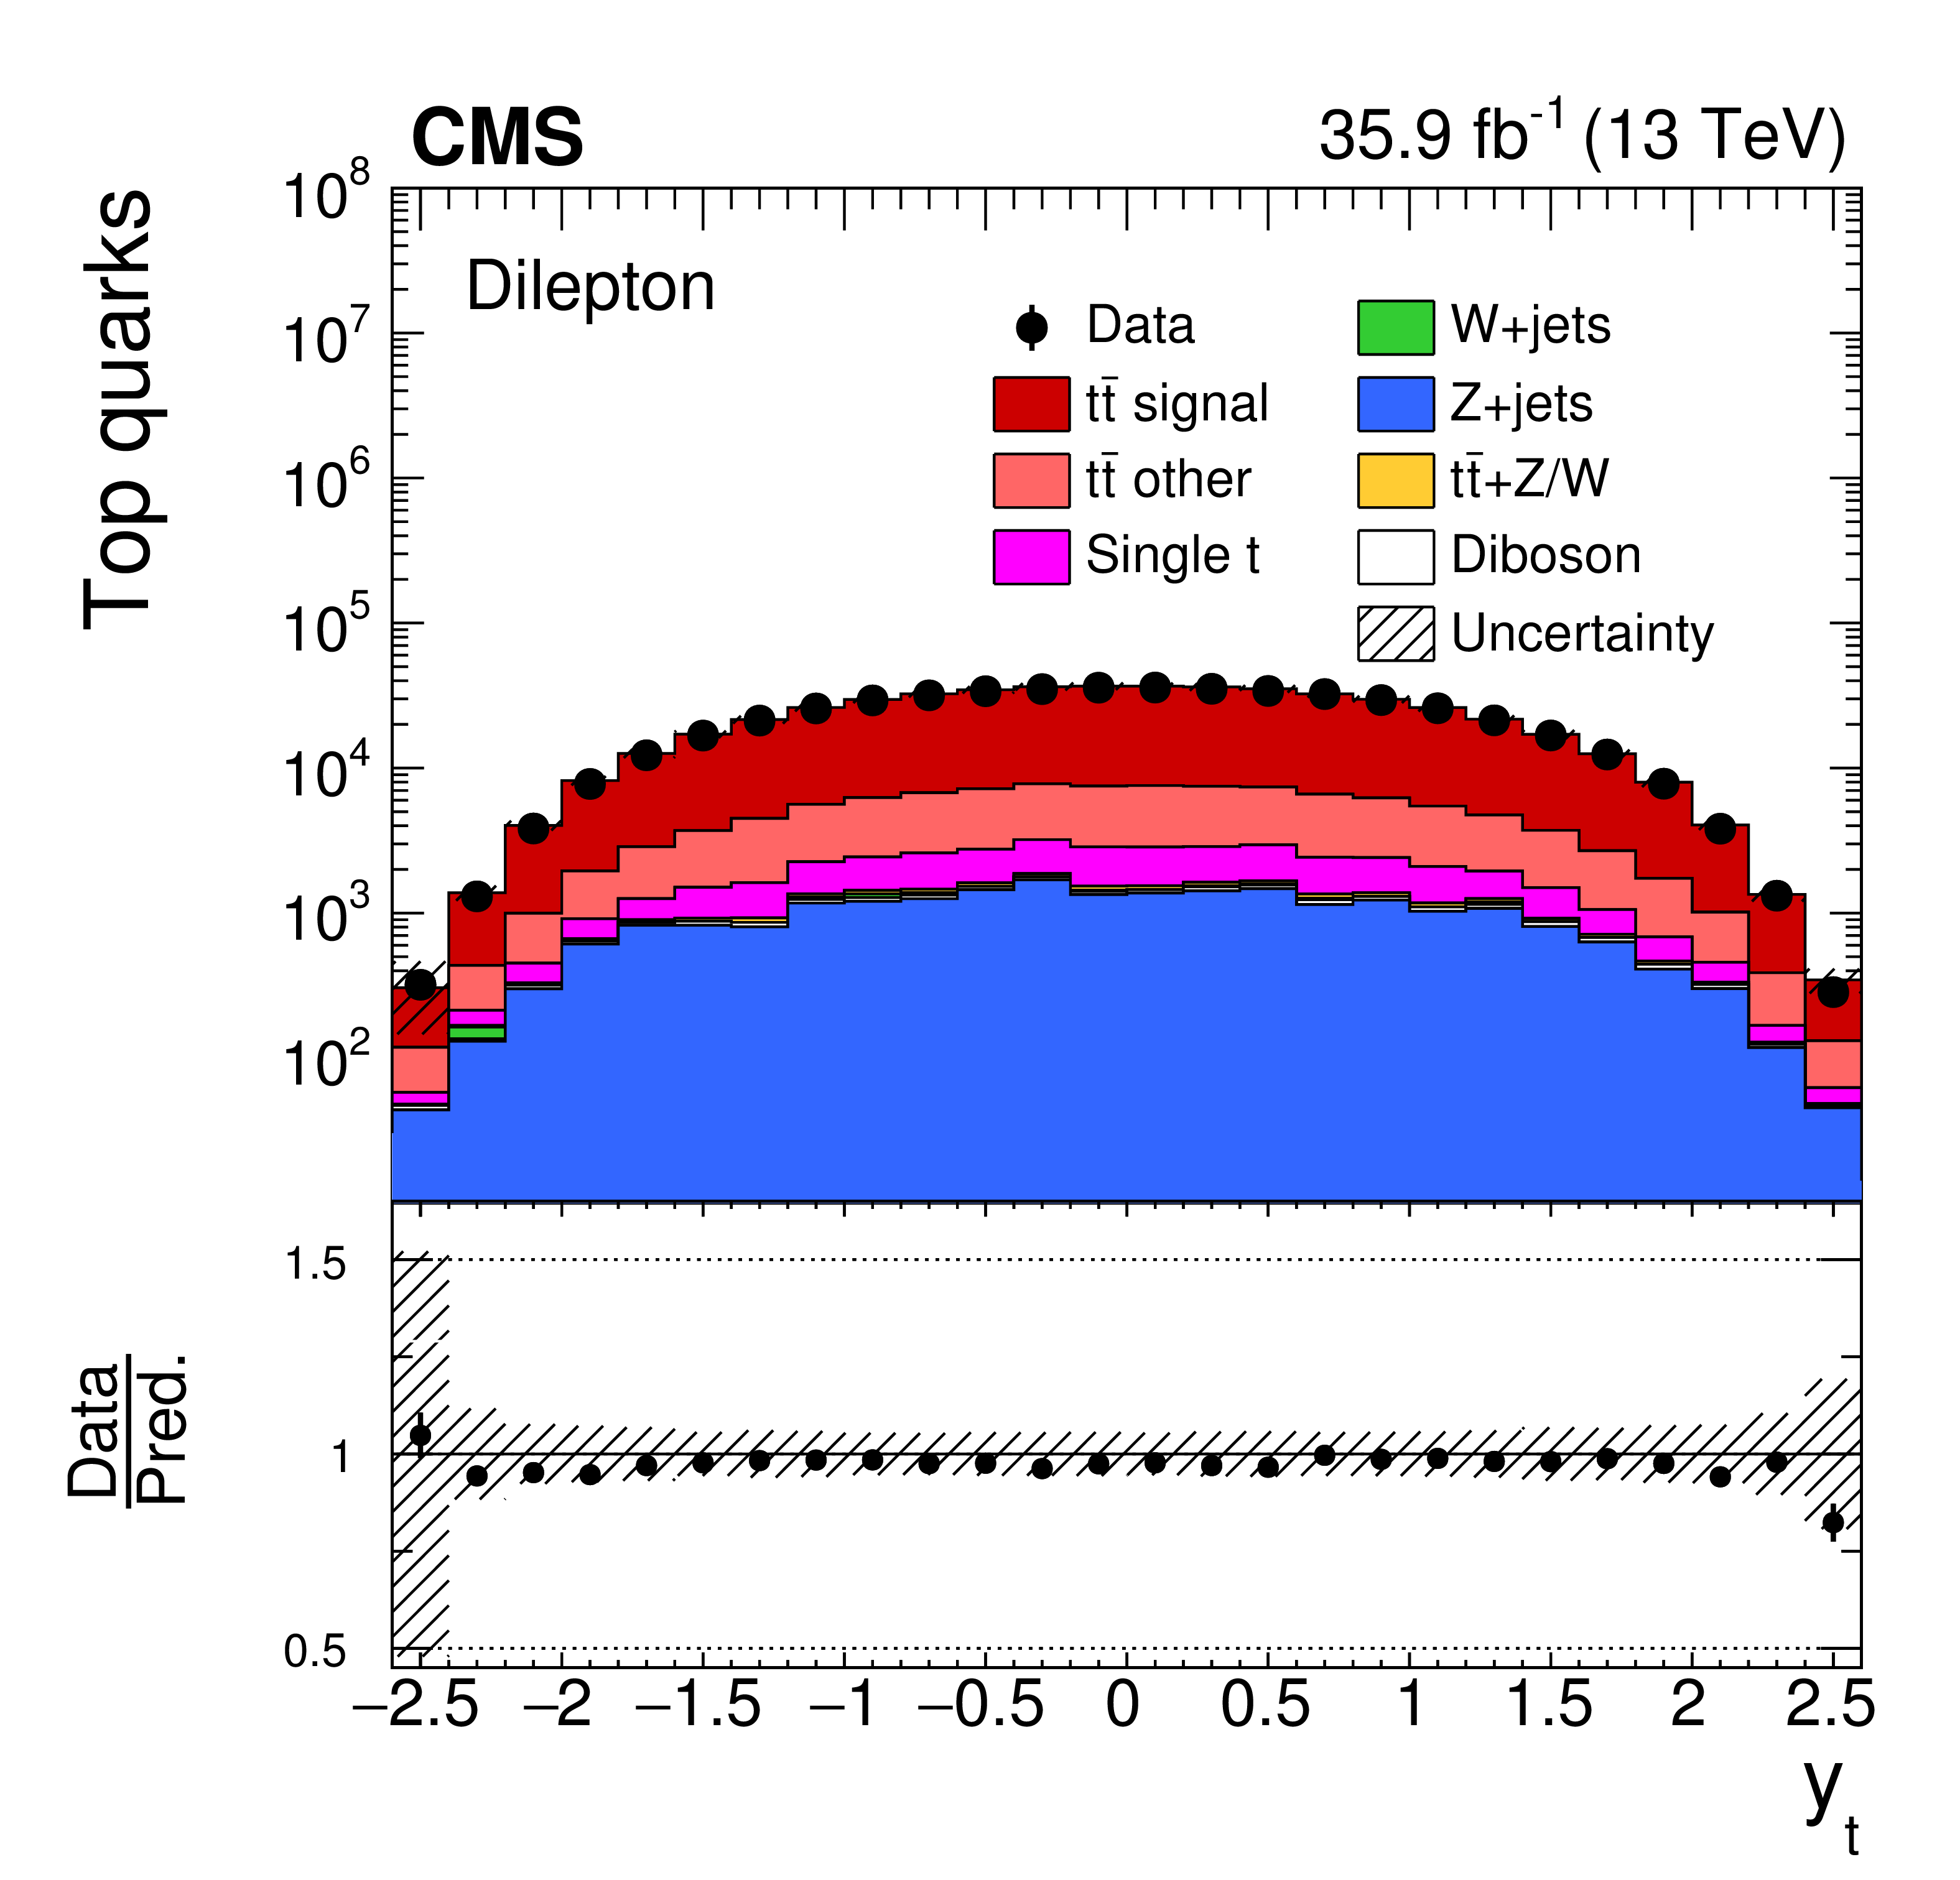
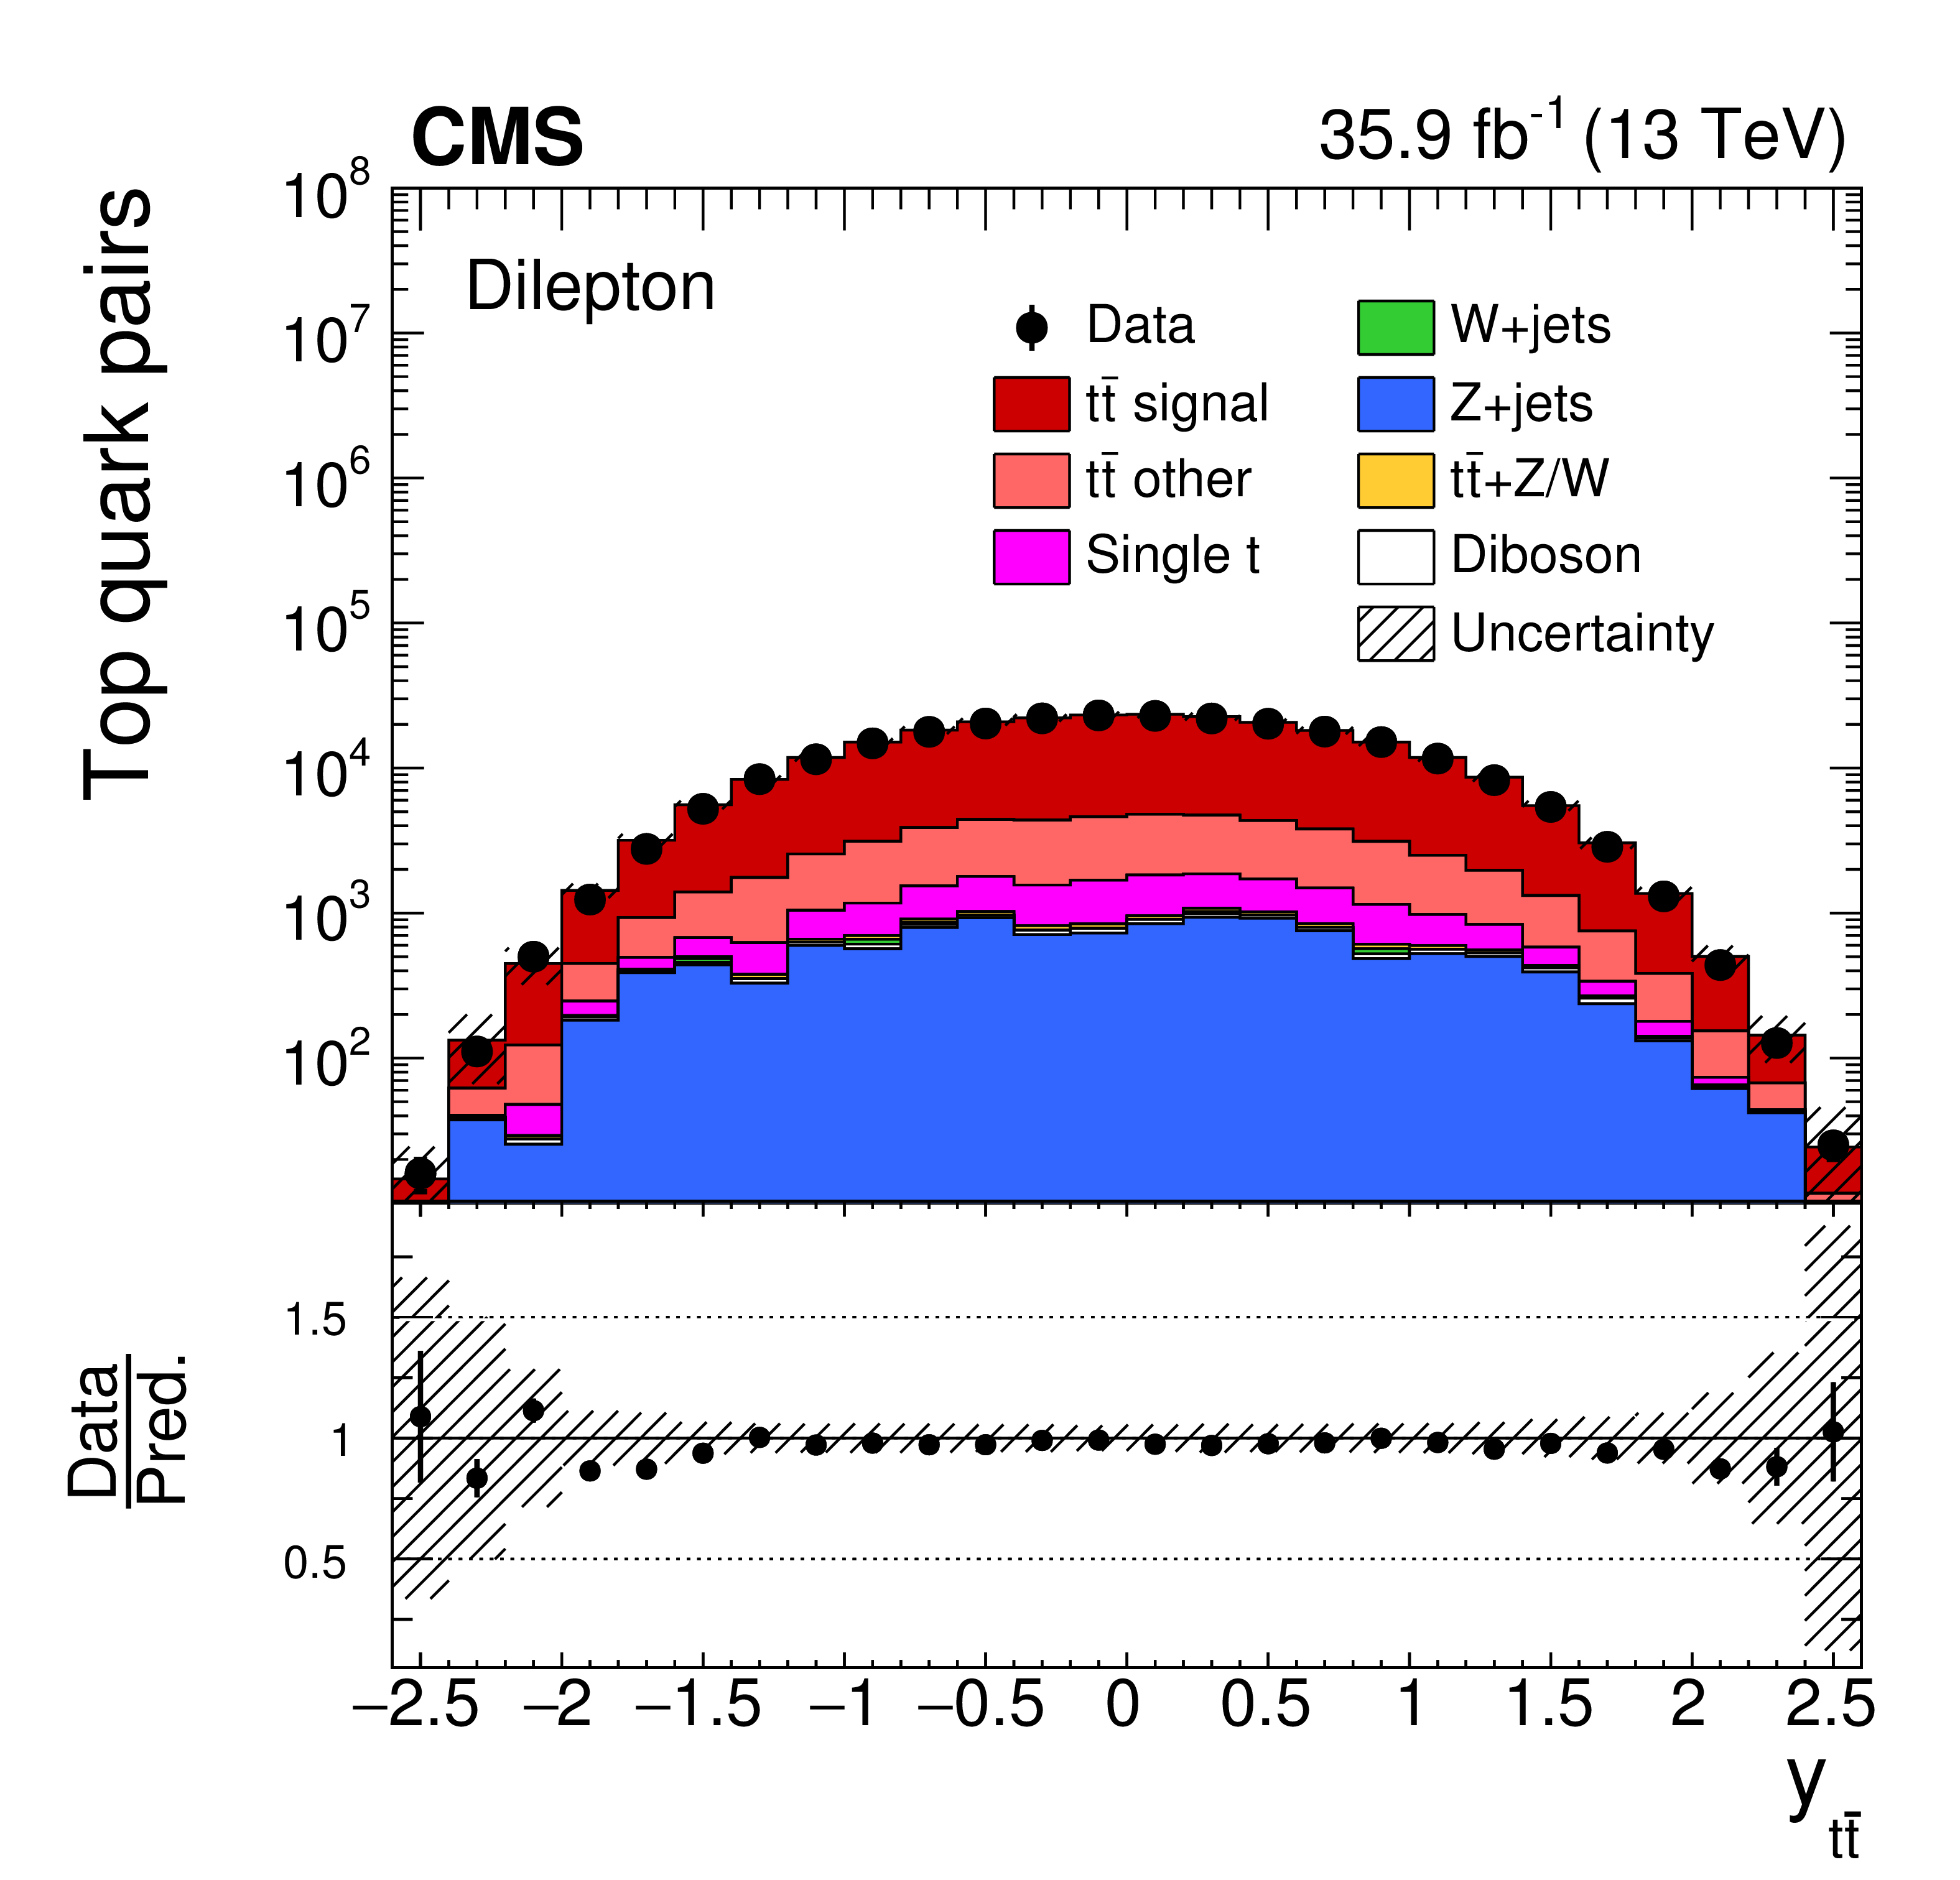
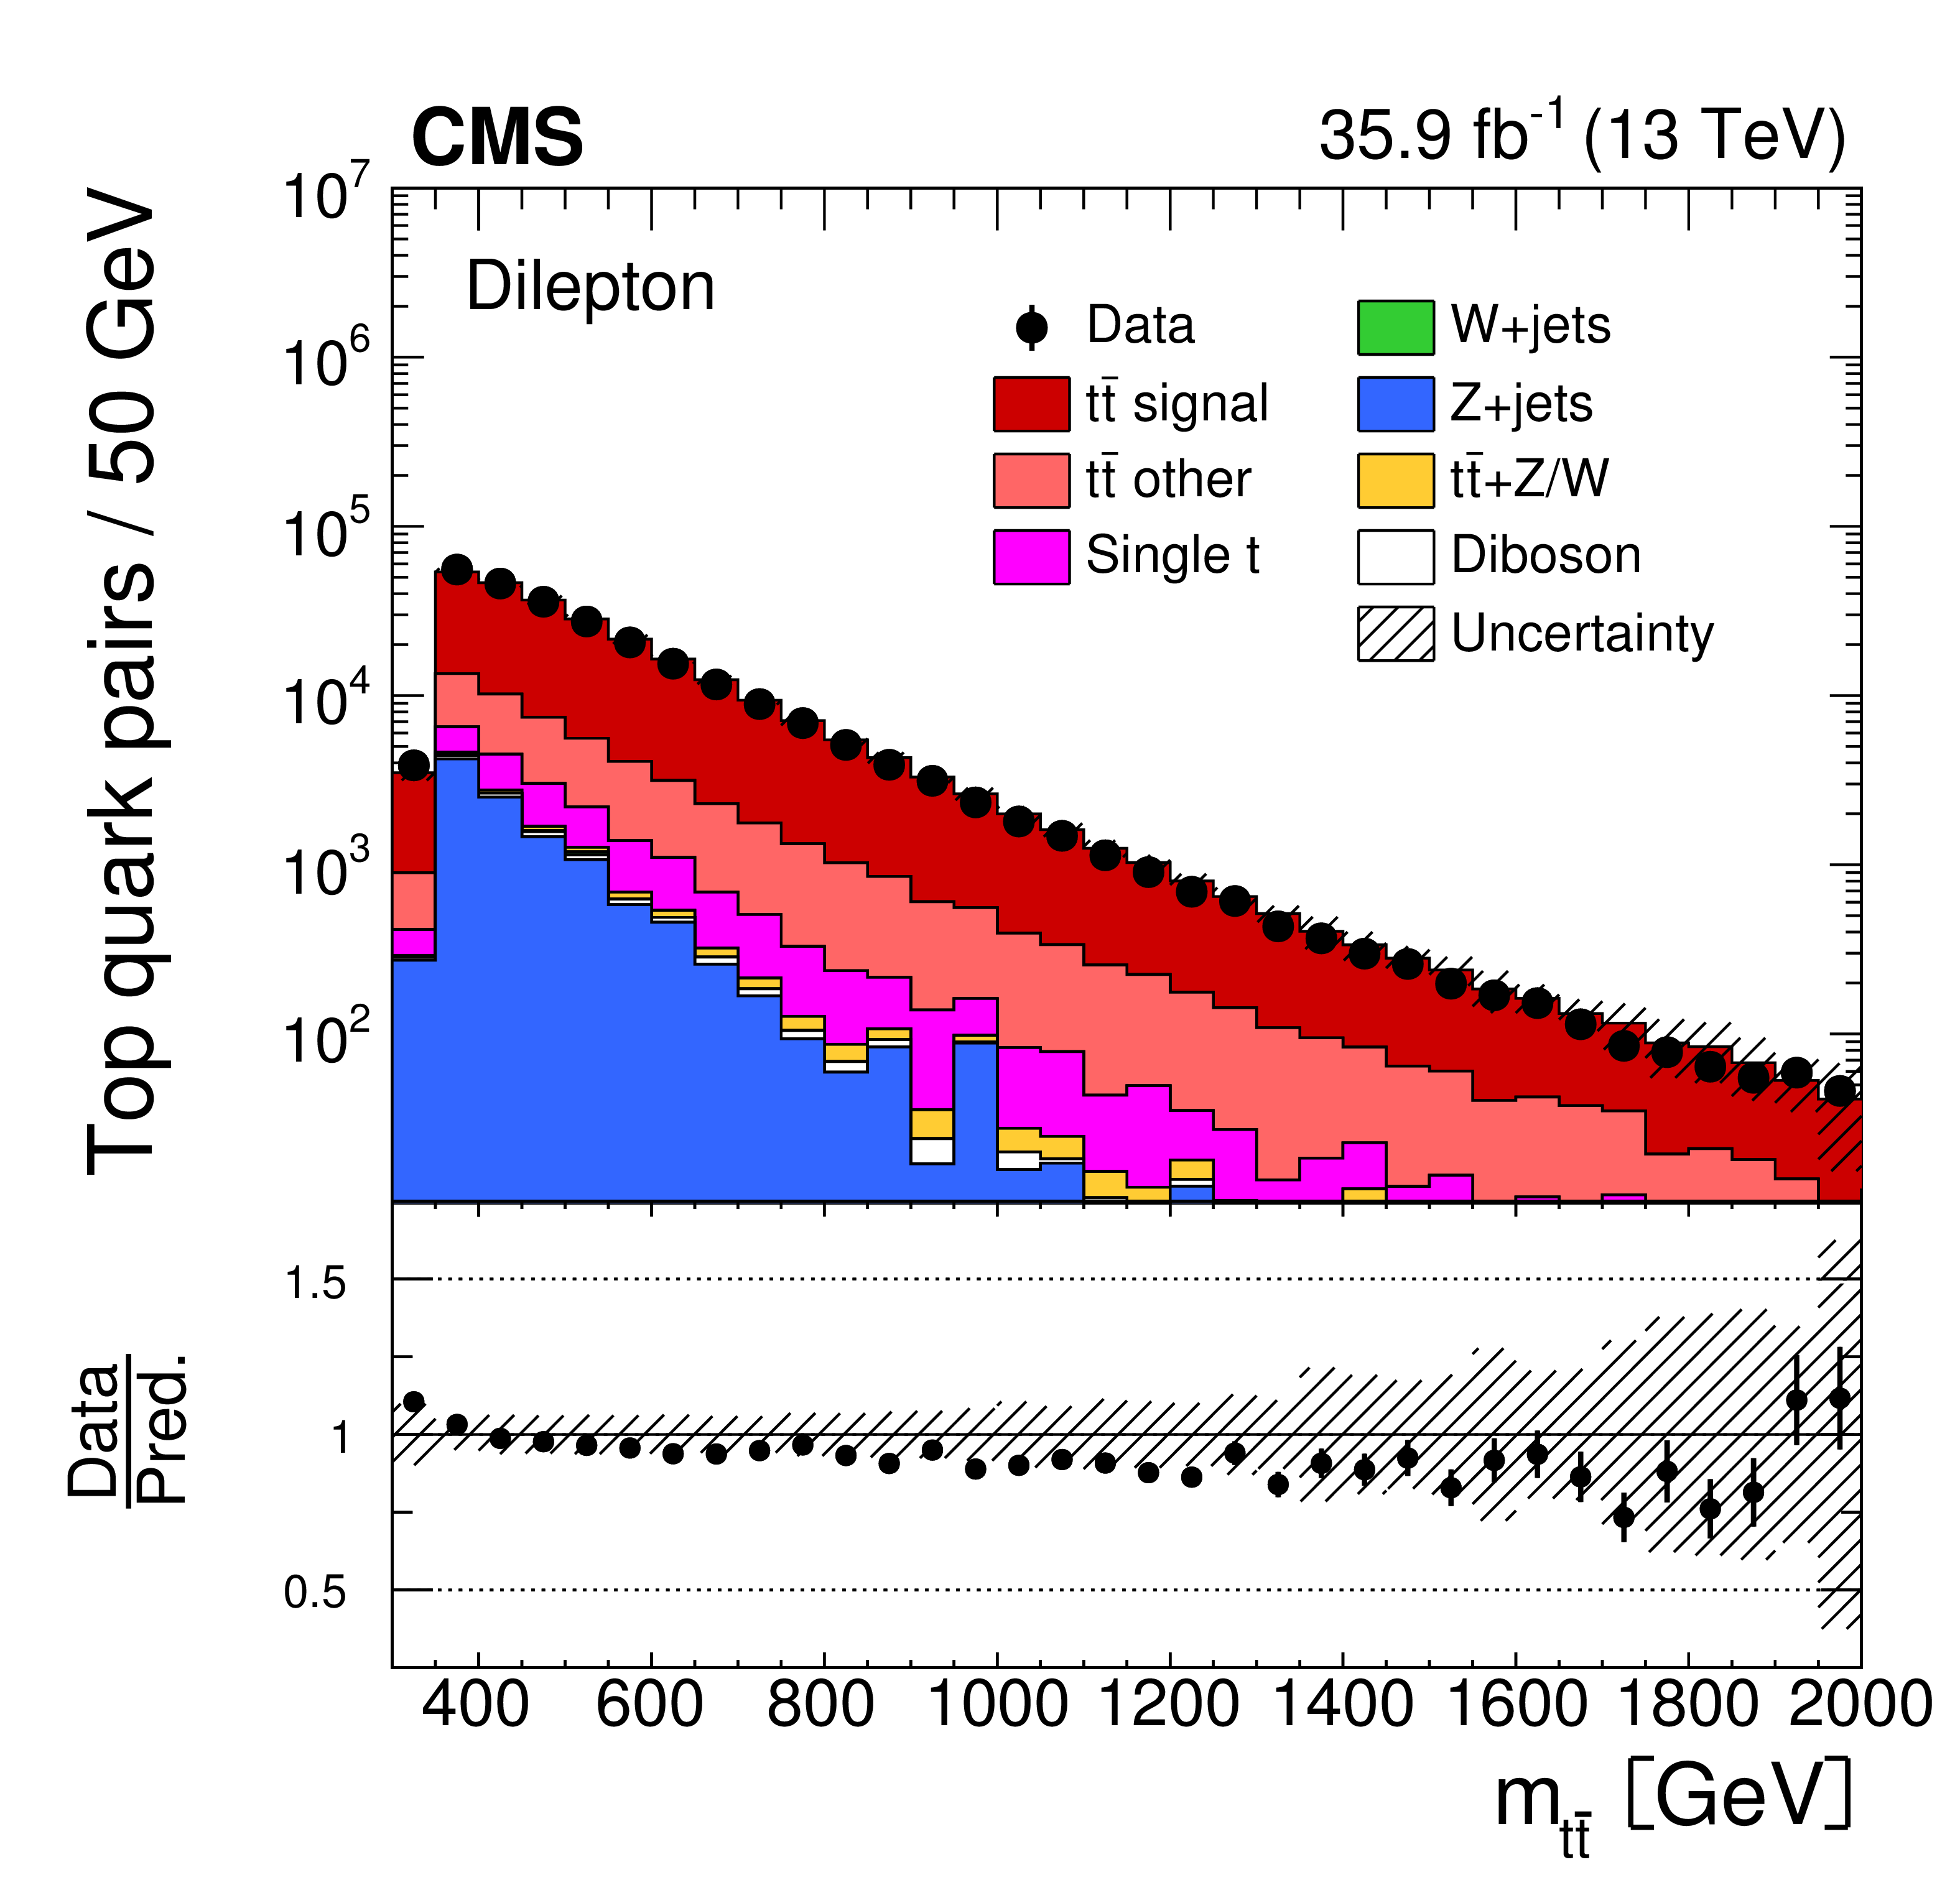
Figure 2:
Distributions of the $ {p_{\mathrm {T}}} $ (upper row) and rapidities (middle row), at detector level for the top quarks (left column), and $ {{\mathrm {t}\overline {\mathrm {t}}}} $ system (right column), and $ {m_{{{\mathrm {t}\overline {\mathrm {t}}}}}} $ (lower plot) are shown for data (points) and simulation (histograms). The vertical bars on the points represent the statistical uncertainties in the data. The hatched regions correspond to the systematic uncertainties in the signal and backgrounds, as described in Section 5. The lower panel of each plot shows the ratio of the data to the predictions from simulation. |
png pdf |
Figure 2-a:
Distributions of the $ {p_{\mathrm {T}}} $ (upper row) and rapidities (middle row), at detector level for the top quarks (left column), and $ {{\mathrm {t}\overline {\mathrm {t}}}} $ system (right column), and $ {m_{{{\mathrm {t}\overline {\mathrm {t}}}}}} $ (lower plot) are shown for data (points) and simulation (histograms). The vertical bars on the points represent the statistical uncertainties in the data. The hatched regions correspond to the systematic uncertainties in the signal and backgrounds, as described in Section 5. The lower panel of each plot shows the ratio of the data to the predictions from simulation. |

png pdf |
Figure 2-b:
Distributions of the $ {p_{\mathrm {T}}} $ (upper row) and rapidities (middle row), at detector level for the top quarks (left column), and $ {{\mathrm {t}\overline {\mathrm {t}}}} $ system (right column), and $ {m_{{{\mathrm {t}\overline {\mathrm {t}}}}}} $ (lower plot) are shown for data (points) and simulation (histograms). The vertical bars on the points represent the statistical uncertainties in the data. The hatched regions correspond to the systematic uncertainties in the signal and backgrounds, as described in Section 5. The lower panel of each plot shows the ratio of the data to the predictions from simulation. |
png pdf |
Figure 2-c:
Distributions of the $ {p_{\mathrm {T}}} $ (upper row) and rapidities (middle row), at detector level for the top quarks (left column), and $ {{\mathrm {t}\overline {\mathrm {t}}}} $ system (right column), and $ {m_{{{\mathrm {t}\overline {\mathrm {t}}}}}} $ (lower plot) are shown for data (points) and simulation (histograms). The vertical bars on the points represent the statistical uncertainties in the data. The hatched regions correspond to the systematic uncertainties in the signal and backgrounds, as described in Section 5. The lower panel of each plot shows the ratio of the data to the predictions from simulation. |
png pdf |
Figure 2-d:
Distributions of the $ {p_{\mathrm {T}}} $ (upper row) and rapidities (middle row), at detector level for the top quarks (left column), and $ {{\mathrm {t}\overline {\mathrm {t}}}} $ system (right column), and $ {m_{{{\mathrm {t}\overline {\mathrm {t}}}}}} $ (lower plot) are shown for data (points) and simulation (histograms). The vertical bars on the points represent the statistical uncertainties in the data. The hatched regions correspond to the systematic uncertainties in the signal and backgrounds, as described in Section 5. The lower panel of each plot shows the ratio of the data to the predictions from simulation. |
png pdf |
Figure 2-e:
Distributions of the $ {p_{\mathrm {T}}} $ (upper row) and rapidities (middle row), at detector level for the top quarks (left column), and $ {{\mathrm {t}\overline {\mathrm {t}}}} $ system (right column), and $ {m_{{{\mathrm {t}\overline {\mathrm {t}}}}}} $ (lower plot) are shown for data (points) and simulation (histograms). The vertical bars on the points represent the statistical uncertainties in the data. The hatched regions correspond to the systematic uncertainties in the signal and backgrounds, as described in Section 5. The lower panel of each plot shows the ratio of the data to the predictions from simulation. |
png pdf |
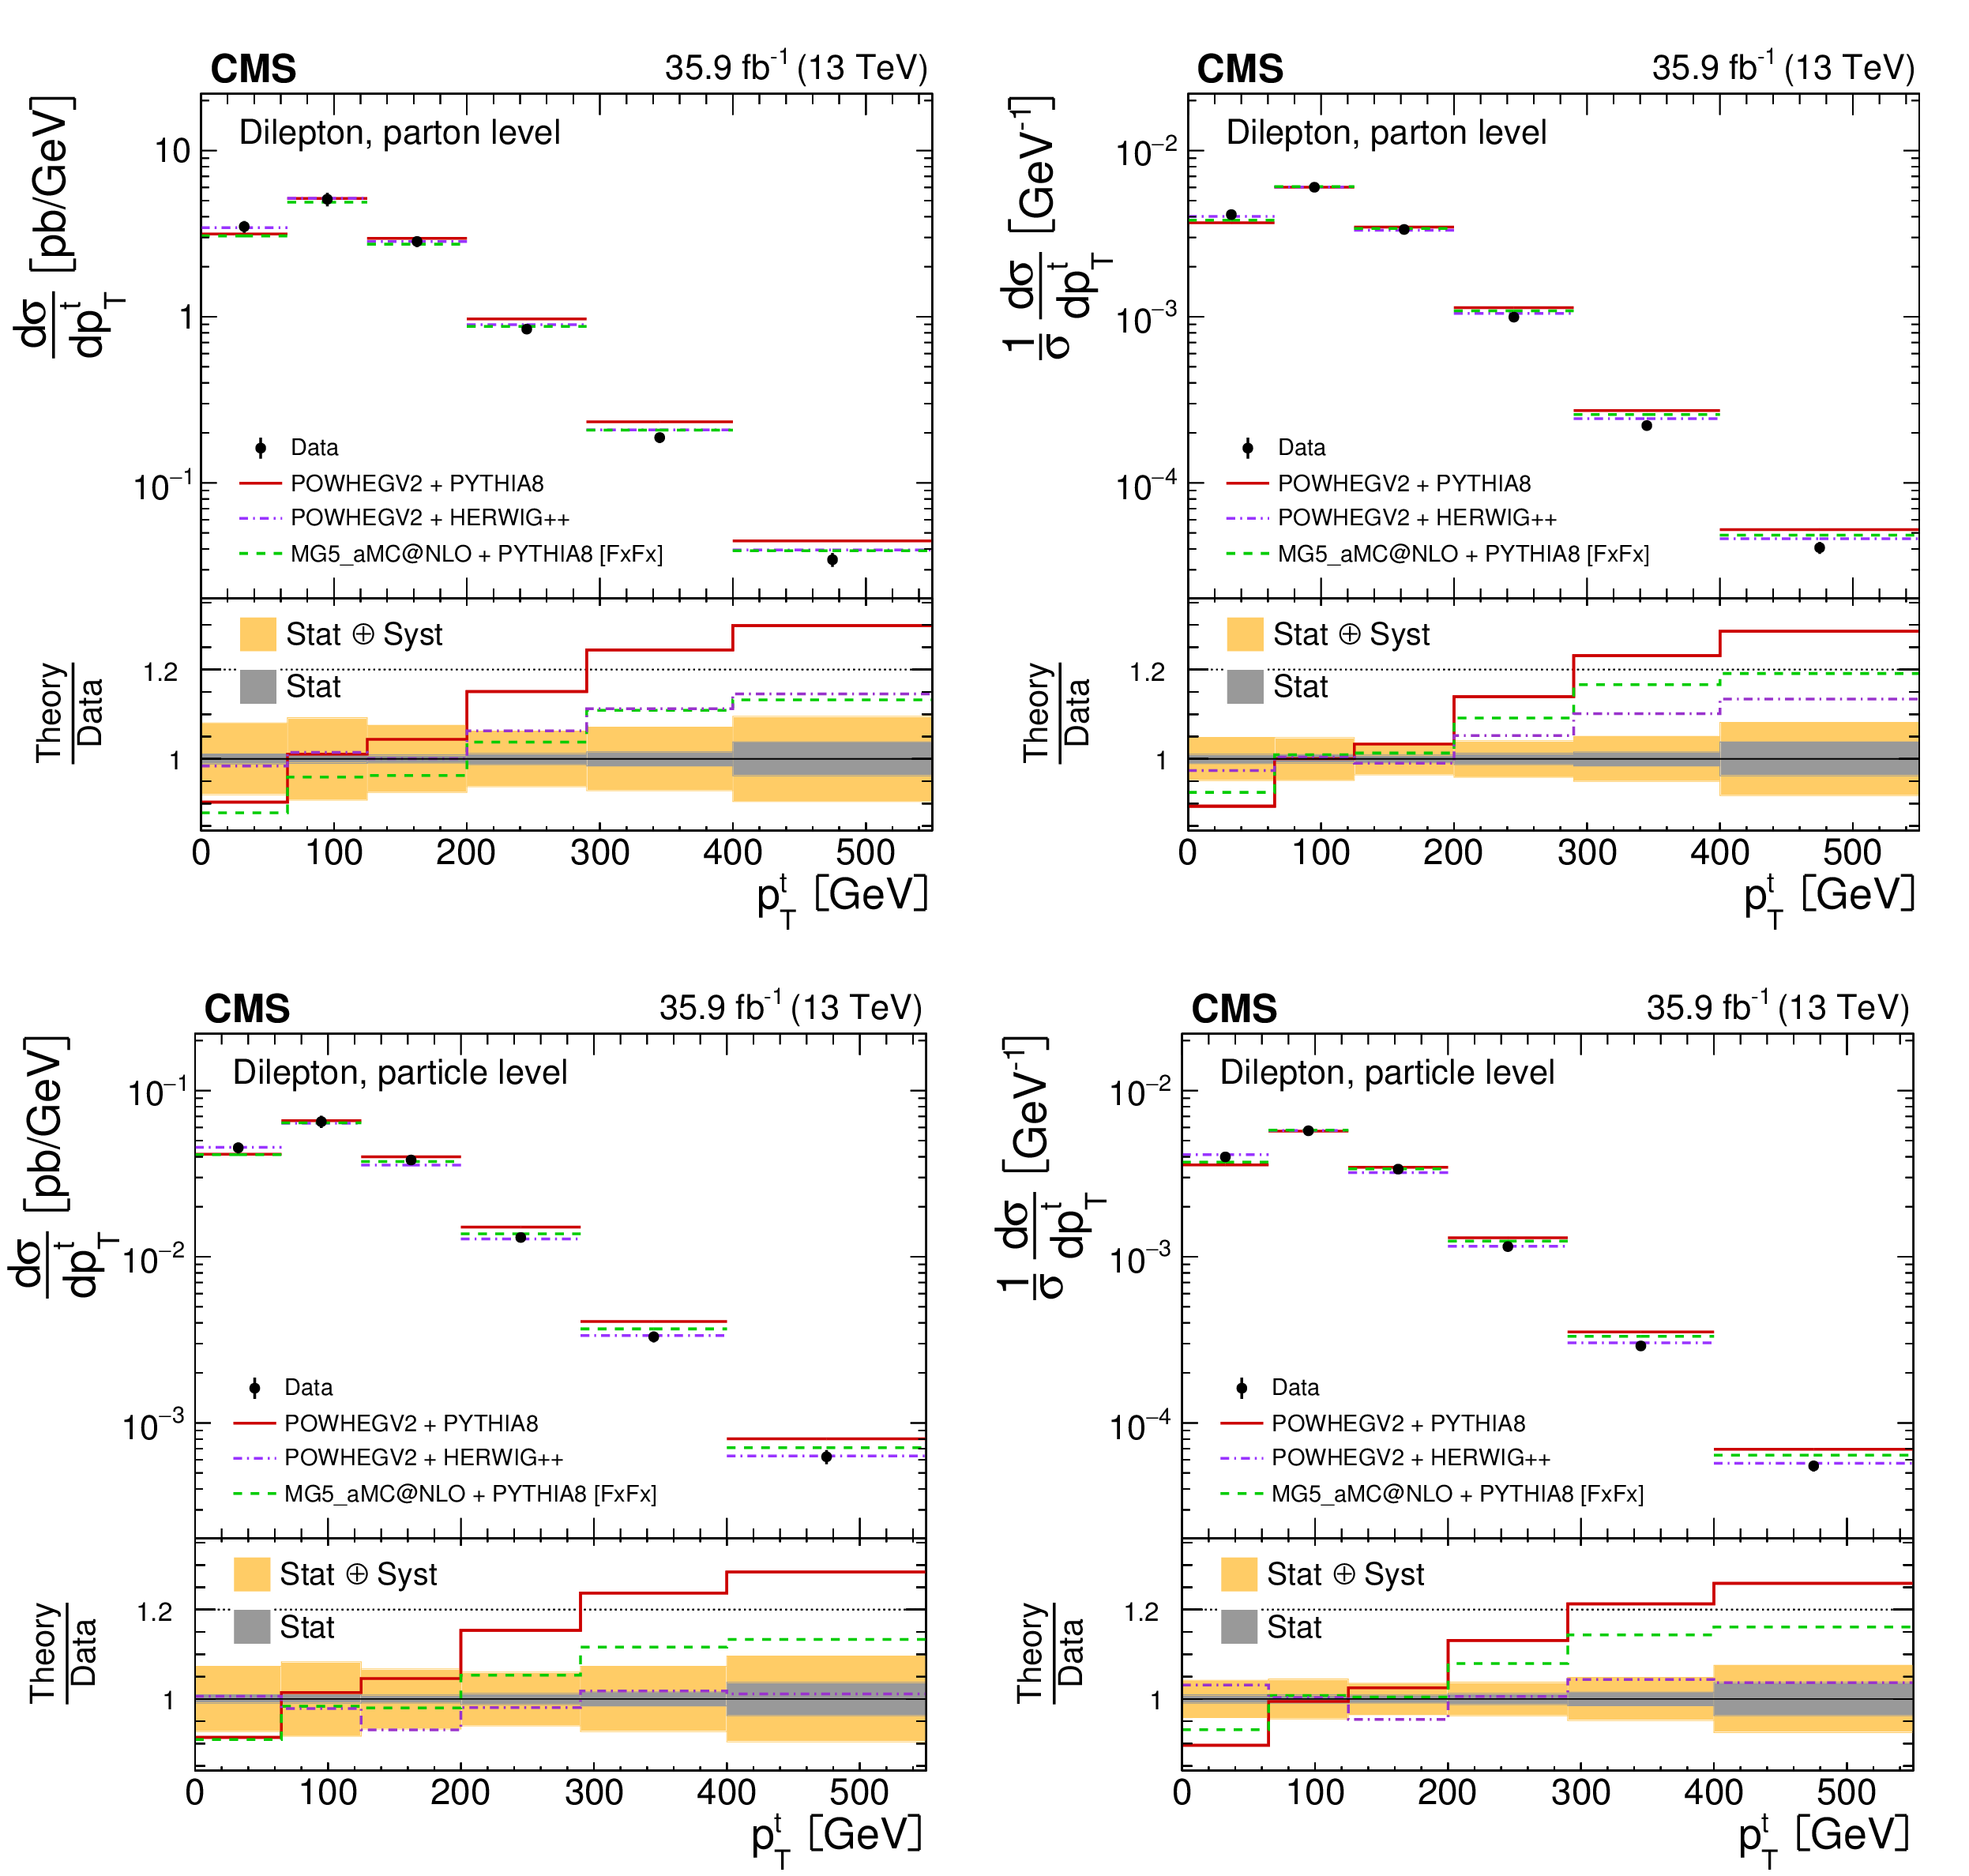
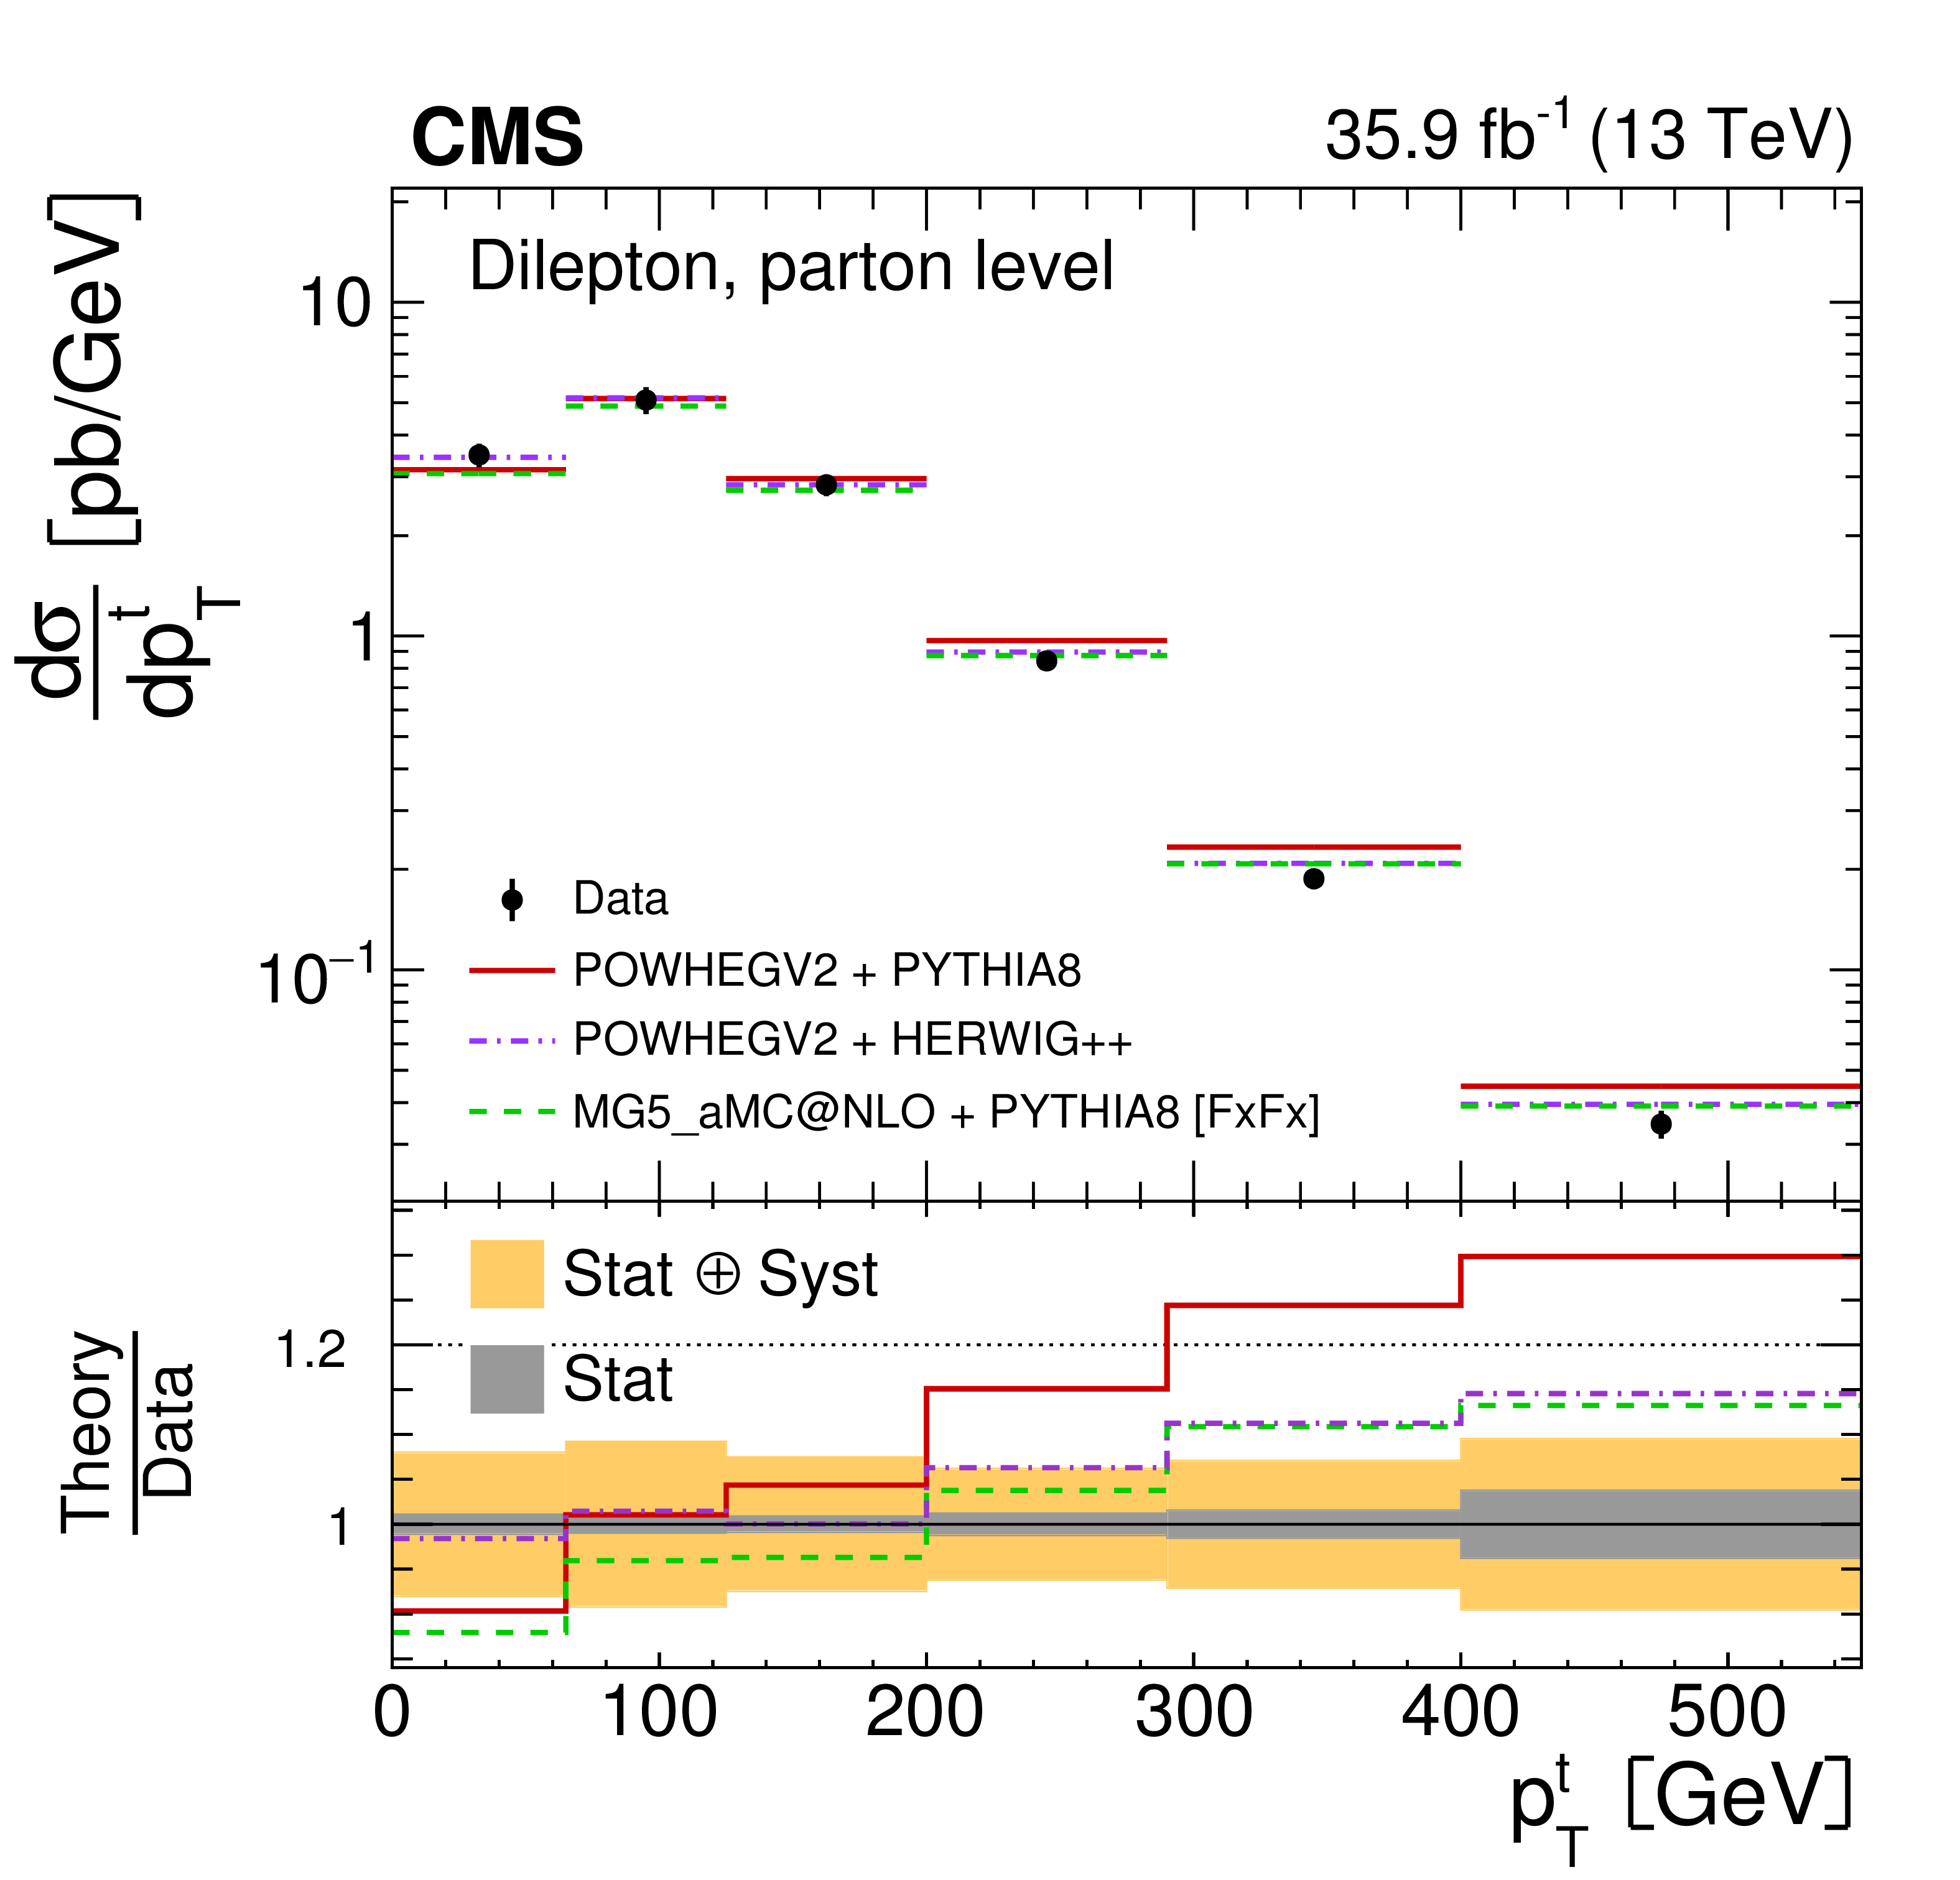
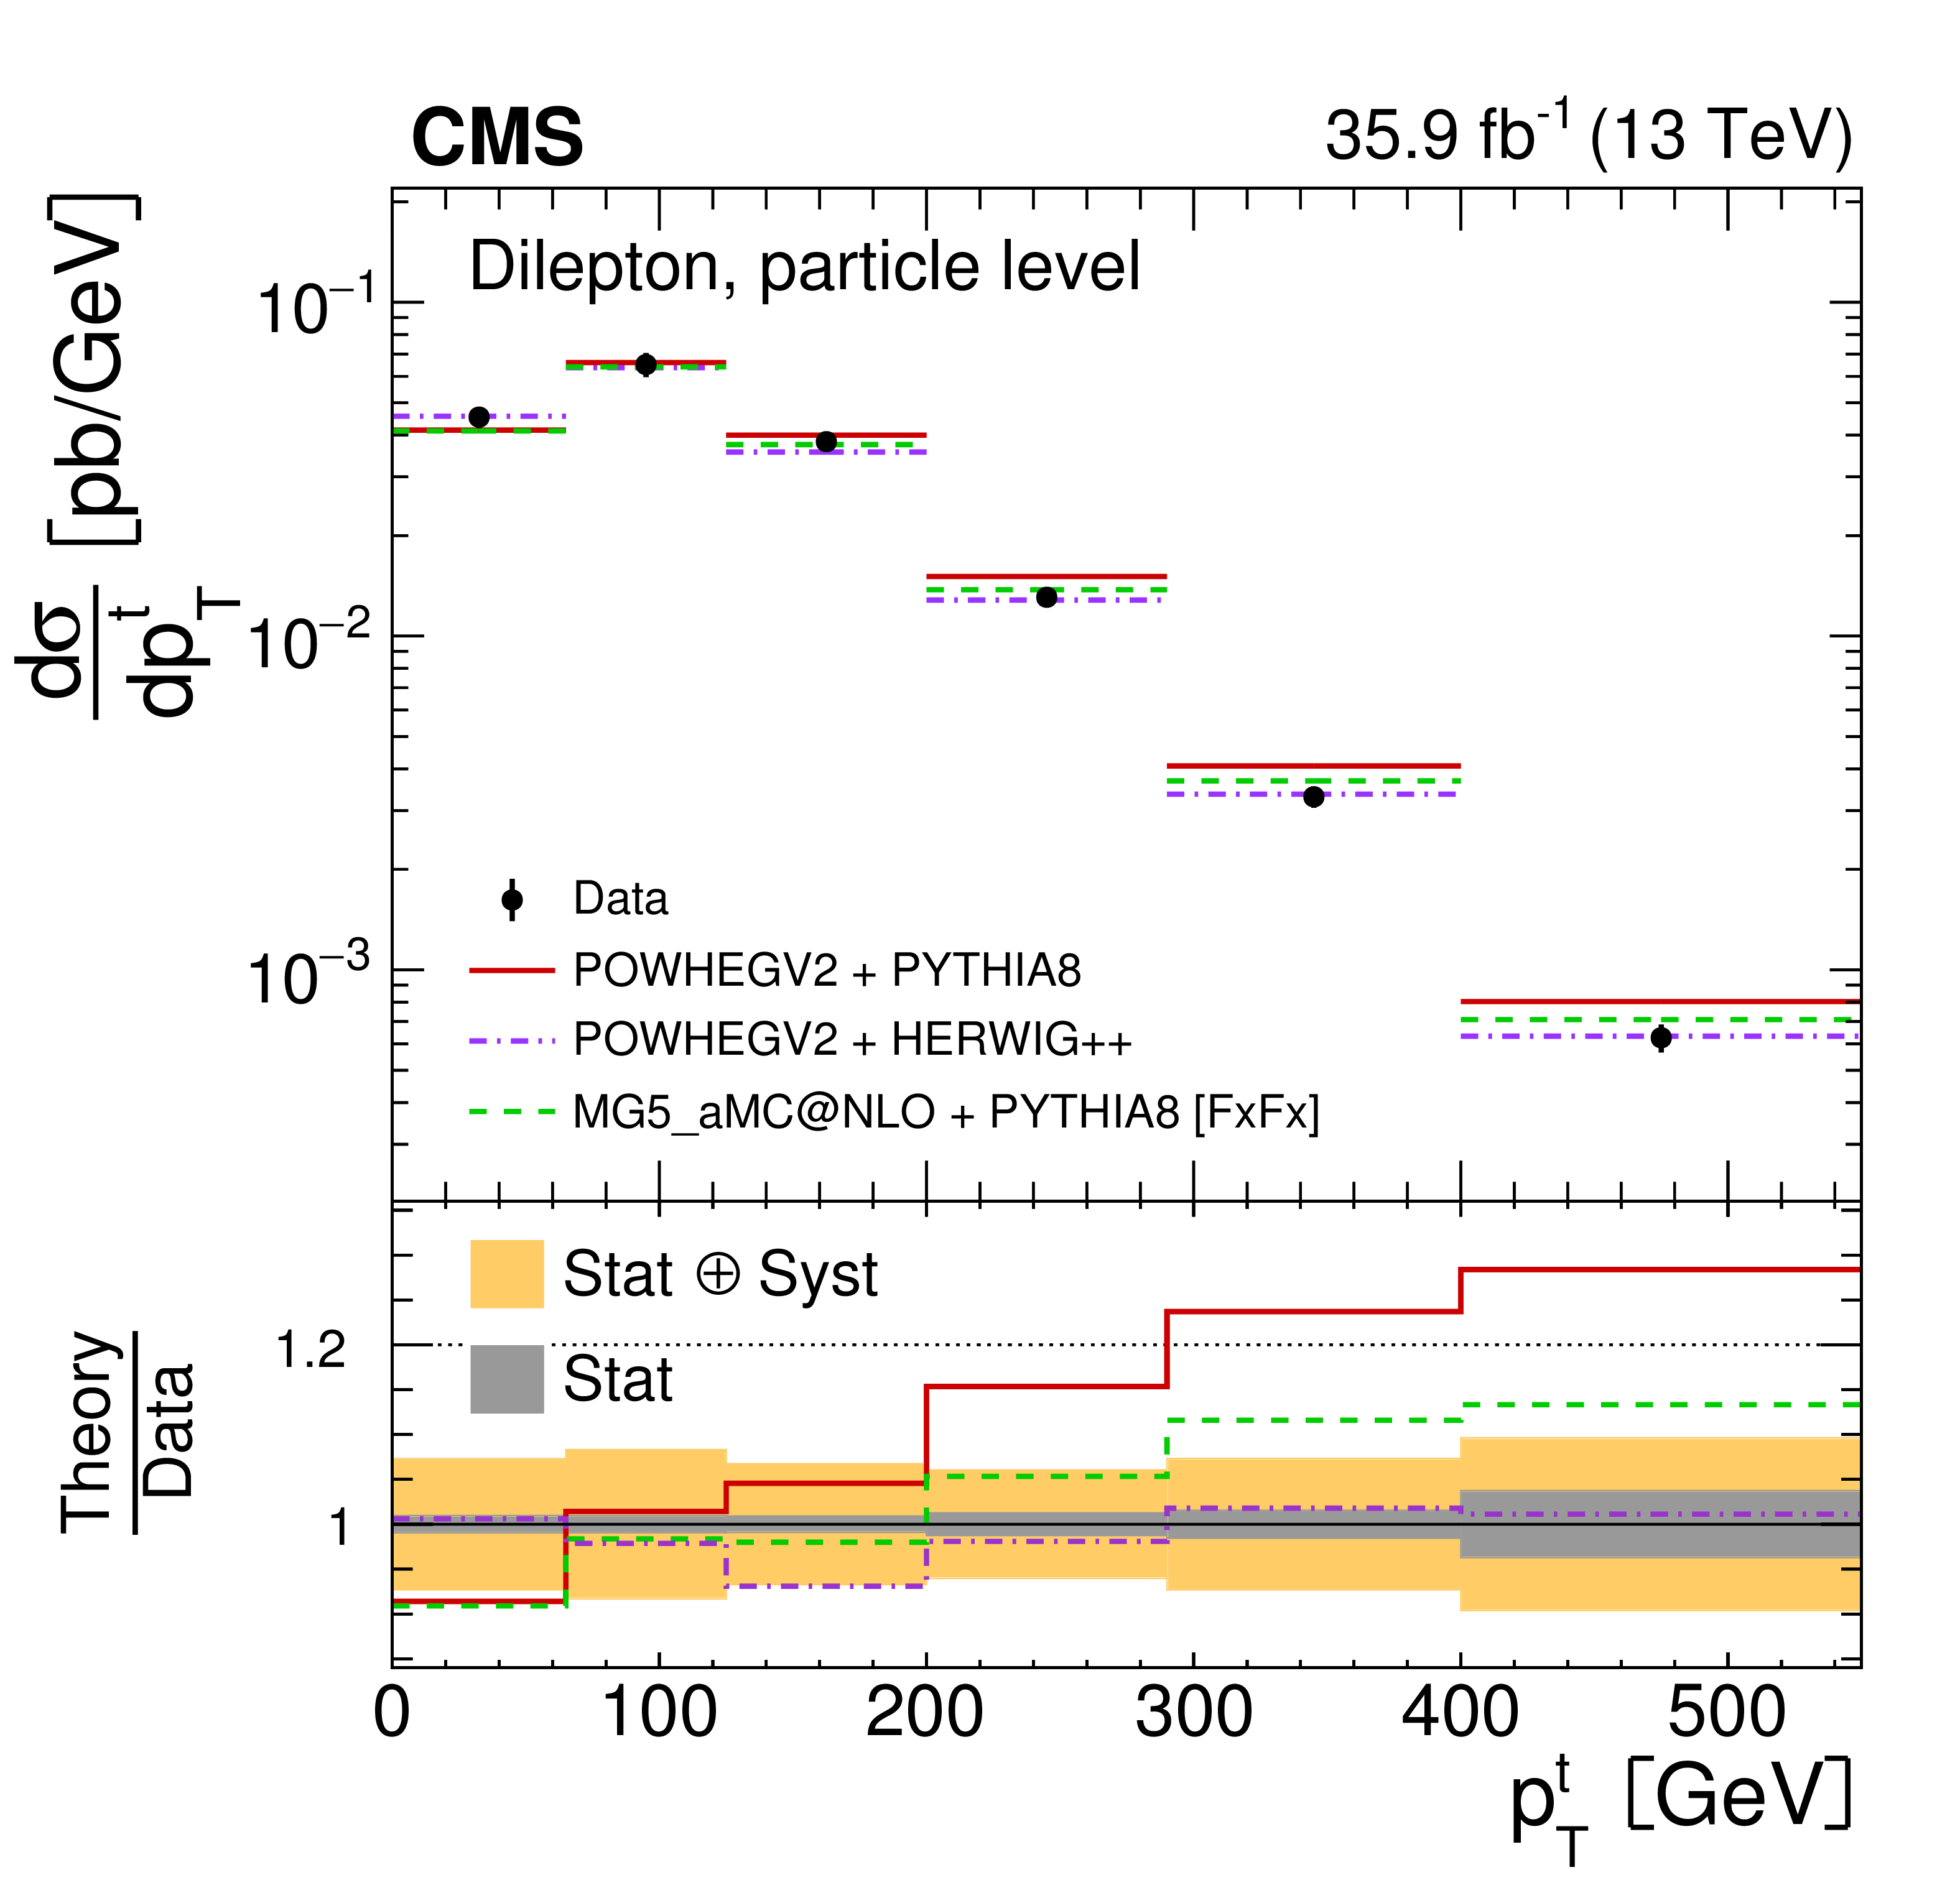
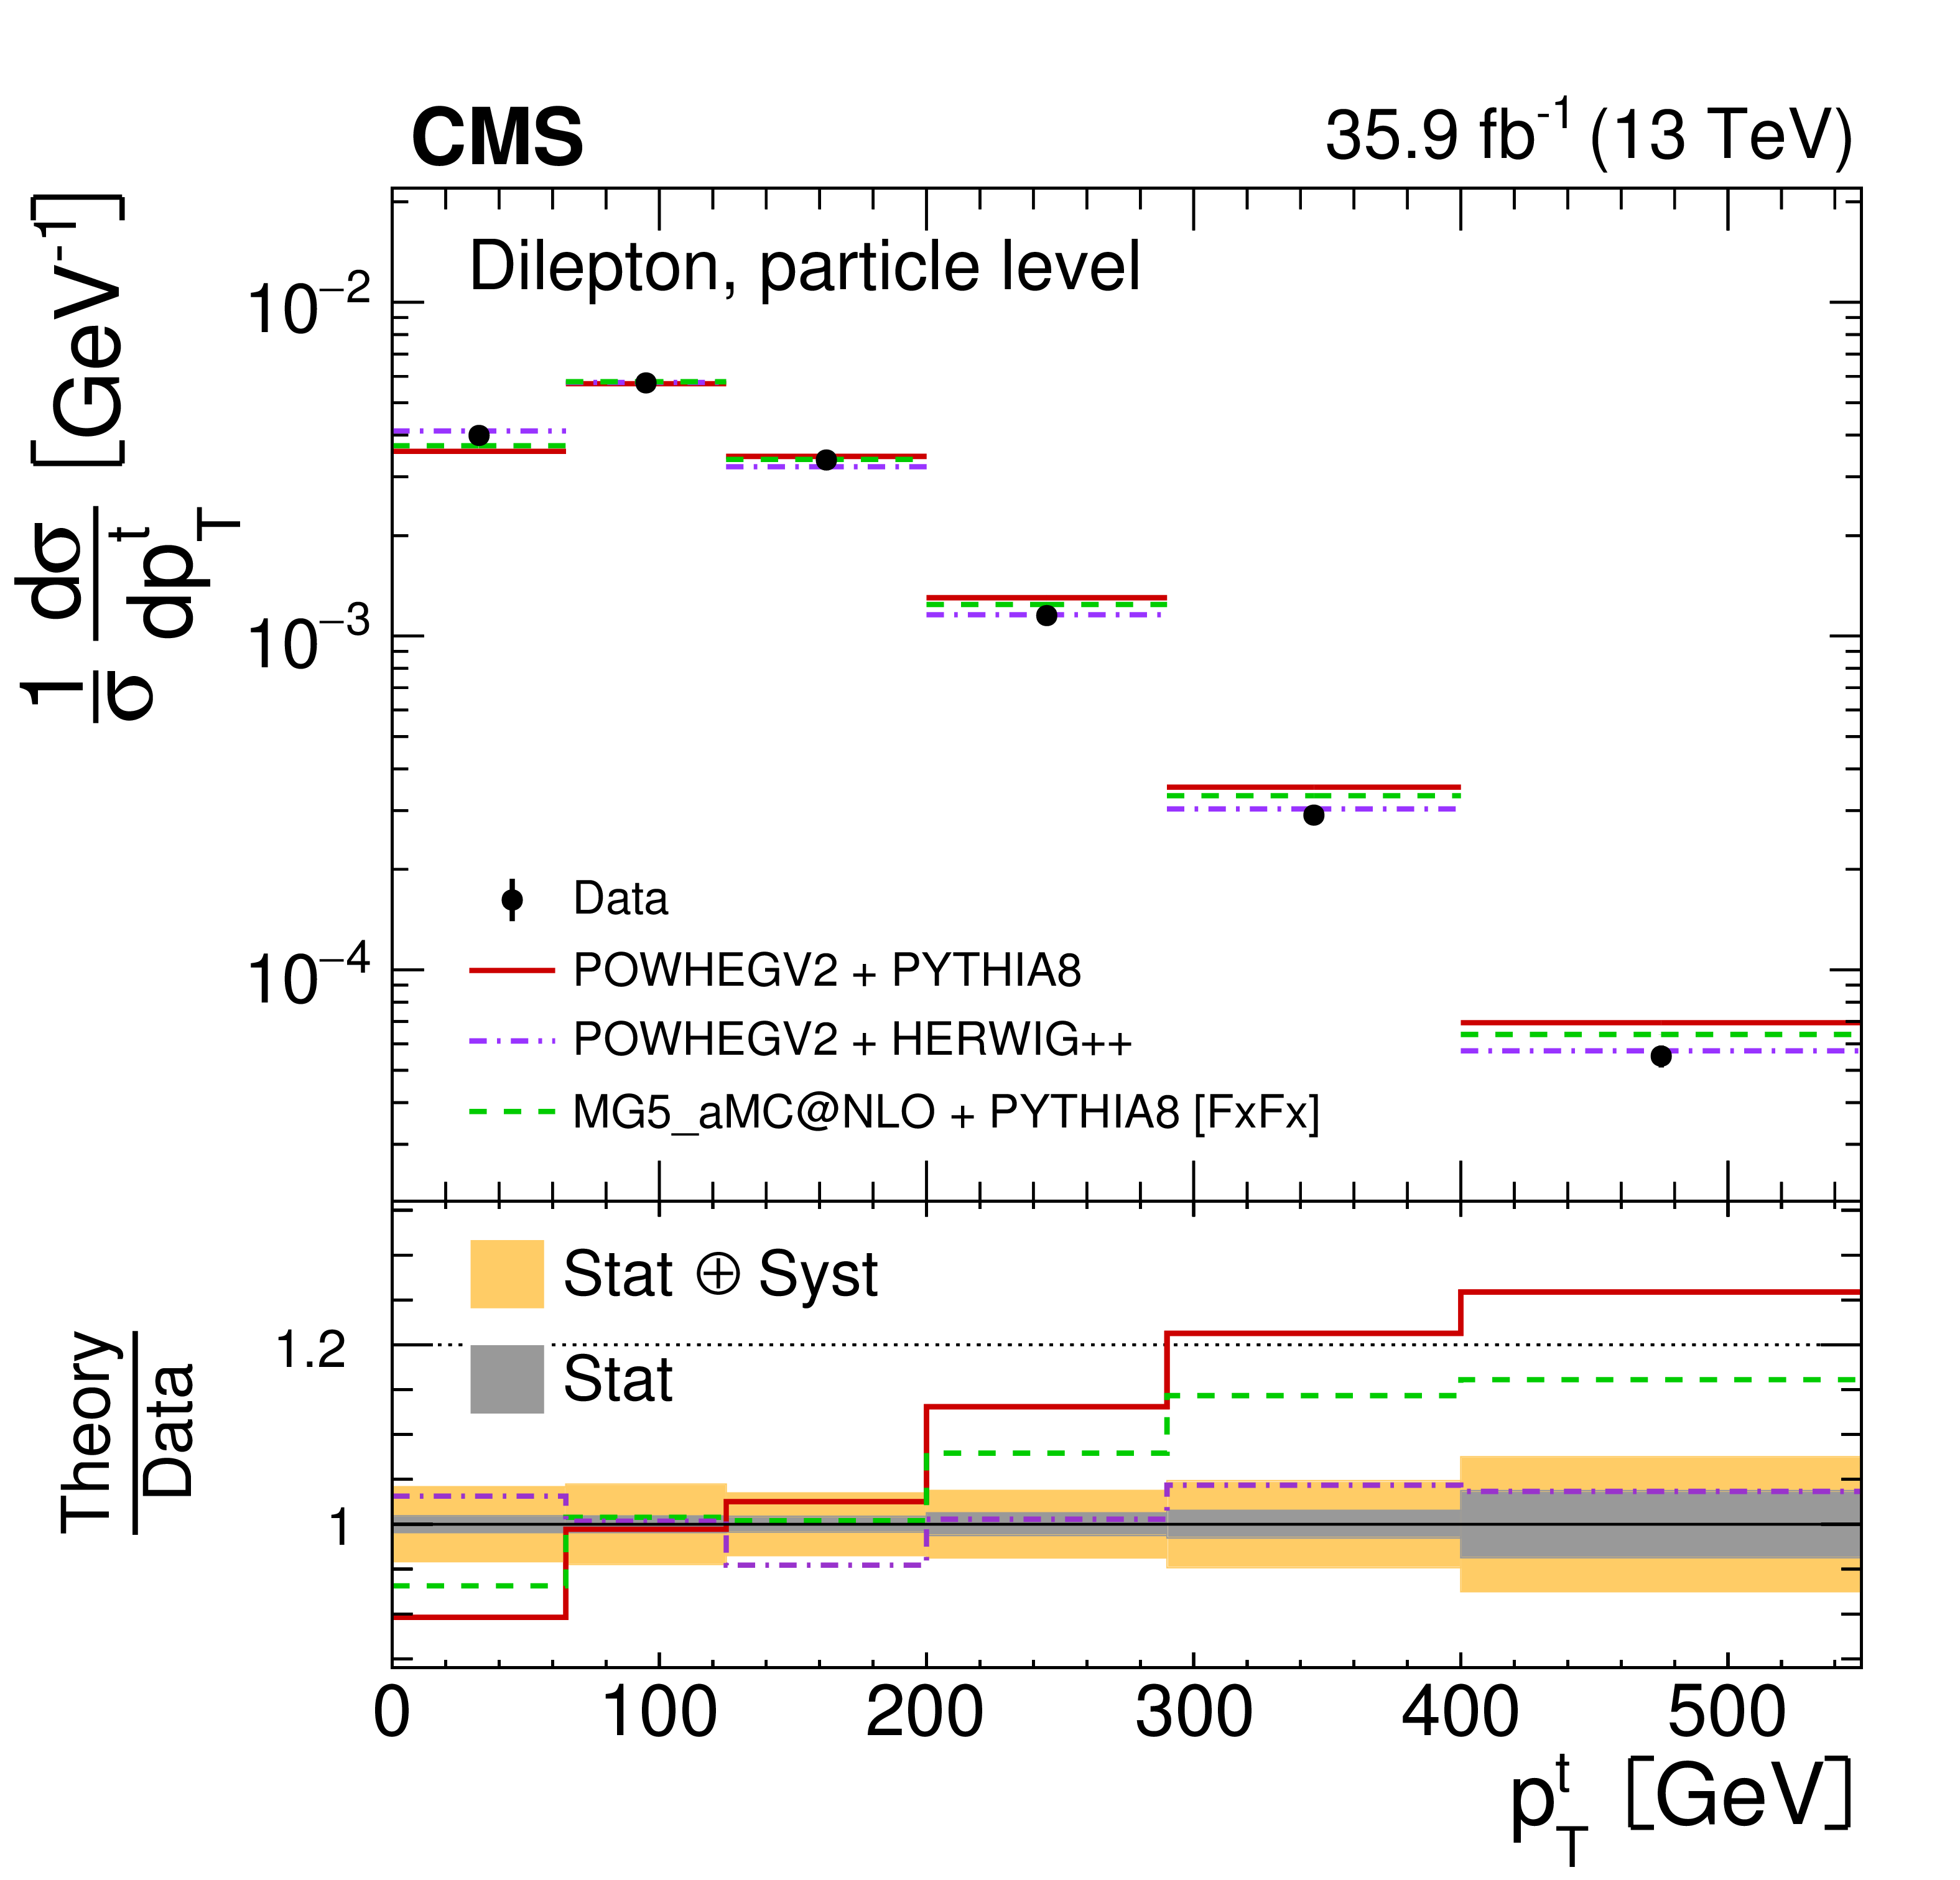
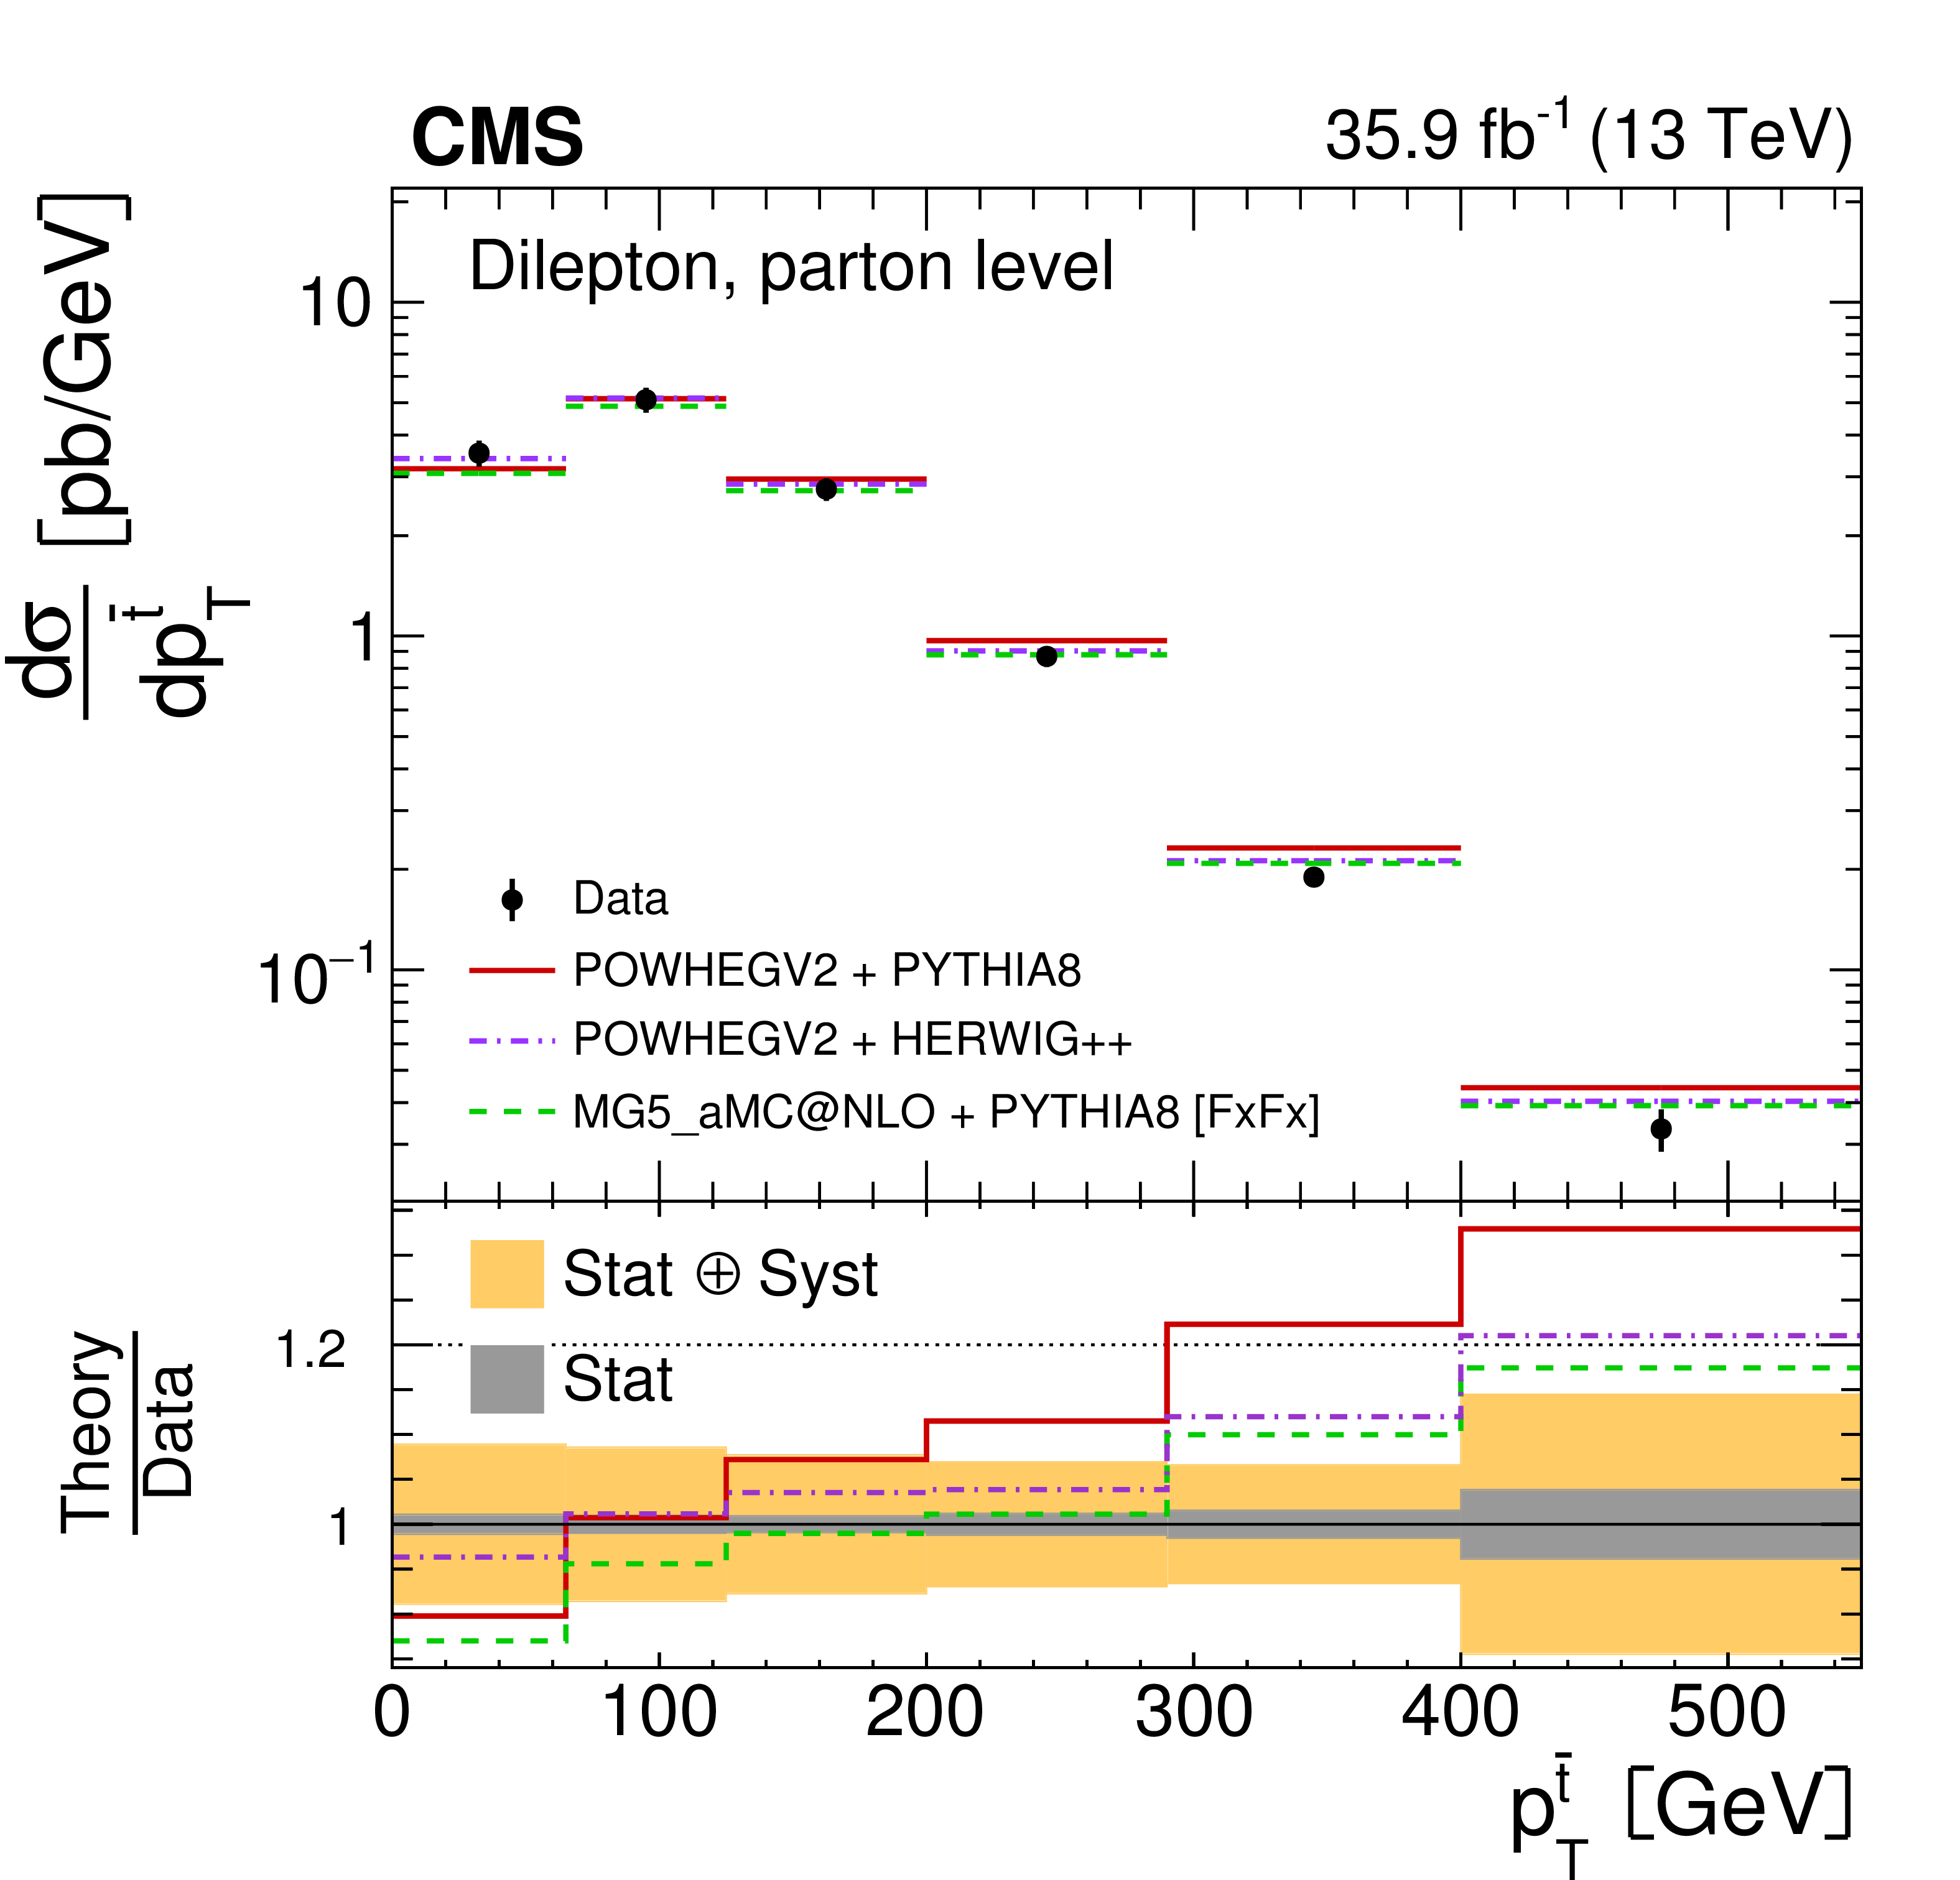
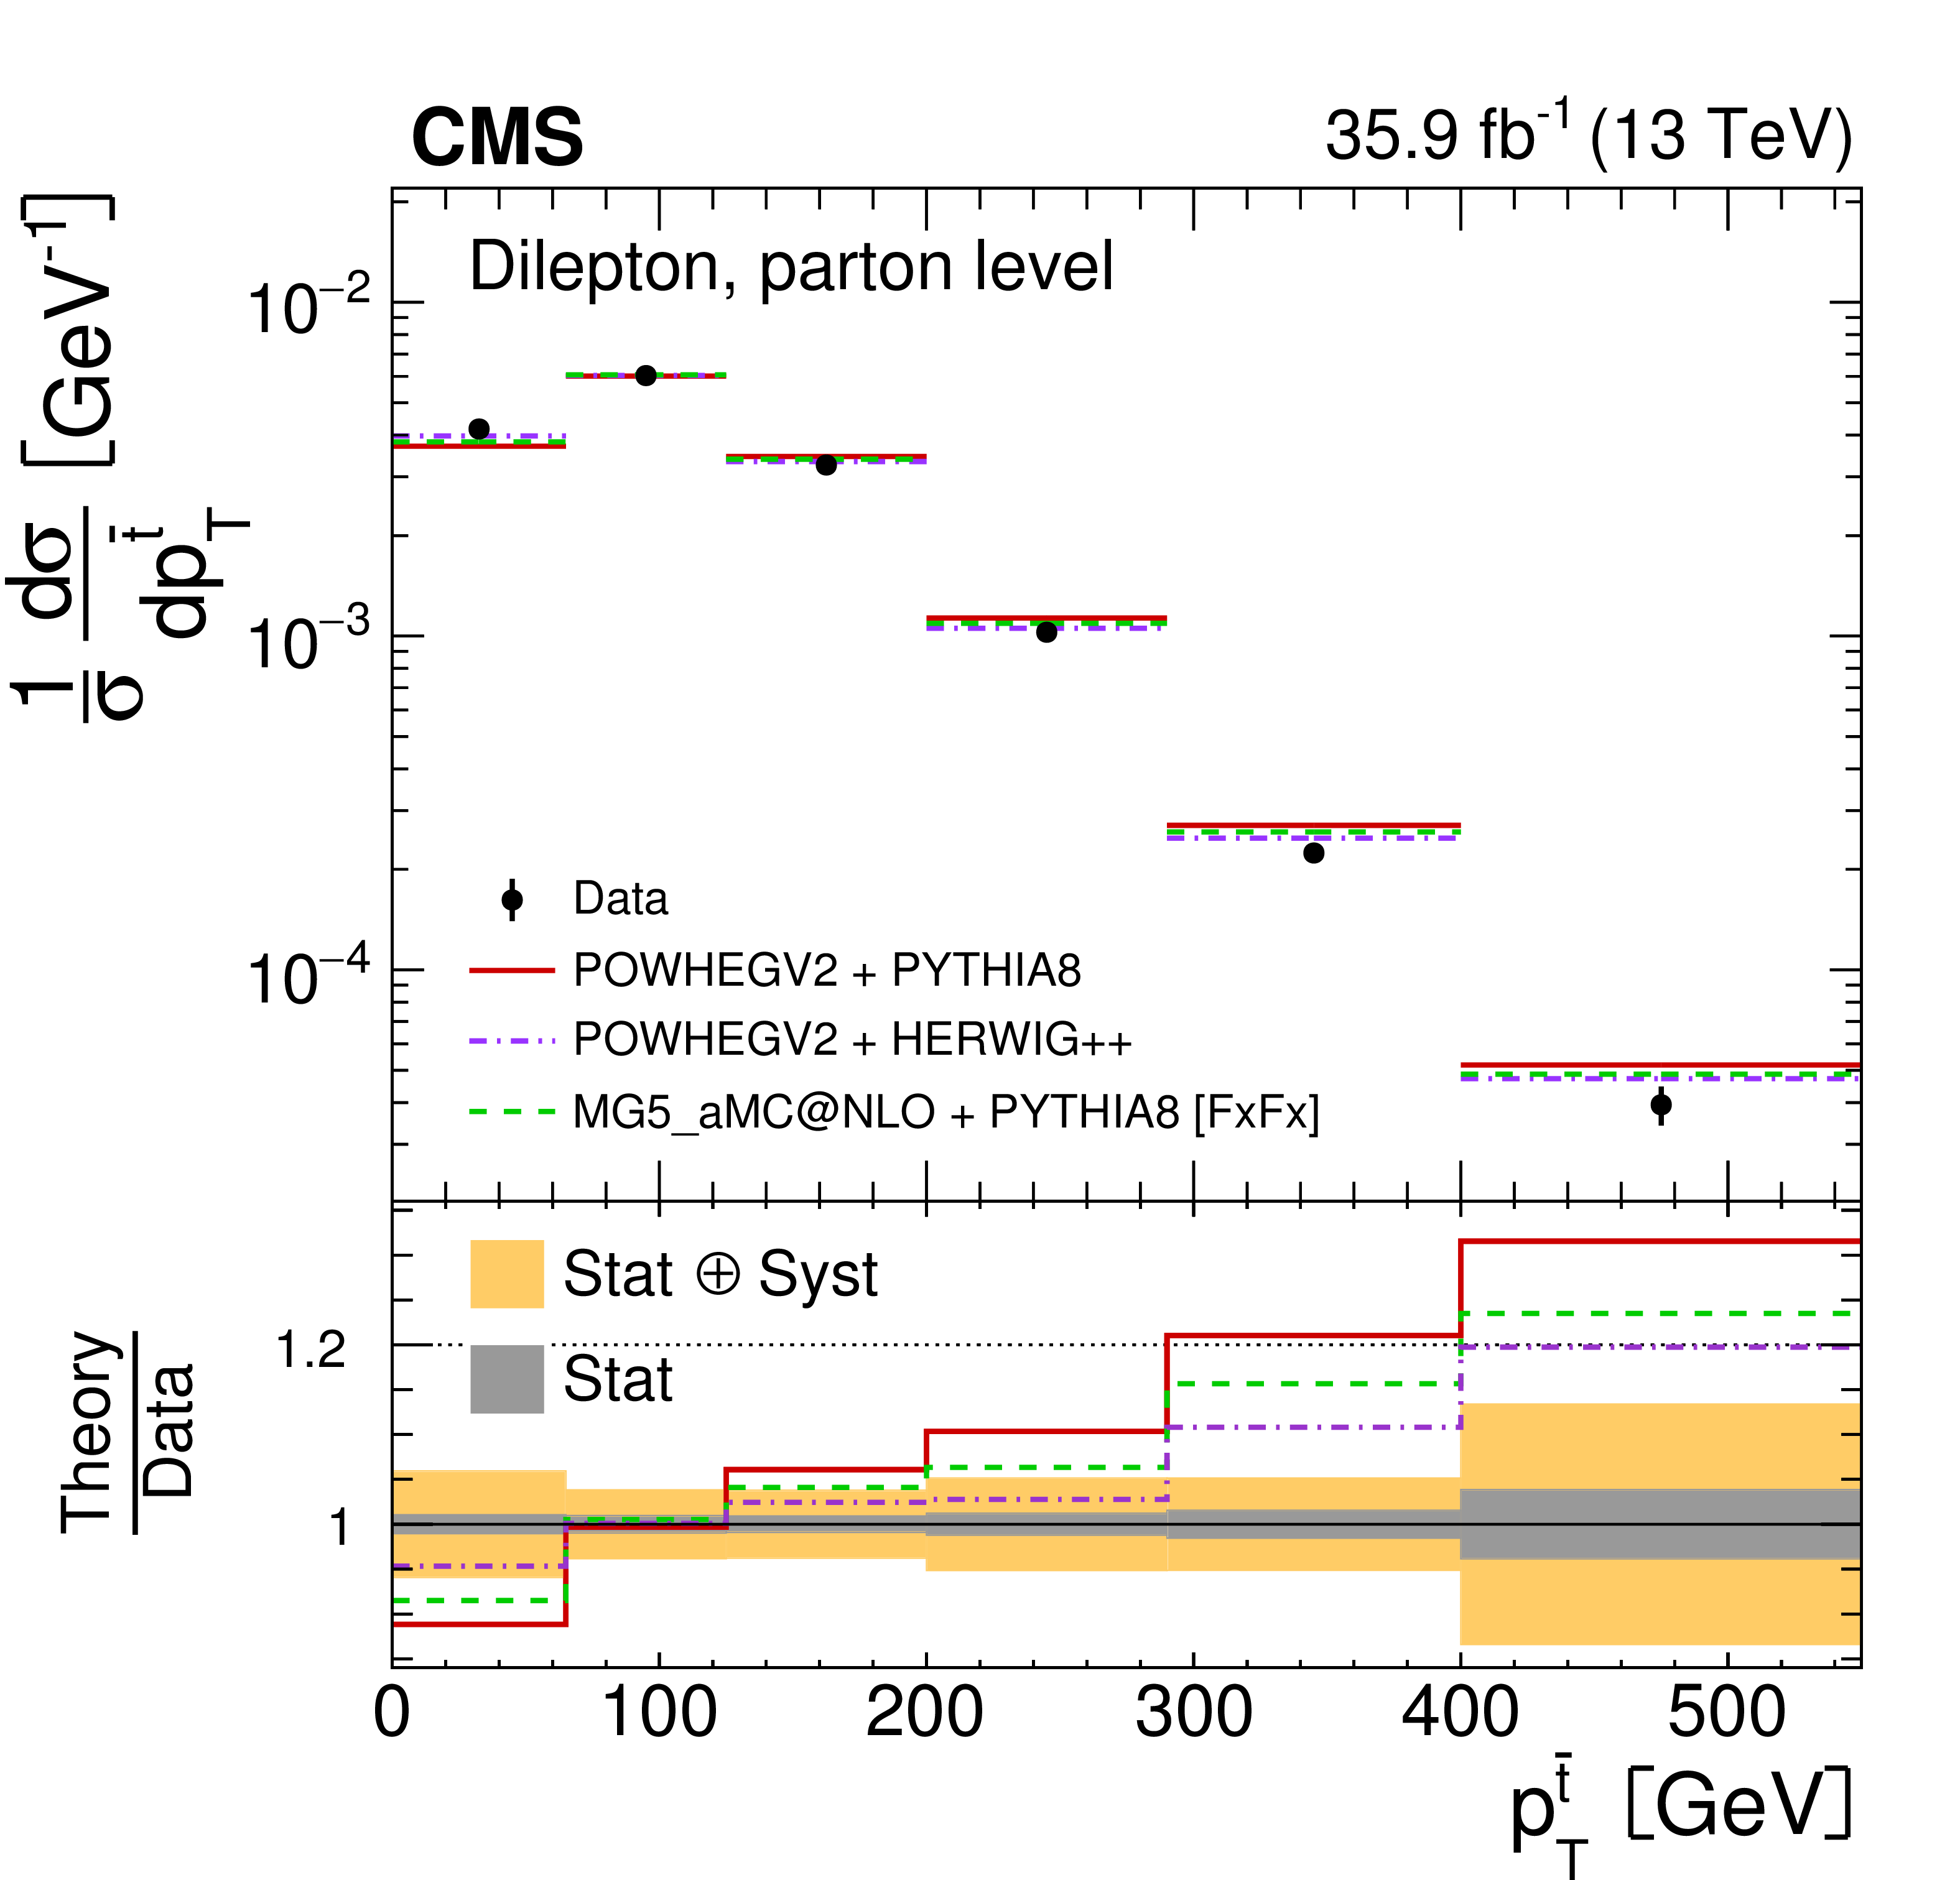
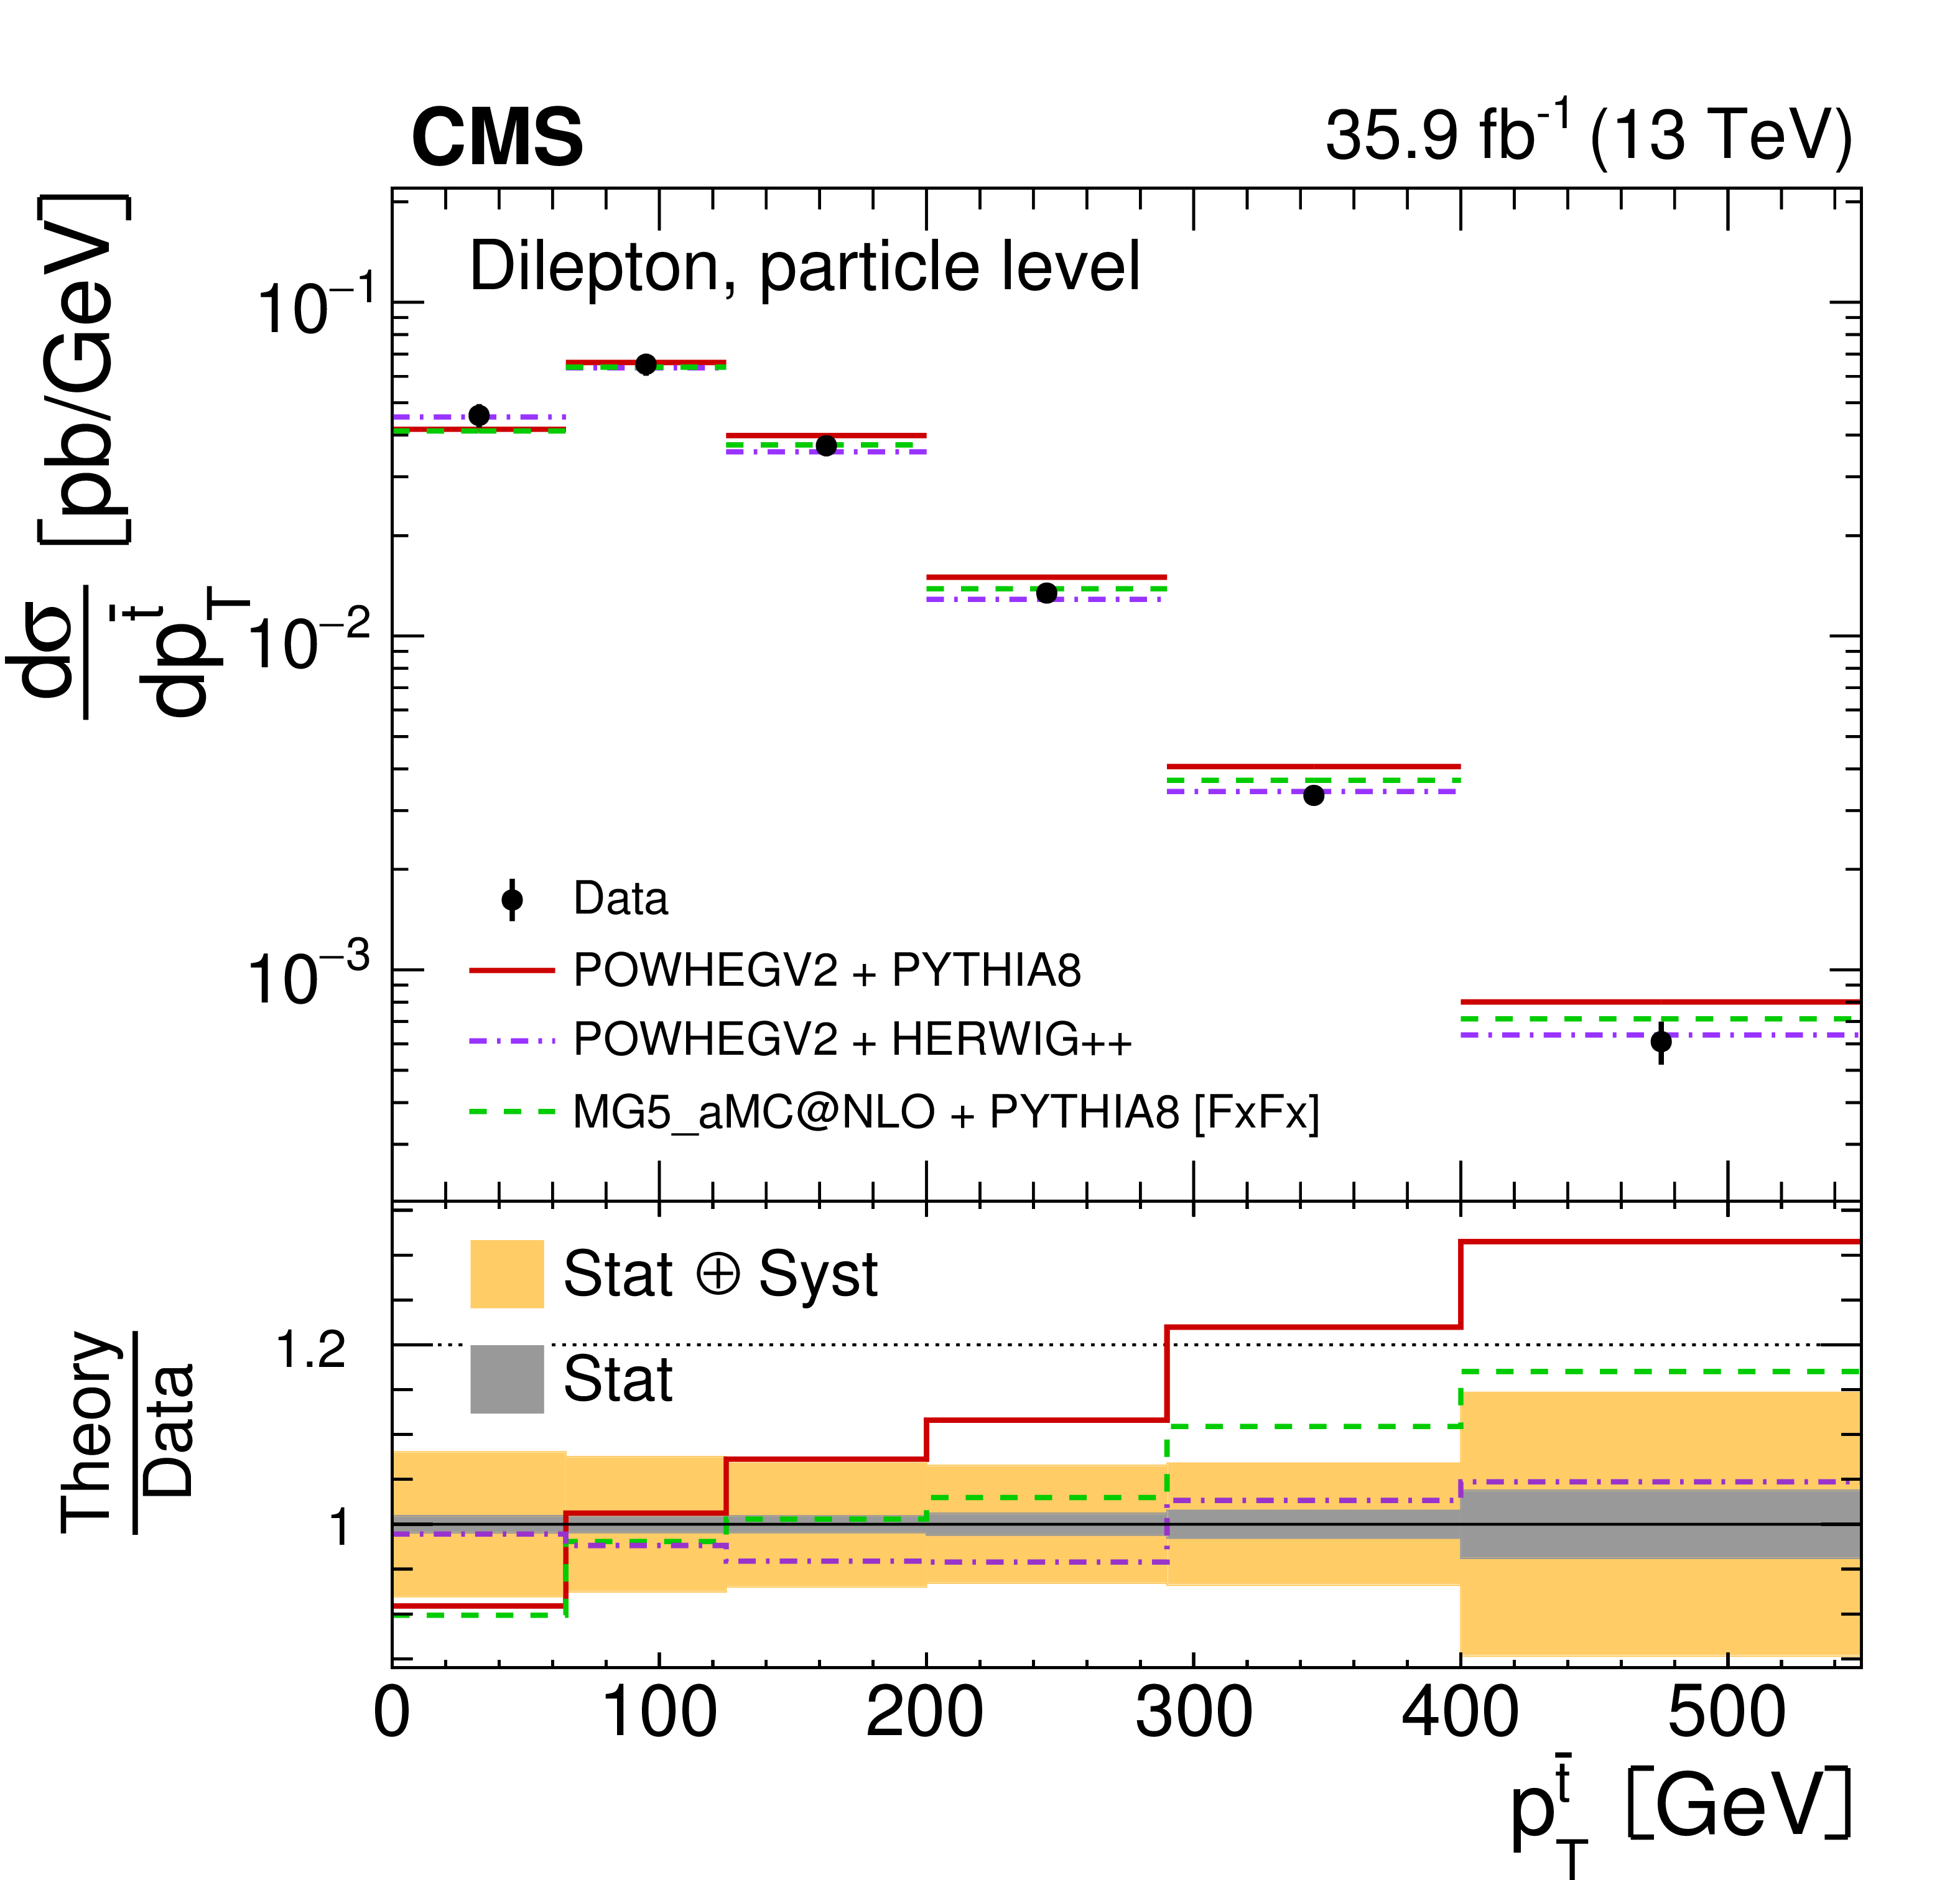
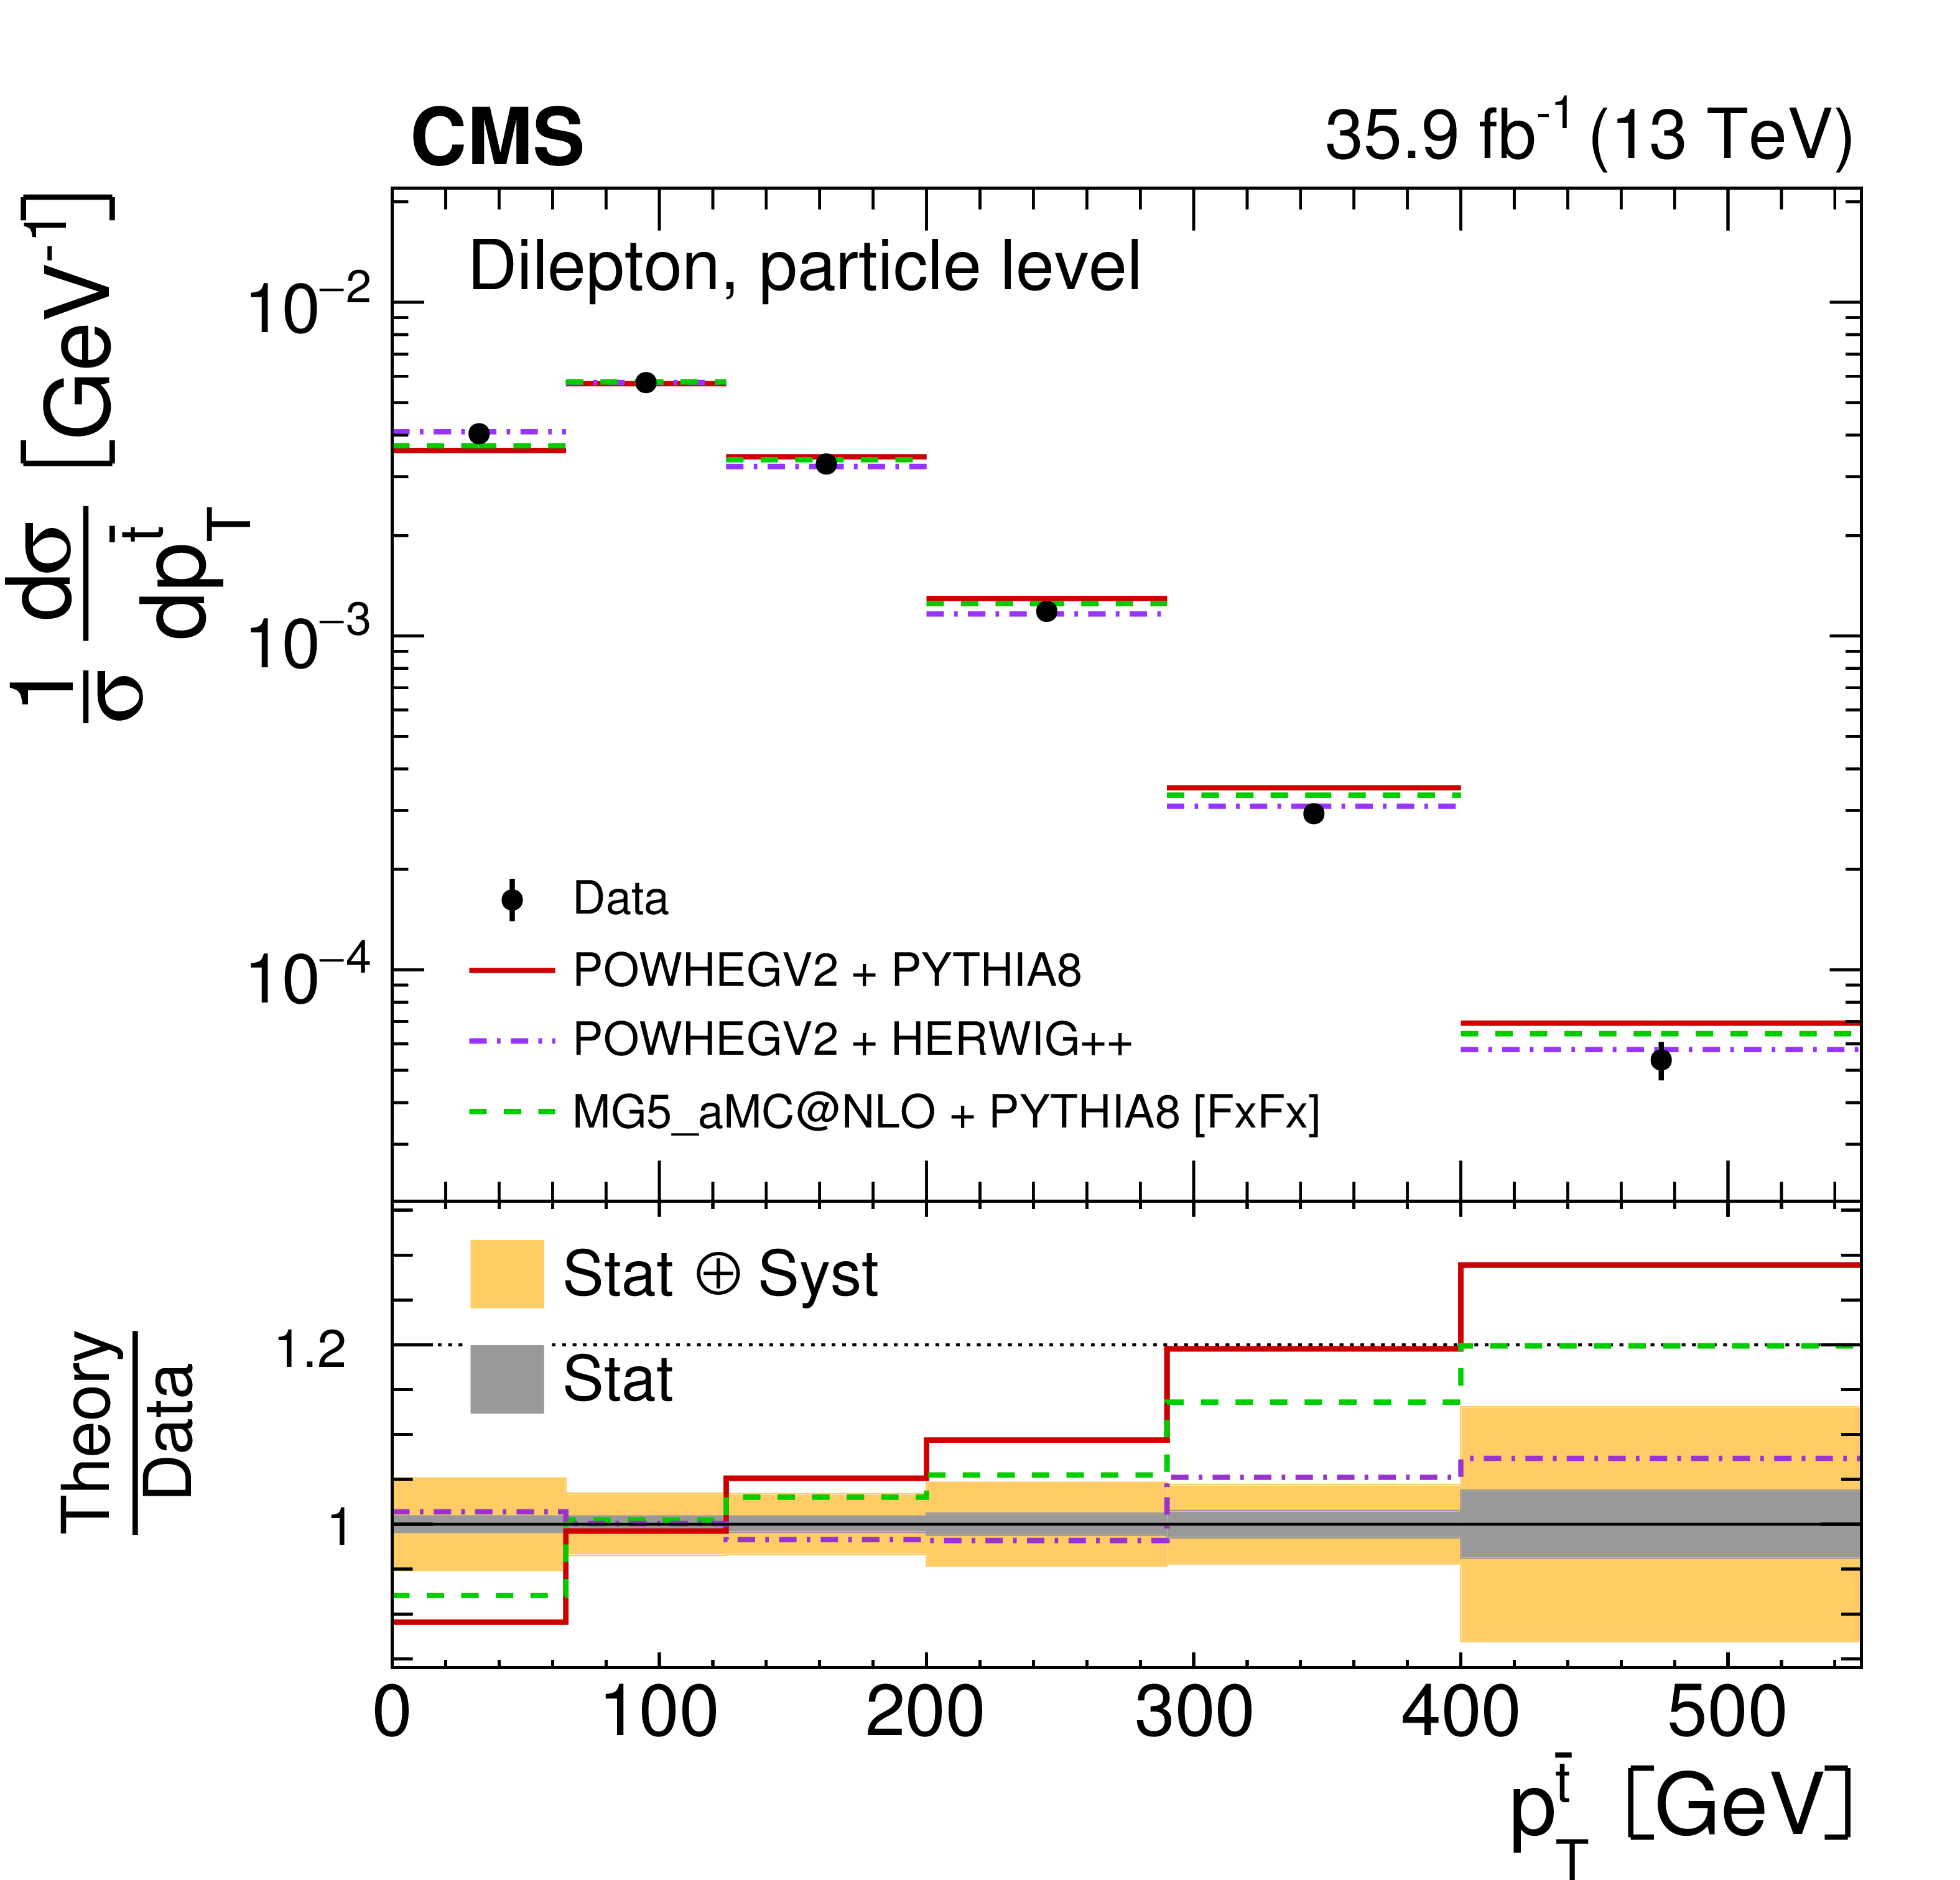
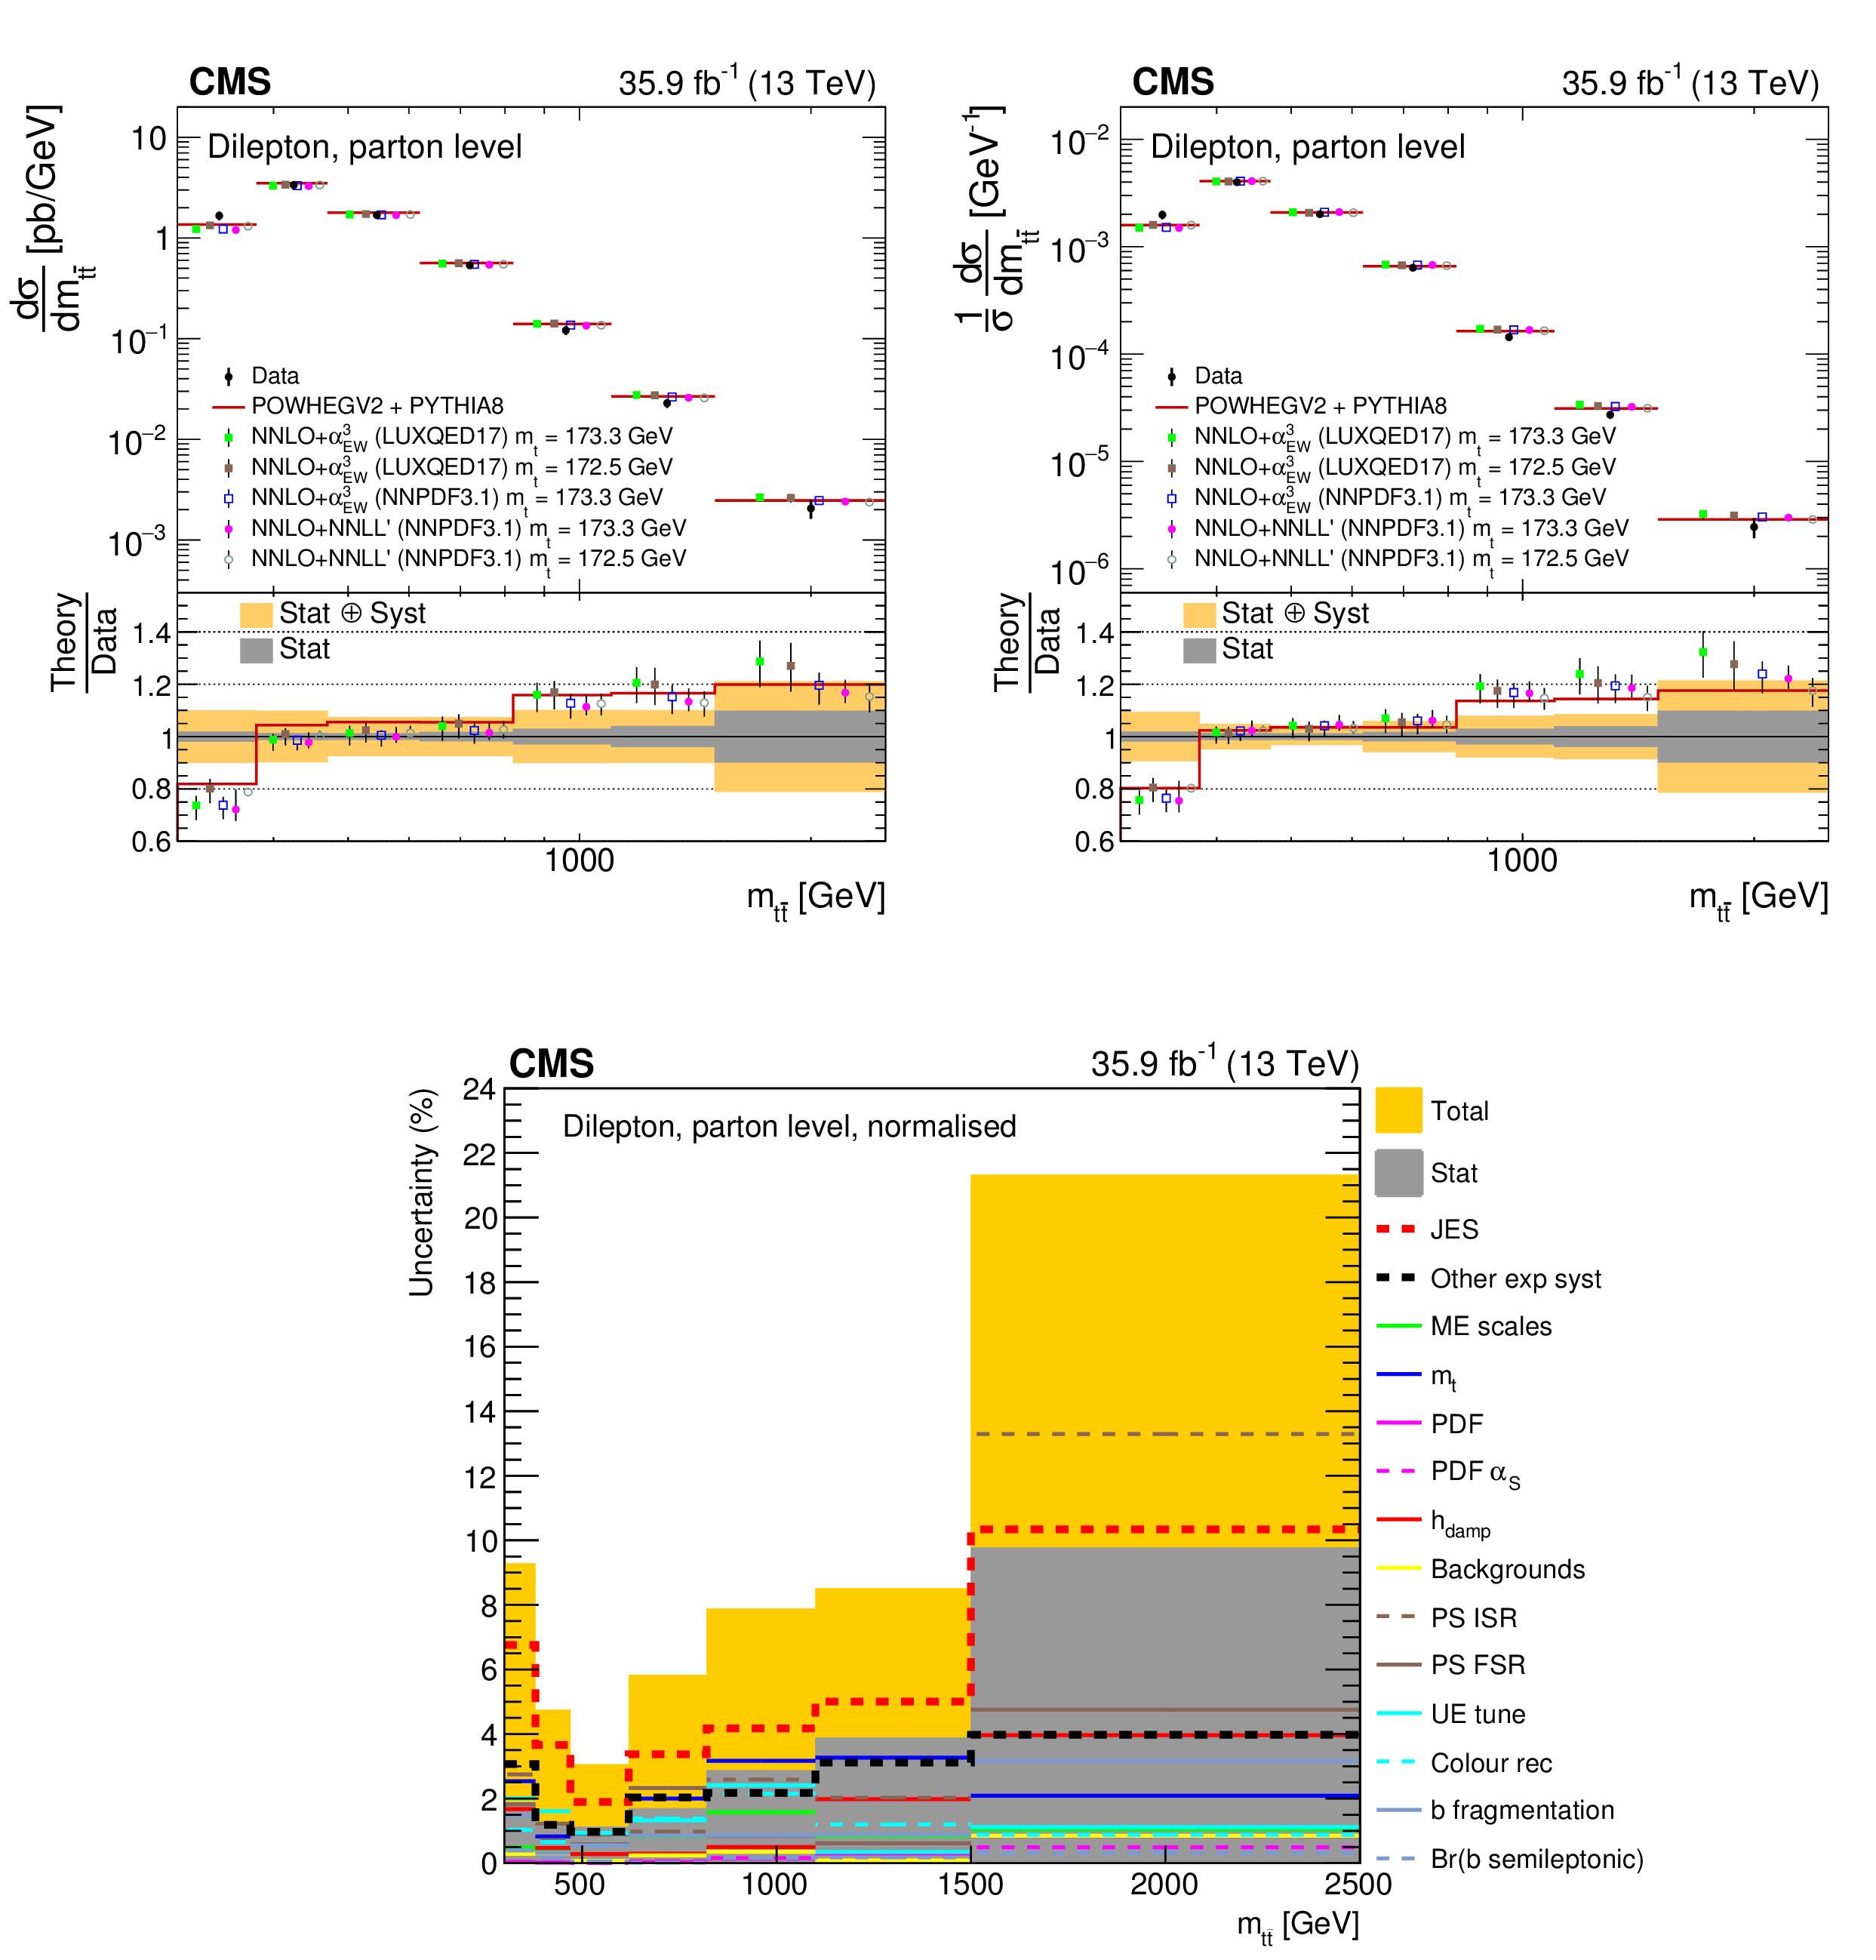
Figure 3:
The differential $ {{\mathrm {t}\overline {\mathrm {t}}}} $ production cross sections as a function of $ {{p_{\mathrm {T}}} ^{{\mathrm {t}}}} $ are shown for the data (points) and the MC predictions (lines). The vertical lines on the points indicate the total uncertainty in the data. The left and right columns correspond to absolute and normalised measurements, respectively. The upper row corresponds to measurements at the parton level in the full phase space and the lower row to the particle level in a fiducial phase space. The lower panel in each plot shows the ratios of the theoretical predictions to the data. The dark and light bands show the relative statistical and total uncertainties in the data, respectively. |
png pdf |
Figure 3-a:
The differential $ {{\mathrm {t}\overline {\mathrm {t}}}} $ production cross sections as a function of $ {{p_{\mathrm {T}}} ^{{\mathrm {t}}}} $ are shown for the data (points) and the MC predictions (lines). The vertical lines on the points indicate the total uncertainty in the data. The left and right columns correspond to absolute and normalised measurements, respectively. The upper row corresponds to measurements at the parton level in the full phase space and the lower row to the particle level in a fiducial phase space. The lower panel in each plot shows the ratios of the theoretical predictions to the data. The dark and light bands show the relative statistical and total uncertainties in the data, respectively. |

png pdf |
Figure 3-b:
The differential $ {{\mathrm {t}\overline {\mathrm {t}}}} $ production cross sections as a function of $ {{p_{\mathrm {T}}} ^{{\mathrm {t}}}} $ are shown for the data (points) and the MC predictions (lines). The vertical lines on the points indicate the total uncertainty in the data. The left and right columns correspond to absolute and normalised measurements, respectively. The upper row corresponds to measurements at the parton level in the full phase space and the lower row to the particle level in a fiducial phase space. The lower panel in each plot shows the ratios of the theoretical predictions to the data. The dark and light bands show the relative statistical and total uncertainties in the data, respectively. |
png pdf |
Figure 3-c:
The differential $ {{\mathrm {t}\overline {\mathrm {t}}}} $ production cross sections as a function of $ {{p_{\mathrm {T}}} ^{{\mathrm {t}}}} $ are shown for the data (points) and the MC predictions (lines). The vertical lines on the points indicate the total uncertainty in the data. The left and right columns correspond to absolute and normalised measurements, respectively. The upper row corresponds to measurements at the parton level in the full phase space and the lower row to the particle level in a fiducial phase space. The lower panel in each plot shows the ratios of the theoretical predictions to the data. The dark and light bands show the relative statistical and total uncertainties in the data, respectively. |
png pdf |
Figure 3-d:
The differential $ {{\mathrm {t}\overline {\mathrm {t}}}} $ production cross sections as a function of $ {{p_{\mathrm {T}}} ^{{\mathrm {t}}}} $ are shown for the data (points) and the MC predictions (lines). The vertical lines on the points indicate the total uncertainty in the data. The left and right columns correspond to absolute and normalised measurements, respectively. The upper row corresponds to measurements at the parton level in the full phase space and the lower row to the particle level in a fiducial phase space. The lower panel in each plot shows the ratios of the theoretical predictions to the data. The dark and light bands show the relative statistical and total uncertainties in the data, respectively. |

png pdf |
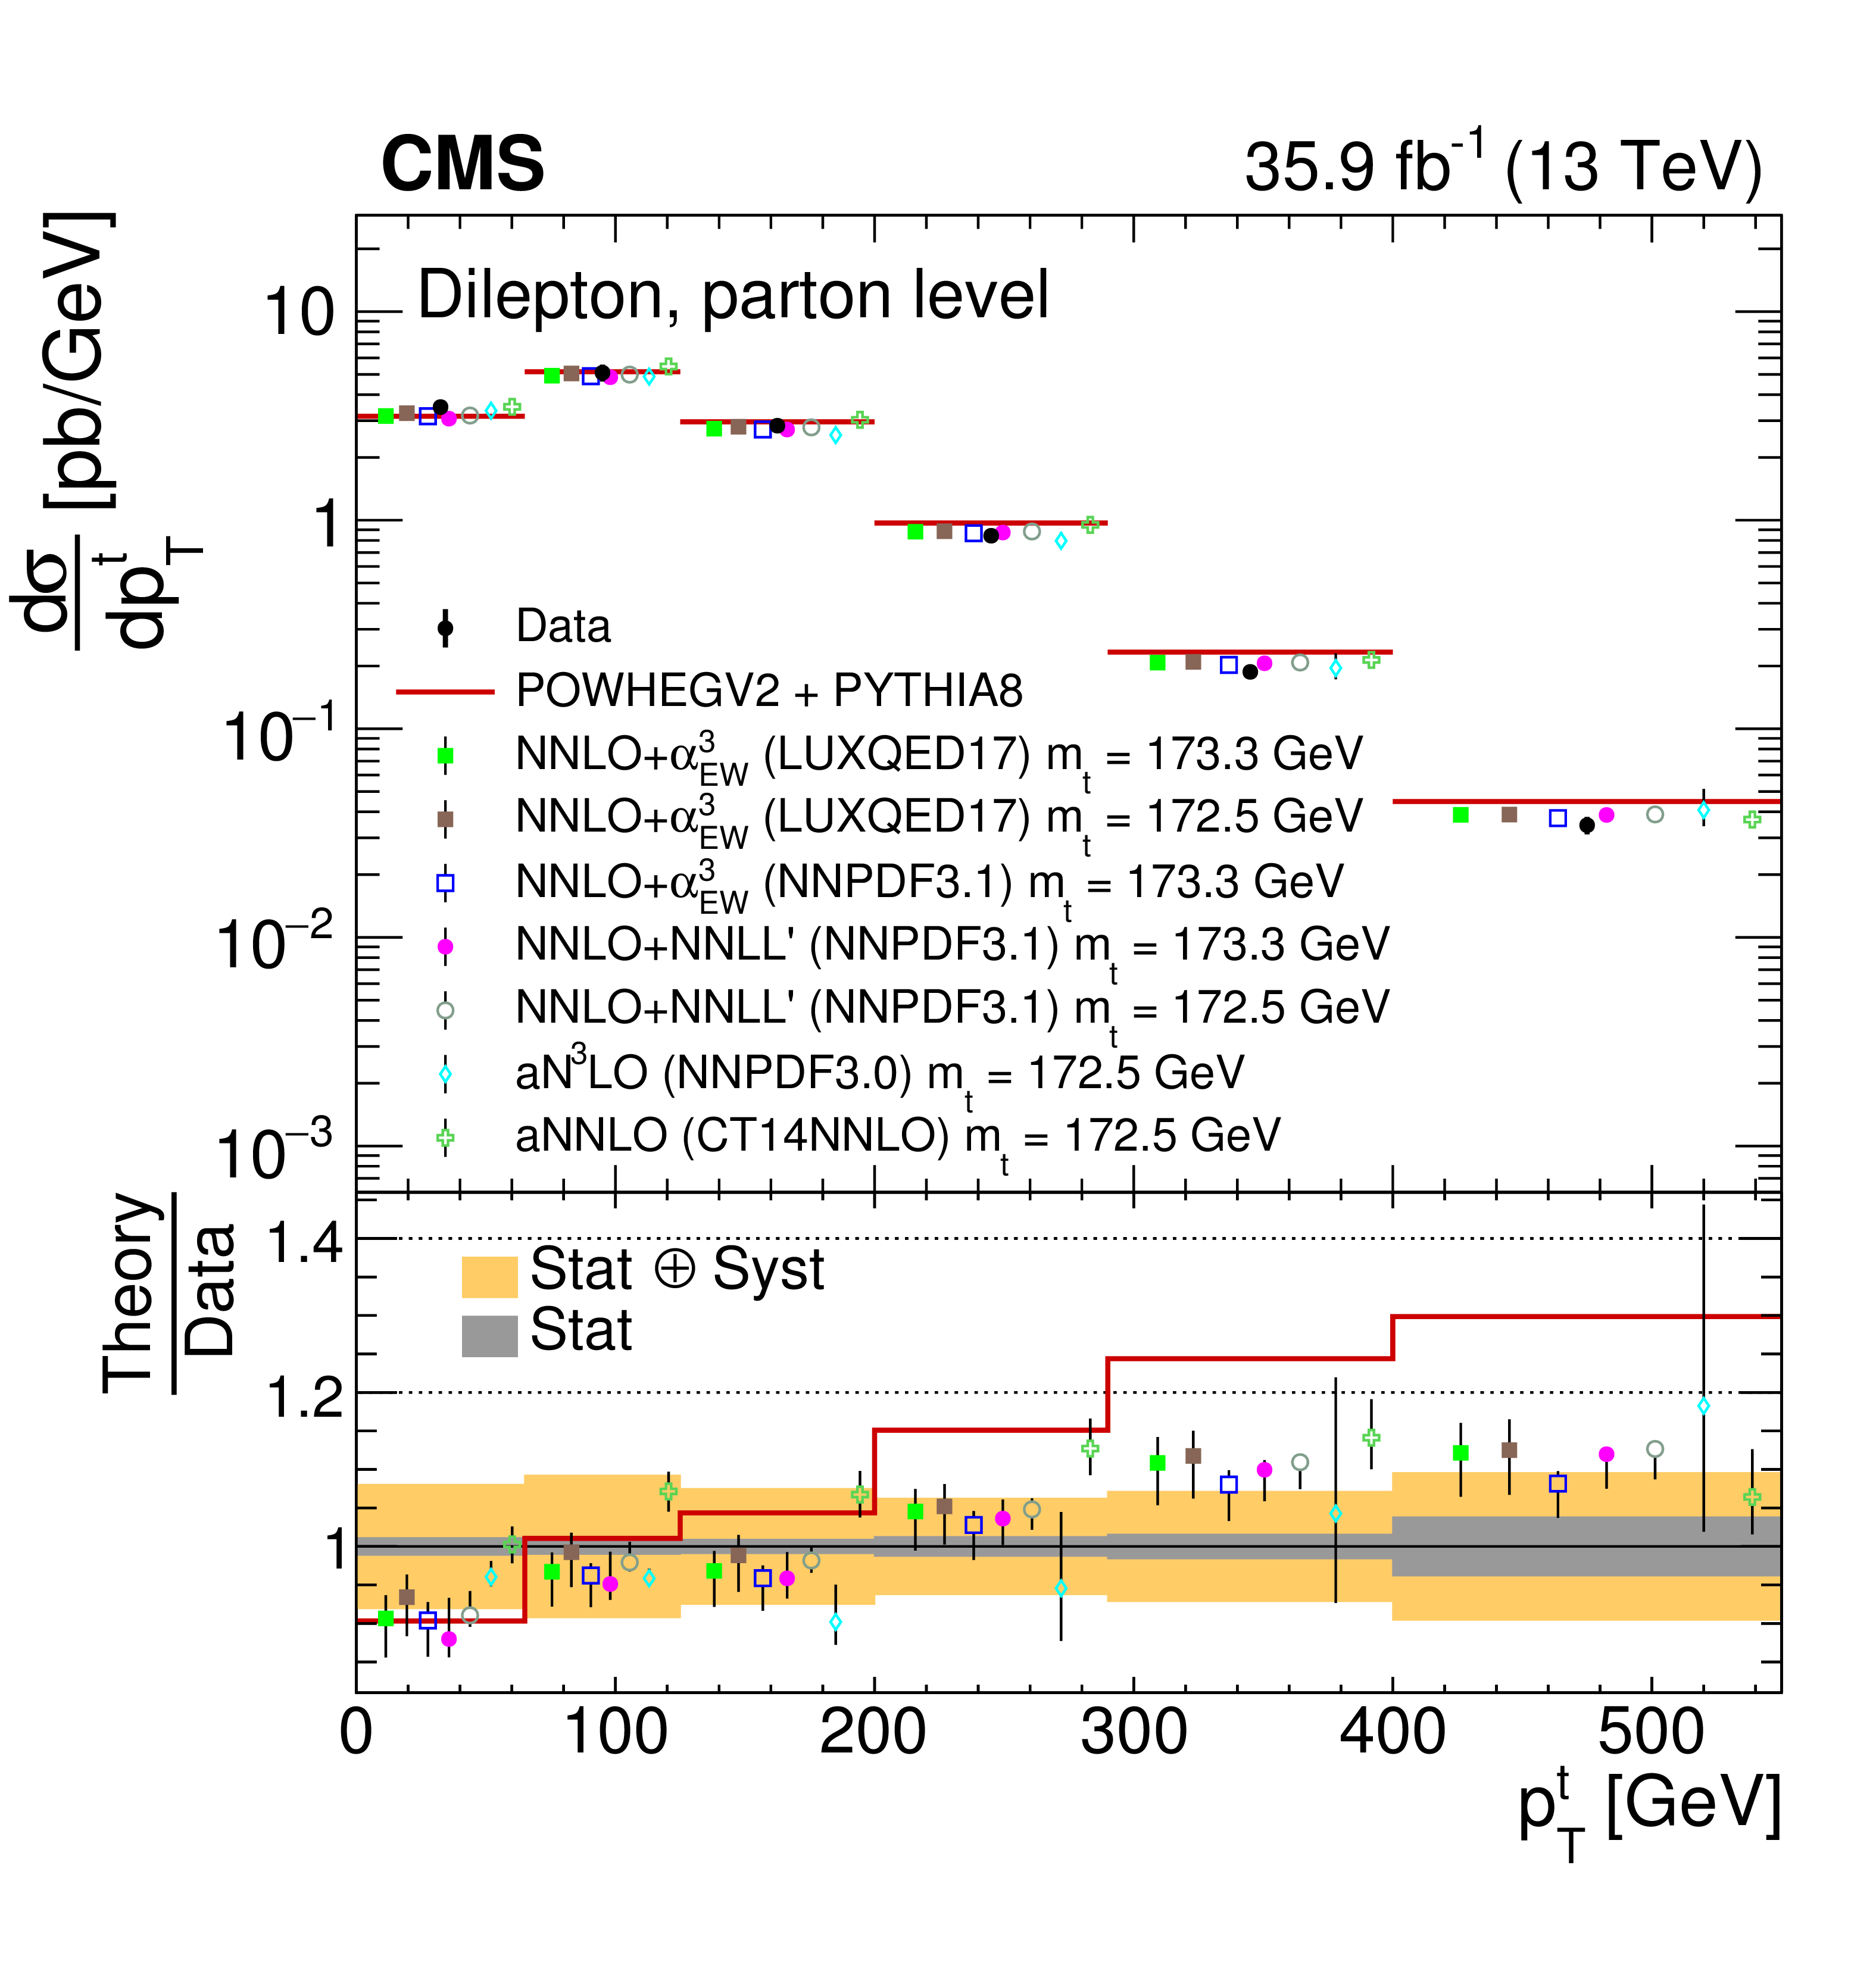
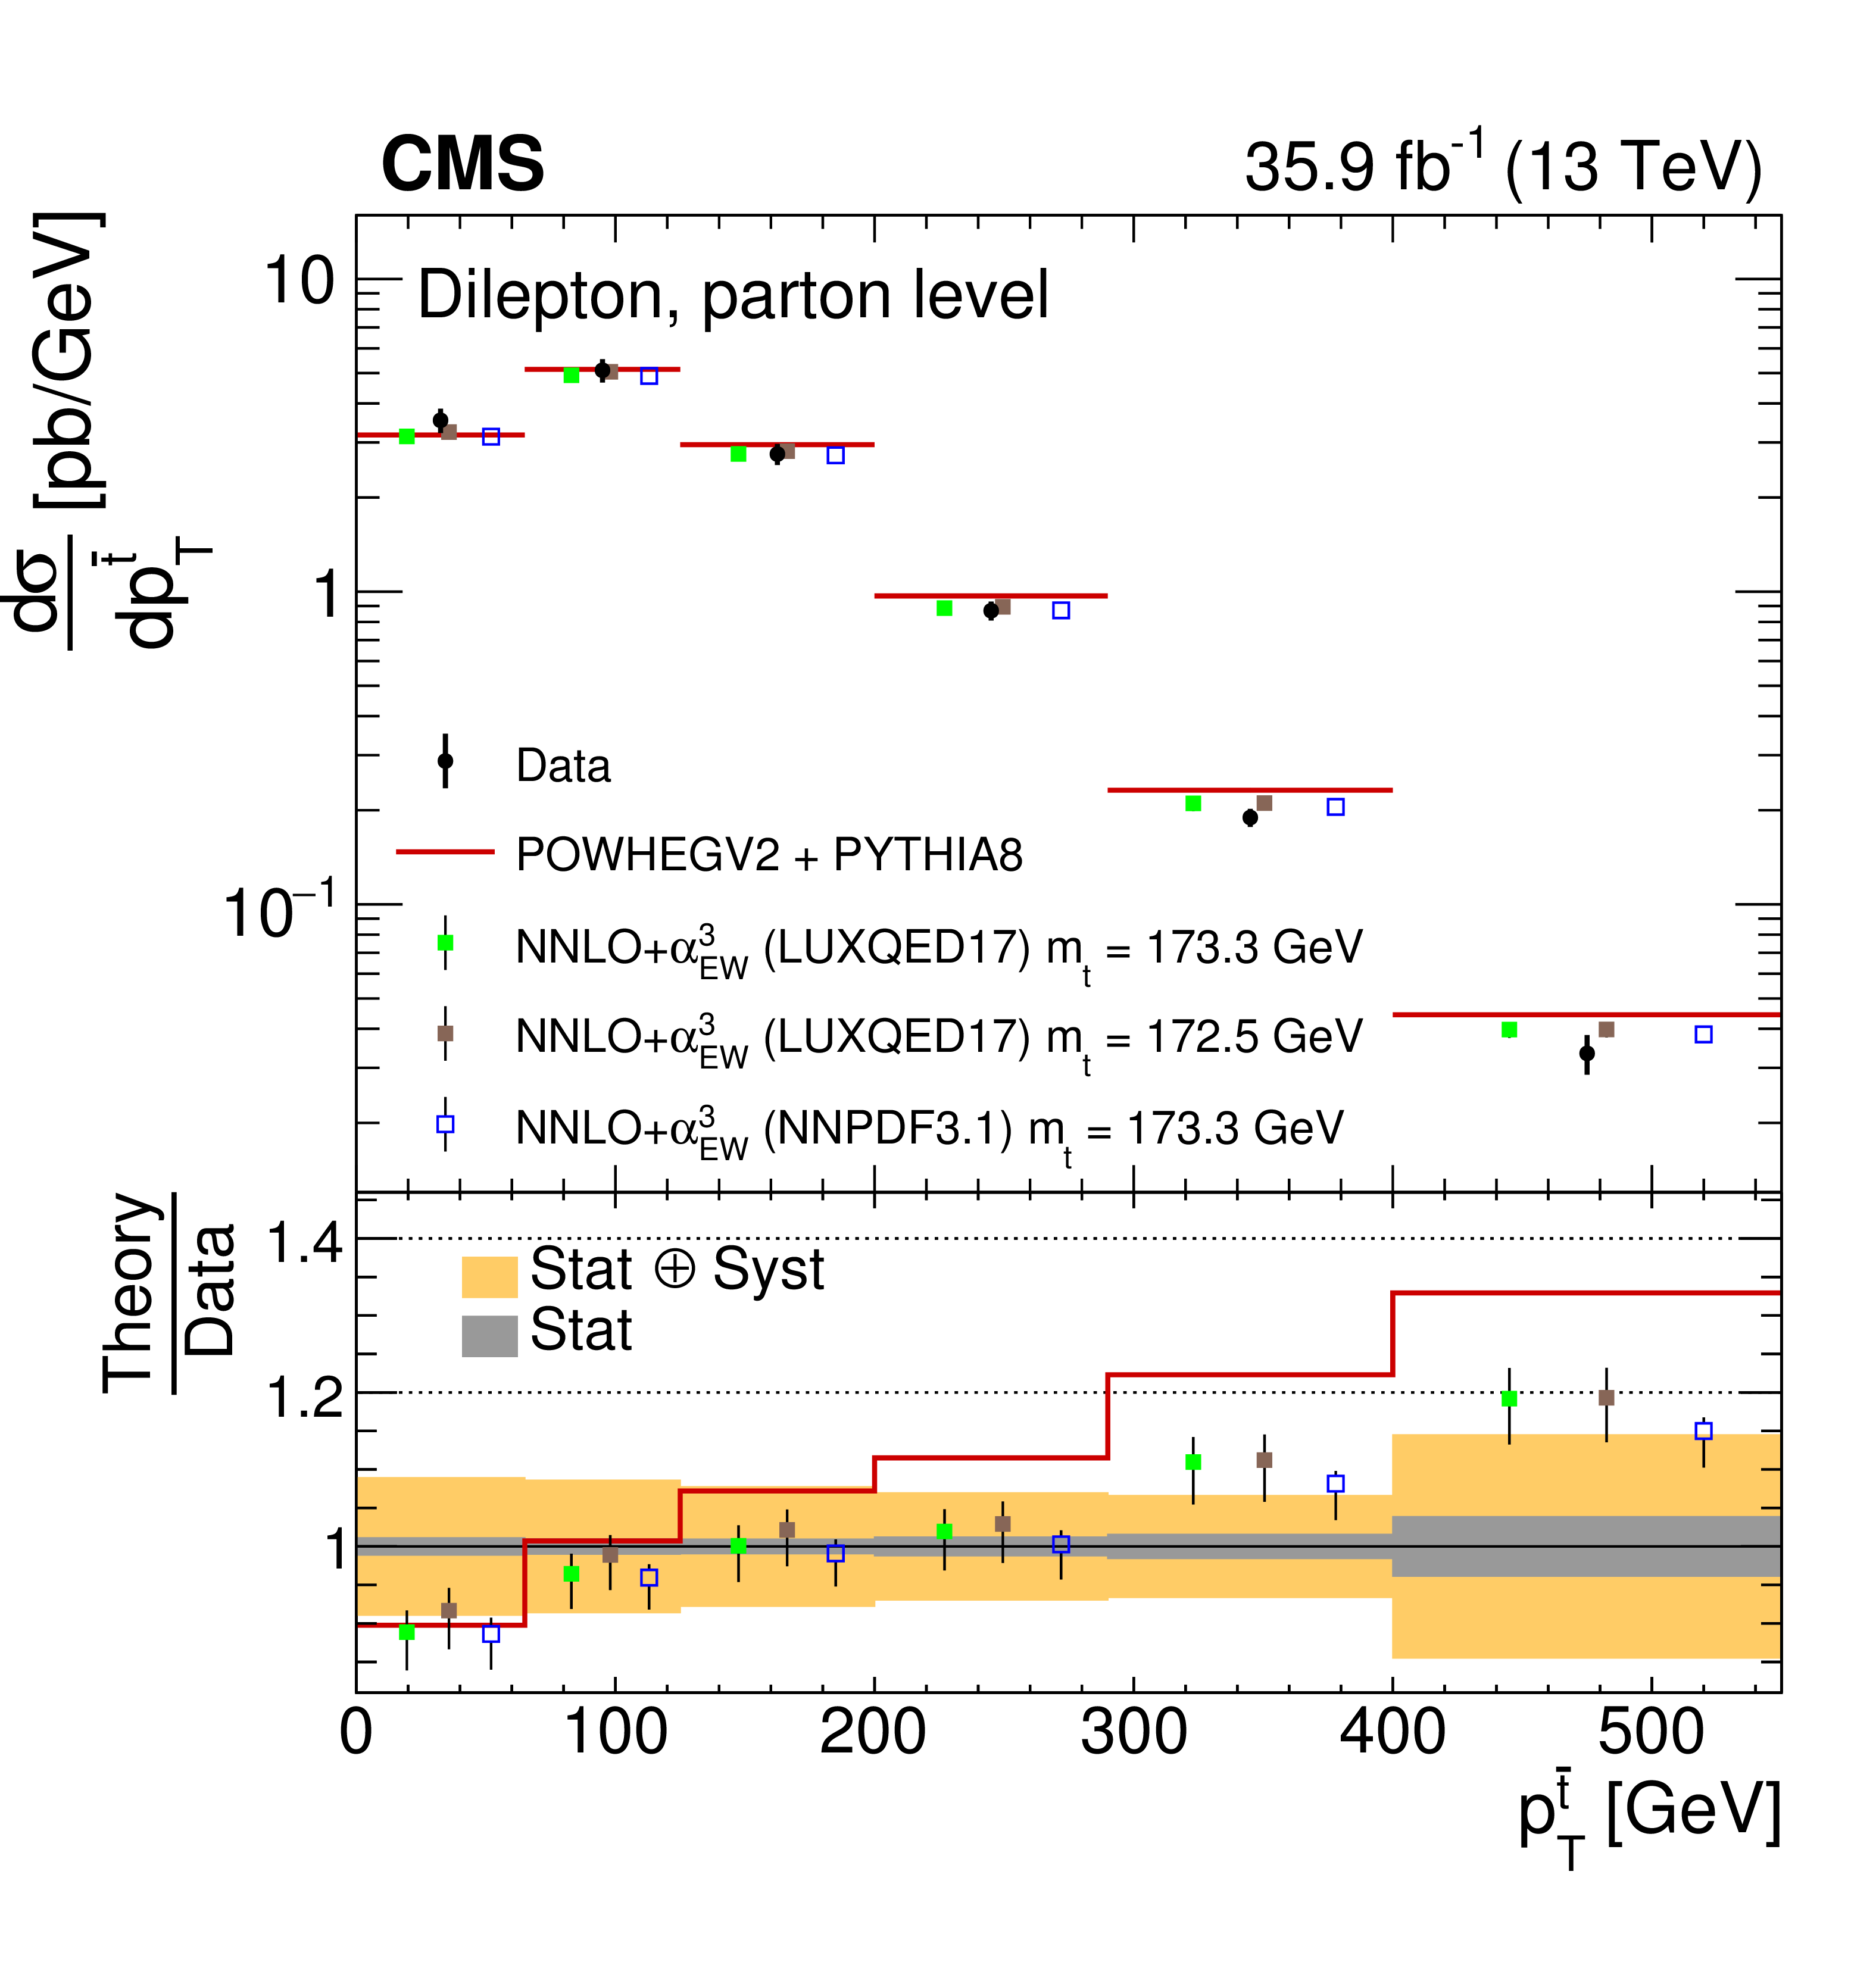
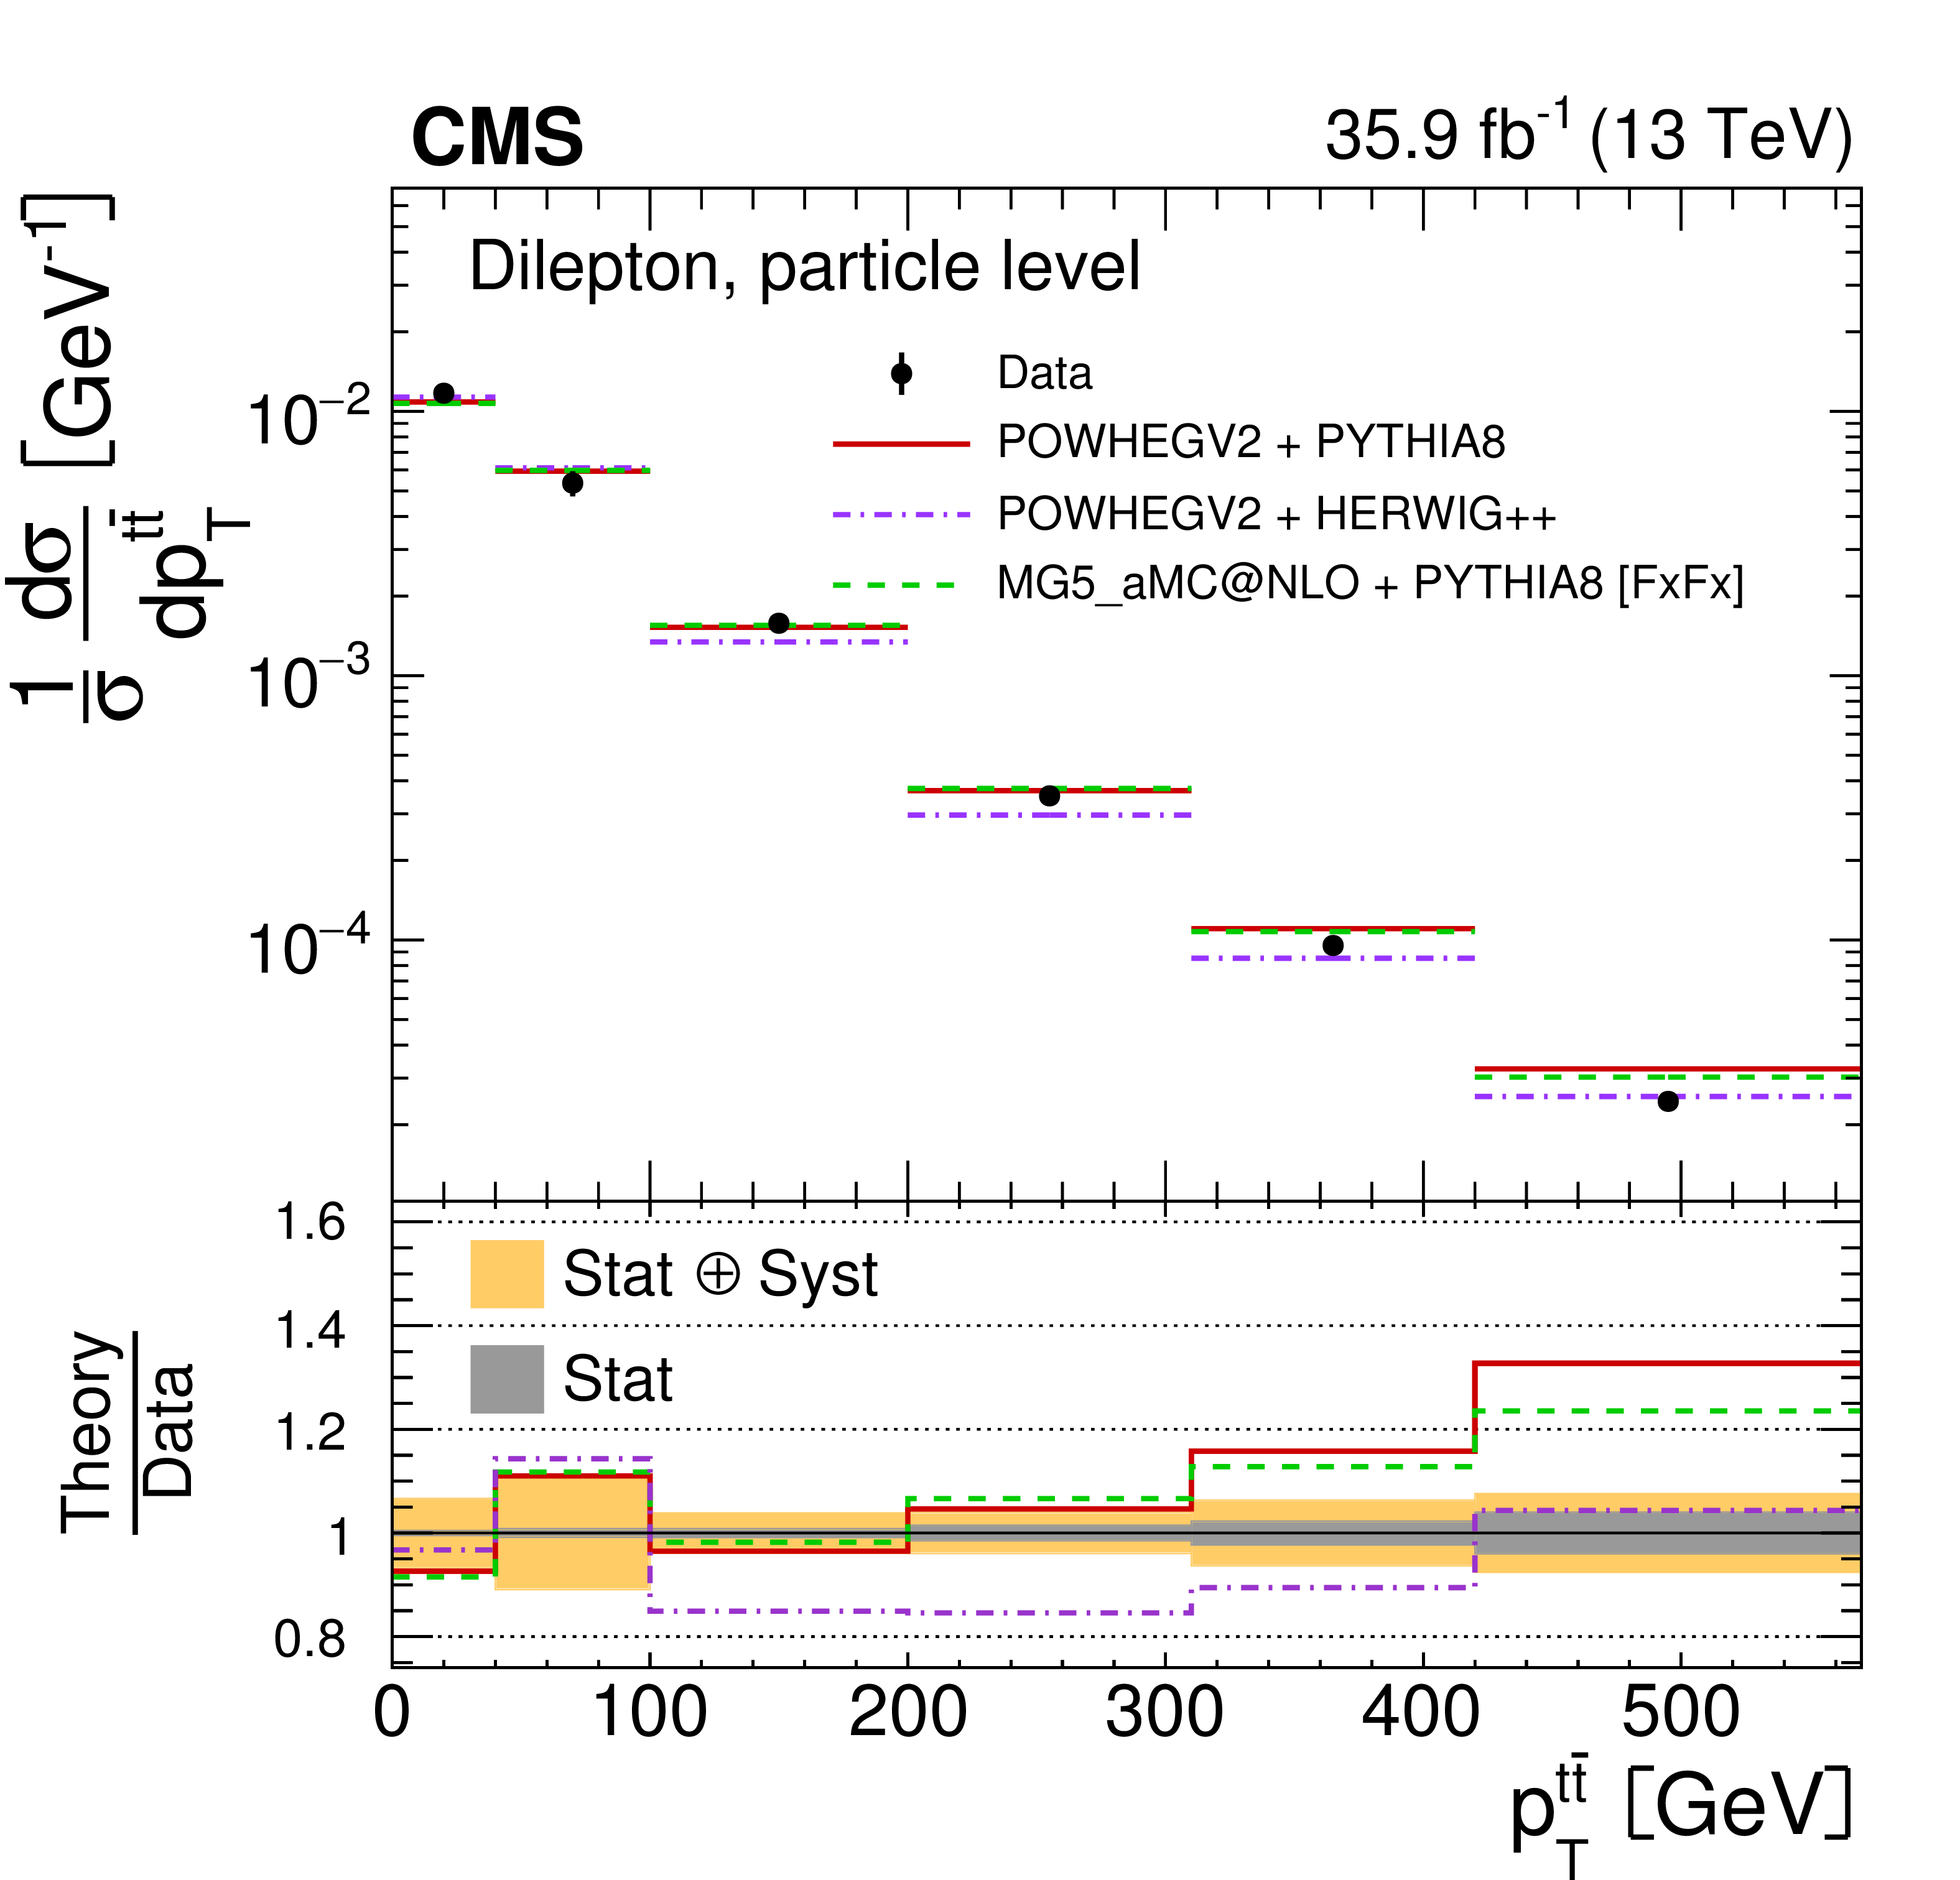
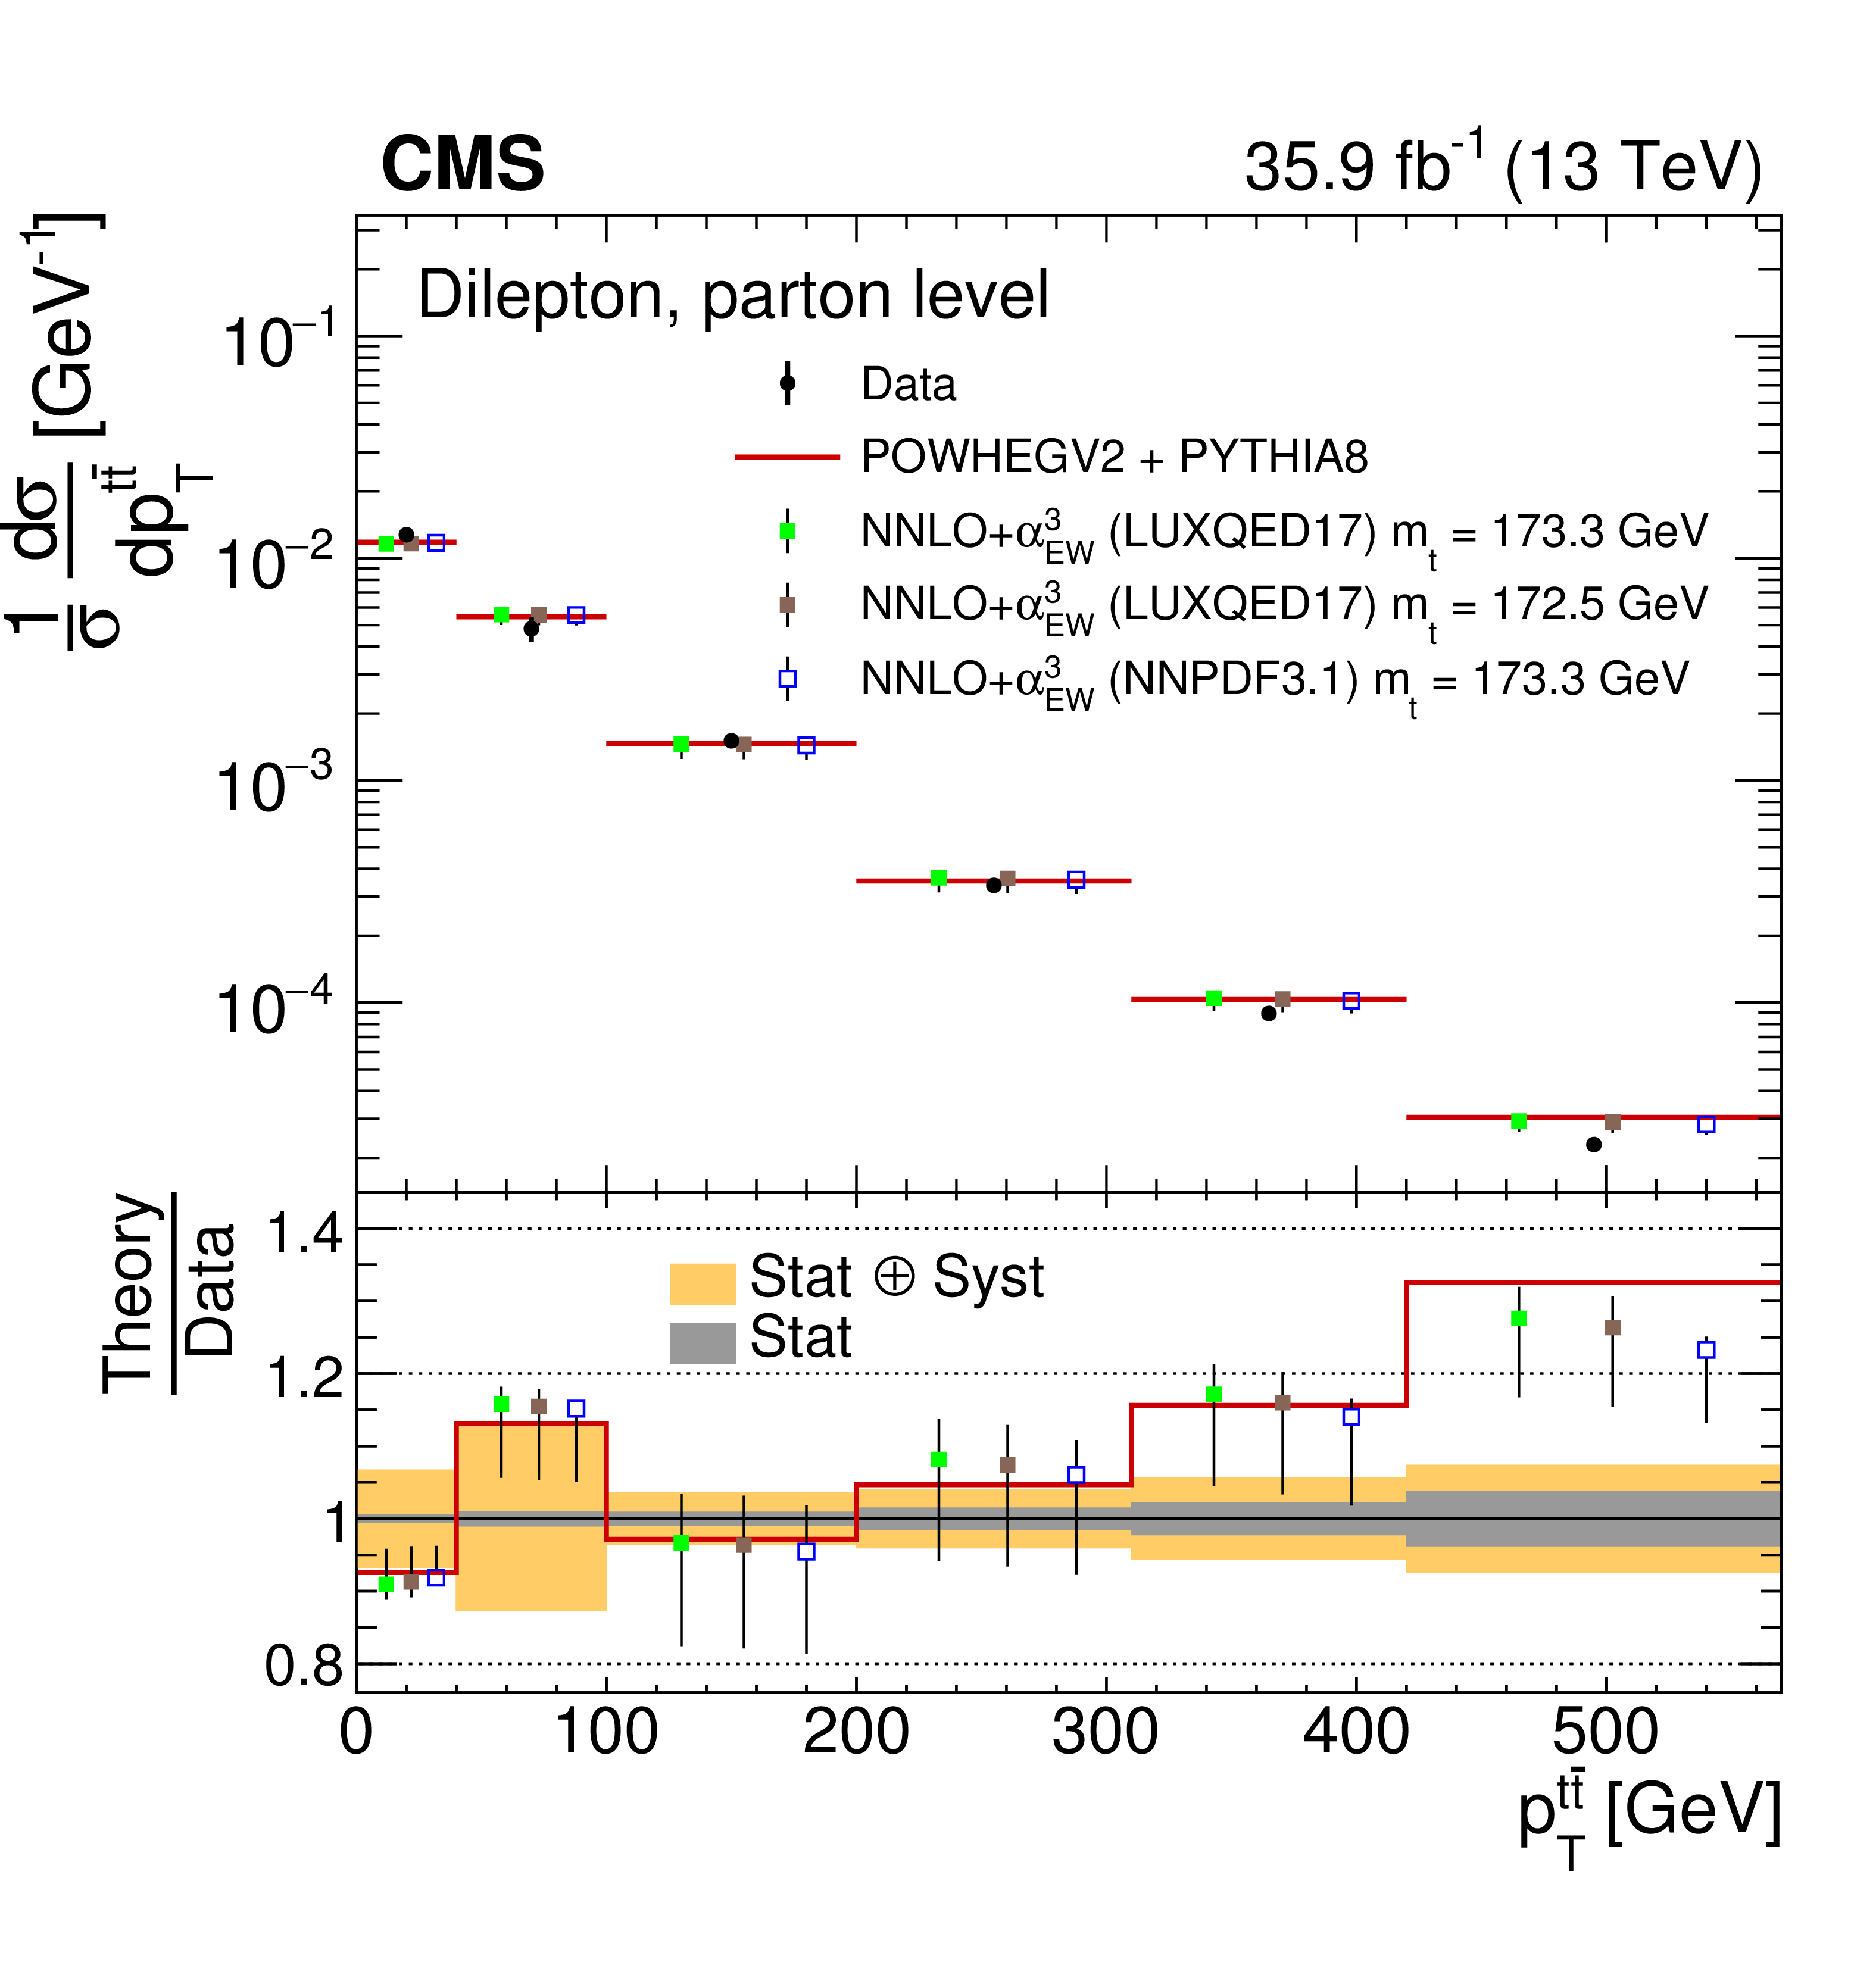
Figure 4:
The differential $ {{\mathrm {t}\overline {\mathrm {t}}}} $ production cross sections as a function of $ {{p_{\mathrm {T}}} ^{{\mathrm {t}}}} $ are shown for the data (filled circles), the theoretical predictions with beyond-NLO precision (other points) and the prediction from POWHEG+PYTHIA (solid line). The vertical lines on the filled circles and other points indicate the total uncertainty in the data and theoretical predictions, respectively. The left and right plots correspond to absolute and normalised measurements, respectively. The lower panel in each plot shows the ratios of the theoretical predictions to the data. The dark and light bands show the relative statistical and total uncertainties in the data, respectively. |
png pdf |
Figure 4-a:
The differential $ {{\mathrm {t}\overline {\mathrm {t}}}} $ production cross sections as a function of $ {{p_{\mathrm {T}}} ^{{\mathrm {t}}}} $ are shown for the data (filled circles), the theoretical predictions with beyond-NLO precision (other points) and the prediction from POWHEG+PYTHIA (solid line). The vertical lines on the filled circles and other points indicate the total uncertainty in the data and theoretical predictions, respectively. The left and right plots correspond to absolute and normalised measurements, respectively. The lower panel in each plot shows the ratios of the theoretical predictions to the data. The dark and light bands show the relative statistical and total uncertainties in the data, respectively. |

png pdf |
Figure 4-b:
The differential $ {{\mathrm {t}\overline {\mathrm {t}}}} $ production cross sections as a function of $ {{p_{\mathrm {T}}} ^{{\mathrm {t}}}} $ are shown for the data (filled circles), the theoretical predictions with beyond-NLO precision (other points) and the prediction from POWHEG+PYTHIA (solid line). The vertical lines on the filled circles and other points indicate the total uncertainty in the data and theoretical predictions, respectively. The left and right plots correspond to absolute and normalised measurements, respectively. The lower panel in each plot shows the ratios of the theoretical predictions to the data. The dark and light bands show the relative statistical and total uncertainties in the data, respectively. |
png pdf |
Figure 5:
The contributions of each source of systematic uncertainty in each bin is shown for the measurement of the normalised $ {{\mathrm {t}\overline {\mathrm {t}}}} $ production cross sections as a function of $ {{p_{\mathrm {T}}} ^{{\mathrm {t}}}} $. The sources affecting the JES are added in quadrature and shown as a single component. Additional experimental systematic uncertainties are also added in quadrature and shown as a single component. Contributions from theoretical uncertainties are shown separately. The statistical and total uncertainties, corresponding to the quadrature addition of statistical and systematic uncertainties, are shown by the dark and light filled histograms, respectively. |

png pdf |
Figure 6:
The differential $ \mathrm {t}\overline {\mathrm {t}} $ production cross sections as a function of $ p_{\mathrm {T}} ^{\overline {\mathrm {t}}} $ are shown for the data (points) and the MC predictions (lines). The vertical lines on the points indicate the total uncertainty in the data. The left and right columns correspond to absolute and normalised measurements, respectively. The upper row corresponds to measurements at the parton level in the full phase space and the lower row to the particle level in a fiducial phase space. The lower panel in each plot shows the ratios of the theoretical predictions to the data. The dark and light bands show the relative statistical and total uncertainties in the data, respectively. |
png pdf |
Figure 6-a:
The differential $ \mathrm {t}\overline {\mathrm {t}} $ production cross sections as a function of $ p_{\mathrm {T}} ^{\overline {\mathrm {t}}} $ are shown for the data (points) and the MC predictions (lines). The vertical lines on the points indicate the total uncertainty in the data. The left and right columns correspond to absolute and normalised measurements, respectively. The upper row corresponds to measurements at the parton level in the full phase space and the lower row to the particle level in a fiducial phase space. The lower panel in each plot shows the ratios of the theoretical predictions to the data. The dark and light bands show the relative statistical and total uncertainties in the data, respectively. |
png pdf |
Figure 6-b:
The differential $ \mathrm {t}\overline {\mathrm {t}} $ production cross sections as a function of $ p_{\mathrm {T}} ^{\overline {\mathrm {t}}} $ are shown for the data (points) and the MC predictions (lines). The vertical lines on the points indicate the total uncertainty in the data. The left and right columns correspond to absolute and normalised measurements, respectively. The upper row corresponds to measurements at the parton level in the full phase space and the lower row to the particle level in a fiducial phase space. The lower panel in each plot shows the ratios of the theoretical predictions to the data. The dark and light bands show the relative statistical and total uncertainties in the data, respectively. |
png pdf |
Figure 6-c:
The differential $ \mathrm {t}\overline {\mathrm {t}} $ production cross sections as a function of $ p_{\mathrm {T}} ^{\overline {\mathrm {t}}} $ are shown for the data (points) and the MC predictions (lines). The vertical lines on the points indicate the total uncertainty in the data. The left and right columns correspond to absolute and normalised measurements, respectively. The upper row corresponds to measurements at the parton level in the full phase space and the lower row to the particle level in a fiducial phase space. The lower panel in each plot shows the ratios of the theoretical predictions to the data. The dark and light bands show the relative statistical and total uncertainties in the data, respectively. |
png pdf |
Figure 6-d:
The differential $ \mathrm {t}\overline {\mathrm {t}} $ production cross sections as a function of $ p_{\mathrm {T}} ^{\overline {\mathrm {t}}} $ are shown for the data (points) and the MC predictions (lines). The vertical lines on the points indicate the total uncertainty in the data. The left and right columns correspond to absolute and normalised measurements, respectively. The upper row corresponds to measurements at the parton level in the full phase space and the lower row to the particle level in a fiducial phase space. The lower panel in each plot shows the ratios of the theoretical predictions to the data. The dark and light bands show the relative statistical and total uncertainties in the data, respectively. |
png pdf |
Figure 7:
The differential $ {{\mathrm {t}\overline {\mathrm {t}}}} $ production cross sections as a function of $ {{p_{\mathrm {T}}} ^{{\overline {\mathrm {t}}}}} $ are shown for the data (filled circles), the theoretical predictions with beyond-NLO precision (other points) and the prediction from POWHEG+PYTHIA (solid line). The vertical lines on the filled circles and other points indicate the total uncertainty in the data and theoretical predictions, respectively. The left and right plots correspond to absolute and normalised measurements, respectively. The lower panel in each plot shows the ratios of the theoretical predictions to the data. The dark and light bands show the relative statistical and total uncertainties in the data, respectively. |
png pdf |
Figure 7-a:
The differential $ {{\mathrm {t}\overline {\mathrm {t}}}} $ production cross sections as a function of $ {{p_{\mathrm {T}}} ^{{\overline {\mathrm {t}}}}} $ are shown for the data (filled circles), the theoretical predictions with beyond-NLO precision (other points) and the prediction from POWHEG+PYTHIA (solid line). The vertical lines on the filled circles and other points indicate the total uncertainty in the data and theoretical predictions, respectively. The left and right plots correspond to absolute and normalised measurements, respectively. The lower panel in each plot shows the ratios of the theoretical predictions to the data. The dark and light bands show the relative statistical and total uncertainties in the data, respectively. |

png pdf |
Figure 7-b:
The differential $ {{\mathrm {t}\overline {\mathrm {t}}}} $ production cross sections as a function of $ {{p_{\mathrm {T}}} ^{{\overline {\mathrm {t}}}}} $ are shown for the data (filled circles), the theoretical predictions with beyond-NLO precision (other points) and the prediction from POWHEG+PYTHIA (solid line). The vertical lines on the filled circles and other points indicate the total uncertainty in the data and theoretical predictions, respectively. The left and right plots correspond to absolute and normalised measurements, respectively. The lower panel in each plot shows the ratios of the theoretical predictions to the data. The dark and light bands show the relative statistical and total uncertainties in the data, respectively. |

png pdf |
Figure 8:
The contributions of each source of systematic uncertainty to the total systematic uncertainty in each bin is shown for the measurement of the normalised $ {{\mathrm {t}\overline {\mathrm {t}}}} $ production cross sections as a function of $ {{p_{\mathrm {T}}} ^{{\overline {\mathrm {t}}}}} $. The sources affecting the JES are added in quadrature and shown as a single component. Additional experimental systematic uncertainties are also added in quadrature and shown as a single component. Contributions from theoretical uncertainties are shown separately. The statistical and total uncertainties, corresponding to the quadrature addition of statistical and systematic uncertainties, are shown by the dark and light filled histograms, respectively. |
png pdf |
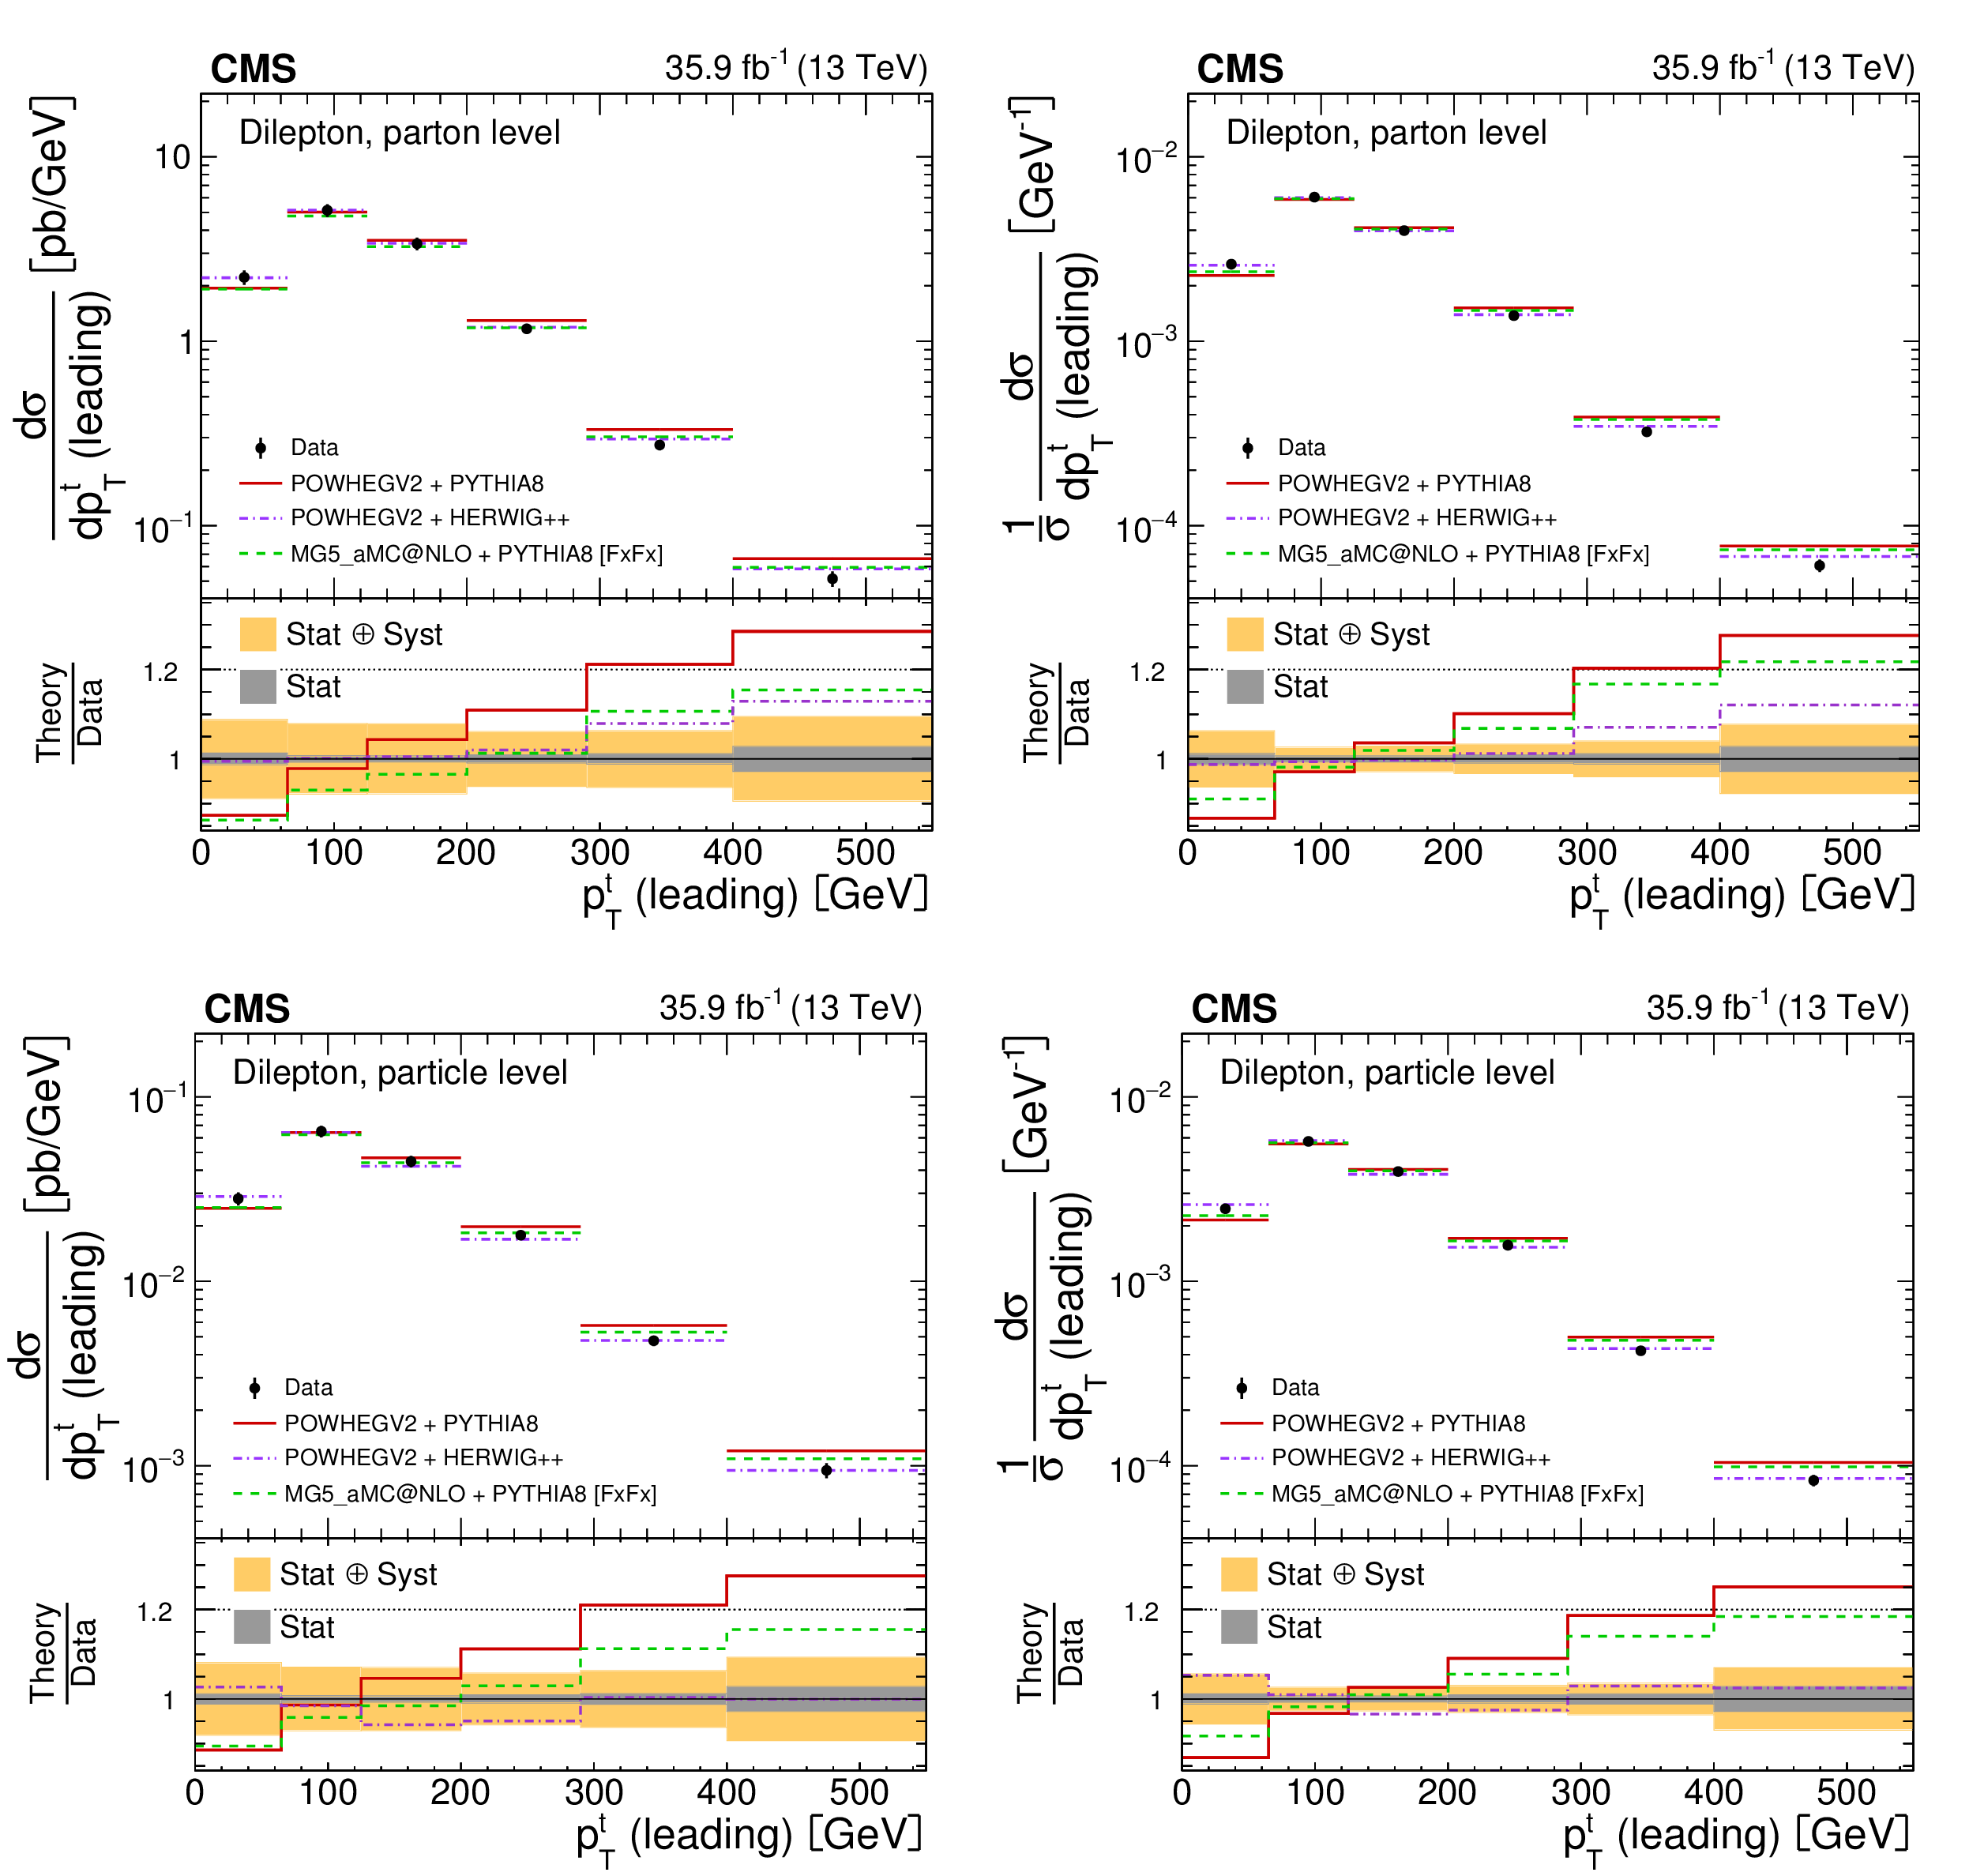
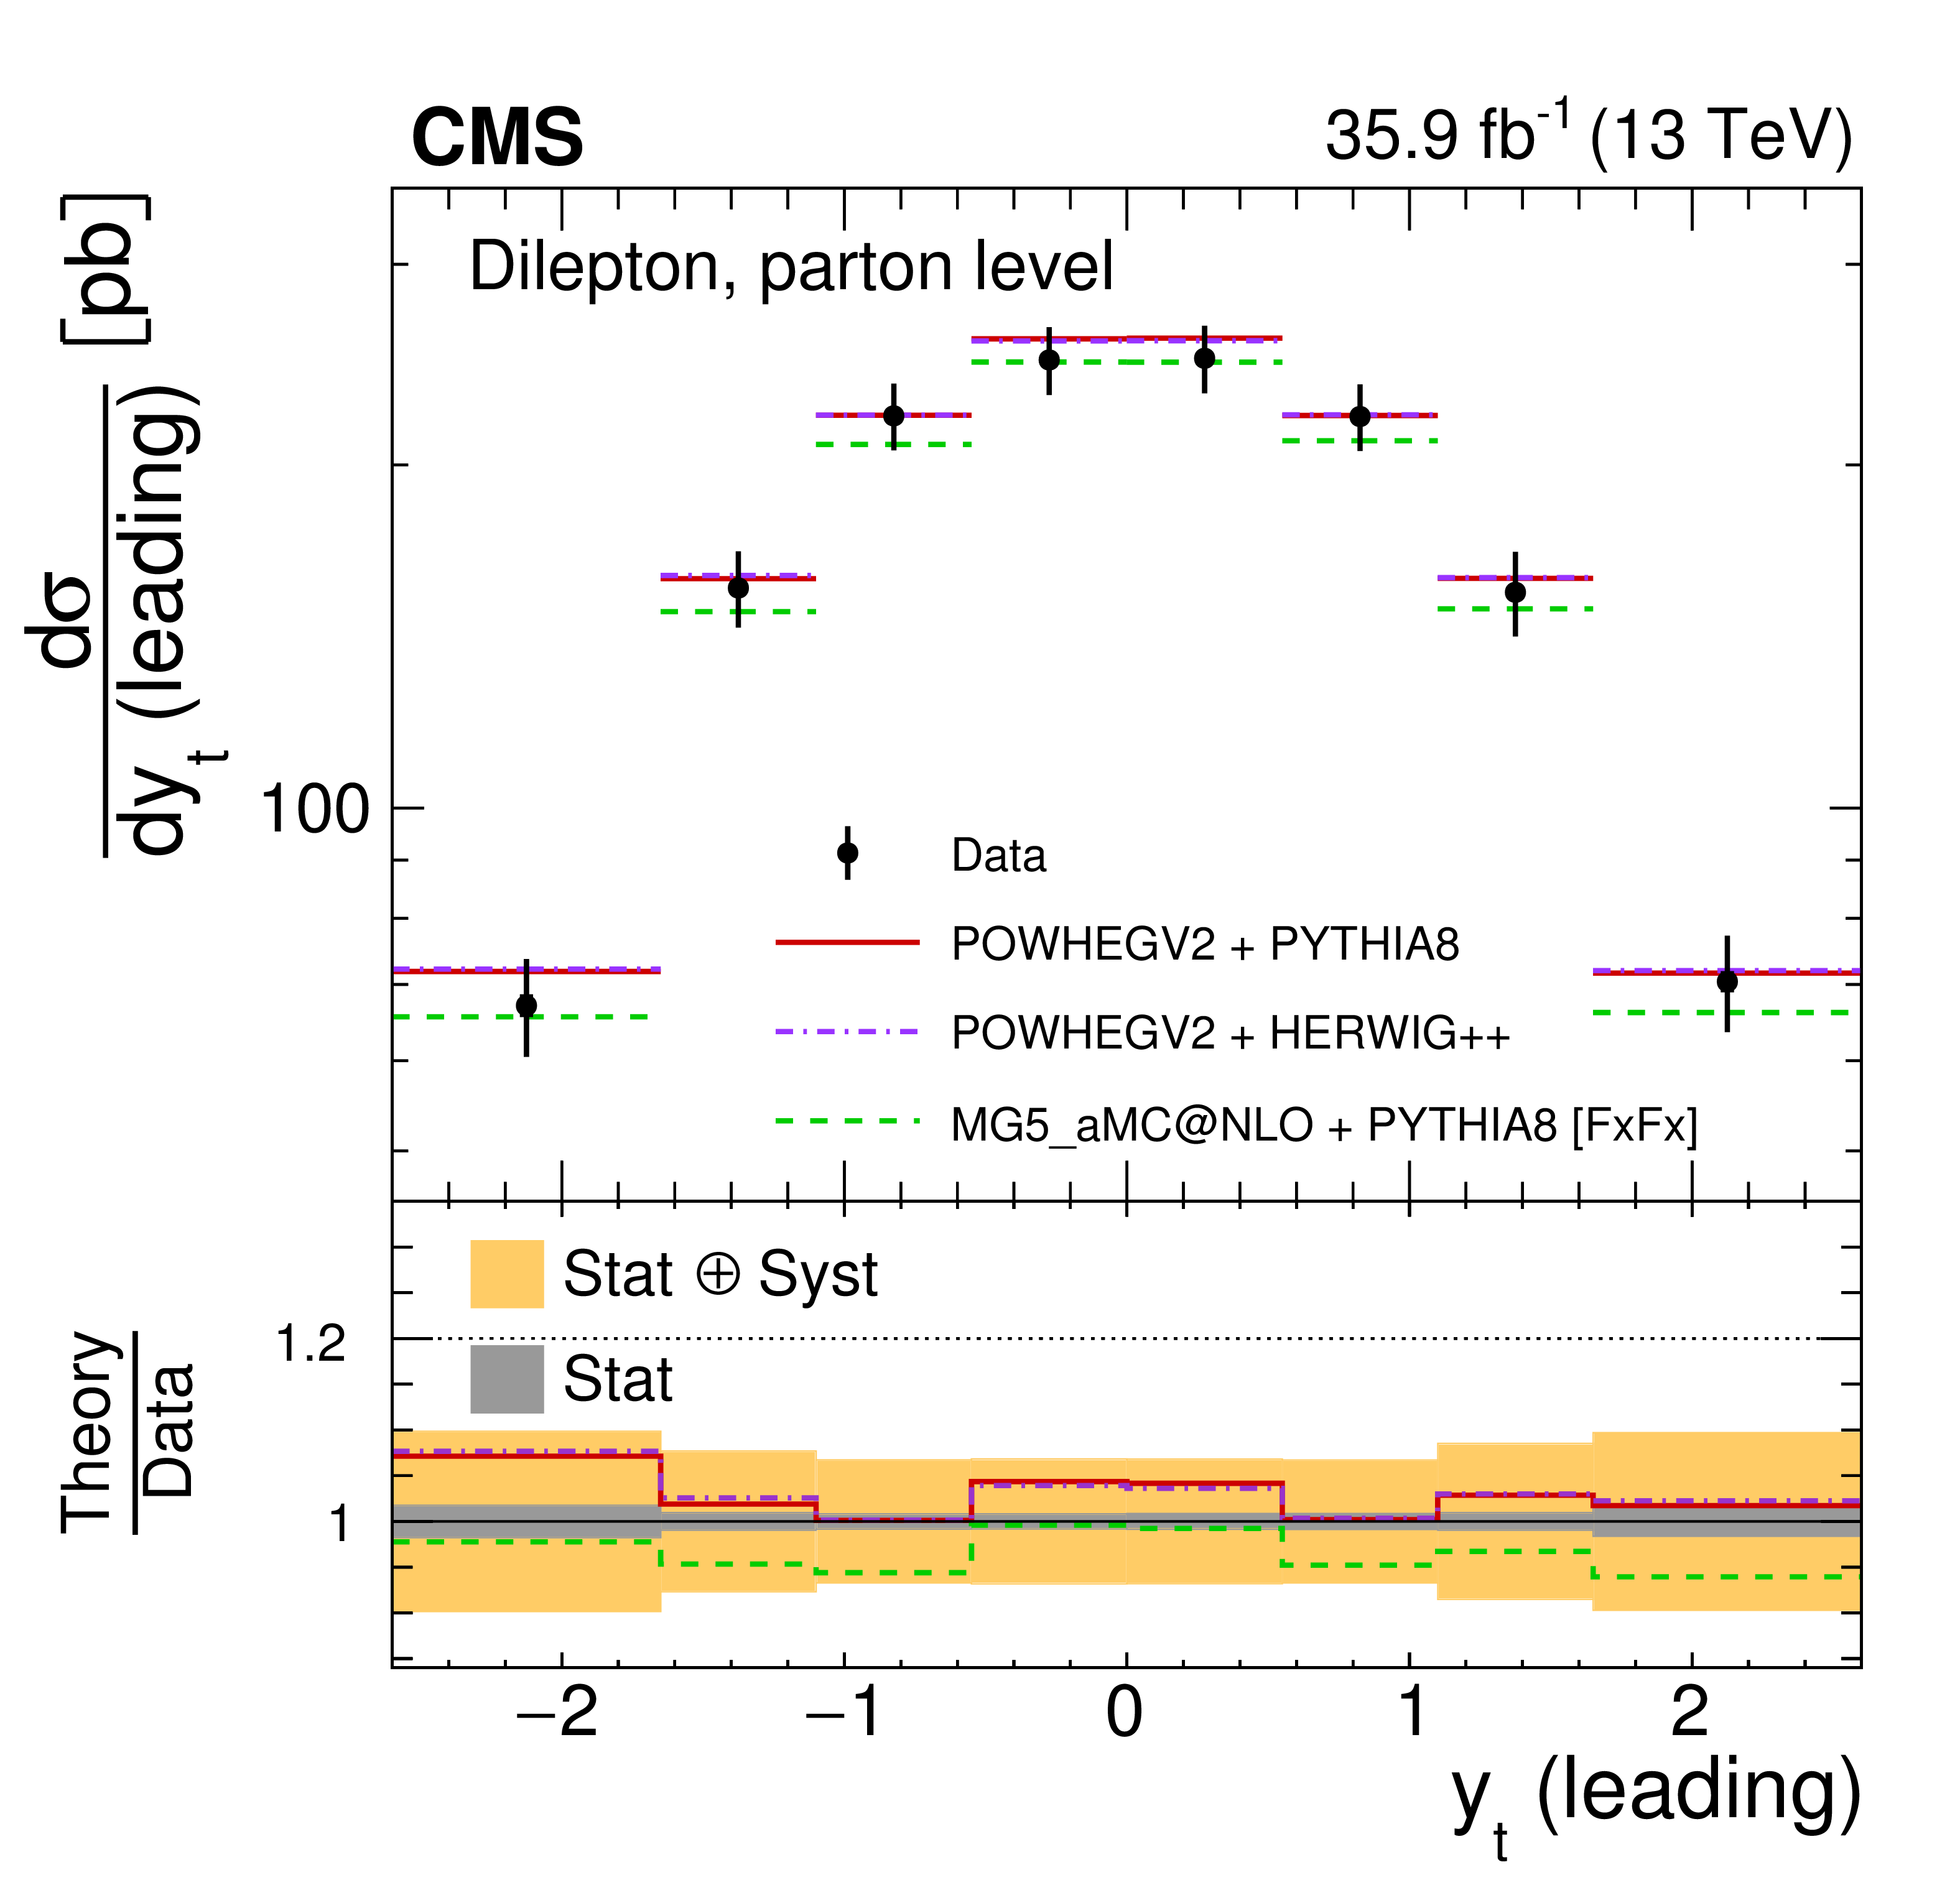
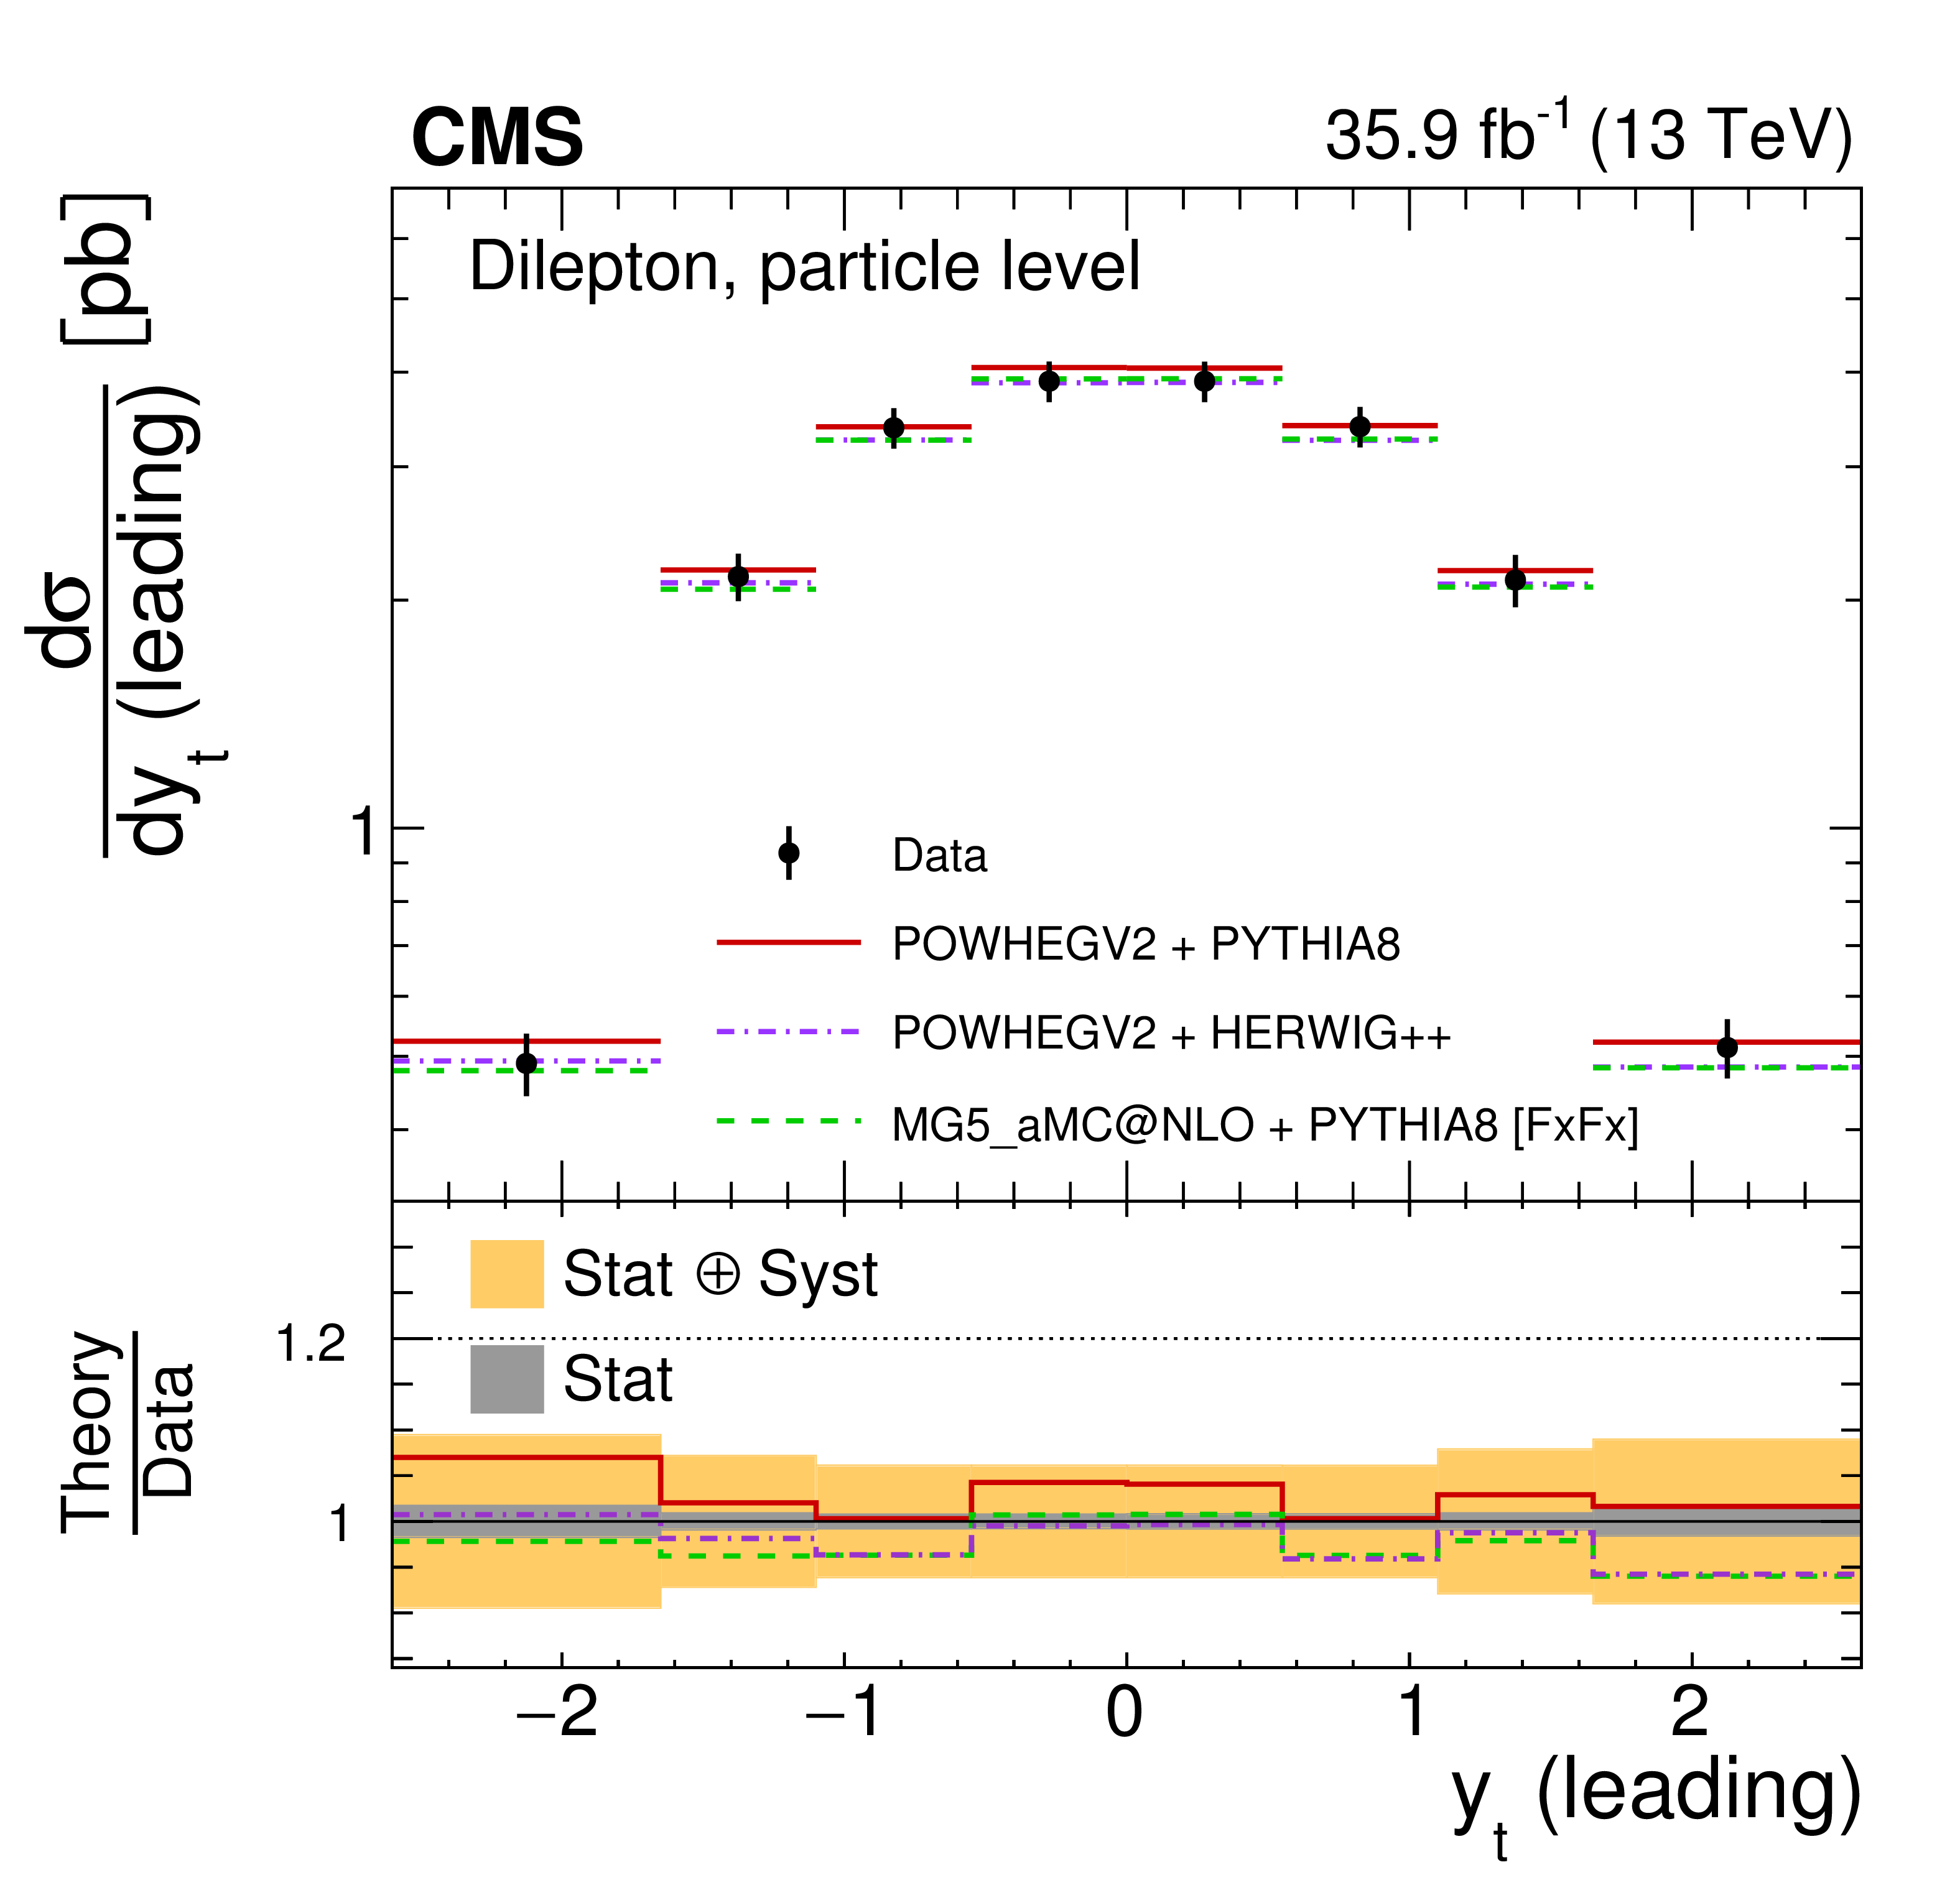
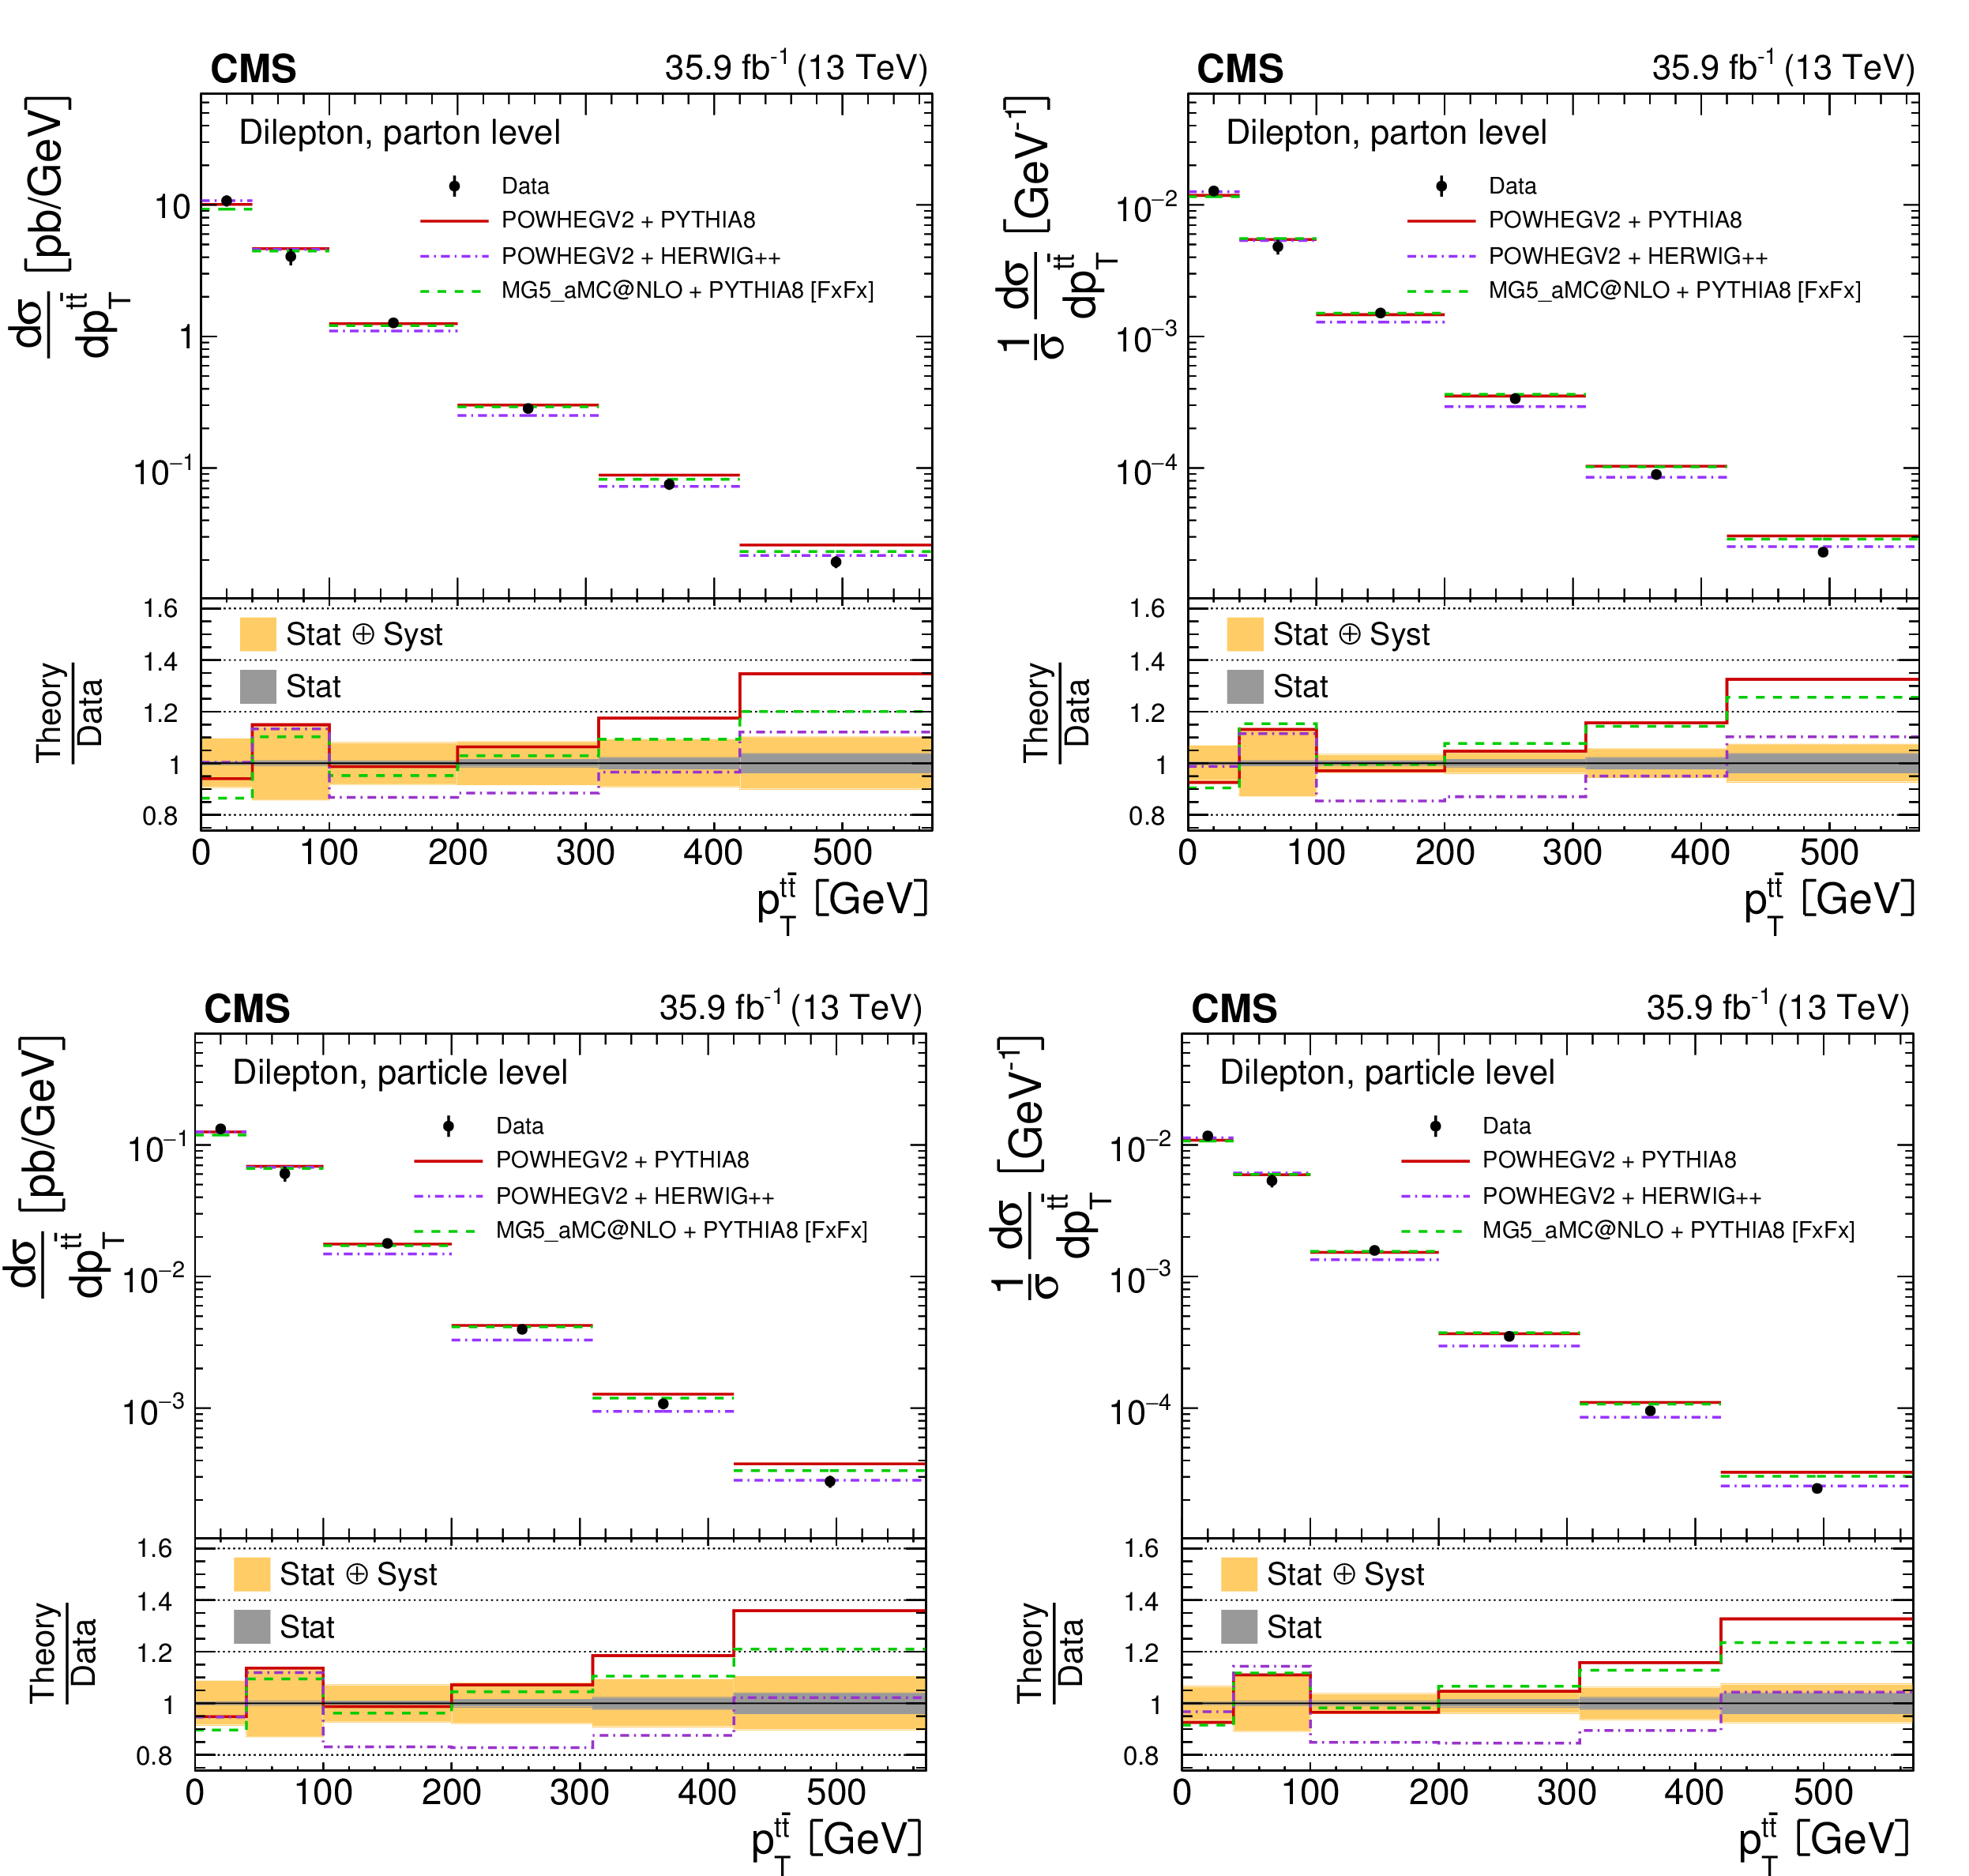
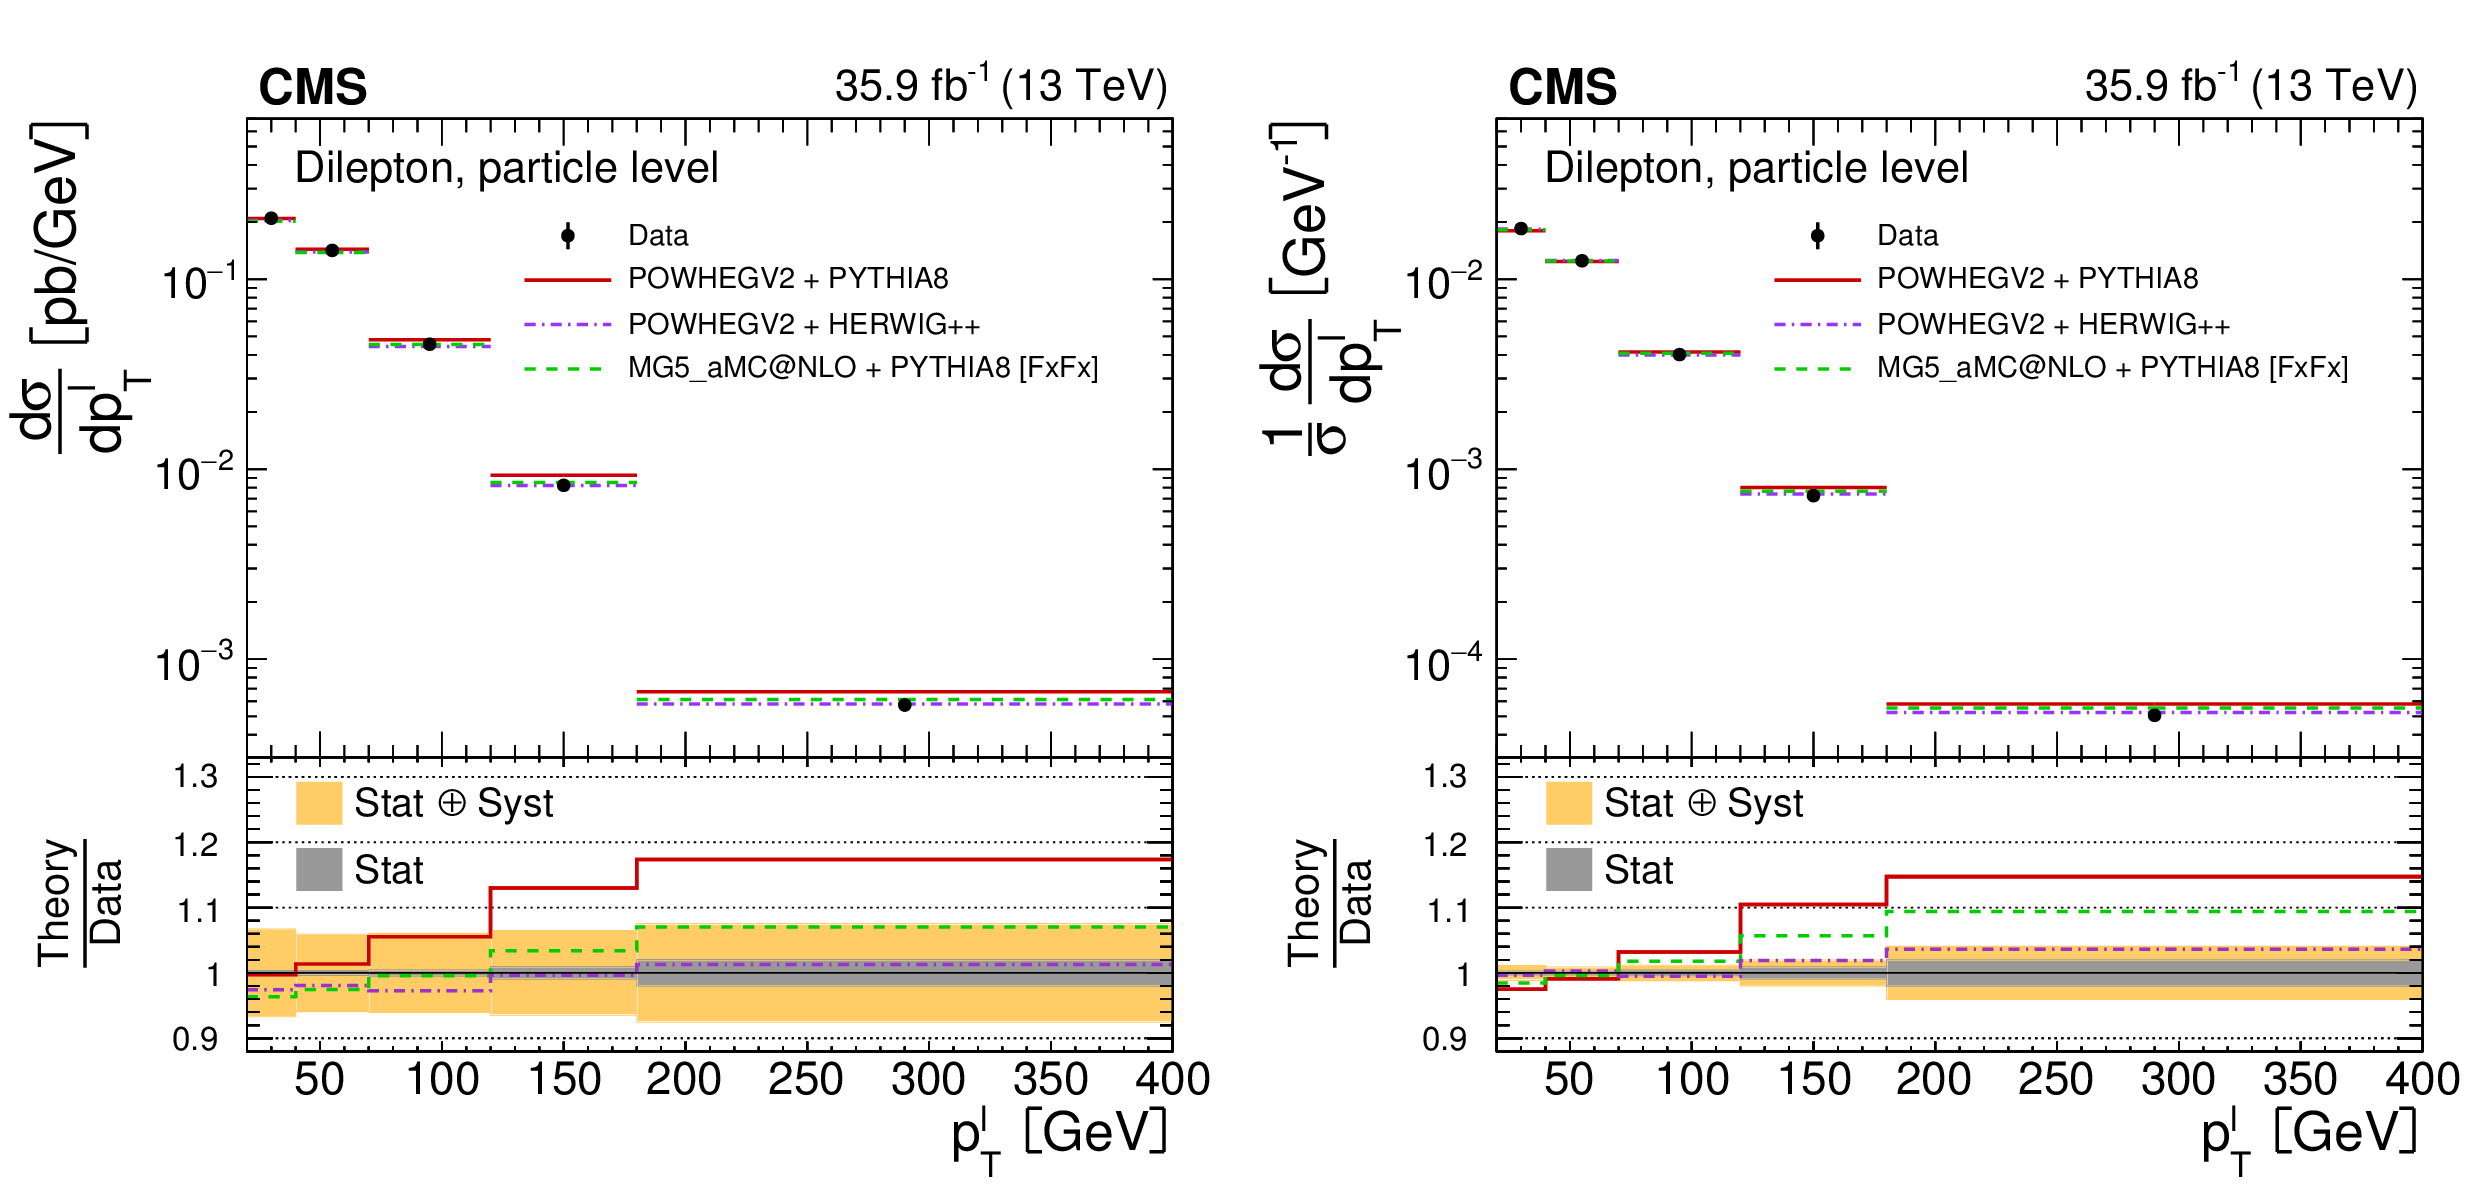
Figure 9:
The differential $ {{\mathrm {t}\overline {\mathrm {t}}}} $ production cross sections as a function of $ {{p_{\mathrm {T}}} ^{{\mathrm {t}}}} $ (leading) are shown for the data (points) and the MC predictions (lines). The vertical lines on the points indicate the total uncertainty in the data. The left and right columns correspond to absolute and normalised measurements, respectively. The upper row corresponds to measurements at the parton level in the full phase space and the lower row to the particle level in a fiducial phase space. The lower panel in each plot shows the ratios of the theoretical predictions to the data. The dark and light bands show the relative statistical and total uncertainties in the data, respectively. |
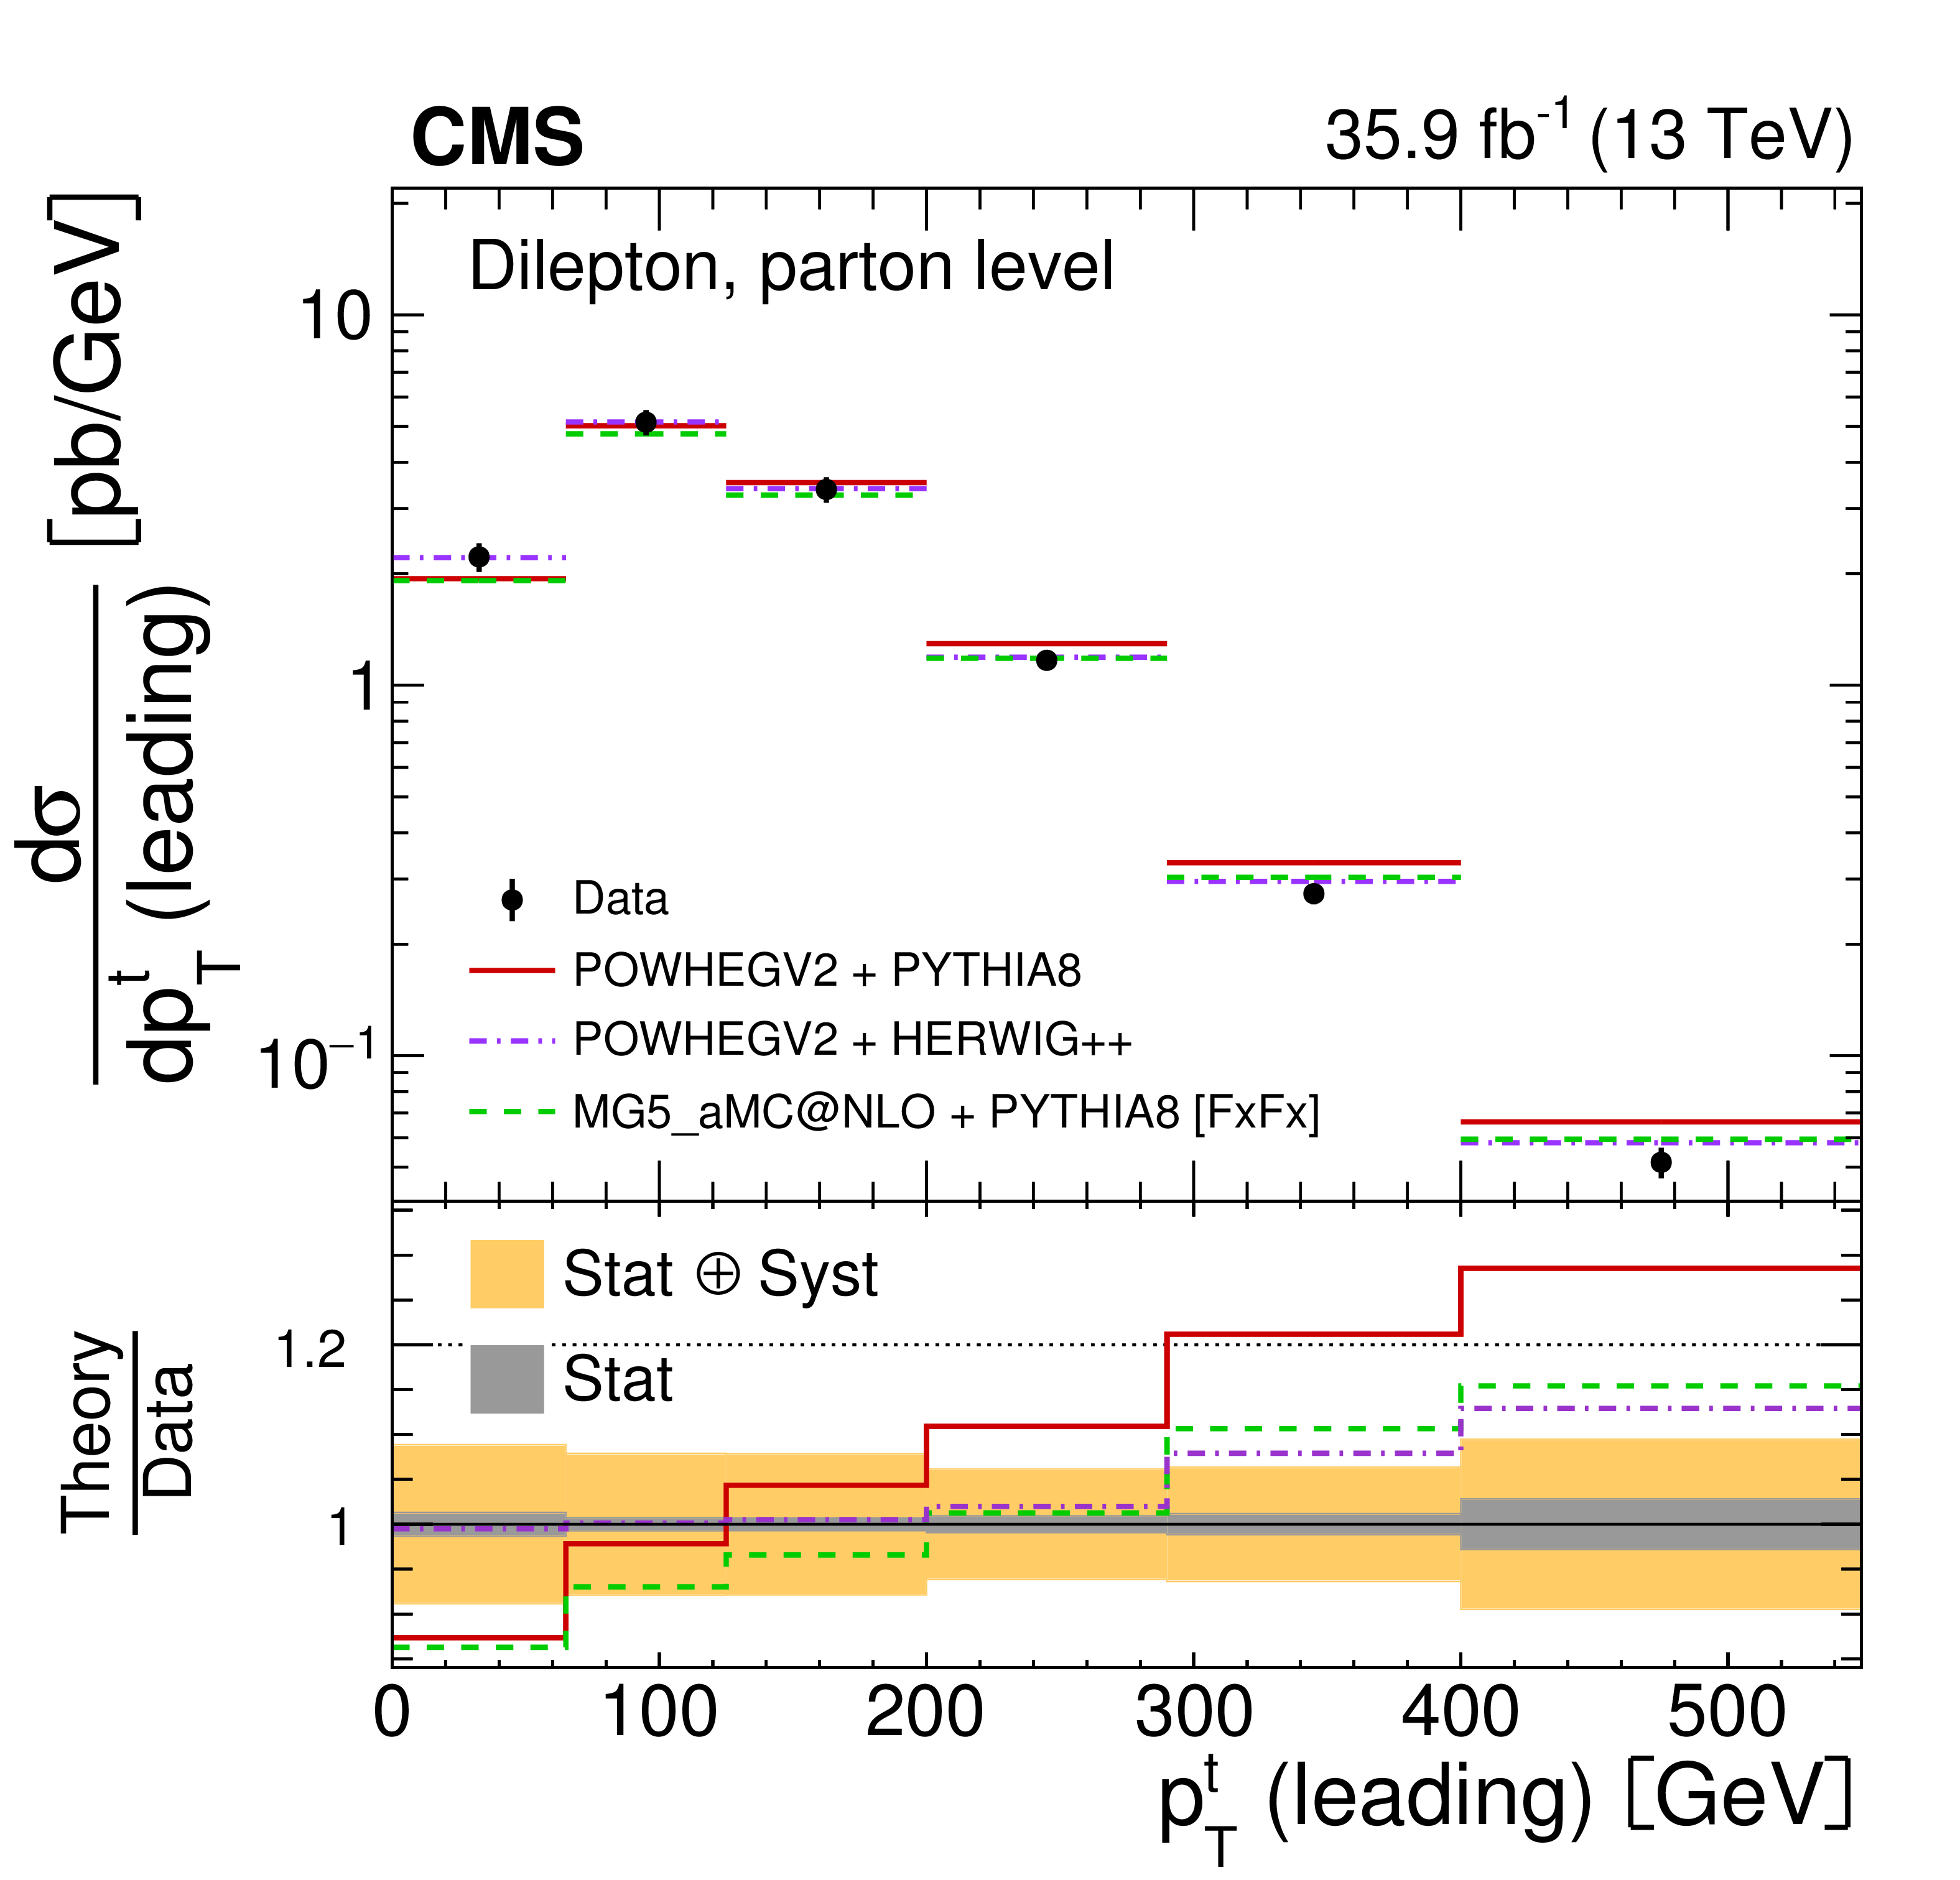
png pdf |
Figure 9-a:
The differential $ {{\mathrm {t}\overline {\mathrm {t}}}} $ production cross sections as a function of $ {{p_{\mathrm {T}}} ^{{\mathrm {t}}}} $ (leading) are shown for the data (points) and the MC predictions (lines). The vertical lines on the points indicate the total uncertainty in the data. The left and right columns correspond to absolute and normalised measurements, respectively. The upper row corresponds to measurements at the parton level in the full phase space and the lower row to the particle level in a fiducial phase space. The lower panel in each plot shows the ratios of the theoretical predictions to the data. The dark and light bands show the relative statistical and total uncertainties in the data, respectively. |
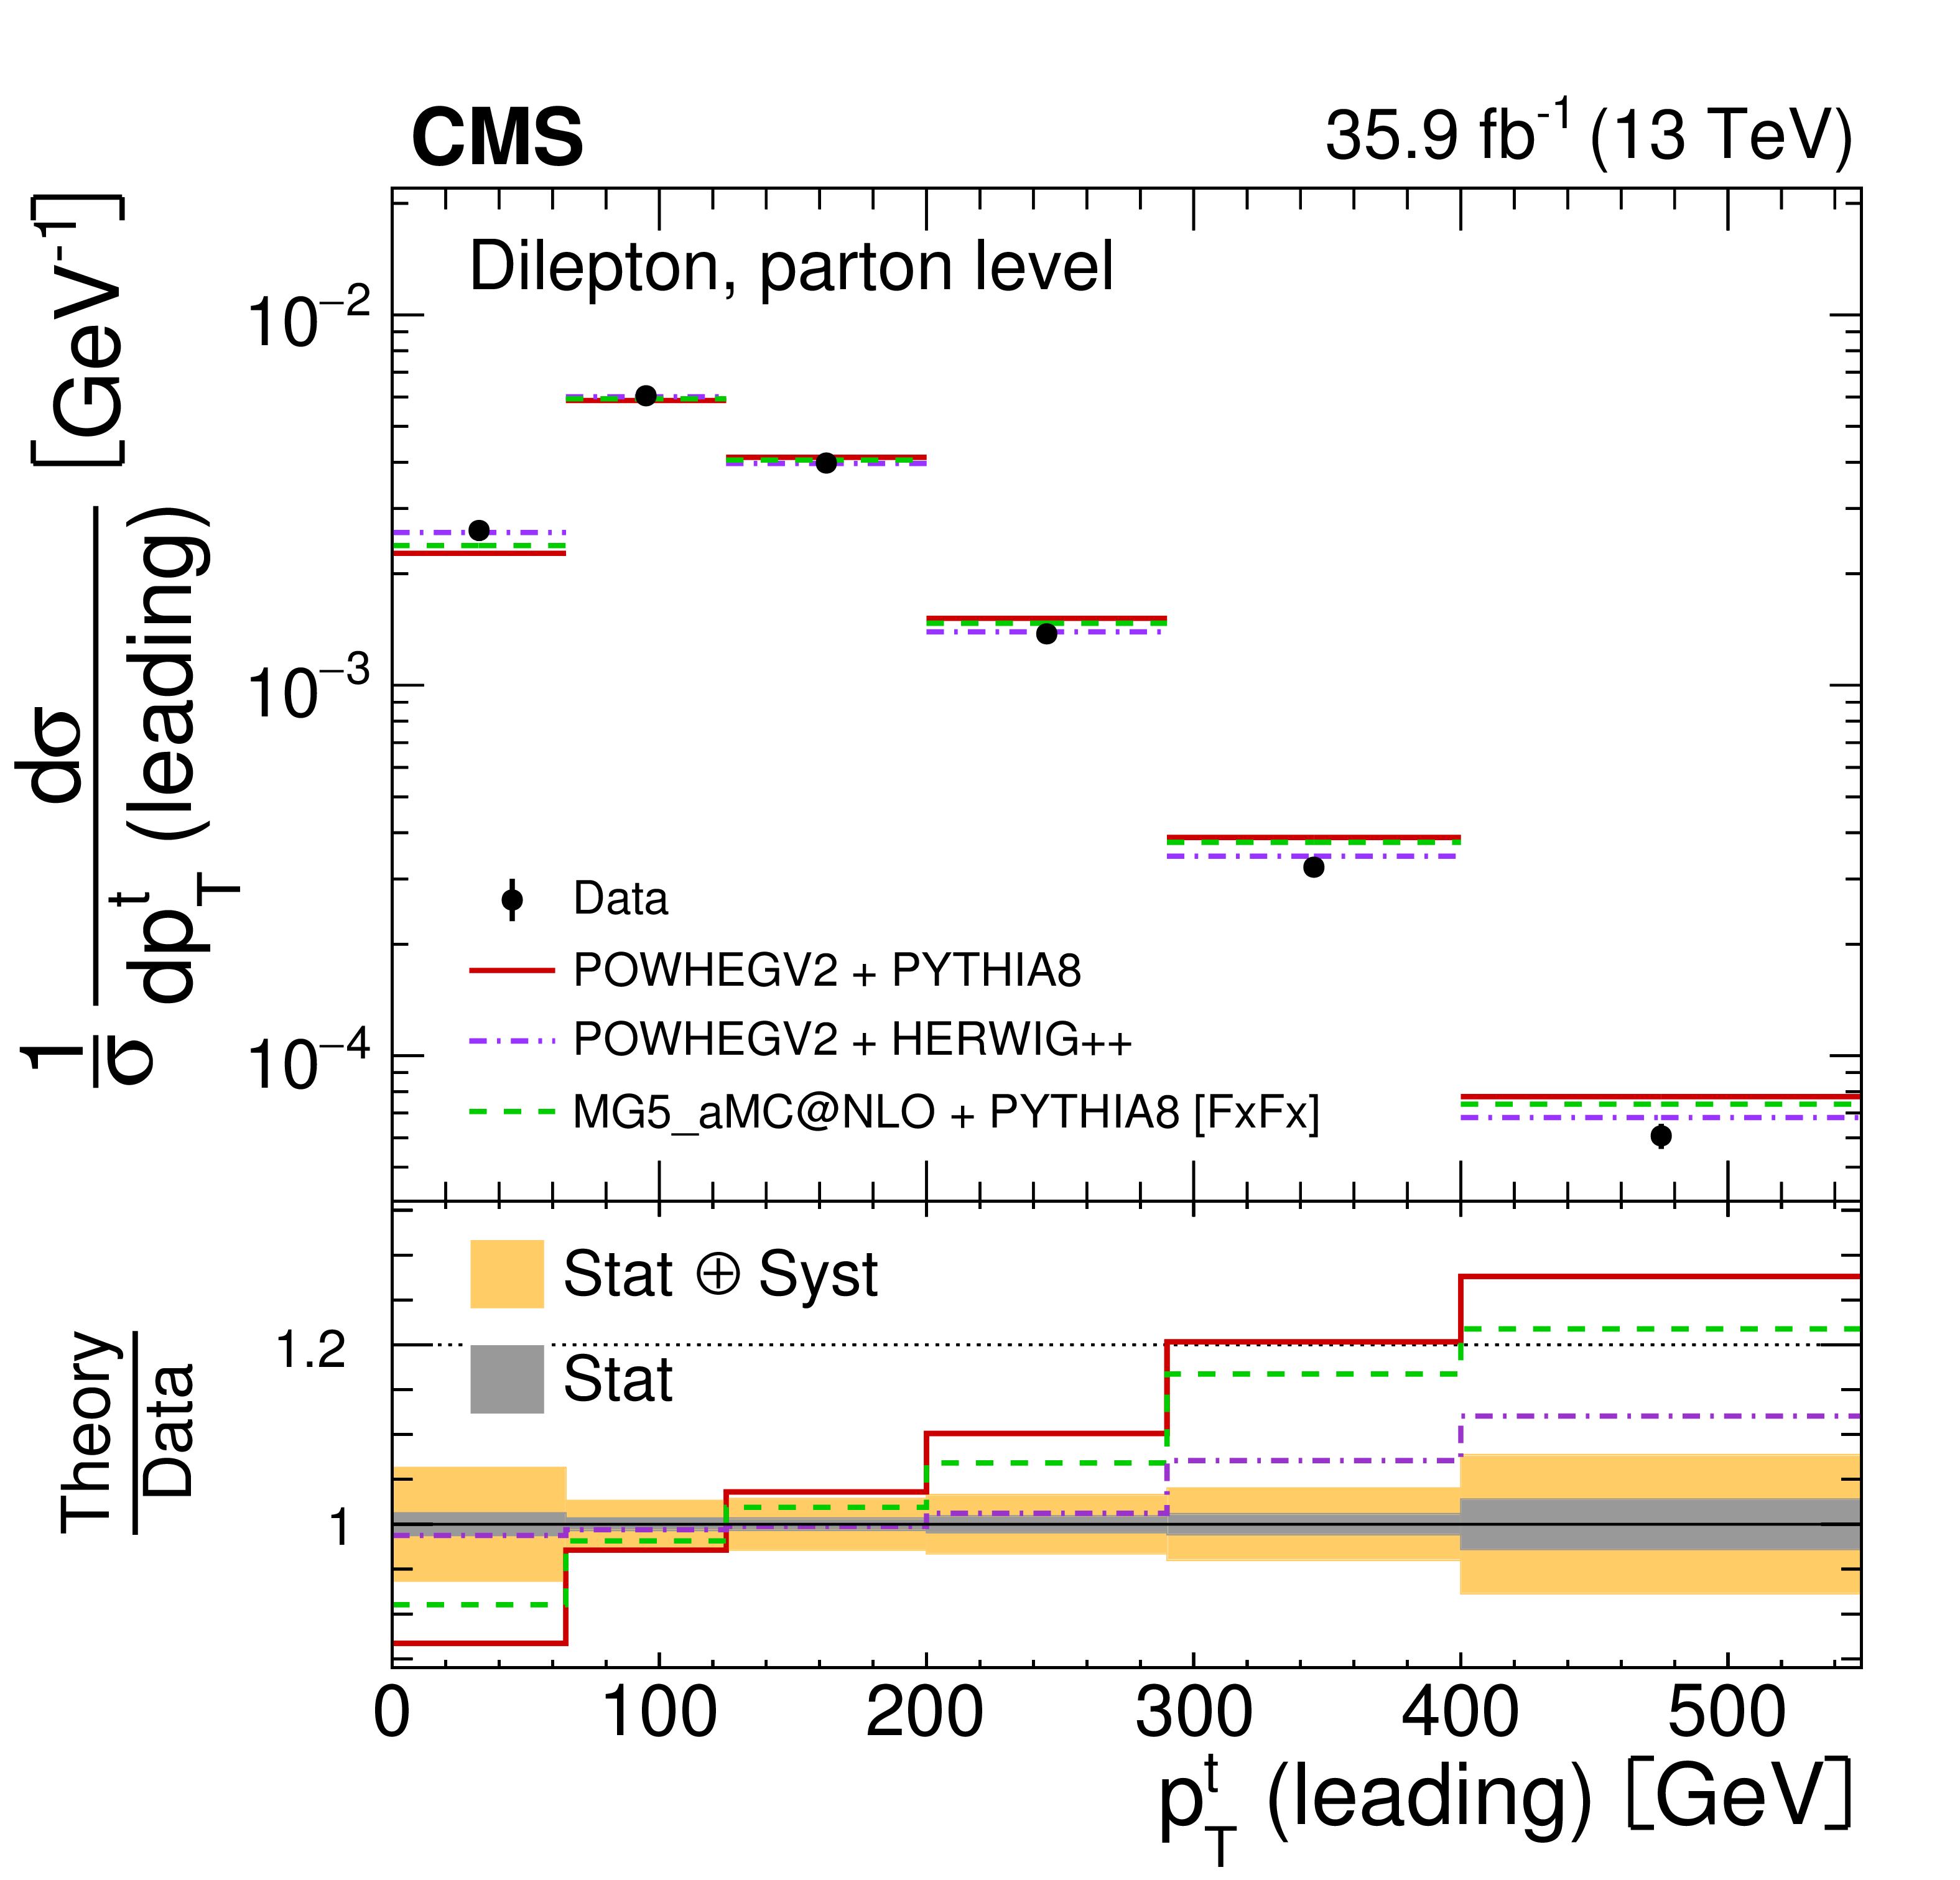
png pdf |
Figure 9-b:
The differential $ {{\mathrm {t}\overline {\mathrm {t}}}} $ production cross sections as a function of $ {{p_{\mathrm {T}}} ^{{\mathrm {t}}}} $ (leading) are shown for the data (points) and the MC predictions (lines). The vertical lines on the points indicate the total uncertainty in the data. The left and right columns correspond to absolute and normalised measurements, respectively. The upper row corresponds to measurements at the parton level in the full phase space and the lower row to the particle level in a fiducial phase space. The lower panel in each plot shows the ratios of the theoretical predictions to the data. The dark and light bands show the relative statistical and total uncertainties in the data, respectively. |

png pdf |
Figure 9-c:
The differential $ {{\mathrm {t}\overline {\mathrm {t}}}} $ production cross sections as a function of $ {{p_{\mathrm {T}}} ^{{\mathrm {t}}}} $ (leading) are shown for the data (points) and the MC predictions (lines). The vertical lines on the points indicate the total uncertainty in the data. The left and right columns correspond to absolute and normalised measurements, respectively. The upper row corresponds to measurements at the parton level in the full phase space and the lower row to the particle level in a fiducial phase space. The lower panel in each plot shows the ratios of the theoretical predictions to the data. The dark and light bands show the relative statistical and total uncertainties in the data, respectively. |
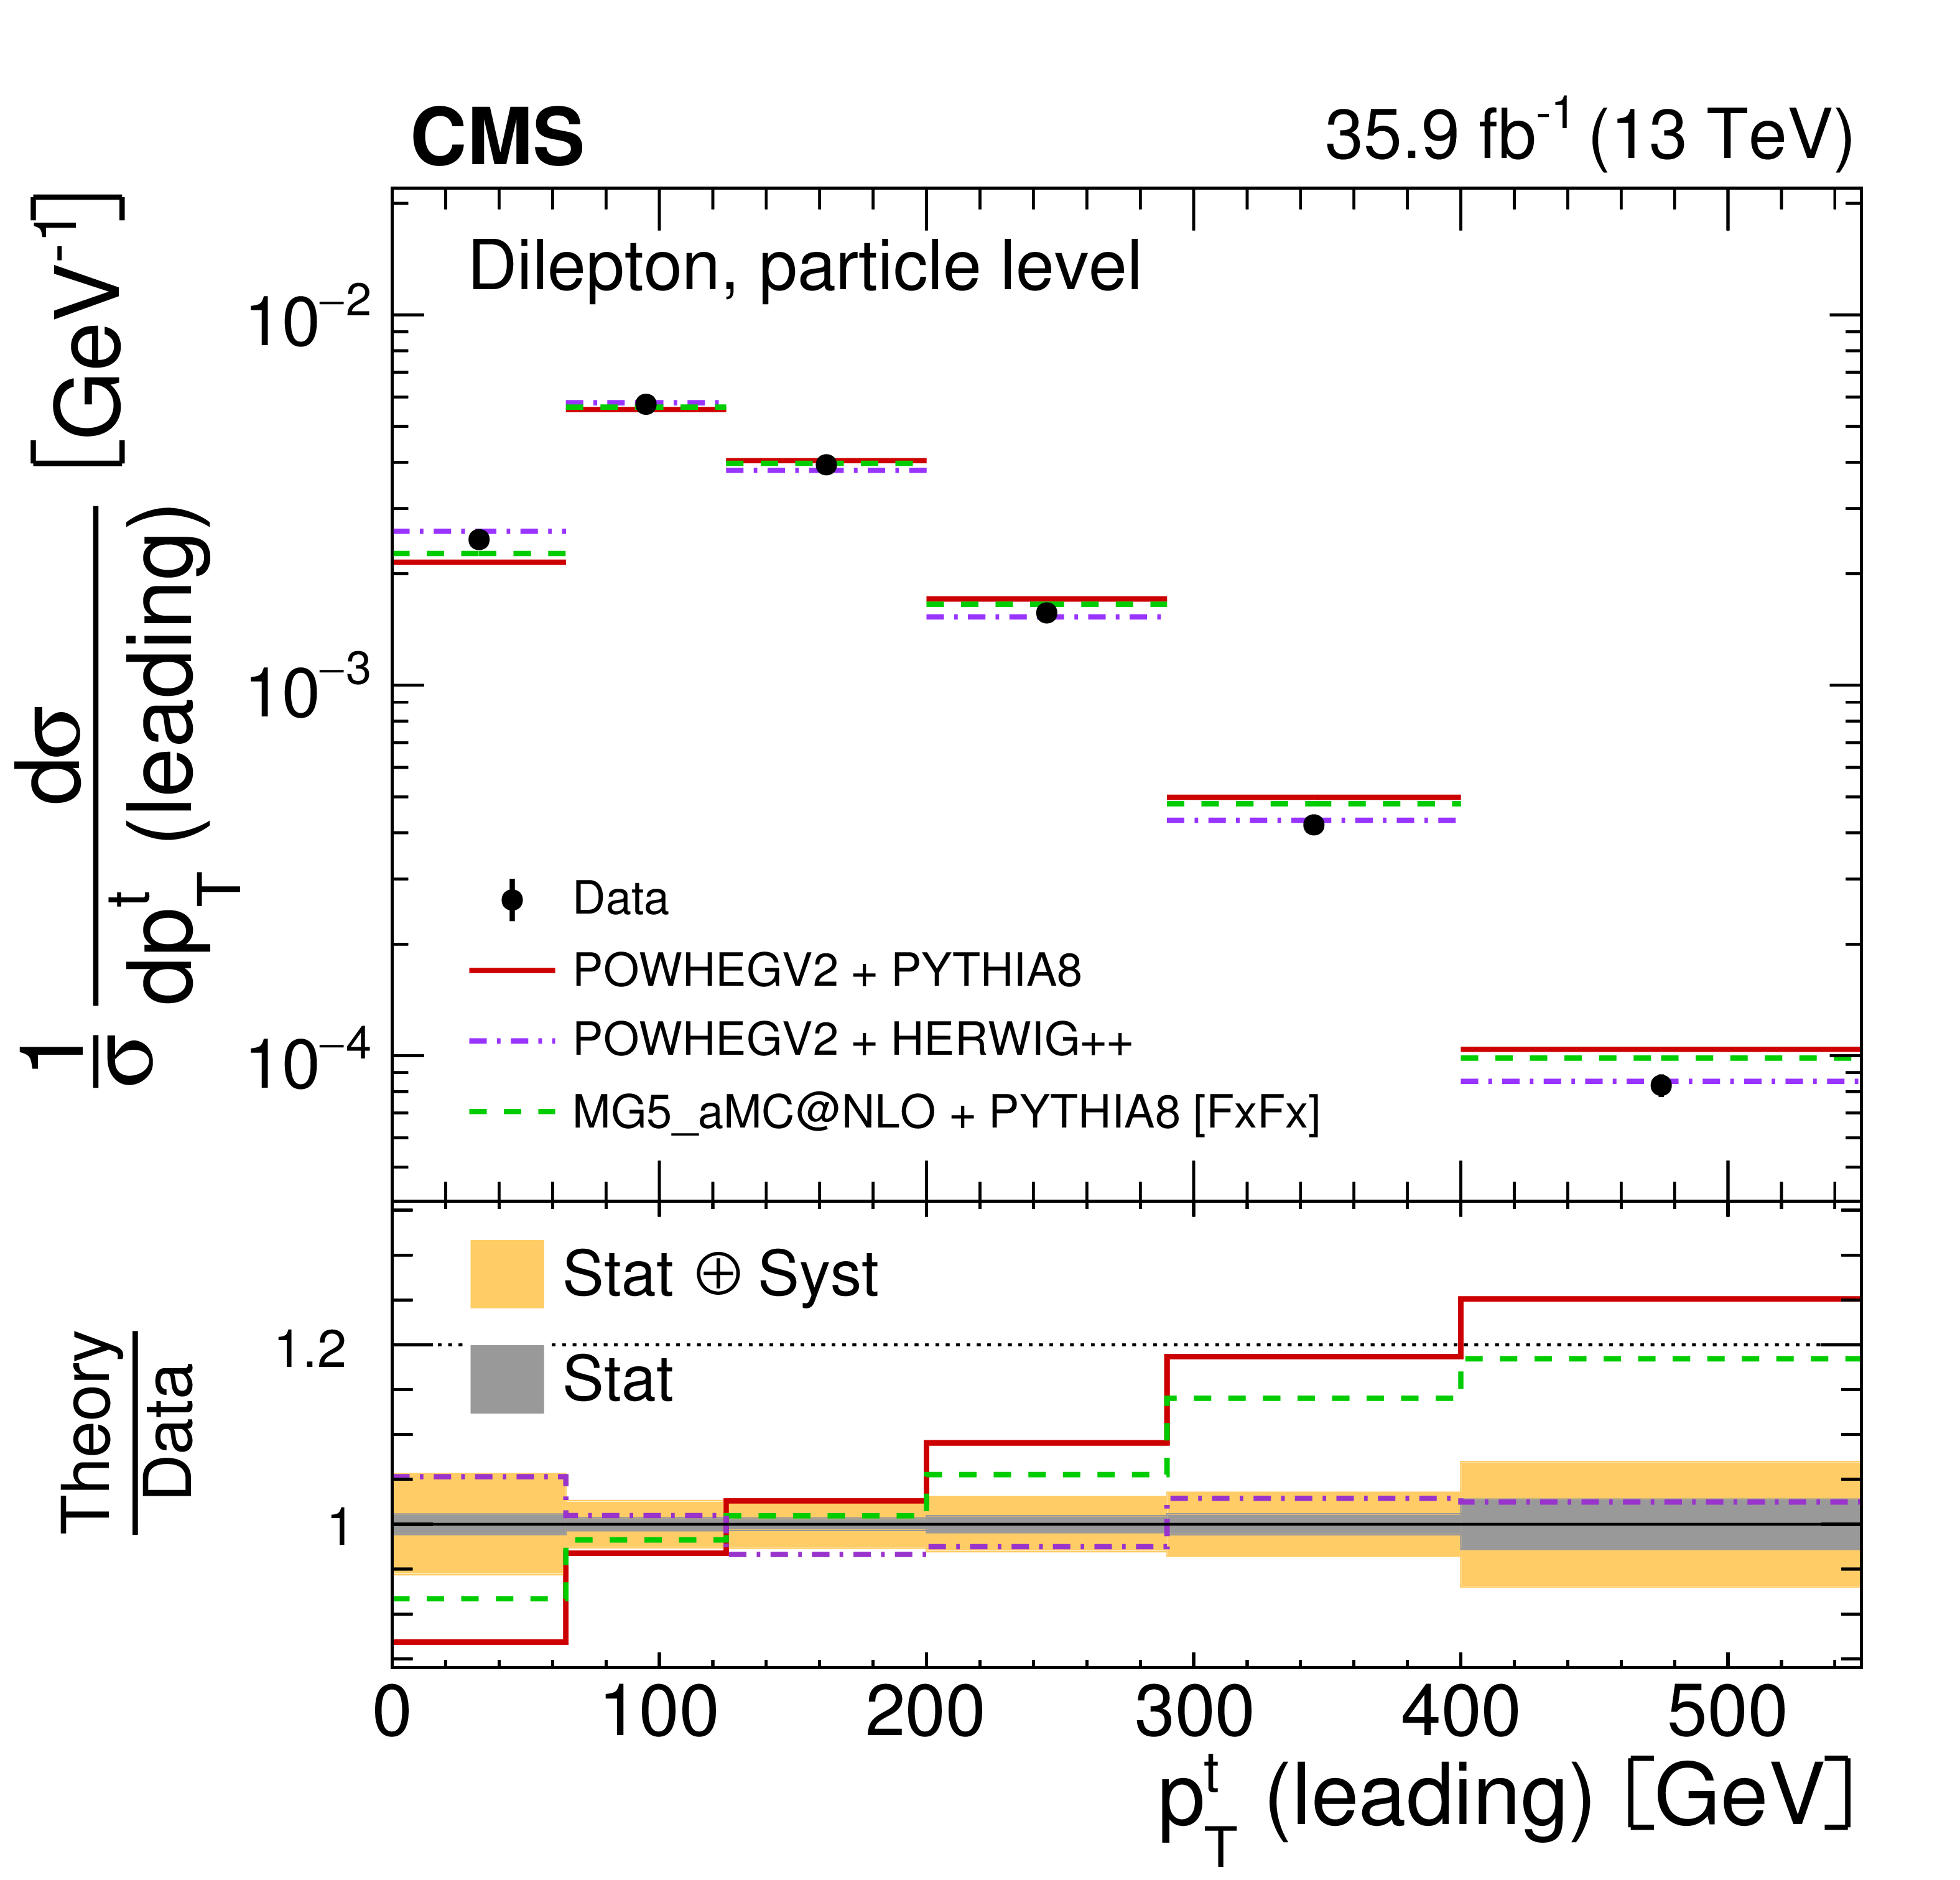
png pdf |
Figure 9-d:
The differential $ {{\mathrm {t}\overline {\mathrm {t}}}} $ production cross sections as a function of $ {{p_{\mathrm {T}}} ^{{\mathrm {t}}}} $ (leading) are shown for the data (points) and the MC predictions (lines). The vertical lines on the points indicate the total uncertainty in the data. The left and right columns correspond to absolute and normalised measurements, respectively. The upper row corresponds to measurements at the parton level in the full phase space and the lower row to the particle level in a fiducial phase space. The lower panel in each plot shows the ratios of the theoretical predictions to the data. The dark and light bands show the relative statistical and total uncertainties in the data, respectively. |
png pdf |
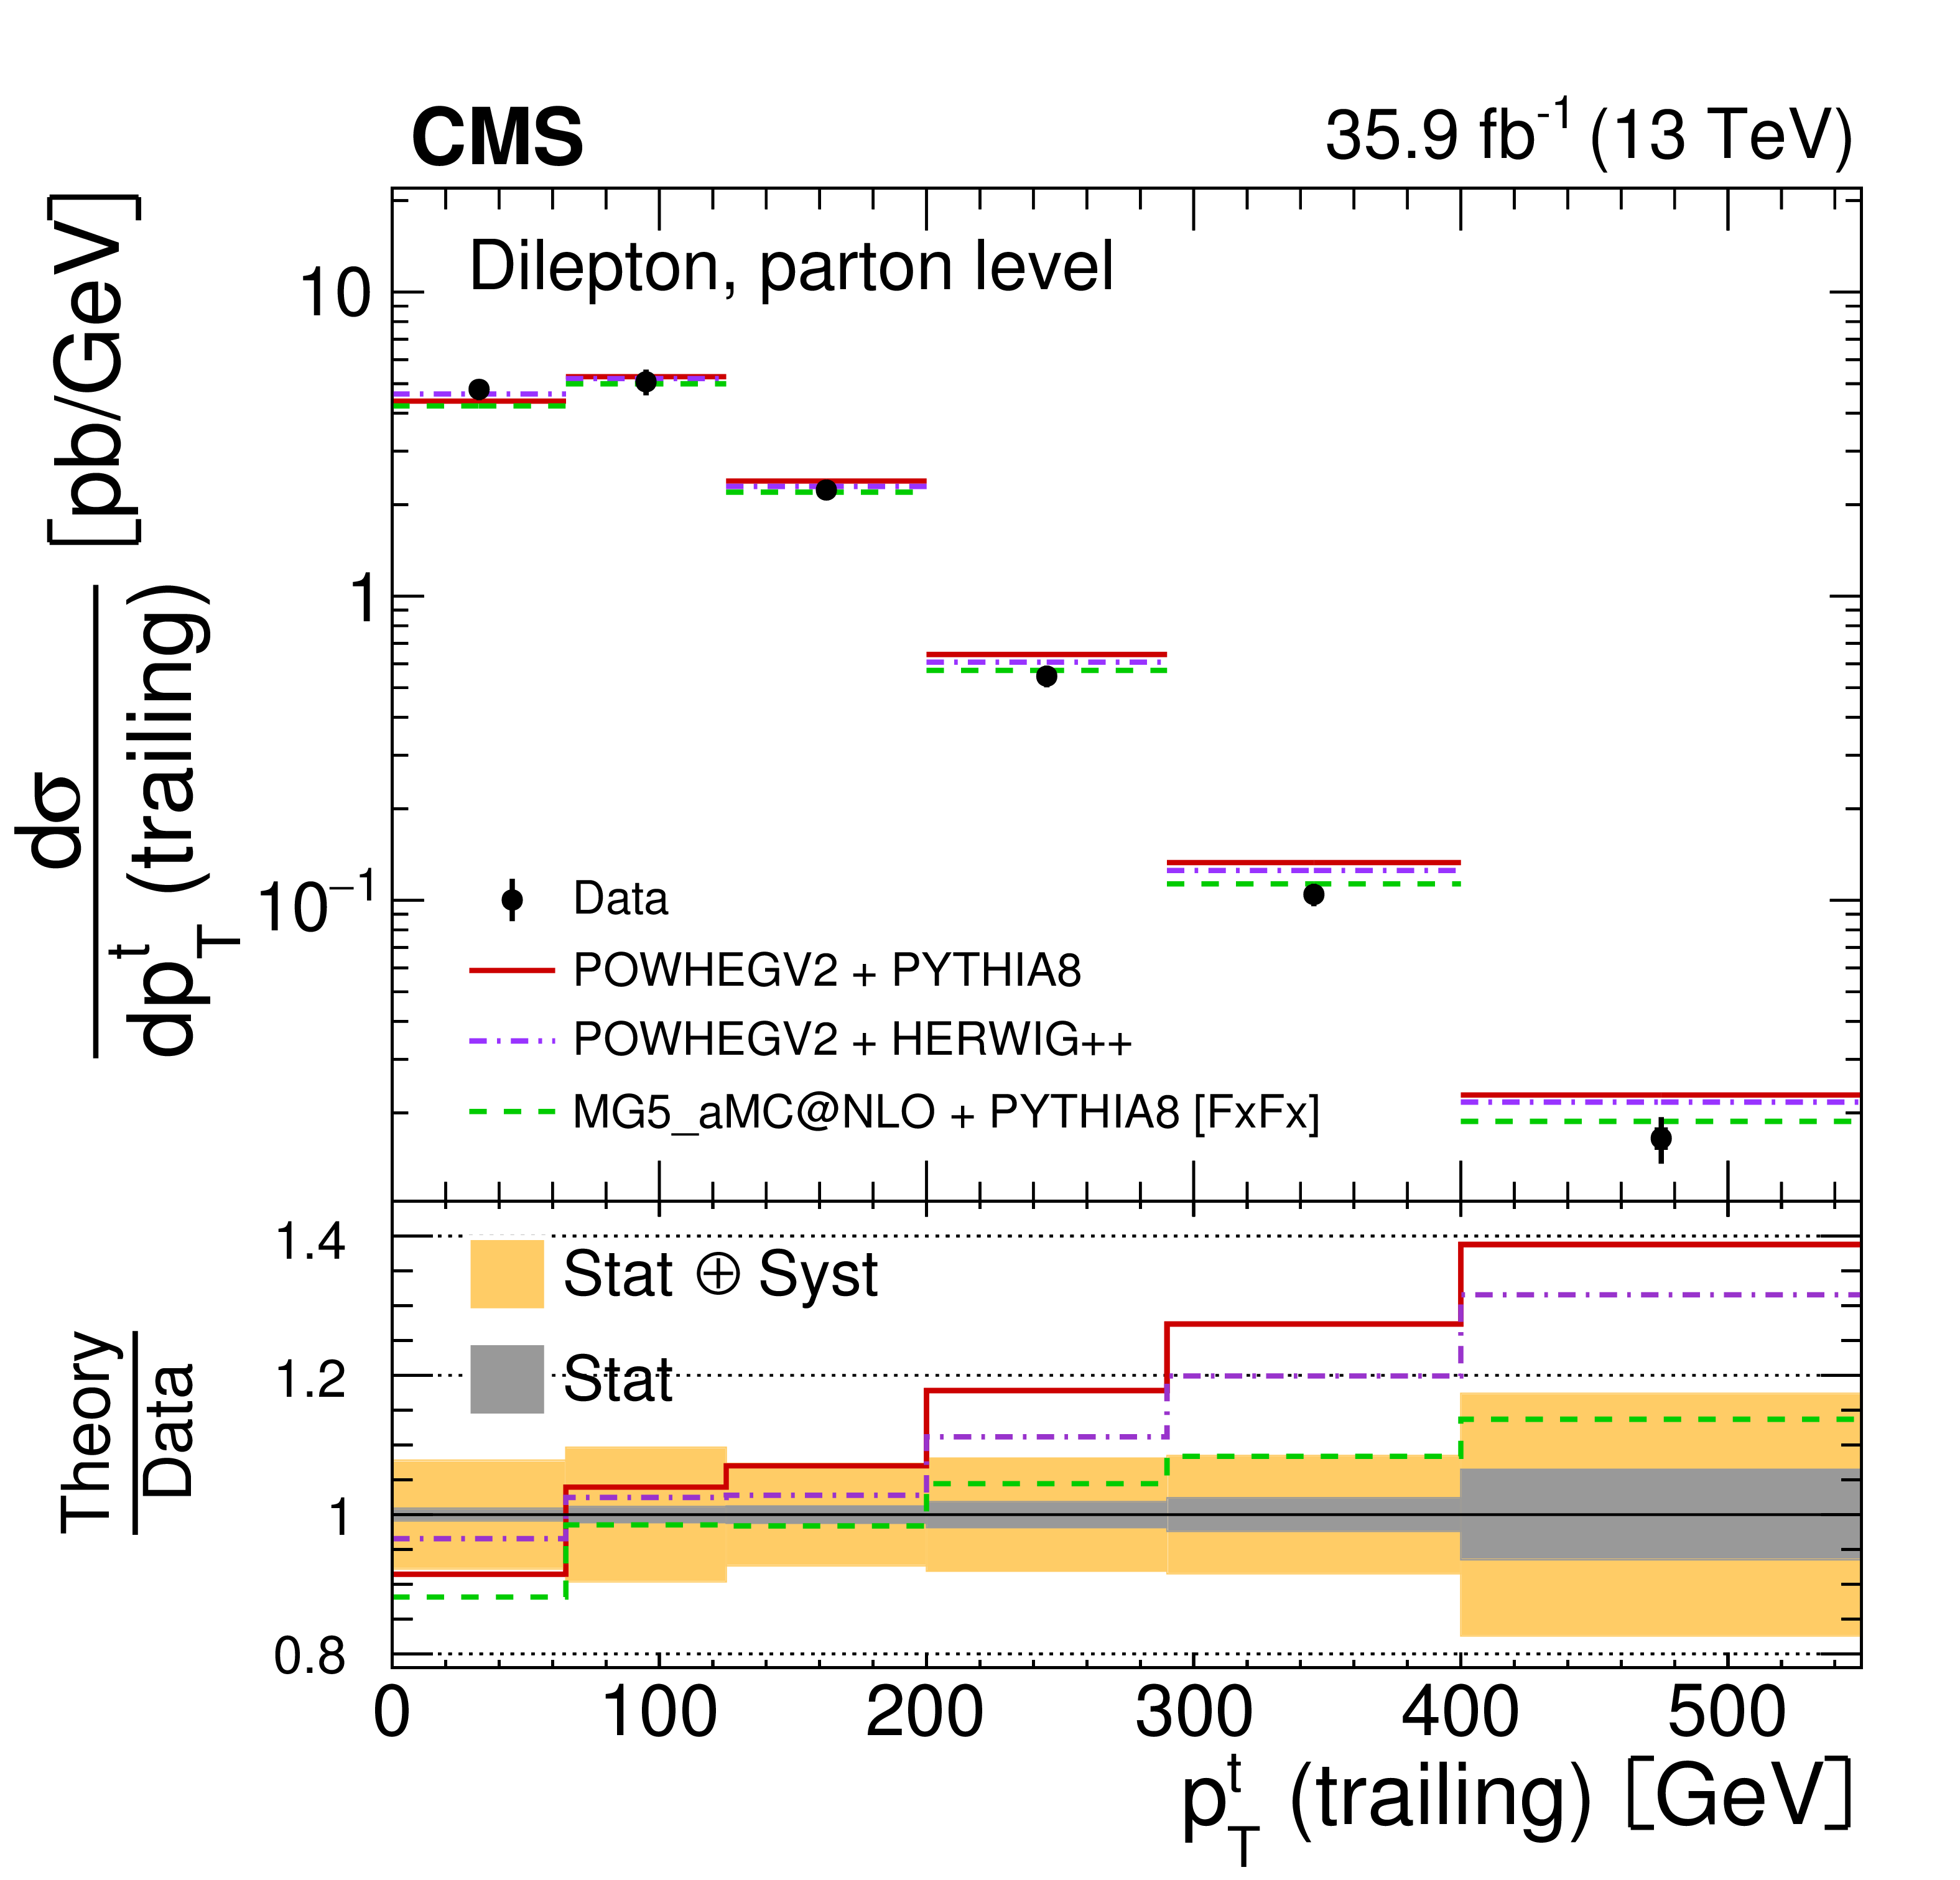
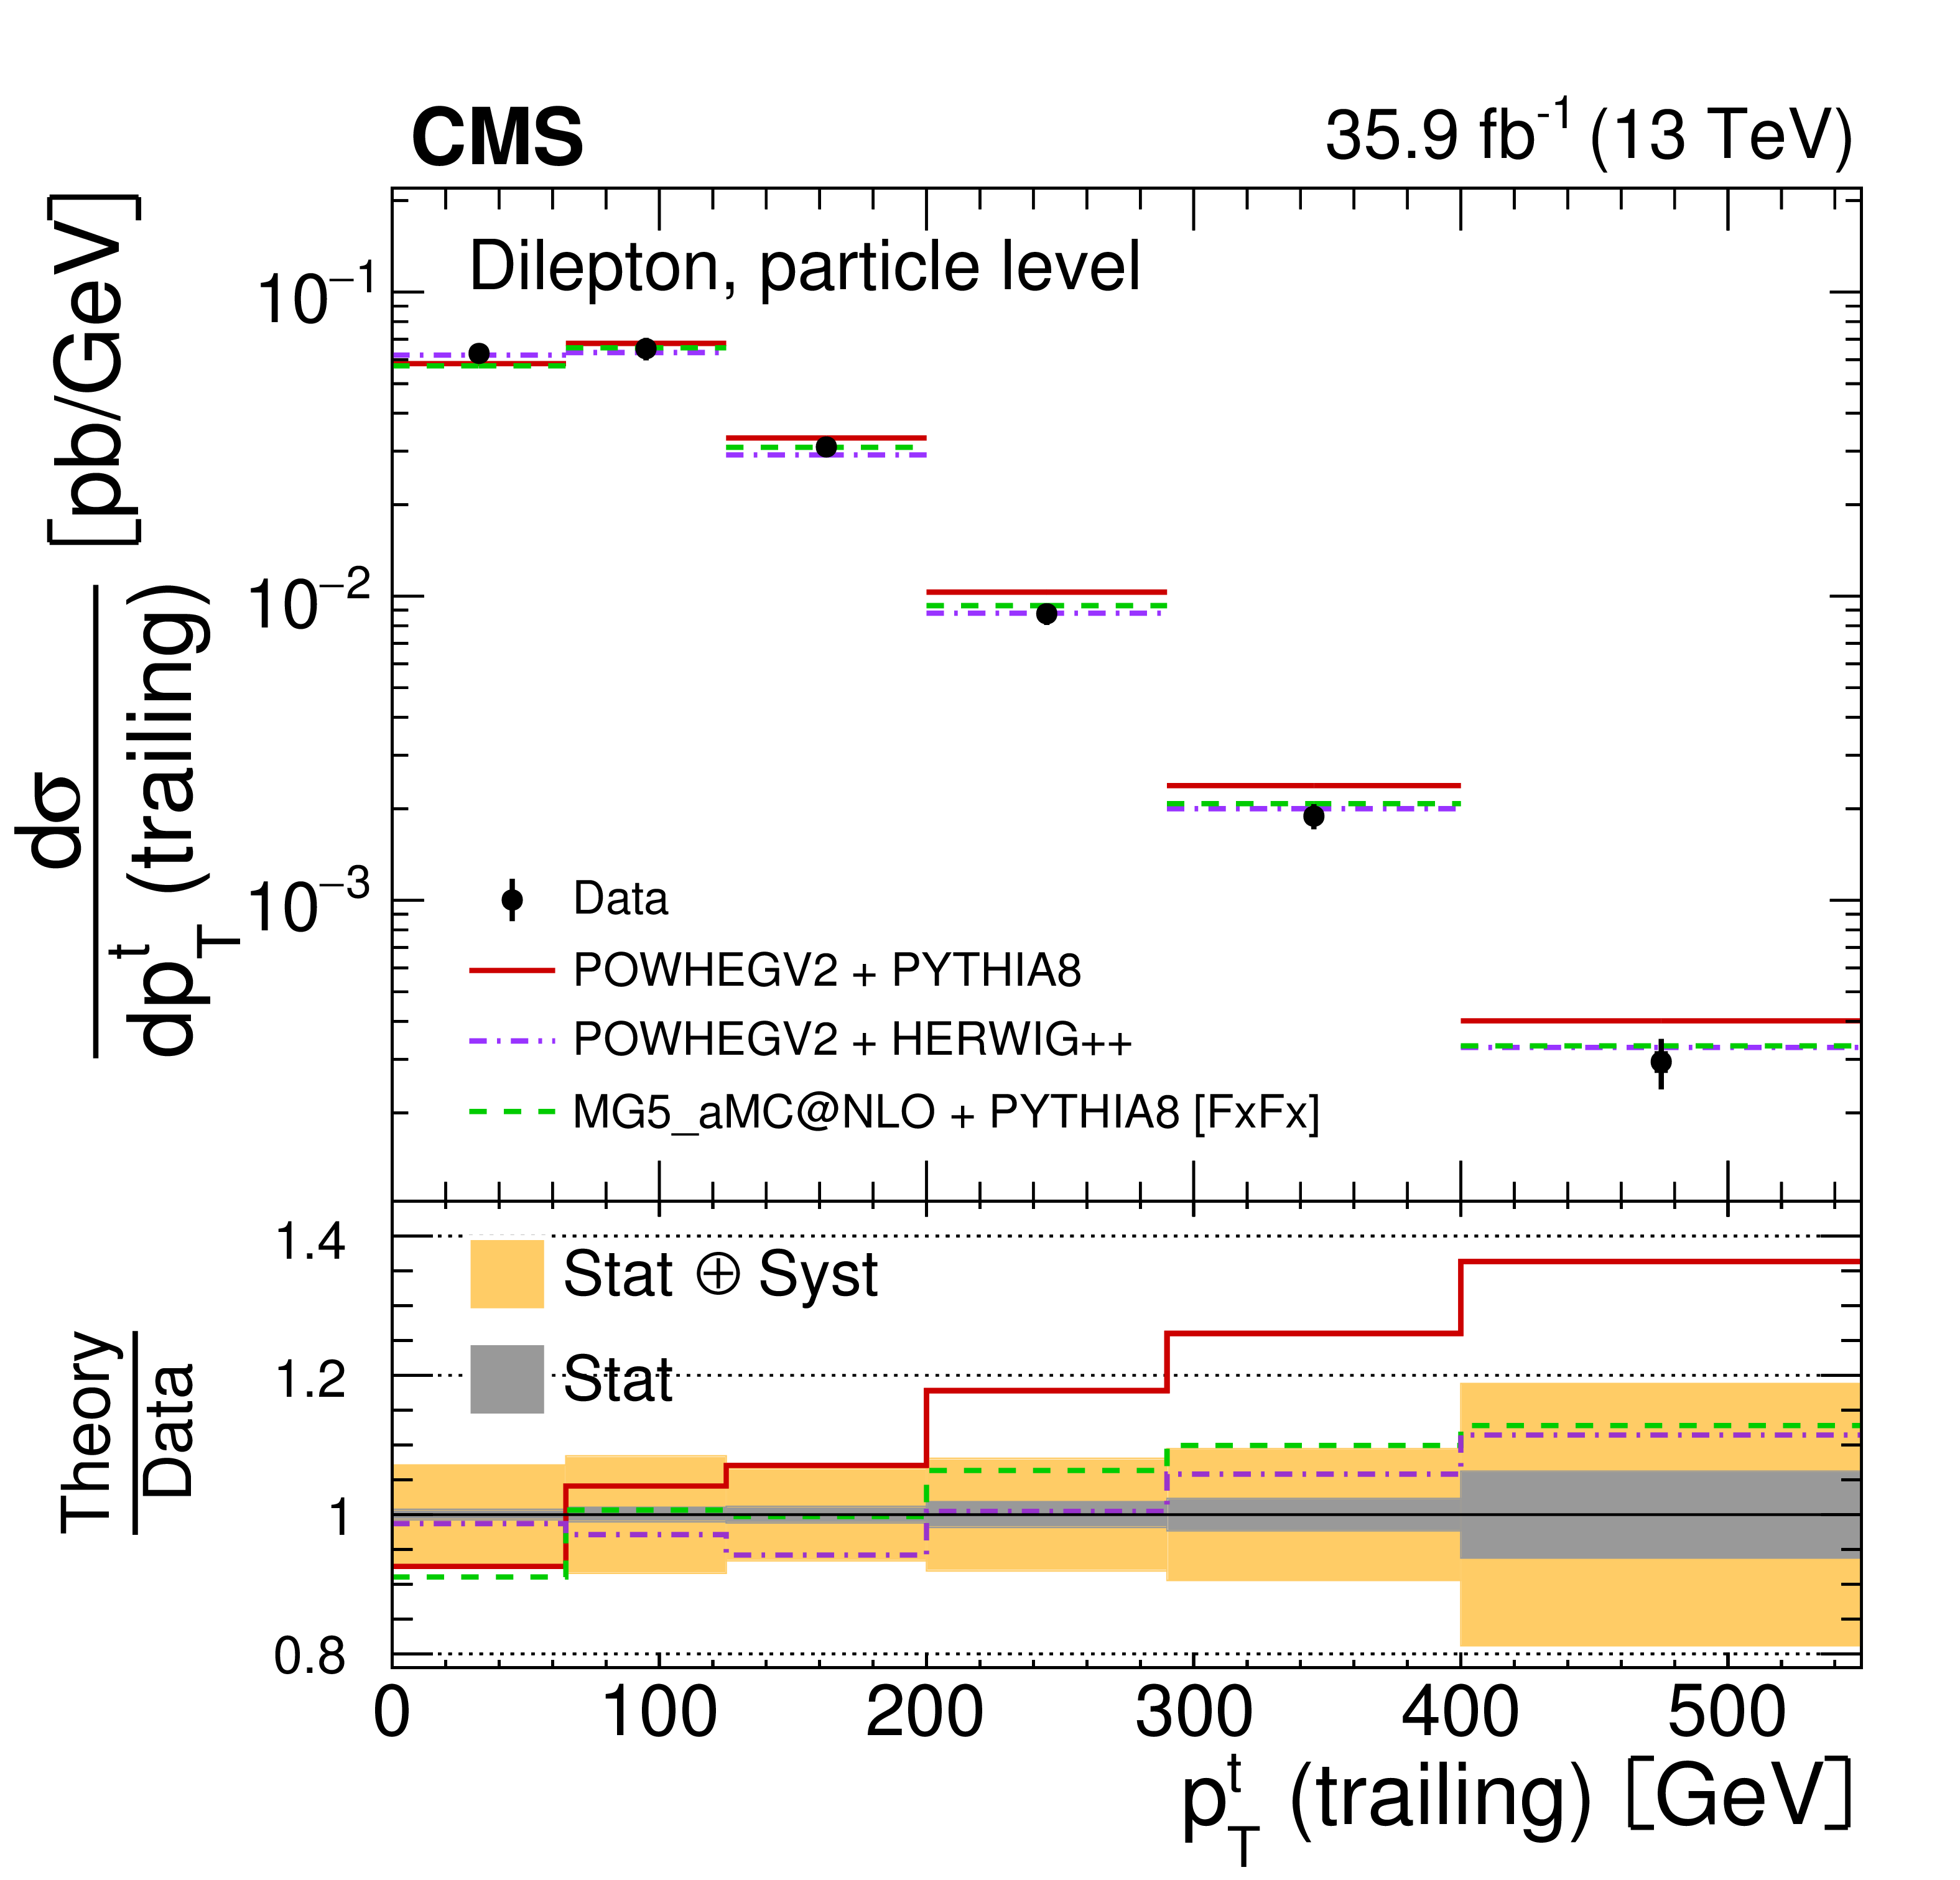
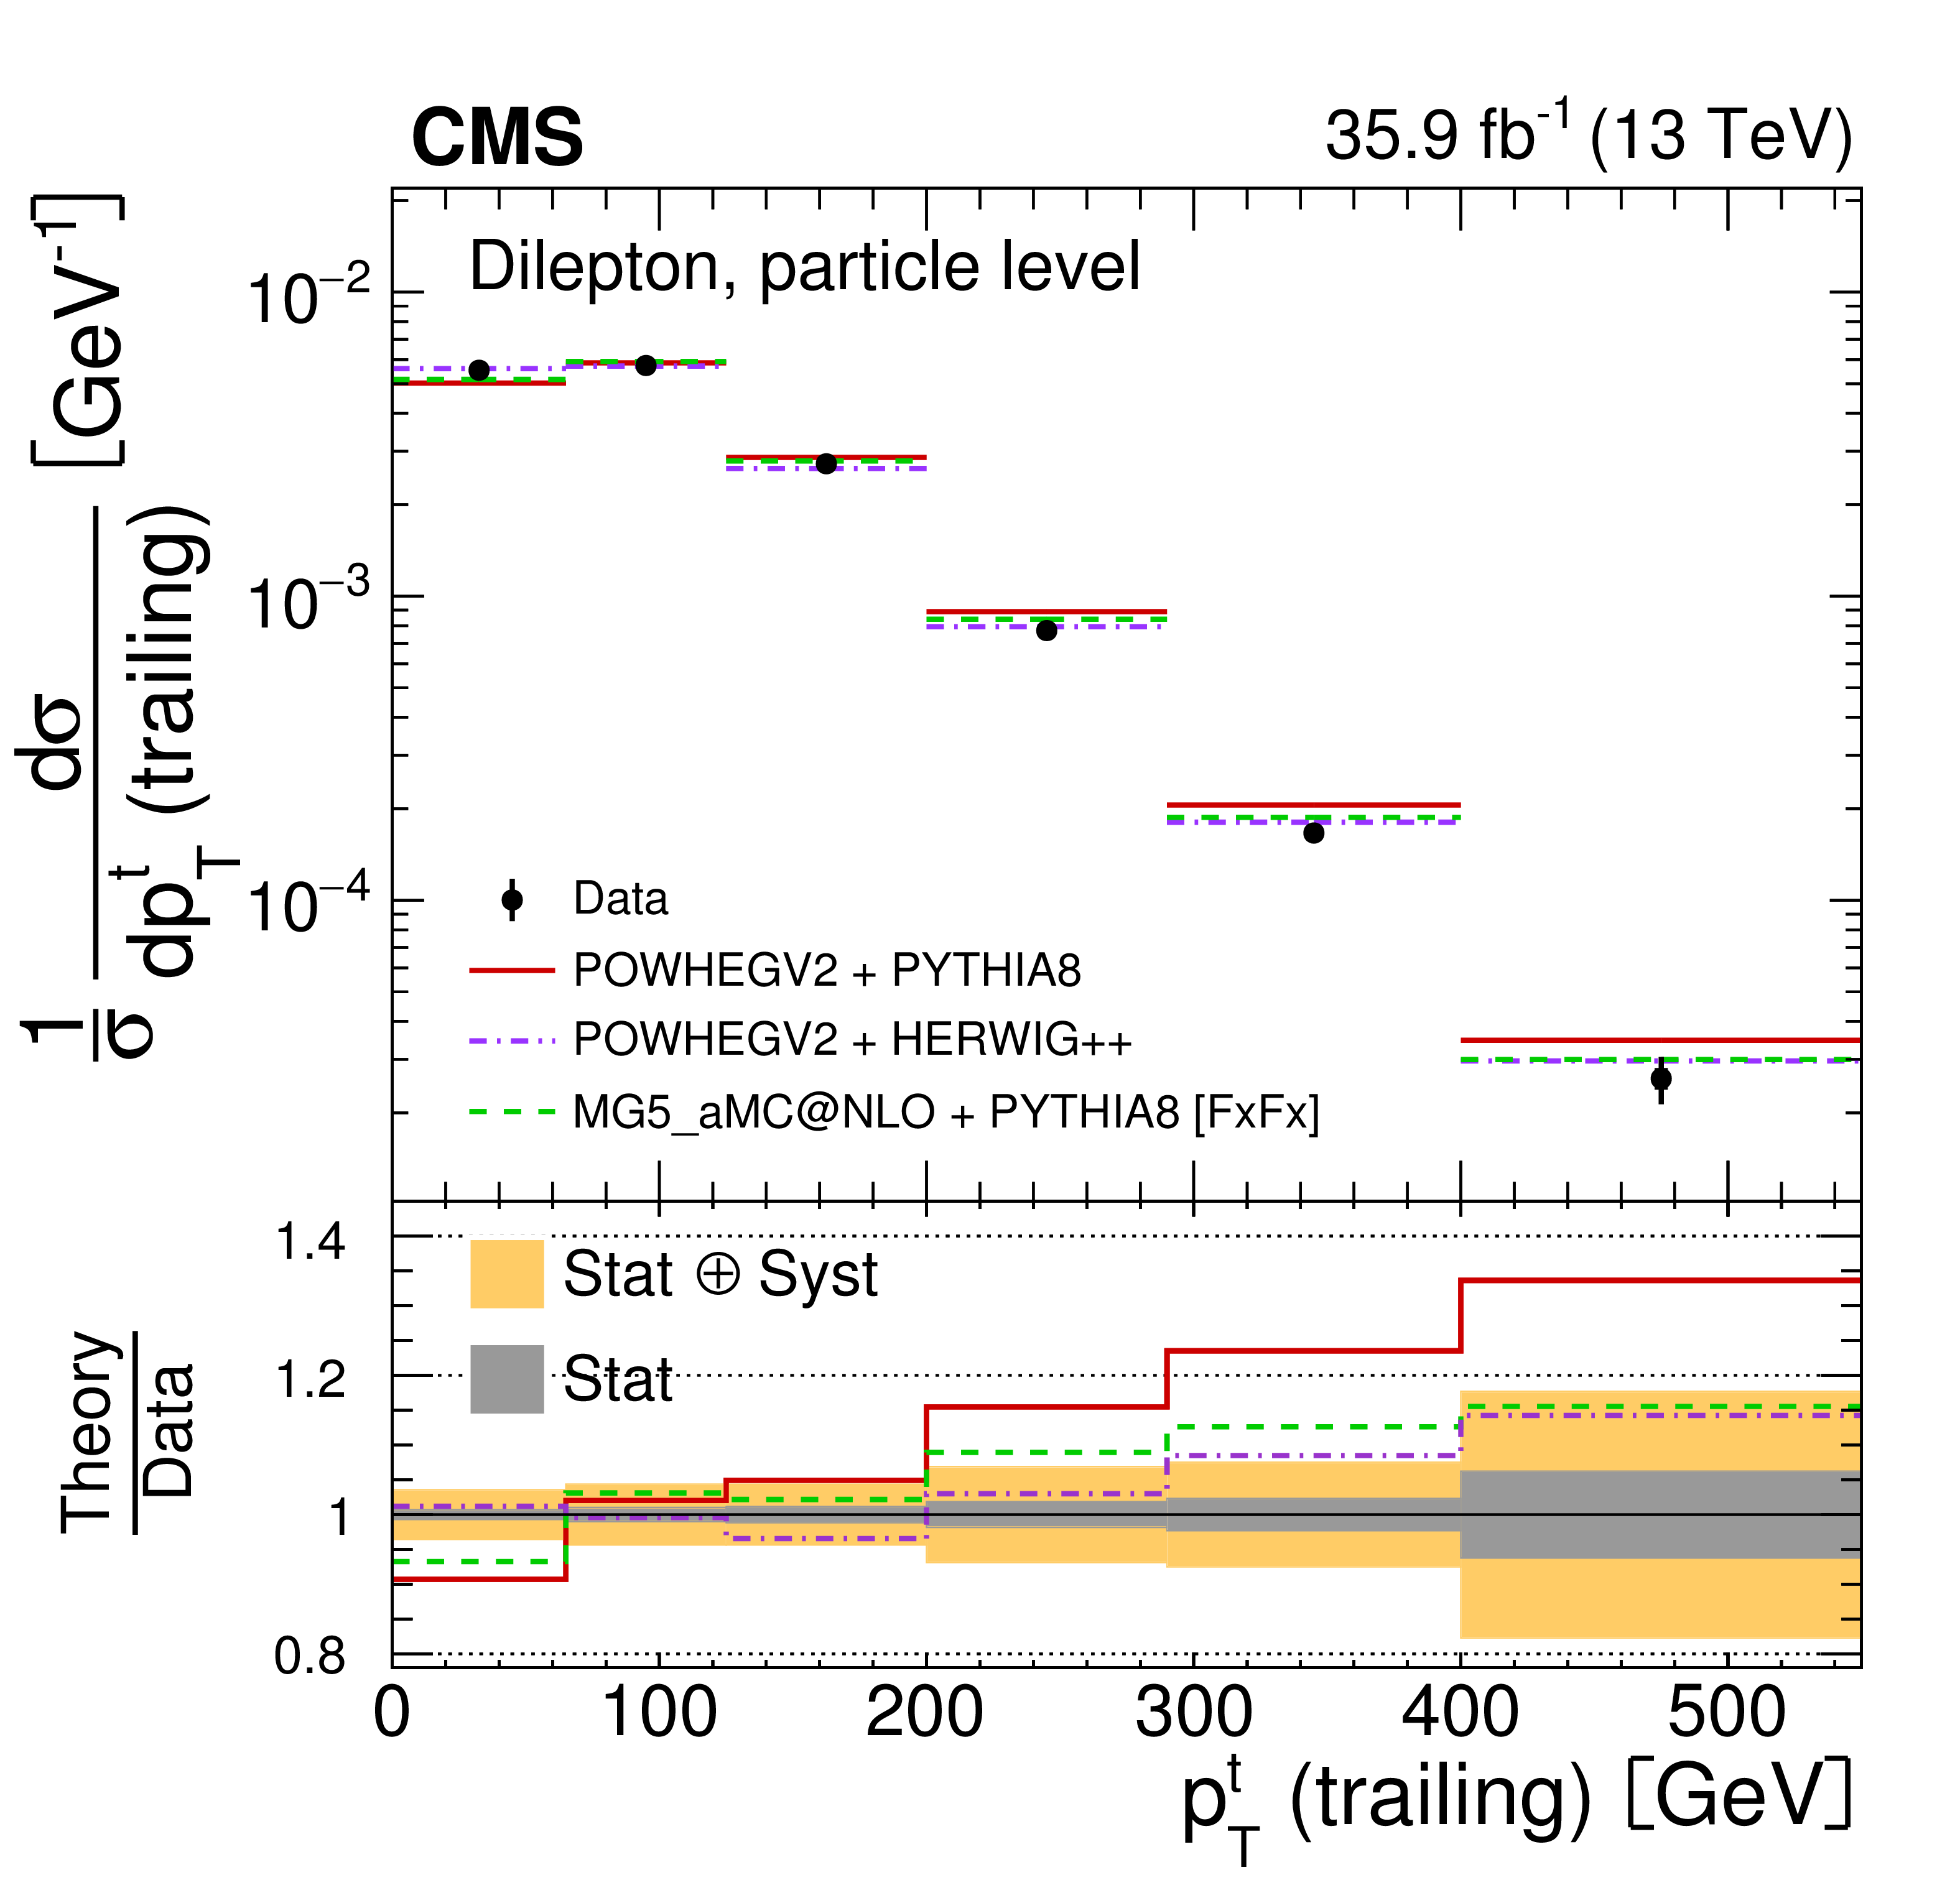
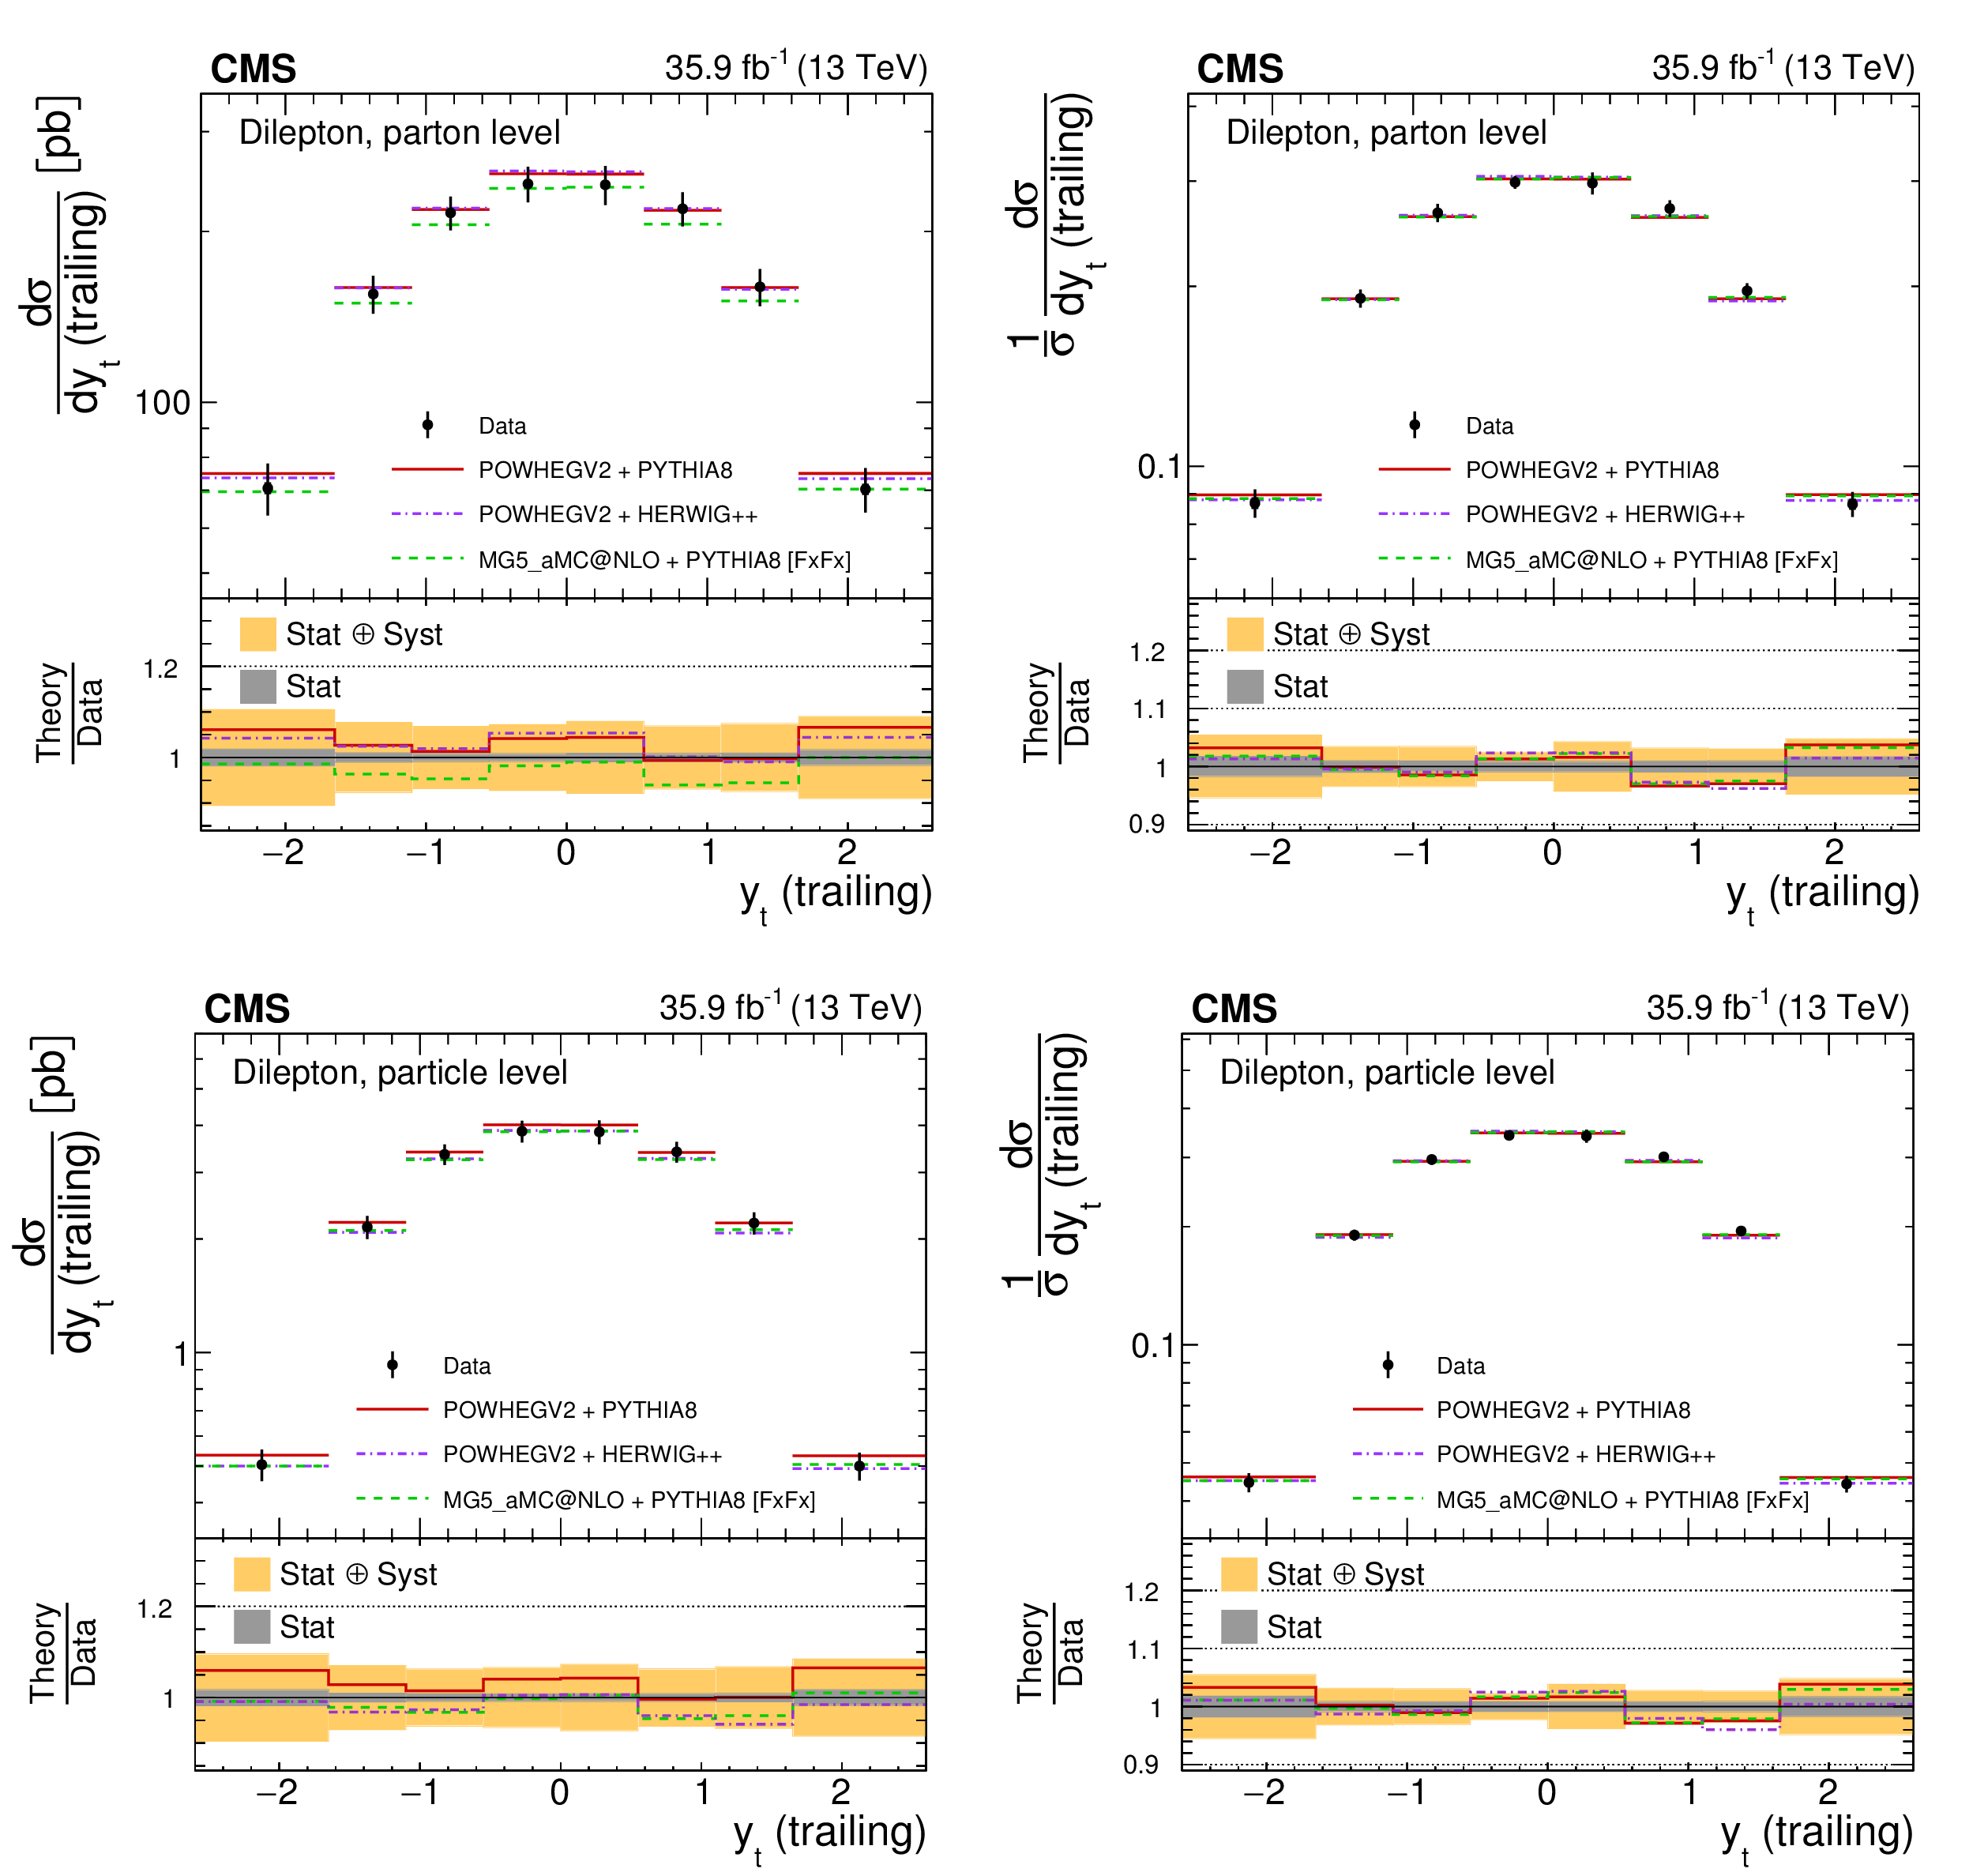
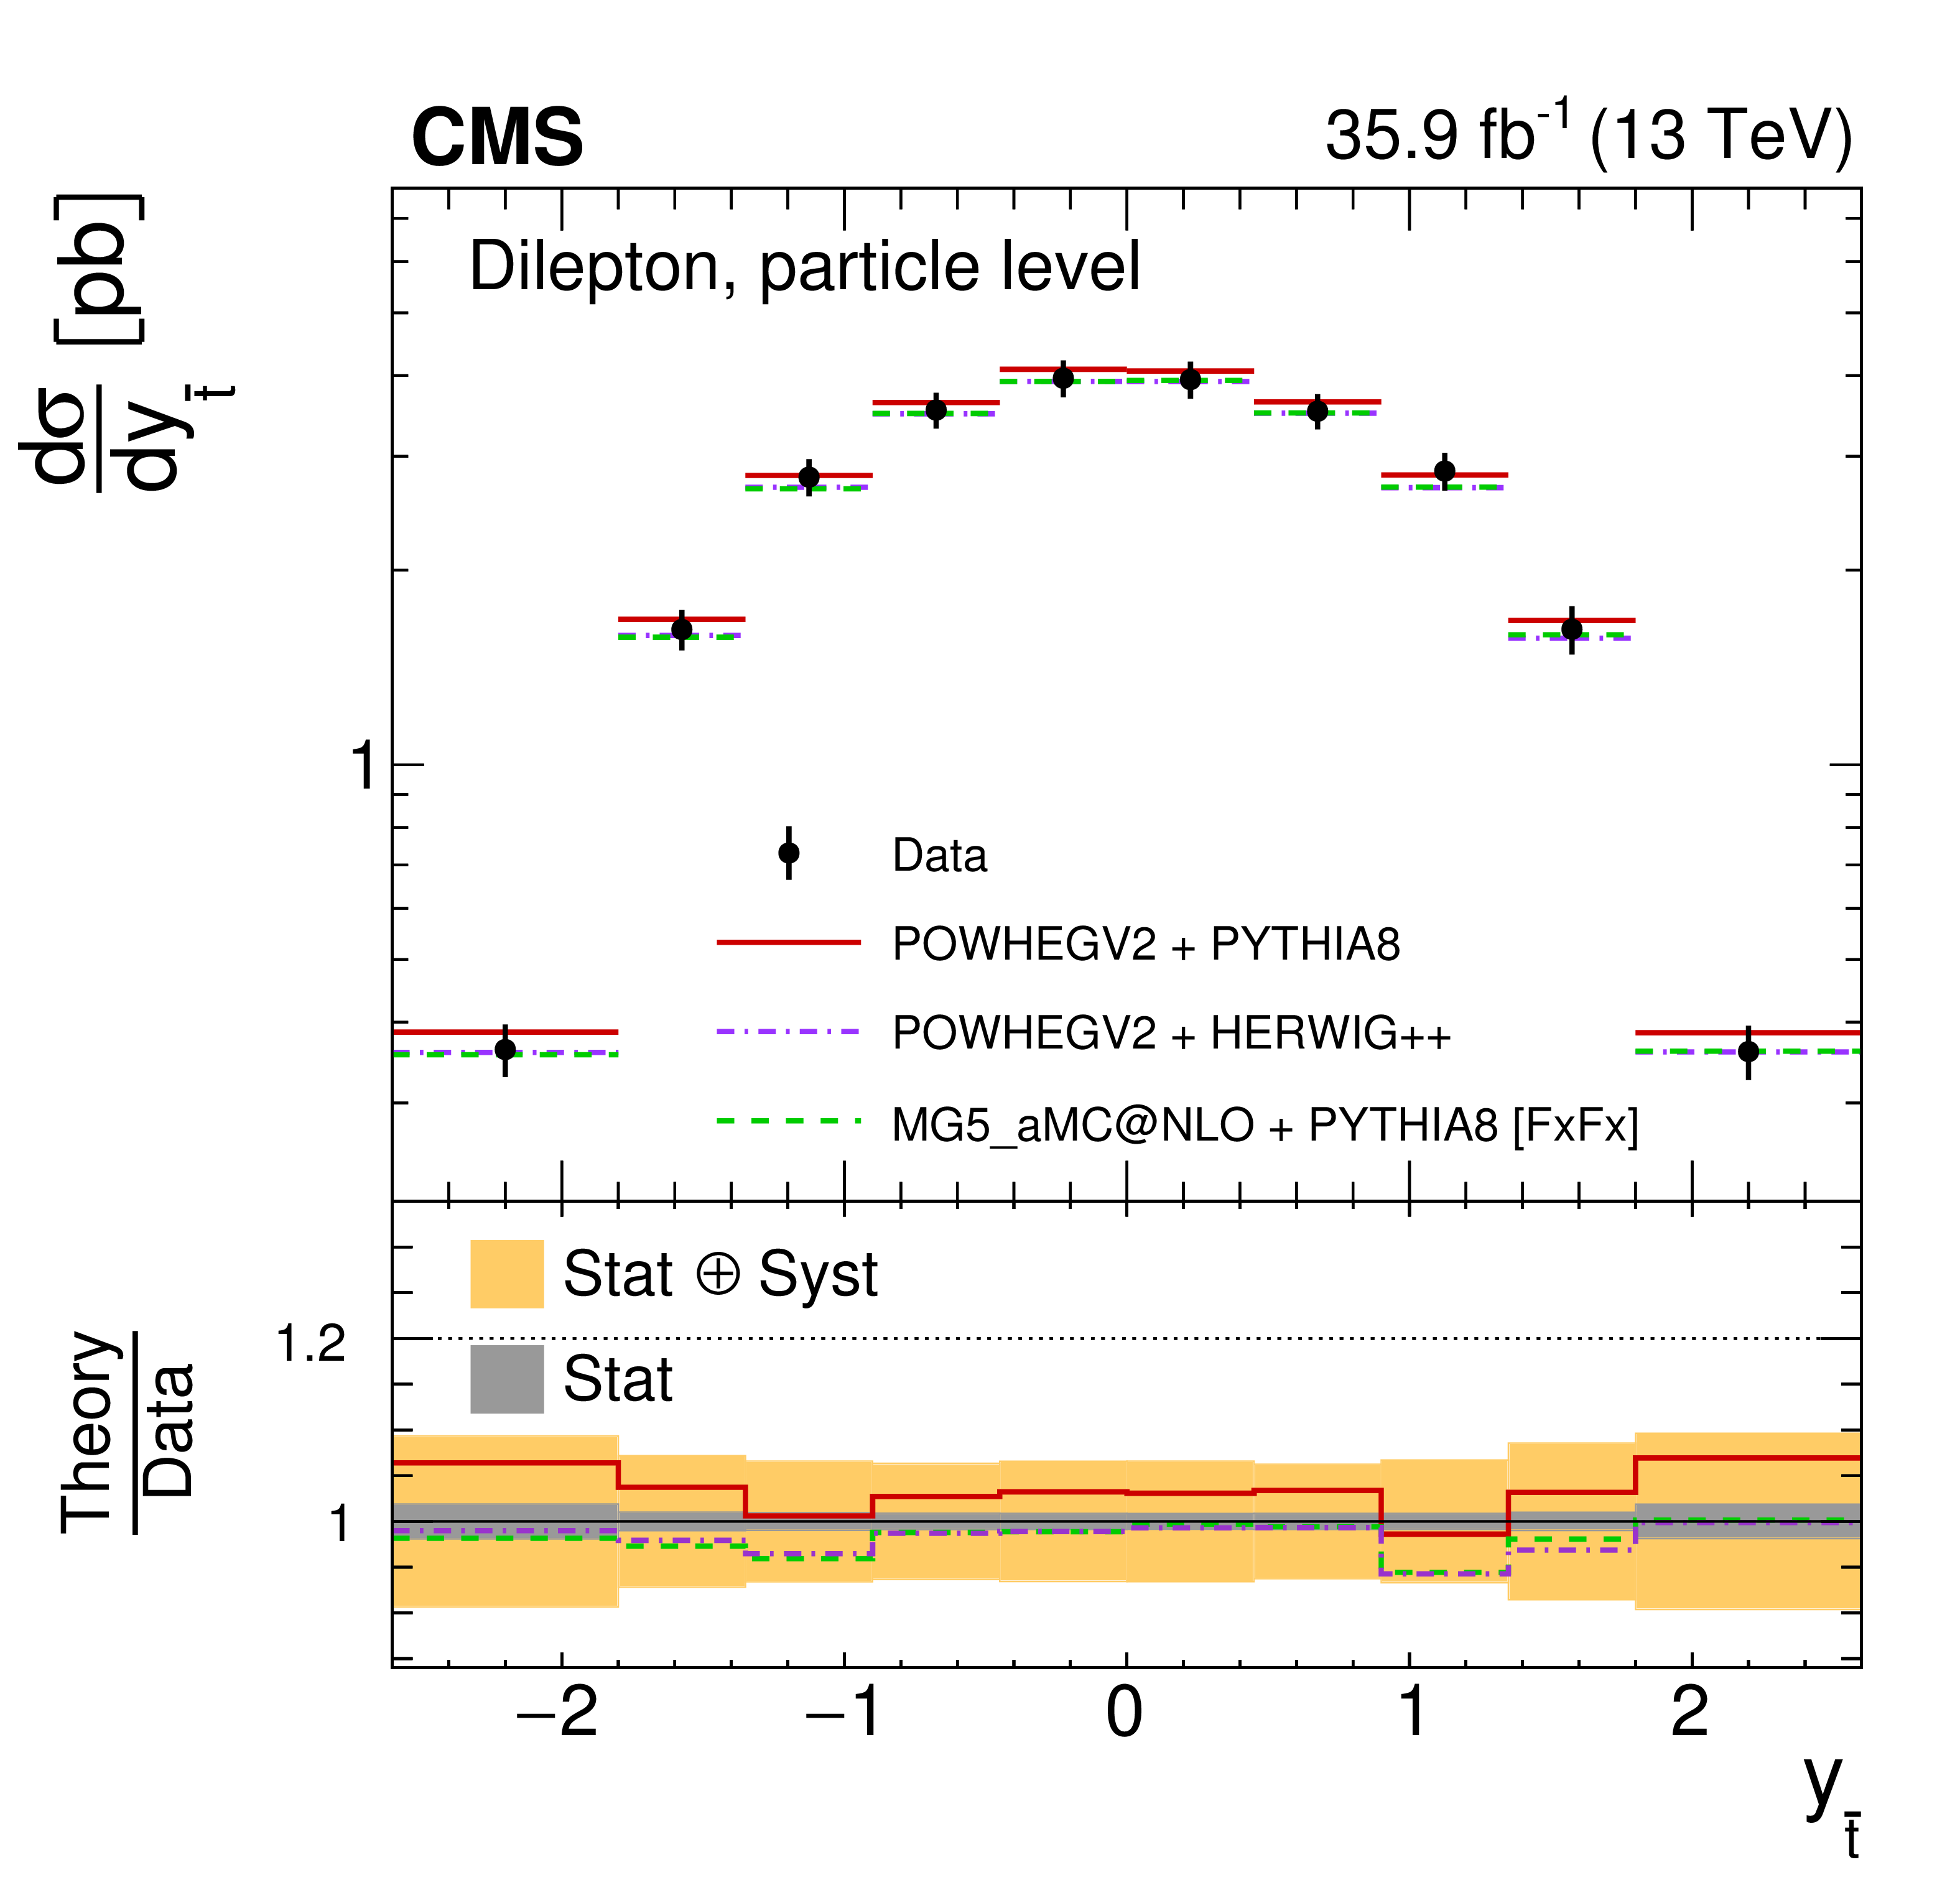
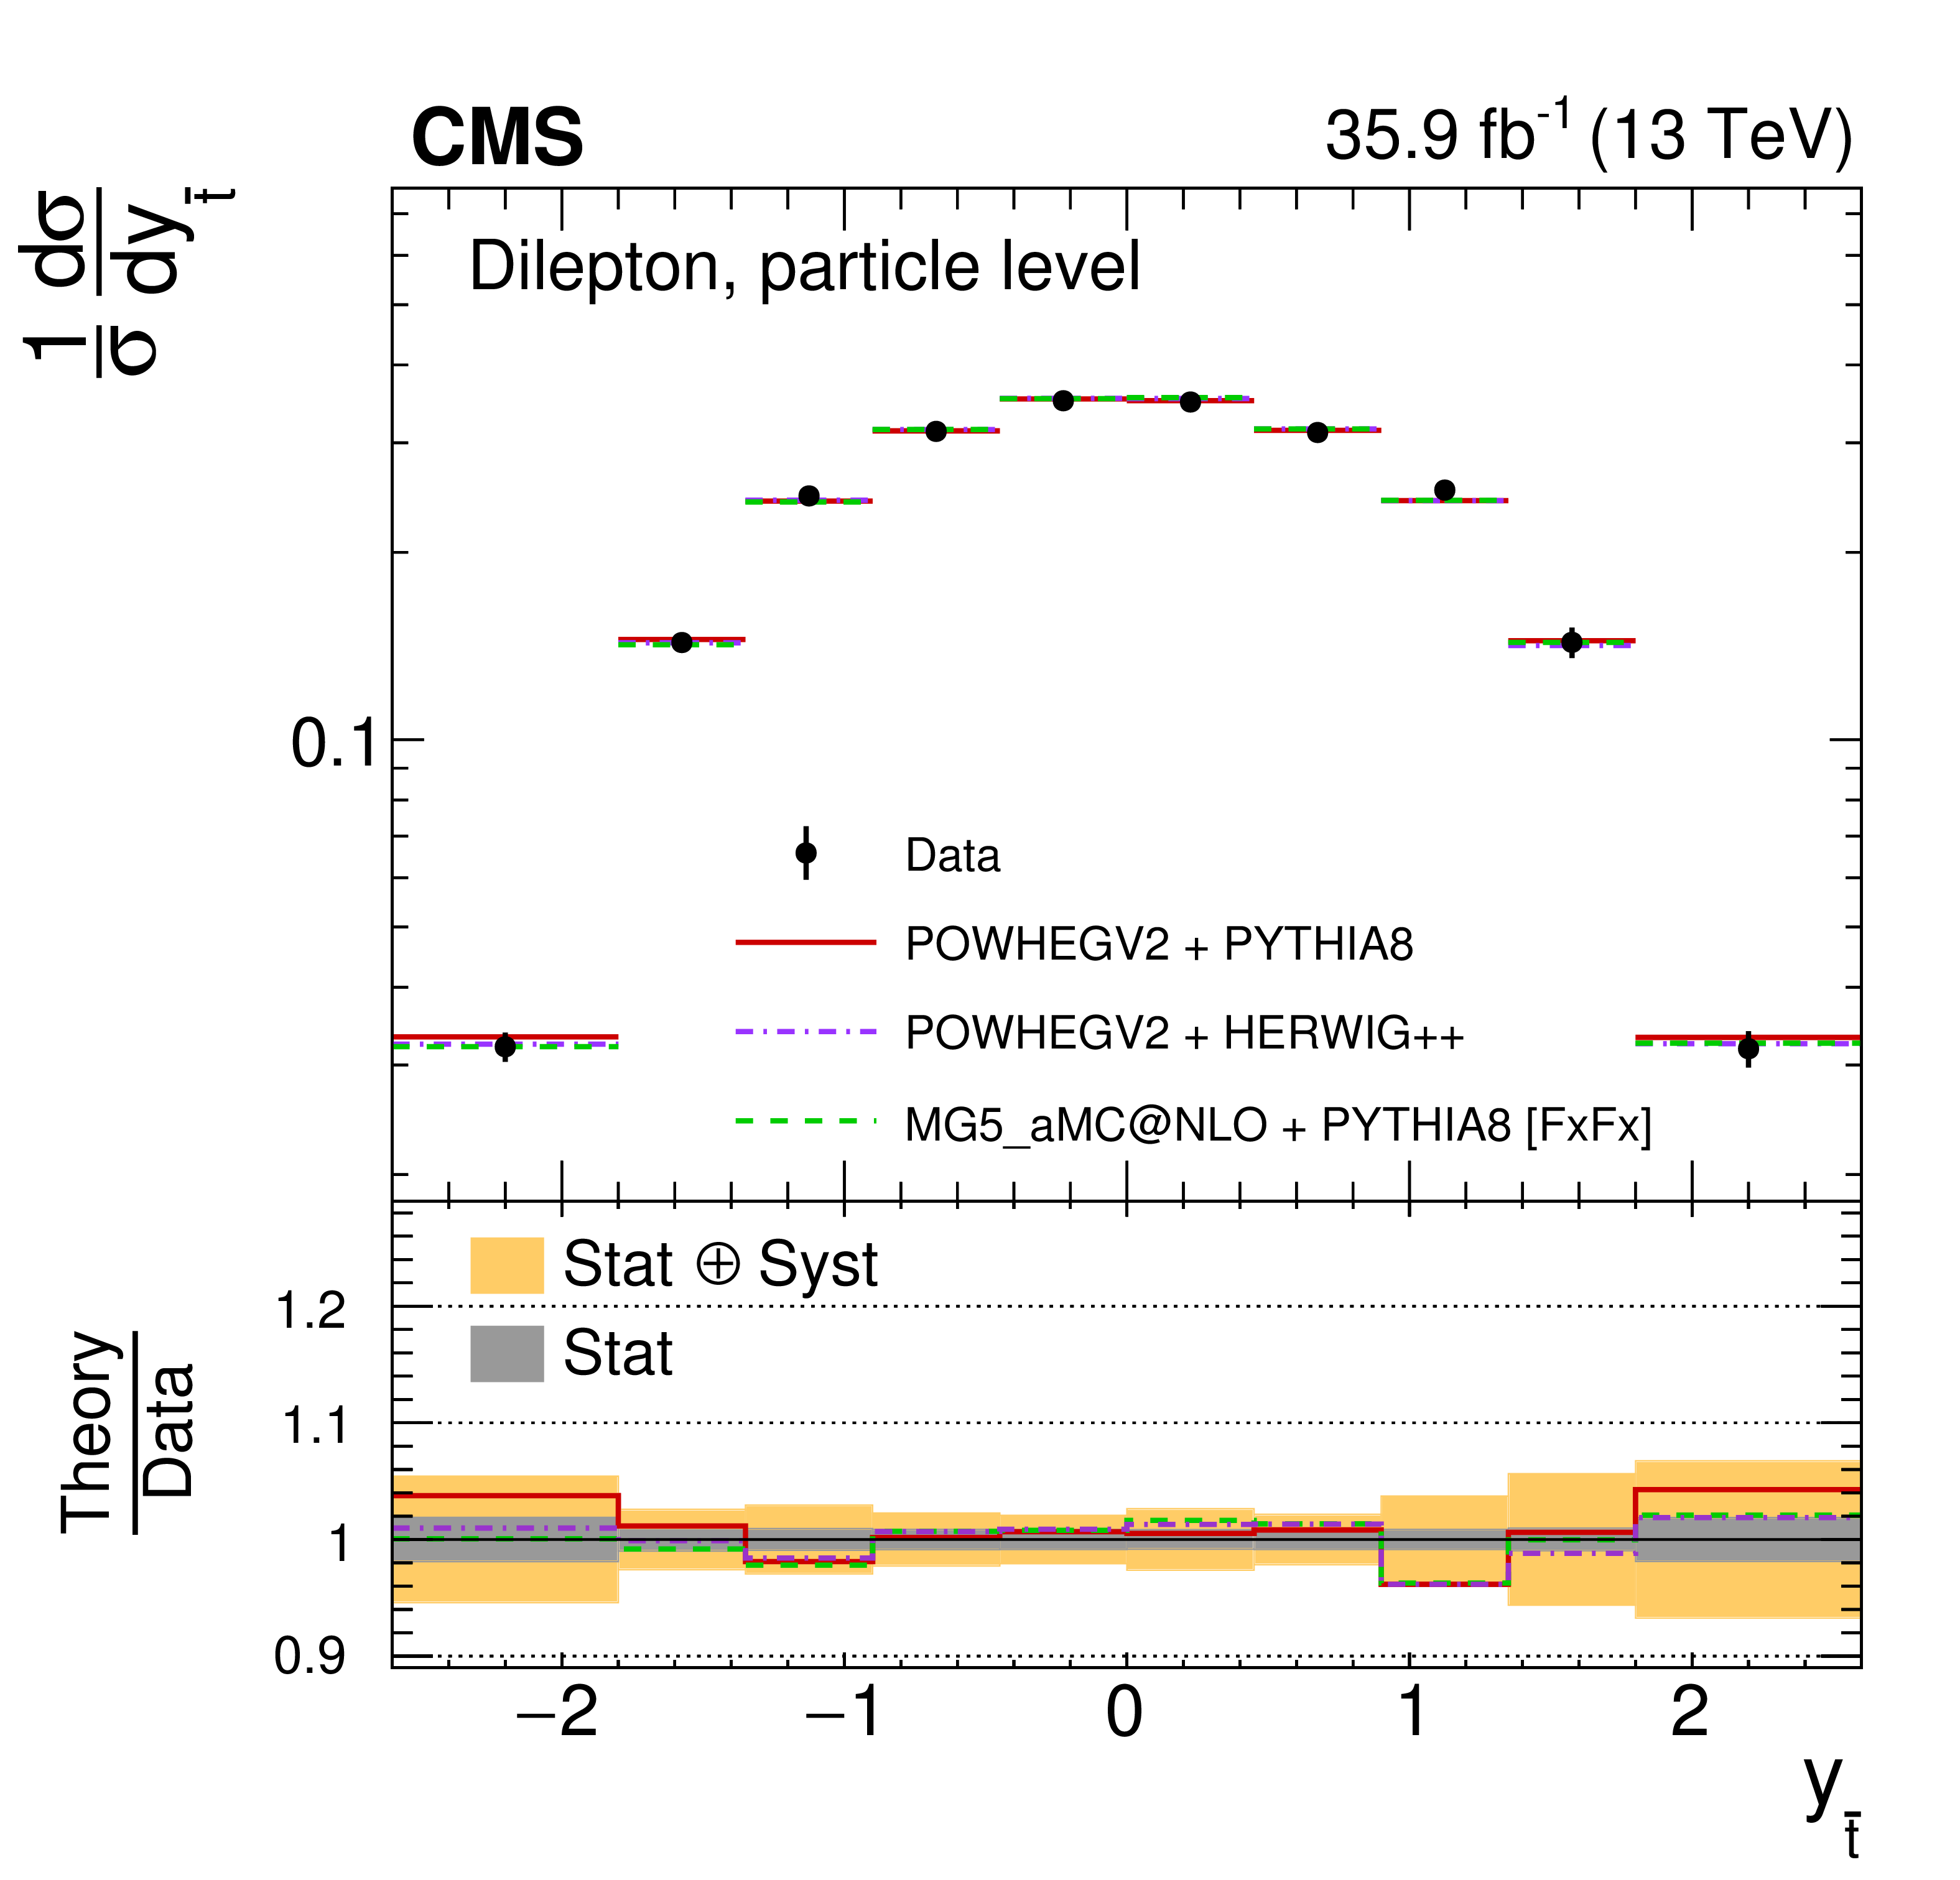
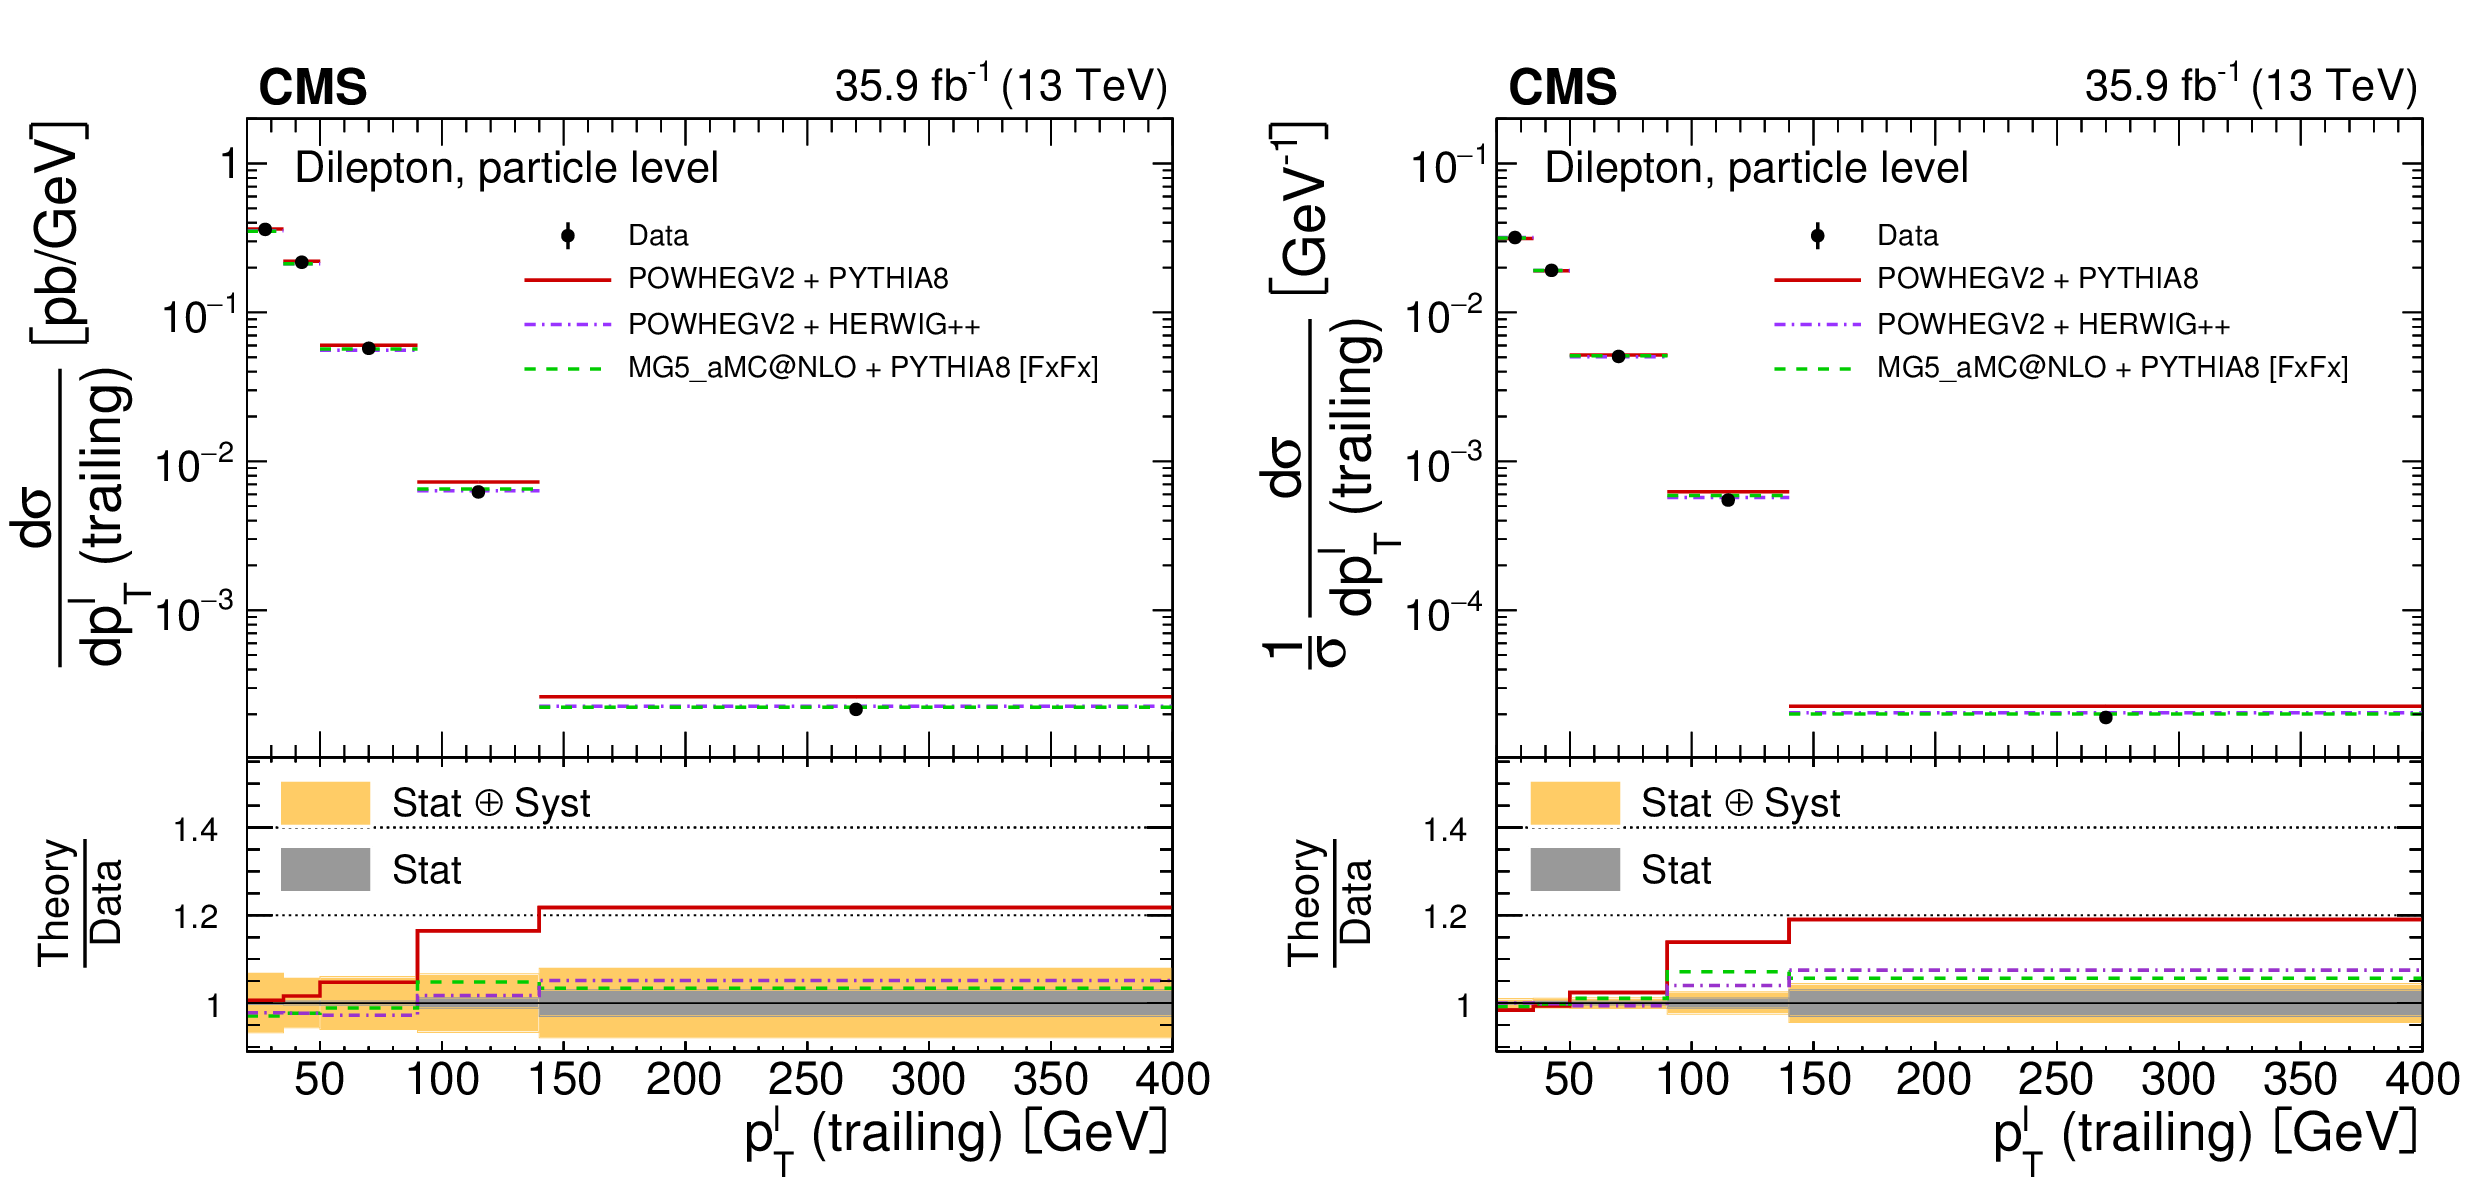
Figure 10:
The differential $ {{\mathrm {t}\overline {\mathrm {t}}}} $ production cross sections as a function of $ {{p_{\mathrm {T}}} ^{{\mathrm {t}}}} $ (trailing) are shown for the data (points) and the MC predictions (lines). The vertical lines on the points indicate the total uncertainty in the data. The left and right columns correspond to absolute and normalised measurements, respectively. The upper row corresponds to measurements at the parton level in the full phase space and the lower row to the particle level in a fiducial phase space. The lower panel in each plot shows the ratios of the theoretical predictions to the data. The dark and light bands show the relative statistical and total uncertainties in the data, respectively. |
png pdf |
Figure 10-a:
The differential $ {{\mathrm {t}\overline {\mathrm {t}}}} $ production cross sections as a function of $ {{p_{\mathrm {T}}} ^{{\mathrm {t}}}} $ (trailing) are shown for the data (points) and the MC predictions (lines). The vertical lines on the points indicate the total uncertainty in the data. The left and right columns correspond to absolute and normalised measurements, respectively. The upper row corresponds to measurements at the parton level in the full phase space and the lower row to the particle level in a fiducial phase space. The lower panel in each plot shows the ratios of the theoretical predictions to the data. The dark and light bands show the relative statistical and total uncertainties in the data, respectively. |

png pdf |
Figure 10-b:
The differential $ {{\mathrm {t}\overline {\mathrm {t}}}} $ production cross sections as a function of $ {{p_{\mathrm {T}}} ^{{\mathrm {t}}}} $ (trailing) are shown for the data (points) and the MC predictions (lines). The vertical lines on the points indicate the total uncertainty in the data. The left and right columns correspond to absolute and normalised measurements, respectively. The upper row corresponds to measurements at the parton level in the full phase space and the lower row to the particle level in a fiducial phase space. The lower panel in each plot shows the ratios of the theoretical predictions to the data. The dark and light bands show the relative statistical and total uncertainties in the data, respectively. |
png pdf |
Figure 10-c:
The differential $ {{\mathrm {t}\overline {\mathrm {t}}}} $ production cross sections as a function of $ {{p_{\mathrm {T}}} ^{{\mathrm {t}}}} $ (trailing) are shown for the data (points) and the MC predictions (lines). The vertical lines on the points indicate the total uncertainty in the data. The left and right columns correspond to absolute and normalised measurements, respectively. The upper row corresponds to measurements at the parton level in the full phase space and the lower row to the particle level in a fiducial phase space. The lower panel in each plot shows the ratios of the theoretical predictions to the data. The dark and light bands show the relative statistical and total uncertainties in the data, respectively. |
png pdf |
Figure 10-d:
The differential $ {{\mathrm {t}\overline {\mathrm {t}}}} $ production cross sections as a function of $ {{p_{\mathrm {T}}} ^{{\mathrm {t}}}} $ (trailing) are shown for the data (points) and the MC predictions (lines). The vertical lines on the points indicate the total uncertainty in the data. The left and right columns correspond to absolute and normalised measurements, respectively. The upper row corresponds to measurements at the parton level in the full phase space and the lower row to the particle level in a fiducial phase space. The lower panel in each plot shows the ratios of the theoretical predictions to the data. The dark and light bands show the relative statistical and total uncertainties in the data, respectively. |
png pdf |
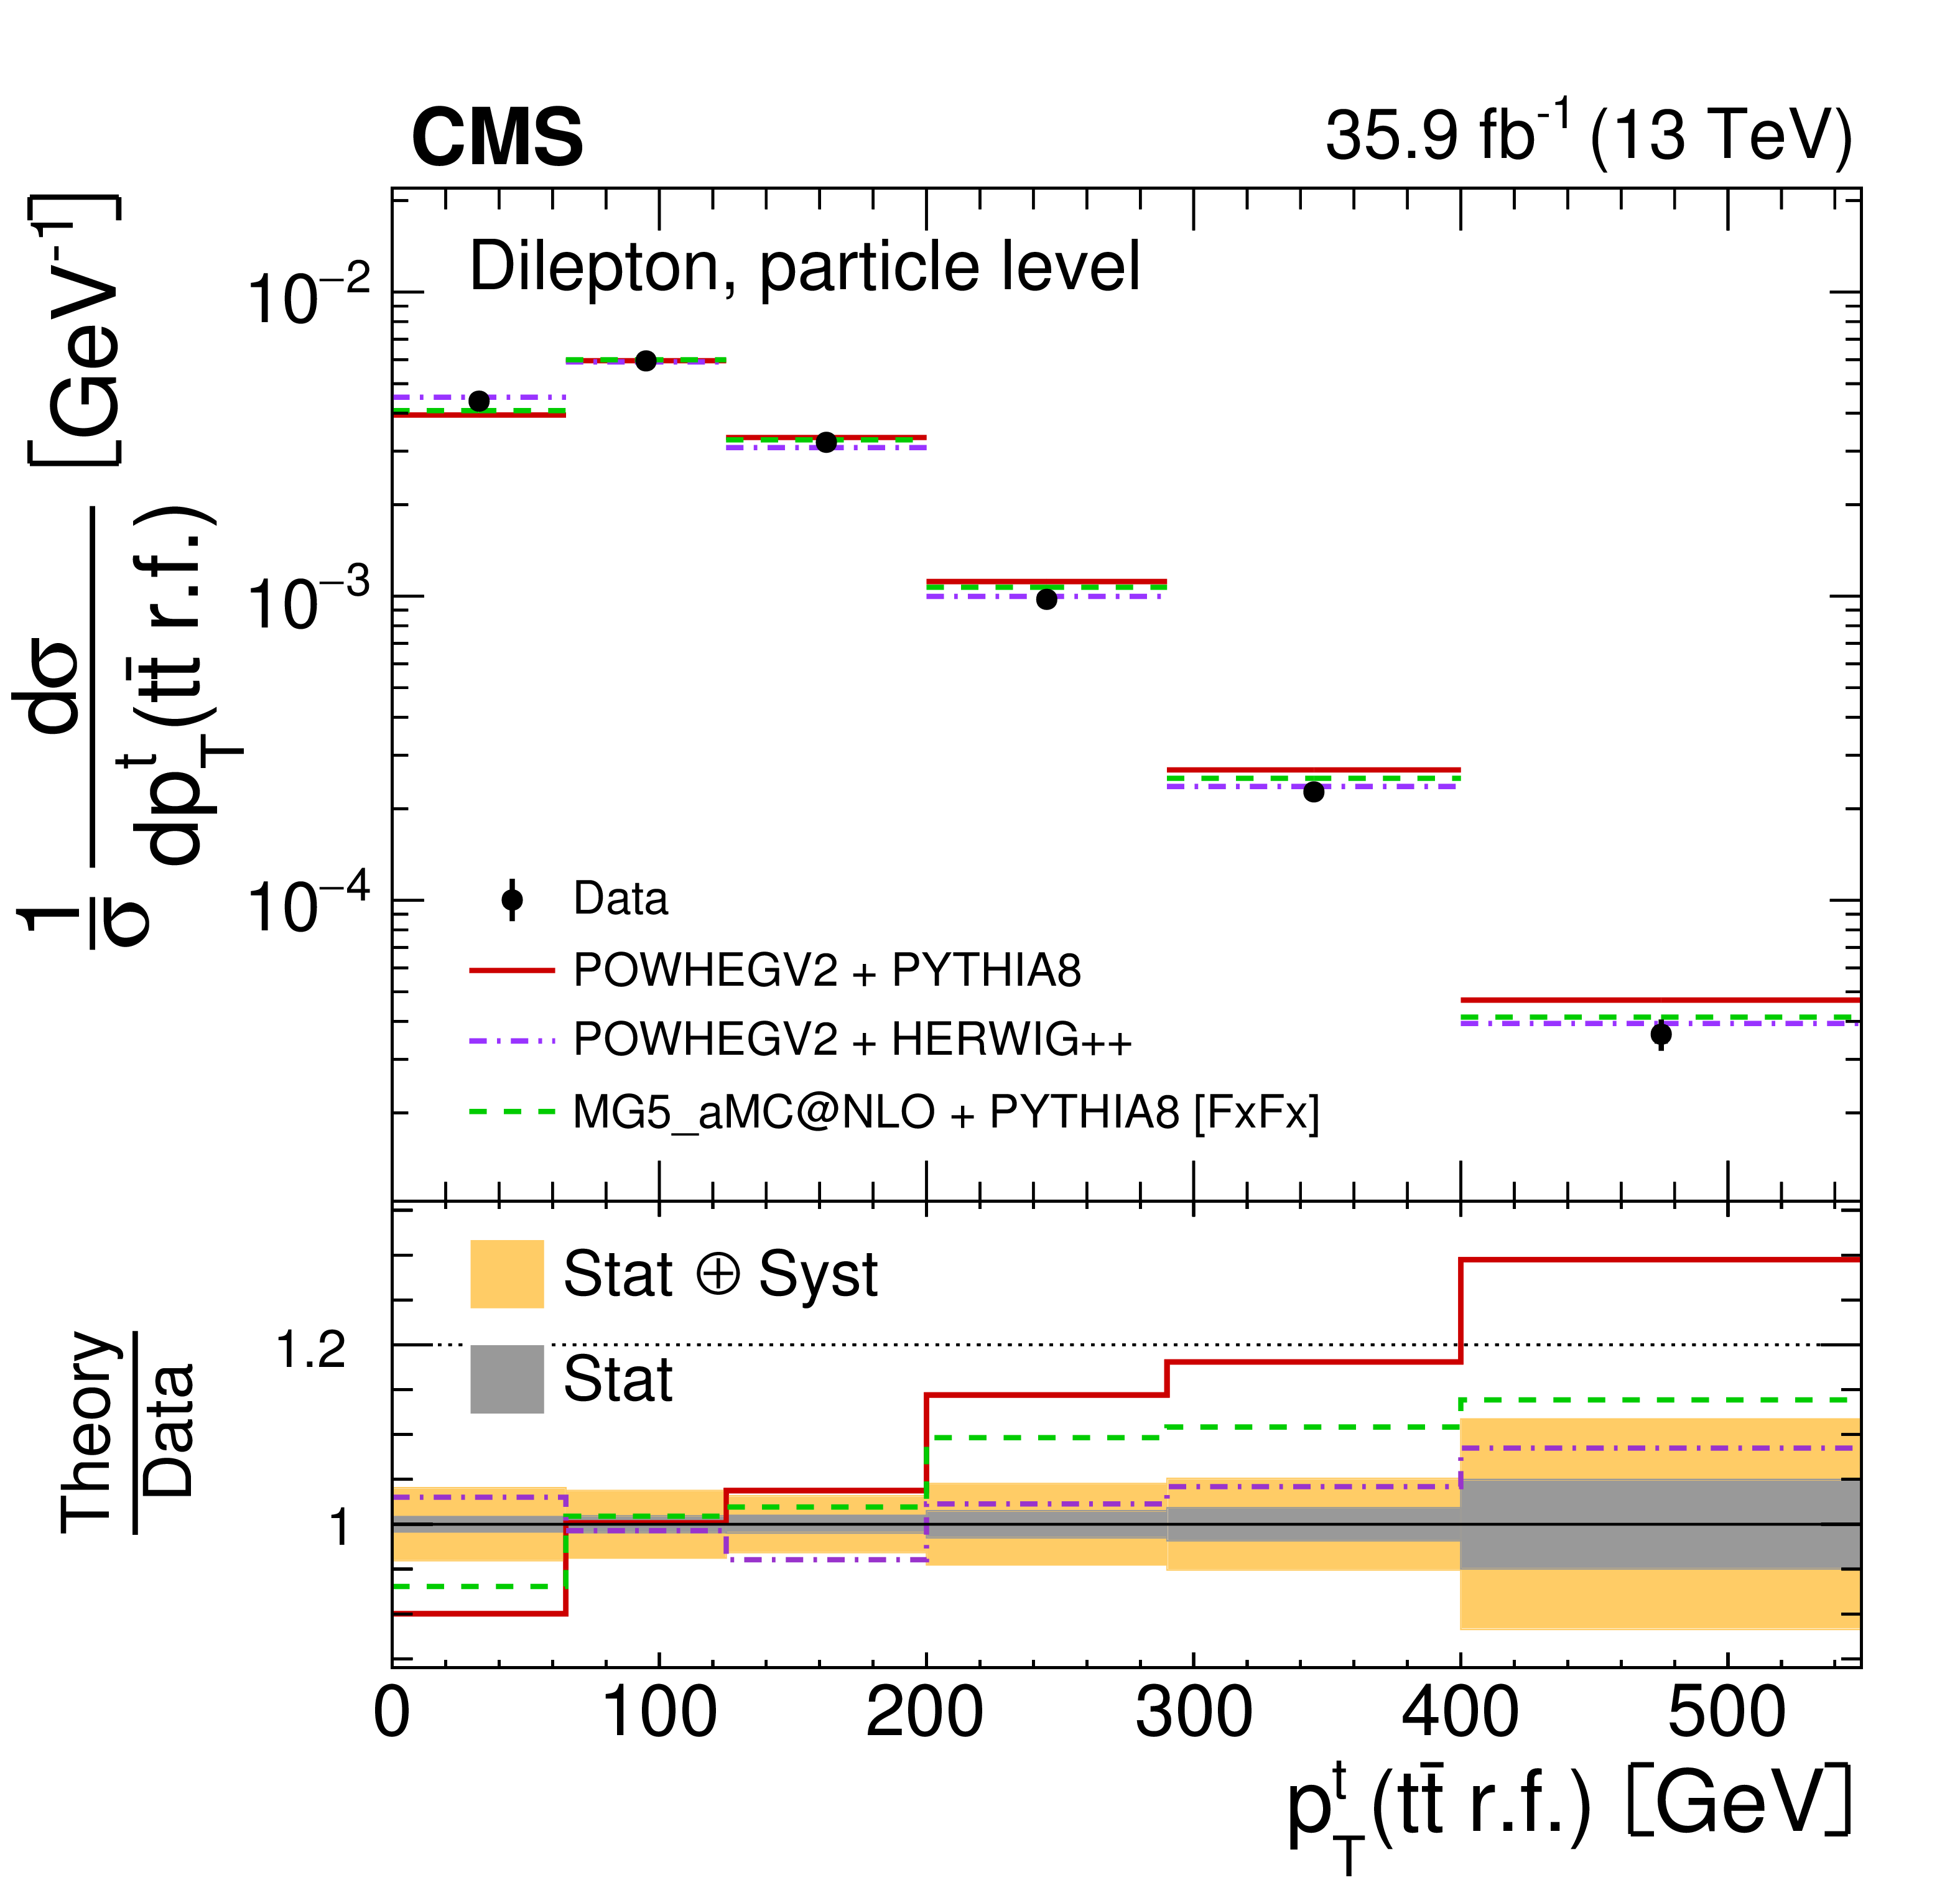
Figure 11:
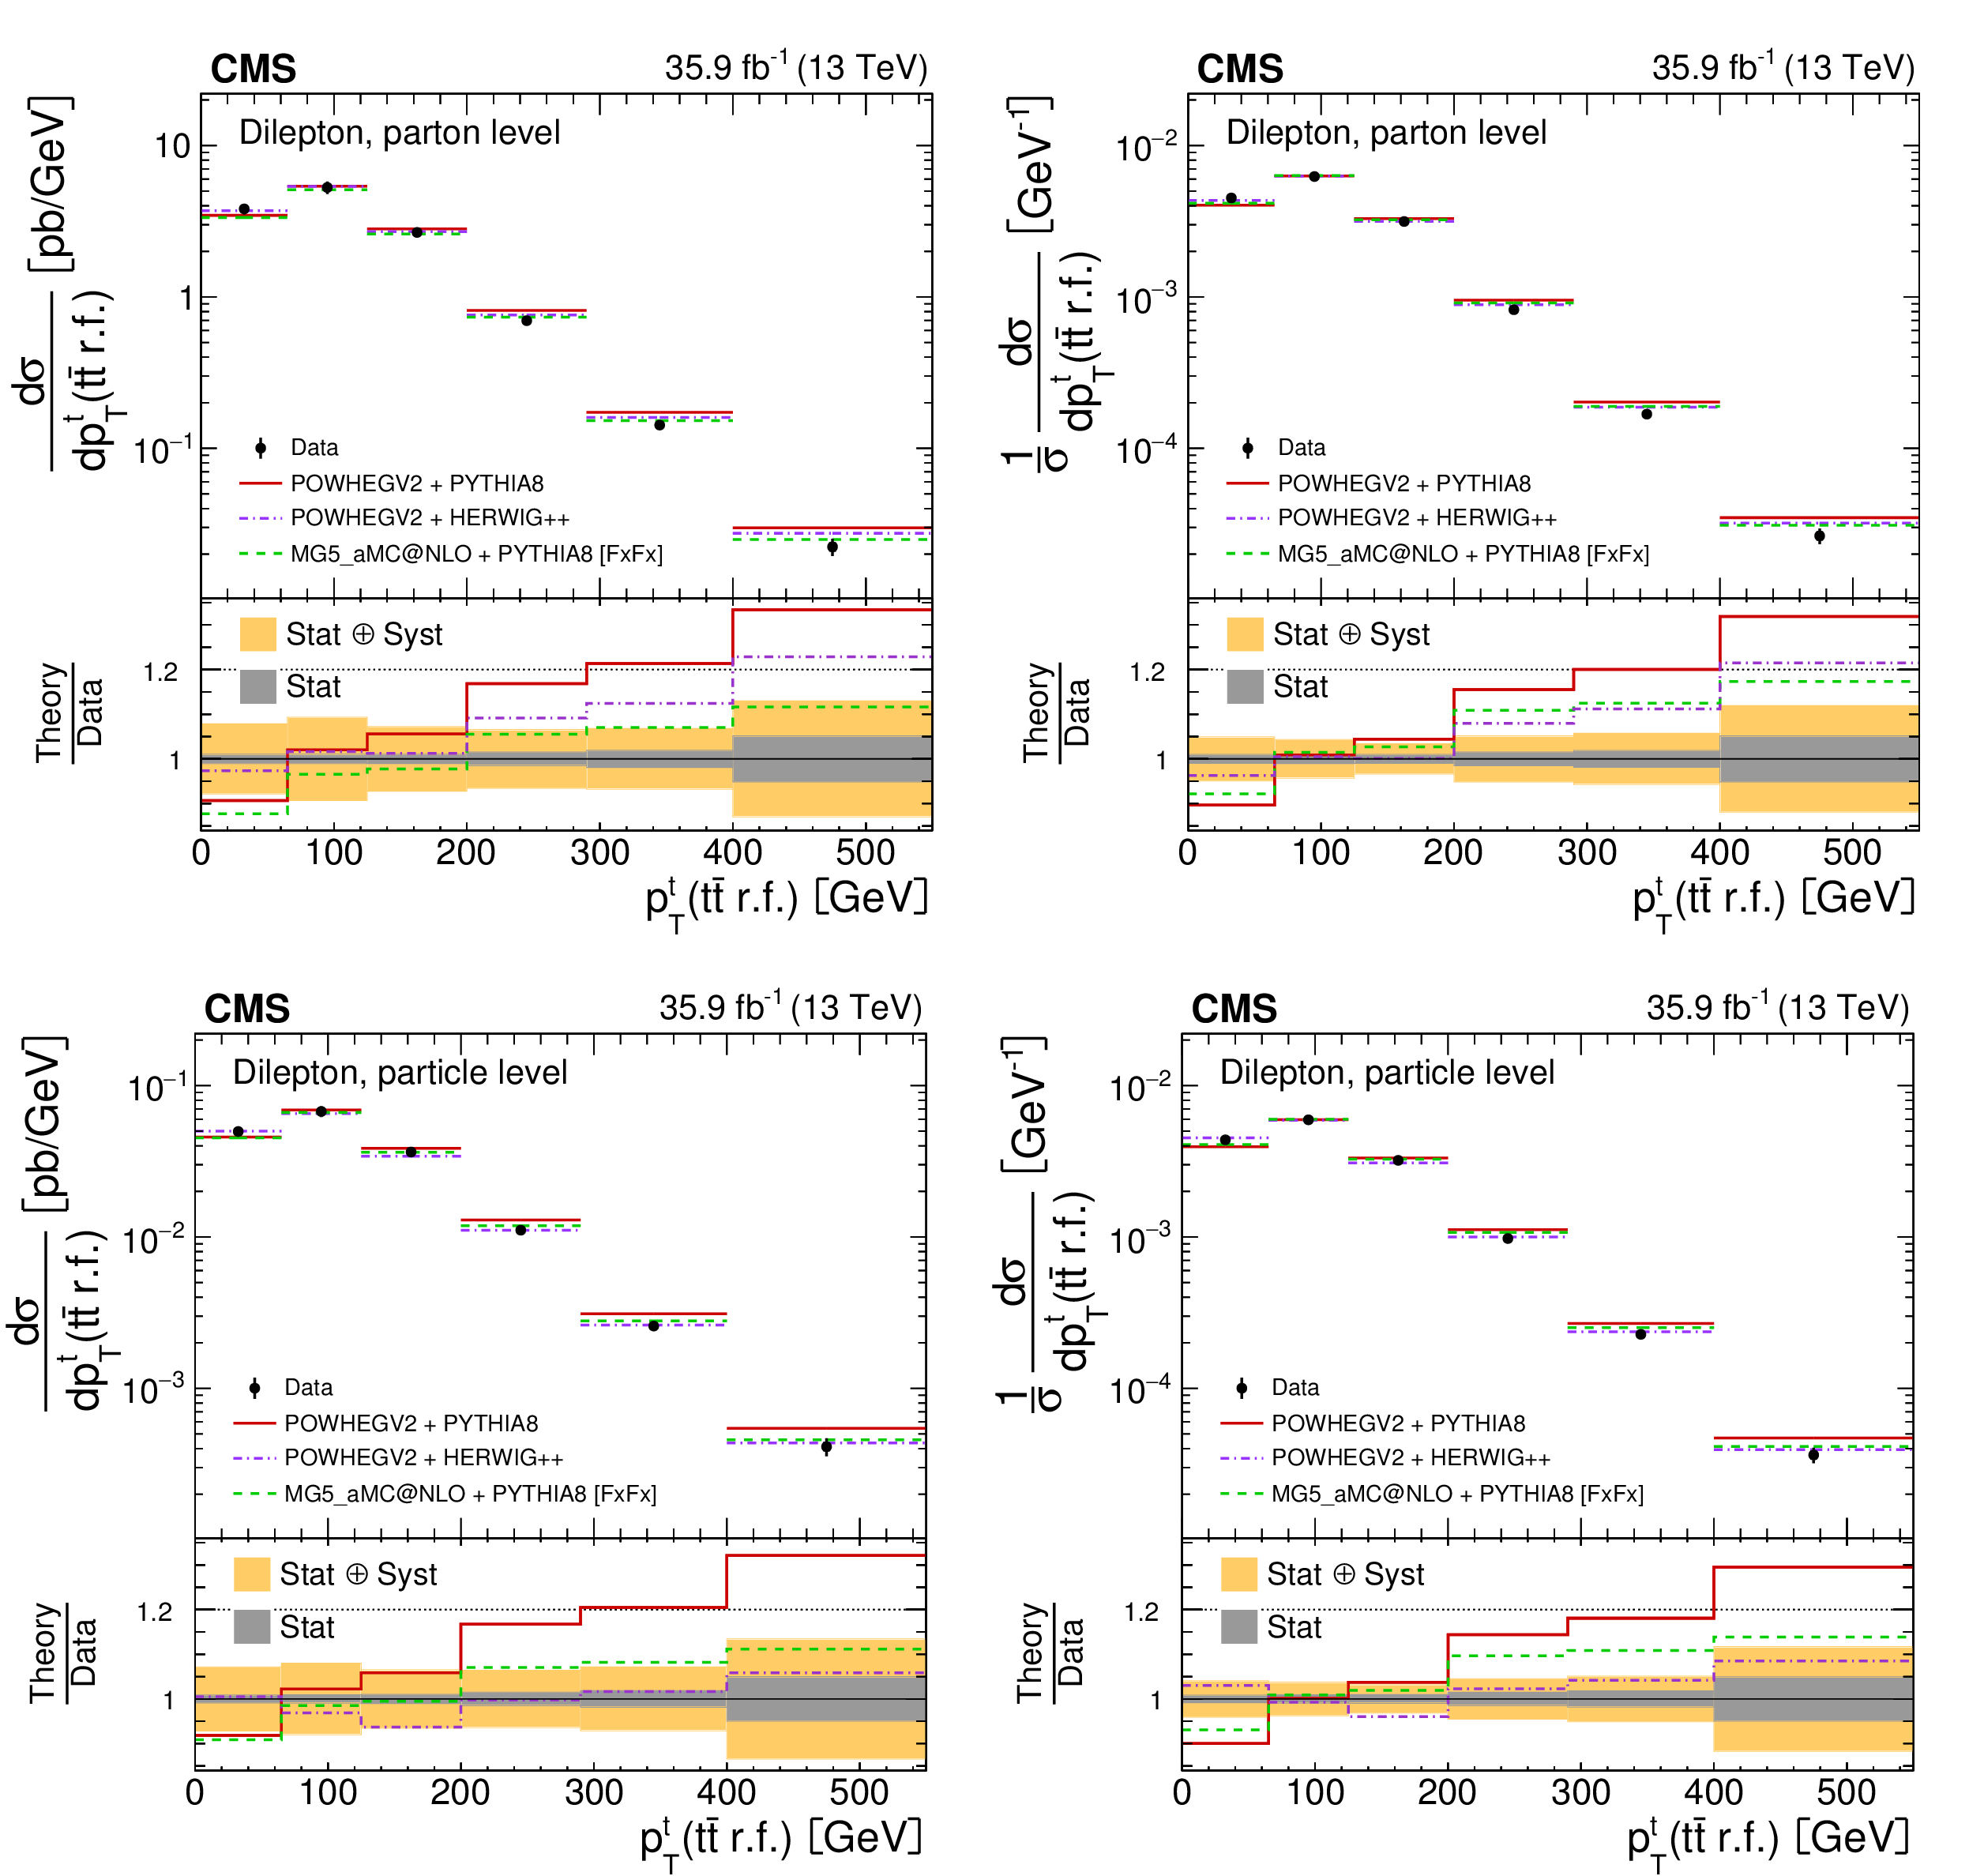
The differential $ {{\mathrm {t}\overline {\mathrm {t}}}} $ production cross sections as a function of $ {{p_{\mathrm {T}}} ^{{\mathrm {t}}}} $ ($ {{\mathrm {t}\overline {\mathrm {t}}}} $ r.f.) system are shown for the data (points) and the MC predictions (lines). The vertical lines on the points indicate the total uncertainty in the data. The left and right columns correspond to absolute and normalised measurements, respectively. The upper row corresponds to measurements at the parton level in the full phase space and the lower row to the particle level in a fiducial phase space. The lower panel in each plot shows the ratios of the theoretical predictions to the data. The dark and light bands show the relative statistical and total uncertainties in the data, respectively. |

png pdf |
Figure 11-a:
The differential $ {{\mathrm {t}\overline {\mathrm {t}}}} $ production cross sections as a function of $ {{p_{\mathrm {T}}} ^{{\mathrm {t}}}} $ ($ {{\mathrm {t}\overline {\mathrm {t}}}} $ r.f.) system are shown for the data (points) and the MC predictions (lines). The vertical lines on the points indicate the total uncertainty in the data. The left and right columns correspond to absolute and normalised measurements, respectively. The upper row corresponds to measurements at the parton level in the full phase space and the lower row to the particle level in a fiducial phase space. The lower panel in each plot shows the ratios of the theoretical predictions to the data. The dark and light bands show the relative statistical and total uncertainties in the data, respectively. |

png pdf |
Figure 11-b:
The differential $ {{\mathrm {t}\overline {\mathrm {t}}}} $ production cross sections as a function of $ {{p_{\mathrm {T}}} ^{{\mathrm {t}}}} $ ($ {{\mathrm {t}\overline {\mathrm {t}}}} $ r.f.) system are shown for the data (points) and the MC predictions (lines). The vertical lines on the points indicate the total uncertainty in the data. The left and right columns correspond to absolute and normalised measurements, respectively. The upper row corresponds to measurements at the parton level in the full phase space and the lower row to the particle level in a fiducial phase space. The lower panel in each plot shows the ratios of the theoretical predictions to the data. The dark and light bands show the relative statistical and total uncertainties in the data, respectively. |

png pdf |
Figure 11-c:
The differential $ {{\mathrm {t}\overline {\mathrm {t}}}} $ production cross sections as a function of $ {{p_{\mathrm {T}}} ^{{\mathrm {t}}}} $ ($ {{\mathrm {t}\overline {\mathrm {t}}}} $ r.f.) system are shown for the data (points) and the MC predictions (lines). The vertical lines on the points indicate the total uncertainty in the data. The left and right columns correspond to absolute and normalised measurements, respectively. The upper row corresponds to measurements at the parton level in the full phase space and the lower row to the particle level in a fiducial phase space. The lower panel in each plot shows the ratios of the theoretical predictions to the data. The dark and light bands show the relative statistical and total uncertainties in the data, respectively. |
png pdf |
Figure 11-d:
The differential $ {{\mathrm {t}\overline {\mathrm {t}}}} $ production cross sections as a function of $ {{p_{\mathrm {T}}} ^{{\mathrm {t}}}} $ ($ {{\mathrm {t}\overline {\mathrm {t}}}} $ r.f.) system are shown for the data (points) and the MC predictions (lines). The vertical lines on the points indicate the total uncertainty in the data. The left and right columns correspond to absolute and normalised measurements, respectively. The upper row corresponds to measurements at the parton level in the full phase space and the lower row to the particle level in a fiducial phase space. The lower panel in each plot shows the ratios of the theoretical predictions to the data. The dark and light bands show the relative statistical and total uncertainties in the data, respectively. |
png pdf |
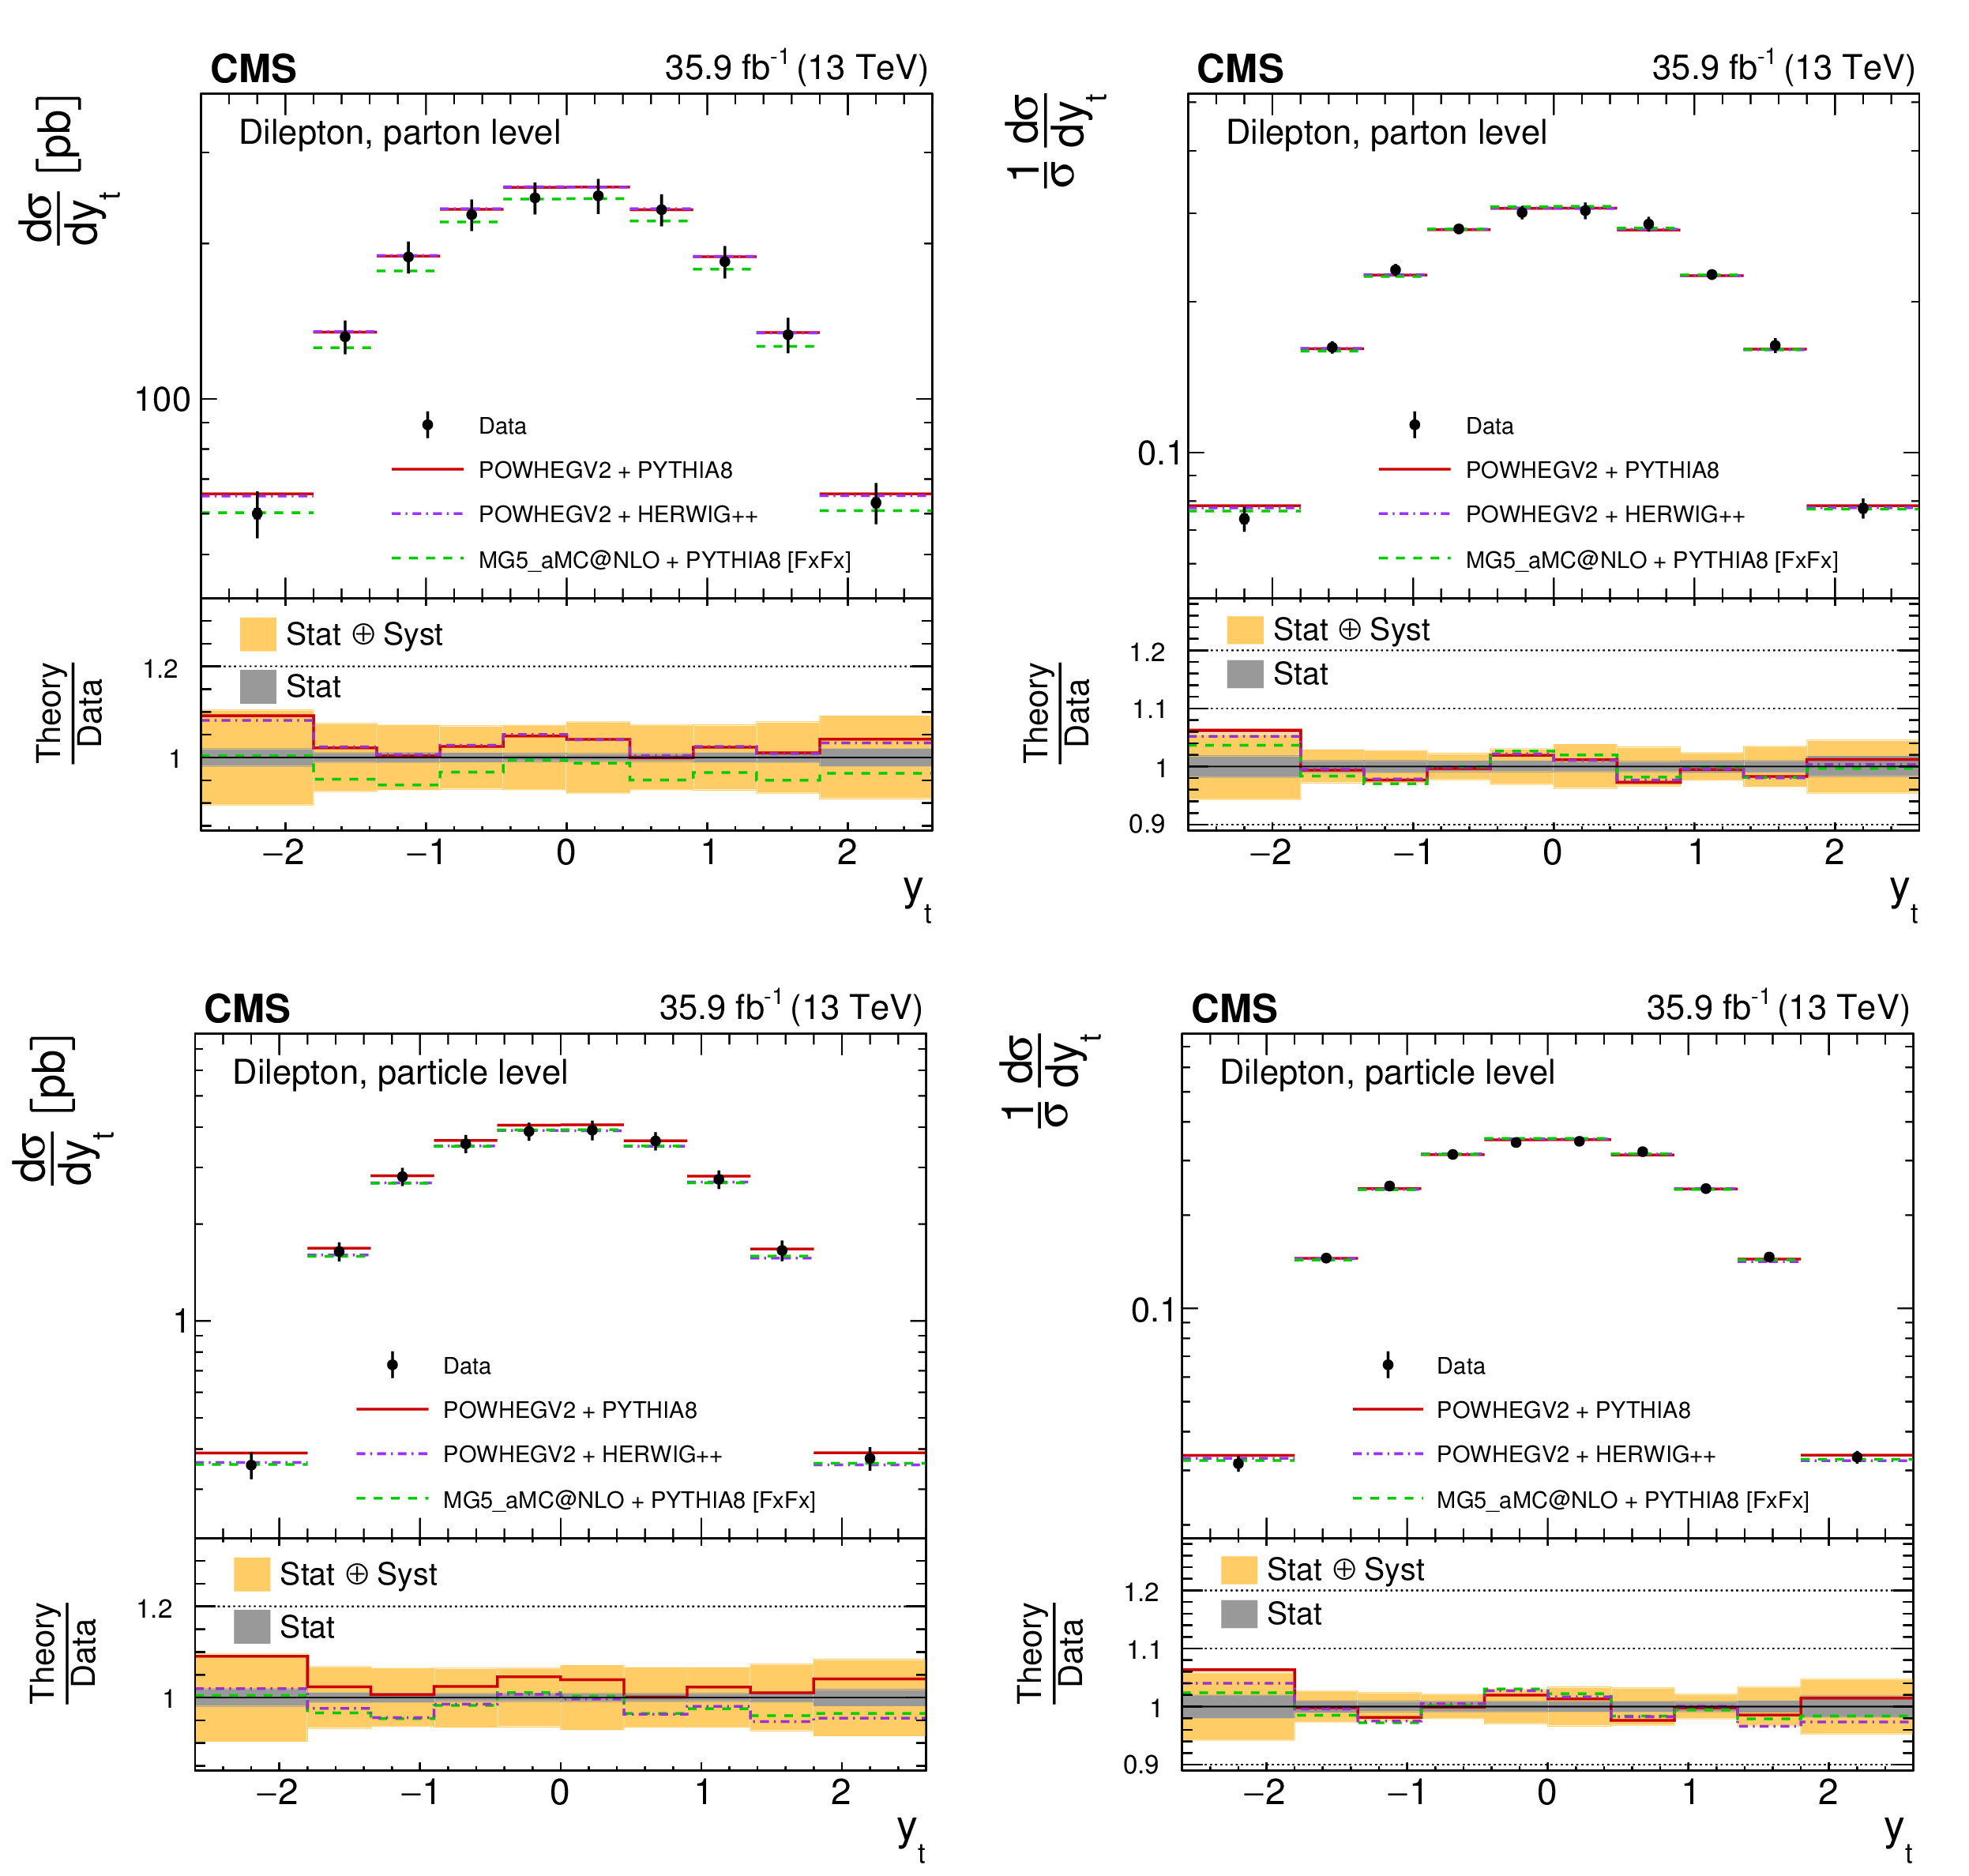
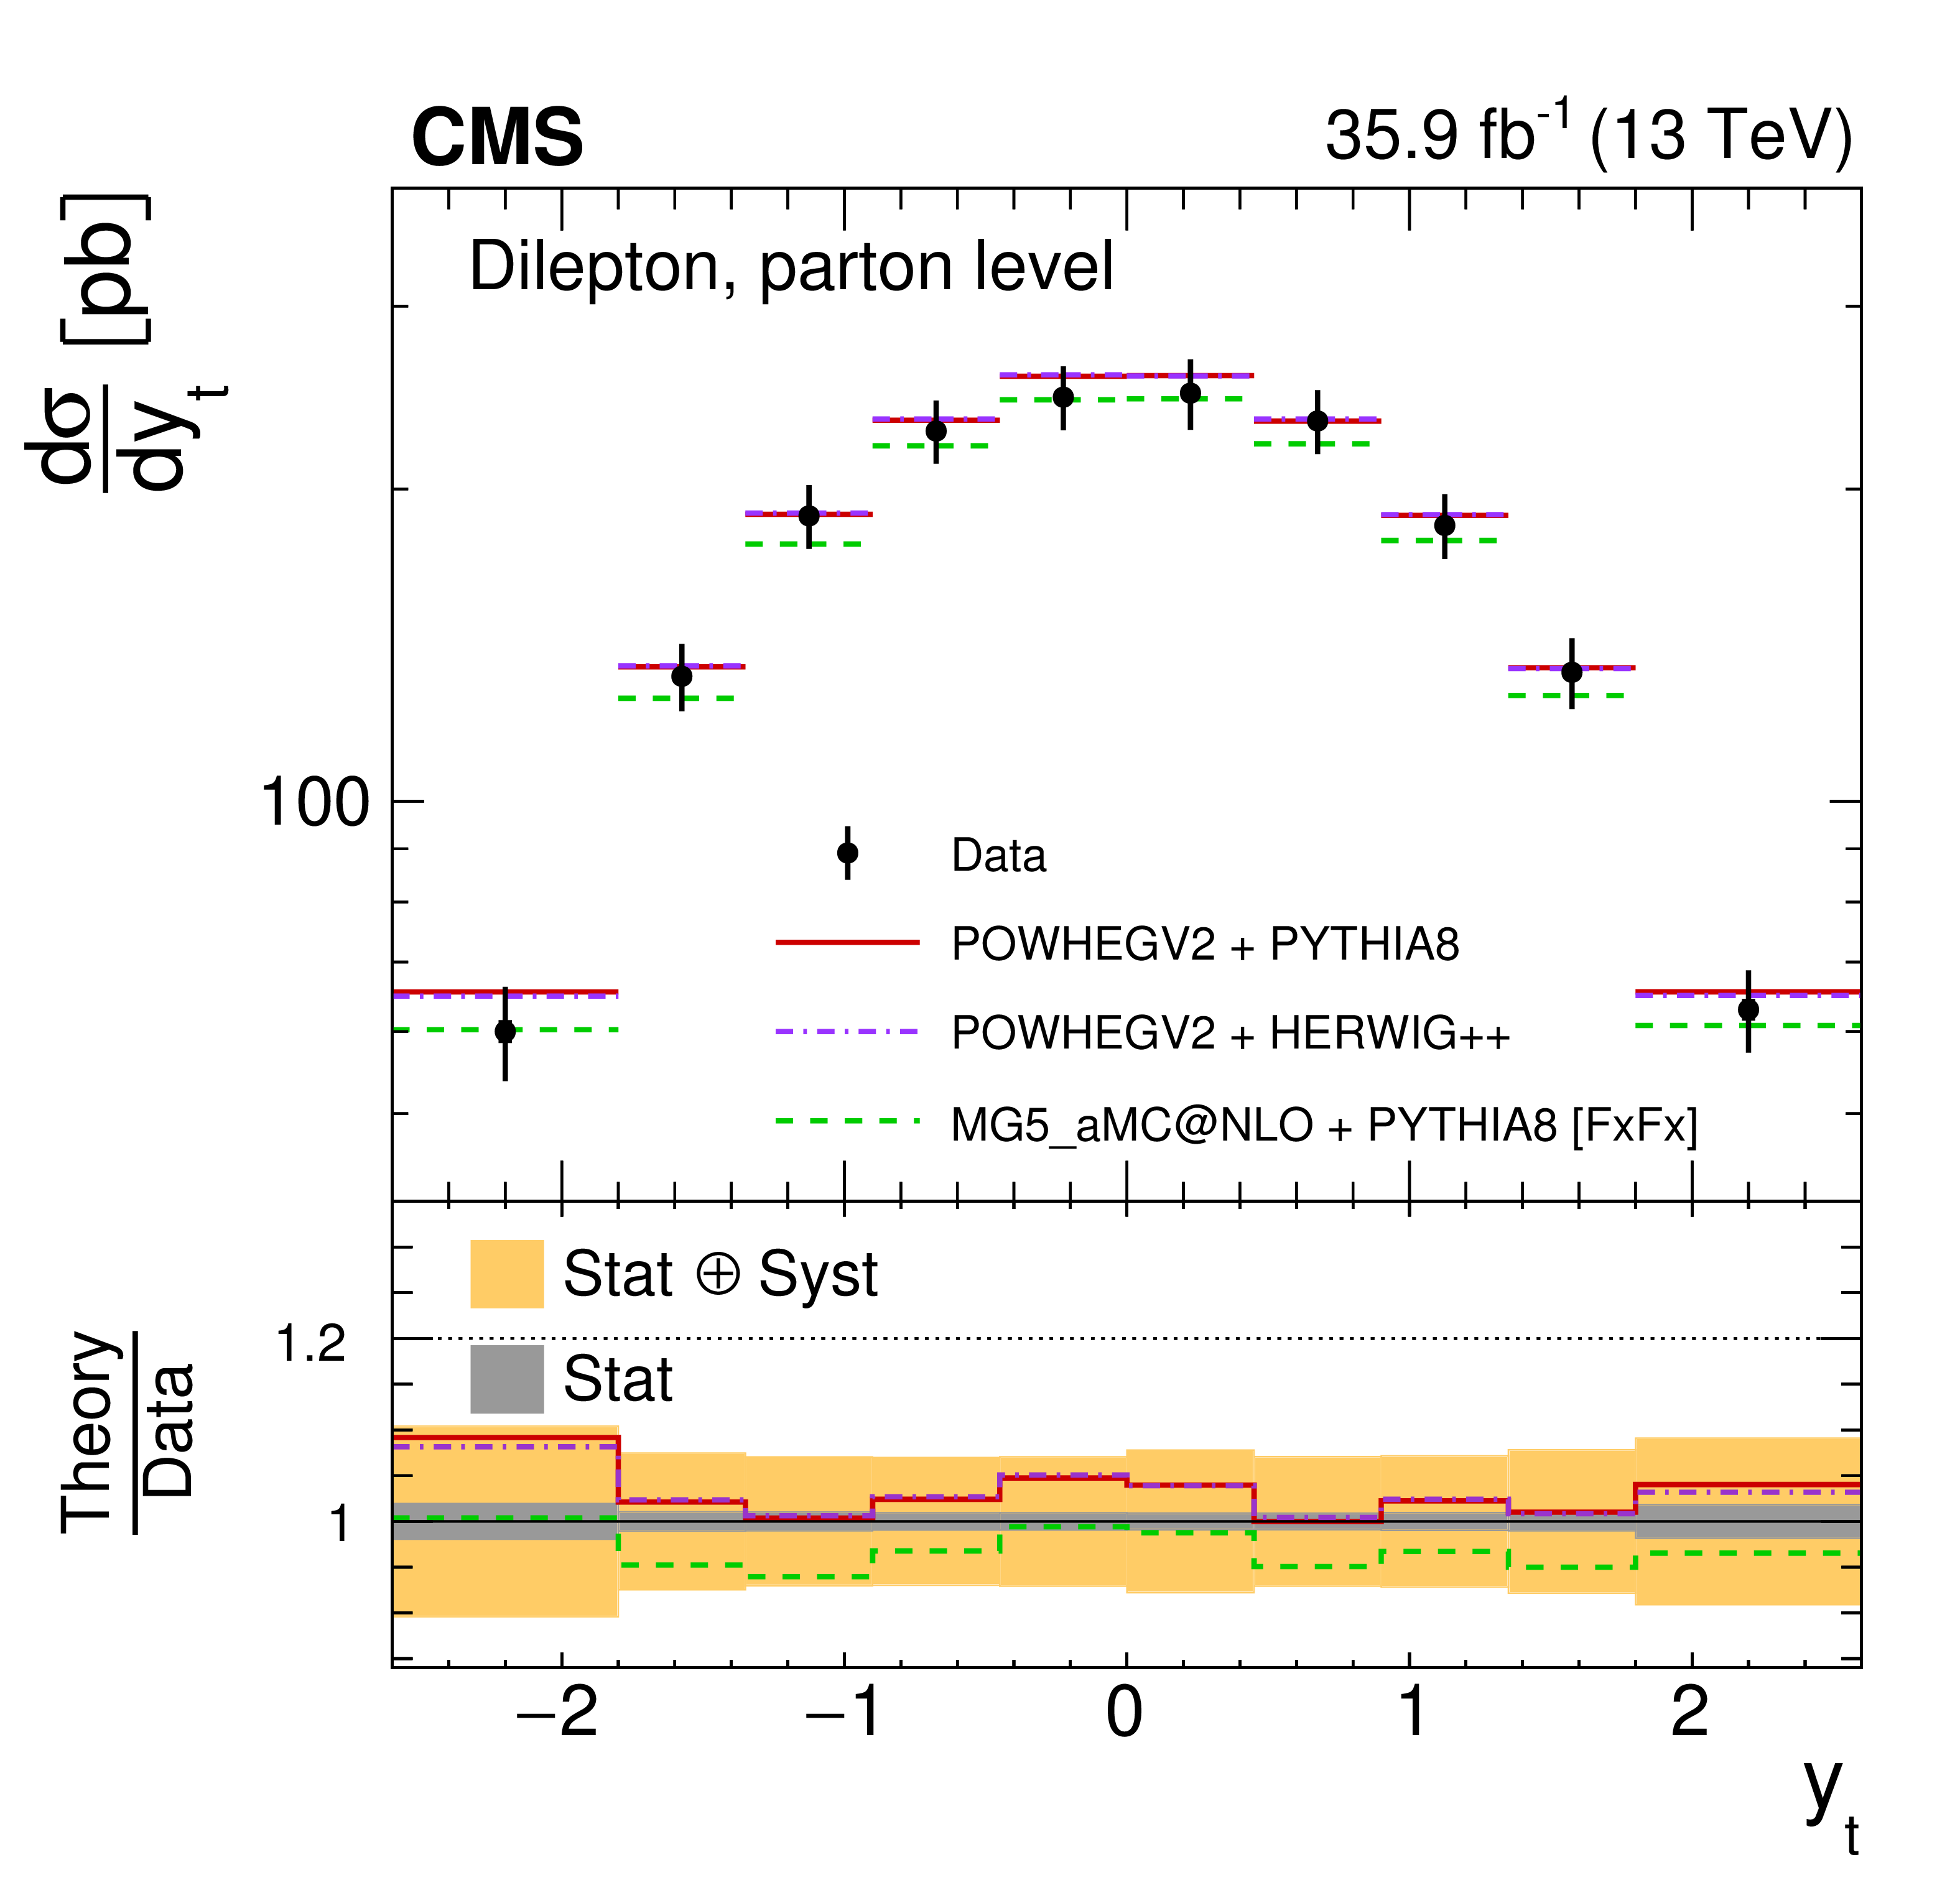
Figure 12:
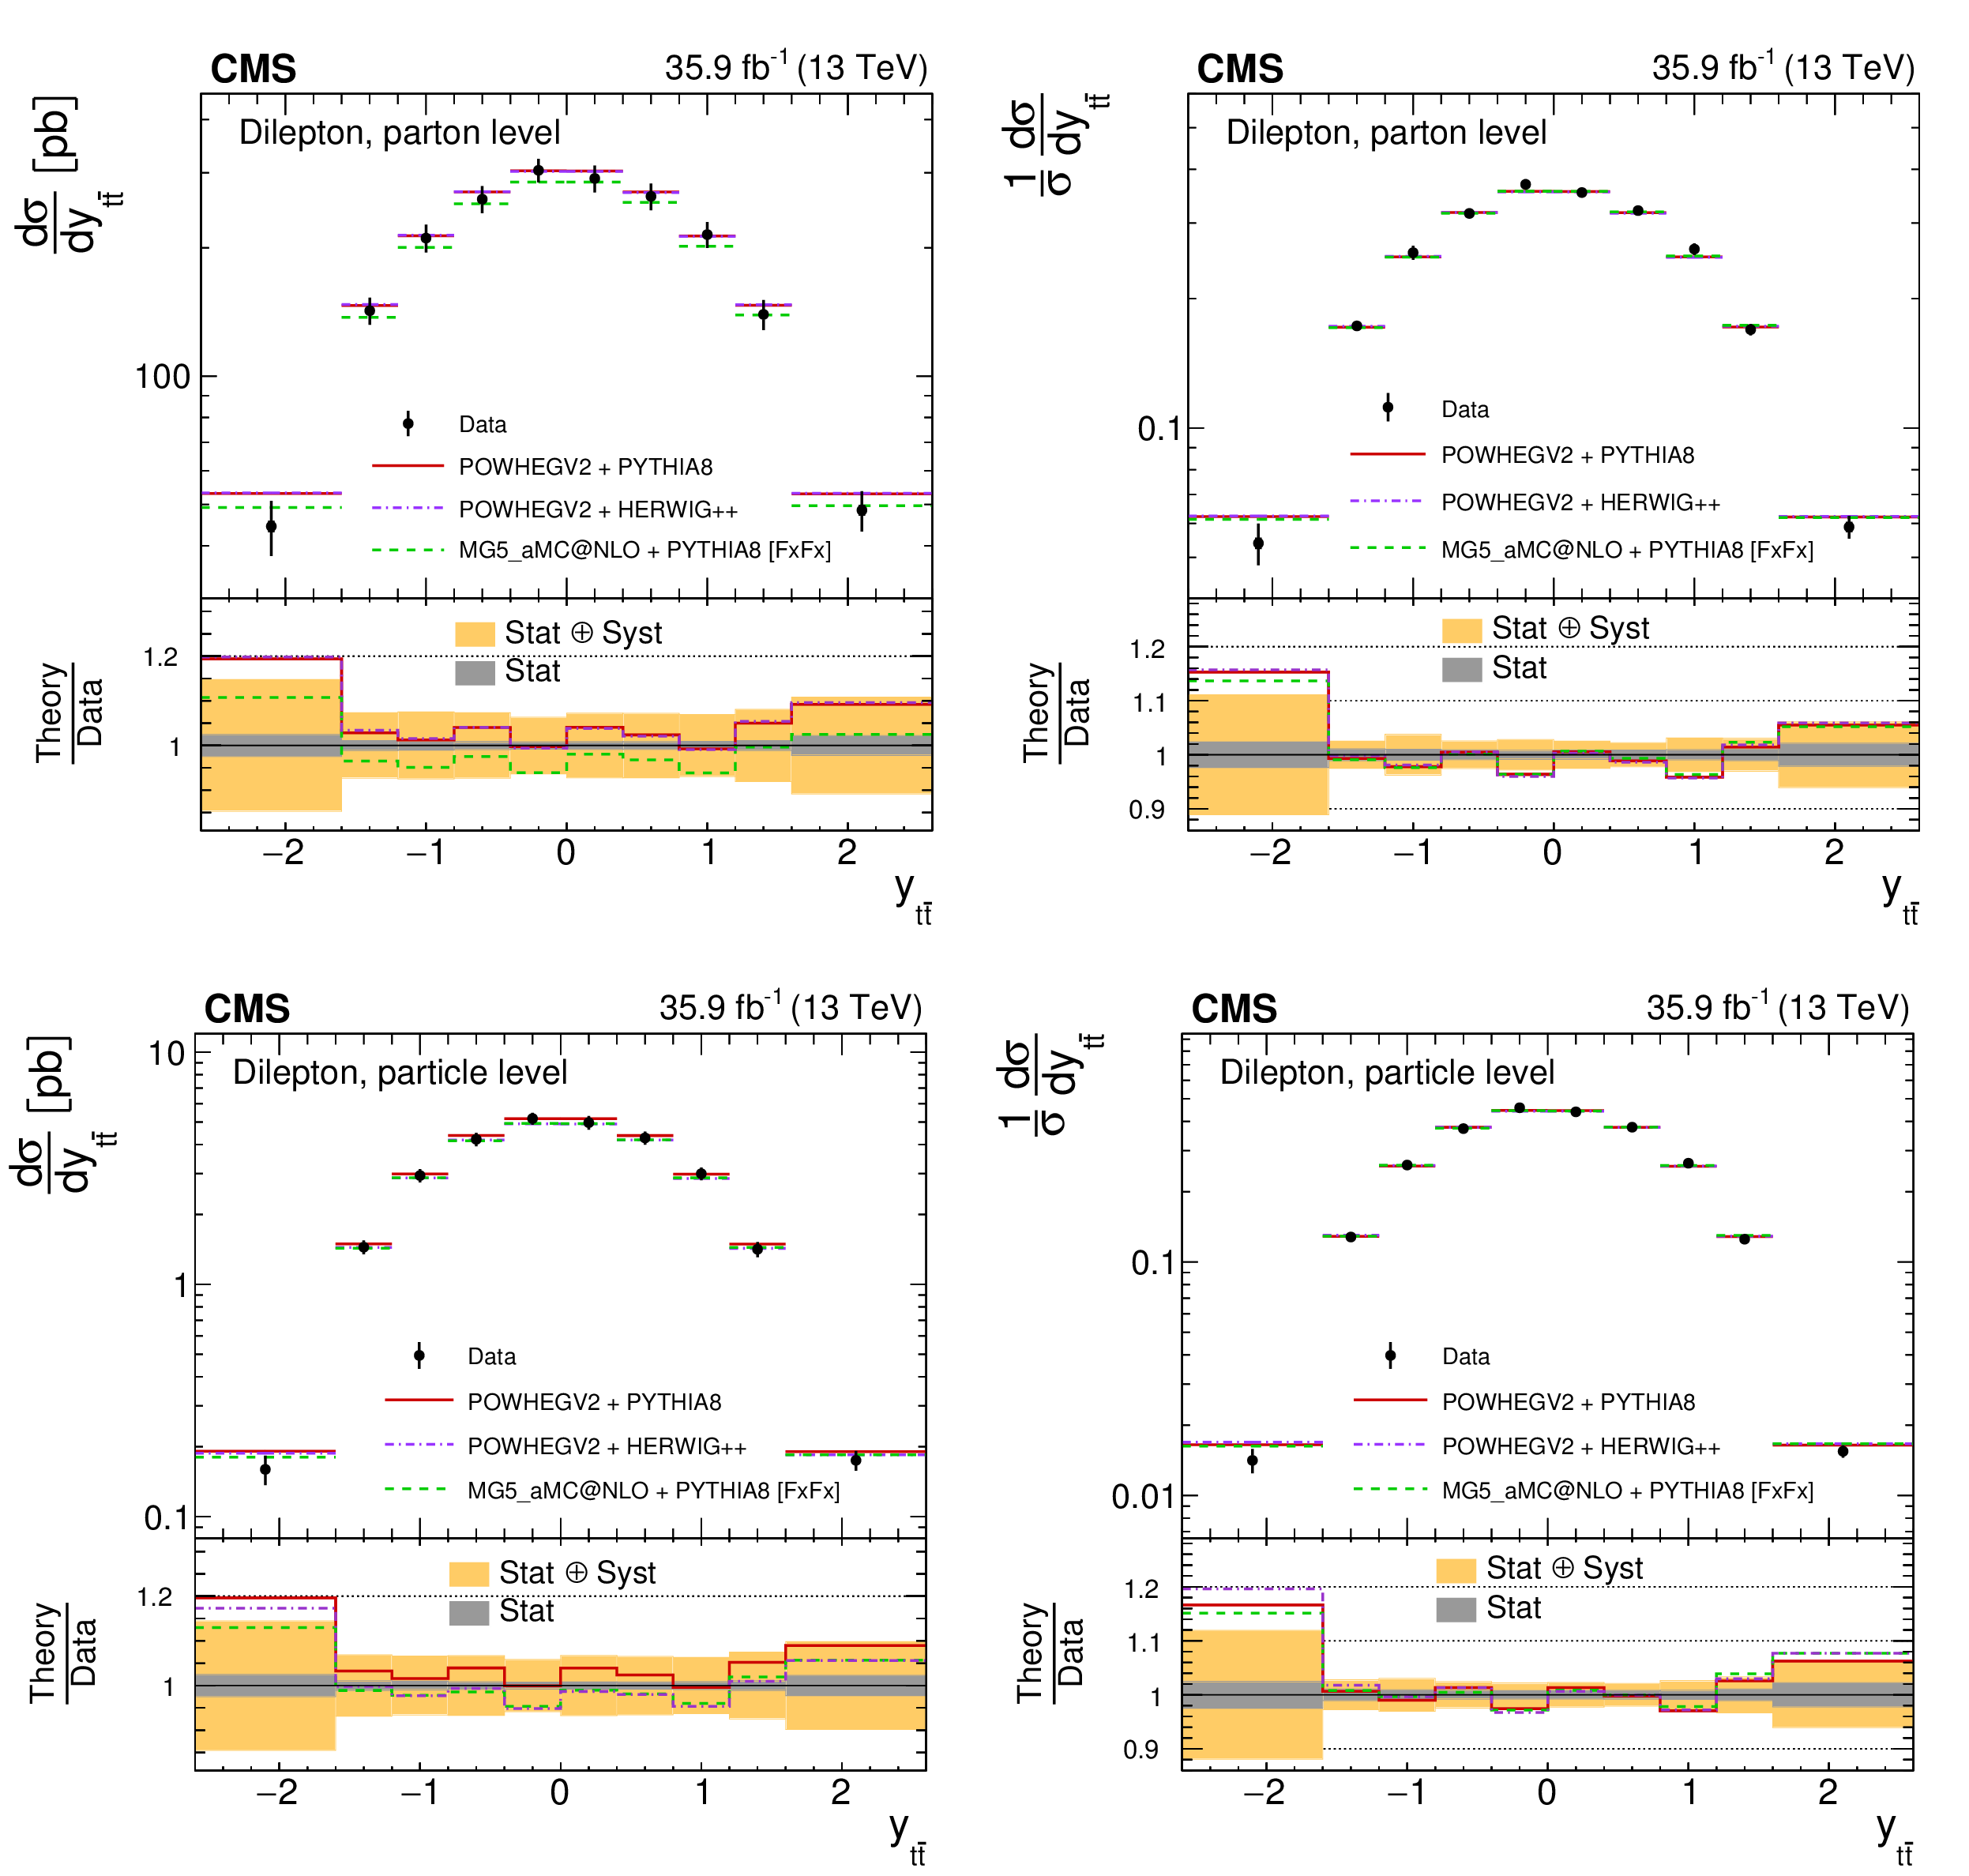
The differential $ {{\mathrm {t}\overline {\mathrm {t}}}} $ production cross sections as a function of $ {y_{{\mathrm {t}}}} $ are shown for the data (points) and the MC predictions (lines). The vertical lines on the points indicate the total uncertainty in the data. The left and right columns correspond to absolute and normalised measurements, respectively. The upper row corresponds to measurements at the parton level in the full phase space and the lower row to the particle level in a fiducial phase space. The lower panel in each plot shows the ratios of the theoretical predictions to the data. The dark and light bands show the relative statistical and total uncertainties in the data, respectively. |
png pdf |
Figure 12-a:
The differential $ {{\mathrm {t}\overline {\mathrm {t}}}} $ production cross sections as a function of $ {y_{{\mathrm {t}}}} $ are shown for the data (points) and the MC predictions (lines). The vertical lines on the points indicate the total uncertainty in the data. The left and right columns correspond to absolute and normalised measurements, respectively. The upper row corresponds to measurements at the parton level in the full phase space and the lower row to the particle level in a fiducial phase space. The lower panel in each plot shows the ratios of the theoretical predictions to the data. The dark and light bands show the relative statistical and total uncertainties in the data, respectively. |
png pdf |
Figure 12-b:
The differential $ {{\mathrm {t}\overline {\mathrm {t}}}} $ production cross sections as a function of $ {y_{{\mathrm {t}}}} $ are shown for the data (points) and the MC predictions (lines). The vertical lines on the points indicate the total uncertainty in the data. The left and right columns correspond to absolute and normalised measurements, respectively. The upper row corresponds to measurements at the parton level in the full phase space and the lower row to the particle level in a fiducial phase space. The lower panel in each plot shows the ratios of the theoretical predictions to the data. The dark and light bands show the relative statistical and total uncertainties in the data, respectively. |

png pdf |
Figure 12-c:
The differential $ {{\mathrm {t}\overline {\mathrm {t}}}} $ production cross sections as a function of $ {y_{{\mathrm {t}}}} $ are shown for the data (points) and the MC predictions (lines). The vertical lines on the points indicate the total uncertainty in the data. The left and right columns correspond to absolute and normalised measurements, respectively. The upper row corresponds to measurements at the parton level in the full phase space and the lower row to the particle level in a fiducial phase space. The lower panel in each plot shows the ratios of the theoretical predictions to the data. The dark and light bands show the relative statistical and total uncertainties in the data, respectively. |

png pdf |
Figure 12-d:
The differential $ {{\mathrm {t}\overline {\mathrm {t}}}} $ production cross sections as a function of $ {y_{{\mathrm {t}}}} $ are shown for the data (points) and the MC predictions (lines). The vertical lines on the points indicate the total uncertainty in the data. The left and right columns correspond to absolute and normalised measurements, respectively. The upper row corresponds to measurements at the parton level in the full phase space and the lower row to the particle level in a fiducial phase space. The lower panel in each plot shows the ratios of the theoretical predictions to the data. The dark and light bands show the relative statistical and total uncertainties in the data, respectively. |

png pdf |
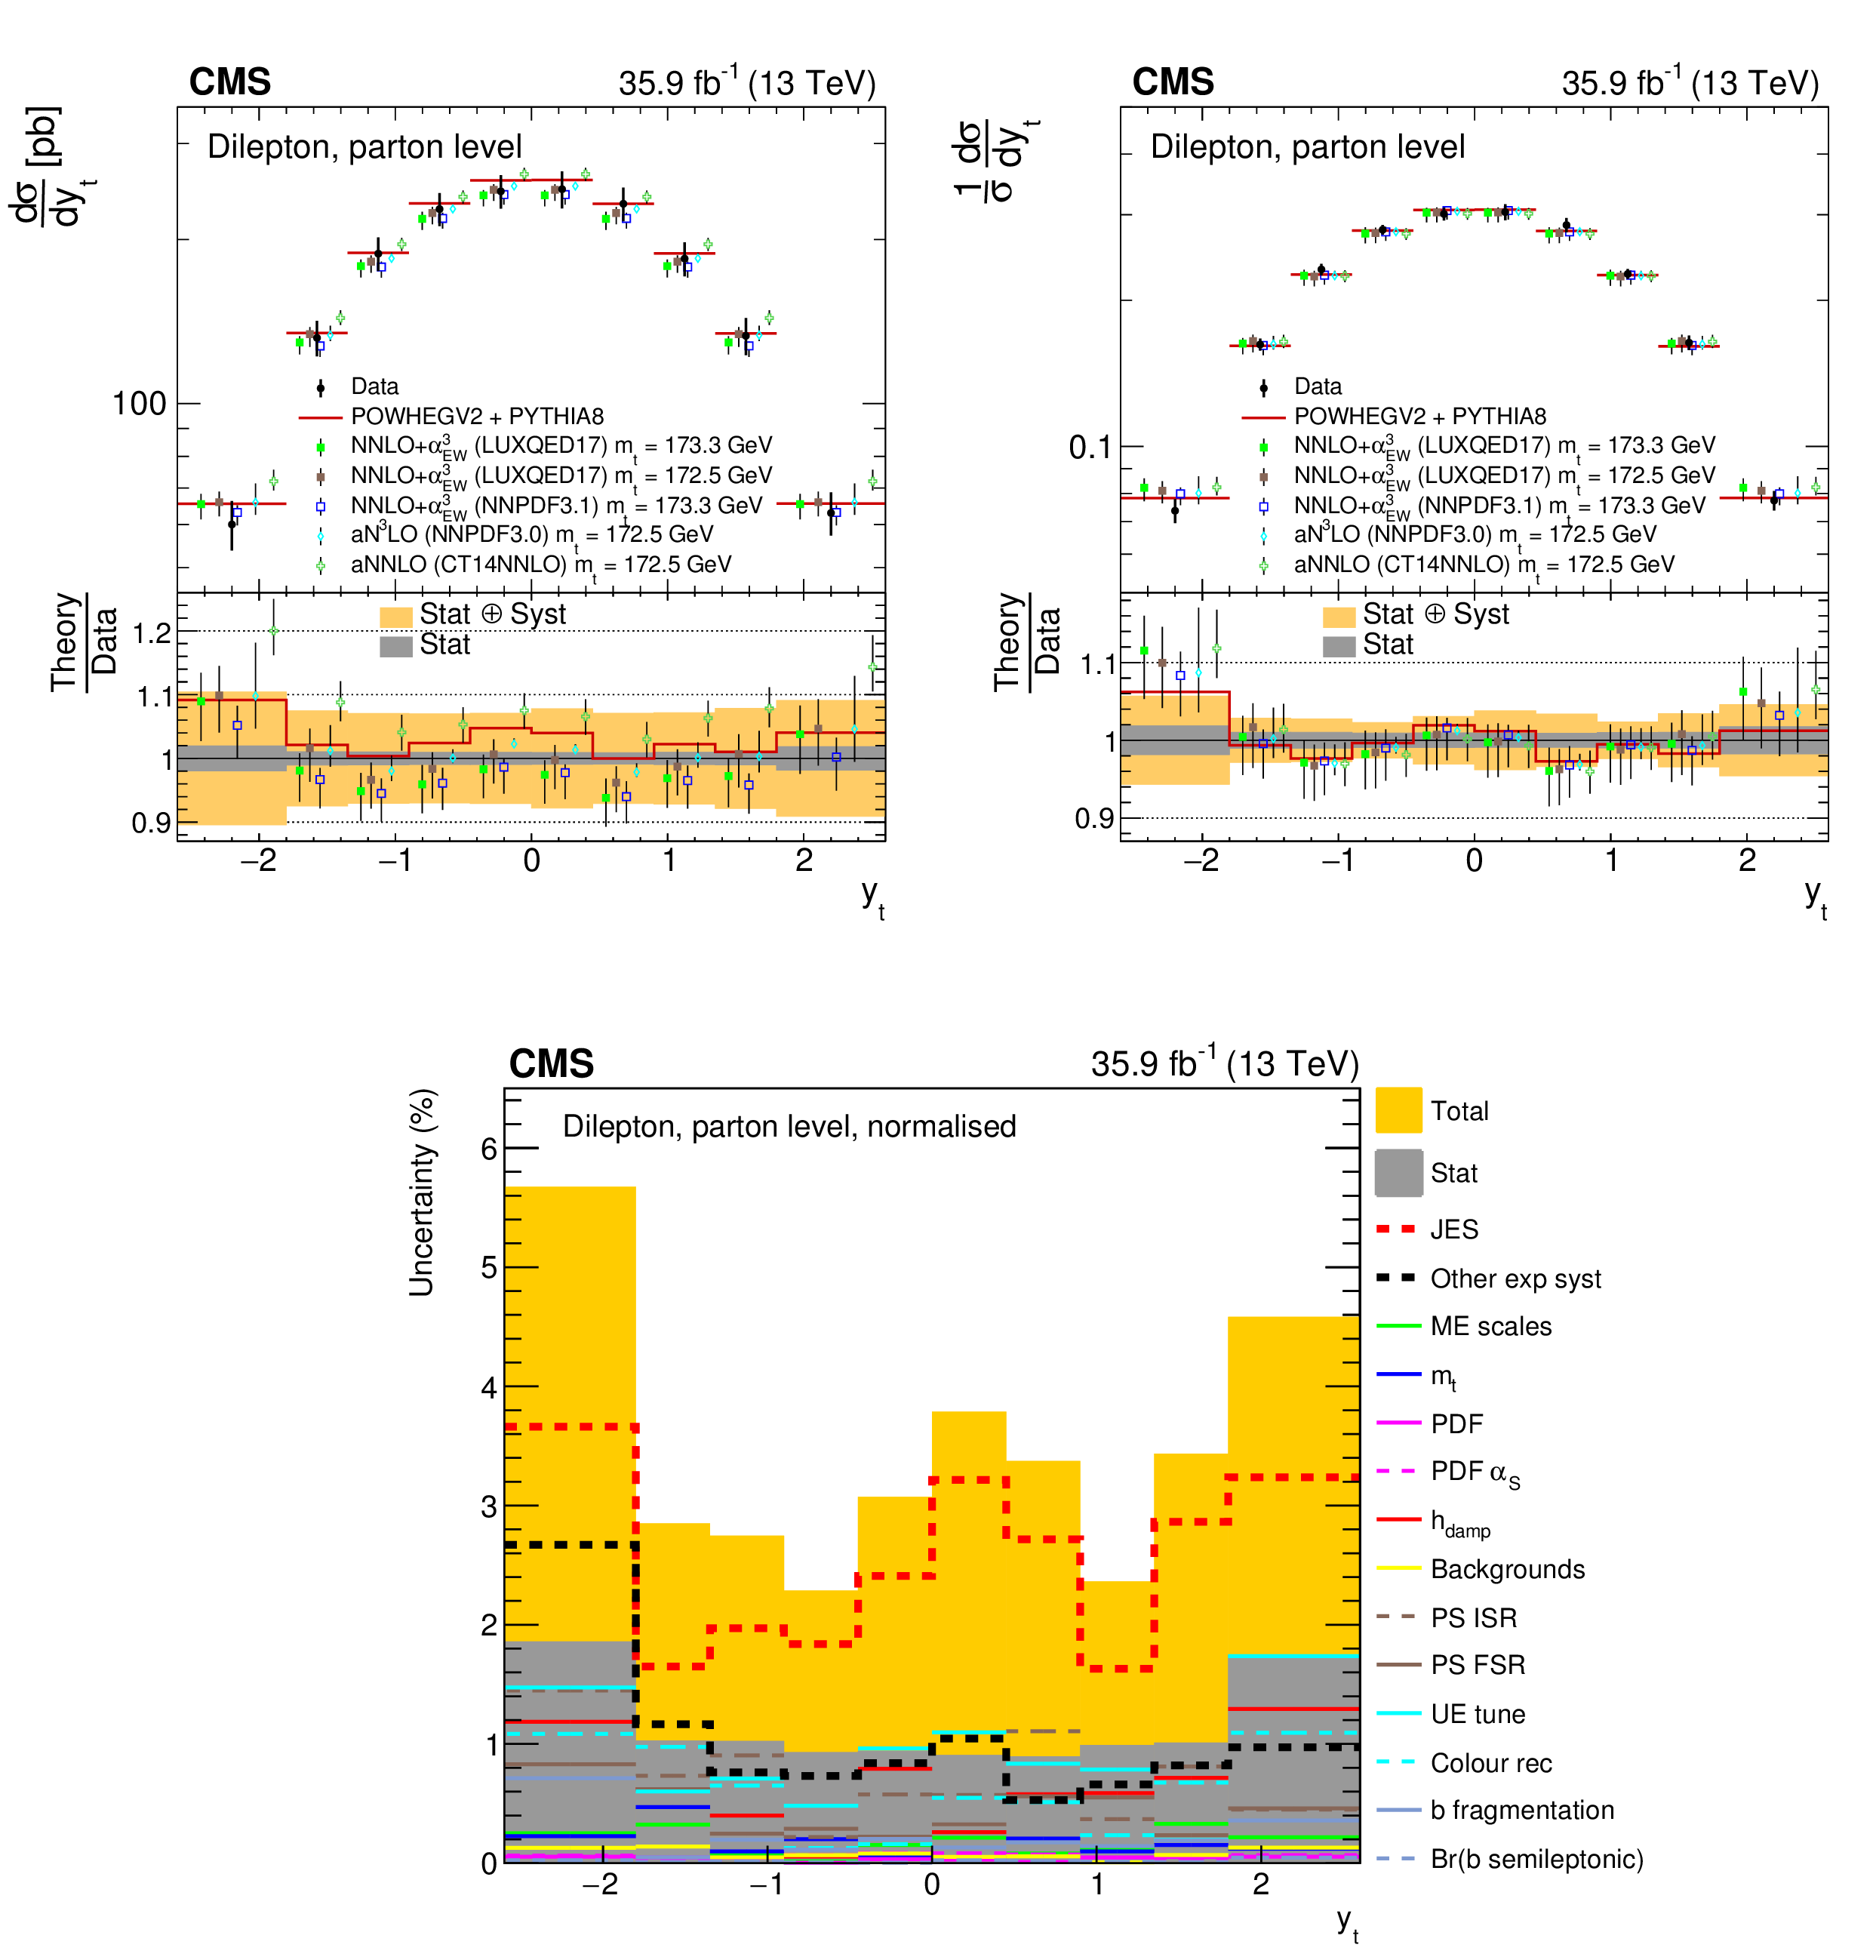
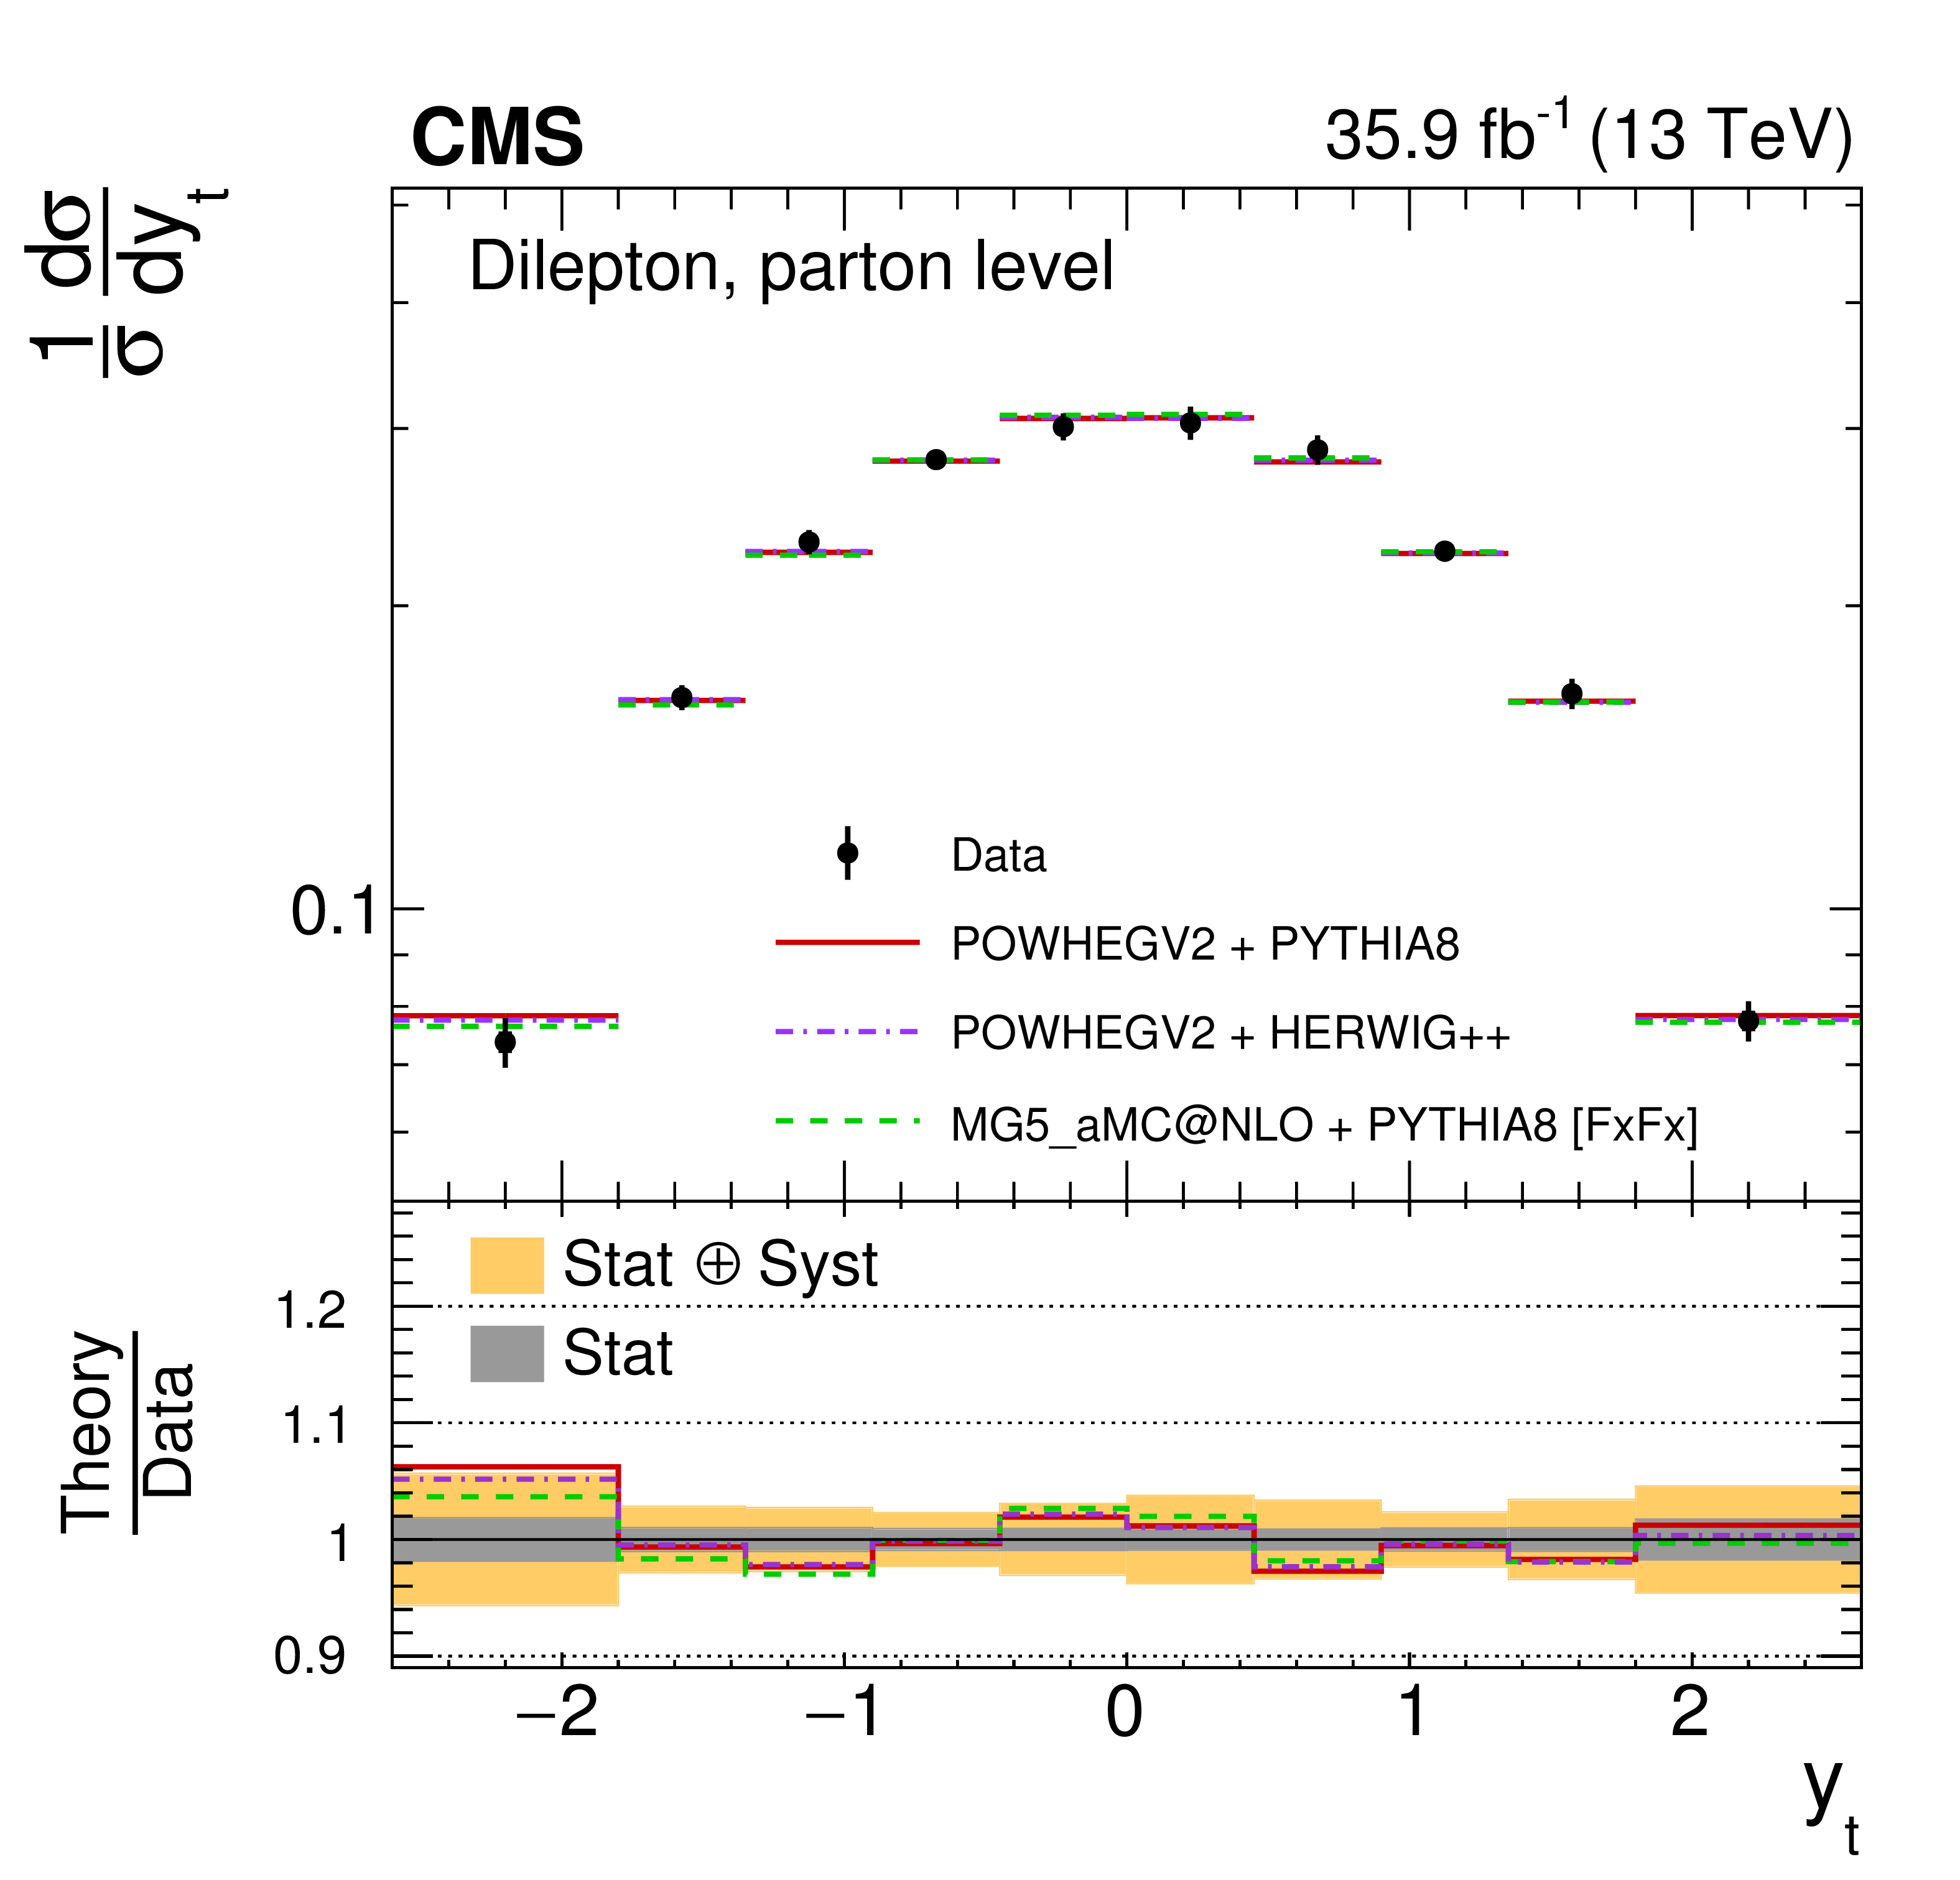
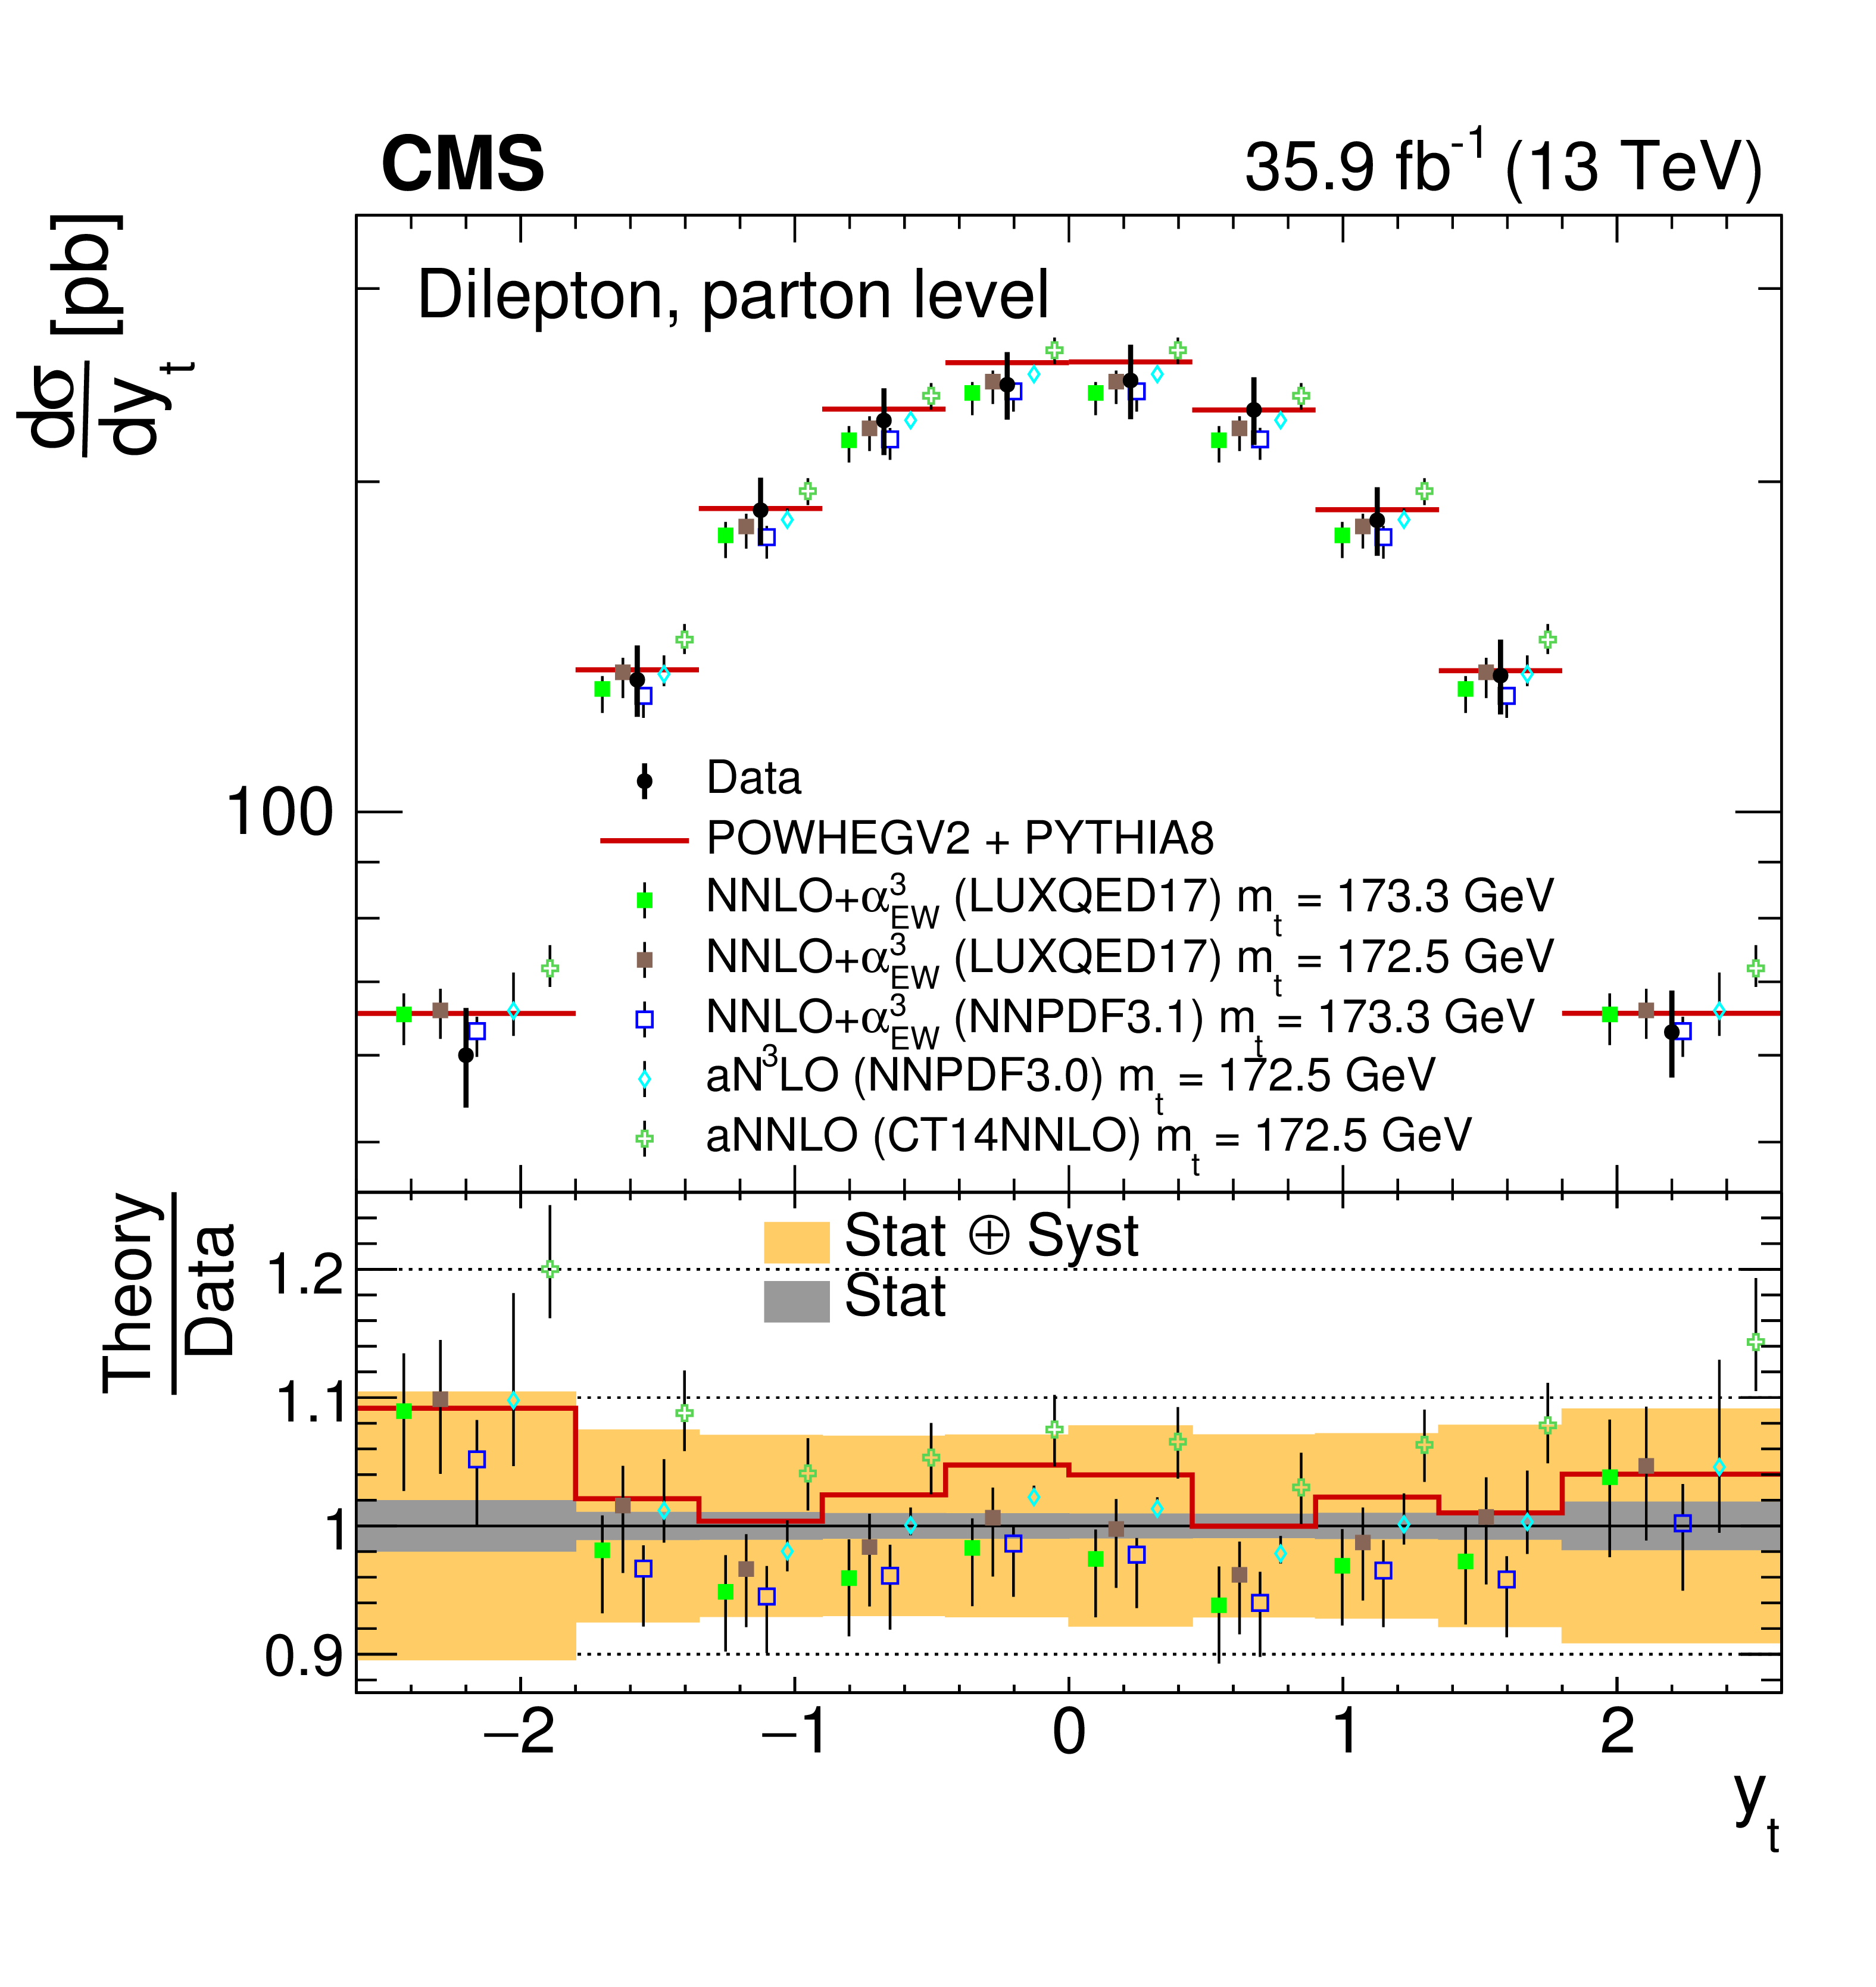
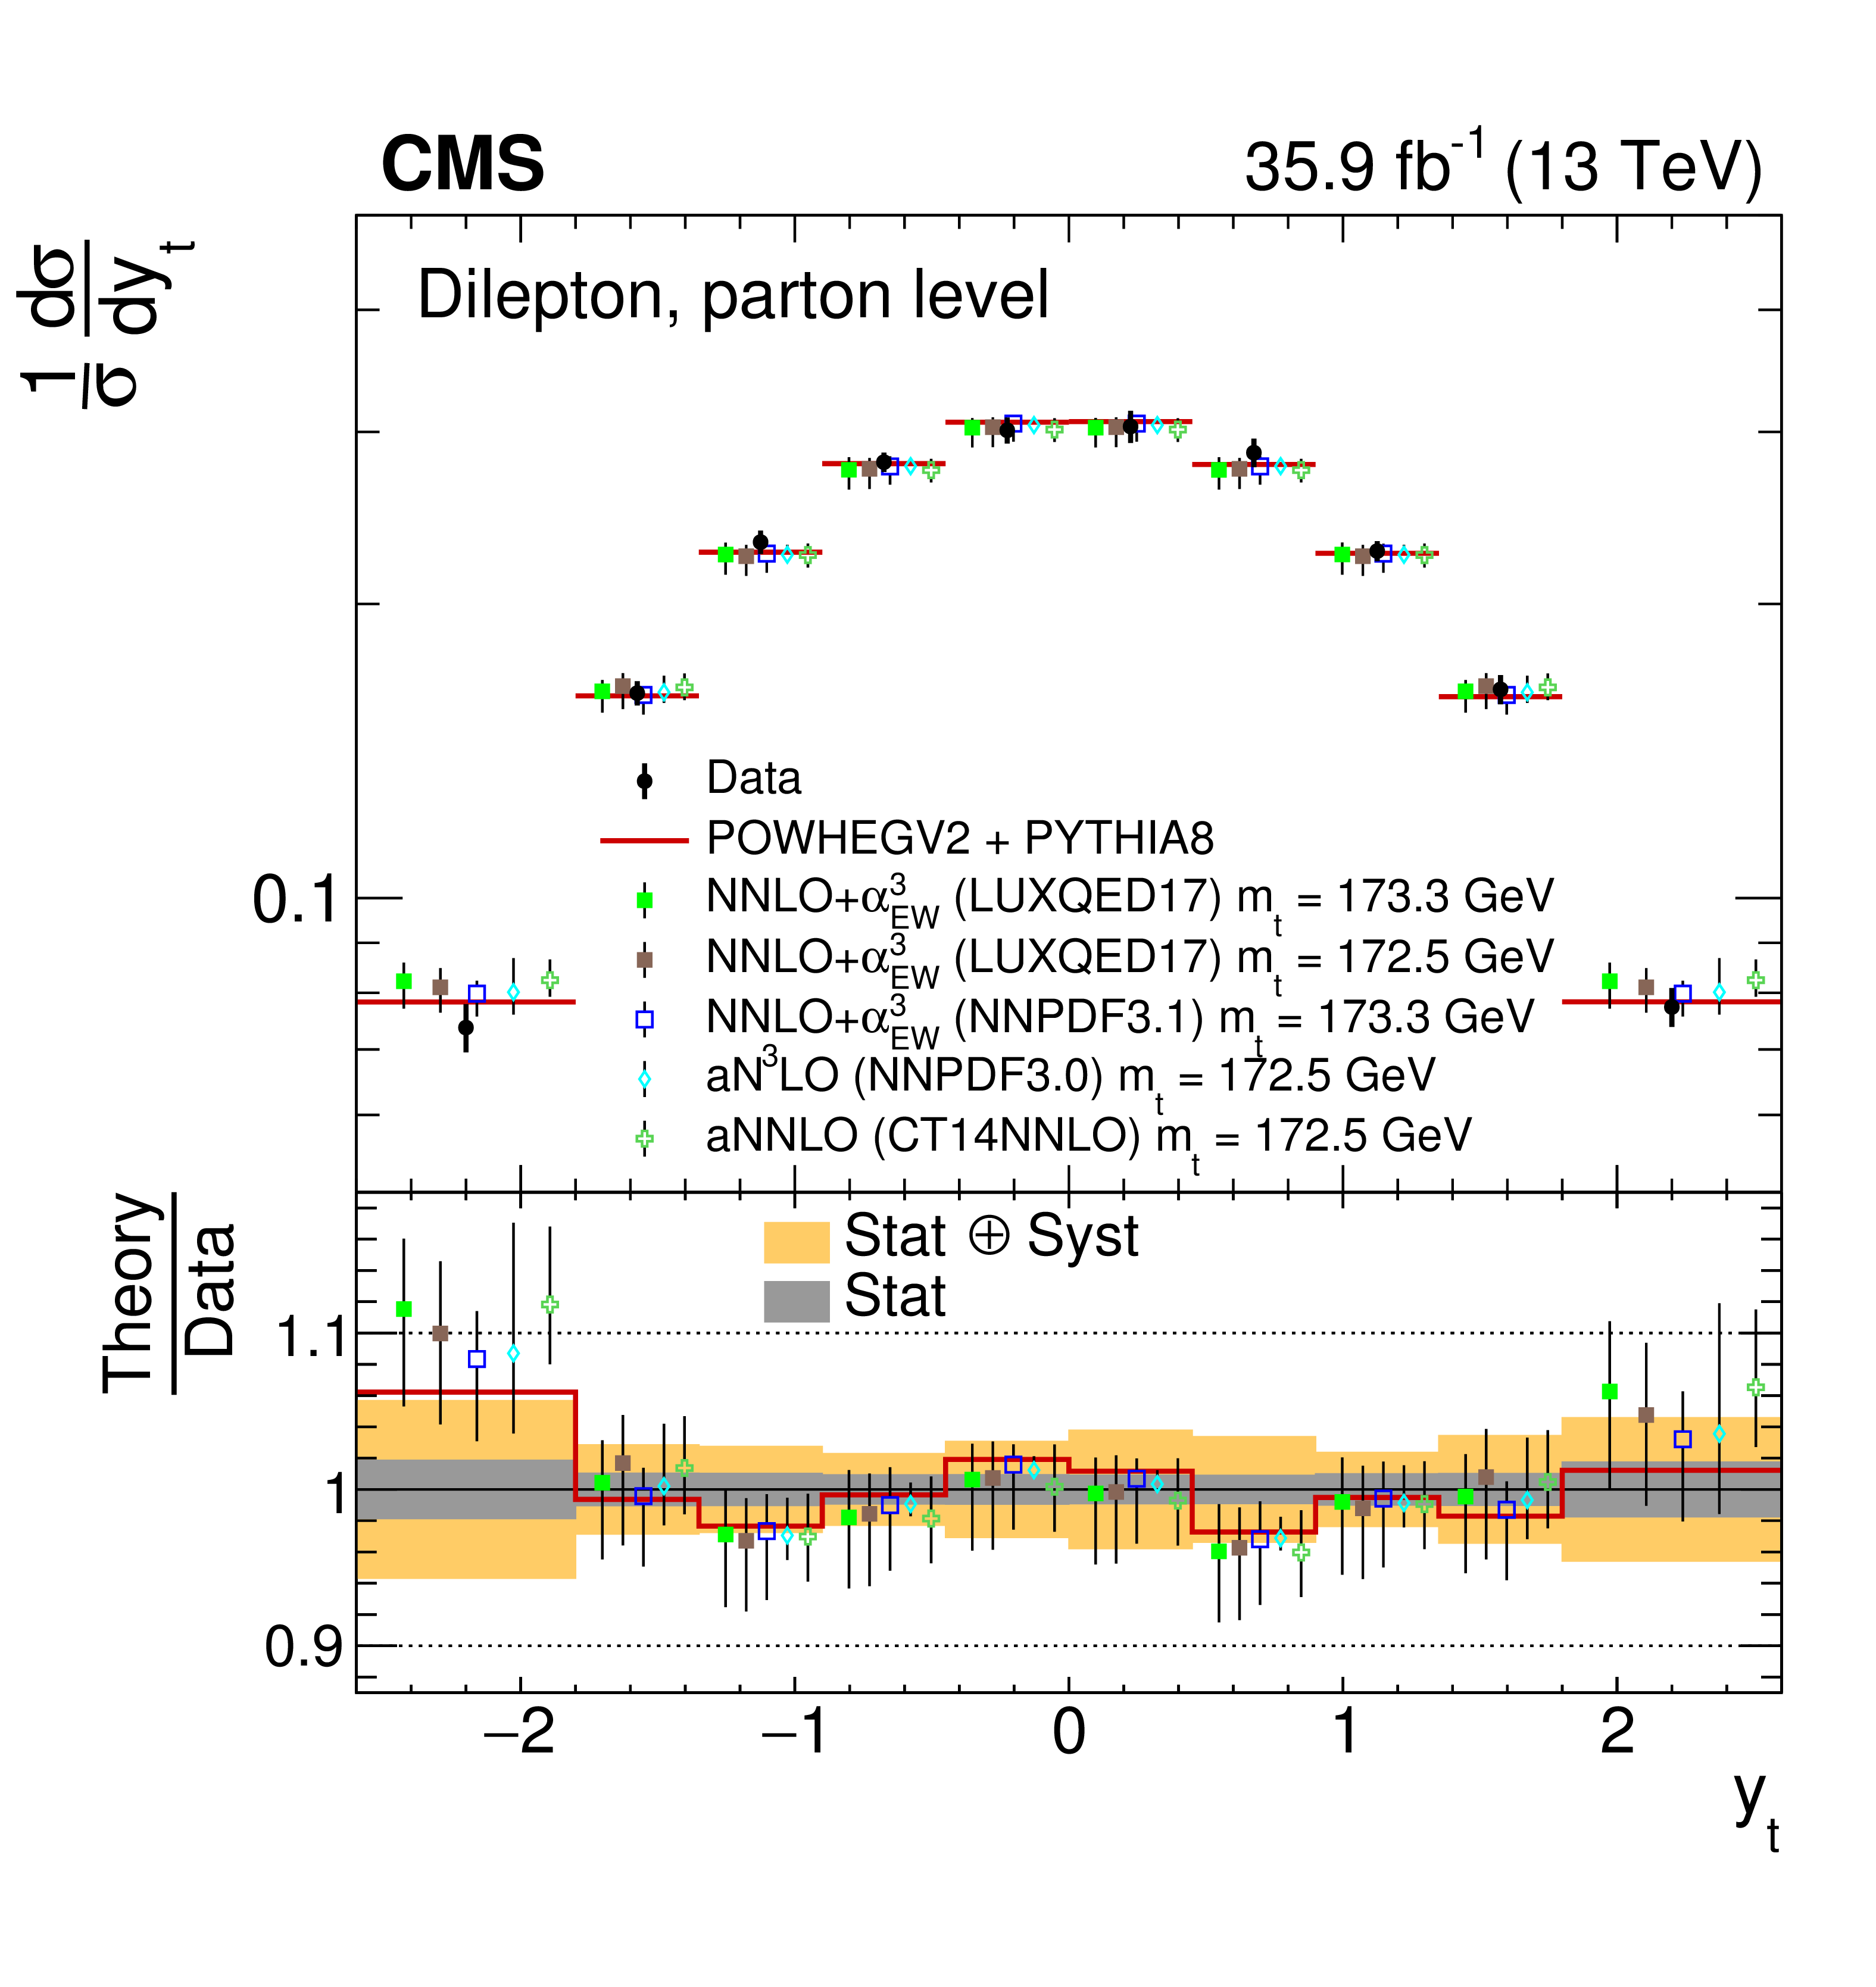
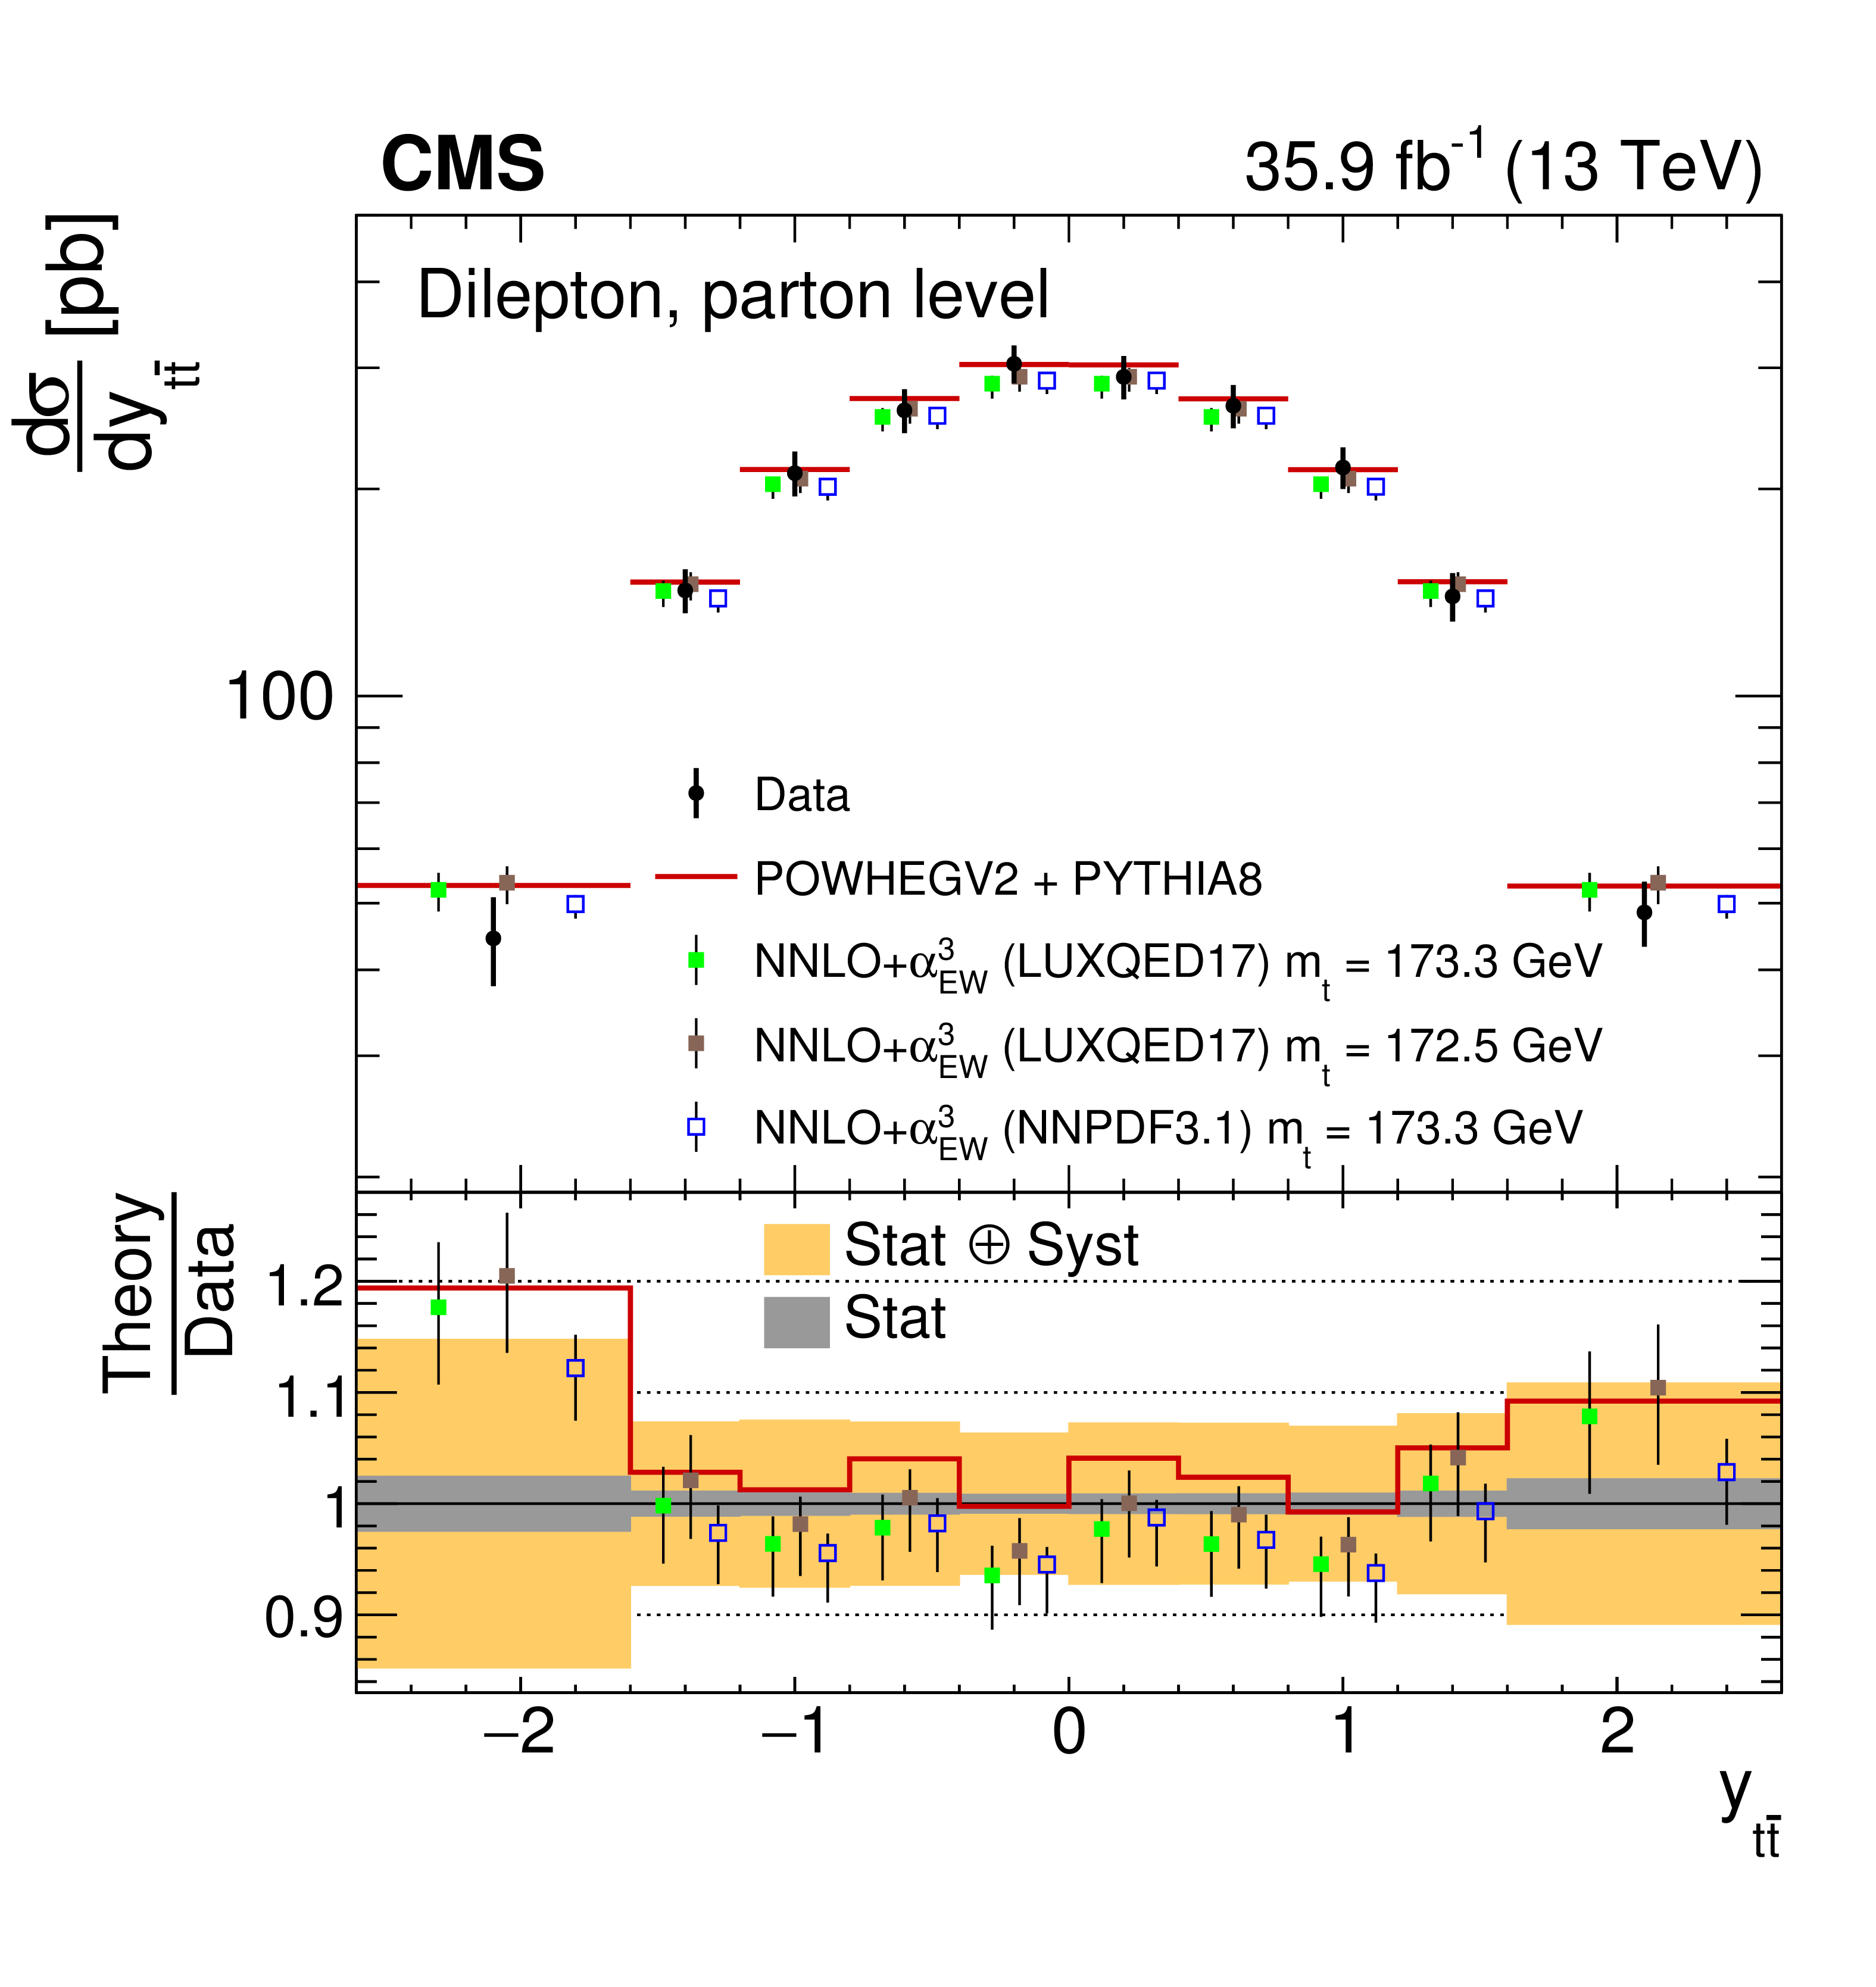
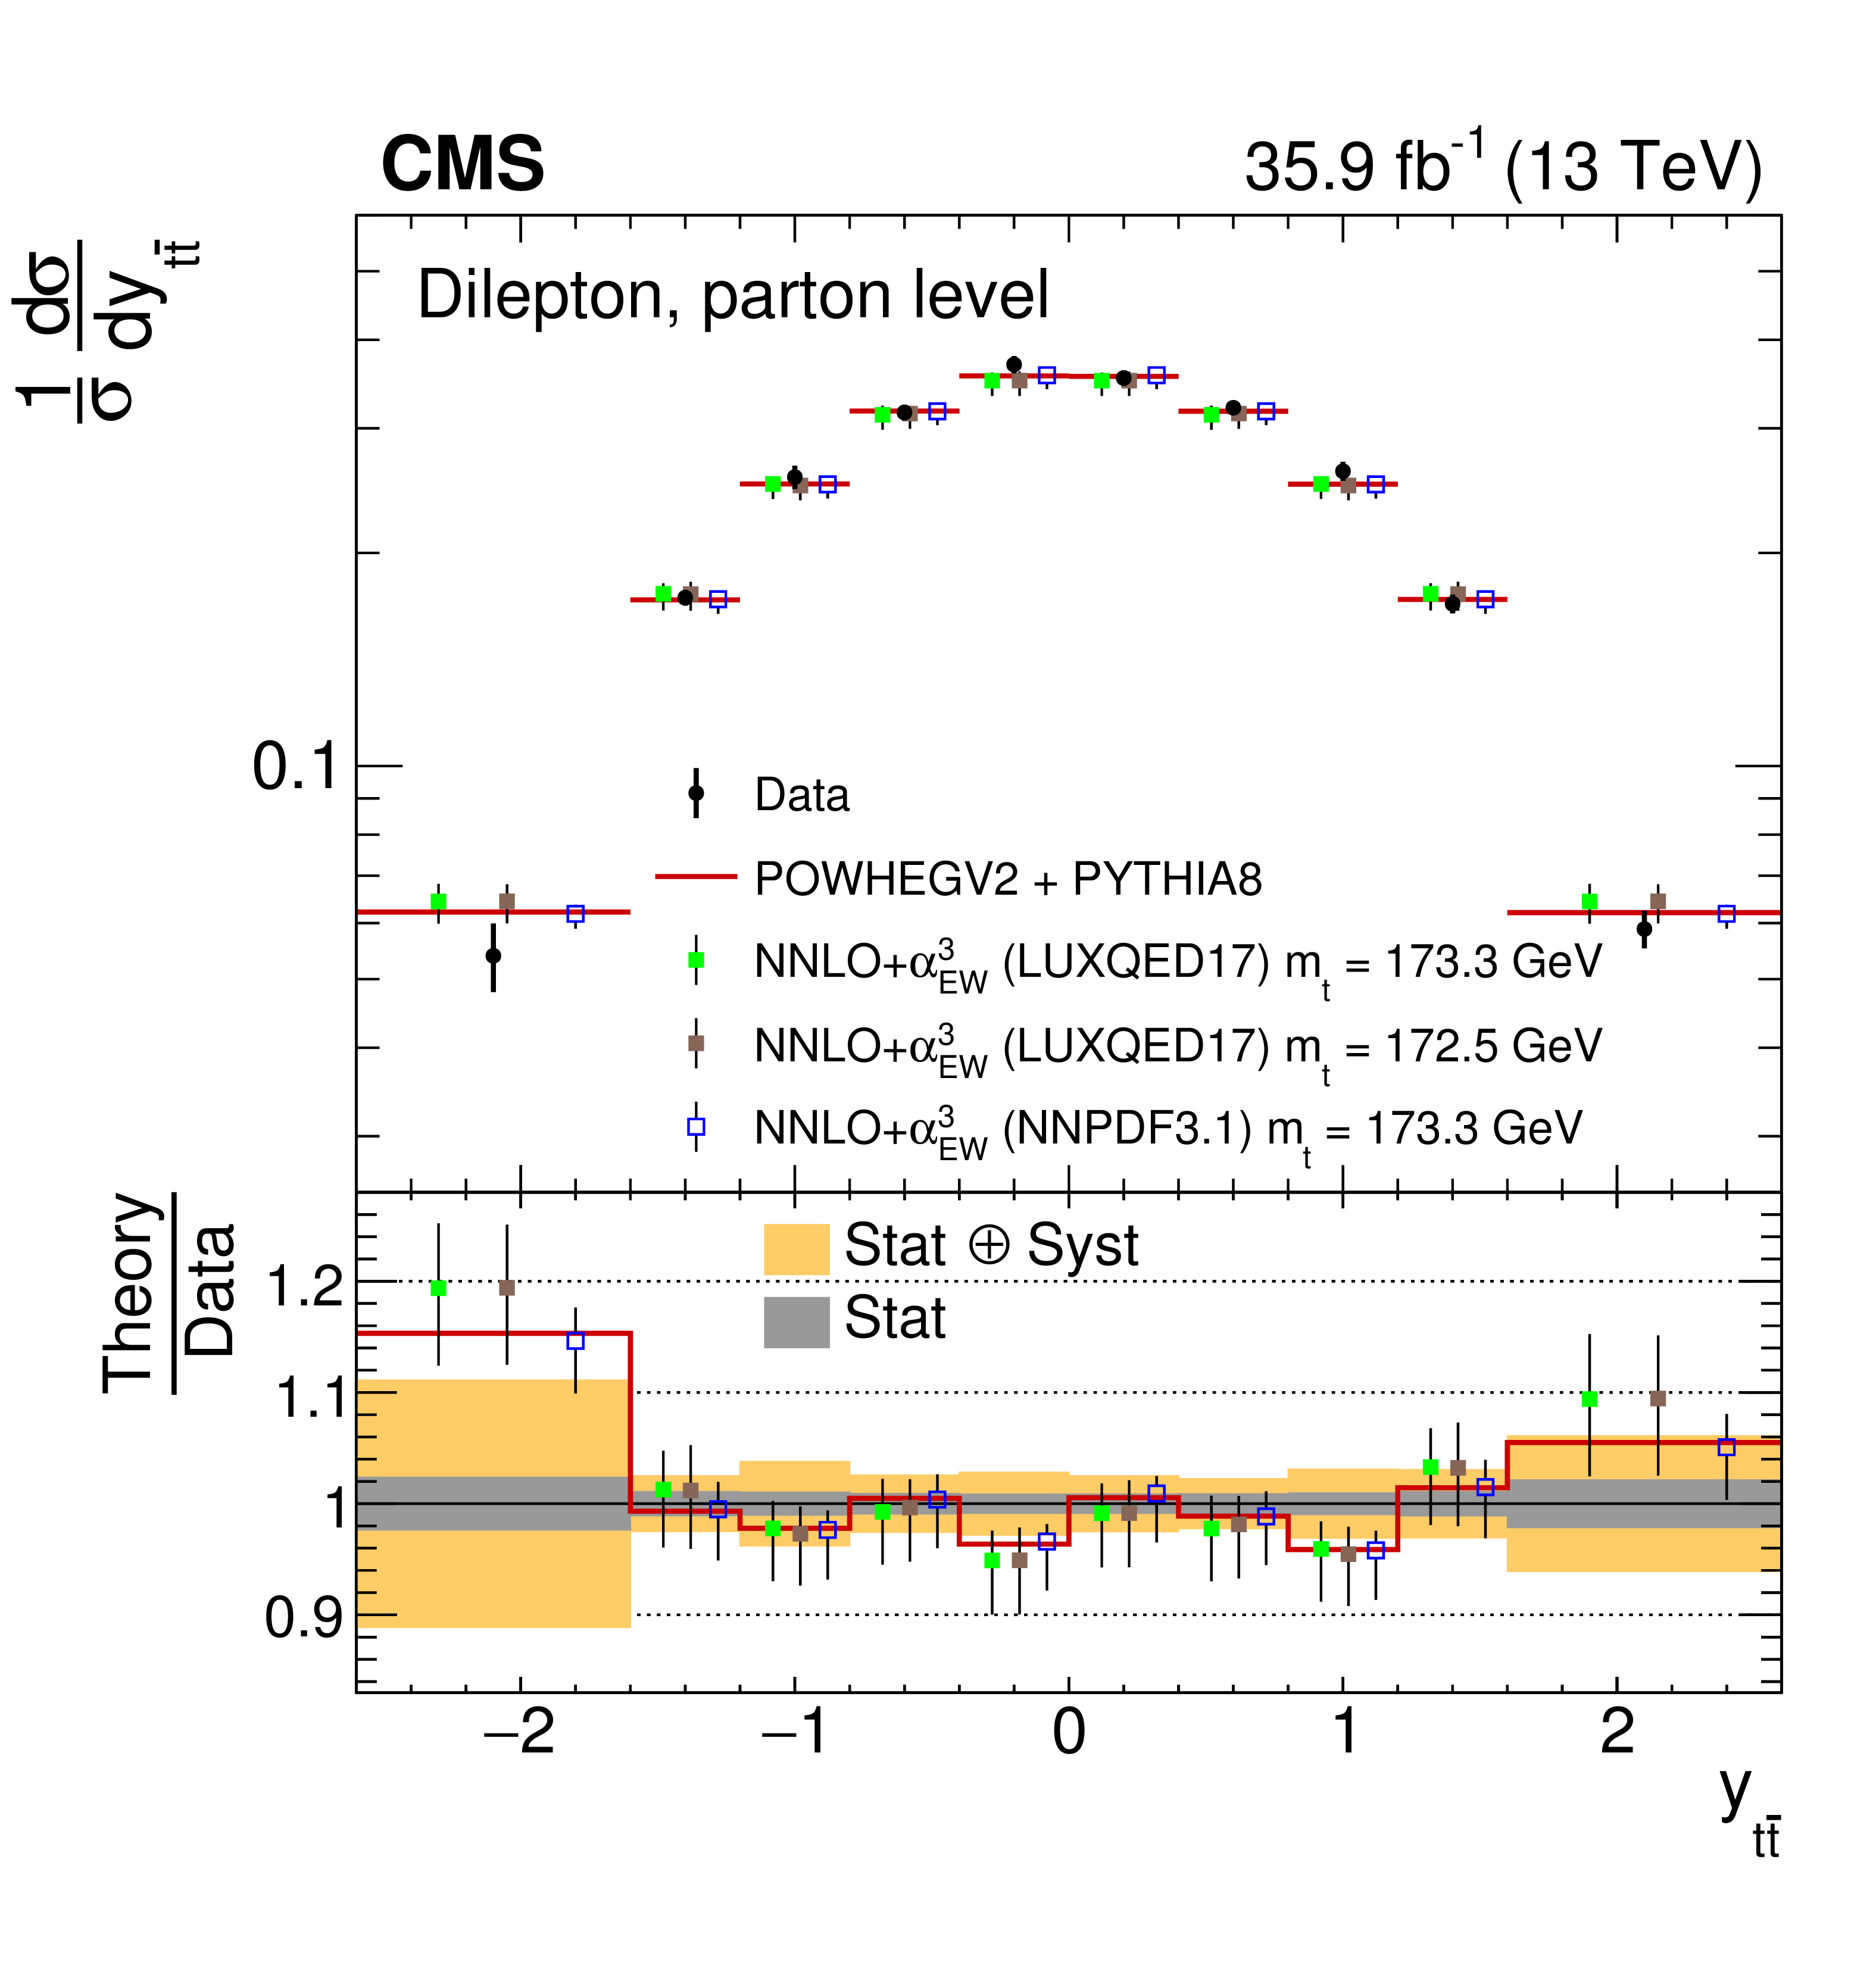
Figure 13:
The differential $ {{\mathrm {t}\overline {\mathrm {t}}}} $ production cross sections as a function of $ {y_{{\mathrm {t}}}} $ are shown for the data (filled circles), the theoretical predictions with beyond-NLO precision (other points) and the prediction from POWHEG+PYTHIA (solid line). The vertical lines on the filled circles and other points indicate the total uncertainty in the data and theoretical predictions, respectively. The left and right plots correspond to absolute and normalised measurements, respectively. The lower panel in each plot shows the ratios of the theoretical predictions to the data. The dark and light bands show the relative statistical and total uncertainties in the data, respectively. |
png pdf |
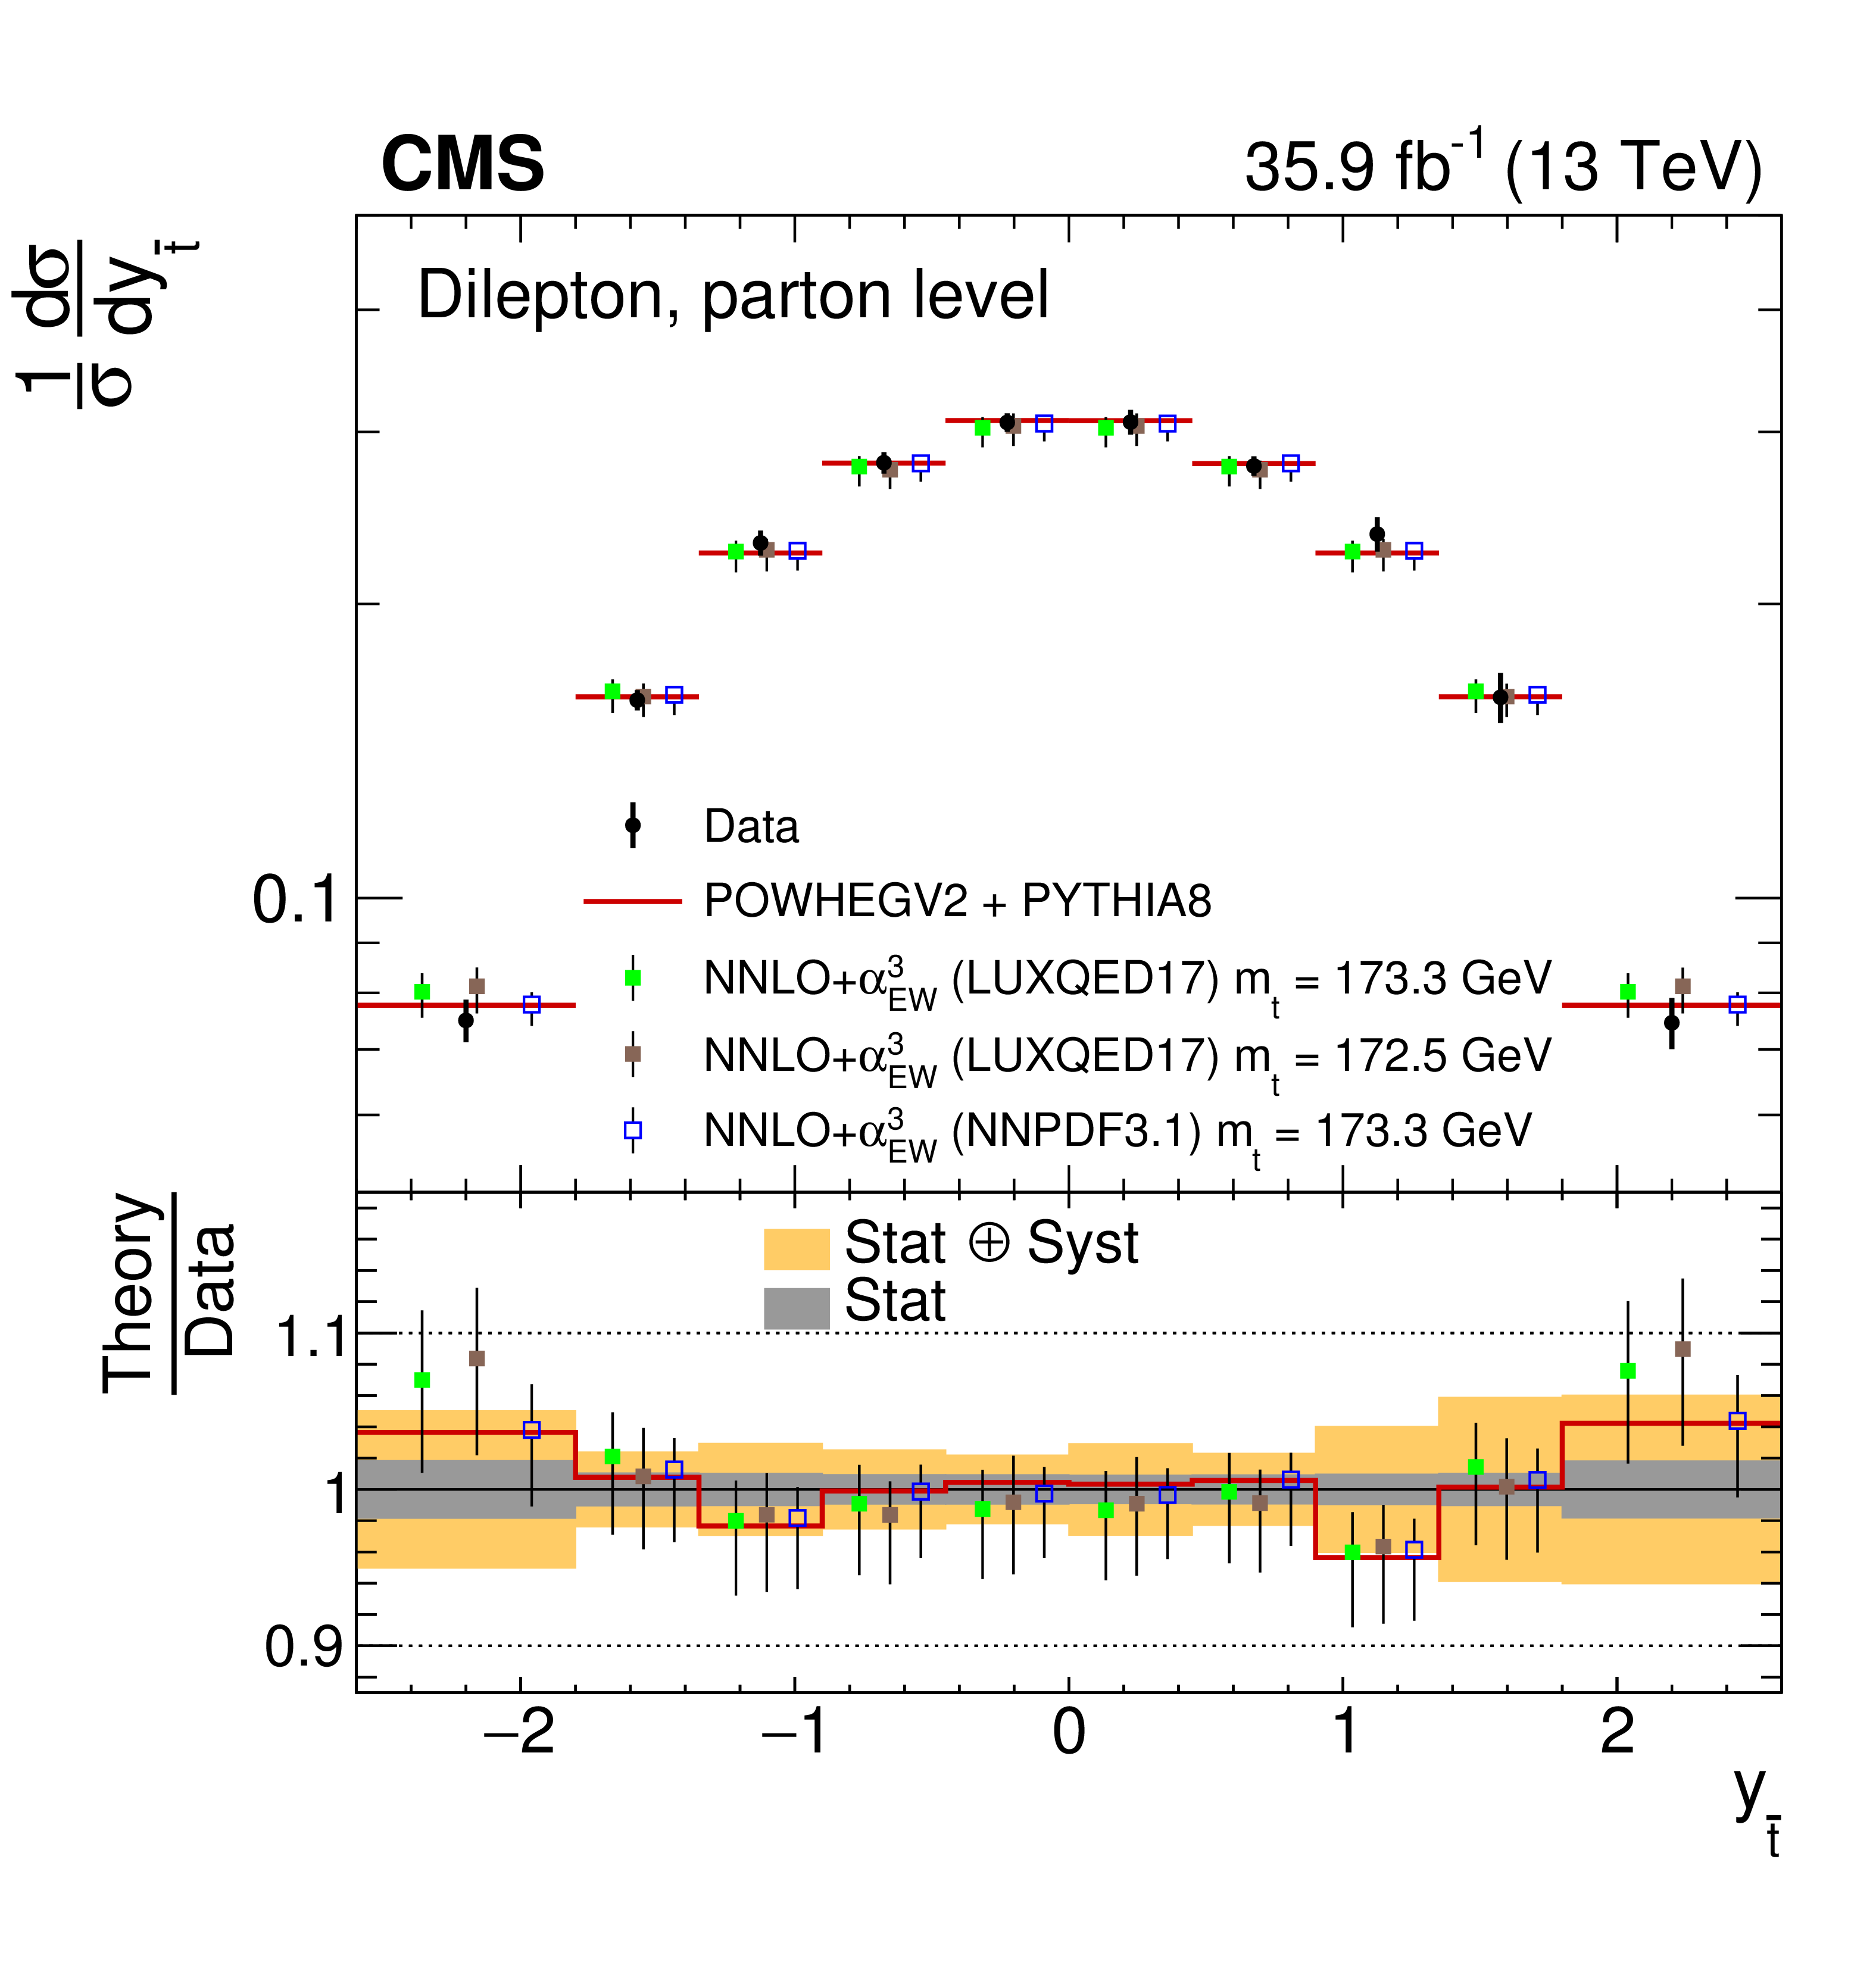
Figure 13-a:
The differential $ {{\mathrm {t}\overline {\mathrm {t}}}} $ production cross sections as a function of $ {y_{{\mathrm {t}}}} $ are shown for the data (filled circles), the theoretical predictions with beyond-NLO precision (other points) and the prediction from POWHEG+PYTHIA (solid line). The vertical lines on the filled circles and other points indicate the total uncertainty in the data and theoretical predictions, respectively. The left and right plots correspond to absolute and normalised measurements, respectively. The lower panel in each plot shows the ratios of the theoretical predictions to the data. The dark and light bands show the relative statistical and total uncertainties in the data, respectively. |
png pdf |
Figure 13-b:
The differential $ {{\mathrm {t}\overline {\mathrm {t}}}} $ production cross sections as a function of $ {y_{{\mathrm {t}}}} $ are shown for the data (filled circles), the theoretical predictions with beyond-NLO precision (other points) and the prediction from POWHEG+PYTHIA (solid line). The vertical lines on the filled circles and other points indicate the total uncertainty in the data and theoretical predictions, respectively. The left and right plots correspond to absolute and normalised measurements, respectively. The lower panel in each plot shows the ratios of the theoretical predictions to the data. The dark and light bands show the relative statistical and total uncertainties in the data, respectively. |
png pdf |
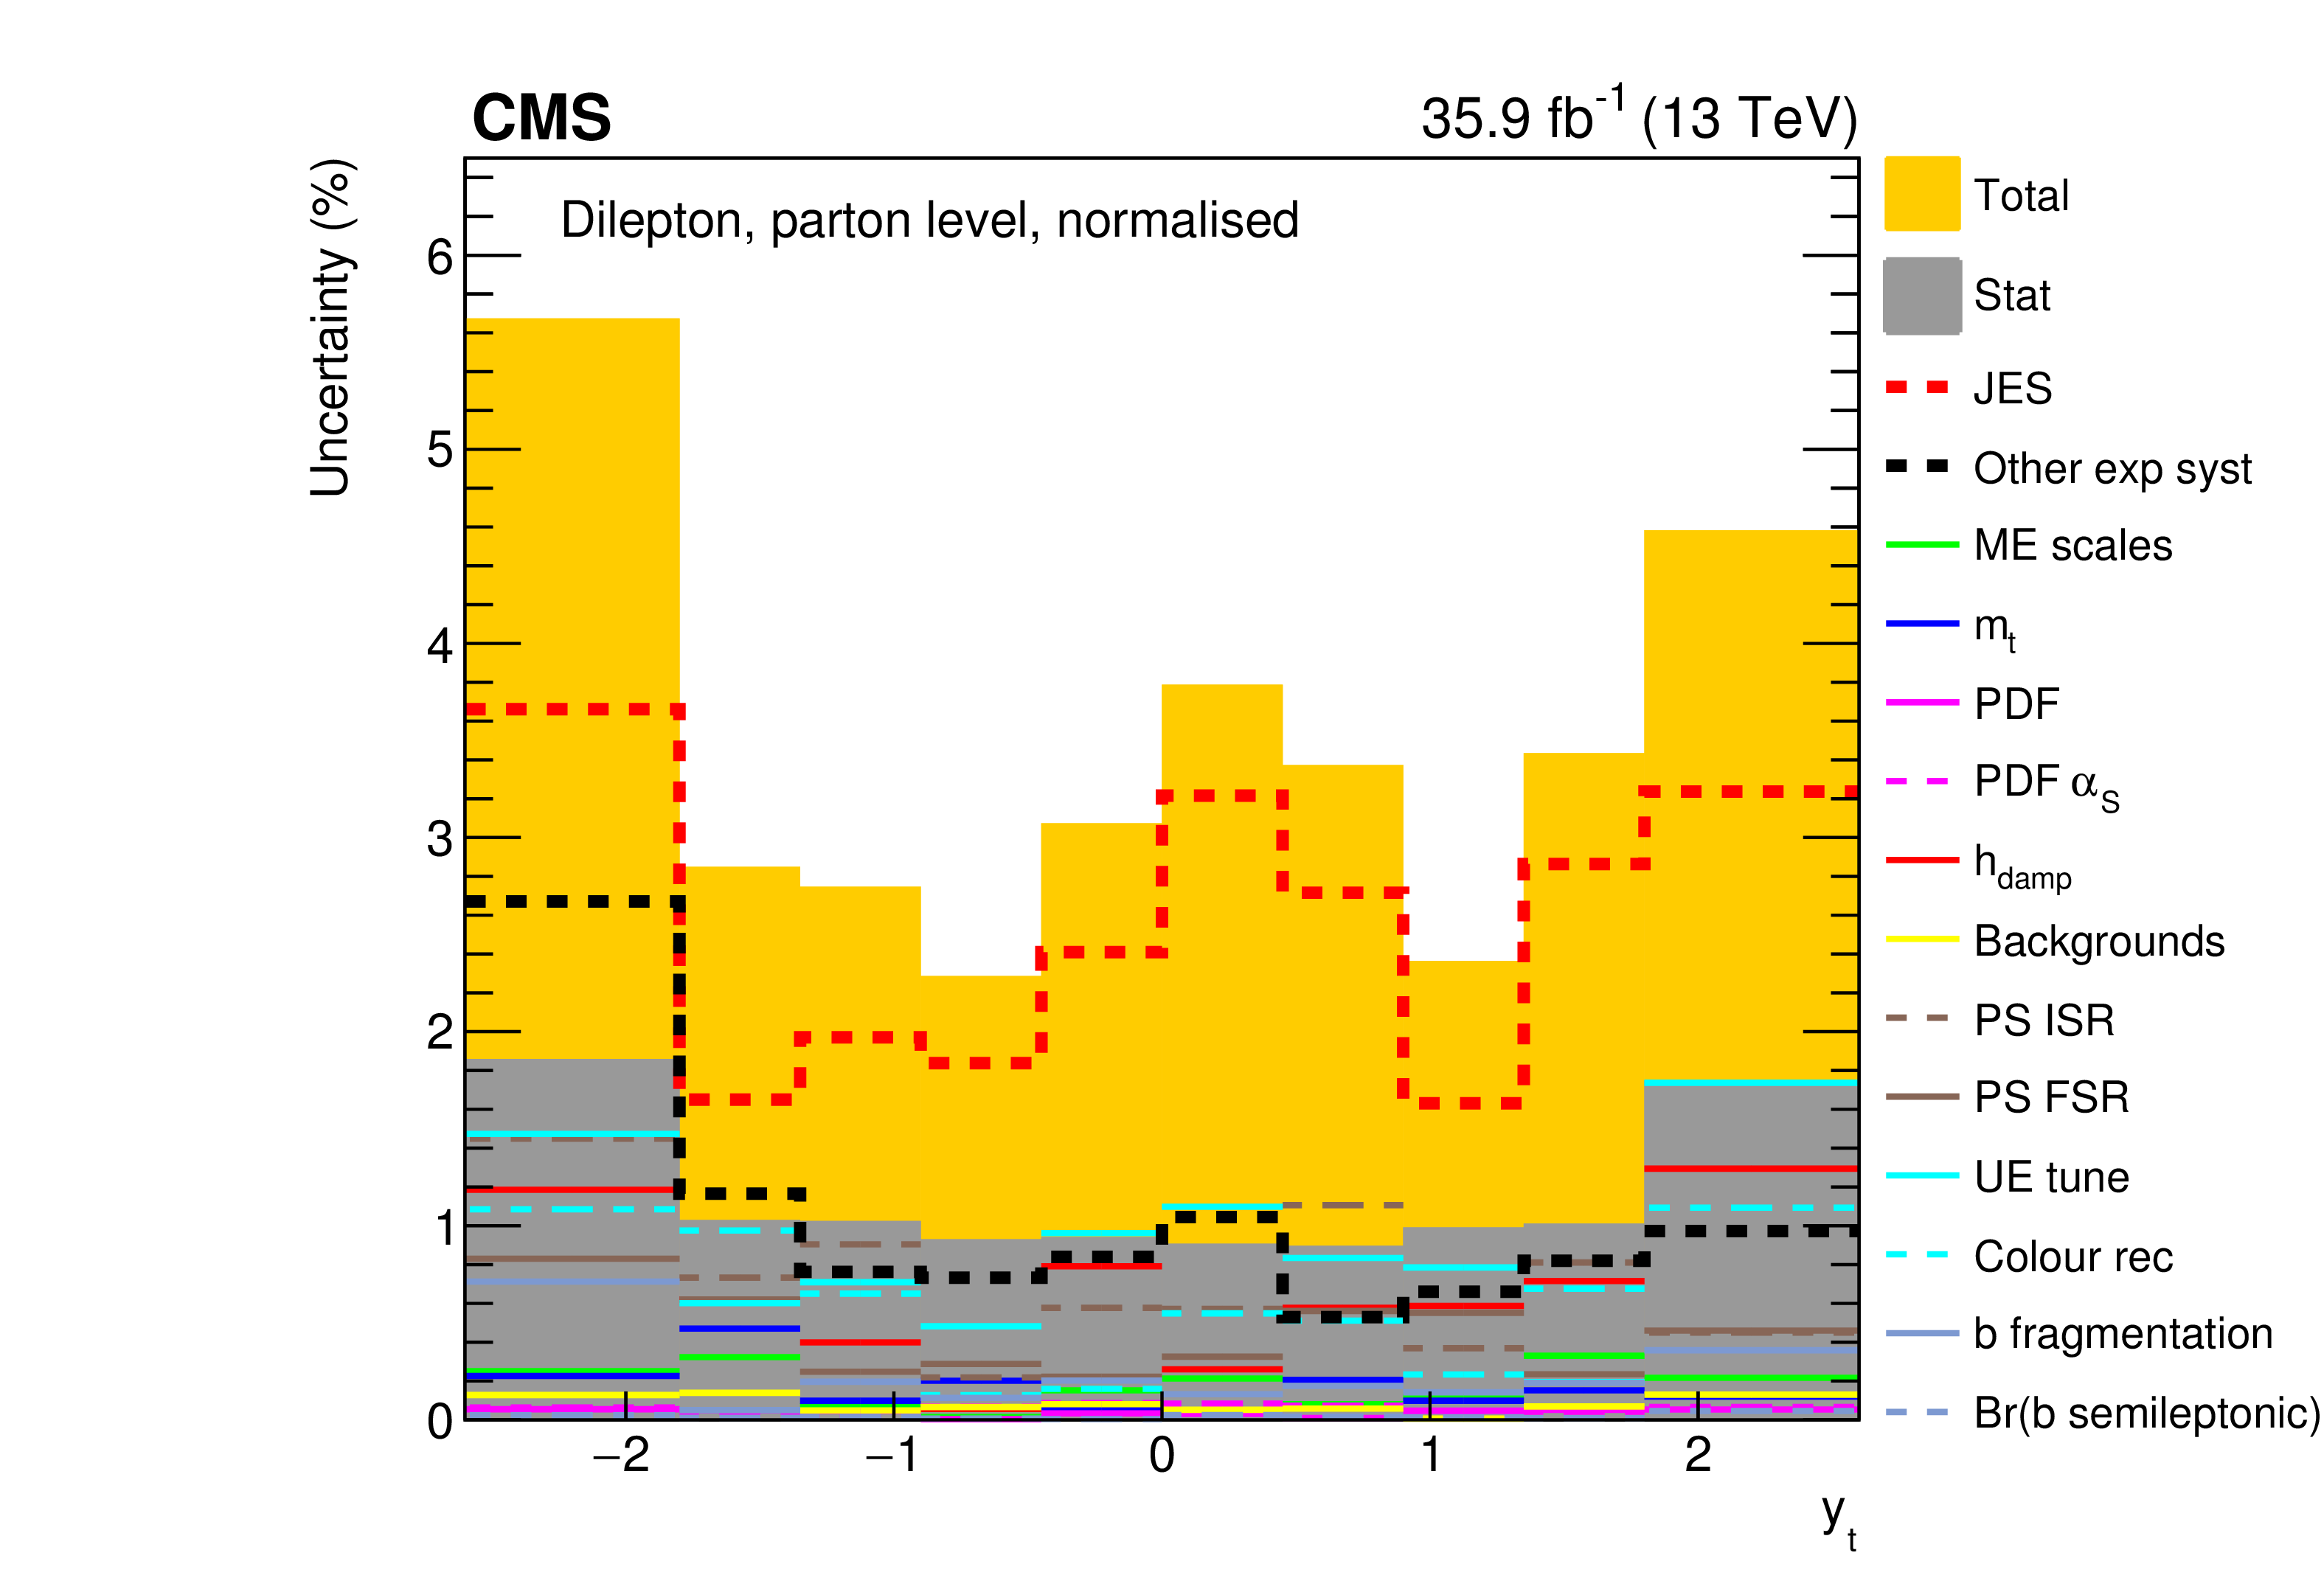
Figure 14:
The contributions of each source of systematic uncertainty to the total systematic uncertainty in each bin is shown for the measurement of the normalised $ {{\mathrm {t}\overline {\mathrm {t}}}} $ production cross sections as a function of $ {y_{{\mathrm {t}}}} $. The sources affecting the JES are added in quadrature and shown as a single component. Additional experimental systematic uncertainties are also added in quadrature and shown as a single component. Contributions from theoretical uncertainties are shown separately. The statistical and total uncertainties, corresponding to the quadrature addition of statistical and systematic uncertainties, are shown by the dark and light filled histograms, respectively. |
png pdf |
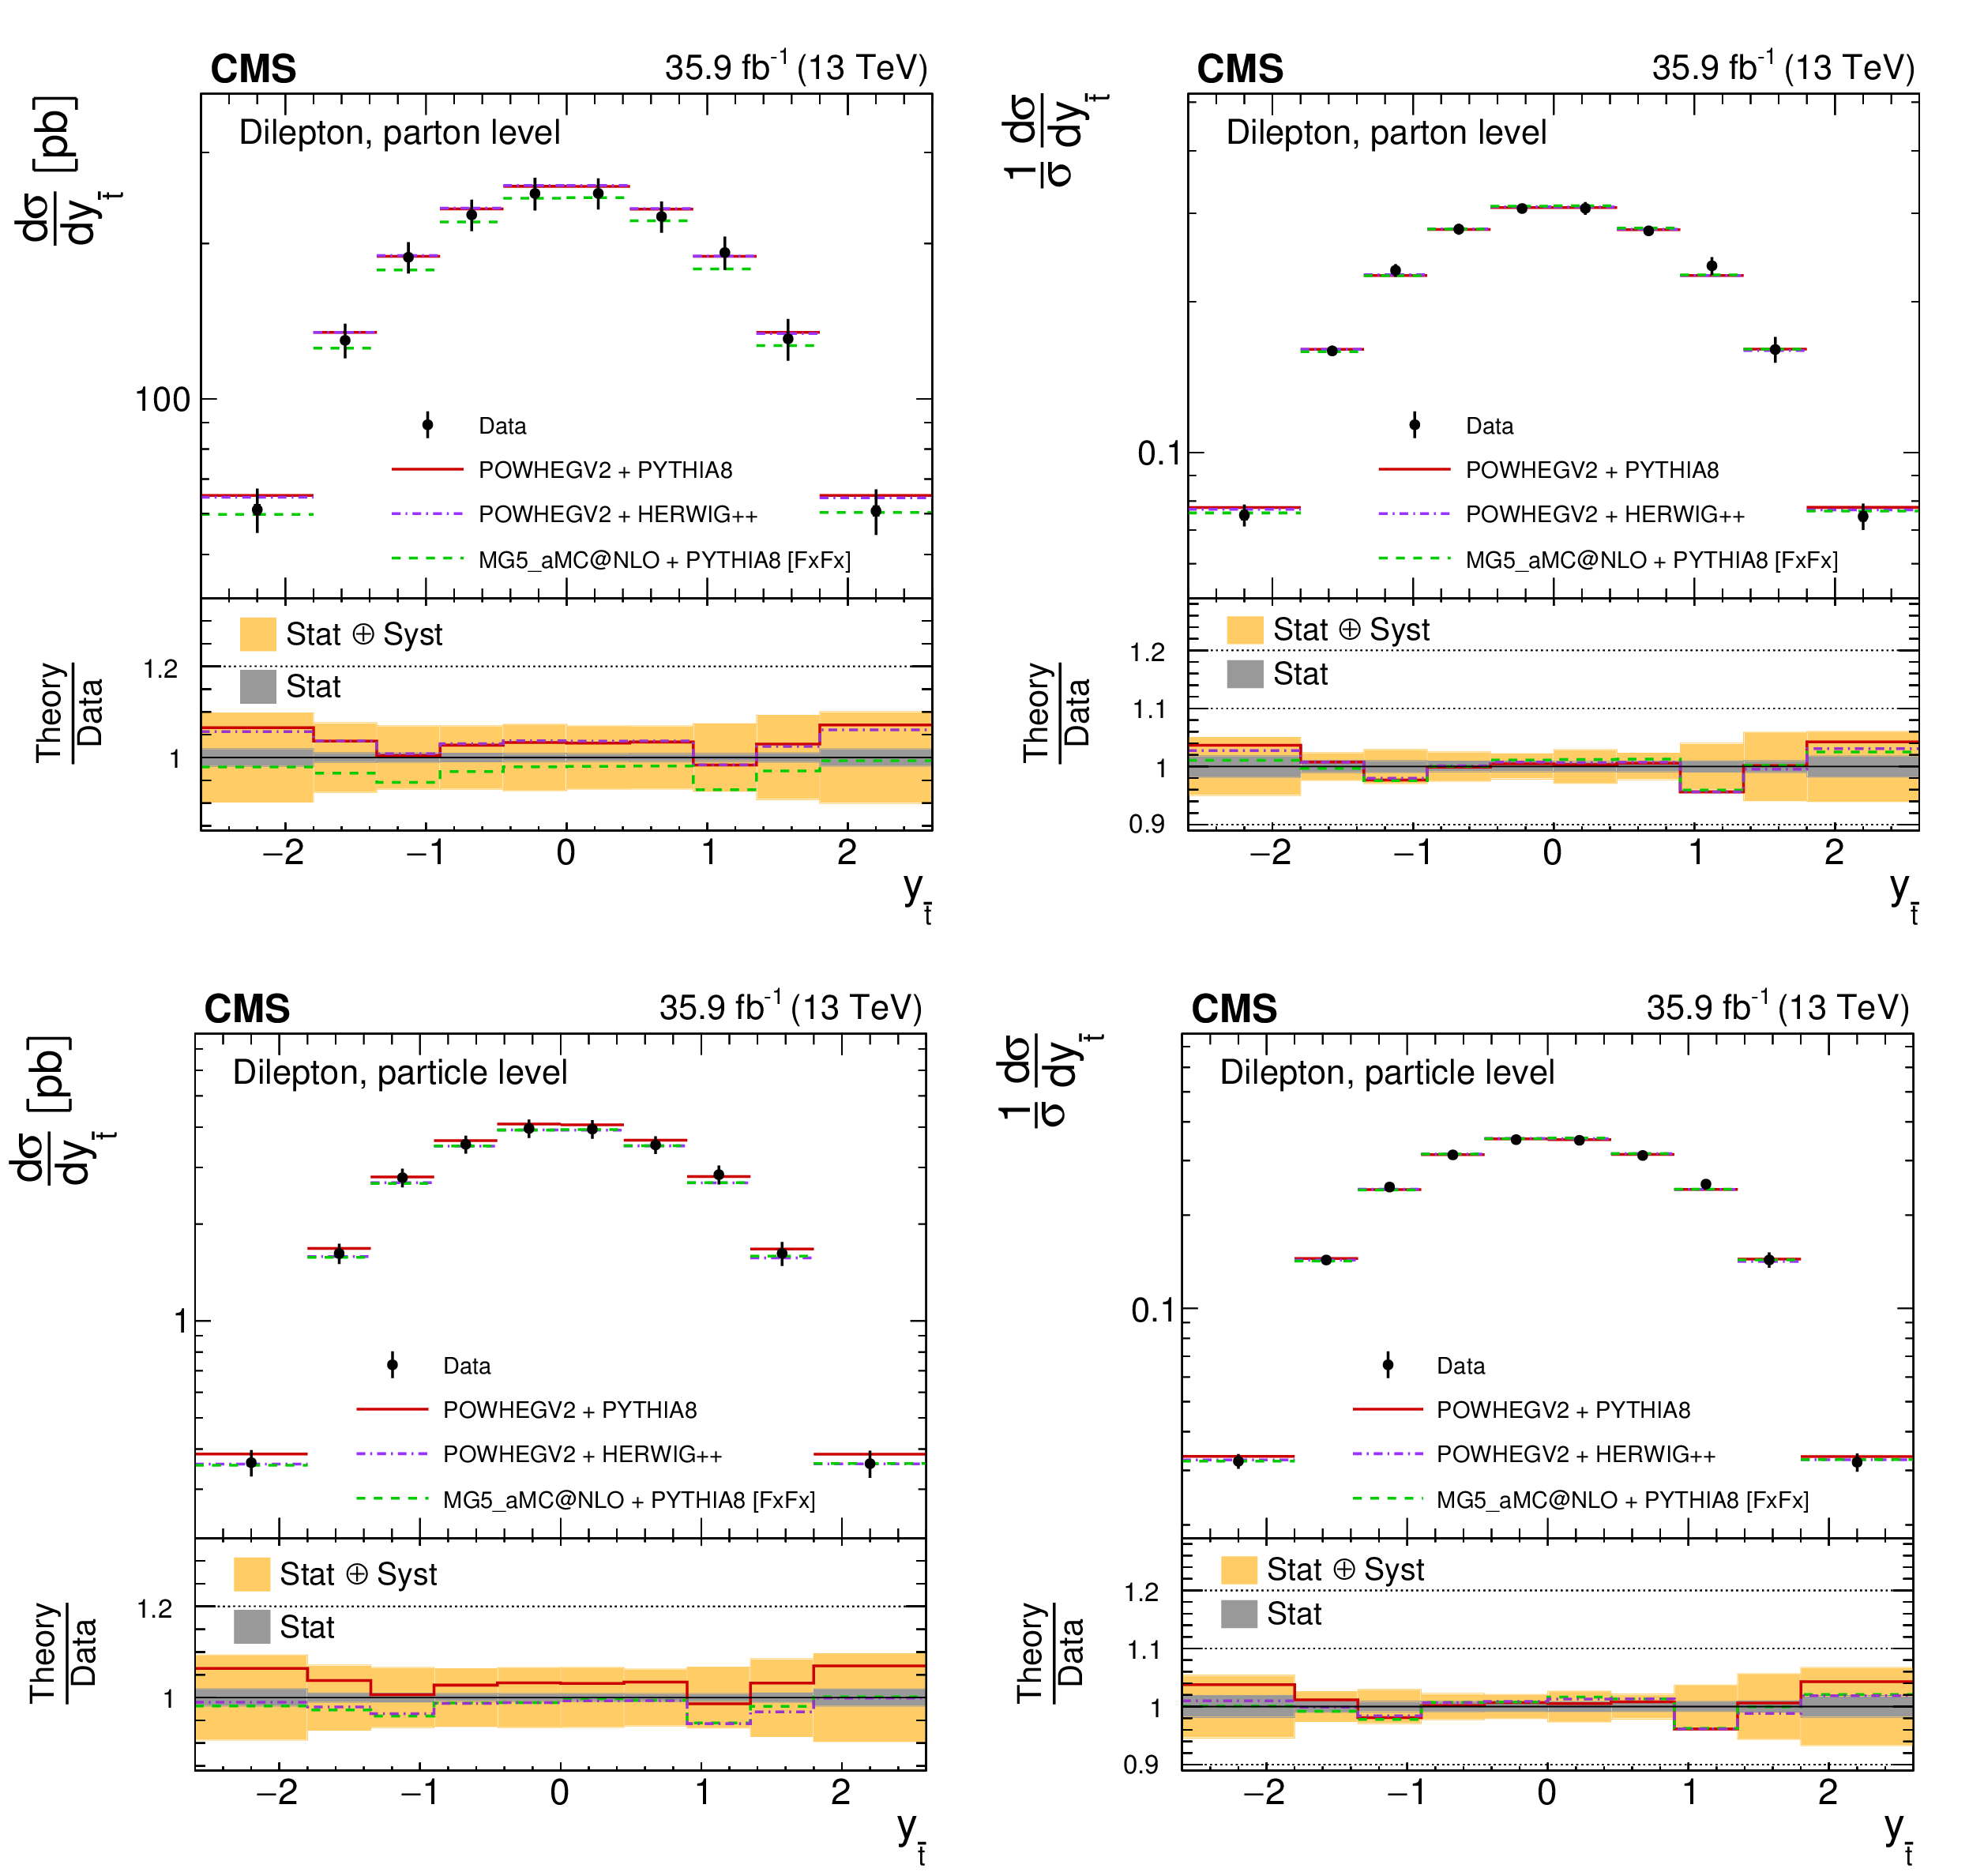
Figure 15:
The differential $ {{\mathrm {t}\overline {\mathrm {t}}}} $ production cross sections as a function of $ {y_{{\overline {\mathrm {t}}}}} $ are shown for the data (points) and the MC predictions (lines). The vertical lines on the points indicate the total uncertainty in the data. The left and right columns correspond to absolute and normalised measurements, respectively. The upper row corresponds to measurements at the parton level in the full phase space and the lower row to the particle level in a fiducial phase space. The lower panel in each plot shows the ratios of the theoretical predictions to the data. The dark and light bands show the relative statistical and total uncertainties in the data, respectively. |

png pdf |
Figure 15-a:
The differential $ {{\mathrm {t}\overline {\mathrm {t}}}} $ production cross sections as a function of $ {y_{{\overline {\mathrm {t}}}}} $ are shown for the data (points) and the MC predictions (lines). The vertical lines on the points indicate the total uncertainty in the data. The left and right columns correspond to absolute and normalised measurements, respectively. The upper row corresponds to measurements at the parton level in the full phase space and the lower row to the particle level in a fiducial phase space. The lower panel in each plot shows the ratios of the theoretical predictions to the data. The dark and light bands show the relative statistical and total uncertainties in the data, respectively. |

png pdf |
Figure 15-b:
The differential $ {{\mathrm {t}\overline {\mathrm {t}}}} $ production cross sections as a function of $ {y_{{\overline {\mathrm {t}}}}} $ are shown for the data (points) and the MC predictions (lines). The vertical lines on the points indicate the total uncertainty in the data. The left and right columns correspond to absolute and normalised measurements, respectively. The upper row corresponds to measurements at the parton level in the full phase space and the lower row to the particle level in a fiducial phase space. The lower panel in each plot shows the ratios of the theoretical predictions to the data. The dark and light bands show the relative statistical and total uncertainties in the data, respectively. |
png pdf |
Figure 15-c:
The differential $ {{\mathrm {t}\overline {\mathrm {t}}}} $ production cross sections as a function of $ {y_{{\overline {\mathrm {t}}}}} $ are shown for the data (points) and the MC predictions (lines). The vertical lines on the points indicate the total uncertainty in the data. The left and right columns correspond to absolute and normalised measurements, respectively. The upper row corresponds to measurements at the parton level in the full phase space and the lower row to the particle level in a fiducial phase space. The lower panel in each plot shows the ratios of the theoretical predictions to the data. The dark and light bands show the relative statistical and total uncertainties in the data, respectively. |
png pdf |
Figure 15-d:
The differential $ {{\mathrm {t}\overline {\mathrm {t}}}} $ production cross sections as a function of $ {y_{{\overline {\mathrm {t}}}}} $ are shown for the data (points) and the MC predictions (lines). The vertical lines on the points indicate the total uncertainty in the data. The left and right columns correspond to absolute and normalised measurements, respectively. The upper row corresponds to measurements at the parton level in the full phase space and the lower row to the particle level in a fiducial phase space. The lower panel in each plot shows the ratios of the theoretical predictions to the data. The dark and light bands show the relative statistical and total uncertainties in the data, respectively. |
png pdf |
Figure 16:
The differential $ {{\mathrm {t}\overline {\mathrm {t}}}} $ production cross sections as a function of $ {y_{{\overline {\mathrm {t}}}}} $ are shown for the data (filled circles), the theoretical predictions with beyond-NLO precision (other points) and the prediction from POWHEG+PYTHIA (solid line). The vertical lines on the filled circles and other points indicate the total uncertainty in the data and theoretical predictions, respectively. The left and right plots correspond to absolute and normalised measurements, respectively. The lower panel in each plot shows the ratios of the theoretical predictions to the data. The dark and light bands show the relative statistical and total uncertainties in the data, respectively. |

png pdf |
Figure 16-a:
The differential $ {{\mathrm {t}\overline {\mathrm {t}}}} $ production cross sections as a function of $ {y_{{\overline {\mathrm {t}}}}} $ are shown for the data (filled circles), the theoretical predictions with beyond-NLO precision (other points) and the prediction from POWHEG+PYTHIA (solid line). The vertical lines on the filled circles and other points indicate the total uncertainty in the data and theoretical predictions, respectively. The left and right plots correspond to absolute and normalised measurements, respectively. The lower panel in each plot shows the ratios of the theoretical predictions to the data. The dark and light bands show the relative statistical and total uncertainties in the data, respectively. |
png pdf |
Figure 16-b:
The differential $ {{\mathrm {t}\overline {\mathrm {t}}}} $ production cross sections as a function of $ {y_{{\overline {\mathrm {t}}}}} $ are shown for the data (filled circles), the theoretical predictions with beyond-NLO precision (other points) and the prediction from POWHEG+PYTHIA (solid line). The vertical lines on the filled circles and other points indicate the total uncertainty in the data and theoretical predictions, respectively. The left and right plots correspond to absolute and normalised measurements, respectively. The lower panel in each plot shows the ratios of the theoretical predictions to the data. The dark and light bands show the relative statistical and total uncertainties in the data, respectively. |
png pdf |
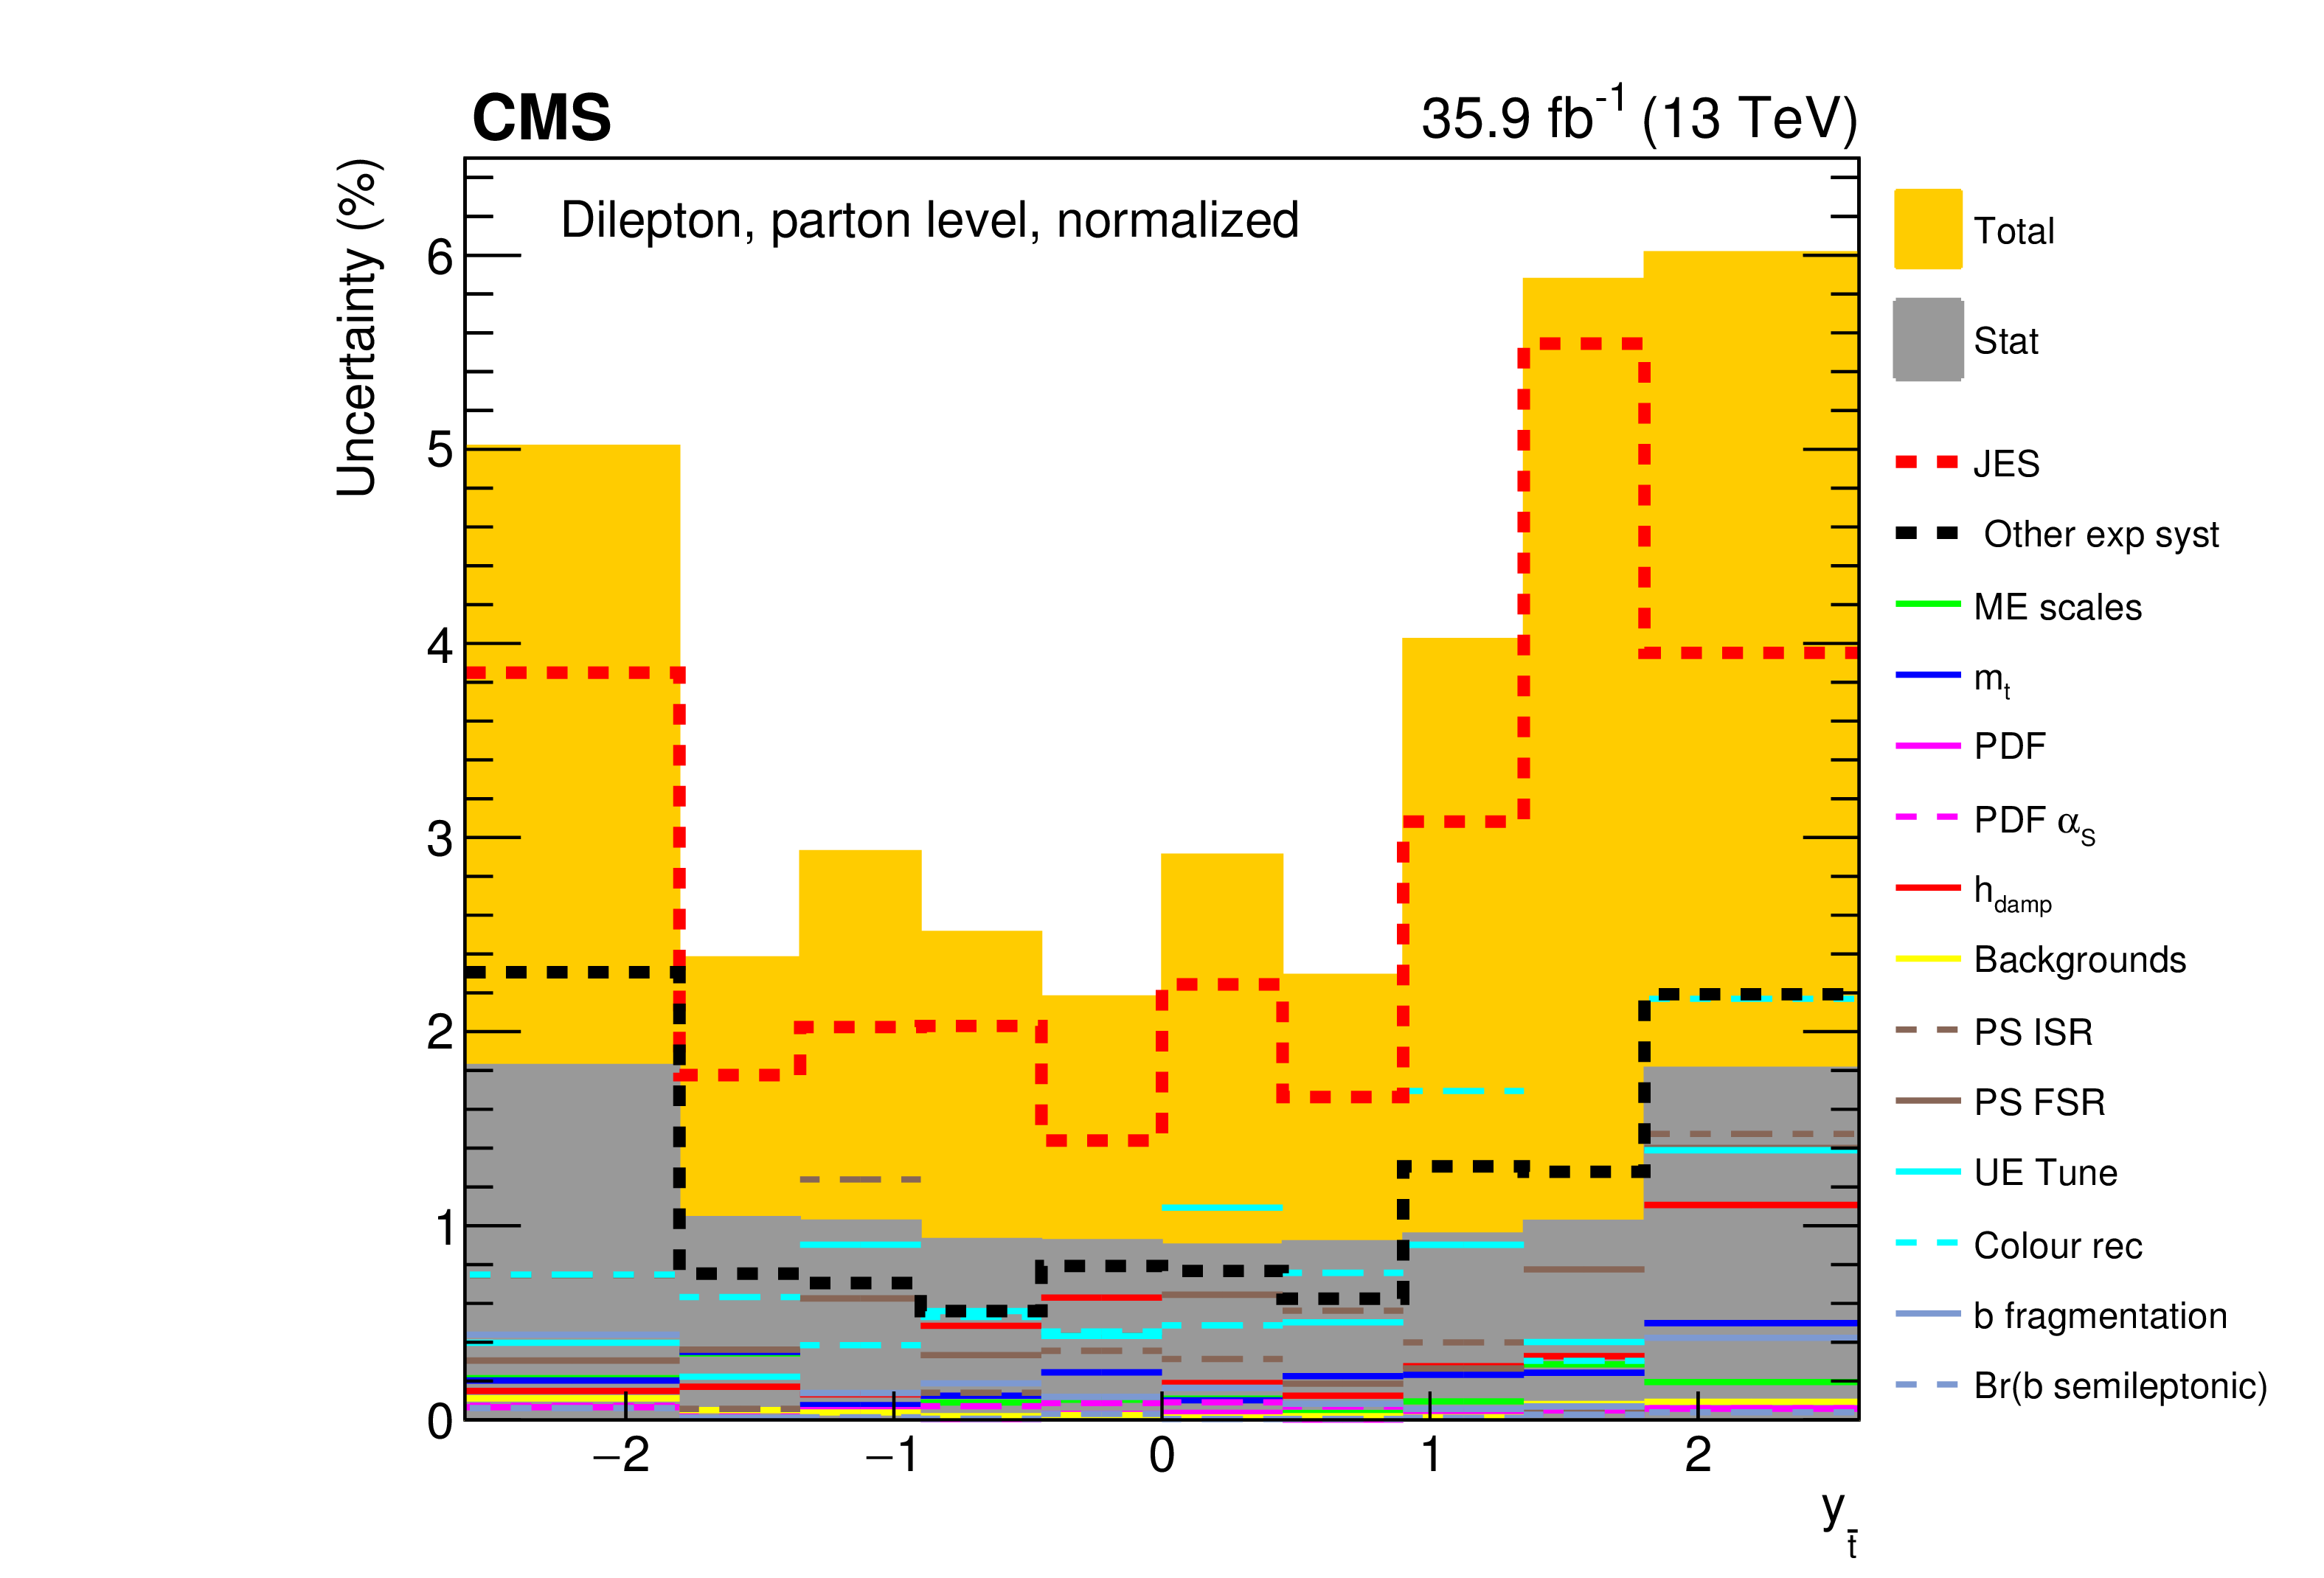
Figure 17:
The contributions of each source of systematic uncertainty to the total systematic uncertainty in each bin is shown for the measurement of the normalised $ {{\mathrm {t}\overline {\mathrm {t}}}} $ production cross sections as a function of $ {y_{{\overline {\mathrm {t}}}}} $. The sources affecting the JES are added in quadrature and shown as a single component. Additional experimental systematic uncertainties are also added in quadrature and shown as a single component. Contributions from theoretical uncertainties are shown separately. The statistical and total uncertainties, corresponding to the quadrature addition of statistical and systematic uncertainties, are shown by the dark and light filled histograms, respectively. |

png pdf |
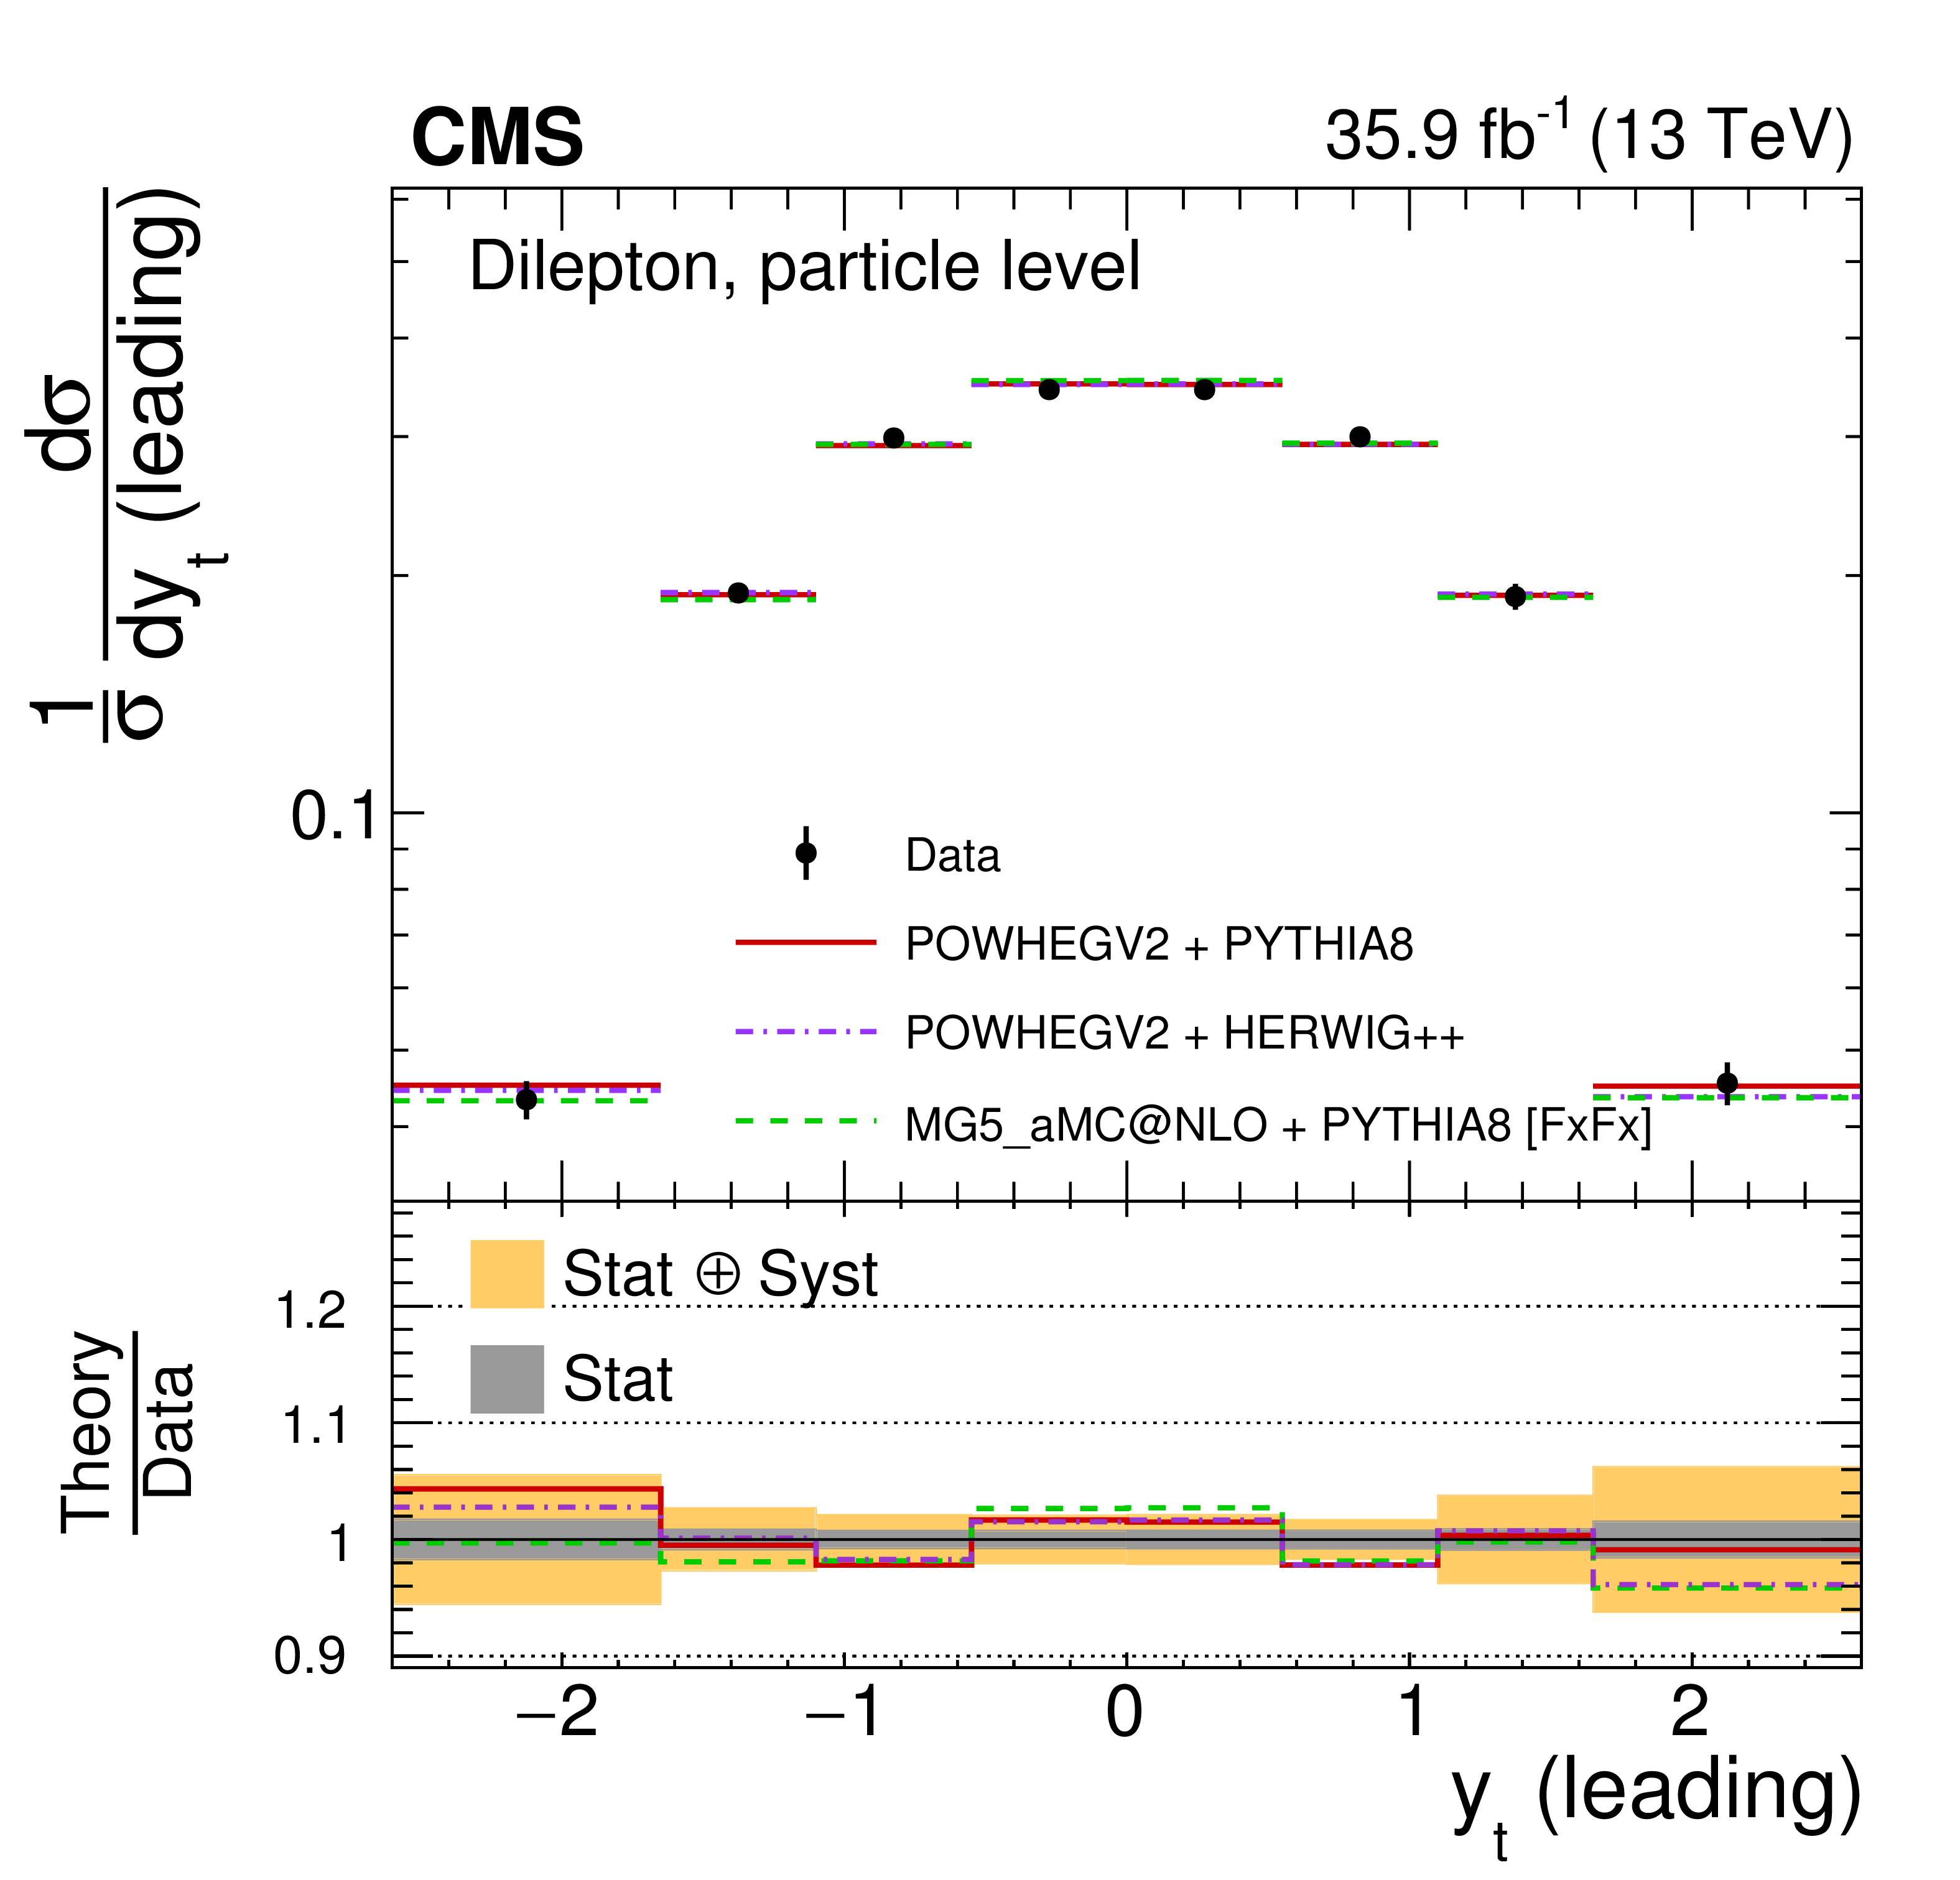
Figure 18:
The differential $ {{\mathrm {t}\overline {\mathrm {t}}}} $ production cross sections as a function of $ {y_{{\mathrm {t}}}} $ (leading) are shown for the data (points) and the MC predictions (lines). The vertical lines on the points indicate the total uncertainty in the data. The left and right columns correspond to absolute and normalised measurements, respectively. The upper row corresponds to measurements at the parton level in the full phase space and the lower row to the particle level in a fiducial phase space. The lower panel in each plot shows the ratios of the theoretical predictions to the data. The dark and light bands show the relative statistical and total uncertainties in the data, respectively. |
png pdf |
Figure 18-a:
The differential $ {{\mathrm {t}\overline {\mathrm {t}}}} $ production cross sections as a function of $ {y_{{\mathrm {t}}}} $ (leading) are shown for the data (points) and the MC predictions (lines). The vertical lines on the points indicate the total uncertainty in the data. The left and right columns correspond to absolute and normalised measurements, respectively. The upper row corresponds to measurements at the parton level in the full phase space and the lower row to the particle level in a fiducial phase space. The lower panel in each plot shows the ratios of the theoretical predictions to the data. The dark and light bands show the relative statistical and total uncertainties in the data, respectively. |

png pdf |
Figure 18-b:
The differential $ {{\mathrm {t}\overline {\mathrm {t}}}} $ production cross sections as a function of $ {y_{{\mathrm {t}}}} $ (leading) are shown for the data (points) and the MC predictions (lines). The vertical lines on the points indicate the total uncertainty in the data. The left and right columns correspond to absolute and normalised measurements, respectively. The upper row corresponds to measurements at the parton level in the full phase space and the lower row to the particle level in a fiducial phase space. The lower panel in each plot shows the ratios of the theoretical predictions to the data. The dark and light bands show the relative statistical and total uncertainties in the data, respectively. |
png pdf |
Figure 18-c:
The differential $ {{\mathrm {t}\overline {\mathrm {t}}}} $ production cross sections as a function of $ {y_{{\mathrm {t}}}} $ (leading) are shown for the data (points) and the MC predictions (lines). The vertical lines on the points indicate the total uncertainty in the data. The left and right columns correspond to absolute and normalised measurements, respectively. The upper row corresponds to measurements at the parton level in the full phase space and the lower row to the particle level in a fiducial phase space. The lower panel in each plot shows the ratios of the theoretical predictions to the data. The dark and light bands show the relative statistical and total uncertainties in the data, respectively. |
png pdf |
Figure 18-d:
The differential $ {{\mathrm {t}\overline {\mathrm {t}}}} $ production cross sections as a function of $ {y_{{\mathrm {t}}}} $ (leading) are shown for the data (points) and the MC predictions (lines). The vertical lines on the points indicate the total uncertainty in the data. The left and right columns correspond to absolute and normalised measurements, respectively. The upper row corresponds to measurements at the parton level in the full phase space and the lower row to the particle level in a fiducial phase space. The lower panel in each plot shows the ratios of the theoretical predictions to the data. The dark and light bands show the relative statistical and total uncertainties in the data, respectively. |
png pdf |
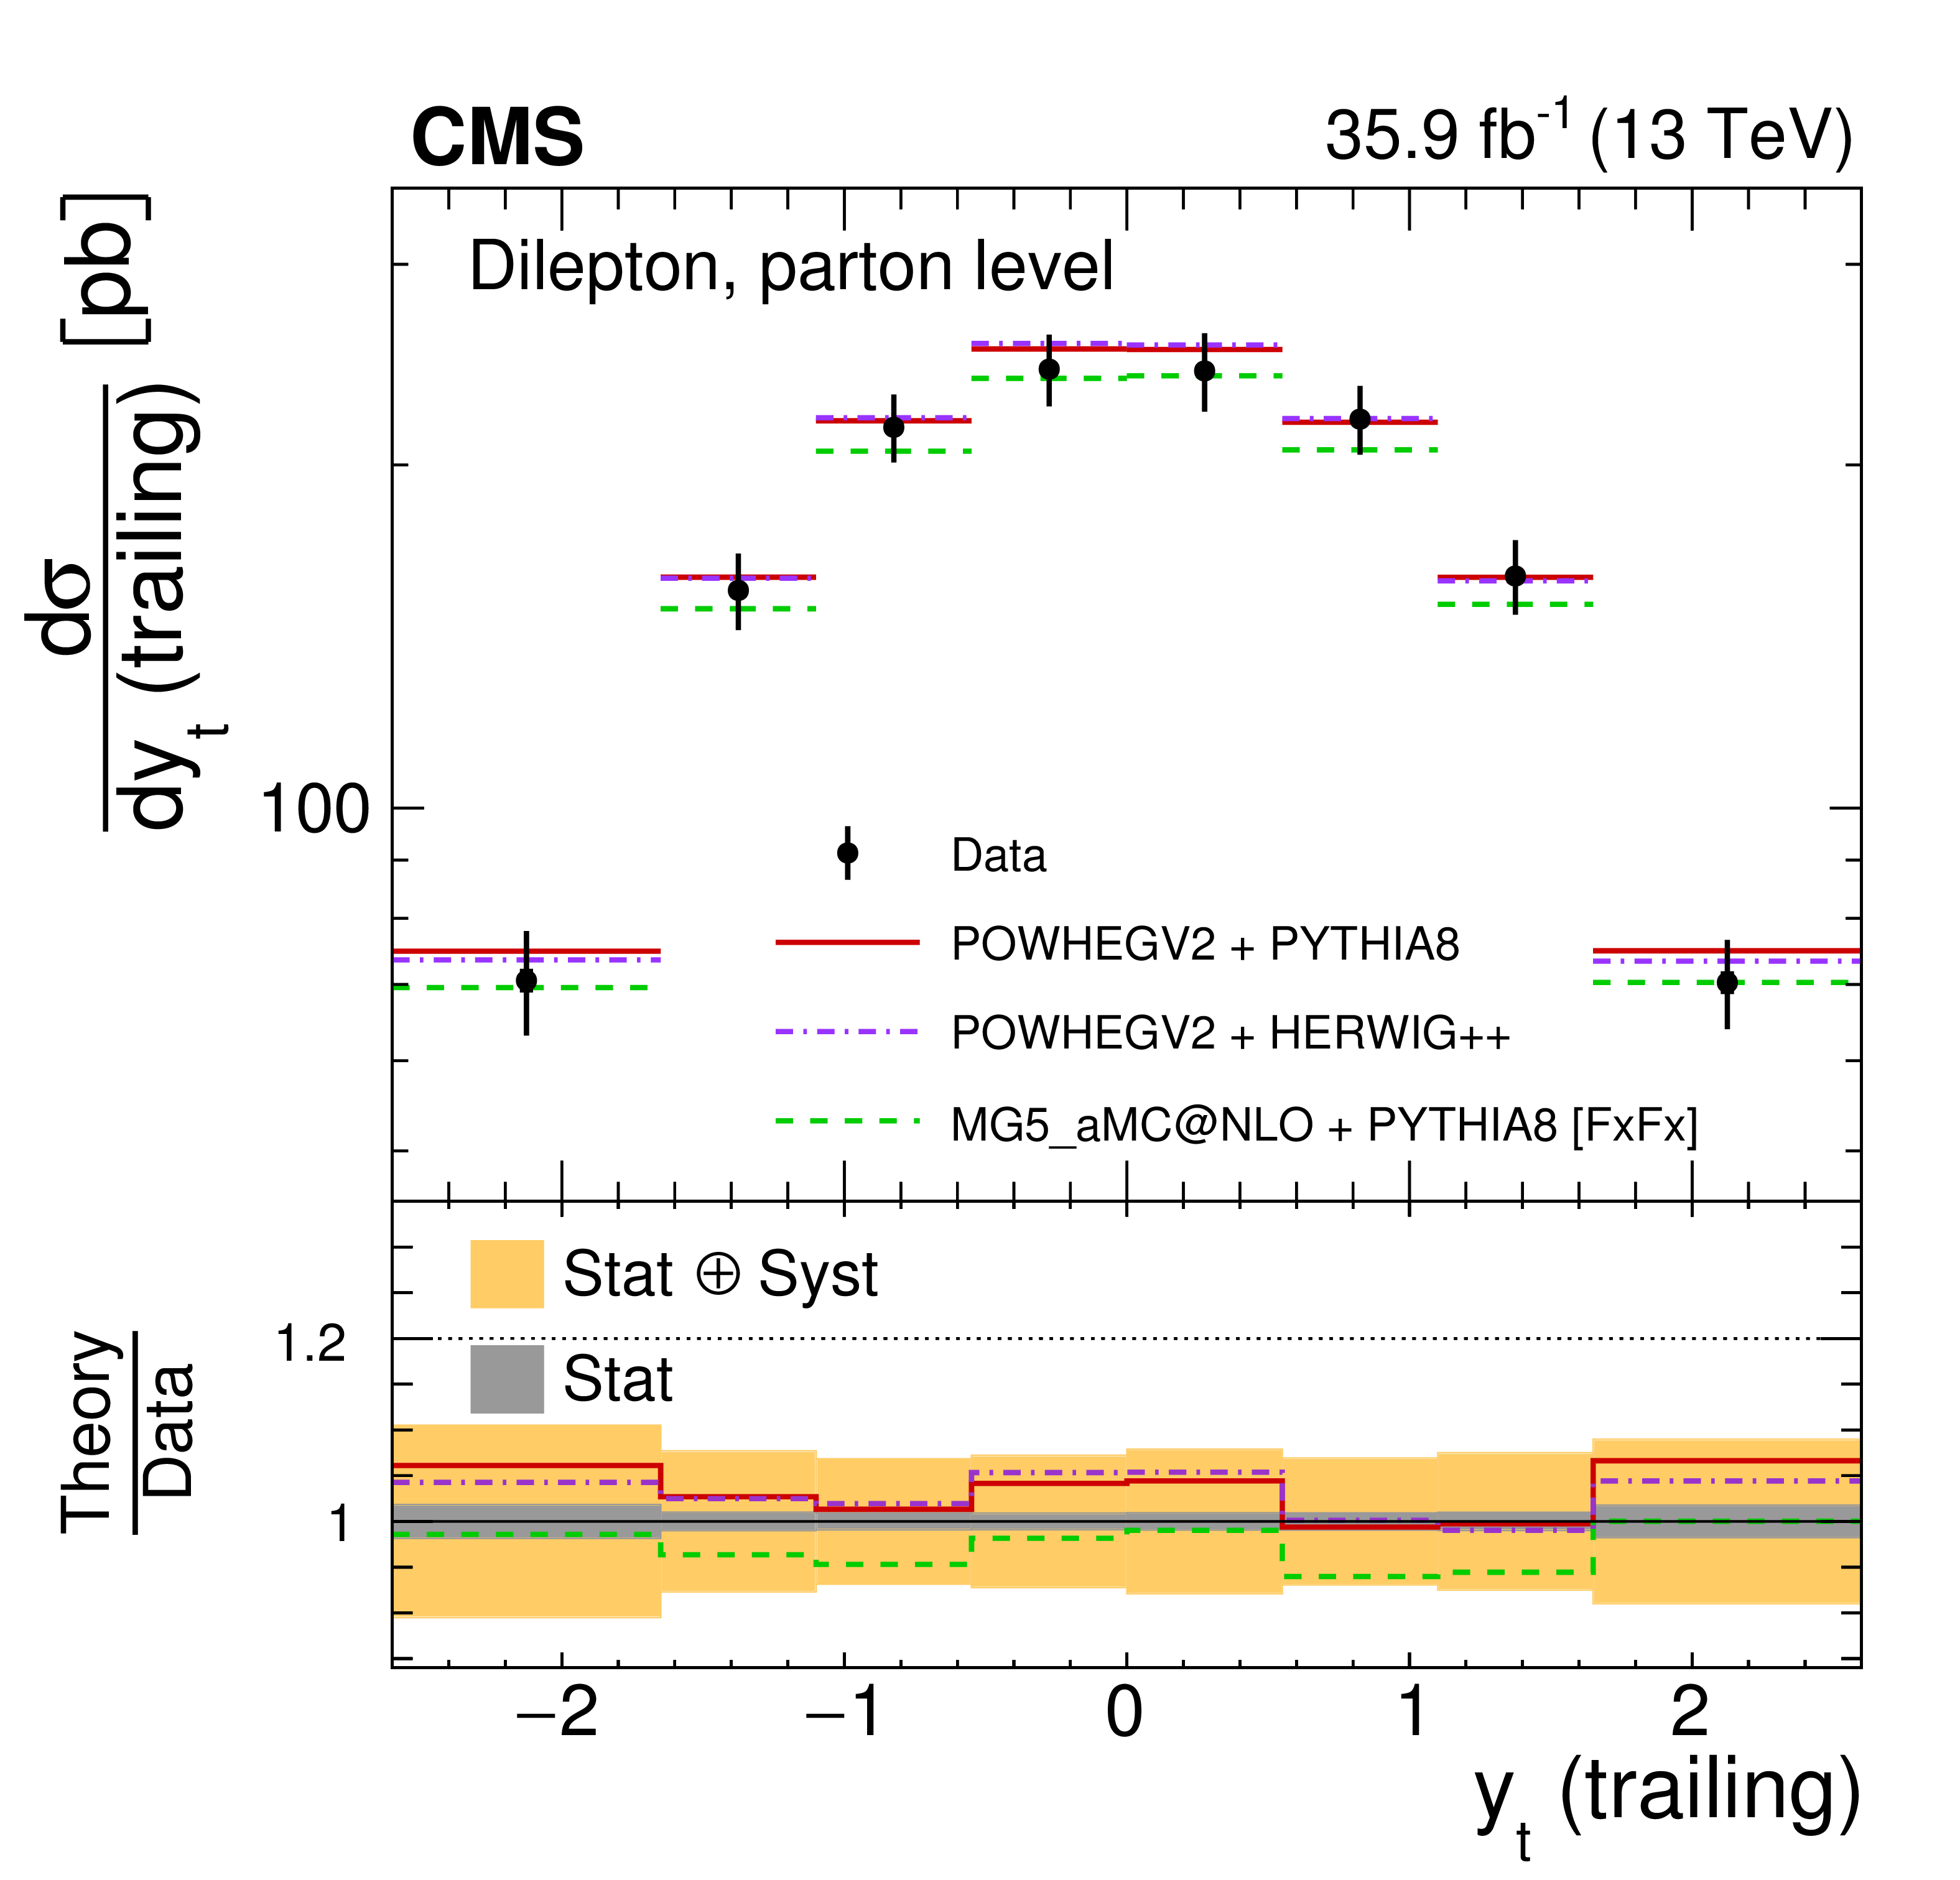
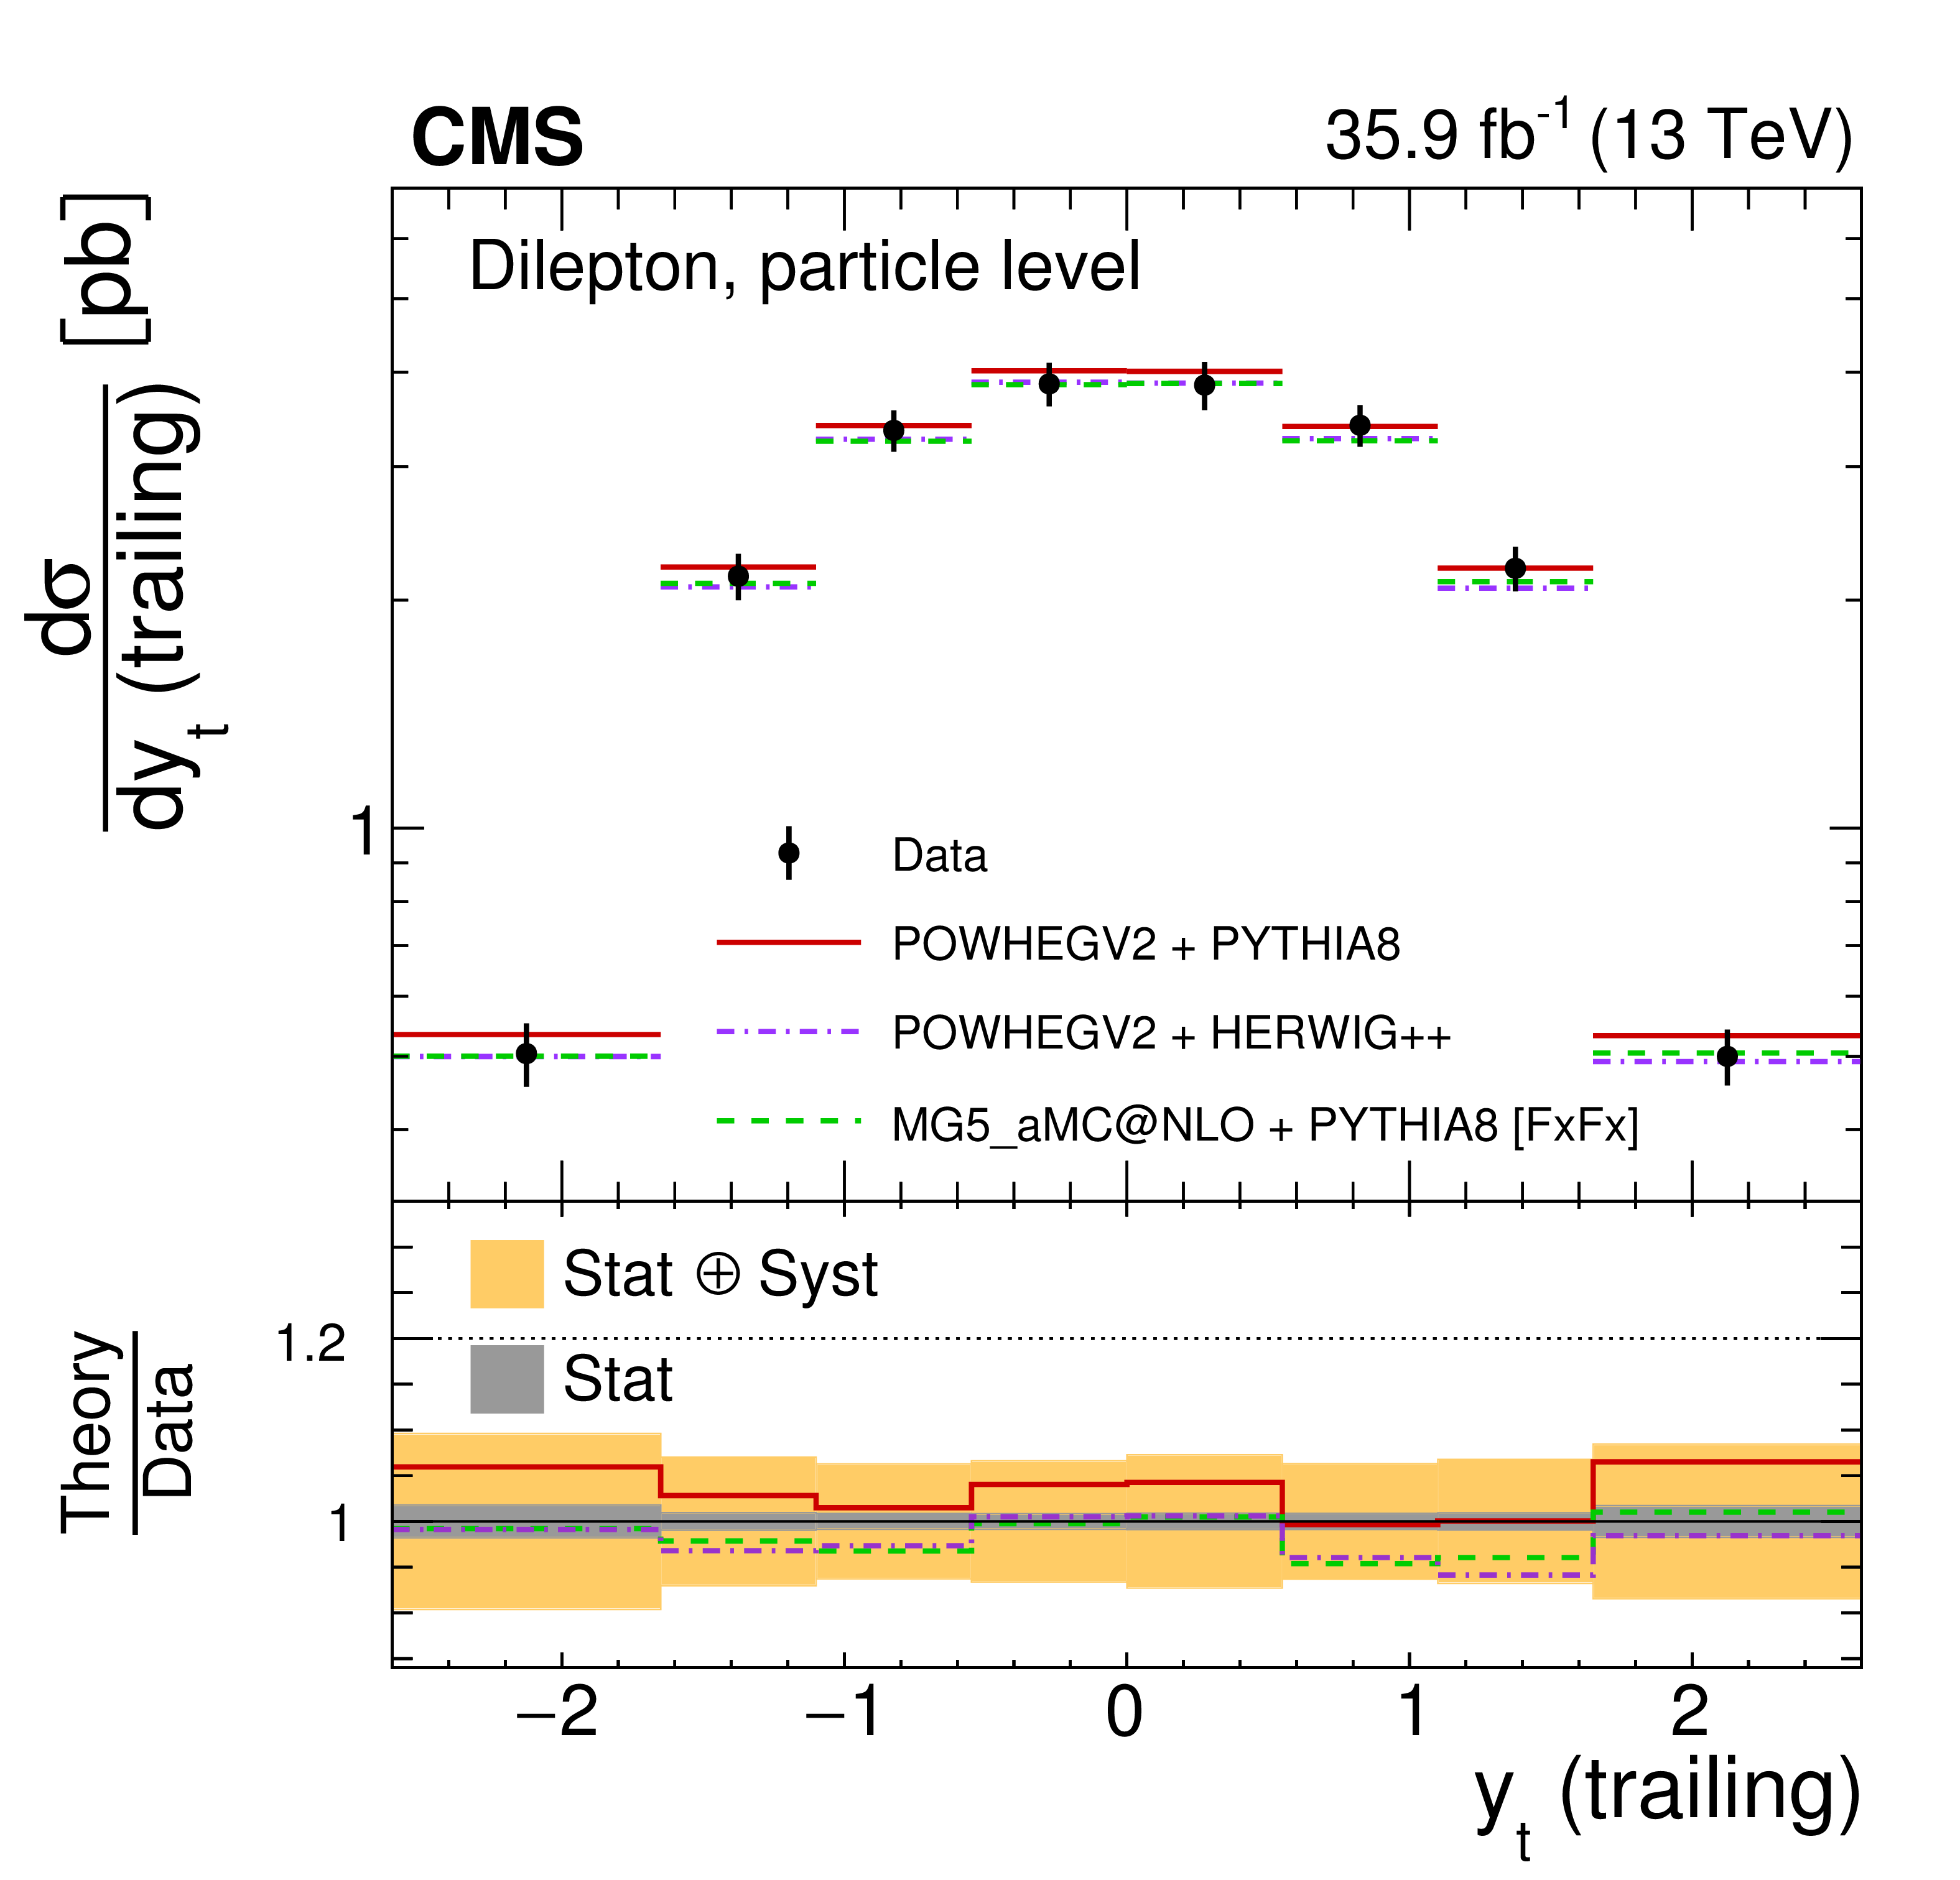
Figure 19:
The differential $ {{\mathrm {t}\overline {\mathrm {t}}}} $ production cross sections as a function of $ {y_{{\mathrm {t}}}} $ (trailing) are shown for the data (points) and the MC predictions (lines). The vertical lines on the points indicate the total uncertainty in the data. The left and right columns correspond to absolute and normalised measurements, respectively. The upper row corresponds to measurements at the parton level in the full phase space and the lower row to the particle level in a fiducial phase space. The lower panel in each plot shows the ratios of the theoretical predictions to the data. The dark and light bands show the relative statistical and total uncertainties in the data, respectively. |
png pdf |
Figure 19-a:
The differential $ {{\mathrm {t}\overline {\mathrm {t}}}} $ production cross sections as a function of $ {y_{{\mathrm {t}}}} $ (trailing) are shown for the data (points) and the MC predictions (lines). The vertical lines on the points indicate the total uncertainty in the data. The left and right columns correspond to absolute and normalised measurements, respectively. The upper row corresponds to measurements at the parton level in the full phase space and the lower row to the particle level in a fiducial phase space. The lower panel in each plot shows the ratios of the theoretical predictions to the data. The dark and light bands show the relative statistical and total uncertainties in the data, respectively. |

png pdf |
Figure 19-b:
The differential $ {{\mathrm {t}\overline {\mathrm {t}}}} $ production cross sections as a function of $ {y_{{\mathrm {t}}}} $ (trailing) are shown for the data (points) and the MC predictions (lines). The vertical lines on the points indicate the total uncertainty in the data. The left and right columns correspond to absolute and normalised measurements, respectively. The upper row corresponds to measurements at the parton level in the full phase space and the lower row to the particle level in a fiducial phase space. The lower panel in each plot shows the ratios of the theoretical predictions to the data. The dark and light bands show the relative statistical and total uncertainties in the data, respectively. |
png pdf |
Figure 19-c:
The differential $ {{\mathrm {t}\overline {\mathrm {t}}}} $ production cross sections as a function of $ {y_{{\mathrm {t}}}} $ (trailing) are shown for the data (points) and the MC predictions (lines). The vertical lines on the points indicate the total uncertainty in the data. The left and right columns correspond to absolute and normalised measurements, respectively. The upper row corresponds to measurements at the parton level in the full phase space and the lower row to the particle level in a fiducial phase space. The lower panel in each plot shows the ratios of the theoretical predictions to the data. The dark and light bands show the relative statistical and total uncertainties in the data, respectively. |
png pdf |
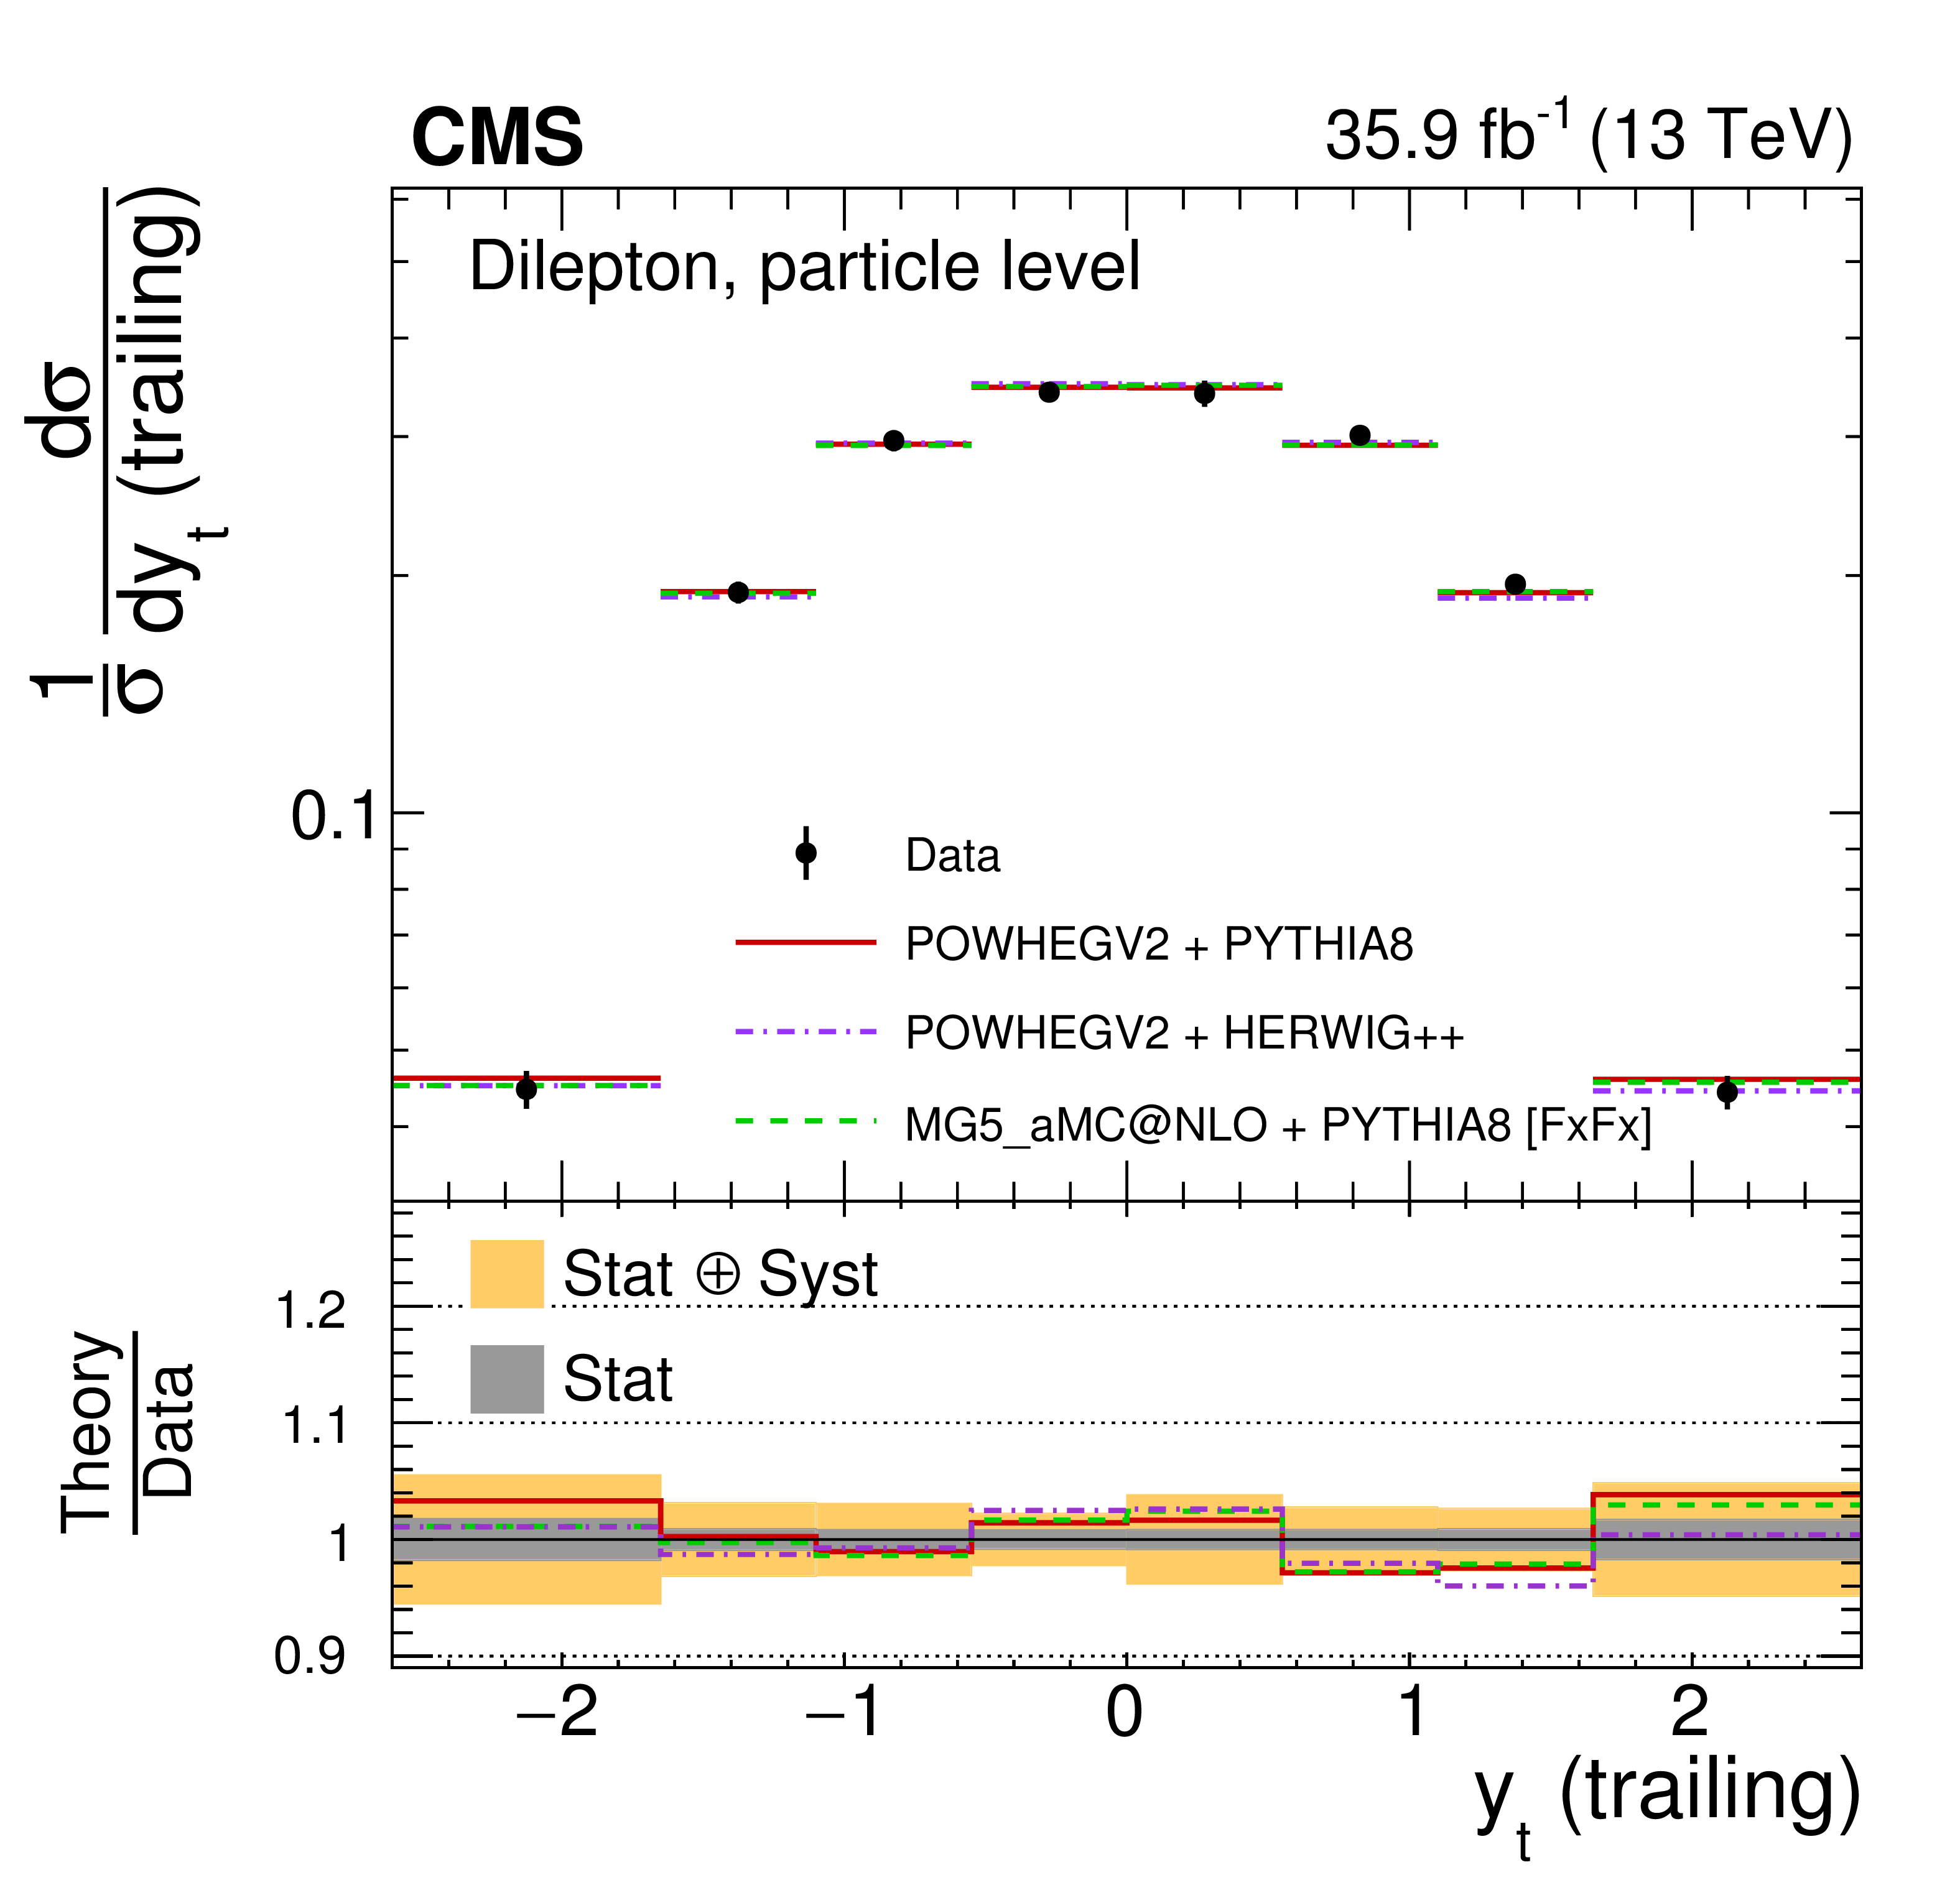
Figure 19-d:
The differential $ {{\mathrm {t}\overline {\mathrm {t}}}} $ production cross sections as a function of $ {y_{{\mathrm {t}}}} $ (trailing) are shown for the data (points) and the MC predictions (lines). The vertical lines on the points indicate the total uncertainty in the data. The left and right columns correspond to absolute and normalised measurements, respectively. The upper row corresponds to measurements at the parton level in the full phase space and the lower row to the particle level in a fiducial phase space. The lower panel in each plot shows the ratios of the theoretical predictions to the data. The dark and light bands show the relative statistical and total uncertainties in the data, respectively. |

png pdf |
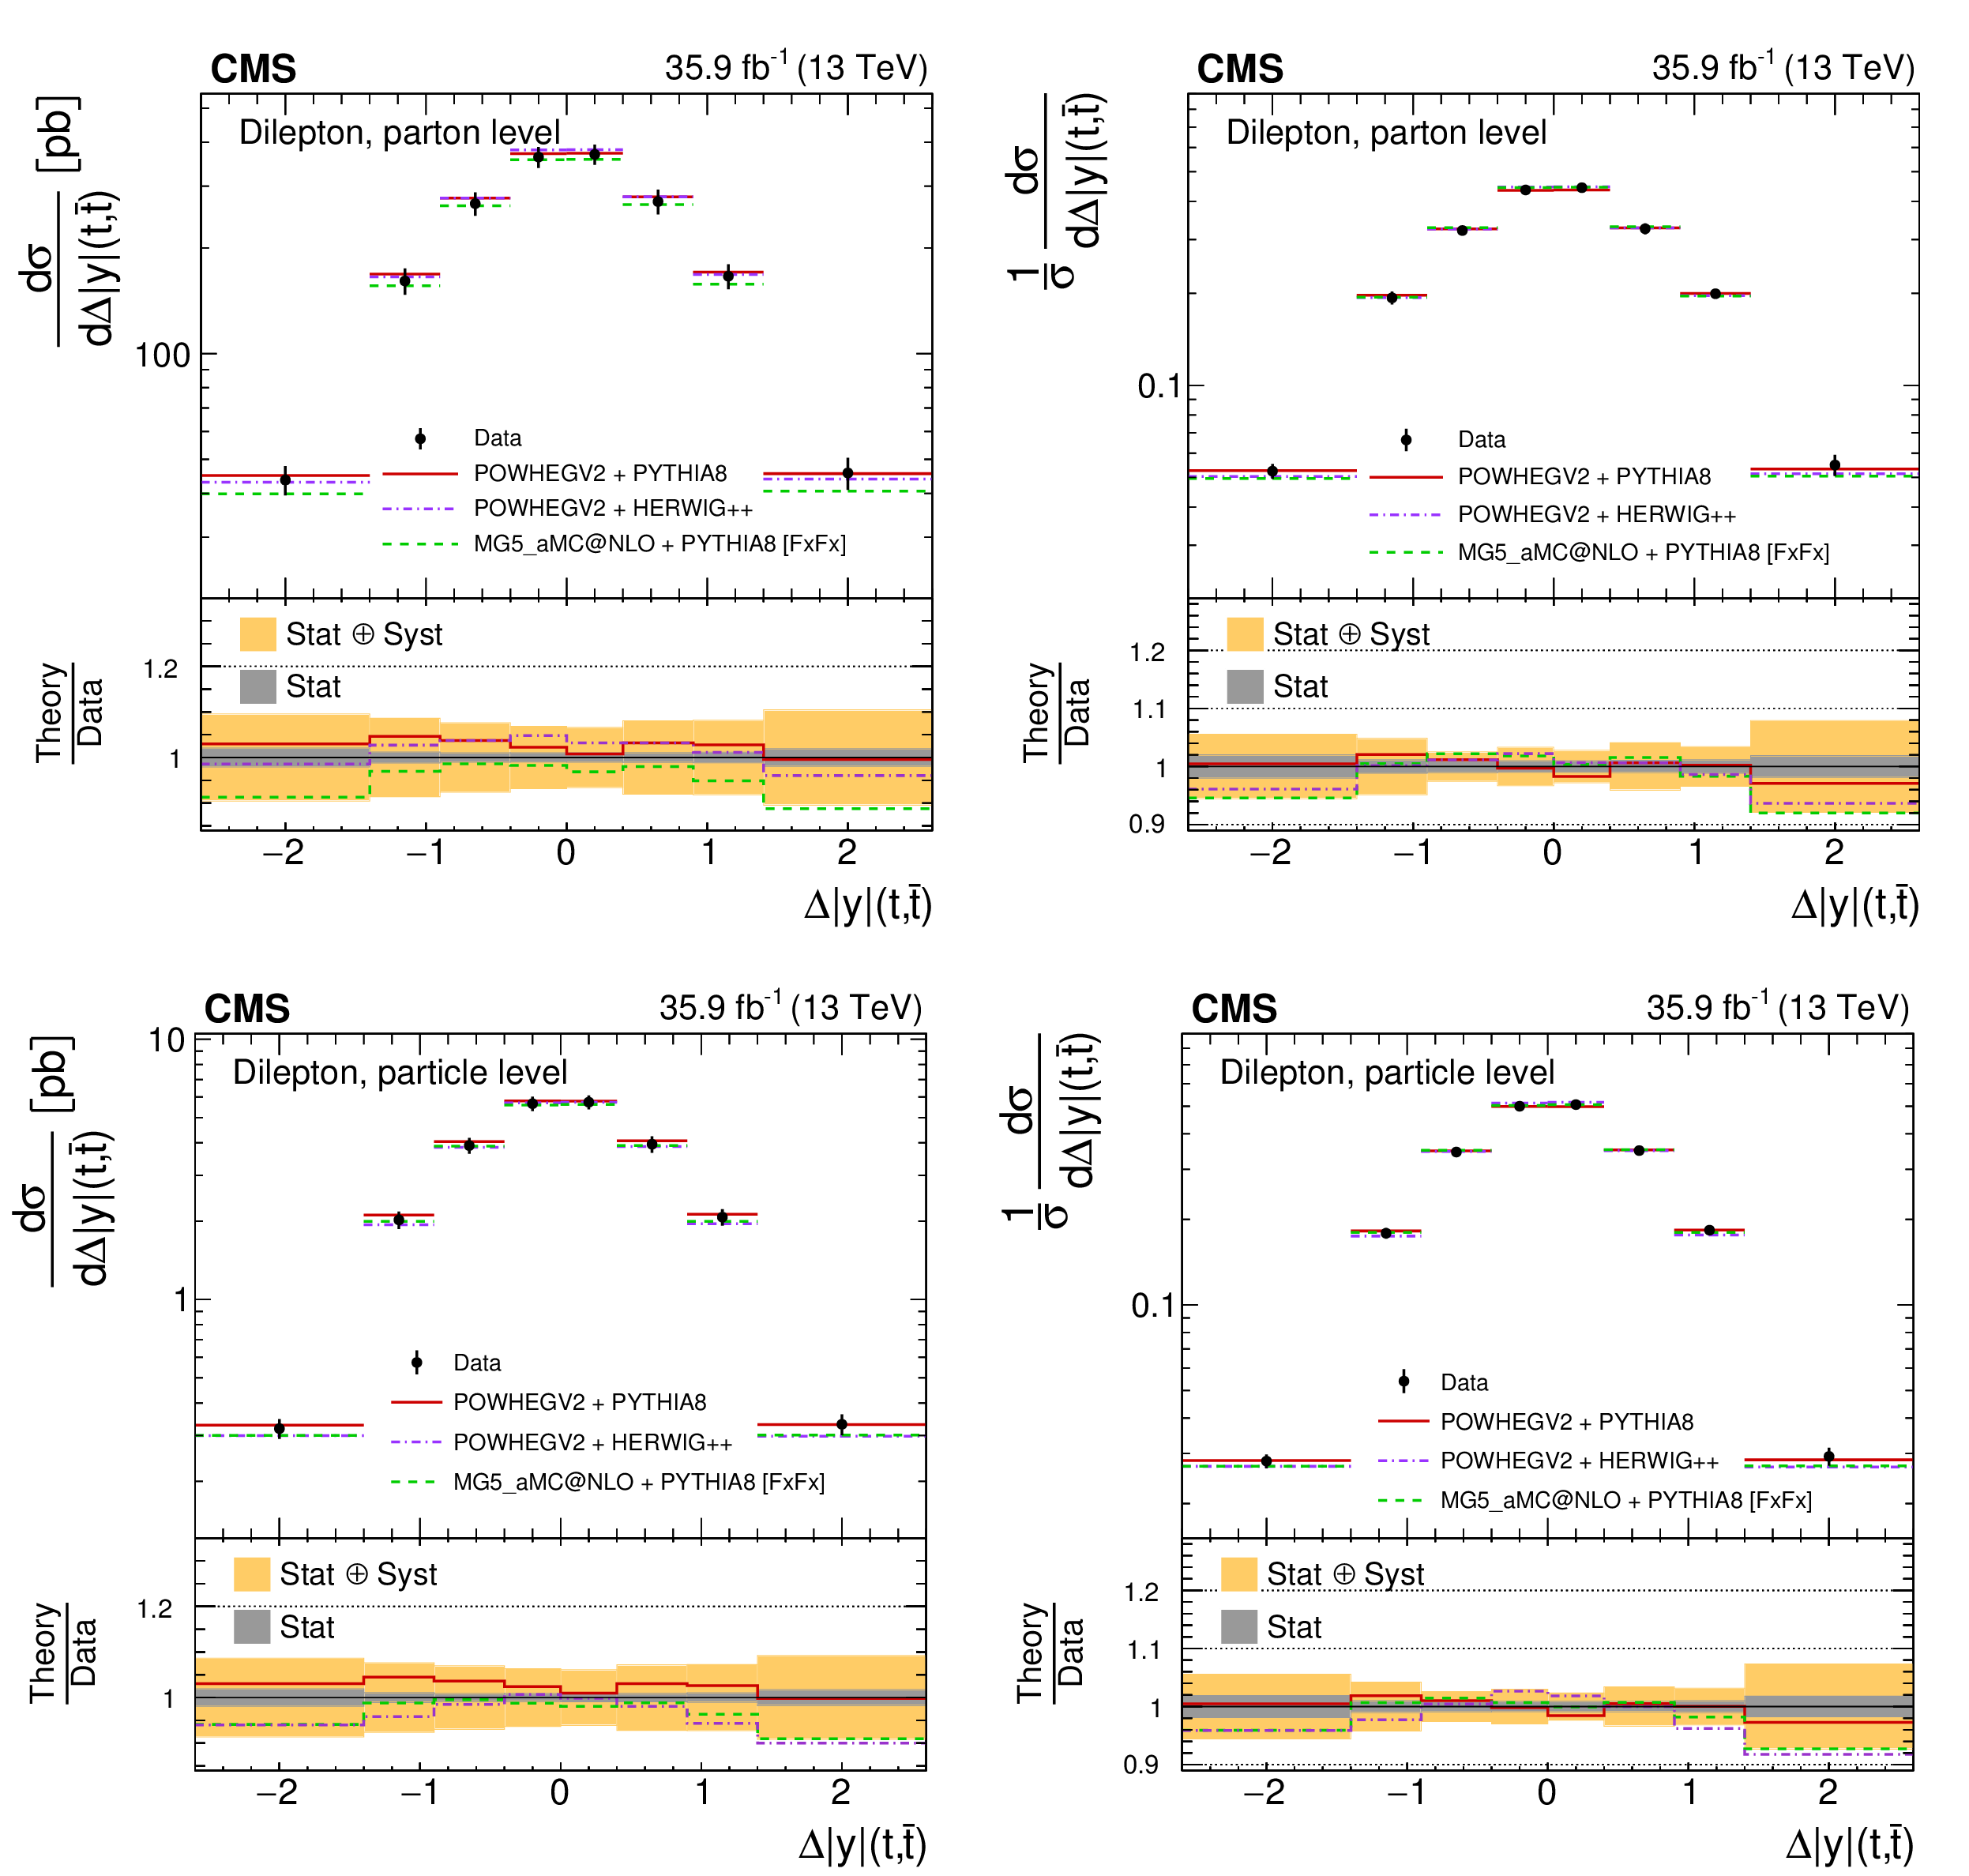
Figure 20:
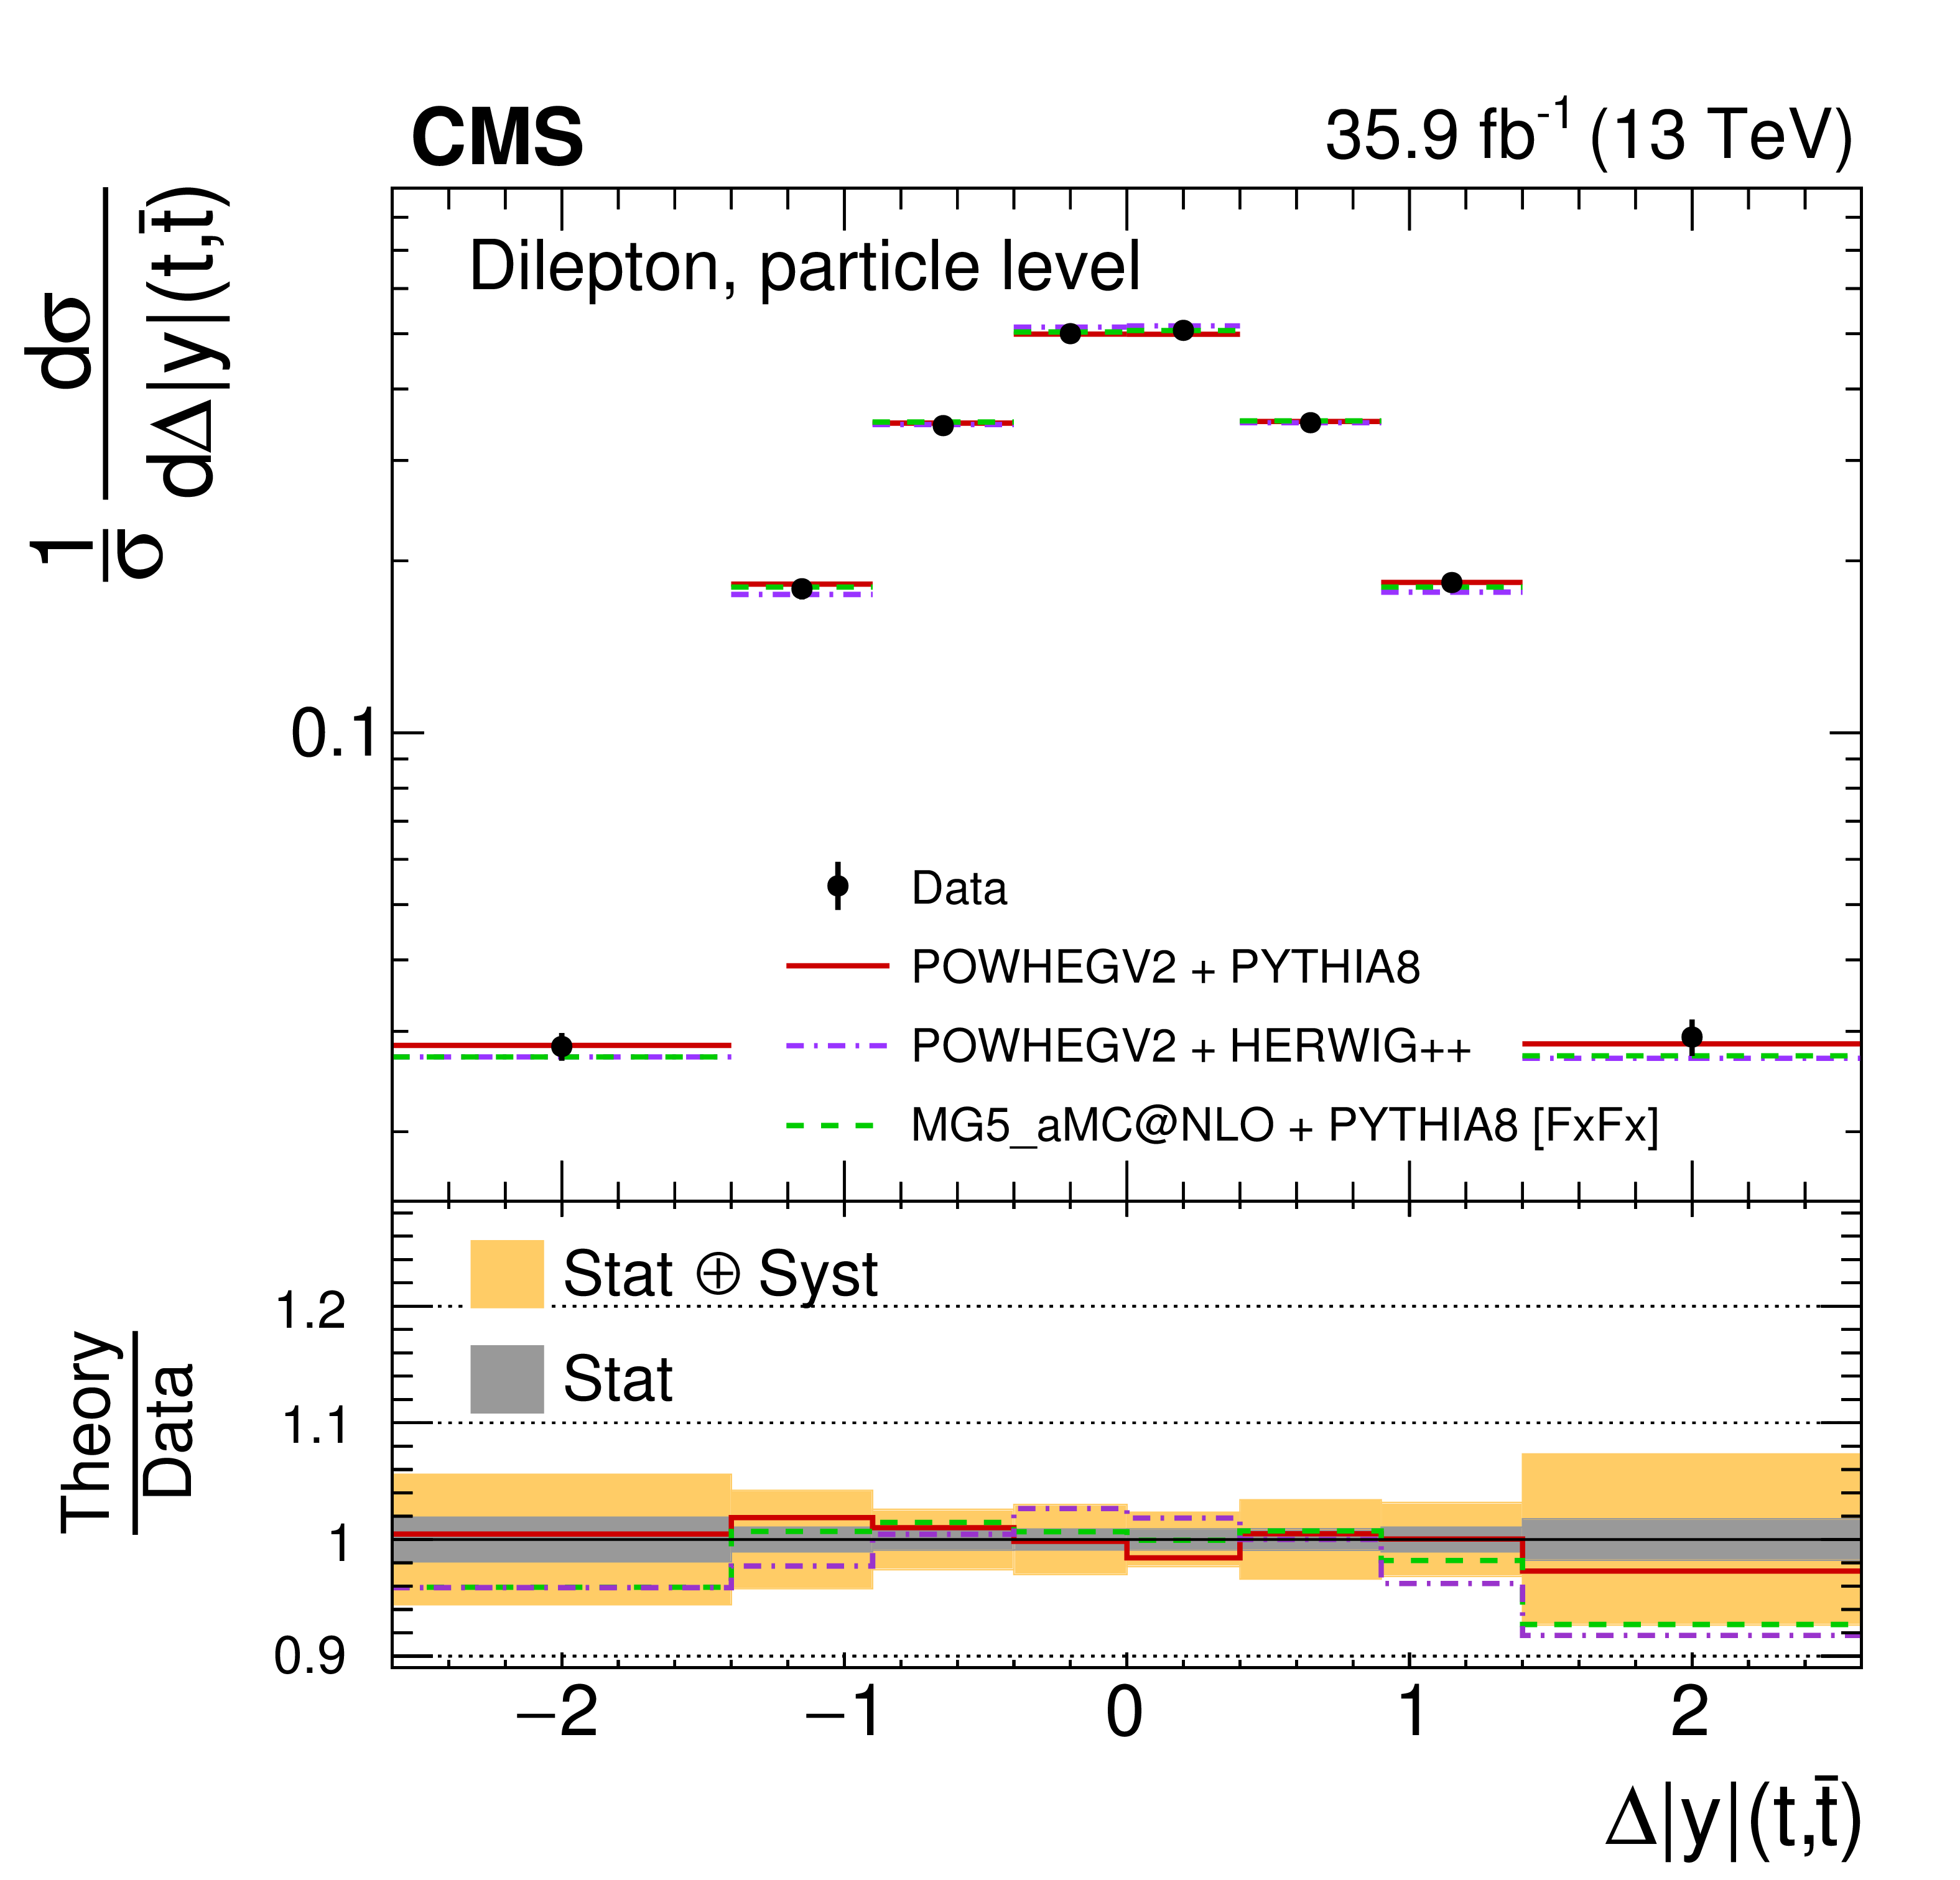
The differential $ {{\mathrm {t}\overline {\mathrm {t}}}} $ production cross sections as a function of $ {\Delta {| y |}({\mathrm {t}}, {\overline {\mathrm {t}}})} $ are shown for the data (points) and the MC predictions (lines). The vertical lines on the points indicate the total uncertainty in the data. The left and right columns correspond to absolute and normalised measurements, respectively. The upper row corresponds to measurements at the parton level in the full phase space and the lower row to the particle level in a fiducial phase space. The lower panel in each plot shows the ratios of the theoretical predictions to the data. The dark and light bands show the relative statistical and total uncertainties in the data, respectively. |
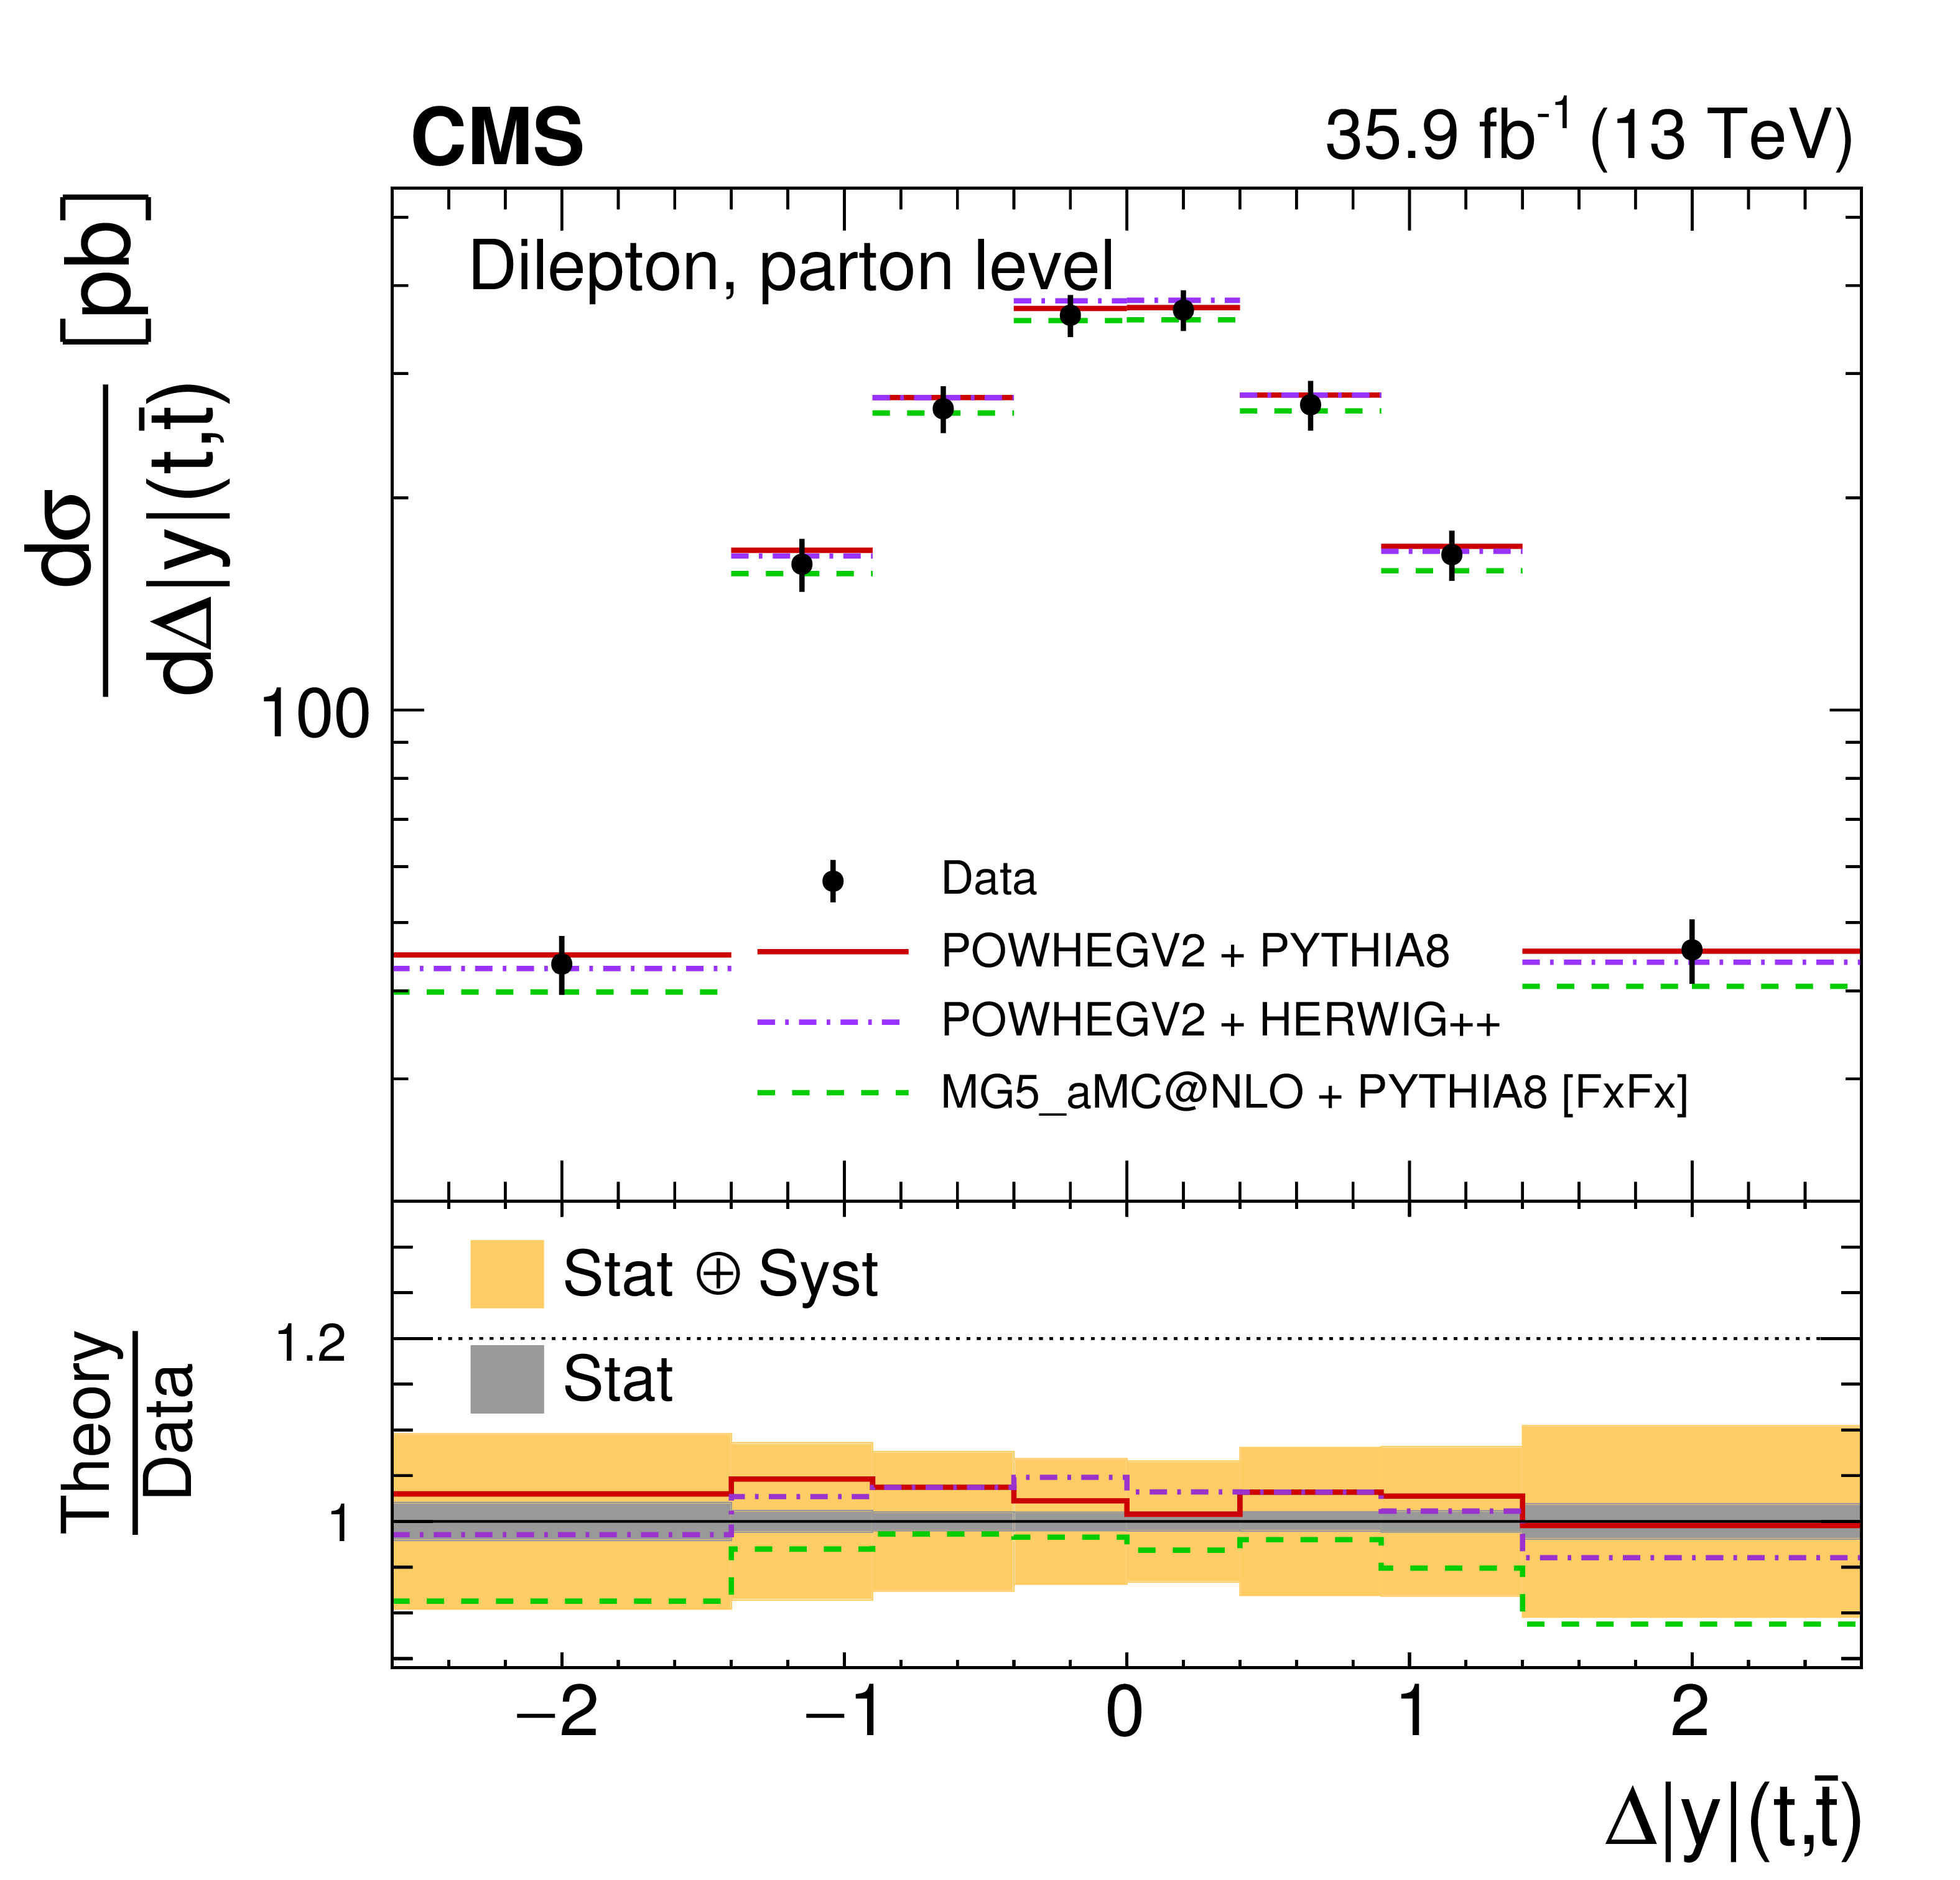
png pdf |
Figure 20-a:
The differential $ {{\mathrm {t}\overline {\mathrm {t}}}} $ production cross sections as a function of $ {\Delta {| y |}({\mathrm {t}}, {\overline {\mathrm {t}}})} $ are shown for the data (points) and the MC predictions (lines). The vertical lines on the points indicate the total uncertainty in the data. The left and right columns correspond to absolute and normalised measurements, respectively. The upper row corresponds to measurements at the parton level in the full phase space and the lower row to the particle level in a fiducial phase space. The lower panel in each plot shows the ratios of the theoretical predictions to the data. The dark and light bands show the relative statistical and total uncertainties in the data, respectively. |

png pdf |
Figure 20-b:
The differential $ {{\mathrm {t}\overline {\mathrm {t}}}} $ production cross sections as a function of $ {\Delta {| y |}({\mathrm {t}}, {\overline {\mathrm {t}}})} $ are shown for the data (points) and the MC predictions (lines). The vertical lines on the points indicate the total uncertainty in the data. The left and right columns correspond to absolute and normalised measurements, respectively. The upper row corresponds to measurements at the parton level in the full phase space and the lower row to the particle level in a fiducial phase space. The lower panel in each plot shows the ratios of the theoretical predictions to the data. The dark and light bands show the relative statistical and total uncertainties in the data, respectively. |

png pdf |
Figure 20-c:
The differential $ {{\mathrm {t}\overline {\mathrm {t}}}} $ production cross sections as a function of $ {\Delta {| y |}({\mathrm {t}}, {\overline {\mathrm {t}}})} $ are shown for the data (points) and the MC predictions (lines). The vertical lines on the points indicate the total uncertainty in the data. The left and right columns correspond to absolute and normalised measurements, respectively. The upper row corresponds to measurements at the parton level in the full phase space and the lower row to the particle level in a fiducial phase space. The lower panel in each plot shows the ratios of the theoretical predictions to the data. The dark and light bands show the relative statistical and total uncertainties in the data, respectively. |
png pdf |
Figure 20-d:
The differential $ {{\mathrm {t}\overline {\mathrm {t}}}} $ production cross sections as a function of $ {\Delta {| y |}({\mathrm {t}}, {\overline {\mathrm {t}}})} $ are shown for the data (points) and the MC predictions (lines). The vertical lines on the points indicate the total uncertainty in the data. The left and right columns correspond to absolute and normalised measurements, respectively. The upper row corresponds to measurements at the parton level in the full phase space and the lower row to the particle level in a fiducial phase space. The lower panel in each plot shows the ratios of the theoretical predictions to the data. The dark and light bands show the relative statistical and total uncertainties in the data, respectively. |
png pdf |
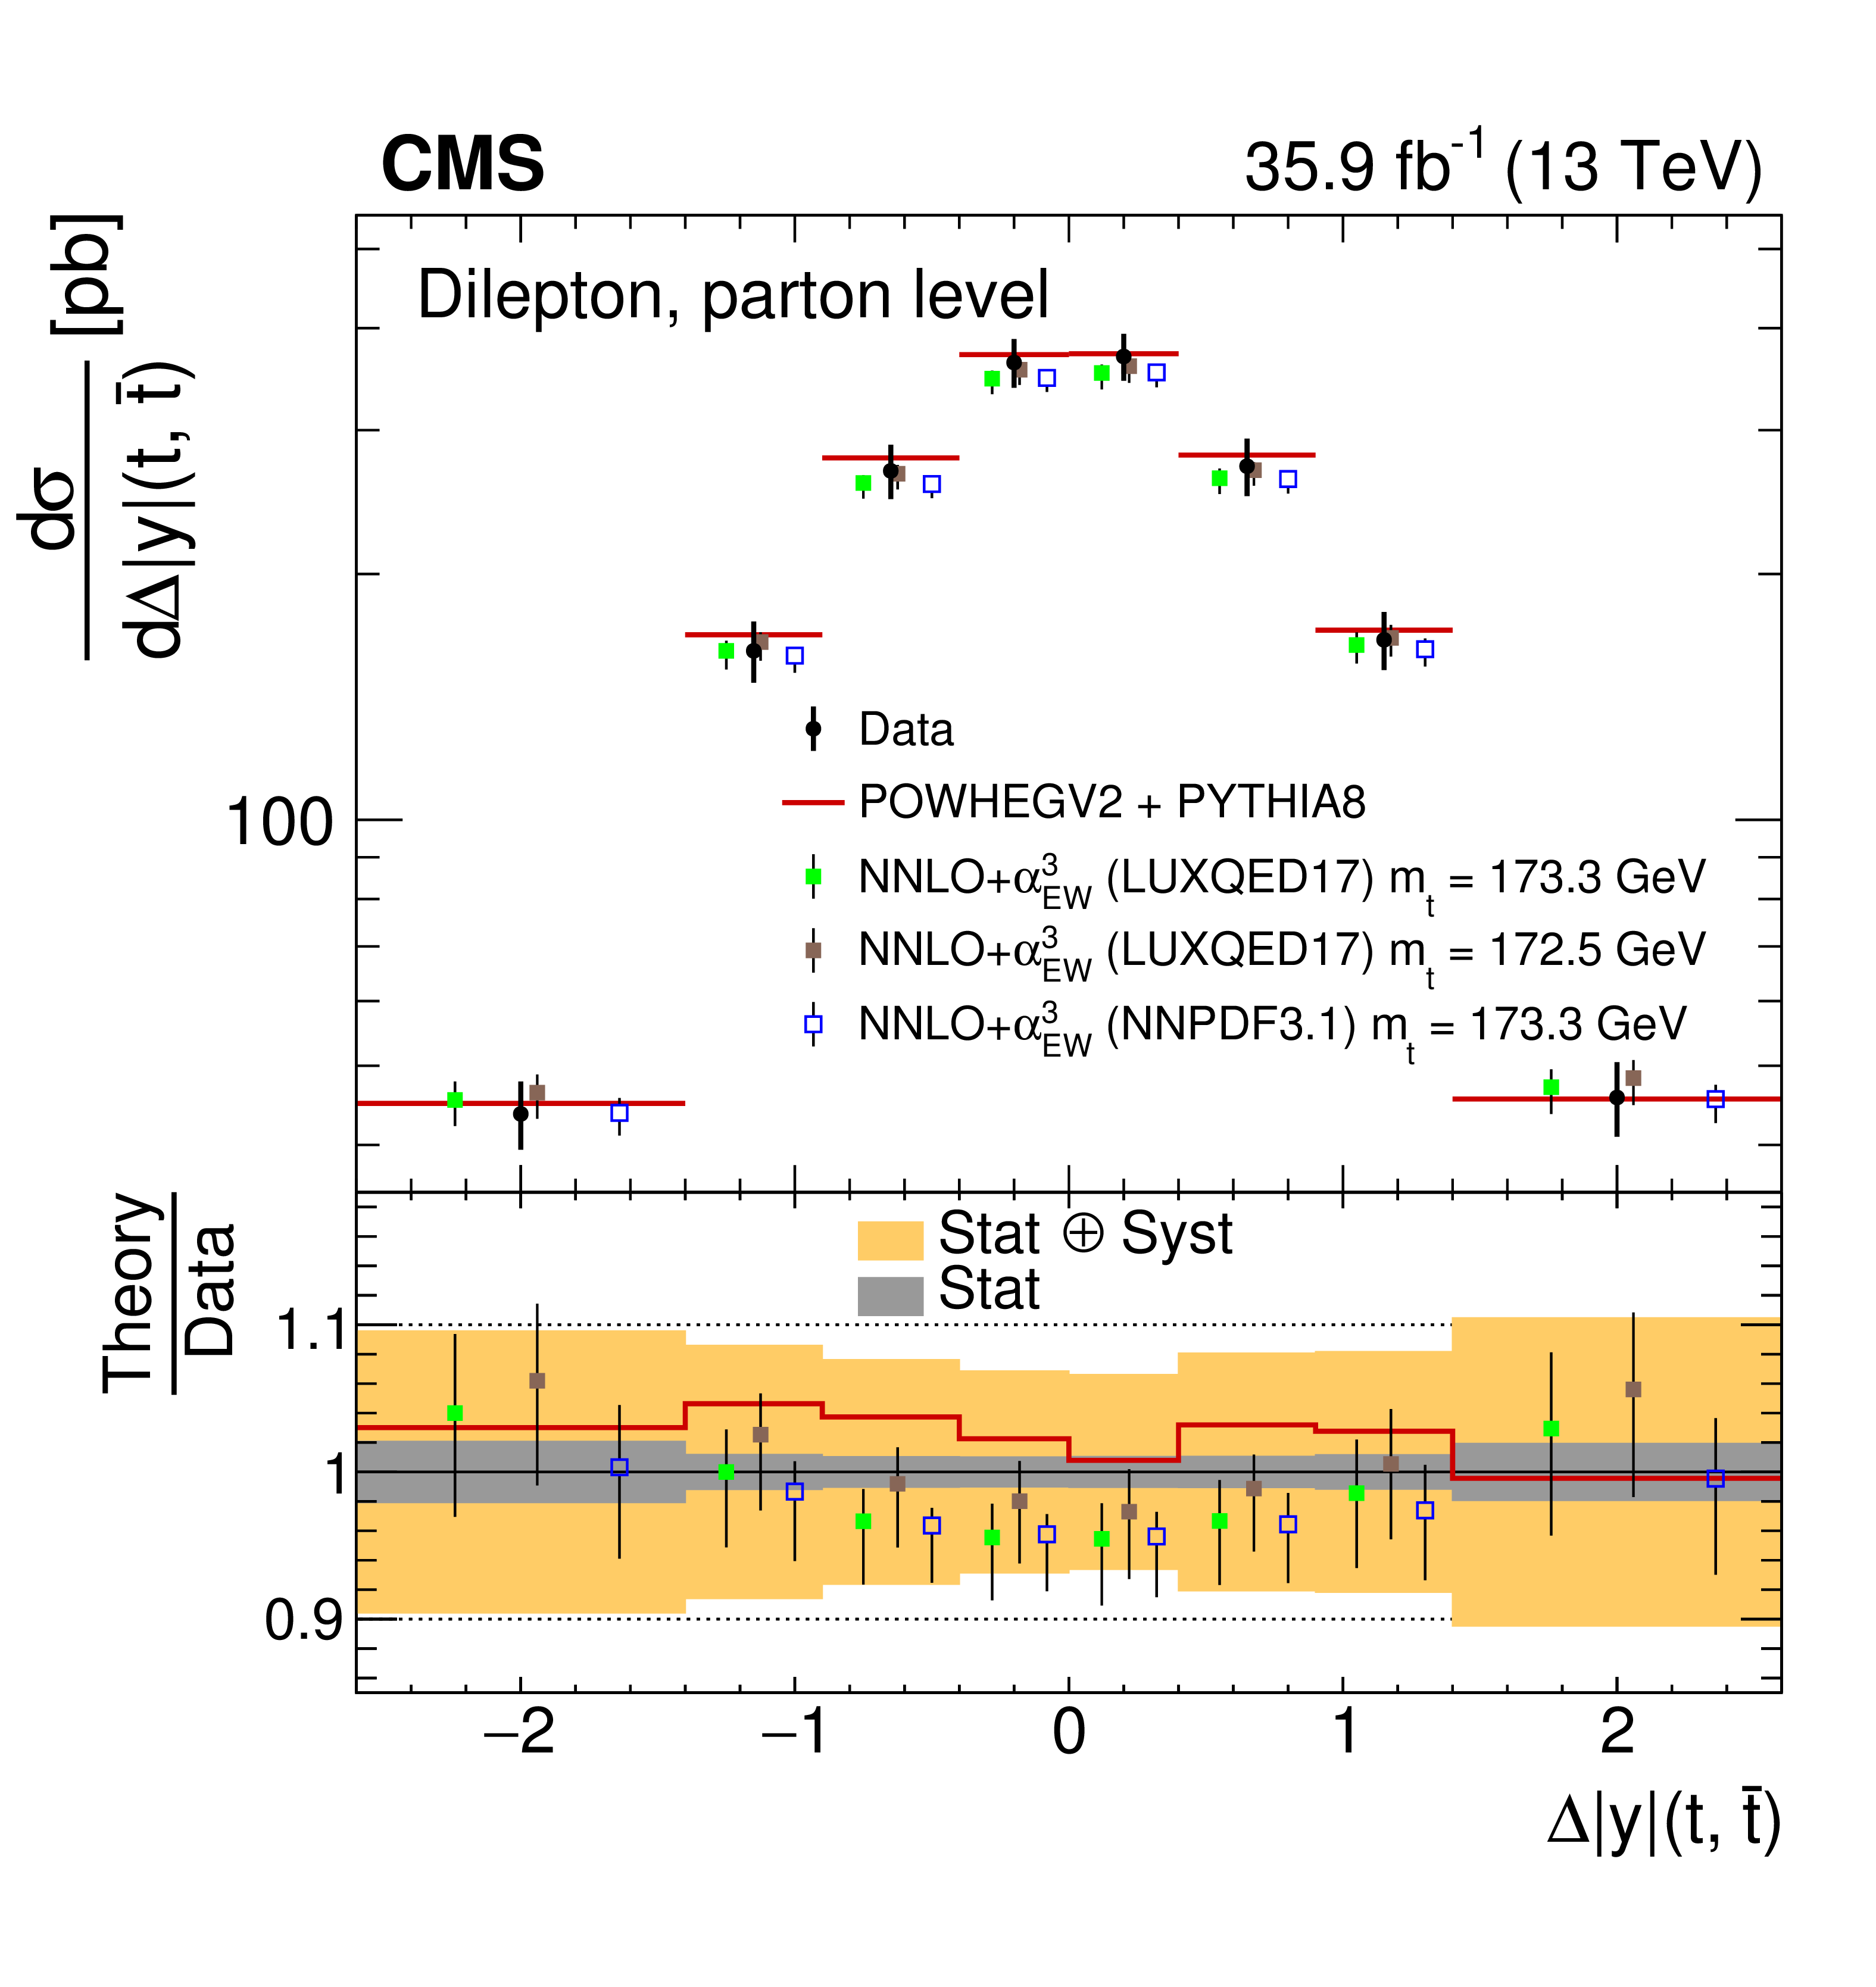
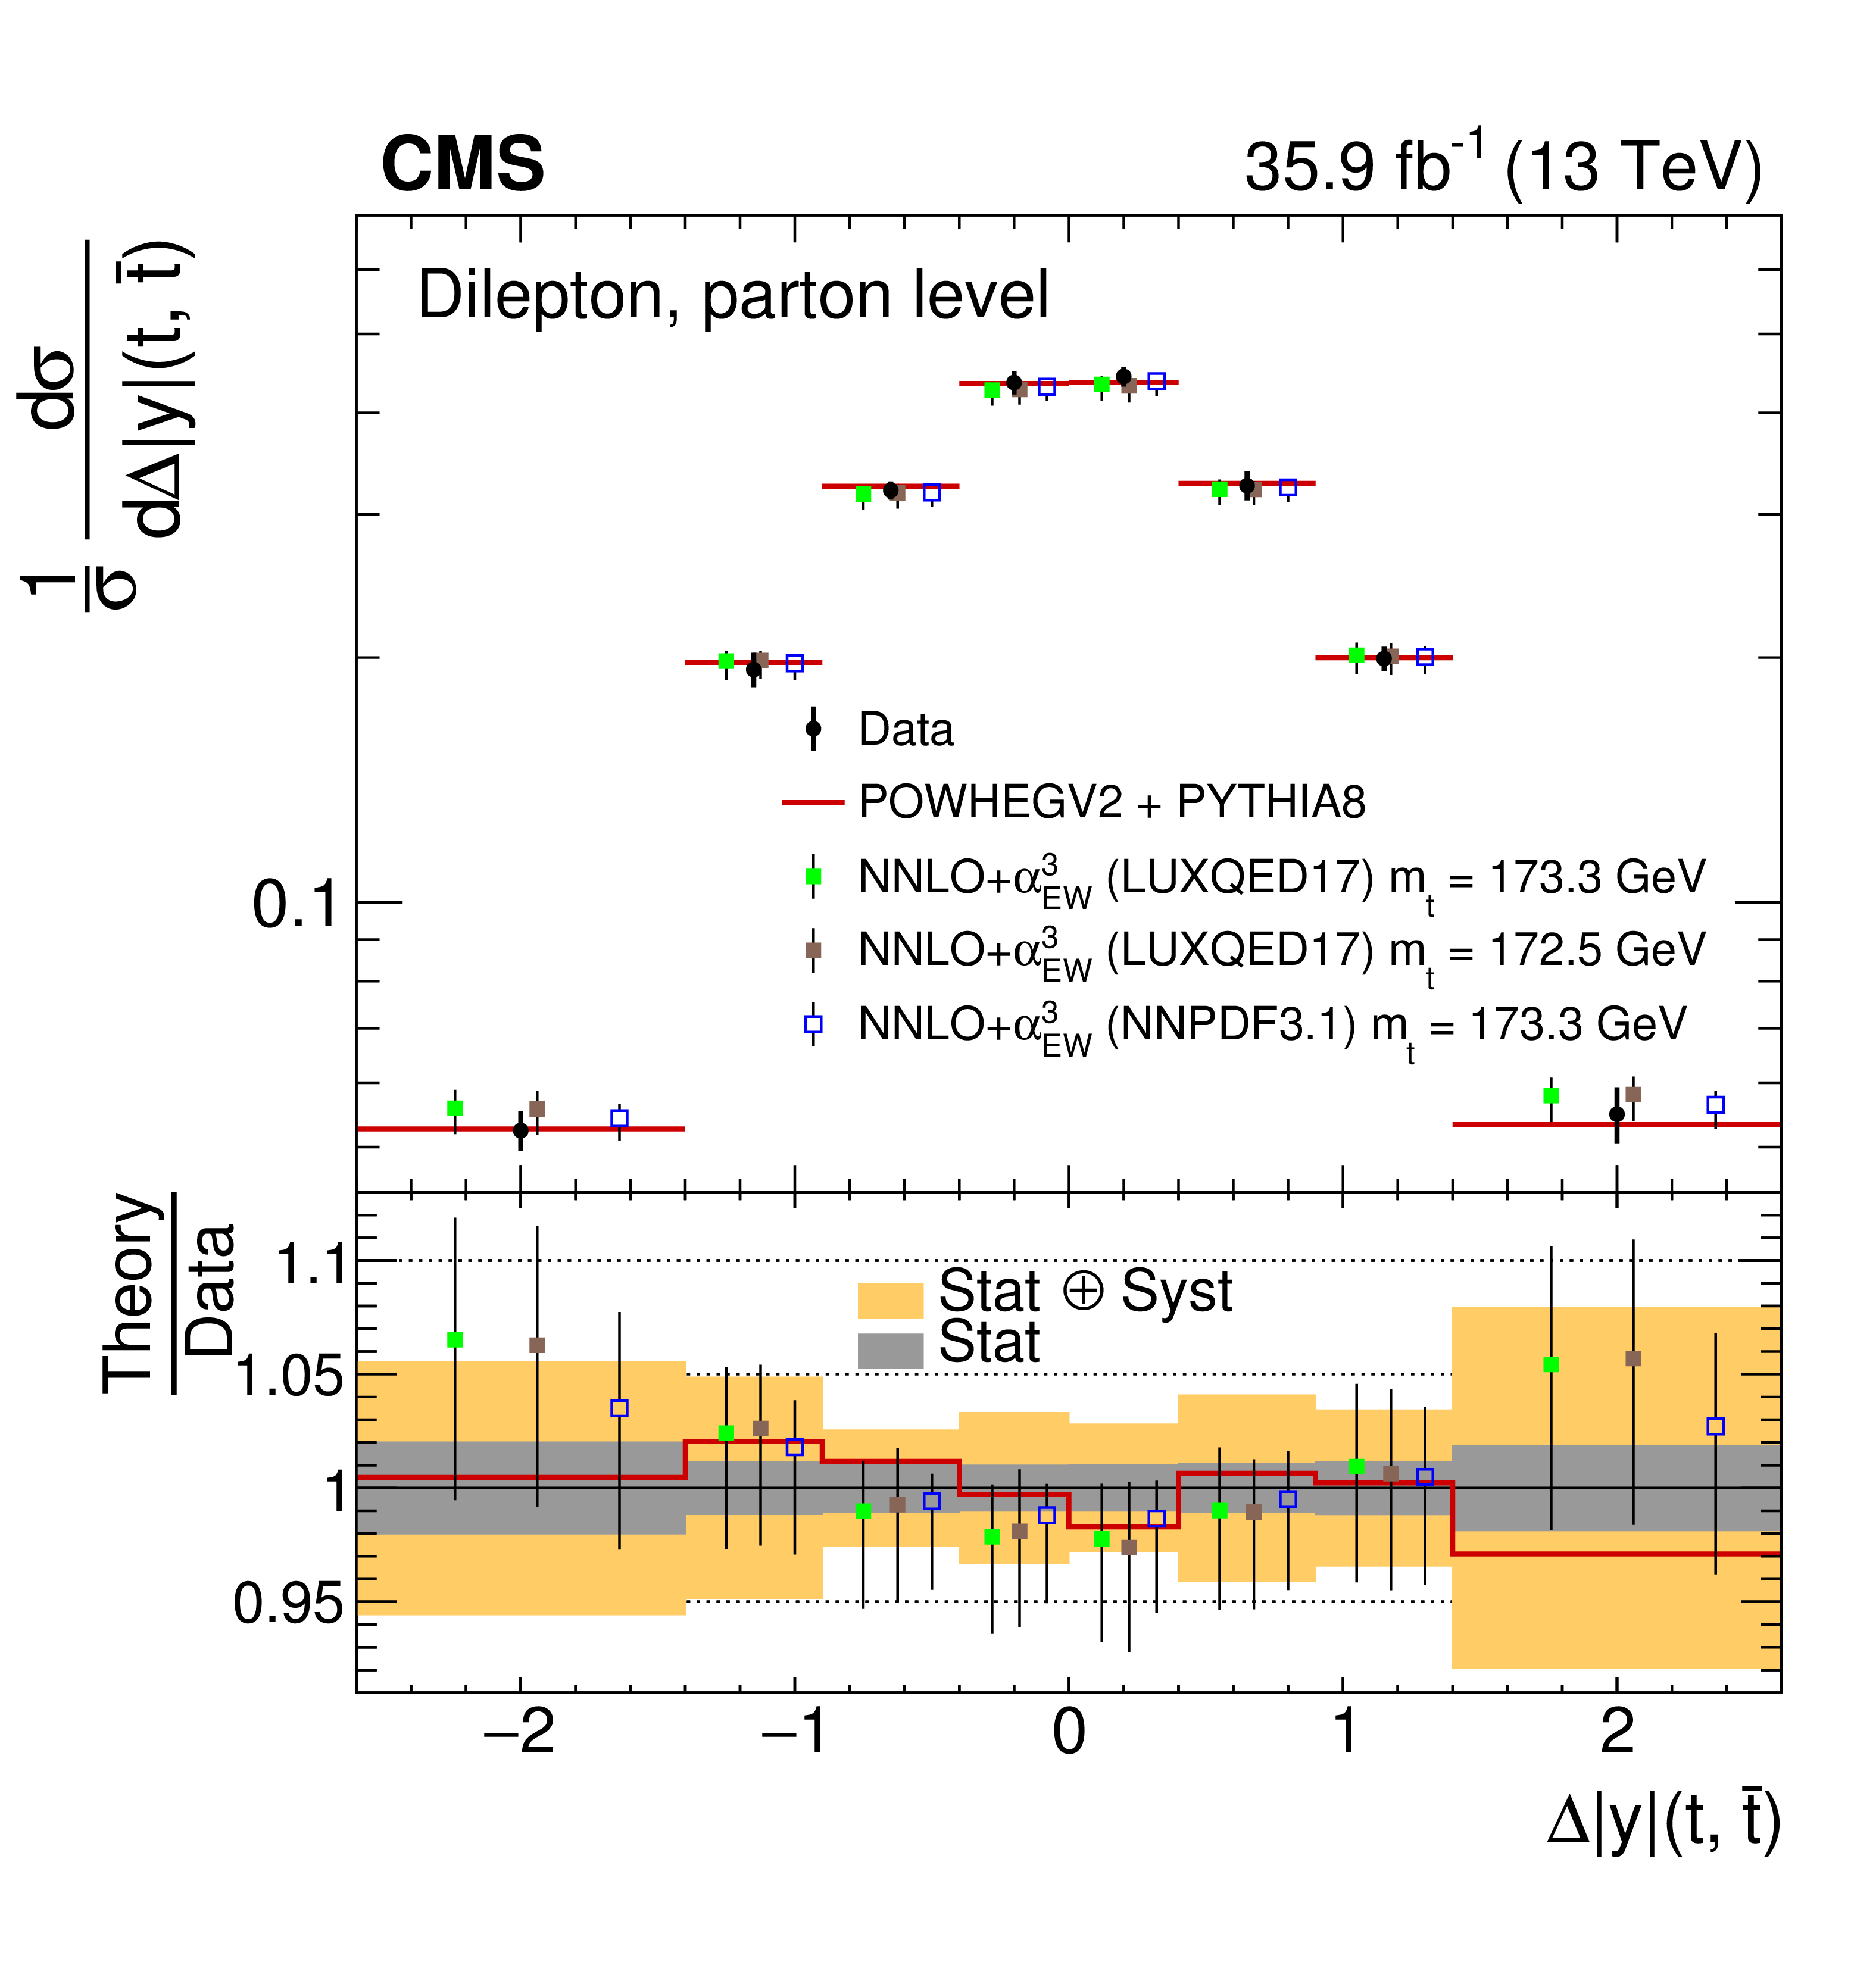
Figure 21:
The differential $ {{\mathrm {t}\overline {\mathrm {t}}}} $ production cross sections as a function of $ {\Delta {| y |}({\mathrm {t}}, {\overline {\mathrm {t}}})} $ are shown for the data (filled circles), the theoretical predictions with beyond-NLO precision (other points) and the prediction from POWHEG+PYTHIA (solid line). The vertical lines on the filled circles and other points indicate the total uncertainty in the data and theoretical predictions, respectively. The left and right plots correspond to absolute and normalised measurements, respectively. The lower panel in each plot shows the ratios of the theoretical predictions to the data. The dark and light bands show the relative statistical and total uncertainties in the data, respectively. |
png pdf |
Figure 21-a:
The differential $ {{\mathrm {t}\overline {\mathrm {t}}}} $ production cross sections as a function of $ {\Delta {| y |}({\mathrm {t}}, {\overline {\mathrm {t}}})} $ are shown for the data (filled circles), the theoretical predictions with beyond-NLO precision (other points) and the prediction from POWHEG+PYTHIA (solid line). The vertical lines on the filled circles and other points indicate the total uncertainty in the data and theoretical predictions, respectively. The left and right plots correspond to absolute and normalised measurements, respectively. The lower panel in each plot shows the ratios of the theoretical predictions to the data. The dark and light bands show the relative statistical and total uncertainties in the data, respectively. |
png pdf |
Figure 21-b:
The differential $ {{\mathrm {t}\overline {\mathrm {t}}}} $ production cross sections as a function of $ {\Delta {| y |}({\mathrm {t}}, {\overline {\mathrm {t}}})} $ are shown for the data (filled circles), the theoretical predictions with beyond-NLO precision (other points) and the prediction from POWHEG+PYTHIA (solid line). The vertical lines on the filled circles and other points indicate the total uncertainty in the data and theoretical predictions, respectively. The left and right plots correspond to absolute and normalised measurements, respectively. The lower panel in each plot shows the ratios of the theoretical predictions to the data. The dark and light bands show the relative statistical and total uncertainties in the data, respectively. |
png pdf |
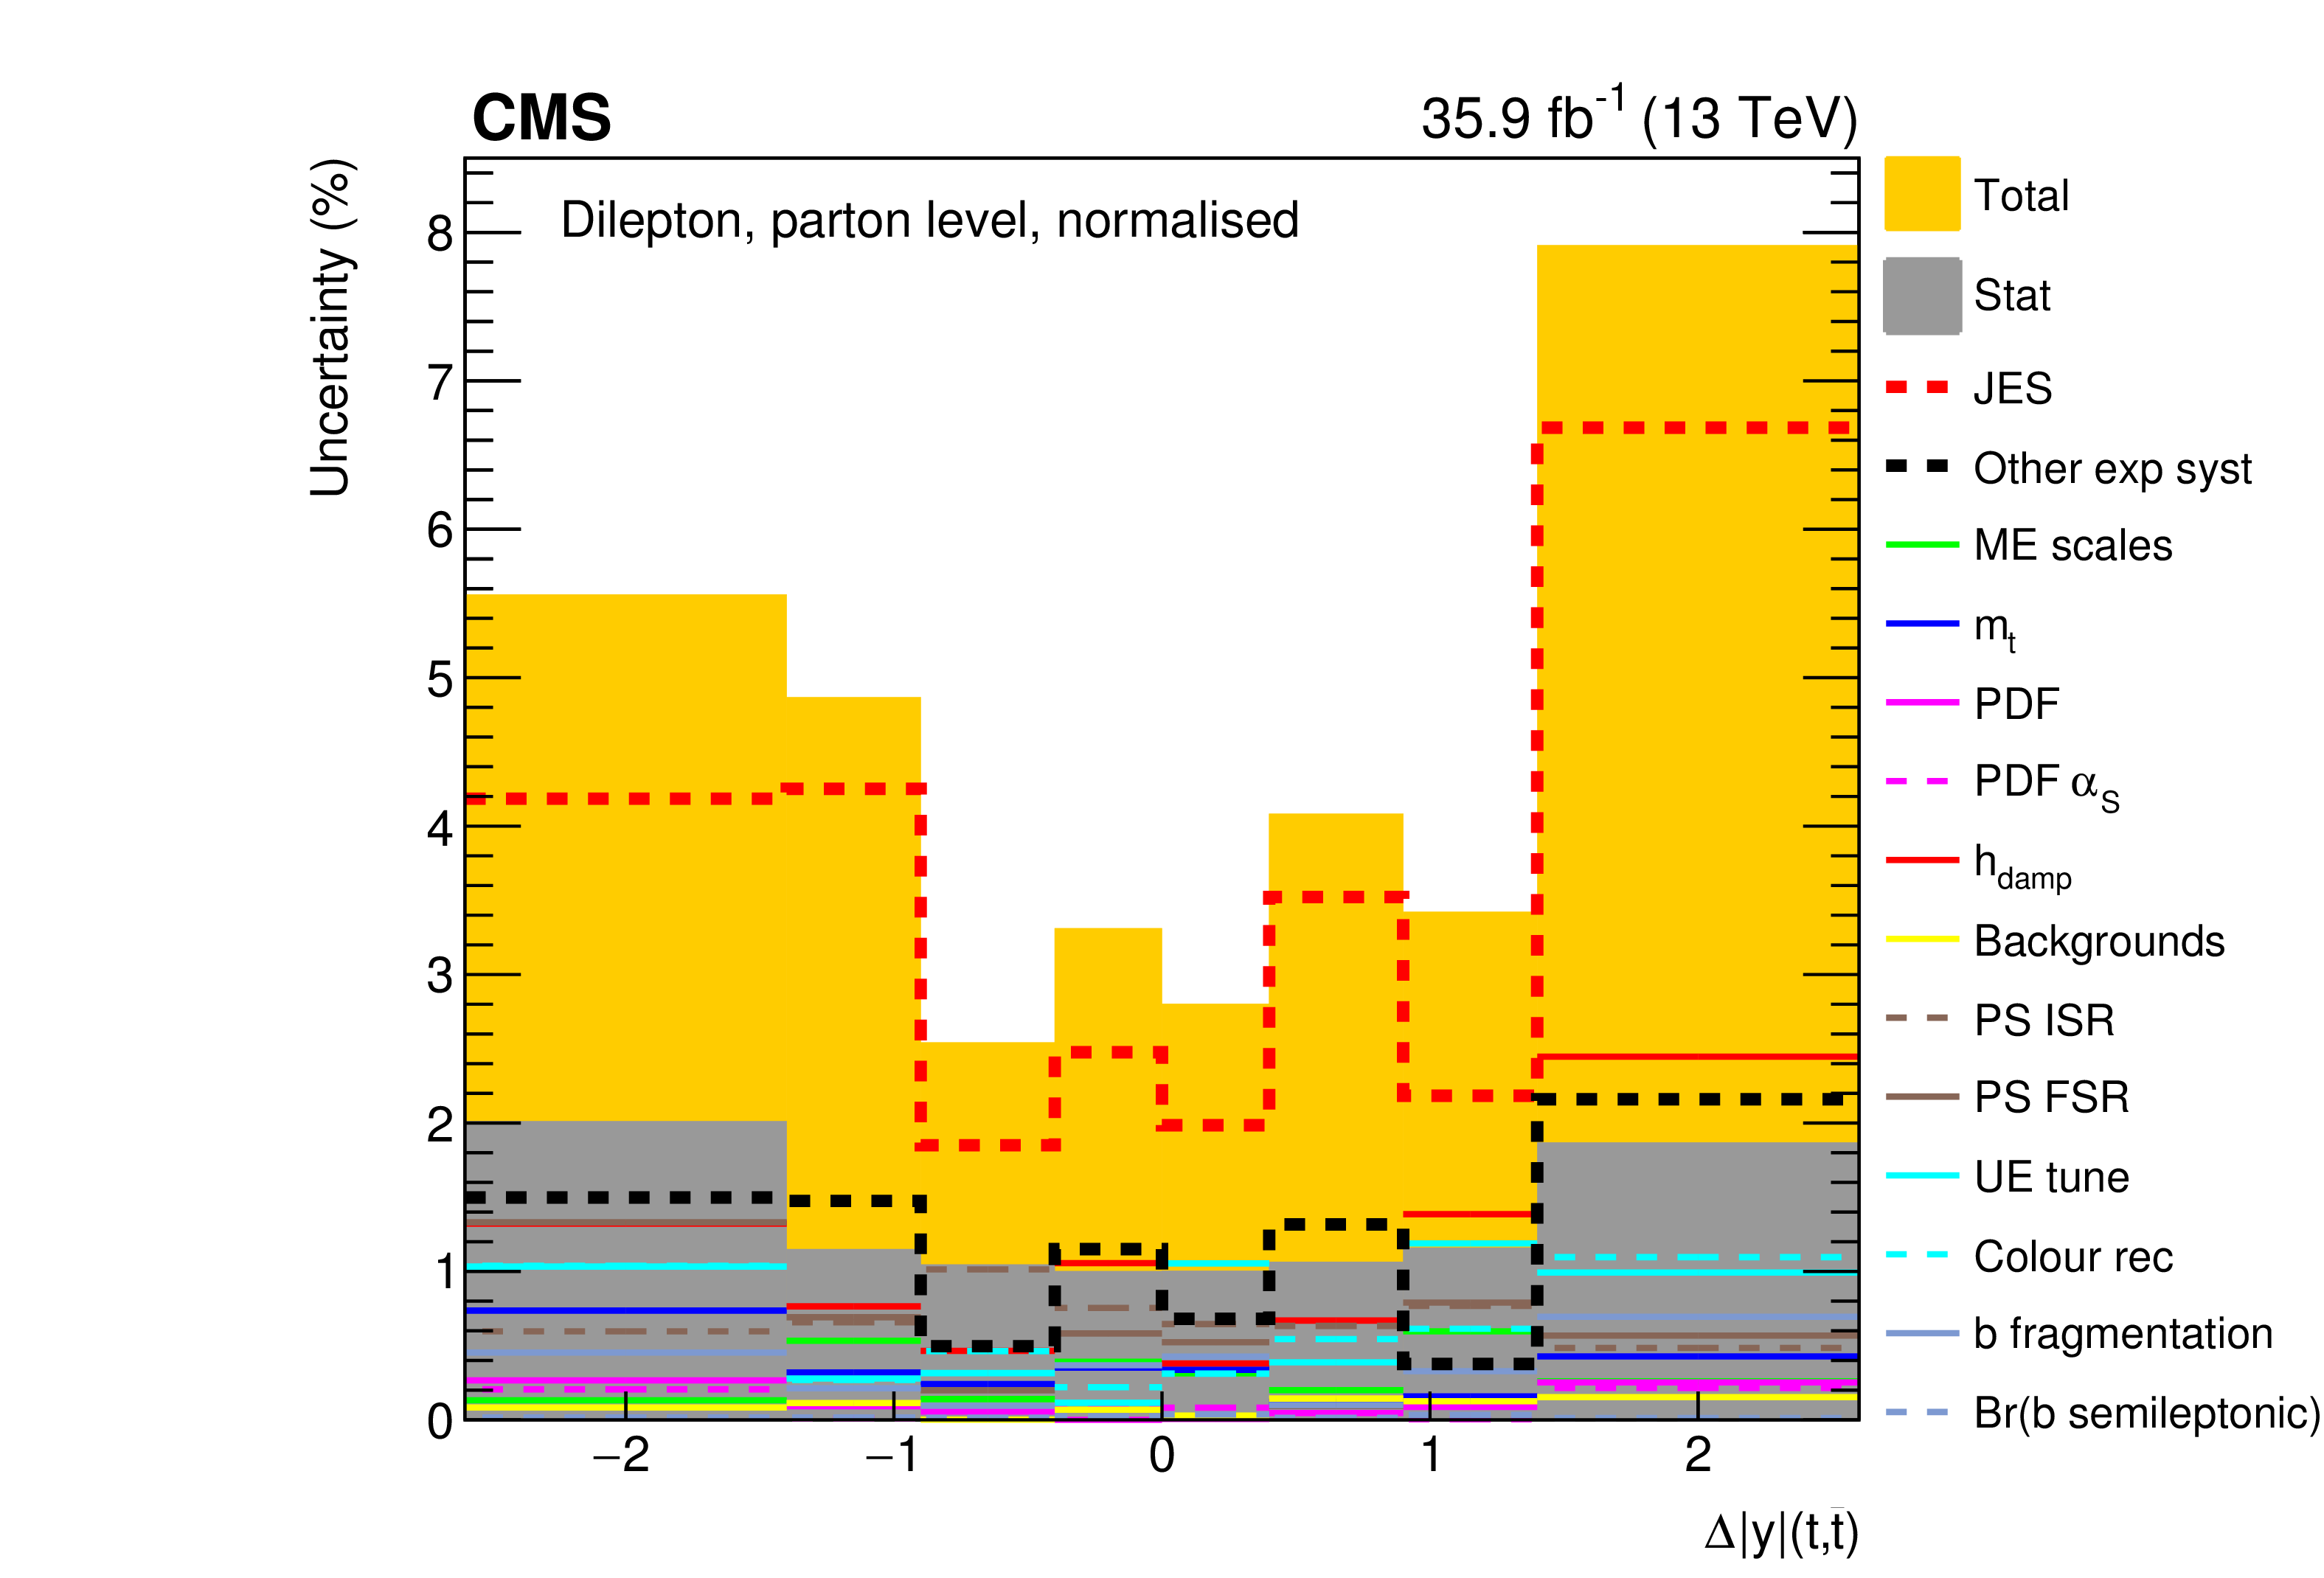
Figure 22:
The contributions of each source of systematic uncertainty to the total systematic uncertainty in each bin is shown for the measurement of the normalised $ {{\mathrm {t}\overline {\mathrm {t}}}} $ production cross sections as a function of $ {\Delta {| y |}({\mathrm {t}}, {\overline {\mathrm {t}}})} $. The sources affecting the JES are added in quadrature and shown as a single component. Additional experimental systematic uncertainties are also added in quadrature and shown as a single component. Contributions from theoretical uncertainties are shown separately. The statistical and total uncertainties, corresponding to the quadrature addition of statistical and systematic uncertainties, are shown by the dark and light filled histograms, respectively. |

png pdf |
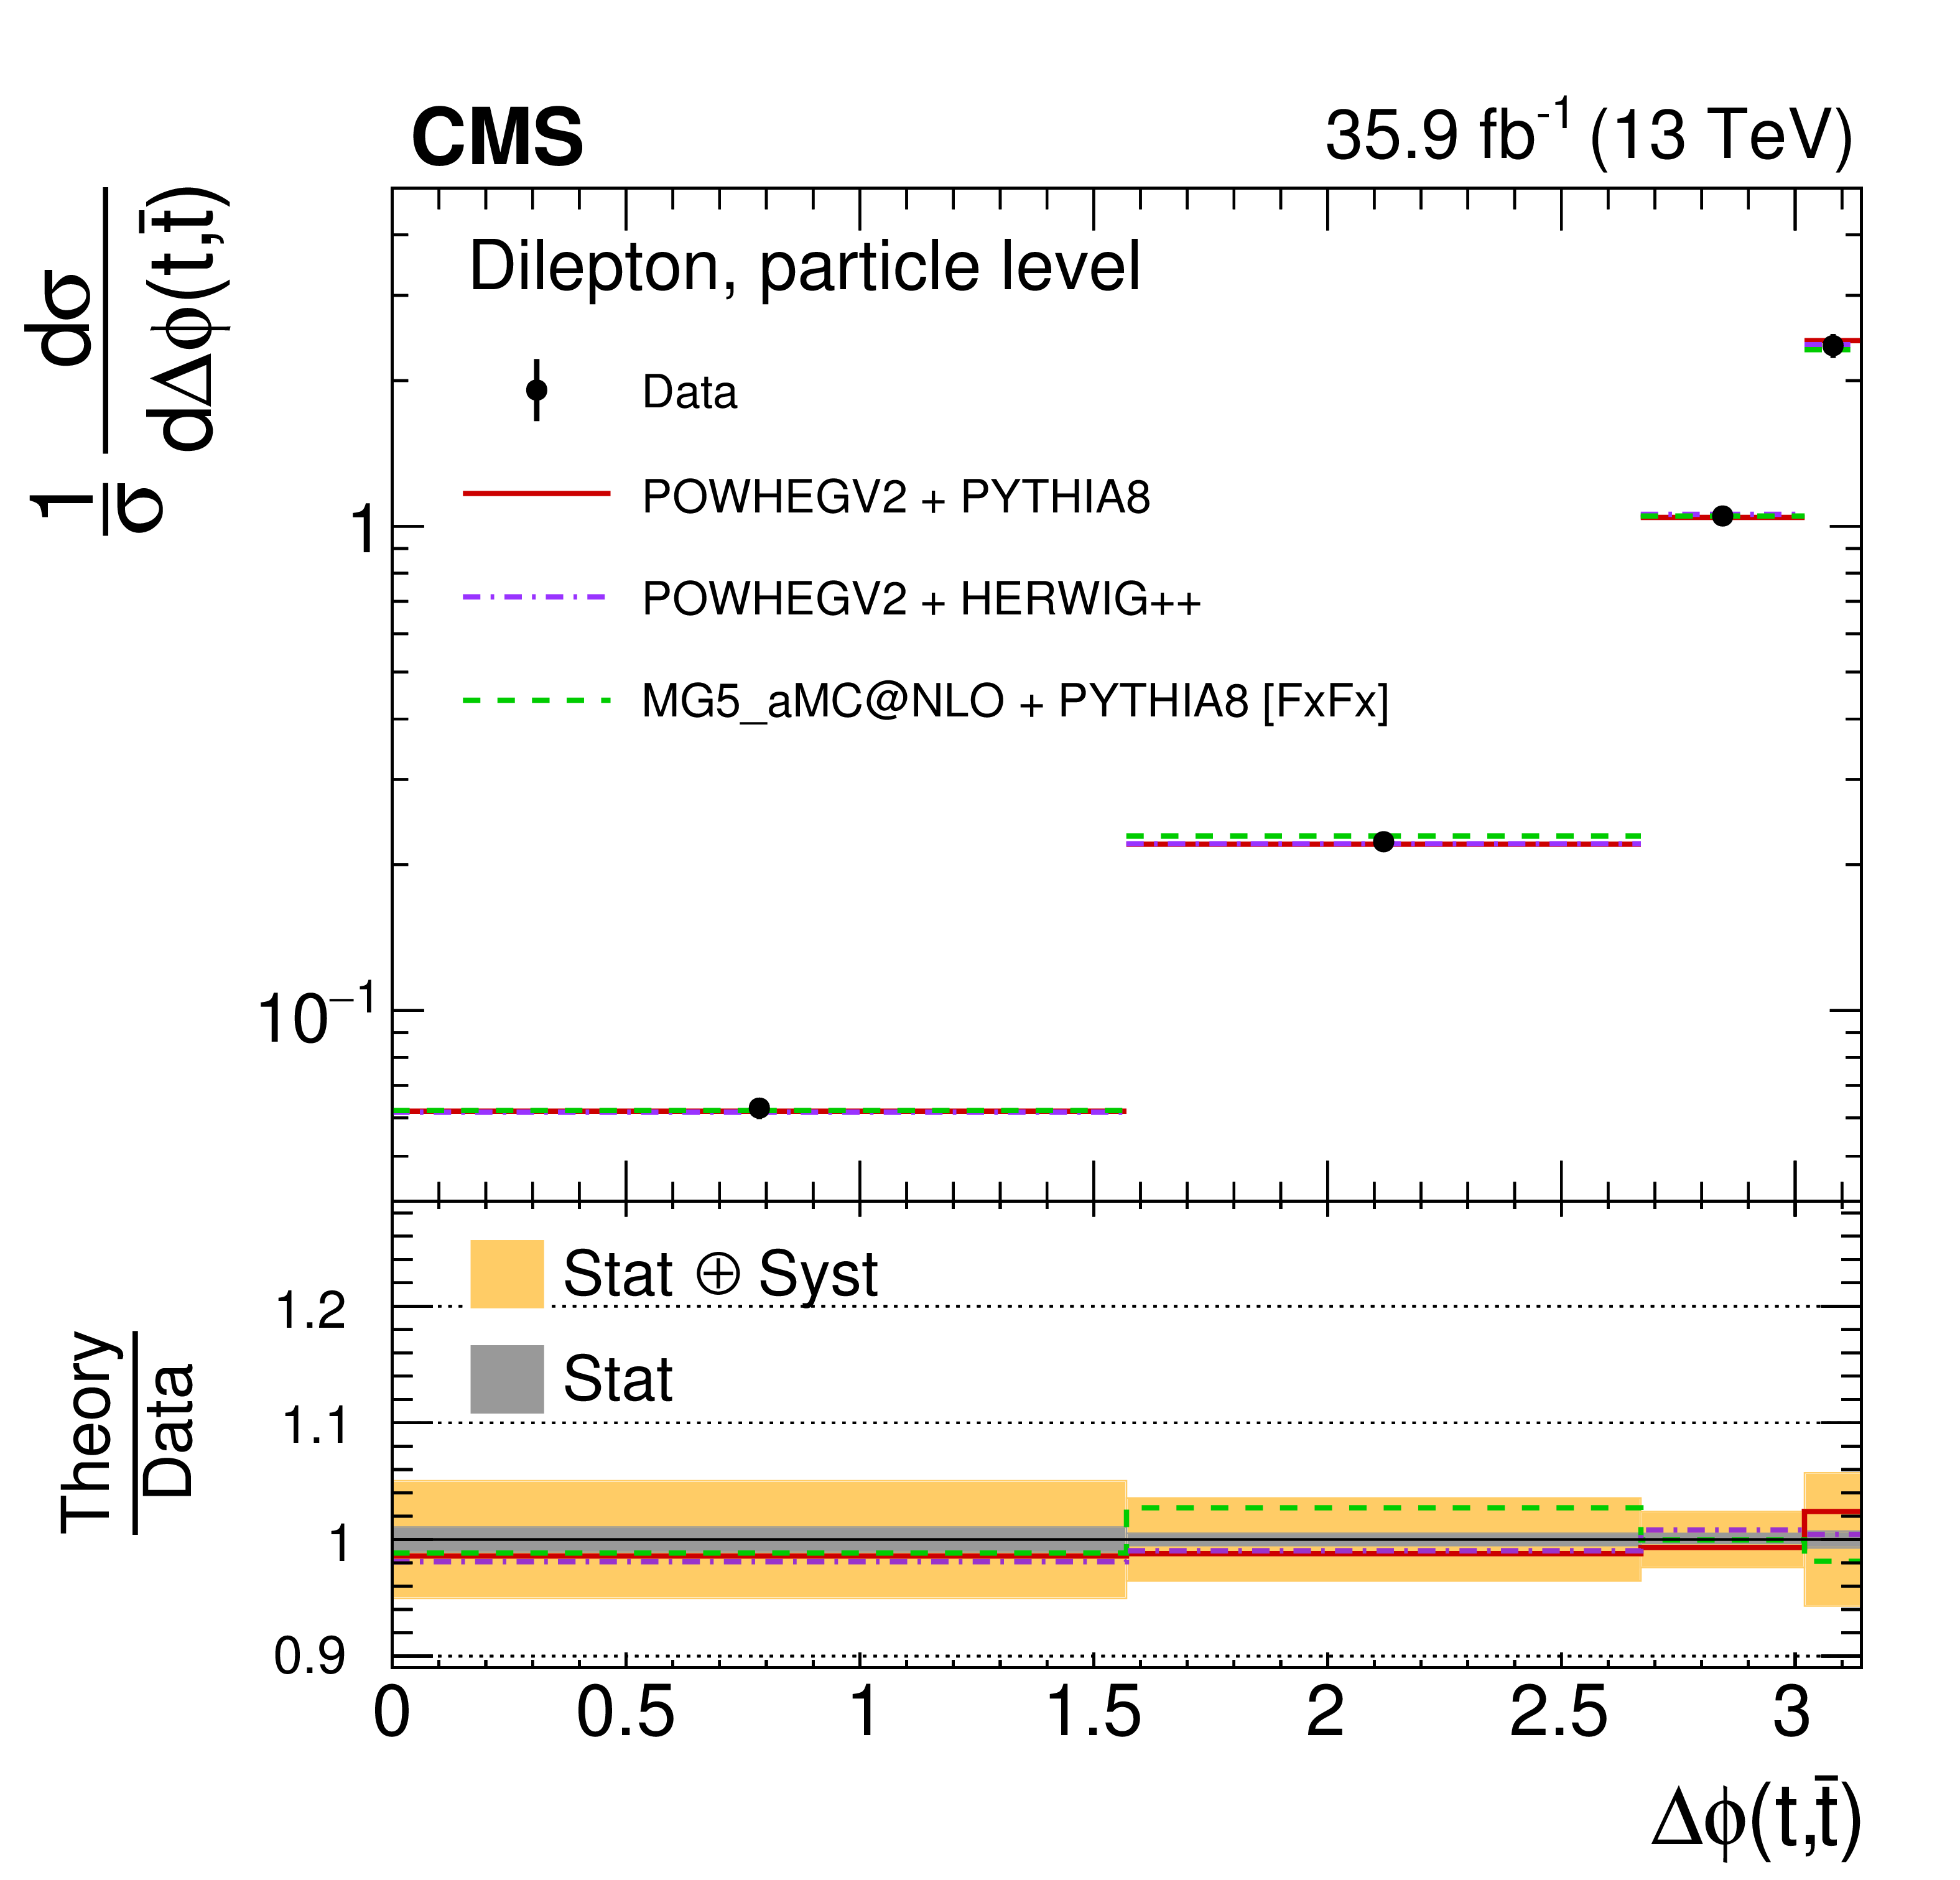
Figure 23:
The differential $ {{\mathrm {t}\overline {\mathrm {t}}}} $ production cross sections as a function of $ {\Delta \phi ({\mathrm {t}}, {\overline {\mathrm {t}}})} $ are shown for the data (points) and the MC predictions (lines). The vertical lines on the points indicate the total uncertainty in the data. The left and right columns correspond to absolute and normalised measurements, respectively. The upper row corresponds to measurements at the parton level in the full phase space and the lower row to the particle level in a fiducial phase space. The lower panel in each plot shows the ratios of the theoretical predictions to the data. The dark and light bands show the relative statistical and total uncertainties in the data, respectively. |

png pdf |
Figure 23-a:
The differential $ {{\mathrm {t}\overline {\mathrm {t}}}} $ production cross sections as a function of $ {\Delta \phi ({\mathrm {t}}, {\overline {\mathrm {t}}})} $ are shown for the data (points) and the MC predictions (lines). The vertical lines on the points indicate the total uncertainty in the data. The left and right columns correspond to absolute and normalised measurements, respectively. The upper row corresponds to measurements at the parton level in the full phase space and the lower row to the particle level in a fiducial phase space. The lower panel in each plot shows the ratios of the theoretical predictions to the data. The dark and light bands show the relative statistical and total uncertainties in the data, respectively. |

png pdf |
Figure 23-b:
The differential $ {{\mathrm {t}\overline {\mathrm {t}}}} $ production cross sections as a function of $ {\Delta \phi ({\mathrm {t}}, {\overline {\mathrm {t}}})} $ are shown for the data (points) and the MC predictions (lines). The vertical lines on the points indicate the total uncertainty in the data. The left and right columns correspond to absolute and normalised measurements, respectively. The upper row corresponds to measurements at the parton level in the full phase space and the lower row to the particle level in a fiducial phase space. The lower panel in each plot shows the ratios of the theoretical predictions to the data. The dark and light bands show the relative statistical and total uncertainties in the data, respectively. |

png pdf |
Figure 23-c:
The differential $ {{\mathrm {t}\overline {\mathrm {t}}}} $ production cross sections as a function of $ {\Delta \phi ({\mathrm {t}}, {\overline {\mathrm {t}}})} $ are shown for the data (points) and the MC predictions (lines). The vertical lines on the points indicate the total uncertainty in the data. The left and right columns correspond to absolute and normalised measurements, respectively. The upper row corresponds to measurements at the parton level in the full phase space and the lower row to the particle level in a fiducial phase space. The lower panel in each plot shows the ratios of the theoretical predictions to the data. The dark and light bands show the relative statistical and total uncertainties in the data, respectively. |
png pdf |
Figure 23-d:
The differential $ {{\mathrm {t}\overline {\mathrm {t}}}} $ production cross sections as a function of $ {\Delta \phi ({\mathrm {t}}, {\overline {\mathrm {t}}})} $ are shown for the data (points) and the MC predictions (lines). The vertical lines on the points indicate the total uncertainty in the data. The left and right columns correspond to absolute and normalised measurements, respectively. The upper row corresponds to measurements at the parton level in the full phase space and the lower row to the particle level in a fiducial phase space. The lower panel in each plot shows the ratios of the theoretical predictions to the data. The dark and light bands show the relative statistical and total uncertainties in the data, respectively. |
png pdf |
Figure 24:
The differential $ {{\mathrm {t}\overline {\mathrm {t}}}} $ production cross sections as a function of $ {{p_{\mathrm {T}}} ^{{{\mathrm {t}\overline {\mathrm {t}}}}}} $ are shown for the data (points) and the MC predictions (lines). The vertical lines on the points indicate the total uncertainty in the data. The left and right columns correspond to absolute and normalised measurements, respectively. The upper row corresponds to measurements at the parton level in the full phase space and the lower row to the particle level in a fiducial phase space. The lower panel in each plot shows the ratios of the theoretical predictions to the data. The dark and light bands show the relative statistical and total uncertainties in the data, respectively. |

png pdf |
Figure 24-a:
The differential $ {{\mathrm {t}\overline {\mathrm {t}}}} $ production cross sections as a function of $ {{p_{\mathrm {T}}} ^{{{\mathrm {t}\overline {\mathrm {t}}}}}} $ are shown for the data (points) and the MC predictions (lines). The vertical lines on the points indicate the total uncertainty in the data. The left and right columns correspond to absolute and normalised measurements, respectively. The upper row corresponds to measurements at the parton level in the full phase space and the lower row to the particle level in a fiducial phase space. The lower panel in each plot shows the ratios of the theoretical predictions to the data. The dark and light bands show the relative statistical and total uncertainties in the data, respectively. |

png pdf |
Figure 24-b:
The differential $ {{\mathrm {t}\overline {\mathrm {t}}}} $ production cross sections as a function of $ {{p_{\mathrm {T}}} ^{{{\mathrm {t}\overline {\mathrm {t}}}}}} $ are shown for the data (points) and the MC predictions (lines). The vertical lines on the points indicate the total uncertainty in the data. The left and right columns correspond to absolute and normalised measurements, respectively. The upper row corresponds to measurements at the parton level in the full phase space and the lower row to the particle level in a fiducial phase space. The lower panel in each plot shows the ratios of the theoretical predictions to the data. The dark and light bands show the relative statistical and total uncertainties in the data, respectively. |

png pdf |
Figure 24-c:
The differential $ {{\mathrm {t}\overline {\mathrm {t}}}} $ production cross sections as a function of $ {{p_{\mathrm {T}}} ^{{{\mathrm {t}\overline {\mathrm {t}}}}}} $ are shown for the data (points) and the MC predictions (lines). The vertical lines on the points indicate the total uncertainty in the data. The left and right columns correspond to absolute and normalised measurements, respectively. The upper row corresponds to measurements at the parton level in the full phase space and the lower row to the particle level in a fiducial phase space. The lower panel in each plot shows the ratios of the theoretical predictions to the data. The dark and light bands show the relative statistical and total uncertainties in the data, respectively. |
png pdf |
Figure 24-d:
The differential $ {{\mathrm {t}\overline {\mathrm {t}}}} $ production cross sections as a function of $ {{p_{\mathrm {T}}} ^{{{\mathrm {t}\overline {\mathrm {t}}}}}} $ are shown for the data (points) and the MC predictions (lines). The vertical lines on the points indicate the total uncertainty in the data. The left and right columns correspond to absolute and normalised measurements, respectively. The upper row corresponds to measurements at the parton level in the full phase space and the lower row to the particle level in a fiducial phase space. The lower panel in each plot shows the ratios of the theoretical predictions to the data. The dark and light bands show the relative statistical and total uncertainties in the data, respectively. |
png pdf |
Figure 25:
The differential $ {{\mathrm {t}\overline {\mathrm {t}}}} $ production cross sections as a function of $ {{p_{\mathrm {T}}} ^{{{\mathrm {t}\overline {\mathrm {t}}}}}} $ are shown for the data (filled circles), the theoretical predictions with beyond-NLO precision (other points) and the prediction from POWHEG+PYTHIA (solid line). The vertical lines on the filled circles and other points indicate the total uncertainty in the data and theoretical predictions, respectively. The left and right plots correspond to absolute and normalised measurements, respectively. The lower panel in each plot shows the ratios of the theoretical predictions to the data. The dark and light bands show the relative statistical and total uncertainties in the data, respectively. |

png pdf |
Figure 25-a:
The differential $ {{\mathrm {t}\overline {\mathrm {t}}}} $ production cross sections as a function of $ {{p_{\mathrm {T}}} ^{{{\mathrm {t}\overline {\mathrm {t}}}}}} $ are shown for the data (filled circles), the theoretical predictions with beyond-NLO precision (other points) and the prediction from POWHEG+PYTHIA (solid line). The vertical lines on the filled circles and other points indicate the total uncertainty in the data and theoretical predictions, respectively. The left and right plots correspond to absolute and normalised measurements, respectively. The lower panel in each plot shows the ratios of the theoretical predictions to the data. The dark and light bands show the relative statistical and total uncertainties in the data, respectively. |
png pdf |
Figure 25-b:
The differential $ {{\mathrm {t}\overline {\mathrm {t}}}} $ production cross sections as a function of $ {{p_{\mathrm {T}}} ^{{{\mathrm {t}\overline {\mathrm {t}}}}}} $ are shown for the data (filled circles), the theoretical predictions with beyond-NLO precision (other points) and the prediction from POWHEG+PYTHIA (solid line). The vertical lines on the filled circles and other points indicate the total uncertainty in the data and theoretical predictions, respectively. The left and right plots correspond to absolute and normalised measurements, respectively. The lower panel in each plot shows the ratios of the theoretical predictions to the data. The dark and light bands show the relative statistical and total uncertainties in the data, respectively. |
png pdf |
Figure 26:
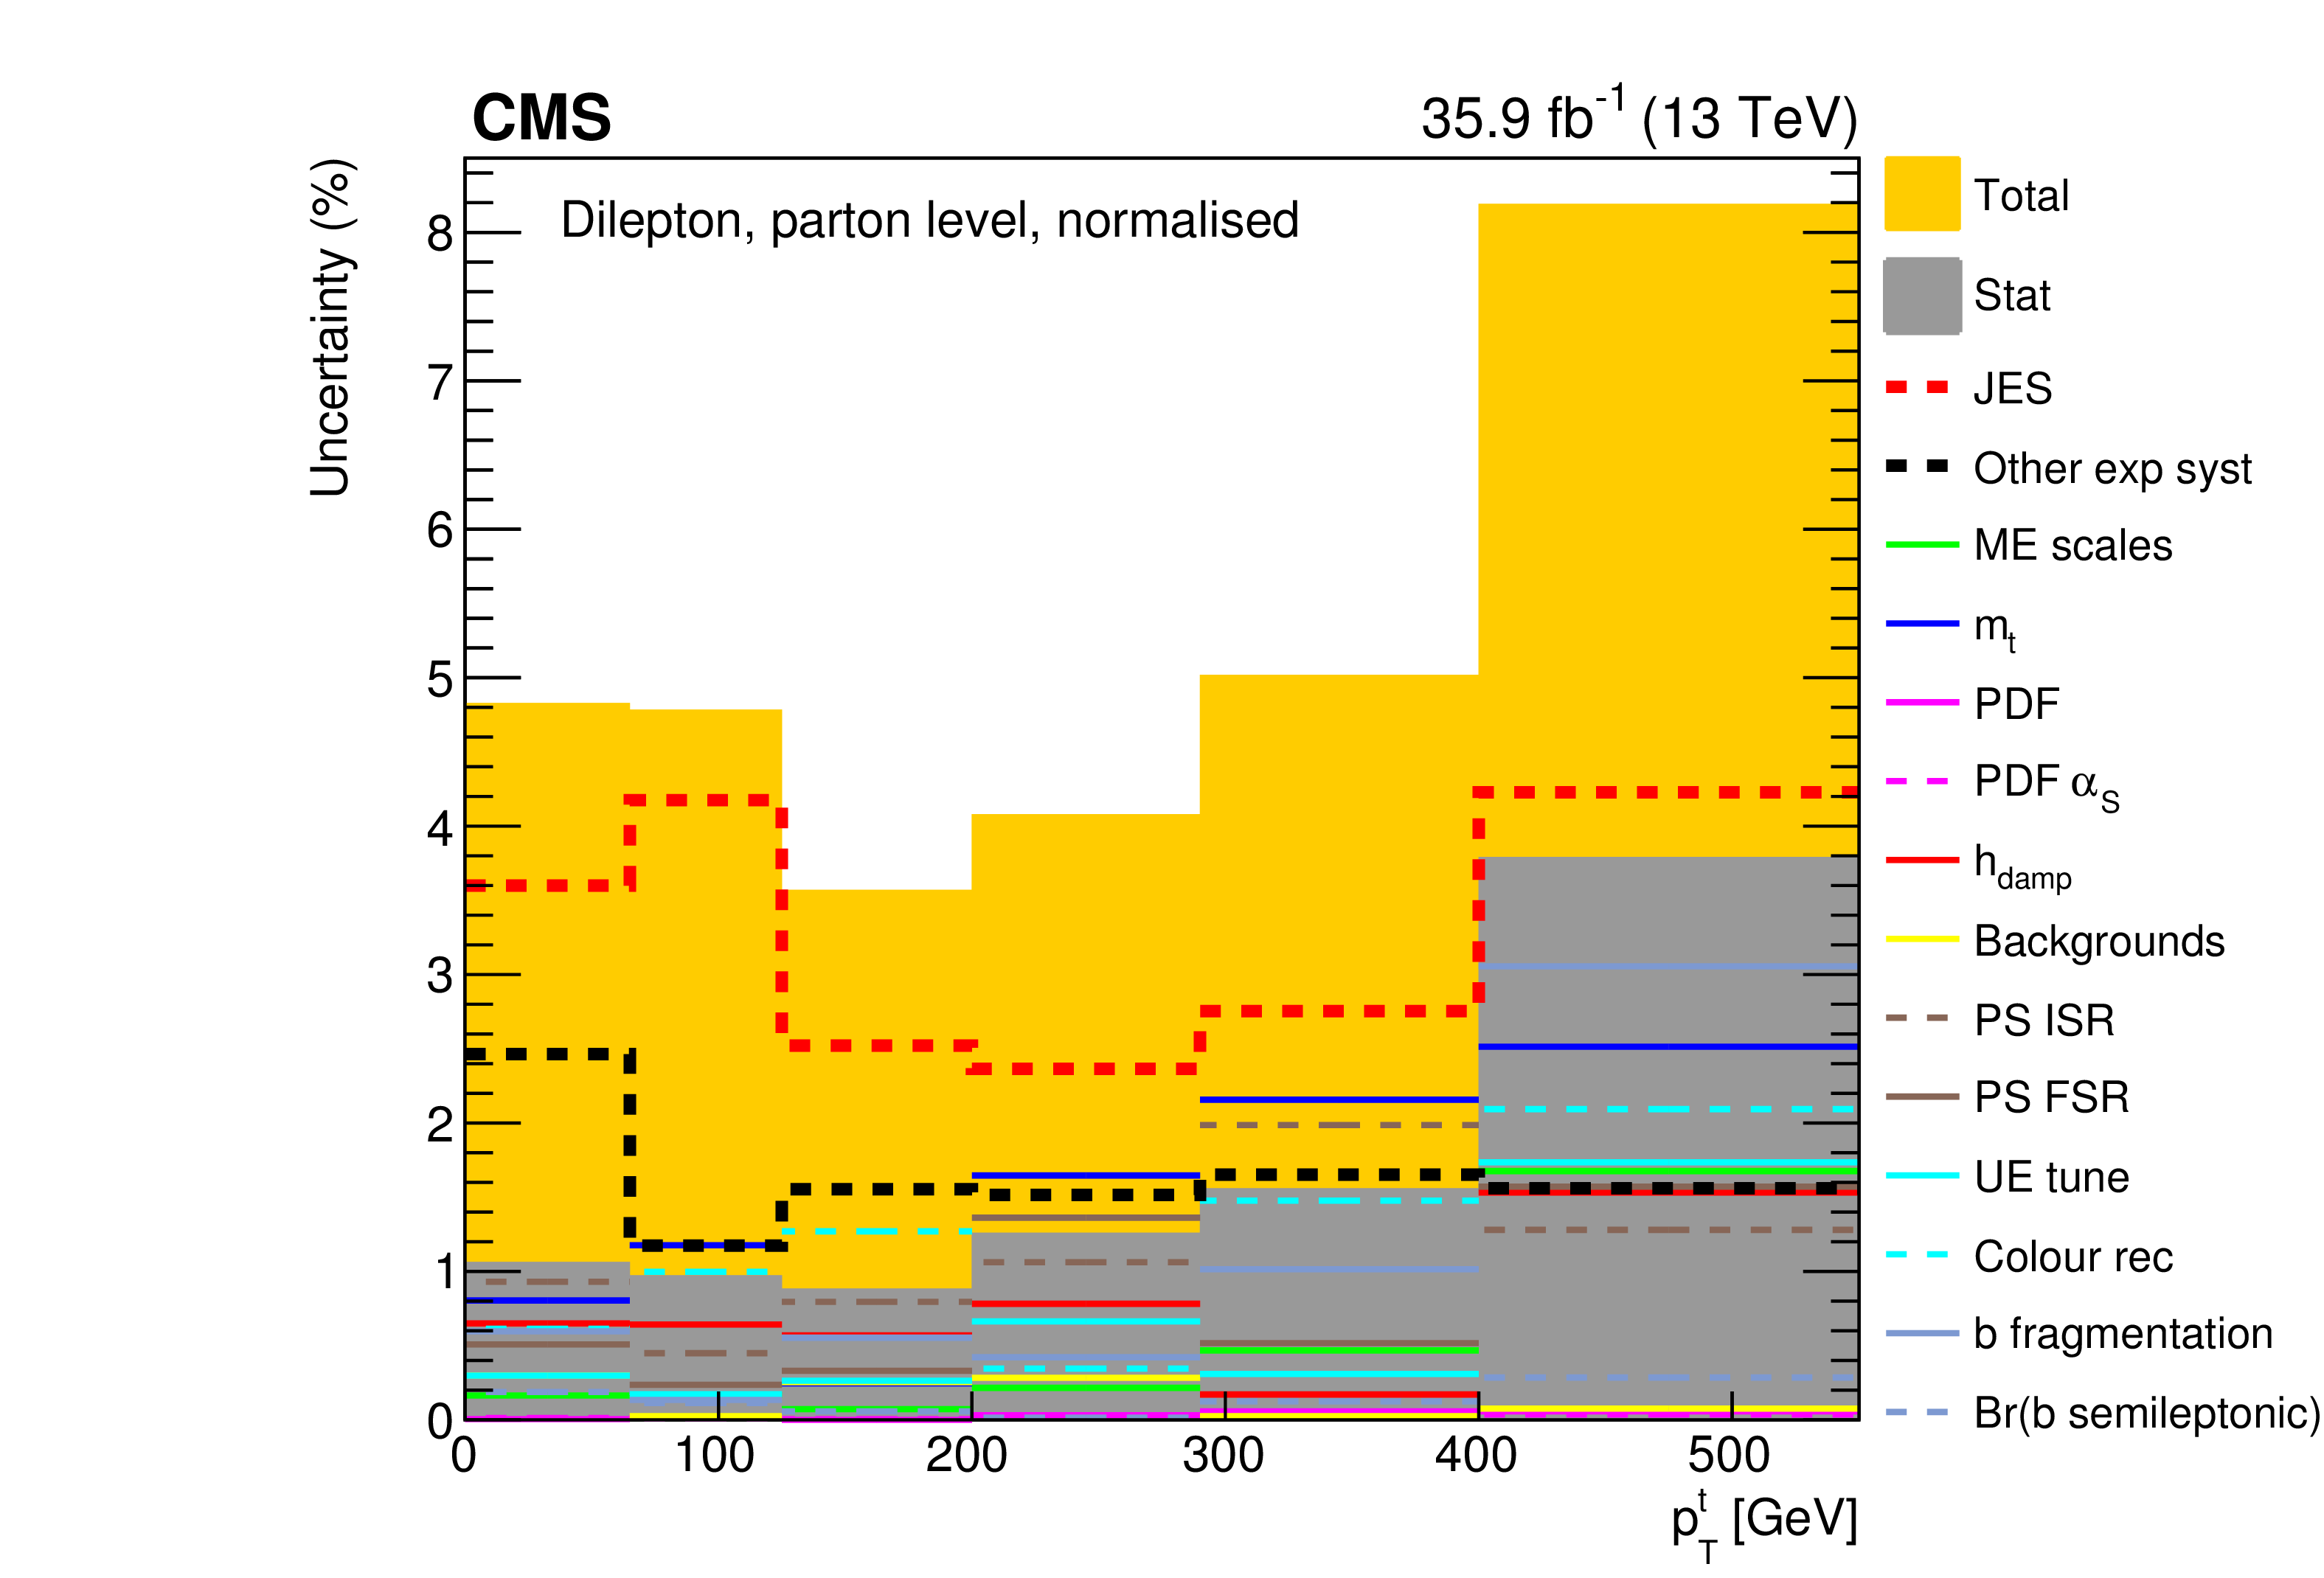
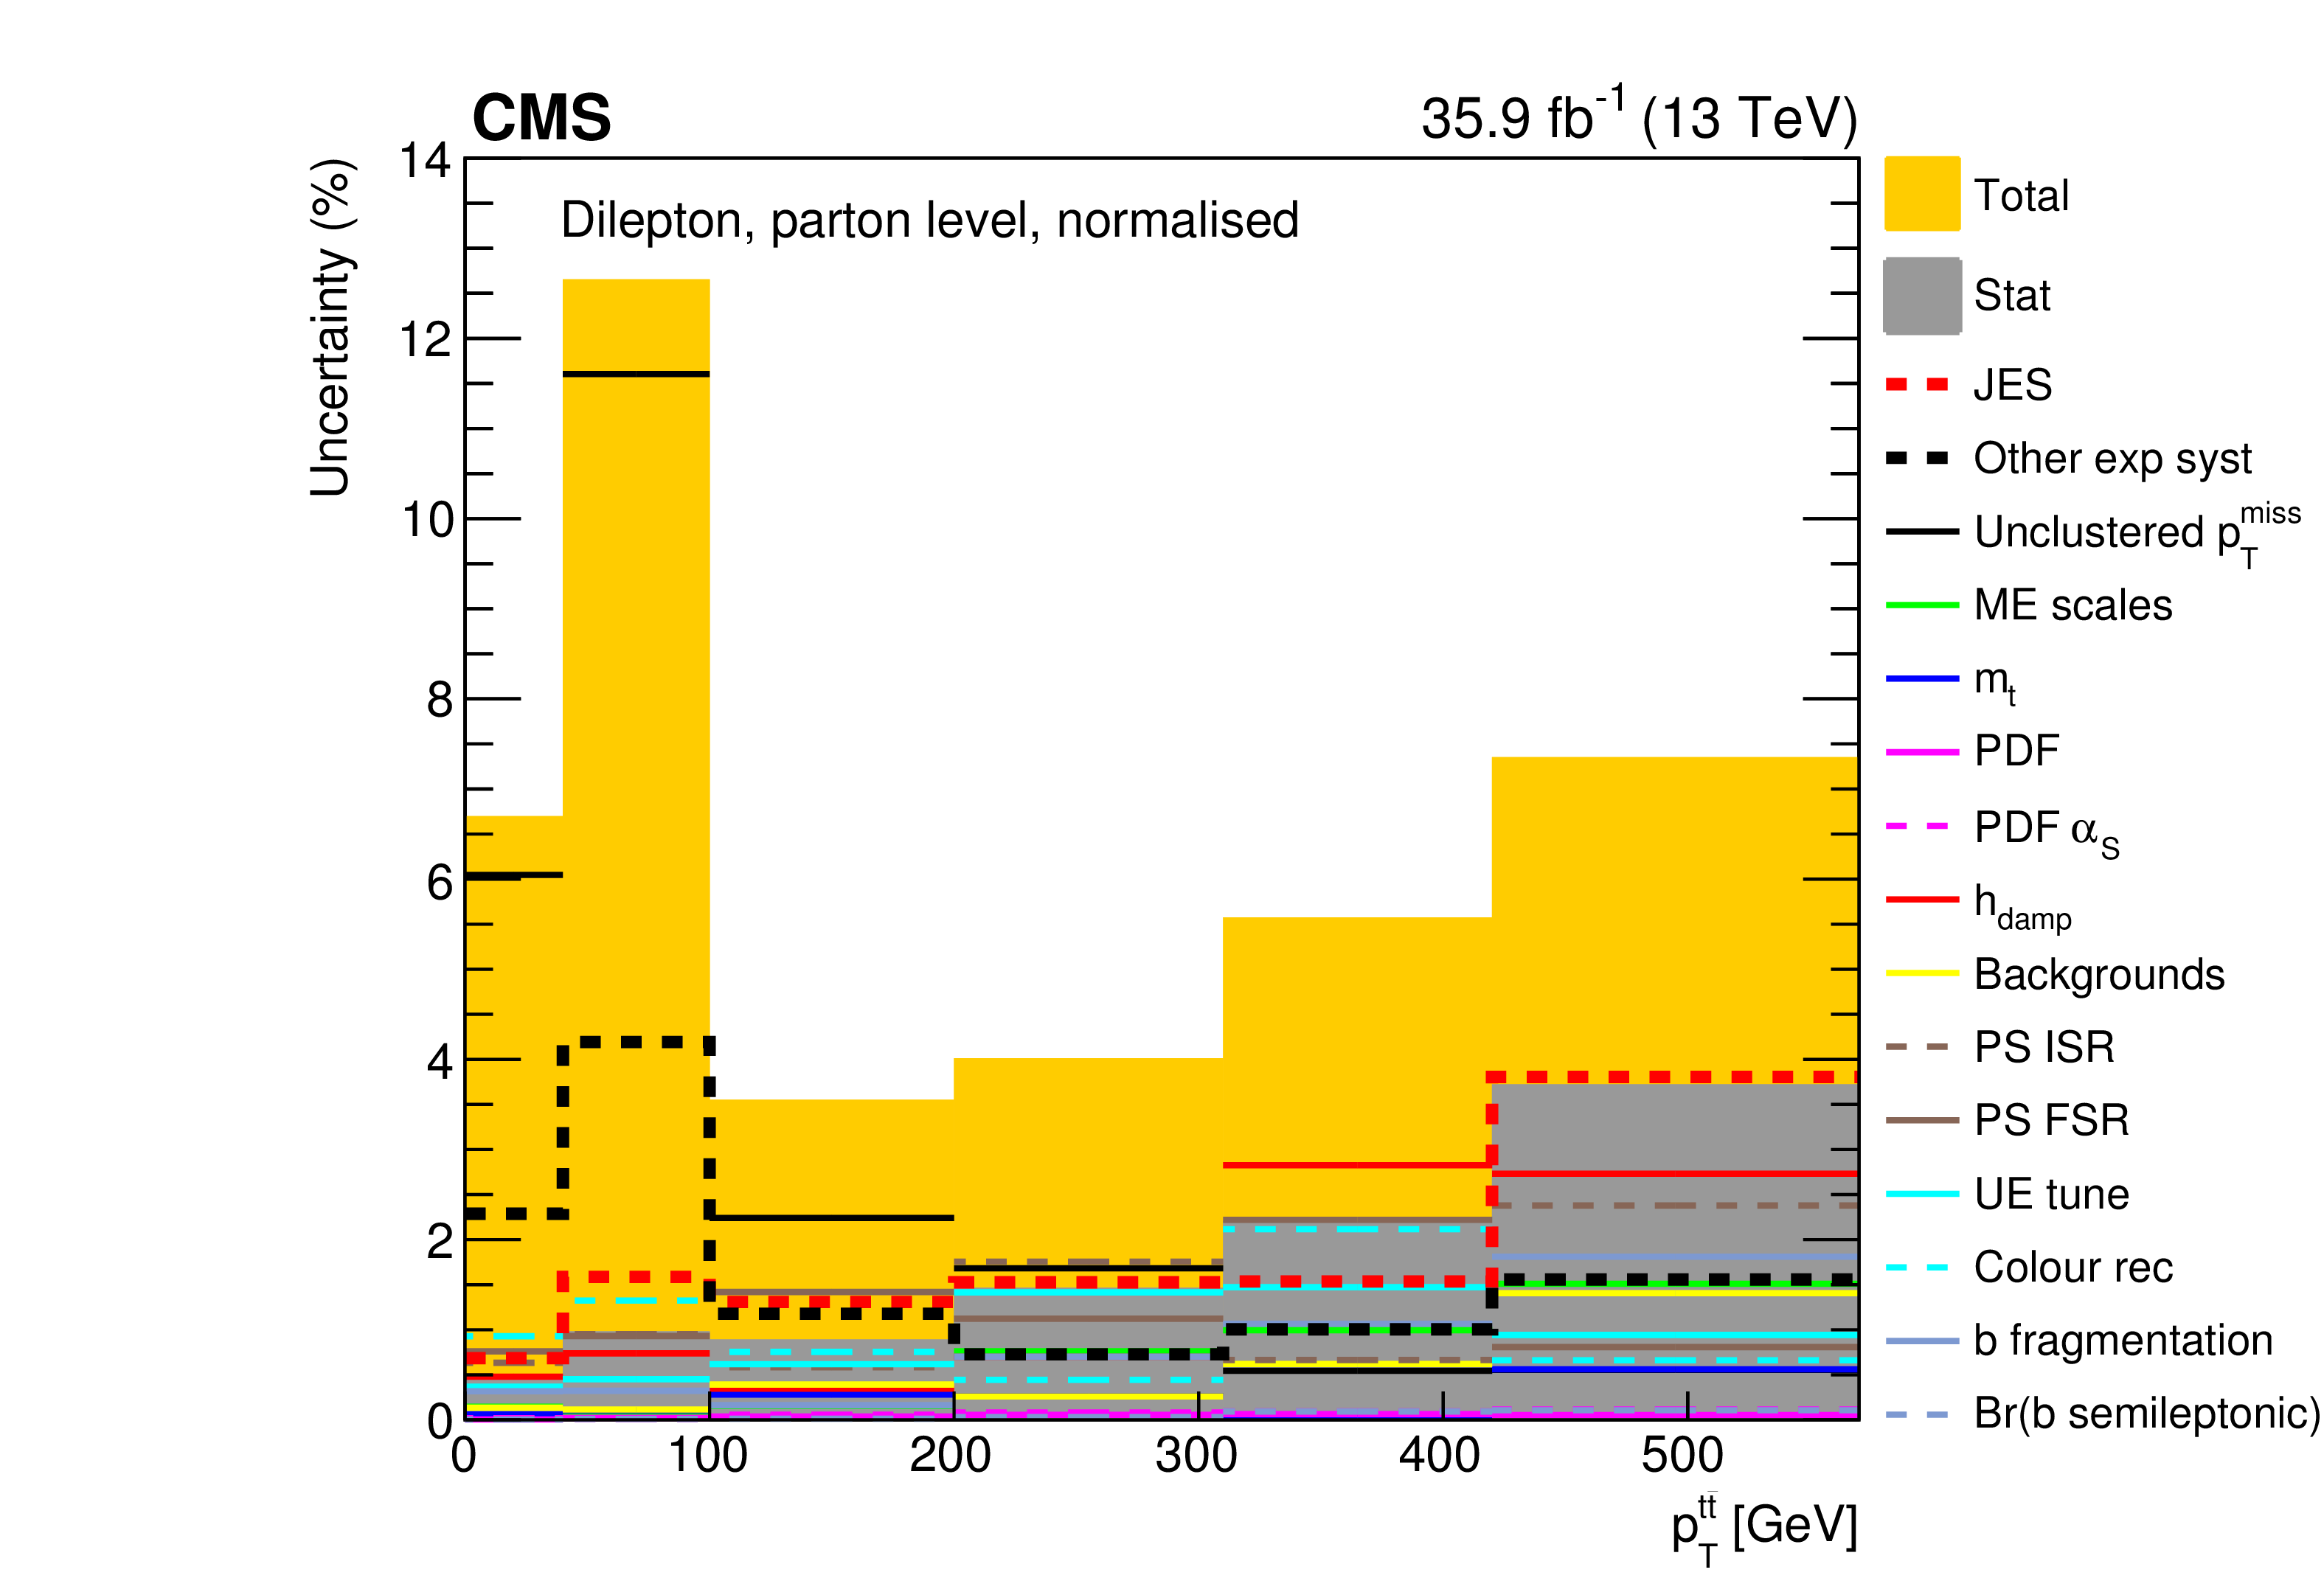
The contributions of each source of systematic uncertainty to the total systematic uncertainty in each bin is shown for the measurement of the normalised $ {{\mathrm {t}\overline {\mathrm {t}}}} $ production cross sections as a function of $ {{p_{\mathrm {T}}} ^{{{\mathrm {t}\overline {\mathrm {t}}}}}} $. The sources affecting the JES are added in quadrature and shown as a single component. As the contribution from unclustered $ {{p_{\mathrm {T}}} ^\text {miss}} $ is dominant in lower bins, it is shown separately. Additional experimental systematic uncertainties are added in quadrature and shown as a single component. Contributions from theoretical uncertainties are shown separately. Related theoretical uncertainties are grouped by colour. |

png pdf |
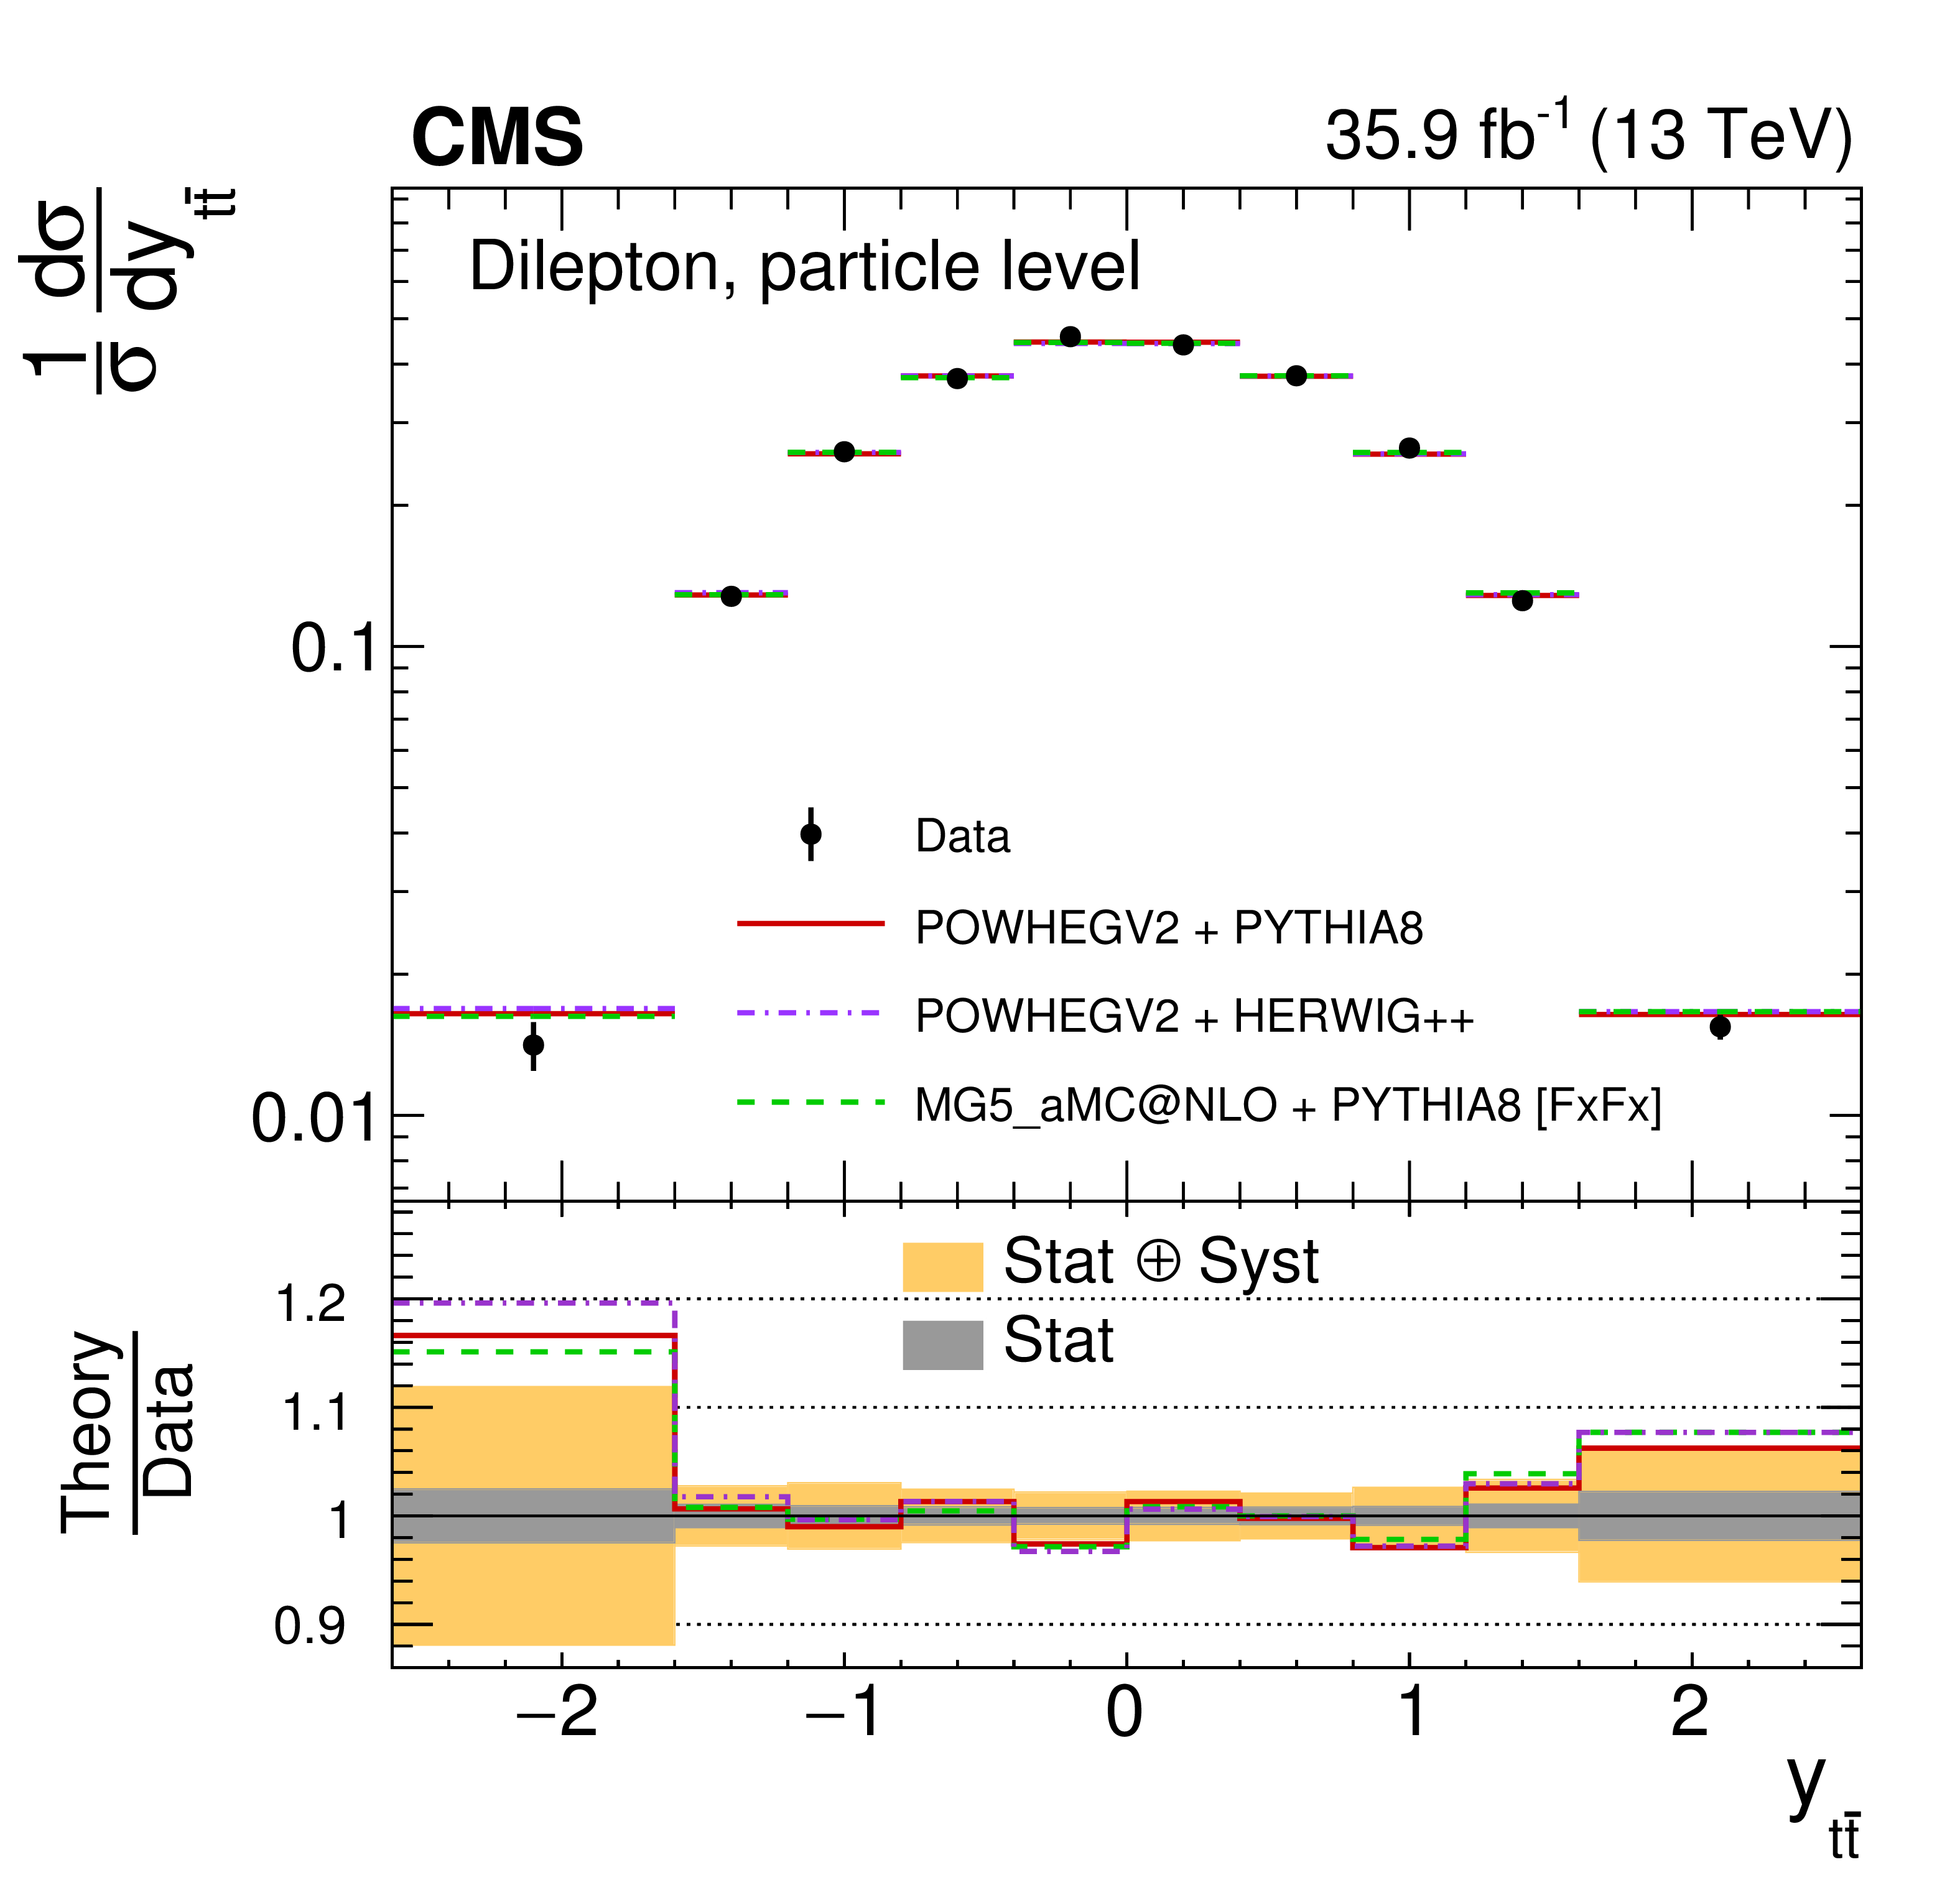
Figure 27:
The differential $ {{\mathrm {t}\overline {\mathrm {t}}}} $ production cross sections as a function of $ {y_{{{\mathrm {t}\overline {\mathrm {t}}}}}} $ are shown for the data (points) and the MC predictions (lines). The vertical lines on the points indicate the total uncertainty in the data. The left and right columns correspond to absolute and normalised measurements, respectively. The upper row corresponds to measurements at the parton level in the full phase space and the lower row to the particle level in a fiducial phase space. The lower panel in each plot shows the ratios of the theoretical predictions to the data. The dark and light bands show the relative statistical and total uncertainties in the data, respectively. |

png pdf |
Figure 27-a:
The differential $ {{\mathrm {t}\overline {\mathrm {t}}}} $ production cross sections as a function of $ {y_{{{\mathrm {t}\overline {\mathrm {t}}}}}} $ are shown for the data (points) and the MC predictions (lines). The vertical lines on the points indicate the total uncertainty in the data. The left and right columns correspond to absolute and normalised measurements, respectively. The upper row corresponds to measurements at the parton level in the full phase space and the lower row to the particle level in a fiducial phase space. The lower panel in each plot shows the ratios of the theoretical predictions to the data. The dark and light bands show the relative statistical and total uncertainties in the data, respectively. |

png pdf |
Figure 27-b:
The differential $ {{\mathrm {t}\overline {\mathrm {t}}}} $ production cross sections as a function of $ {y_{{{\mathrm {t}\overline {\mathrm {t}}}}}} $ are shown for the data (points) and the MC predictions (lines). The vertical lines on the points indicate the total uncertainty in the data. The left and right columns correspond to absolute and normalised measurements, respectively. The upper row corresponds to measurements at the parton level in the full phase space and the lower row to the particle level in a fiducial phase space. The lower panel in each plot shows the ratios of the theoretical predictions to the data. The dark and light bands show the relative statistical and total uncertainties in the data, respectively. |

png pdf |
Figure 27-c:
The differential $ {{\mathrm {t}\overline {\mathrm {t}}}} $ production cross sections as a function of $ {y_{{{\mathrm {t}\overline {\mathrm {t}}}}}} $ are shown for the data (points) and the MC predictions (lines). The vertical lines on the points indicate the total uncertainty in the data. The left and right columns correspond to absolute and normalised measurements, respectively. The upper row corresponds to measurements at the parton level in the full phase space and the lower row to the particle level in a fiducial phase space. The lower panel in each plot shows the ratios of the theoretical predictions to the data. The dark and light bands show the relative statistical and total uncertainties in the data, respectively. |
png pdf |
Figure 27-d:
The differential $ {{\mathrm {t}\overline {\mathrm {t}}}} $ production cross sections as a function of $ {y_{{{\mathrm {t}\overline {\mathrm {t}}}}}} $ are shown for the data (points) and the MC predictions (lines). The vertical lines on the points indicate the total uncertainty in the data. The left and right columns correspond to absolute and normalised measurements, respectively. The upper row corresponds to measurements at the parton level in the full phase space and the lower row to the particle level in a fiducial phase space. The lower panel in each plot shows the ratios of the theoretical predictions to the data. The dark and light bands show the relative statistical and total uncertainties in the data, respectively. |
png pdf |
Figure 28:
The differential $ {{\mathrm {t}\overline {\mathrm {t}}}} $ production cross sections as a function of $ {y_{{{\mathrm {t}\overline {\mathrm {t}}}}}} $ are shown for the data (filled circles), the theoretical predictions with beyond-NLO precision (other points) and the prediction from POWHEG+PYTHIA (solid line). The vertical lines on the filled circles and other points indicate the total uncertainty in the data and theoretical predictions, respectively. The left and right plots correspond to absolute and normalised measurements, respectively. The lower panel in each plot shows the ratios of the theoretical predictions to the data. The dark and light bands show the relative statistical and total uncertainties in the data, respectively. |
png pdf |
Figure 28-a:
The differential $ {{\mathrm {t}\overline {\mathrm {t}}}} $ production cross sections as a function of $ {y_{{{\mathrm {t}\overline {\mathrm {t}}}}}} $ are shown for the data (filled circles), the theoretical predictions with beyond-NLO precision (other points) and the prediction from POWHEG+PYTHIA (solid line). The vertical lines on the filled circles and other points indicate the total uncertainty in the data and theoretical predictions, respectively. The left and right plots correspond to absolute and normalised measurements, respectively. The lower panel in each plot shows the ratios of the theoretical predictions to the data. The dark and light bands show the relative statistical and total uncertainties in the data, respectively. |
png pdf |
Figure 28-b:
The differential $ {{\mathrm {t}\overline {\mathrm {t}}}} $ production cross sections as a function of $ {y_{{{\mathrm {t}\overline {\mathrm {t}}}}}} $ are shown for the data (filled circles), the theoretical predictions with beyond-NLO precision (other points) and the prediction from POWHEG+PYTHIA (solid line). The vertical lines on the filled circles and other points indicate the total uncertainty in the data and theoretical predictions, respectively. The left and right plots correspond to absolute and normalised measurements, respectively. The lower panel in each plot shows the ratios of the theoretical predictions to the data. The dark and light bands show the relative statistical and total uncertainties in the data, respectively. |
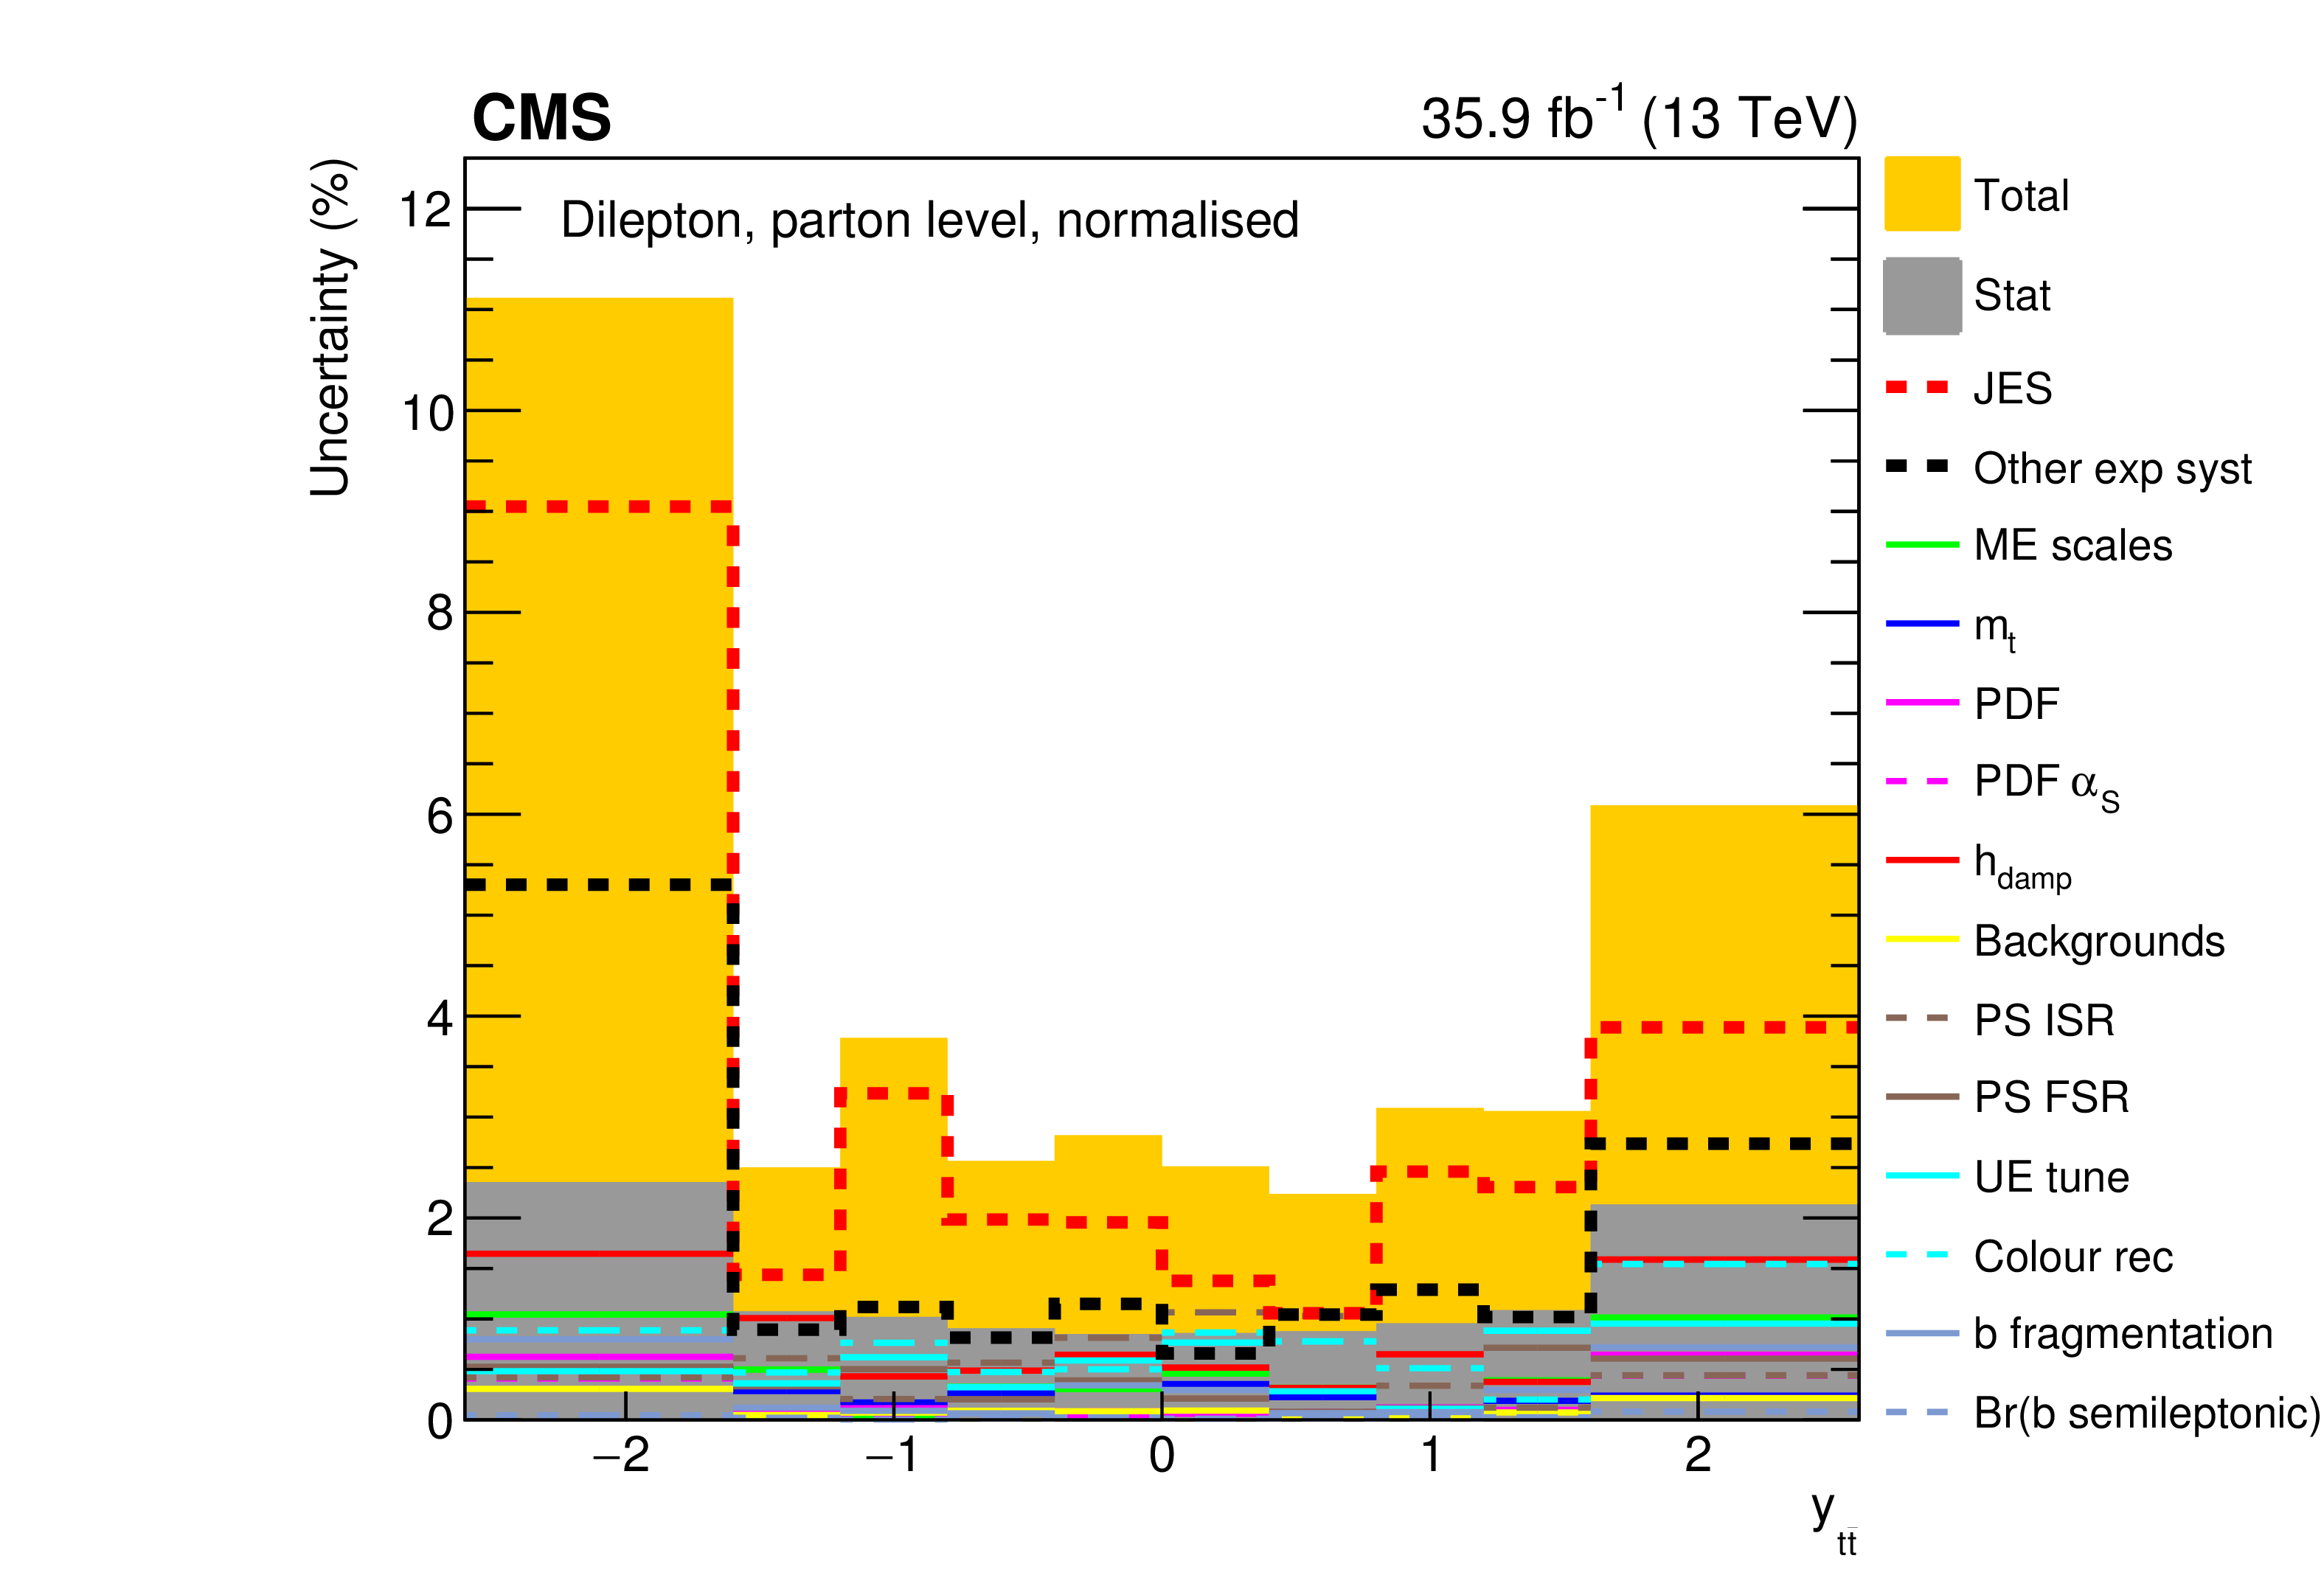
png pdf |
Figure 29:
The contributions of each source of systematic uncertainty to the total systematic uncertainty in each bin is shown for the measurement of the normalised $ {{\mathrm {t}\overline {\mathrm {t}}}} $ production cross sections as a function of $ {y_{{{\mathrm {t}\overline {\mathrm {t}}}}}} $. The sources affecting the JES are added in quadrature and shown as a single component. Additional experimental systematic uncertainties are also added in quadrature and shown as a single component. Contributions from theoretical uncertainties are shown separately. The statistical and total uncertainties, corresponding to the quadrature addition of statistical and systematic uncertainties, are shown by the dark and light filled histograms, respectively. |

png pdf |
Figure 30:
The differential $ {{\mathrm {t}\overline {\mathrm {t}}}} $ production cross sections as a function of $ {m_{{{\mathrm {t}\overline {\mathrm {t}}}}}} $ are shown for the data (points) and the MC predictions (lines). The vertical lines on the points indicate the total uncertainty in the data. The left and right columns correspond to absolute and normalised measurements, respectively. The upper row corresponds to measurements at the parton level in the full phase space and the lower row to the particle level in a fiducial phase space. The lower panel in each plot shows the ratios of the theoretical predictions to the data. The dark and light bands show the relative statistical and total uncertainties in the data, respectively. |

png pdf |
Figure 30-a:
The differential $ {{\mathrm {t}\overline {\mathrm {t}}}} $ production cross sections as a function of $ {m_{{{\mathrm {t}\overline {\mathrm {t}}}}}} $ are shown for the data (points) and the MC predictions (lines). The vertical lines on the points indicate the total uncertainty in the data. The left and right columns correspond to absolute and normalised measurements, respectively. The upper row corresponds to measurements at the parton level in the full phase space and the lower row to the particle level in a fiducial phase space. The lower panel in each plot shows the ratios of the theoretical predictions to the data. The dark and light bands show the relative statistical and total uncertainties in the data, respectively. |

png pdf |
Figure 30-b:
The differential $ {{\mathrm {t}\overline {\mathrm {t}}}} $ production cross sections as a function of $ {m_{{{\mathrm {t}\overline {\mathrm {t}}}}}} $ are shown for the data (points) and the MC predictions (lines). The vertical lines on the points indicate the total uncertainty in the data. The left and right columns correspond to absolute and normalised measurements, respectively. The upper row corresponds to measurements at the parton level in the full phase space and the lower row to the particle level in a fiducial phase space. The lower panel in each plot shows the ratios of the theoretical predictions to the data. The dark and light bands show the relative statistical and total uncertainties in the data, respectively. |

png pdf |
Figure 30-c:
The differential $ {{\mathrm {t}\overline {\mathrm {t}}}} $ production cross sections as a function of $ {m_{{{\mathrm {t}\overline {\mathrm {t}}}}}} $ are shown for the data (points) and the MC predictions (lines). The vertical lines on the points indicate the total uncertainty in the data. The left and right columns correspond to absolute and normalised measurements, respectively. The upper row corresponds to measurements at the parton level in the full phase space and the lower row to the particle level in a fiducial phase space. The lower panel in each plot shows the ratios of the theoretical predictions to the data. The dark and light bands show the relative statistical and total uncertainties in the data, respectively. |

png pdf |
Figure 30-d:
The differential $ {{\mathrm {t}\overline {\mathrm {t}}}} $ production cross sections as a function of $ {m_{{{\mathrm {t}\overline {\mathrm {t}}}}}} $ are shown for the data (points) and the MC predictions (lines). The vertical lines on the points indicate the total uncertainty in the data. The left and right columns correspond to absolute and normalised measurements, respectively. The upper row corresponds to measurements at the parton level in the full phase space and the lower row to the particle level in a fiducial phase space. The lower panel in each plot shows the ratios of the theoretical predictions to the data. The dark and light bands show the relative statistical and total uncertainties in the data, respectively. |
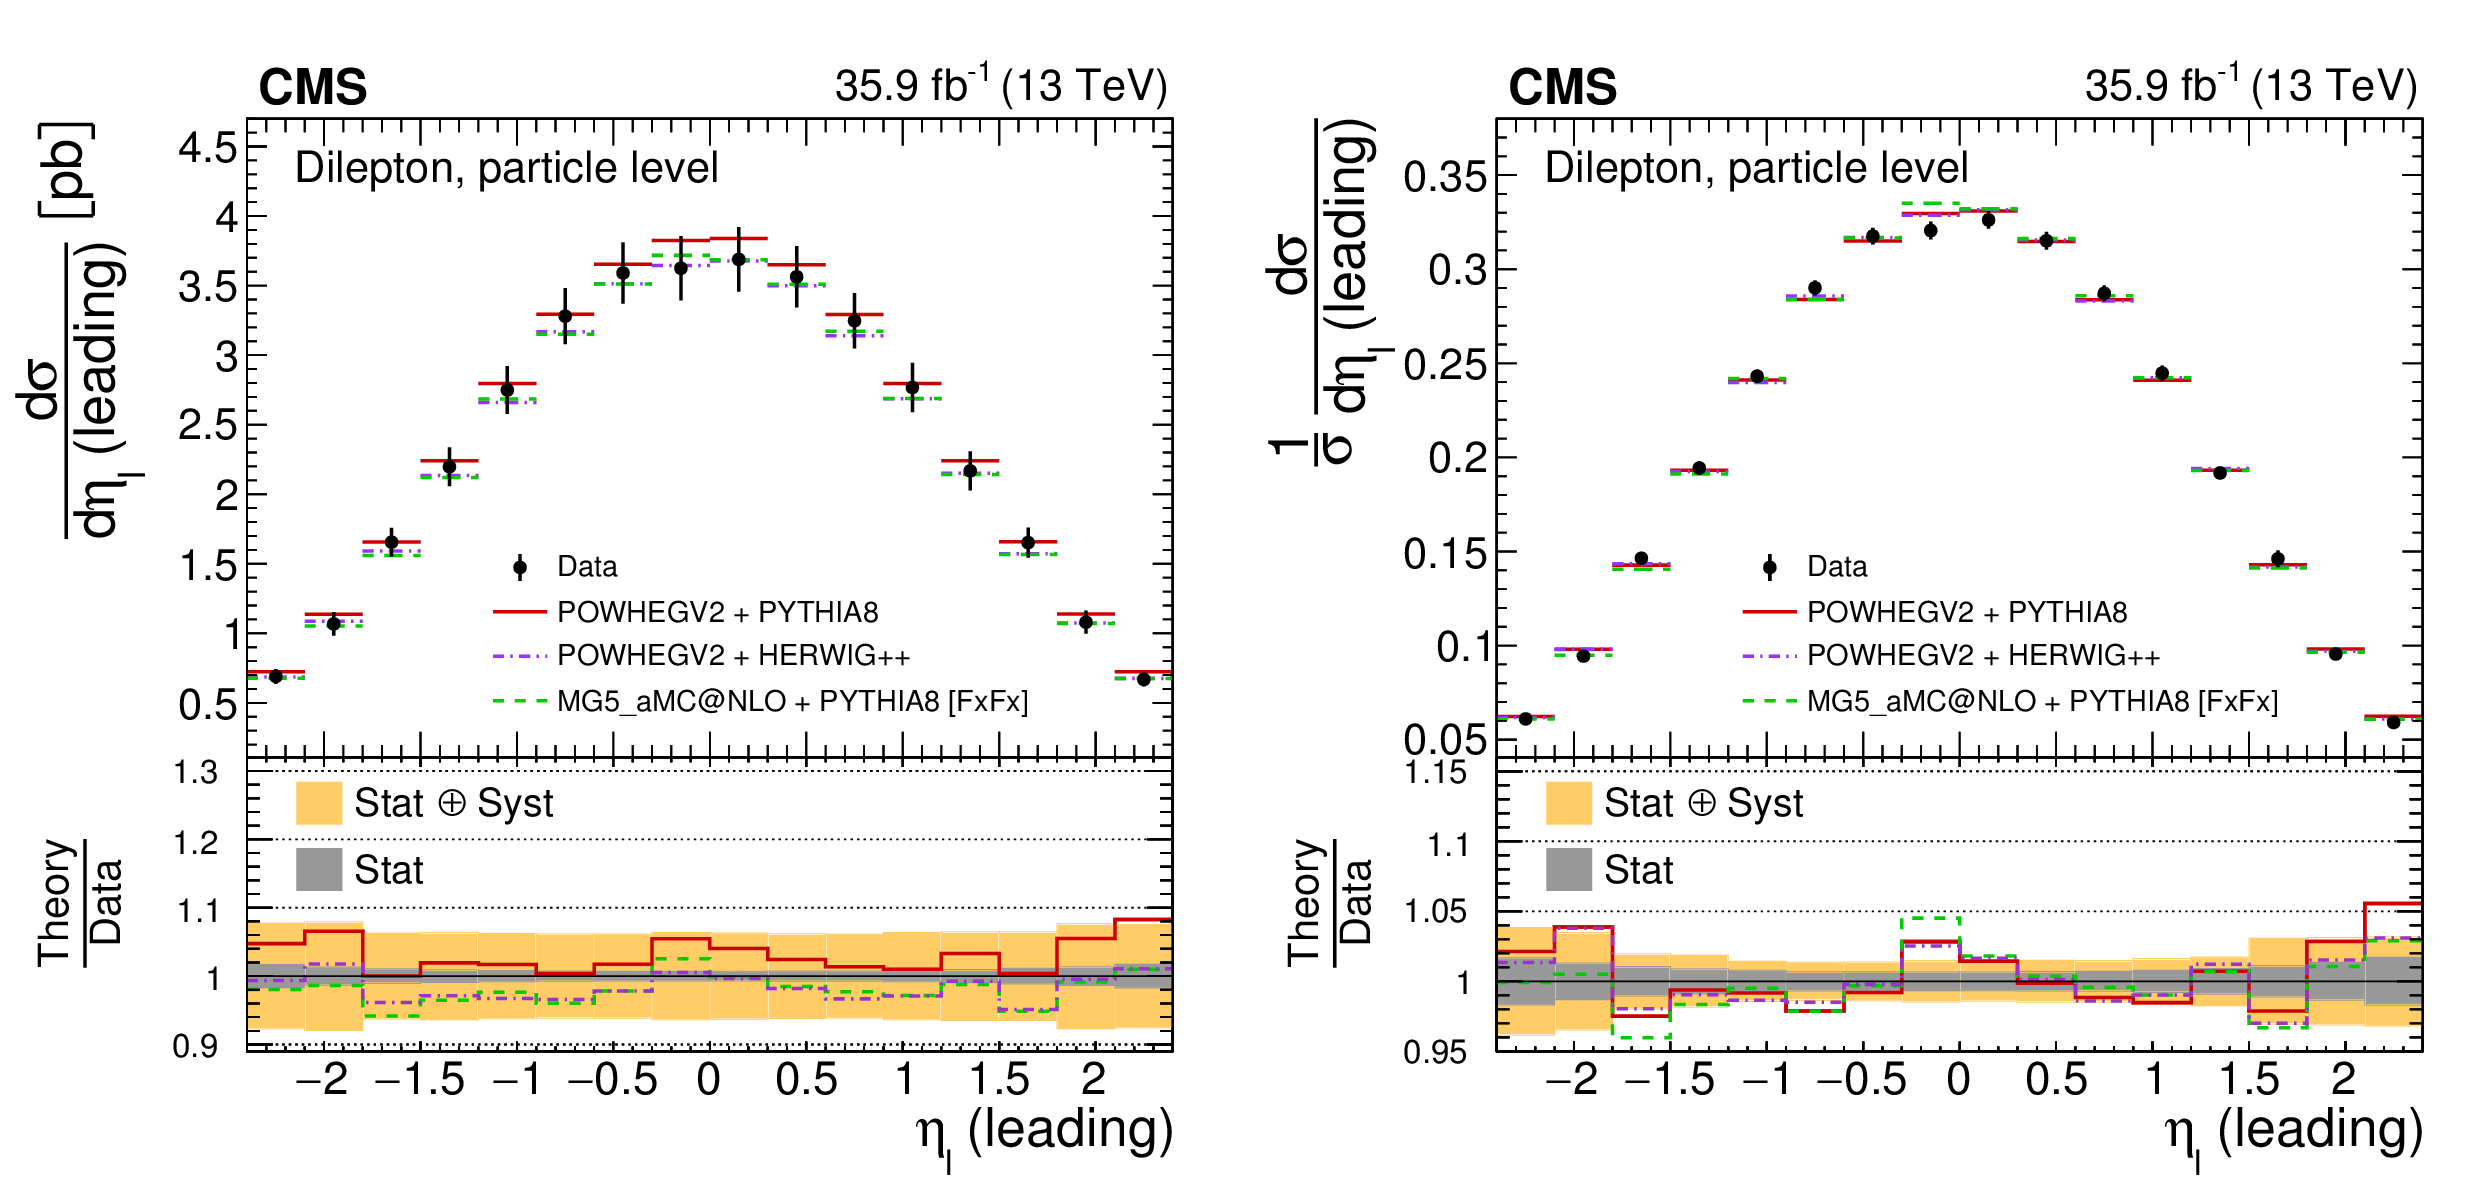
png pdf |
Figure 31:
The differential $ {{\mathrm {t}\overline {\mathrm {t}}}} $ production cross sections as a function of $ {m_{{{\mathrm {t}\overline {\mathrm {t}}}}}} $ are shown for the data (filled circles), the theoretical predictions with beyond-NLO precision (other points) and the prediction from POWHEG+PYTHIA (solid line). The vertical lines on the filled circles and other points indicate the total uncertainty in the data and theoretical predictions, respectively. The left and right plots correspond to absolute and normalised measurements, respectively. The lower panel in each plot shows the ratios of the theoretical predictions to the data. The dark and light bands show the relative statistical and total uncertainties in the data, respectively. |

png pdf |
Figure 31-a:
The differential $ {{\mathrm {t}\overline {\mathrm {t}}}} $ production cross sections as a function of $ {m_{{{\mathrm {t}\overline {\mathrm {t}}}}}} $ are shown for the data (filled circles), the theoretical predictions with beyond-NLO precision (other points) and the prediction from POWHEG+PYTHIA (solid line). The vertical lines on the filled circles and other points indicate the total uncertainty in the data and theoretical predictions, respectively. The left and right plots correspond to absolute and normalised measurements, respectively. The lower panel in each plot shows the ratios of the theoretical predictions to the data. The dark and light bands show the relative statistical and total uncertainties in the data, respectively. |

png pdf |
Figure 31-b:
The differential $ {{\mathrm {t}\overline {\mathrm {t}}}} $ production cross sections as a function of $ {m_{{{\mathrm {t}\overline {\mathrm {t}}}}}} $ are shown for the data (filled circles), the theoretical predictions with beyond-NLO precision (other points) and the prediction from POWHEG+PYTHIA (solid line). The vertical lines on the filled circles and other points indicate the total uncertainty in the data and theoretical predictions, respectively. The left and right plots correspond to absolute and normalised measurements, respectively. The lower panel in each plot shows the ratios of the theoretical predictions to the data. The dark and light bands show the relative statistical and total uncertainties in the data, respectively. |
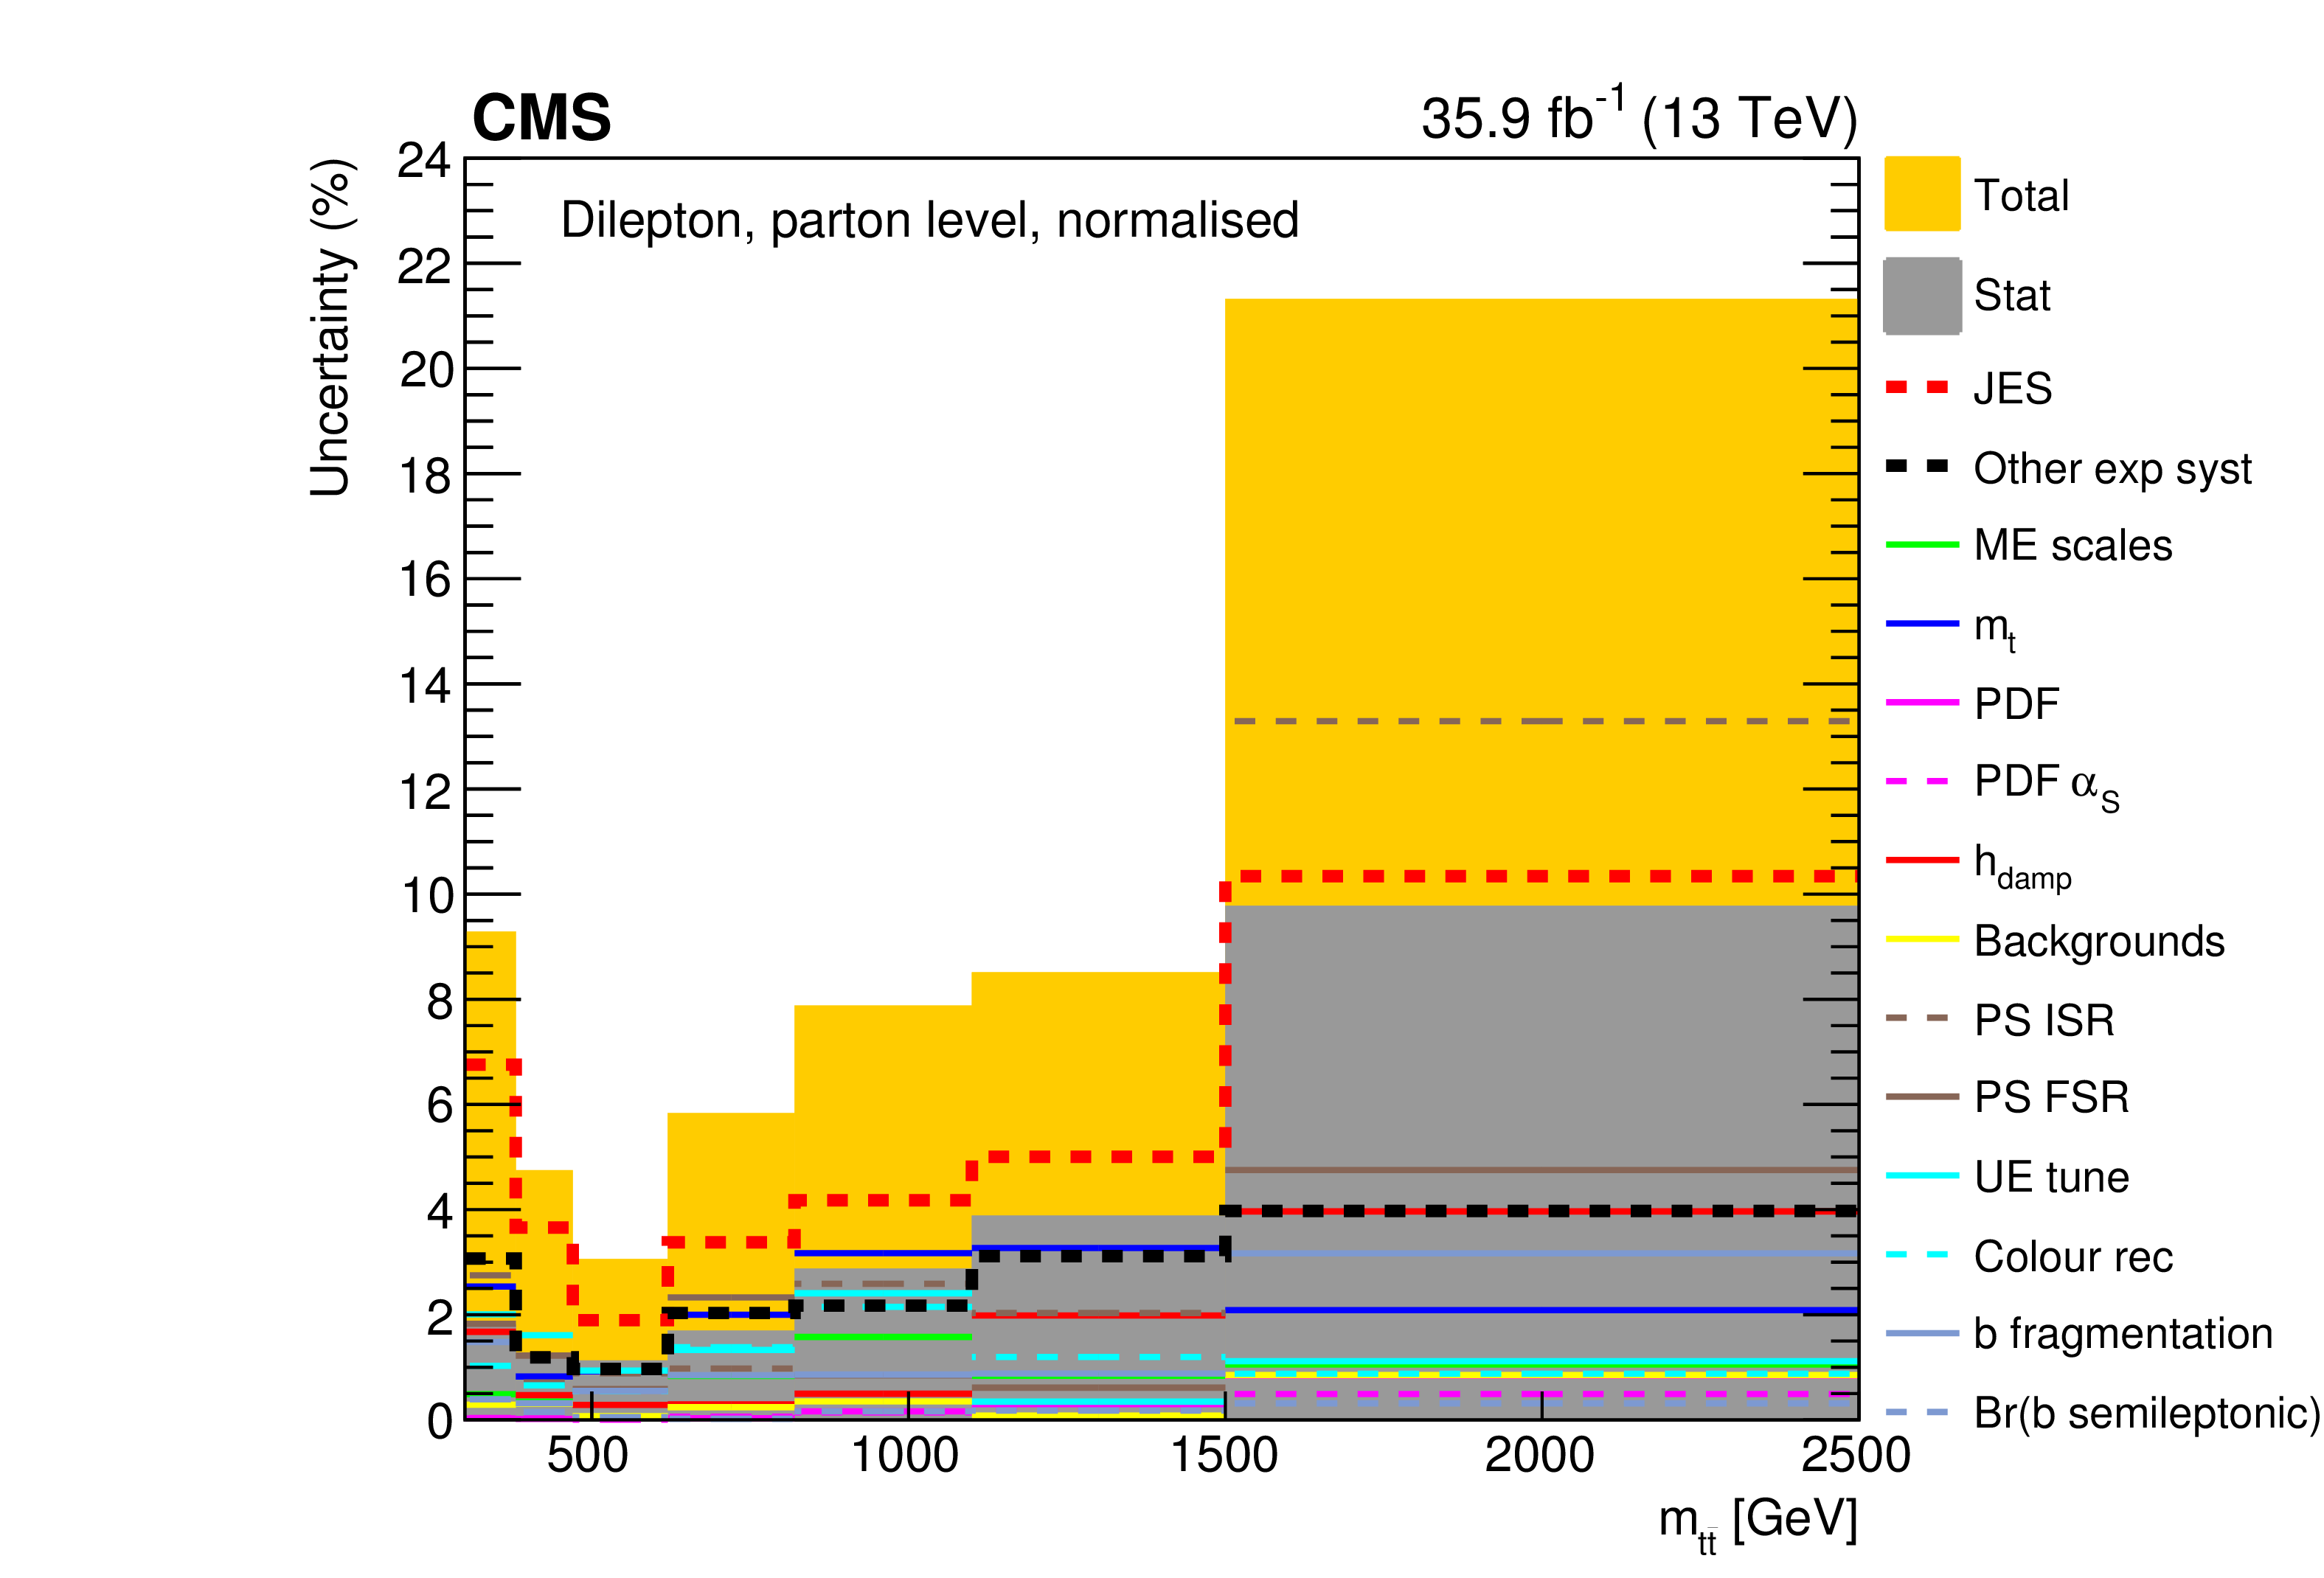
png pdf |
Figure 32:
The contributions of each source of systematic uncertainty to the total systematic uncertainty in each bin is shown for the measurement of the normalised $ {{\mathrm {t}\overline {\mathrm {t}}}} $ production cross sections as a function of $ {m_{{{\mathrm {t}\overline {\mathrm {t}}}}}} $. The sources affecting the JES are added in quadrature and shown as a single component. Additional experimental systematic uncertainties are also added in quadrature and shown as a single component. Contributions from theoretical uncertainties are shown separately. The statistical and total uncertainties, corresponding to the quadrature addition of statistical and systematic uncertainties, are shown by the dark and light filled histograms, respectively. |
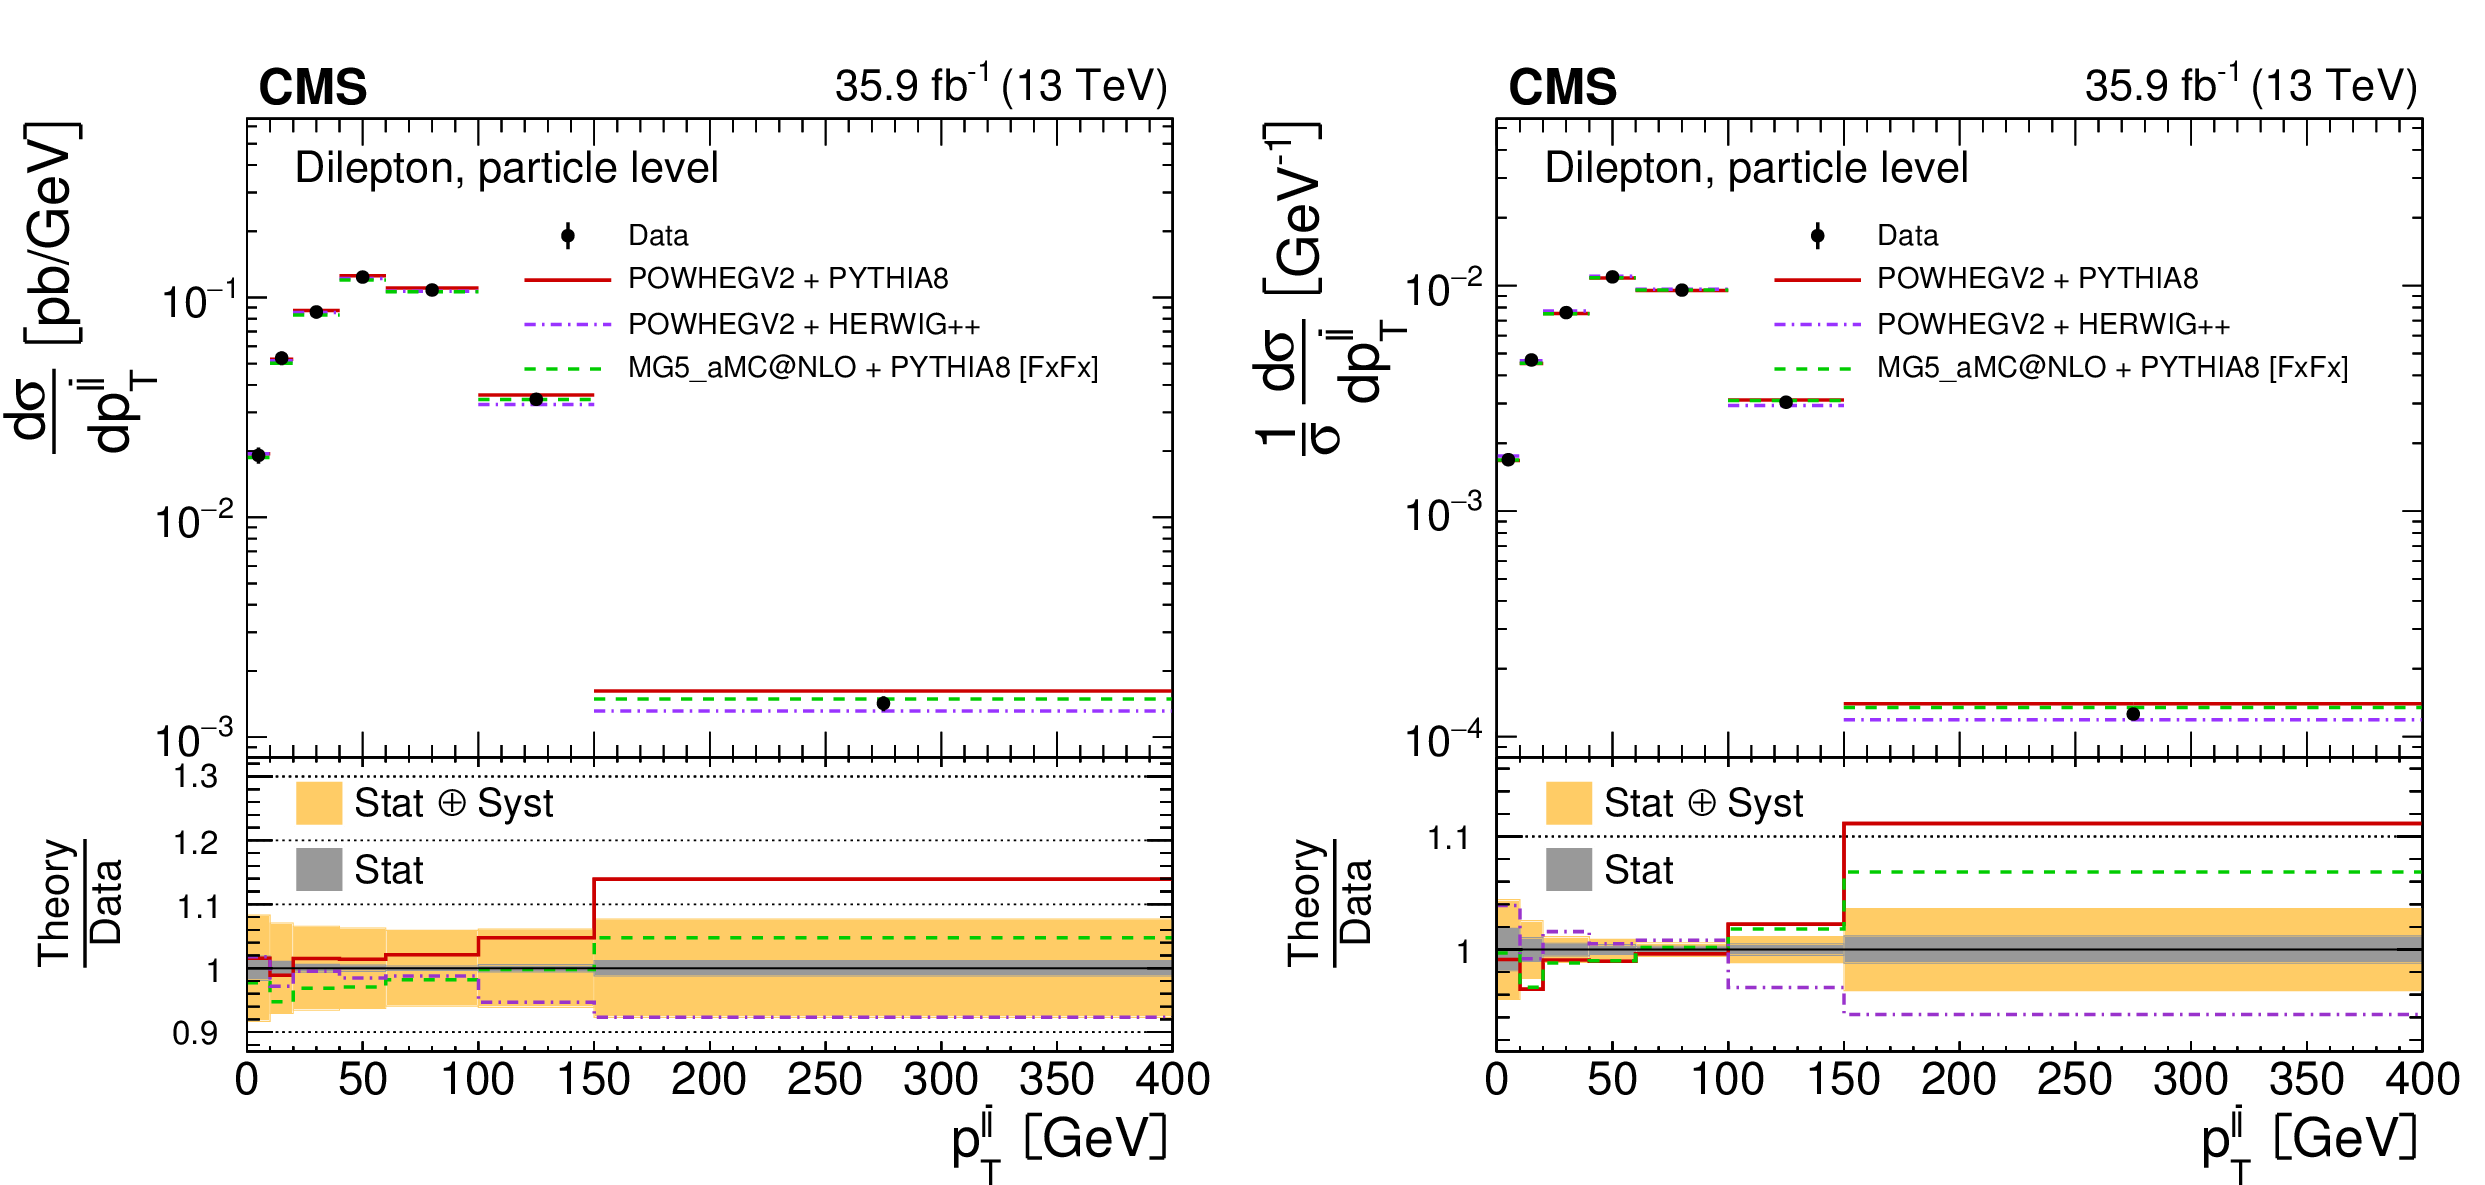
png pdf |
Figure 33:
The differential $ {{\mathrm {t}\overline {\mathrm {t}}}} $ production cross sections as a function of $ {{p_{\mathrm {T}}} ^{{\ell}}} $ in a fiducial phase space at the particle level are shown for the data (points) and the MC predictions (lines). The vertical lines on the points indicate the total uncertainty in the data. The left and right plots correspond to absolute and normalised measurements, respectively. The lower panel in each plot shows the ratios of the theoretical predictions to the data. The dark and light bands show the relative statistical and total uncertainties in the data, respectively. |

png pdf |
Figure 33-a:
The differential $ {{\mathrm {t}\overline {\mathrm {t}}}} $ production cross sections as a function of $ {{p_{\mathrm {T}}} ^{{\ell}}} $ in a fiducial phase space at the particle level are shown for the data (points) and the MC predictions (lines). The vertical lines on the points indicate the total uncertainty in the data. The left and right plots correspond to absolute and normalised measurements, respectively. The lower panel in each plot shows the ratios of the theoretical predictions to the data. The dark and light bands show the relative statistical and total uncertainties in the data, respectively. |

png pdf |
Figure 33-b:
The differential $ {{\mathrm {t}\overline {\mathrm {t}}}} $ production cross sections as a function of $ {{p_{\mathrm {T}}} ^{{\ell}}} $ in a fiducial phase space at the particle level are shown for the data (points) and the MC predictions (lines). The vertical lines on the points indicate the total uncertainty in the data. The left and right plots correspond to absolute and normalised measurements, respectively. The lower panel in each plot shows the ratios of the theoretical predictions to the data. The dark and light bands show the relative statistical and total uncertainties in the data, respectively. |

png pdf |
Figure 34:
The differential $ {{\mathrm {t}\overline {\mathrm {t}}}} $ production cross sections as a function of $ {{p_{\mathrm {T}}} ^{{\bar{\ell}}}} $ in a fiducial phase space at the particle level are shown for the data (points) and the MC predictions (lines). The vertical lines on the points indicate the total uncertainty in the data. The left and right plots correspond to absolute and normalised measurements, respectively. The lower panel in each plot shows the ratios of the theoretical predictions to the data. The dark and light bands show the relative statistical and total uncertainties in the data, respectively. |

png pdf |
Figure 34-a:
The differential $ {{\mathrm {t}\overline {\mathrm {t}}}} $ production cross sections as a function of $ {{p_{\mathrm {T}}} ^{{\bar{\ell}}}} $ in a fiducial phase space at the particle level are shown for the data (points) and the MC predictions (lines). The vertical lines on the points indicate the total uncertainty in the data. The left and right plots correspond to absolute and normalised measurements, respectively. The lower panel in each plot shows the ratios of the theoretical predictions to the data. The dark and light bands show the relative statistical and total uncertainties in the data, respectively. |
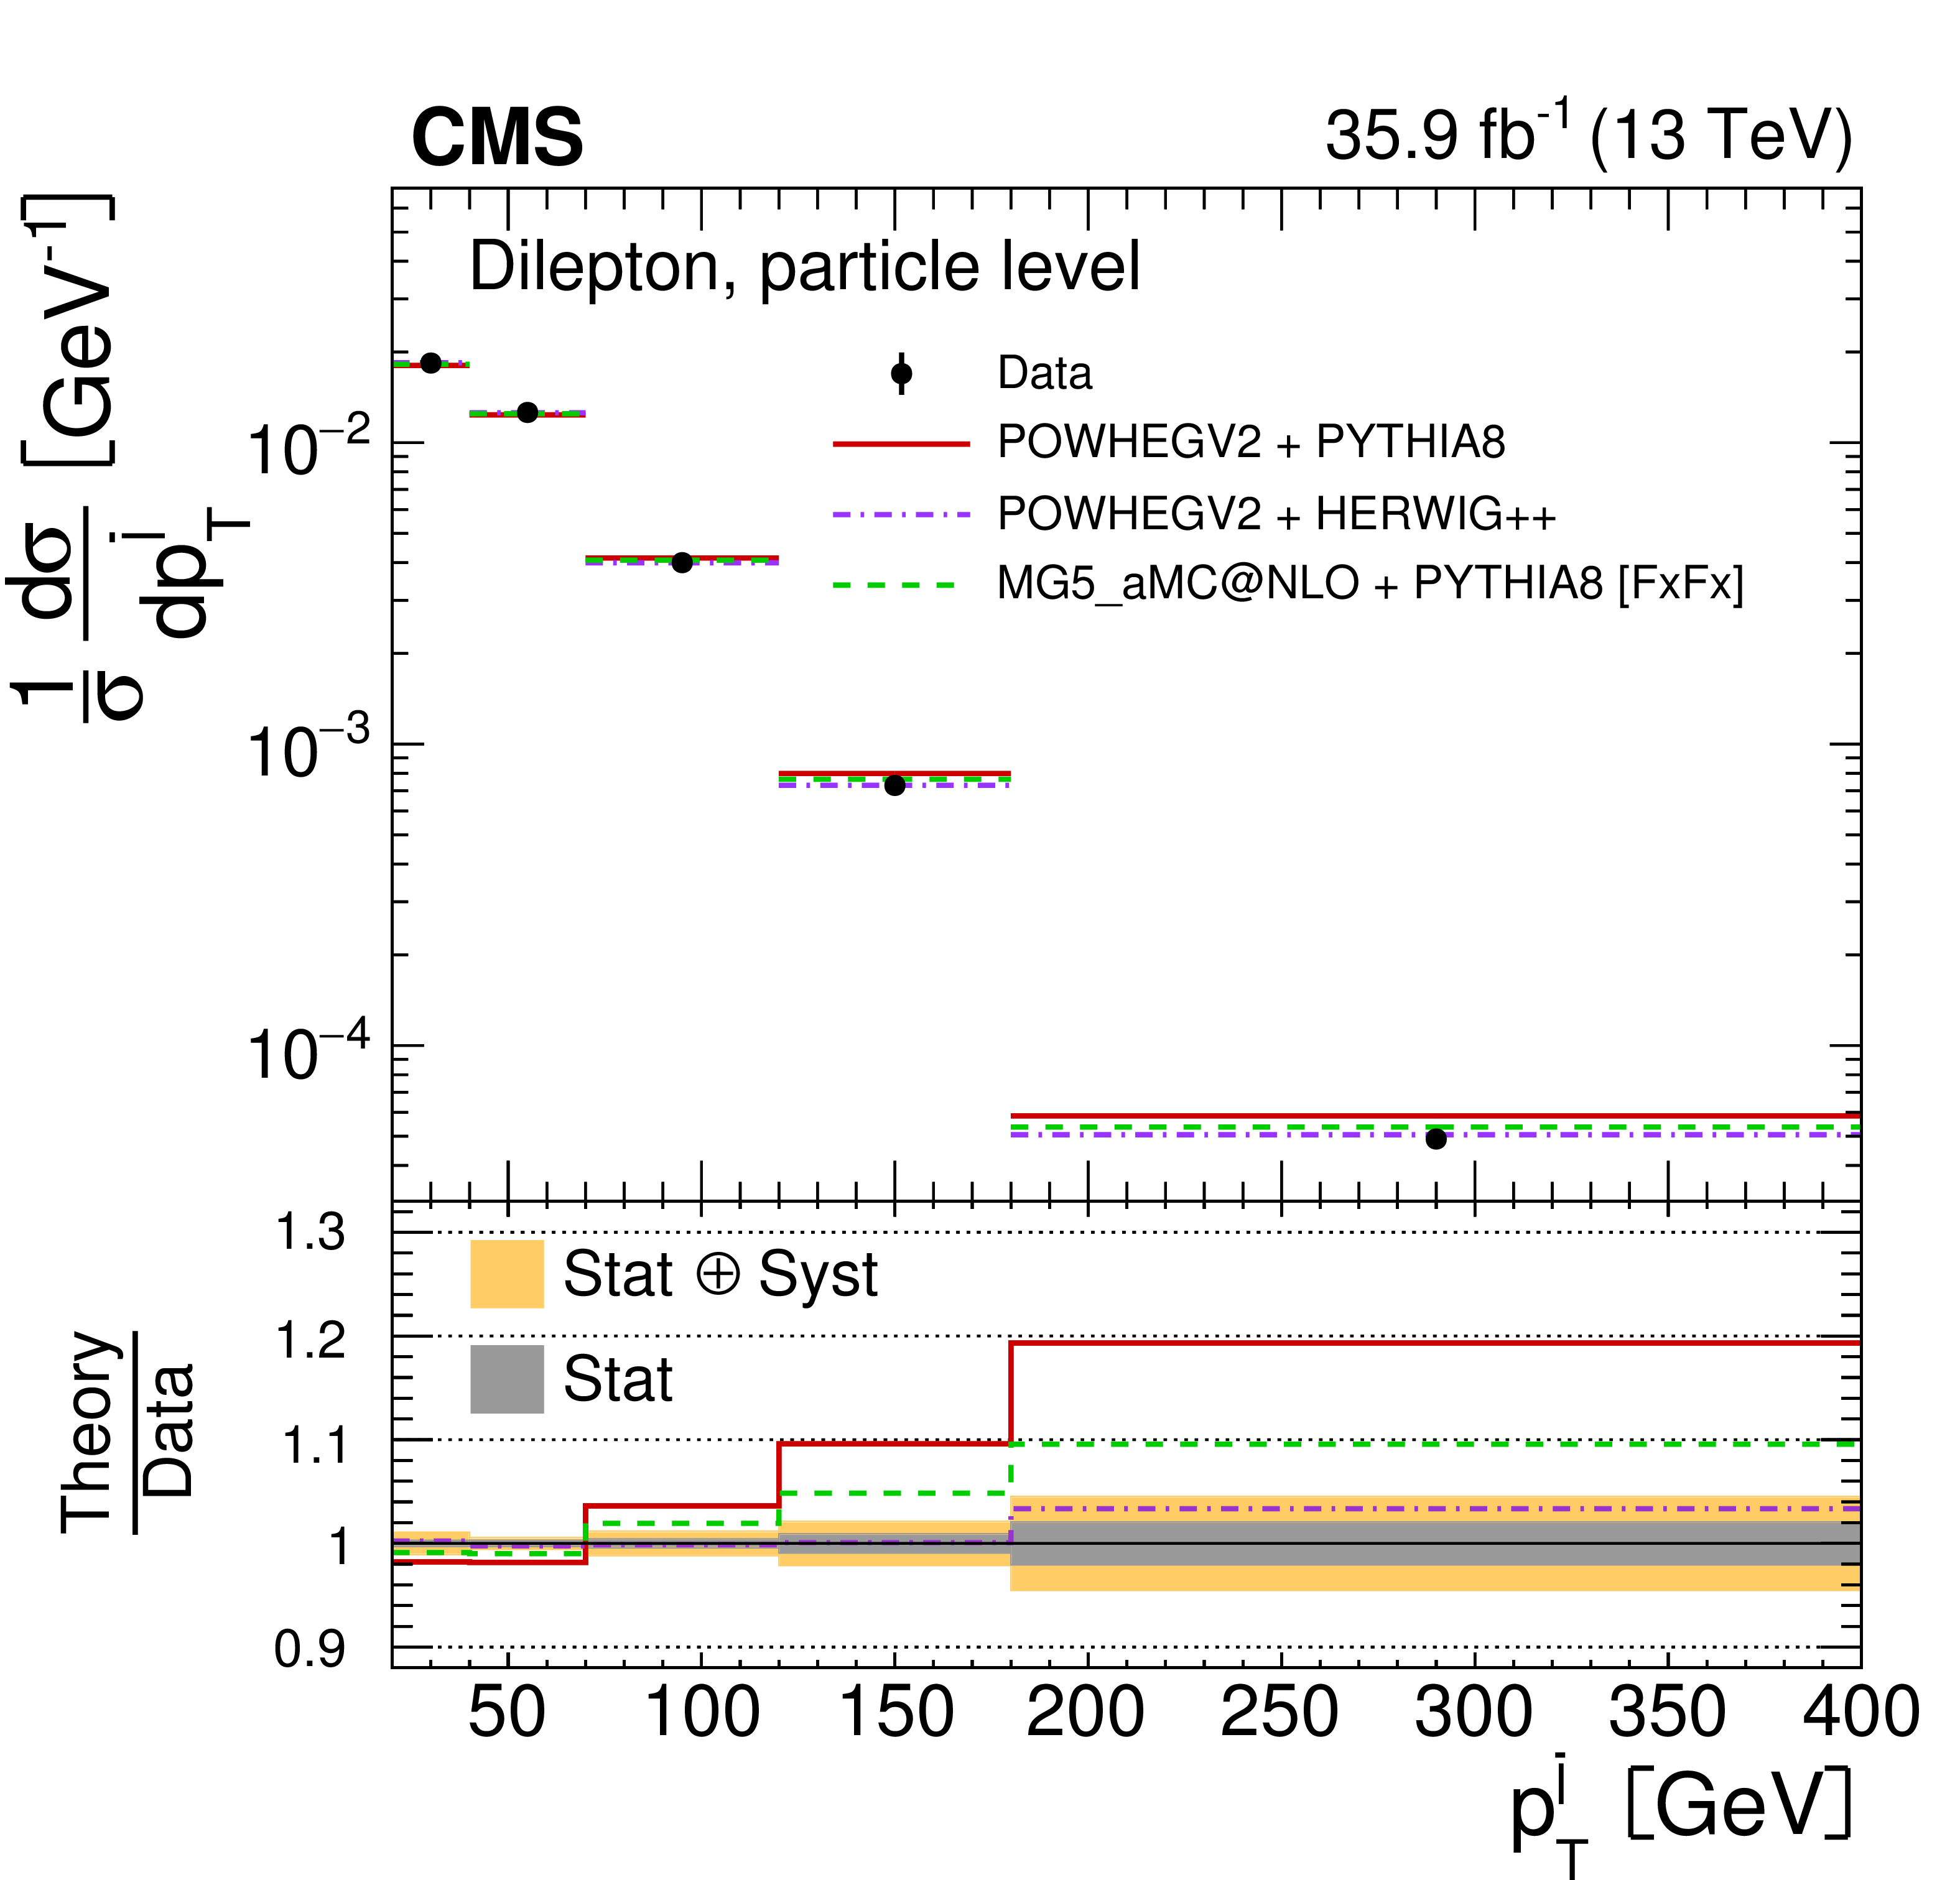
png pdf |
Figure 34-b:
The differential $ {{\mathrm {t}\overline {\mathrm {t}}}} $ production cross sections as a function of $ {{p_{\mathrm {T}}} ^{{\bar{\ell}}}} $ in a fiducial phase space at the particle level are shown for the data (points) and the MC predictions (lines). The vertical lines on the points indicate the total uncertainty in the data. The left and right plots correspond to absolute and normalised measurements, respectively. The lower panel in each plot shows the ratios of the theoretical predictions to the data. The dark and light bands show the relative statistical and total uncertainties in the data, respectively. |
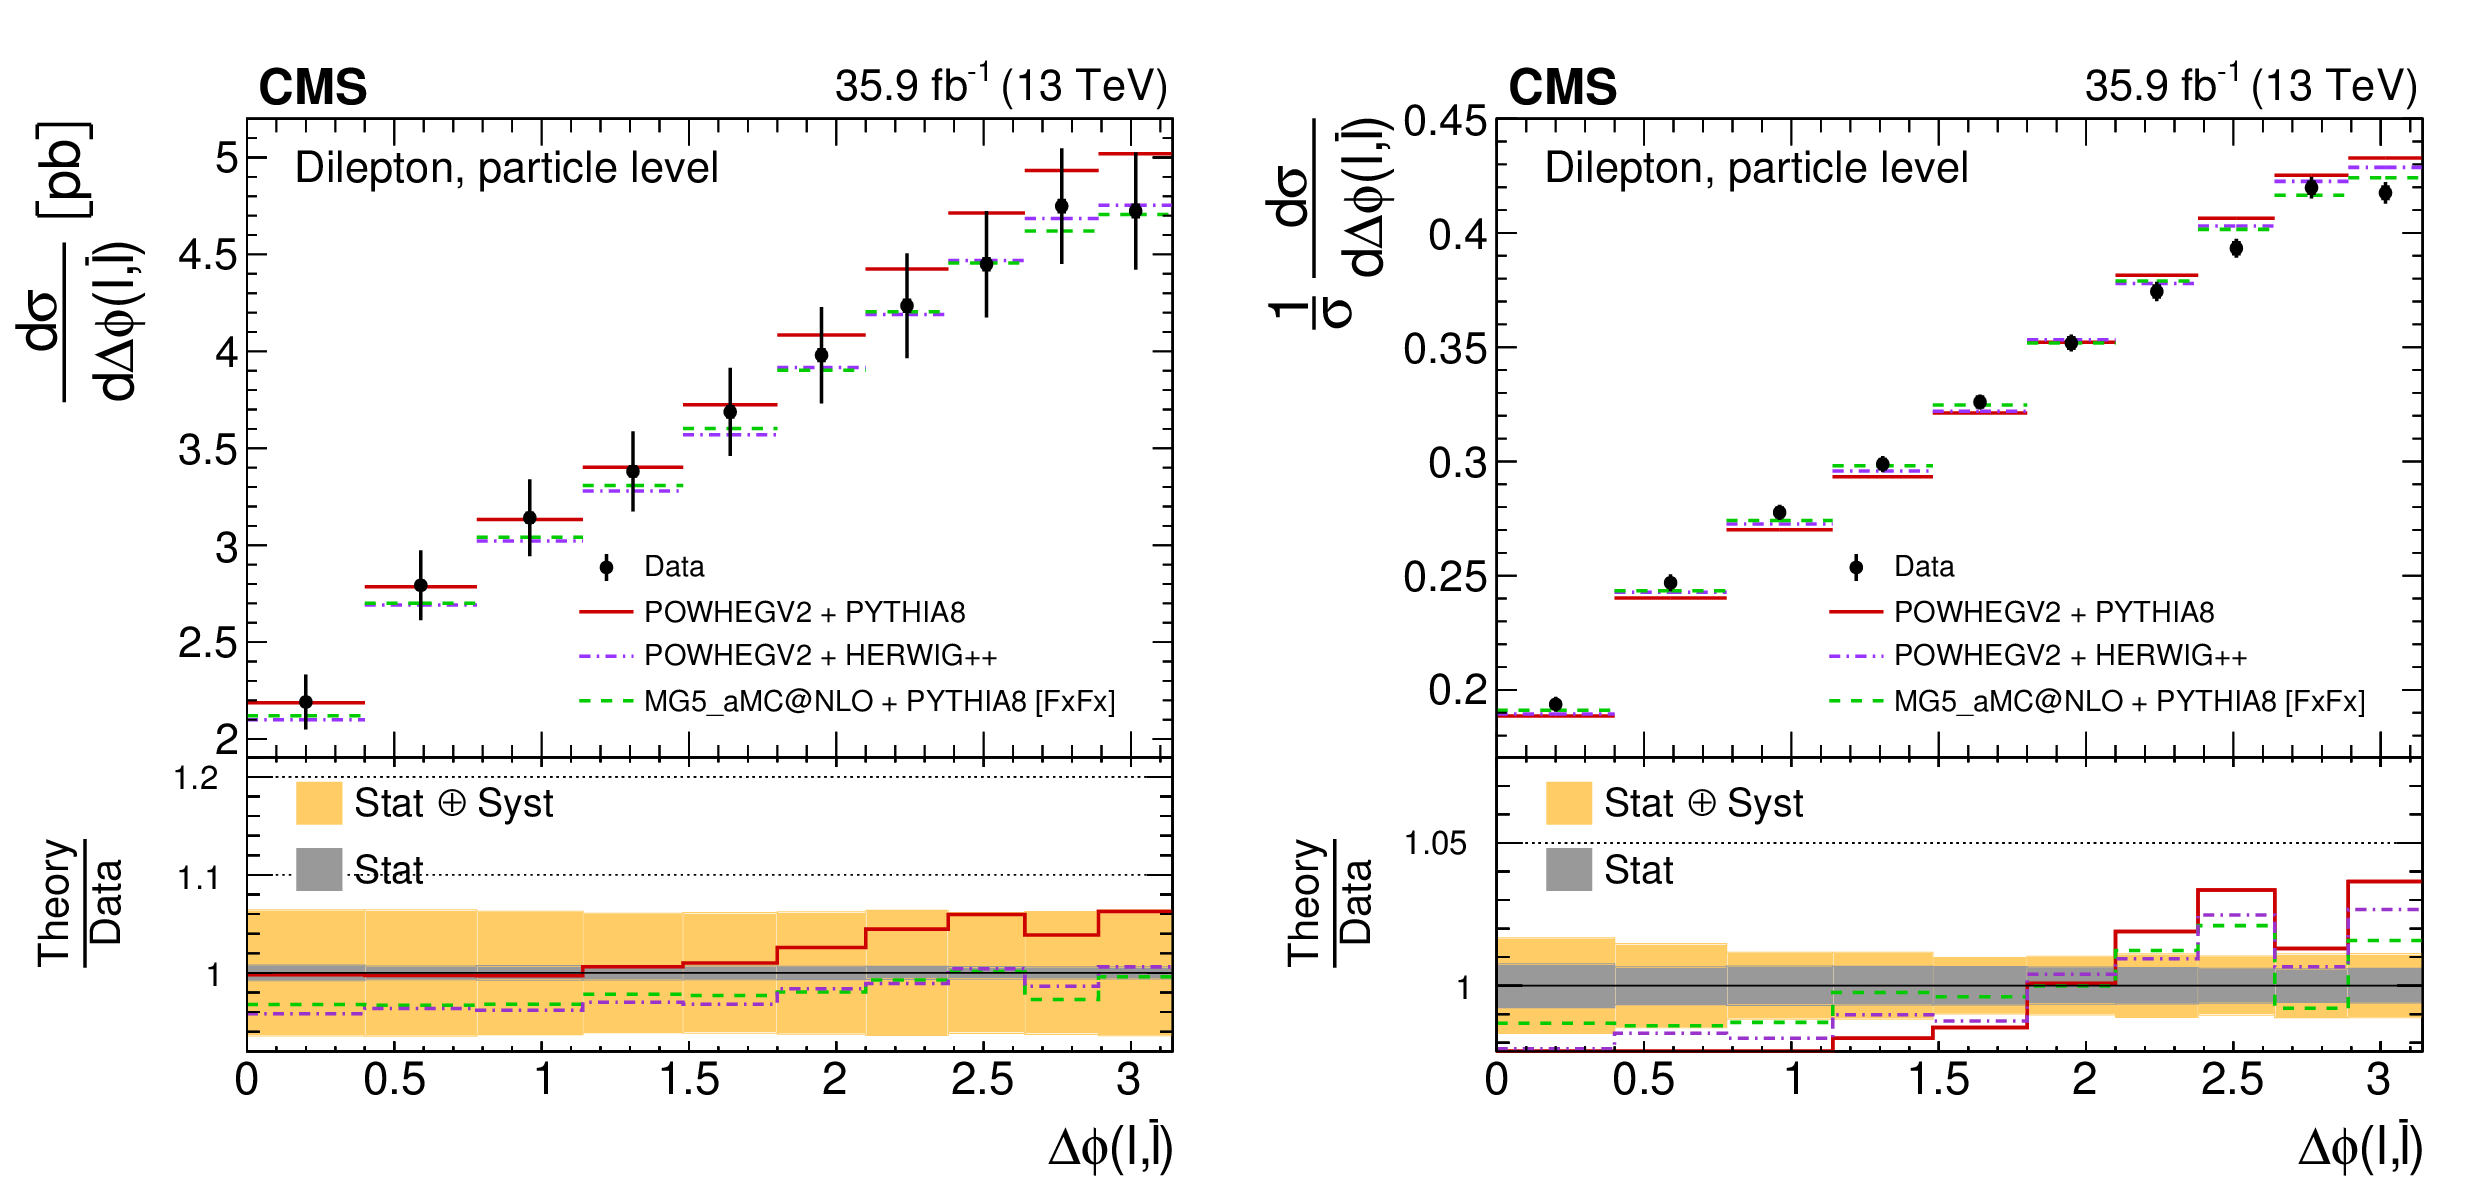
png pdf |
Figure 35:
The differential $ {{\mathrm {t}\overline {\mathrm {t}}}} $ production cross sections as a function of $ {{p_{\mathrm {T}}} ^{{\ell}}} $ (leading) in a fiducial phase space at the particle level are shown for the data (points) and the MC predictions (lines). The vertical lines on the points indicate the total uncertainty in the data. The left and right plots correspond to absolute and normalised measurements, respectively. The lower panel in each plot shows the ratios of the theoretical predictions to the data. The dark and light bands show the relative statistical and total uncertainties in the data, respectively. |

png pdf |
Figure 35-a:
The differential $ {{\mathrm {t}\overline {\mathrm {t}}}} $ production cross sections as a function of $ {{p_{\mathrm {T}}} ^{{\ell}}} $ (leading) in a fiducial phase space at the particle level are shown for the data (points) and the MC predictions (lines). The vertical lines on the points indicate the total uncertainty in the data. The left and right plots correspond to absolute and normalised measurements, respectively. The lower panel in each plot shows the ratios of the theoretical predictions to the data. The dark and light bands show the relative statistical and total uncertainties in the data, respectively. |
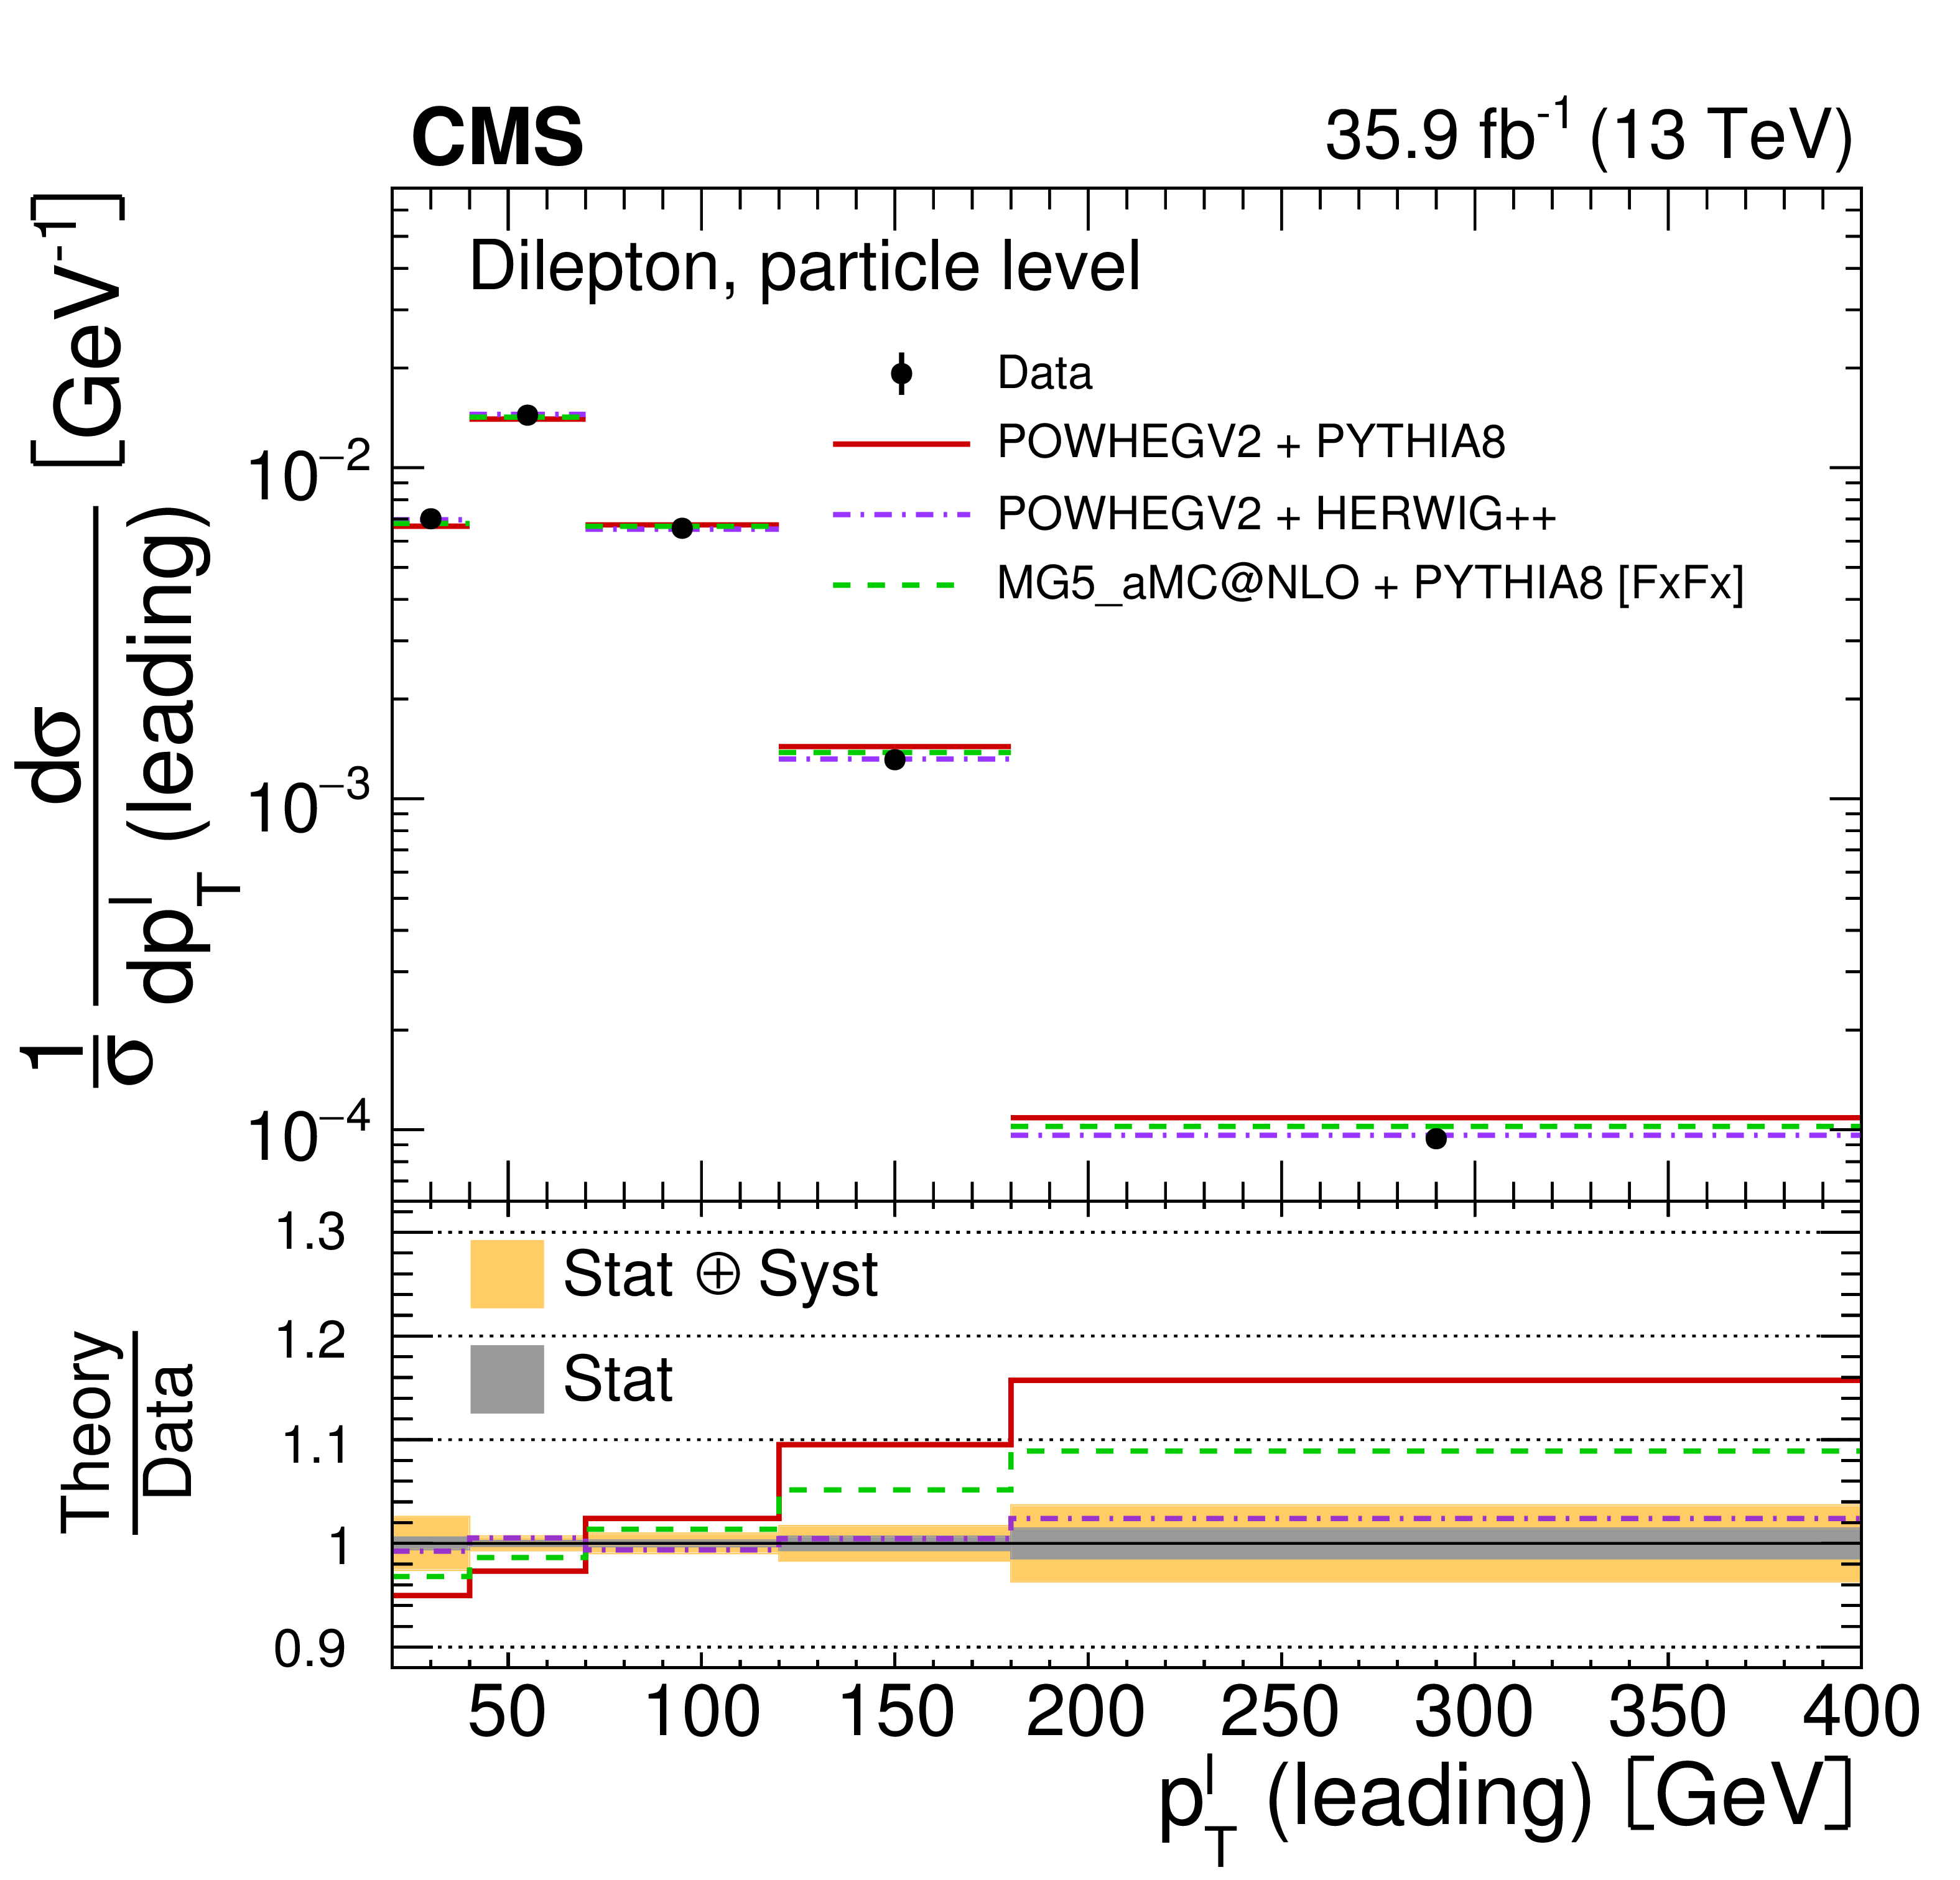
png pdf |
Figure 35-b:
The differential $ {{\mathrm {t}\overline {\mathrm {t}}}} $ production cross sections as a function of $ {{p_{\mathrm {T}}} ^{{\ell}}} $ (leading) in a fiducial phase space at the particle level are shown for the data (points) and the MC predictions (lines). The vertical lines on the points indicate the total uncertainty in the data. The left and right plots correspond to absolute and normalised measurements, respectively. The lower panel in each plot shows the ratios of the theoretical predictions to the data. The dark and light bands show the relative statistical and total uncertainties in the data, respectively. |

png pdf |
Figure 36:
The differential $ {{\mathrm {t}\overline {\mathrm {t}}}} $ production cross sections as a function of $ {{p_{\mathrm {T}}} ^{{\ell}}} $ (trailing) in a fiducial phase space at the particle level are shown for the data (points) and the MC predictions (lines). The vertical lines on the points indicate the total uncertainty in the data. The left and right plots correspond to absolute and normalised measurements, respectively. The lower panel in each plot shows the ratios of the theoretical predictions to the data. The dark and light bands show the relative statistical and total uncertainties in the data, respectively. |
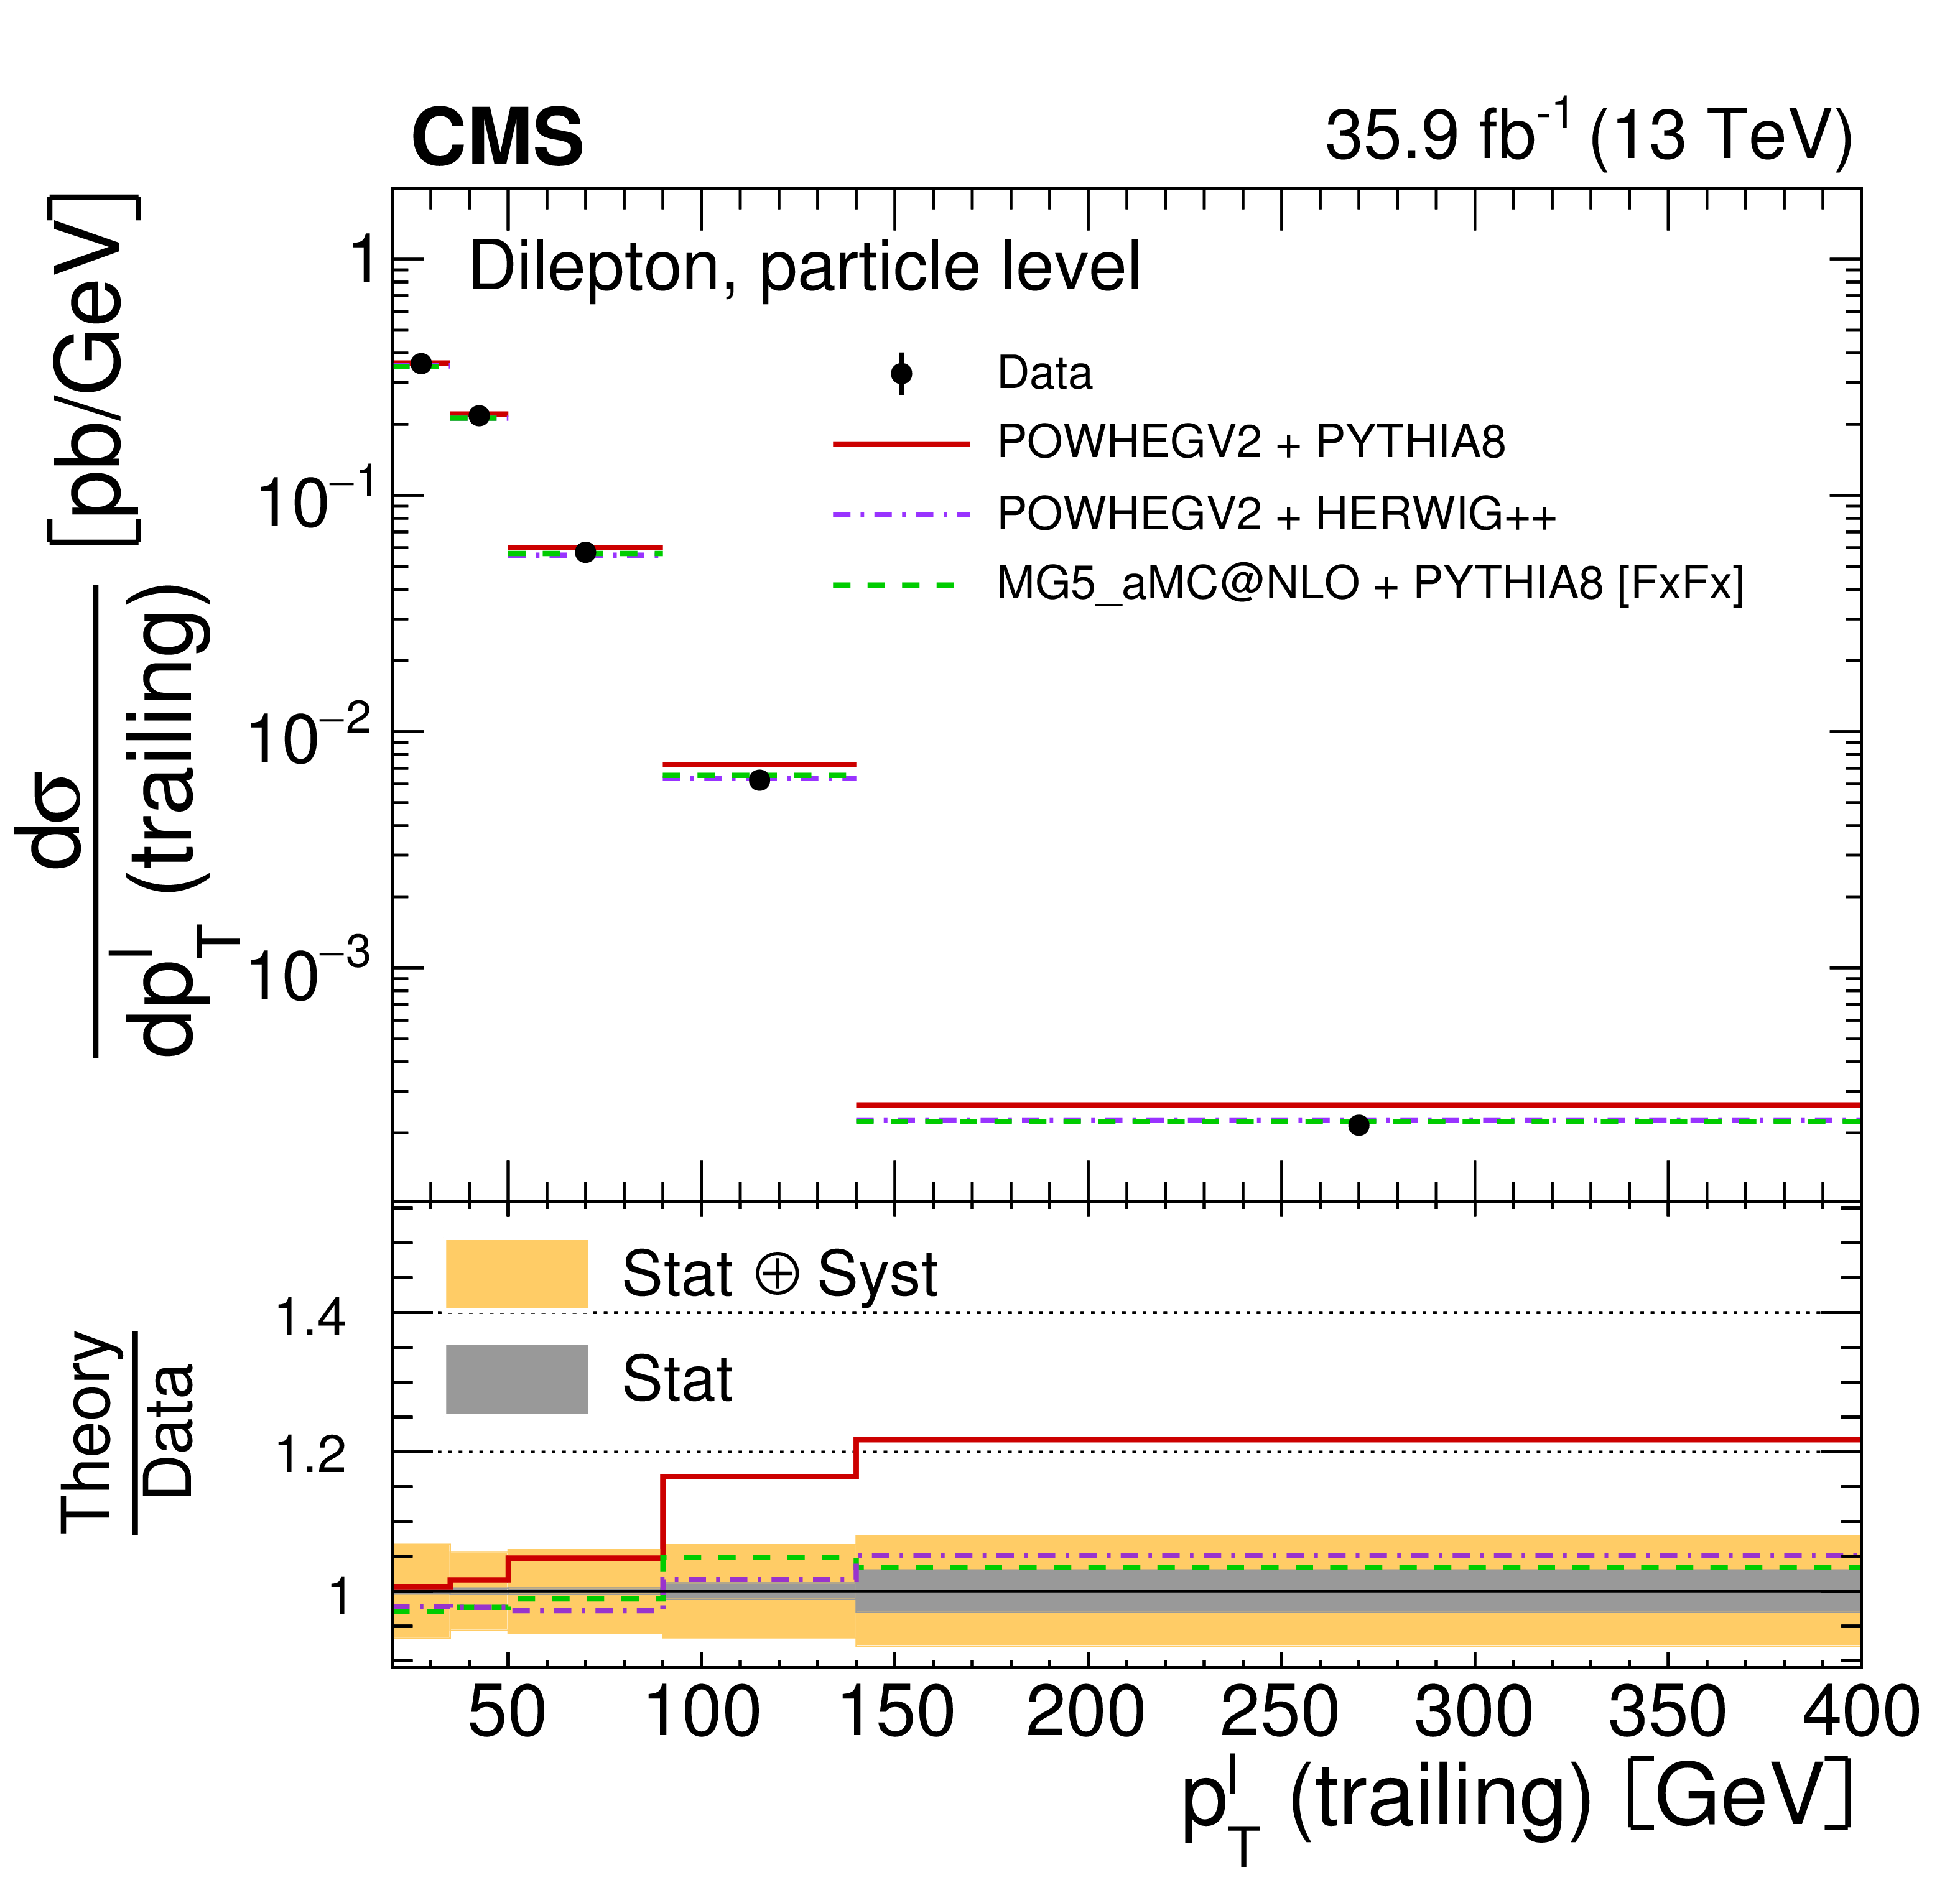
png pdf |
Figure 36-a:
The differential $ {{\mathrm {t}\overline {\mathrm {t}}}} $ production cross sections as a function of $ {{p_{\mathrm {T}}} ^{{\ell}}} $ (trailing) in a fiducial phase space at the particle level are shown for the data (points) and the MC predictions (lines). The vertical lines on the points indicate the total uncertainty in the data. The left and right plots correspond to absolute and normalised measurements, respectively. The lower panel in each plot shows the ratios of the theoretical predictions to the data. The dark and light bands show the relative statistical and total uncertainties in the data, respectively. |
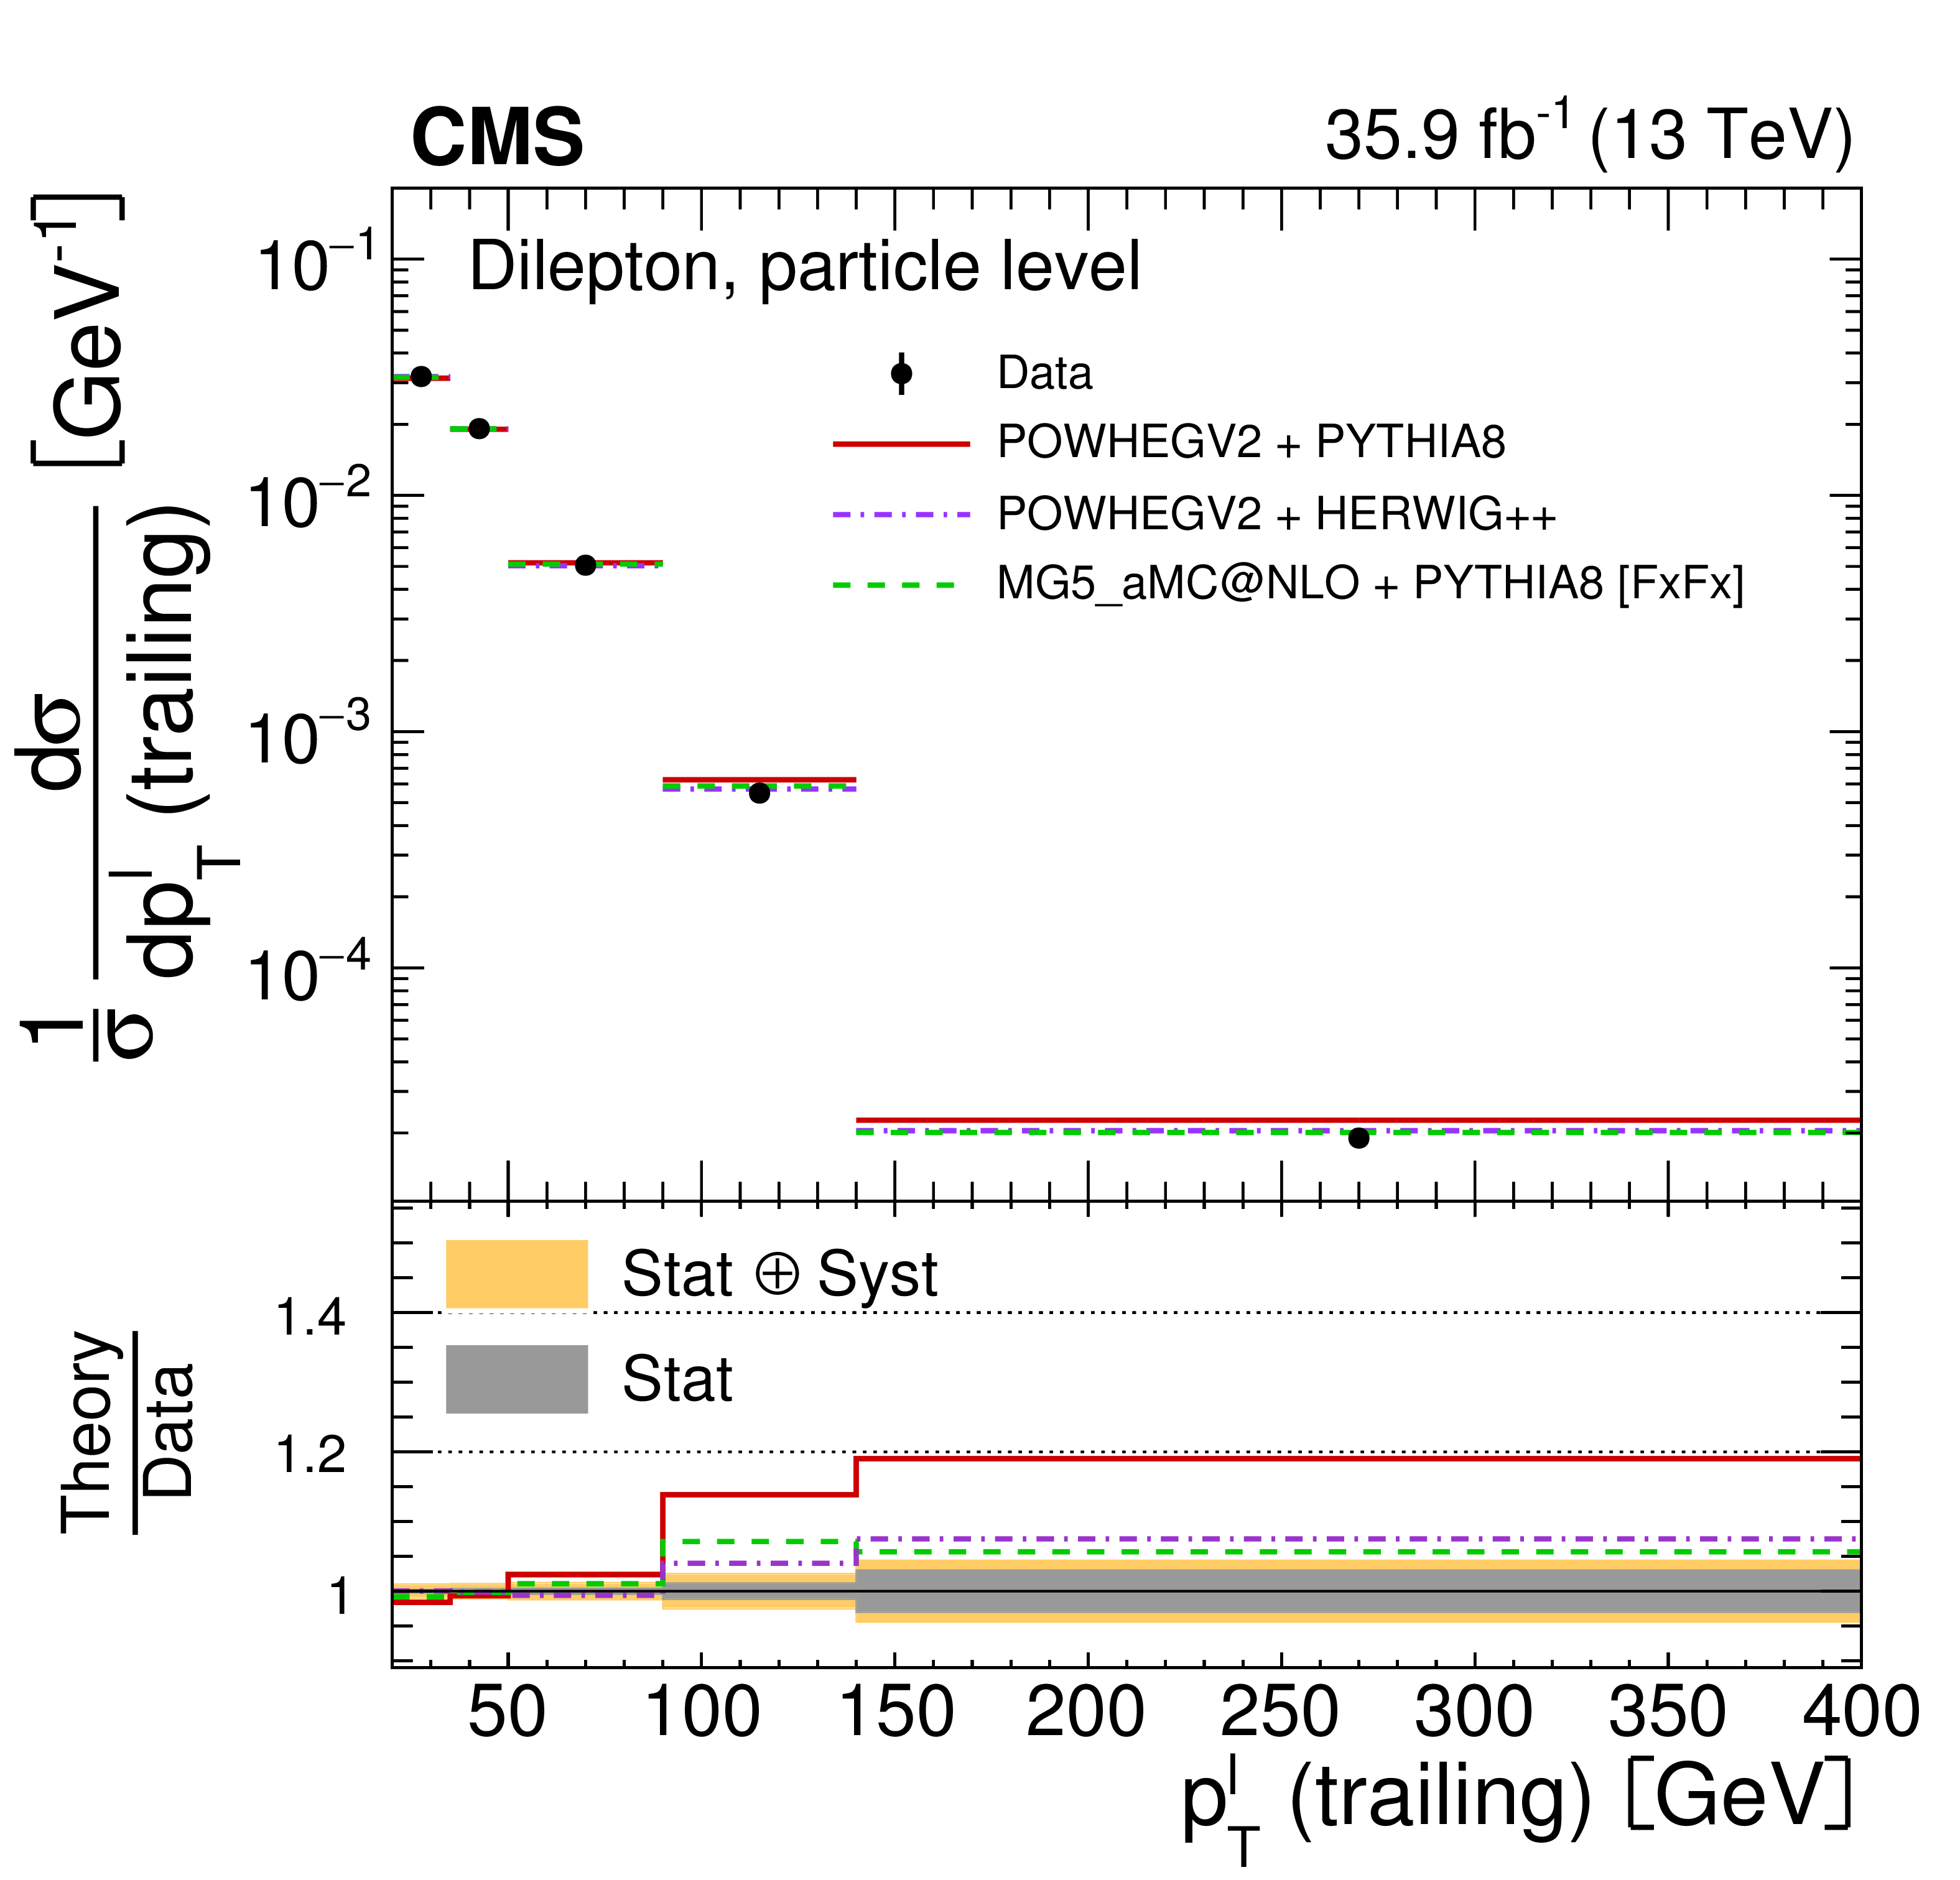
png pdf |
Figure 36-b:
The differential $ {{\mathrm {t}\overline {\mathrm {t}}}} $ production cross sections as a function of $ {{p_{\mathrm {T}}} ^{{\ell}}} $ (trailing) in a fiducial phase space at the particle level are shown for the data (points) and the MC predictions (lines). The vertical lines on the points indicate the total uncertainty in the data. The left and right plots correspond to absolute and normalised measurements, respectively. The lower panel in each plot shows the ratios of the theoretical predictions to the data. The dark and light bands show the relative statistical and total uncertainties in the data, respectively. |
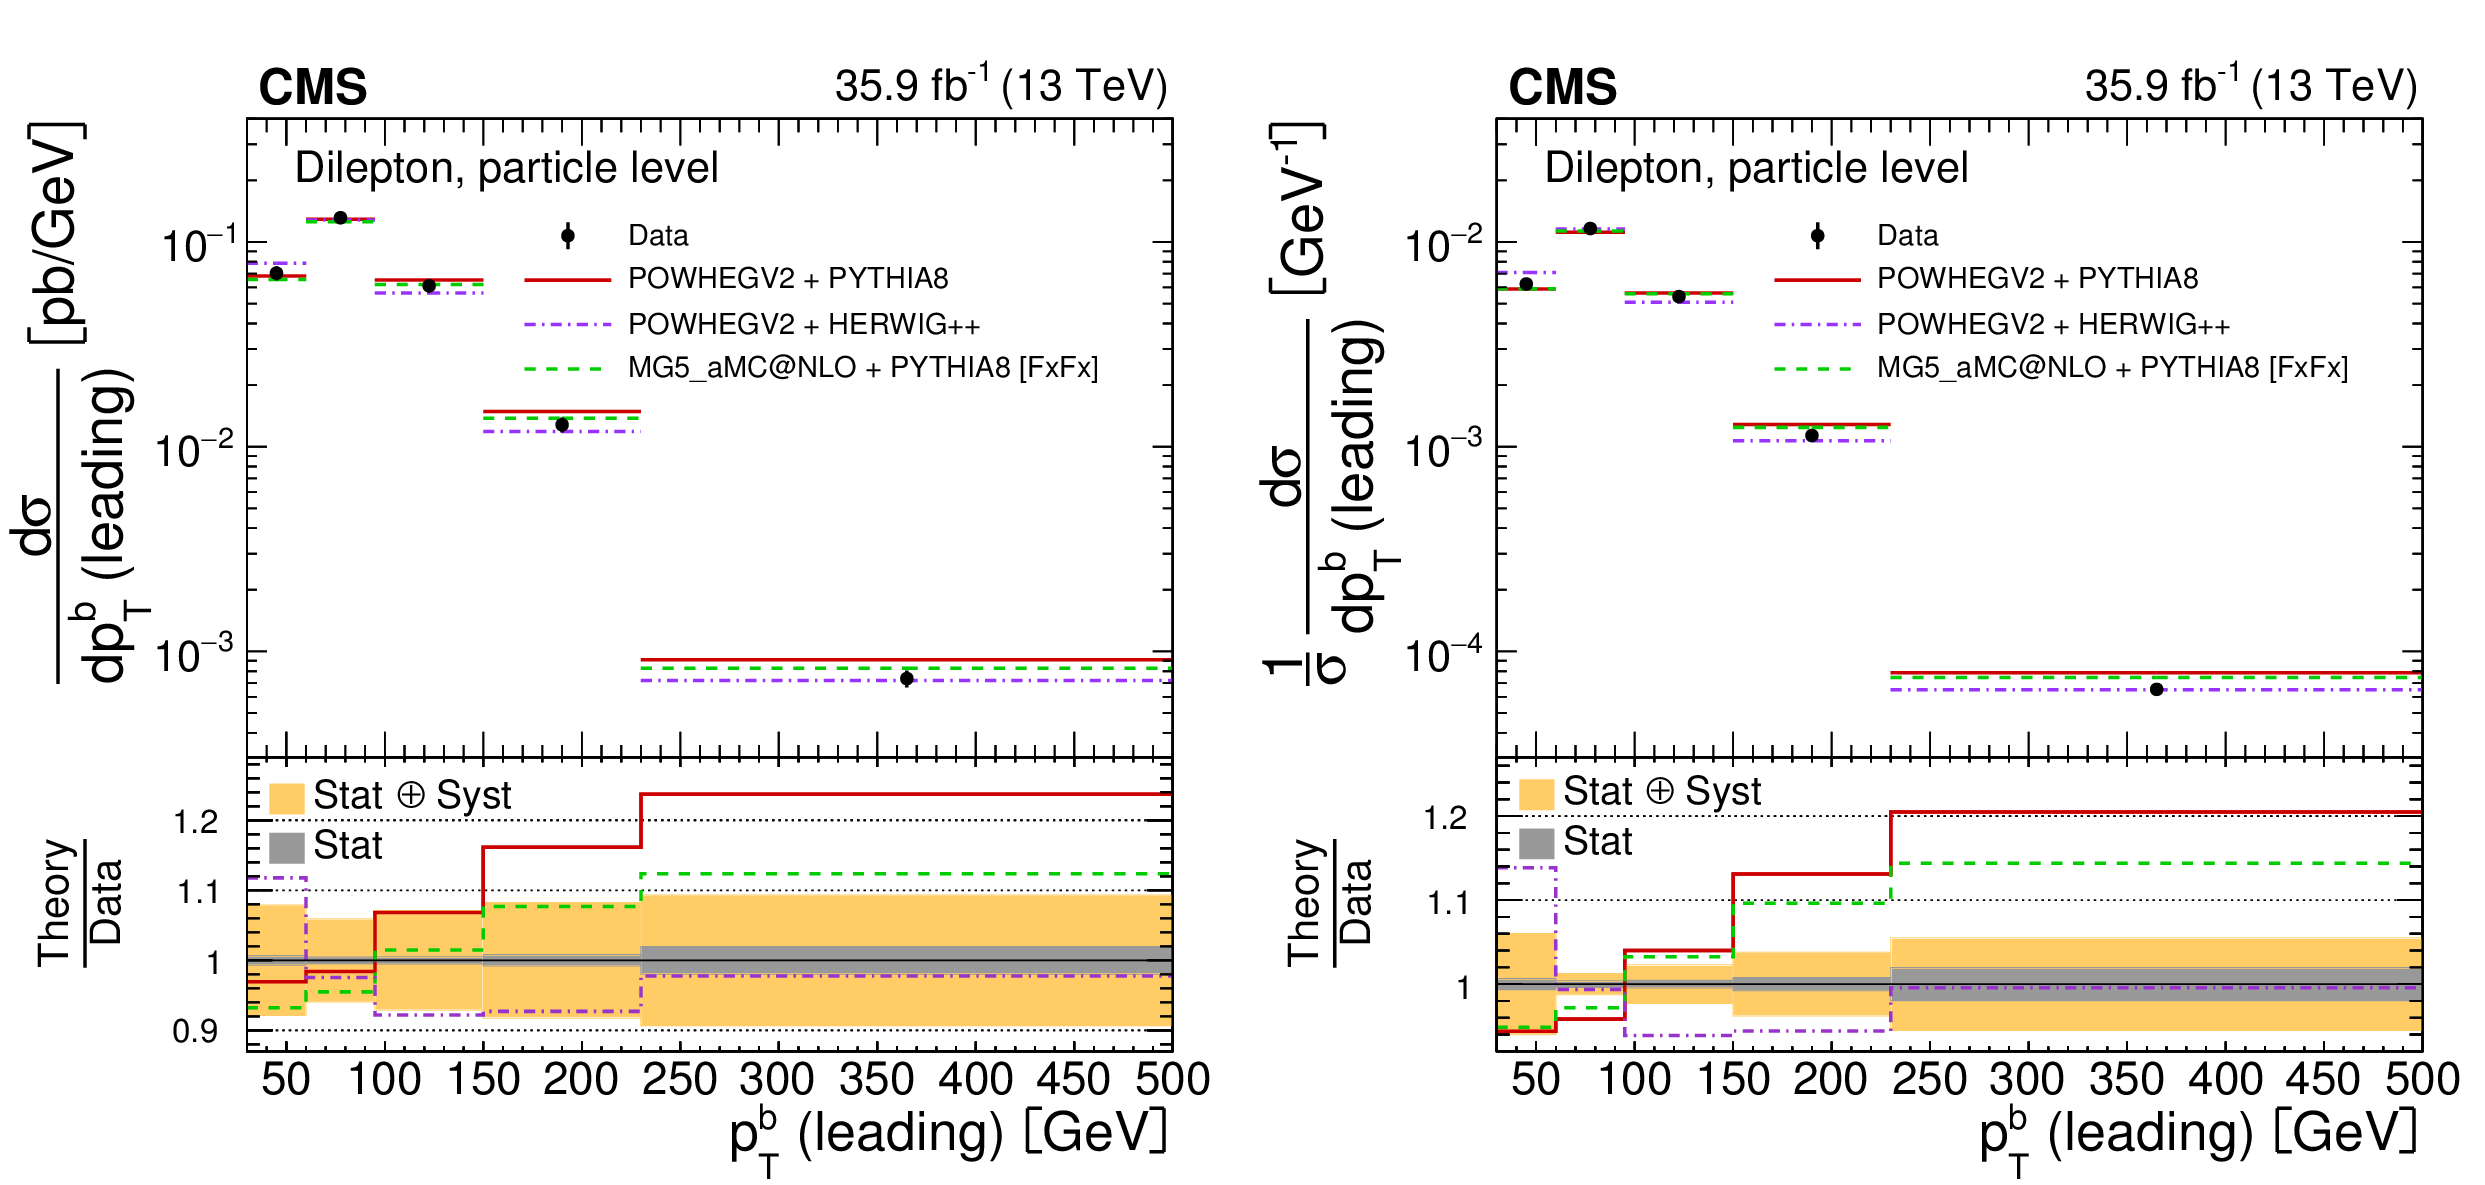
png pdf |
Figure 37:
The differential $ {{\mathrm {t}\overline {\mathrm {t}}}} $ production cross sections as a function of $ {\eta _{{\ell}}} $ in a fiducial phase space at the particle level are shown for the data (points) and the MC predictions (lines). The vertical lines on the points indicate the total uncertainty in the data. The left and right plots correspond to absolute and normalised measurements, respectively. The lower panel in each plot shows the ratios of the theoretical predictions to the data. The dark and light bands show the relative statistical and total uncertainties in the data, respectively. |
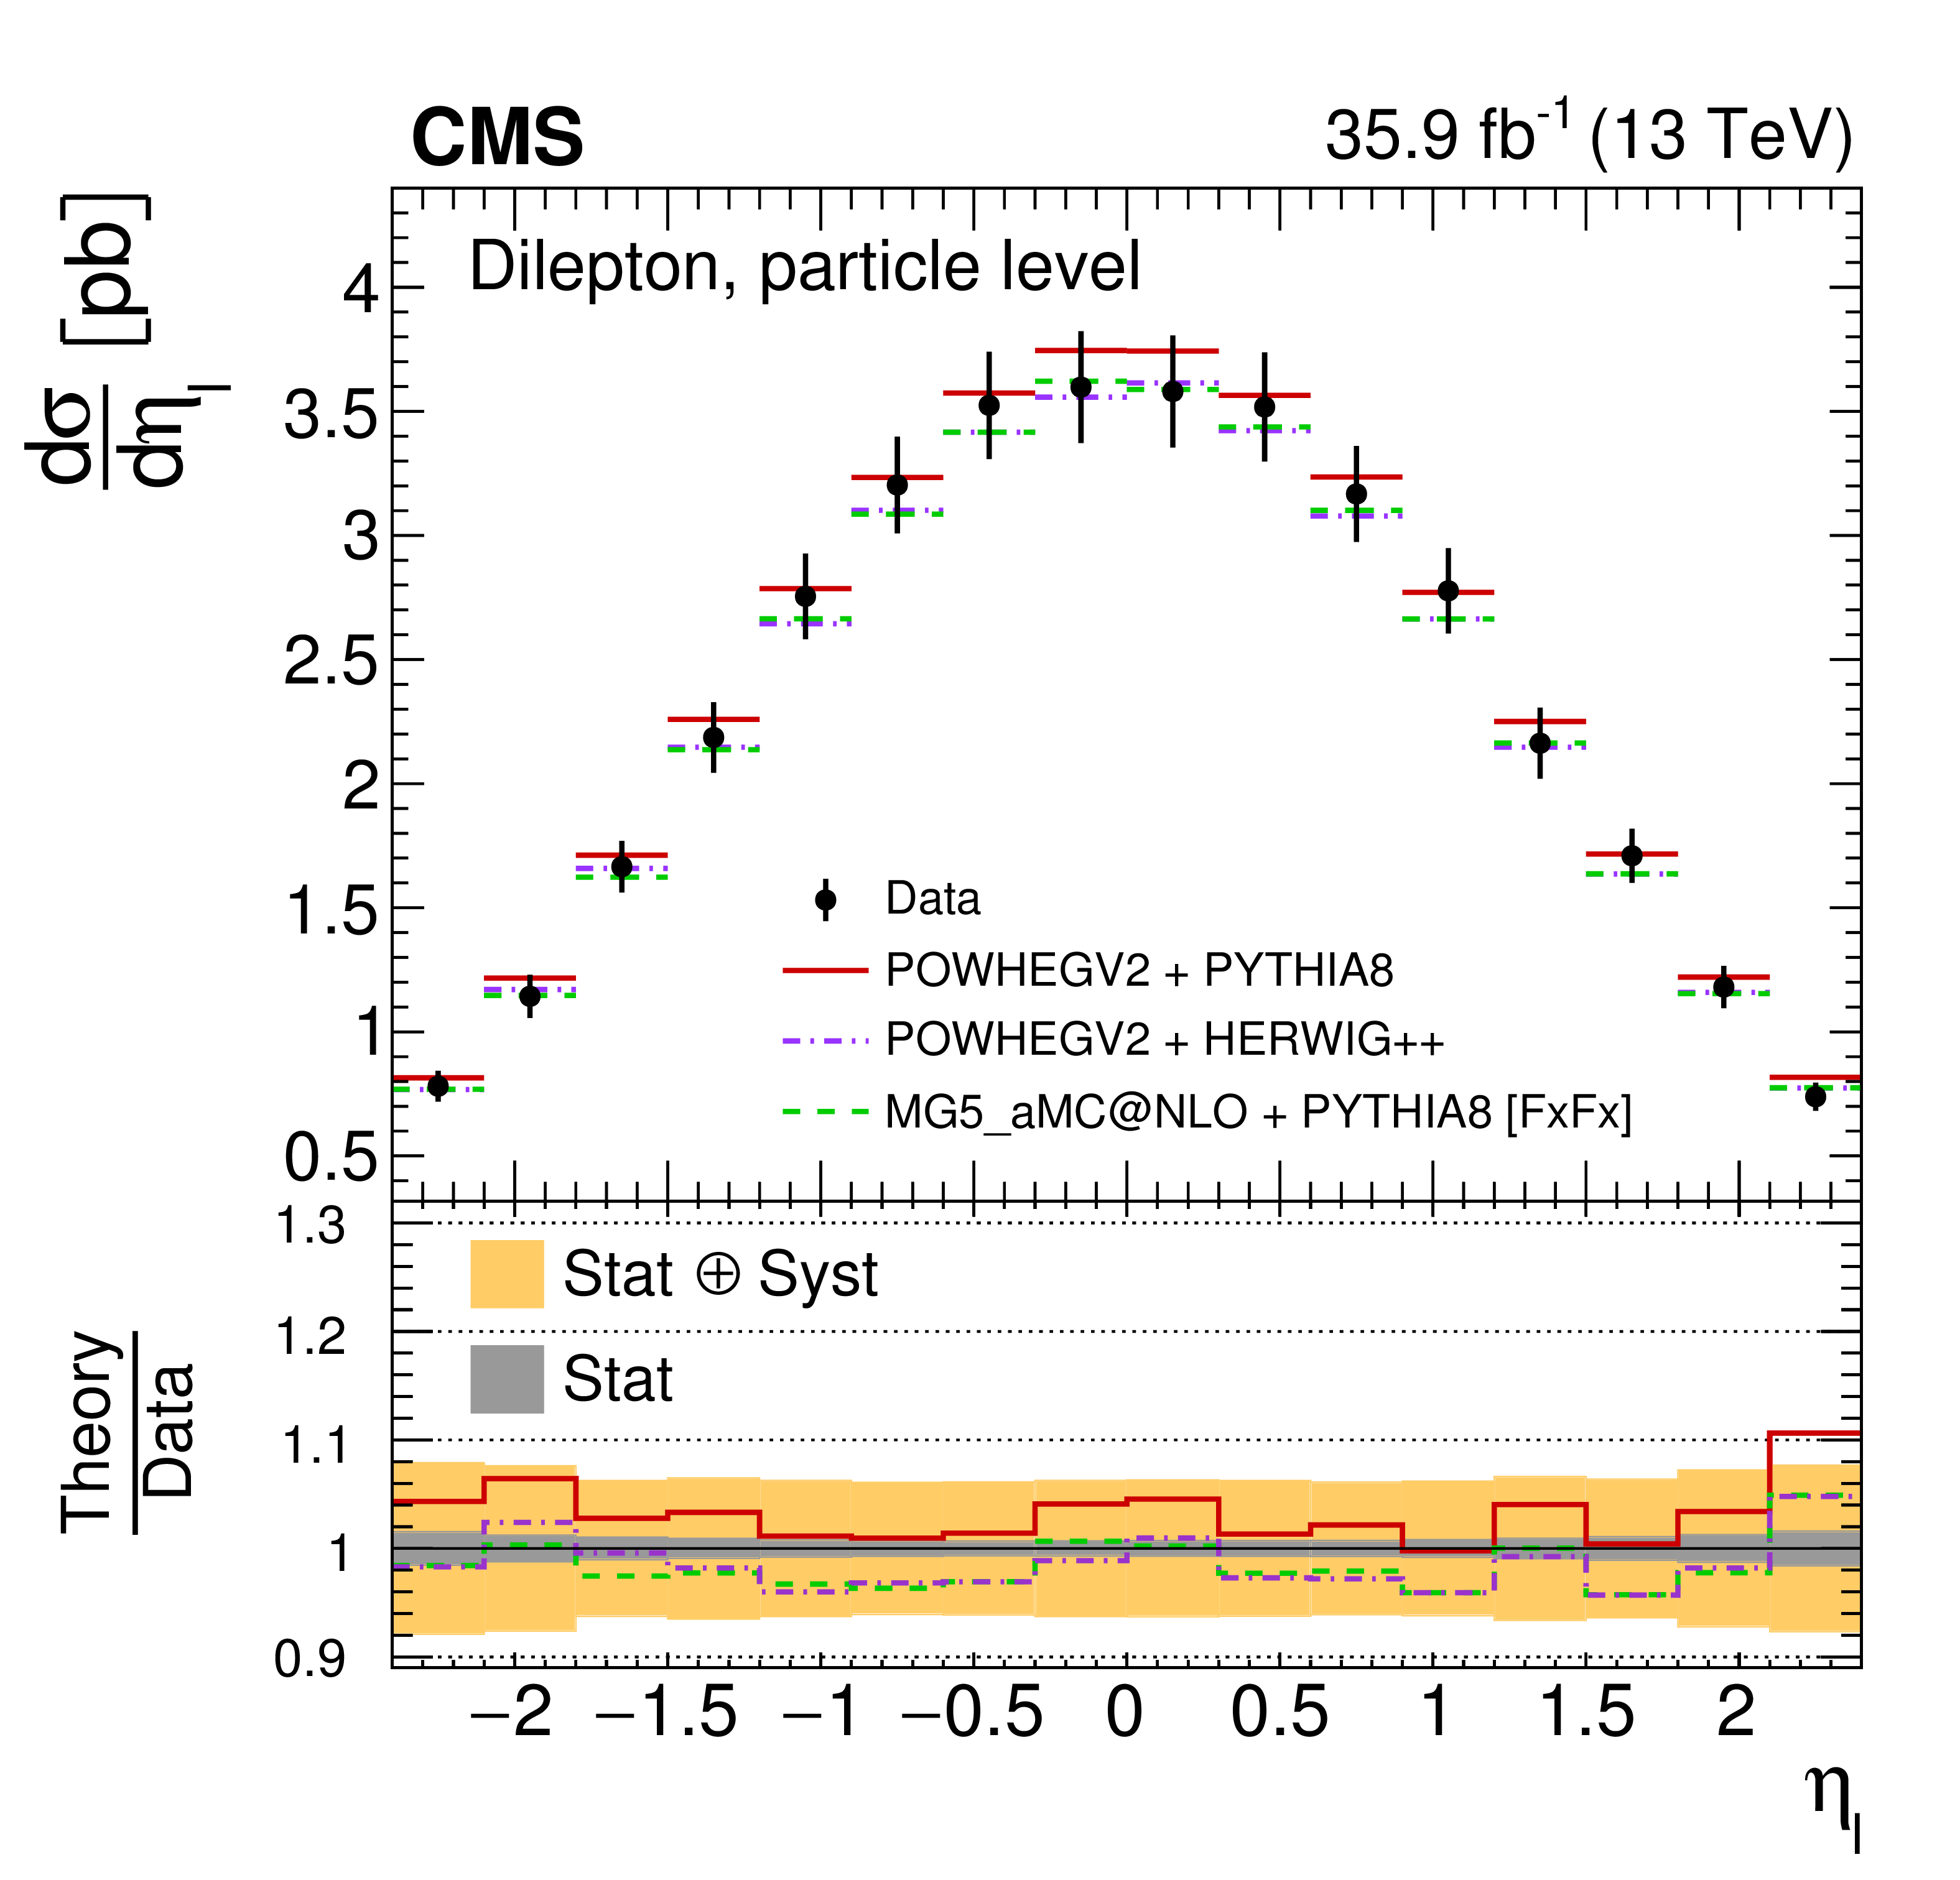
png pdf |
Figure 37-a:
The differential $ {{\mathrm {t}\overline {\mathrm {t}}}} $ production cross sections as a function of $ {\eta _{{\ell}}} $ in a fiducial phase space at the particle level are shown for the data (points) and the MC predictions (lines). The vertical lines on the points indicate the total uncertainty in the data. The left and right plots correspond to absolute and normalised measurements, respectively. The lower panel in each plot shows the ratios of the theoretical predictions to the data. The dark and light bands show the relative statistical and total uncertainties in the data, respectively. |
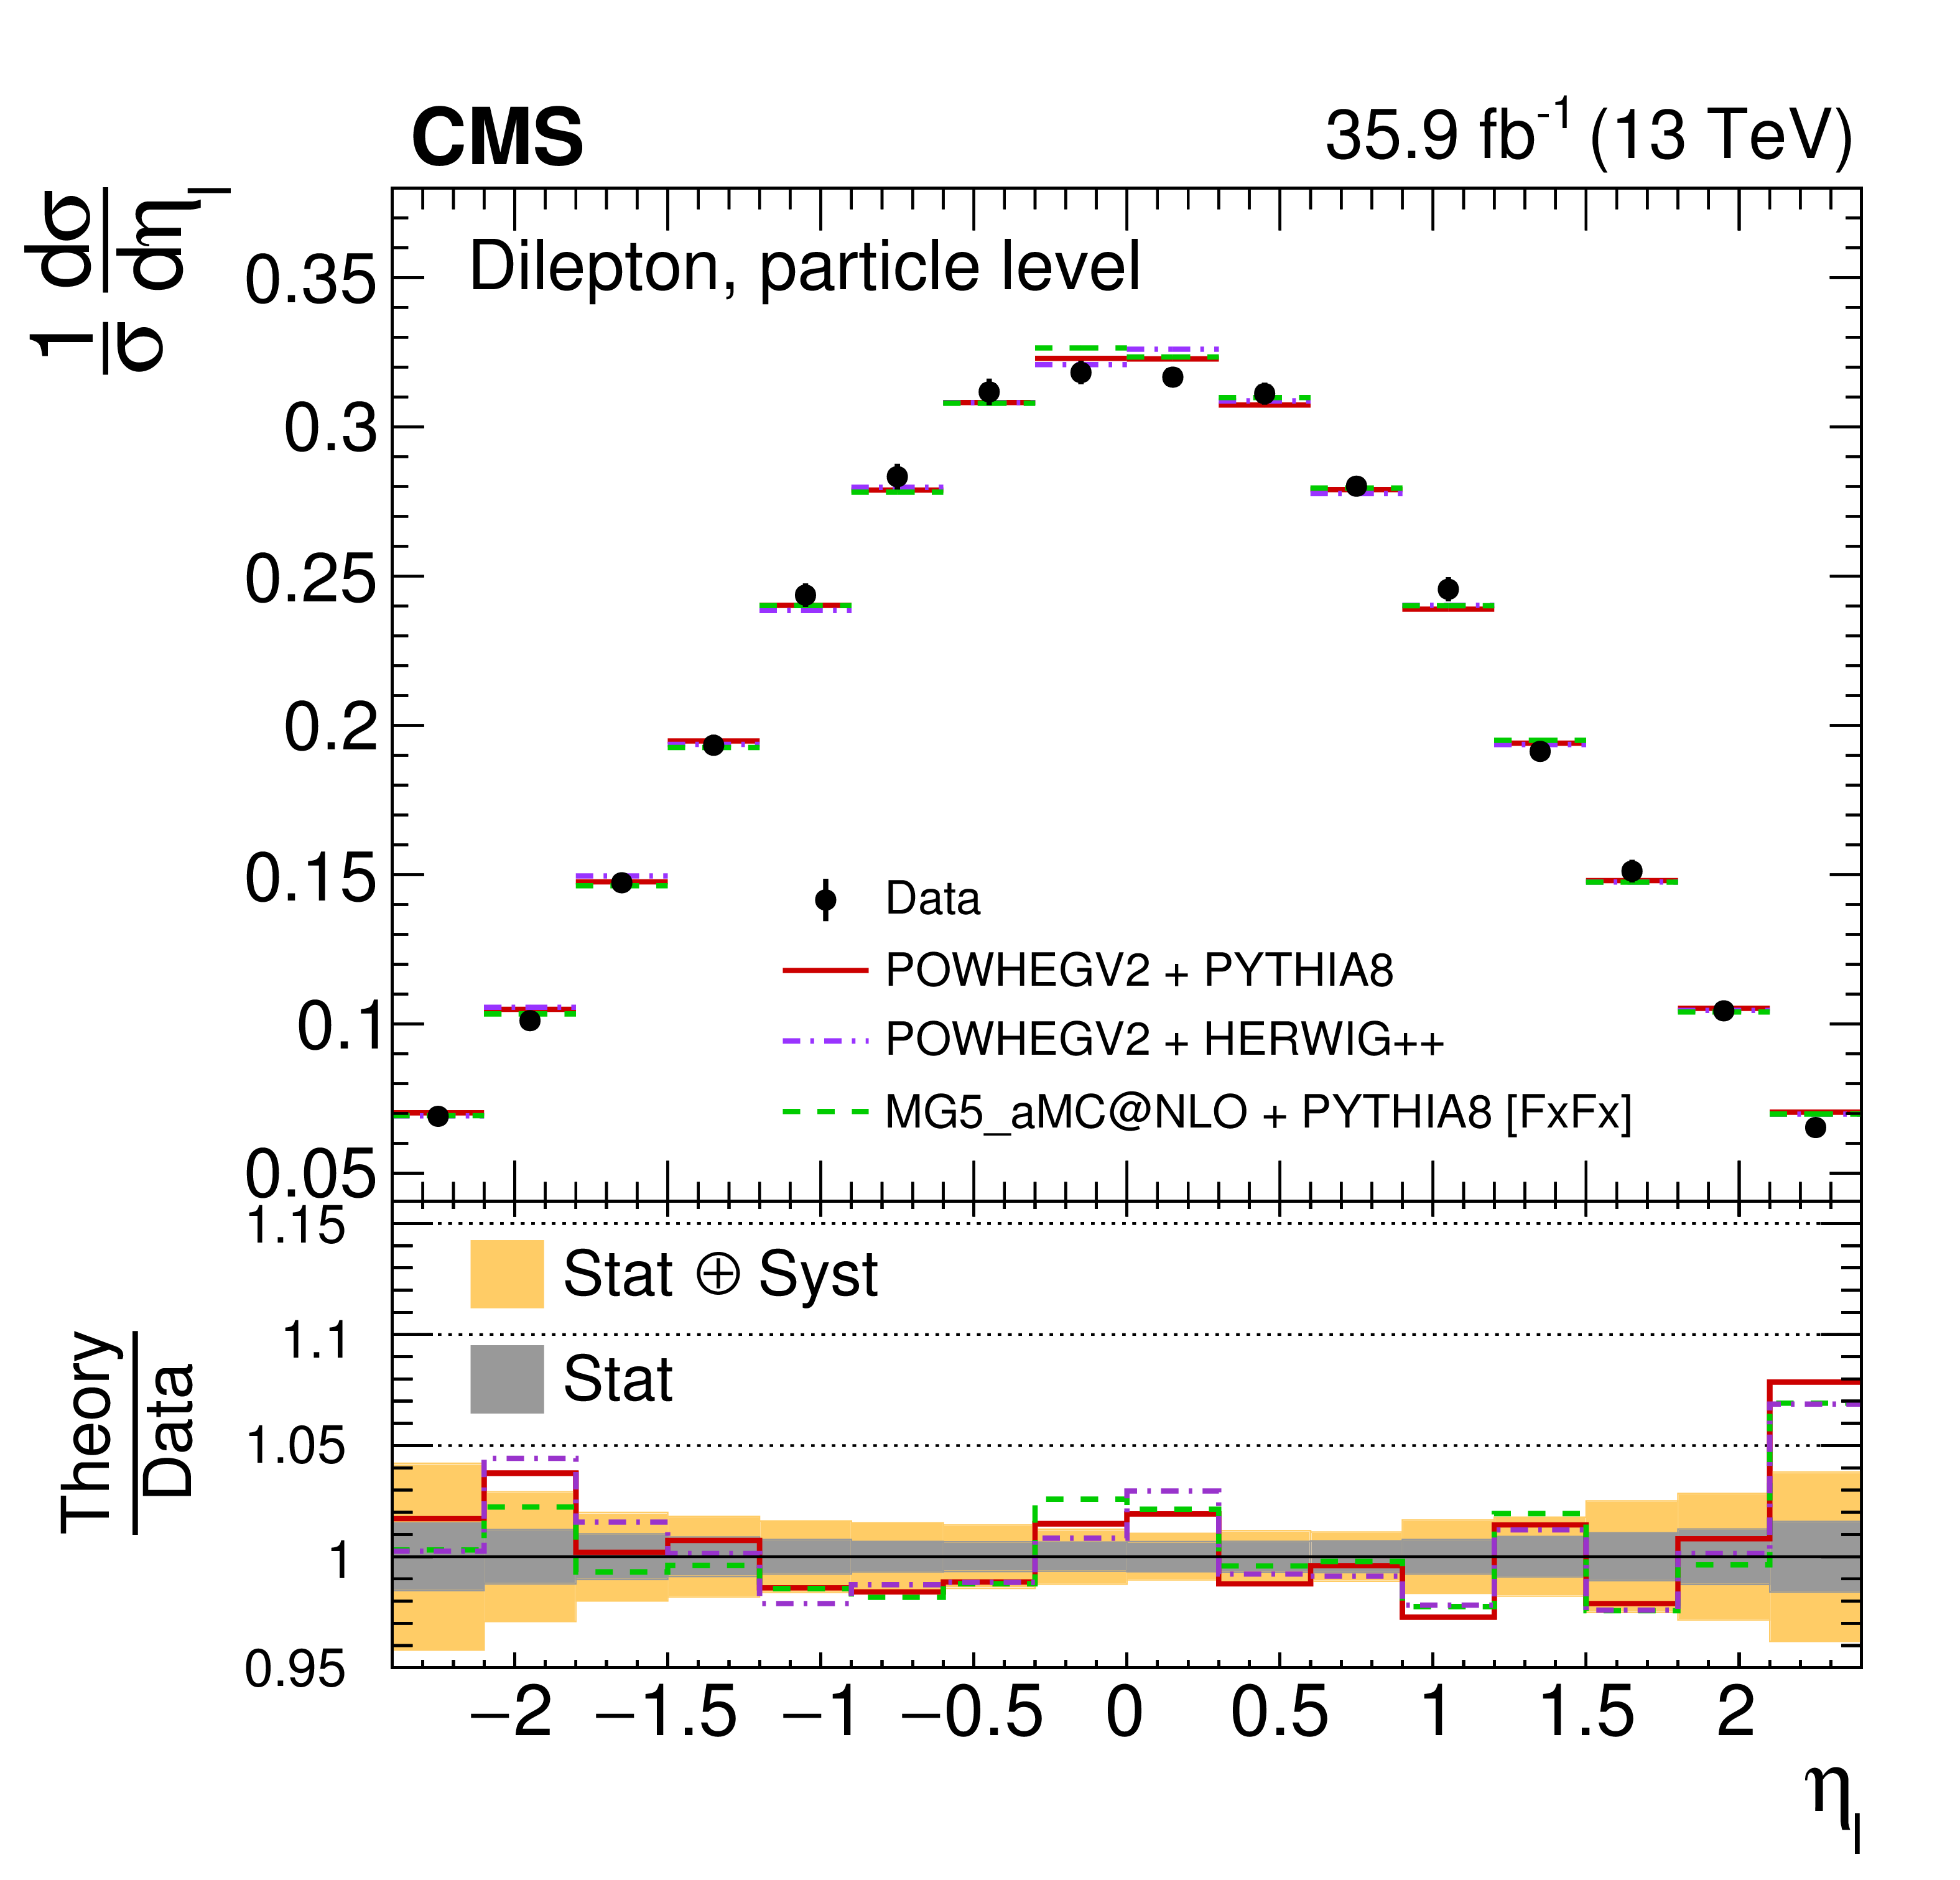
png pdf |
Figure 37-b:
The differential $ {{\mathrm {t}\overline {\mathrm {t}}}} $ production cross sections as a function of $ {\eta _{{\ell}}} $ in a fiducial phase space at the particle level are shown for the data (points) and the MC predictions (lines). The vertical lines on the points indicate the total uncertainty in the data. The left and right plots correspond to absolute and normalised measurements, respectively. The lower panel in each plot shows the ratios of the theoretical predictions to the data. The dark and light bands show the relative statistical and total uncertainties in the data, respectively. |
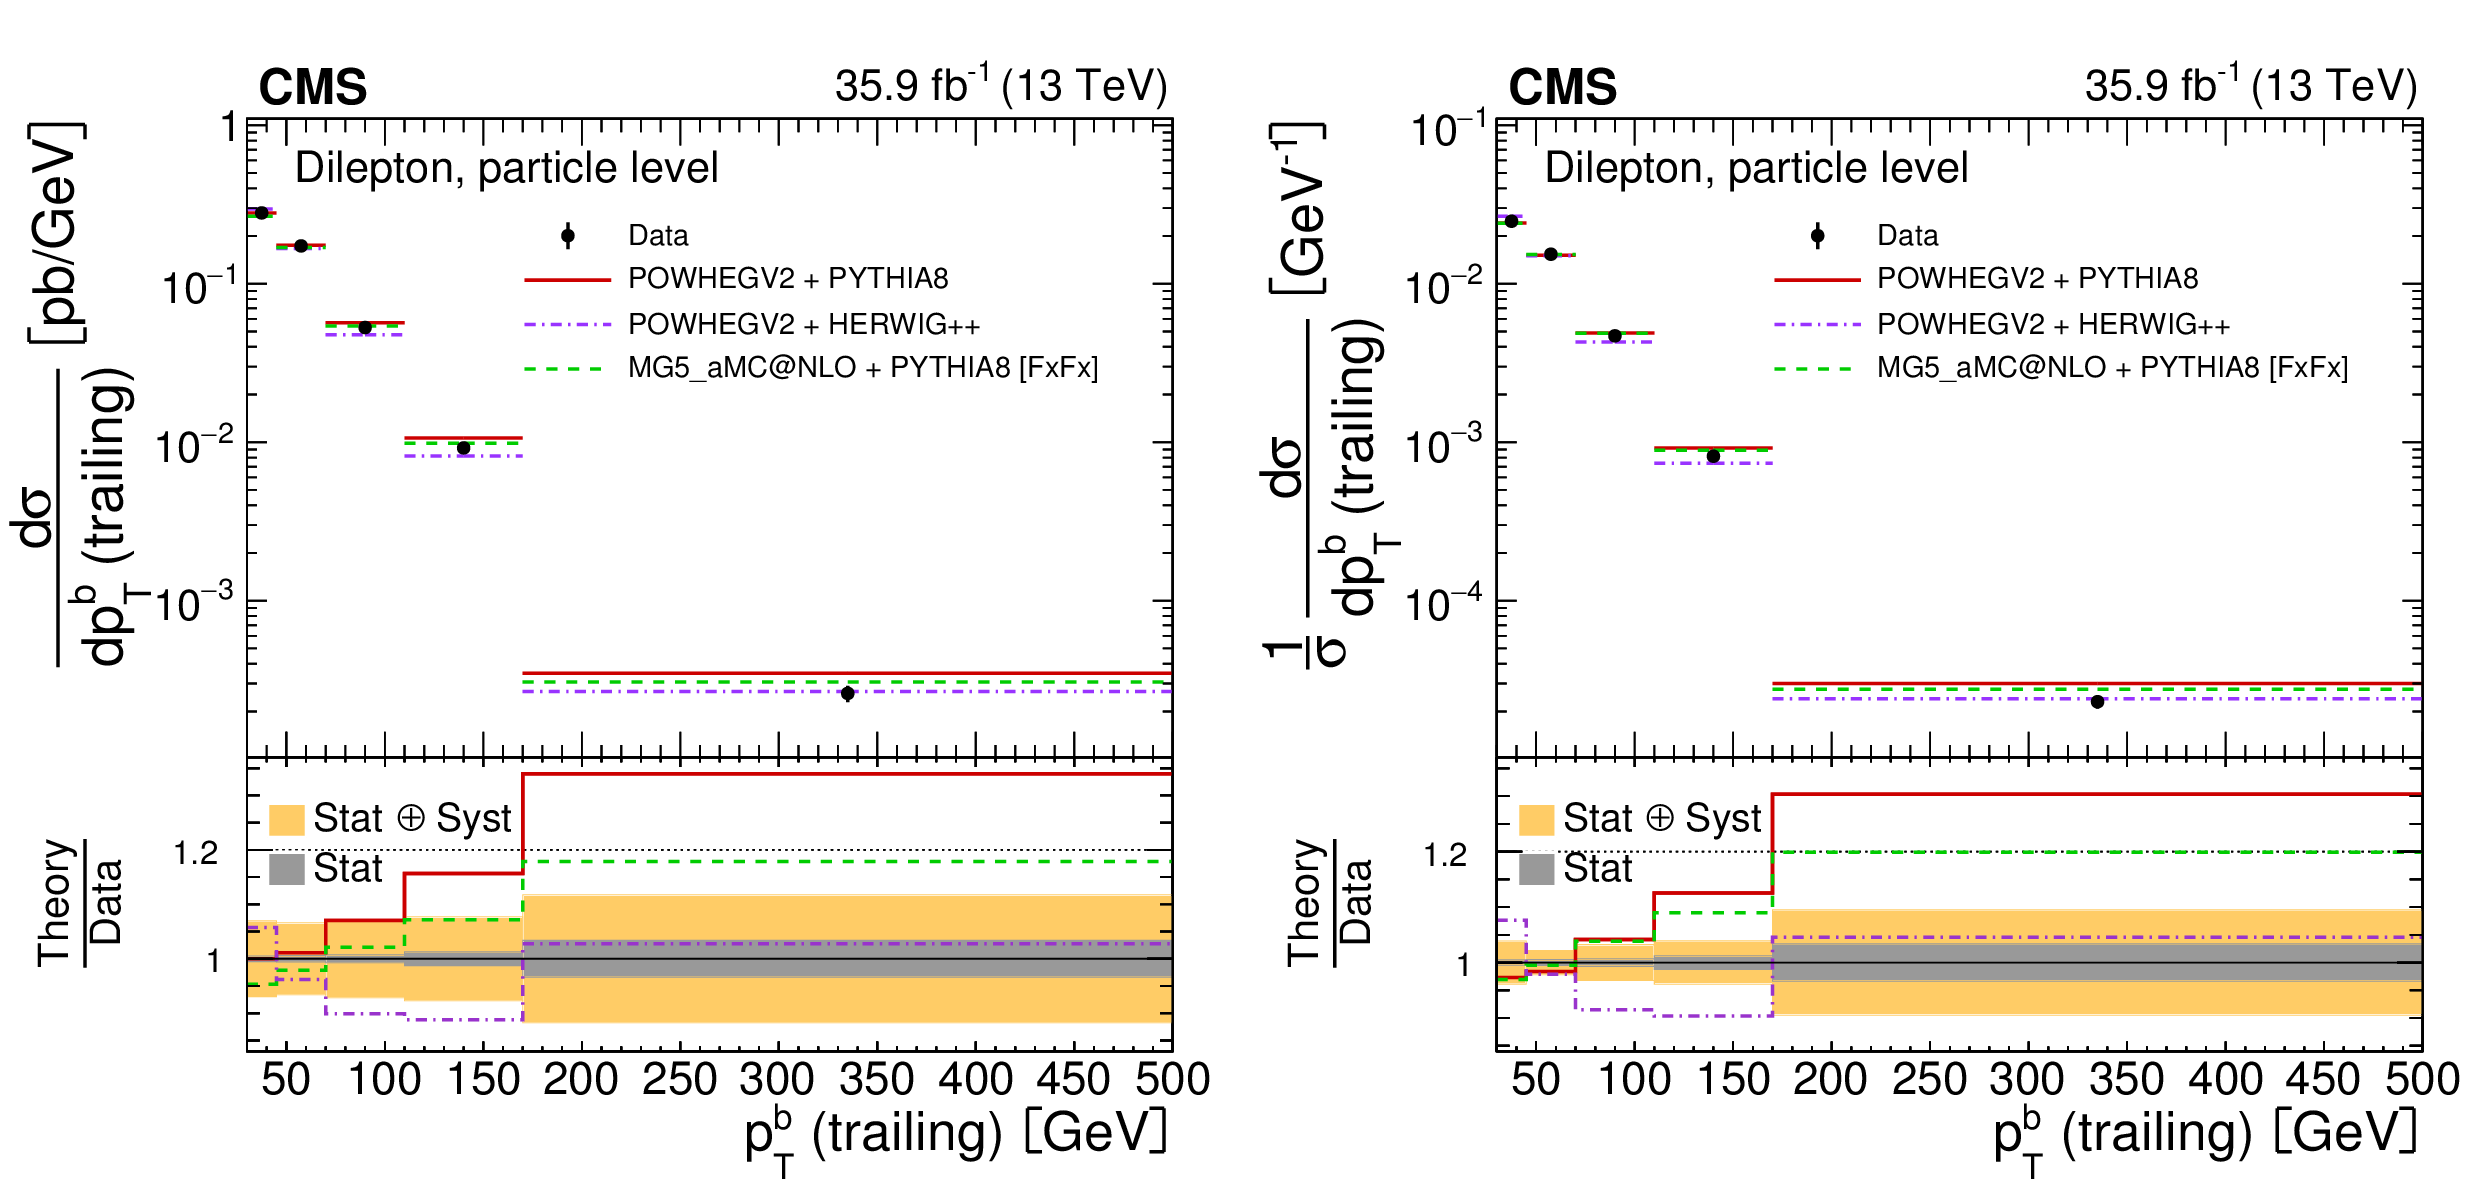
png pdf |
Figure 38:
The differential $ {{\mathrm {t}\overline {\mathrm {t}}}} $ production cross sections as a function of $ {\eta _{{\bar{\ell}}}} $ in a fiducial phase space at the particle level are shown for the data (points) and the MC predictions (lines). The vertical lines on the points indicate the total uncertainty in the data. The left and right plots correspond to absolute and normalised measurements, respectively. The lower panel in each plot shows the ratios of the theoretical predictions to the data. The dark and light bands show the relative statistical and total uncertainties in the data, respectively. |
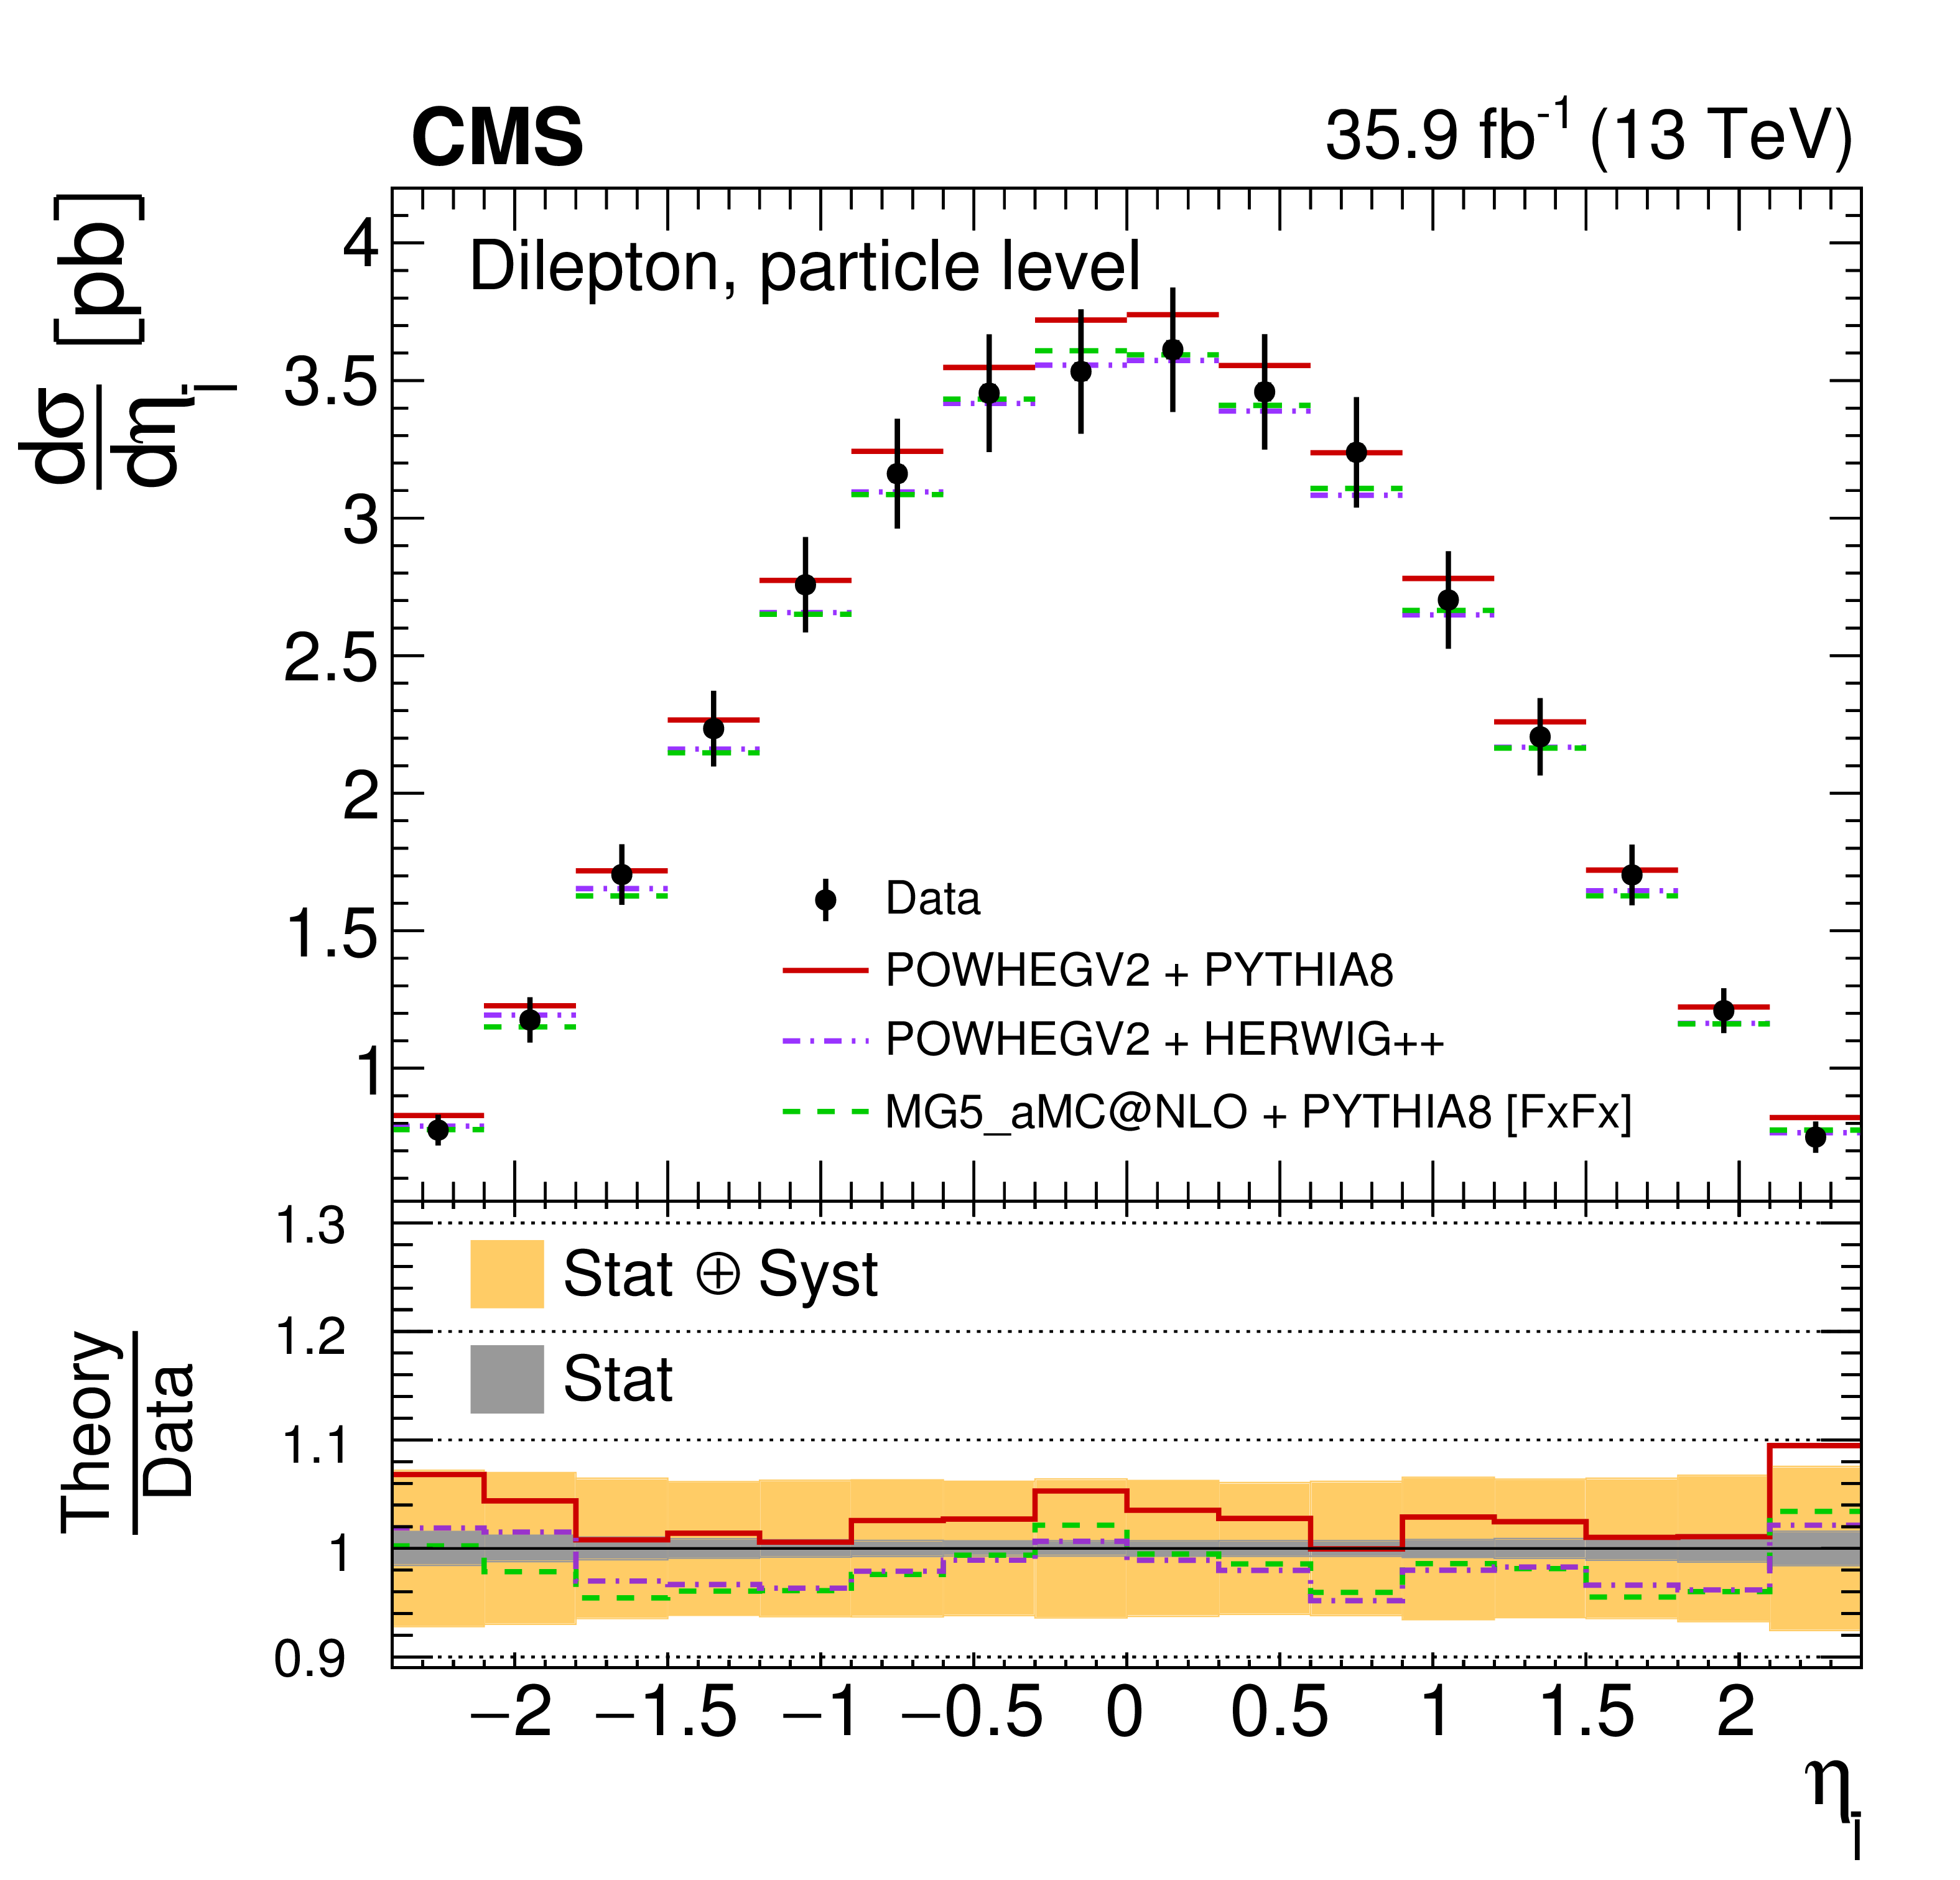
png pdf |
Figure 38-a:
The differential $ {{\mathrm {t}\overline {\mathrm {t}}}} $ production cross sections as a function of $ {\eta _{{\bar{\ell}}}} $ in a fiducial phase space at the particle level are shown for the data (points) and the MC predictions (lines). The vertical lines on the points indicate the total uncertainty in the data. The left and right plots correspond to absolute and normalised measurements, respectively. The lower panel in each plot shows the ratios of the theoretical predictions to the data. The dark and light bands show the relative statistical and total uncertainties in the data, respectively. |

png pdf |
Figure 38-b:
The differential $ {{\mathrm {t}\overline {\mathrm {t}}}} $ production cross sections as a function of $ {\eta _{{\bar{\ell}}}} $ in a fiducial phase space at the particle level are shown for the data (points) and the MC predictions (lines). The vertical lines on the points indicate the total uncertainty in the data. The left and right plots correspond to absolute and normalised measurements, respectively. The lower panel in each plot shows the ratios of the theoretical predictions to the data. The dark and light bands show the relative statistical and total uncertainties in the data, respectively. |
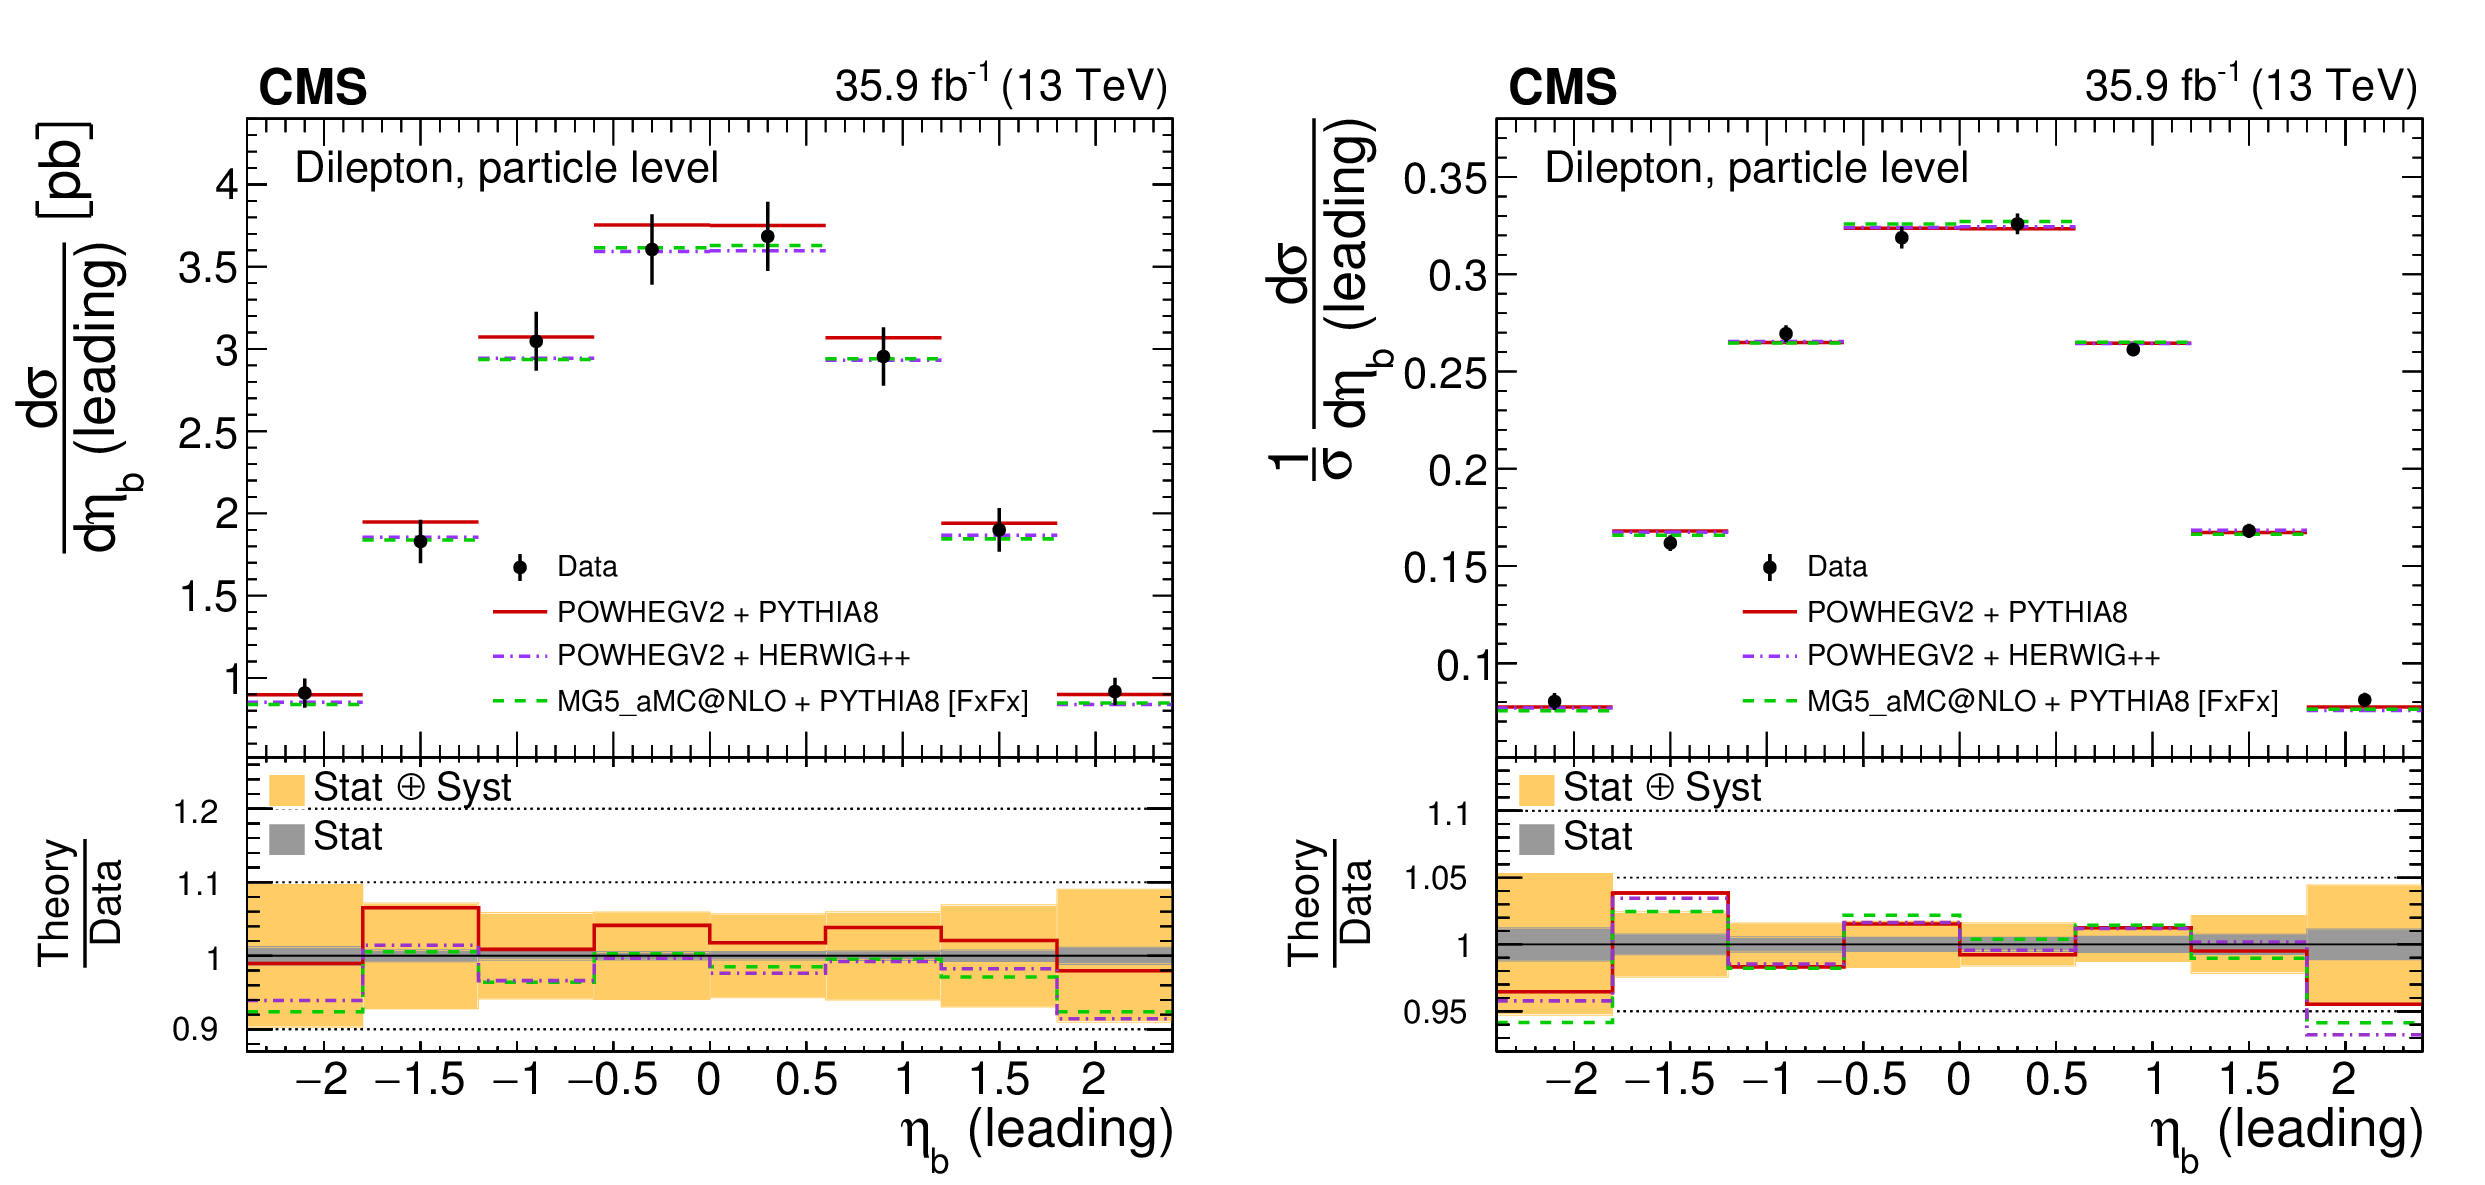
png pdf |
Figure 39:
The differential $ {{\mathrm {t}\overline {\mathrm {t}}}} $ production cross sections as a function of $ {\eta _{{\ell}}} $ (leading) in a fiducial phase space at the particle level are shown for the data (points) and the MC predictions (lines). The vertical lines on the points indicate the total uncertainty in the data. The left and right plots correspond to absolute and normalised measurements, respectively. The lower panel in each plot shows the ratios of the theoretical predictions to the data. The dark and light bands show the relative statistical and total uncertainties in the data, respectively. |

png pdf |
Figure 39-a:
The differential $ {{\mathrm {t}\overline {\mathrm {t}}}} $ production cross sections as a function of $ {\eta _{{\ell}}} $ (leading) in a fiducial phase space at the particle level are shown for the data (points) and the MC predictions (lines). The vertical lines on the points indicate the total uncertainty in the data. The left and right plots correspond to absolute and normalised measurements, respectively. The lower panel in each plot shows the ratios of the theoretical predictions to the data. The dark and light bands show the relative statistical and total uncertainties in the data, respectively. |
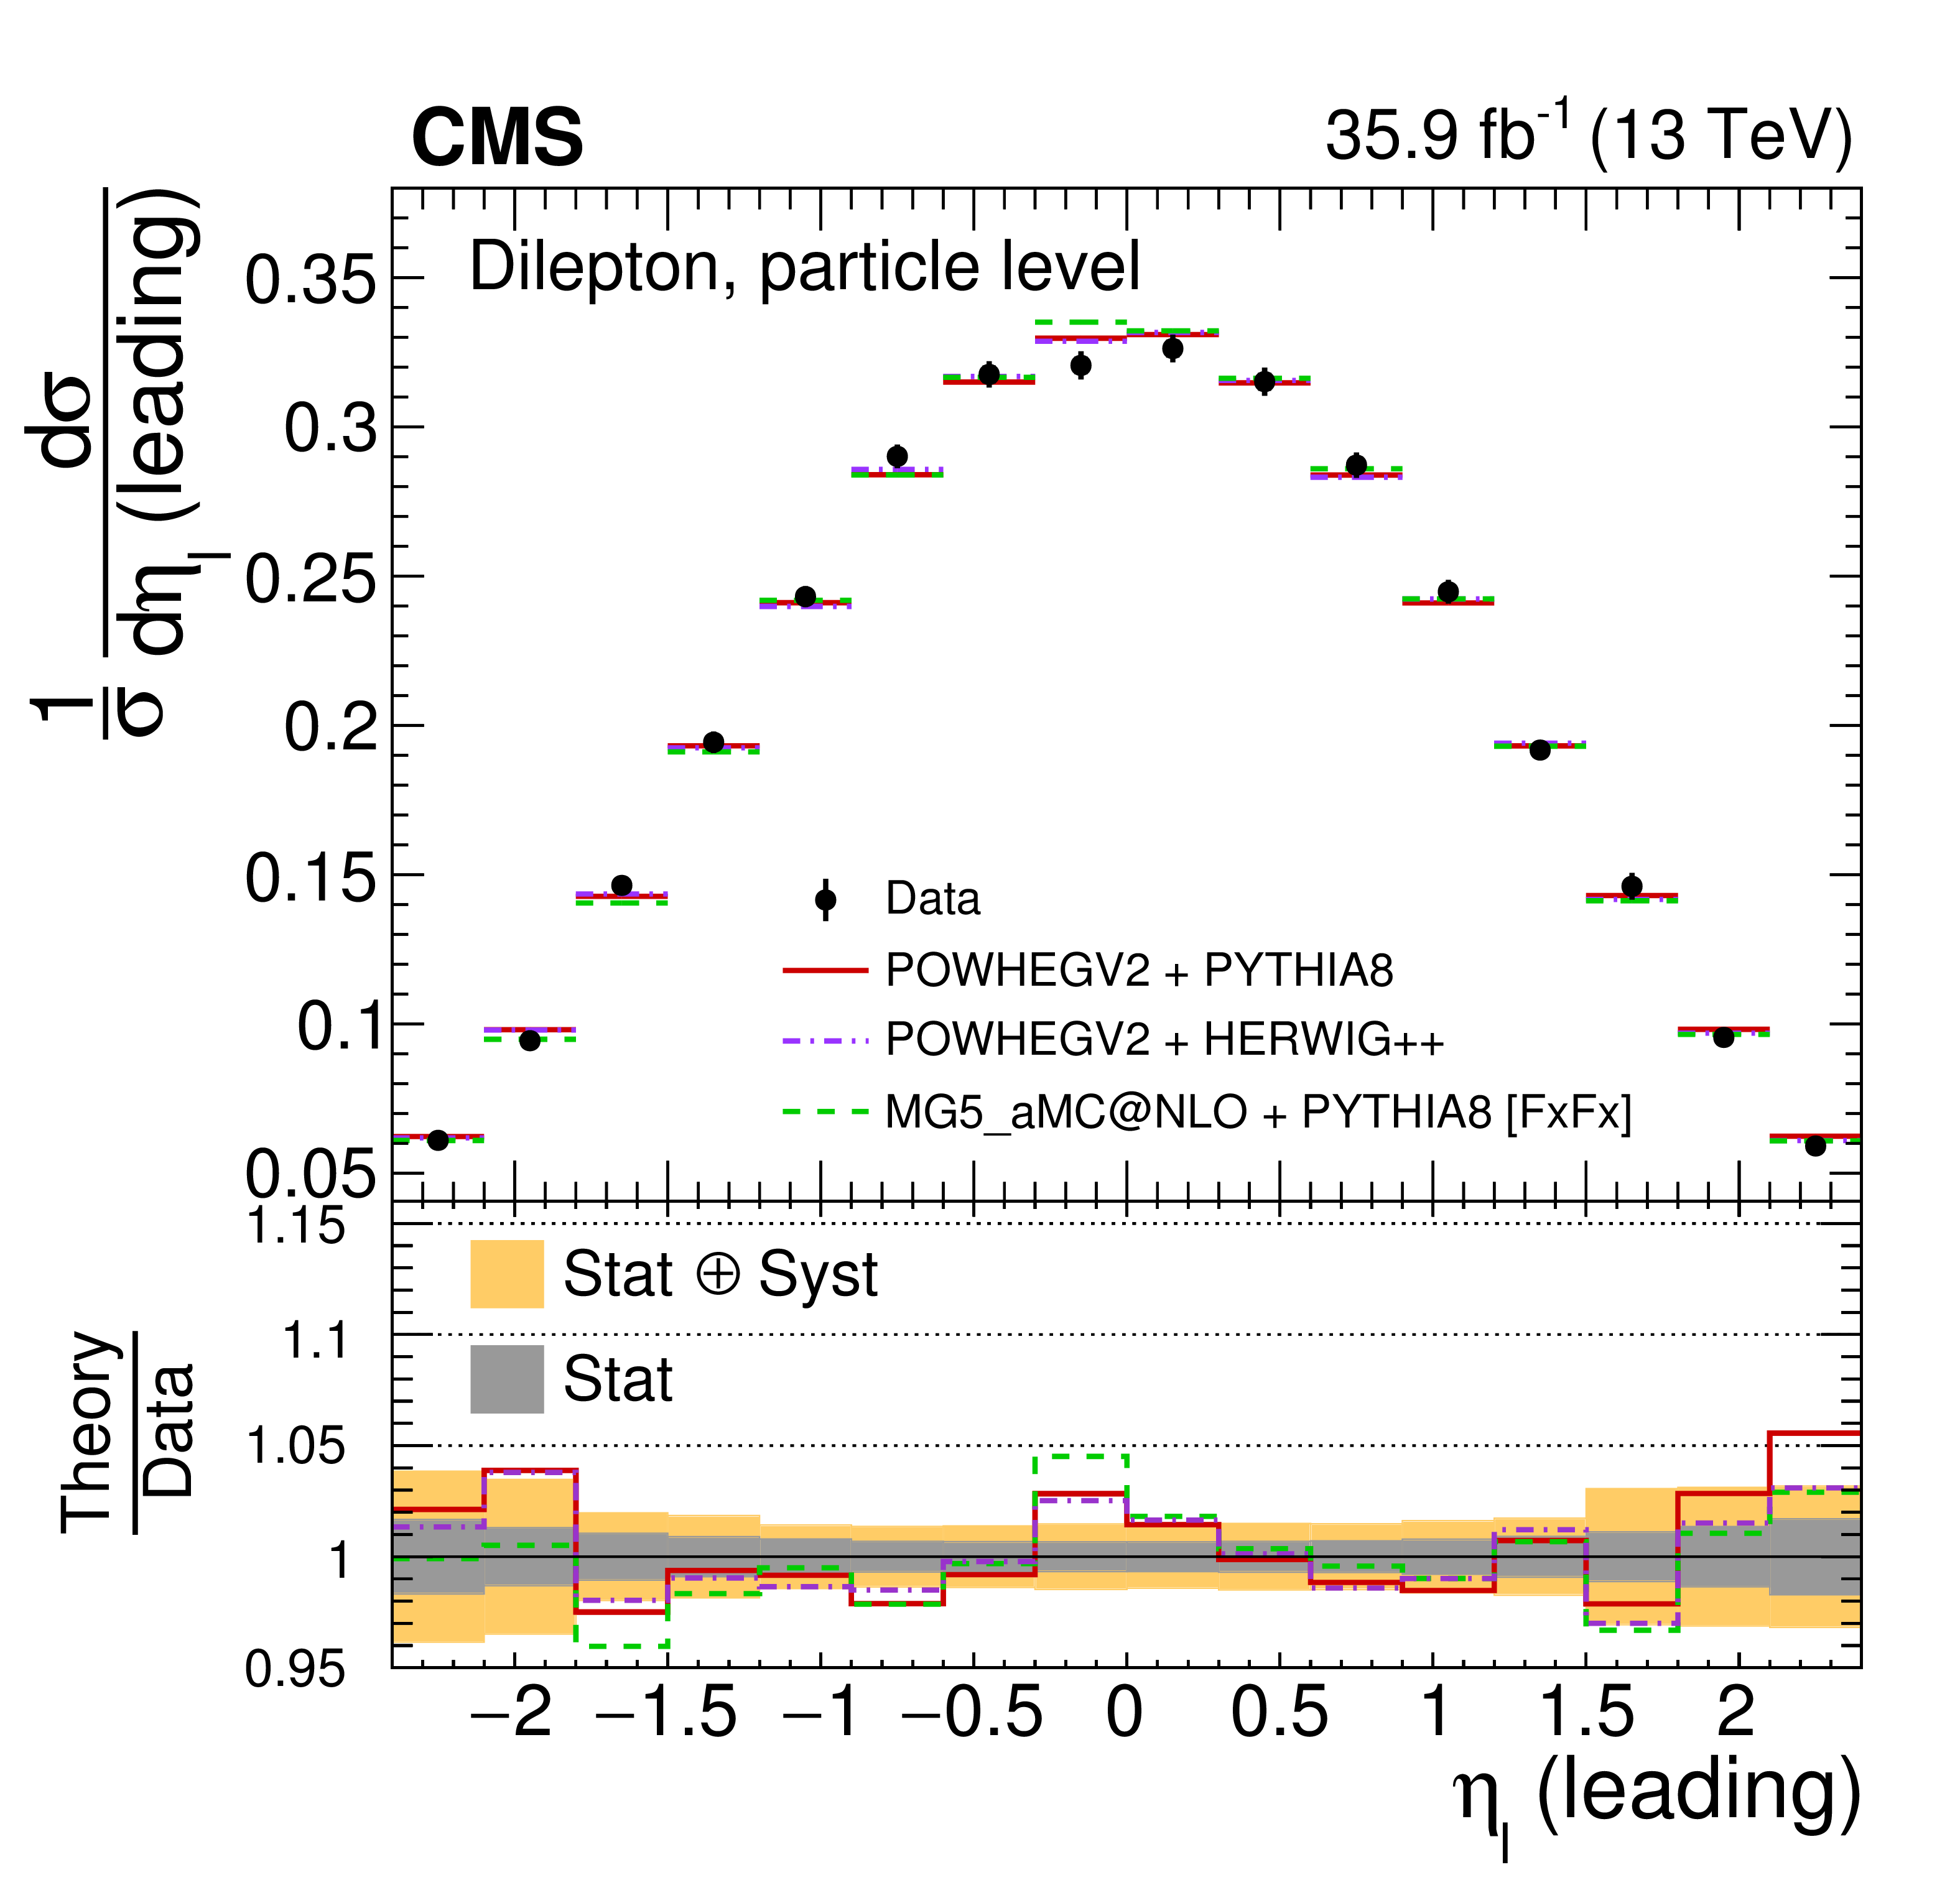
png pdf |
Figure 39-b:
The differential $ {{\mathrm {t}\overline {\mathrm {t}}}} $ production cross sections as a function of $ {\eta _{{\ell}}} $ (leading) in a fiducial phase space at the particle level are shown for the data (points) and the MC predictions (lines). The vertical lines on the points indicate the total uncertainty in the data. The left and right plots correspond to absolute and normalised measurements, respectively. The lower panel in each plot shows the ratios of the theoretical predictions to the data. The dark and light bands show the relative statistical and total uncertainties in the data, respectively. |
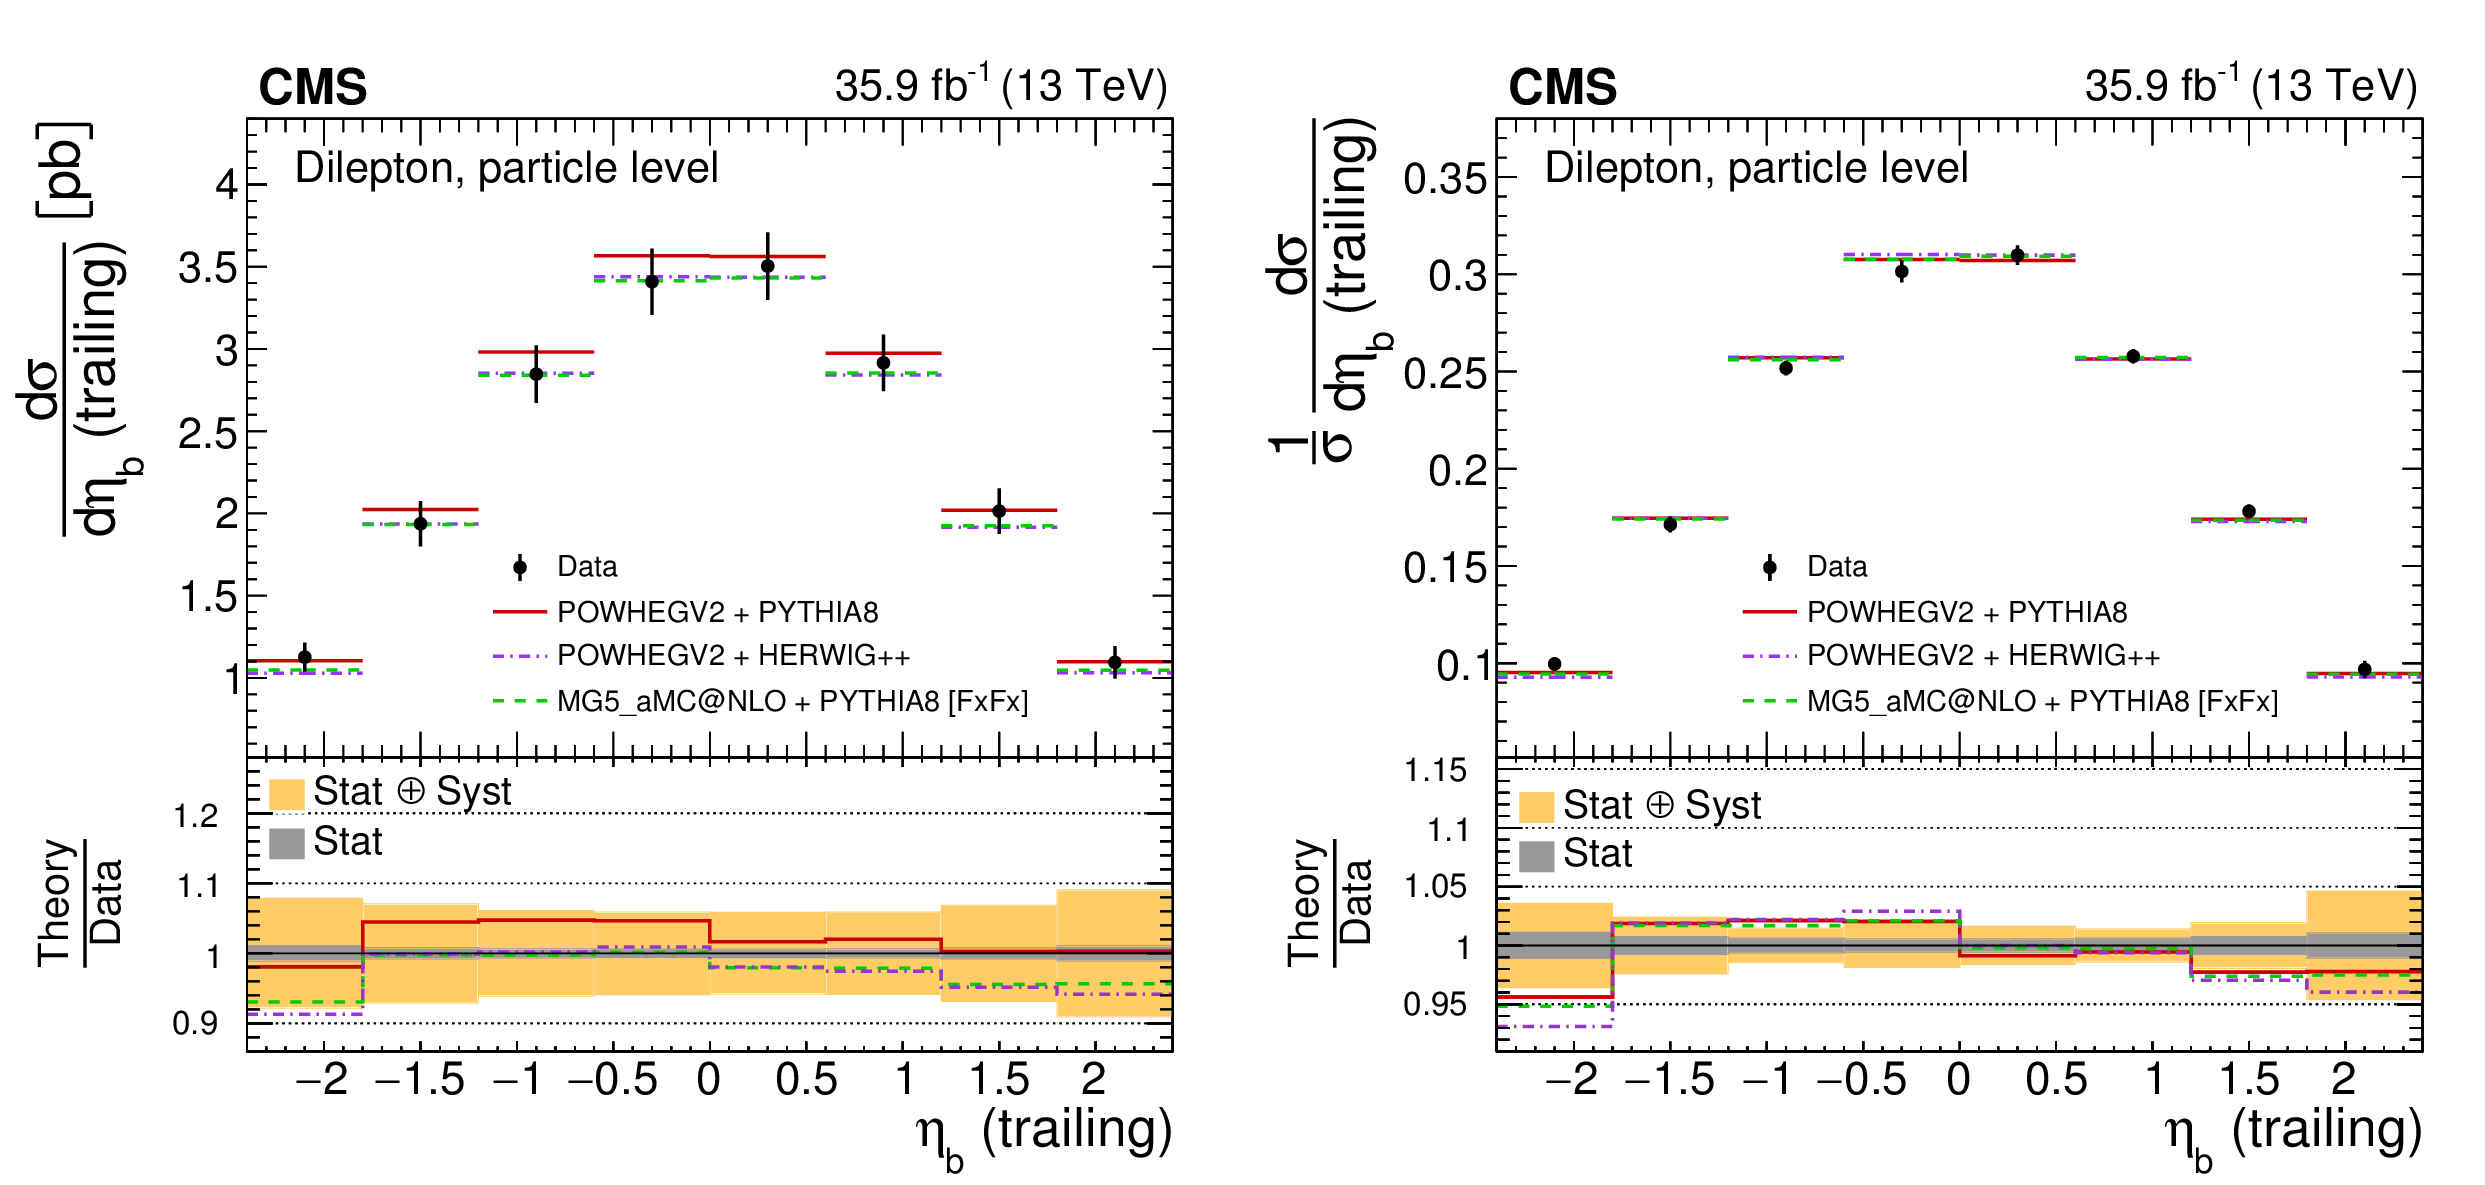
png pdf |
Figure 40:
The differential $ {{\mathrm {t}\overline {\mathrm {t}}}} $ production cross sections as a function of $ {\eta _{{\ell}}} $ (trailing) in a fiducial phase space at the particle level are shown for the data (points) and the MC predictions (lines). The vertical lines on the points indicate the total uncertainty in the data. The left and right plots correspond to absolute and normalised measurements, respectively. The lower panel in each plot shows the ratios of the theoretical predictions to the data. The dark and light bands show the relative statistical and total uncertainties in the data, respectively. |
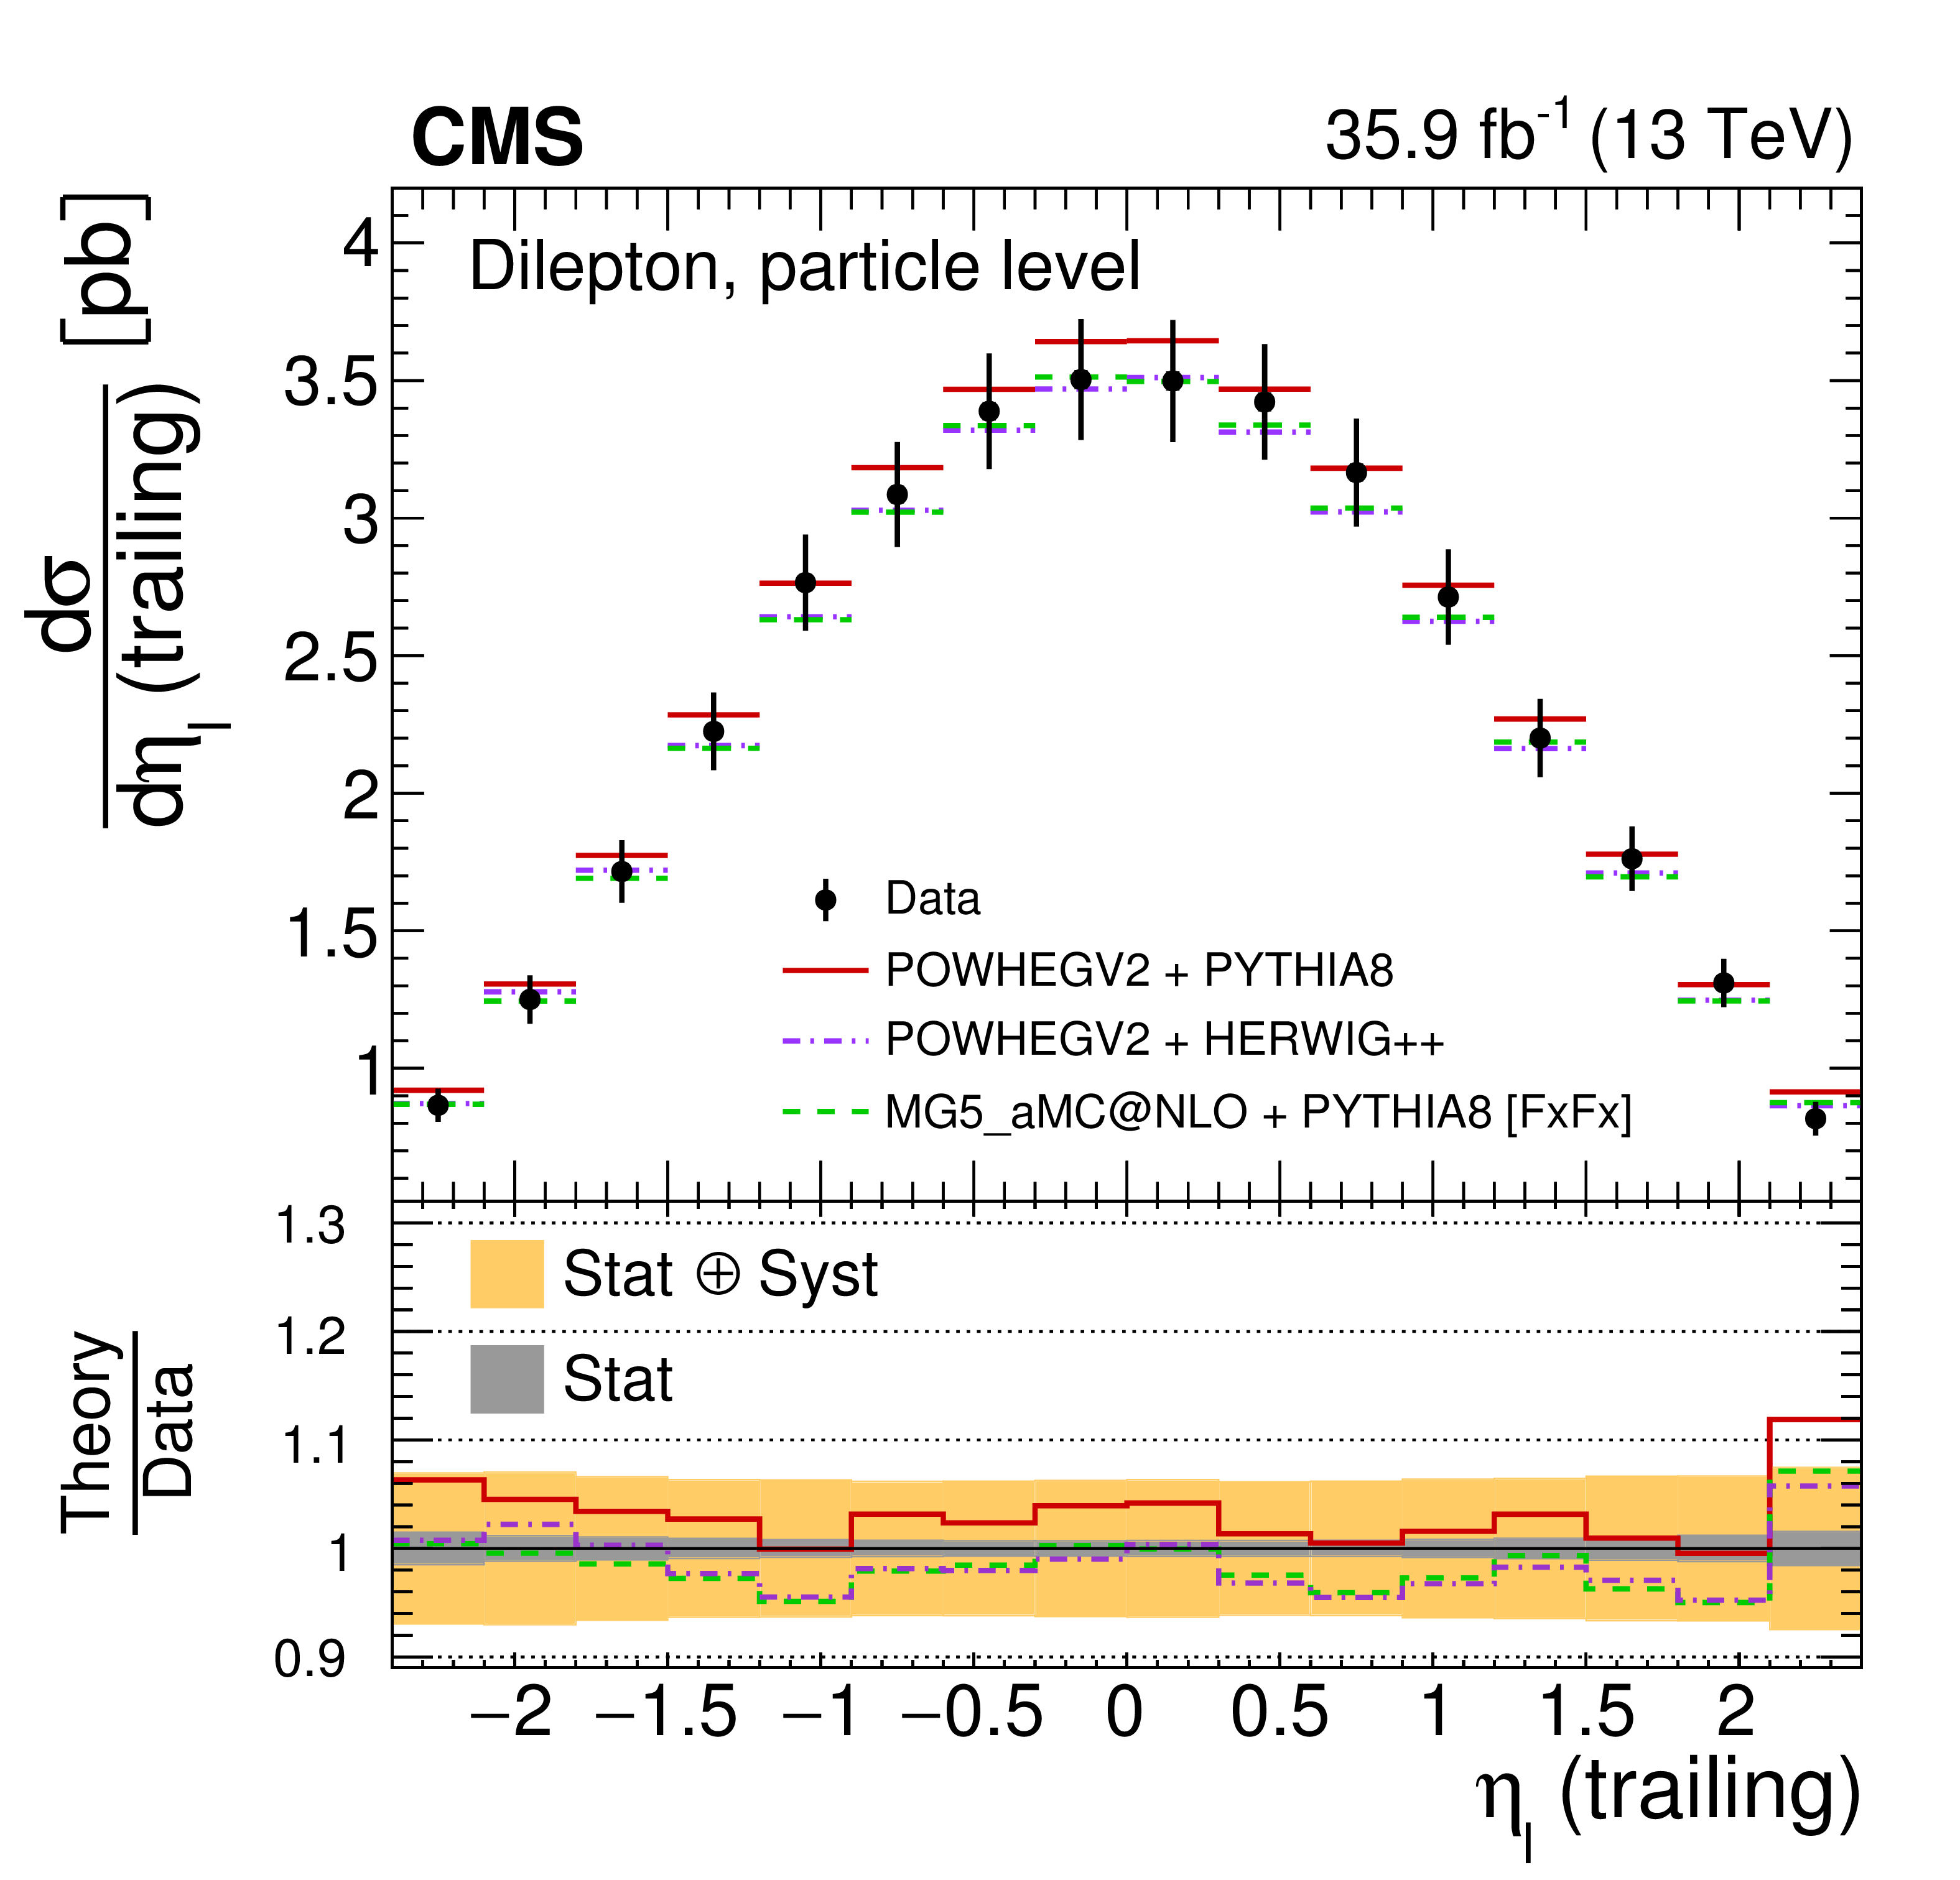
png pdf |
Figure 40-a:
The differential $ {{\mathrm {t}\overline {\mathrm {t}}}} $ production cross sections as a function of $ {\eta _{{\ell}}} $ (trailing) in a fiducial phase space at the particle level are shown for the data (points) and the MC predictions (lines). The vertical lines on the points indicate the total uncertainty in the data. The left and right plots correspond to absolute and normalised measurements, respectively. The lower panel in each plot shows the ratios of the theoretical predictions to the data. The dark and light bands show the relative statistical and total uncertainties in the data, respectively. |

png pdf |
Figure 40-b:
The differential $ {{\mathrm {t}\overline {\mathrm {t}}}} $ production cross sections as a function of $ {\eta _{{\ell}}} $ (trailing) in a fiducial phase space at the particle level are shown for the data (points) and the MC predictions (lines). The vertical lines on the points indicate the total uncertainty in the data. The left and right plots correspond to absolute and normalised measurements, respectively. The lower panel in each plot shows the ratios of the theoretical predictions to the data. The dark and light bands show the relative statistical and total uncertainties in the data, respectively. |
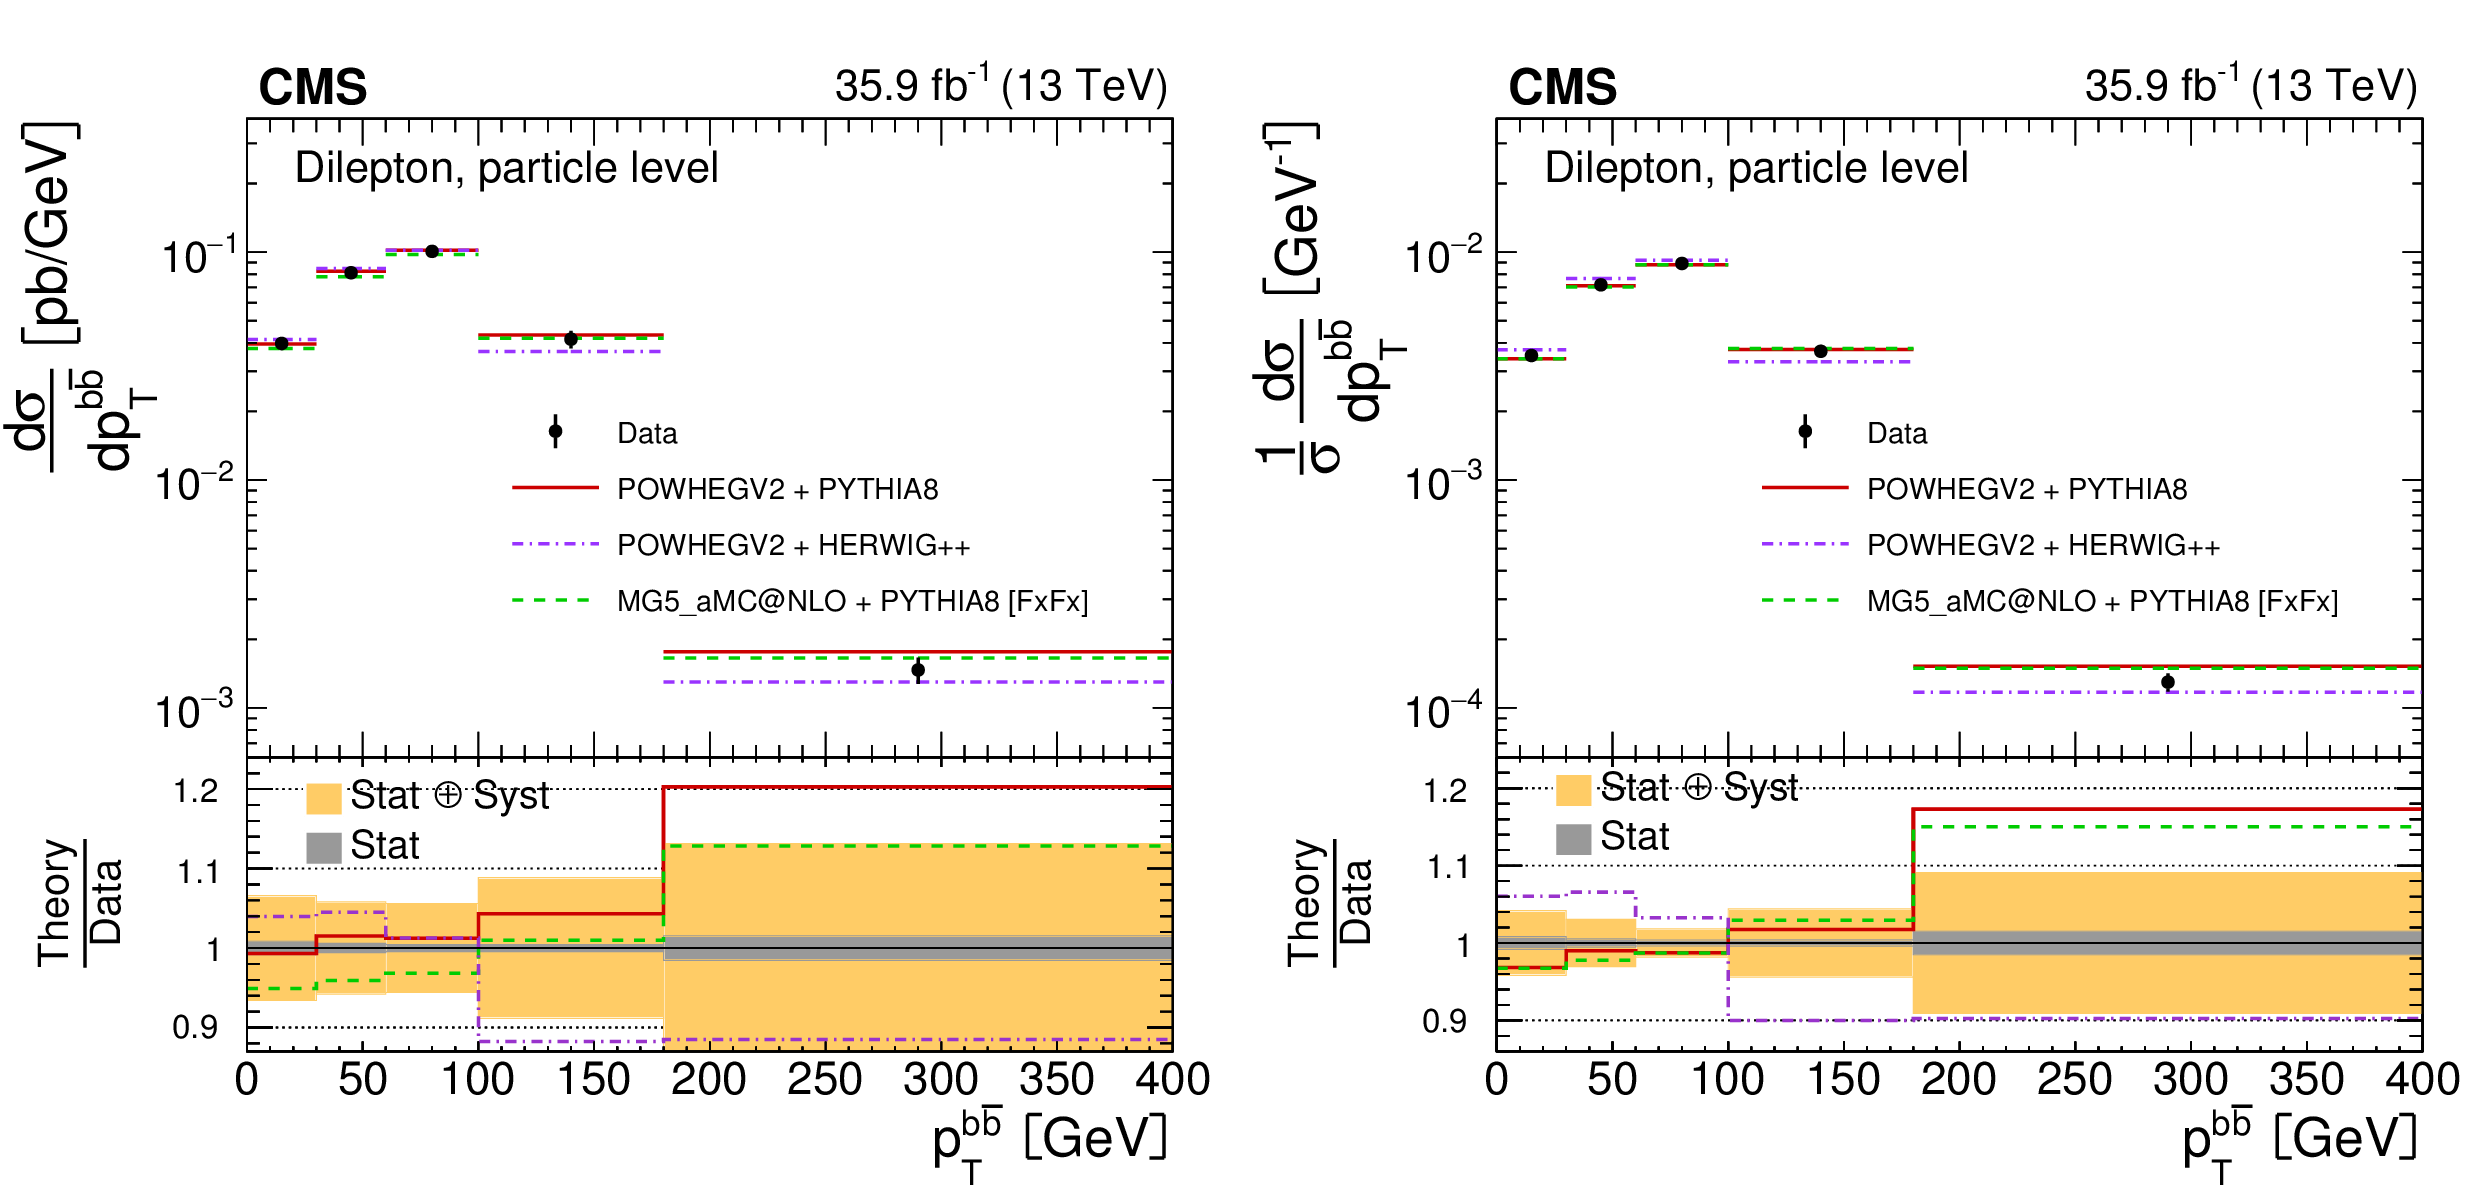
png pdf |
Figure 41:
The differential $ {{\mathrm {t}\overline {\mathrm {t}}}} $ production cross sections as a function of $ {{p_{\mathrm {T}}} ^{{\ell \bar{\ell}}}} $ in a fiducial phase space at the particle level are shown for the data (points) and the MC predictions (lines). The vertical lines on the points indicate the total uncertainty in the data. The left and right plots correspond to absolute and normalised measurements, respectively. The lower panel in each plot shows the ratios of the theoretical predictions to the data. The dark and light bands show the relative statistical and total uncertainties in the data, respectively. |

png pdf |
Figure 41-a:
The differential $ {{\mathrm {t}\overline {\mathrm {t}}}} $ production cross sections as a function of $ {{p_{\mathrm {T}}} ^{{\ell \bar{\ell}}}} $ in a fiducial phase space at the particle level are shown for the data (points) and the MC predictions (lines). The vertical lines on the points indicate the total uncertainty in the data. The left and right plots correspond to absolute and normalised measurements, respectively. The lower panel in each plot shows the ratios of the theoretical predictions to the data. The dark and light bands show the relative statistical and total uncertainties in the data, respectively. |
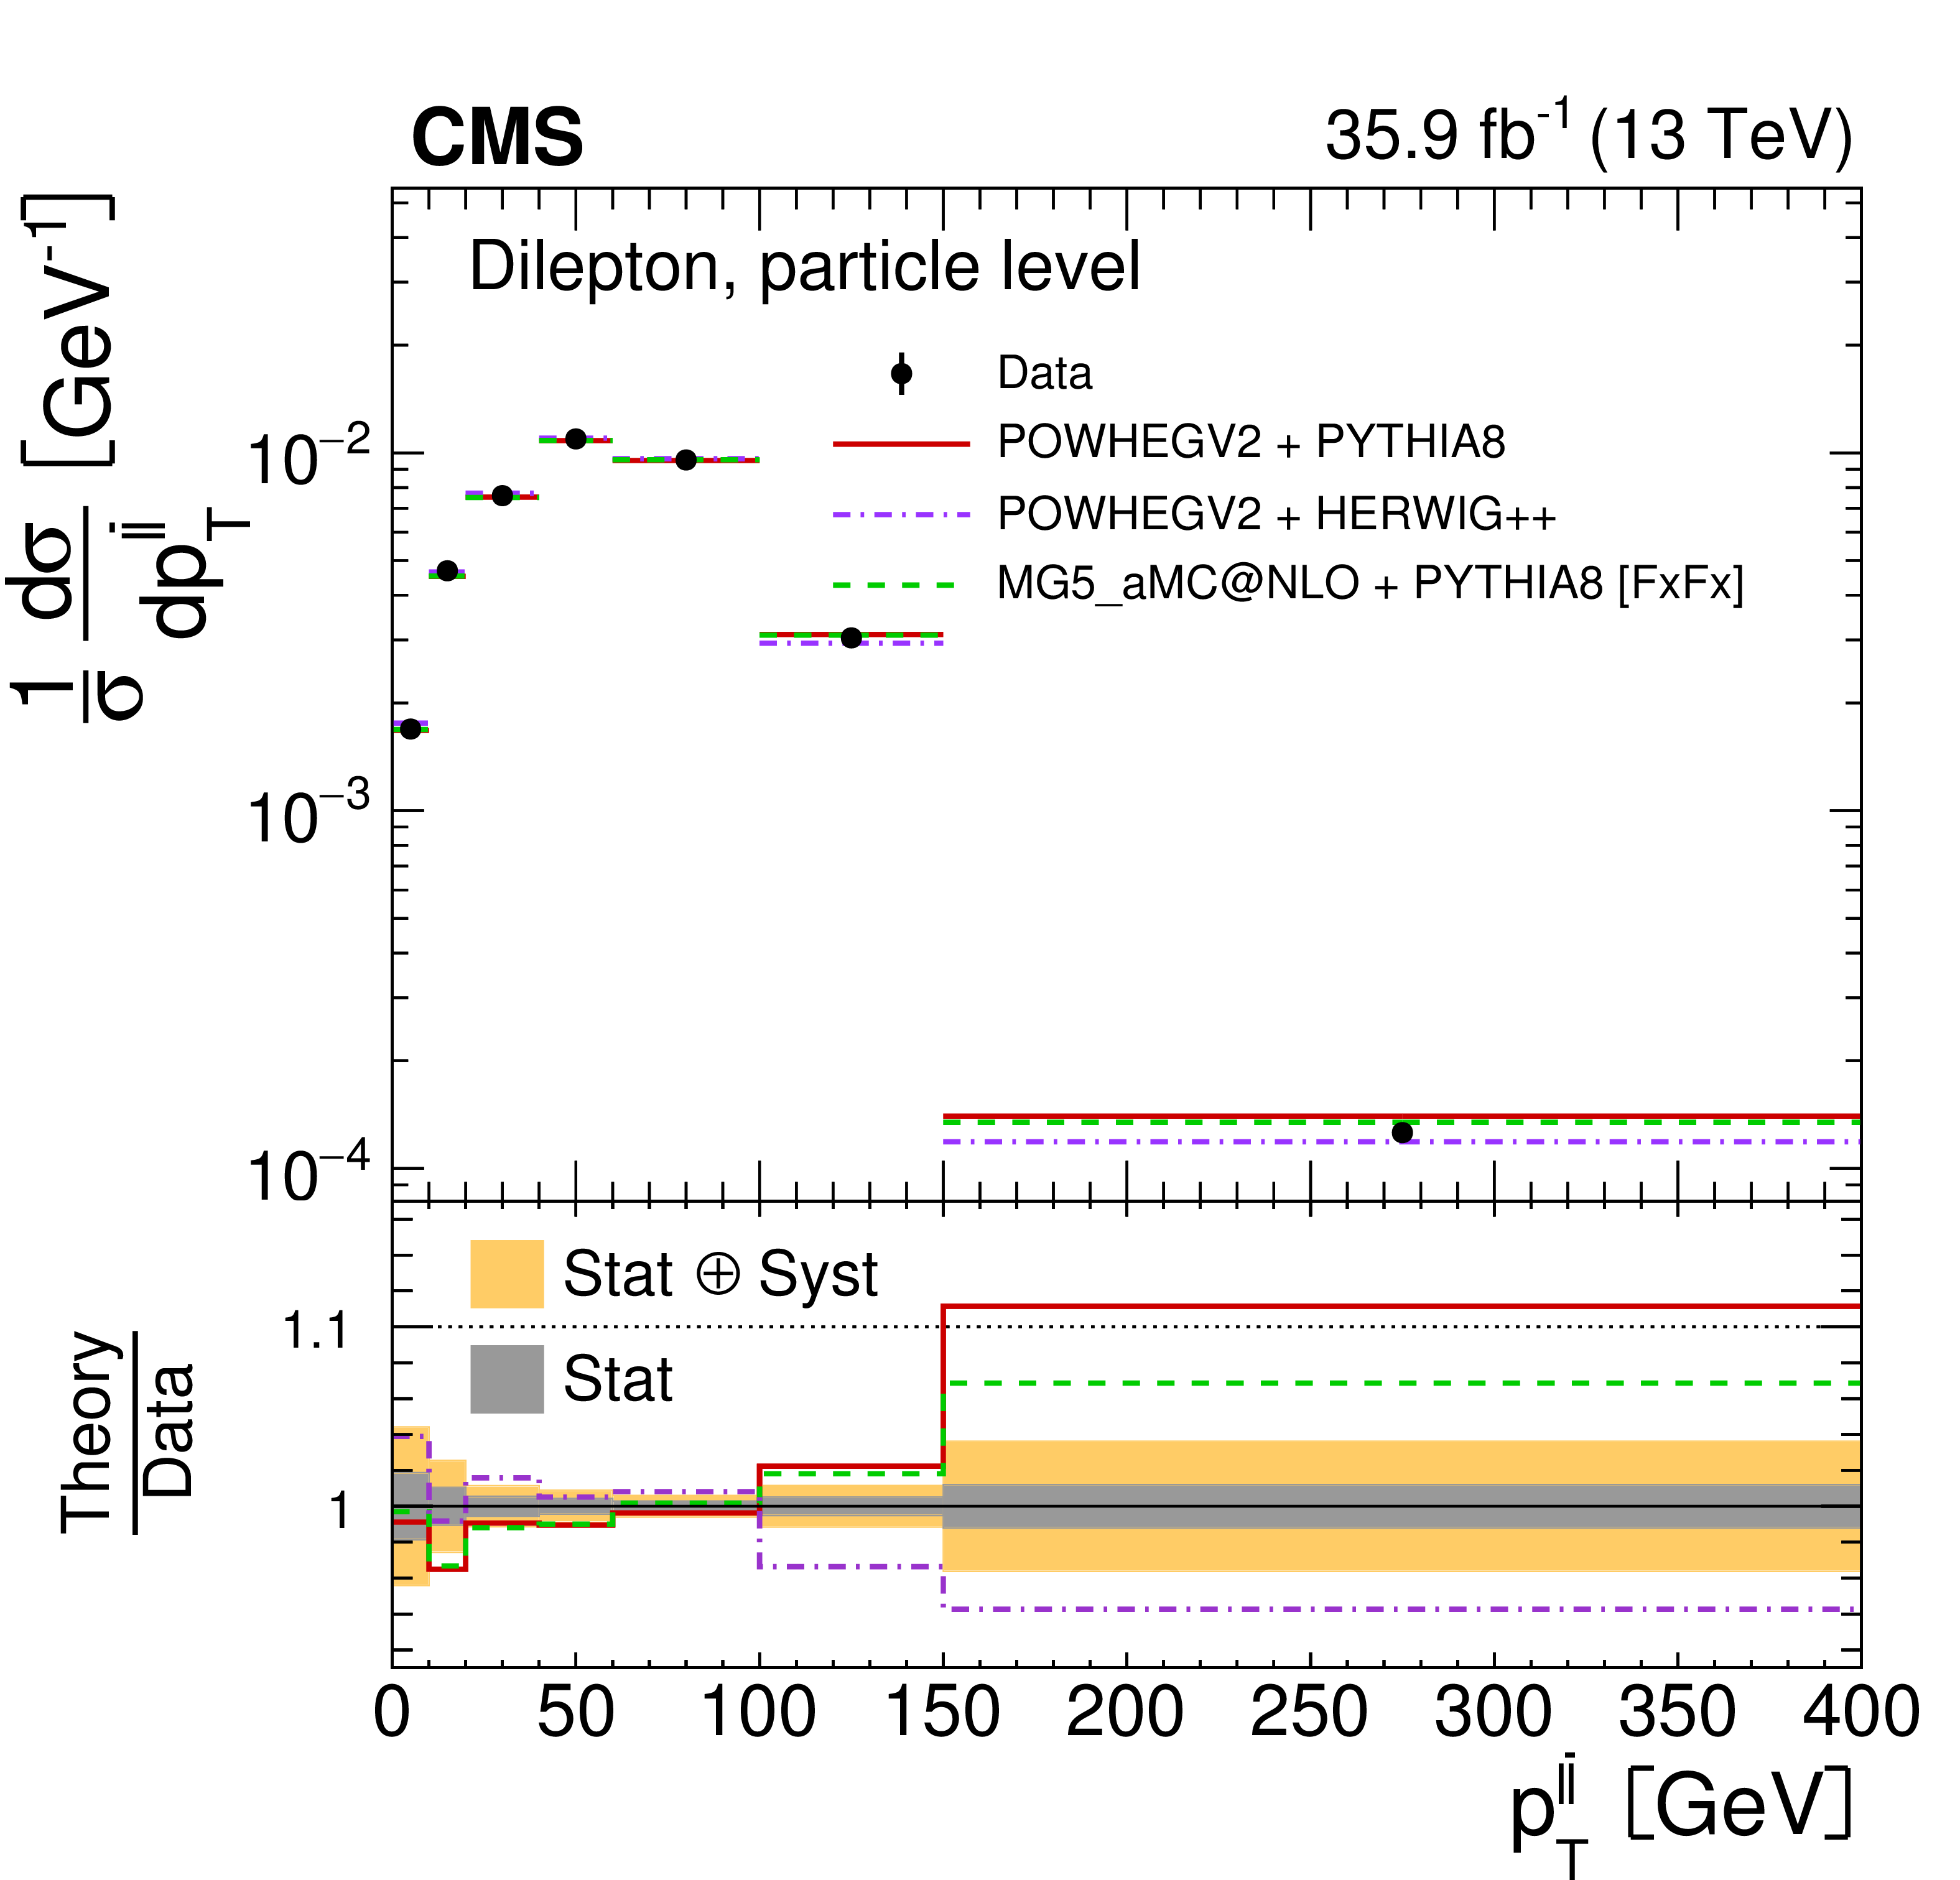
png pdf |
Figure 41-b:
The differential $ {{\mathrm {t}\overline {\mathrm {t}}}} $ production cross sections as a function of $ {{p_{\mathrm {T}}} ^{{\ell \bar{\ell}}}} $ in a fiducial phase space at the particle level are shown for the data (points) and the MC predictions (lines). The vertical lines on the points indicate the total uncertainty in the data. The left and right plots correspond to absolute and normalised measurements, respectively. The lower panel in each plot shows the ratios of the theoretical predictions to the data. The dark and light bands show the relative statistical and total uncertainties in the data, respectively. |
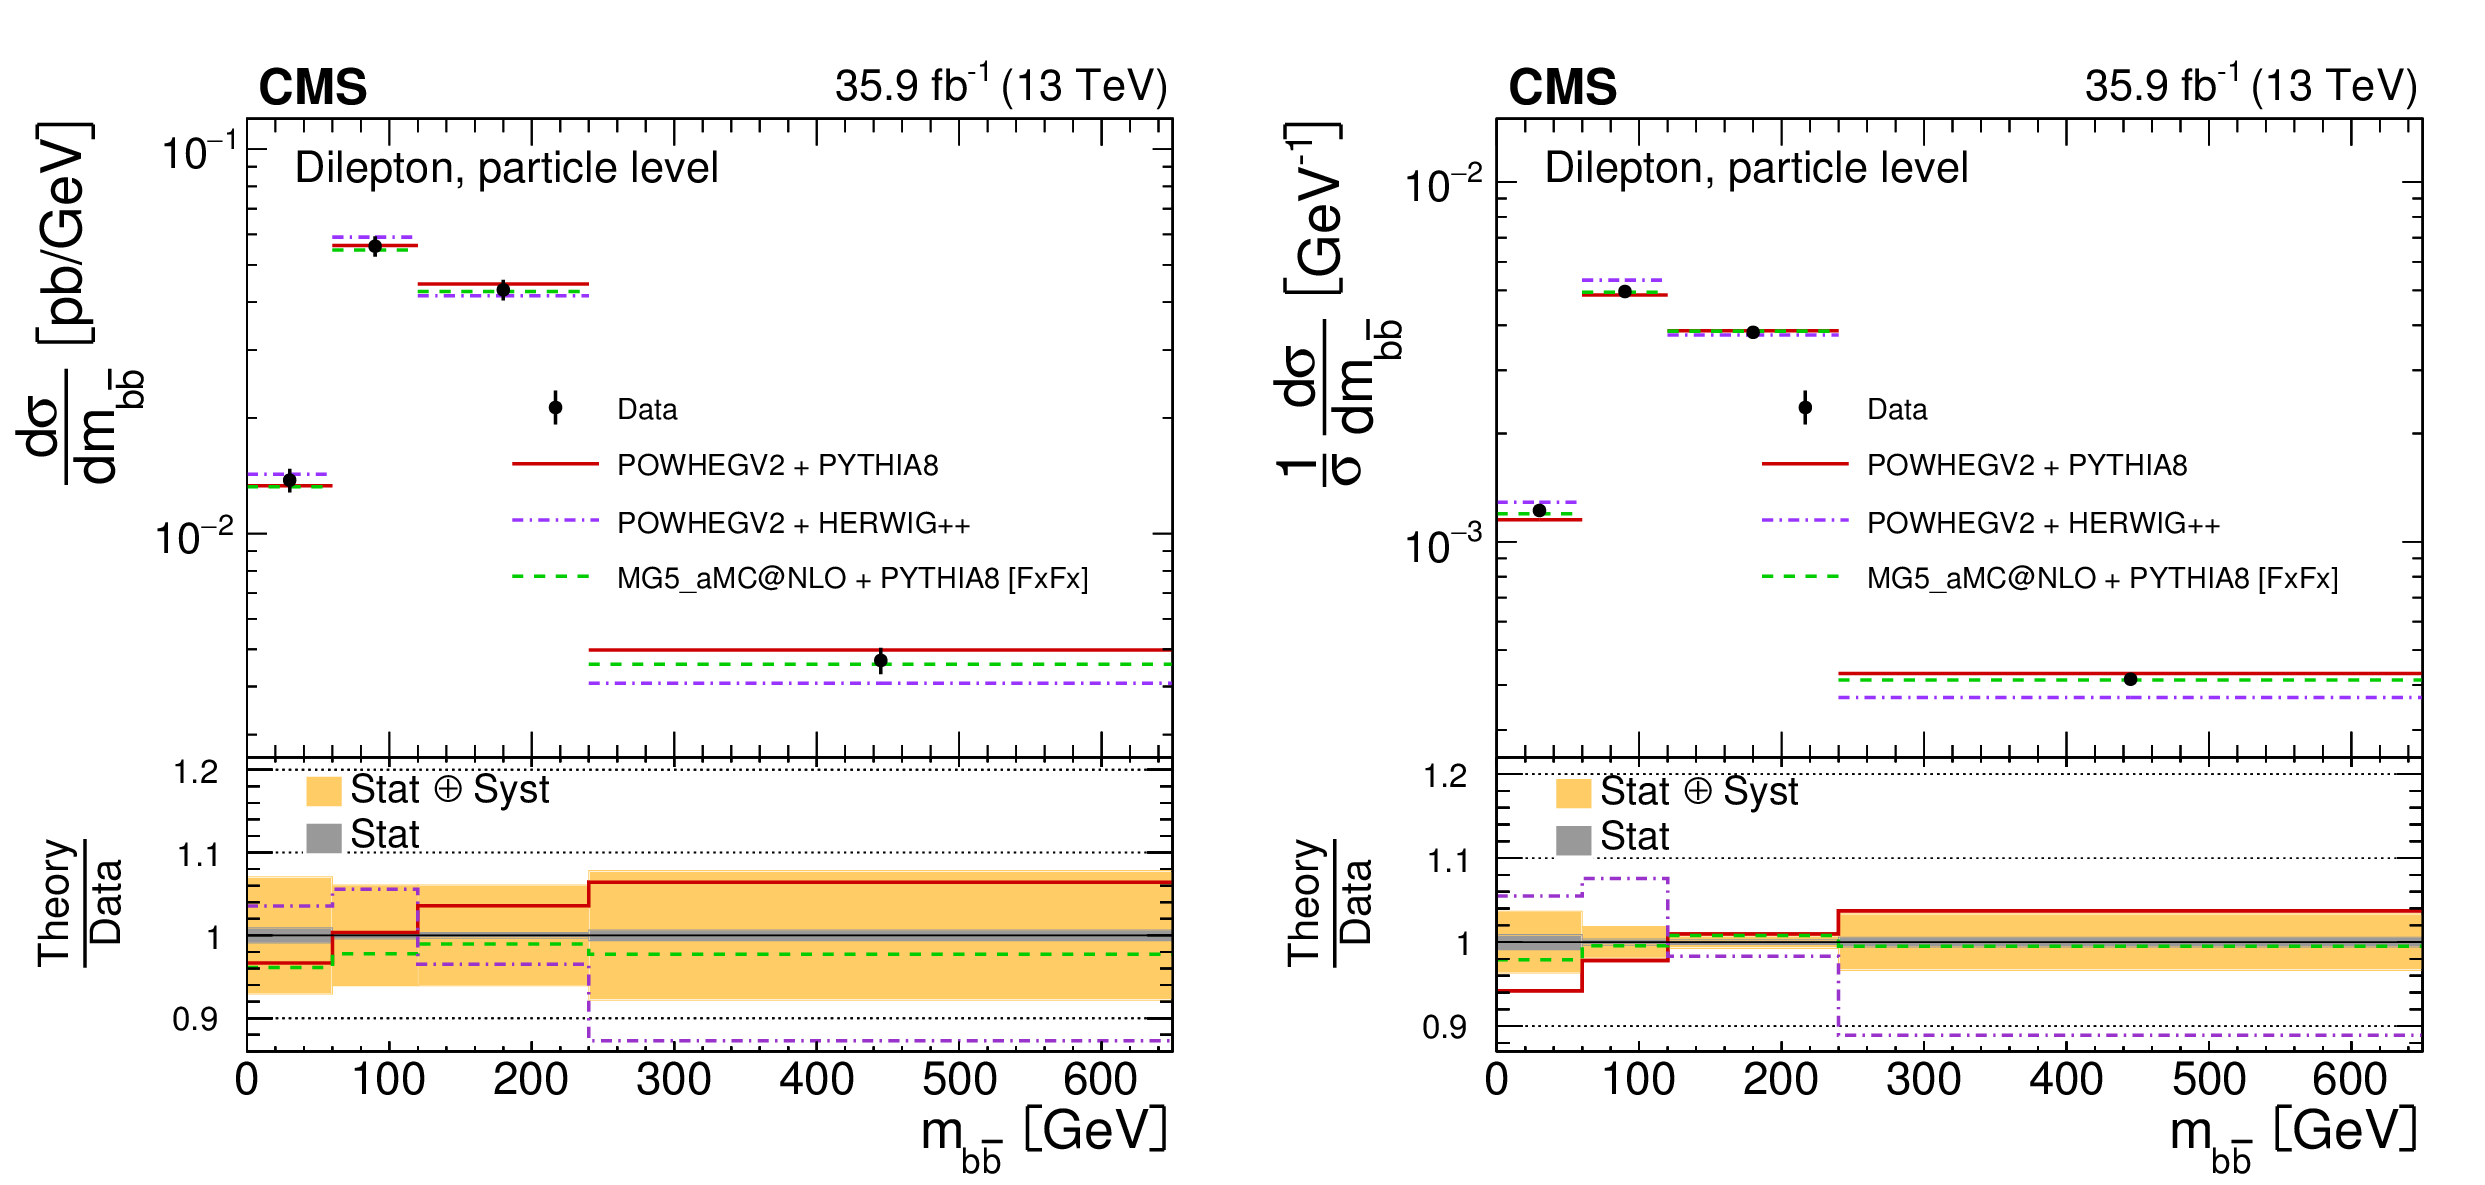
png pdf |
Figure 42:
The differential $ {{\mathrm {t}\overline {\mathrm {t}}}} $ production cross sections as a function of $ {m_{{\ell \bar{\ell}}}} $ in a fiducial phase space at the particle level are shown for the data (points) and the MC predictions (lines). The vertical lines on the points indicate the total uncertainty in the data. The left and right plots correspond to absolute and normalised measurements, respectively. The lower panel in each plot shows the ratios of the theoretical predictions to the data. The dark and light bands show the relative statistical and total uncertainties in the data, respectively. |
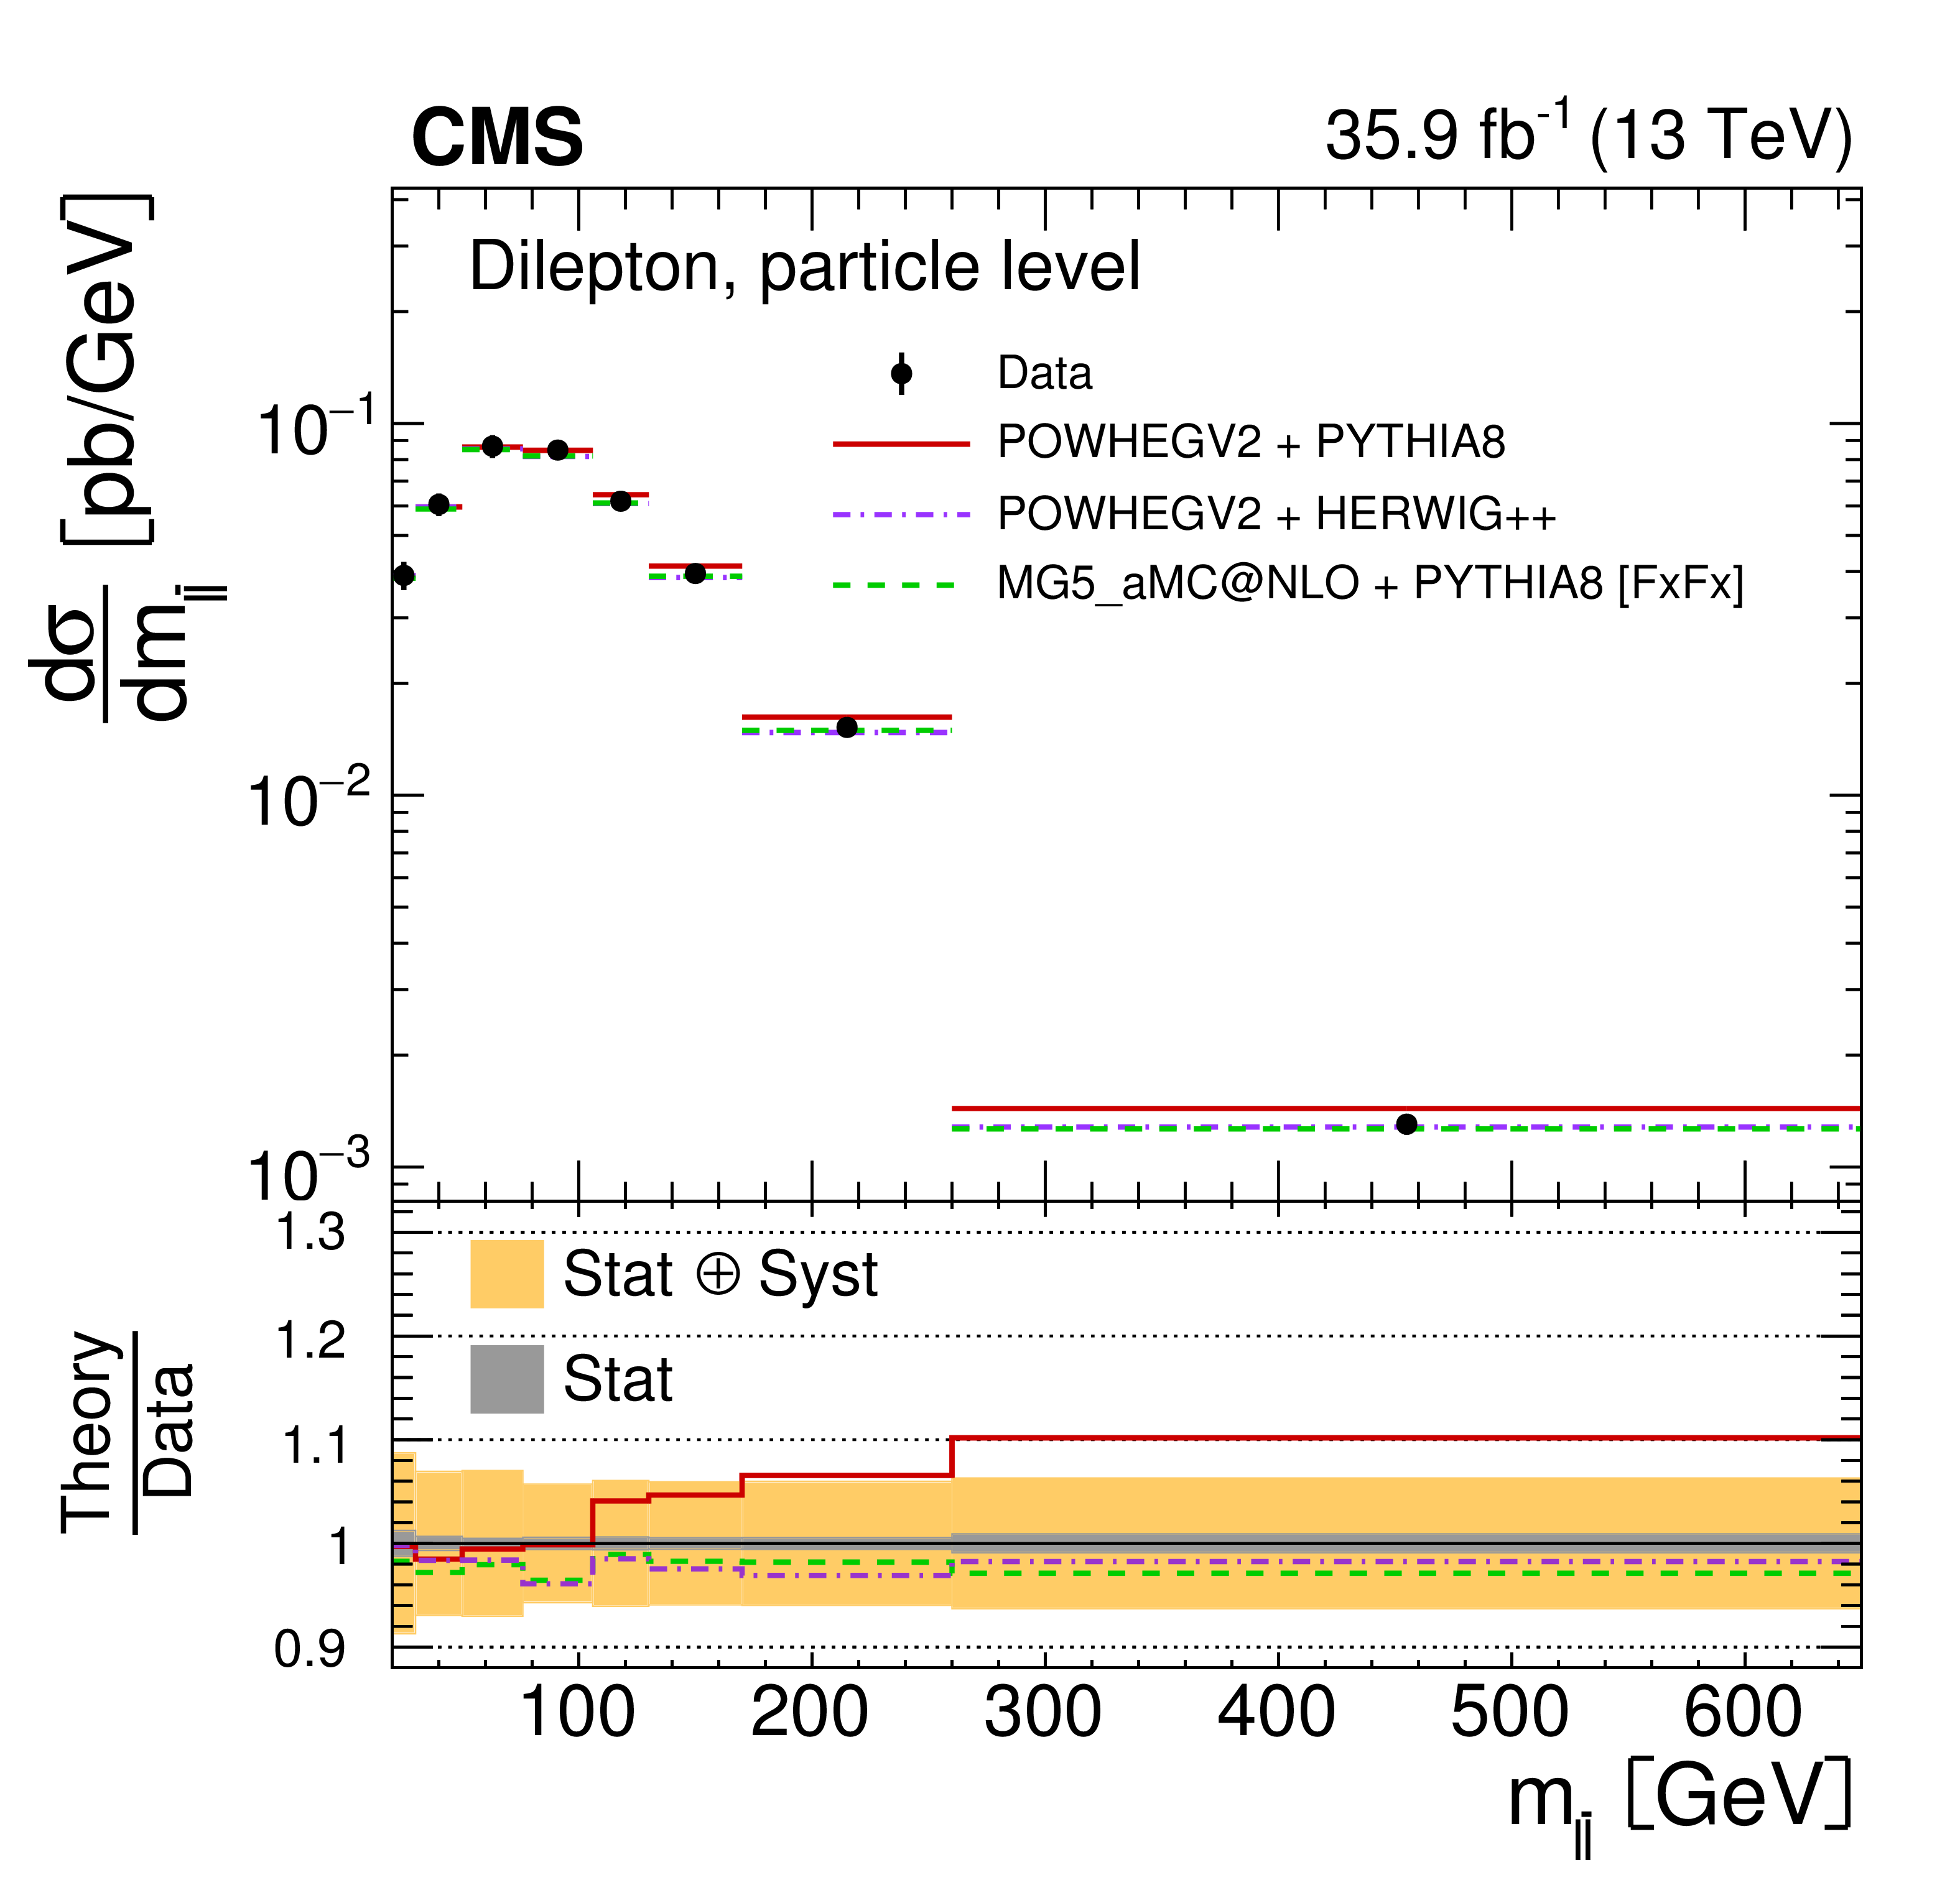
png pdf |
Figure 42-a:
The differential $ {{\mathrm {t}\overline {\mathrm {t}}}} $ production cross sections as a function of $ {m_{{\ell \bar{\ell}}}} $ in a fiducial phase space at the particle level are shown for the data (points) and the MC predictions (lines). The vertical lines on the points indicate the total uncertainty in the data. The left and right plots correspond to absolute and normalised measurements, respectively. The lower panel in each plot shows the ratios of the theoretical predictions to the data. The dark and light bands show the relative statistical and total uncertainties in the data, respectively. |
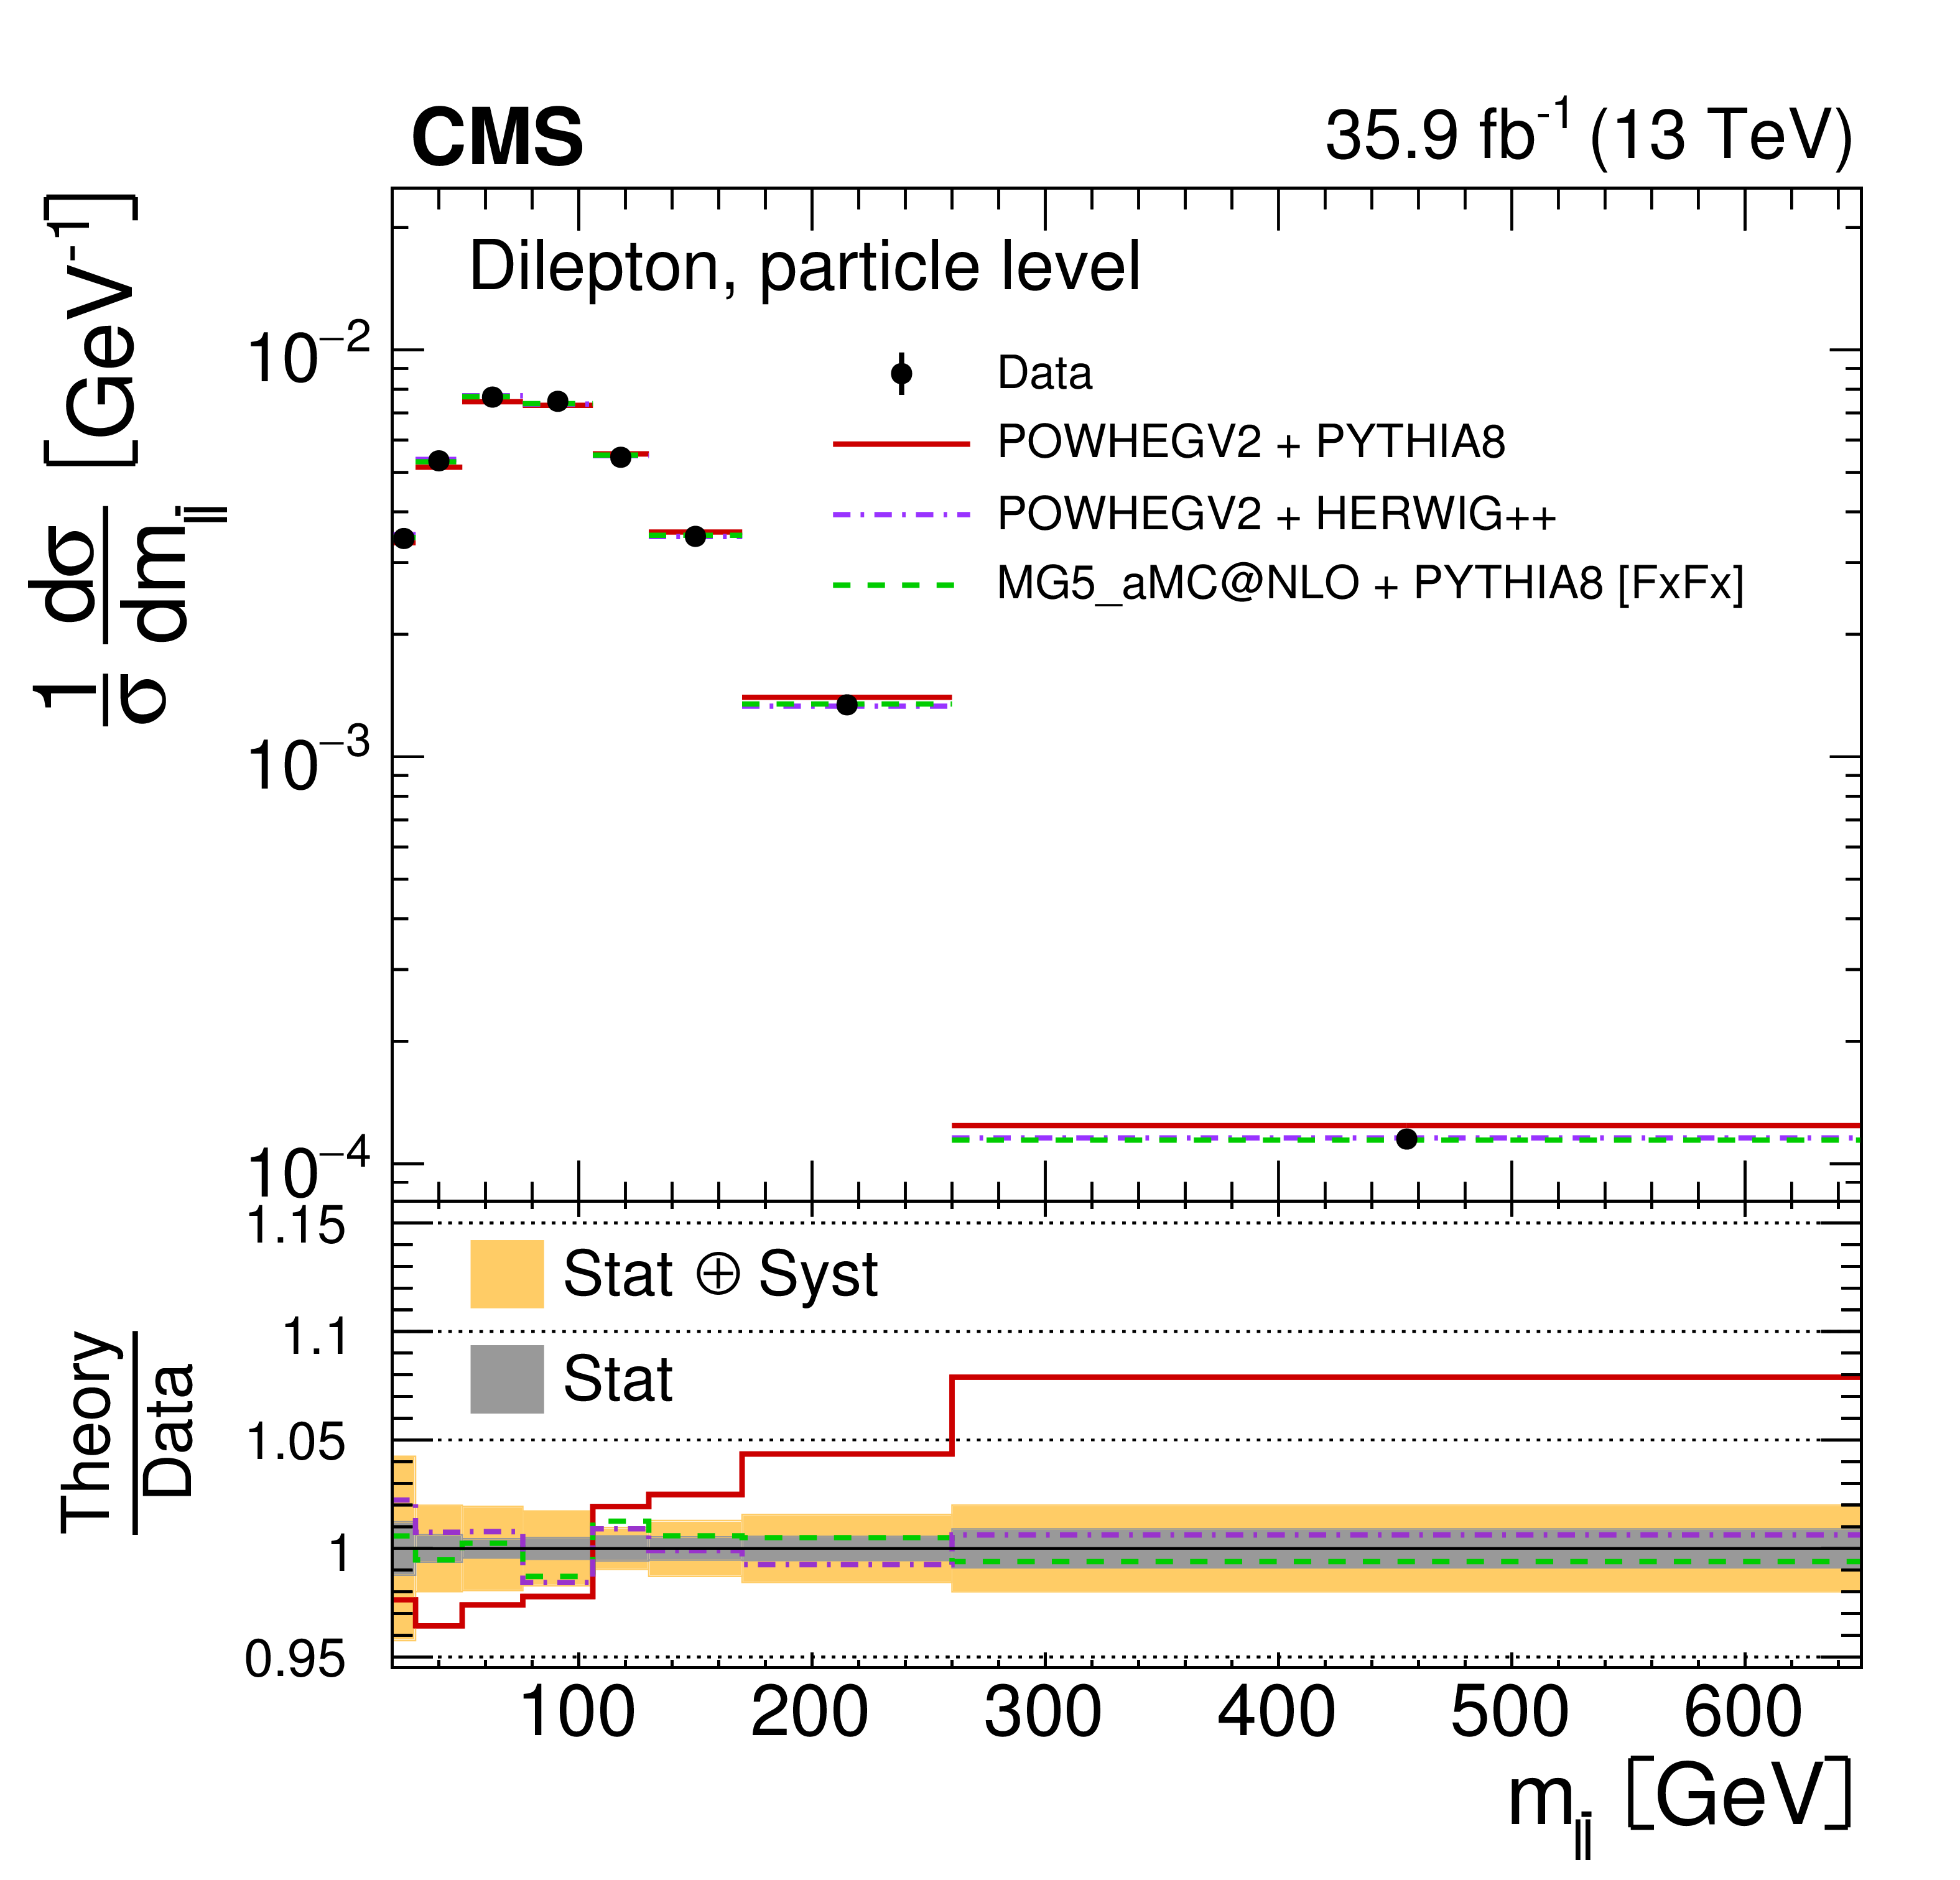
png pdf |
Figure 42-b:
The differential $ {{\mathrm {t}\overline {\mathrm {t}}}} $ production cross sections as a function of $ {m_{{\ell \bar{\ell}}}} $ in a fiducial phase space at the particle level are shown for the data (points) and the MC predictions (lines). The vertical lines on the points indicate the total uncertainty in the data. The left and right plots correspond to absolute and normalised measurements, respectively. The lower panel in each plot shows the ratios of the theoretical predictions to the data. The dark and light bands show the relative statistical and total uncertainties in the data, respectively. |
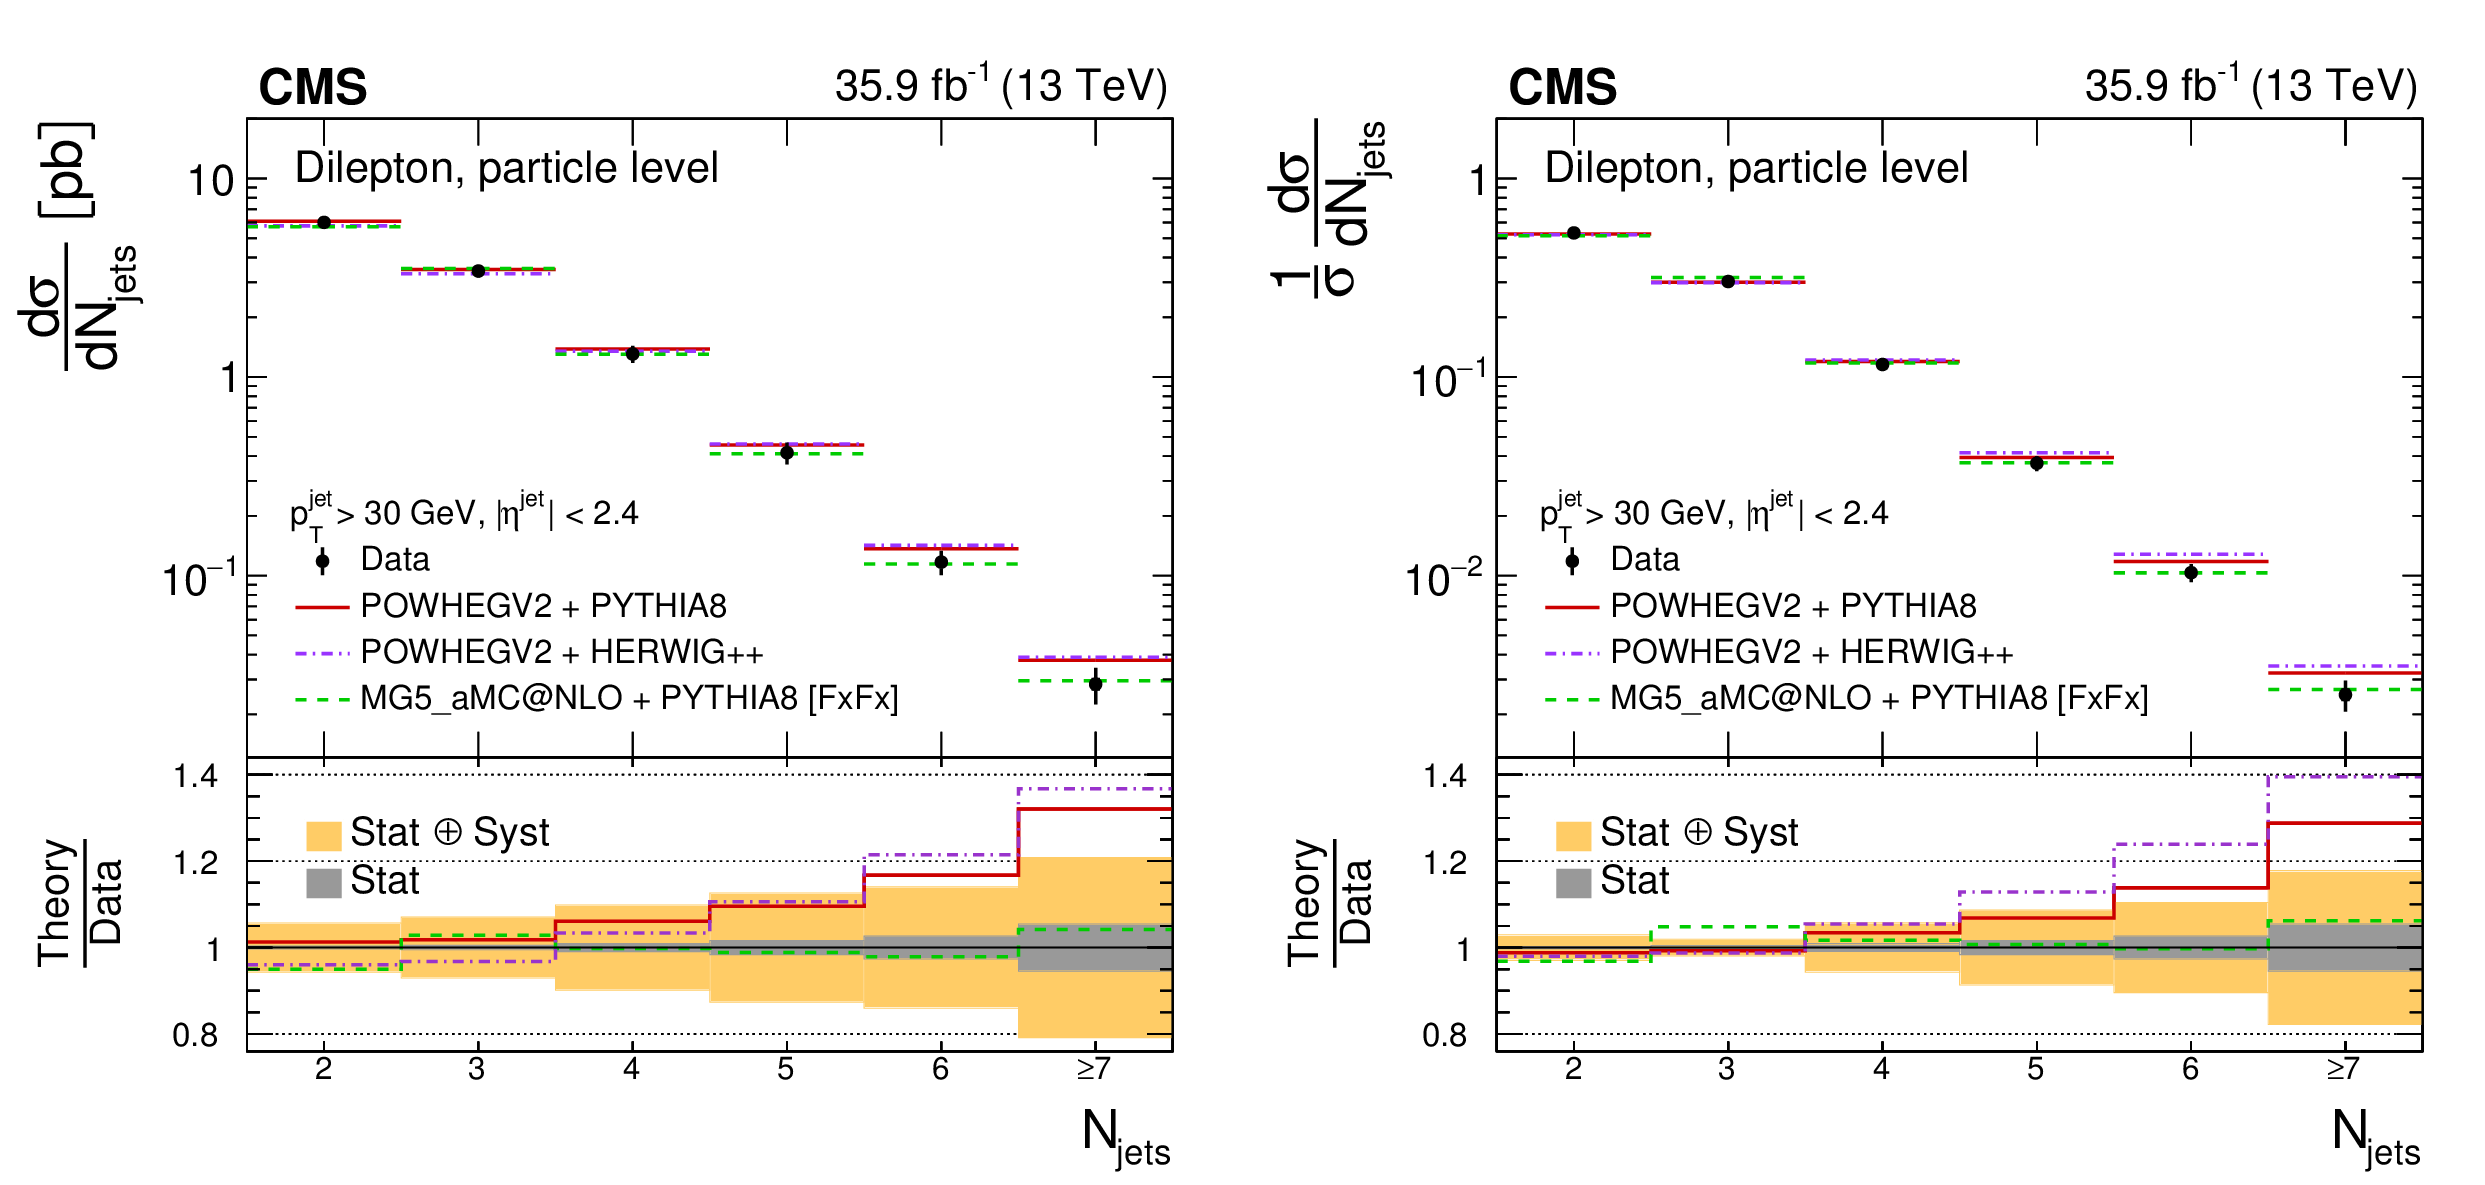
png pdf |
Figure 43:
The differential $ {{\mathrm {t}\overline {\mathrm {t}}}} $ production cross sections as a function of $ {\Delta \phi ({\ell}, {\bar{\ell}})} $ in a fiducial phase space at the particle level are shown for the data (points) and the MC predictions (lines). The vertical lines on the points indicate the total uncertainty in the data. The left and right plots correspond to absolute and normalised measurements, respectively. The lower panel in each plot shows the ratios of the theoretical predictions to the data. The dark and light bands show the relative statistical and total uncertainties in the data, respectively. |

png pdf |
Figure 43-a:
The differential $ {{\mathrm {t}\overline {\mathrm {t}}}} $ production cross sections as a function of $ {\Delta \phi ({\ell}, {\bar{\ell}})} $ in a fiducial phase space at the particle level are shown for the data (points) and the MC predictions (lines). The vertical lines on the points indicate the total uncertainty in the data. The left and right plots correspond to absolute and normalised measurements, respectively. The lower panel in each plot shows the ratios of the theoretical predictions to the data. The dark and light bands show the relative statistical and total uncertainties in the data, respectively. |

png pdf |
Figure 43-b:
The differential $ {{\mathrm {t}\overline {\mathrm {t}}}} $ production cross sections as a function of $ {\Delta \phi ({\ell}, {\bar{\ell}})} $ in a fiducial phase space at the particle level are shown for the data (points) and the MC predictions (lines). The vertical lines on the points indicate the total uncertainty in the data. The left and right plots correspond to absolute and normalised measurements, respectively. The lower panel in each plot shows the ratios of the theoretical predictions to the data. The dark and light bands show the relative statistical and total uncertainties in the data, respectively. |
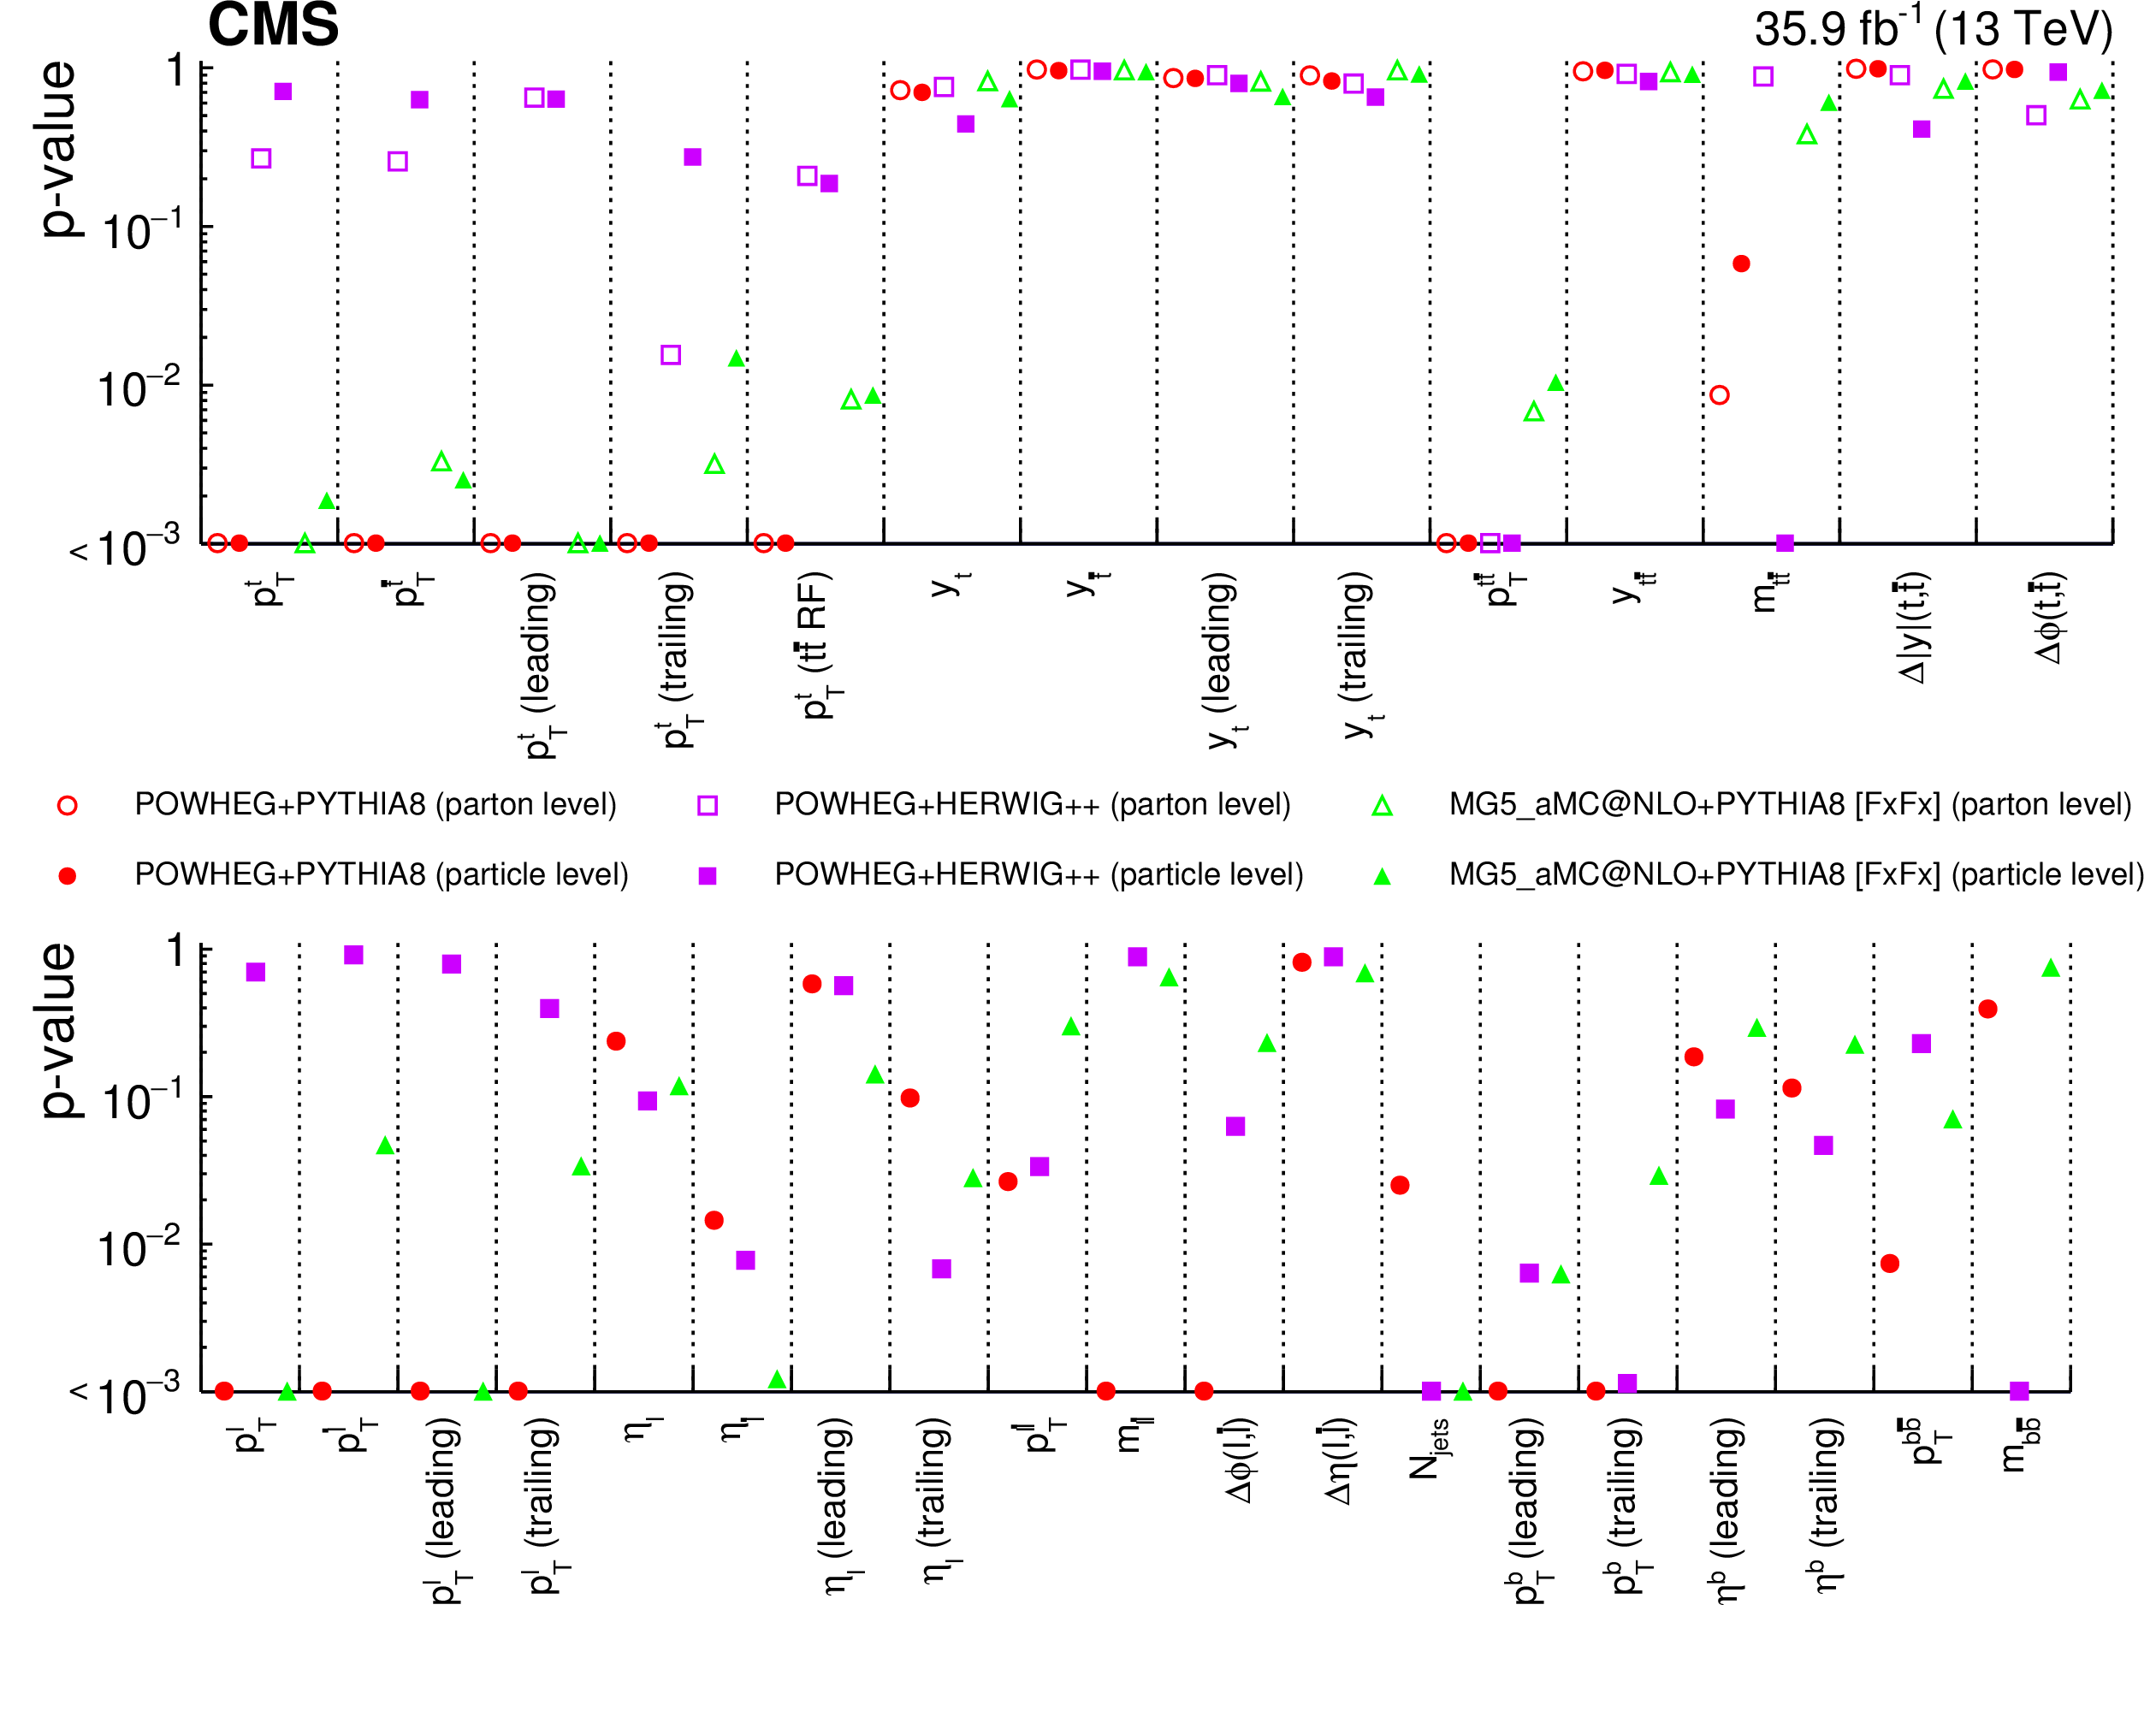
png pdf |
Figure 44:
The differential $ {{\mathrm {t}\overline {\mathrm {t}}}} $ production cross sections as a function of $ {\Delta \eta ({\ell}, {\bar{\ell}})} $ in a fiducial phase space at the particle level are shown for the data (points) and the MC predictions (lines). The vertical lines on the points indicate the total uncertainty in the data. The left and right plots correspond to absolute and normalised measurements, respectively. The lower panel in each plot shows the ratios of the theoretical predictions to the data. The dark and light bands show the relative statistical and total uncertainties in the data, respectively. |

png pdf |
Figure 44-a:
The differential $ {{\mathrm {t}\overline {\mathrm {t}}}} $ production cross sections as a function of $ {\Delta \eta ({\ell}, {\bar{\ell}})} $ in a fiducial phase space at the particle level are shown for the data (points) and the MC predictions (lines). The vertical lines on the points indicate the total uncertainty in the data. The left and right plots correspond to absolute and normalised measurements, respectively. The lower panel in each plot shows the ratios of the theoretical predictions to the data. The dark and light bands show the relative statistical and total uncertainties in the data, respectively. |

png pdf |
Figure 44-b:
The differential $ {{\mathrm {t}\overline {\mathrm {t}}}} $ production cross sections as a function of $ {\Delta \eta ({\ell}, {\bar{\ell}})} $ in a fiducial phase space at the particle level are shown for the data (points) and the MC predictions (lines). The vertical lines on the points indicate the total uncertainty in the data. The left and right plots correspond to absolute and normalised measurements, respectively. The lower panel in each plot shows the ratios of the theoretical predictions to the data. The dark and light bands show the relative statistical and total uncertainties in the data, respectively. |
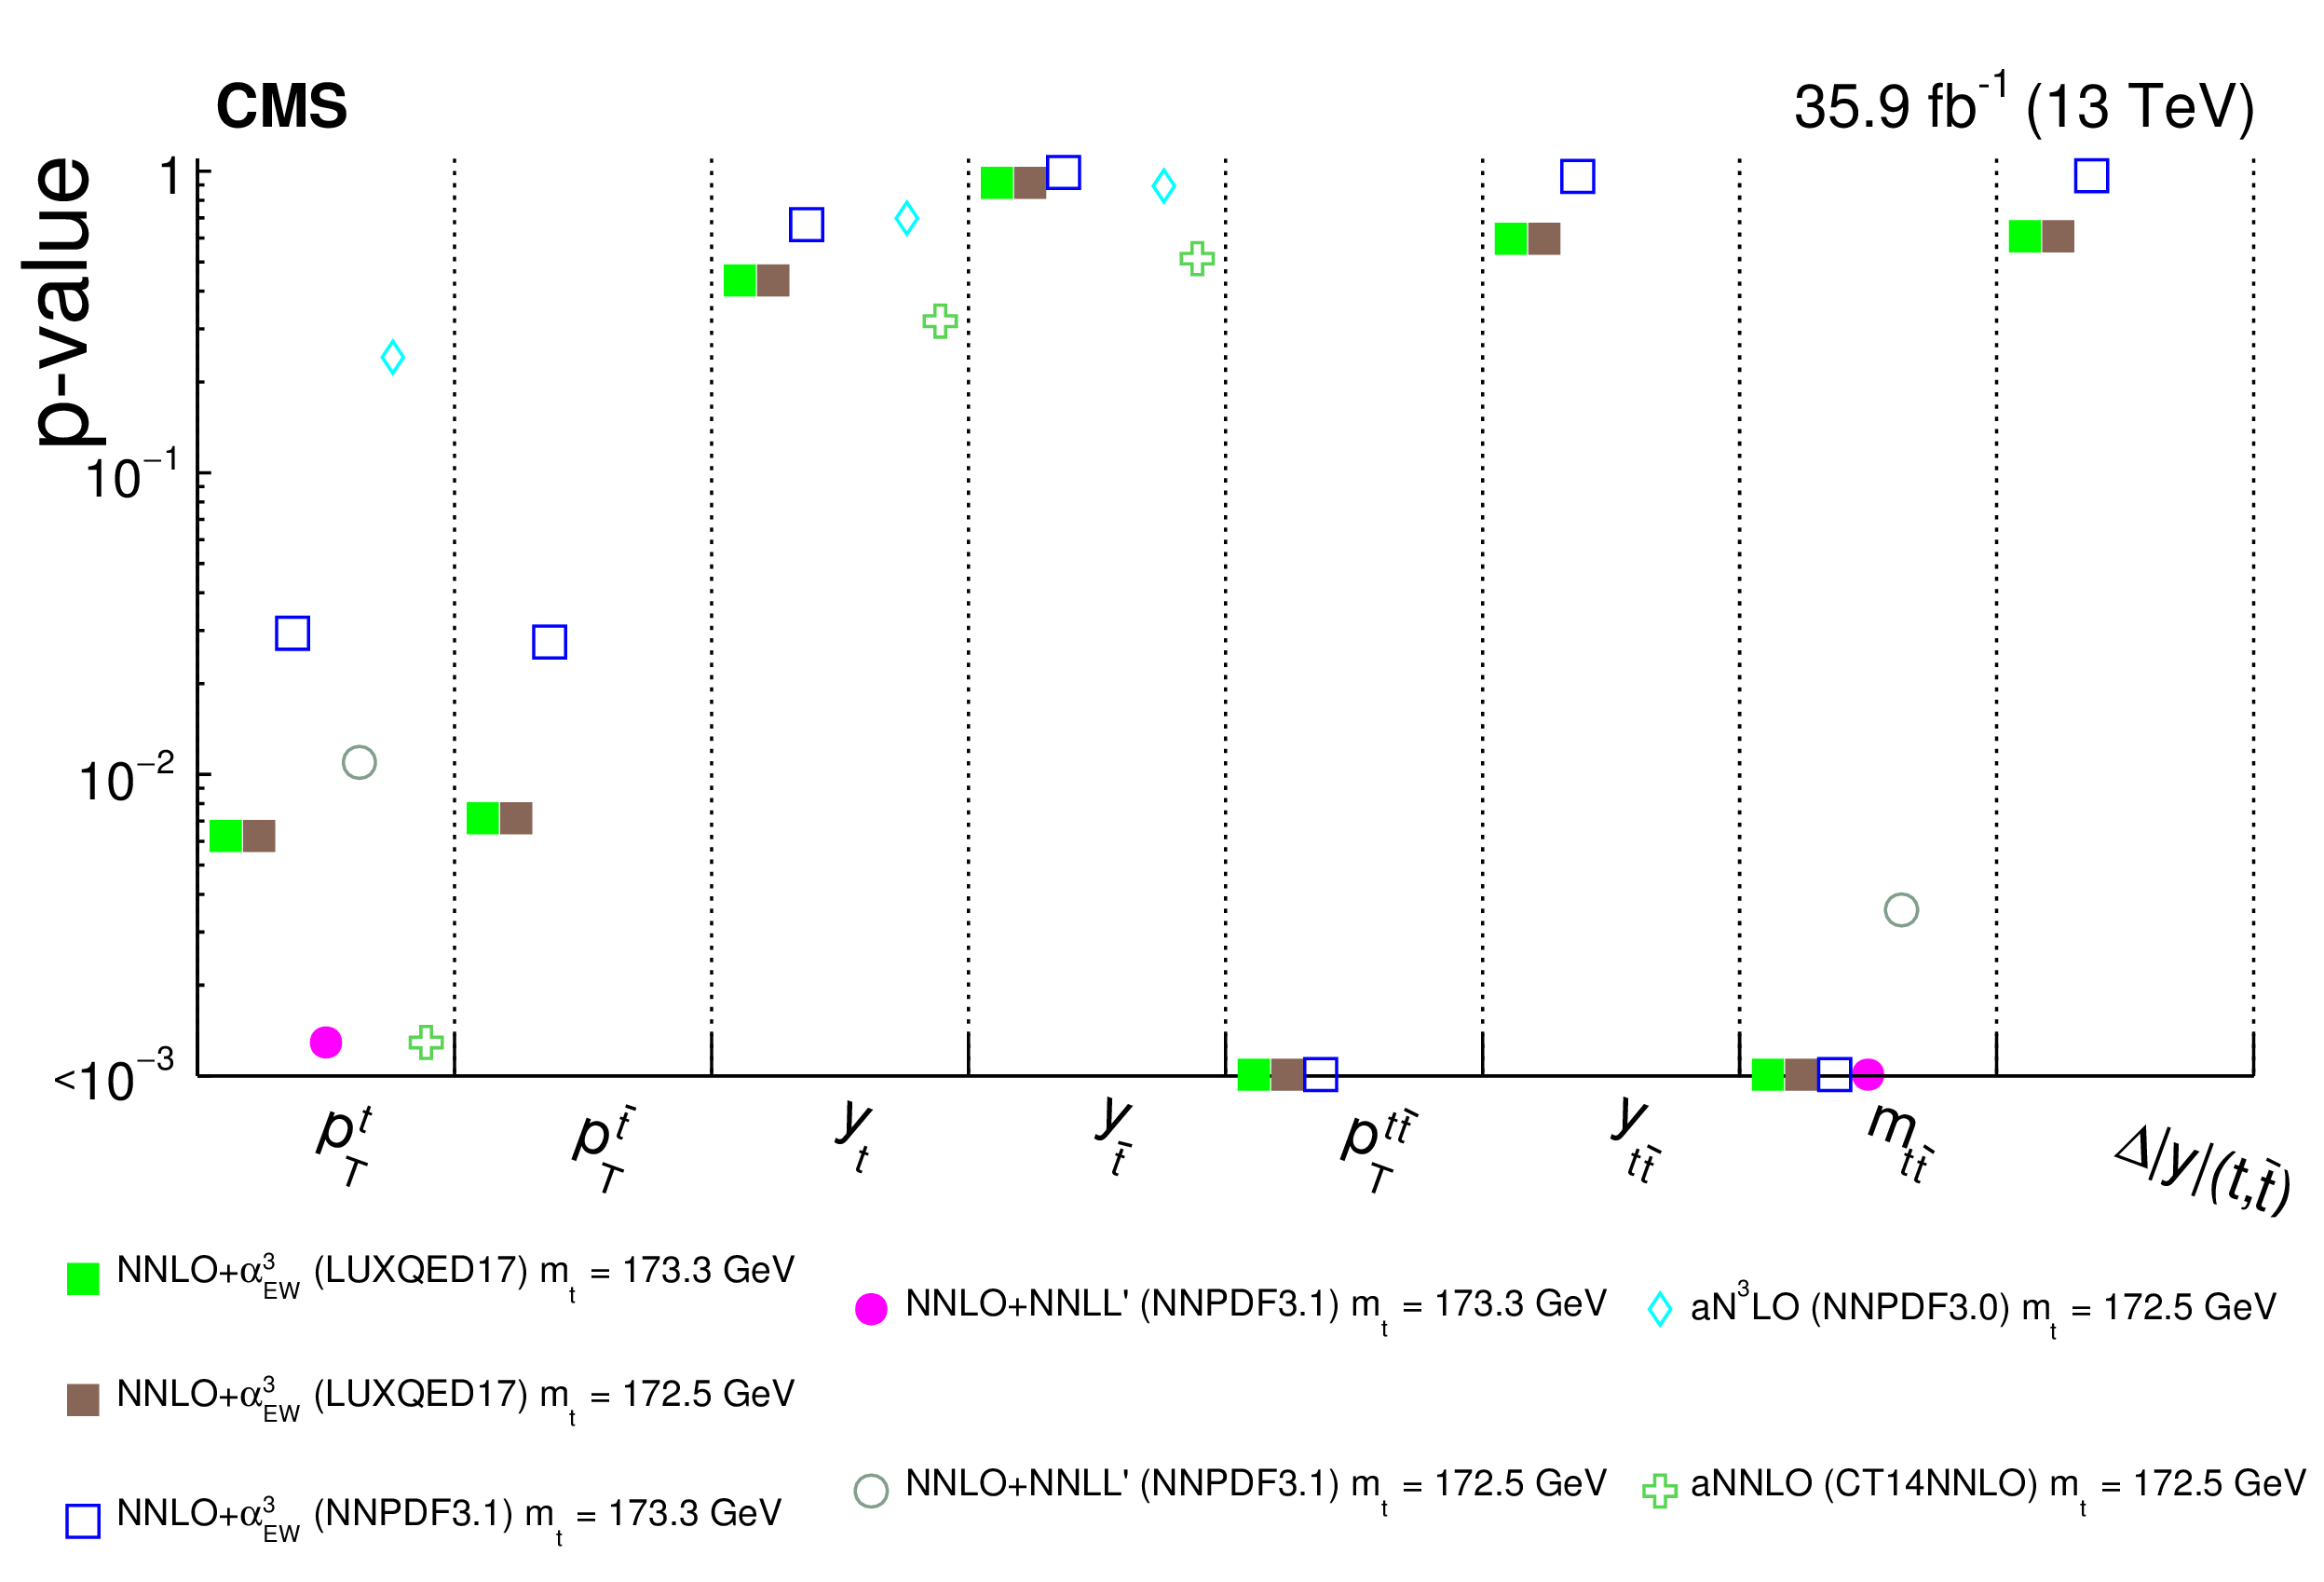
png pdf |
Figure 45:
The differential $ {{\mathrm {t}\overline {\mathrm {t}}}} $ production cross sections as a function of $ {{p_{\mathrm {T}}} ^{{\mathrm {b}}}} $ (leading) in a fiducial phase space at the particle level are shown for the data (points) and the MC predictions (lines). The vertical lines on the points indicate the total uncertainty in the data. The left and right plots correspond to absolute and normalised measurements, respectively. The lower panel in each plot shows the ratios of the theoretical predictions to the data. The dark and light bands show the relative statistical and total uncertainties in the data, respectively. |
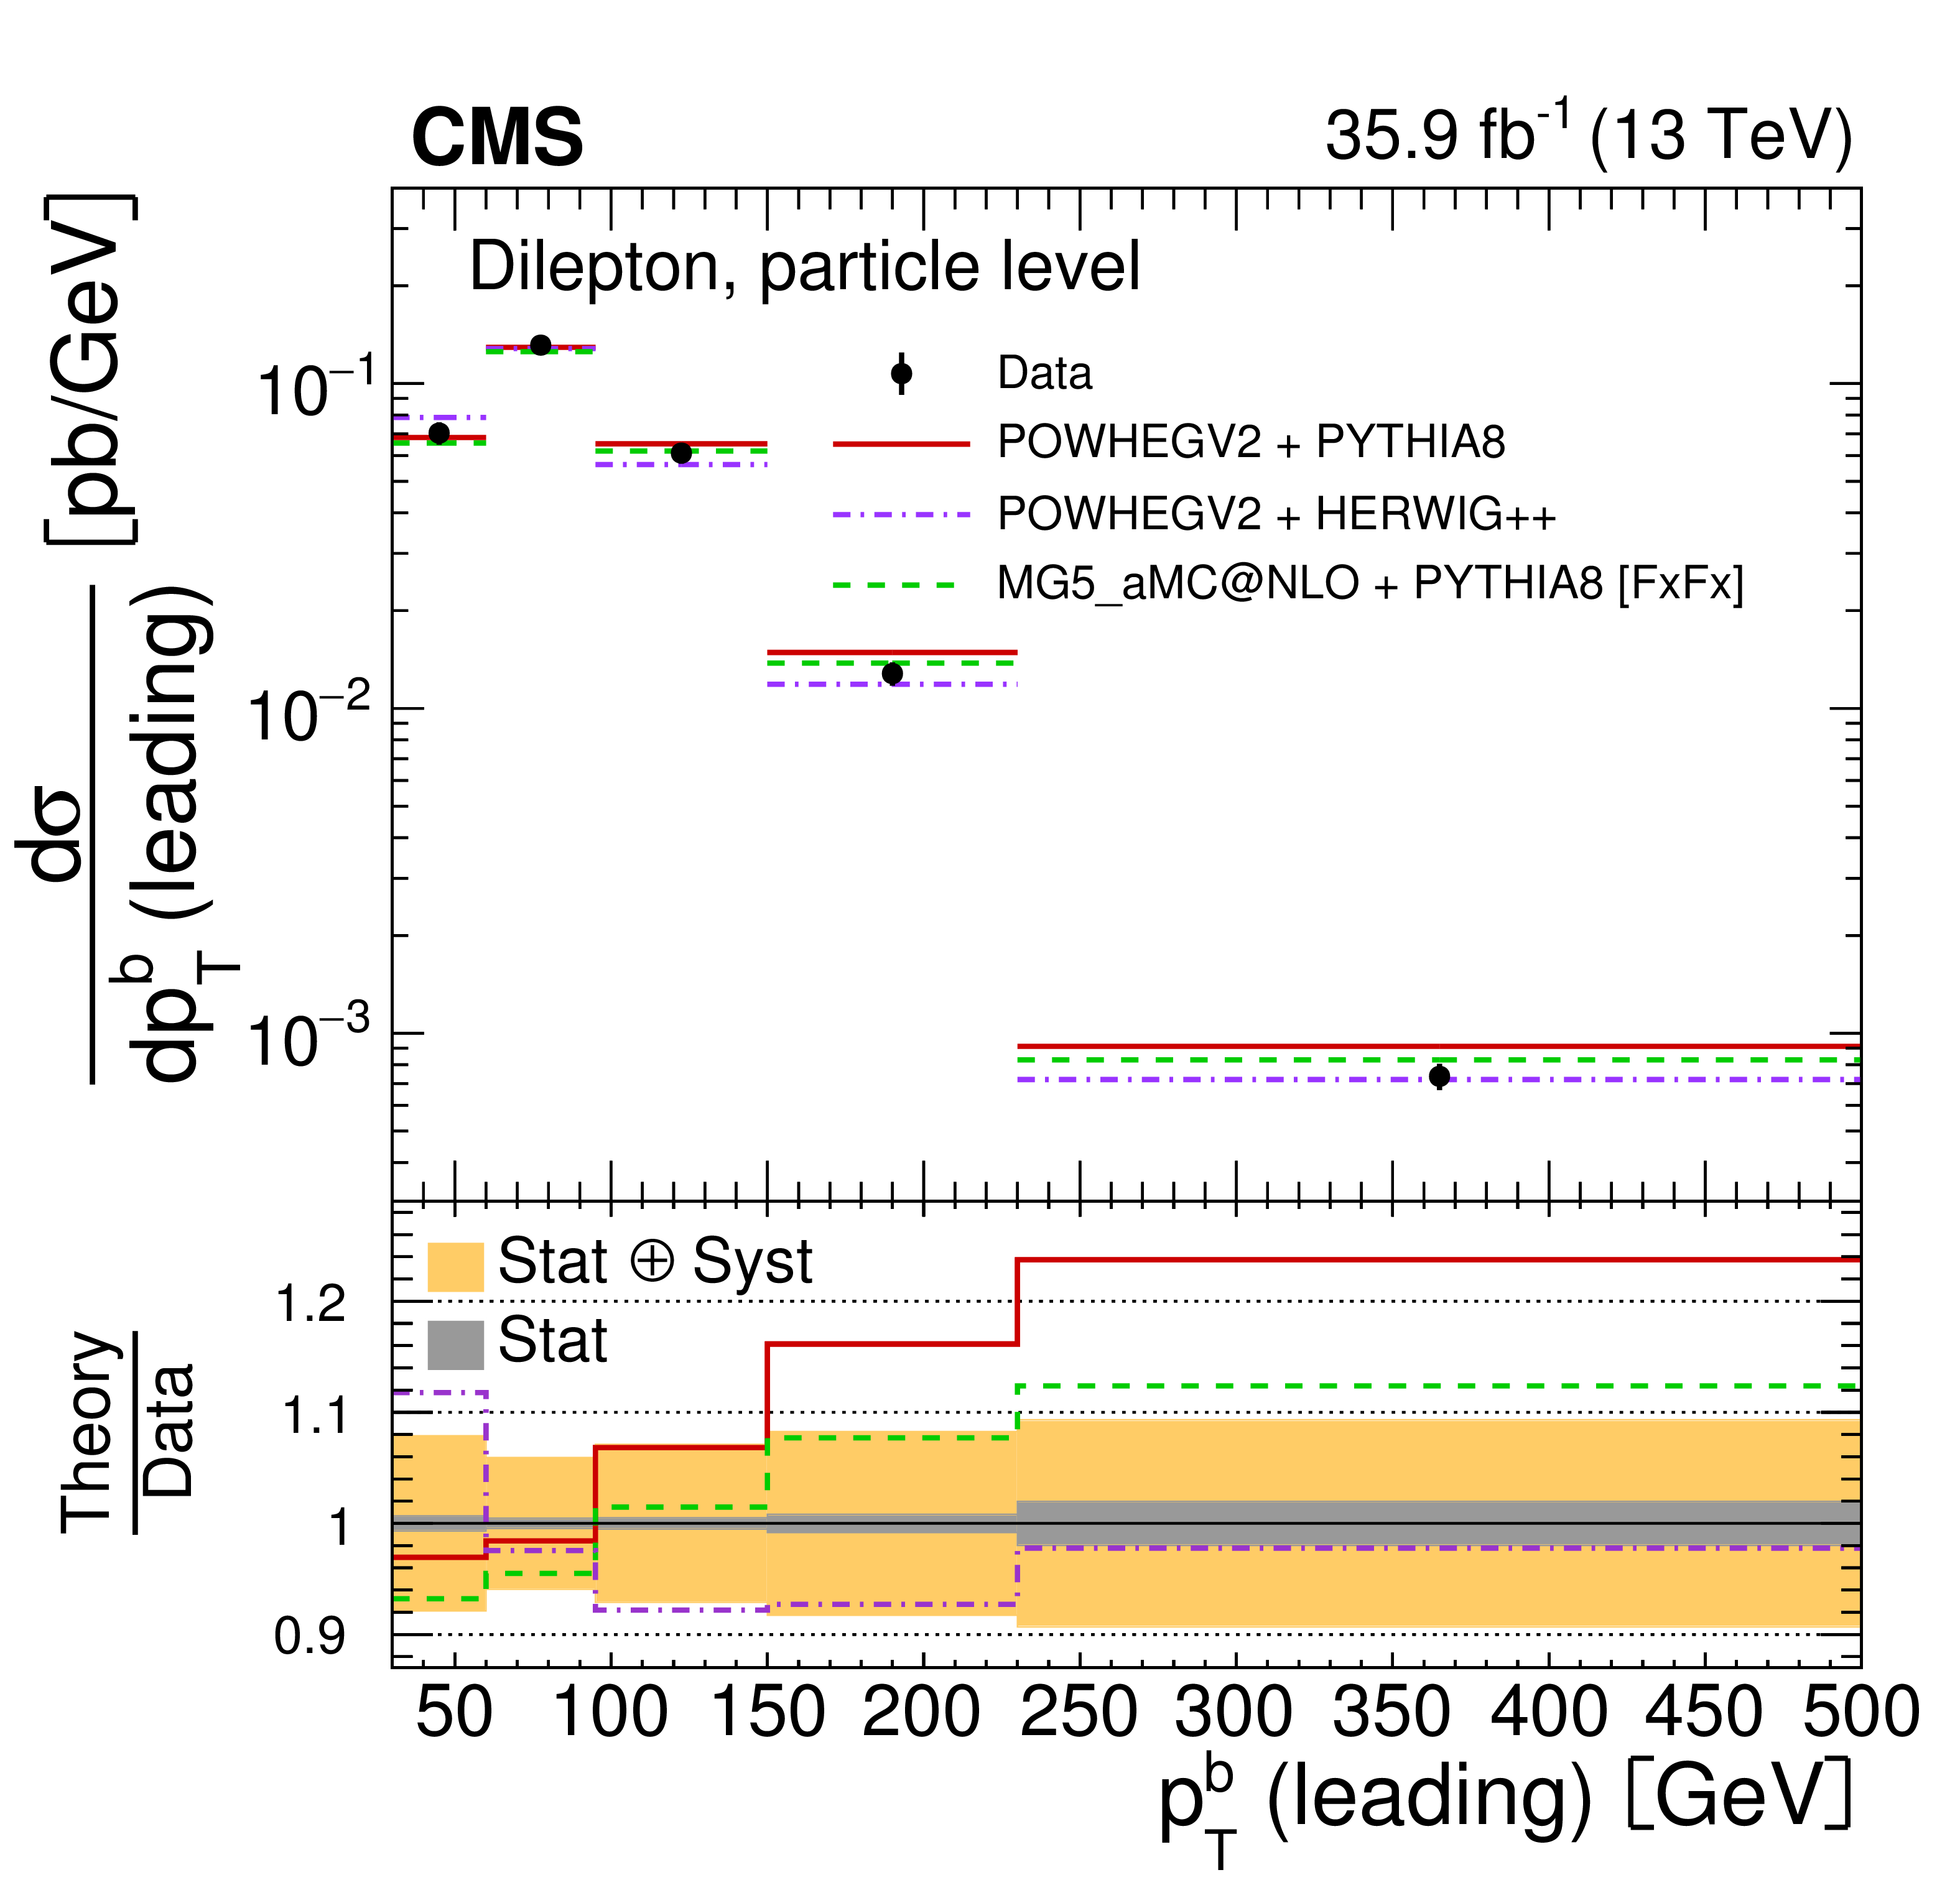
png pdf |
Figure 45-a:
The differential $ {{\mathrm {t}\overline {\mathrm {t}}}} $ production cross sections as a function of $ {{p_{\mathrm {T}}} ^{{\mathrm {b}}}} $ (leading) in a fiducial phase space at the particle level are shown for the data (points) and the MC predictions (lines). The vertical lines on the points indicate the total uncertainty in the data. The left and right plots correspond to absolute and normalised measurements, respectively. The lower panel in each plot shows the ratios of the theoretical predictions to the data. The dark and light bands show the relative statistical and total uncertainties in the data, respectively. |

png pdf |
Figure 45-b:
The differential $ {{\mathrm {t}\overline {\mathrm {t}}}} $ production cross sections as a function of $ {{p_{\mathrm {T}}} ^{{\mathrm {b}}}} $ (leading) in a fiducial phase space at the particle level are shown for the data (points) and the MC predictions (lines). The vertical lines on the points indicate the total uncertainty in the data. The left and right plots correspond to absolute and normalised measurements, respectively. The lower panel in each plot shows the ratios of the theoretical predictions to the data. The dark and light bands show the relative statistical and total uncertainties in the data, respectively. |

png pdf |
Figure 46:
The differential $ {{\mathrm {t}\overline {\mathrm {t}}}} $ production cross sections as a function of $ {{p_{\mathrm {T}}} ^{{\mathrm {b}}}} $ (trailing) in a fiducial phase space at the particle level are shown for the data (points) and the MC predictions (lines). The vertical lines on the points indicate the total uncertainty in the data. The left and right plots correspond to absolute and normalised measurements, respectively. The lower panel in each plot shows the ratios of the theoretical predictions to the data. The dark and light bands show the relative statistical and total uncertainties in the data, respectively. |

png pdf |
Figure 46-a:
The differential $ {{\mathrm {t}\overline {\mathrm {t}}}} $ production cross sections as a function of $ {{p_{\mathrm {T}}} ^{{\mathrm {b}}}} $ (trailing) in a fiducial phase space at the particle level are shown for the data (points) and the MC predictions (lines). The vertical lines on the points indicate the total uncertainty in the data. The left and right plots correspond to absolute and normalised measurements, respectively. The lower panel in each plot shows the ratios of the theoretical predictions to the data. The dark and light bands show the relative statistical and total uncertainties in the data, respectively. |

png pdf |
Figure 46-b:
The differential $ {{\mathrm {t}\overline {\mathrm {t}}}} $ production cross sections as a function of $ {{p_{\mathrm {T}}} ^{{\mathrm {b}}}} $ (trailing) in a fiducial phase space at the particle level are shown for the data (points) and the MC predictions (lines). The vertical lines on the points indicate the total uncertainty in the data. The left and right plots correspond to absolute and normalised measurements, respectively. The lower panel in each plot shows the ratios of the theoretical predictions to the data. The dark and light bands show the relative statistical and total uncertainties in the data, respectively. |
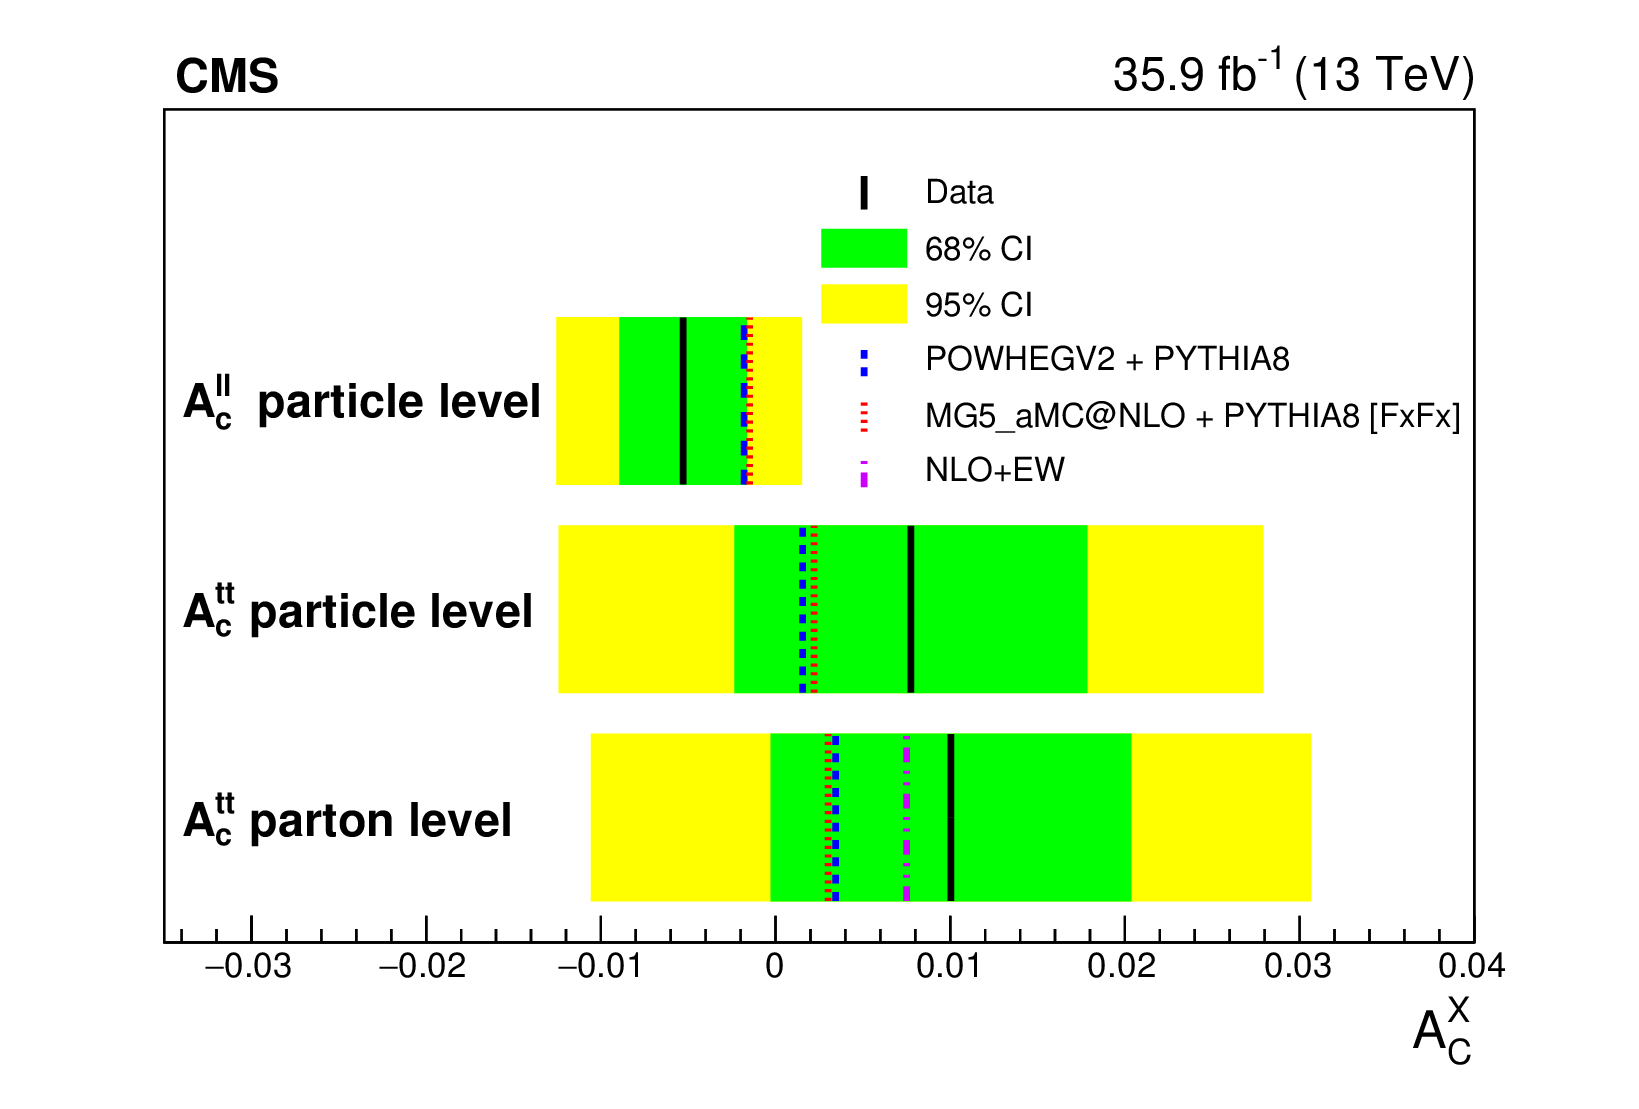
png pdf |
Figure 47:
The differential $ {{\mathrm {t}\overline {\mathrm {t}}}} $ production cross sections as a function of $ {\eta _{{\mathrm {b}}}} $ (leading) in a fiducial phase space at the particle level are shown for the data (points) and the MC predictions (lines). The vertical lines on the points indicate the total uncertainty in the data. The left and right plots correspond to absolute and normalised measurements, respectively. The lower panel in each plot shows the ratios of the theoretical predictions to the data. The dark and light bands show the relative statistical and total uncertainties in the data, respectively. |
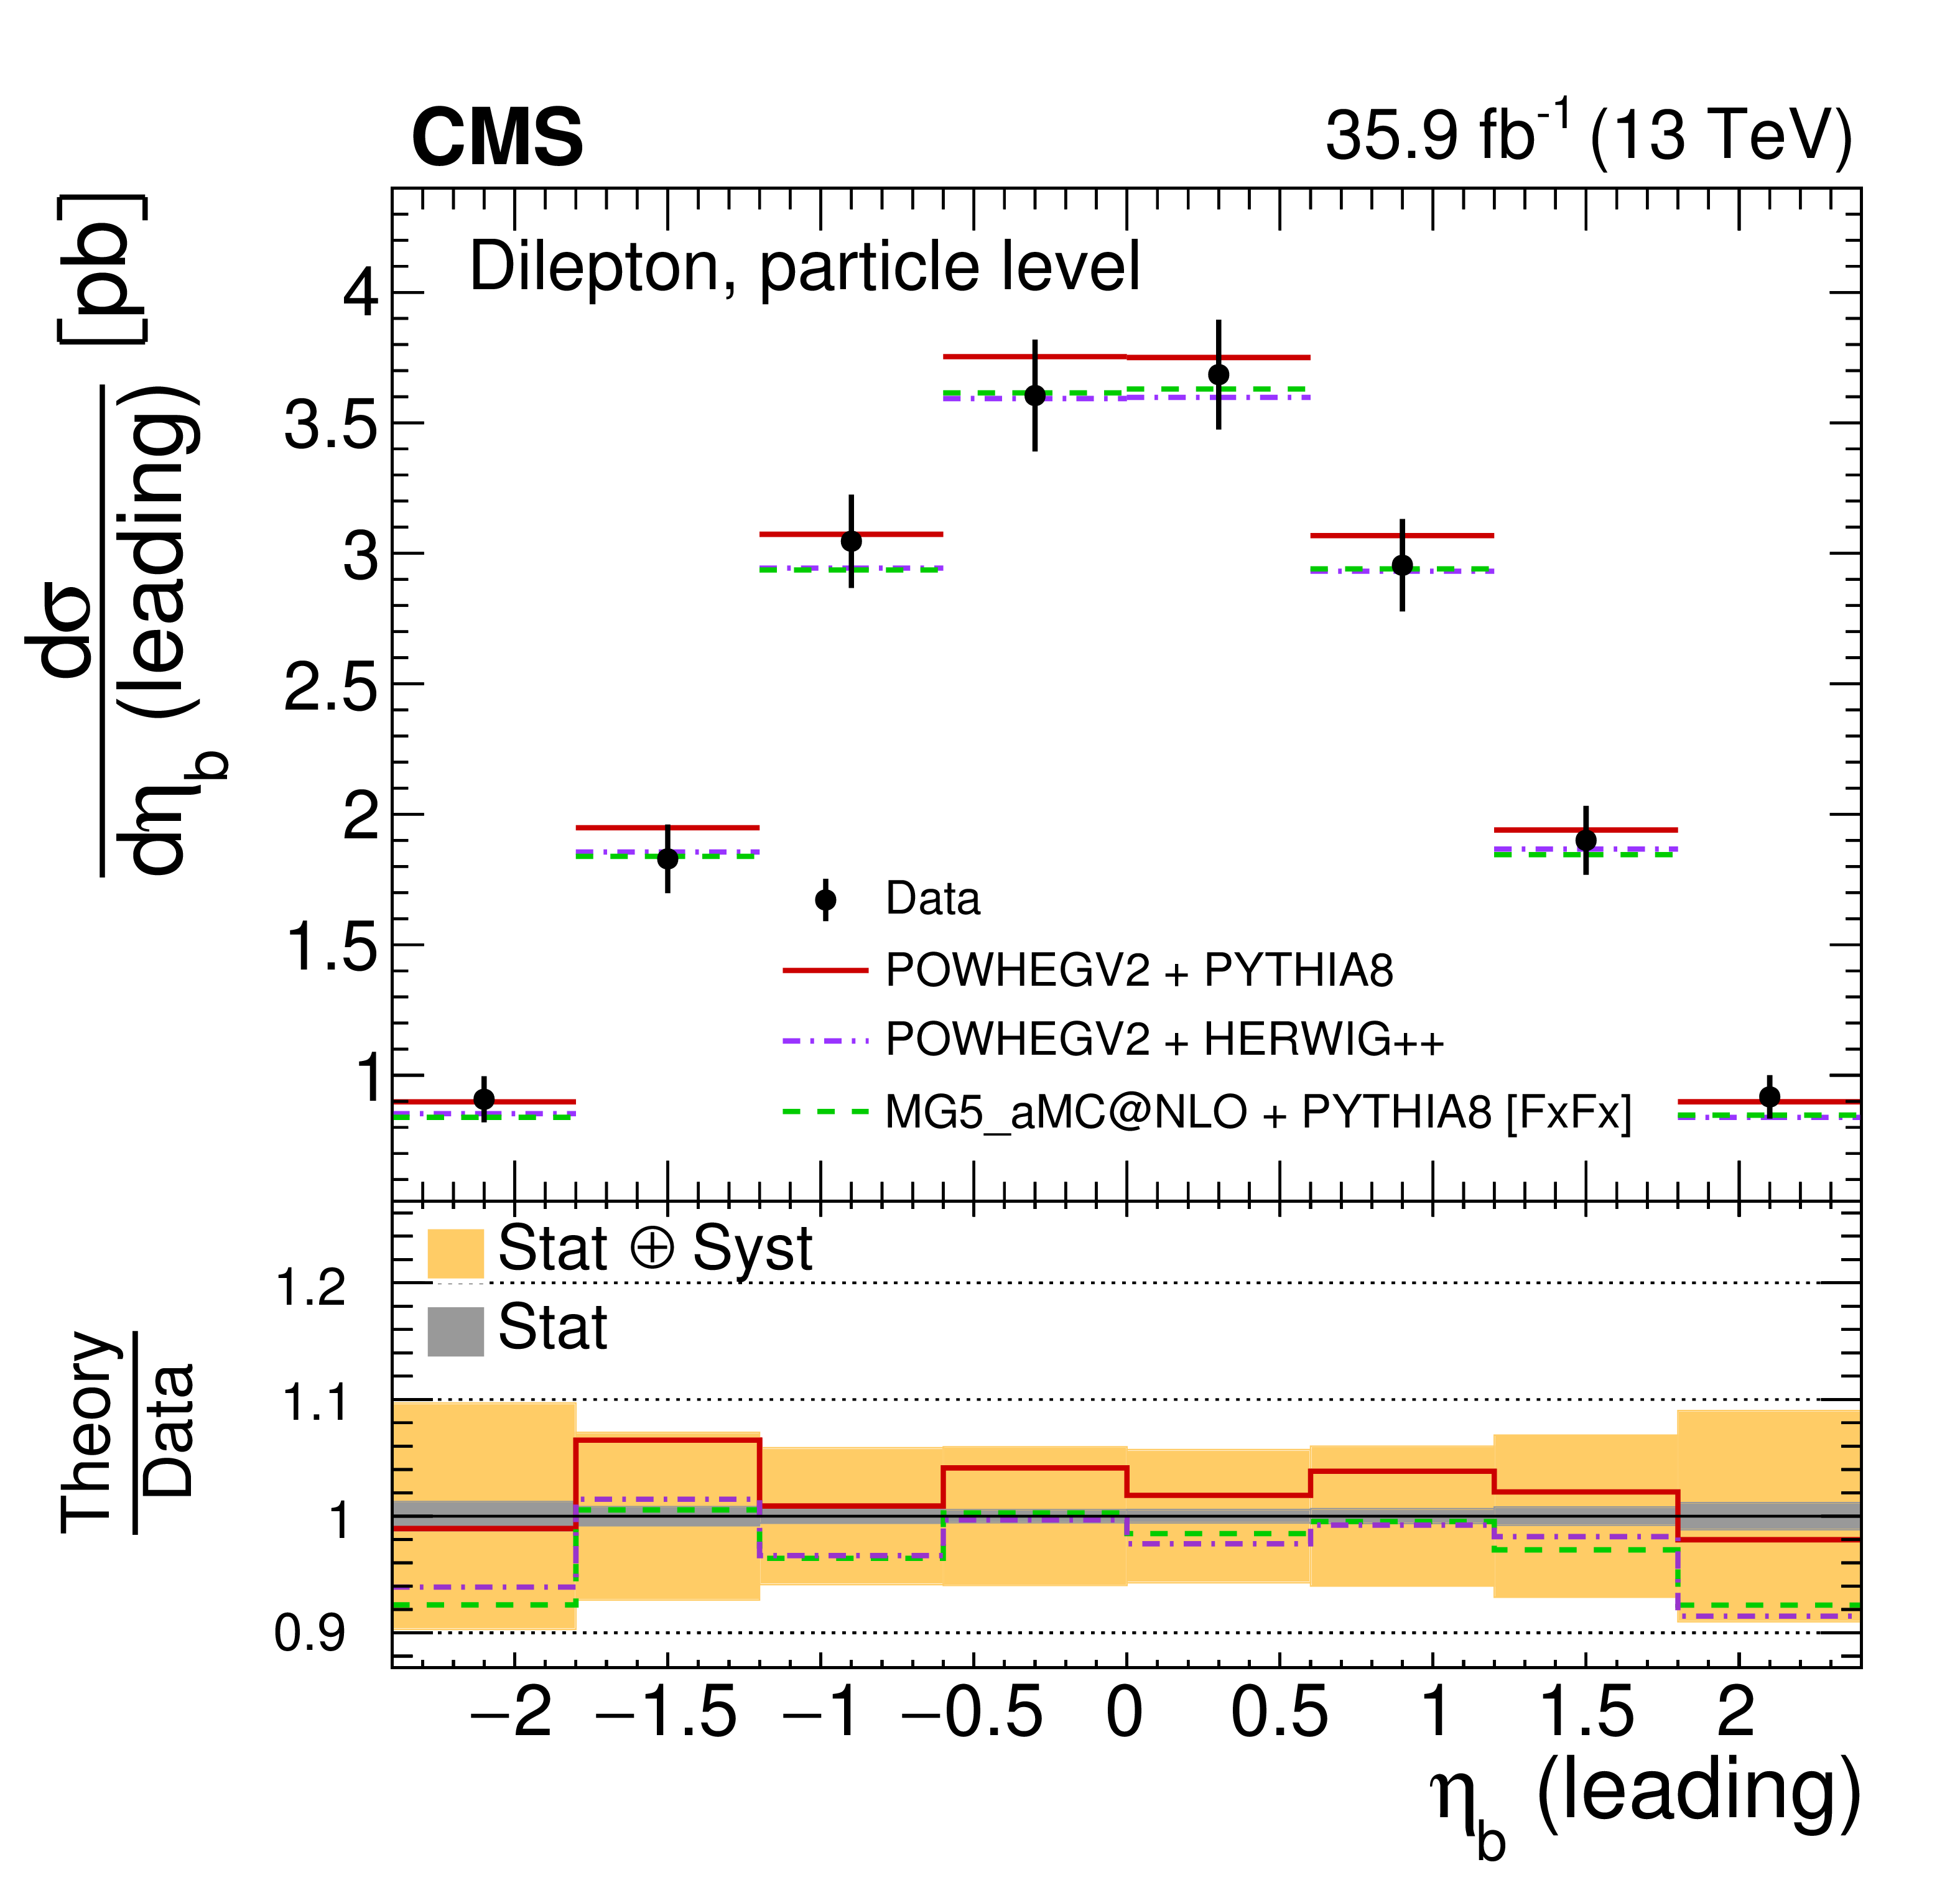
png pdf |
Figure 47-a:
The differential $ {{\mathrm {t}\overline {\mathrm {t}}}} $ production cross sections as a function of $ {\eta _{{\mathrm {b}}}} $ (leading) in a fiducial phase space at the particle level are shown for the data (points) and the MC predictions (lines). The vertical lines on the points indicate the total uncertainty in the data. The left and right plots correspond to absolute and normalised measurements, respectively. The lower panel in each plot shows the ratios of the theoretical predictions to the data. The dark and light bands show the relative statistical and total uncertainties in the data, respectively. |

png pdf |
Figure 47-b:
The differential $ {{\mathrm {t}\overline {\mathrm {t}}}} $ production cross sections as a function of $ {\eta _{{\mathrm {b}}}} $ (leading) in a fiducial phase space at the particle level are shown for the data (points) and the MC predictions (lines). The vertical lines on the points indicate the total uncertainty in the data. The left and right plots correspond to absolute and normalised measurements, respectively. The lower panel in each plot shows the ratios of the theoretical predictions to the data. The dark and light bands show the relative statistical and total uncertainties in the data, respectively. |

png pdf |
Figure 48-a:
The differential $ {{\mathrm {t}\overline {\mathrm {t}}}} $ production cross sections as a function of $ {\eta _{{\mathrm {b}}}} $ (trailing) in a fiducial phase space at the particle level are shown for the data (points) and the MC predictions (lines). The vertical lines on the points indicate the total uncertainty in the data. The left and right plots correspond to absolute and normalised measurements, respectively. The lower panel in each plot shows the ratios of the theoretical predictions to the data. The dark and light bands show the relative statistical and total uncertainties in the data, respectively. |
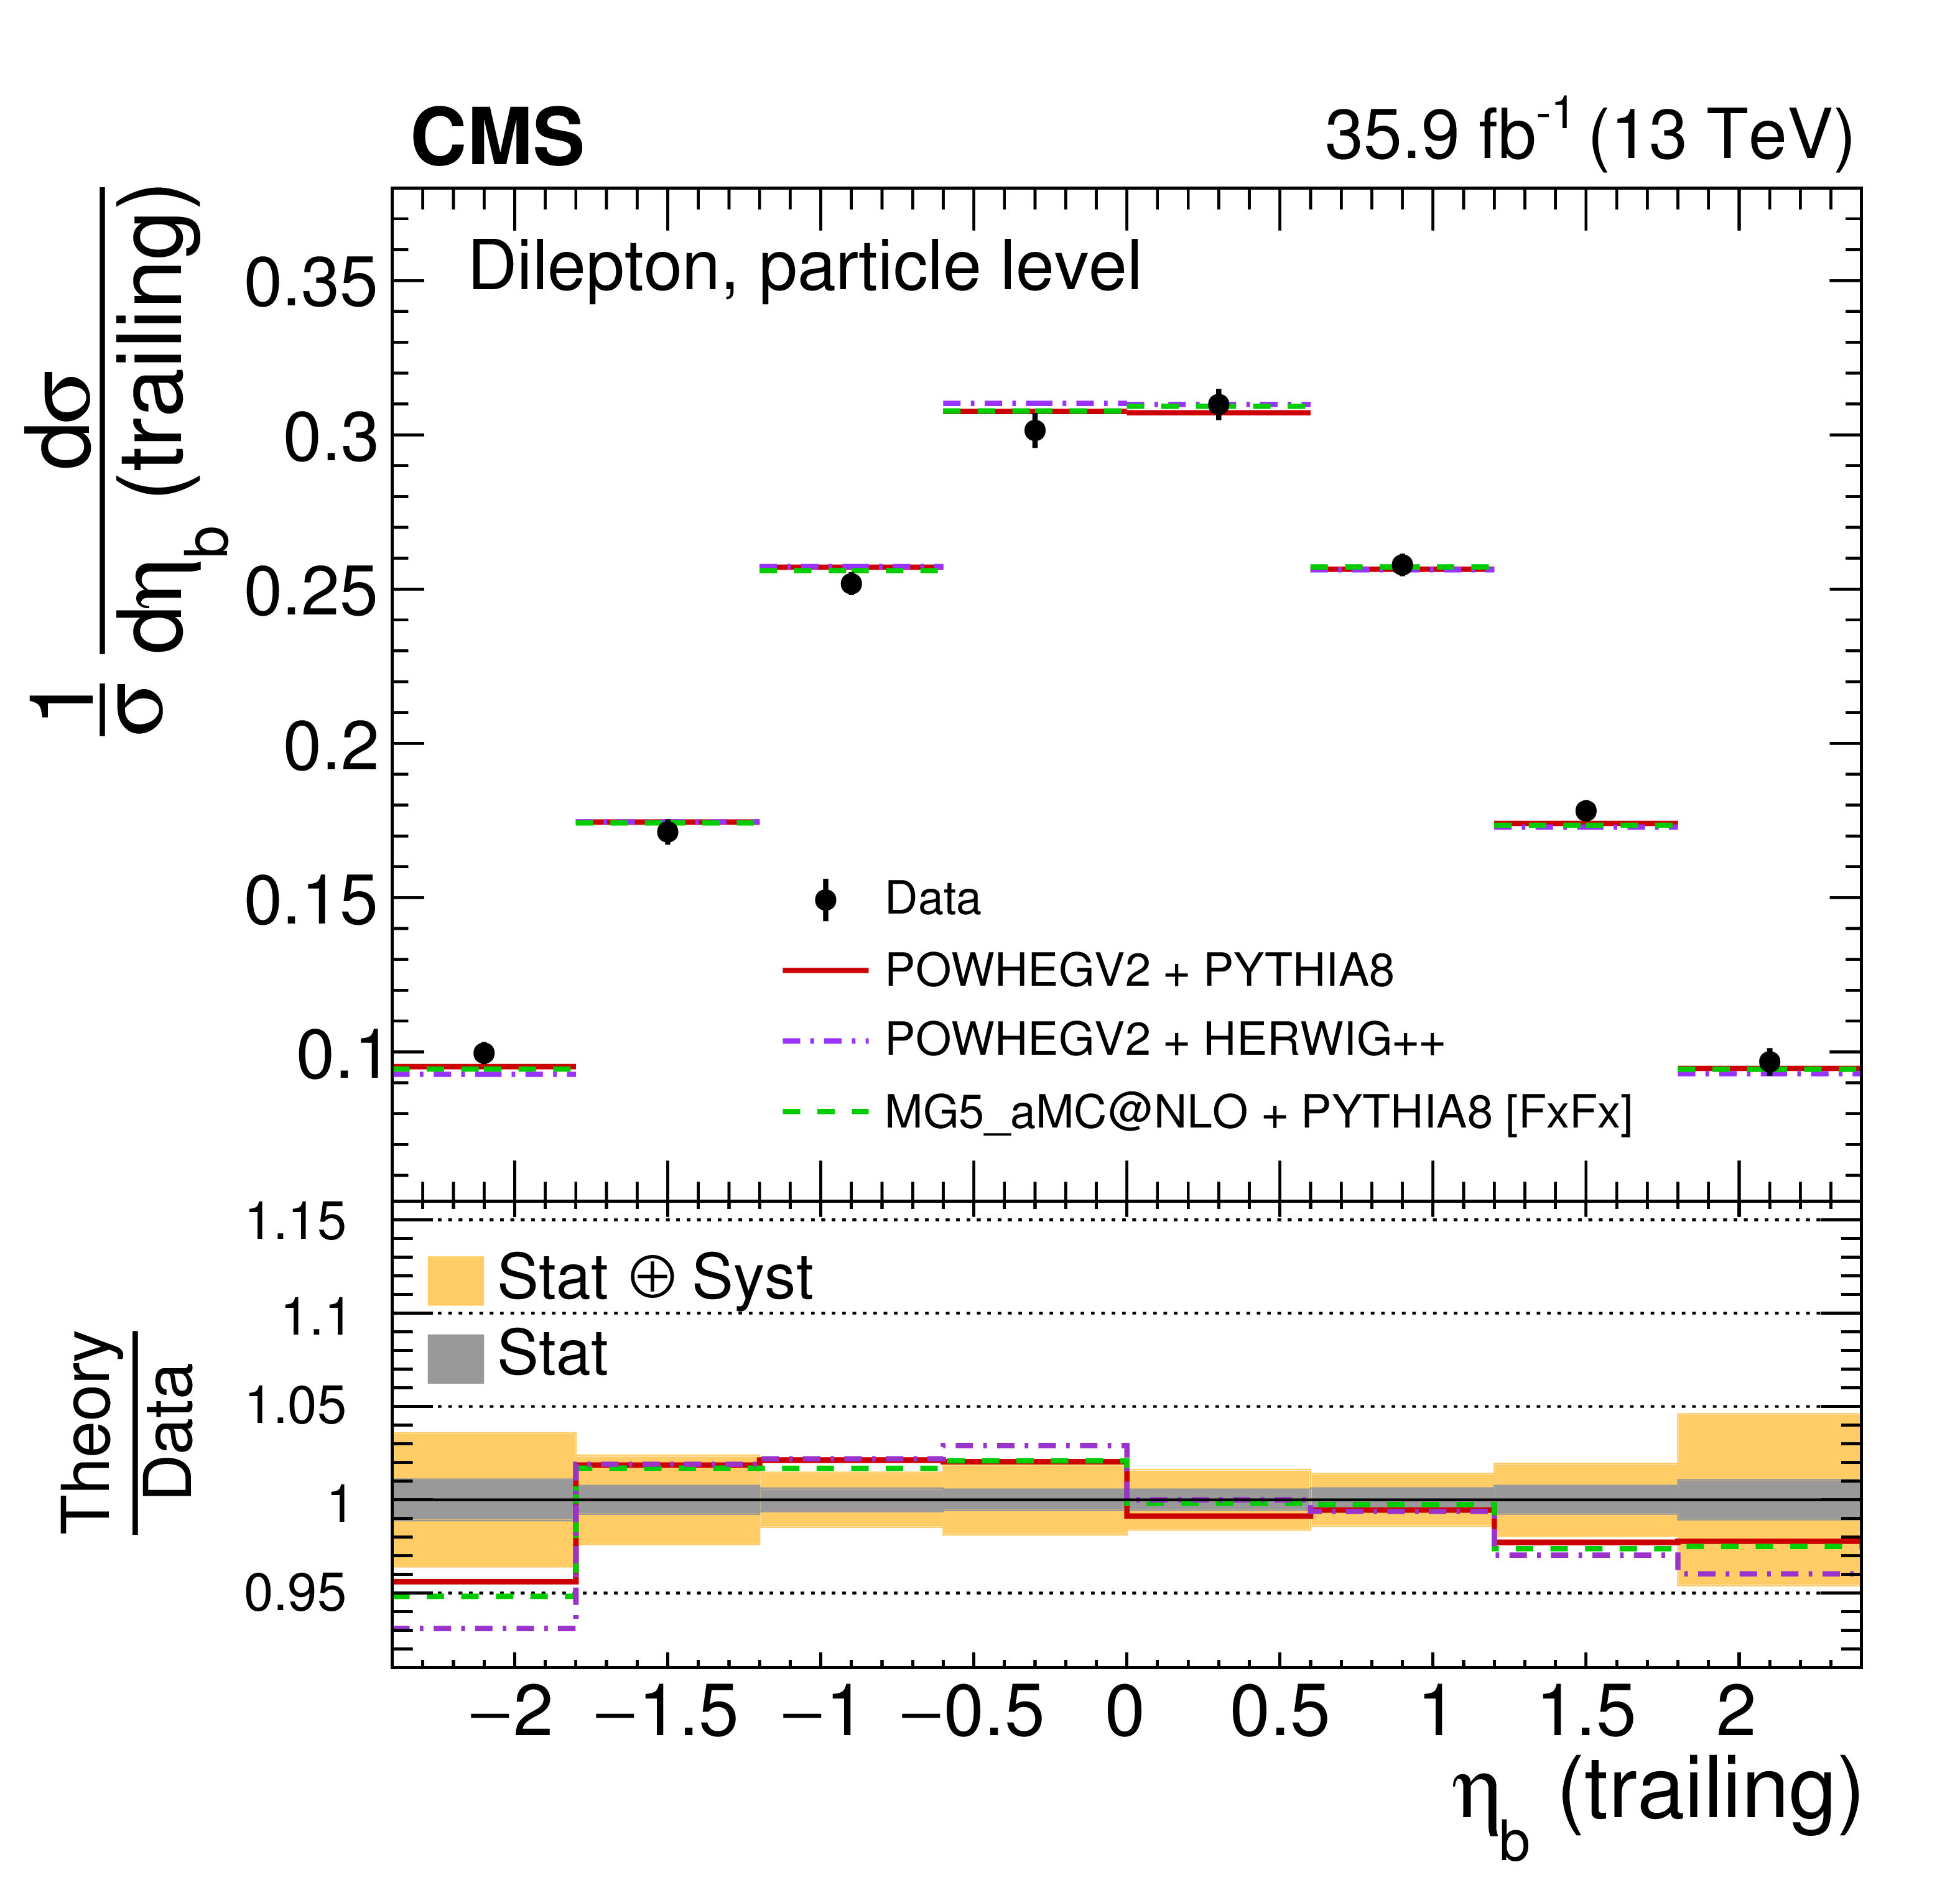
png pdf |
Figure 48-b:
The differential $ {{\mathrm {t}\overline {\mathrm {t}}}} $ production cross sections as a function of $ {\eta _{{\mathrm {b}}}} $ (trailing) in a fiducial phase space at the particle level are shown for the data (points) and the MC predictions (lines). The vertical lines on the points indicate the total uncertainty in the data. The left and right plots correspond to absolute and normalised measurements, respectively. The lower panel in each plot shows the ratios of the theoretical predictions to the data. The dark and light bands show the relative statistical and total uncertainties in the data, respectively. |

png pdf |
Figure 49-a:
The differential $ {{\mathrm {t}\overline {\mathrm {t}}}} $ production cross sections as a function of $ {{p_{\mathrm {T}}} ^{{{\mathrm {b}} {\overline {\mathrm {b}}}}}} $ in a fiducial phase space at the particle level are shown for the data (points) and the MC predictions (lines). The vertical lines on the points indicate the total uncertainty in the data. The left and right plots correspond to absolute and normalised measurements, respectively. The lower panel in each plot shows the ratios of the theoretical predictions to the data. The dark and light bands show the relative statistical and total uncertainties in the data, respectively. |
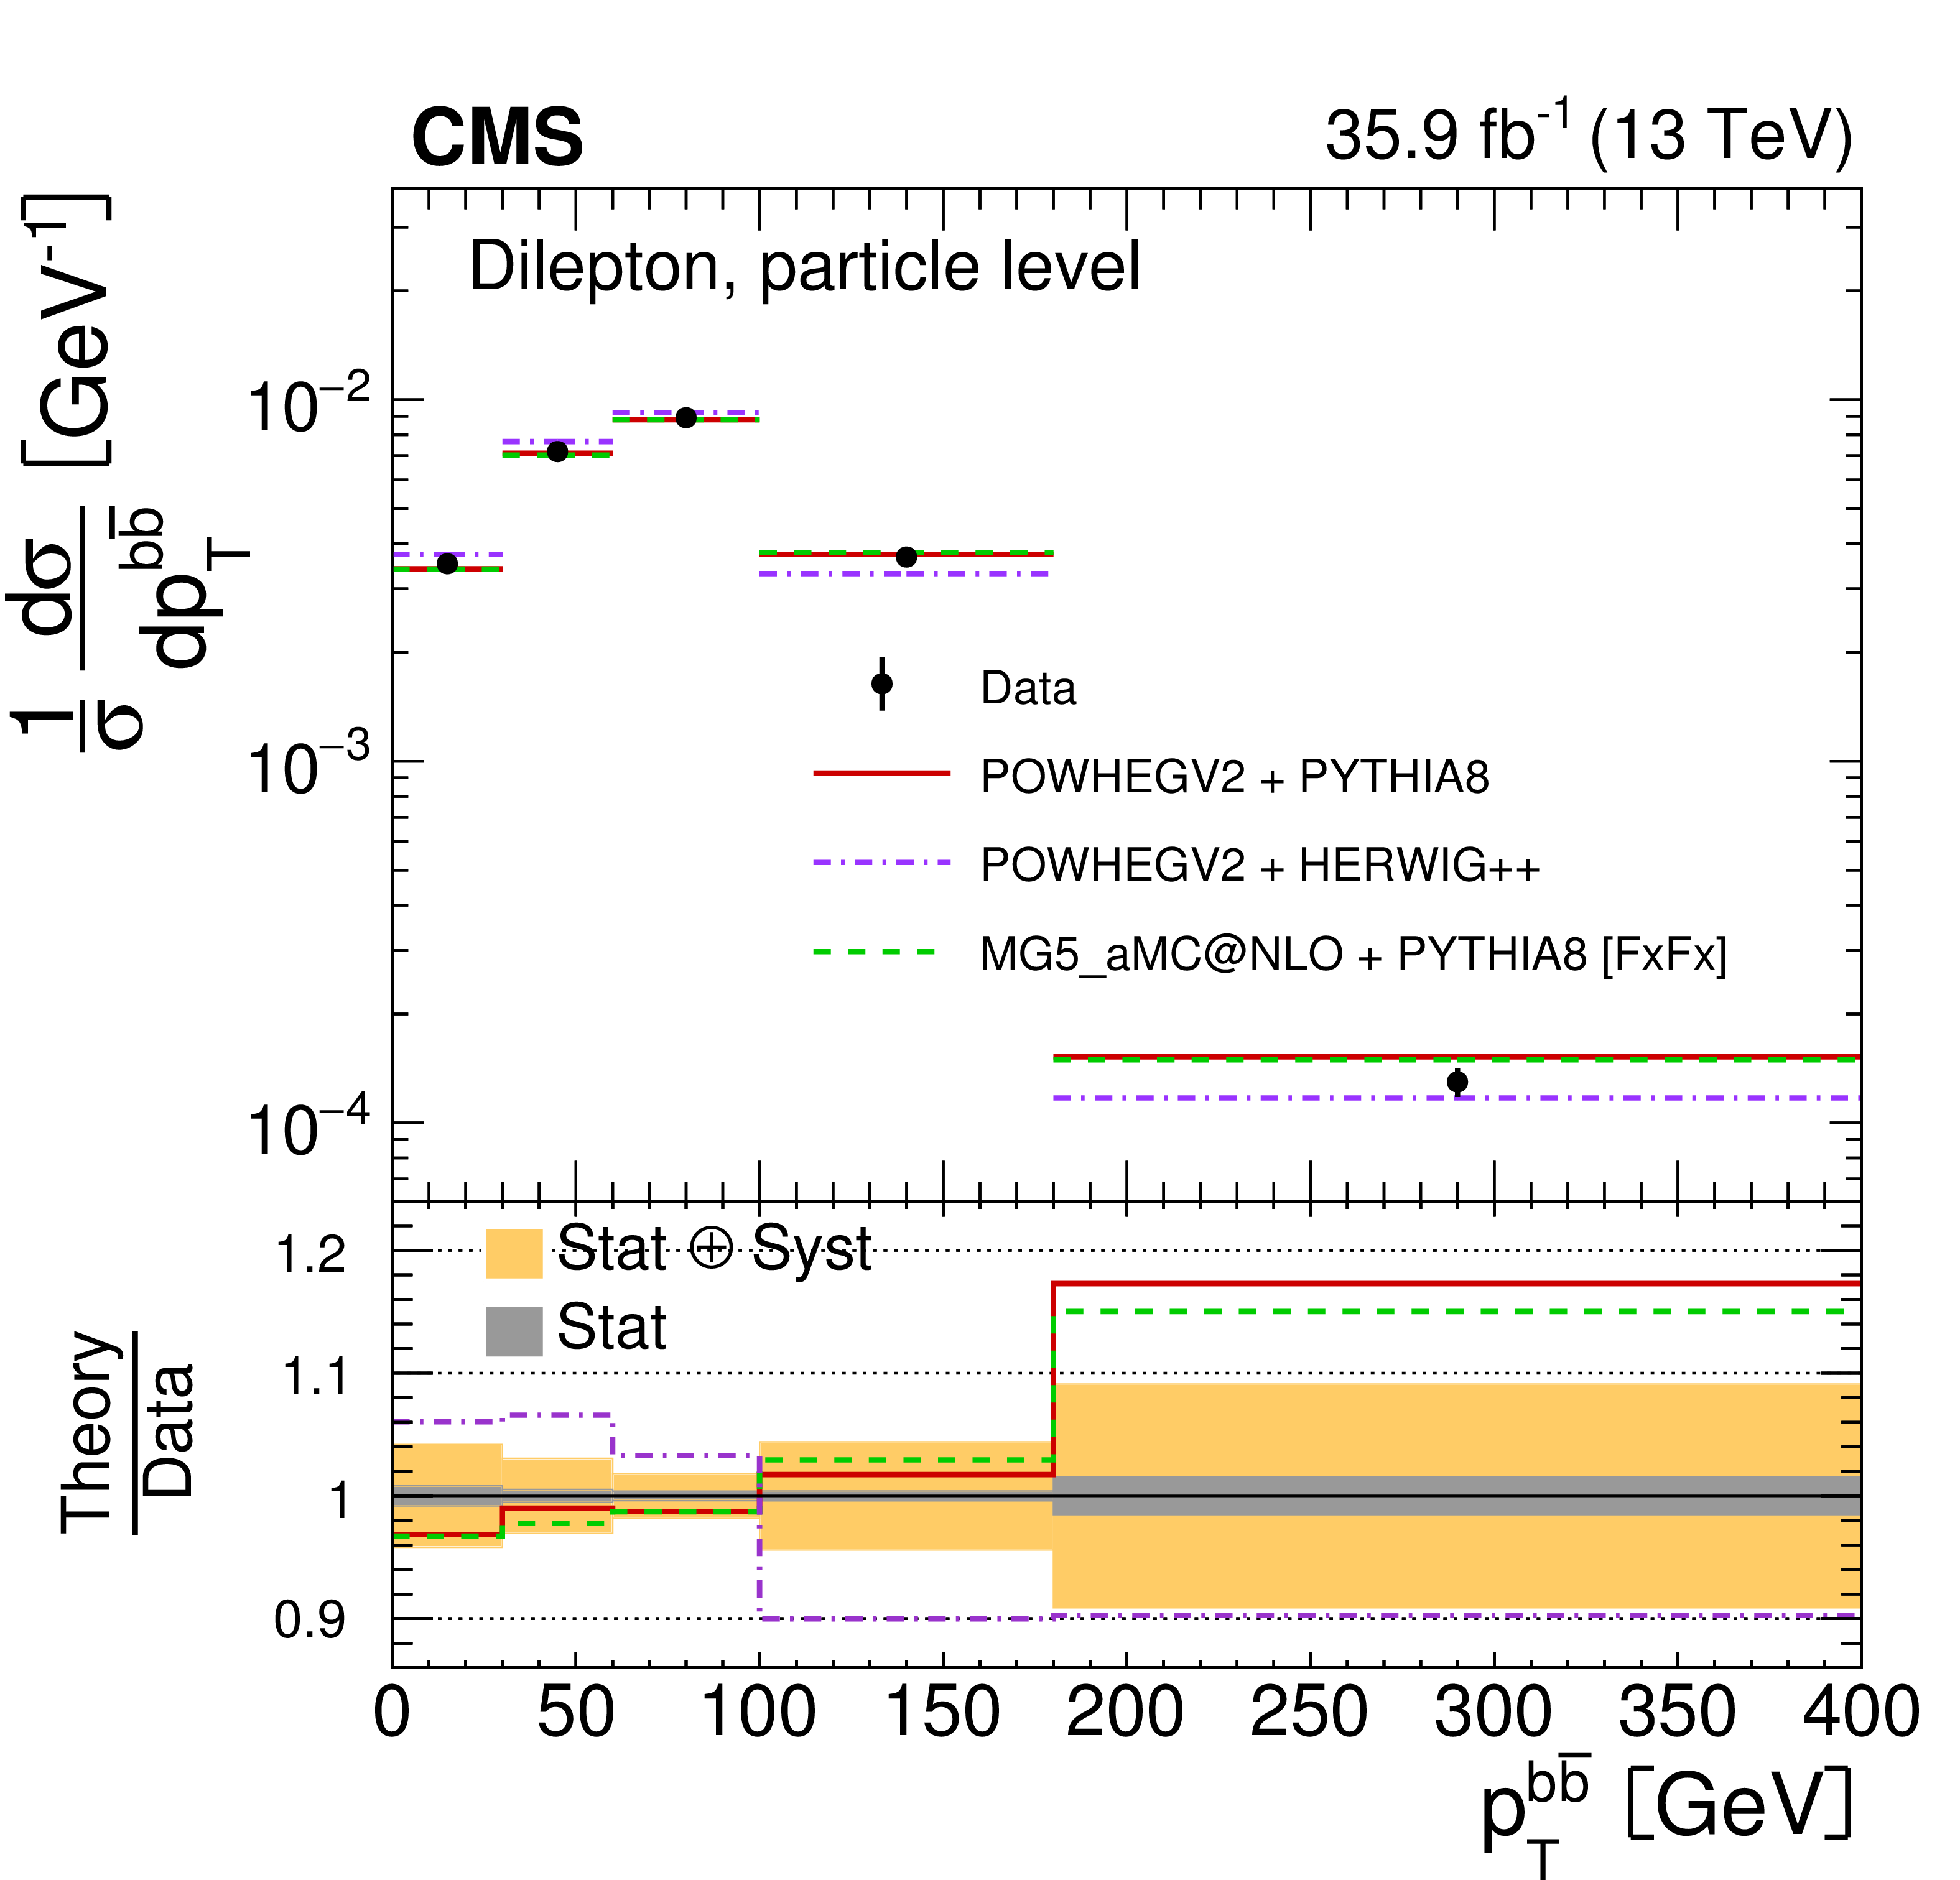
png pdf |
Figure 49-b:
The differential $ {{\mathrm {t}\overline {\mathrm {t}}}} $ production cross sections as a function of $ {{p_{\mathrm {T}}} ^{{{\mathrm {b}} {\overline {\mathrm {b}}}}}} $ in a fiducial phase space at the particle level are shown for the data (points) and the MC predictions (lines). The vertical lines on the points indicate the total uncertainty in the data. The left and right plots correspond to absolute and normalised measurements, respectively. The lower panel in each plot shows the ratios of the theoretical predictions to the data. The dark and light bands show the relative statistical and total uncertainties in the data, respectively. |

png pdf |
Figure 50-a:
The differential $ {{\mathrm {t}\overline {\mathrm {t}}}} $ production cross sections as a function of $ {m_{{{\mathrm {b}} {\overline {\mathrm {b}}}}}} $ in a fiducial phase space at the particle level are shown for the data (points) and the MC predictions (lines). The vertical lines on the points indicate the total uncertainty in the data. The left and right plots correspond to absolute and normalised measurements, respectively. The lower panel in each plot shows the ratios of the theoretical predictions to the data. The dark and light bands show the relative statistical and total uncertainties in the data, respectively. |
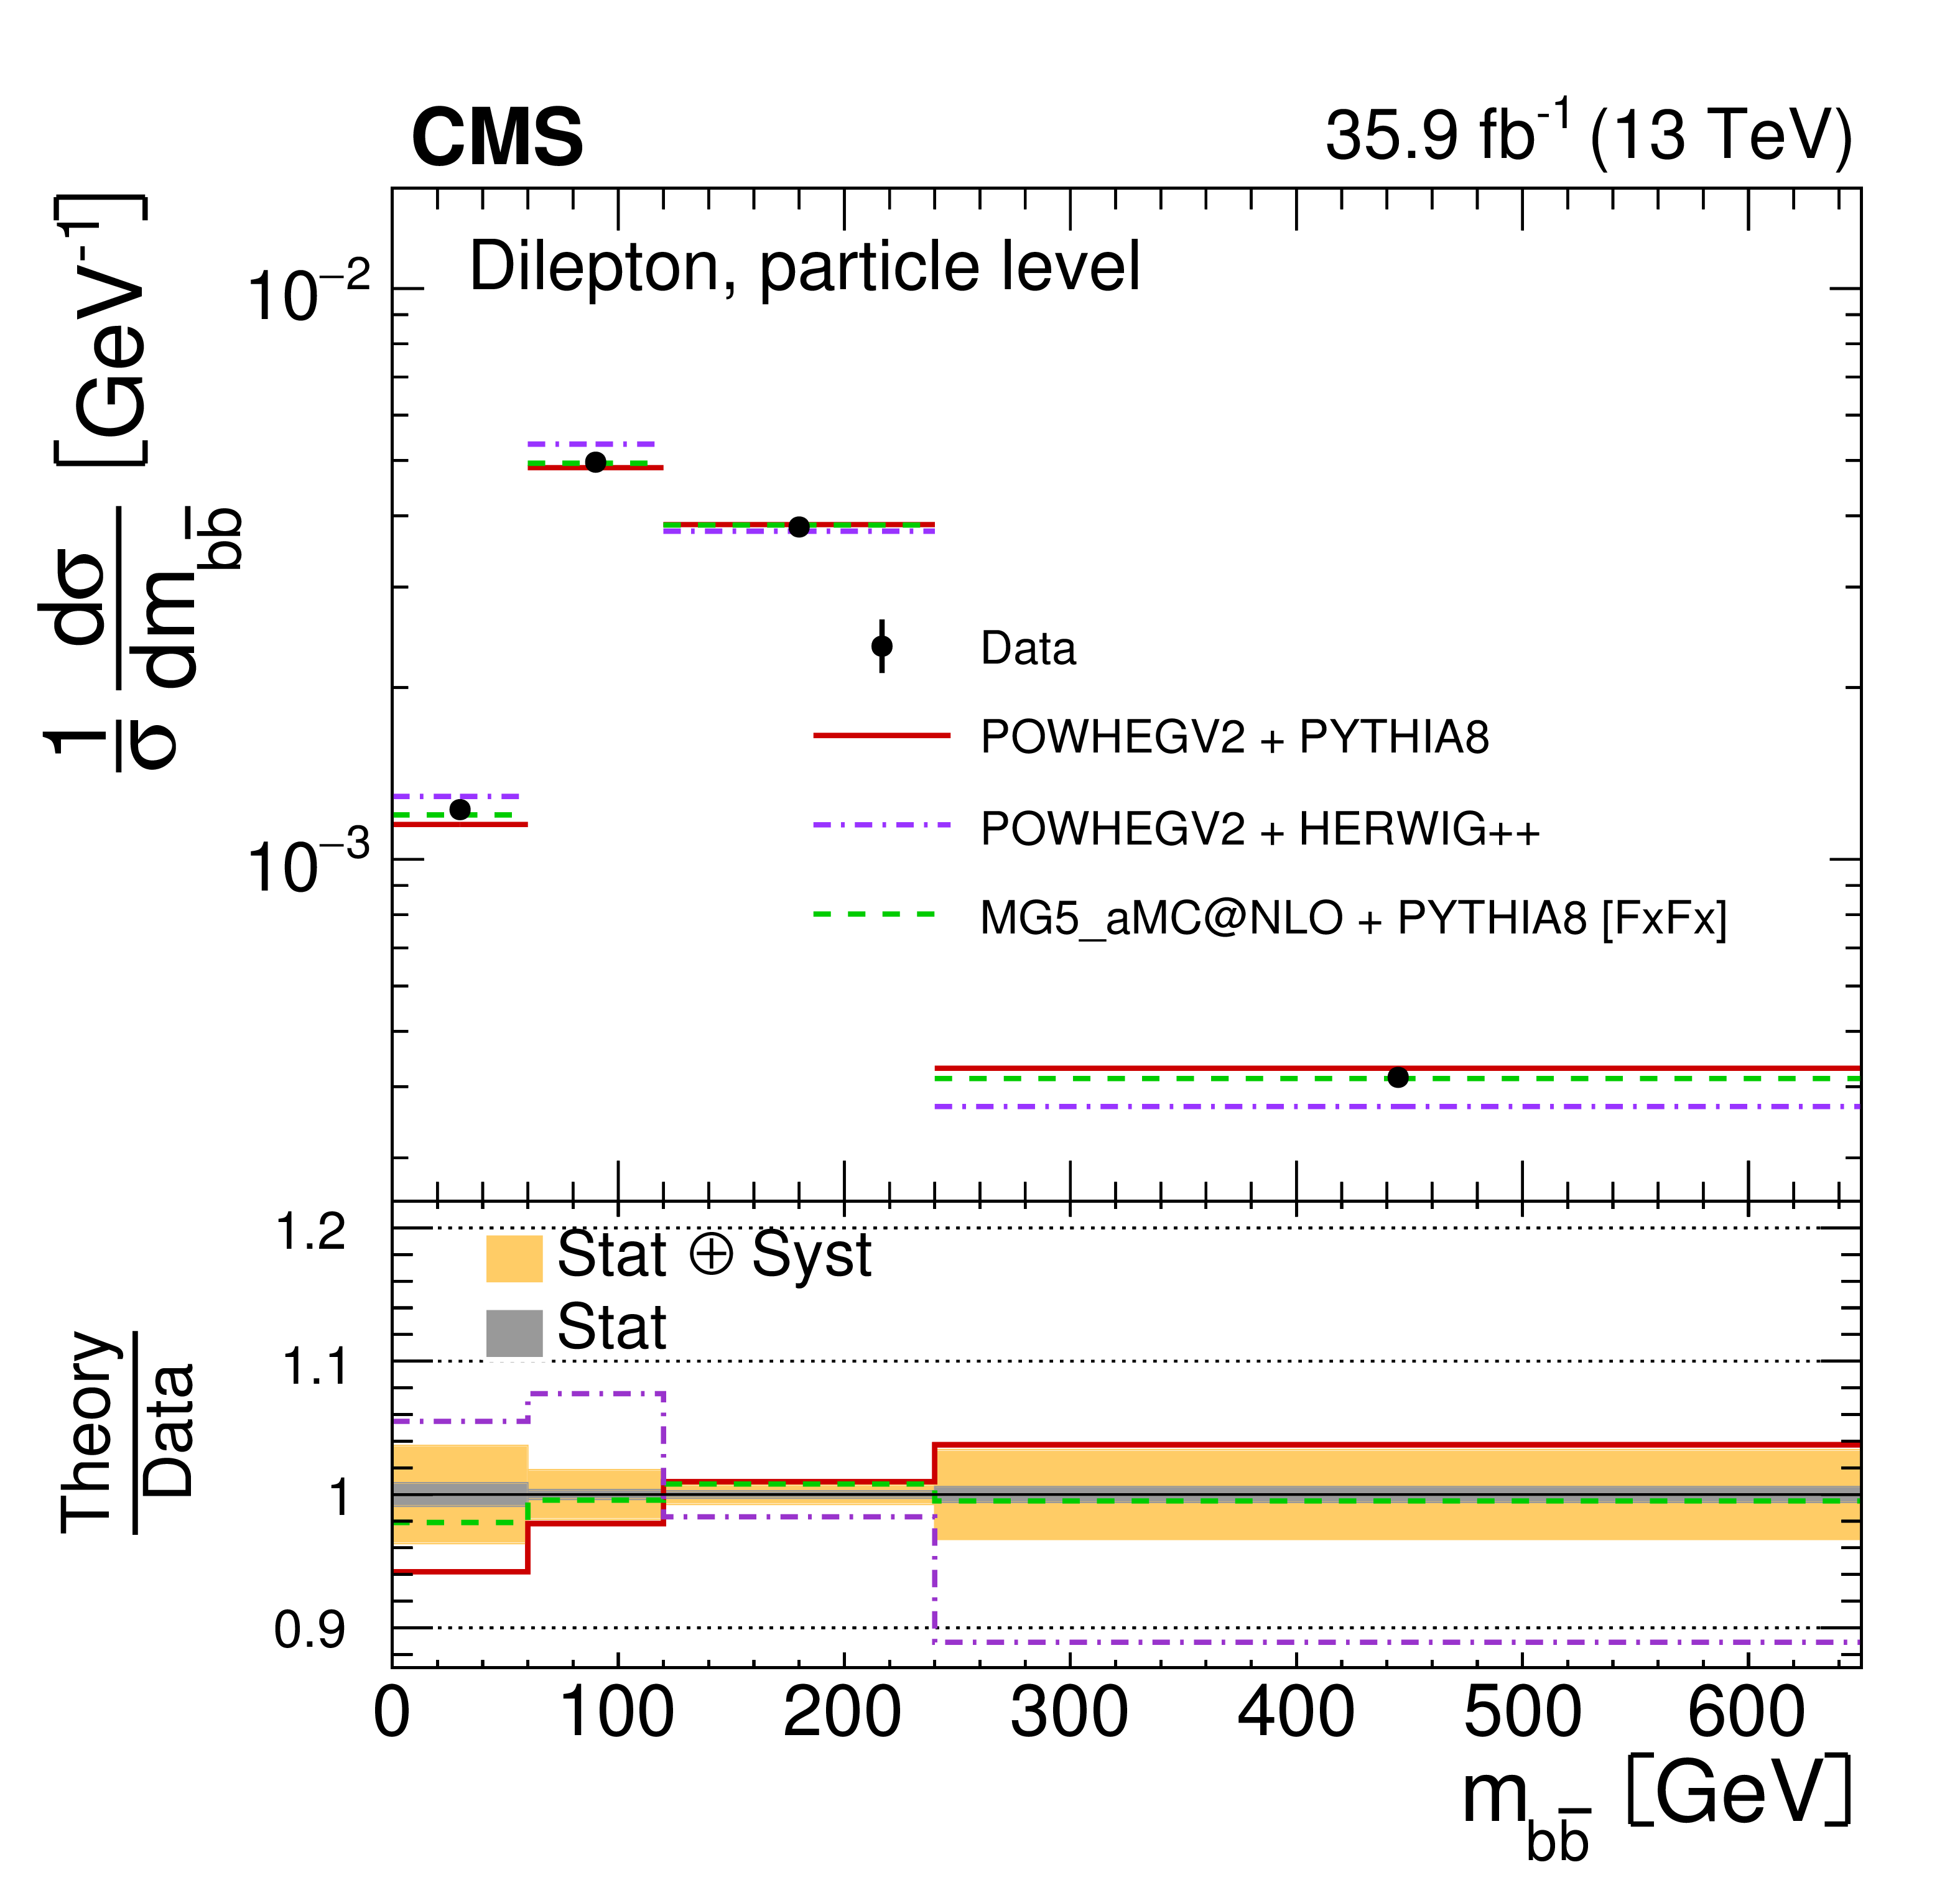
png pdf |
Figure 50-b:
The differential $ {{\mathrm {t}\overline {\mathrm {t}}}} $ production cross sections as a function of $ {m_{{{\mathrm {b}} {\overline {\mathrm {b}}}}}} $ in a fiducial phase space at the particle level are shown for the data (points) and the MC predictions (lines). The vertical lines on the points indicate the total uncertainty in the data. The left and right plots correspond to absolute and normalised measurements, respectively. The lower panel in each plot shows the ratios of the theoretical predictions to the data. The dark and light bands show the relative statistical and total uncertainties in the data, respectively. |
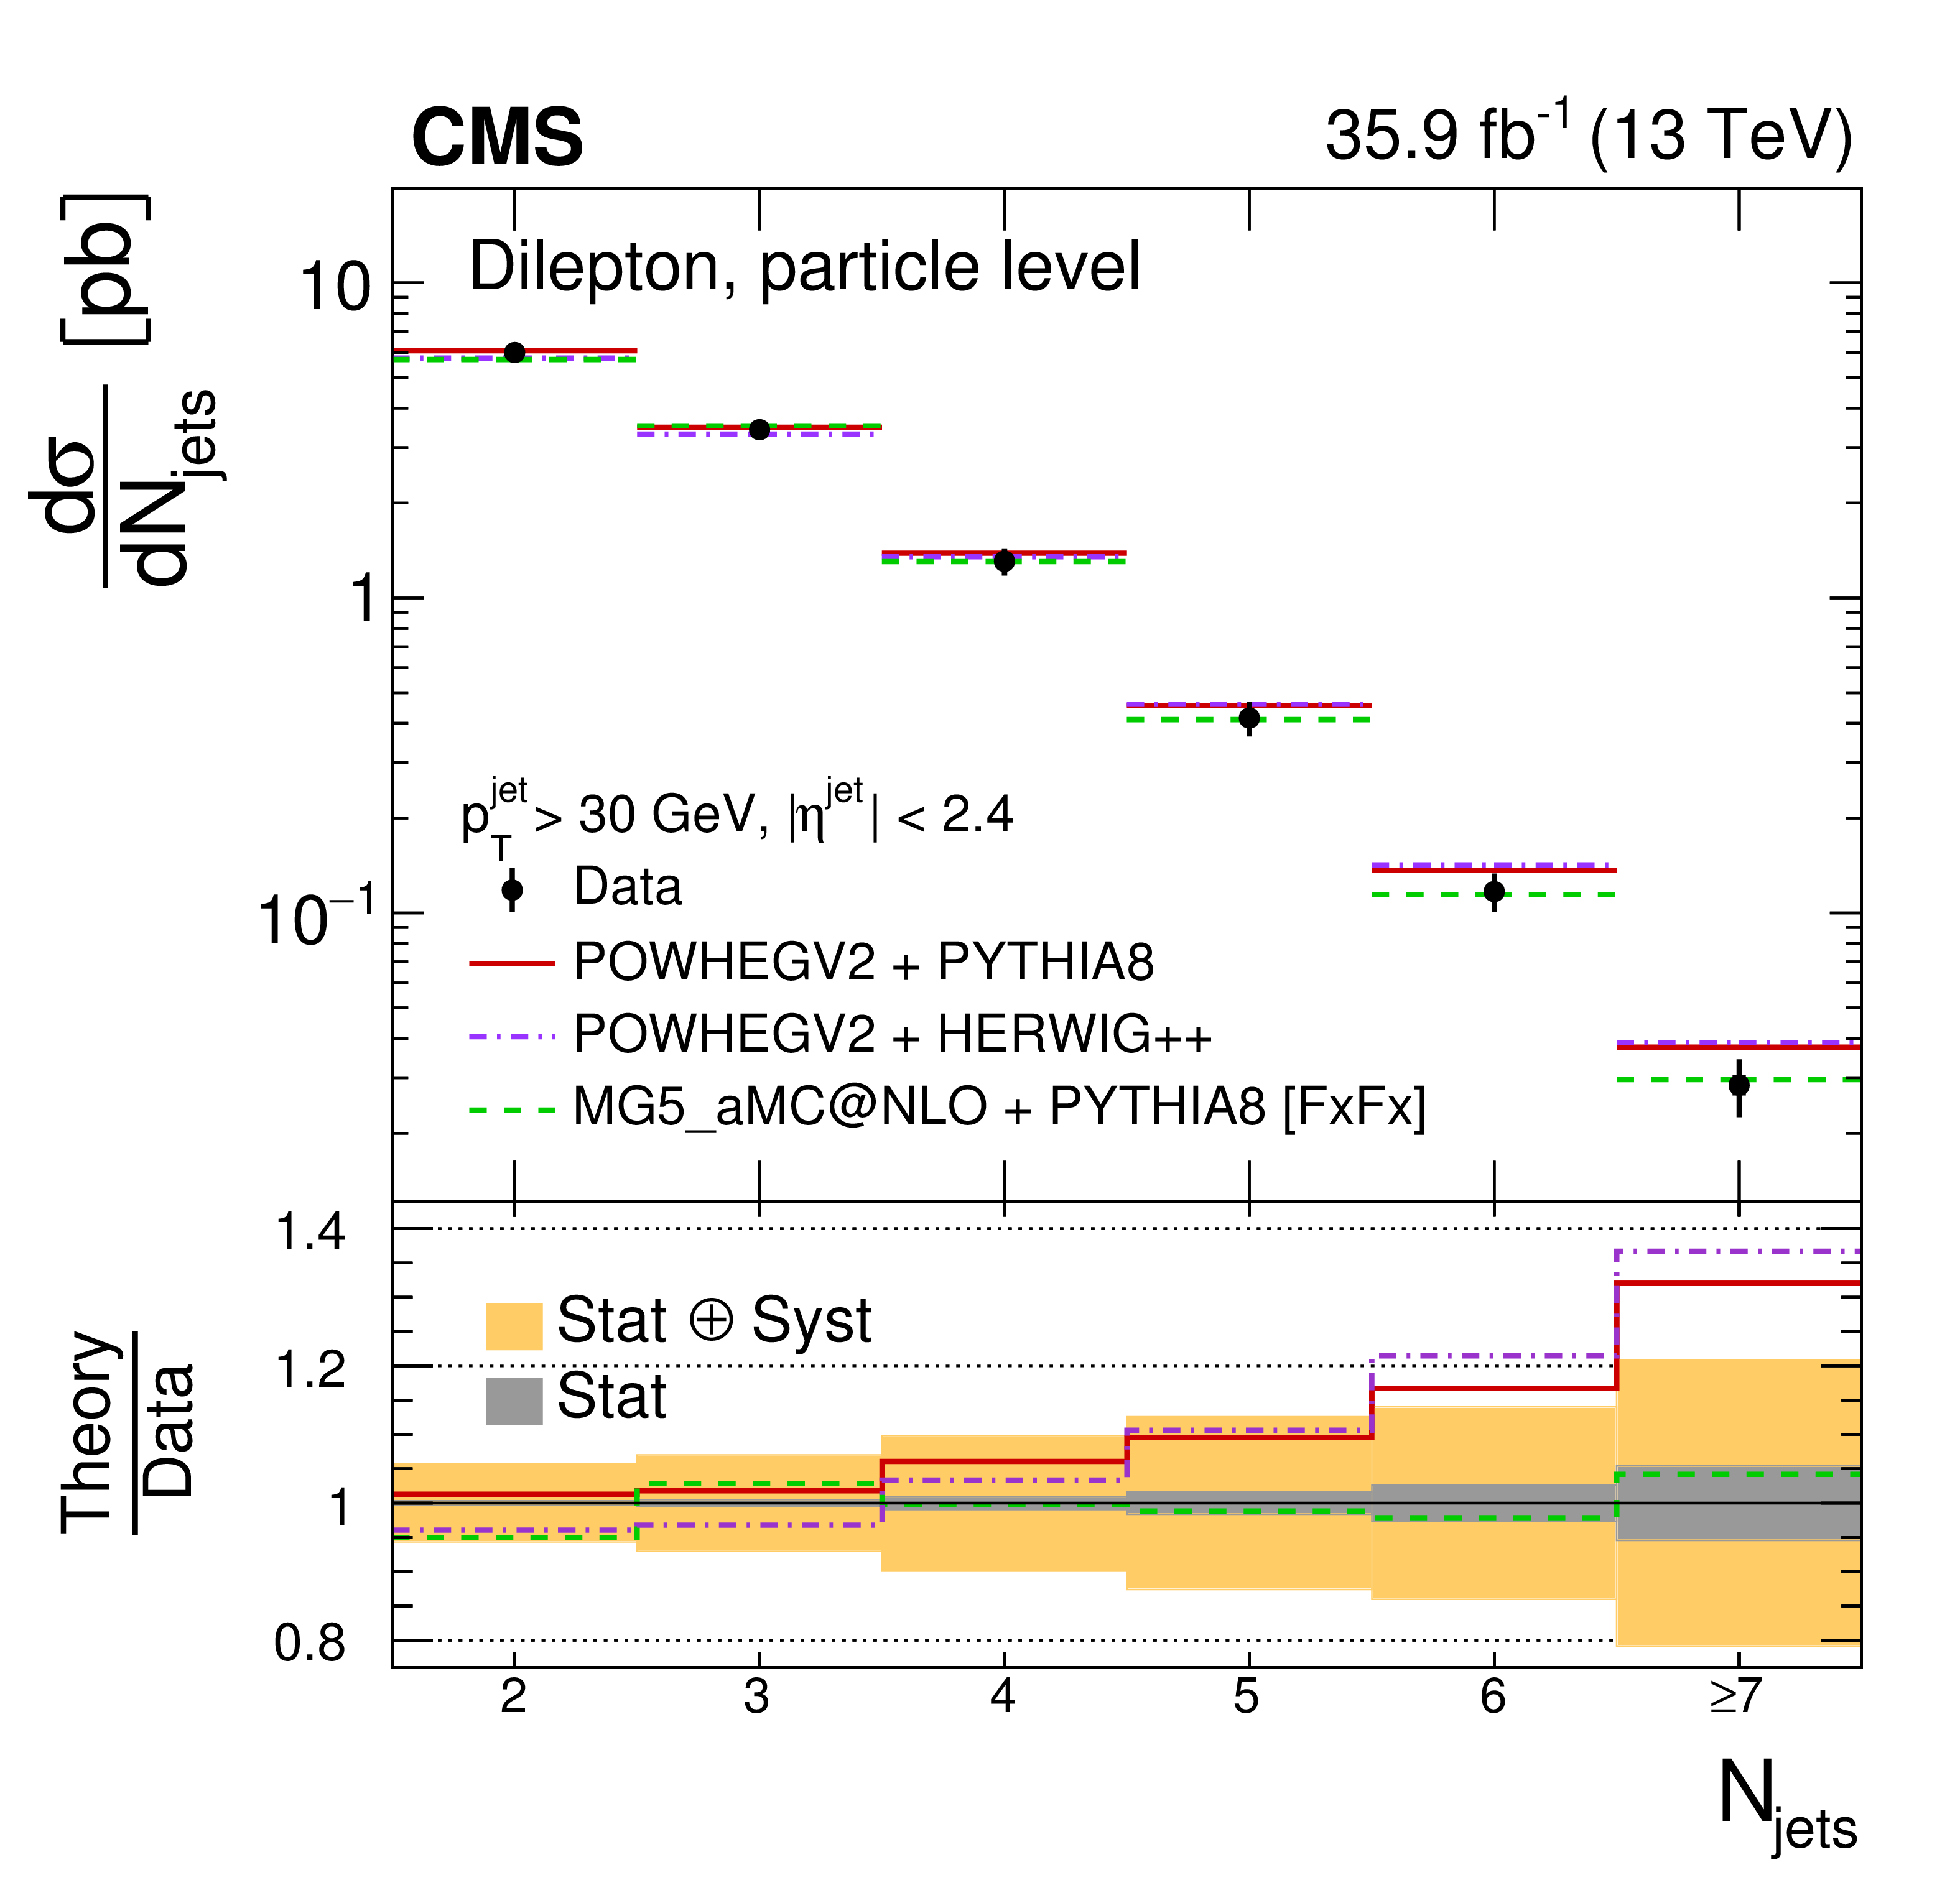
png pdf |
Figure 51-a:
The differential $ {{\mathrm {t}\overline {\mathrm {t}}}} $ production cross sections as a function of $ {N_{\text {jets}}} $ in a fiducial phase space at the particle level are shown for the data (points) and the MC predictions (lines). The vertical lines on the points indicate the total uncertainty in the data. The left and right plots correspond to absolute and normalised measurements, respectively. The lower panel in each plot shows the ratios of the theoretical predictions to the data. The dark and light bands show the relative statistical and total uncertainties in the data, respectively. |

png pdf |
Figure 51-b:
The differential $ {{\mathrm {t}\overline {\mathrm {t}}}} $ production cross sections as a function of $ {N_{\text {jets}}} $ in a fiducial phase space at the particle level are shown for the data (points) and the MC predictions (lines). The vertical lines on the points indicate the total uncertainty in the data. The left and right plots correspond to absolute and normalised measurements, respectively. The lower panel in each plot shows the ratios of the theoretical predictions to the data. The dark and light bands show the relative statistical and total uncertainties in the data, respectively. |
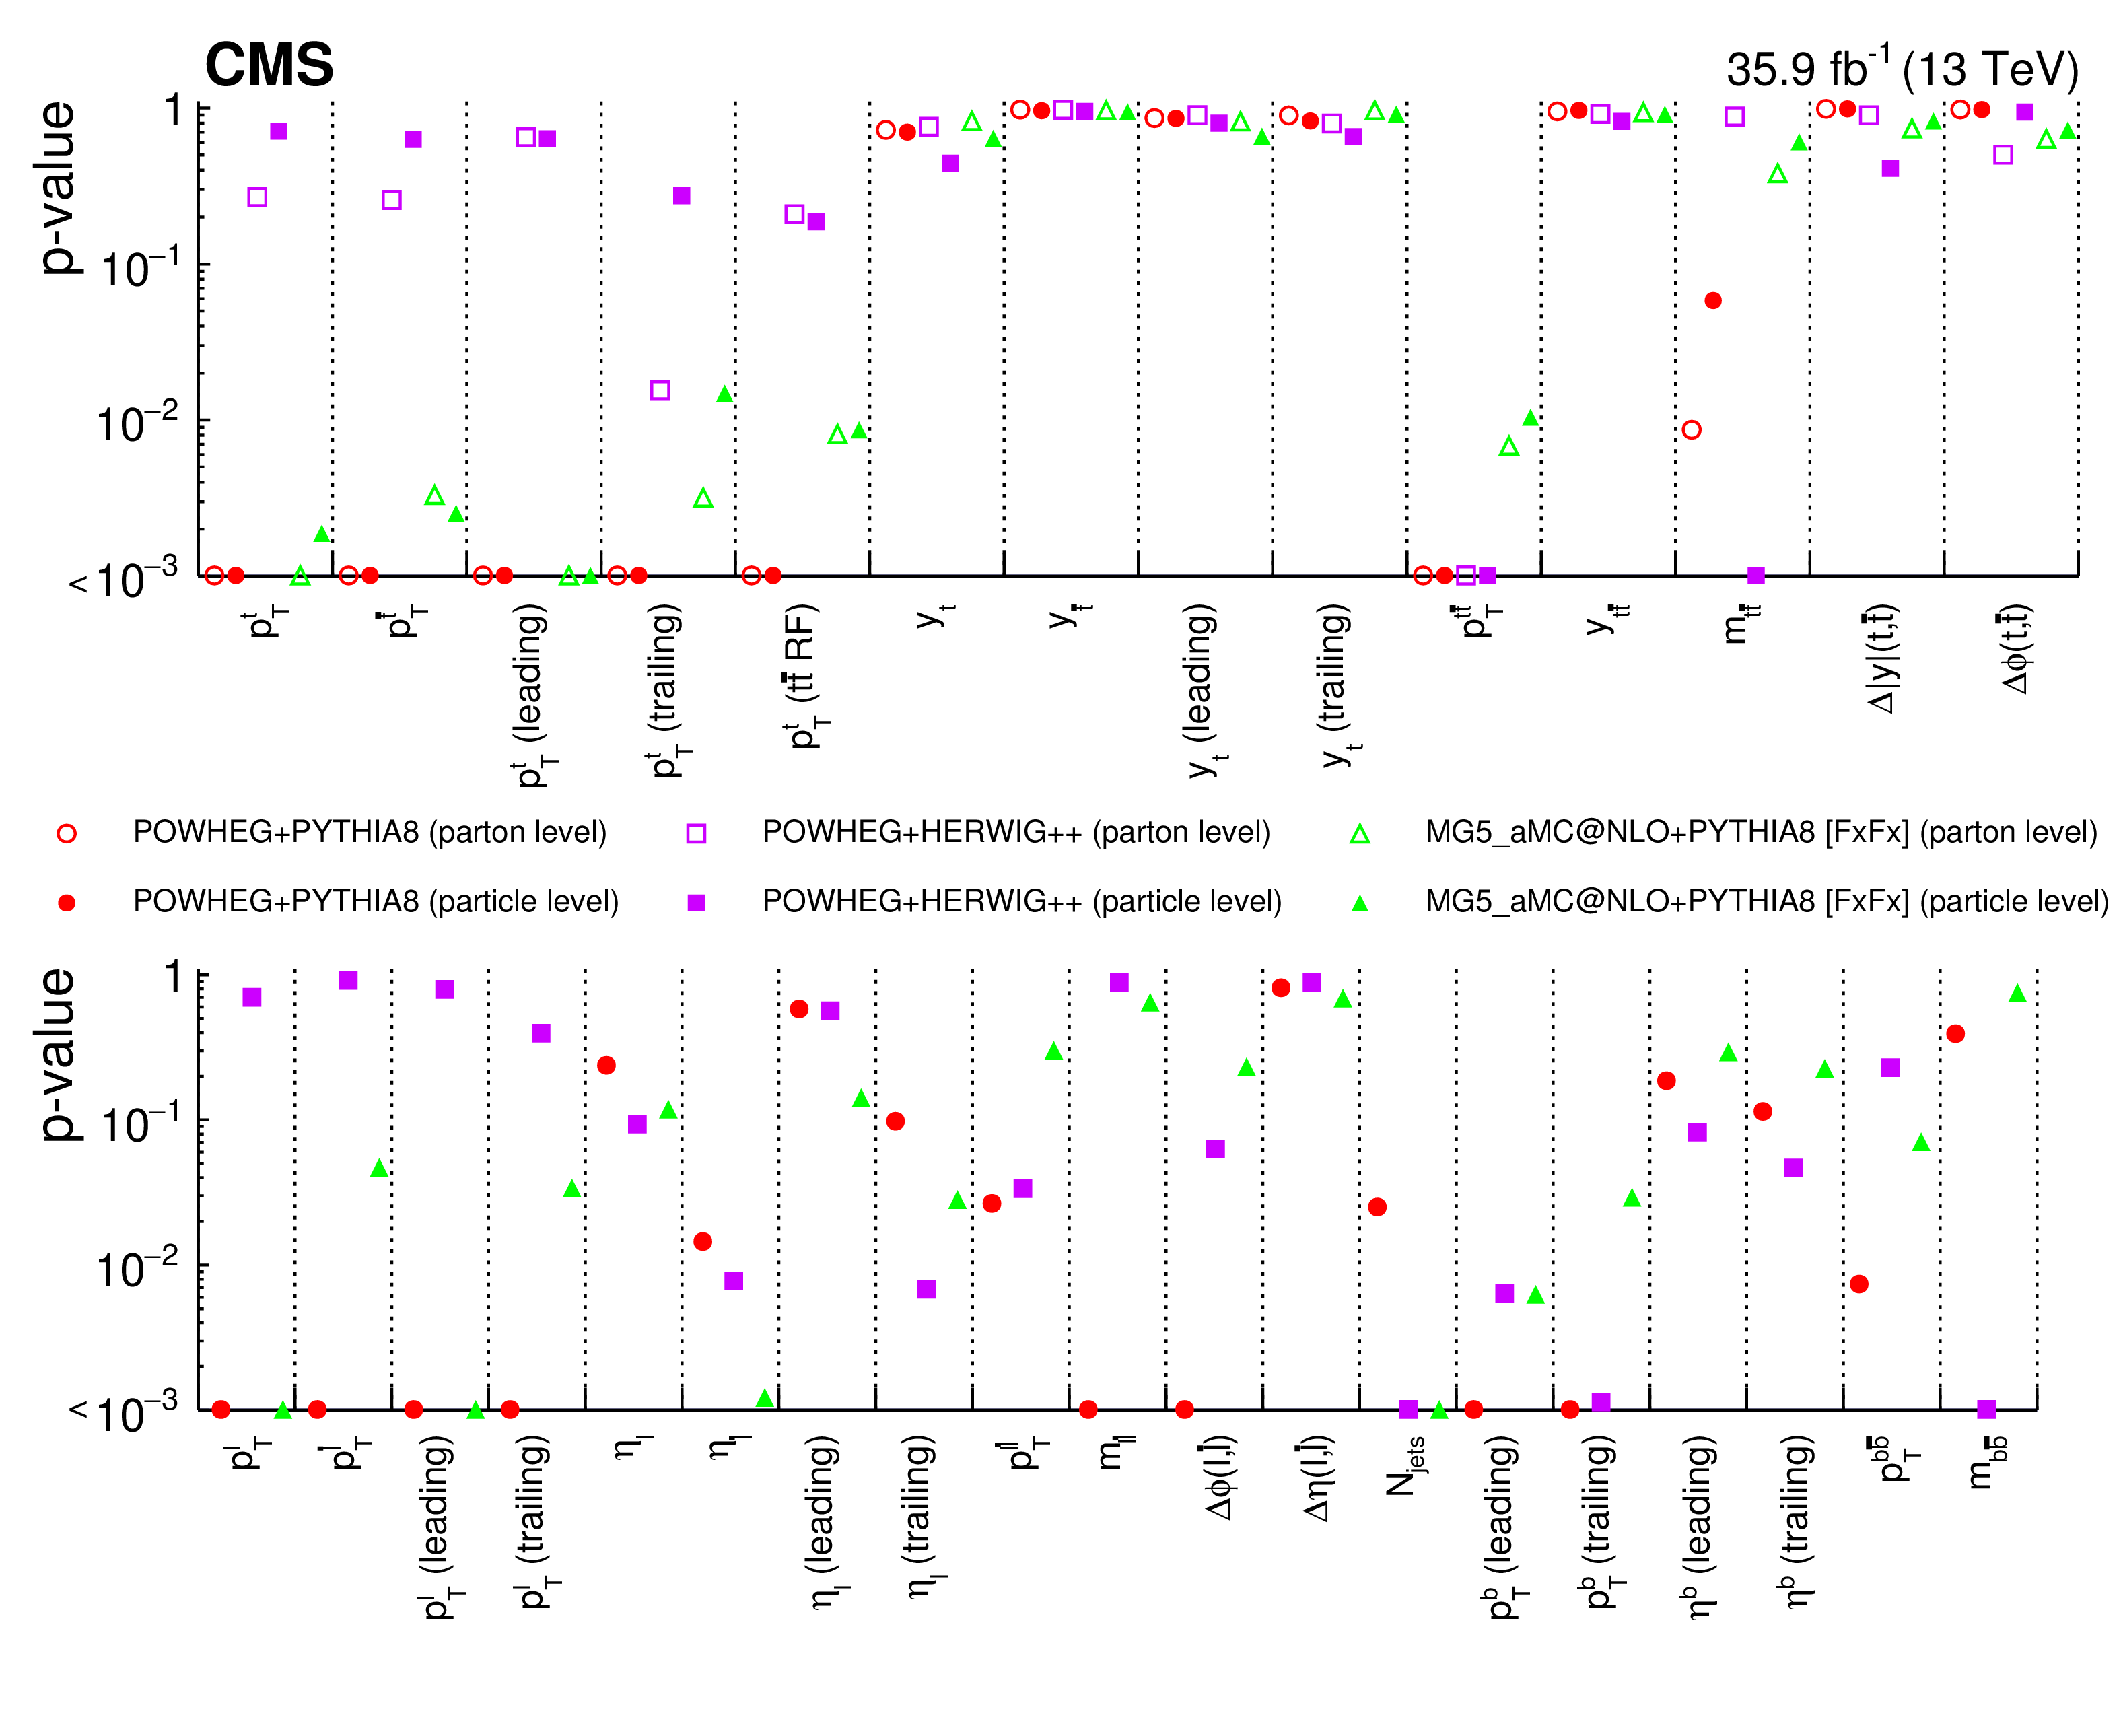
png pdf |
Figure 52:
The $p$-values quantifying the agreement between the data and MC predictions from for all normalised measurements are shown. Points situated on the horizontal axis indicate $p$-values less than 0.001. The upper panel includes distributions measured at parton and particle levels while the bottom panel includes those measured at particle level only. |
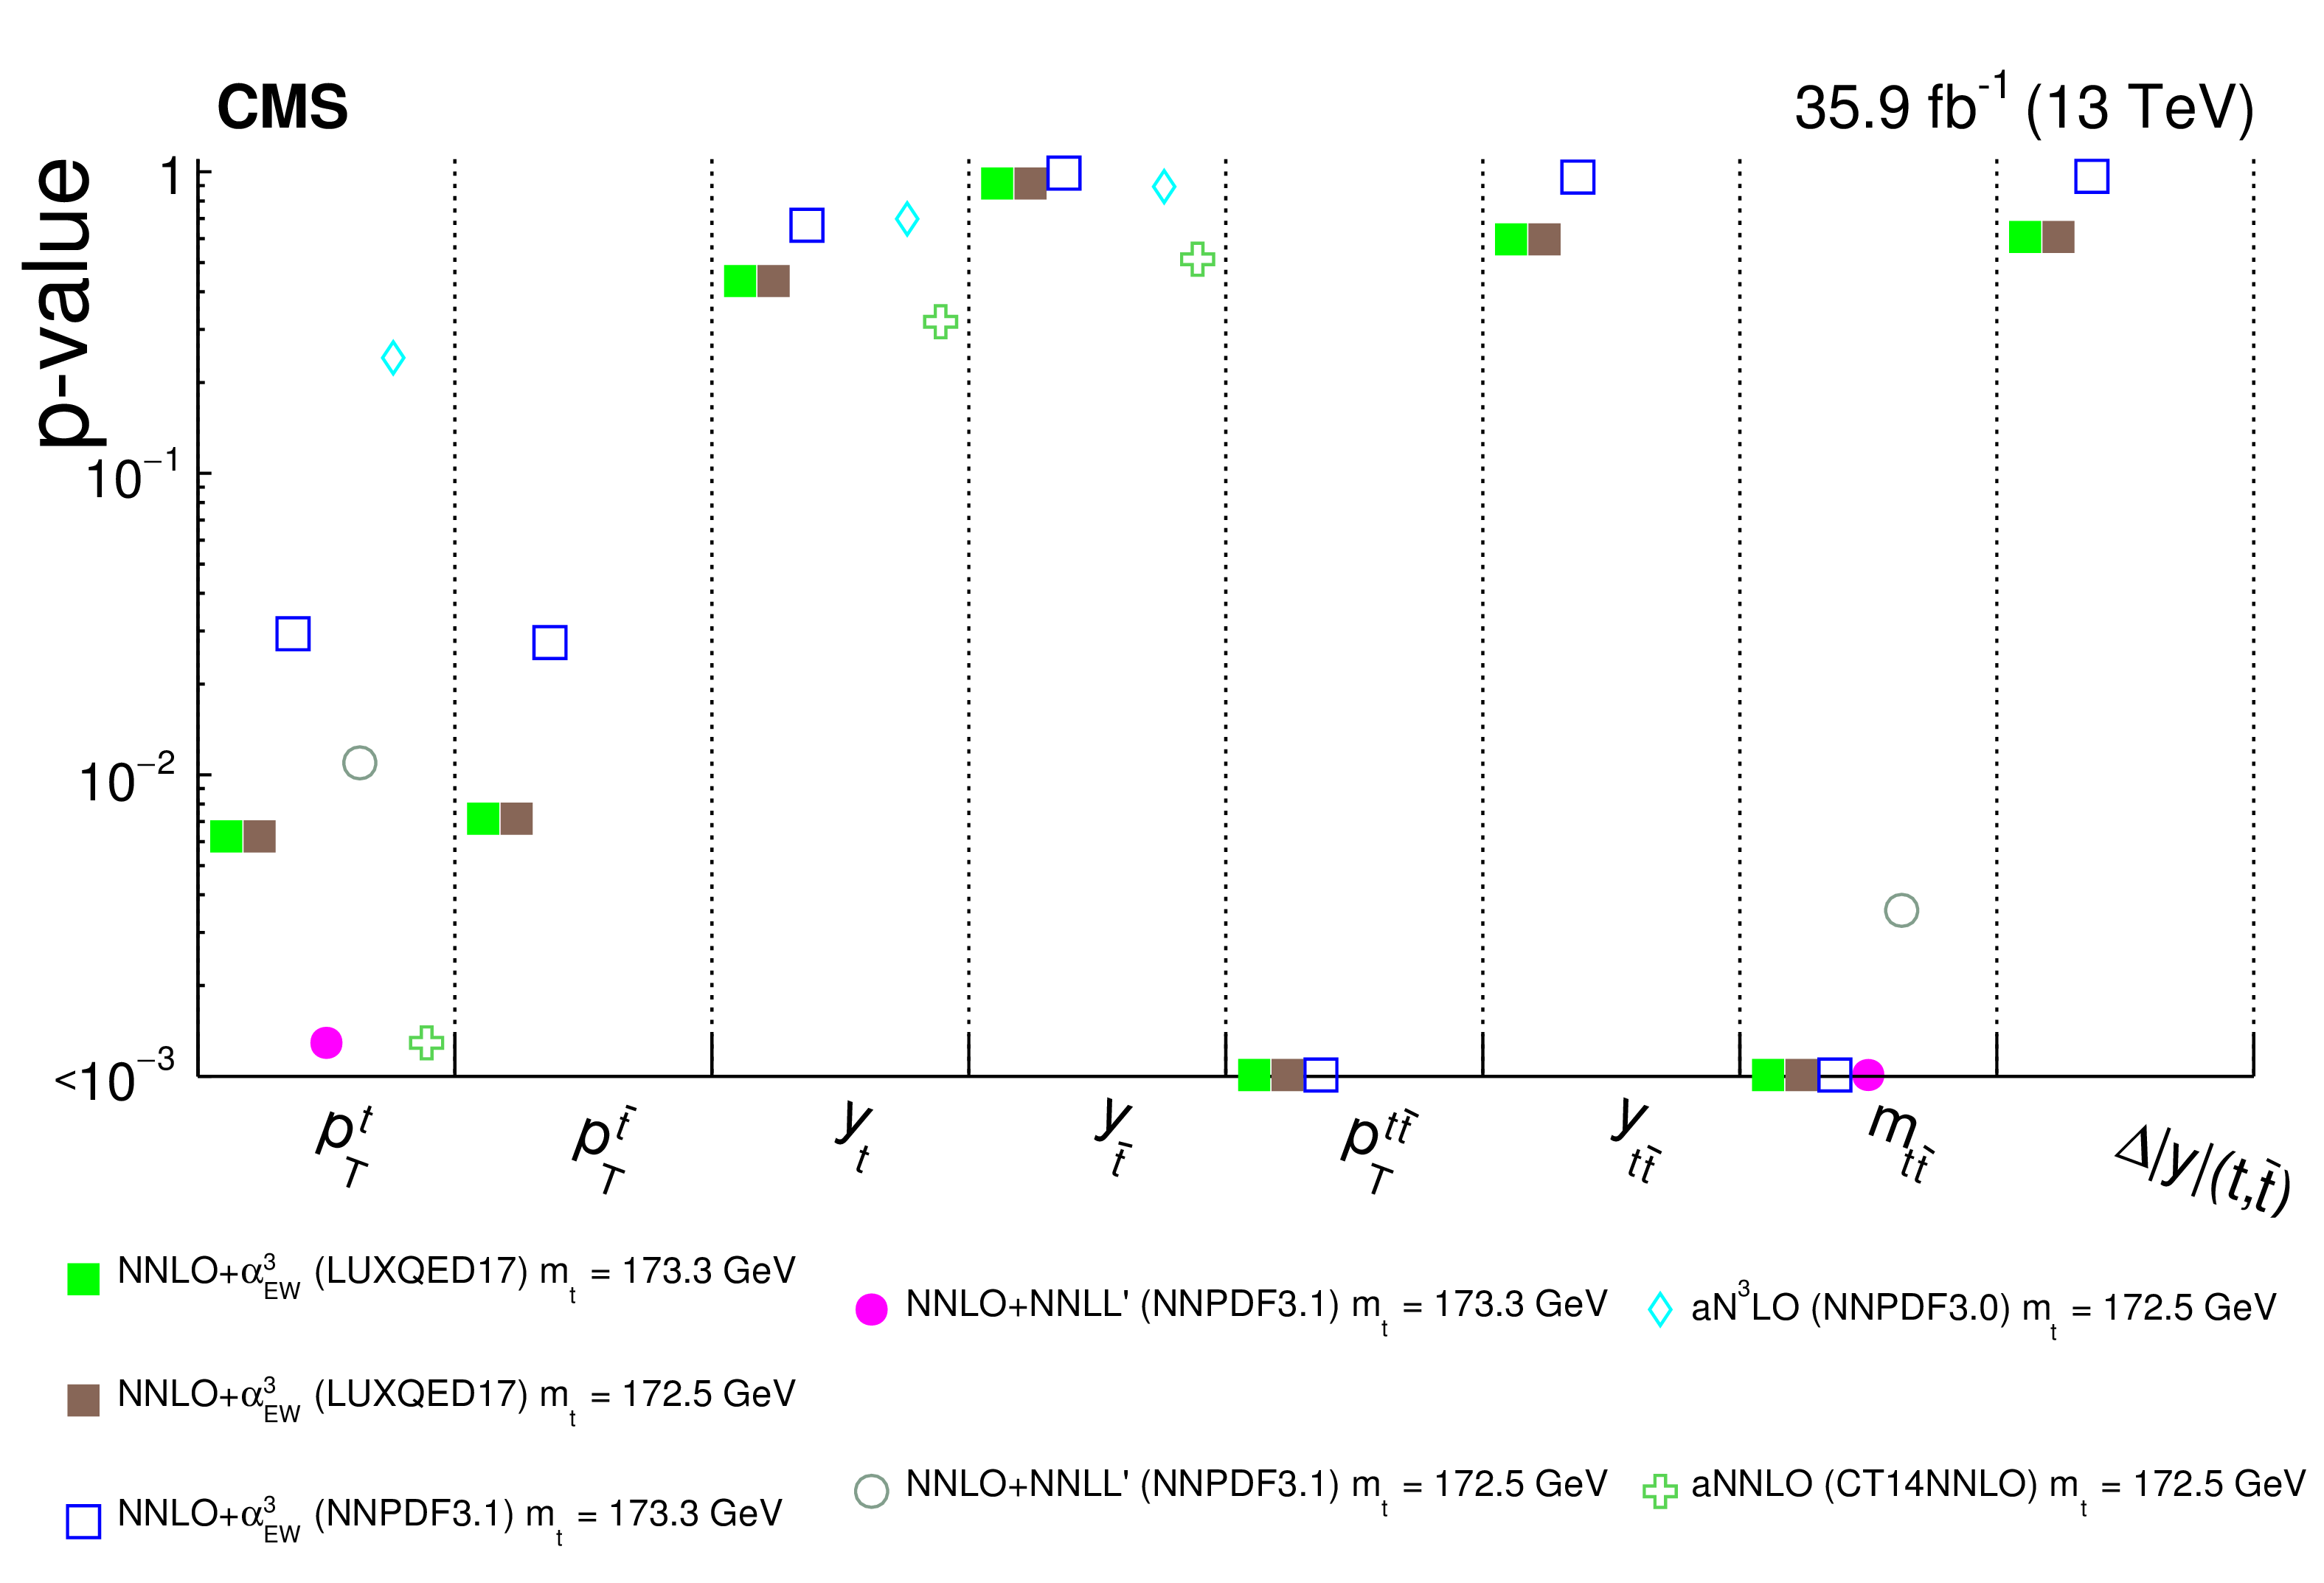
png pdf |
Figure 53:
The $p$-values quantifying the agreement between theoretical predictions with beyond-NLO precision and the data for selected normalised measurements at parton level are shown. Points situated on the horizontal axis indicate $p$-values of less than 0.001. |

png pdf |
Figure 54-a:
In the left plot, the differential $ {{\mathrm {t}\overline {\mathrm {t}}}} $ cross sections as a function of $ {\Delta \phi ({\ell}, {\bar{\ell}})} $ at the particle level in a fiducial phase space described in the text are shown. The points correspond to data and vertical bars on the points give the total uncertainty. The solid lines show the NLO predictions from the MG5\_aMC@NLO generator interfaced with PYTHIA for $ {C_\mathrm {tG}/\Lambda ^{2}} $ values of 1.0, 0.0, and $-$1.0 TeV$ ^{-2}$. The lower plot displays the ratio of the theoretical predictions to the data. In the right plot, $ {\Delta \chi ^{2}} $ values from the fit to the data in the left plot are shown as a function of ${C_\mathrm {tG}/\Lambda ^{2}}$. The dark curve gives the result of the nominal fit, with the vertical dashed line giving the best-fit value. The two horizontal dashed lines indicate the $ {\Delta \chi ^{2}} $ values for the 68 and 95% CIs. The dark and light bands correspond to those 68 and 95% CLs, respectively. The other curves show the $ {\Delta \chi ^{2}} $ values for fits that give the maximally positive and negative changes in the best-fit value when the theoretical predictions are allowed to vary within their systematic uncertainties. |
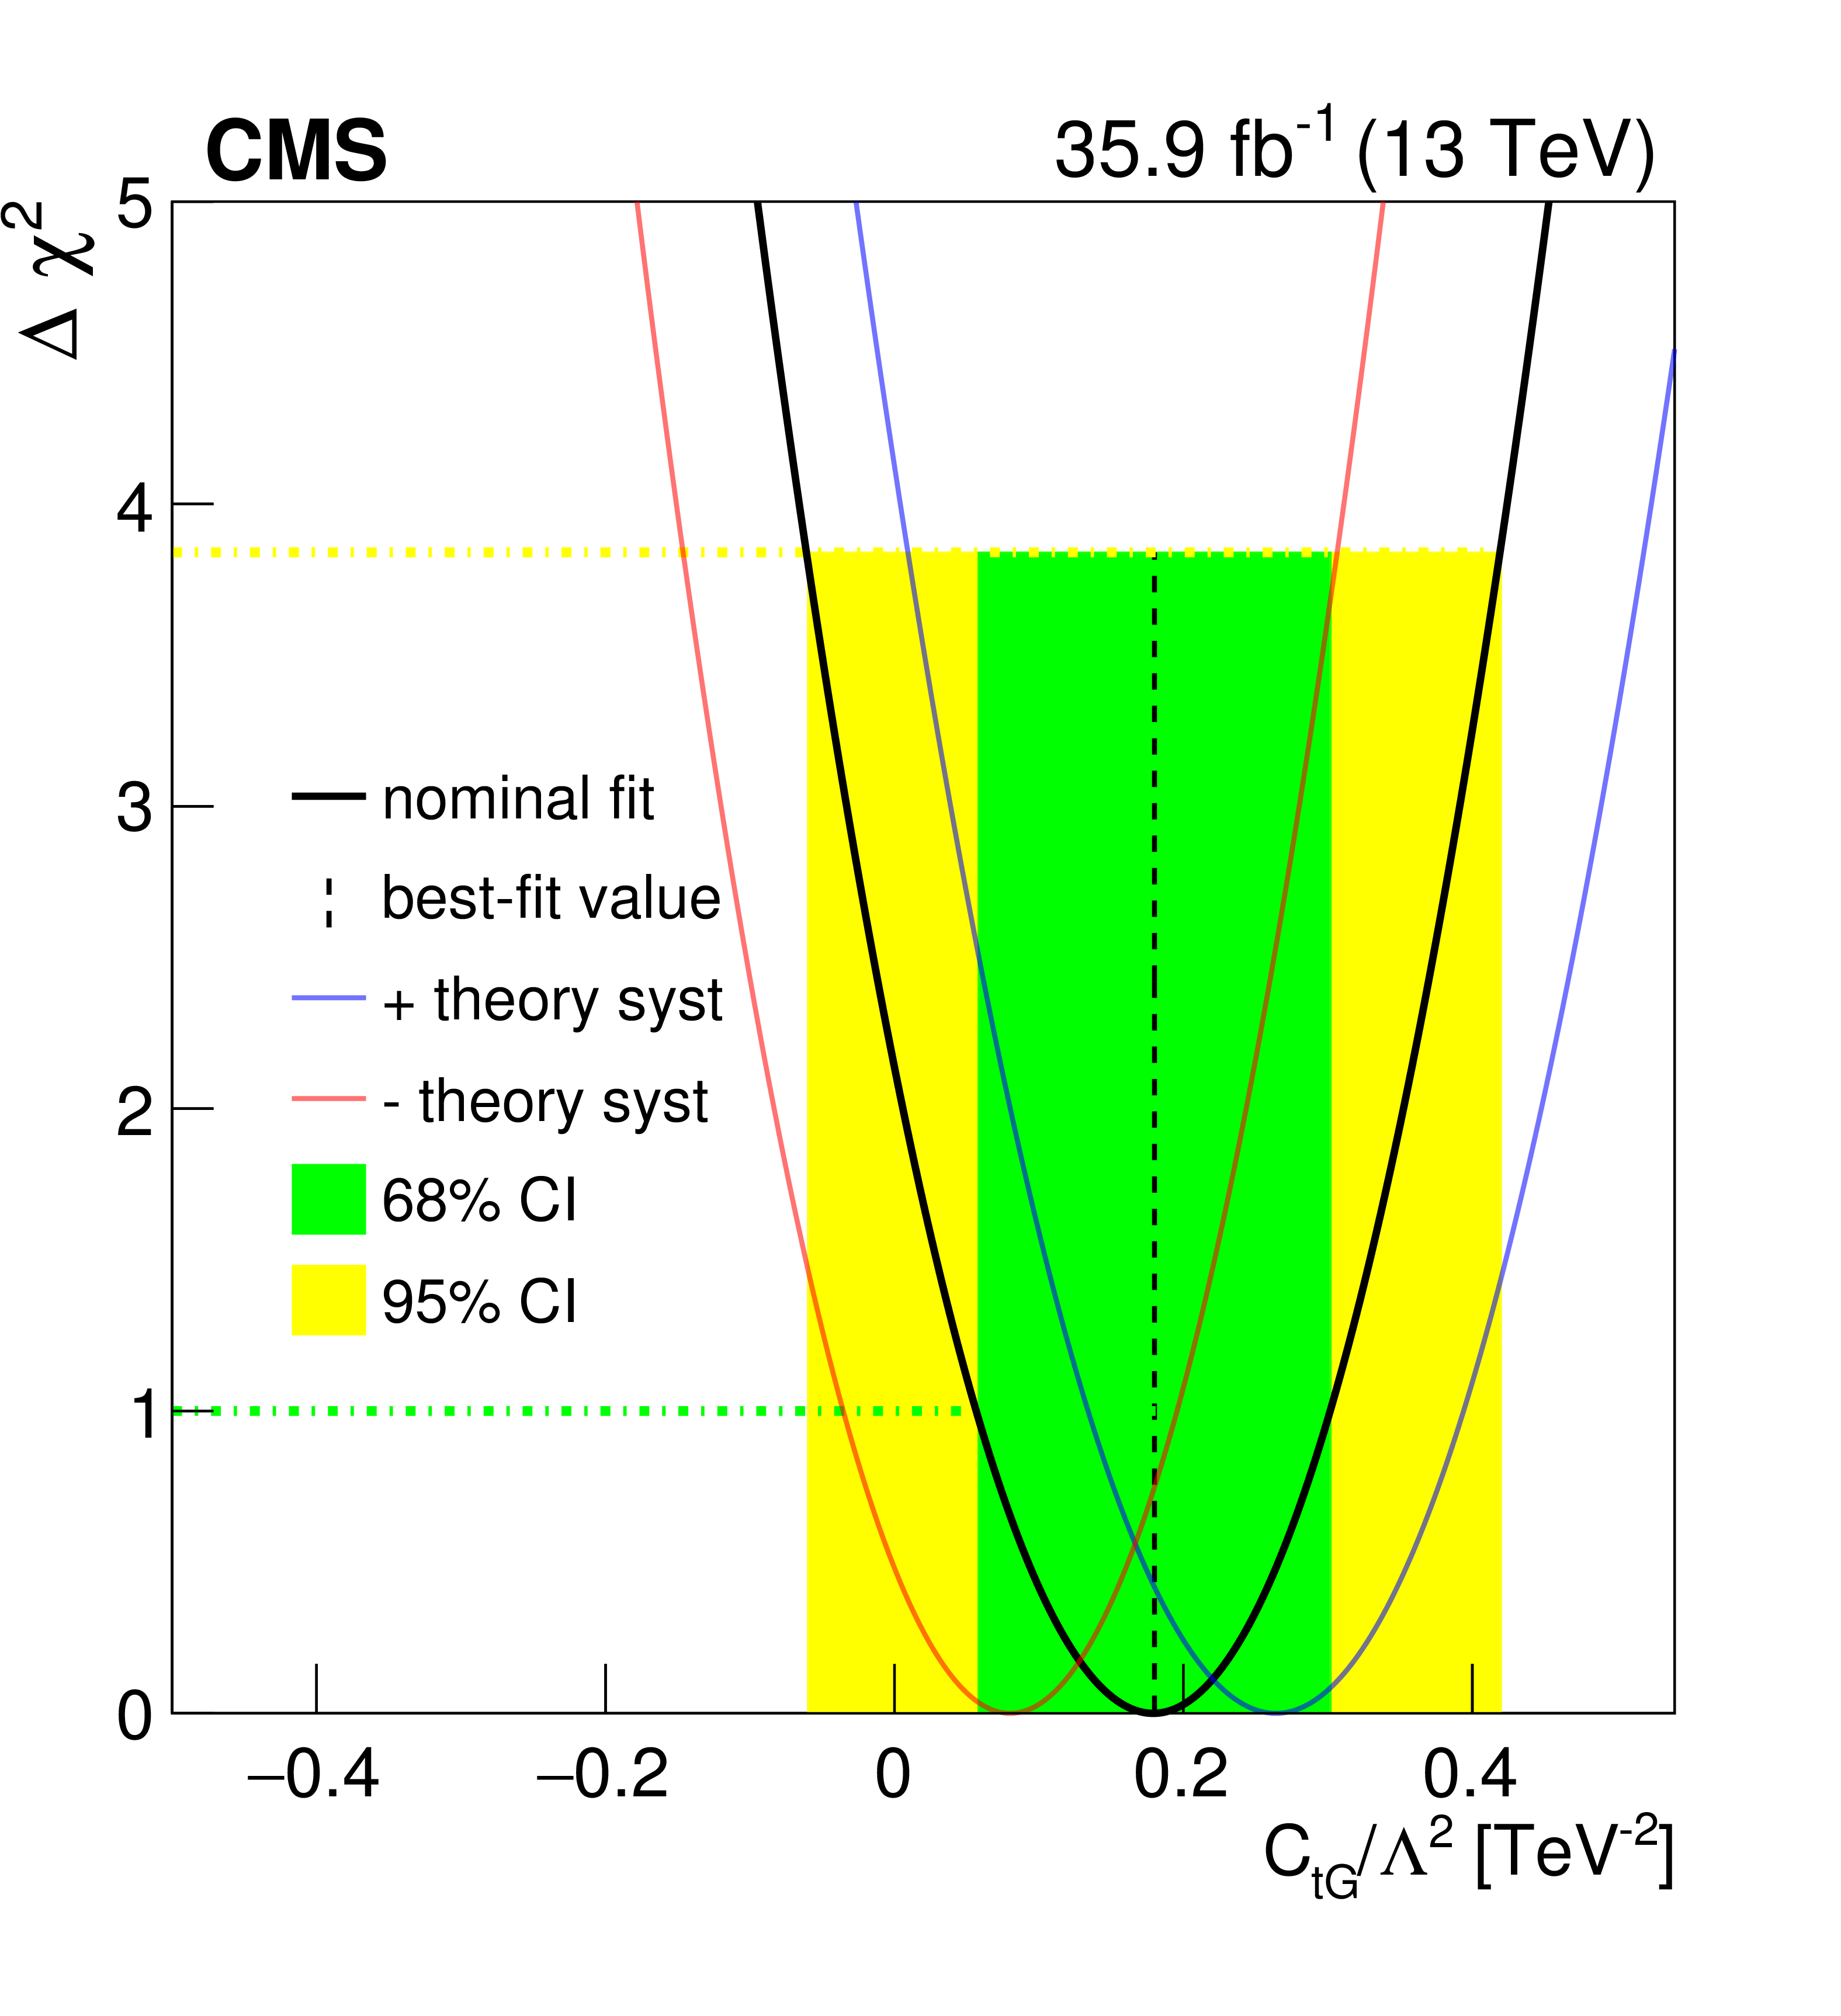
png pdf |
Figure 54-b:
In the left plot, the differential $ {{\mathrm {t}\overline {\mathrm {t}}}} $ cross sections as a function of $ {\Delta \phi ({\ell}, {\bar{\ell}})} $ at the particle level in a fiducial phase space described in the text are shown. The points correspond to data and vertical bars on the points give the total uncertainty. The solid lines show the NLO predictions from the MG5\_aMC@NLO generator interfaced with PYTHIA for $ {C_\mathrm {tG}/\Lambda ^{2}} $ values of 1.0, 0.0, and $-$1.0 TeV$ ^{-2}$. The lower plot displays the ratio of the theoretical predictions to the data. In the right plot, $ {\Delta \chi ^{2}} $ values from the fit to the data in the left plot are shown as a function of ${C_\mathrm {tG}/\Lambda ^{2}}$. The dark curve gives the result of the nominal fit, with the vertical dashed line giving the best-fit value. The two horizontal dashed lines indicate the $ {\Delta \chi ^{2}} $ values for the 68 and 95% CIs. The dark and light bands correspond to those 68 and 95% CLs, respectively. The other curves show the $ {\Delta \chi ^{2}} $ values for fits that give the maximally positive and negative changes in the best-fit value when the theoretical predictions are allowed to vary within their systematic uncertainties. |

png pdf |
Figure 55:
The results of the $ {A_\text {c}^{\text {x}}} $ extraction (x = $ {{\mathrm {t}\overline {\mathrm {t}}}} $ or ${\ell \bar{\ell}}$) from integrating the normalised parton- and particle-level differential cross section measurements as a function of $ {\Delta {| y |}({\mathrm {t}}, {\overline {\mathrm {t}}})} $ and $ {\Delta \eta ({\ell}, {\bar{\ell}})} $ are shown. The central values for the data are indicated by the solid lines with the 68 and 95% CIs represented by the dark and light shaded bands, respectively. The three types of dashed lines indicate the SM predictions produced with the MG5\_aMC@NLO and POWHEG generators, both interfaced with PYTHIA, and a calculation at NLO precision in QCD and including corrections arising from mixing between QCD and electroweak diagrams, and between QCD and QED diagrams [90]. |
| Tables | |
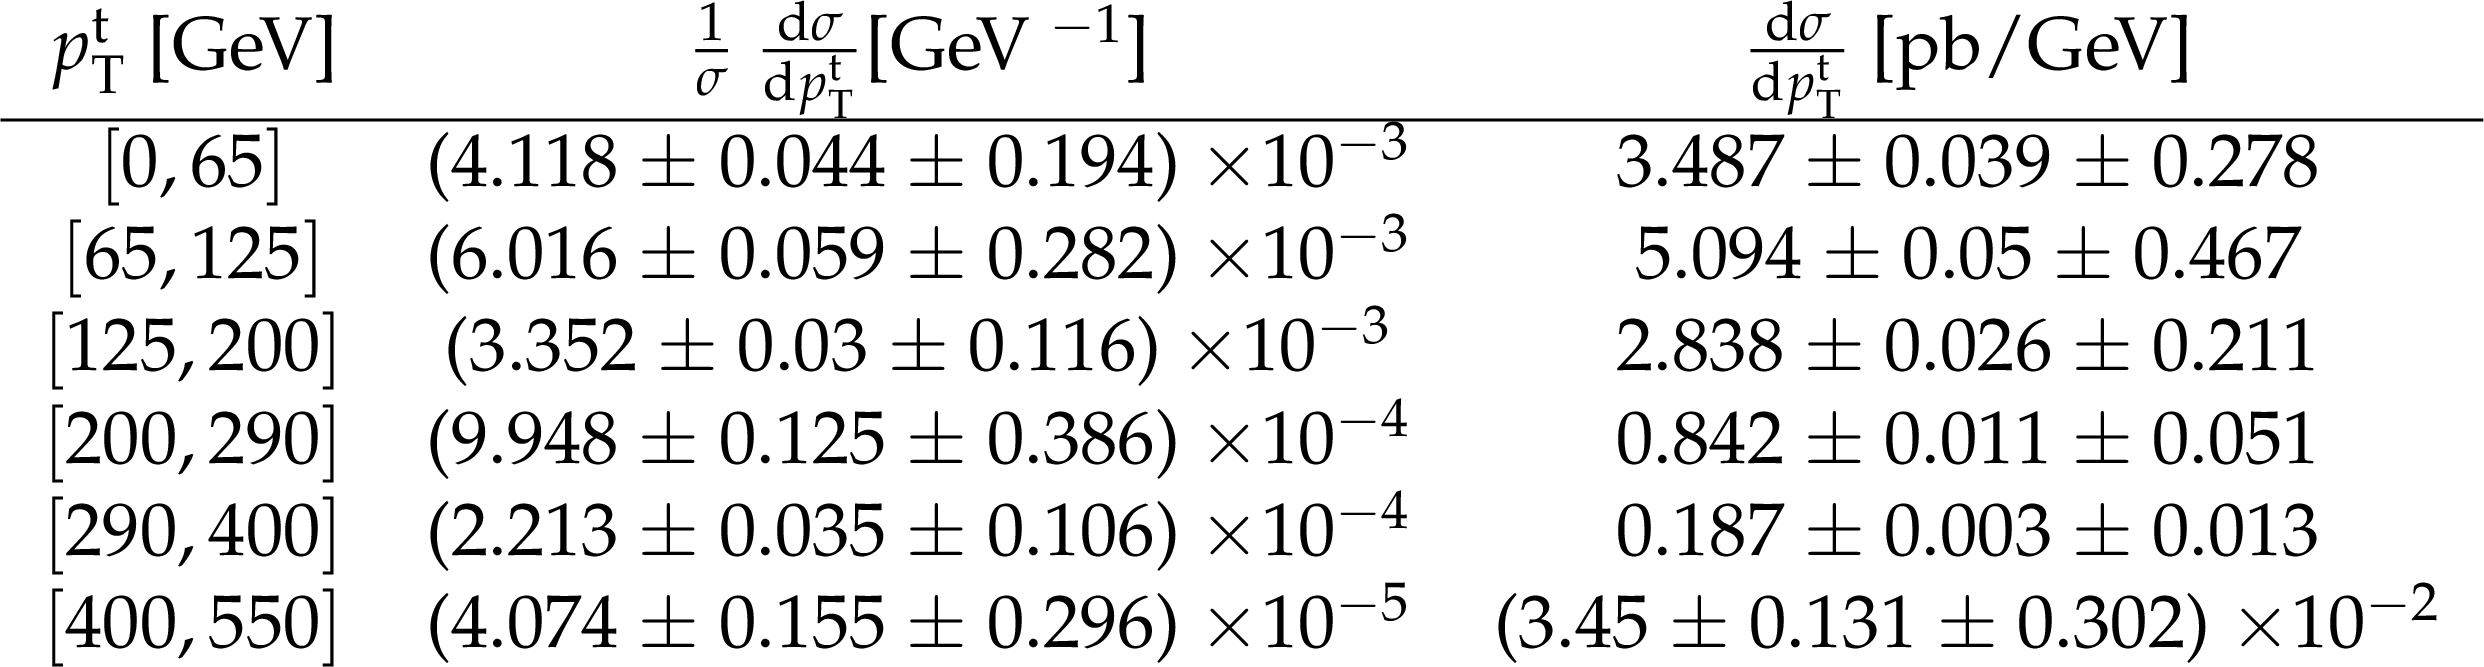
png pdf |
Table 1:
The measured differential cross section and bin boundaries for each bin of the normalized and absolute measurements of the $ {{\mathrm {t}\overline {\mathrm {t}}}} $ differential cross section at parton level in the full phase space as a function of $ {{p_{\mathrm {T}}} ^{{\mathrm {t}}}} $ are tabulated. |

png pdf |
Table 2:
The measured differential cross section and bin boundaries for each bin of the normalized and absolute measurements of the $ {{\mathrm {t}\overline {\mathrm {t}}}} $ differential cross section at parton level in the full phase space as a function of $ {{p_{\mathrm {T}}} ^{{\overline {\mathrm {t}}}}} $ are tabulated. |

png pdf |
Table 3:
The measured differential cross section and bin boundaries for each bin of the normalized and absolute measurements of the $ {{\mathrm {t}\overline {\mathrm {t}}}} $ differential cross section at parton level in the full phase space as a function of $ {{p_{\mathrm {T}}} ^{{\mathrm {t}}}} $ (leading) are tabulated. |
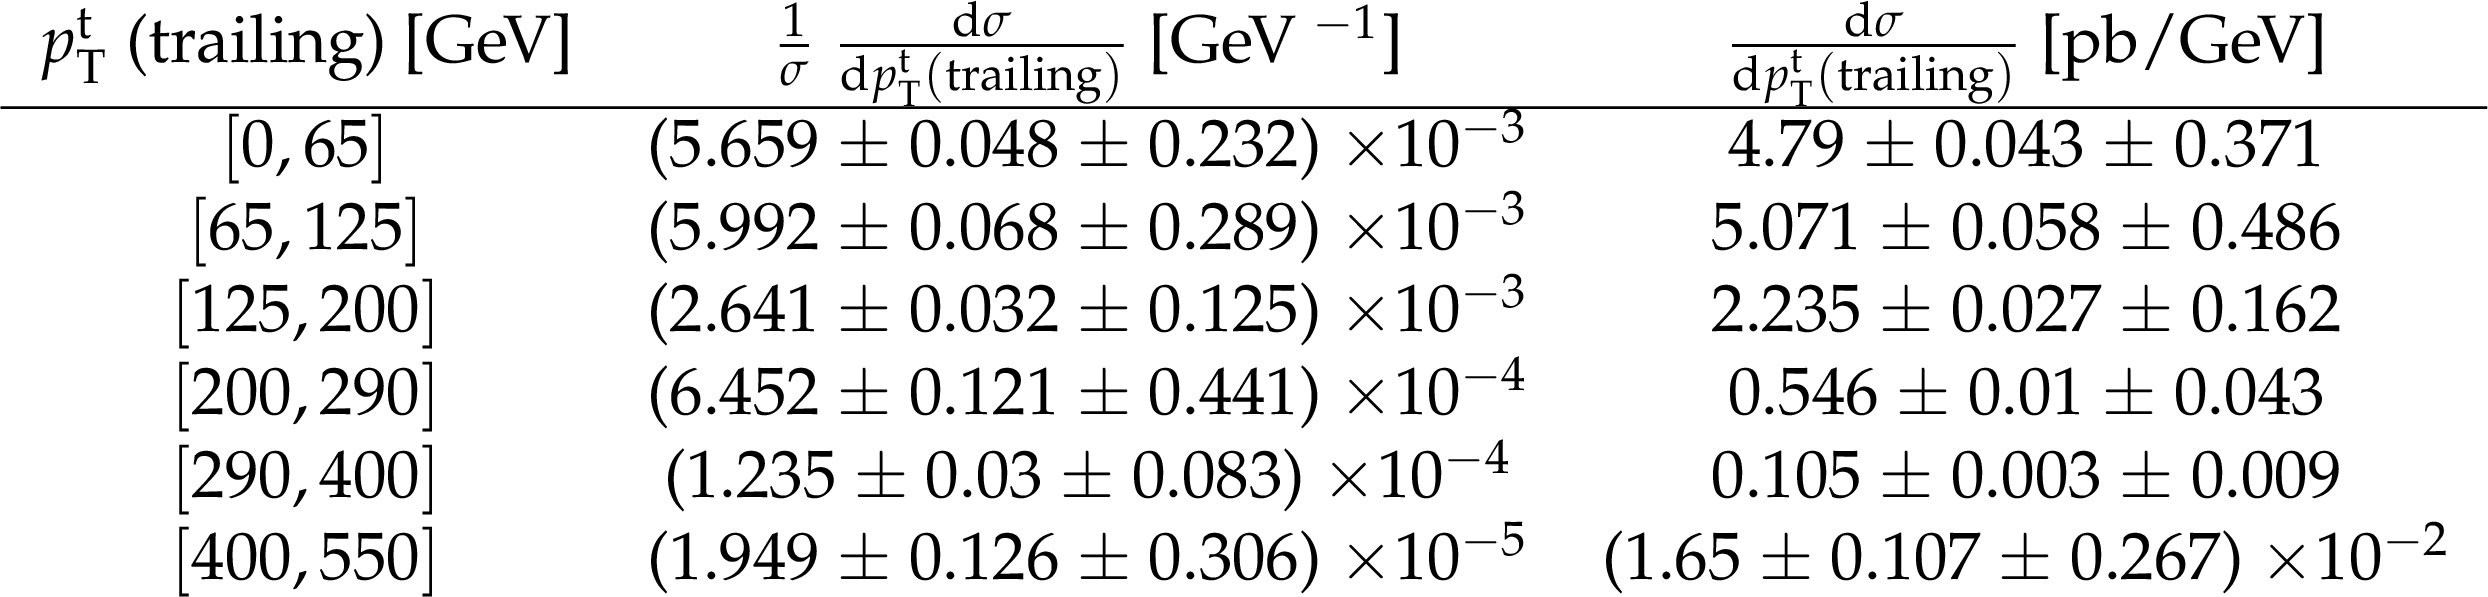
png pdf |
Table 4:
The measured differential cross section and bin boundaries for each bin of the normalized and absolute measurements of the $ {{\mathrm {t}\overline {\mathrm {t}}}} $ differential cross section at parton level in the full phase space as a function of $ {{p_{\mathrm {T}}} ^{{\mathrm {t}}}} $ (trailing) are tabulated. |
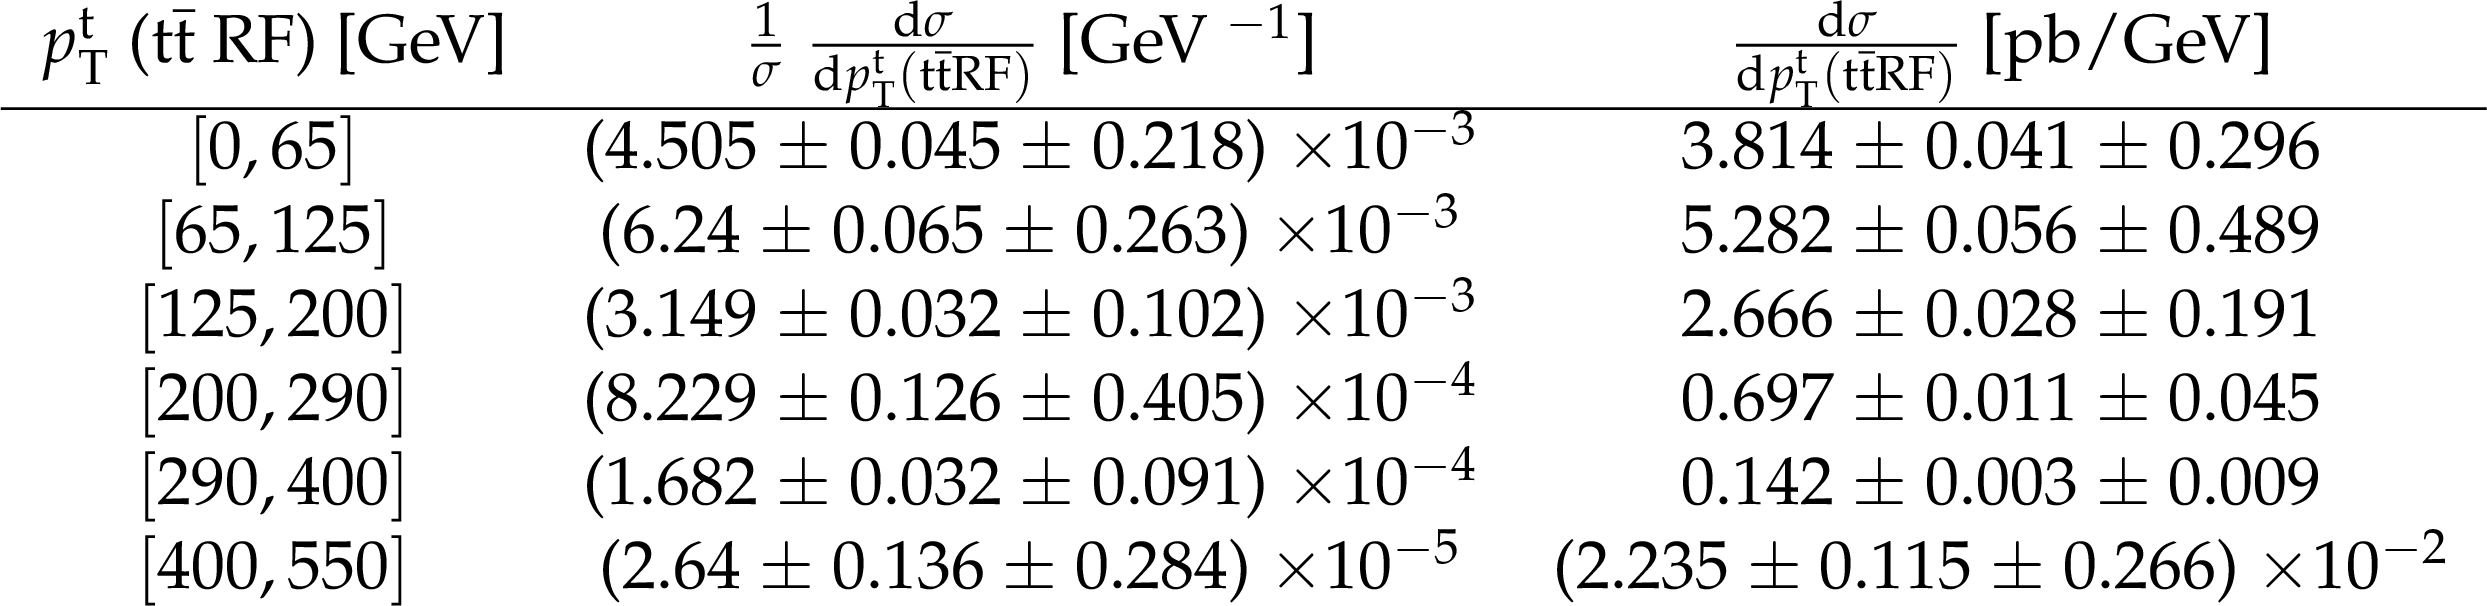
png pdf |
Table 5:
The measured differential cross section and bin boundaries for each bin of the normalized and absolute measurements of the $ {{\mathrm {t}\overline {\mathrm {t}}}} $ differential cross section at parton level in the full phase space as a function of $ {{p_{\mathrm {T}}} ^{{\mathrm {t}}}} $ ($ {{\mathrm {t}\overline {\mathrm {t}}}} $ RF) are tabulated. |

png pdf |
Table 6:
The measured differential cross section and bin boundaries for each bin of the normalized and absolute measurements of the $ {{\mathrm {t}\overline {\mathrm {t}}}} $ differential cross section at parton level in the full phase space as a function of $ {y_{{\mathrm {t}}}} $ are tabulated. |

png pdf |
Table 7:
The measured differential cross section and bin boundaries for each bin of the normalized and absolute measurements of the $ {{\mathrm {t}\overline {\mathrm {t}}}} $ differential cross section at parton level in the full phase space as a function of $ {y_{{\overline {\mathrm {t}}}}} $ are tabulated. |
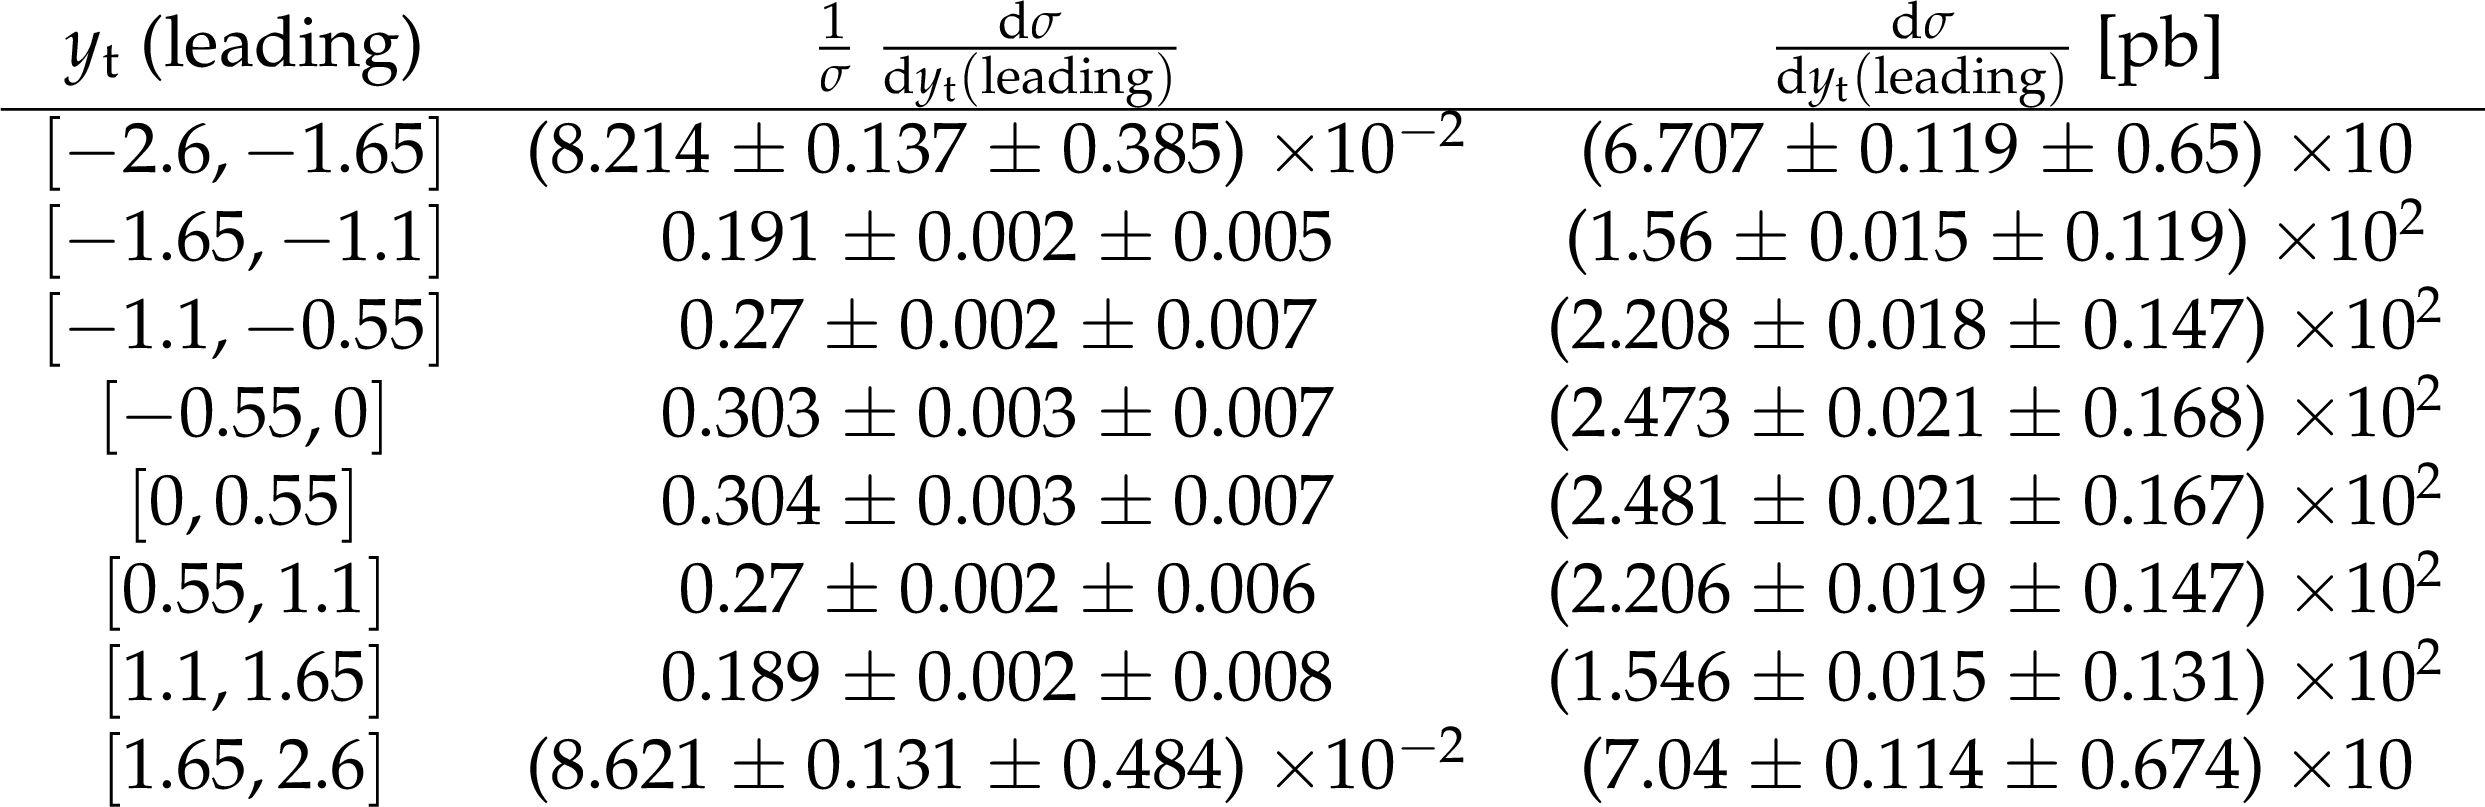
png pdf |
Table 8:
The measured differential cross section and bin boundaries for each bin of the normalized and absolute measurements of the $ {{\mathrm {t}\overline {\mathrm {t}}}} $ differential cross section at parton level in the full phase space as a function of $ {y_{{\mathrm {t}}}} $ (leading) are tabulated. |
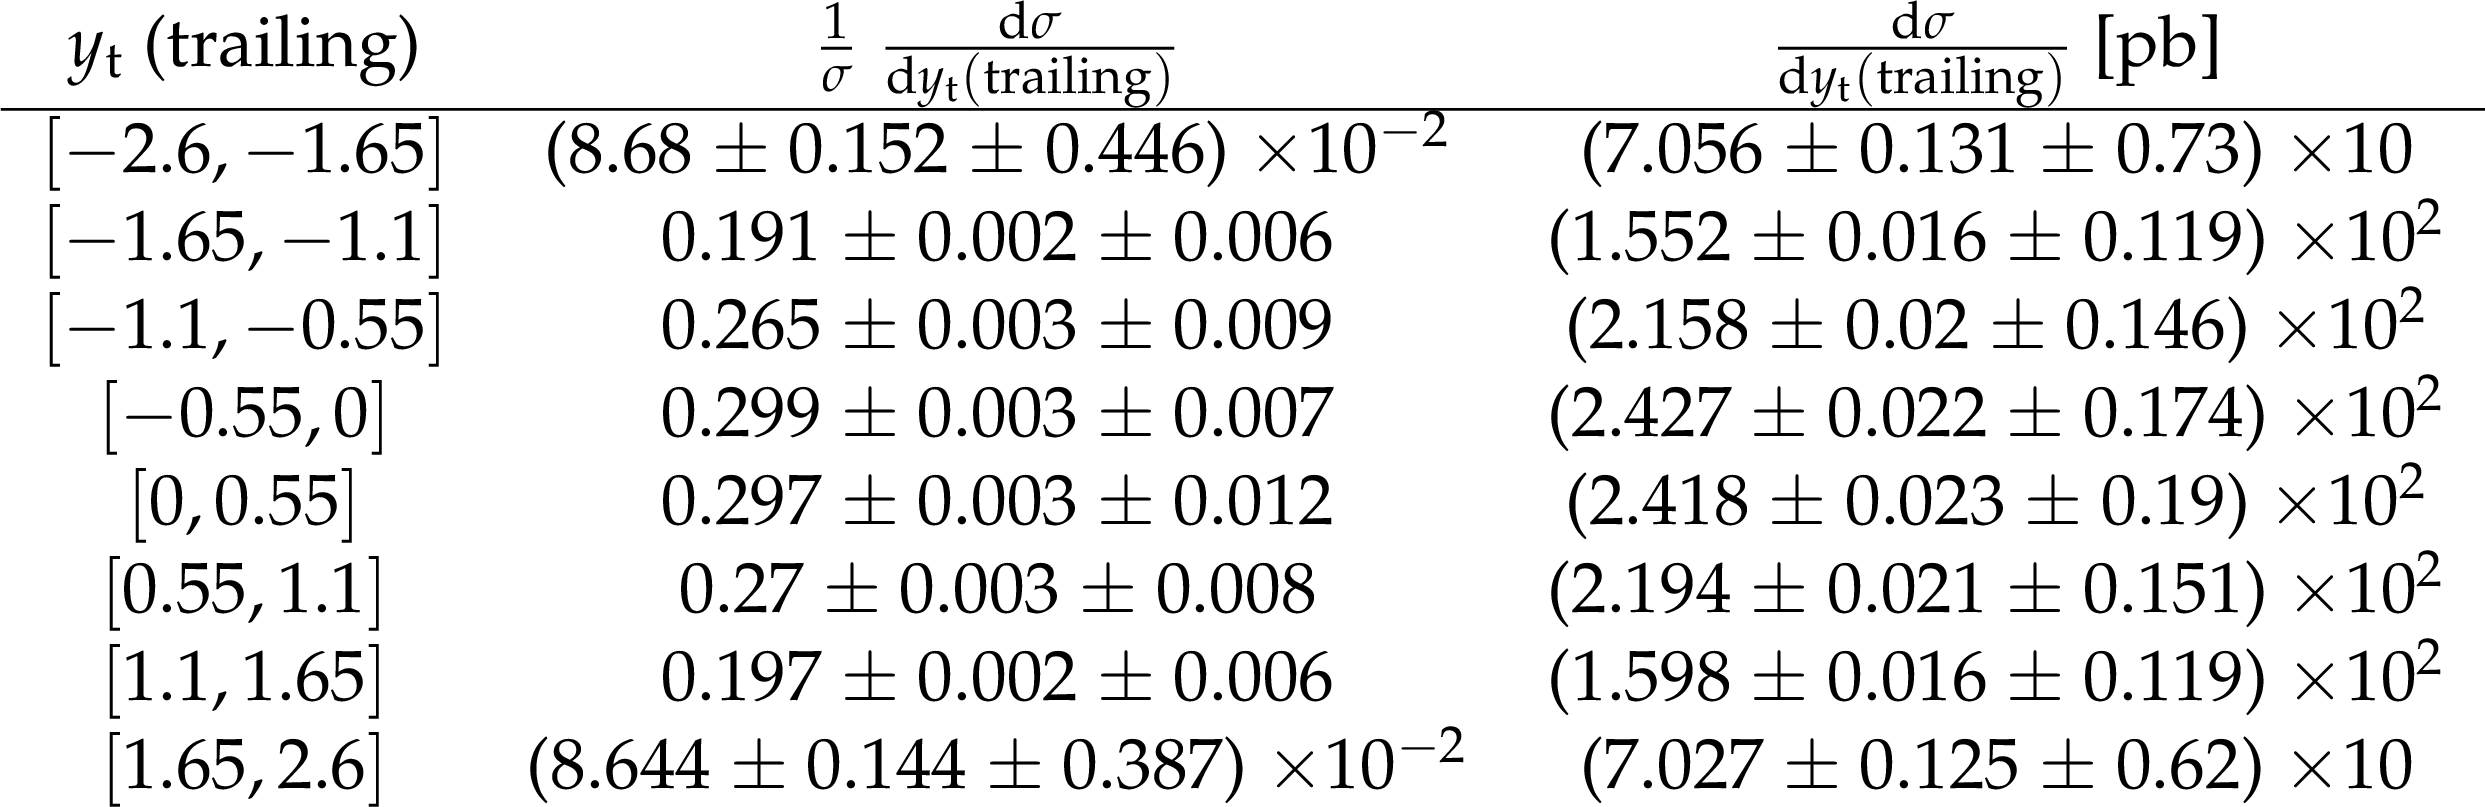
png pdf |
Table 9:
The measured differential cross section and bin boundaries for each bin of the normalized and absolute measurements of the $ {{\mathrm {t}\overline {\mathrm {t}}}} $ differential cross section at parton level in the full phase space as a function of $ {y_{{\mathrm {t}}}} $ (trailing) are tabulated. |
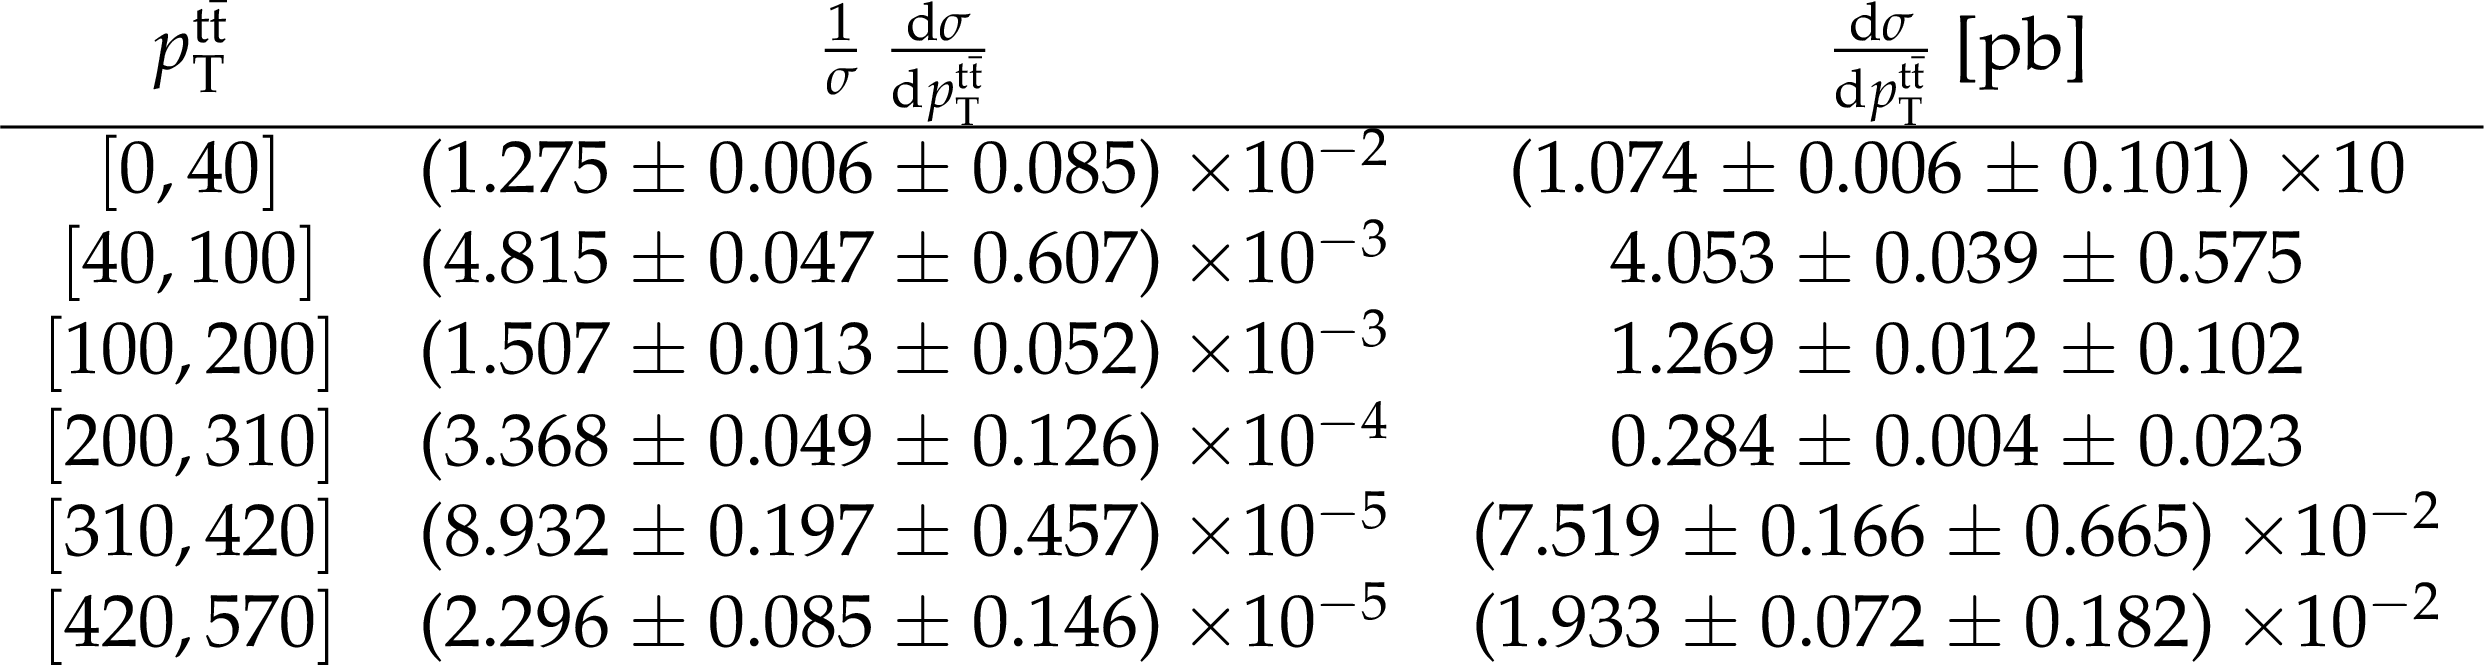
png pdf |
Table 10:
The measured differential cross section and bin boundaries for each bin of the normalized and absolute measurements of the $ {{\mathrm {t}\overline {\mathrm {t}}}} $ differential cross section at parton level in the full phase space as a function of $ {{p_{\mathrm {T}}} ^{{{\mathrm {t}\overline {\mathrm {t}}}}}} $ are tabulated. |

png pdf |
Table 11:
The measured differential cross section and bin boundaries for each bin of the normalized and absolute measurements of the $ {{\mathrm {t}\overline {\mathrm {t}}}} $ differential cross section at parton level in the full phase space as a function of $ {y_{{{\mathrm {t}\overline {\mathrm {t}}}}}} $ are tabulated. |
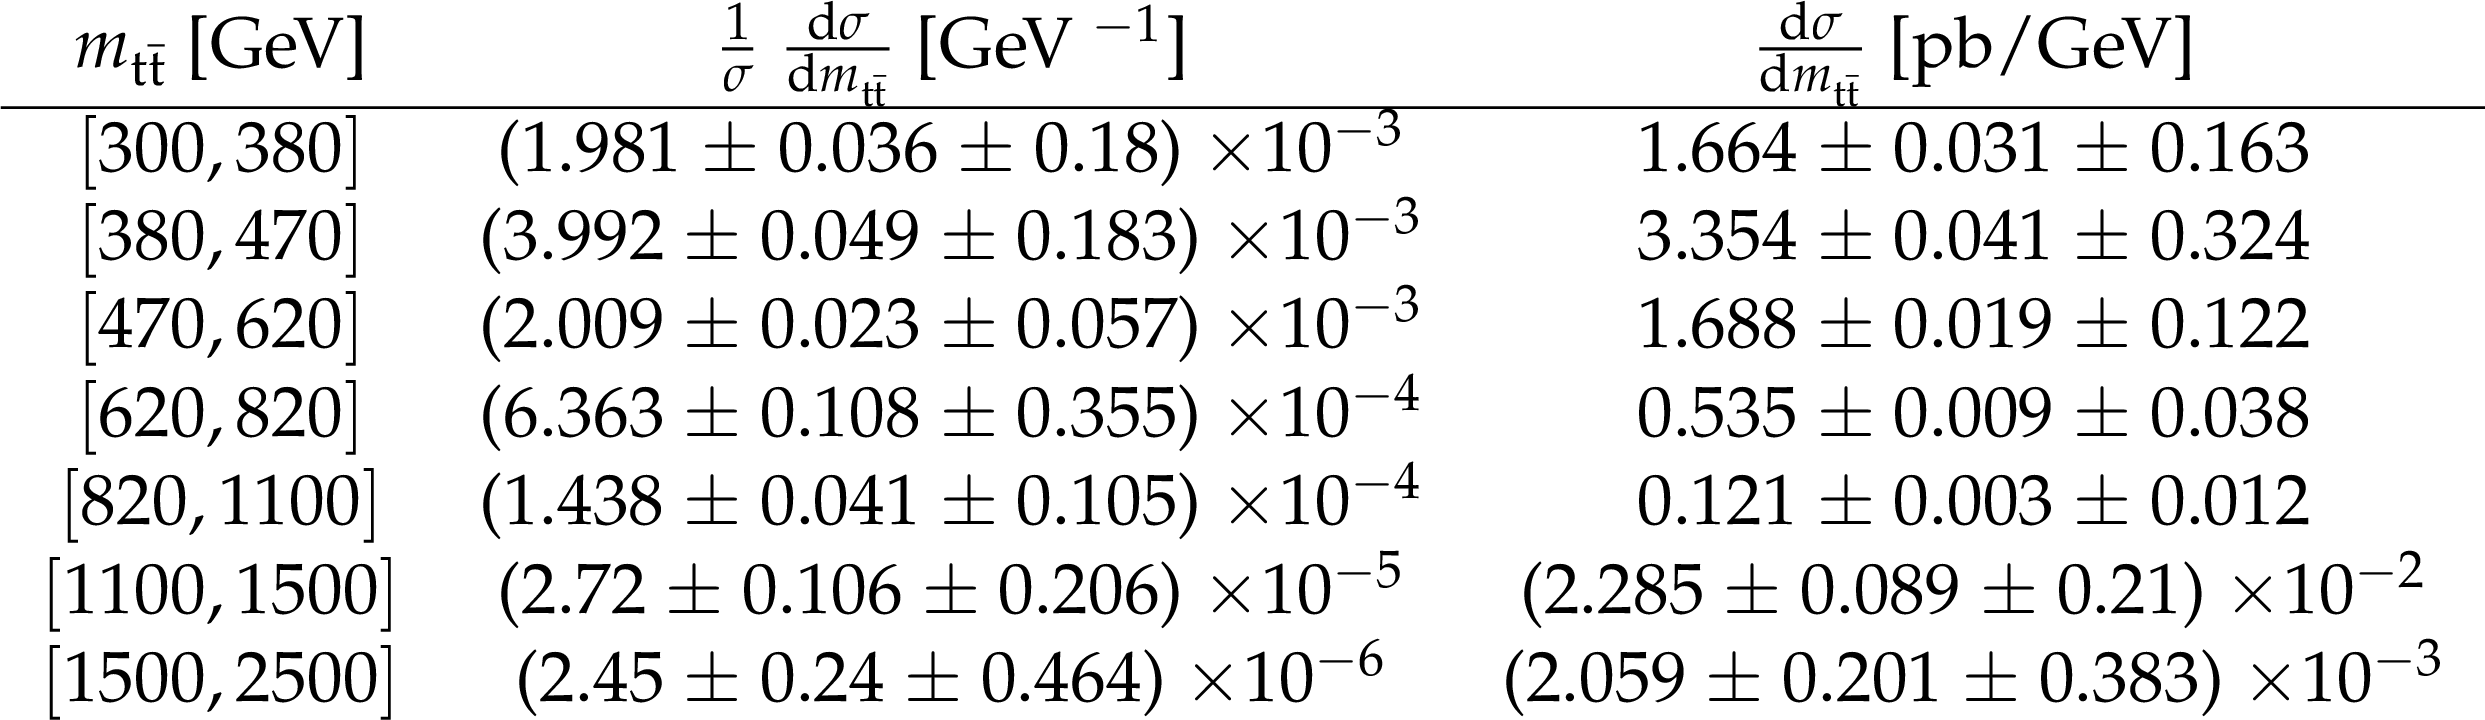
png pdf |
Table 12:
The measured differential cross section and bin boundaries for each bin of the normalized and absolute measurements of the $ {{\mathrm {t}\overline {\mathrm {t}}}} $ differential cross section at parton level in the full phase space as a function of $ {m_{{{\mathrm {t}\overline {\mathrm {t}}}}}} $ are tabulated. |

png pdf |
Table 13:
The measured differential cross section and bin boundaries for each bin of the normalized and absolute measurements of the $ {{\mathrm {t}\overline {\mathrm {t}}}} $ differential cross section at parton level in the full phase space as a function of $ {\Delta {| y |}({\mathrm {t}}, {\overline {\mathrm {t}}})} $ are tabulated. |

png pdf |
Table 14:
The measured differential cross section and bin boundaries for each bin of the normalized and absolute measurements of the $ {{\mathrm {t}\overline {\mathrm {t}}}} $ differential cross section at parton level in the full phase space as a function of $ {\Delta \phi ({\mathrm {t}}, {\overline {\mathrm {t}}})} $ are tabulated. |

png pdf |
Table 15:
The measured differential cross section and bin boundaries for each bin of the normalized and absolute measurements of the $ {{\mathrm {t}\overline {\mathrm {t}}}} $ differential cross section at particle level in the fiducial phase space as a function of $ {{p_{\mathrm {T}}} ^{{\mathrm {t}}}} $ are tabulated. |
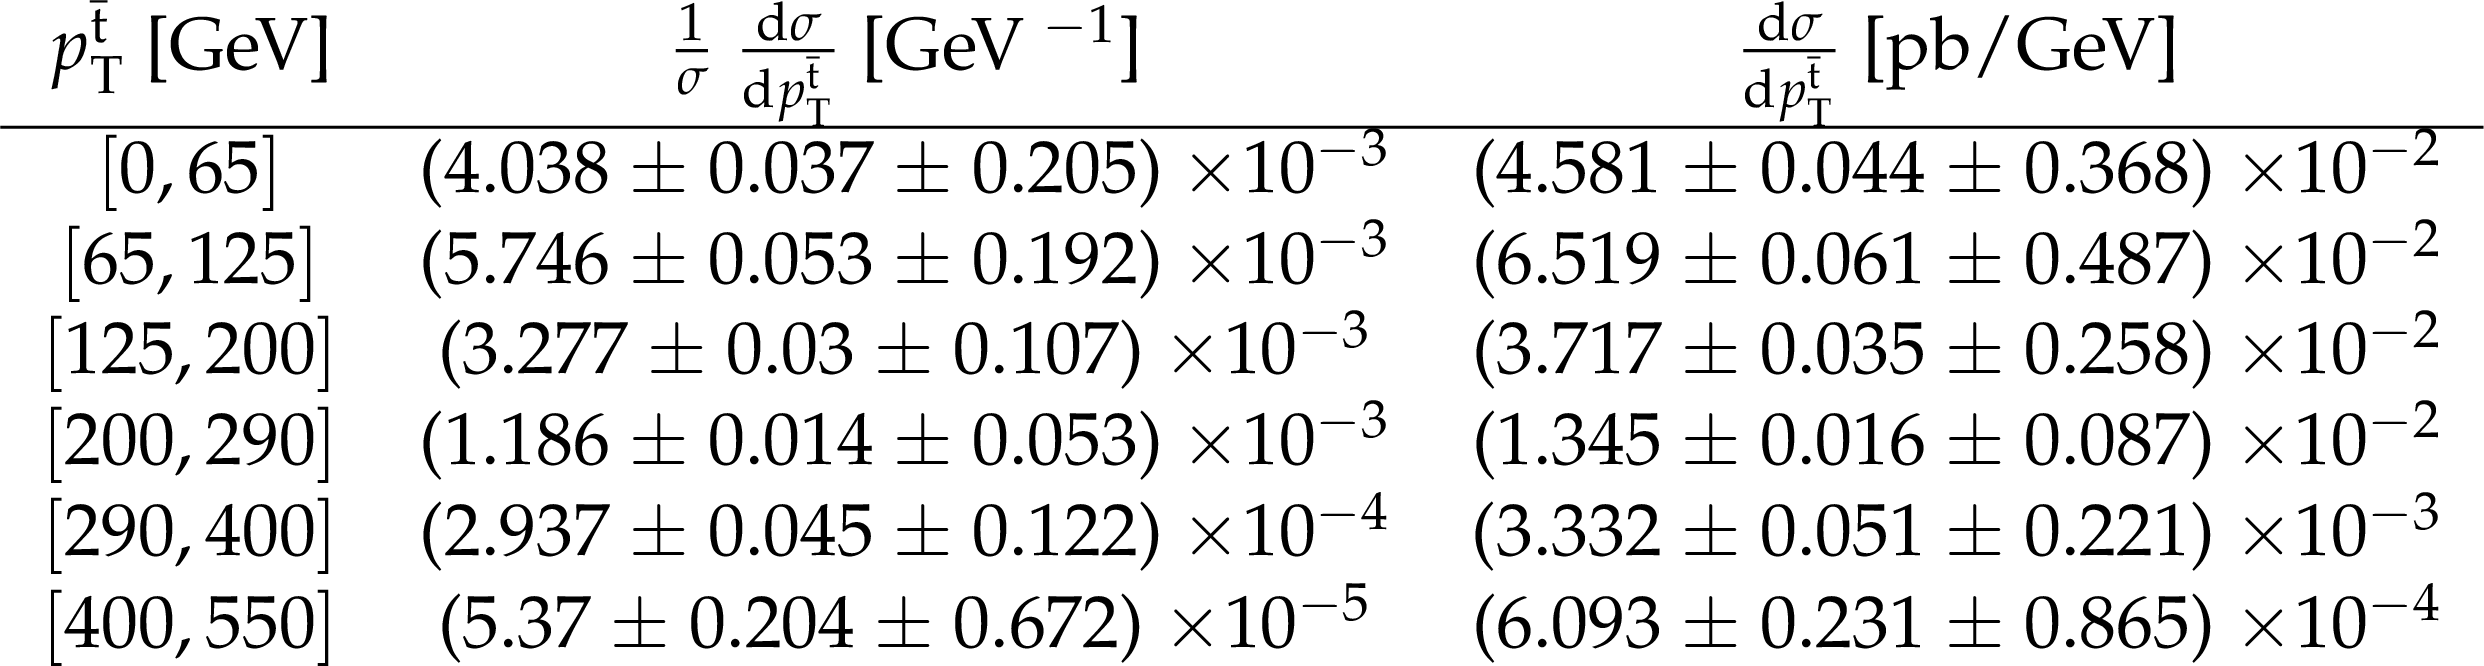
png pdf |
Table 16:
The measured differential cross section and bin boundaries for each bin of the normalized and absolute measurements of the $ {{\mathrm {t}\overline {\mathrm {t}}}} $ differential cross section at particle level in the fiducial phase space as a function of $ {{p_{\mathrm {T}}} ^{{\overline {\mathrm {t}}}}} $ are tabulated. |
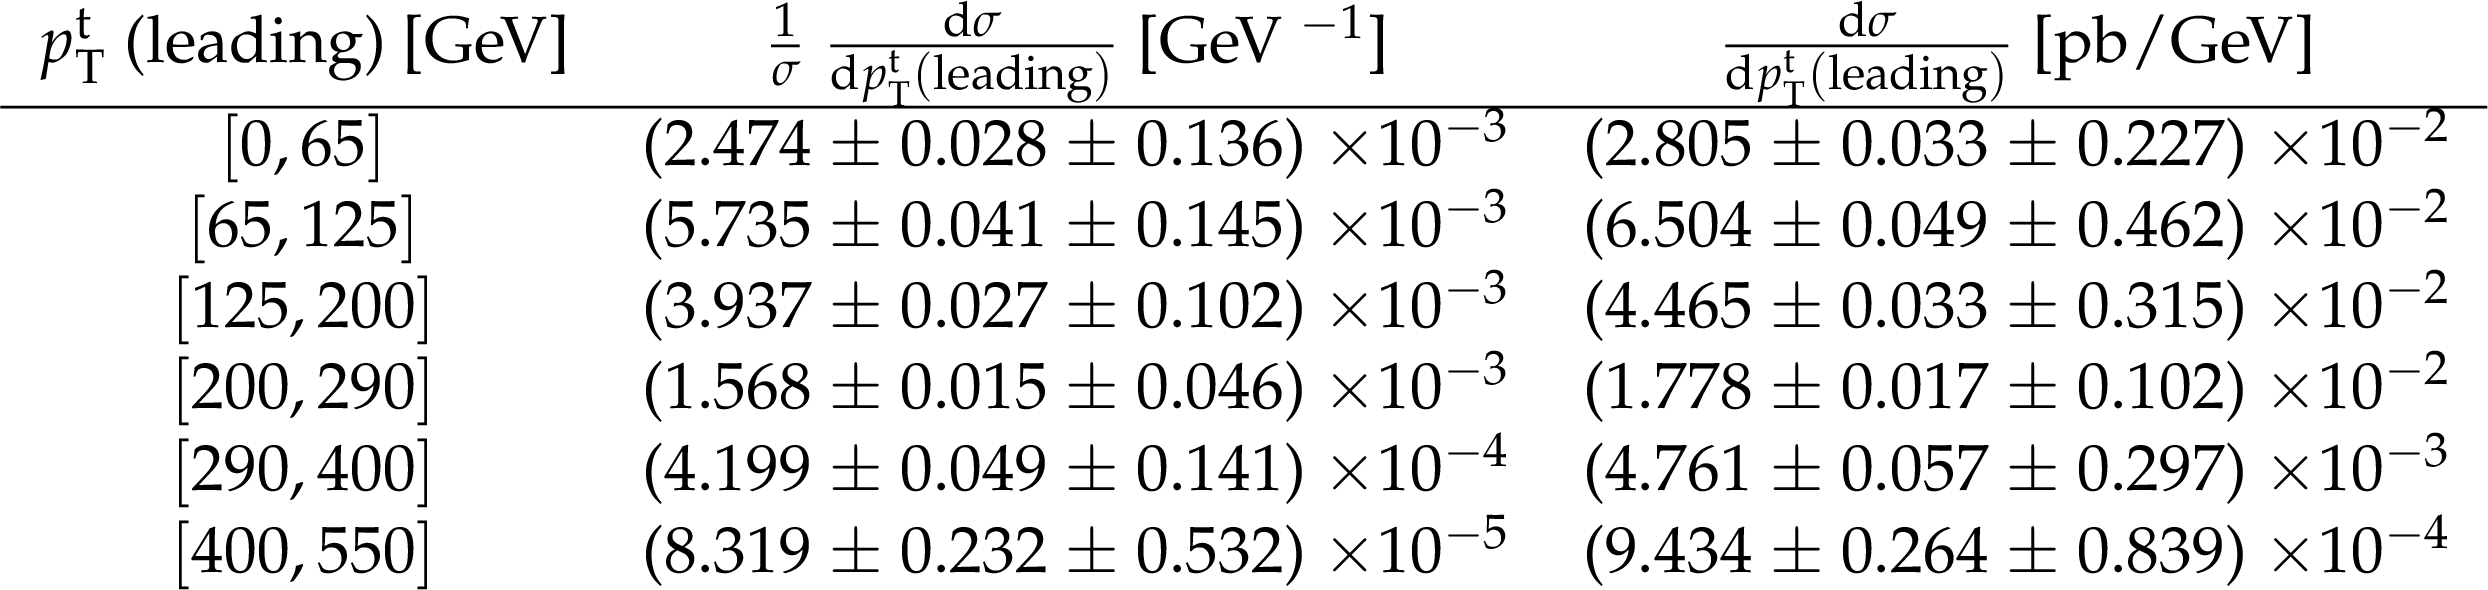
png pdf |
Table 17:
The measured differential cross section and bin boundaries for each bin of the normalized and absolute measurements of the $ {{\mathrm {t}\overline {\mathrm {t}}}} $ differential cross section at particle level in the fiducial phase space as a function of $ {{p_{\mathrm {T}}} ^{{\mathrm {t}}}} $ (leading) are tabulated. |

png pdf |
Table 18:
The measured differential cross section and bin boundaries for each bin of the normalized and absolute measurements of the $ {{\mathrm {t}\overline {\mathrm {t}}}} $ differential cross section at particle level in the fiducial phase space as a function of $ {{p_{\mathrm {T}}} ^{{\mathrm {t}}}} $ (trailing) are tabulated. |
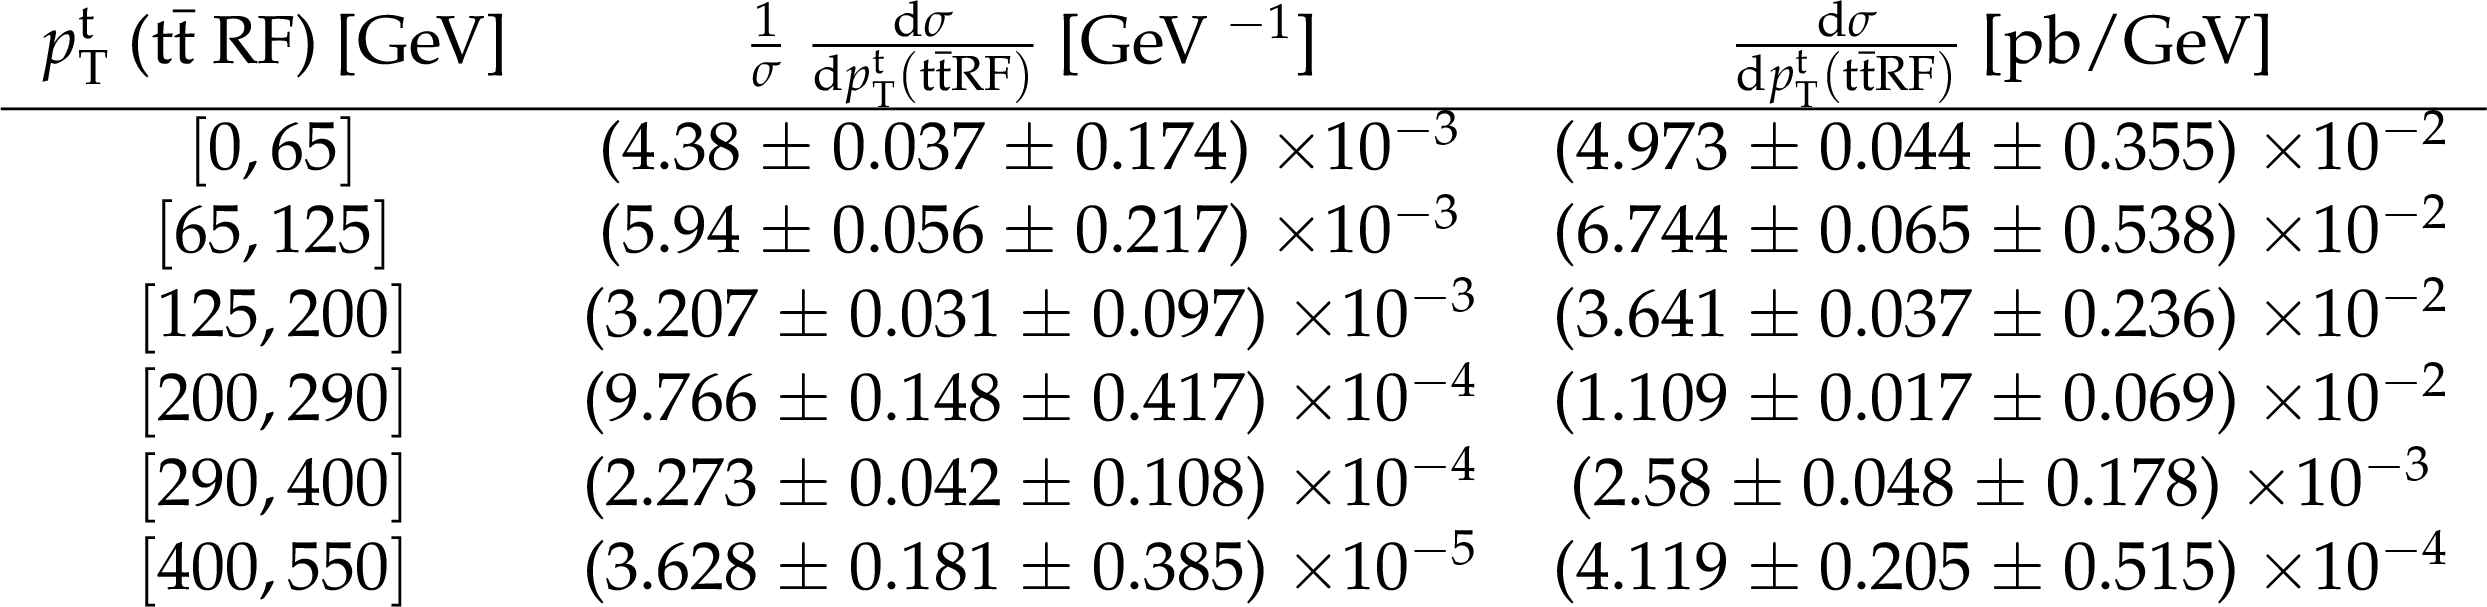
png pdf |
Table 19:
The measured differential cross section and bin boundaries for each bin of the normalized and absolute measurements of the $ {{\mathrm {t}\overline {\mathrm {t}}}} $ differential cross section at particle level in the fiducial phase space as a function of $ {{p_{\mathrm {T}}} ^{{\mathrm {t}}}} $ ($ {{\mathrm {t}\overline {\mathrm {t}}}} $ RF) are tabulated. |
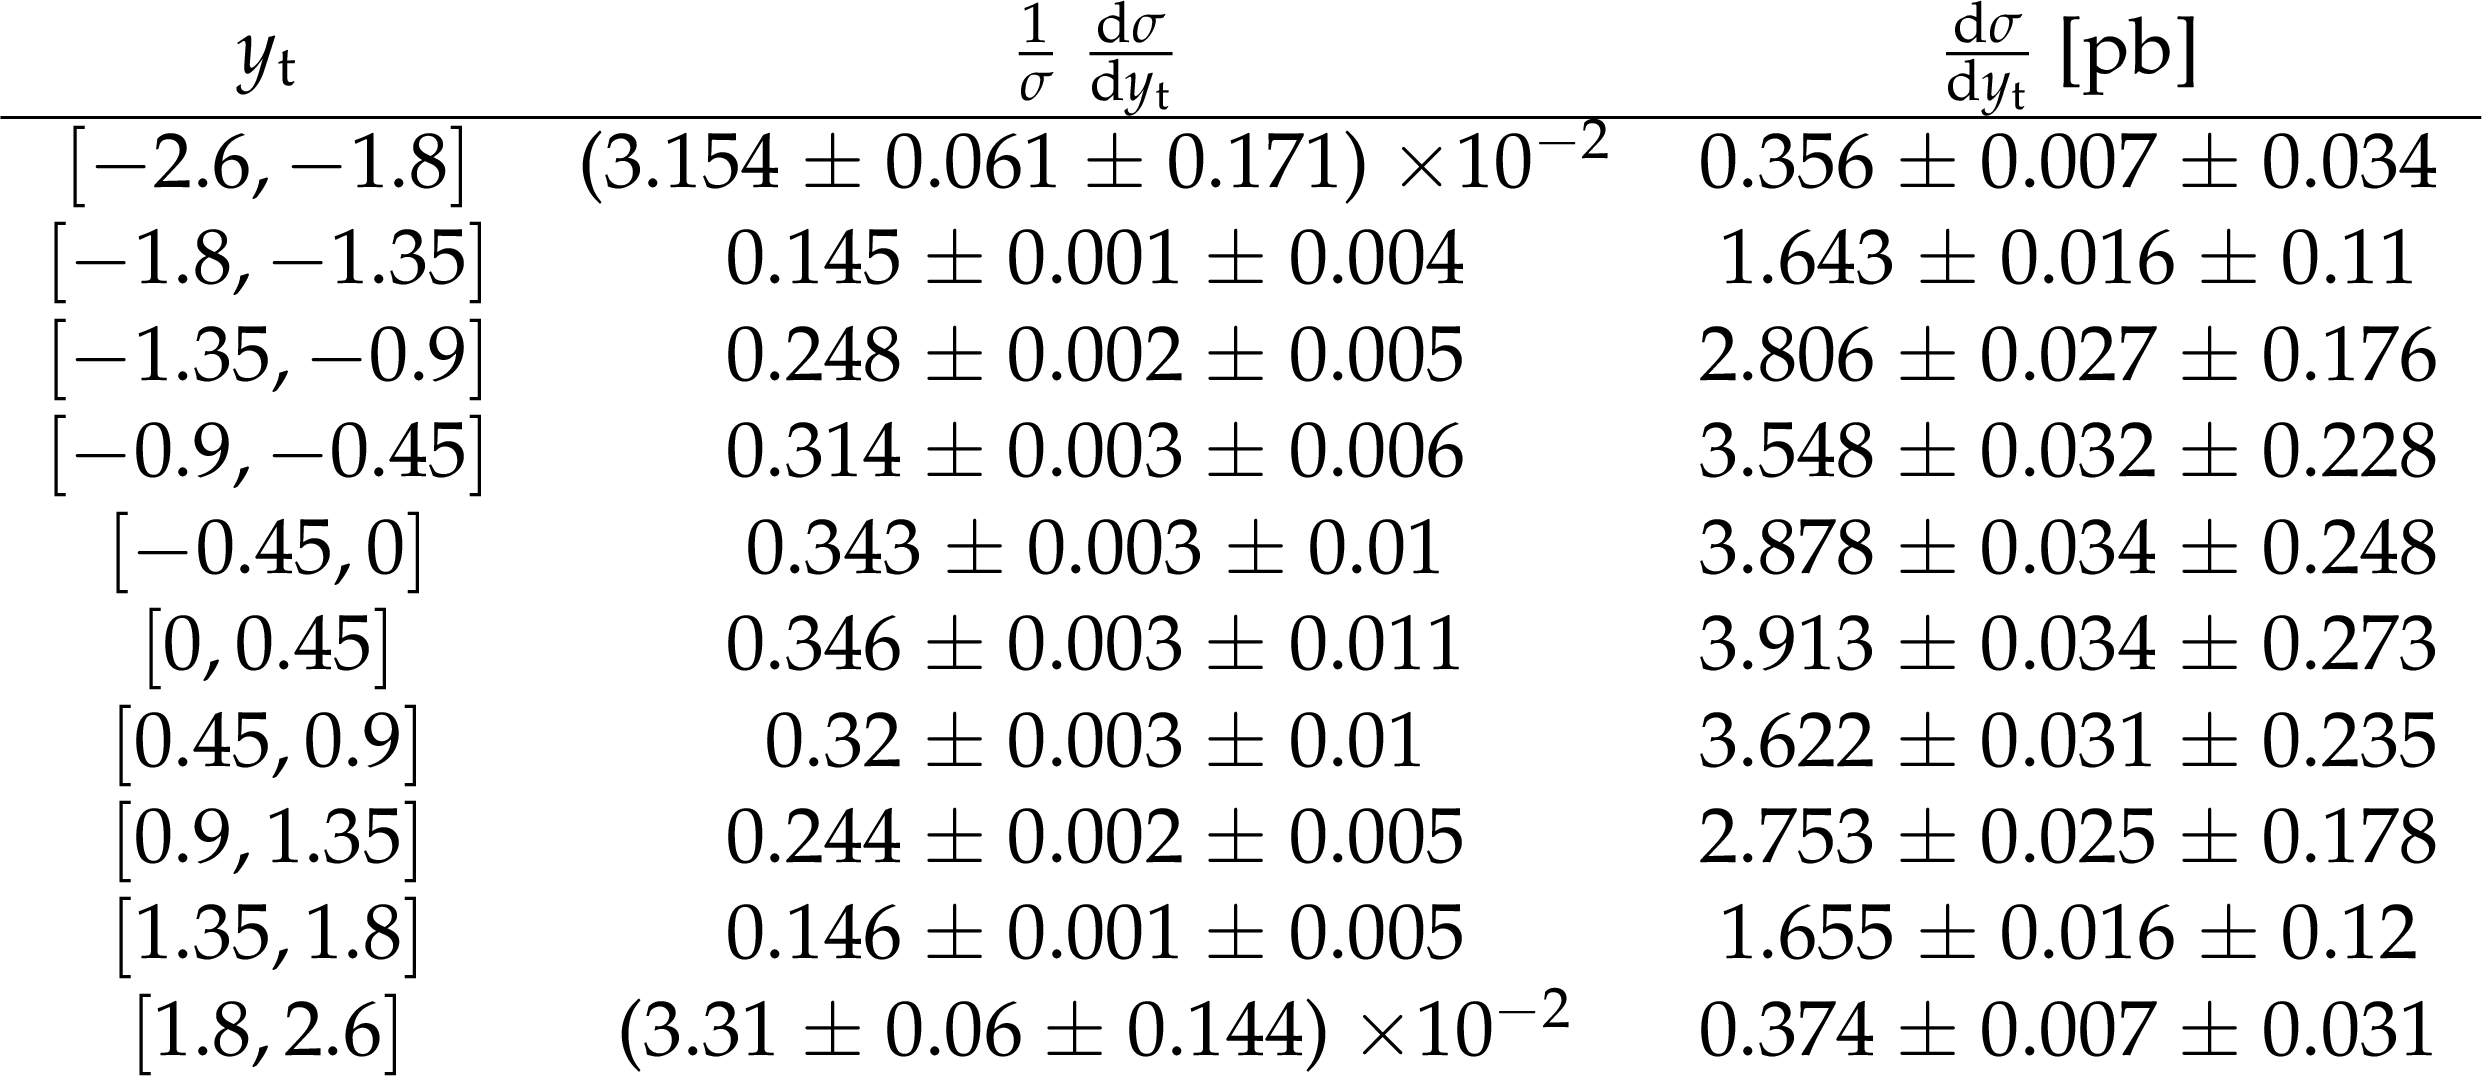
png pdf |
Table 20:
The measured differential cross section and bin boundaries for each bin of the normalized and absolute measurements of the $ {{\mathrm {t}\overline {\mathrm {t}}}} $ differential cross section at particle level in the fiducial phase space as a function of $ {y_{{\mathrm {t}}}} $ are tabulated. |

png pdf |
Table 21:
The measured differential cross section and bin boundaries for each bin of the normalized and absolute measurements of the $ {{\mathrm {t}\overline {\mathrm {t}}}} $ differential cross section at particle level in the fiducial phase space as a function of $ {y_{{\overline {\mathrm {t}}}}} $ are tabulated. |

png pdf |
Table 22:
The measured differential cross section and bin boundaries for each bin of the normalized and absolute measurements of the $ {{\mathrm {t}\overline {\mathrm {t}}}} $ differential cross section at particle level in the fiducial phase space as a function of $ {y_{{\mathrm {t}}}} $ (leading) are tabulated. |
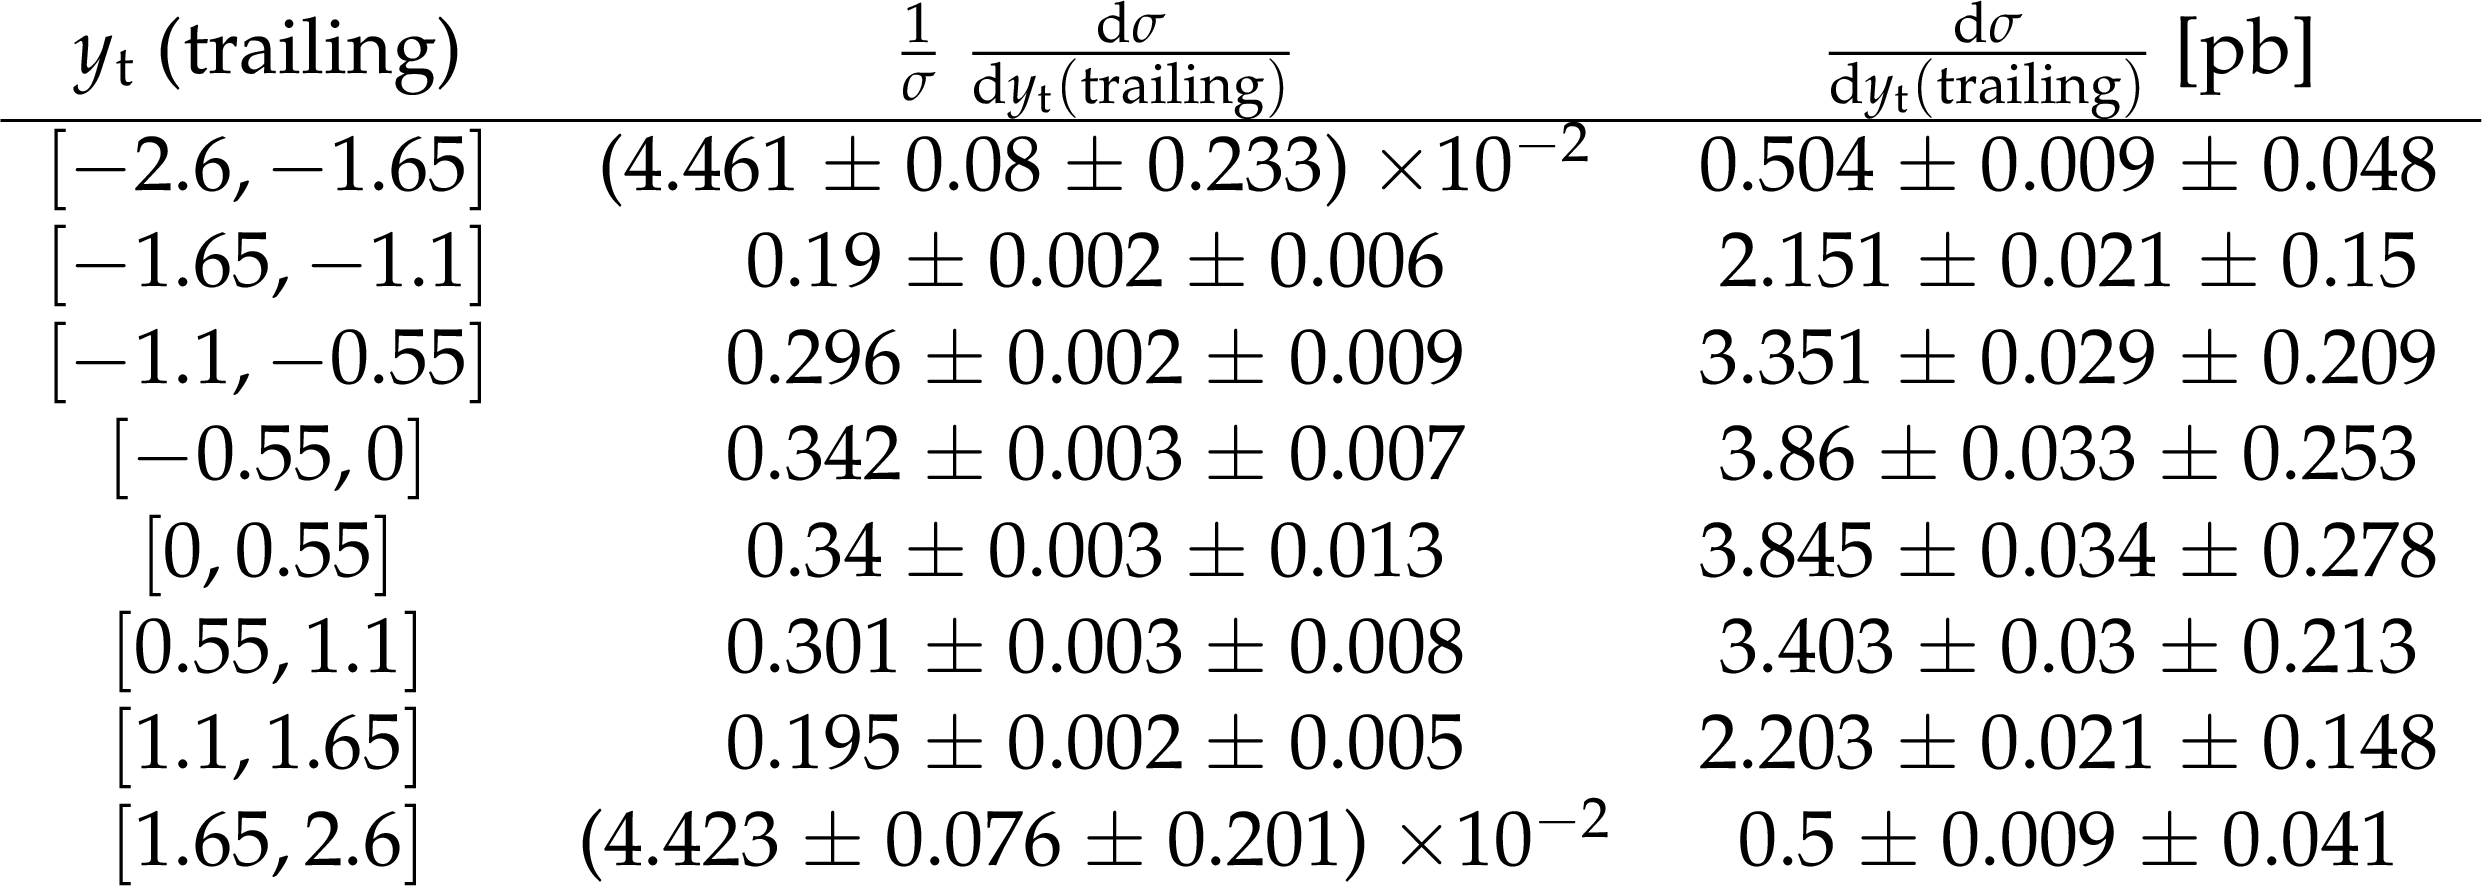
png pdf |
Table 23:
The measured differential cross section and bin boundaries for each bin of the normalized and absolute measurements of the $ {{\mathrm {t}\overline {\mathrm {t}}}} $ differential cross section at particle level in the fiducial phase space as a function of $ {y_{{\mathrm {t}}}} $ (trailing) are tabulated. |
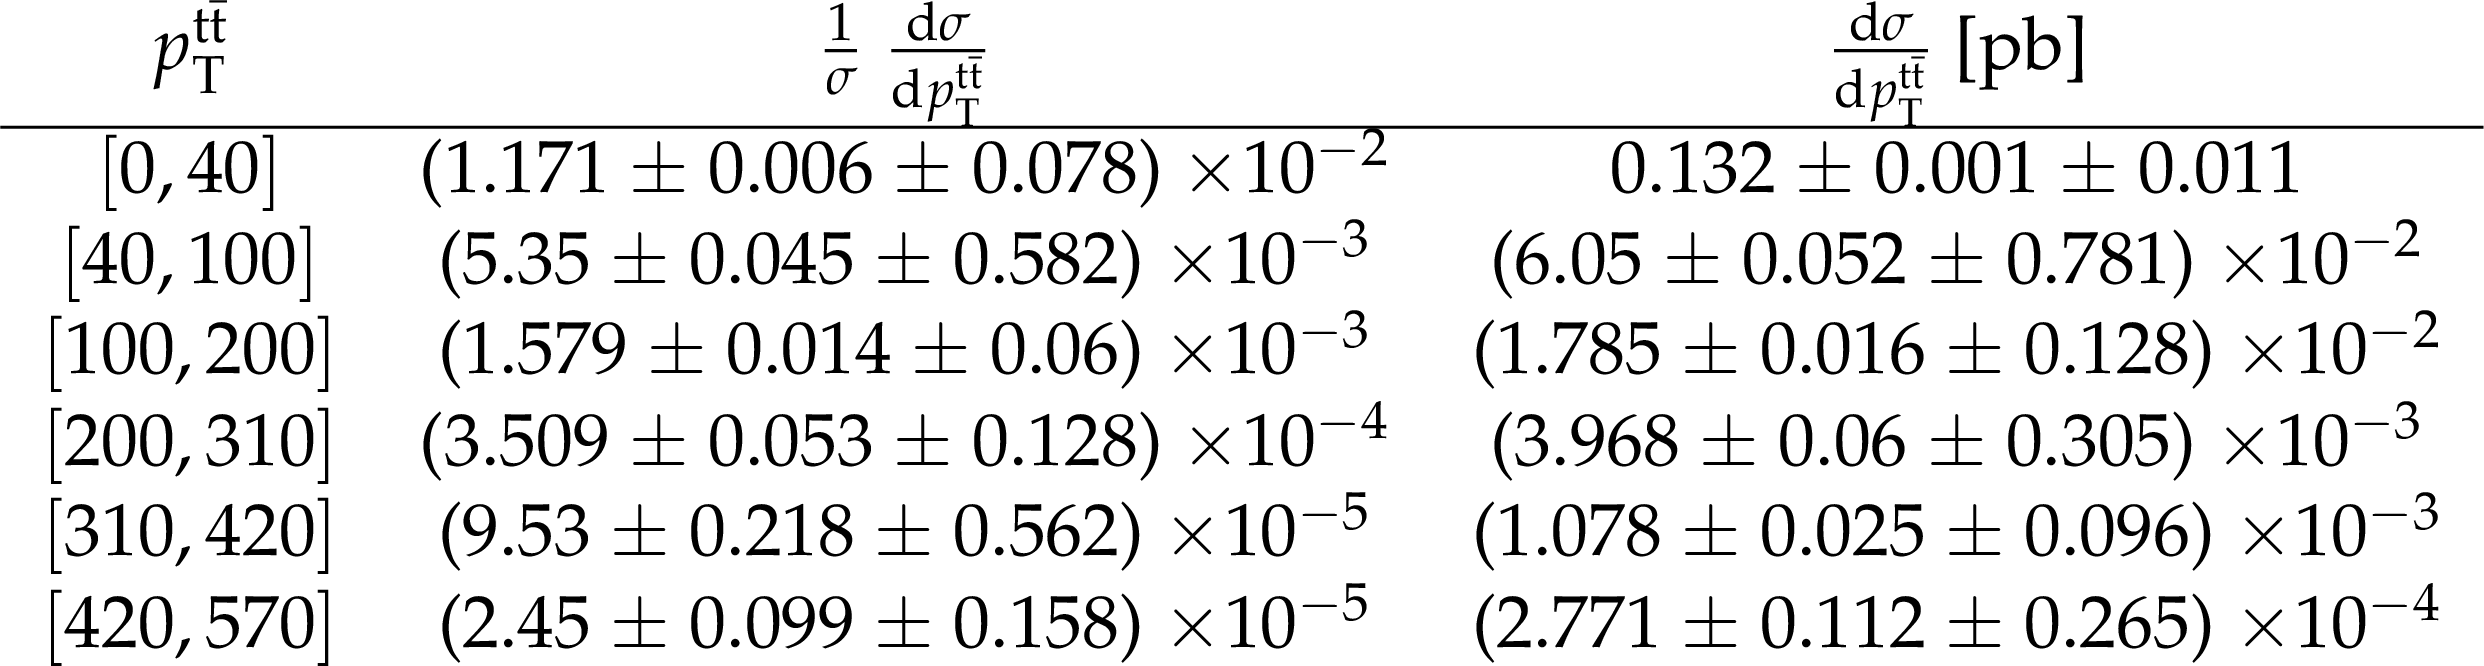
png pdf |
Table 24:
The measured differential cross section and bin boundaries for each bin of the normalized and absolute measurements of the $ {{\mathrm {t}\overline {\mathrm {t}}}} $ differential cross section at particle level in the fiducial phase space as a function of $ {{p_{\mathrm {T}}} ^{{{\mathrm {t}\overline {\mathrm {t}}}}}} $ are tabulated. |

png pdf |
Table 25:
The measured differential cross section and bin boundaries for each bin of the normalized and absolute measurements of the $ {{\mathrm {t}\overline {\mathrm {t}}}} $ differential cross section at particle level in the fiducial phase space as a function of $ {y_{{{\mathrm {t}\overline {\mathrm {t}}}}}} $ are tabulated. |
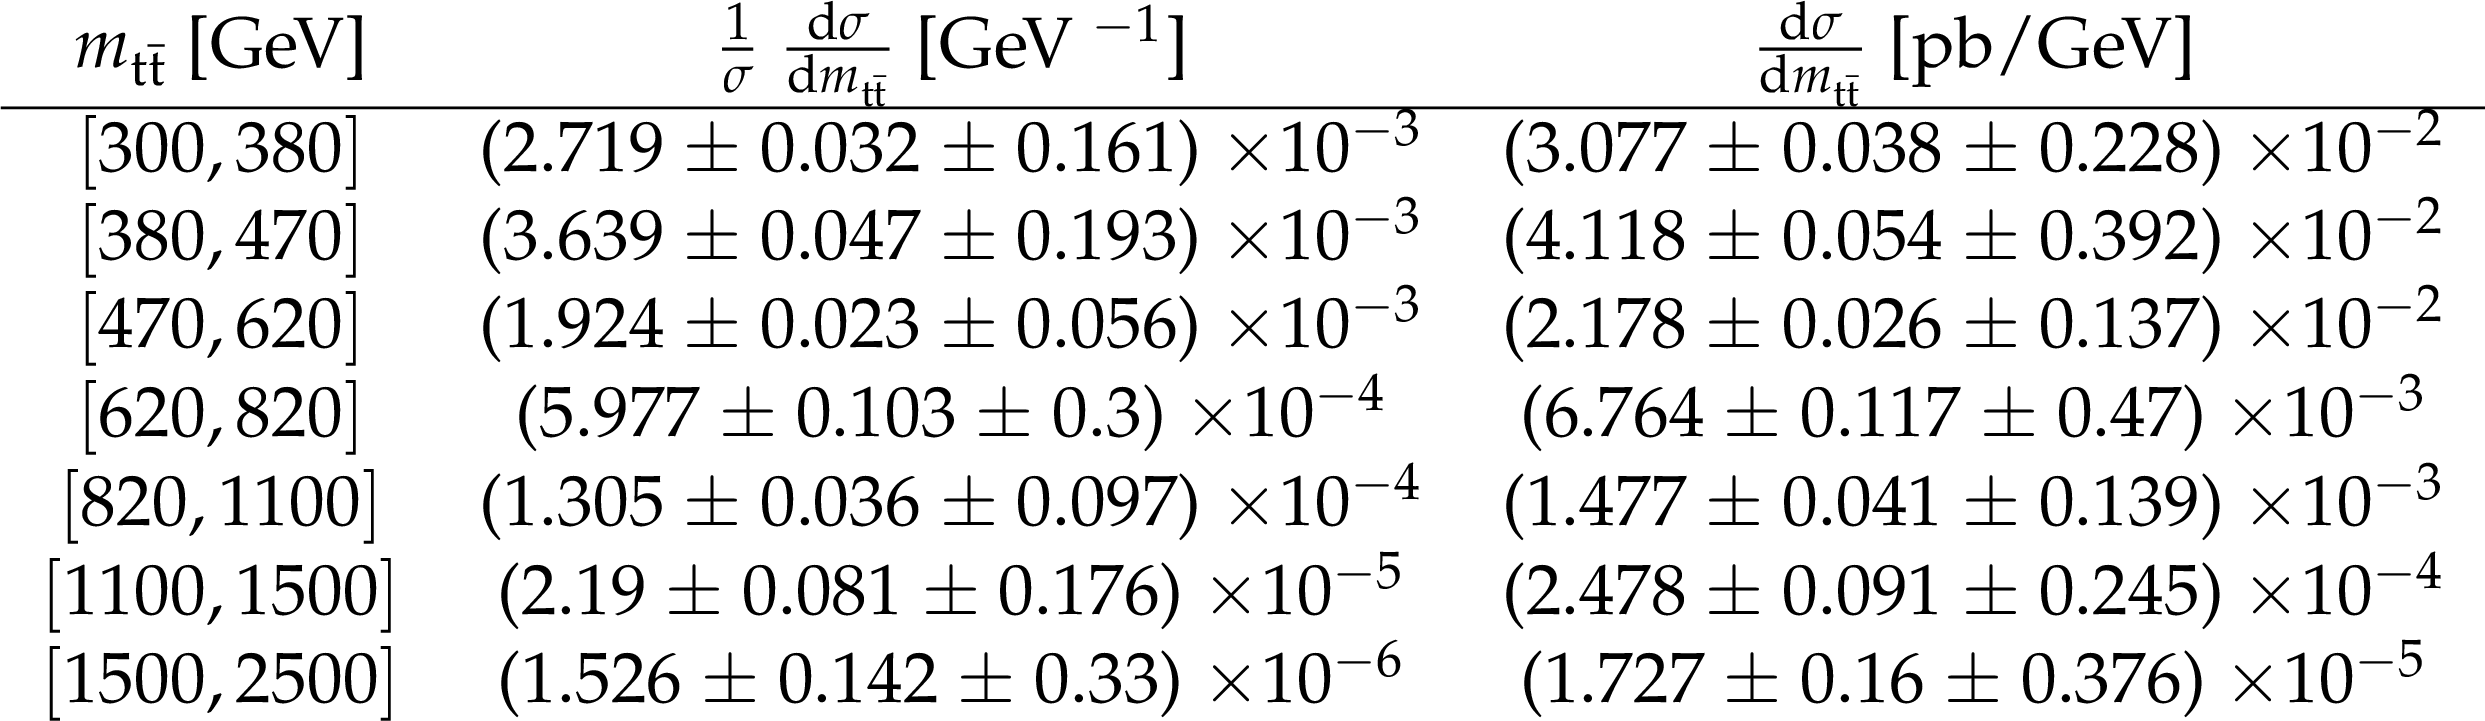
png pdf |
Table 26:
The measured differential cross section and bin boundaries for each bin of the normalized and absolute measurements of the $ {{\mathrm {t}\overline {\mathrm {t}}}} $ differential cross section at particle level in the fiducial phase space as a function of $ {m_{{{\mathrm {t}\overline {\mathrm {t}}}}}} $ are tabulated. |

png pdf |
Table 27:
The measured differential cross section and bin boundaries for each bin of the normalized and absolute measurements of the $ {{\mathrm {t}\overline {\mathrm {t}}}} $ differential cross section at particle level in the fiducial phase space as a function of $ {\Delta {| y |}({\mathrm {t}}, {\overline {\mathrm {t}}})} $ are tabulated. |
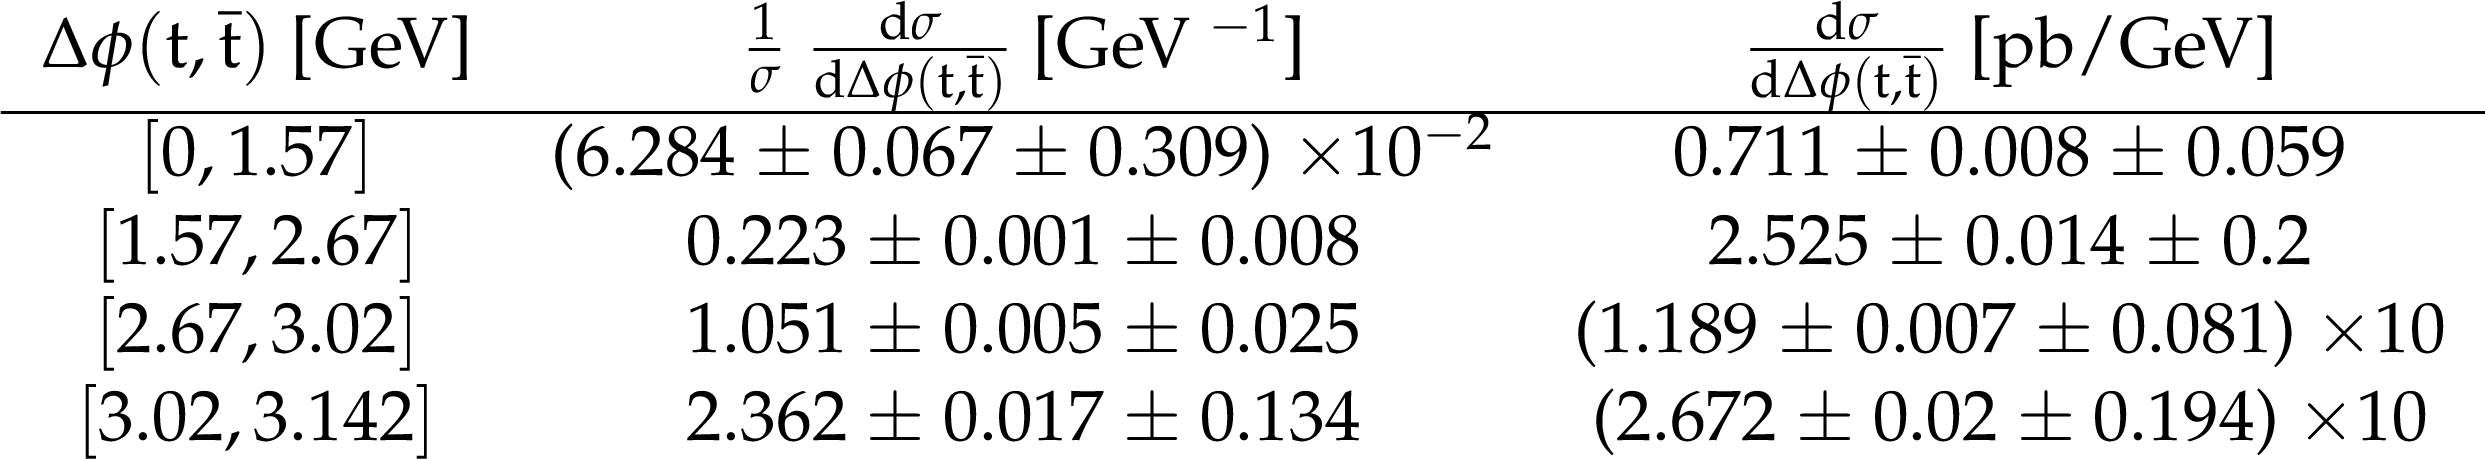
png pdf |
Table 28:
The measured differential cross section and bin boundaries for each bin of the normalized and absolute measurements of the $ {{\mathrm {t}\overline {\mathrm {t}}}} $ differential cross section at particle level in the fiducial phase space as a function of $ {\Delta \phi ({\mathrm {t}}, {\overline {\mathrm {t}}})} $ are tabulated. |
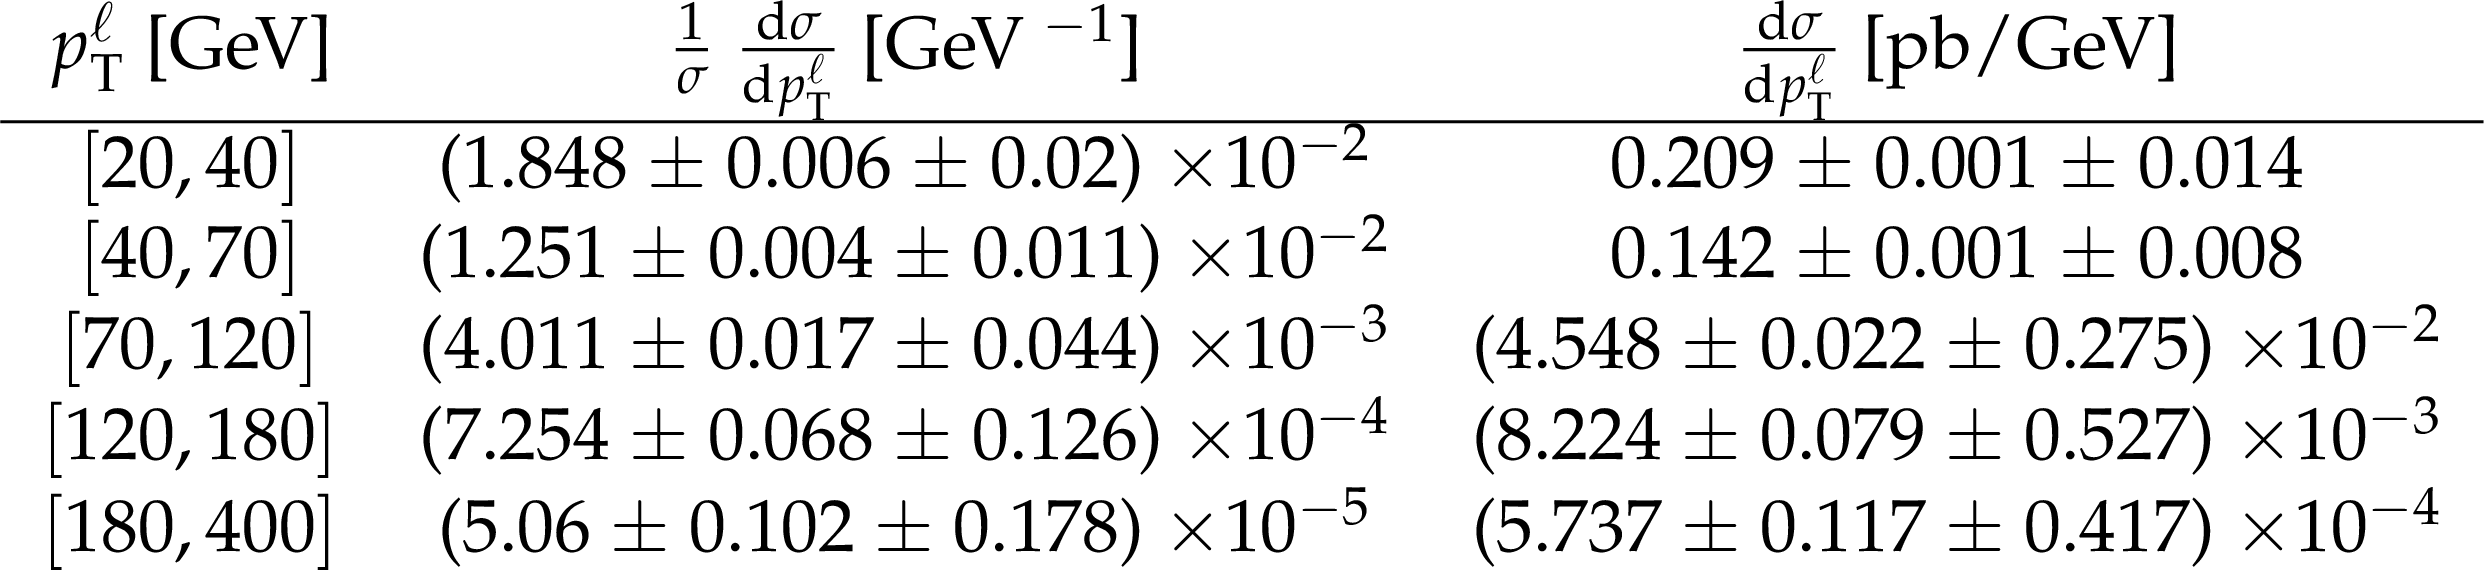
png pdf |
Table 29:
The measured differential cross section and bin boundaries for each bin of the normalized and absolute measurements of the $ {{\mathrm {t}\overline {\mathrm {t}}}} $ differential cross section at particle level in the fiducial phase space as a function of $ {{p_{\mathrm {T}}} ^{{\ell}}} $ are tabulated. |
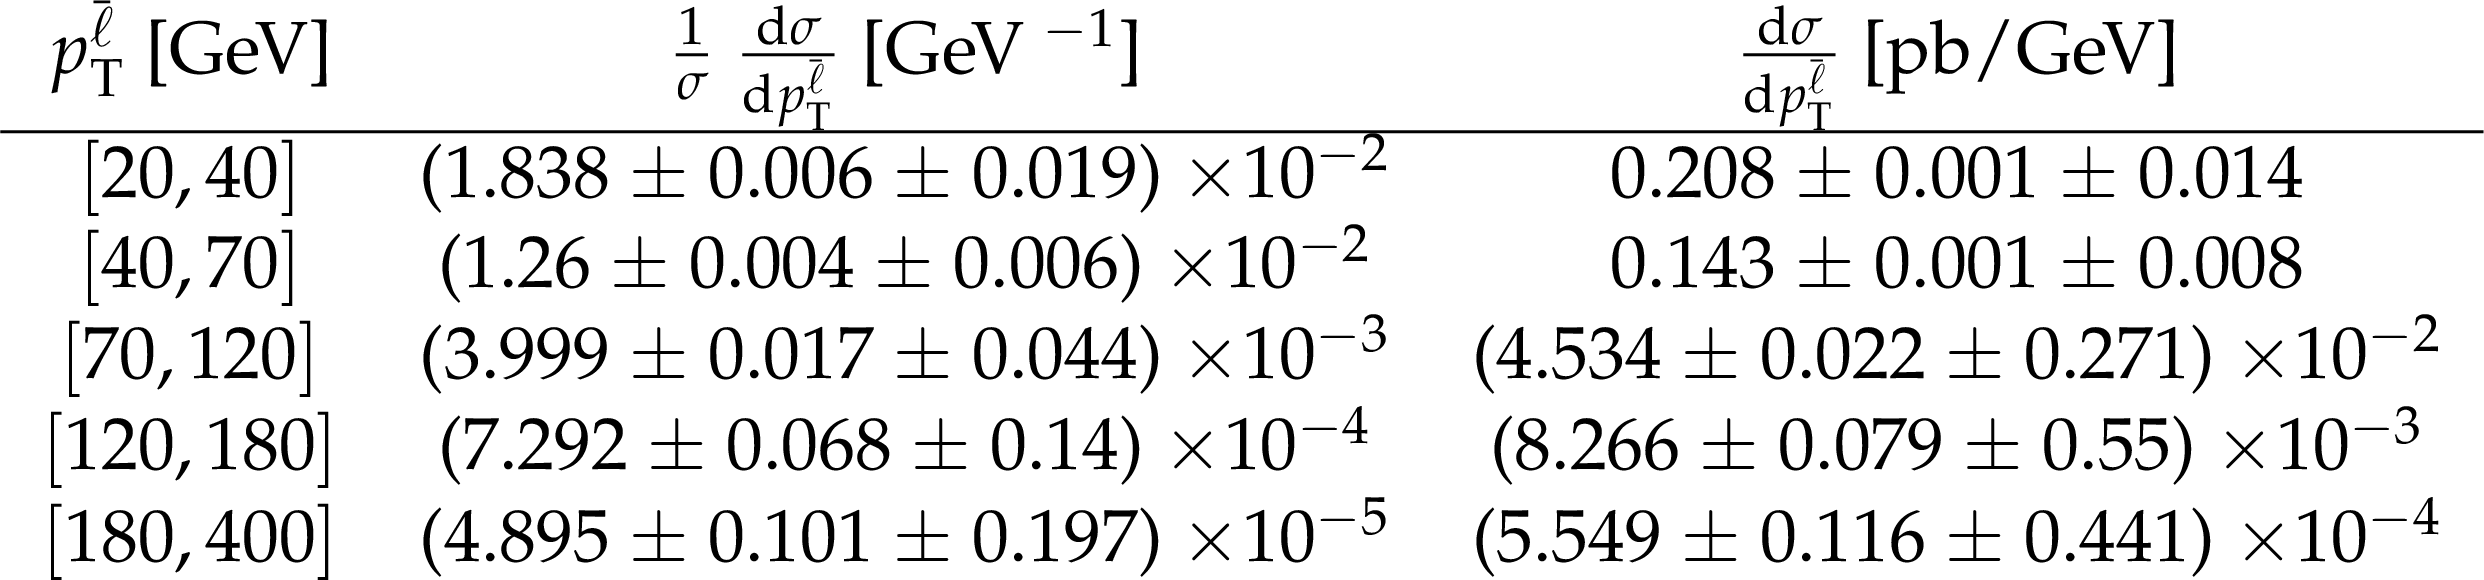
png pdf |
Table 30:
The measured differential cross section and bin boundaries for each bin of the normalized and absolute measurements of the $ {{\mathrm {t}\overline {\mathrm {t}}}} $ differential cross section at particle level in the fiducial phase space as a function of $ {{p_{\mathrm {T}}} ^{{\bar{\ell}}}} $ are tabulated. |

png pdf |
Table 31:
The measured differential cross section and bin boundaries for each bin of the normalized and absolute measurements of the $ {{\mathrm {t}\overline {\mathrm {t}}}} $ differential cross section at particle level in the fiducial phase space as a function of $ {{p_{\mathrm {T}}} ^{{\ell}}} $ (leading) are tabulated. |

png pdf |
Table 32:
The measured differential cross section and bin boundaries for each bin of the normalized and absolute measurements of the $ {{\mathrm {t}\overline {\mathrm {t}}}} $ differential cross section at particle level in the fiducial phase space as a function of $ {{p_{\mathrm {T}}} ^{{\ell}}} $ (trailing) are tabulated. |

png pdf |
Table 33:
The measured differential cross section and bin boundaries for each bin of the normalized and absolute measurements of the $ {{\mathrm {t}\overline {\mathrm {t}}}} $ differential cross section at particle level in the fiducial phase space as a function of $ {\eta _{{\ell}}} $ are tabulated. |

png pdf |
Table 34:
The measured differential cross section and bin boundaries for each bin of the normalized and absolute measurements of the $ {{\mathrm {t}\overline {\mathrm {t}}}} $ differential cross section at particle level in the fiducial phase space as a function of $ {\eta _{{\bar{\ell}}}} $ are tabulated. |

png pdf |
Table 35:
The measured differential cross section and bin boundaries for each bin of the normalized and absolute measurements of the $ {{\mathrm {t}\overline {\mathrm {t}}}} $ differential cross section at particle level in the fiducial phase space as a function of $ {\eta _{{\ell}}} $ (leading) are tabulated. |

png pdf |
Table 36:
The measured differential cross section and bin boundaries for each bin of the normalized and absolute measurements of the $ {{\mathrm {t}\overline {\mathrm {t}}}} $ differential cross section at particle level in the fiducial phase space as a function of $ {\eta _{{\ell}}} $ (trailing) are tabulated. |

png pdf |
Table 37:
The measured differential cross section and bin boundaries for each bin of the normalized and absolute measurements of the $ {{\mathrm {t}\overline {\mathrm {t}}}} $ differential cross section at particle level in the fiducial phase space as a function of $ {{p_{\mathrm {T}}} ^{{\ell \bar{\ell}}}} $ are tabulated. |

png pdf |
Table 38:
The measured differential cross section and bin boundaries for each bin of the normalized and absolute measurements of the $ {{\mathrm {t}\overline {\mathrm {t}}}} $ differential cross section at particle level in the fiducial phase space as a function of $ {m_{{\ell \bar{\ell}}}} $ are tabulated. |
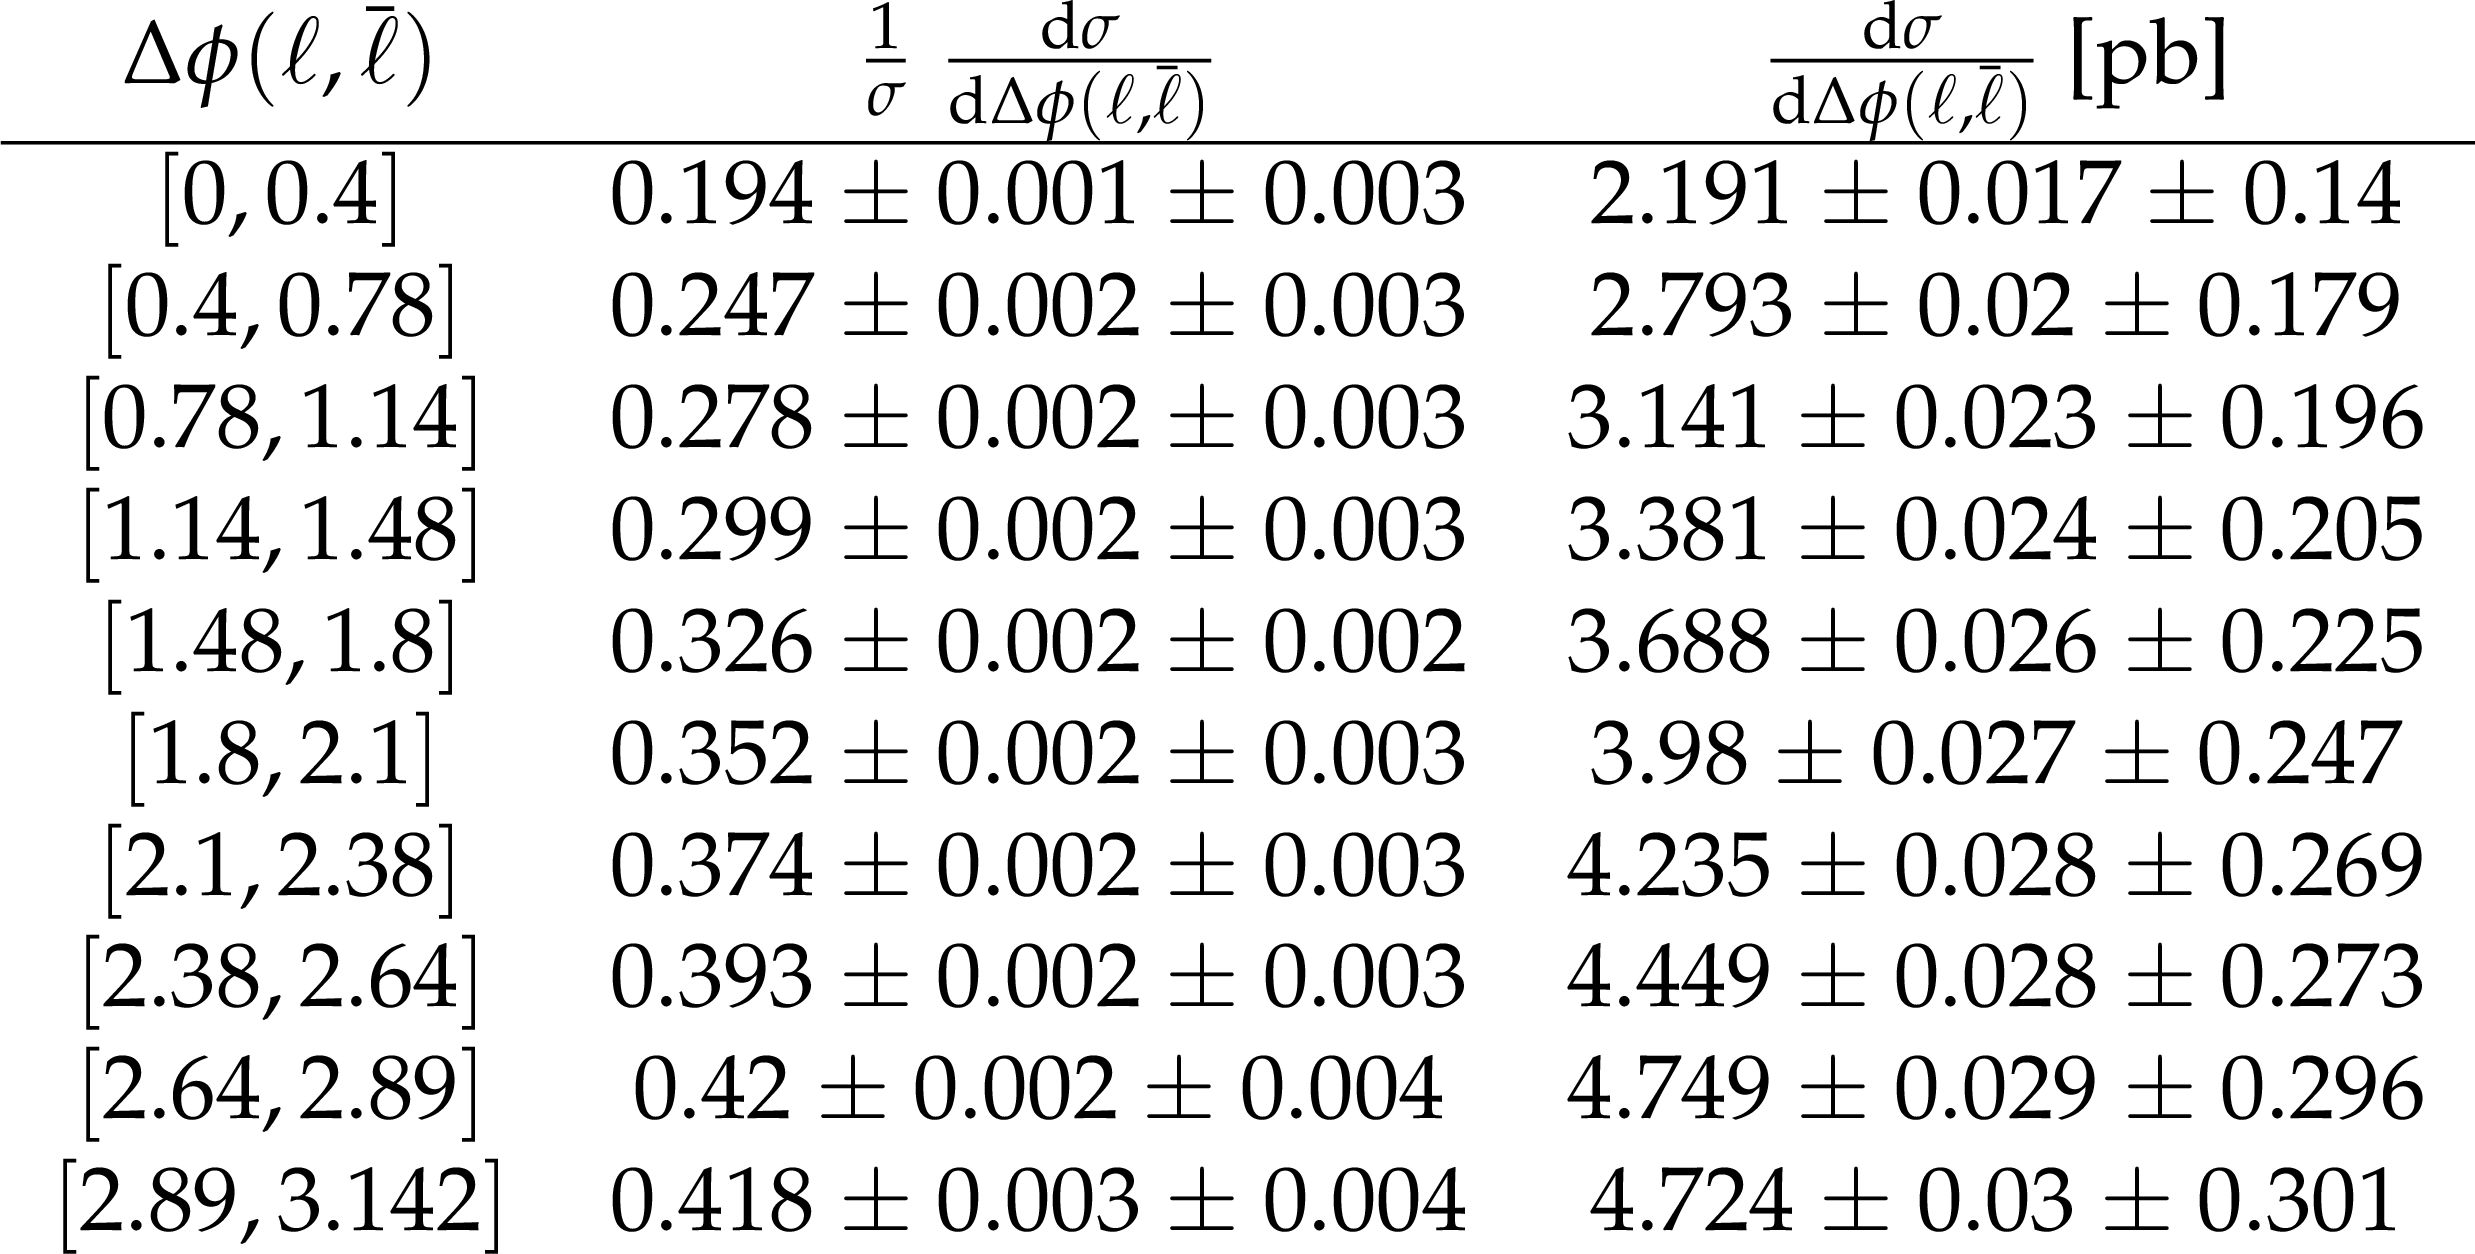
png pdf |
Table 39:
The measured differential cross section and bin boundaries for each bin of the normalized and absolute measurements of the $ {{\mathrm {t}\overline {\mathrm {t}}}} $ differential cross section at particle level in the fiducial phase space as a function of $ {\Delta \phi ({\ell}, {\bar{\ell}})} $ are tabulated. |

png pdf |
Table 40:
The measured differential cross section and bin boundaries for each bin of the normalized and absolute measurements of the $ {{\mathrm {t}\overline {\mathrm {t}}}} $ differential cross section at particle level in the fiducial phase space as a function of $ {\Delta \eta ({\ell}, {\bar{\ell}})} $ are tabulated. |
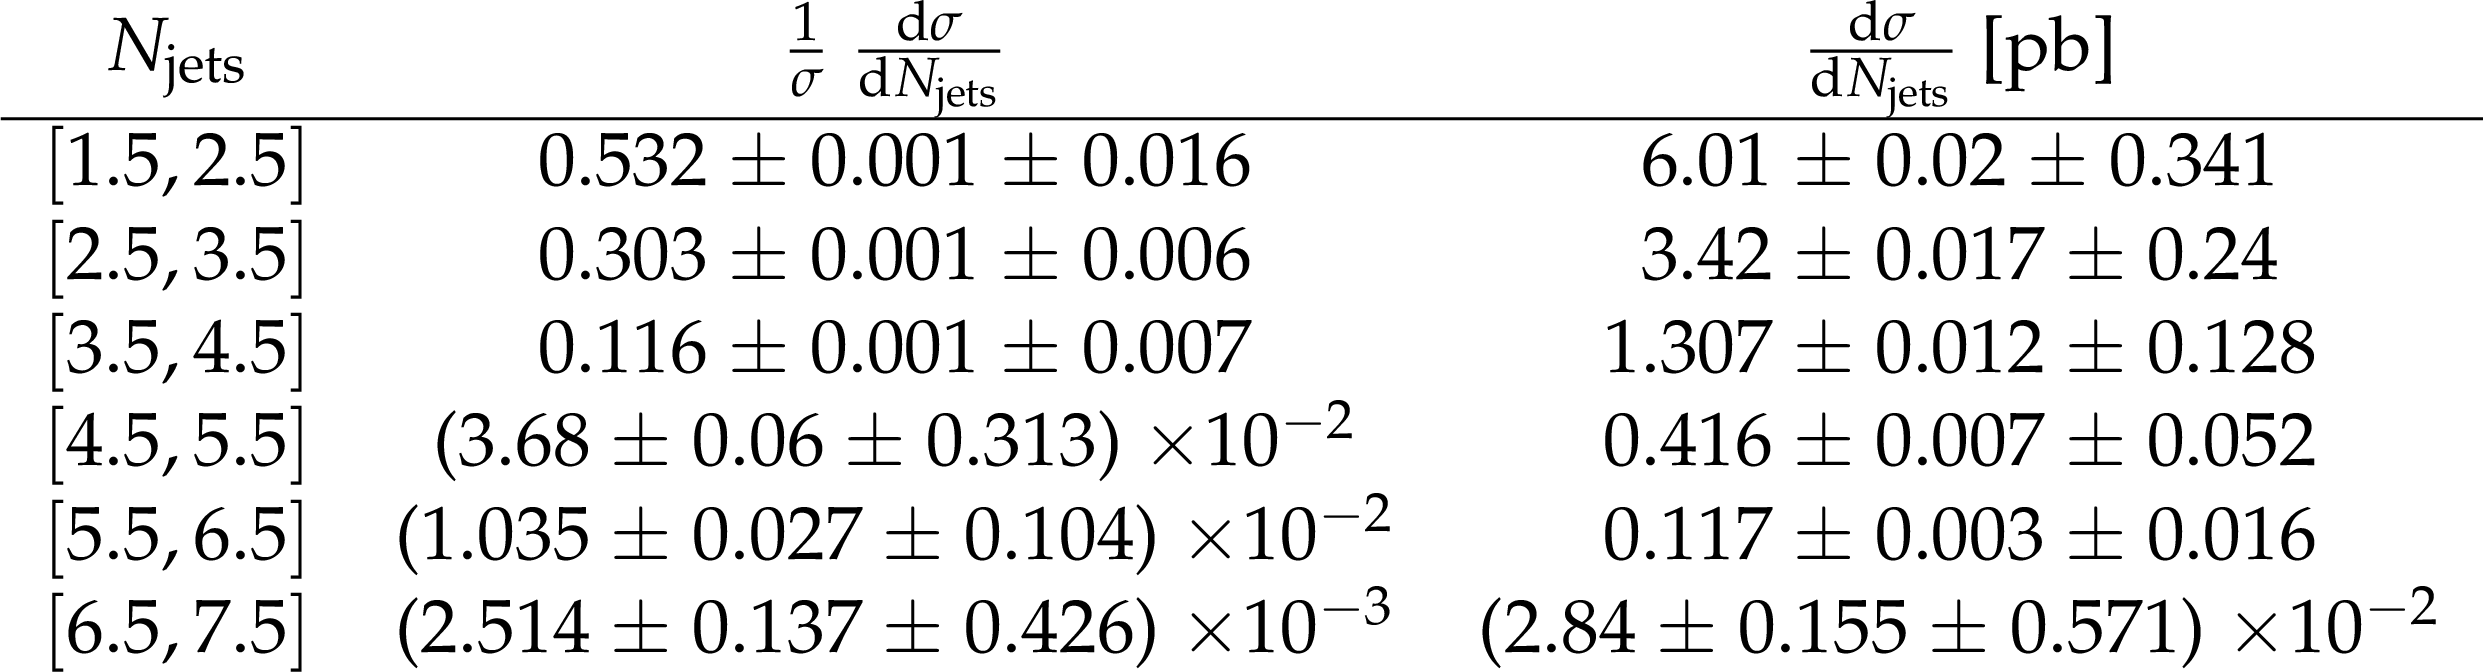
png pdf |
Table 41:
The measured differential cross section and bin boundaries for each bin of the normalized and absolute measurements of the $ {{\mathrm {t}\overline {\mathrm {t}}}} $ differential cross section at particle level in the fiducial phase space as a function of $ {N_{\text {jets}}} $ are tabulated. |
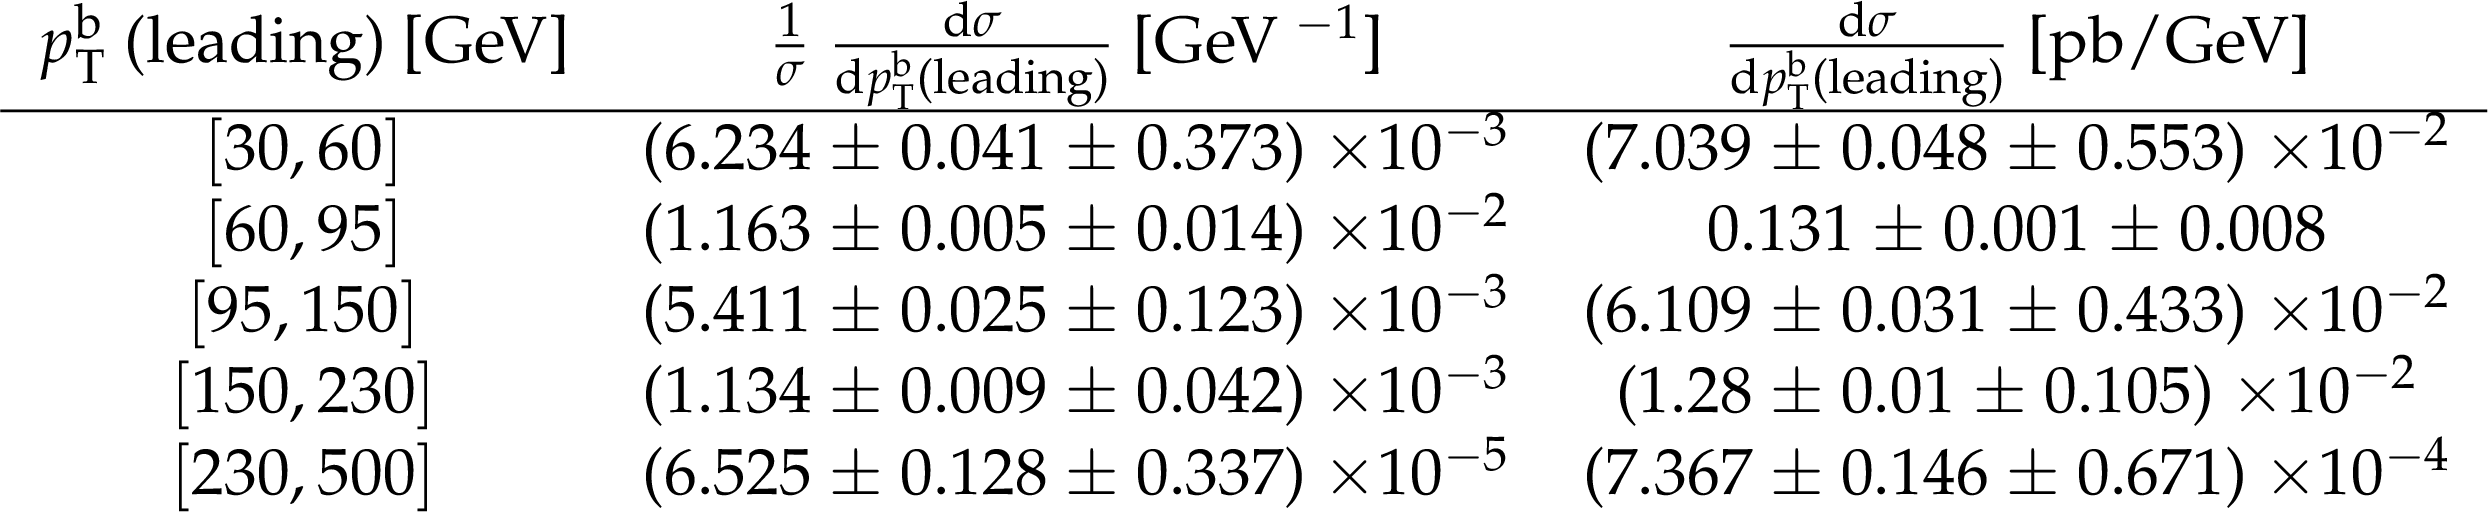
png pdf |
Table 42:
The measured differential cross section and bin boundaries for each bin of the normalized and absolute measurements of the $ {{\mathrm {t}\overline {\mathrm {t}}}} $ differential cross section at particle level in the fiducial phase space as a function of $ {p_{\mathrm {T}}} ^{\mathrm {b}} \text {(leading)}$ are tabulated. |

png pdf |
Table 43:
The measured differential cross section and bin boundaries for each bin of the normalized and absolute measurements of the $ {{\mathrm {t}\overline {\mathrm {t}}}} $ differential cross section at particle level in the fiducial phase space as a function of $ {{p_{\mathrm {T}}} ^{{\mathrm {b}}}} $ (trailing) are tabulated. |

png pdf |
Table 44:
The measured differential cross section and bin boundaries for each bin of the normalized and absolute measurements of the $ {{\mathrm {t}\overline {\mathrm {t}}}} $ differential cross section at particle level in the fiducial phase space as a function of $ {\eta _{{\mathrm {b}}}} $ (leading) are tabulated. |

png pdf |
Table 45:
The measured differential cross section and bin boundaries for each bin of the normalized and absolute measurements of the $ {{\mathrm {t}\overline {\mathrm {t}}}} $ differential cross section at particle level in the fiducial phase space as a function of $ {\eta _{{\mathrm {b}}}} $ (trailing) are tabulated. |

png pdf |
Table 46:
The measured differential cross section and bin boundaries for each bin of the normalized and absolute measurements of the $ {{\mathrm {t}\overline {\mathrm {t}}}} $ differential cross section at particle level in the fiducial phase space as a function of $ {{p_{\mathrm {T}}} ^{{{\mathrm {b}} {\overline {\mathrm {b}}}}}} $ are tabulated. |

png pdf |
Table 47:
The measured differential cross section and bin boundaries for each bin of the normalized and absolute measurements of the $ {{\mathrm {t}\overline {\mathrm {t}}}} $ differential cross section at particle level in the fiducial phase space as a function of $ {m_{{{\mathrm {b}} {\overline {\mathrm {b}}}}}} $ are tabulated. |

png pdf |
Table 48:
The $ {\chi ^{2}} $/dof and $p$-values quantifying the agreement between the three MC predictions and the measured, parton-level normalised cross sections are shown. |
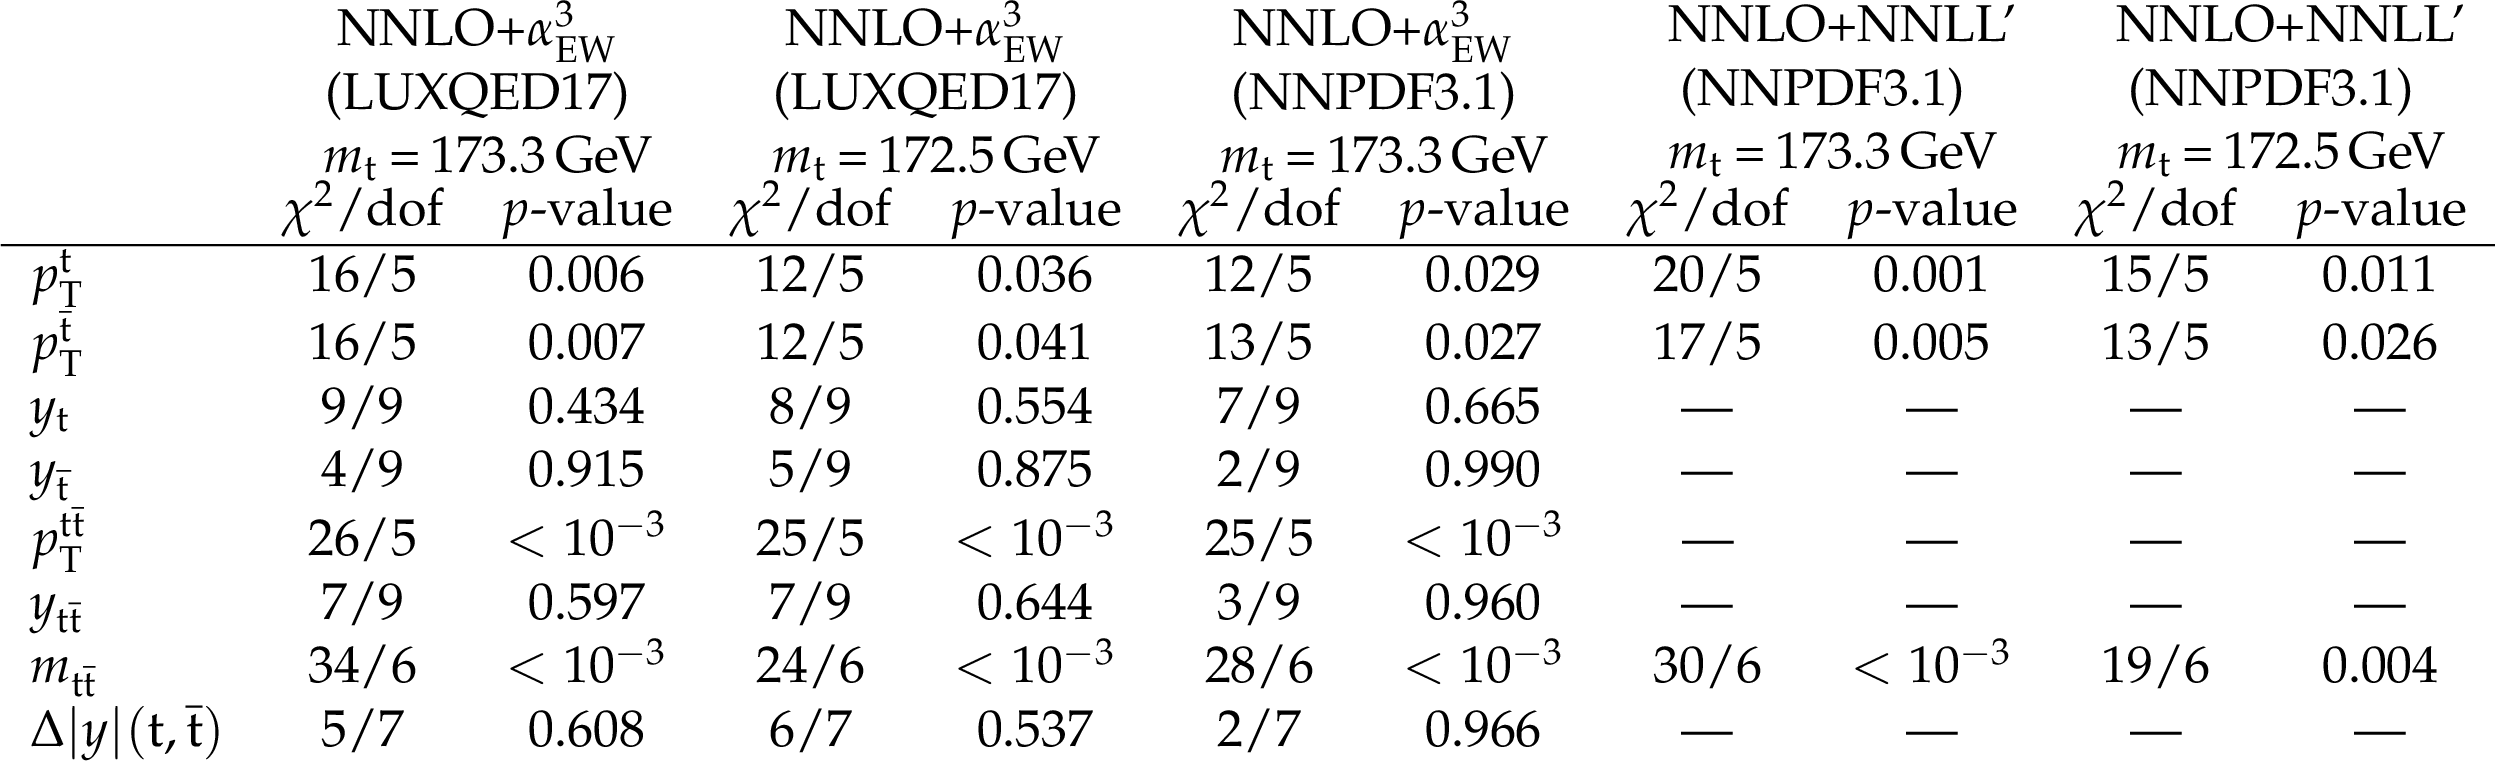
png pdf |
Table 49:
The $ {\chi ^{2}} $/dof and $p$-values quantifying the agreement between the five theoretical predictions with NNLO+$ {\alpha _\mathrm {EW}^{3}} $ and NNLO+NNLL' precision and the measured, parton-level normalised cross sections are shown. |

png pdf |
Table 50:
The $ {\chi ^{2}} $/dof and $p$-values quantifying the agreement between the two theoretical predictions with a N$^{3}$LO and aNNLO precision and the measured, parton-level normalised cross sections are shown. |

png pdf |
Table 51:
The $ {\chi ^{2}} $/dof and $p$-values quantifying the agreement between the three MC predictions and the measured, parton-level absolute cross sections are shown. |

png pdf |
Table 52:
The $ {\chi ^{2}} $/dof and $p$-values quantifying the agreement between the five theoretical predictions with NNLO+$ {\alpha _\mathrm {EW}^{3}} $ and NNLO+NNLL' precision and the measured, parton-level absolute cross sections are shown. |

png pdf |
Table 53:
The $ {\chi ^{2}} $/dof and $p$-values quantifying the agreement between the two theoretical predictions with a N$^{3}$LO and aNNLO precision and the measured, parton-level absolute cross sections are shown. |
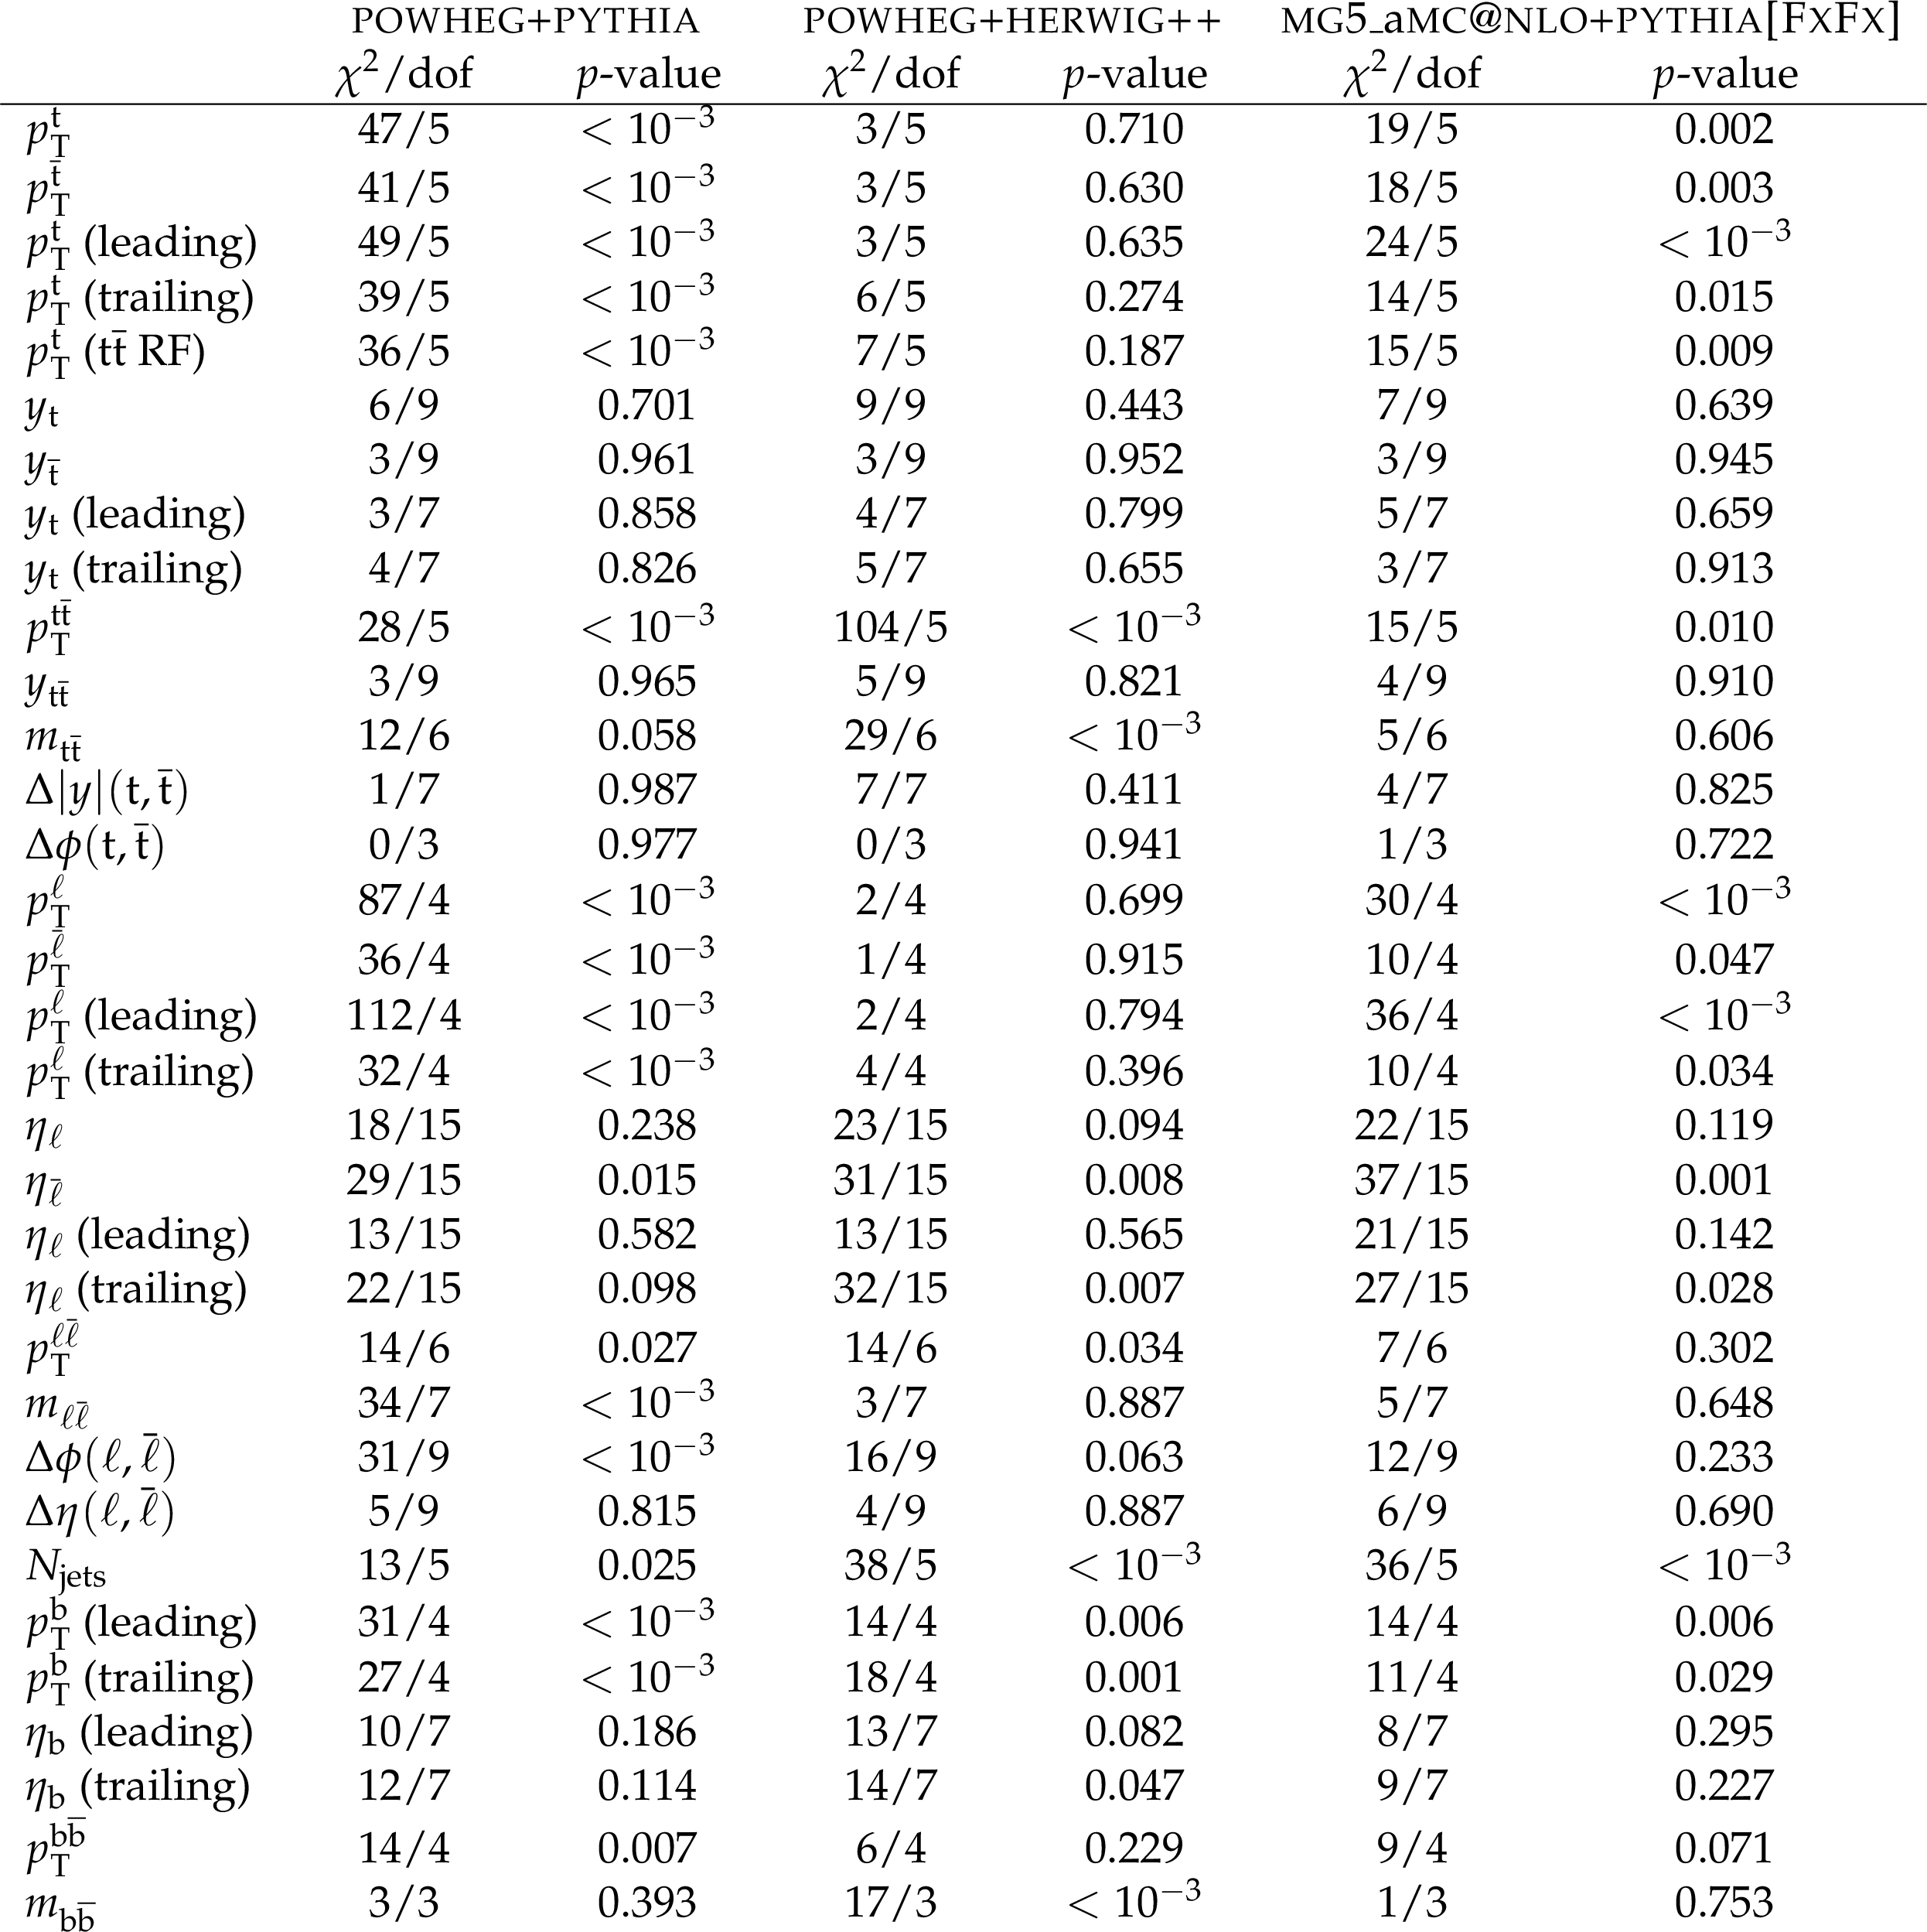
png pdf |
Table 54:
The $ {\chi ^{2}} $/dof and $p$-values quantifying the agreement between the three MC predictions and the measured, particle-level normalised cross sections are shown. |
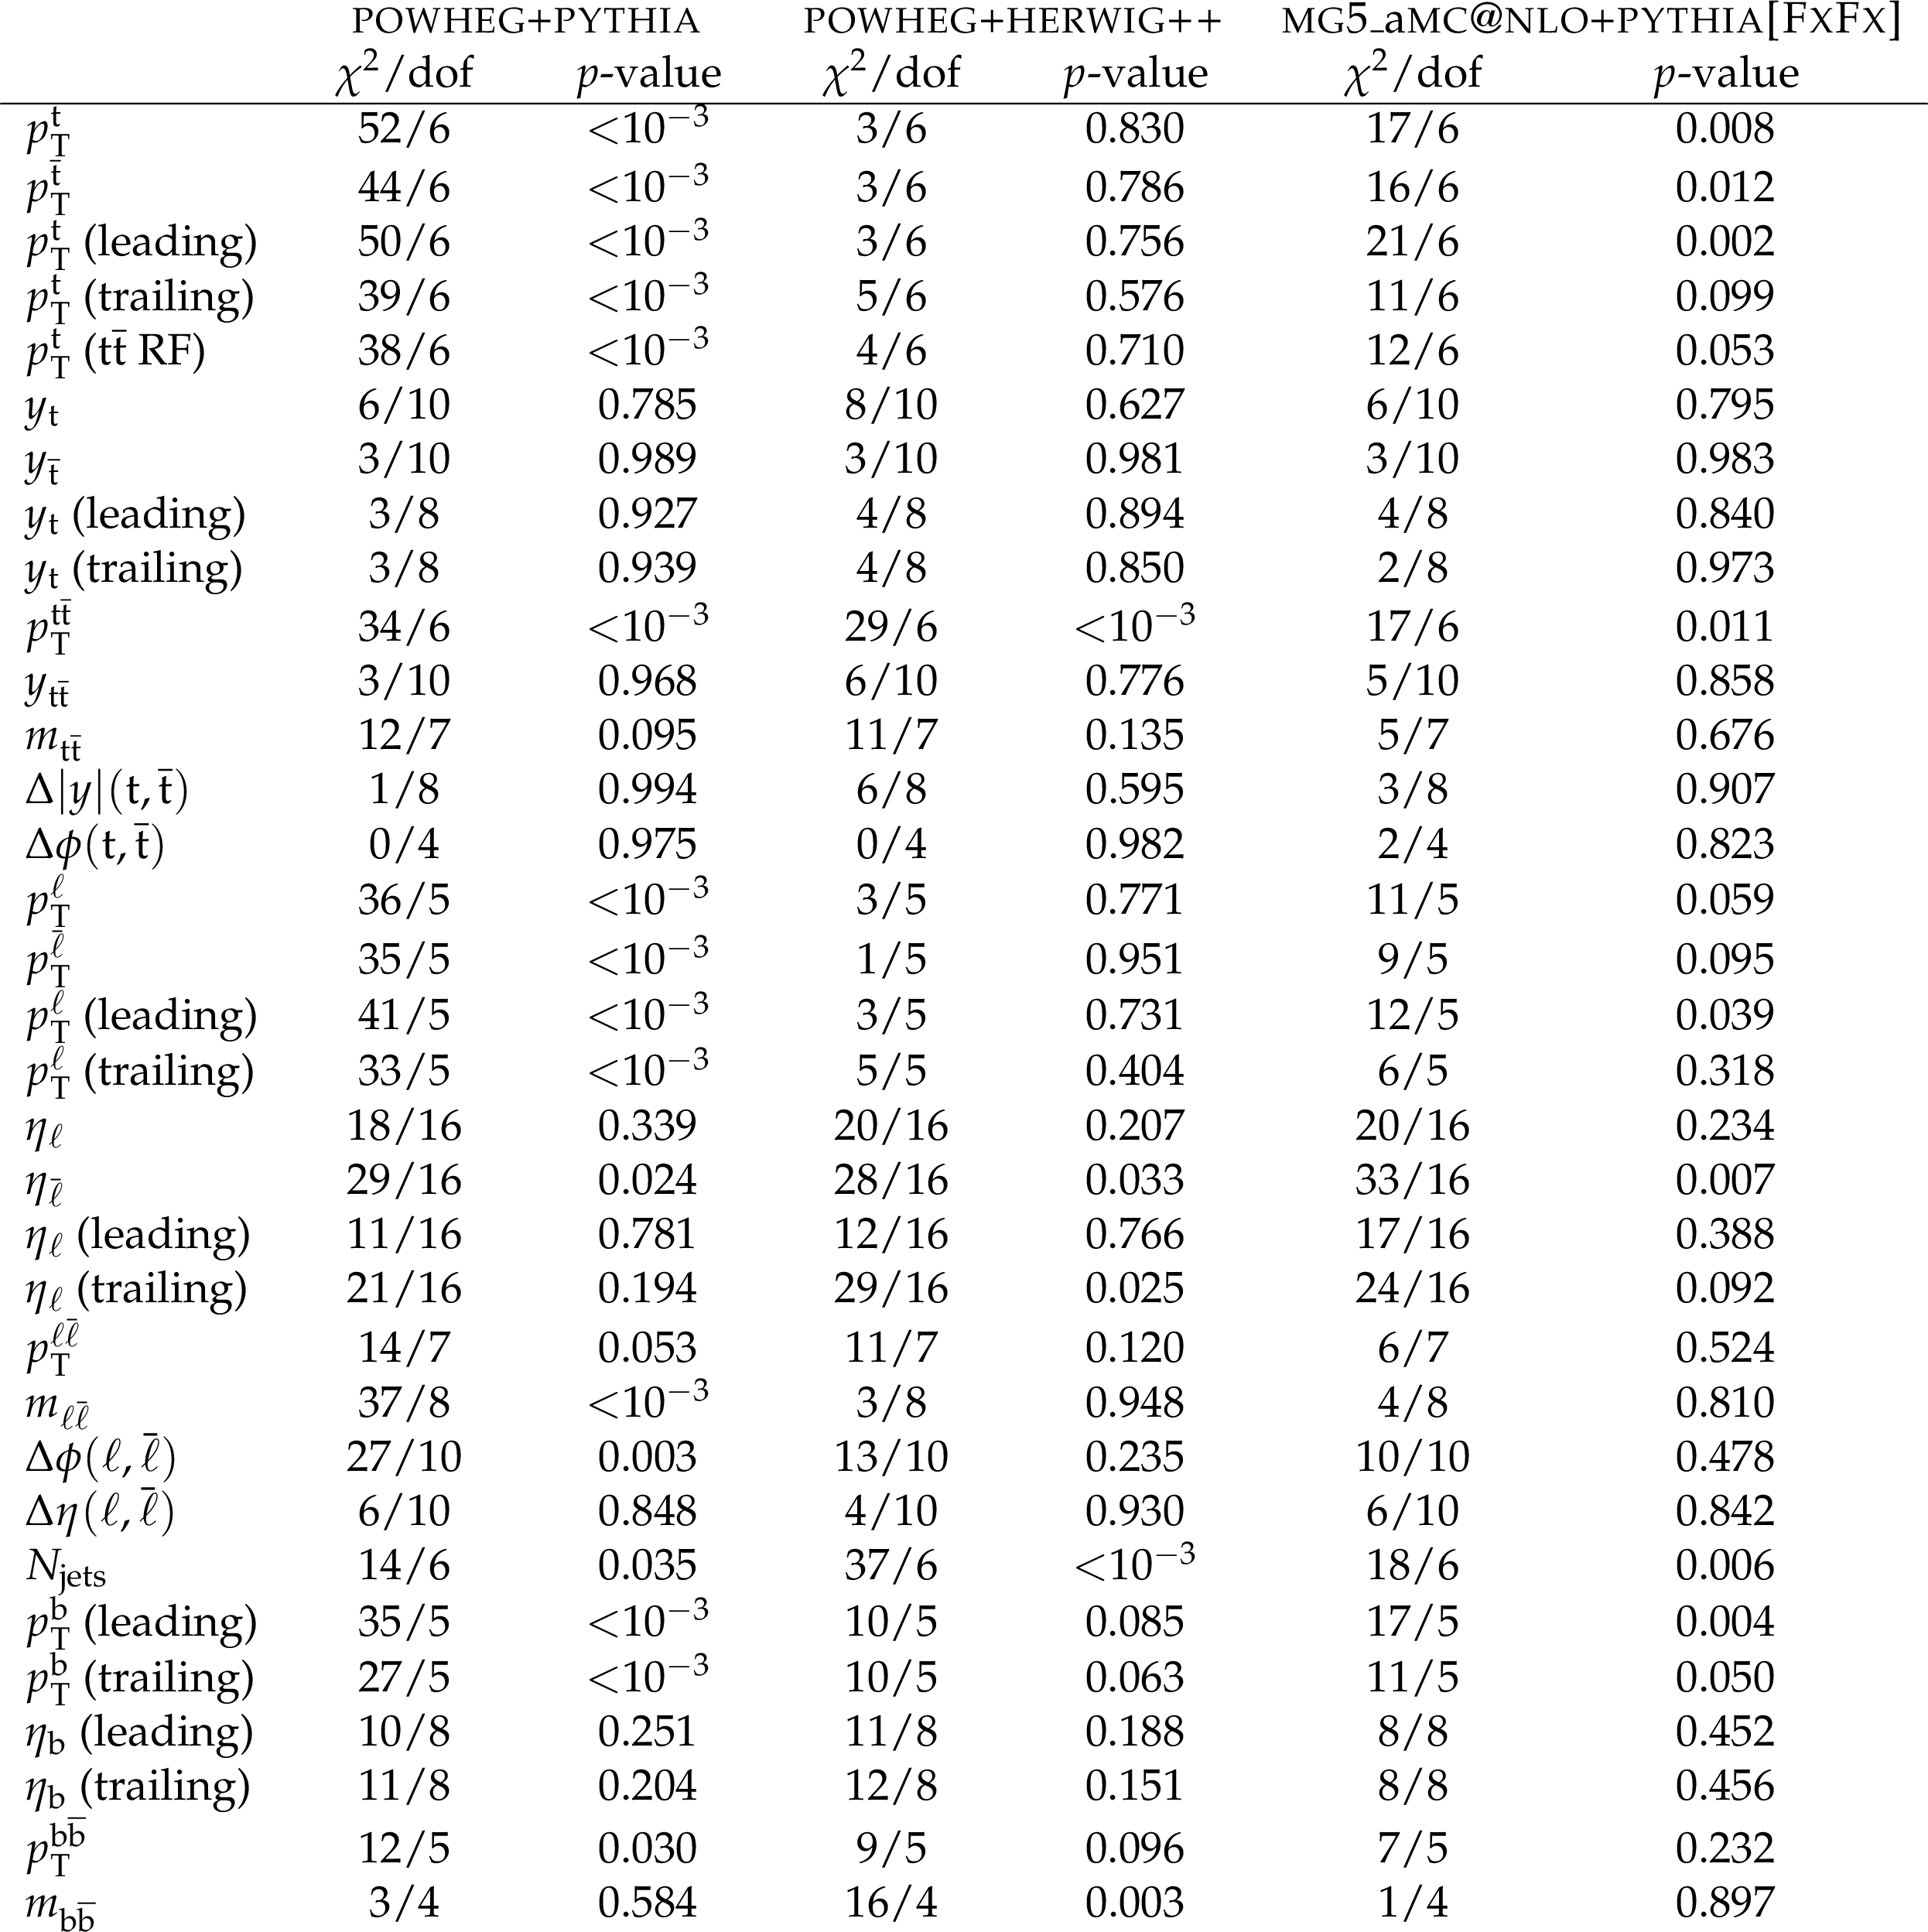
png pdf |
Table 55:
The $ {\chi ^{2}} $/dof and $p$-values quantifying the agreement between the three MC predictions and the measured, particle-level absolute cross sections are shown. |
| Summary |
| Measurements of differential $ \mathrm{t\bar{t}} $ cross sections using events containing two oppositely charged leptons produced in pp collisions at a centre-of-mass energy of 13 TeV are presented. The data were recorded with the CMS detector in 2016 and correspond to a integrated luminosity of 35.9 fb$^{-1}$. The differential cross sections are presented as functions of numerous observables related to $ \mathrm{t\bar{t}} $ production and decay and are based on both particle-level objects in a phase space close to that of the detector acceptance and parton-level top quarks in the full phase space. For each observable, absolute and normalised differential cross sections are presented. Most measured differential cross sections are well modelled by theoretical predictions. However, significant disagreement between the data and Monte Carlo simulation with next-to-leading-order (NLO) precision in quantum chromodynamics is observed for the transverse momentum of top quarks, leptons, b jets, $ \mathrm{t\bar{t}} $, $ {\ell\bar{\ell}} $, and $ \mathrm{b\bar{b}} $ systems, and the invariant mass of the $ \mathrm{t\bar{t}} $, $ {\ell\bar{\ell}} $, and $ \mathrm{b\bar{b}} $ systems. Similar levels of disagreement are observed for predictions with beyond-NLO precision. The jet multiplicity distribution is not well described by any of the Monte Carlo predictions. The absolute particle-level differential cross section as a function of $ \Delta \phi (\ell\bar{\ell}) $ is used to constrain the top quark chromomagnetic dipole moment at NLO precision in quantum chromodynamics using an effective field theory framework. The $ \mathrm{t\bar{t}} $ and leptonic charge asymmetries are measured using 13 TeV data for the first time and found to be in agreement with standard model predictions. |
| Additional Figures | |
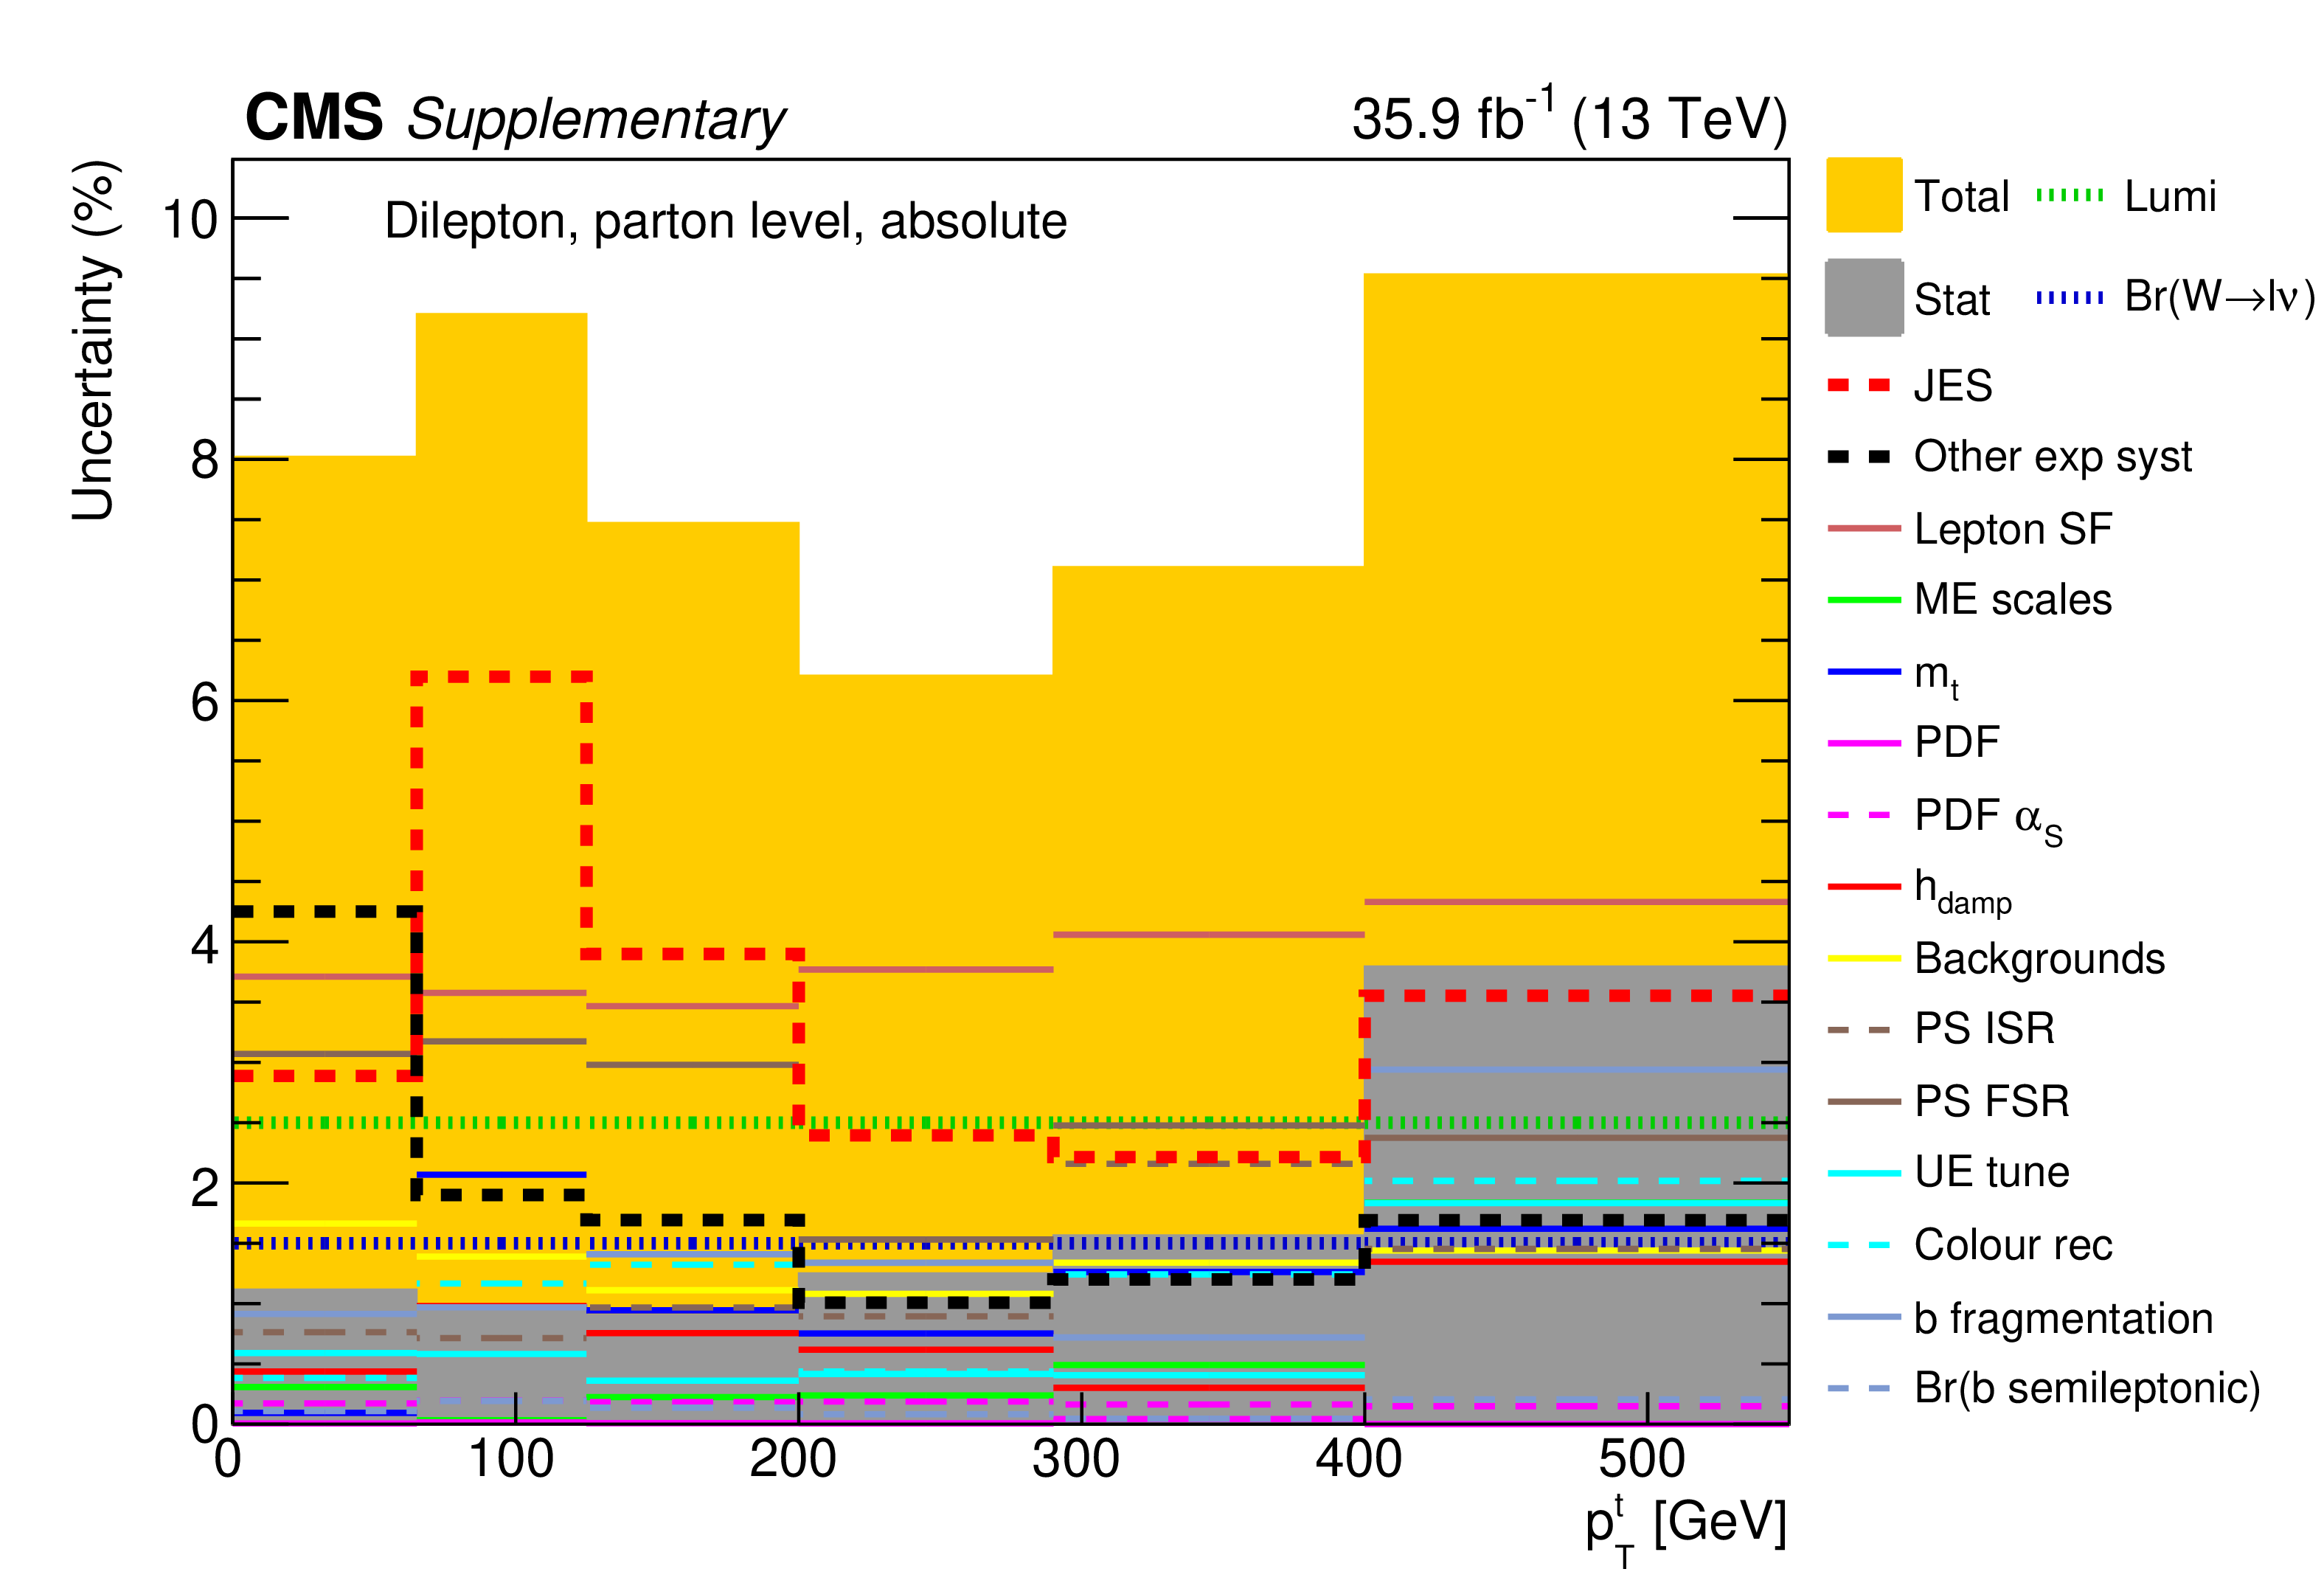
png pdf |
Additional Figure 1:
The breakdown of uncertainties for the absolute measurement of the differential $\mathrm{t\bar{t}}$ cross section as a function of $p_{\mathrm {T}}^{\mathrm {t}}$ at parton level is shown. The contributions of each source of systematic uncertainty in each bin are indicated by the coloured lines. Experimental systematic uncertainties that are small in all bins are added in quadrature and shown as a single component. The statistical and total uncertainties are indicated by the shaded areas. |

png pdf |
Additional Figure 2:
The covariance matrix of the measured data for the absolute measurement of the differential $\mathrm{t\bar{t}}$ cross section as a function of $p_{\mathrm {T}}^{\mathrm {t}}$ at parton level is shown. |
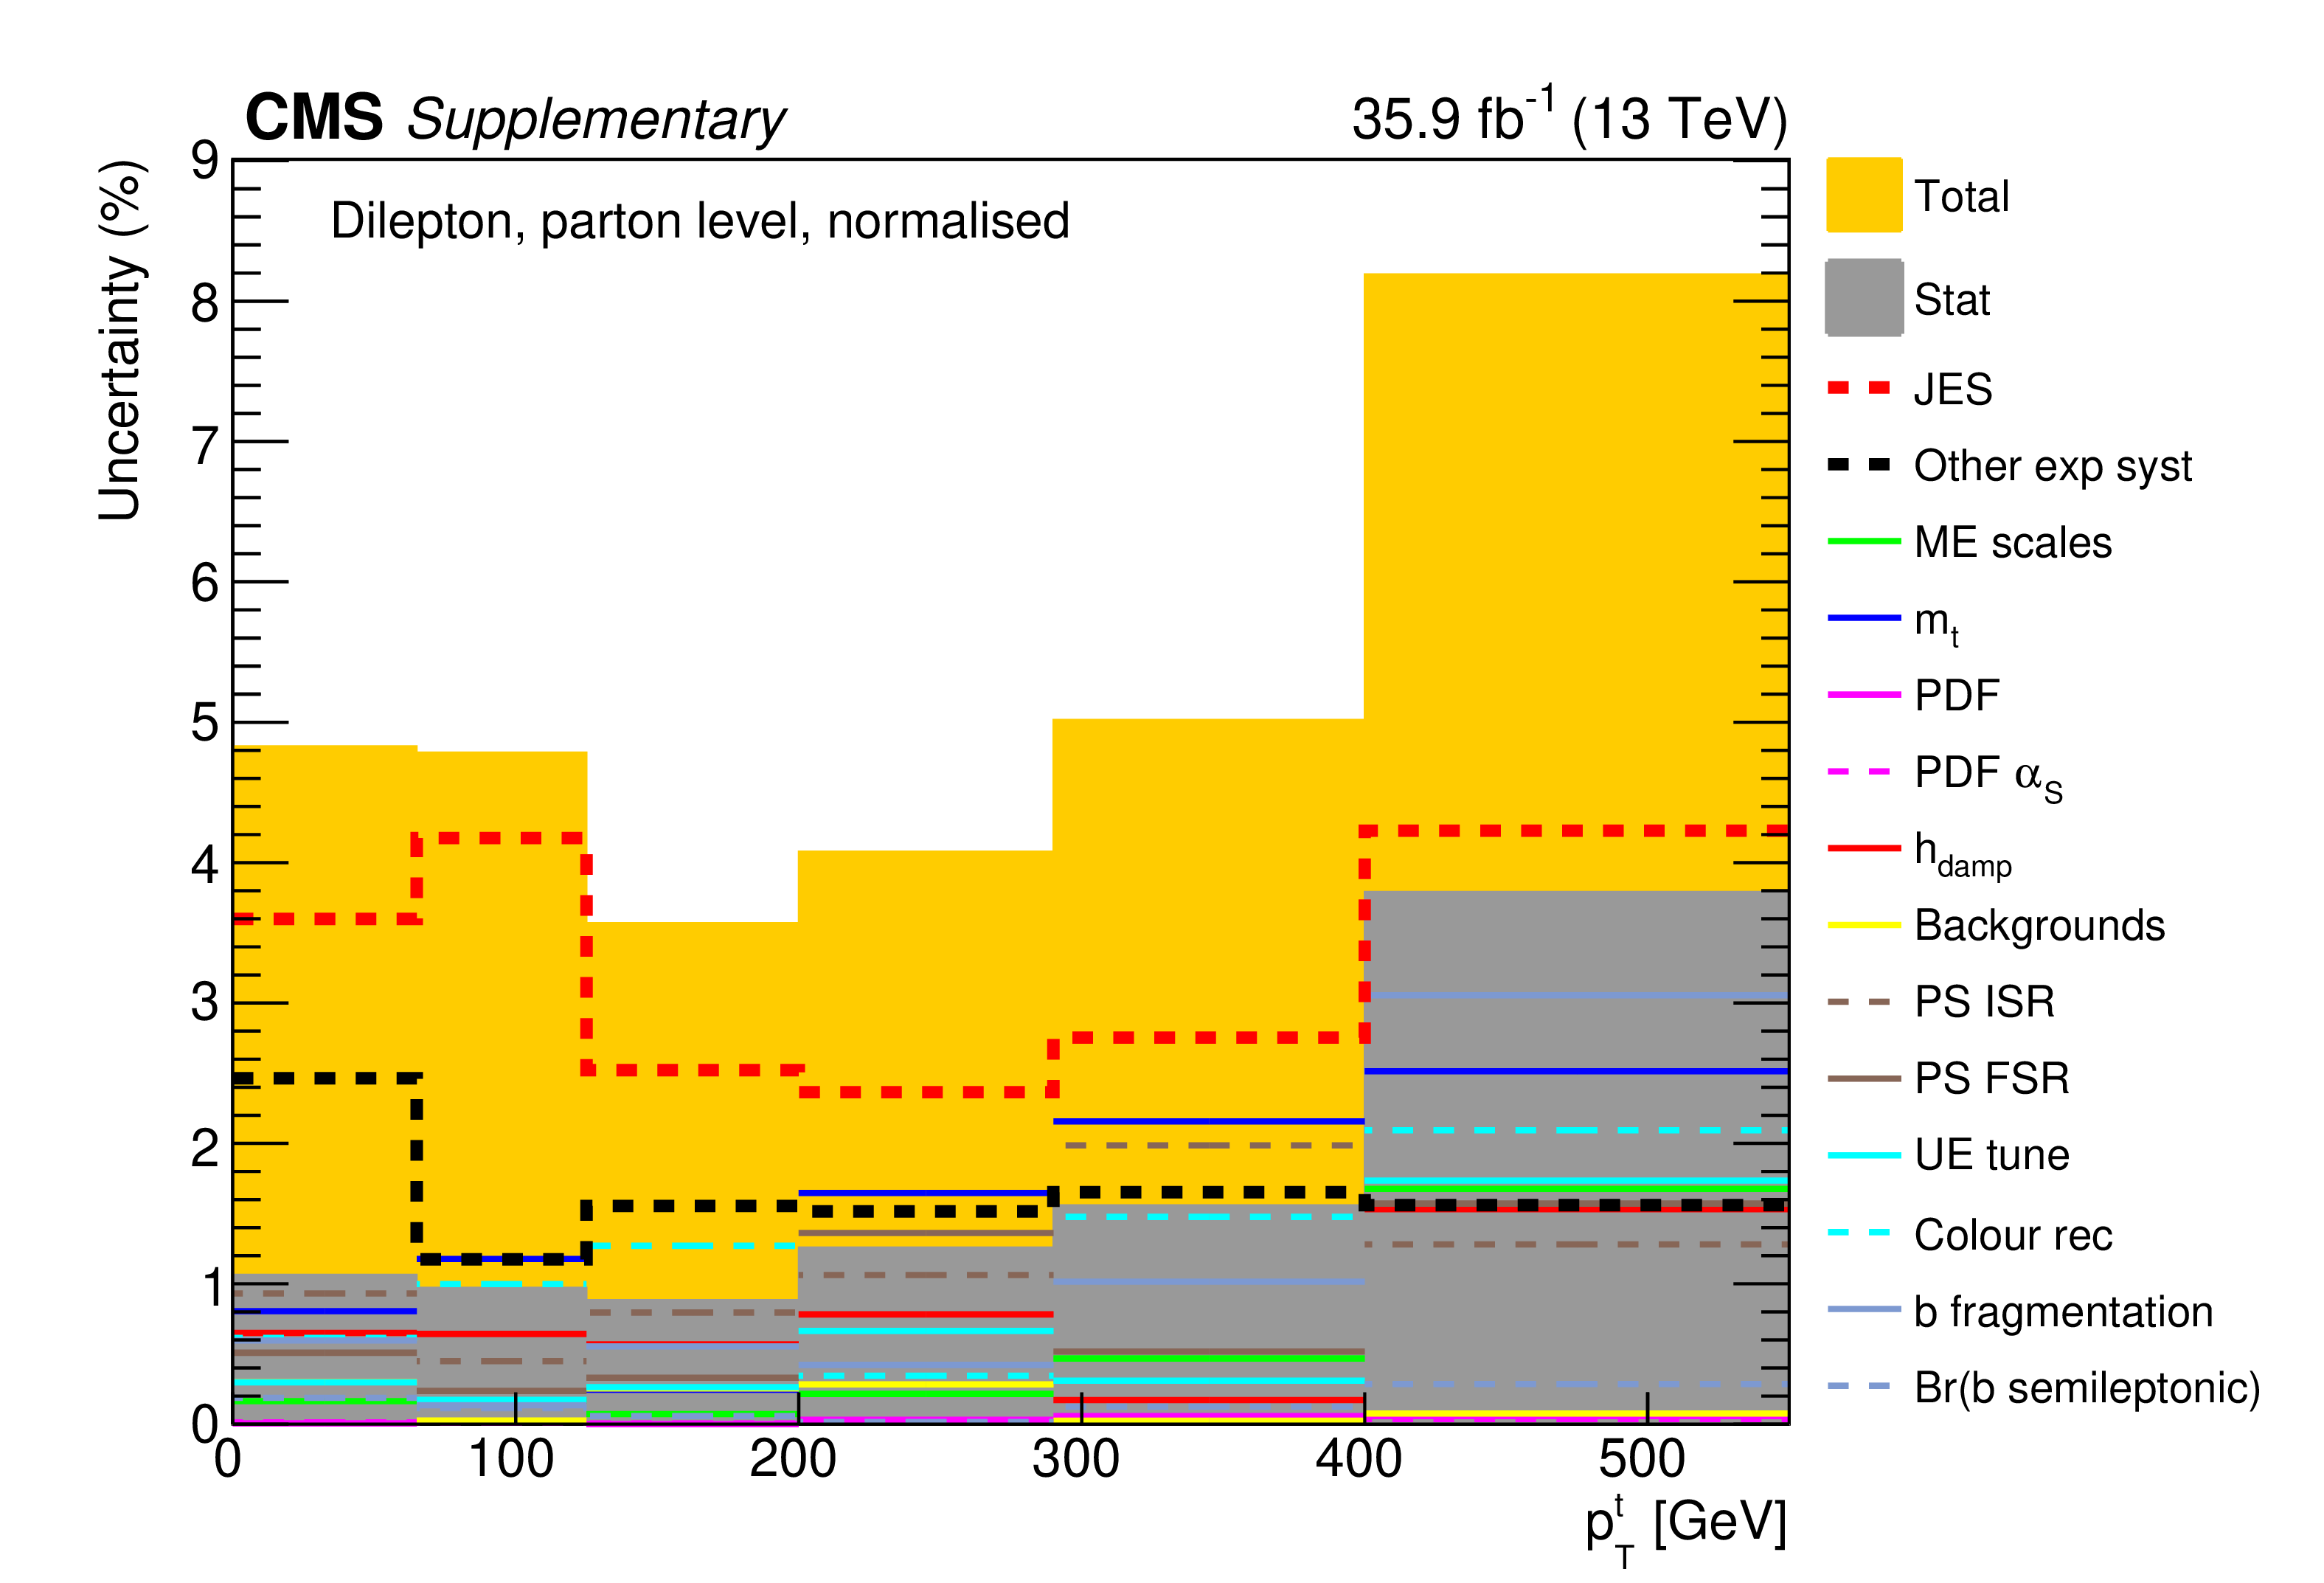
png pdf |
Additional Figure 3:
The breakdown of uncertainties for the normalised measurement of the differential $\mathrm{t\bar{t}}$ cross section as a function of $p_{\mathrm {T}}^{\mathrm {t}}$ at parton level is shown. The contributions of each source of systematic uncertainty in each bin are indicated by the coloured lines. Experimental systematic uncertainties that are small in all bins are added in quadrature and shown as a single component. The statistical and total uncertainties are indicated by the shaded areas. |

png pdf |
Additional Figure 4:
The covariance matrix of the measured data for the normalised measurement of the differential $\mathrm{t\bar{t}}$ cross section as a function of $p_{\mathrm {T}}^{\mathrm {t}}$ at parton level is shown. |

png pdf |
Additional Figure 5:
The breakdown of uncertainties for the absolute measurement of the differential $\mathrm{t\bar{t}}$ cross section as a function of $p_{\mathrm {T}}^{\mathrm {t}}$ at particle level is shown. The contributions of each source of systematic uncertainty in each bin are indicated by the coloured lines. Experimental systematic uncertainties that are small in all bins are added in quadrature and shown as a single component. The statistical and total uncertainties are indicated by the shaded areas. |

png pdf |
Additional Figure 6:
The covariance matrix of the measured data for the absolute measurement of the differential $\mathrm{t\bar{t}}$ cross section as a function of $p_{\mathrm {T}}^{\mathrm {t}}$ at particle level is shown. |

png pdf |
Additional Figure 7:
The breakdown of uncertainties for the normalised measurement of the differential $\mathrm{t\bar{t}}$ cross section as a function of $p_{\mathrm {T}}^{\mathrm {t}}$ at particle level is shown. The contributions of each source of systematic uncertainty in each bin are indicated by the coloured lines. Experimental systematic uncertainties that are small in all bins are added in quadrature and shown as a single component. The statistical and total uncertainties are indicated by the shaded areas. |

png pdf |
Additional Figure 8:
The covariance matrix of the measured data for the normalised measurement of the differential $\mathrm{t\bar{t}}$ cross section as a function of $p_{\mathrm {T}}^{\mathrm {t}}$ at particle level is shown. |

png pdf |
Additional Figure 9:
The breakdown of uncertainties for the absolute measurement of the differential $\mathrm{t\bar{t}}$ cross section as a function of $p_{\mathrm {T}}^{\bar{\mathrm {t}}}$ at parton level is shown. The contributions of each source of systematic uncertainty in each bin are indicated by the coloured lines. Experimental systematic uncertainties that are small in all bins are added in quadrature and shown as a single component. The statistical and total uncertainties are indicated by the shaded areas. |

png pdf |
Additional Figure 10:
The covariance matrix of the measured data for the absolute measurement of the differential $\mathrm{t\bar{t}}$ cross section as a function of $p_{\mathrm {T}}^{\bar{\mathrm {t}}}$ at parton level is shown. |

png pdf |
Additional Figure 11:
The breakdown of uncertainties for the normalised measurement of the differential $\mathrm{t\bar{t}}$ cross section as a function of $p_{\mathrm {T}}^{\bar{\mathrm {t}}}$ at parton level is shown. The contributions of each source of systematic uncertainty in each bin are indicated by the coloured lines. Experimental systematic uncertainties that are small in all bins are added in quadrature and shown as a single component. The statistical and total uncertainties are indicated by the shaded areas. |
png pdf |
Additional Figure 12:
The covariance matrix of the measured data for the normalised measurement of the differential $\mathrm{t\bar{t}}$ cross section as a function of $p_{\mathrm {T}}^{\bar{\mathrm {t}}}$ at parton level is shown. |
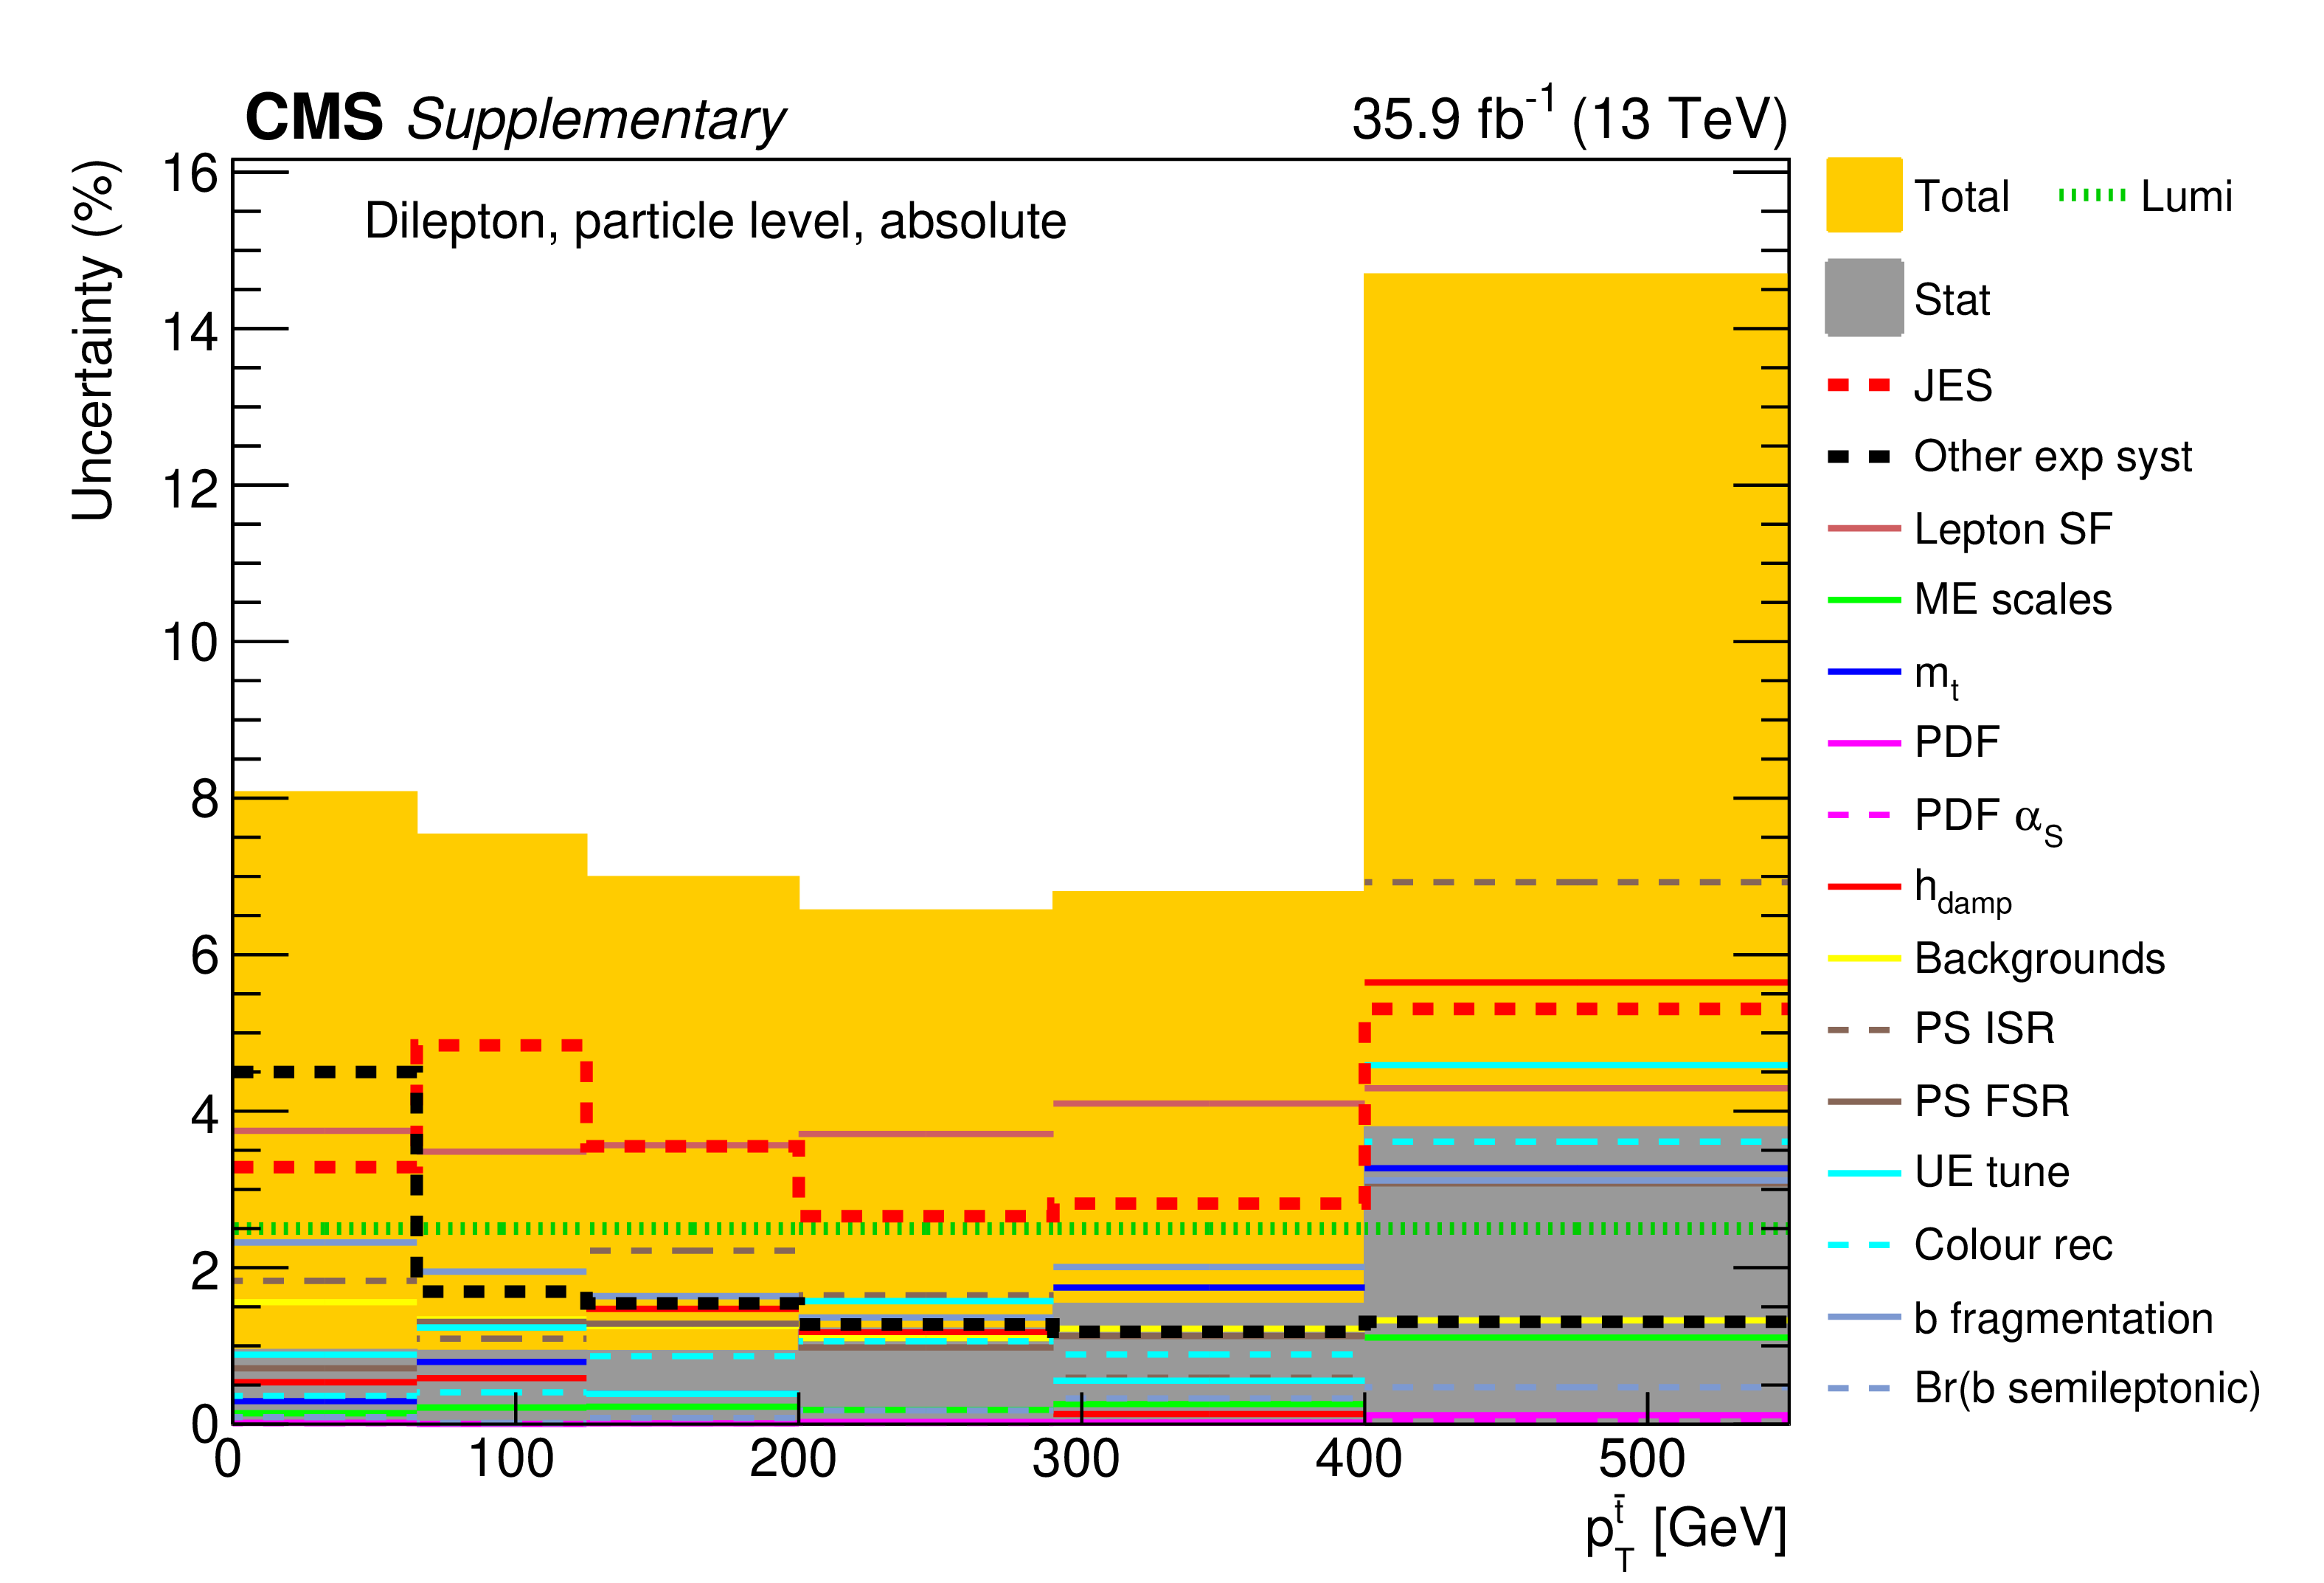
png pdf |
Additional Figure 13:
The breakdown of uncertainties for the absolute measurement of the differential $\mathrm{t\bar{t}}$ cross section as a function of $p_{\mathrm {T}}^{\bar{\mathrm {t}}}$ at particle level is shown. The contributions of each source of systematic uncertainty in each bin are indicated by the coloured lines. Experimental systematic uncertainties that are small in all bins are added in quadrature and shown as a single component. The statistical and total uncertainties are indicated by the shaded areas. |
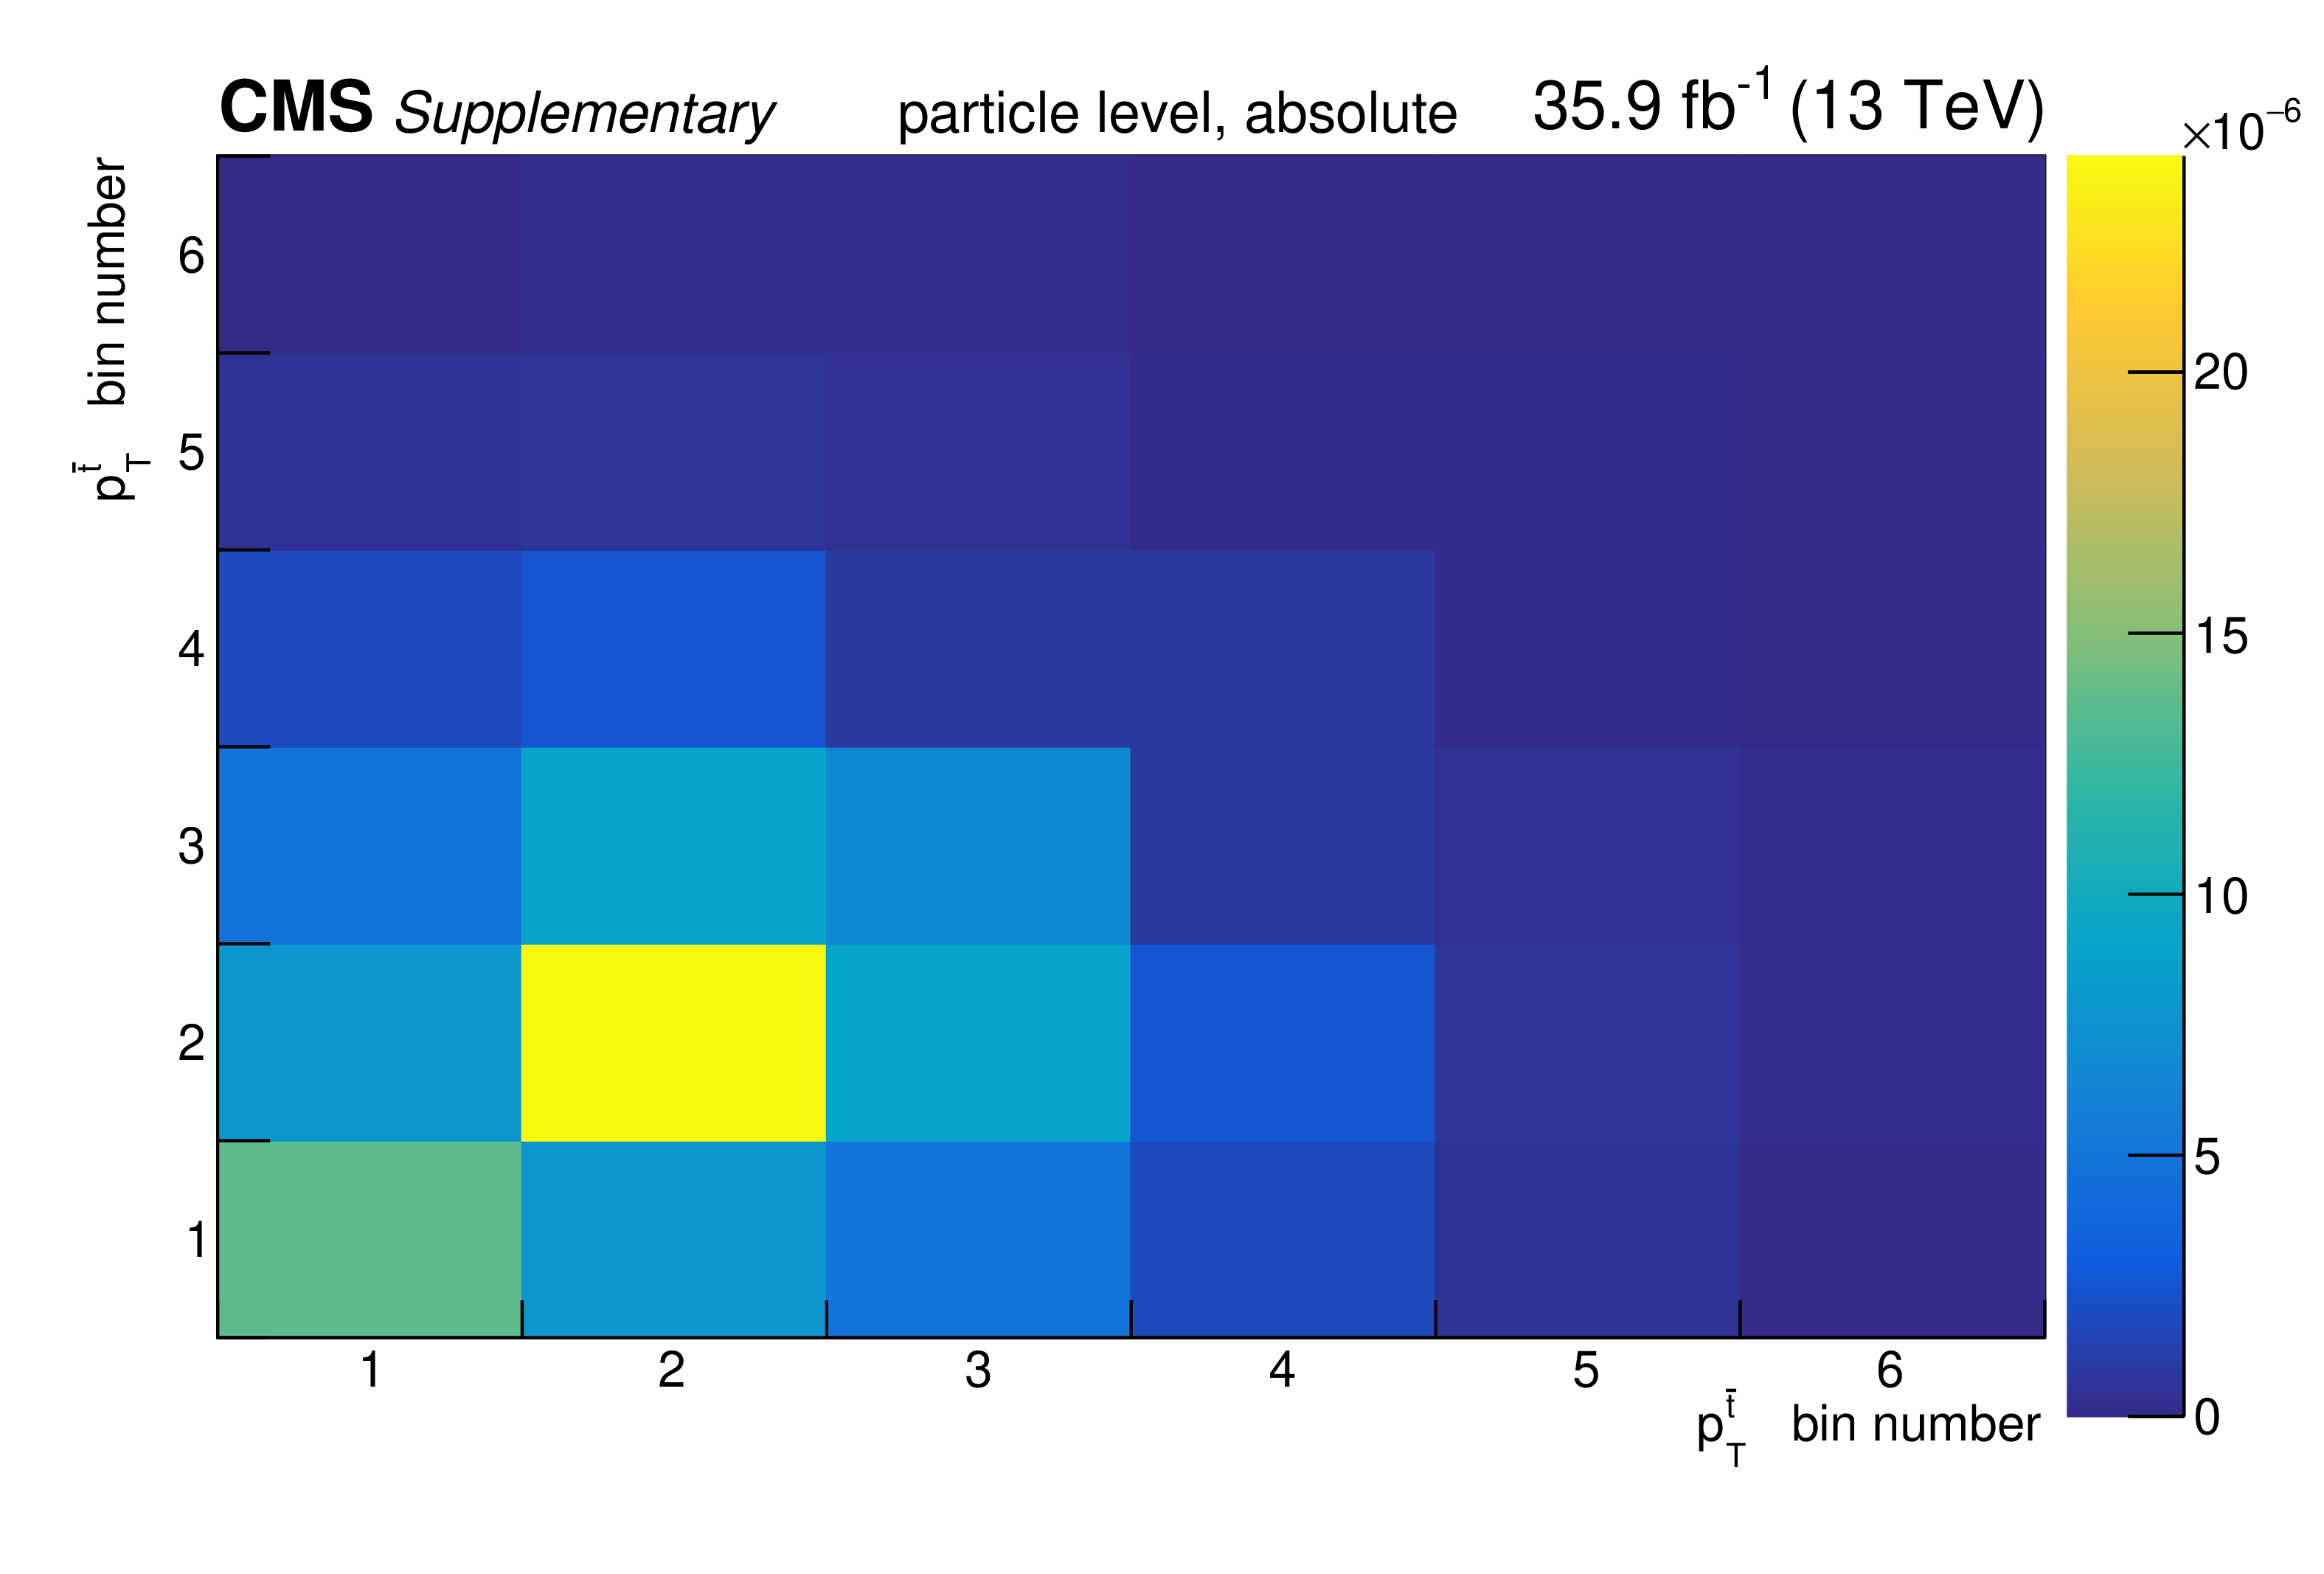
png pdf |
Additional Figure 14:
The covariance matrix of the measured data for the absolute measurement of the differential $\mathrm{t\bar{t}}$ cross section as a function of $p_{\mathrm {T}}^{\bar{\mathrm {t}}}$ at particle level is shown. |

png pdf |
Additional Figure 15:
The breakdown of uncertainties for the normalised measurement of the differential $\mathrm{t\bar{t}}$ cross section as a function of $p_{\mathrm {T}}^{\bar{\mathrm {t}}}$ at particle level is shown. The contributions of each source of systematic uncertainty in each bin are indicated by the coloured lines. Experimental systematic uncertainties that are small in all bins are added in quadrature and shown as a single component. The statistical and total uncertainties are indicated by the shaded areas. |

png pdf |
Additional Figure 16:
The covariance matrix of the measured data for the normalised measurement of the differential $\mathrm{t\bar{t}}$ cross section as a function of $p_{\mathrm {T}}^{\bar{\mathrm {t}}}$ at particle level is shown. |
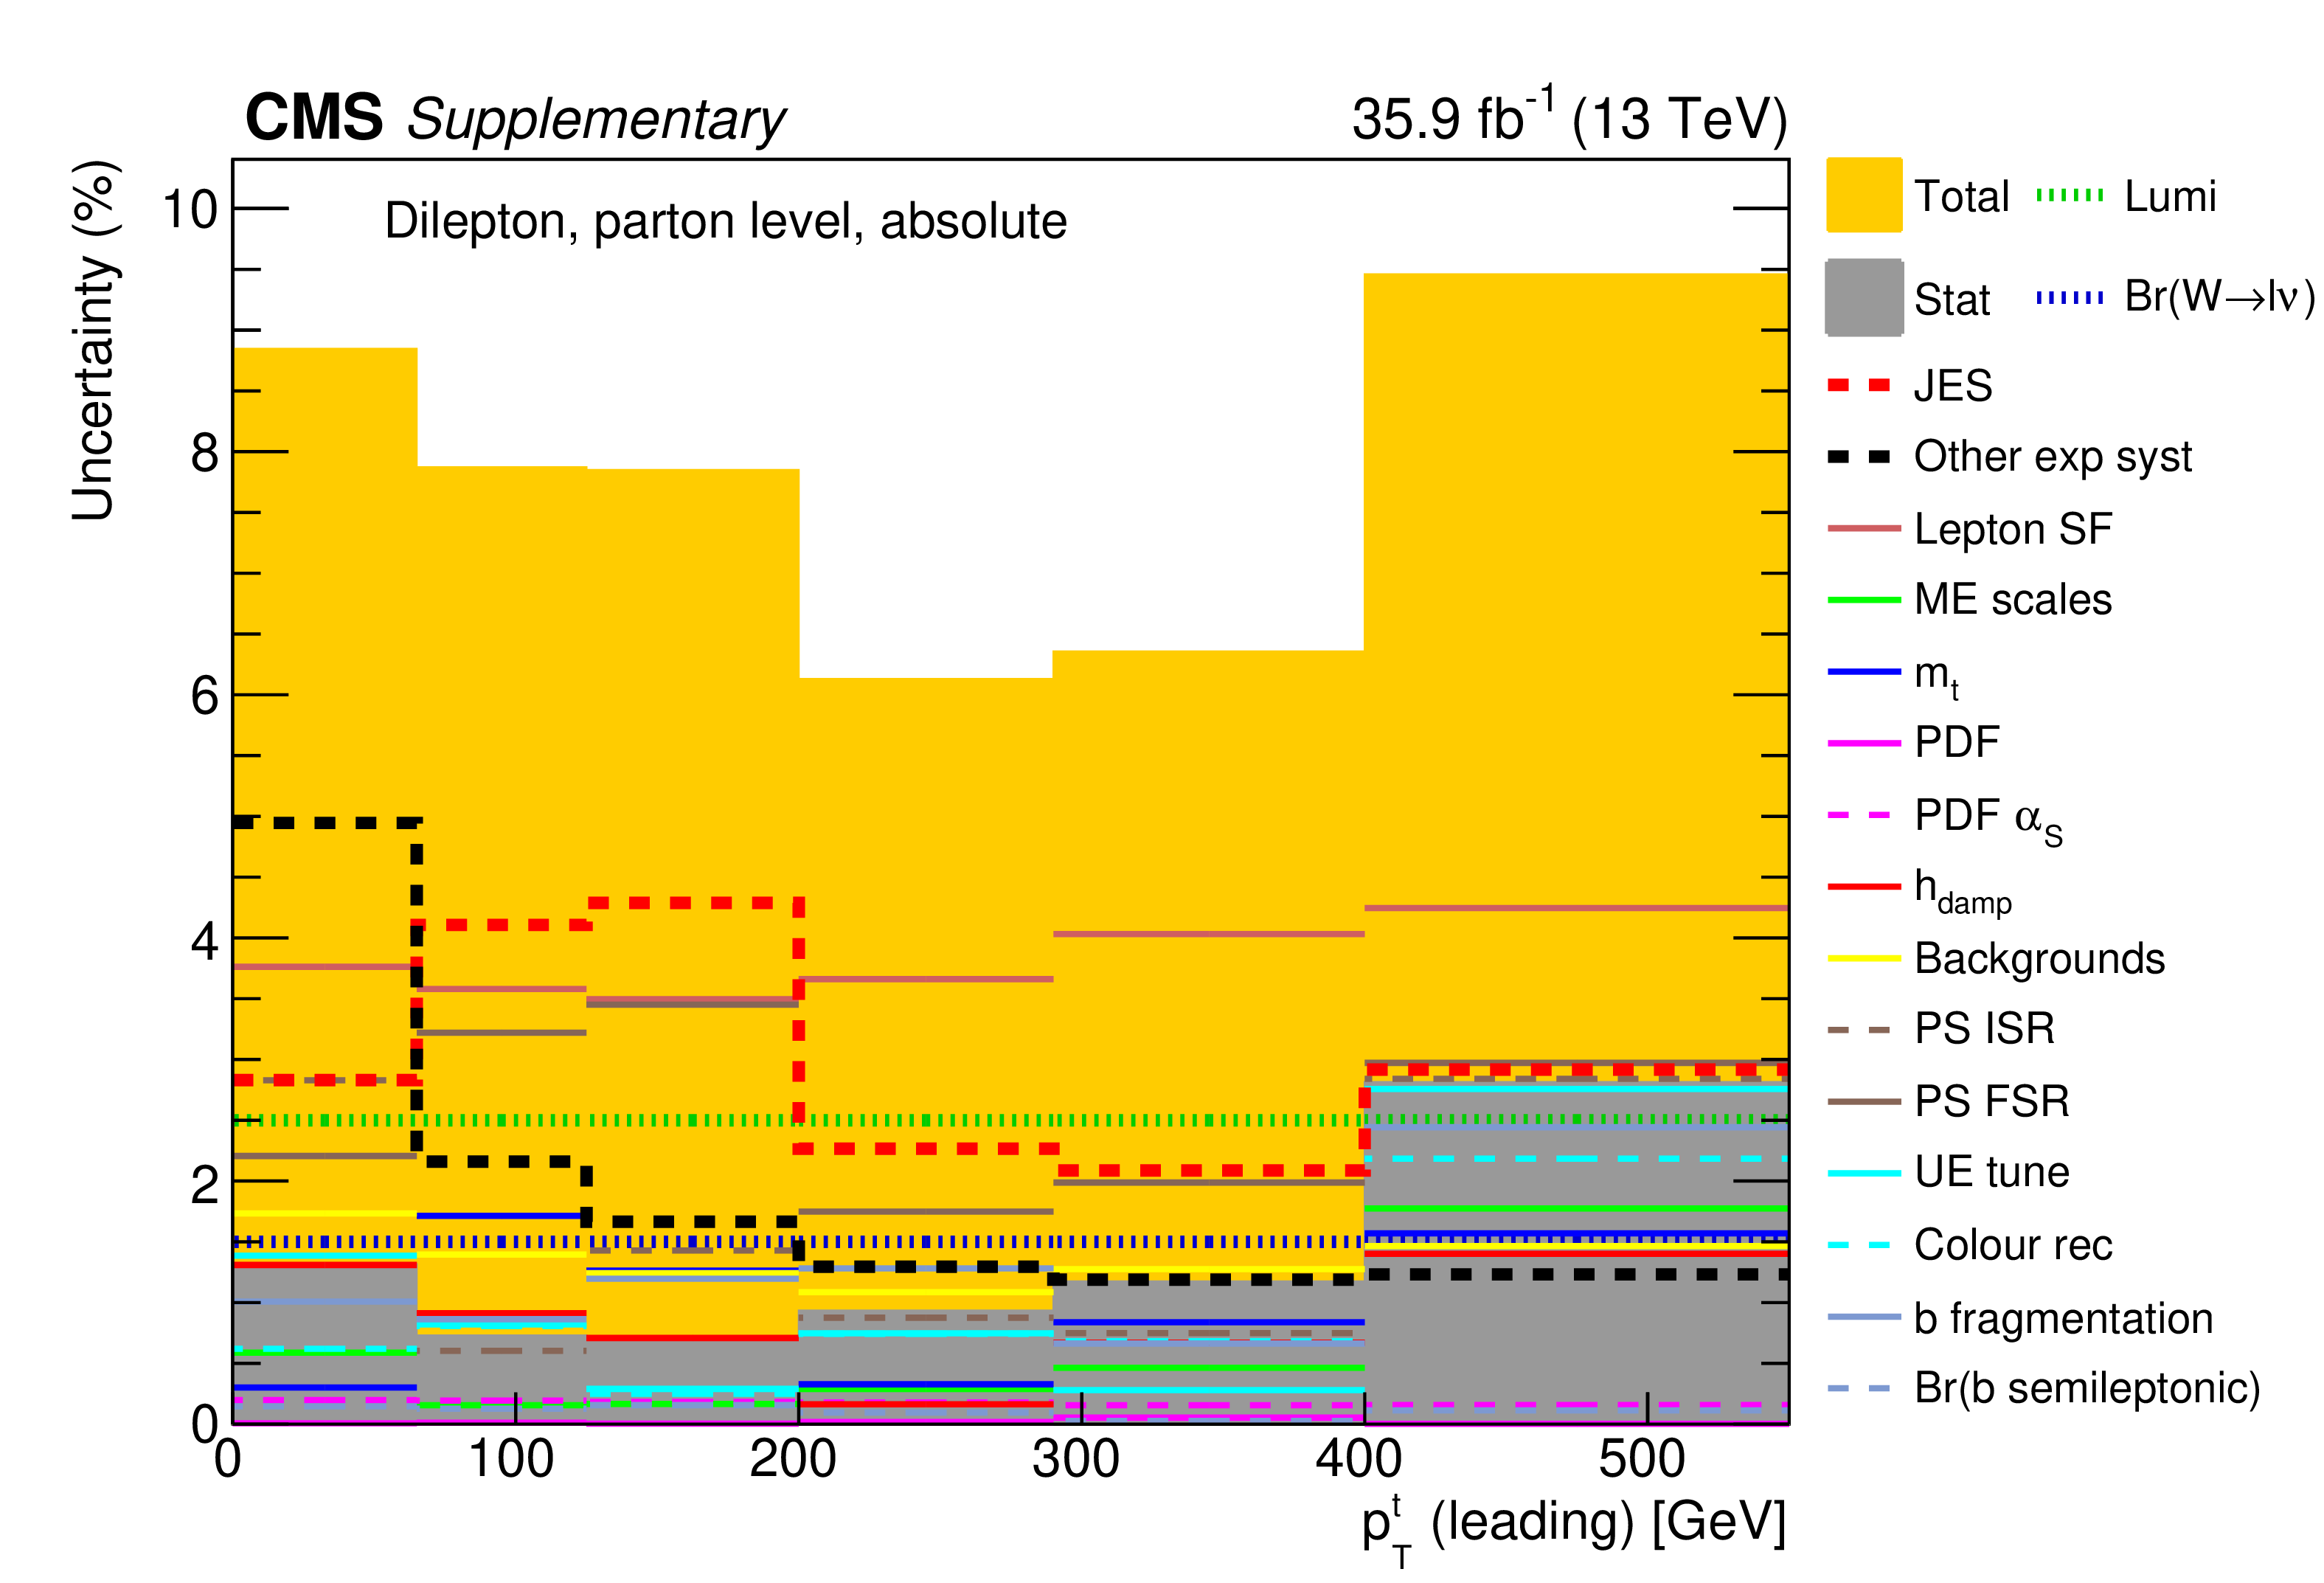
png pdf |
Additional Figure 17:
The breakdown of uncertainties for the absolute measurement of the differential $\mathrm{t\bar{t}}$ cross section as a function of $p_{\mathrm {T}}^{\mathrm {t}}$ (leading) at parton level is shown. The contributions of each source of systematic uncertainty in each bin are indicated by the coloured lines. Experimental systematic uncertainties that are small in all bins are added in quadrature and shown as a single component. The statistical and total uncertainties are indicated by the shaded areas. |

png pdf |
Additional Figure 18:
The covariance matrix of the measured data for the absolute measurement of the differential $\mathrm{t\bar{t}}$ cross section as a function of $p_{\mathrm {T}}^{\mathrm {t}}$ (leading) at parton level is shown. |

png pdf |
Additional Figure 19:
The breakdown of uncertainties for the normalised measurement of the differential $\mathrm{t\bar{t}}$ cross section as a function of $p_{\mathrm {T}}^{\mathrm {t}}$ (leading) at parton level is shown. The contributions of each source of systematic uncertainty in each bin are indicated by the coloured lines. Experimental systematic uncertainties that are small in all bins are added in quadrature and shown as a single component. The statistical and total uncertainties are indicated by the shaded areas. |

png pdf |
Additional Figure 20:
The covariance matrix of the measured data for the normalised measurement of the differential $\mathrm{t\bar{t}}$ cross section as a function of $p_{\mathrm {T}}^{\mathrm {t}}$ (leading) at parton level is shown. |
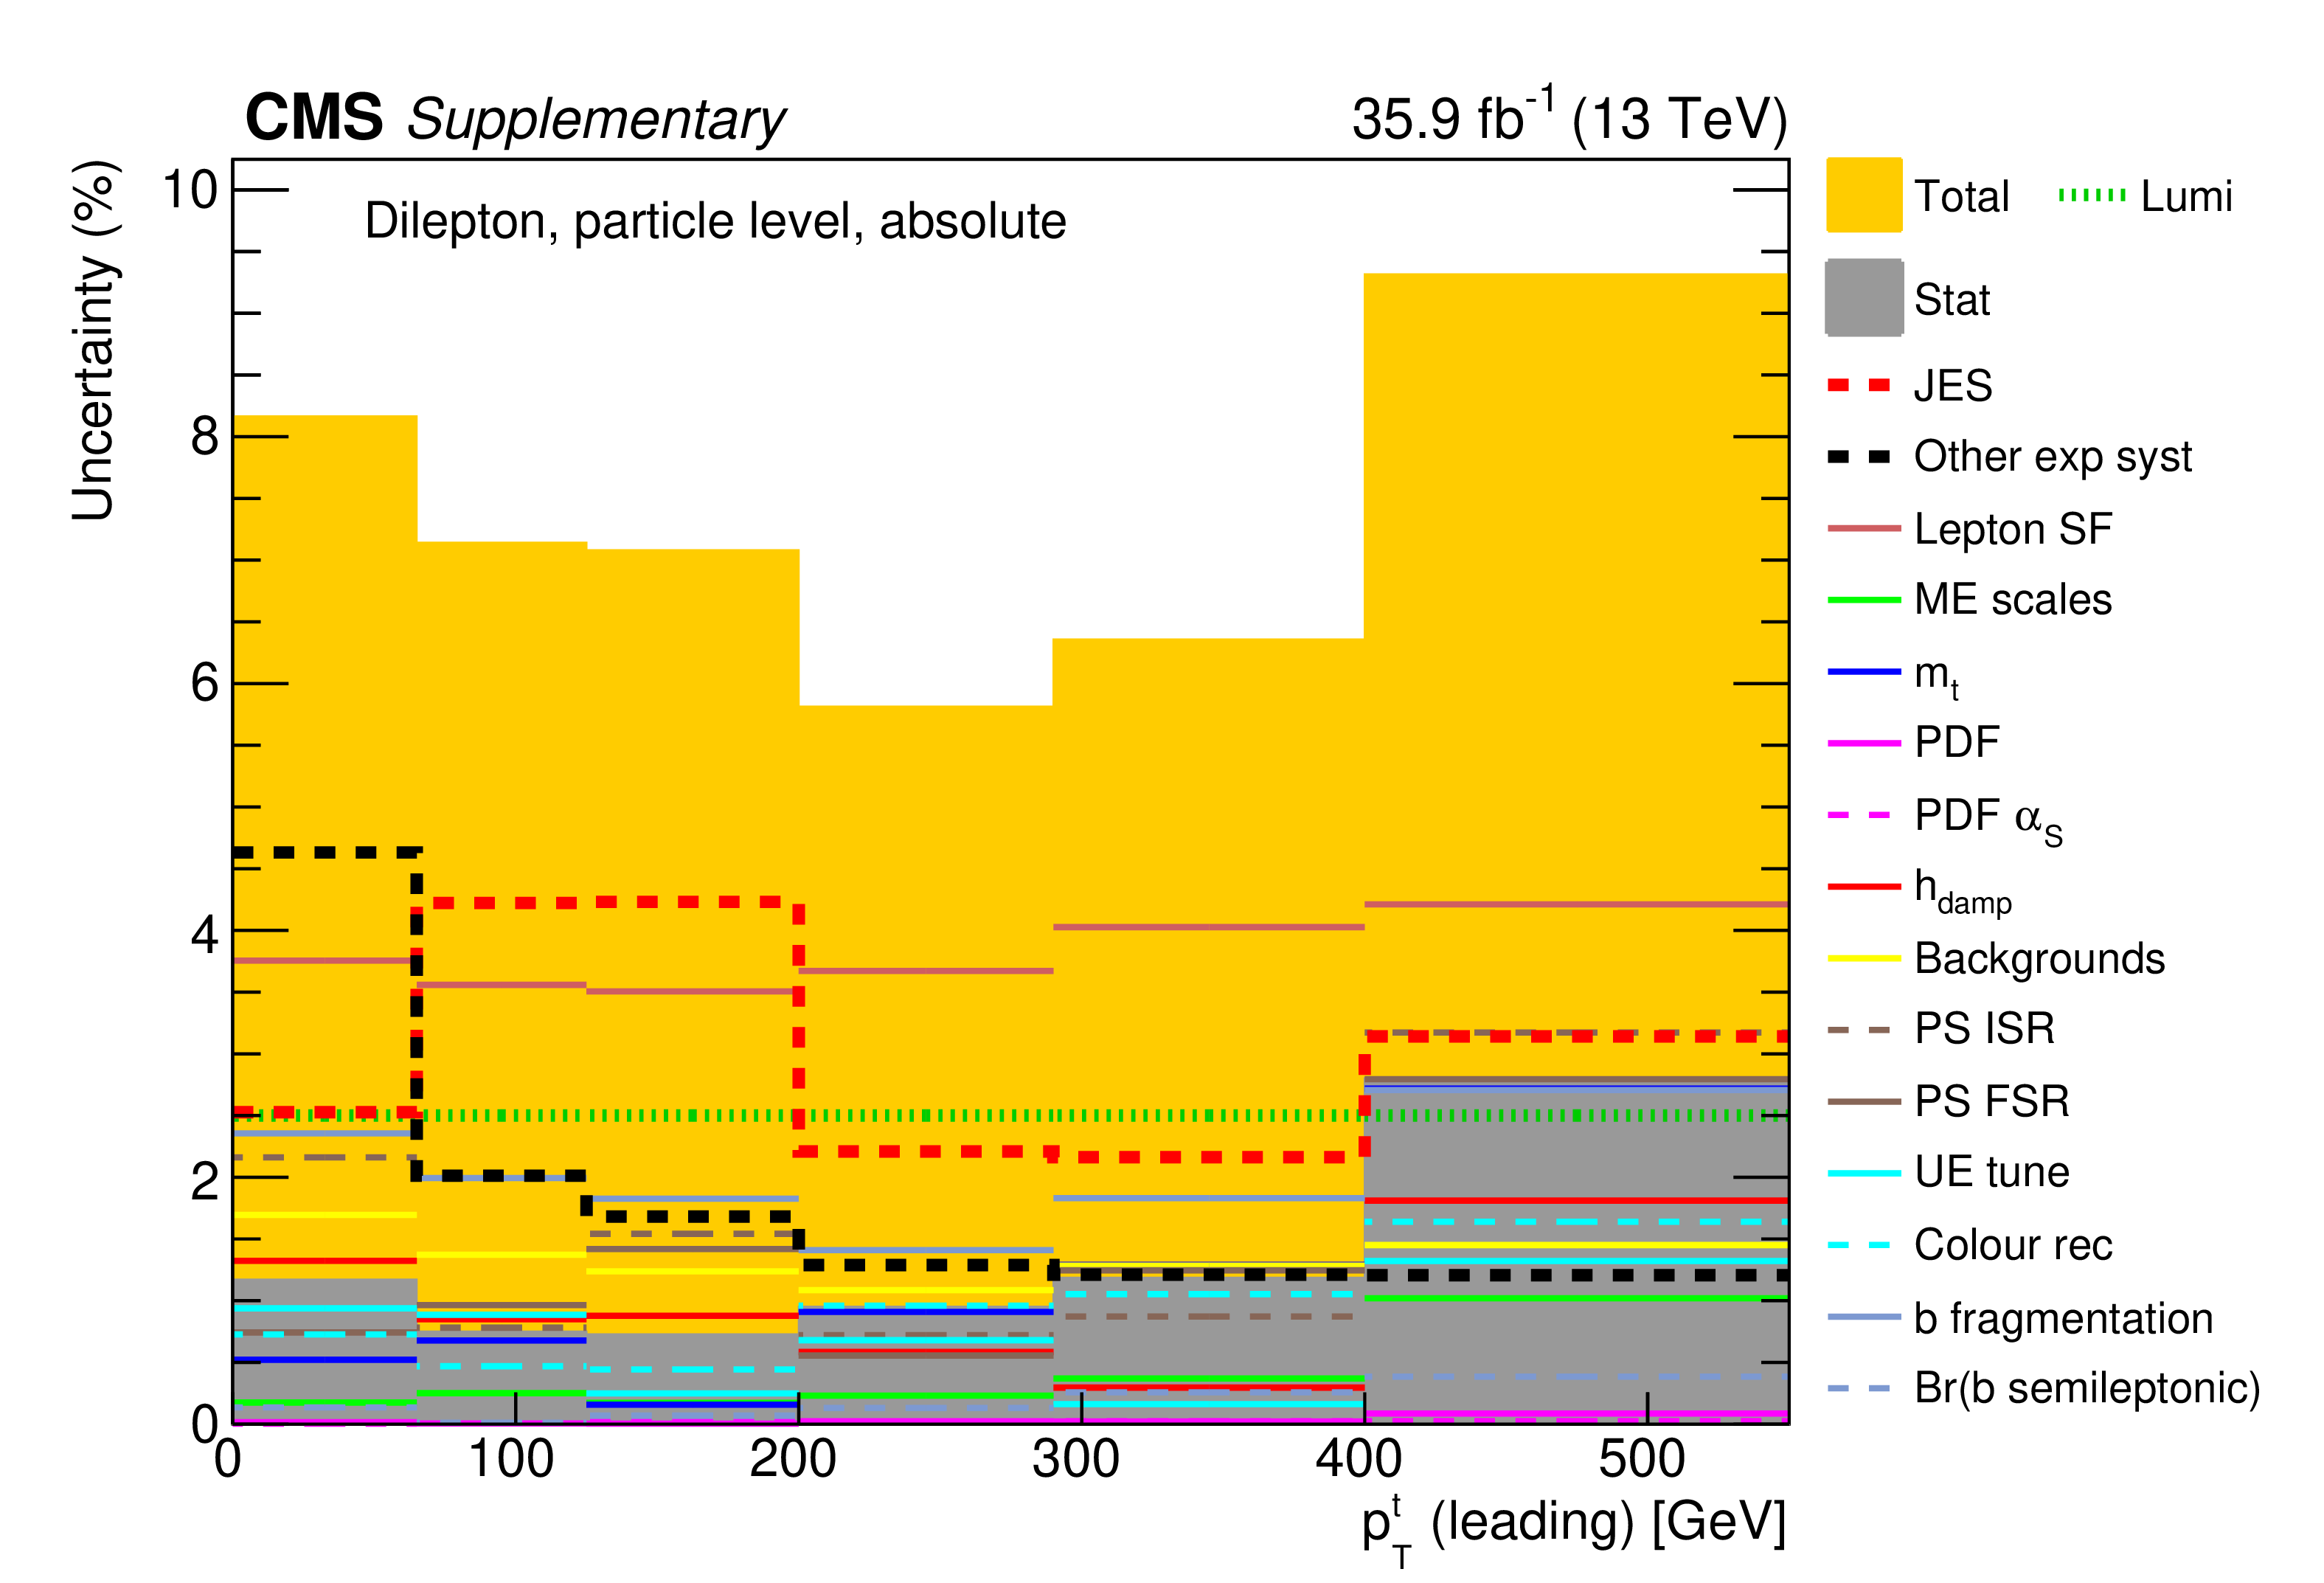
png pdf |
Additional Figure 21:
The breakdown of uncertainties for the absolute measurement of the differential $\mathrm{t\bar{t}}$ cross section as a function of $p_{\mathrm {T}}^{\mathrm {t}}$ (leading) at particle level is shown. The contributions of each source of systematic uncertainty in each bin are indicated by the coloured lines. Experimental systematic uncertainties that are small in all bins are added in quadrature and shown as a single component. The statistical and total uncertainties are indicated by the shaded areas. |

png pdf |
Additional Figure 22:
The covariance matrix of the measured data for the absolute measurement of the differential $\mathrm{t\bar{t}}$ cross section as a function of $p_{\mathrm {T}}^{\mathrm {t}}$ (leading) at particle level is shown. |

png pdf |
Additional Figure 23:
The breakdown of uncertainties for the normalised measurement of the differential $\mathrm{t\bar{t}}$ cross section as a function of $p_{\mathrm {T}}^{\mathrm {t}}$ (leading) at particle level is shown. The contributions of each source of systematic uncertainty in each bin are indicated by the coloured lines. Experimental systematic uncertainties that are small in all bins are added in quadrature and shown as a single component. The statistical and total uncertainties are indicated by the shaded areas. |

png pdf |
Additional Figure 24:
The covariance matrix of the measured data for the normalised measurement of the differential $\mathrm{t\bar{t}}$ cross section as a function of $p_{\mathrm {T}}^{\mathrm {t}}$ (leading) at particle level is shown. |
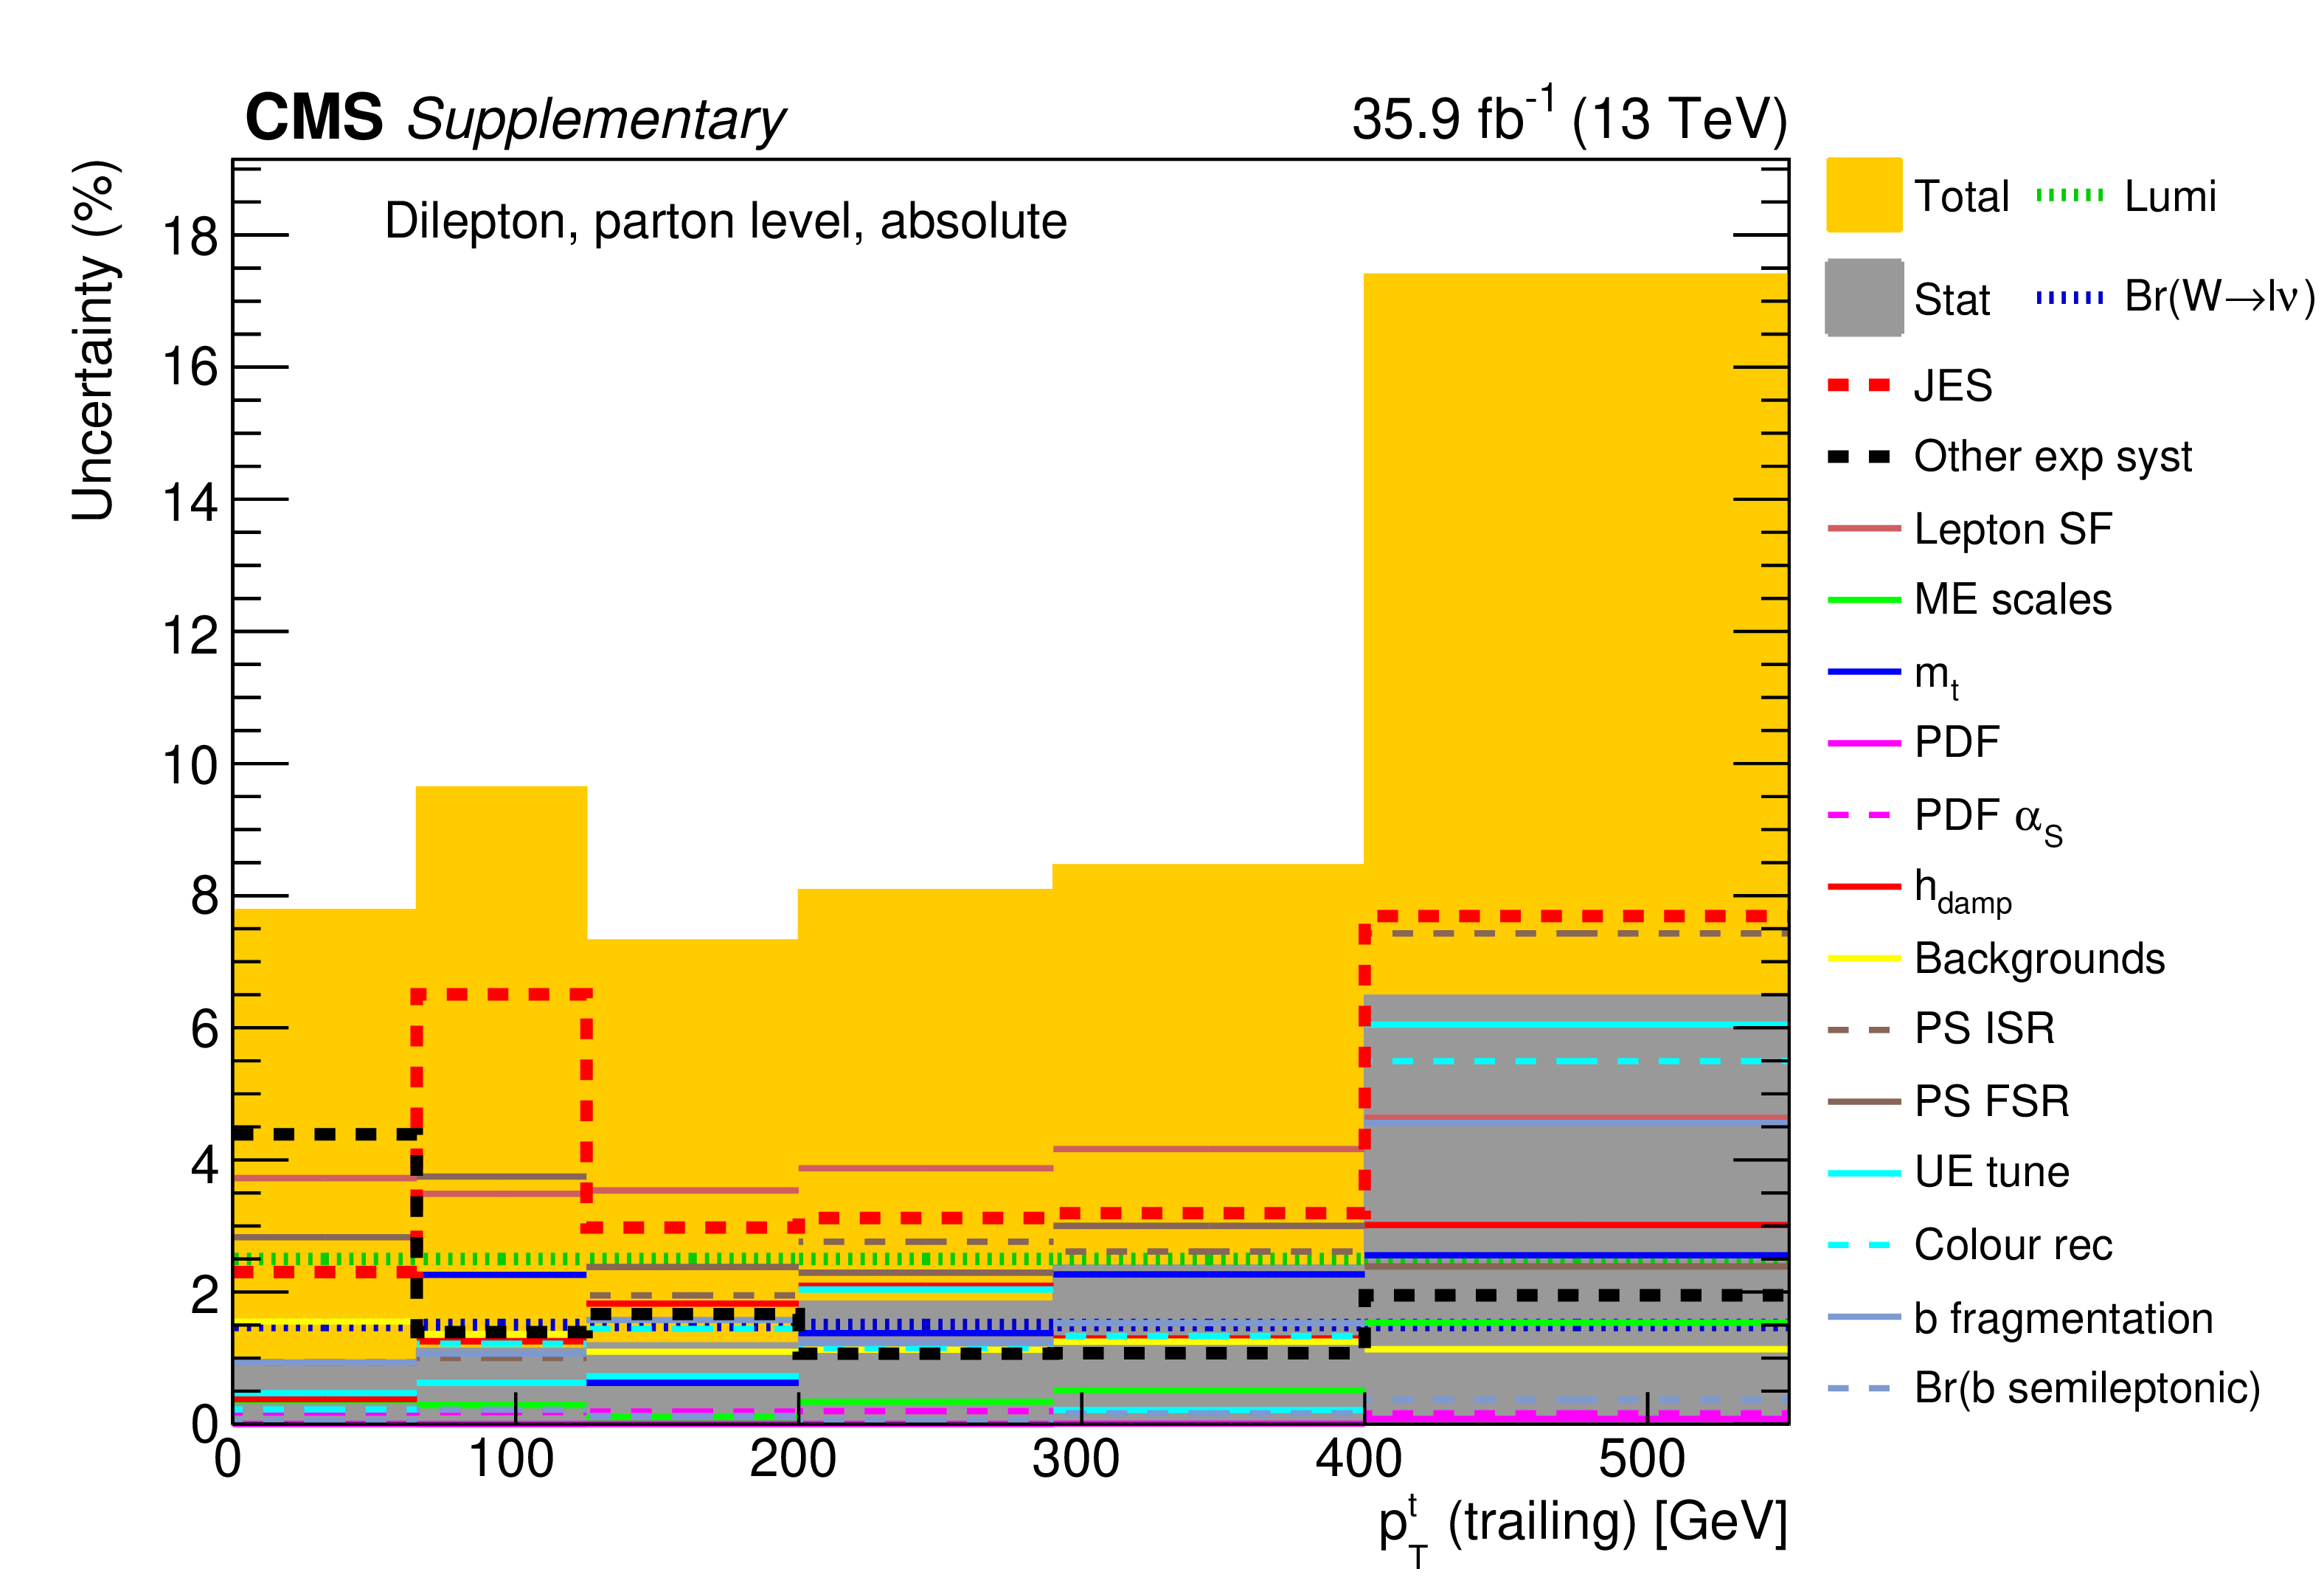
png pdf |
Additional Figure 25:
The breakdown of uncertainties for the absolute measurement of the differential $\mathrm{t\bar{t}}$ cross section as a function of $p_{\mathrm {T}}^{\mathrm {t}}$ (trailing) at parton level is shown. The contributions of each source of systematic uncertainty in each bin are indicated by the coloured lines. Experimental systematic uncertainties that are small in all bins are added in quadrature and shown as a single component. The statistical and total uncertainties are indicated by the shaded areas. |
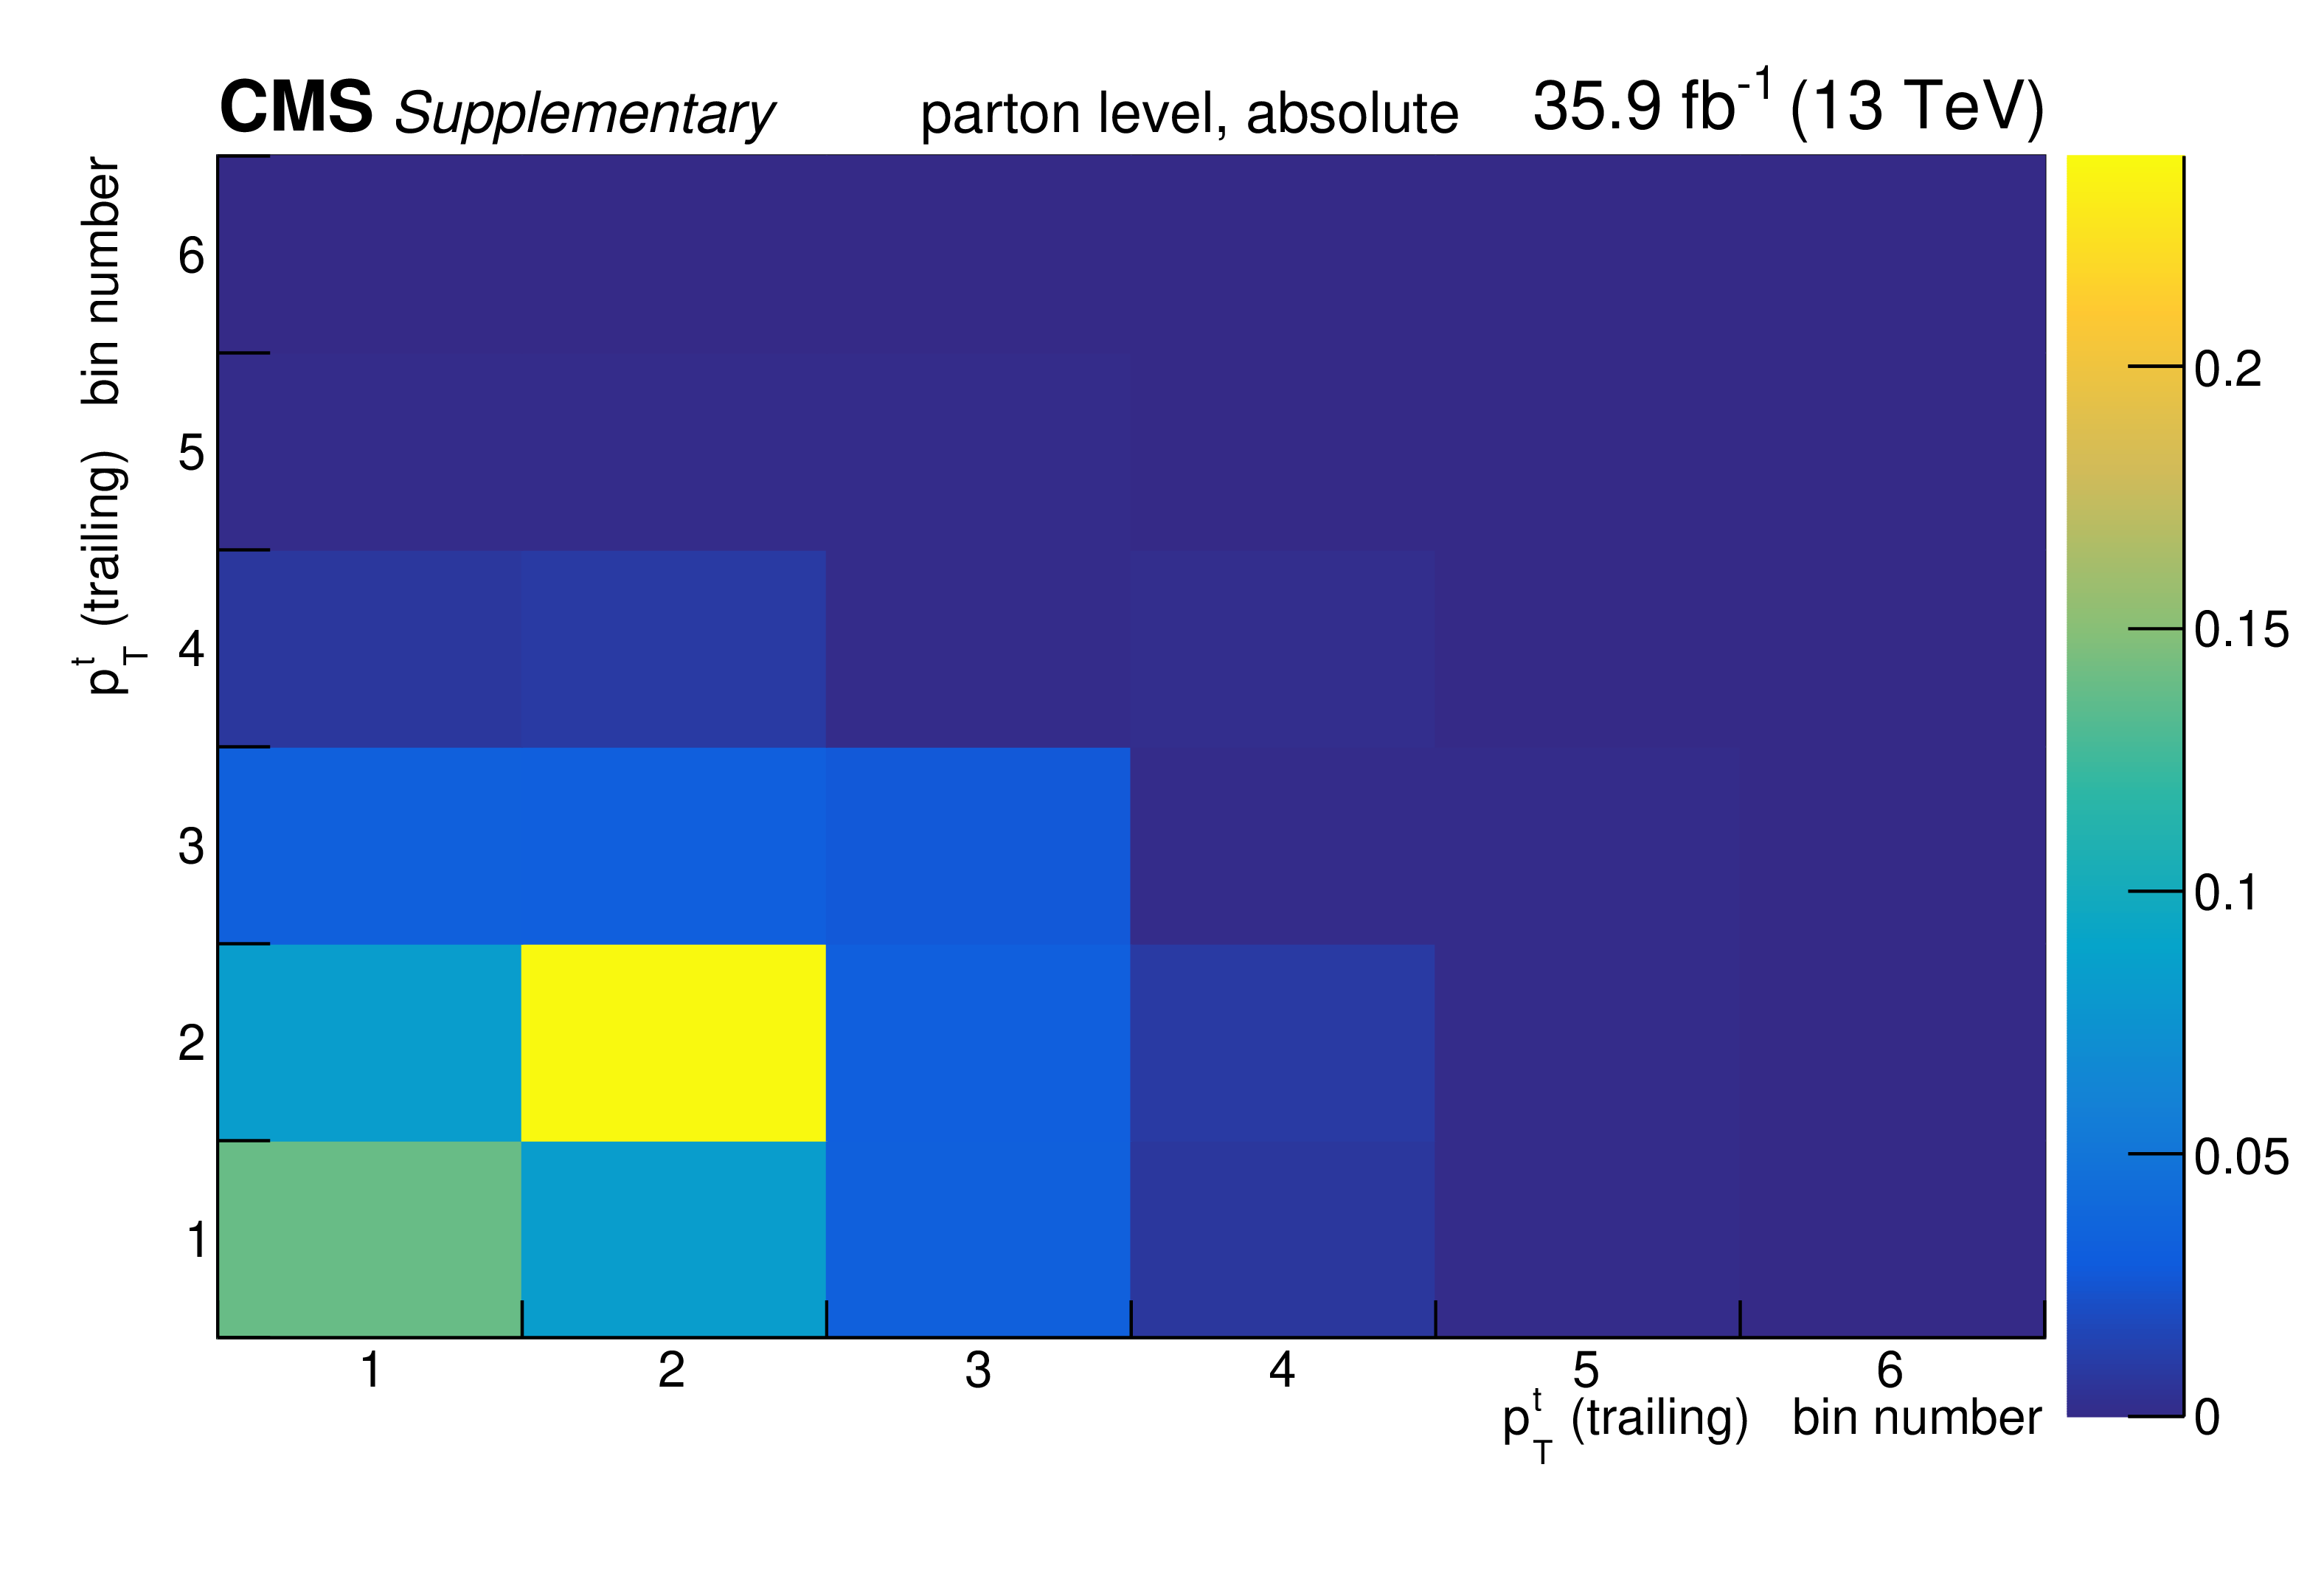
png pdf |
Additional Figure 26:
The covariance matrix of the measured data for the absolute measurement of the differential $\mathrm{t\bar{t}}$ cross section as a function of $p_{\mathrm {T}}^{\mathrm {t}}$ (trailing) at parton level is shown. |
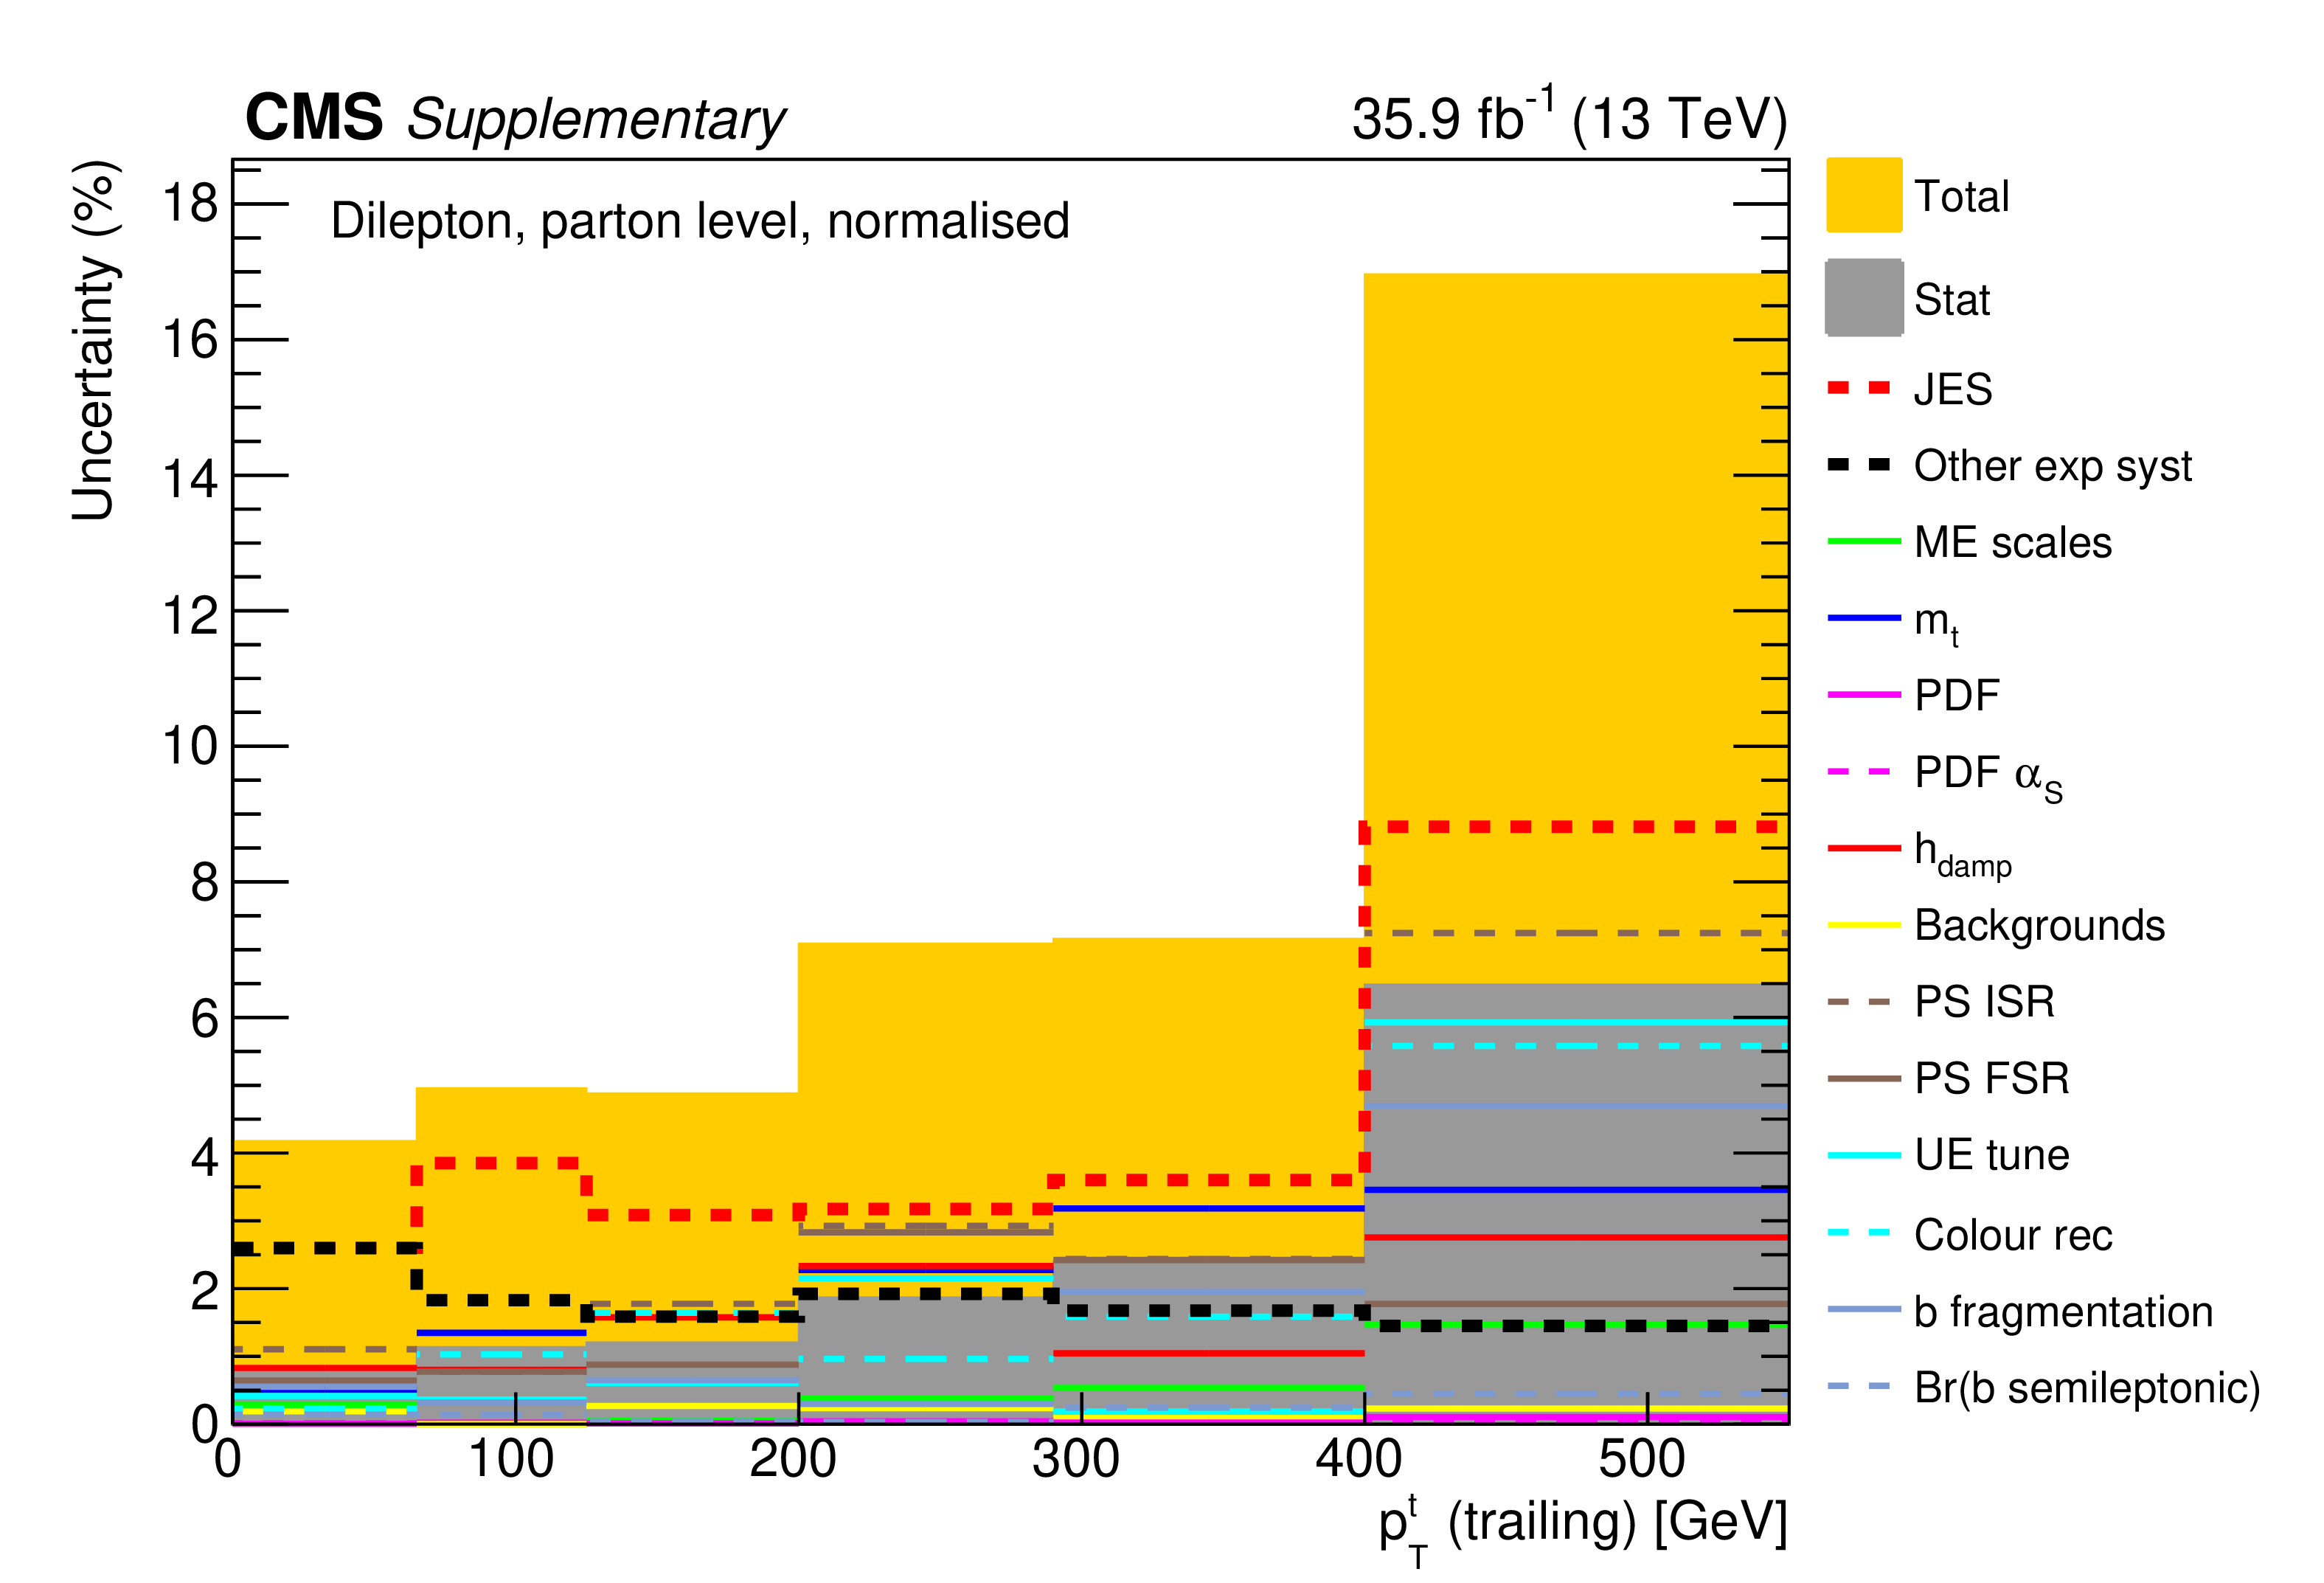
png pdf |
Additional Figure 27:
The breakdown of uncertainties for the normalised measurement of the differential $\mathrm{t\bar{t}}$ cross section as a function of $p_{\mathrm {T}}^{\mathrm {t}}$ (trailing) at parton level is shown. The contributions of each source of systematic uncertainty in each bin are indicated by the coloured lines. Experimental systematic uncertainties that are small in all bins are added in quadrature and shown as a single component. The statistical and total uncertainties are indicated by the shaded areas. |

png pdf |
Additional Figure 28:
The covariance matrix of the measured data for the normalised measurement of the differential $\mathrm{t\bar{t}}$ cross section as a function of $p_{\mathrm {T}}^{\mathrm {t}}$ (trailing) at parton level is shown. |
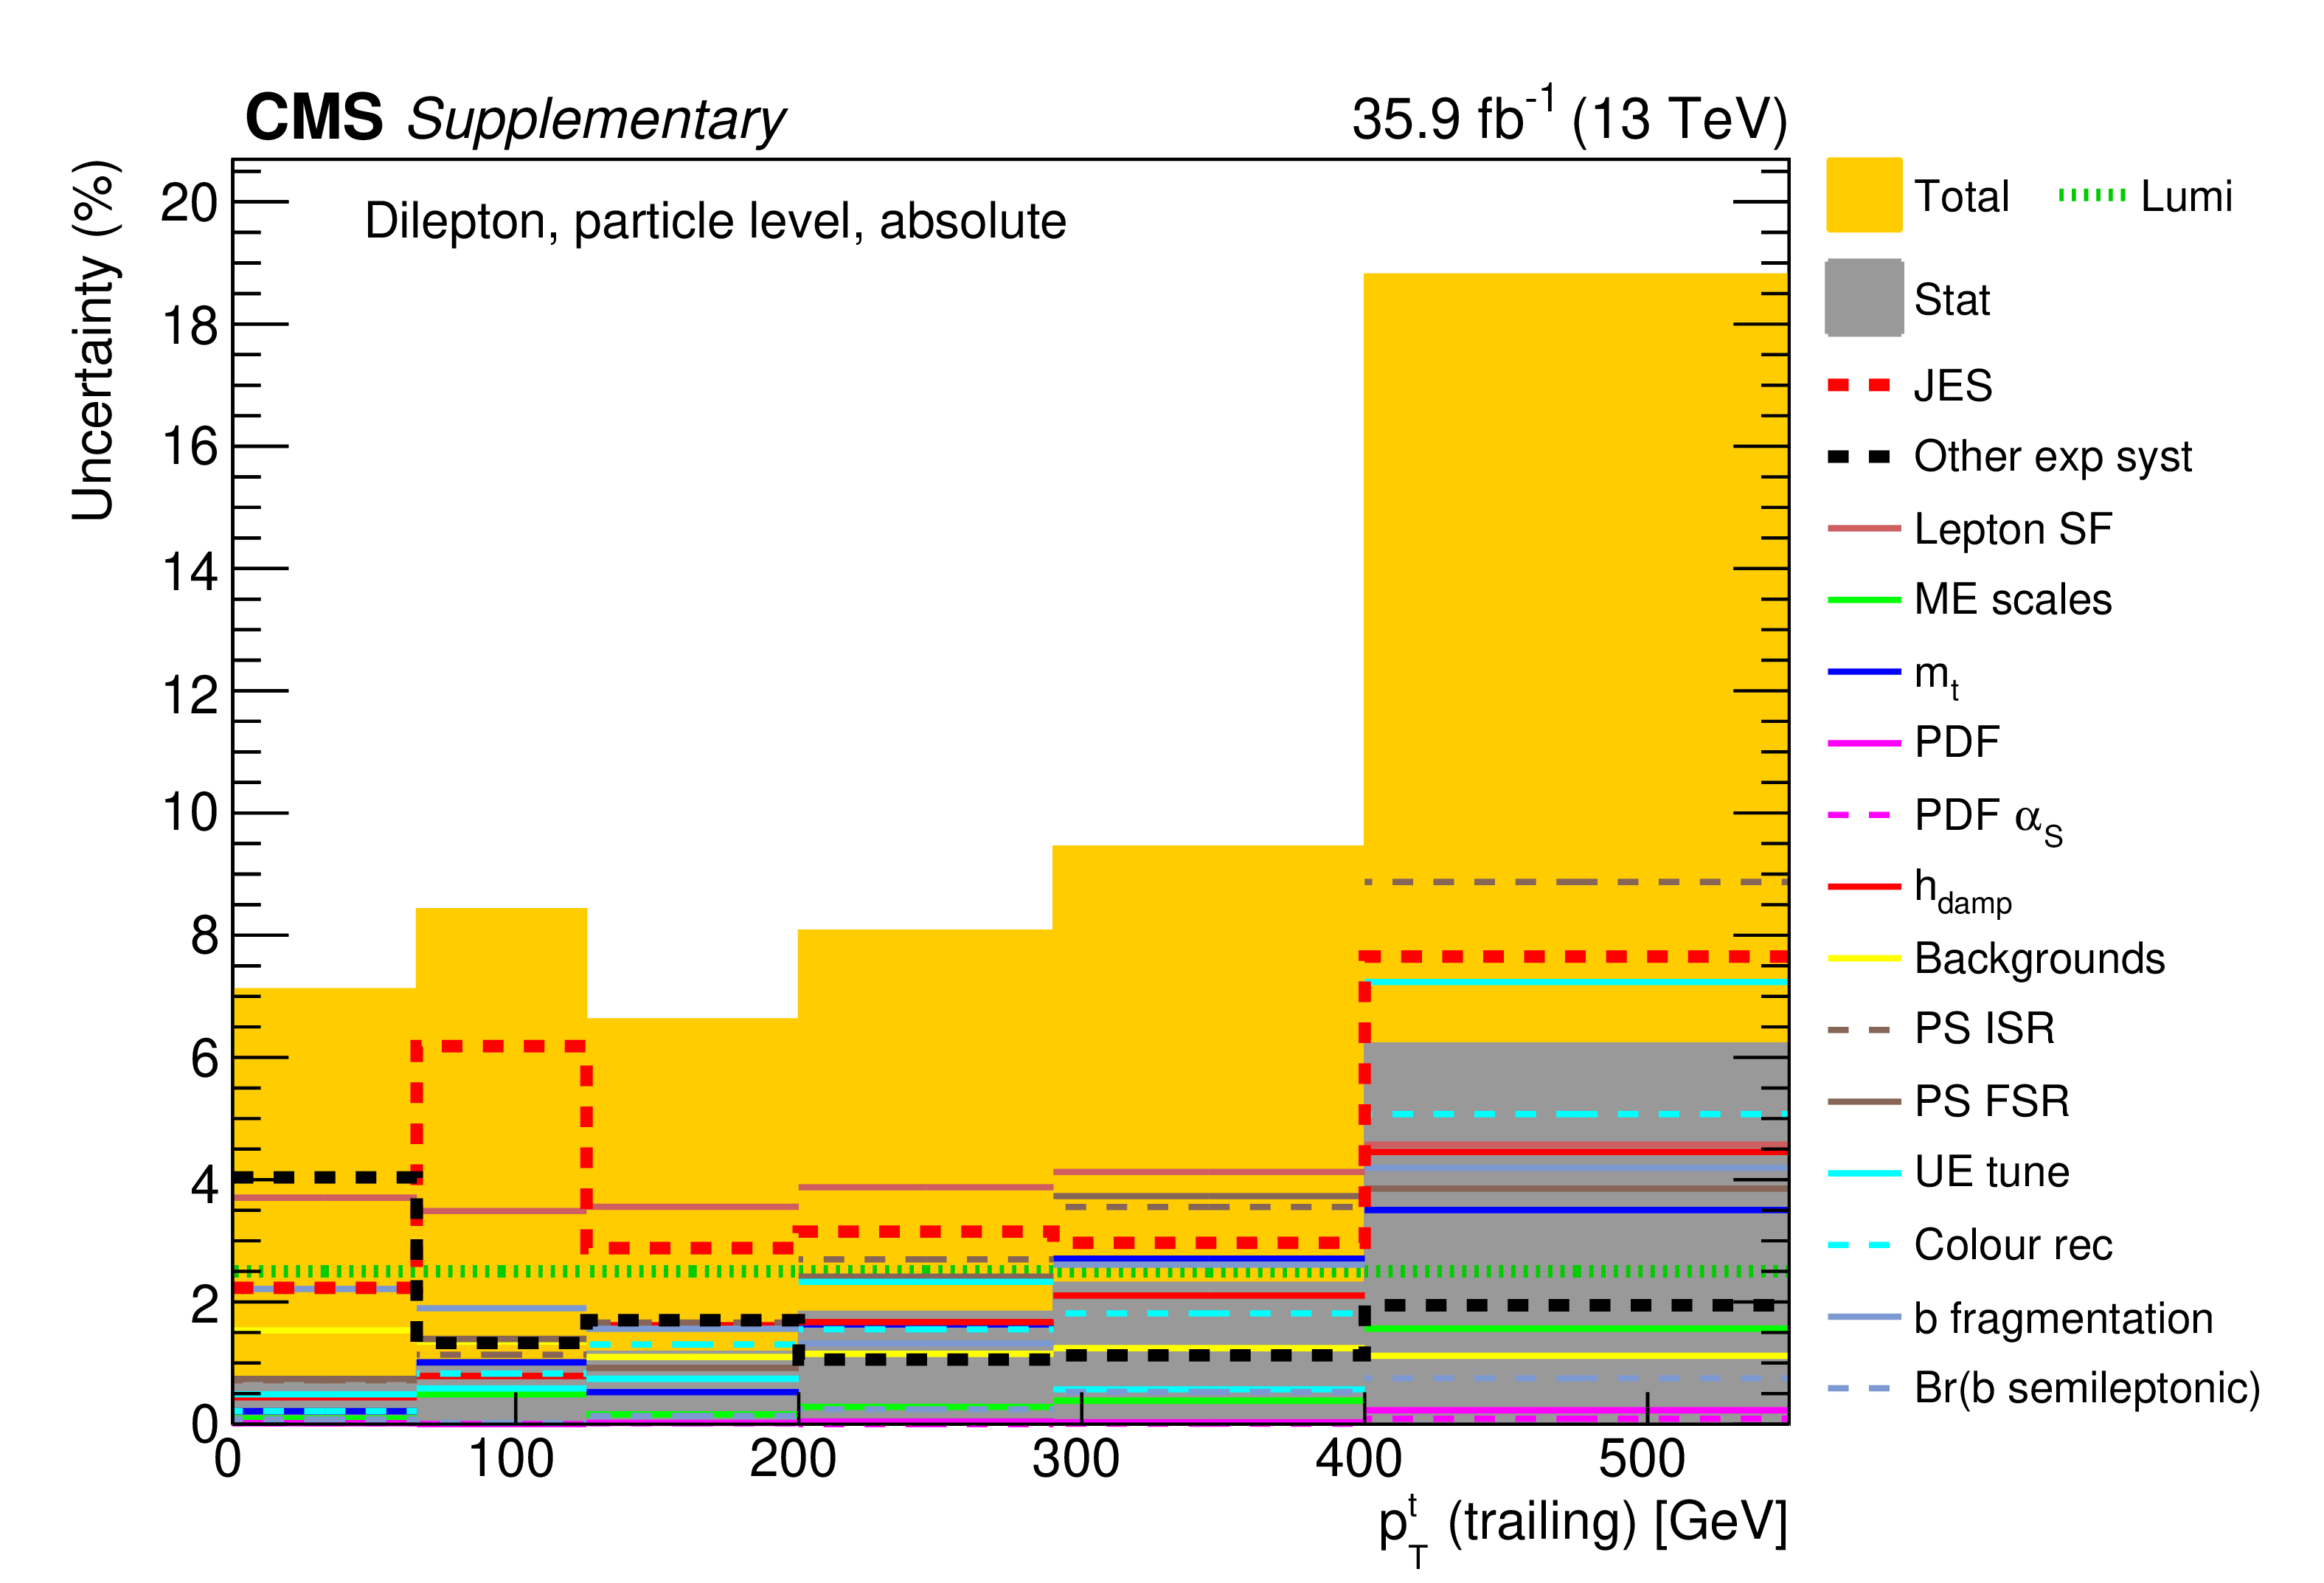
png pdf |
Additional Figure 29:
The breakdown of uncertainties for the absolute measurement of the differential $\mathrm{t\bar{t}}$ cross section as a function of $p_{\mathrm {T}}^{\mathrm {t}}$ (trailing) at particle level is shown. The contributions of each source of systematic uncertainty in each bin are indicated by the coloured lines. Experimental systematic uncertainties that are small in all bins are added in quadrature and shown as a single component. The statistical and total uncertainties are indicated by the shaded areas. |

png pdf |
Additional Figure 30:
The covariance matrix of the measured data for the absolute measurement of the differential $\mathrm{t\bar{t}}$ cross section as a function of $p_{\mathrm {T}}^{\mathrm {t}}$ (trailing) at particle level is shown. |
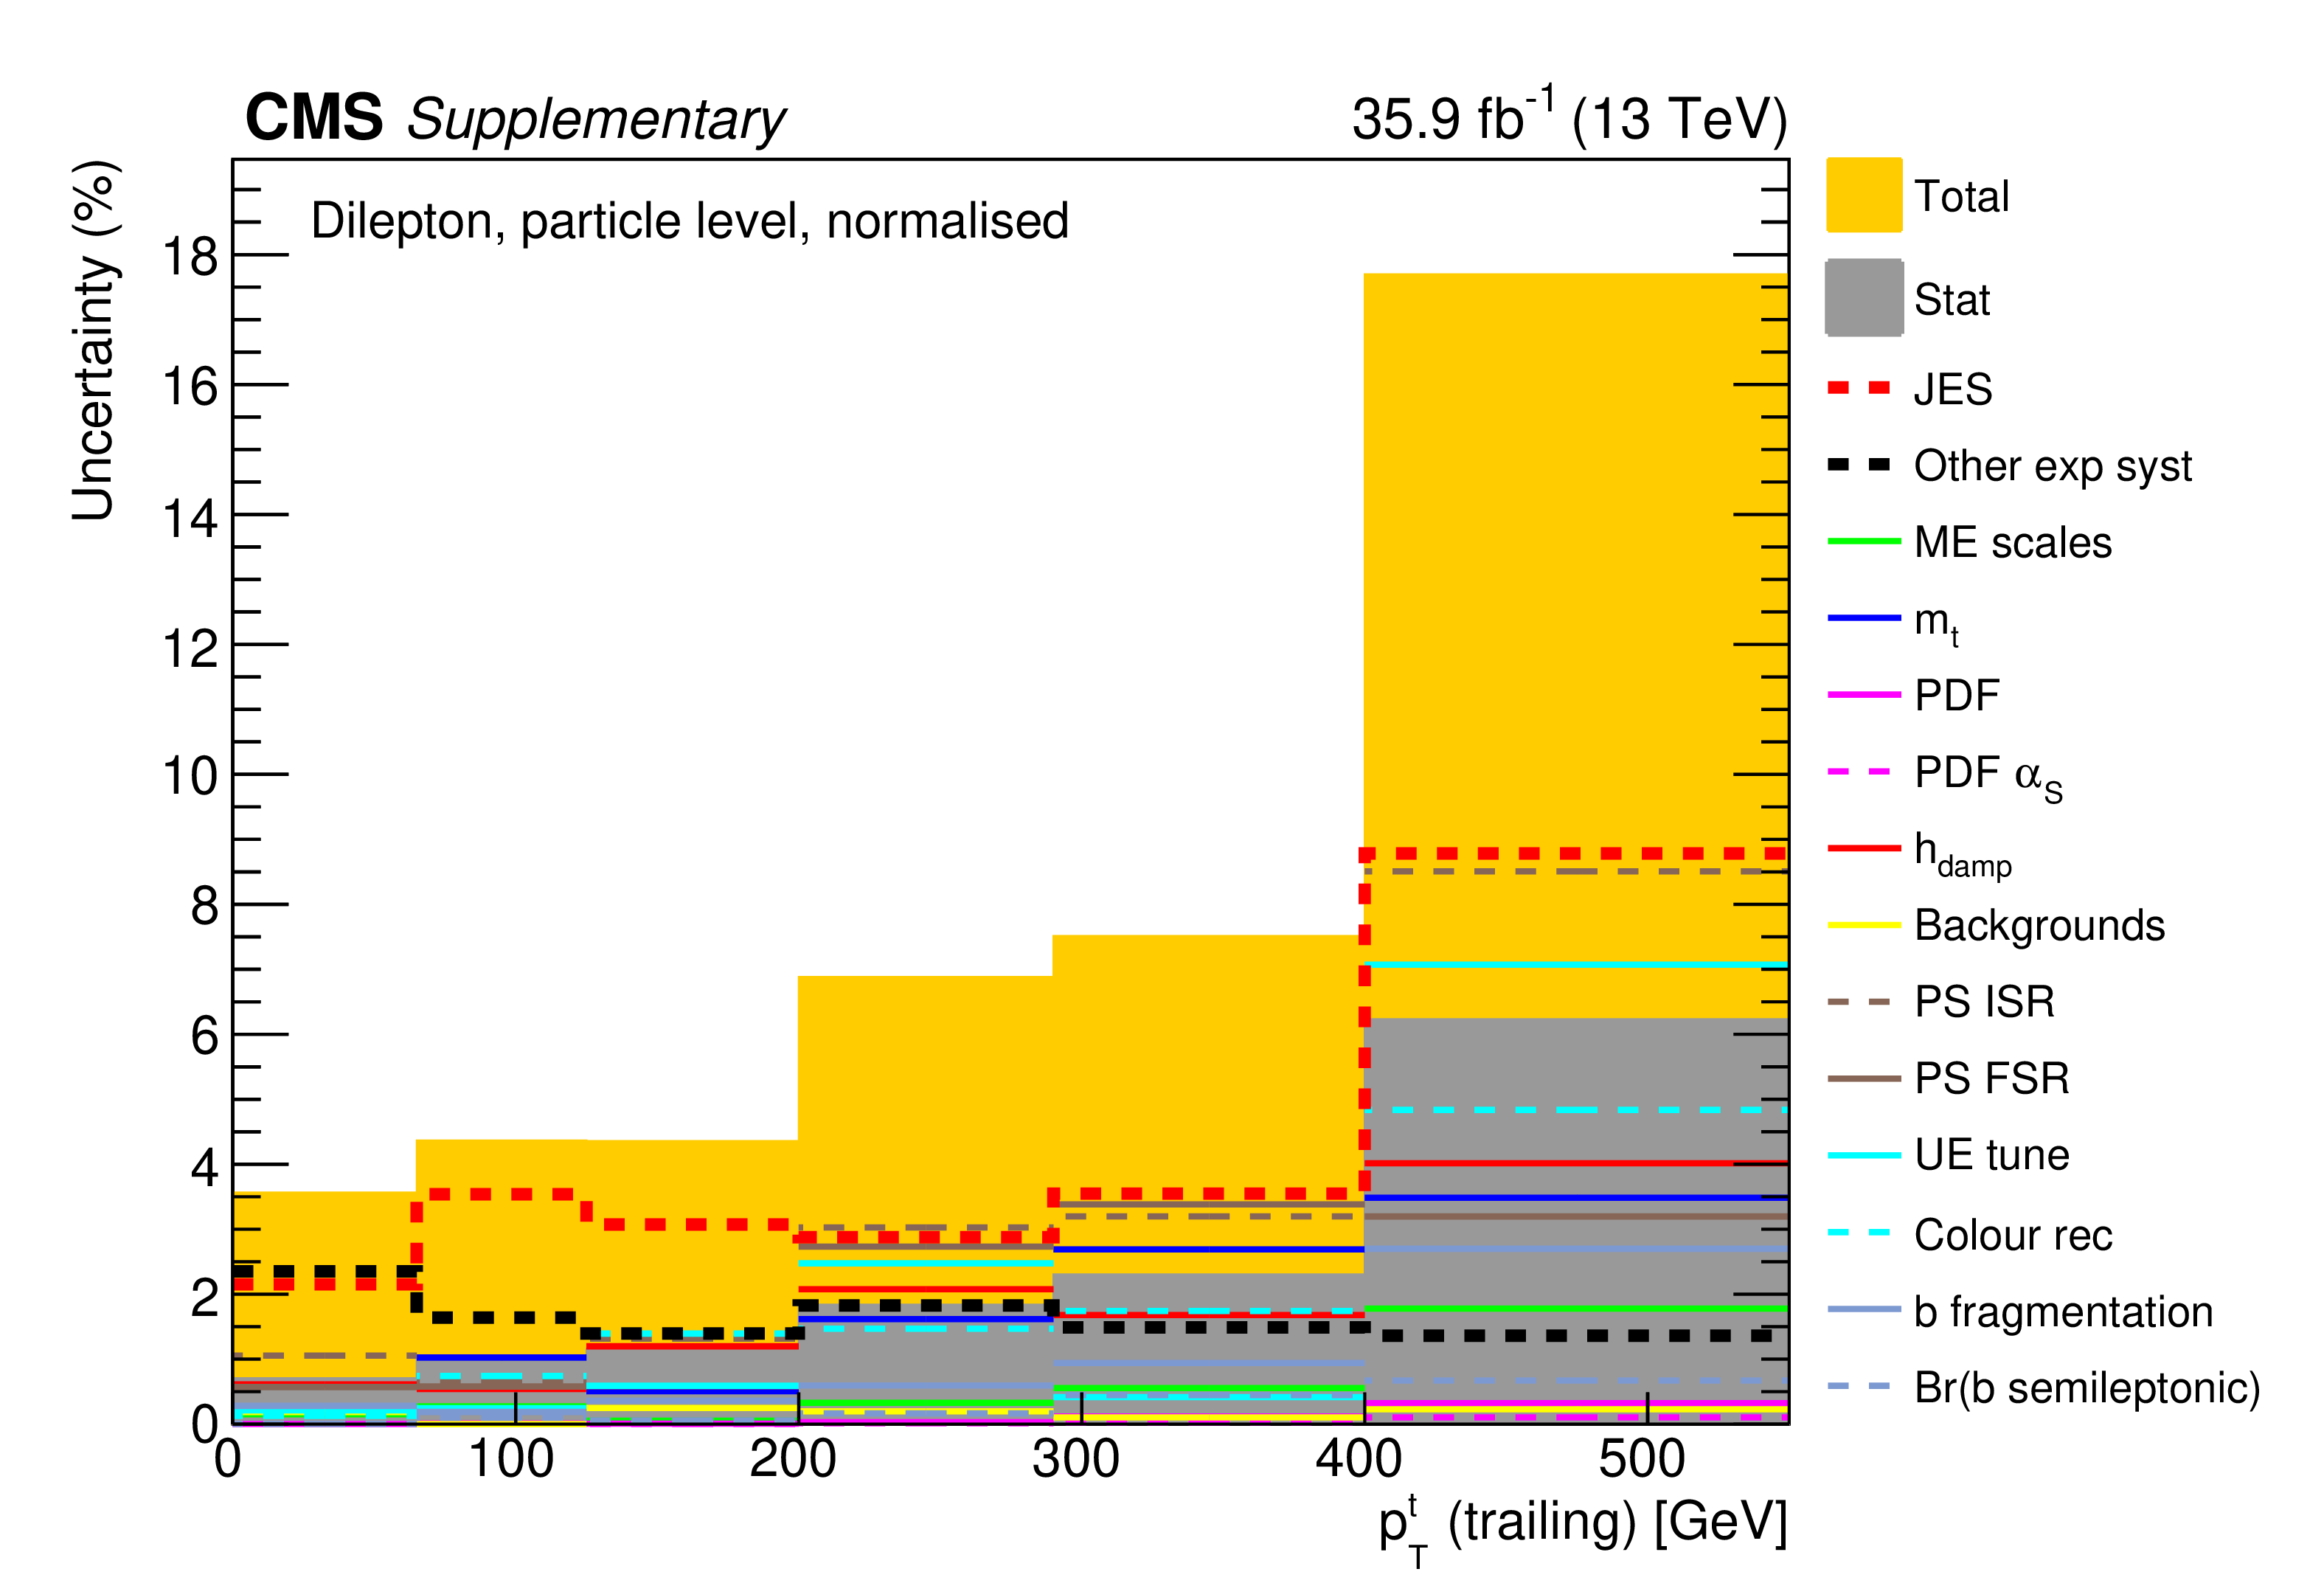
png pdf |
Additional Figure 31:
The breakdown of uncertainties for the normalised measurement of the differential $\mathrm{t\bar{t}}$ cross section as a function of $p_{\mathrm {T}}^{\mathrm {t}}$ (trailing) at particle level is shown. The contributions of each source of systematic uncertainty in each bin are indicated by the coloured lines. Experimental systematic uncertainties that are small in all bins are added in quadrature and shown as a single component. The statistical and total uncertainties are indicated by the shaded areas. |
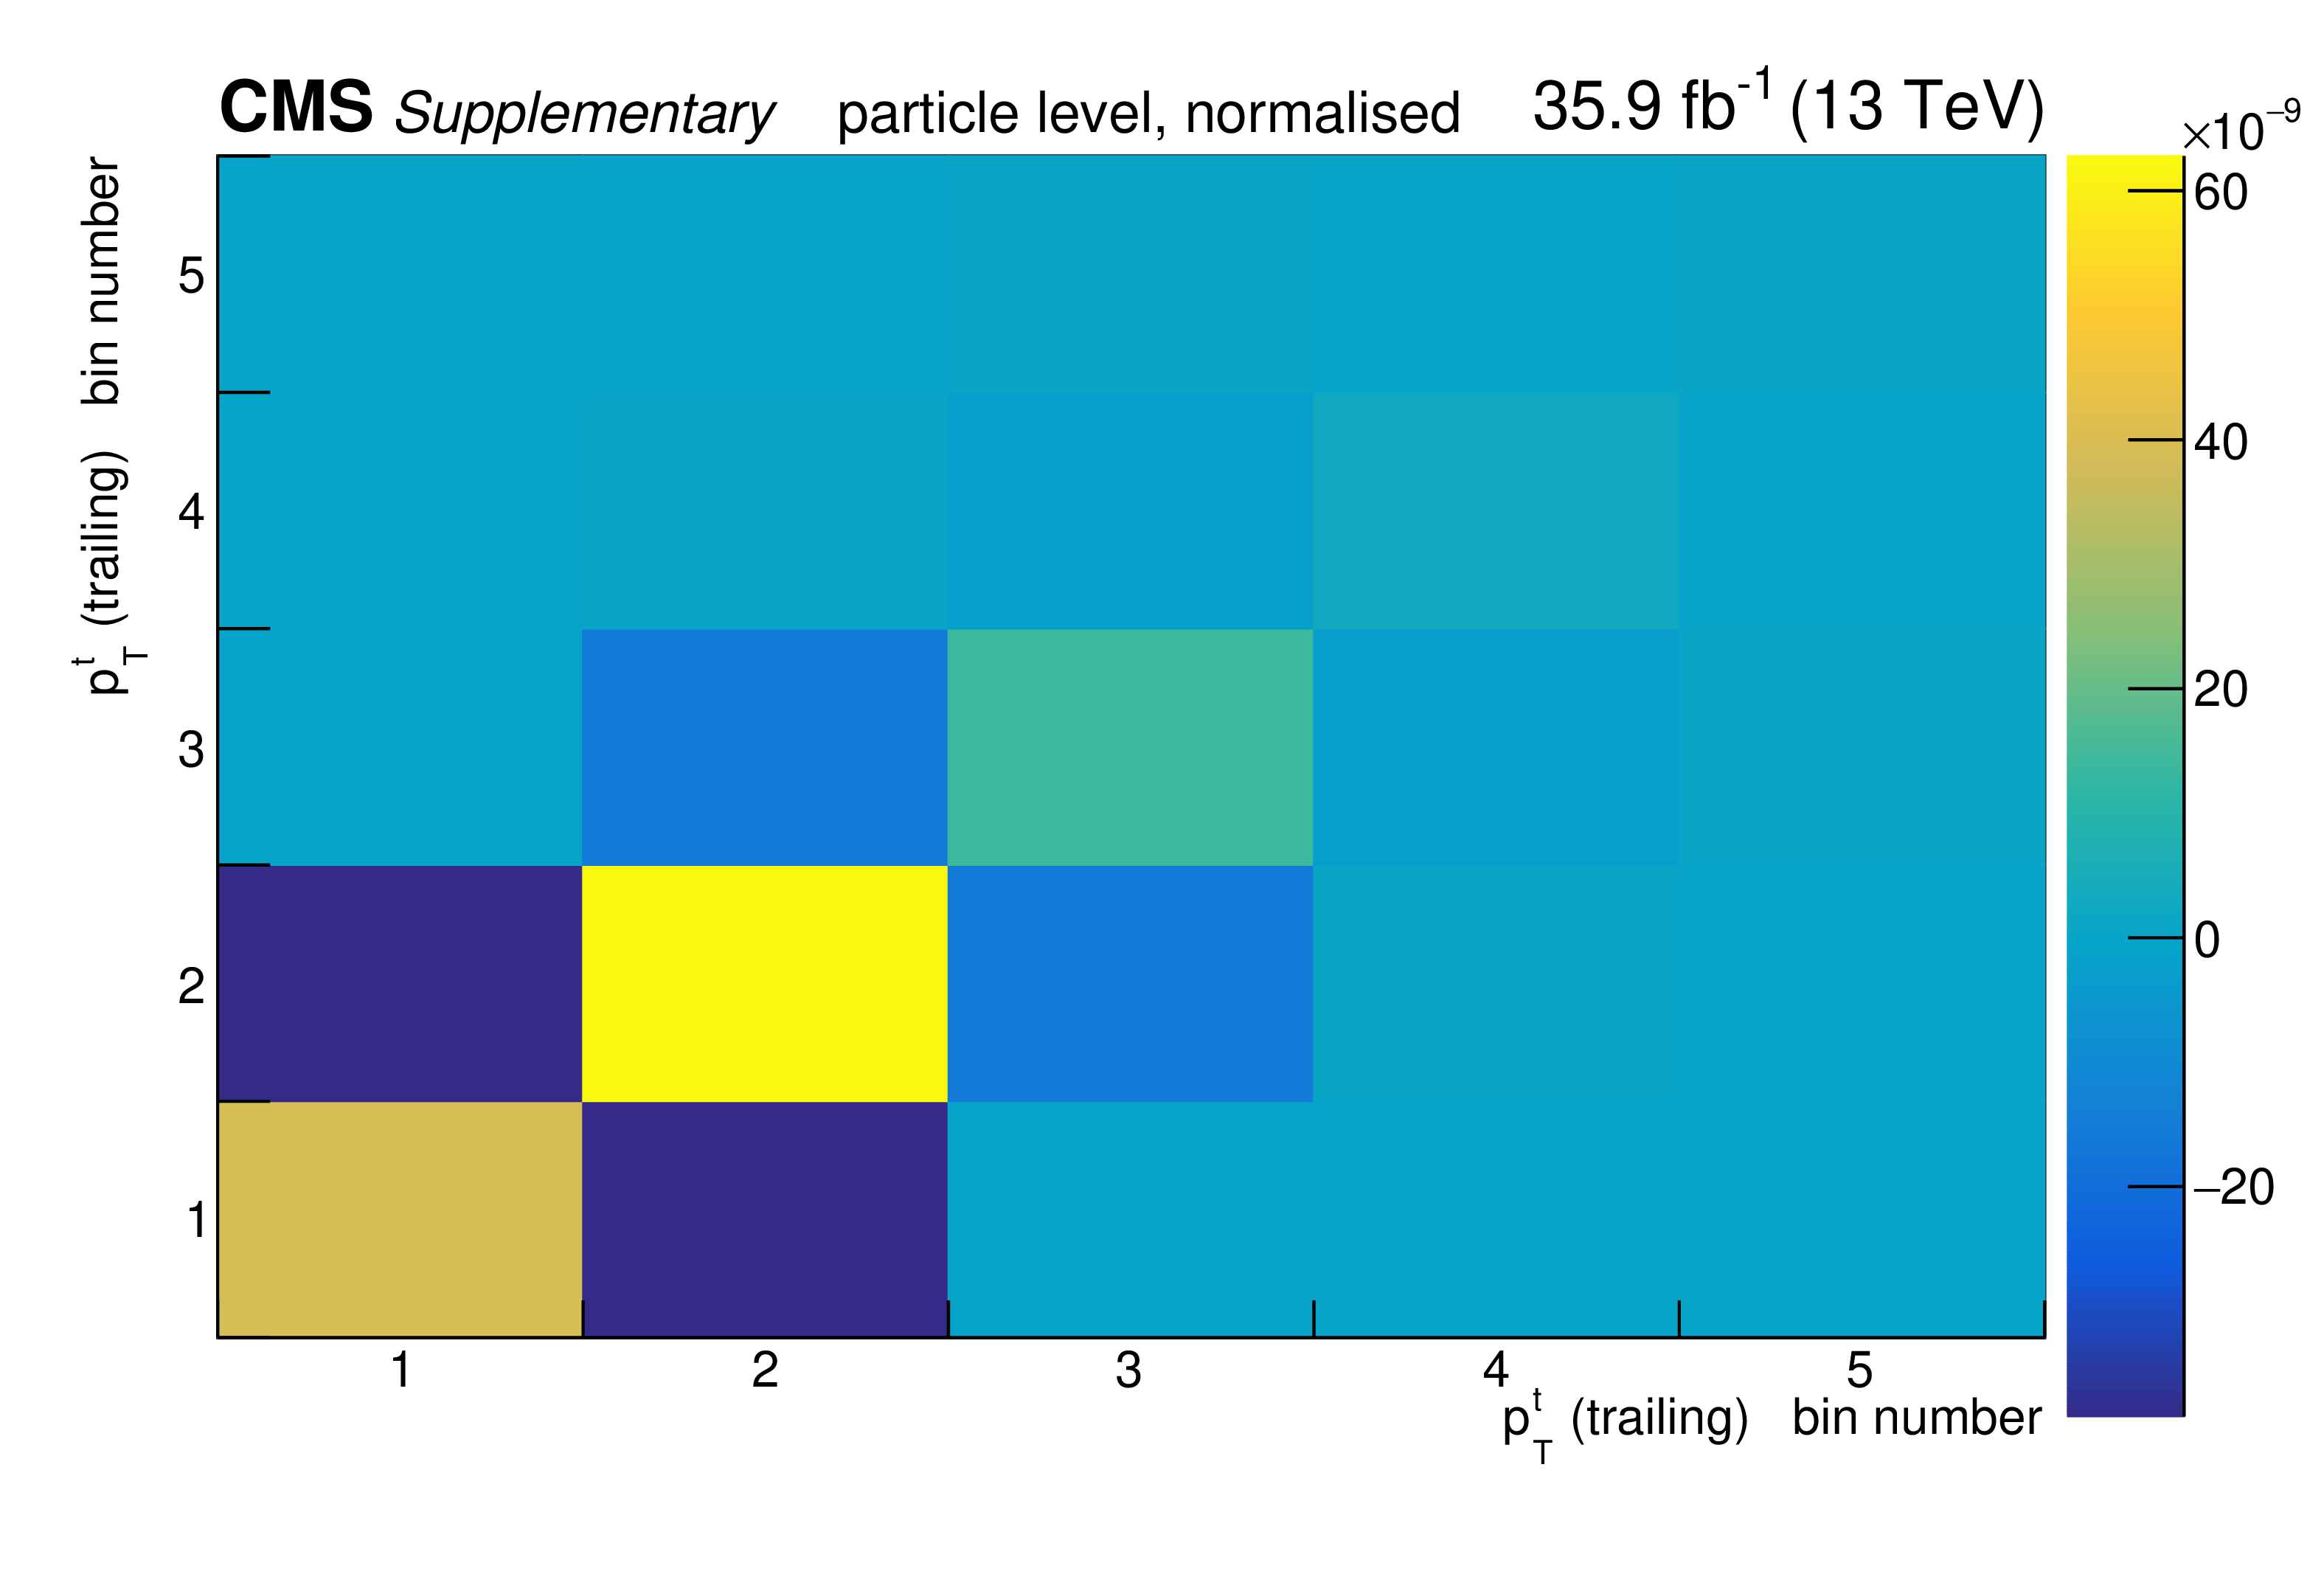
png pdf |
Additional Figure 32:
The covariance matrix of the measured data for the normalised measurement of the differential $\mathrm{t\bar{t}}$ cross section as a function of $p_{\mathrm {T}}^{\mathrm {t}}$ (trailing) at particle level is shown. |

png pdf |
Additional Figure 33:
The breakdown of uncertainties for the absolute measurement of the differential $\mathrm{t\bar{t}}$ cross section as a function of $p_{\mathrm {T}}^{\mathrm {t}}$ ($\mathrm{t\bar{t}}$ RF) at parton level is shown. The contributions of each source of systematic uncertainty in each bin are indicated by the coloured lines. Experimental systematic uncertainties that are small in all bins are added in quadrature and shown as a single component. The statistical and total uncertainties are indicated by the shaded areas. |

png pdf |
Additional Figure 34:
The covariance matrix of the measured data for the absolute measurement of the differential $\mathrm{t\bar{t}}$ cross section as a function of $p_{\mathrm {T}}^{\mathrm {t}}$ ($\mathrm{t\bar{t}}$ RF) at parton level is shown. |
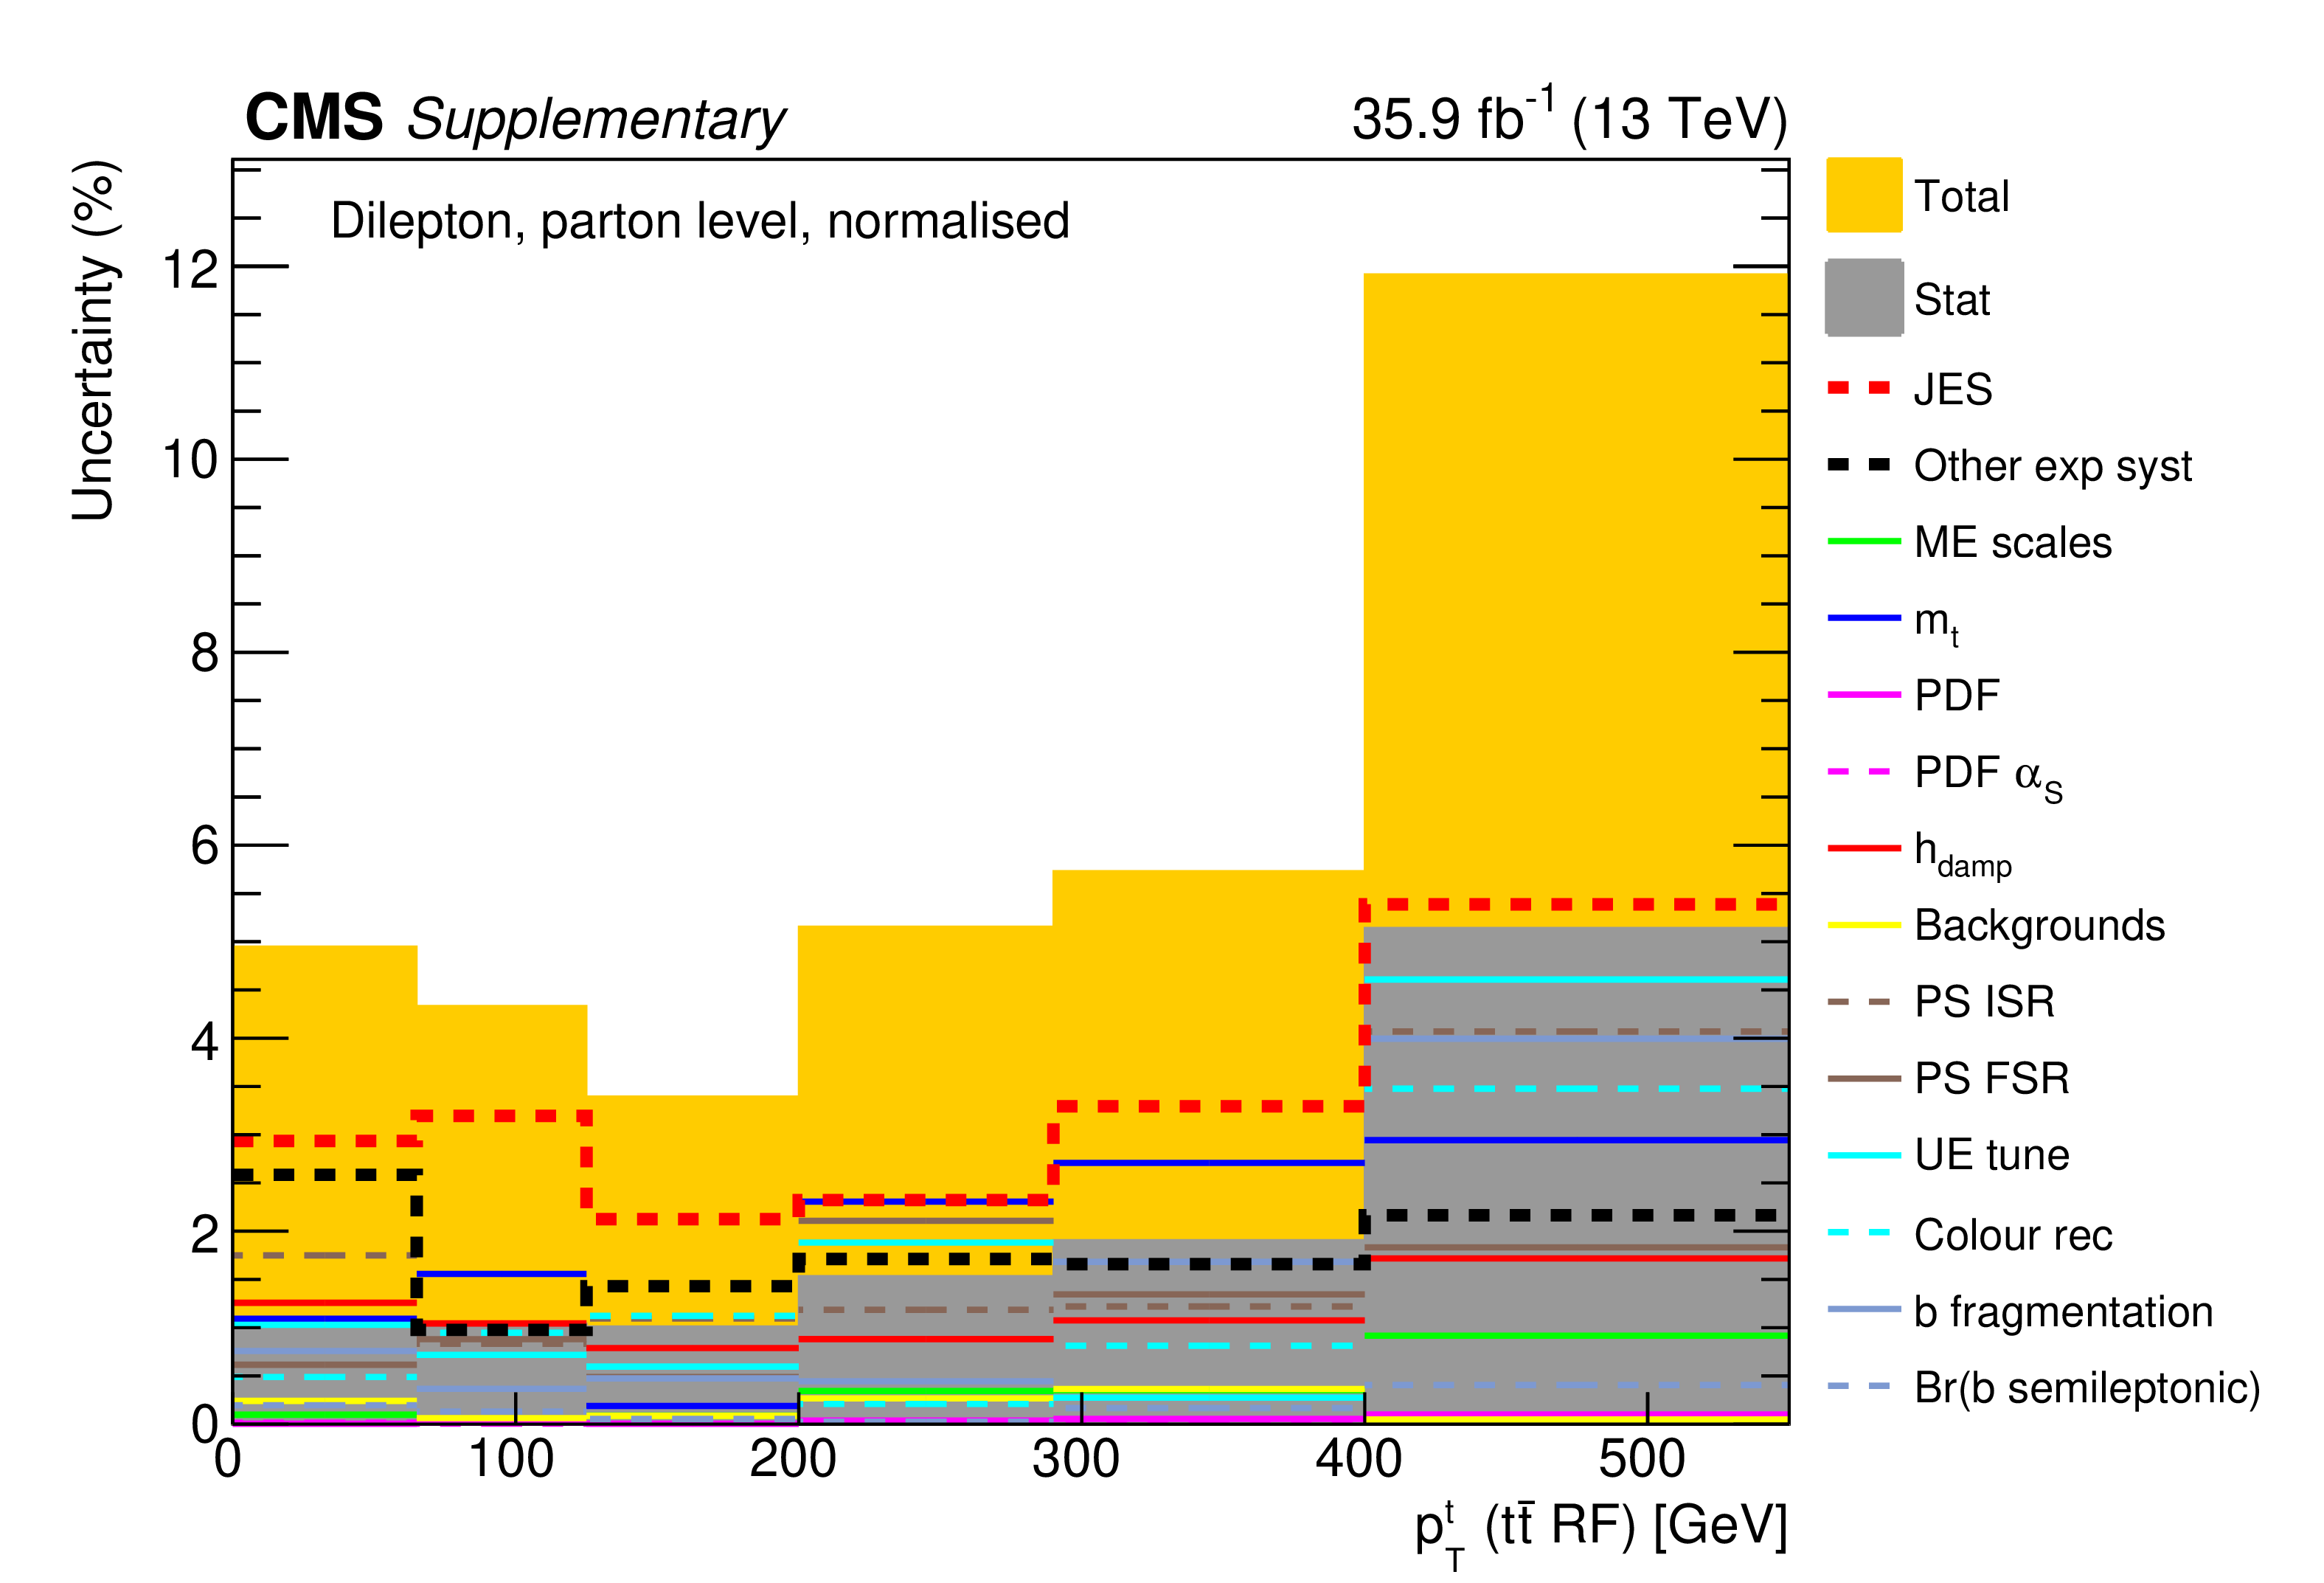
png pdf |
Additional Figure 35:
The breakdown of uncertainties for the normalised measurement of the differential $\mathrm{t\bar{t}}$ cross section as a function of $p_{\mathrm {T}}^{\mathrm {t}}$ ($\mathrm{t\bar{t}}$ RF) at parton level is shown. The contributions of each source of systematic uncertainty in each bin are indicated by the coloured lines. Experimental systematic uncertainties that are small in all bins are added in quadrature and shown as a single component. The statistical and total uncertainties are indicated by the shaded areas. |
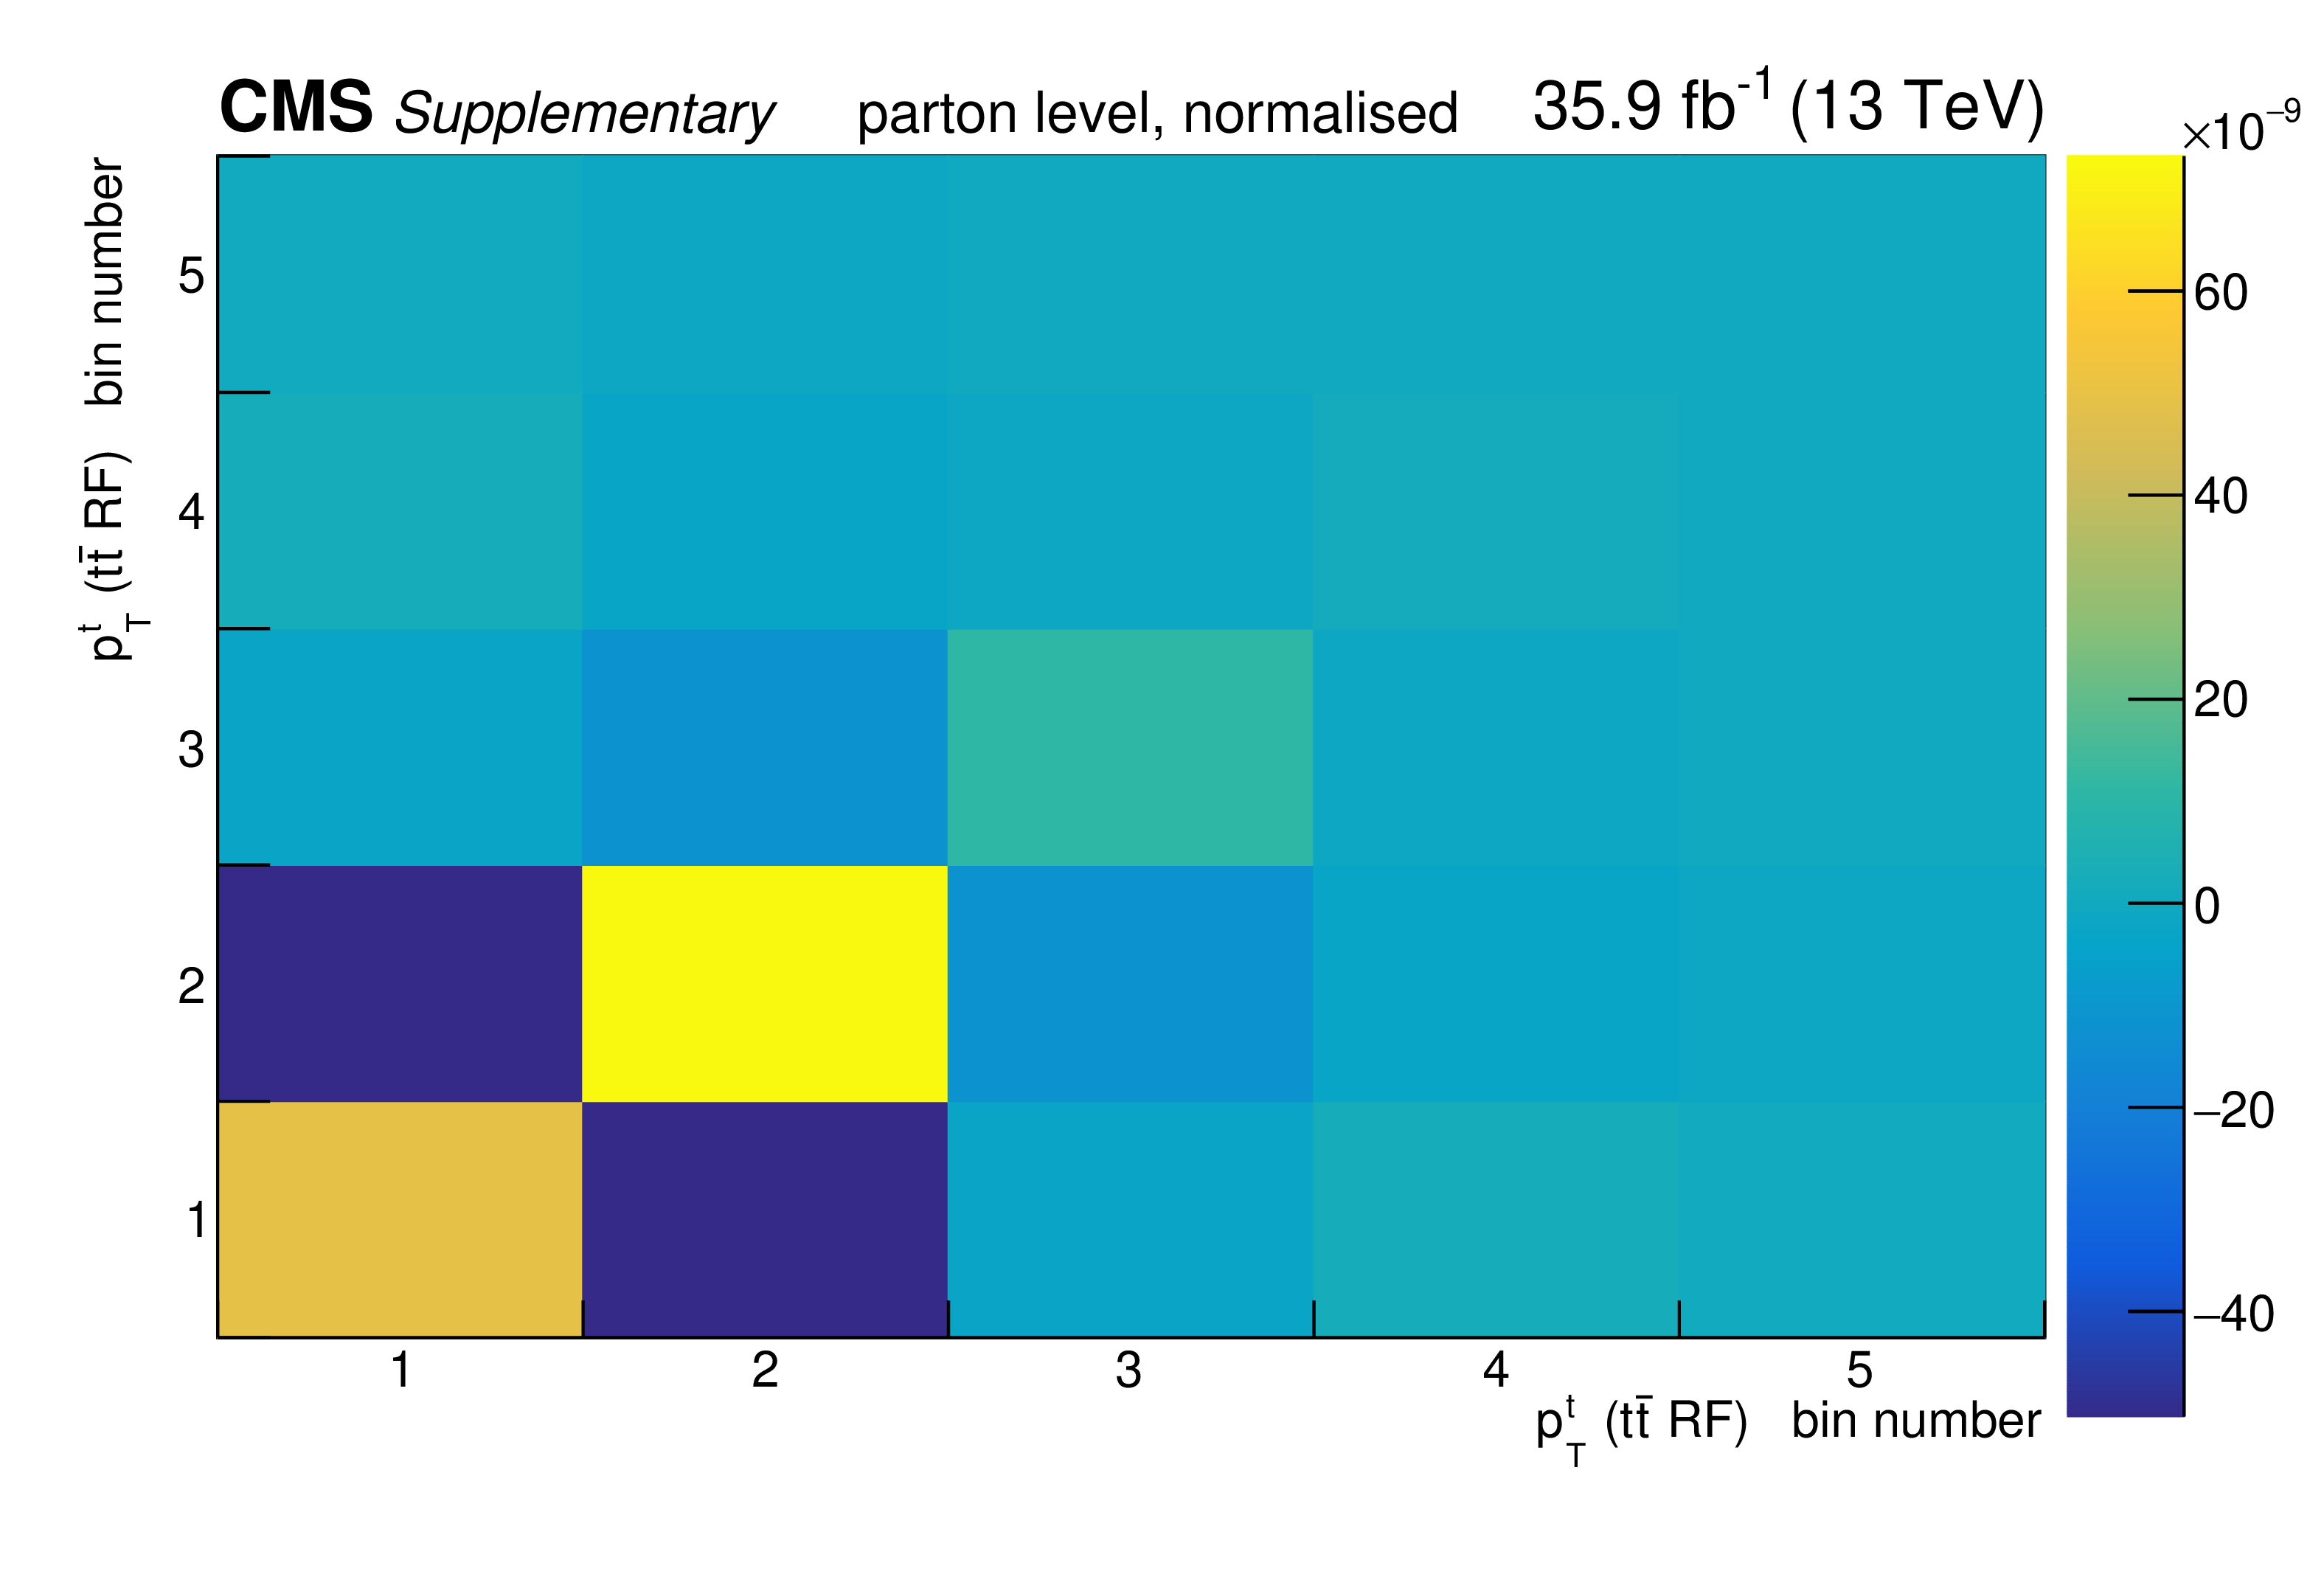
png pdf |
Additional Figure 36:
The covariance matrix of the measured data for the normalised measurement of the differential $\mathrm{t\bar{t}}$ cross section as a function of $p_{\mathrm {T}}^{\mathrm {t}}$ ($\mathrm{t\bar{t}}$ RF) at parton level is shown. |
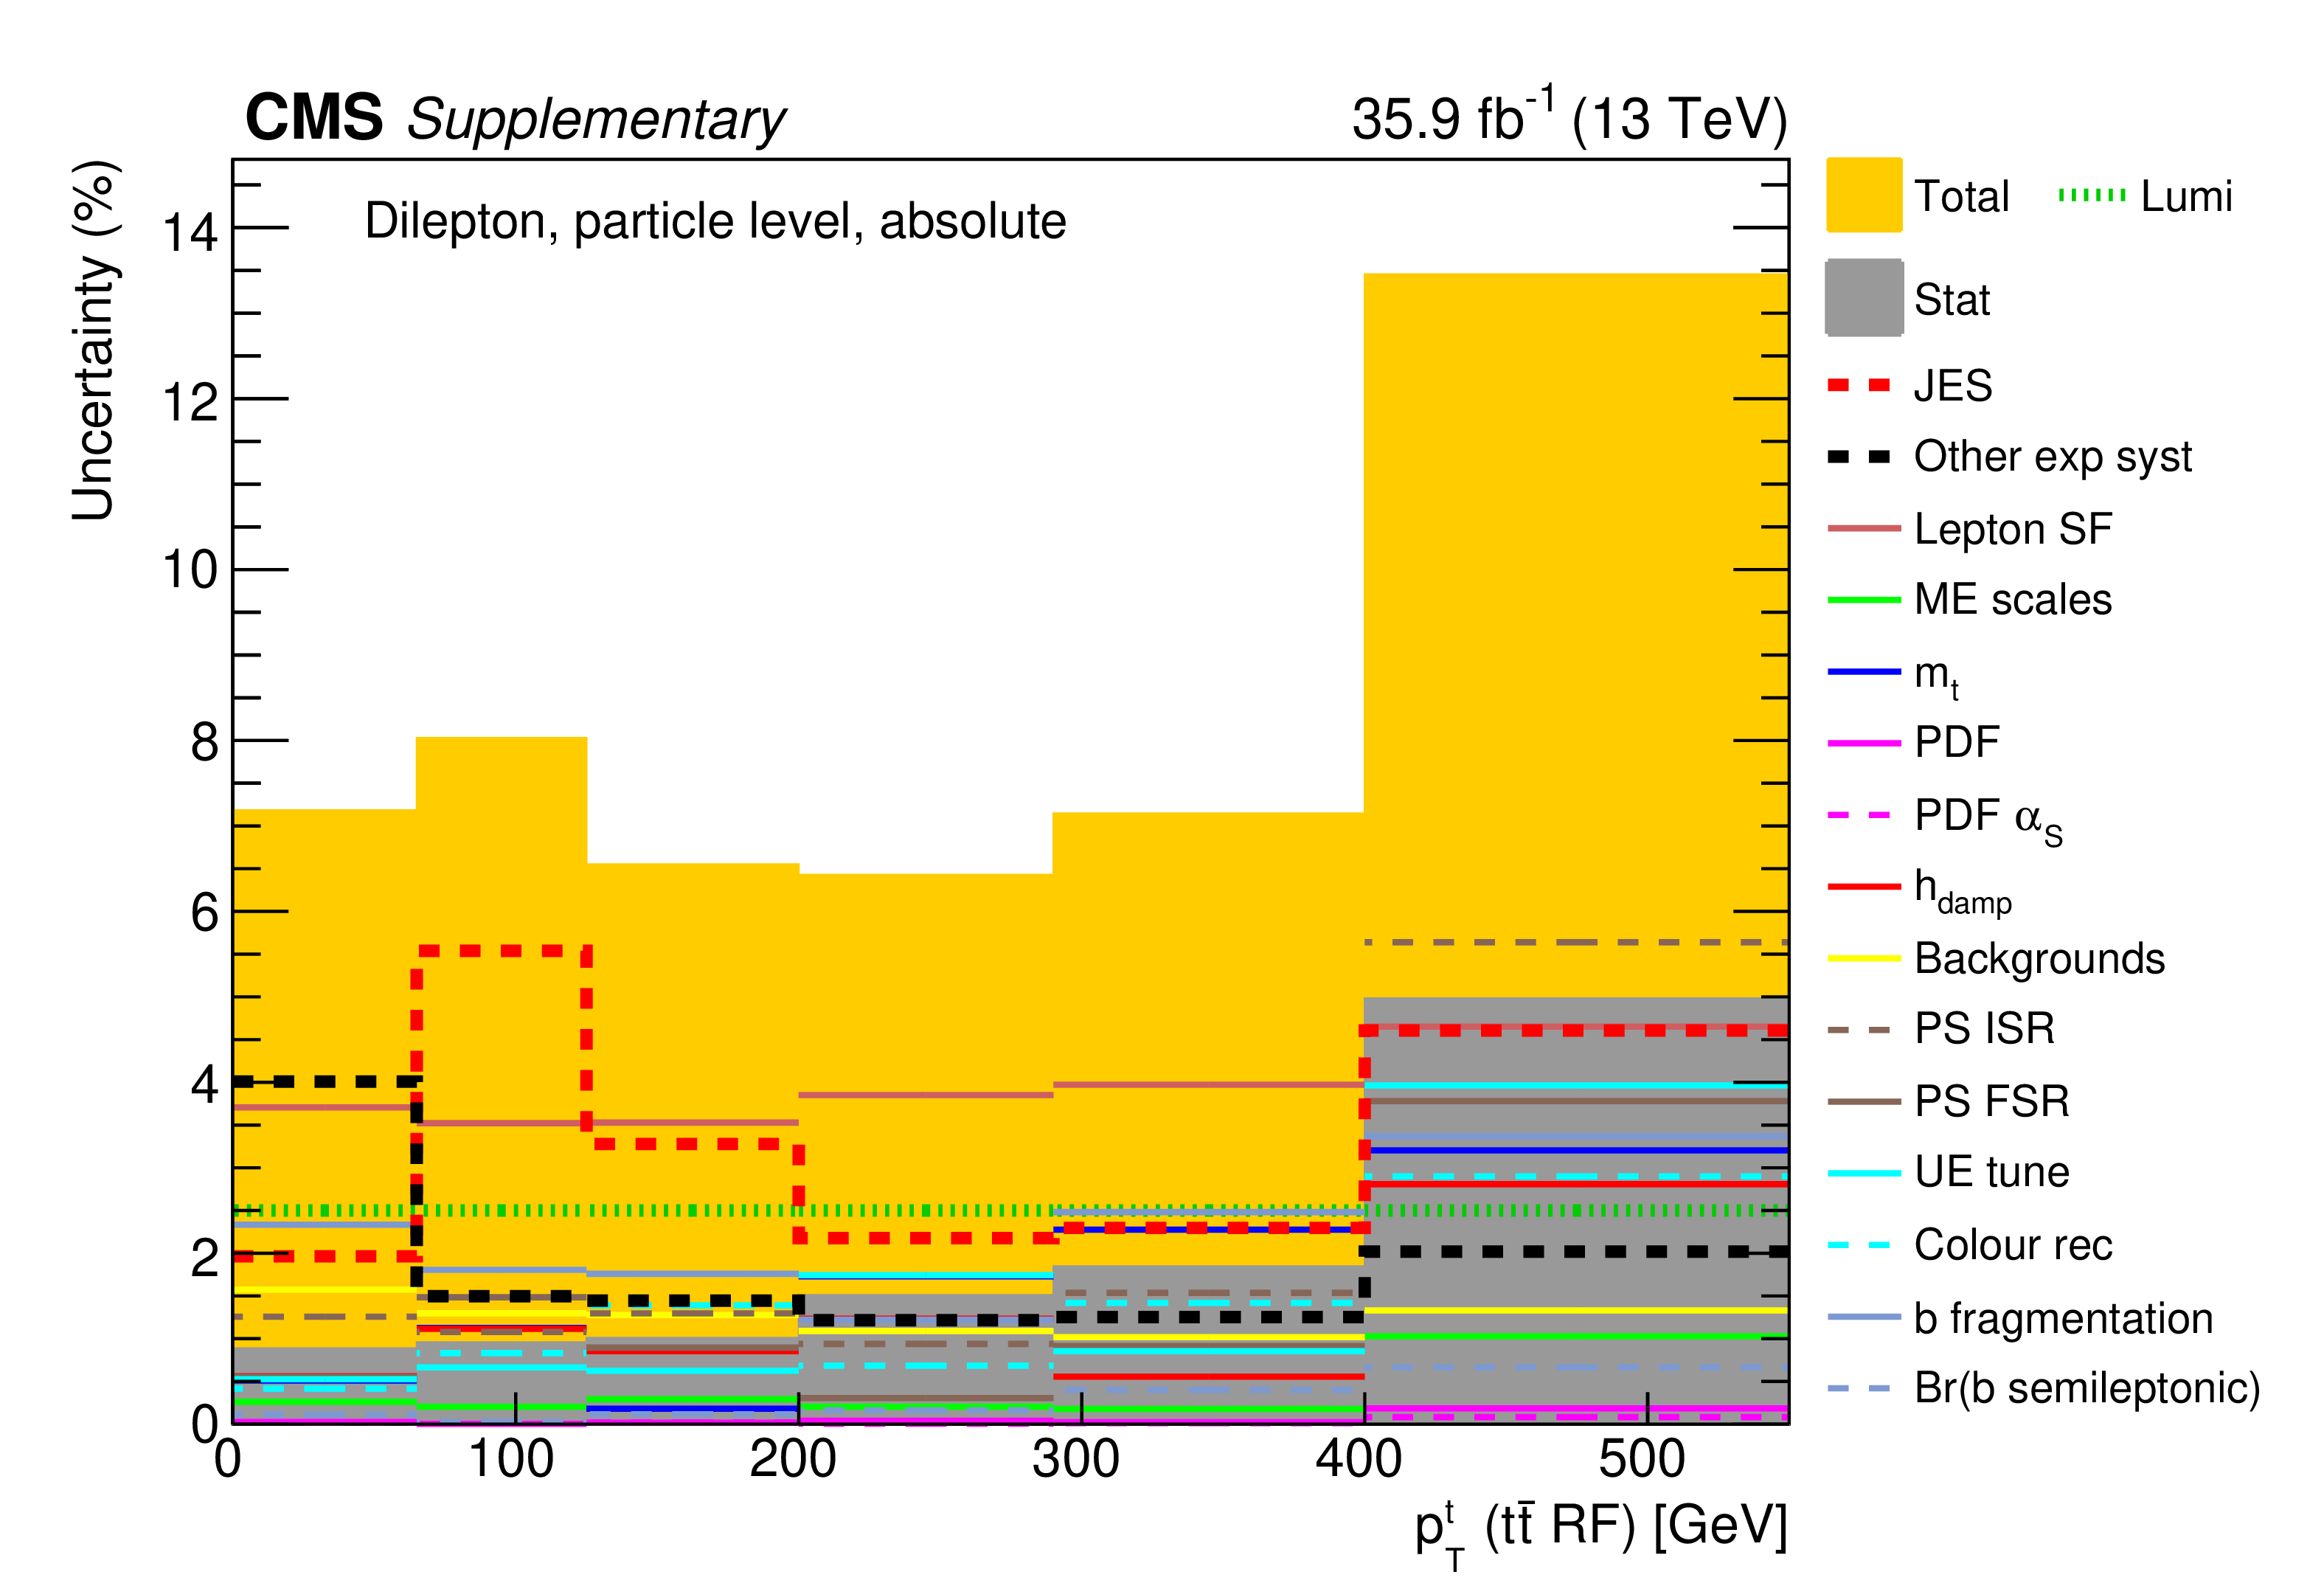
png pdf |
Additional Figure 37:
The breakdown of uncertainties for the absolute measurement of the differential $\mathrm{t\bar{t}}$ cross section as a function of $p_{\mathrm {T}}^{\mathrm {t}}$ ($\mathrm{t\bar{t}}$ RF) at particle level is shown. The contributions of each source of systematic uncertainty in each bin are indicated by the coloured lines. Experimental systematic uncertainties that are small in all bins are added in quadrature and shown as a single component. The statistical and total uncertainties are indicated by the shaded areas. |
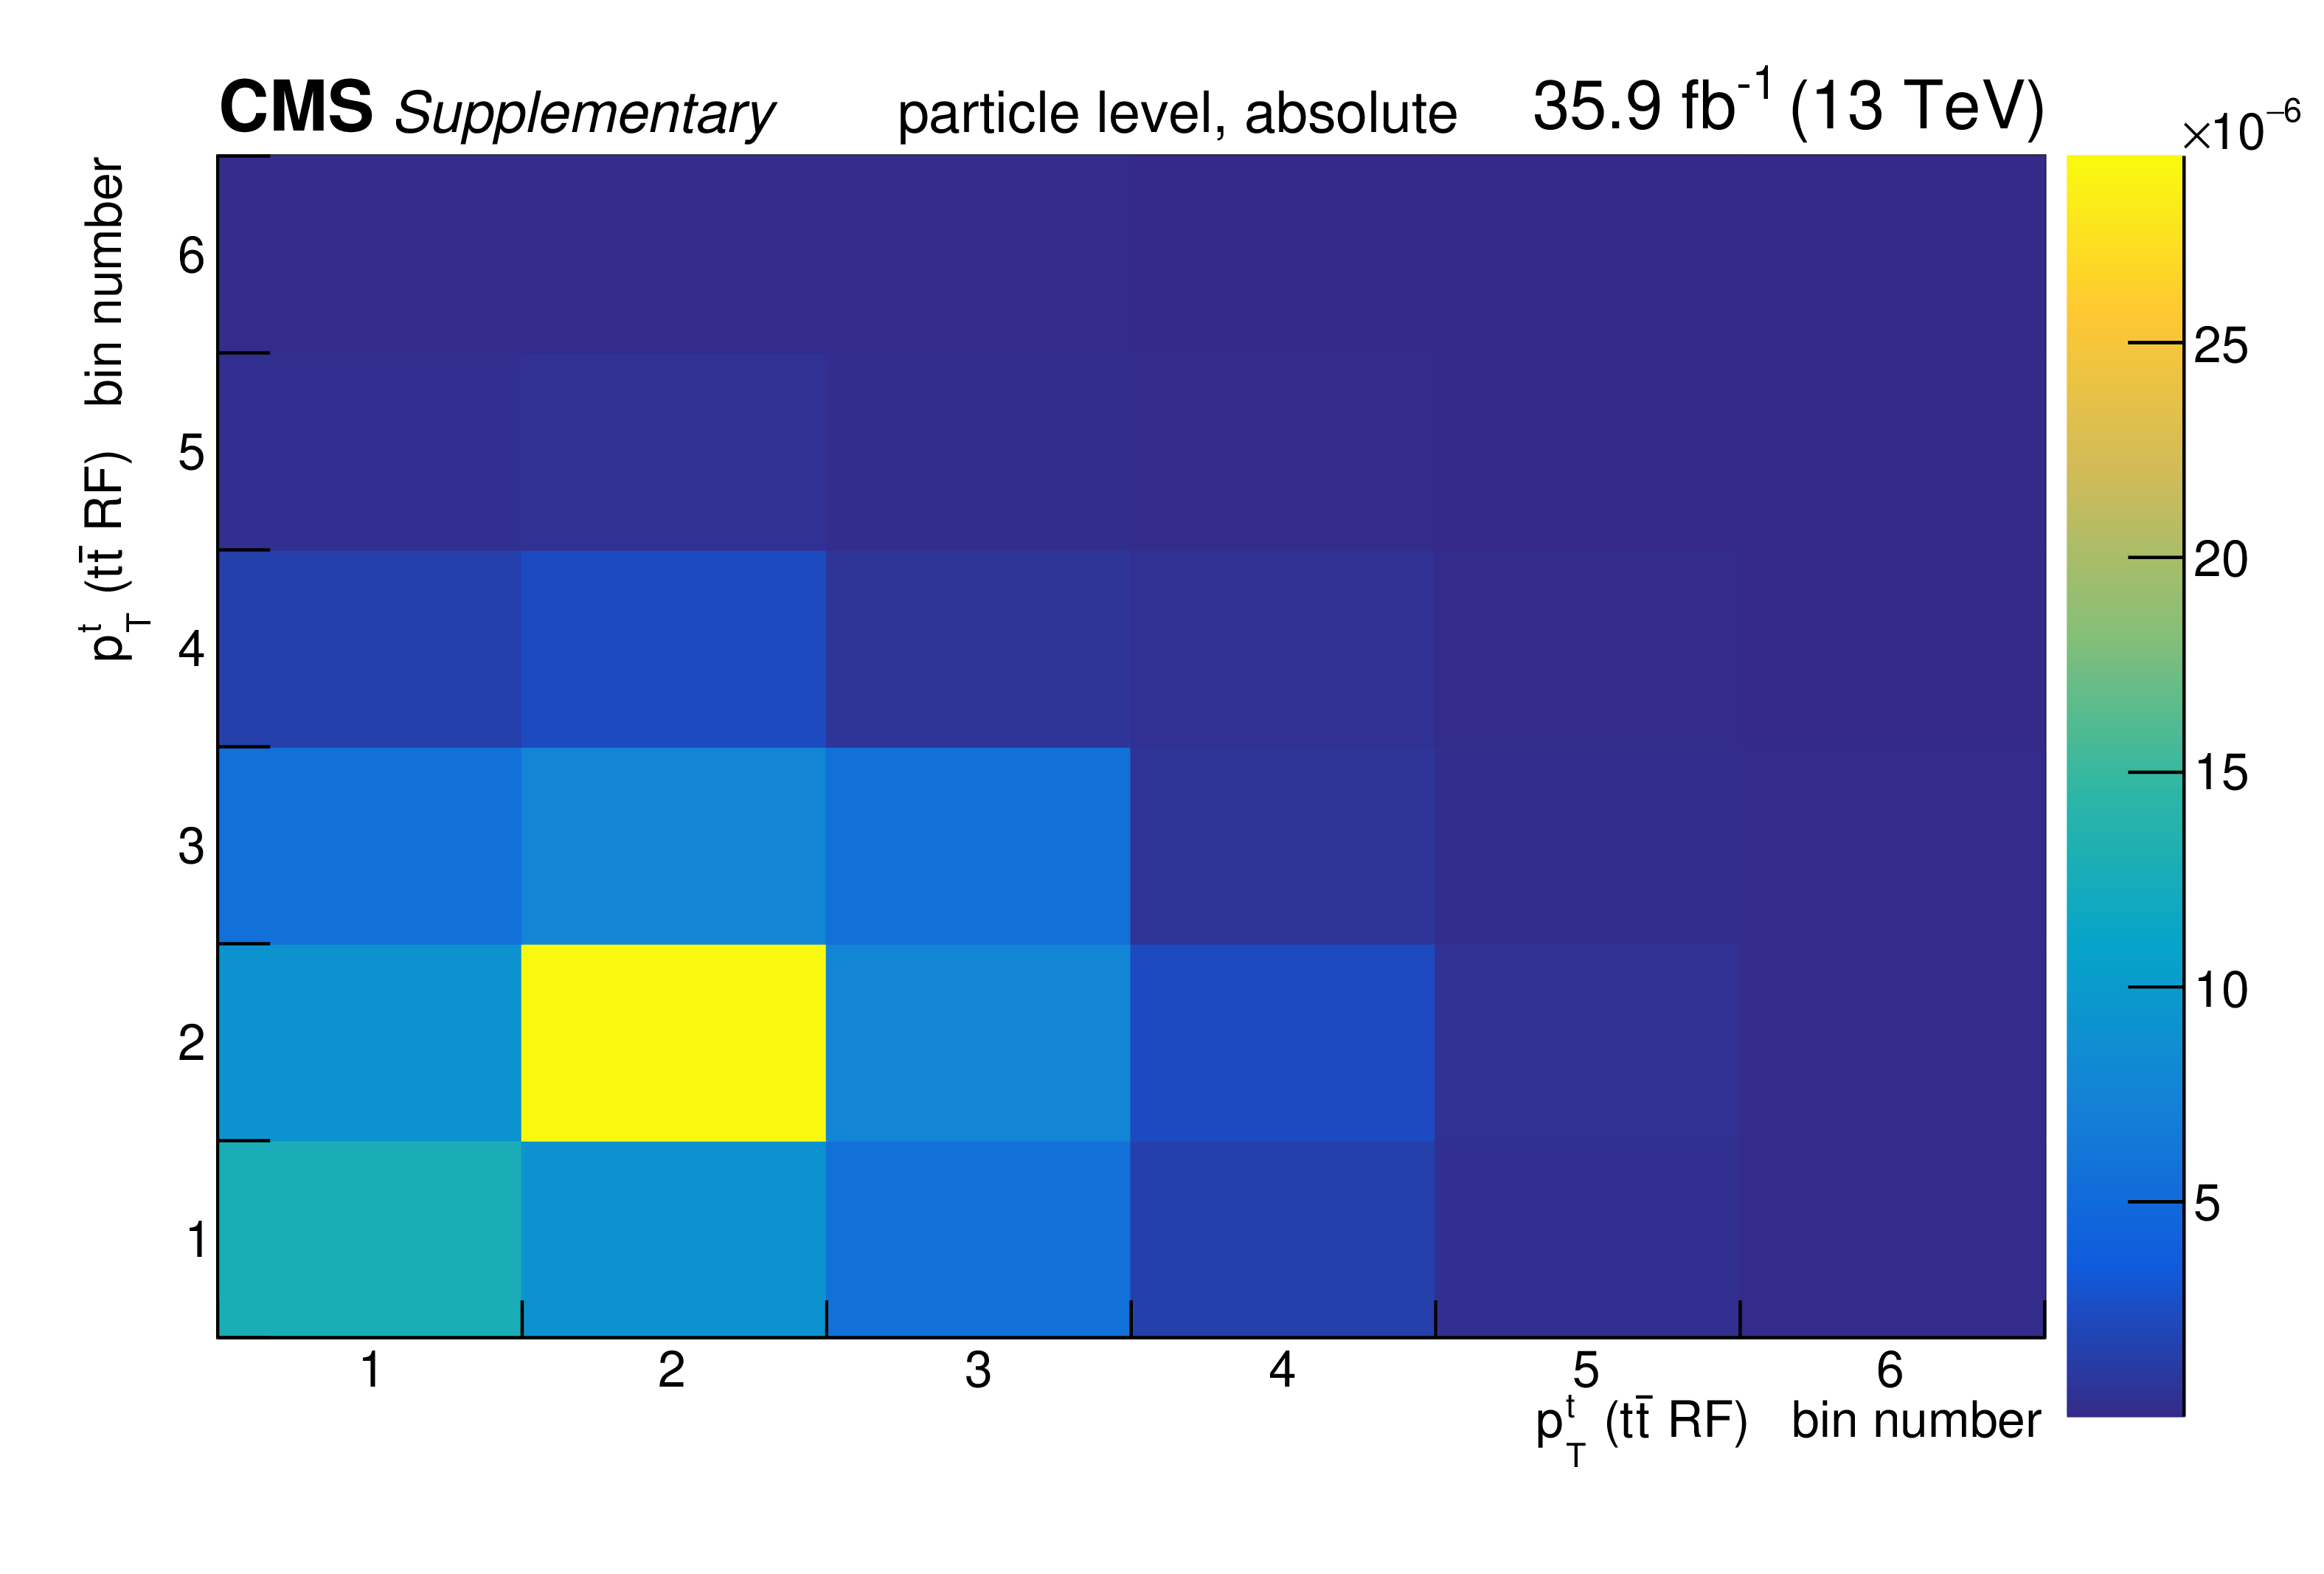
png pdf |
Additional Figure 38:
The covariance matrix of the measured data for the absolute measurement of the differential $\mathrm{t\bar{t}}$ cross section as a function of $p_{\mathrm {T}}^{\mathrm {t}}$ ($\mathrm{t\bar{t}}$ RF) at particle level is shown. |

png pdf |
Additional Figure 39:
The breakdown of uncertainties for the normalised measurement of the differential $\mathrm{t\bar{t}}$ cross section as a function of $p_{\mathrm {T}}^{\mathrm {t}}$ ($\mathrm{t\bar{t}}$ RF) at particle level is shown. The contributions of each source of systematic uncertainty in each bin are indicated by the coloured lines. Experimental systematic uncertainties that are small in all bins are added in quadrature and shown as a single component. The statistical and total uncertainties are indicated by the shaded areas. |

png pdf |
Additional Figure 40:
The covariance matrix of the measured data for the normalised measurement of the differential $\mathrm{t\bar{t}}$ cross section as a function of $p_{\mathrm {T}}^{\mathrm {t}}$ ($\mathrm{t\bar{t}}$ RF) at particle level is shown. |

png pdf |
Additional Figure 41:
The breakdown of uncertainties for the absolute measurement of the differential $\mathrm{t\bar{t}}$ cross section as a function of $y_{\mathrm {t}}$ at parton level is shown. The contributions of each source of systematic uncertainty in each bin are indicated by the coloured lines. Experimental systematic uncertainties that are small in all bins are added in quadrature and shown as a single component. The statistical and total uncertainties are indicated by the shaded areas. |
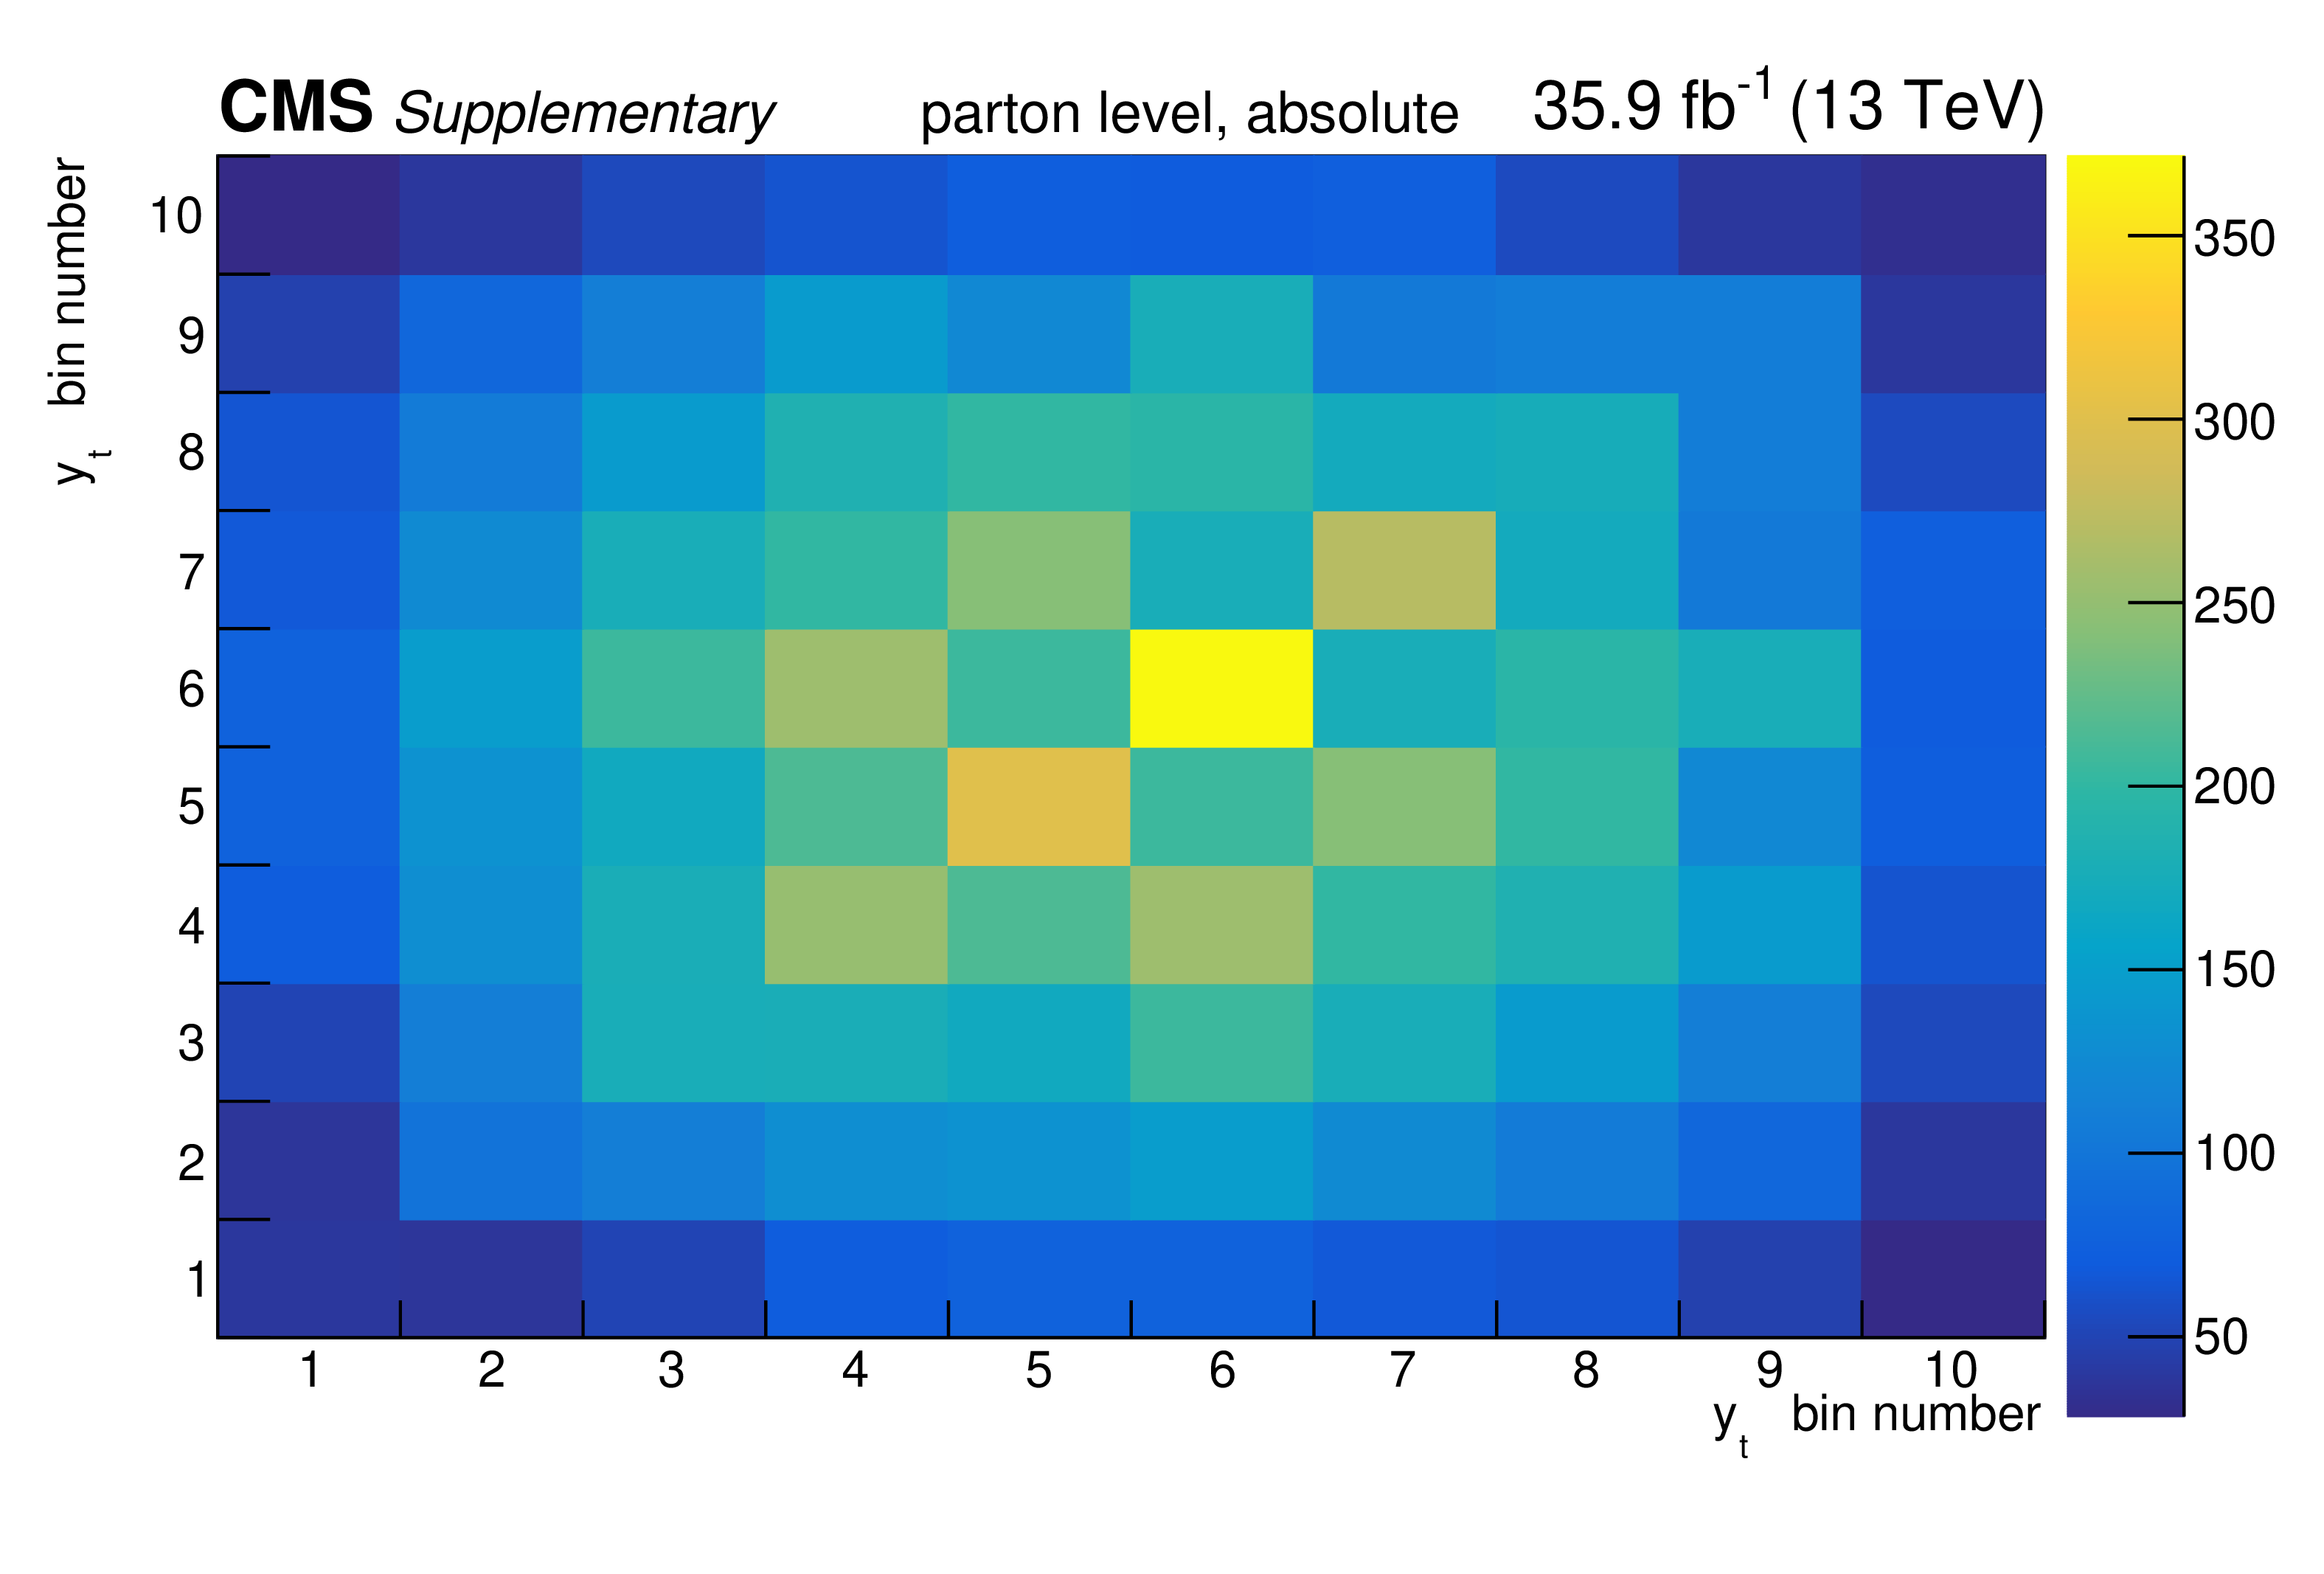
png pdf |
Additional Figure 42:
The covariance matrix of the measured data for the absolute measurement of the differential $\mathrm{t\bar{t}}$ cross section as a function of $y_{\mathrm {t}}$ at parton level is shown. |
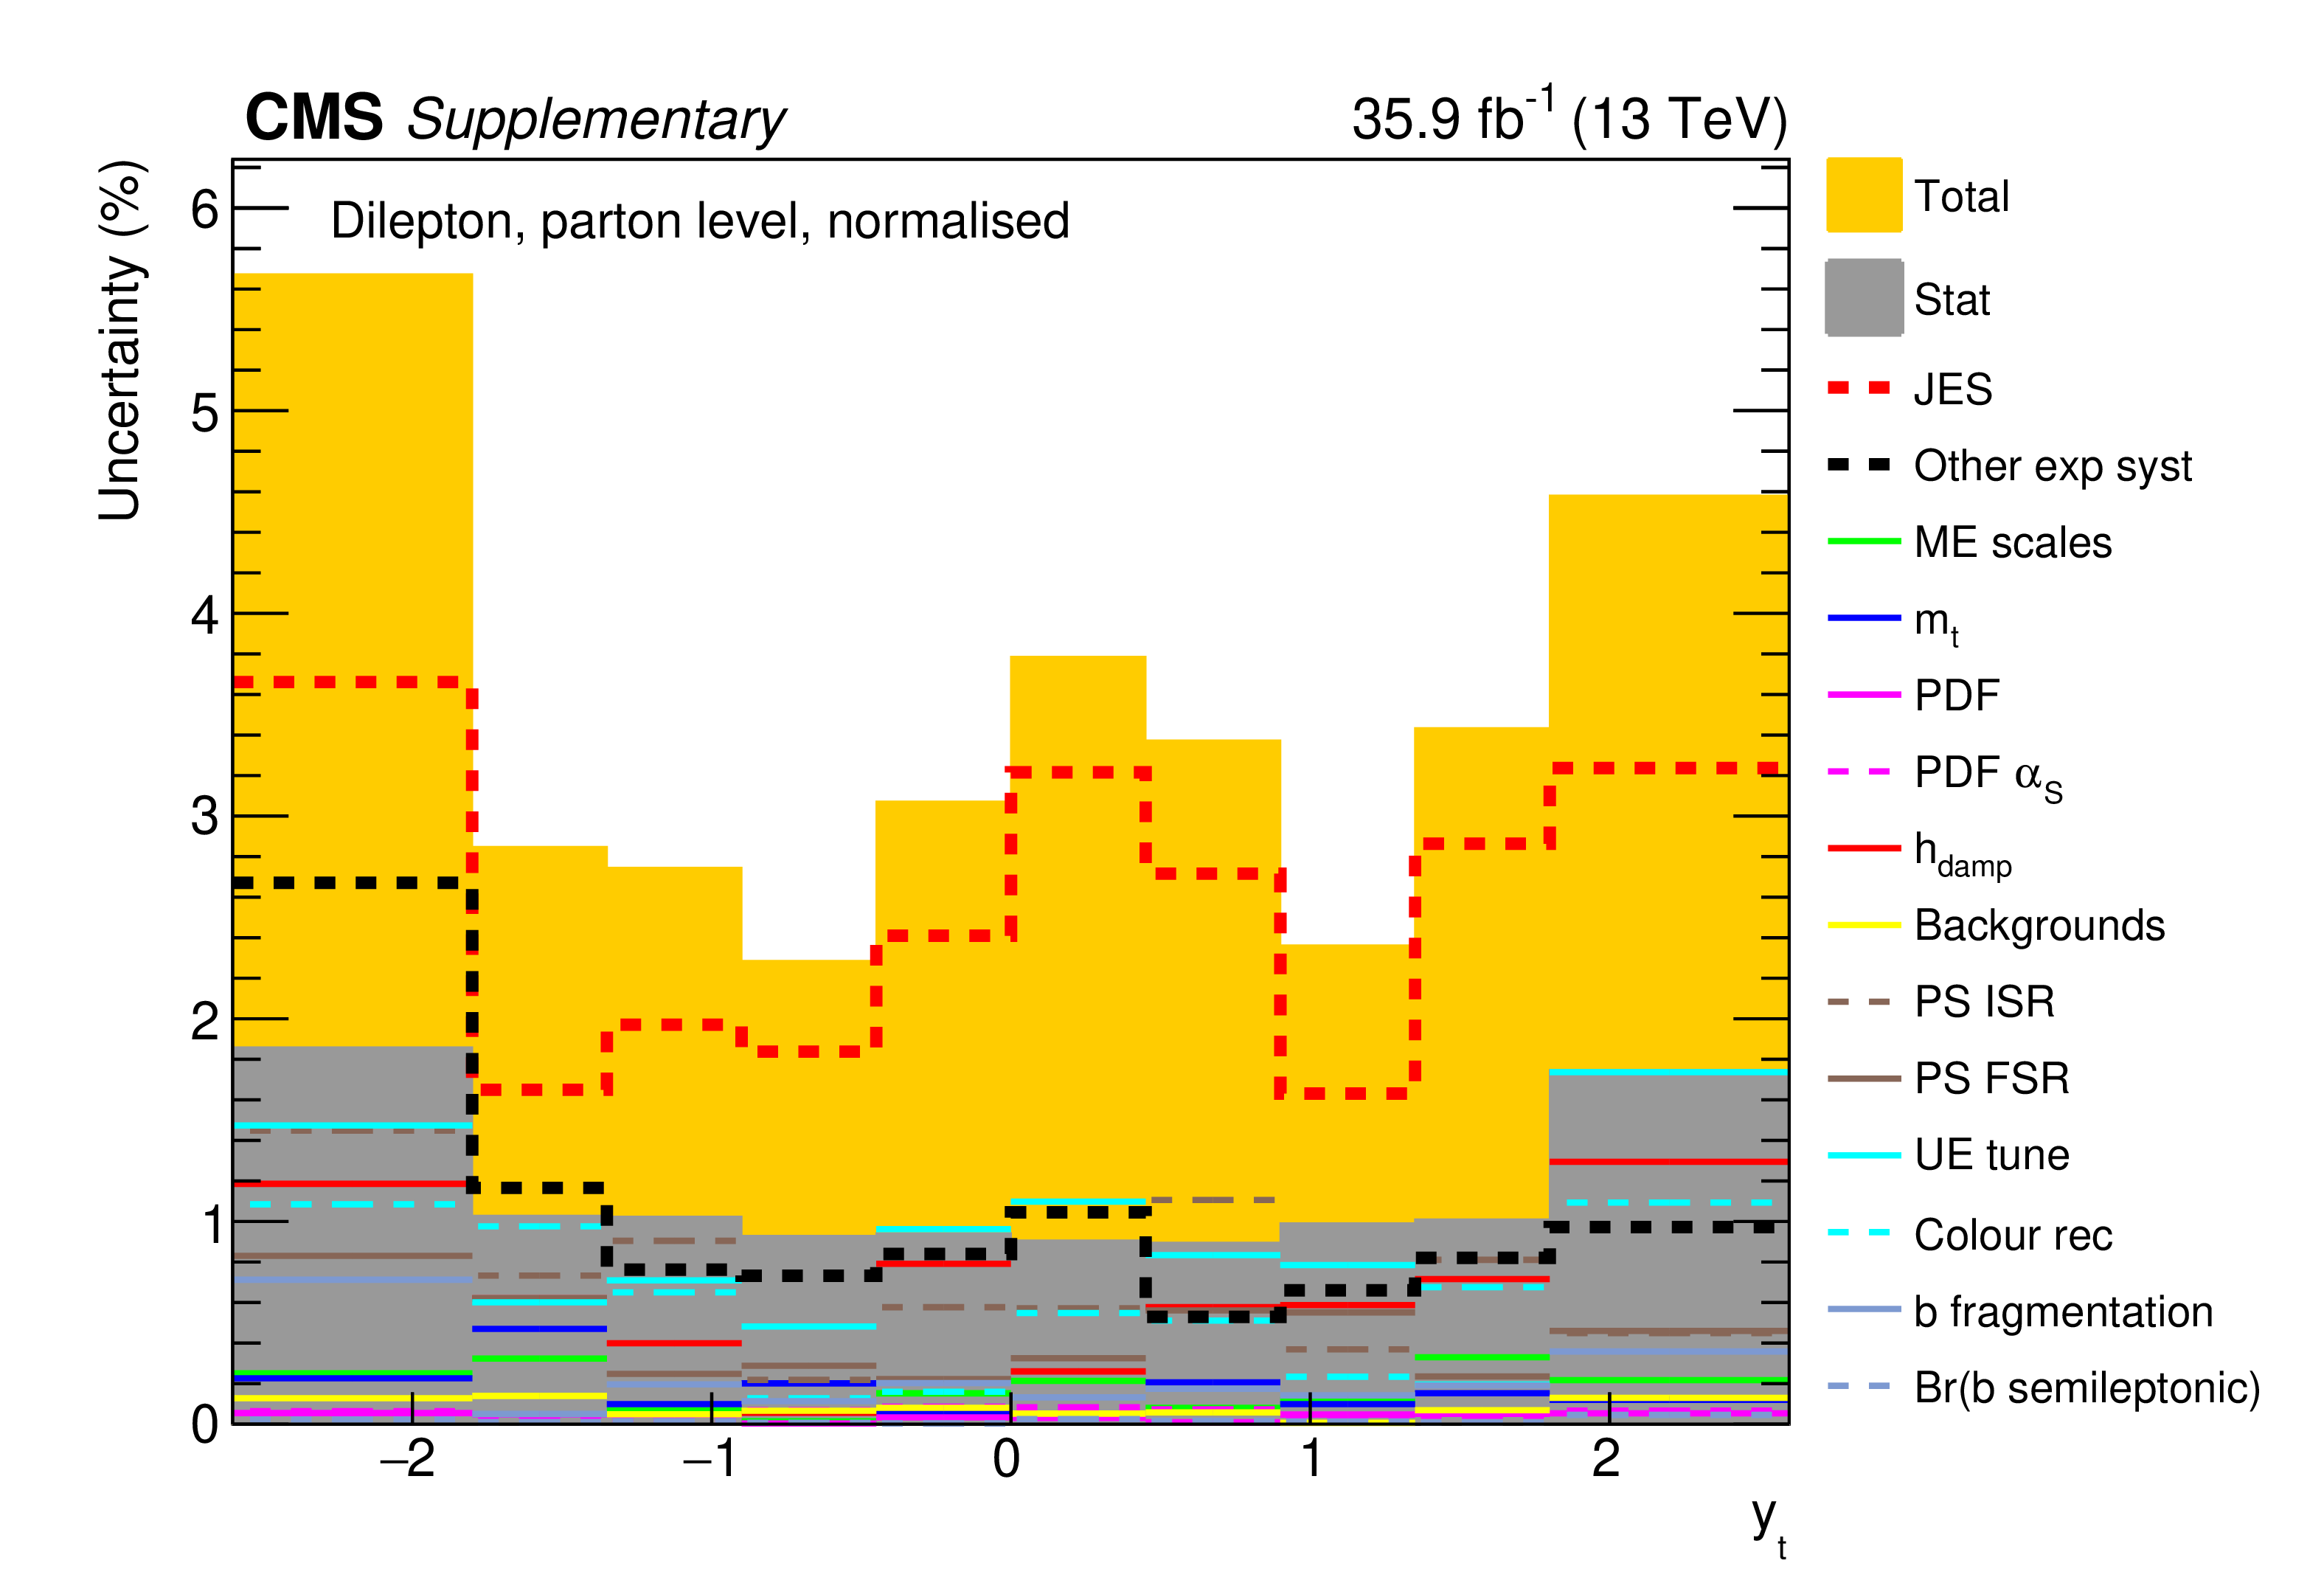
png pdf |
Additional Figure 43:
The breakdown of uncertainties for the normalised measurement of the differential $\mathrm{t\bar{t}}$ cross section as a function of $y_{\mathrm {t}}$ at parton level is shown. The contributions of each source of systematic uncertainty in each bin are indicated by the coloured lines. Experimental systematic uncertainties that are small in all bins are added in quadrature and shown as a single component. The statistical and total uncertainties are indicated by the shaded areas. |

png pdf |
Additional Figure 44:
The covariance matrix of the measured data for the normalised measurement of the differential $\mathrm{t\bar{t}}$ cross section as a function of $y_{\mathrm {t}}$ at parton level is shown. |

png pdf |
Additional Figure 45:
The breakdown of uncertainties for the absolute measurement of the differential $\mathrm{t\bar{t}}$ cross section as a function of $y_{\mathrm {t}}$ at particle level is shown. The contributions of each source of systematic uncertainty in each bin are indicated by the coloured lines. Experimental systematic uncertainties that are small in all bins are added in quadrature and shown as a single component. The statistical and total uncertainties are indicated by the shaded areas. |
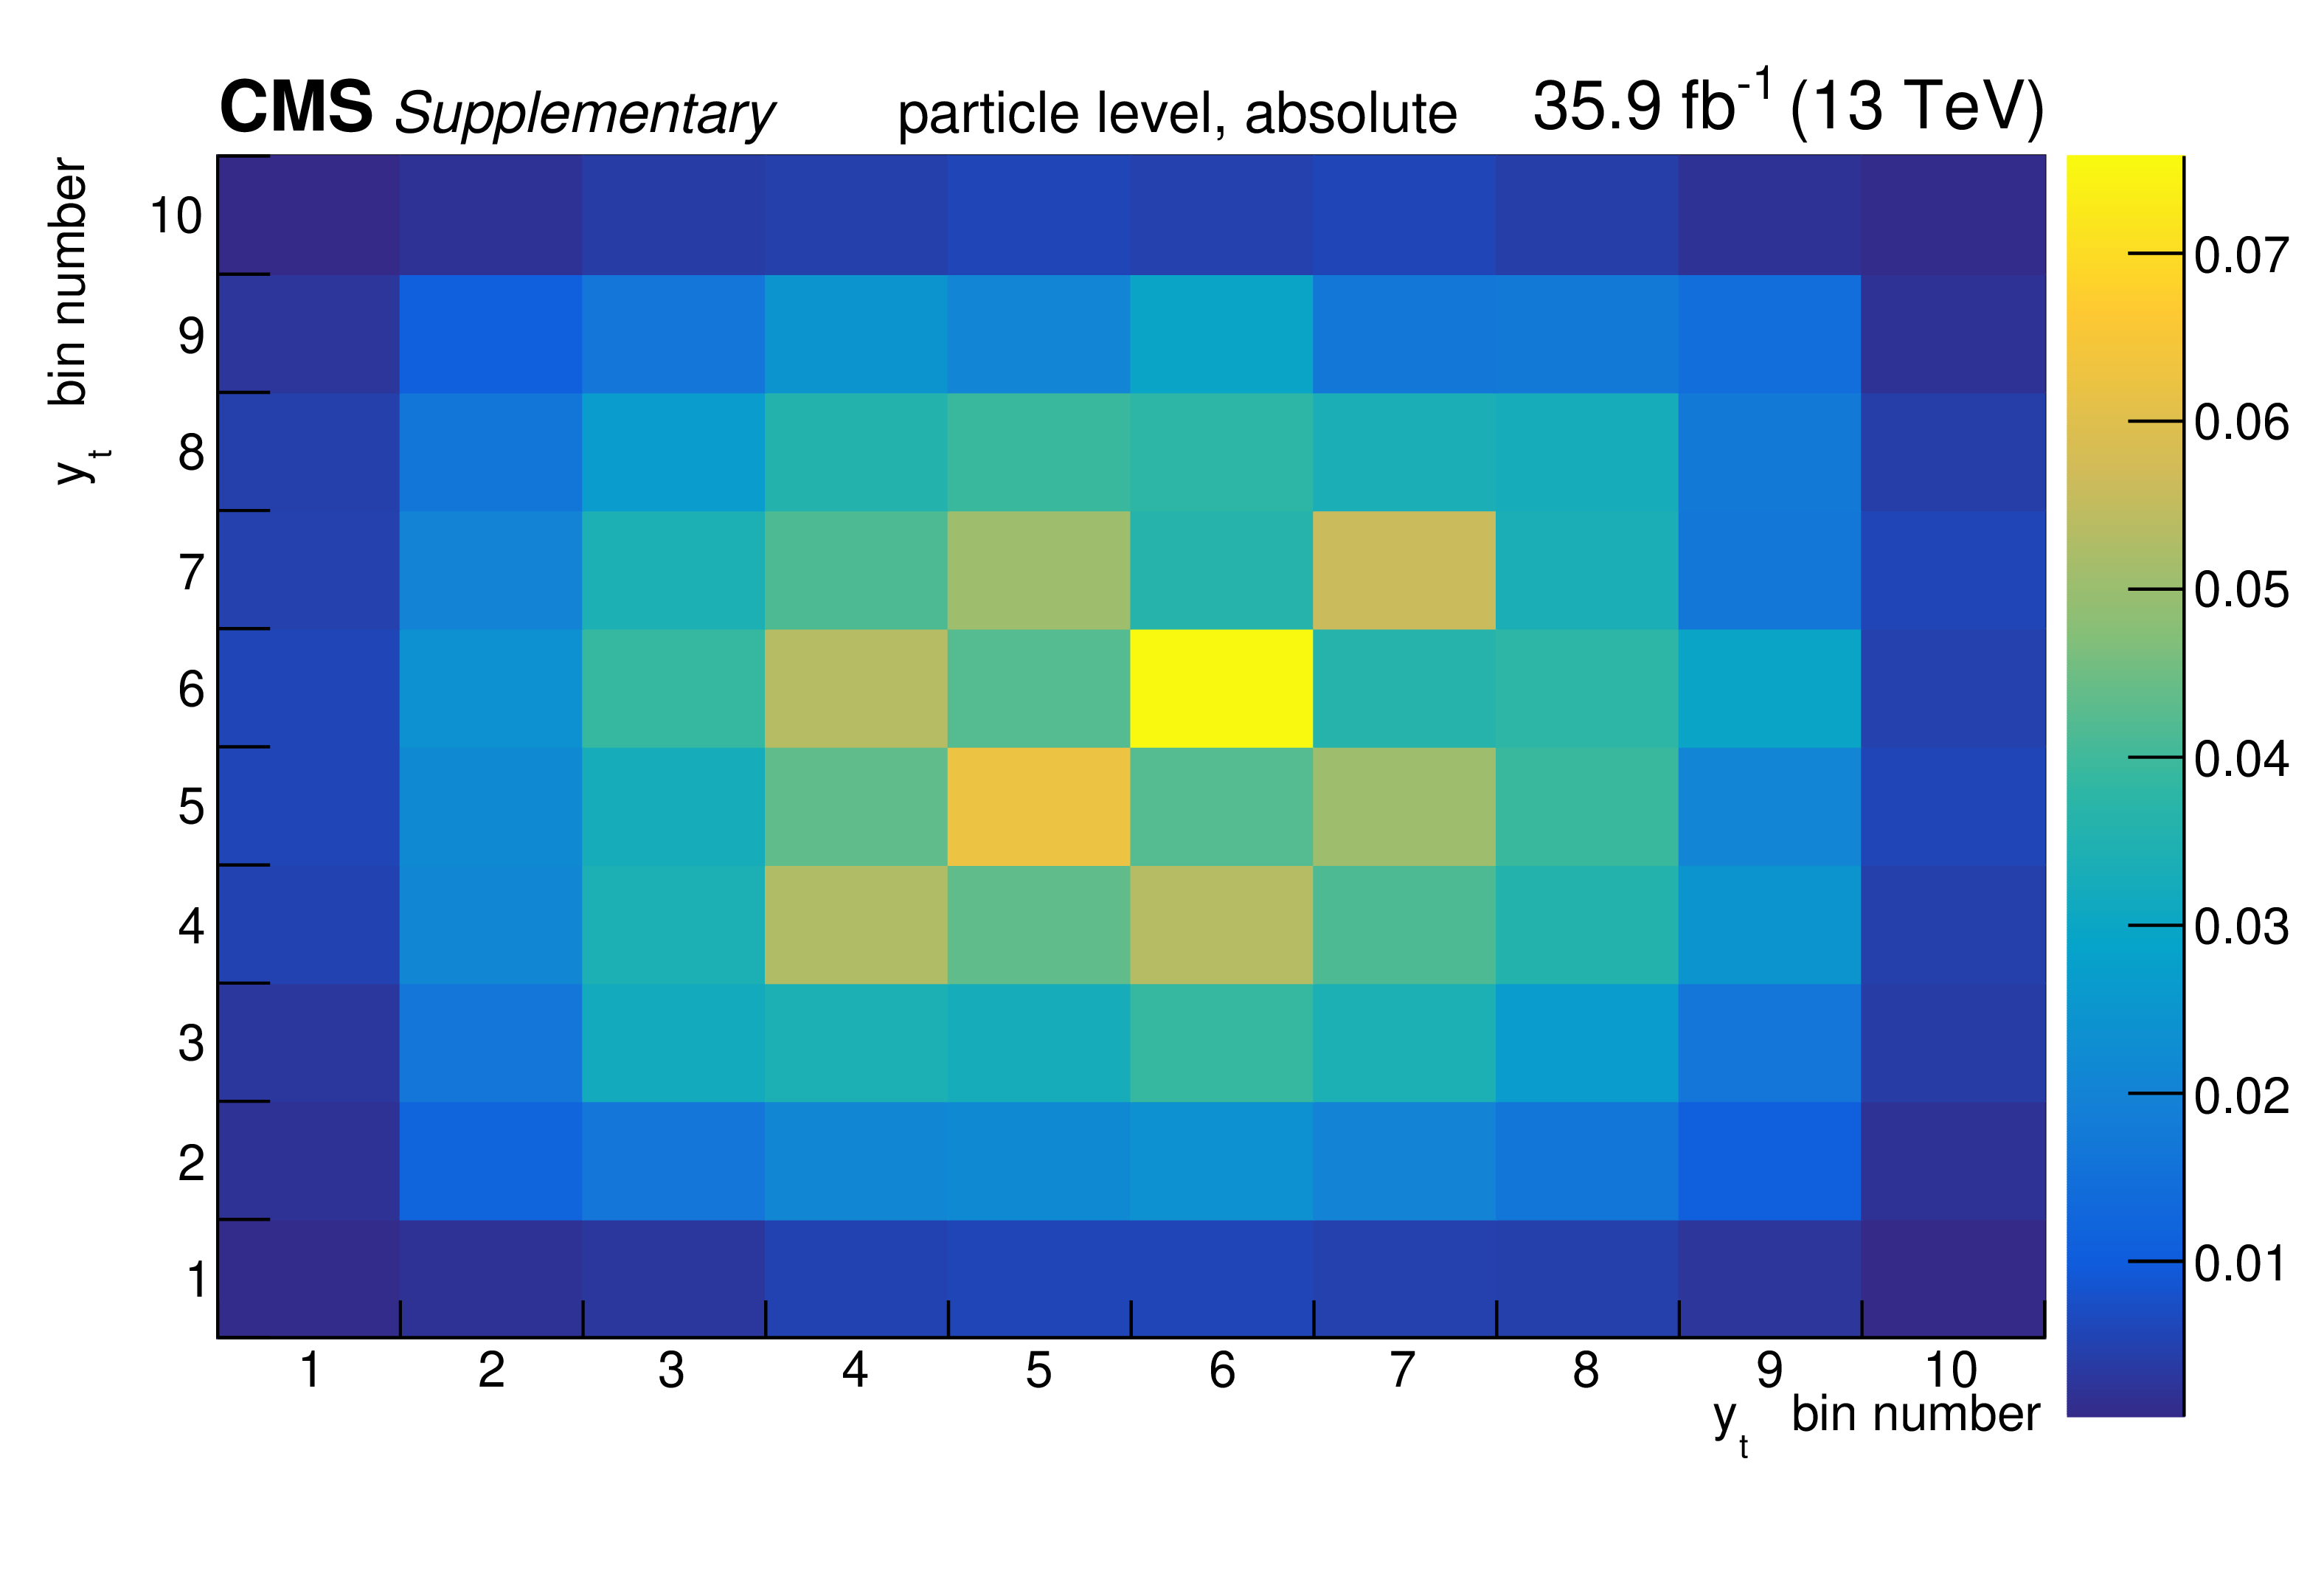
png pdf |
Additional Figure 46:
The covariance matrix of the measured data for the absolute measurement of the differential $\mathrm{t\bar{t}}$ cross section as a function of $y_{\mathrm {t}}$ at particle level is shown. |

png pdf |
Additional Figure 47:
The breakdown of uncertainties for the normalised measurement of the differential $\mathrm{t\bar{t}}$ cross section as a function of $y_{\mathrm {t}}$ at particle level is shown. The contributions of each source of systematic uncertainty in each bin are indicated by the coloured lines. Experimental systematic uncertainties that are small in all bins are added in quadrature and shown as a single component. The statistical and total uncertainties are indicated by the shaded areas. |
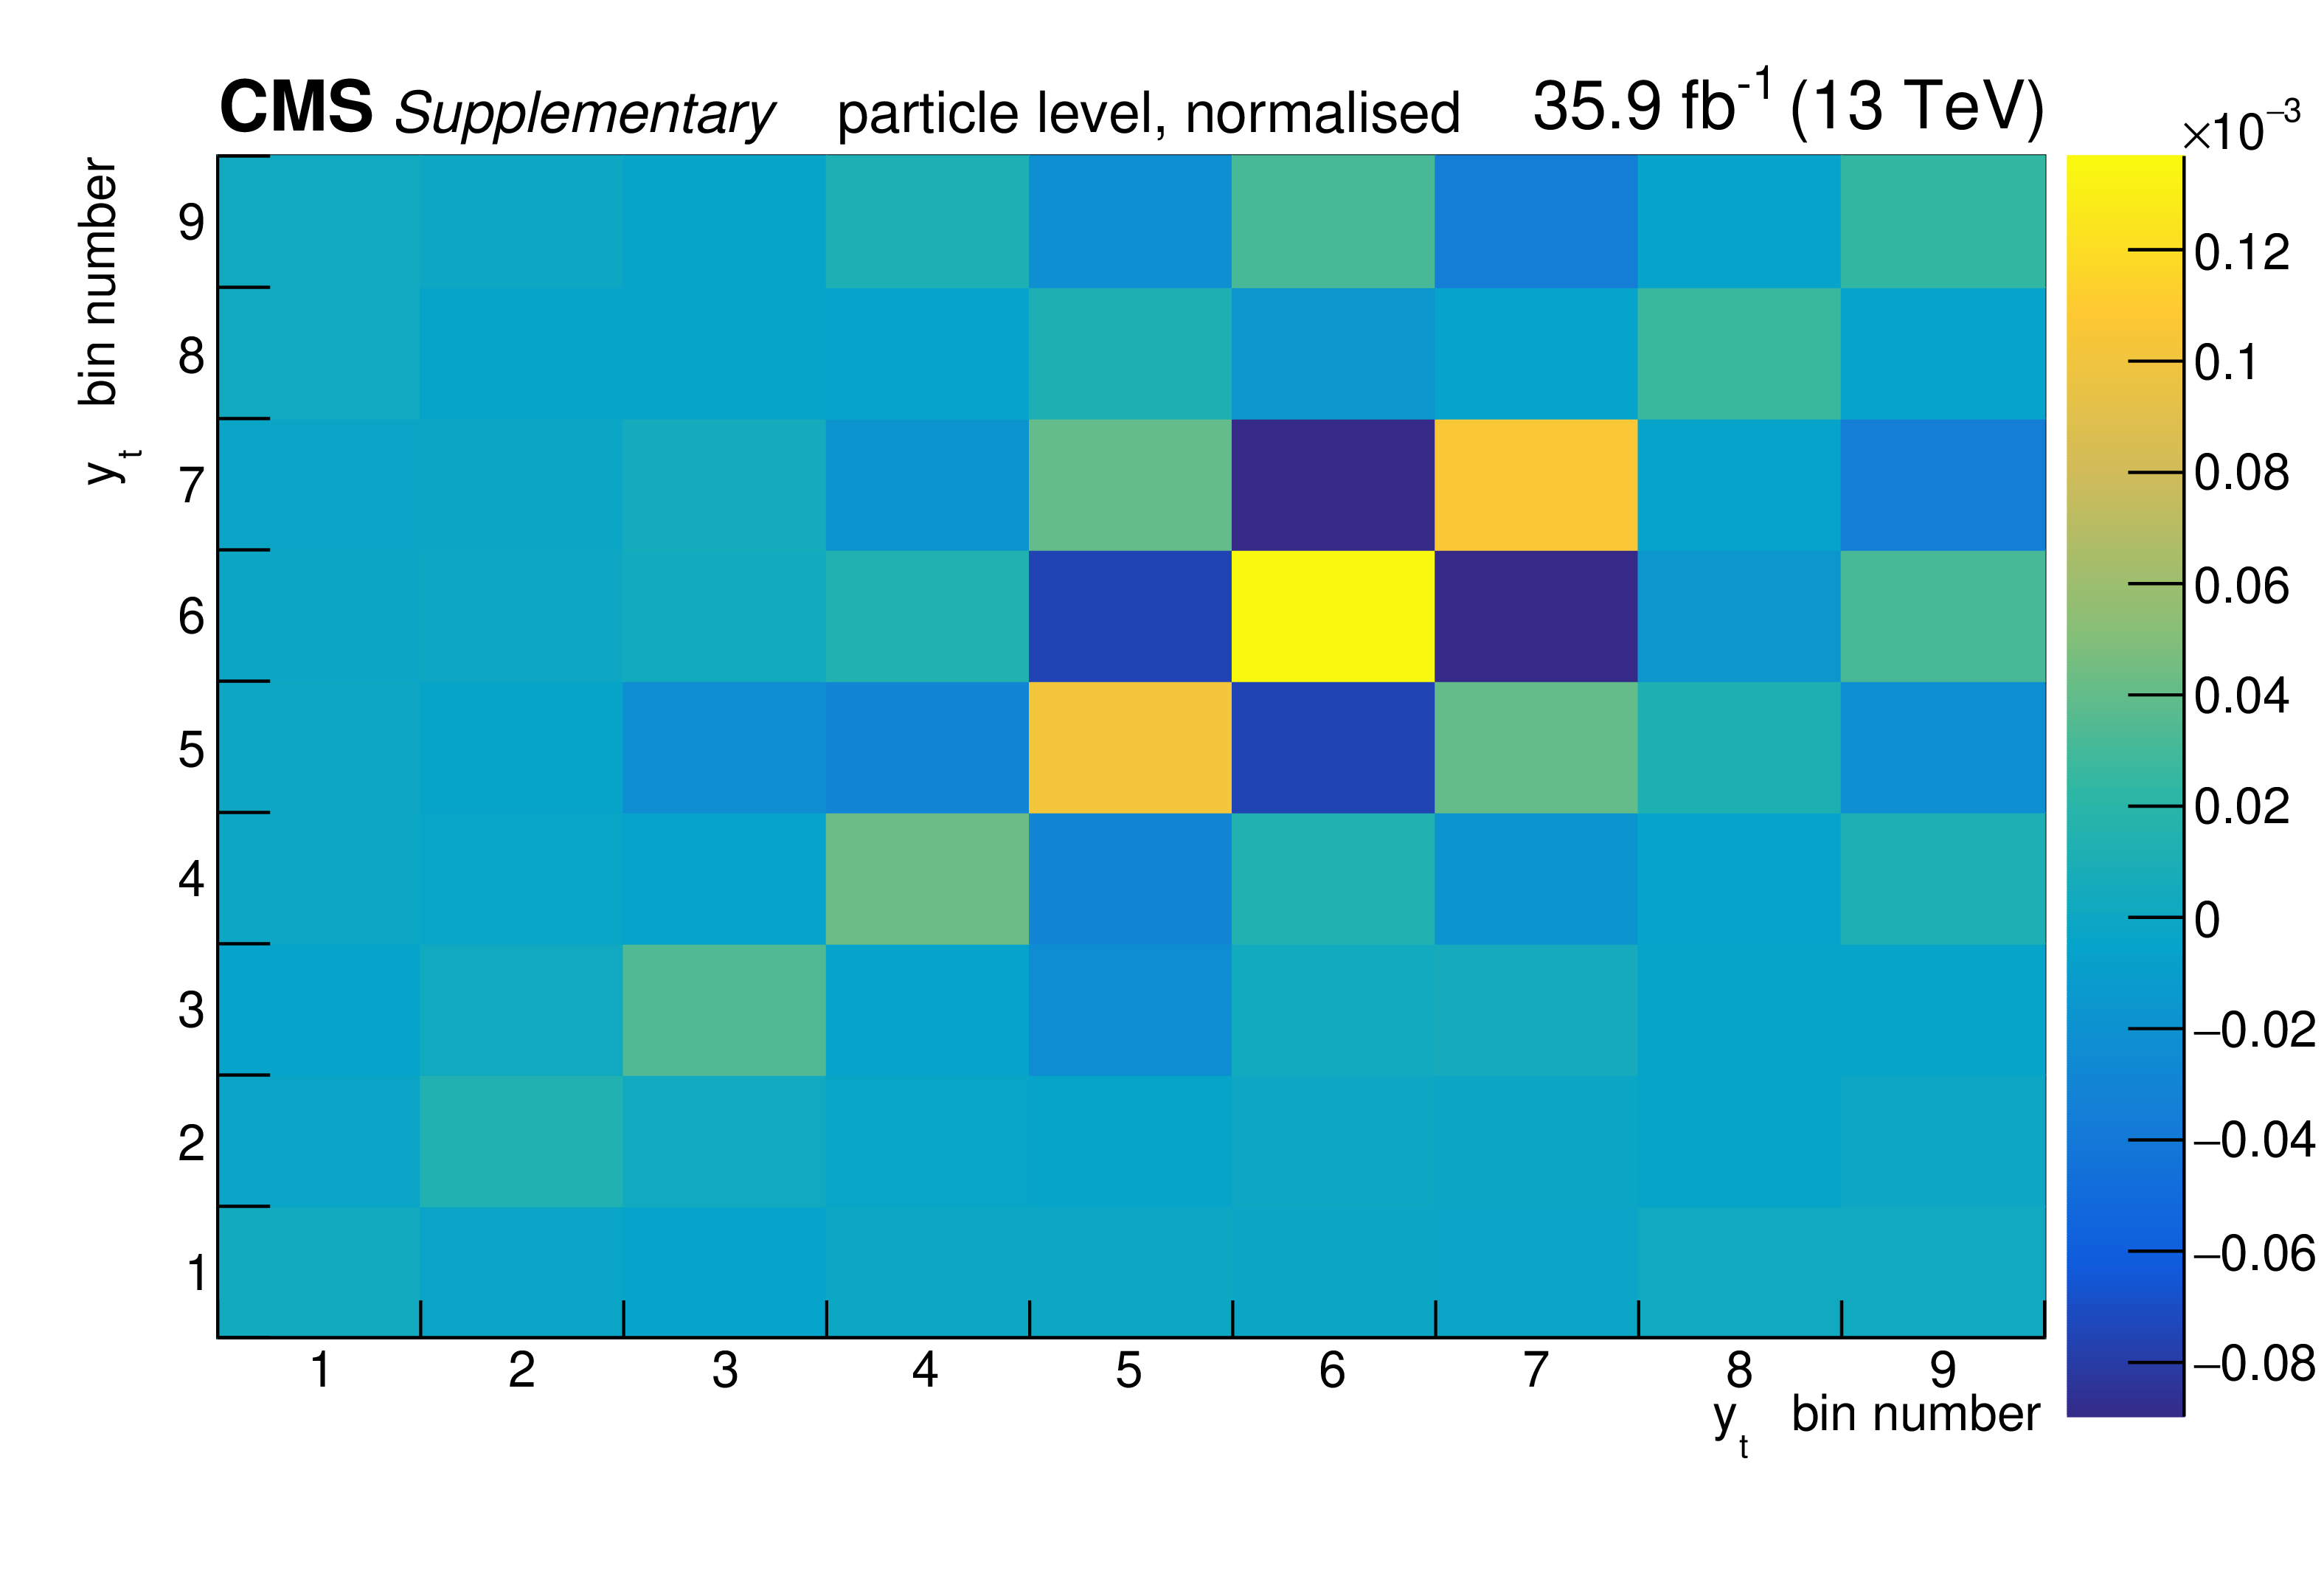
png pdf |
Additional Figure 48:
The covariance matrix of the measured data for the normalised measurement of the differential $\mathrm{t\bar{t}}$ cross section as a function of $y_{\mathrm {t}}$ at particle level is shown. |

png pdf |
Additional Figure 49:
The breakdown of uncertainties for the absolute measurement of the differential $\mathrm{t\bar{t}}$ cross section as a function of $y_{\bar{\mathrm {t}}}$ at parton level is shown. The contributions of each source of systematic uncertainty in each bin are indicated by the coloured lines. Experimental systematic uncertainties that are small in all bins are added in quadrature and shown as a single component. The statistical and total uncertainties are indicated by the shaded areas. |
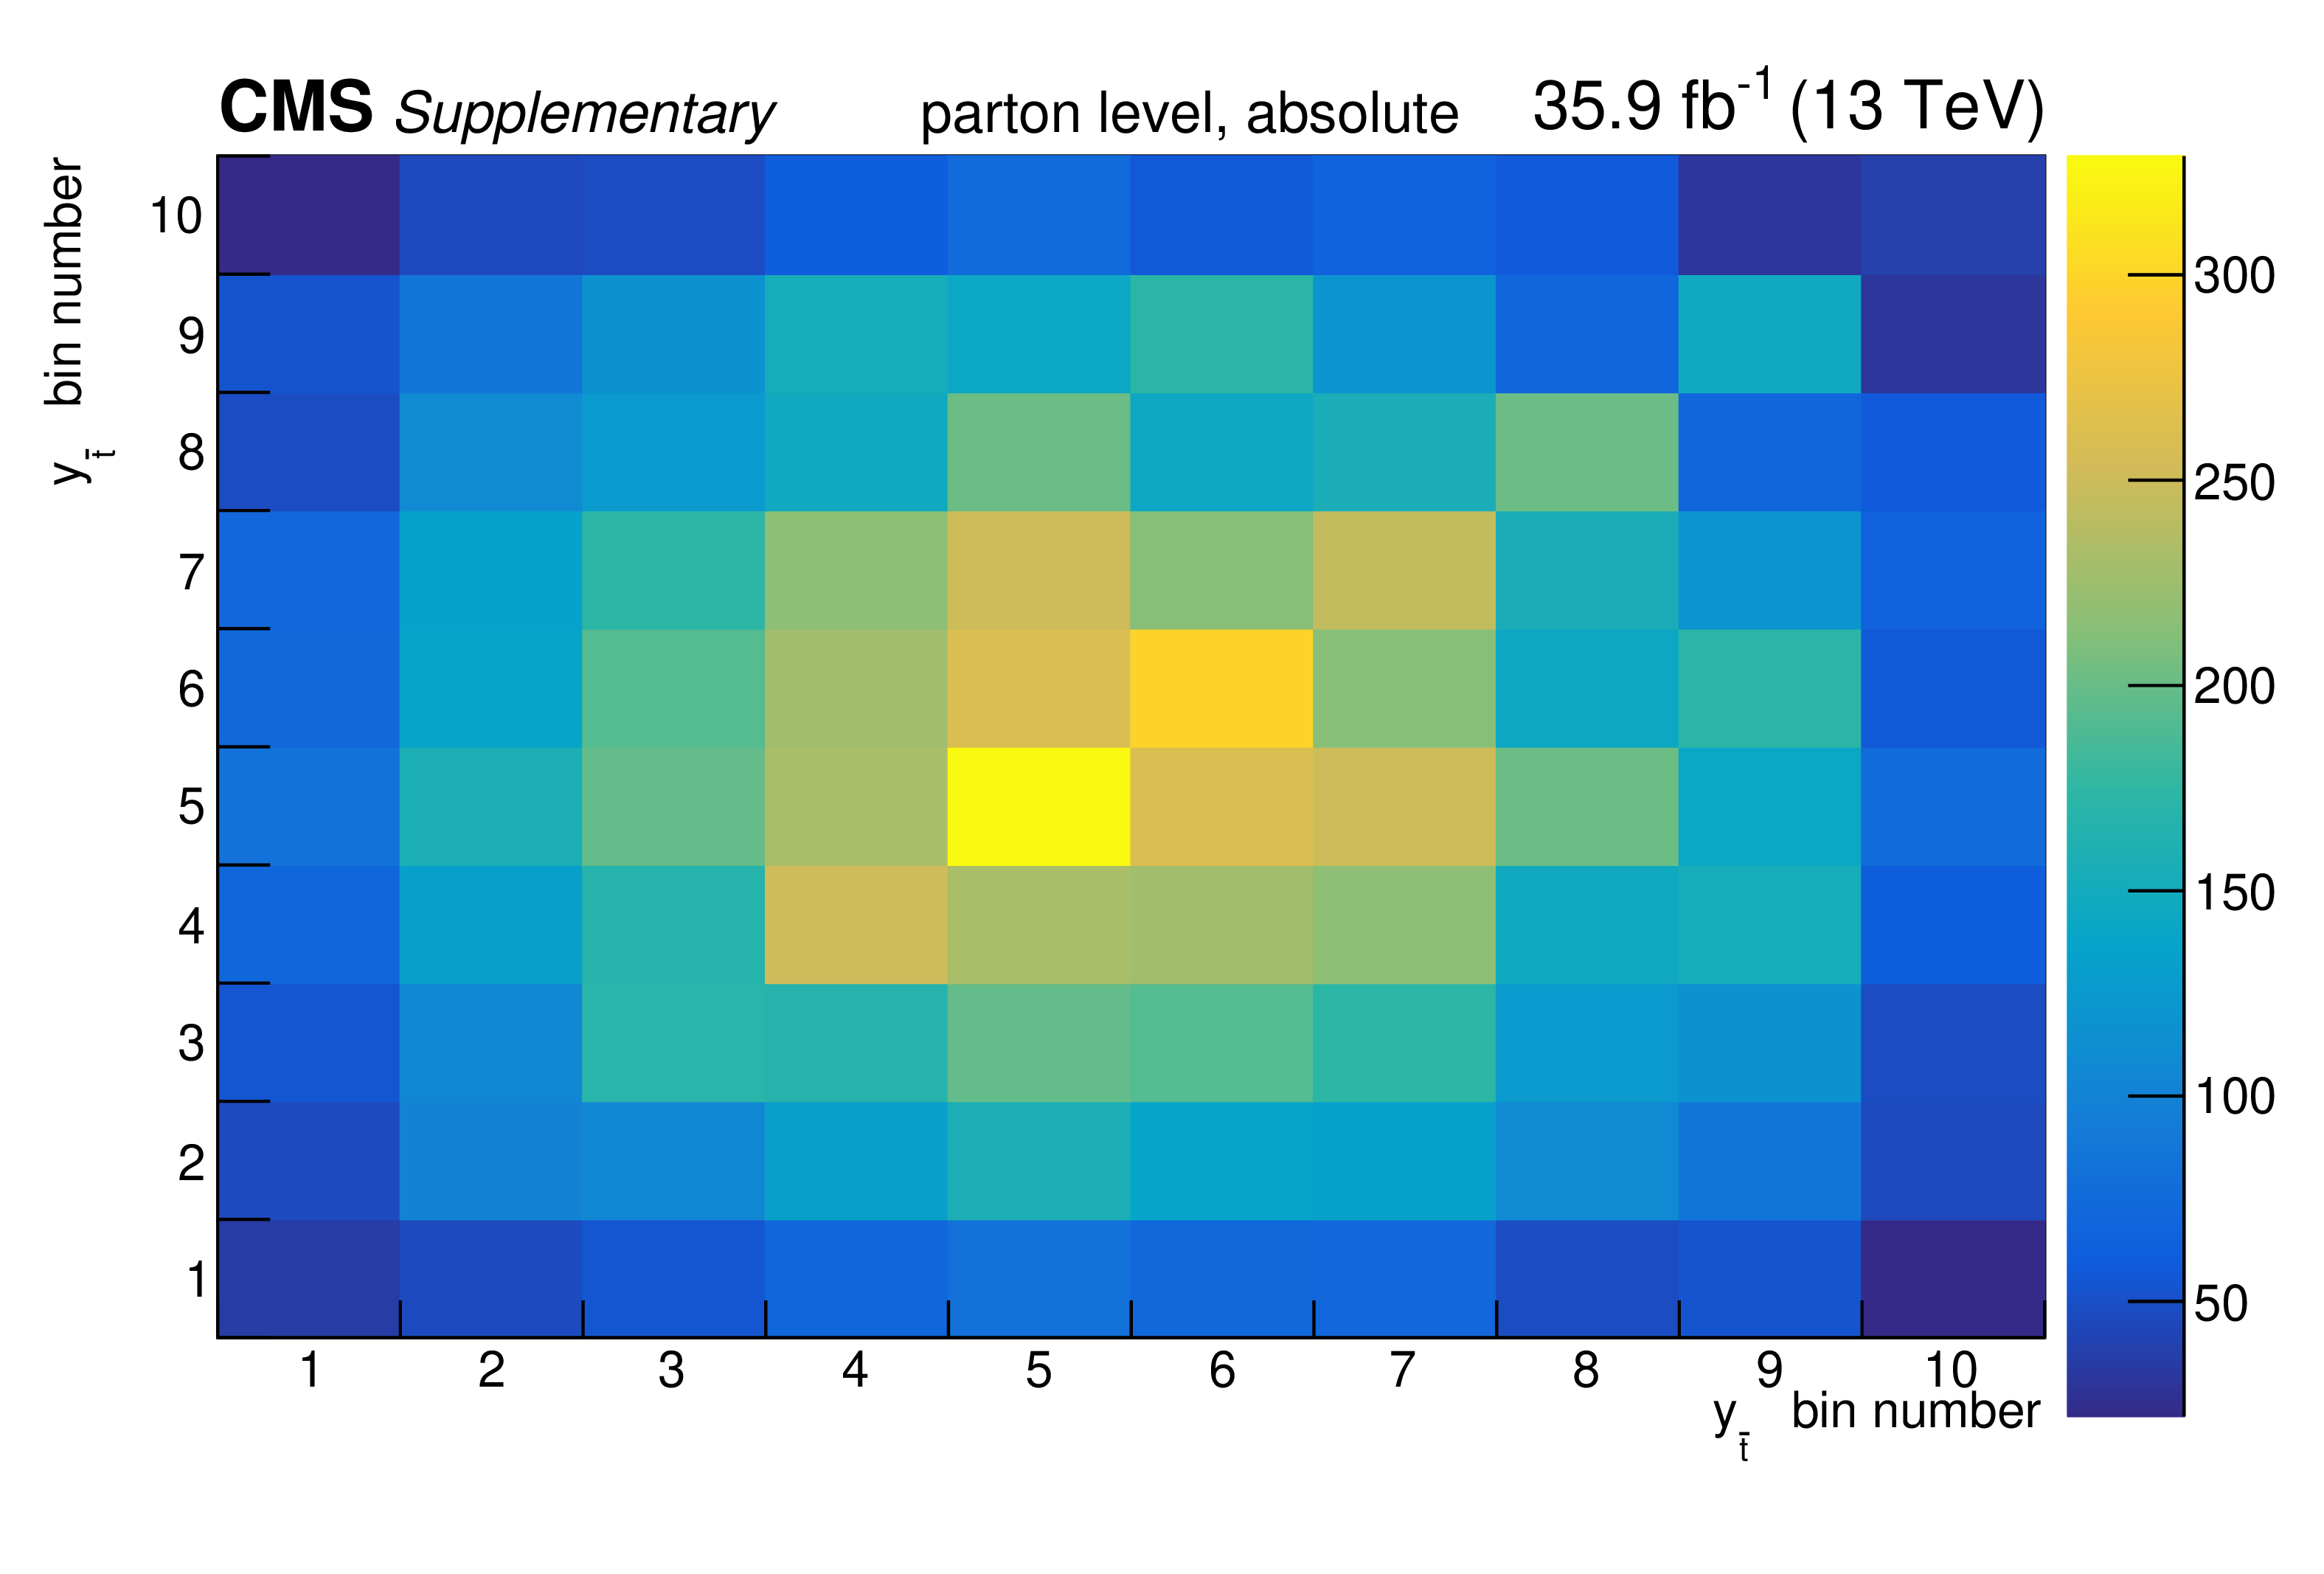
png pdf |
Additional Figure 50:
The covariance matrix of the measured data for the absolute measurement of the differential $\mathrm{t\bar{t}}$ cross section as a function of $y_{\bar{\mathrm {t}}}$ at parton level is shown. |

png pdf |
Additional Figure 51:
The breakdown of uncertainties for the normalised measurement of the differential $\mathrm{t\bar{t}}$ cross section as a function of $y_{\bar{\mathrm {t}}}$ at parton level is shown. The contributions of each source of systematic uncertainty in each bin are indicated by the coloured lines. Experimental systematic uncertainties that are small in all bins are added in quadrature and shown as a single component. The statistical and total uncertainties are indicated by the shaded areas. |

png pdf |
Additional Figure 52:
The covariance matrix of the measured data for the normalised measurement of the differential $\mathrm{t\bar{t}}$ cross section as a function of $y_{\bar{\mathrm {t}}}$ at parton level is shown. |
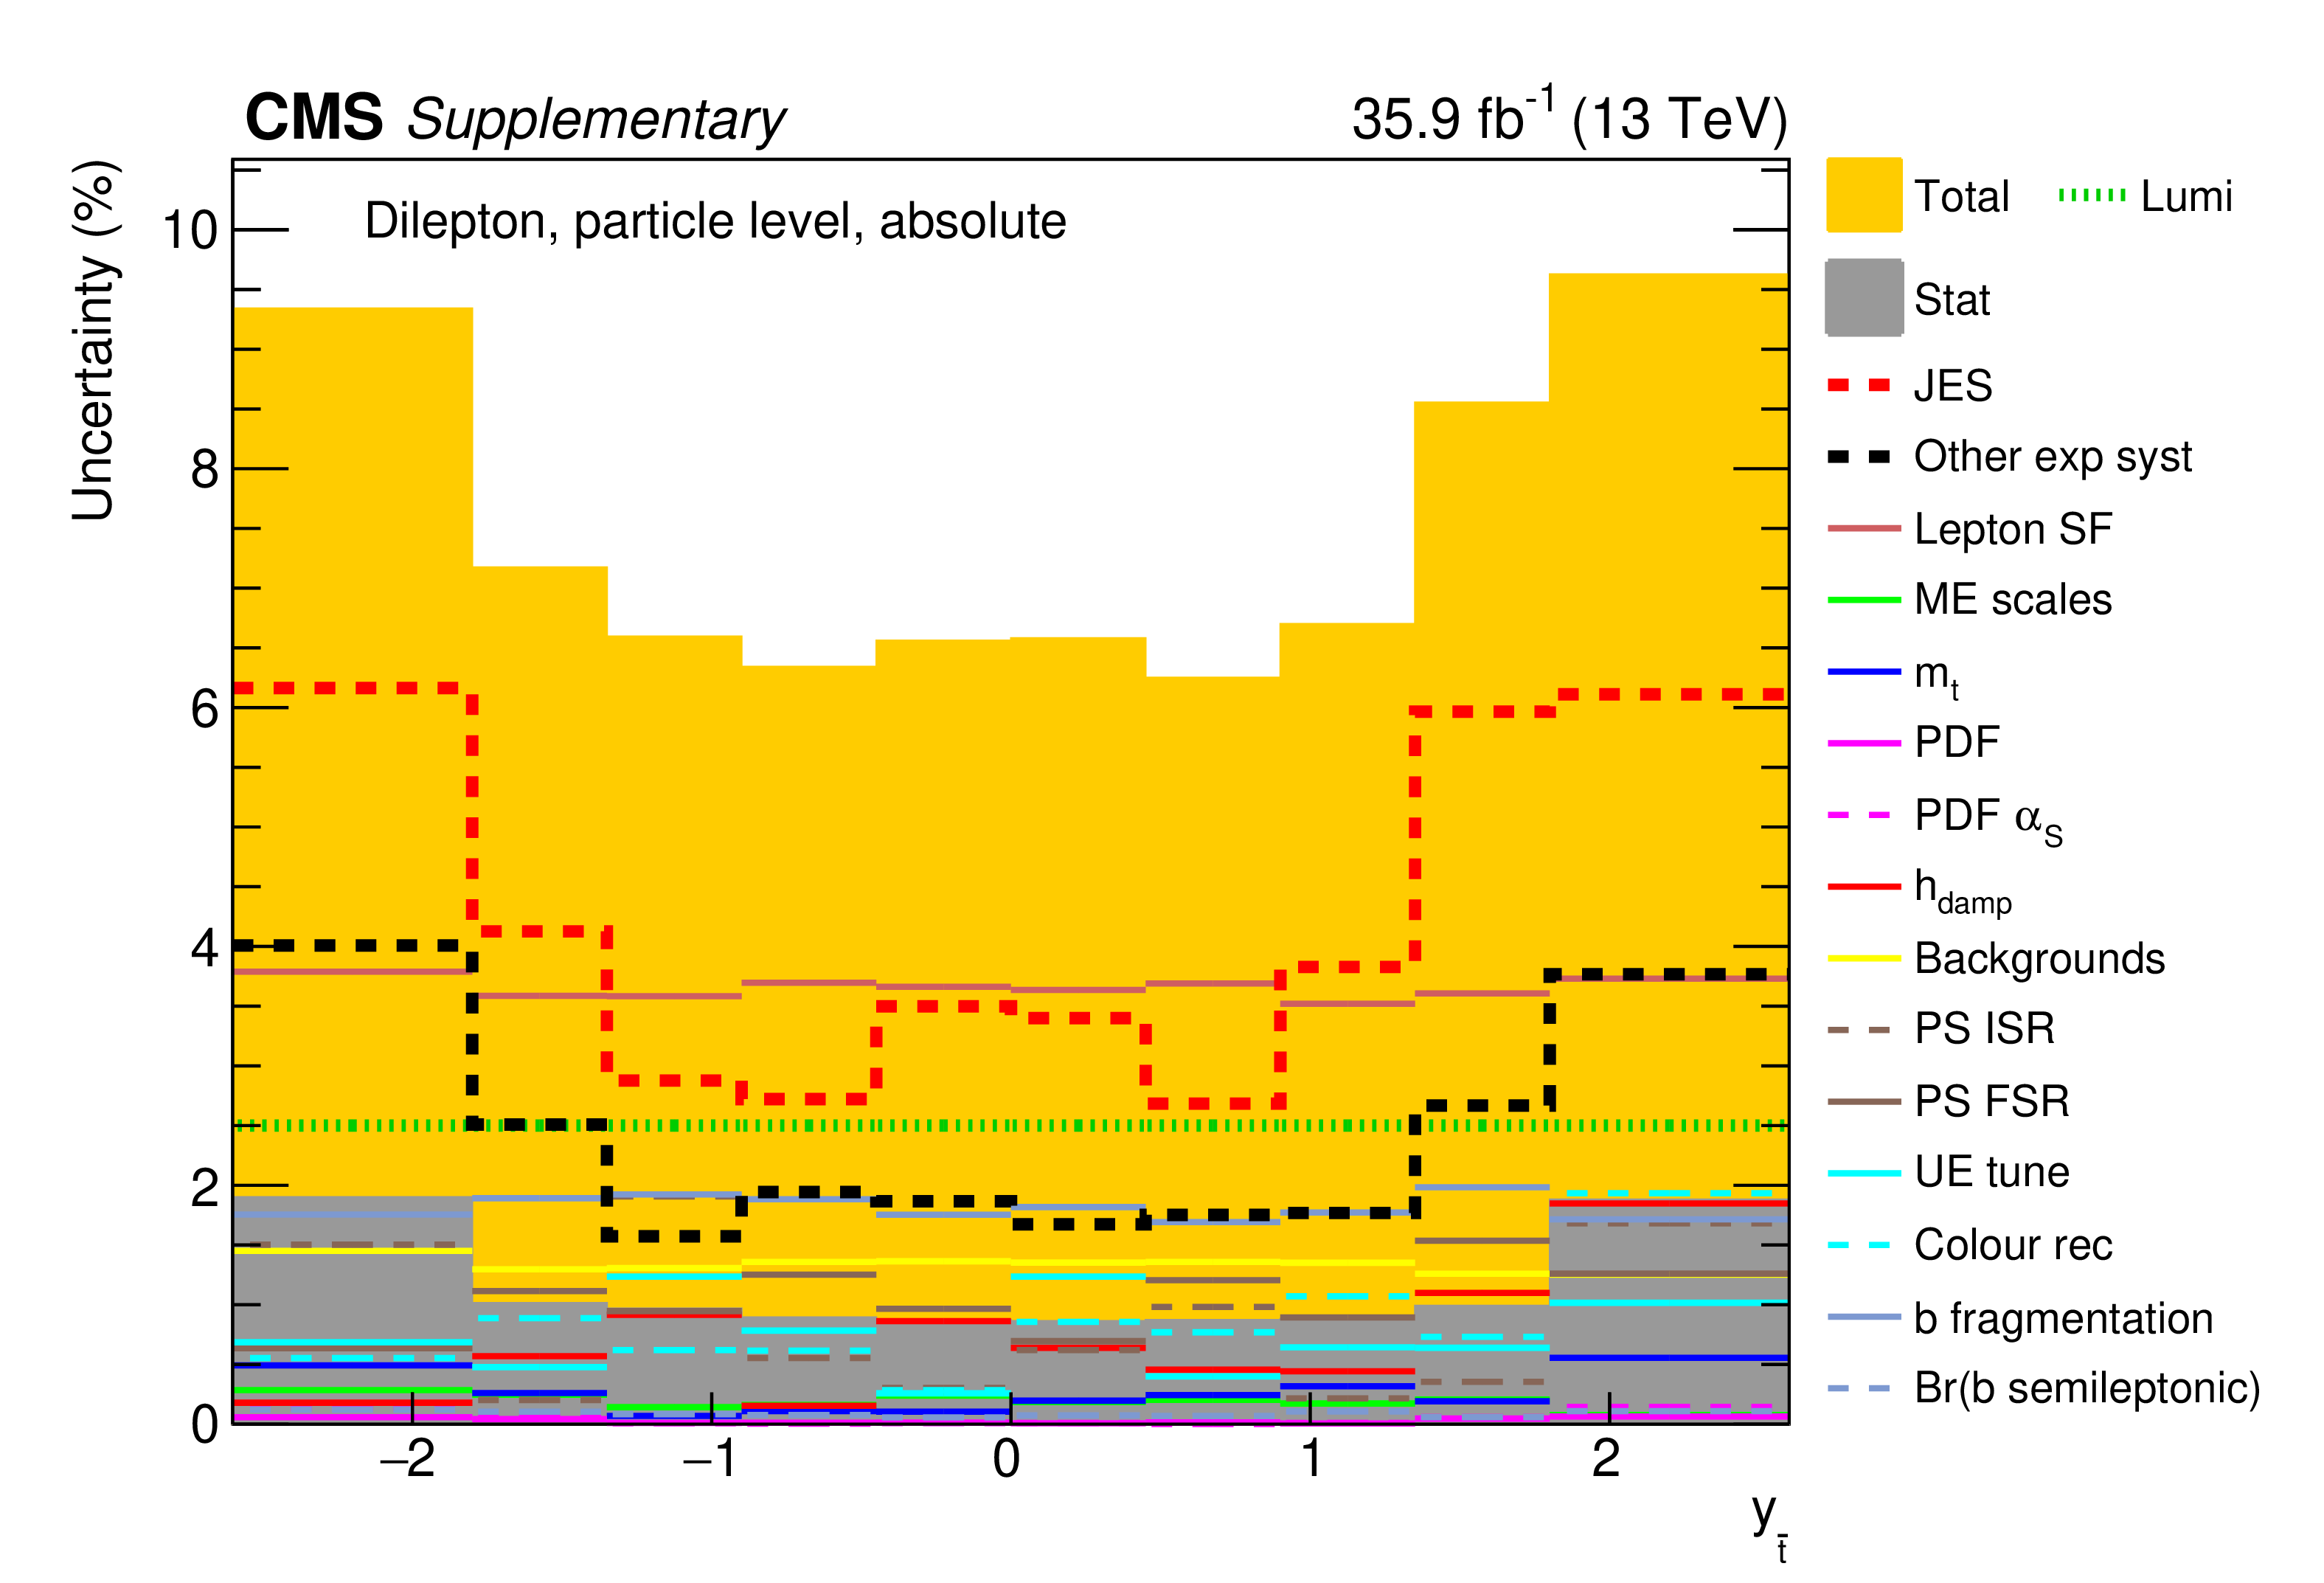
png pdf |
Additional Figure 53:
The breakdown of uncertainties for the absolute measurement of the differential $\mathrm{t\bar{t}}$ cross section as a function of $y_{\bar{\mathrm {t}}}$ at particle level is shown. The contributions of each source of systematic uncertainty in each bin are indicated by the coloured lines. Experimental systematic uncertainties that are small in all bins are added in quadrature and shown as a single component. The statistical and total uncertainties are indicated by the shaded areas. |
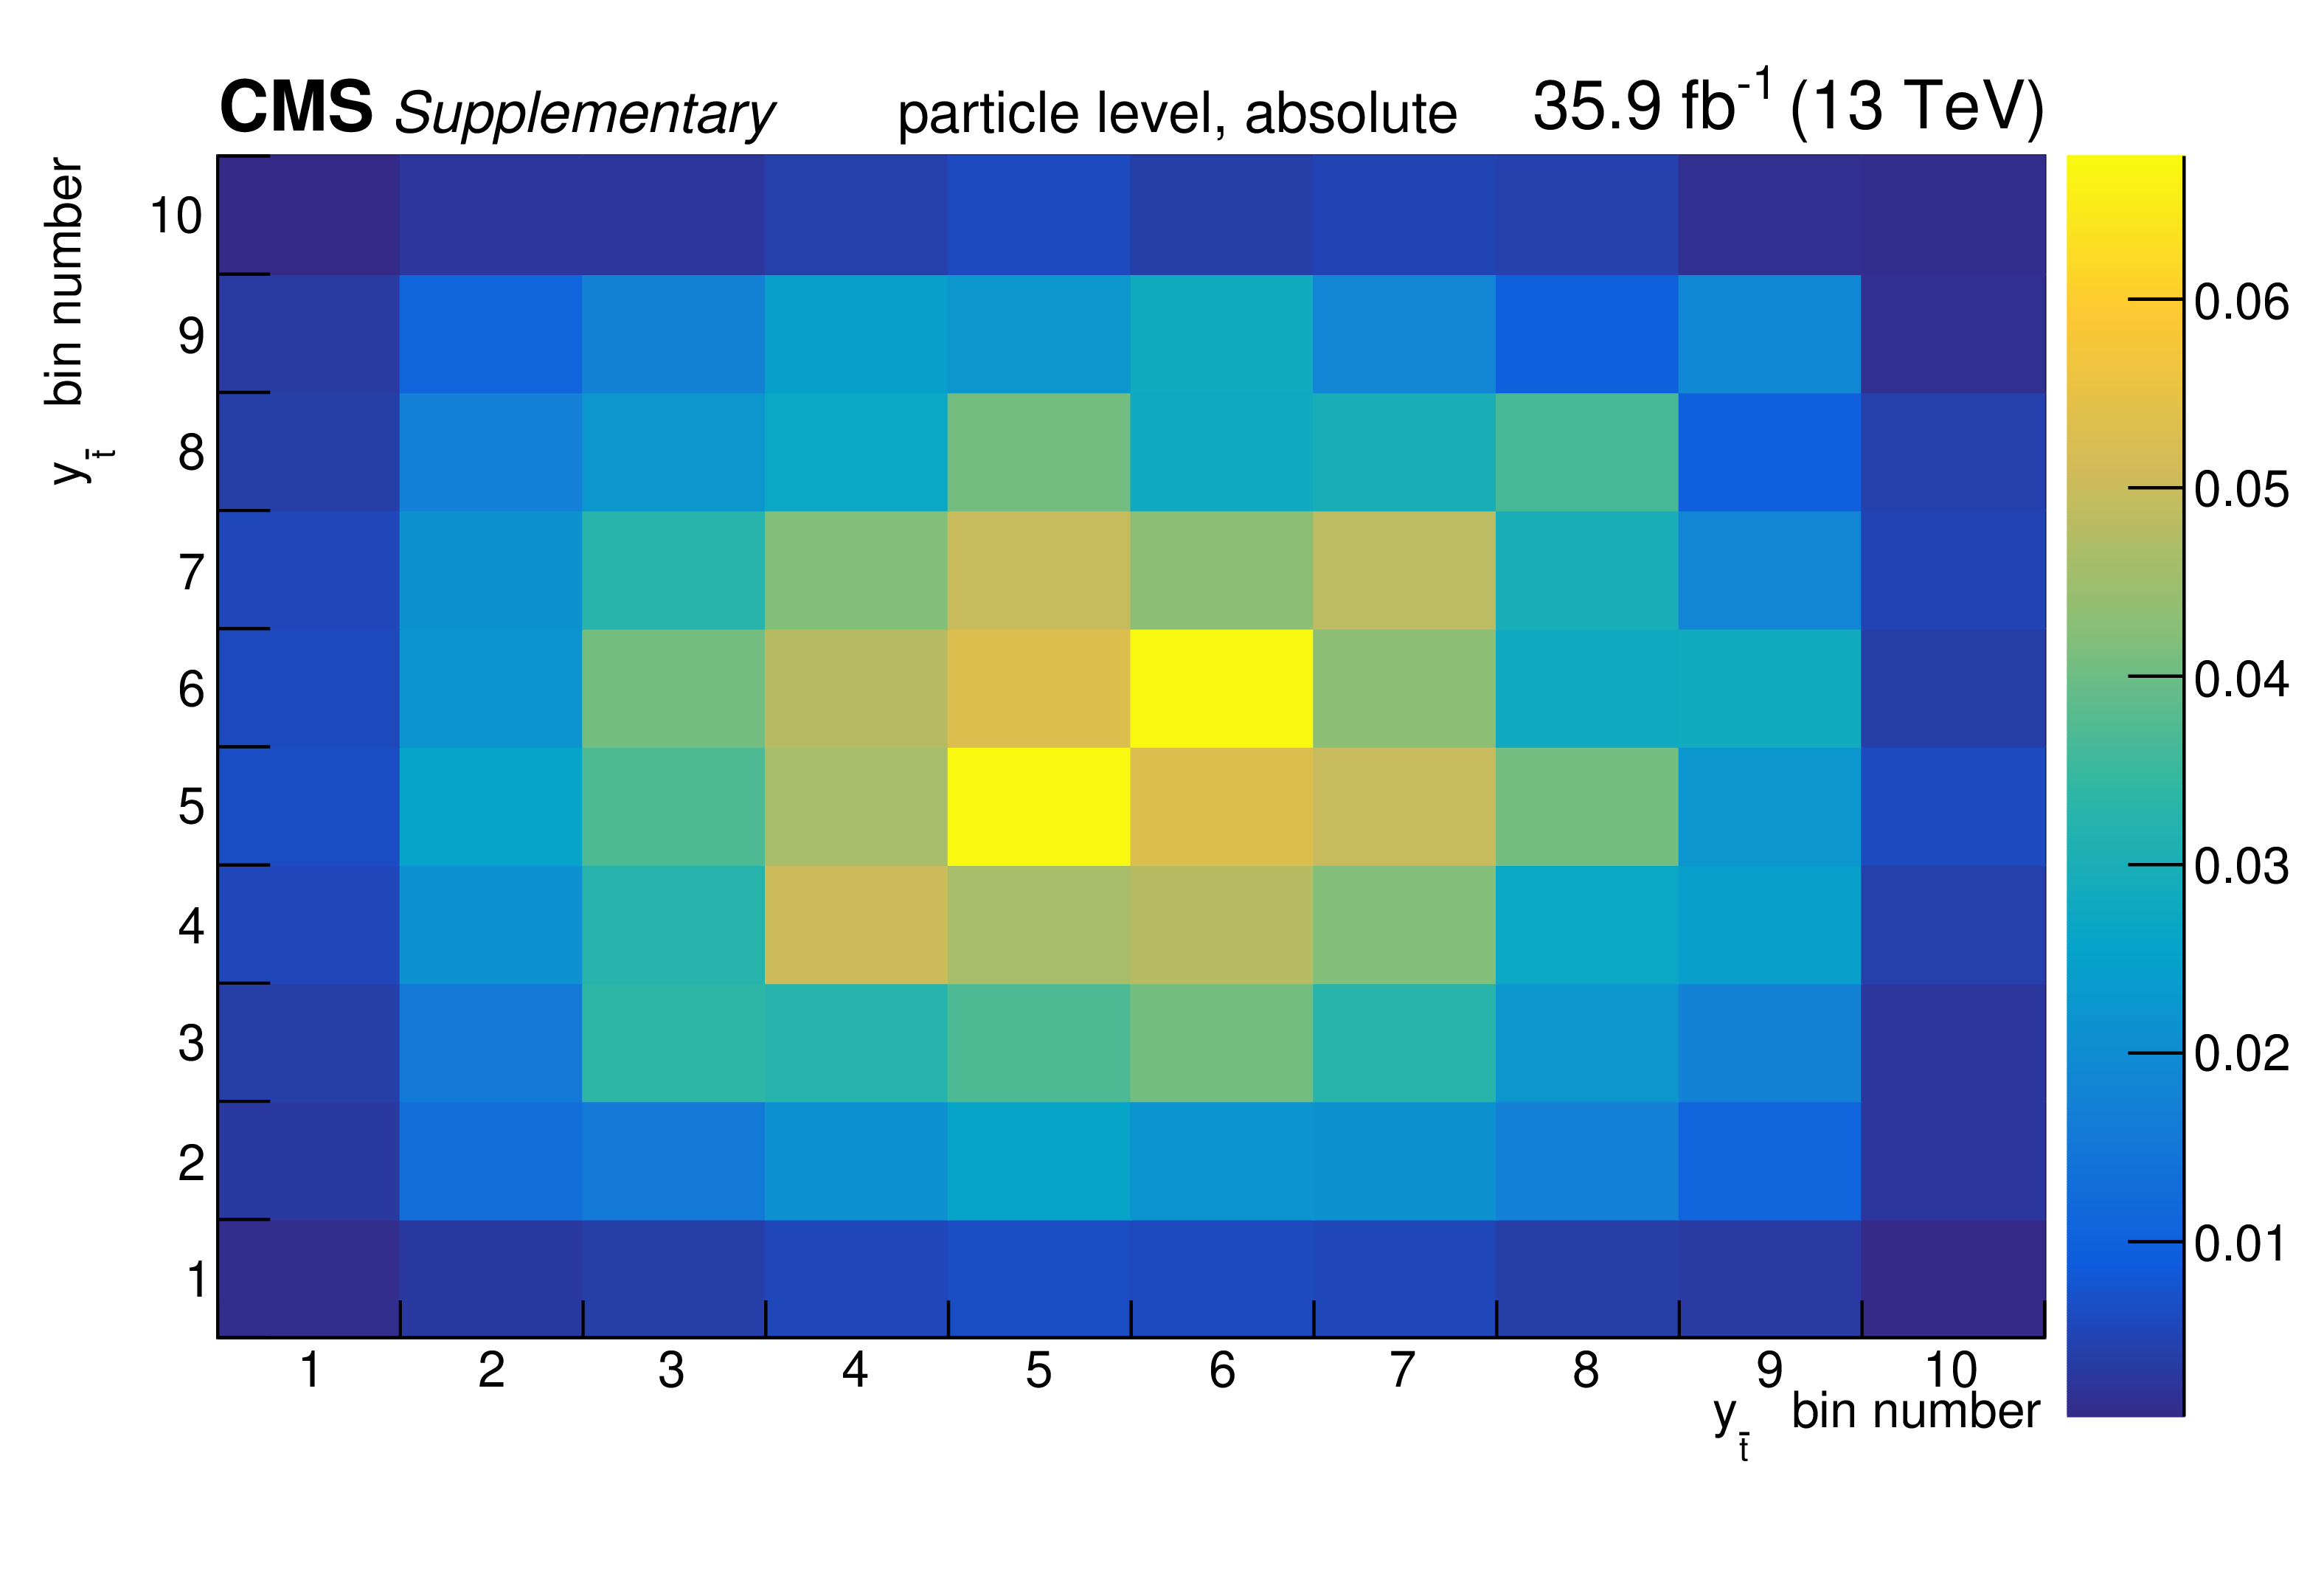
png pdf |
Additional Figure 54:
The covariance matrix of the measured data for the absolute measurement of the differential $\mathrm{t\bar{t}}$ cross section as a function of $y_{\bar{\mathrm {t}}}$ at particle level is shown. |

png pdf |
Additional Figure 55:
The breakdown of uncertainties for the normalised measurement of the differential $\mathrm{t\bar{t}}$ cross section as a function of $y_{\bar{\mathrm {t}}}$ at particle level is shown. The contributions of each source of systematic uncertainty in each bin are indicated by the coloured lines. Experimental systematic uncertainties that are small in all bins are added in quadrature and shown as a single component. The statistical and total uncertainties are indicated by the shaded areas. |

png pdf |
Additional Figure 56:
The covariance matrix of the measured data for the normalised measurement of the differential $\mathrm{t\bar{t}}$ cross section as a function of $y_{\bar{\mathrm {t}}}$ at particle level is shown. |

png pdf |
Additional Figure 57:
The breakdown of uncertainties for the absolute measurement of the differential $\mathrm{t\bar{t}}$ cross section as a function of $y_{\mathrm {t}}$ (leading) at parton level is shown. The contributions of each source of systematic uncertainty in each bin are indicated by the coloured lines. Experimental systematic uncertainties that are small in all bins are added in quadrature and shown as a single component. The statistical and total uncertainties are indicated by the shaded areas. |

png pdf |
Additional Figure 58:
The covariance matrix of the measured data for the absolute measurement of the differential $\mathrm{t\bar{t}}$ cross section as a function of $y_{\mathrm {t}}$ (leading) at parton level is shown. |

png pdf |
Additional Figure 59:
The breakdown of uncertainties for the normalised measurement of the differential $\mathrm{t\bar{t}}$ cross section as a function of $y_{\mathrm {t}}$ (leading) at parton level is shown. The contributions of each source of systematic uncertainty in each bin are indicated by the coloured lines. Experimental systematic uncertainties that are small in all bins are added in quadrature and shown as a single component. The statistical and total uncertainties are indicated by the shaded areas. |

png pdf |
Additional Figure 60:
The covariance matrix of the measured data for the normalised measurement of the differential $\mathrm{t\bar{t}}$ cross section as a function of $y_{\mathrm {t}}$ (leading) at parton level is shown. |

png pdf |
Additional Figure 61:
The breakdown of uncertainties for the absolute measurement of the differential $\mathrm{t\bar{t}}$ cross section as a function of $y_{\mathrm {t}}$ (leading) at particle level is shown. The contributions of each source of systematic uncertainty in each bin are indicated by the coloured lines. Experimental systematic uncertainties that are small in all bins are added in quadrature and shown as a single component. The statistical and total uncertainties are indicated by the shaded areas. |
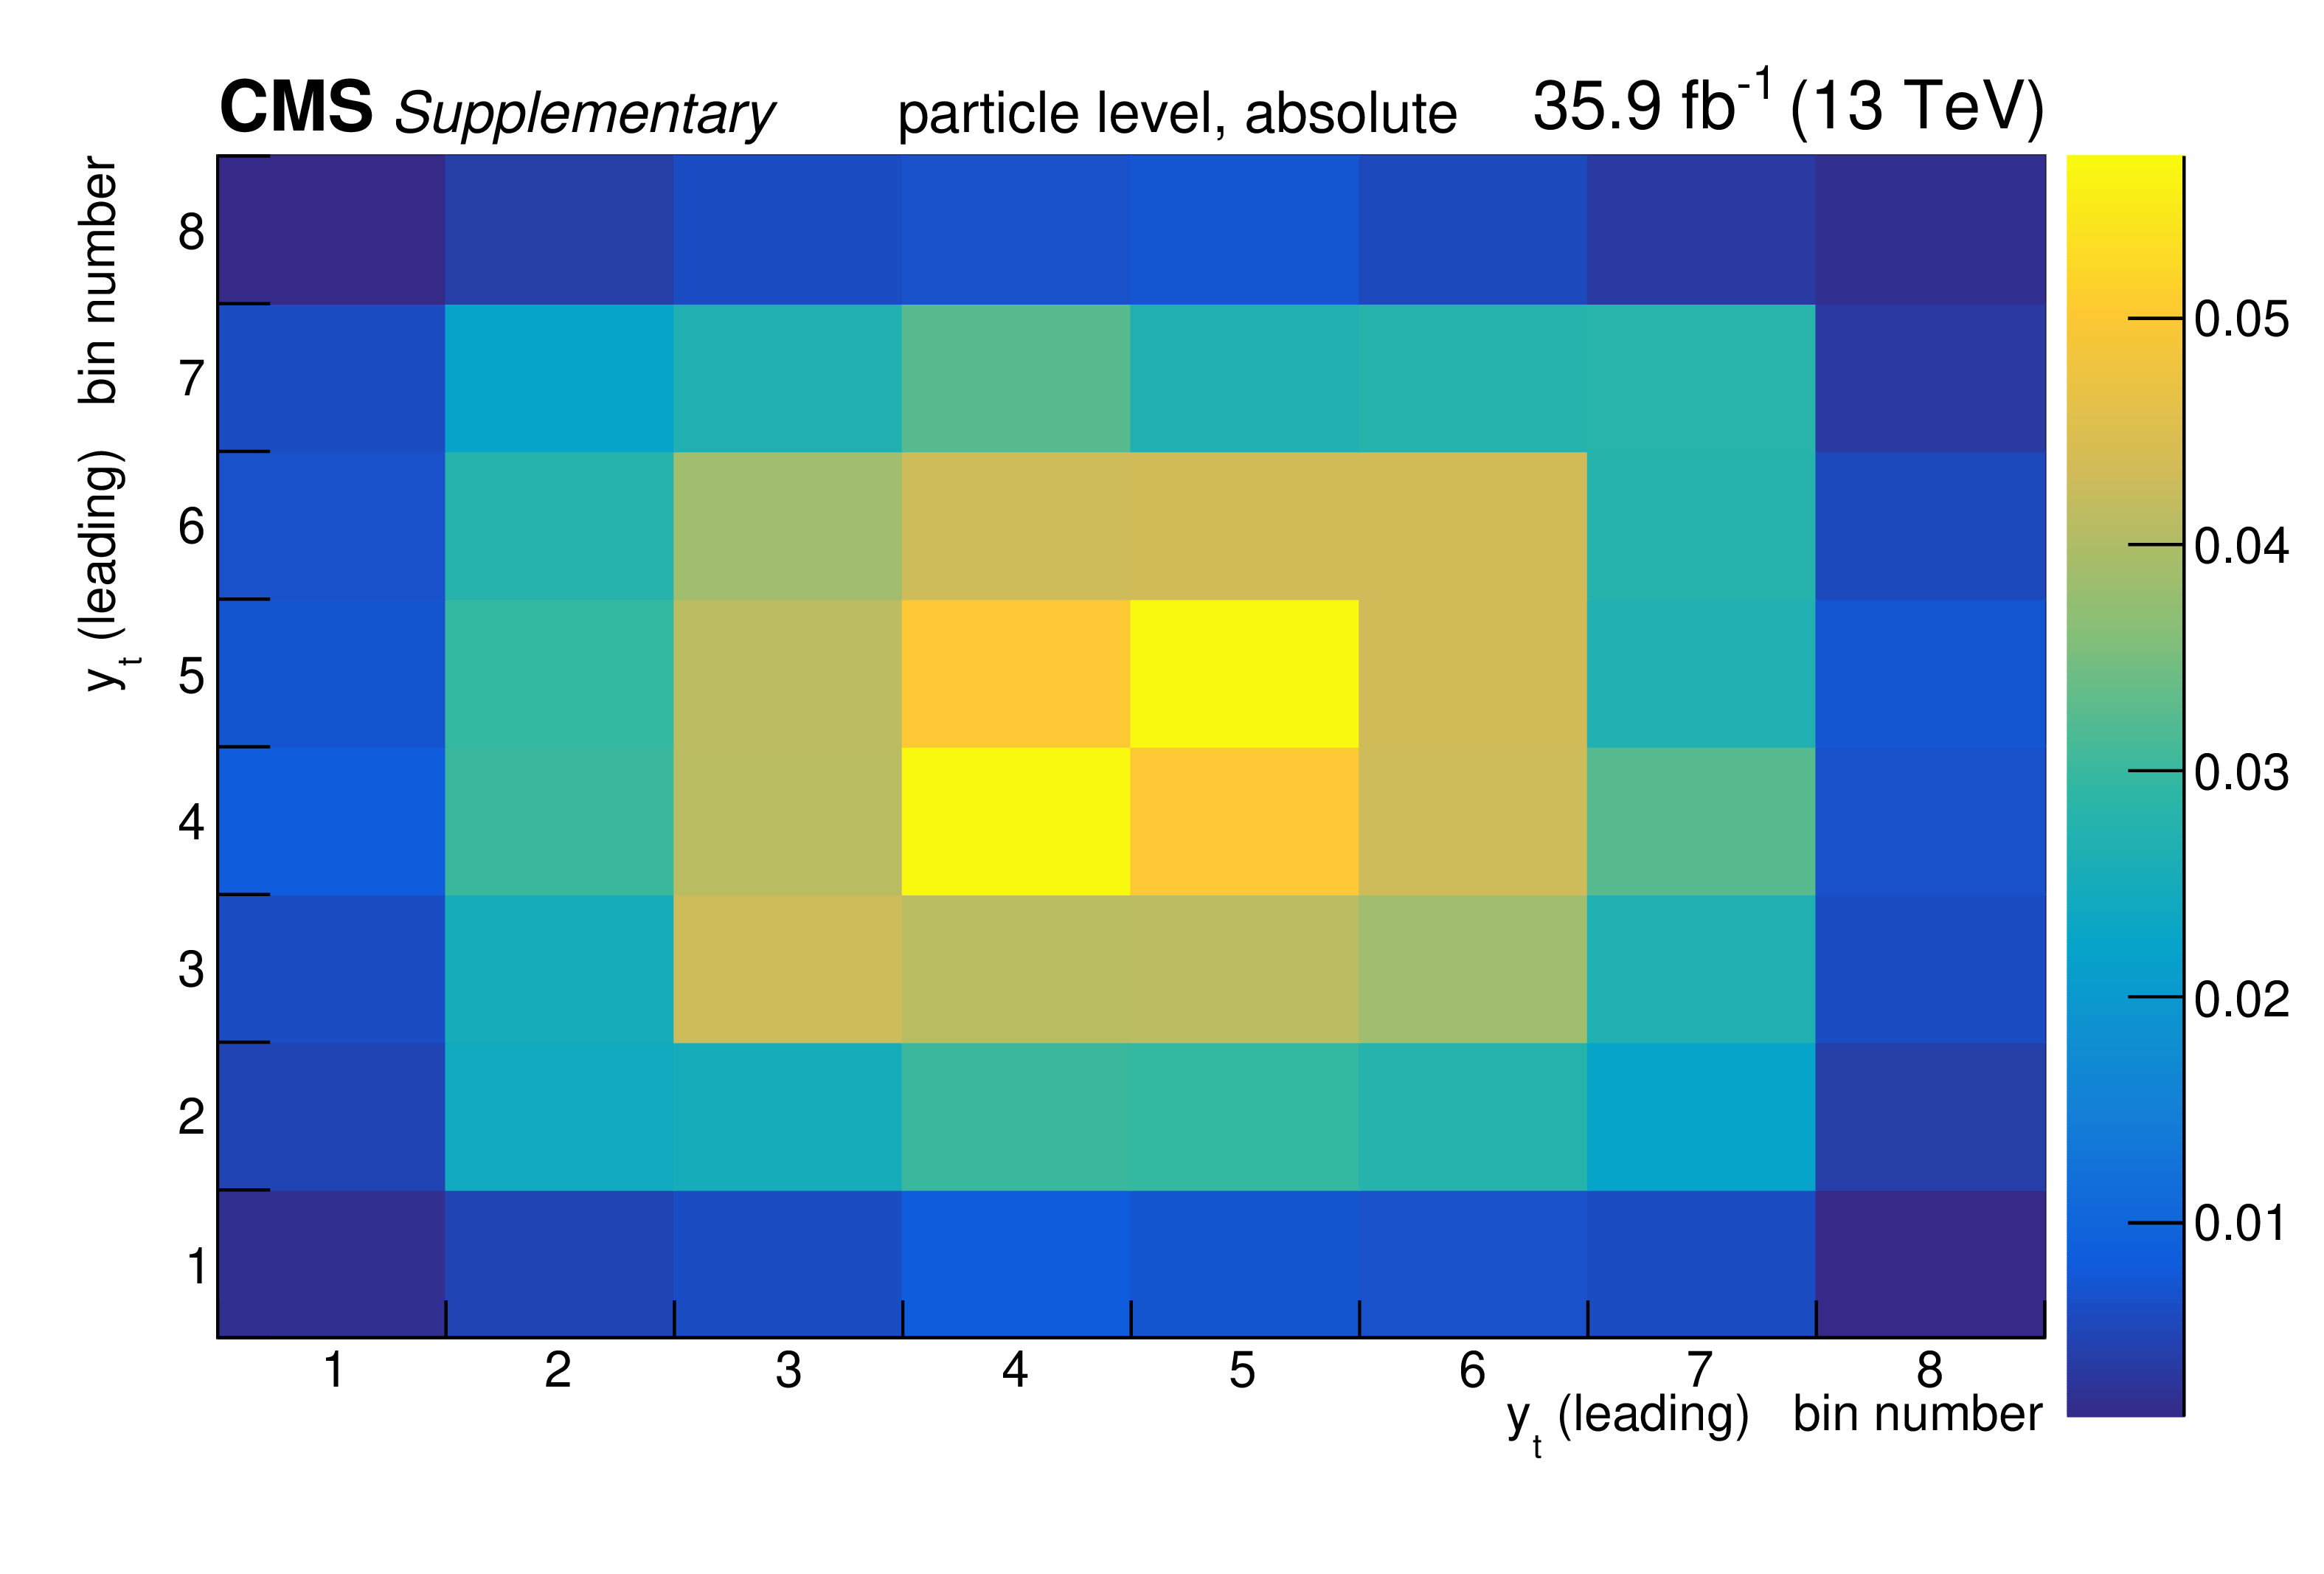
png pdf |
Additional Figure 62:
The covariance matrix of the measured data for the absolute measurement of the differential $\mathrm{t\bar{t}}$ cross section as a function of $y_{\mathrm {t}}$ (leading) at particle level is shown. |

png pdf |
Additional Figure 63:
The breakdown of uncertainties for the normalised measurement of the differential $\mathrm{t\bar{t}}$ cross section as a function of $y_{\mathrm {t}}$ (leading) at particle level is shown. The contributions of each source of systematic uncertainty in each bin are indicated by the coloured lines. Experimental systematic uncertainties that are small in all bins are added in quadrature and shown as a single component. The statistical and total uncertainties are indicated by the shaded areas. |

png pdf |
Additional Figure 64:
The covariance matrix of the measured data for the normalised measurement of the differential $\mathrm{t\bar{t}}$ cross section as a function of $y_{\mathrm {t}}$ (leading) at particle level is shown. |
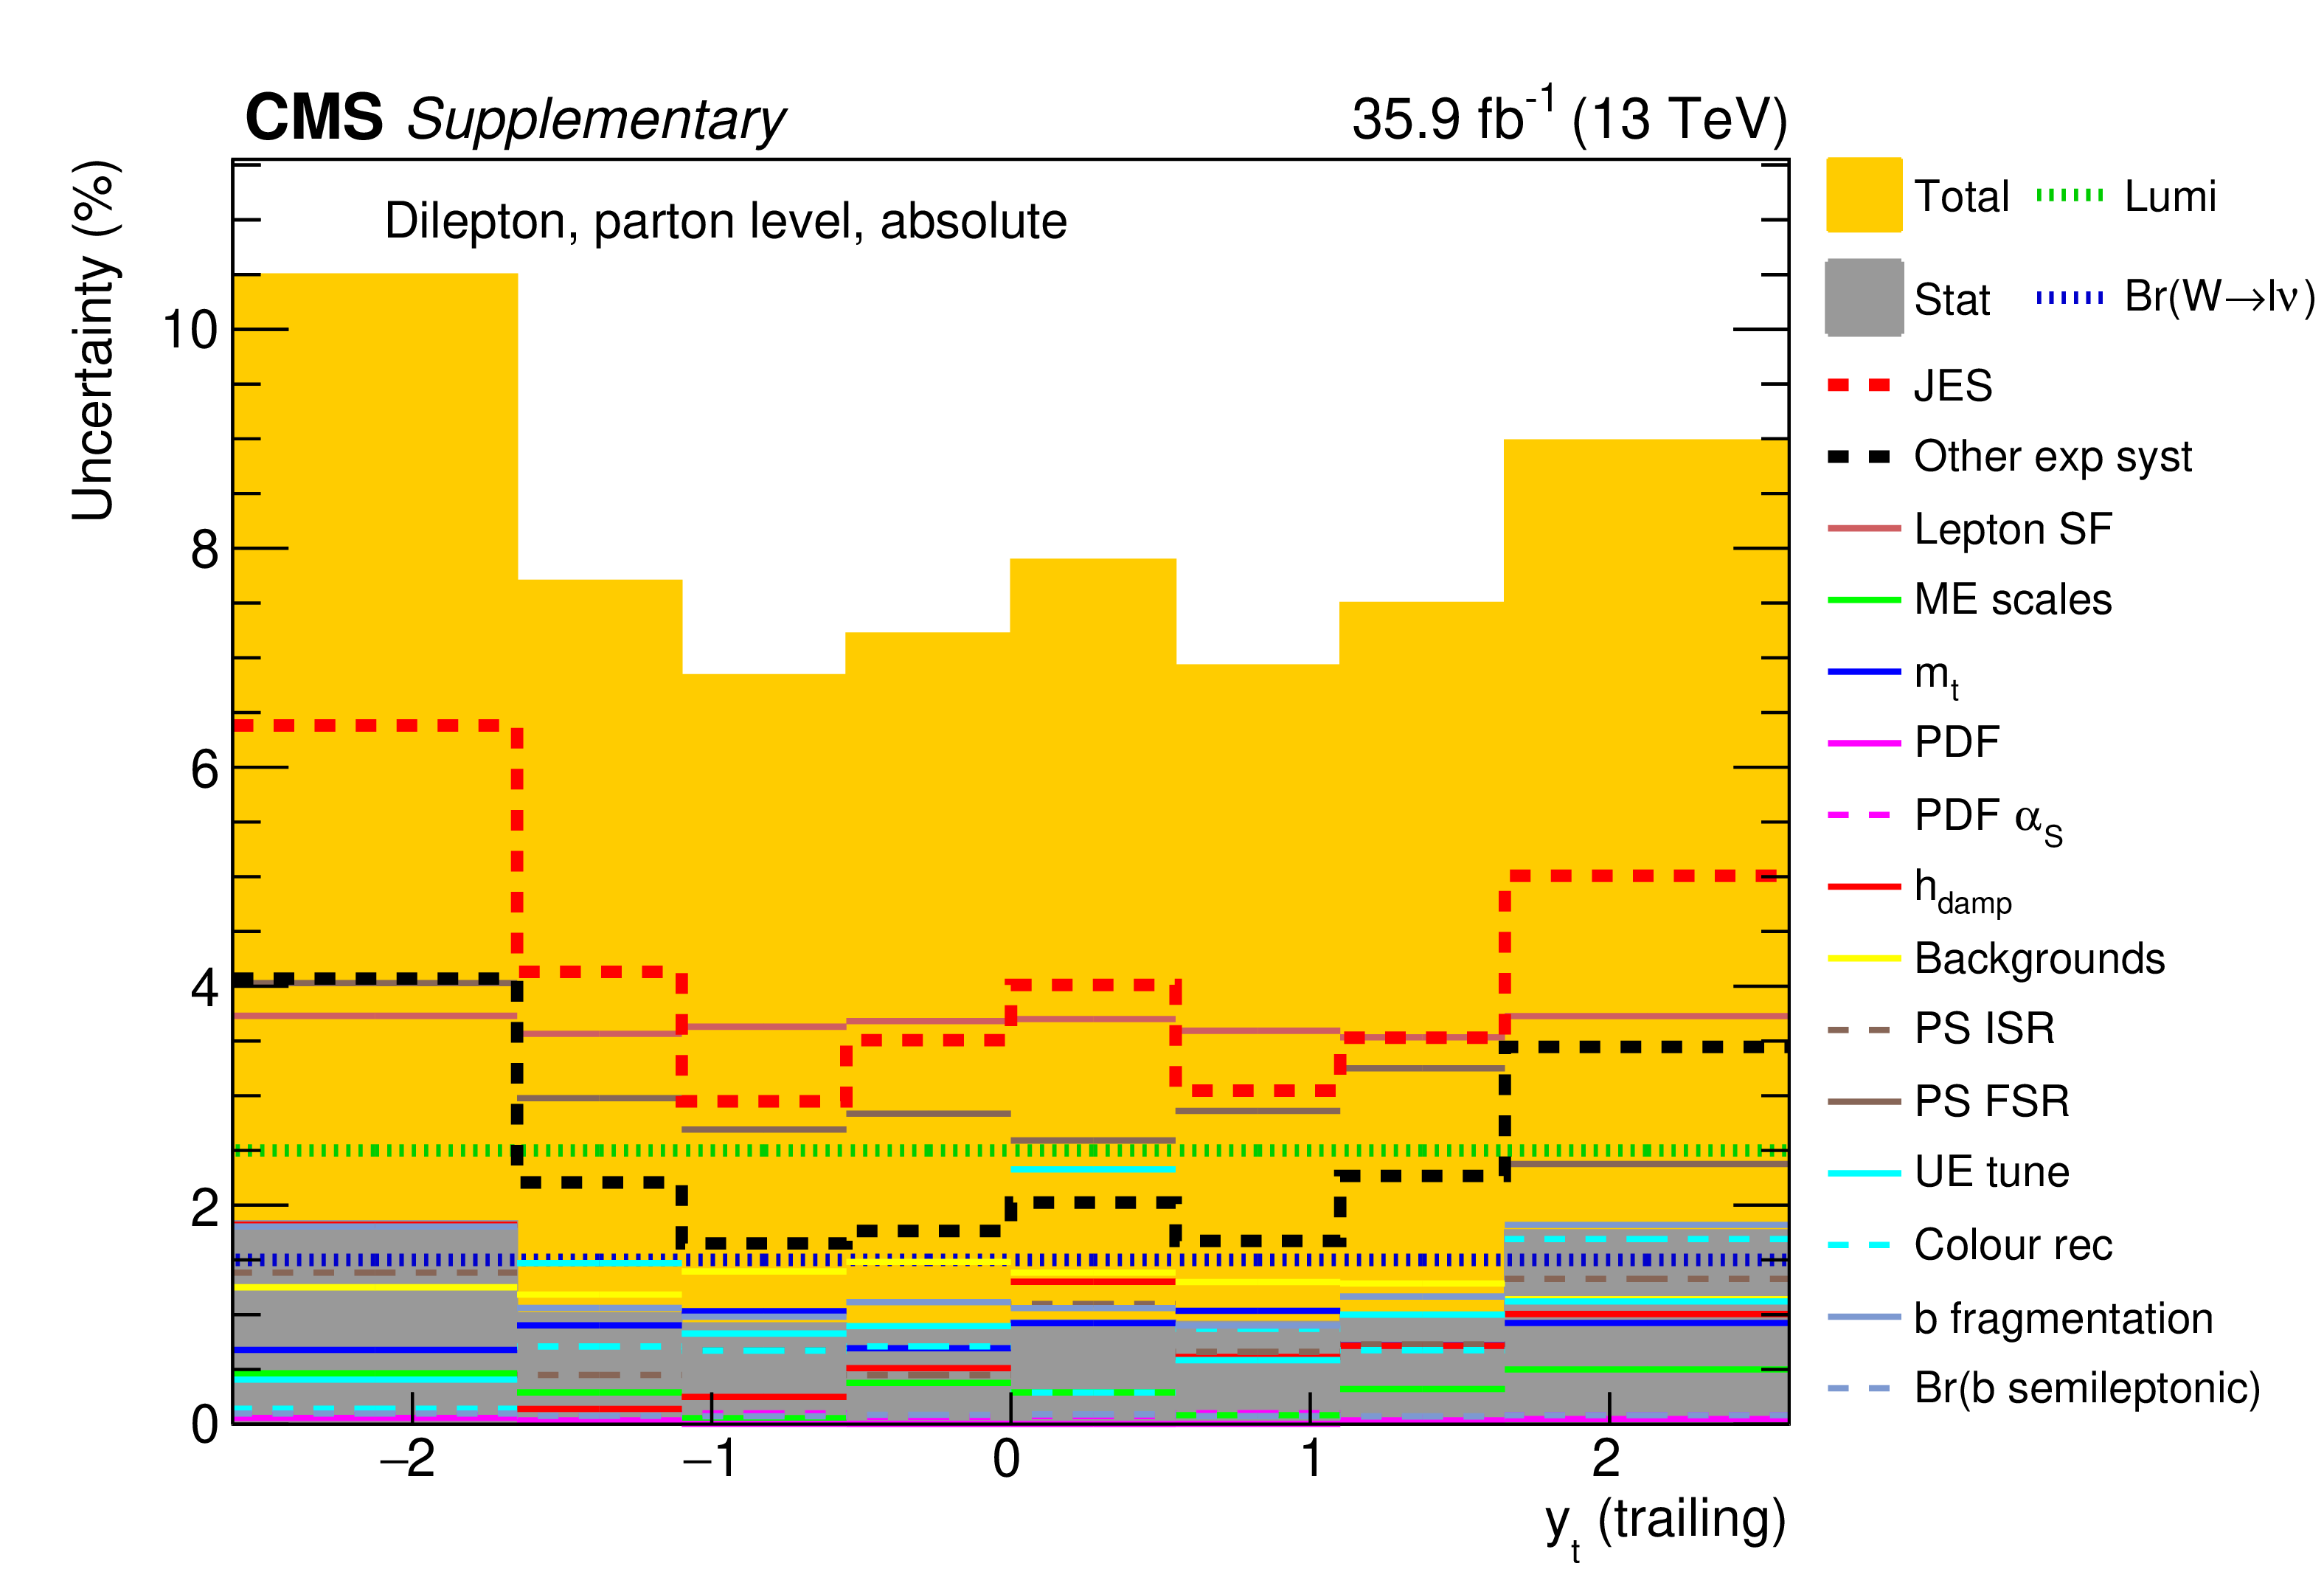
png pdf |
Additional Figure 65:
The breakdown of uncertainties for the absolute measurement of the differential $\mathrm{t\bar{t}}$ cross section as a function of $y_{\mathrm {t}}$ (trailing) at parton level is shown. The contributions of each source of systematic uncertainty in each bin are indicated by the coloured lines. Experimental systematic uncertainties that are small in all bins are added in quadrature and shown as a single component. The statistical and total uncertainties are indicated by the shaded areas. |
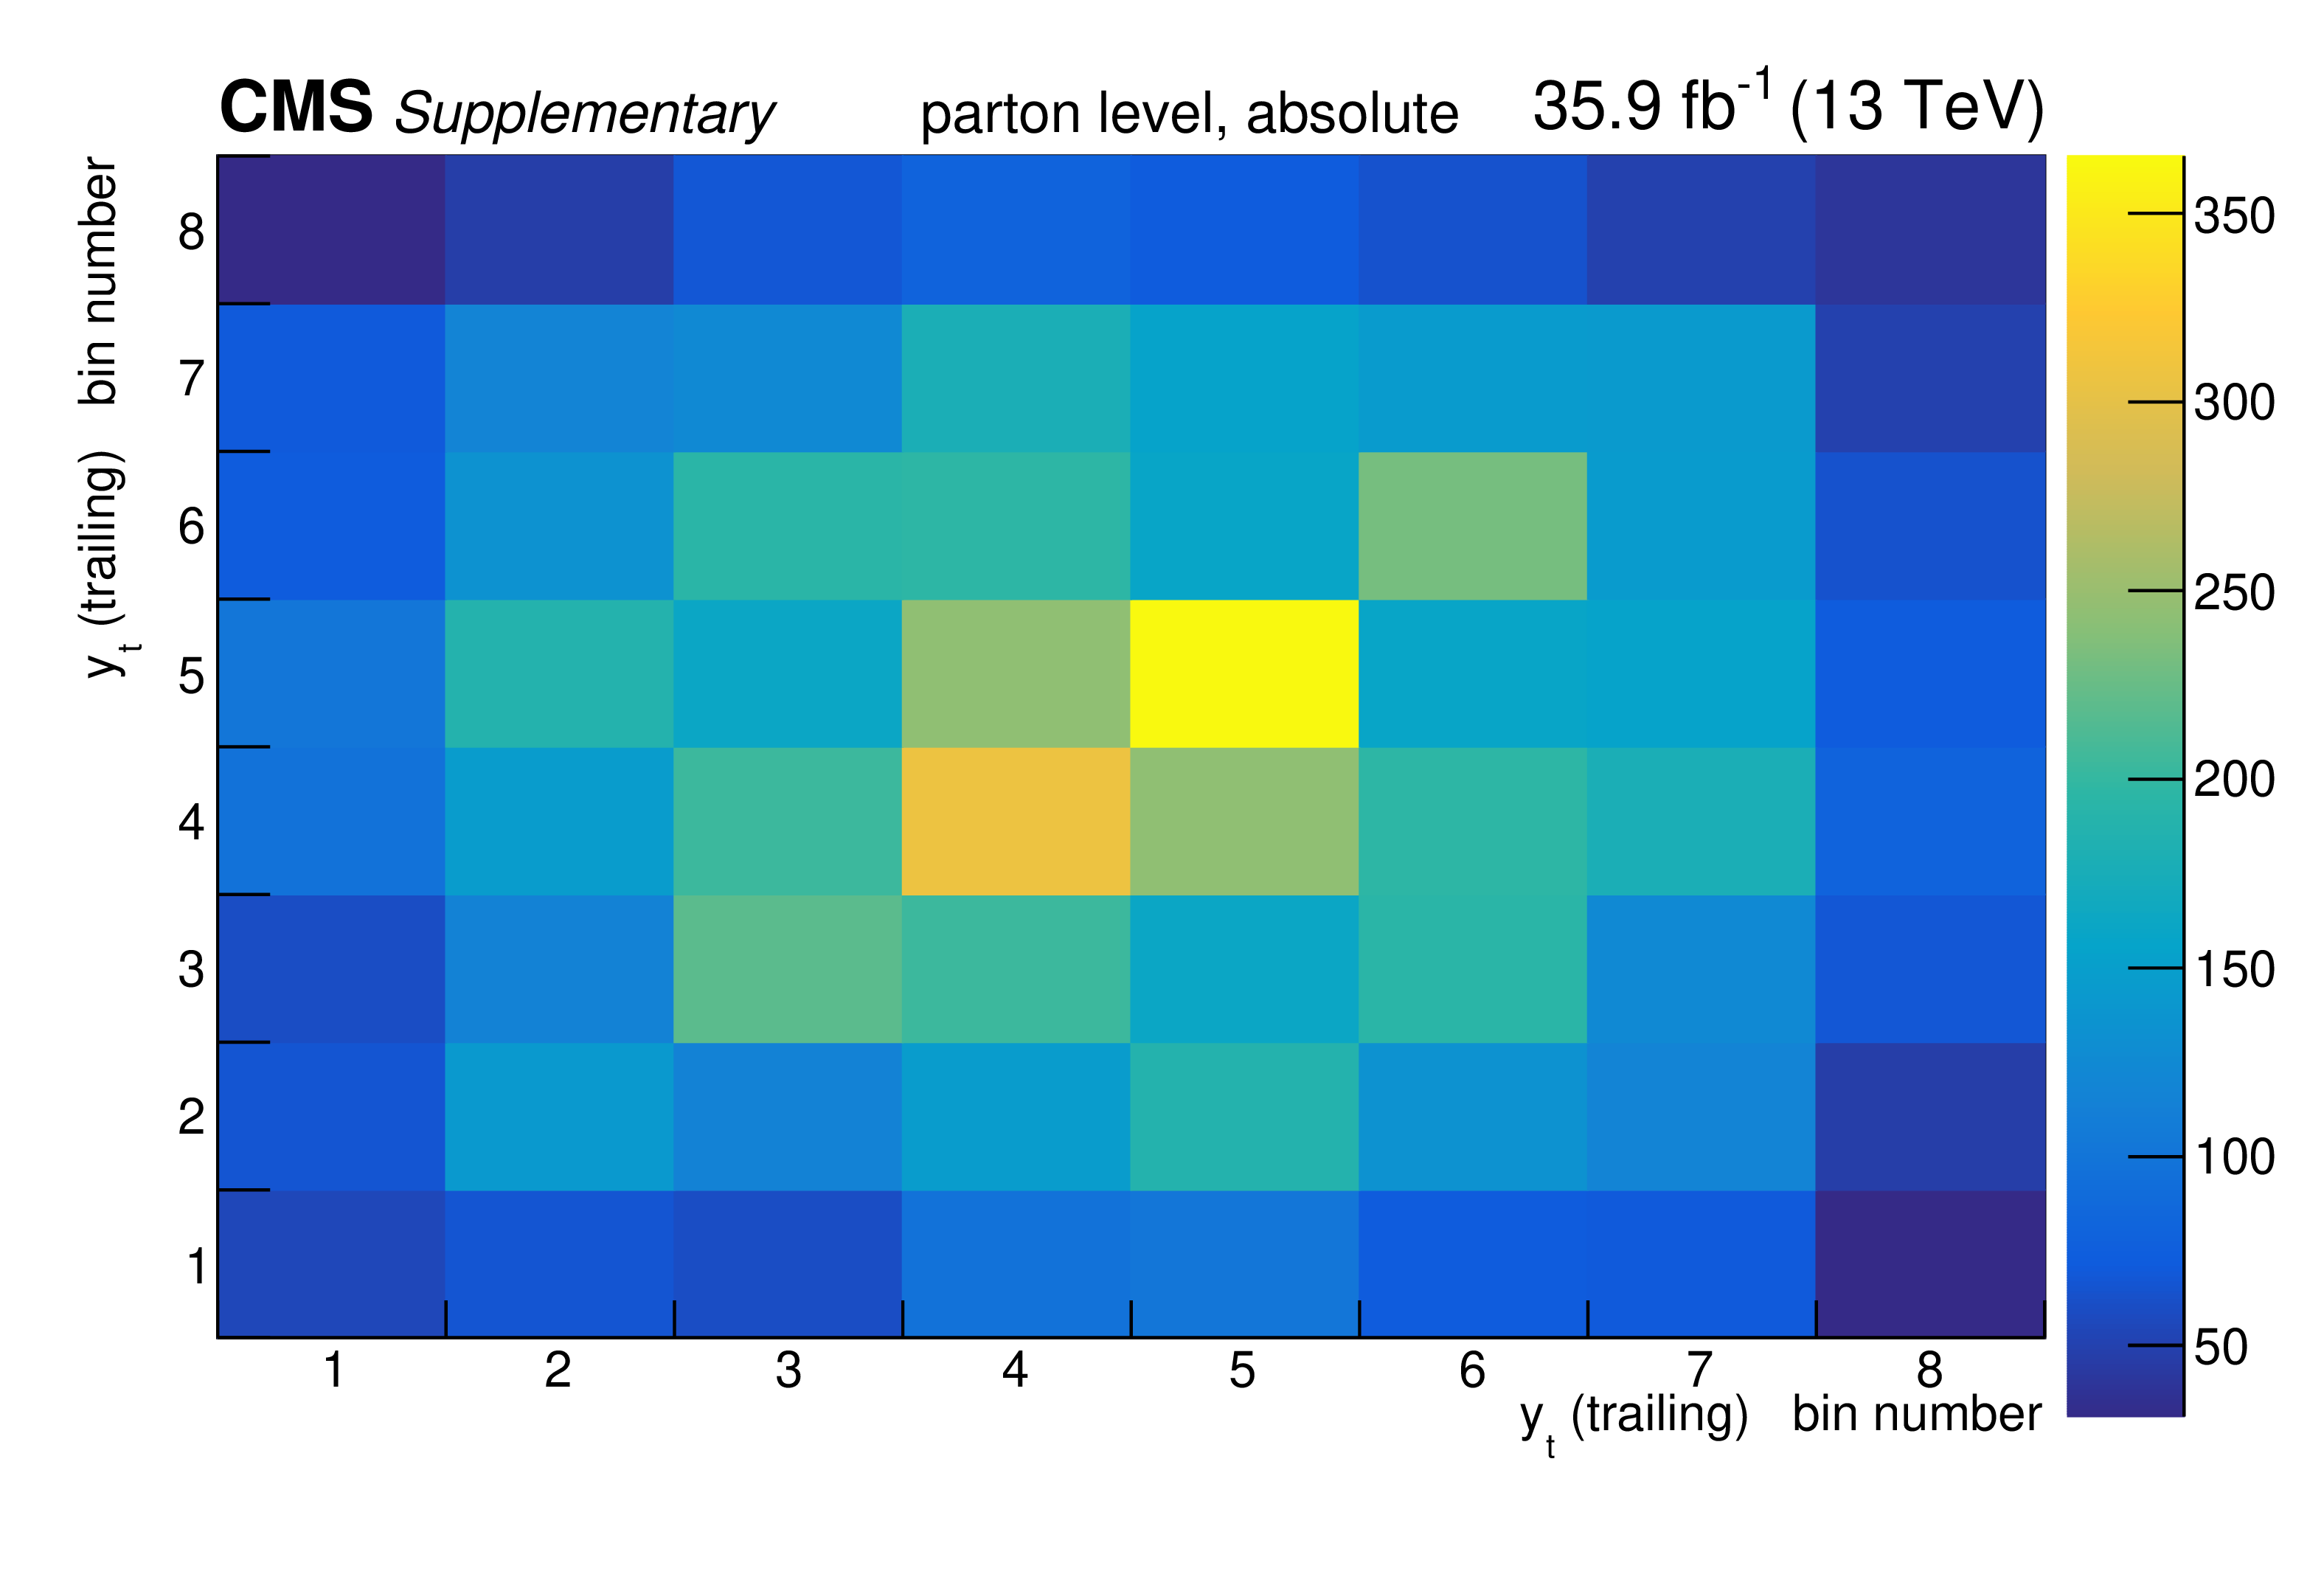
png pdf |
Additional Figure 66:
The covariance matrix of the measured data for the absolute measurement of the differential $\mathrm{t\bar{t}}$ cross section as a function of $y_{\mathrm {t}}$ (trailing) at parton level is shown. |

png pdf |
Additional Figure 67:
The breakdown of uncertainties for the normalised measurement of the differential $\mathrm{t\bar{t}}$ cross section as a function of $y_{\mathrm {t}}$ (trailing) at parton level is shown. The contributions of each source of systematic uncertainty in each bin are indicated by the coloured lines. Experimental systematic uncertainties that are small in all bins are added in quadrature and shown as a single component. The statistical and total uncertainties are indicated by the shaded areas. |
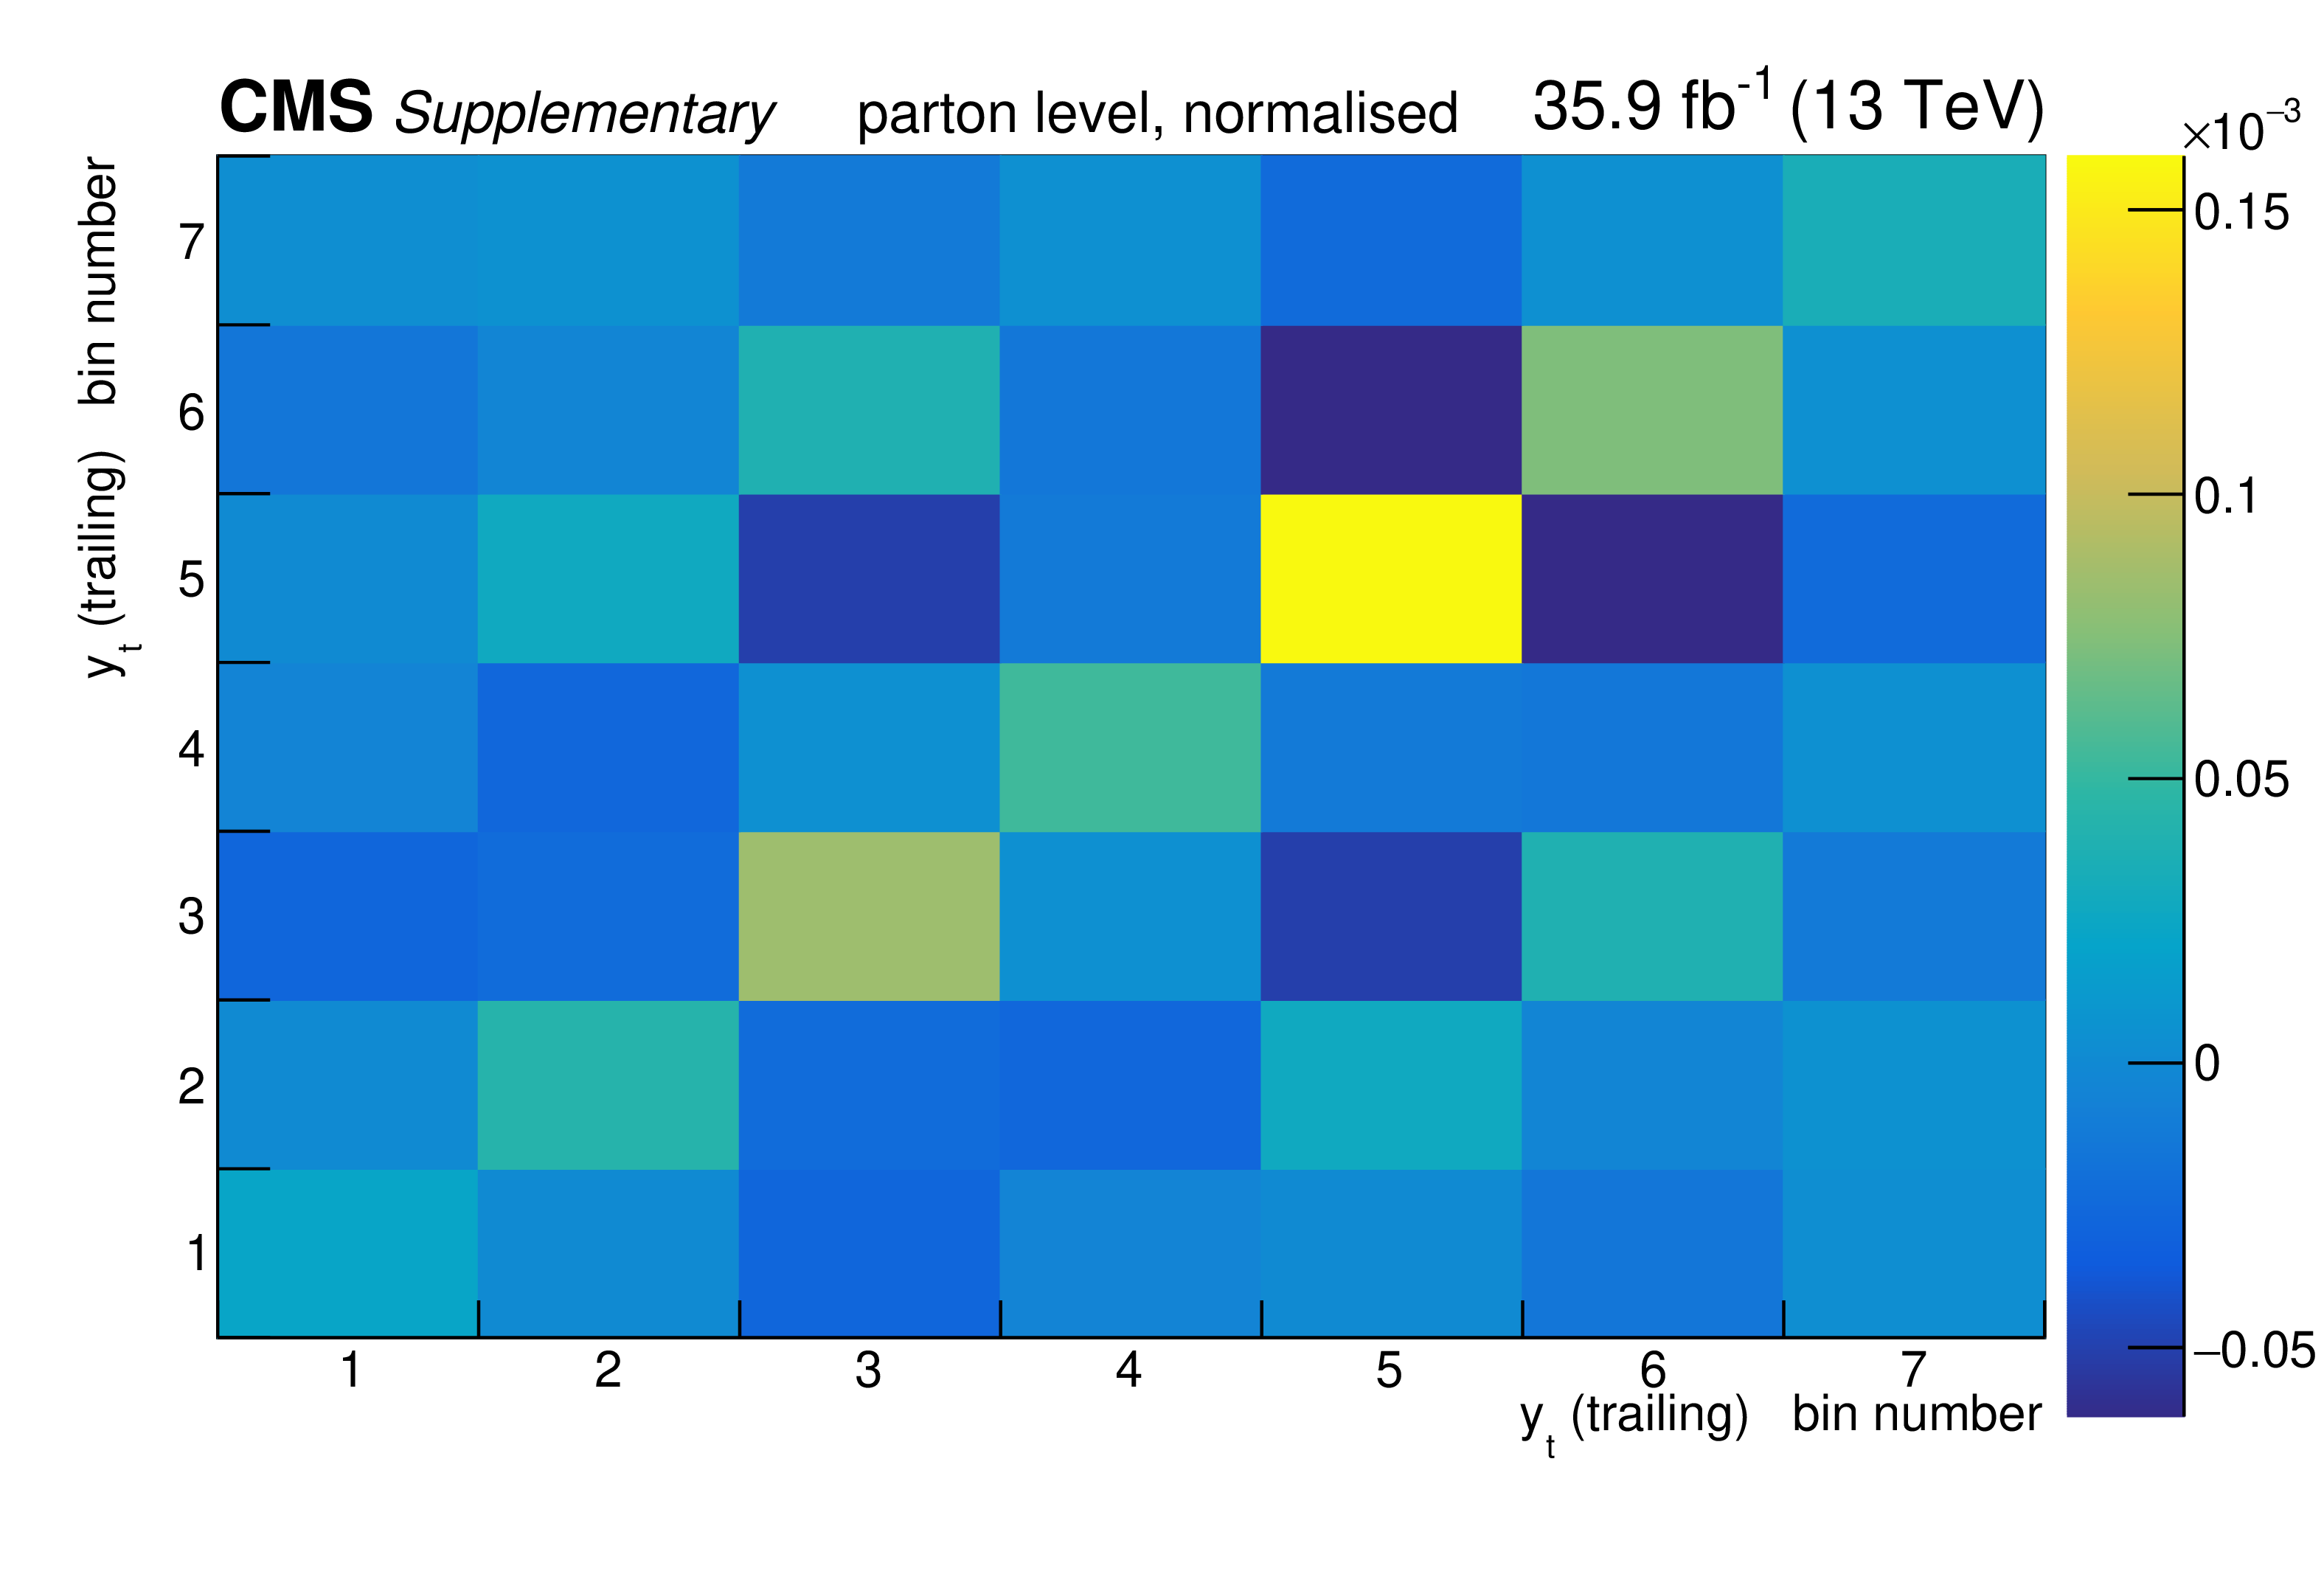
png pdf |
Additional Figure 68:
The covariance matrix of the measured data for the normalised measurement of the differential $\mathrm{t\bar{t}}$ cross section as a function of $y_{\mathrm {t}}$ (trailing) at parton level is shown. |
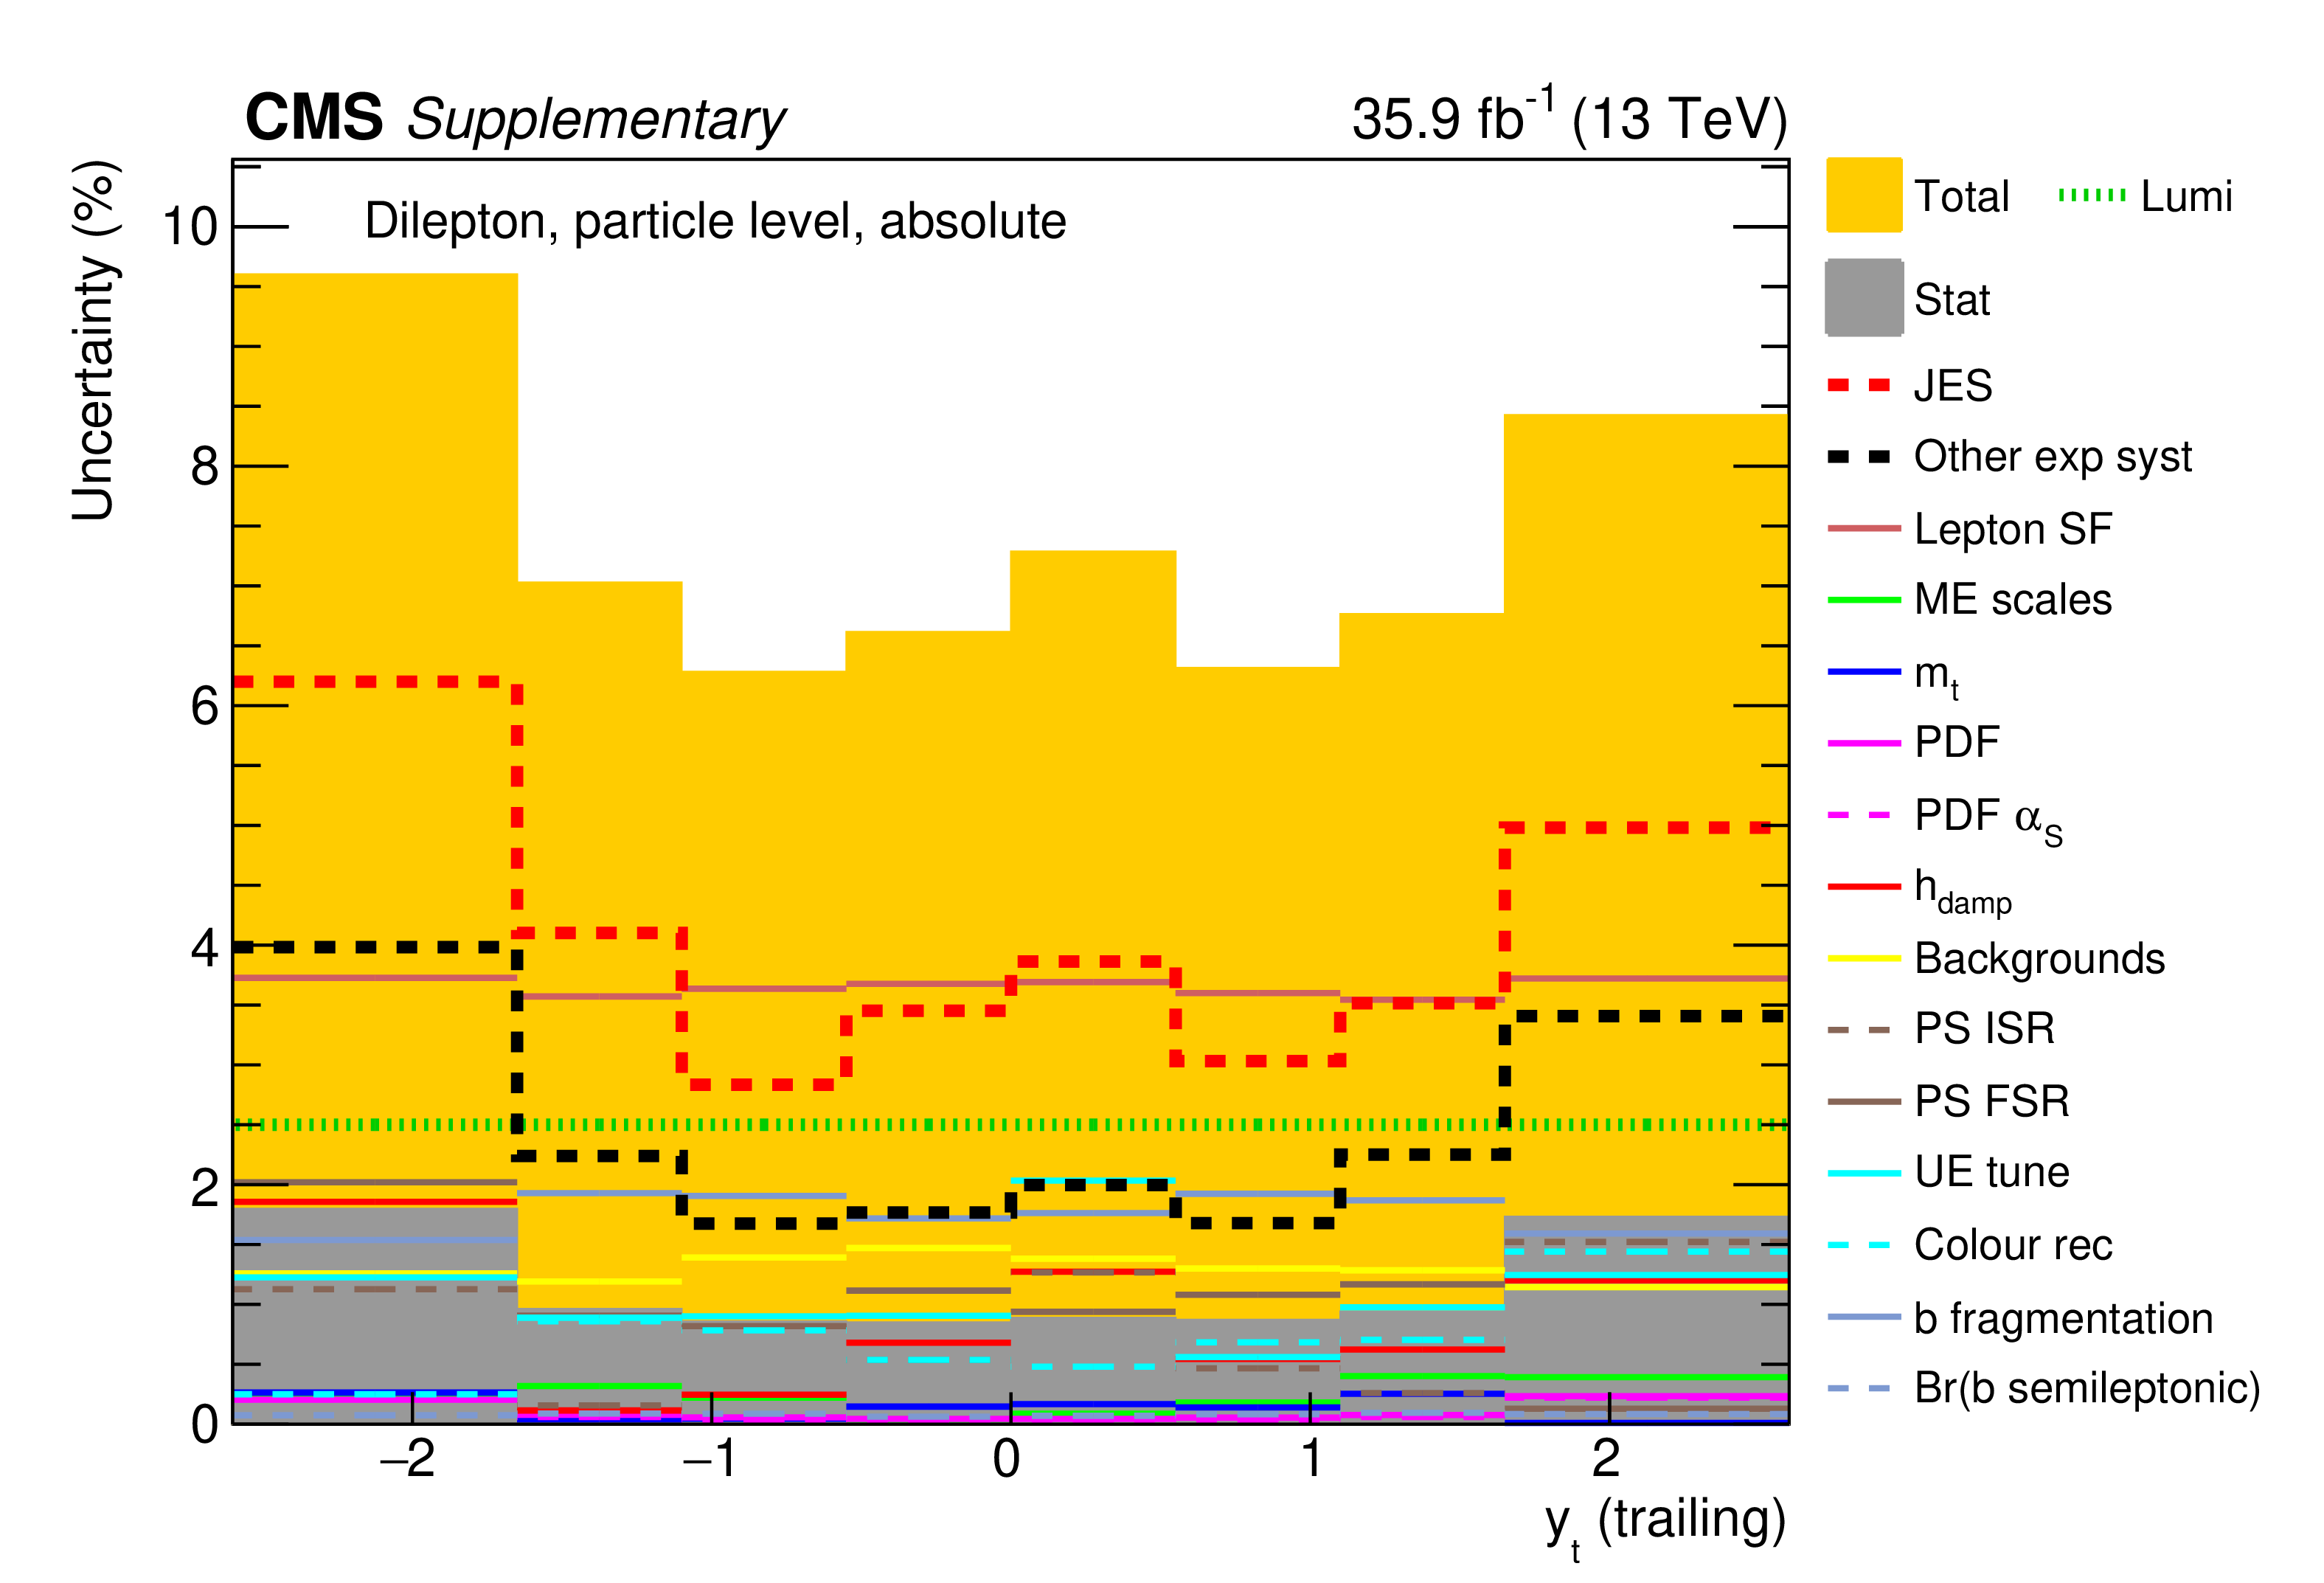
png pdf |
Additional Figure 69:
The breakdown of uncertainties for the absolute measurement of the differential $\mathrm{t\bar{t}}$ cross section as a function of $y_{\mathrm {t}}$ (trailing) at particle level is shown. The contributions of each source of systematic uncertainty in each bin are indicated by the coloured lines. Experimental systematic uncertainties that are small in all bins are added in quadrature and shown as a single component. The statistical and total uncertainties are indicated by the shaded areas. |
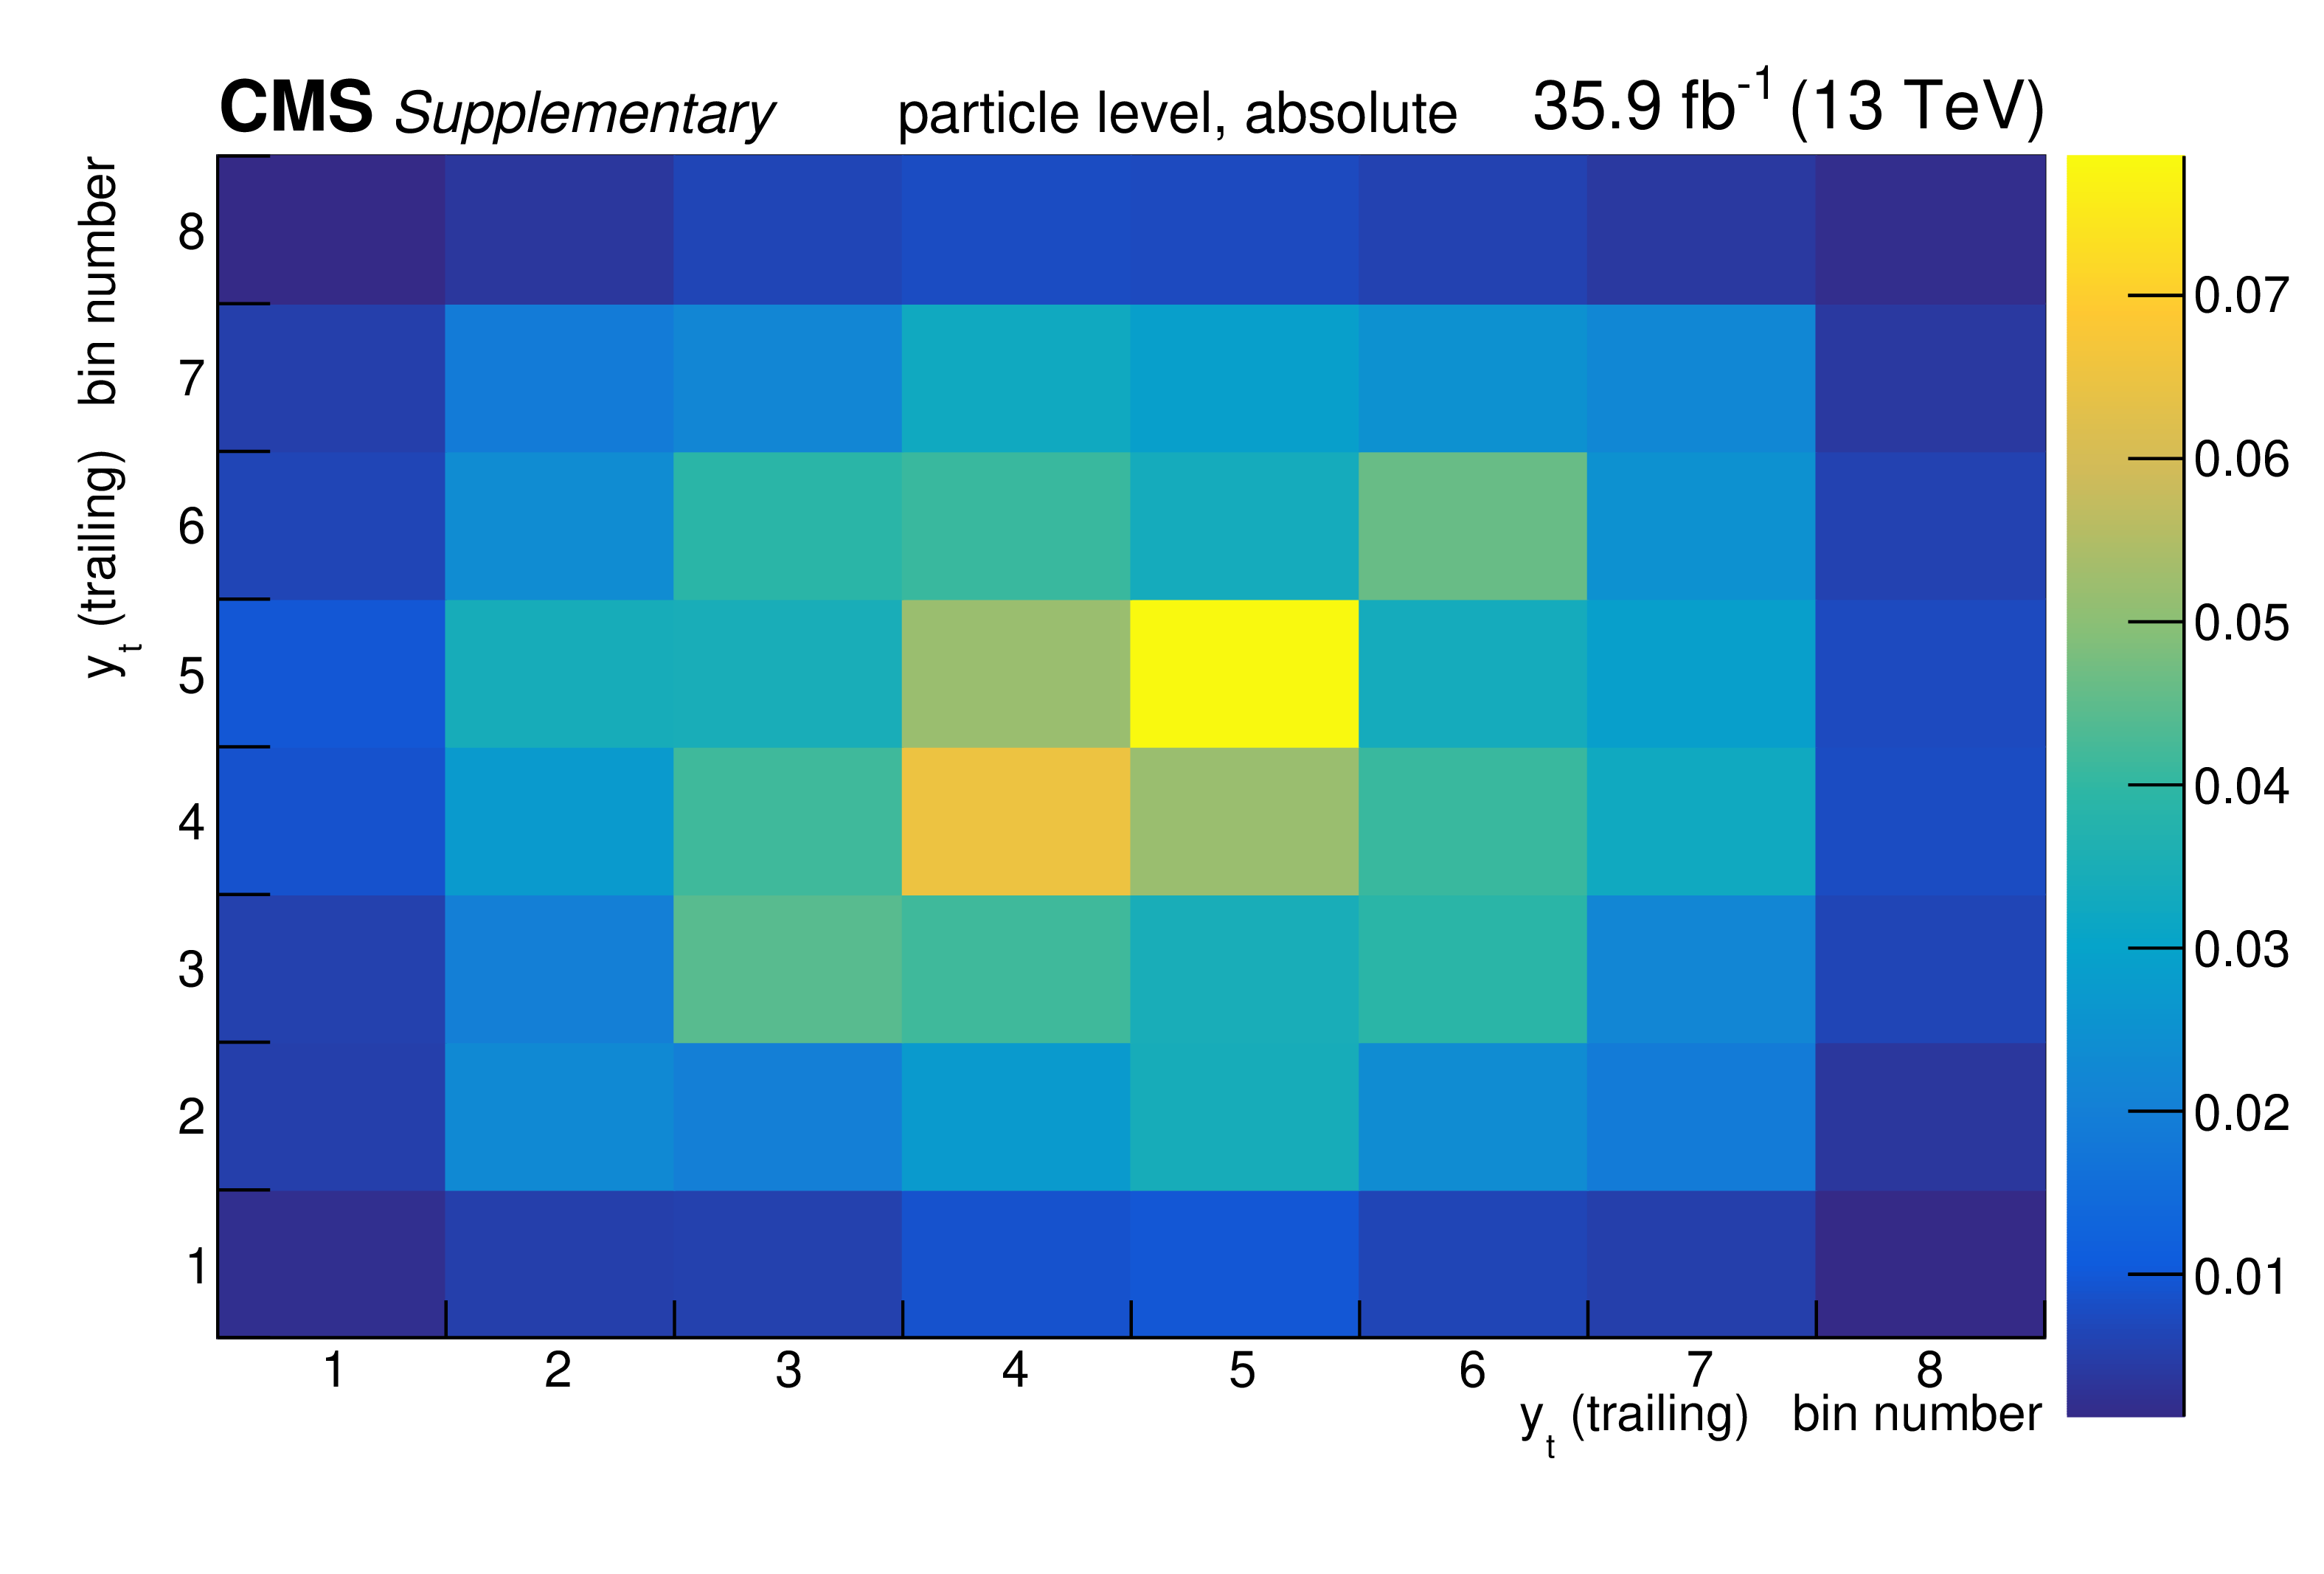
png pdf |
Additional Figure 70:
The covariance matrix of the measured data for the absolute measurement of the differential $\mathrm{t\bar{t}}$ cross section as a function of $y_{\mathrm {t}}$ (trailing) at particle level is shown. |

png pdf |
Additional Figure 71:
The breakdown of uncertainties for the normalised measurement of the differential $\mathrm{t\bar{t}}$ cross section as a function of $y_{\mathrm {t}}$ (trailing) at particle level is shown. The contributions of each source of systematic uncertainty in each bin are indicated by the coloured lines. Experimental systematic uncertainties that are small in all bins are added in quadrature and shown as a single component. The statistical and total uncertainties are indicated by the shaded areas. |

png pdf |
Additional Figure 72:
The covariance matrix of the measured data for the normalised measurement of the differential $\mathrm{t\bar{t}}$ cross section as a function of $y_{\mathrm {t}}$ (trailing) at particle level is shown. |

png pdf |
Additional Figure 73:
The breakdown of uncertainties for the absolute measurement of the differential $\mathrm{t\bar{t}}$ cross section as a function of $\Delta | y |$(t,$\bar{\mathrm {t}}$) at parton level is shown. The contributions of each source of systematic uncertainty in each bin are indicated by the coloured lines. Experimental systematic uncertainties that are small in all bins are added in quadrature and shown as a single component. The statistical and total uncertainties are indicated by the shaded areas. |
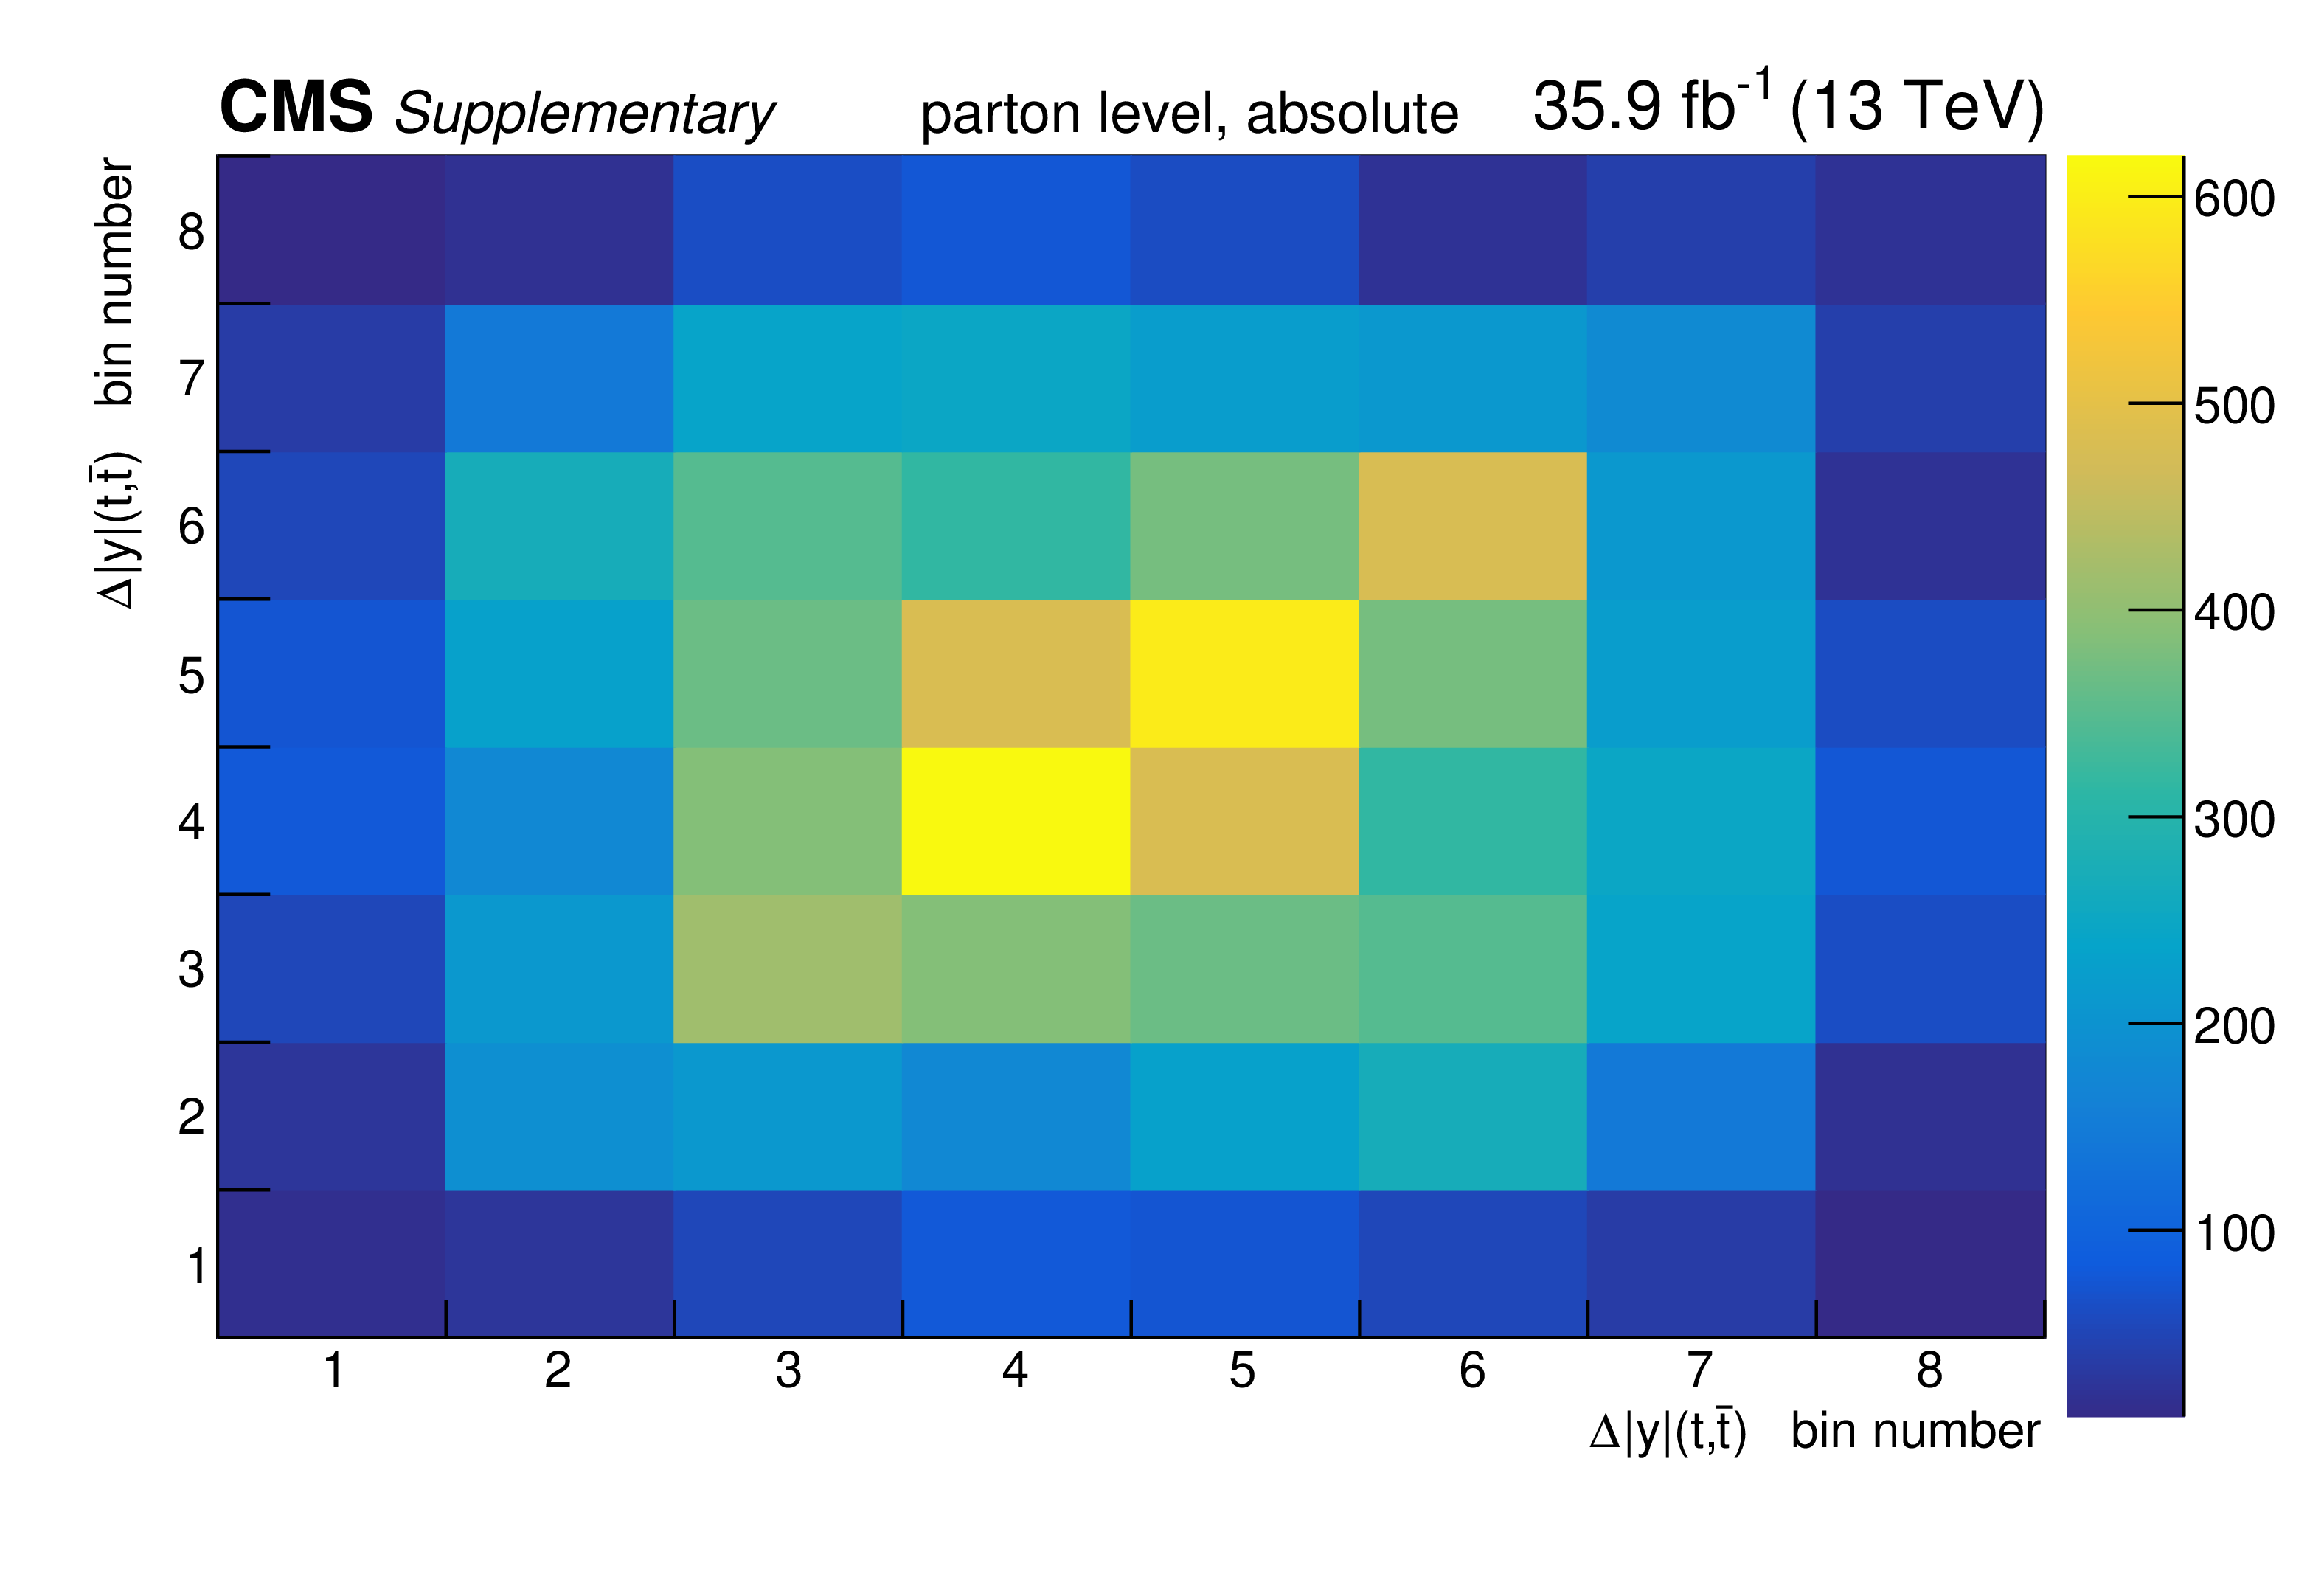
png pdf |
Additional Figure 74:
The covariance matrix of the measured data for the absolute measurement of the differential $\mathrm{t\bar{t}}$ cross section as a function of $\Delta | y |$(t,$\bar{\mathrm {t}}$) at parton level is shown. |

png pdf |
Additional Figure 75:
The breakdown of uncertainties for the normalised measurement of the differential $\mathrm{t\bar{t}}$ cross section as a function of $\Delta | y |$(t,$\bar{\mathrm {t}}$) at parton level is shown. The contributions of each source of systematic uncertainty in each bin are indicated by the coloured lines. Experimental systematic uncertainties that are small in all bins are added in quadrature and shown as a single component. The statistical and total uncertainties are indicated by the shaded areas. |

png pdf |
Additional Figure 76:
The covariance matrix of the measured data for the normalised measurement of the differential $\mathrm{t\bar{t}}$ cross section as a function of $\Delta | y |$(t,$\bar{\mathrm {t}}$) at parton level is shown. |

png pdf |
Additional Figure 77:
The breakdown of uncertainties for the absolute measurement of the differential $\mathrm{t\bar{t}}$ cross section as a function of $\Delta | y |$(t,$\bar{\mathrm {t}}$) at particle level is shown. The contributions of each source of systematic uncertainty in each bin are indicated by the coloured lines. Experimental systematic uncertainties that are small in all bins are added in quadrature and shown as a single component. The statistical and total uncertainties are indicated by the shaded areas. |
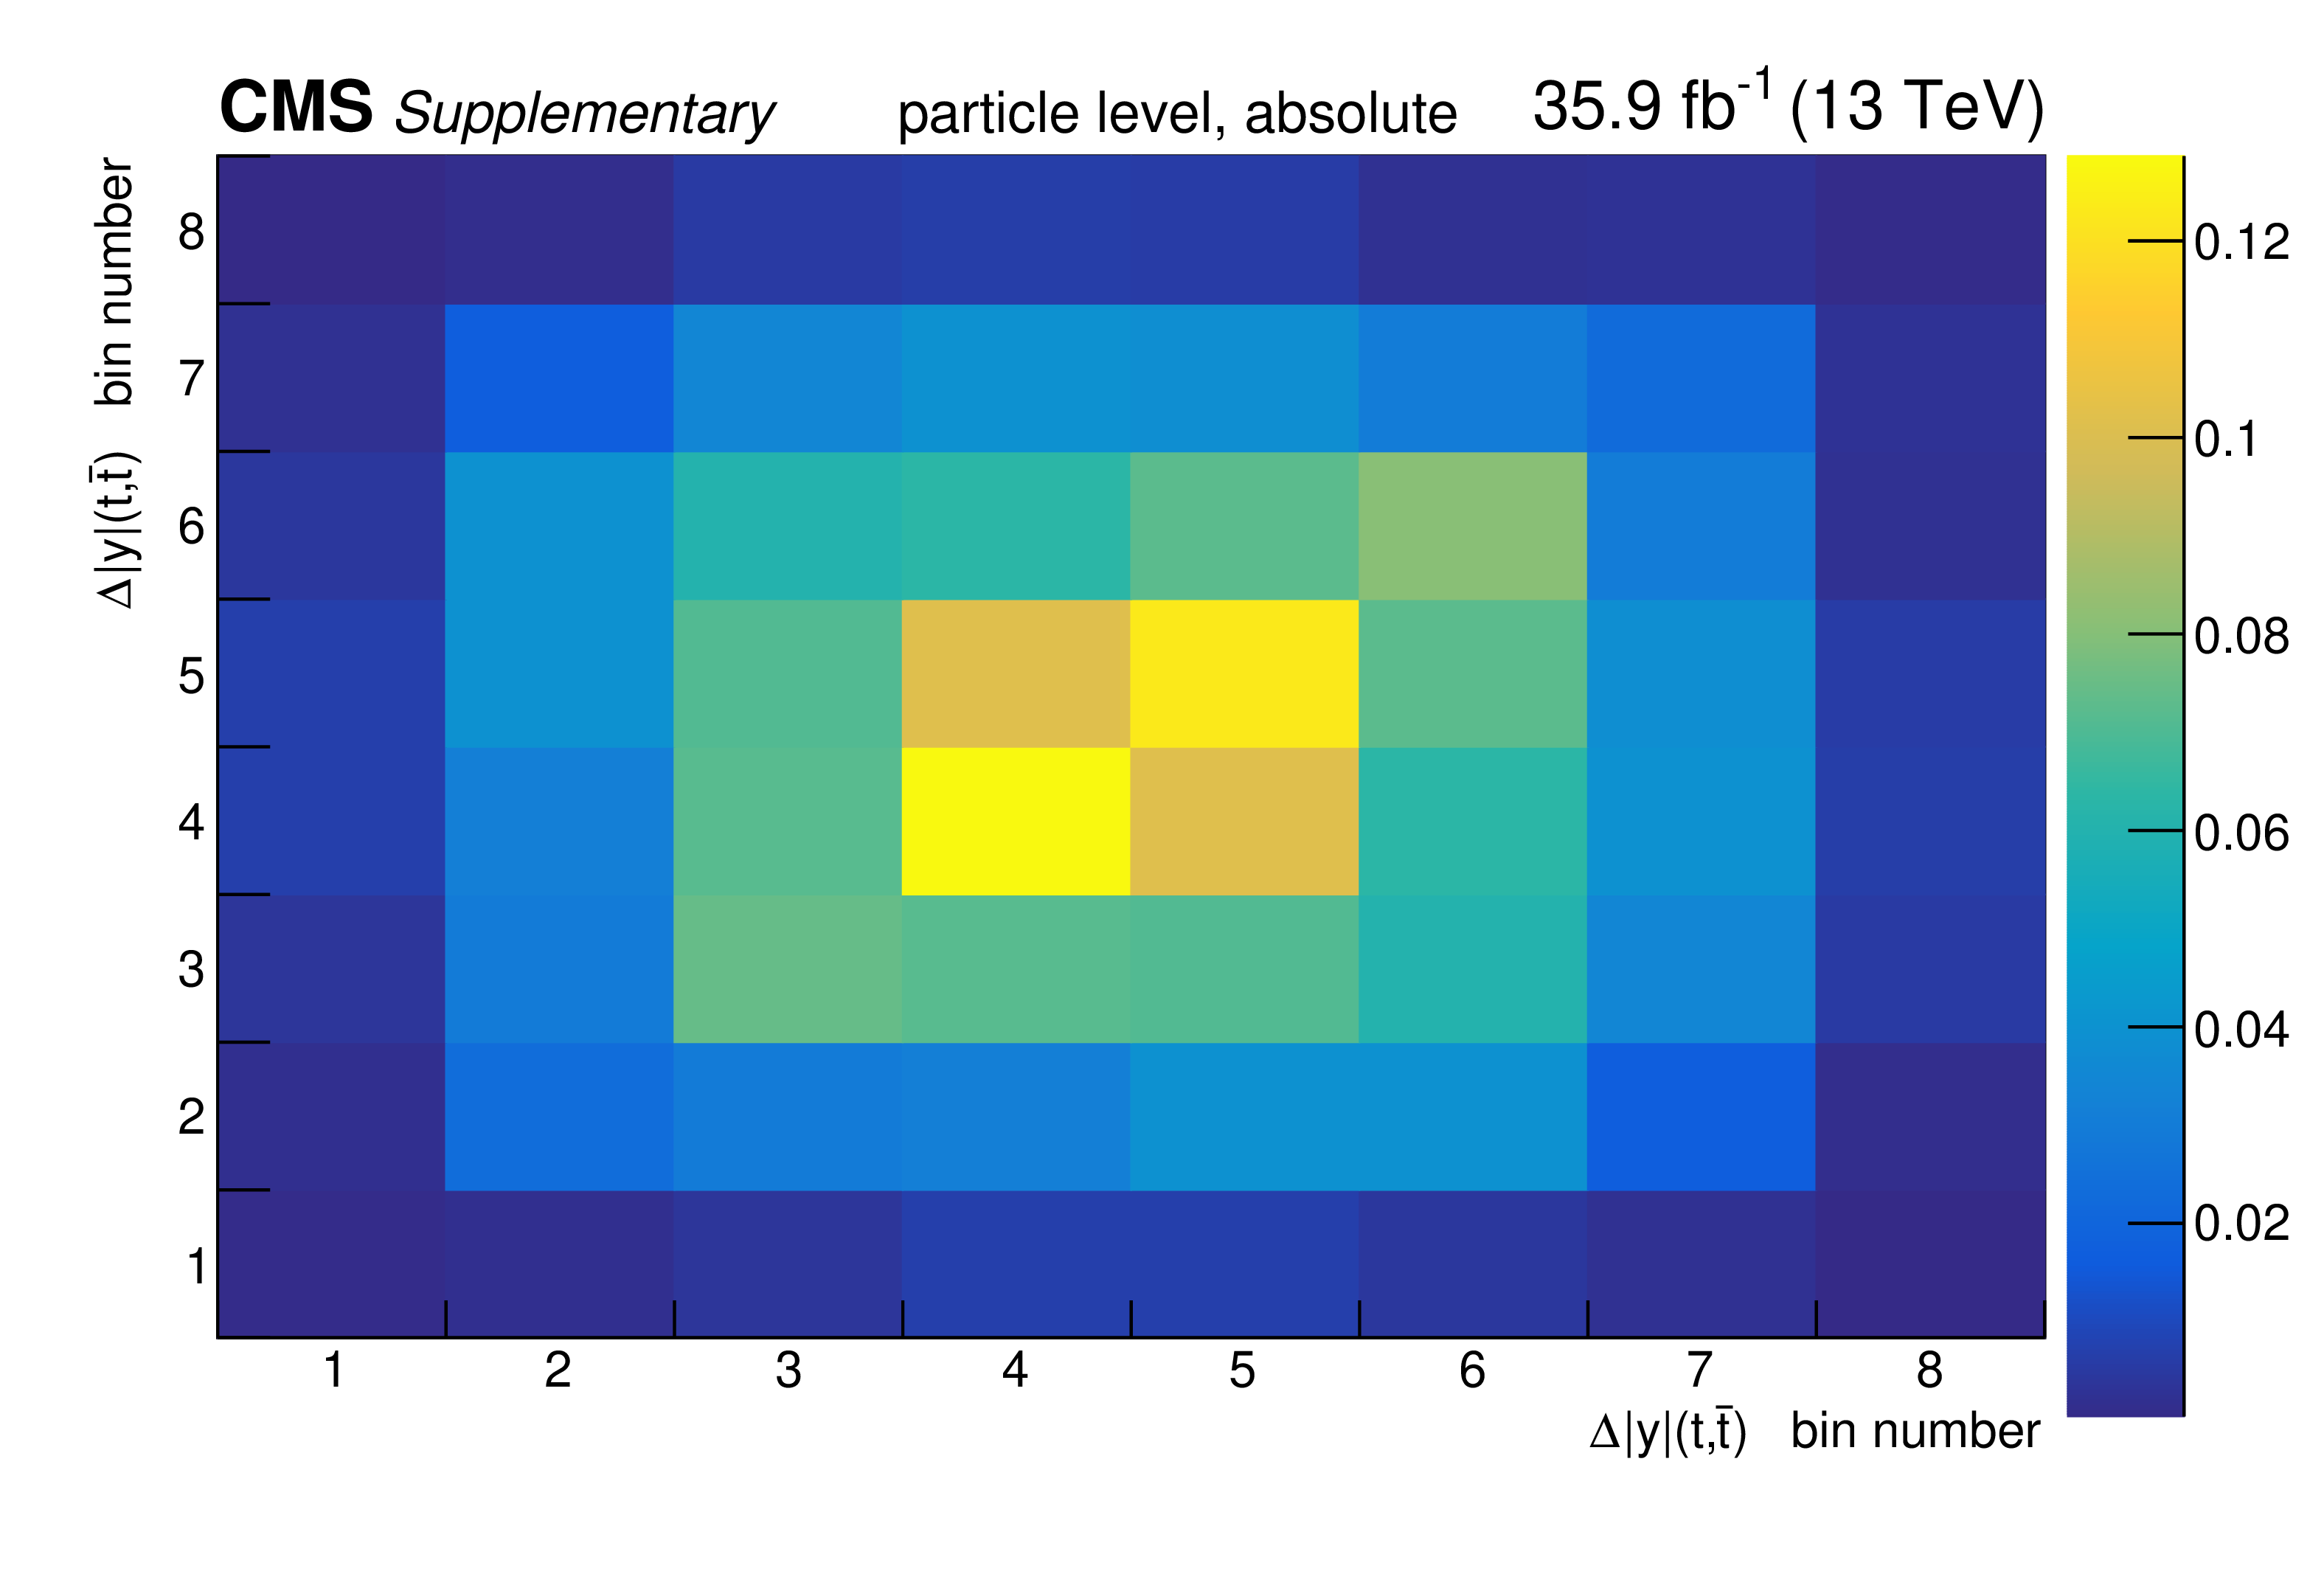
png pdf |
Additional Figure 78:
The covariance matrix of the measured data for the absolute measurement of the differential $\mathrm{t\bar{t}}$ cross section as a function of $\Delta | y |$(t,$\bar{\mathrm {t}}$) at particle level is shown. |
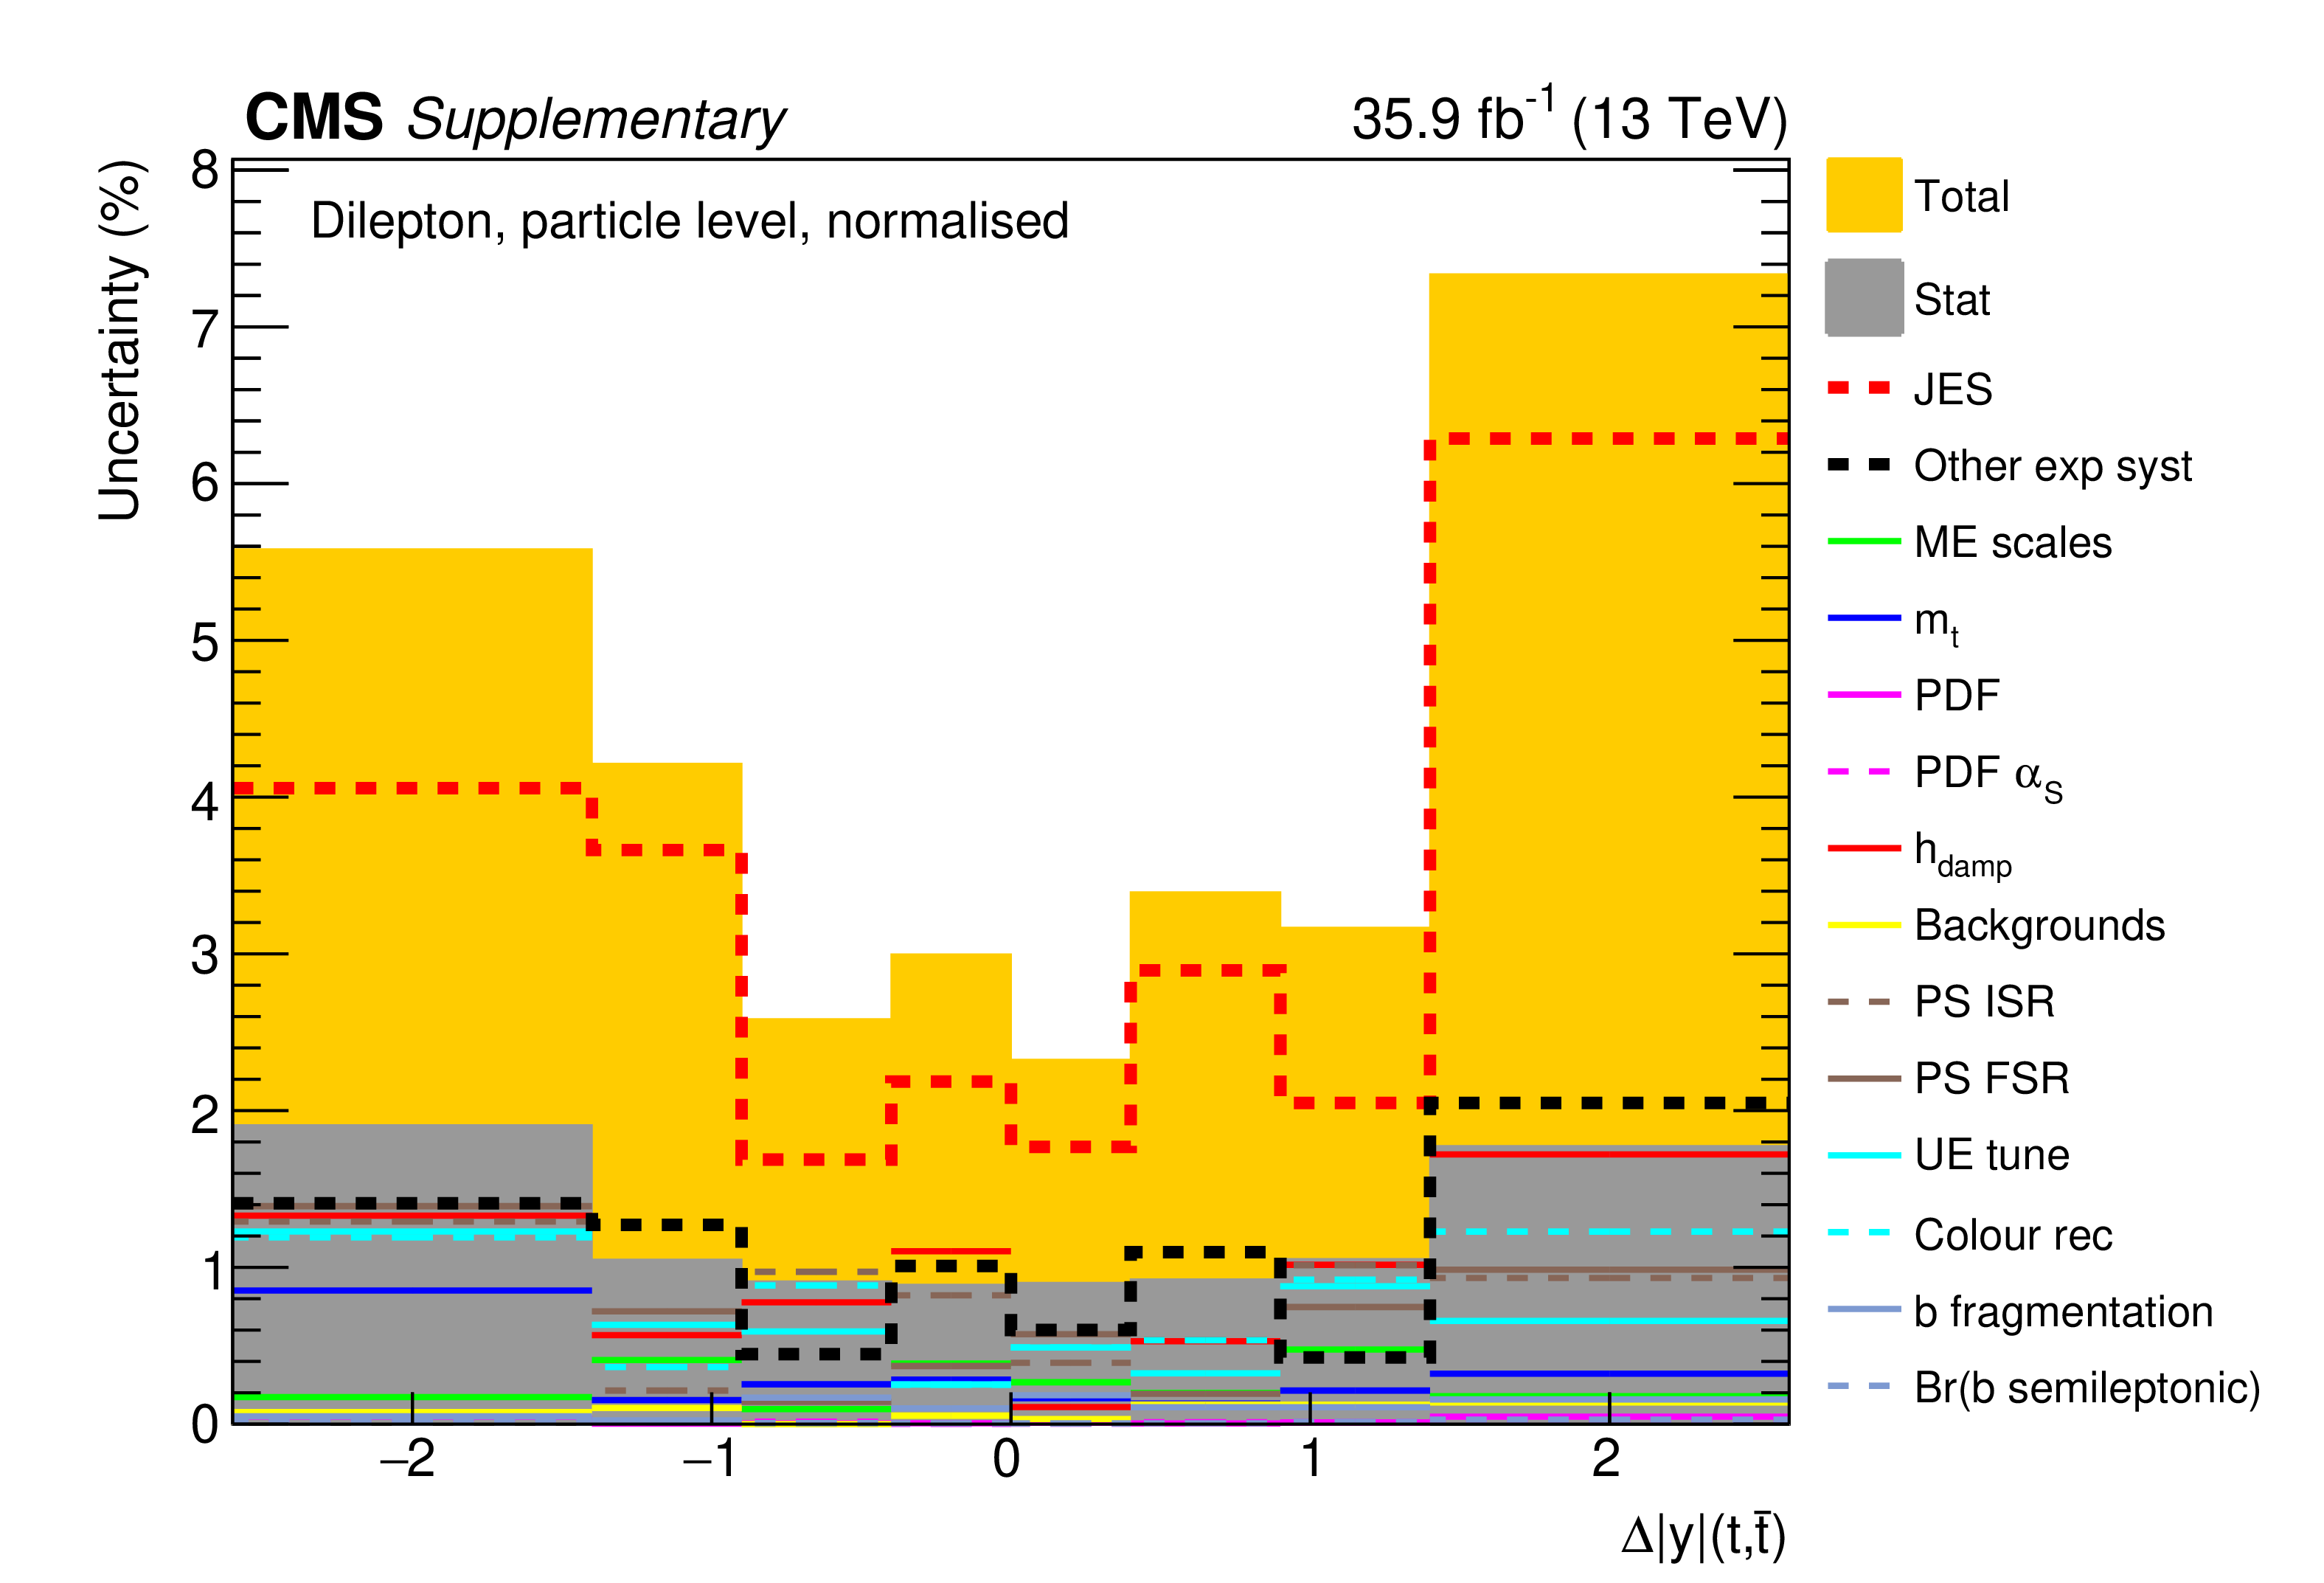
png pdf |
Additional Figure 79:
The breakdown of uncertainties for the normalised measurement of the differential $\mathrm{t\bar{t}}$ cross section as a function of $\Delta | y |$(t,$\bar{\mathrm {t}}$) at particle level is shown. The contributions of each source of systematic uncertainty in each bin are indicated by the coloured lines. Experimental systematic uncertainties that are small in all bins are added in quadrature and shown as a single component. The statistical and total uncertainties are indicated by the shaded areas. |

png pdf |
Additional Figure 80:
The covariance matrix of the measured data for the normalised measurement of the differential $\mathrm{t\bar{t}}$ cross section as a function of $\Delta | y |$(t,$\bar{\mathrm {t}}$) at particle level is shown. |
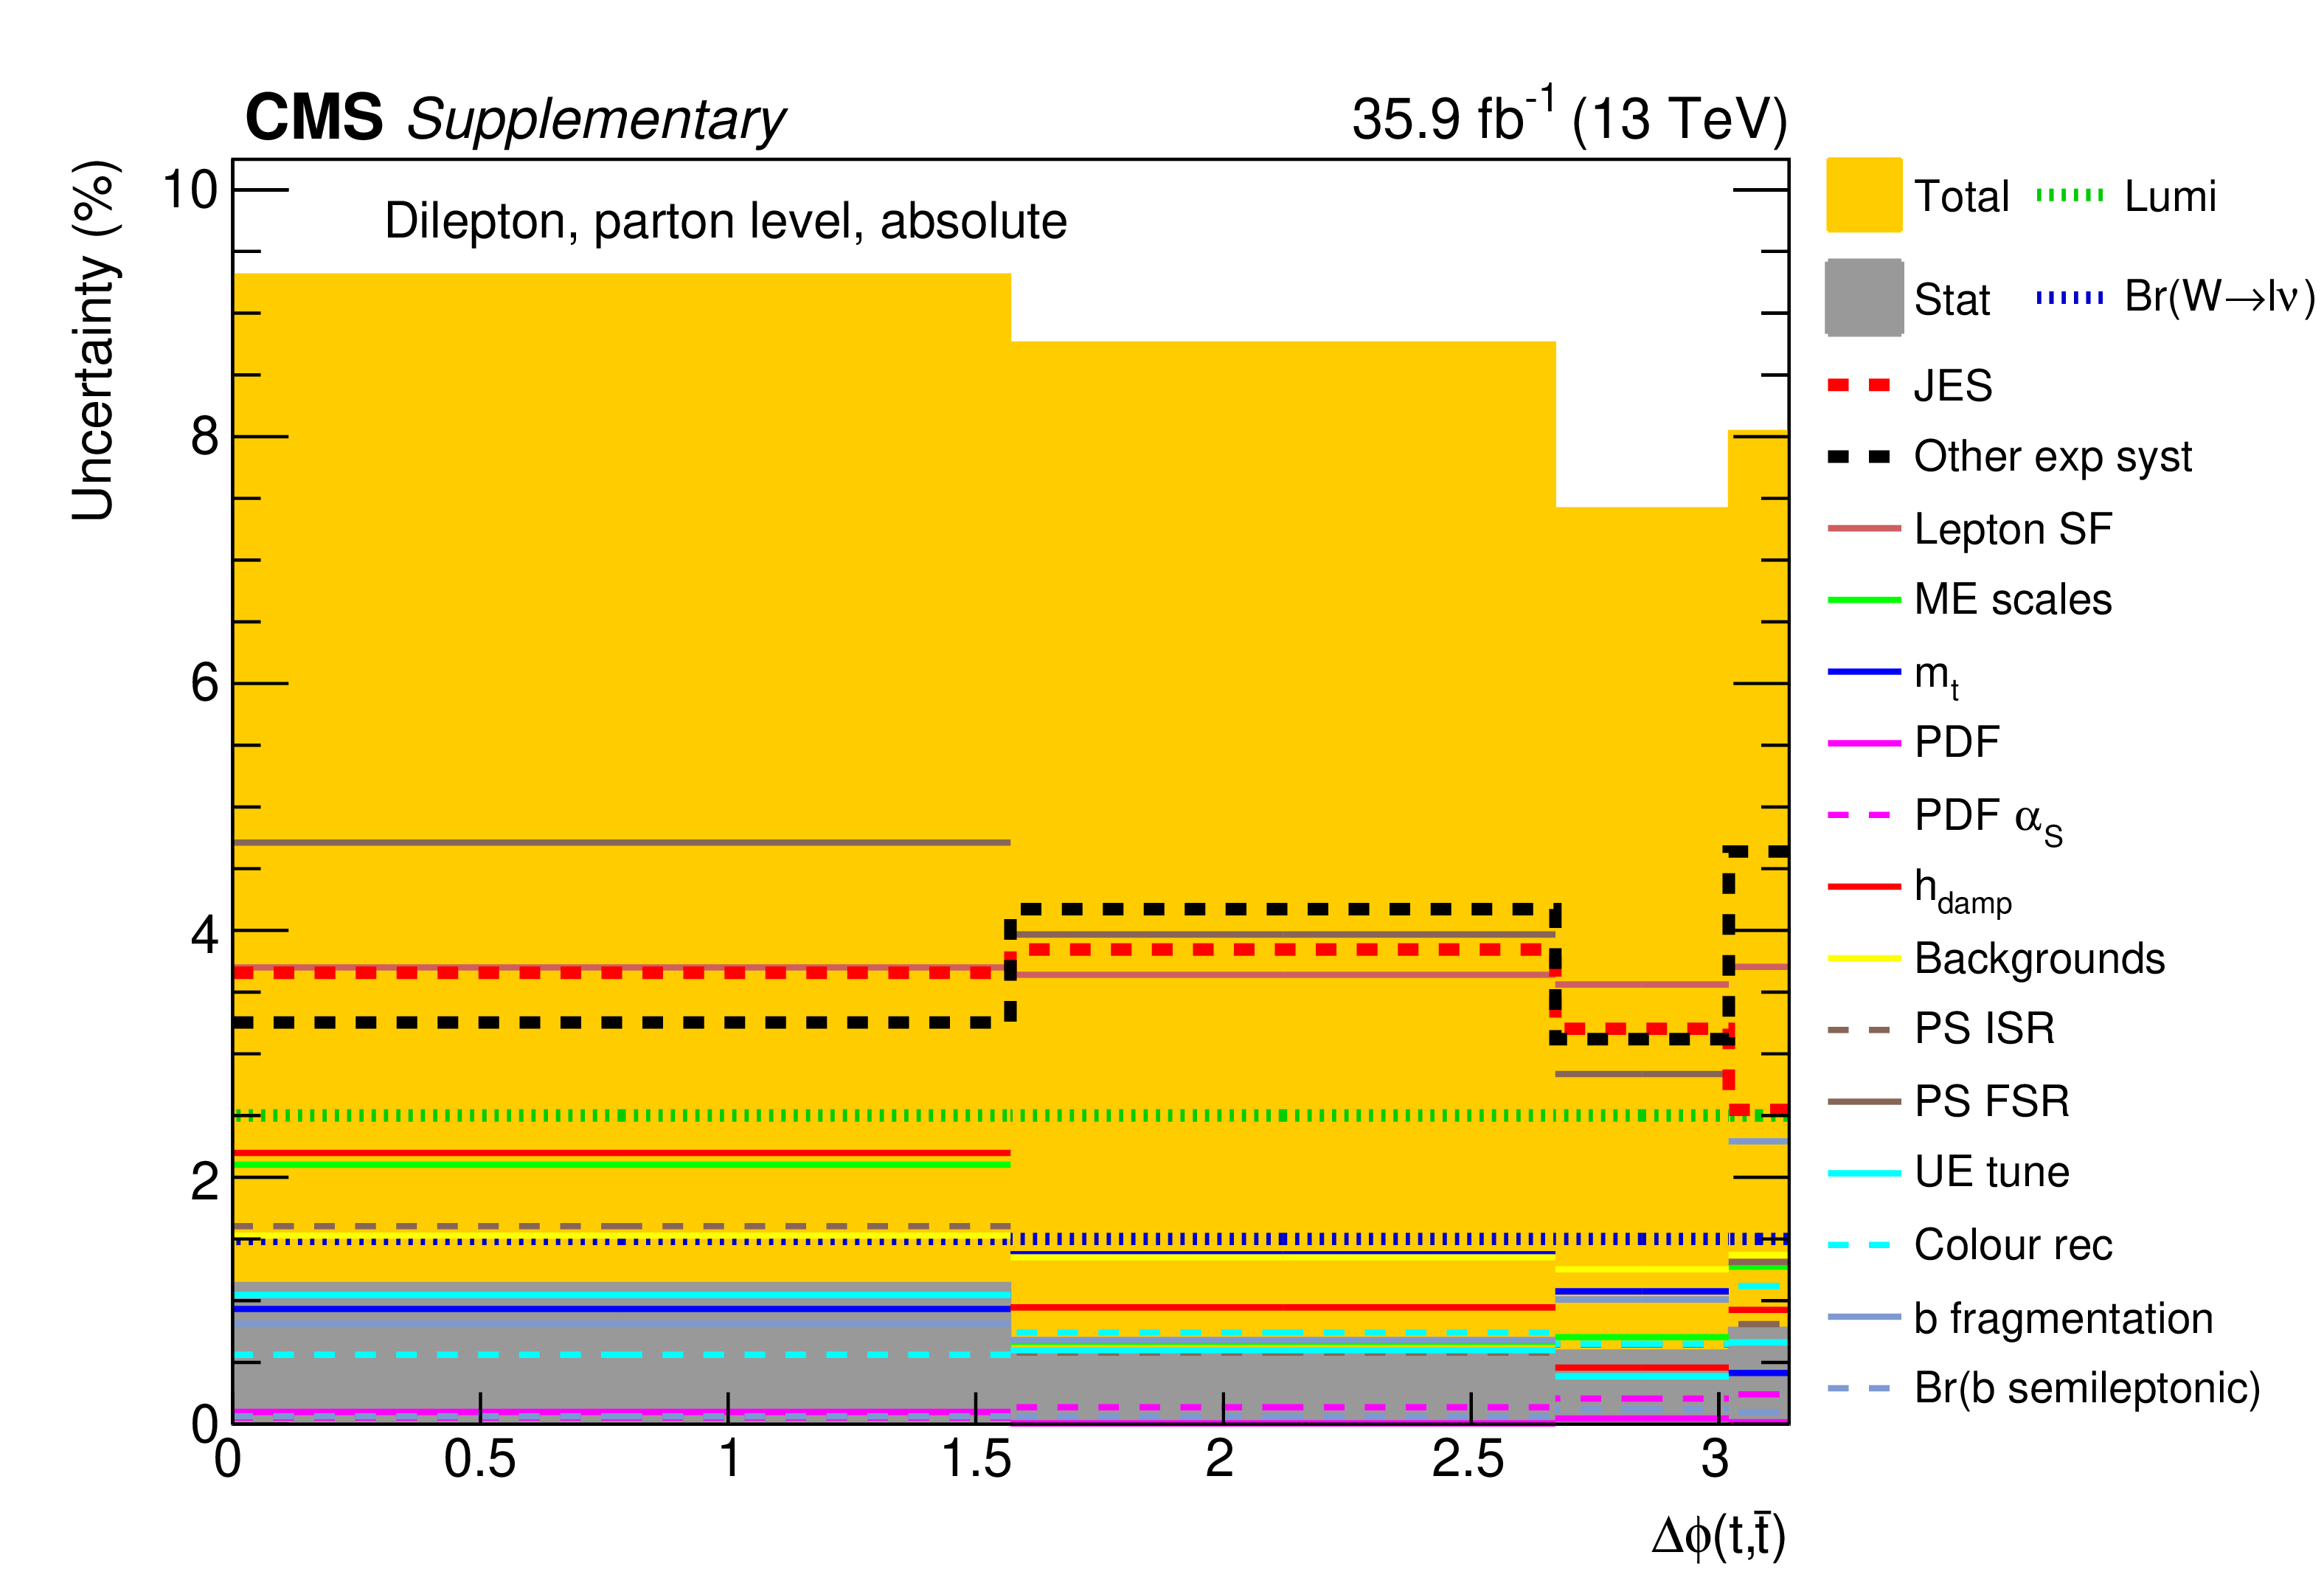
png pdf |
Additional Figure 81:
The breakdown of uncertainties for the absolute measurement of the differential $\mathrm{t\bar{t}}$ cross section as a function of $\Delta \phi $(t,$\bar{\mathrm {t}}$) at parton level is shown. The contributions of each source of systematic uncertainty in each bin are indicated by the coloured lines. Experimental systematic uncertainties that are small in all bins are added in quadrature and shown as a single component. The statistical and total uncertainties are indicated by the shaded areas. |

png pdf |
Additional Figure 82:
The covariance matrix of the measured data for the absolute measurement of the differential $\mathrm{t\bar{t}}$ cross section as a function of $\Delta \phi $(t,$\bar{\mathrm {t}}$) at parton level is shown. |
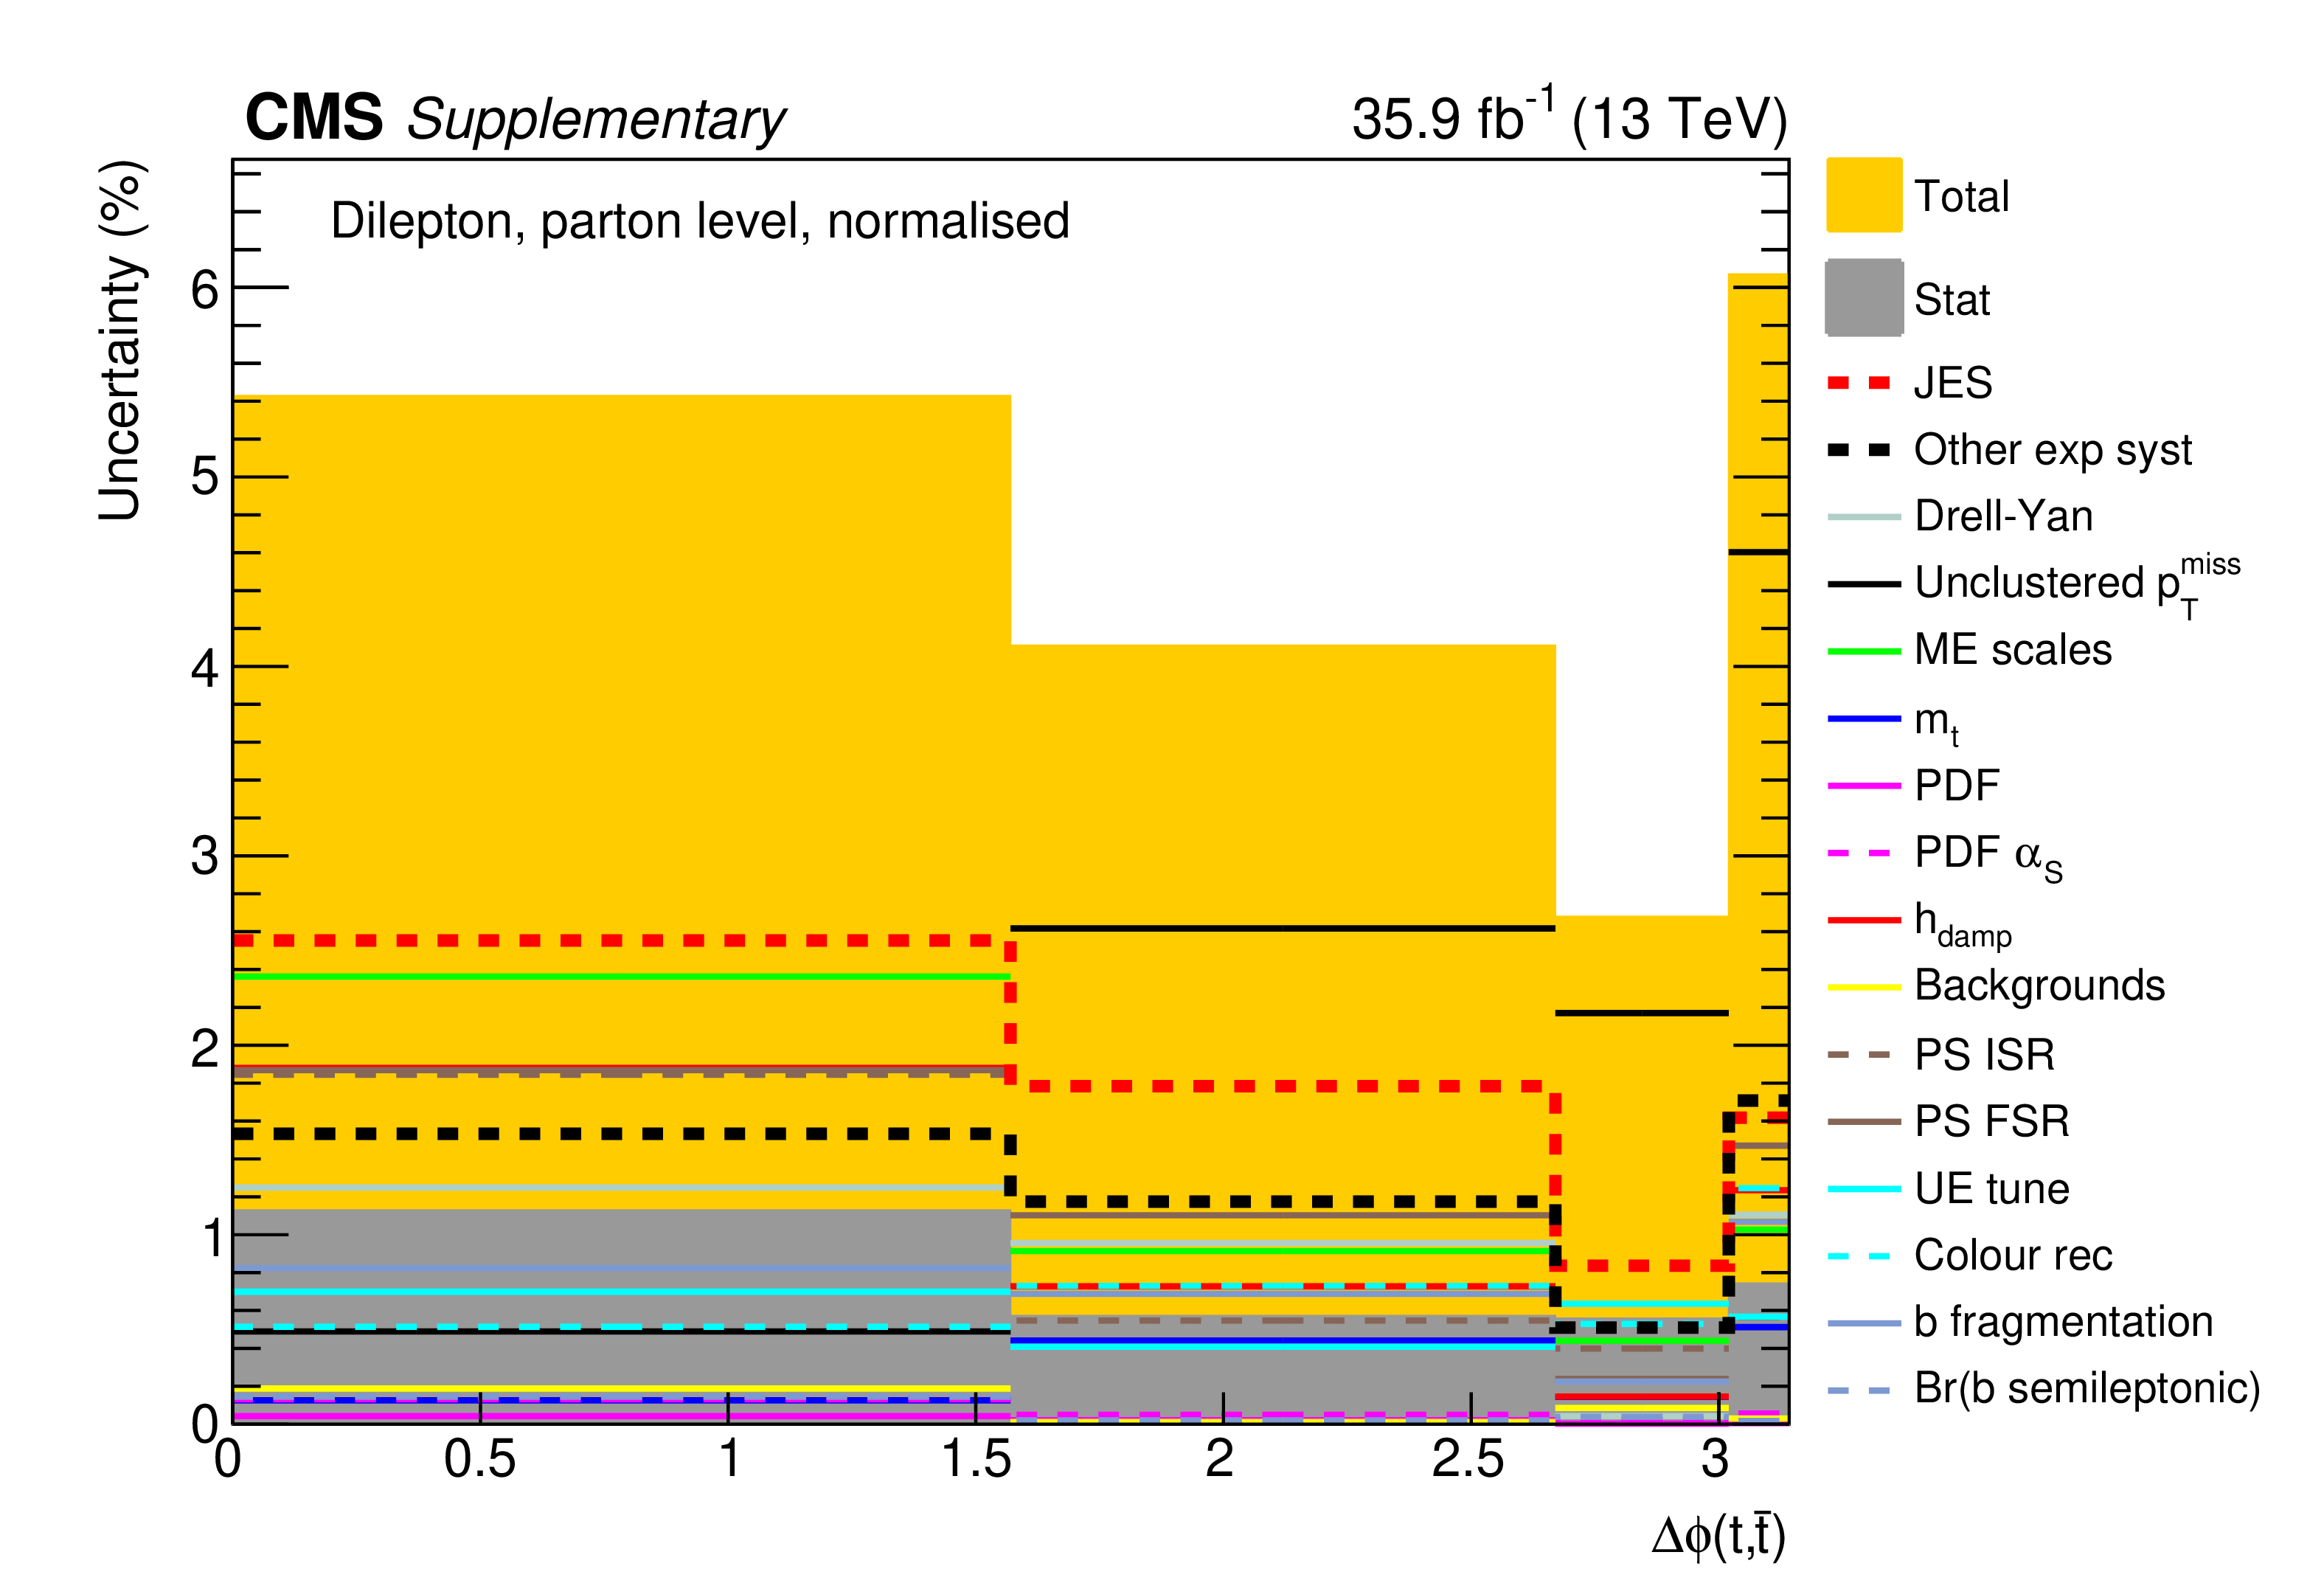
png pdf |
Additional Figure 83:
The breakdown of uncertainties for the normalised measurement of the differential $\mathrm{t\bar{t}}$ cross section as a function of $\Delta \phi $(t,$\bar{\mathrm {t}}$) at parton level is shown. The contributions of each source of systematic uncertainty in each bin are indicated by the coloured lines. Experimental systematic uncertainties that are small in all bins are added in quadrature and shown as a single component. The statistical and total uncertainties are indicated by the shaded areas. |

png pdf |
Additional Figure 84:
The covariance matrix of the measured data for the normalised measurement of the differential $\mathrm{t\bar{t}}$ cross section as a function of $\Delta \phi $(t,$\bar{\mathrm {t}}$) at parton level is shown. |
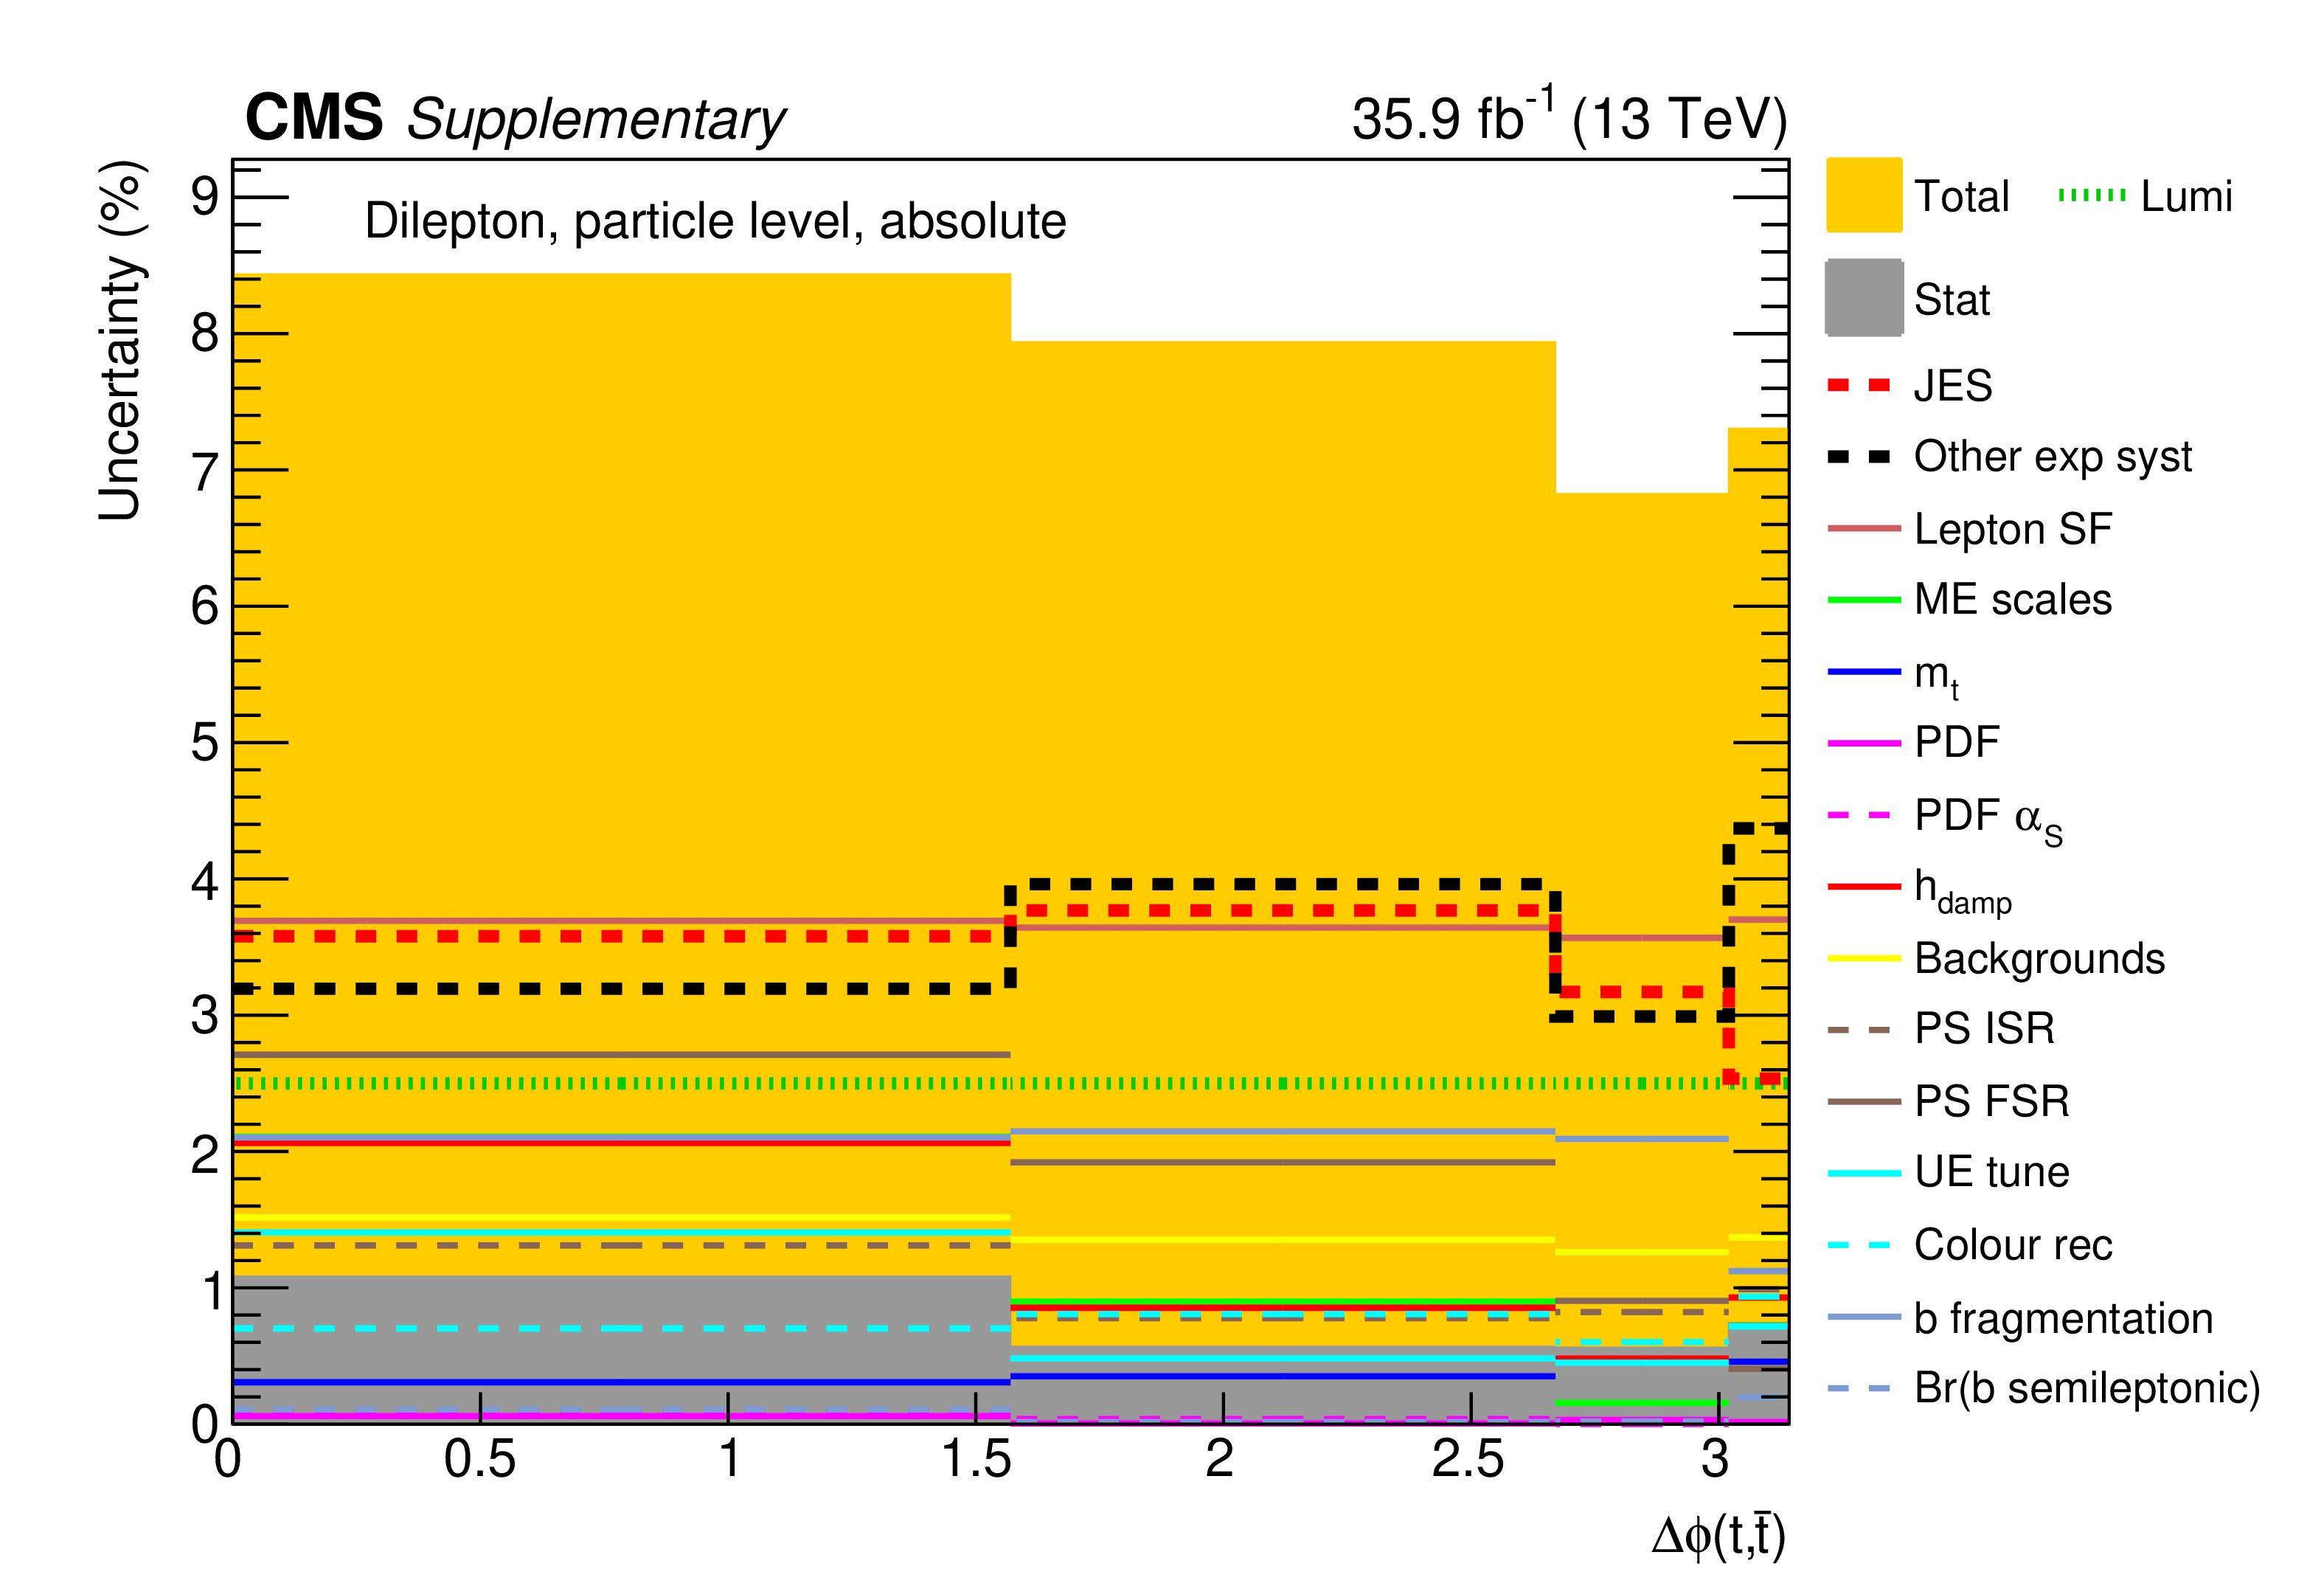
png pdf |
Additional Figure 85:
The breakdown of uncertainties for the absolute measurement of the differential $\mathrm{t\bar{t}}$ cross section as a function of $\Delta \phi $(t,$\bar{\mathrm {t}}$) at particle level is shown. The contributions of each source of systematic uncertainty in each bin are indicated by the coloured lines. Experimental systematic uncertainties that are small in all bins are added in quadrature and shown as a single component. The statistical and total uncertainties are indicated by the shaded areas. |
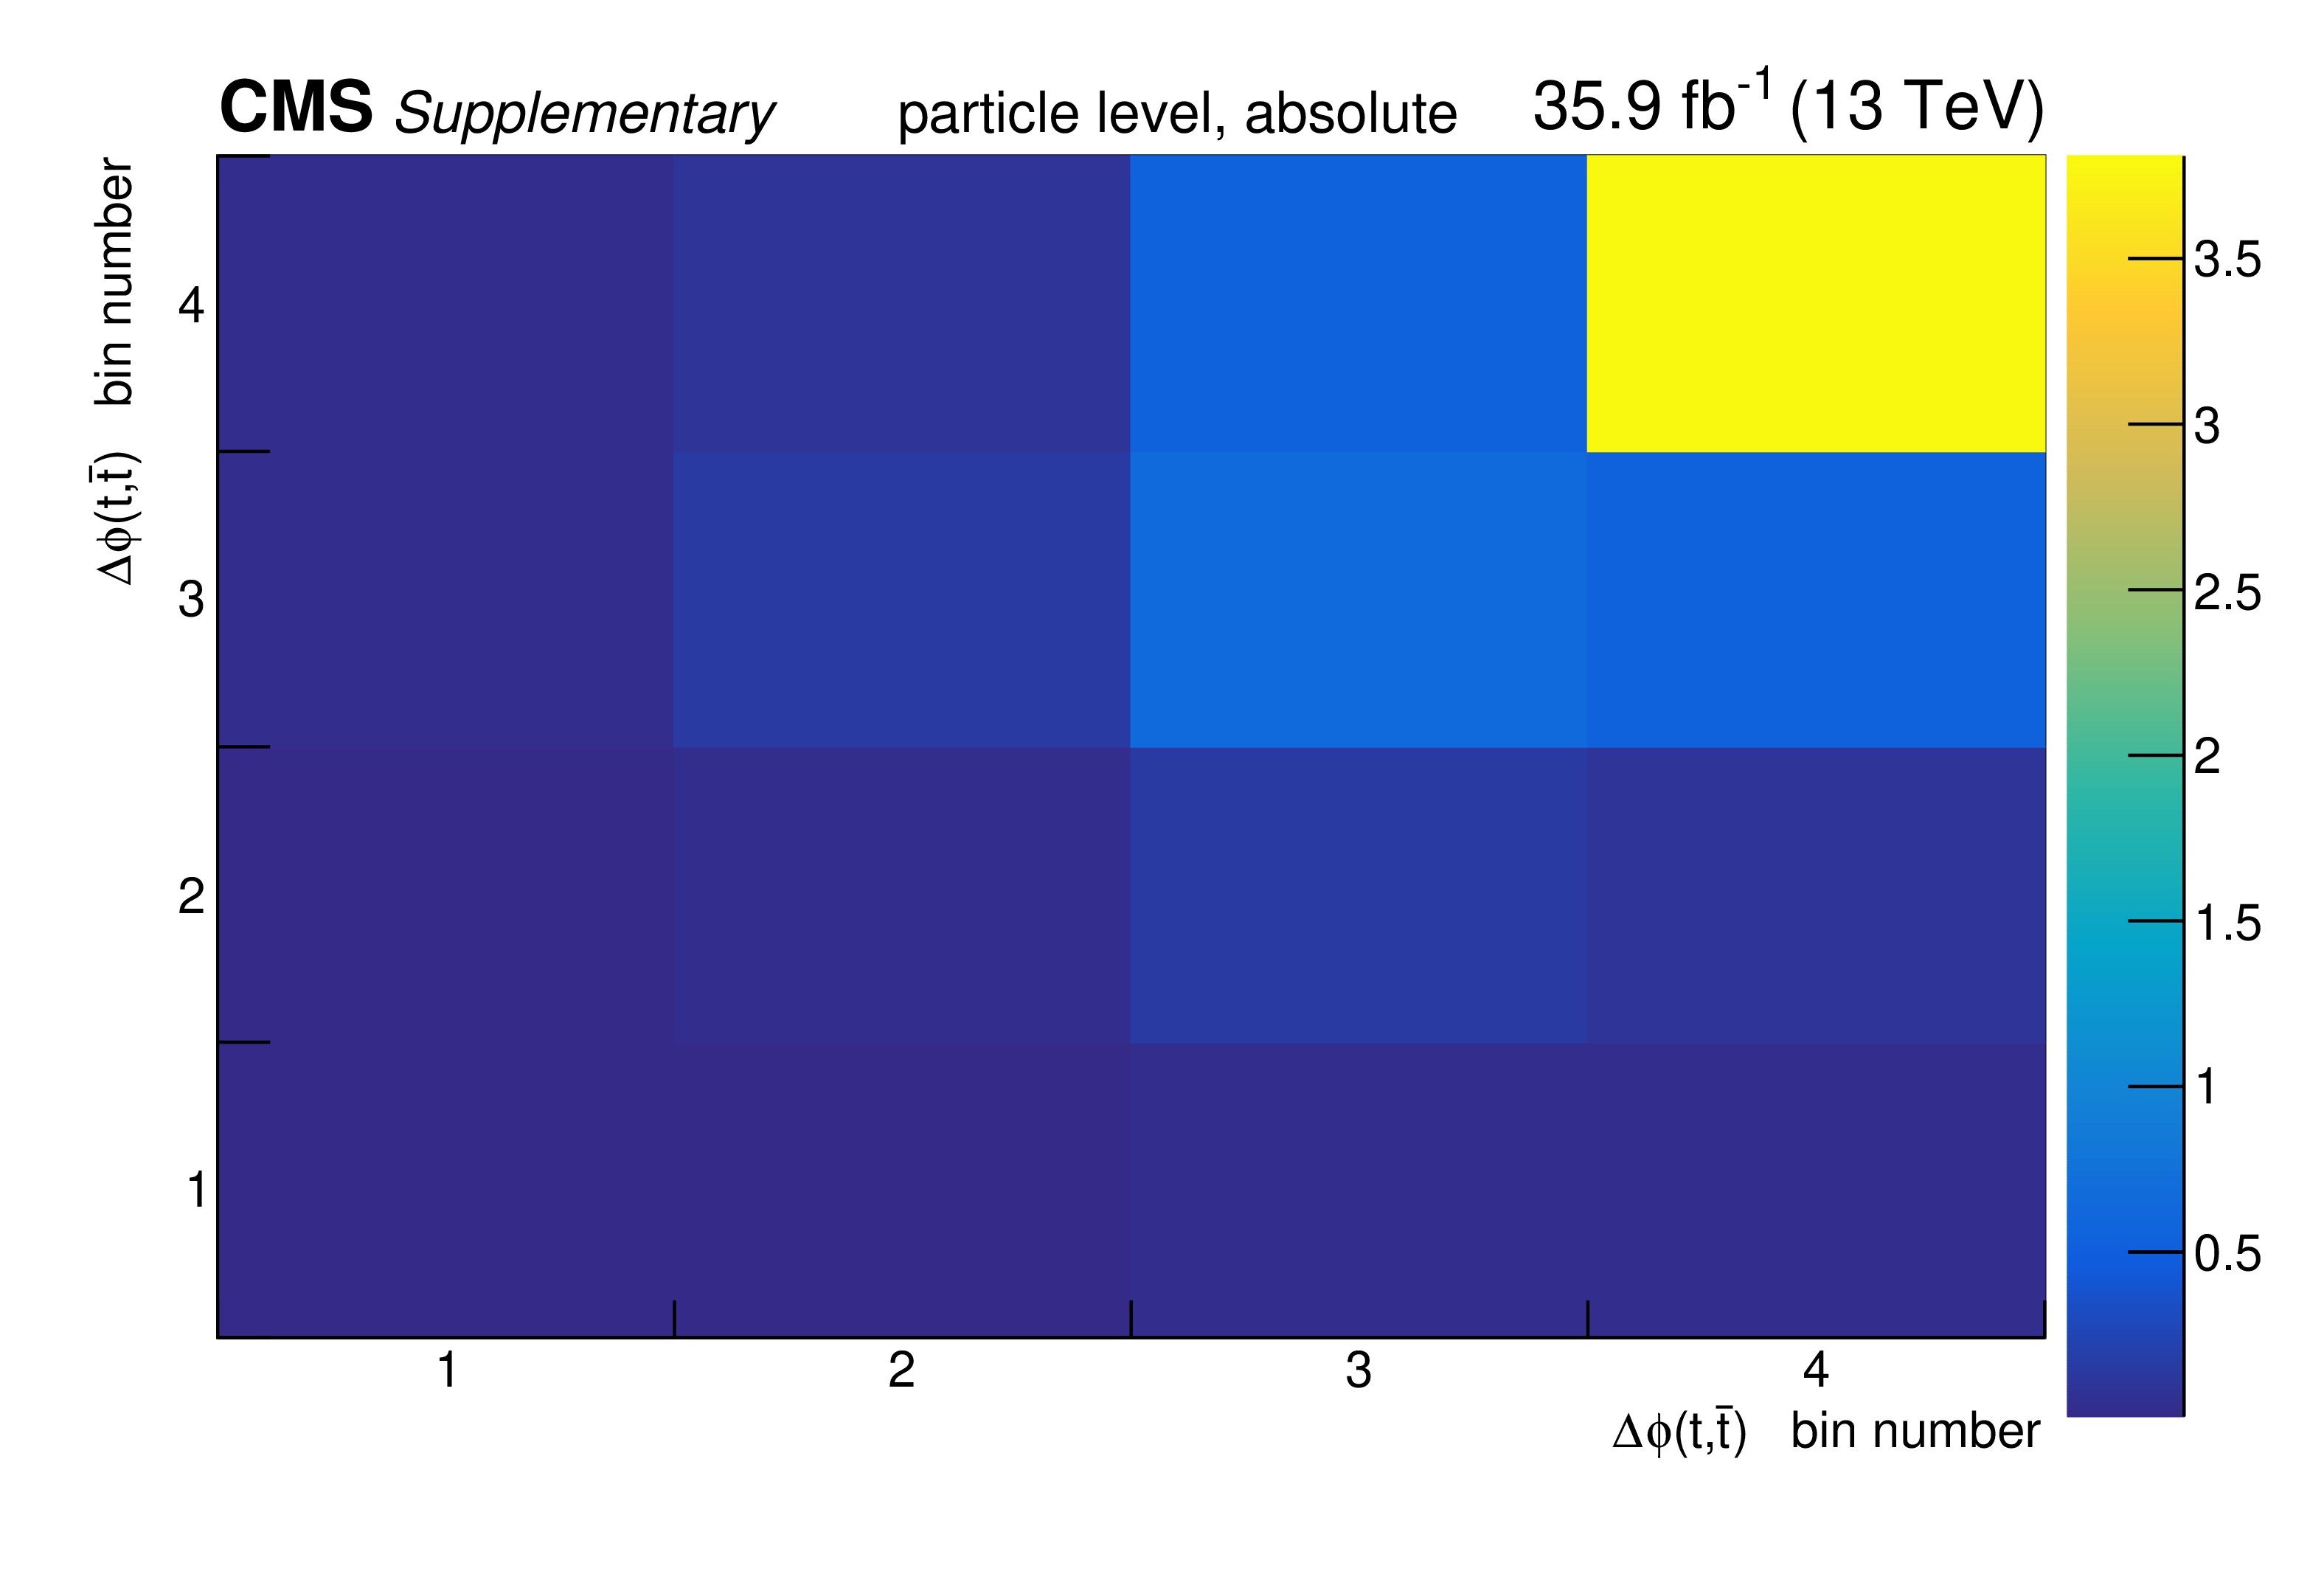
png pdf |
Additional Figure 86:
The covariance matrix of the measured data for the absolute measurement of the differential $\mathrm{t\bar{t}}$ cross section as a function of $\Delta \phi $(t,$\bar{\mathrm {t}}$) at particle level is shown. |
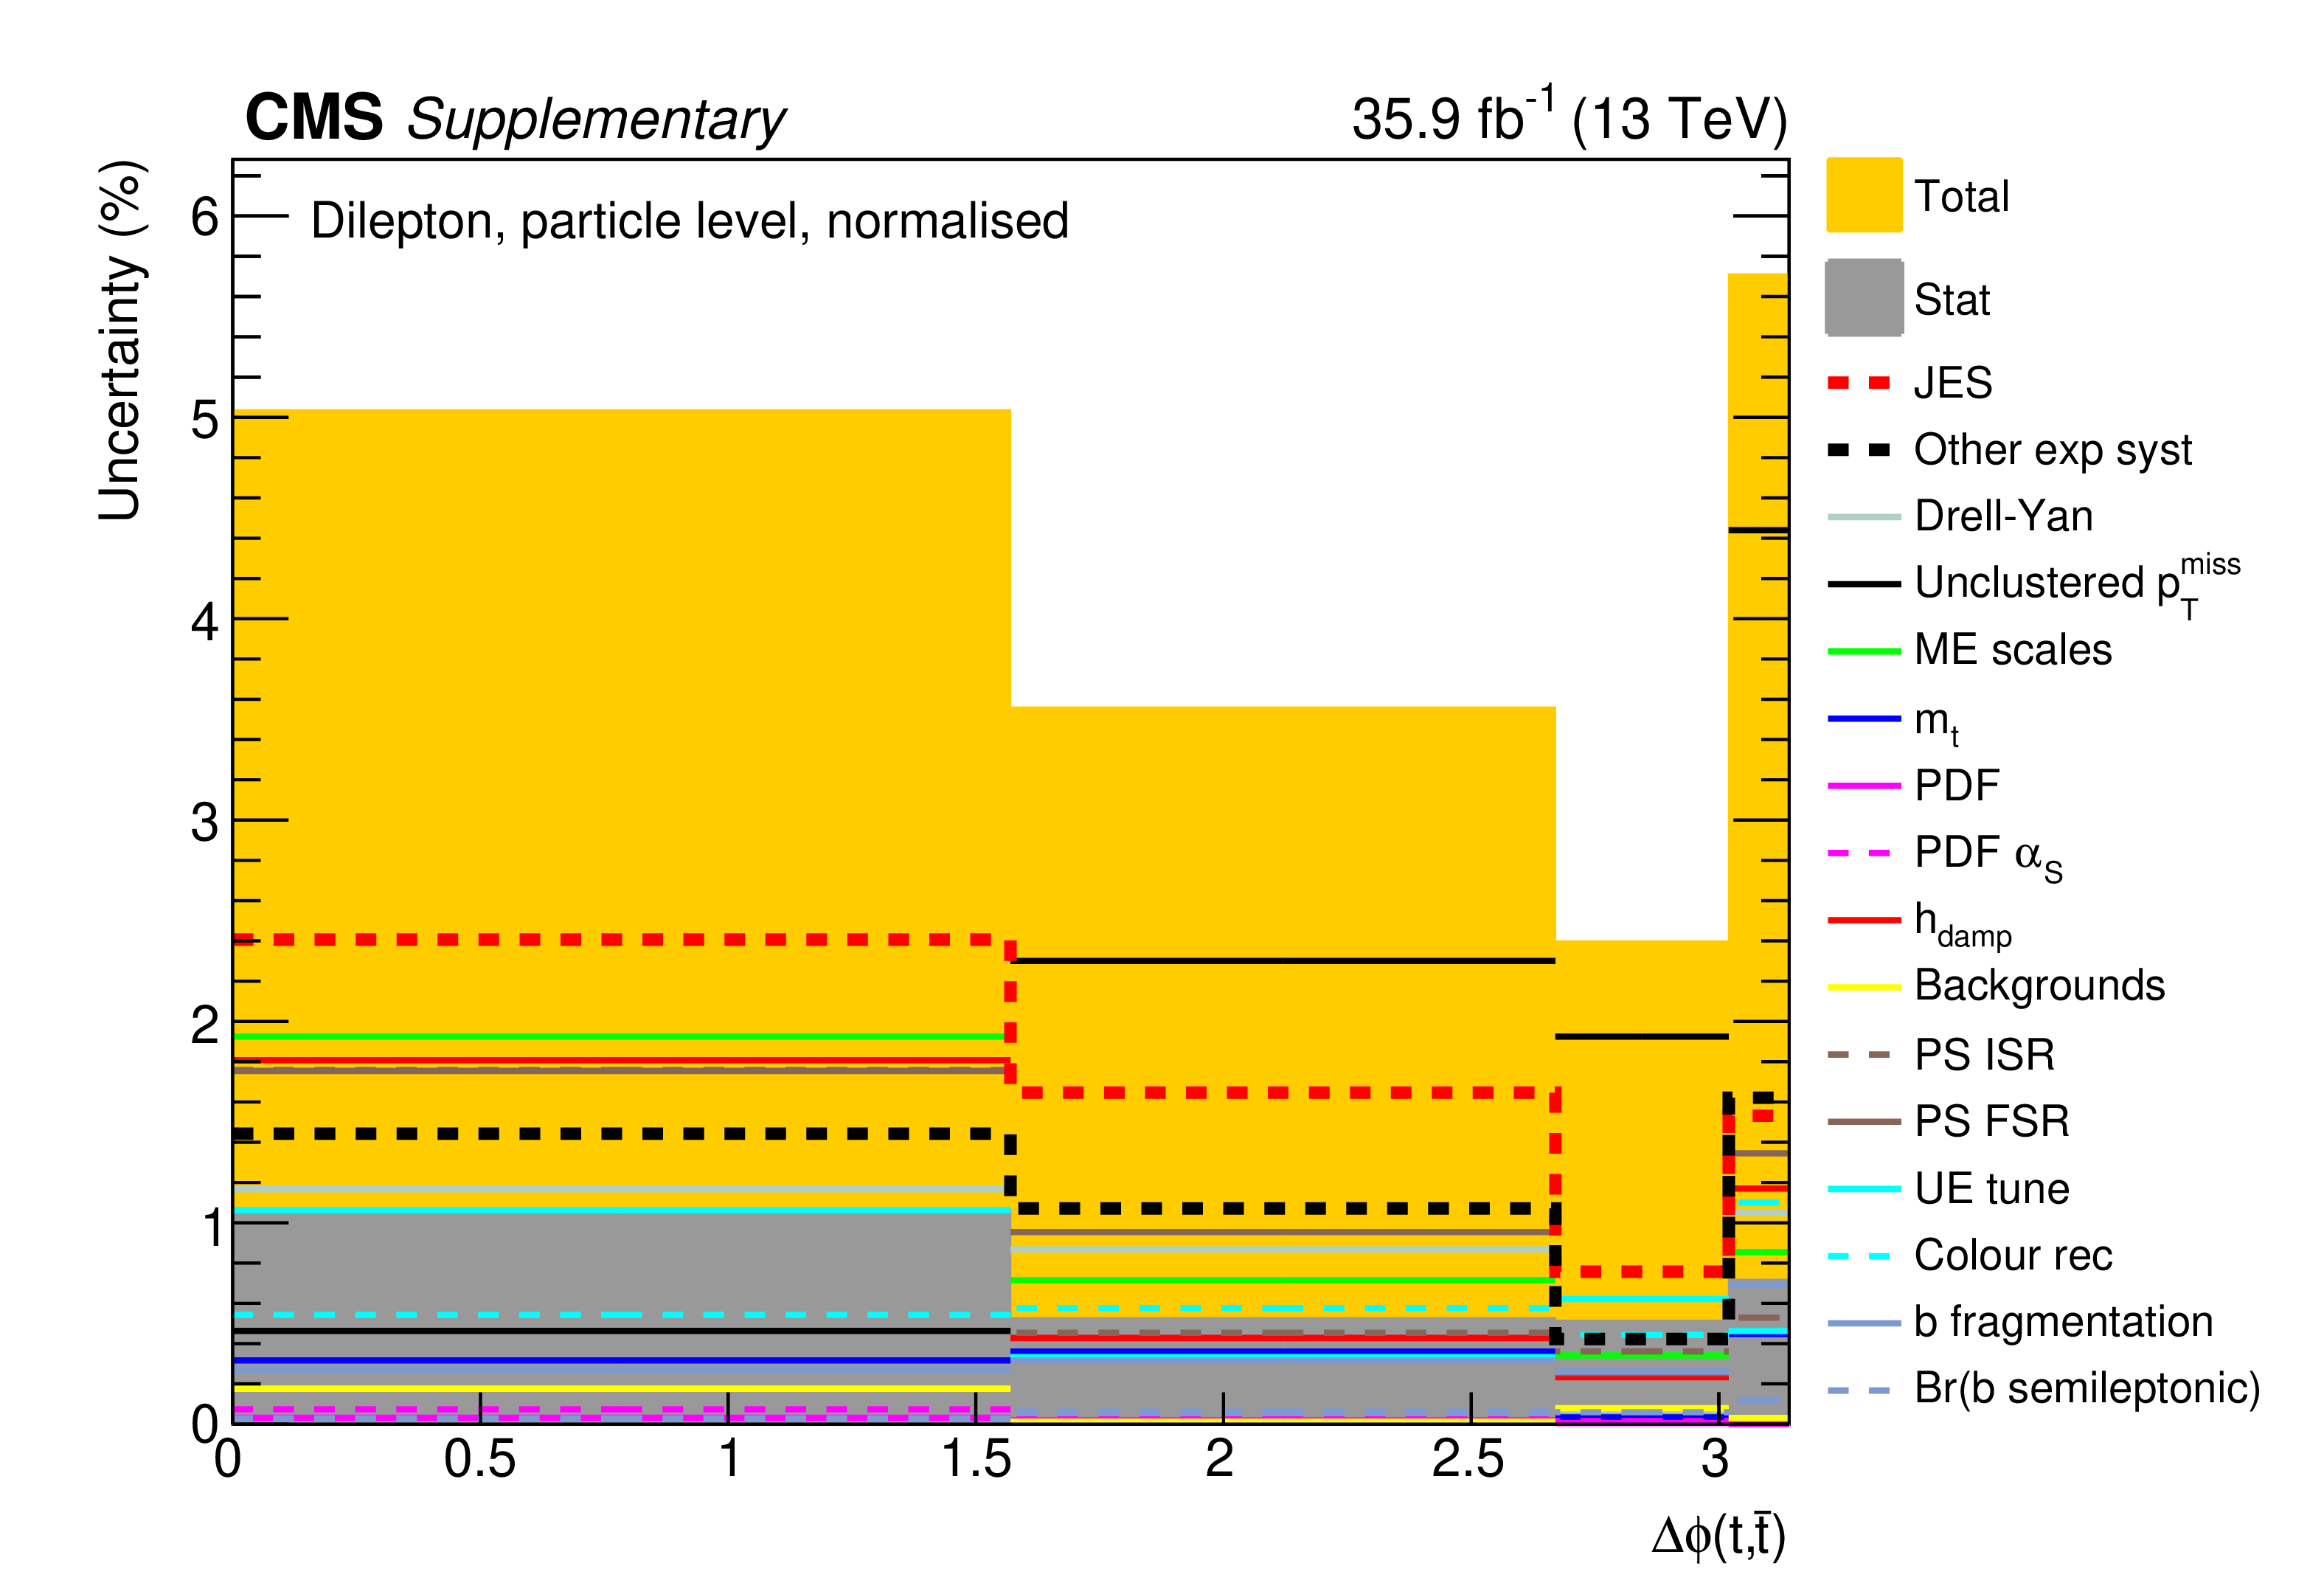
png pdf |
Additional Figure 87:
The breakdown of uncertainties for the normalised measurement of the differential $\mathrm{t\bar{t}}$ cross section as a function of $\Delta \phi $(t,$\bar{\mathrm {t}}$) at particle level is shown. The contributions of each source of systematic uncertainty in each bin are indicated by the coloured lines. Experimental systematic uncertainties that are small in all bins are added in quadrature and shown as a single component. The statistical and total uncertainties are indicated by the shaded areas. |
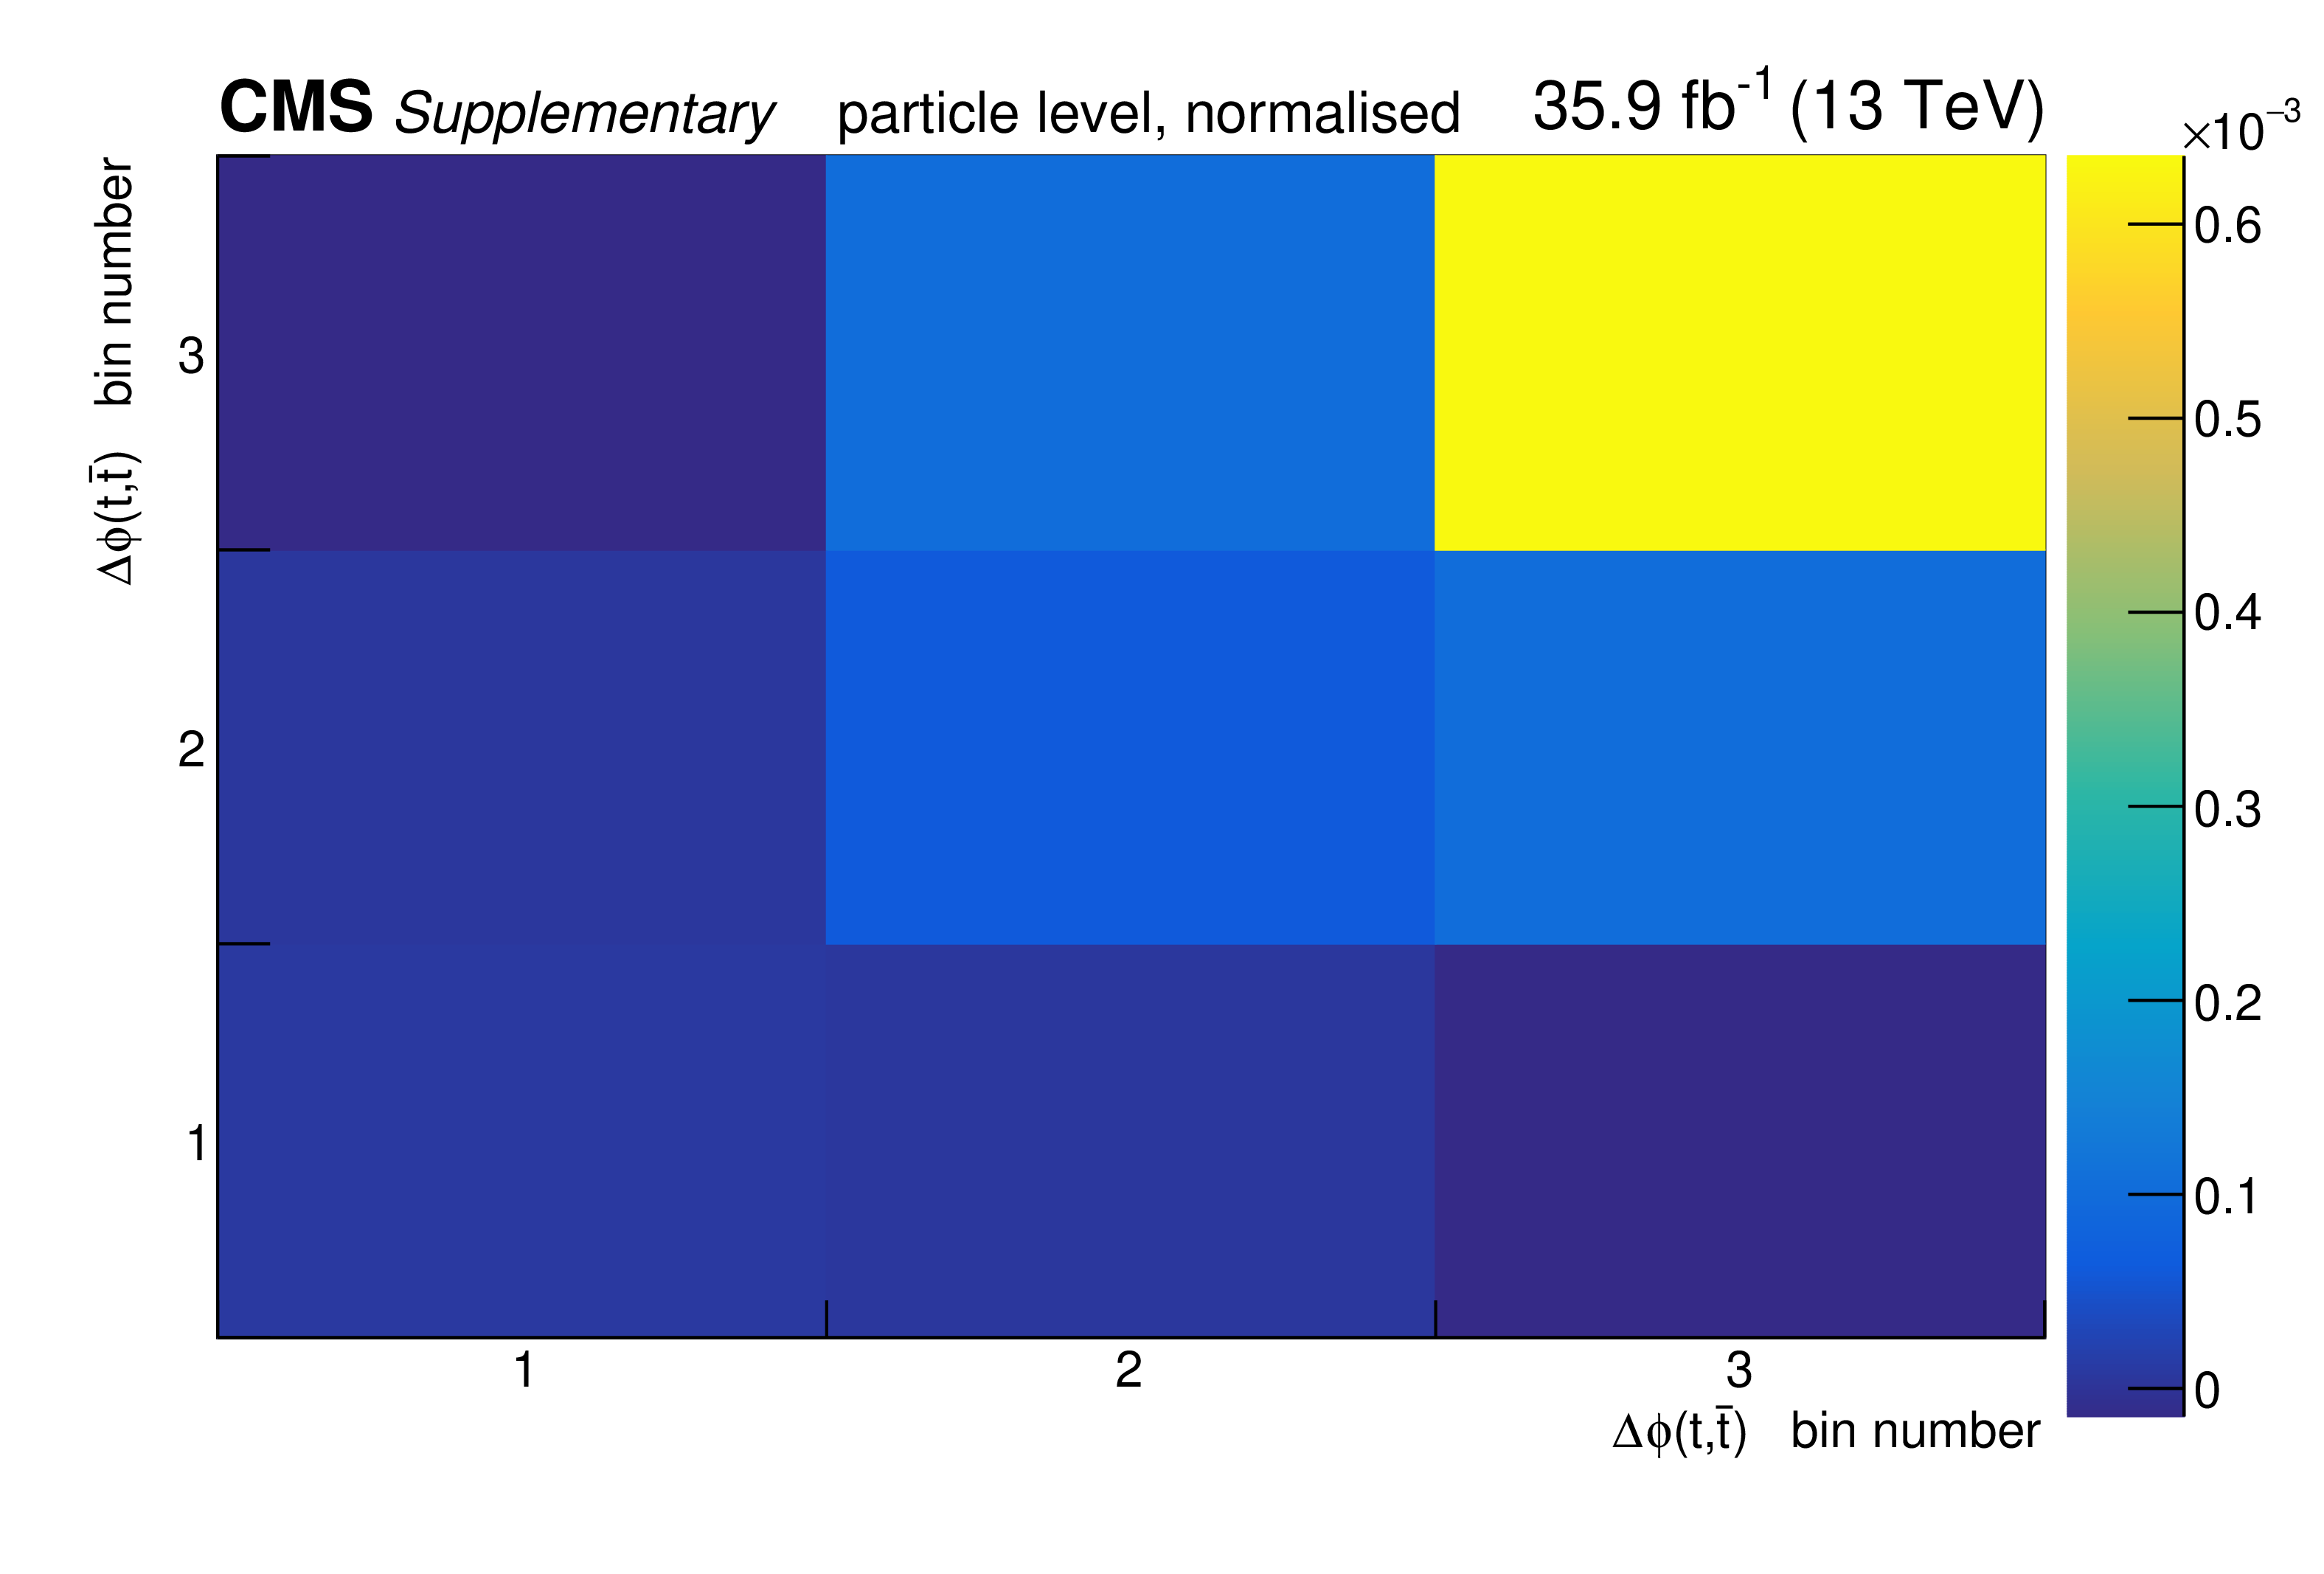
png pdf |
Additional Figure 88:
The covariance matrix of the measured data for the normalised measurement of the differential $\mathrm{t\bar{t}}$ cross section as a function of $\Delta \phi $(t,$\bar{\mathrm {t}}$) at particle level is shown. |

png pdf |
Additional Figure 89:
The breakdown of uncertainties for the absolute measurement of the differential $\mathrm{t\bar{t}}$ cross section as a function of $p_{\mathrm {T}}^{\mathrm {t}\bar{\mathrm {t}}}$ at parton level is shown. The contributions of each source of systematic uncertainty in each bin are indicated by the coloured lines. Experimental systematic uncertainties that are small in all bins are added in quadrature and shown as a single component. The statistical and total uncertainties are indicated by the shaded areas. |
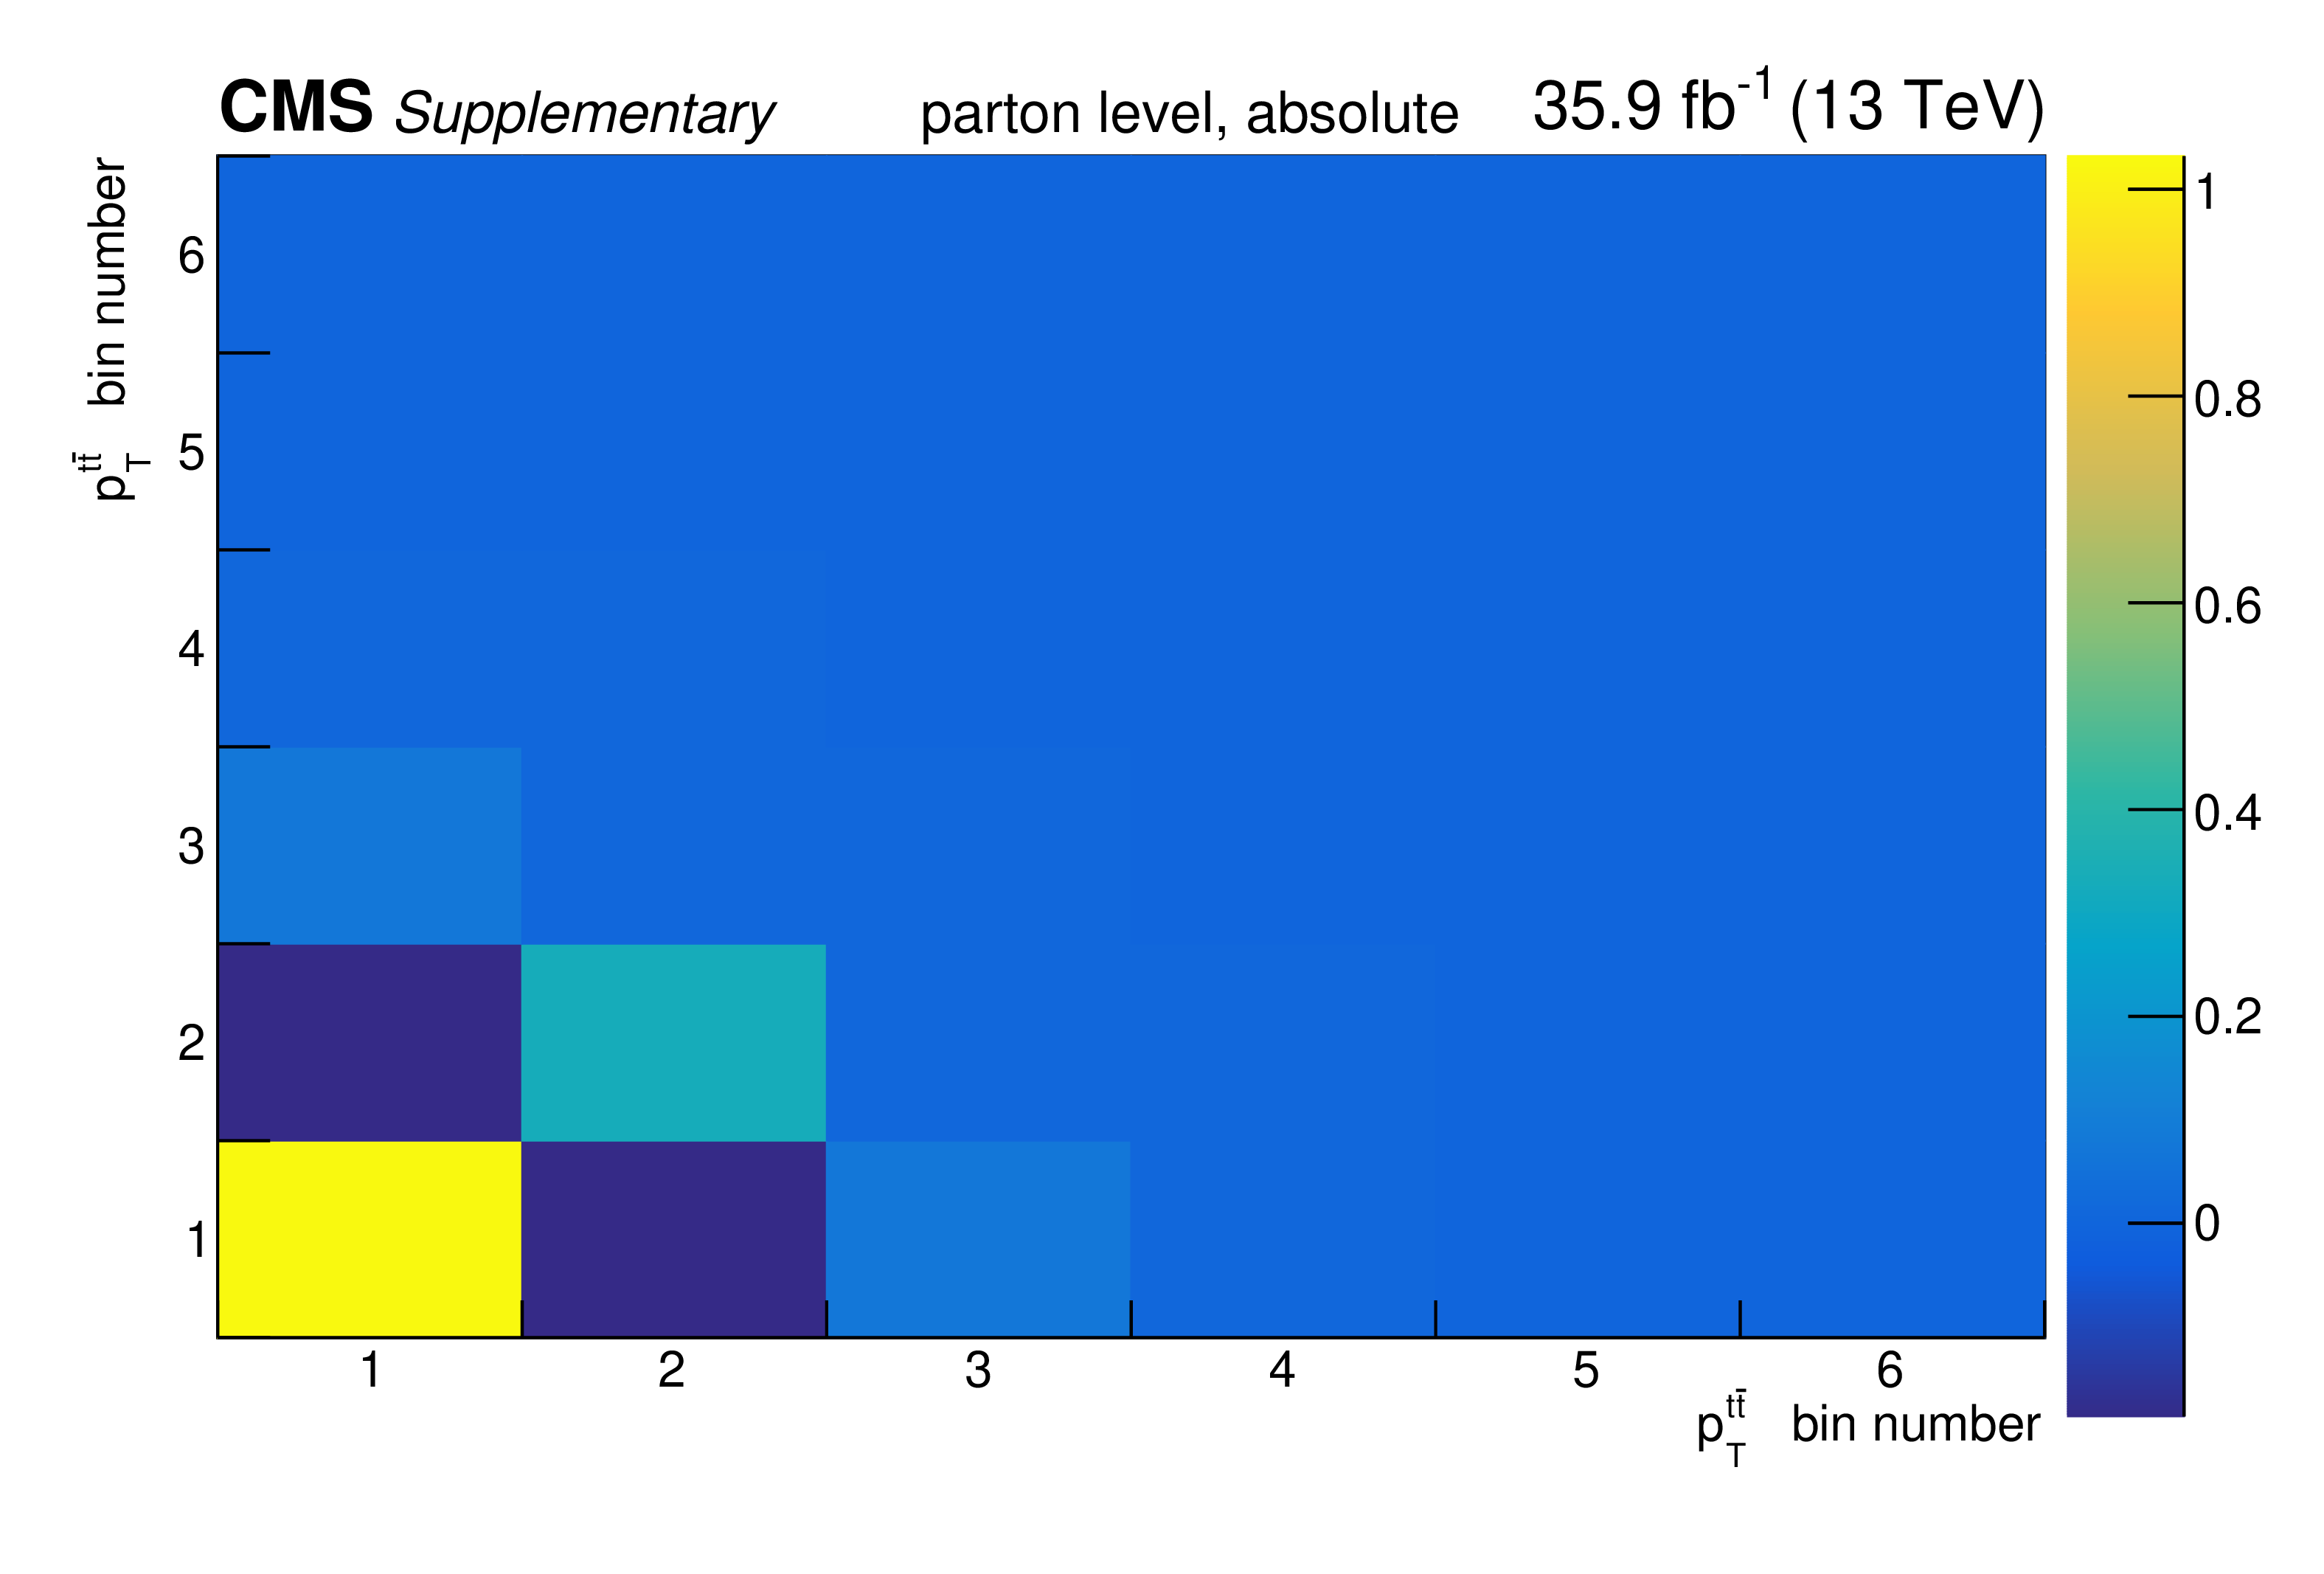
png pdf |
Additional Figure 90:
The covariance matrix of the measured data for the absolute measurement of the differential $\mathrm{t\bar{t}}$ cross section as a function of $p_{\mathrm {T}}^{\mathrm {t}\bar{\mathrm {t}}}$ at parton level is shown. |

png pdf |
Additional Figure 91:
The breakdown of uncertainties for the normalised measurement of the differential $\mathrm{t\bar{t}}$ cross section as a function of $p_{\mathrm {T}}^{\mathrm {t}\bar{\mathrm {t}}}$ at particle level is shown. The contributions of each source of systematic uncertainty in each bin are indicated by the coloured lines. Experimental systematic uncertainties that are small in all bins are added in quadrature and shown as a single component. The statistical and total uncertainties are indicated by the shaded areas. |
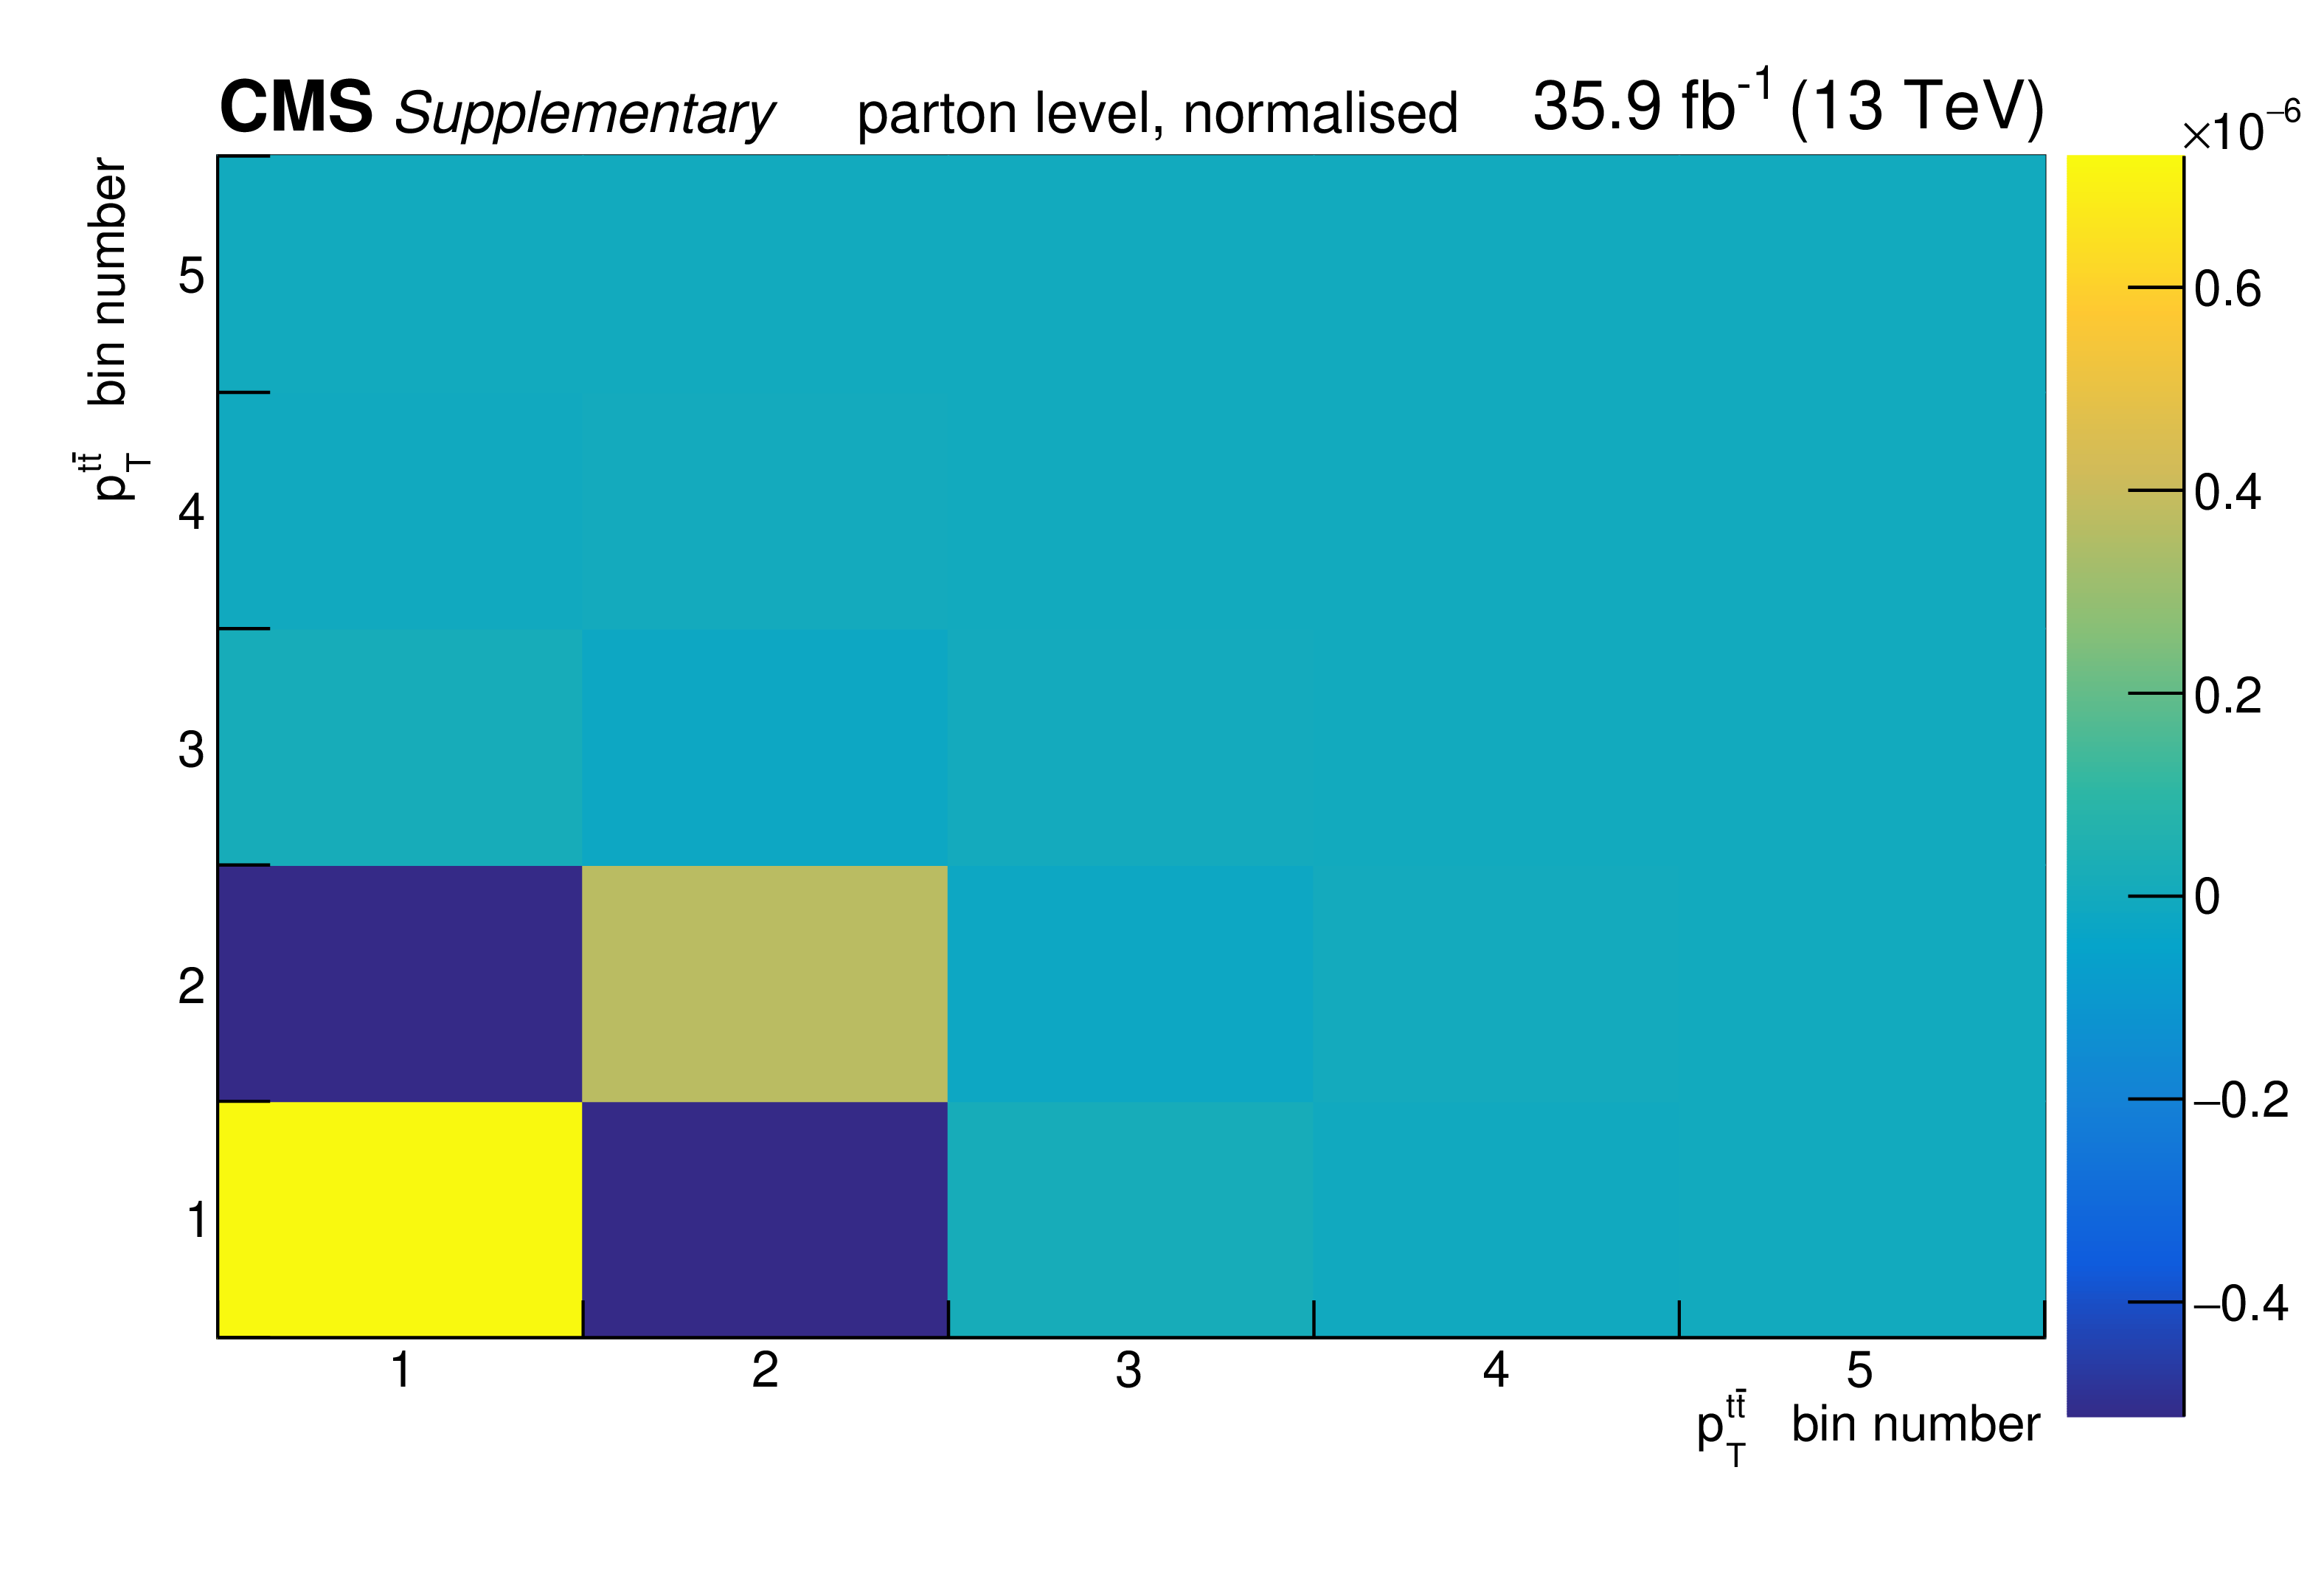
png pdf |
Additional Figure 92:
The covariance matrix of the measured data for the normalised measurement of the differential $\mathrm{t\bar{t}}$ cross section as a function of $p_{\mathrm {T}}^{\mathrm {t}\bar{\mathrm {t}}}$ at particle level is shown. |

png pdf |
Additional Figure 93:
The breakdown of uncertainties for the absolute measurement of the differential $\mathrm{t\bar{t}}$ cross section as a function of $p_{\mathrm {T}}^{\mathrm {t}\bar{\mathrm {t}}}$ at particle level is shown. The contributions of each source of systematic uncertainty in each bin are indicated by the coloured lines. Experimental systematic uncertainties that are small in all bins are added in quadrature and shown as a single component. The statistical and total uncertainties are indicated by the shaded areas. |
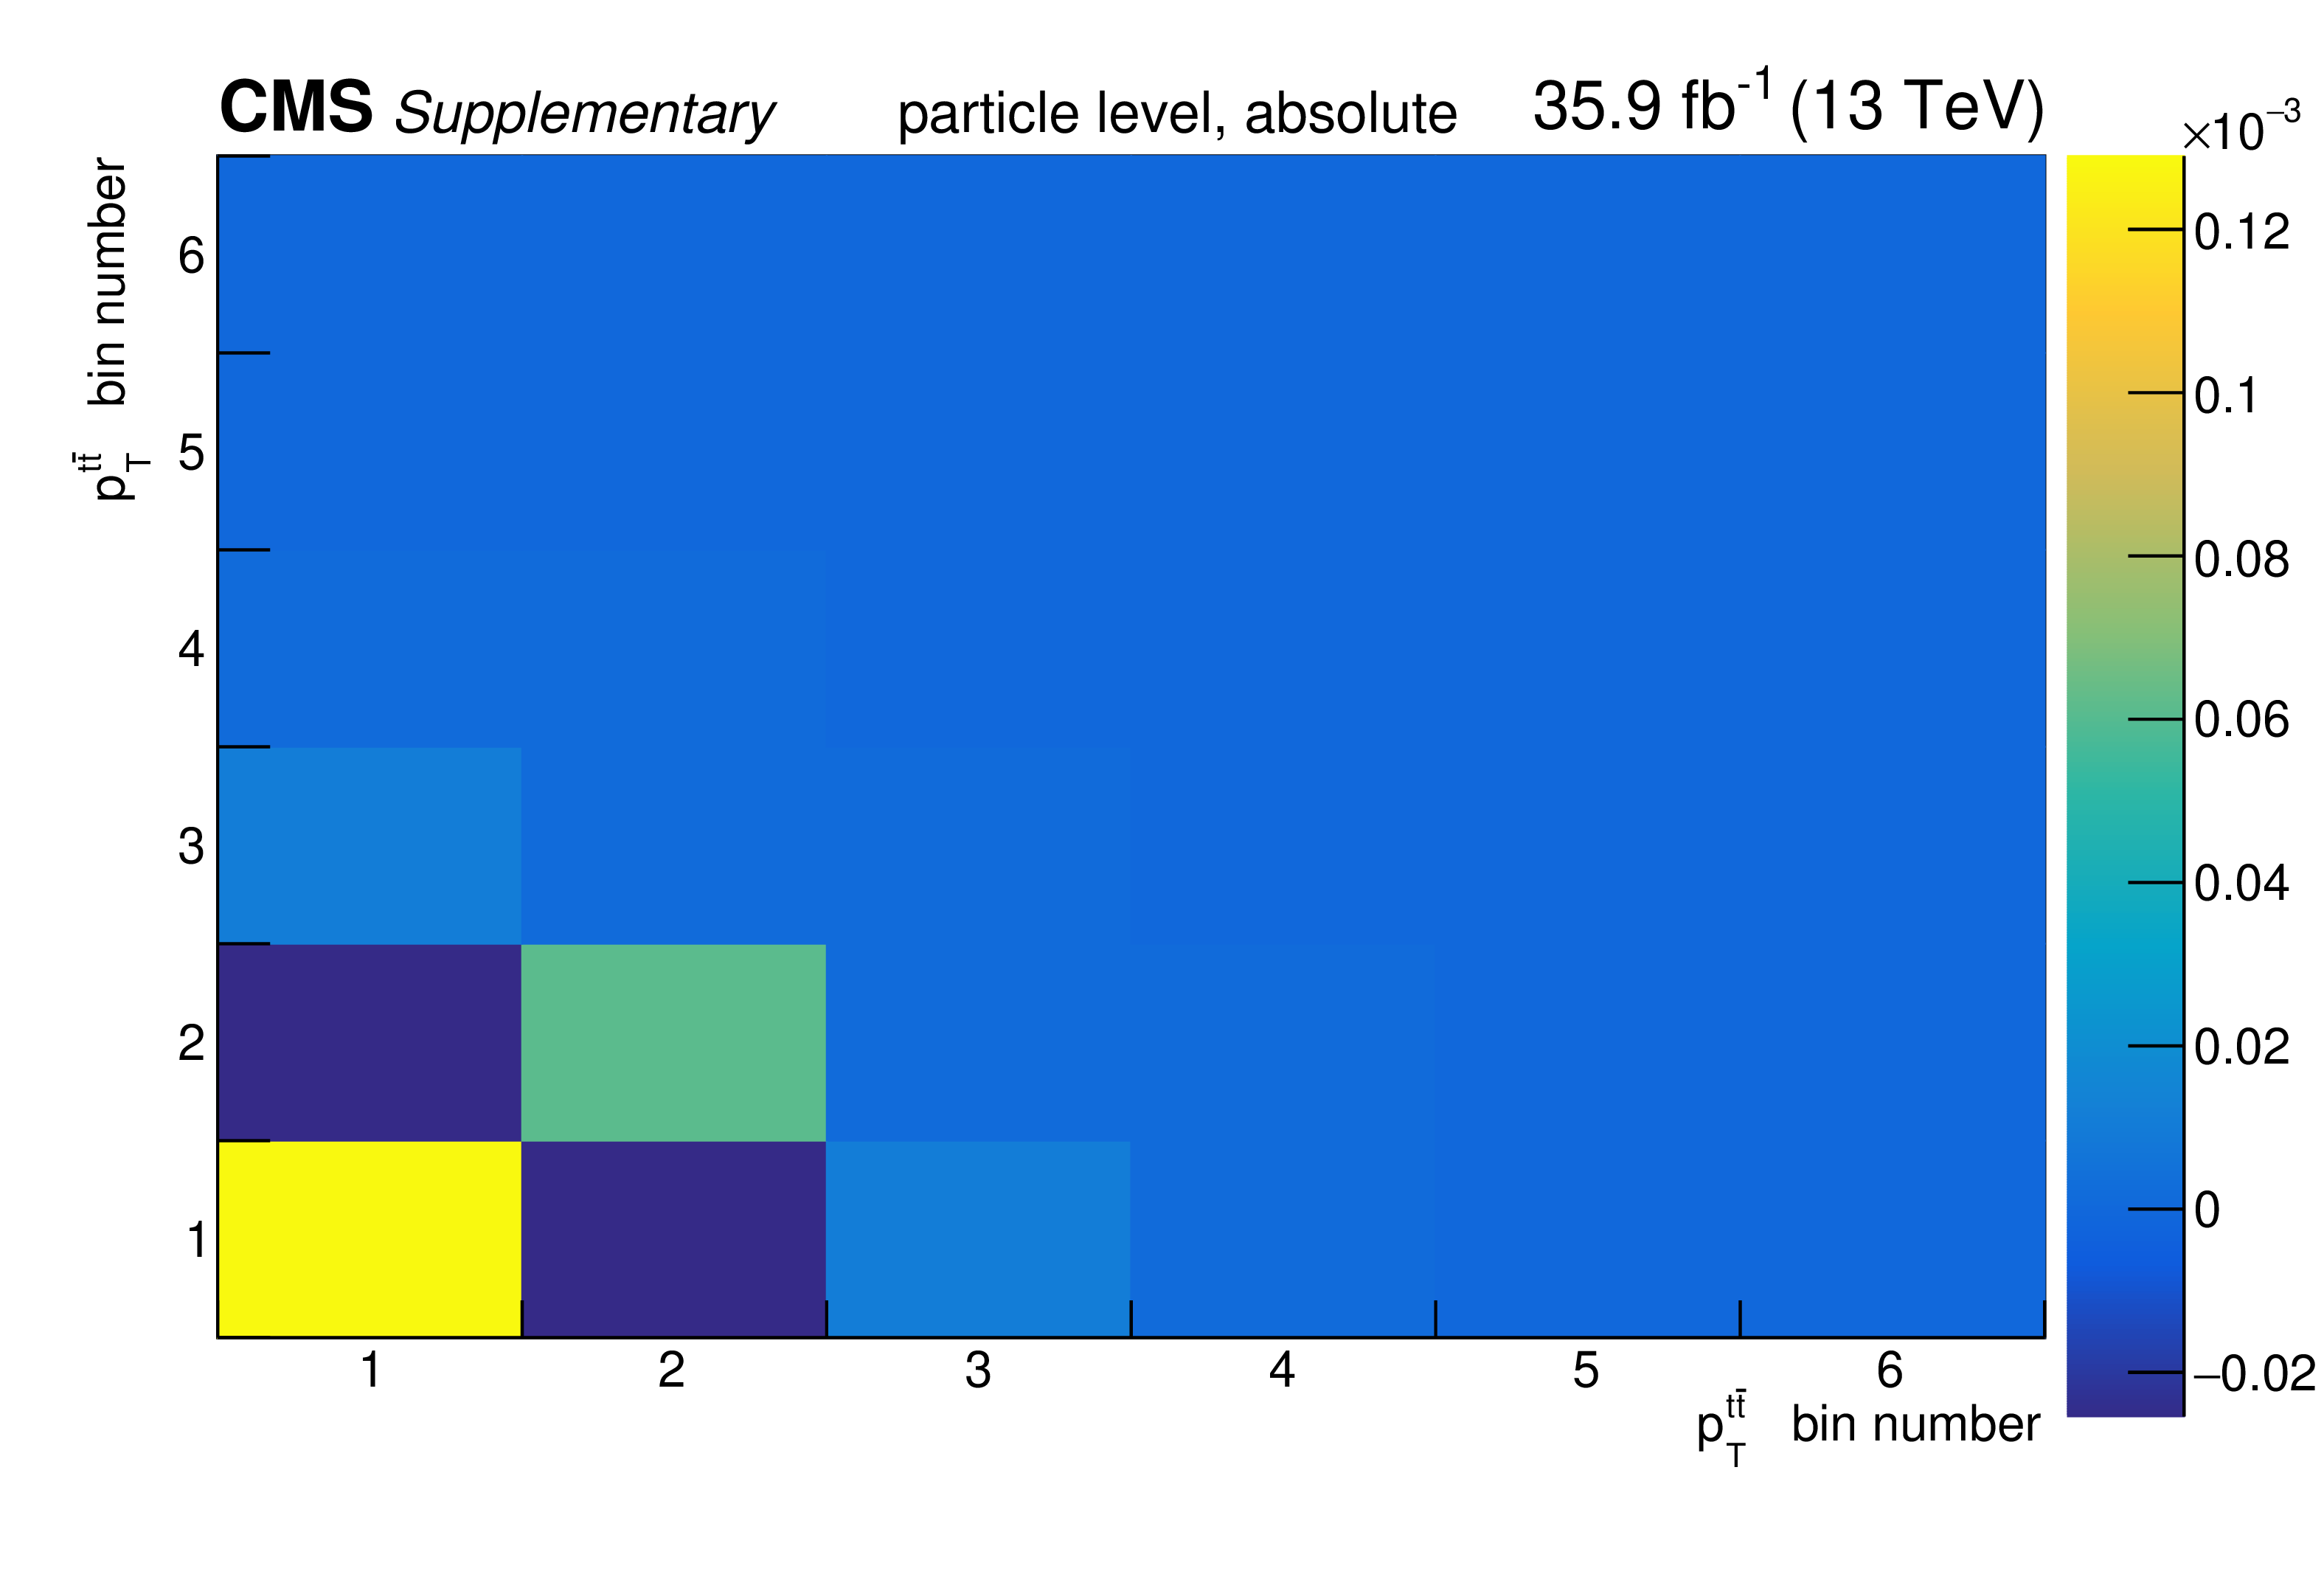
png pdf |
Additional Figure 94:
The covariance matrix of the measured data for the absolute measurement of the differential $\mathrm{t\bar{t}}$ cross section as a function of $p_{\mathrm {T}}^{\mathrm {t}\bar{\mathrm {t}}}$ at particle level is shown. |

png pdf |
Additional Figure 95:
The breakdown of uncertainties for the normalised measurement of the differential $\mathrm{t\bar{t}}$ cross section as a function of $p_{\mathrm {T}}^{\mathrm {t}\bar{\mathrm {t}}}$ at parton level is shown. The contributions of each source of systematic uncertainty in each bin are indicated by the coloured lines. Experimental systematic uncertainties that are small in all bins are added in quadrature and shown as a single component. The statistical and total uncertainties are indicated by the shaded areas. |

png pdf |
Additional Figure 96:
The covariance matrix of the measured data for the normalised measurement of the differential $\mathrm{t\bar{t}}$ cross section as a function of $p_{\mathrm {T}}^{\mathrm {t}\bar{\mathrm {t}}}$ at parton level is shown. |

png pdf |
Additional Figure 97:
The breakdown of uncertainties for the absolute measurement of the differential $\mathrm{t\bar{t}}$ cross section as a function of $y_{\mathrm {t}\bar{\mathrm {t}}}$ at parton level is shown. The contributions of each source of systematic uncertainty in each bin are indicated by the coloured lines. Experimental systematic uncertainties that are small in all bins are added in quadrature and shown as a single component. The statistical and total uncertainties are indicated by the shaded areas. |

png pdf |
Additional Figure 98:
The covariance matrix of the measured data for the absolute measurement of the differential $\mathrm{t\bar{t}}$ cross section as a function of $y_{\mathrm {t}\bar{\mathrm {t}}}$ at parton level is shown. |

png pdf |
Additional Figure 99:
The breakdown of uncertainties for the normalised measurement of the differential $\mathrm{t\bar{t}}$ cross section as a function of $y_{\mathrm {t}\bar{\mathrm {t}}}$ at parton level is shown. The contributions of each source of systematic uncertainty in each bin are indicated by the coloured lines. Experimental systematic uncertainties that are small in all bins are added in quadrature and shown as a single component. The statistical and total uncertainties are indicated by the shaded areas. |
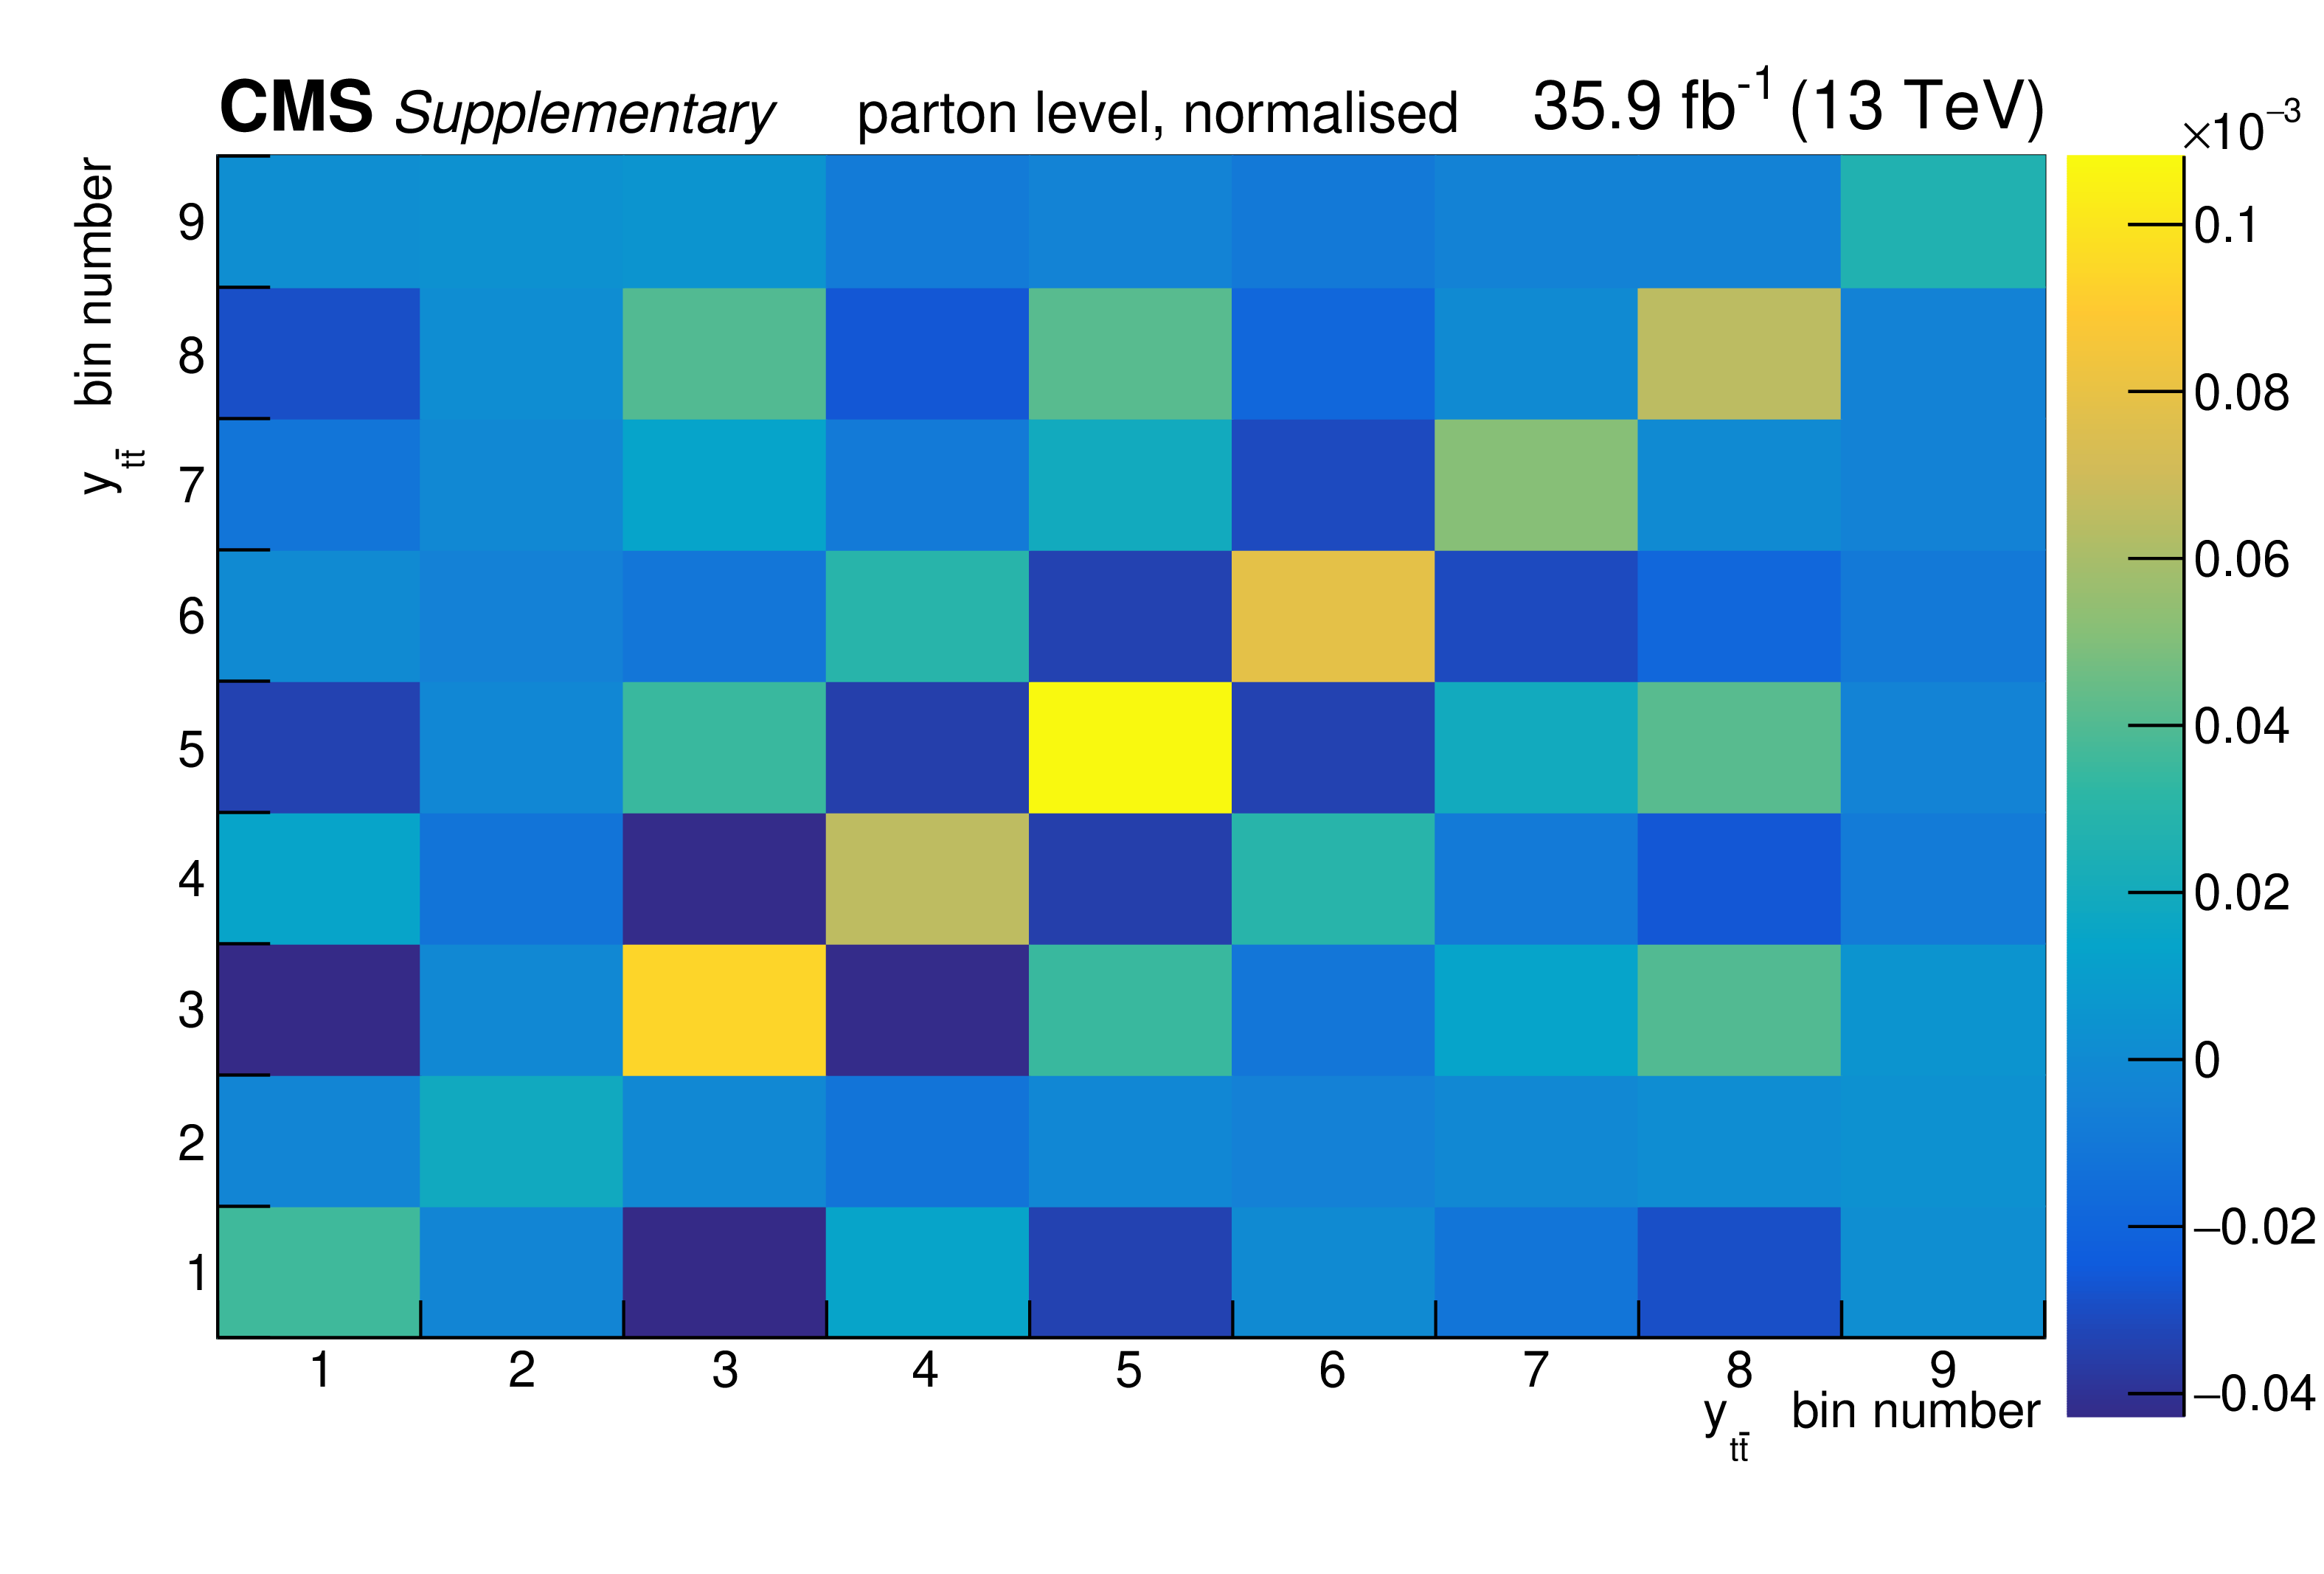
png pdf |
Additional Figure 100:
The covariance matrix of the measured data for the normalised measurement of the differential $\mathrm{t\bar{t}}$ cross section as a function of $y_{\mathrm {t}\bar{\mathrm {t}}}$ at parton level is shown. |
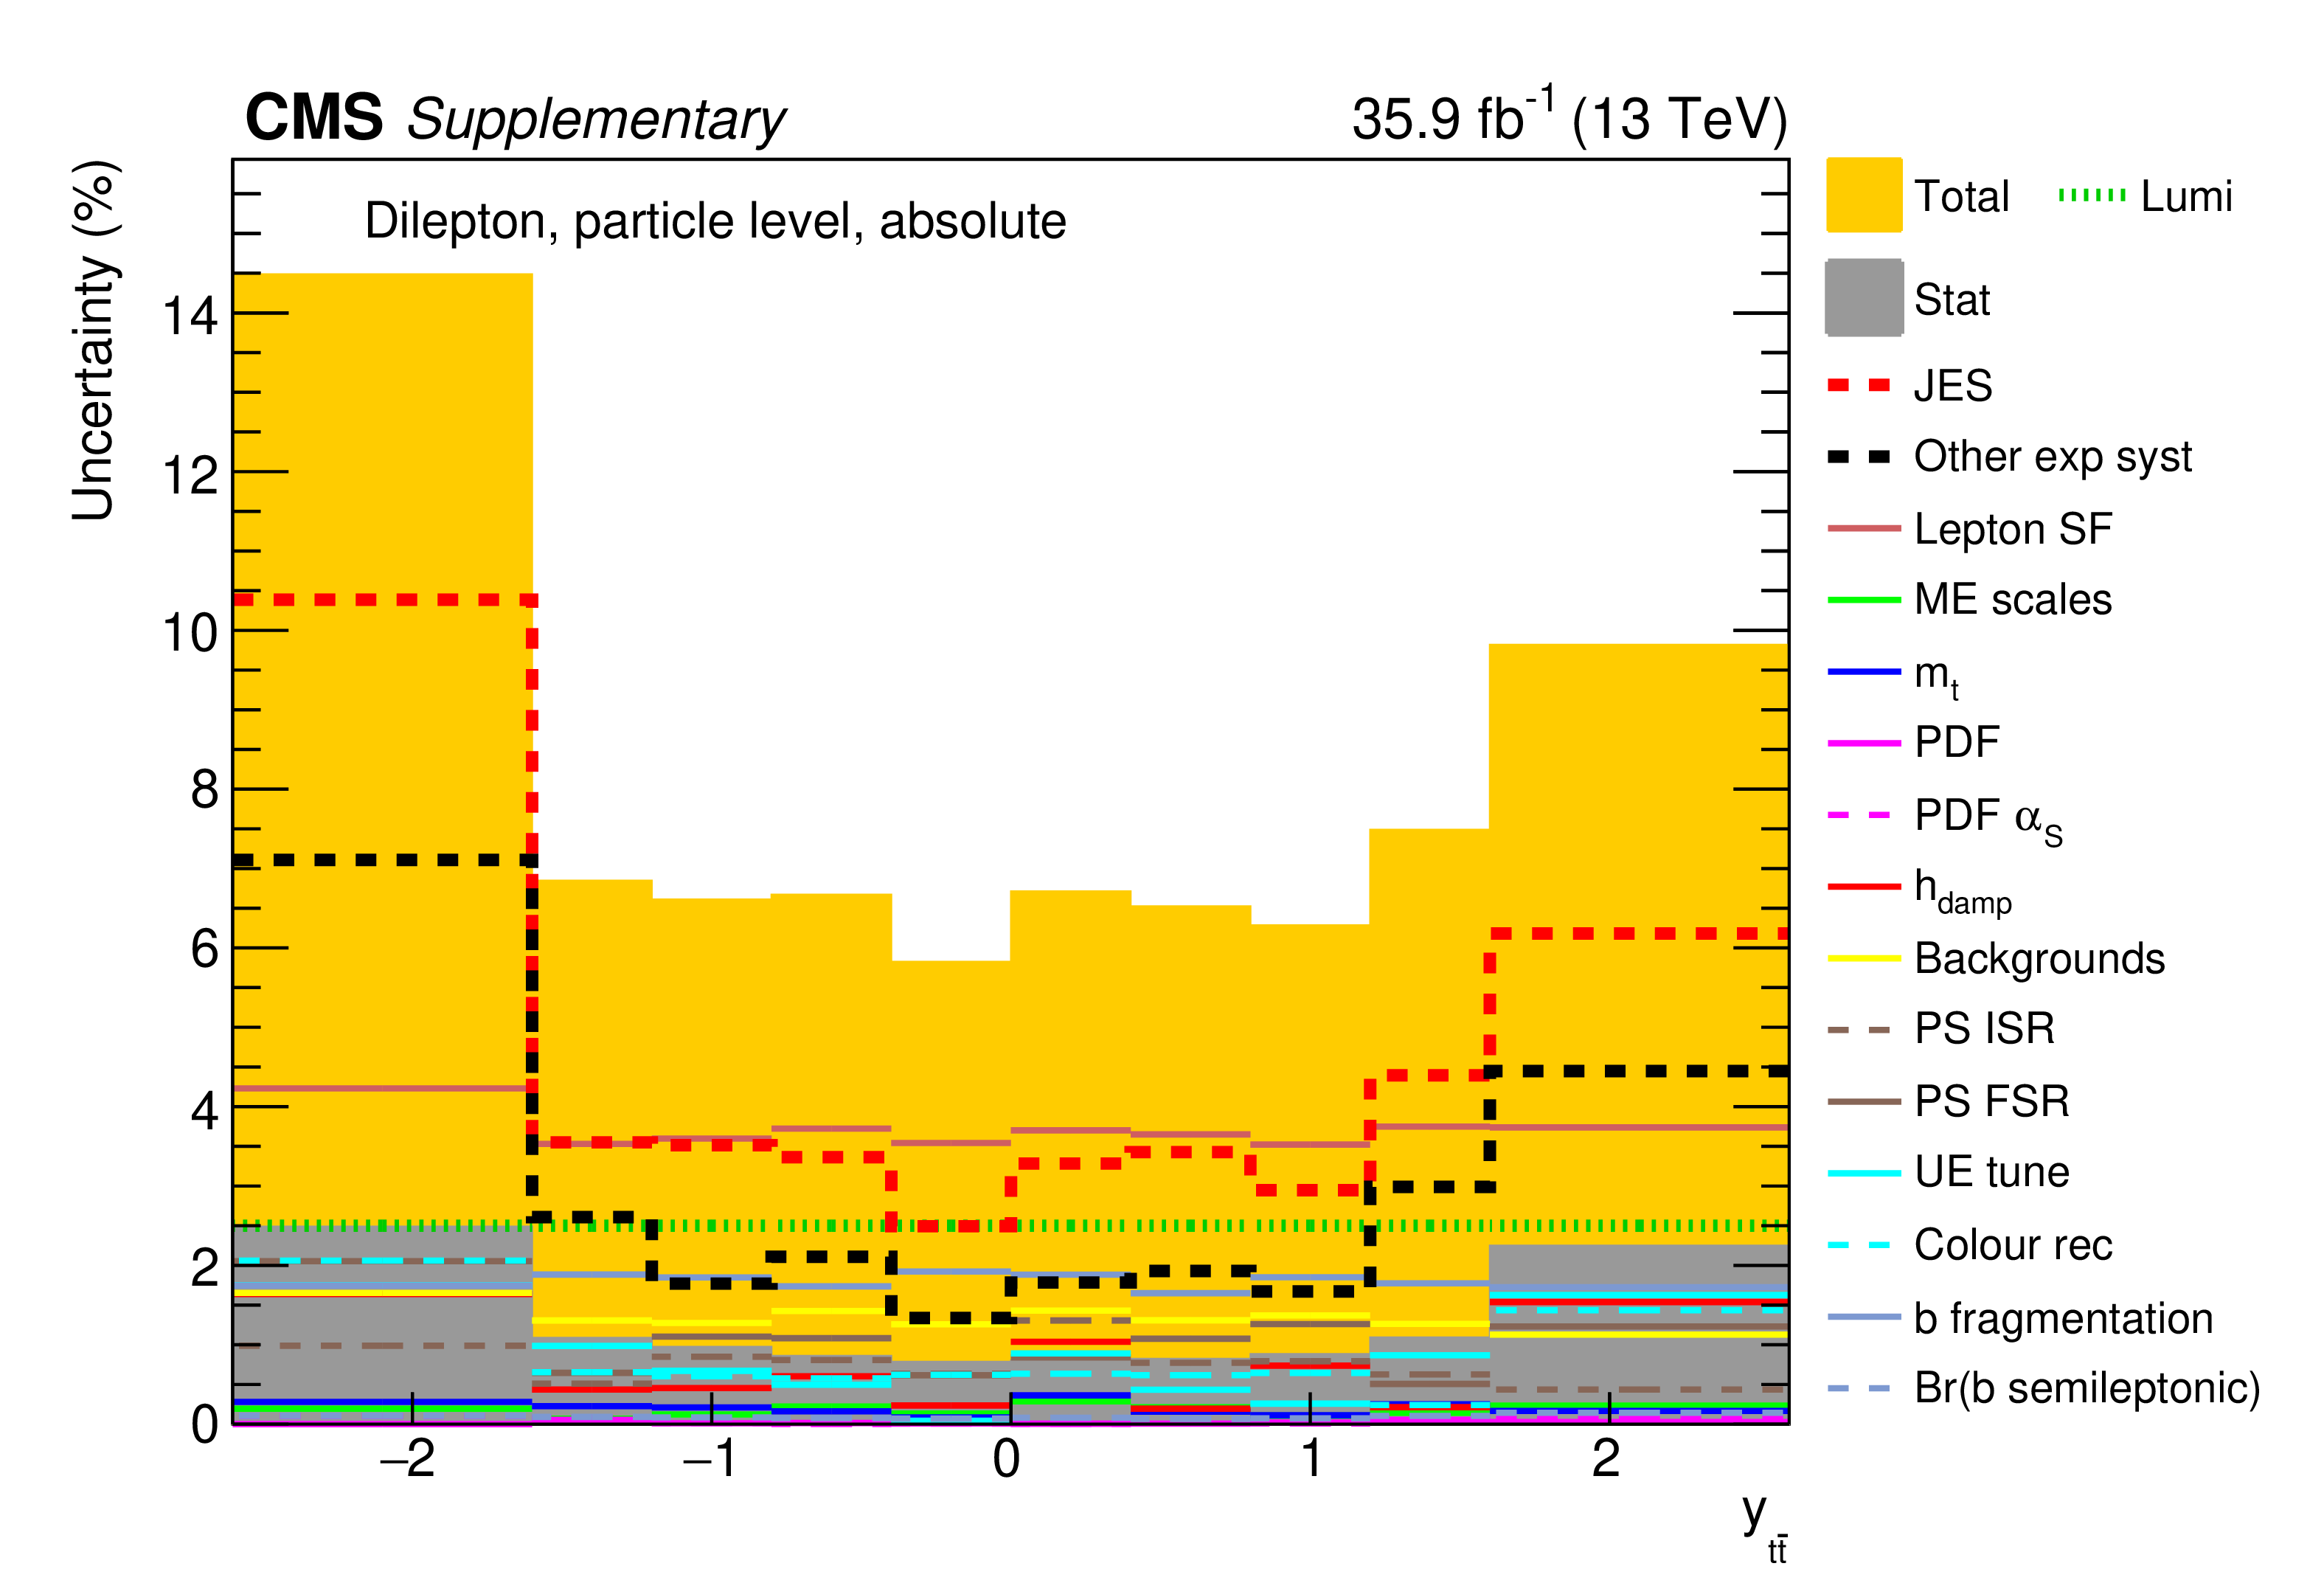
png pdf |
Additional Figure 101:
The breakdown of uncertainties for the absolute measurement of the differential $\mathrm{t\bar{t}}$ cross section as a function of $y_{\mathrm {t}\bar{\mathrm {t}}}$ at particle level is shown. The contributions of each source of systematic uncertainty in each bin are indicated by the coloured lines. Experimental systematic uncertainties that are small in all bins are added in quadrature and shown as a single component. The statistical and total uncertainties are indicated by the shaded areas. |
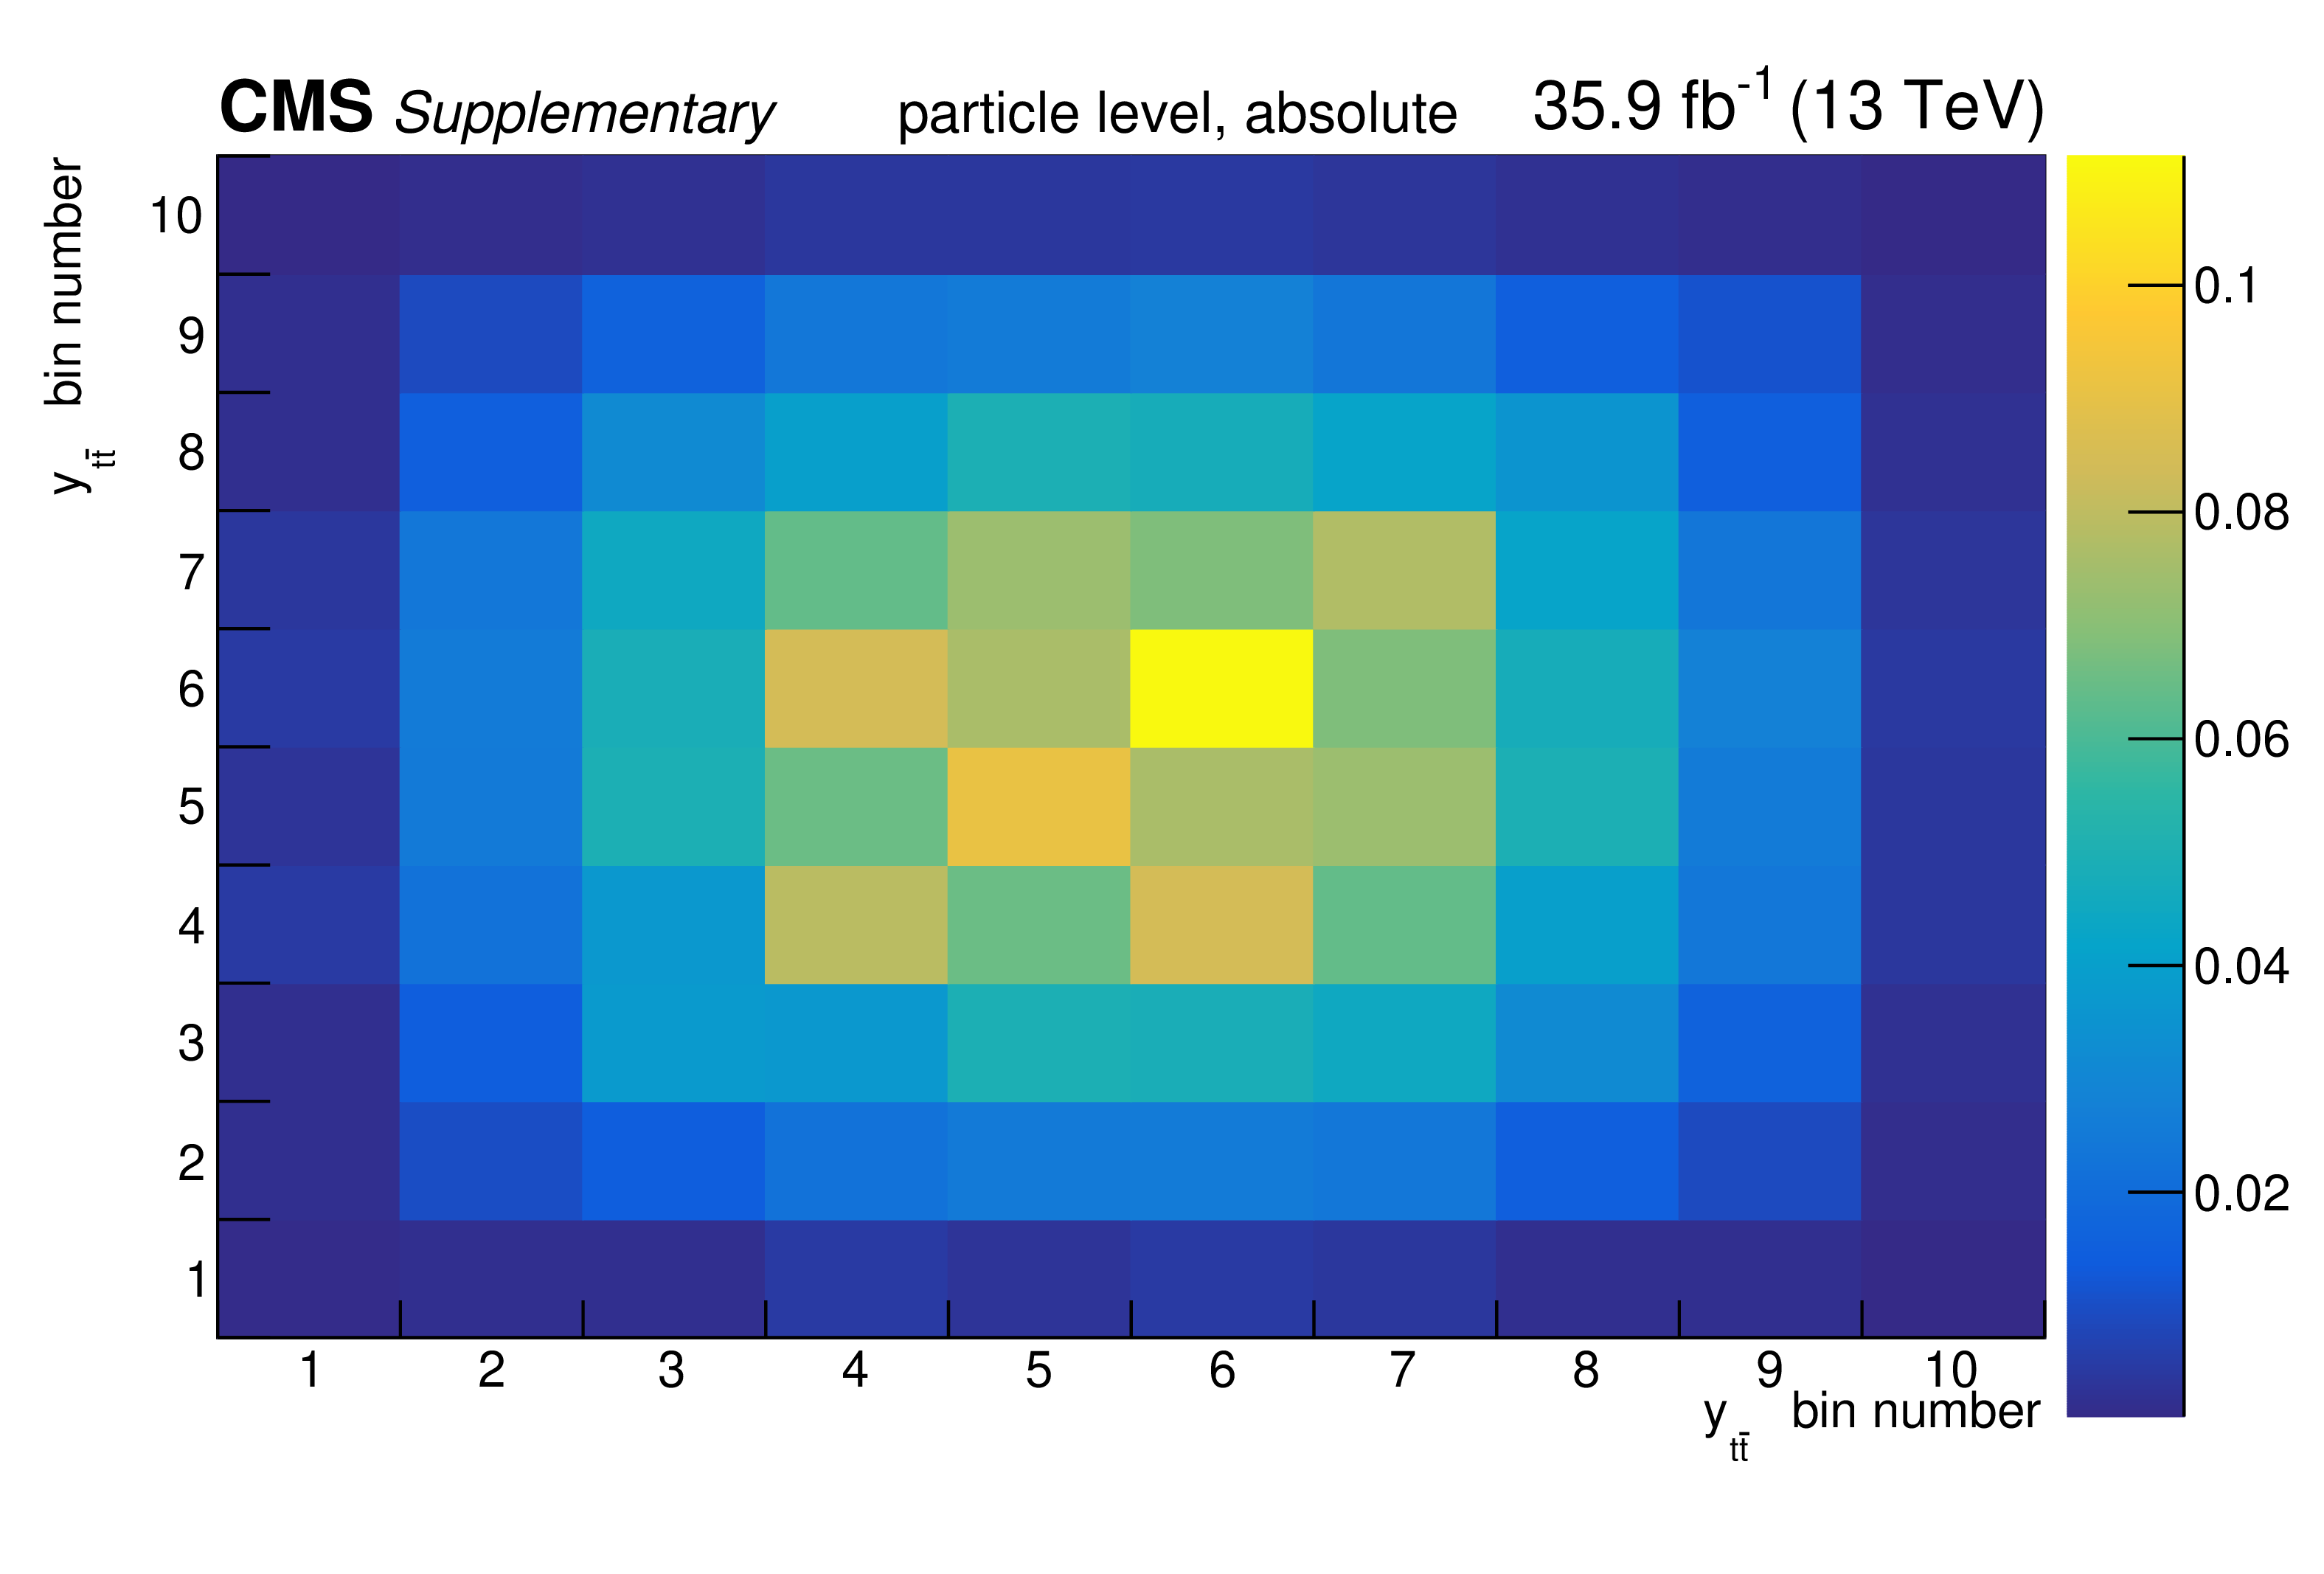
png pdf |
Additional Figure 102:
The covariance matrix of the measured data for the absolute measurement of the differential $\mathrm{t\bar{t}}$ cross section as a function of $y_{\mathrm {t}\bar{\mathrm {t}}}$ at particle level is shown. |

png pdf |
Additional Figure 103:
The breakdown of uncertainties for the normalised measurement of the differential $\mathrm{t\bar{t}}$ cross section as a function of $y_{\mathrm {t}\bar{\mathrm {t}}}$ at particle level is shown. The contributions of each source of systematic uncertainty in each bin are indicated by the coloured lines. Experimental systematic uncertainties that are small in all bins are added in quadrature and shown as a single component. The statistical and total uncertainties are indicated by the shaded areas. |
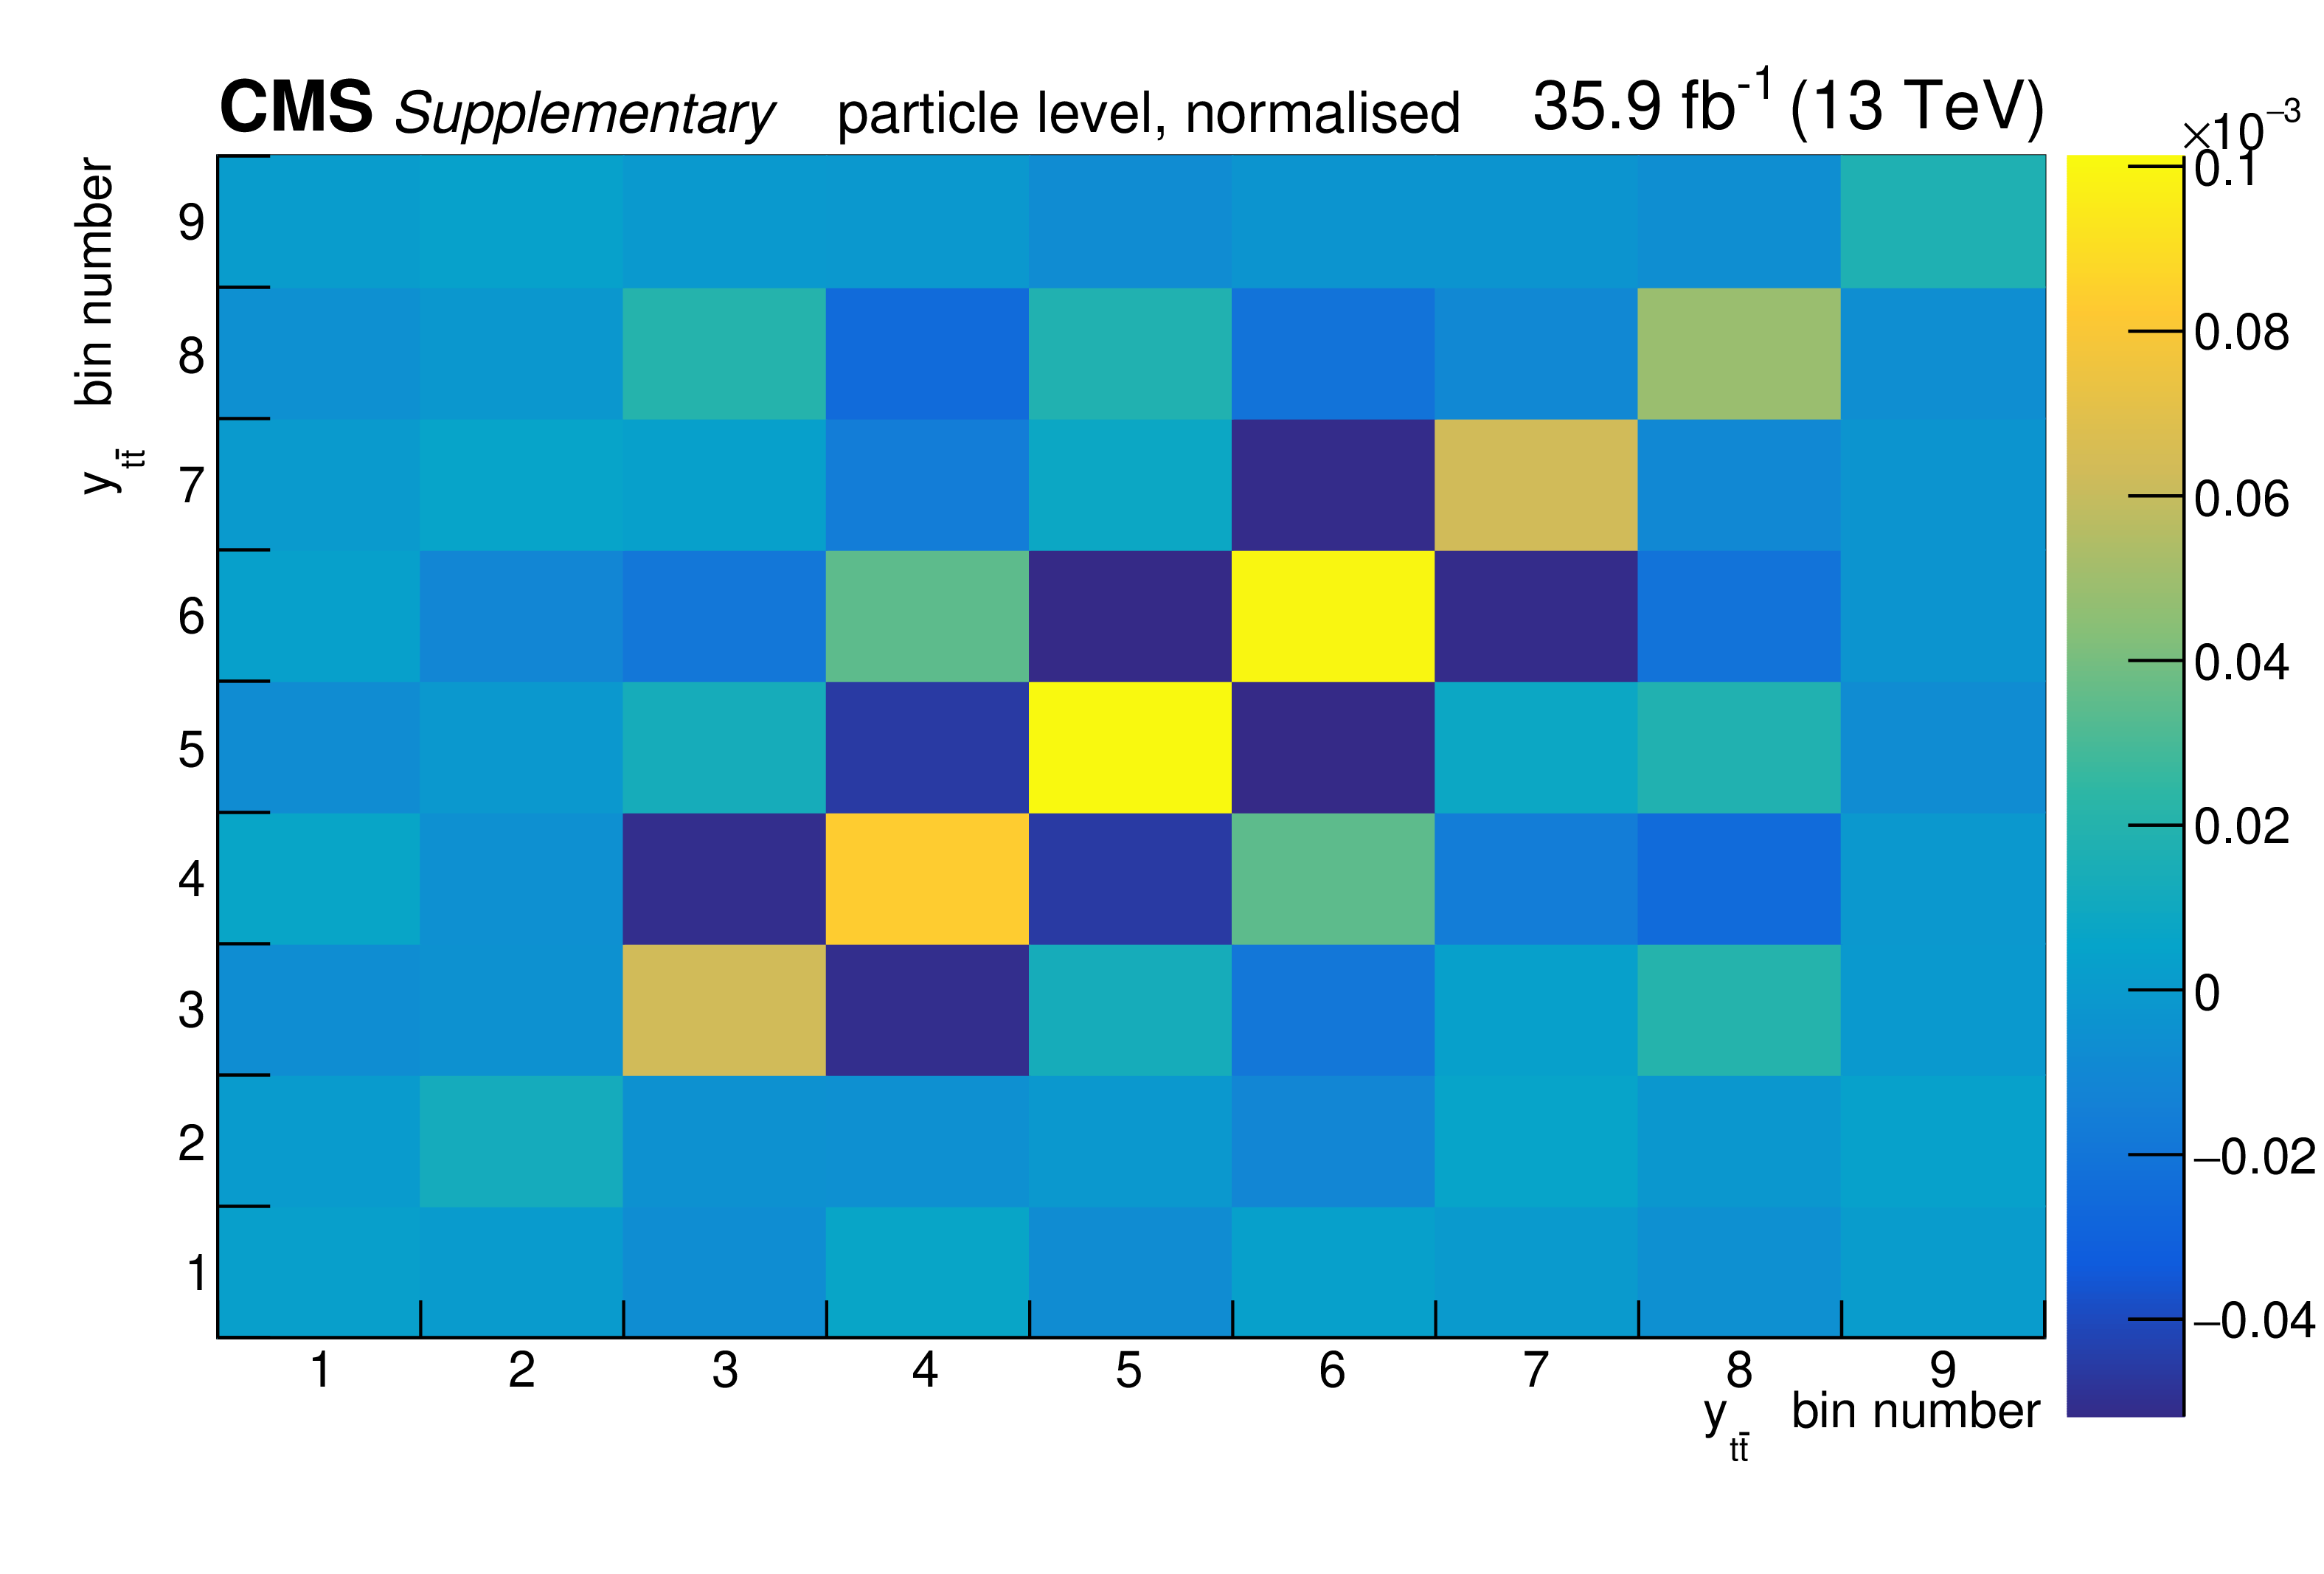
png pdf |
Additional Figure 104:
The covariance matrix of the measured data for the normalised measurement of the differential $\mathrm{t\bar{t}}$ cross section as a function of $y_{\mathrm {t}\bar{\mathrm {t}}}$ at particle level is shown. |

png pdf |
Additional Figure 105:
The breakdown of uncertainties for the absolute measurement of the differential $\mathrm{t\bar{t}}$ cross section as a function of $m_{\mathrm {t}\bar{\mathrm {t}}}$ at parton level is shown. The contributions of each source of systematic uncertainty in each bin are indicated by the coloured lines. Experimental systematic uncertainties that are small in all bins are added in quadrature and shown as a single component. The statistical and total uncertainties are indicated by the shaded areas. |
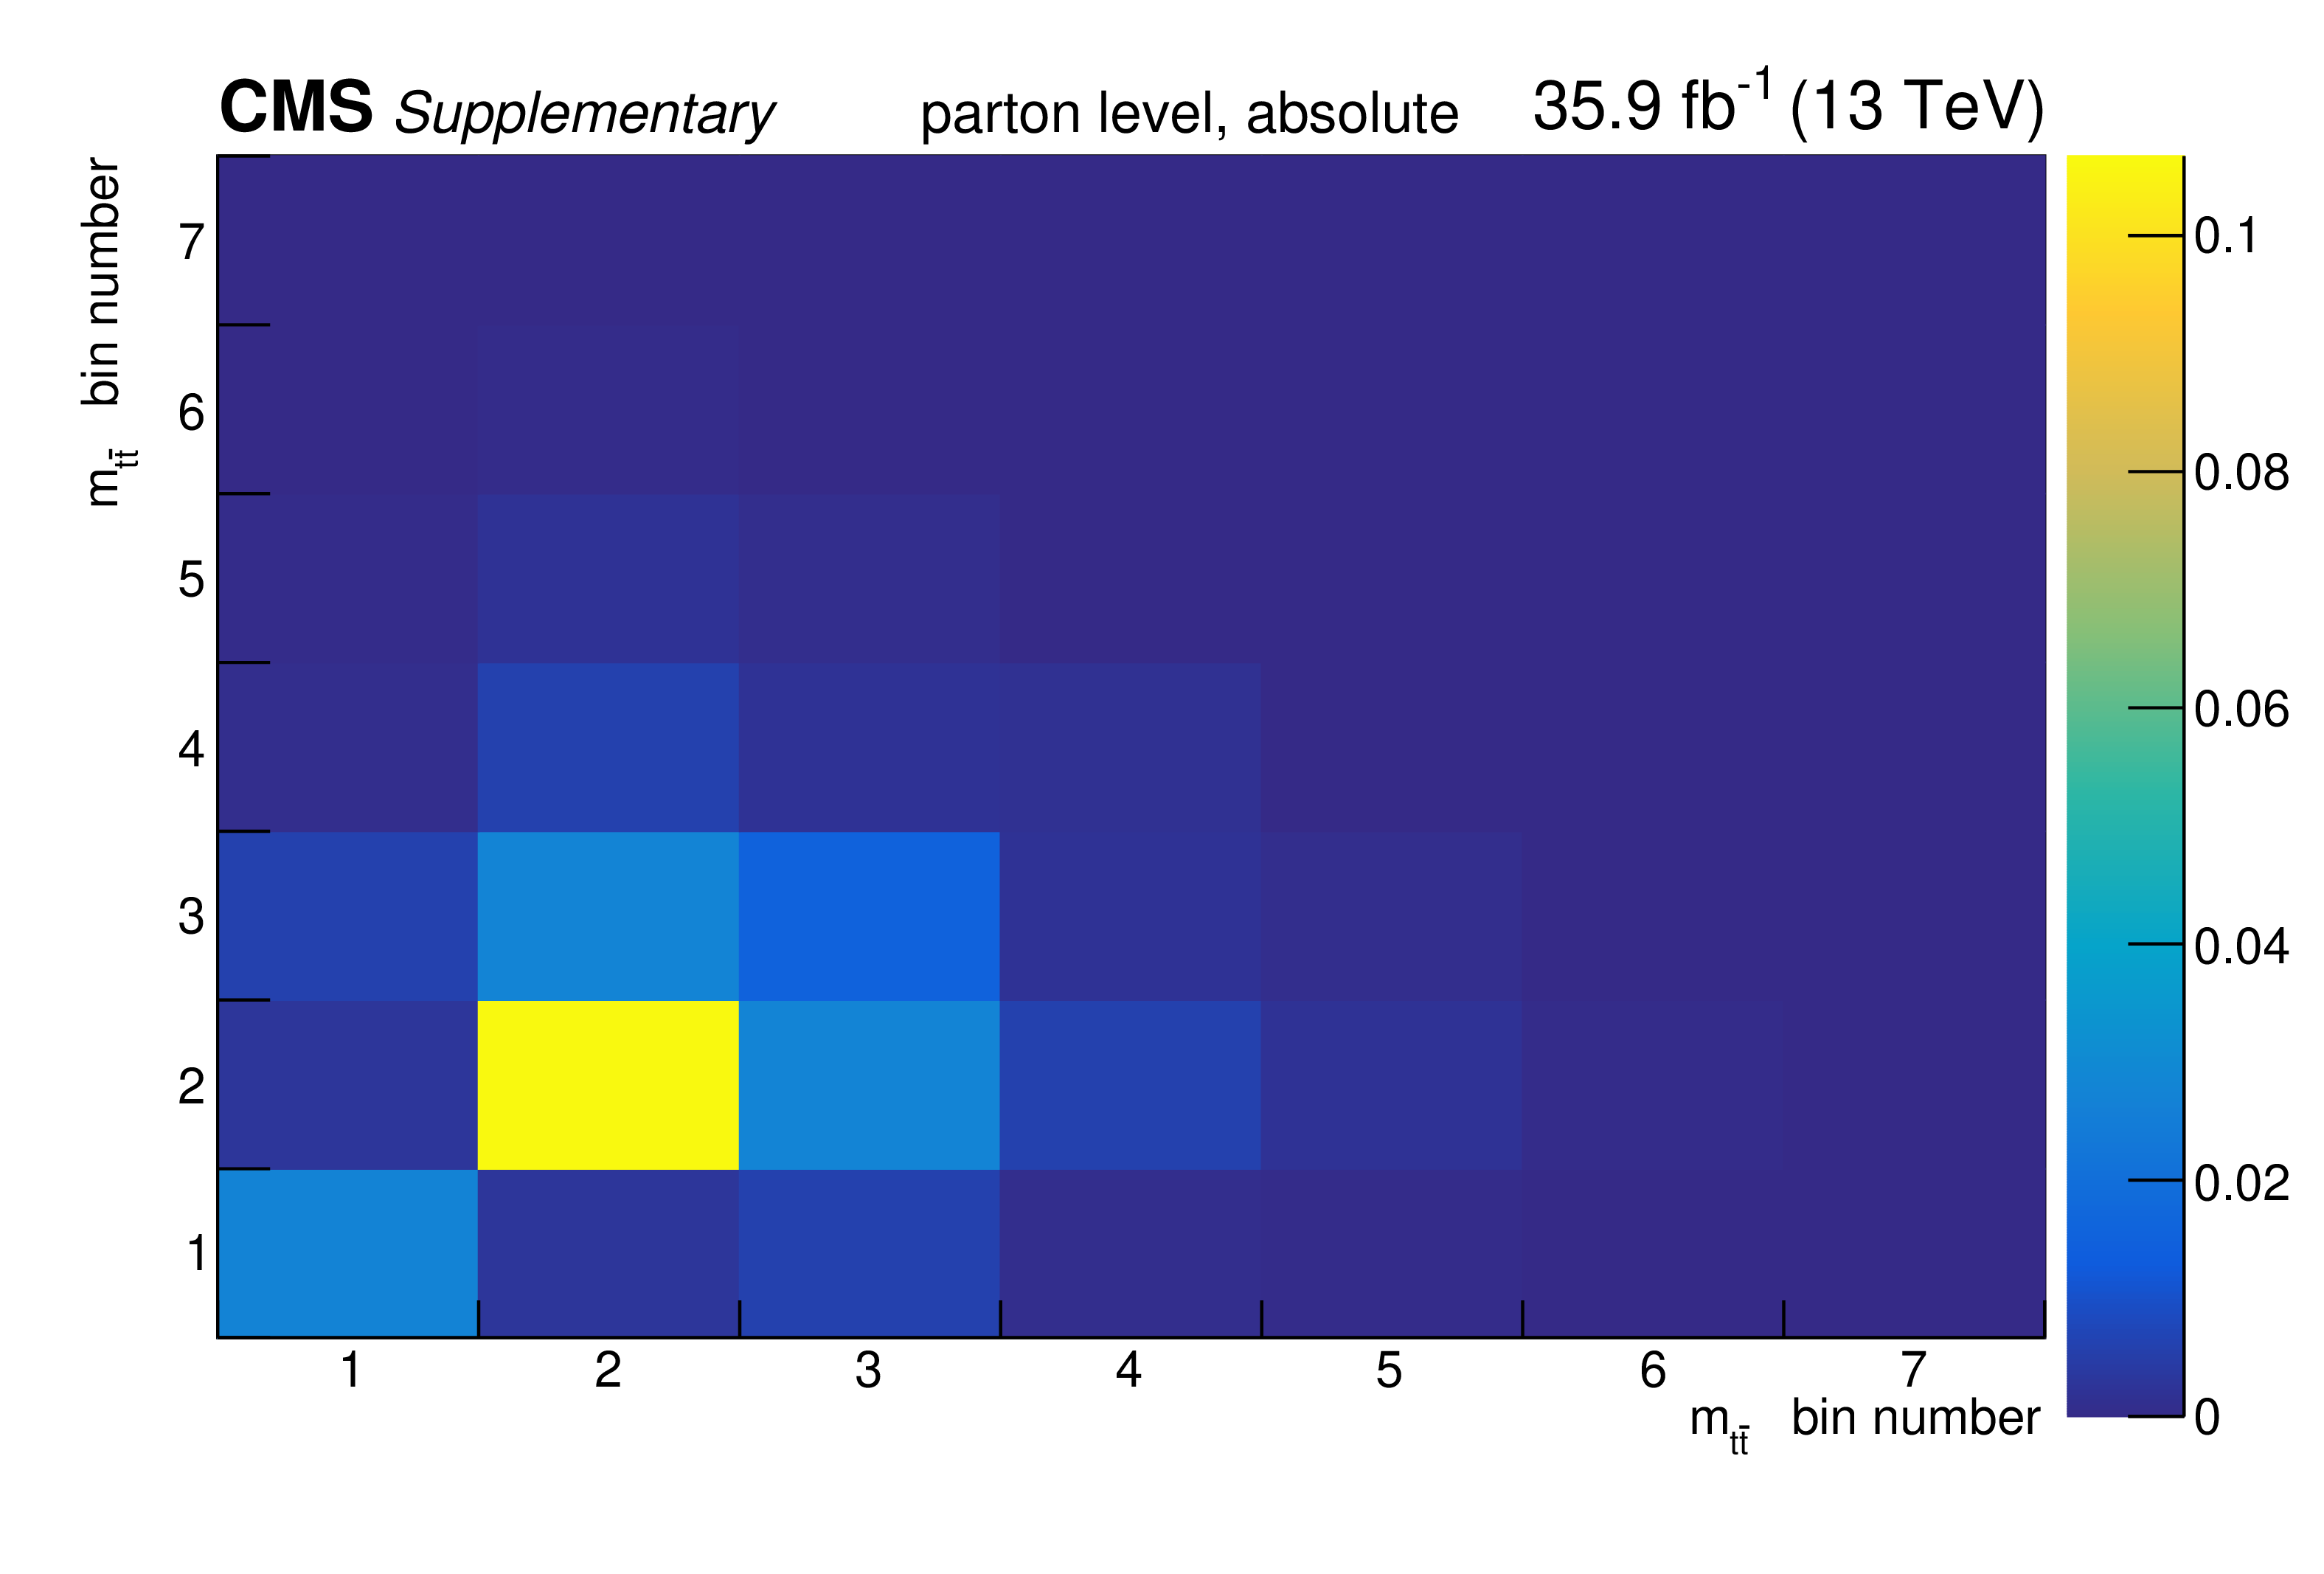
png pdf |
Additional Figure 106:
The covariance matrix of the measured data for the absolute measurement of the differential $\mathrm{t\bar{t}}$ cross section as a function of $m_{\mathrm {t}\bar{\mathrm {t}}}$ at parton level is shown. |
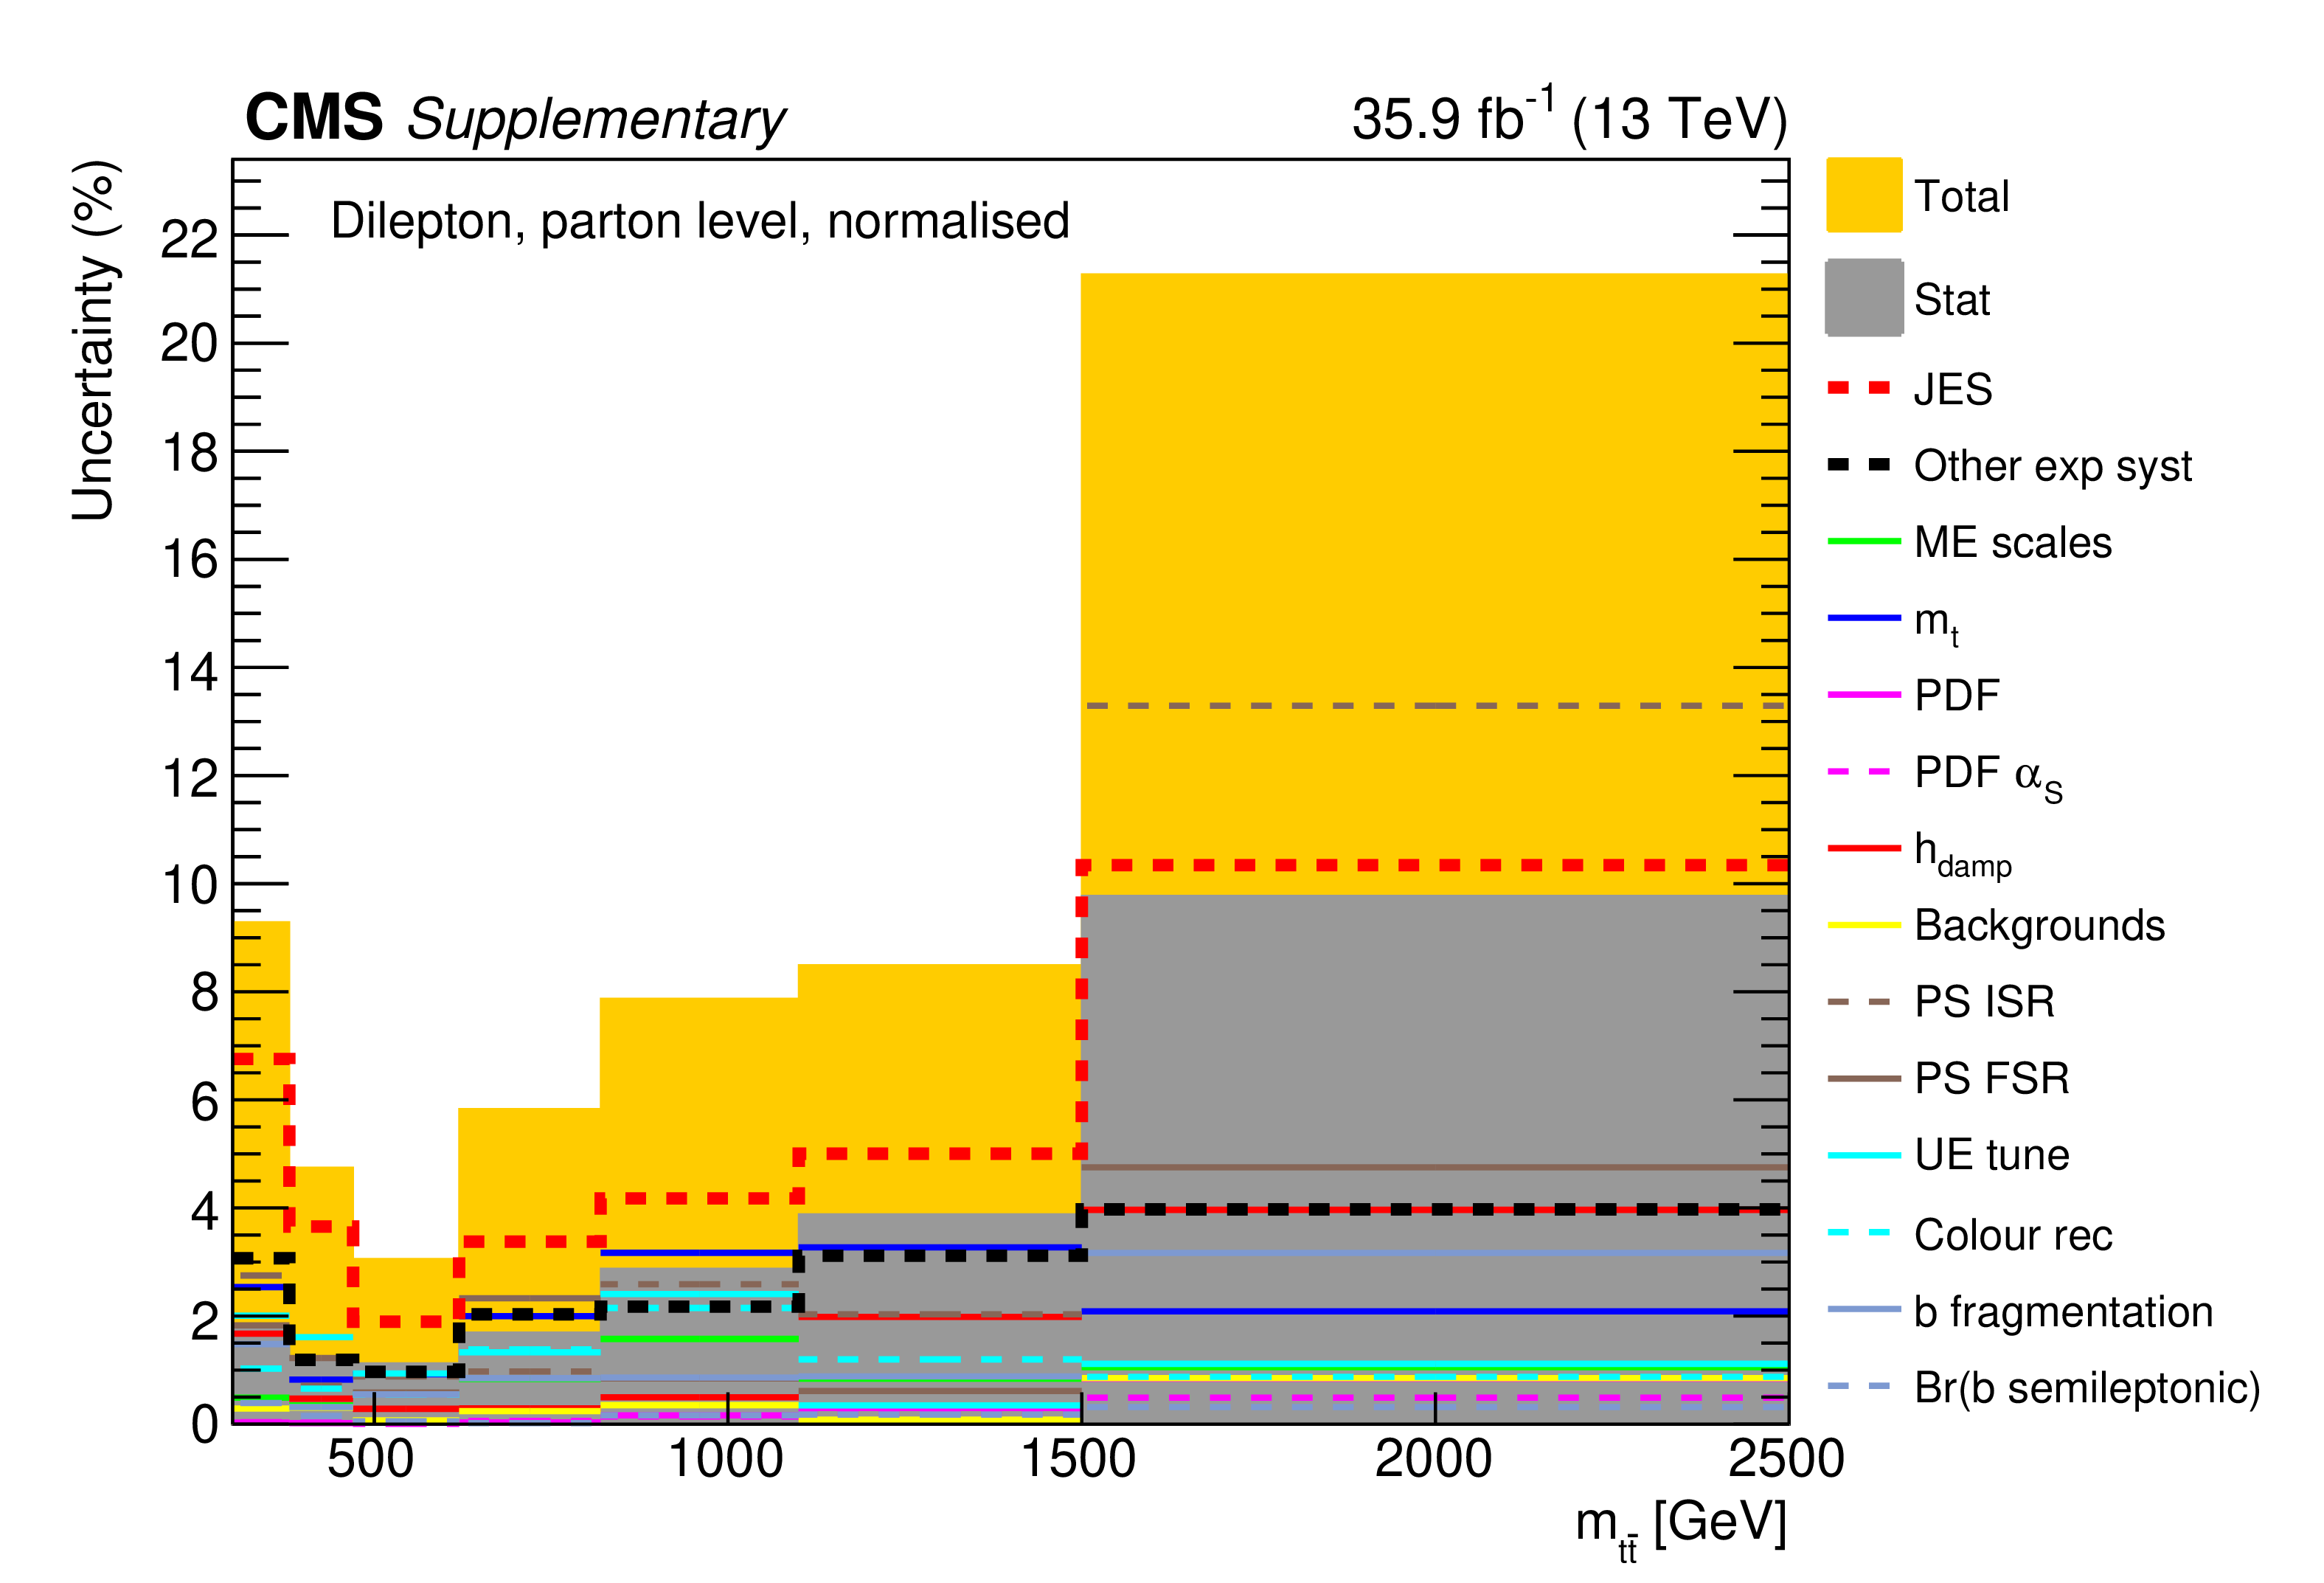
png pdf |
Additional Figure 107:
The breakdown of uncertainties for the normalised measurement of the differential $\mathrm{t\bar{t}}$ cross section as a function of $m_{\mathrm {t}\bar{\mathrm {t}}}$ at parton level is shown. The contributions of each source of systematic uncertainty in each bin are indicated by the coloured lines. Experimental systematic uncertainties that are small in all bins are added in quadrature and shown as a single component. The statistical and total uncertainties are indicated by the shaded areas. |
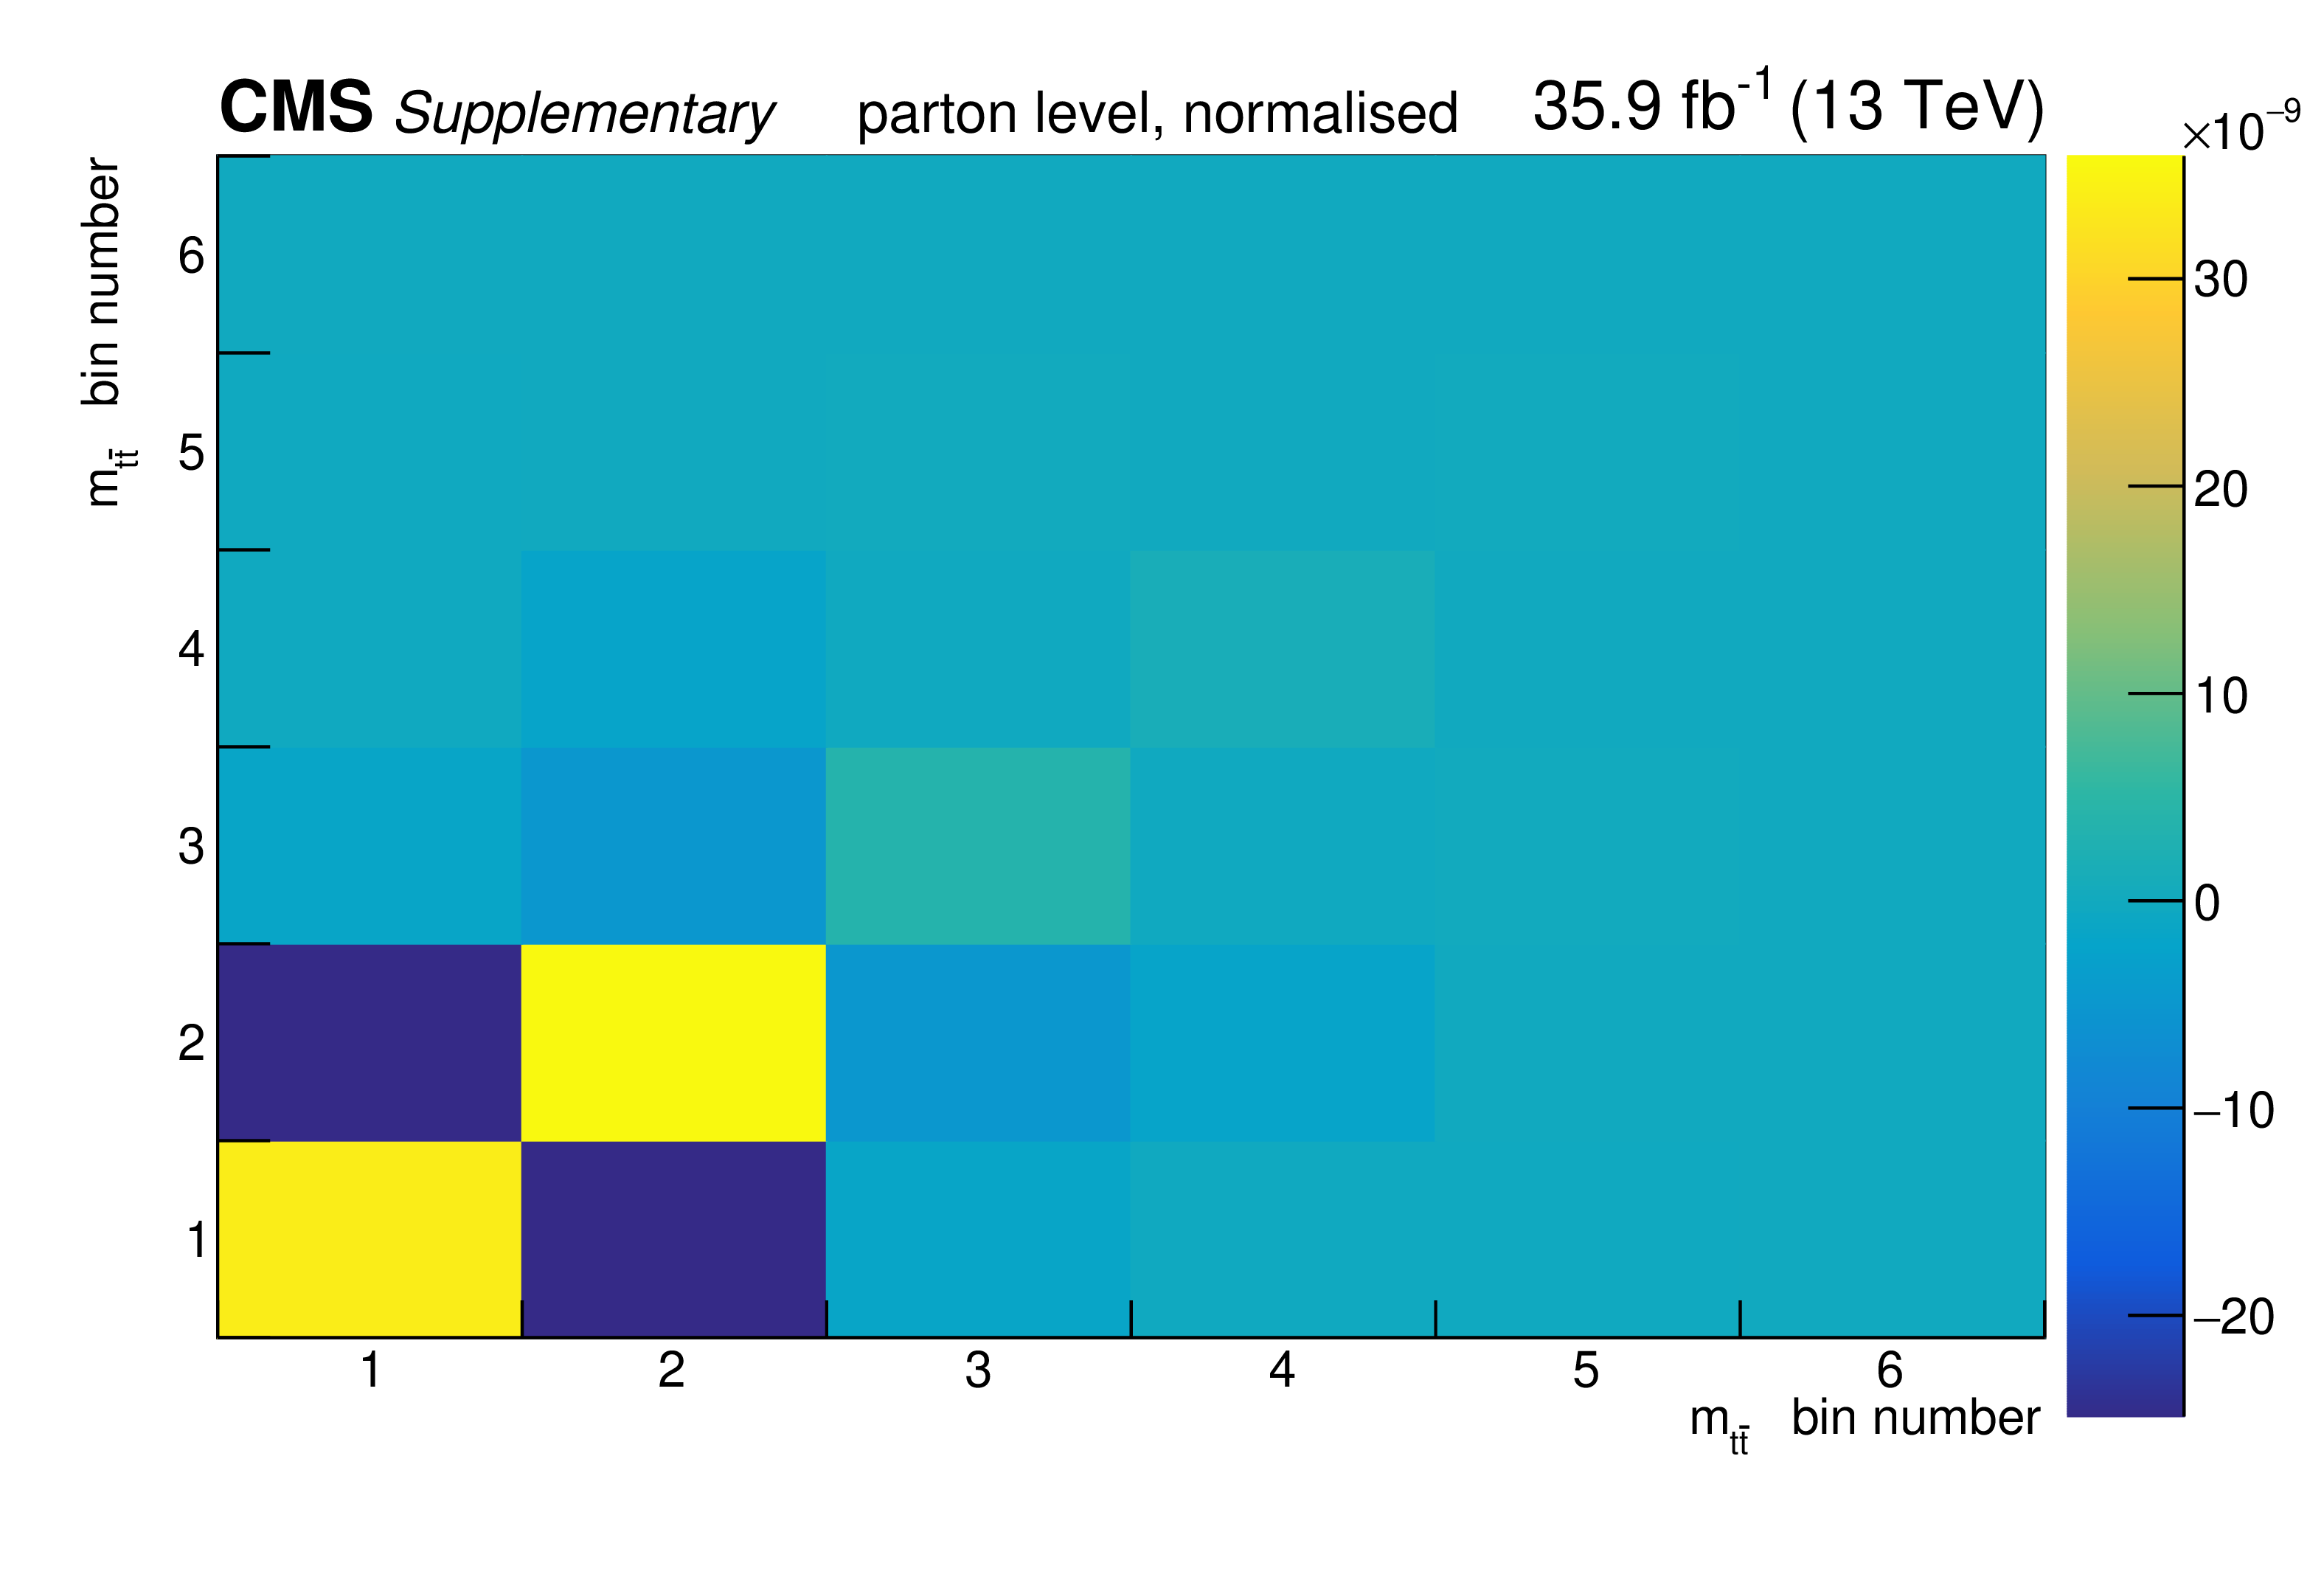
png pdf |
Additional Figure 108:
The covariance matrix of the measured data for the normalised measurement of the differential $\mathrm{t\bar{t}}$ cross section as a function of $m_{\mathrm {t}\bar{\mathrm {t}}}$ at parton level is shown. |

png pdf |
Additional Figure 109:
The breakdown of uncertainties for the absolute measurement of the differential $\mathrm{t\bar{t}}$ cross section as a function of $m_{\mathrm {t}\bar{\mathrm {t}}}$ at particle level is shown. The contributions of each source of systematic uncertainty in each bin are indicated by the coloured lines. Experimental systematic uncertainties that are small in all bins are added in quadrature and shown as a single component. The statistical and total uncertainties are indicated by the shaded areas. |

png pdf |
Additional Figure 110:
The covariance matrix of the measured data for the absolute measurement of the differential $\mathrm{t\bar{t}}$ cross section as a function of $m_{\mathrm {t}\bar{\mathrm {t}}}$ at particle level is shown. |

png pdf |
Additional Figure 111:
The breakdown of uncertainties for the normalised measurement of the differential $\mathrm{t\bar{t}}$ cross section as a function of $m_{\mathrm {t}\bar{\mathrm {t}}}$ at particle level is shown. The contributions of each source of systematic uncertainty in each bin are indicated by the coloured lines. Experimental systematic uncertainties that are small in all bins are added in quadrature and shown as a single component. The statistical and total uncertainties are indicated by the shaded areas. |
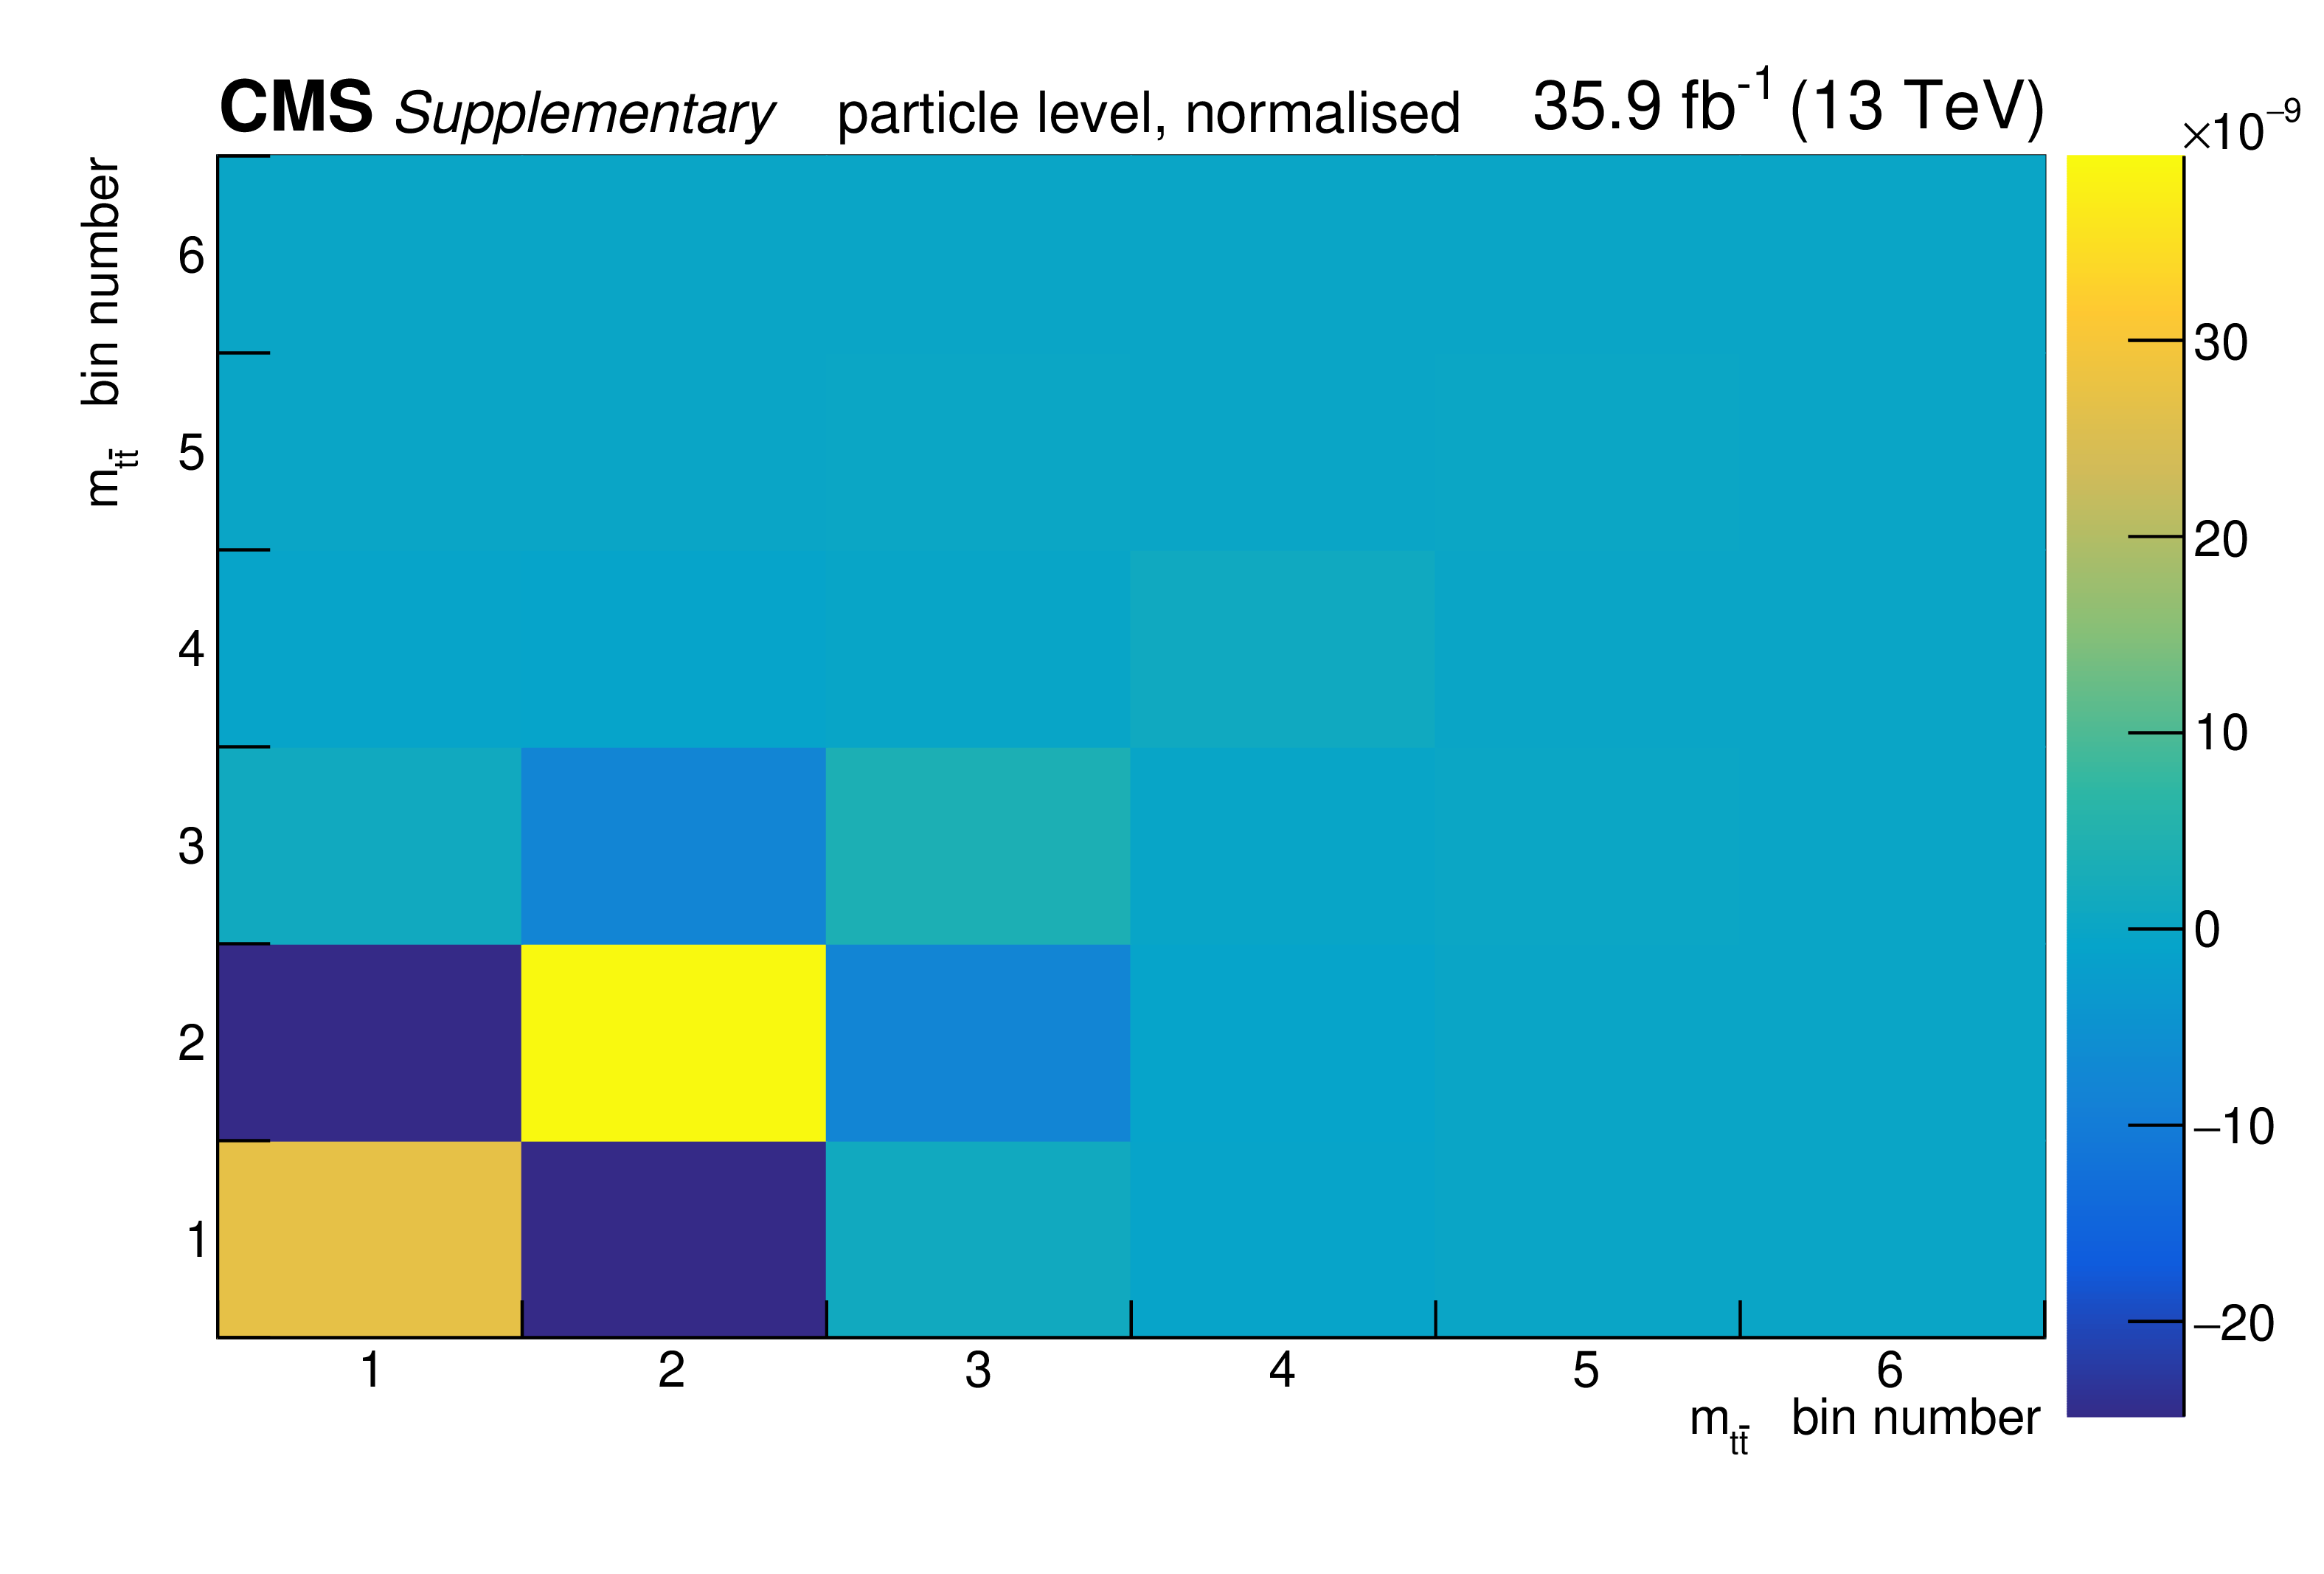
png pdf |
Additional Figure 112:
The covariance matrix of the measured data for the normalised measurement of the differential $\mathrm{t\bar{t}}$ cross section as a function of $m_{\mathrm {t}\bar{\mathrm {t}}}$ at particle level is shown. |
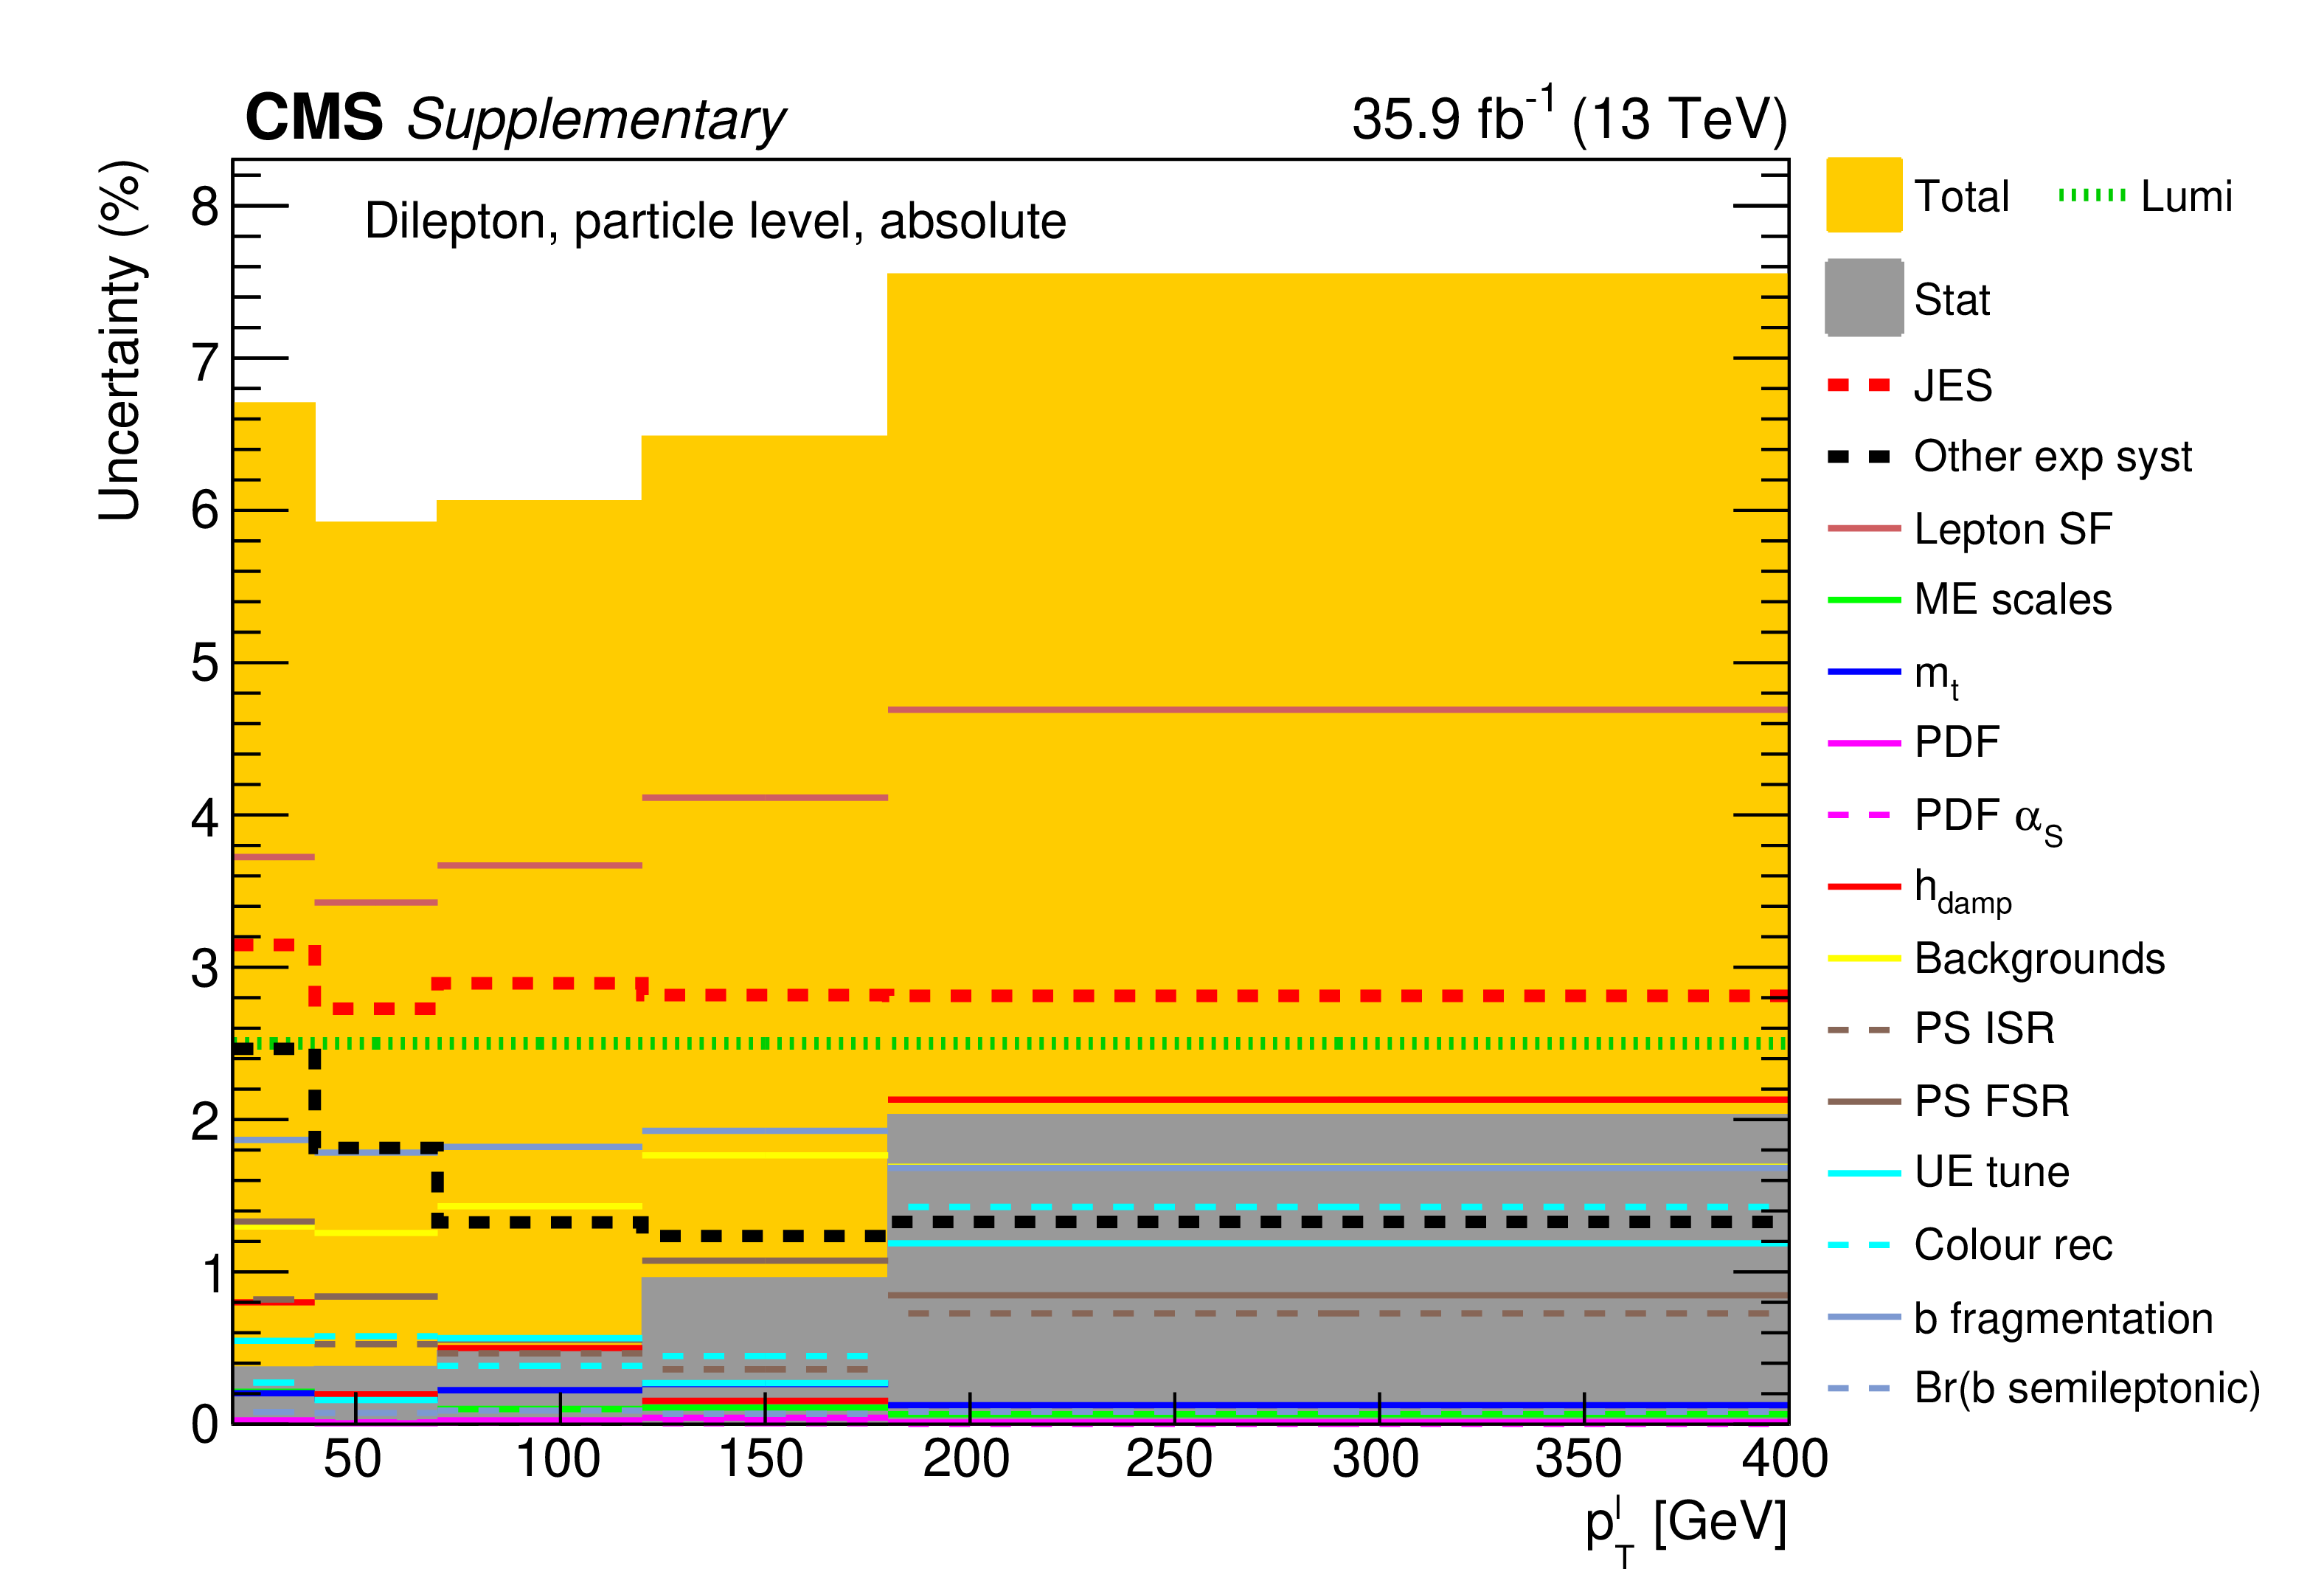
png pdf |
Additional Figure 113:
The breakdown of uncertainties for the absolute measurement of the differential $\mathrm{t\bar{t}}$ cross section as a function of $p_{\mathrm {T}}^{{\ell}}$ at particle level is shown. The contributions of each source of systematic uncertainty in each bin are indicated by the coloured lines. Experimental systematic uncertainties that are small in all bins are added in quadrature and shown as a single component. The statistical and total uncertainties are indicated by the shaded areas. |

png pdf |
Additional Figure 114:
The covariance matrix of the measured data for the absolute measurement of the differential $\mathrm{t\bar{t}}$ cross section as a function of $p_{\mathrm {T}}^{{\ell}}$ at particle level is shown. |
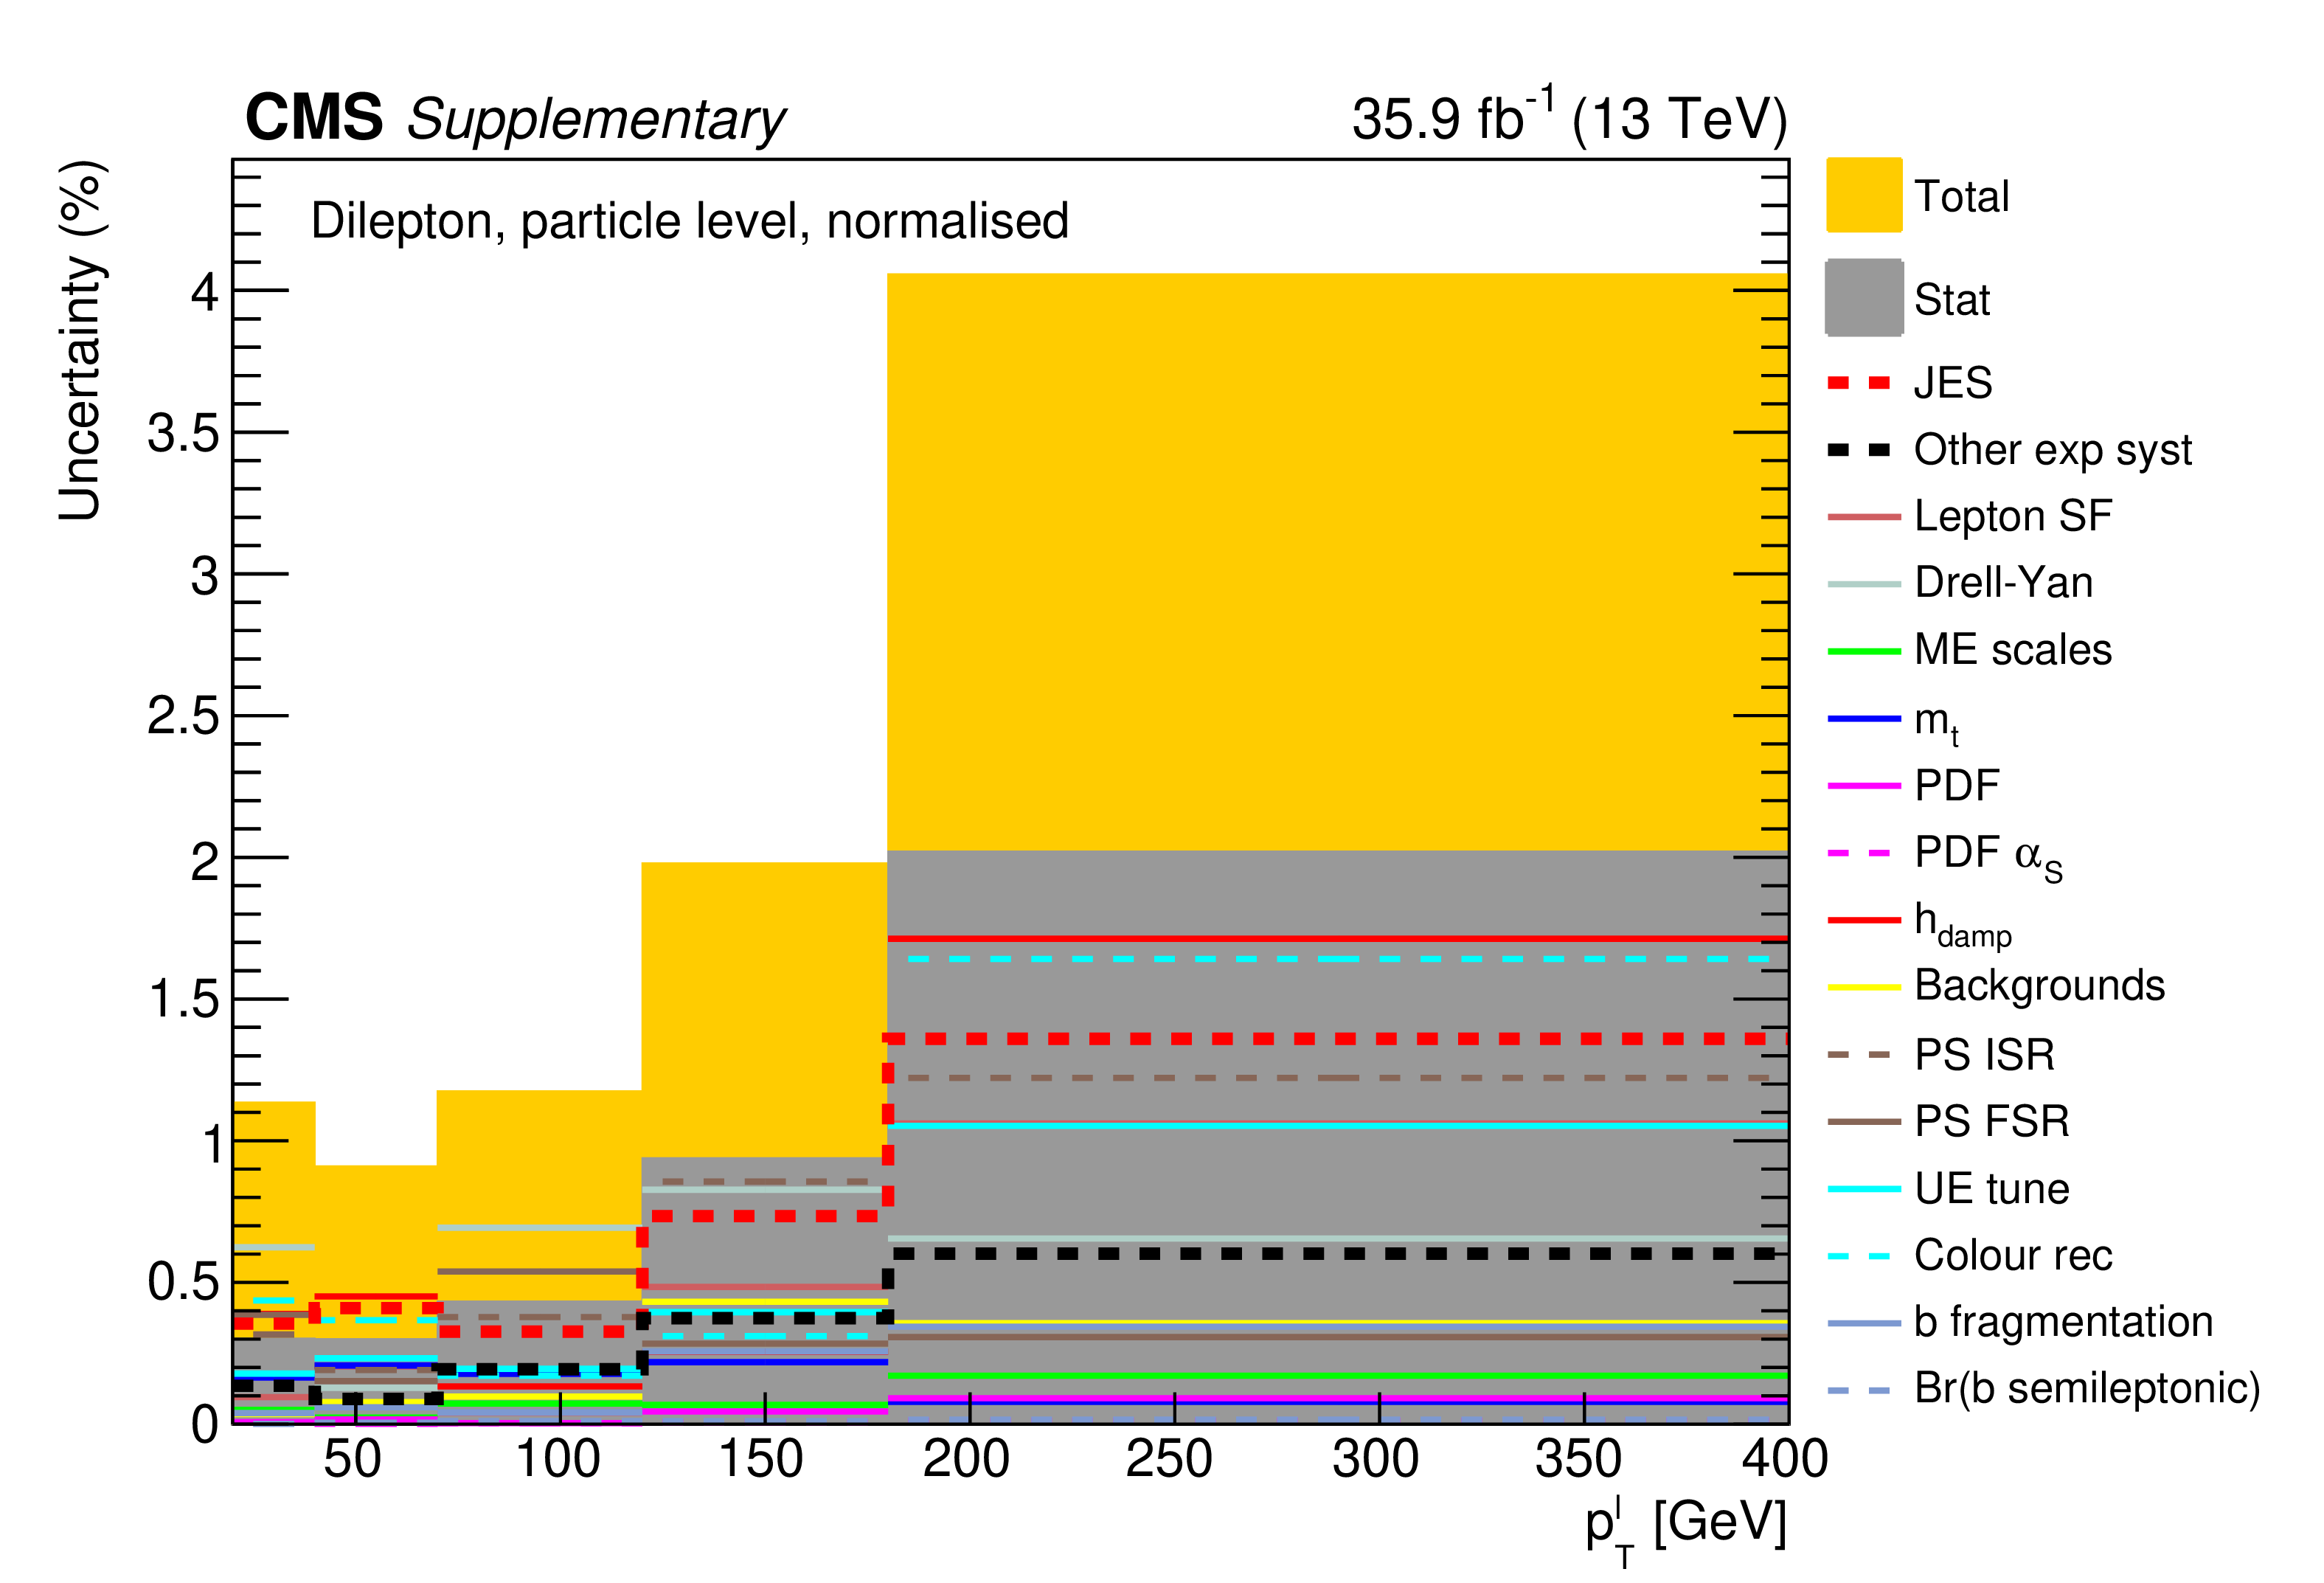
png pdf |
Additional Figure 115:
The breakdown of uncertainties for the normalised measurement of the differential $\mathrm{t\bar{t}}$ cross section as a function of $p_{\mathrm {T}}^{{\ell}}$ at particle level is shown. The contributions of each source of systematic uncertainty in each bin are indicated by the coloured lines. Experimental systematic uncertainties that are small in all bins are added in quadrature and shown as a single component. The statistical and total uncertainties are indicated by the shaded areas. |

png pdf |
Additional Figure 116:
The covariance matrix of the measured data for the normalised measurement of the differential $\mathrm{t\bar{t}}$ cross section as a function of $p_{\mathrm {T}}^{{\ell}}$ at particle level is shown. |
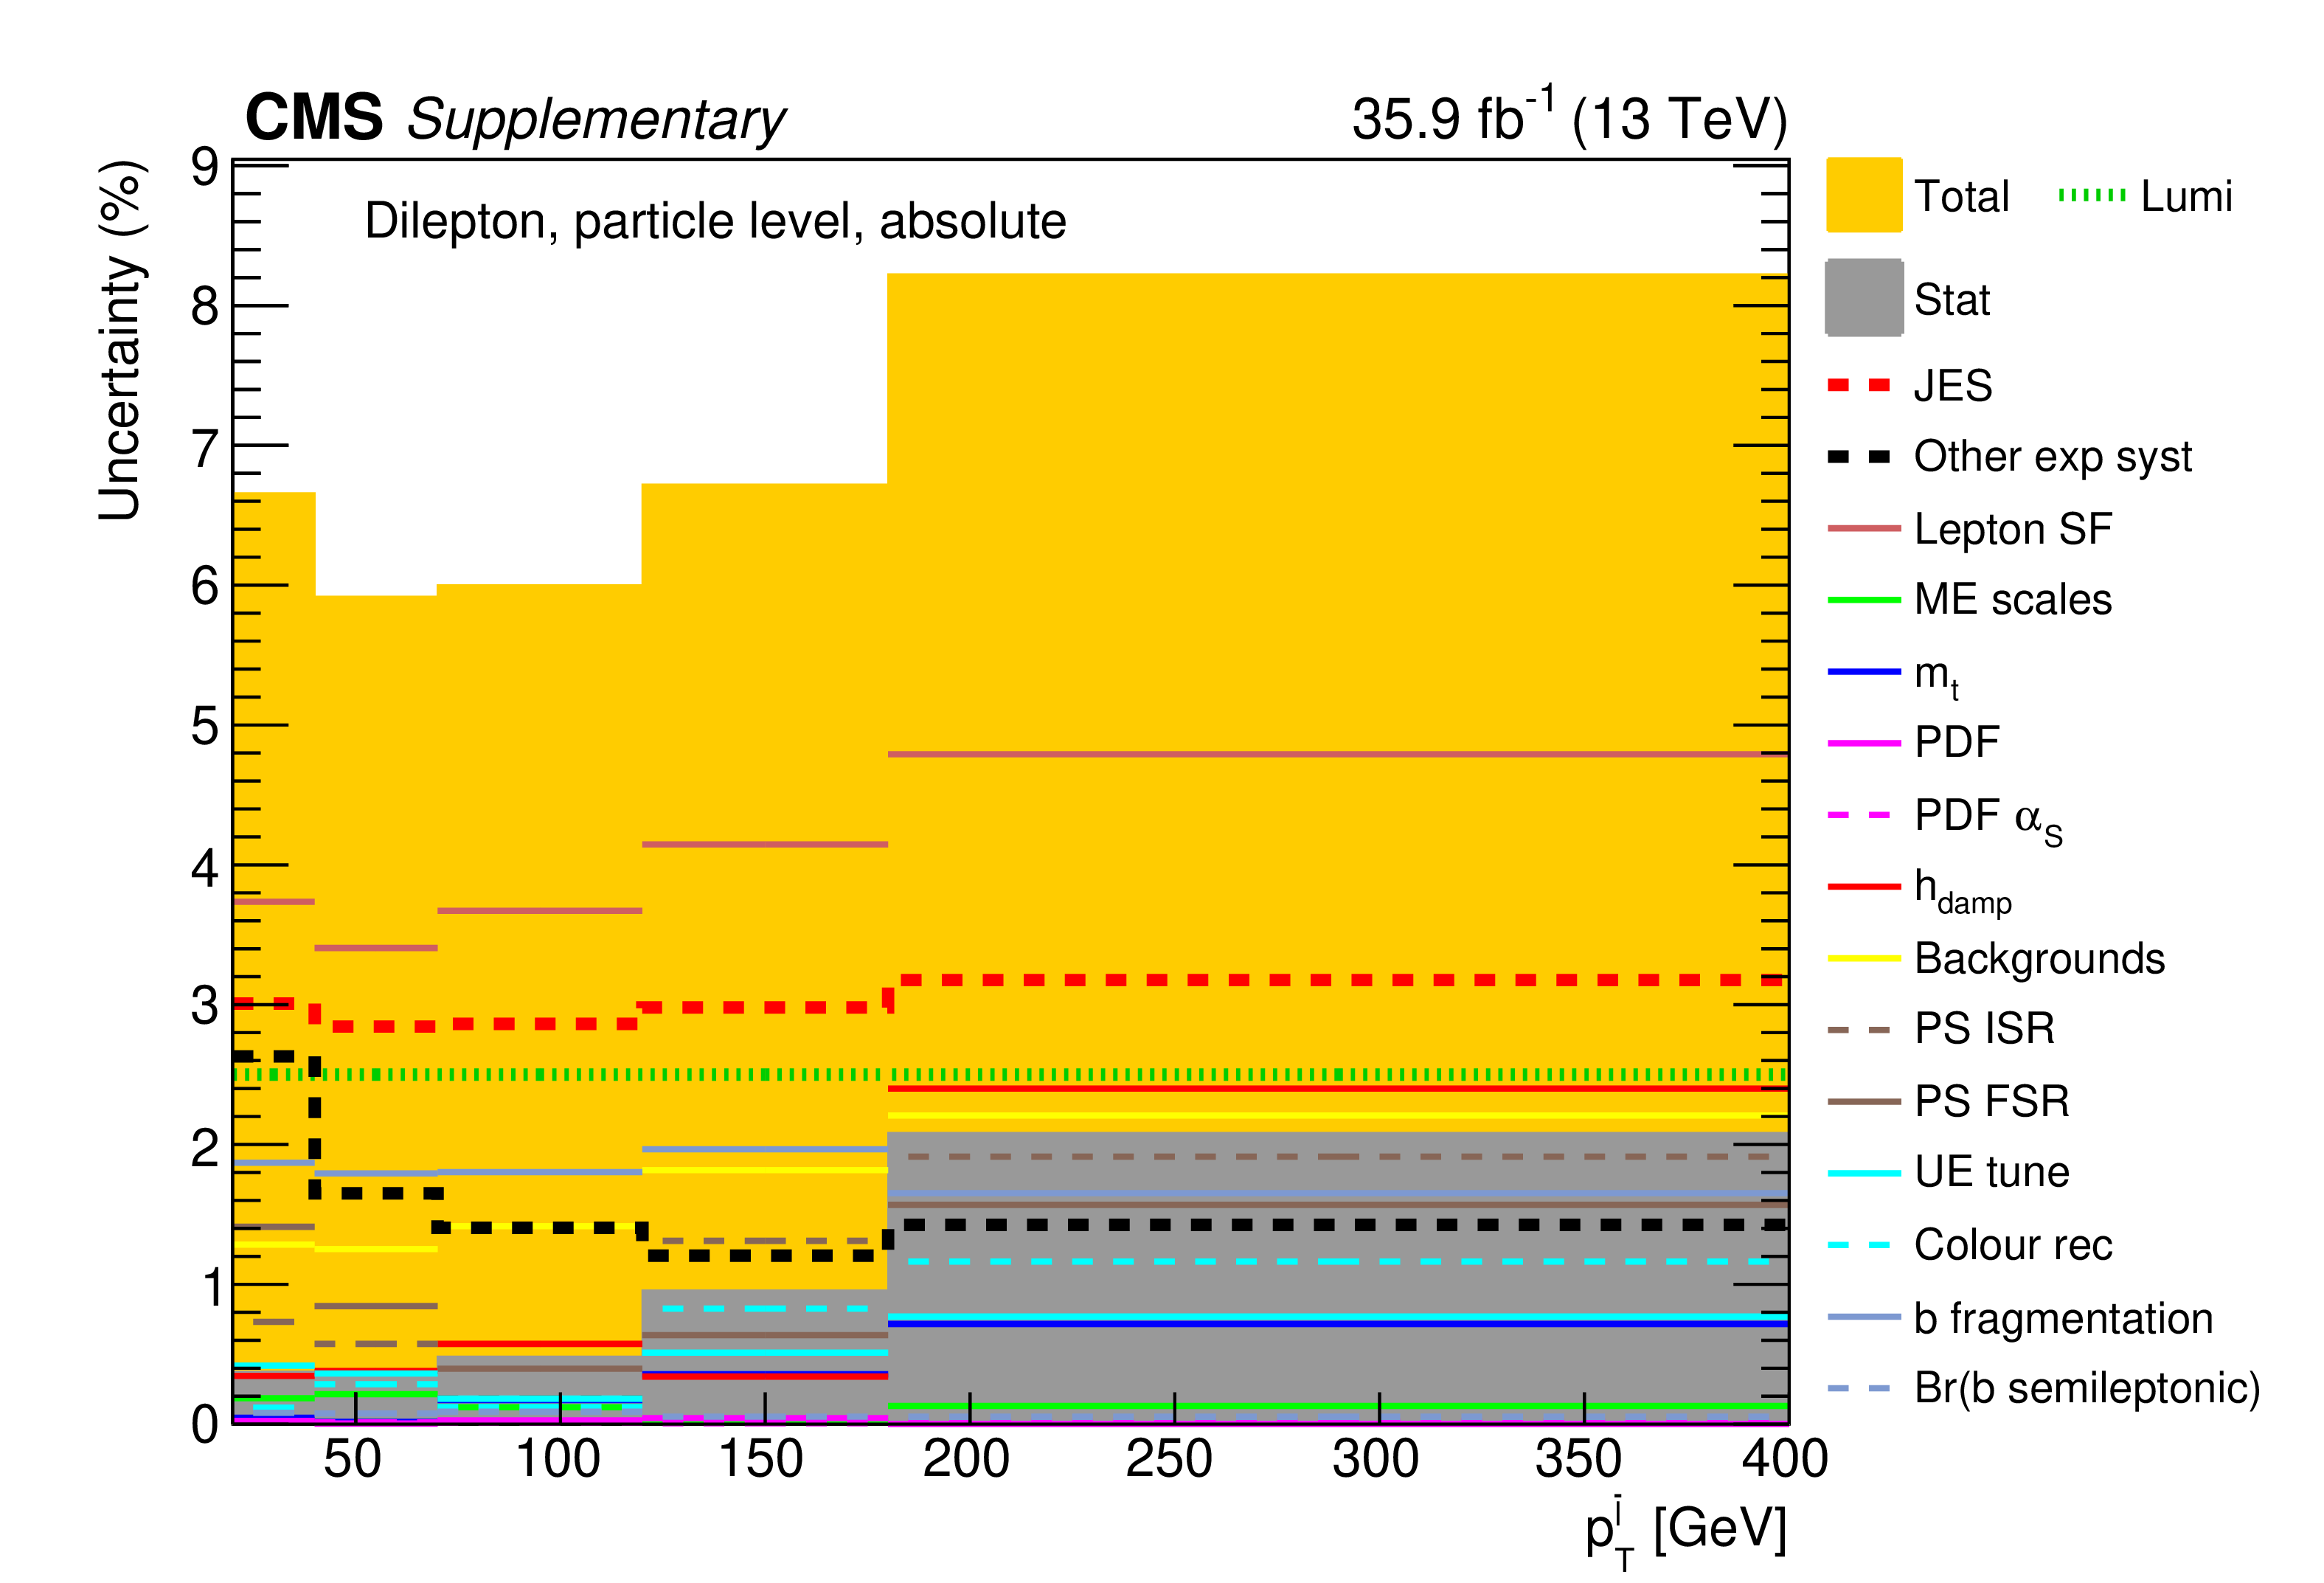
png pdf |
Additional Figure 117:
The breakdown of uncertainties for the absolute measurement of the differential $\mathrm{t\bar{t}}$ cross section as a function of $p_{\mathrm {T}}^{{\bar{\ell}}}$ at particle level is shown. The contributions of each source of systematic uncertainty in each bin are indicated by the coloured lines. Experimental systematic uncertainties that are small in all bins are added in quadrature and shown as a single component. The statistical and total uncertainties are indicated by the shaded areas. |

png pdf |
Additional Figure 118:
The covariance matrix of the measured data for the absolute measurement of the differential $\mathrm{t\bar{t}}$ cross section as a function of $p_{\mathrm {T}}^{{\bar{\ell}}}$ at particle level is shown. |
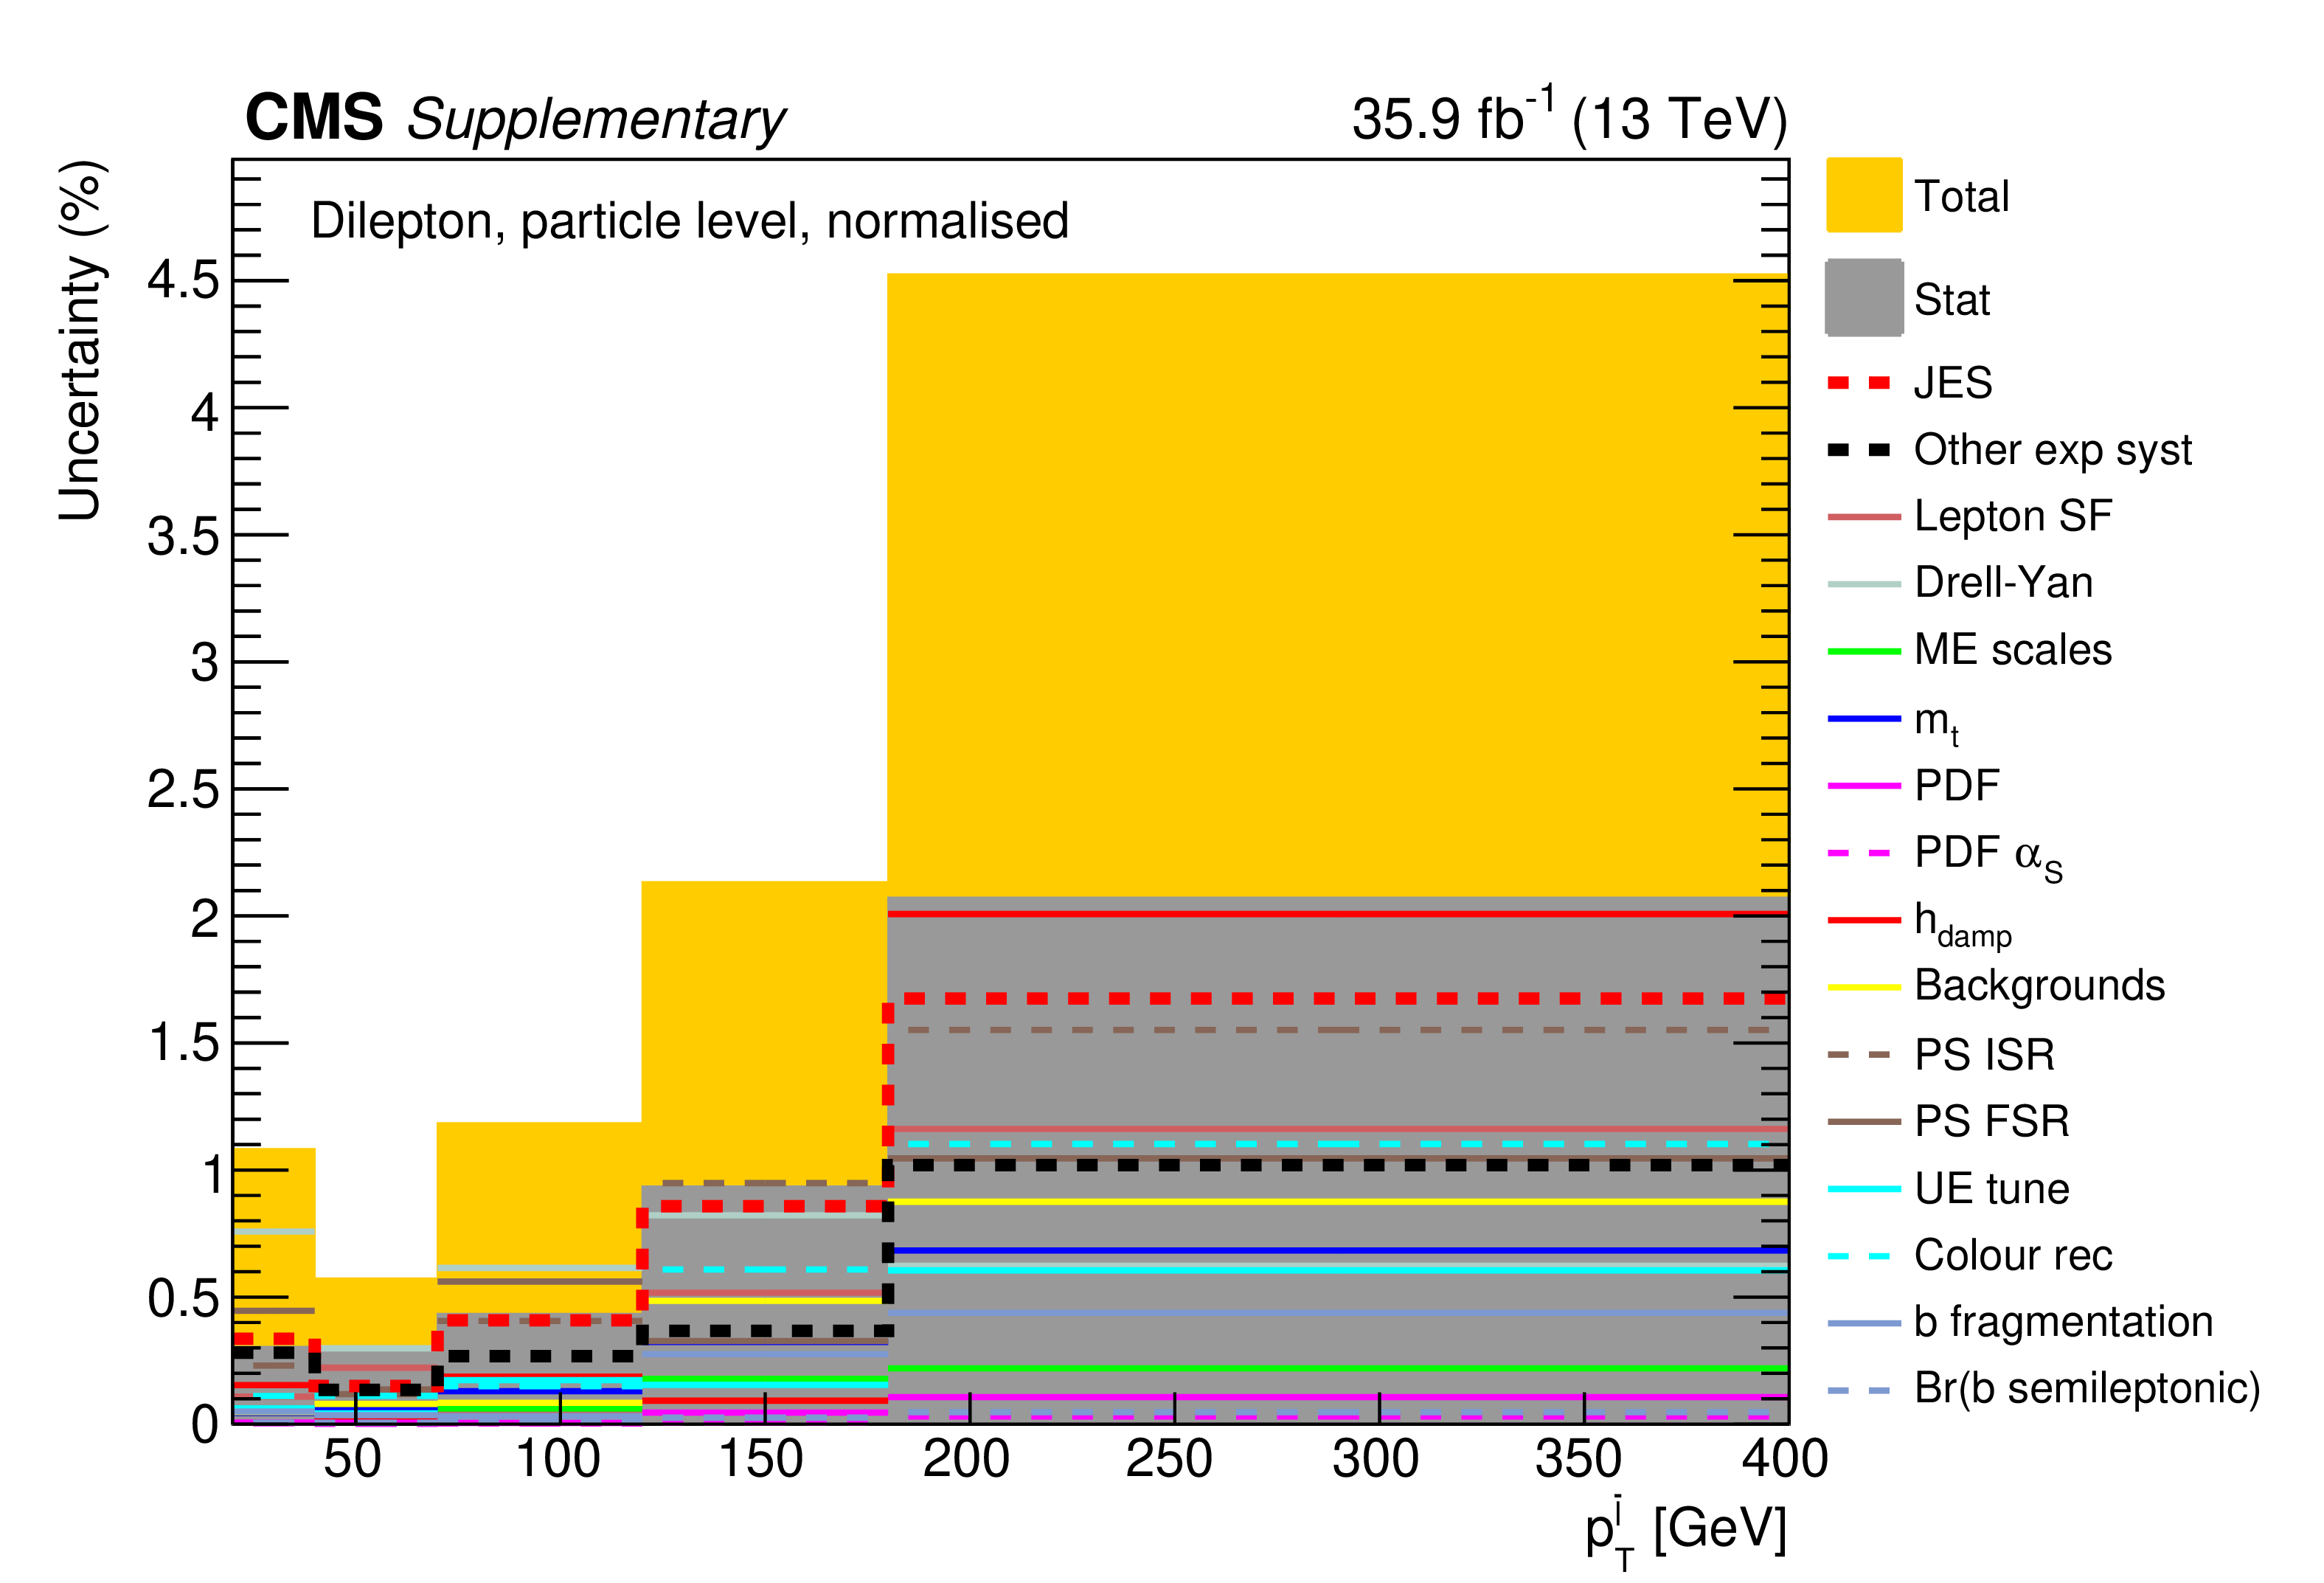
png pdf |
Additional Figure 119:
The breakdown of uncertainties for the normalised measurement of the differential $\mathrm{t\bar{t}}$ cross section as a function of $p_{\mathrm {T}}^{{\bar{\ell}}}$ at particle level is shown. The contributions of each source of systematic uncertainty in each bin are indicated by the coloured lines. Experimental systematic uncertainties that are small in all bins are added in quadrature and shown as a single component. The statistical and total uncertainties are indicated by the shaded areas. |
png pdf |
Additional Figure 120:
The covariance matrix of the measured data for the normalised measurement of the differential $\mathrm{t\bar{t}}$ cross section as a function of $p_{\mathrm {T}}^{{\bar{\ell}}}$ at particle level is shown. |

png pdf |
Additional Figure 121:
The breakdown of uncertainties for the absolute measurement of the differential $\mathrm{t\bar{t}}$ cross section as a function of $p_{\mathrm {T}}^{{\ell}}$ (leading) at particle level is shown. The contributions of each source of systematic uncertainty in each bin are indicated by the coloured lines. Experimental systematic uncertainties that are small in all bins are added in quadrature and shown as a single component. The statistical and total uncertainties are indicated by the shaded areas. |
png pdf |
Additional Figure 122:
The covariance matrix of the measured data for the absolute measurement of the differential $\mathrm{t\bar{t}}$ cross section as a function of $p_{\mathrm {T}}^{{\ell}}$ (leading) at particle level is shown. |

png pdf |
Additional Figure 123:
The breakdown of uncertainties for the normalised measurement of the differential $\mathrm{t\bar{t}}$ cross section as a function of $p_{\mathrm {T}}^{{\ell}}$ (leading) at particle level is shown. The contributions of each source of systematic uncertainty in each bin are indicated by the coloured lines. Experimental systematic uncertainties that are small in all bins are added in quadrature and shown as a single component. The statistical and total uncertainties are indicated by the shaded areas. |
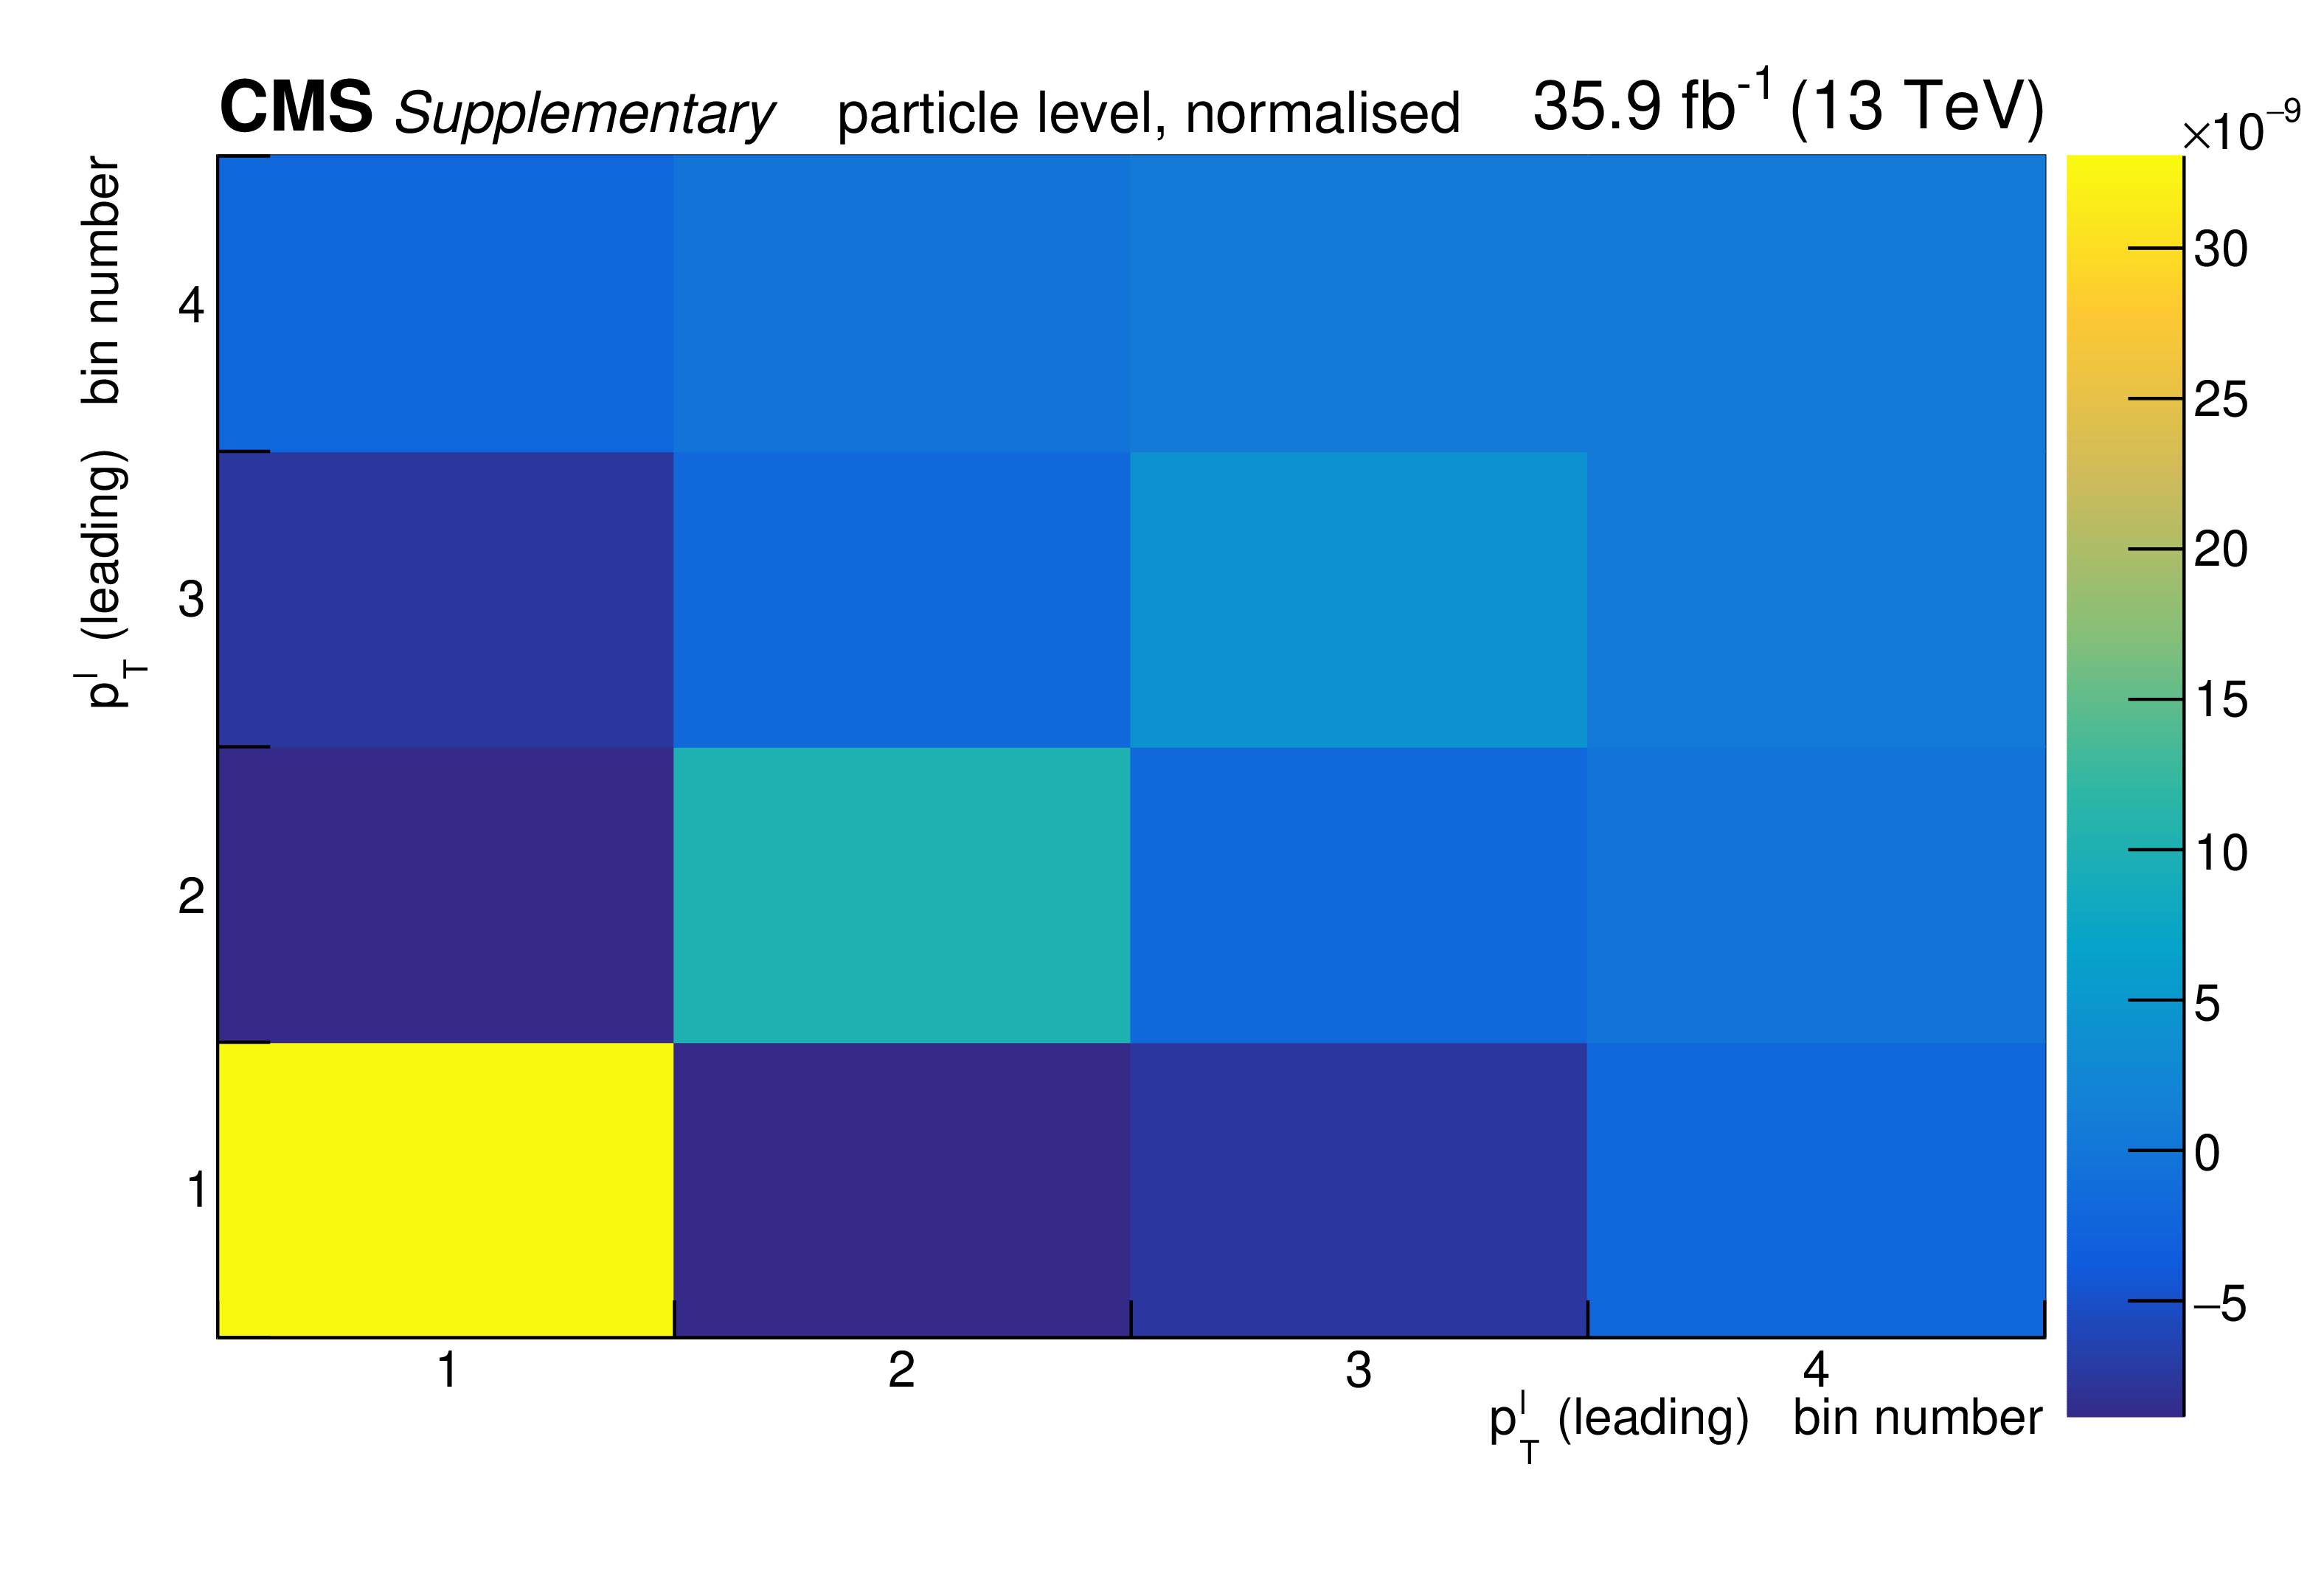
png pdf |
Additional Figure 124:
The covariance matrix of the measured data for the normalised measurement of the differential $\mathrm{t\bar{t}}$ cross section as a function of $p_{\mathrm {T}}^{{\ell}}$ (leading) at particle level is shown. |
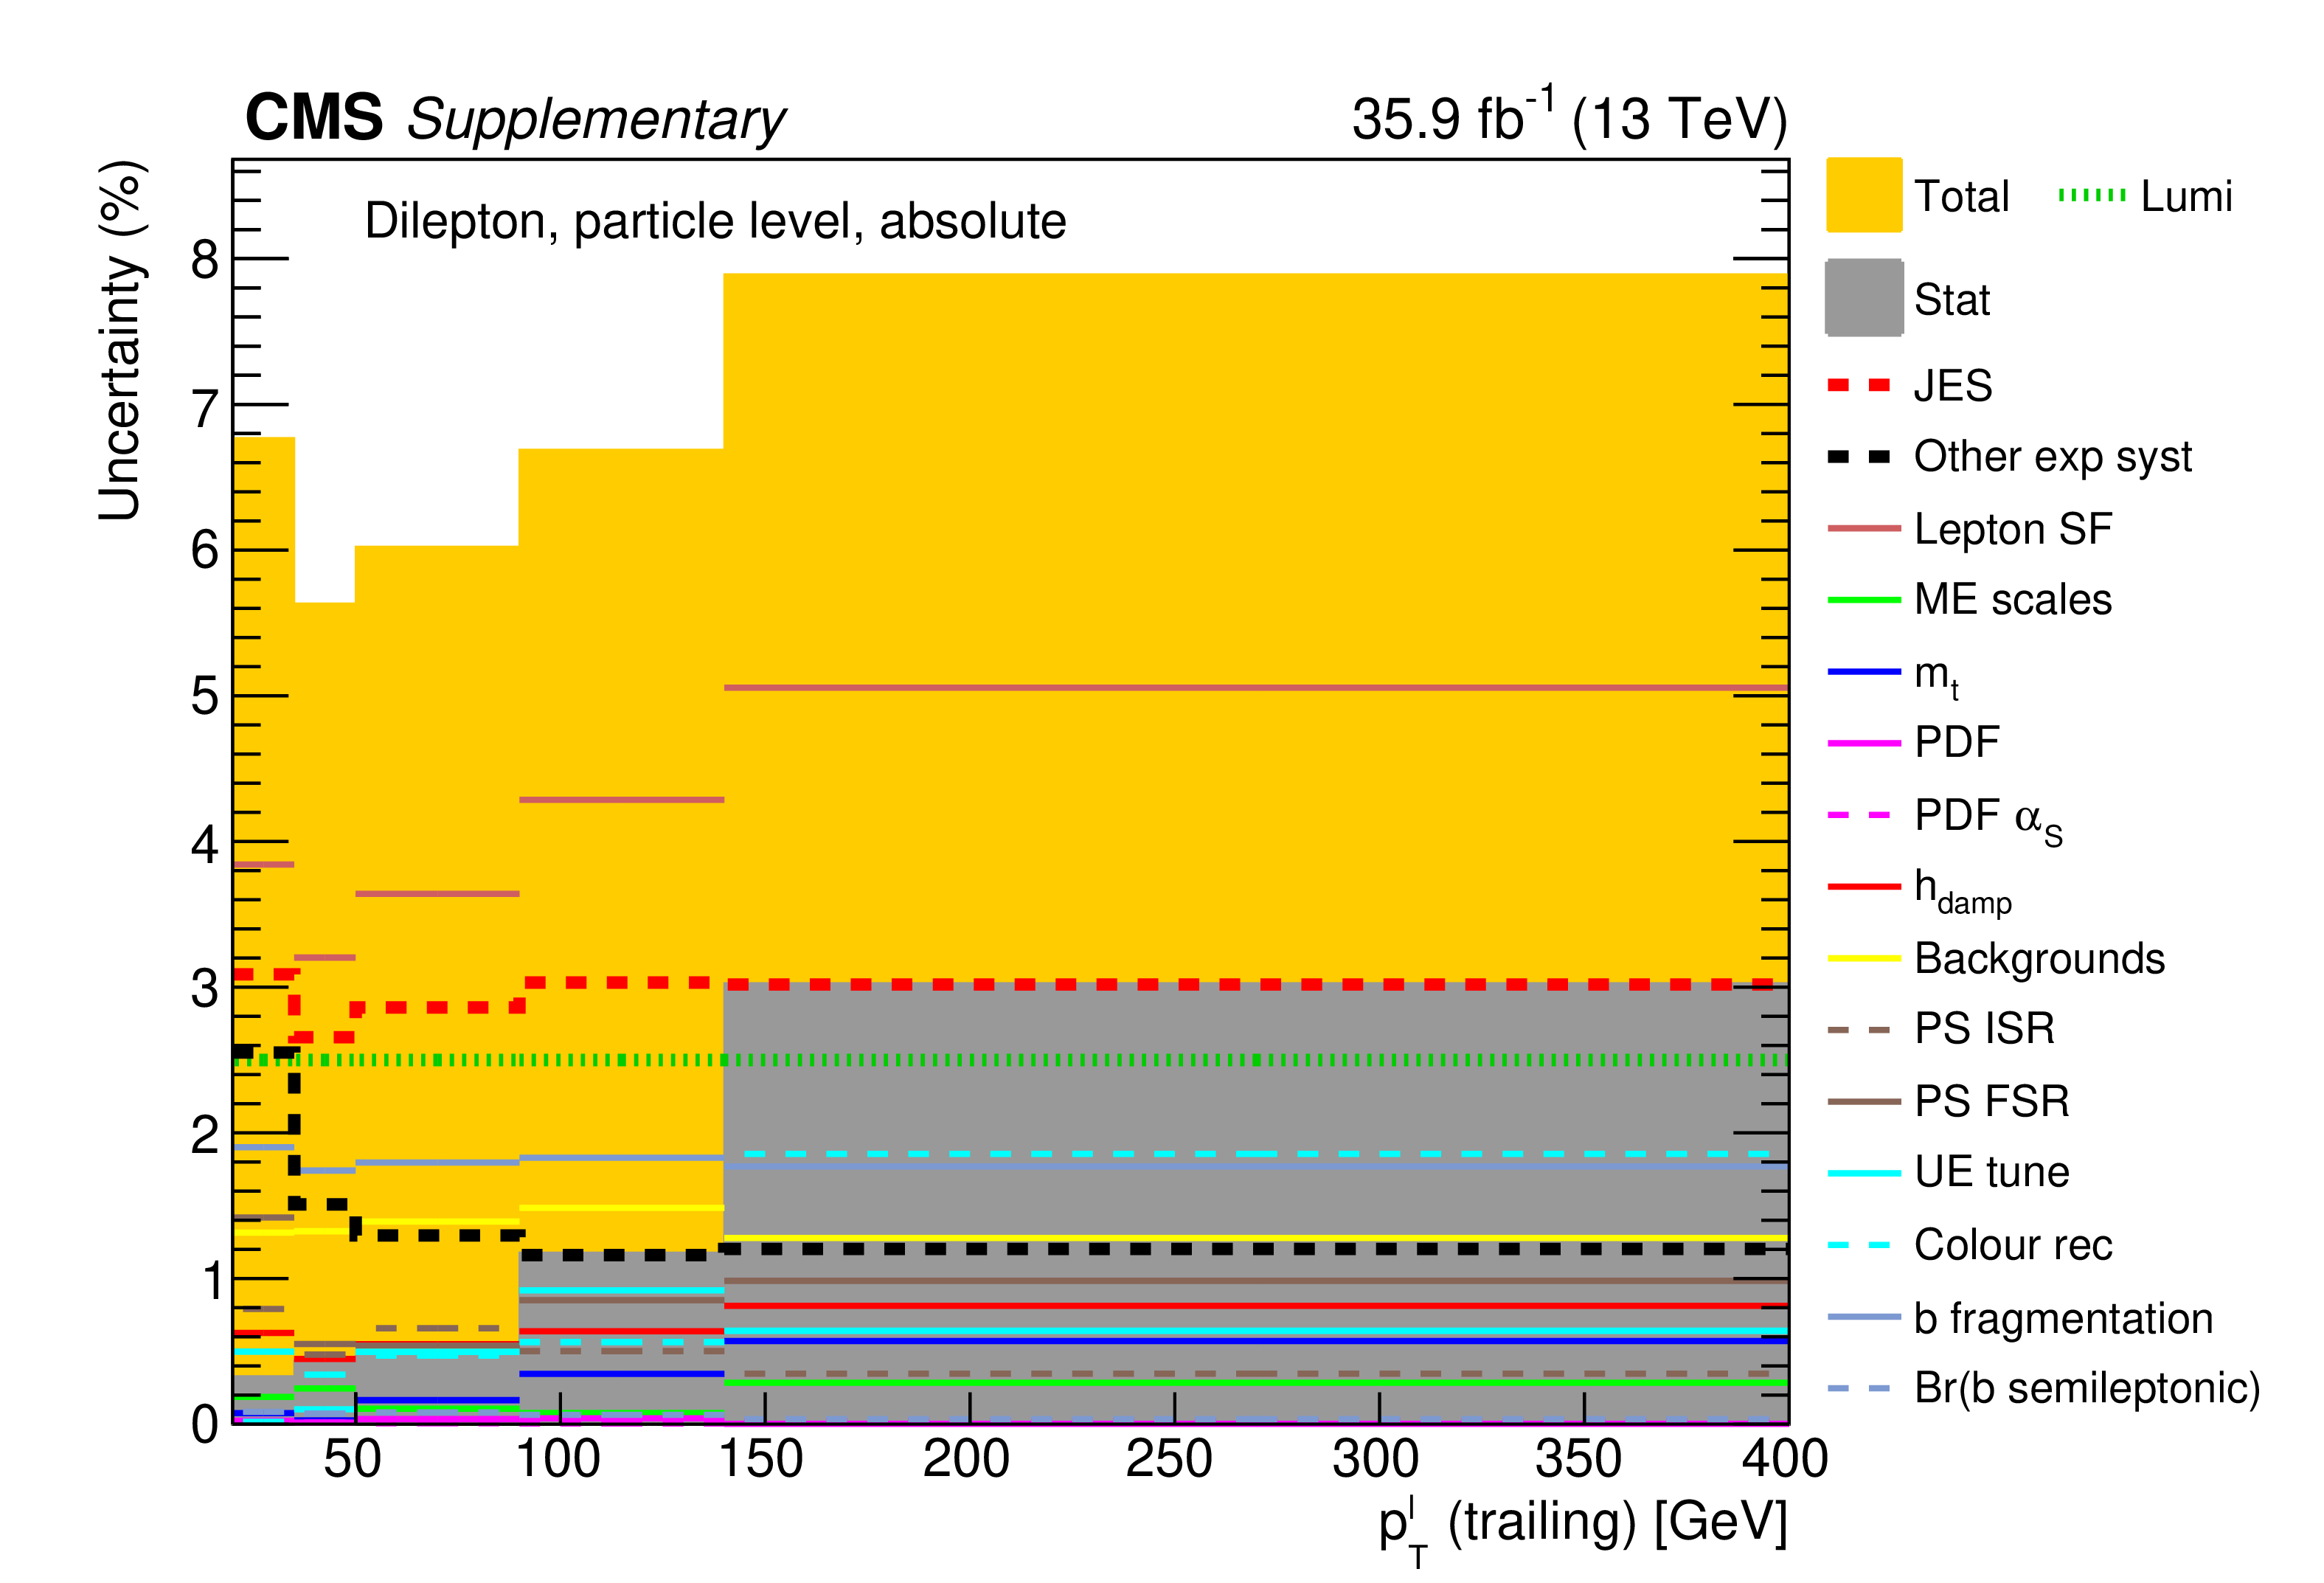
png pdf |
Additional Figure 125:
The breakdown of uncertainties for the absolute measurement of the differential $\mathrm{t\bar{t}}$ cross section as a function of $p_{\mathrm {T}}^{{\ell}}$ (trailing) at particle level is shown. The contributions of each source of systematic uncertainty in each bin are indicated by the coloured lines. Experimental systematic uncertainties that are small in all bins are added in quadrature and shown as a single component. The statistical and total uncertainties are indicated by the shaded areas. |
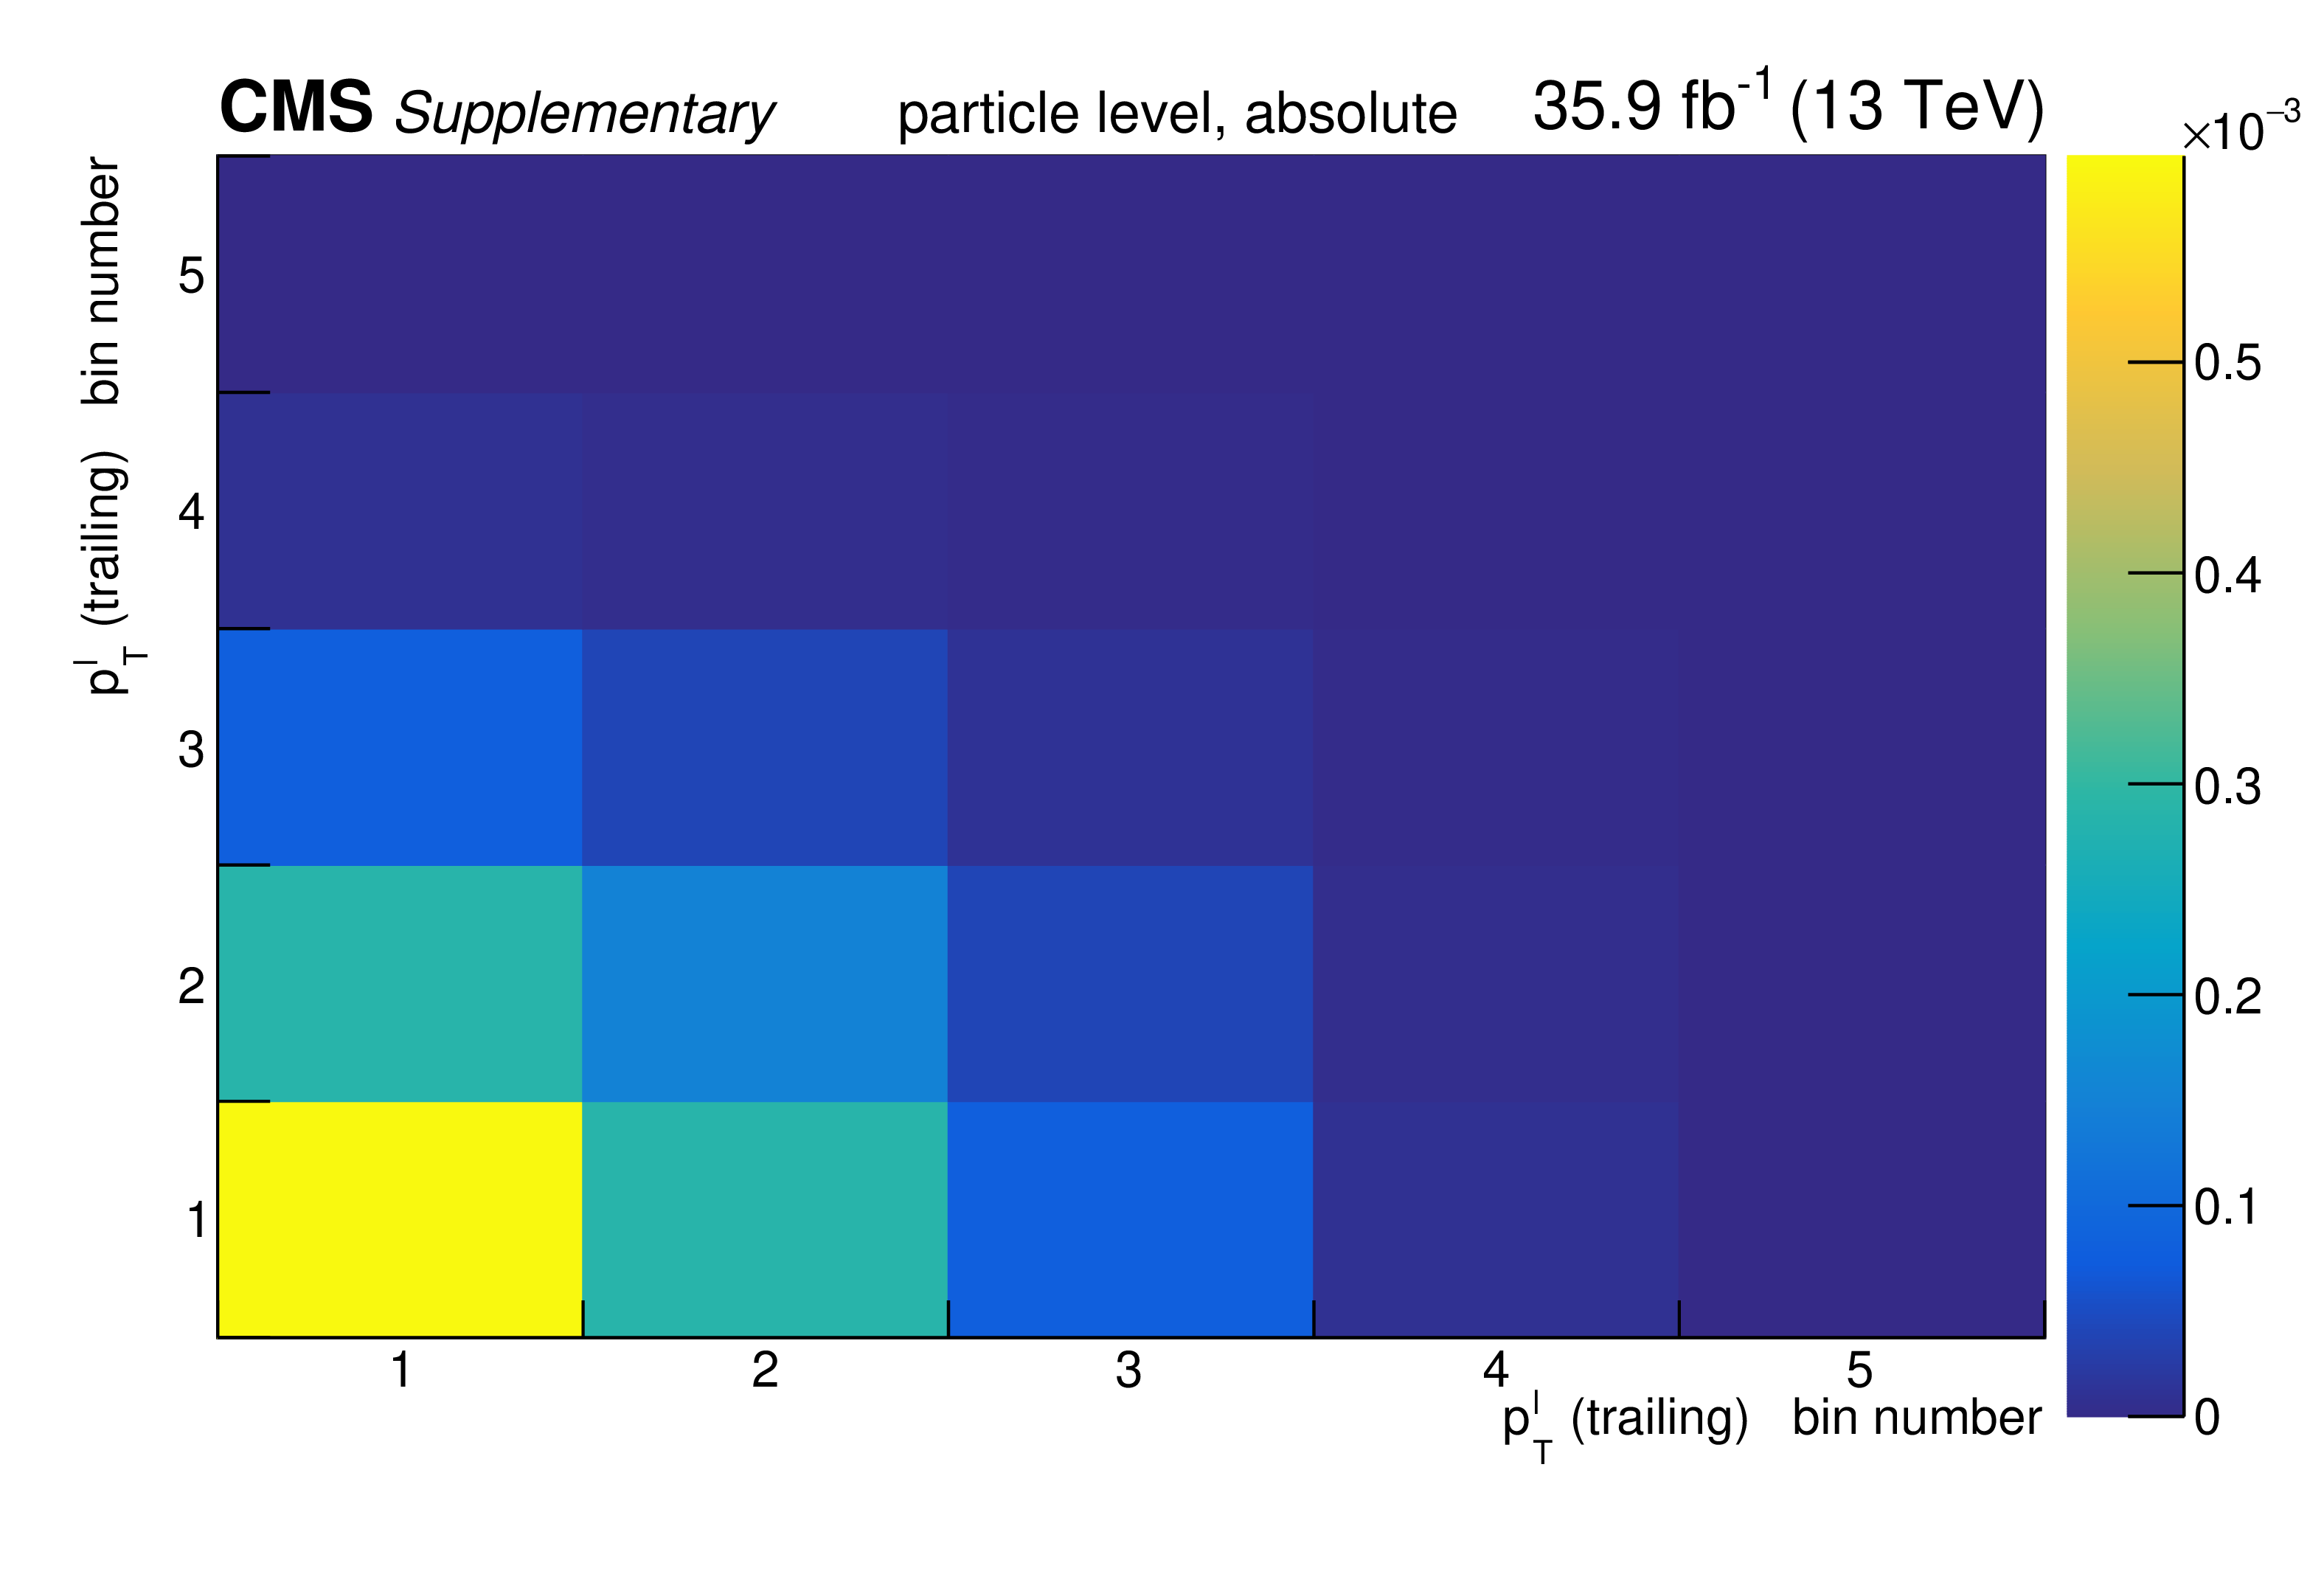
png pdf |
Additional Figure 126:
The covariance matrix of the measured data for the absolute measurement of the differential $\mathrm{t\bar{t}}$ cross section as a function of $p_{\mathrm {T}}^{{\ell}}$ (trailing) at particle level is shown. |
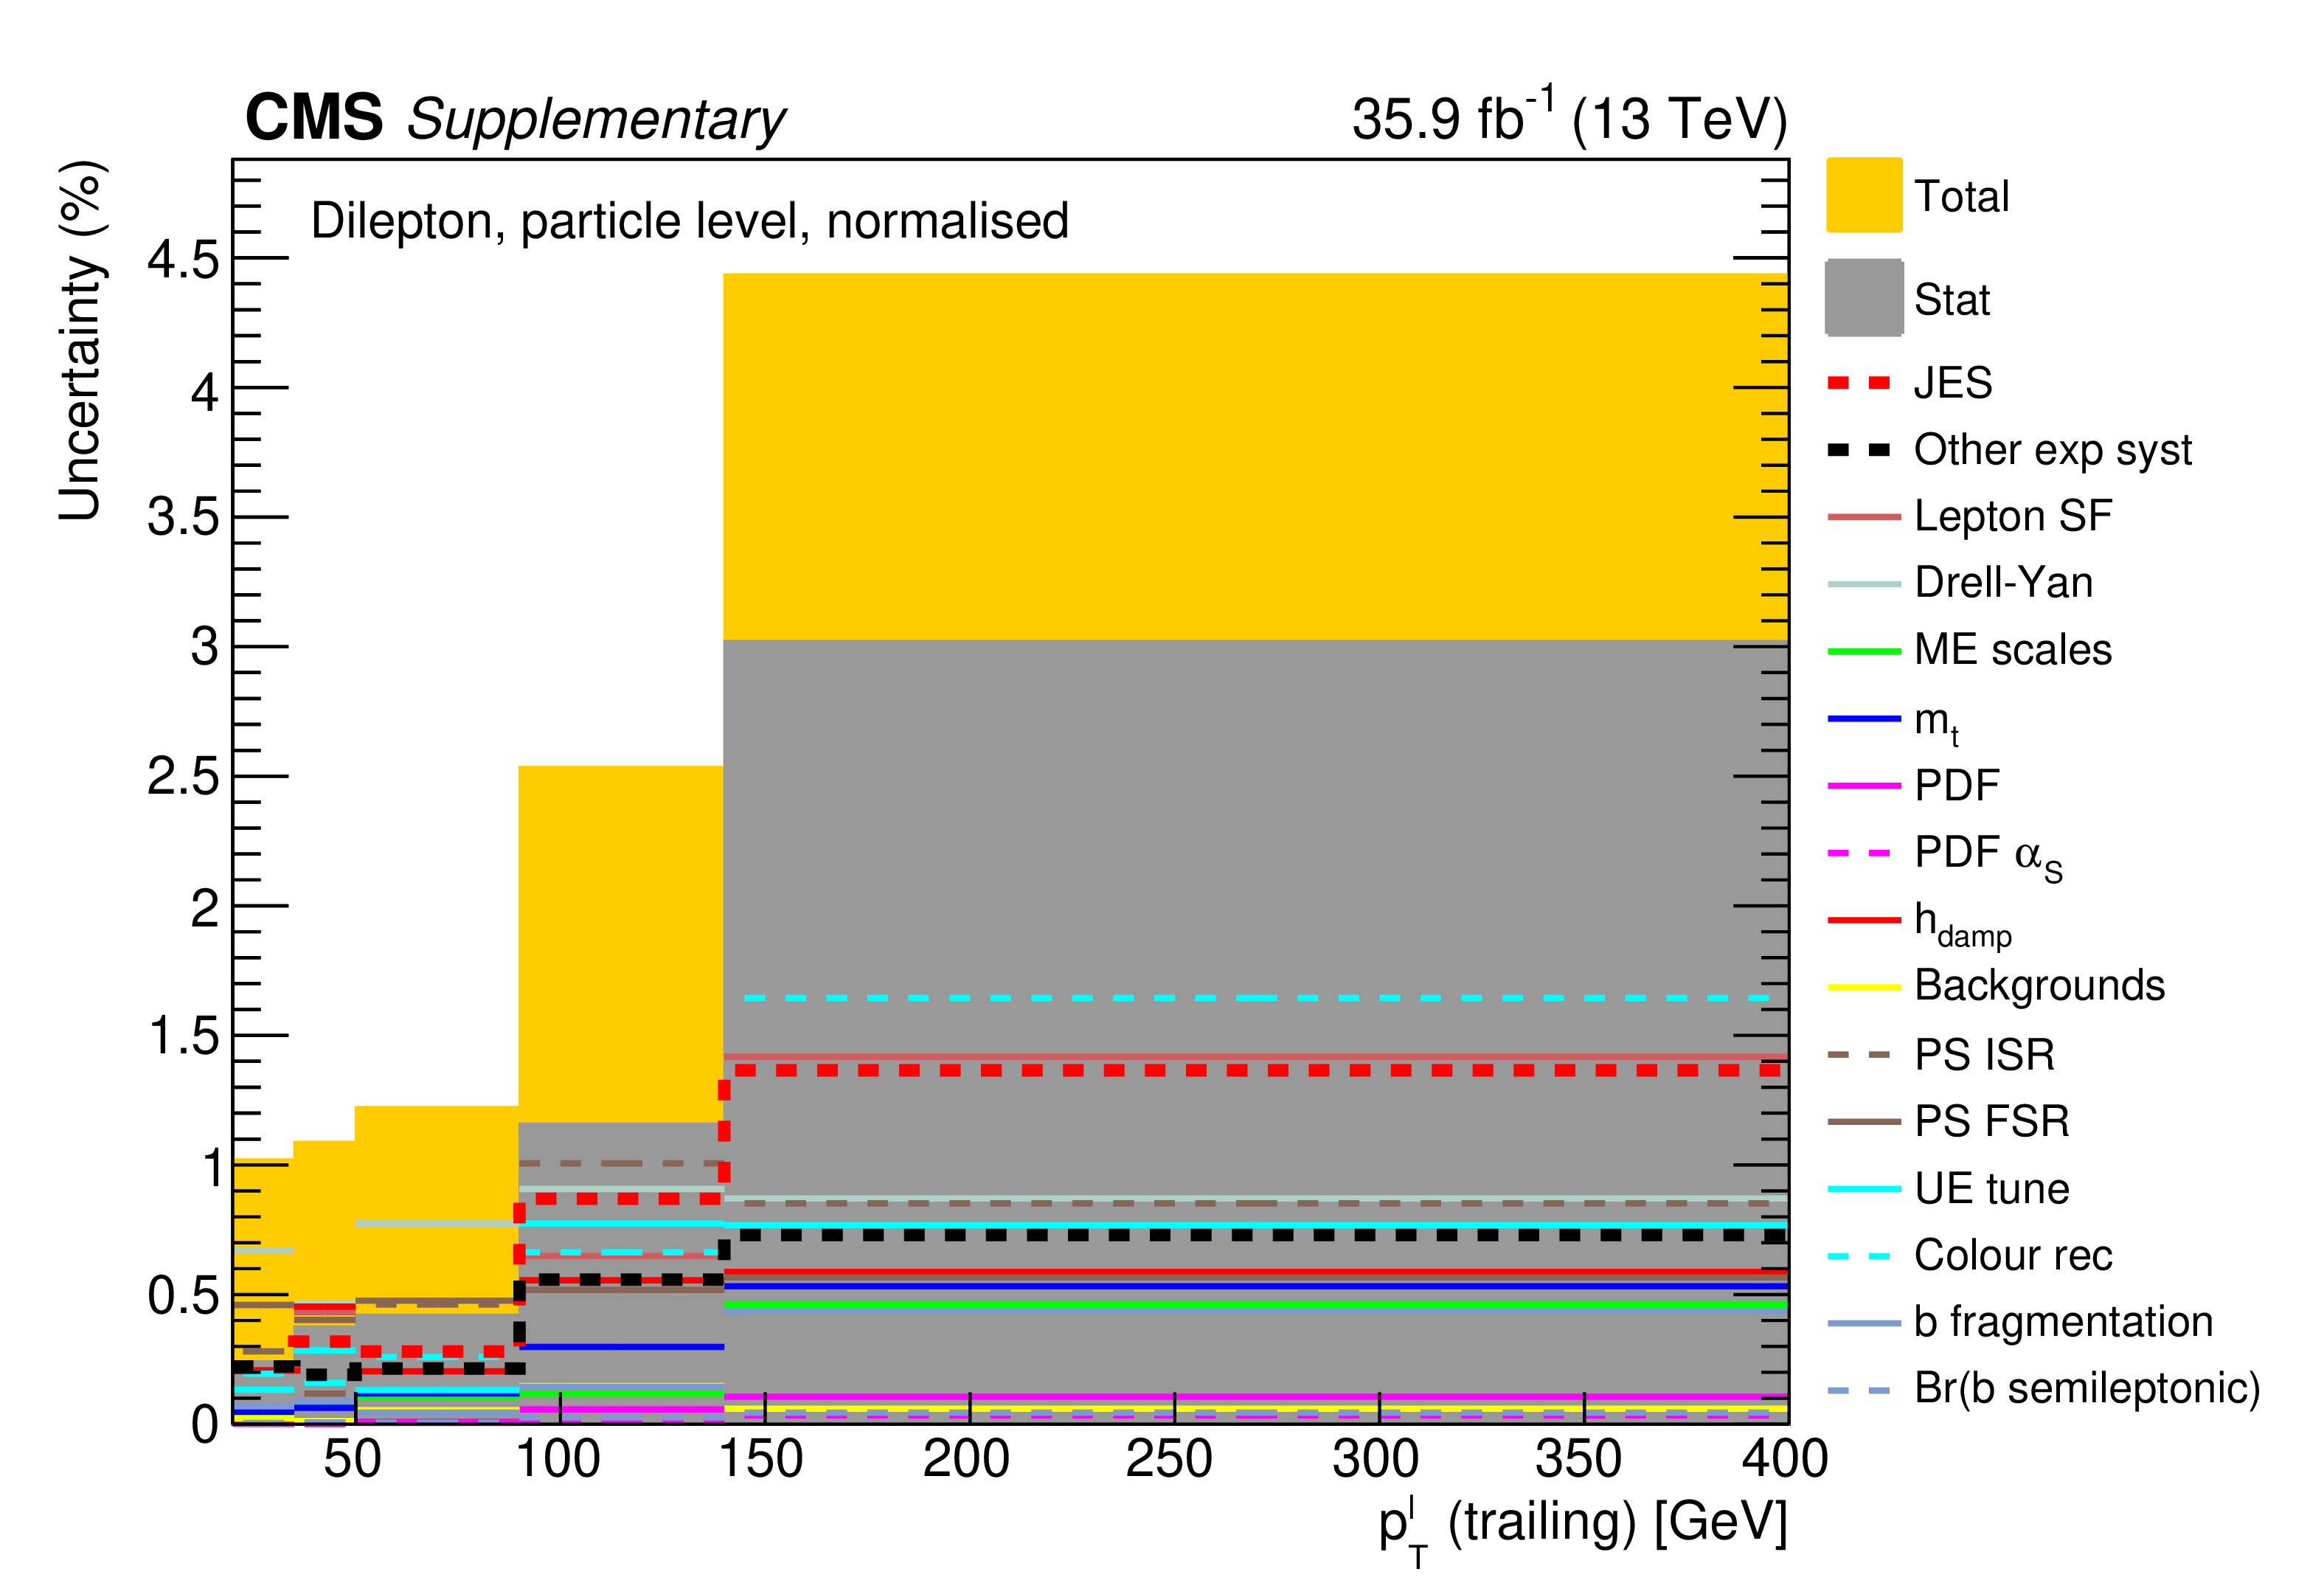
png pdf |
Additional Figure 127:
The breakdown of uncertainties for the normalised measurement of the differential $\mathrm{t\bar{t}}$ cross section as a function of $p_{\mathrm {T}}^{{\ell}}$ (trailing) at particle level is shown. The contributions of each source of systematic uncertainty in each bin are indicated by the coloured lines. Experimental systematic uncertainties that are small in all bins are added in quadrature and shown as a single component. The statistical and total uncertainties are indicated by the shaded areas. |
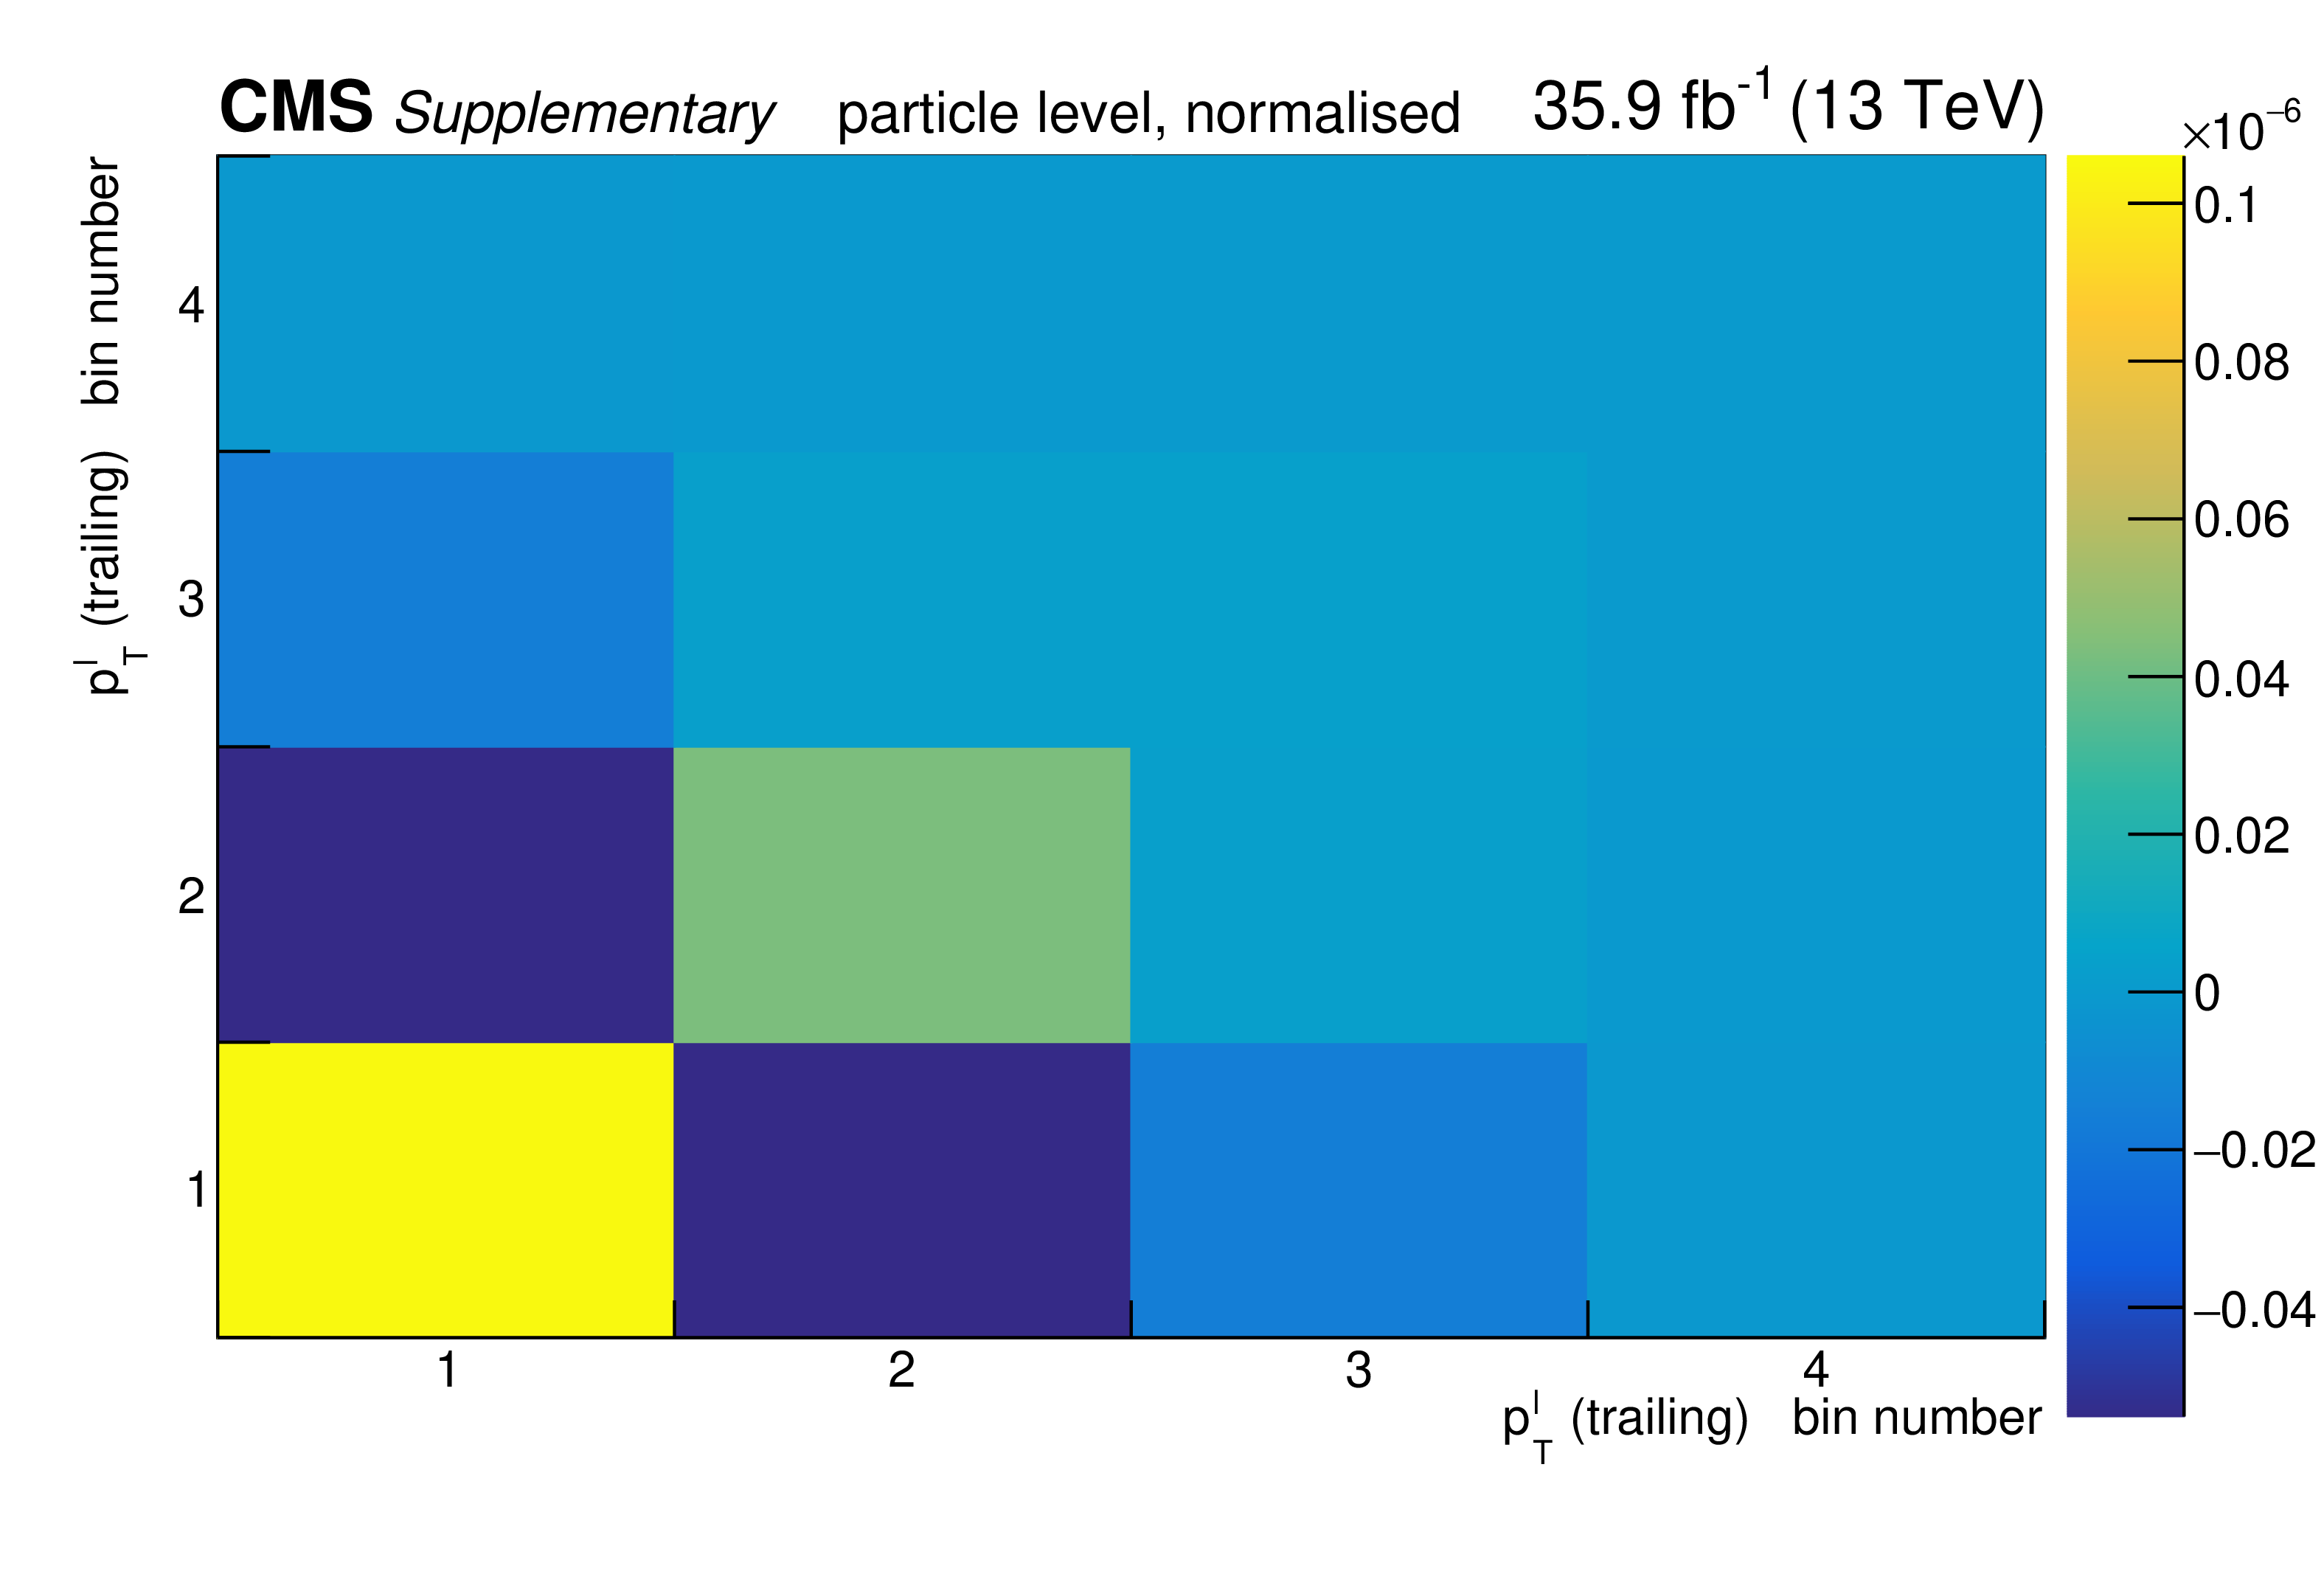
png pdf |
Additional Figure 128:
The covariance matrix of the measured data for the normalised measurement of the differential $\mathrm{t\bar{t}}$ cross section as a function of $p_{\mathrm {T}}^{{\ell}}$ (trailing) at particle level is shown. |
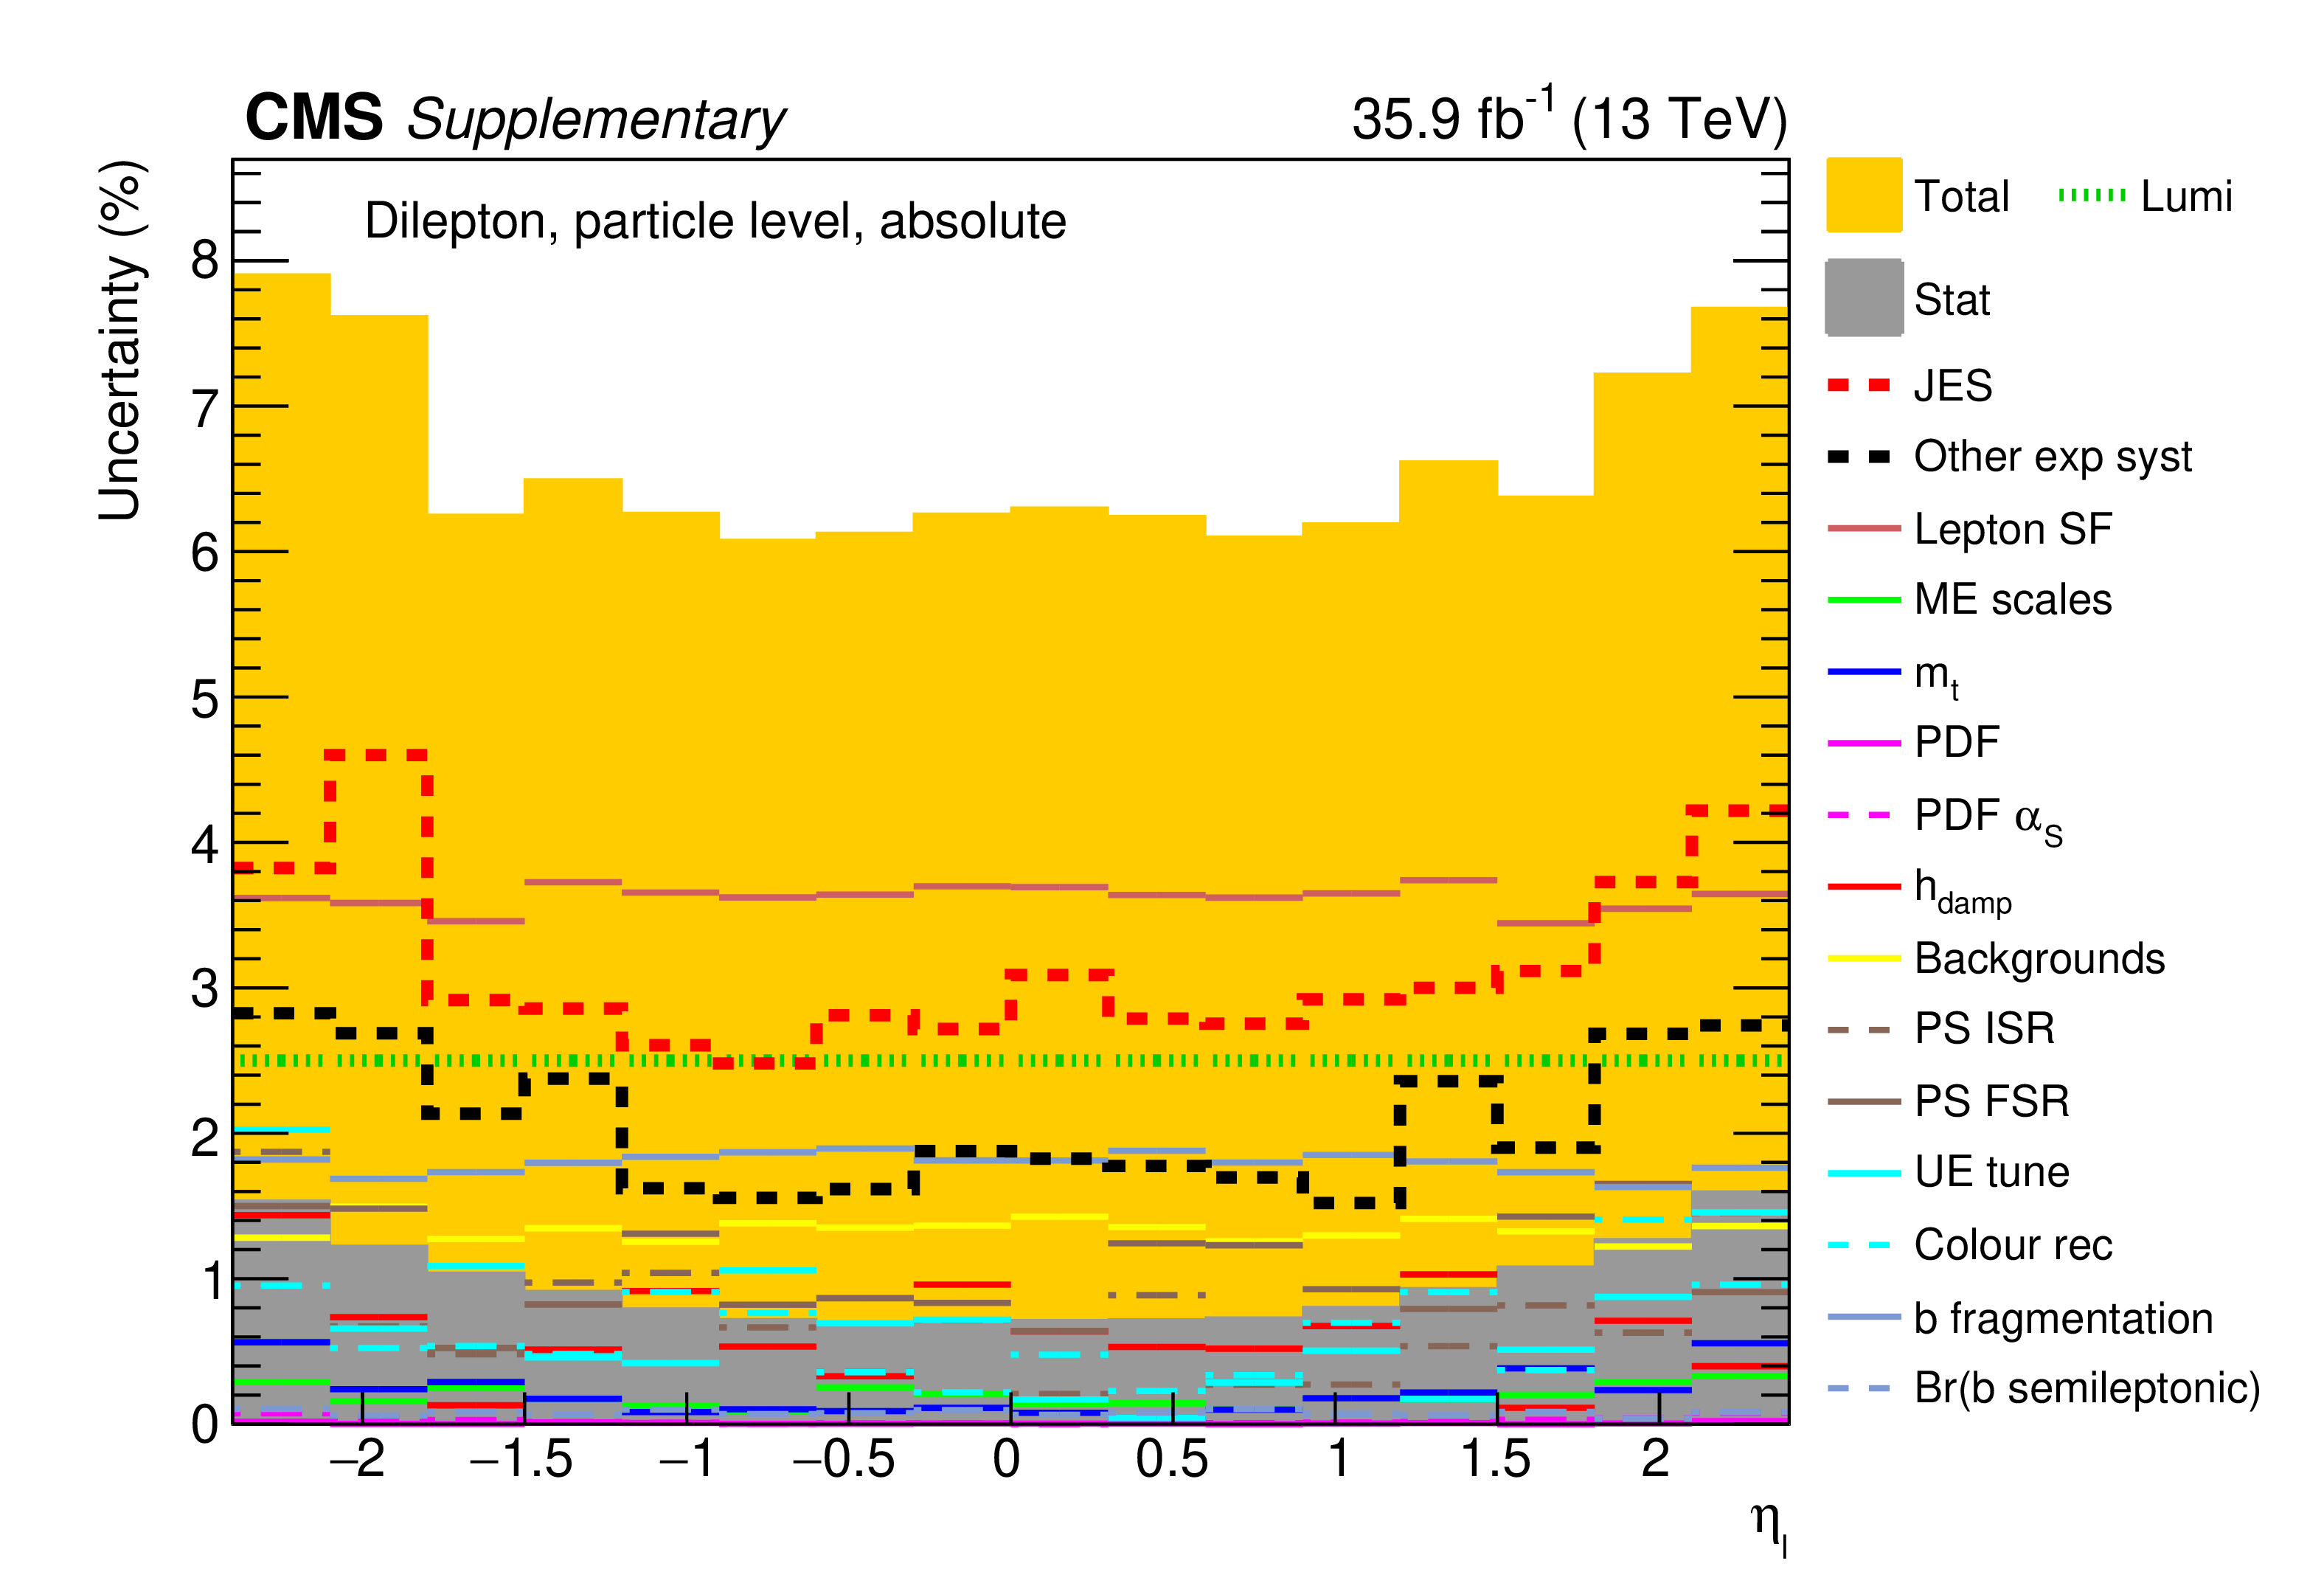
png pdf |
Additional Figure 129:
The breakdown of uncertainties for the absolute measurement of the differential $\mathrm{t\bar{t}}$ cross section as a function of $\eta _{{\ell}}$ at particle level is shown. The contributions of each source of systematic uncertainty in each bin are indicated by the coloured lines. Experimental systematic uncertainties that are small in all bins are added in quadrature and shown as a single component. The statistical and total uncertainties are indicated by the shaded areas. |

png pdf |
Additional Figure 130:
The covariance matrix of the measured data for the absolute measurement of the differential $\mathrm{t\bar{t}}$ cross section as a function of $\eta _{{\ell}}$ at particle level is shown. |

png pdf |
Additional Figure 131:
The breakdown of uncertainties for the normalised measurement of the differential $\mathrm{t\bar{t}}$ cross section as a function of $\eta _{{\ell}}$ at particle level is shown. The contributions of each source of systematic uncertainty in each bin are indicated by the coloured lines. Experimental systematic uncertainties that are small in all bins are added in quadrature and shown as a single component. The statistical and total uncertainties are indicated by the shaded areas. |

png pdf |
Additional Figure 132:
The covariance matrix of the measured data for the normalised measurement of the differential $\mathrm{t\bar{t}}$ cross section as a function of $\eta _{{\ell}}$ at particle level is shown. |
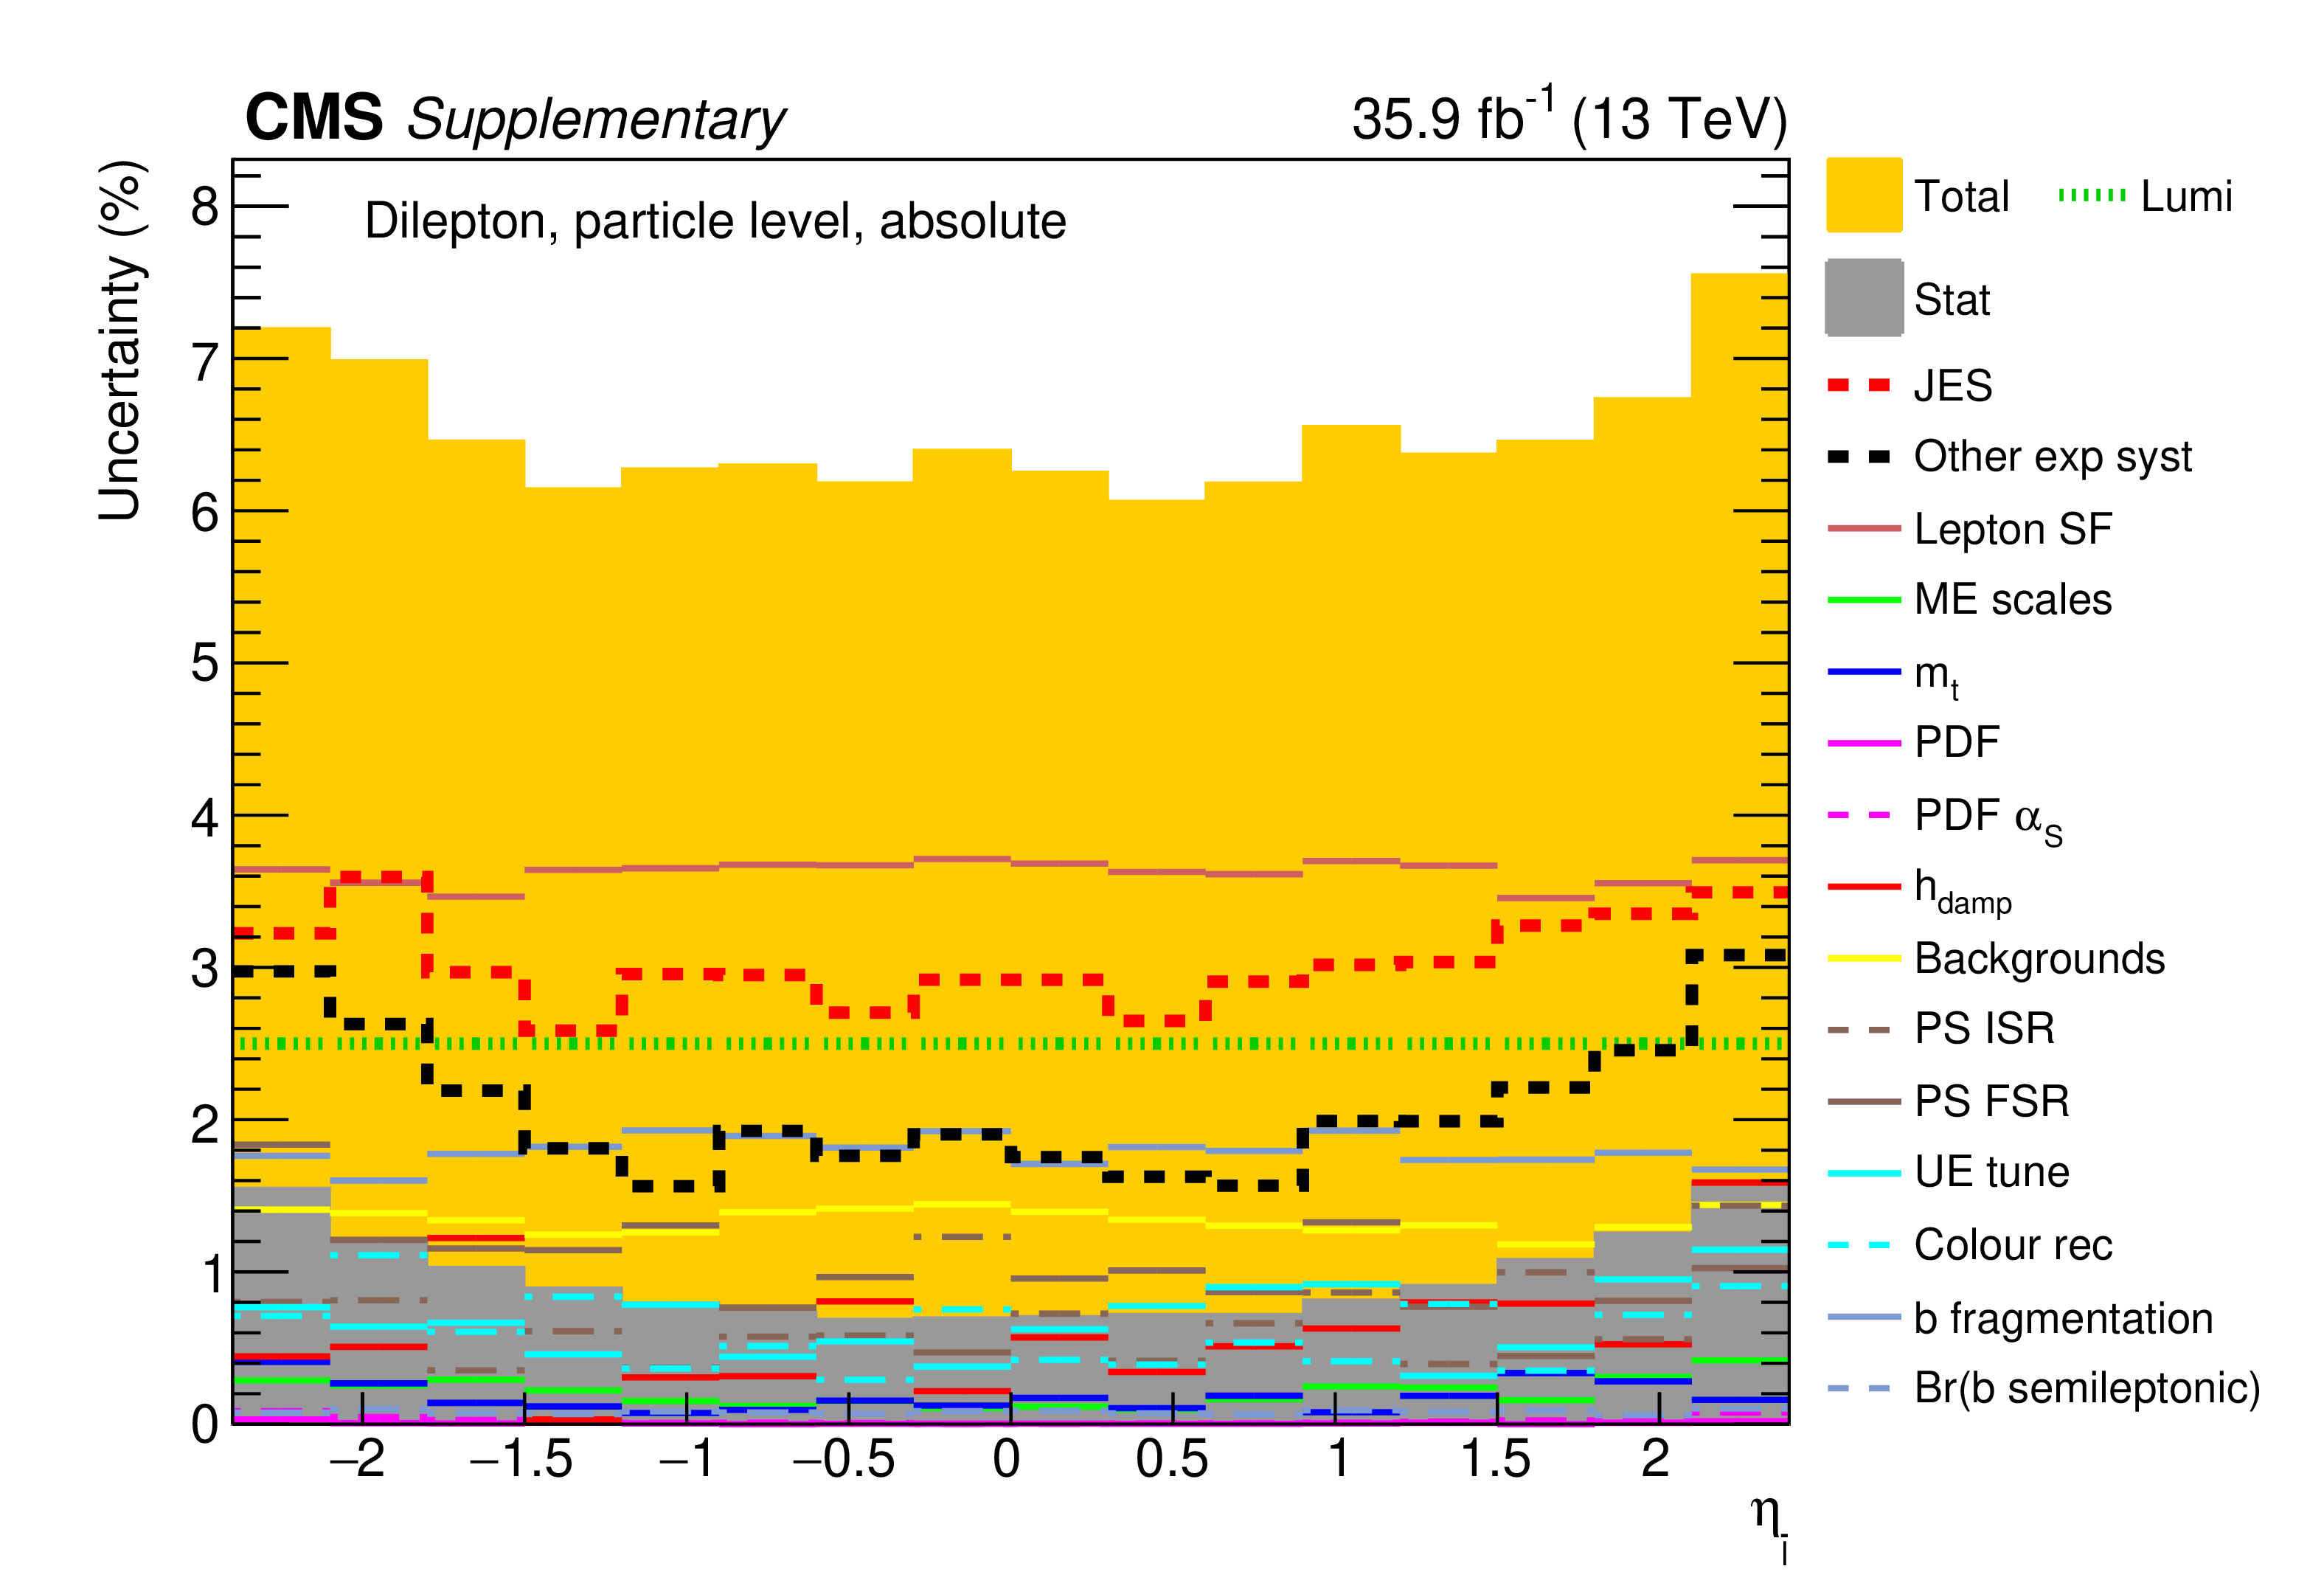
png pdf |
Additional Figure 133:
The breakdown of uncertainties for the absolute measurement of the differential $\mathrm{t\bar{t}}$ cross section as a function of $\eta _{\bar{{\ell}}}$ at particle level is shown. The contributions of each source of systematic uncertainty in each bin are indicated by the coloured lines. Experimental systematic uncertainties that are small in all bins are added in quadrature and shown as a single component. The statistical and total uncertainties are indicated by the shaded areas. |

png pdf |
Additional Figure 134:
The covariance matrix of the measured data for the absolute measurement of the differential $\mathrm{t\bar{t}}$ cross section as a function of $\eta _{\bar{{\ell}}}$ at particle level is shown. |
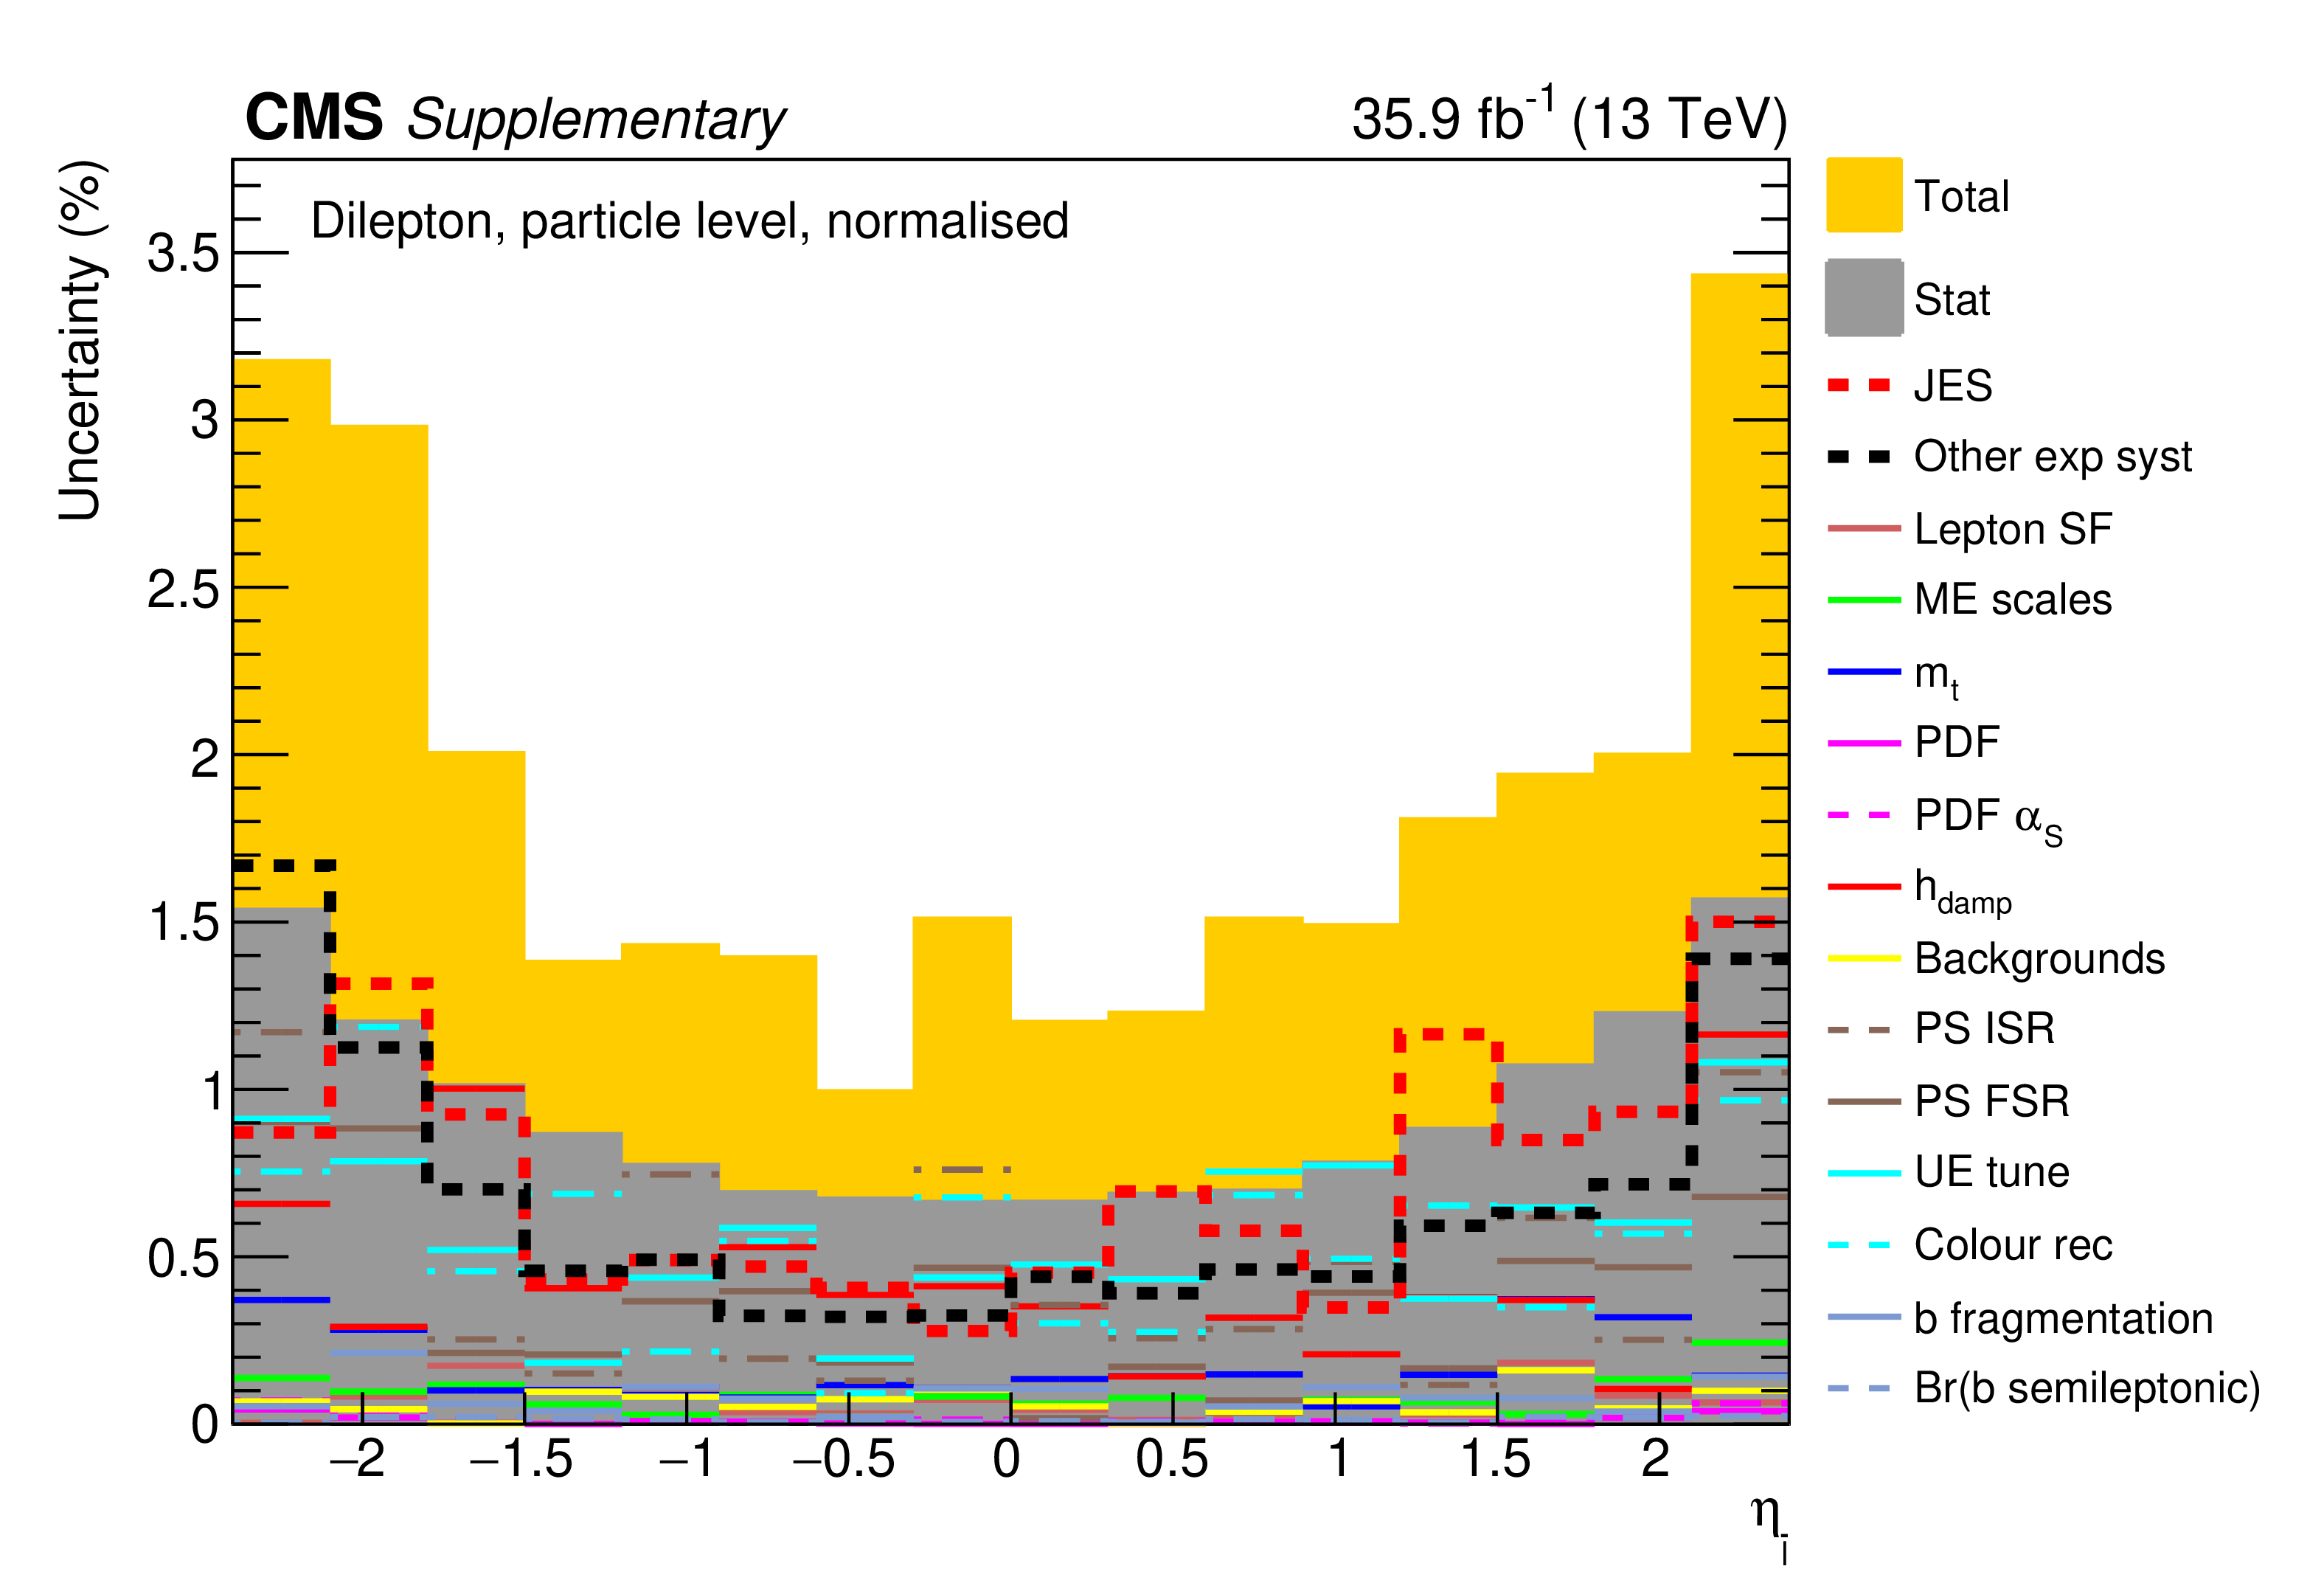
png pdf |
Additional Figure 135:
The breakdown of uncertainties for the normalised measurement of the differential $\mathrm{t\bar{t}}$ cross section as a function of $\eta _{\bar{{\ell}}}$ at particle level is shown. The contributions of each source of systematic uncertainty in each bin are indicated by the coloured lines. Experimental systematic uncertainties that are small in all bins are added in quadrature and shown as a single component. The statistical and total uncertainties are indicated by the shaded areas. |

png pdf |
Additional Figure 136:
The covariance matrix of the measured data for the normalised measurement of the differential $\mathrm{t\bar{t}}$ cross section as a function of $\eta _{\bar{{\ell}}}$ at particle level is shown. |
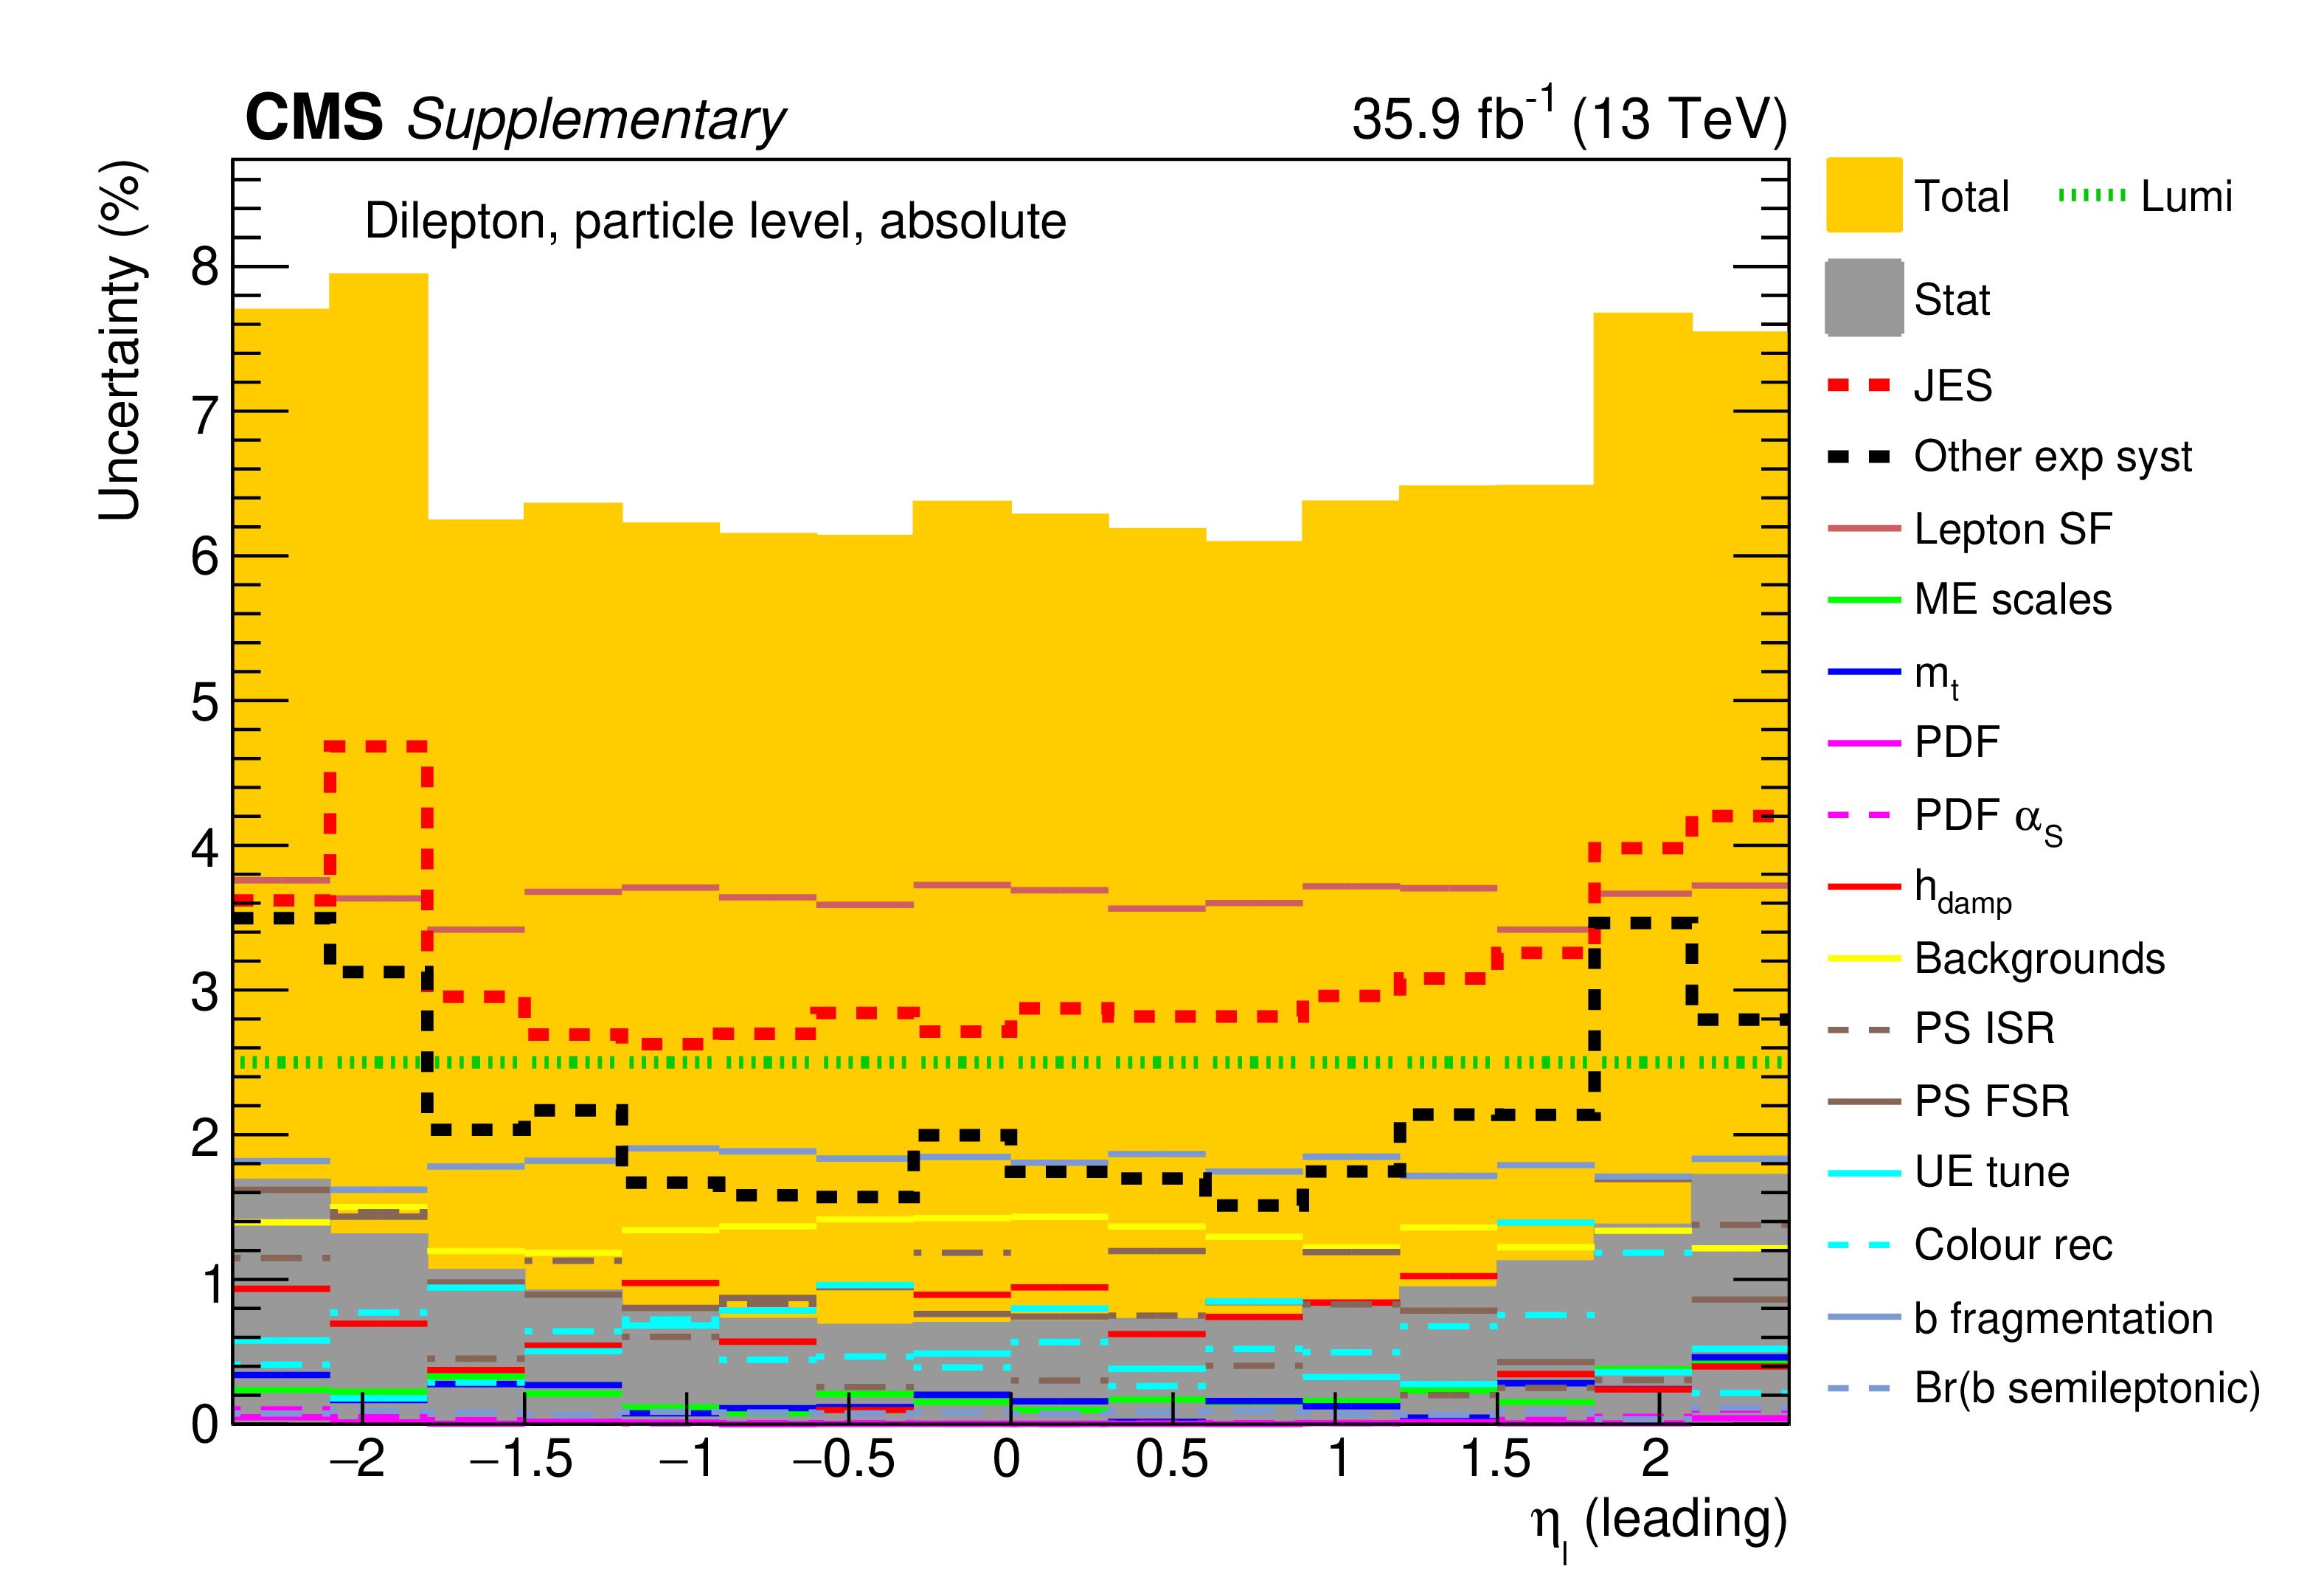
png pdf |
Additional Figure 137:
The breakdown of uncertainties for the absolute measurement of the differential $\mathrm{t\bar{t}}$ cross section as a function of $\eta _{{\ell}}$ (leading) at particle level is shown. The contributions of each source of systematic uncertainty in each bin are indicated by the coloured lines. Experimental systematic uncertainties that are small in all bins are added in quadrature and shown as a single component. The statistical and total uncertainties are indicated by the shaded areas. |
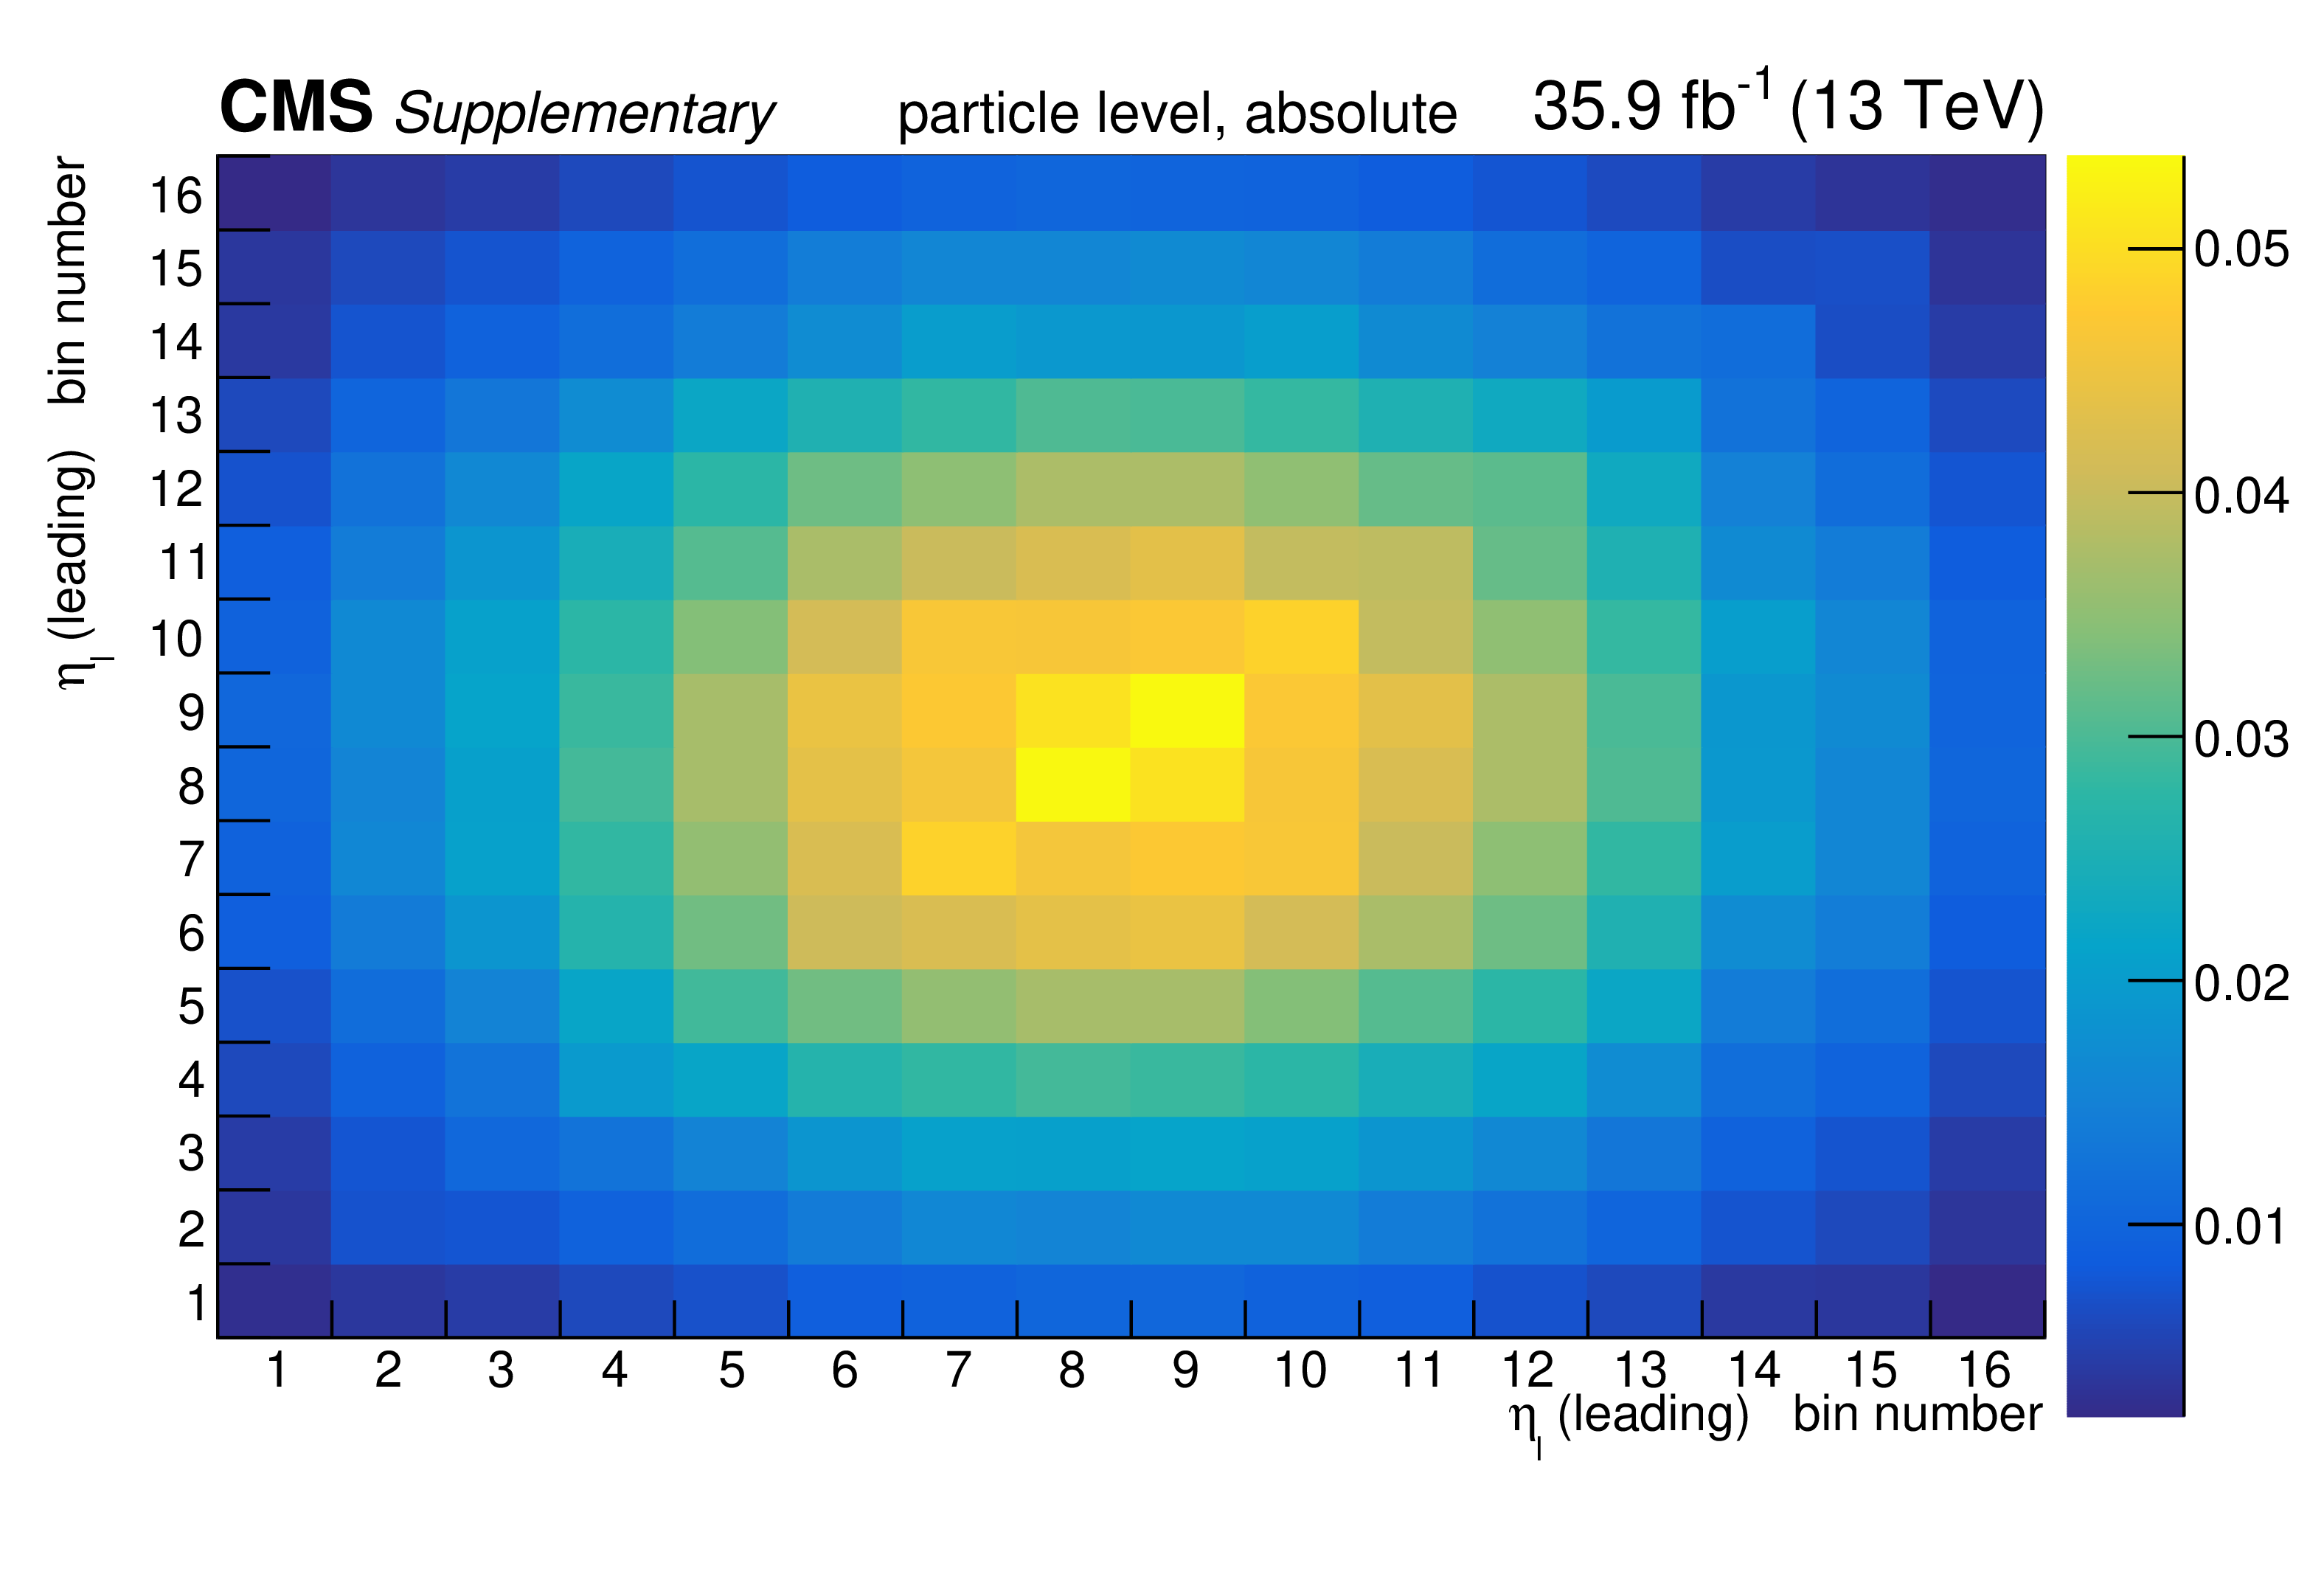
png pdf |
Additional Figure 138:
The covariance matrix of the measured data for the absolute measurement of the differential $\mathrm{t\bar{t}}$ cross section as a function of $\eta _{{\ell}}$ (leading) at particle level is shown. |
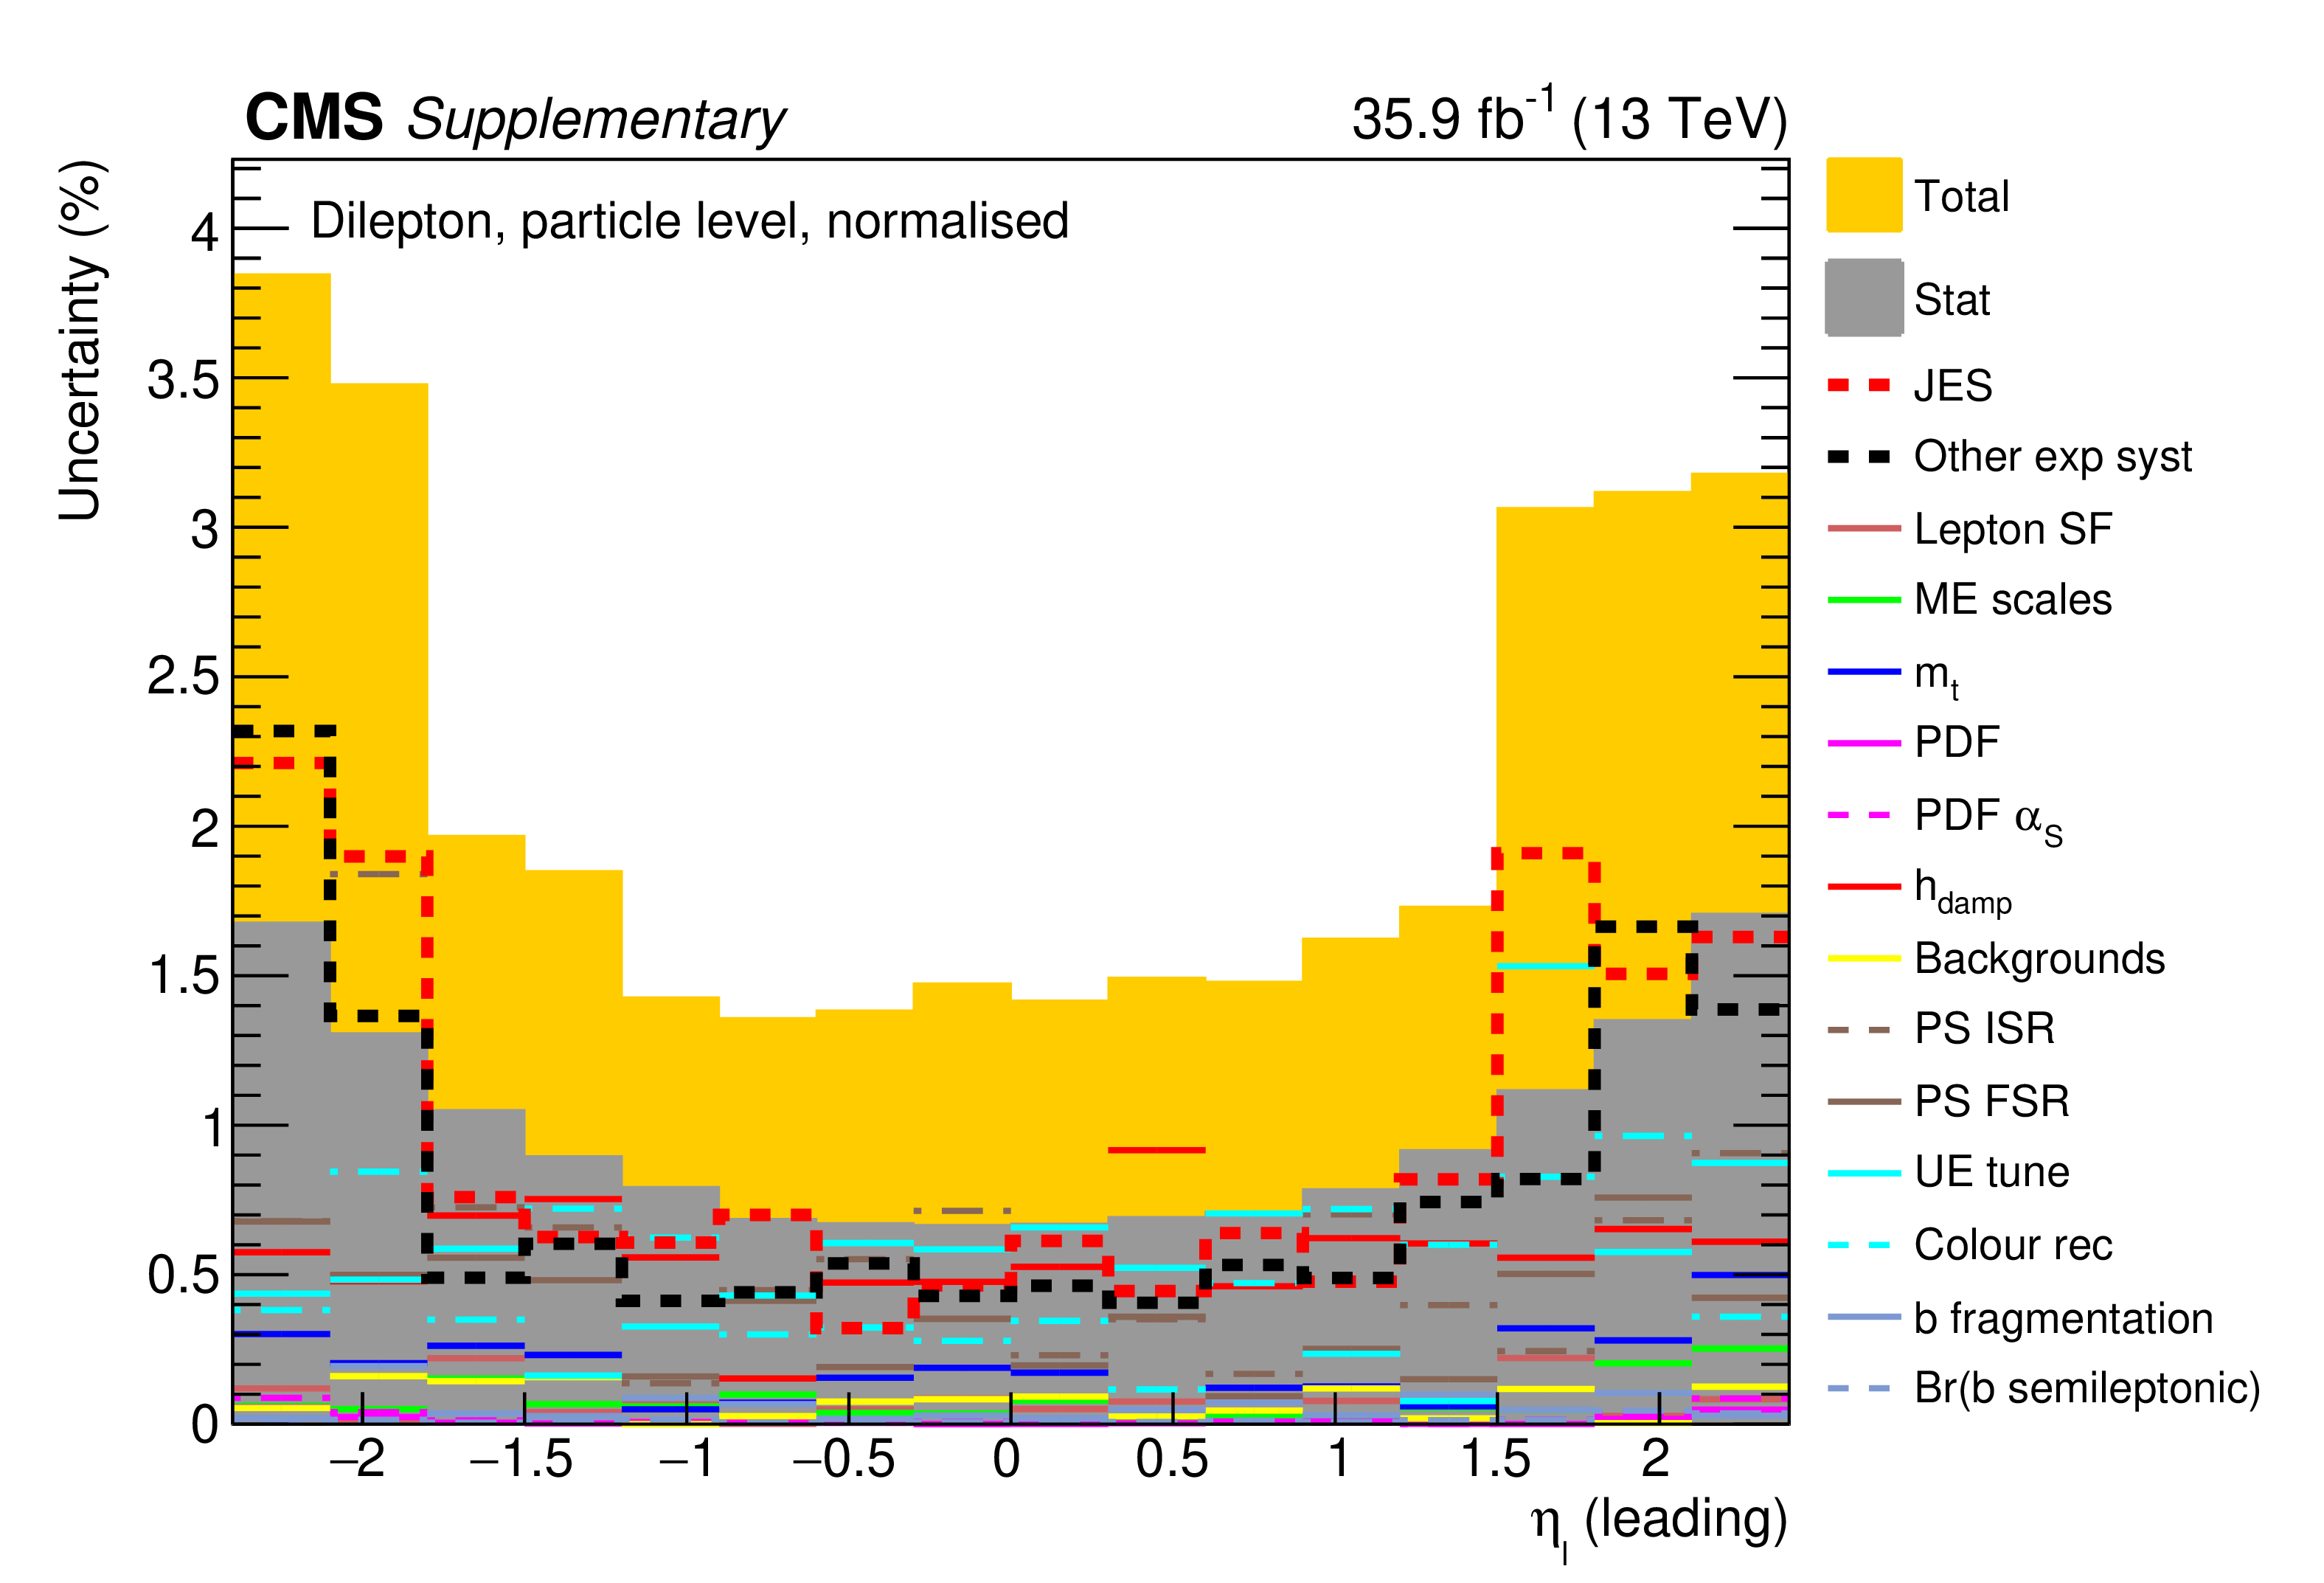
png pdf |
Additional Figure 139:
The breakdown of uncertainties for the normalised measurement of the differential $\mathrm{t\bar{t}}$ cross section as a function of $\eta _{{\ell}}$ (leading) at particle level is shown. The contributions of each source of systematic uncertainty in each bin are indicated by the coloured lines. Experimental systematic uncertainties that are small in all bins are added in quadrature and shown as a single component. The statistical and total uncertainties are indicated by the shaded areas. |
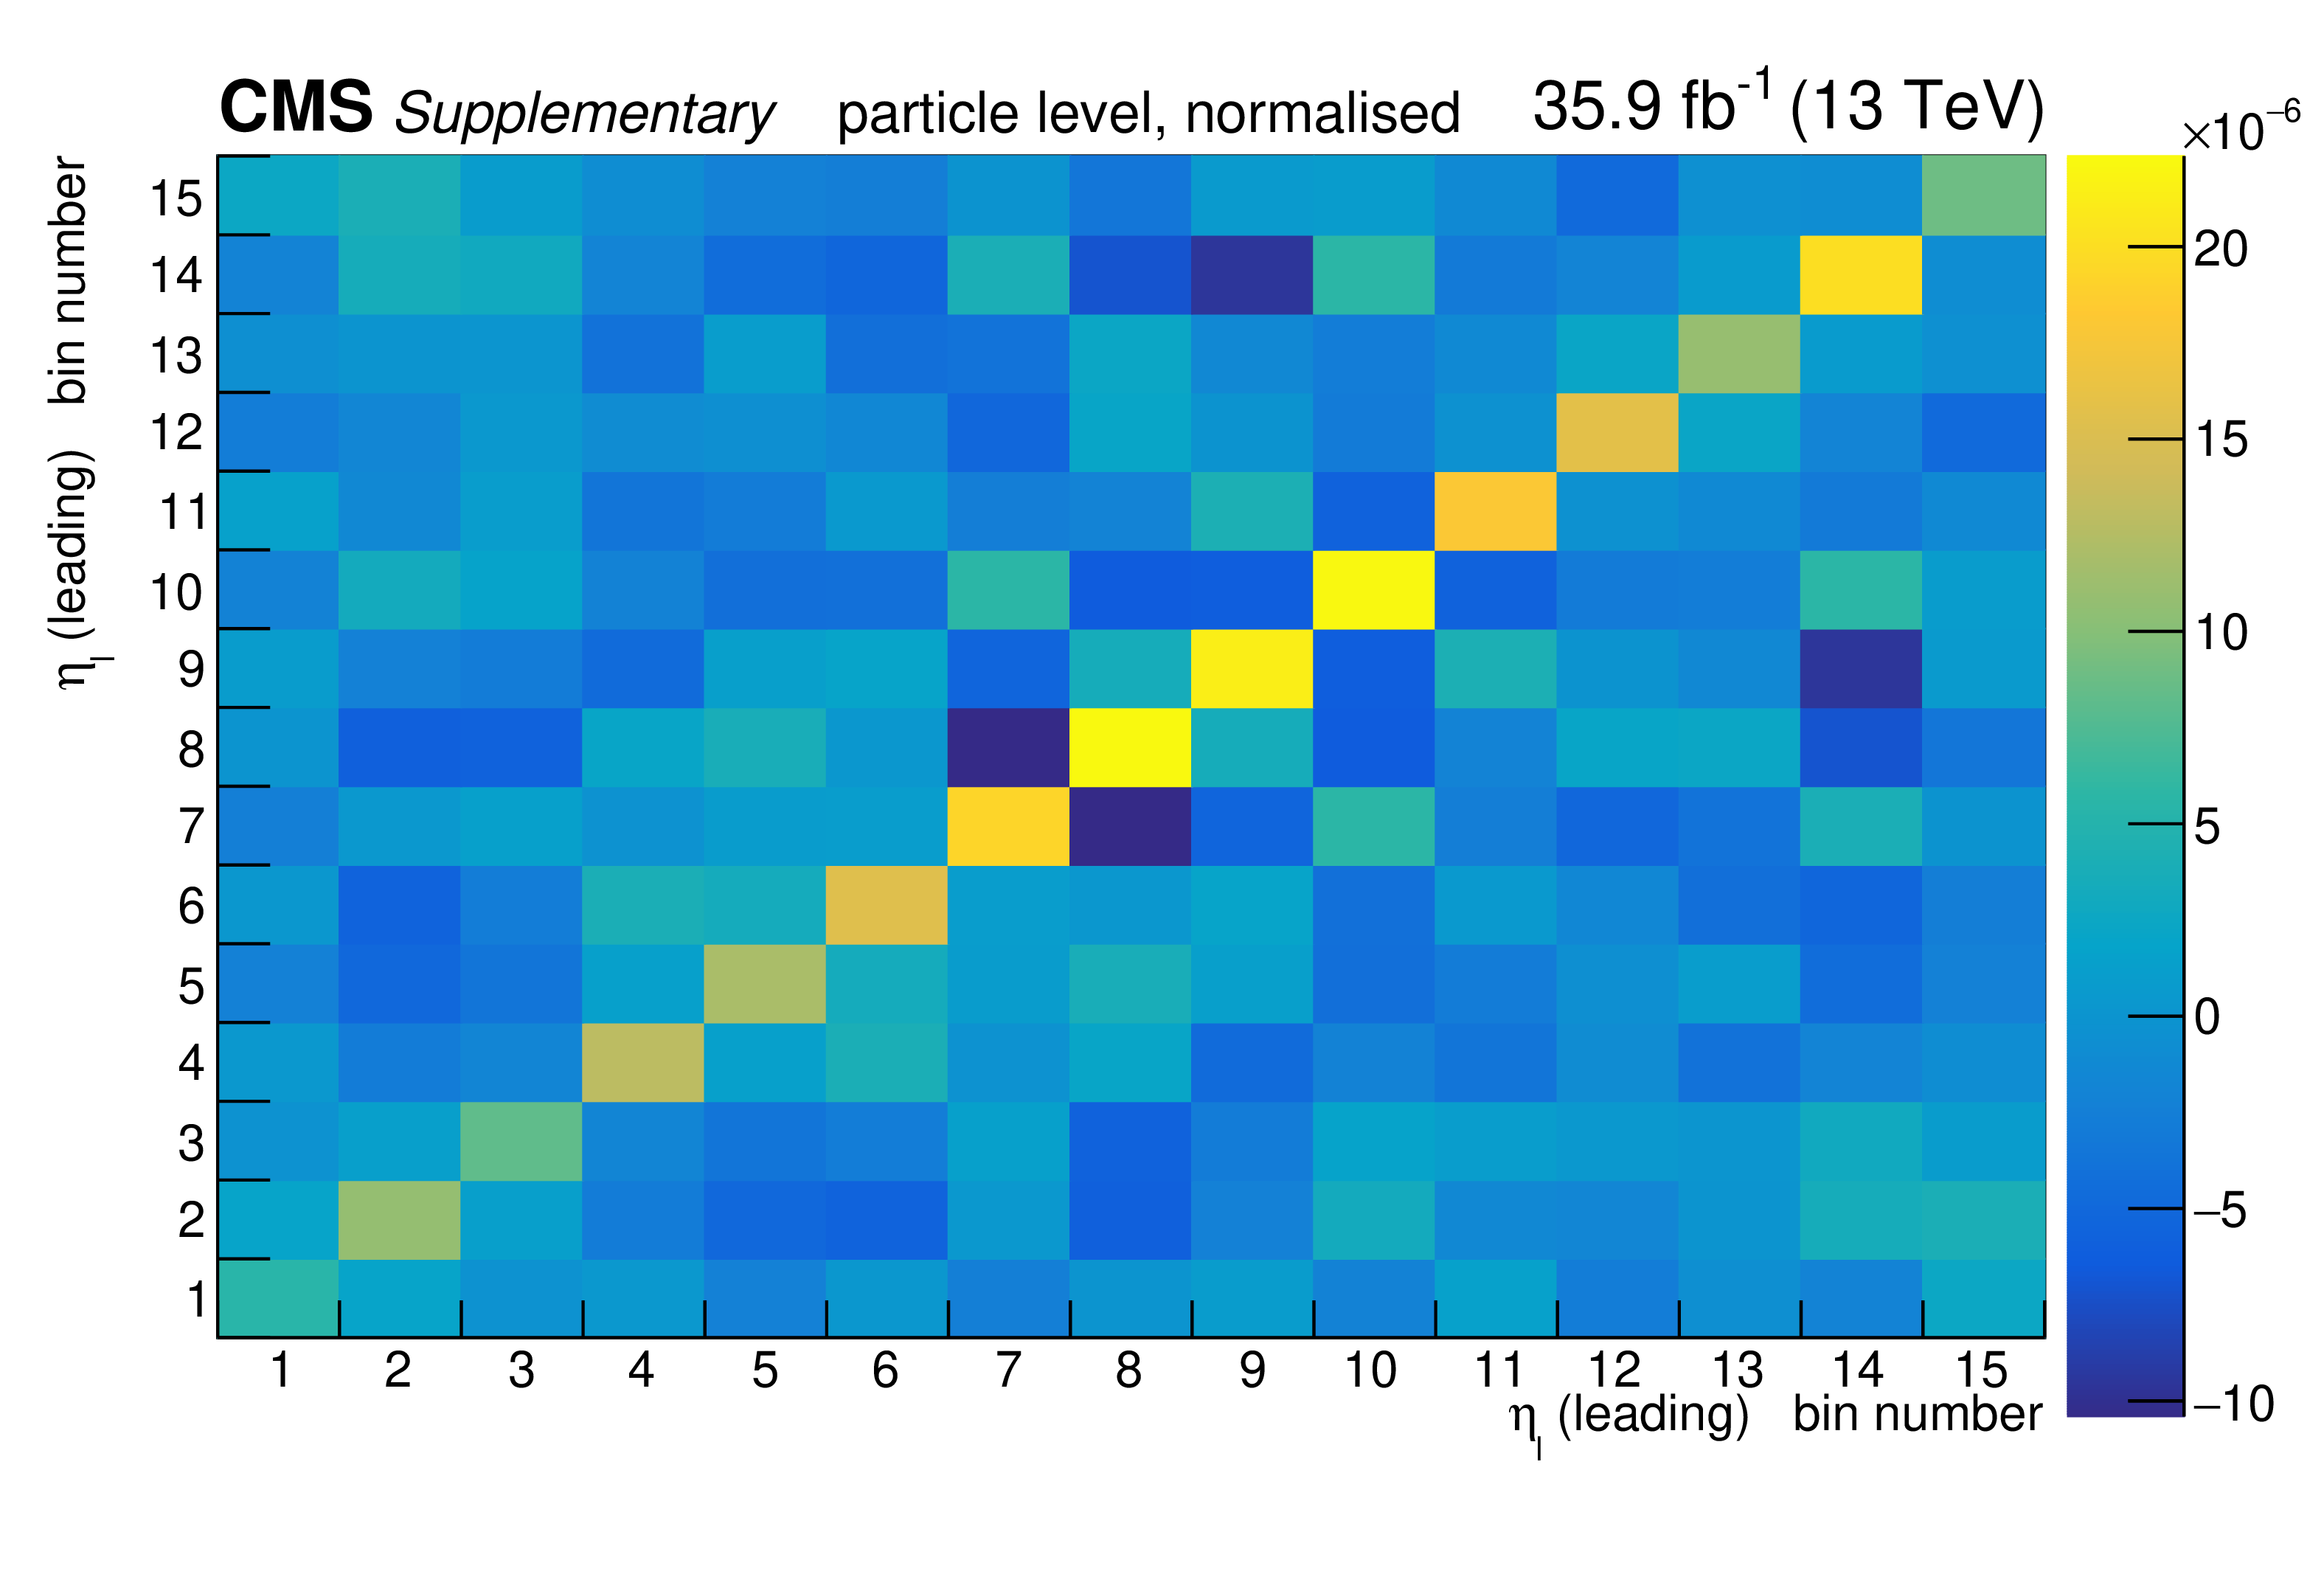
png pdf |
Additional Figure 140:
The covariance matrix of the measured data for the normalised measurement of the differential $\mathrm{t\bar{t}}$ cross section as a function of $\eta _{{\ell}}$ (leading) at particle level is shown. |
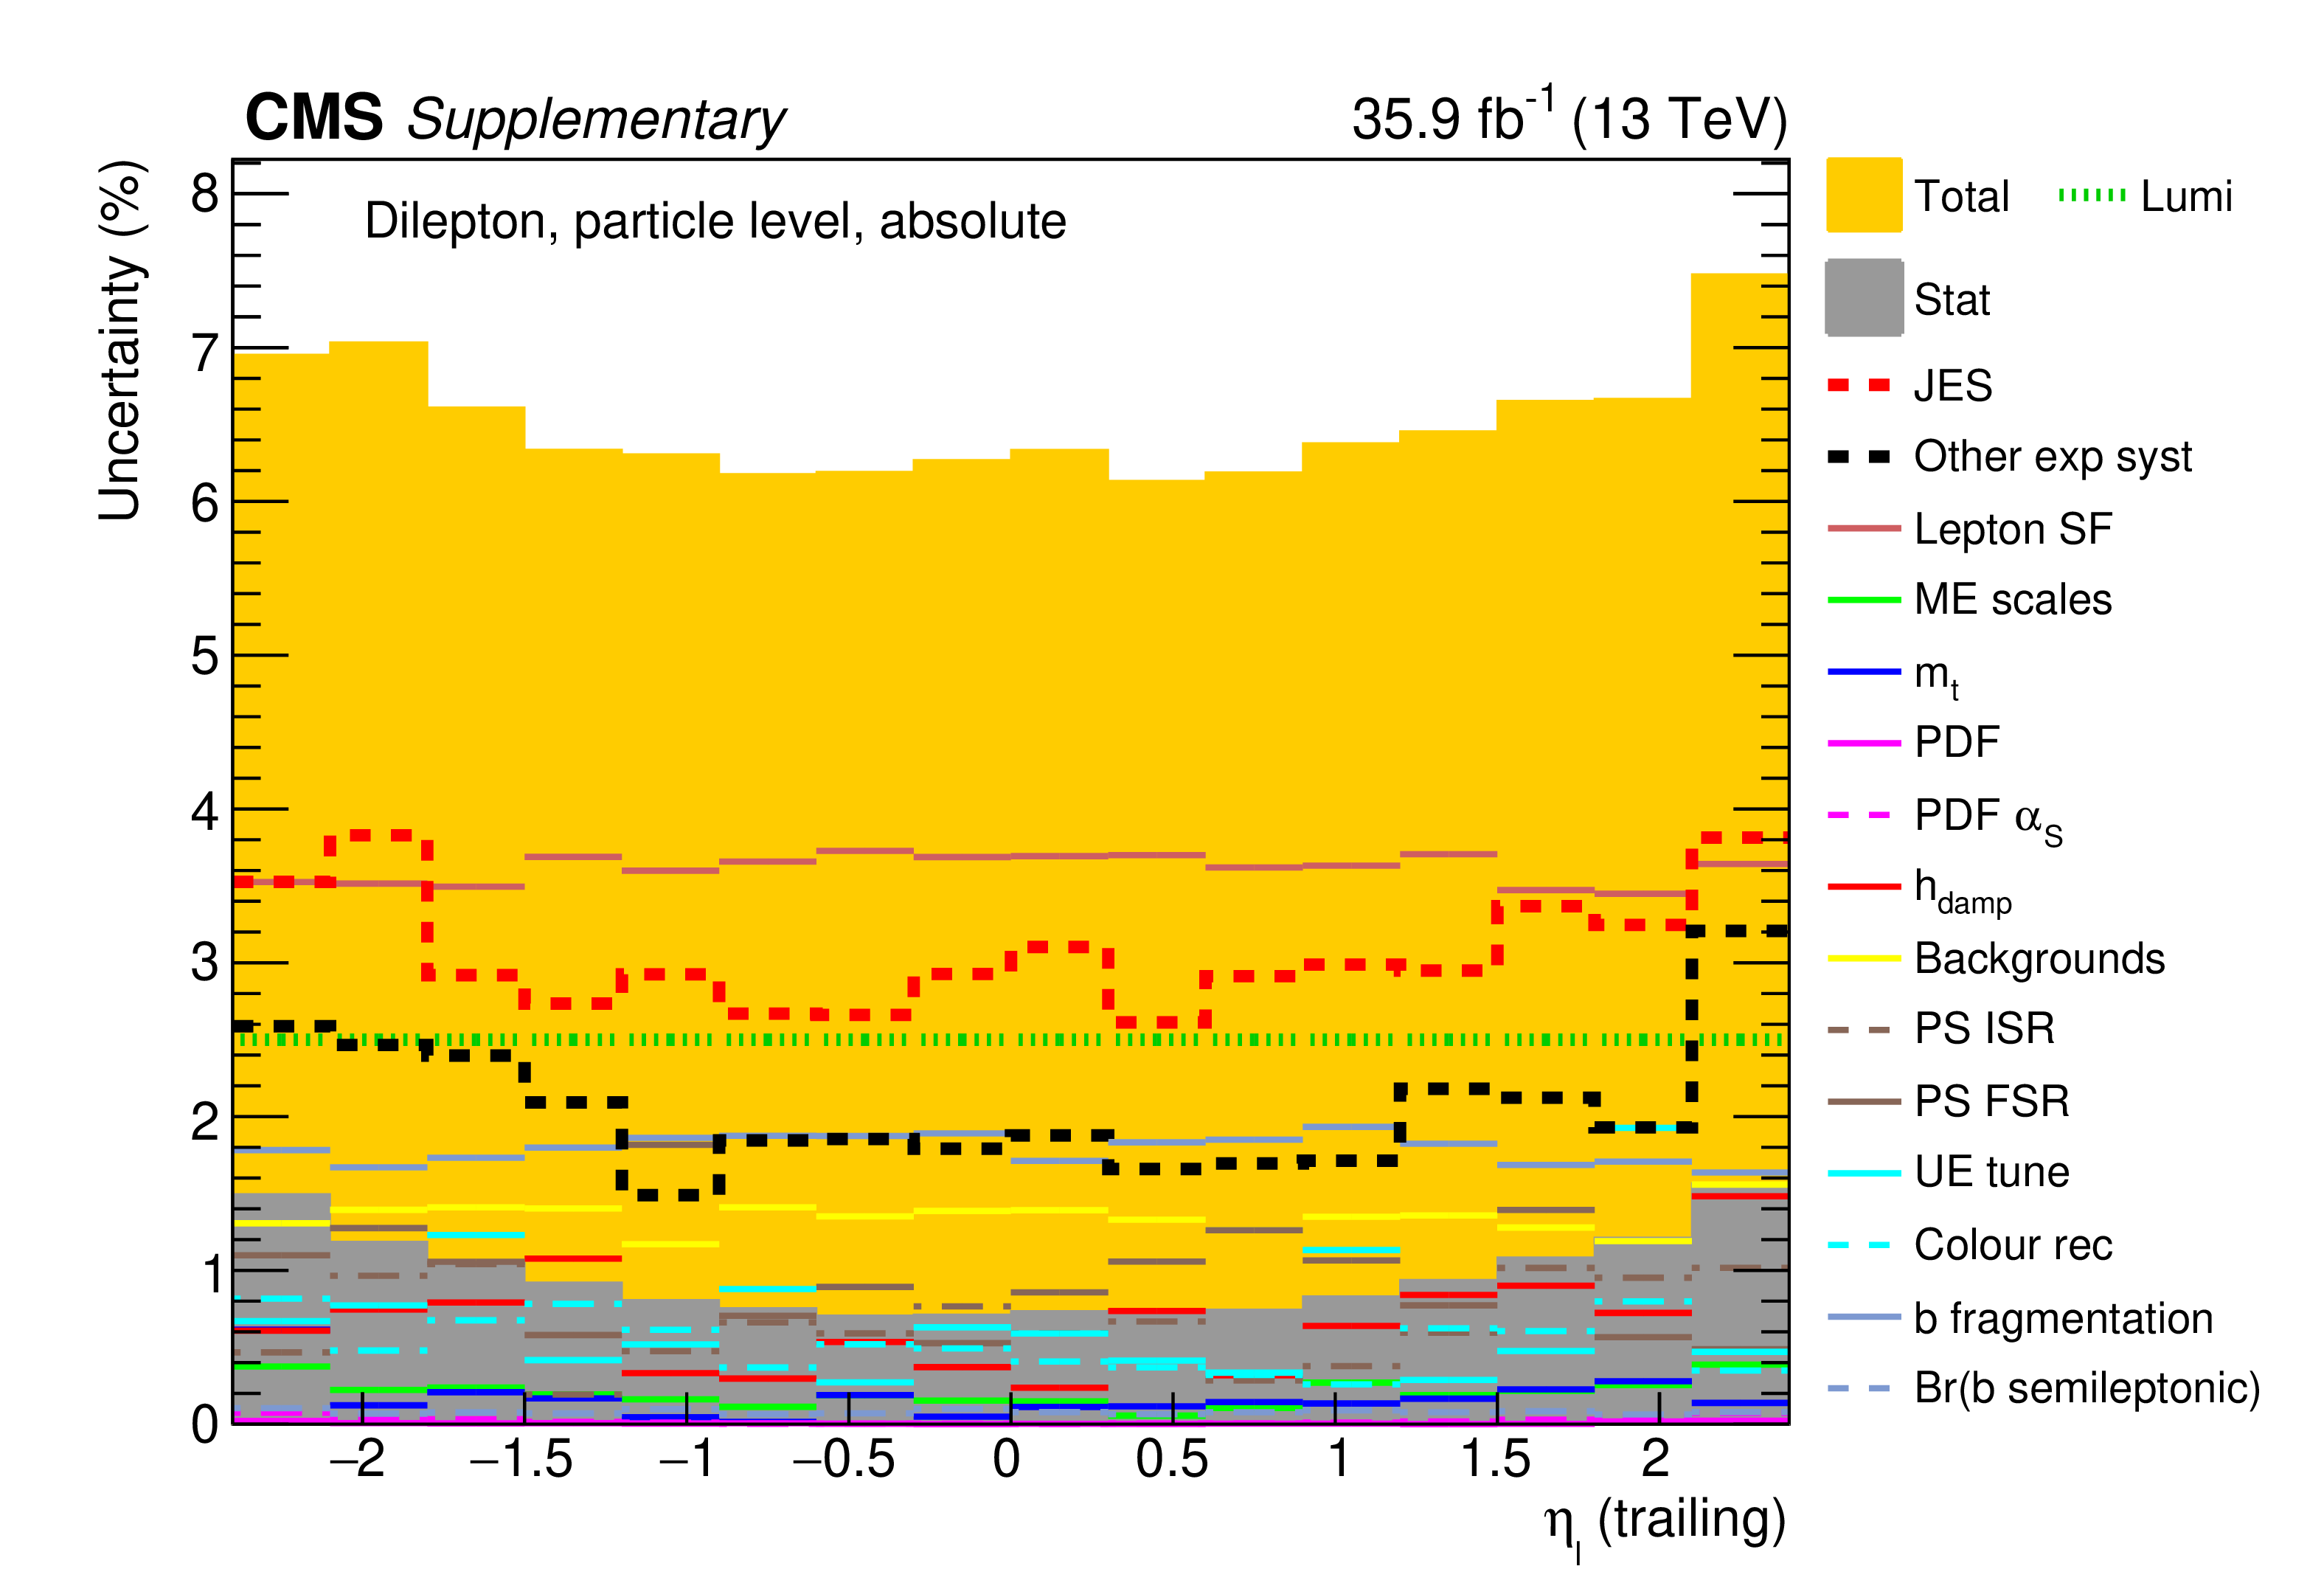
png pdf |
Additional Figure 141:
The breakdown of uncertainties for the absolute measurement of the differential $\mathrm{t\bar{t}}$ cross section as a function of $\eta _{{\ell}}$ (trailing) at particle level is shown. The contributions of each source of systematic uncertainty in each bin are indicated by the coloured lines. Experimental systematic uncertainties that are small in all bins are added in quadrature and shown as a single component. The statistical and total uncertainties are indicated by the shaded areas. |
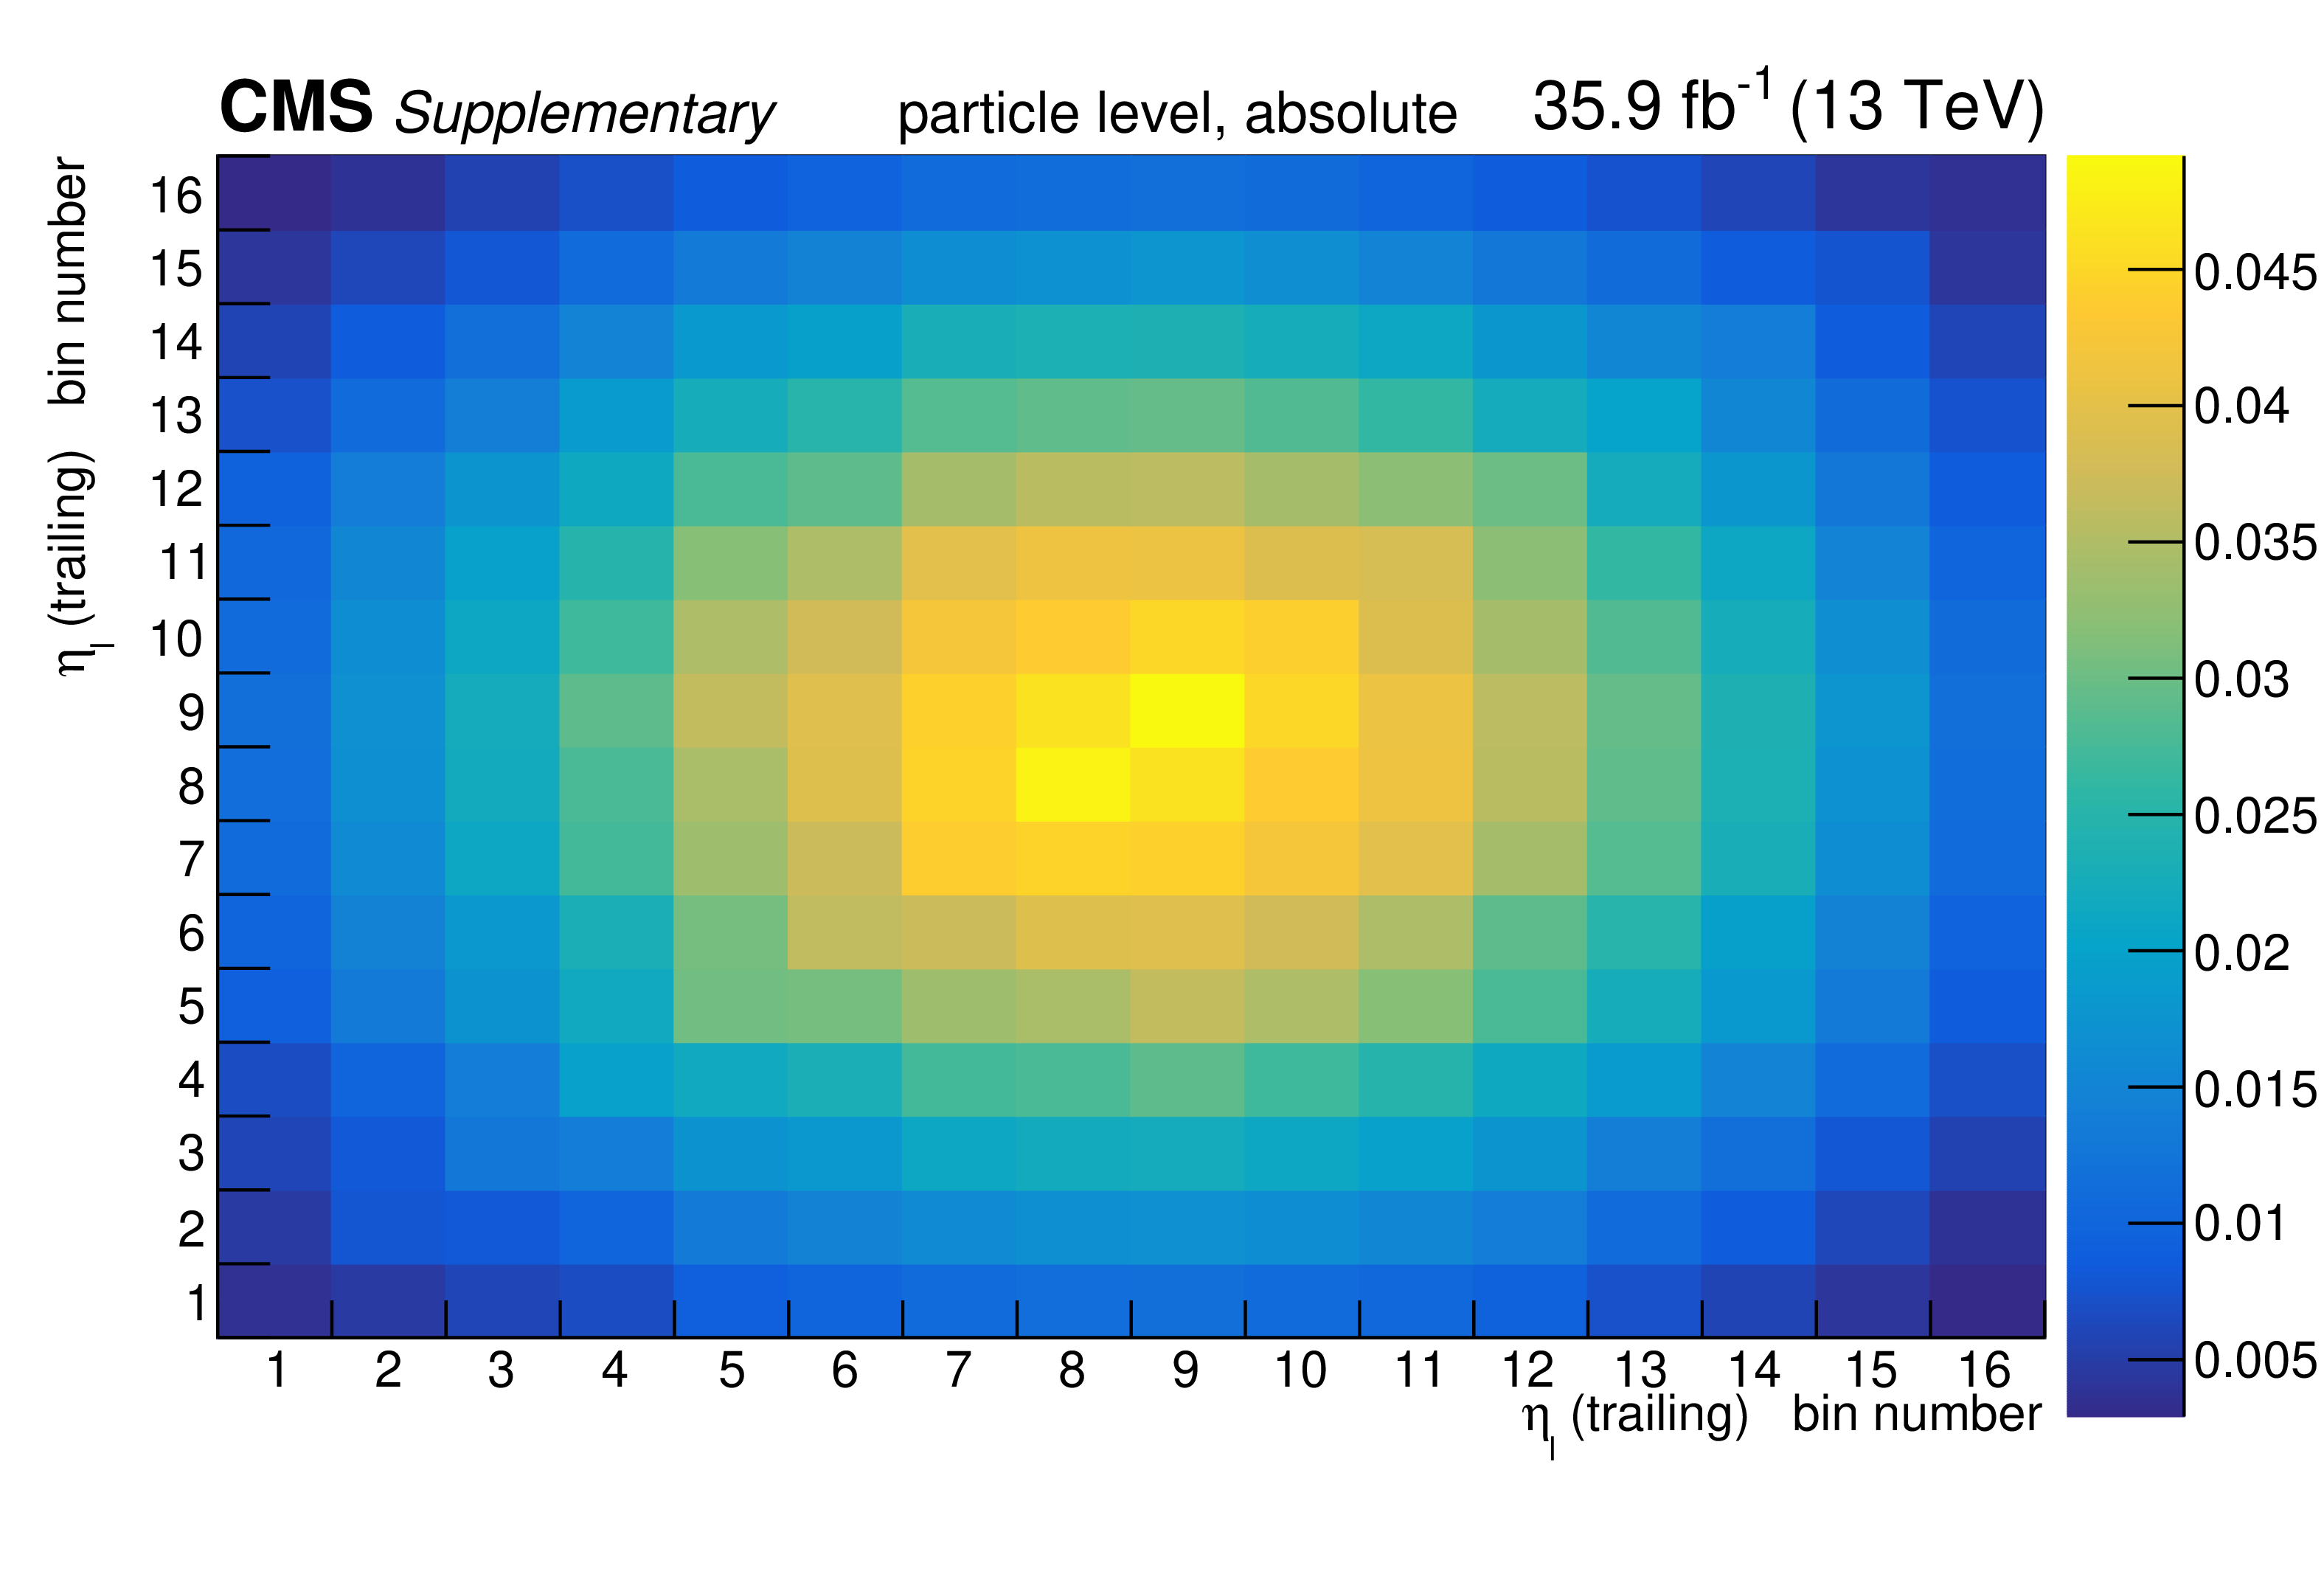
png pdf |
Additional Figure 142:
The covariance matrix of the measured data for the absolute measurement of the differential $\mathrm{t\bar{t}}$ cross section as a function of $\eta _{{\ell}}$ (trailing) at particle level is shown. |

png pdf |
Additional Figure 143:
The breakdown of uncertainties for the normalised measurement of the differential $\mathrm{t\bar{t}}$ cross section as a function of $\eta _{{\ell}}$ (trailing) at particle level is shown. The contributions of each source of systematic uncertainty in each bin are indicated by the coloured lines. Experimental systematic uncertainties that are small in all bins are added in quadrature and shown as a single component. The statistical and total uncertainties are indicated by the shaded areas. |

png pdf |
Additional Figure 144:
The covariance matrix of the measured data for the normalised measurement of the differential $\mathrm{t\bar{t}}$ cross section as a function of $\eta _{{\ell}}$ (trailing) at particle level is shown. |
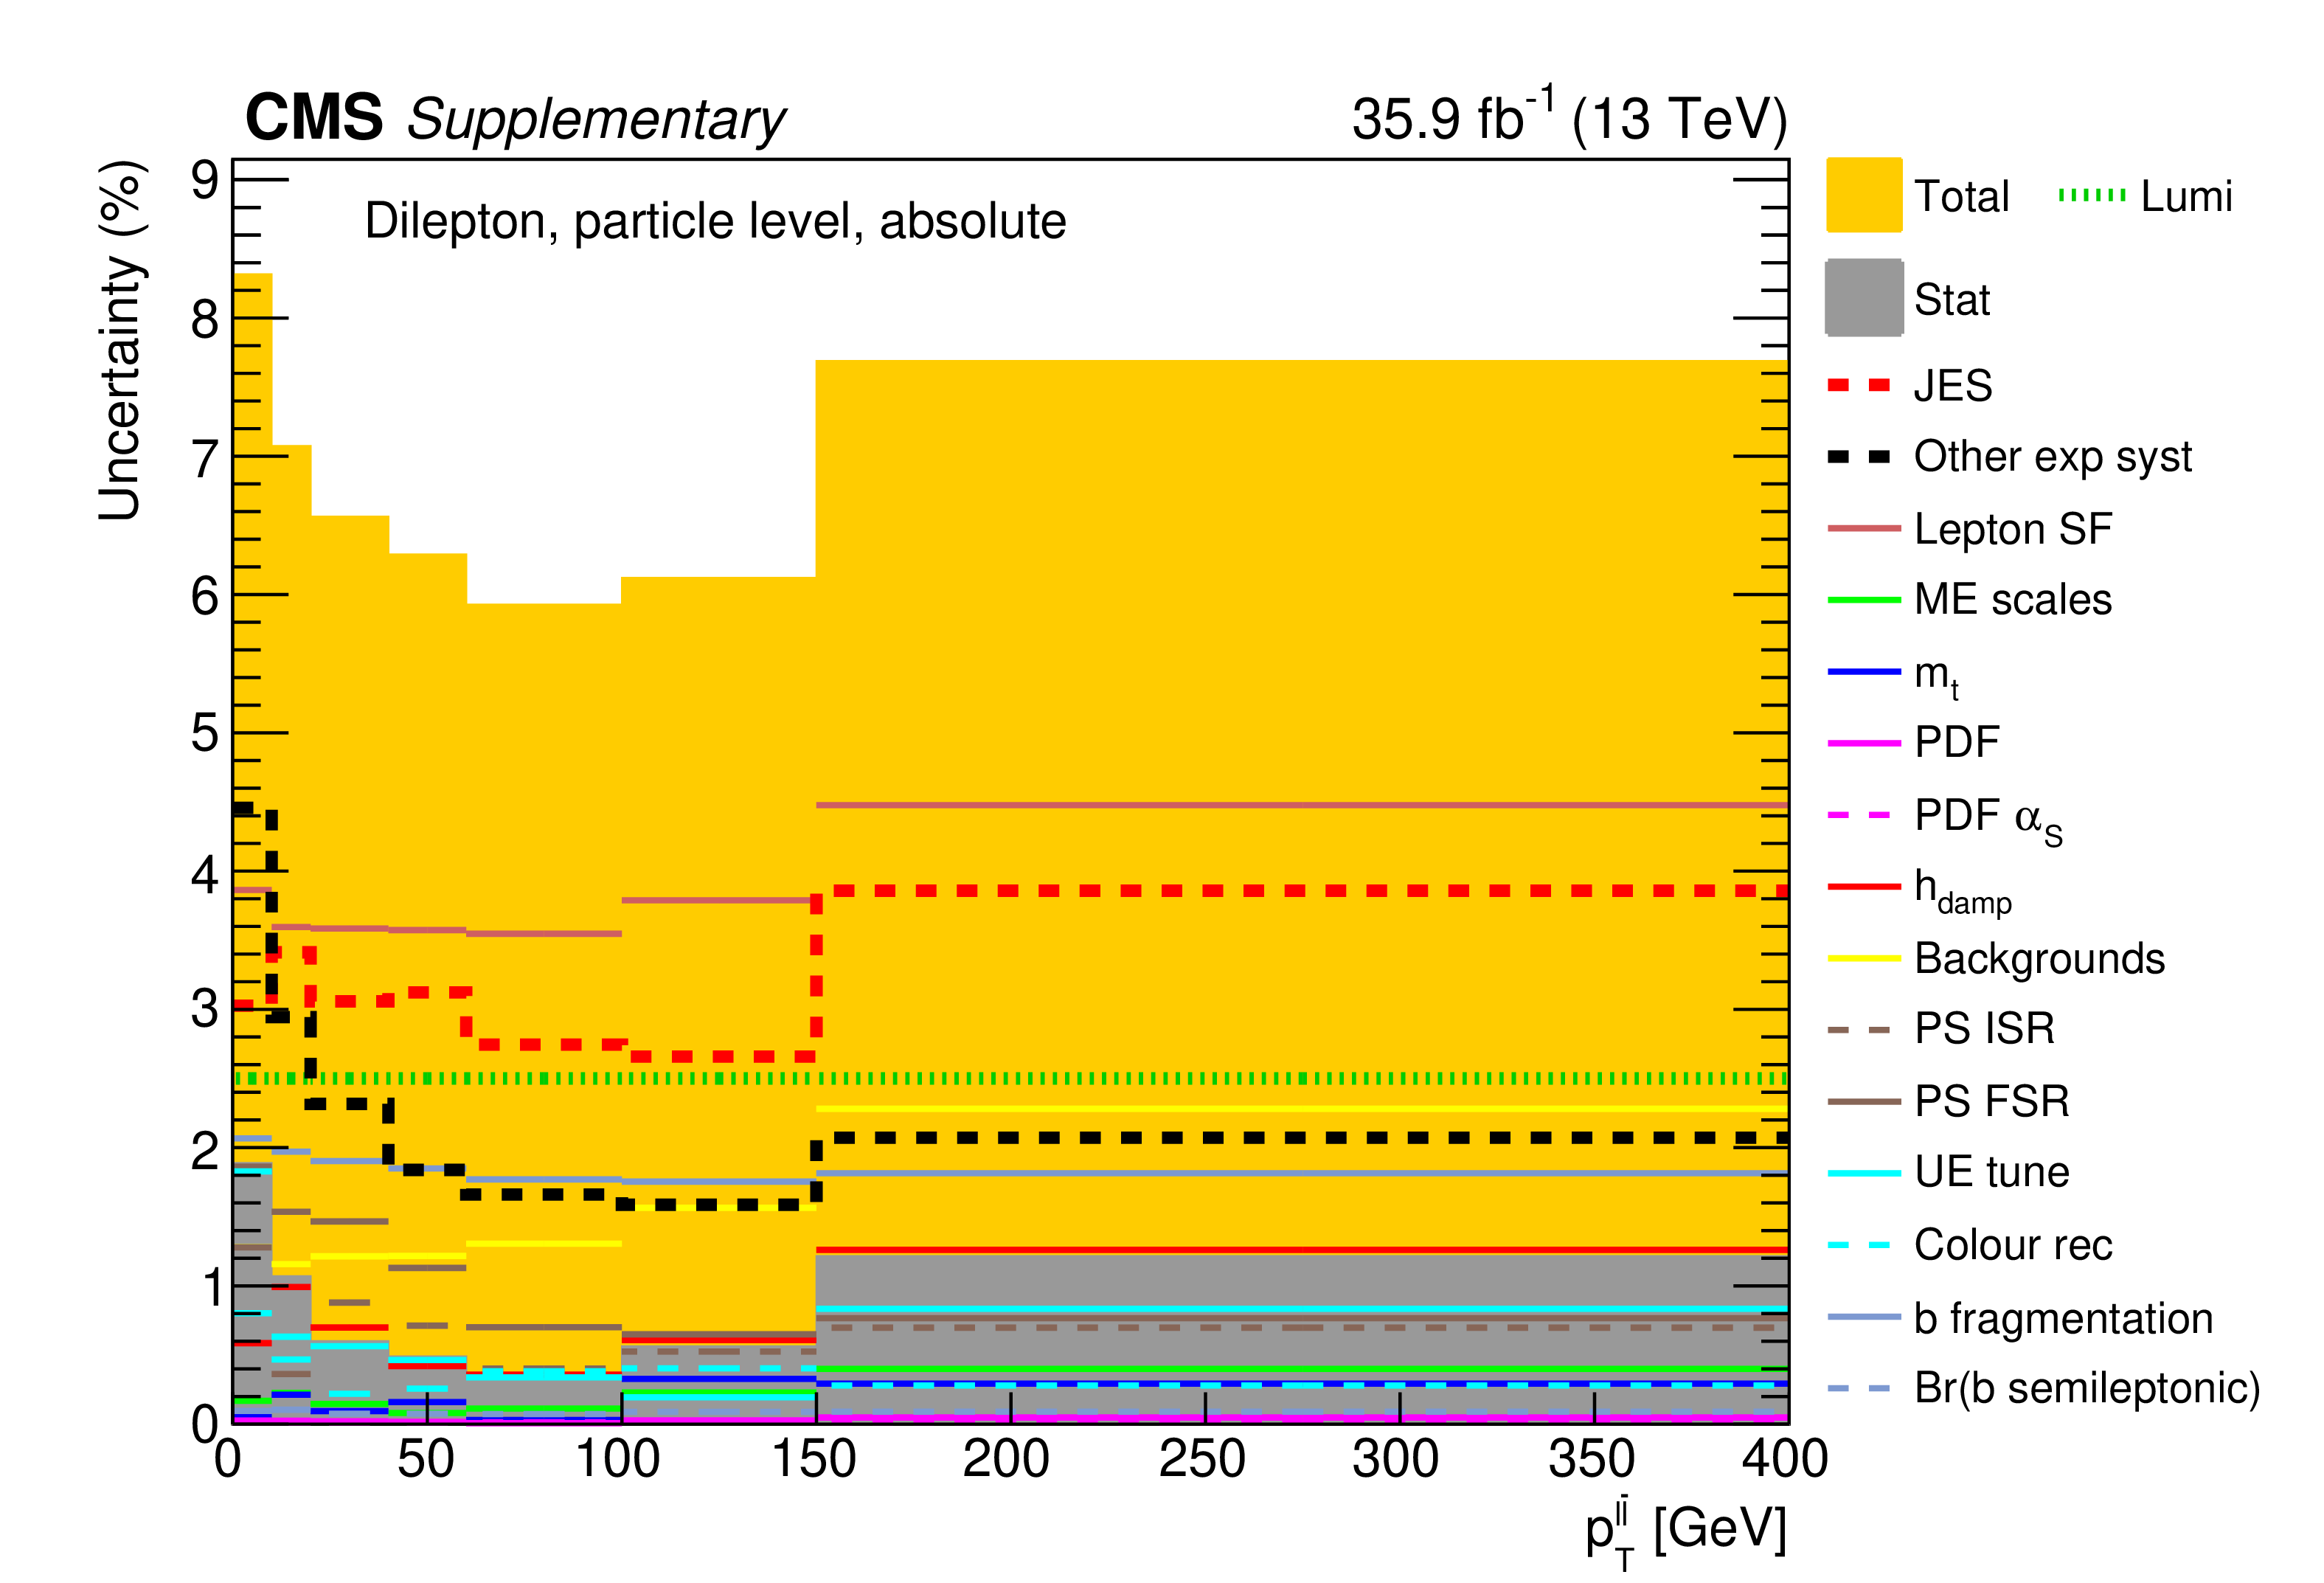
png pdf |
Additional Figure 145:
The breakdown of uncertainties for the absolute measurement of the differential $\mathrm{t\bar{t}}$ cross section as a function of $p_{\mathrm {T}}^{{\ell}\bar{{\ell}}}$ at particle level is shown. The contributions of each source of systematic uncertainty in each bin are indicated by the coloured lines. Experimental systematic uncertainties that are small in all bins are added in quadrature and shown as a single component. The statistical and total uncertainties are indicated by the shaded areas. |

png pdf |
Additional Figure 146:
The covariance matrix of the measured data for the absolute measurement of the differential $\mathrm{t\bar{t}}$ cross section as a function of $p_{\mathrm {T}}^{{\ell}\bar{{\ell}}}$ at particle level is shown. |
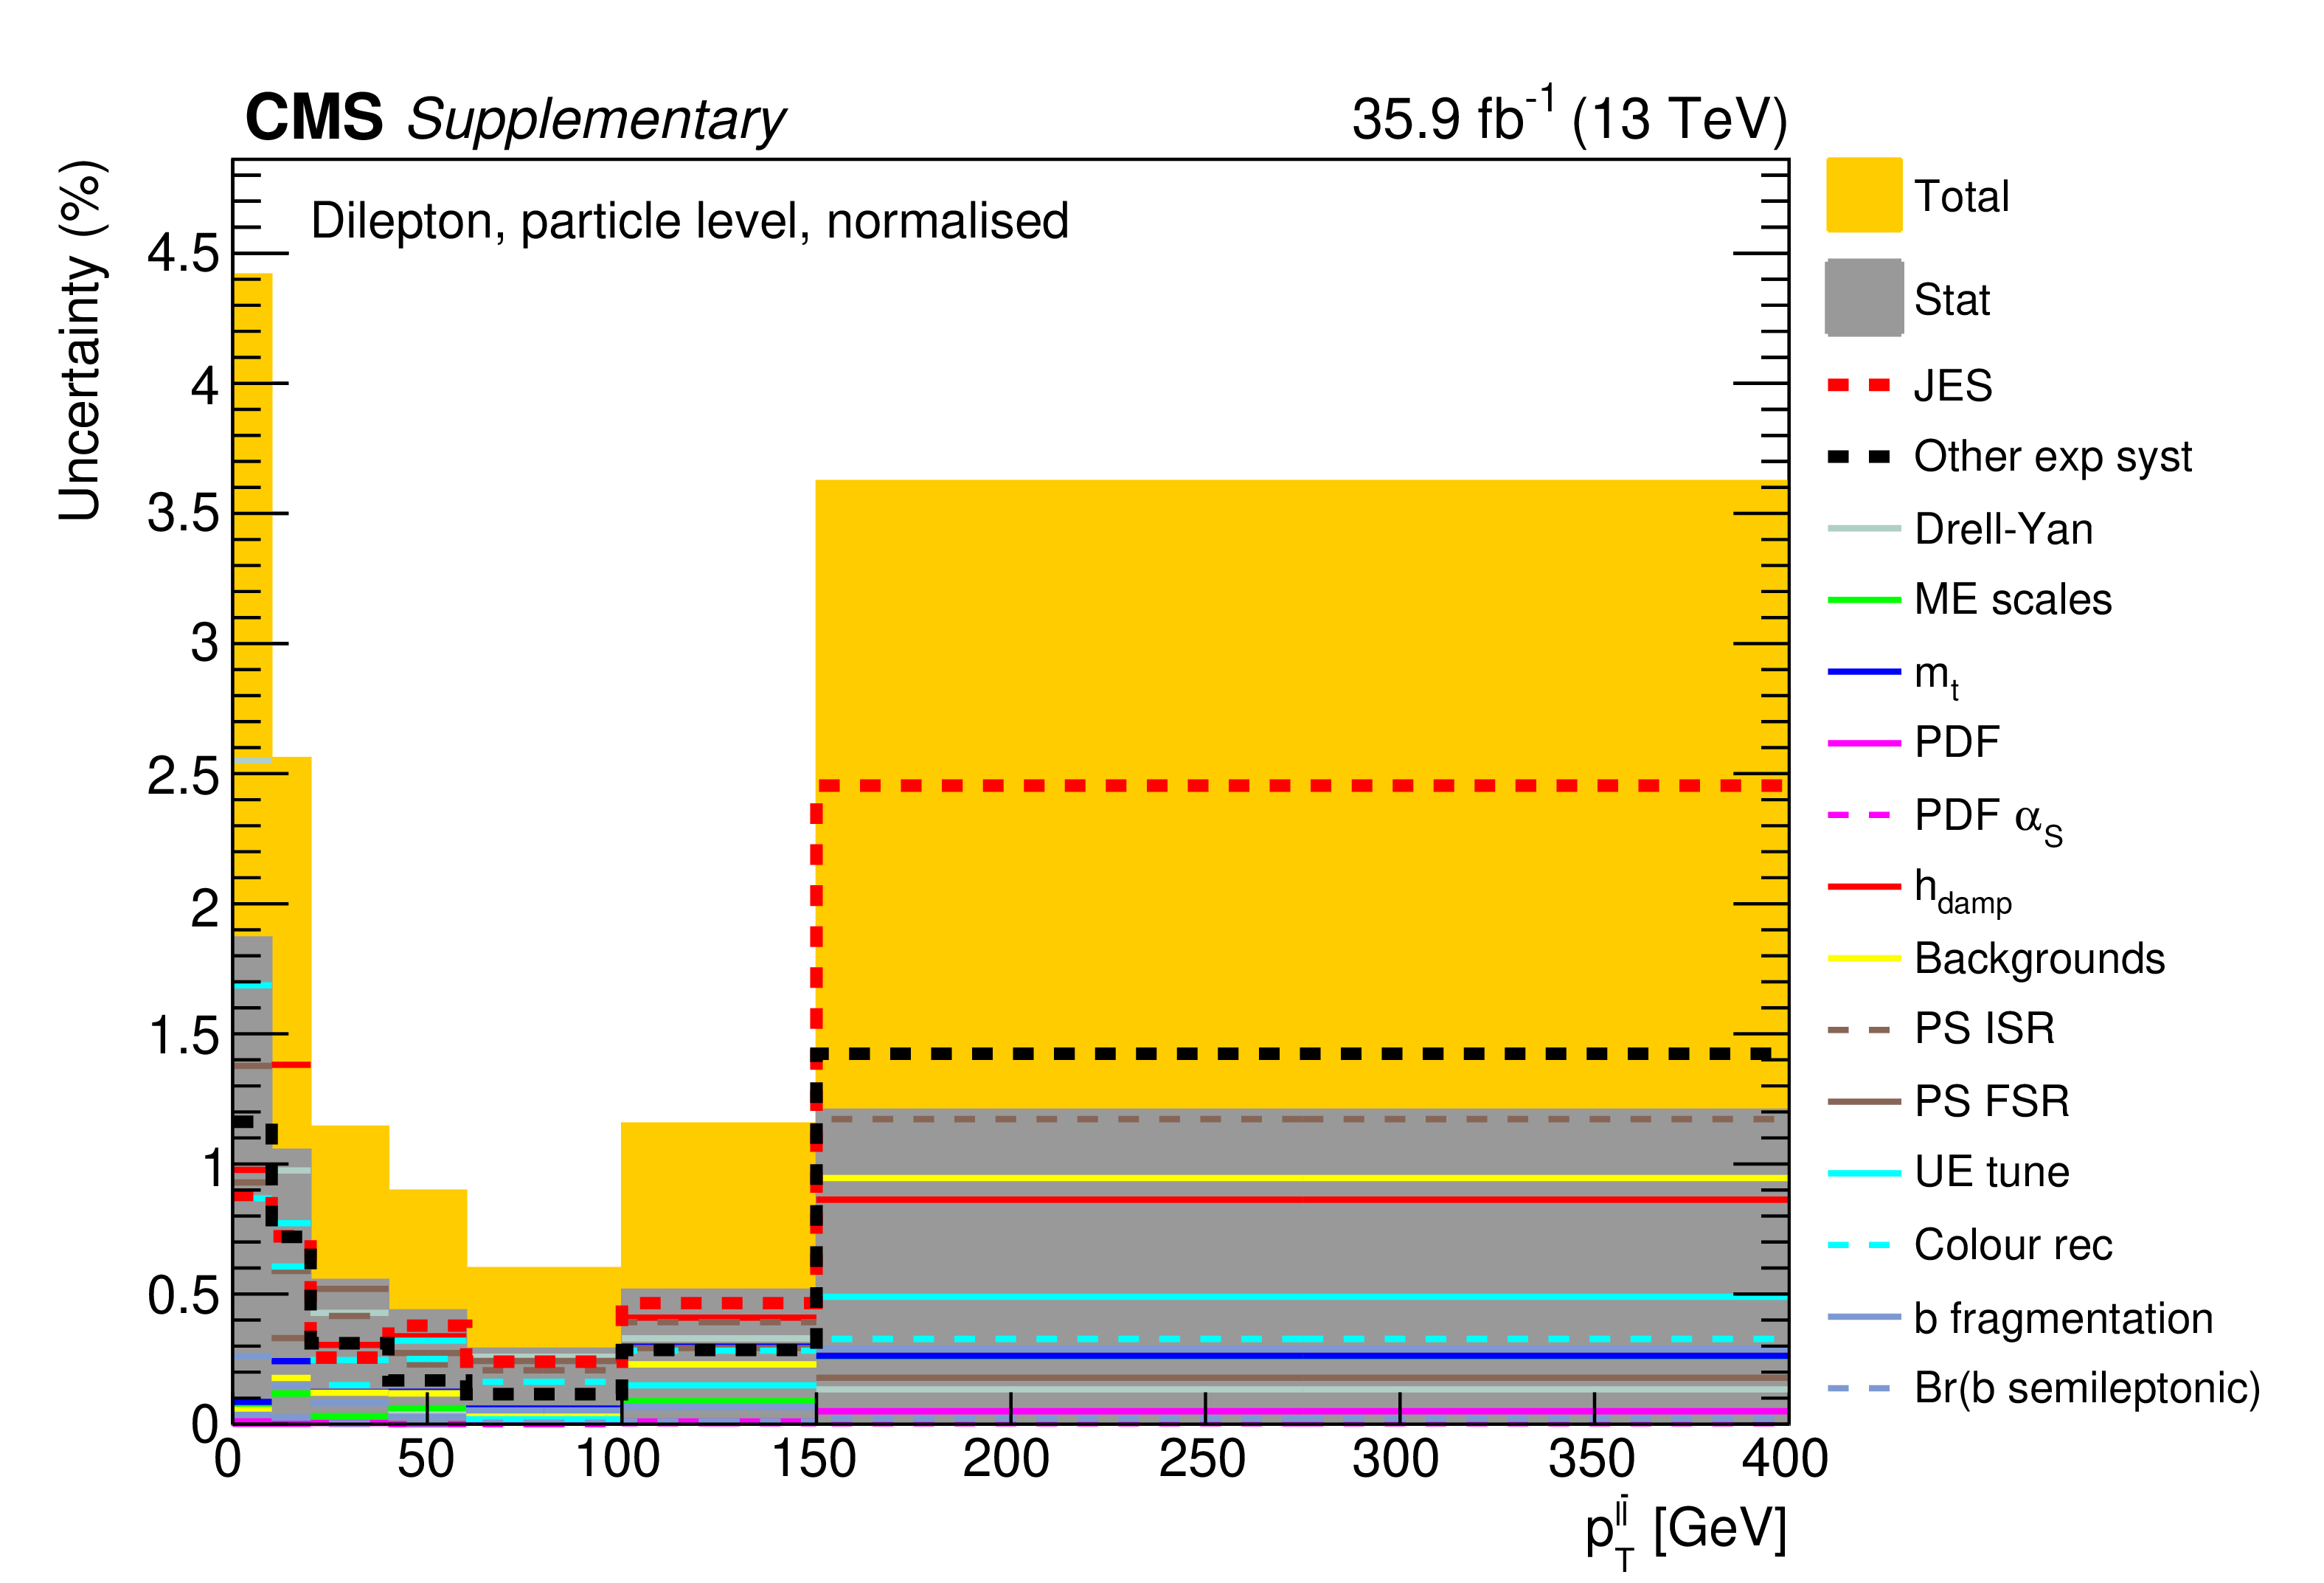
png pdf |
Additional Figure 147:
The breakdown of uncertainties for the normalised measurement of the differential $\mathrm{t\bar{t}}$ cross section as a function of $p_{\mathrm {T}}^{{\ell}\bar{{\ell}}}$ at particle level is shown. The contributions of each source of systematic uncertainty in each bin are indicated by the coloured lines. Experimental systematic uncertainties that are small in all bins are added in quadrature and shown as a single component. The statistical and total uncertainties are indicated by the shaded areas. |
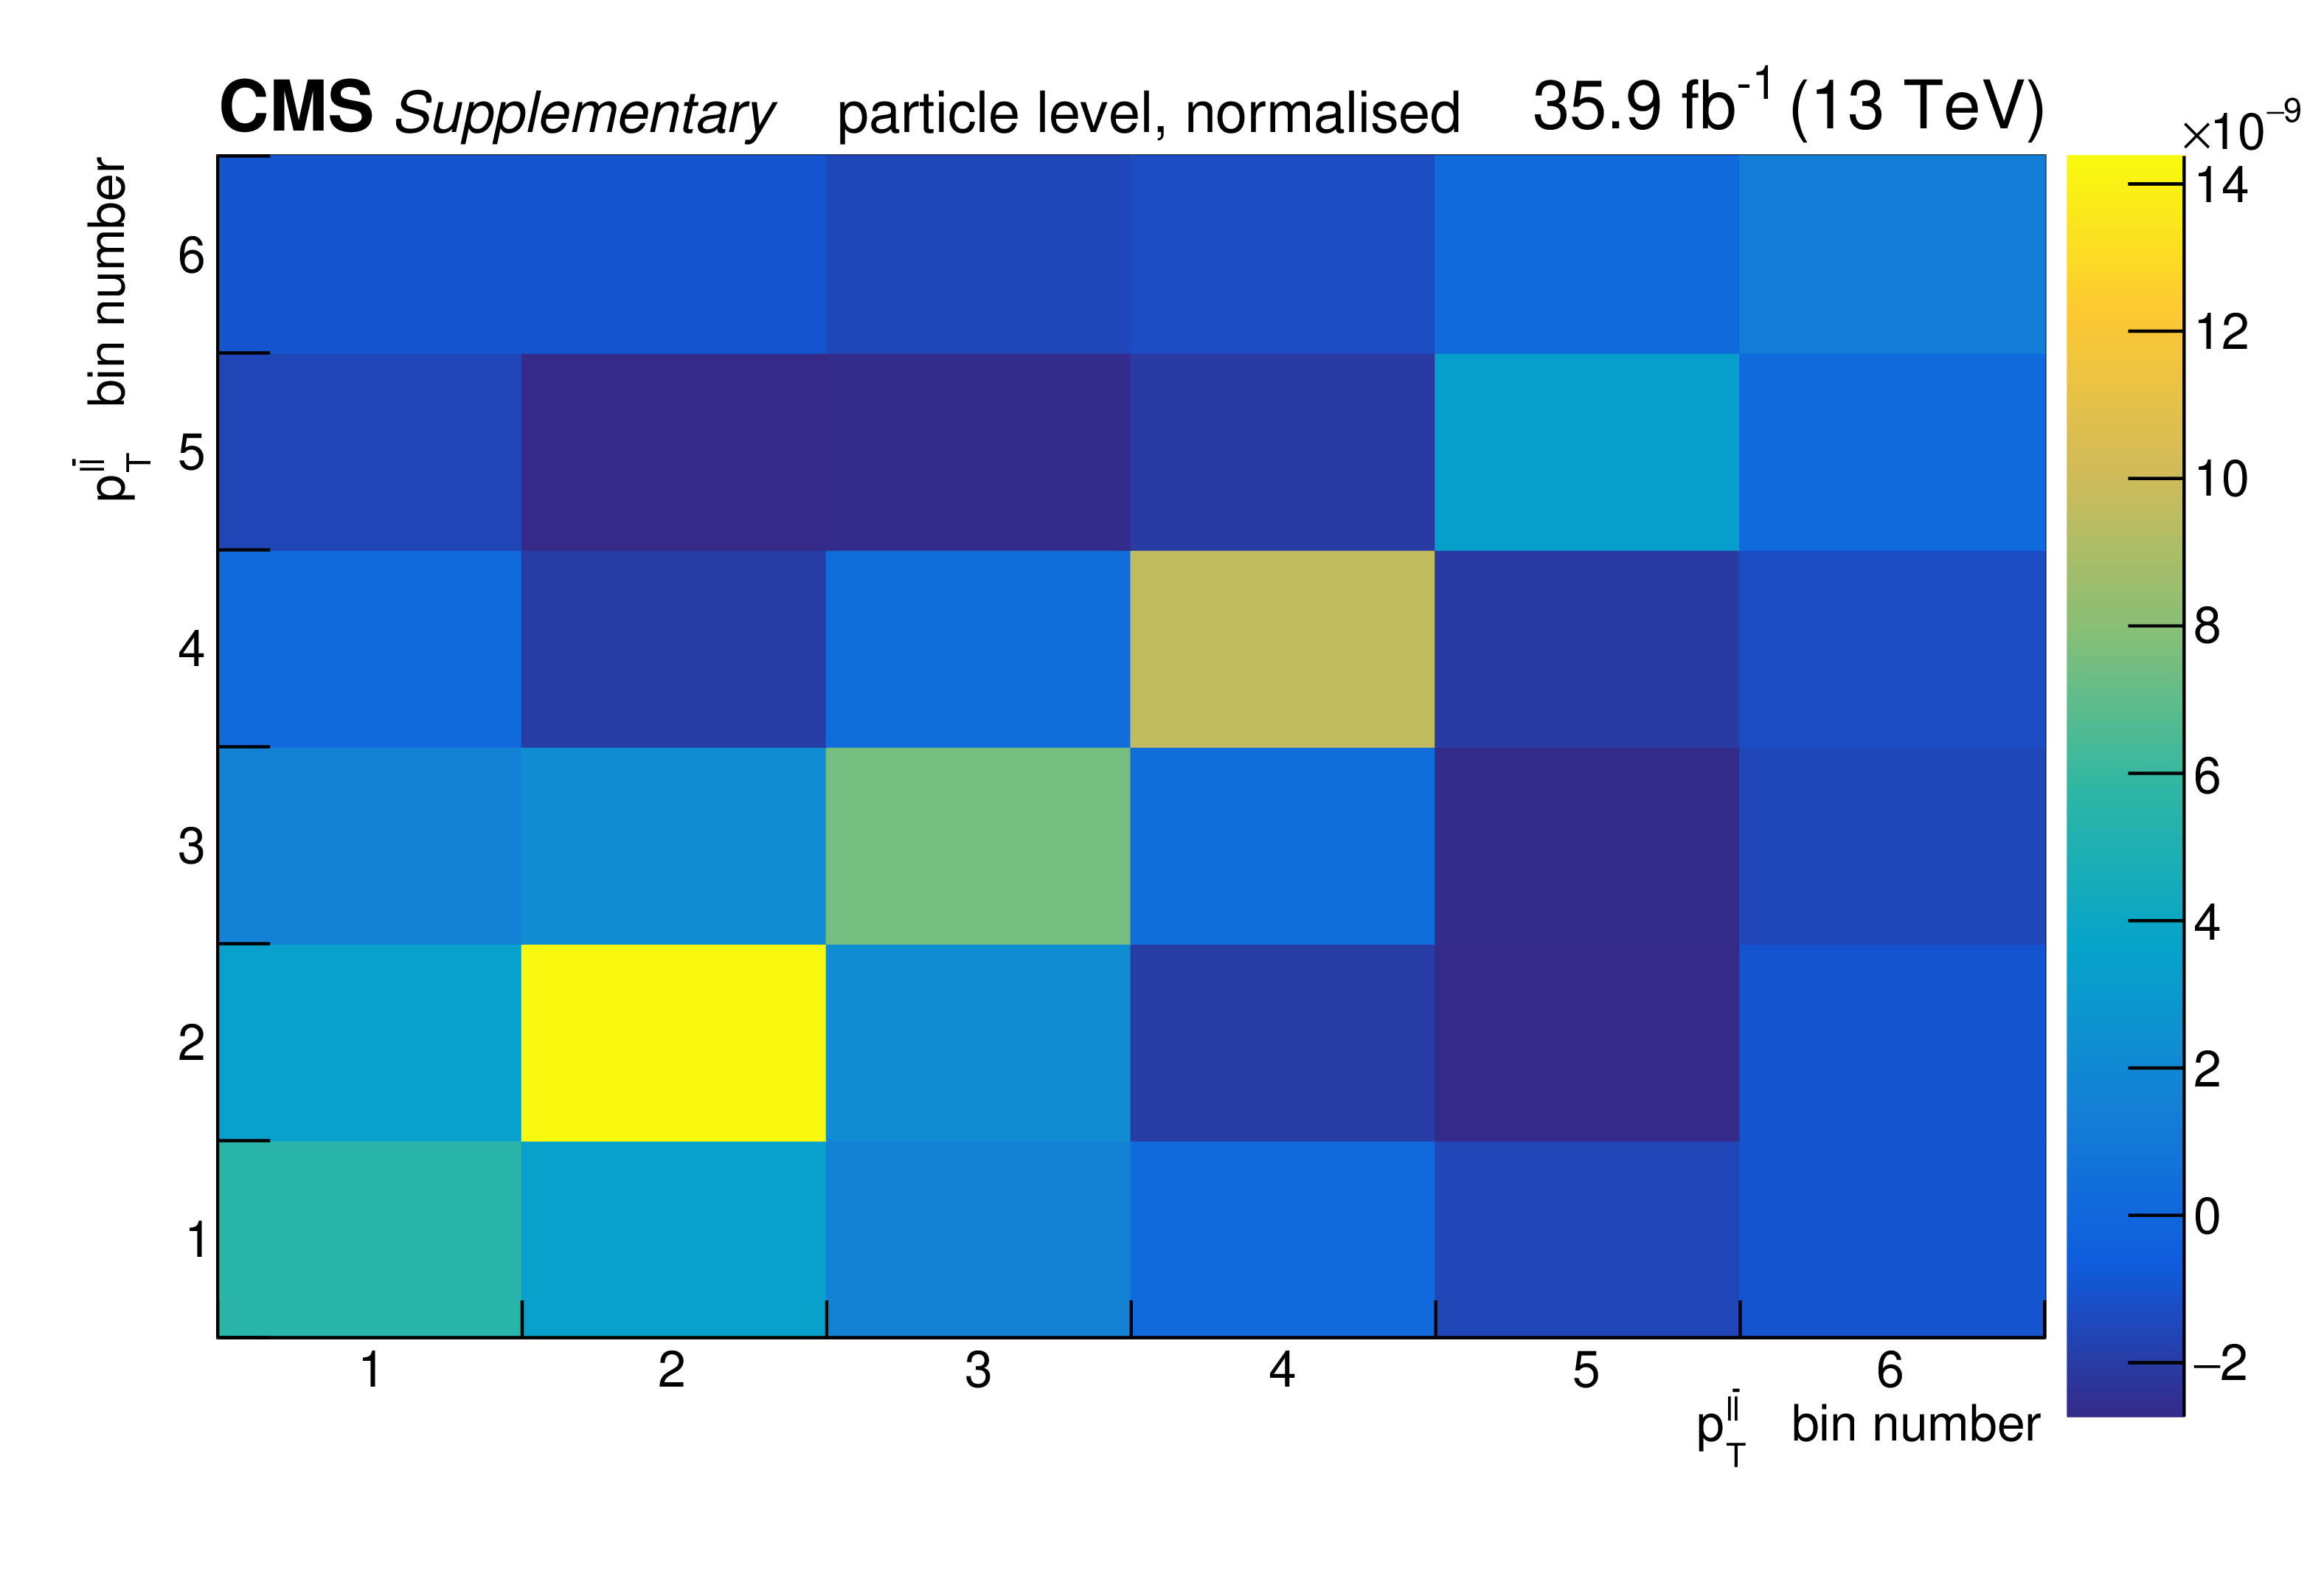
png pdf |
Additional Figure 148:
The covariance matrix of the measured data for the normalised measurement of the differential $\mathrm{t\bar{t}}$ cross section as a function of $p_{\mathrm {T}}^{{\ell}\bar{{\ell}}}$ at particle level is shown. |
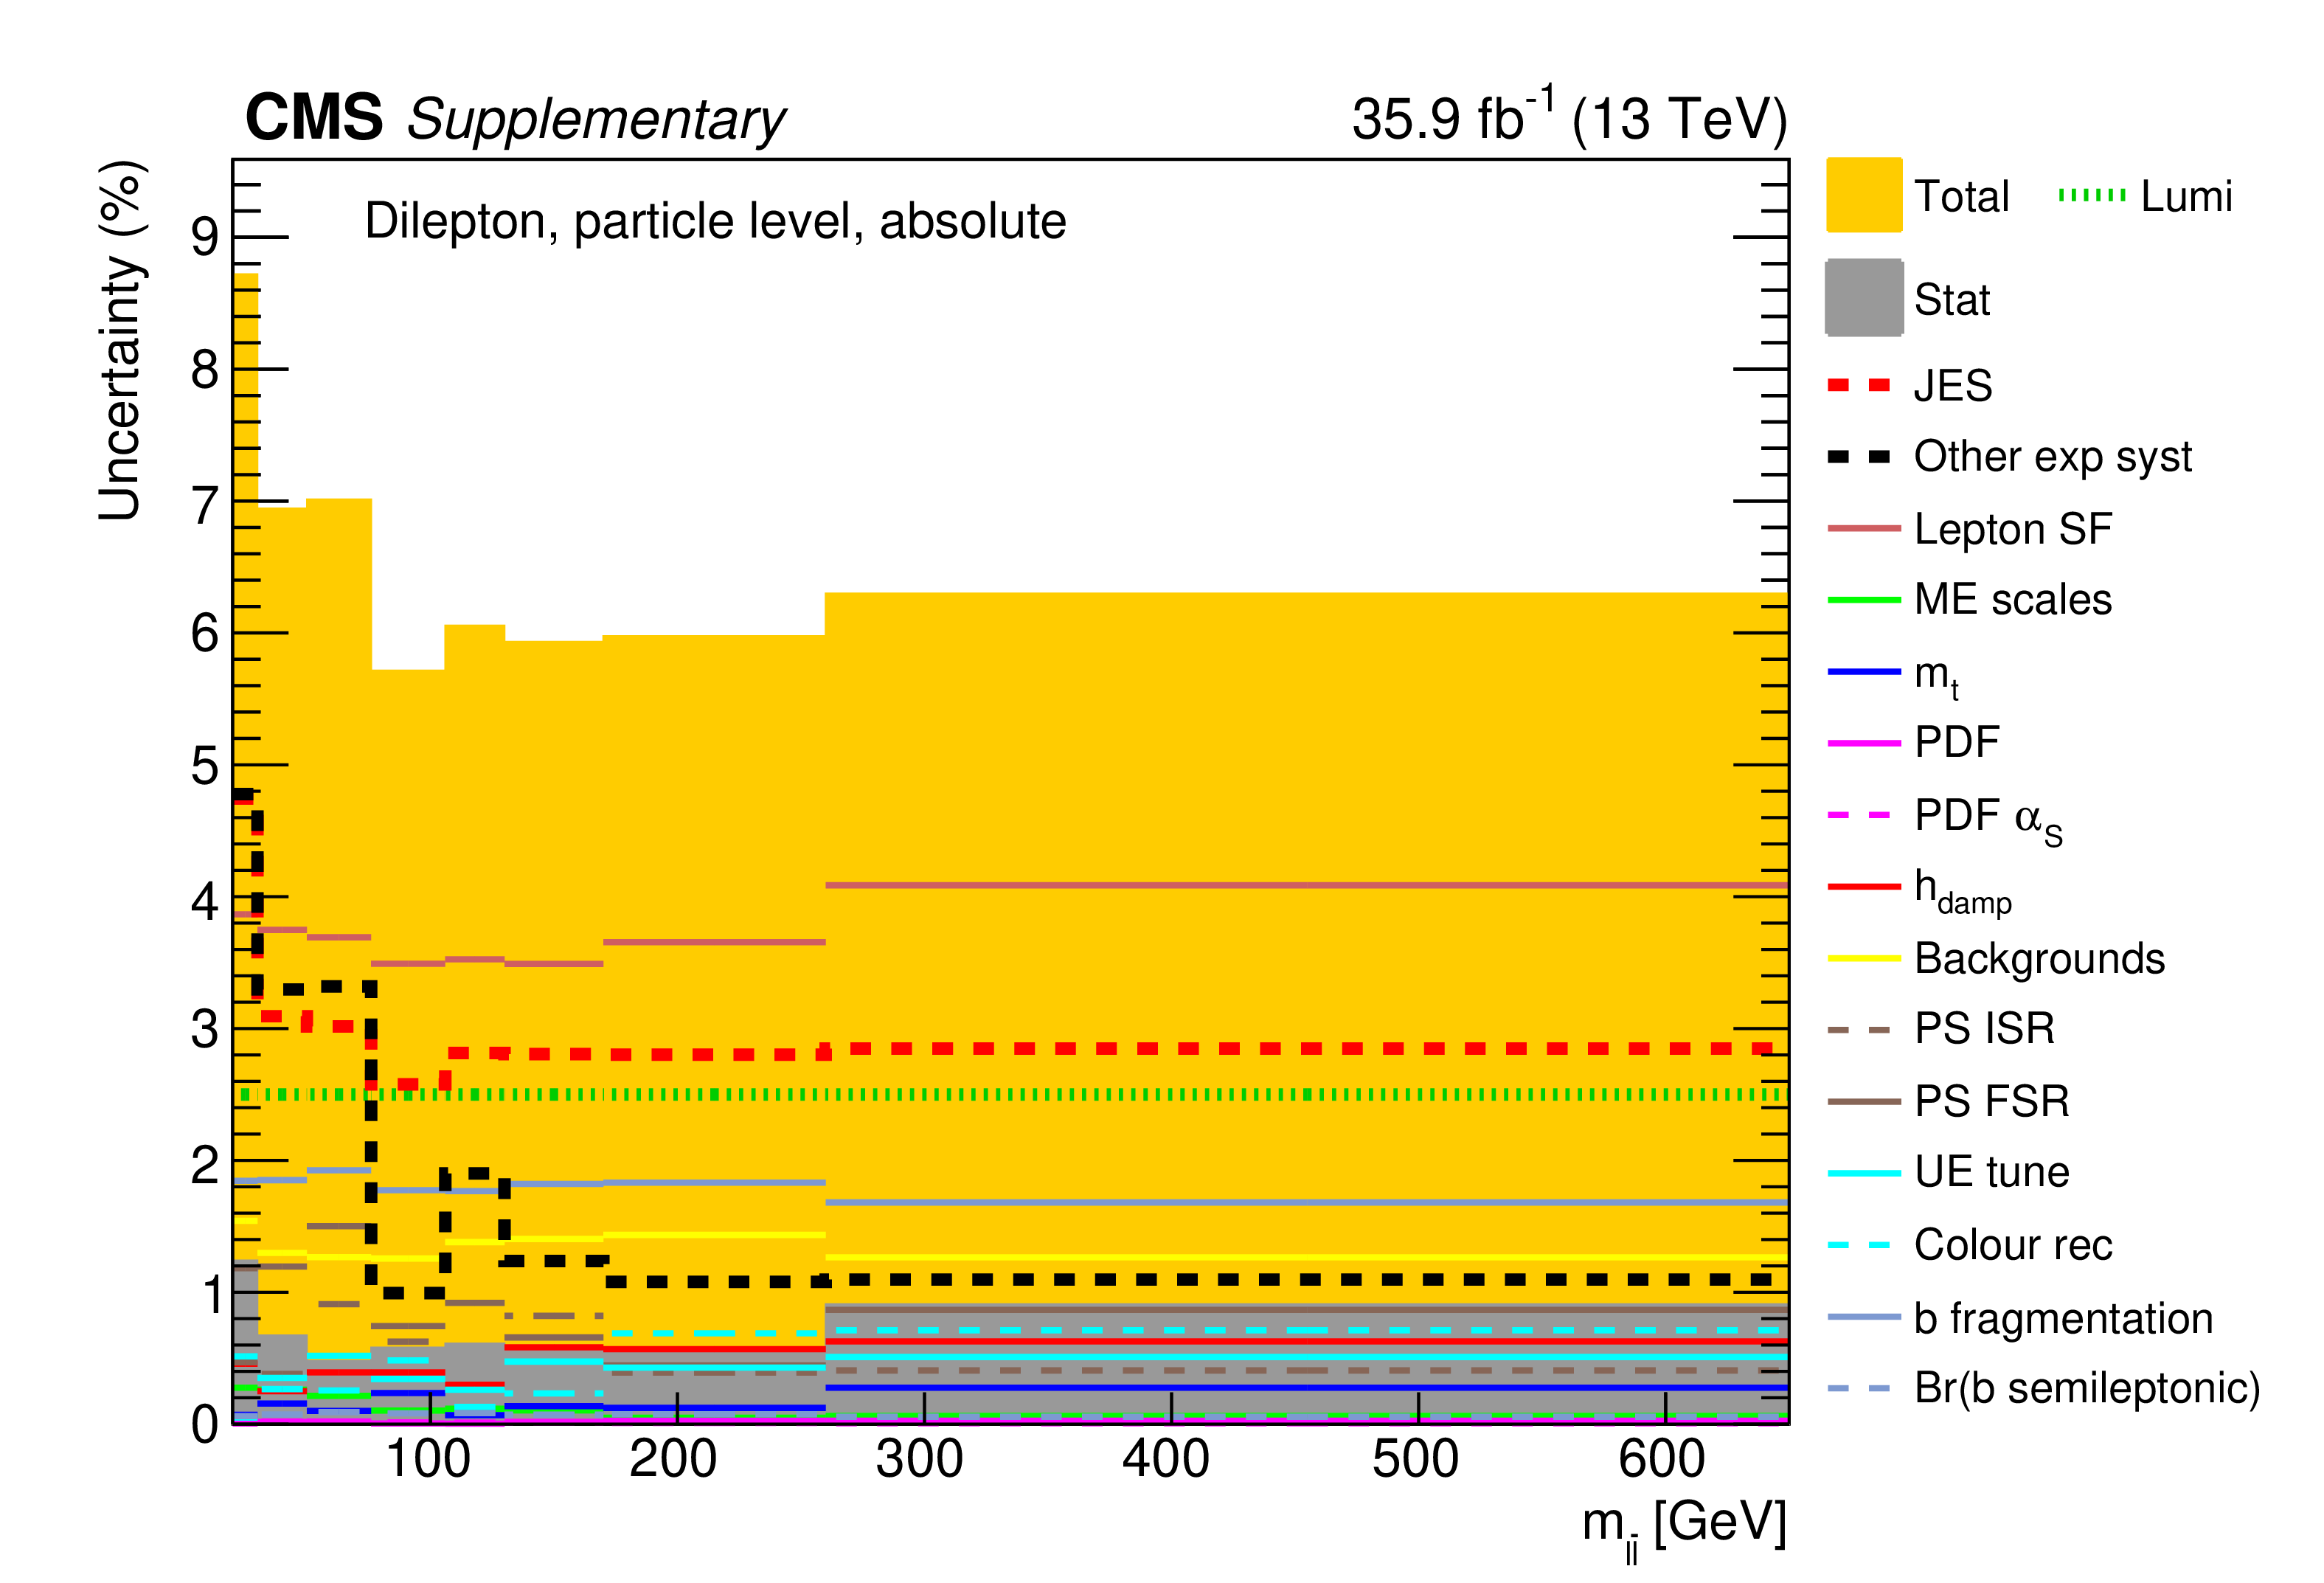
png pdf |
Additional Figure 149:
The breakdown of uncertainties for the absolute measurement of the differential $\mathrm{t\bar{t}}$ cross section as a function of $m_{{\ell}\bar{{\ell}}}$ at particle level is shown. The contributions of each source of systematic uncertainty in each bin are indicated by the coloured lines. Experimental systematic uncertainties that are small in all bins are added in quadrature and shown as a single component. The statistical and total uncertainties are indicated by the shaded areas. |
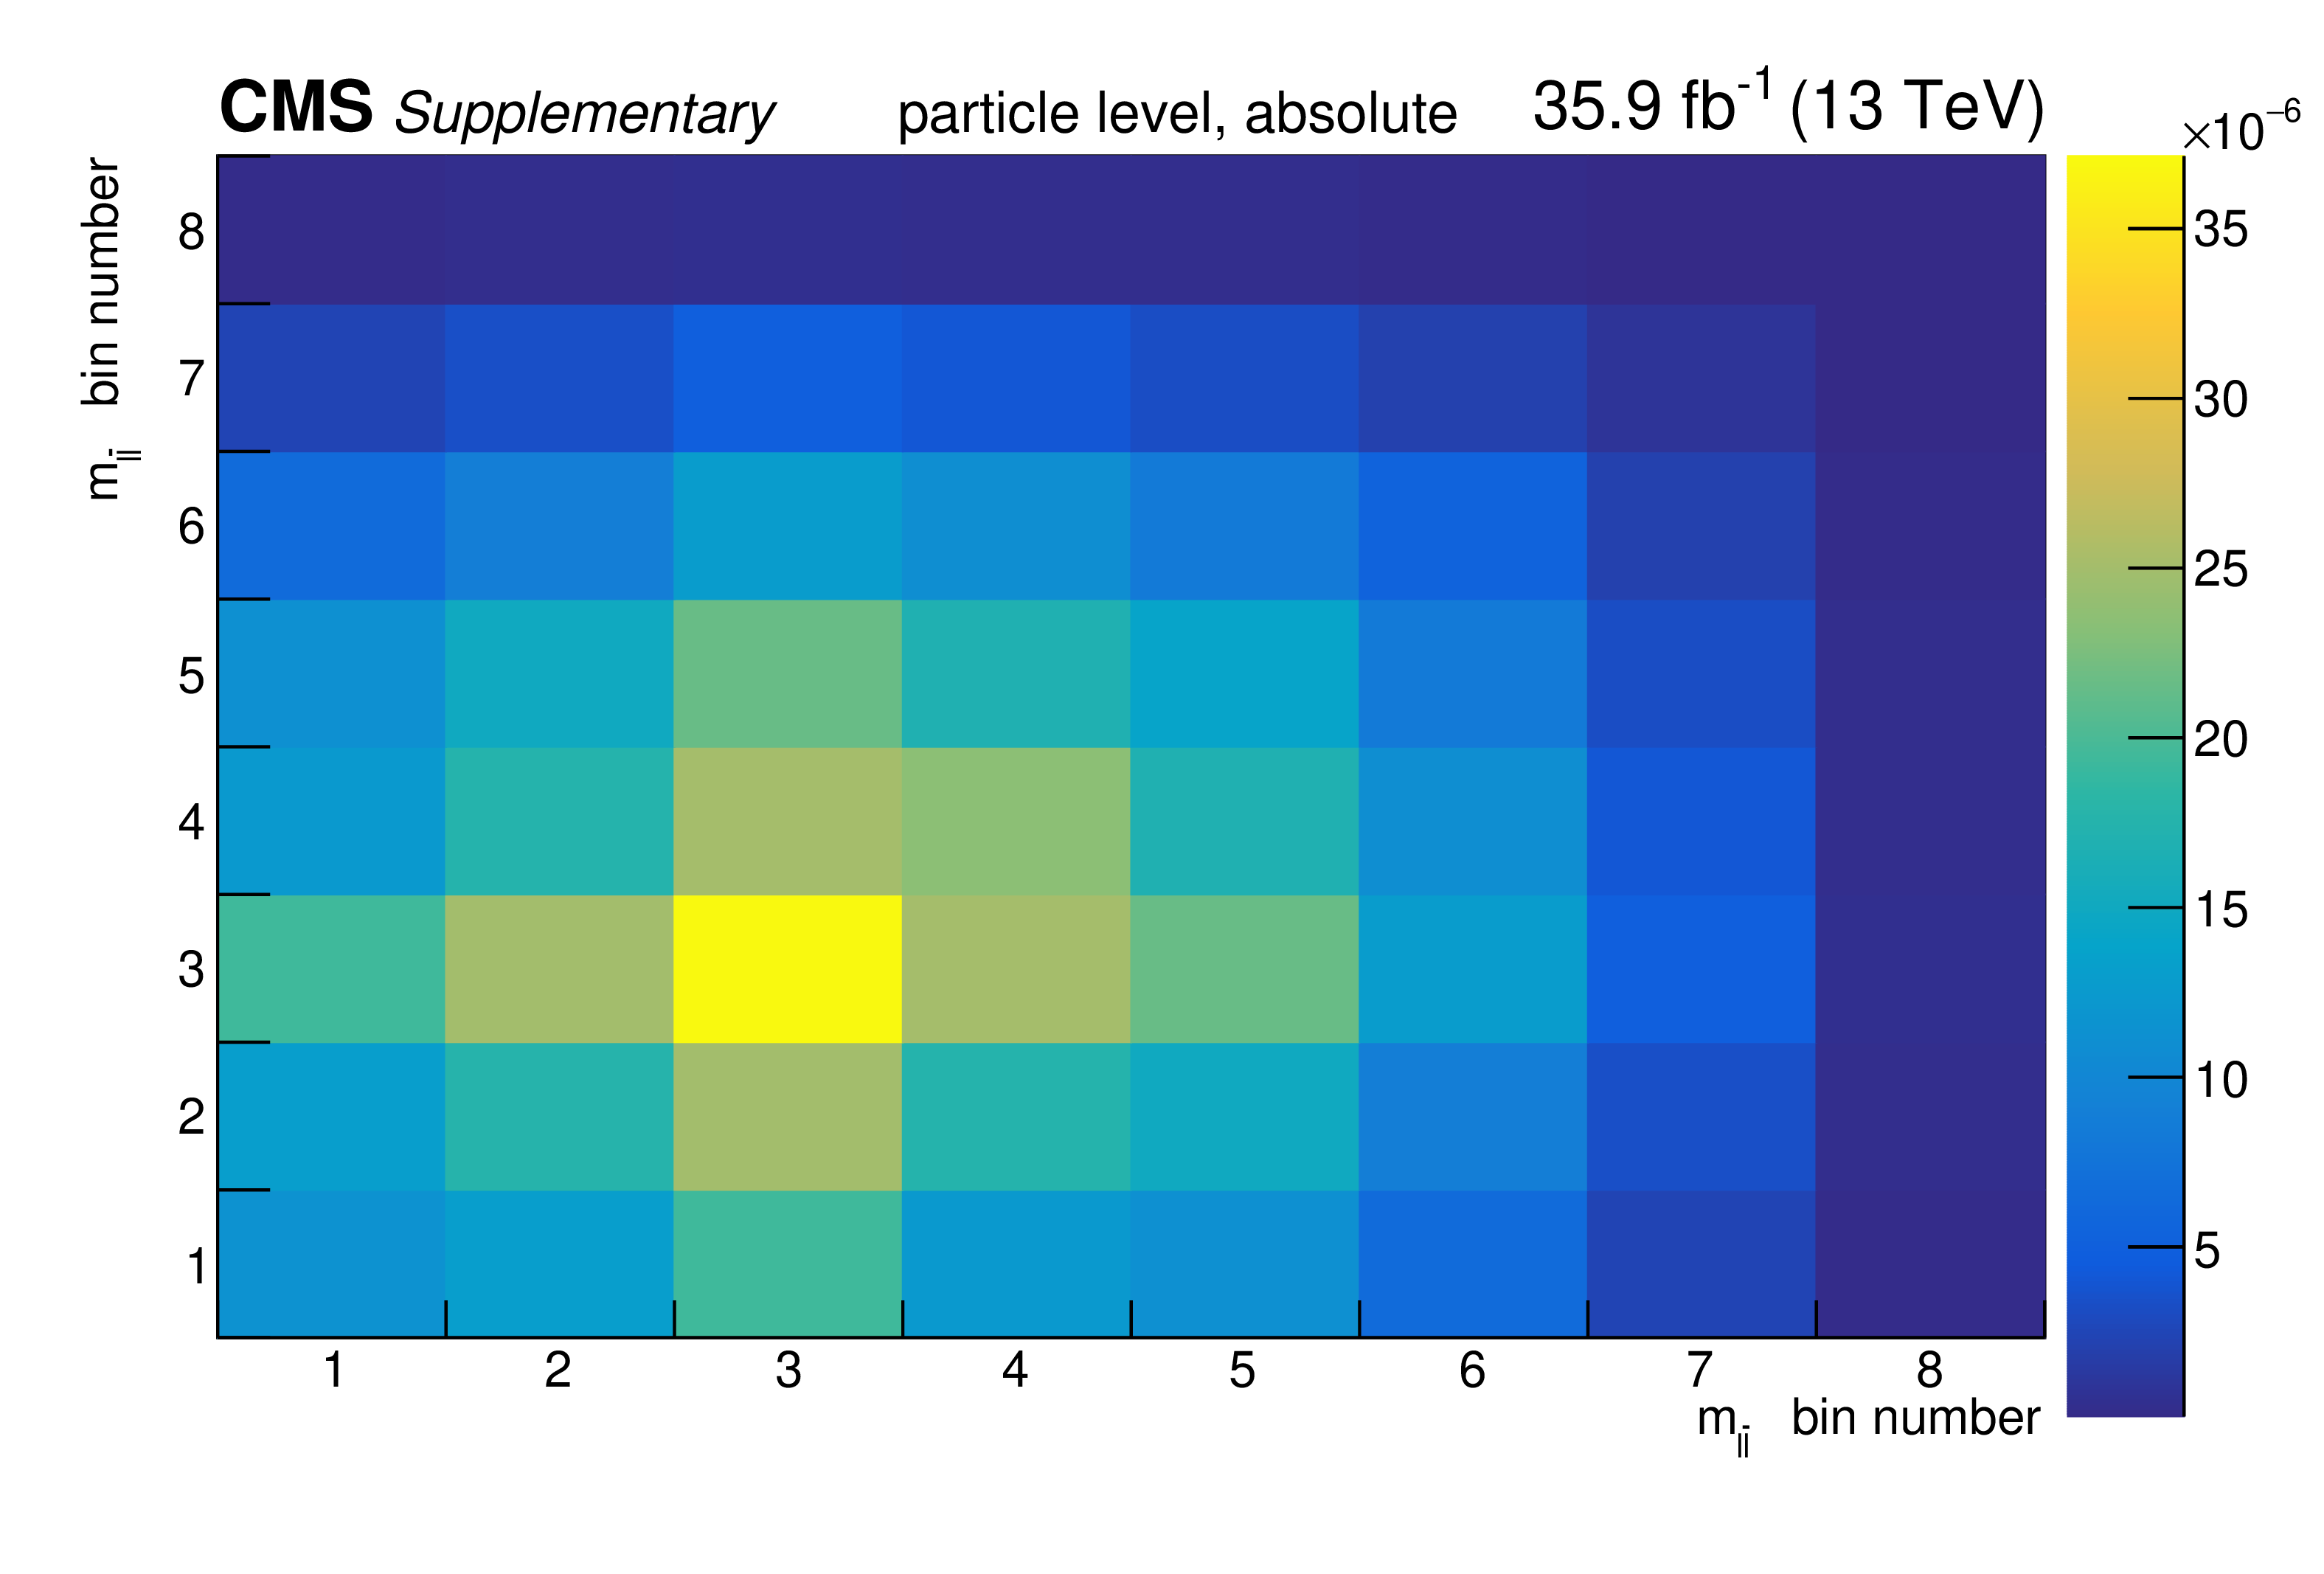
png pdf |
Additional Figure 150:
The covariance matrix of the measured data for the absolute measurement of the differential $\mathrm{t\bar{t}}$ cross section as a function of $m_{{\ell}\bar{{\ell}}}$ at particle level is shown. |
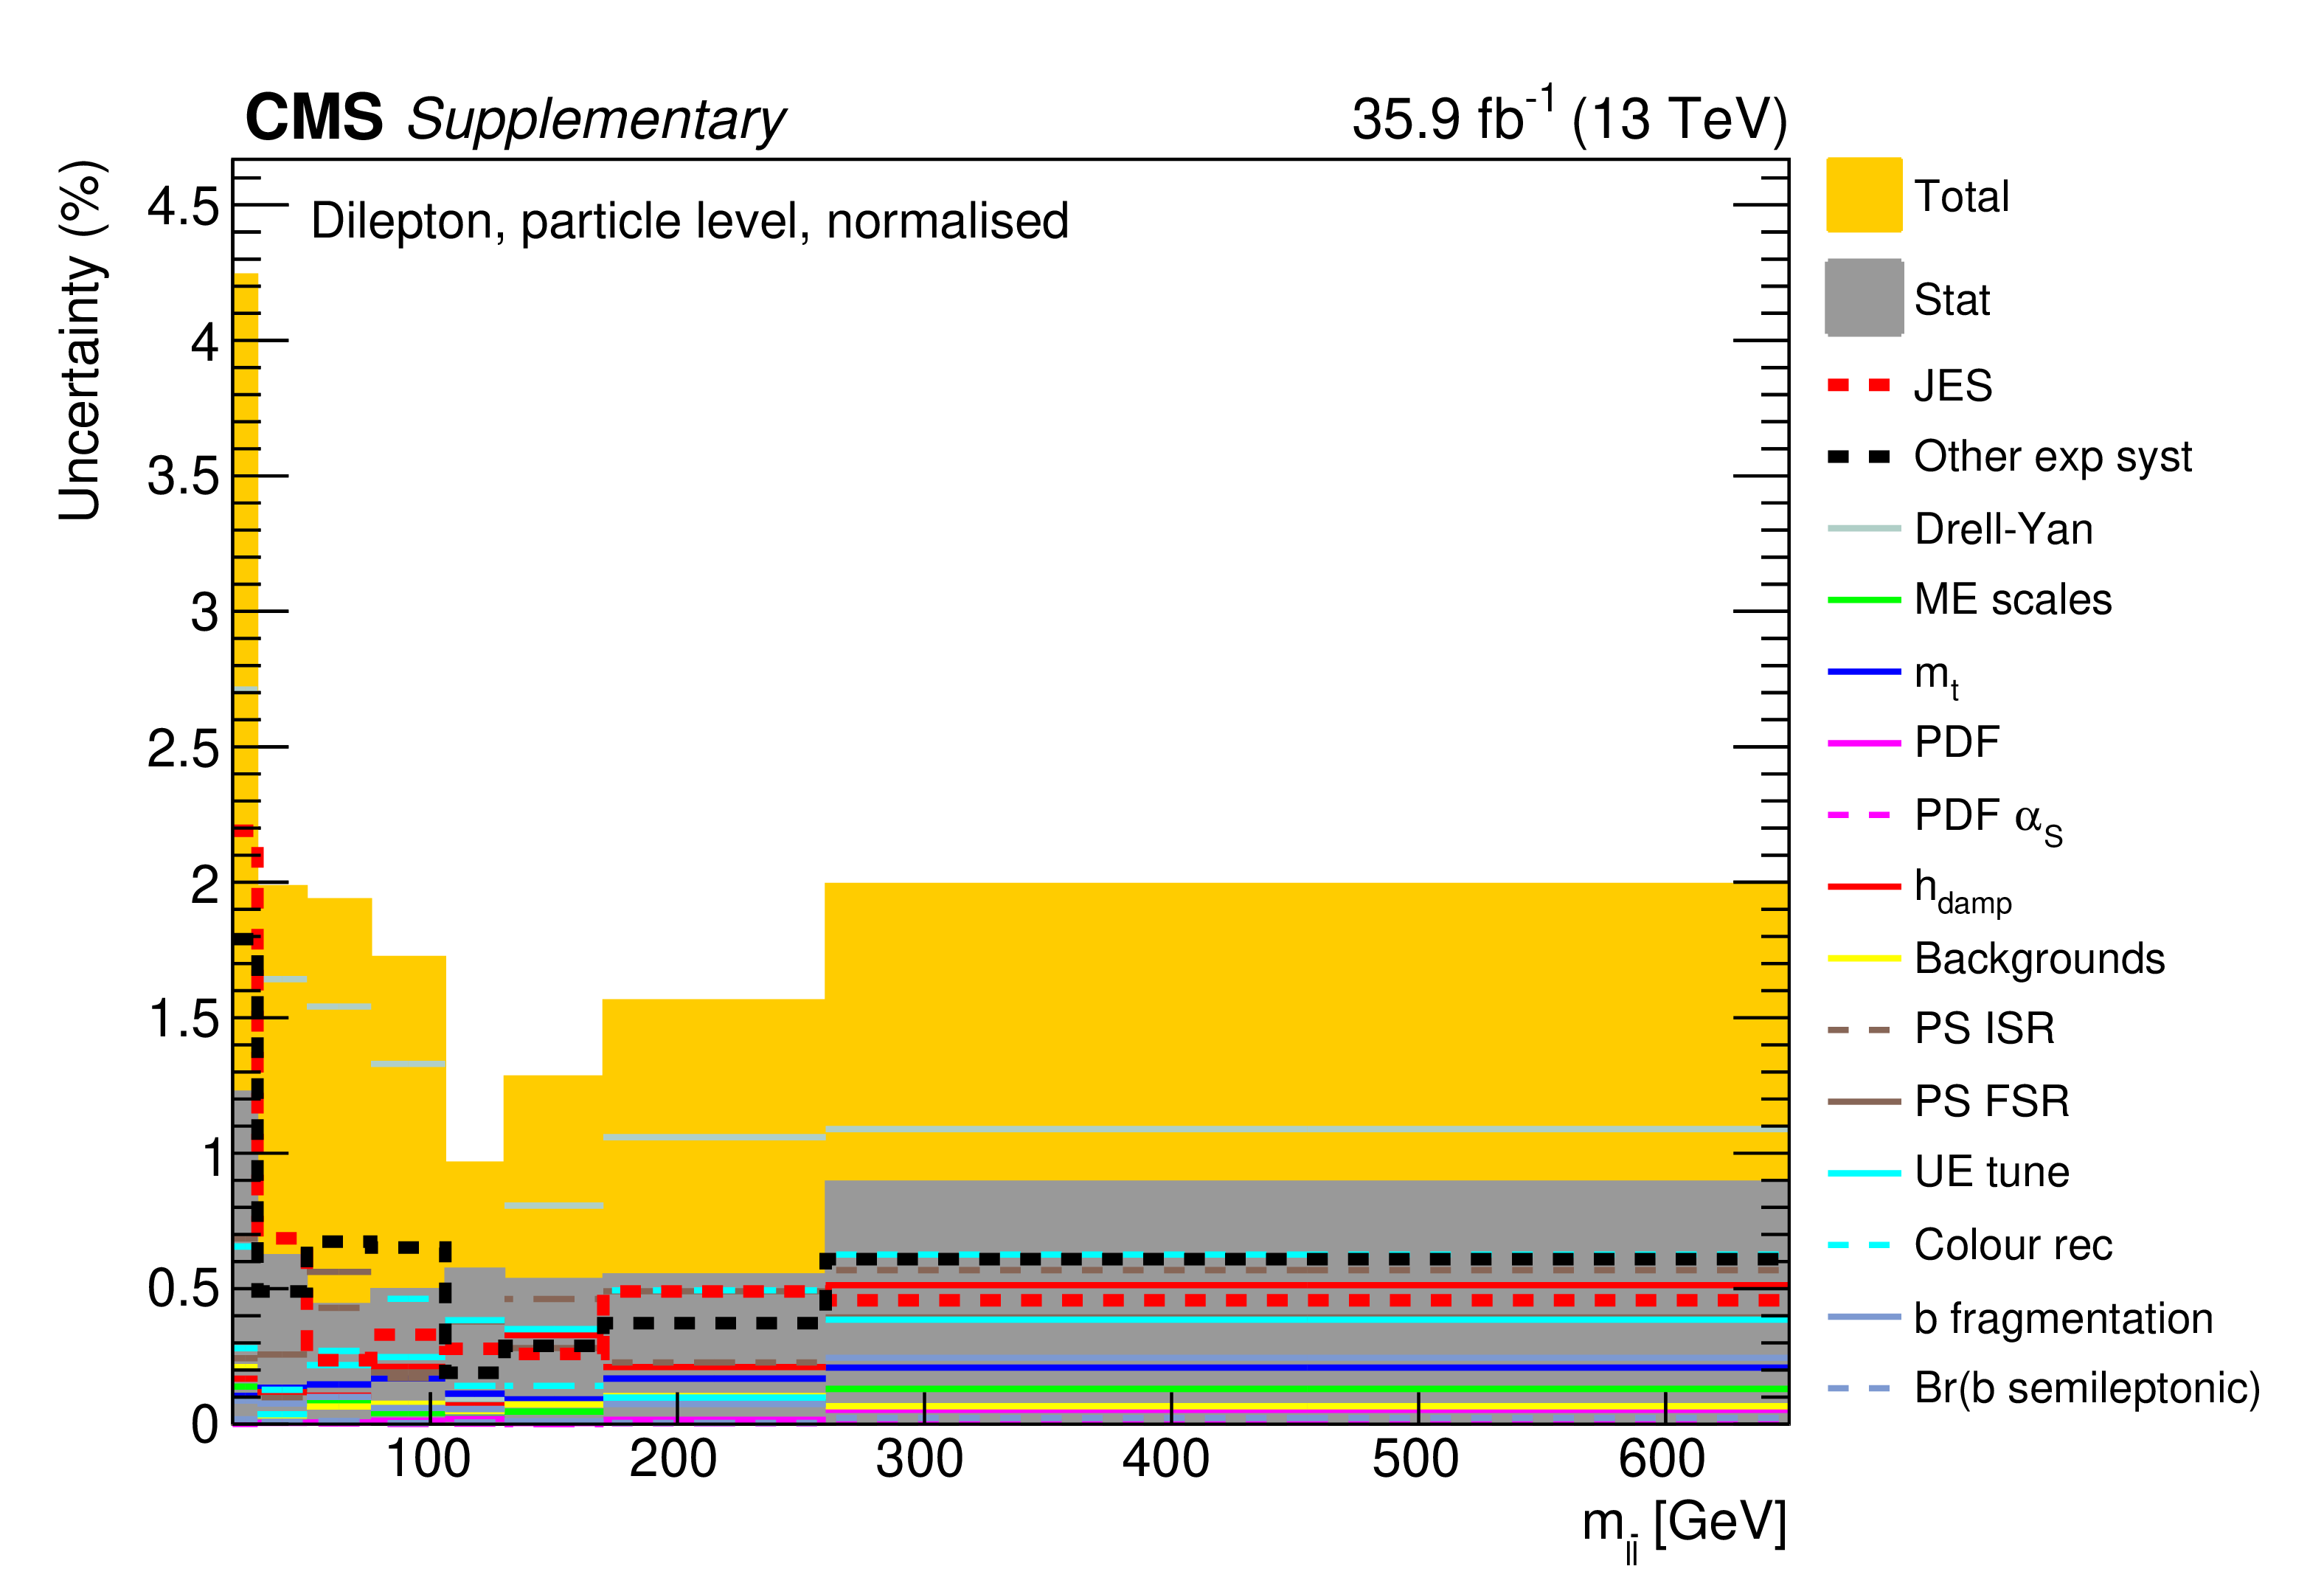
png pdf |
Additional Figure 151:
The breakdown of uncertainties for the normalised measurement of the differential $\mathrm{t\bar{t}}$ cross section as a function of $m_{{\ell}\bar{{\ell}}}$ at particle level is shown. The contributions of each source of systematic uncertainty in each bin are indicated by the coloured lines. Experimental systematic uncertainties that are small in all bins are added in quadrature and shown as a single component. The statistical and total uncertainties are indicated by the shaded areas. |

png pdf |
Additional Figure 152:
The covariance matrix of the measured data for the normalised measurement of the differential $\mathrm{t\bar{t}}$ cross section as a function of $m_{{\ell}\bar{{\ell}}}$ at particle level is shown. |

png pdf |
Additional Figure 153:
The breakdown of uncertainties for the absolute measurement of the differential $\mathrm{t\bar{t}}$ cross section as a function of $\Delta \phi ({\ell},\bar{{\ell}}$) at particle level is shown. The contributions of each source of systematic uncertainty in each bin are indicated by the coloured lines. Experimental systematic uncertainties that are small in all bins are added in quadrature and shown as a single component. The statistical and total uncertainties are indicated by the shaded areas. |
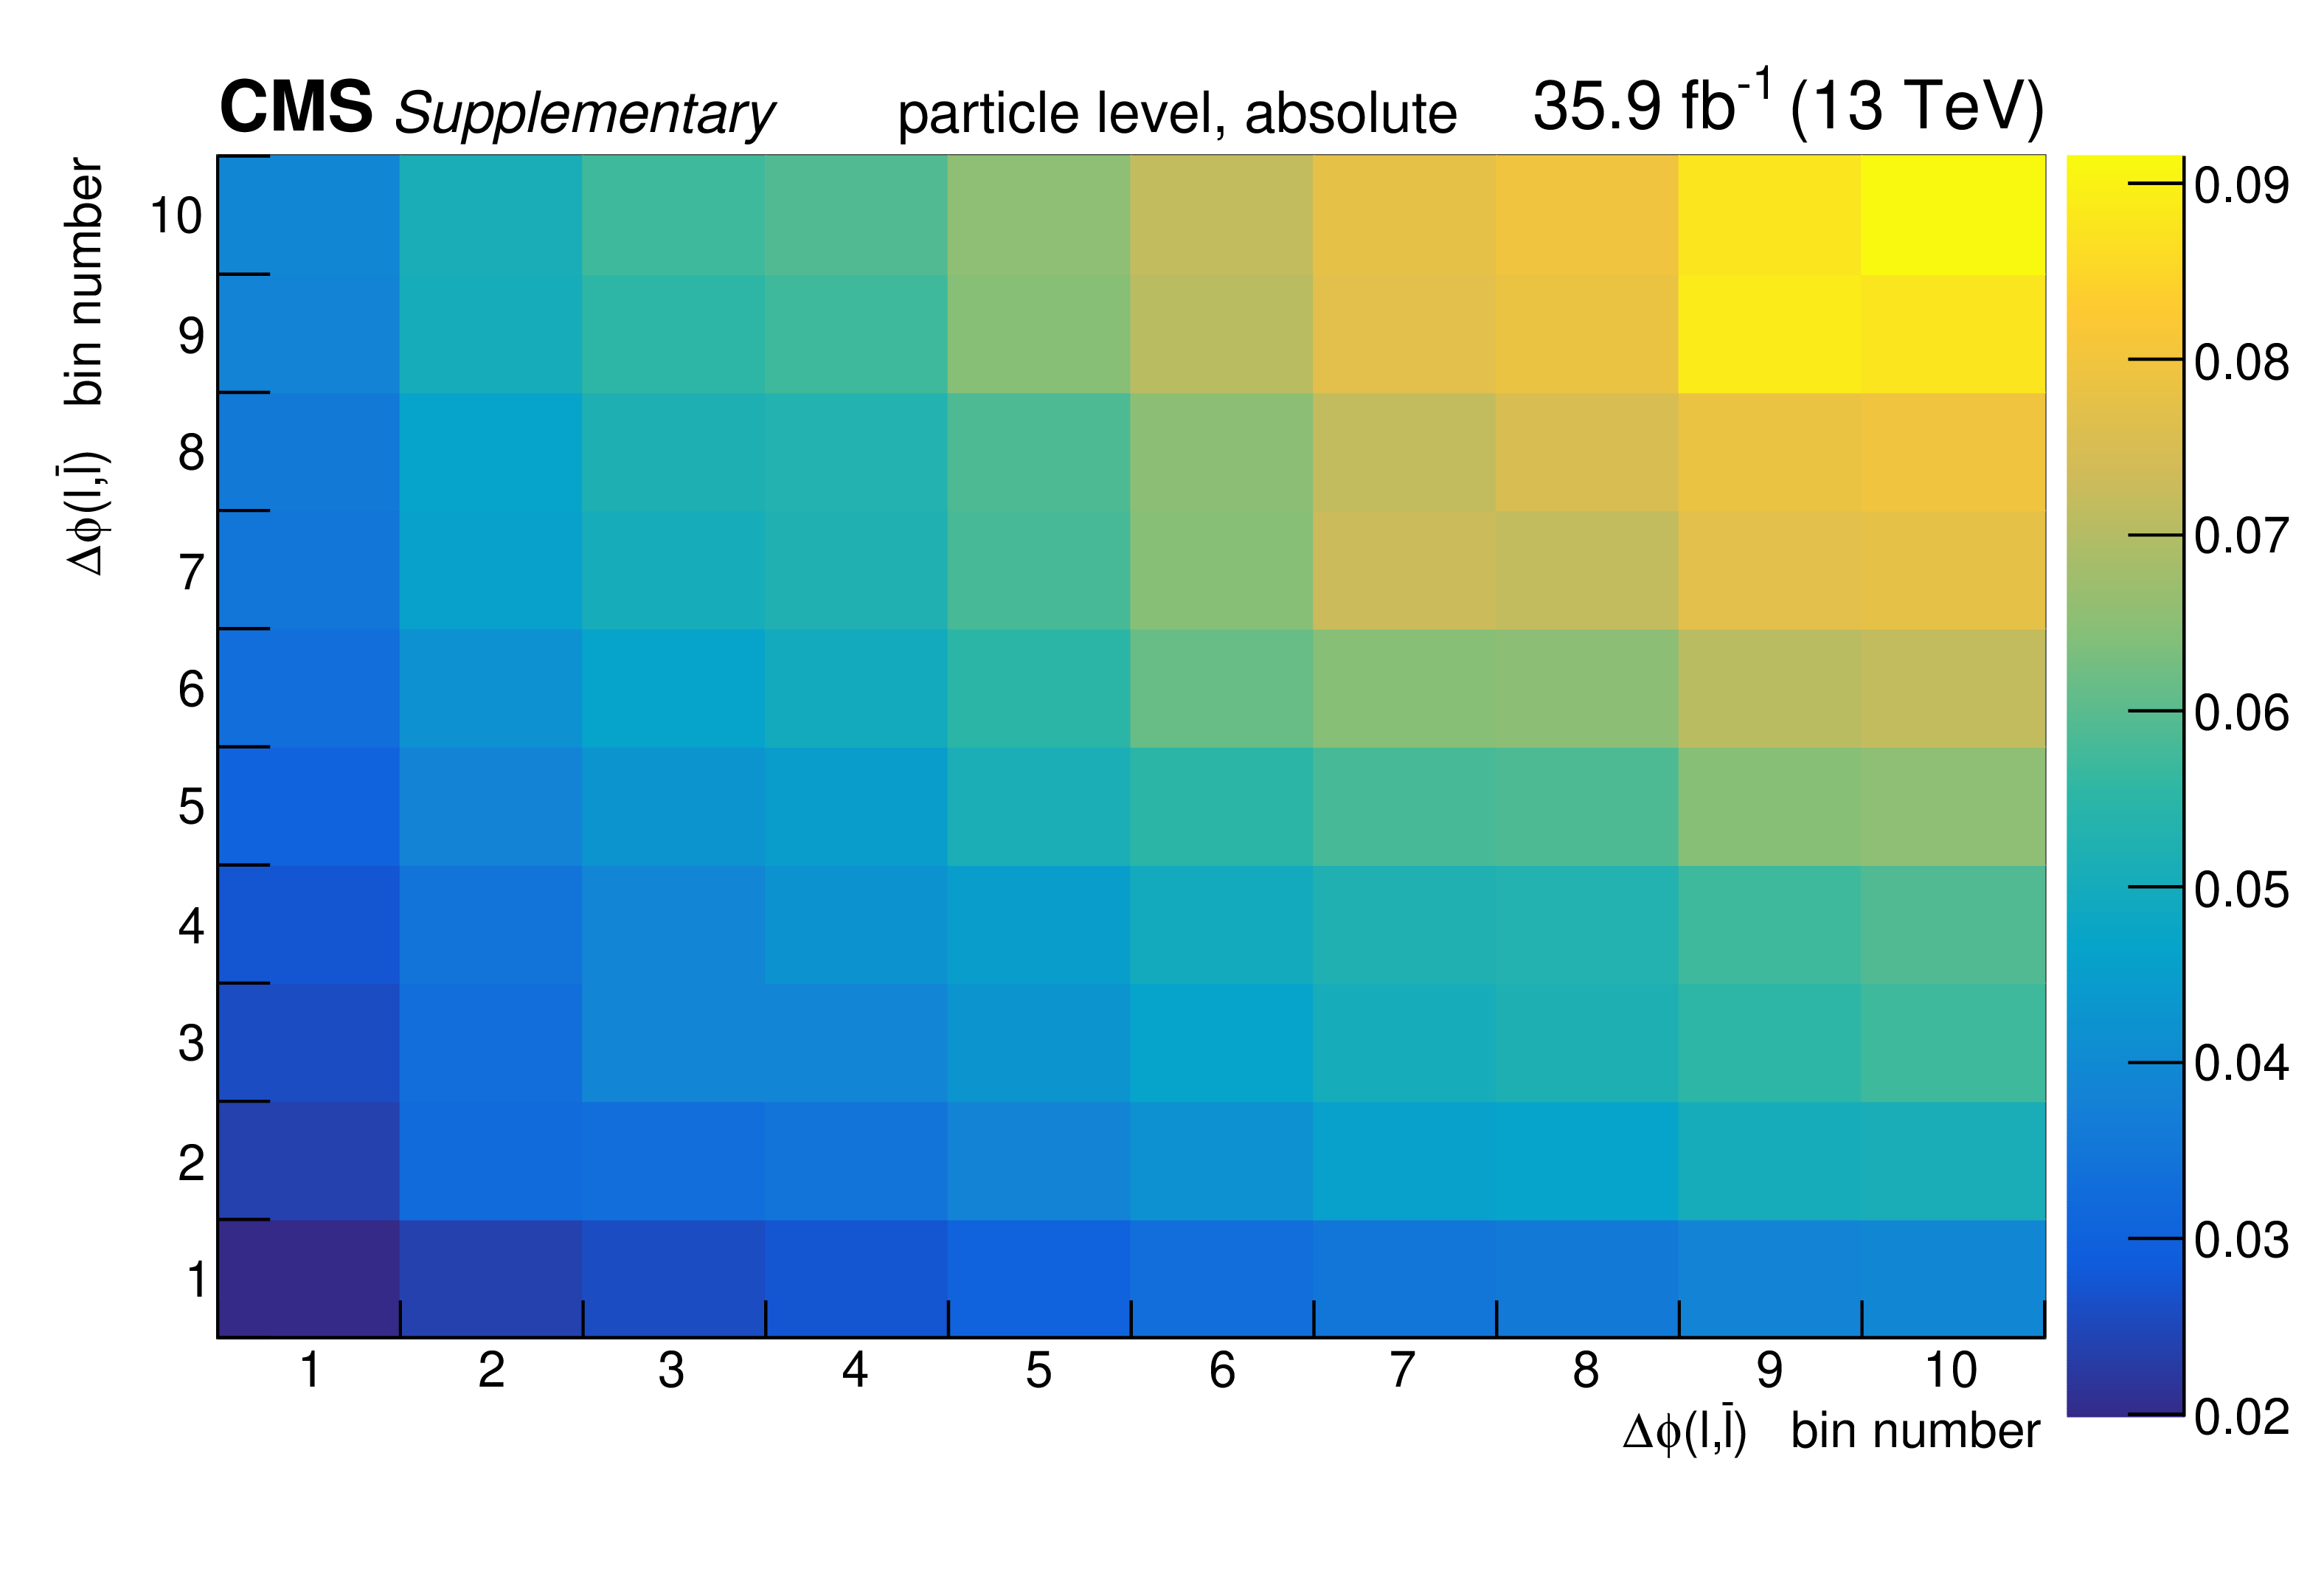
png pdf |
Additional Figure 154:
The covariance matrix of the measured data for the absolute measurement of the differential $\mathrm{t\bar{t}}$ cross section as a function of $\Delta \phi ({\ell},\bar{{\ell}}$) at particle level is shown. |

png pdf |
Additional Figure 155:
The breakdown of uncertainties for the normalised measurement of the differential $\mathrm{t\bar{t}}$ cross section as a function of $\Delta \phi ({\ell},\bar{{\ell}}$) at particle level is shown. The contributions of each source of systematic uncertainty in each bin are indicated by the coloured lines. Experimental systematic uncertainties that are small in all bins are added in quadrature and shown as a single component. The statistical and total uncertainties are indicated by the shaded areas. |
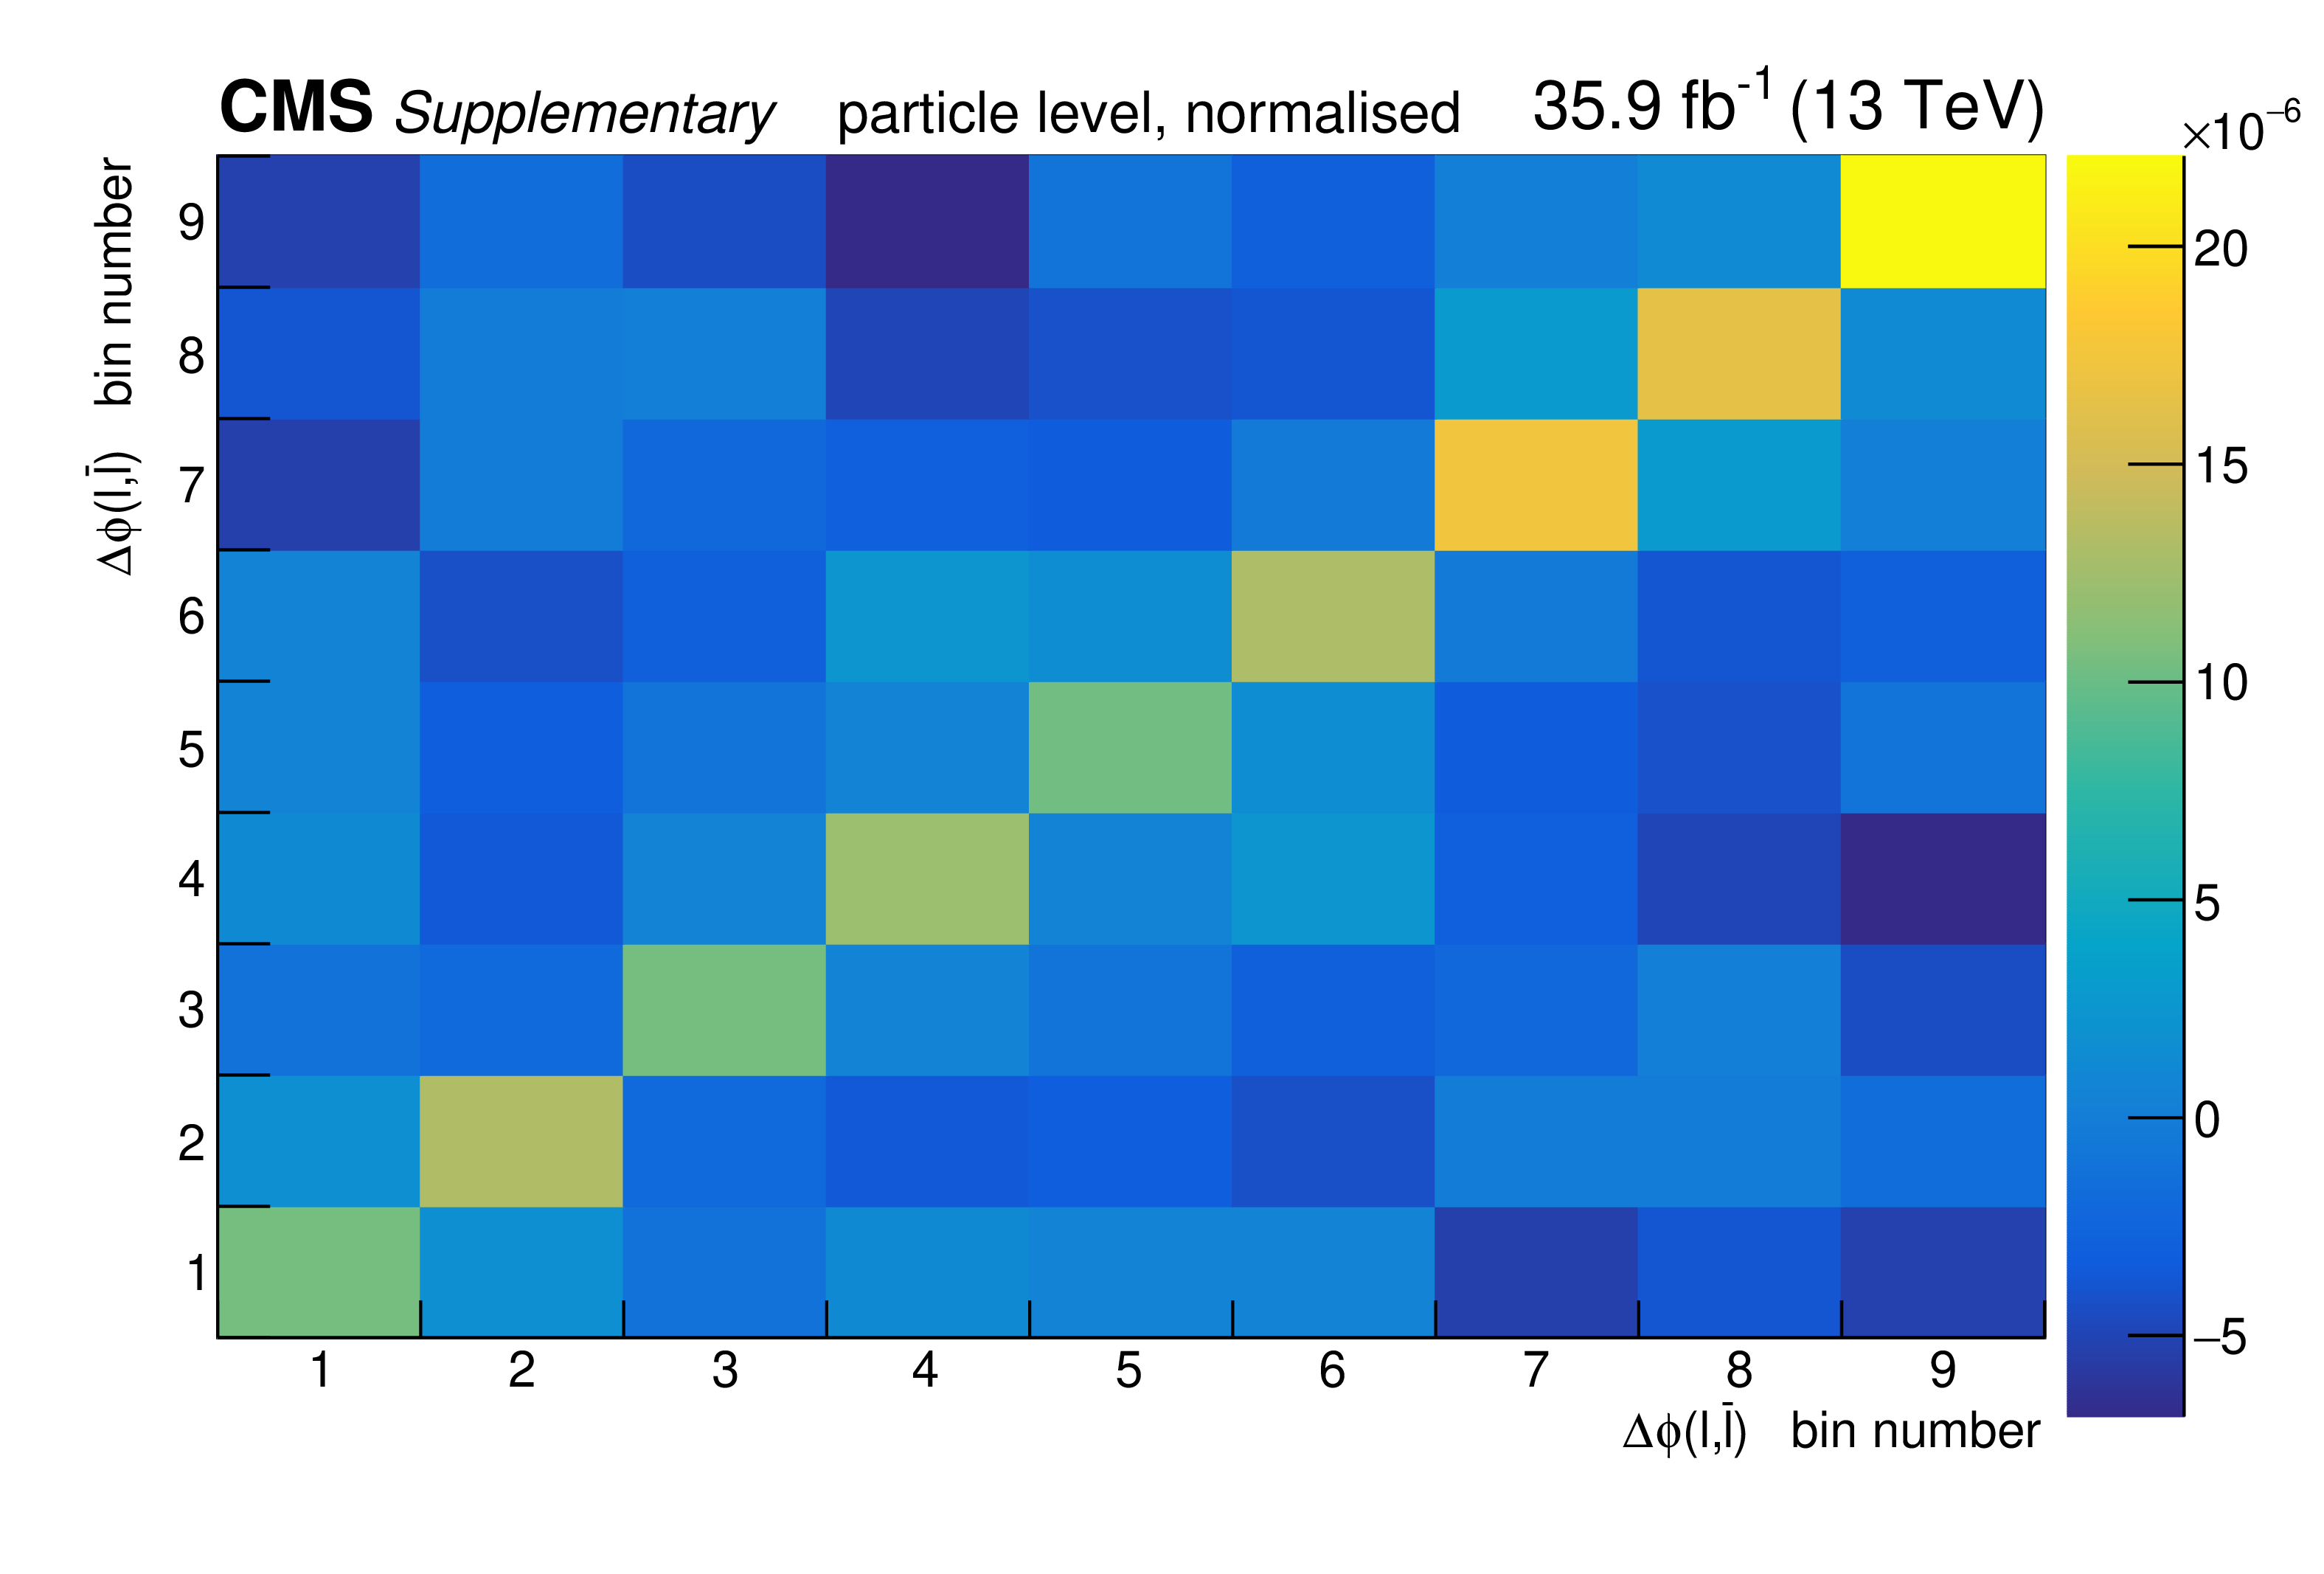
png pdf |
Additional Figure 156:
The covariance matrix of the measured data for the normalised measurement of the differential $\mathrm{t\bar{t}}$ cross section as a function of $\Delta \phi ({\ell},\bar{{\ell}}$) at particle level is shown. |
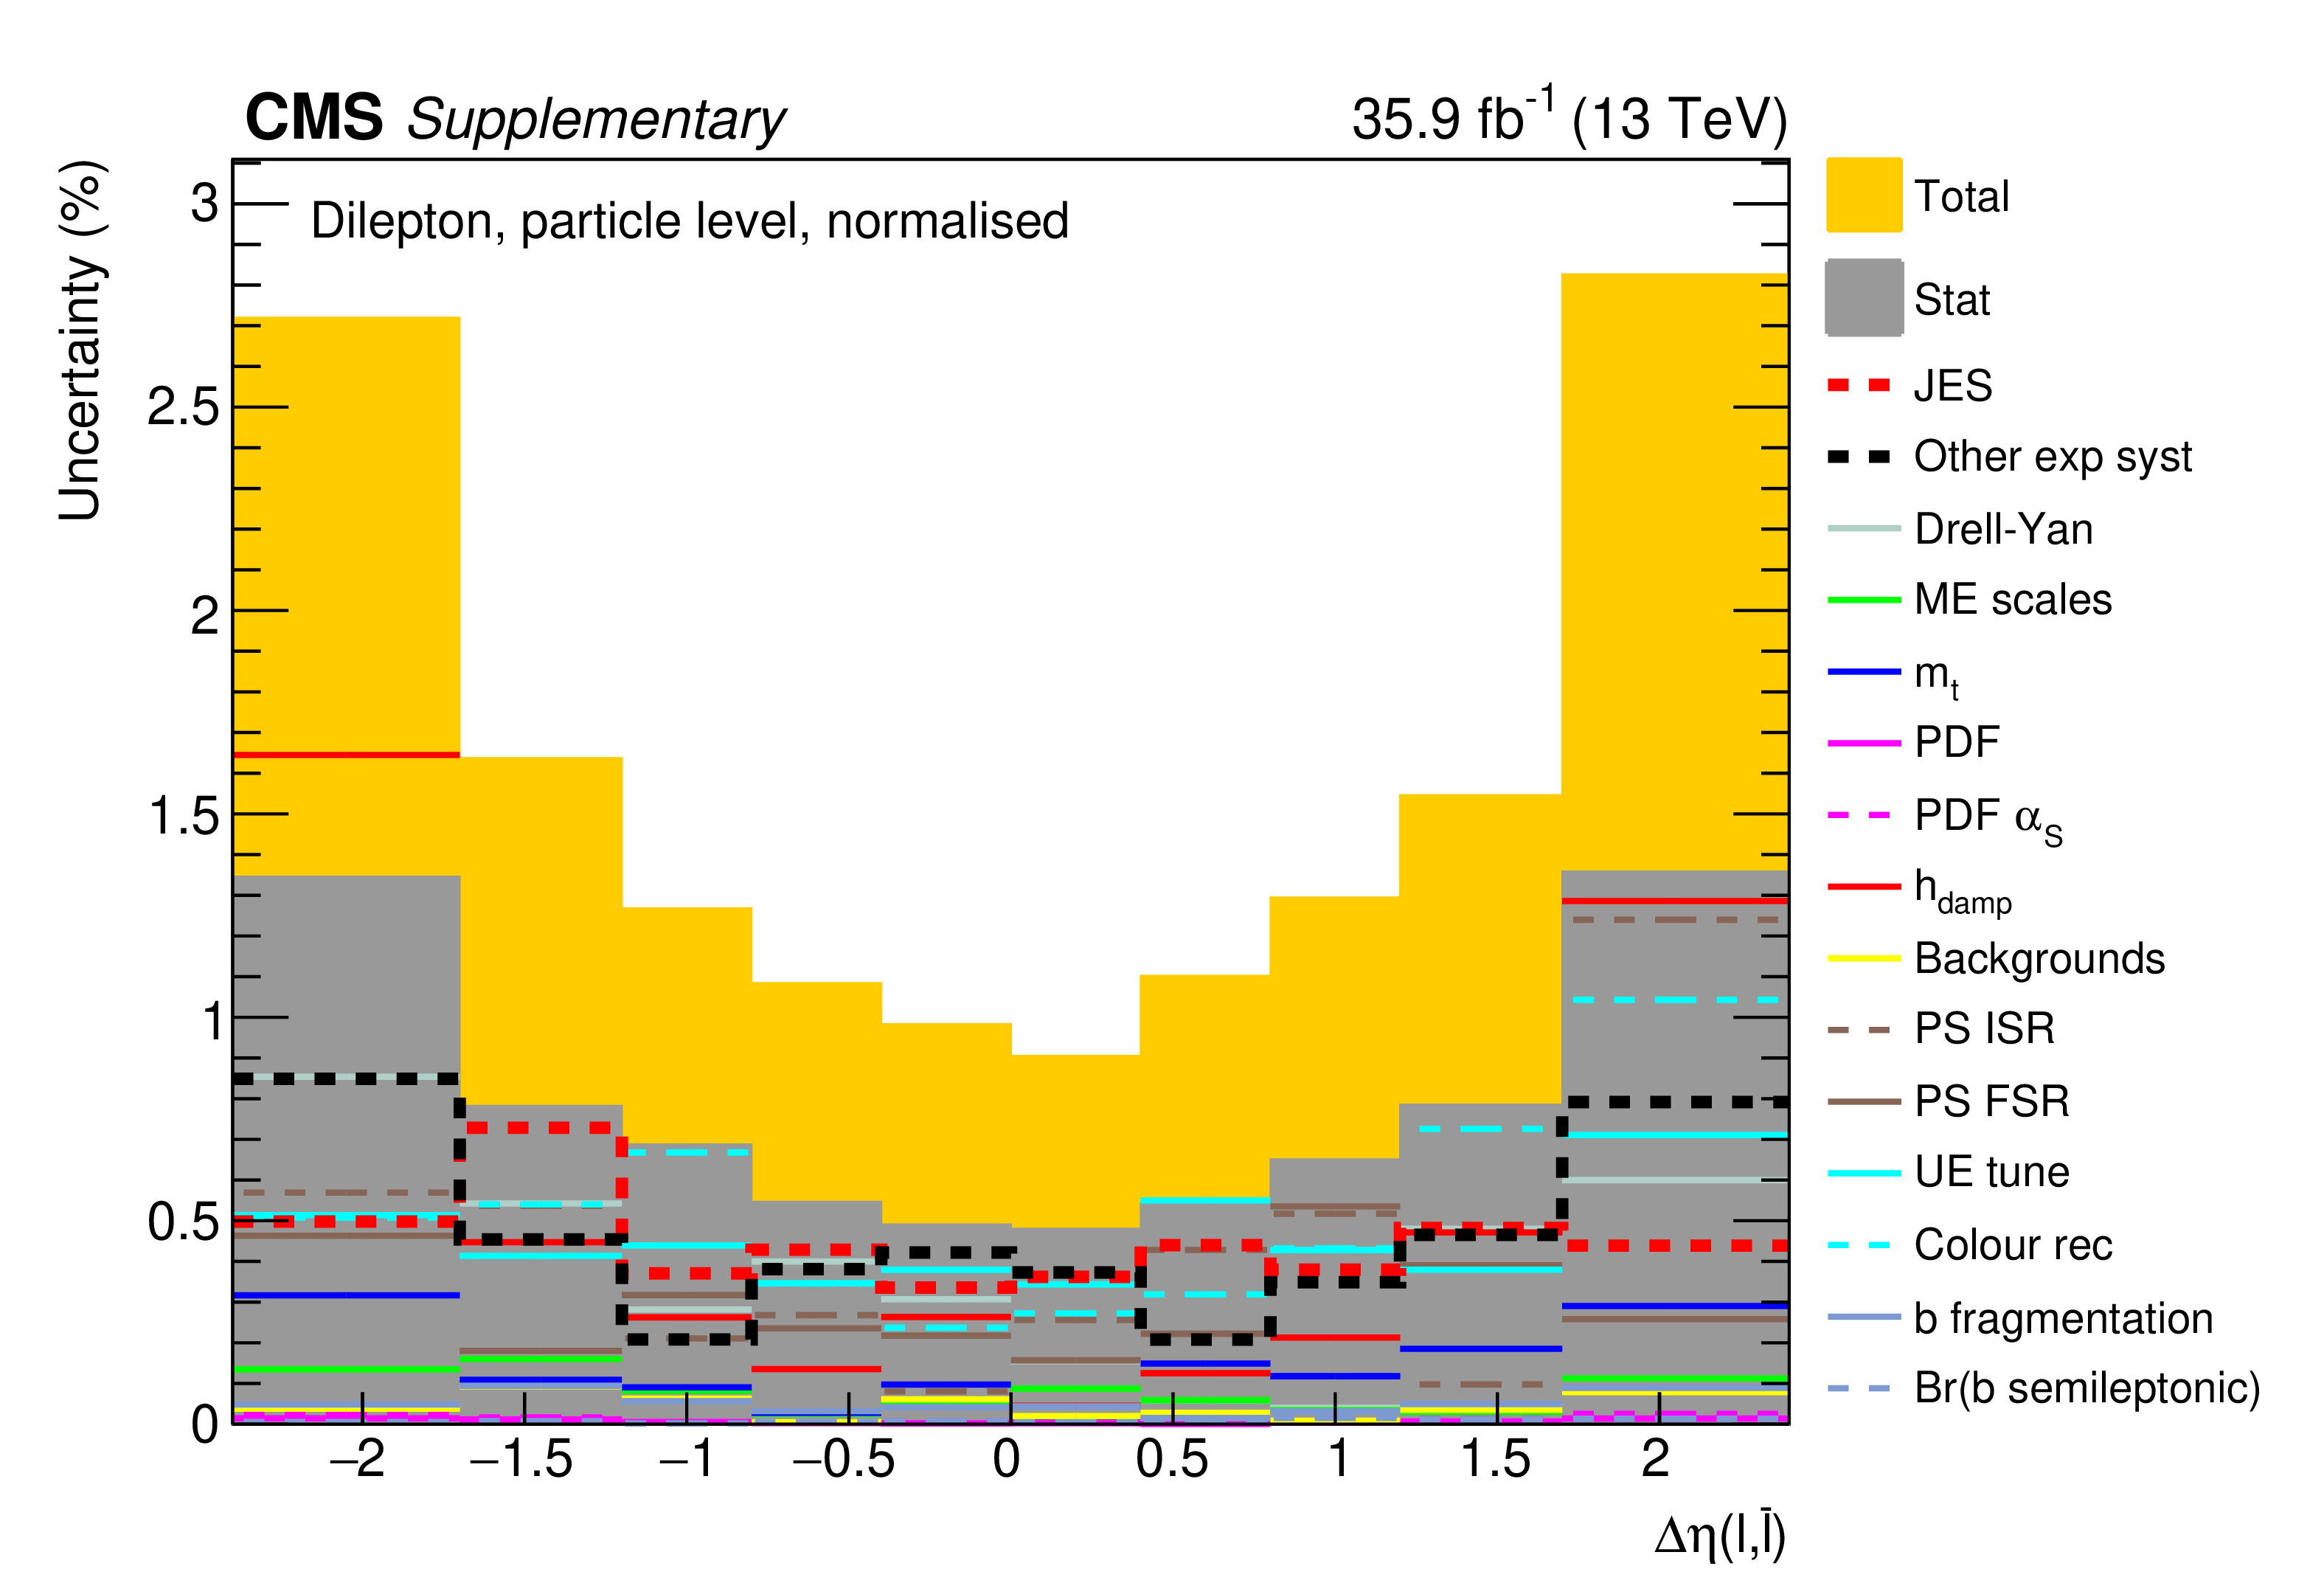
png pdf |
Additional Figure 157:
The breakdown of uncertainties for the normalised measurement of the differential $\mathrm{t\bar{t}}$ cross section as a function of $\Delta \eta ({\ell},\bar{{\ell}}$) at particle level is shown. The contributions of each source of systematic uncertainty in each bin are indicated by the coloured lines. Experimental systematic uncertainties that are small in all bins are added in quadrature and shown as a single component. The statistical and total uncertainties are indicated by the shaded areas. |
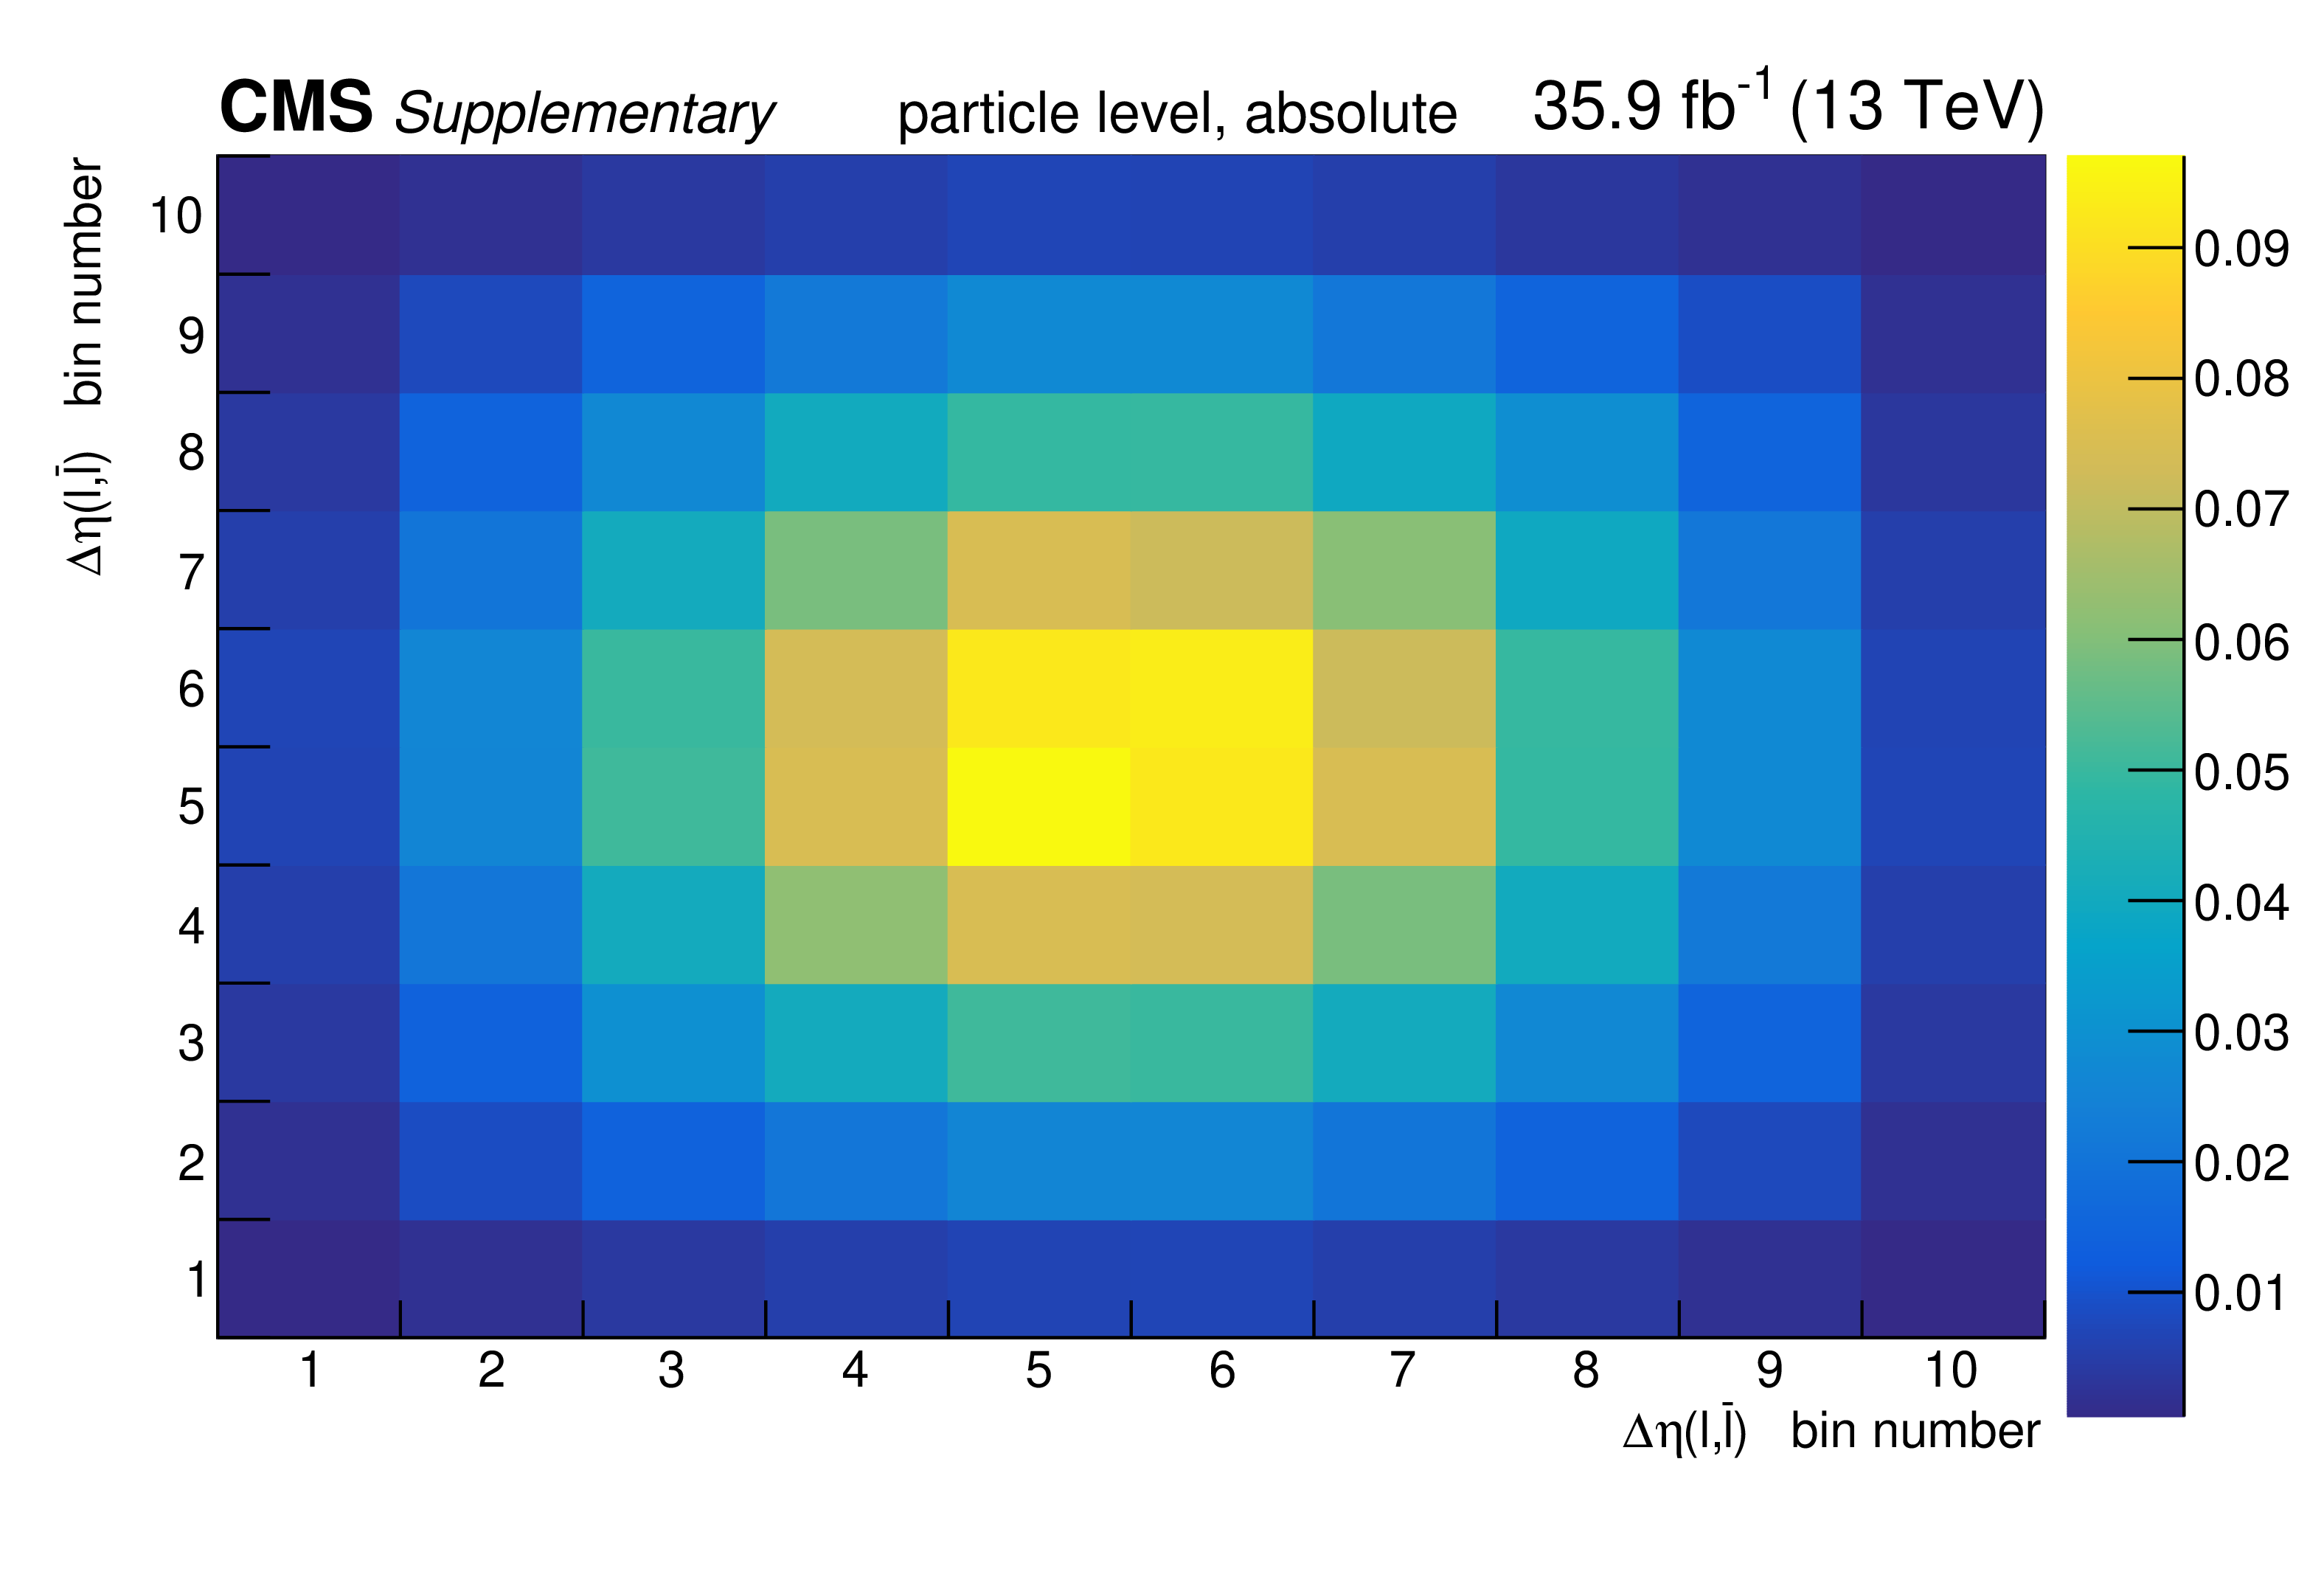
png pdf |
Additional Figure 158:
The covariance matrix of the measured data for the normalised measurement of the differential $\mathrm{t\bar{t}}$ cross section as a function of $\Delta \eta ({\ell},\bar{{\ell}}$) at particle level is shown. |

png pdf |
Additional Figure 159:
The breakdown of uncertainties for the absolute measurement of the differential $\mathrm{t\bar{t}}$ cross section as a function of $\Delta \eta ({\ell},\bar{{\ell}}$) at particle level is shown. The contributions of each source of systematic uncertainty in each bin are indicated by the coloured lines. Experimental systematic uncertainties that are small in all bins are added in quadrature and shown as a single component. The statistical and total uncertainties are indicated by the shaded areas. |
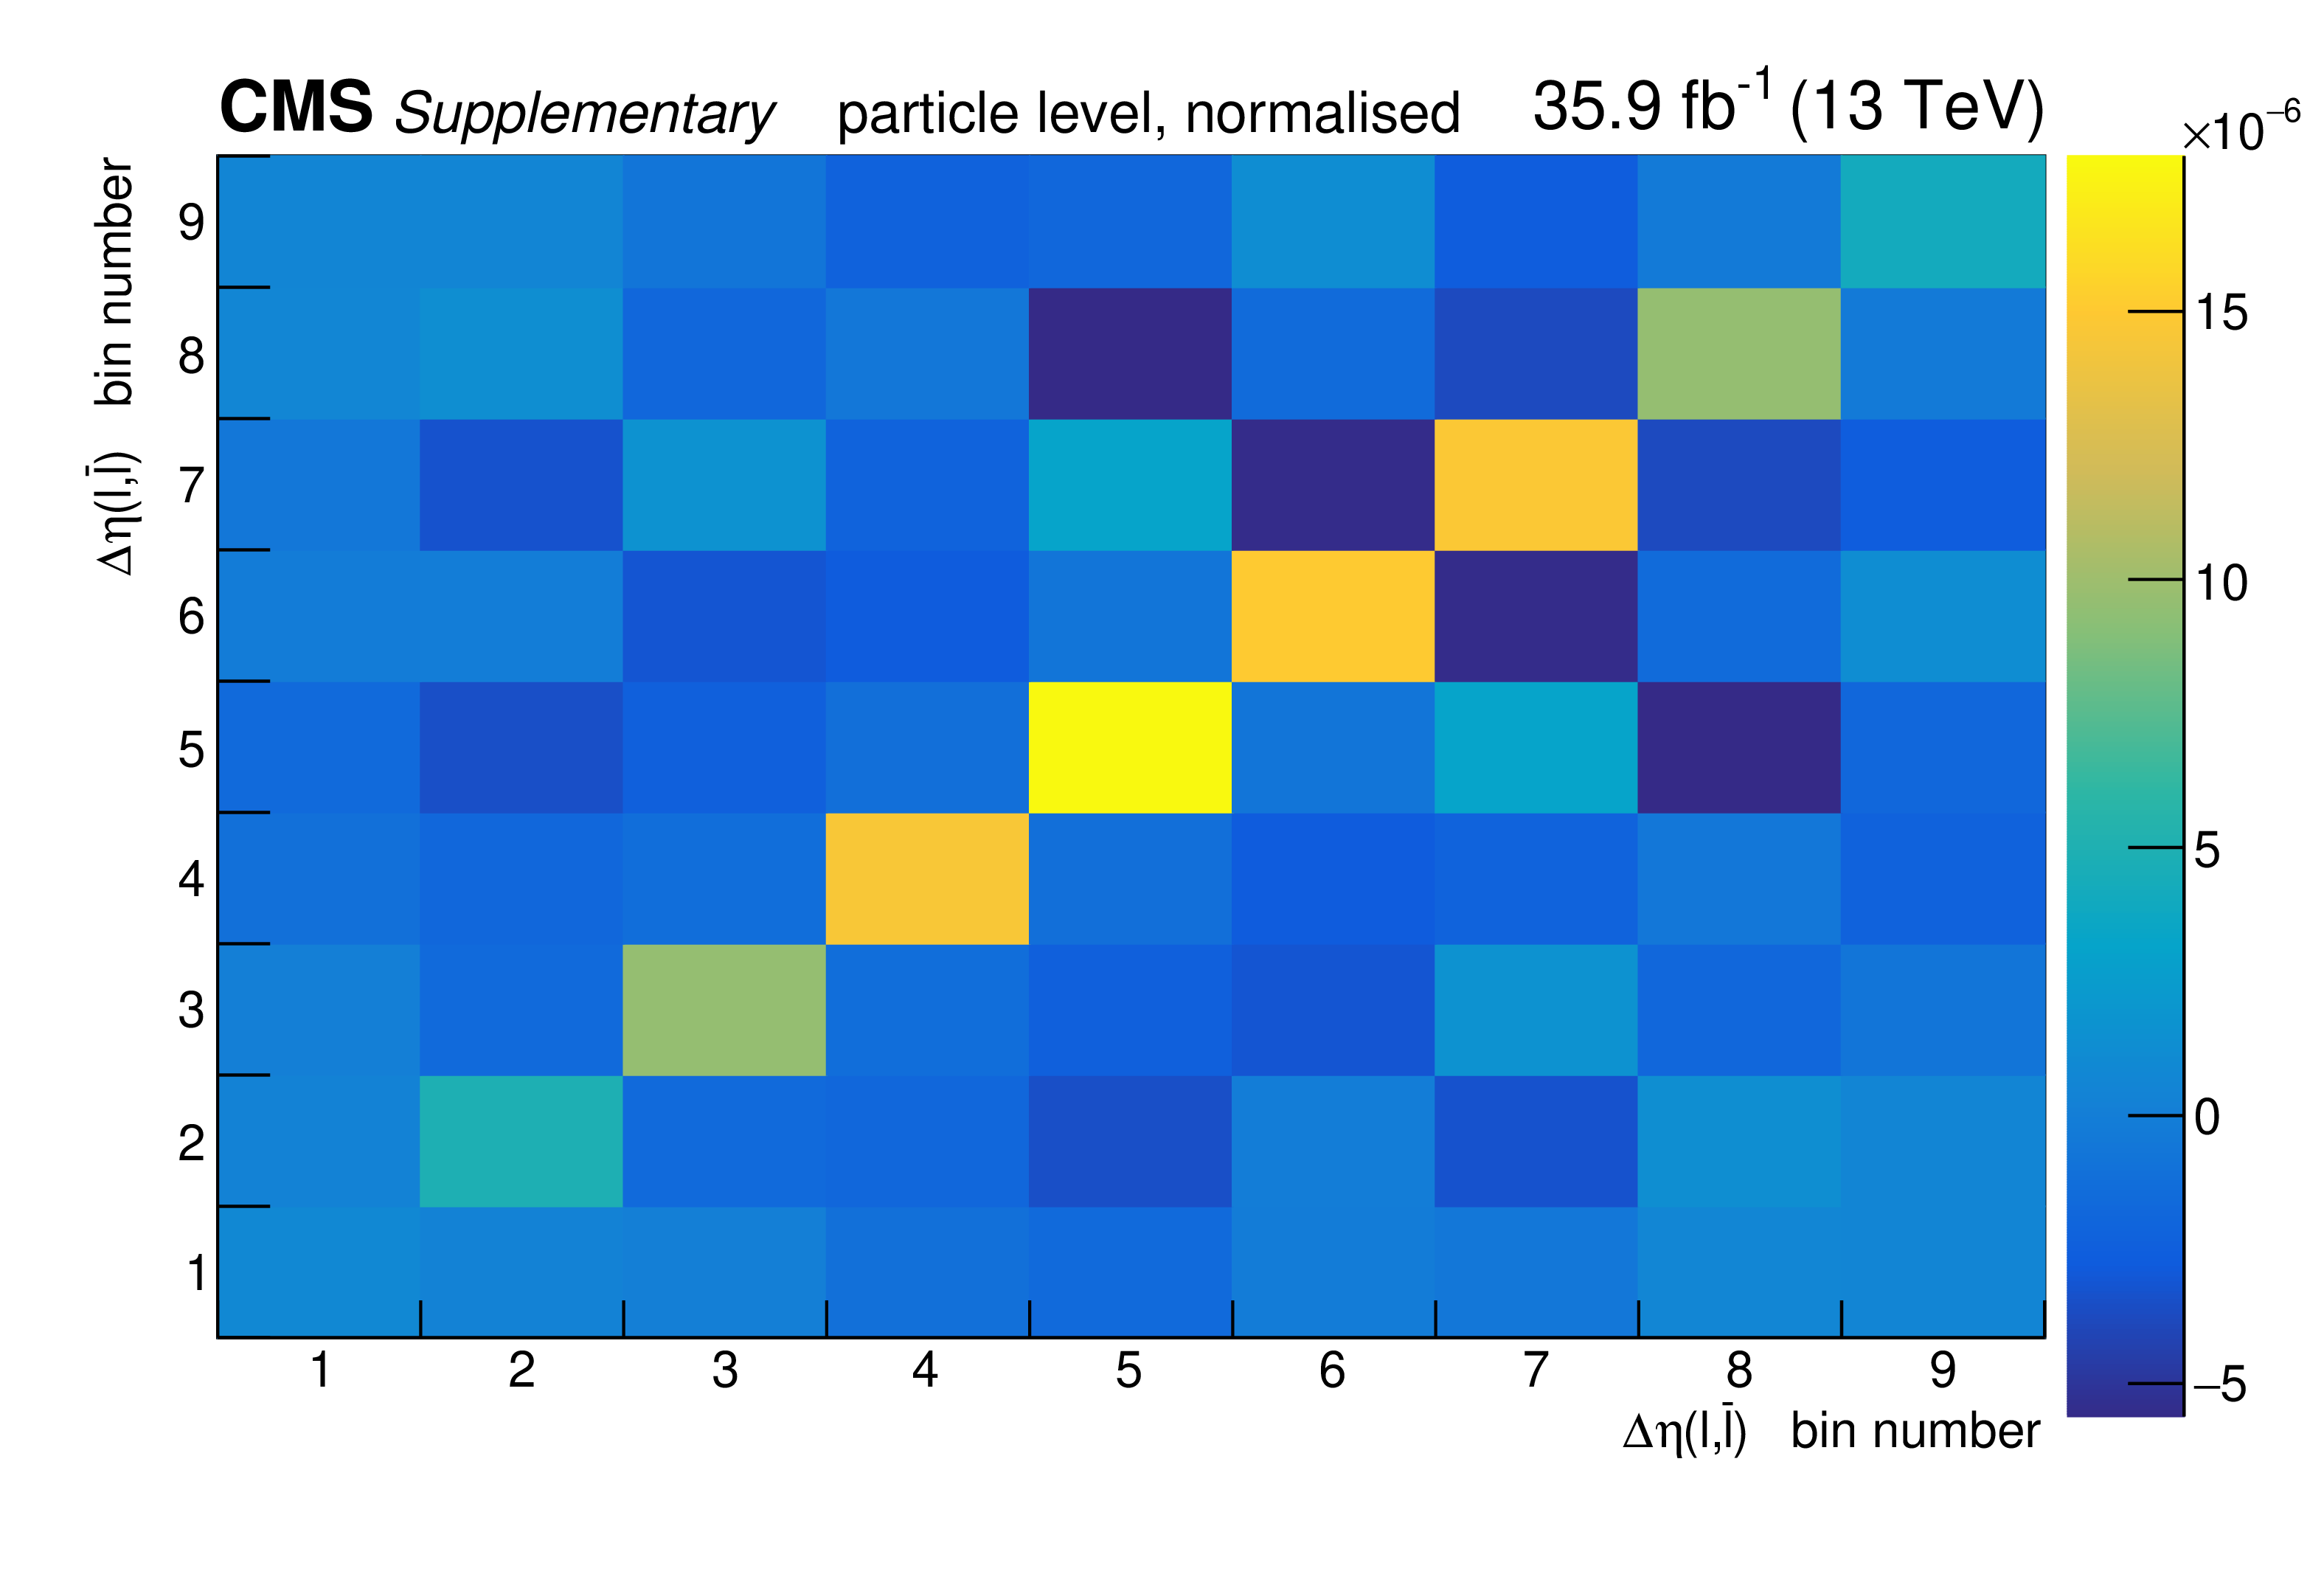
png pdf |
Additional Figure 160:
The covariance matrix of the measured data for the absolute measurement of the differential $\mathrm{t\bar{t}}$ cross section as a function of $\Delta \eta ({\ell},\bar{{\ell}}$) at particle level is shown. |
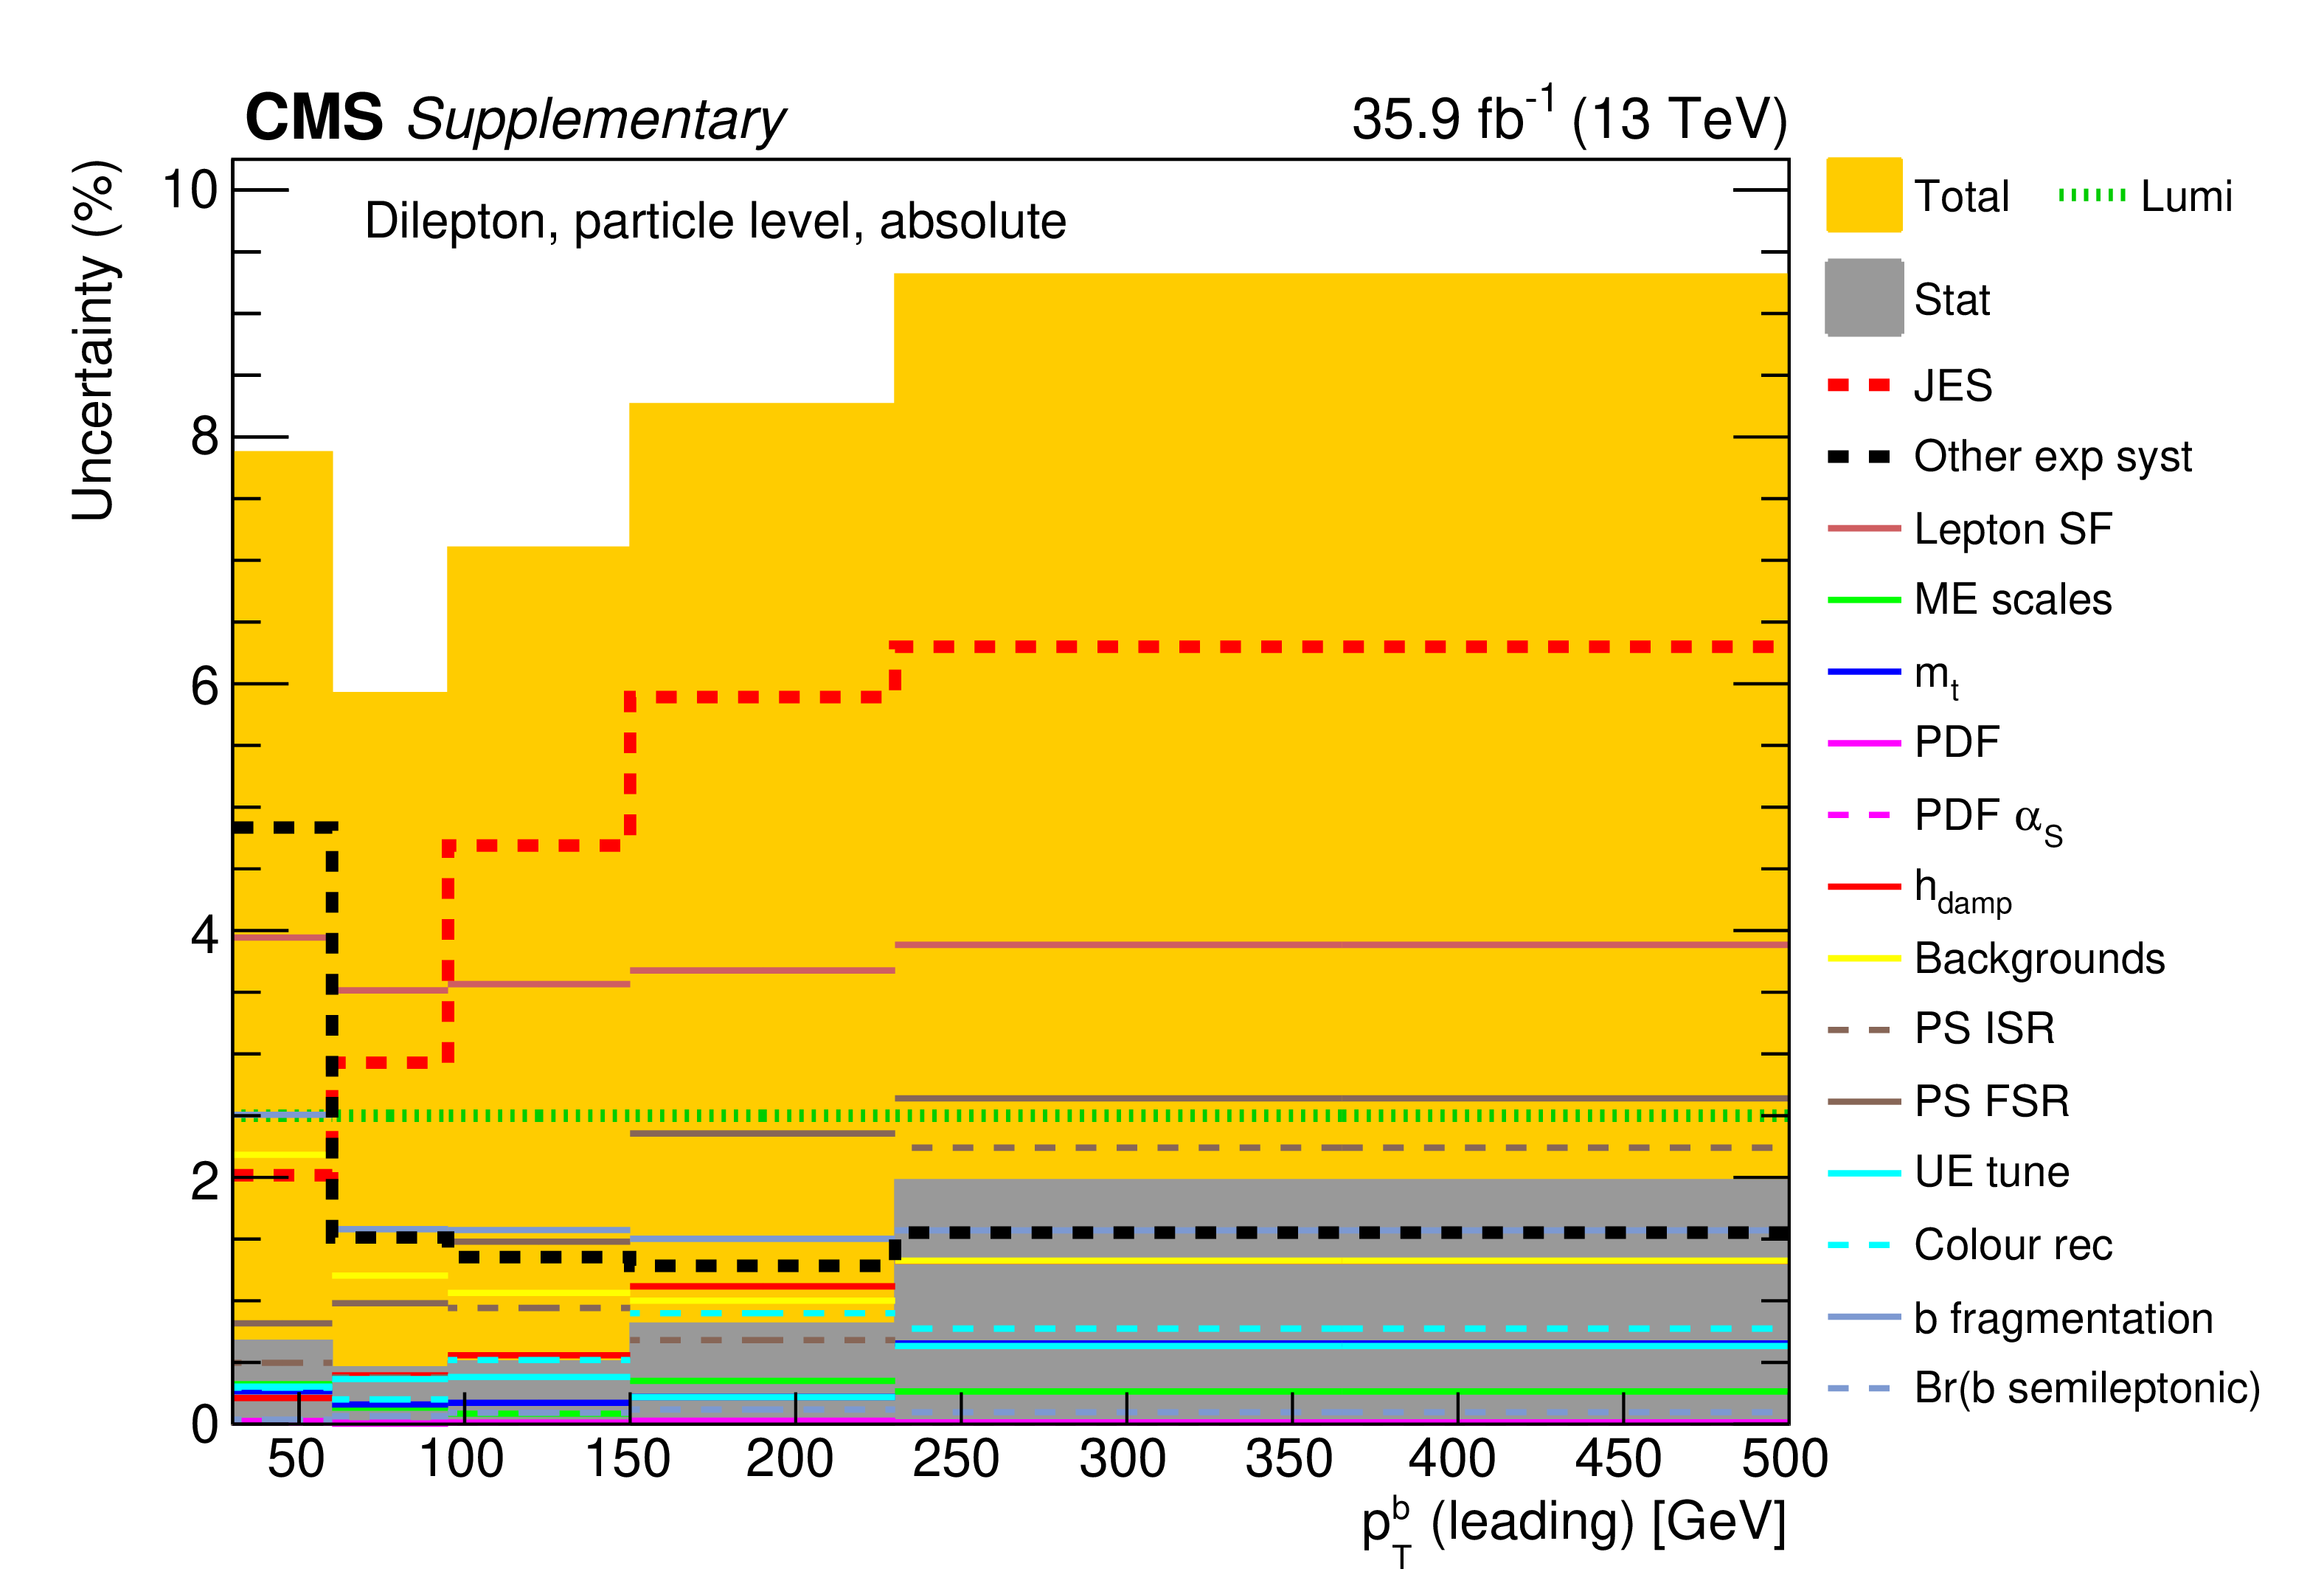
png pdf |
Additional Figure 161:
The breakdown of uncertainties for the absolute measurement of the differential $\mathrm{t\bar{t}}$ cross section as a function of $p_{\mathrm {T}}^{b}$ (leading) at particle level is shown. The contributions of each source of systematic uncertainty in each bin are indicated by the coloured lines. Experimental systematic uncertainties that are small in all bins are added in quadrature and shown as a single component. The statistical and total uncertainties are indicated by the shaded areas. |

png pdf |
Additional Figure 162:
The covariance matrix of the measured data for the absolute measurement of the differential $\mathrm{t\bar{t}}$ cross section as a function of $p_{\mathrm {T}}^{b}$ (leading) at particle level is shown. |
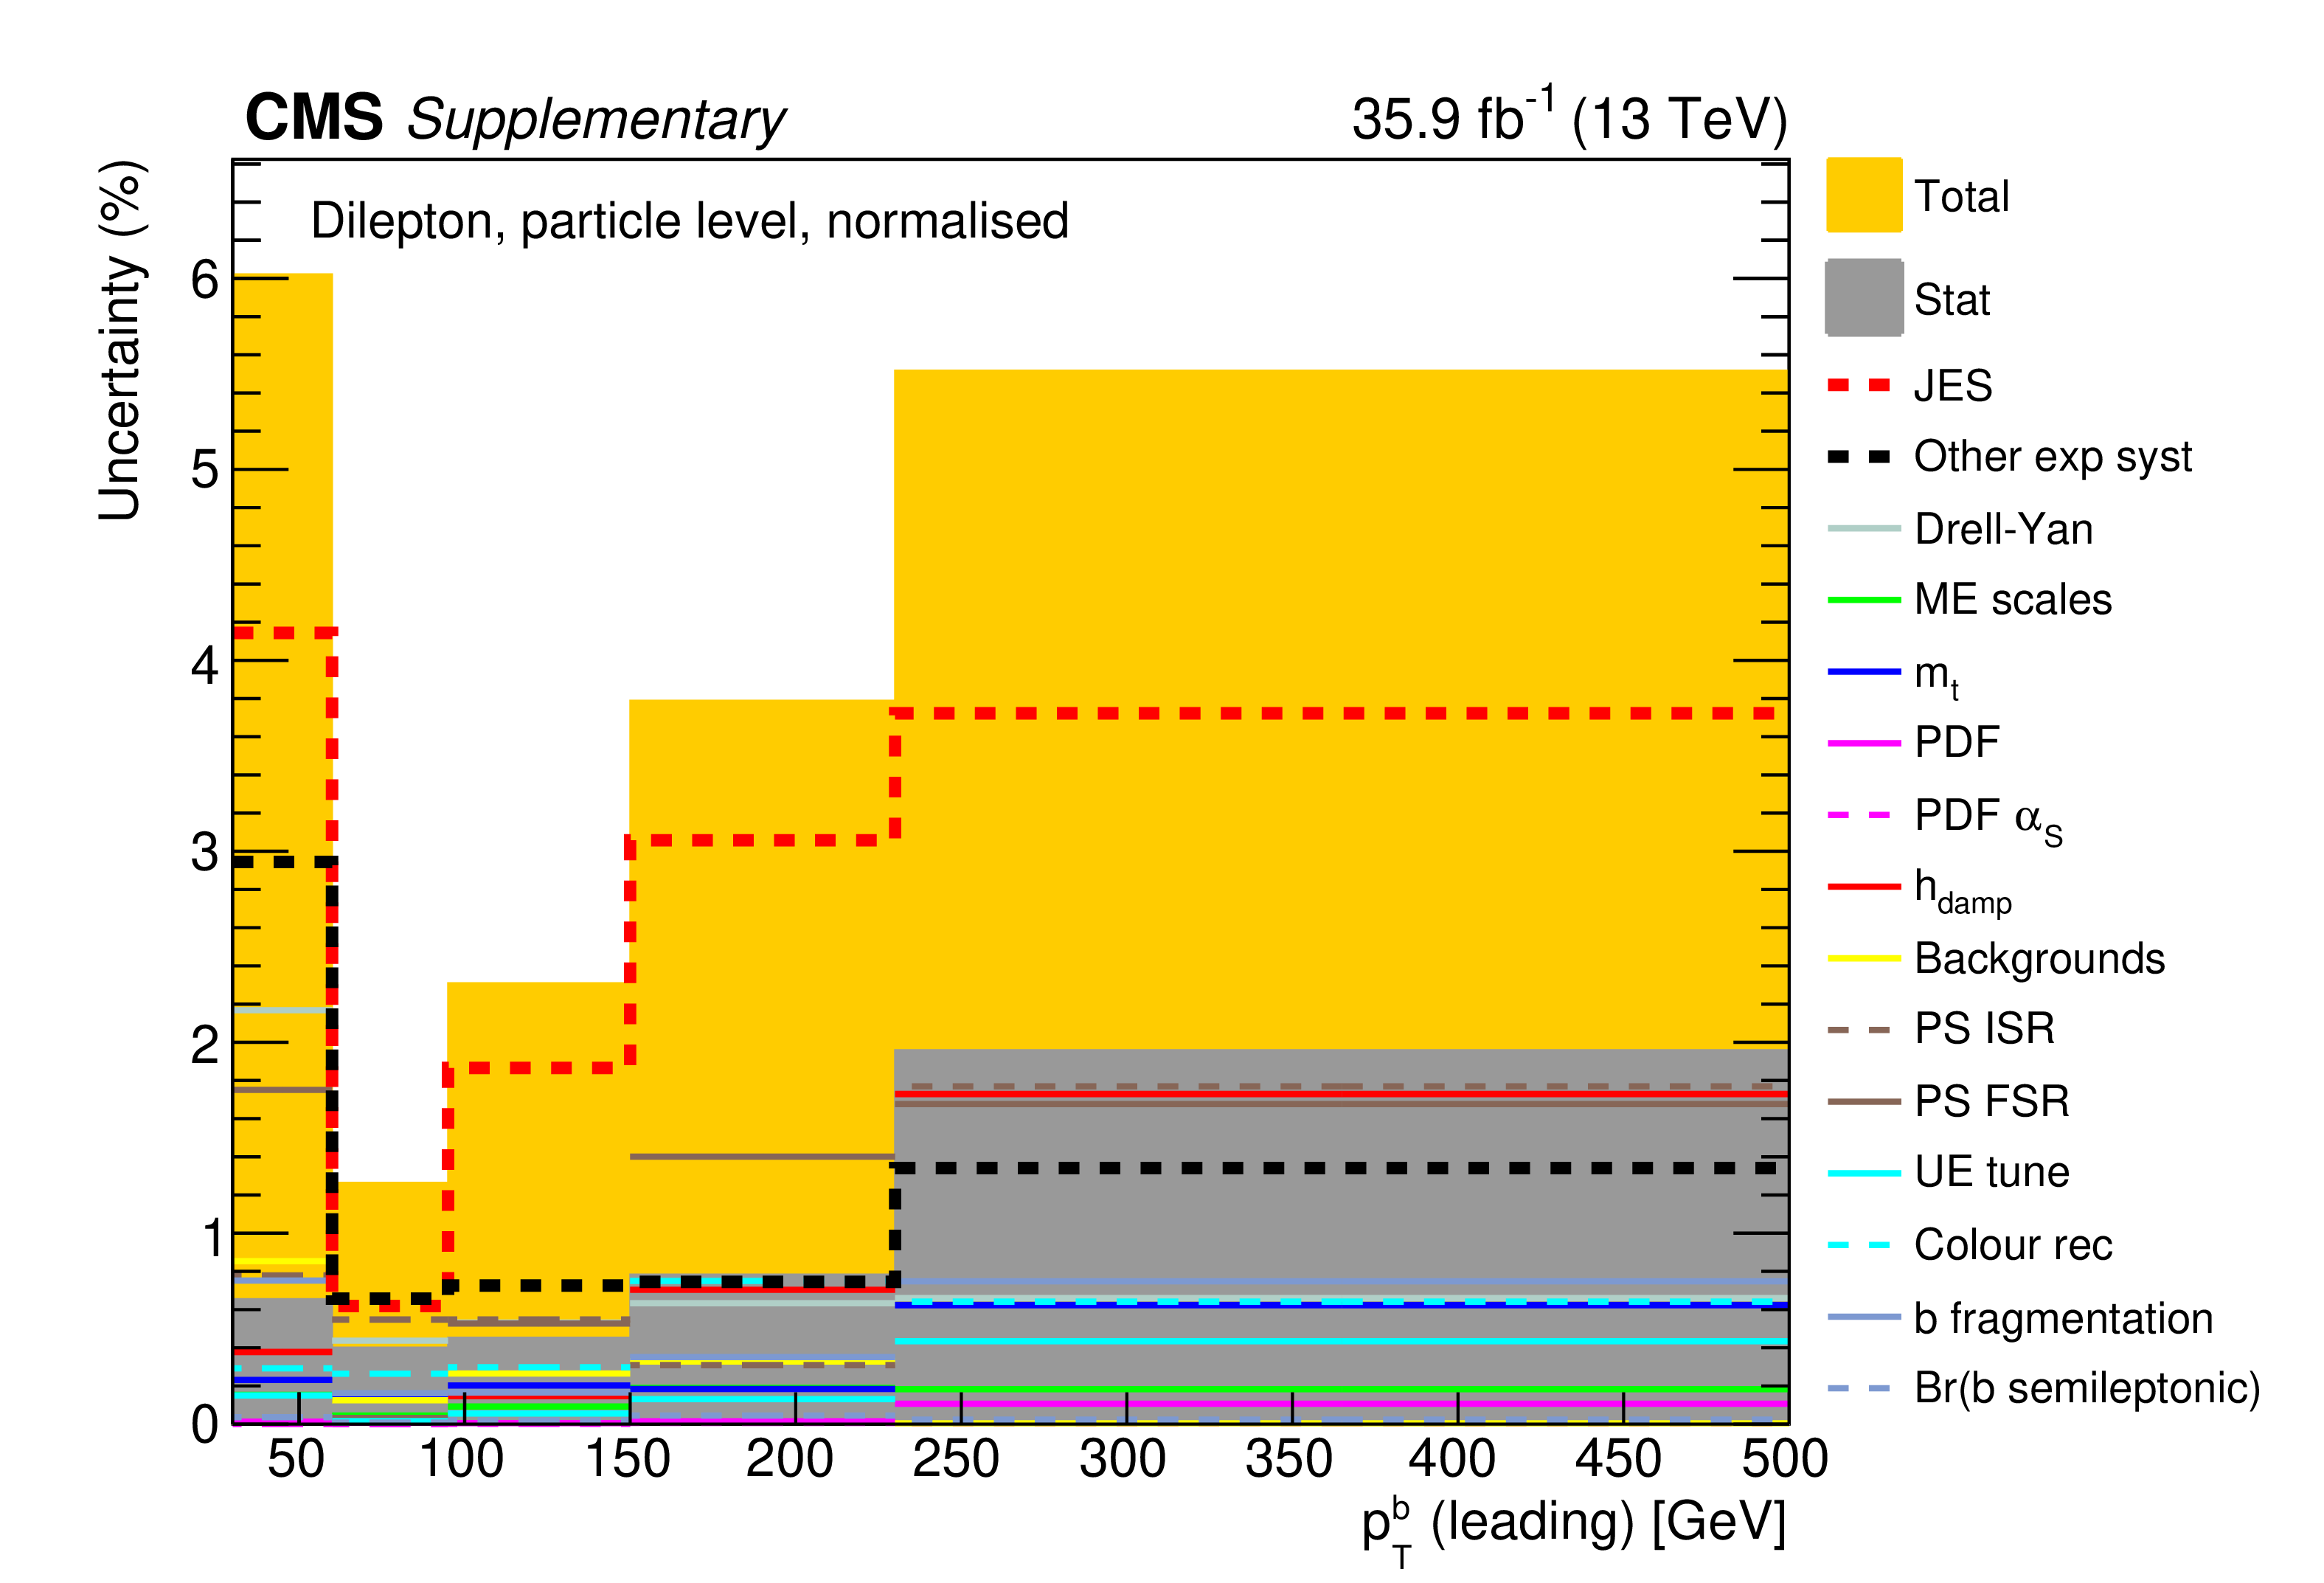
png pdf |
Additional Figure 163:
The breakdown of uncertainties for the normalised measurement of the differential $\mathrm{t\bar{t}}$ cross section as a function of $p_{\mathrm {T}}^{b}$ (leading) at particle level is shown. The contributions of each source of systematic uncertainty in each bin are indicated by the coloured lines. Experimental systematic uncertainties that are small in all bins are added in quadrature and shown as a single component. The statistical and total uncertainties are indicated by the shaded areas. |
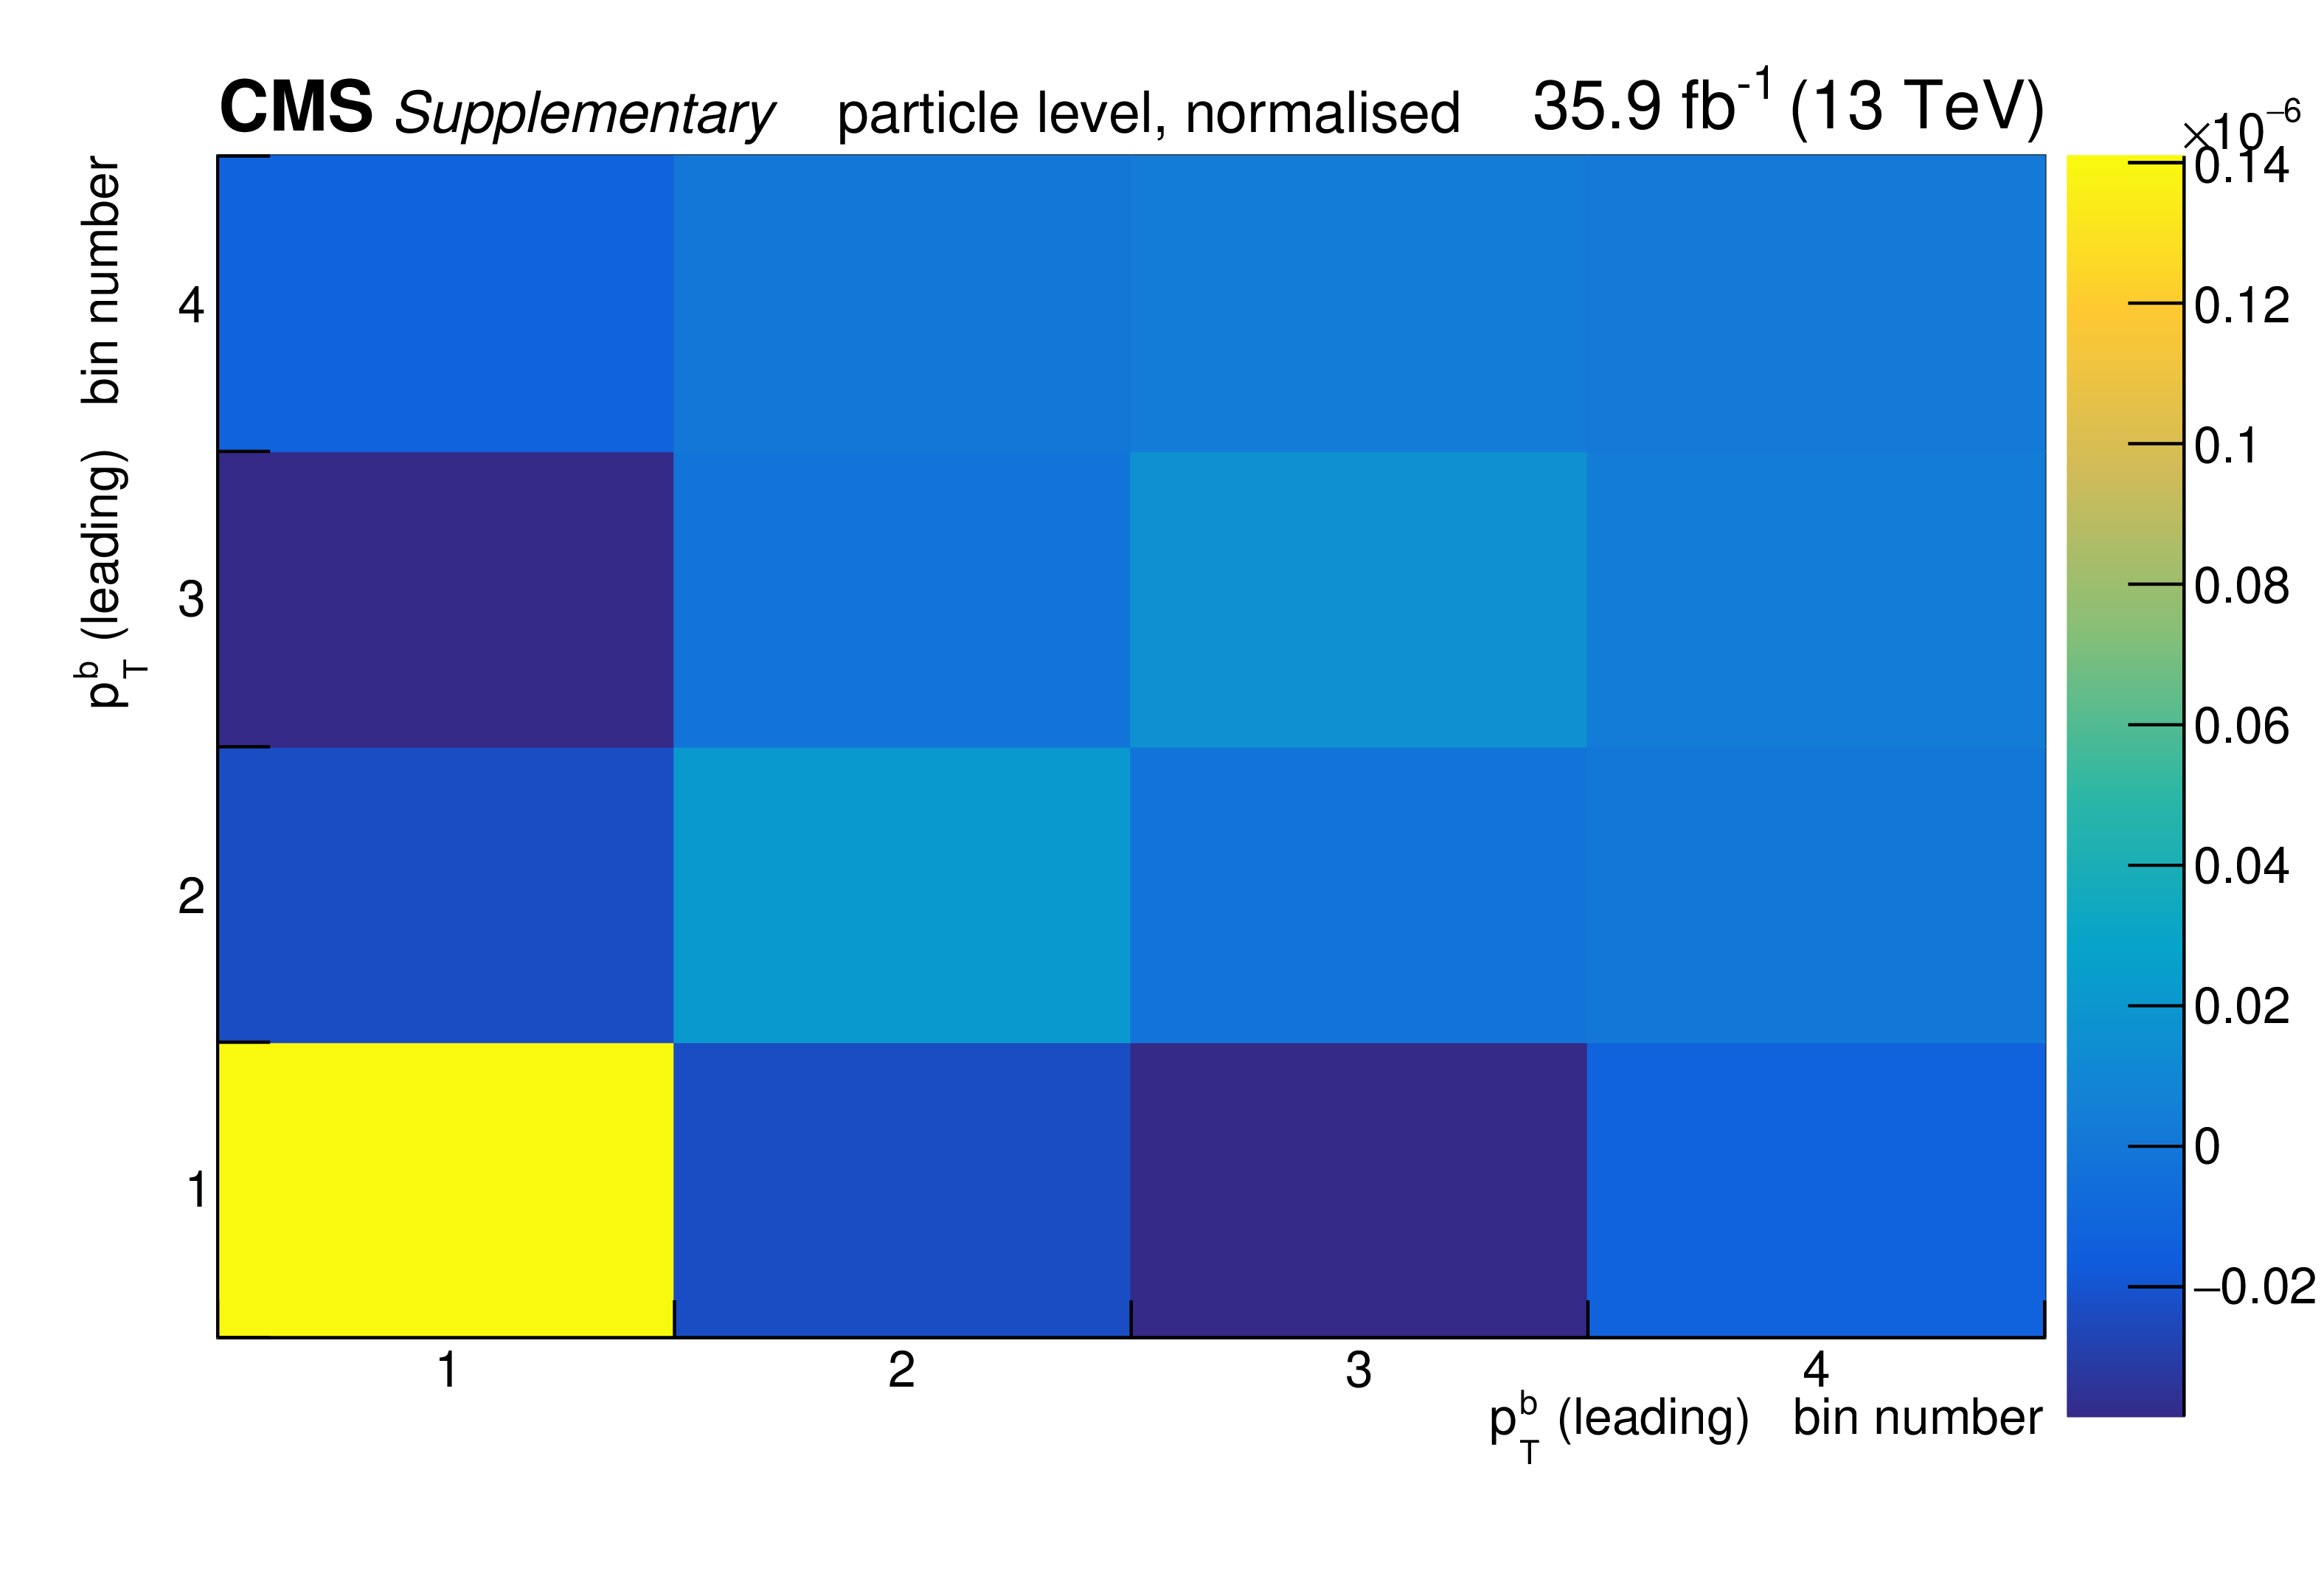
png pdf |
Additional Figure 164:
The covariance matrix of the measured data for the normalised measurement of the differential $\mathrm{t\bar{t}}$ cross section as a function of $p_{\mathrm {T}}^{b}$ (leading) at particle level is shown. |
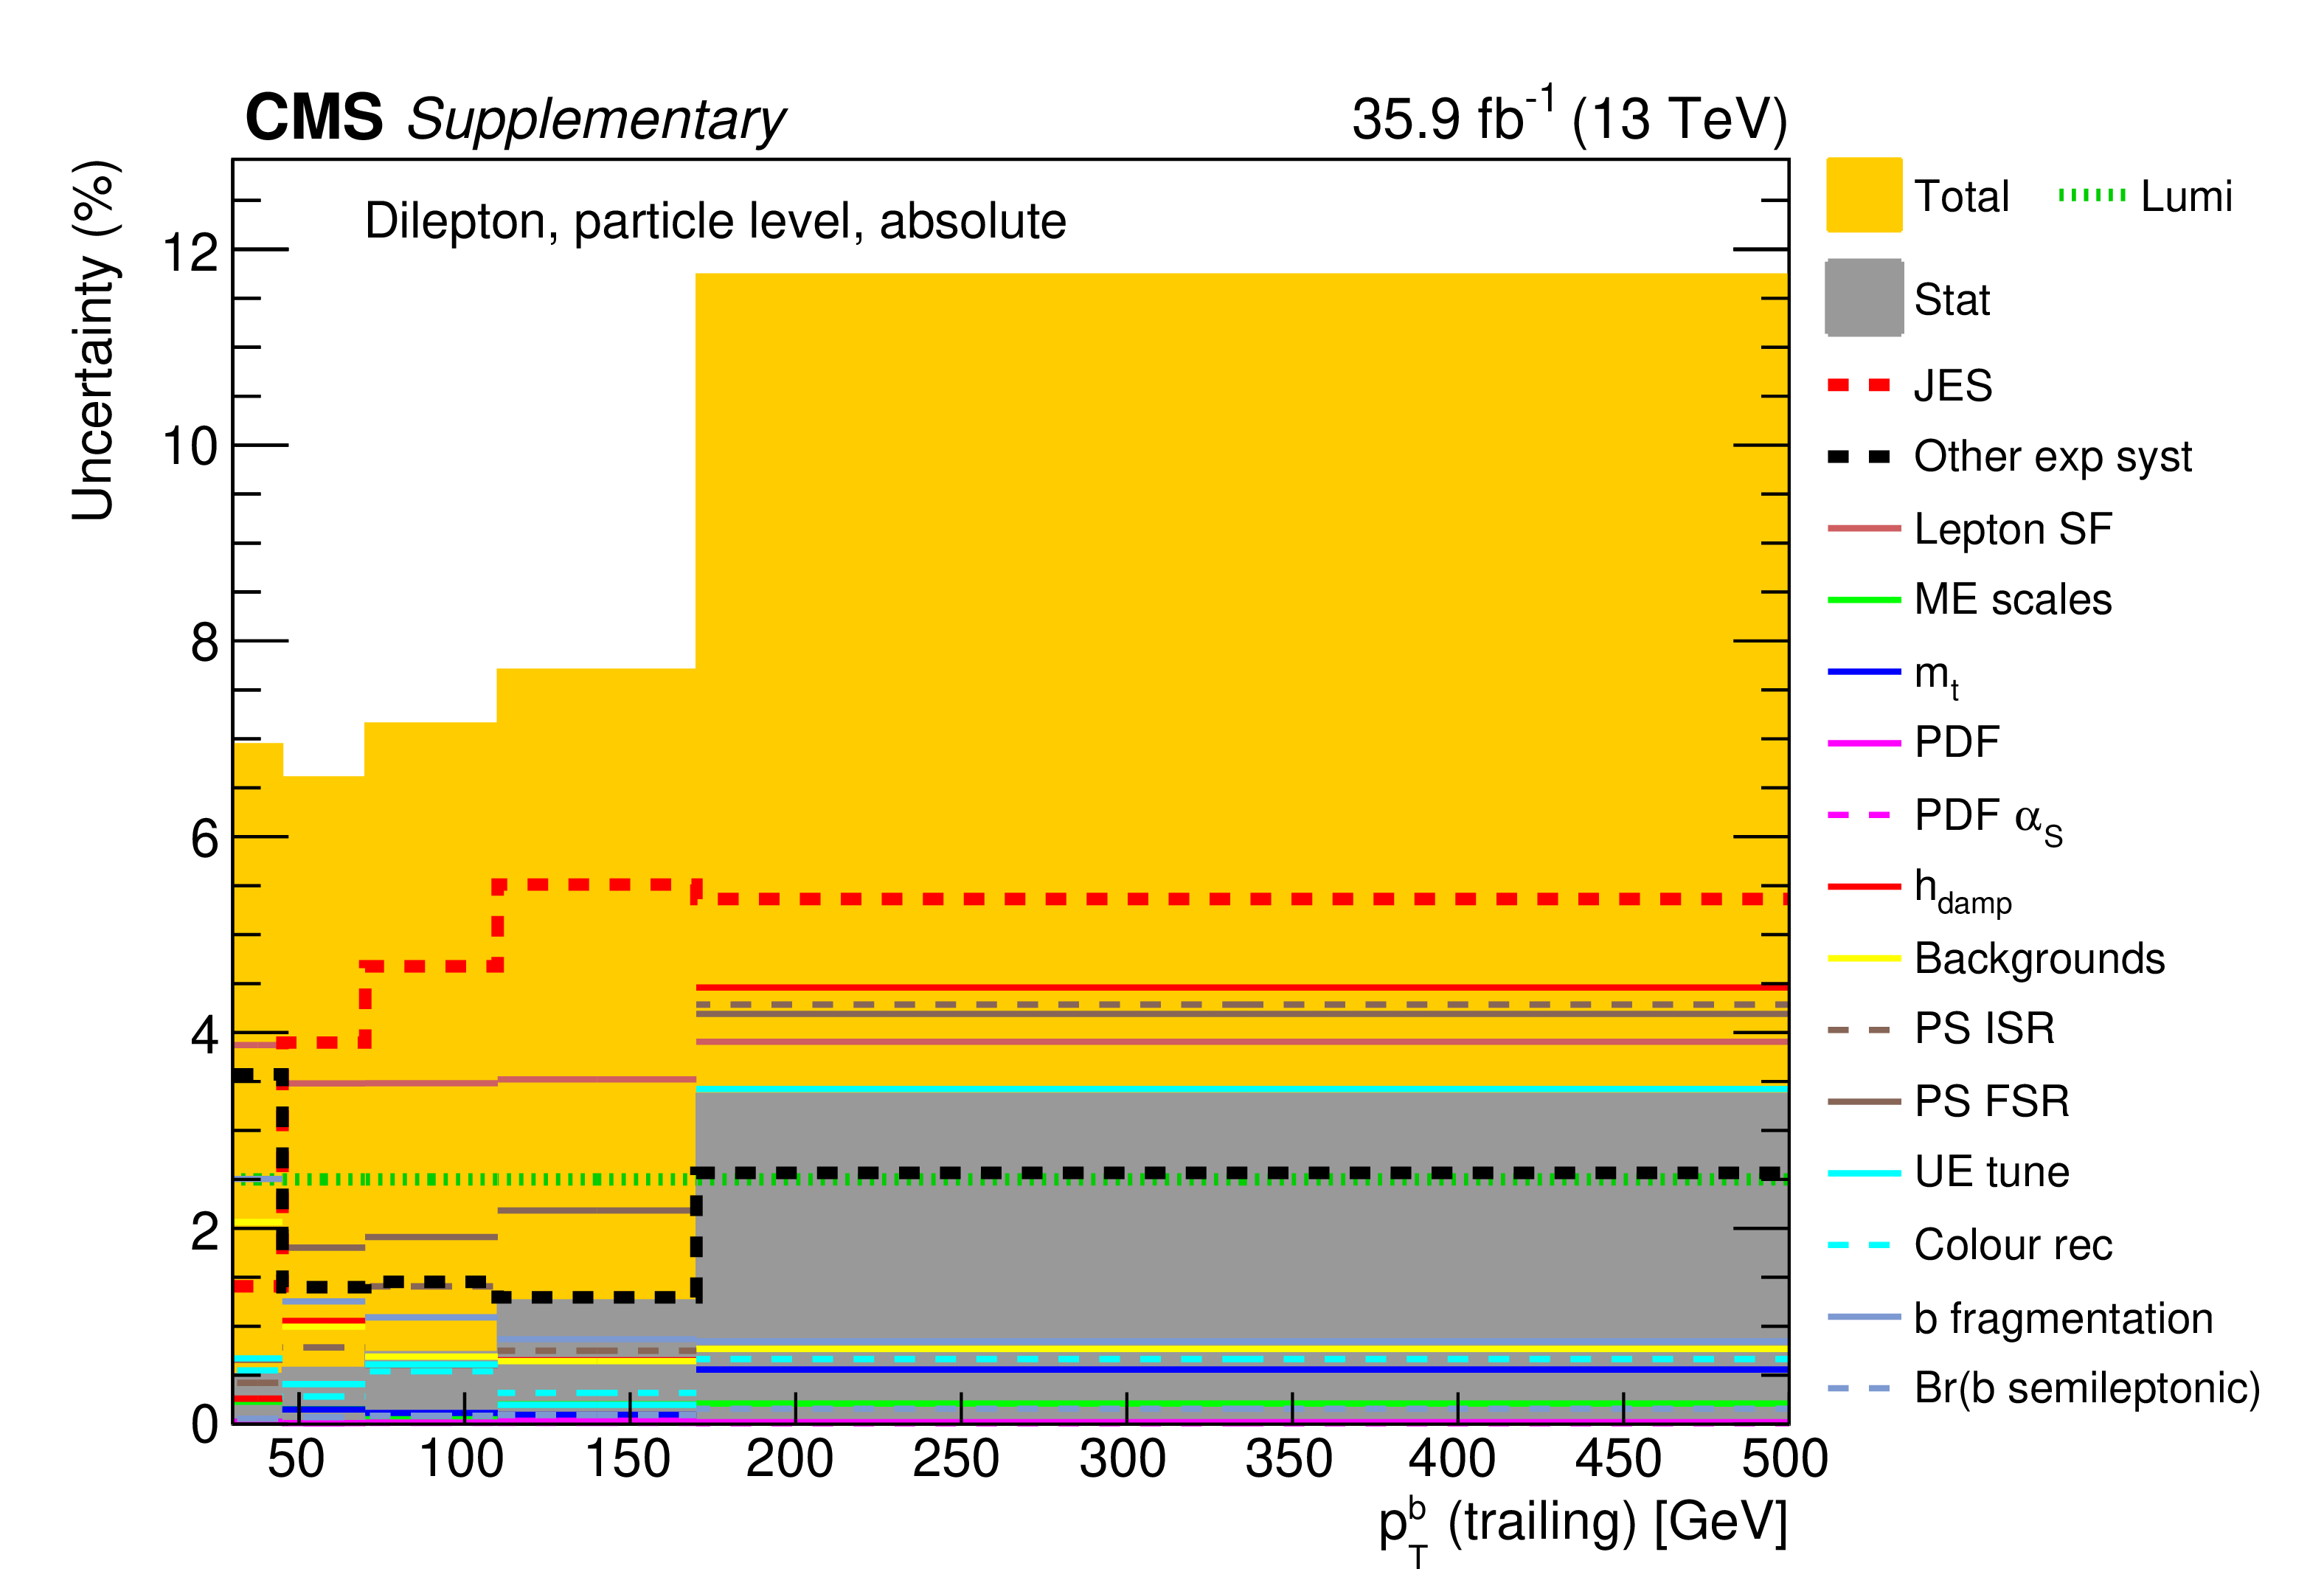
png pdf |
Additional Figure 165:
The breakdown of uncertainties for the absolute measurement of the differential $\mathrm{t\bar{t}}$ cross section as a function of $p_{\mathrm {T}}^{b}$ (trailing) at particle level is shown. The contributions of each source of systematic uncertainty in each bin are indicated by the coloured lines. Experimental systematic uncertainties that are small in all bins are added in quadrature and shown as a single component. The statistical and total uncertainties are indicated by the shaded areas. |
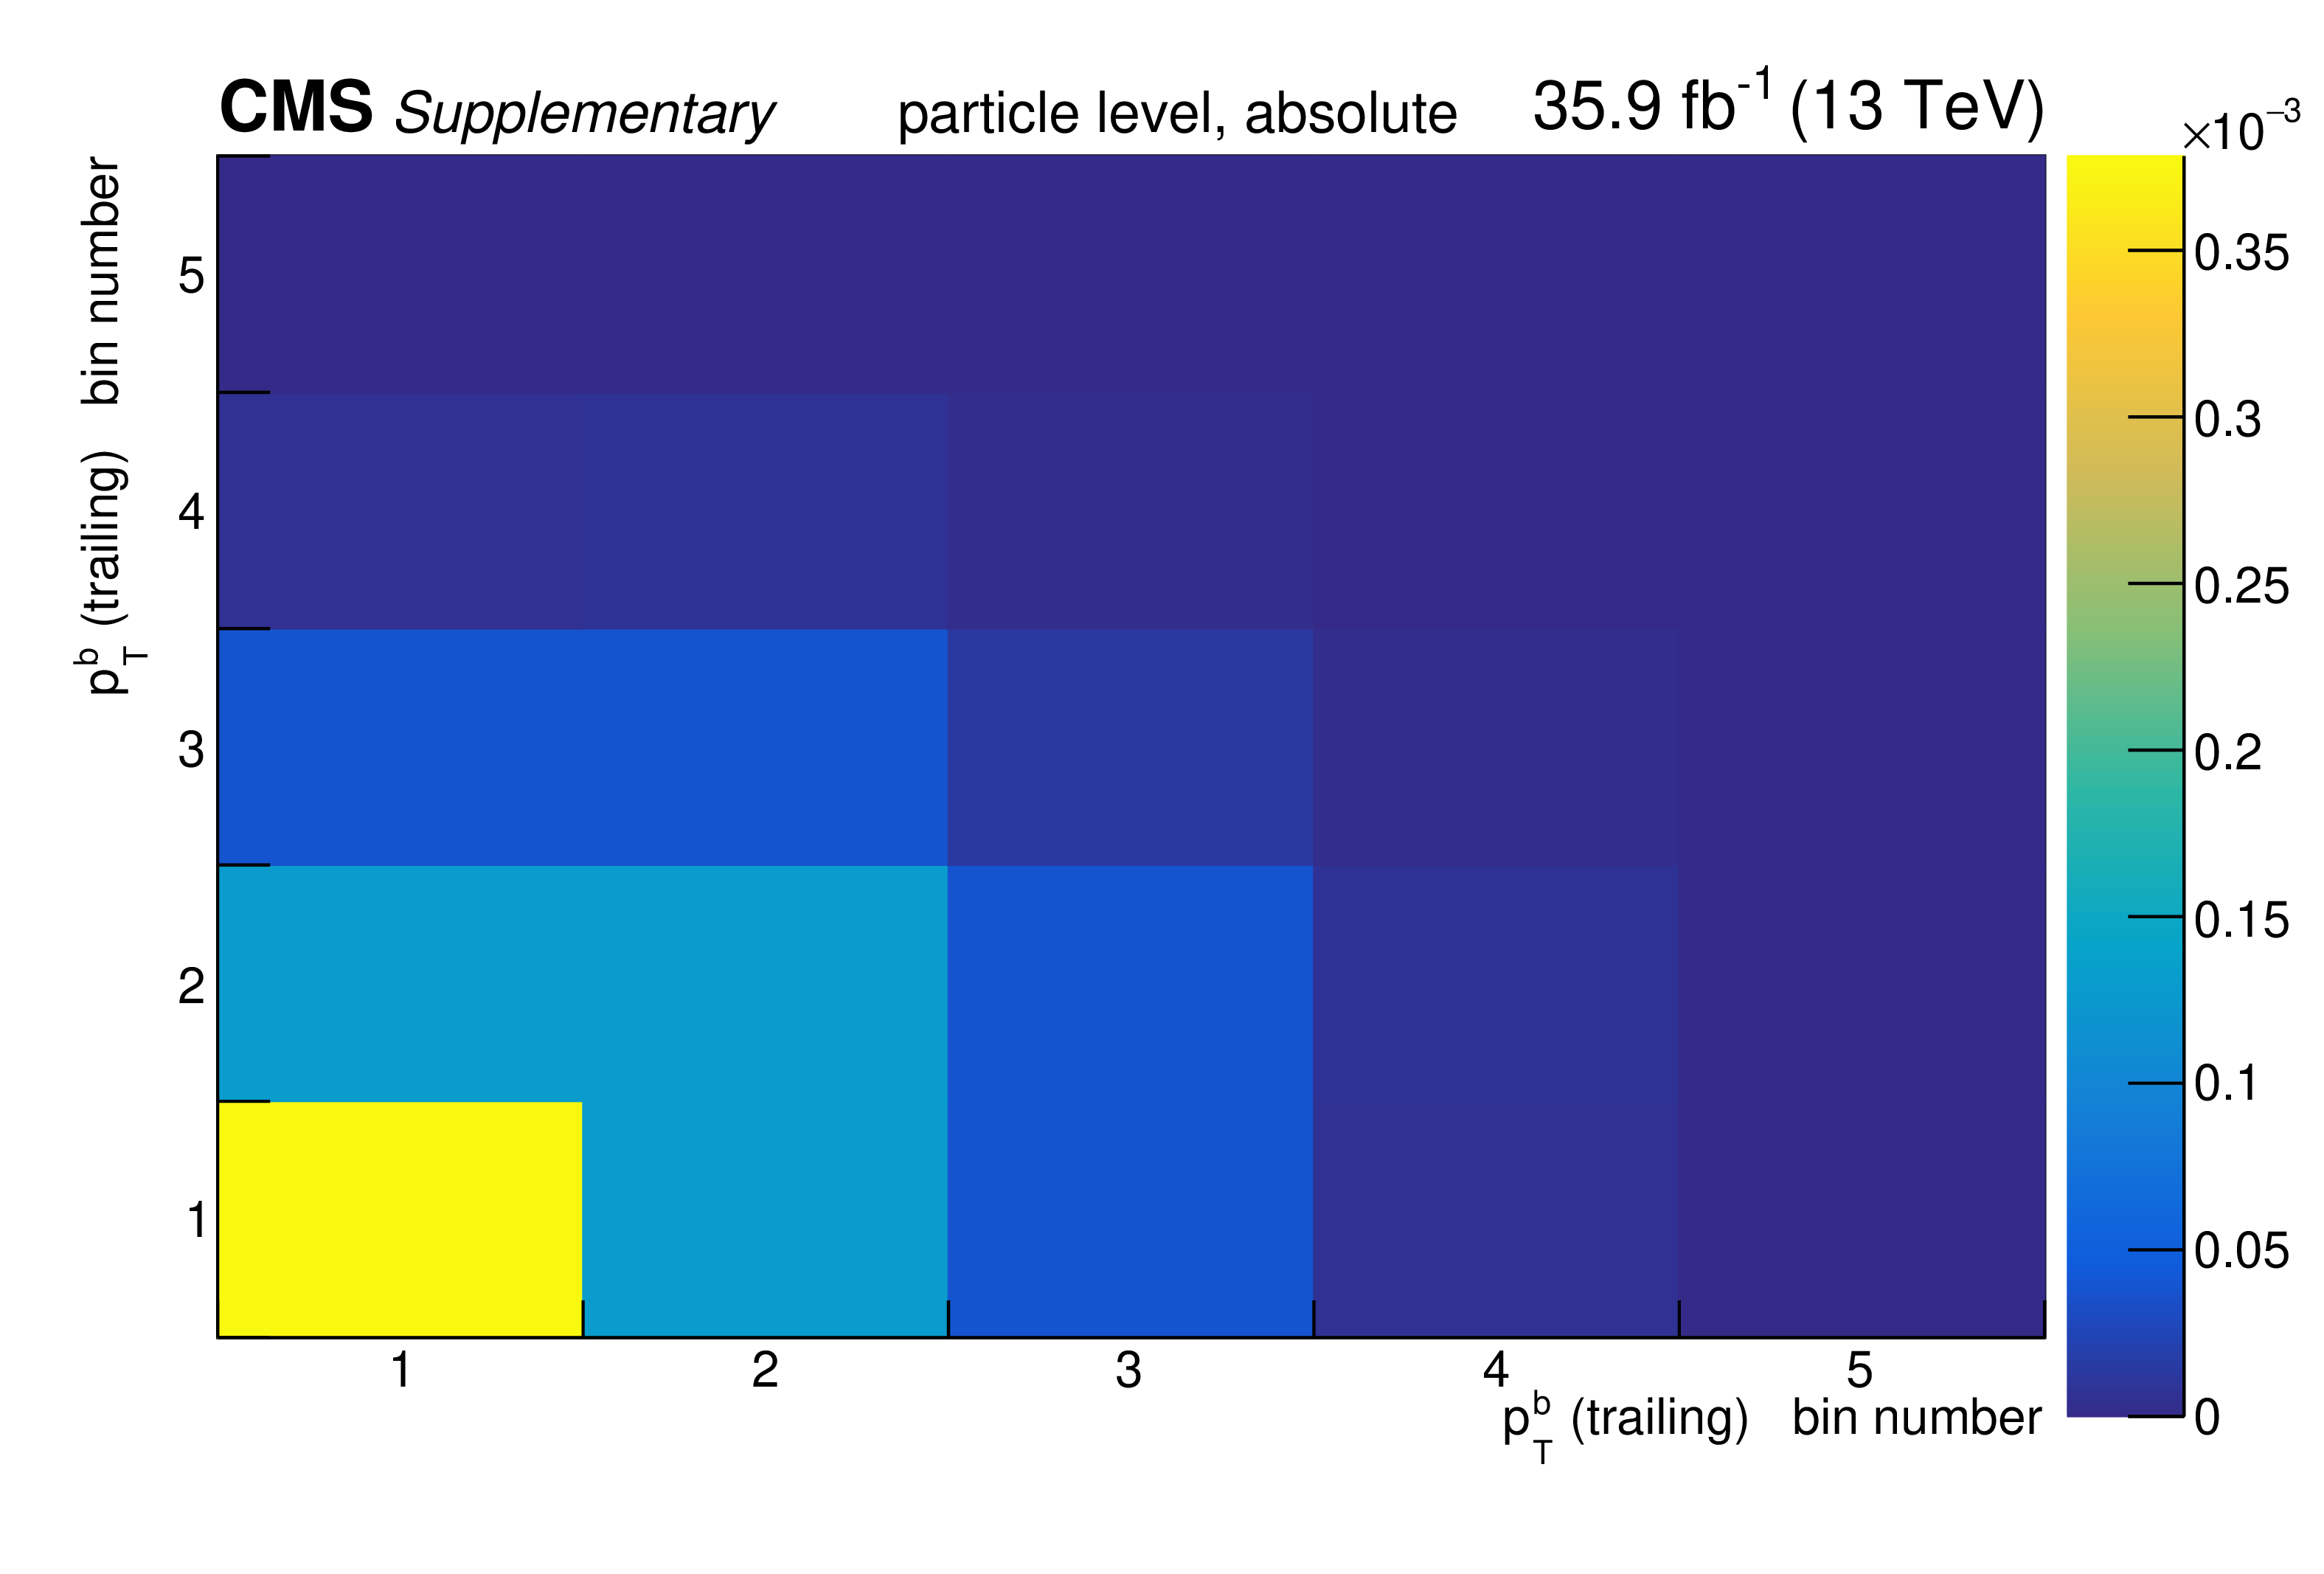
png pdf |
Additional Figure 166:
The covariance matrix of the measured data for the absolute measurement of the differential $\mathrm{t\bar{t}}$ cross section as a function of $p_{\mathrm {T}}^{b}$ (trailing) at particle level is shown. |
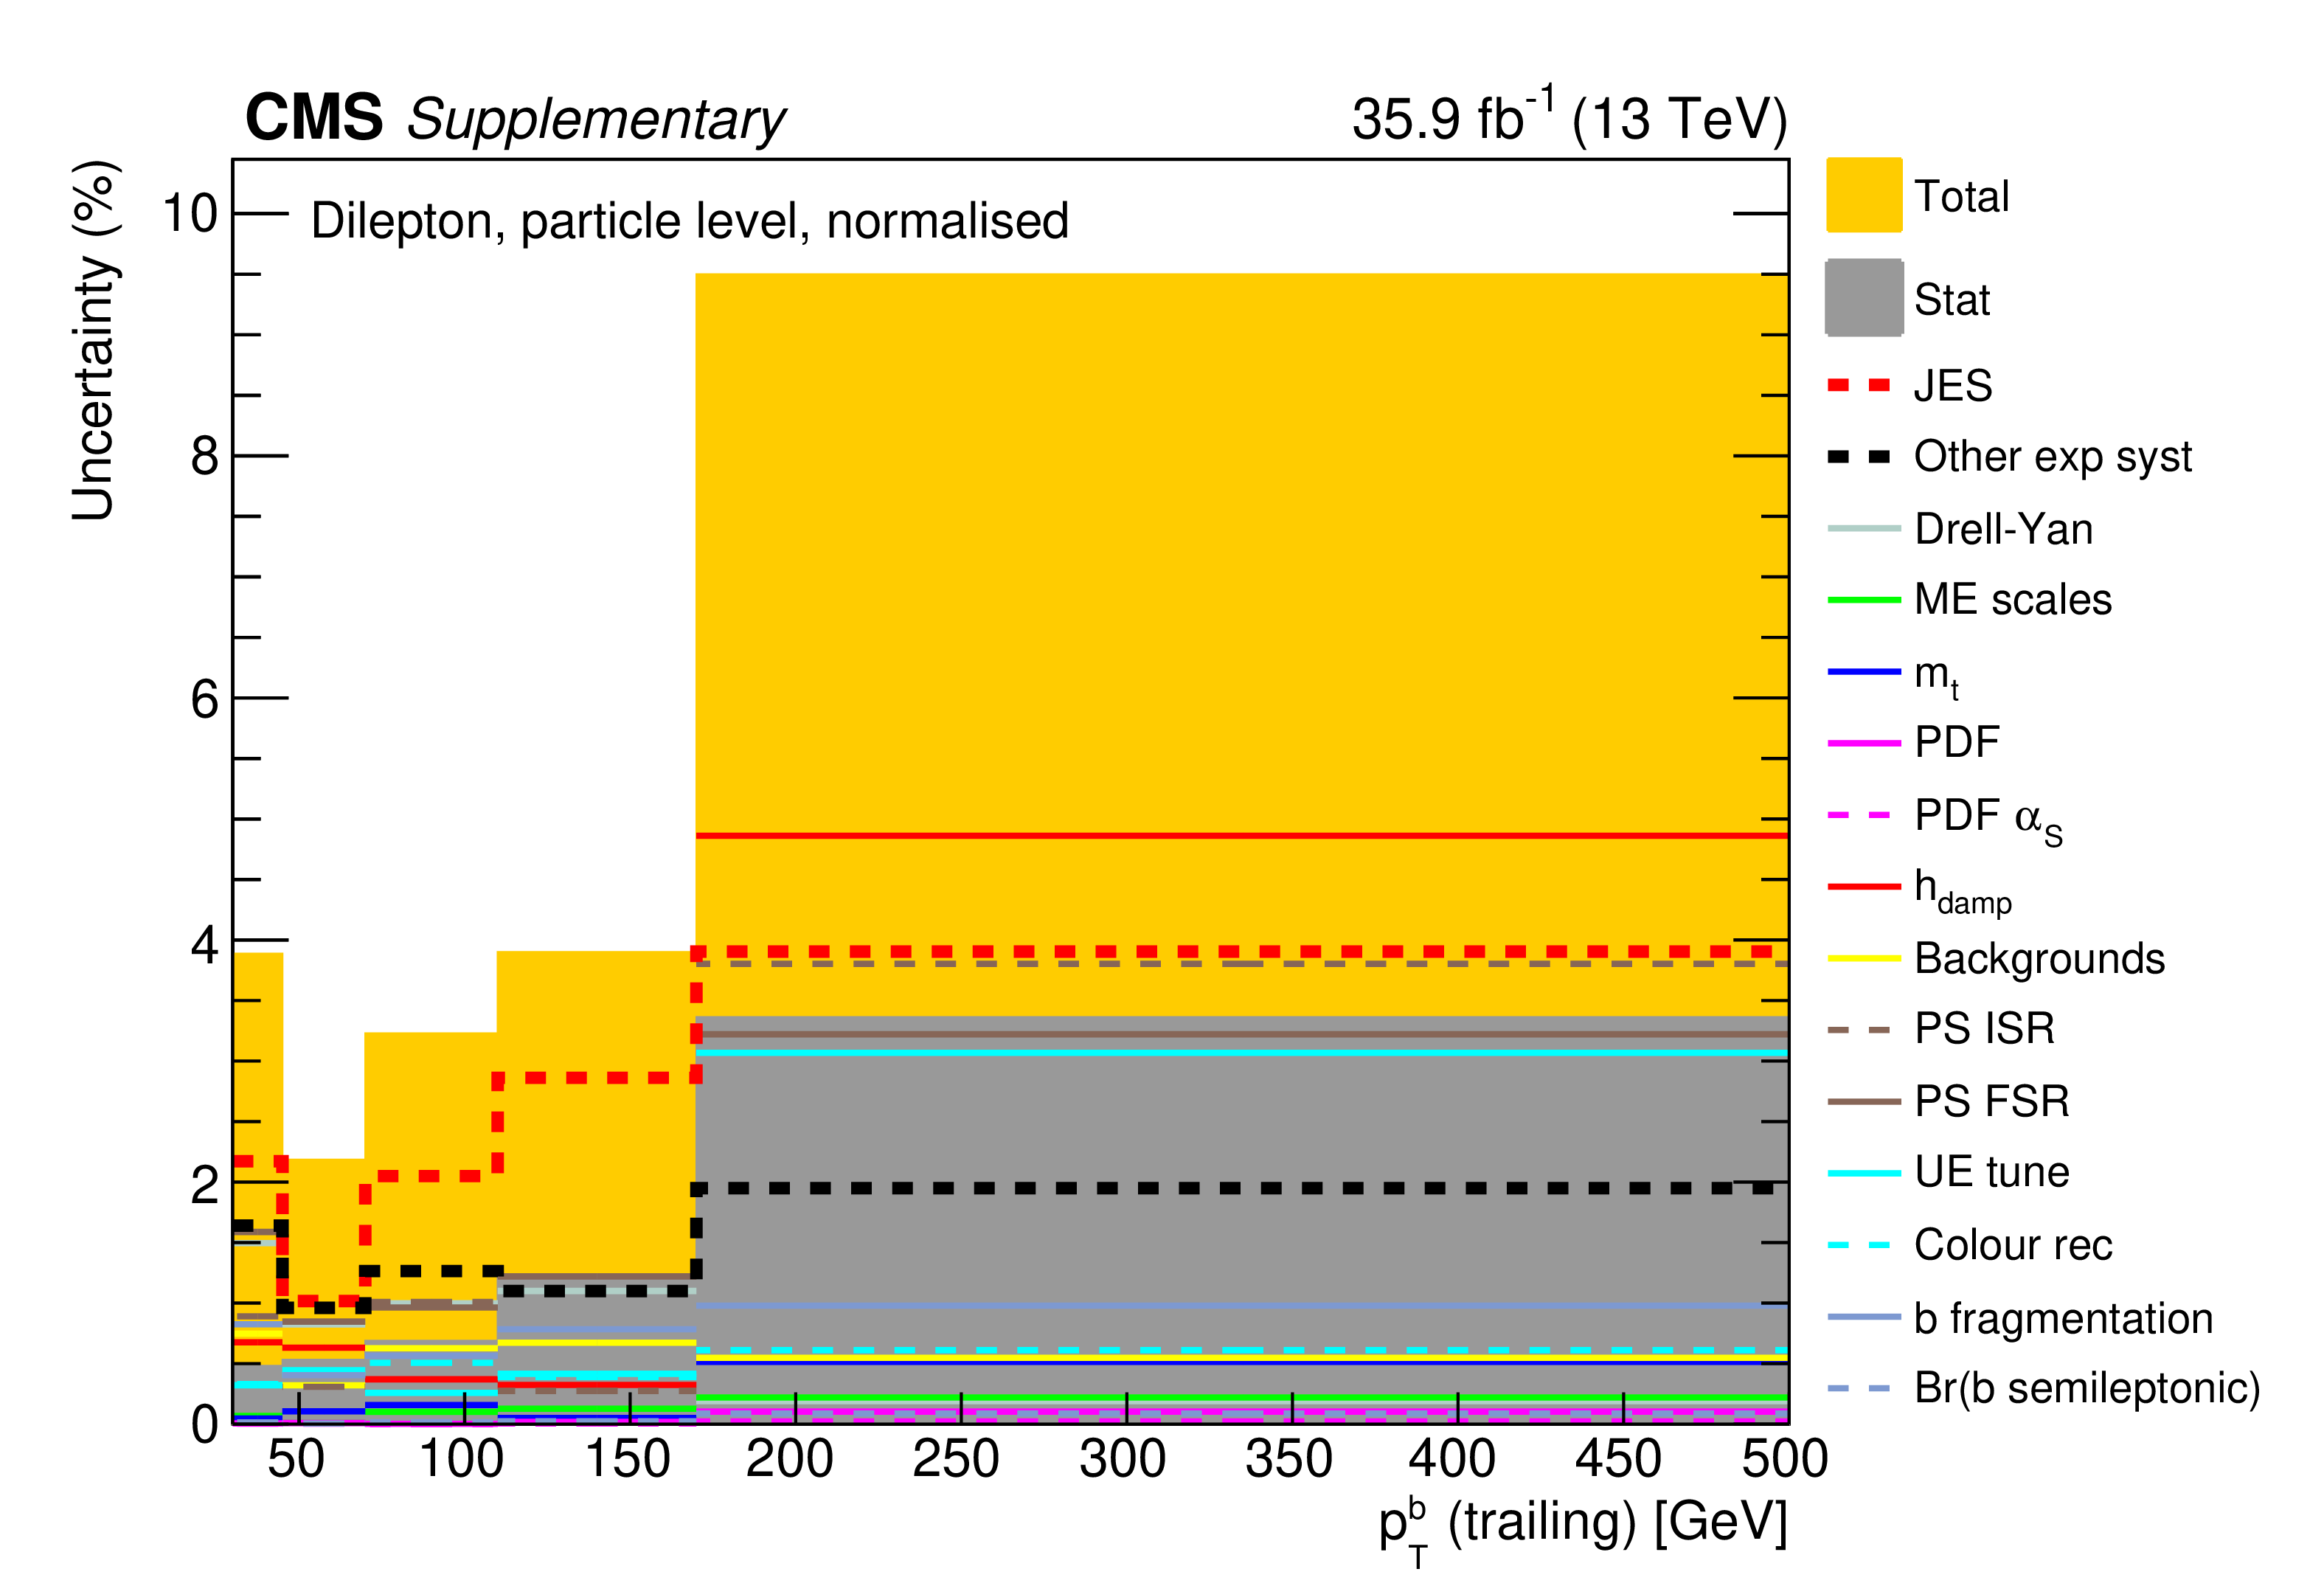
png pdf |
Additional Figure 167:
The breakdown of uncertainties for the normalised measurement of the differential $\mathrm{t\bar{t}}$ cross section as a function of $p_{\mathrm {T}}^{b}$ (trailing) at particle level is shown. The contributions of each source of systematic uncertainty in each bin are indicated by the coloured lines. Experimental systematic uncertainties that are small in all bins are added in quadrature and shown as a single component. The statistical and total uncertainties are indicated by the shaded areas. |

png pdf |
Additional Figure 168:
The covariance matrix of the measured data for the normalised measurement of the differential $\mathrm{t\bar{t}}$ cross section as a function of $p_{\mathrm {T}}^{b}$ (trailing) at particle level is shown. |
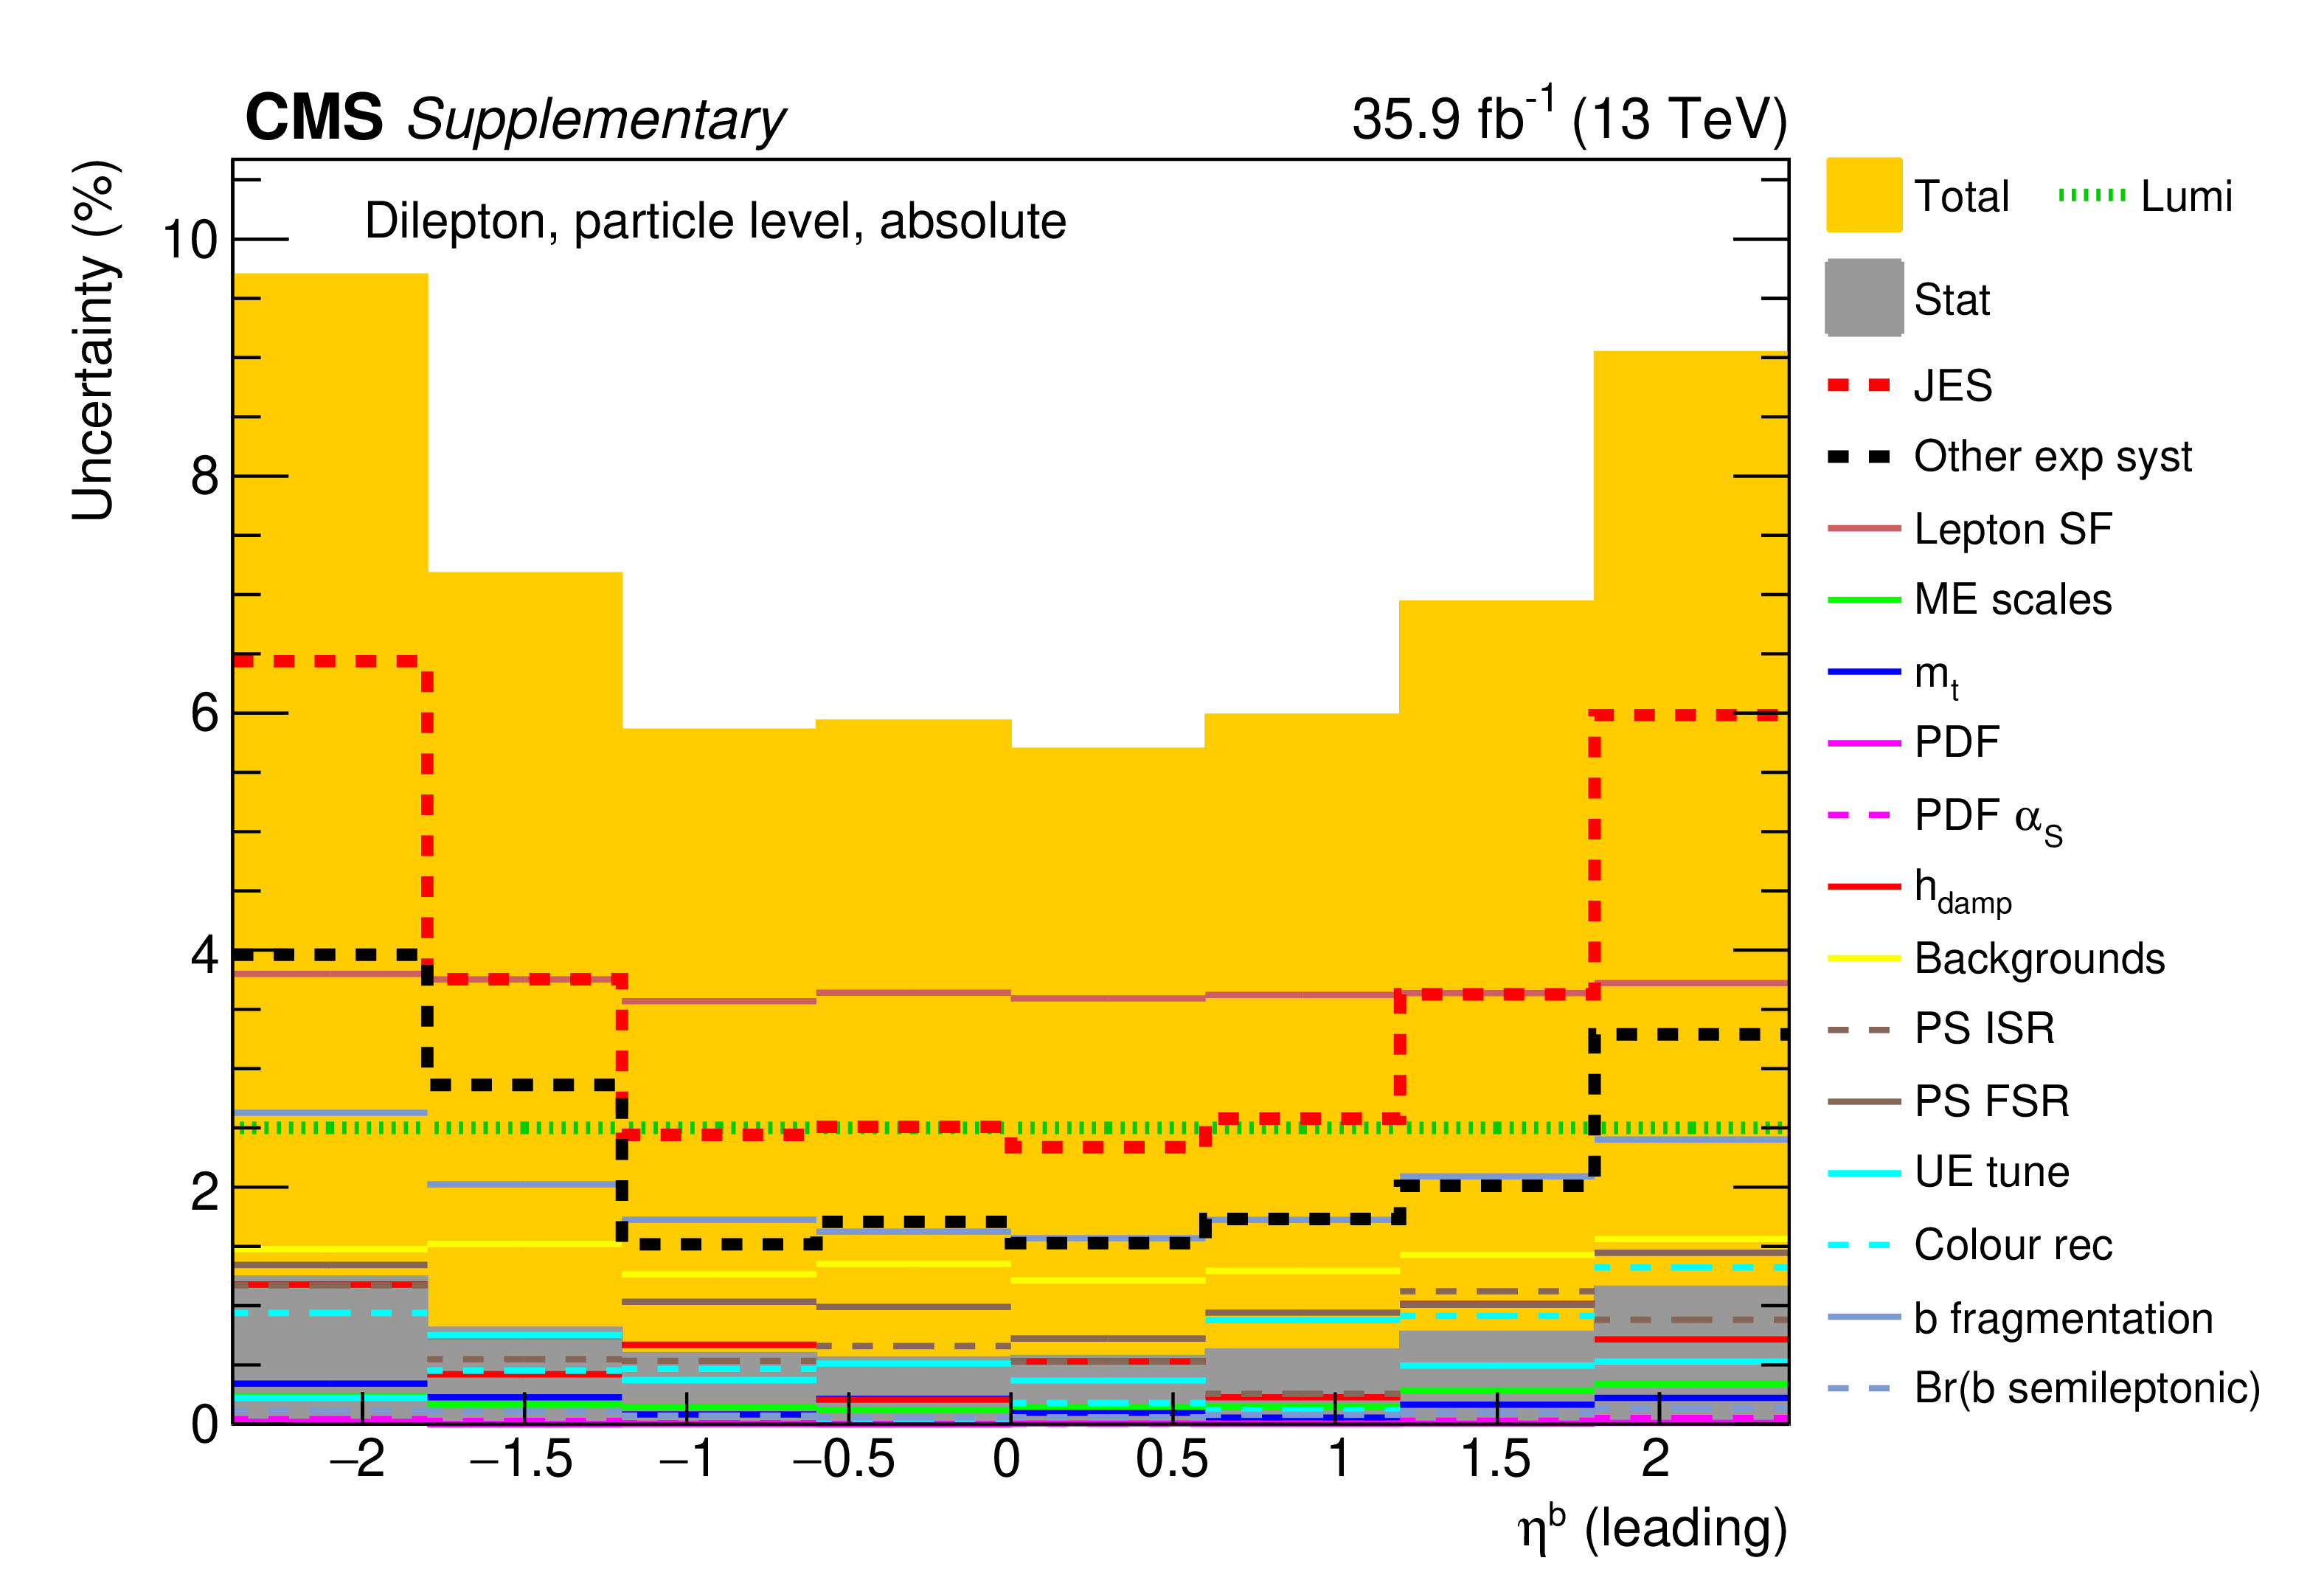
png pdf |
Additional Figure 169:
The breakdown of uncertainties for the absolute measurement of the differential $\mathrm{t\bar{t}}$ cross section as a function of $\eta _{b}$ (leading) at particle level is shown. The contributions of each source of systematic uncertainty in each bin are indicated by the coloured lines. Experimental systematic uncertainties that are small in all bins are added in quadrature and shown as a single component. The statistical and total uncertainties are indicated by the shaded areas. |

png pdf |
Additional Figure 170:
The covariance matrix of the measured data for the absolute measurement of the differential $\mathrm{t\bar{t}}$ cross section as a function of $\eta _{b}$ (leading) at particle level is shown. |
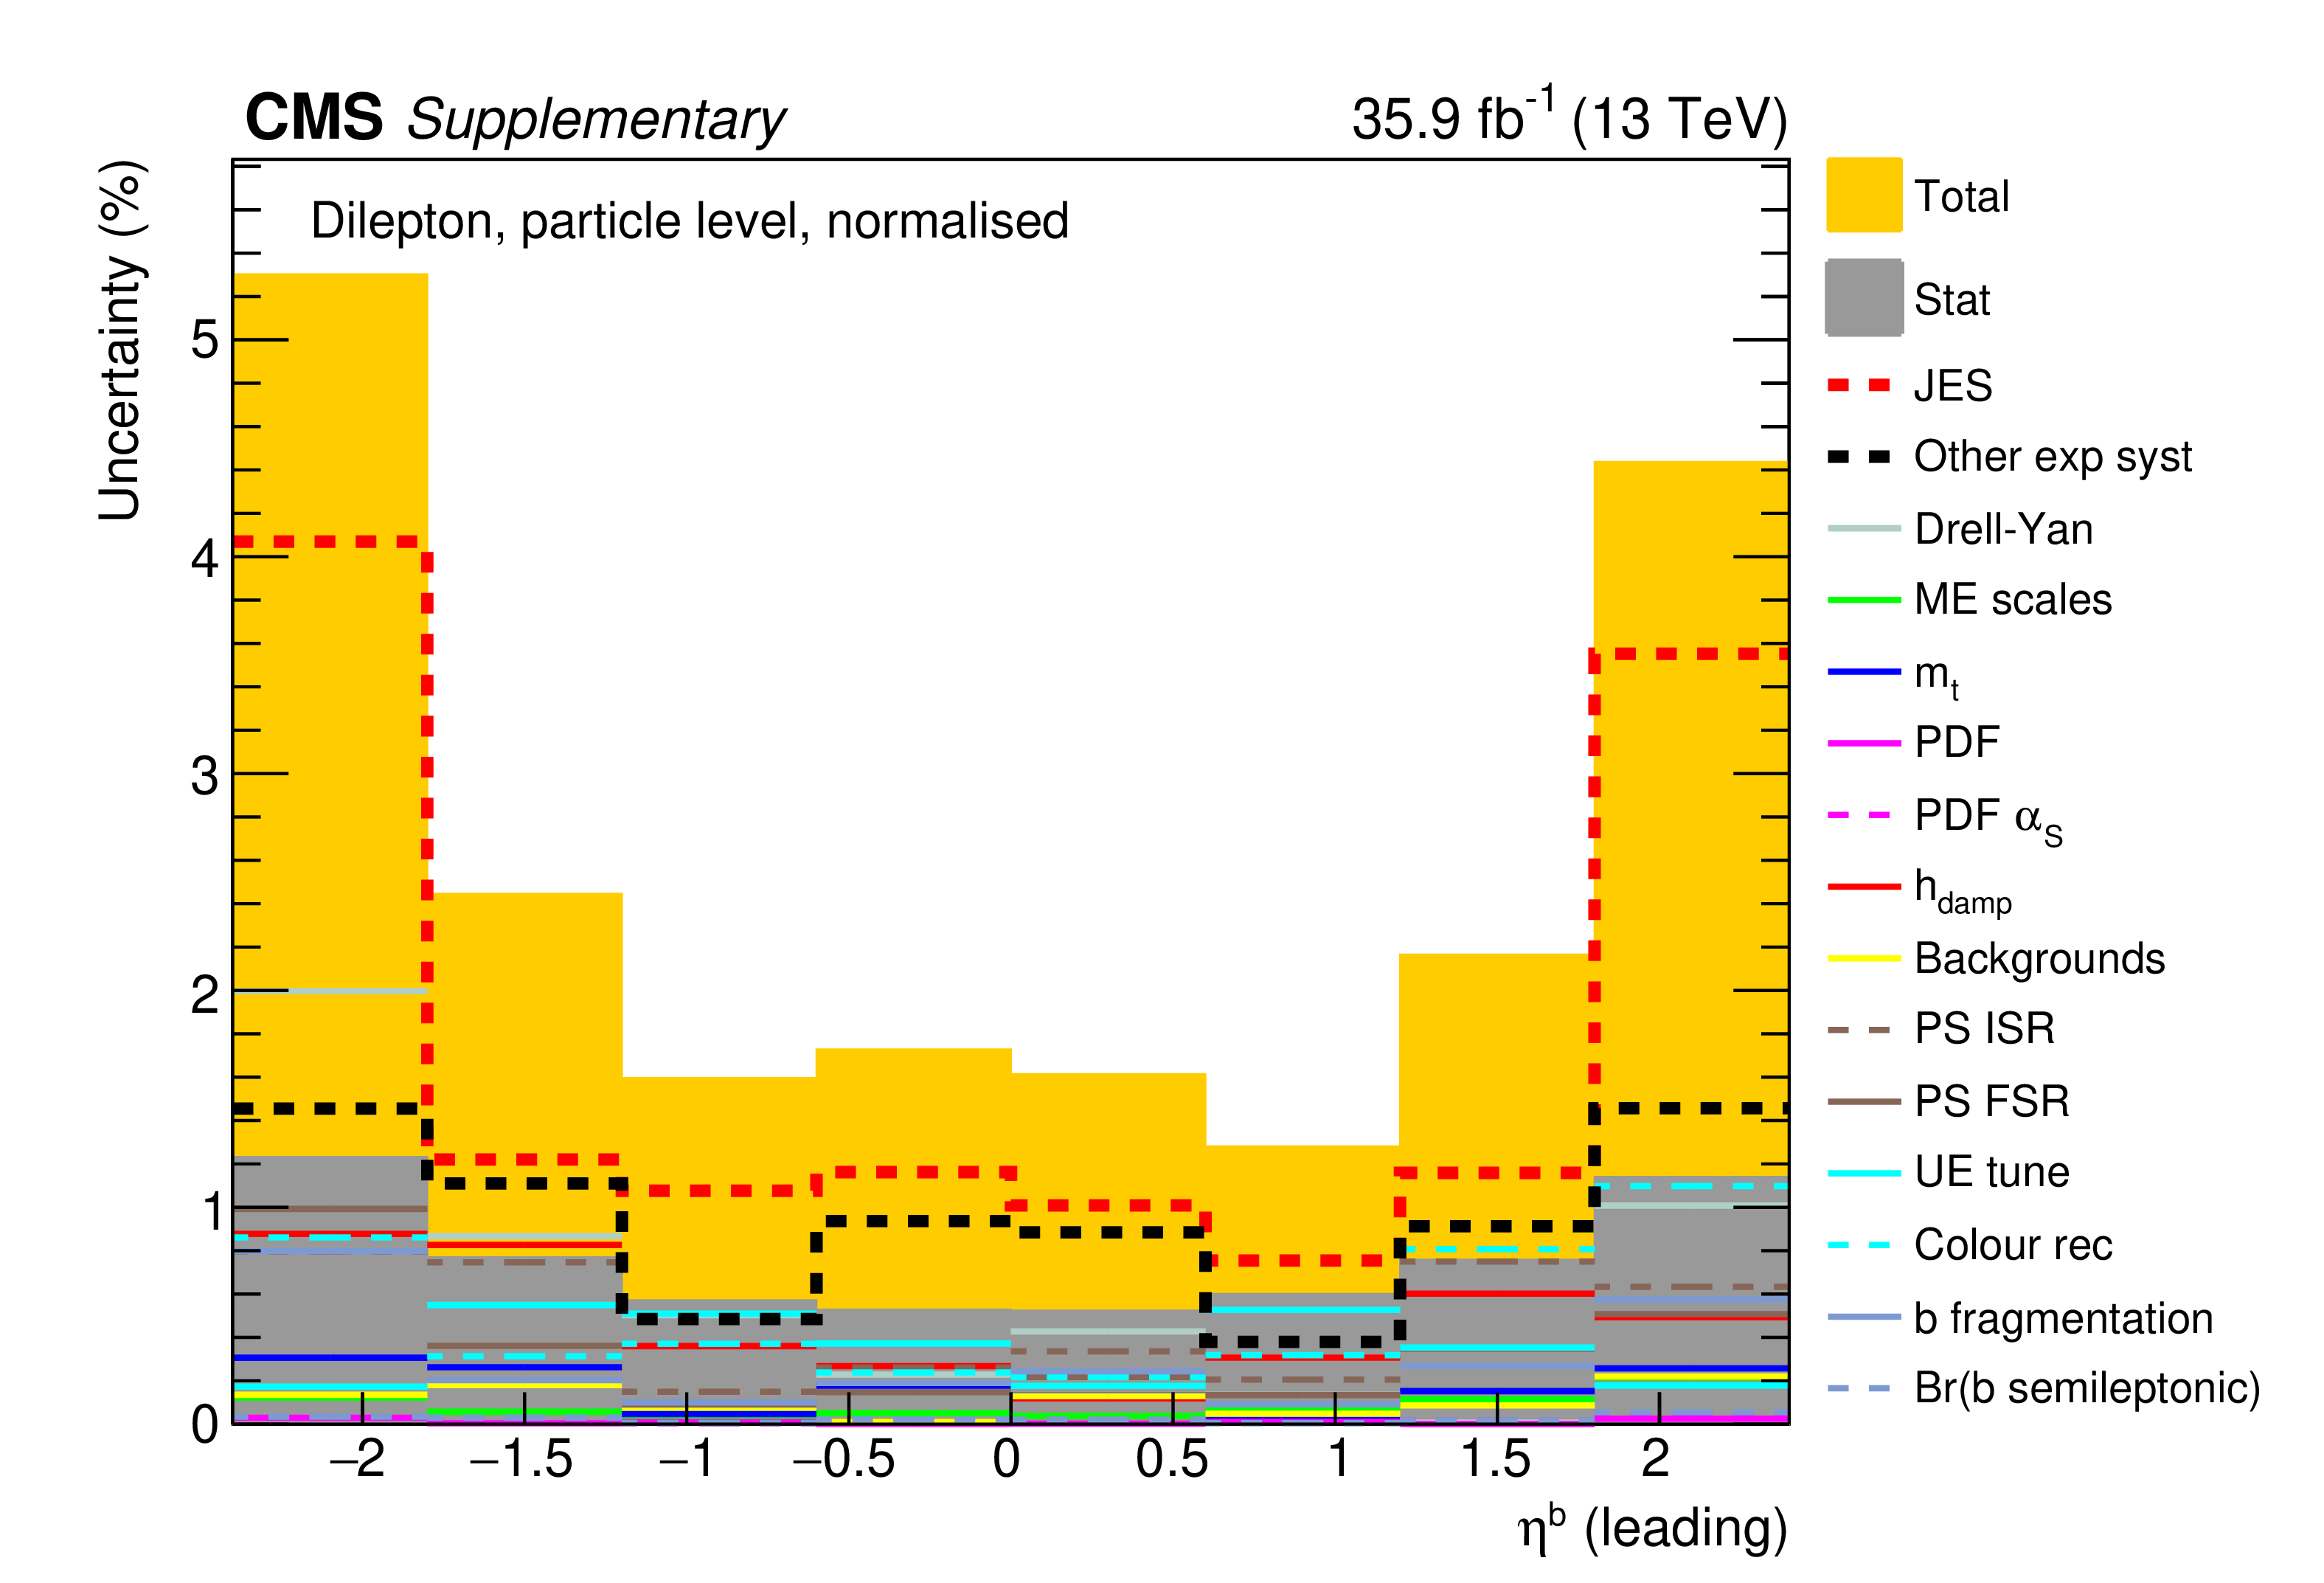
png pdf |
Additional Figure 171:
The breakdown of uncertainties for the normalised measurement of the differential $\mathrm{t\bar{t}}$ cross section as a function of $\eta _{b}$ (leading) at particle level is shown. The contributions of each source of systematic uncertainty in each bin are indicated by the coloured lines. Experimental systematic uncertainties that are small in all bins are added in quadrature and shown as a single component. The statistical and total uncertainties are indicated by the shaded areas. |
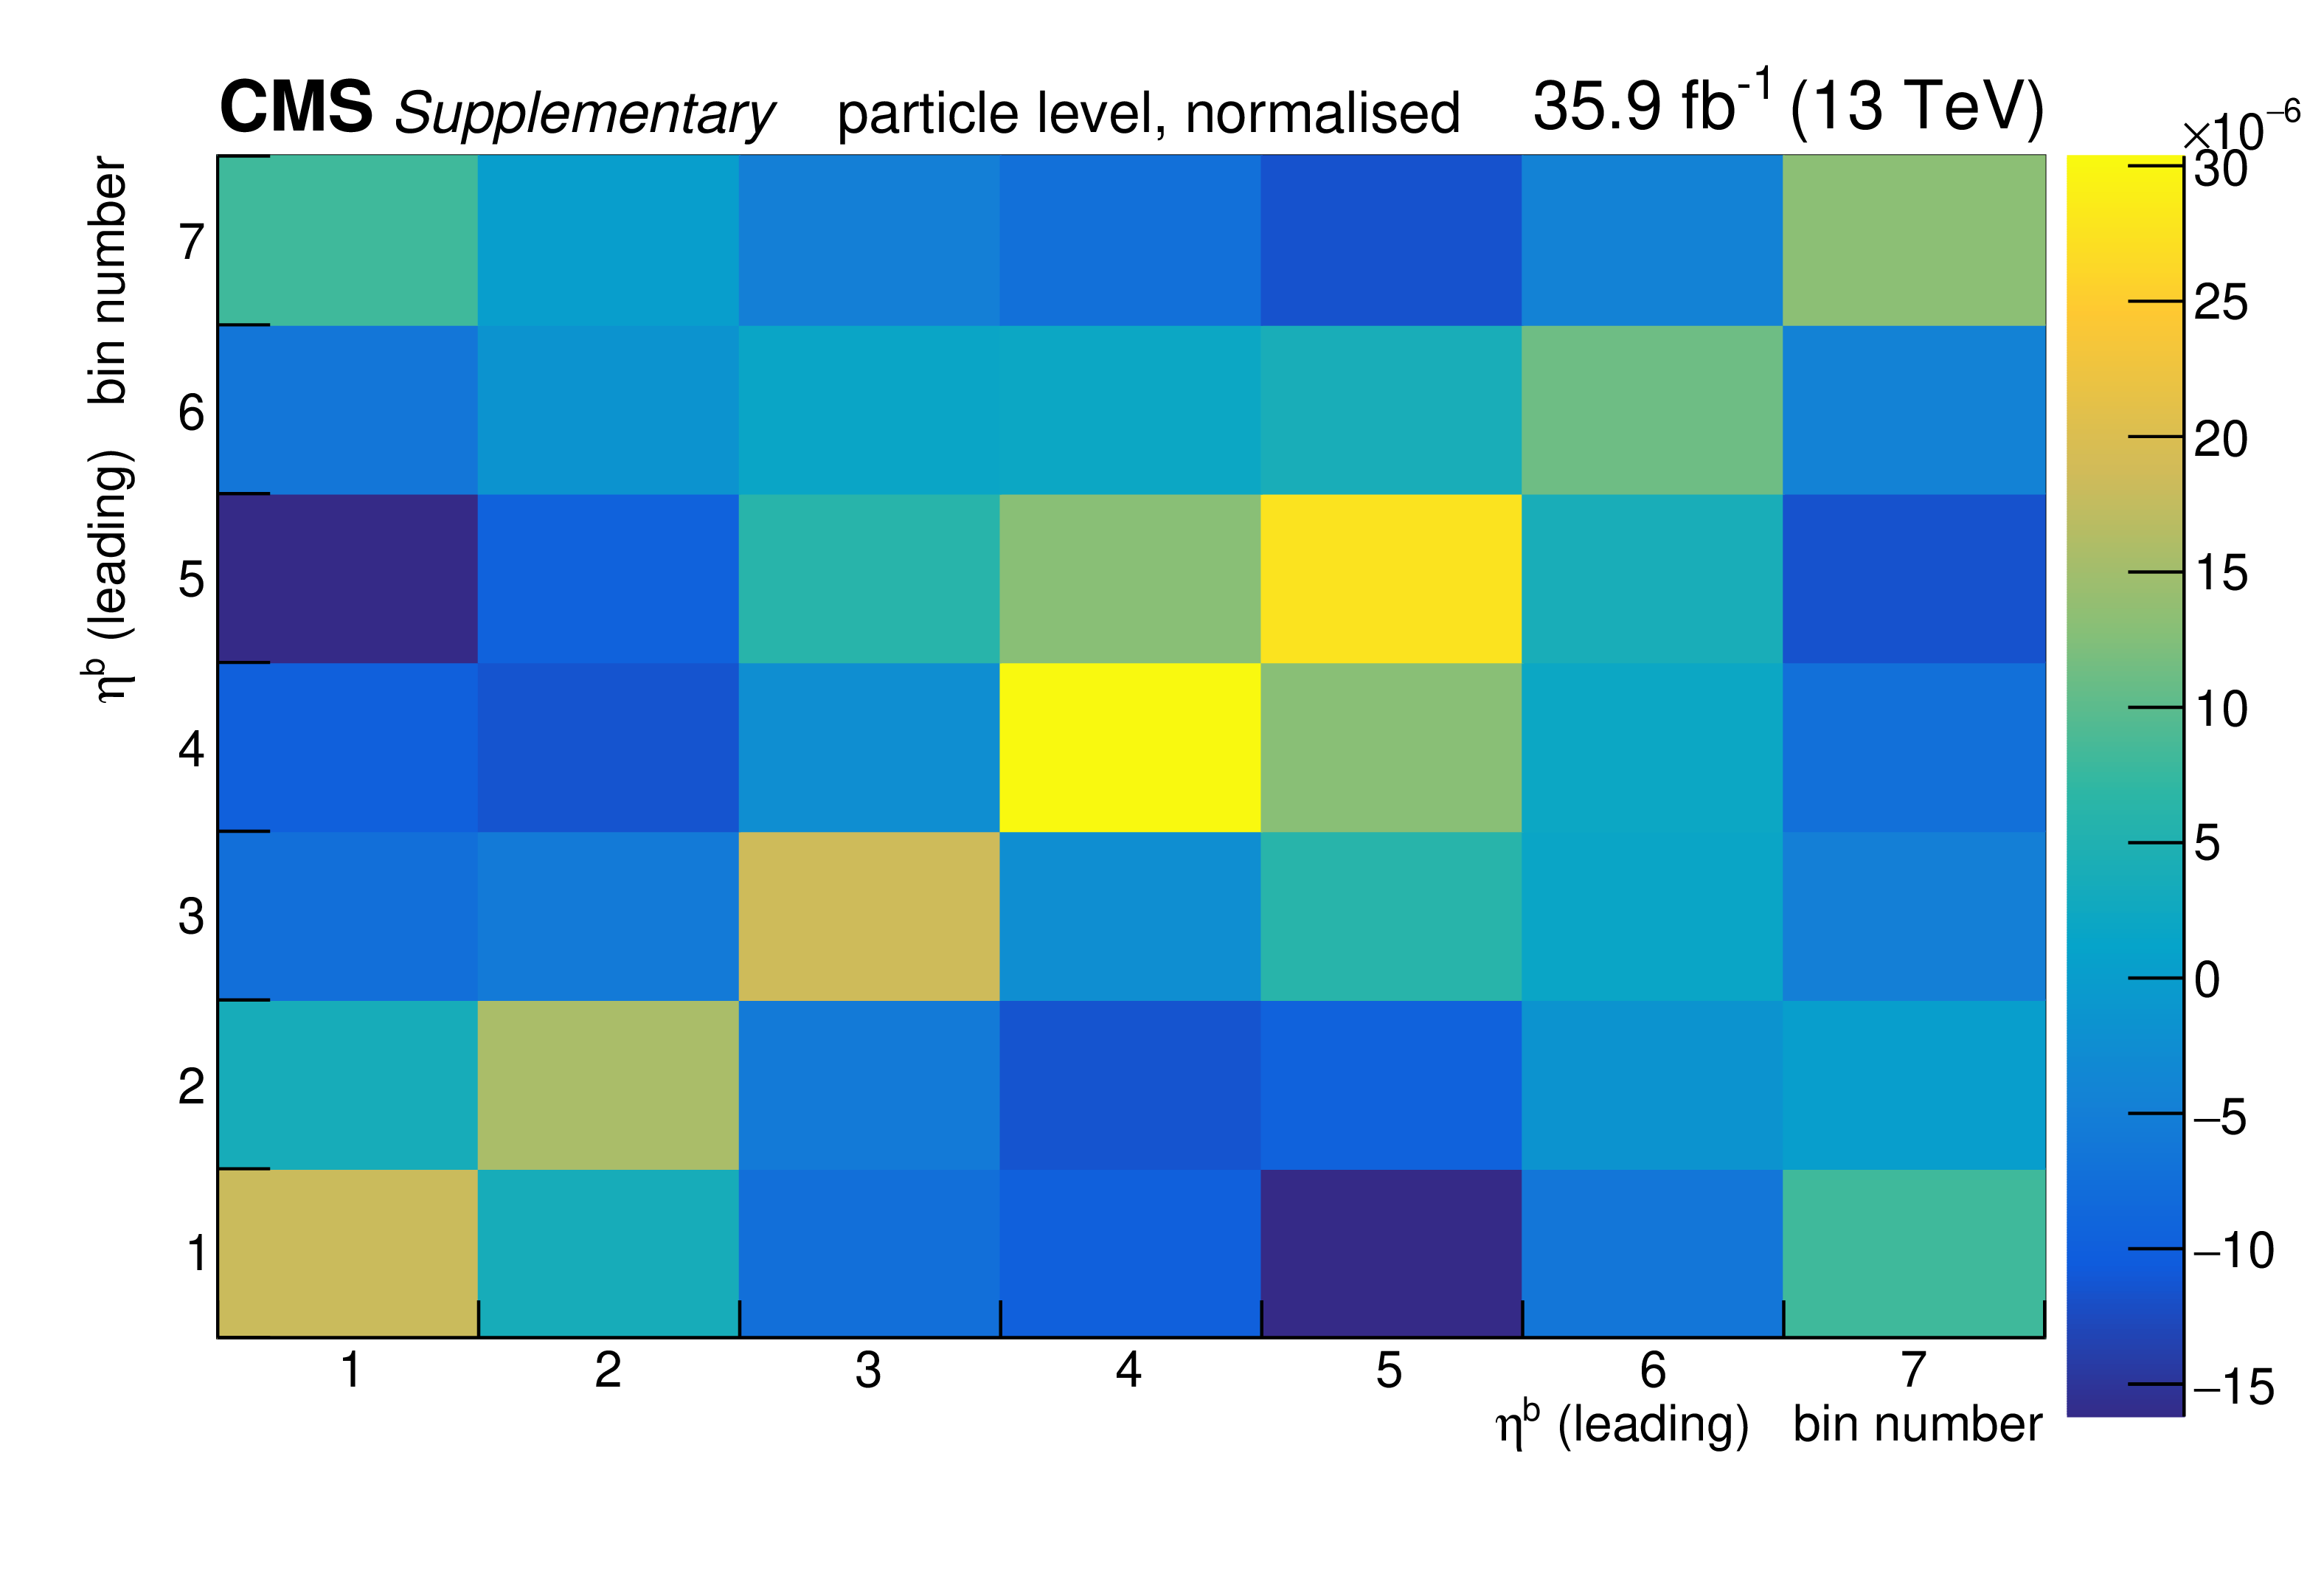
png pdf |
Additional Figure 172:
The covariance matrix of the measured data for the normalised measurement of the differential $\mathrm{t\bar{t}}$ cross section as a function of $\eta _{b}$ (leading) at particle level is shown. |
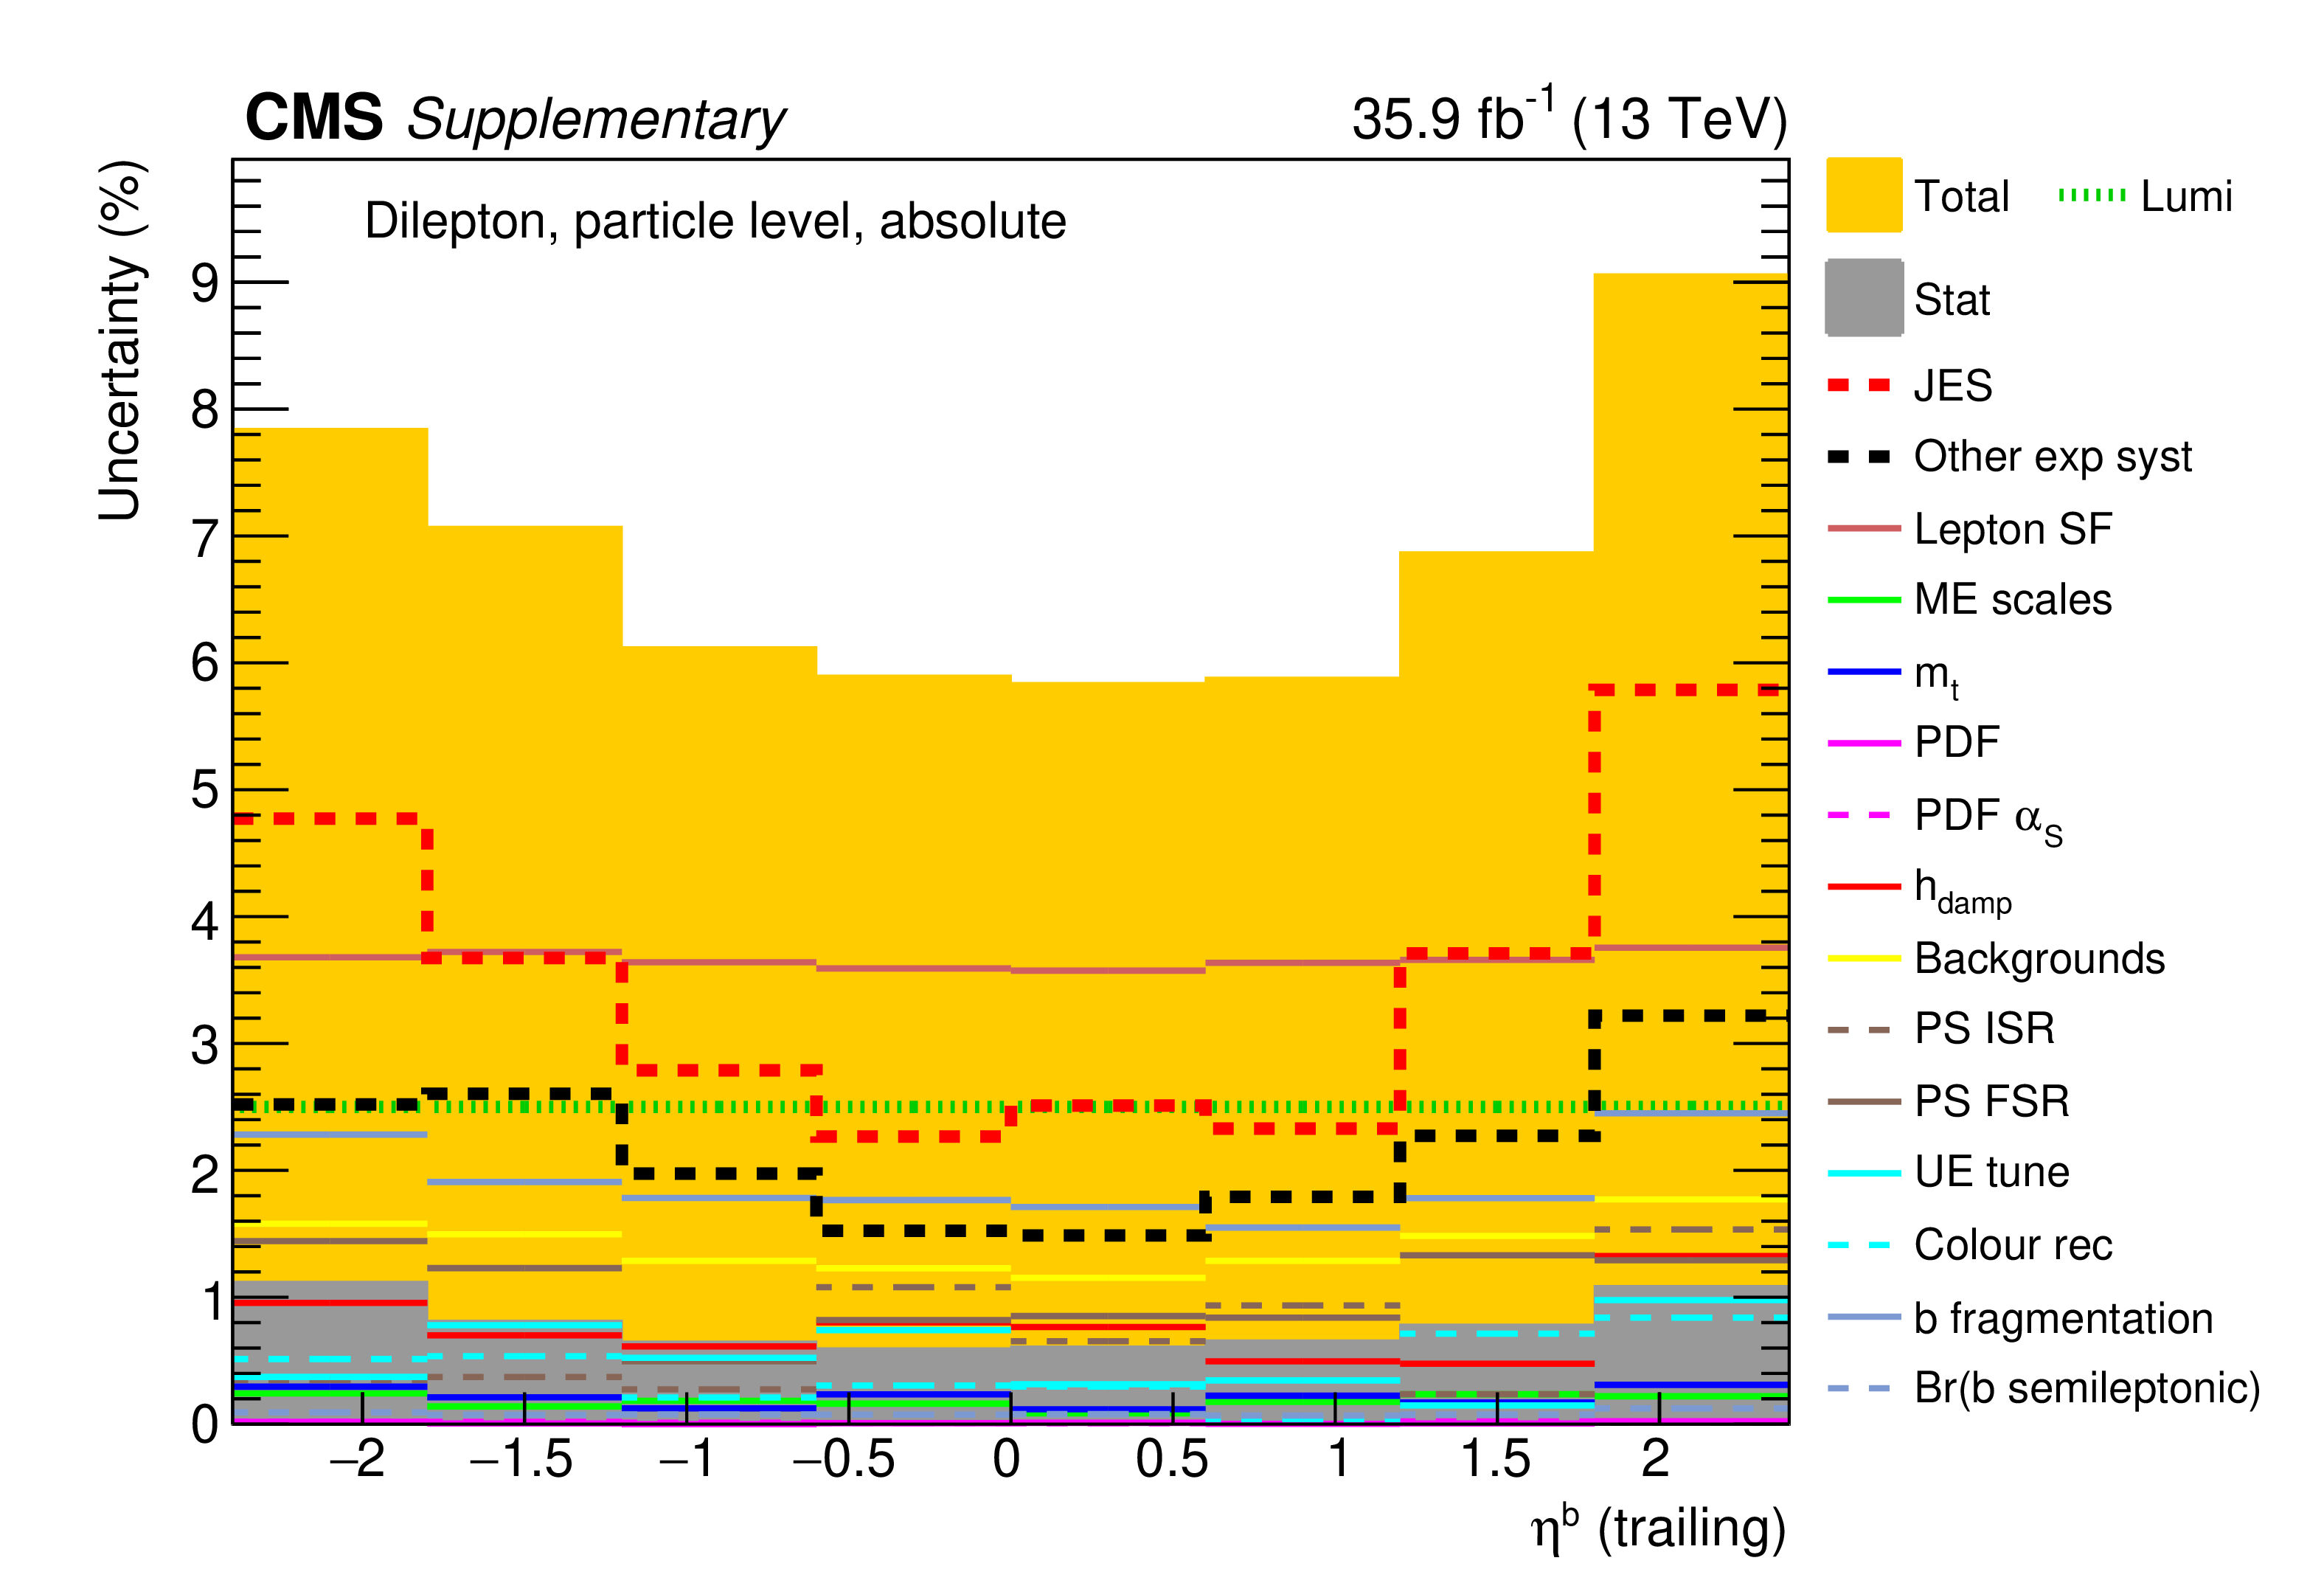
png pdf |
Additional Figure 173:
The breakdown of uncertainties for the absolute measurement of the differential $\mathrm{t\bar{t}}$ cross section as a function of $\eta _{b}$ (trailing) at particle level is shown. The contributions of each source of systematic uncertainty in each bin are indicated by the coloured lines. Experimental systematic uncertainties that are small in all bins are added in quadrature and shown as a single component. The statistical and total uncertainties are indicated by the shaded areas. |
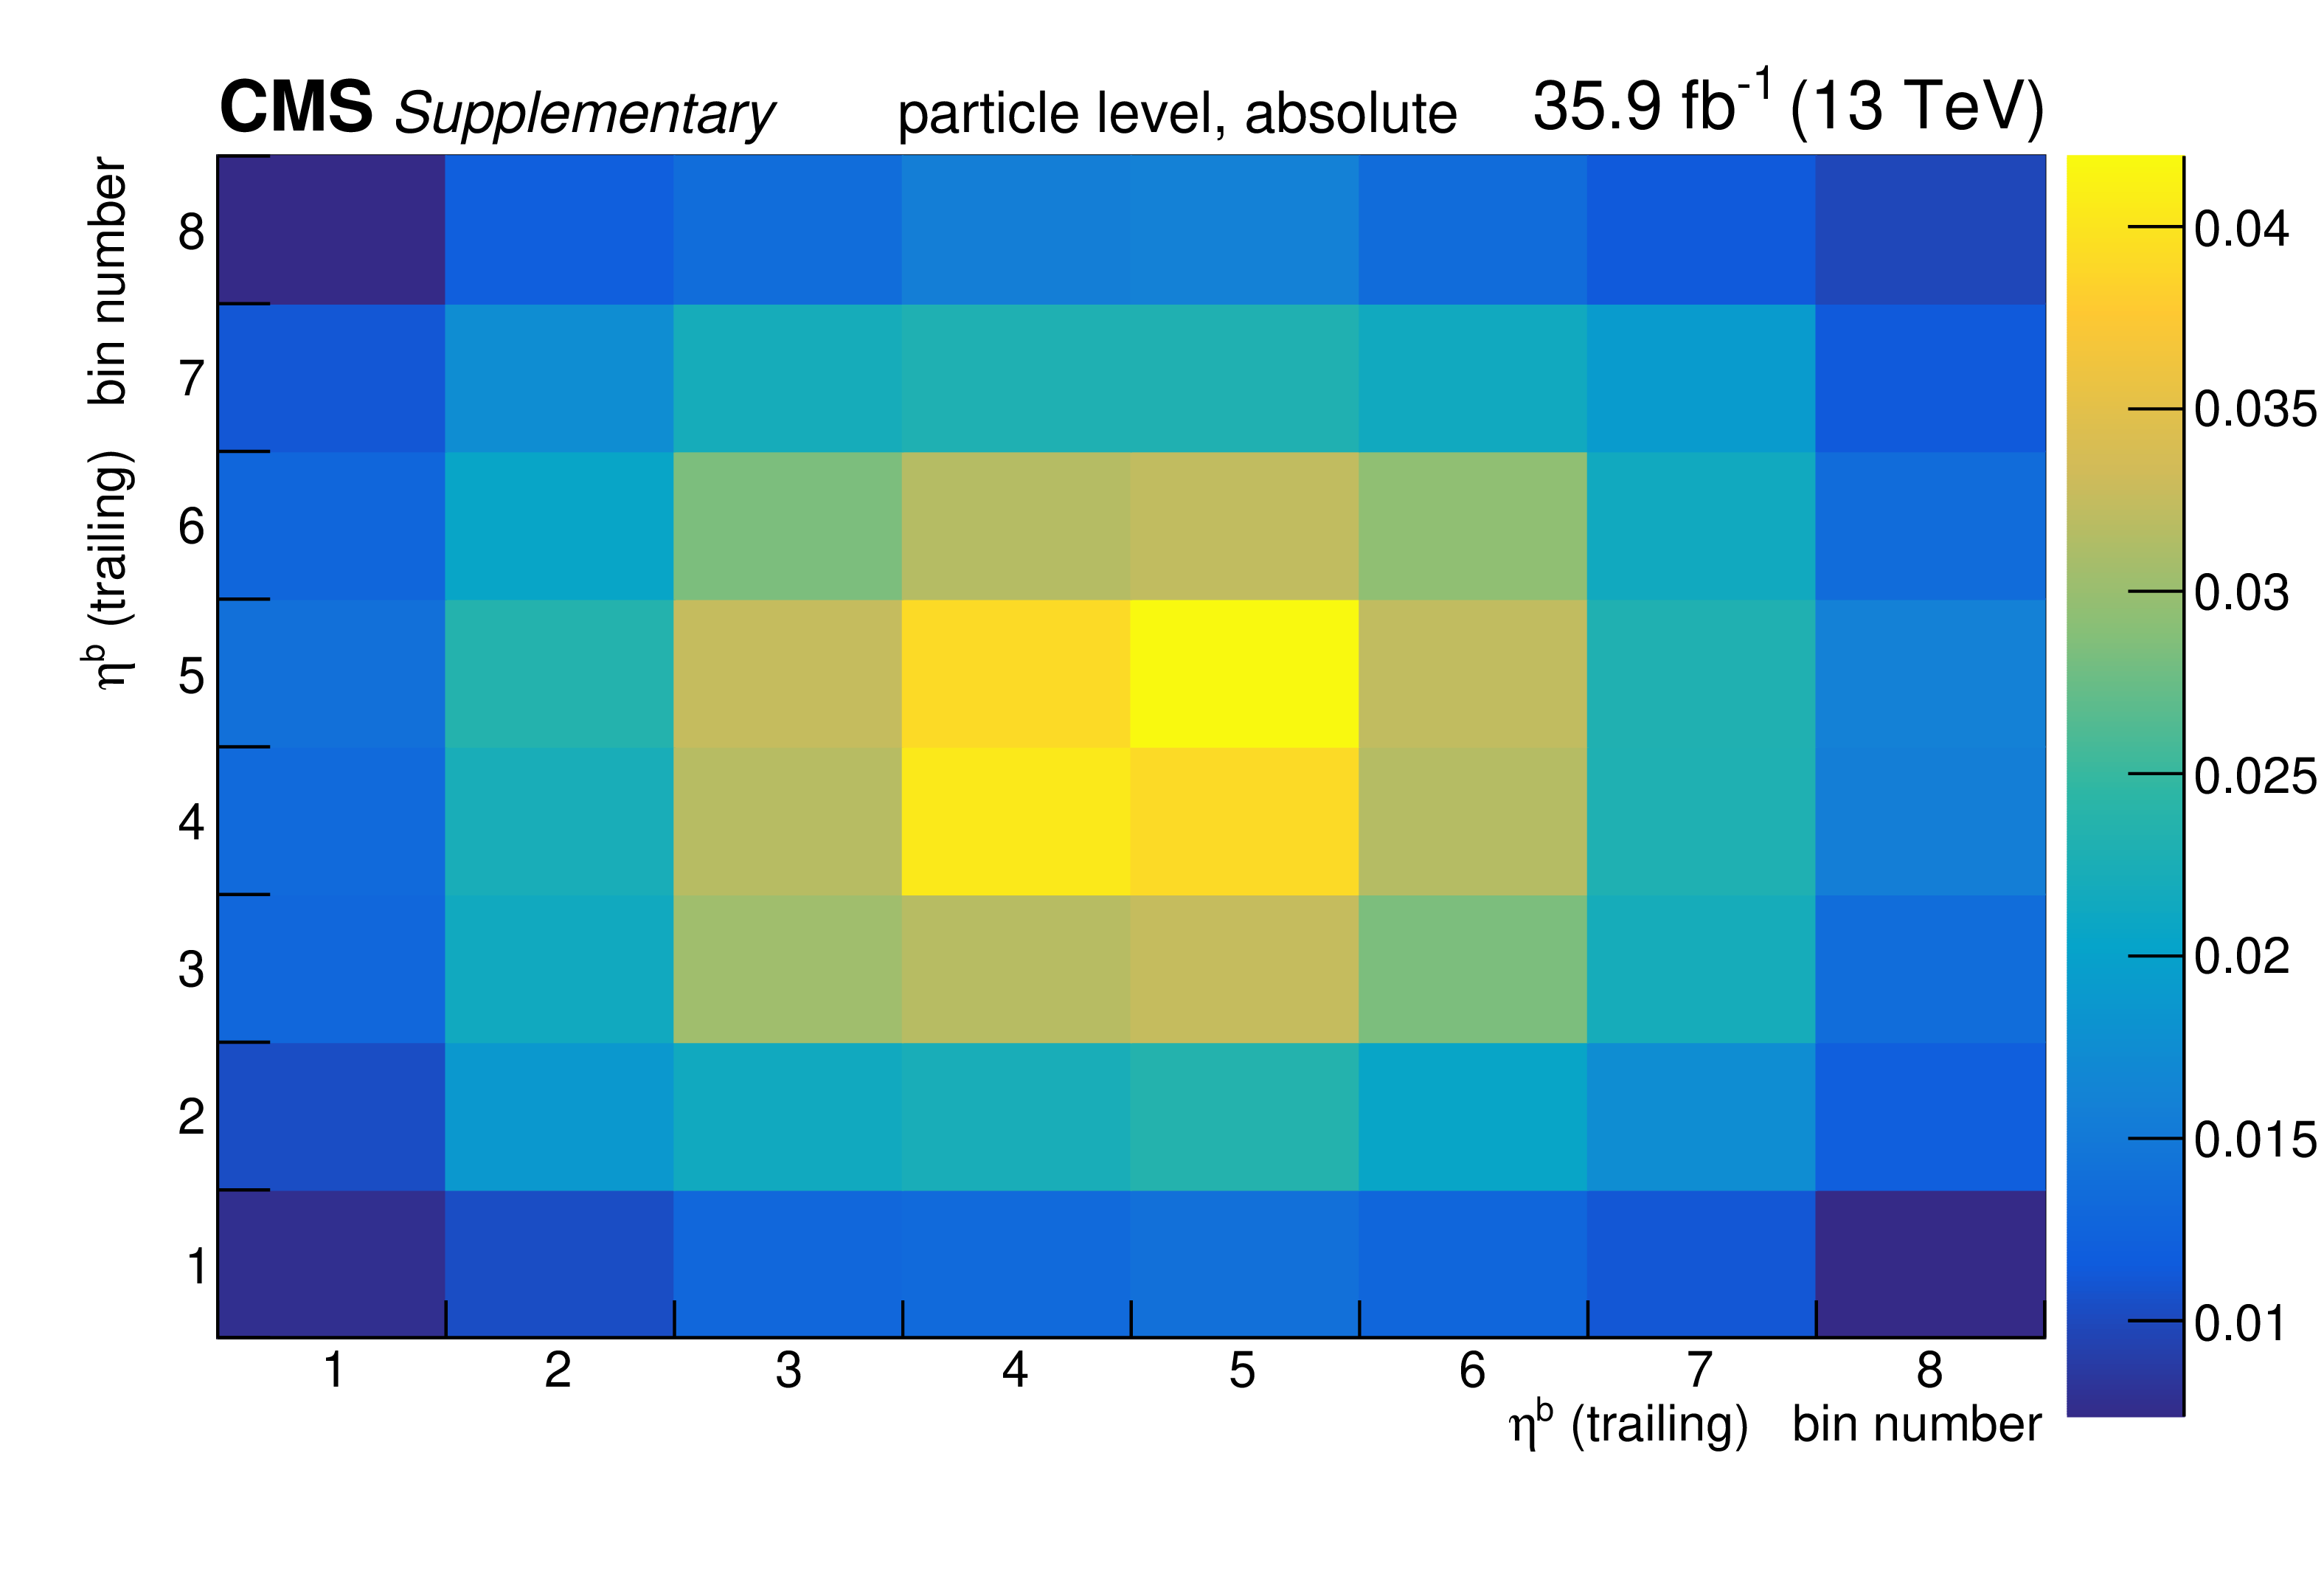
png pdf |
Additional Figure 174:
The covariance matrix of the measured data for the absolute measurement of the differential $\mathrm{t\bar{t}}$ cross section as a function of $\eta _{b}$ (trailing) at particle level is shown. |

png pdf |
Additional Figure 175:
The breakdown of uncertainties for the normalised measurement of the differential $\mathrm{t\bar{t}}$ cross section as a function of $\eta _{b}$ (trailing) at particle level is shown. The contributions of each source of systematic uncertainty in each bin are indicated by the coloured lines. Experimental systematic uncertainties that are small in all bins are added in quadrature and shown as a single component. The statistical and total uncertainties are indicated by the shaded areas. |
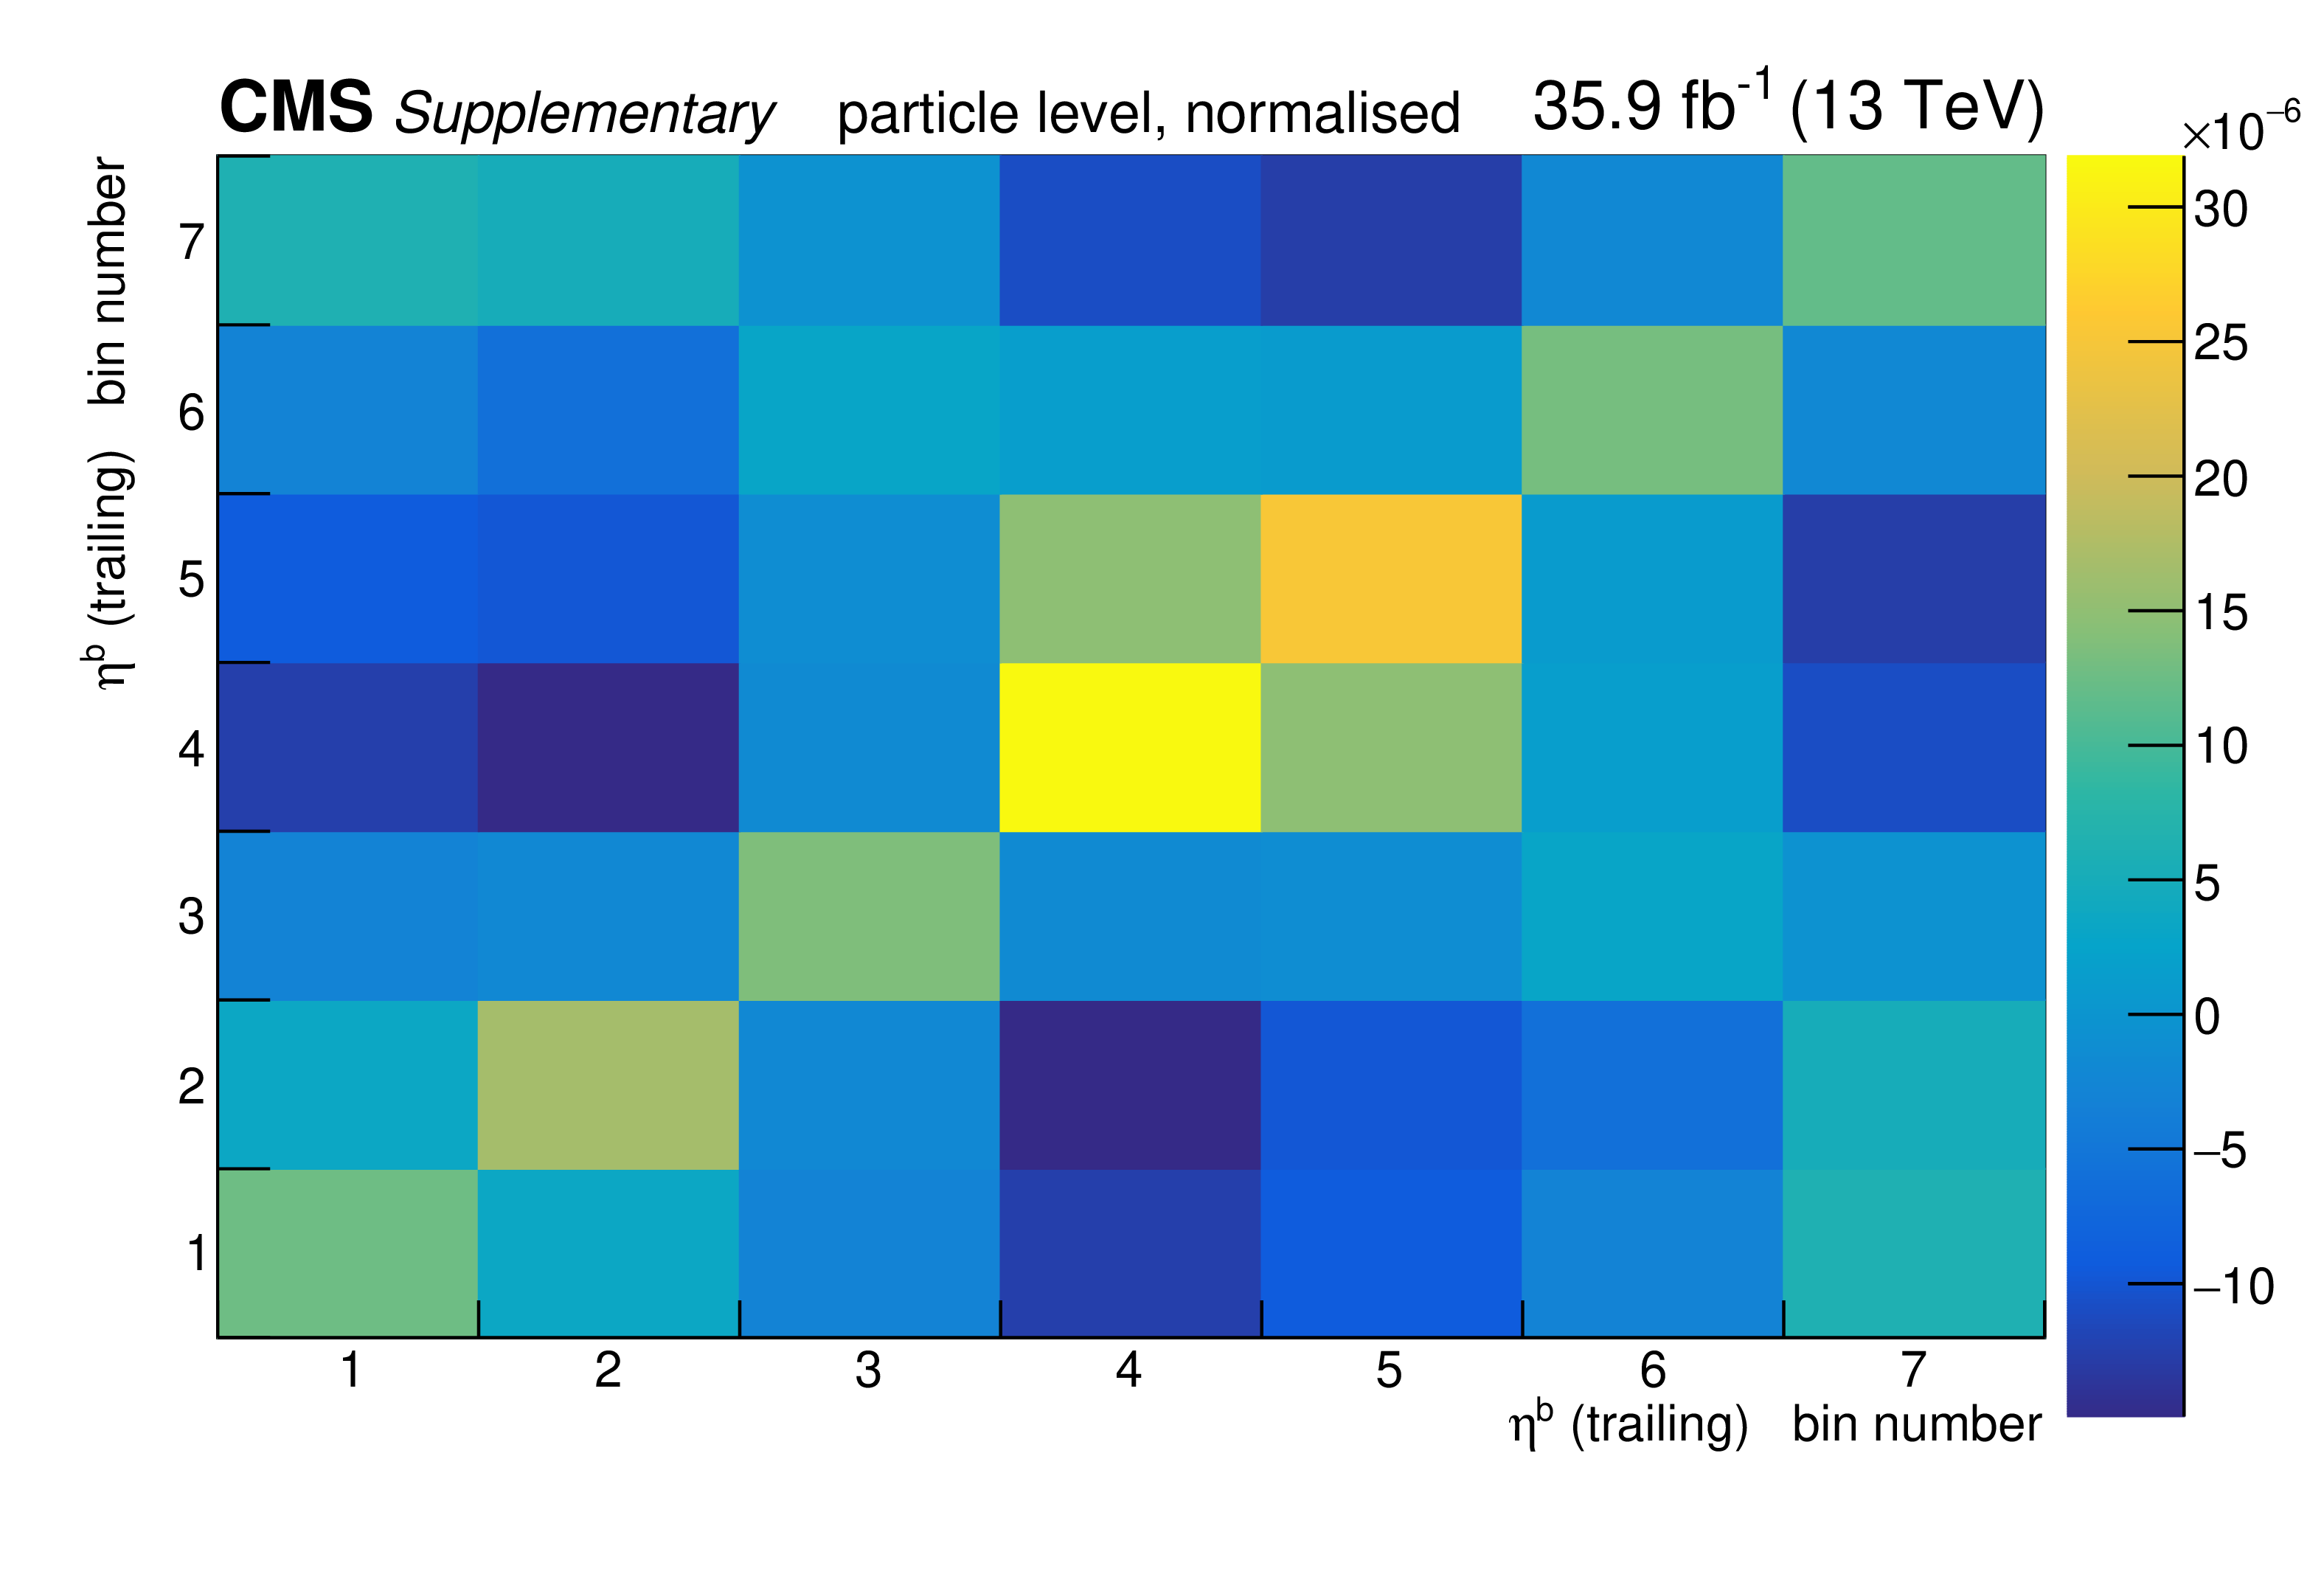
png pdf |
Additional Figure 176:
The covariance matrix of the measured data for the normalised measurement of the differential $\mathrm{t\bar{t}}$ cross section as a function of $\eta _{b}$ (trailing) at particle level is shown. |

png pdf |
Additional Figure 177:
The breakdown of uncertainties for the absolute measurement of the differential $\mathrm{t\bar{t}}$ cross section as a function of $p_{\mathrm {T}}^{\mathrm {b}\bar{\mathrm {b}}}$ at particle level is shown. The contributions of each source of systematic uncertainty in each bin are indicated by the coloured lines. Experimental systematic uncertainties that are small in all bins are added in quadrature and shown as a single component. The statistical and total uncertainties are indicated by the shaded areas. |
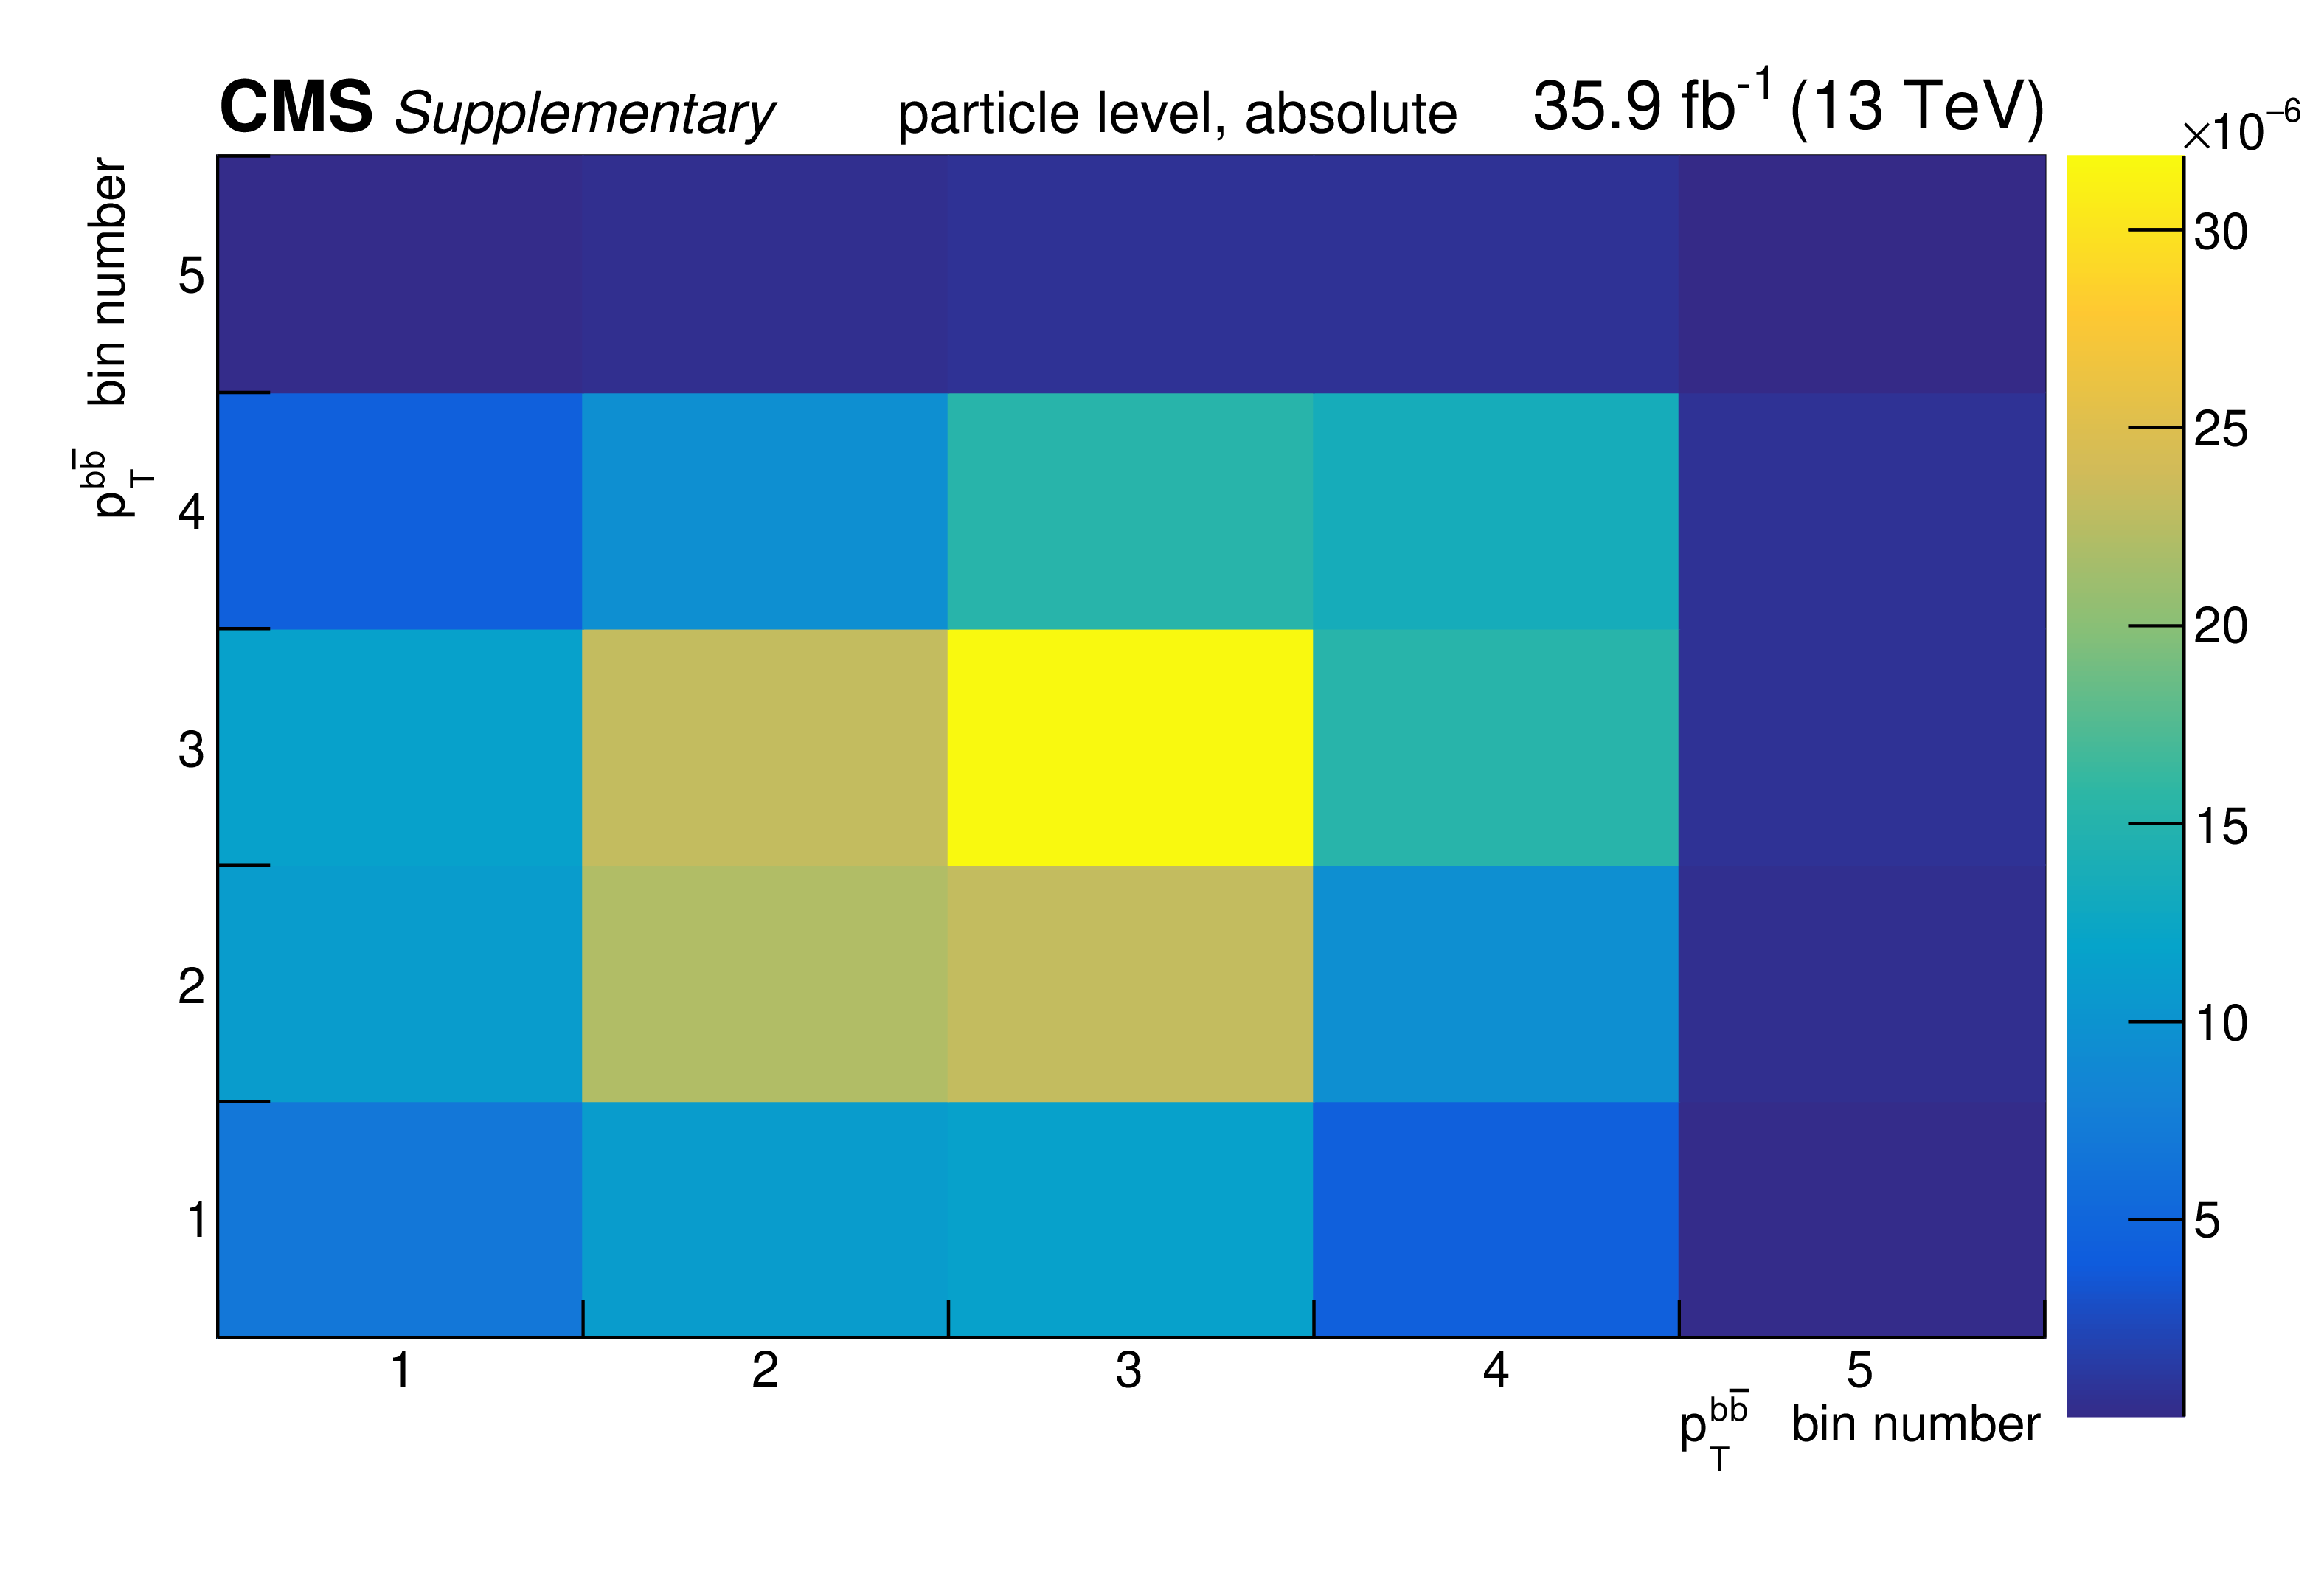
png pdf |
Additional Figure 178:
The covariance matrix of the measured data for the absolute measurement of the differential $\mathrm{t\bar{t}}$ cross section as a function of $p_{\mathrm {T}}^{\mathrm {b}\bar{\mathrm {b}}}$ at particle level is shown. |
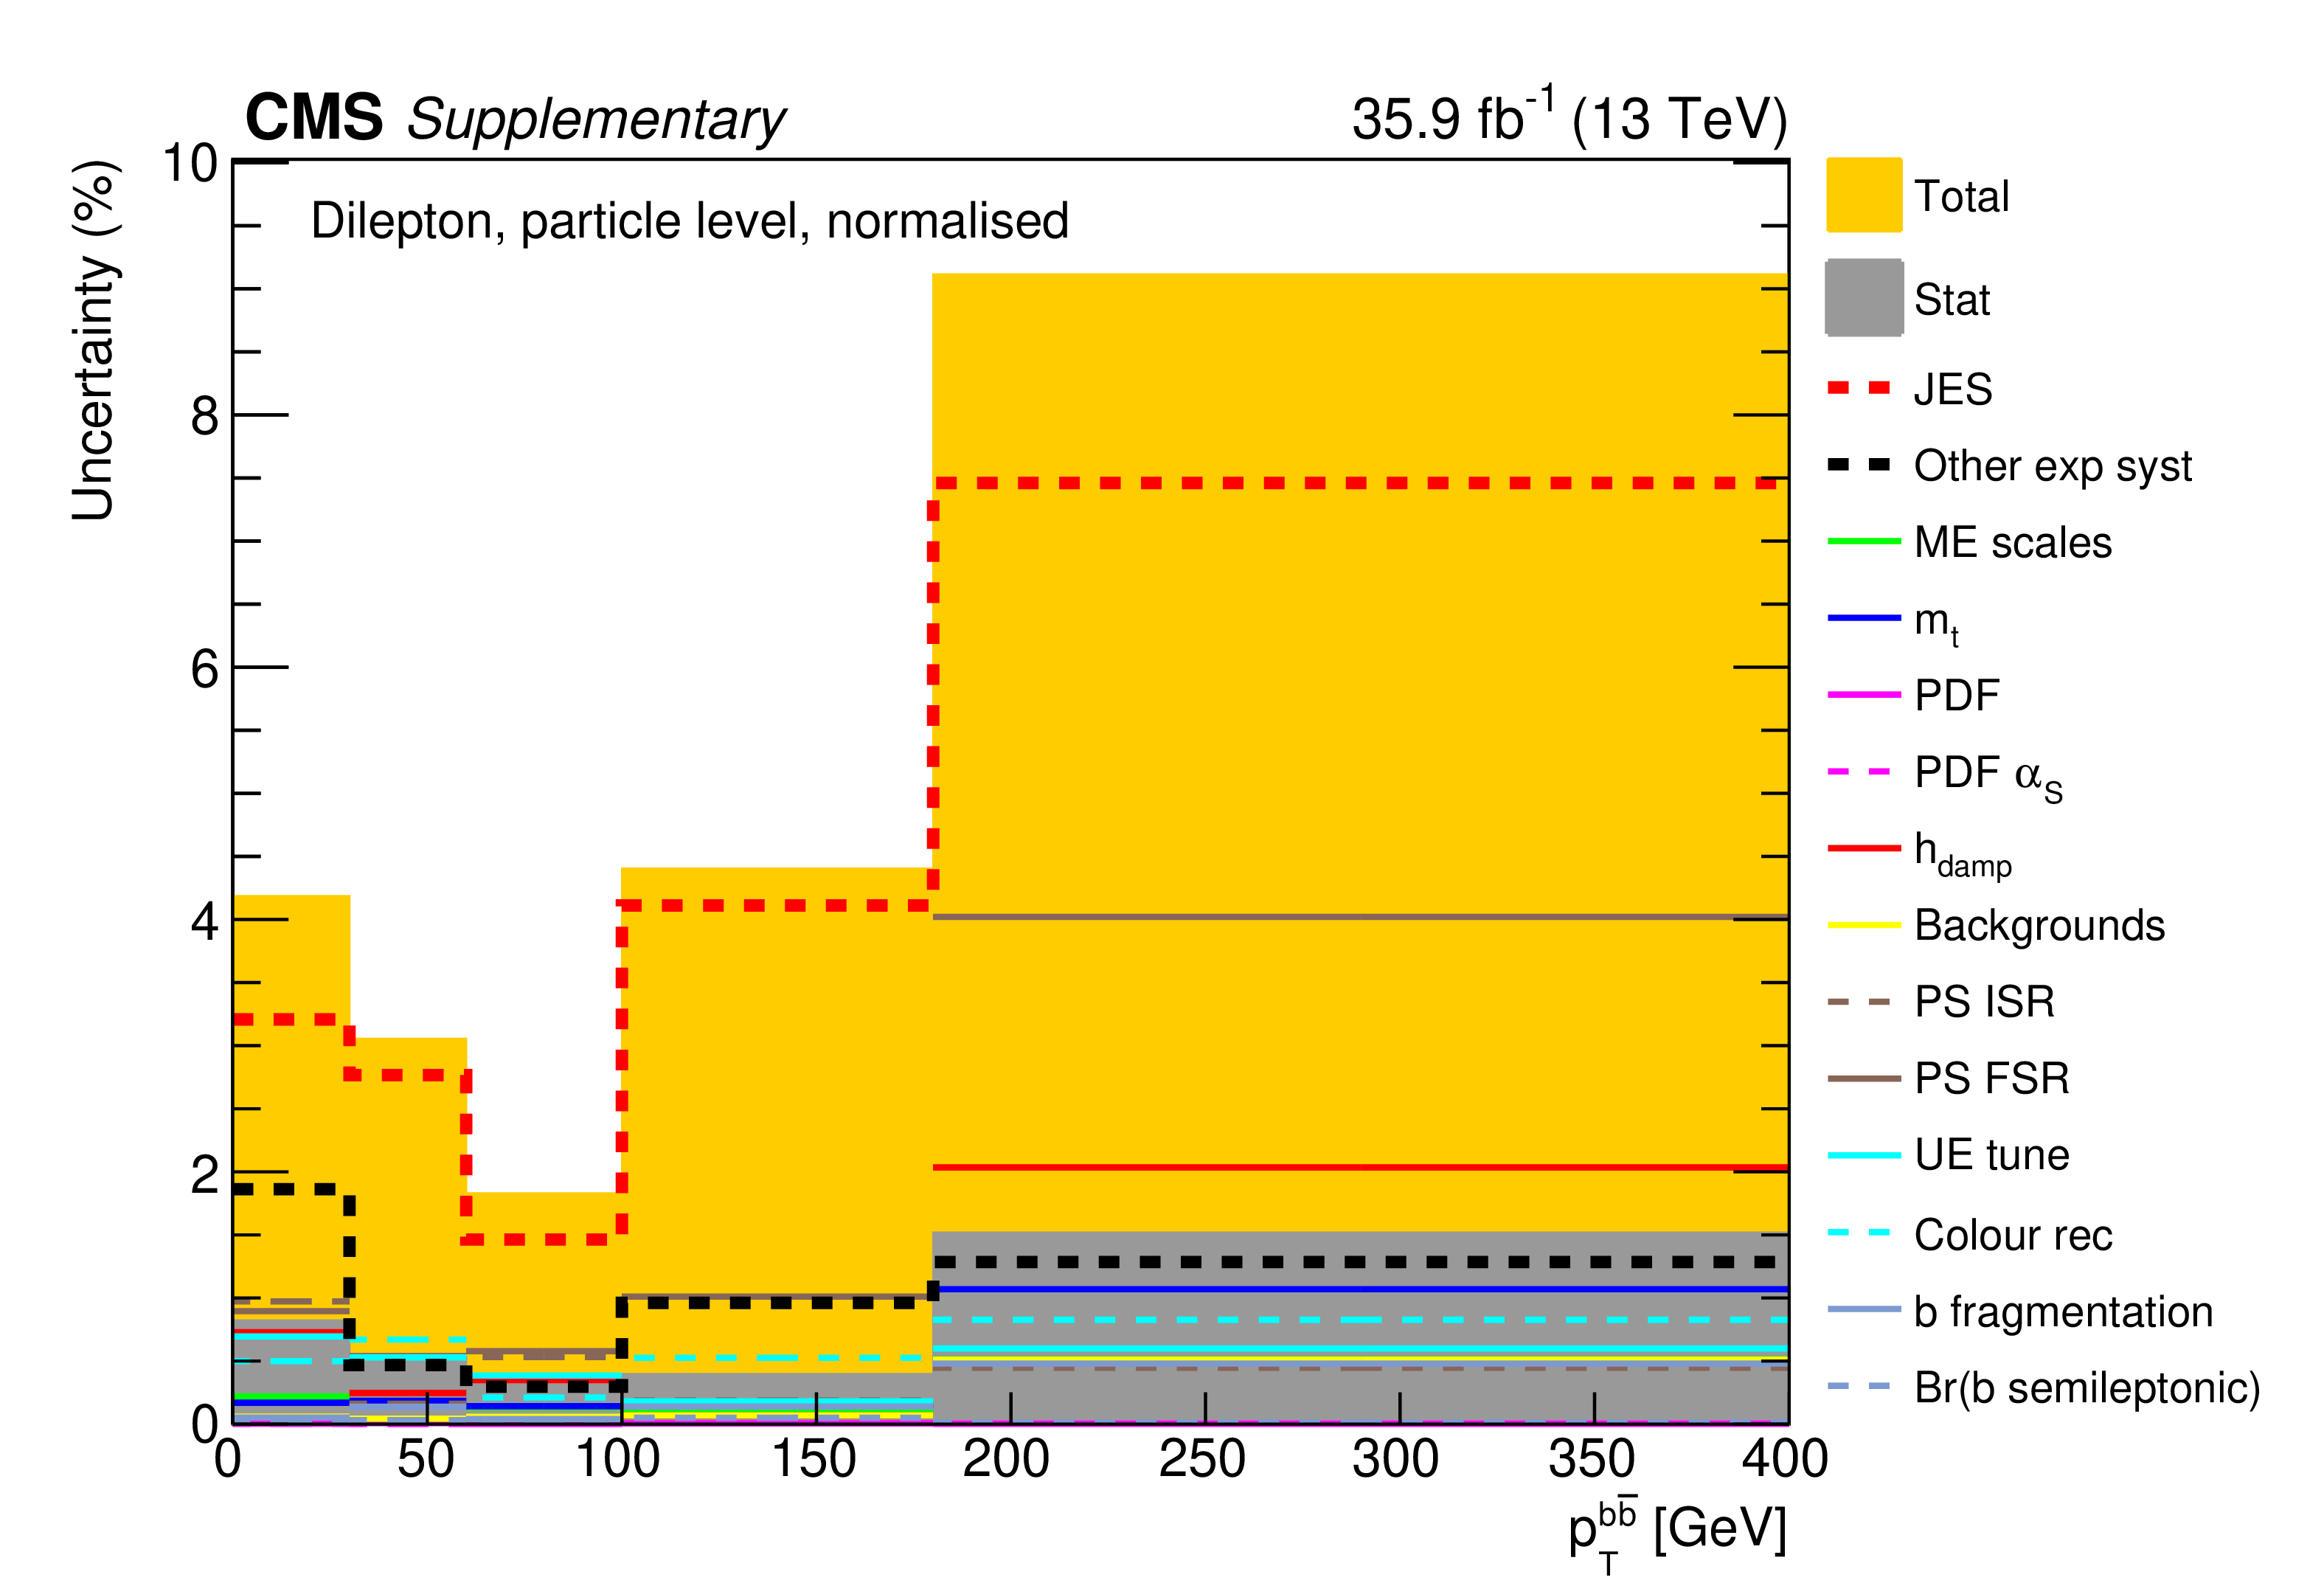
png pdf |
Additional Figure 179:
The breakdown of uncertainties for the normalised measurement of the differential $\mathrm{t\bar{t}}$ cross section as a function of $p_{\mathrm {T}}^{\mathrm {b}\bar{\mathrm {b}}}$ at particle level is shown. The contributions of each source of systematic uncertainty in each bin are indicated by the coloured lines. Experimental systematic uncertainties that are small in all bins are added in quadrature and shown as a single component. The statistical and total uncertainties are indicated by the shaded areas. |
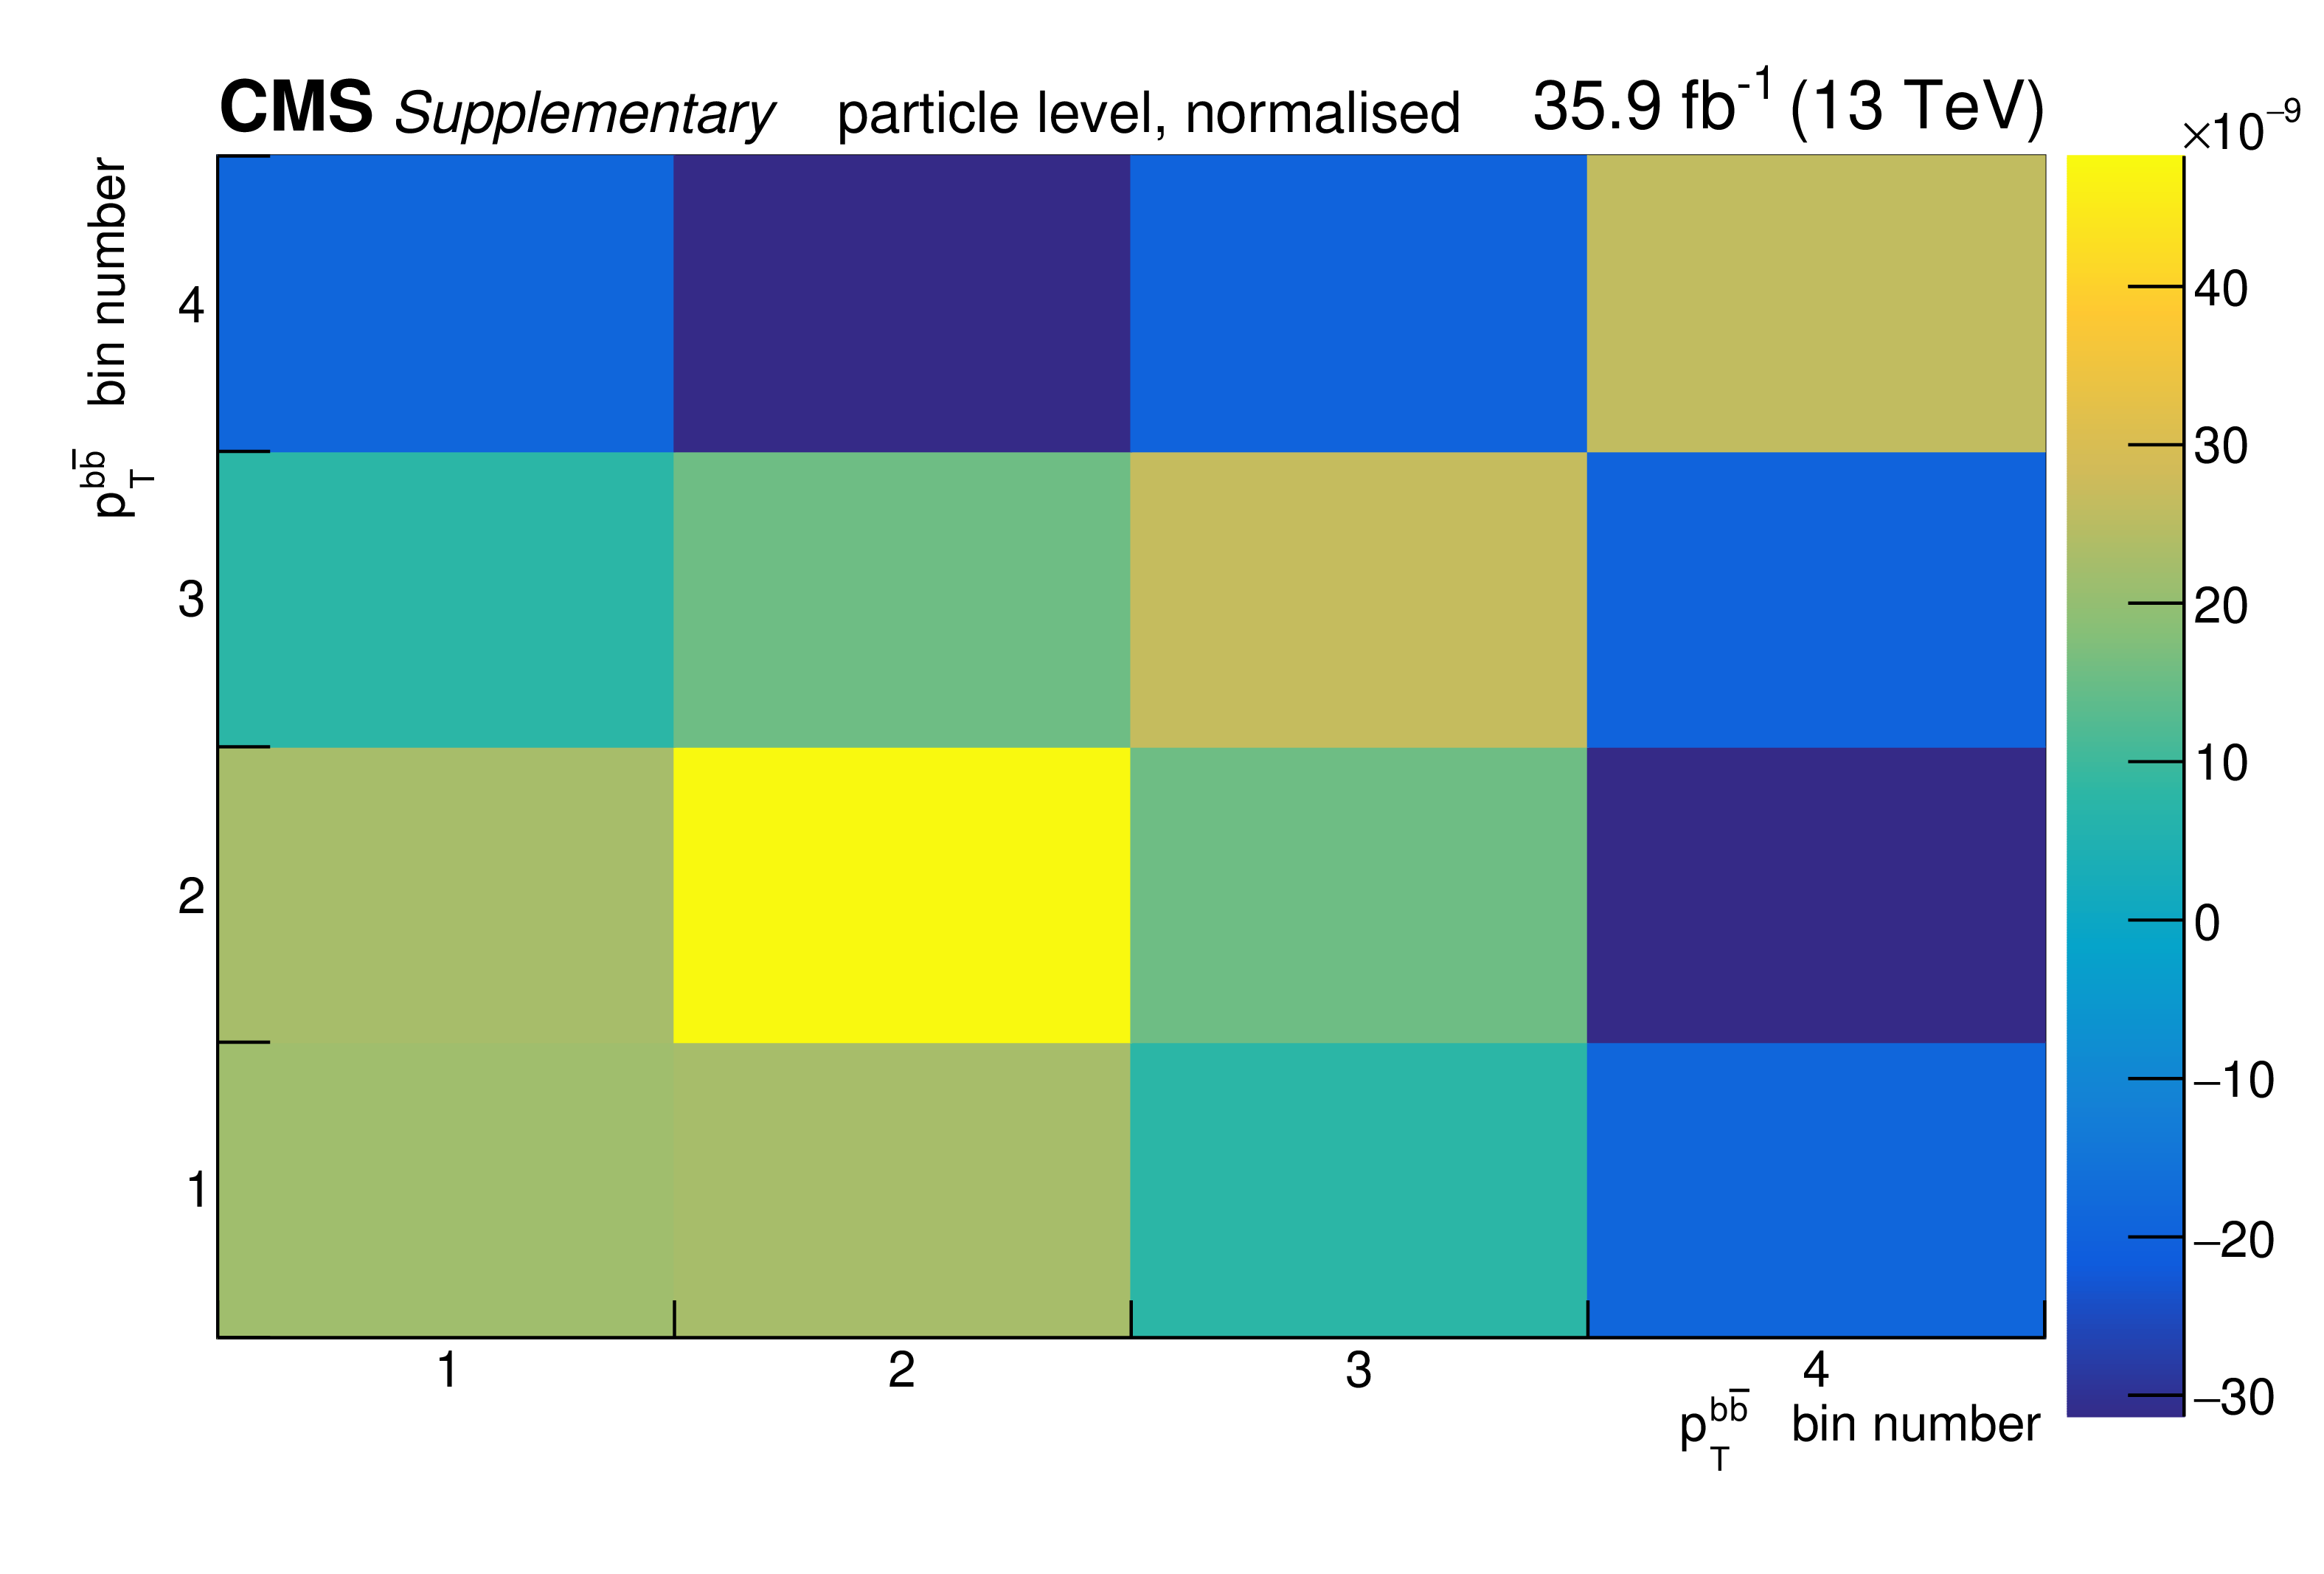
png pdf |
Additional Figure 180:
The covariance matrix of the measured data for the normalised measurement of the differential $\mathrm{t\bar{t}}$ cross section as a function of $p_{\mathrm {T}}^{\mathrm {b}\bar{\mathrm {b}}}$ at particle level is shown. |
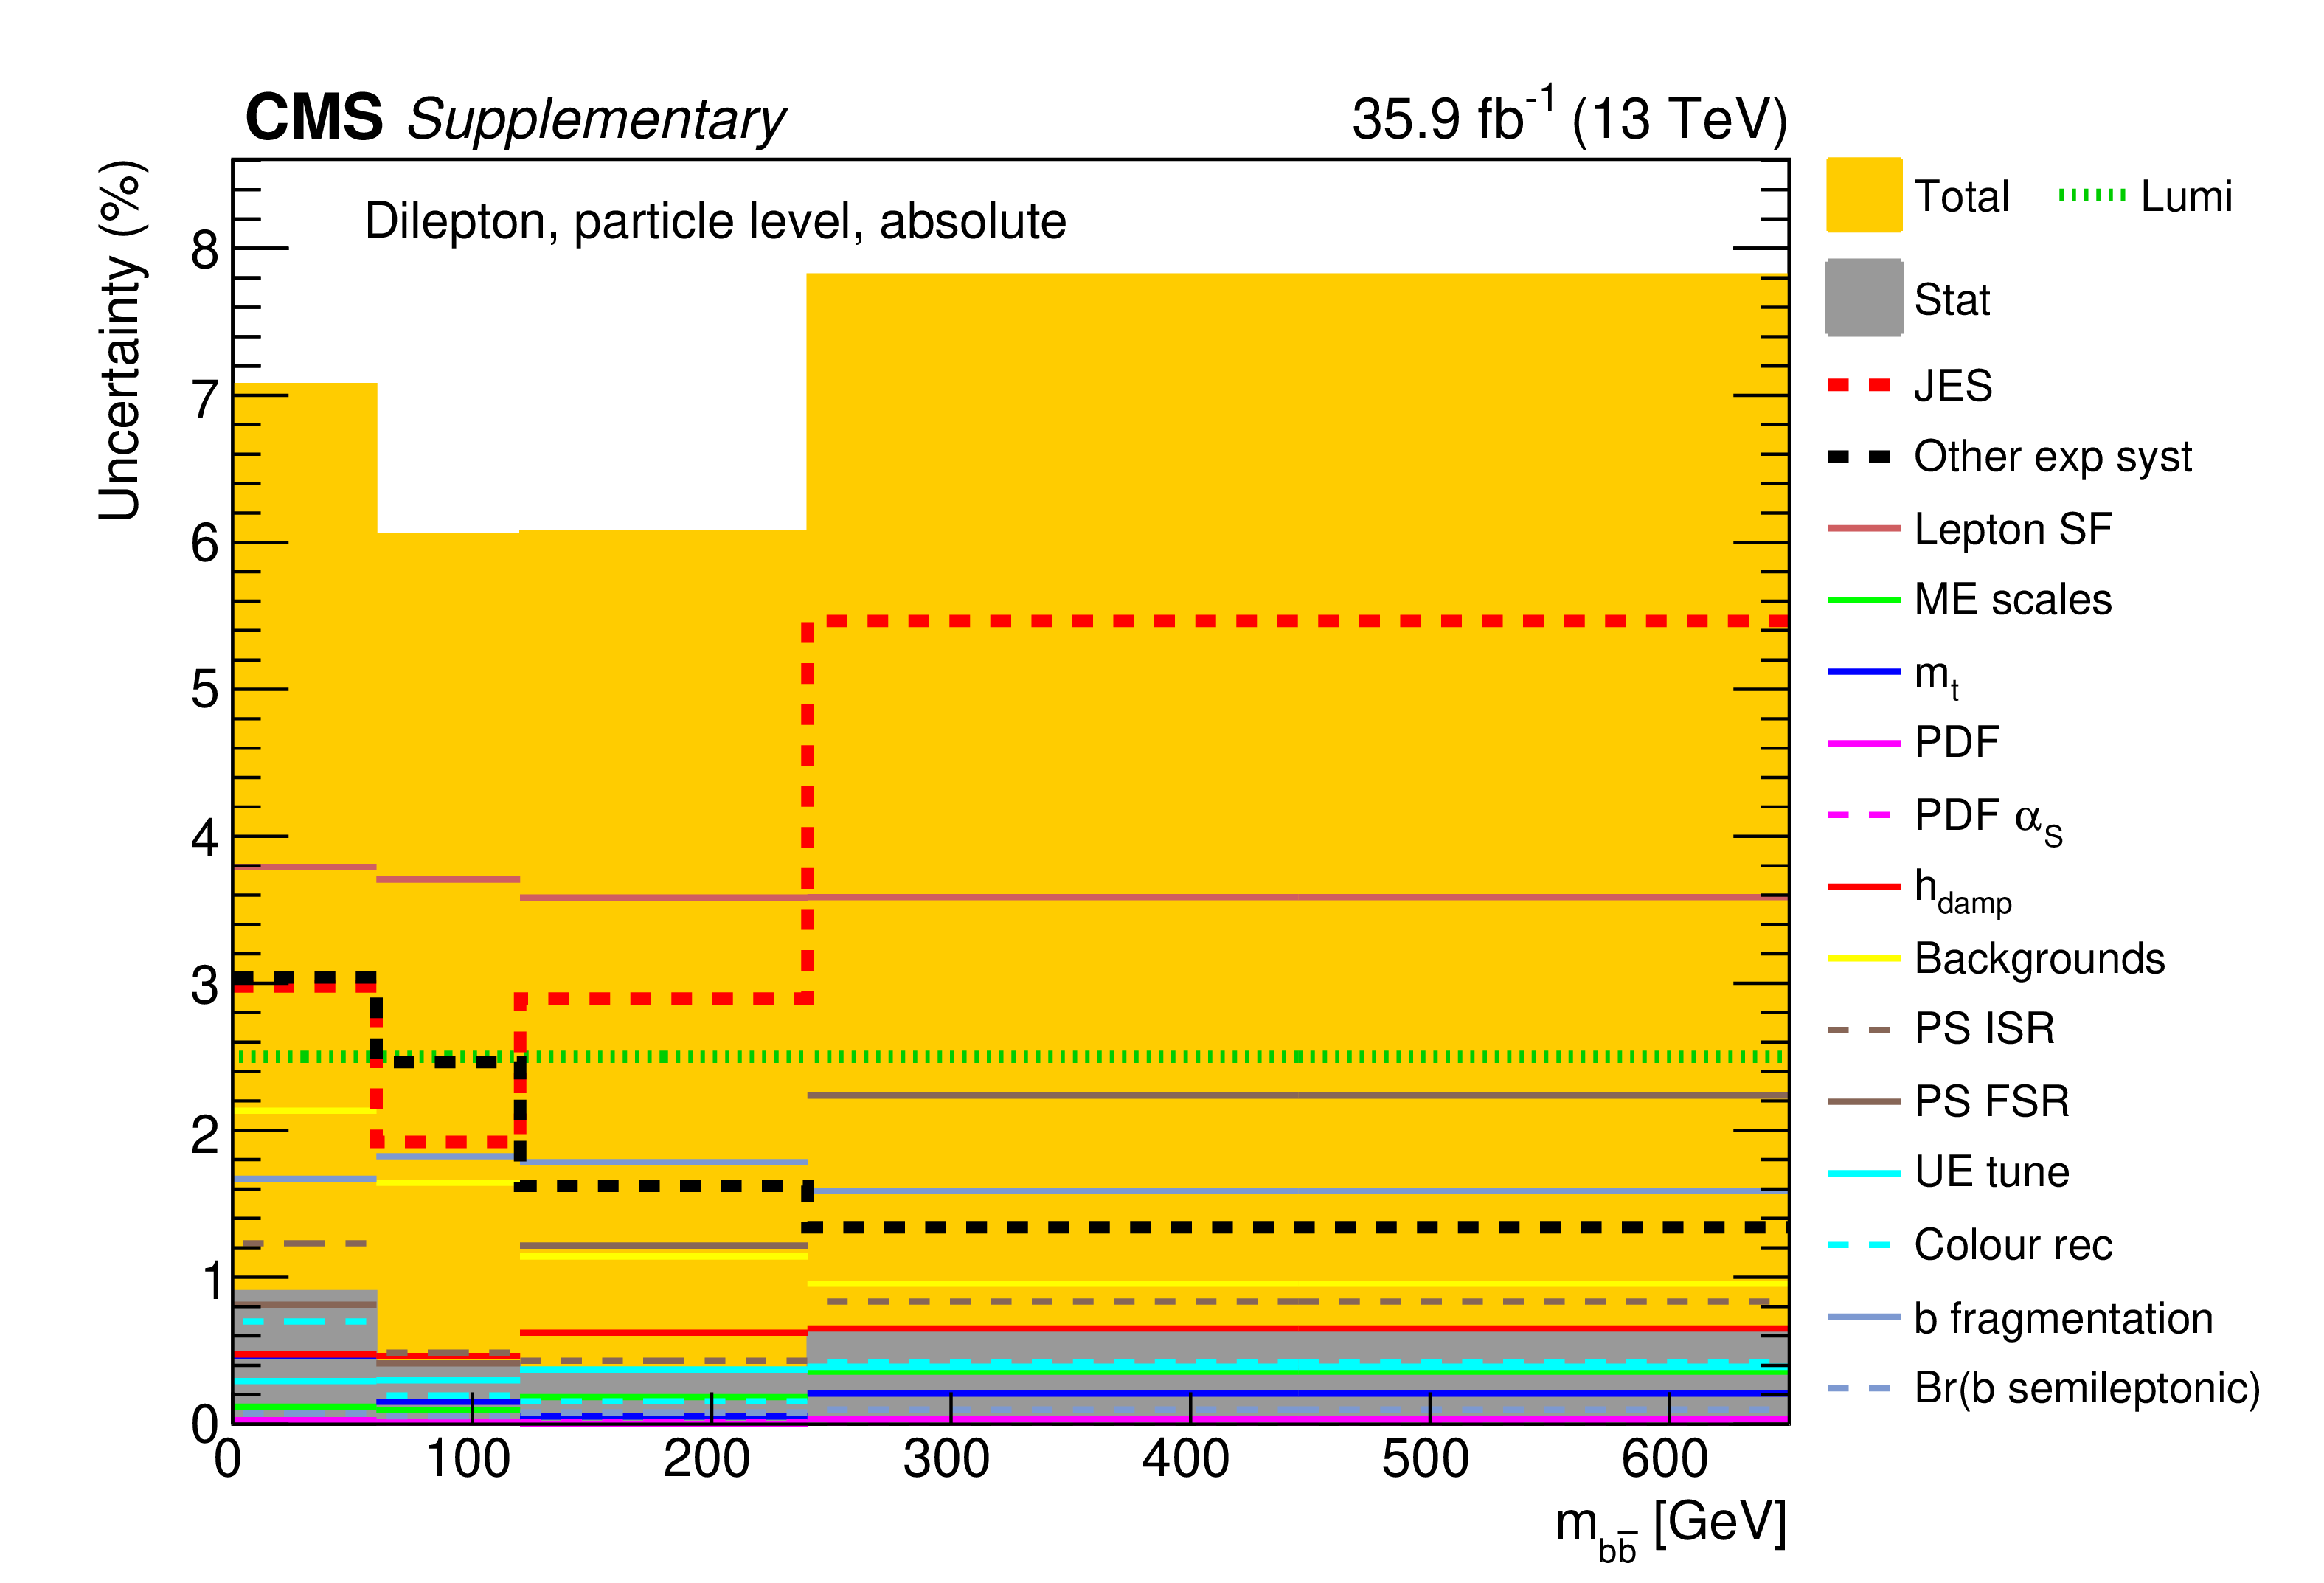
png pdf |
Additional Figure 181:
The breakdown of uncertainties for the absolute measurement of the differential $\mathrm{t\bar{t}}$ cross section as a function of $m_{\mathrm {b}\bar{\mathrm {b}}}$ at particle level is shown. The contributions of each source of systematic uncertainty in each bin are indicated by the coloured lines. Experimental systematic uncertainties that are small in all bins are added in quadrature and shown as a single component. The statistical and total uncertainties are indicated by the shaded areas. |

png pdf |
Additional Figure 182:
The covariance matrix of the measured data for the absolute measurement of the differential $\mathrm{t\bar{t}}$ cross section as a function of $m_{\mathrm {b}\bar{\mathrm {b}}}$ at particle level is shown. |

png pdf |
Additional Figure 183:
The breakdown of uncertainties for the normalised measurement of the differential $\mathrm{t\bar{t}}$ cross section as a function of $m_{\mathrm {b}\bar{\mathrm {b}}}$ at particle level is shown. The contributions of each source of systematic uncertainty in each bin are indicated by the coloured lines. Experimental systematic uncertainties that are small in all bins are added in quadrature and shown as a single component. The statistical and total uncertainties are indicated by the shaded areas. |
png pdf |
Additional Figure 184:
The covariance matrix of the measured data for the normalised measurement of the differential $\mathrm{t\bar{t}}$ cross section as a function of $m_{\mathrm {b}\bar{\mathrm {b}}}$ at particle level is shown. |
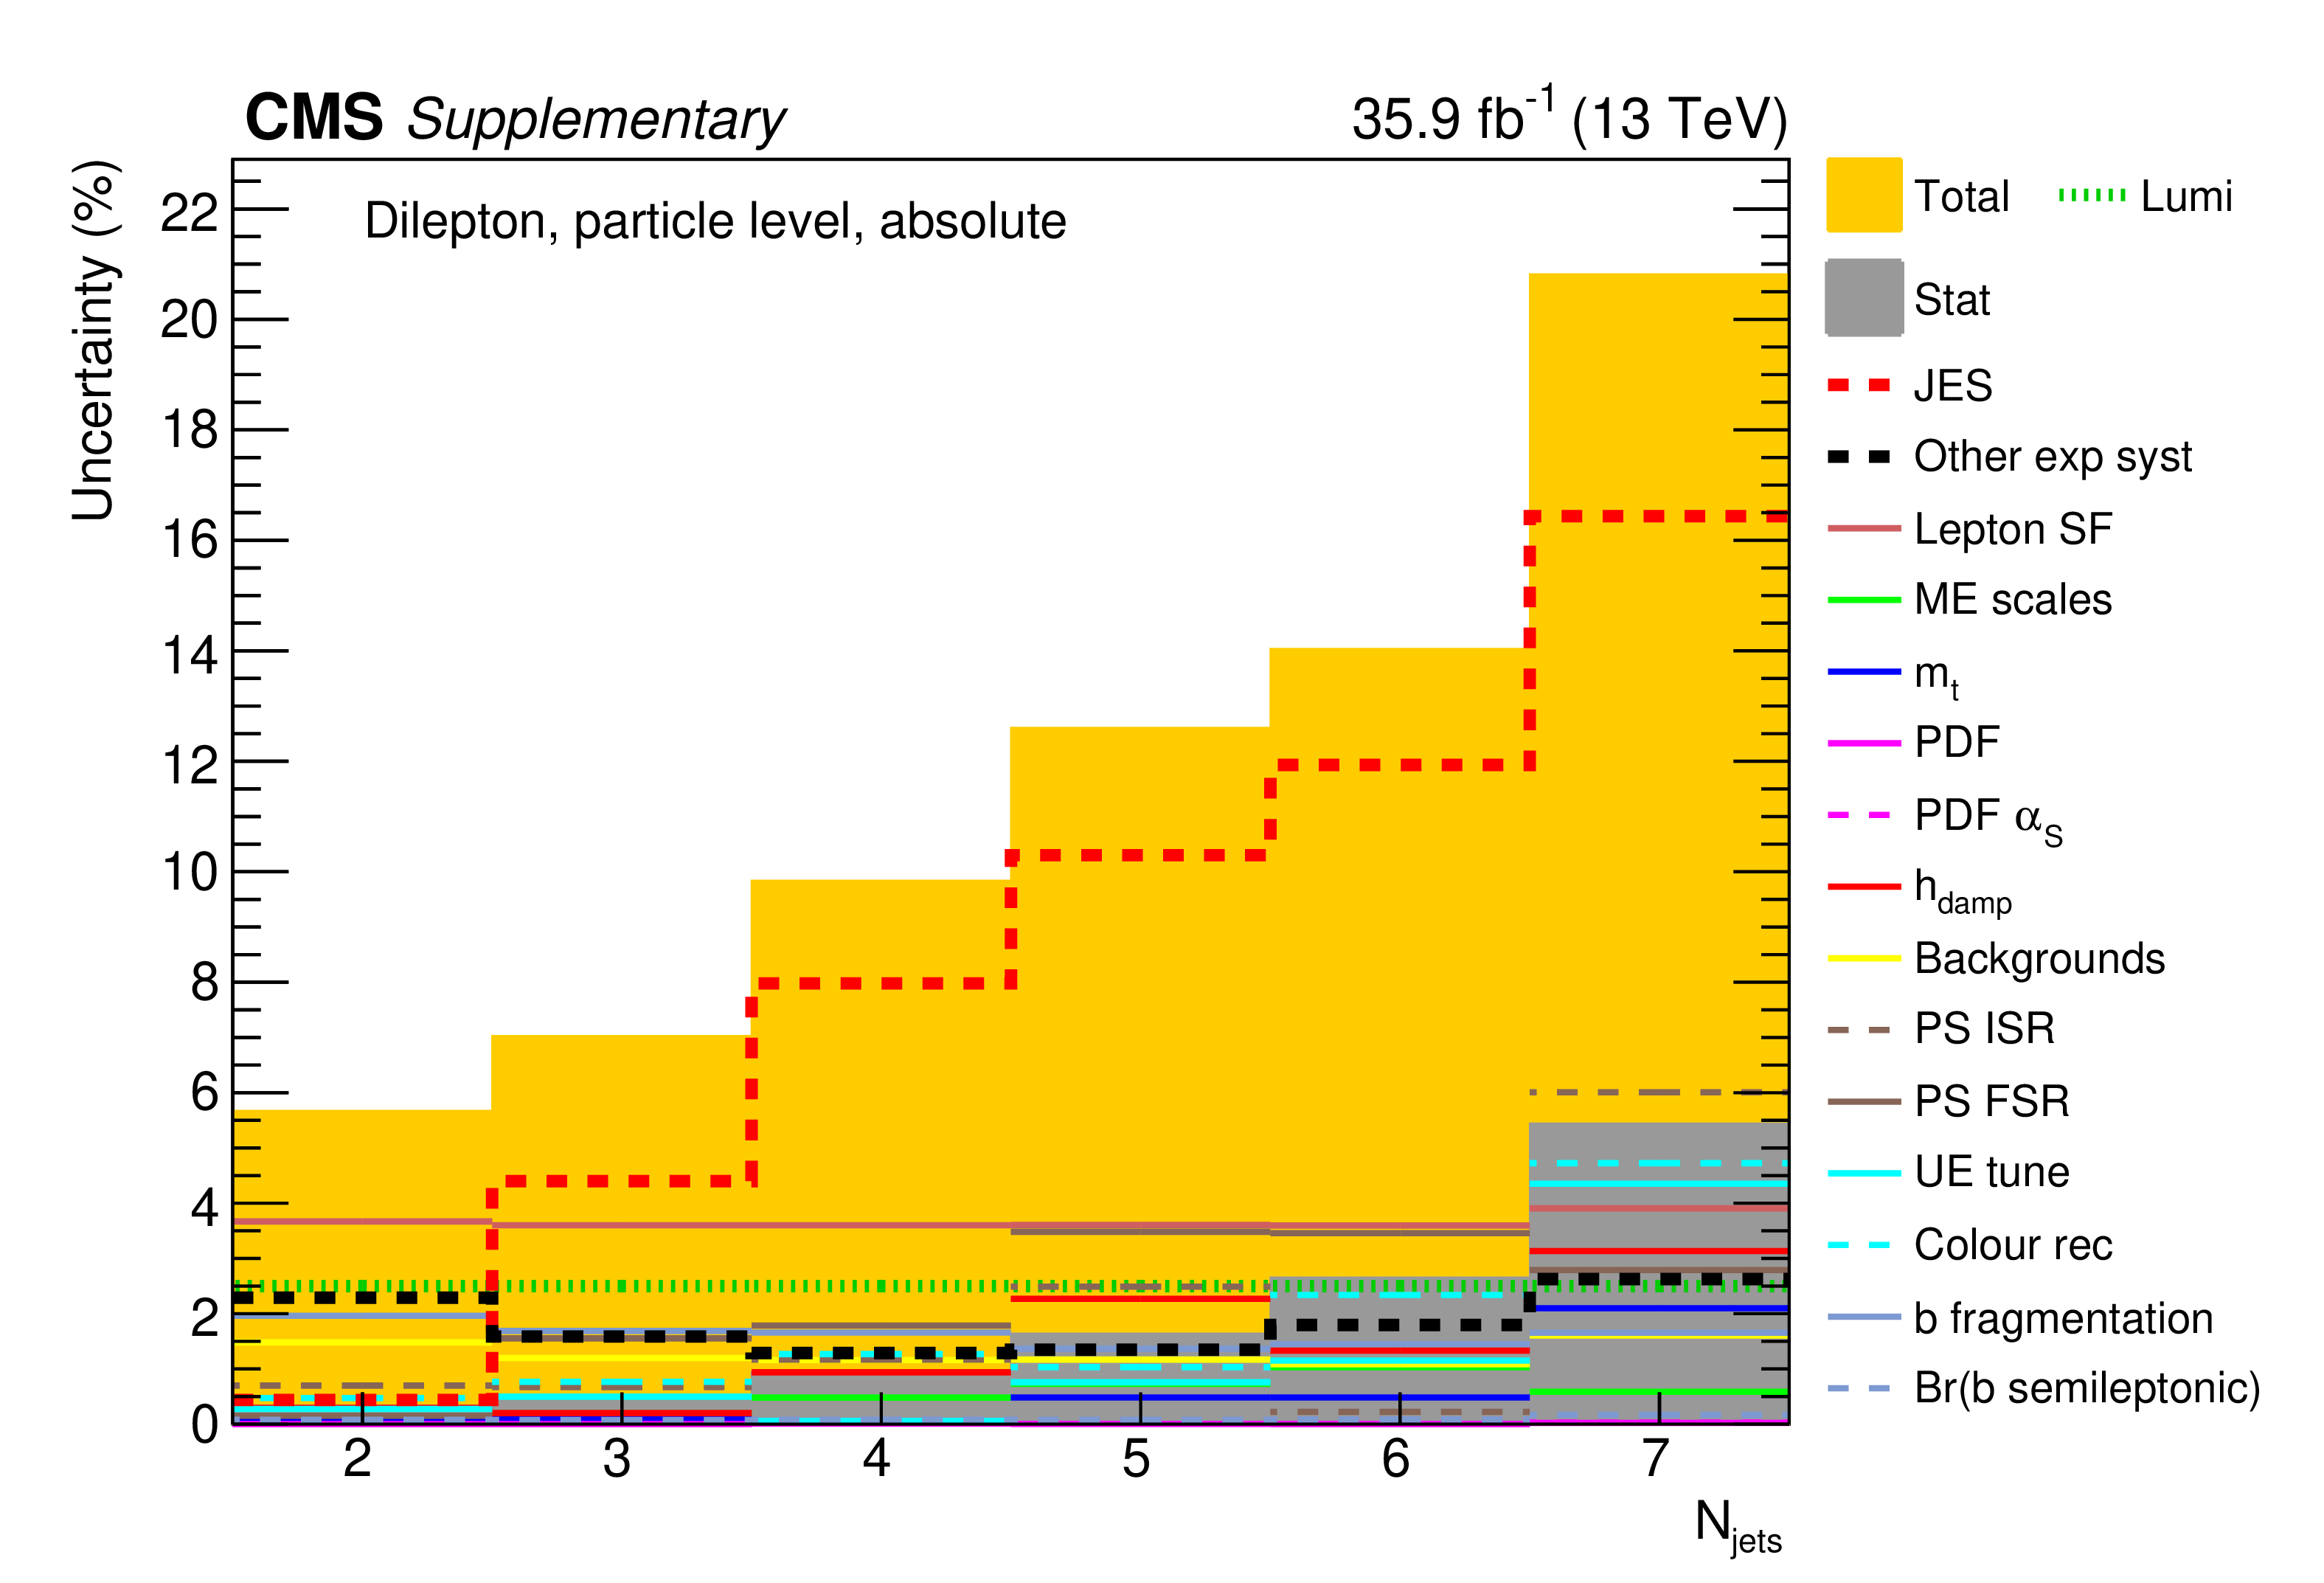
png pdf |
Additional Figure 185:
The breakdown of uncertainties for the absolute measurement of the differential $\mathrm{t\bar{t}}$ cross section as a function of $N_{\mathrm {jets}}$ at particle level is shown. The contributions of each source of systematic uncertainty in each bin are indicated by the coloured lines. Experimental systematic uncertainties that are small in all bins are added in quadrature and shown as a single component. The statistical and total uncertainties are indicated by the shaded areas. |

png pdf |
Additional Figure 186:
The covariance matrix of the measured data for the absolute measurement of the differential $\mathrm{t\bar{t}}$ cross section as a function of $N_{\mathrm {jets}}$ at particle level is shown. |
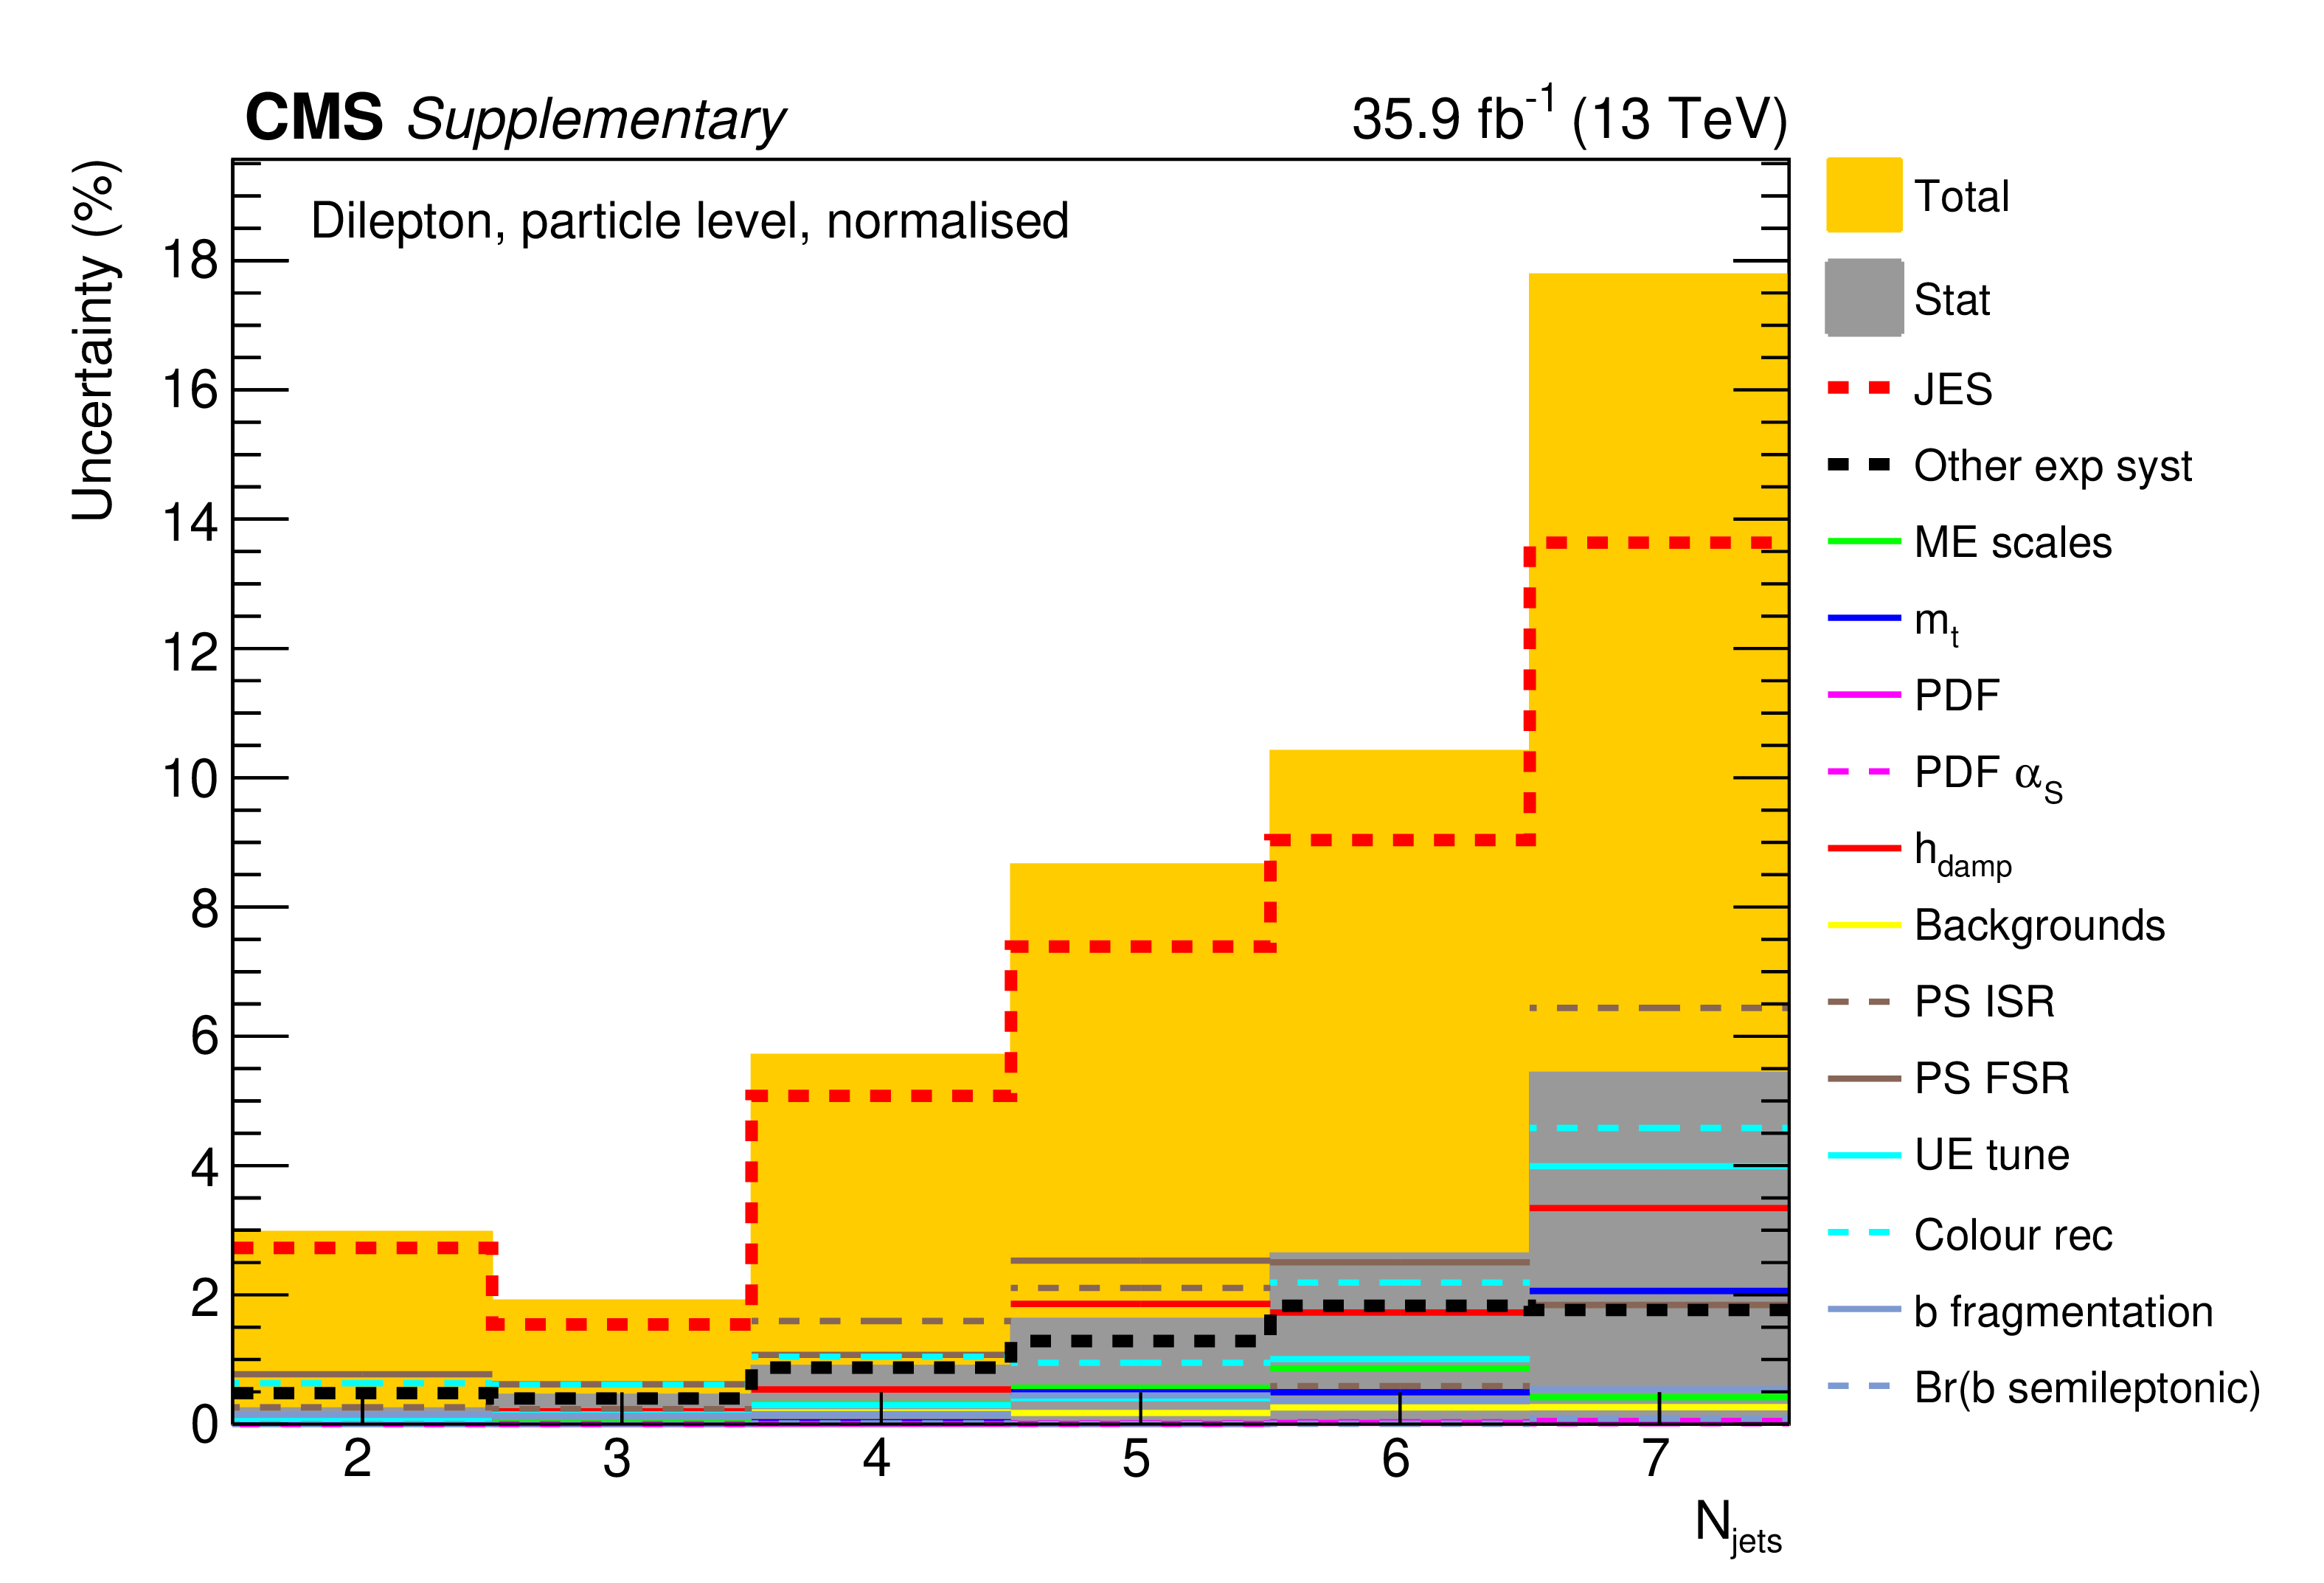
png pdf |
Additional Figure 187:
The breakdown of uncertainties for the normalised measurement of the differential $\mathrm{t\bar{t}}$ cross section as a function of $N_{\mathrm {jets}}$ at particle level is shown. The contributions of each source of systematic uncertainty in each bin are indicated by the coloured lines. Experimental systematic uncertainties that are small in all bins are added in quadrature and shown as a single component. The statistical and total uncertainties are indicated by the shaded areas. |
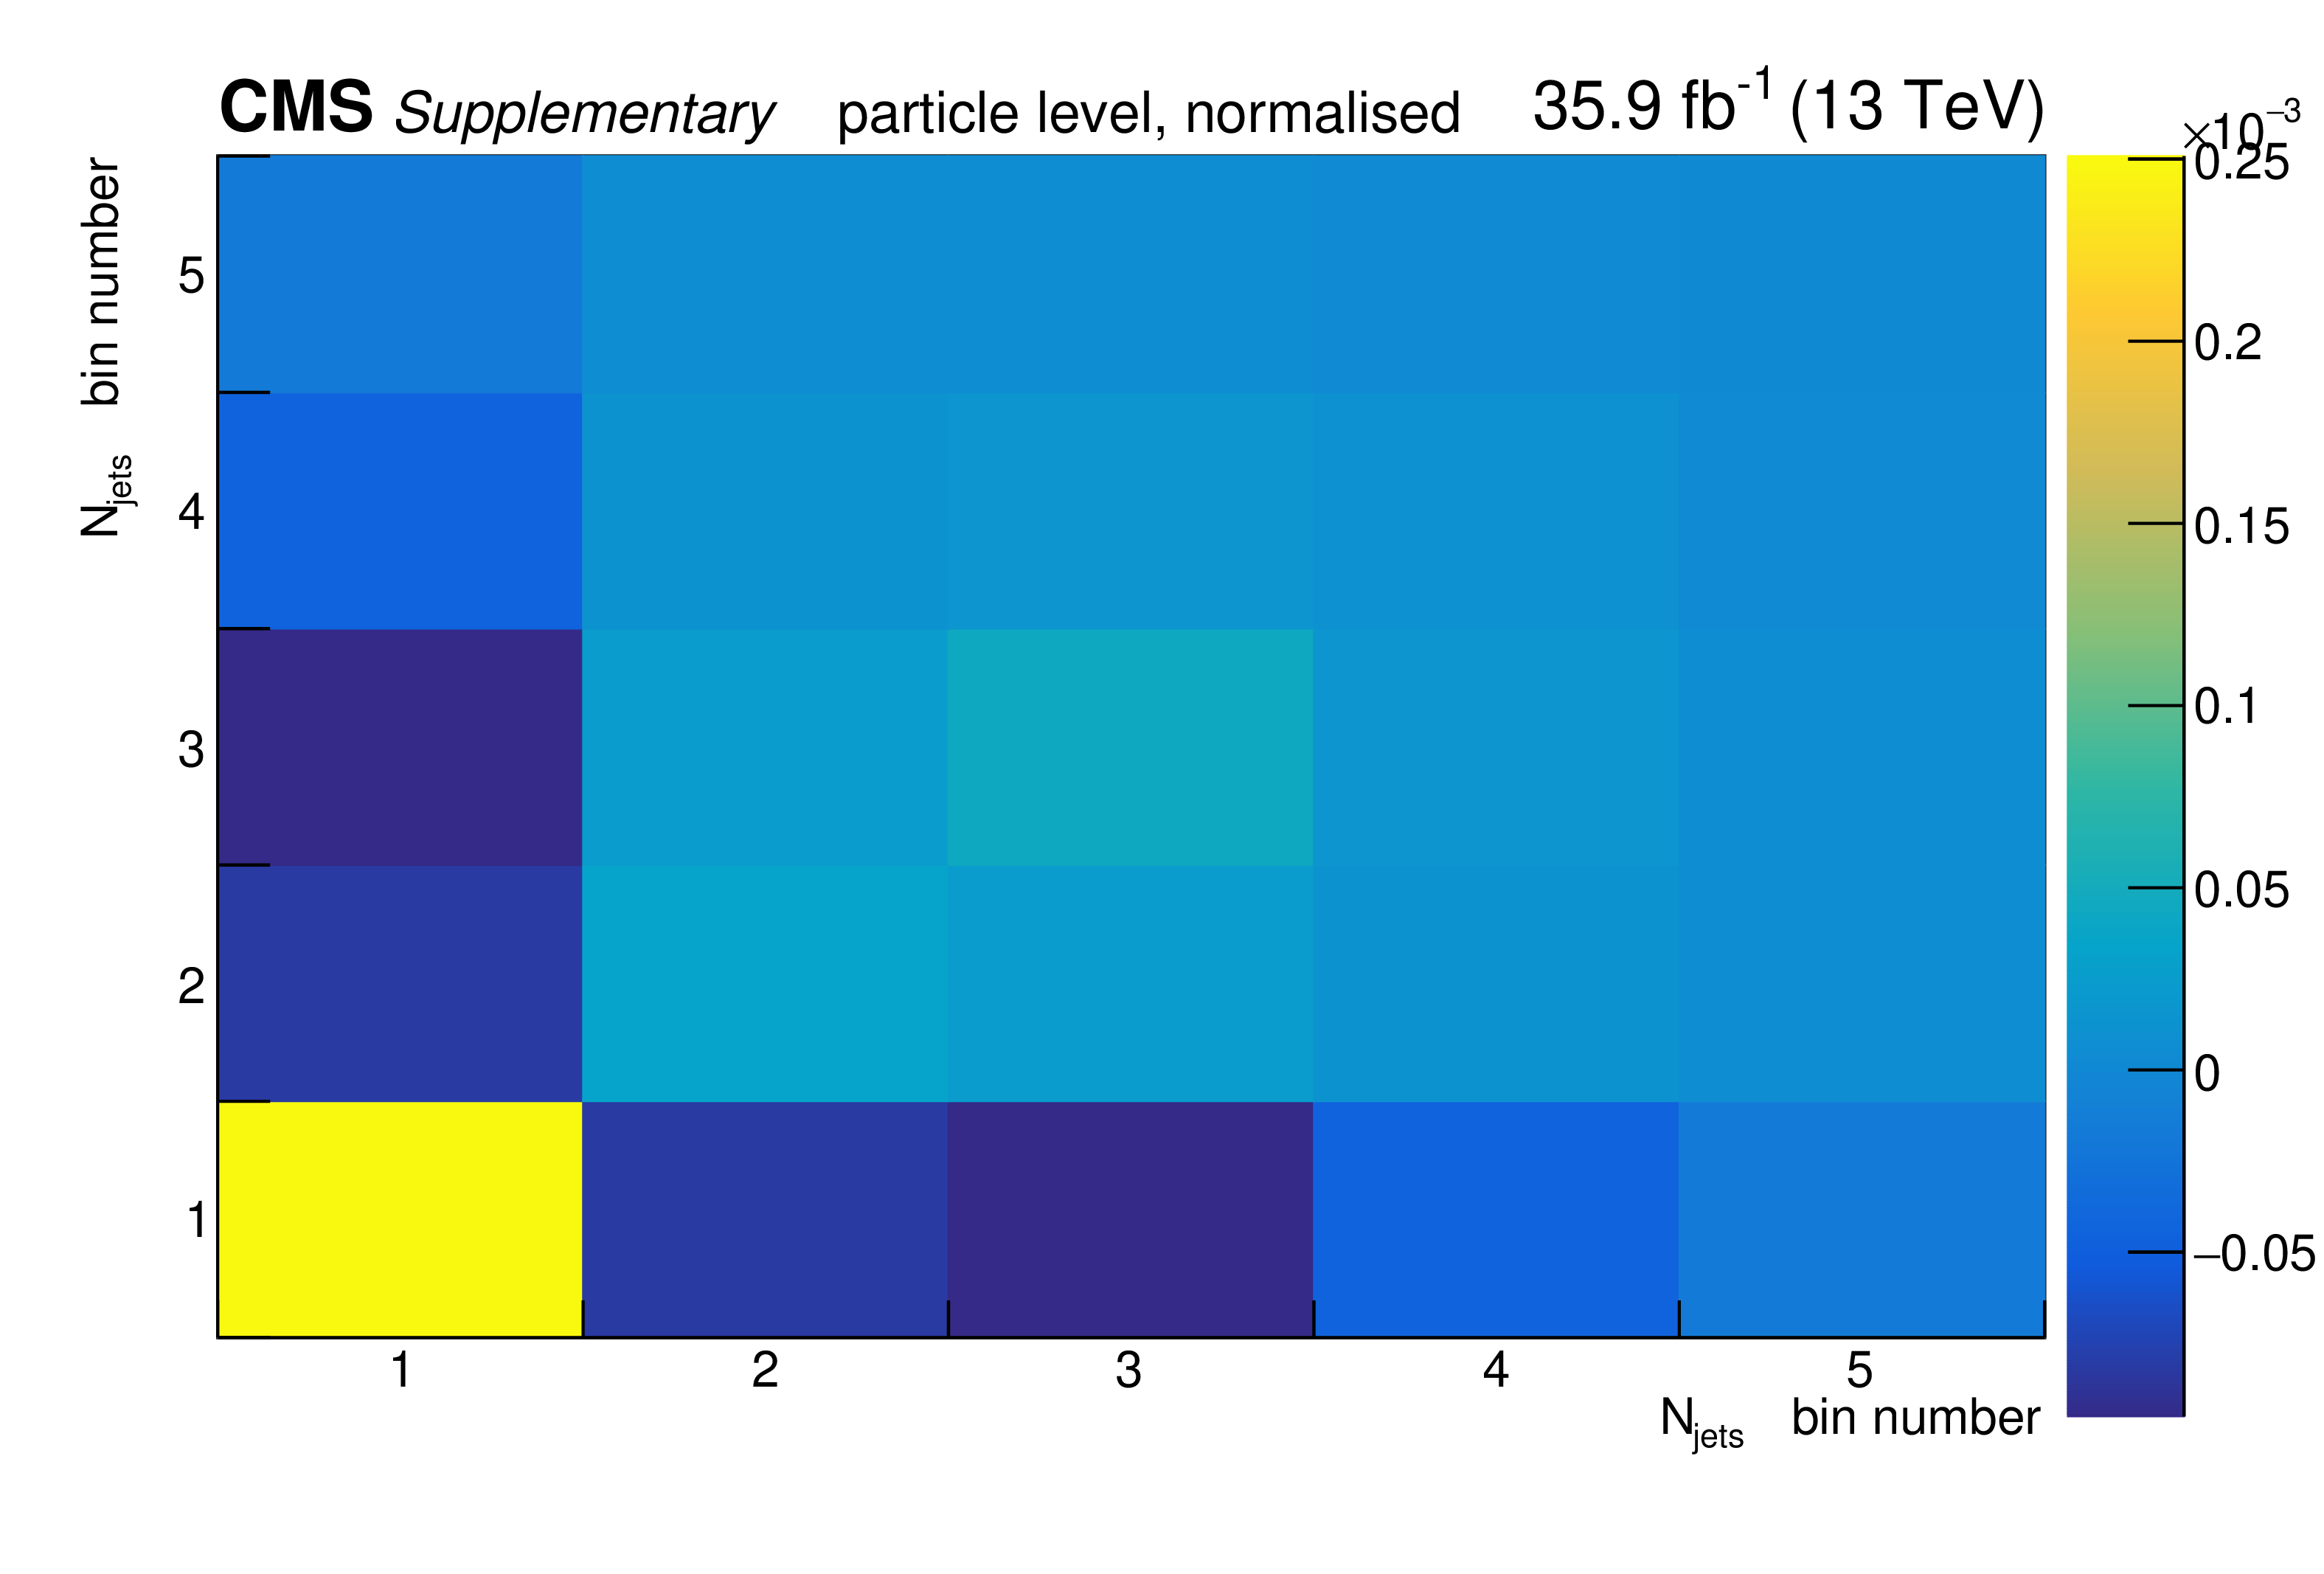
png pdf |
Additional Figure 188:
The covariance matrix of the measured data for the normalised measurement of the differential $\mathrm{t\bar{t}}$ cross section as a function of $N_{\mathrm {jets}}$ at particle level is shown. |

png pdf |
Additional Figure 189:
Absolute differential $\mathrm{t\bar{t}}$ production cross sections as a function of $p_{\mathrm {T}}^{\mathrm {t}}$ in a fiducial phase space at the particle level are shown for the data (filled circles) in comparison with POWHEG v2 + PYTHIA8 MC predictions (lines), and to the fixed-order calculations with the NNLO precision in QCD (in preparation) [91], for which the nominal prediction (crosses) and alternative scale choices (triangles) are provided. A modified version of particle level reconstruction for the unfolded data (open circles, showing only the statistical uncertainty) and the MC simulation (dashed line) is also presented. In the modified version of particle level reconstruction, neutrinos from hadronic decays are included in the jet clustering. The lower panel shows the ratios with respect to the standard unfolded data. The dark and light bands show the relative statistical and total uncertainties in the standard data, respectively. |
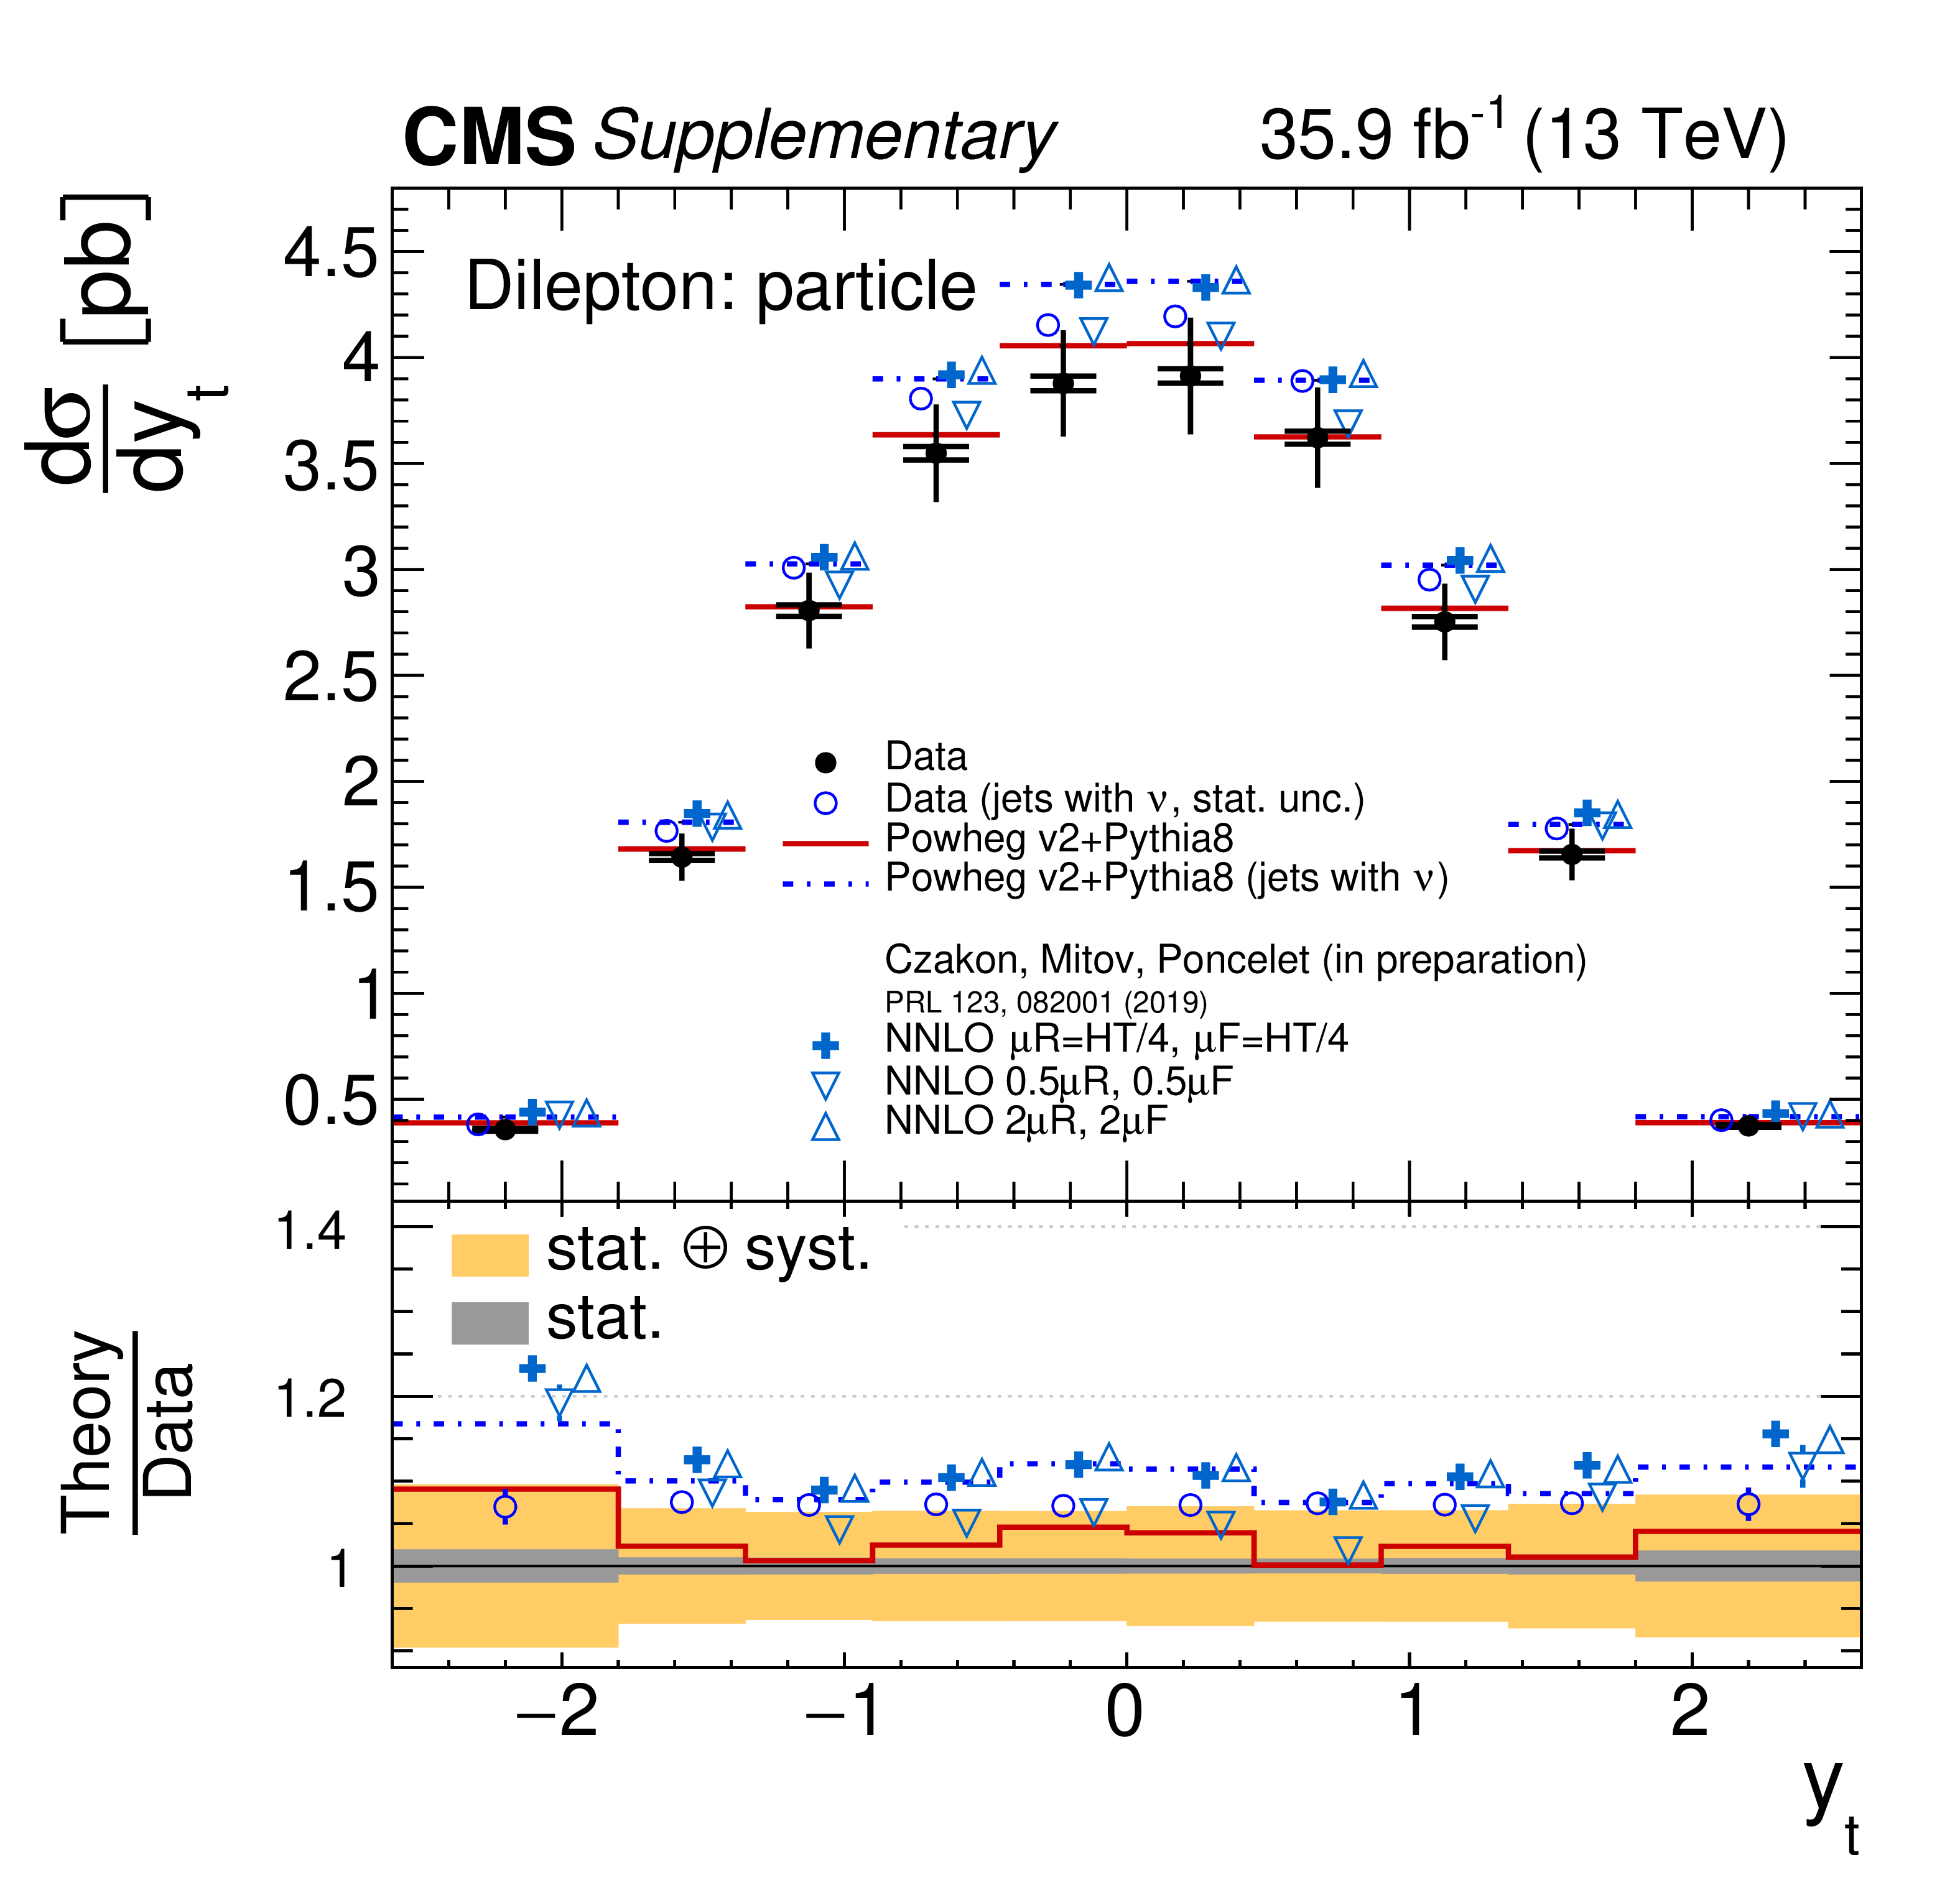
png pdf |
Additional Figure 190:
Absolute differential $\mathrm{t\bar{t}}$ production cross sections as a function of $y_{\mathrm {t}}$ in a fiducial phase space at the particle level are shown for the data (filled circles) in comparison with POWHEG v2 + PYTHIA8 MC predictions (lines), and to the fixed-order calculations with the NNLO precision in QCD (in preparation) [91], for which the nominal prediction (crosses) and alternative scale choices (triangles) are provided. A modified version of particle level reconstruction for the unfolded data (open circles, showing only the statistical uncertainty) and the MC simulation (dashed line) is also presented. In the modified version of particle level reconstruction, neutrinos from hadronic decays are included in the jet clustering. The lower panel shows the ratios with respect to the standard unfolded data. The dark and light bands show the relative statistical and total uncertainties in the standard data, respectively. |
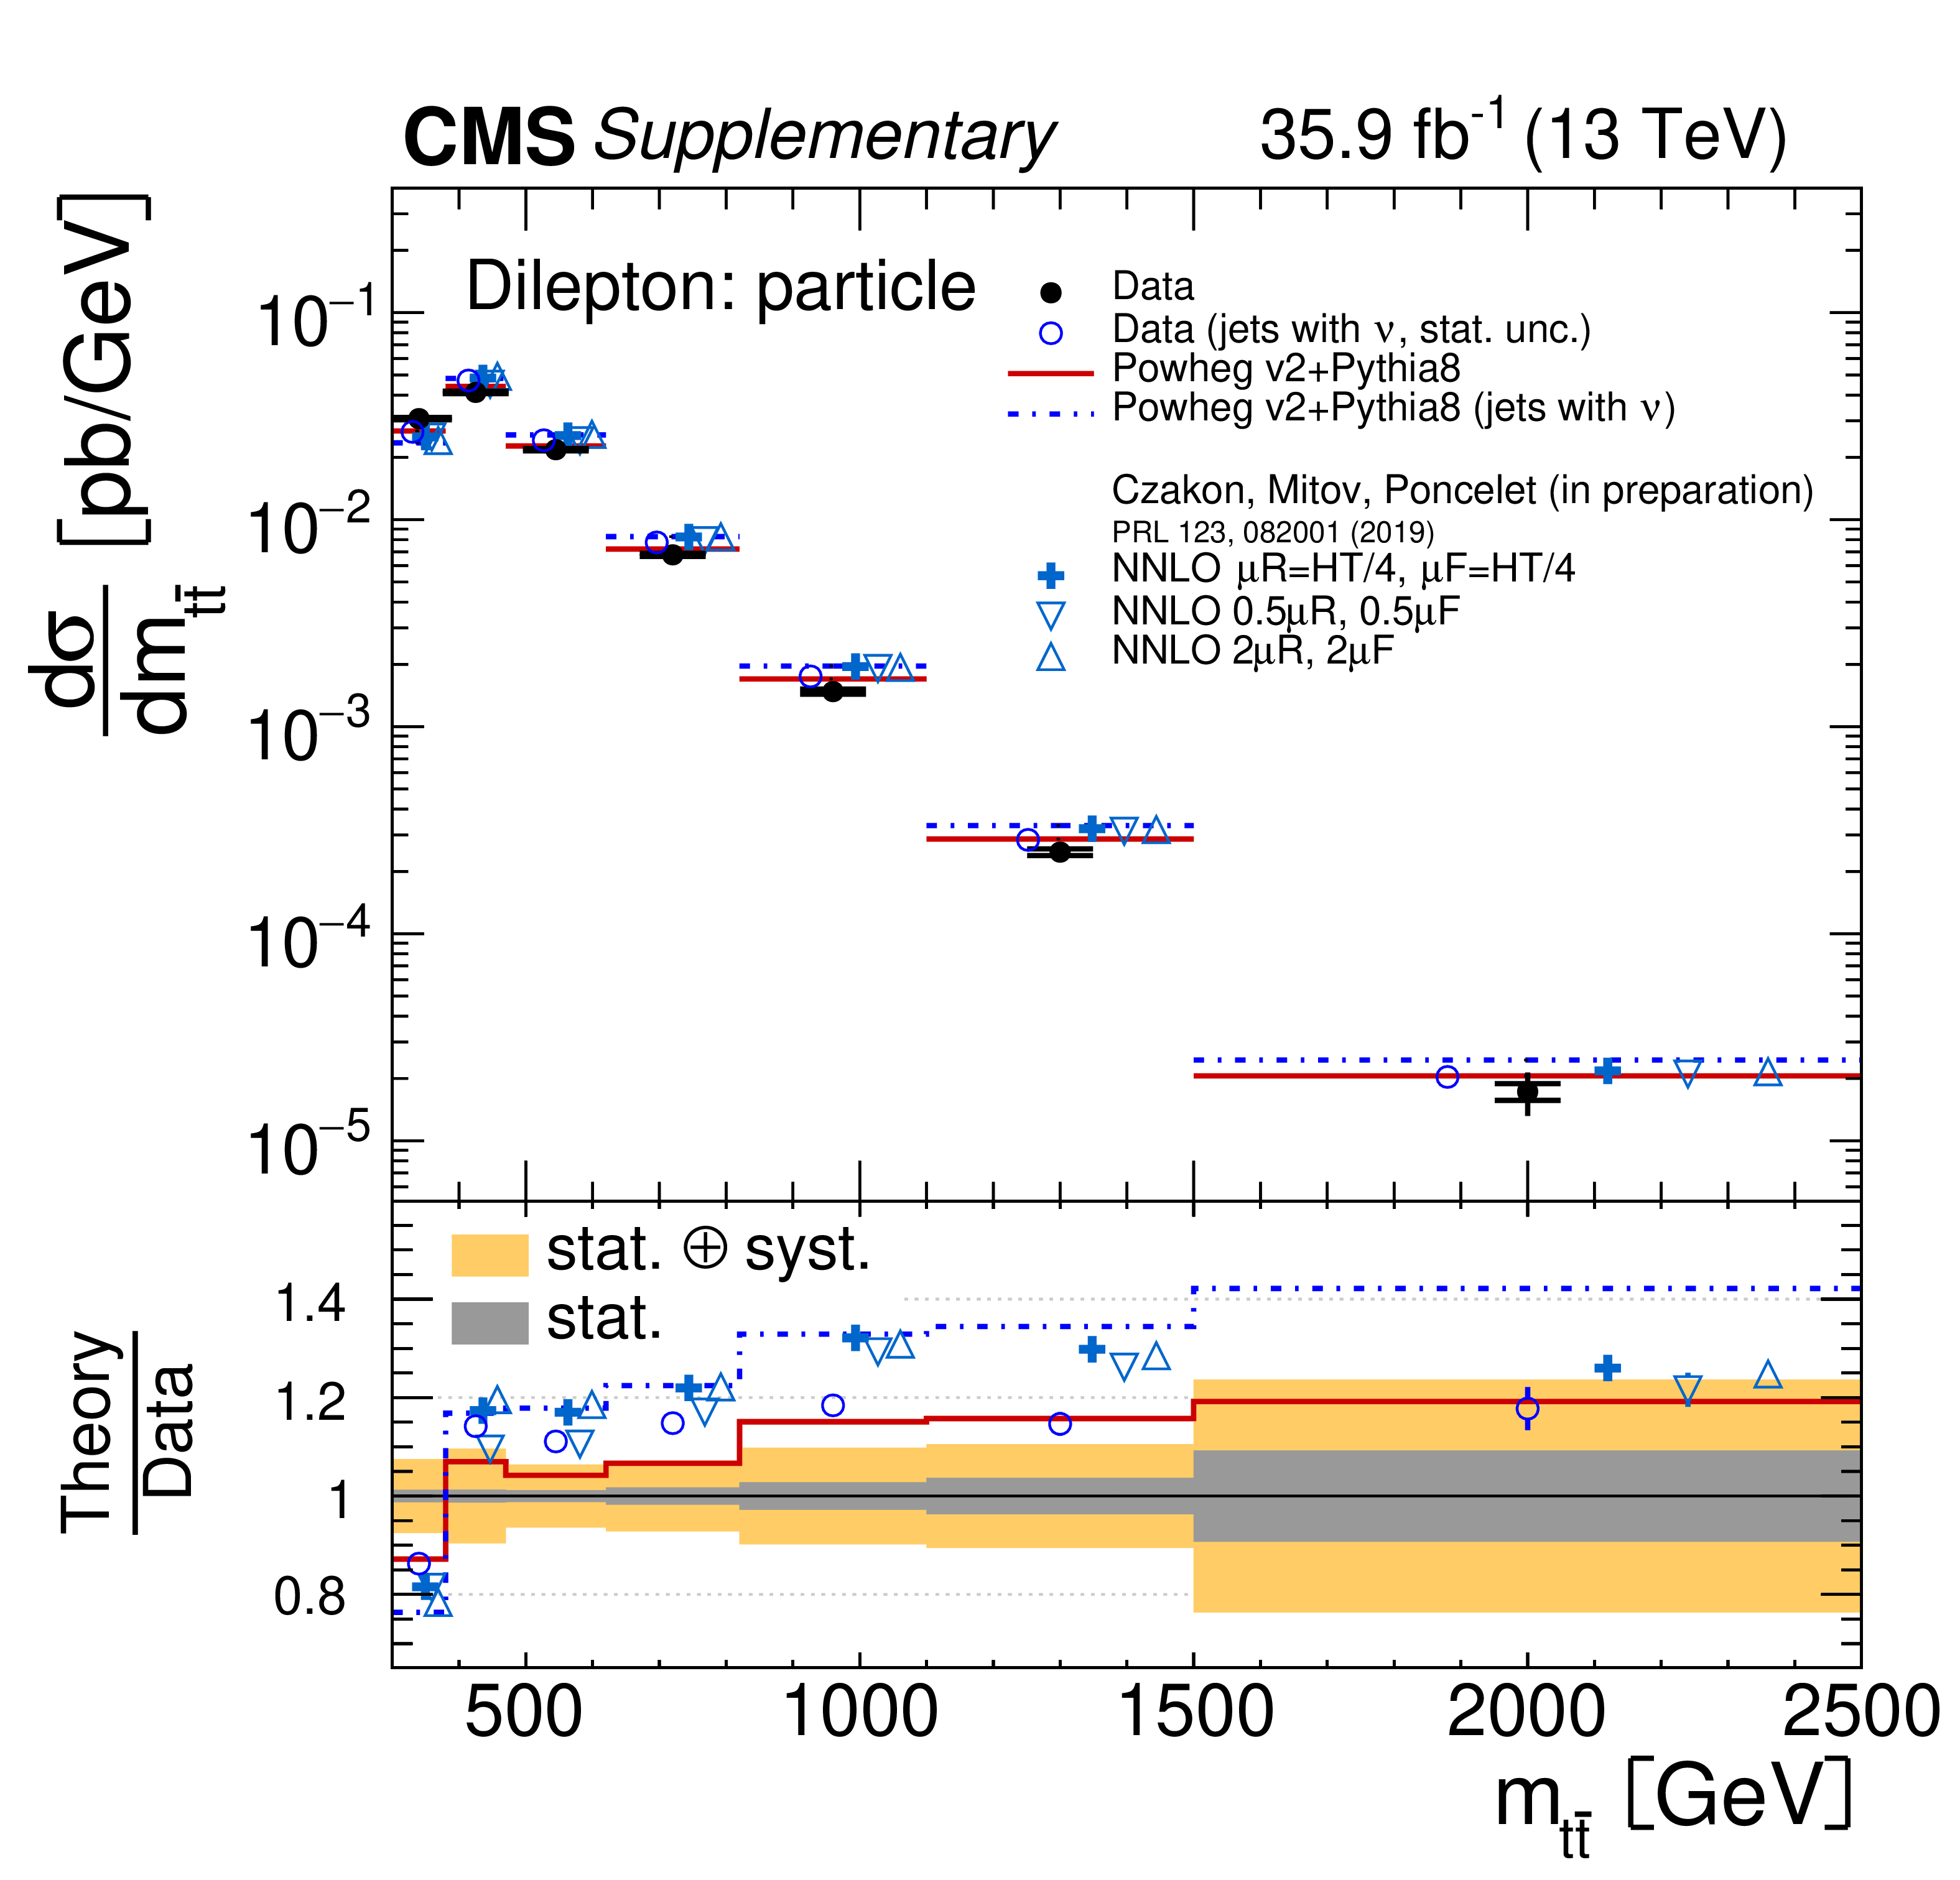
png pdf |
Additional Figure 191:
Absolute differential $\mathrm{t\bar{t}}$ production cross sections as a function of $m_{\mathrm{t\bar{t}}}$ in a fiducial phase space at the particle level are shown for the data (filled circles) in comparison with POWHEG v2 + PYTHIA8 MC predictions (lines), and to the fixed-order calculations with the NNLO precision in QCD (in preparation) [91], for which the nominal prediction (crosses) and alternative scale choices (triangles) are provided. A modified version of particle level reconstruction for the unfolded data (open circles, showing only the statistical uncertainty) and the MC simulation (dashed line) is also presented. In the modified version of particle level reconstruction, neutrinos from hadronic decays are included in the jet clustering. The lower panel shows the ratios with respect to the standard unfolded data. The dark and light bands show the relative statistical and total uncertainties in the standard data, respectively. |

png pdf |
Additional Figure 192:
Absolute differential $\mathrm{t\bar{t}}$ production cross sections as a function of $p_{\mathrm {T}}^{\mathrm{t\bar{t}}}$ in a fiducial phase space at the particle level are shown for the data (filled circles) in comparison with POWHEG v2 + PYTHIA8 MC predictions (lines), and to the fixed-order calculations with the NNLO precision in QCD (in preparation) [91], for which the nominal prediction (crosses) and alternative scale choices (triangles) are provided. A modified version of particle level reconstruction for the unfolded data (open circles, showing only the statistical uncertainty) and the MC simulation (dashed line) is also presented. In the modified version of particle level reconstruction, neutrinos from hadronic decays are included in the jet clustering. The lower panel shows the ratios with respect to the standard unfolded data. The dark and light bands show the relative statistical and total uncertainties in the standard data, respectively. |
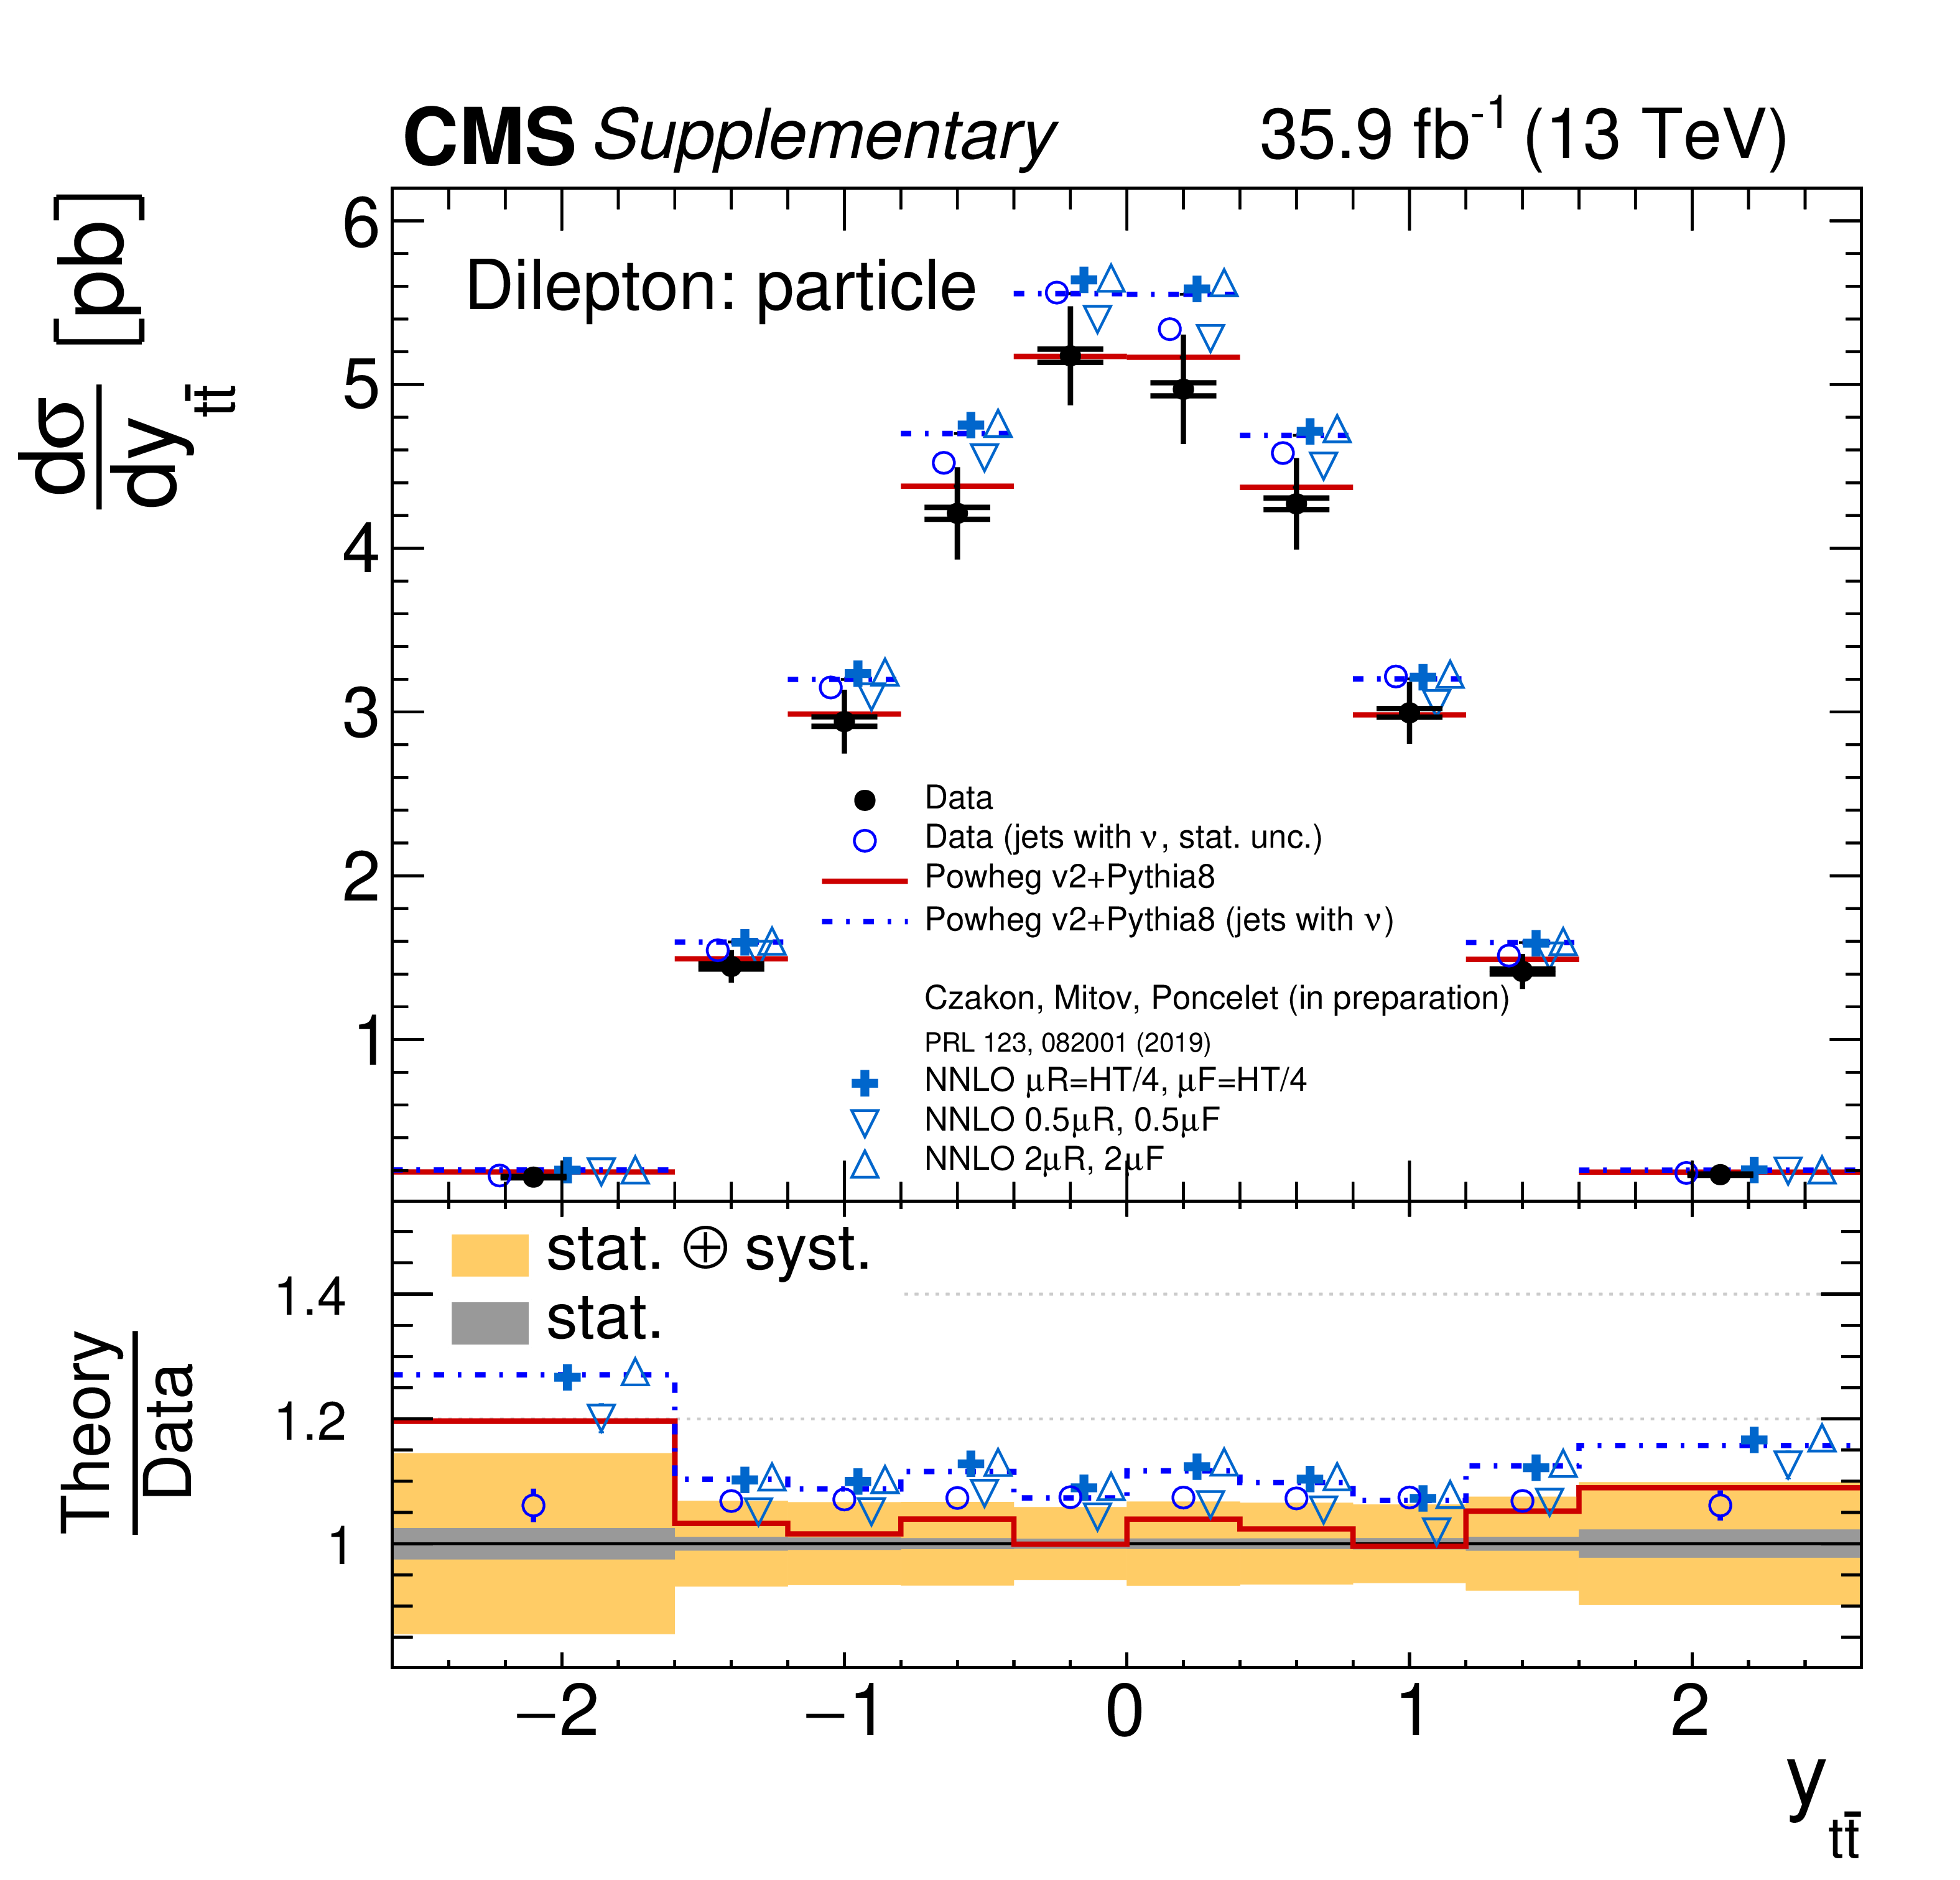
png pdf |
Additional Figure 193:
Absolute differential $\mathrm{t\bar{t}}$ production cross sections as a function of $y_{\mathrm{t\bar{t}}}$ in a fiducial phase space at the particle level are shown for the data (filled circles) in comparison with POWHEG v2 + PYTHIA8 MC predictions (lines), and to the fixed-order calculations with the NNLO precision in QCD (in preparation) [91], for which the nominal prediction (crosses) and alternative scale choices (triangles) are provided. A modified version of particle level reconstruction for the unfolded data (open circles, showing only the statistical uncertainty) and the MC simulation (dashed line) is also presented. In the modified version of particle level reconstruction, neutrinos from hadronic decays are included in the jet clustering. The lower panel shows the ratios with respect to the standard unfolded data. The dark and light bands show the relative statistical and total uncertainties in the standard data, respectively. |

png pdf |
Additional Figure 194:
Absolute differential $\mathrm{t\bar{t}}$ production cross sections as a function of $p_{\mathrm {T}}^{{\ell}}$ in a fiducial phase space at the particle level are shown for the data (filled circles) in comparison with POWHEG v2 + PYTHIA8 MC predictions (lines), and to the fixed-order calculations with the NNLO precision in QCD (in preparation) [91], for which the nominal prediction (crosses) and alternative scale choices (triangles) are provided. A modified version of particle level reconstruction for the unfolded data (open circles, showing only the statistical uncertainty) and the MC simulation (dashed line) is also presented. In the modified version of particle level reconstruction, neutrinos from hadronic decays are included in the jet clustering. The lower panel shows the ratios with respect to the standard unfolded data. The dark and light bands show the relative statistical and total uncertainties in the standard data, respectively. |

png pdf |
Additional Figure 195:
Absolute differential $\mathrm{t\bar{t}}$ production cross sections as a function of $\eta _{{\ell}}$ in a fiducial phase space at the particle level are shown for the data (filled circles) in comparison with POWHEG v2 + PYTHIA8 MC predictions (lines), and to the fixed-order calculations with the NNLO precision in QCD (in preparation) [91], for which the nominal prediction (crosses) and alternative scale choices (triangles) are provided. A modified version of particle level reconstruction for the unfolded data (open circles, showing only the statistical uncertainty) and the MC simulation (dashed line) is also presented. In the modified version of particle level reconstruction, neutrinos from hadronic decays are included in the jet clustering. The lower panel shows the ratios with respect to the standard unfolded data. The dark and light bands show the relative statistical and total uncertainties in the standard data, respectively. |

png pdf |
Additional Figure 196:
Absolute differential $\mathrm{t\bar{t}}$ production cross sections as a function of $m_{{\ell}\bar{\ell}}$ in a fiducial phase space at the particle level are shown for the data (filled circles) in comparison with POWHEG v2 + PYTHIA8 MC predictions (lines), and to the fixed-order calculations with the NNLO precision in QCD (in preparation) [91], for which the nominal prediction (crosses) and alternative scale choices (triangles) are provided. A modified version of particle level reconstruction for the unfolded data (open circles, showing only the statistical uncertainty) and the MC simulation (dashed line) is also presented. In the modified version of particle level reconstruction, neutrinos from hadronic decays are included in the jet clustering. The lower panel shows the ratios with respect to the standard unfolded data. The dark and light bands show the relative statistical and total uncertainties in the standard data, respectively. |
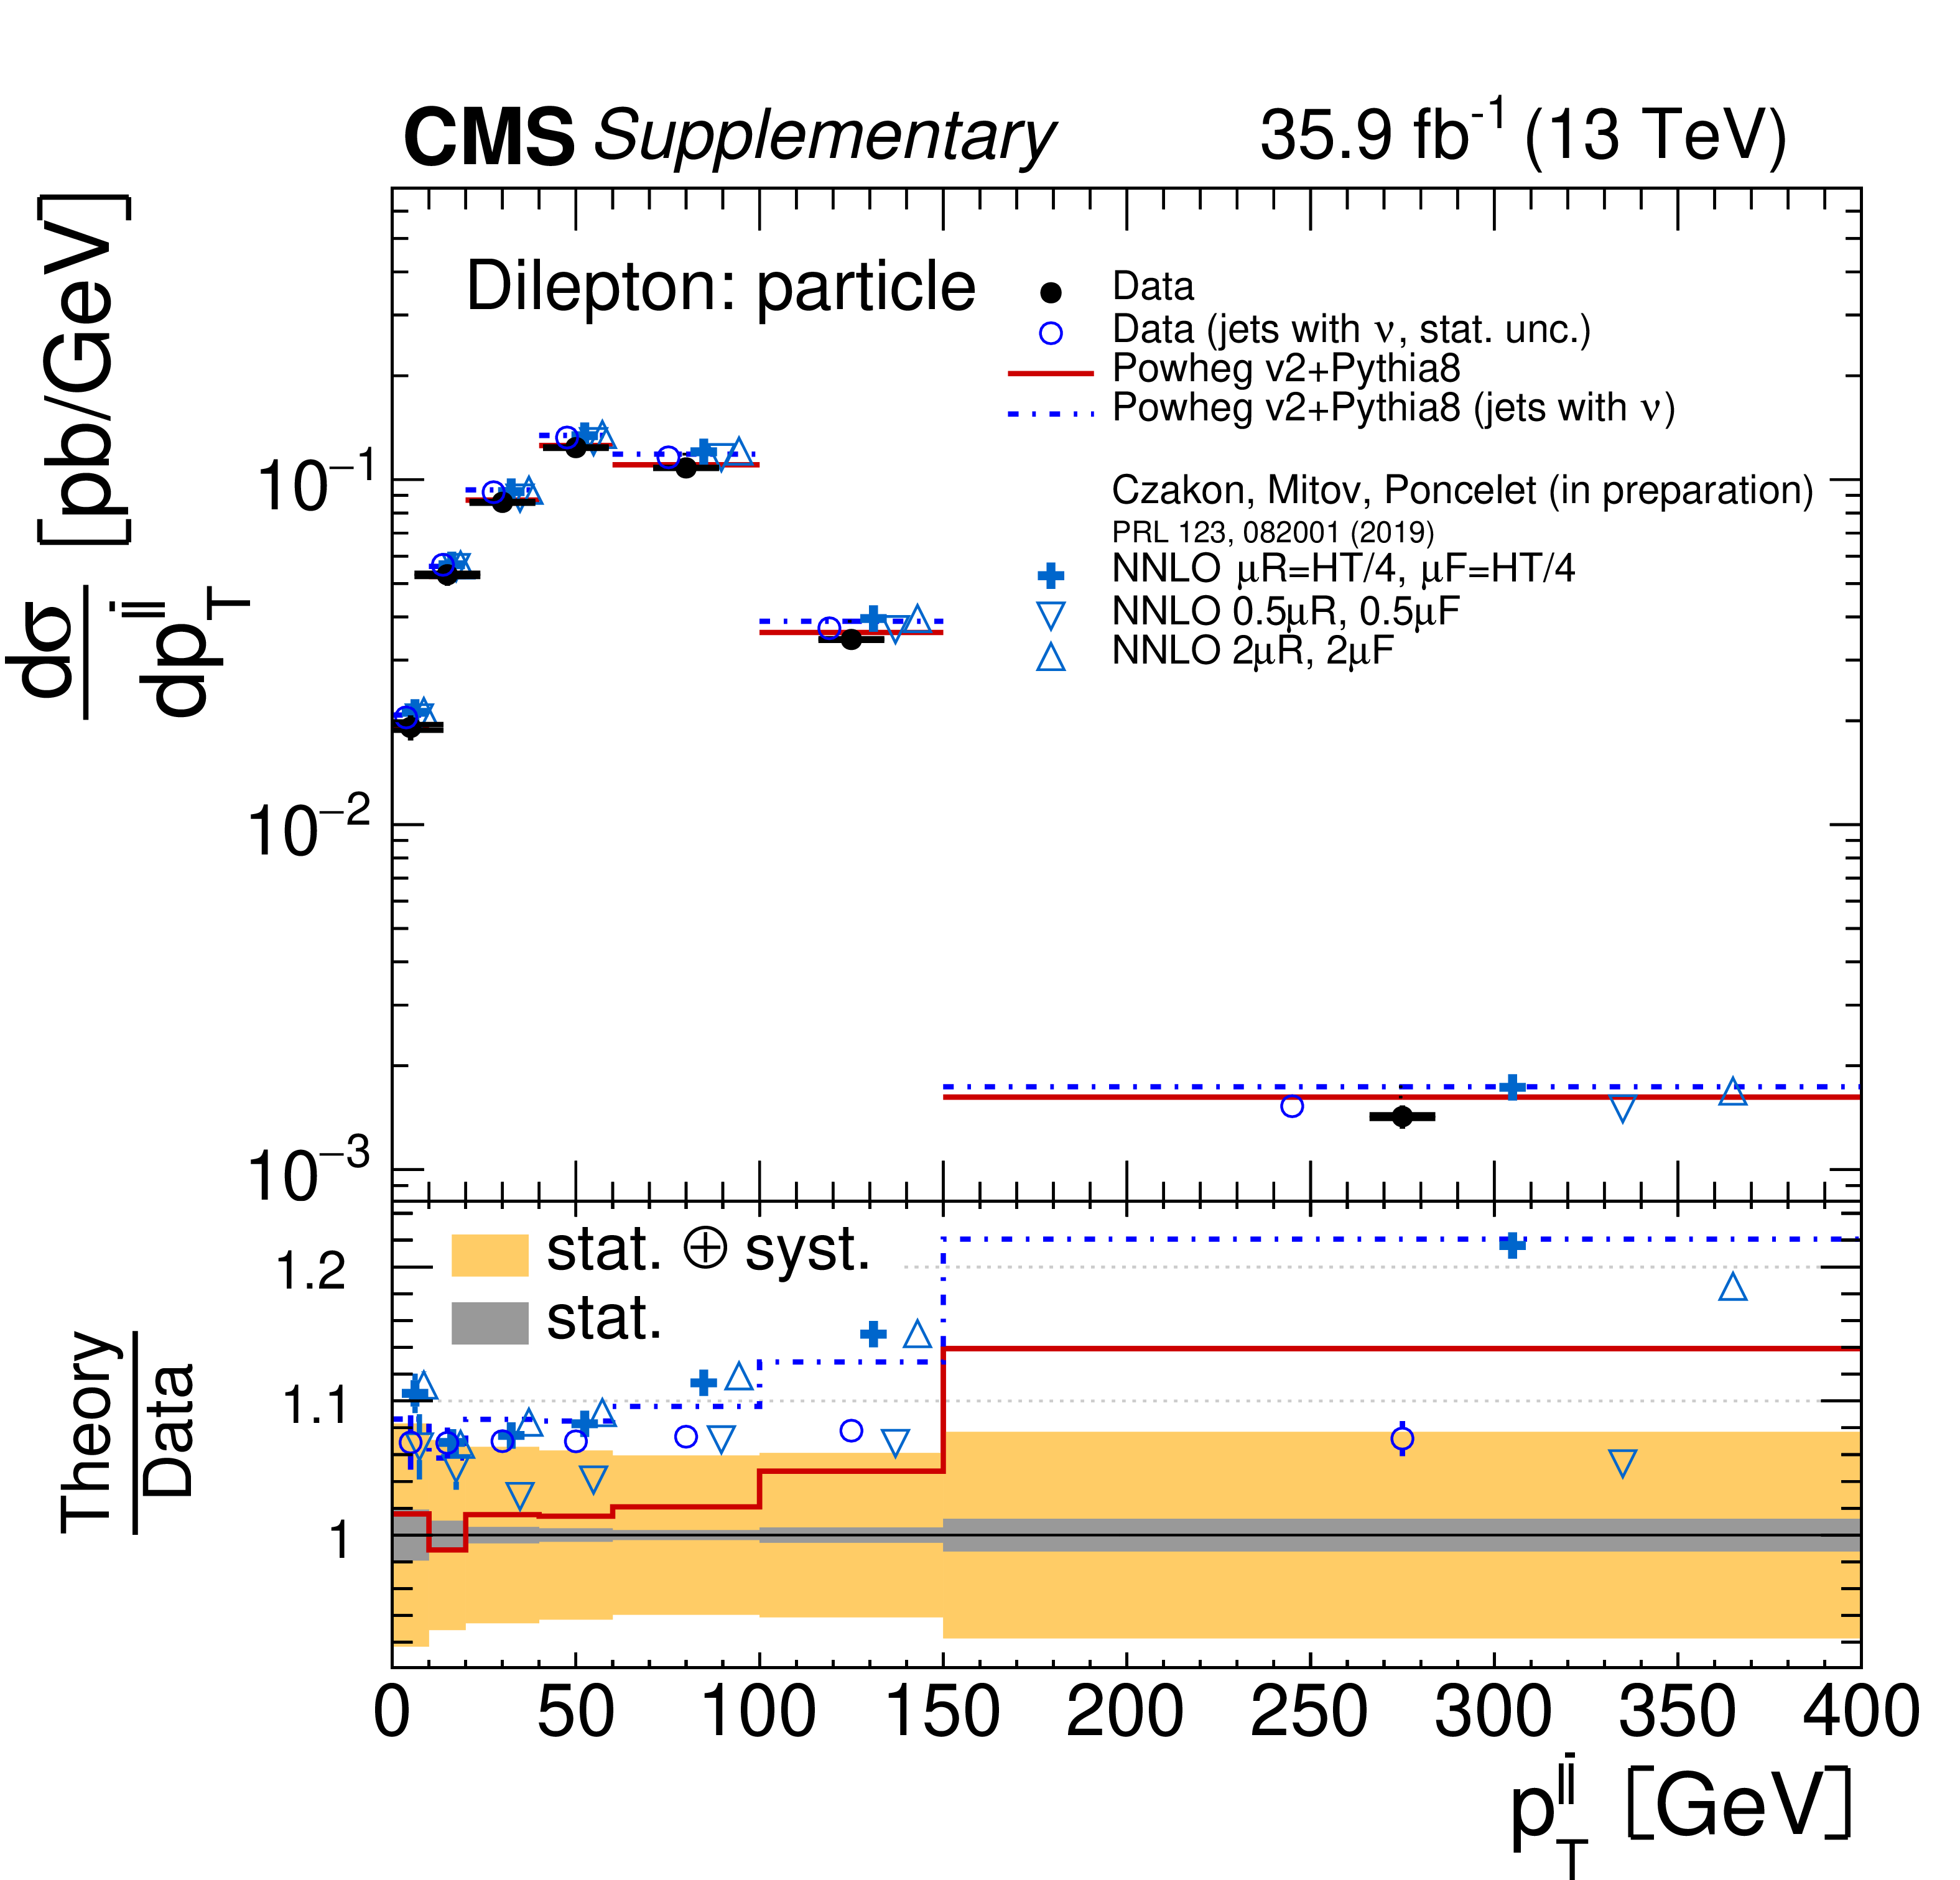
png pdf |
Additional Figure 197:
Absolute differential $\mathrm{t\bar{t}}$ production cross sections as a function of $p_{\mathrm {T}}^{{\ell}\bar{\ell}}$ in a fiducial phase space at the particle level are shown for the data (filled circles) in comparison with POWHEG v2 + PYTHIA8 MC predictions (lines), and to the fixed-order calculations with the NNLO precision in QCD (in preparation) [91], for which the nominal prediction (crosses) and alternative scale choices (triangles) are provided. A modified version of particle level reconstruction for the unfolded data (open circles, showing only the statistical uncertainty) and the MC simulation (dashed line) is also presented. In the modified version of particle level reconstruction, neutrinos from hadronic decays are included in the jet clustering. The lower panel shows the ratios with respect to the standard unfolded data. The dark and light bands show the relative statistical and total uncertainties in the standard data, respectively. |
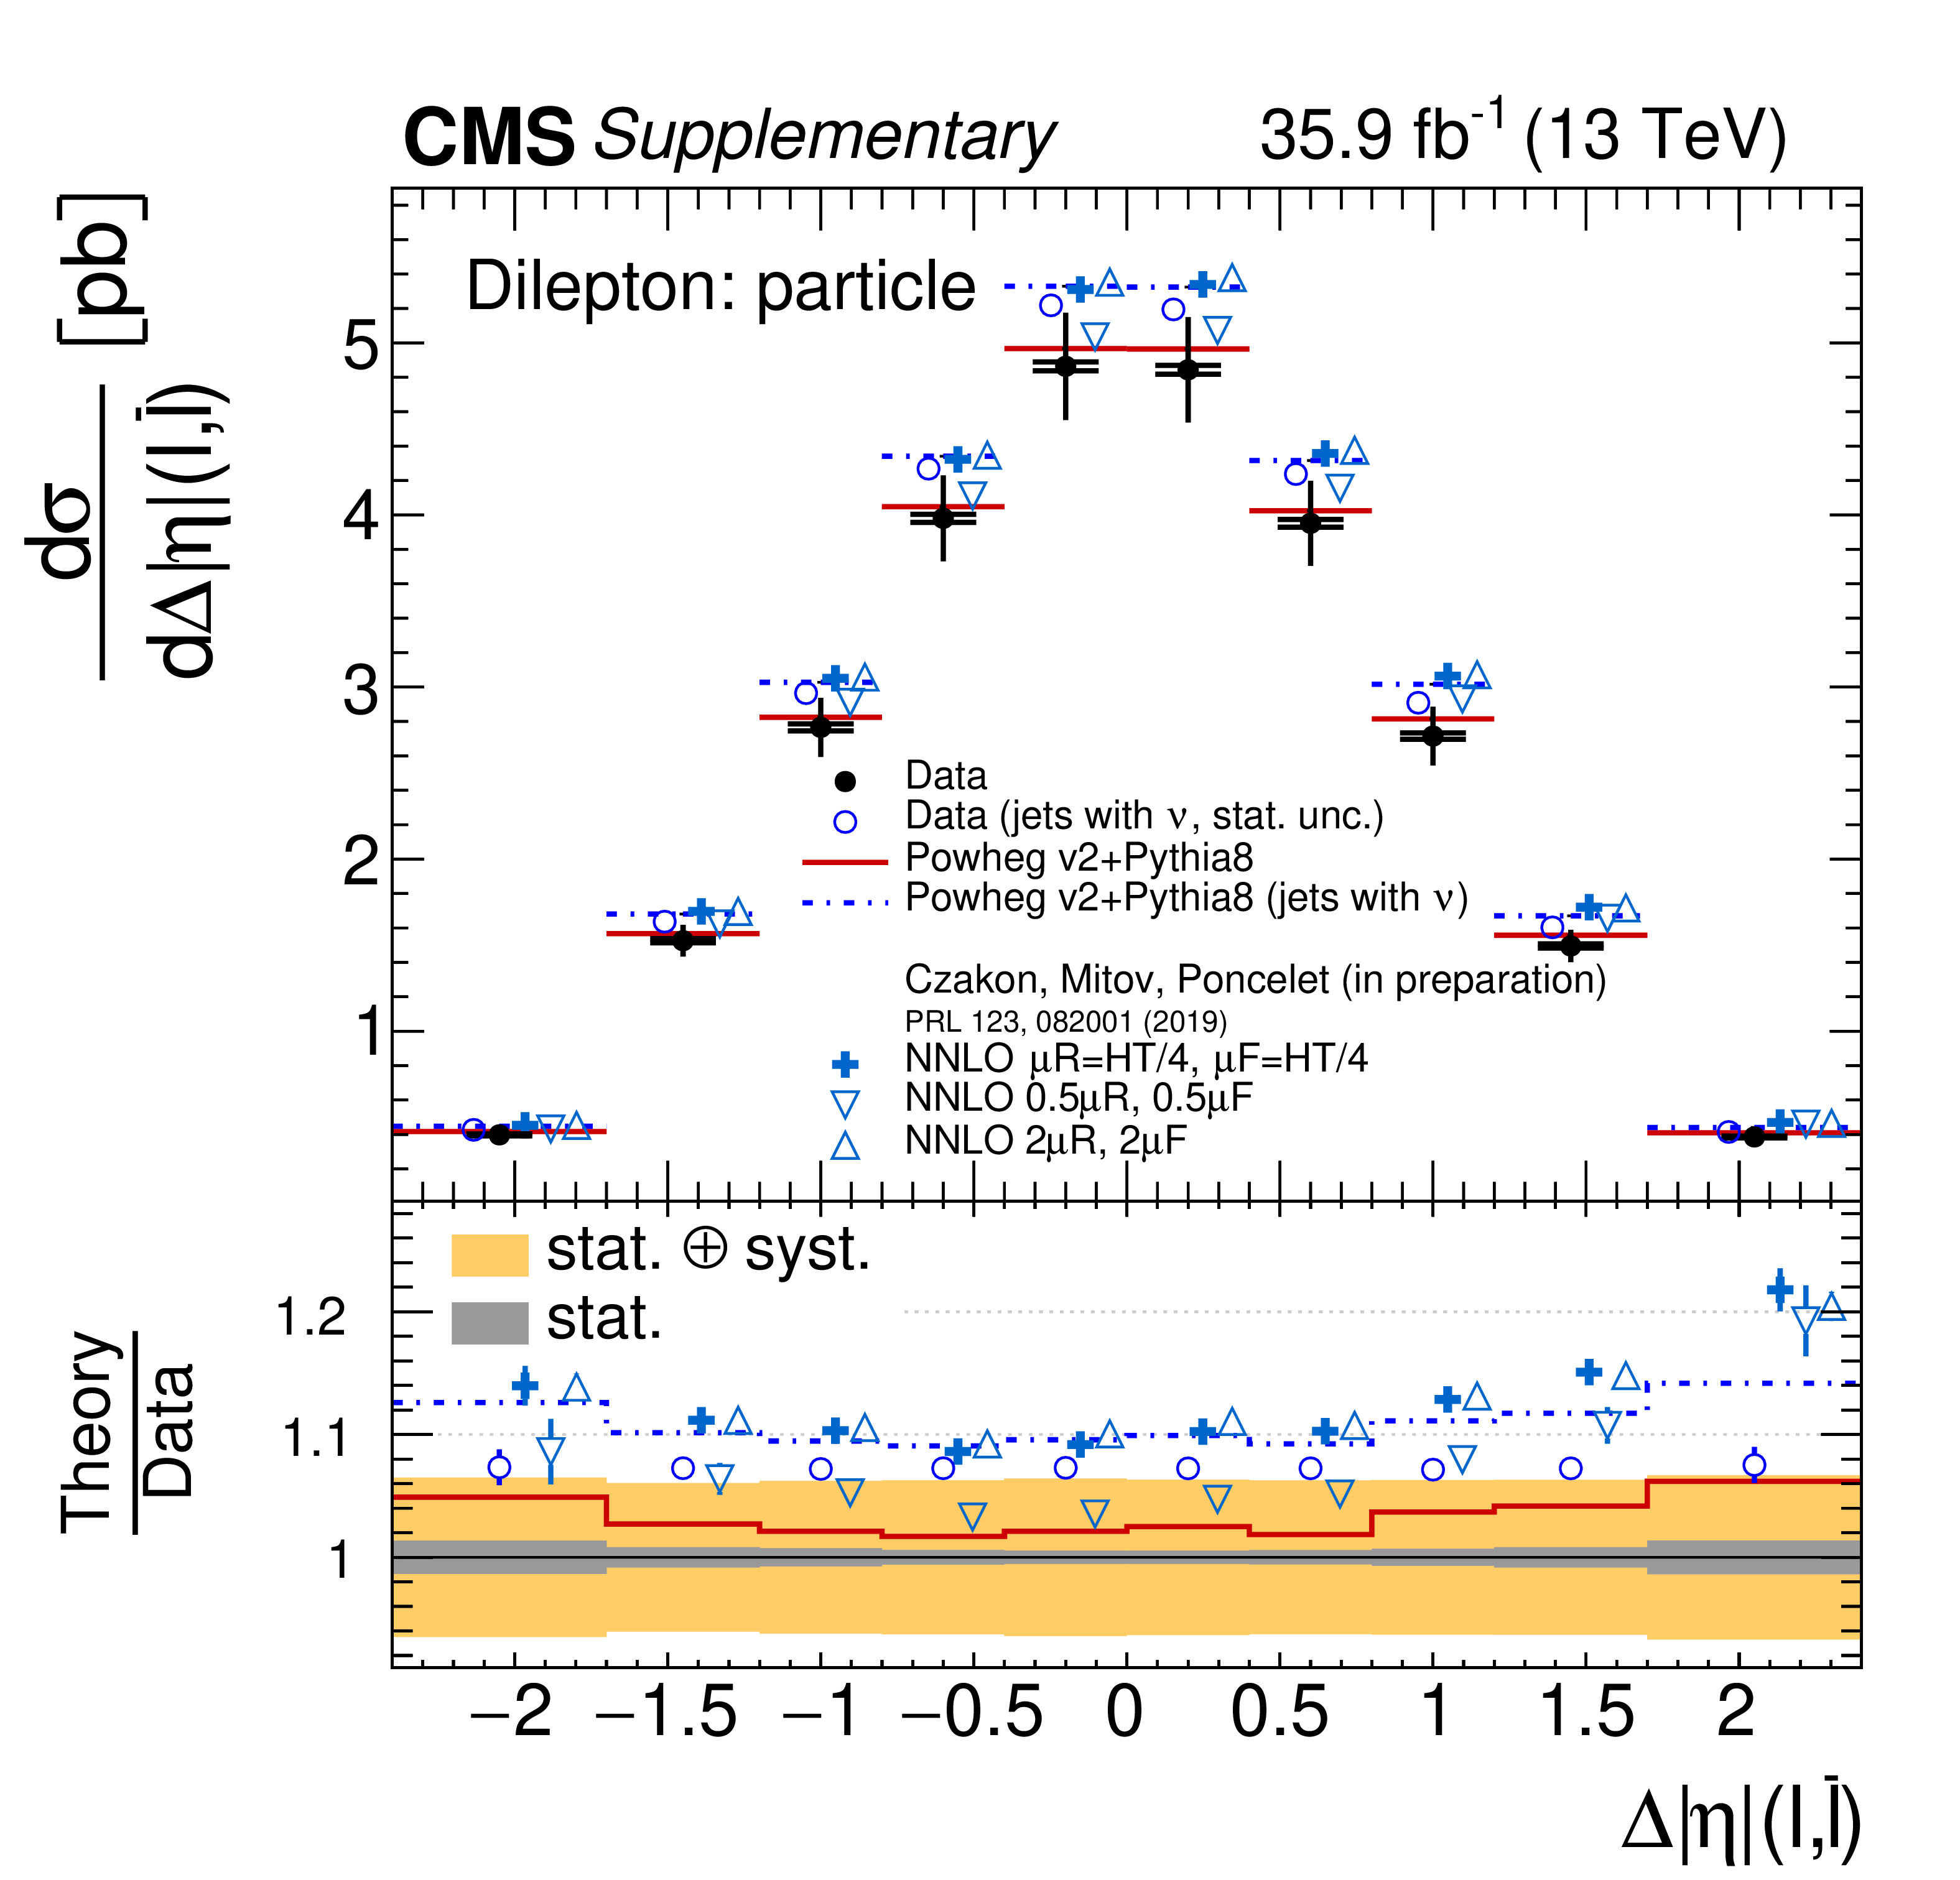
png pdf |
Additional Figure 198:
Absolute differential $\mathrm{t\bar{t}}$ production cross sections as a function of $\Delta \eta ({\ell},\bar{\ell})$ in a fiducial phase space at the particle level are shown for the data (filled circles) in comparison with POWHEG v2 + PYTHIA8 MC predictions (lines), and to the fixed-order calculations with the NNLO precision in QCD (in preparation) [91], for which the nominal prediction (crosses) and alternative scale choices (triangles) are provided. A modified version of particle level reconstruction for the unfolded data (open circles, showing only the statistical uncertainty) and the MC simulation (dashed line) is also presented. In the modified version of particle level reconstruction, neutrinos from hadronic decays are included in the jet clustering. The lower panel shows the ratios with respect to the standard unfolded data. The dark and light bands show the relative statistical and total uncertainties in the standard data, respectively. |

png pdf |
Additional Figure 199:
Absolute differential $\mathrm{t\bar{t}}$ production cross sections as a function of $\Delta \phi ({\ell},\bar{\ell})$ in a fiducial phase space at the particle level are shown for the data (filled circles) in comparison with POWHEG v2 + PYTHIA8 MC predictions (lines), and to the fixed-order calculations with the NNLO precision in QCD (in preparation) [91], for which the nominal prediction (crosses) and alternative scale choices (triangles) are provided. A modified version of particle level reconstruction for the unfolded data (open circles, showing only the statistical uncertainty) and the MC simulation (dashed line) is also presented. In the modified version of particle level reconstruction, neutrinos from hadronic decays are included in the jet clustering. The lower panel shows the ratios with respect to the standard unfolded data. The dark and light bands show the relative statistical and total uncertainties in the standard data, respectively. |
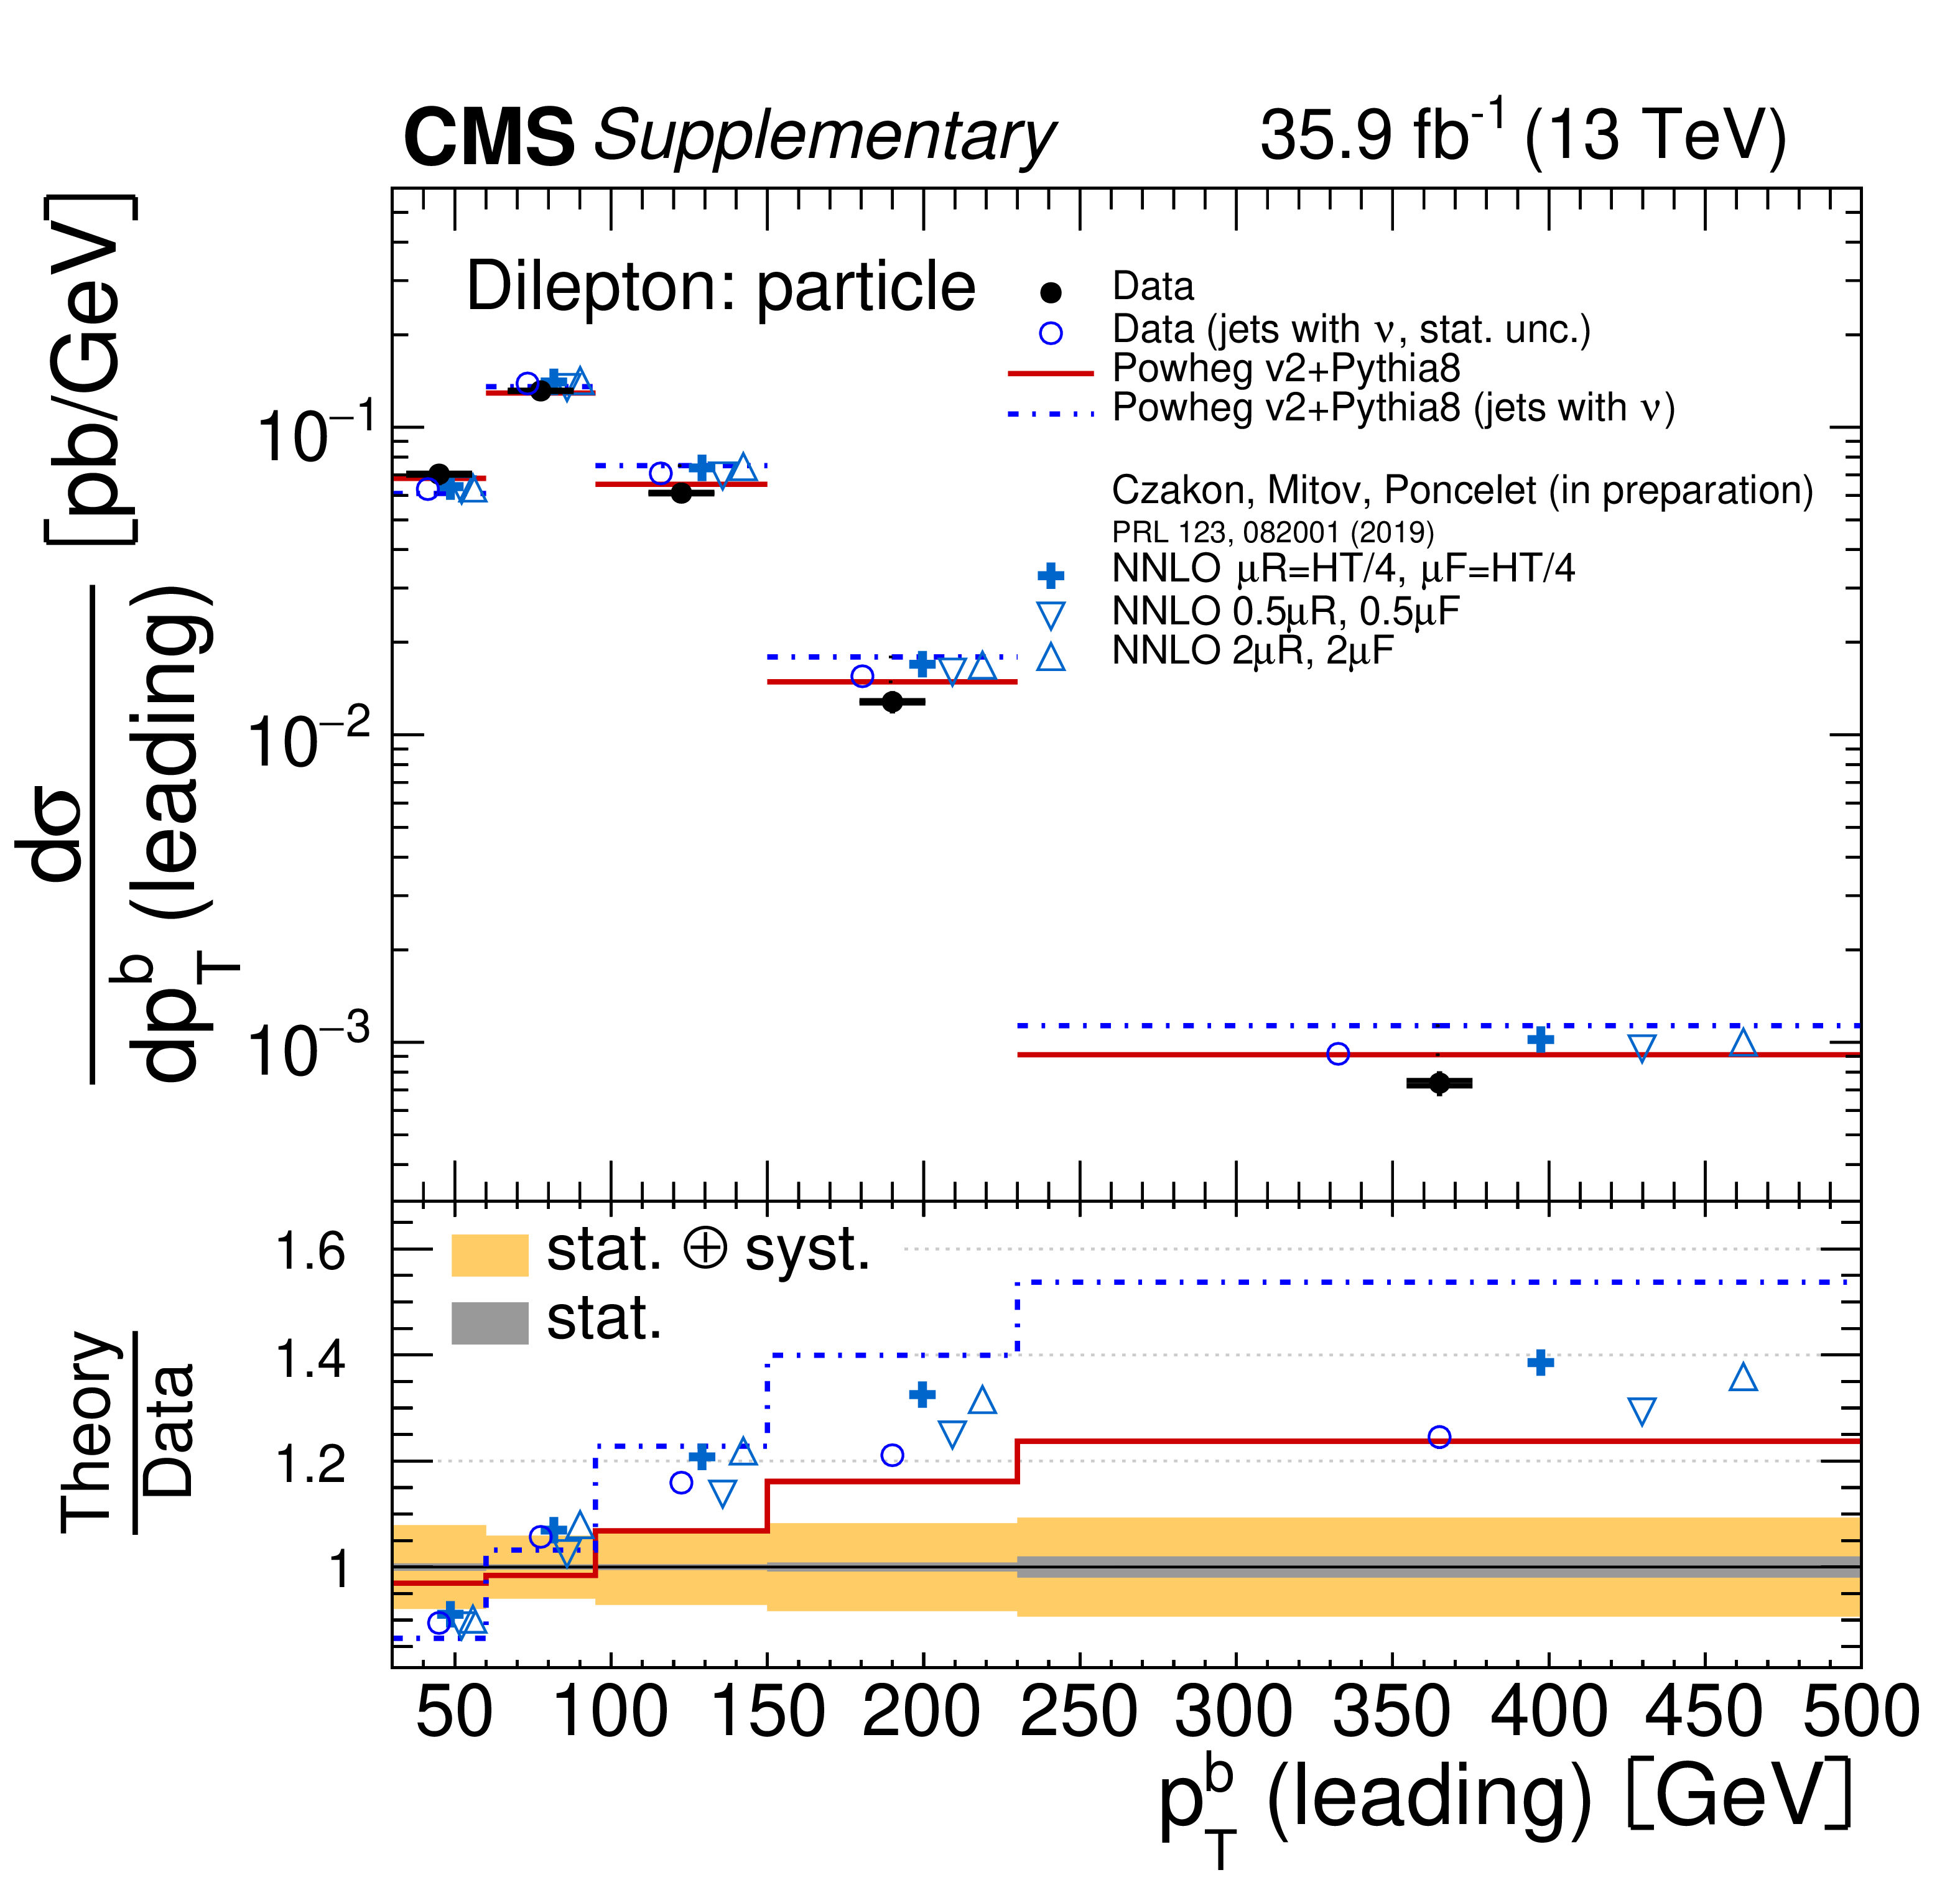
png pdf |
Additional Figure 200:
Absolute differential $\mathrm{t\bar{t}}$ production cross sections as a function of $p_{\mathrm {T}}^{\mathrm{b}}$ (leading) in a fiducial phase space at the particle level are shown for the data (filled circles) in comparison with POWHEG v2 + PYTHIA8 MC predictions (lines), and to the fixed-order calculations with the NNLO precision in QCD (in preparation) [91], for which the nominal prediction (crosses) and alternative scale choices (triangles) are provided. A modified version of particle level reconstruction for the unfolded data (open circles, showing only the statistical uncertainty) and the MC simulation (dashed line) is also presented. In the modified version of particle level reconstruction, neutrinos from hadronic decays are included in the jet clustering. The lower panel shows the ratios with respect to the standard unfolded data. The dark and light bands show the relative statistical and total uncertainties in the standard data, respectively. |

png pdf |
Additional Figure 201:
Absolute differential $\mathrm{t\bar{t}}$ production cross sections as a function of $p_{\mathrm {T}}^{\mathrm{b}}$ (trailing) in a fiducial phase space at the particle level are shown for the data (filled circles) in comparison with POWHEG v2 + PYTHIA8 MC predictions (lines), and to the fixed-order calculations with the NNLO precision in QCD (in preparation) [91], for which the nominal prediction (crosses) and alternative scale choices (triangles) are provided. A modified version of particle level reconstruction for the unfolded data (open circles, showing only the statistical uncertainty) and the MC simulation (dashed line) is also presented. In the modified version of particle level reconstruction, neutrinos from hadronic decays are included in the jet clustering. The lower panel shows the ratios with respect to the standard unfolded data. The dark and light bands show the relative statistical and total uncertainties in the standard data, respectively. |
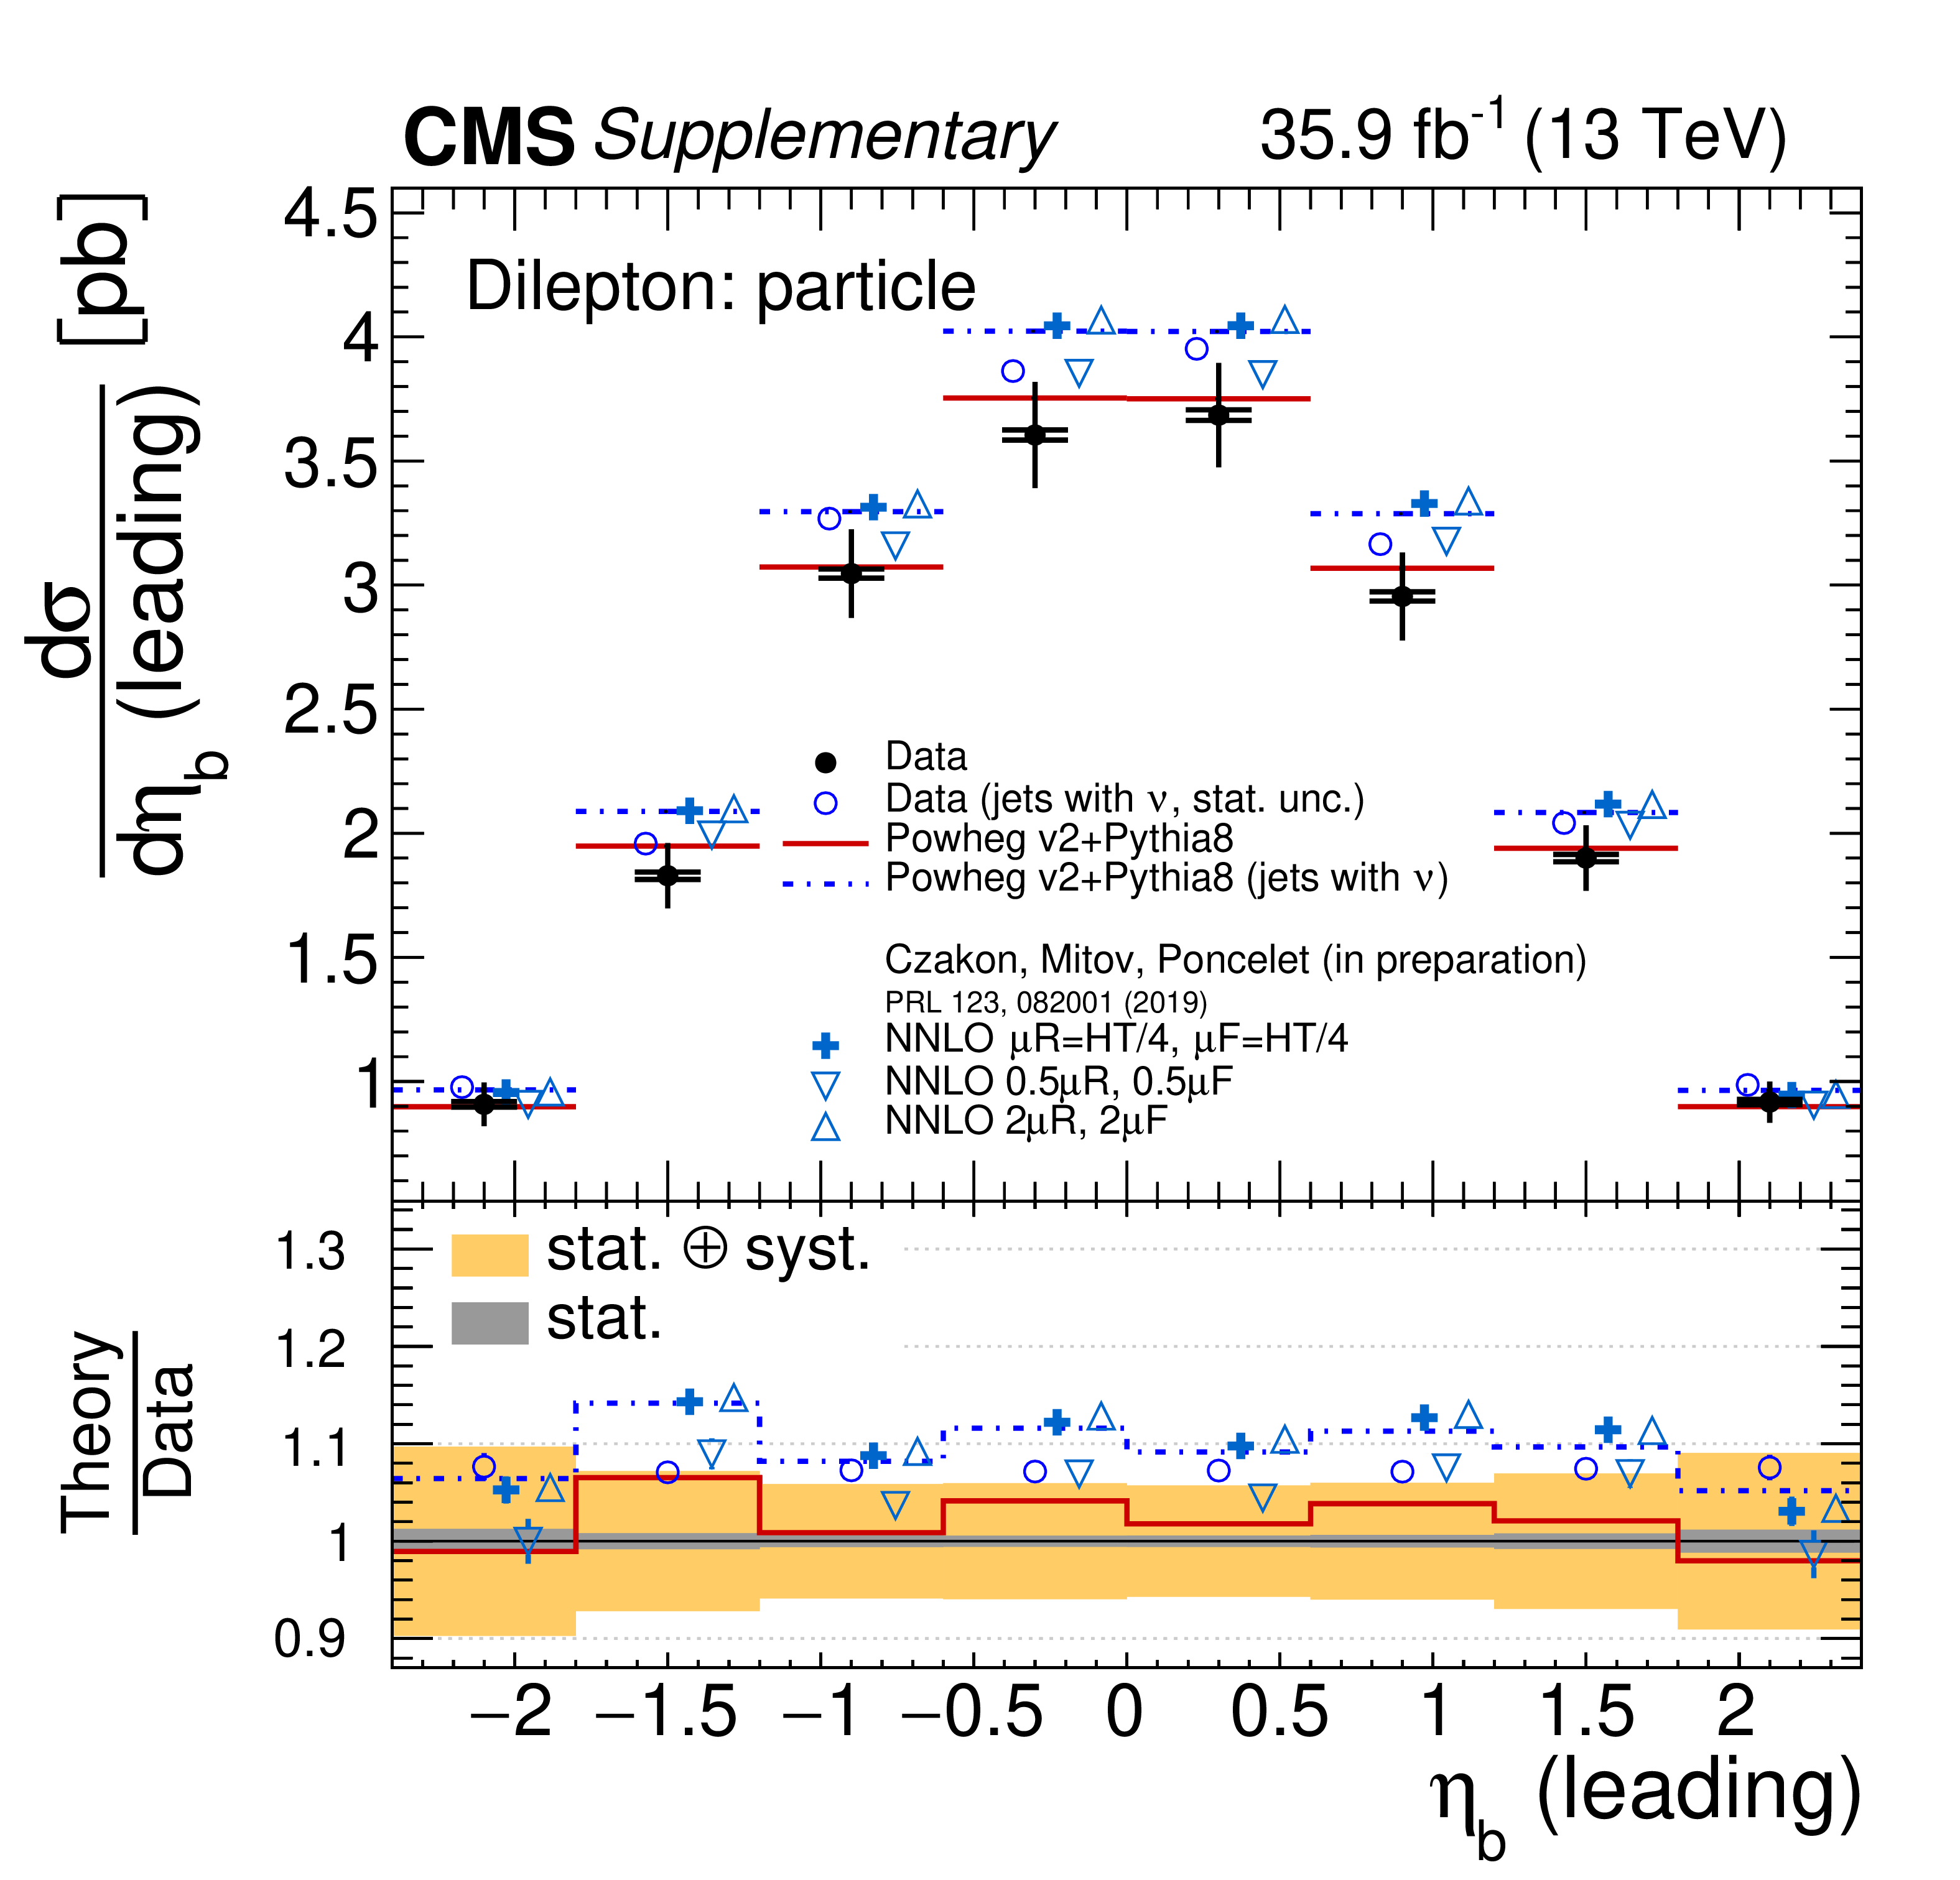
png pdf |
Additional Figure 202:
Absolute differential $\mathrm{t\bar{t}}$ production cross sections as a function of $\eta _{\mathrm{b}}$ (leading) in a fiducial phase space at the particle level are shown for the data (filled circles) in comparison with POWHEG v2 + PYTHIA8 MC predictions (lines), and to the fixed-order calculations with the NNLO precision in QCD (in preparation) [91], for which the nominal prediction (crosses) and alternative scale choices (triangles) are provided. A modified version of particle level reconstruction for the unfolded data (open circles, showing only the statistical uncertainty) and the MC simulation (dashed line) is also presented. In the modified version of particle level reconstruction, neutrinos from hadronic decays are included in the jet clustering. The lower panel shows the ratios with respect to the standard unfolded data. The dark and light bands show the relative statistical and total uncertainties in the standard data, respectively. |
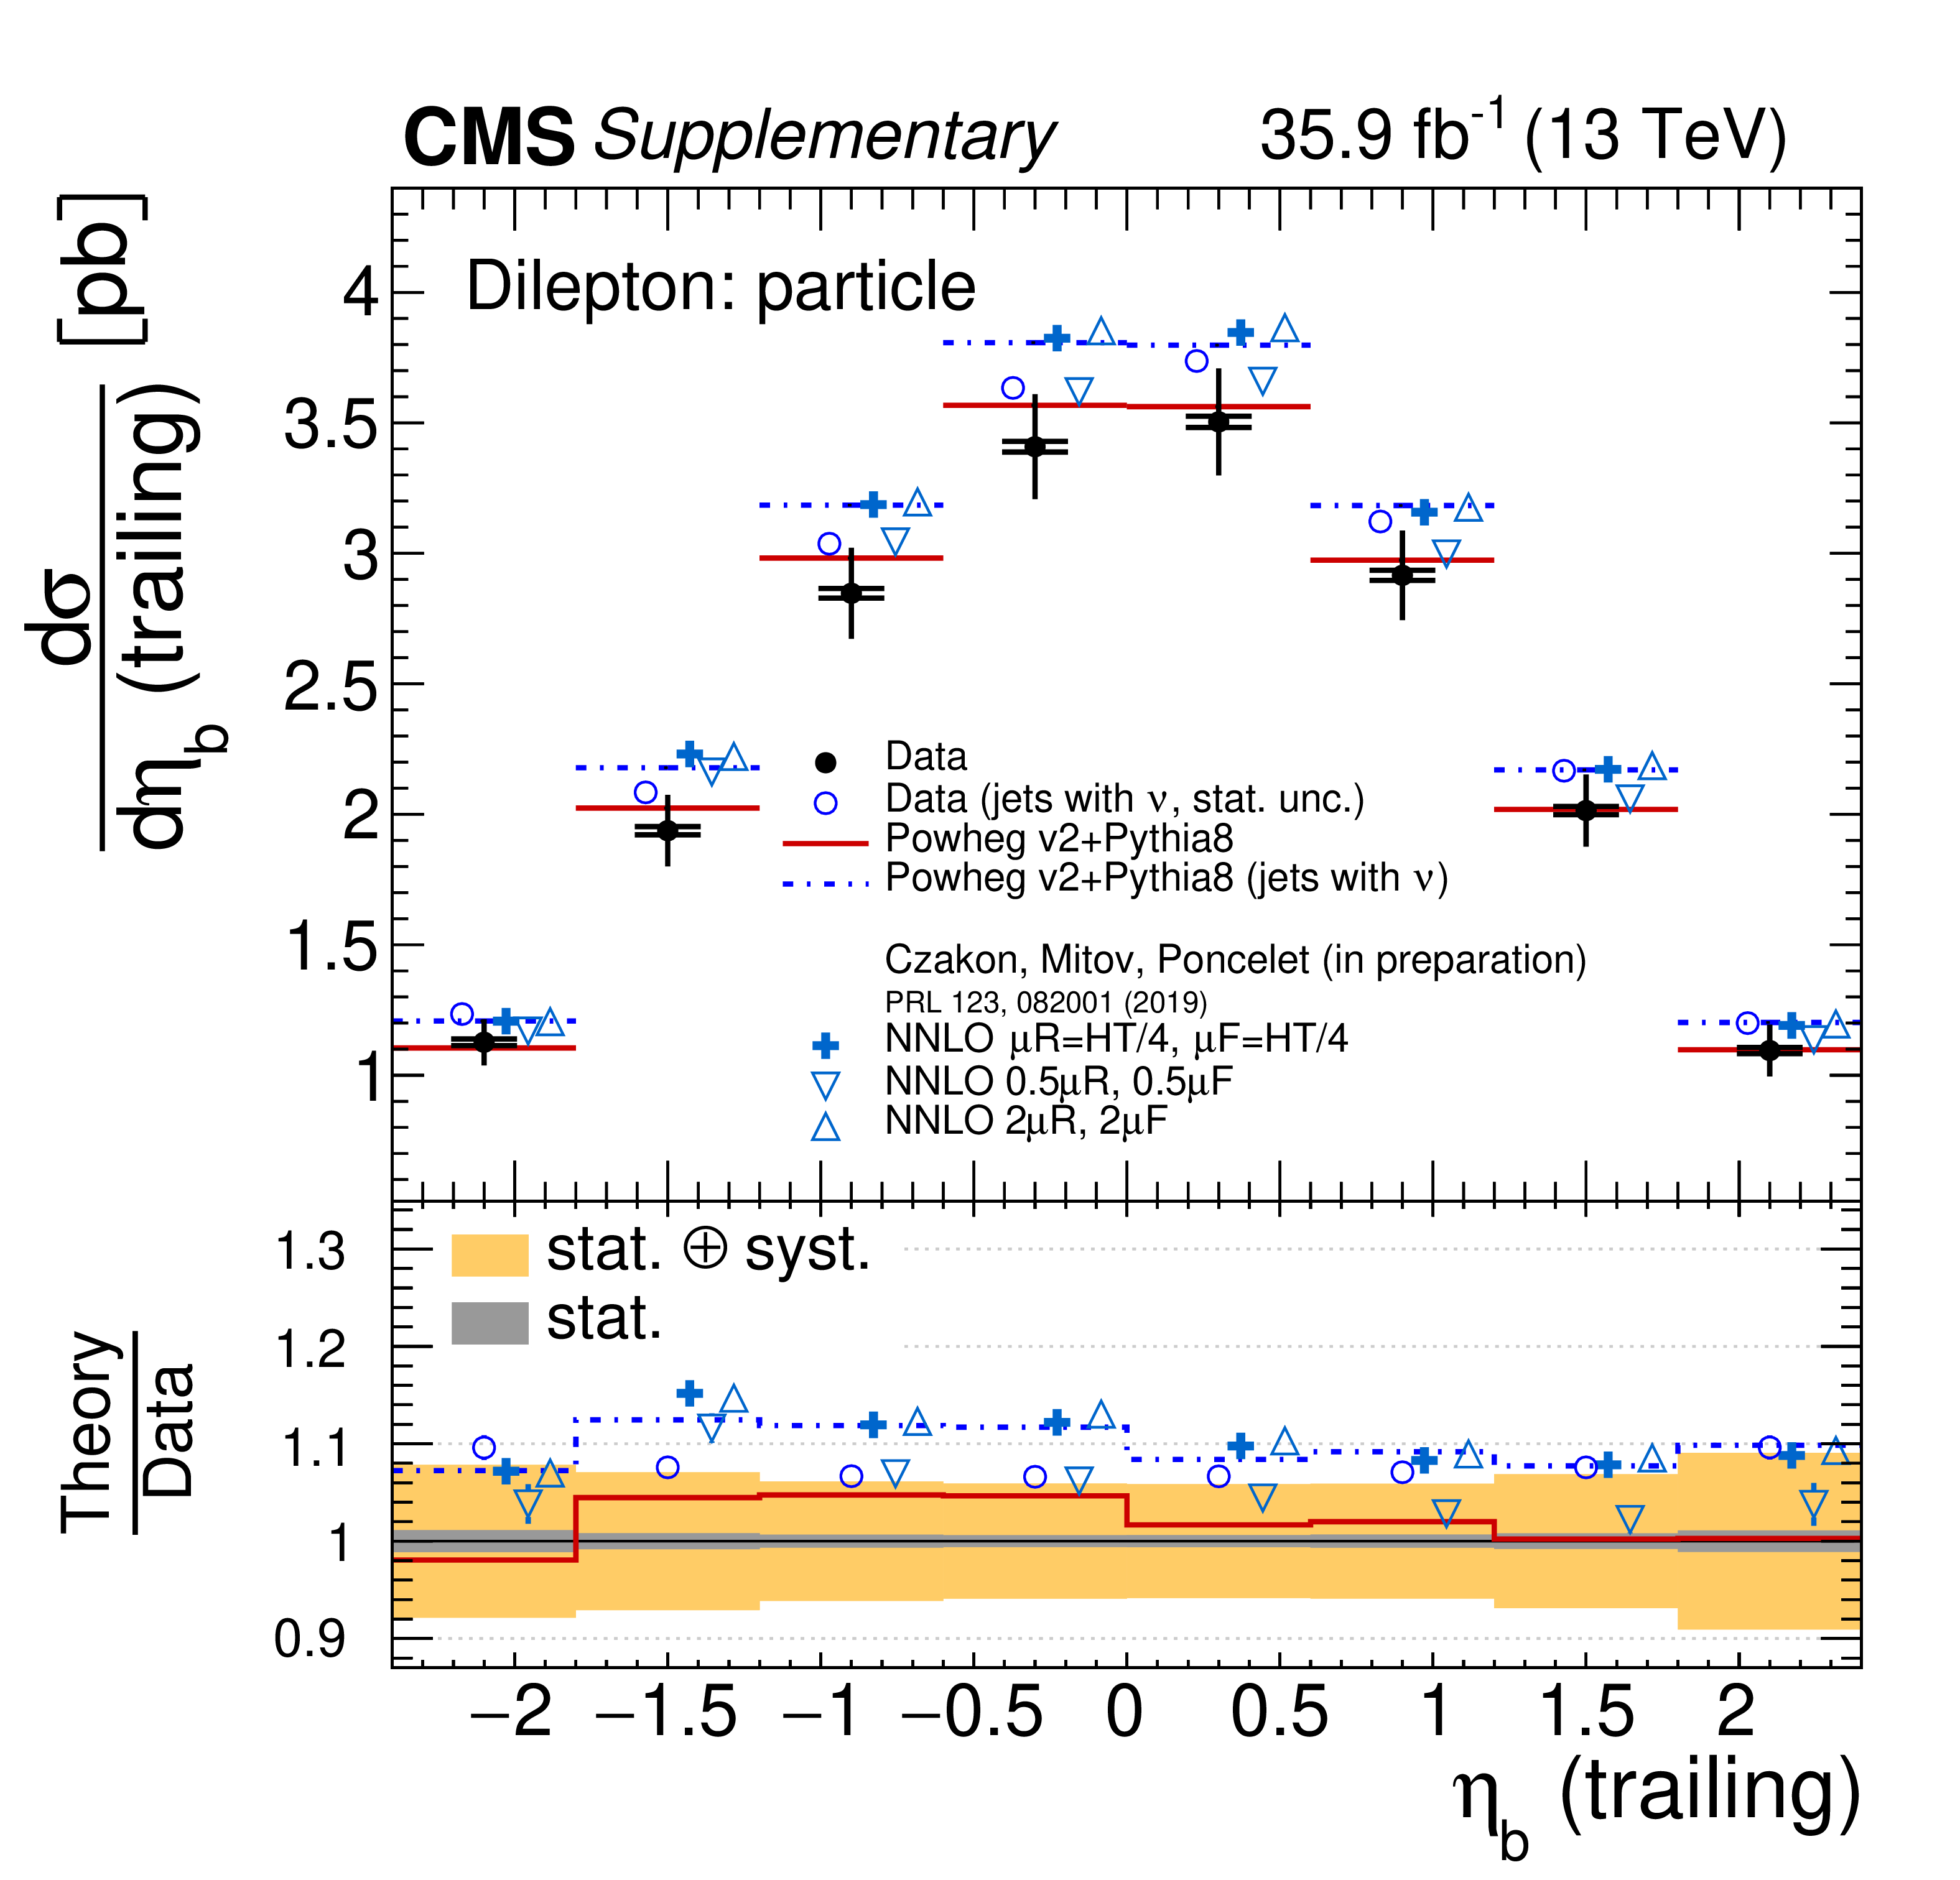
png pdf |
Additional Figure 203:
Absolute differential $\mathrm{t\bar{t}}$ production cross sections as a function of $\eta _{\mathrm{b}}$ (trailing) in a fiducial phase space at the particle level are shown for the data (filled circles) in comparison with POWHEG v2 + PYTHIA8 MC predictions (lines), and to the fixed-order calculations with the NNLO precision in QCD (in preparation) [91], for which the nominal prediction (crosses) and alternative scale choices (triangles) are provided. A modified version of particle level reconstruction for the unfolded data (open circles, showing only the statistical uncertainty) and the MC simulation (dashed line) is also presented. In the modified version of particle level reconstruction, neutrinos from hadronic decays are included in the jet clustering. The lower panel shows the ratios with respect to the standard unfolded data. The dark and light bands show the relative statistical and total uncertainties in the standard data, respectively. |
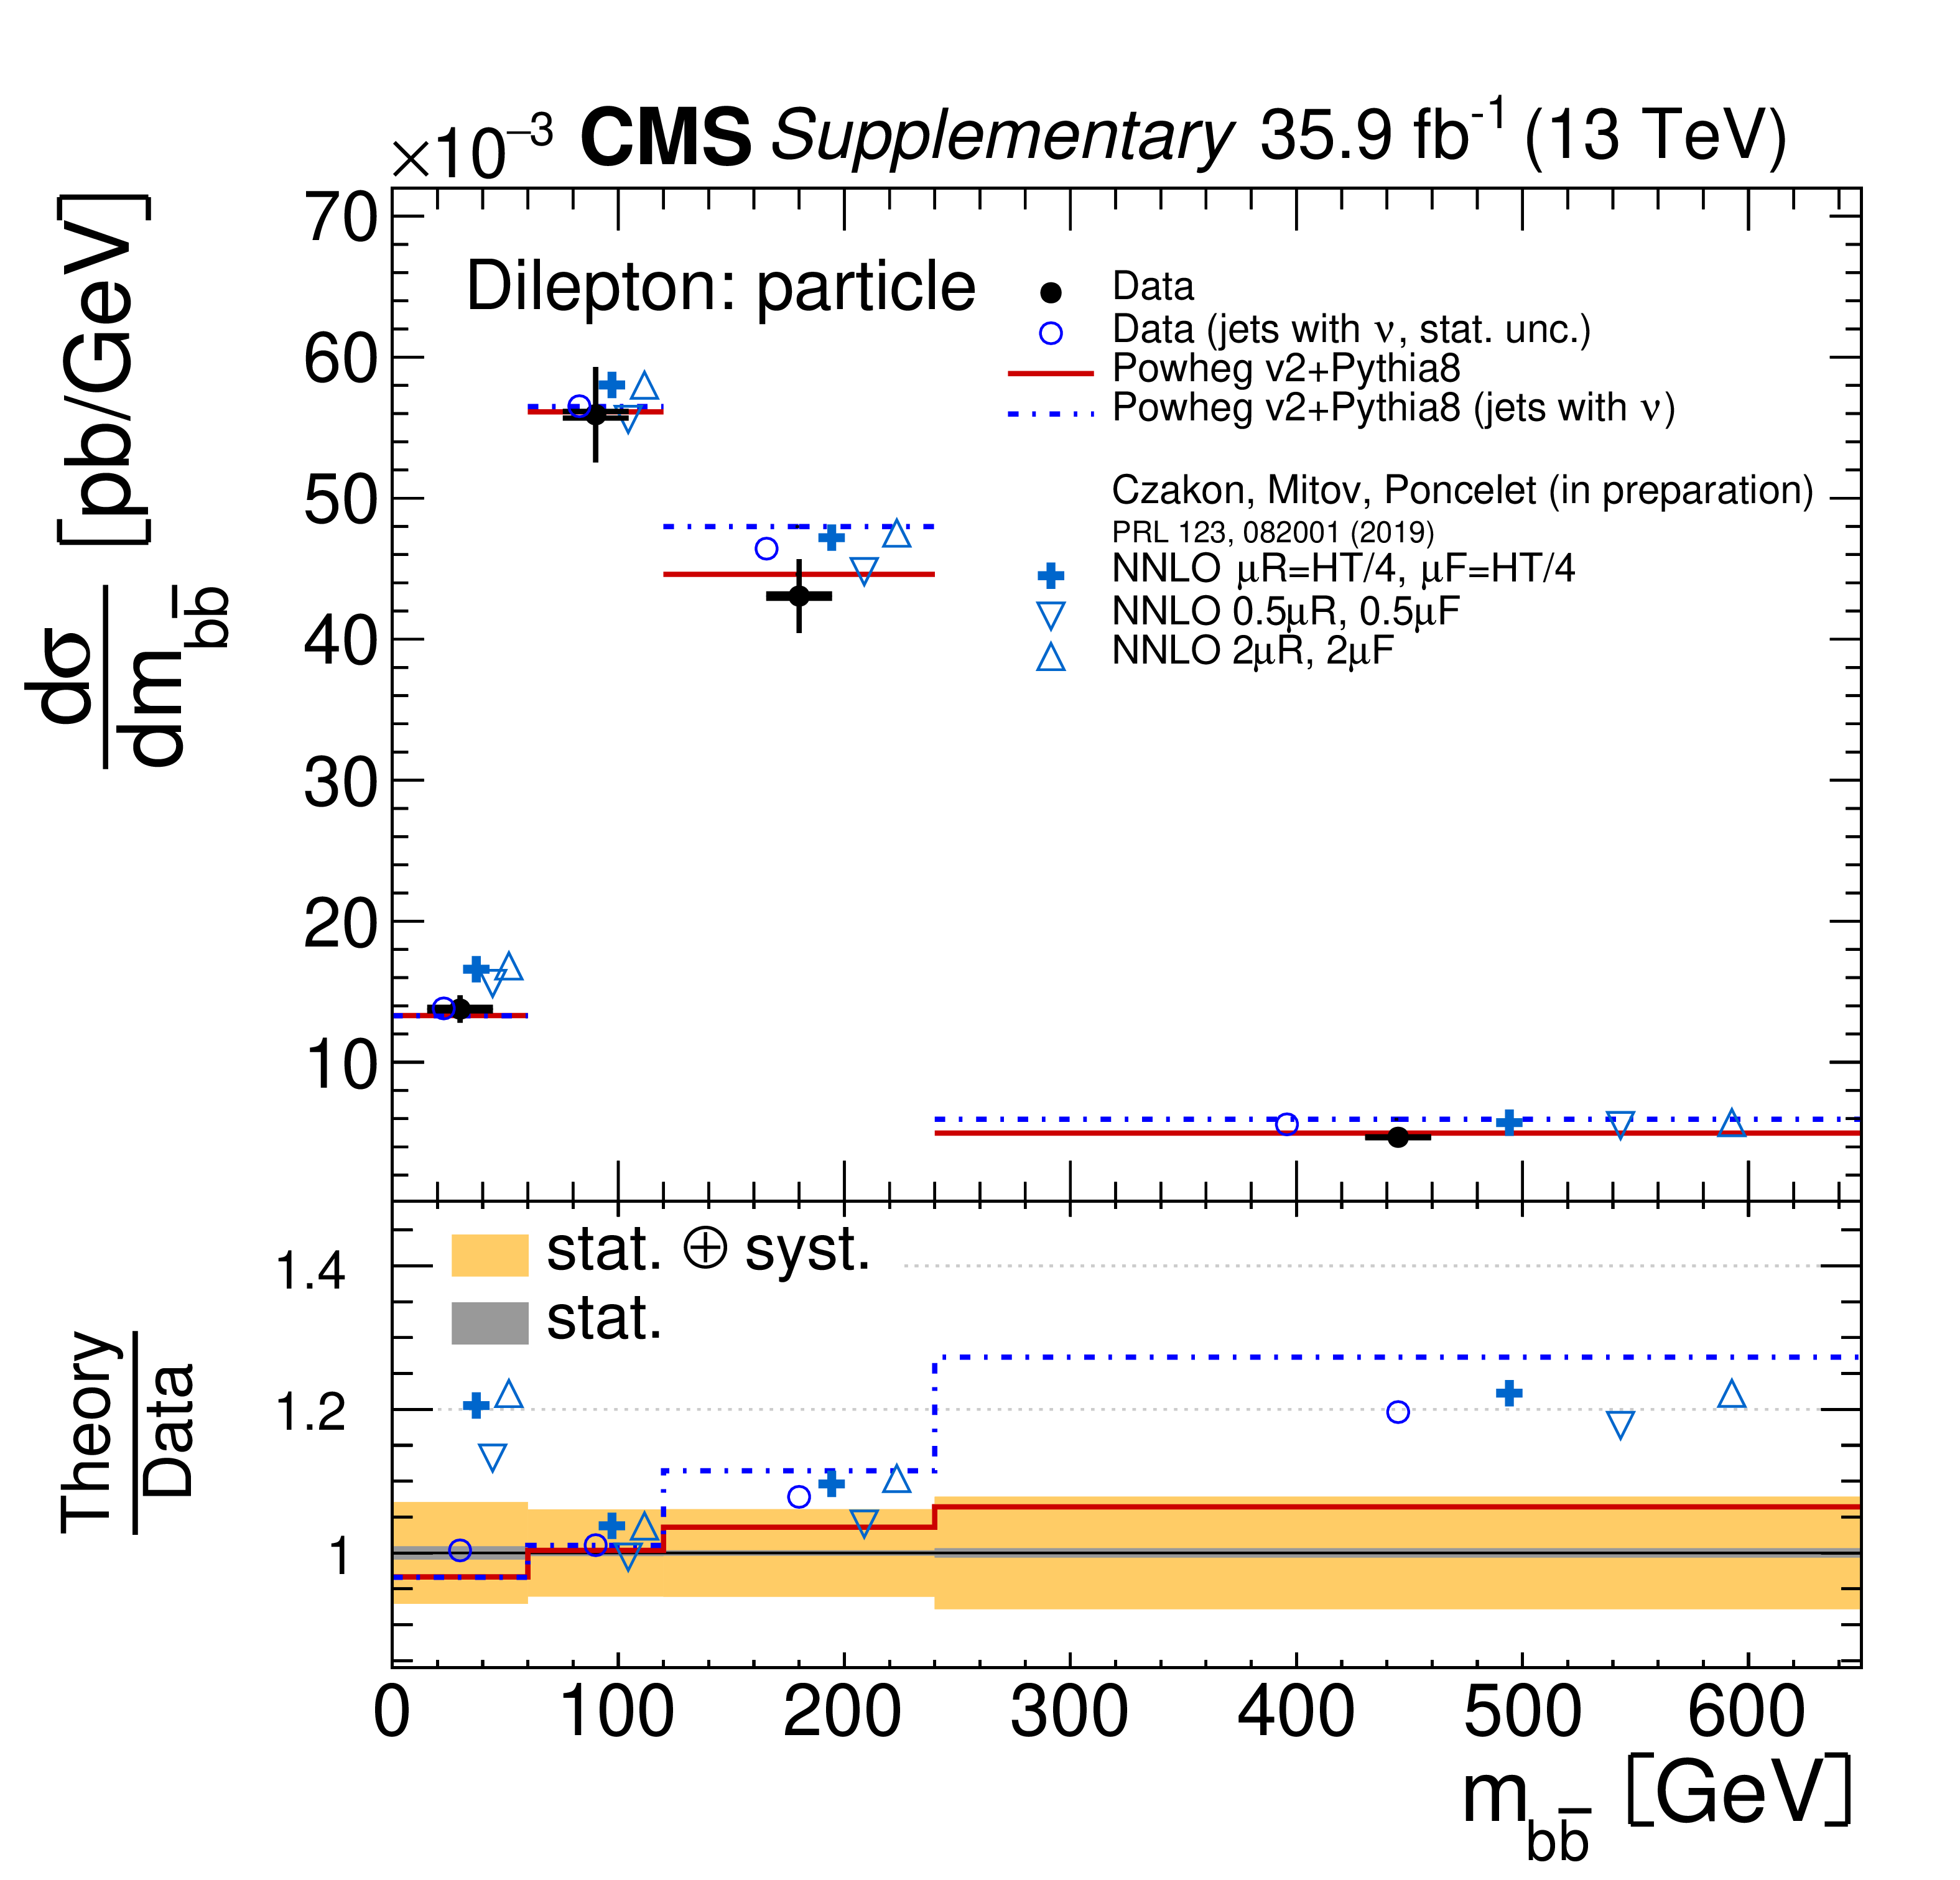
png pdf |
Additional Figure 204:
Absolute differential $\mathrm{t\bar{t}}$ production cross sections as a function of $m_{\mathrm{b\bar{b}}}$ in a fiducial phase space at the particle level are shown for the data (filled circles) in comparison with POWHEG v2 + PYTHIA8 MC predictions (lines), and to the fixed-order calculations with the NNLO precision in QCD (in preparation) [91], for which the nominal prediction (crosses) and alternative scale choices (triangles) are provided. A modified version of particle level reconstruction for the unfolded data (open circles, showing only the statistical uncertainty) and the MC simulation (dashed line) is also presented. In the modified version of particle level reconstruction, neutrinos from hadronic decays are included in the jet clustering. The lower panel shows the ratios with respect to the standard unfolded data. The dark and light bands show the relative statistical and total uncertainties in the standard data, respectively. |

png pdf |
Additional Figure 205:
Absolute differential $\mathrm{t\bar{t}}$ production cross sections as a function of $p_{\mathrm {T}}^{\mathrm{b\bar{b}}}$ in a fiducial phase space at the particle level are shown for the data (filled circles) in comparison with POWHEG v2 + PYTHIA8 MC predictions (lines), and to the fixed-order calculations with the NNLO precision in QCD (in preparation) [91], for which the nominal prediction (crosses) and alternative scale choices (triangles) are provided. A modified version of particle level reconstruction for the unfolded data (open circles, showing only the statistical uncertainty) and the MC simulation (dashed line) is also presented. In the modified version of particle level reconstruction, neutrinos from hadronic decays are included in the jet clustering. The lower panel shows the ratios with respect to the standard unfolded data. The dark and light bands show the relative statistical and total uncertainties in the standard data, respectively. |

png pdf |
Additional Figure 206:
Normalised differential $\mathrm{t\bar{t}}$ production cross sections as a function of $p_{\mathrm {T}}^{\mathrm {t}}$ in a fiducial phase space at the particle level are shown for the data (filled circles) in comparison with POWHEG v2 + PYTHIA8 MC predictions (lines), and to the fixed-order calculations with the NNLO precision in QCD (in preparation) [91], for which the nominal prediction (crosses) and alternative scale choices (triangles) are provided. A modified version of particle level reconstruction for the unfolded data (open circles, showing only the statistical uncertainty) and the MC simulation (dashed line) is also presented. In the modified version of particle level reconstruction, neutrinos from hadronic decays are included in the jet clustering. The lower panel shows the ratios with respect to the standard unfolded data. The dark and light bands show the relative statistical and total uncertainties in the standard data, respectively. |

png pdf |
Additional Figure 207:
Normalised differential $\mathrm{t\bar{t}}$ production cross sections as a function of $y_{\mathrm {t}}$ in a fiducial phase space at the particle level are shown for the data (filled circles) in comparison with POWHEG v2 + PYTHIA8 MC predictions (lines), and to the fixed-order calculations with the NNLO precision in QCD (in preparation) [91], for which the nominal prediction (crosses) and alternative scale choices (triangles) are provided. A modified version of particle level reconstruction for the unfolded data (open circles, showing only the statistical uncertainty) and the MC simulation (dashed line) is also presented. In the modified version of particle level reconstruction, neutrinos from hadronic decays are included in the jet clustering. The lower panel shows the ratios with respect to the standard unfolded data. The dark and light bands show the relative statistical and total uncertainties in the standard data, respectively. |
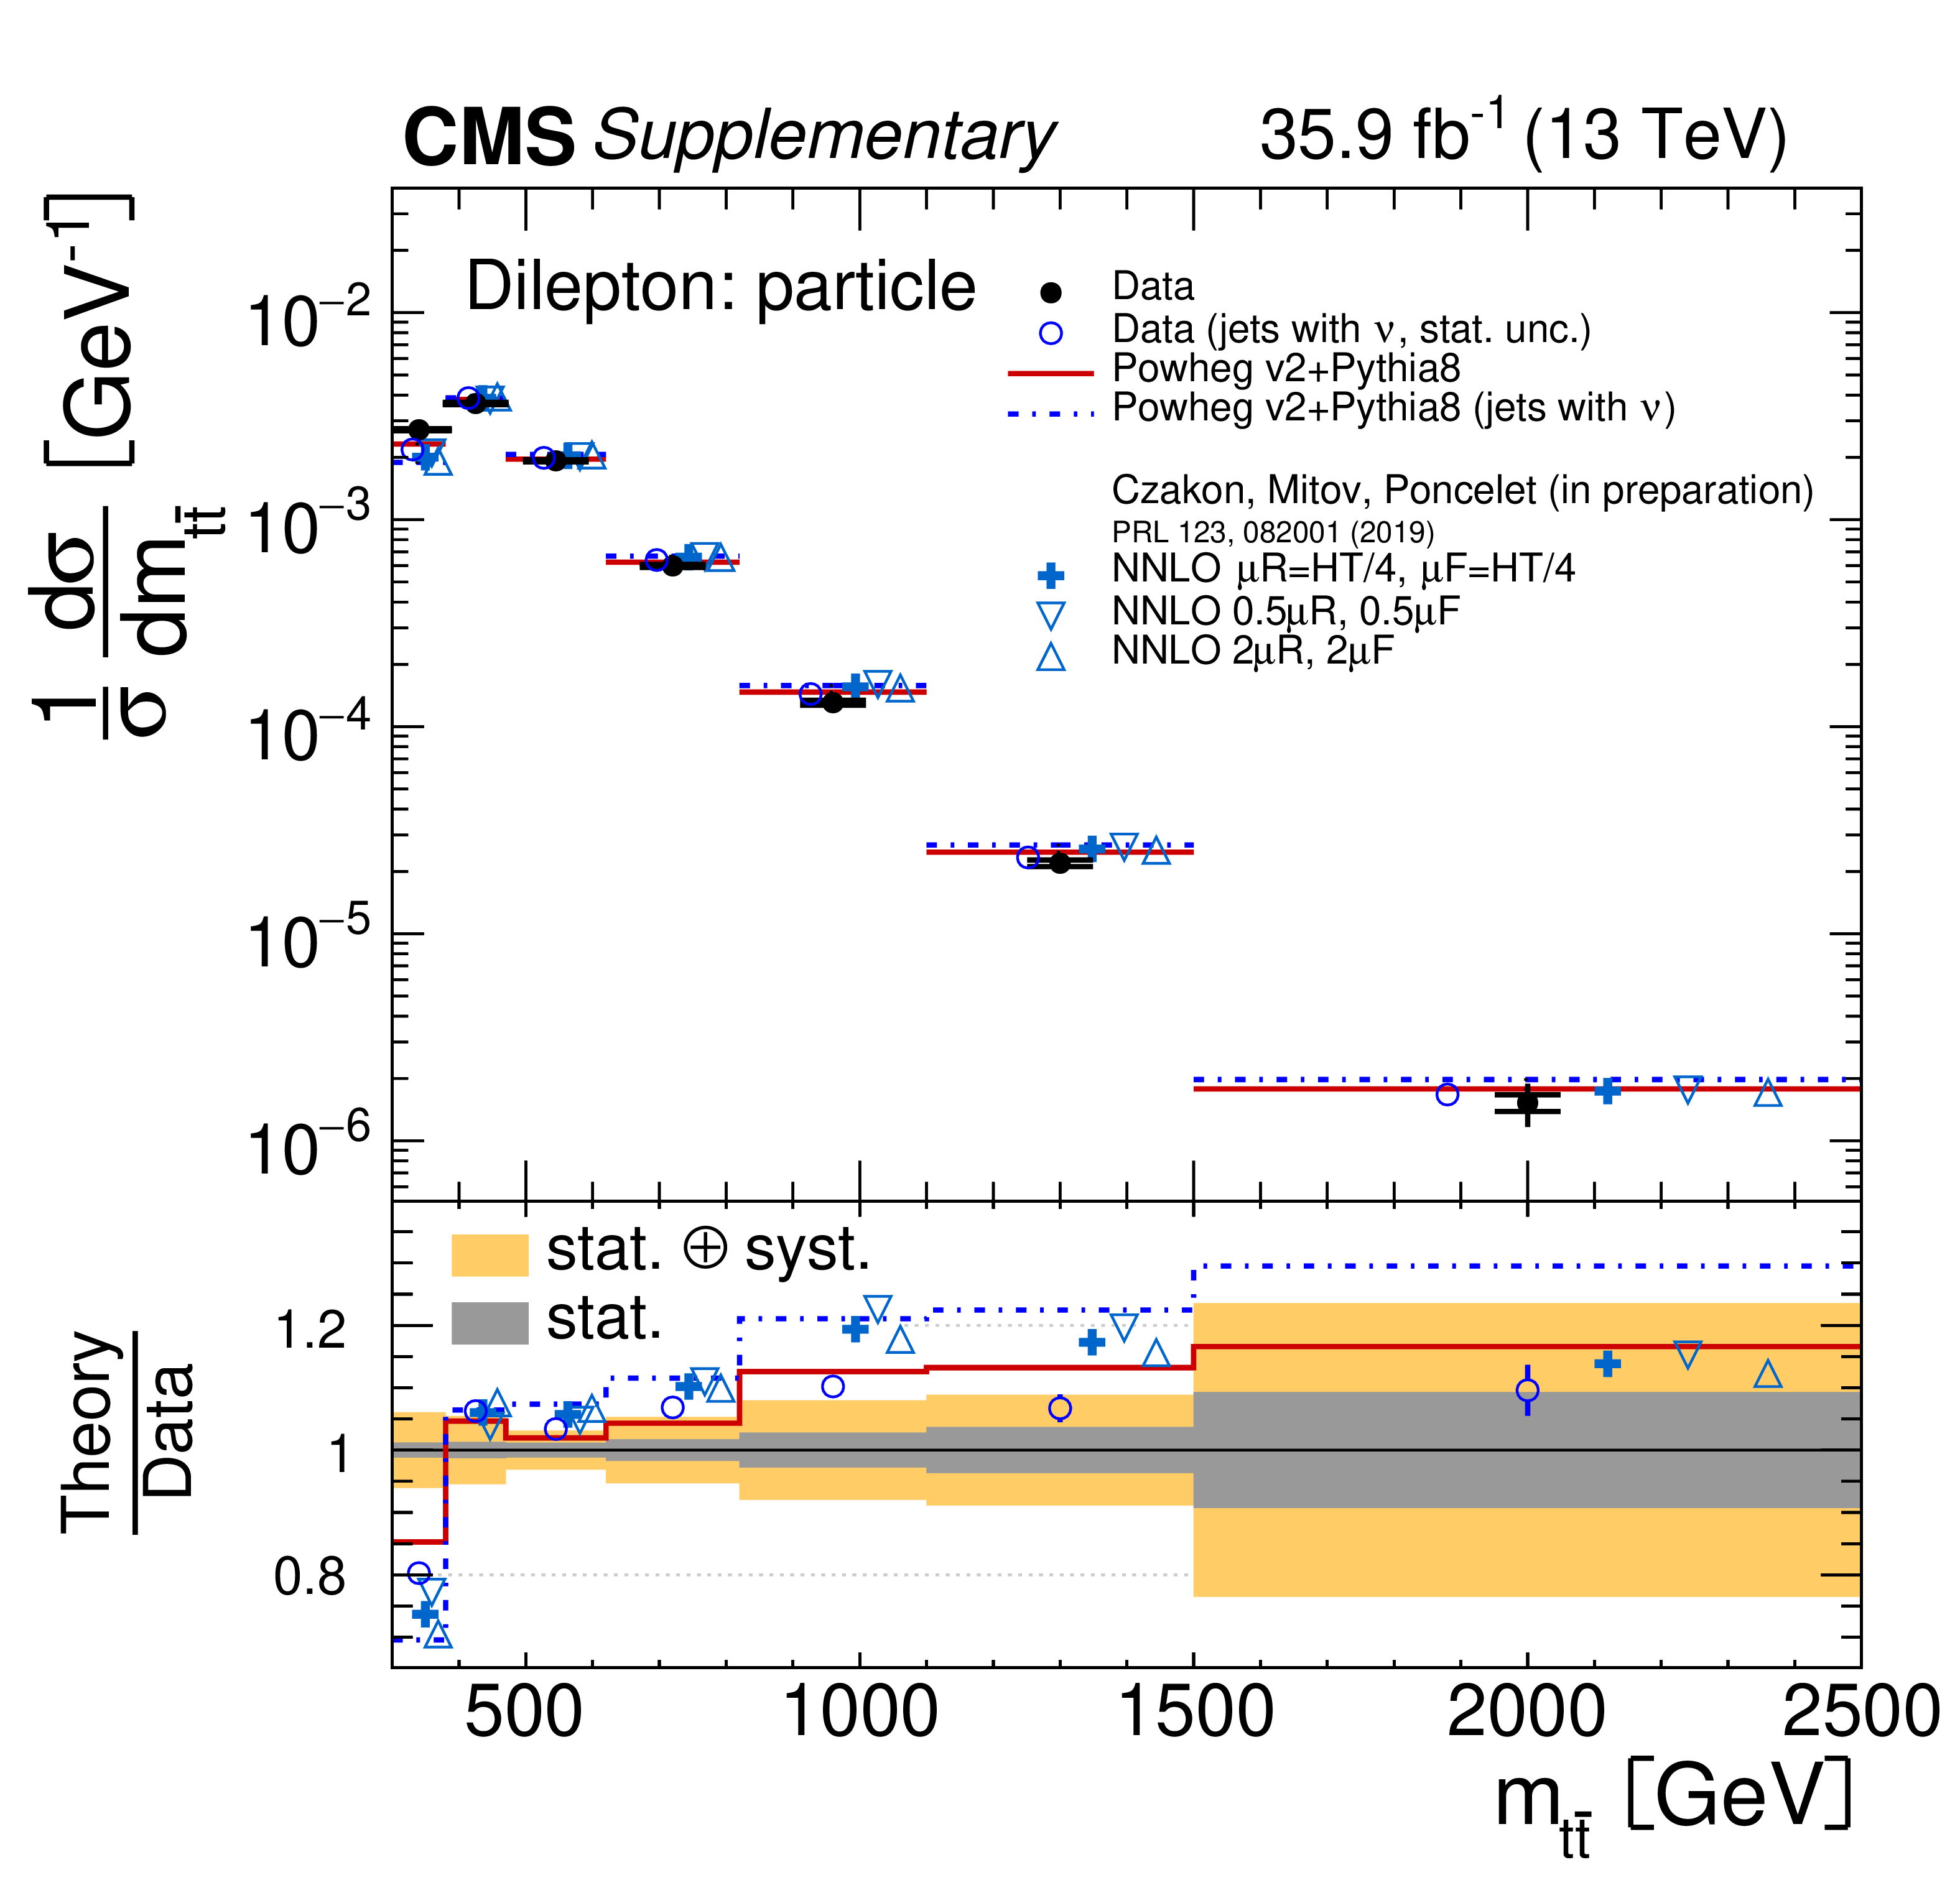
png pdf |
Additional Figure 208:
Normalised differential $\mathrm{t\bar{t}}$ production cross sections as a function of $m_{\mathrm{t\bar{t}}}$ in a fiducial phase space at the particle level are shown for the data (filled circles) in comparison with POWHEG v2 + PYTHIA8 MC predictions (lines), and to the fixed-order calculations with the NNLO precision in QCD (in preparation) [91], for which the nominal prediction (crosses) and alternative scale choices (triangles) are provided. A modified version of particle level reconstruction for the unfolded data (open circles, showing only the statistical uncertainty) and the MC simulation (dashed line) is also presented. In the modified version of particle level reconstruction, neutrinos from hadronic decays are included in the jet clustering. The lower panel shows the ratios with respect to the standard unfolded data. The dark and light bands show the relative statistical and total uncertainties in the standard data, respectively. |

png pdf |
Additional Figure 209:
Normalised differential $\mathrm{t\bar{t}}$ production cross sections as a function of $p_{\mathrm {T}}^{\mathrm{t\bar{t}}}$ in a fiducial phase space at the particle level are shown for the data (filled circles) in comparison with POWHEG v2 + PYTHIA8 MC predictions (lines), and to the fixed-order calculations with the NNLO precision in QCD (in preparation) [91], for which the nominal prediction (crosses) and alternative scale choices (triangles) are provided. A modified version of particle level reconstruction for the unfolded data (open circles, showing only the statistical uncertainty) and the MC simulation (dashed line) is also presented. In the modified version of particle level reconstruction, neutrinos from hadronic decays are included in the jet clustering. The lower panel shows the ratios with respect to the standard unfolded data. The dark and light bands show the relative statistical and total uncertainties in the standard data, respectively. |

png pdf |
Additional Figure 210:
Normalised differential $\mathrm{t\bar{t}}$ production cross sections as a function of $y_{\mathrm{t\bar{t}}}$ in a fiducial phase space at the particle level are shown for the data (filled circles) in comparison with POWHEG v2 + PYTHIA8 MC predictions (lines), and to the fixed-order calculations with the NNLO precision in QCD (in preparation) [91], for which the nominal prediction (crosses) and alternative scale choices (triangles) are provided. A modified version of particle level reconstruction for the unfolded data (open circles, showing only the statistical uncertainty) and the MC simulation (dashed line) is also presented. In the modified version of particle level reconstruction, neutrinos from hadronic decays are included in the jet clustering. The lower panel shows the ratios with respect to the standard unfolded data. The dark and light bands show the relative statistical and total uncertainties in the standard data, respectively. |
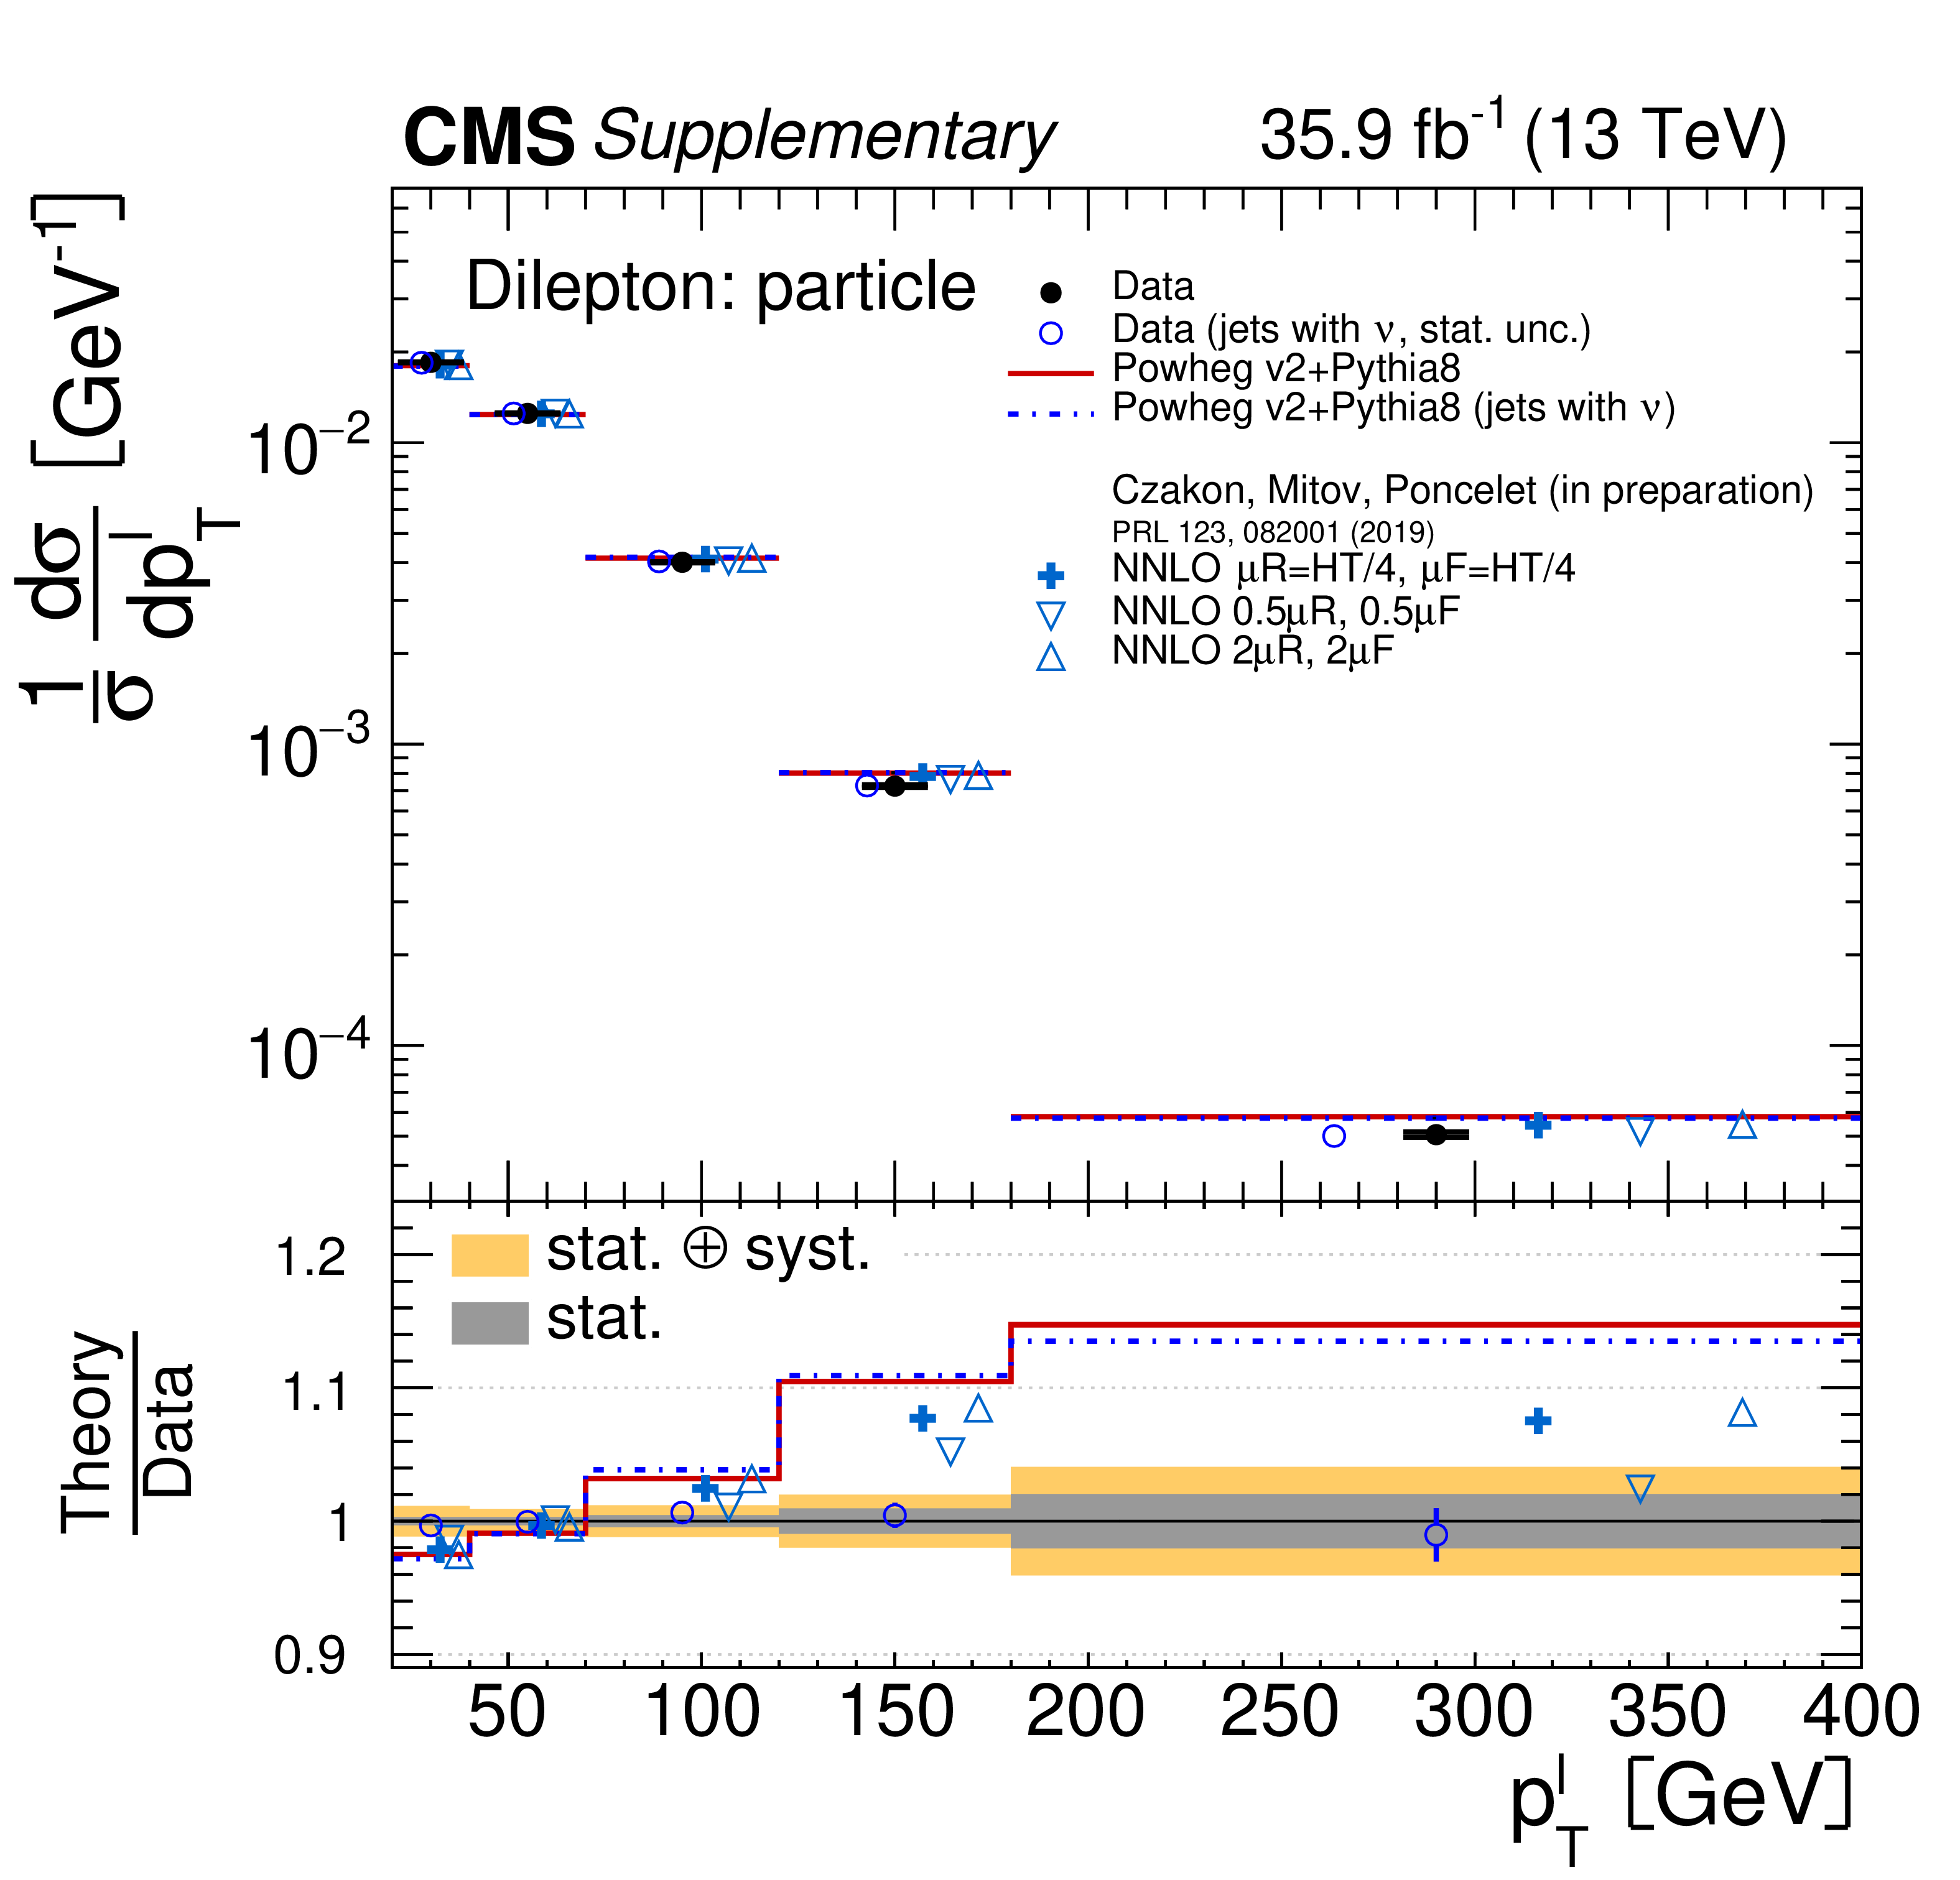
png pdf |
Additional Figure 211:
Normalised differential $\mathrm{t\bar{t}}$ production cross sections as a function of $p_{\mathrm {T}}^{{\ell}}$ in a fiducial phase space at the particle level are shown for the data (filled circles) in comparison with POWHEG v2 + PYTHIA8 MC predictions (lines), and to the fixed-order calculations with the NNLO precision in QCD (in preparation) [91], for which the nominal prediction (crosses) and alternative scale choices (triangles) are provided. A modified version of particle level reconstruction for the unfolded data (open circles, showing only the statistical uncertainty) and the MC simulation (dashed line) is also presented. In the modified version of particle level reconstruction, neutrinos from hadronic decays are included in the jet clustering. The lower panel shows the ratios with respect to the standard unfolded data. The dark and light bands show the relative statistical and total uncertainties in the standard data, respectively. |
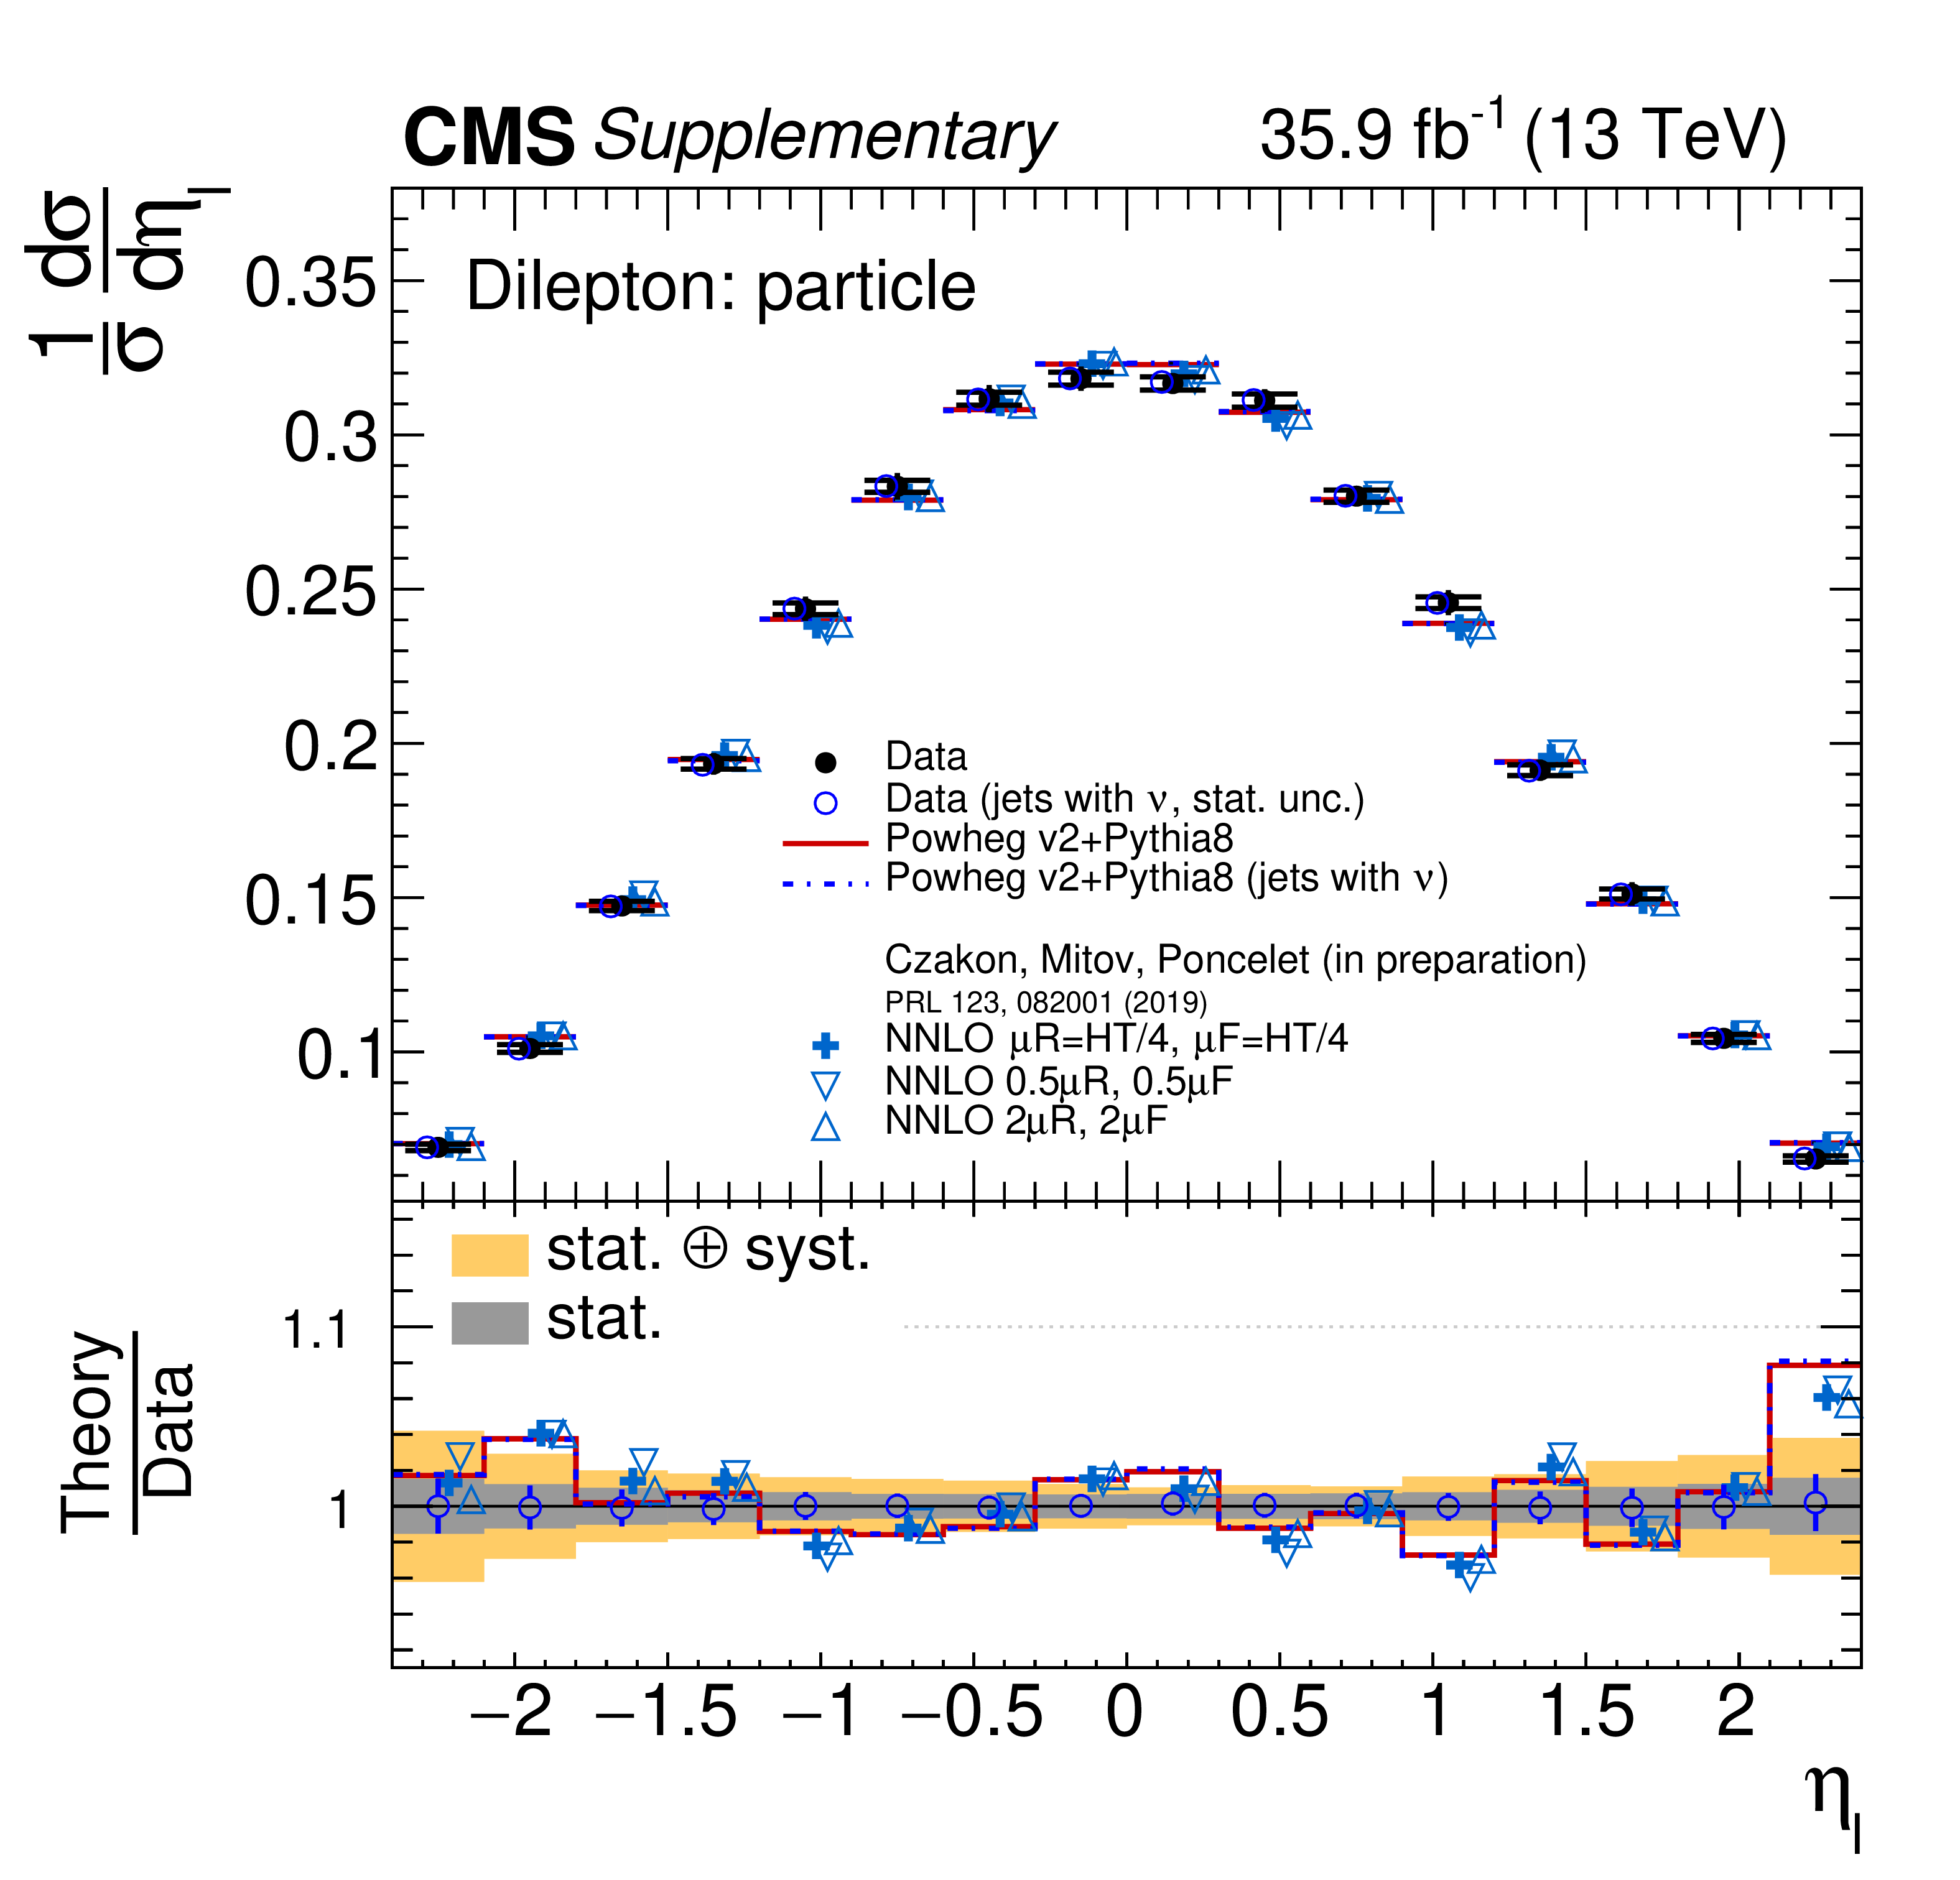
png pdf |
Additional Figure 212:
Normalised differential $\mathrm{t\bar{t}}$ production cross sections as a function of $\eta _{{\ell}}$ in a fiducial phase space at the particle level are shown for the data (filled circles) in comparison with POWHEG v2 + PYTHIA8 MC predictions (lines), and to the fixed-order calculations with the NNLO precision in QCD (in preparation) [91], for which the nominal prediction (crosses) and alternative scale choices (triangles) are provided. A modified version of particle level reconstruction for the unfolded data (open circles, showing only the statistical uncertainty) and the MC simulation (dashed line) is also presented. In the modified version of particle level reconstruction, neutrinos from hadronic decays are included in the jet clustering. The lower panel shows the ratios with respect to the standard unfolded data. The dark and light bands show the relative statistical and total uncertainties in the standard data, respectively. |
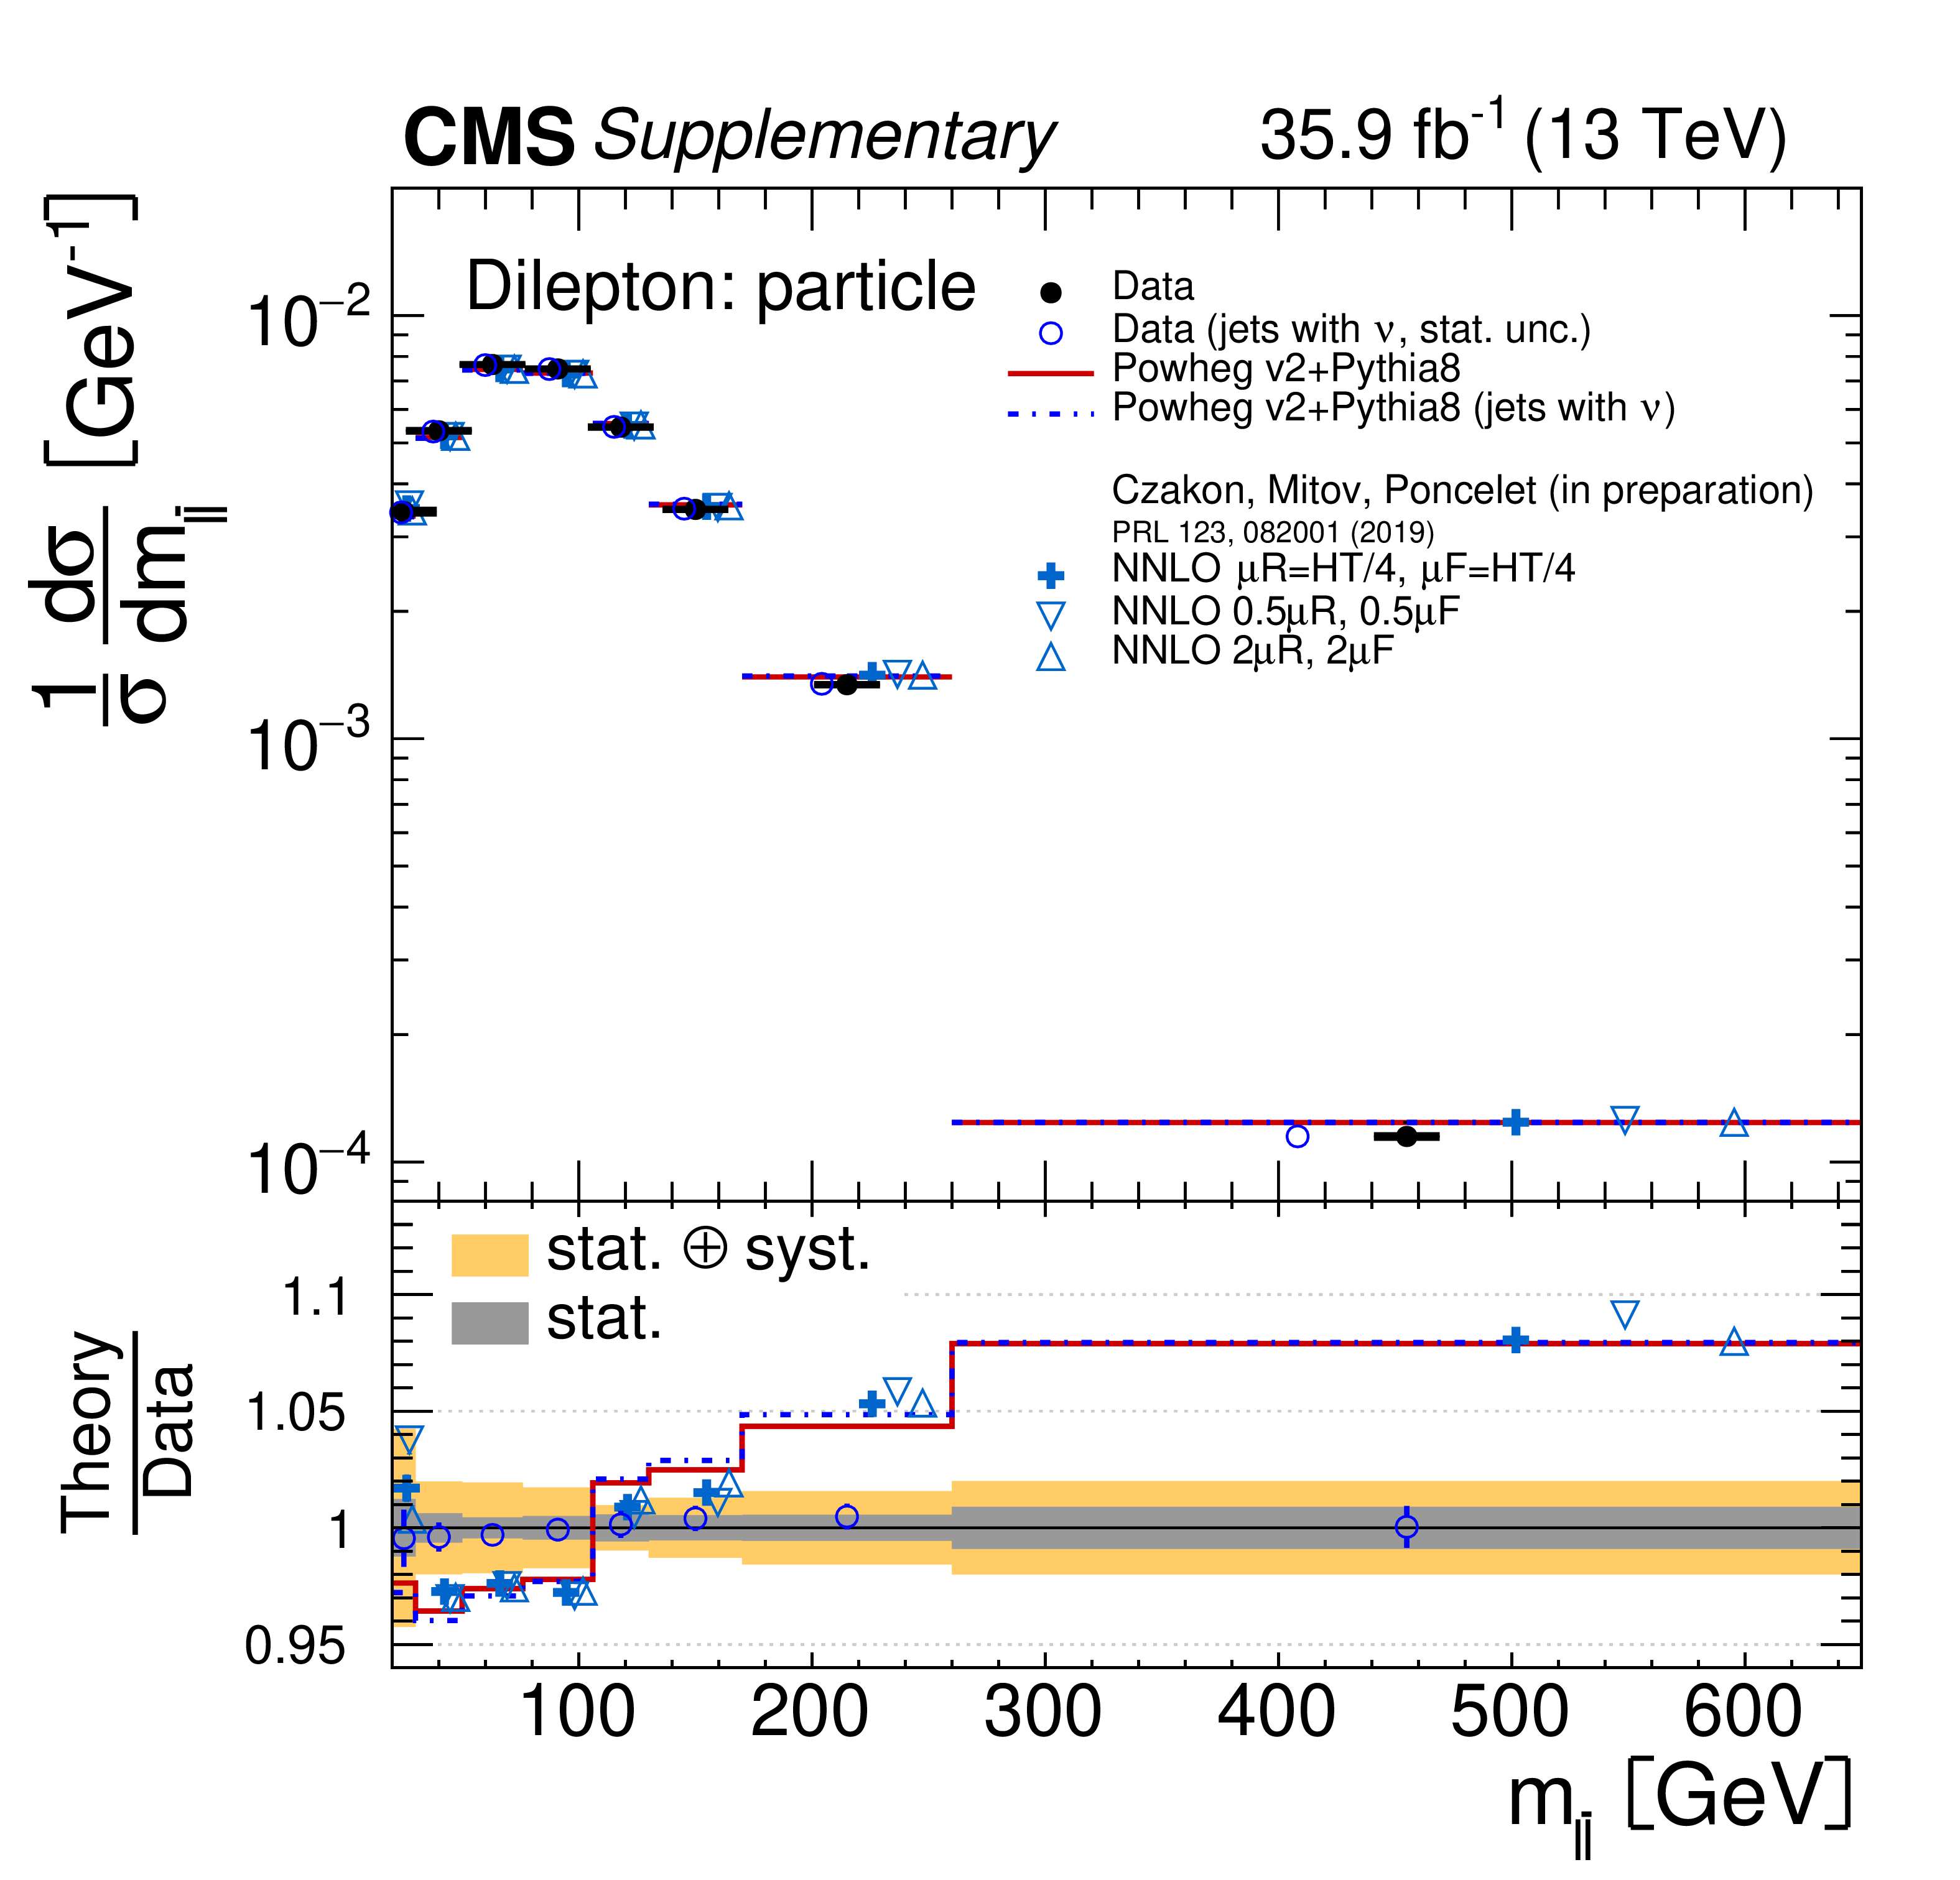
png pdf |
Additional Figure 213:
Normalised differential $\mathrm{t\bar{t}}$ production cross sections as a function of $m_{{\ell}\bar{\ell}}$ in a fiducial phase space at the particle level are shown for the data (filled circles) in comparison with POWHEG v2 + PYTHIA8 MC predictions (lines), and to the fixed-order calculations with the NNLO precision in QCD (in preparation) [91], for which the nominal prediction (crosses) and alternative scale choices (triangles) are provided. A modified version of particle level reconstruction for the unfolded data (open circles, showing only the statistical uncertainty) and the MC simulation (dashed line) is also presented. In the modified version of particle level reconstruction, neutrinos from hadronic decays are included in the jet clustering. The lower panel shows the ratios with respect to the standard unfolded data. The dark and light bands show the relative statistical and total uncertainties in the standard data, respectively. |

png pdf |
Additional Figure 214:
Normalised differential $\mathrm{t\bar{t}}$ production cross sections as a function of $p_{\mathrm {T}}^{{\ell}\bar{\ell}}$ in a fiducial phase space at the particle level are shown for the data (filled circles) in comparison with POWHEG v2 + PYTHIA8 MC predictions (lines), and to the fixed-order calculations with the NNLO precision in QCD (in preparation) [91], for which the nominal prediction (crosses) and alternative scale choices (triangles) are provided. A modified version of particle level reconstruction for the unfolded data (open circles, showing only the statistical uncertainty) and the MC simulation (dashed line) is also presented. In the modified version of particle level reconstruction, neutrinos from hadronic decays are included in the jet clustering. The lower panel shows the ratios with respect to the standard unfolded data. The dark and light bands show the relative statistical and total uncertainties in the standard data, respectively. |
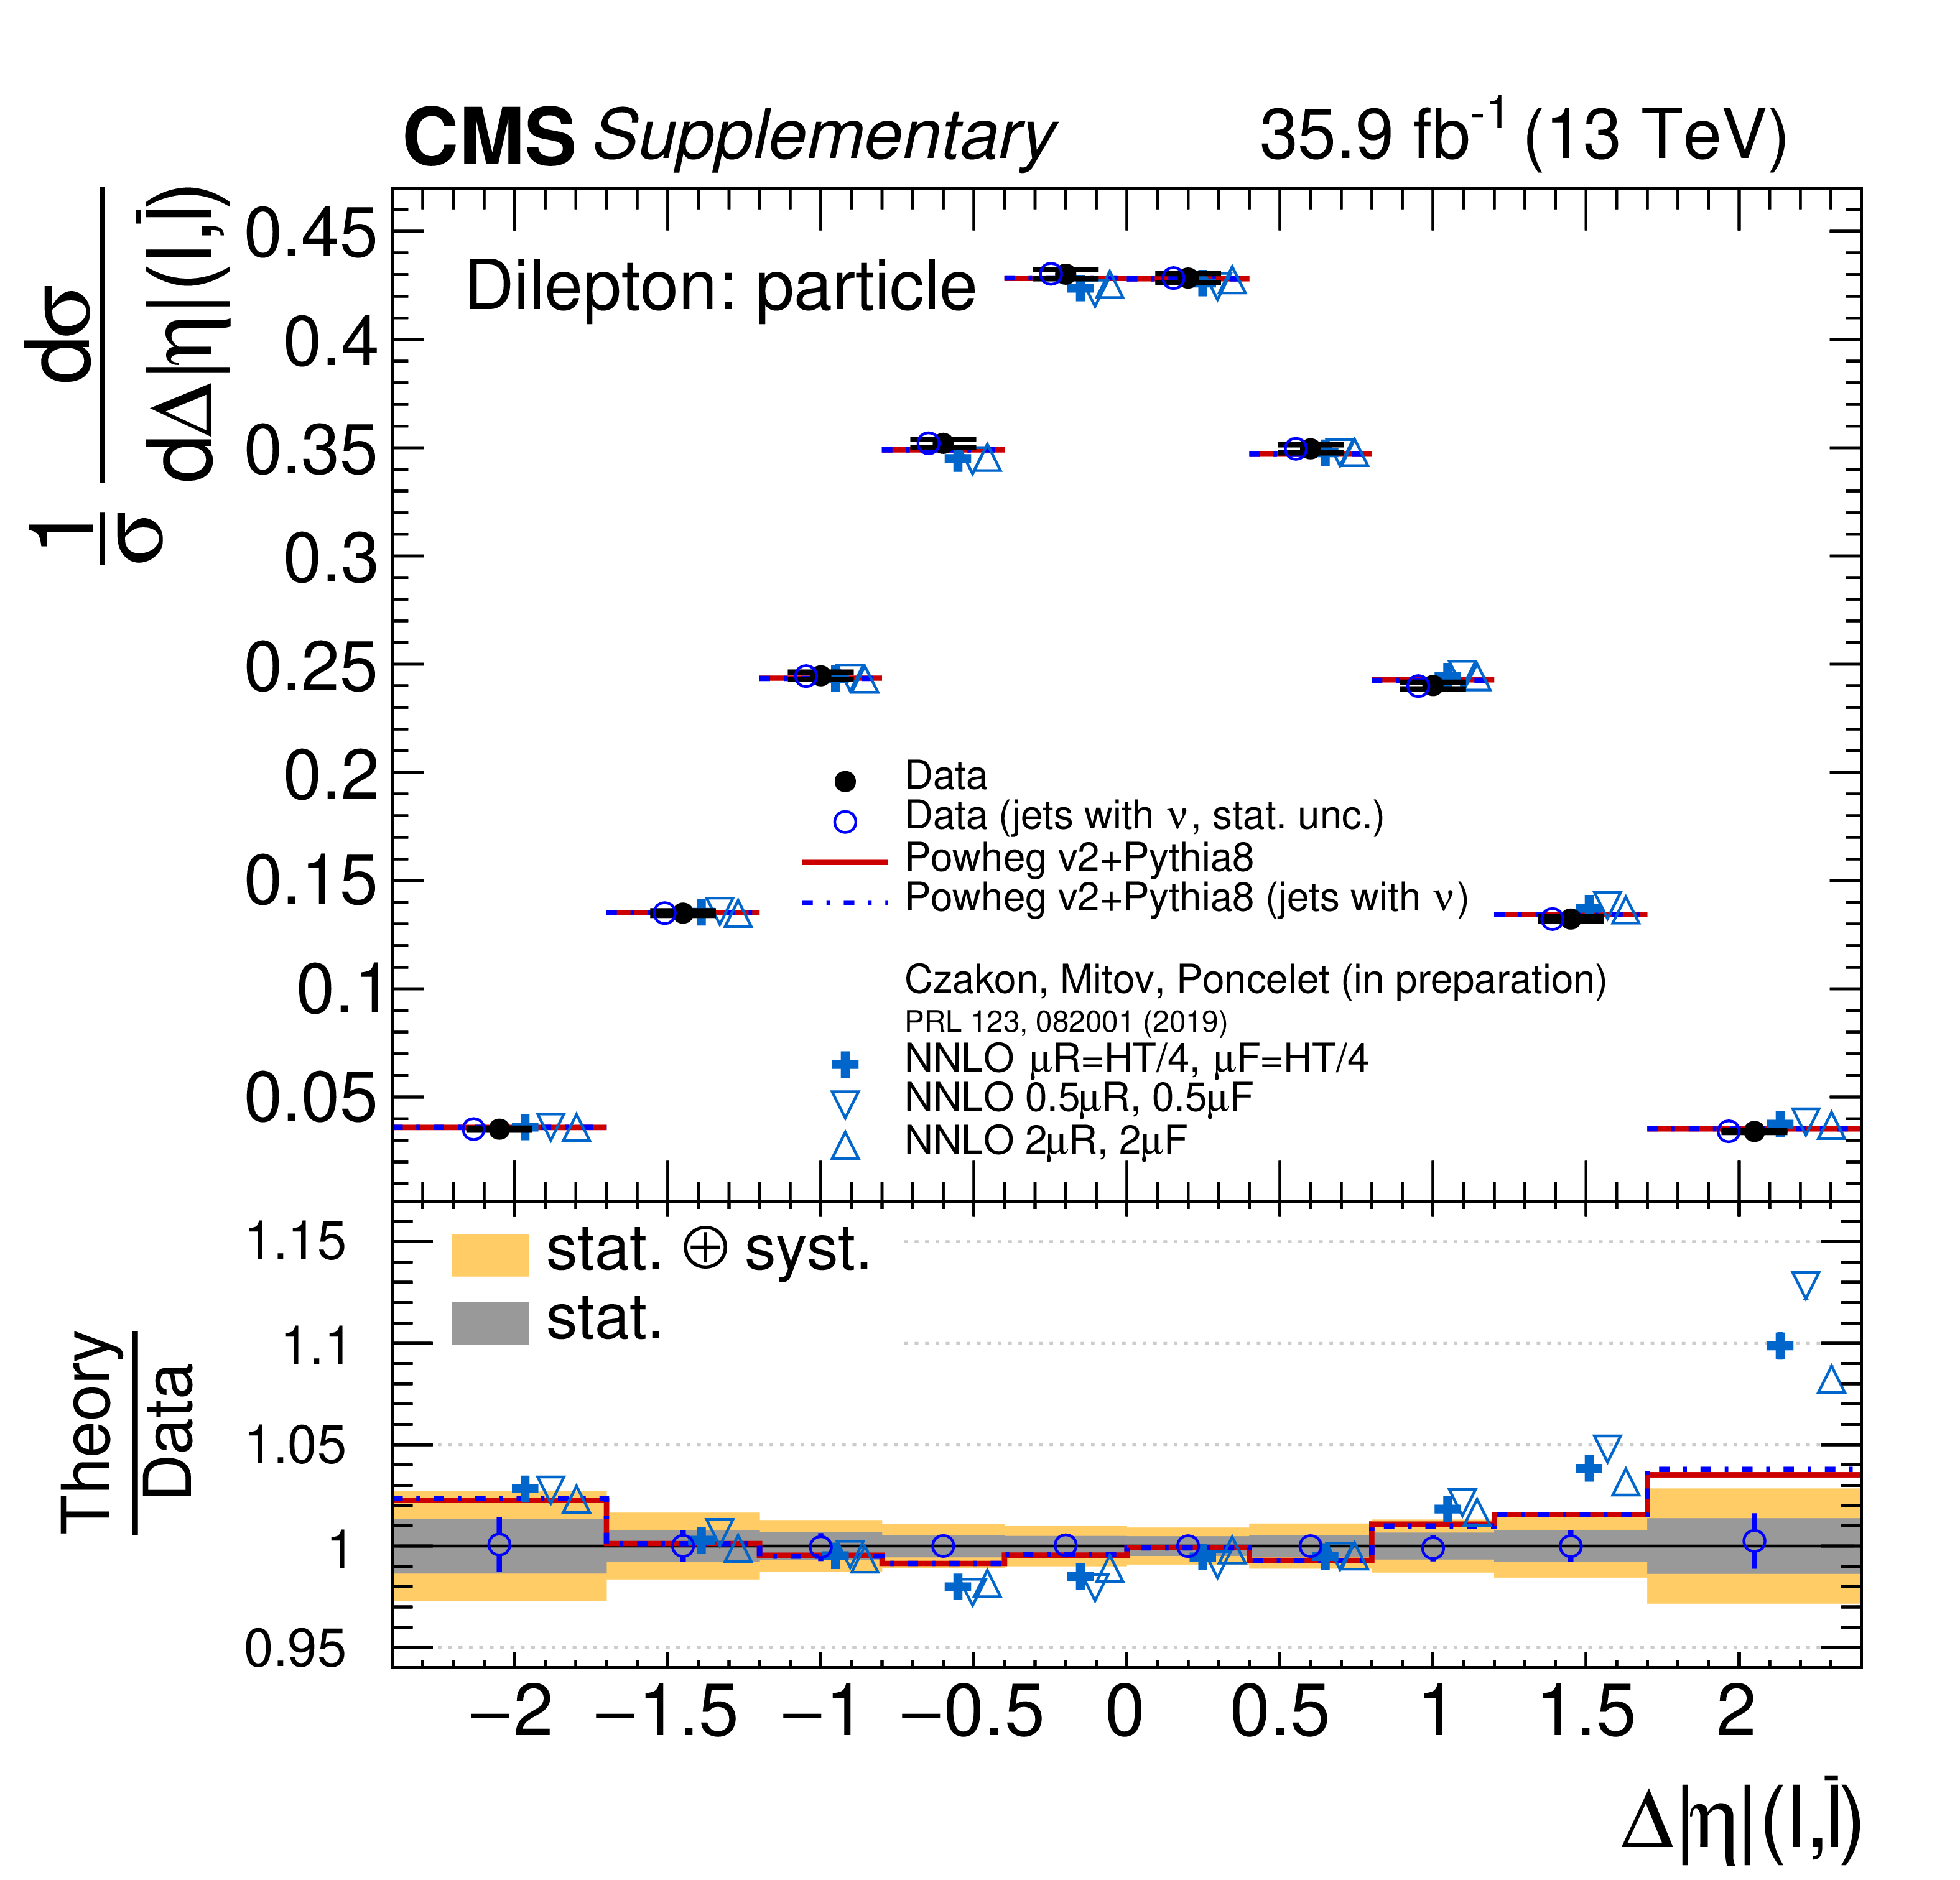
png pdf |
Additional Figure 215:
Normalised differential $\mathrm{t\bar{t}}$ production cross sections as a function of $\Delta \eta ({\ell},\bar{\ell})$ in a fiducial phase space at the particle level are shown for the data (filled circles) in comparison with POWHEG v2 + PYTHIA8 MC predictions (lines), and to the fixed-order calculations with the NNLO precision in QCD (in preparation) [91], for which the nominal prediction (crosses) and alternative scale choices (triangles) are provided. A modified version of particle level reconstruction for the unfolded data (open circles, showing only the statistical uncertainty) and the MC simulation (dashed line) is also presented. In the modified version of particle level reconstruction, neutrinos from hadronic decays are included in the jet clustering. The lower panel shows the ratios with respect to the standard unfolded data. The dark and light bands show the relative statistical and total uncertainties in the standard data, respectively. |
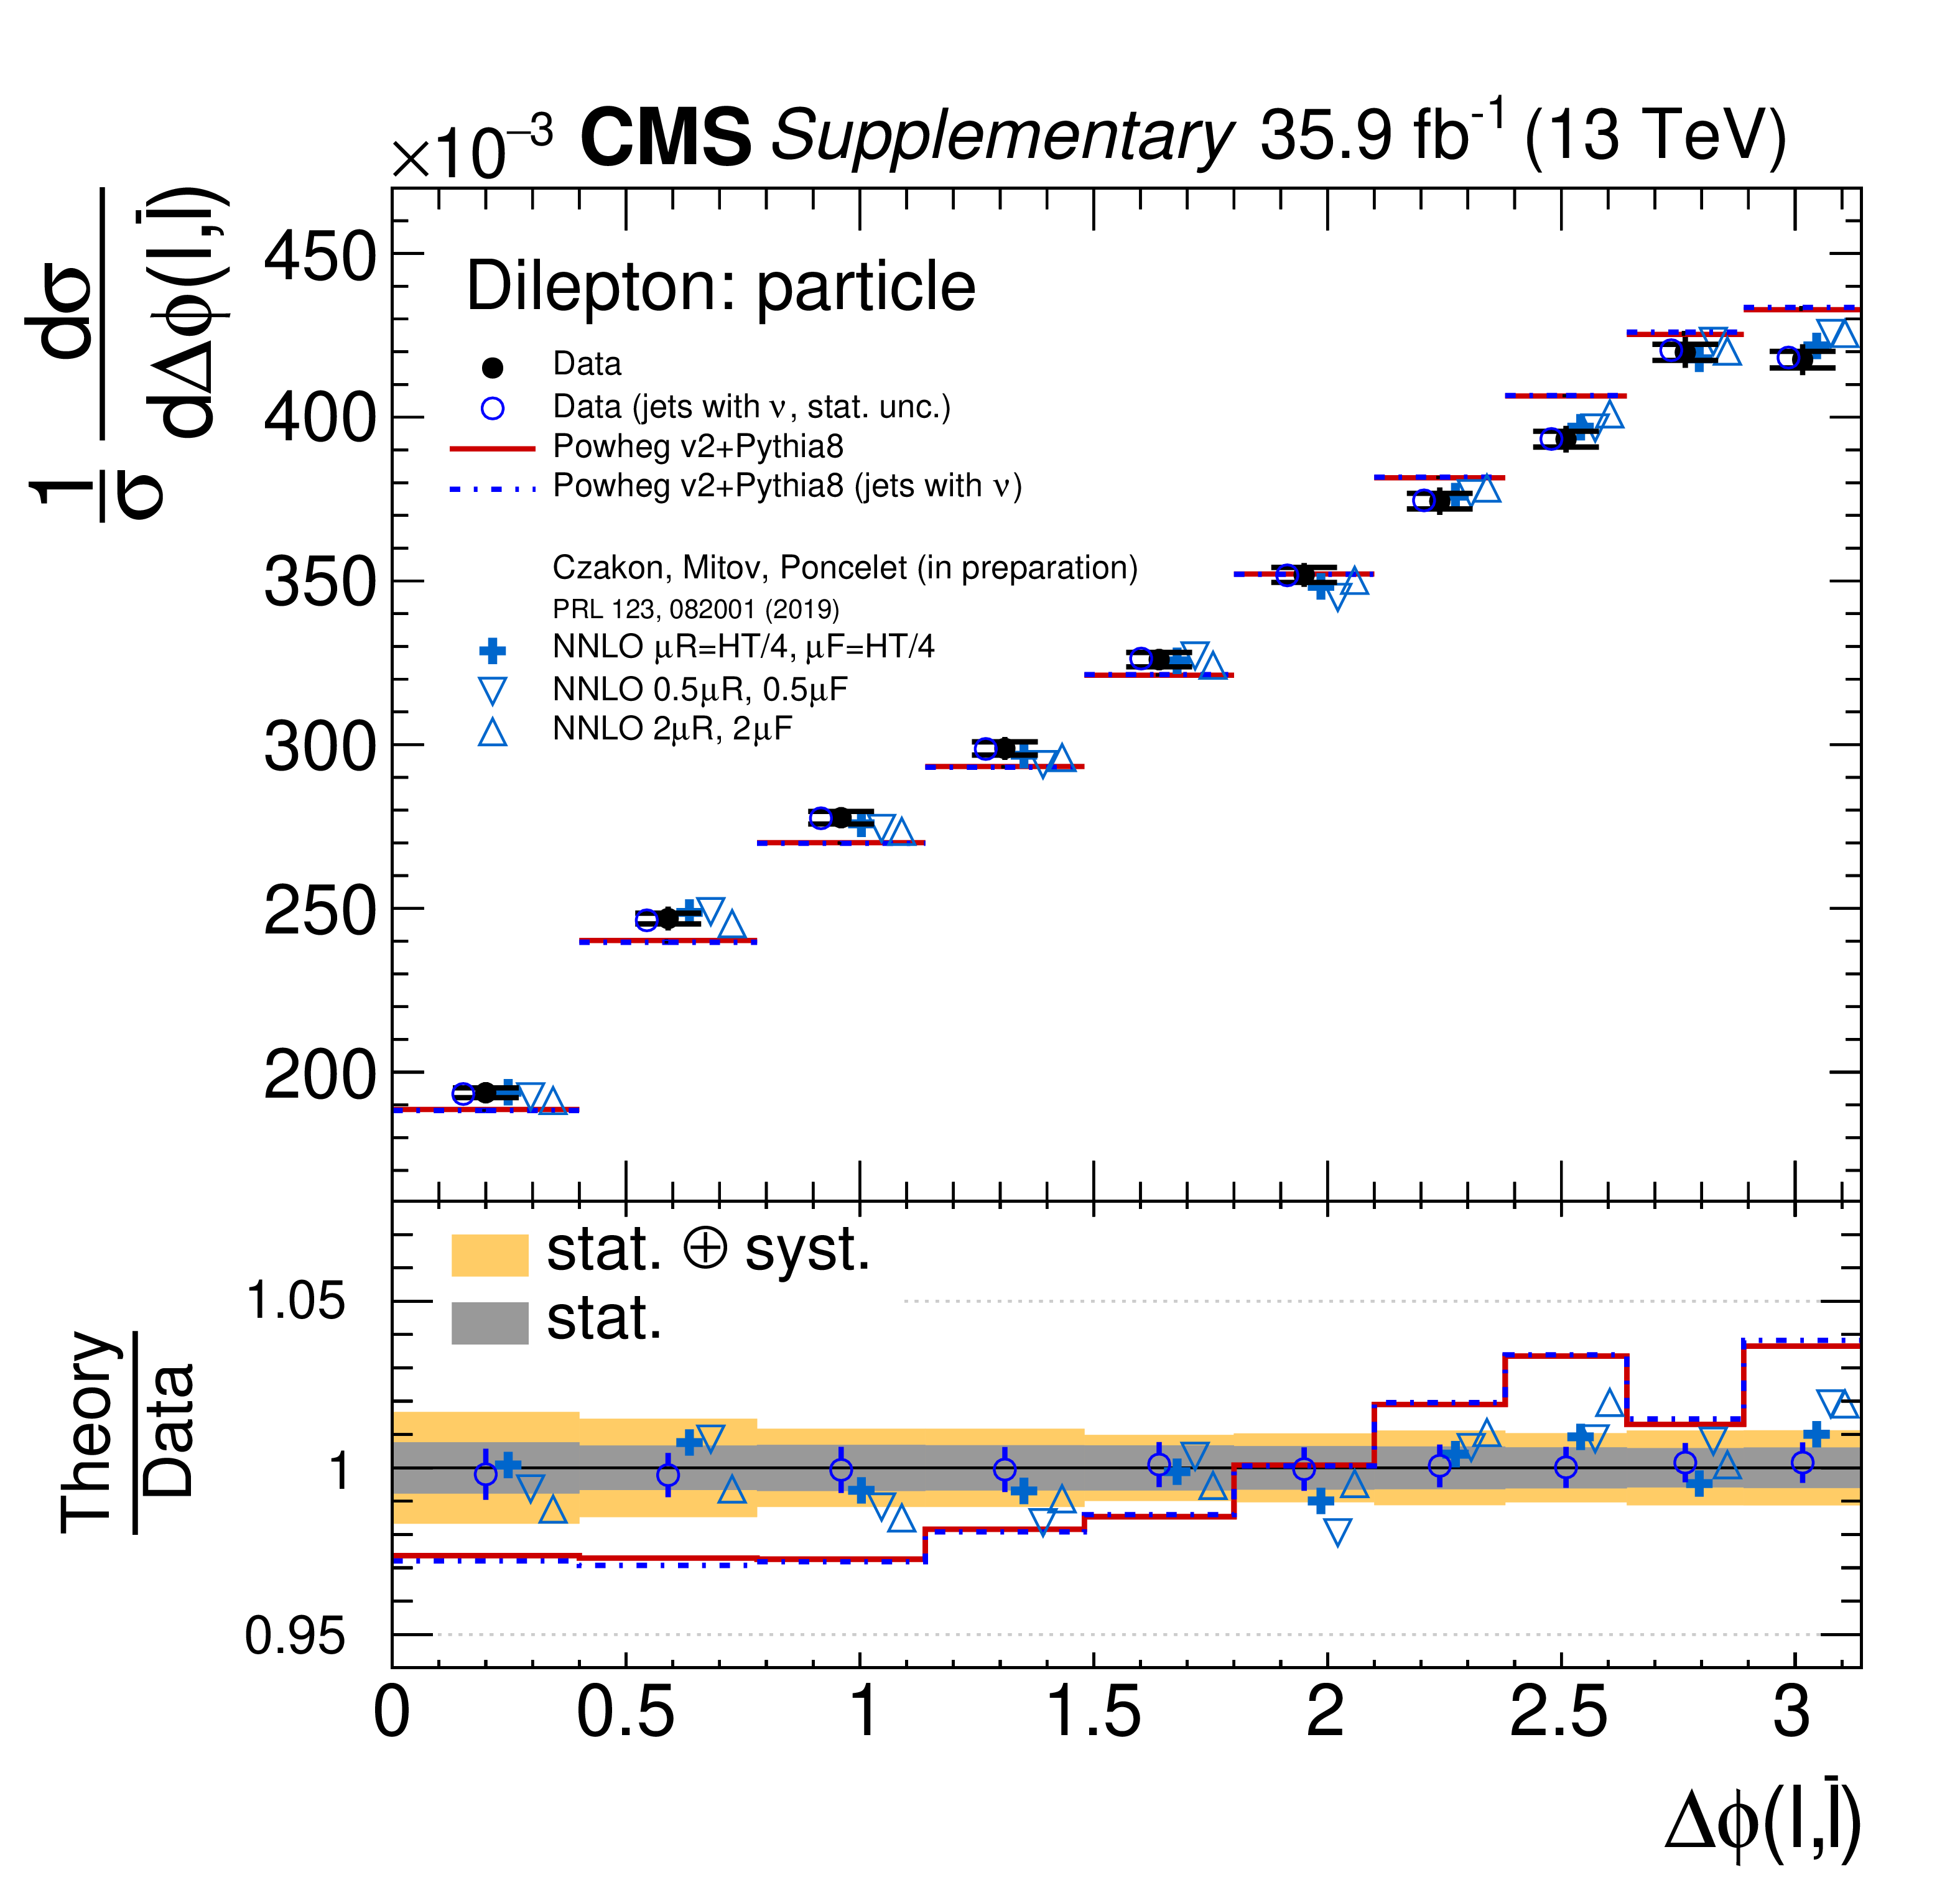
png pdf |
Additional Figure 216:
Normalised differential $\mathrm{t\bar{t}}$ production cross sections as a function of $\Delta \phi ({\ell},\bar{\ell})$ in a fiducial phase space at the particle level are shown for the data (filled circles) in comparison with POWHEG v2 + PYTHIA8 MC predictions (lines), and to the fixed-order calculations with the NNLO precision in QCD (in preparation) [91], for which the nominal prediction (crosses) and alternative scale choices (triangles) are provided. A modified version of particle level reconstruction for the unfolded data (open circles, showing only the statistical uncertainty) and the MC simulation (dashed line) is also presented. In the modified version of particle level reconstruction, neutrinos from hadronic decays are included in the jet clustering. The lower panel shows the ratios with respect to the standard unfolded data. The dark and light bands show the relative statistical and total uncertainties in the standard data, respectively. |

png pdf |
Additional Figure 217:
Normalised differential $\mathrm{t\bar{t}}$ production cross sections as a function of $p_{\mathrm {T}}^{\mathrm{b}}$ (leading) in a fiducial phase space at the particle level are shown for the data (filled circles) in comparison with POWHEG v2 + PYTHIA8 MC predictions (lines), and to the fixed-order calculations with the NNLO precision in QCD (in preparation) [91], for which the nominal prediction (crosses) and alternative scale choices (triangles) are provided. A modified version of particle level reconstruction for the unfolded data (open circles, showing only the statistical uncertainty) and the MC simulation (dashed line) is also presented. In the modified version of particle level reconstruction, neutrinos from hadronic decays are included in the jet clustering. The lower panel shows the ratios with respect to the standard unfolded data. The dark and light bands show the relative statistical and total uncertainties in the standard data, respectively. |

png pdf |
Additional Figure 218:
Normalised differential $\mathrm{t\bar{t}}$ production cross sections as a function of $p_{\mathrm {T}}^{\mathrm{b}}$ (trailing) in a fiducial phase space at the particle level are shown for the data (filled circles) in comparison with POWHEG v2 + PYTHIA8 MC predictions (lines), and to the fixed-order calculations with the NNLO precision in QCD (in preparation) [91], for which the nominal prediction (crosses) and alternative scale choices (triangles) are provided. A modified version of particle level reconstruction for the unfolded data (open circles, showing only the statistical uncertainty) and the MC simulation (dashed line) is also presented. In the modified version of particle level reconstruction, neutrinos from hadronic decays are included in the jet clustering. The lower panel shows the ratios with respect to the standard unfolded data. The dark and light bands show the relative statistical and total uncertainties in the standard data, respectively. |

png pdf |
Additional Figure 219:
Normalised differential $\mathrm{t\bar{t}}$ production cross sections as a function of $\eta _{\mathrm{b}}$ (leading) in a fiducial phase space at the particle level are shown for the data (filled circles) in comparison with POWHEG v2 + PYTHIA8 MC predictions (lines), and to the fixed-order calculations with the NNLO precision in QCD (in preparation) [91], for which the nominal prediction (crosses) and alternative scale choices (triangles) are provided. A modified version of particle level reconstruction for the unfolded data (open circles, showing only the statistical uncertainty) and the MC simulation (dashed line) is also presented. In the modified version of particle level reconstruction, neutrinos from hadronic decays are included in the jet clustering. The lower panel shows the ratios with respect to the standard unfolded data. The dark and light bands show the relative statistical and total uncertainties in the standard data, respectively. |

png pdf |
Additional Figure 220:
Normalised differential $\mathrm{t\bar{t}}$ production cross sections as a function of $\eta _{\mathrm{b}}$ (trailing) in a fiducial phase space at the particle level are shown for the data (filled circles) in comparison with POWHEG v2 + PYTHIA8 MC predictions (lines), and to the fixed-order calculations with the NNLO precision in QCD (in preparation) [91], for which the nominal prediction (crosses) and alternative scale choices (triangles) are provided. A modified version of particle level reconstruction for the unfolded data (open circles, showing only the statistical uncertainty) and the MC simulation (dashed line) is also presented. In the modified version of particle level reconstruction, neutrinos from hadronic decays are included in the jet clustering. The lower panel shows the ratios with respect to the standard unfolded data. The dark and light bands show the relative statistical and total uncertainties in the standard data, respectively. |

png pdf |
Additional Figure 221:
Normalised differential $\mathrm{t\bar{t}}$ production cross sections as a function of $m_{\mathrm{b\bar{b}}}$ in a fiducial phase space at the particle level are shown for the data (filled circles) in comparison with POWHEG v2 + PYTHIA8 MC predictions (lines), and to the fixed-order calculations with the NNLO precision in QCD (in preparation) [91], for which the nominal prediction (crosses) and alternative scale choices (triangles) are provided. A modified version of particle level reconstruction for the unfolded data (open circles, showing only the statistical uncertainty) and the MC simulation (dashed line) is also presented. In the modified version of particle level reconstruction, neutrinos from hadronic decays are included in the jet clustering. The lower panel shows the ratios with respect to the standard unfolded data. The dark and light bands show the relative statistical and total uncertainties in the standard data, respectively. |

png pdf |
Additional Figure 222:
Normalised differential $\mathrm{t\bar{t}}$ production cross sections as a function of $p_{\mathrm {T}}^{\mathrm{b\bar{b}}}$ in a fiducial phase space at the particle level are shown for the data (filled circles) in comparison with POWHEG v2 + PYTHIA8 MC predictions (lines), and to the fixed-order calculations with the NNLO precision in QCD (in preparation) [91], for which the nominal prediction (crosses) and alternative scale choices (triangles) are provided. A modified version of particle level reconstruction for the unfolded data (open circles, showing only the statistical uncertainty) and the MC simulation (dashed line) is also presented. In the modified version of particle level reconstruction, neutrinos from hadronic decays are included in the jet clustering. The lower panel shows the ratios with respect to the standard unfolded data. The dark and light bands show the relative statistical and total uncertainties in the standard data, respectively. |
| References | ||||
| 1 | ATLAS Collaboration | Measurements of top quark pair relative differential cross-sections with ATLAS in pp collisions at $ \sqrt{s} = $ 7 TeV | EPJC 73 (2013) 2261 | 1207.5644 |
| 2 | ATLAS Collaboration | Measurement of the $ \mathrm{t\bar{t}}\ $ production cross-section as a function of jet multiplicity and jet transverse momentum in 7 TeV proton-proton collisions with the ATLAS detector | JHEP 01 (2015) 020 | 1407.0891 |
| 3 | CMS Collaboration | Measurement of differential top-quark pair production cross sections in pp collisions at $ \sqrt{s} = $ 7 TeV | EPJC 73 (2013) 2339 | CMS-TOP-11-013 1211.2220 |
| 4 | CMS Collaboration | Measurement of the differential cross sections for top quark pair production as a function of kinematic event variables in pp collisions at $ \sqrt{s} = $ 7 and 8 TeV | PRD 94 (2016) 052006 | CMS-TOP-12-042 1607.00837 |
| 5 | ATLAS Collaboration | Measurements of top-quark pair differential cross-sections in the lepton+jets channel in pp collisions at $ \sqrt{s}= $ 8 TeV using the ATLAS detector | EPJC 76 (2016) 538 | 1511.04716 |
| 6 | ATLAS Collaboration | Measurement of lepton differential distributions and the top quark mass in $ \mathrm{t\bar{t}}\ $ production in pp collisions at $ \sqrt{s}= $ 8 TeV with the ATLAS detector | EPJC 77 (2017) 804 | 1709.09407 |
| 7 | ATLAS Collaboration | Measurement of the differential cross-section of highly boosted top quarks as a function of their transverse momentum in $ \sqrt{s} = $ 8 TeV proton-proton collisions using the ATLAS detector | PRD 93 (2016) 032009 | 1510.03818 |
| 8 | CMS Collaboration | Measurement of the differential cross section for top quark pair production in pp collisions at $ \sqrt{s} = $ 8 TeV | EPJC 75 (2015) 542 | CMS-TOP-12-028 1505.04480 |
| 9 | CMS Collaboration | Measurement of $ \mathrm {t}\overline{\mathrm {t}} $ production with additional jet activity, including $ \mathrm{b} $ quark jets, in the dilepton decay channel using pp collisions at $ \sqrt{s} = $ 8 TeV | EPJC 76 (2016) 379 | CMS-TOP-12-041 1510.03072 |
| 10 | CMS Collaboration | Measurement of the $ \mathrm{t}\overline{{\mathrm{t}}} $ production cross section in the all-jets final state in pp collisions at $ \sqrt{s}= $ 8 TeV | EPJC 76 (2016) 128 | Khachatryan:2016gxp |
| 11 | CMS Collaboration | Measurement of the integrated and differential $ \mathrm{t\bar{t}}\ $ production cross sections for high-$ p_t $ top quarks in pp collisions at $ \sqrt s = $ 8 TeV | PRD 94 (2016) 072002 | CMS-TOP-14-012 1605.00116 |
| 12 | CMS Collaboration | Measurement of double-differential cross sections for top quark pair production in pp collisions at $ \sqrt{s} = $ 8 TeV and impact on parton distribution functions | EPJC 77 (2017) 459 | CMS-TOP-14-013 1703.01630 |
| 13 | ATLAS Collaboration | Measurements of top-quark pair differential cross-sections in the lepton+jets channel in pp collisions at $ \sqrt{s} = $ 13 TeV using the ATLAS detector | JHEP 11 (2017) 191 | 1708.00727 |
| 14 | ATLAS Collaboration | Measurement of jet activity produced in top-quark events with an electron, a muon and two b-tagged jets in the final state in pp collisions at $ \sqrt{s}= $ 13 TeV with the ATLAS detector | EPJC 77 (2017) 220 | 1610.09978 |
| 15 | ATLAS Collaboration | Measurements of top-quark pair differential cross-sections in the e$ \mu $ channel in pp collisions at $ \sqrt{s} = $ 13 TeV using the ATLAS detector | EPJC 77 (2017) 292 | 1612.05220 |
| 16 | CMS Collaboration | Measurement of differential cross sections for top quark pair production using the lepton+jets final state in proton-proton collisions at 13 TeV | PRD 95 (2017) 092001 | CMS-TOP-16-008 1610.04191 |
| 17 | CMS Collaboration | Measurement of differential cross sections for the production of top quark pairs and of additional jets in lepton+jets events from pp collisions at $ \sqrt{s} = $ 13 TeV | PRD 97 (2018) 112003 | CMS-TOP-17-002 1803.08856 |
| 18 | CMS Collaboration | Measurement of normalized differential $ \mathrm{t}\overline{\mathrm{t}} $ cross sections in the dilepton channel from pp collisions at $ \sqrt{s}= $ 13 TeV | JHEP 04 (2018) 060 | CMS-TOP-16-007 1708.07638 |
| 19 | CMS Collaboration | Measurements of differential cross sections of top quark pair production as a function of kinematic event variables in proton-proton collisions at $ \sqrt{s}= $ 13 TeV | JHEP 06 (2018) 002 | CMS-TOP-16-014 1803.03991 |
| 20 | CMS Collaboration | CMS luminosity measurements for the 2016 data taking period | CMS-PAS-LUM-17-001 | CMS-PAS-LUM-17-001 |
| 21 | M. Guzzi, K. Lipka, and S.-O. Moch | Top-quark pair production at hadron colliders: differential cross section and phenomenological applications with difftop | JHEP 01 (2015) 082 | 1406.0386 |
| 22 | N. Kidonakis | NNNLO soft-gluon corrections for the top-quark $ {p_{\mathrm{T}}} $ and rapidity distributions | PRD 91 (2015) 031501 | 1411.2633 |
| 23 | M. Czakon, D. Heymes, and A. Mitov | High-precision differential predictions for top-quark pairs at the LHC | PRL 116 (2016) 082003 | 1511.00549 |
| 24 | B. D. Pecjak, D. J. Scott, X. Wang, and L. L. Yang | Resummed differential cross sections for top-quark pairs at the LHC | PRL 116 (2016) 202001 | 1601.07020 |
| 25 | X.-Q. Li et al. | Light top squark in precision top quark sample | PRD 89 (2014) 077703 | 1311.6874 |
| 26 | R. Frederix and F. Maltoni | Top pair invariant mass distribution: a window on new physics | JHEP 01 (2009) 047 | 0712.2355 |
| 27 | R. M. Harris and S. Jain | Cross sections for leptophobic topcolor Z' decaying to top-antitop | EPJC 72 (2012) 2072 | 1112.4928 |
| 28 | D. Buarque Franzosi and C. Zhang | Probing the top-quark chromomagnetic dipole moment at next-to-leading order in QCD | PRD 91 (2015) 114010 | 1503.08841 |
| 29 | R. Martinez, M. A. Perez, and N. Poveda | Chromomagnetic dipole moment of the top quark revisited | EPJC 53 (2008) 221 | hep-ph/0701098 |
| 30 | CMS Collaboration | The CMS trigger system | JINST 12 (2017) P01020 | CMS-TRG-12-001 1609.02366 |
| 31 | CMS Collaboration | The CMS experiment at the CERN LHC | JINST 3 (2008) S08004 | CMS-00-001 |
| 32 | S. Frixione, P. Nason, and G. Ridolfi | A positive-weight next-to-leading-order Monte Carlo for heavy flavour hadroproduction | JHEP 09 (2007) 126 | 0707.3088 |
| 33 | P. Nason | A new method for combining NLO QCD with shower Monte Carlo algorithms | JHEP 11 (2004) 040 | hep-ph/0409146 |
| 34 | S. Frixione, P. Nason, and C. Oleari | Matching NLO QCD computations with parton shower simulations: the POWHEG method | JHEP 11 (2007) 070 | 0709.2092 |
| 35 | S. Alioli, P. Nason, C. Oleari, and E. Re | A general framework for implementing NLO calculations in shower Monte Carlo programs: the POWHEG BOX | JHEP 06 (2010) 043 | 1002.2581 |
| 36 | T. Sjostrand et al. | An introduction to PYTHIA 8.2 | CPC 191 (2015) 159 | 1410.3012 |
| 37 | CMS Collaboration | Investigations of the impact of the parton shower tuning in PYTHIA in the modelling of $ \mathrm{t\bar{t}}\ $ at $ \sqrt{s}= $ 8 and 13 TeV | CMS-PAS-TOP-16-021 | CMS-PAS-TOP-16-021 |
| 38 | CMS Collaboration | Event generator tunes obtained from underlying event and multiparton scattering measurements | EPJC 76 (2016) 155 | CMS-GEN-14-001 1512.00815 |
| 39 | P. Skands, S. Carrazza, and J. Rojo | Tuning PYTHIA 8.1: the Monash 2013 tune | EPJC 74 (2014) 3024 | 1404.5630 |
| 40 | J. Alwall et al. | The automated computation of tree-level and next-to-leading order differential cross sections, and their matching to parton shower simulations | JHEP 07 (2014) 079 | 1405.0301 |
| 41 | P. Artoisenet, R. Frederix, O. Mattelaer, and R. Rietkerk | Automatic spin-entangled decays of heavy resonances in Monte Carlo simulations | JHEP 03 (2013) 015 | 1212.3460 |
| 42 | R. Frederix and S. Frixione | Merging meets matching in MC@NLO | JHEP 12 (2012) 061 | 1209.6215 |
| 43 | M. Bahr et al. | Herwig++ physics and manual | EPJC 58 (2008) 639 | 0803.0883 |
| 44 | M. H. Seymour and A. Siodmok | Constraining MPI models using $ \sigma_{\mathrm{eff}} $ and recent Tevatron and LHC underlying event data | JHEP 10 (2013) 113 | 1307.5015 |
| 45 | J. Alwall et al. | Comparative study of various algorithms for the merging of parton showers and matrix elements in hadronic collisions | EPJC 53 (2008) 437 | 0706.2569 |
| 46 | S. Alioli, P. Nason, C. Oleari, and E. Re | NLO single-top production matched with shower in POWHEG: $ s $- and $ t $-channel contributions | JHEP 09 (2009) 111 | 0907.4076 |
| 47 | E. Re | Single-top Wt-channel production matched with parton showers using the POWHEG method | EPJC 71 (2011) 1547 | 1009.2450 |
| 48 | NNPDF Collaboration | Unbiased global determination of parton distributions and their uncertainties at NNLO and LO | NPB 855 (2012) 153 | 1107.2652 |
| 49 | Y. Li and F. Petriello | Combining QCD and electroweak corrections to dilepton production in FEWZ | PRD 86 (2012) 094034 | 1208.5967 |
| 50 | N. Kidonakis | Two-loop soft anomalous dimensions for single top quark associated production with $ \mathrm{W^-} $ or $ \mathrm{H^-} $ | PRD 82 (2010) 054018 | hep-ph/1005.4451 |
| 51 | J. M. Campbell, R. K. Ellis, and C. Williams | Vector boson pair production at the LHC | JHEP 07 (2011) 018 | 1105.0020 |
| 52 | F. Maltoni, D. Pagani, and I. Tsinikos | Associated production of a top-quark pair with vector bosons at NLO in QCD: impact on $ \mathrm{t}\overline{\mathrm{t}}\mathrm{H} $ searches at the LHC | JHEP 02 (2016) 113 | 1507.05640 |
| 53 | M. Czakon and A. Mitov | Top++: a program for the calculation of the top-pair cross-section at hadron colliders | CPC 185 (2014) 2930 | 1112.5675 |
| 54 | GEANT4 Collaboration | GEANT4---a simulation toolkit | NIMA 506 (2003) 250 | |
| 55 | CMS Collaboration | Particle-flow reconstruction and global event description with the CMS detector | JINST 12 (2017) P10003 | CMS-PRF-14-001 1706.04965 |
| 56 | CMS Collaboration | Performance of electron reconstruction and selection with the CMS detector in proton-proton collisions at $ \sqrt{s} = $ 8 TeV | JINST 10 (2015) P06005 | CMS-EGM-13-001 1502.02701 |
| 57 | CMS Collaboration | Performance of the CMS muon detector and muon reconstruction with proton-proton collisions at $ \sqrt{s}= $ 13 TeV | JINST 13 (2018) P06015 | CMS-MUO-16-001 1804.04528 |
| 58 | M. Cacciari, G. P. Salam, and G. Soyez | The anti-$ {k_{\mathrm{T}}} $ jet clustering algorithm | JHEP 04 (2008) 063 | 0802.1189 |
| 59 | M. Cacciari, G. P. Salam, and G. Soyez | FastJet user manual | EPJC 72 (2012) 1896 | 1111.6097 |
| 60 | CMS Collaboration | Identification of heavy-flavour jets with the cms detector in pp collisions at 13 TeV | JINST 13 (2018) P05011 | CMS-BTV-16-002 1712.07158 |
| 61 | CMS Collaboration | Measurement of the top quark pair production cross section in proton-proton collisions at $ \sqrt{s} = $ 13 TeV with the CMS detector | PRL 116 (2016) 052002 | CMS-TOP-15-003 1510.05302 |
| 62 | Particle Data Group, C. Patrignani et al. | Review of particle physics | CPC 40 (2016) 100001 | |
| 63 | CMS Collaboration | Measurement of the Drell--Yan cross sections in pp collisions at $ \sqrt{s} = $ 7 TeV with the CMS experiment | JHEP 10 (2011) 007 | CMS-EWK-10-007 1108.0566 |
| 64 | CMS Collaboration | Jet energy scale and resolution in the CMS experiment in pp collisions at 8 TeV | JINST 12 (2017) P02014 | CMS-JME-13-004 1607.03663 |
| 65 | ATLAS Collaboration | Measurement of the inelastic proton-proton cross section at $ \sqrt{s} = $ 13 TeV with the ATLAS detector at the LHC | PRL 117 (2016) 182002 | 1606.02625 |
| 66 | S. Argyropoulos and T. Sjostrand | Effects of color reconnection on $ \mathrm{t\bar{t}}\ $ final states at the LHC | JHEP 11 (2014) 043 | 1407.6653 |
| 67 | J. R. Christiansen and P. Z. Skands | String formation beyond leading colour | JHEP 08 (2015) 003 | 1505.01681 |
| 68 | M. G. Bowler | $ \text{e}^{+}\text{e}^{-} $ production of heavy quarks in the string model | Z. Phys. C 11 (1981) 169 | |
| 69 | C. Peterson, D. Schlatter, I. Schmitt, and P. M. Zerwas | Scaling violations in inclusive $ \text{e}^{+}\text{e}^{{-}} $ annihilation spectra | PRD 27 (1983) 105 | |
| 70 | A. Hoecker and V. Kartvelishvili | SVD approach to data unfolding | NIMA 372 (1996) 469 | hep-ph/9509307 |
| 71 | V. Blobel | An unfolding method for high-energy physics experiments | in Advanced Statistical Techniques in Particle Physics. Proceedings, Conference, Durham, UK, March 18-22, 2002, p. 258 2002 | hep-ex/0208022 |
| 72 | F. James | Statistical methods in experimental physics | World Scientific, second edition | |
| 73 | CMS Collaboration | Object definitions for top quark analyses at the particle level | CDS | |
| 74 | M. Czakon et al. | Top-pair production at the LHC through NNLO QCD and NLO EW | JHEP 10 (2017) 186 | 1705.04105 |
| 75 | A. Manohar, P. Nason, G. P. Salam, and G. Zanderighi | How bright is the proton? a precise determination of the photon parton distribution function | PRL 117 (2016) 242002 | 1607.04266 |
| 76 | NNPDF Collaboration | Illuminating the photon content of the proton within a global PDF analysis | SciPost Phys. 5 (2018) 008 | 1712.07053 |
| 77 | M. Czakon et al. | Resummation for (boosted) top-quark pair production at NNLO+NNLL' in QCD | JHEP 05 (2018) 149 | 1803.07623 |
| 78 | NNPDF Collaboration | Parton distributions from high-precision collider data | EPJC 77 (2017) 663 | 1706.00428 |
| 79 | S. Dulat et al. | New parton distribution functions from a global analysis of quantum chromodynamics | PRD 93 (2016) 033006 | 1506.07443 |
| 80 | W. Buchmuller and D. Wyler | Effective lagrangian analysis of new interactions and flavor conservation | NPB 268 (1986) 621 | |
| 81 | B. Grzadkowski, M. Iskrzynski, M. Misiak, and J. Rosiek | Dimension-six terms in the standard model lagrangian | JHEP 10 (2010) 085 | 1008.4884 |
| 82 | A. Buckley et al. | Rivet user manual | CPC 184 (2013) 2803 | 1003.0694 |
| 83 | M. Czakon, P. Fiedler, and A. Mitov | Total top-quark pair-production cross section at hadron colliders through $ o({\alpha_s}^4) $ | PRL 110 (2013) 252004 | 1303.6254 |
| 84 | CMS Collaboration | Combination of ATLAS and CMS top quark pair cross section measurements in the e$ \mu $ final state using proton-proton collisions at 8 TeV | CMS-PAS-TOP-14-016 | CMS-PAS-TOP-14-016 |
| 85 | CDF, D0 Collaboration | Combination of measurements of the top-quark pair production cross section from the tevatron collider | PRD 89 (2014) 072001 | 1309.7570 |
| 86 | CMS Collaboration | Measurements of $ \mathrm{t\bar{t}}\ $ spin correlations and top quark polarization using dilepton final states in pp collisions at $ \sqrt{s} = $ 8 TeV | PRD 93 (2016) 052007 | CMS-TOP-14-023 1601.01107 |
| 87 | W. Bernreuther and Z.-G. Si | Top quark spin correlations and polarization at the LHC: standard model predictions and effects of anomalous top chromo moments | PLB 725 (2013) 115, (2015) 413] | 1305.2066 |
| 88 | J. A. Aguilar-Saavedra and M. P\'erez-Victoria | Simple models for the top asymmetry: constraints and predictions | JHEP 09 (2011) 097 | 1107.0841 |
| 89 | J. H. Kuhn and G. Rodrigo | Charge asymmetries of top quarks at hadron colliders revisited | JHEP 01 (2012) 063 | 1109.6830 |
| 90 | W. Bernreuther, D. Heisler, and Z.-G. Si | A set of top quark spin correlation and polarization observables for the LHC: Standard model predictions and new physics contributions | JHEP 12 (2015) 026 | 1508.05271 |
| 91 | A. Behring et al. | Higher Order Corrections to Spin Correlations in Top Quark Pair Production at the LHC | PRL 123 (2019) 082001 | 1901.05407 |
|
|
Compact Muon Solenoid LHC, CERN |
|

|

|

|

|

|