

Compact Muon Solenoid
LHC, CERN
| CMS-B2G-17-018 ; CERN-EP-2018-230 | ||
| Search for single production of vector-like quarks decaying to a top quark and a W boson in proton-proton collisions at $\sqrt{s} = $ 13 TeV | ||
| CMS Collaboration | ||
| 23 September 2018 | ||
| Eur. Phys. J. C 79 (2019) 90 | ||
| Abstract: A search is presented for the single production of vector-like quarks in proton-proton collisions at $\sqrt{s} = $ 13 TeV. The data were recorded with the CMS experiment at the LHC, corresponding to an integrated luminosity of 35.9 fb$^{-1}$. The analysis focuses on the vector-like quark decay into a top quark and a W boson, with one muon or electron in the final state. The mass of the vector-like quark candidate is reconstructed from hadronic jets, the lepton, and the missing transverse momentum. Methods for the identification of b quarks and of highly Lorentz boosted hadronically decaying top quarks and W bosons are exploited in this search. No significant deviation from the standard model background expectation is observed. Exclusion limits at 95% confidence level are set on the product of the production cross section and branching fraction as a function of the vector-like quark mass, which range from 0.3 to 0.03pb for vector-like quark masses of 700 to 2000 GeV. Mass exclusion limits up to 1660 GeV are obtained, depending on the vector-like quark type, coupling, and decay width. These represent the most stringent exclusion limits for the single production of vector-like quarks in this channel. | ||
| Links: e-print arXiv:1809.08597 [hep-ex] (PDF) ; CDS record ; inSPIRE record ; CADI line (restricted) ; | ||
| Figures | |
png pdf |
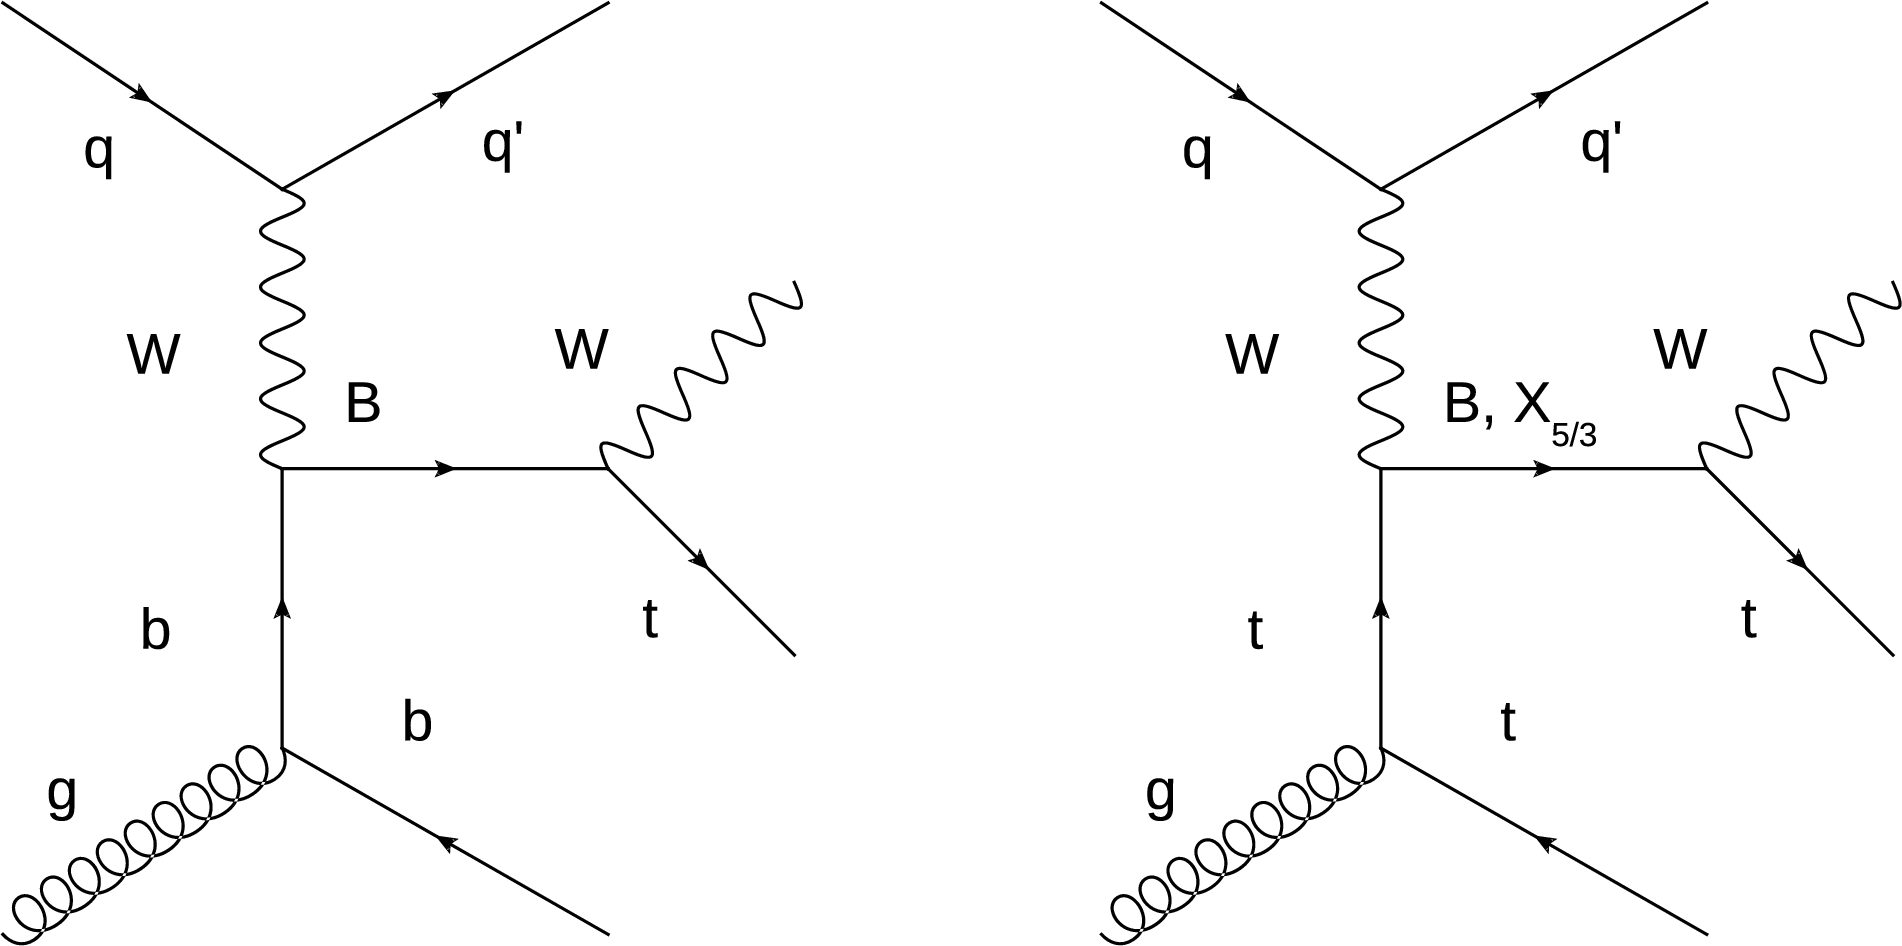
Figure 1:
Leading order Feynman diagrams for the production of a single vector-like B or $ {X_{5/3}}$ quark in association with a b (left) or t (right) and a light-flavour quark, and the subsequent decay of the VLQ to tW. |
png pdf |
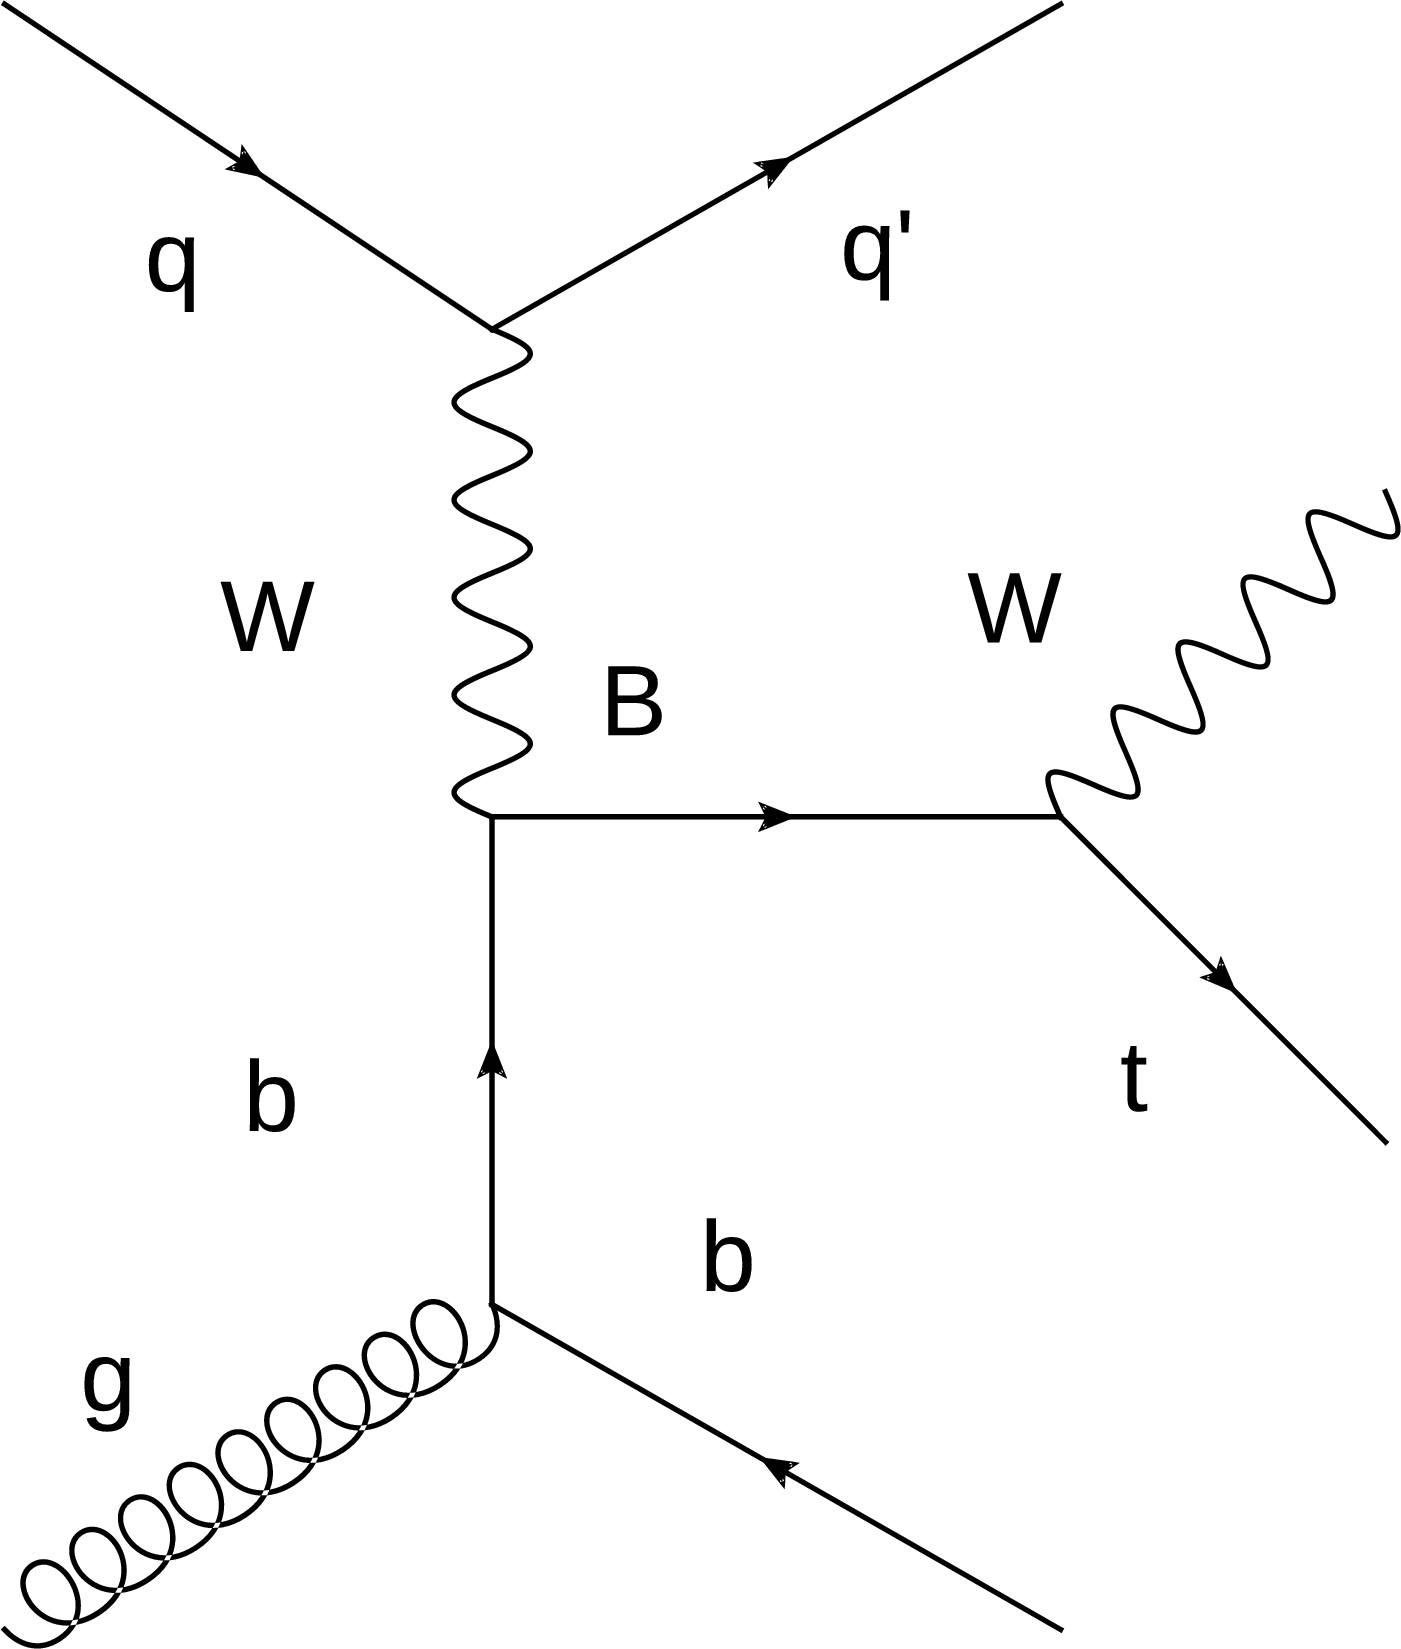
Figure 1-a:
Leading order Feynman diagram for the production of a single vector-like B or $ {X_{5/3}}$ quark in association with a b and a light-flavour quark, and the subsequent decay of the VLQ to tW. |
png pdf |
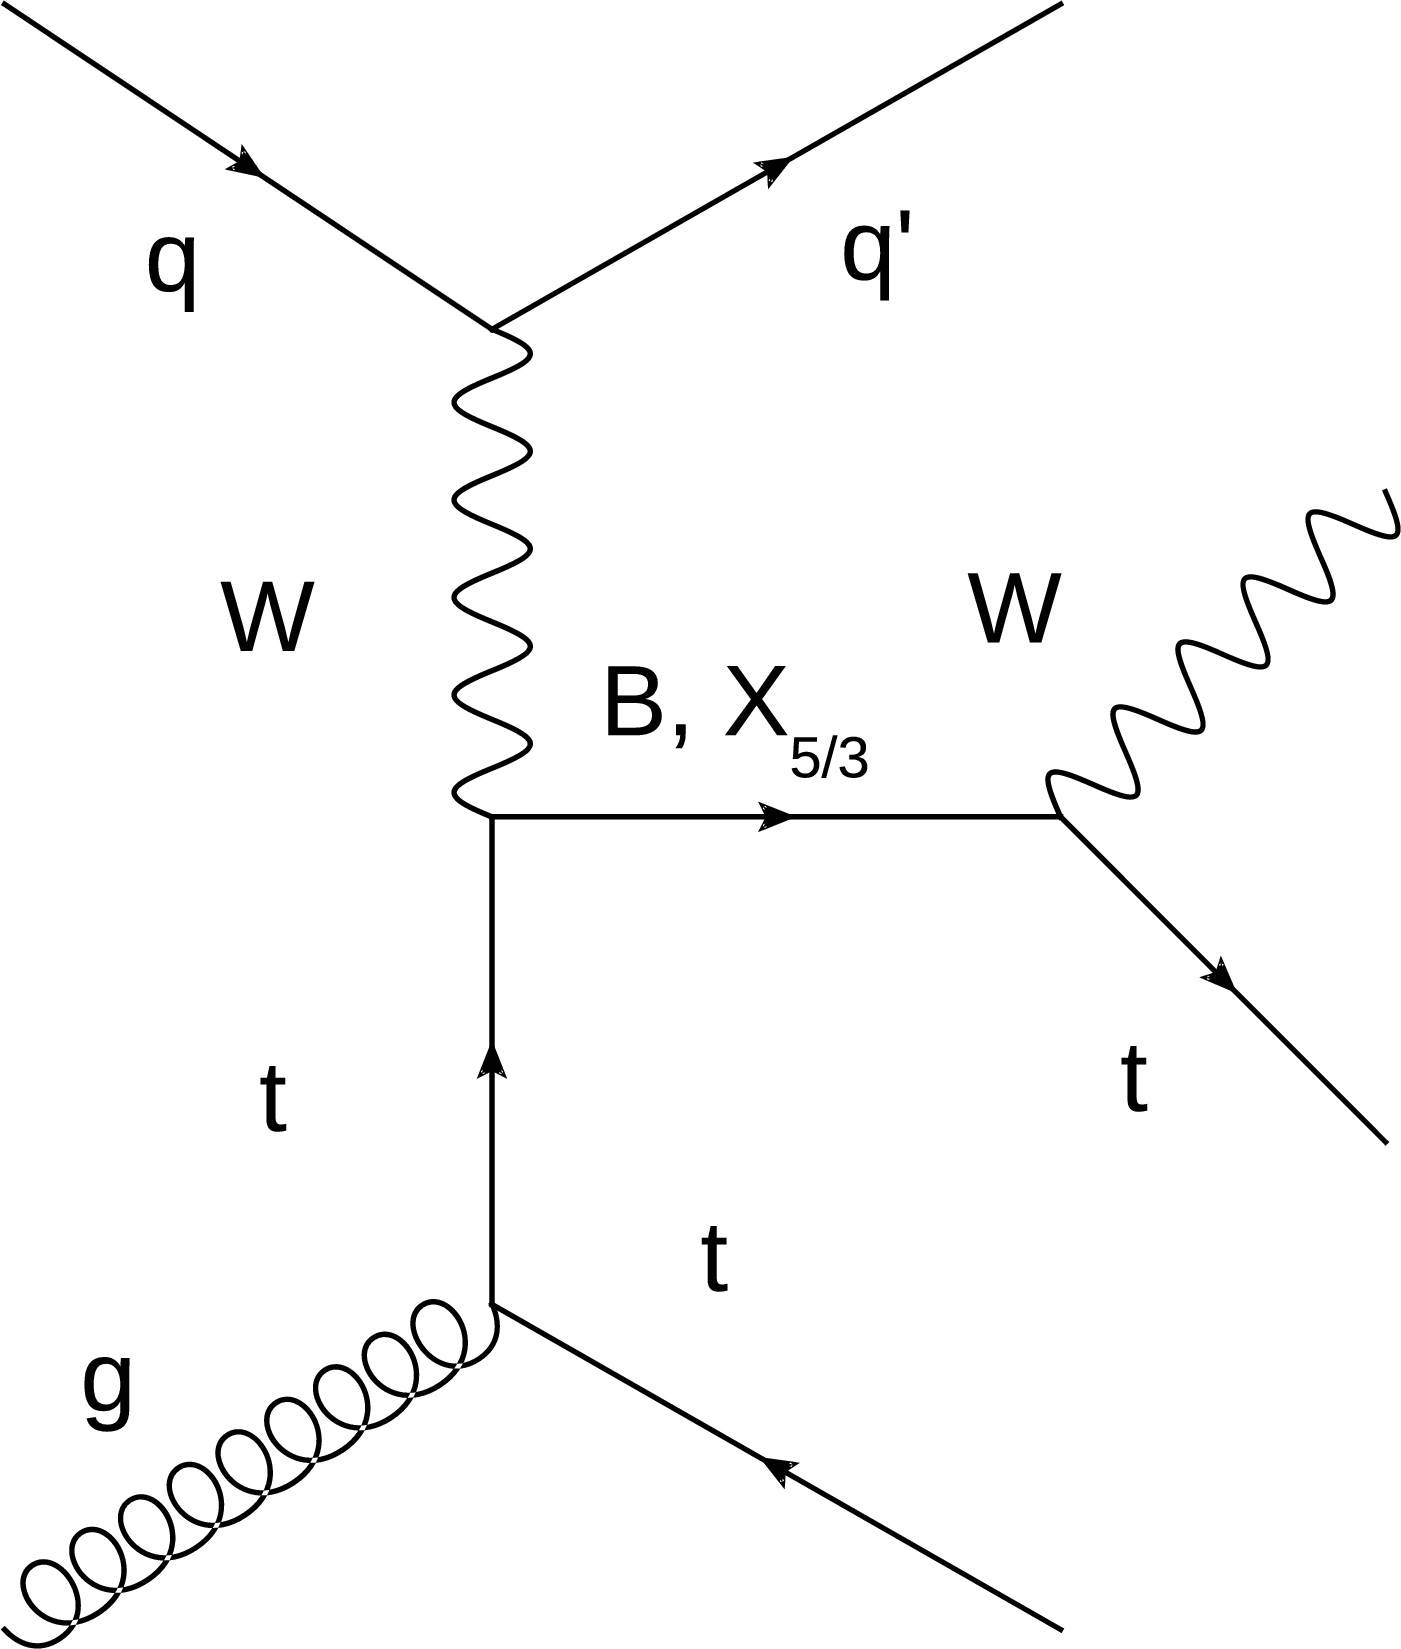
Figure 1-b:
Leading order Feynman diagram for the production of a single vector-like B or $ {X_{5/3}}$ quark in association with a t and a light-flavour quark, and the subsequent decay of the VLQ to tW. |
png pdf |
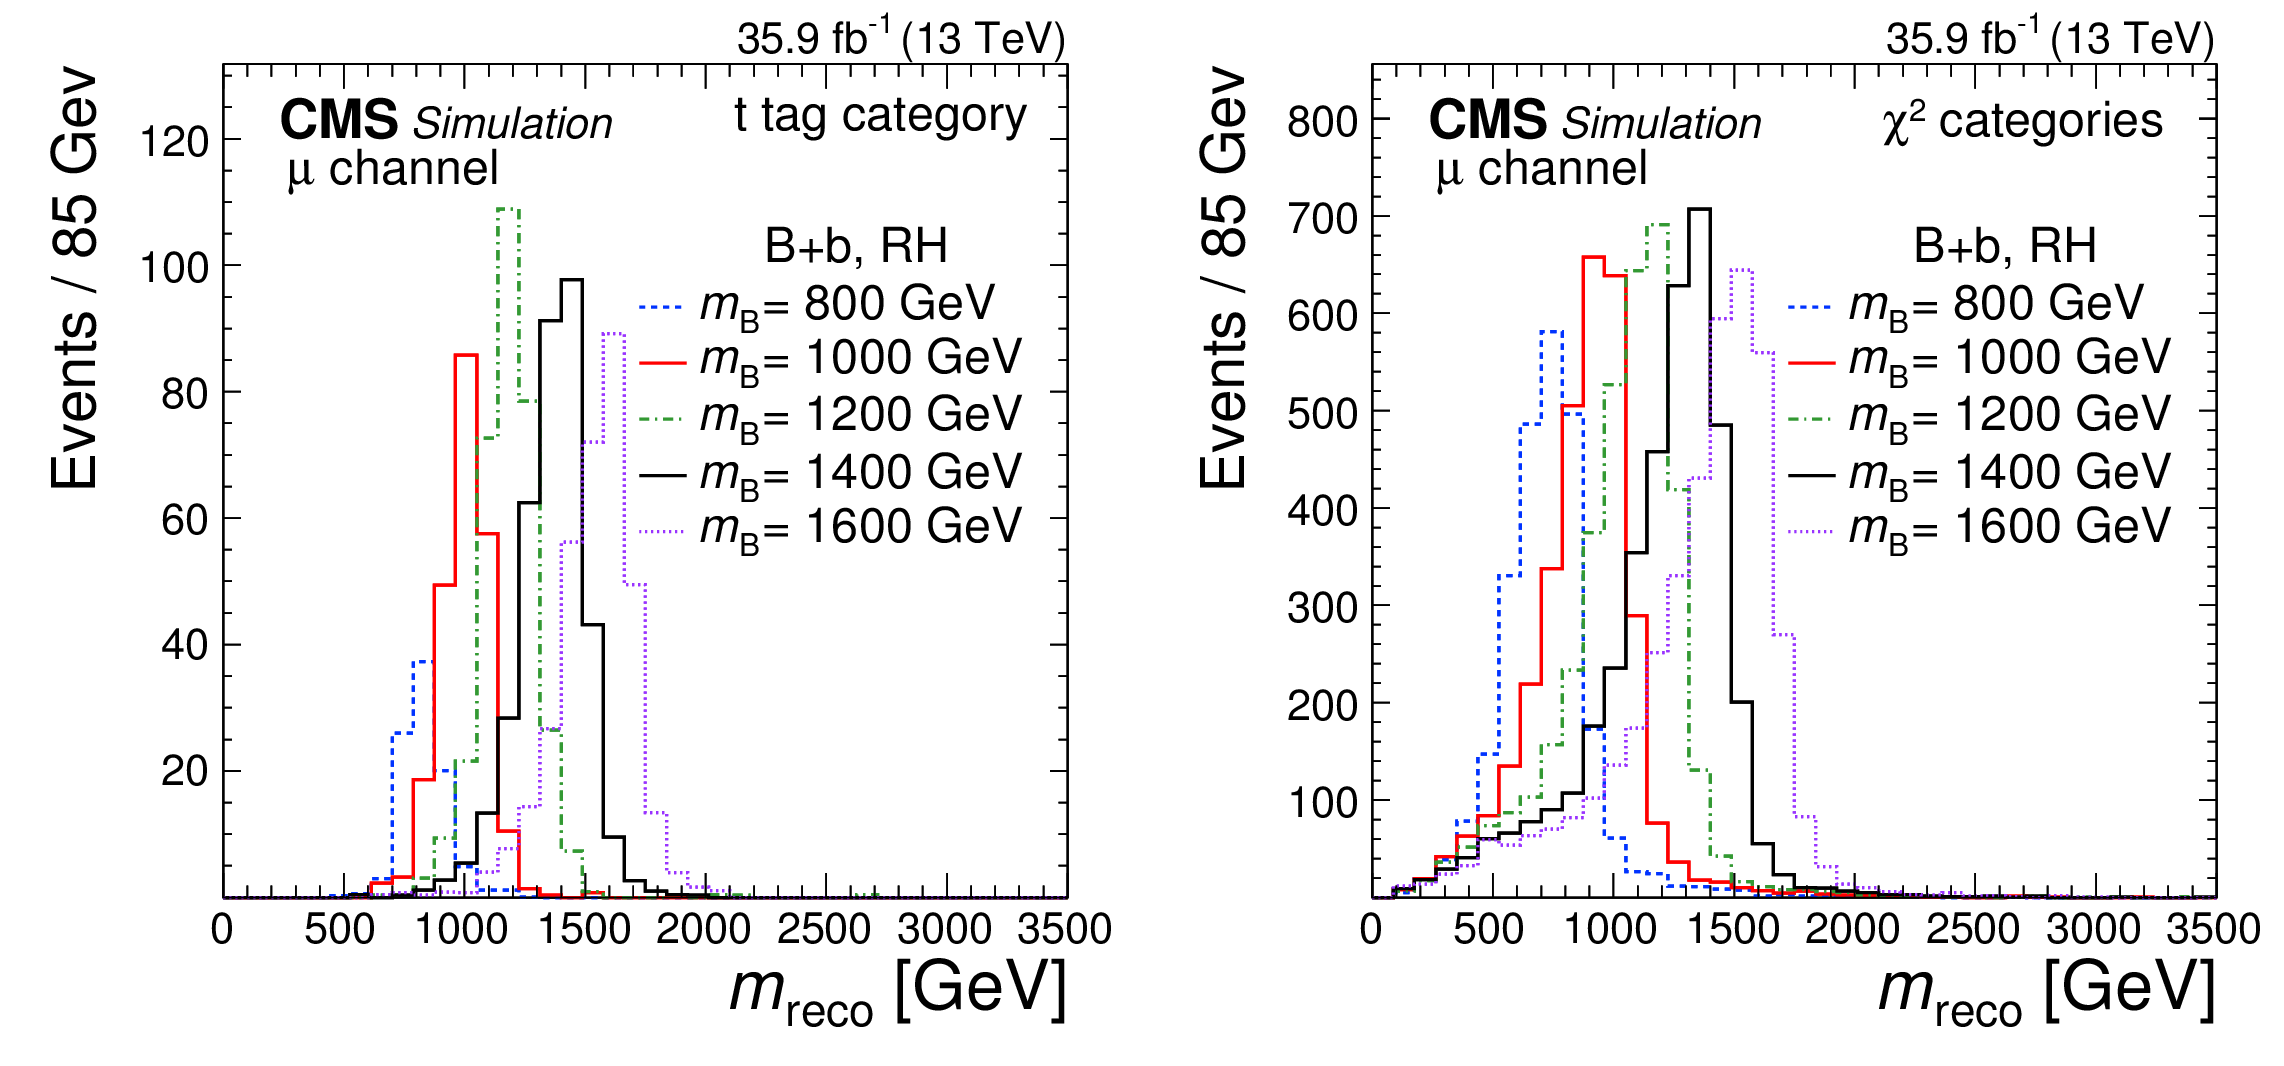
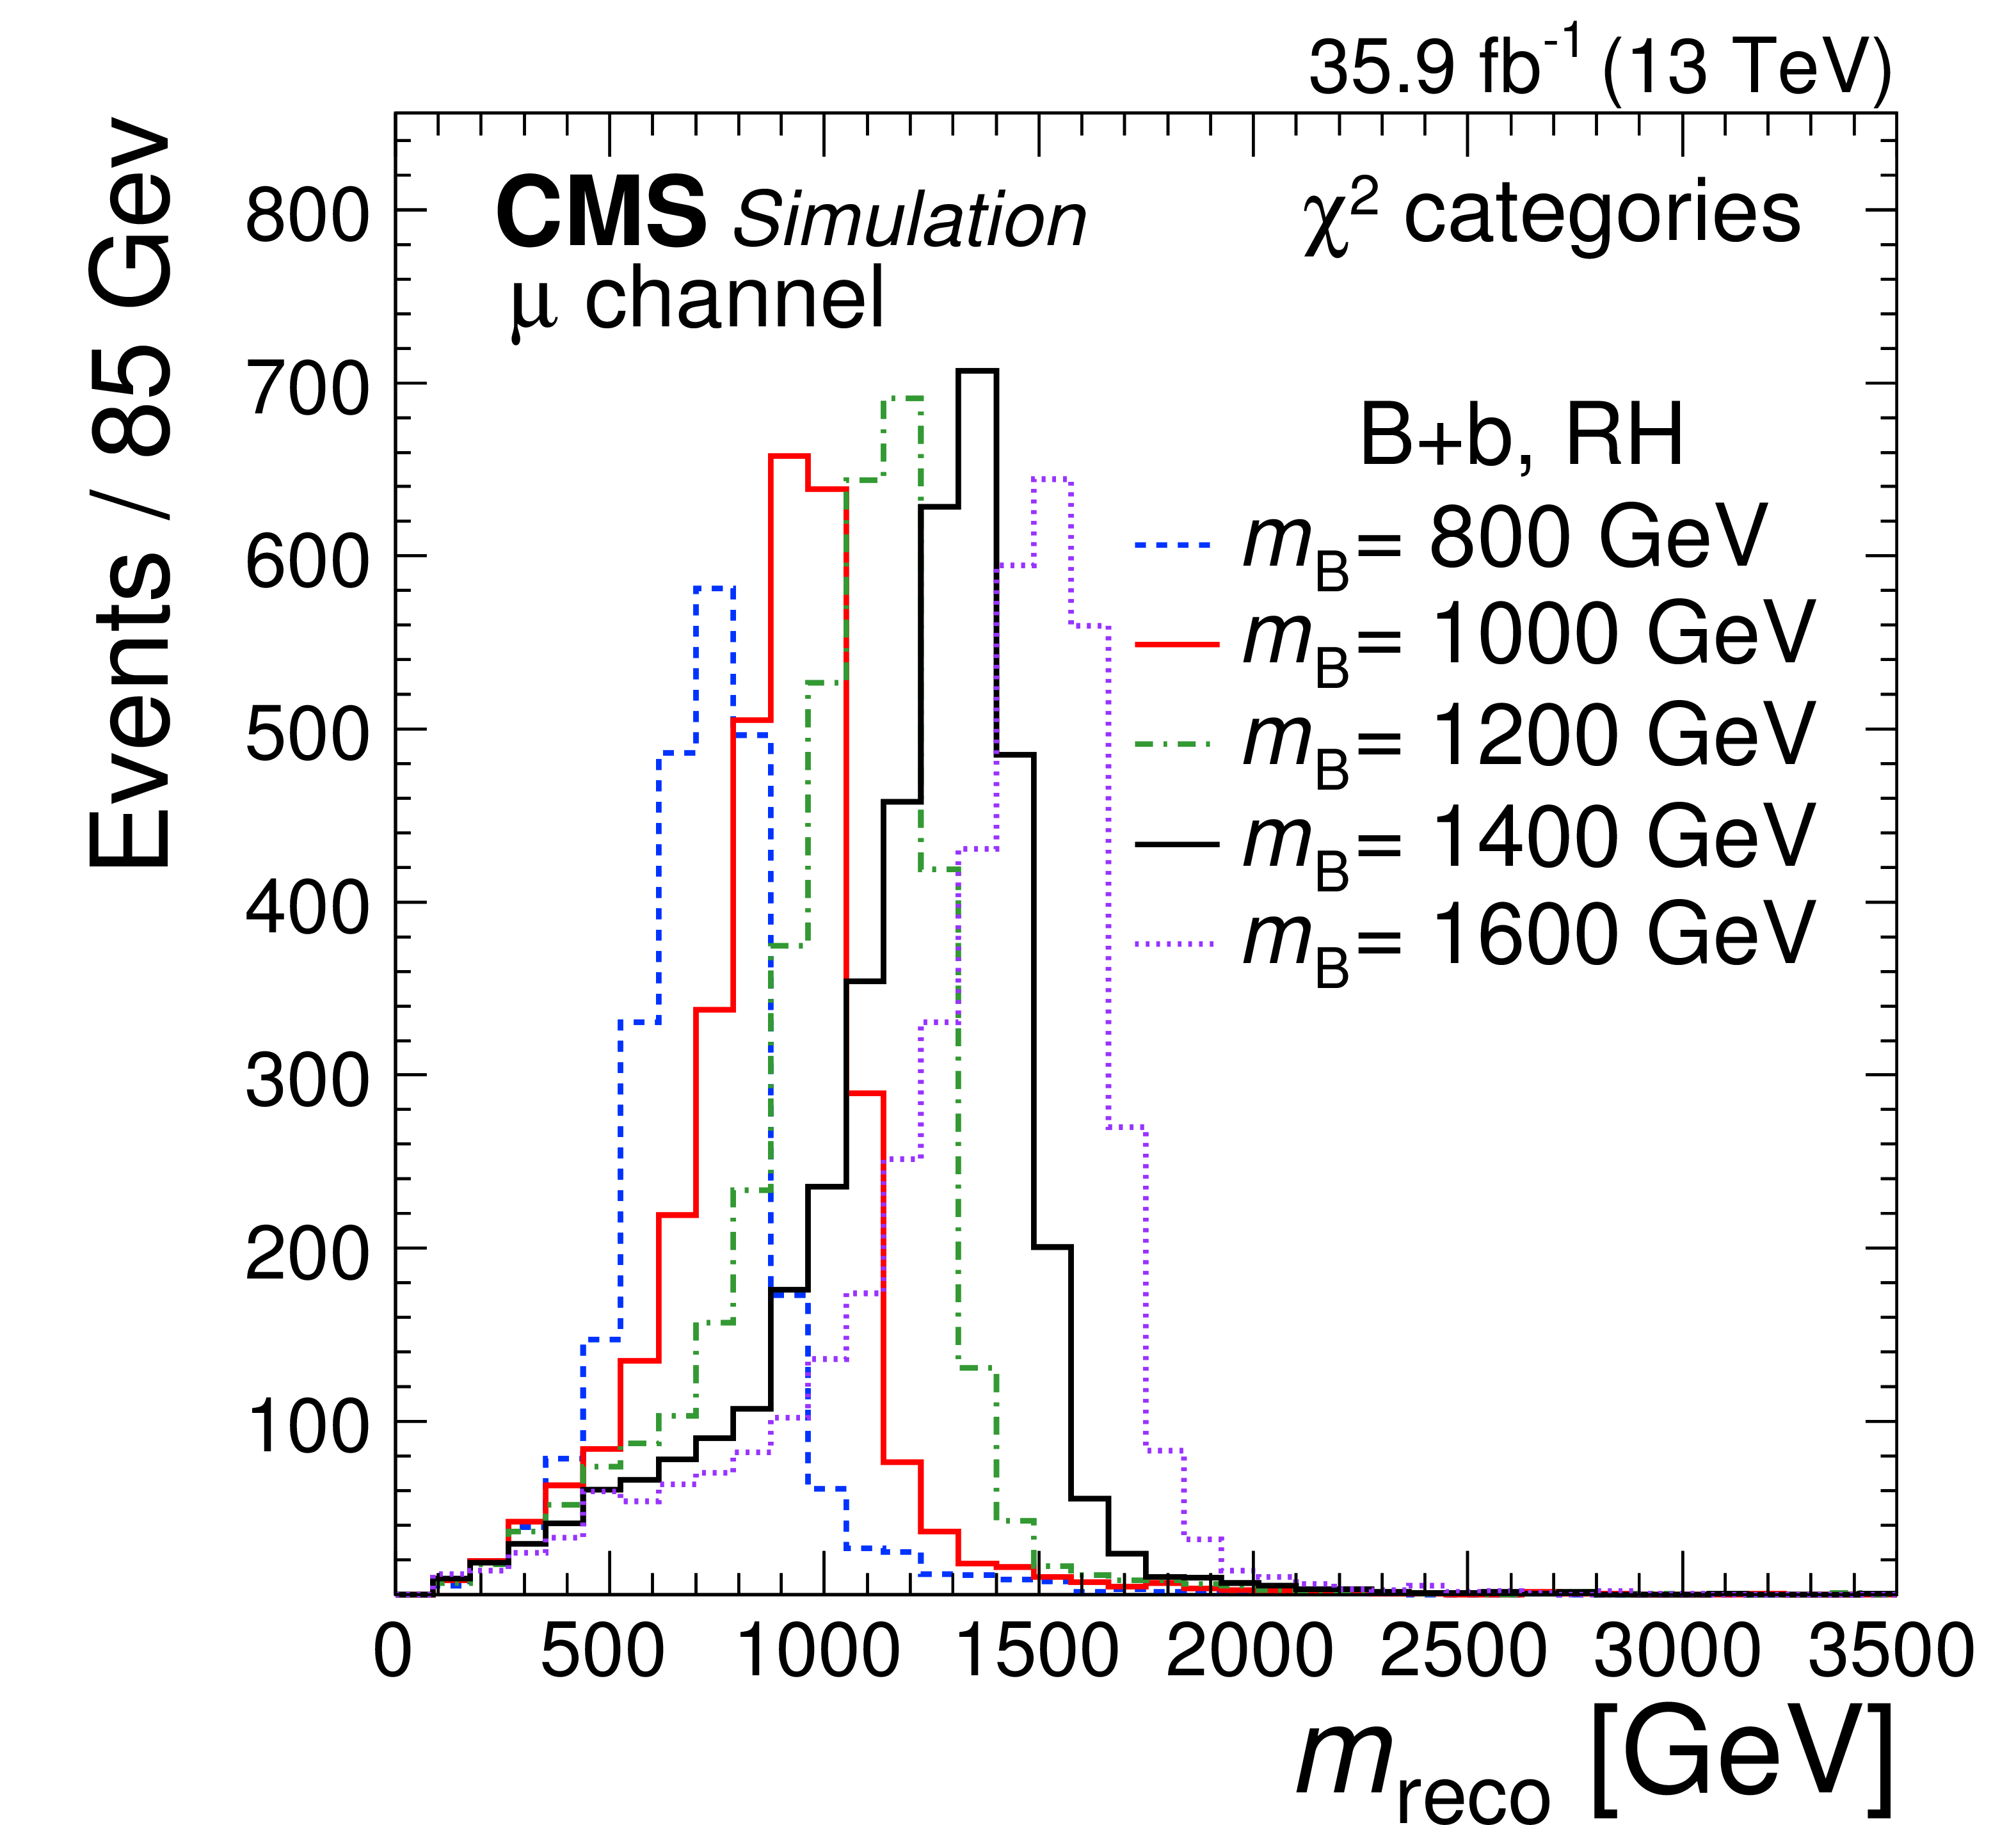
Figure 2:
Distributions of $ {m_\mathrm {reco}} $ for the B+b production mode, obtained for simulated events with a muon in the final state, reconstructed with a t tag (left) and with the $\chi ^2$ method (right) for right-handed VLQ couplings and various VLQ masses $m_{{\mathrm {B}}}$. Signal events are shown assuming a production cross section of 1 pb and a relative VLQ decay width of 1%. |

png pdf |
Figure 2-a:
Distributions of $ {m_\mathrm {reco}} $ for the B+b production mode, obtained for simulated events with a muon in the final state, reconstructed with a t tag for right-handed VLQ couplings and various VLQ masses $m_{{\mathrm {B}}}$. Signal events are shown assuming a production cross section of 1 pb and a relative VLQ decay width of 1%. |
png pdf |
Figure 2-b:
Distributions of $ {m_\mathrm {reco}} $ for the B+b production mode, obtained for simulated events with a muon in the final state, reconstructed with the $\chi ^2$ method for right-handed VLQ couplings and various VLQ masses $m_{{\mathrm {B}}}$. Signal events are shown assuming a production cross section of 1 pb and a relative VLQ decay width of 1%. |
png pdf |
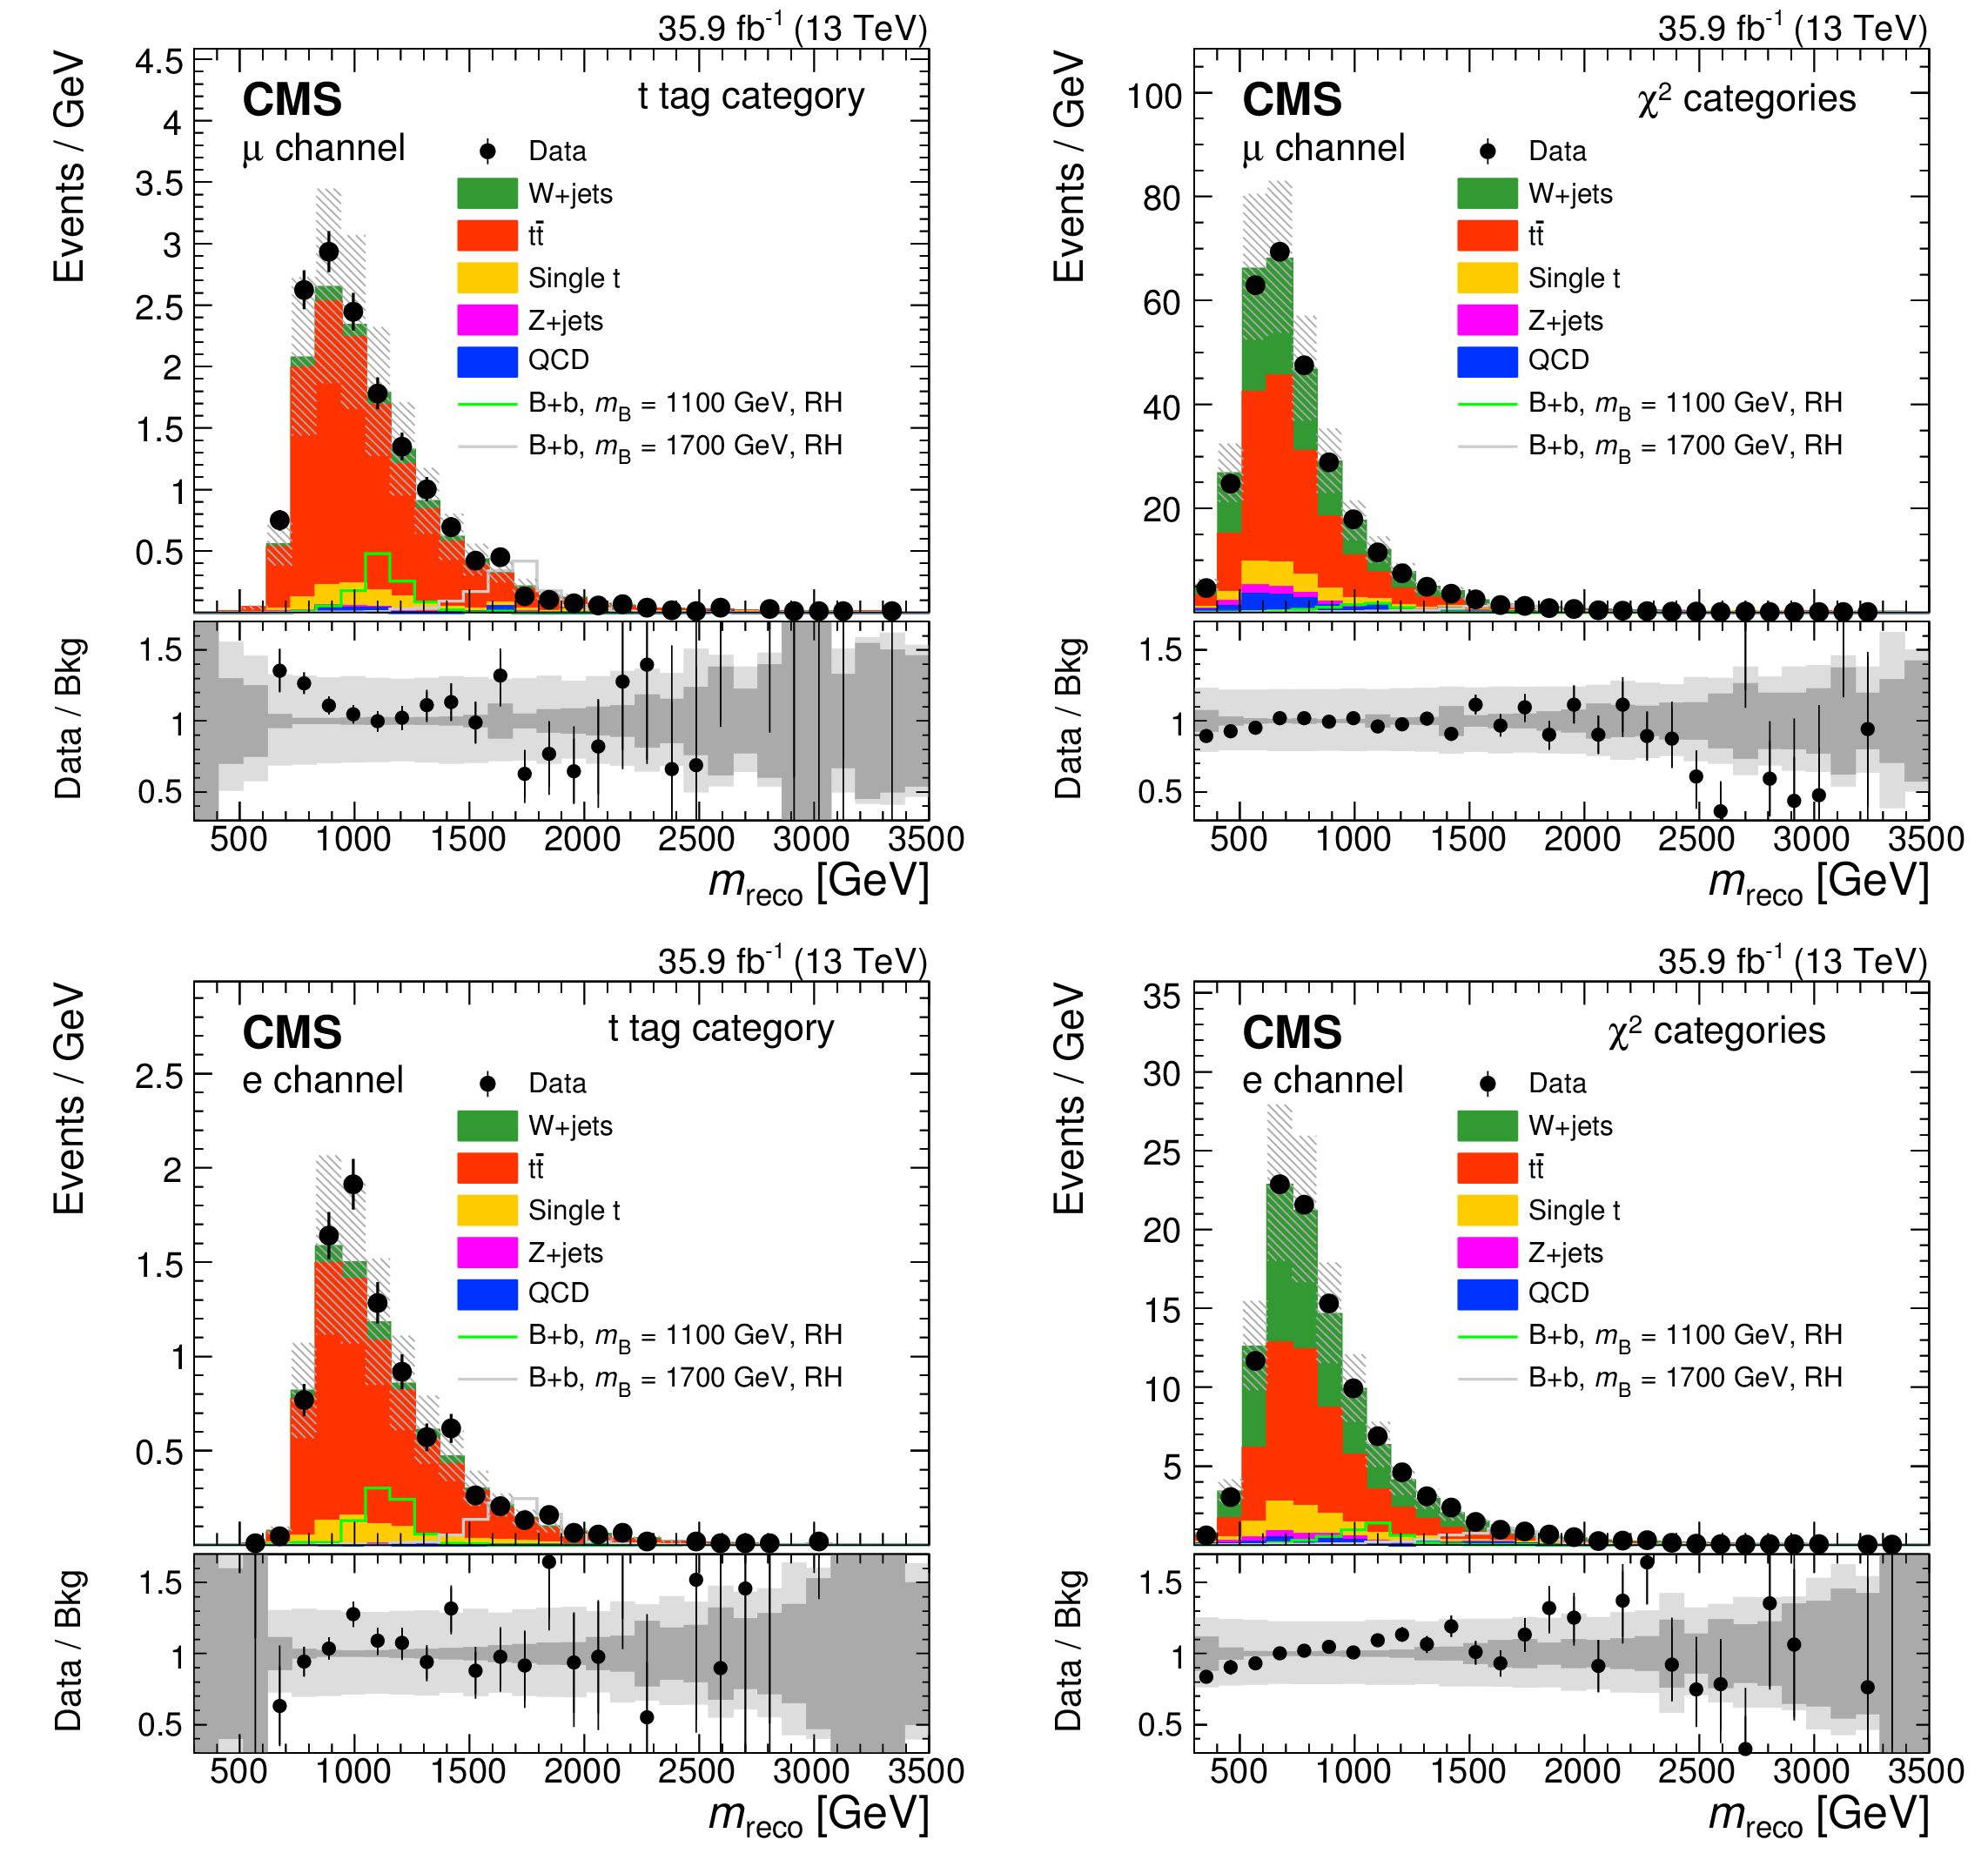
Figure 3:
Distributions of ${m_\mathrm {reco}}$ in data and simulation in the control region for the muon (upper) and electron (lower) channels for events reconstructed with a t tag (left) and with the $\chi ^2$ method (right). The VLQ signal is shown for the B+b production mode and right-handed VLQ couplings. The vertical bars illustrate the statistical uncertainties on the data, while the shaded area shows the total uncertainties for the background simulation. The lower panels show the ratio of data to the background prediction. The dark and light gray bands correspond to the statistical and total uncertainties, respectively. |
png pdf |
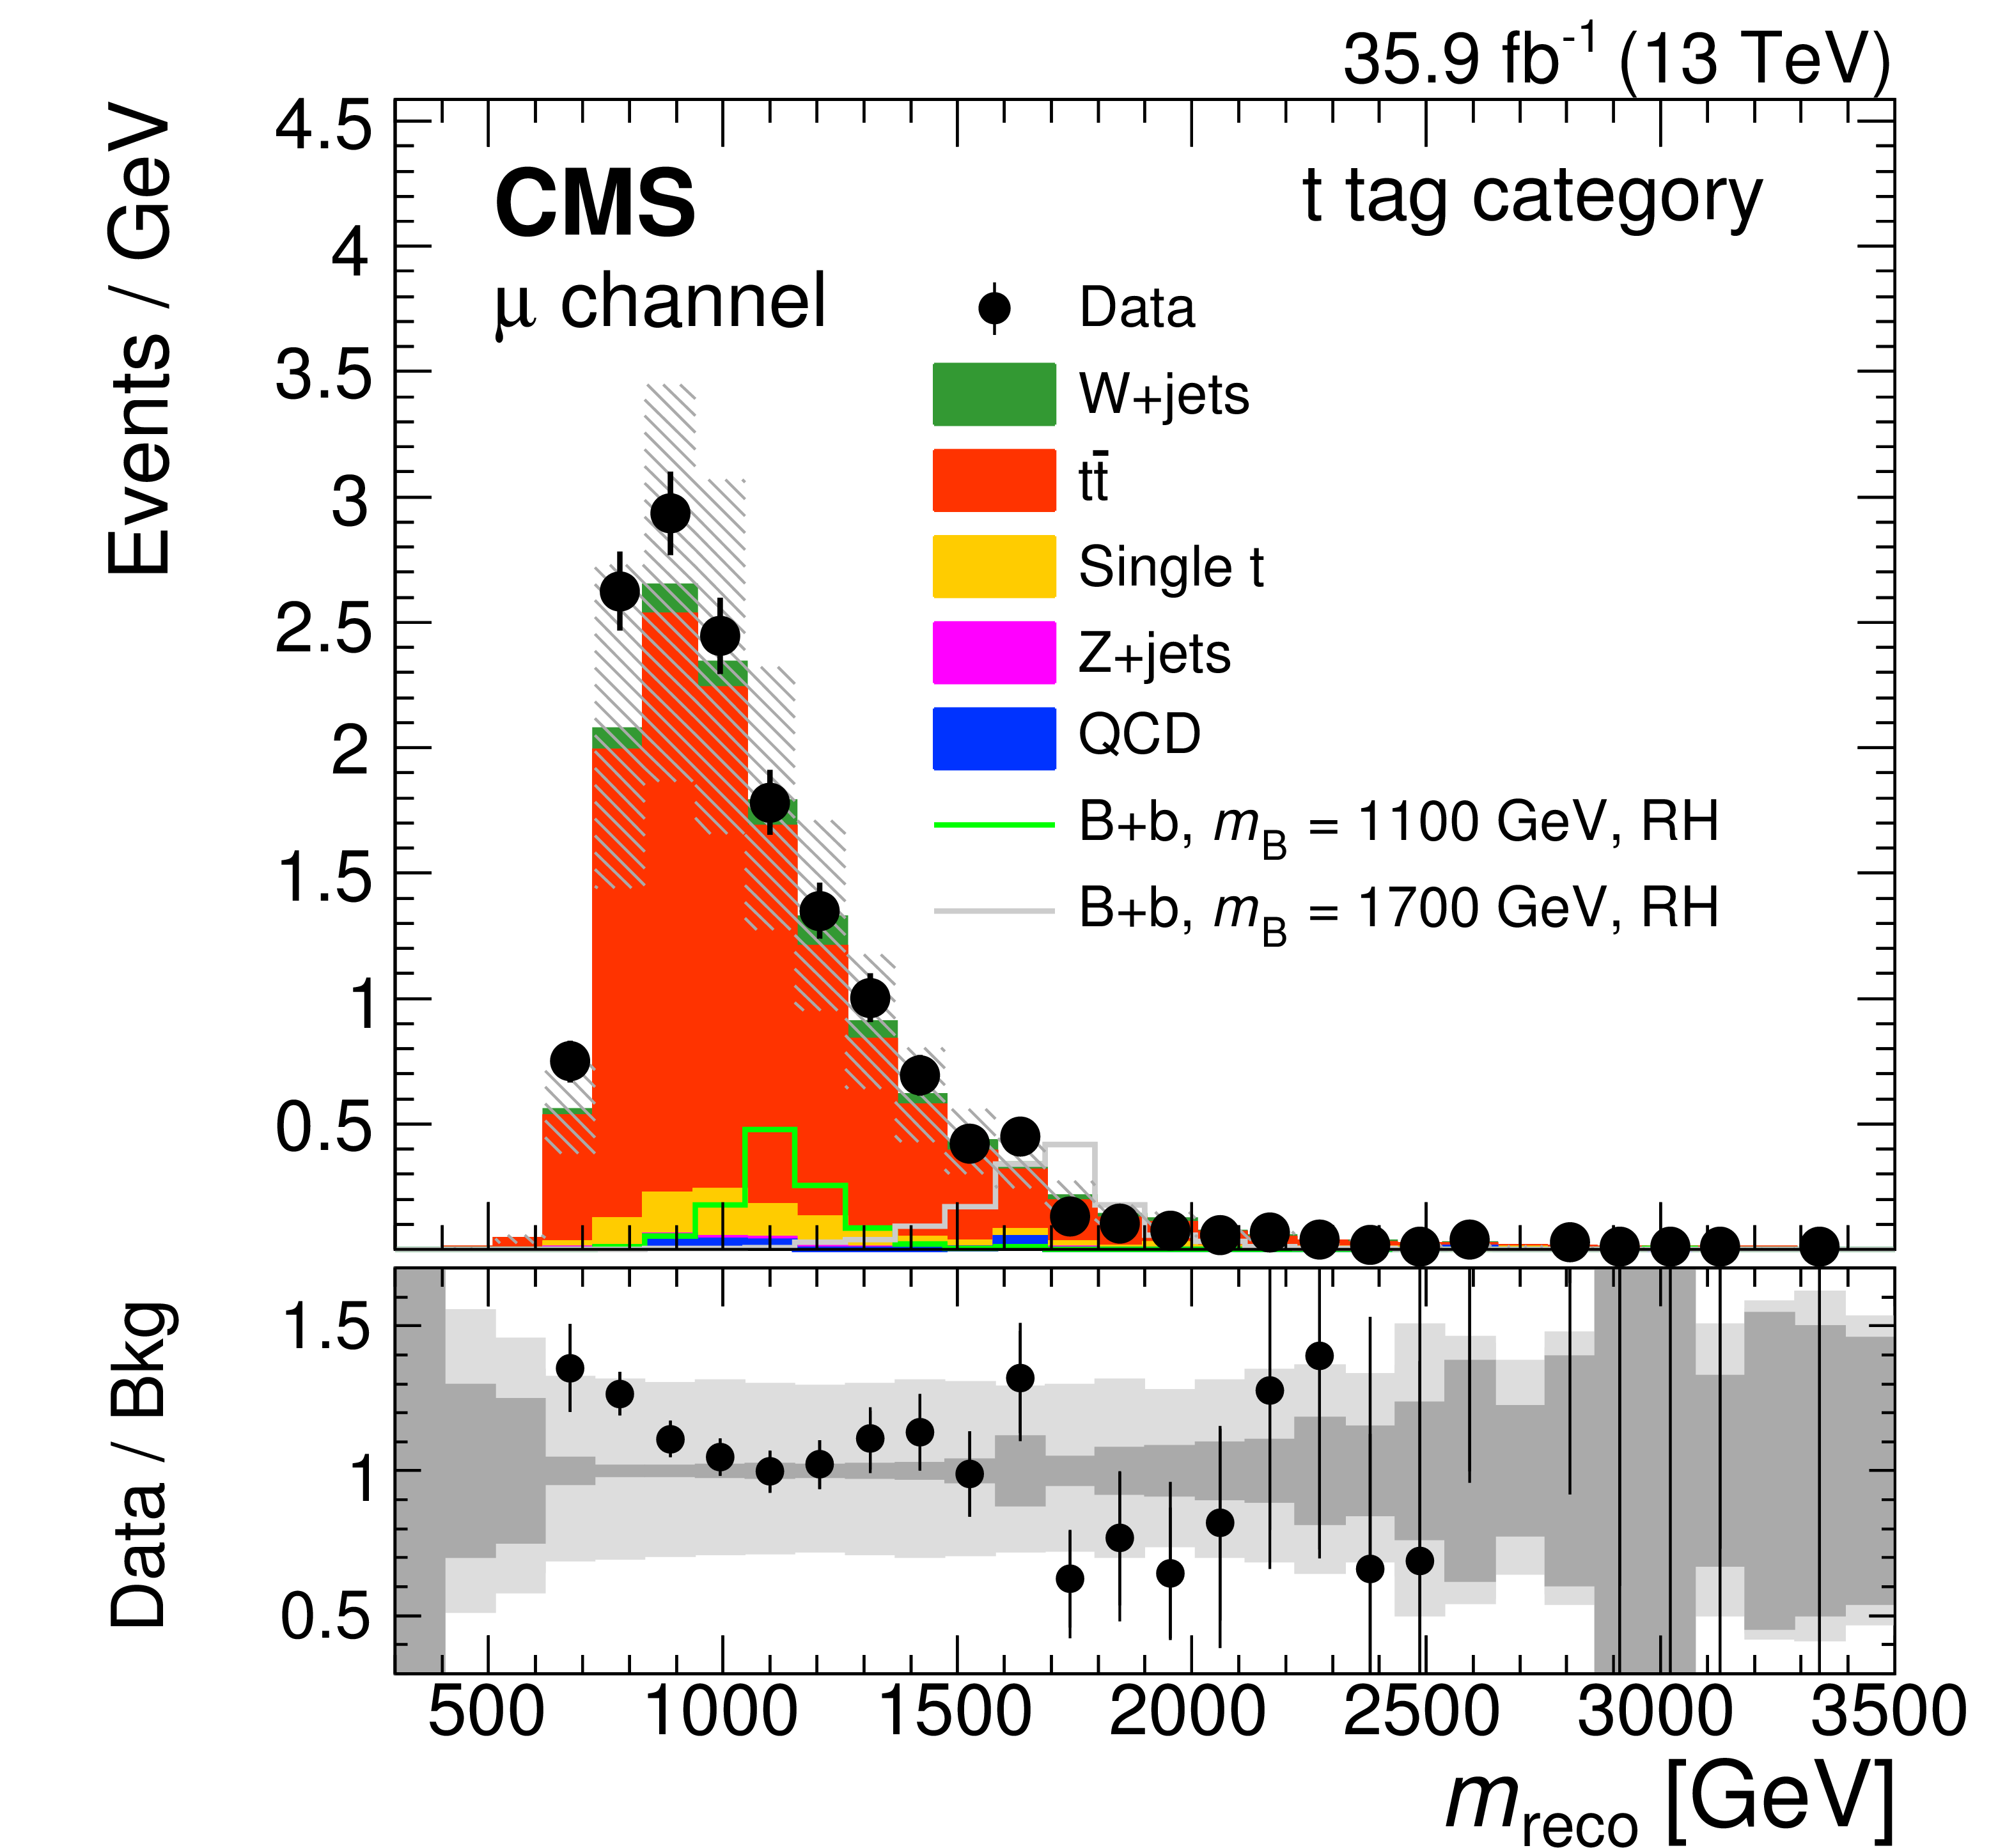
Figure 3-a:
Distributions of ${m_\mathrm {reco}}$ in data and simulation in the control region for the muon channel for events reconstructed with a t tag. The VLQ signal is shown for the B+b production mode and right-handed VLQ couplings. The vertical bars illustrate the statistical uncertainties on the data, while the shaded area shows the total uncertainties for the background simulation. The lower panel shows the ratio of data to the background prediction. The dark and light gray bands correspond to the statistical and total uncertainties, respectively. |

png pdf |
Figure 3-b:
Distributions of ${m_\mathrm {reco}}$ in data and simulation in the control region for the muon channel for events reconstructed with the $\chi ^2$ method. The VLQ signal is shown for the B+b production mode and right-handed VLQ couplings. The vertical bars illustrate the statistical uncertainties on the data, while the shaded area shows the total uncertainties for the background simulation. The lower panel shows the ratio of data to the background prediction. The dark and light gray bands correspond to the statistical and total uncertainties, respectively. |

png pdf |
Figure 3-c:
Distributions of ${m_\mathrm {reco}}$ in data and simulation in the control region for the electron channel for events reconstructed with a t tag. The VLQ signal is shown for the B+b production mode and right-handed VLQ couplings. The vertical bars illustrate the statistical uncertainties on the data, while the shaded area shows the total uncertainties for the background simulation. The lower panel shows the ratio of data to the background prediction. The dark and light gray bands correspond to the statistical and total uncertainties, respectively. |
png pdf |
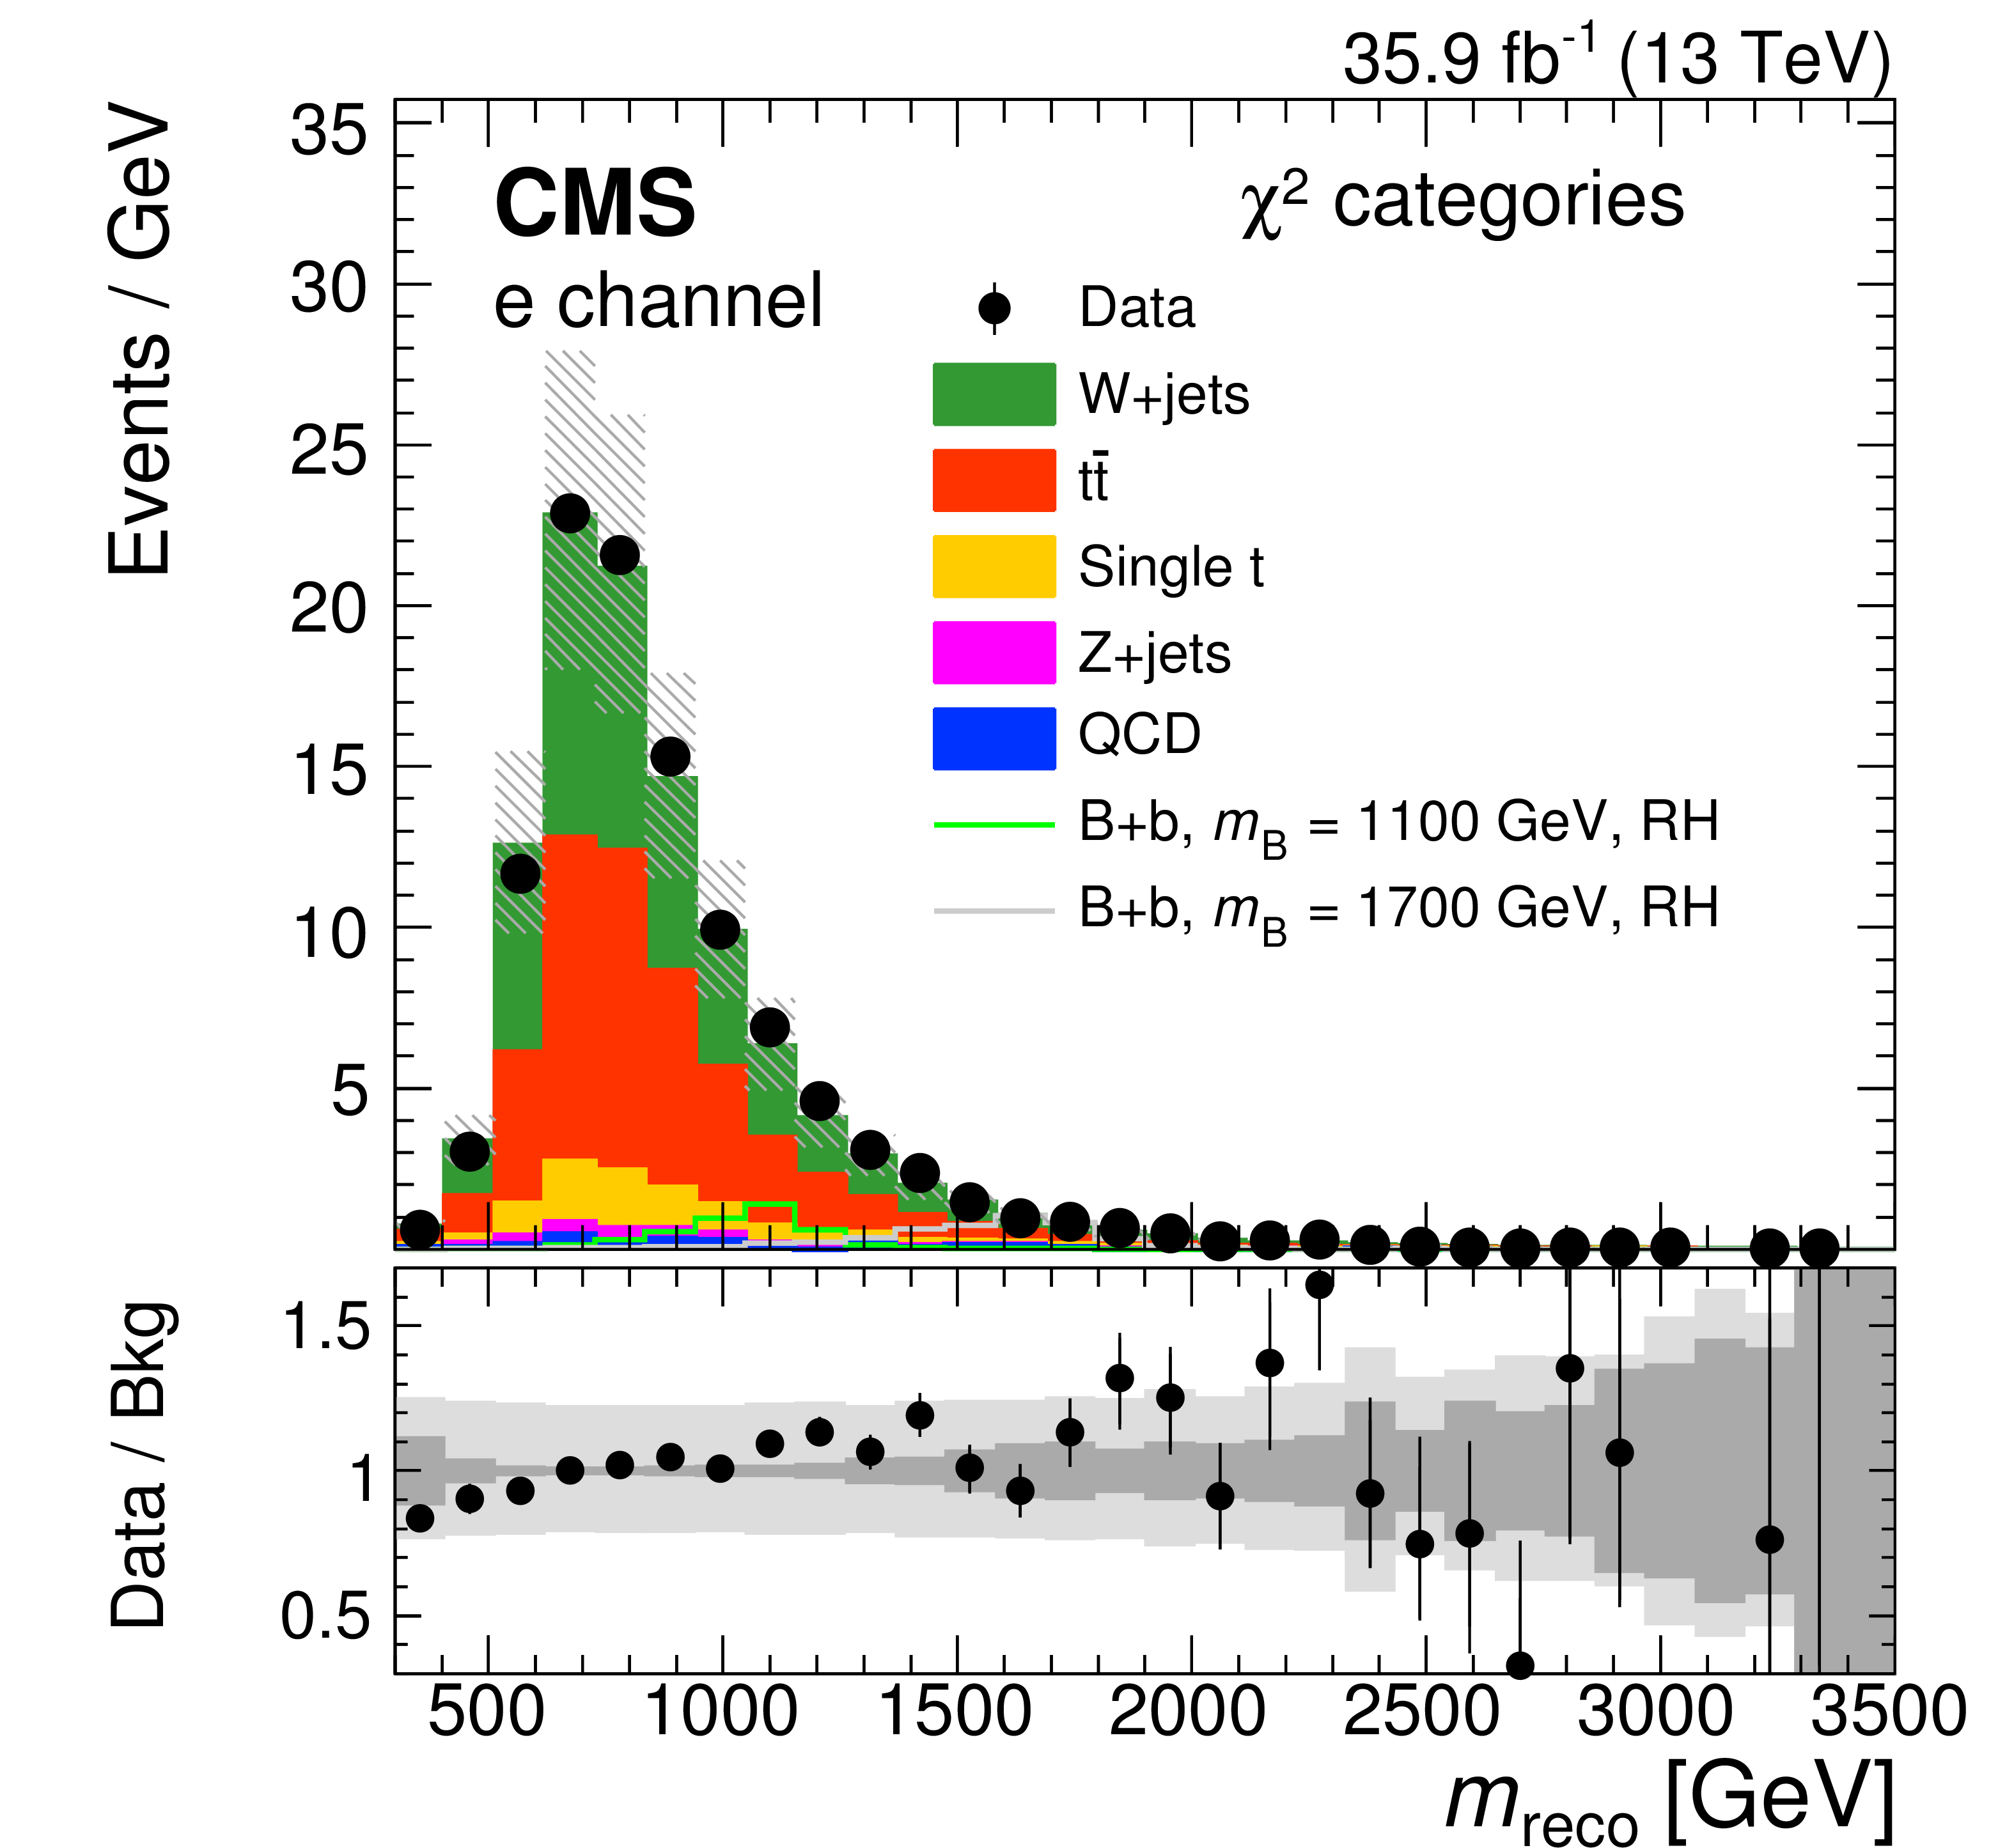
Figure 3-d:
Distributions of ${m_\mathrm {reco}}$ in data and simulation in the control region for the electron channel for events reconstructed with the $\chi ^2$ method. The VLQ signal is shown for the B+b production mode and right-handed VLQ couplings. The vertical bars illustrate the statistical uncertainties on the data, while the shaded area shows the total uncertainties for the background simulation. The lower panel shows the ratio of data to the background prediction. The dark and light gray bands correspond to the statistical and total uncertainties, respectively. |
png pdf |
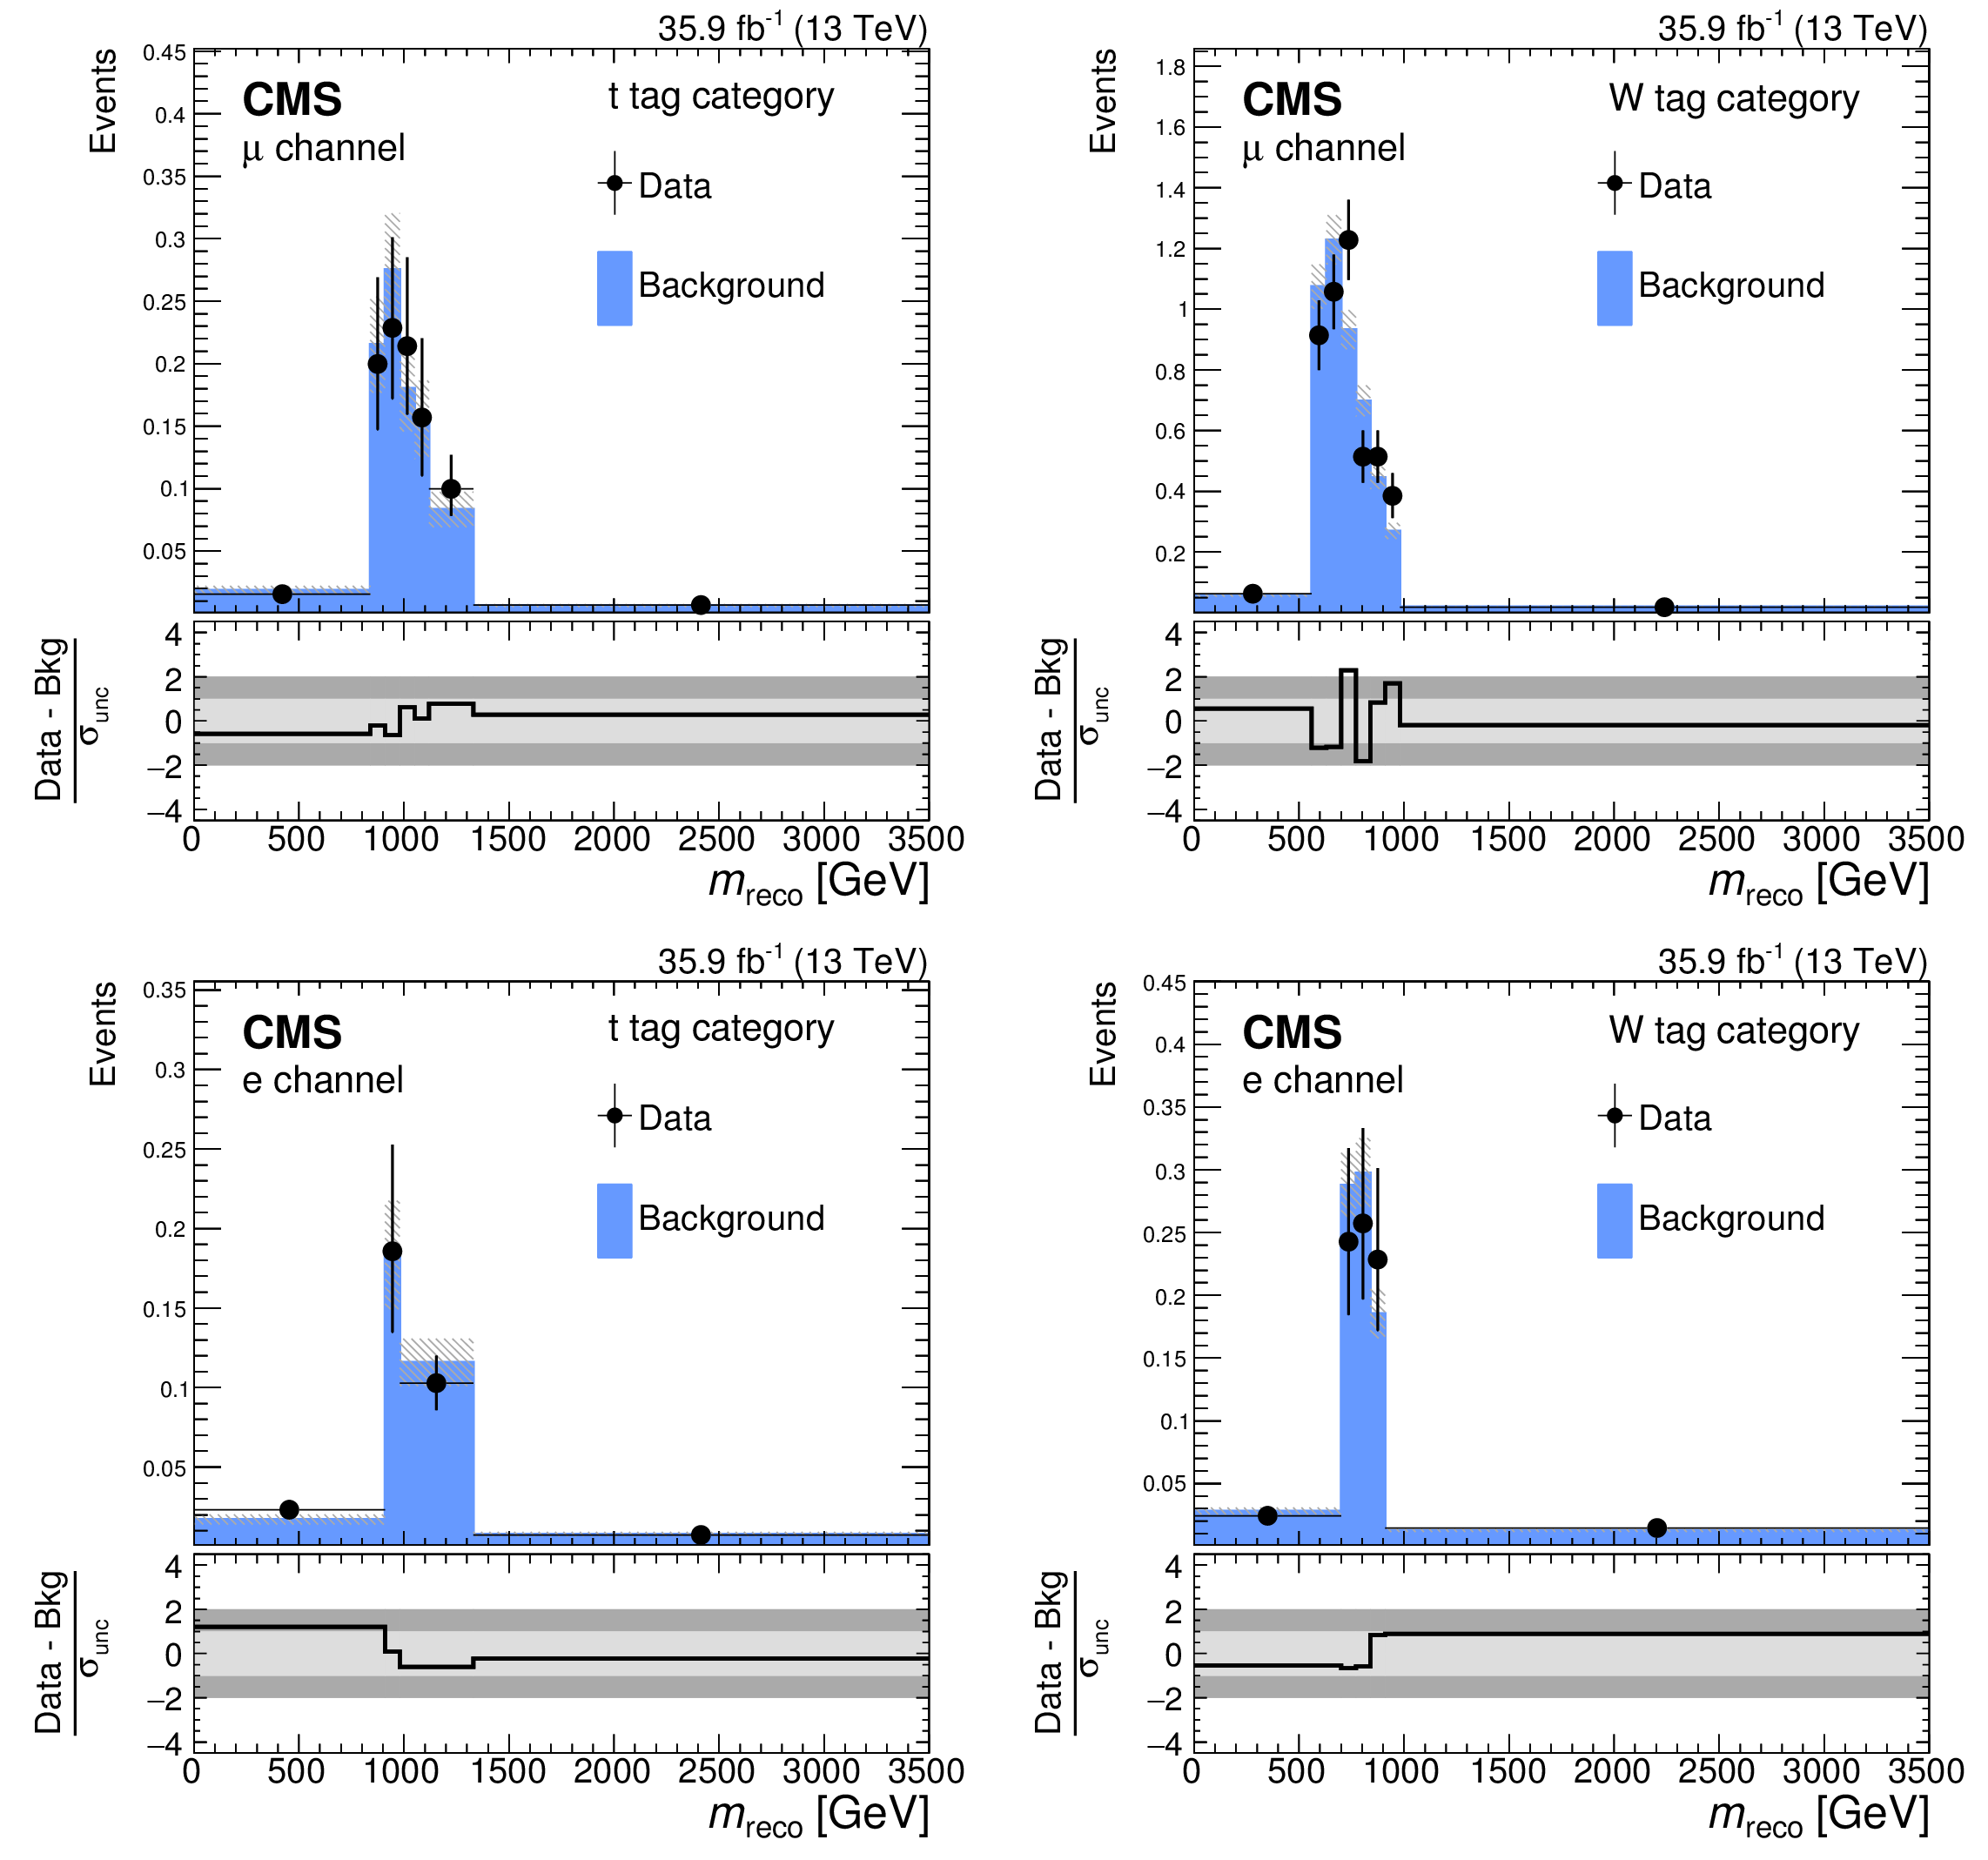
Figure 4:
Distributions of ${m_\mathrm {reco}}$ in the validation region of the two most sensitive categories in the muon channel (upper) and electron channel (lower). The lower panels show the difference of data and background expectations in units of the total (stat. and sys.) uncertainty on the background estimate. |
png pdf |
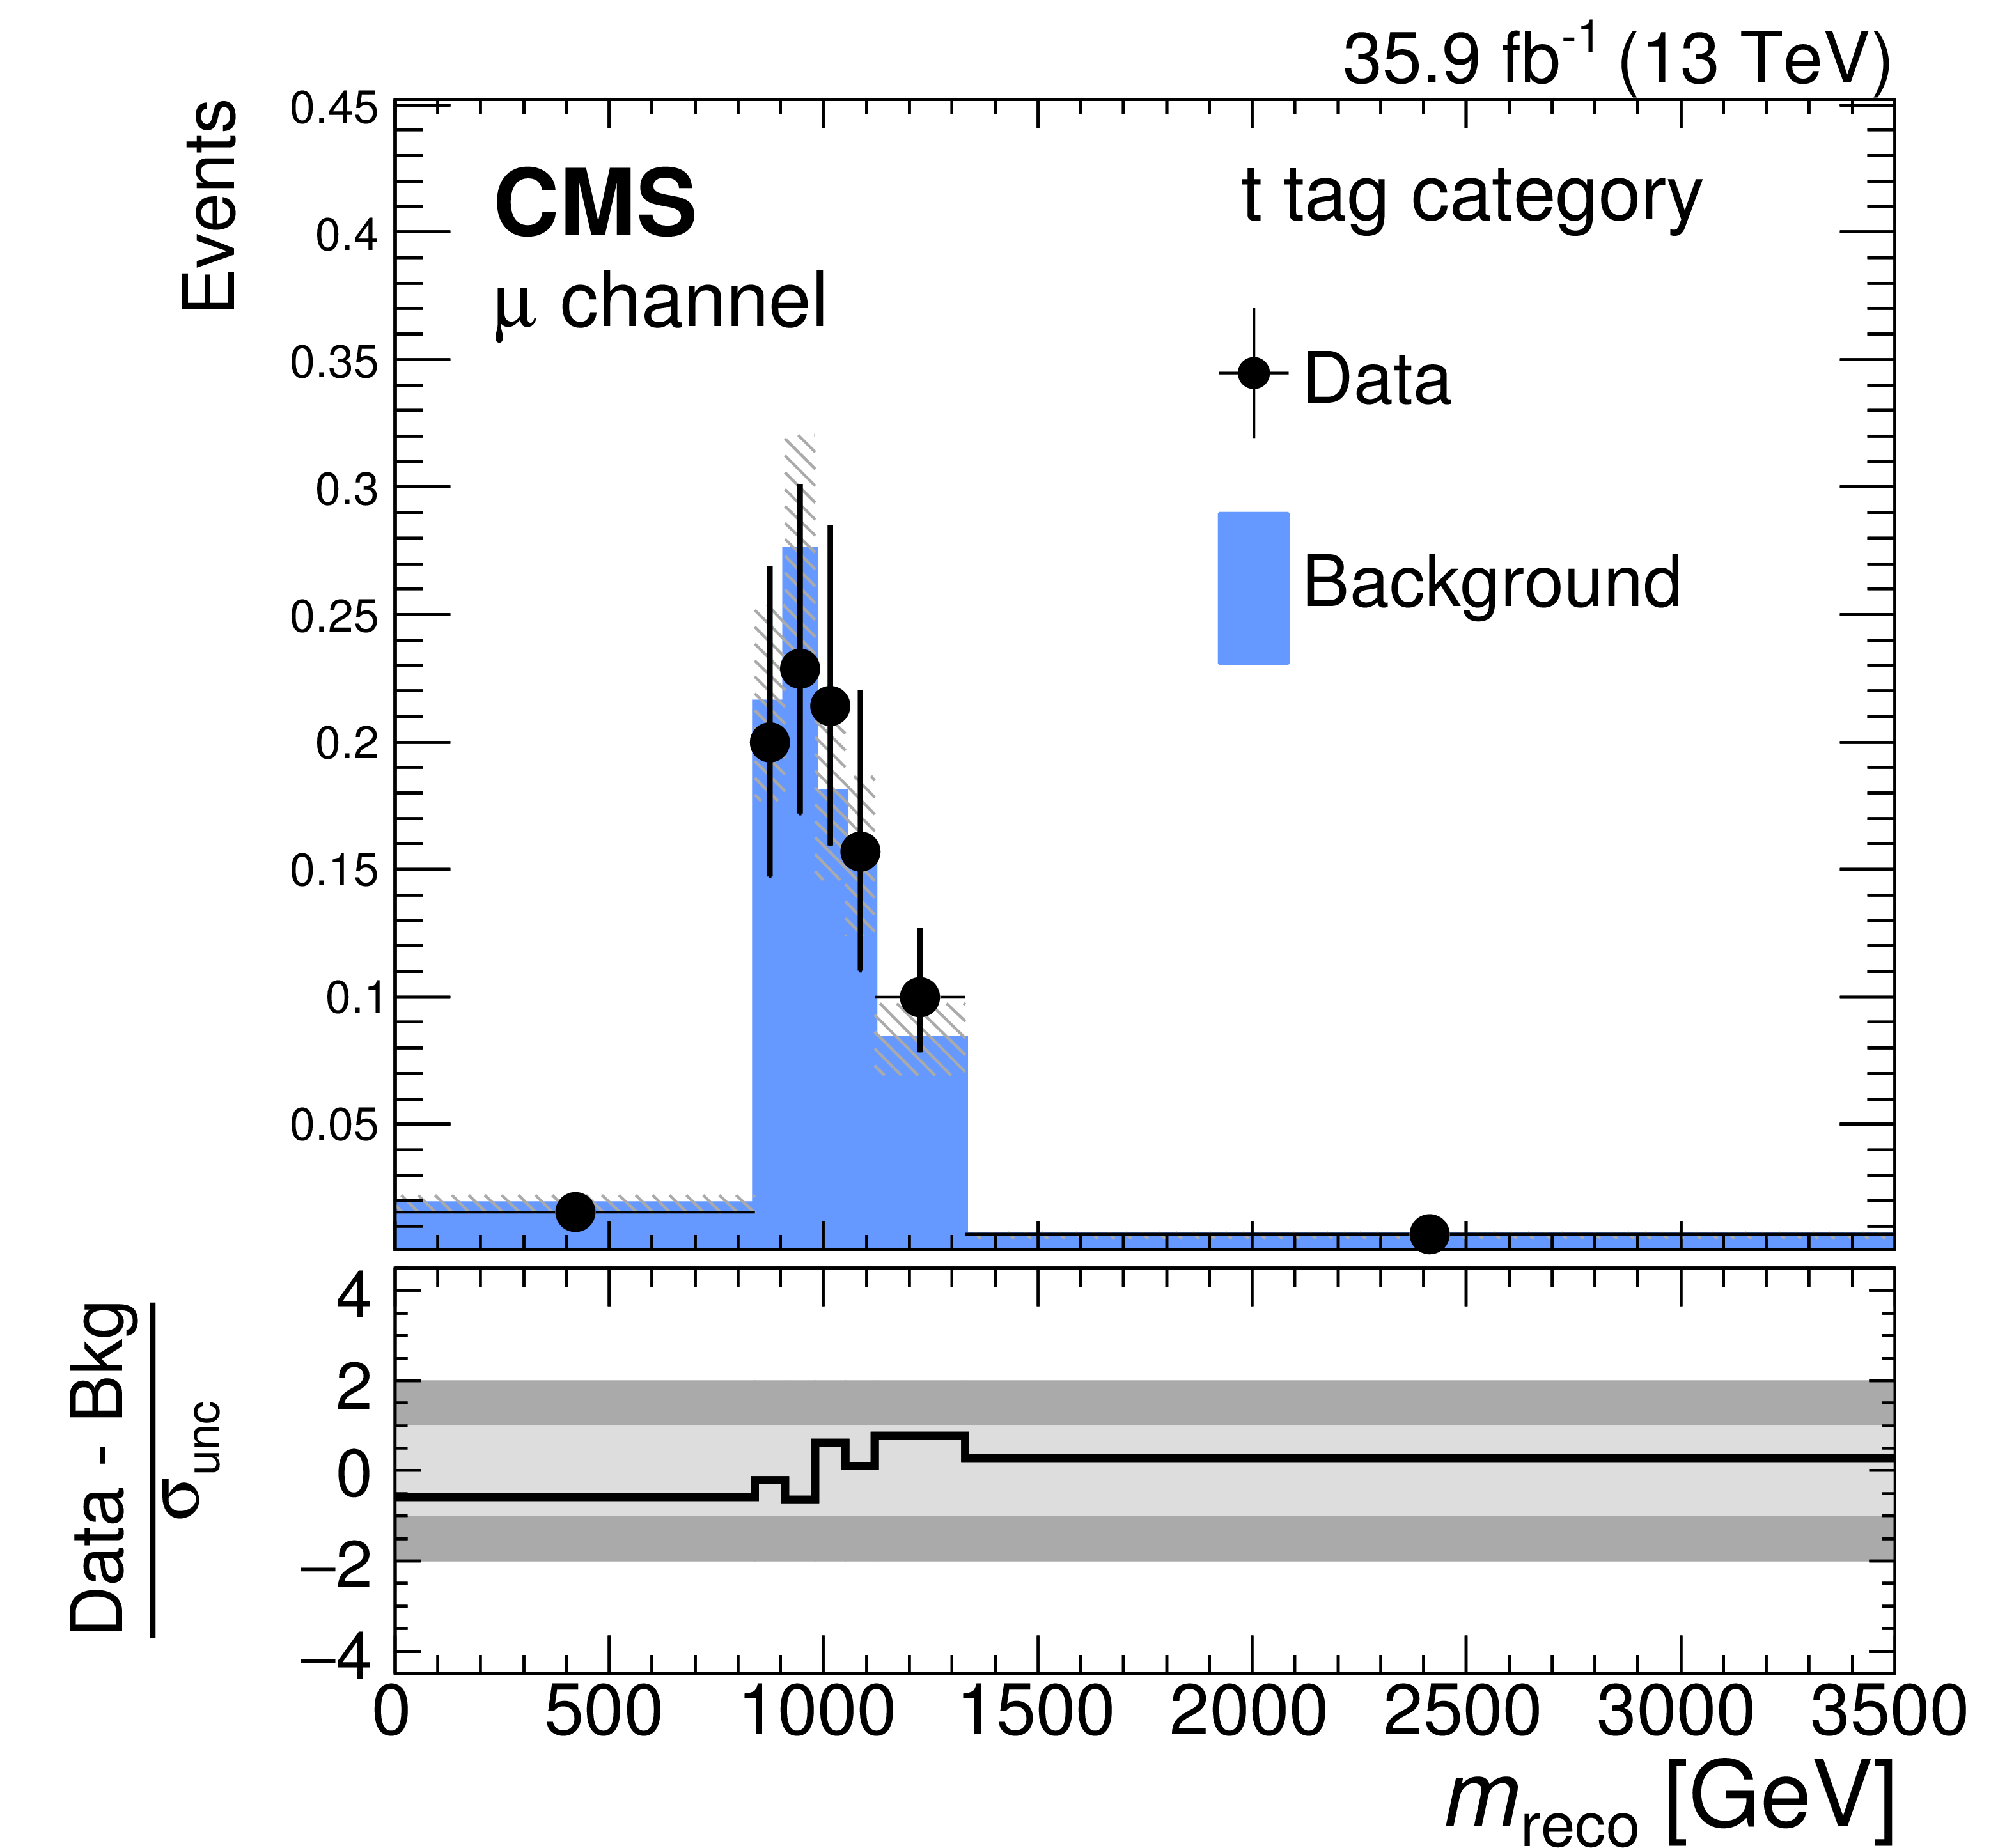
Figure 4-a:
Distributions of ${m_\mathrm {reco}}$ in the validation region of the t tag category in the muon channel. The lower panel shows the difference of data and background expectations in units of the total (stat. and sys.) uncertainty on the background estimate. |
png pdf |
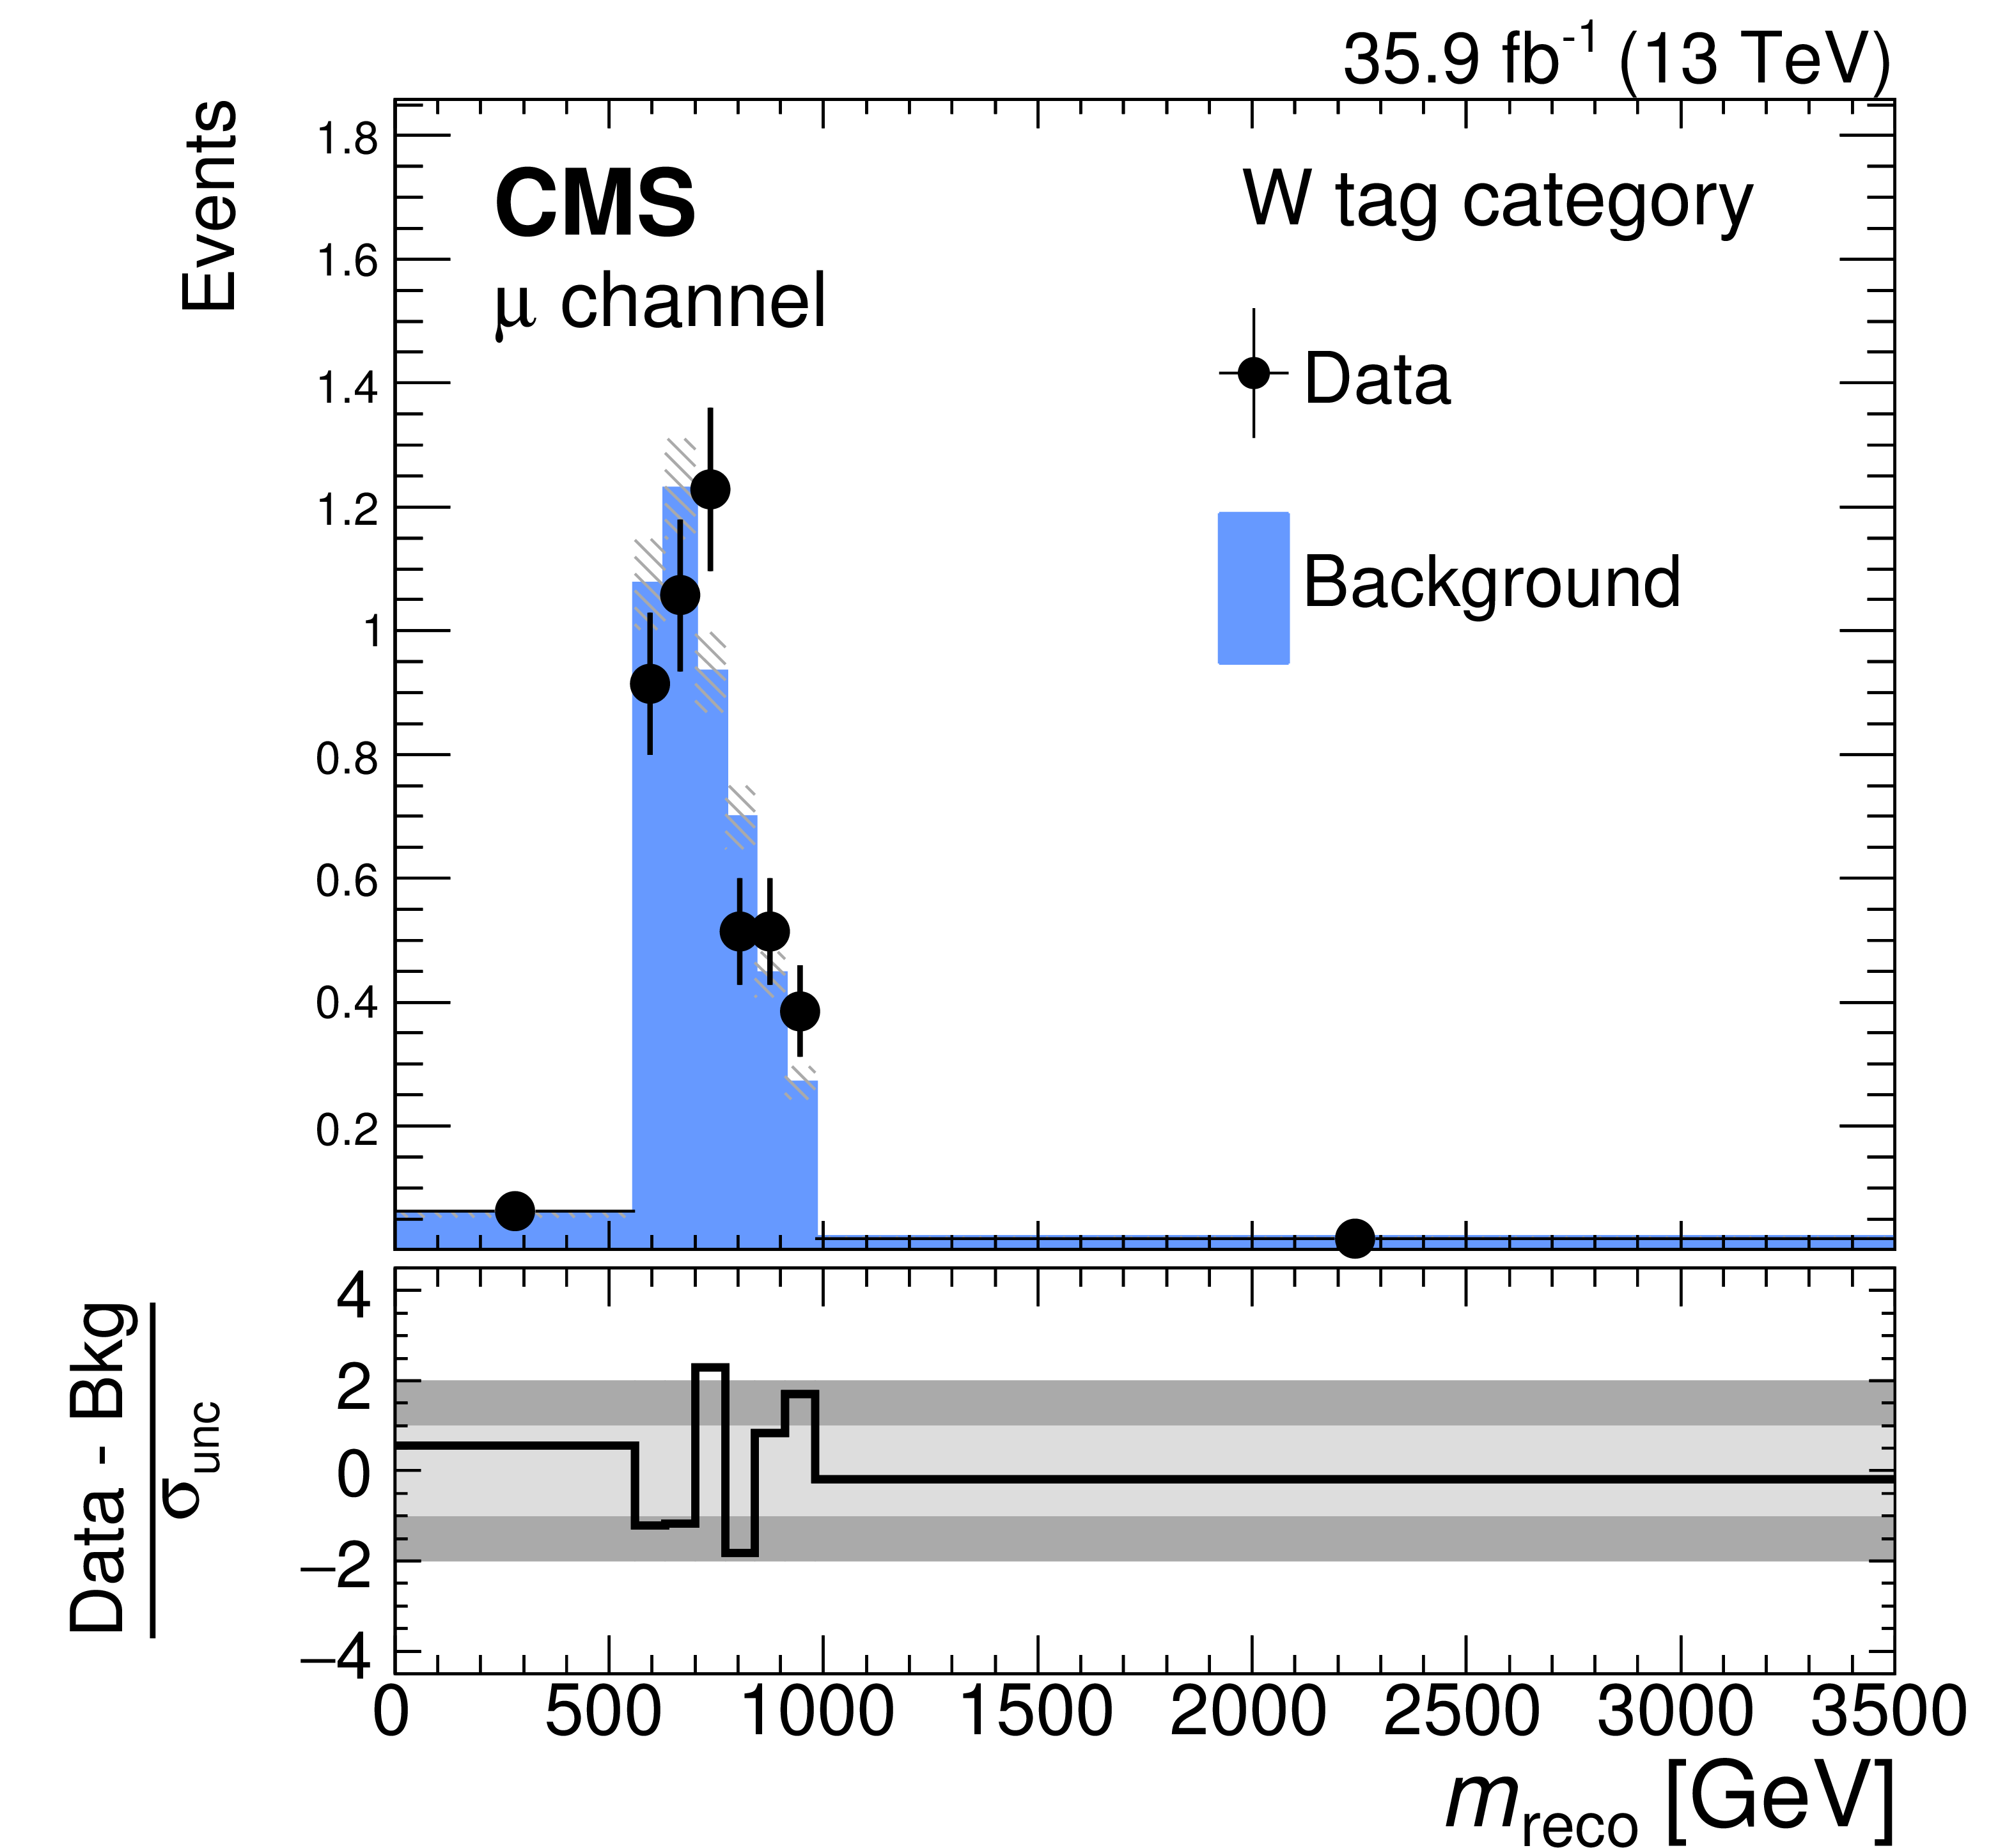
Figure 4-b:
Distributions of ${m_\mathrm {reco}}$ in the validation region of the W tag category in the muon channel. The lower panel shows the difference of data and background expectations in units of the total (stat. and sys.) uncertainty on the background estimate. |

png pdf |
Figure 4-c:
Distributions of ${m_\mathrm {reco}}$ in the validation region of the t tag category in the electron channel. The lower panel shows the difference of data and background expectations in units of the total (stat. and sys.) uncertainty on the background estimate. |
png pdf |
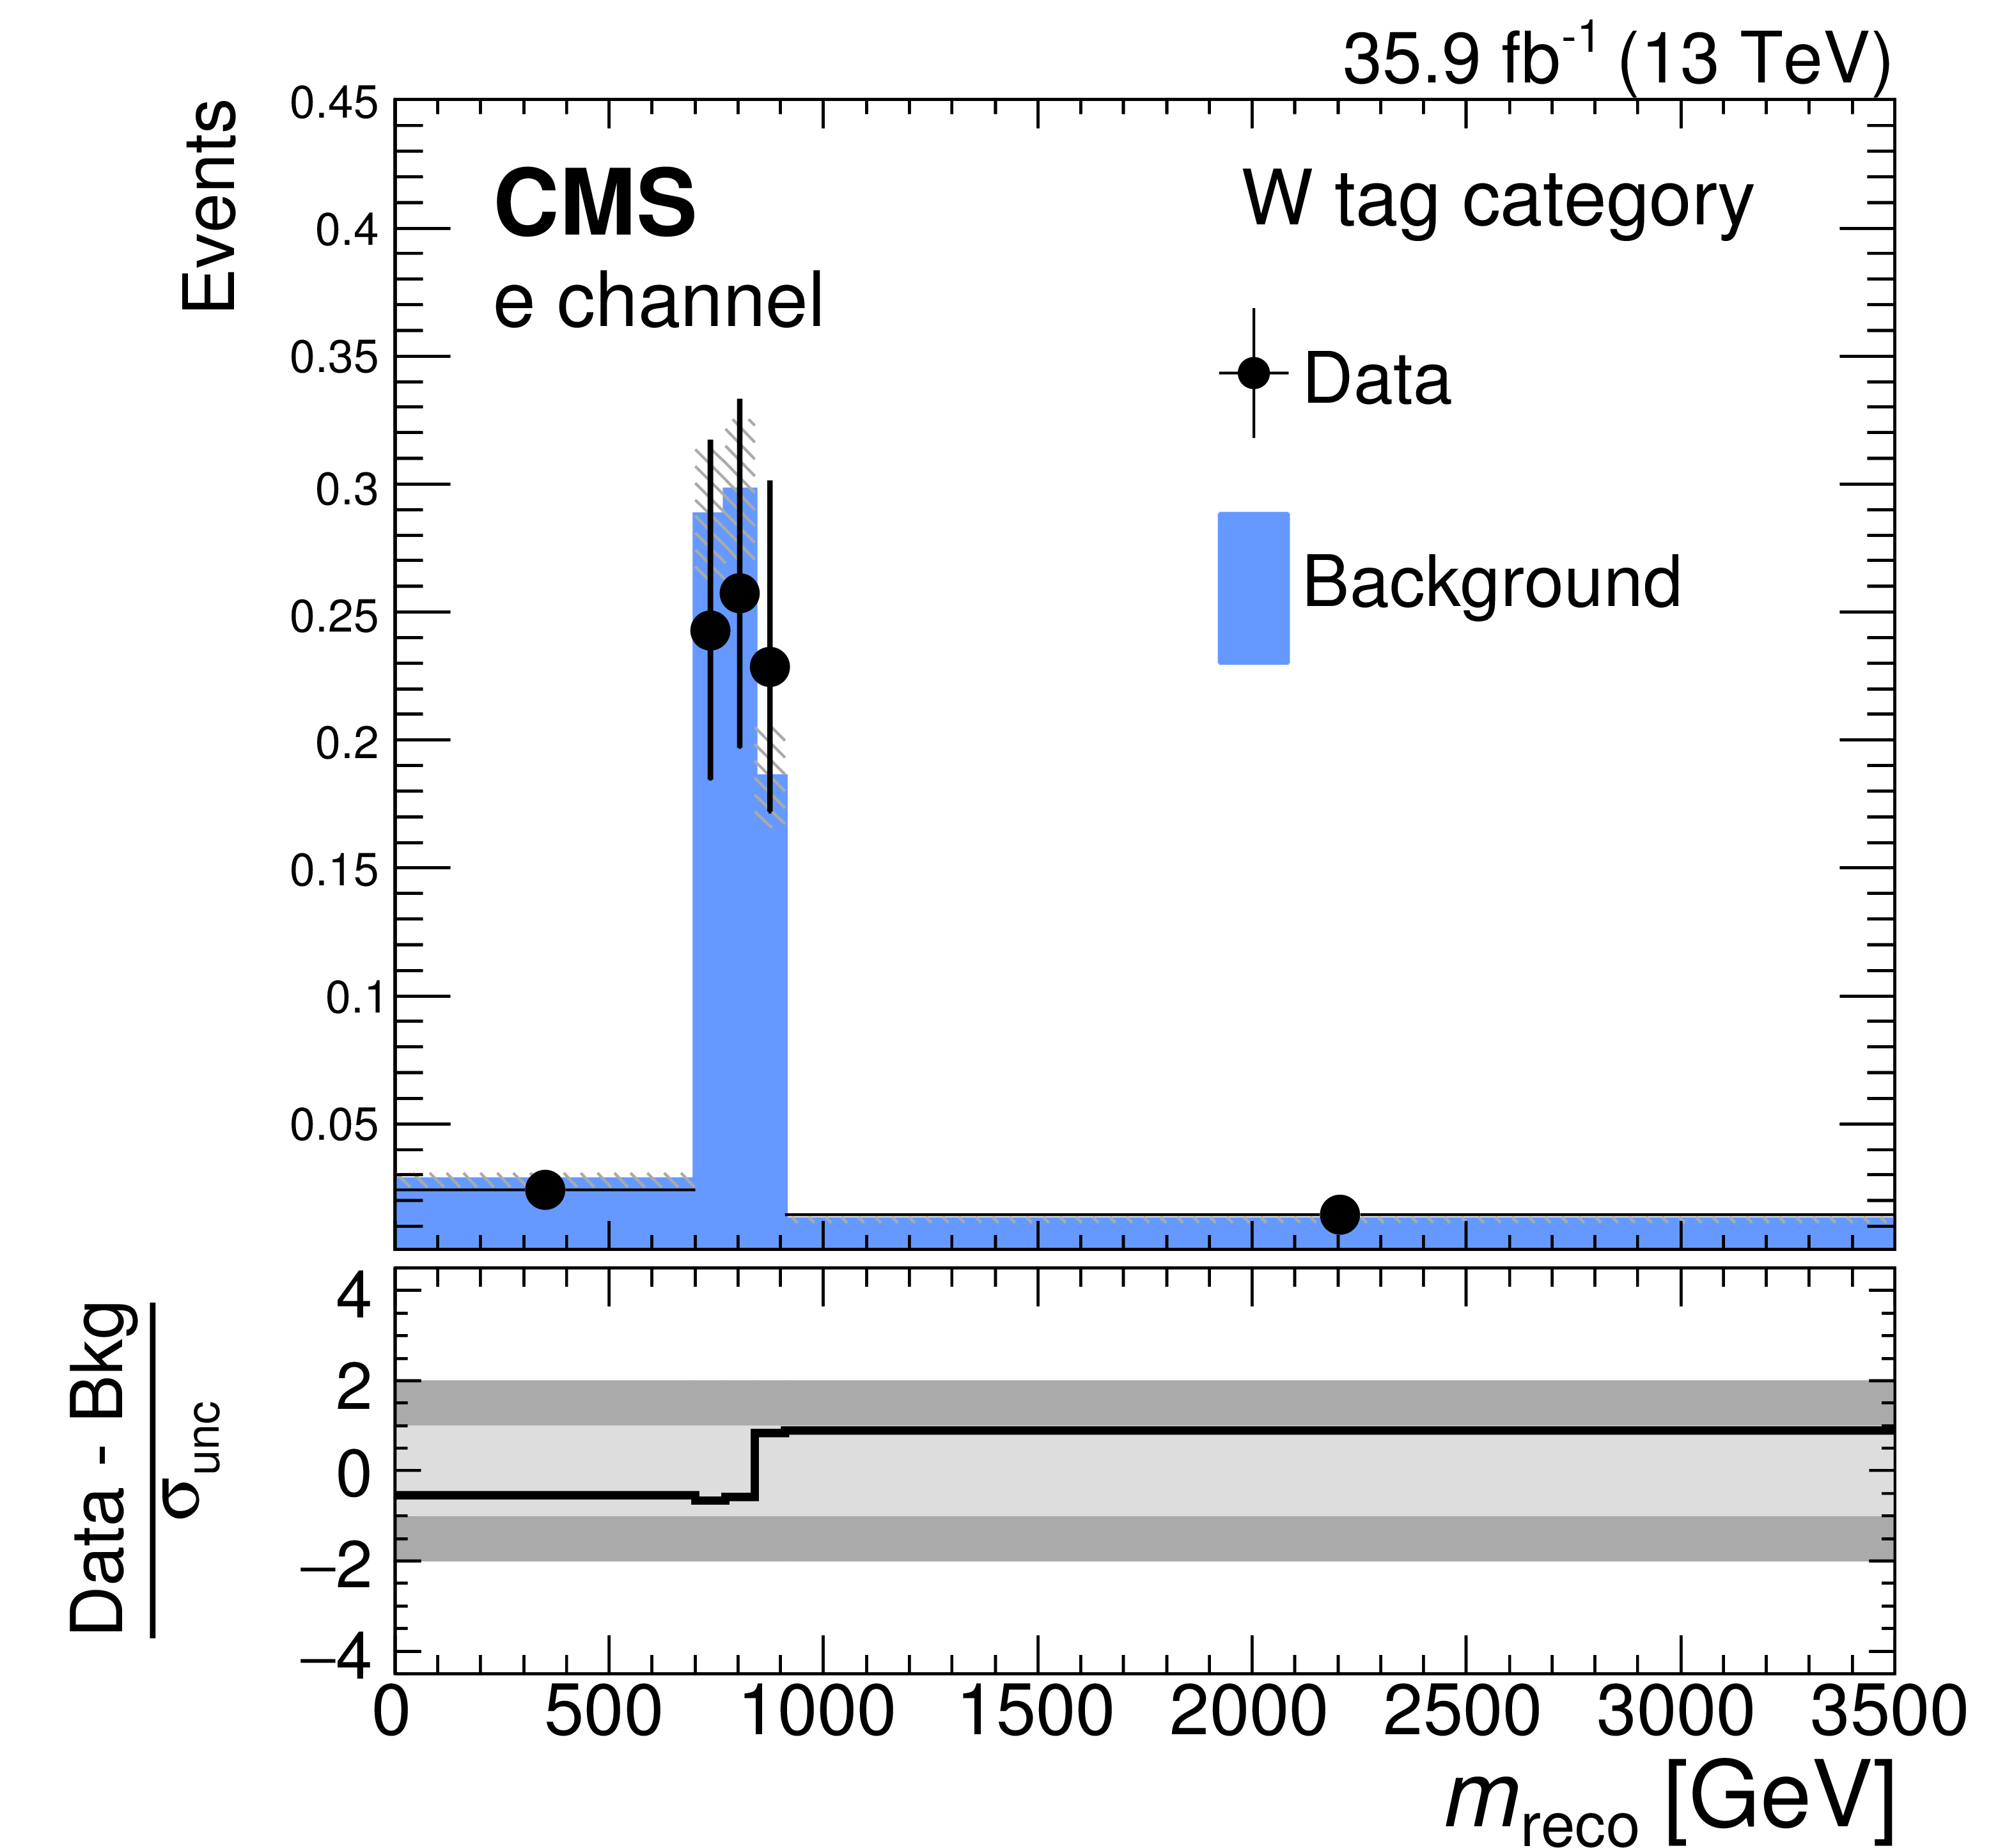
Figure 4-d:
Distributions of ${m_\mathrm {reco}}$ in the validation region of the W tag category in the electron channel. The lower panel shows the difference of data and background expectations in units of the total (stat. and sys.) uncertainty on the background estimate. |

png pdf |
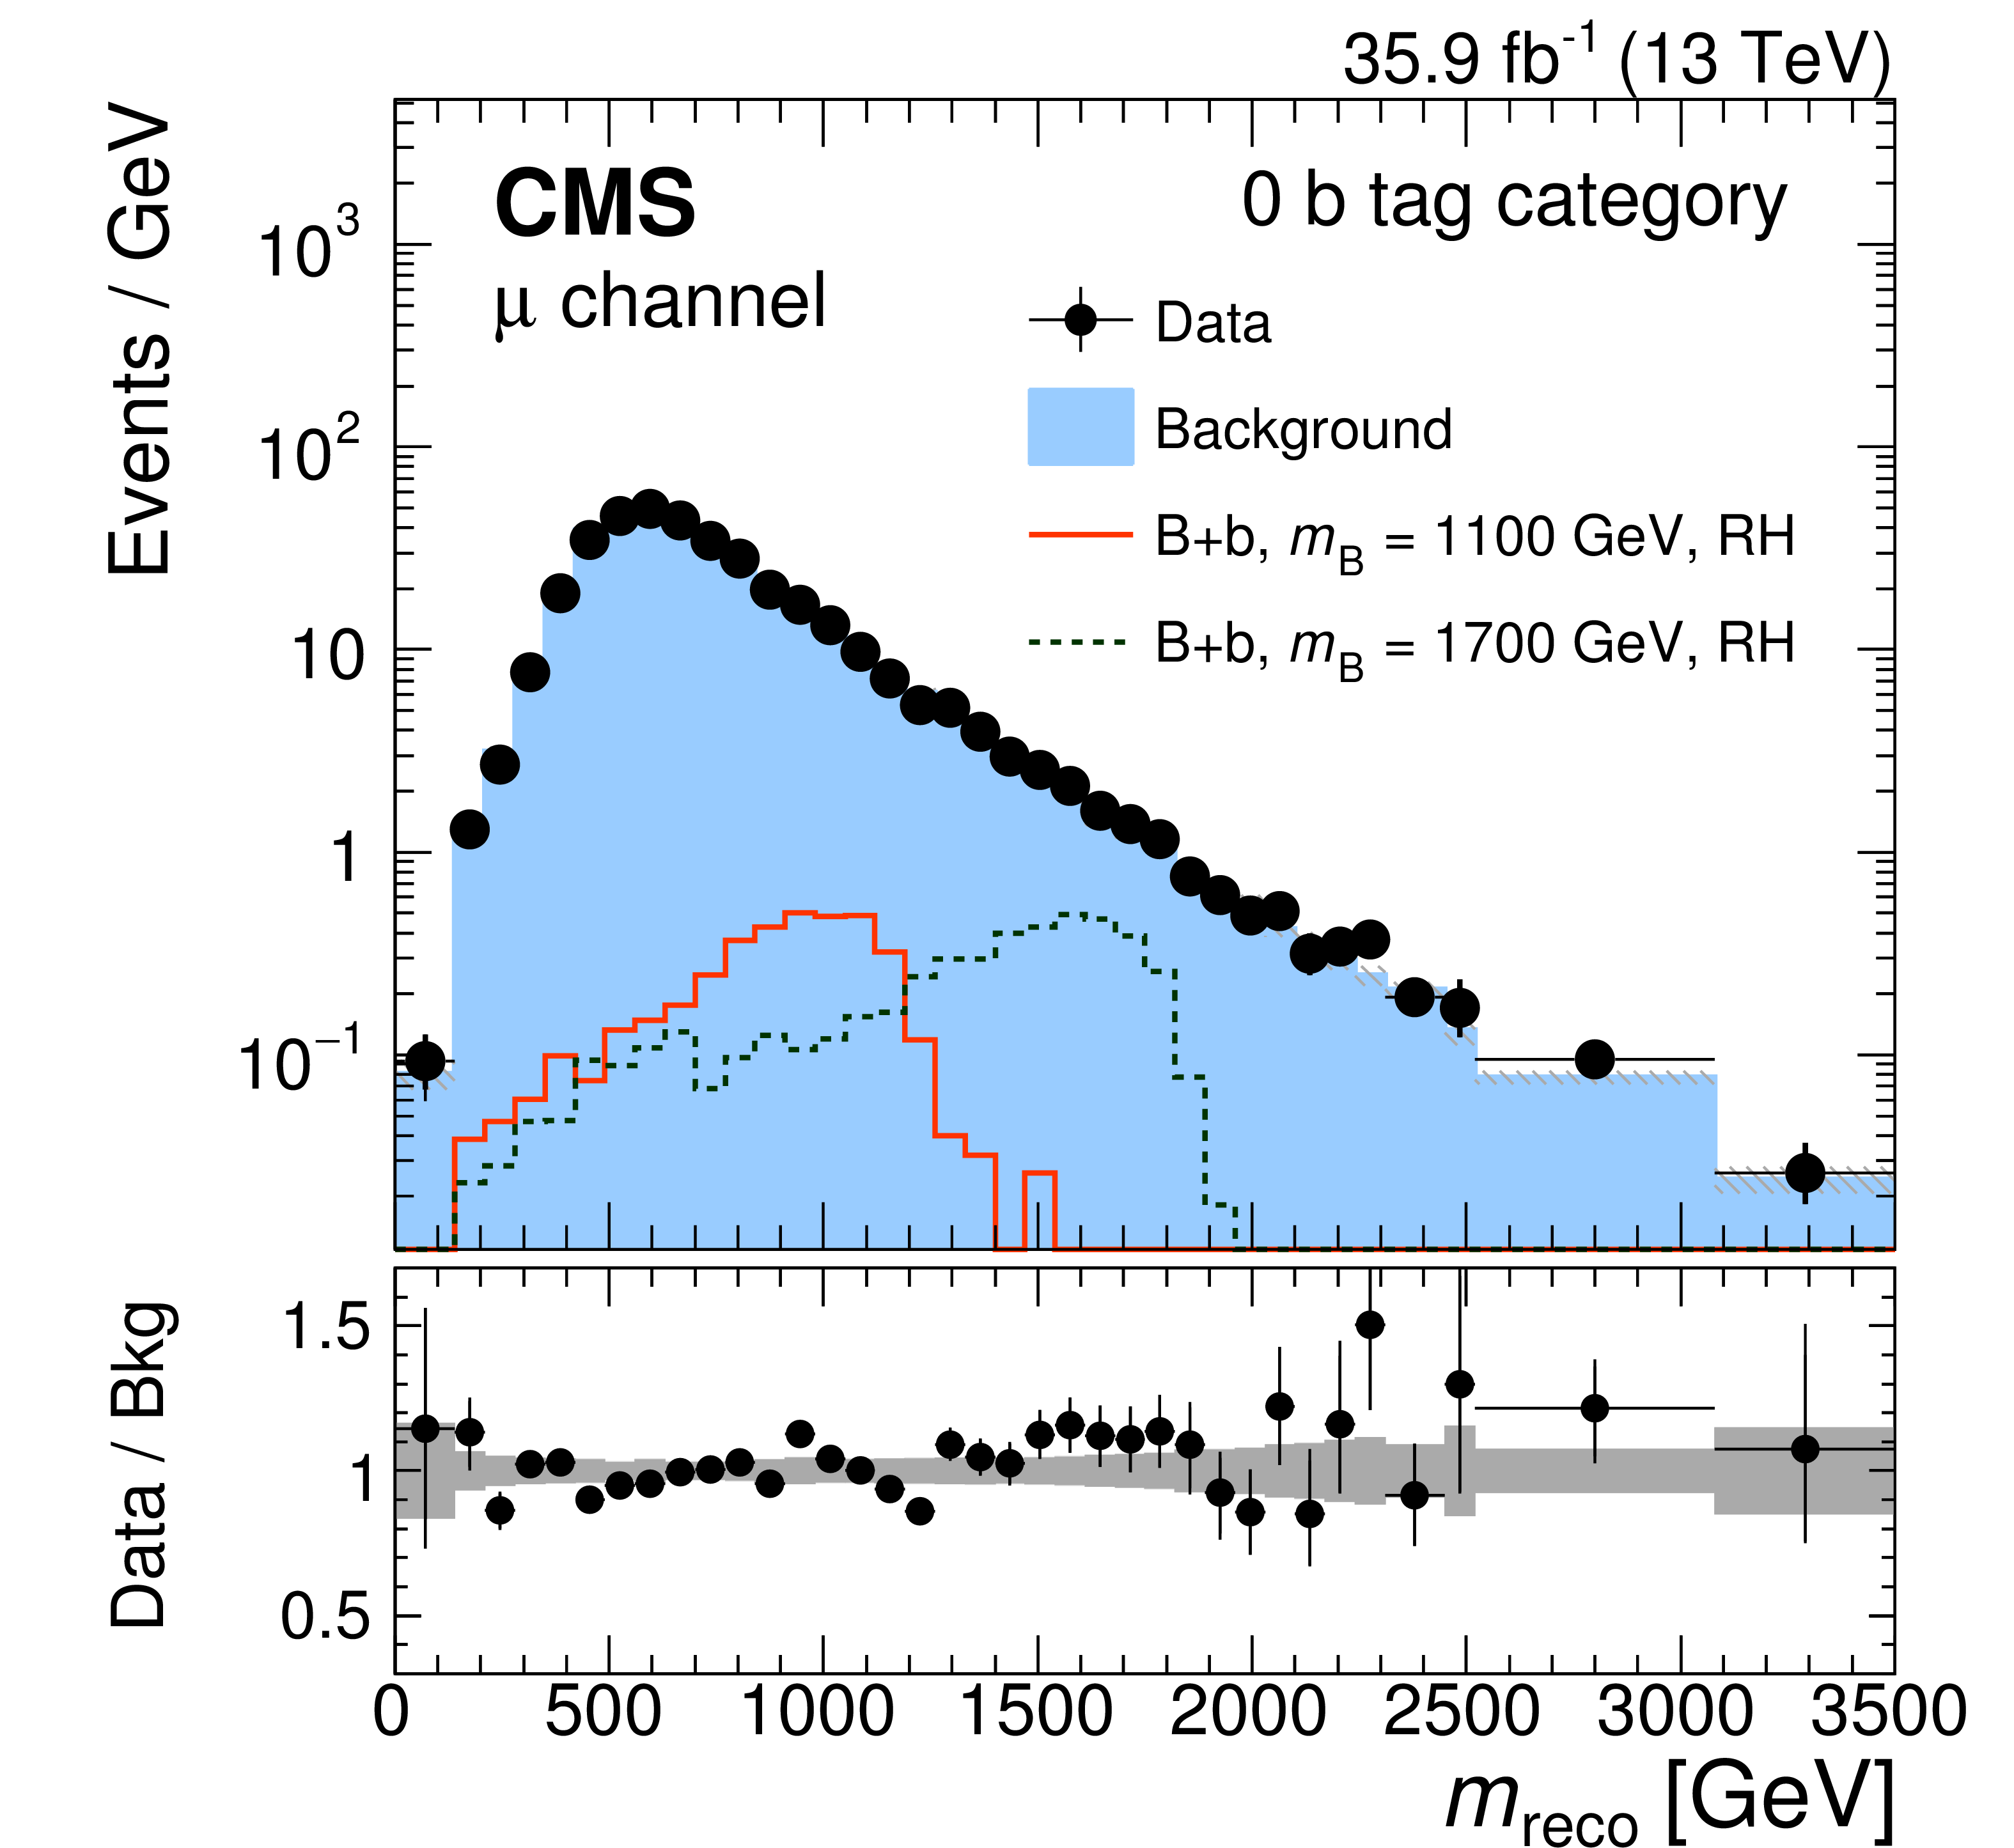
Figure 5:
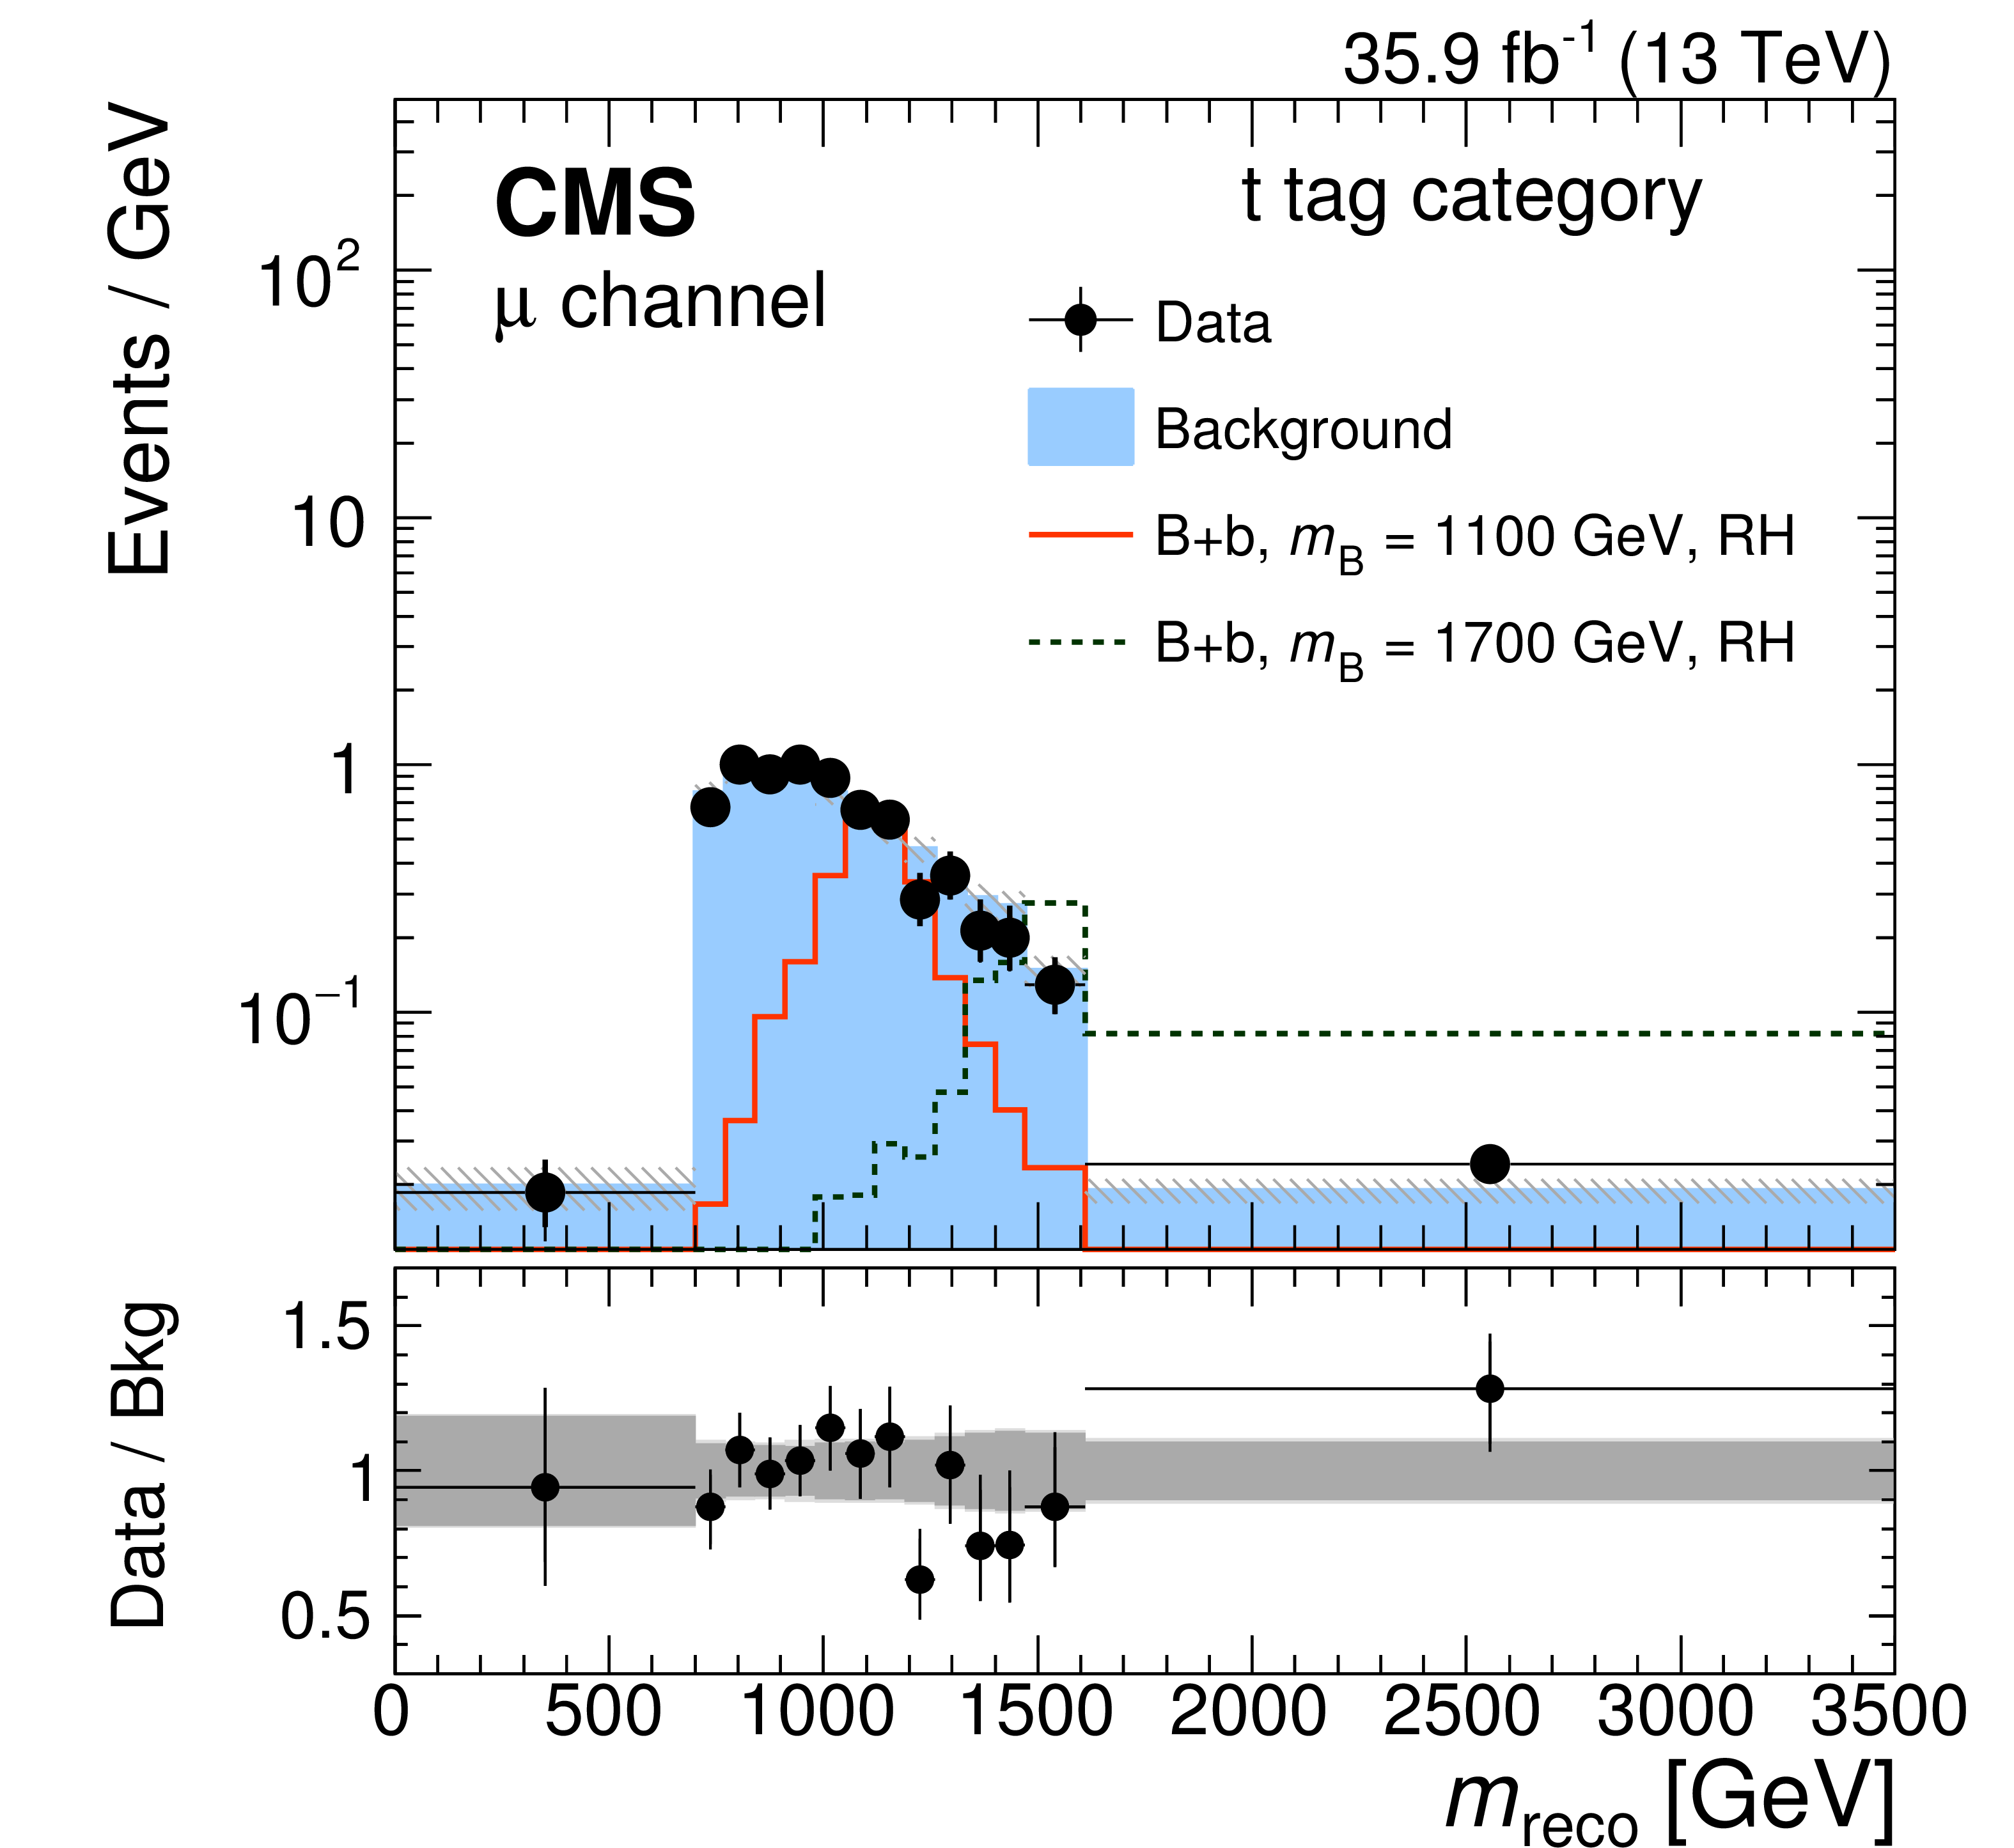
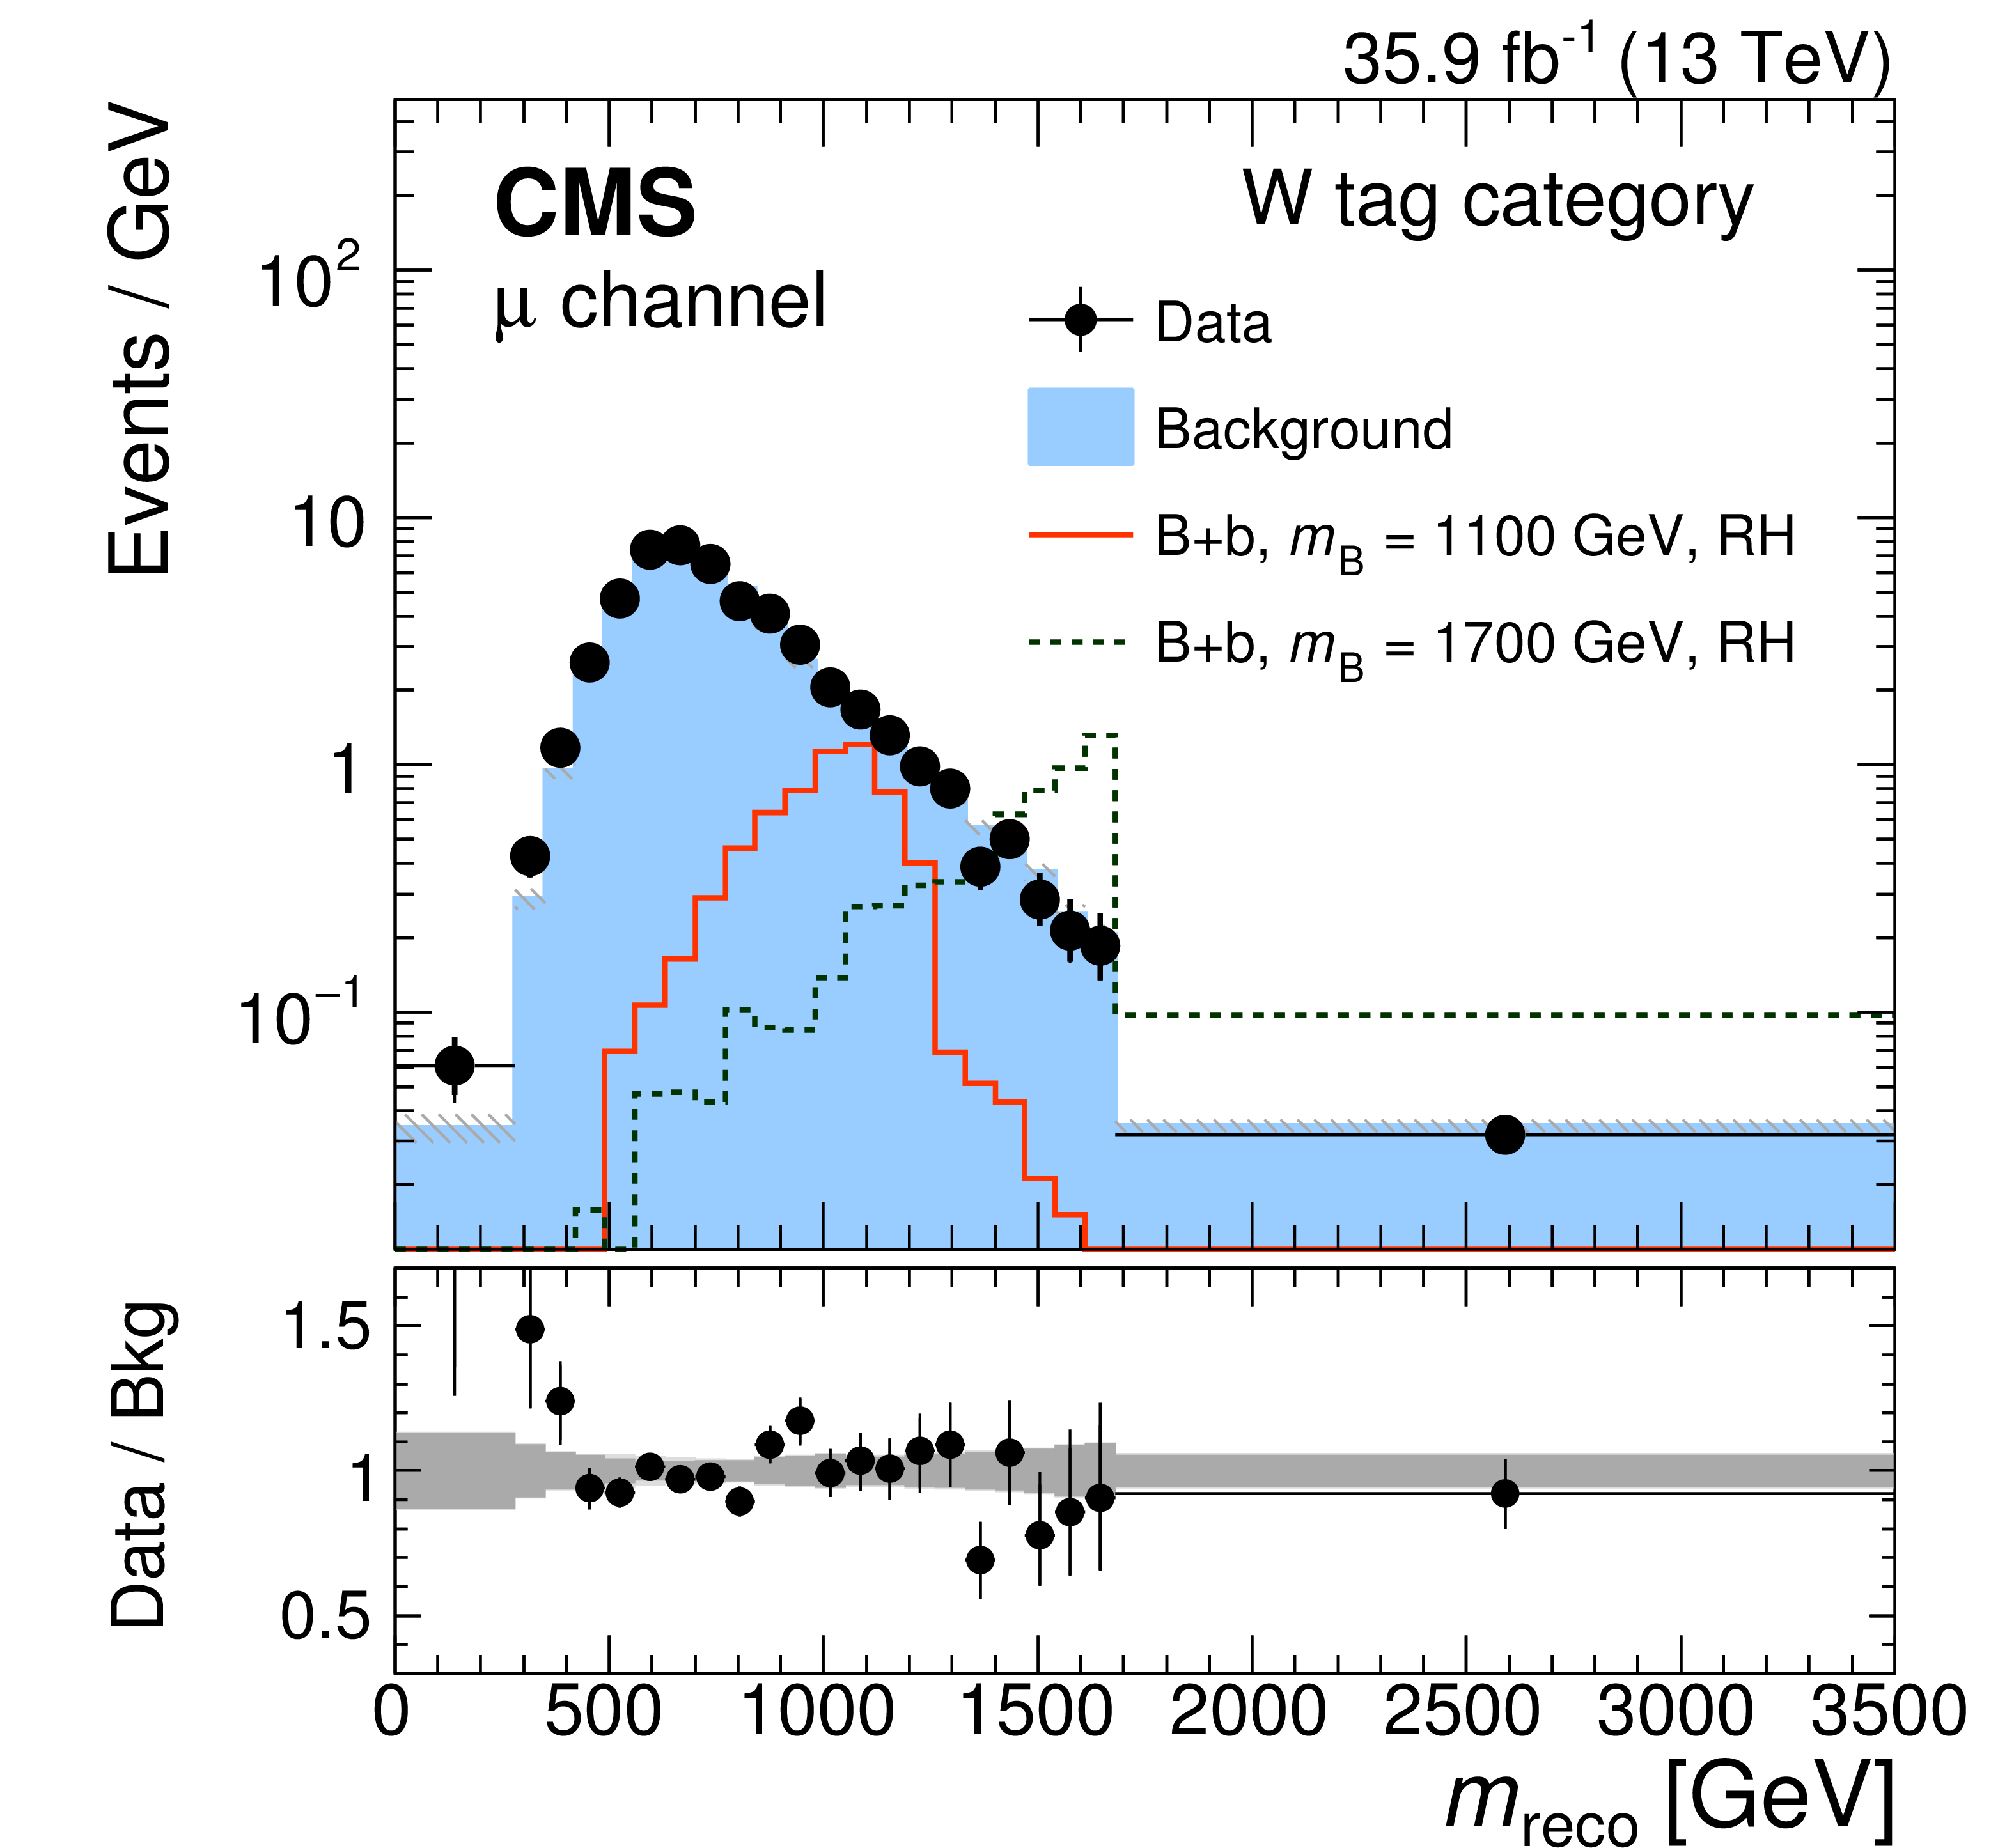
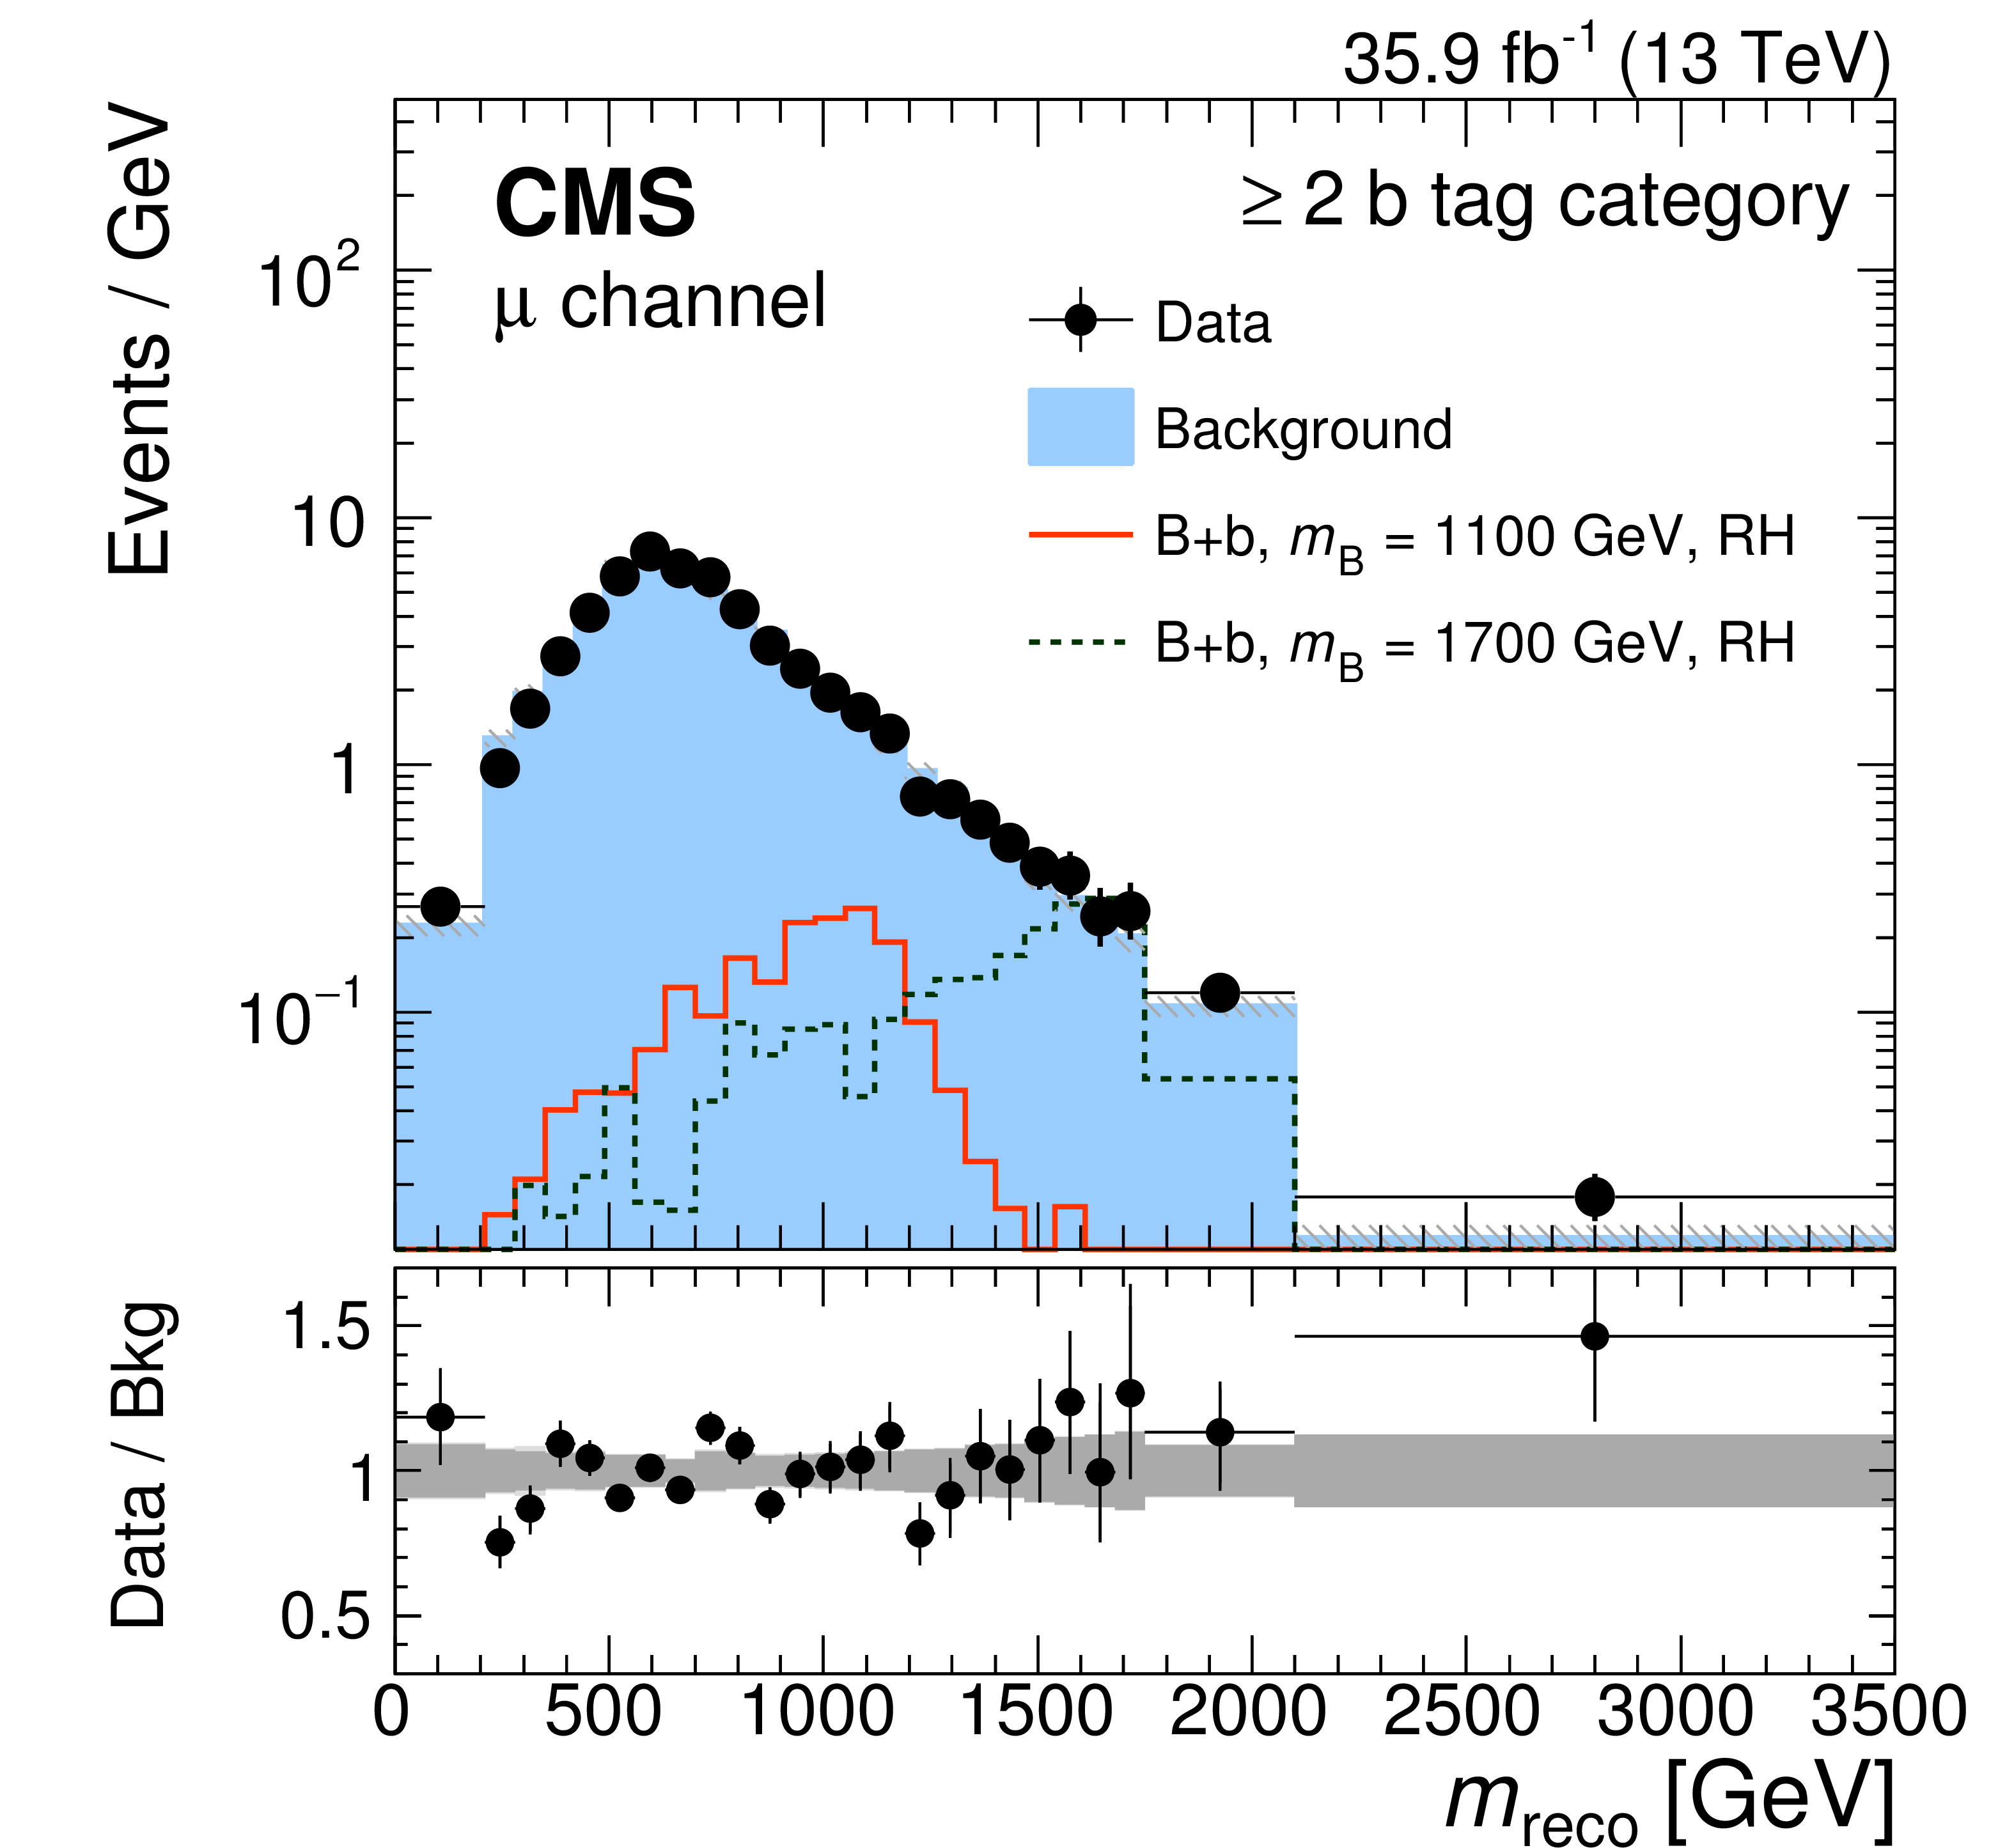
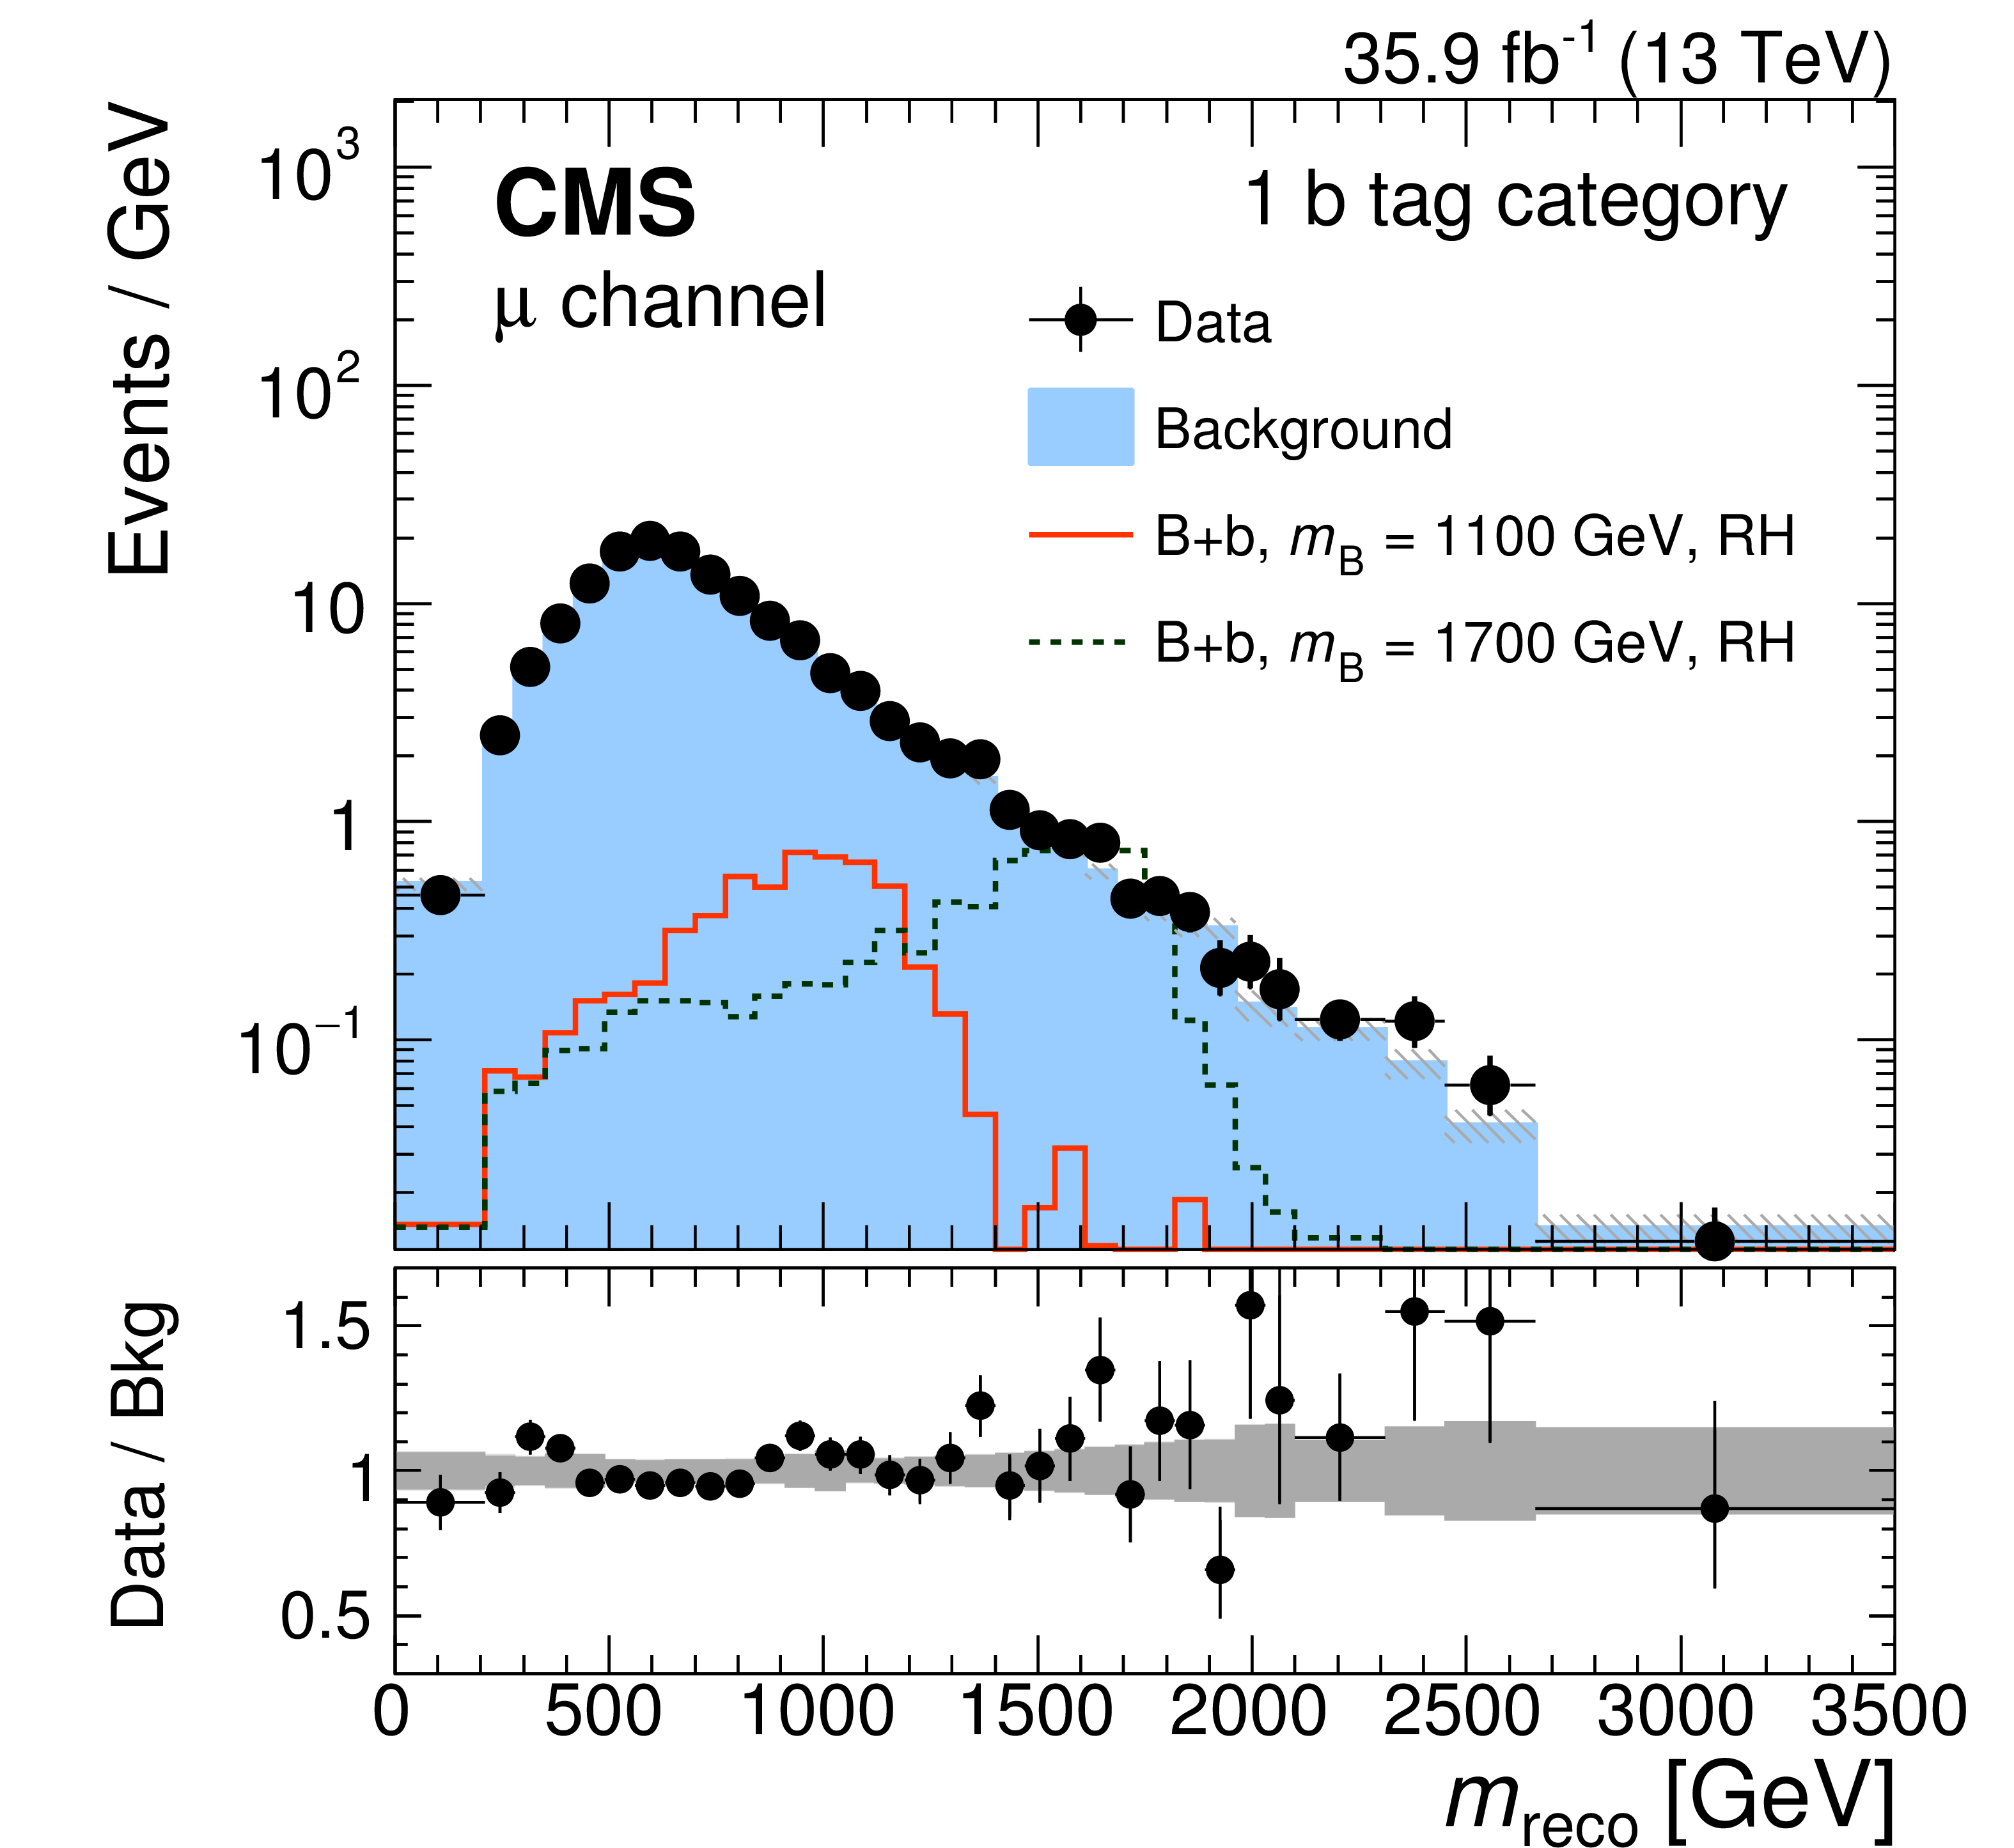
Distributions of ${m_\mathrm {reco}}$ measured in the signal region for events with a jet in the forward direction with $ | \eta | > $ 2.4 in the muon channel. Shown are the sensitive categories: t tag (upper left), W tag (upper right), ${\geq}$2 b tag (lower left), 1 b tag (lower right) and 0 b tag. The background prediction is obtained from control regions as detailed in the main text. The distributions from two example signal samples for the B+b production mode with right-handed VLQ couplings with a cross section of 1 pb and a relative width of 1% are shown for illustration. |
png pdf |
Figure 5-a:
Distribution of ${m_\mathrm {reco}}$ measured in the signal region for events with a jet in the forward direction with $ | \eta | > $ 2.4 in the muon channel, for the t tag category. The background prediction is obtained from control regions as detailed in the main text. The distributions from two example signal samples for the B+b production mode with right-handed VLQ couplings with a cross section of 1 pb and a relative width of 1% are shown for illustration. |
png pdf |
Figure 5-b:
Distribution of ${m_\mathrm {reco}}$ measured in the signal region for events with a jet in the forward direction with $ | \eta | > $ 2.4 in the muon channel, for the W tag category. The background prediction is obtained from control regions as detailed in the main text. The distributions from two example signal samples for the B+b production mode with right-handed VLQ couplings with a cross section of 1 pb and a relative width of 1% are shown for illustration. |
png pdf |
Figure 5-c:
Distribution of ${m_\mathrm {reco}}$ measured in the signal region for events with a jet in the forward direction with $ | \eta | > $ 2.4 in the muon channel, for the ${\geq}$2 b tag category. The background prediction is obtained from control regions as detailed in the main text. The distributions from two example signal samples for the B+b production mode with right-handed VLQ couplings with a cross section of 1 pb and a relative width of 1% are shown for illustration. |
png pdf |
Figure 5-d:
Distribution of ${m_\mathrm {reco}}$ measured in the signal region for events with a jet in the forward direction with $ | \eta | > $ 2.4 in the muon channel, for the 1 b tag category. The background prediction is obtained from control regions as detailed in the main text. The distributions from two example signal samples for the B+b production mode with right-handed VLQ couplings with a cross section of 1 pb and a relative width of 1% are shown for illustration. |
png pdf |
Figure 5-e:
Distribution of ${m_\mathrm {reco}}$ measured in the signal region for events with a jet in the forward direction with $ | \eta | > $ 2.4 in the muon channel, for the 0 b tag category. The background prediction is obtained from control regions as detailed in the main text. The distributions from two example signal samples for the B+b production mode with right-handed VLQ couplings with a cross section of 1 pb and a relative width of 1% are shown for illustration. |
png pdf |
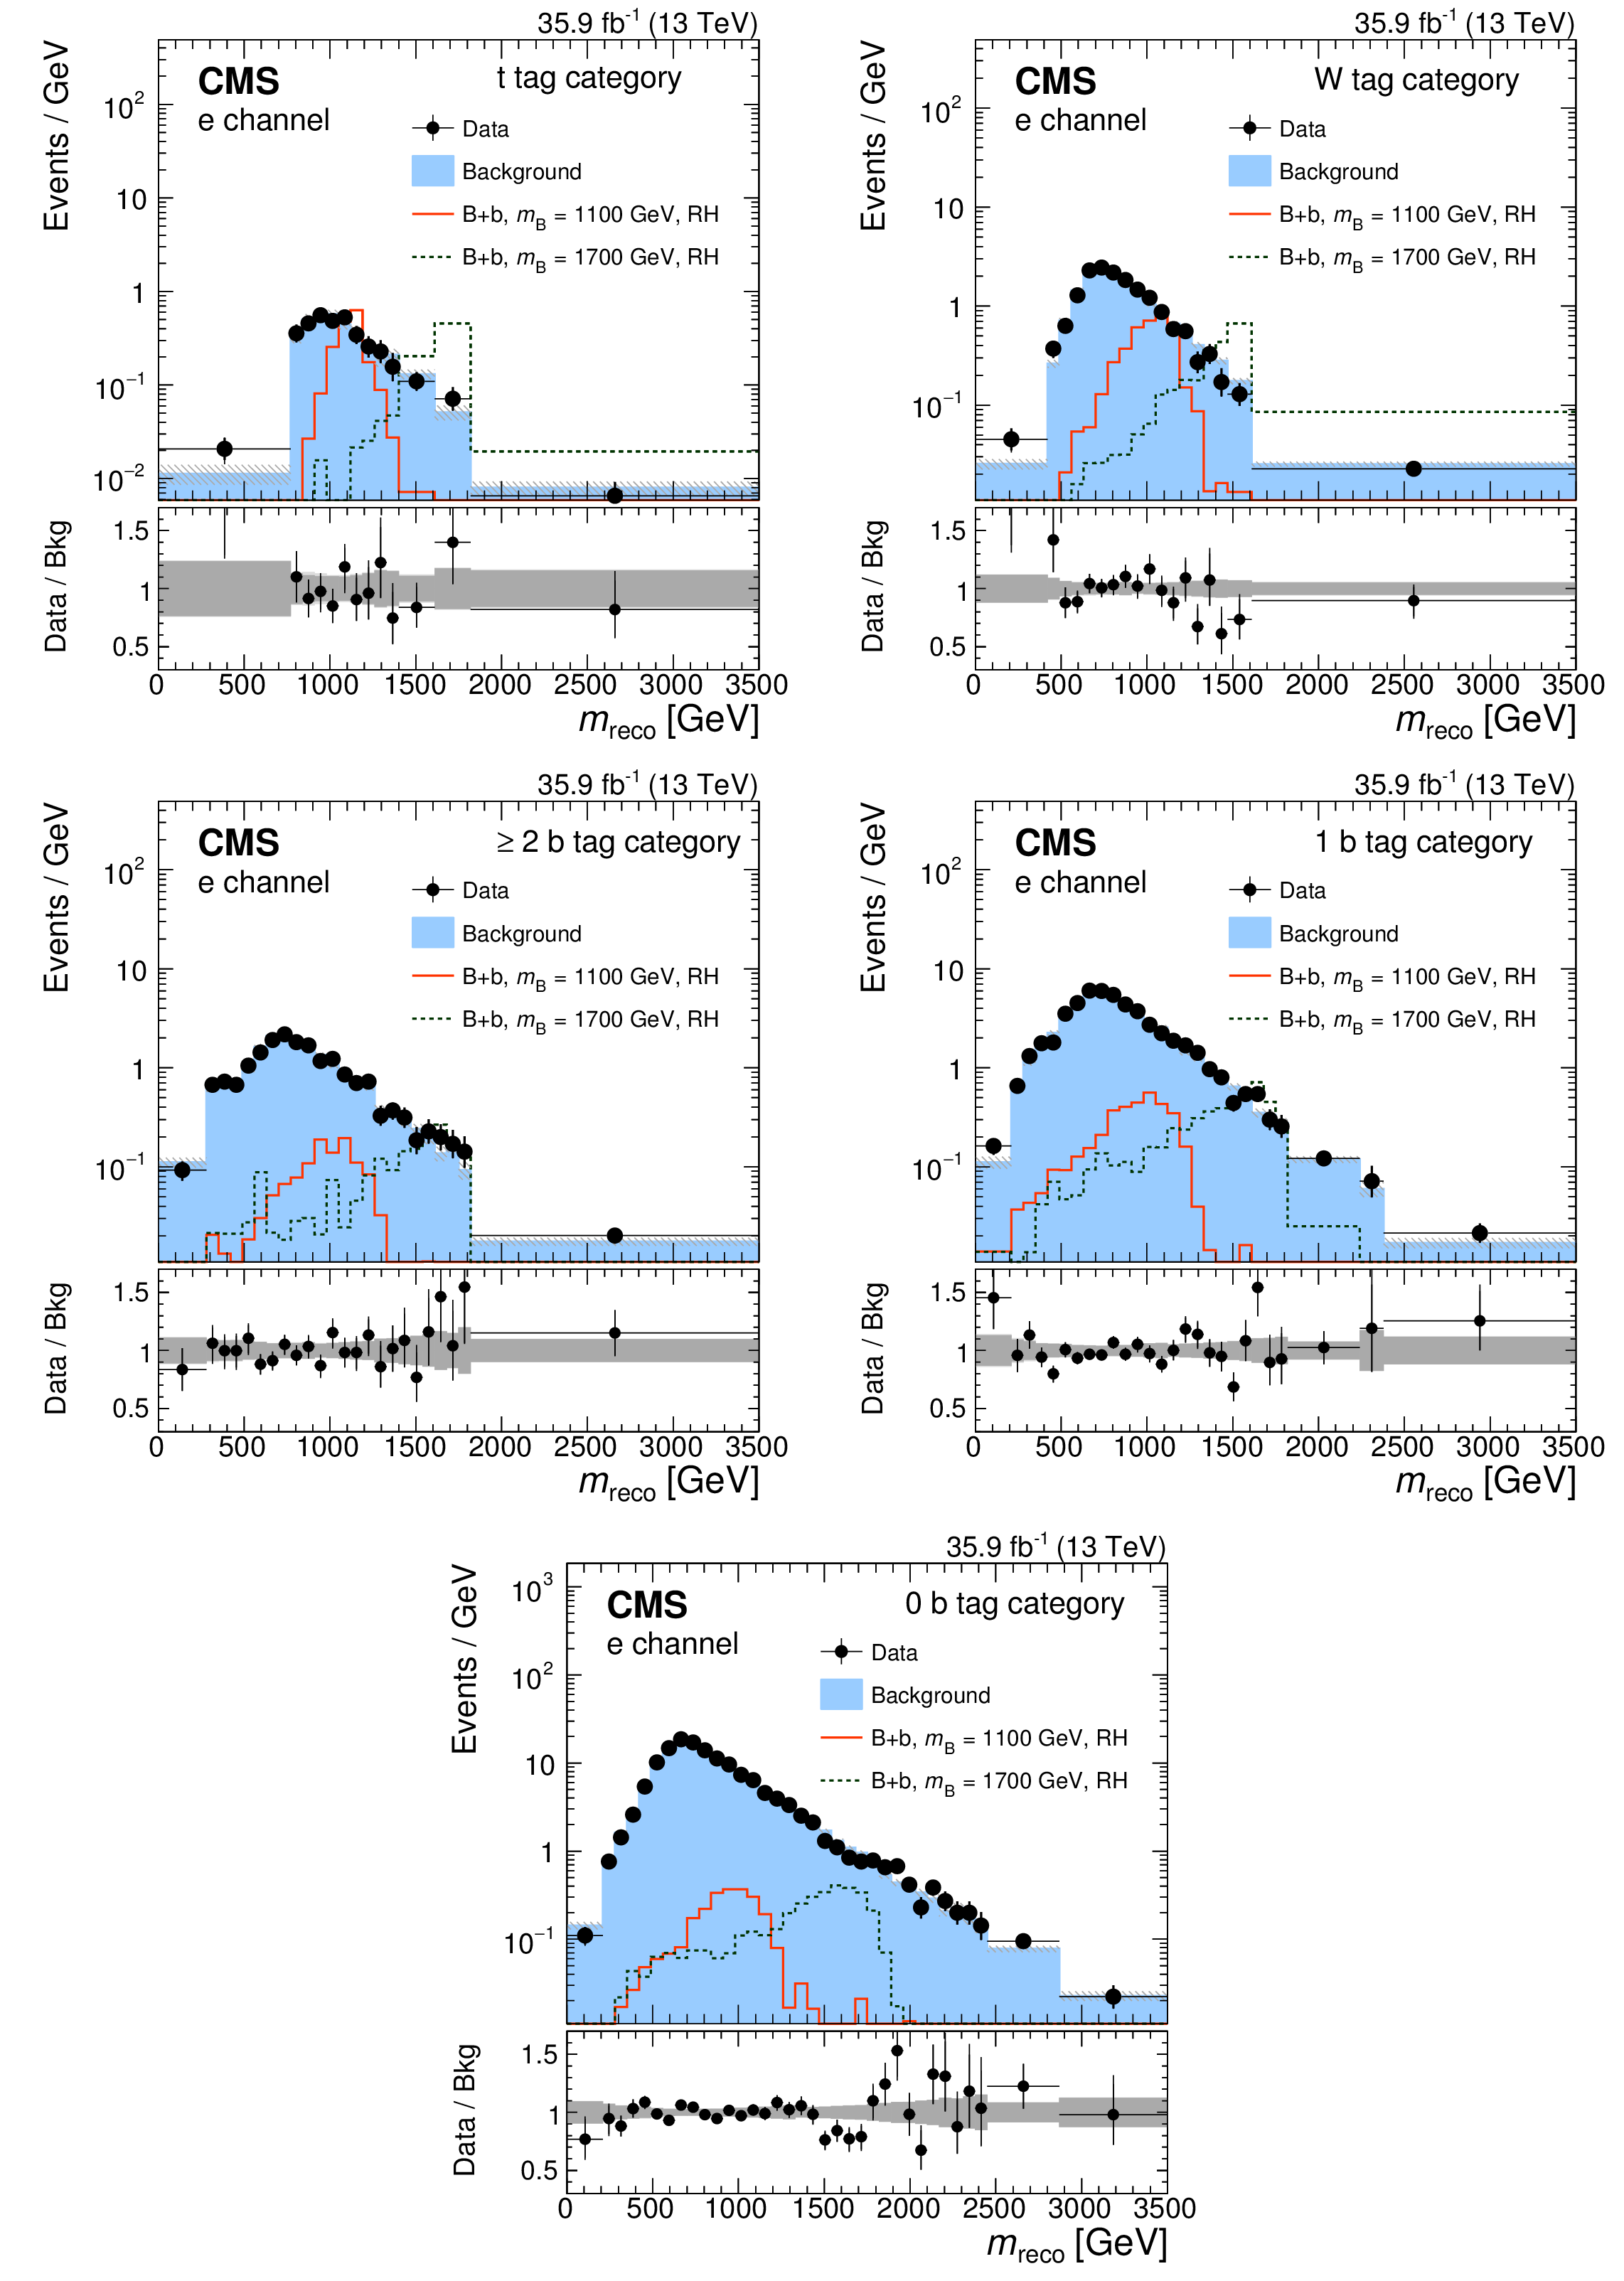
Figure 6:
Distributions of ${m_\mathrm {reco}}$ measured in the signal region for events with a jet in the forward direction with $ | \eta | > $ 2.4 in the electron channel. Shown are the sensitive categories: t tag(upper left), W tag(upper right), ${\geq}$2 b tag (middle left), 1 b tag (middle right) and 0 b tag (lower). The background prediction is obtained from control regions as detailed in the main text. The distributions from two example signal samples for the B+b production mode with right-handed VLQ couplings with a cross section of 1 pb and a relative VLQ width of 1% are shown for illustration. |
png pdf |
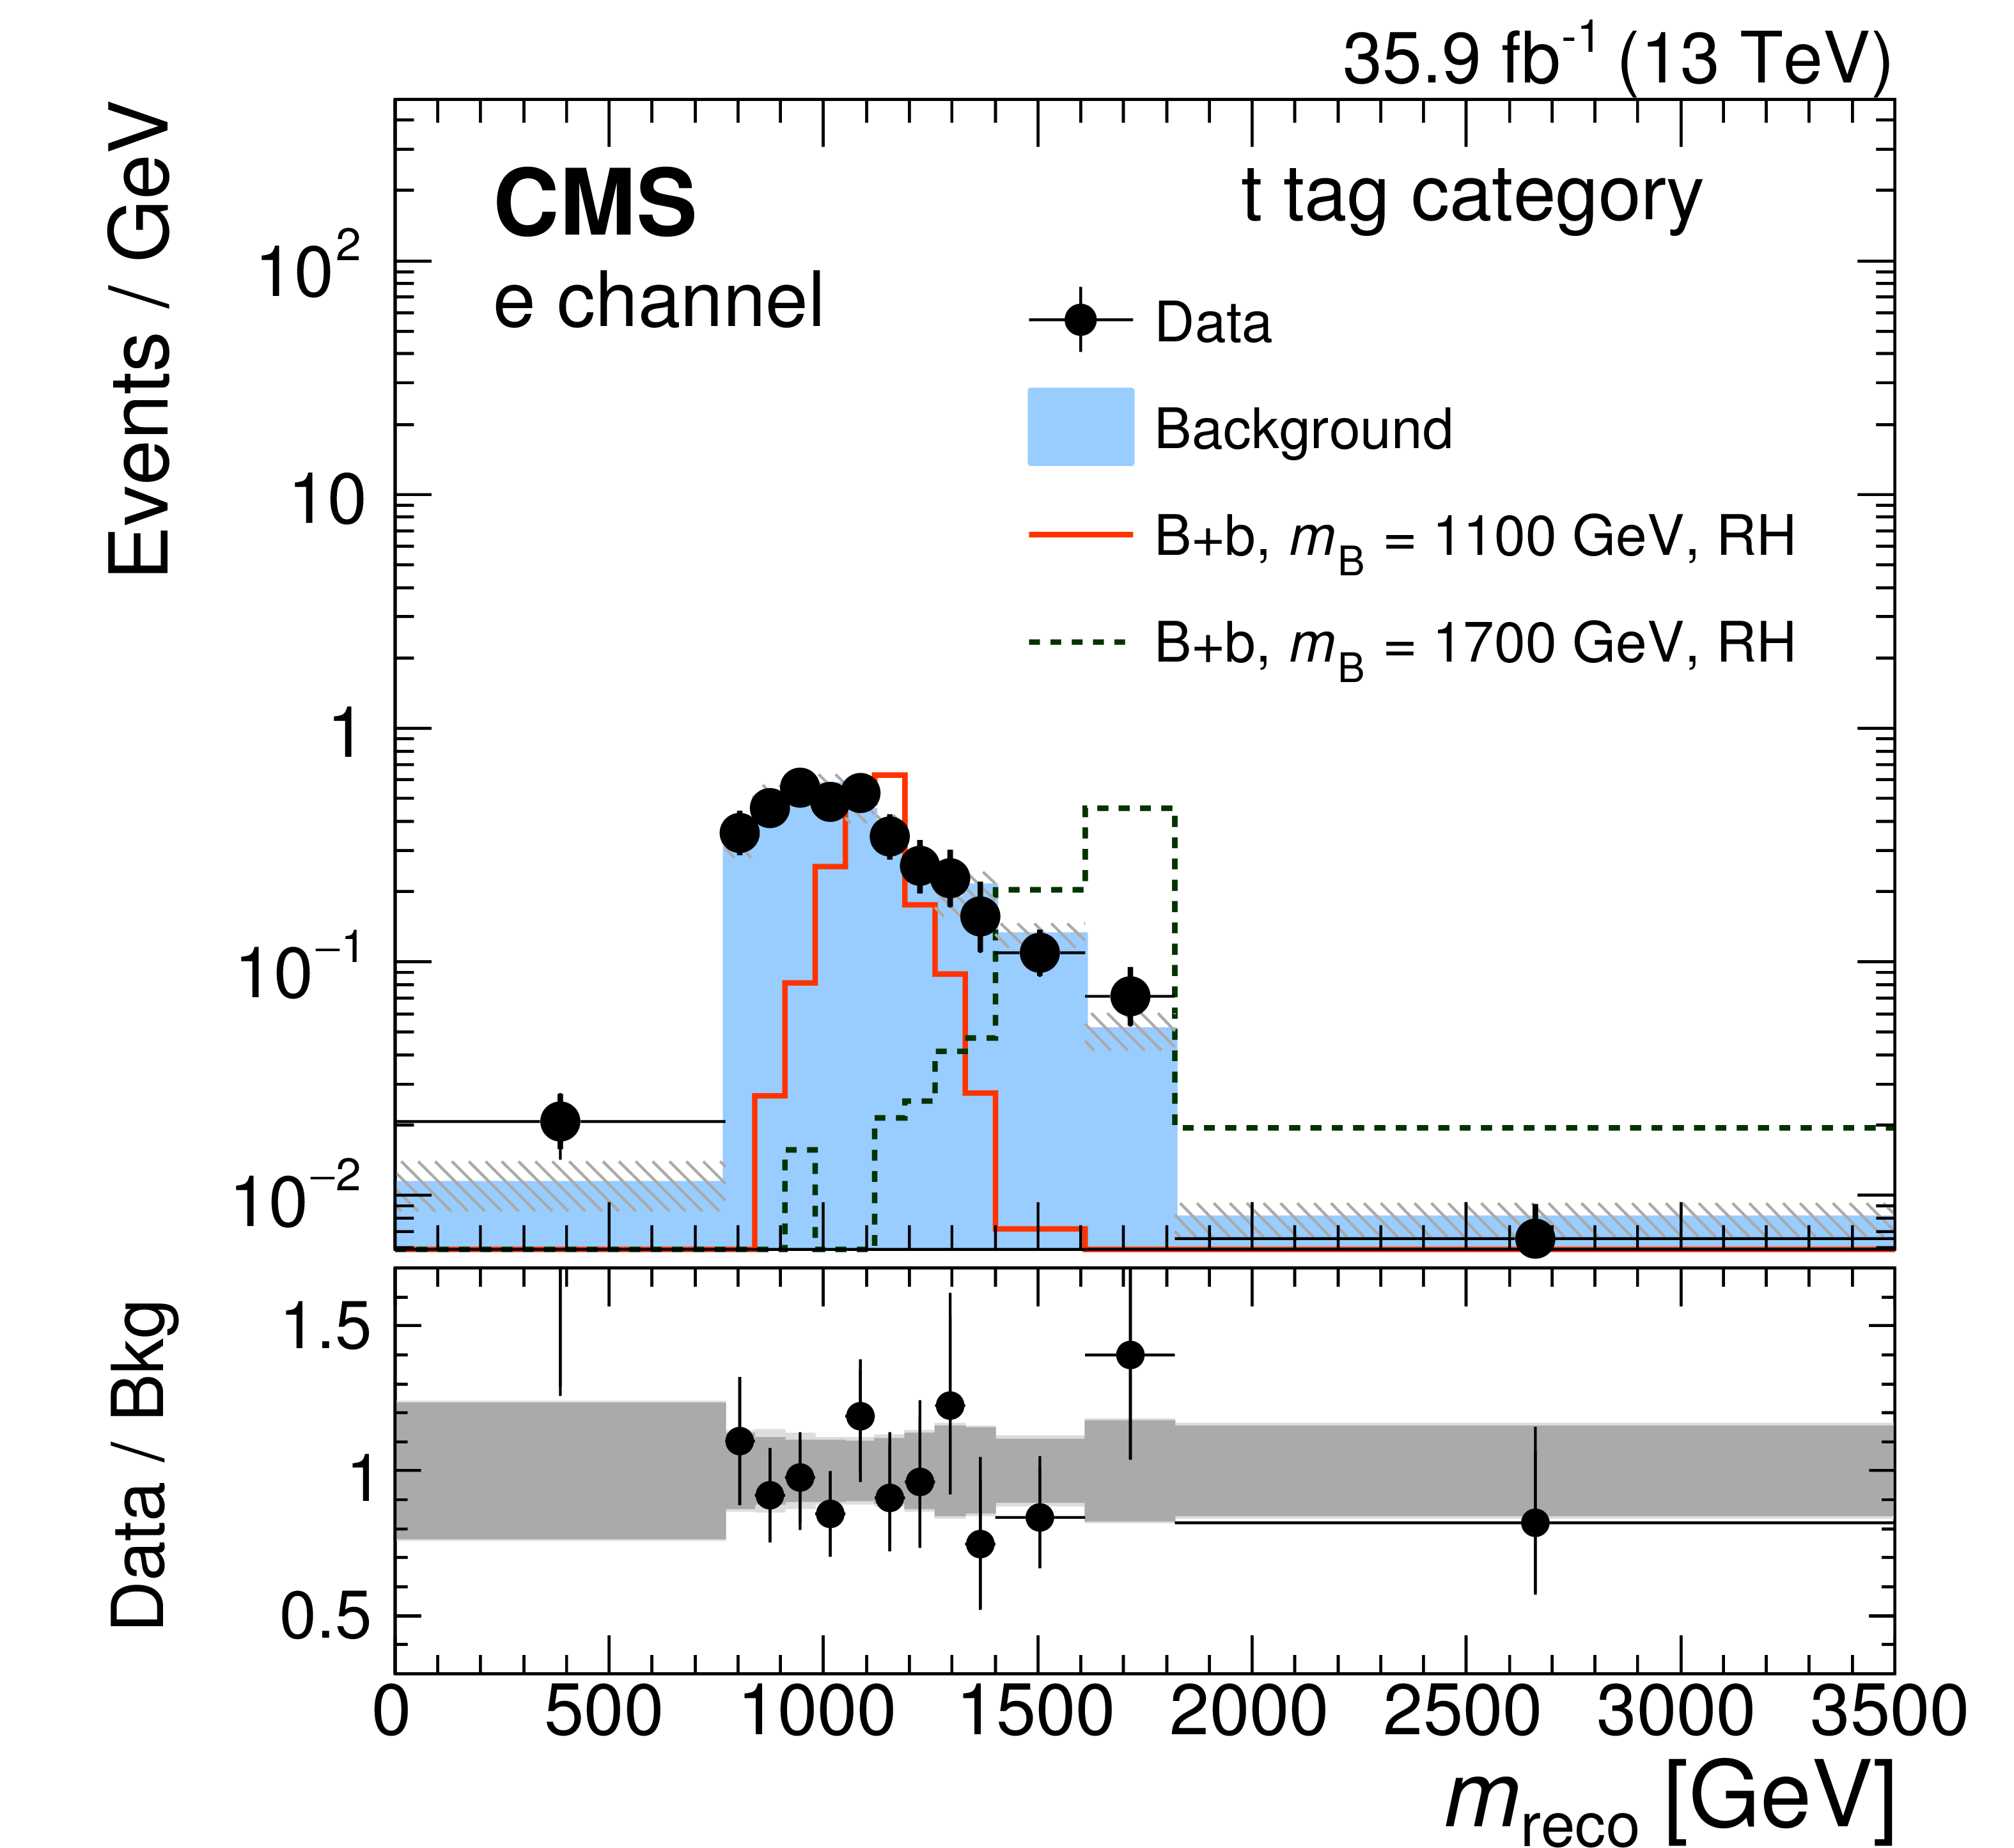
Figure 6-a:
Distribution of ${m_\mathrm {reco}}$ measured in the signal region for events with a jet in the forward direction with $ | \eta | > $ 2.4 in the electron channel, for the t tag category. The background prediction is obtained from control regions as detailed in the main text. The distributions from two example signal samples for the B+b production mode with right-handed VLQ couplings with a cross section of 1 pb and a relative VLQ width of 1% are shown for illustration. |

png pdf |
Figure 6-b:
Distribution of ${m_\mathrm {reco}}$ measured in the signal region for events with a jet in the forward direction with $ | \eta | > $ 2.4 in the electron channel, for the W tag category. The background prediction is obtained from control regions as detailed in the main text. The distributions from two example signal samples for the B+b production mode with right-handed VLQ couplings with a cross section of 1 pb and a relative VLQ width of 1% are shown for illustration. |
png pdf |
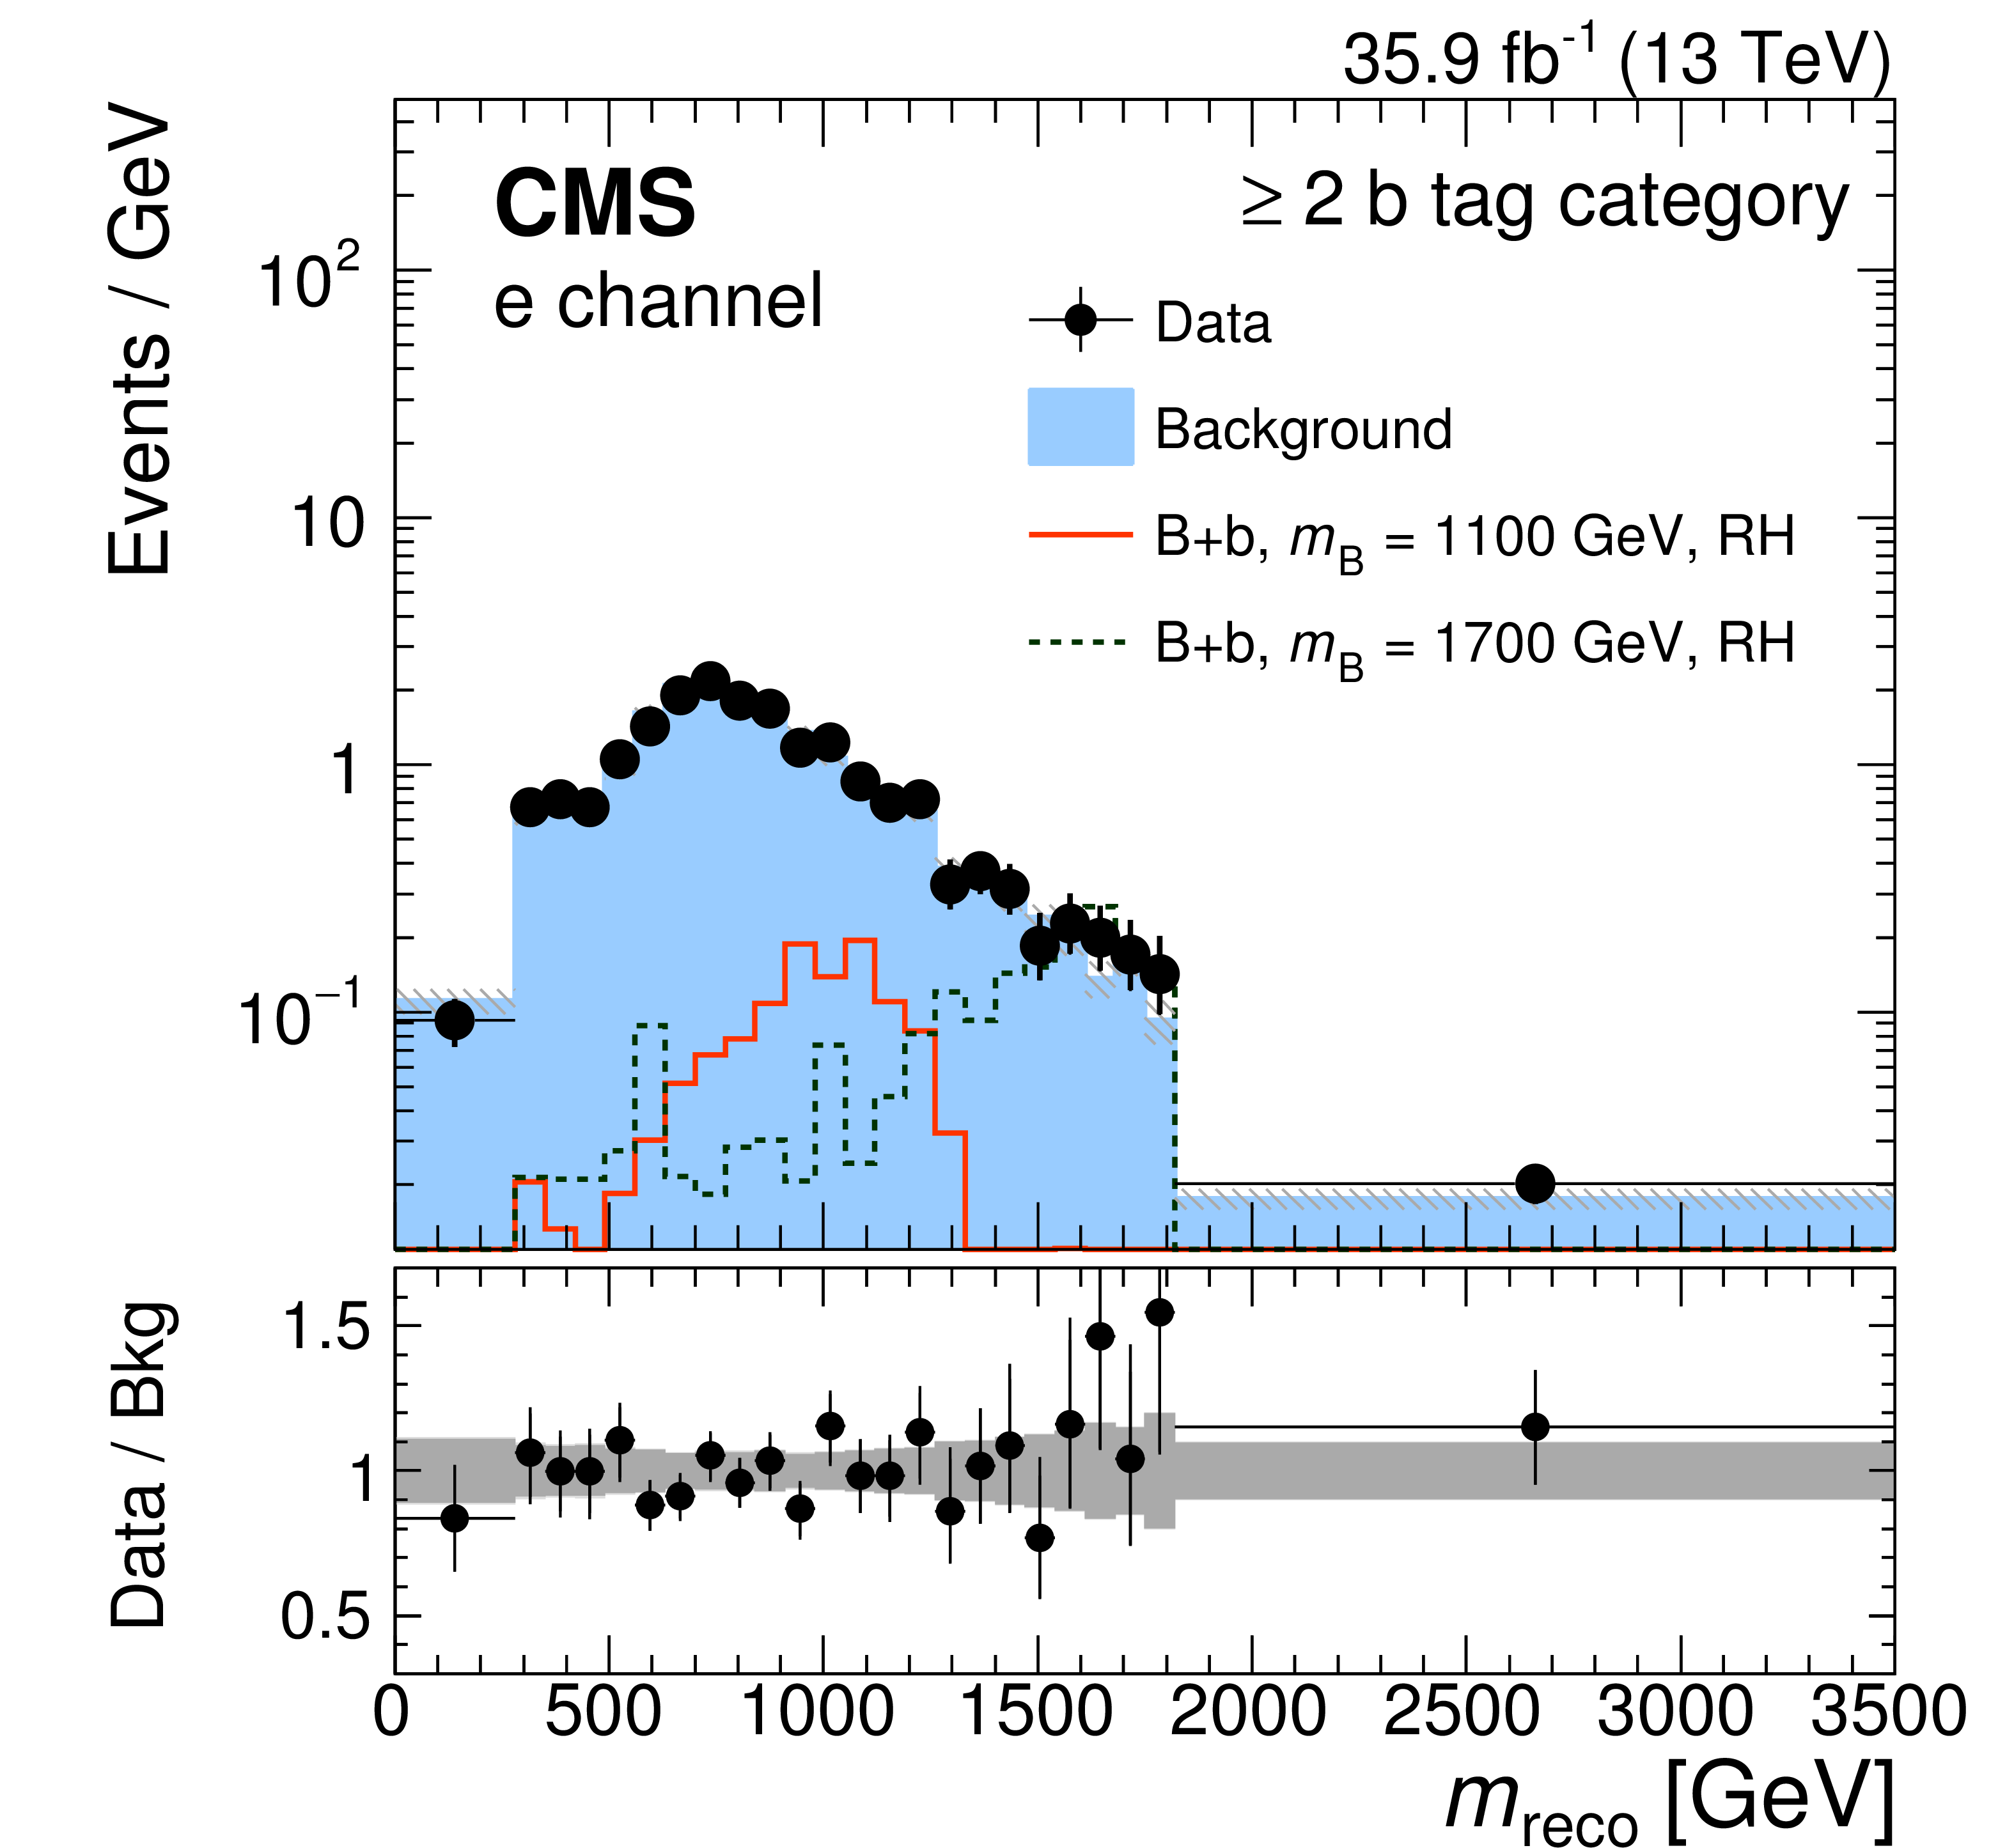
Figure 6-c:
Distribution of ${m_\mathrm {reco}}$ measured in the signal region for events with a jet in the forward direction with $ | \eta | > $ 2.4 in the electron channel, for the ${\geq}$2 b tag category. The background prediction is obtained from control regions as detailed in the main text. The distributions from two example signal samples for the B+b production mode with right-handed VLQ couplings with a cross section of 1 pb and a relative VLQ width of 1% are shown for illustration. |
png pdf |
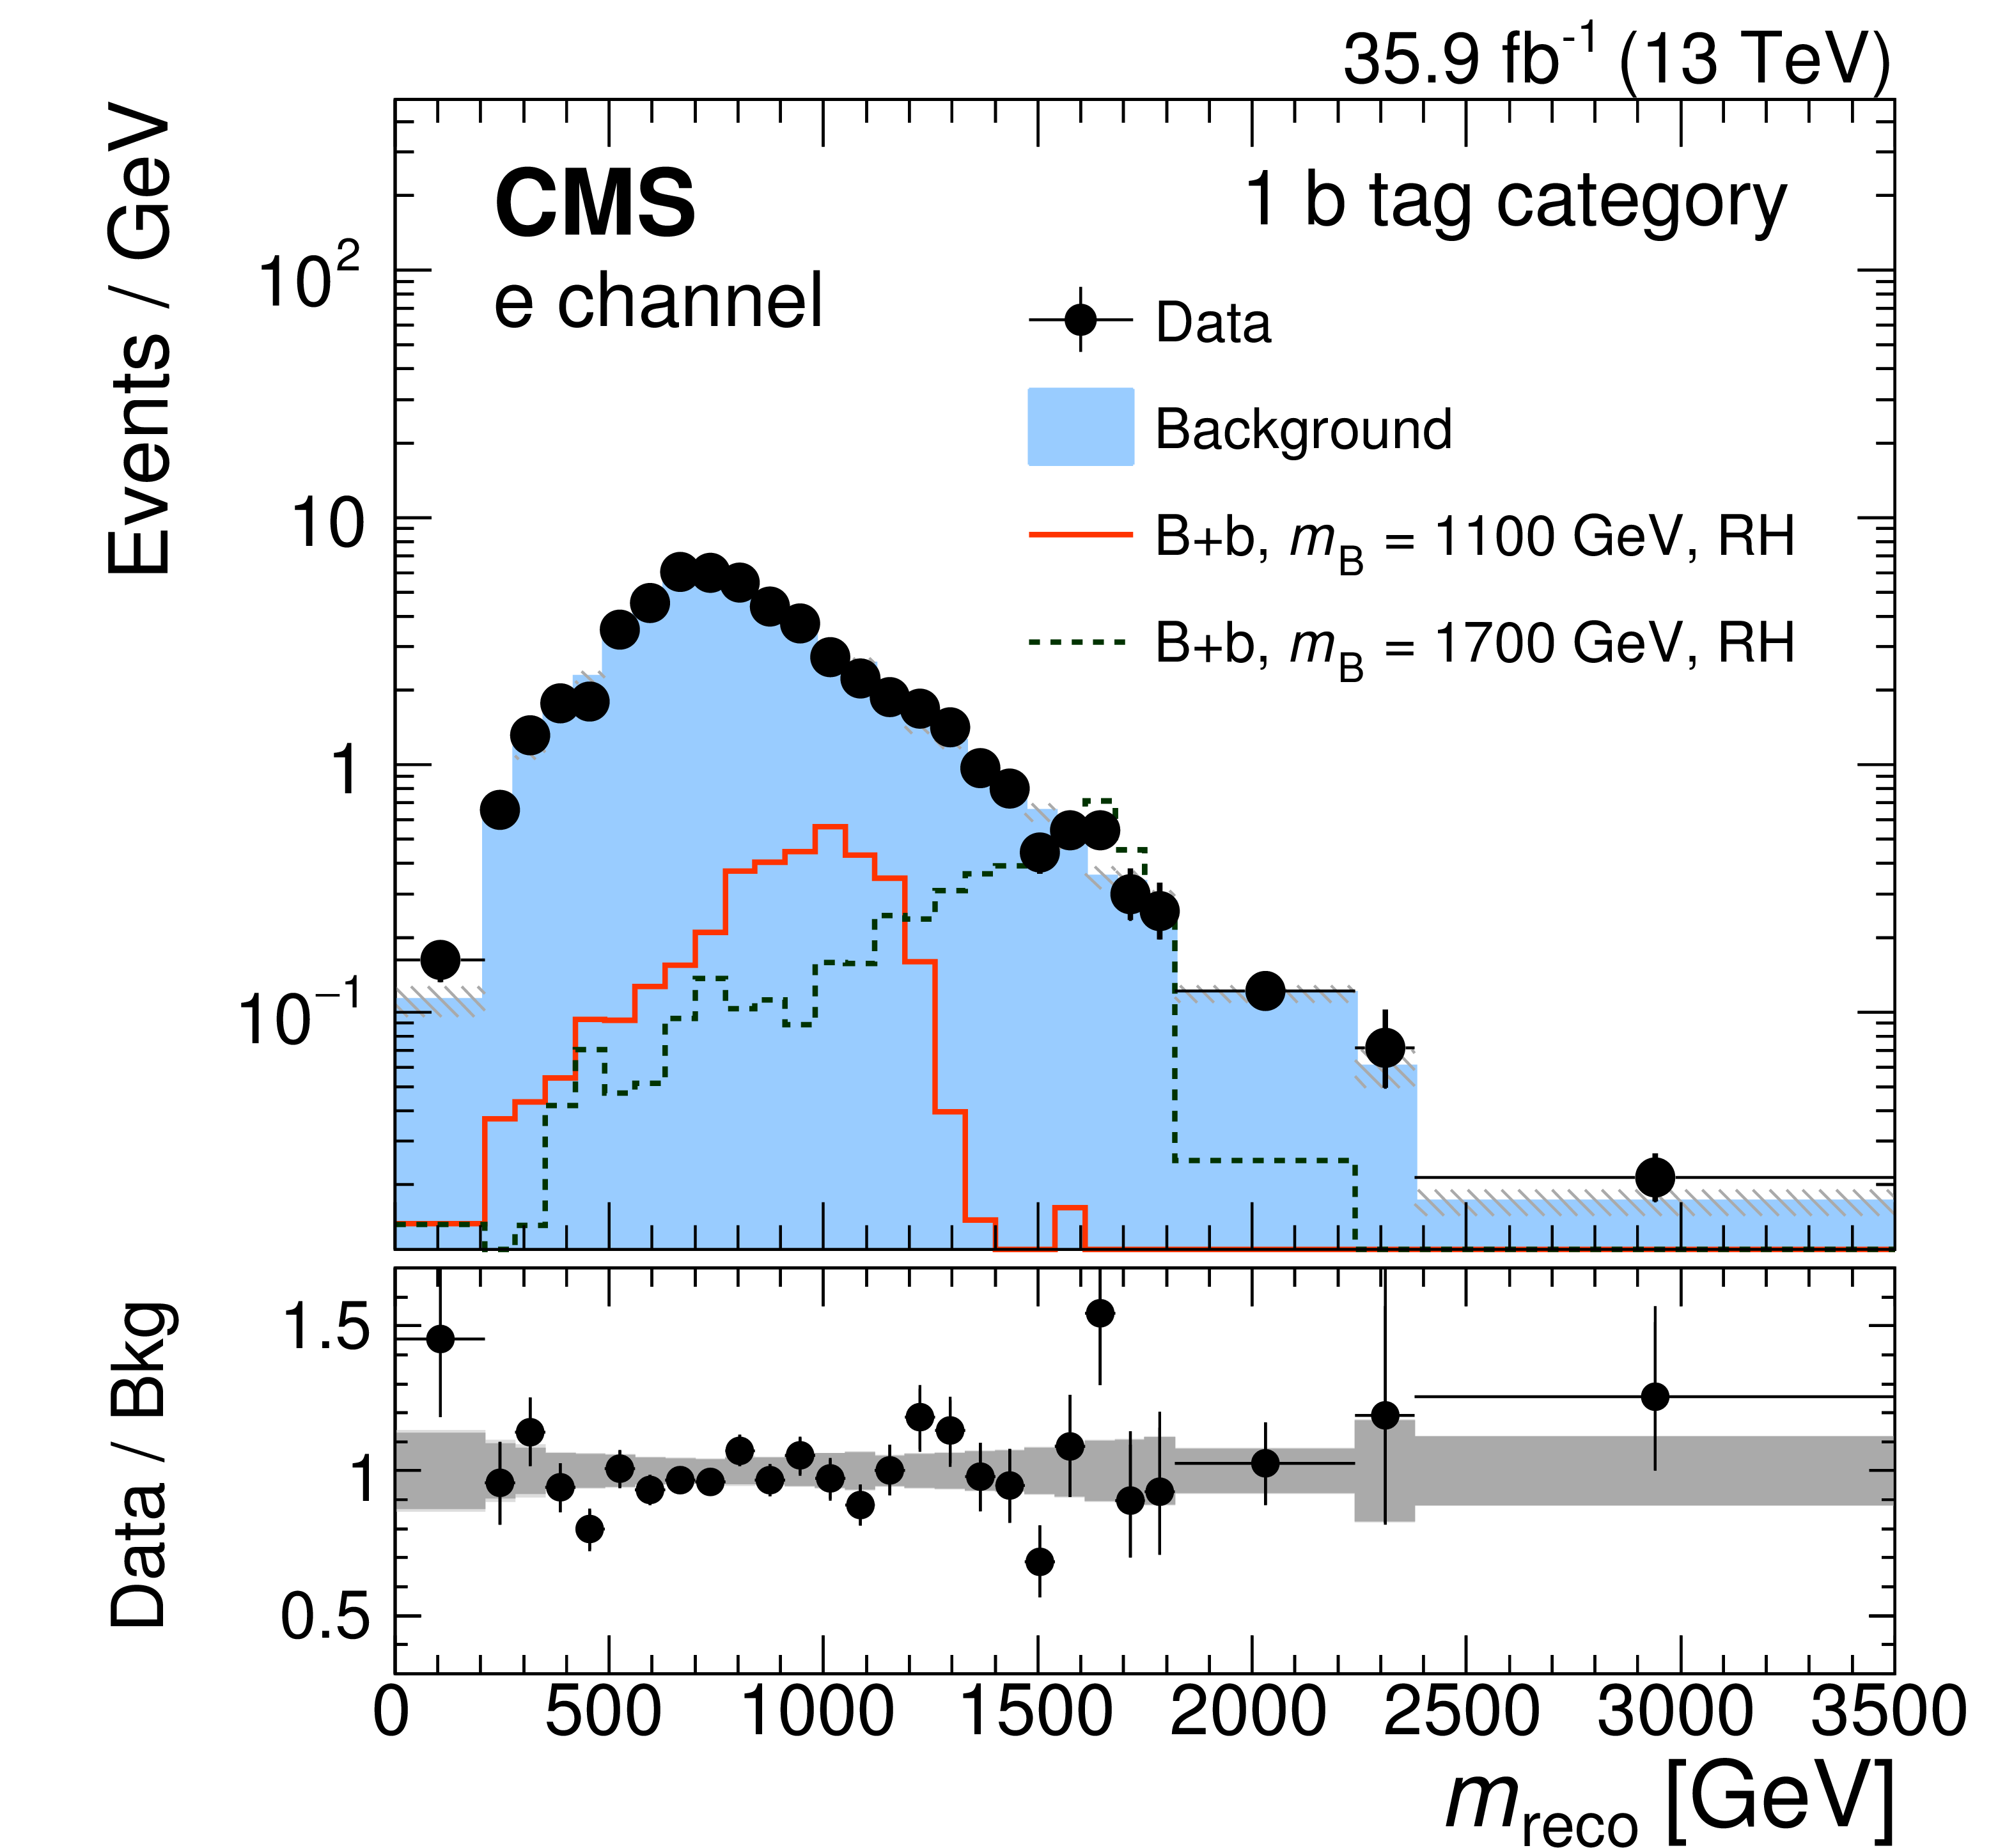
Figure 6-d:
Distribution of ${m_\mathrm {reco}}$ measured in the signal region for events with a jet in the forward direction with $ | \eta | > $ 2.4 in the electron channel, for the 1 b tag category. The background prediction is obtained from control regions as detailed in the main text. The distributions from two example signal samples for the B+b production mode with right-handed VLQ couplings with a cross section of 1 pb and a relative VLQ width of 1% are shown for illustration. |

png pdf |
Figure 6-e:
Distribution of ${m_\mathrm {reco}}$ measured in the signal region for events with a jet in the forward direction with $ | \eta | > $ 2.4 in the electron channel, for the 0 b tag category. The background prediction is obtained from control regions as detailed in the main text. The distributions from two example signal samples for the B+b production mode with right-handed VLQ couplings with a cross section of 1 pb and a relative VLQ width of 1% are shown for illustration. |
png pdf |
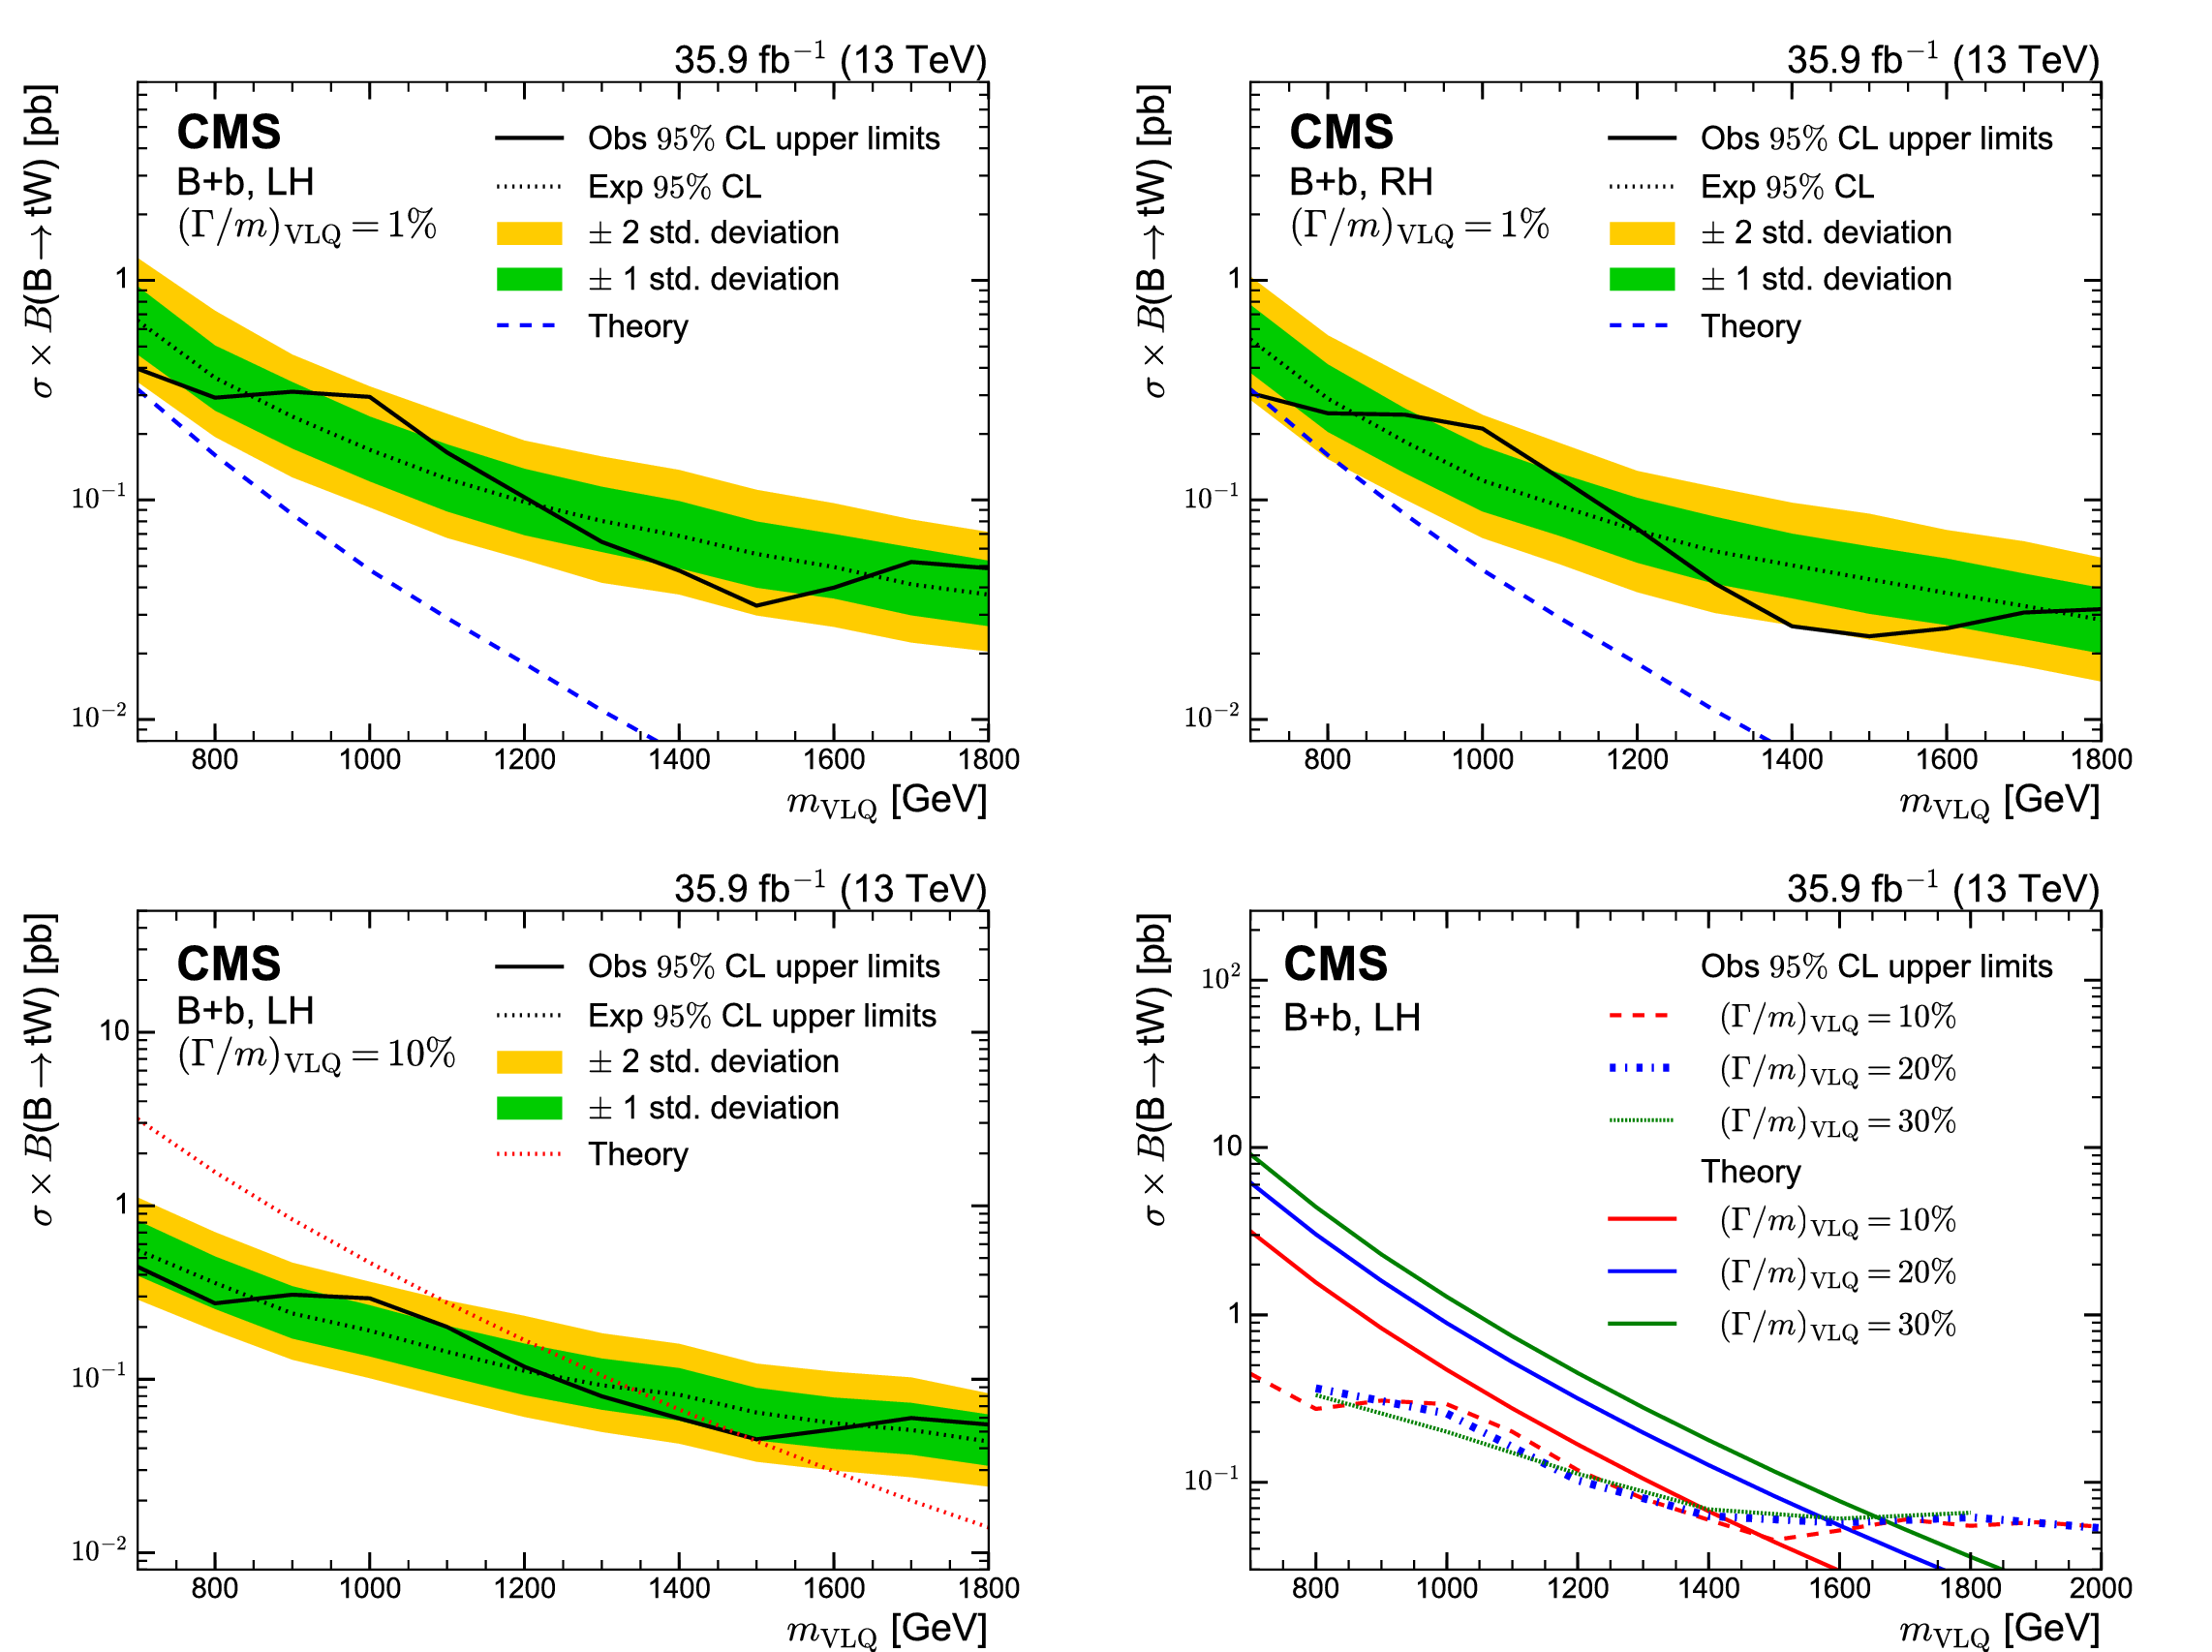
Figure 7:
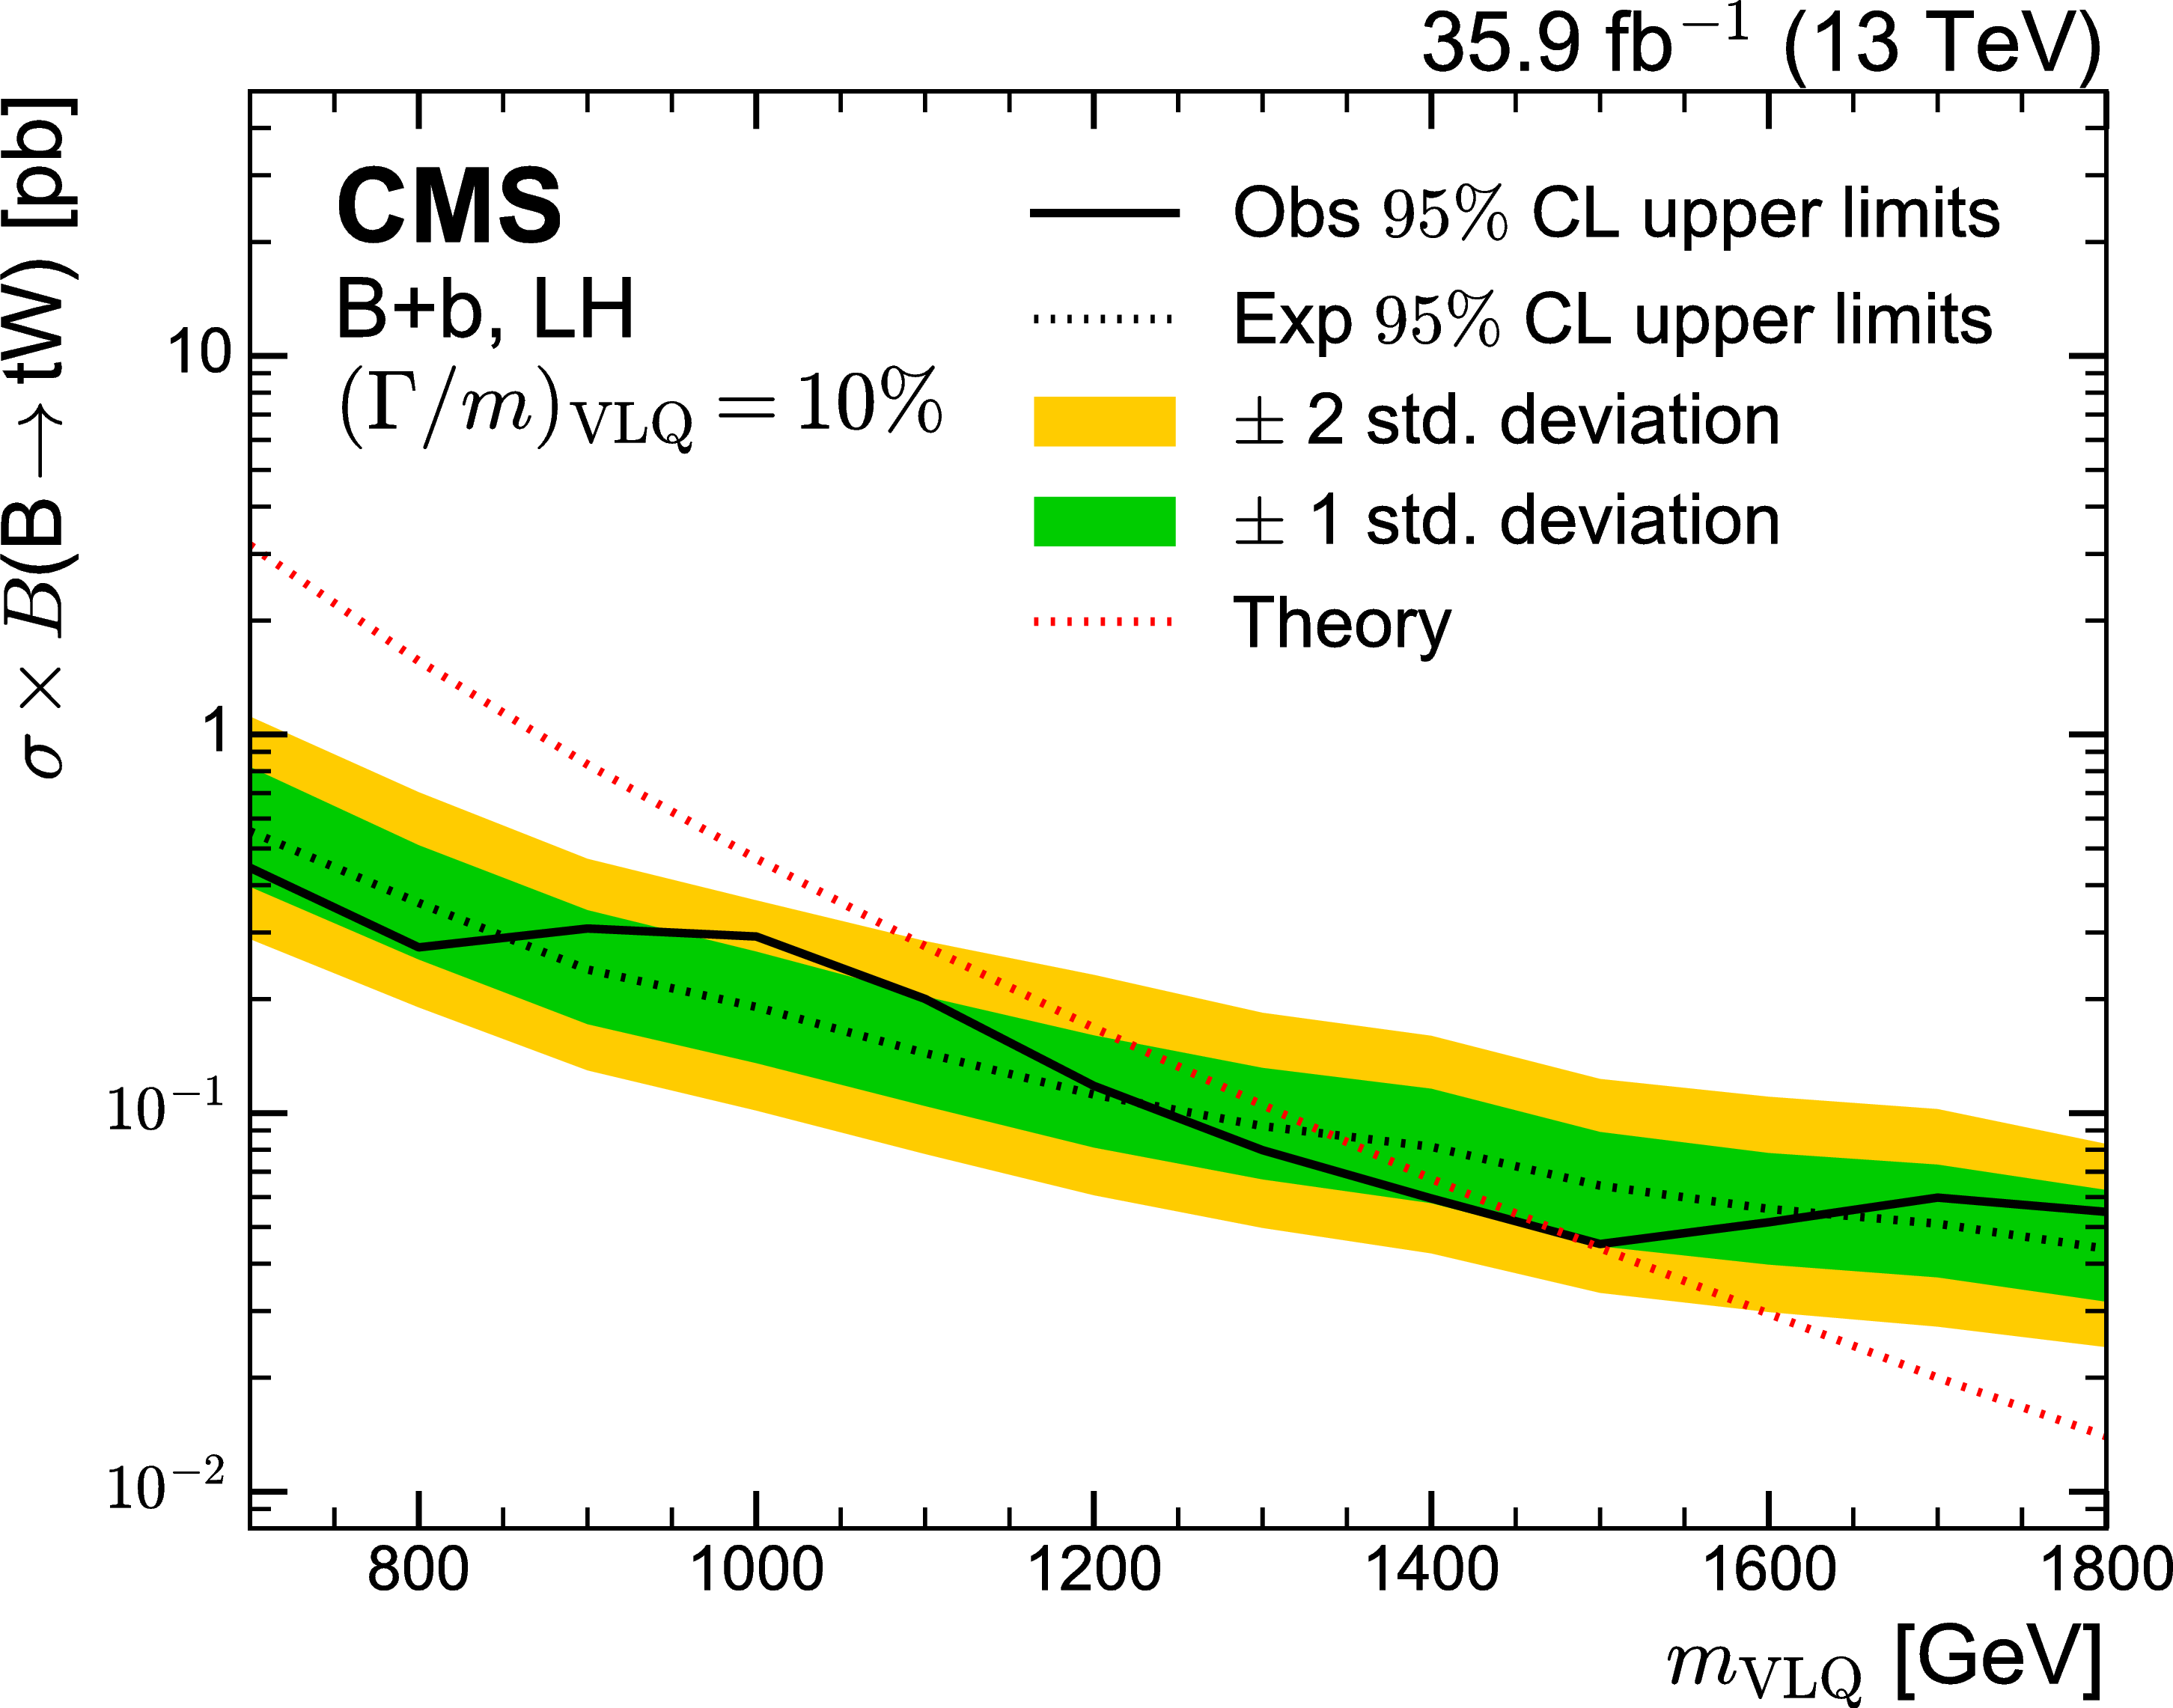
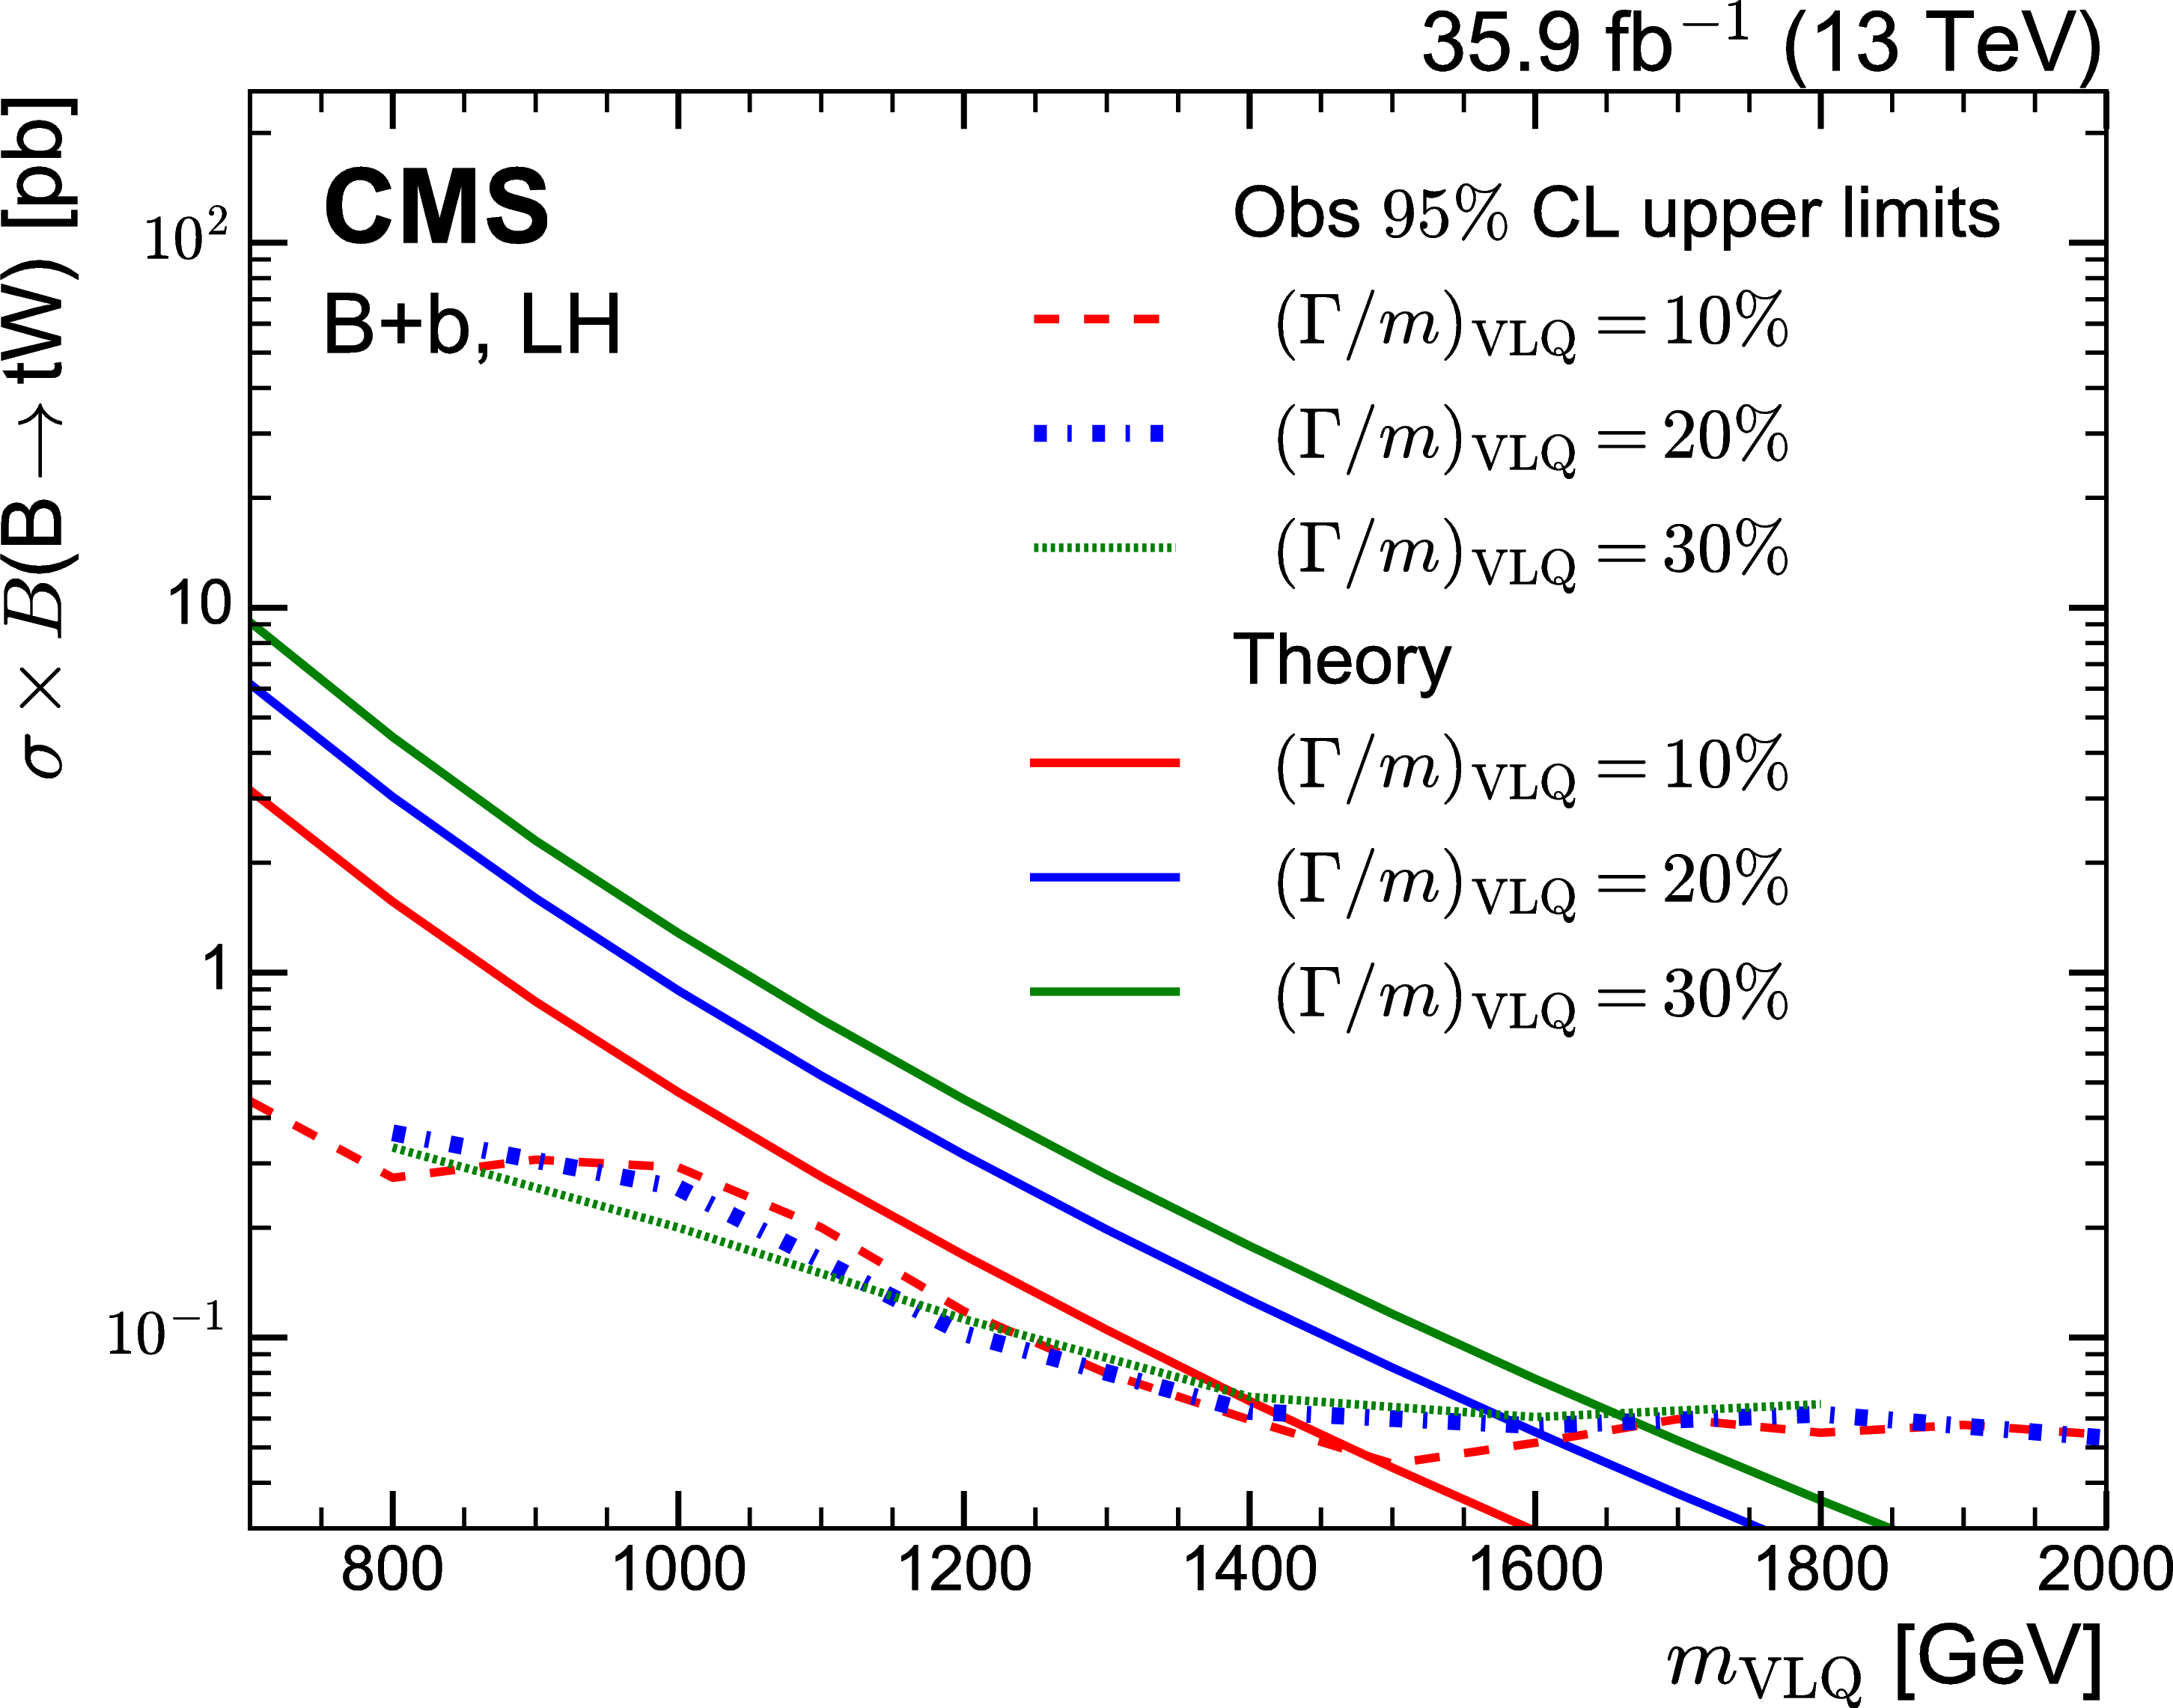
Upper limits at 95% CL on the product of the VLQ production cross section and branching fraction for the B+b production mode for a relative VLQ width of 1% and left- and right-handed VLQ couplings (upper left and right), for 10% relative VLQ width and left-handed VLQ couplings (lower left), and a comparison of the observed exclusion limits for relative VLQ widths of 10, 20, and 30% for left-handed couplings (lower right). The dashed lines show the theoretical predictions. |
png pdf |
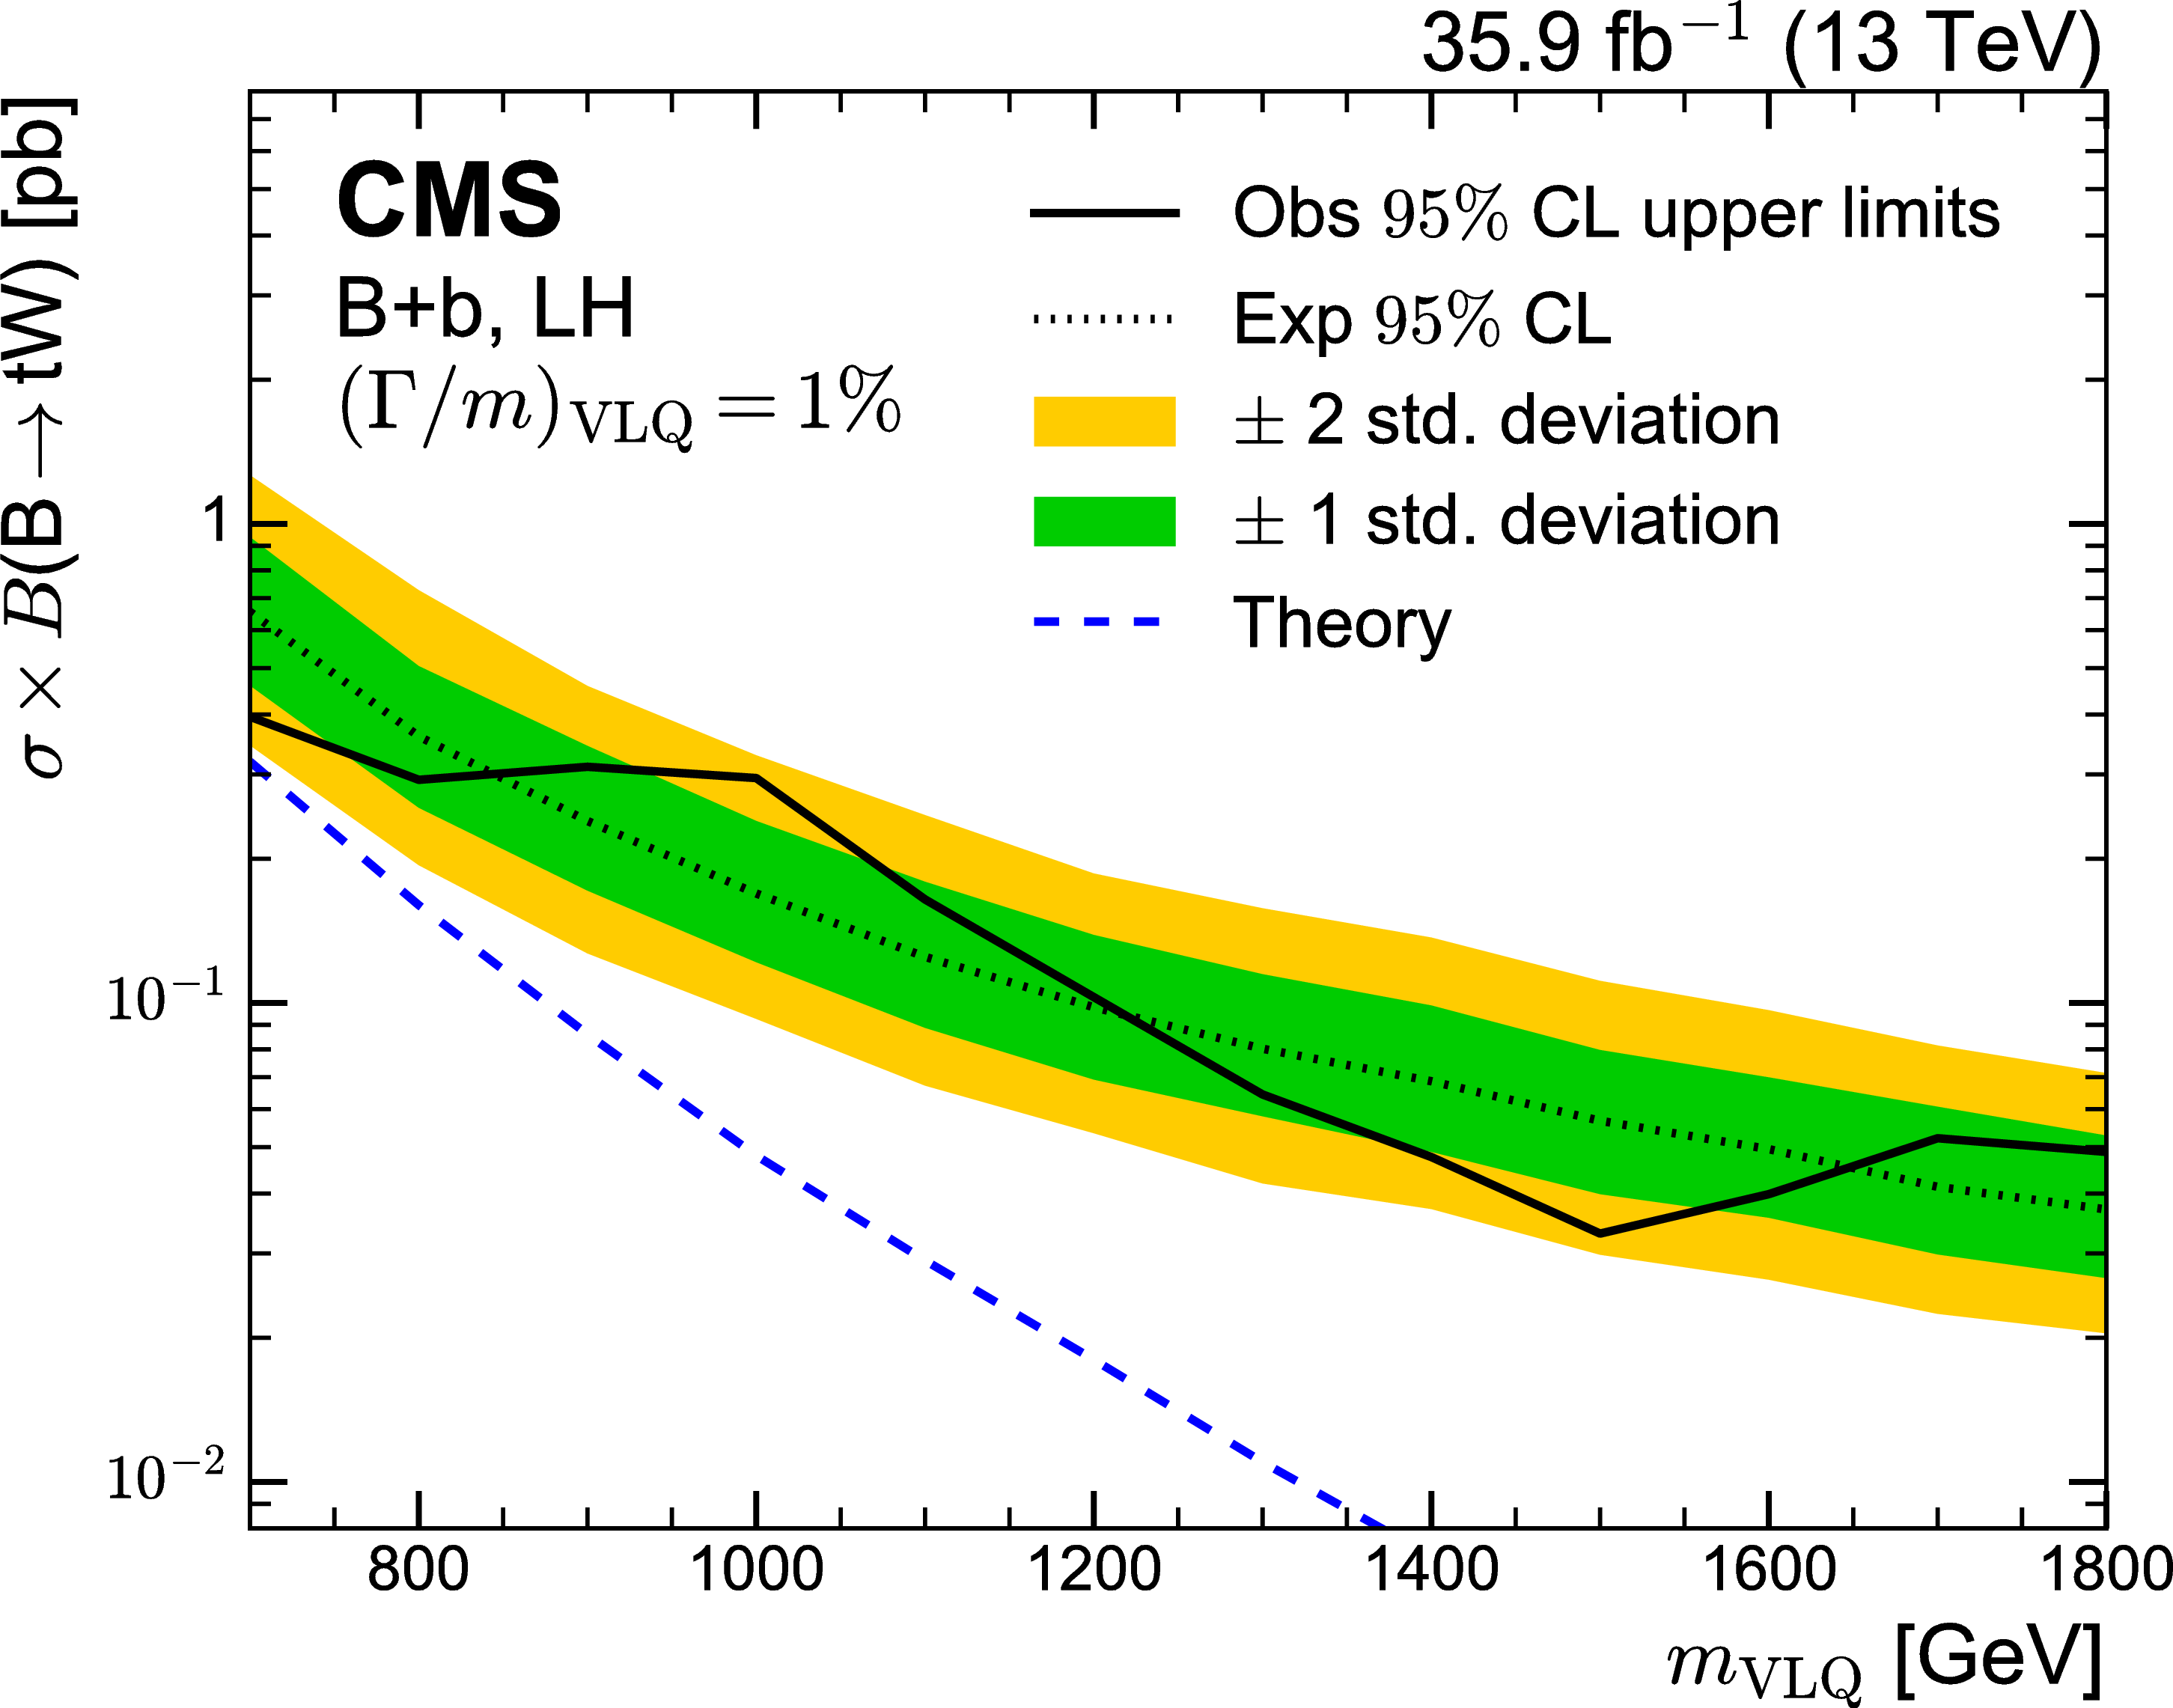
Figure 7-a:
Upper limits at 95% CL on the product of the VLQ production cross section and branching fraction for the B+b production mode for a relative VLQ width of 1% and left-handed VLQ couplings. The dashed lines show the theoretical predictions. |
png pdf |
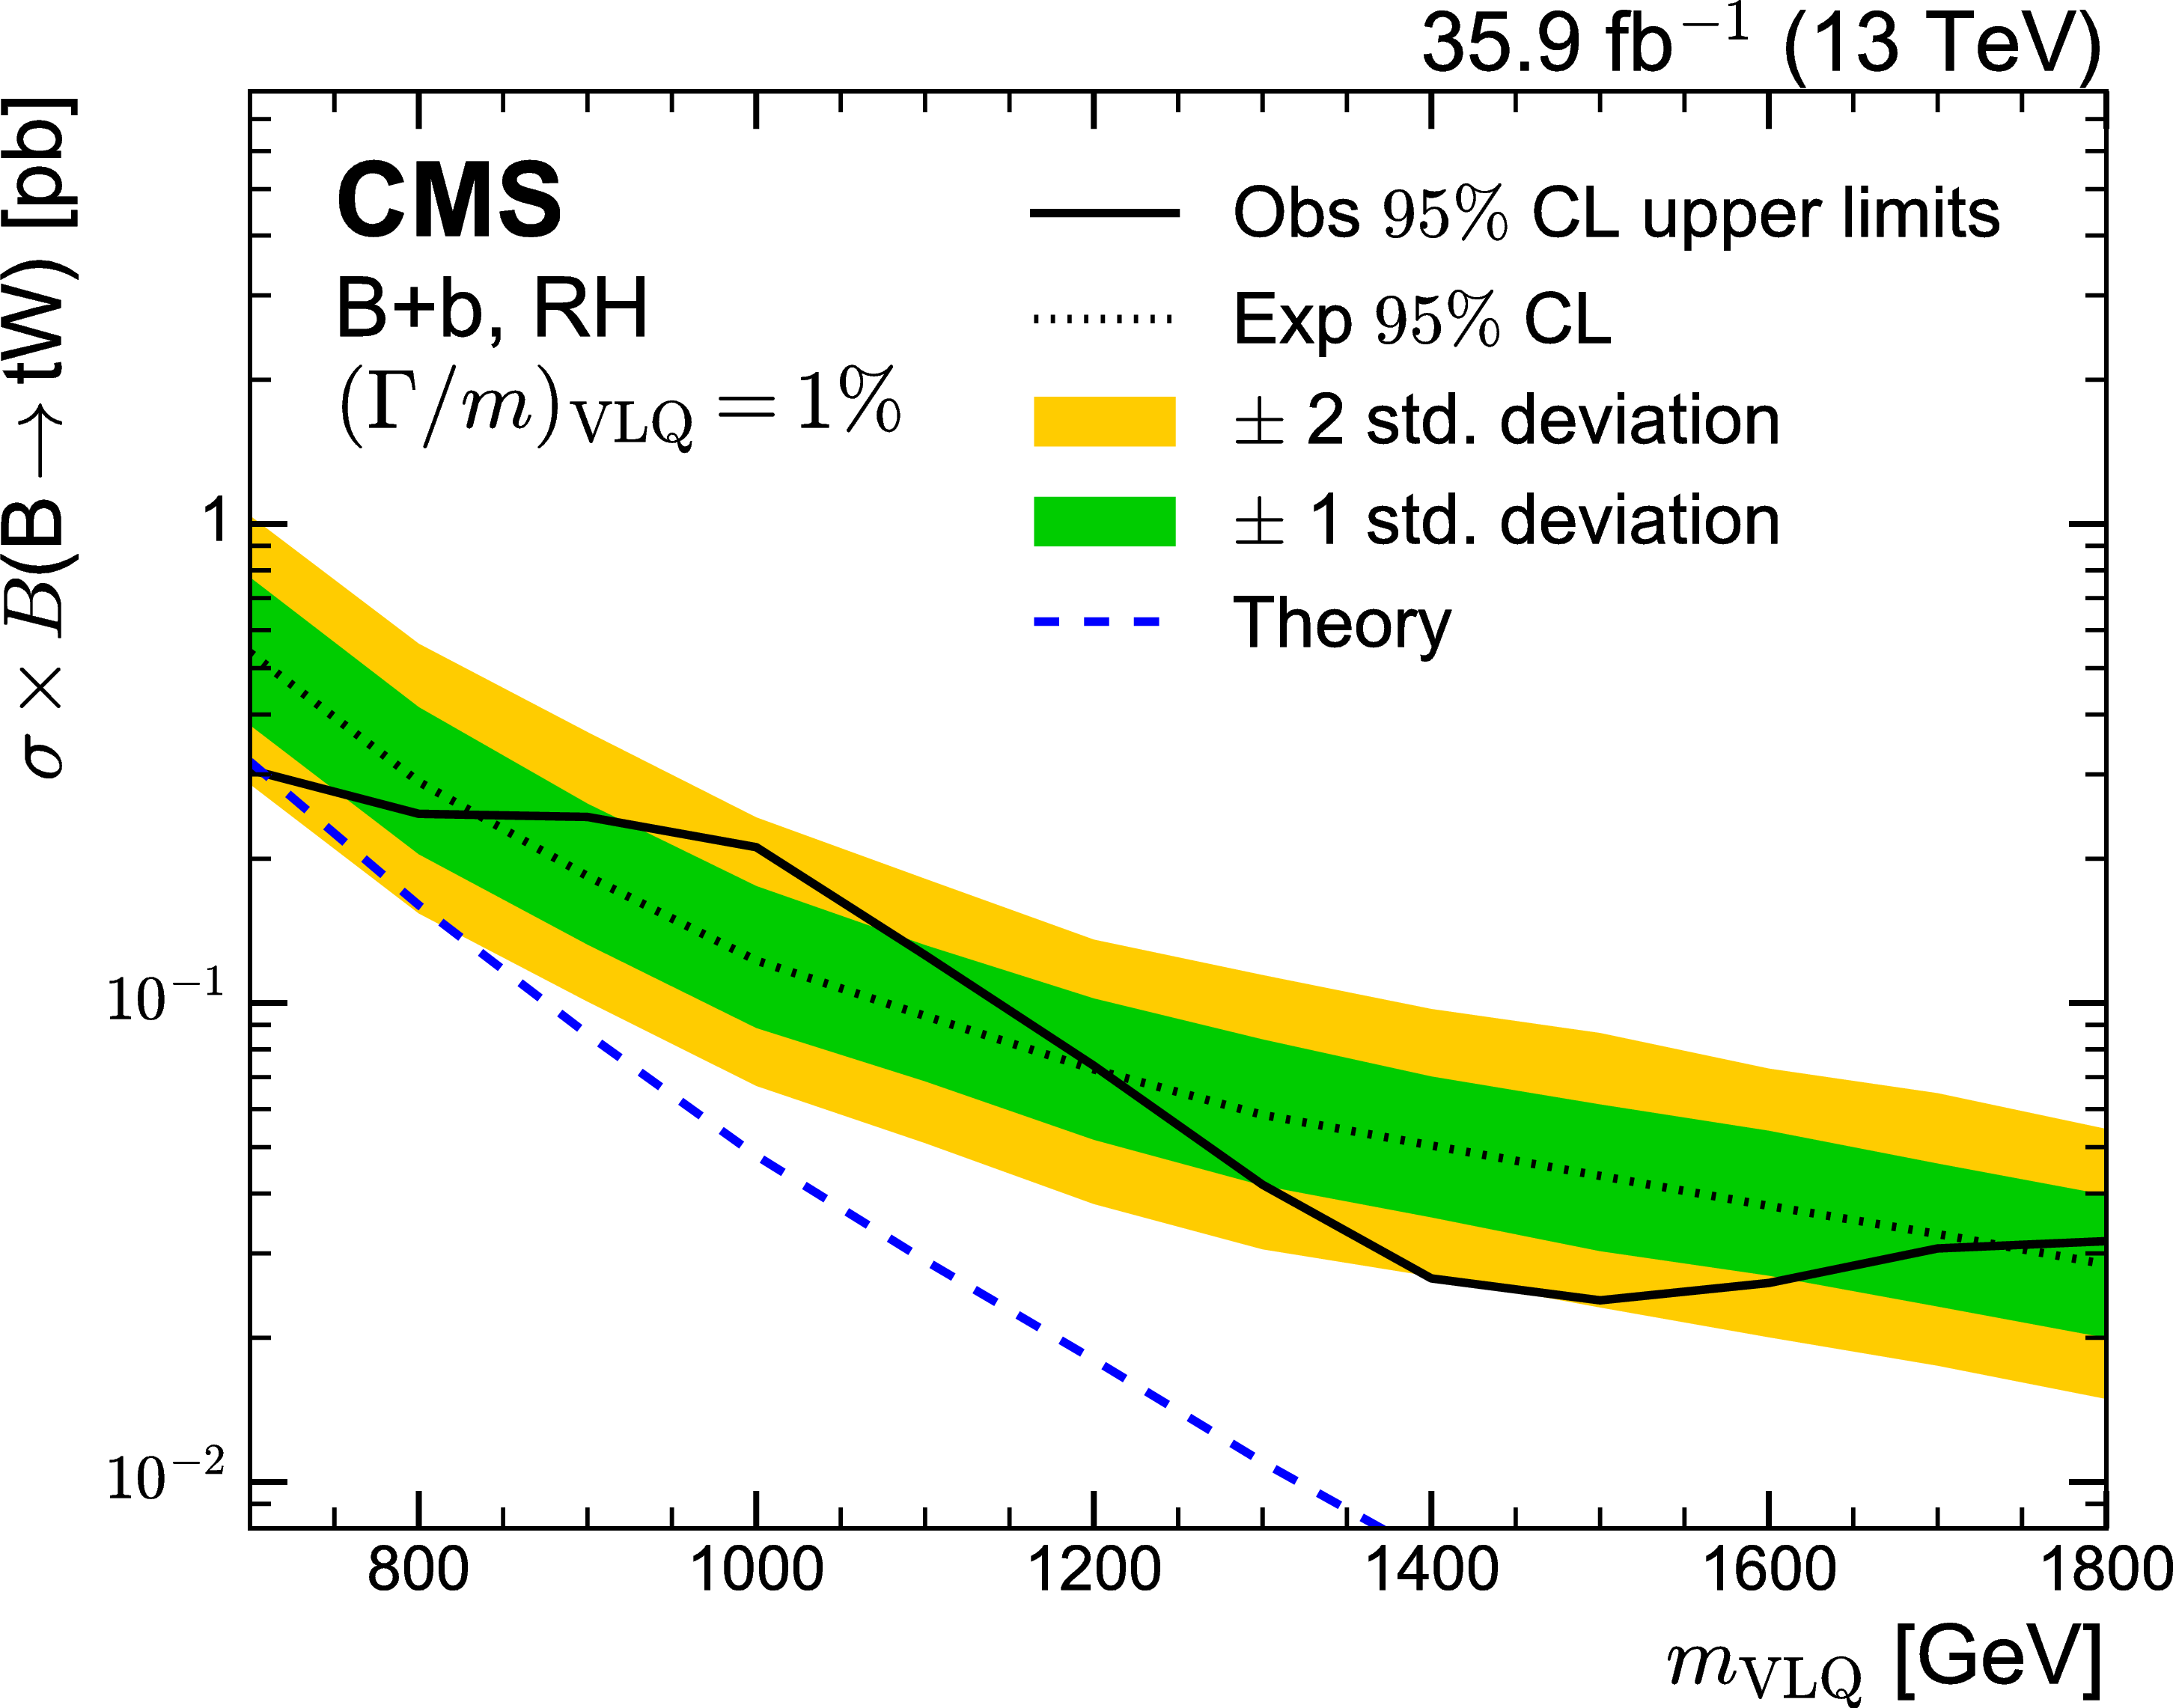
Figure 7-b:
Upper limits at 95% CL on the product of the VLQ production cross section and branching fraction for the B+b production mode for a relative VLQ width of 1% and right-handed VLQ couplings. The dashed lines show the theoretical predictions. |
png pdf |
Figure 7-c:
Upper limits at 95% CL on the product of the VLQ production cross section and branching fraction for the B+b production mode for 10% relative VLQ width and left-handed VLQ couplings The dashed lines show the theoretical predictions. |
png pdf |
Figure 7-d:
A comparison of the observed exclusion limits for relative VLQ widths of 10, 20, and 30% for left-handed couplings. The dashed lines show the theoretical predictions. |
png pdf |
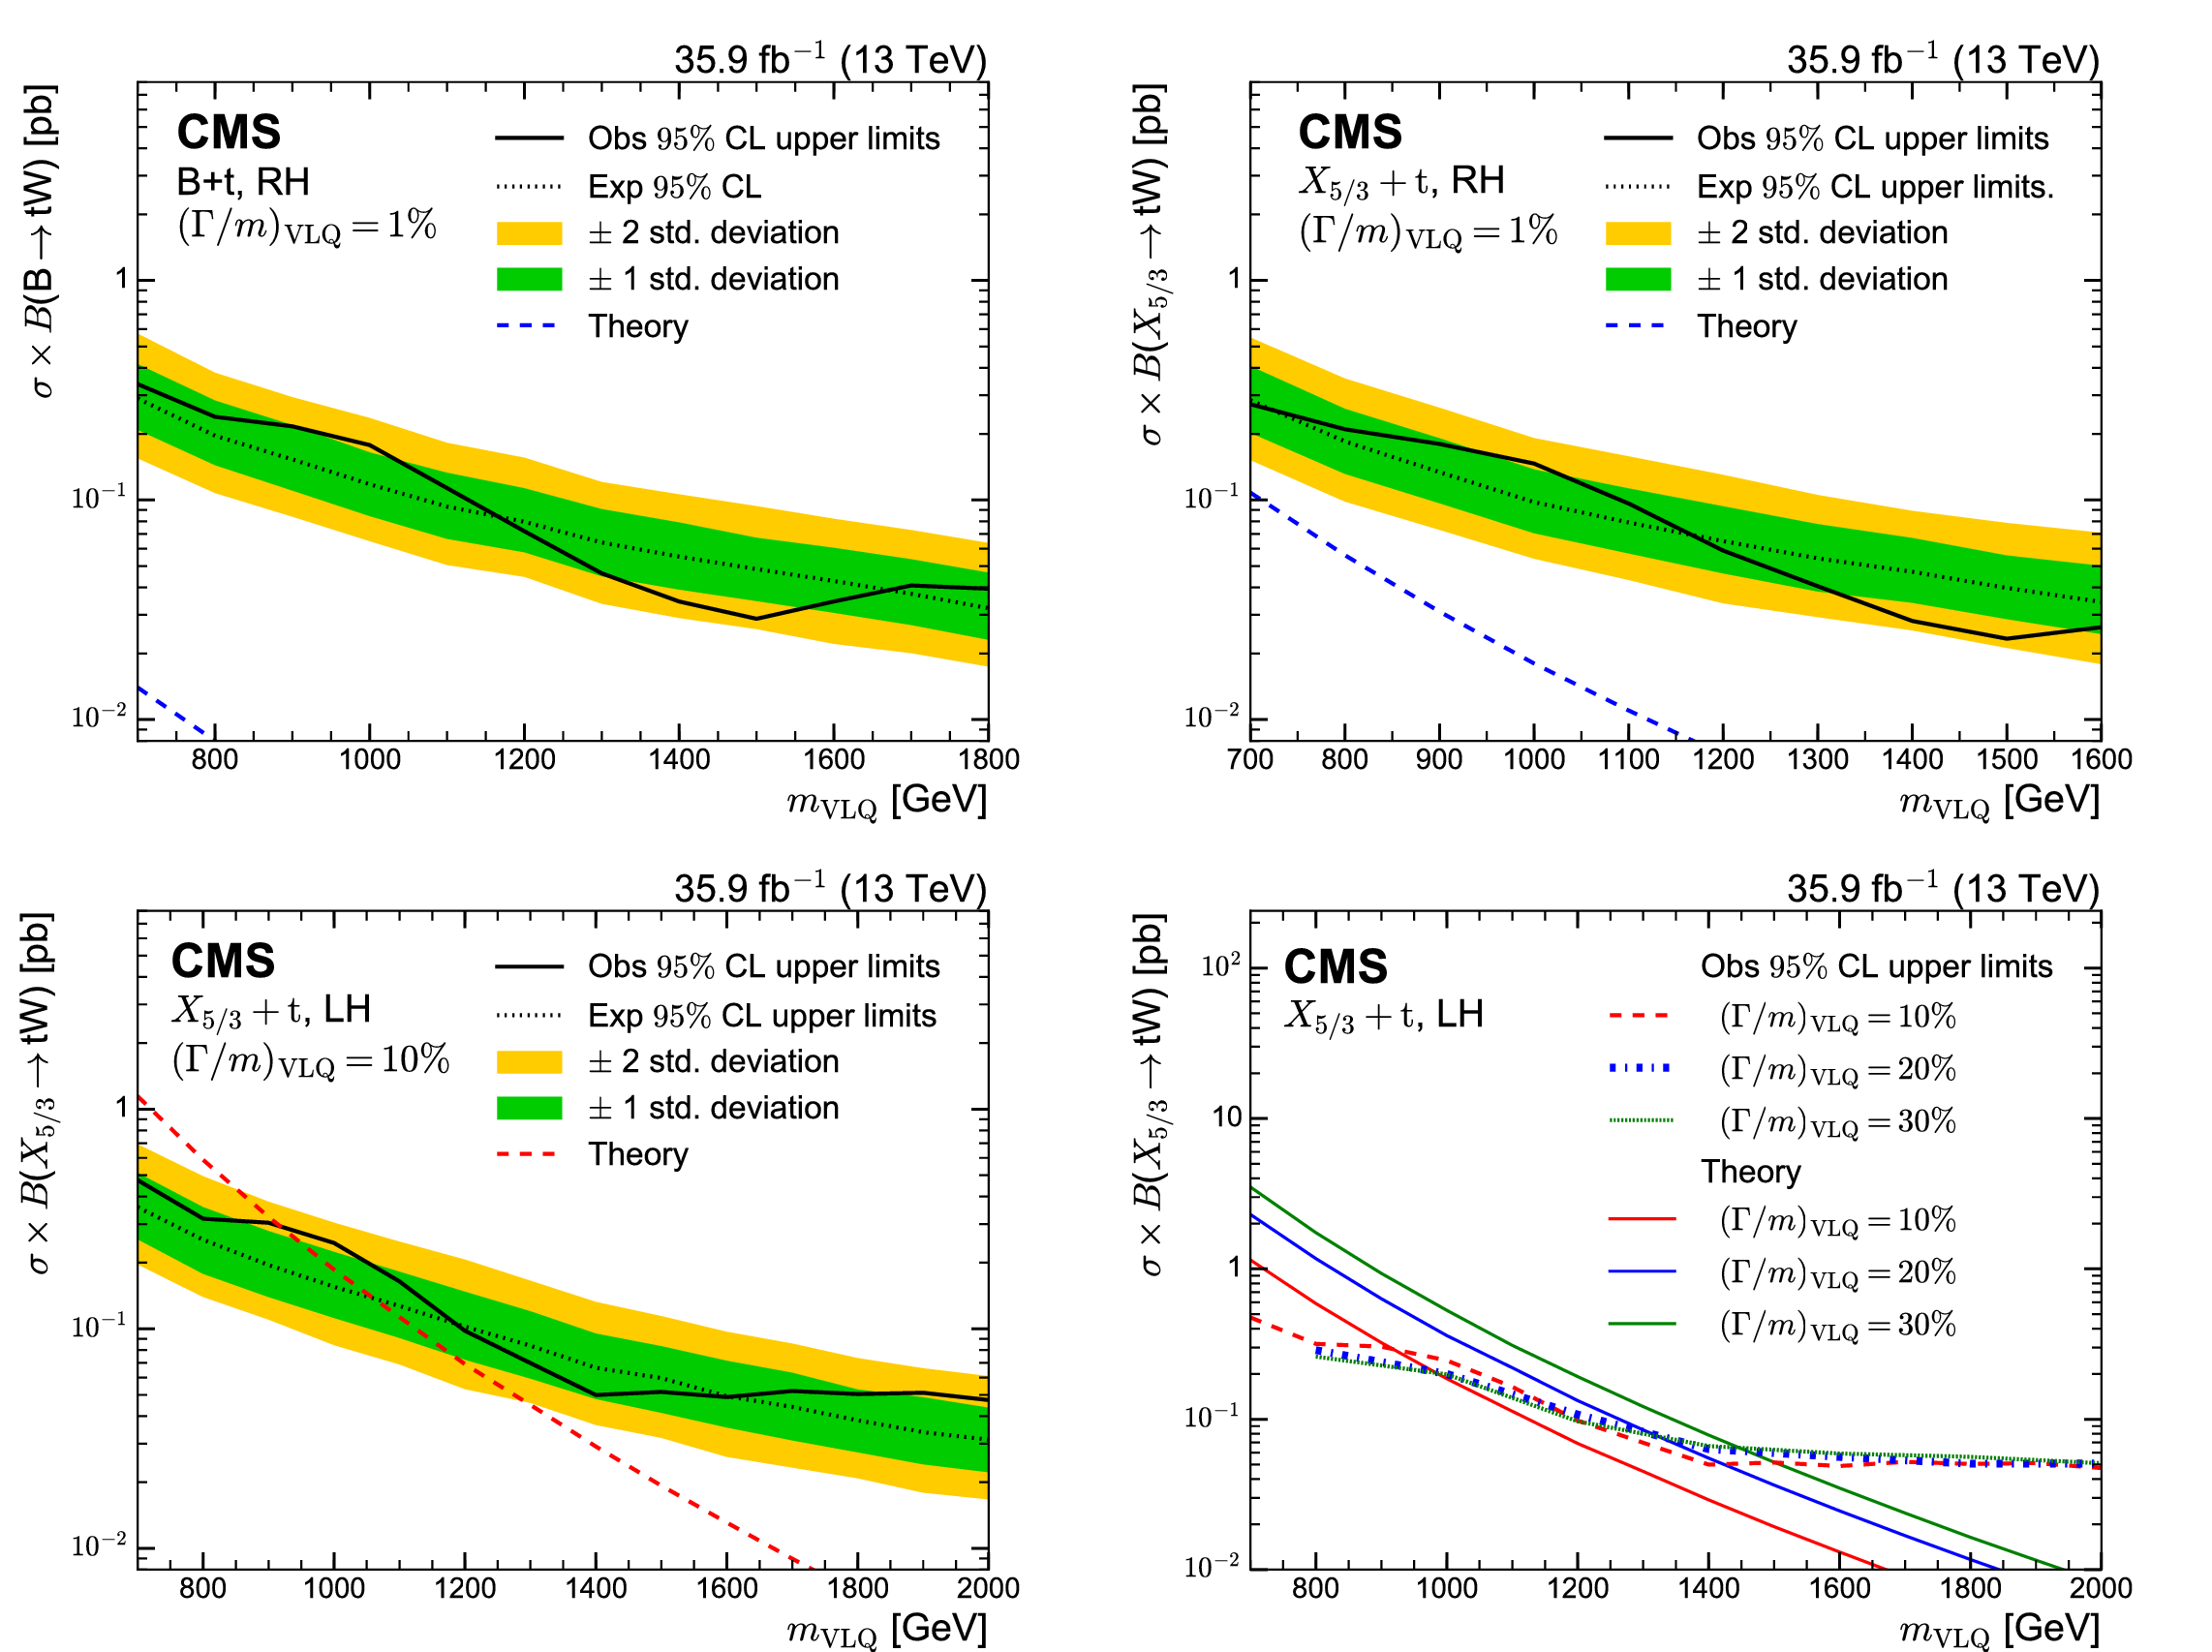
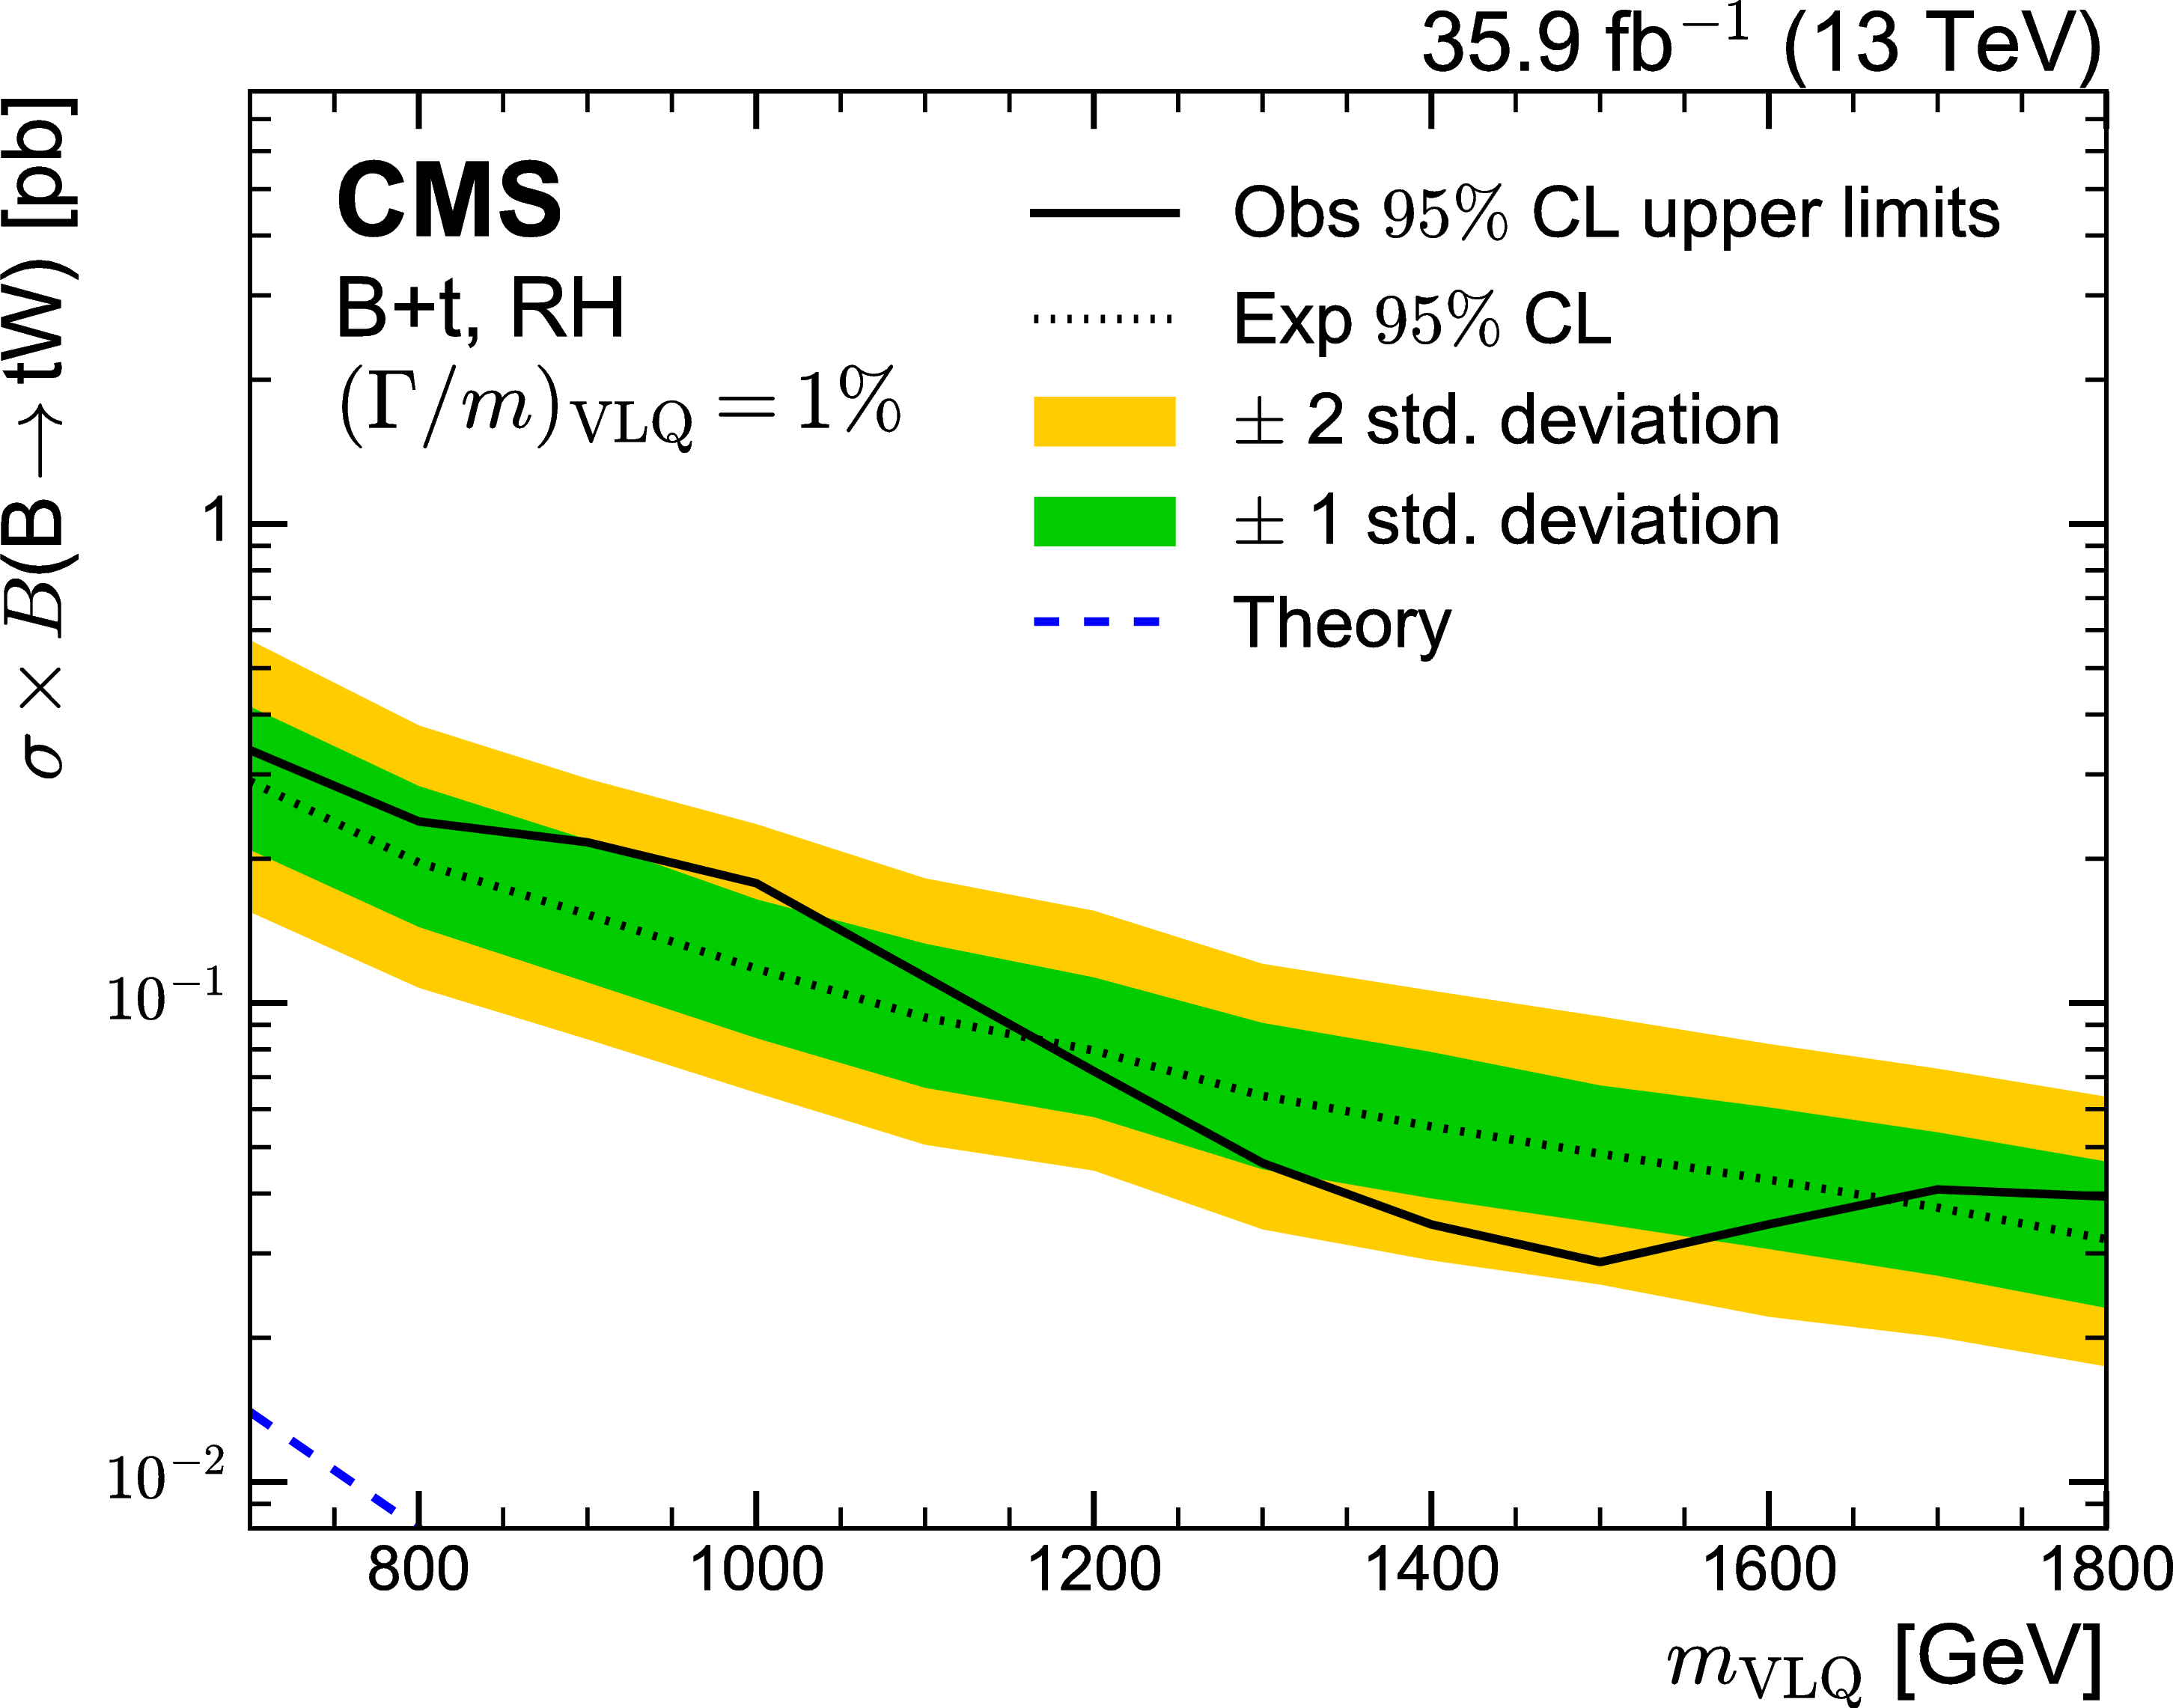
Figure 8:
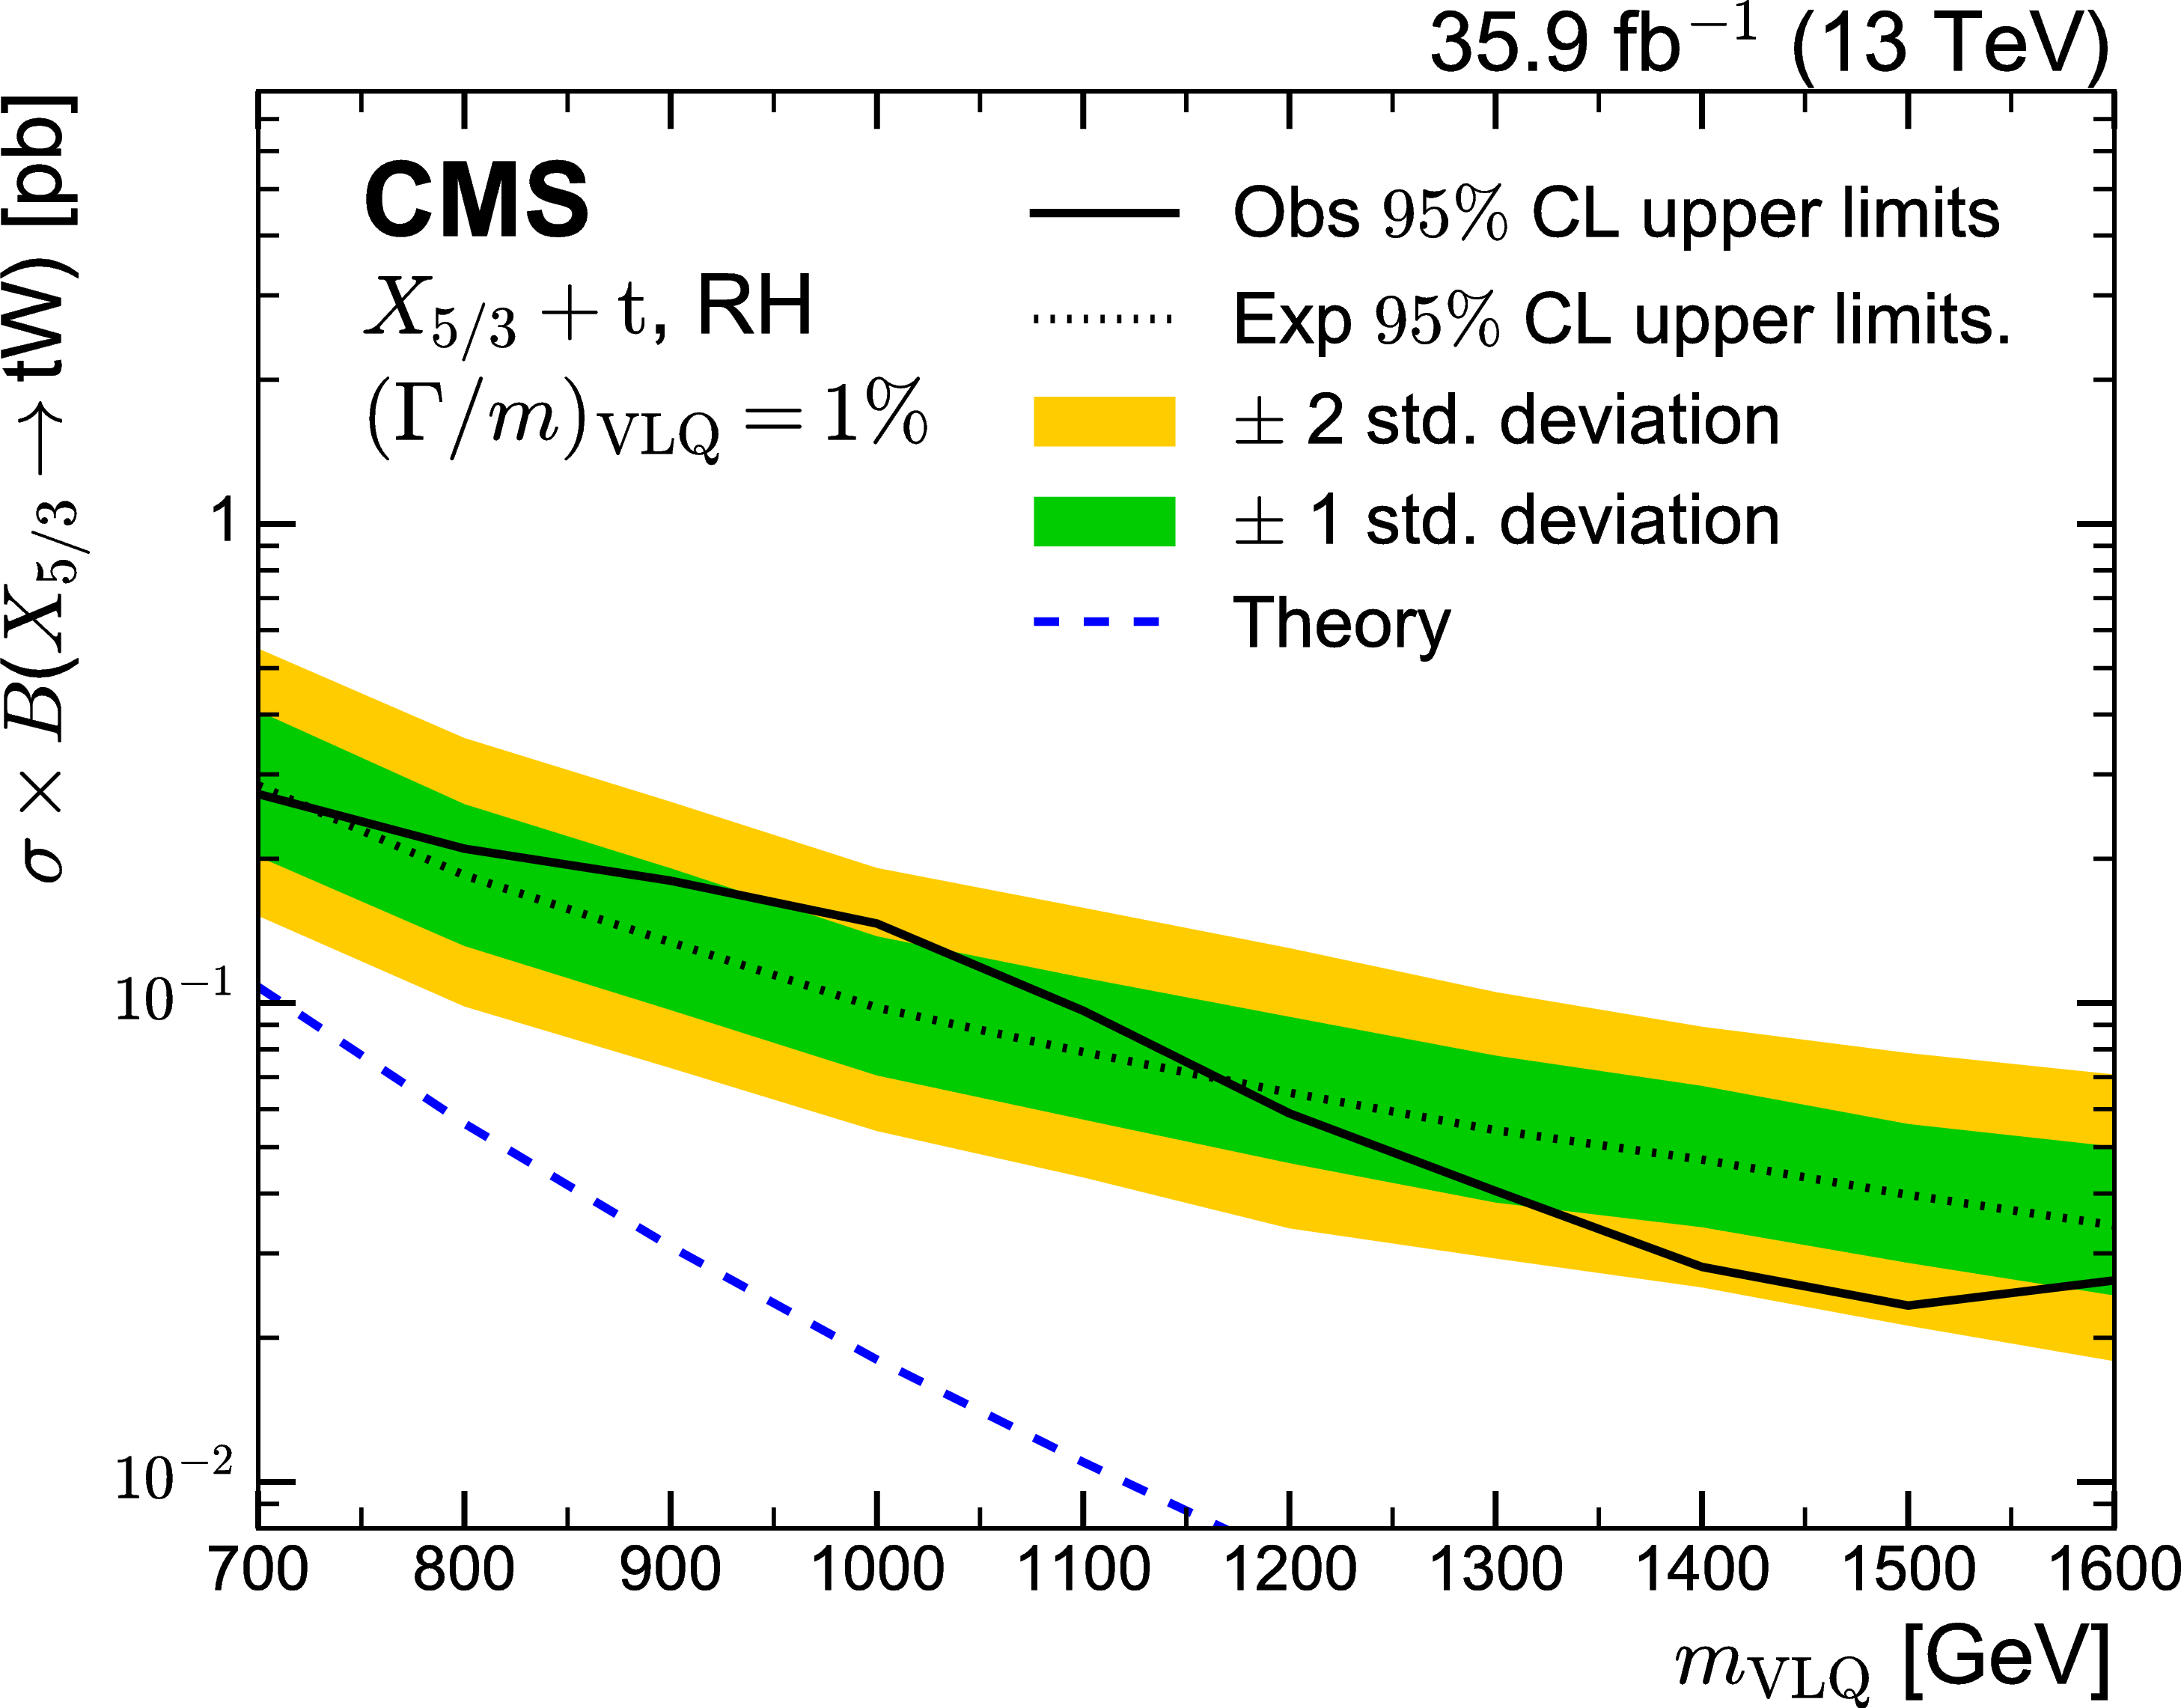
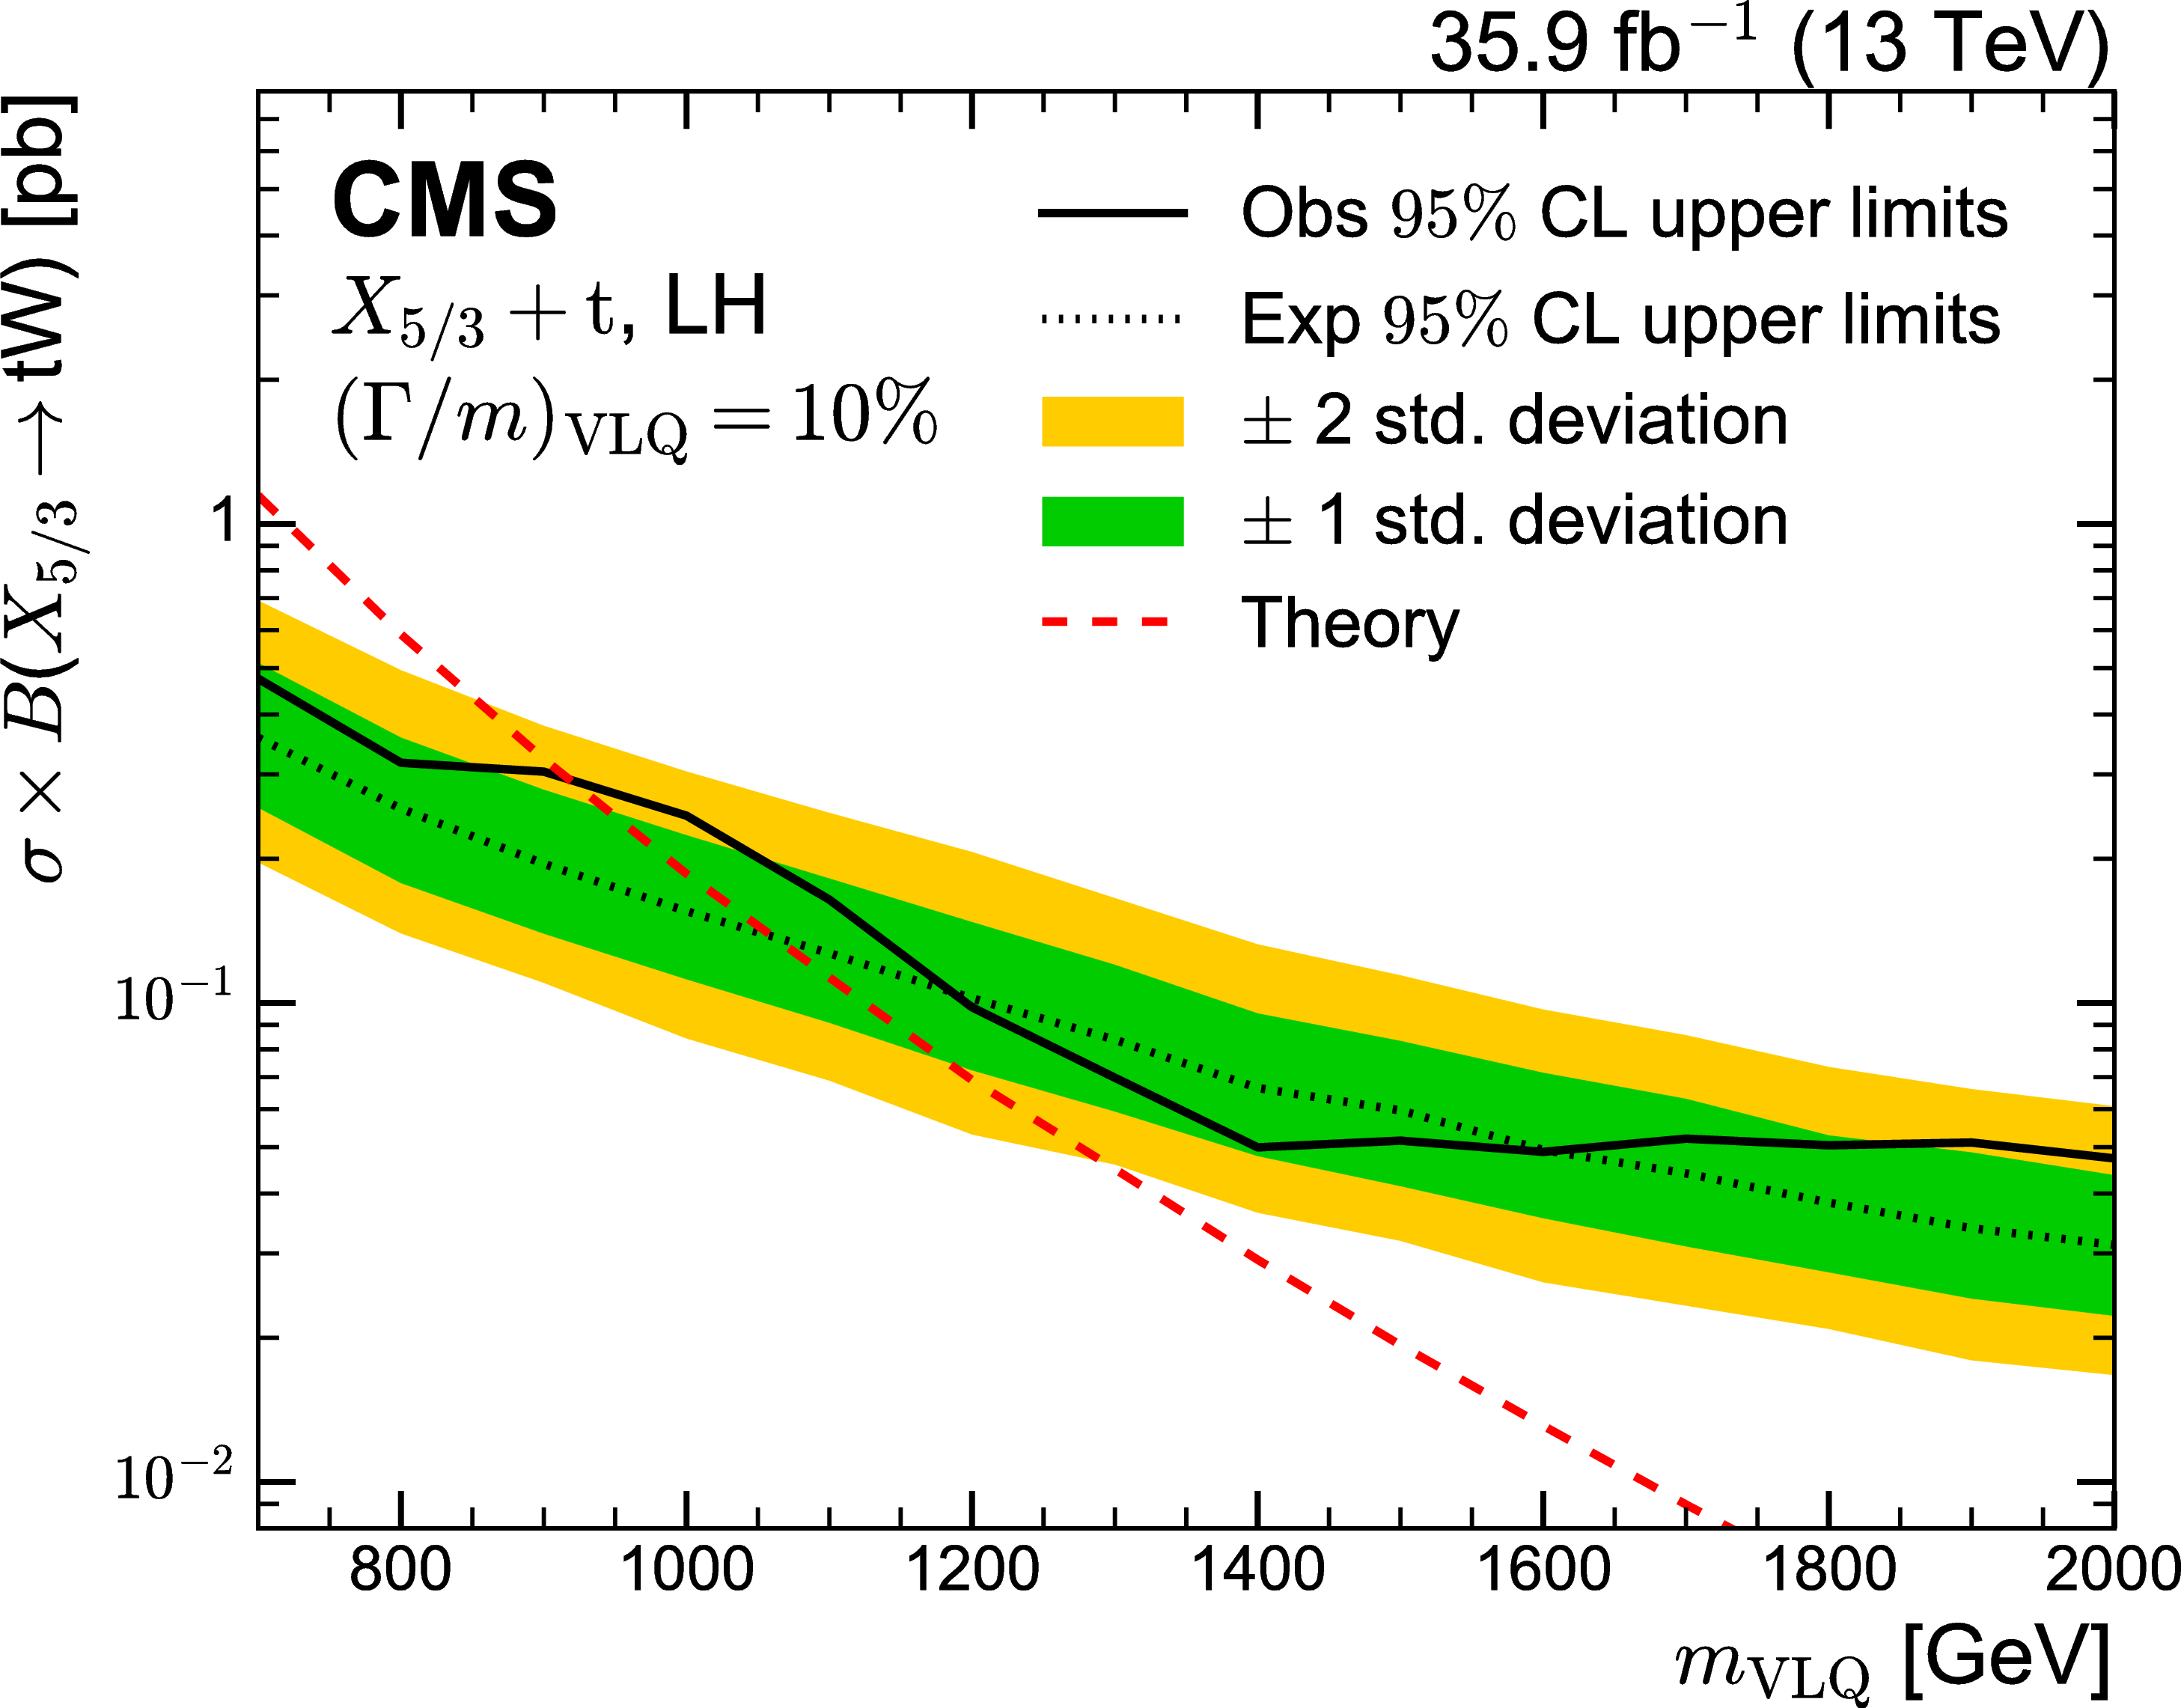
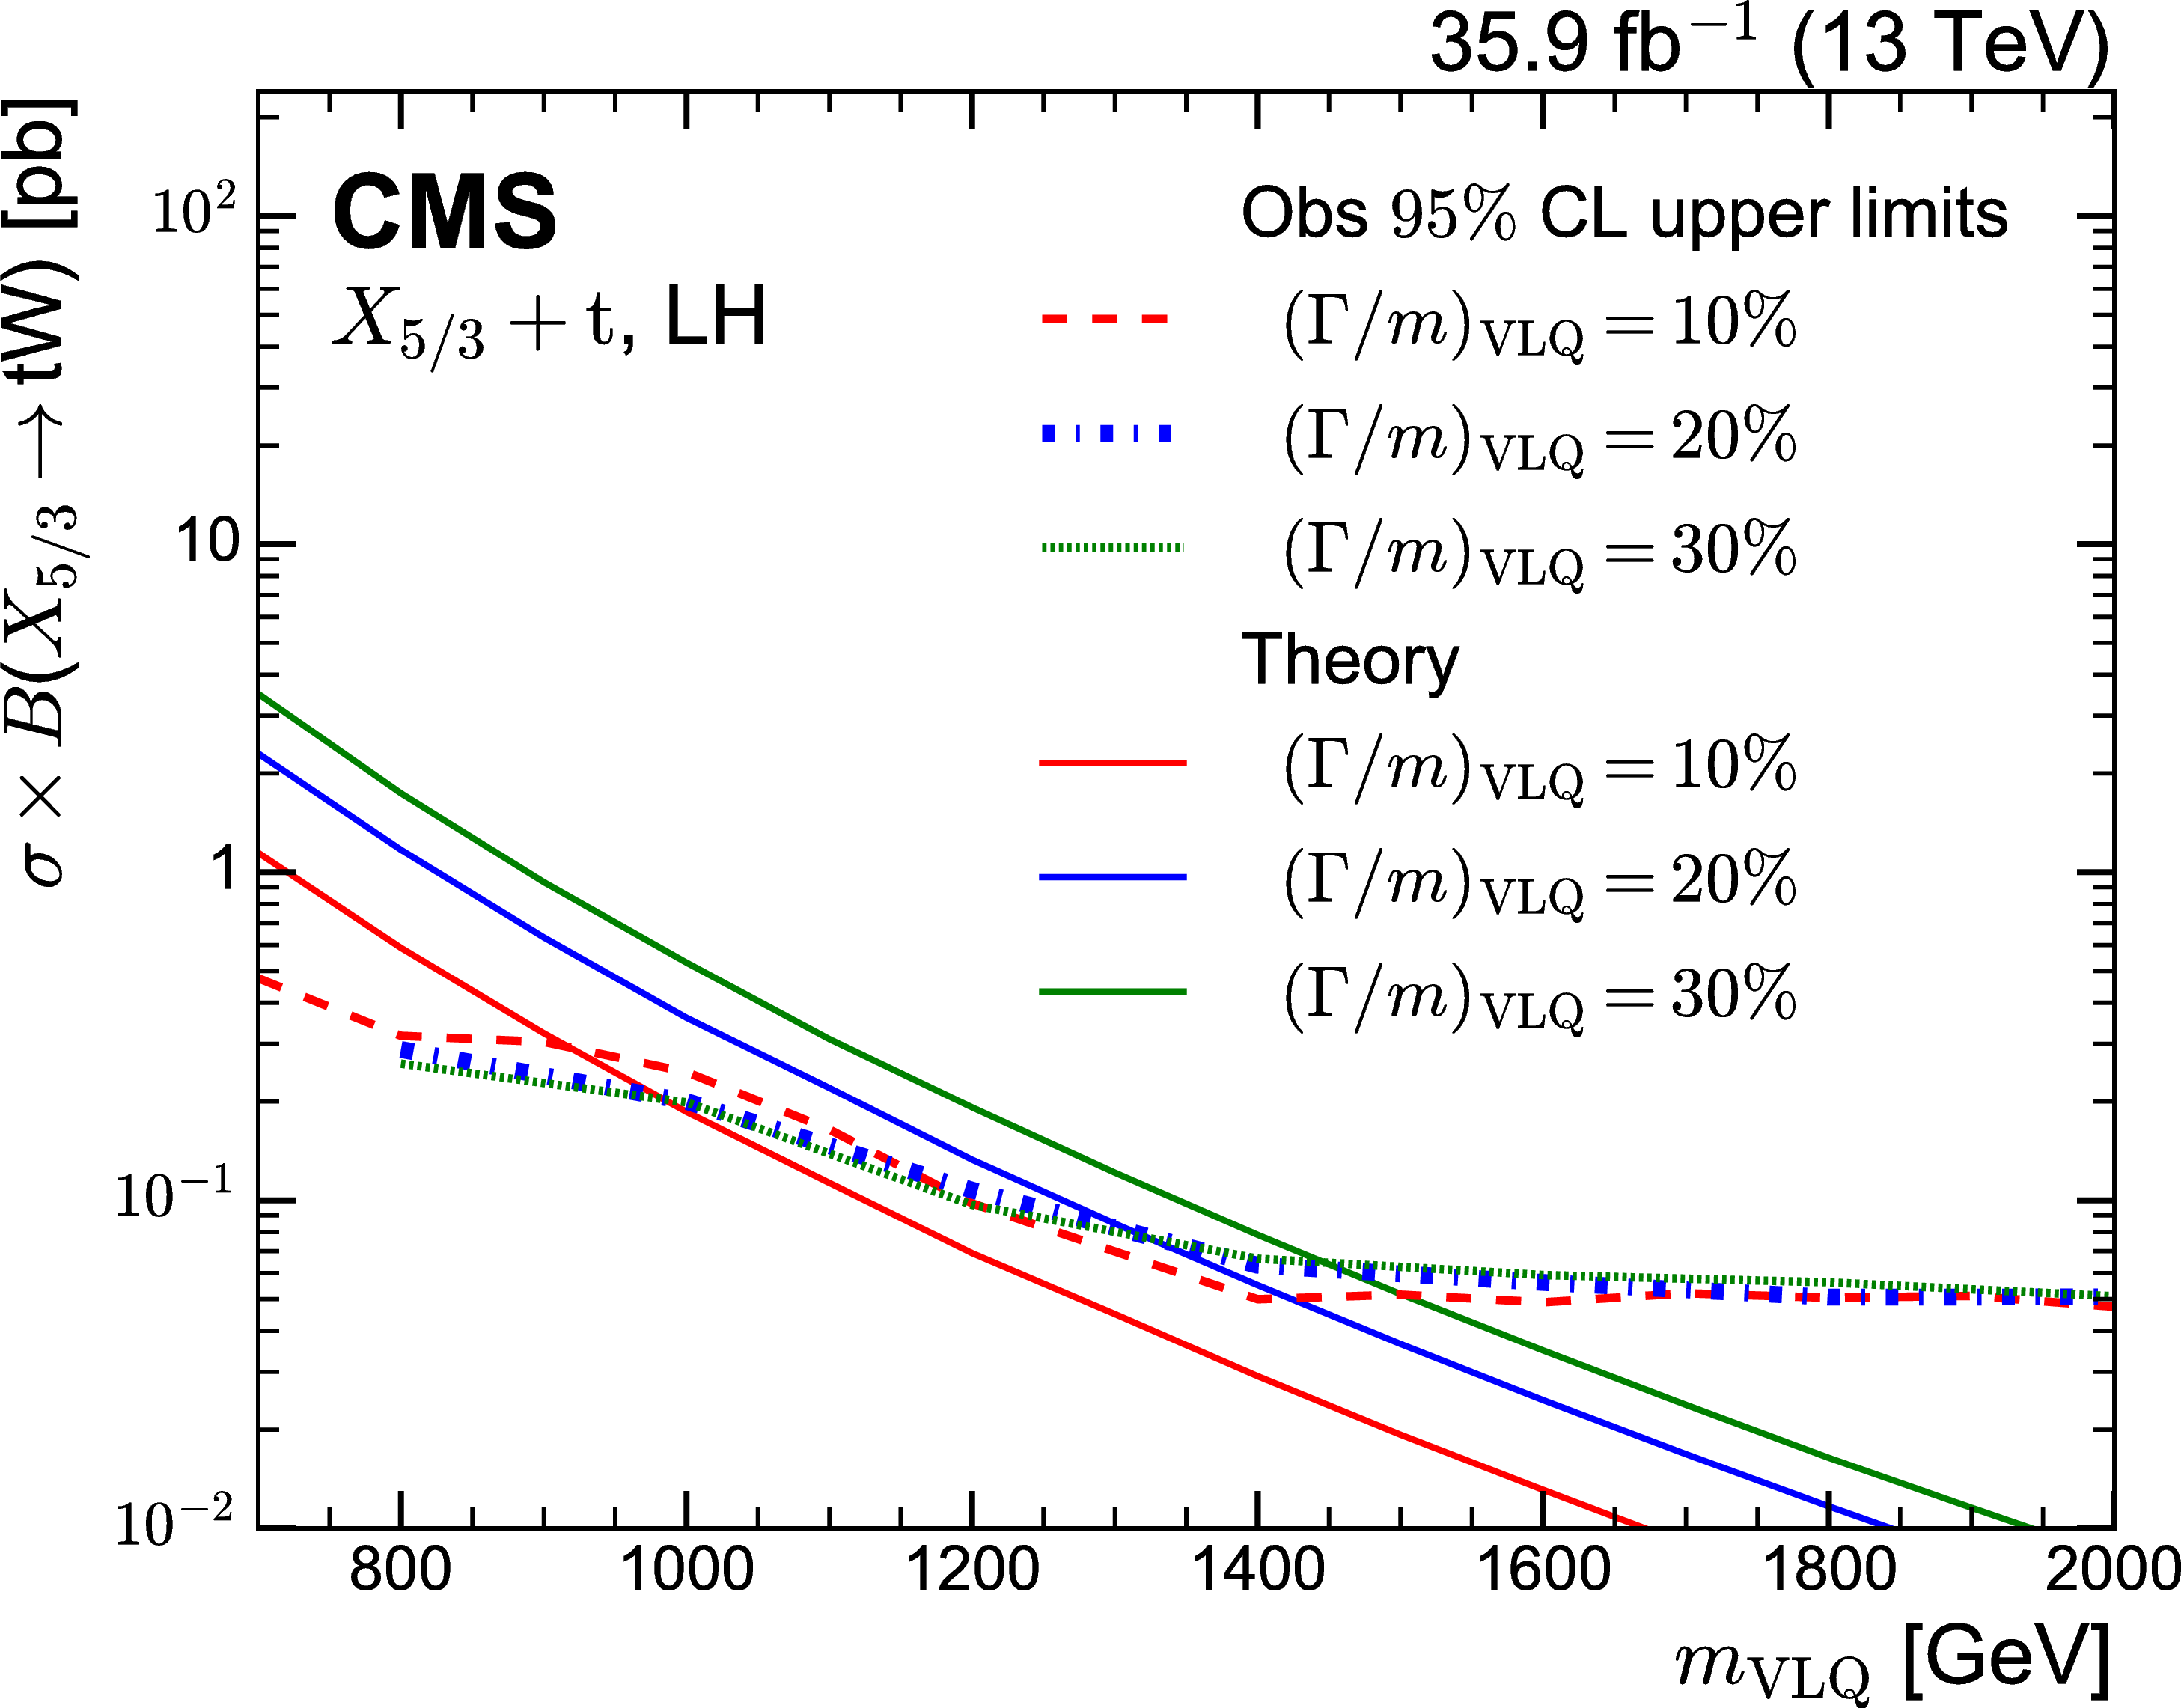
Upper limits at 95% CL on the product of the VLQ production cross section and branching fraction for the B+t and ${X_{5/3}}$+t production modes for right-handed VLQ couplings assuming a relative VLQ width of 1% (upper left and right), for the ${X_{5/3}}$+t production mode with left-handed VLQ couplings and a 10% relative width (lower left) and a comparison of the observed exclusion limits for left-handed couplings for relative widths of 10, 20, and 30% (lower right). The dashed lines show the theoretical predictions. |
png pdf |
Figure 8-a:
Upper limits at 95% CL on the product of the VLQ production cross section and branching fraction for the B+t production modes for right-handed VLQ couplings assuming a relative VLQ width of 1%. The dashed lines show the theoretical predictions. |
png pdf |
Figure 8-b:
Upper limits at 95% CL on the product of the VLQ production cross section and branching fraction for the ${X_{5/3}}$+t production modes for right-handed VLQ couplings assuming a relative VLQ width of 1%. The dashed lines show the theoretical predictions. |
png pdf |
Figure 8-c:
Upper limits at 95% CL on the product of the VLQ production cross section and branching fraction for the ${X_{5/3}}$+t production mode with left-handed VLQ couplings and a 10% relative width. The dashed lines show the theoretical predictions. |
png pdf |
Figure 8-d:
A comparison of the observed exclusion limits for left-handed couplings for relative widths of 10, 20, and 30%. The dashed lines show the theoretical predictions. |
| Tables | |
png pdf |
Table 1:
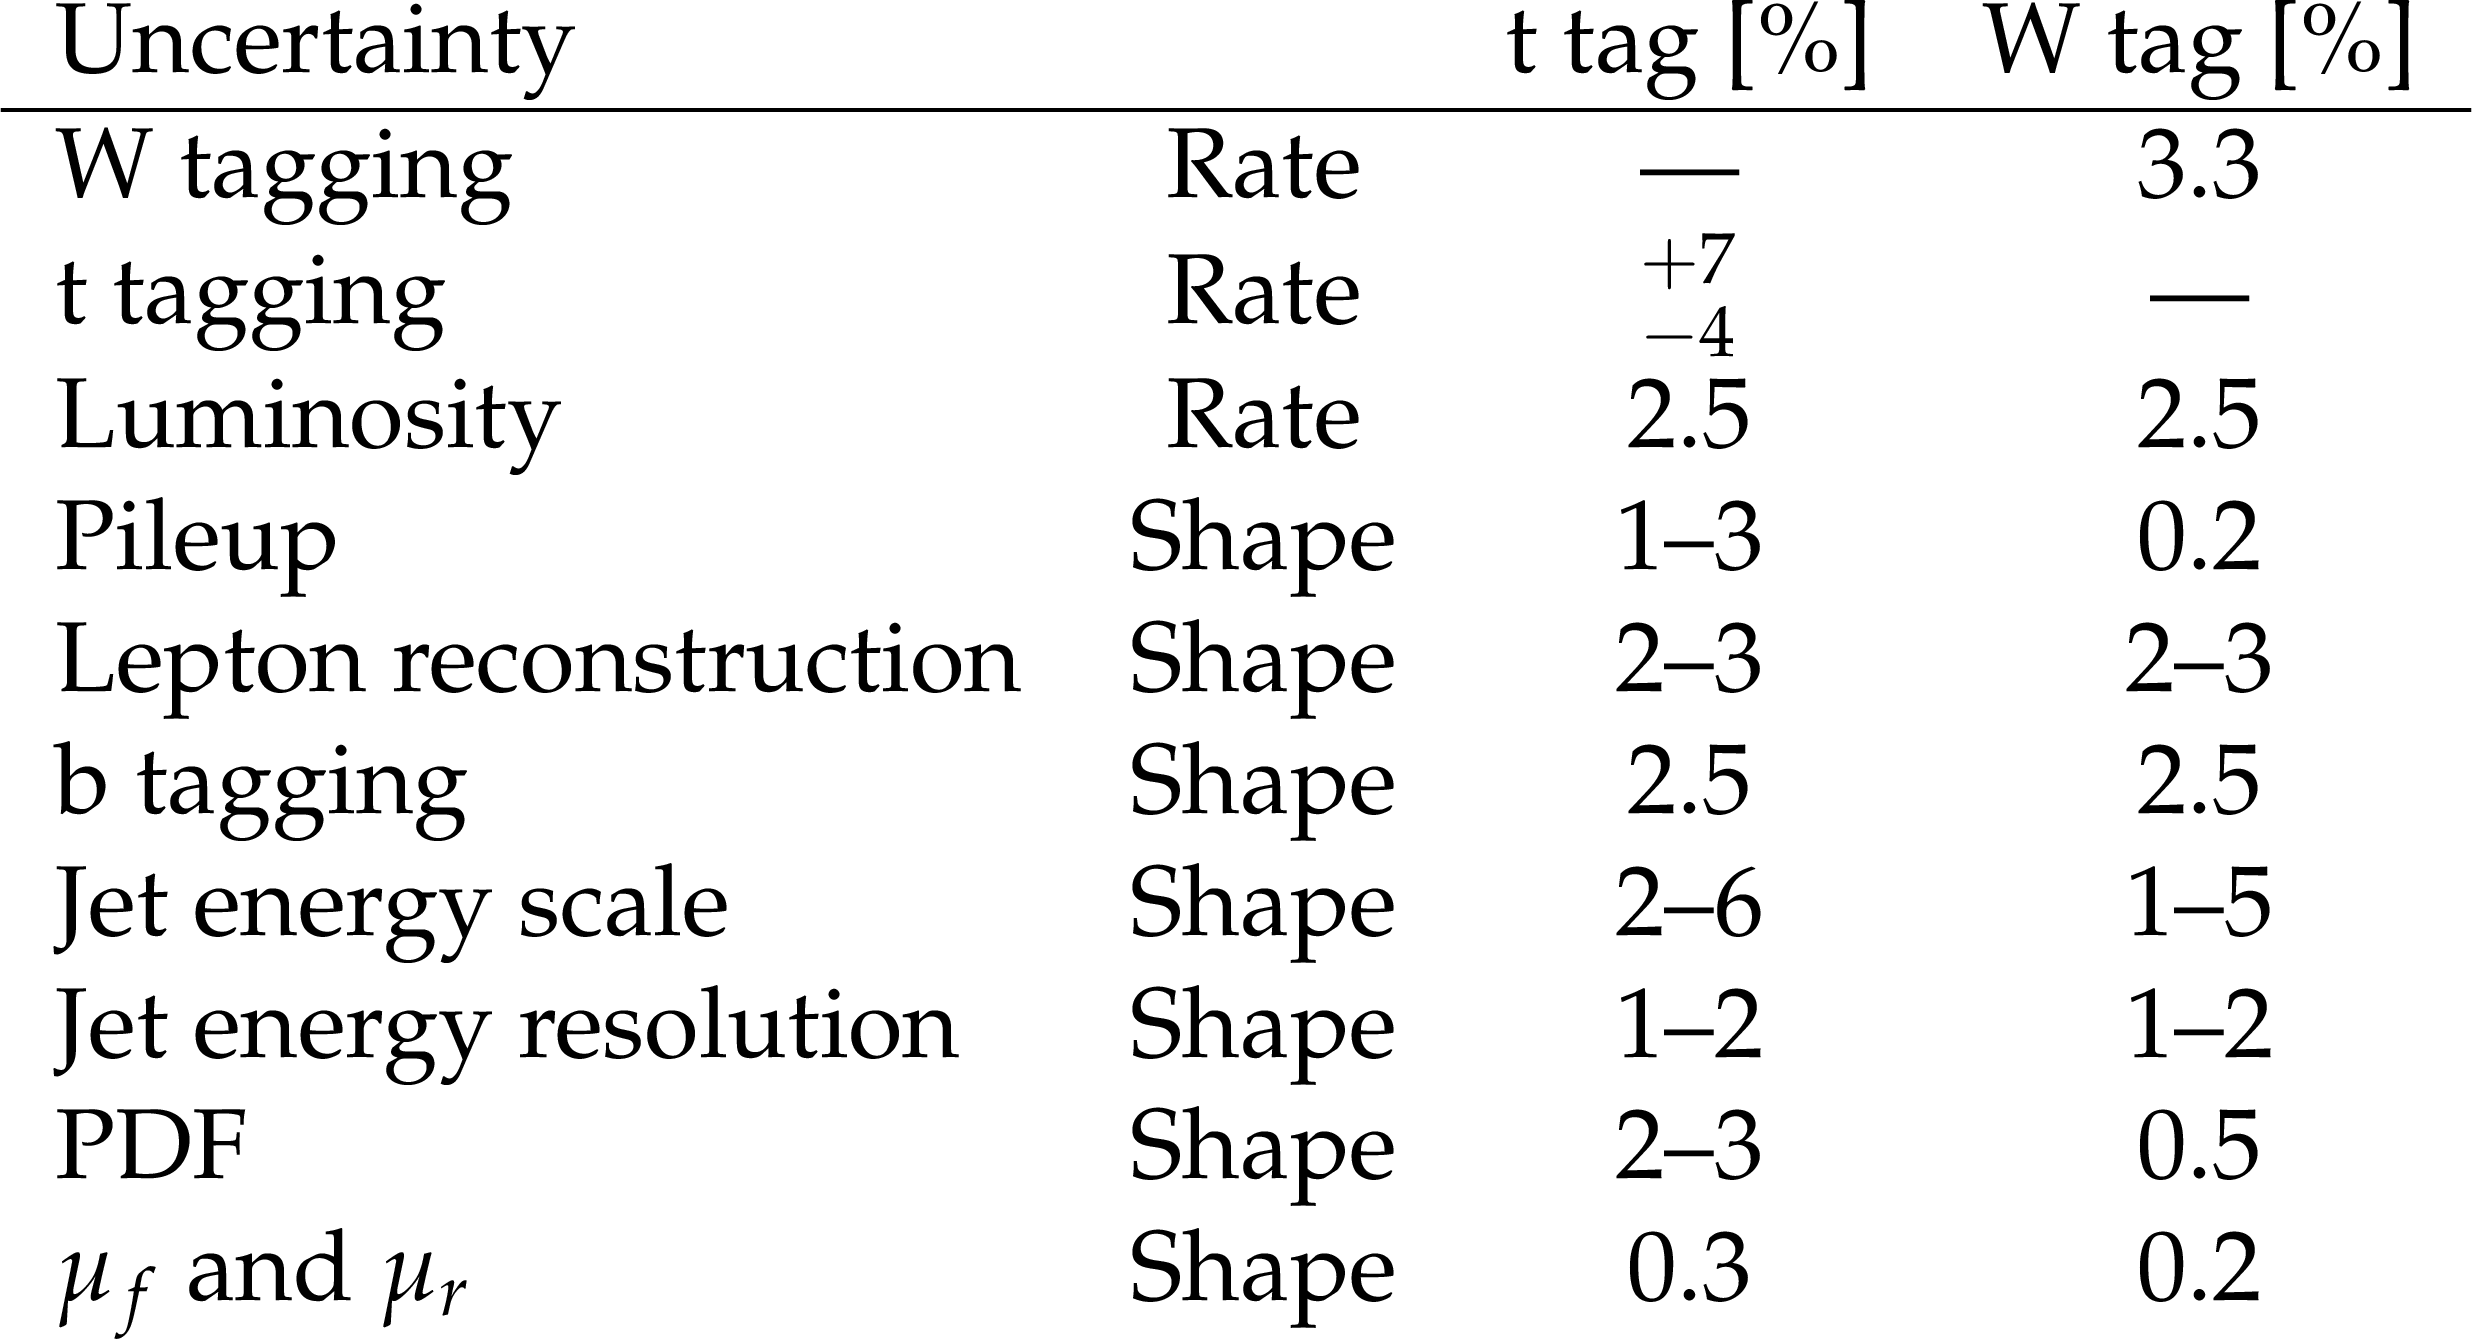
Uncertainties considered for simulated signal events in the B+b production mode ($m_{{\mathrm {B}} } = $ 900 GeV) for right-handed VLQ couplings for the t tag and W tag categories. The uncertainties in the b tag categories are of comparable size to those in the W tag category. |
png pdf |
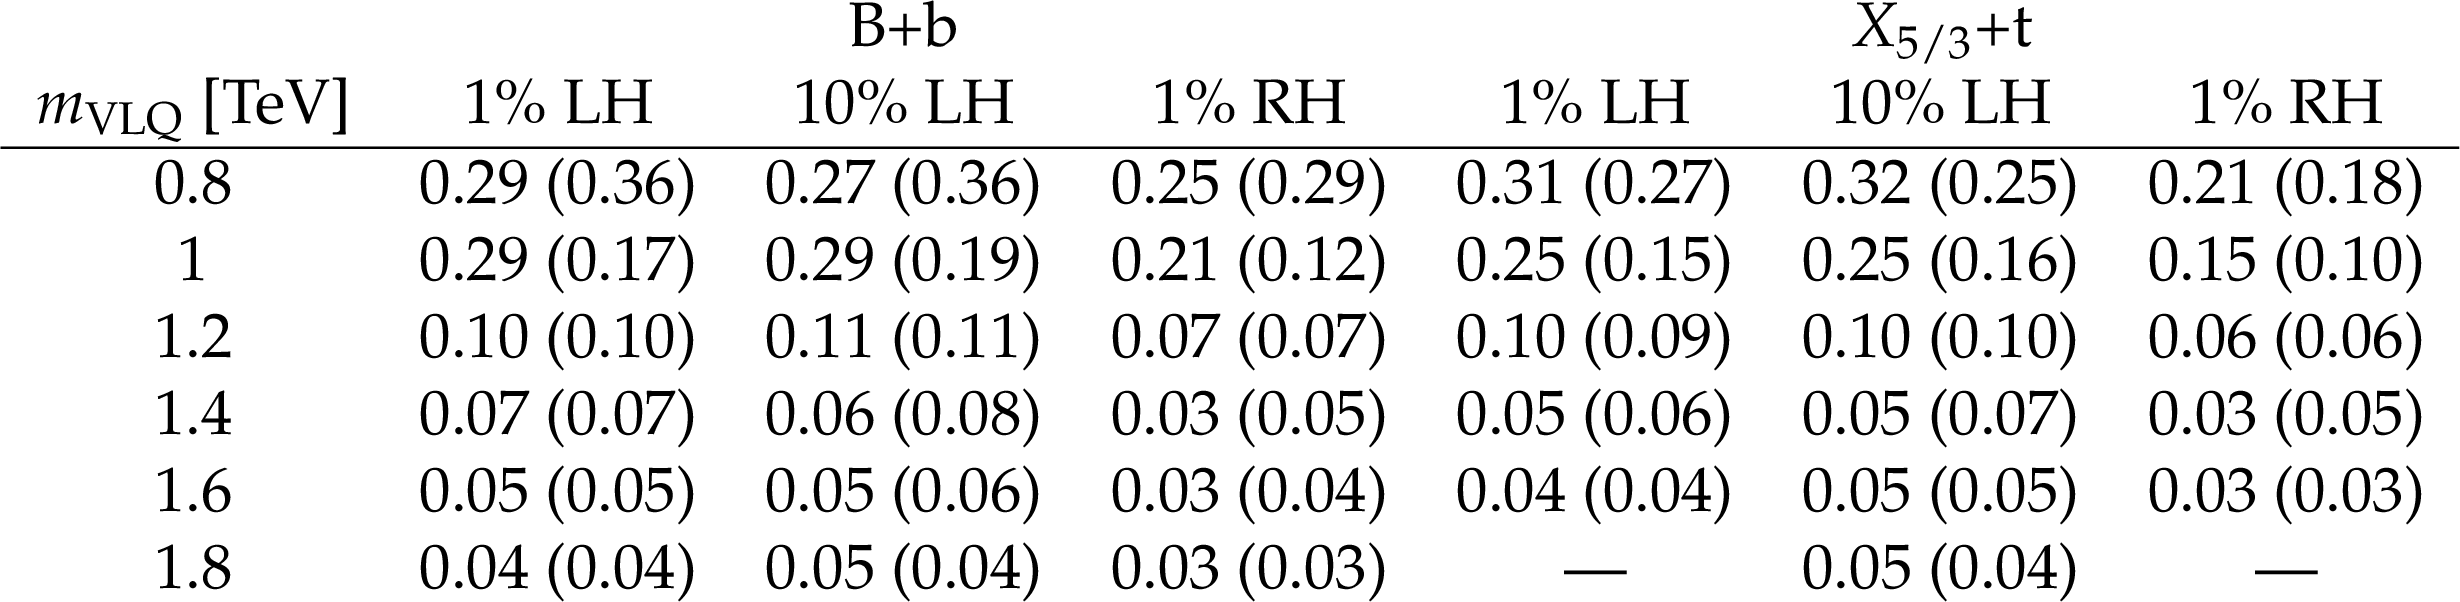
Table 2:
Observed (expected) upper limits at 95% CL on the product of the cross section and branching fraction for the B+b and ${X_{5/3}}$+t production modes, for a set of VLQ masses, for VLQs widths of 1% and 10%, and for left-handed and right-handed couplings. The exclusion limits for the B+t production mode (not shown) are very similar to those for the ${X_{5/3}}$+t mode. |
| Summary |
| A search for singly produced vector-like quarks decaying into a top quark and a W boson has been performed using the 2016 data set recorded by the CMS experiment at the CERN LHC. The selection is optimised for high vector-like quark masses, with a single muon or electron, significant missing transverse momentum, and two jets with high ${p_{\mathrm{T}}}$ in the final state. Vector-like quarks in the single production mode can be produced in association with a t or a b quark and a forward jet. The latter feature is used to obtain the background prediction in the signal regions from data. The mass of the vector-like quark is reconstructed from the hadronic jets, the missing transverse momentum, and the lepton in the event. Different decay possibilities of the t and W are considered. The reach of the search is enhanced by t, W, and b tagging methods. No significant deviation from the standard model prediction is observed. Upper exclusion limits at 95% confidence level on the product of the production cross section and branching fraction range from around 0.3-0.03pb for vector-like quark masses between 700 and 2000 GeV. Depending on the vector-like quark type, coupling, and decay width to tW, mass exclusion limits up to 1660 GeV are obtained. These represent the most stringent exclusion limits for the single production of vector-like quarks in this channel. |
| References | ||||
| 1 | ATLAS Collaboration | Observation of a new particle in the search for the standard model Higgs boson with the ATLAS detector at the LHC | PLB 716 (2012) 1 | 1207.7214 |
| 2 | CMS Collaboration | Observation of a new boson at a mass of 125 GeV with the CMS experiment at the LHC | PLB 716 (2012) 30 | CMS-HIG-12-028 1207.7235 |
| 3 | N. Arkani-Hamed, A. G. Cohen, E. Katz, and A. E. Nelson | The littlest Higgs | JHEP 07 (2002) 034 | hep-ph/0206021 |
| 4 | M. Schmaltz | Physics beyond the standard model (theory): Introducing the little Higgs | NPPS 117 (2003) 40 | hep-ph/0210415 |
| 5 | M. Schmaltz and D. Tucker-Smith | Little Higgs review | Ann. Rev. Nucl. Part. Sci. 55 (2005) 229 | hep-ph/0502182 |
| 6 | D. Marzocca, M. Serone, and J. Shu | General composite Higgs models | JHEP 08 (2012) 013 | 1205.0770 |
| 7 | A. Djouadi and A. Lenz | Sealing the fate of a fourth generation of fermions | PLB 715 (2012) 310 | 1204.1252 |
| 8 | J. A. Aguilar-Saavedra, R. Benbrik, S. Heinemeyer, and M. P\'erez-Victoria | Handbook of vectorlike quarks: Mixing and single production | PRD 88 (2013) 094010 | 1306.0572 |
| 9 | ATLAS and CMS Collaborations | Measurements of the Higgs boson production and decay rates and constraints on its couplings from a combined ATLAS and CMS analysis of the LHC $ {\mathrm{p}}{\mathrm{p}} $ collision data at $ \sqrt{s}= $ 7 and 8 TeV | JHEP 08 (2016) 045 | 1606.02266 |
| 10 | CMS Collaboration | Inclusive search for a vector-like T quark with charge $ \frac{2}{3} $ in pp collisions at $ \sqrt{s} = $ 8 TeV | PLB 729 (2014) 149 | CMS-B2G-12-015 1311.7667 |
| 11 | CMS Collaboration | Search for vector-like T quarks decaying to top quarks and Higgs bosons in the all-hadronic channel using jet substructure | JHEP 06 (2015) 080 | CMS-B2G-14-002 1503.01952 |
| 12 | CMS Collaboration | Search for vector-like charge $ 2/3 $ T quarks in proton-proton collisions at $ \sqrt{s} = $ 8 TeV | PRD 93 (2016) 012003 | CMS-B2G-13-005 1509.04177 |
| 13 | CMS Collaboration | Search for single production of a heavy vector-like T quark decaying to a Higgs boson and a top quark with a lepton and jets in the final state | PLB 771 (2017) 80 | CMS-B2G-15-008 1612.00999 |
| 14 | CMS Collaboration | Search for single production of vector-like quarks decaying into a b quark and a W boson in proton-proton collisions at $ \sqrt s = $ 13 TeV | PLB 772 (2017) 634 | CMS-B2G-16-006 1701.08328 |
| 15 | CMS Collaboration | Search for top quark partners with charge 5/3 in proton-proton collisions at $ \sqrt{s}= $ 13 TeV | JHEP 08 (2017) 073 | CMS-B2G-15-006 1705.10967 |
| 16 | CMS Collaboration | Search for pair production of vector-like T and B quarks in single-lepton final states using boosted jet substructure in proton-proton collisions at $ \sqrt{s}= $ 13 TeV | JHEP 11 (2017) 085 | CMS-B2G-16-024 1706.03408 |
| 17 | CMS Collaboration | Search for pair production of vector-like quarks in the bW$ \overline{\mathrm{b}} $W channel from proton-proton collisions at $ \sqrt{s} = $ 13 TeV | PLB 779 (2018) 82 | CMS-B2G-17-003 1710.01539 |
| 18 | CMS Collaboration | Search for single production of a vector-like T quark decaying to a Z boson and a top quark in proton-proton collisions at $ \sqrt{s} = $ 13 TeV | PLB 781 (2018) 574 | CMS-B2G-17-007 1708.01062 |
| 19 | CMS Collaboration | Search for single production of vector-like quarks decaying to a b quark and a Higgs boson | JHEP 06 (2018) 031 | CMS-B2G-17-009 1802.01486 |
| 20 | ATLAS Collaboration | Search for heavy vector-like quarks coupling to light quarks in proton-proton collisions at $ \sqrt{s}= $ 7 TeV with the ATLAS detector | PLB 712 (2012) 22 | 1112.5755 |
| 21 | ATLAS Collaboration | Search for pair production of a new quark that decays to a Z boson and a bottom quark with the ATLAS detector | PRL 109 (2012) 071801 | 1204.1265 |
| 22 | ATLAS Collaboration | Search for pair and single production of new heavy quarks that decay to a $ Z $ boson and a third-generation quark in $ {\mathrm{p}}{\mathrm{p}} $ collisions at $ \sqrt{s}= $ 8 TeV with the ATLAS detector | JHEP 11 (2014) 104 | 1409.5500 |
| 23 | ATLAS Collaboration | Analysis of events with $ b $-jets and a pair of leptons of the same charge in $ {\mathrm{p}}{\mathrm{p}} $ collisions at $ \sqrt{s}= $ 8 TeV with the ATLAS detector | JHEP 10 (2015) 150 | 1504.04605 |
| 24 | ATLAS Collaboration | Search for production of vector-like quark pairs and of four top quarks in the lepton-plus-jets final state in $ {\mathrm{p}}{\mathrm{p}} $ collisions at $ \sqrt{s}= $ 8 TeV with the ATLAS detector | JHEP 08 (2015) 105 | 1505.04306 |
| 25 | ATLAS Collaboration | Search for vector-like $ B $ quarks in events with one isolated lepton, missing transverse momentum and jets at $ \sqrt{s}= $ 8 TeV with the ATLAS detector | PRD 91 (2015) 112011 | 1503.05425 |
| 26 | ATLAS Collaboration | Search for top squarks in final states with one isolated lepton, jets, and missing transverse momentum in $ \sqrt{s}=13 TeV {\mathrm{p}}{\mathrm{p}} $ collisions with the ATLAS detector | PRD 94 (2016) 052009 | 1606.03903 |
| 27 | ATLAS Collaboration | Search for single production of vector-like quarks decaying into Wb in $ {\mathrm{p}}{\mathrm{p}} $ collisions at $ \sqrt{s} = $ 8 TeV with the atlas detector | EPJC 76 (2016) 442 | 1602.05606 |
| 28 | ATLAS Collaboration | Search for single production of a vector-like quark via a heavy gluon in the $ 4b $ final state with the ATLAS detector in $ {\mathrm{p}}{\mathrm{p}} $ collisions at $ \sqrt{s} = $ 8 TeV | PLB 758 (2016) 249 | 1602.06034 |
| 29 | ATLAS Collaboration | Search for pair production of vector-like top quarks in events with one lepton, jets, and missing transverse momentum in $ \sqrt{s}=13 TeV {\mathrm{p}}{\mathrm{p}} $ collisions with the ATLAS detector | JHEP 08 (2017) 052 | 1705.10751 |
| 30 | ATLAS Collaboration | Search for pair production of heavy vector-like quarks decaying to high-$ p_{\mathrm{T}} $ W bosons and b quarks in the lepton-plus-jets final state in $ {\mathrm{p}}{\mathrm{p}} $ collisions at $ \sqrt{s}= $ 13 TeV with the ATLAS detector | JHEP 10 (2017) 141 | 1707.03347 |
| 31 | ATLAS Collaboration | Search for pair production of up-type vector-like quarks and for four-top-quark events in final states with multiple $ b $-jets with the ATLAS detector | JHEP 07 (2018) 089 | 1803.09678 |
| 32 | ATLAS Collaboration | Search for the production of single vector-like and excited quarks in the $ \mathrm{W}\Pqt $ final state in $ {\mathrm{p}}{\mathrm{p}} $ collisions at $ \sqrt{s} = $ 8 TeV with the ATLAS detector | JHEP 02 (2016) 110 | 1510.02664 |
| 33 | CMS Collaboration | Particle-flow reconstruction and global event description with the CMS detector | JINST 12 (2017) P10003 | CMS-PRF-14-001 1706.04965 |
| 34 | CMS Collaboration | Performance of electron reconstruction and selection with the CMS detector in proton-proton collisions at $ \sqrt{s} = $ 8 TeV | JINST 10 (2015) P06005 | CMS-EGM-13-001 1502.02701 |
| 35 | CMS Collaboration | Performance of CMS muon reconstruction in $ {\mathrm{p}}{\mathrm{p}} $ collision events at $ \sqrt{s} = $ 7 TeV | JINST 7 (2012) P10002 | CMS-MUO-10-004 1206.4071 |
| 36 | M. Cacciari, G. P. Salam, and G. Soyez | The anti-$ {k_{\mathrm{T}}} $ jet clustering algorithm | JHEP 04 (2008) 063 | 0802.1189 |
| 37 | M. Cacciari, G. P. Salam, and G. Soyez | Fastjet user manual | EPJC 72 (2012) 1896 | 1111.6097 |
| 38 | CMS Collaboration | The CMS experiment at the CERN LHC | JINST 3 (2008) S08004 | CMS-00-001 |
| 39 | CMS Collaboration | The CMS trigger system | JINST 12 (2017) P01020 | CMS-TRG-12-001 1609.02366 |
| 40 | CMS Collaboration | CMS luminosity measurements for the 2016 data taking period | CMS-PAS-LUM-17-001 | CMS-PAS-LUM-17-001 |
| 41 | P. Nason | A new method for combining NLO QCD with shower Monte Carlo algorithms | JHEP 11 (2004) 040 | hep-ph/0409146 |
| 42 | S. Frixione, P. Nason, and C. Oleari | Matching NLO QCD computations with parton shower simulations: the POWHEG method | JHEP 11 (2007) 070 | 0709.2092 |
| 43 | S. Alioli, P. Nason, C. Oleari, and E. Re | A general framework for implementing nlo calculations in shower monte carlo programs: the POWHEG BOX | JHEP 06 (2010) 043 | 1002.2581 |
| 44 | J. Alwall et al. | The automated computation of tree-level and next-to-leading order differential cross sections, and their matching to parton shower simulations | JHEP 07 (2014) 079 | 1405.0301 |
| 45 | R. Frederix and S. Frixione | Merging meets matching in MC@NLO | JHEP 12 (2012) 061 | 1209.6215 |
| 46 | J. Alwall et al. | Comparative study of various algorithms for the merging of parton showers and matrix elements in hadronic collisions | EPJC 53 (2008) 473 | 0706.2569 |
| 47 | T. Sjostrand et al. | An introduction to PYTHIA 8.2 | CPC 191 (2015) 159 | 1410.3012 |
| 48 | NNPDF Collaboration | Parton distributions for the LHC run II | JHEP 04 (2015) 040 | 1410.8849 |
| 49 | CMS Collaboration | Event generator tunes obtained from underlying event and multiparton scattering measurements | EPJC 76 (2016) 155 | CMS-GEN-14-001 1512.00815 |
| 50 | P. Skands, S. Carrazza, and J. Rojo | Tuning PYTHIA 8.1: the Monash 2013 tune | EPJC 74 (2014) 3024 | 1404.5630 |
| 51 | CMS Collaboration | Investigations of the impact of the parton shower tuning in Pythia 8 in the modelling of $ \mathrm{t\overline{t}} $ at $ \sqrt{s}= $ 8 and 13 TeV | CMS-PAS-TOP-16-021 | CMS-PAS-TOP-16-021 |
| 52 | M. Buchkremer, G. Cacciapaglia, A. Deandrea, and L. Panizzi | Model independent framework for searches of top partners | NPB 876 (2013) 376 | 1305.4172 |
| 53 | B. Fuks and H.-S. Shao | QCD next-to-leading-order predictions matched to parton showers for vector-like quark models | EPJC 77 (2017) 135 | 1610.04622 |
| 54 | A. Carvalho | Gravity particles from warped extra dimensions, predictions for LHC | 1404.0102 | |
| 55 | J. M. Campbell, R. K. Ellis, and F. Tramontano | Single top production and decay at next-to-leading order | PRD 70 (2004) 094012 | hep-ph/0408158 |
| 56 | O. Matsedonskyi, G. Panico, and A. Wulzer | On the interpretation of top partners searches | JHEP 12 (2014) 097 | 1409.0100 |
| 57 | A. Carvalho et al. | Single production of vector-like quarks with large width at the Large Hadron Collider | PRD 98 (2018) 015029 | 1805.06402 |
| 58 | S. Frixione, E. Laenen, P. Motylinski, and B. R. Webber | Angular correlations of lepton pairs from vector boson and top quark decays in Monte Carlo simulations | JHEP 04 (2007) 081 | hep-ph/0702198 |
| 59 | P. Artoisenet, R. Frederix, O. Mattelaer, and R. Rietkerk | Automatic spin-entangled decays of heavy resonances in Monte Carlo simulations | JHEP 03 (2013) 015 | 1212.3460 |
| 60 | \GEANTfour Collaboration | $ GEANT4-a $ simulation toolkit | NIMA 506 (2003) 250 | |
| 61 | CMS Collaboration | Jet energy scale and resolution in the CMS experiment in $ {\mathrm{p}}{\mathrm{p}} $ collisions at 8 TeV | JINST 12 (2017) P02014 | CMS-JME-13-004 1607.03663 |
| 62 | CMS Collaboration | Performance of the CMS muon detector and muon reconstruction with proton-proton collisions at $ \sqrt{s}= $ 13 TeV | JINST 13 (2018) , Submitted to \it JINST | CMS-MUO-16-001 1804.04528 |
| 63 | CMS Collaboration | Top tagging with new approaches | CMS-PAS-JME-15-002 | CMS-PAS-JME-15-002 |
| 64 | CMS Collaboration | Jet algorithms performance in 13 TeV data | CMS-PAS-JME-16-003 | CMS-PAS-JME-16-003 |
| 65 | M. Dasgupta, A. Fregoso, S. Marzani, and G. P. Salam | Towards an understanding of jet substructure | JHEP 09 (2013) 029 | 1307.0007 |
| 66 | A. J. Larkoski, S. Marzani, G. Soyez, and J. Thaler | Soft Drop | JHEP 05 (2014) 146 | 1402.2657 |
| 67 | CMS Collaboration | Identification of heavy-flavour jets with the CMS detector in pp collisions at 13 TeV | JINST 13 (2018) P05011 | CMS-BTV-16-002 1712.07158 |
| 68 | J. Thaler and K. Van Tilburg | Identifying boosted objects with N-subjettiness | JHEP 03 (2011) 015 | 1011.2268 |
| 69 | J. Thaler and K. Van Tilburg | Maximizing boosted top identification by minimizing N-subjettiness | JHEP 02 (2012) 093 | 1108.2701 |
| 70 | CMS Collaboration | Measurement of the inelastic proton-proton cross section at $ \sqrt{s}= $ 7 TeV | PLB 722 (2013) 5 | CMS-FWD-11-001 1210.6718 |
| 71 | J. Butterworth et al. | PDF4LHC recommendations for LHC run II | JPG 43 (2016) 023001 | 1510.03865 |
| 72 | M. Bahr et al. | Herwig++ physics and manual | EPJC 58 (2008) 639 | 0803.0883 |
| 73 | J. Ott | THETA -- A framework for template-based modeling and inference | ||
| 74 | A. O'Hagan and J. J. Forster | Kendall?s advanced theory of statistics. Vol. 2B: Bayesian Inference | Arnold, London, 2004 ISBN 978-0470685693 | |
|
|
Compact Muon Solenoid LHC, CERN |
|

|

|

|

|

|