

Compact Muon Solenoid
LHC, CERN
| CMS-HIG-19-003 ; CERN-EP-2020-107 | ||
| Inclusive search for highly boosted Higgs bosons decaying to bottom quark-antiquark pairs in proton-proton collisions at $\sqrt{s} = $ 13 TeV | ||
| CMS Collaboration | ||
| 24 June 2020 | ||
| JHEP 12 (2020) 085 | ||
| Abstract: A search for standard model Higgs bosons (H) produced with transverse momentum (${p_{\mathrm{T}}}$) greater than 450 GeV and decaying to bottom quark-antiquark pairs ($\mathrm{b\bar{b}}$) is performed using proton-proton collision data collected by the CMS experiment at the LHC at $\sqrt{s} = $ 13 TeV. The data sample corresponds to an integrated luminosity of 137 fb$^{-1}$. The search is inclusive in the Higgs boson production mode. Highly Lorentz-boosted Higgs bosons decaying to $\mathrm{b\bar{b}}$ are reconstructed as single large-radius jets, and are identified using jet substructure and a dedicated b tagging technique based on a deep neural network. The method is validated with $\mathrm{Z}\to\mathrm{b\bar{b}}$ decays. For a Higgs boson mass of 125 GeV, an excess of events above the background assuming no Higgs boson production is observed with a local significance of 2.5 standard deviations ($\sigma$), while the expectation is 0.7. The corresponding signal strength and local significance with respect to the standard model expectation are $\mu_{\mathrm{H}} = $ 3.7 $\pm$ 1.2 (stat)$_{-0.7}^{+0.6}$ (syst)$_{-0.5}^{+0.8}$ (theo) and 1.9$\sigma$. Additionally, an unfolded differential cross section as a function of Higgs boson ${p_{\mathrm{T}}}$ for the gluon fusion production mode is presented, assuming the other production modes occur at the expected rates. | ||
| Links: e-print arXiv:2006.13251 [hep-ex] (PDF) ; CDS record ; inSPIRE record ; CADI line (restricted) ; | ||
| Figures | |
png pdf |
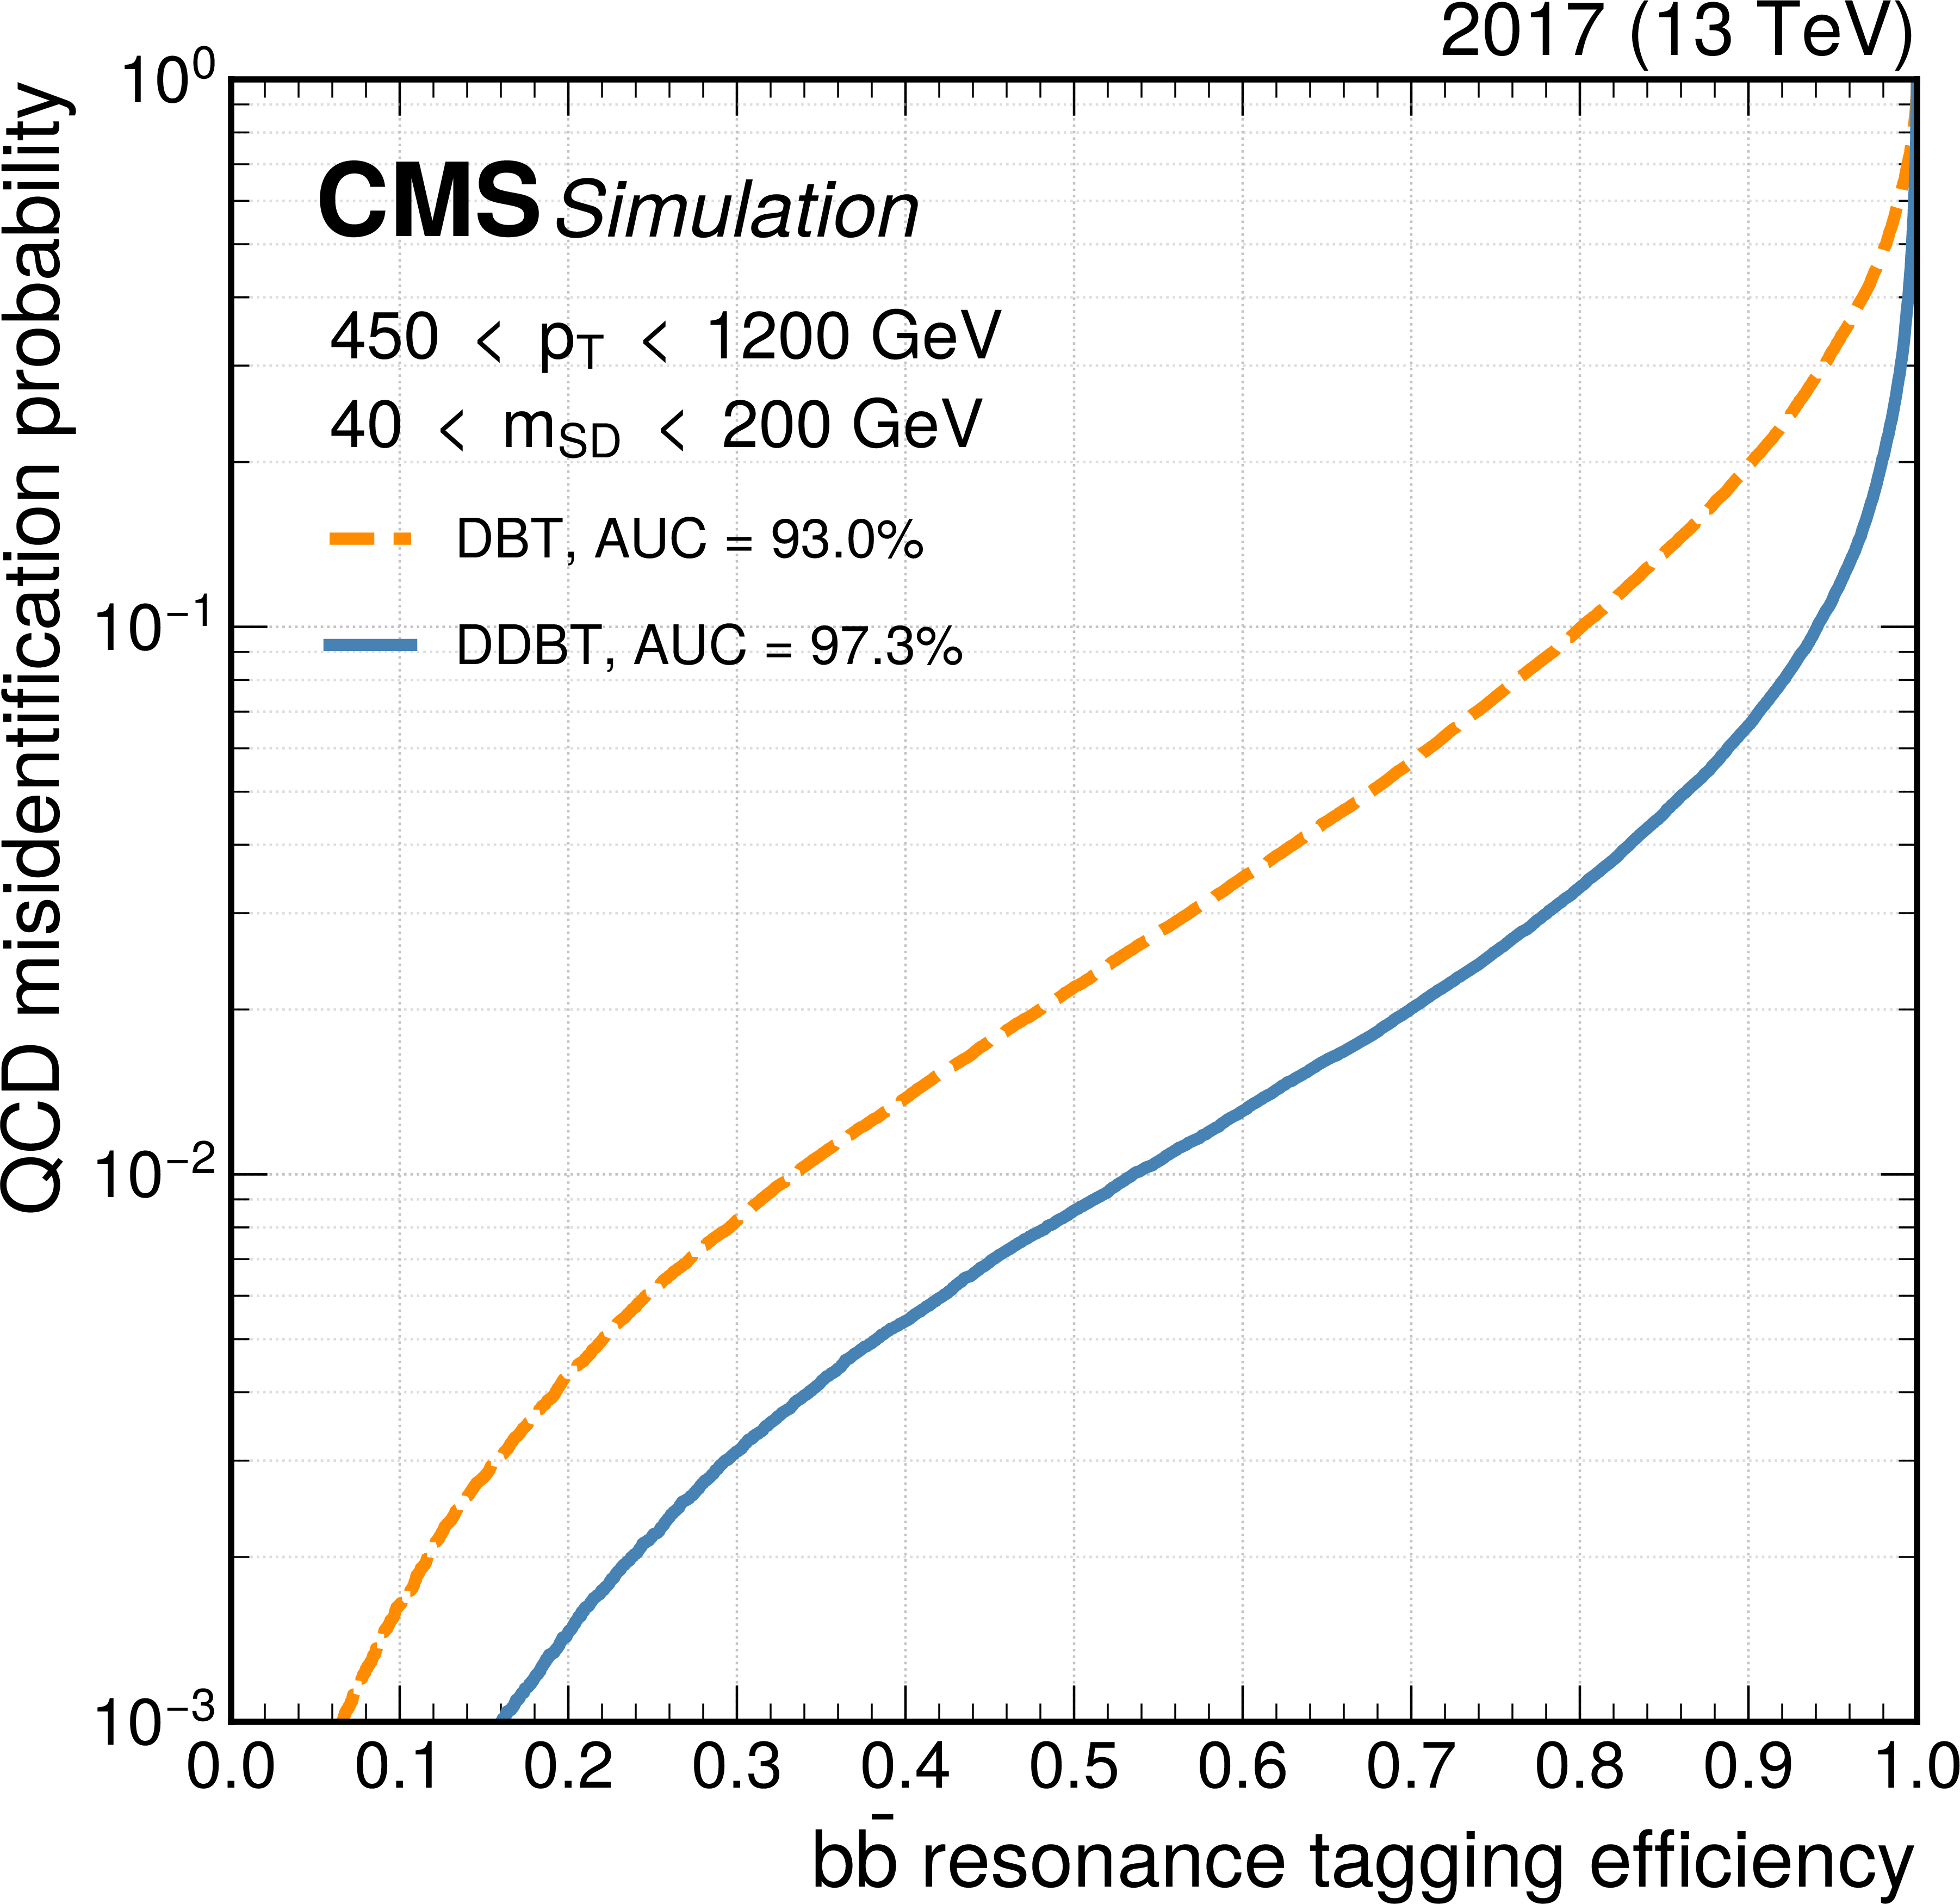
Figure 1:
The performance curves of misidentification probability for jets originating from QCD multijet production versus the identification probability for $\mathrm{b} {}\mathrm{\bar{b}} $ resonance jets for the DBT (orange dashed line) used in a prior CMS result and the DDBT (blue solid line). The $\mathrm{b} {}\mathrm{\bar{b}} $ resonances are generated with variable masses in the range 15-250 GeV. The curves are evaluated with simulation corresponding to the detector conditions in 2017. Jets are required to have ${p_{\mathrm {T}}}$ in the range 450-1200 GeV and ${m_{\mathrm {SD}}}$ in the range 40-200 GeV. |
png pdf |
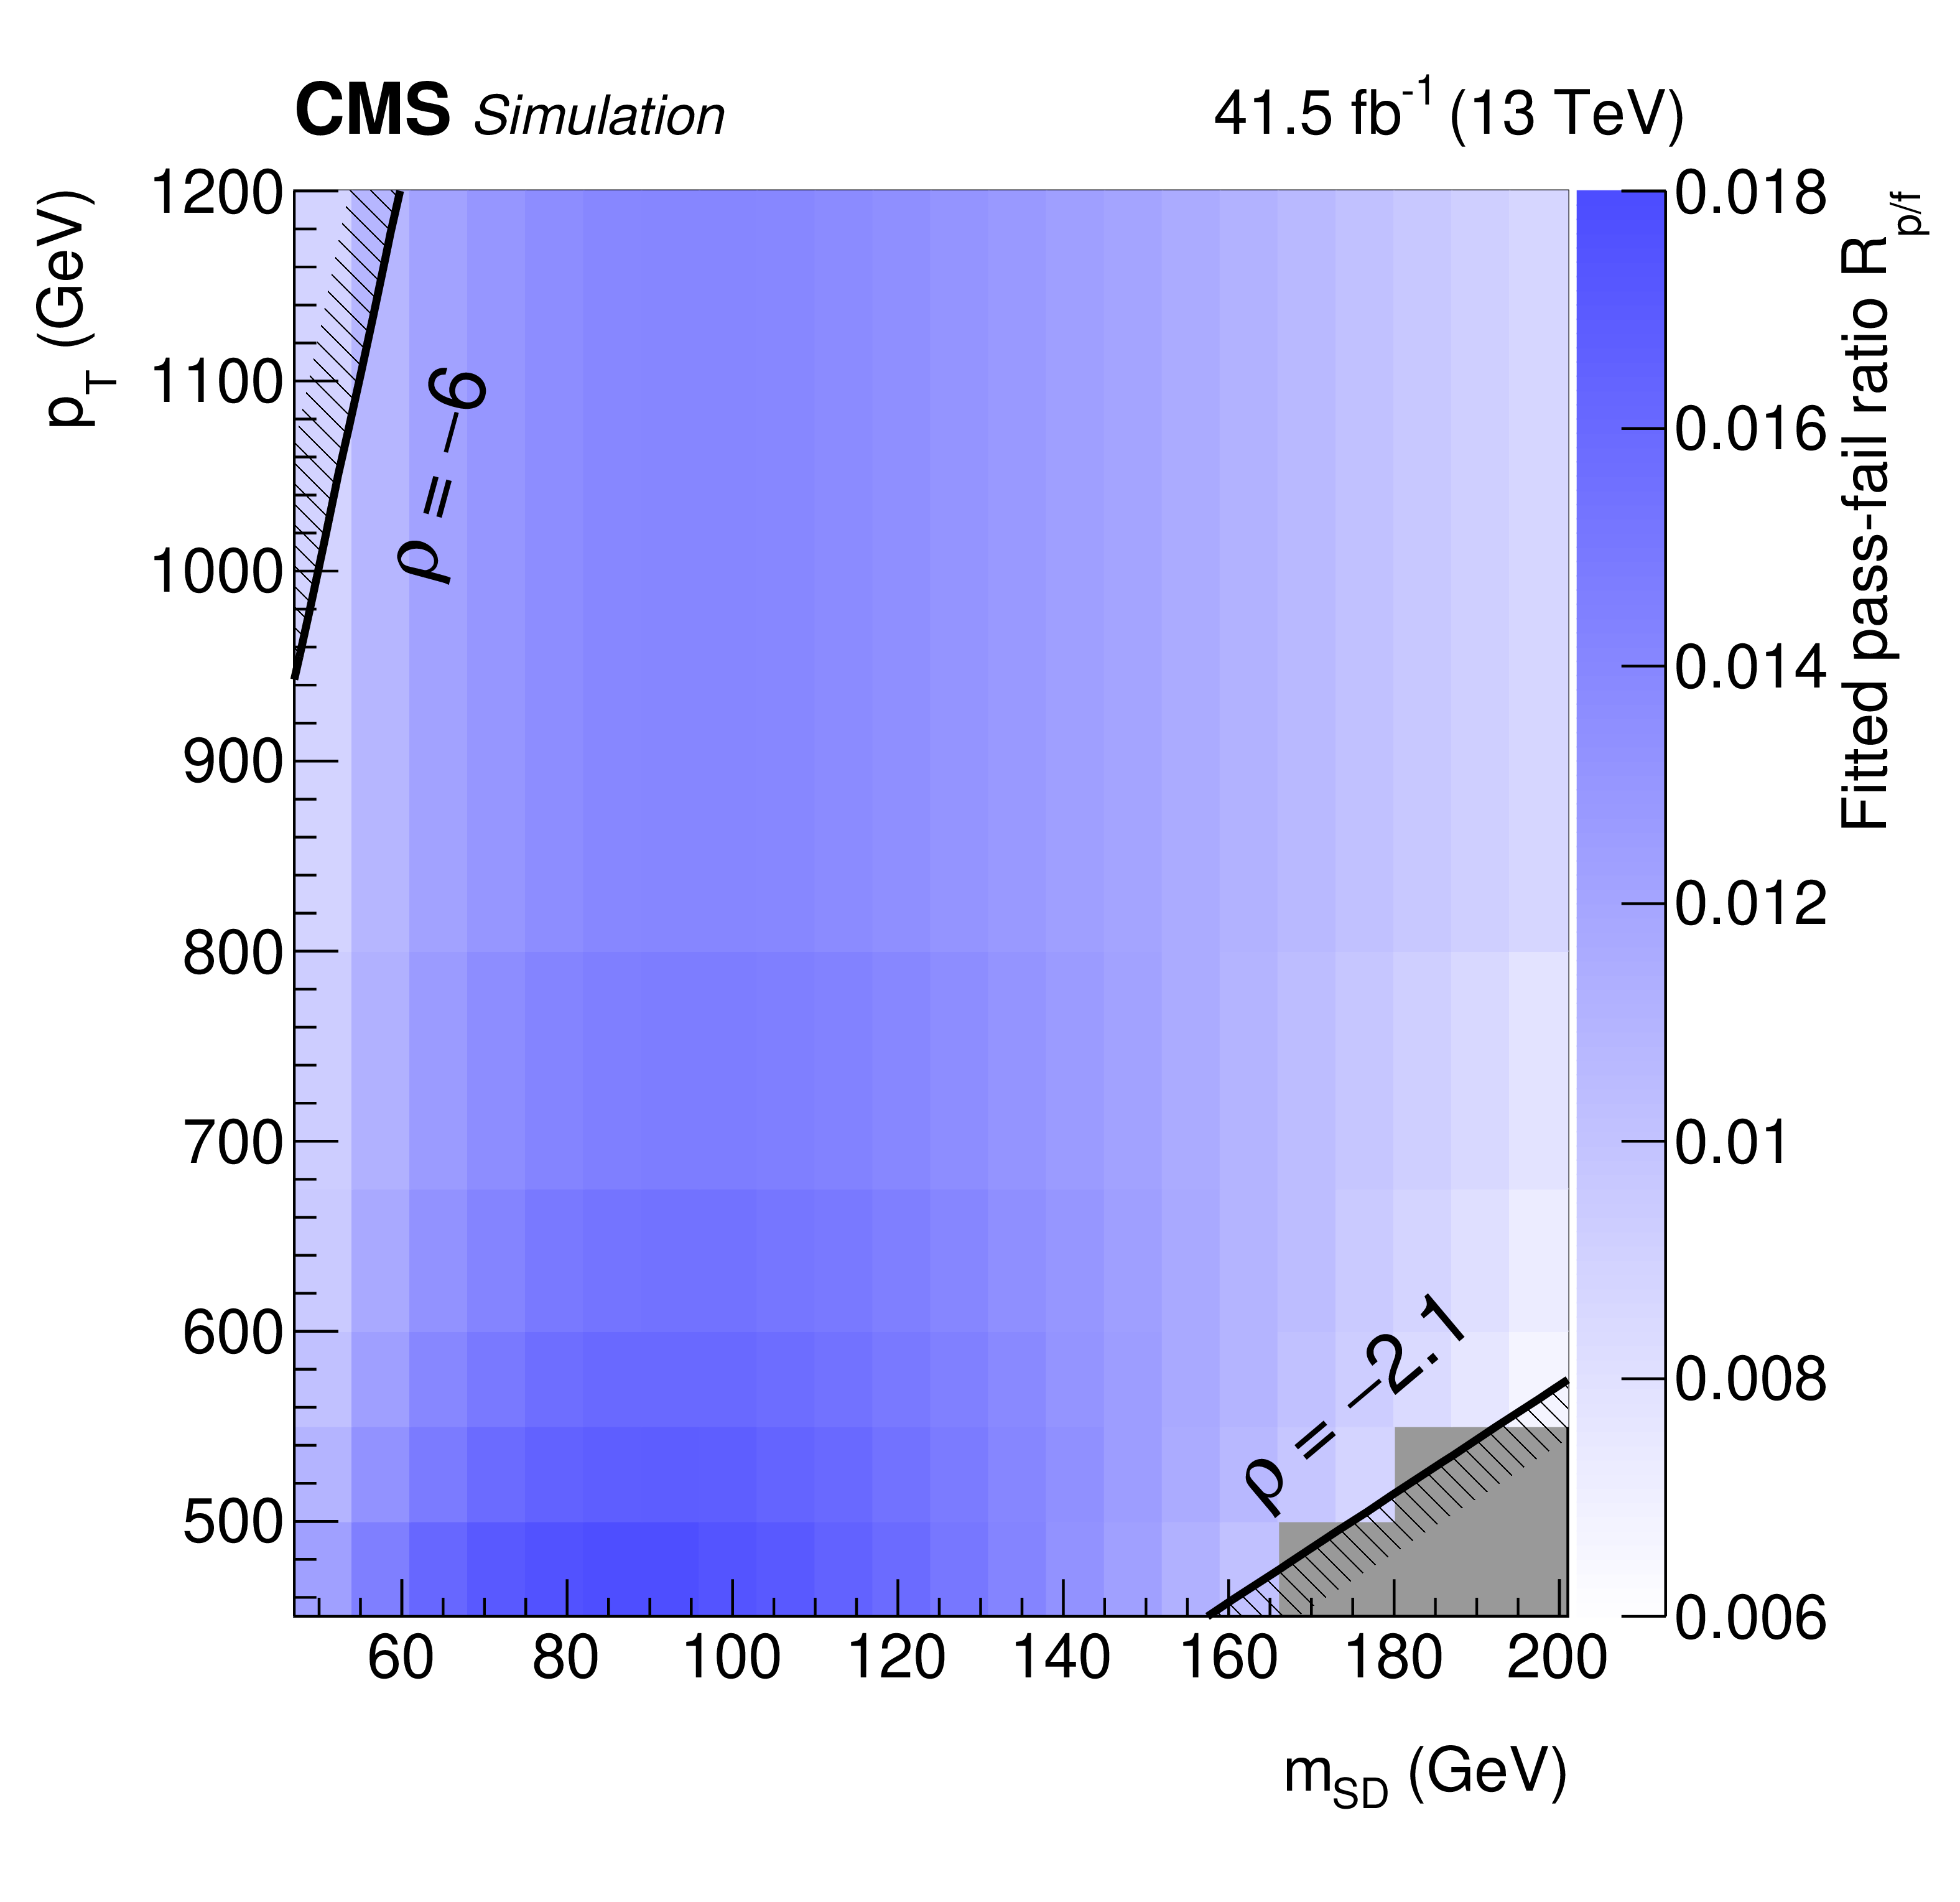
Figure 2:
The fitted pass-fail ratio ${R_{\mathrm {p}/\mathrm {f}}}$ as a function of jet ${p_{\mathrm {T}}}$ and ${m_{\mathrm {SD}}}$ for data collected in 2017. The ratio relates the QCD multijet event yield in the DDBT passing region to that of the failing region. The binning corresponds to the 22 ${m_{\mathrm {SD}}}$ bins and 6 ${p_{\mathrm {T}}}$ categories used in the statistical analysis. The lower-right bins filled in gray fall outside of the $\rho $ acceptance. |
png pdf |
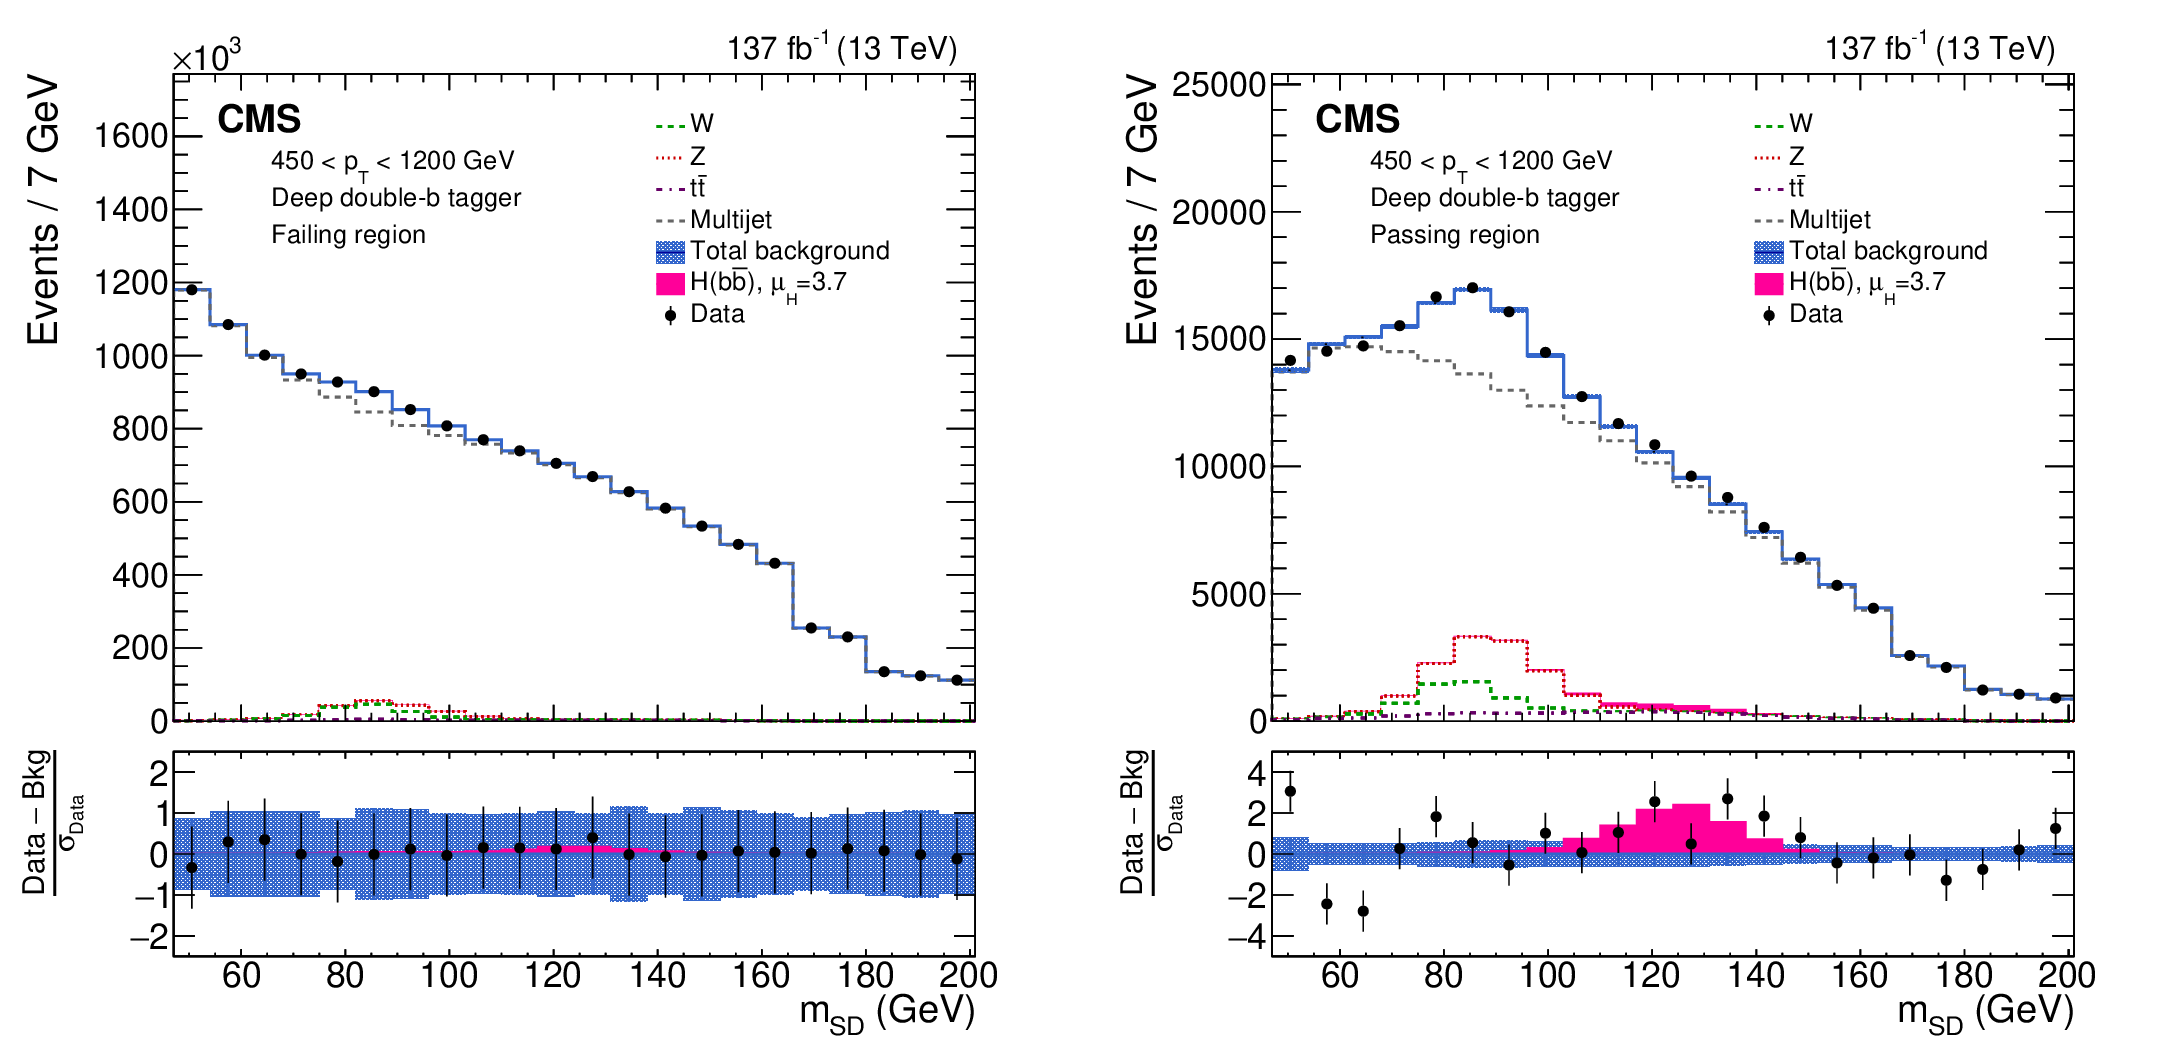
Figure 3:
The observed and fitted background ${m_{\mathrm {SD}}}$ distributions for the DDBT failing (left) and passing (right) regions, combining all the ${p_{\mathrm {T}}}$ categories, and three data collection years. The fit is performed under the signal-plus-background hypothesis with one inclusive $\mathrm{H} (\mathrm{b} {}\mathrm{\bar{b}})$ signal strength parameter floating in all the ${p_{\mathrm {T}}}$ categories. Because of the finite $\rho $ acceptance, some ${m_{\mathrm {SD}}}$ bins within a given ${p_{\mathrm {T}}}$ category may be removed, giving rise to the steps at 166 and 180 GeV. The shaded blue band shows the systematic uncertainty in the total background prediction. The bottom panel shows the difference between the data and the total background prediction, divided by the statistical uncertainty in the data. In the failing region, the background model includes a free parameter for each ${m_{\mathrm {SD}}}$ bin, ensuring the nearly perfect agreement between the model and the data. Thus, the statistical uncertainty in the data gives rise to the systematic uncertainty in the background prediction. This is reflected in the fact that the error bar for the data and the uncertainty band for the background are approximately equal in size. |
png pdf |
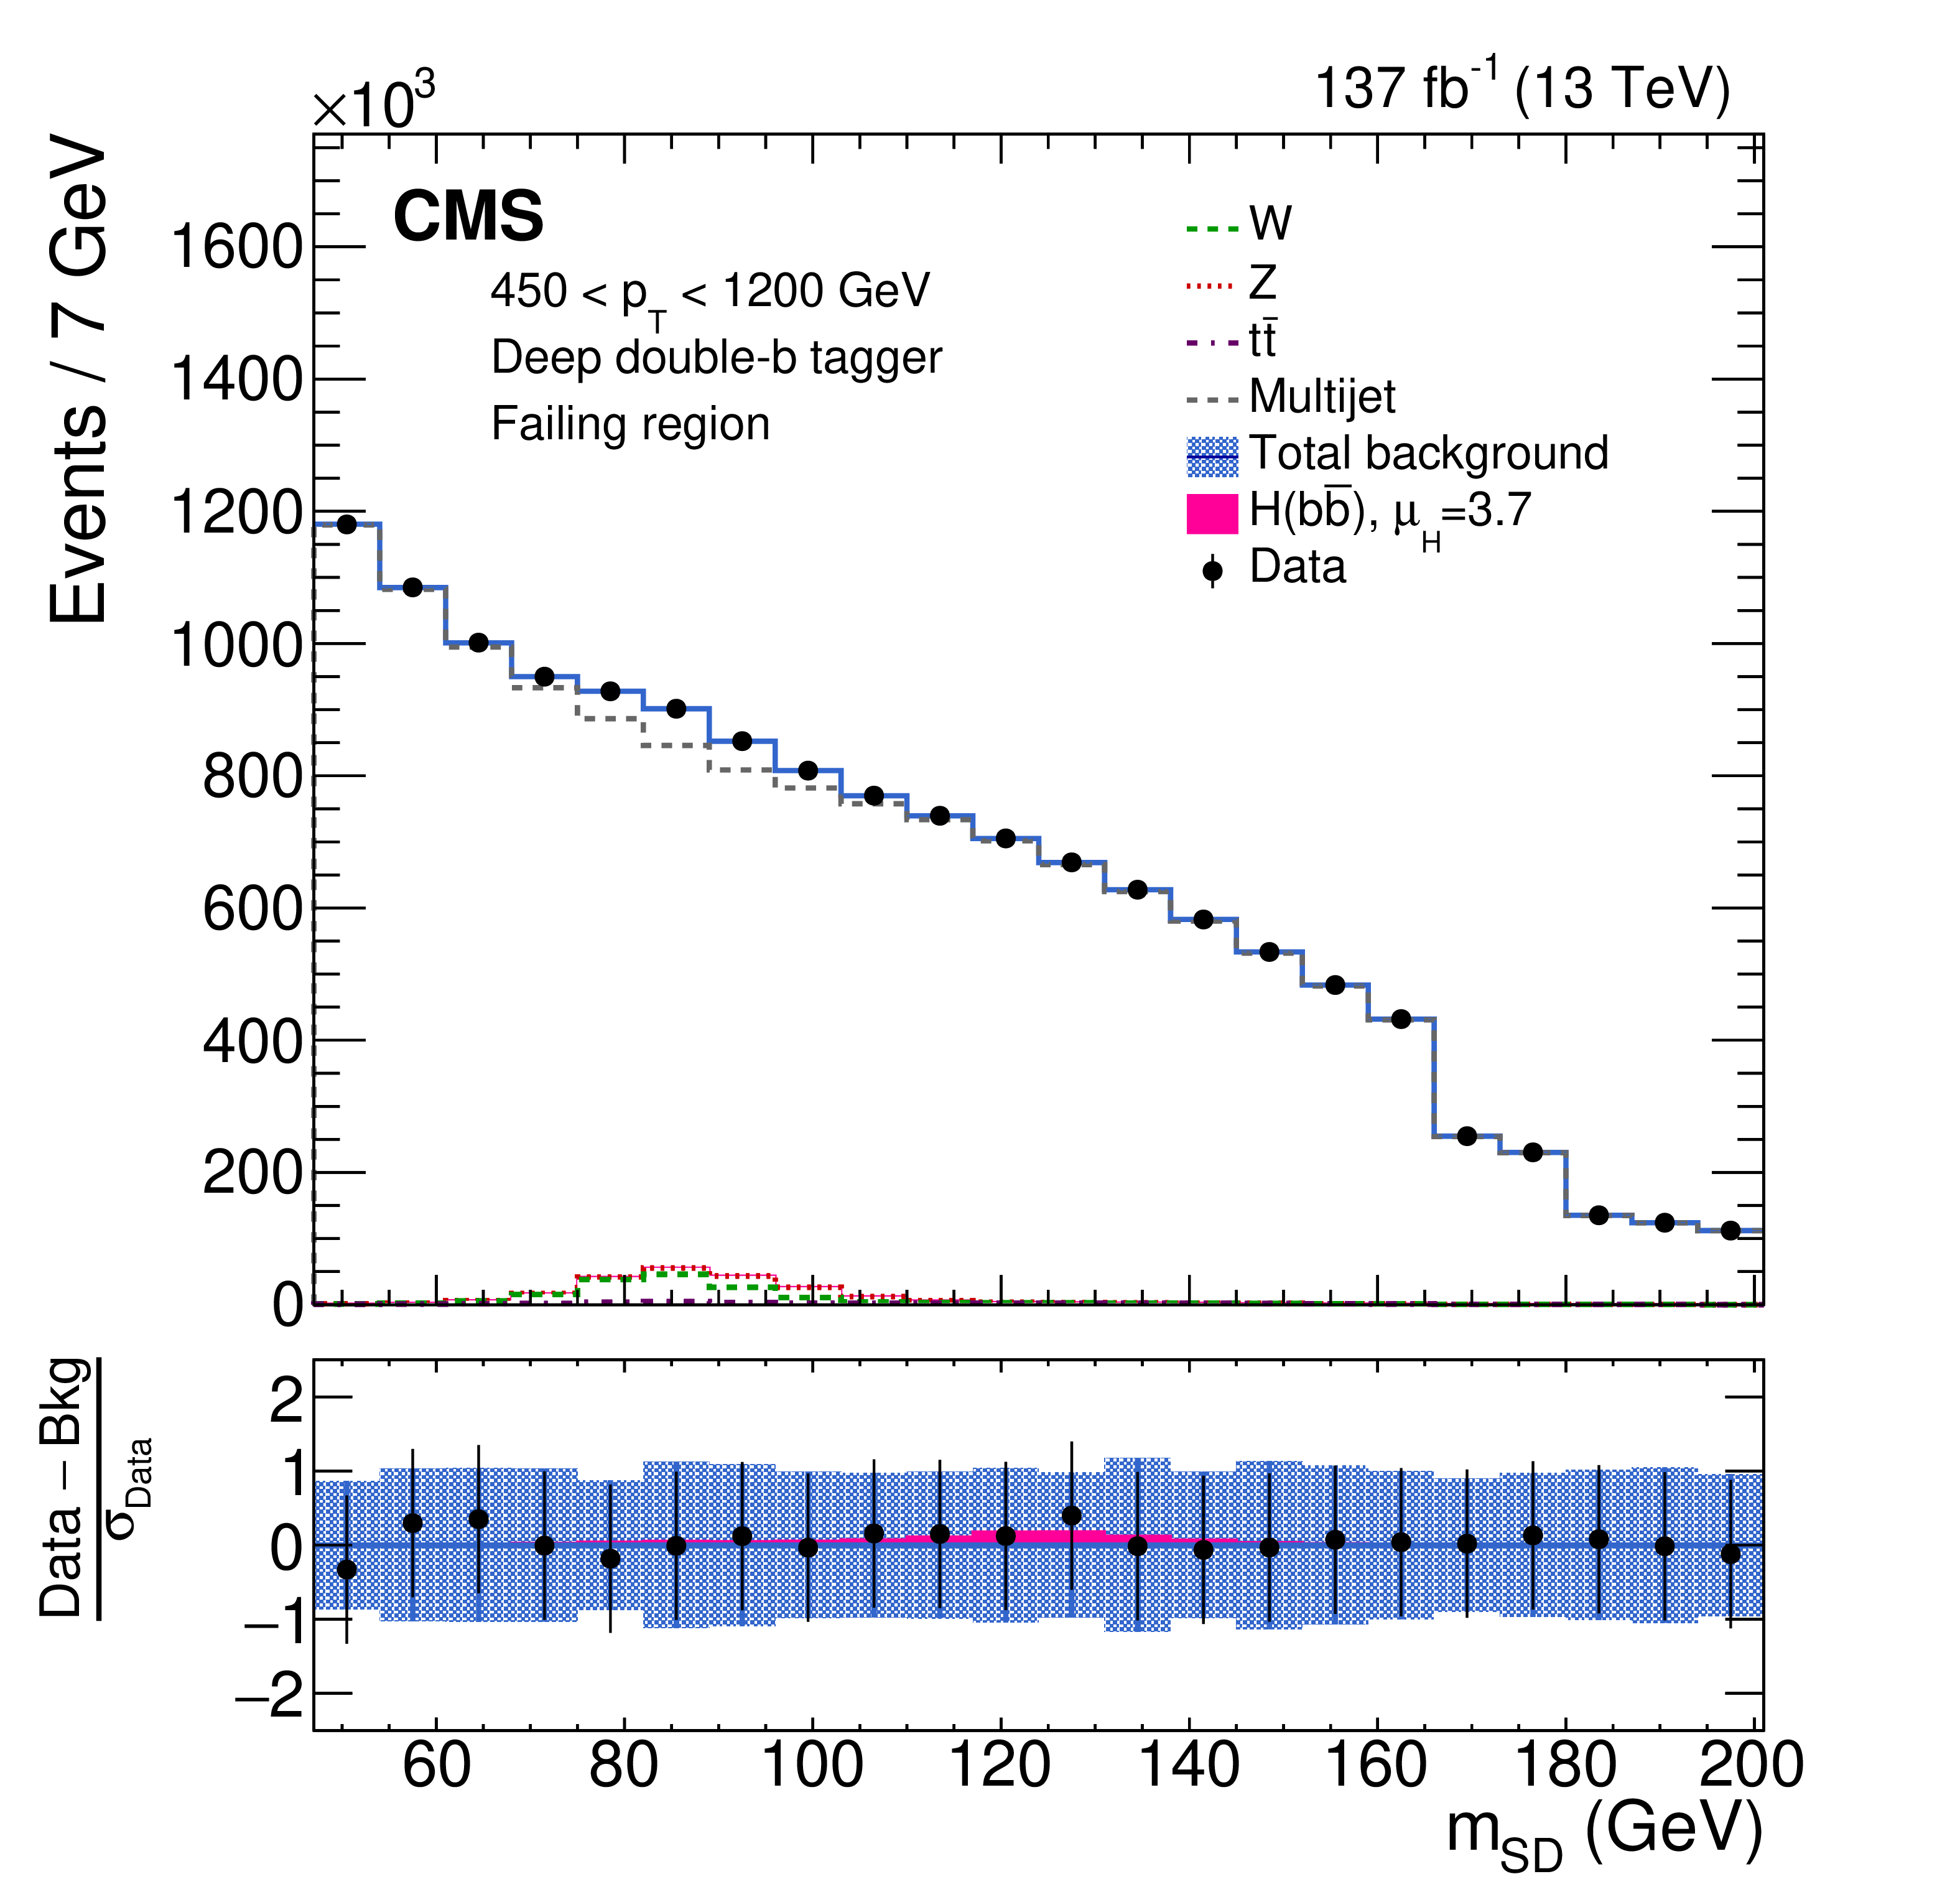
Figure 3-a:
The observed and fitted background ${m_{\mathrm {SD}}}$ distributions for the DDBT failing region, combining all the ${p_{\mathrm {T}}}$ categories, and three data collection years. The fit is performed under the signal-plus-background hypothesis with one inclusive $\mathrm{H} (\mathrm{b} {}\mathrm{\bar{b}})$ signal strength parameter floating in all the ${p_{\mathrm {T}}}$ categories. Because of the finite $\rho $ acceptance, some ${m_{\mathrm {SD}}}$ bins within a given ${p_{\mathrm {T}}}$ category may be removed, giving rise to the steps at 166 and 180 GeV. The shaded blue band shows the systematic uncertainty in the total background prediction. The bottom panel shows the difference between the data and the total background prediction, divided by the statistical uncertainty in the data. In the failing region, the background model includes a free parameter for each ${m_{\mathrm {SD}}}$ bin, ensuring the nearly perfect agreement between the model and the data. Thus, the statistical uncertainty in the data gives rise to the systematic uncertainty in the background prediction. This is reflected in the fact that the error bar for the data and the uncertainty band for the background are approximately equal in size. |
png pdf |
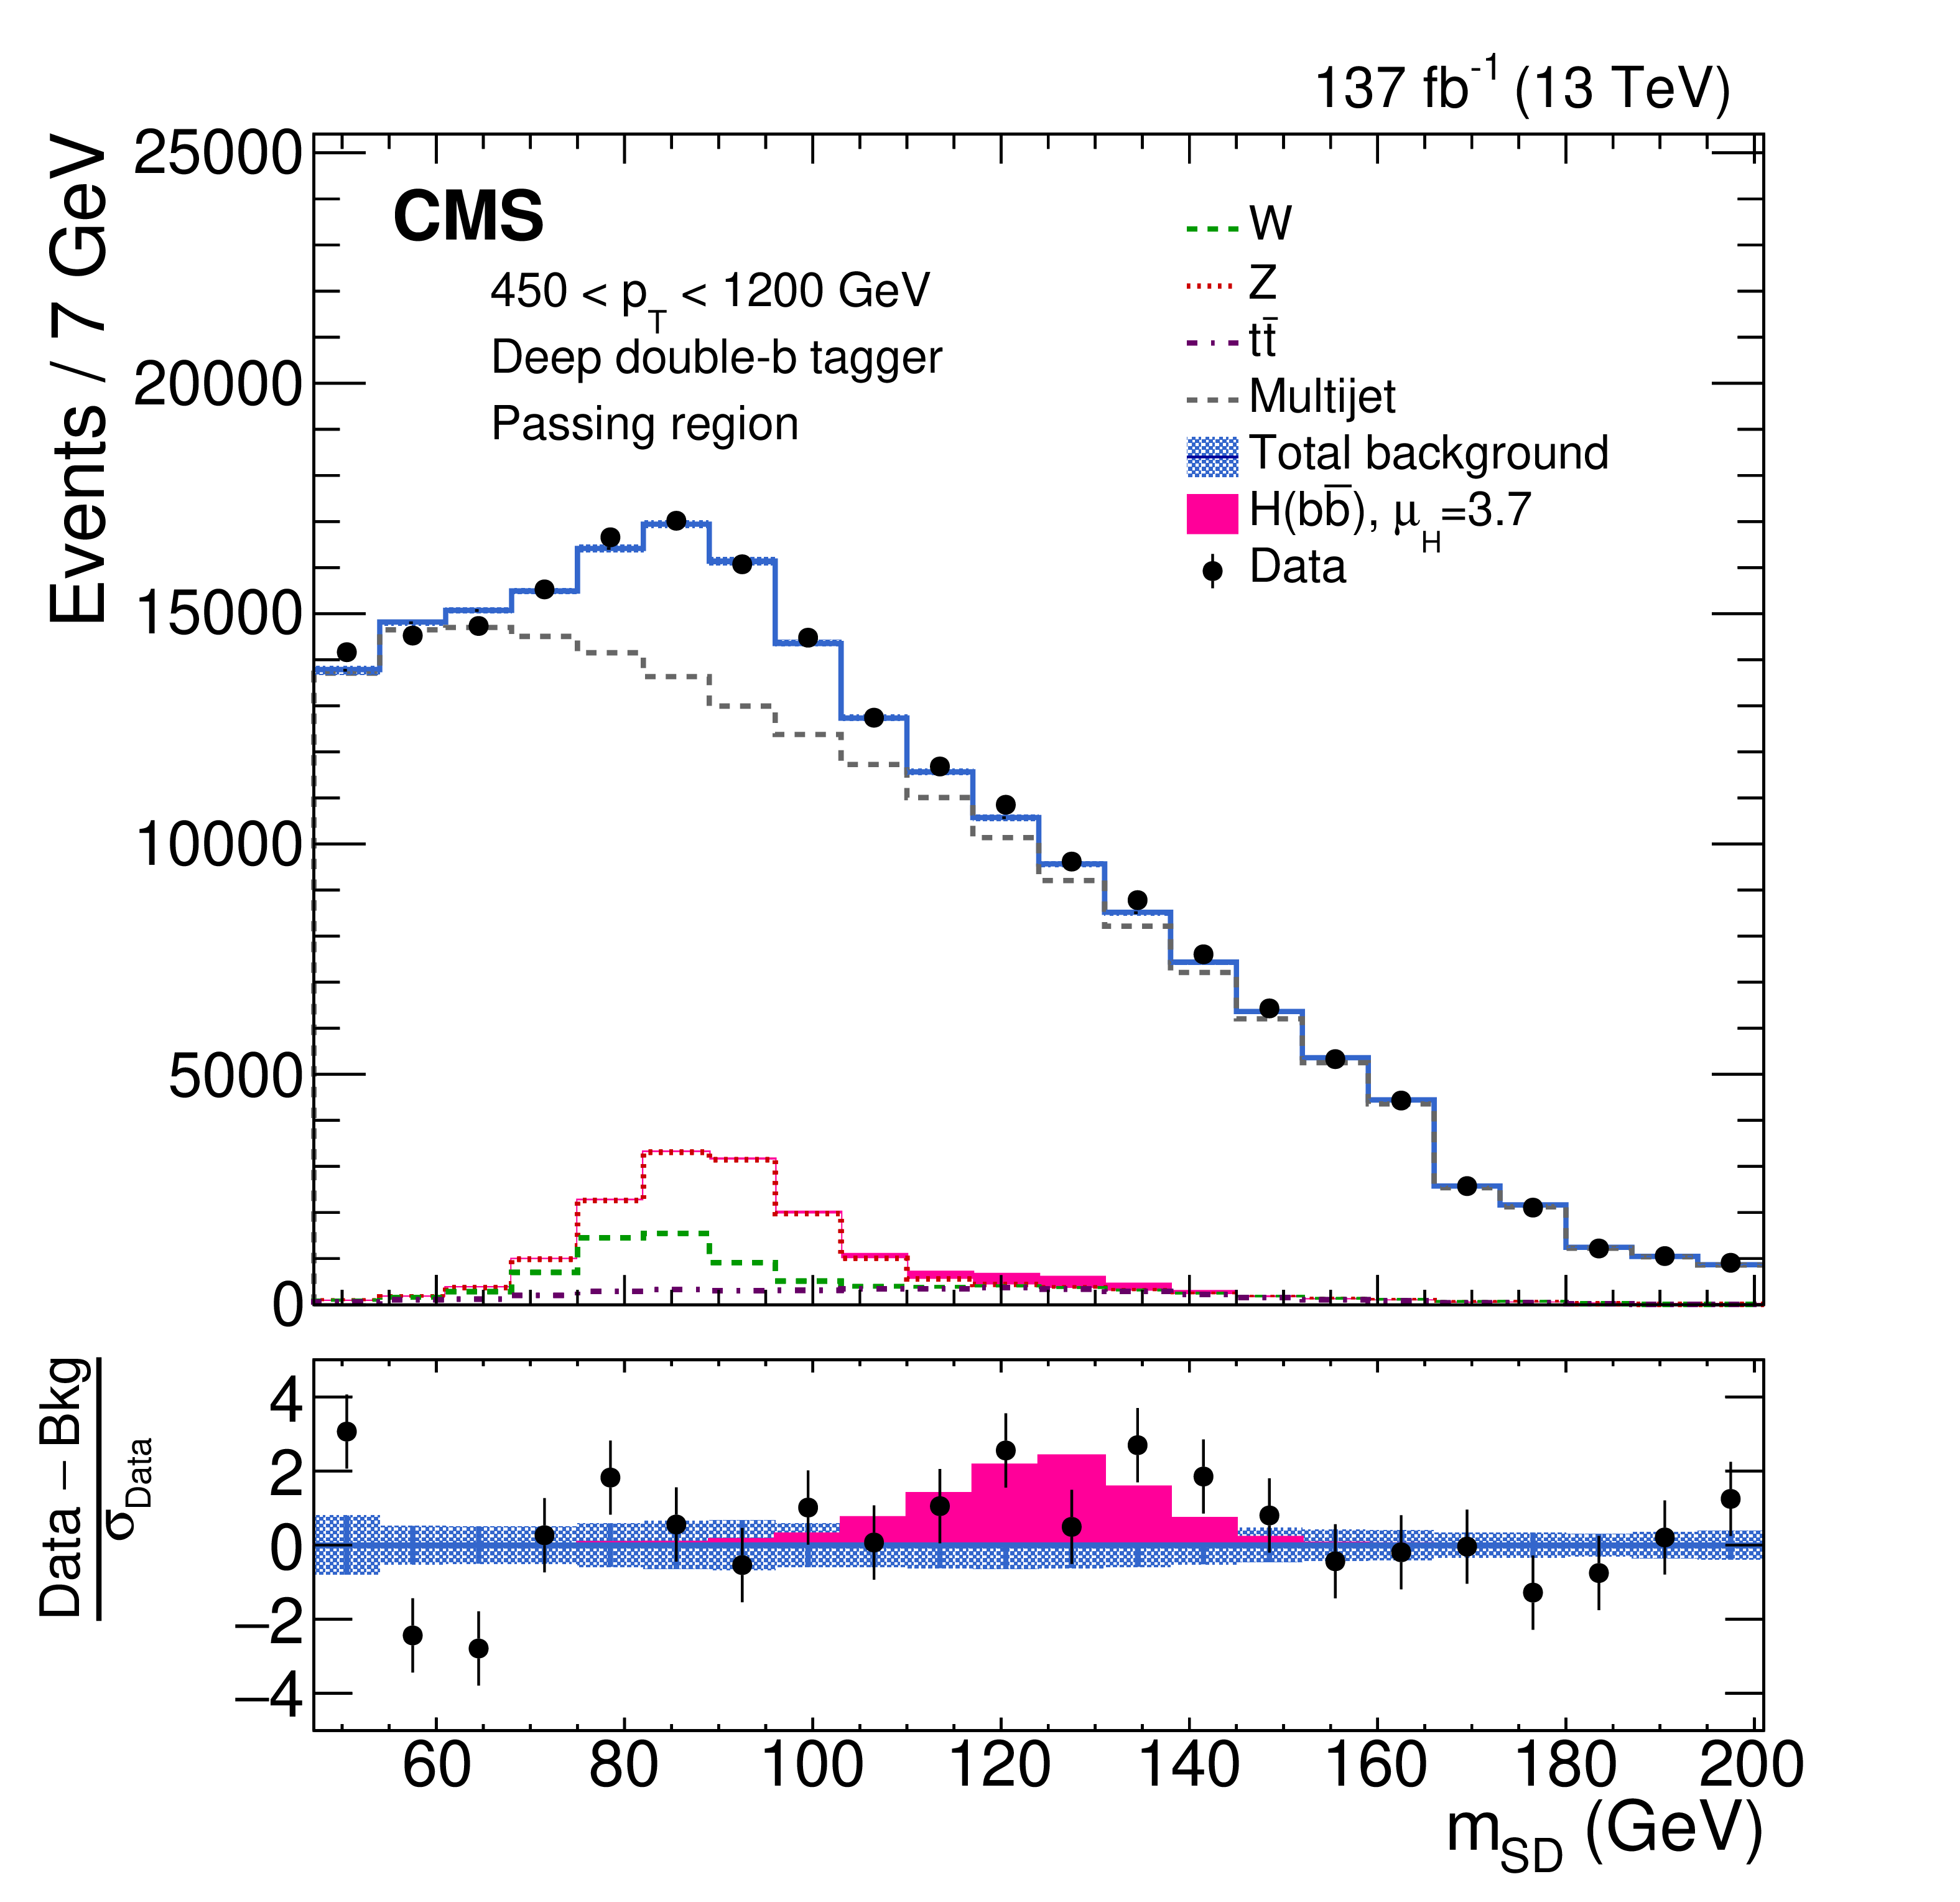
Figure 3-b:
The observed and fitted background ${m_{\mathrm {SD}}}$ distributions for the DDBT passing region, combining all the ${p_{\mathrm {T}}}$ categories, and three data collection years. The fit is performed under the signal-plus-background hypothesis with one inclusive $\mathrm{H} (\mathrm{b} {}\mathrm{\bar{b}})$ signal strength parameter floating in all the ${p_{\mathrm {T}}}$ categories. Because of the finite $\rho $ acceptance, some ${m_{\mathrm {SD}}}$ bins within a given ${p_{\mathrm {T}}}$ category may be removed, giving rise to the steps at 166 and 180 GeV. The shaded blue band shows the systematic uncertainty in the total background prediction. The bottom panel shows the difference between the data and the total background prediction, divided by the statistical uncertainty in the data. In the failing region, the background model includes a free parameter for each ${m_{\mathrm {SD}}}$ bin, ensuring the nearly perfect agreement between the model and the data. Thus, the statistical uncertainty in the data gives rise to the systematic uncertainty in the background prediction. This is reflected in the fact that the error bar for the data and the uncertainty band for the background are approximately equal in size. |
png pdf |
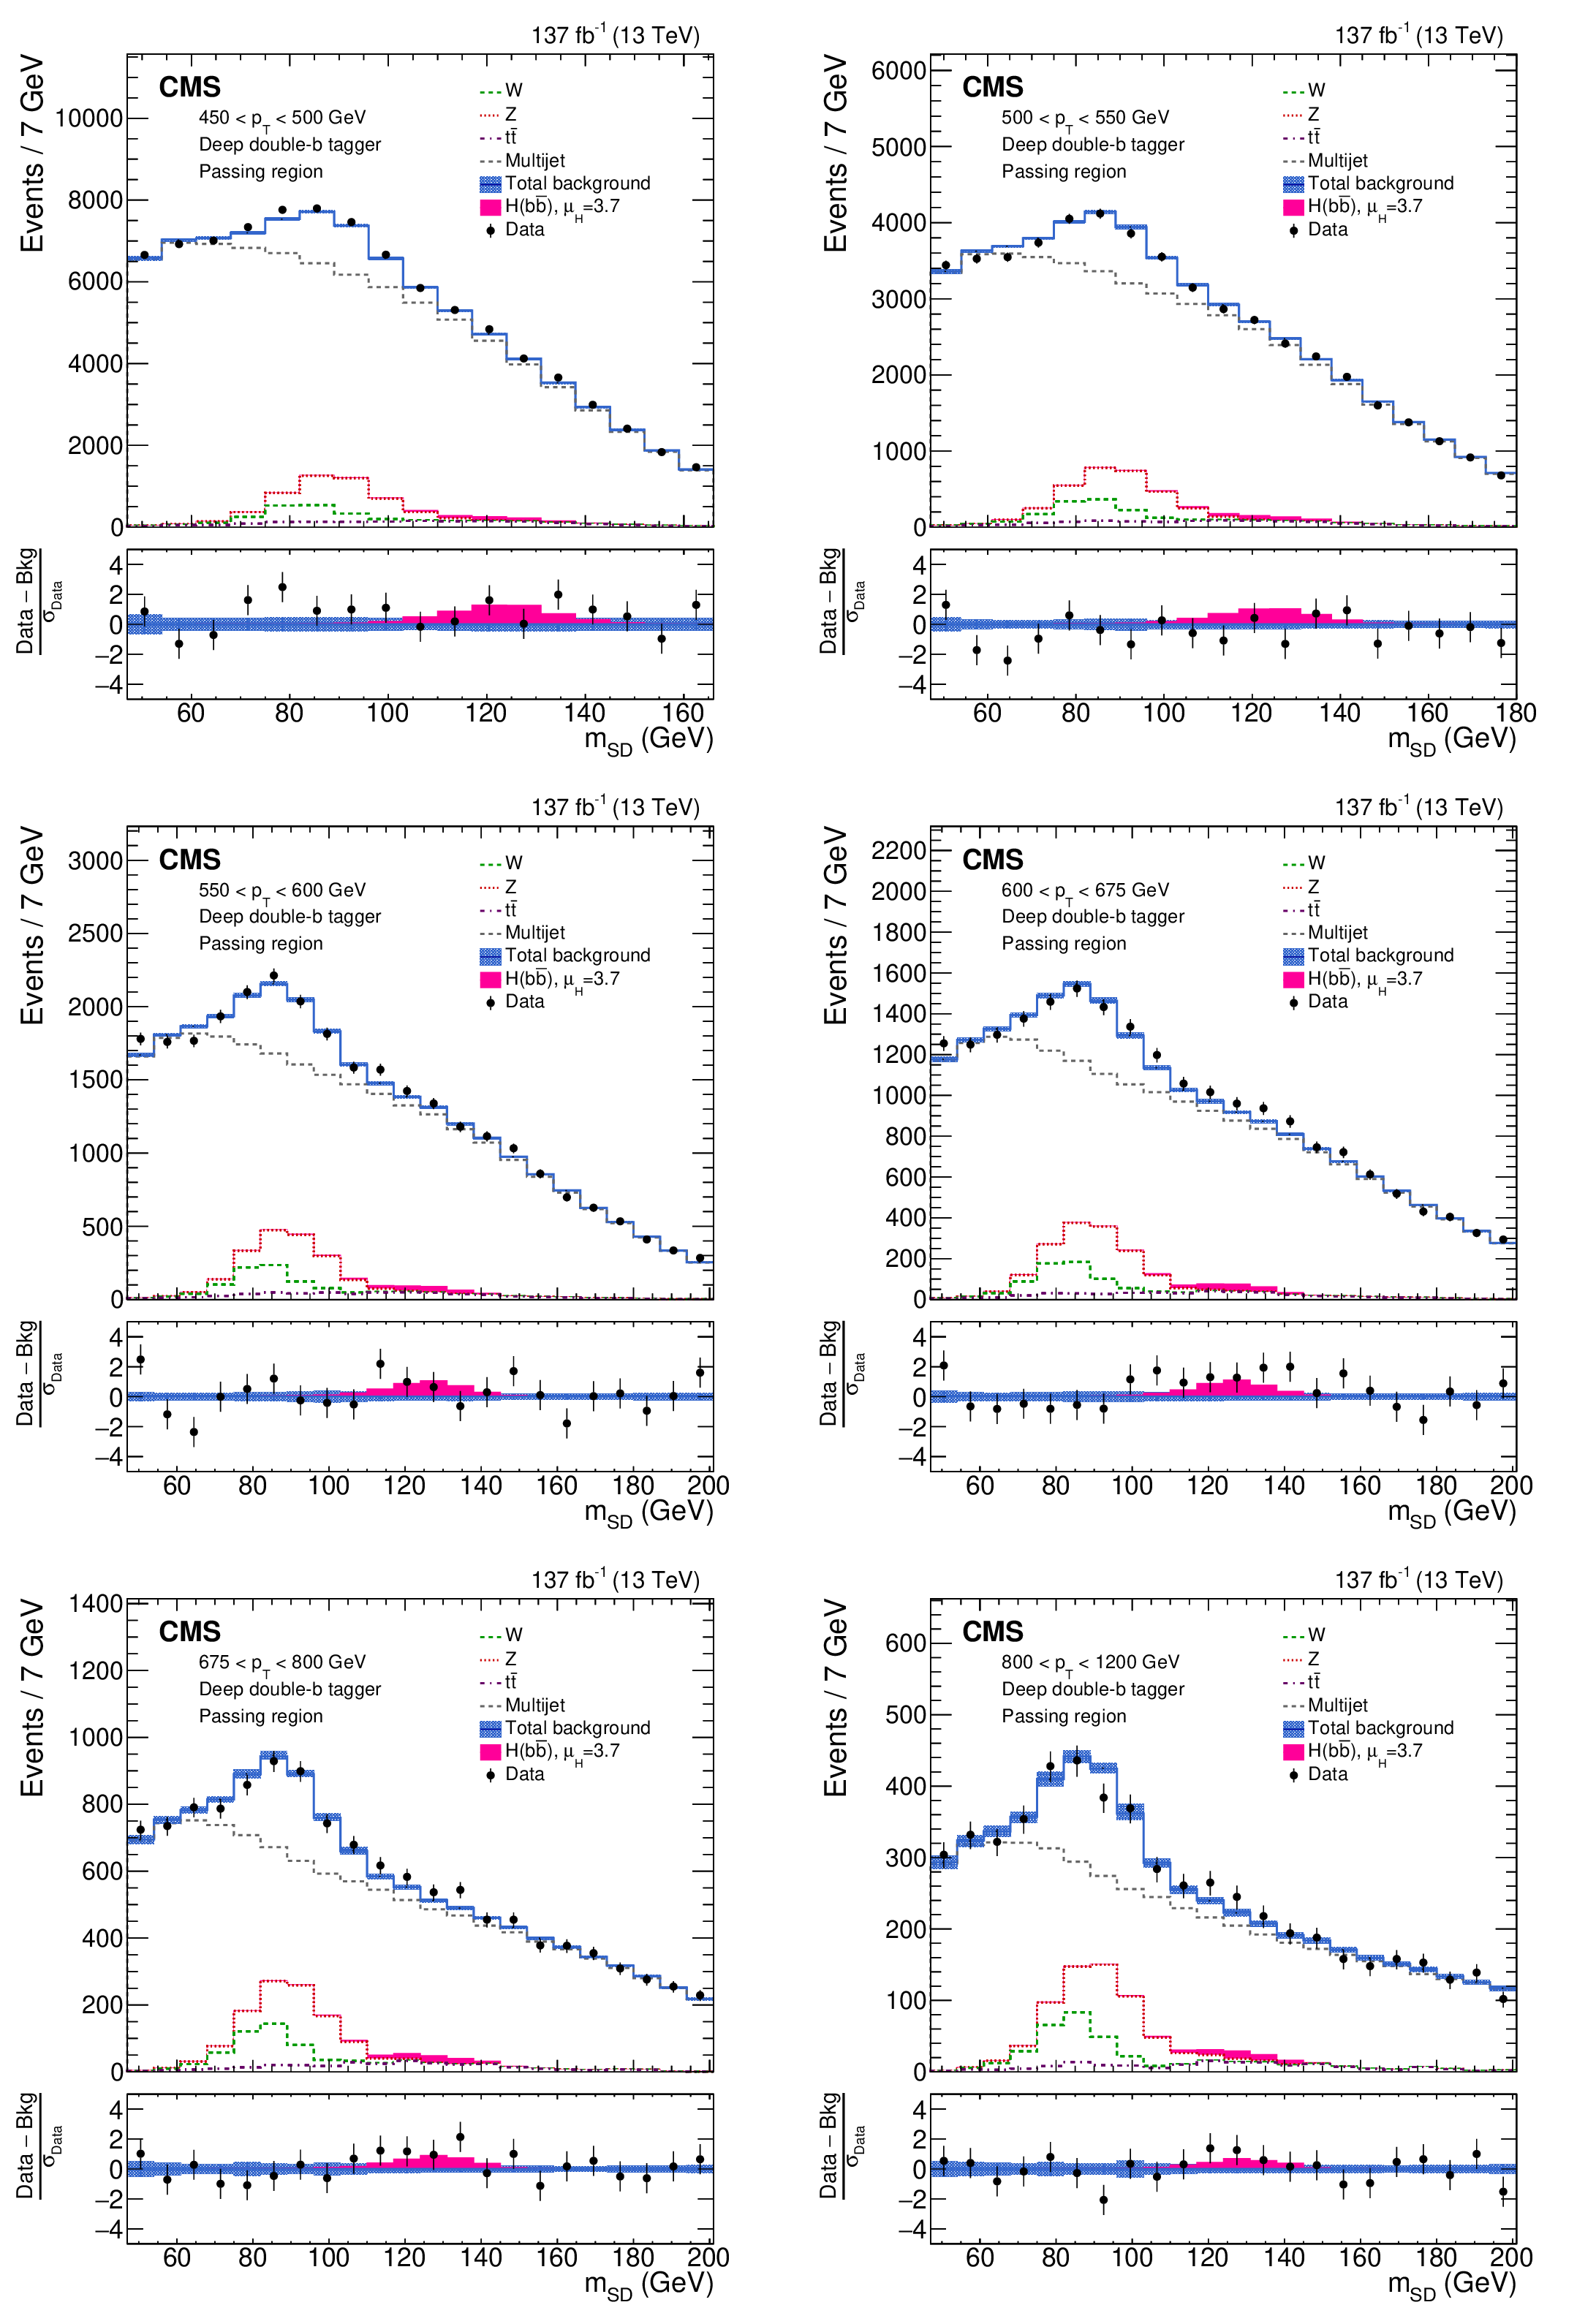
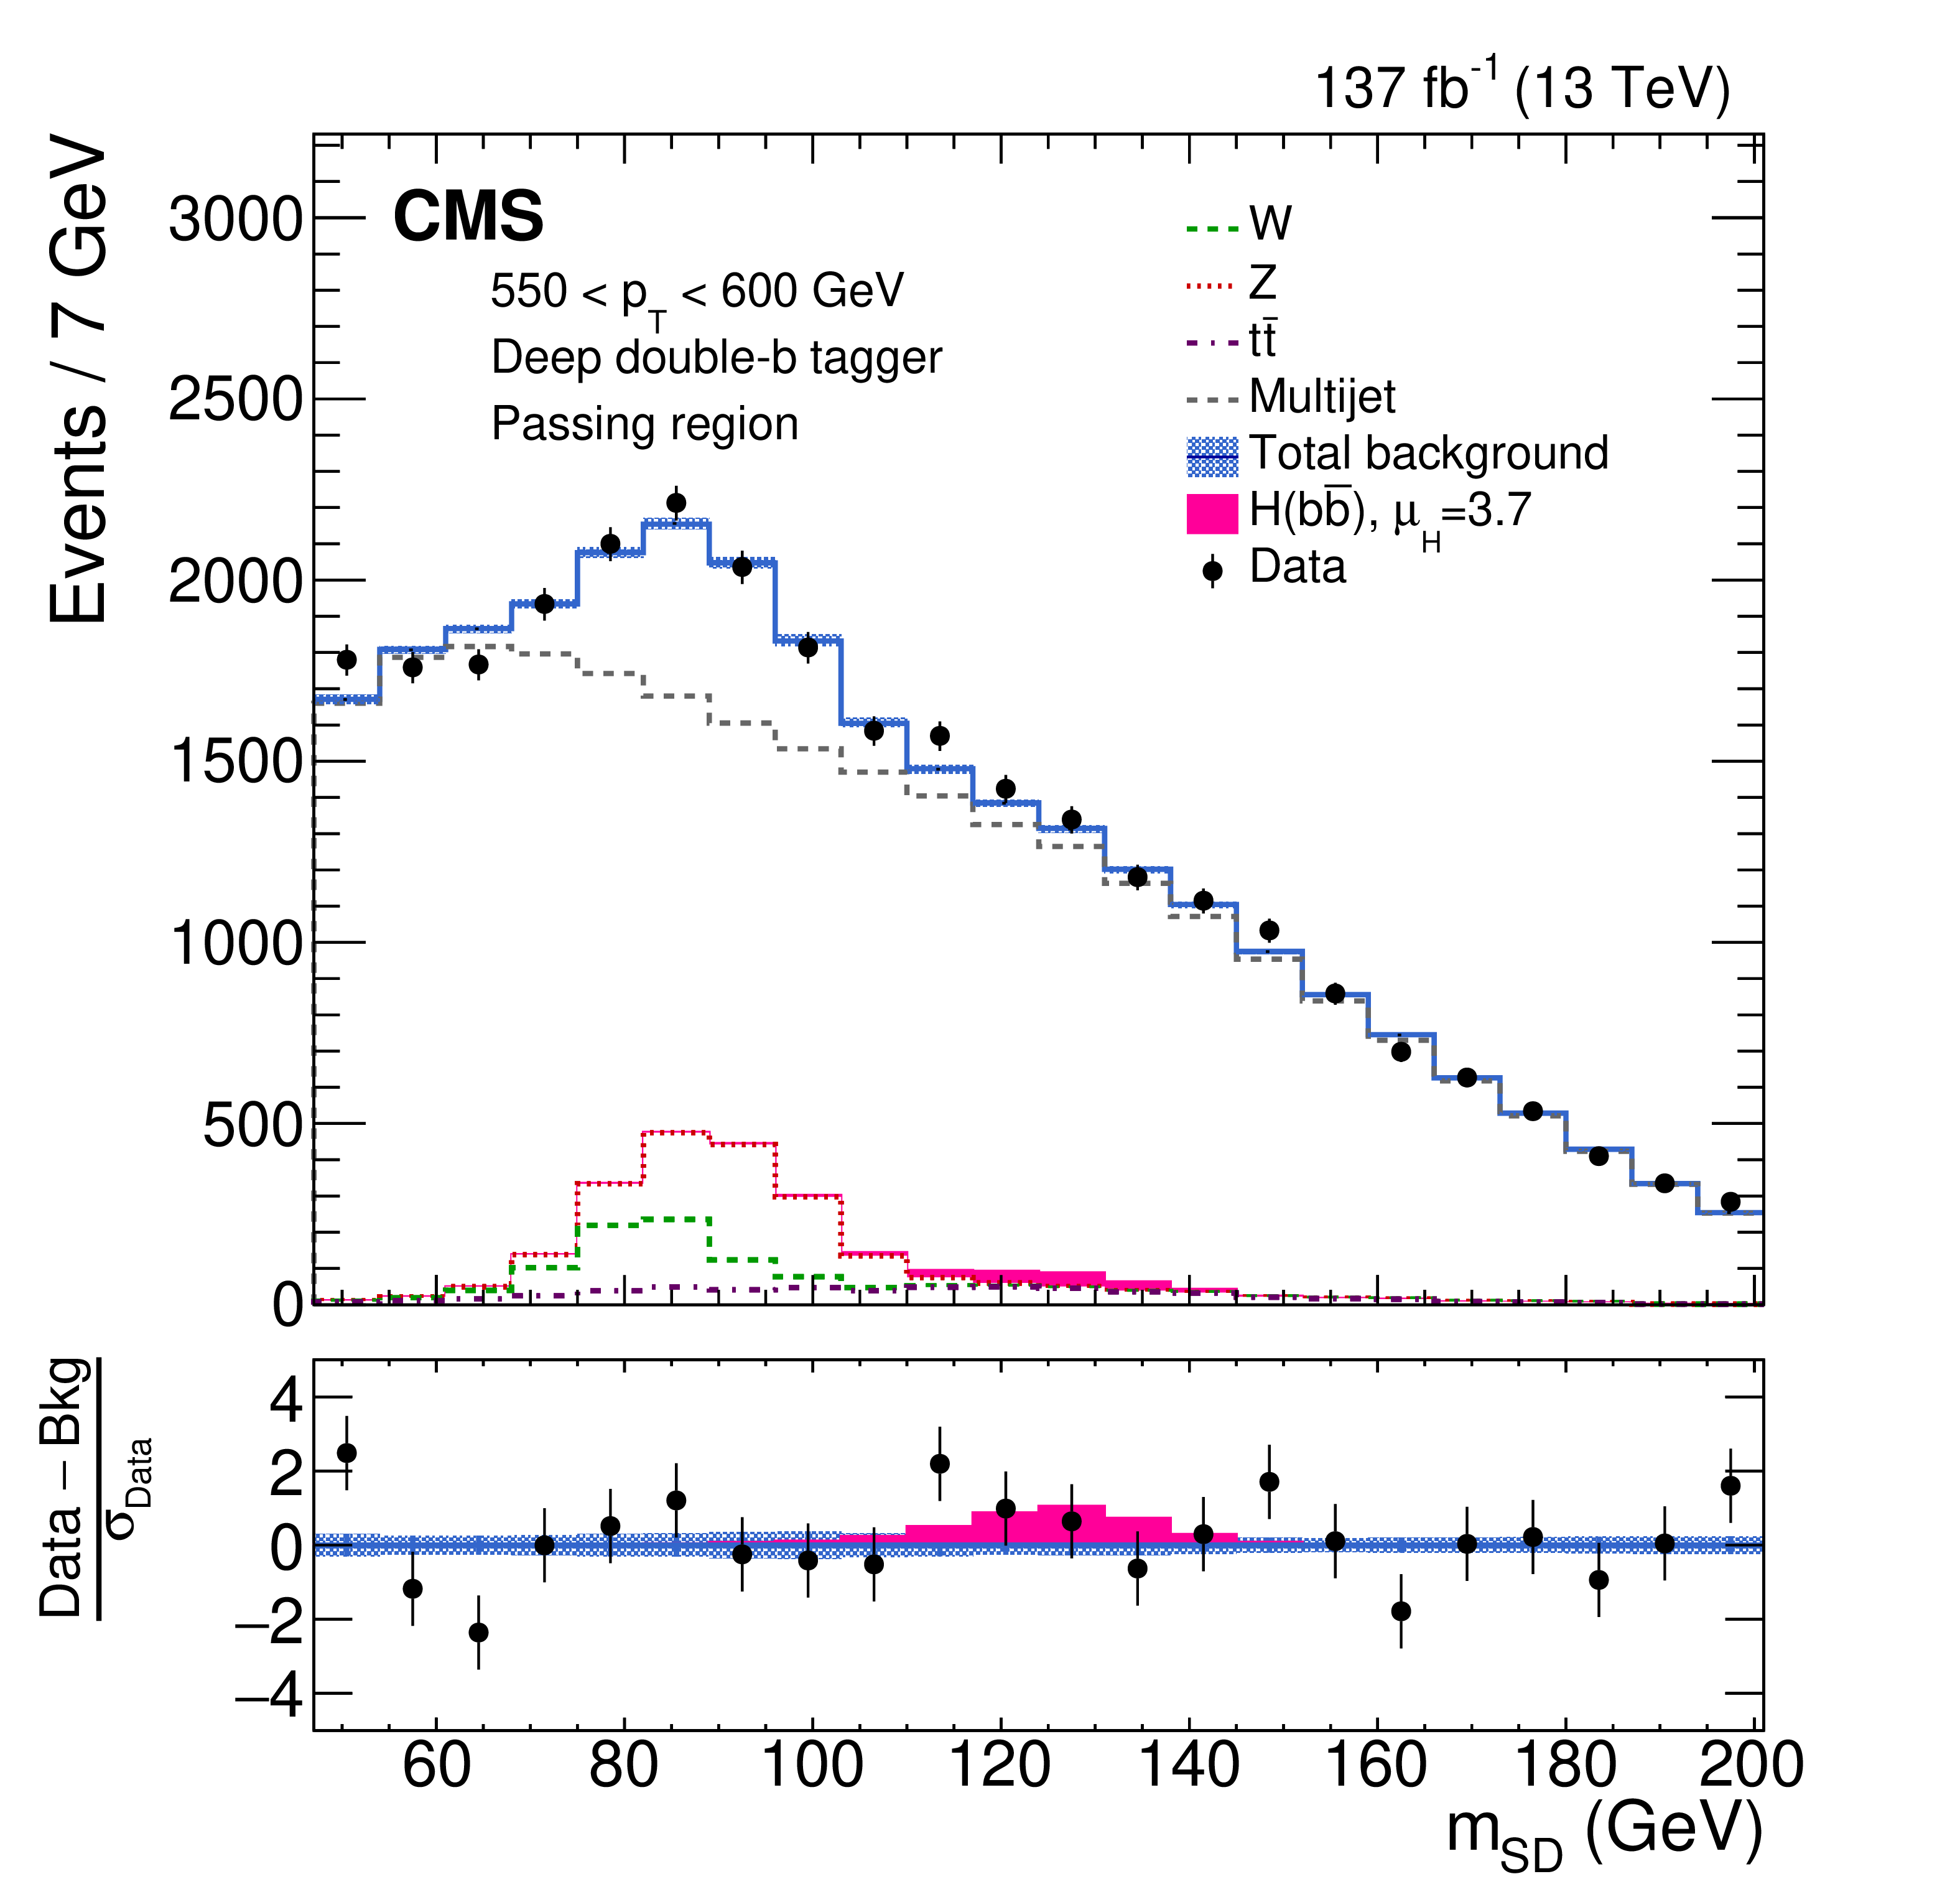
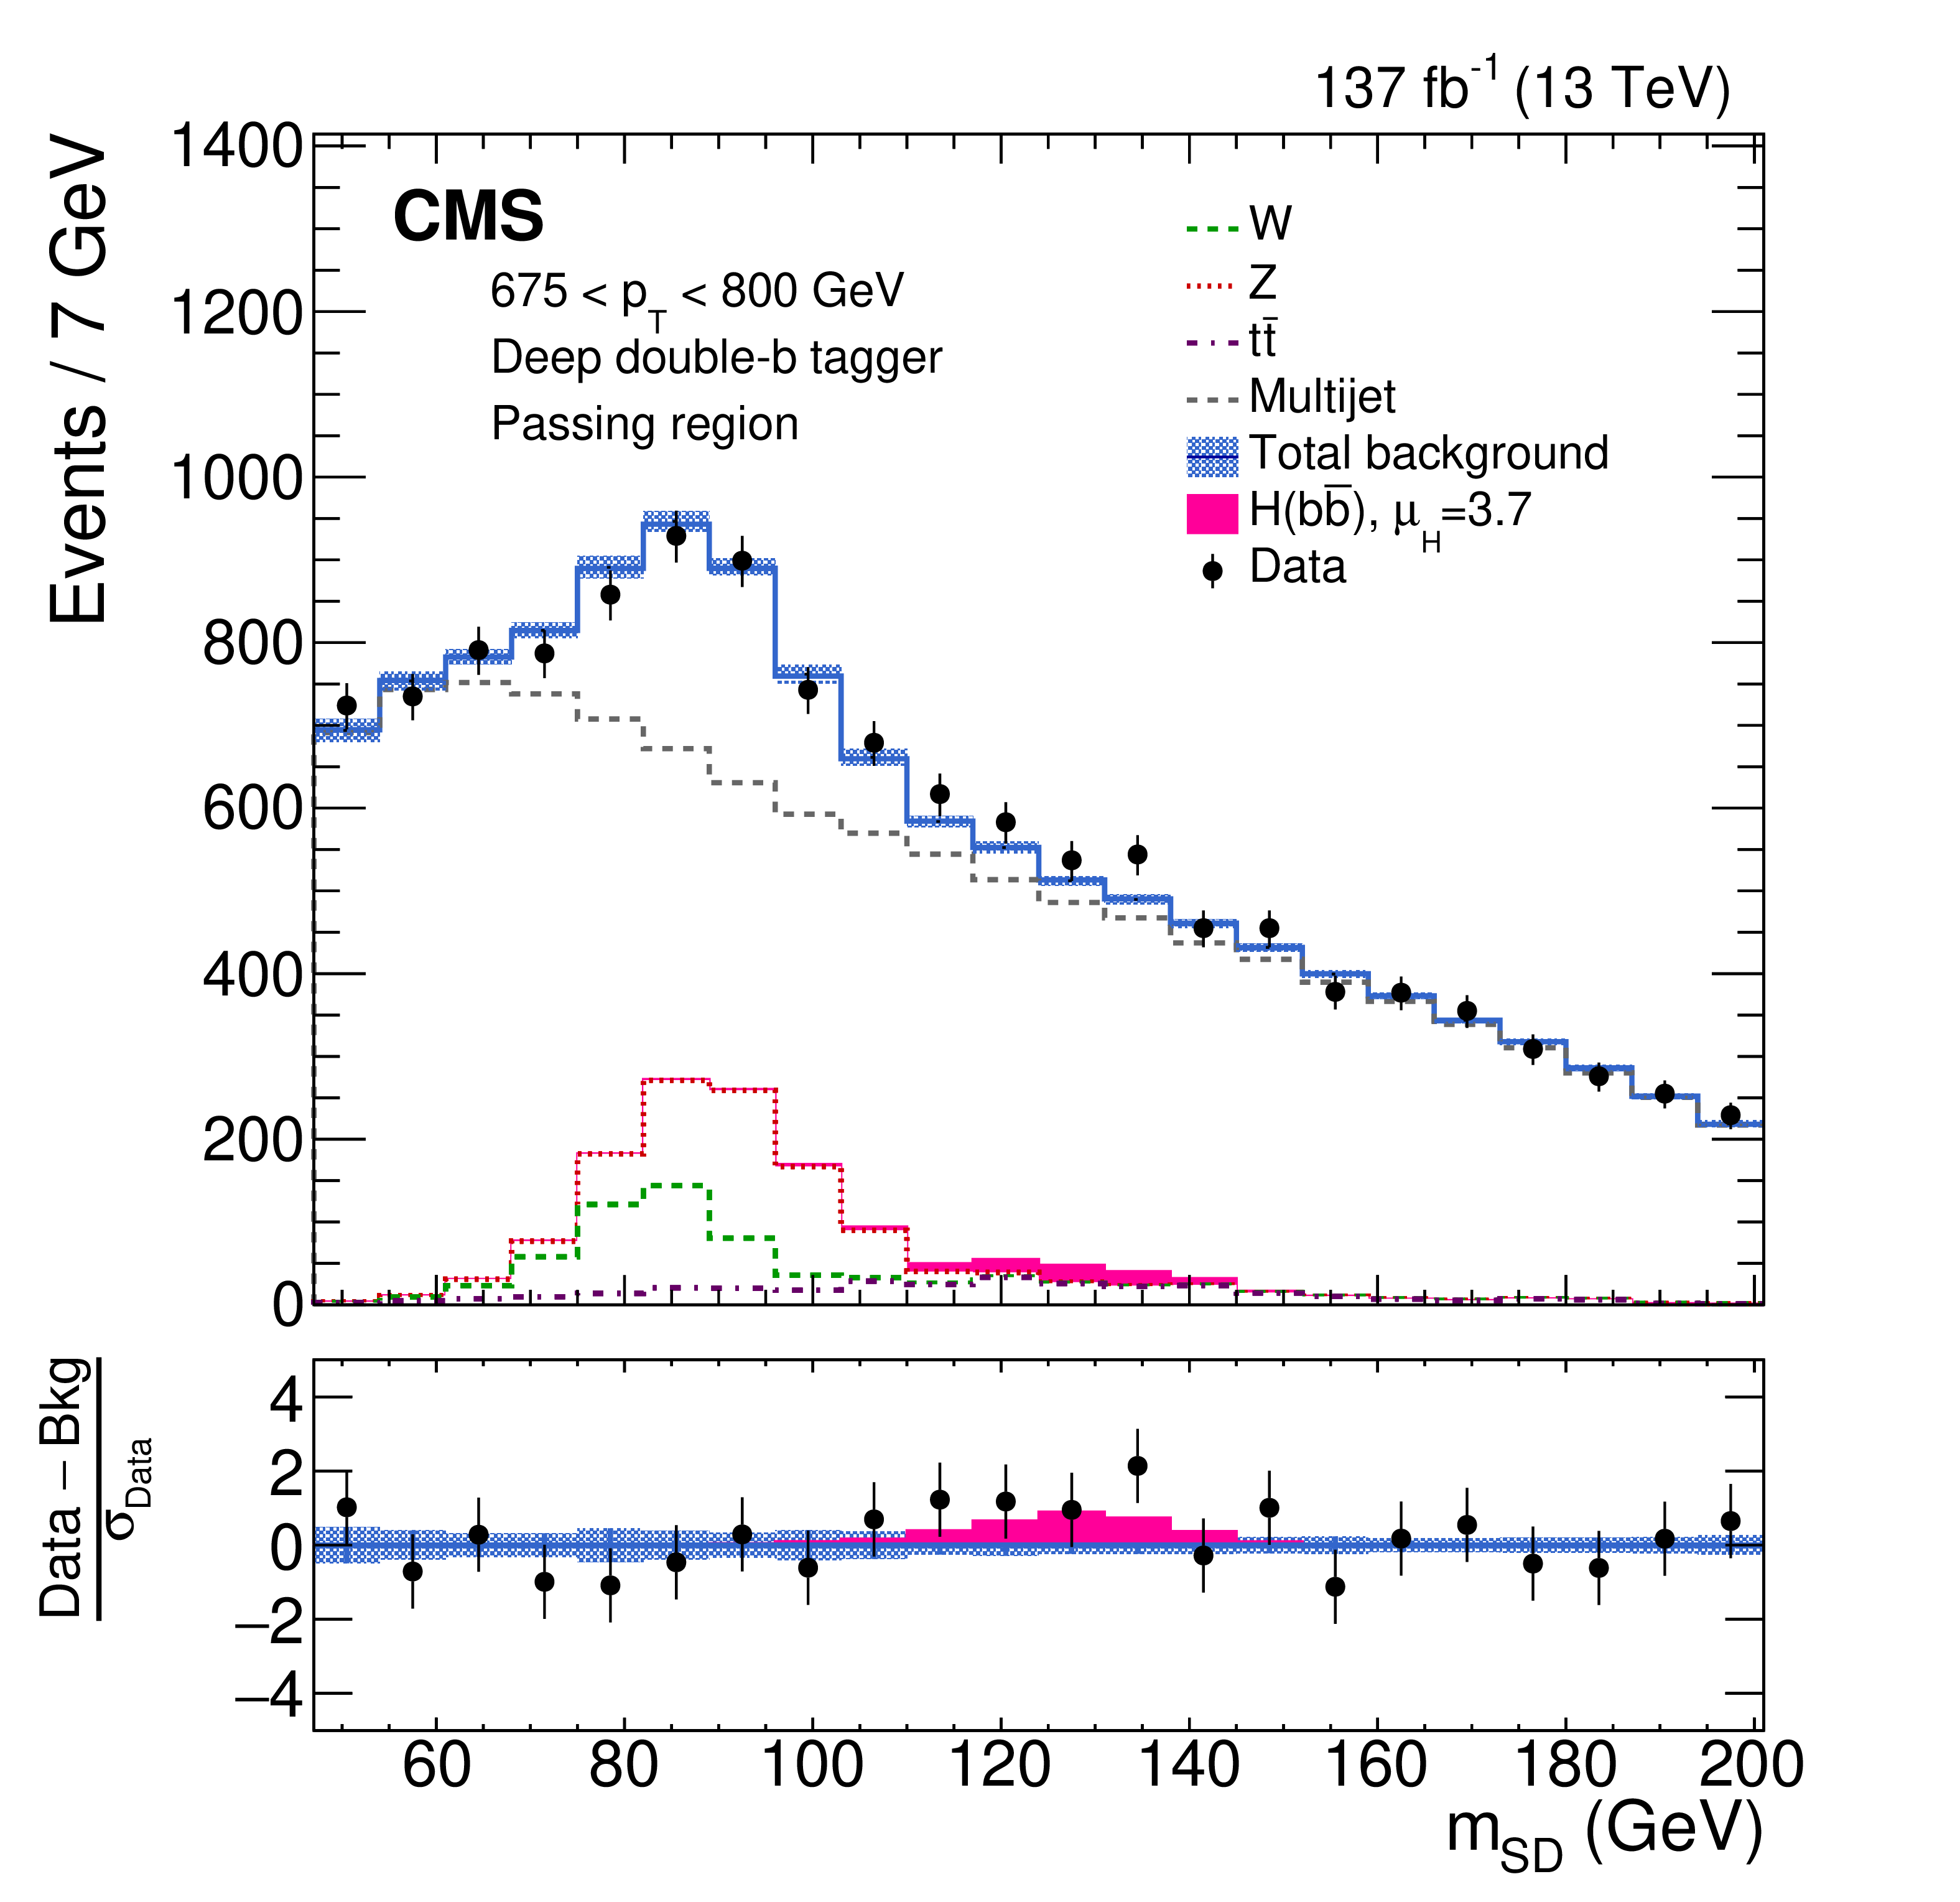
Figure 4:
The observed and fitted background ${m_{\mathrm {SD}}}$ distributions in each ${p_{\mathrm {T}}}$ category in the DDBT passing regions. The fit is performed under the signal-plus-background hypothesis with one inclusive $\mathrm{H} (\mathrm{b} {}\mathrm{\bar{b}})$ signal strength parameter floating in all the ${p_{\mathrm {T}}}$ categories. The shaded blue band shows the systematic uncertainty in the total background prediction. The bottom panel shows the difference between the data and the total background prediction, divided by the statistical uncertainty in the data. |
png pdf |
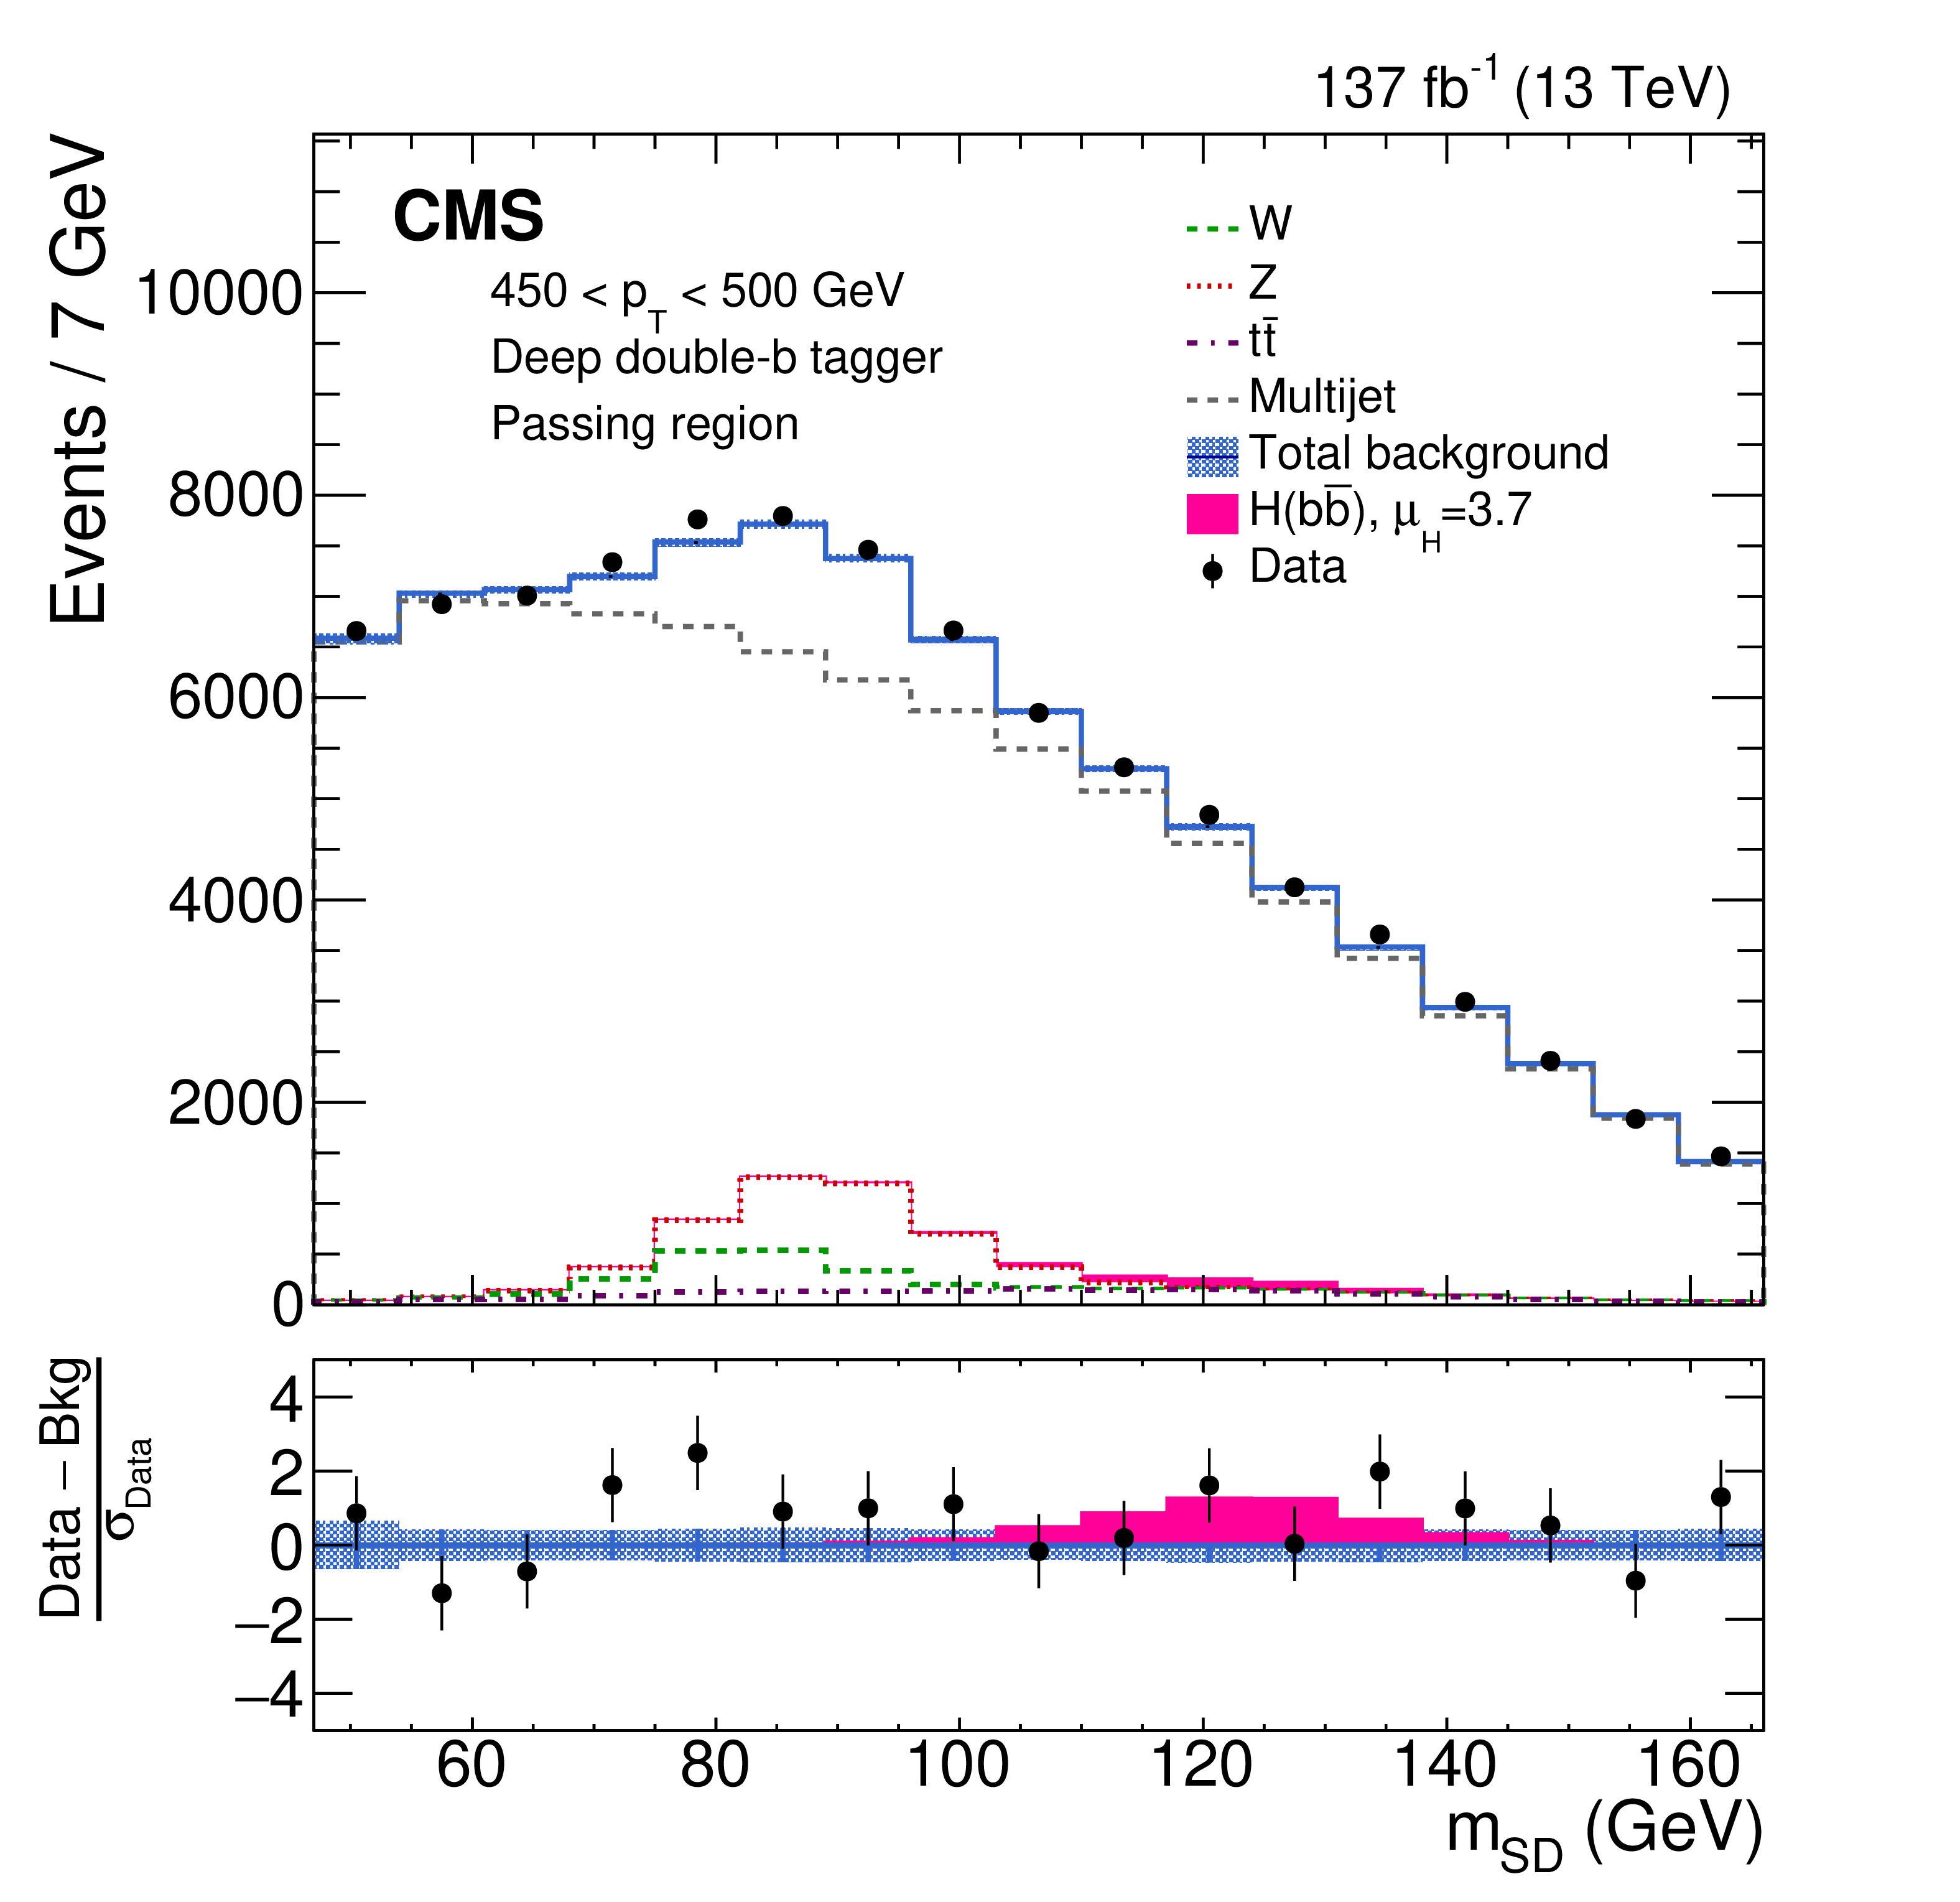
Figure 4-a:
The observed and fitted background ${m_{\mathrm {SD}}}$ distributions in the 450 $< {p_{\mathrm {T}}} < $ 500 GeV category in the DDBT passing regions. The fit is performed under the signal-plus-background hypothesis with one inclusive $\mathrm{H} (\mathrm{b} {}\mathrm{\bar{b}})$ signal strength parameter floating. The shaded blue band shows the systematic uncertainty in the total background prediction. The bottom panel shows the difference between the data and the total background prediction, divided by the statistical uncertainty in the data. |
png pdf |
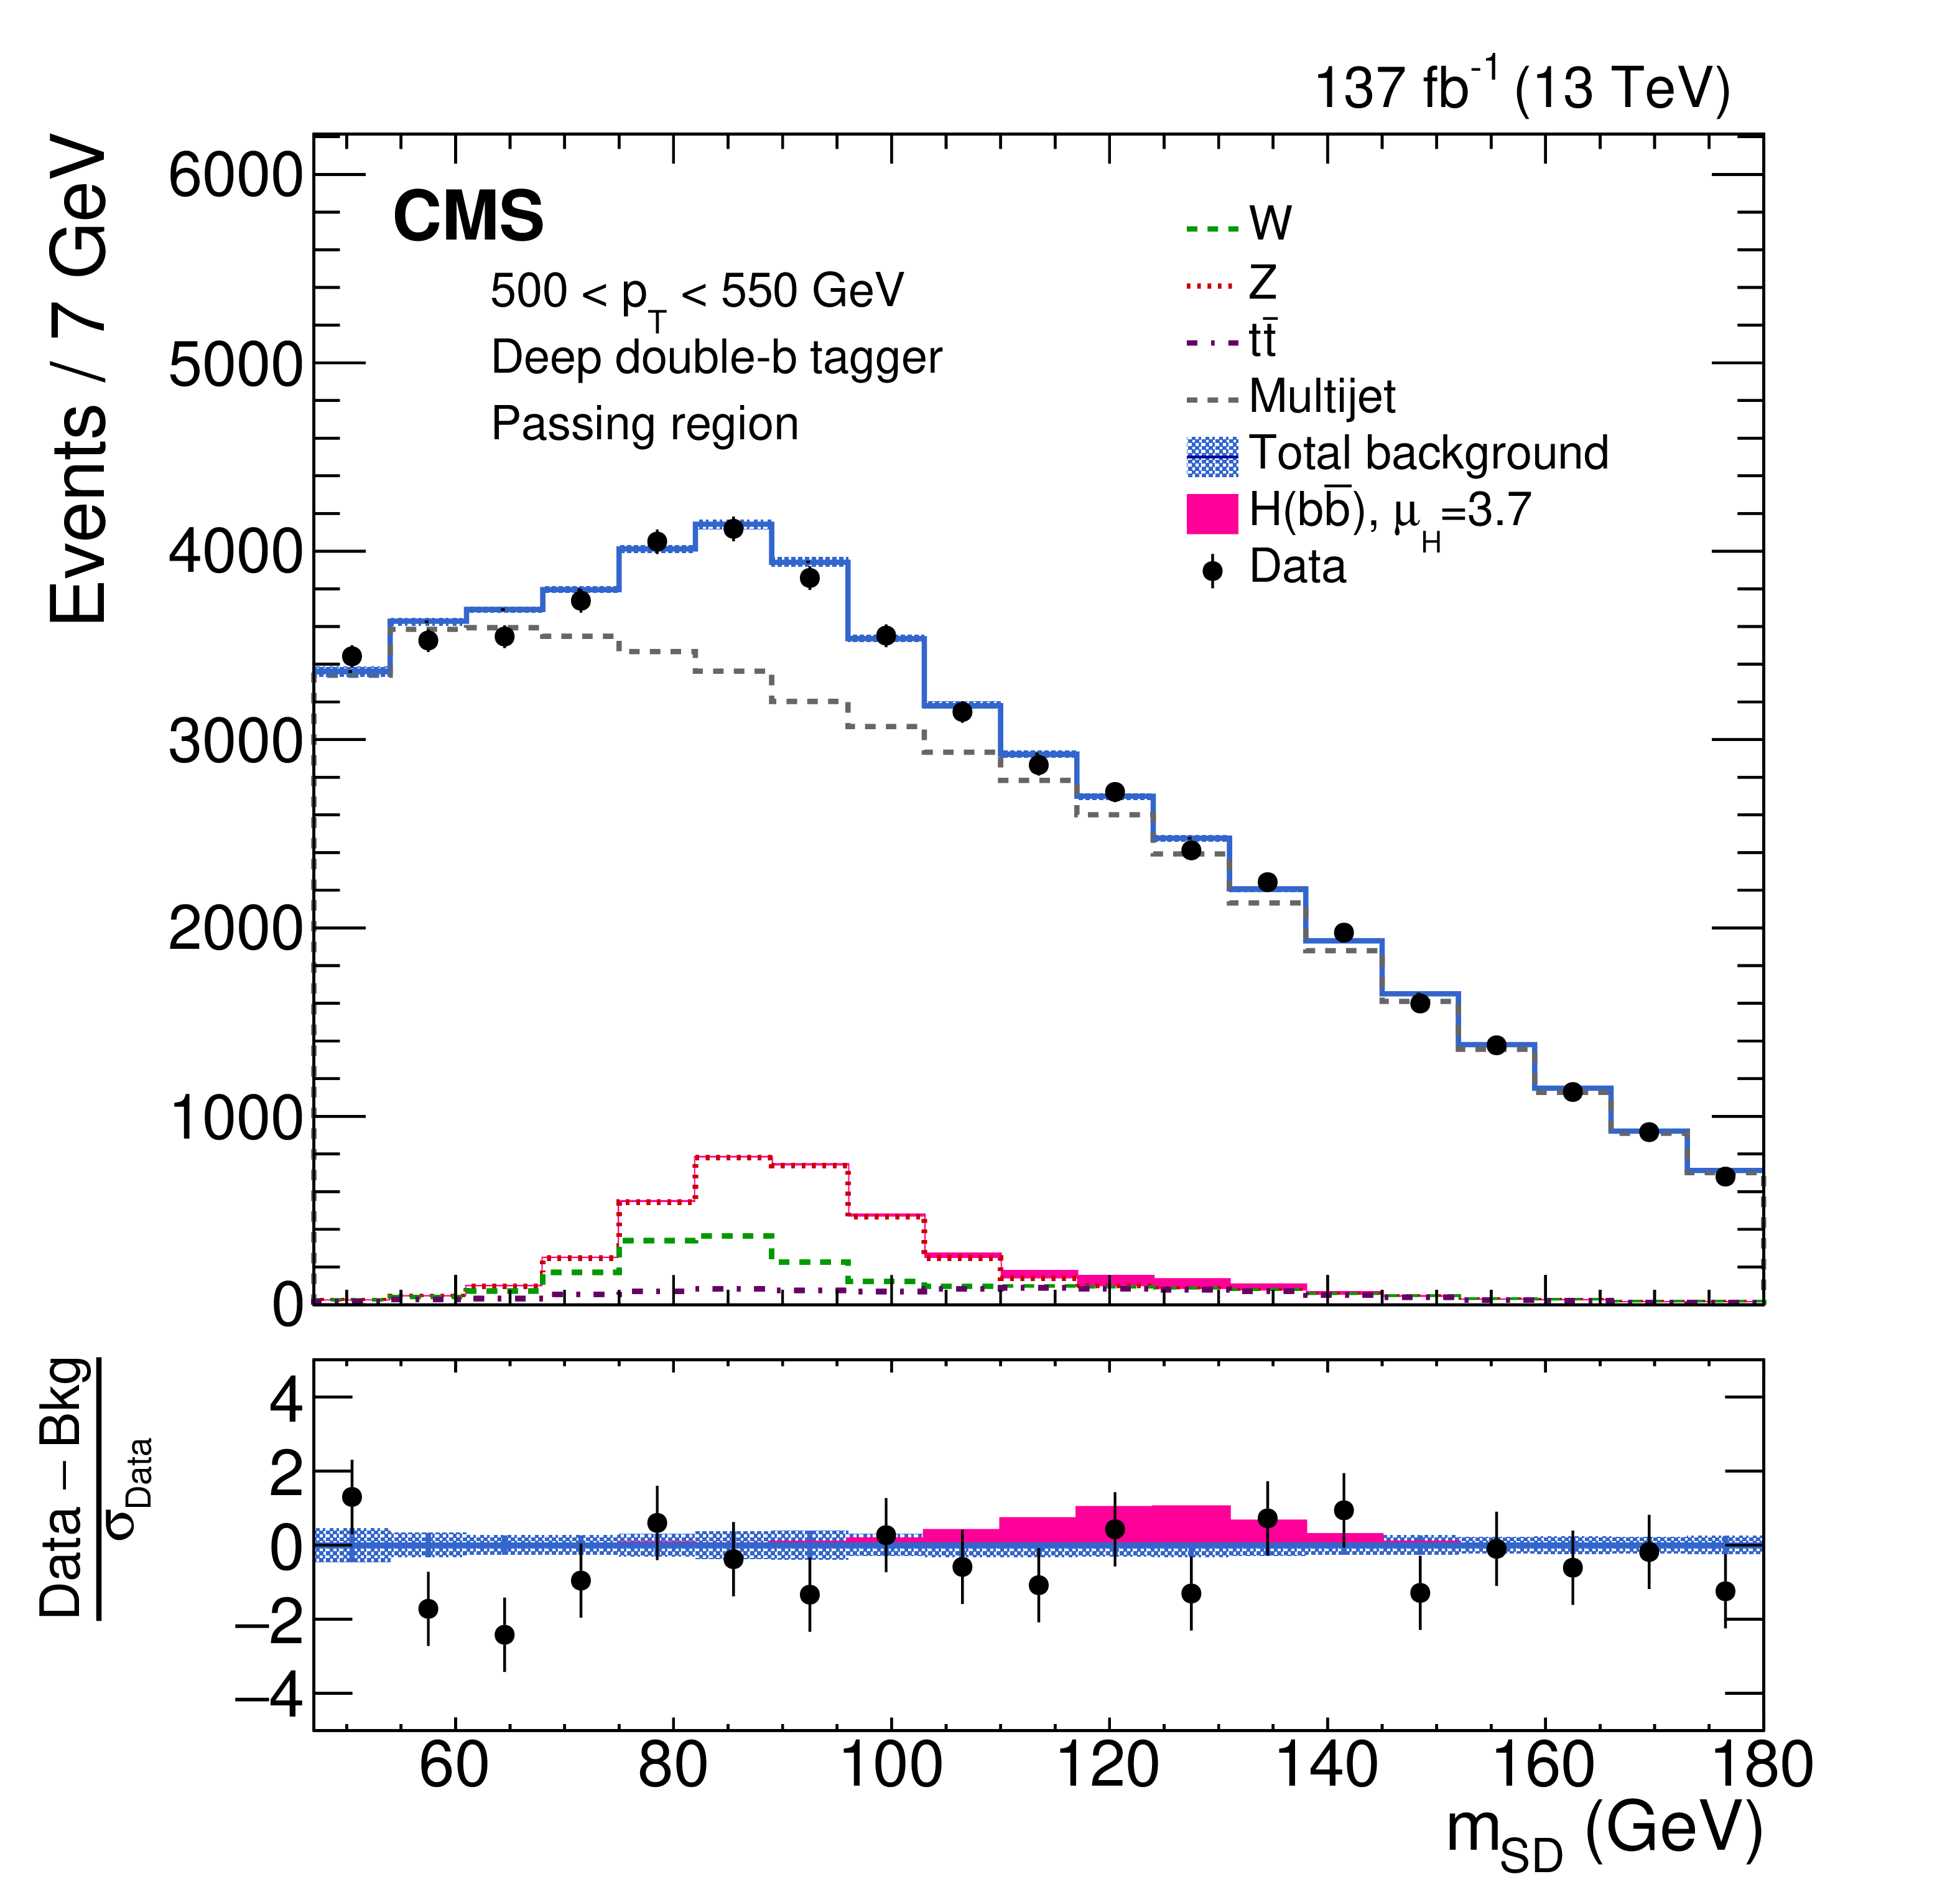
Figure 4-b:
The observed and fitted background ${m_{\mathrm {SD}}}$ distributions in the 500 $< {p_{\mathrm {T}}} < $ 550 GeV category in the DDBT passing regions. The fit is performed under the signal-plus-background hypothesis with one inclusive $\mathrm{H} (\mathrm{b} {}\mathrm{\bar{b}})$ signal strength parameter floating. The shaded blue band shows the systematic uncertainty in the total background prediction. The bottom panel shows the difference between the data and the total background prediction, divided by the statistical uncertainty in the data. |
png pdf |
Figure 4-c:
The observed and fitted background ${m_{\mathrm {SD}}}$ distributions in the 550 $< {p_{\mathrm {T}}} < $ 600 GeV category in the DDBT passing regions. The fit is performed under the signal-plus-background hypothesis with one inclusive $\mathrm{H} (\mathrm{b} {}\mathrm{\bar{b}})$ signal strength parameter floating. The shaded blue band shows the systematic uncertainty in the total background prediction. The bottom panel shows the difference between the data and the total background prediction, divided by the statistical uncertainty in the data. |

png pdf |
Figure 4-d:
The observed and fitted background ${m_{\mathrm {SD}}}$ distributions in the 600 $< {p_{\mathrm {T}}} < $ 675 GeV category in the DDBT passing regions. The fit is performed under the signal-plus-background hypothesis with one inclusive $\mathrm{H} (\mathrm{b} {}\mathrm{\bar{b}})$ signal strength parameter floating. The shaded blue band shows the systematic uncertainty in the total background prediction. The bottom panel shows the difference between the data and the total background prediction, divided by the statistical uncertainty in the data. |
png pdf |
Figure 4-e:
The observed and fitted background ${m_{\mathrm {SD}}}$ distributions in the 675 $< {p_{\mathrm {T}}} < $ 800 GeV category in the DDBT passing regions. The fit is performed under the signal-plus-background hypothesis with one inclusive $\mathrm{H} (\mathrm{b} {}\mathrm{\bar{b}})$ signal strength parameter floating. The shaded blue band shows the systematic uncertainty in the total background prediction. The bottom panel shows the difference between the data and the total background prediction, divided by the statistical uncertainty in the data. |

png pdf |
Figure 4-f:
The observed and fitted background ${m_{\mathrm {SD}}}$ distributions in the 800 $< {p_{\mathrm {T}}} < $ 1200 GeV category in the DDBT passing regions. The fit is performed under the signal-plus-background hypothesis with one inclusive $\mathrm{H} (\mathrm{b} {}\mathrm{\bar{b}})$ signal strength parameter floating. The shaded blue band shows the systematic uncertainty in the total background prediction. The bottom panel shows the difference between the data and the total background prediction, divided by the statistical uncertainty in the data. |
png pdf |
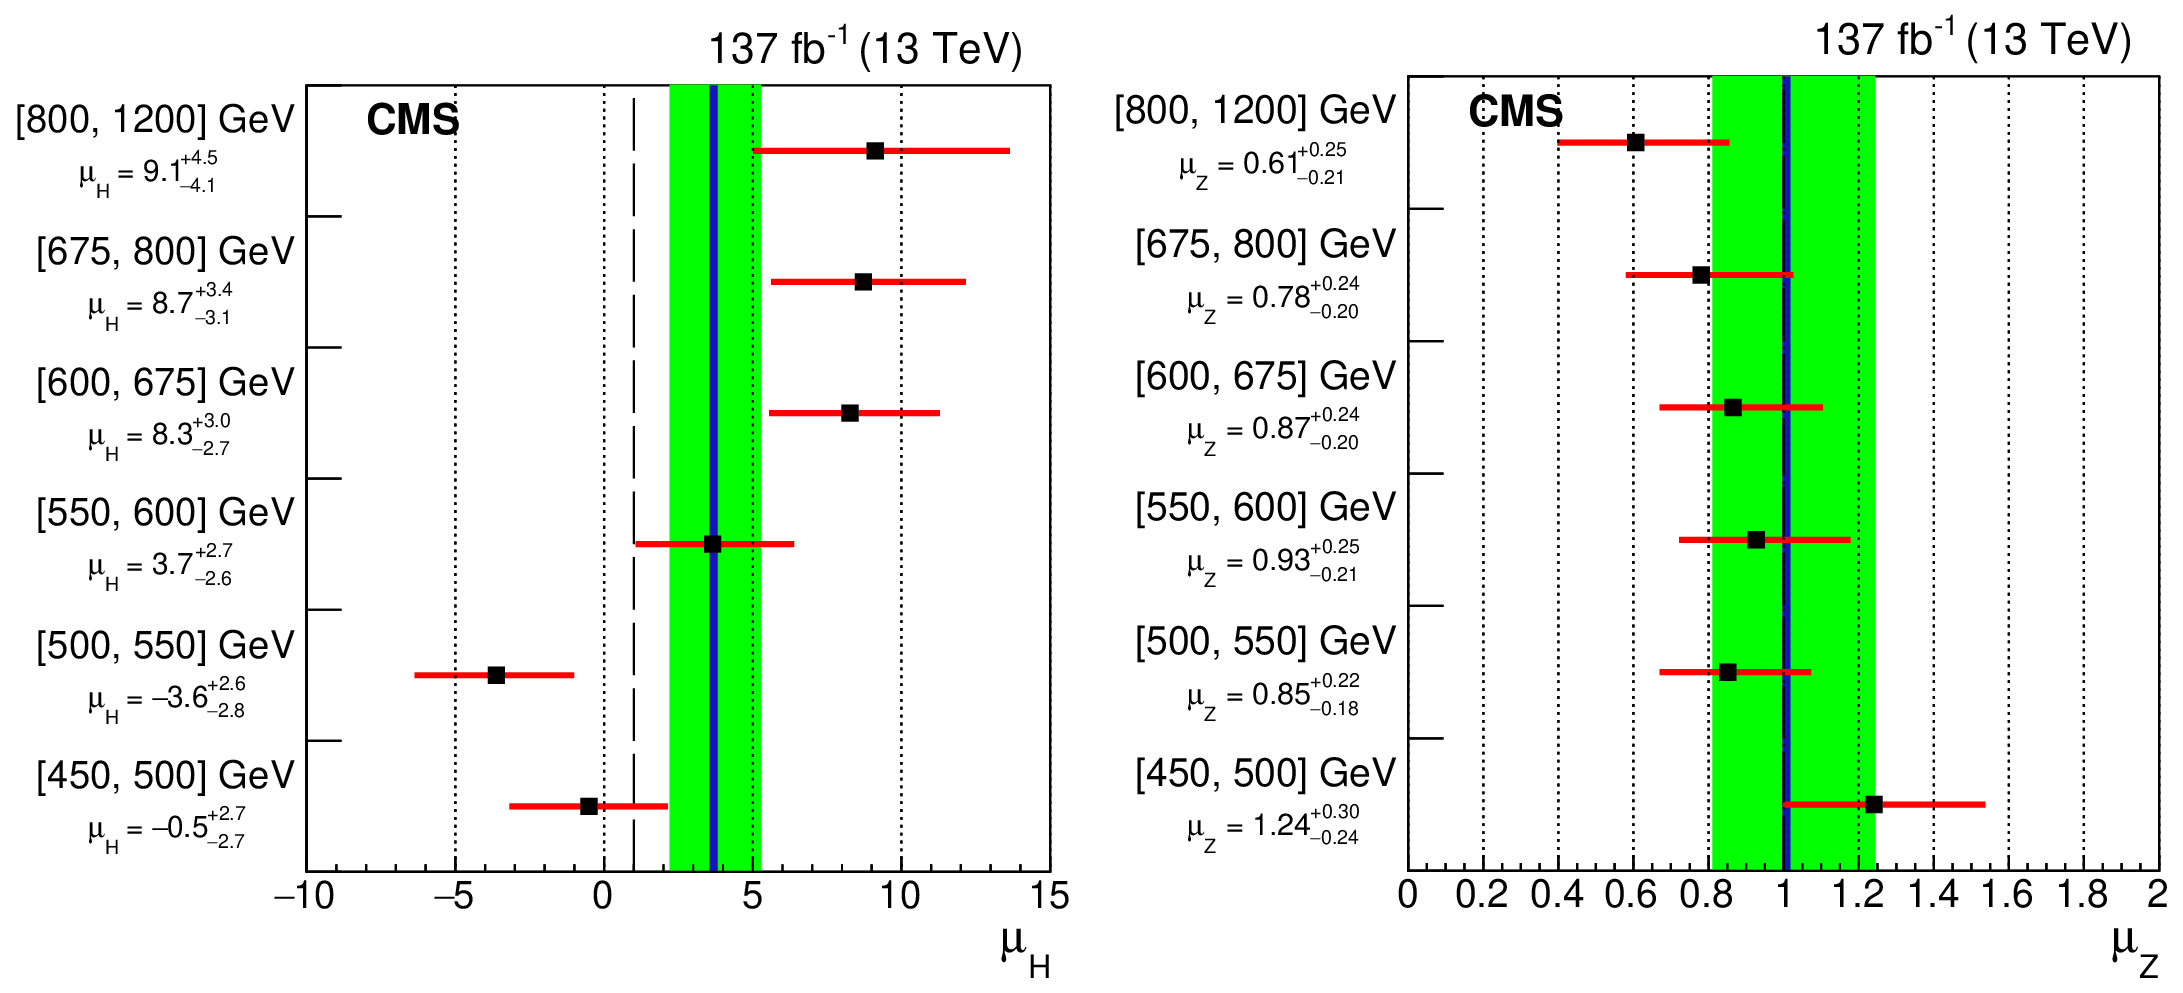
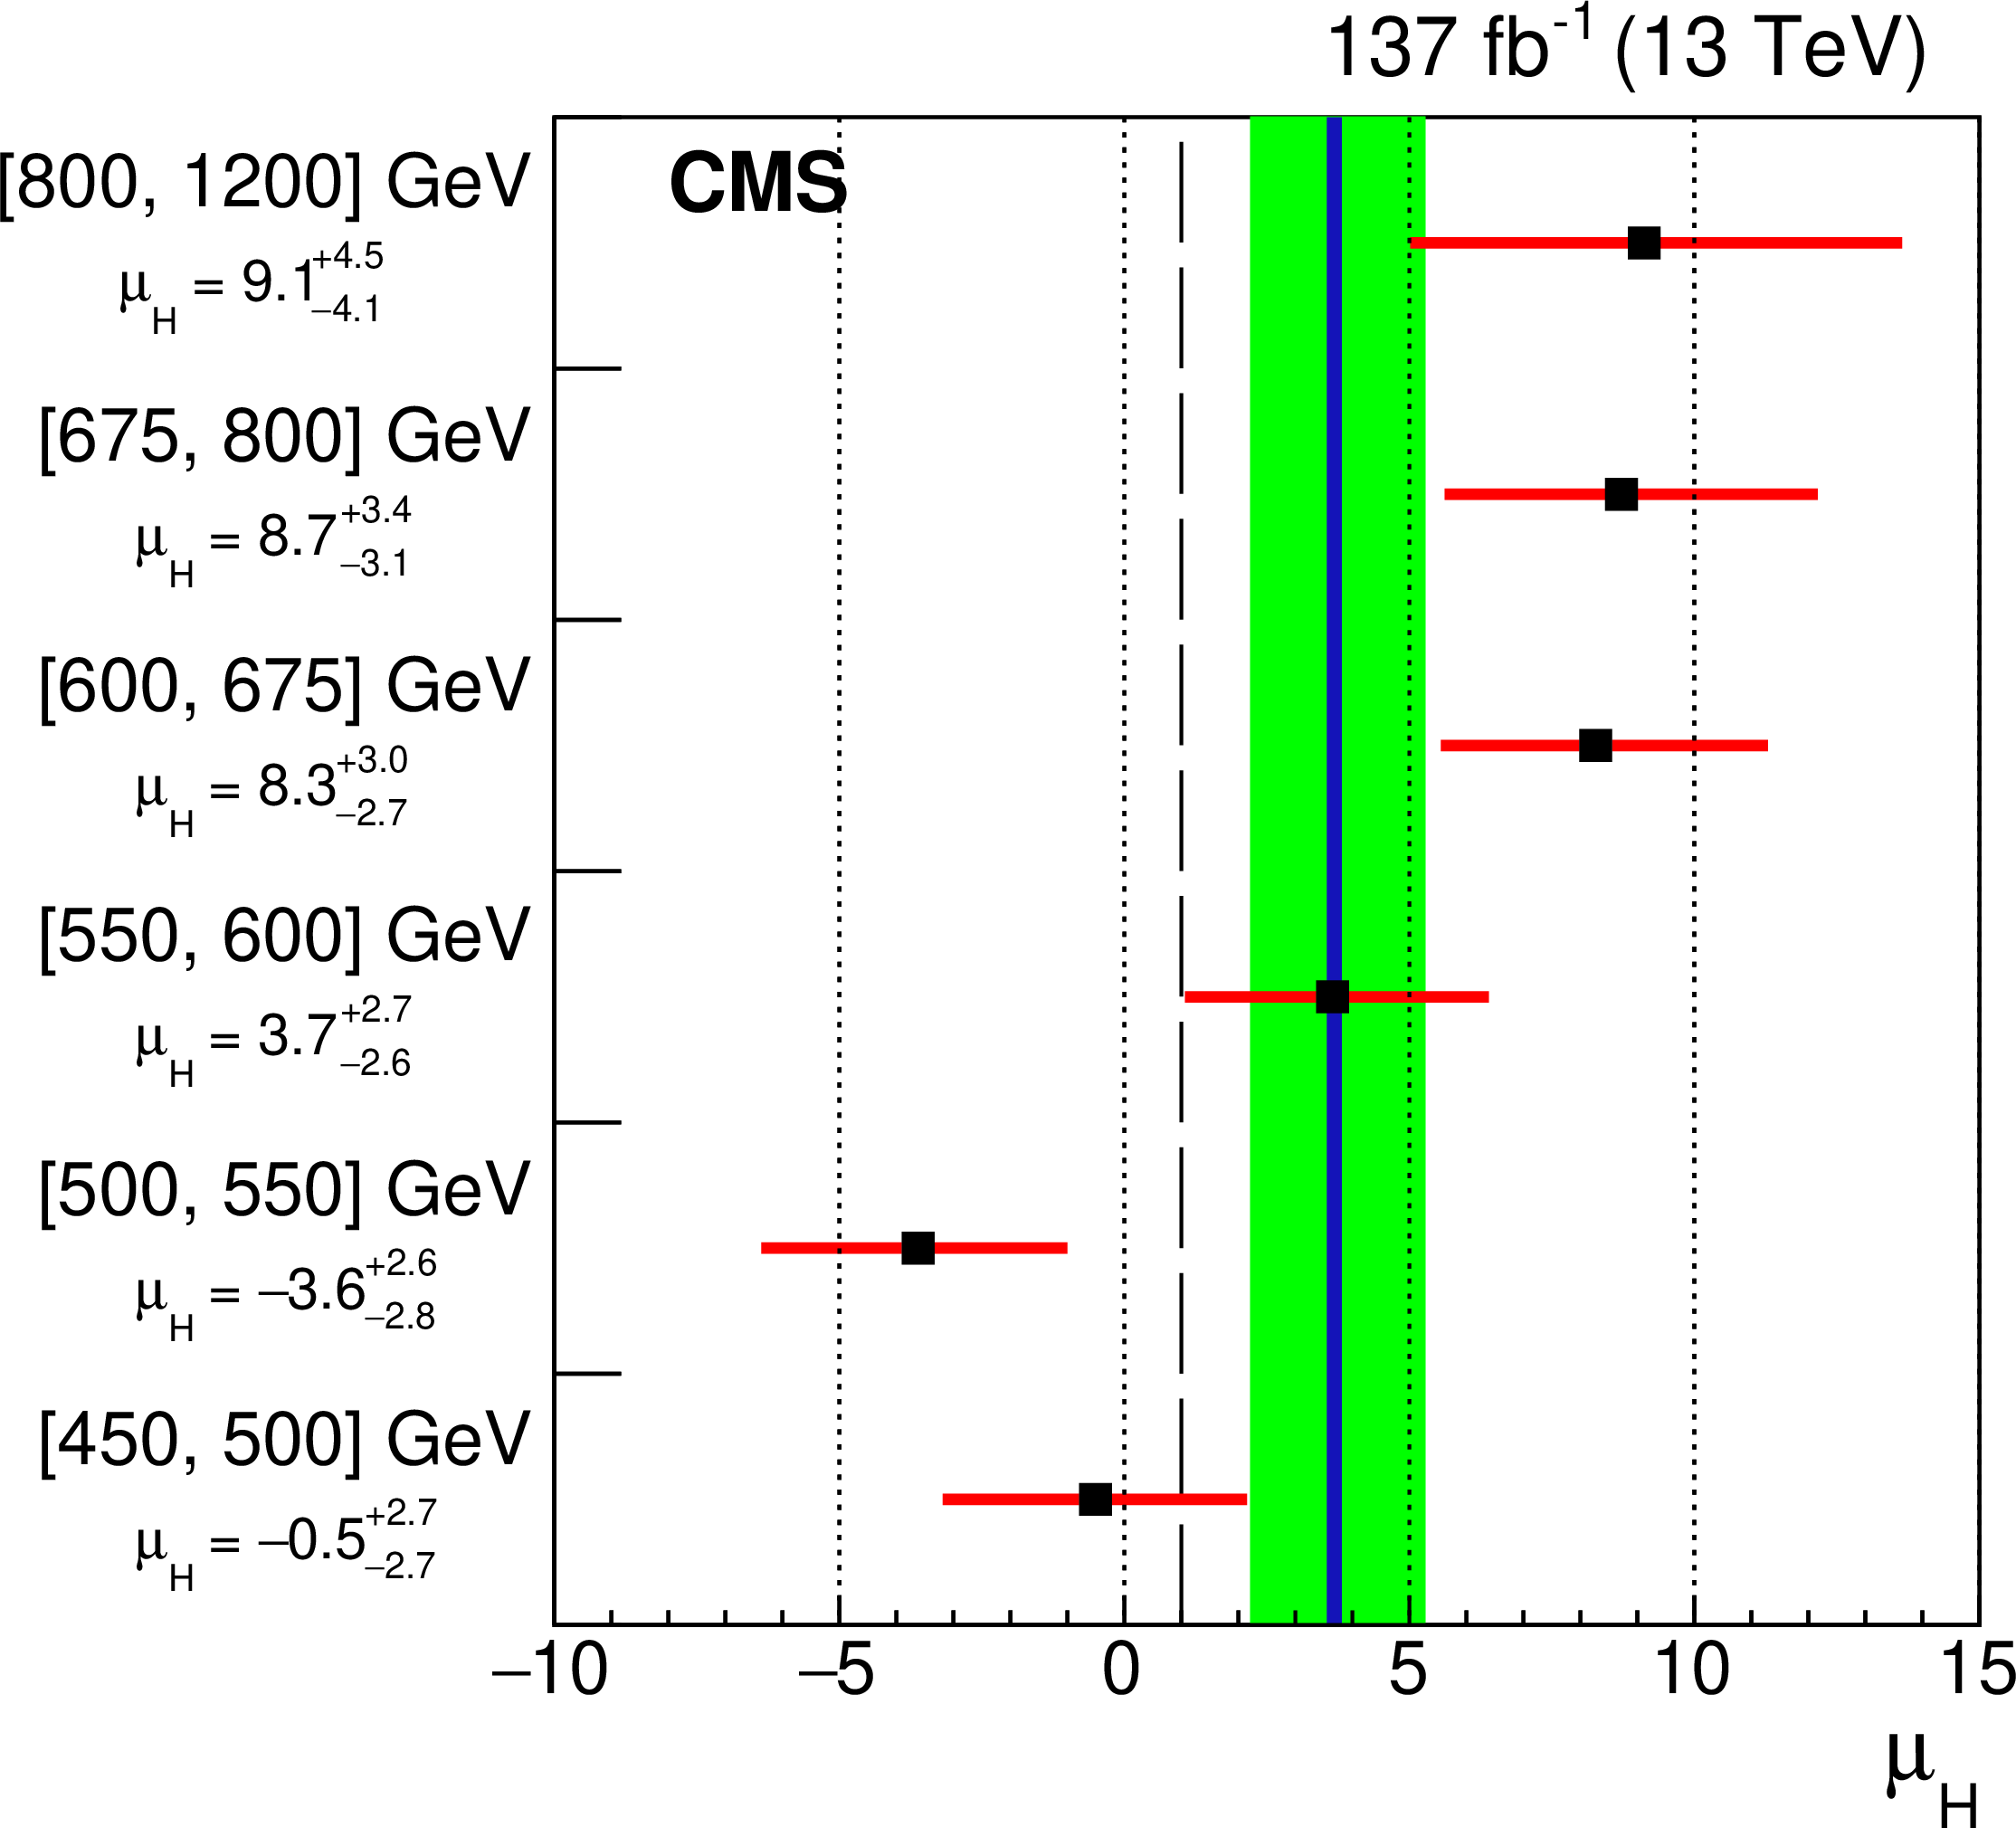
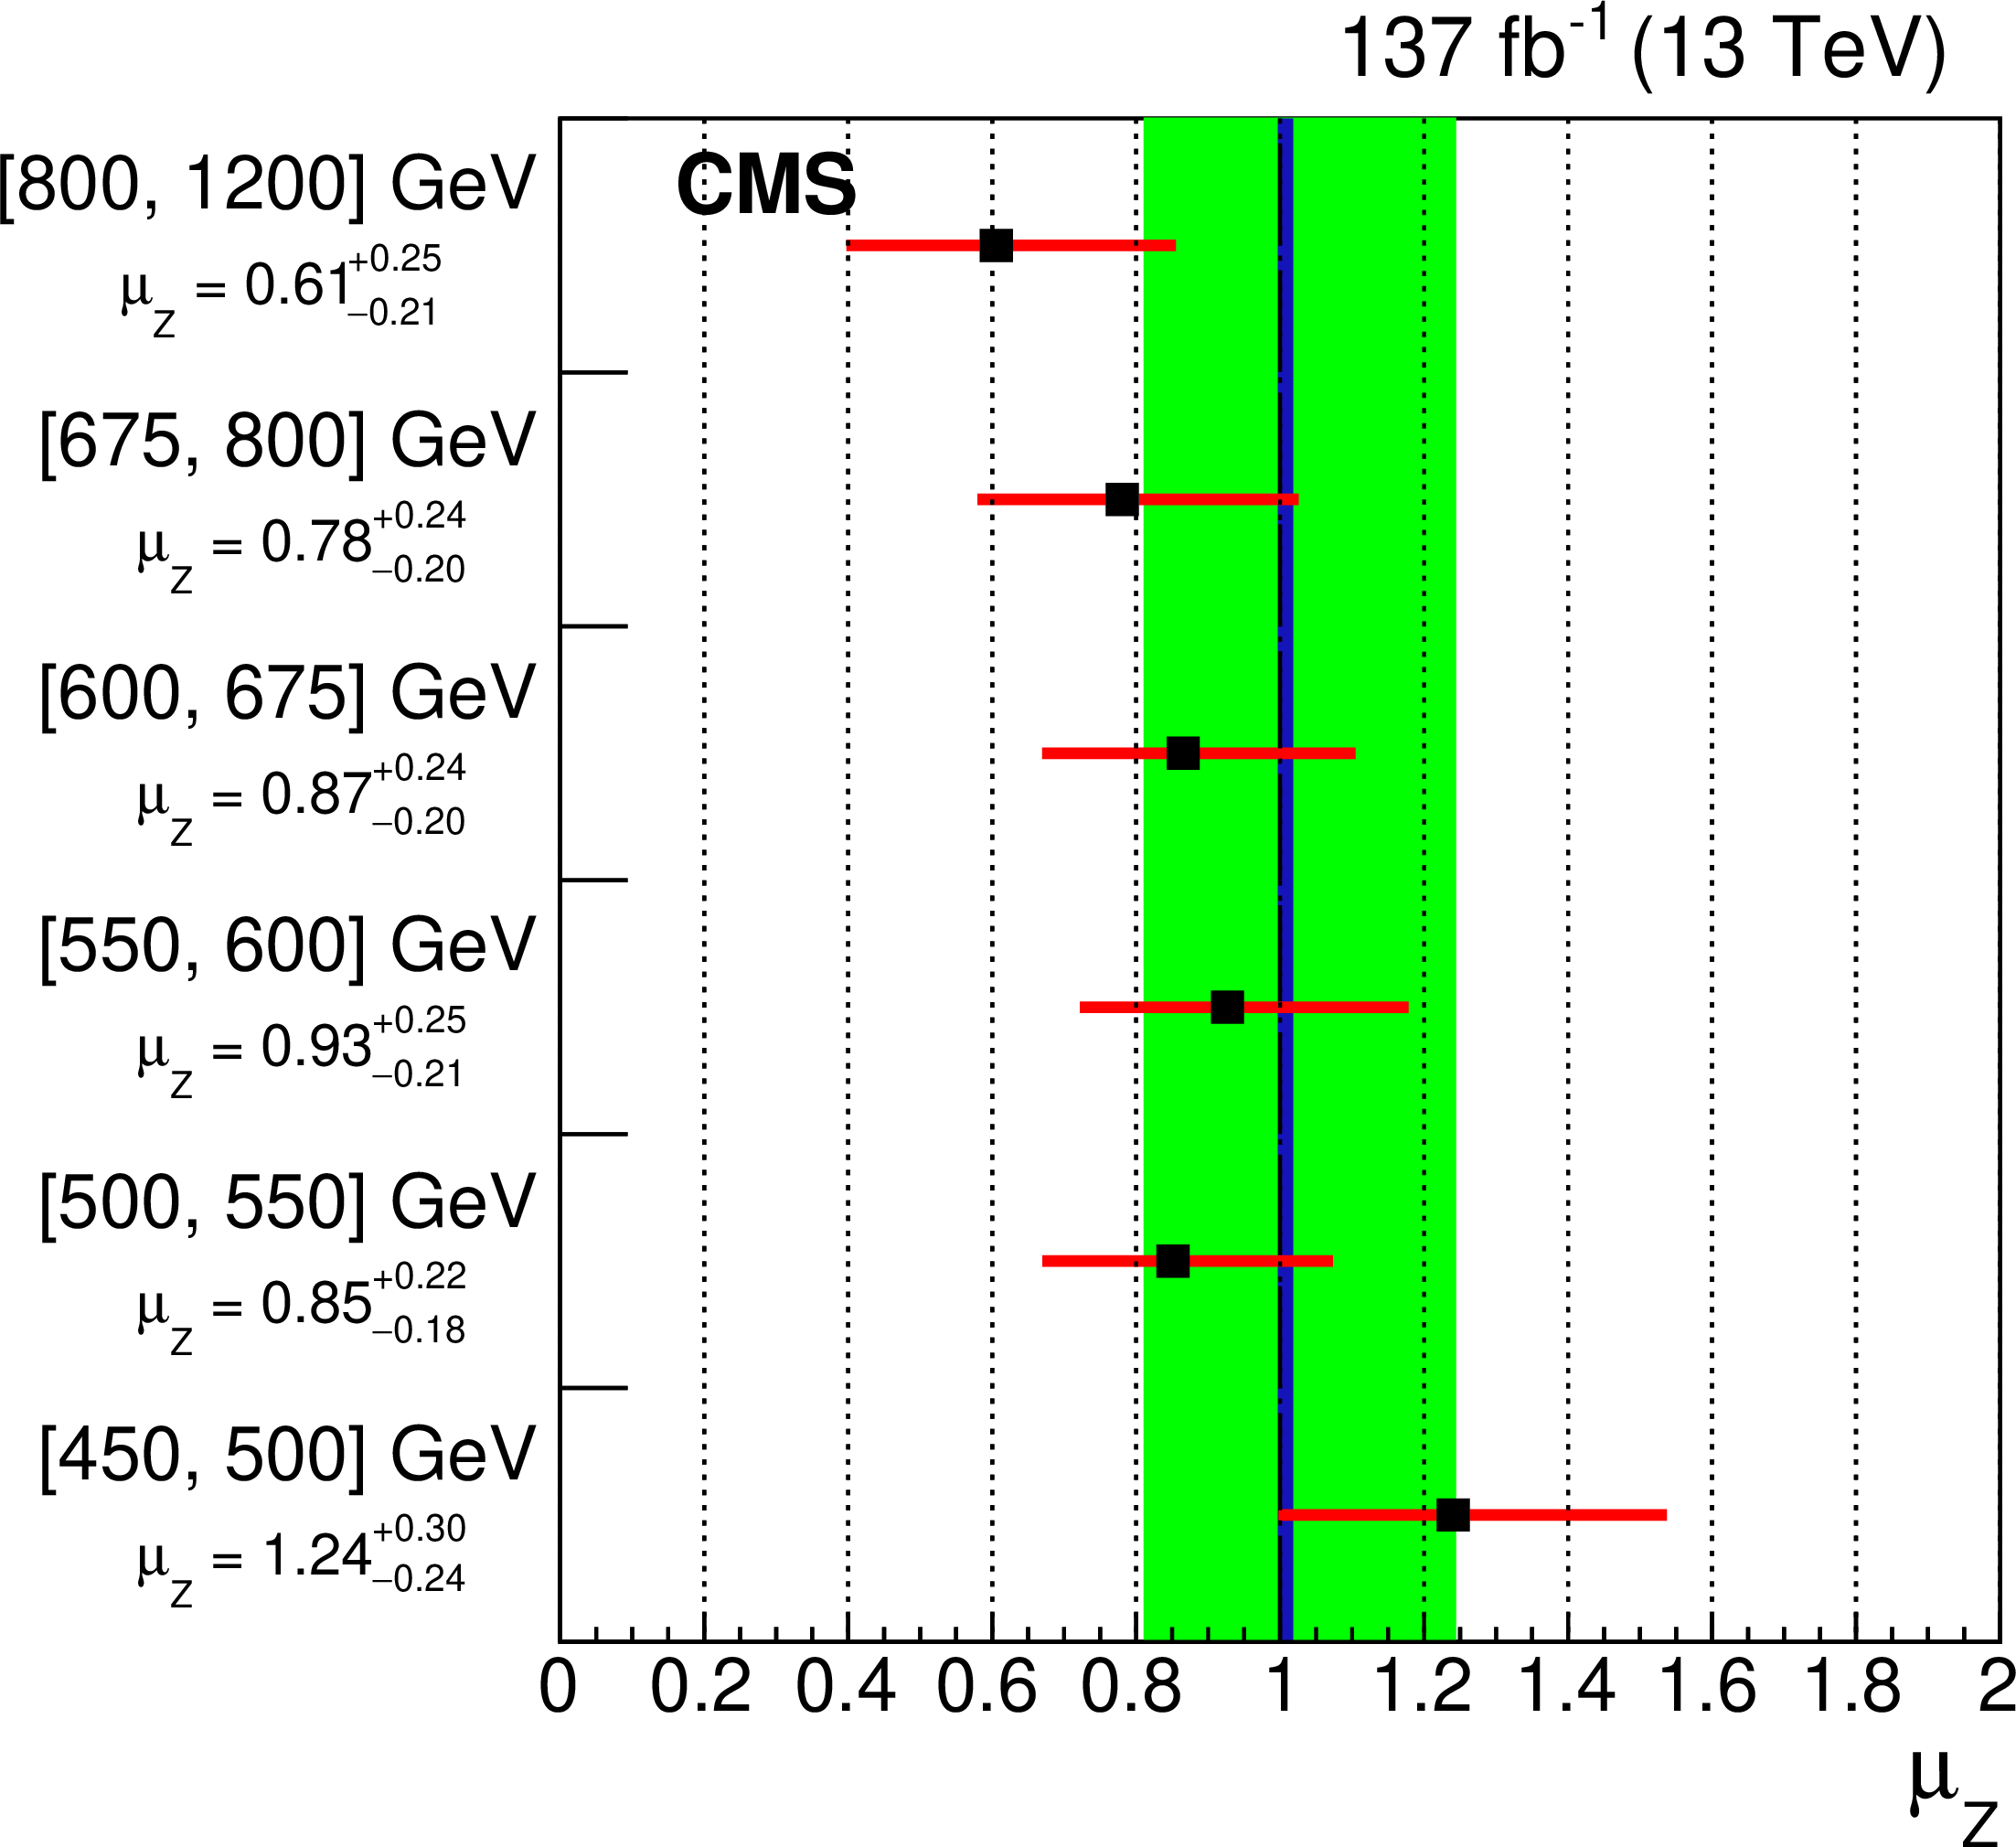
Figure 5:
The best-fit signal strength $\mu _{\mathrm{H}}$ (black squares) and uncertainty (red lines) per ${p_{\mathrm {T}}}$ category based on the {HJ-MiNLO} [32,33] prediction (left) and the same for $\mu _{\mathrm{Z}}$ (right). The dashed black line indicates the SM expectation. The solid blue line and green band represents the combined best-fit signal strength and uncertainty, respectively, of $\mu _{\mathrm{H}} = {3.7} _{- {1.5}}^{+ {1.6}}$ or $\mu _{\mathrm{Z}}= {1.01} _{- {0.20}}^{+ {0.24}}$ extracted from a simultaneous fit of all channels. |
png pdf |
Figure 5-a:
The best-fit signal strength $\mu _{\mathrm{H}}$ (black squares) and uncertainty (red lines) per ${p_{\mathrm {T}}}$ category based on the {HJ-MiNLO} [32,33] prediction. The dashed black line indicates the SM expectation. The solid blue line and green band represents the combined best-fit signal strength and uncertainty, respectively, of $\mu _{\mathrm{H}} = {3.7} _{- {1.5}}^{+ {1.6}}$ extracted from a simultaneous fit of all channels. |
png pdf |
Figure 5-b:
The best-fit signal strength $\mu _{\mathrm{Z}}$ (black squares) and uncertainty (red lines) per ${p_{\mathrm {T}}}$ category based on the {HJ-MiNLO} [32,33] prediction. The dashed black line indicates the SM expectation. The solid blue line and green band represents the combined best-fit signal strength and uncertainty, respectively, of $\mu _{\mathrm{Z}}= {1.01} _{- {0.20}}^{+ {0.24}}$ extracted from a simultaneous fit of all channels. |
png pdf |
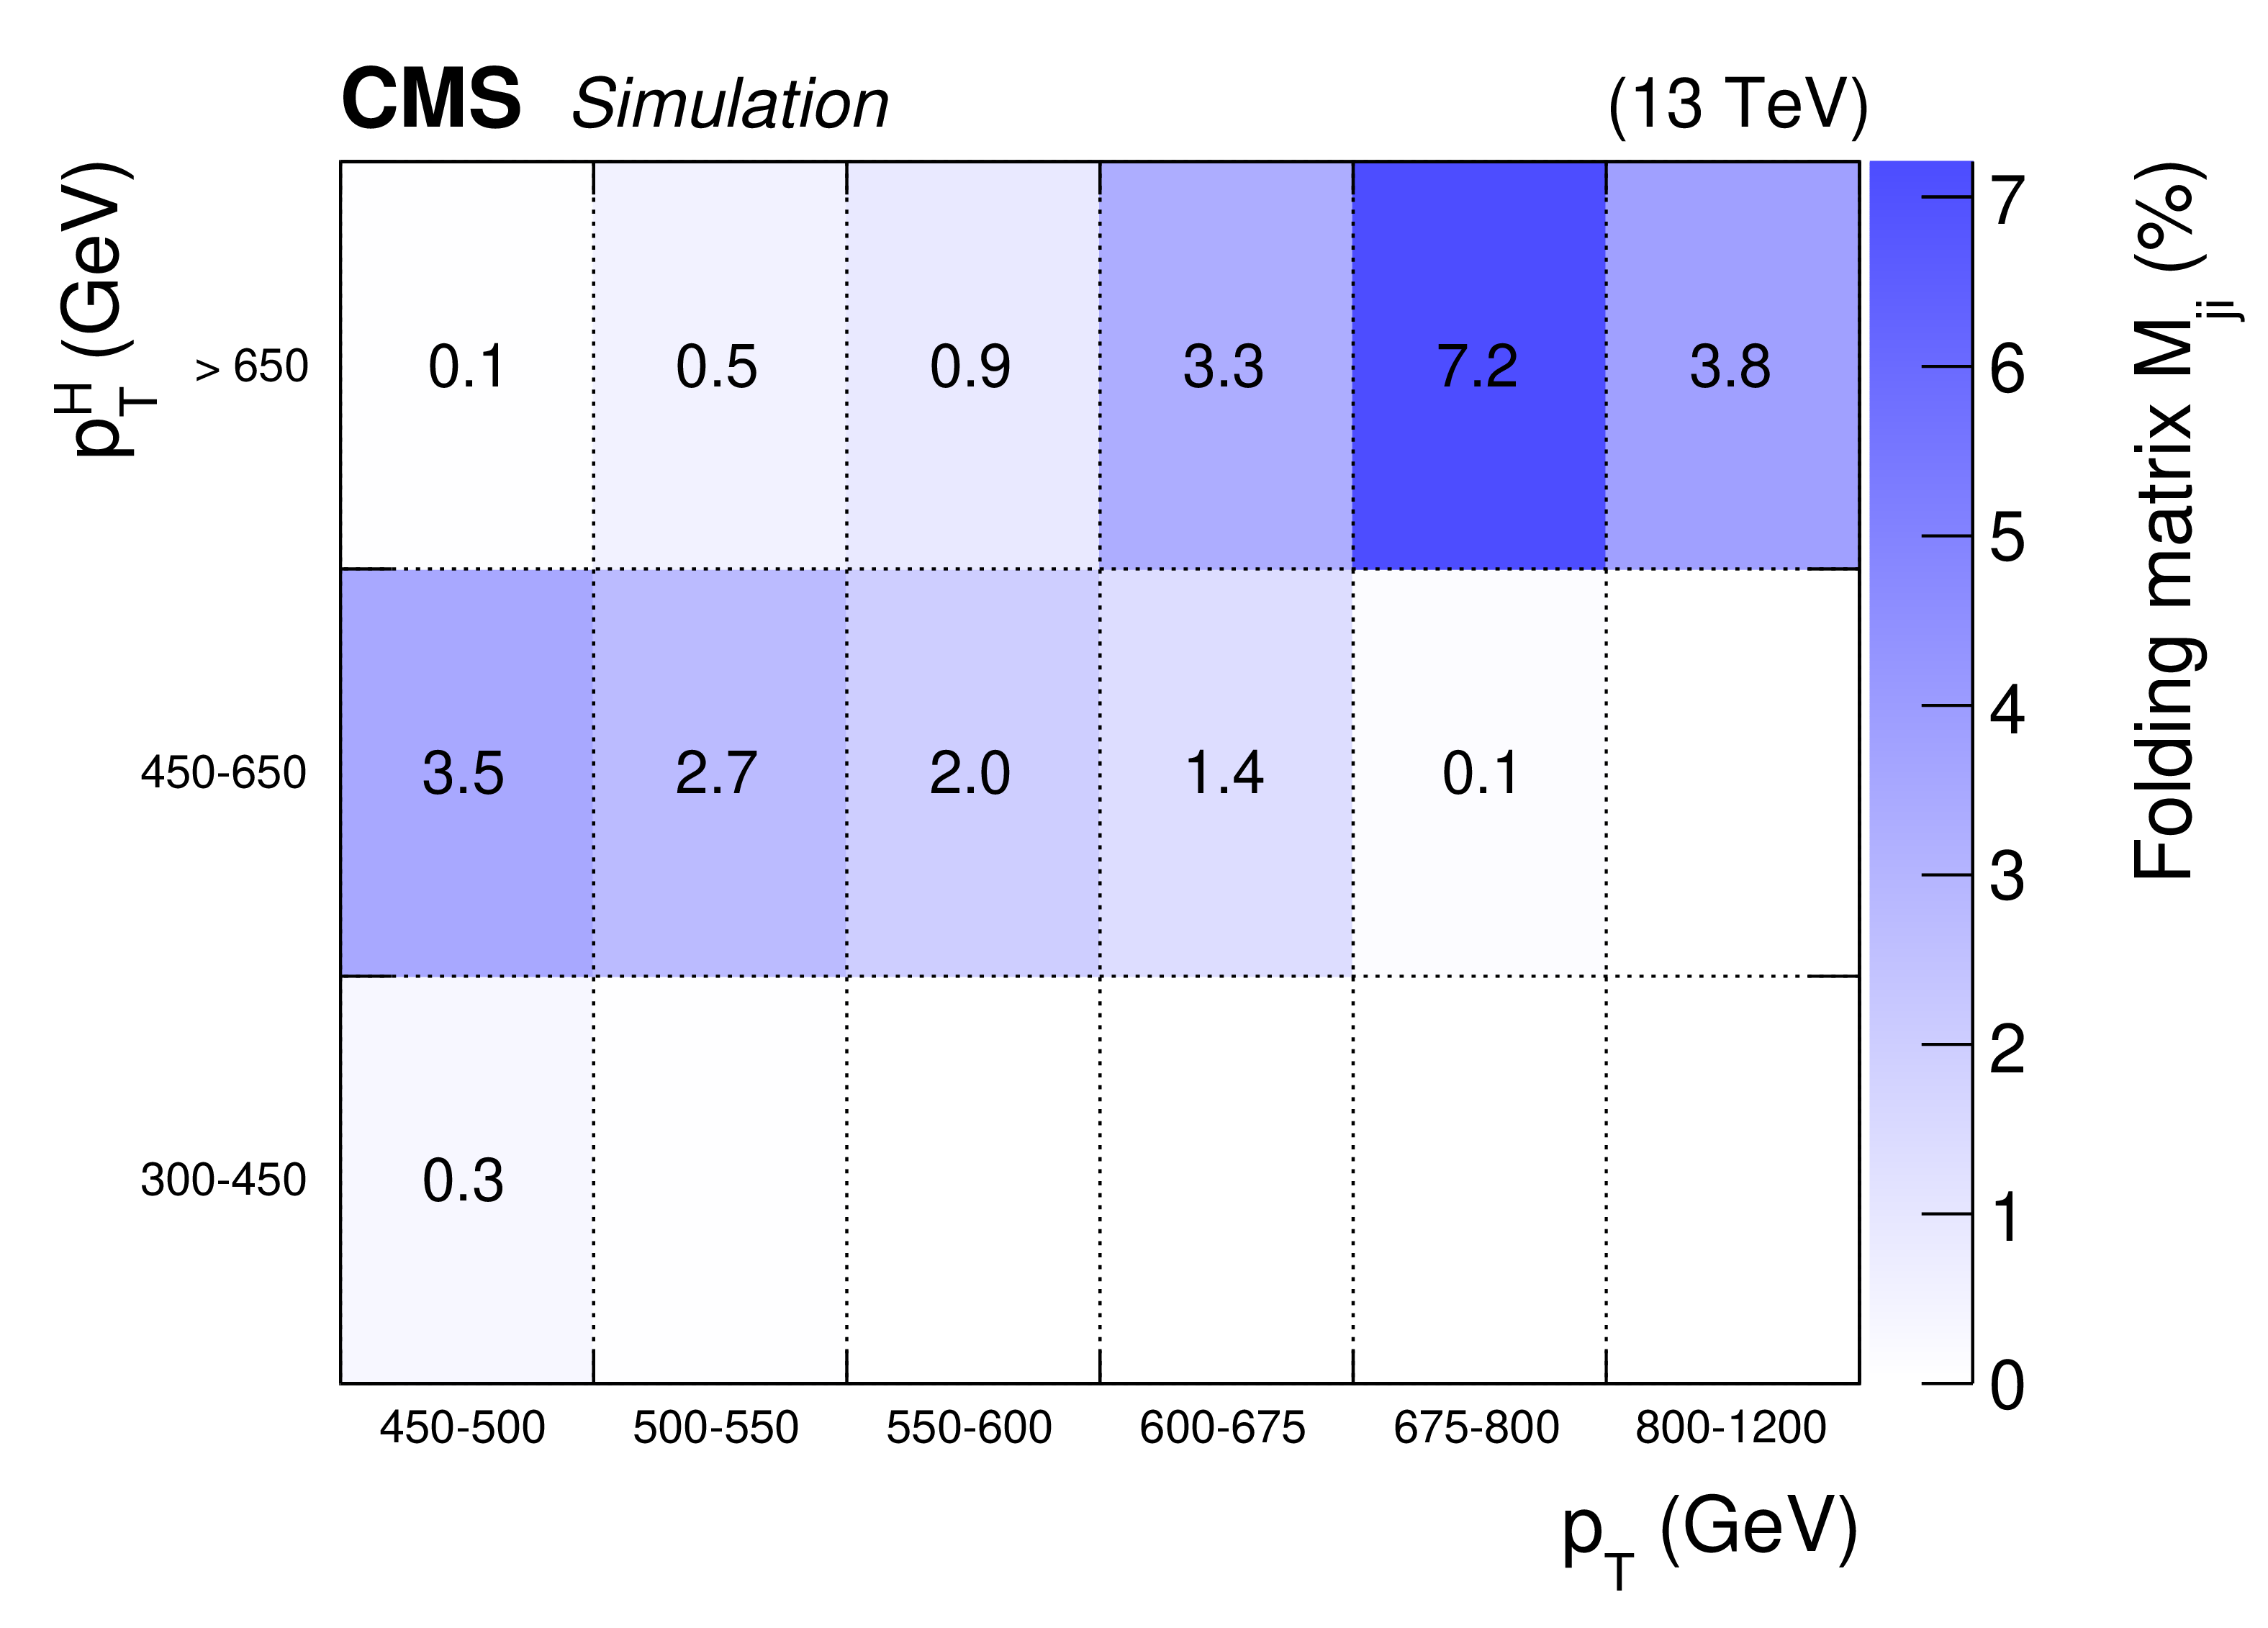
Figure 6:
The folding matrix $M_{ji}$, defined as the product of the acceptance and the efficiency as a percentage for an $\mathrm{H} (\mathrm{b} {}\mathrm{\bar{b}})$ event in $ {p_{\mathrm {T}}} ^{\mathrm{H}}$ bin $j$ to be found in jet ${p_{\mathrm {T}}}$ bin $i$, for the ggH HJ-MiNLO simulation. |
png pdf |
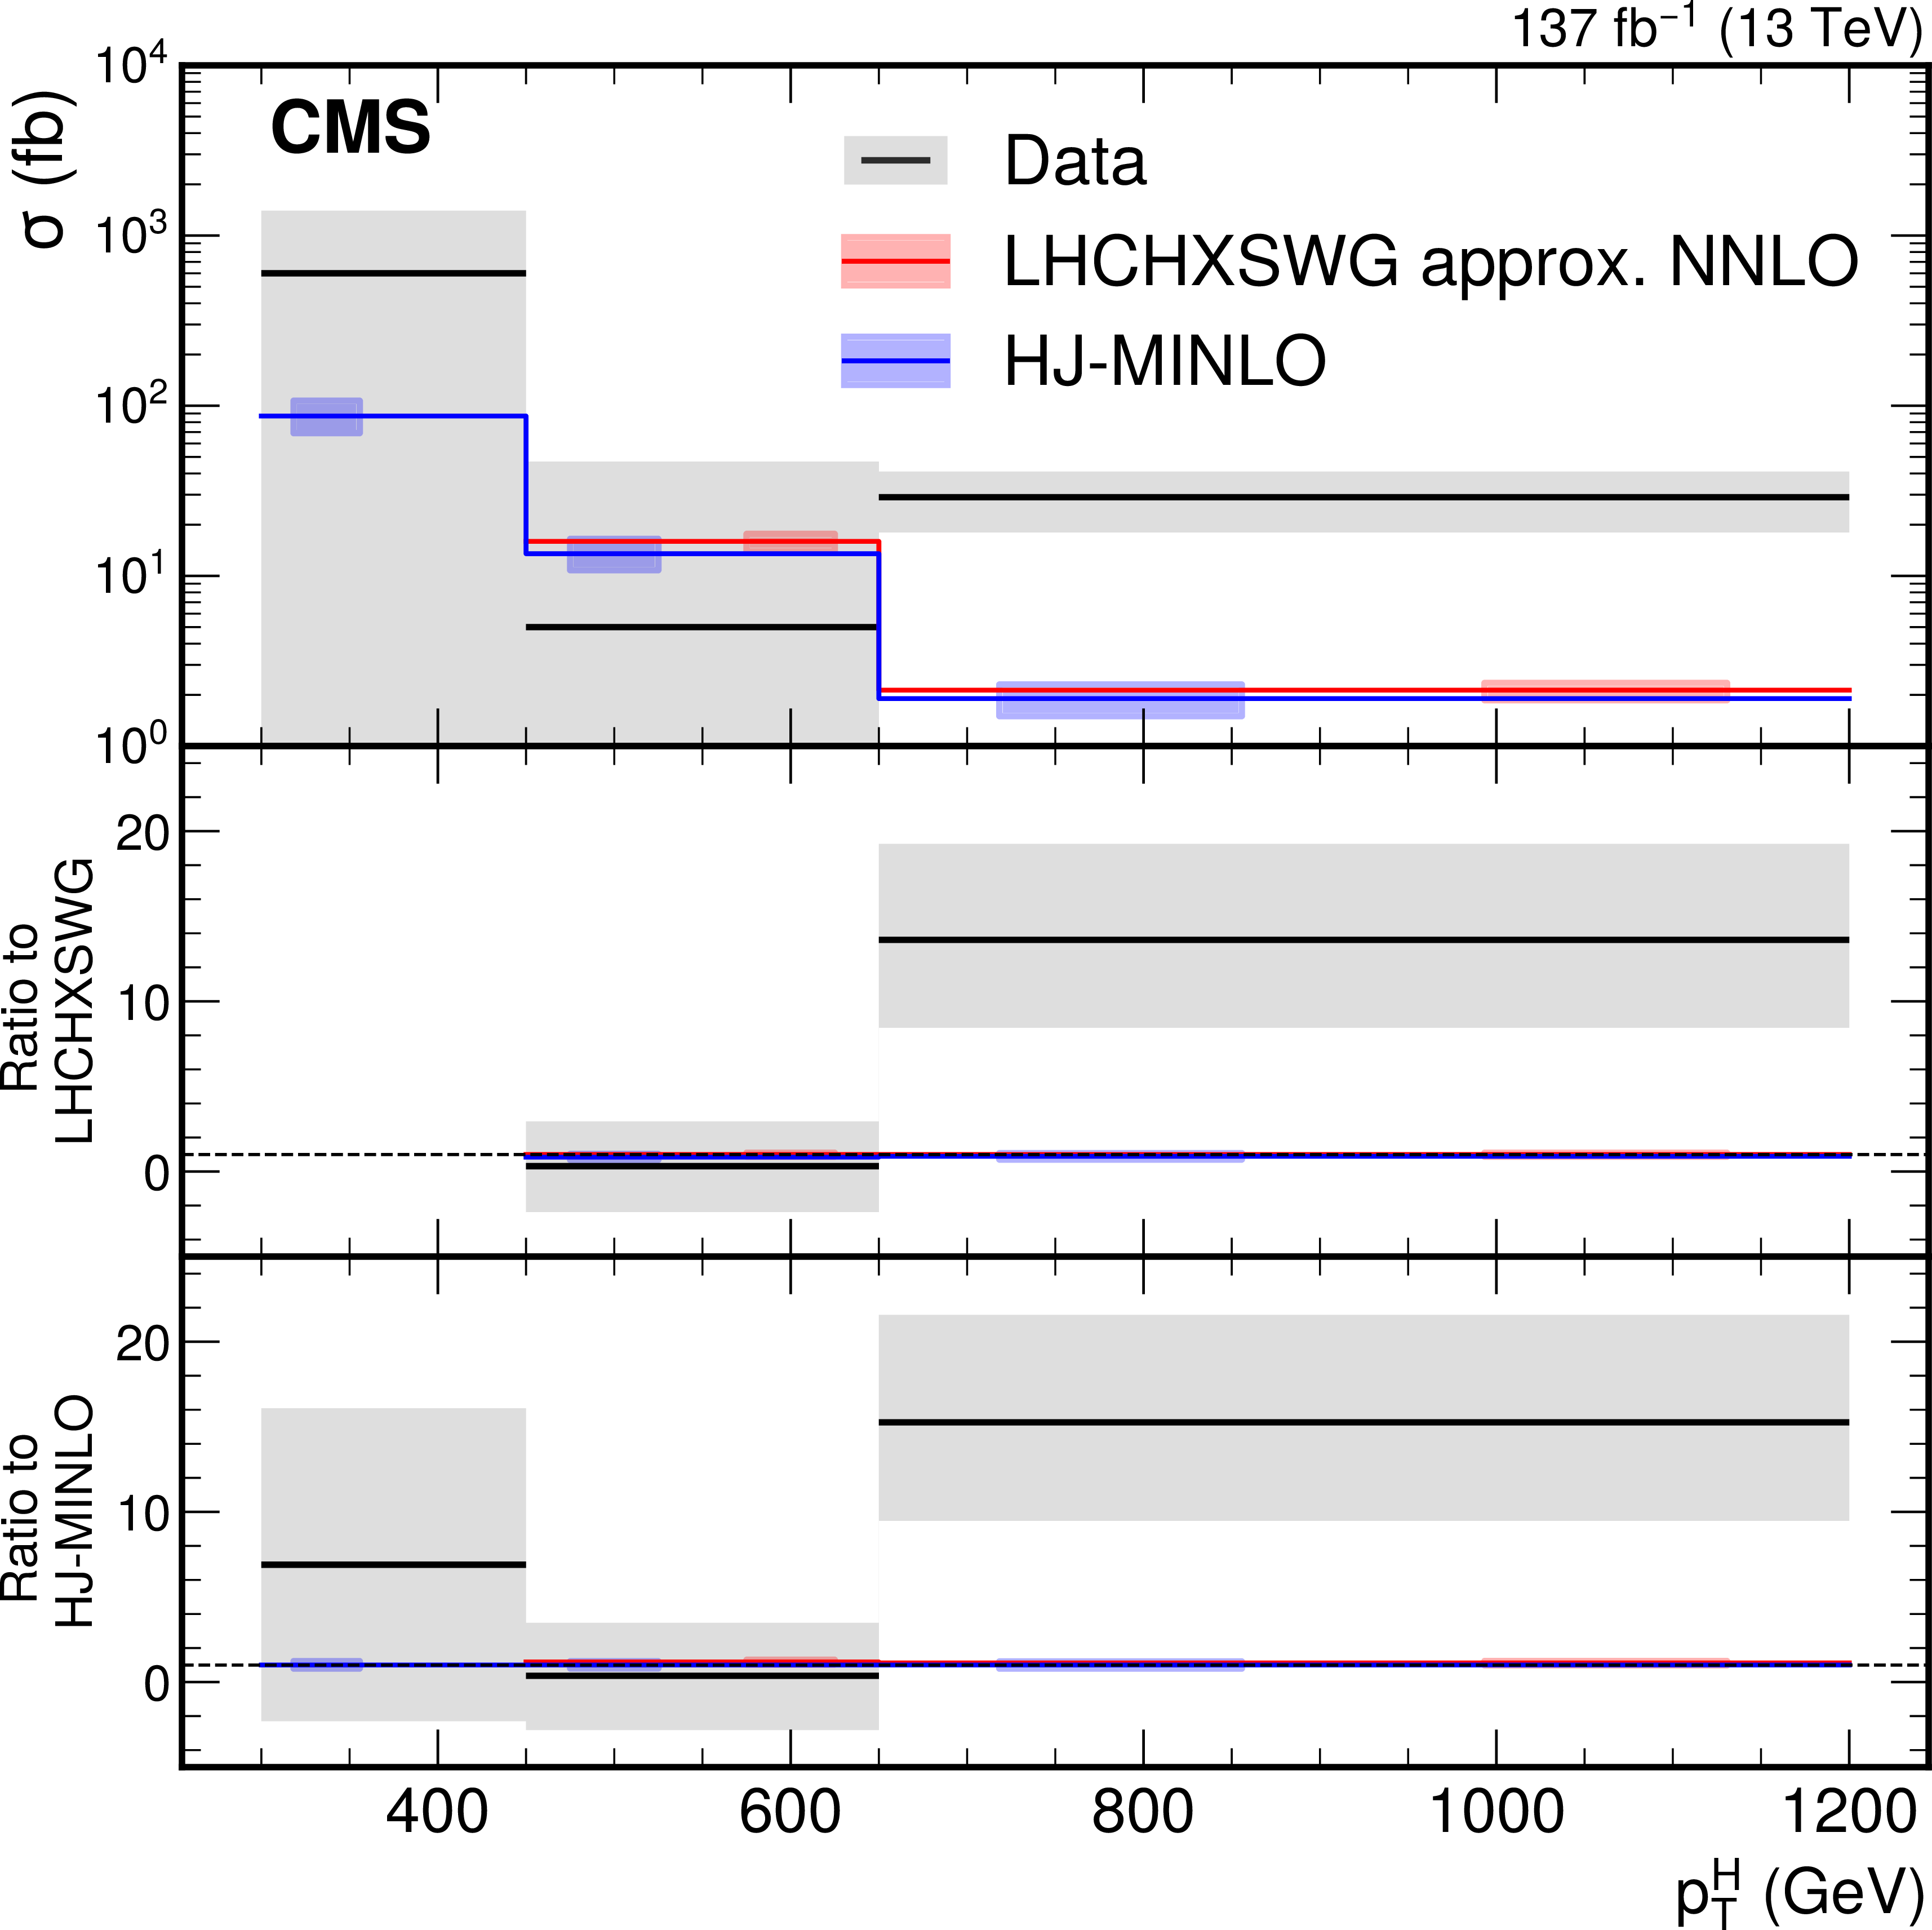
Figure 7:
Measured ggH differential fiducial cross section as a function of Higgs boson ${p_{\mathrm {T}}}$ shown in black, in comparison to the predictions of Ref. [33], shown in red, and {HJ-MiNLO} [32], shown in blue. The two predictions are nearly identical. The larger gray band shows the total uncertainty in the measured cross section while the red and blue hatched bands show the uncertainties in the predictions of Ref. [33] and {HJ-MiNLO}, respectively. In the bottom two panels, the dotted line corresponds to a ratio of one. The relative uncertainties in the predictions of Ref. [33] and {HJ-MiNLO} are approximately 10 and 20%, respectively. |
| Tables | |
png pdf |
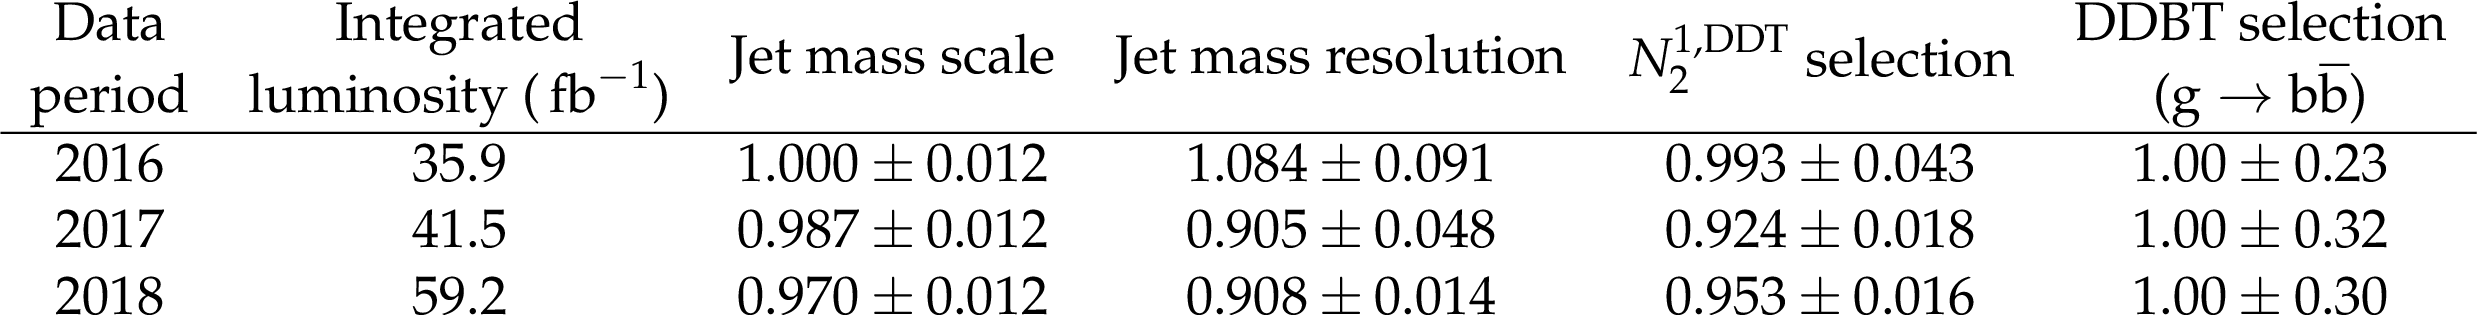
Table 1:
Summary of applied data-to-simulation scale factors for the jet mass scale, jet mass resolution, $ {N_{2}^{1\mathrm {,DDT}}} $ selection, and DDBT selection for different data taking periods. |
png pdf |
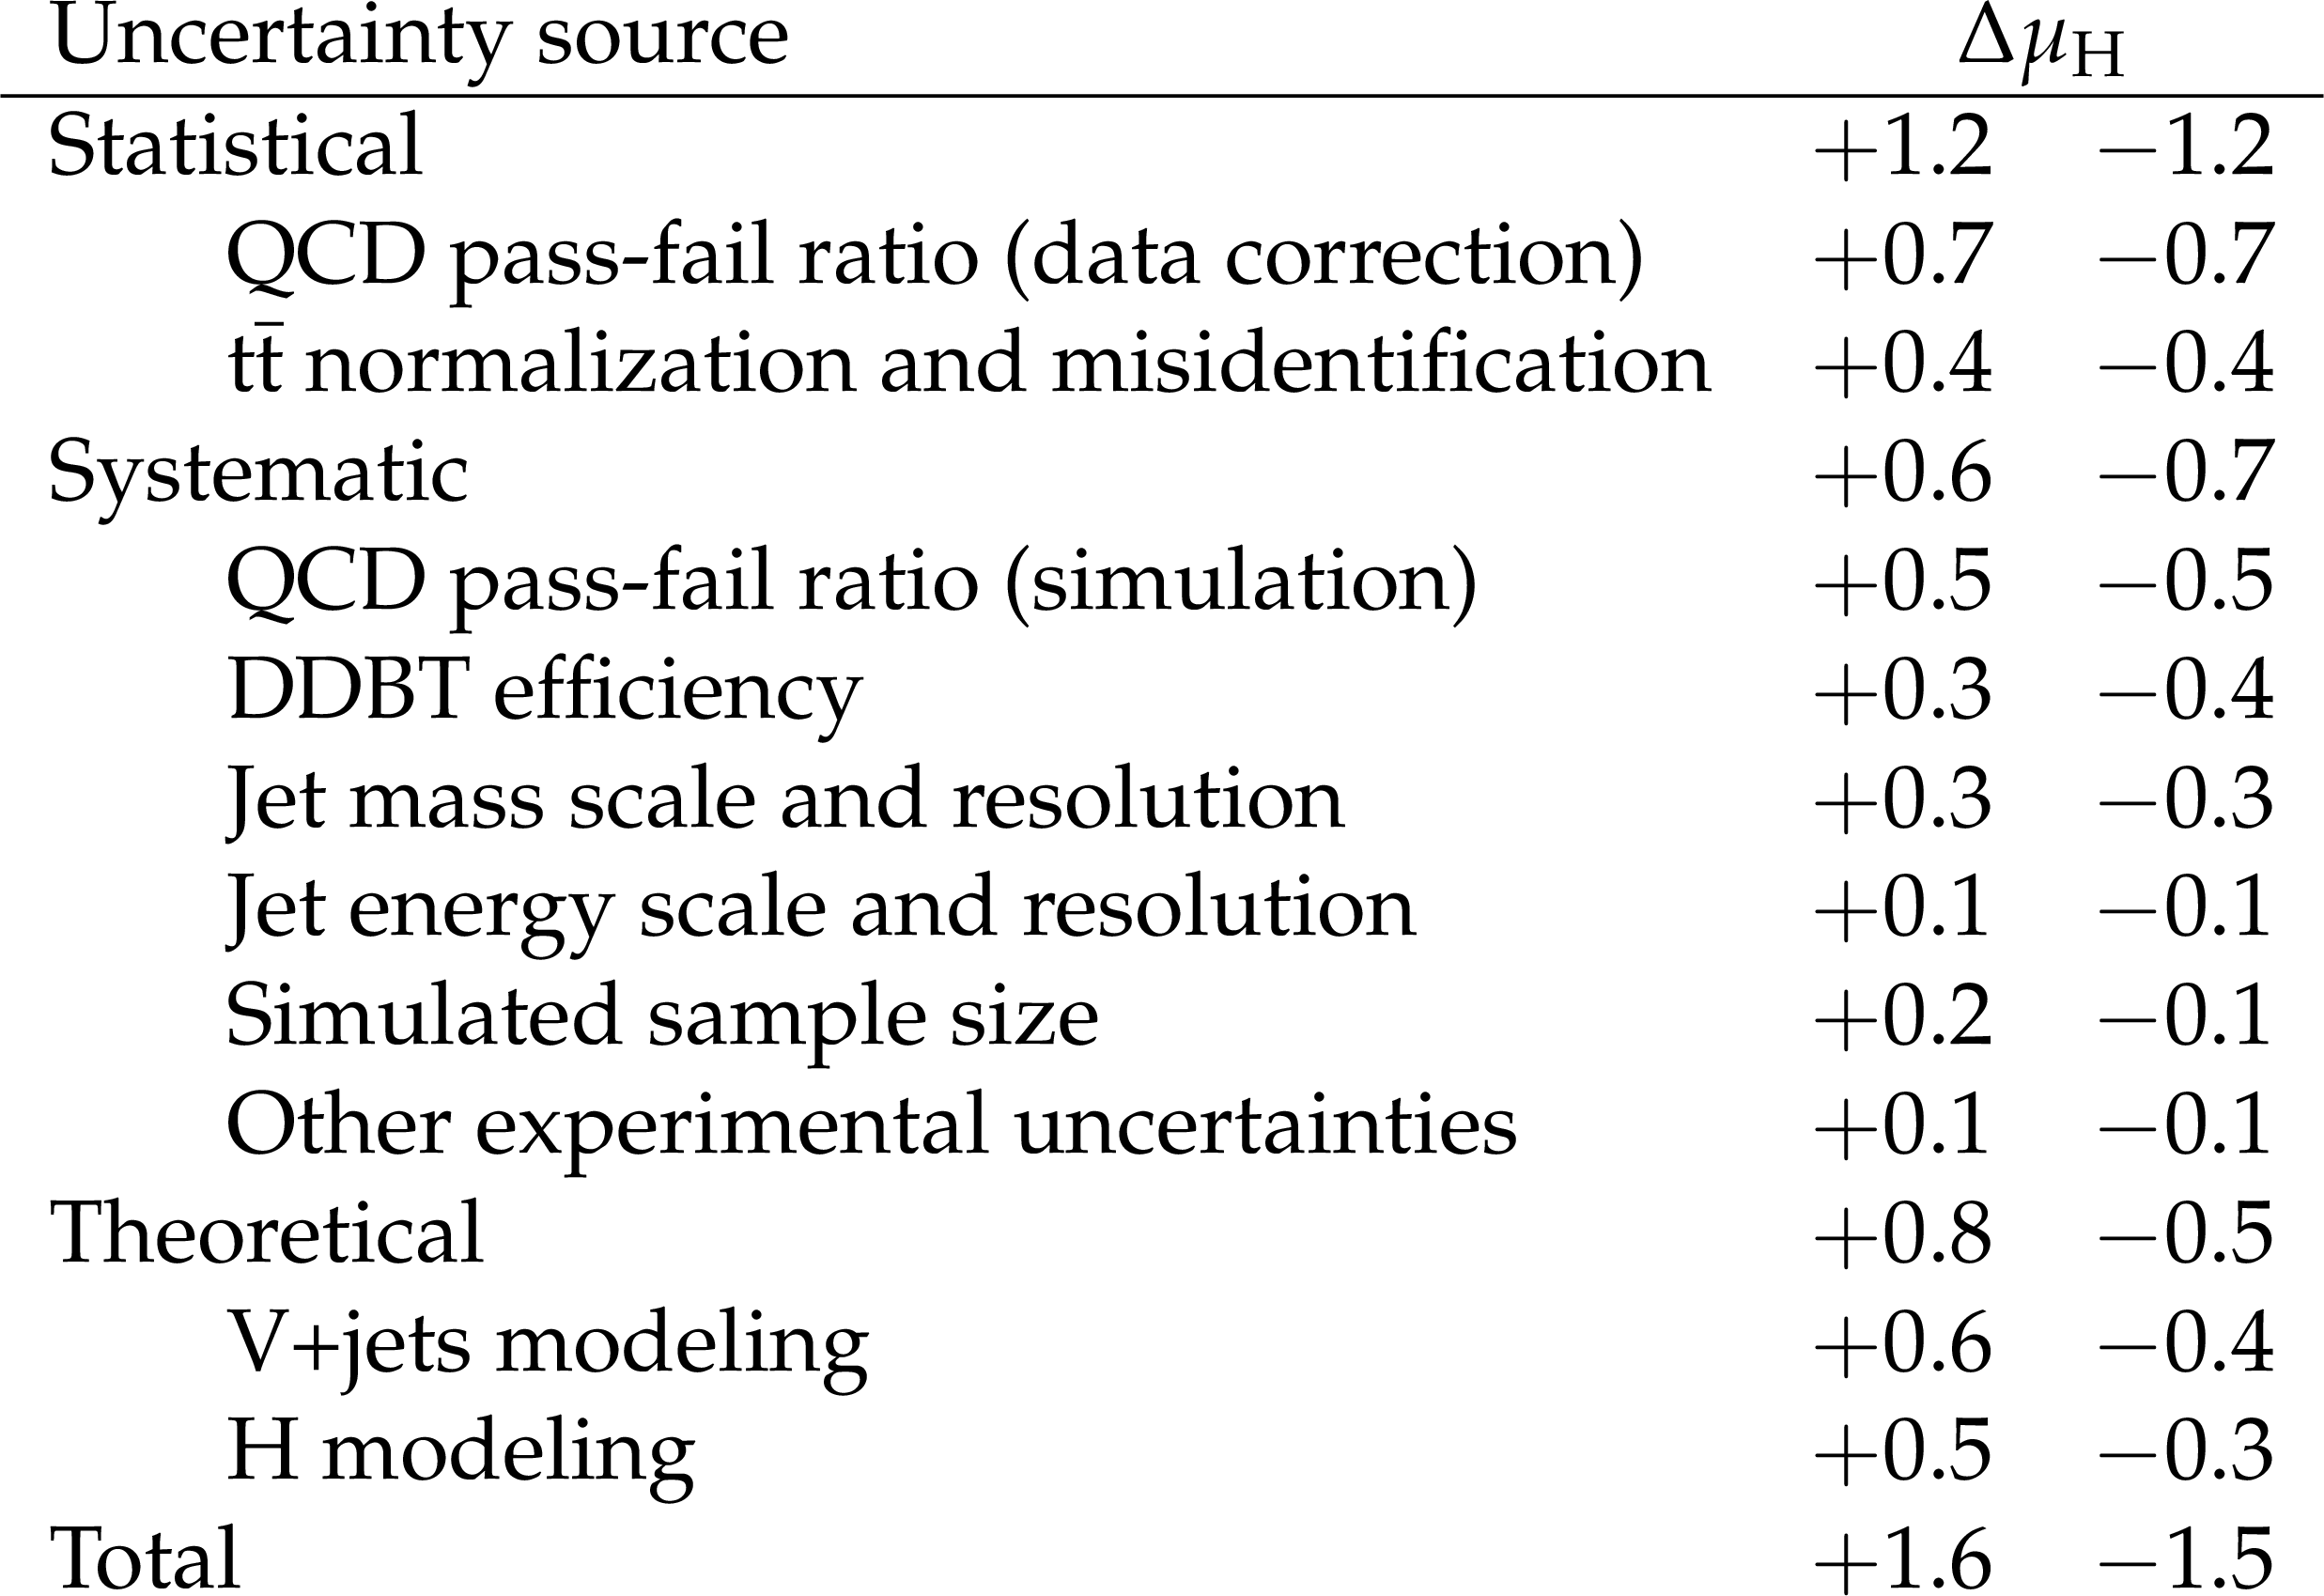
Table 2:
Major sources of uncertainty in the measurement of the signal strength $\mu _{\mathrm{H}}$ based on the {HJ-MiNLO} prediction, and their observed impact ($\Delta \mu _{\mathrm{H}}$) from a fit to the combined data set. Decompositions of the statistical, systematic, and theoretical components of the total uncertainty are specified. The impact of each uncertainty is evaluated considering only that source. The sum in quadrature for each source does not in general equal the total uncertainty of each component because of correlations in the combined fit between nuisance parameters corresponding to different sources. |
png pdf |
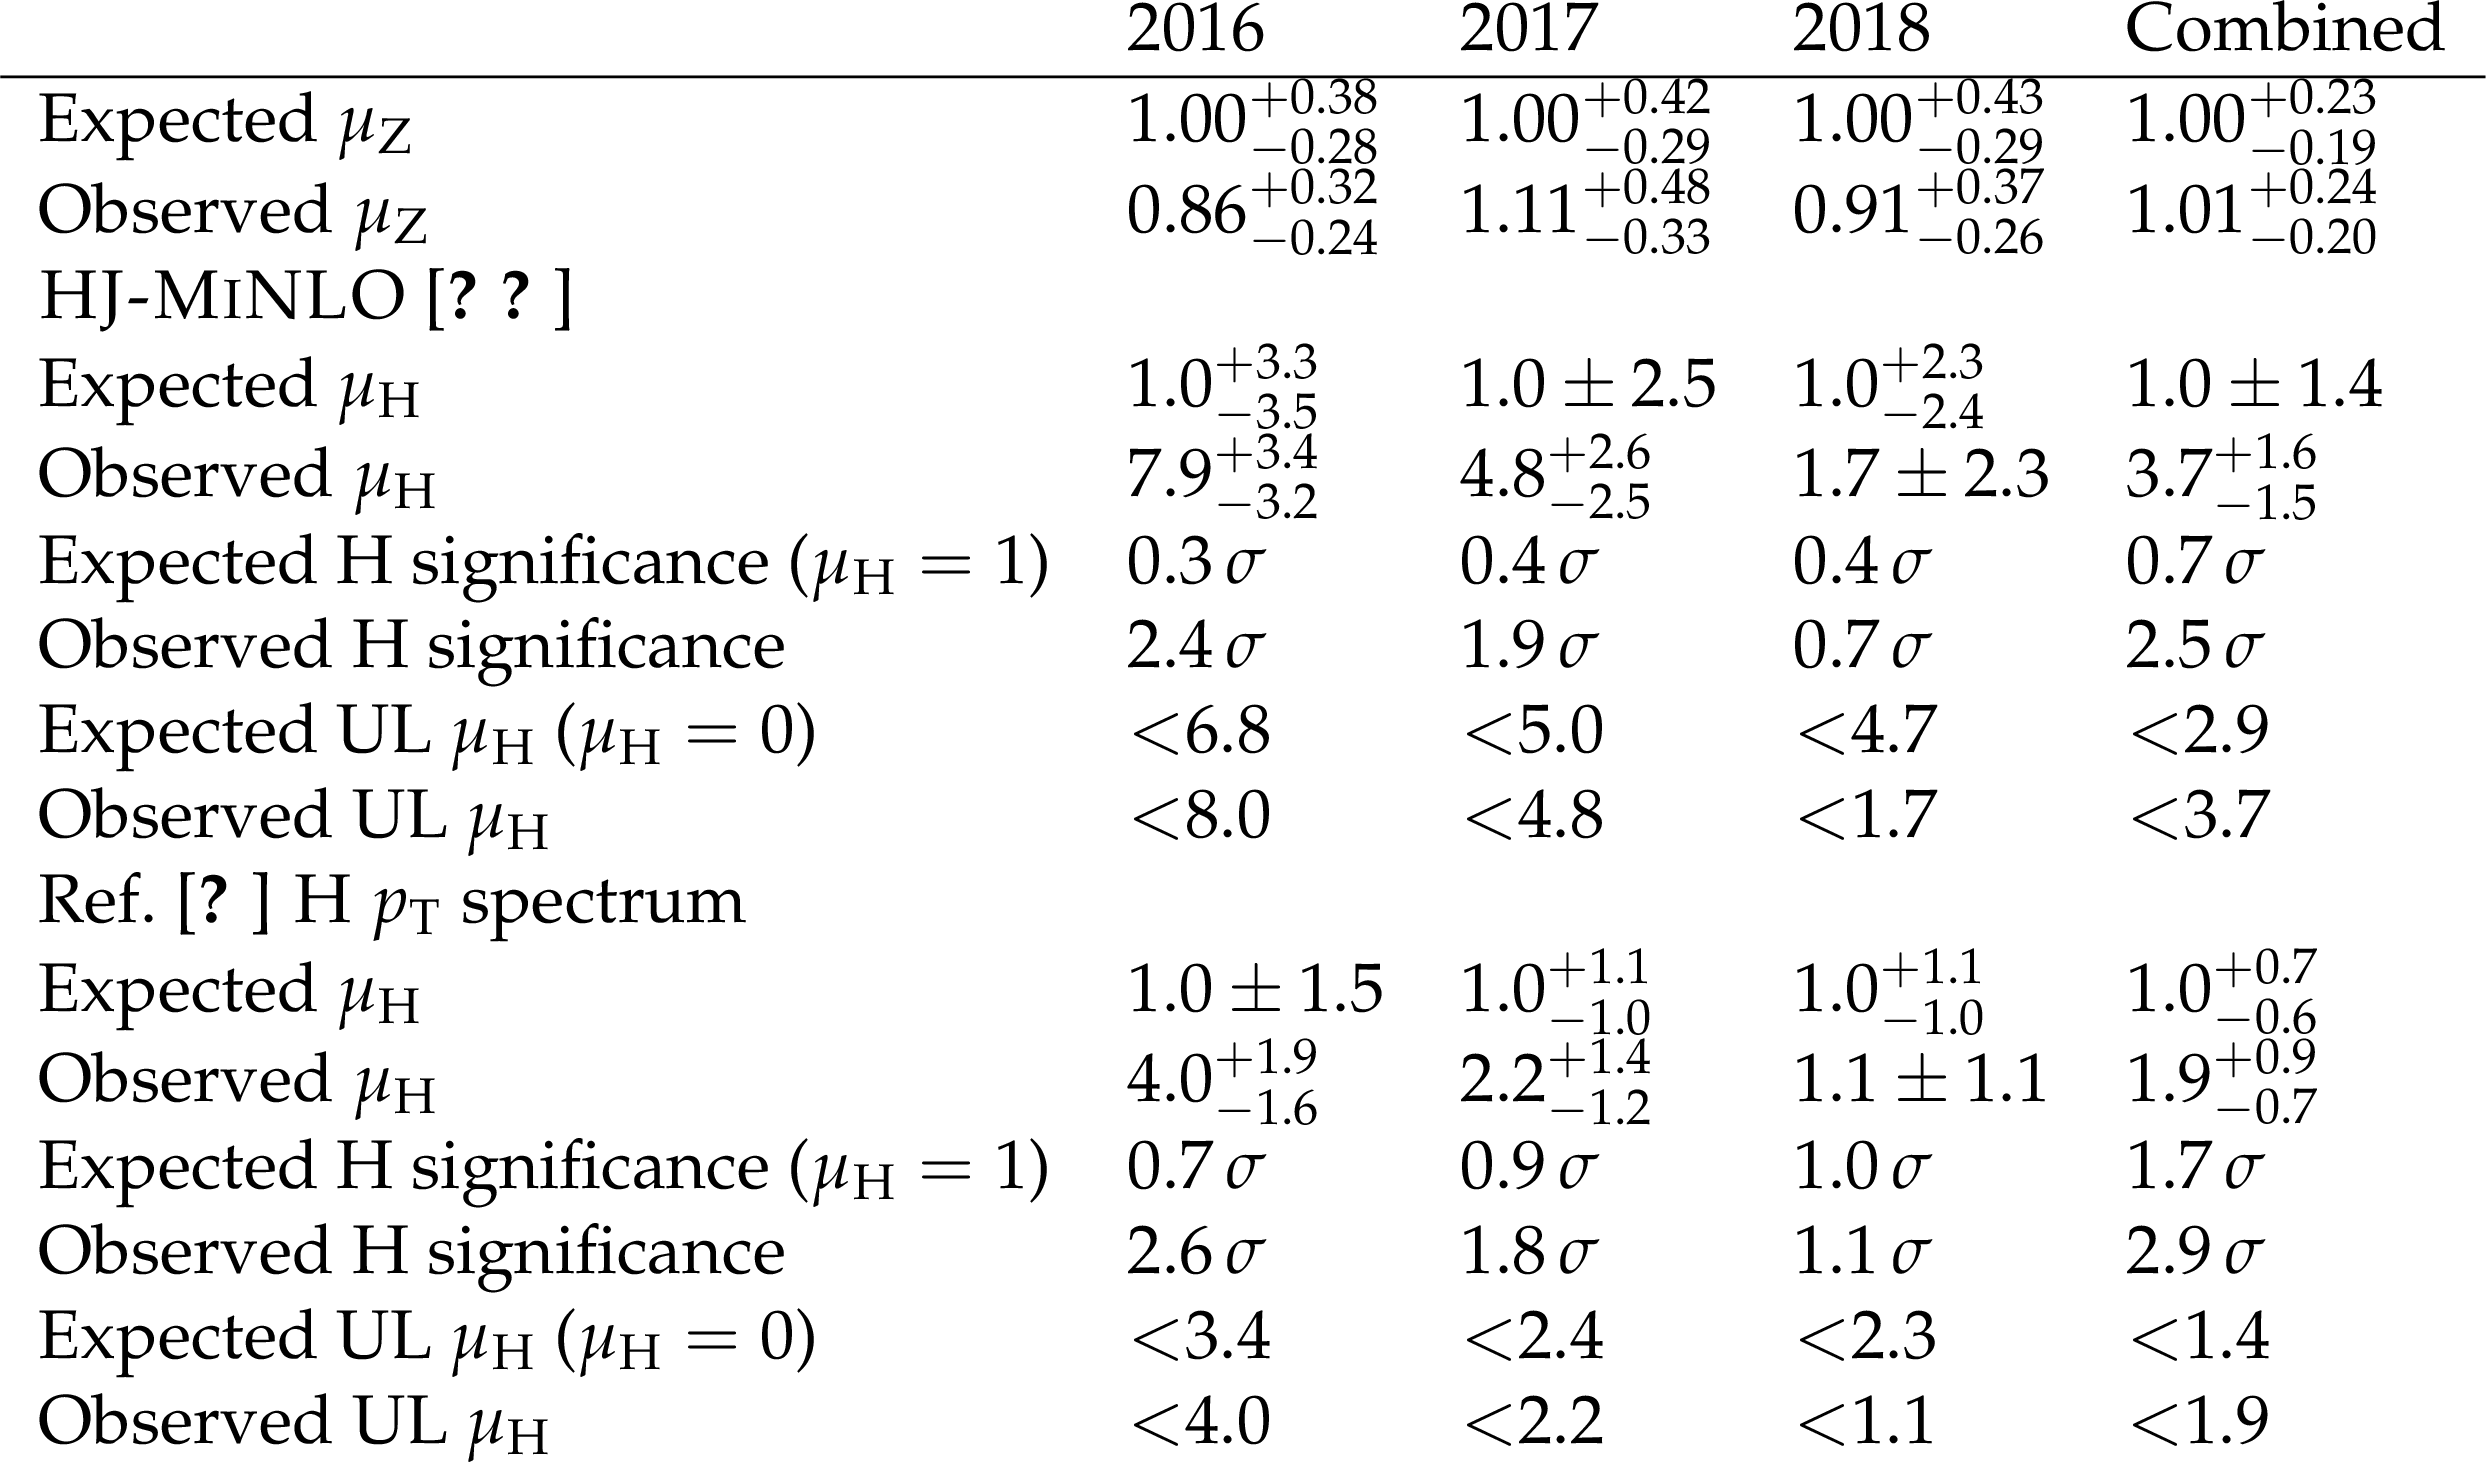
Table 3:
Fitted signal strength, and expected and observed significance of the Higgs and Z boson signals. The Higgs boson results are presented with two ggH signal models, one using the nominal {HJ-MiNLO} sample and the other simulated with the same procedure described in Ref. [23]. The 95% confidence level upper limit (UL) on the Higgs boson signal strength is also listed. In the results for the Higgs boson, the Z boson yield is fixed to the SM prediction value with the corresponding theoretical uncertainties to better constrain the data-to-simulation scale factor for the DDBT. For the expected and observed signal strengths of the Z boson, the Higgs boson signal strength is freely floating. |
png pdf |
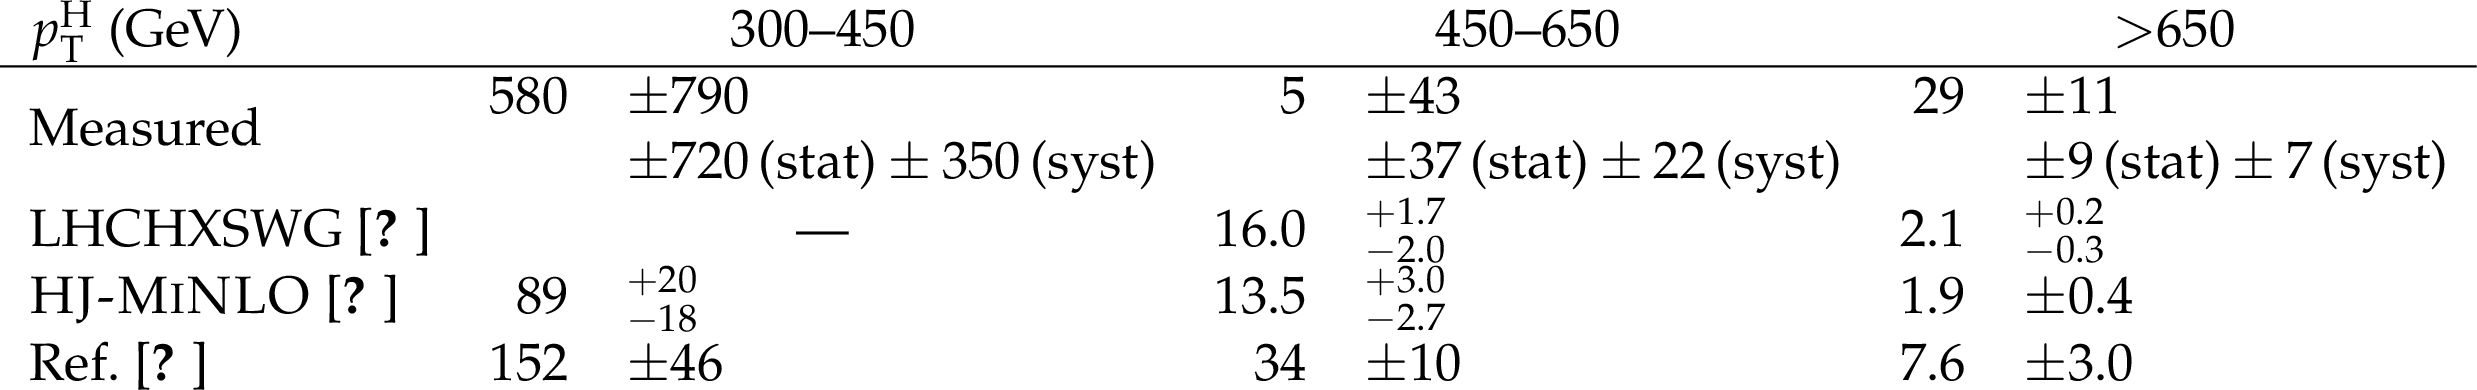
Table 4:
Measured and predicted ggH differential fiducial cross section as a function of Higgs boson ${p_{\mathrm {T}}}$. All cross sections are in units of fb. The cumulative cross section predictions from Ref. [33] are converted to differential cross section predictions by subtraction assuming the cumulative cross section uncertainties are fully correlated. |
png pdf |
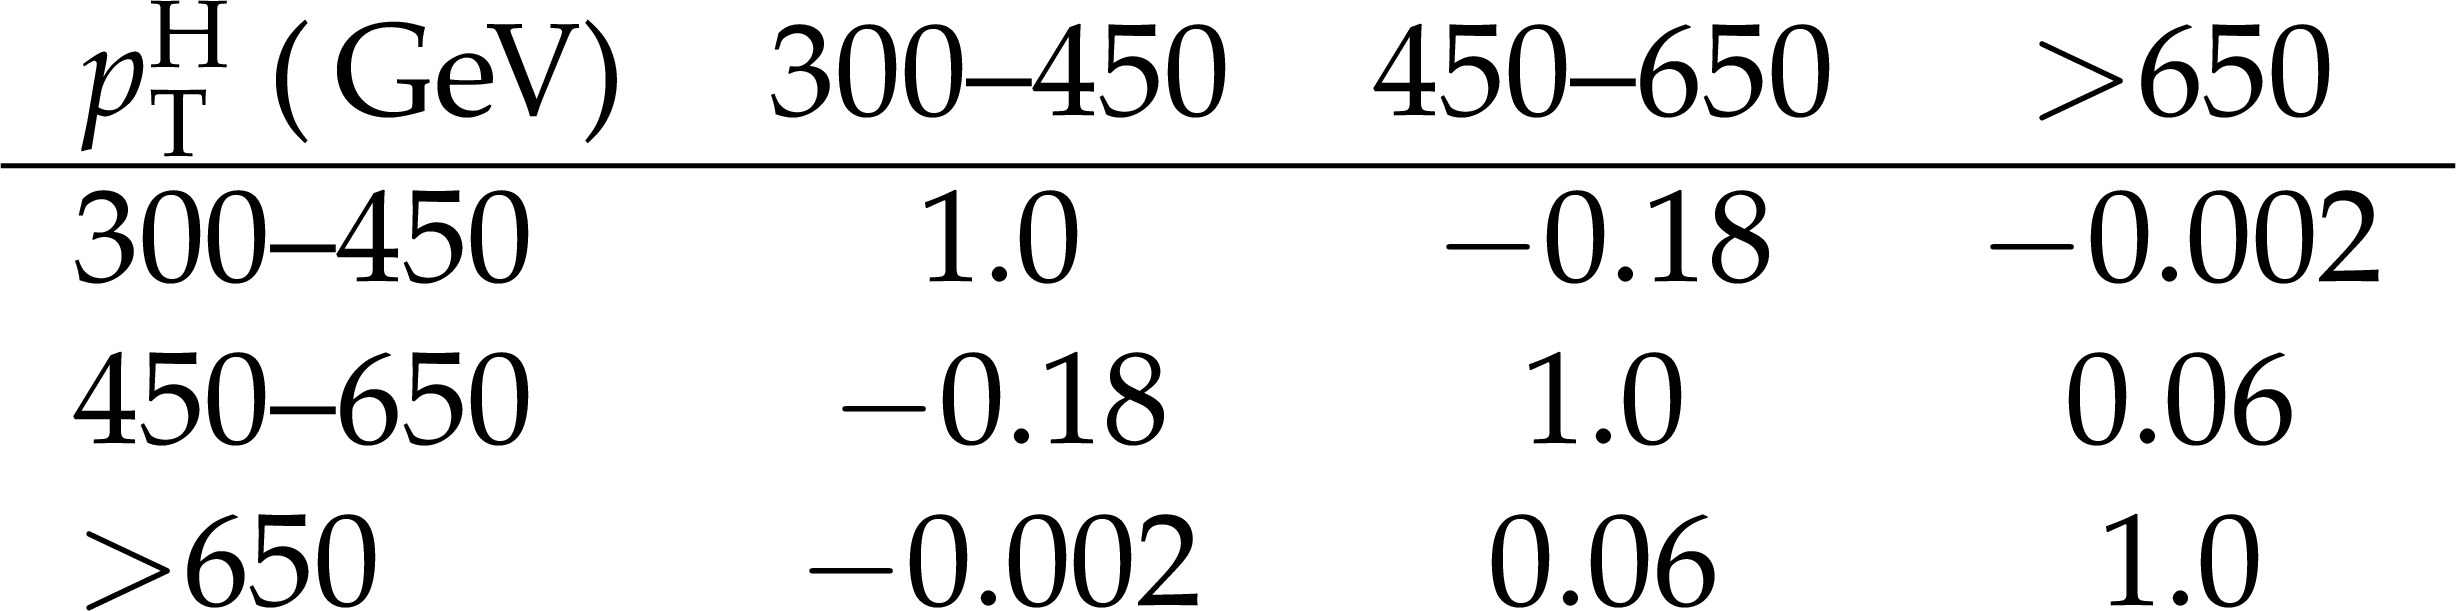
Table 5:
Correlation coefficients between the three $ {p_{\mathrm {T}}} ^{\mathrm{H}}$ bins of the unfolded ggH differential cross section measurement. |
| Summary |
| An inclusive search for the standard model (SM) Higgs boson decaying to a bottom quark-antiquark pair and reconstructed as a single large-radius jet with transverse momentum ${p_{\mathrm{T}}} > $ 450 GeV has been presented. The search uses a data sample of proton-proton collisions at $\sqrt{s} = $ 13 TeV, corresponding to an integrated luminosity of 137 fb$^{-1}$. The associated production of a Z boson and jets is used to validate the method and is measured to be consistent with the SM prediction. The inclusive Higgs boson signal strength is measured to be $\mu_{\mathrm{H}} = $ 3.7 $\pm$ 1.2 (stat)$_{-0.7}^{+0.6}$ (syst)$_{-0.5}^{+0.8}$ (theo) $= $ 3.7$ _{-1.5} ^{+1.6 }$, based on the theoretical prediction from the HJ-MiNLO generator for the gluon fusion production mode. The measured $\mu_{\mathrm{H}}$ corresponds to an observed significance of 2.5 standard deviations ($\sigma$) with respect to the background-only hypothesis, while the expected significance of the SM signal is 0.7$\sigma$. The significance of the observed excess with respect to the SM expectation is 1.9$\sigma$. With respect to the previous CMS result, the relative precision of the $\mu_{\mathrm{H}}$ measurement improves by approximately a factor of two because of the increased integrated luminosity, an improved b tagging technique based on a deep neural network, and smaller theoretical uncertainties. Finally, the differential cross section for the ${p_{\mathrm{T}}}$ of a Higgs boson produced through gluon fusion, assuming the other production modes occur at the SM rates, in the phase space regions recommended by the LHC simplified template cross section framework has also been presented. An excess is seen for Higgs boson ${p_{\mathrm{T}}} > $ 650 GeV with a local significance of 2.6$\sigma$ with respect to the SM expectation including the Higgs boson. |
| References | ||||
| 1 | ATLAS Collaboration | Observation of a new particle in the search for the standard model Higgs boson with the ATLAS detector at the LHC | PLB 716 (2012) 1 | 1207.7214 |
| 2 | CMS Collaboration | Observation of a new boson at a mass of 125 GeV with the CMS experiment at the LHC | PLB 716 (2012) 30 | CMS-HIG-12-028 1207.7235 |
| 3 | CMS Collaboration | Observation of a new boson with mass near 125 GeV in pp collisions at $ \sqrt{s} = $ 7 and 8 TeV | JHEP 06 (2013) 081 | CMS-HIG-12-036 1303.4571 |
| 4 | A. Salam | Weak and electromagnetic interactions | in Elementary particle physics: relativistic groups and analyticity, Almqvist & Wiksell, 1968 Proceedings of the eighth Nobel symposium | |
| 5 | S. L. Glashow | Partial-symmetries of weak interactions | NP 22 (1961) 579 | |
| 6 | S. Weinberg | A model of leptons | PRL 19 (1967) 1264 | |
| 7 | F. Englert and R. Brout | Broken symmetry and the mass of gauge vector mesons | PRL 13 (1964) 321 | |
| 8 | P. W. Higgs | Broken symmetries, massless particles and gauge fields | PRL 12 (1964) 132 | |
| 9 | P. W. Higgs | Broken symmetries and the masses of gauge bosons | PRL 13 (1964) 508 | |
| 10 | P. W. Higgs | Spontaneous symmetry breakdown without massless bosons | PRL 145 (1966) 1156 | |
| 11 | G. S. Guralnik, C. R. Hagen, and T. W. B. Kibble | Global conservation laws and massless particless | PRL 13 (1964) 585 | |
| 12 | CMS Collaboration | Observation of Higgs boson decay to bottom quarks | PRL 121 (2018) 121801 | CMS-HIG-18-016 1808.08242 |
| 13 | ATLAS Collaboration | Observation of $ \mathrm{H} \rightarrow \mathrm{b\bar{b}} $ decays and VH production with the ATLAS detector | PLB 786 (2018) 59 | 1808.08238 |
| 14 | LHC Higgs Cross Section Working Group | Handbook of LHC Higgs cross sections: 4. deciphering the nature of the Higgs sector | CERN (2016) | 1610.07922 |
| 15 | M. H. Seymour | Tagging a heavy Higgs boson | in ECFA Large Hadron Collider Workshop, Aachen, Germany, 4-9 Oct 1990, p. 5571991 | |
| 16 | M. H. Seymour | Searches for new particles using cone and cluster jet algorithms: A comparative study | Z. Phys. C 62 (1994) 127 | |
| 17 | M. H. Seymour | The average number of subjets in a hadron collider jet | NPB 421 (1994) 545 | |
| 18 | J. M. Butterworth, B. E. Cox, and J. R. Forshaw | $ \mathrm{W}\mathrm{W} $ scattering at the CERN LHC | PRD 65 (2002) 096014 | hep-ph/0201098 |
| 19 | J. M. Butterworth, A. R. Davison, M. Rubin, and G. P. Salam | Jet substructure as a new Higgs-search channel at the Large Hadron Collider | PRL 100 (2008) 242001 | 0802.2470 |
| 20 | CMS Collaboration | Identification of heavy-flavour jets with the CMS detector in pp collisions at 13 TeV | JINST 13 (2018) P05011 | CMS-BTV-16-002 1712.07158 |
| 21 | CMS Collaboration | Performance of deep tagging algorithms for boosted double quark jet topology in proton-proton collisions at 13 TeV with the Phase-0 CMS detector | CDS | |
| 22 | ATLAS Collaboration | Identification of boosted Higgs bosons decaying into $ \mathrm{b} $-quark pairs with the ATLAS detector at 13 TeV | EPJC 79 (2019) 836 | 1906.11005 |
| 23 | CMS Collaboration | Inclusive search for a highly boosted Higgs boson decaying to a bottom quark-antiquark pair | PRL 120 (2018) 071802 | CMS-HIG-17-010 1709.05543 |
| 24 | CMS Collaboration | Measurement and interpretation of differential cross sections for Higgs boson production at $ \sqrt{s} = $ 13 TeV | PLB 792 (2019) 369 | CMS-HIG-17-028 1812.06504 |
| 25 | C. Grojean, E. Salvioni, M. Schlaffer, and A. Weiler | Very boosted Higgs in gluon fusion | JHEP 05 (2014) 022 | 1312.3317 |
| 26 | S. Dawson, I. M. Lewis, and M. Zeng | Usefulness of effective field theory for boosted Higgs production | PRD 91 (2015) 074012 | 1501.04103 |
| 27 | M. Schlaffer et al. | Boosted Higgs shapes | EPJC 74 (2014) 3120 | 1405.4295 |
| 28 | M. Grazzini, A. Ilnicka, M. Spira, and M. Wiesemann | Effective field theory for Higgs properties parametrisation: the transverse momentum spectrum case | in 52nd Rencontres de Moriond on QCD and high energy interactions, p. 23 2017 | 1705.05143 |
| 29 | M. Grazzini, A. Ilnicka, M. Spira, and M. Wiesemann | Modeling BSM effects on the Higgs transverse-momentum spectrum in an EFT approach | JHEP 03 (2017) 115 | 1612.00283 |
| 30 | F. Bishara, U. Haisch, P. F. Monni, and E. Re | Constraining light-quark Yukawa couplings from Higgs distributions | PRL 118 (2017) 121801 | 1606.09253 |
| 31 | Y.-Y. Li, R. Nicolaidou, and S. Paganis | Exclusion of heavy, broad resonances from precise measurements of WZ and VH final states at the LHC | EPJC 79 (2019) 348 | 1904.03995 |
| 32 | K. Hamilton, P. Nason, C. Oleari, and G. Zanderighi | Merging H/W/Z + 0 and 1 jet at NLO with no merging scale: a path to parton shower + NNLO matching | JHEP 05 (2013) 082 | 1212.4504 |
| 33 | K. Becker et al. | Precise predictions for boosted Higgs production | 2005.07762 | |
| 34 | T. Neumann | NLO Higgs+jet production at large transverse momenta including top quark mass effects | J. Phys. Comm. 2 (2018) 095017 | 1802.02981 |
| 35 | S. P. Jones, M. Kerner, and G. Luisoni | Next-to-leading-order QCD corrections to Higgs boson plus jet production with full top-quark mass dependence | PRL 120 (2018) 162001 | 1802.00349 |
| 36 | J. M. Lindert, K. Kudashkin, K. Melnikov, and C. Wever | Higgs bosons with large transverse momentum at the LHC | PLB 782 (2018) 210 | 1801.08226 |
| 37 | CMS Collaboration | The CMS trigger system | JINST 12 (2017) P01020 | CMS-TRG-12-001 1609.02366 |
| 38 | CMS Collaboration | The CMS experiment at the CERN LHC | JINST 3 (2008) S08004 | CMS-00-001 |
| 39 | GEANT4 Collaboration | GEANT4--a simulation toolkit | NIMA 506 (2003) 250 | |
| 40 | J. Alwall et al. | The automated computation of tree-level and next-to-leading order differential cross sections, and their matching to parton shower simulations | JHEP 07 (2014) 079 | 1405.0301 |
| 41 | J. Alwall et al. | Comparative study of various algorithms for the merging of parton showers and matrix elements in hadronic collisions | EPJC 53 (2008) 473 | 0706.2569 |
| 42 | P. Nason | A new method for combining NLO QCD with shower Monte Carlo algorithms | JHEP 11 (2004) 040 | hep-ph/0409146 |
| 43 | S. Frixione, P. Nason, and C. Oleari | Matching NLO QCD computations with parton shower simulations: the POWHEG method | JHEP 11 (2007) 070 | 0709.2092 |
| 44 | S. Alioli, P. Nason, C. Oleari, and E. Re | A general framework for implementing NLO calculations in shower Monte Carlo programs: the POWHEG BOX | JHEP 06 (2010) 043 | 1002.2581 |
| 45 | S. Frixione, P. Nason, and G. Ridolfi | A positive-weight next-to-leading-order Monte Carlo for heavy flavour hadroproduction | JHEP 09 (2007) 126 | 0707.3088 |
| 46 | R. Frederix, E. Re, and P. Torrielli | Single-top $ t $-channel hadroproduction in the four-flavour scheme with POWHEG and a MCatNLO | JHEP 09 (2012) 130 | 1207.5391 |
| 47 | E. Re | Single-top $ \mathrm{W}\mathrm{t} $-channel production matched with parton showers using the POWHEG method | EPJC 71 (2011) 1547 | 1009.2450 |
| 48 | T. Sjostrand et al. | An introduction to PYTHIA 8.2 | CPC 191 (2015) 159 | 1410.3012 |
| 49 | S. Kallweit et al. | NLO electroweak automation and precise predictions for W+multijet production at the LHC | JHEP 04 (2015) 012 | 1412.5157 |
| 50 | S. Kallweit et al. | NLO QCD+EW predictions for V+jets including off-shell vector-boson decays and multijet merging | JHEP 04 (2016) 021 | 1511.08692 |
| 51 | S. Kallweit et al. | NLO QCD+EW automation and precise predictions for V+multijet production | in 50th Rencontres de Moriond, QCD and high energy interactions, p. 121 2015 | 1505.05704 |
| 52 | J. M. Lindert et al. | Precise predictions for V+jets dark matter backgrounds | EPJC 77 (2017) 829 | 1705.04664 |
| 53 | J. M. Campbell and R. K. Ellis | MCFM for the Tevatron and the LHC | NPPS 205-206 (2010) 10 | 1007.3492 |
| 54 | G. Luisoni, P. Nason, C. Oleari, and F. Tramontano | $ \mathrm{H}\mathrm{W}^{\pm} $/$ \mathrm{H}\mathrm{Z} $+0 and 1 jet at NLO with the POWHEG box interfaced to GoSam and their merging within MiNLO | JHEP 10 (2013) 083 | 1306.2542 |
| 55 | P. Nason and C. Oleari | NLO Higgs boson production via vector-boson fusion matched with shower in POWHEG | JHEP 02 (2010) 037 | 0911.5299 |
| 56 | H. B. Hartanto, B. Jager, L. Reina, and D. Wackeroth | Higgs boson production in association with top quarks in the POWHEG BOX | PRD 91 (2015) 094003 | 1501.04498 |
| 57 | M. Cacciari et al. | Fully differential vector-boson-fusion Higgs production at next-to-next-to-leading order | PRL 115 (2015) 082002 | 1506.02660 |
| 58 | F. A. Dreyer and A. Karlberg | Vector-boson fusion Higgs production at three loops in QCD | PRL 117 (2016) 072001 | 1606.00840 |
| 59 | CMS Collaboration | Event generator tunes obtained from underlying event and multiparton scattering measurements | EPJC 76 (2016) 155 | CMS-GEN-14-001 1512.00815 |
| 60 | CMS Collaboration | Extraction and validation of a new set of CMS PYTHIA8 tunes from underlying-event measurements | EPJC 80 (2020) 4 | CMS-GEN-17-001 1903.12179 |
| 61 | CMS Collaboration | Investigations of the impact of the parton shower tuning in PYTHIA 8 in the modelling of $ \mathrm{t\overline{t}} $ at $ \sqrt{s}= $ 8 and 13 TeV | CMS-PAS-TOP-16-021 | CMS-PAS-TOP-16-021 |
| 62 | NNPDF Collaboration | Parton distributions for the LHC run II | JHEP 04 (2015) 040 | 1410.8849 |
| 63 | NNPDF Collaboration | Parton distributions from high-precision collider data | EPJC 77 (2017) 663 | 1706.00428 |
| 64 | CMS Collaboration | Particle-flow reconstruction and global event description with the CMS detector | JINST 12 (2017) P10003 | CMS-PRF-14-001 1706.04965 |
| 65 | M. Cacciari, G. P. Salam, and G. Soyez | The anti-$ {k_{\mathrm{T}}} $ jet clustering algorithm | JHEP 04 (2008) 063 | 0802.1189 |
| 66 | M. Cacciari, G. P. Salam, and G. Soyez | FastJet user manual | EPJC 72 (2012) 1896 | 1111.6097 |
| 67 | D. Bertolini, P. Harris, M. Low, and N. Tran | Pileup per particle identification | JHEP 10 (2014) 059 | 1407.6013 |
| 68 | CMS Collaboration | Pileup mitigation at CMS in 13 TeV data | Submmited to JINST | CMS-JME-18-001 2003.00503 |
| 69 | CMS Collaboration | Jet energy scale and resolution in the CMS experiment in pp collisions at 8 TeV | JINST 12 (2017) P02014 | CMS-JME-13-004 1607.03663 |
| 70 | CMS Collaboration | Jet algorithms performance in 13 TeV data | CMS-PAS-JME-16-003 | CMS-PAS-JME-16-003 |
| 71 | D. Krohn, J. Thaler, and L. Wang | Jet trimming | JHEP 02 (2010) 084 | 0912.1342 |
| 72 | CMS Collaboration | Search for neutral Higgs bosons decaying to tau pairs in $ {\mathrm{p}}{\mathrm{p}} $ collisions at $ \sqrt{s} = $ 7 TeV | PLB 713 (2012) 68 | CMS-HIG-11-029 1202.4083 |
| 73 | CMS Collaboration | Performance of electron reconstruction and selection with the CMS detector in proton-proton collisions at $ \sqrt{s}= $ 8 TeV | JINST 10 (2015) P06005 | CMS-EGM-13-001 1502.02701 |
| 74 | CMS Collaboration | Performance of the CMS muon detector and muon reconstruction with proton-proton collisions at $ \sqrt{s}= $ 13 TeV | JINST 13 (2018) P06015 | CMS-MUO-16-001 1804.04528 |
| 75 | A. J. Larkoski, S. Marzani, G. Soyez, and J. Thaler | Soft drop | JHEP 05 (2014) 146 | 1402.2657 |
| 76 | M. Dasgupta, A. Fregoso, S. Marzani, and G. P. Salam | Towards an understanding of jet substructure | JHEP 09 (2013) 029 | 1307.0007 |
| 77 | J. Dolen et al. | Thinking outside the ROCs: Designing decorrelated taggers (DDT) for jet substructure | JHEP 05 (2016) 156 | 1603.00027 |
| 78 | I. Moult, L. Necib, and J. Thaler | New angles on energy correlation functions | JHEP 12 (2016) 153 | 1609.07483 |
| 79 | A. J. Larkoski, G. P. Salam, and J. Thaler | Energy correlation functions for jet substructure | JHEP 06 (2013) 108 | 1305.0007 |
| 80 | J. Thaler and K. Van Tilburg | Identifying boosted objects with N-subjettiness | JHEP 03 (2011) 015 | 1011.2268 |
| 81 | S. Bernstein | Démonstration du théorème de Weierstrass fondée sur le calcul des probabilités | Comm. Soc. Math. Kharkov 13 (1912) 1 | |
| 82 | R. A. Fisher | On the interpretation of $ \chi^{2} $ from contingency tables, and the calculation of P | J. R. Stat. Soc. 85 (1922) 87 | |
| 83 | CMS Collaboration | Search for low mass vector resonances decaying into quark-antiquark pairs in proton-proton collisions at $ \sqrt{s}= $ 13 TeV | PRD 100 (2019) 112007 | CMS-EXO-18-012 1909.04114 |
| 84 | CMS Collaboration | Identification of $ \mathrm{b} $-quark jets with the CMS experiment | JINST 8 (2013) P04013 | CMS-BTV-12-001 1211.4462 |
| 85 | M. Cacciari et al. | The $ \mathrm{t\bar{t}} $ cross-section at 1.8 TeV and 1.96$ TeV: $ A study of the systematics due to parton densities and scale dependence | JHEP 04 (2004) 068 | hep-ph/0303085 |
| 86 | S. Catani, D. de Florian, M. Grazzini, and P. Nason | Soft gluon resummation for Higgs boson production at hadron colliders | JHEP 07 (2003) 028 | hep-ph/0306211 |
| 87 | CMS Collaboration | Search for new physics in final states with an energetic jet or a hadronically decaying W or Z boson and transverse momentum imbalance at $ \sqrt{s} = $ 13 TeV | PRD 97 (2018) 092005 | CMS-EXO-16-048 1712.02345 |
| 88 | A. Denner, S. Dittmaier, T. Kasprzik, and A. Muck | Electroweak corrections to W+jet hadroproduction including leptonic W-boson decays | JHEP 08 (2009) 075 | 0906.1656 |
| 89 | A. Denner, S. Dittmaier, T. Kasprzik, and A. Muck | Electroweak corrections to dilepton+jet production at hadron colliders | JHEP 06 (2011) 069 | 1103.0914 |
| 90 | A. Denner, S. Dittmaier, T. Kasprzik, and A. Maeck | Electroweak corrections to monojet production at the LHC | EPJC 73 (2013) 2297 | 1211.5078 |
| 91 | J. H. Kuhn, A. Kulesza, S. Pozzorini, and M. Schulze | Electroweak corrections to hadronic photon production at large transverse momenta | JHEP 03 (2006) 059 | hep-ph/0508253 |
| 92 | CMS Collaboration | Determination of jet energy calibration and transverse momentum resolution in CMS | JINST 6 (2011) 11002 | CMS-JME-10-011 1107.4277 |
| 93 | CMS Collaboration | CMS luminosity measurements for the 2016 data taking period | CMS-PAS-LUM-17-001 | CMS-PAS-LUM-17-001 |
| 94 | The ATLAS Collaboration, The CMS Collaboration, The LHC Higgs Combination Group | Procedure for the LHC Higgs boson search combination in Summer 2011 | CMS-NOTE-2011-005 | |
| 95 | CMS Collaboration | Precise determination of the mass of the Higgs boson and tests of compatibility of its couplings with the standard model predictions using proton collisions at 7 and 8 TeV | EPJC 75 (2015) 212 | CMS-HIG-14-009 1412.8662 |
| 96 | F. J. Massey Jr. | The Kolmogorov-Smirnov test for goodness of fit | J. Am. Stat. Assoc. 46 (1951) 68 | |
| 97 | A. L. Read | Presentation of search results: the CLs technique | JPG 28 (2002) 2693 | |
| 98 | T. Junk | Confidence level computation for combining searches with small statistics | NIMA 434 (1999) 435 | hep-ex/9902006 |
| 99 | G. Cowan, K. Cranmer, E. Gross, and O. Vitells | Asymptotic formulae for likelihood-based tests of new physics | EPJC 71 (2011) 1554 | 1007.1727 |
| 100 | L. Demortier | P values and nuisance parameters | in Statistical issues for LHC physics. Proceedings, Workshop, PHYSTAT-LHC, Geneva, Switzerland, June 27-29, 2007, p. 23 2008 | |
| 101 | LHC Higgs Cross Section Working Group | Simplified template cross sections---stage 1.1 | LHCHXSWG-2019-003 | 1906.02754 |
| 102 | P. C. Hansen | The L-curve and its use in the numerical treatment of inverse problems | in Computational Inverse Problems in Electrocardiology, p. 119 Southampton: WIT Press | |
|
|
Compact Muon Solenoid LHC, CERN |
|

|

|

|

|

|