

Compact Muon Solenoid
LHC, CERN
| CMS-SMP-19-012 ; CERN-EP-2020-064 | ||
| Measurements of production cross sections of WZ and same-sign WW boson pairs in association with two jets in proton-proton collisions at $\sqrt{s} = $ 13 TeV | ||
| CMS Collaboration | ||
| 4 May 2020 | ||
| Phys. Lett. B 809 (2020) 135710 | ||
| Abstract: Measurements of production cross sections of WZ and same-sign WW boson pairs in association with two jets in proton-proton collisions at $\sqrt{s} = $ 13 TeV at the LHC are reported. The data sample corresponds to an integrated luminosity of 137 fb$^{-1}$, collected with the CMS detector during 2016-2018. The measurements are performed in the leptonic decay modes $\mathrm{W}^\pm\mathrm{Z} \to \ell^\pm\nu\ell'^\pm\ell'^\mp$ and ${\mathrm{W}^\pm\mathrm{W}^\pm} \to \ell^\pm\nu\ell'^\pm\nu$, where $\ell, \ell' = $ e, $\mu$. Differential fiducial cross sections as functions of the invariant masses of the jet and charged lepton pairs, as well as of the leading-lepton transverse momentum, are measured for ${\mathrm{W}^\pm\mathrm{W}^\pm} $ production and are consistent with the standard model predictions. The dependence of differential cross sections on the invariant mass of the jet pair is also measured for WZ production. An observation of electroweak production of WZ boson pairs is reported with an observed (expected) significance of 6.8 (5.3) standard deviations. Constraints are obtained on the structure of quartic vector boson interactions in the framework of effective field theory. | ||
| Links: e-print arXiv:2005.01173 [hep-ex] (PDF) ; CDS record ; inSPIRE record ; HepData record ; CADI line (restricted) ; | ||
| Figures & Tables | Summary | Additional Figures | References | CMS Publications |
|---|
| Figures | |
png pdf |
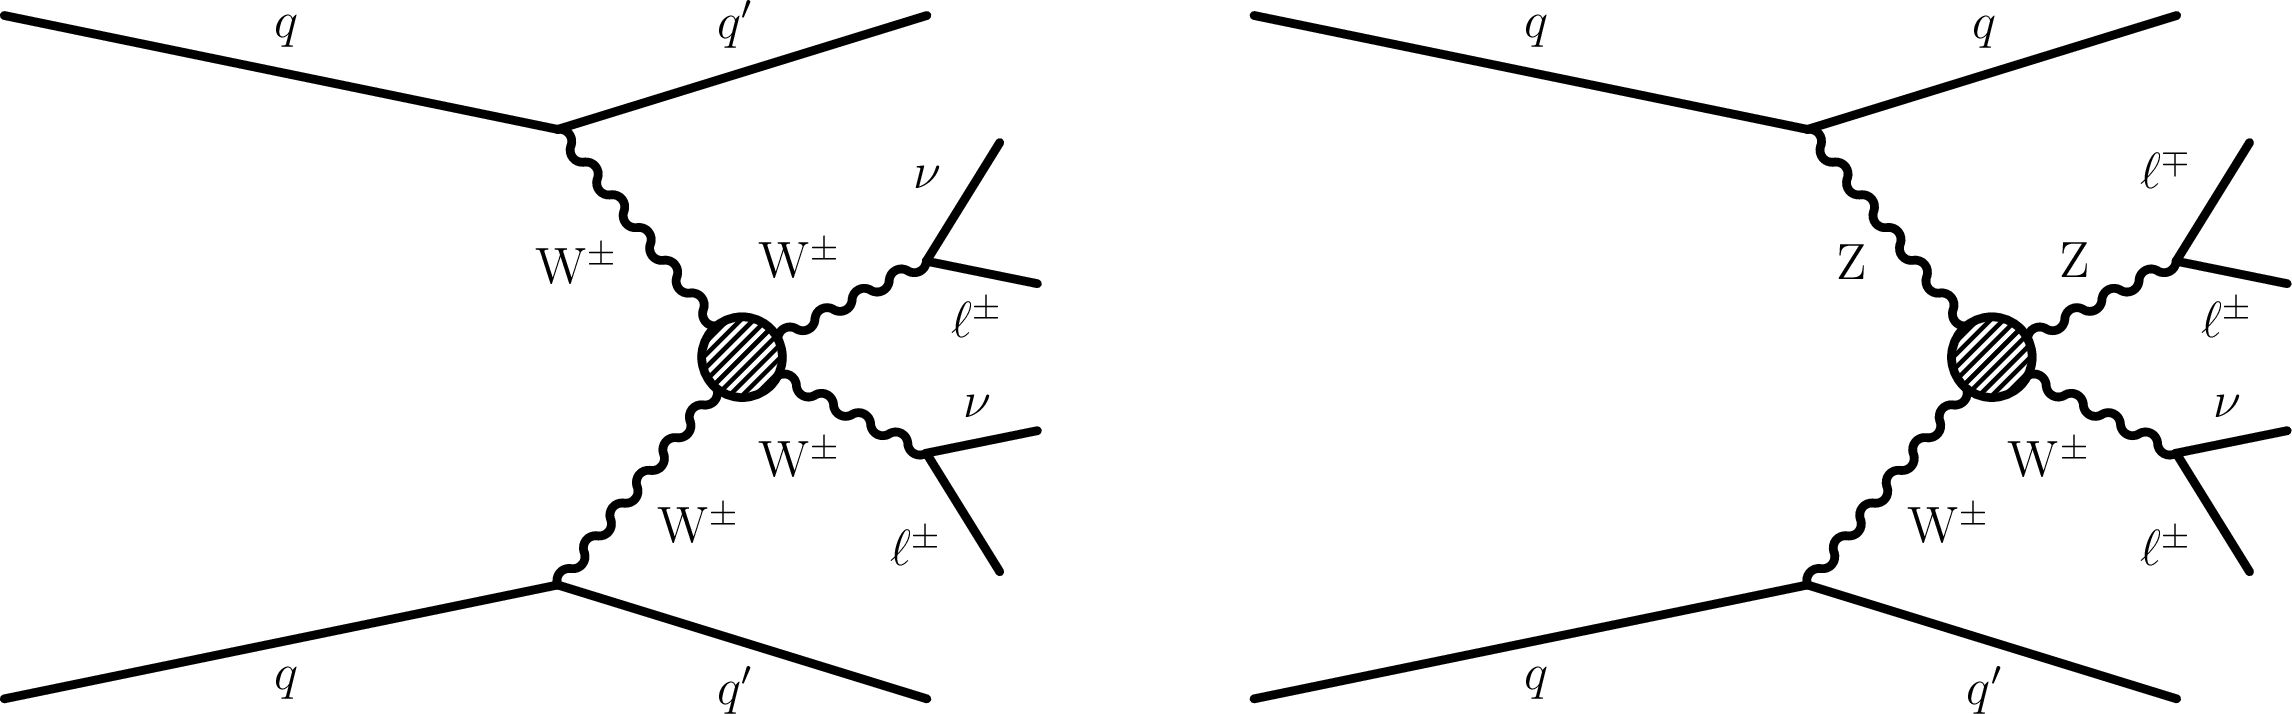
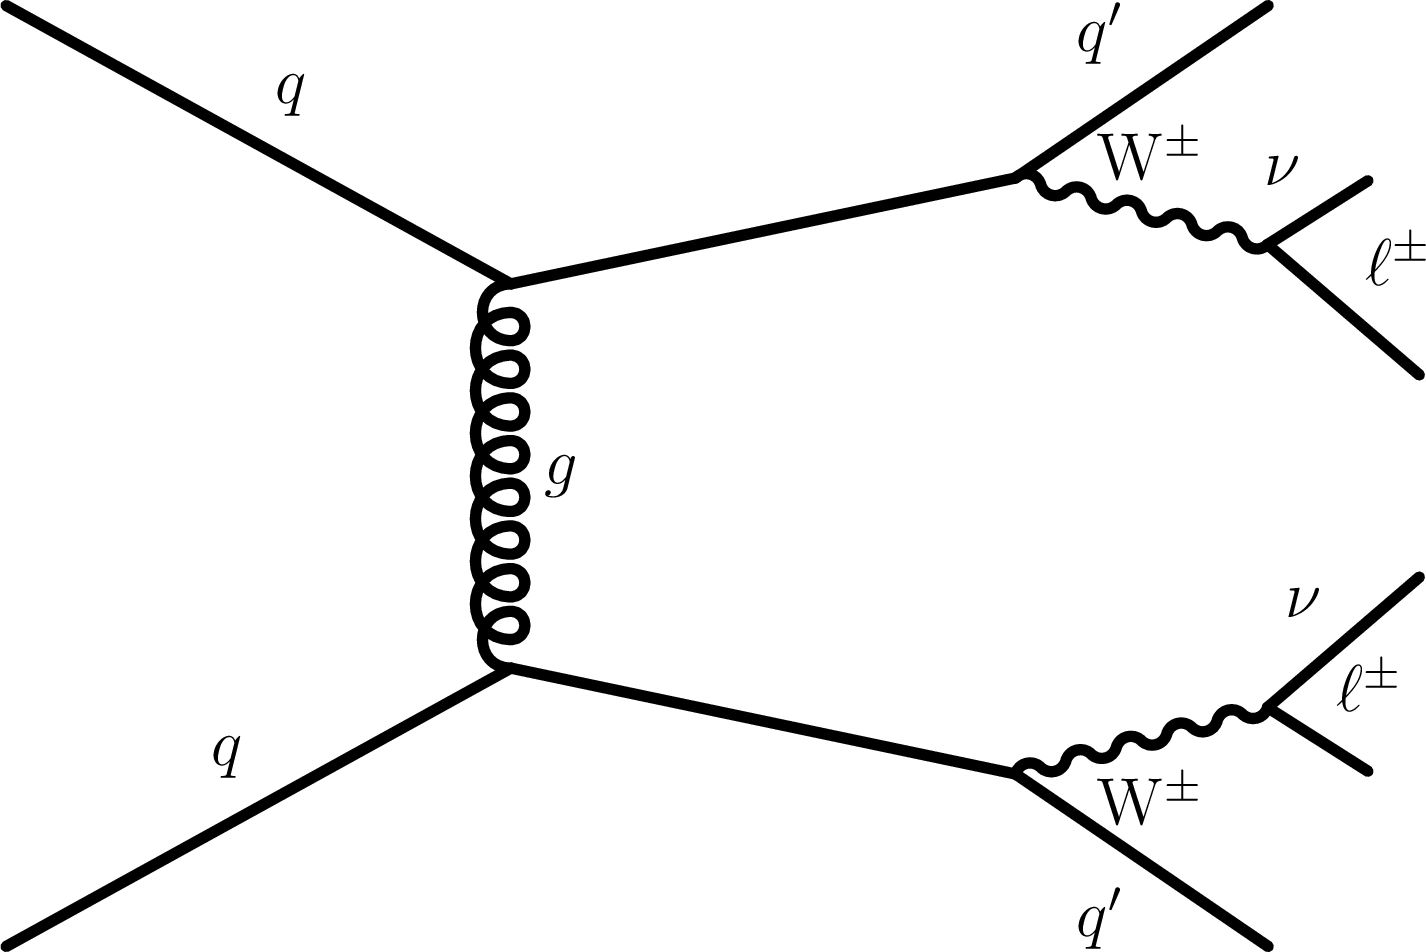
Figure 1:
Representative Feynman diagrams of a VBS process contributing to the EW-induced production of events containing $ {\mathrm{W} ^\pm \mathrm{W} ^\pm} $ (left) and $ {\mathrm{W} \mathrm{Z}} $ (right) boson pairs decaying to leptons, and two forward jets. New physics (represented by a dashed circle) in the EW sector can modify the quartic gauge couplings. |
png pdf |
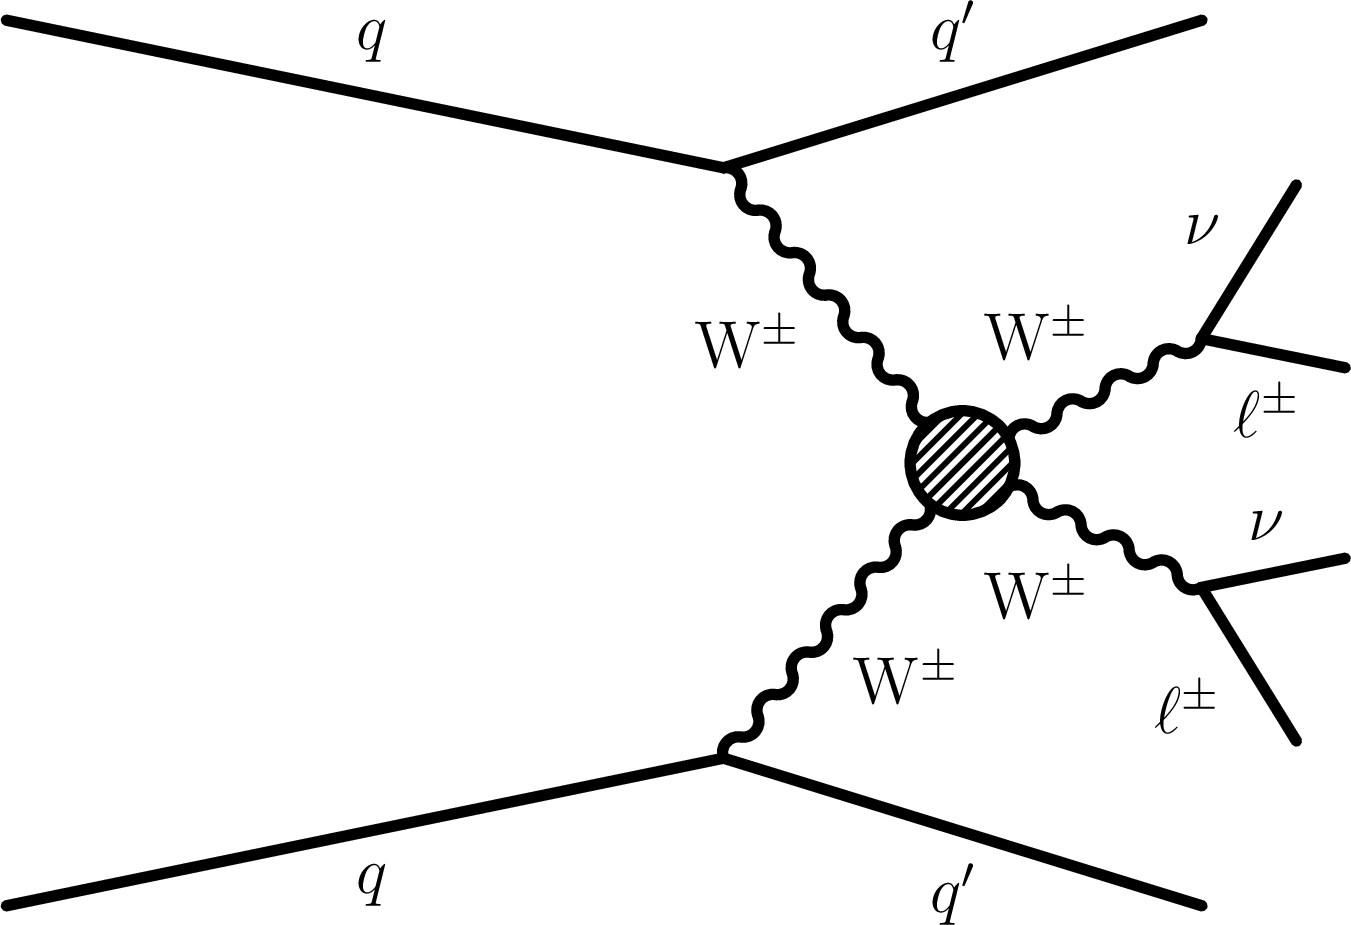
Figure 1-a:
Representative Feynman diagram of a VBS process contributing to the EW-induced production of events containing $ {\mathrm{W} ^\pm \mathrm{W} ^\pm} $ boson pairs decaying to leptons, and two forward jets. New physics (represented by a dashed circle) in the EW sector can modify the quartic gauge couplings. |
png pdf |
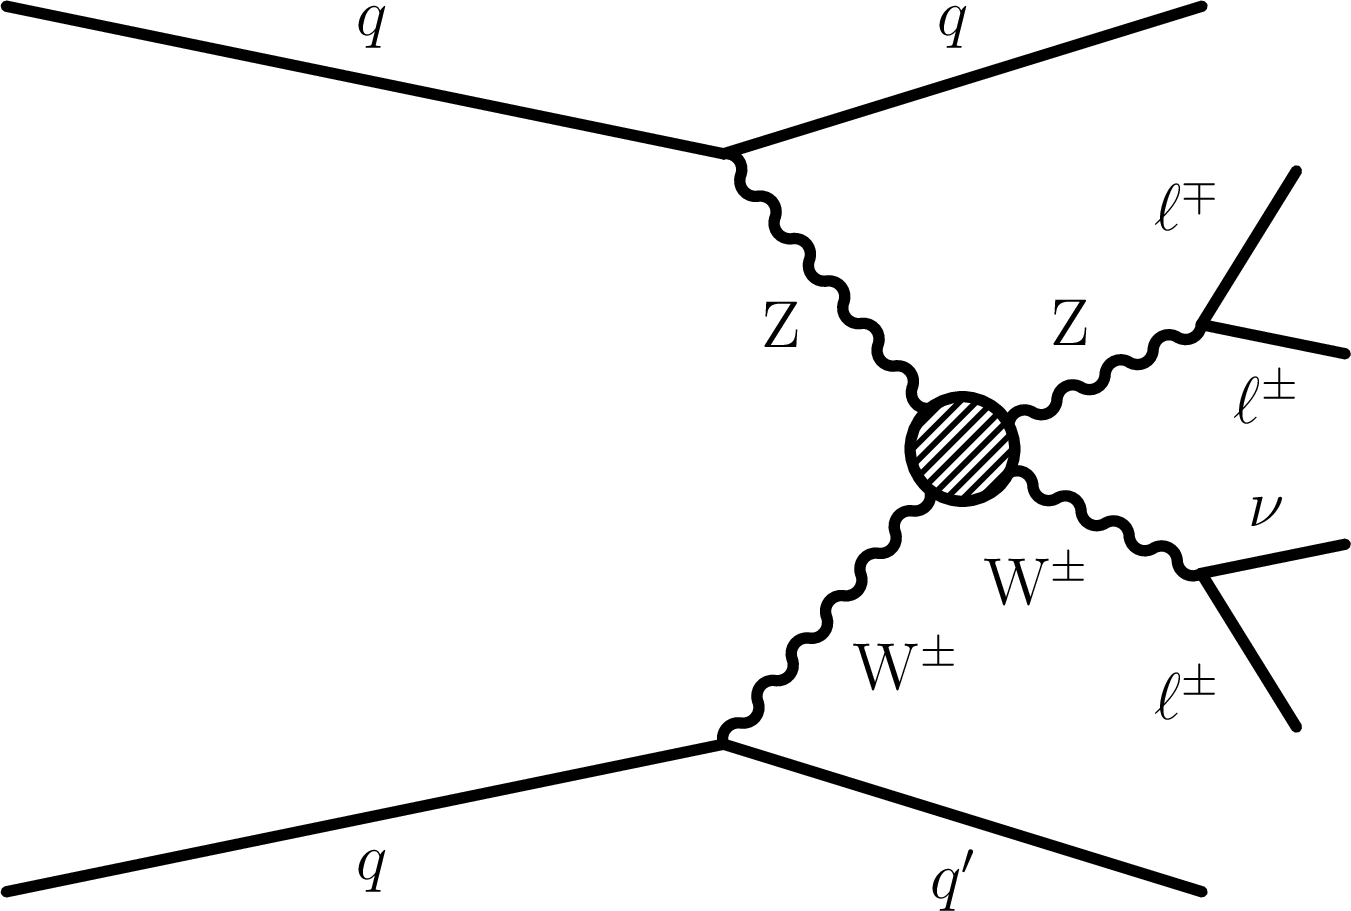
Figure 1-b:
Representative Feynman diagram of a VBS process contributing to the EW-induced production of events containing $ {\mathrm{W} \mathrm{Z}} $ boson pairs decaying to leptons, and two forward jets. New physics (represented by a dashed circle) in the EW sector can modify the quartic gauge couplings. |
png pdf |
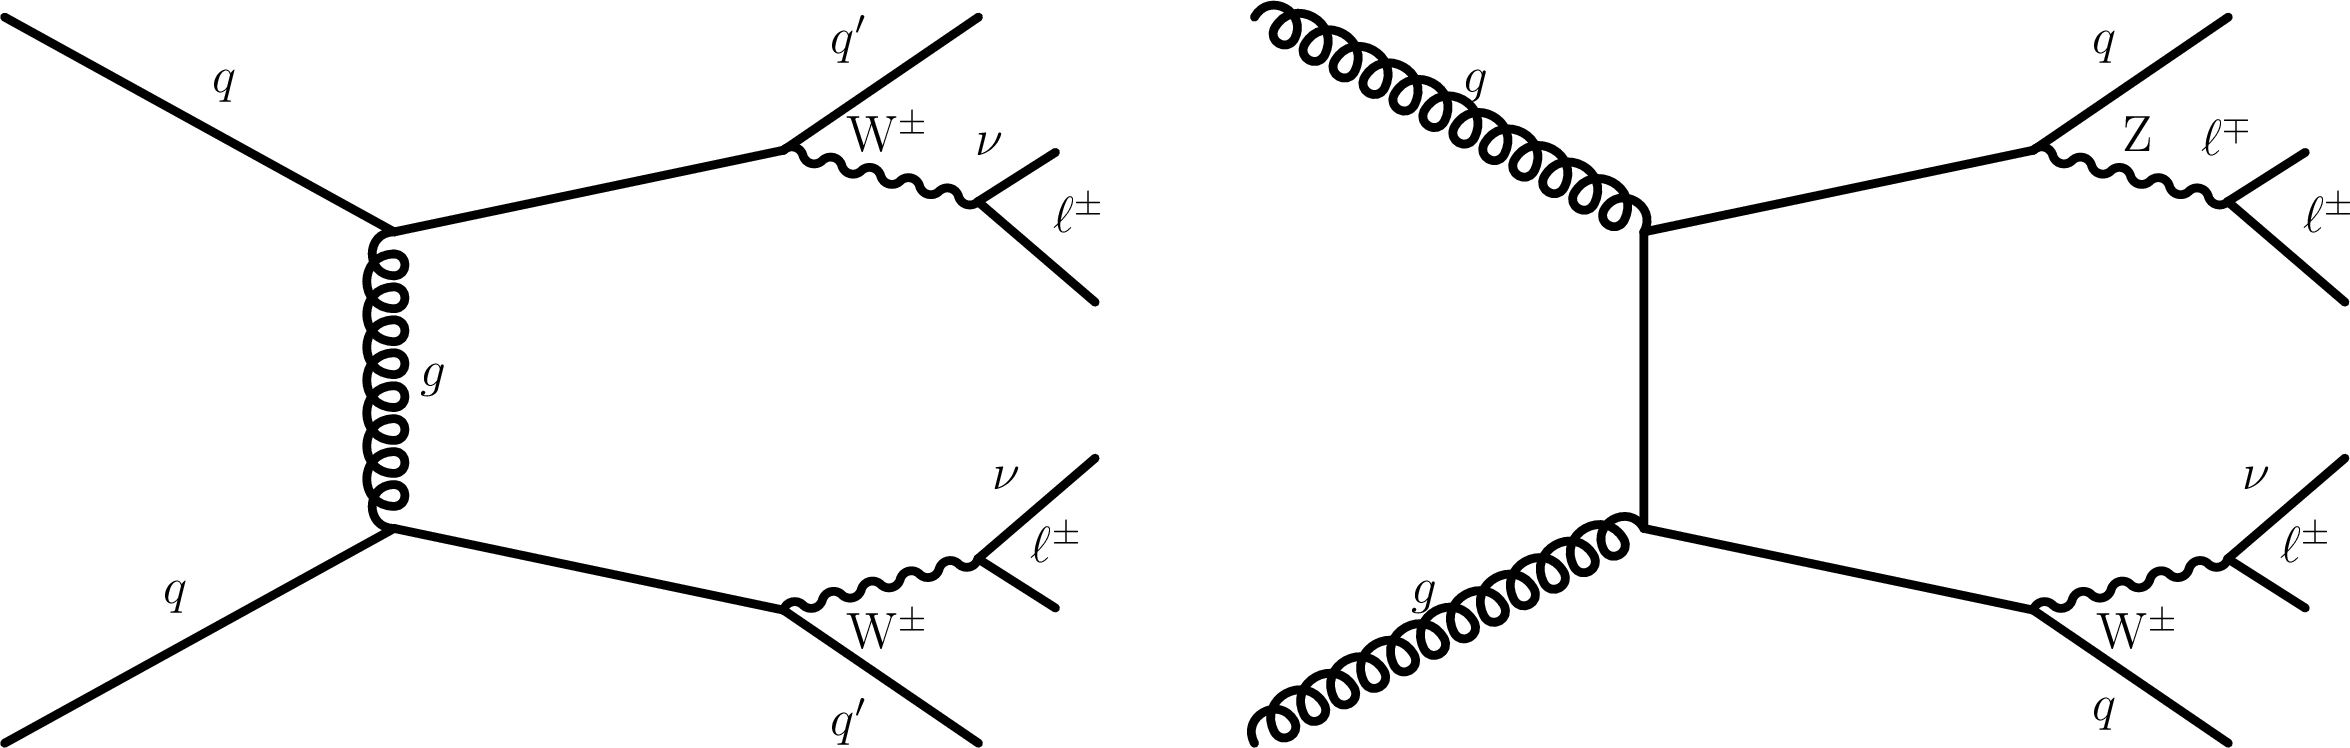
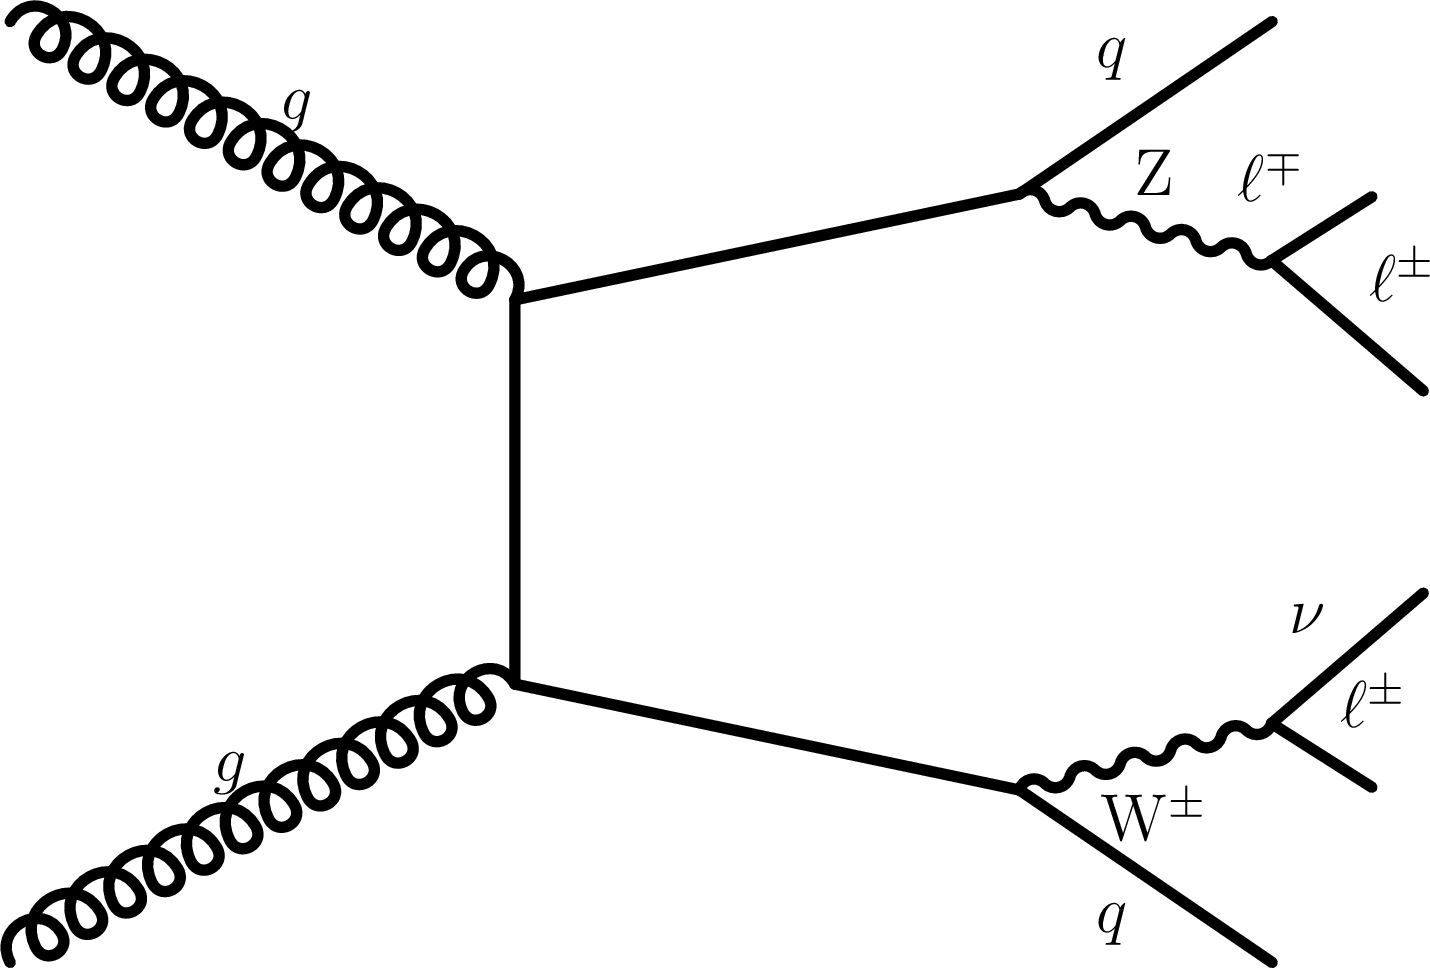
Figure 2:
Representative Feynman diagrams of the QCD-induced production of $ {\mathrm{W} ^\pm \mathrm{W} ^\pm} $ (left) and $ {\mathrm{W} \mathrm{Z}} $ (right) boson pairs decaying to leptons, and two jets. |
png pdf |
Figure 2-a:
Representative Feynman diagram of the QCD-induced production of $ {\mathrm{W} ^\pm \mathrm{W} ^\pm} $ boson pairs decaying to leptons, and two jets. |
png pdf |
Figure 2-b:
Representative Feynman diagram of the QCD-induced production of $ {\mathrm{W} \mathrm{Z}} $ boson pairs decaying to leptons, and two jets. |
png pdf |
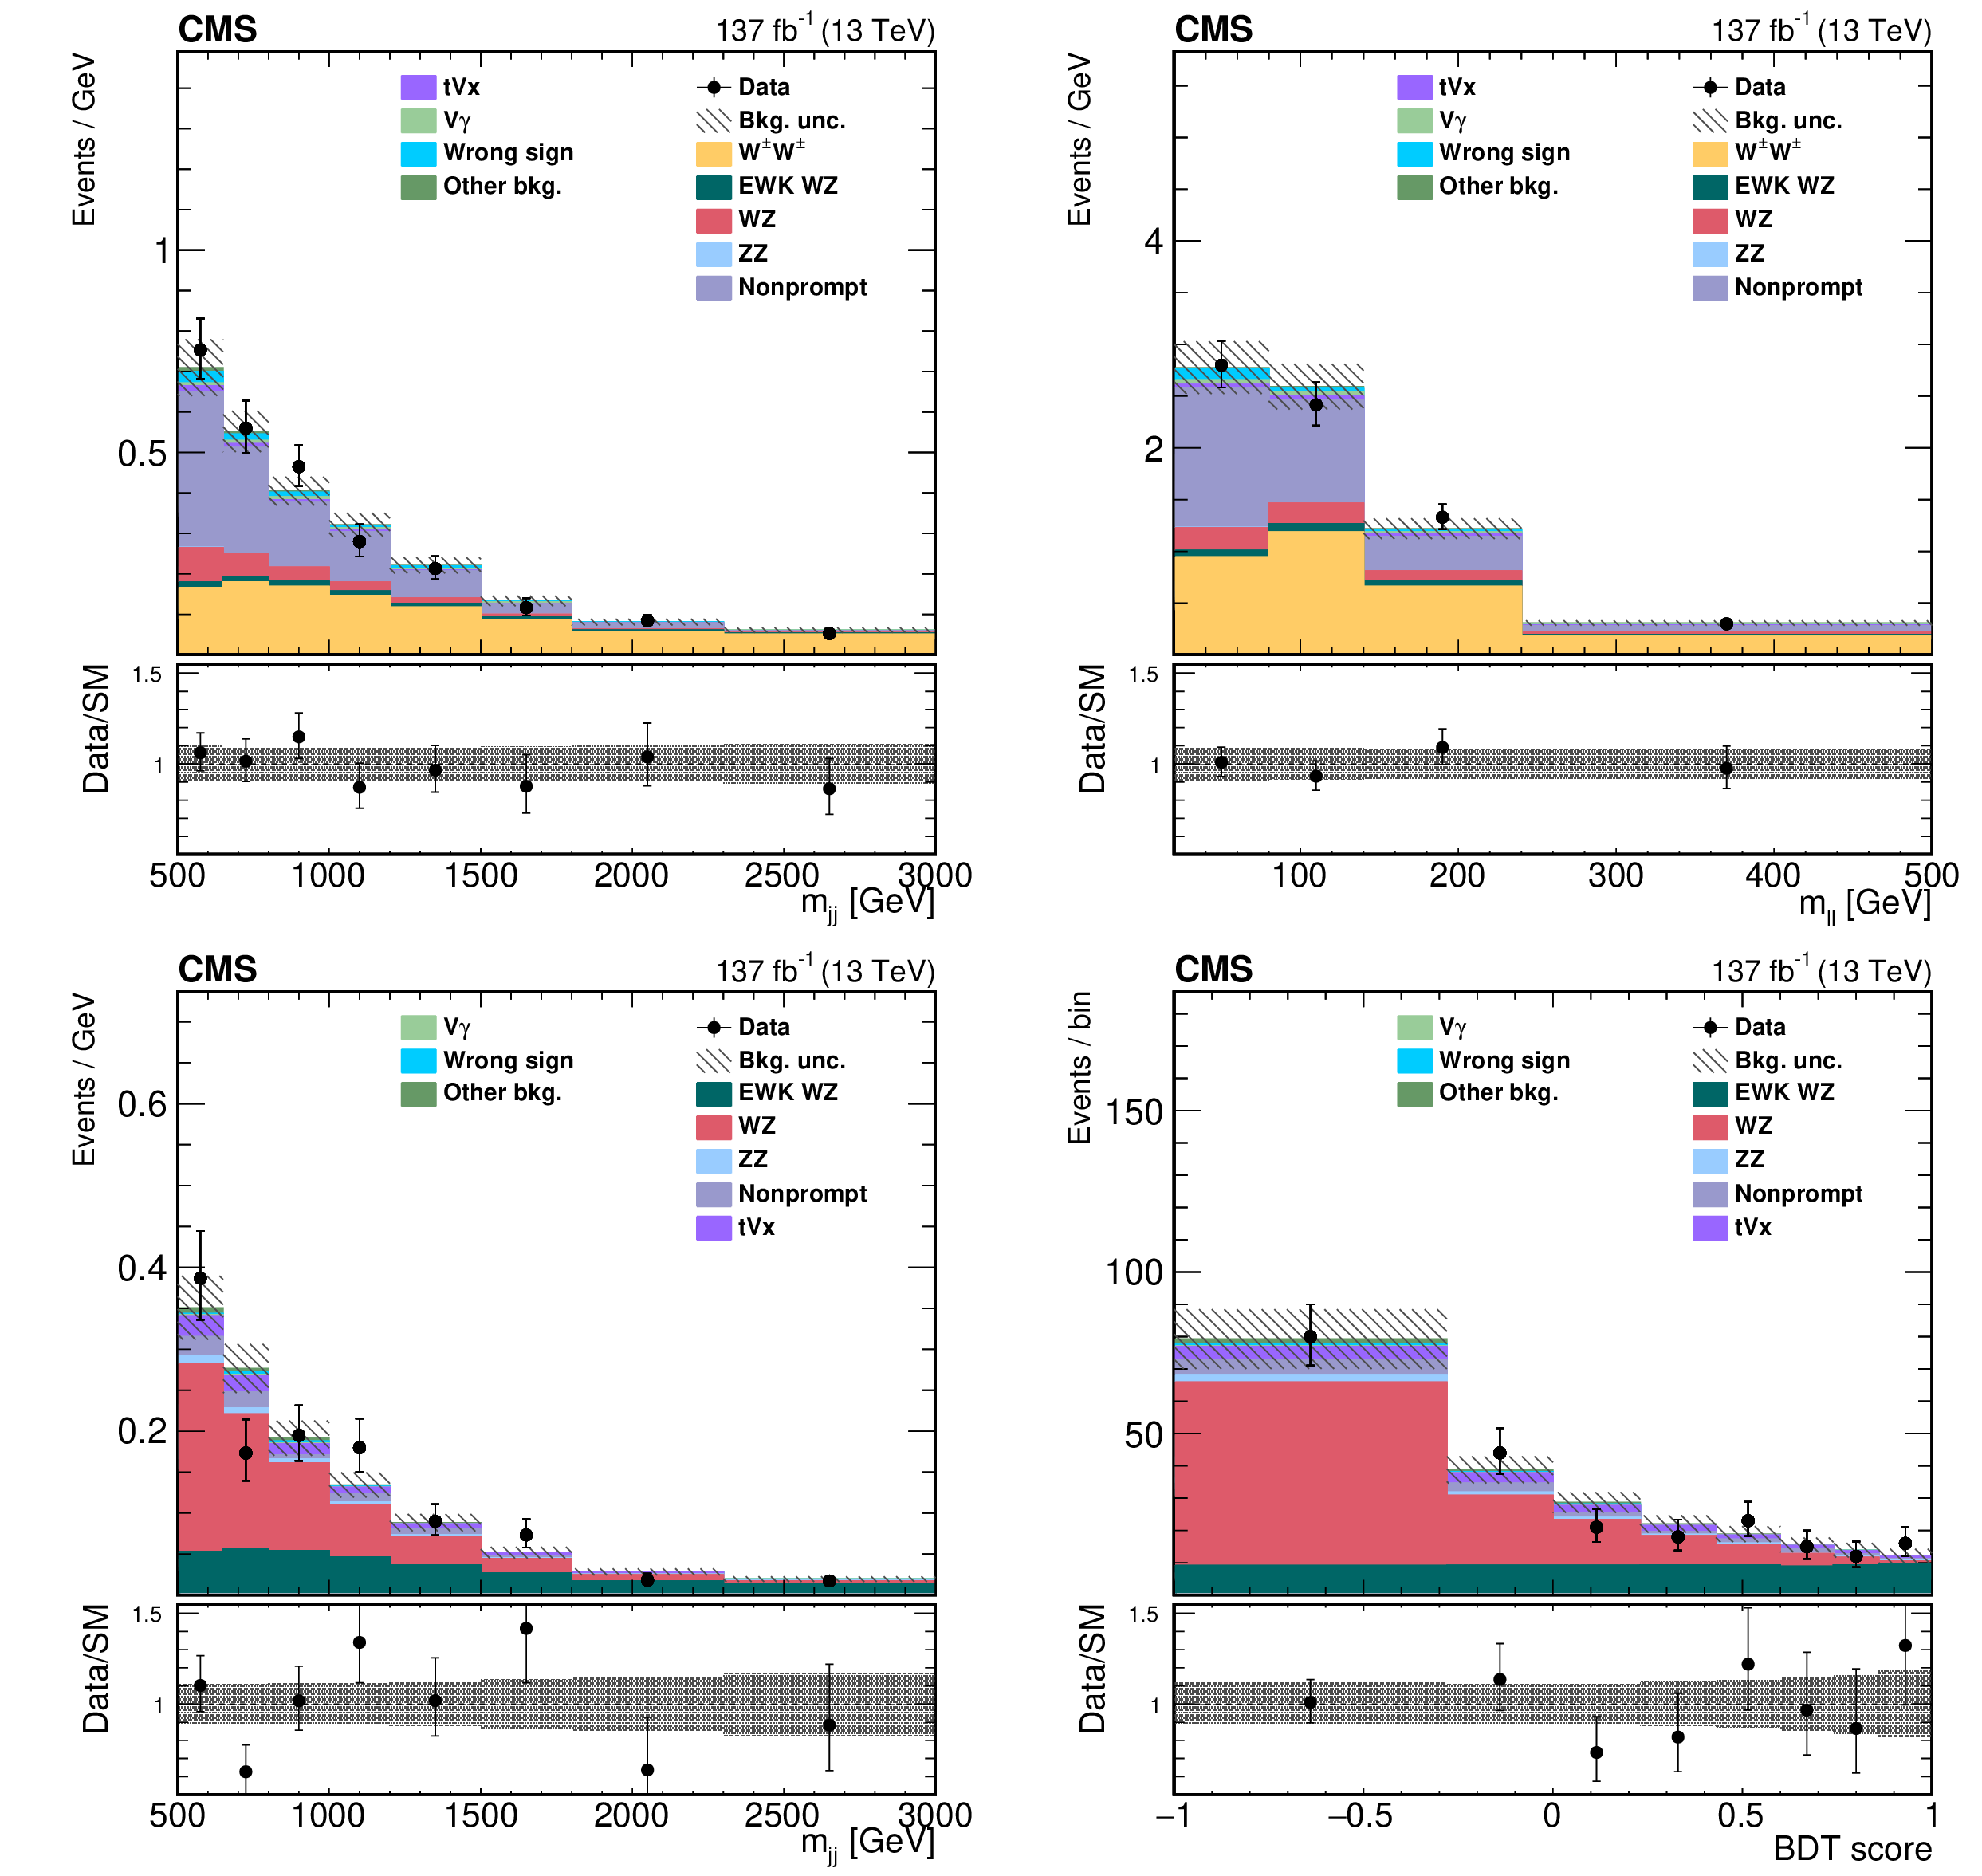
Figure 3:
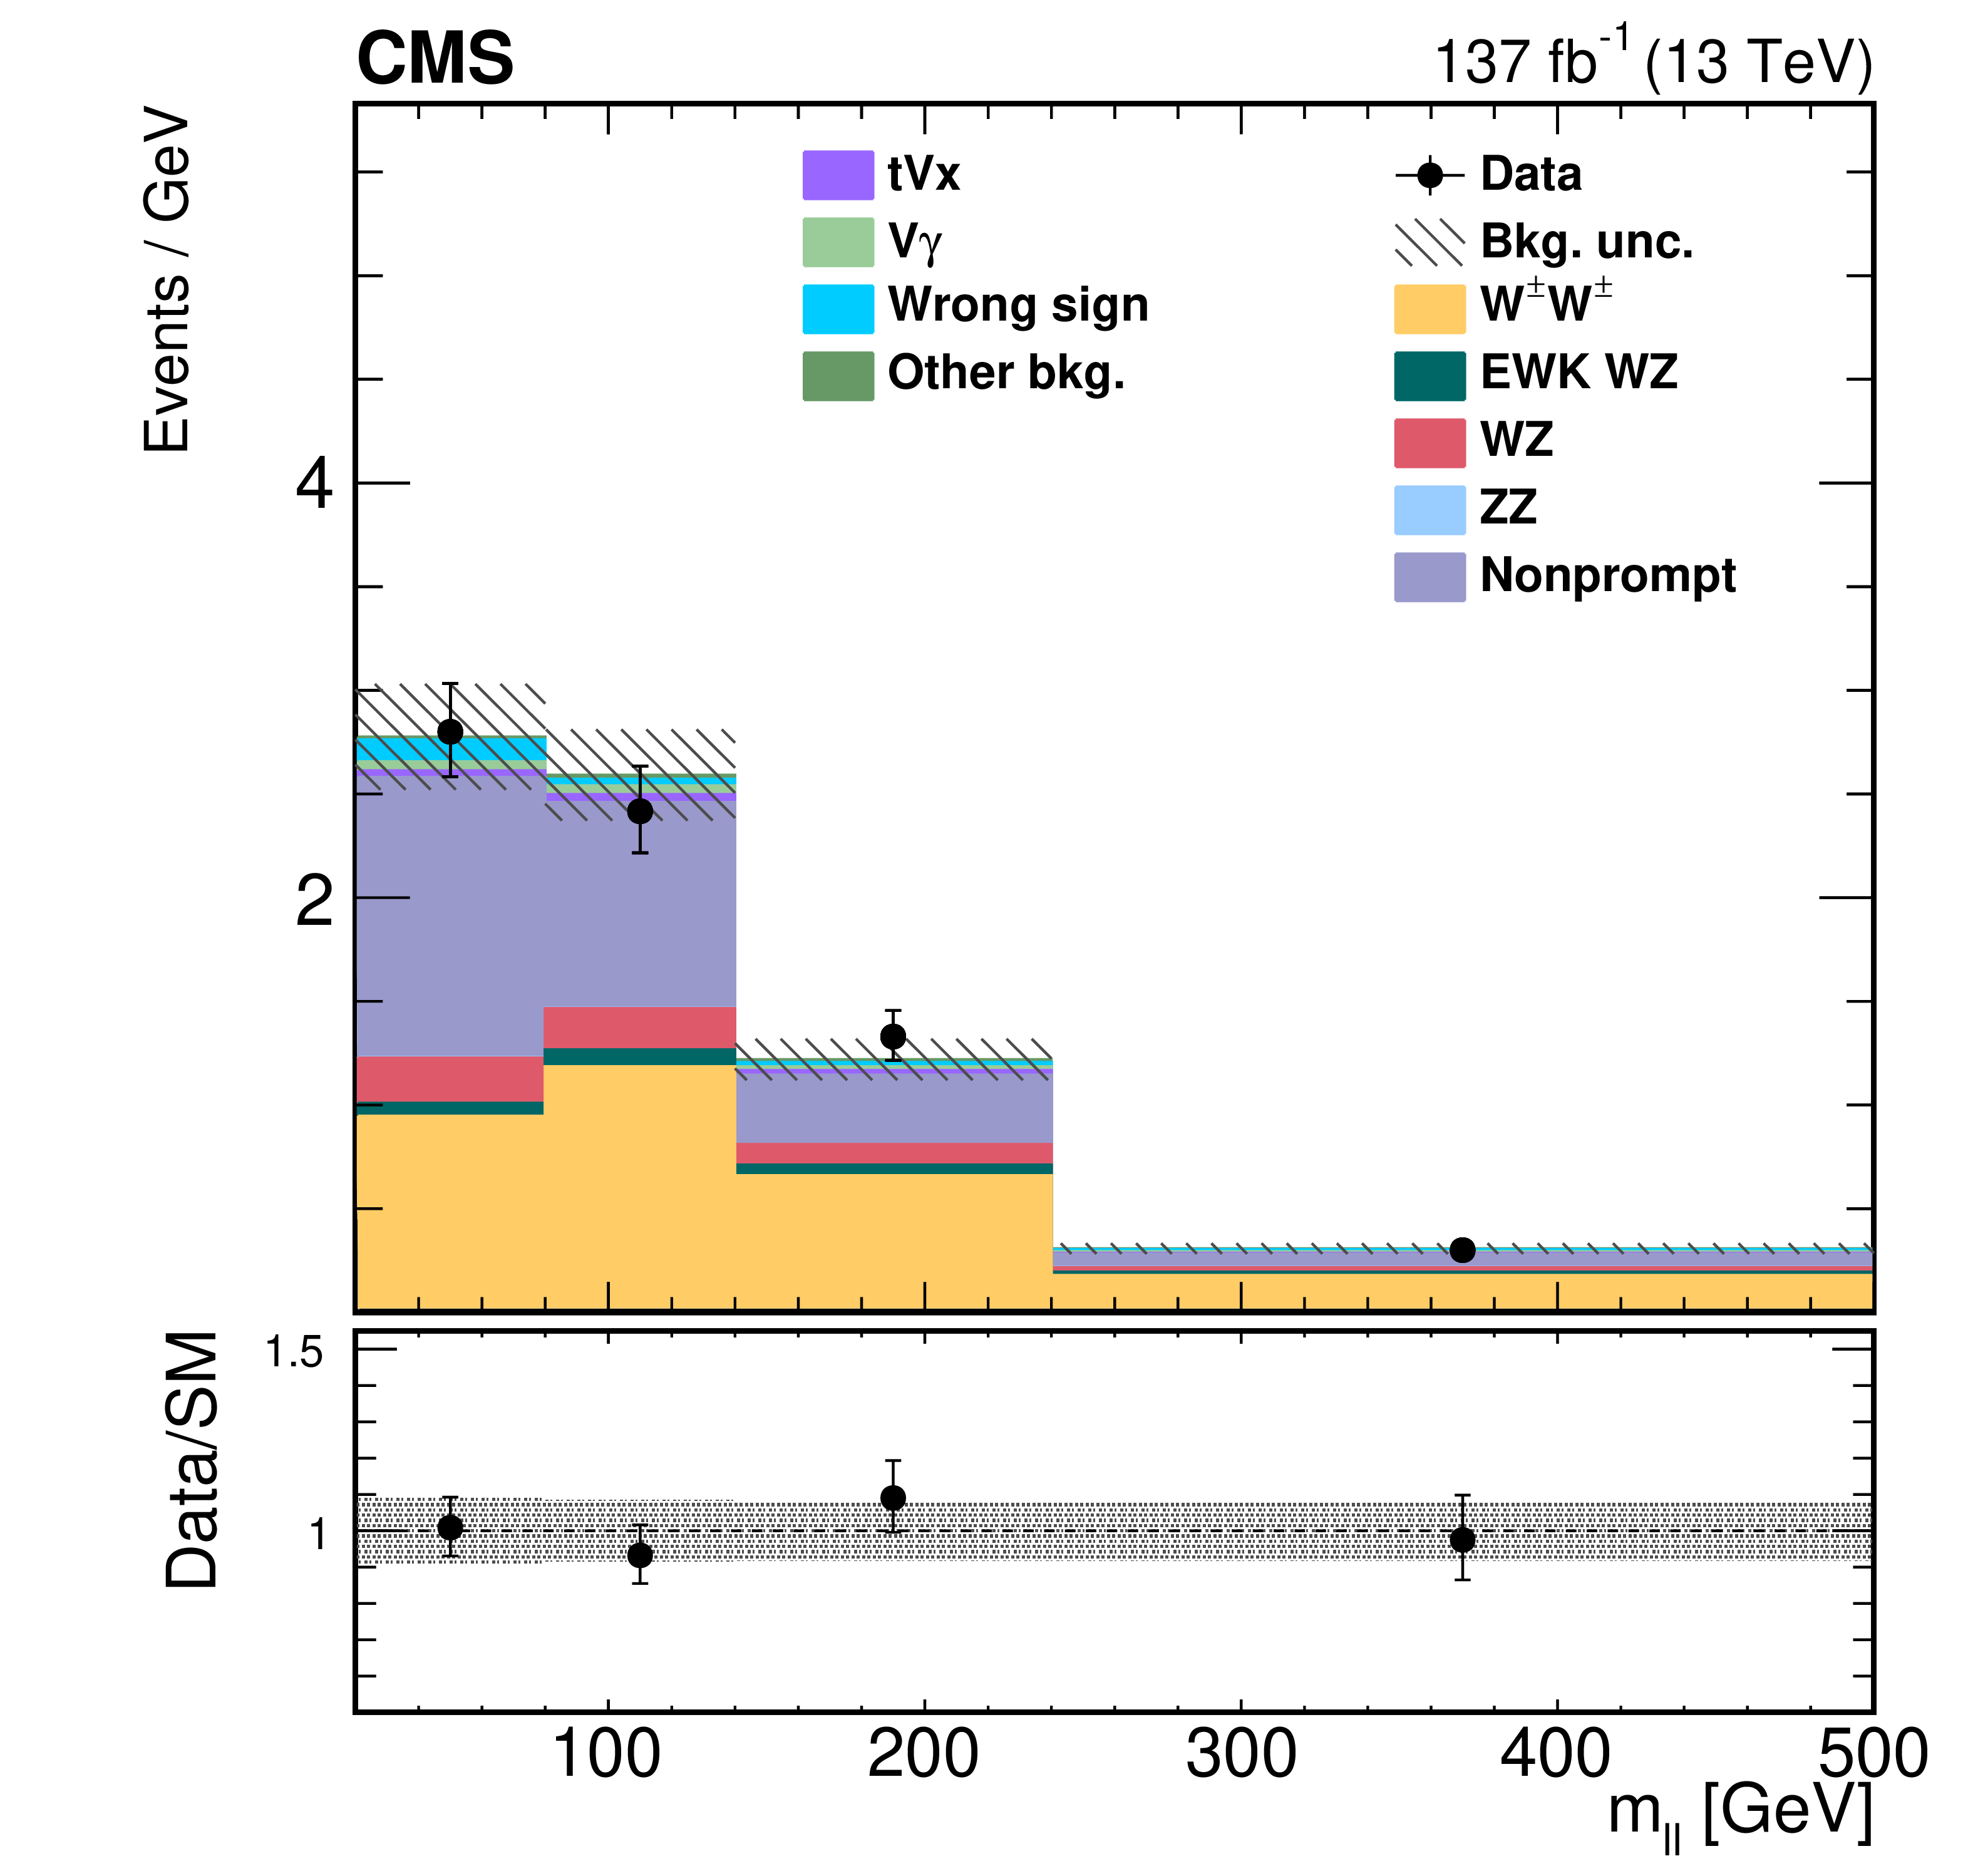
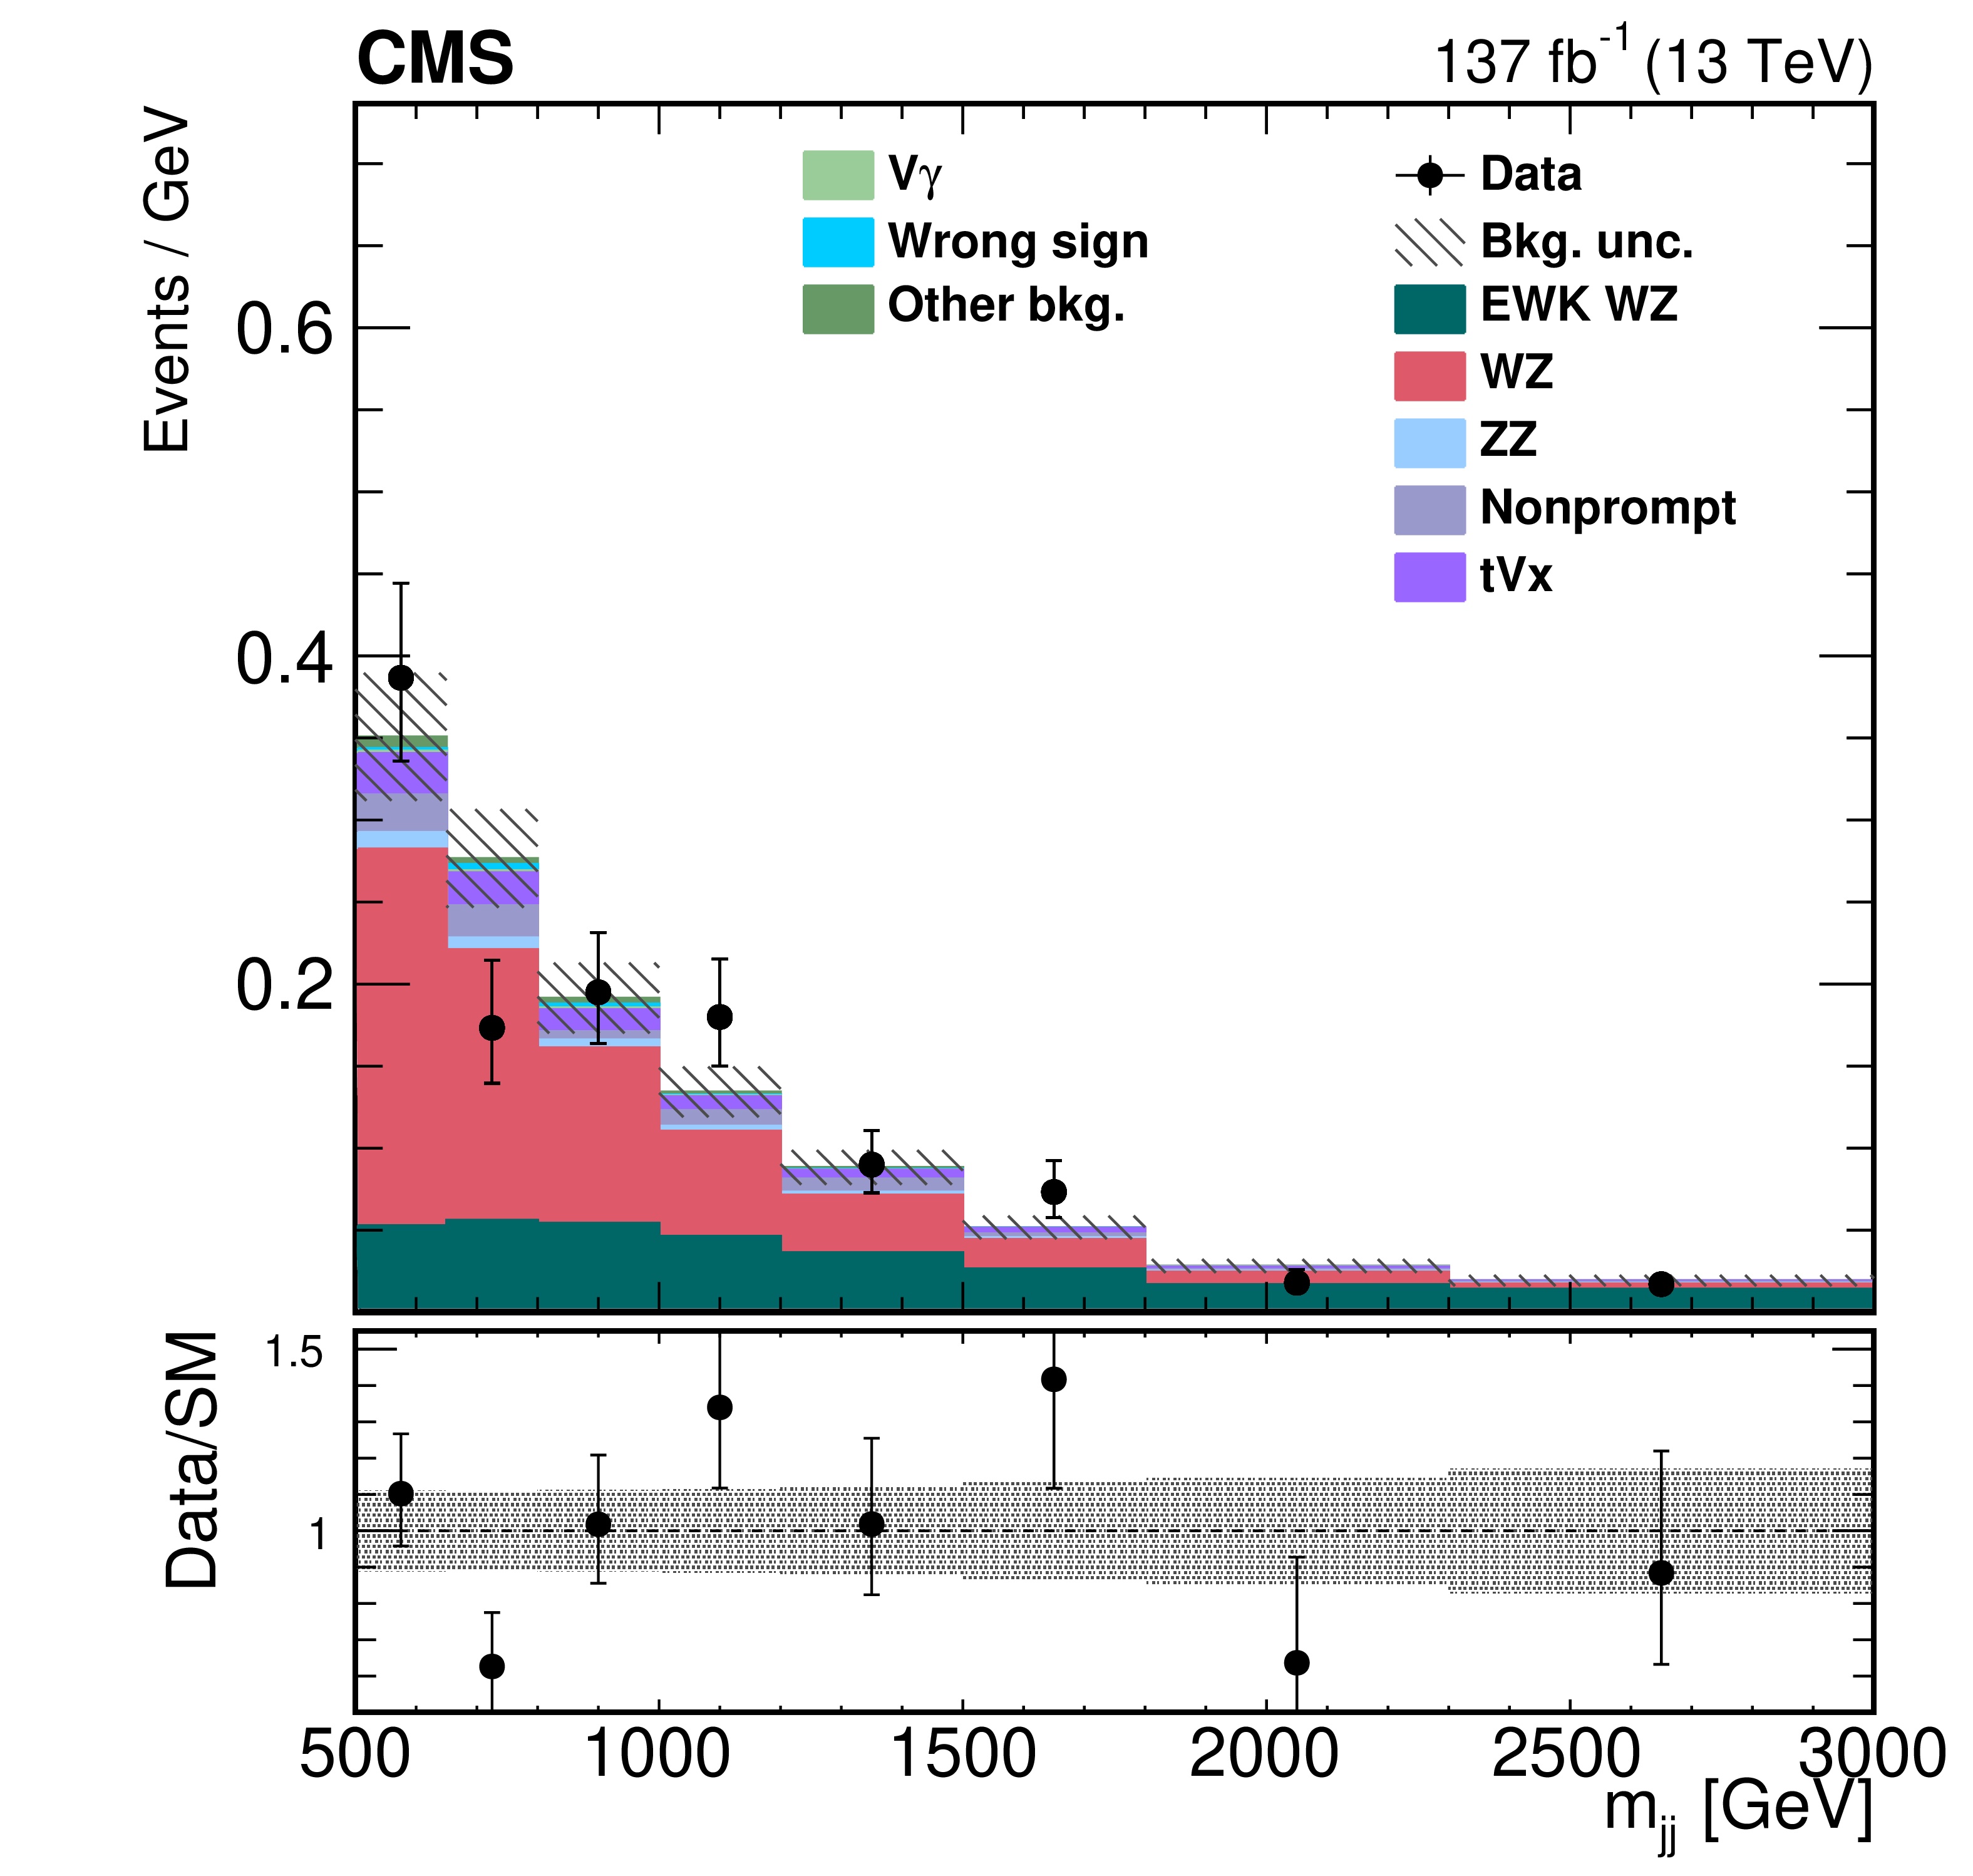
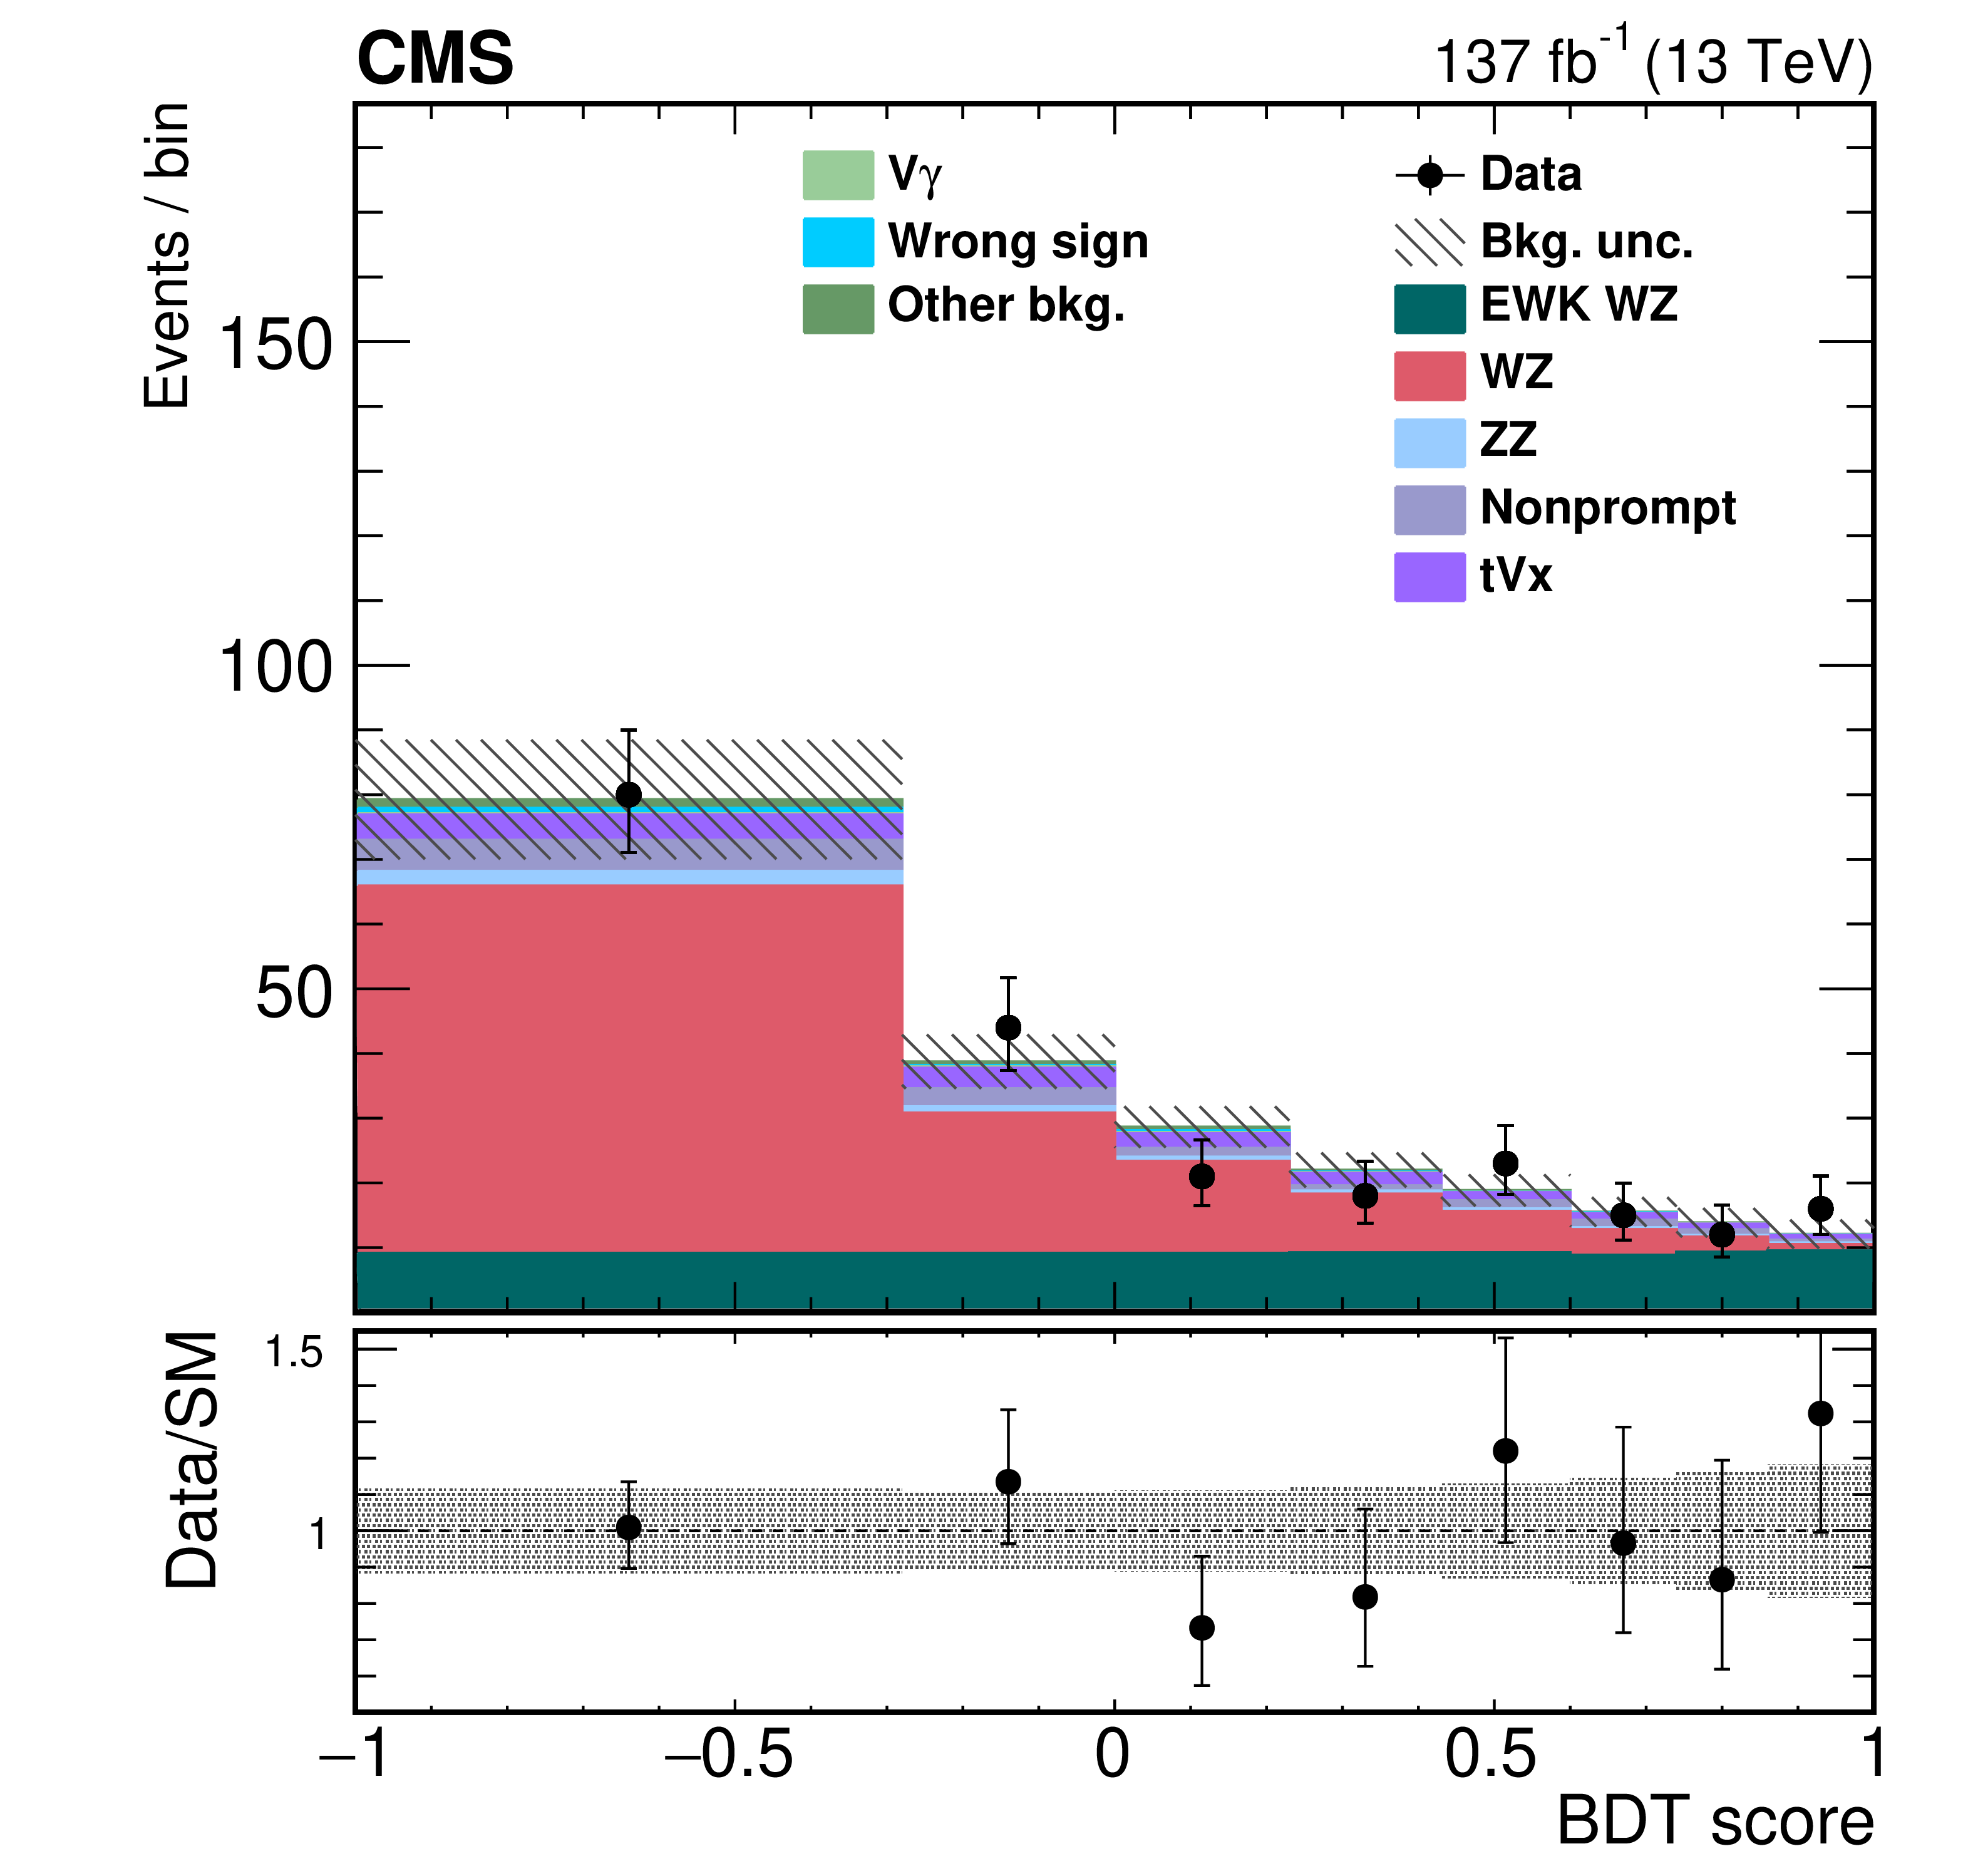
Distributions of $ {m_{{\mathrm {j}} {\mathrm {j}}}} $ (upper left) and $ {m_{\ell \ell}} $ (upper right) in the $ {\mathrm{W} ^\pm \mathrm{W} ^\pm} $ SR, and the distributions of $ {m_{{\mathrm {j}} {\mathrm {j}}}} $ (lower left) and BDT score (lower right) in the $ {\mathrm{W} \mathrm{Z}} $ SR. The predicted yields are shown with their best fit normalizations from the simultaneous fit. Vertical bars on data points represent the statistical uncertainty in the data. The histograms for $ {\mathrm{t} \mathrm{V} \mathrm {x}} $ backgrounds include the contributions from ${\mathrm{t} {}\mathrm{\bar{t}}} \mathrm{V} $ and $ {\mathrm{t} \mathrm{Z} \mathrm{q}} $ processes. The histograms for other backgrounds include the contributions from double parton scattering and $\mathrm{V} \mathrm{V} \mathrm{V} $ processes. The overflow is included in the last bin. The bottom panel in each figure shows the ratio of the number of events observed in data to that of the total SM prediction. The gray bands represent the uncertainties in the predicted yields. |
png pdf |
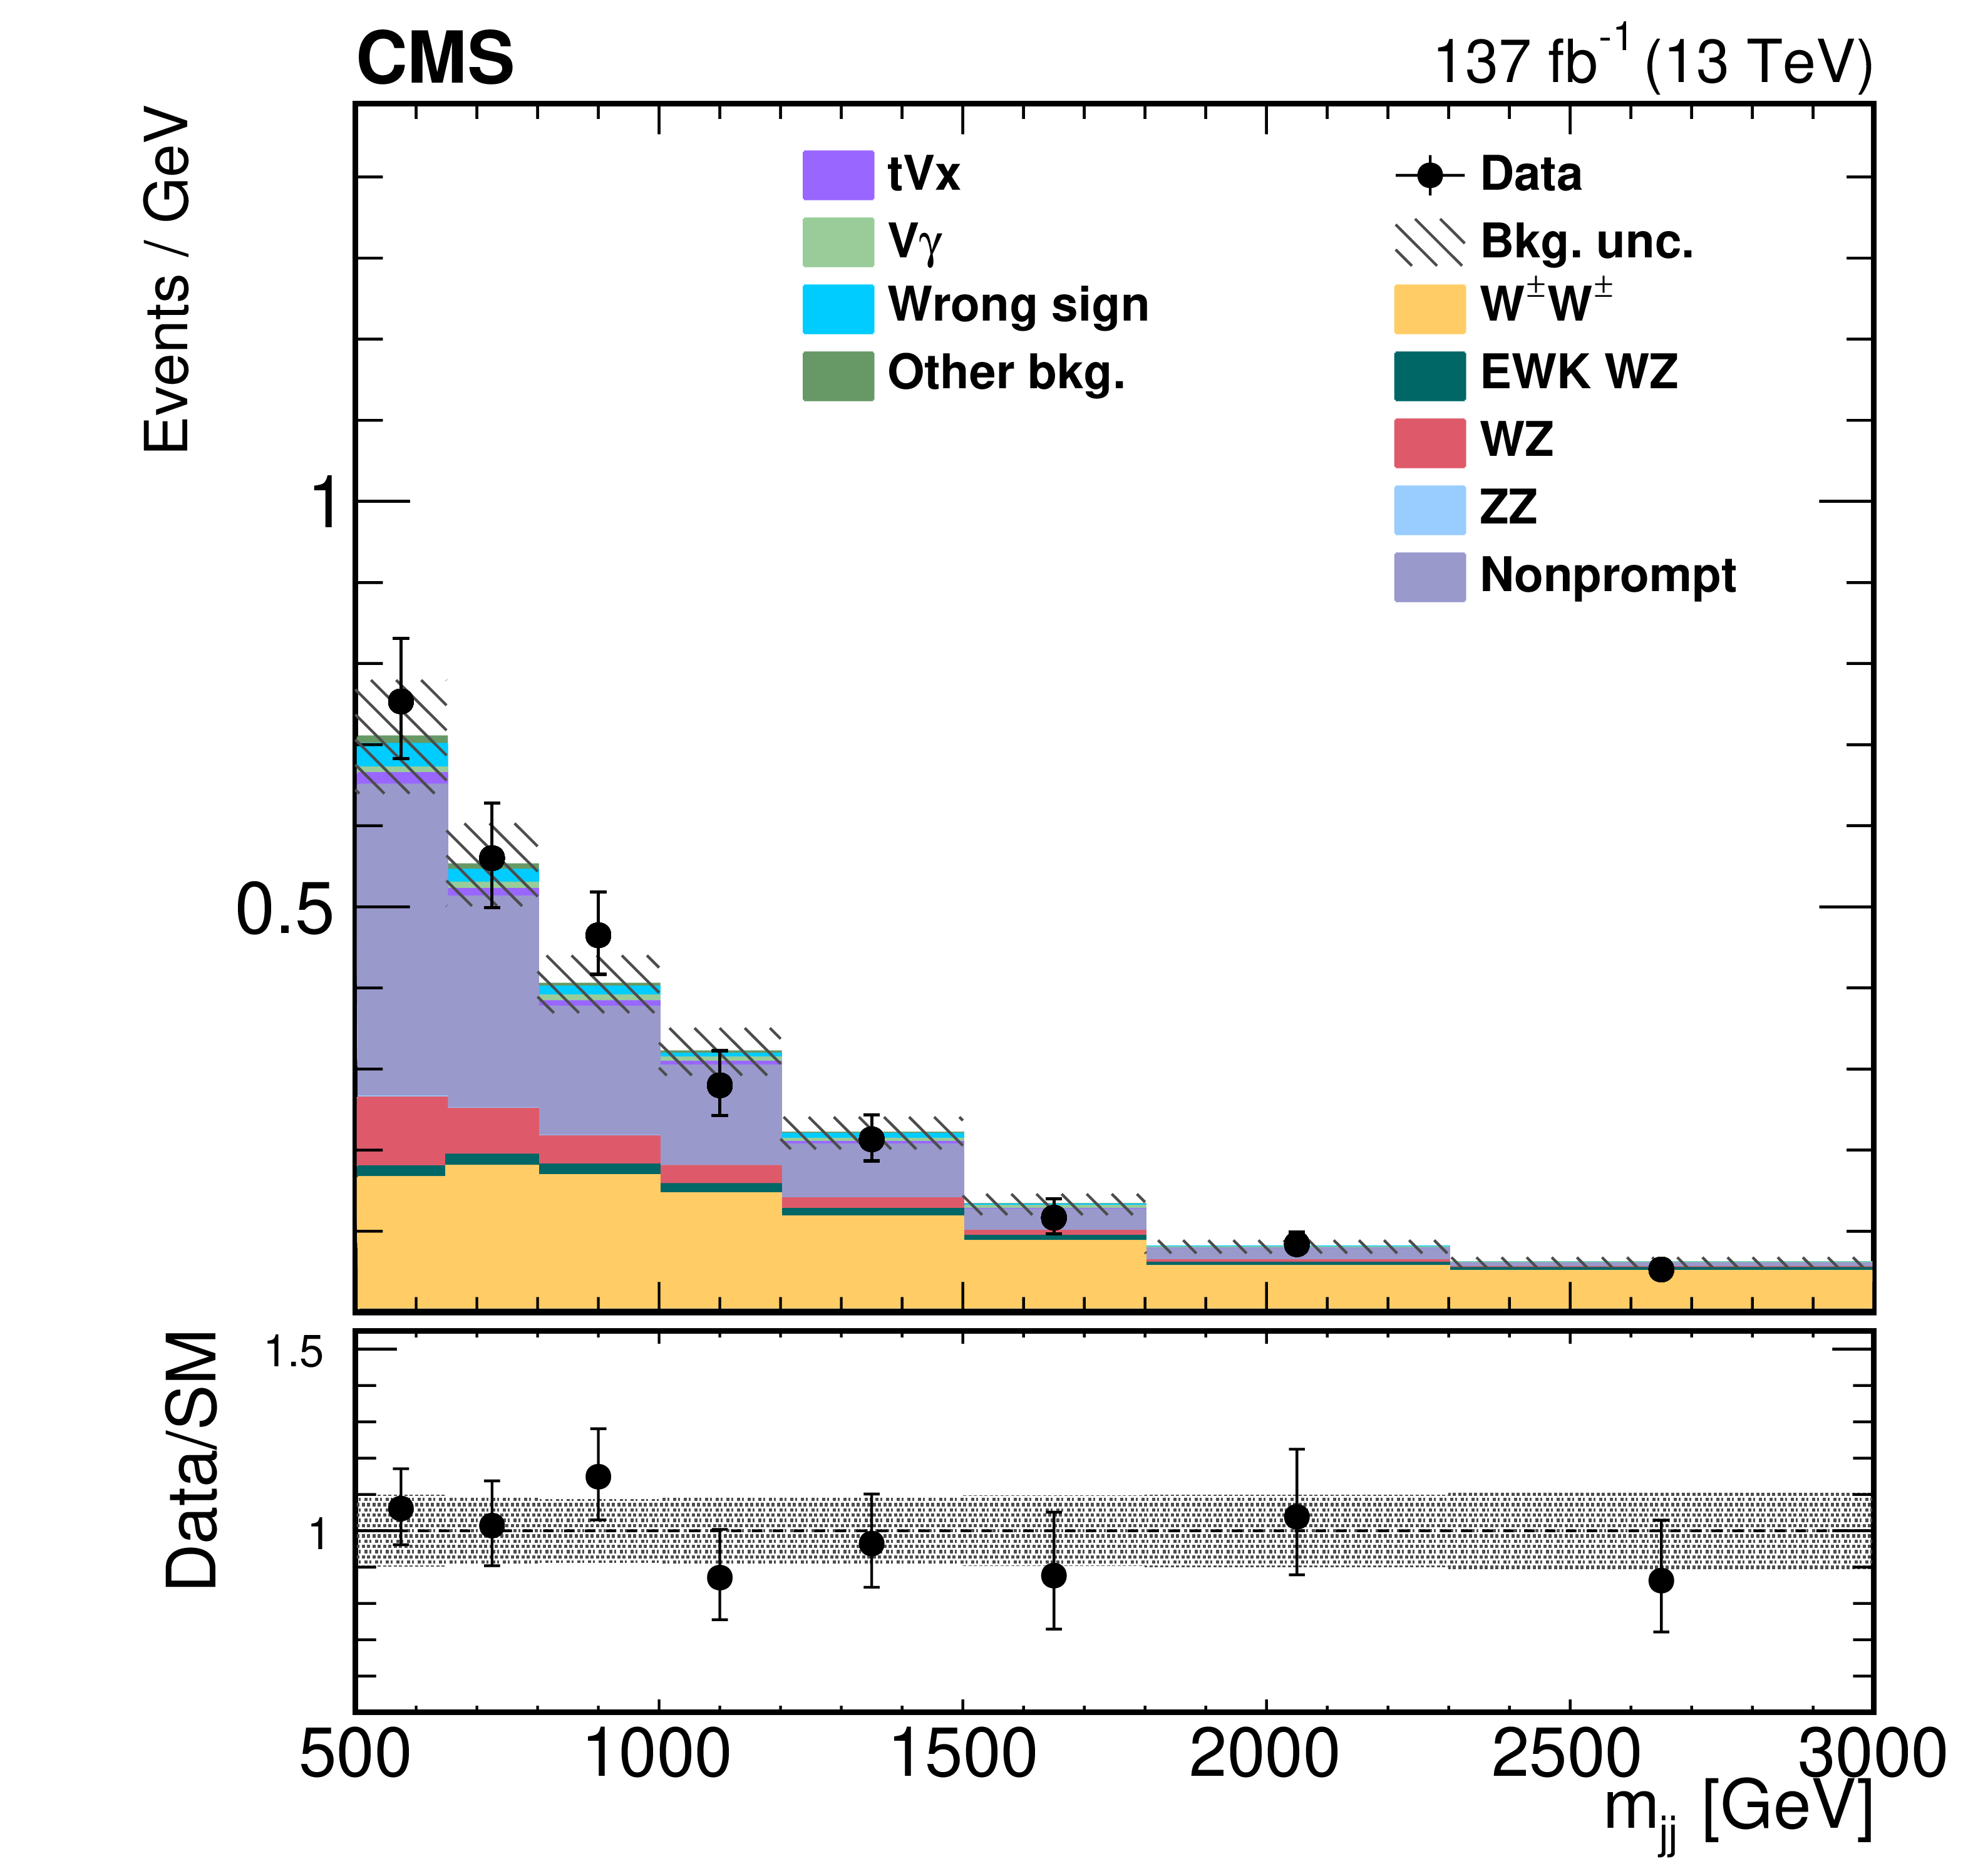
Figure 3-a:
Distribution of $ {m_{{\mathrm {j}} {\mathrm {j}}}} $ in the $ {\mathrm{W} ^\pm \mathrm{W} ^\pm} $ SR. The predicted yields are shown with their best fit normalizations from the simultaneous fit. Vertical bars on data points represent the statistical uncertainty in the data. The histograms for $ {\mathrm{t} \mathrm{V} \mathrm {x}} $ backgrounds include the contributions from ${\mathrm{t} {}\mathrm{\bar{t}}} \mathrm{V} $ and $ {\mathrm{t} \mathrm{Z} \mathrm{q}} $ processes. The histograms for other backgrounds include the contributions from double parton scattering and $\mathrm{V} \mathrm{V} \mathrm{V} $ processes. The overflow is included in the last bin. The bottom panel shows the ratio of the number of events observed in data to that of the total SM prediction. The gray bands represent the uncertainties in the predicted yields. |
png pdf |
Figure 3-b:
Distribution of $ {m_{\ell \ell}} $ in the $ {\mathrm{W} ^\pm \mathrm{W} ^\pm} $ SR. The predicted yields are shown with their best fit normalizations from the simultaneous fit. Vertical bars on data points represent the statistical uncertainty in the data. The histograms for $ {\mathrm{t} \mathrm{V} \mathrm {x}} $ backgrounds include the contributions from ${\mathrm{t} {}\mathrm{\bar{t}}} \mathrm{V} $ and $ {\mathrm{t} \mathrm{Z} \mathrm{q}} $ processes. The histograms for other backgrounds include the contributions from double parton scattering and $\mathrm{V} \mathrm{V} \mathrm{V} $ processes. The overflow is included in the last bin. The bottom panel shows the ratio of the number of events observed in data to that of the total SM prediction. The gray bands represent the uncertainties in the predicted yields. |
png pdf |
Figure 3-c:
Distribution of $ {m_{{\mathrm {j}} {\mathrm {j}}}} $ in the $ {\mathrm{W} \mathrm{Z}} $ SR. The predicted yields are shown with their best fit normalizations from the simultaneous fit. Vertical bars on data points represent the statistical uncertainty in the data. The histograms for $ {\mathrm{t} \mathrm{V} \mathrm {x}} $ backgrounds include the contributions from ${\mathrm{t} {}\mathrm{\bar{t}}} \mathrm{V} $ and $ {\mathrm{t} \mathrm{Z} \mathrm{q}} $ processes. The histograms for other backgrounds include the contributions from double parton scattering and $\mathrm{V} \mathrm{V} \mathrm{V} $ processes. The overflow is included in the last bin. The bottom panel shows the ratio of the number of events observed in data to that of the total SM prediction. The gray bands represent the uncertainties in the predicted yields. |
png pdf |
Figure 3-d:
Distribution of BDT score in the $ {\mathrm{W} \mathrm{Z}} $ SR. The predicted yields are shown with their best fit normalizations from the simultaneous fit. Vertical bars on data points represent the statistical uncertainty in the data. The histograms for $ {\mathrm{t} \mathrm{V} \mathrm {x}} $ backgrounds include the contributions from ${\mathrm{t} {}\mathrm{\bar{t}}} \mathrm{V} $ and $ {\mathrm{t} \mathrm{Z} \mathrm{q}} $ processes. The histograms for other backgrounds include the contributions from double parton scattering and $\mathrm{V} \mathrm{V} \mathrm{V} $ processes. The overflow is included in the last bin. The bottom panel shows the ratio of the number of events observed in data to that of the total SM prediction. The gray bands represent the uncertainties in the predicted yields. |

png pdf |
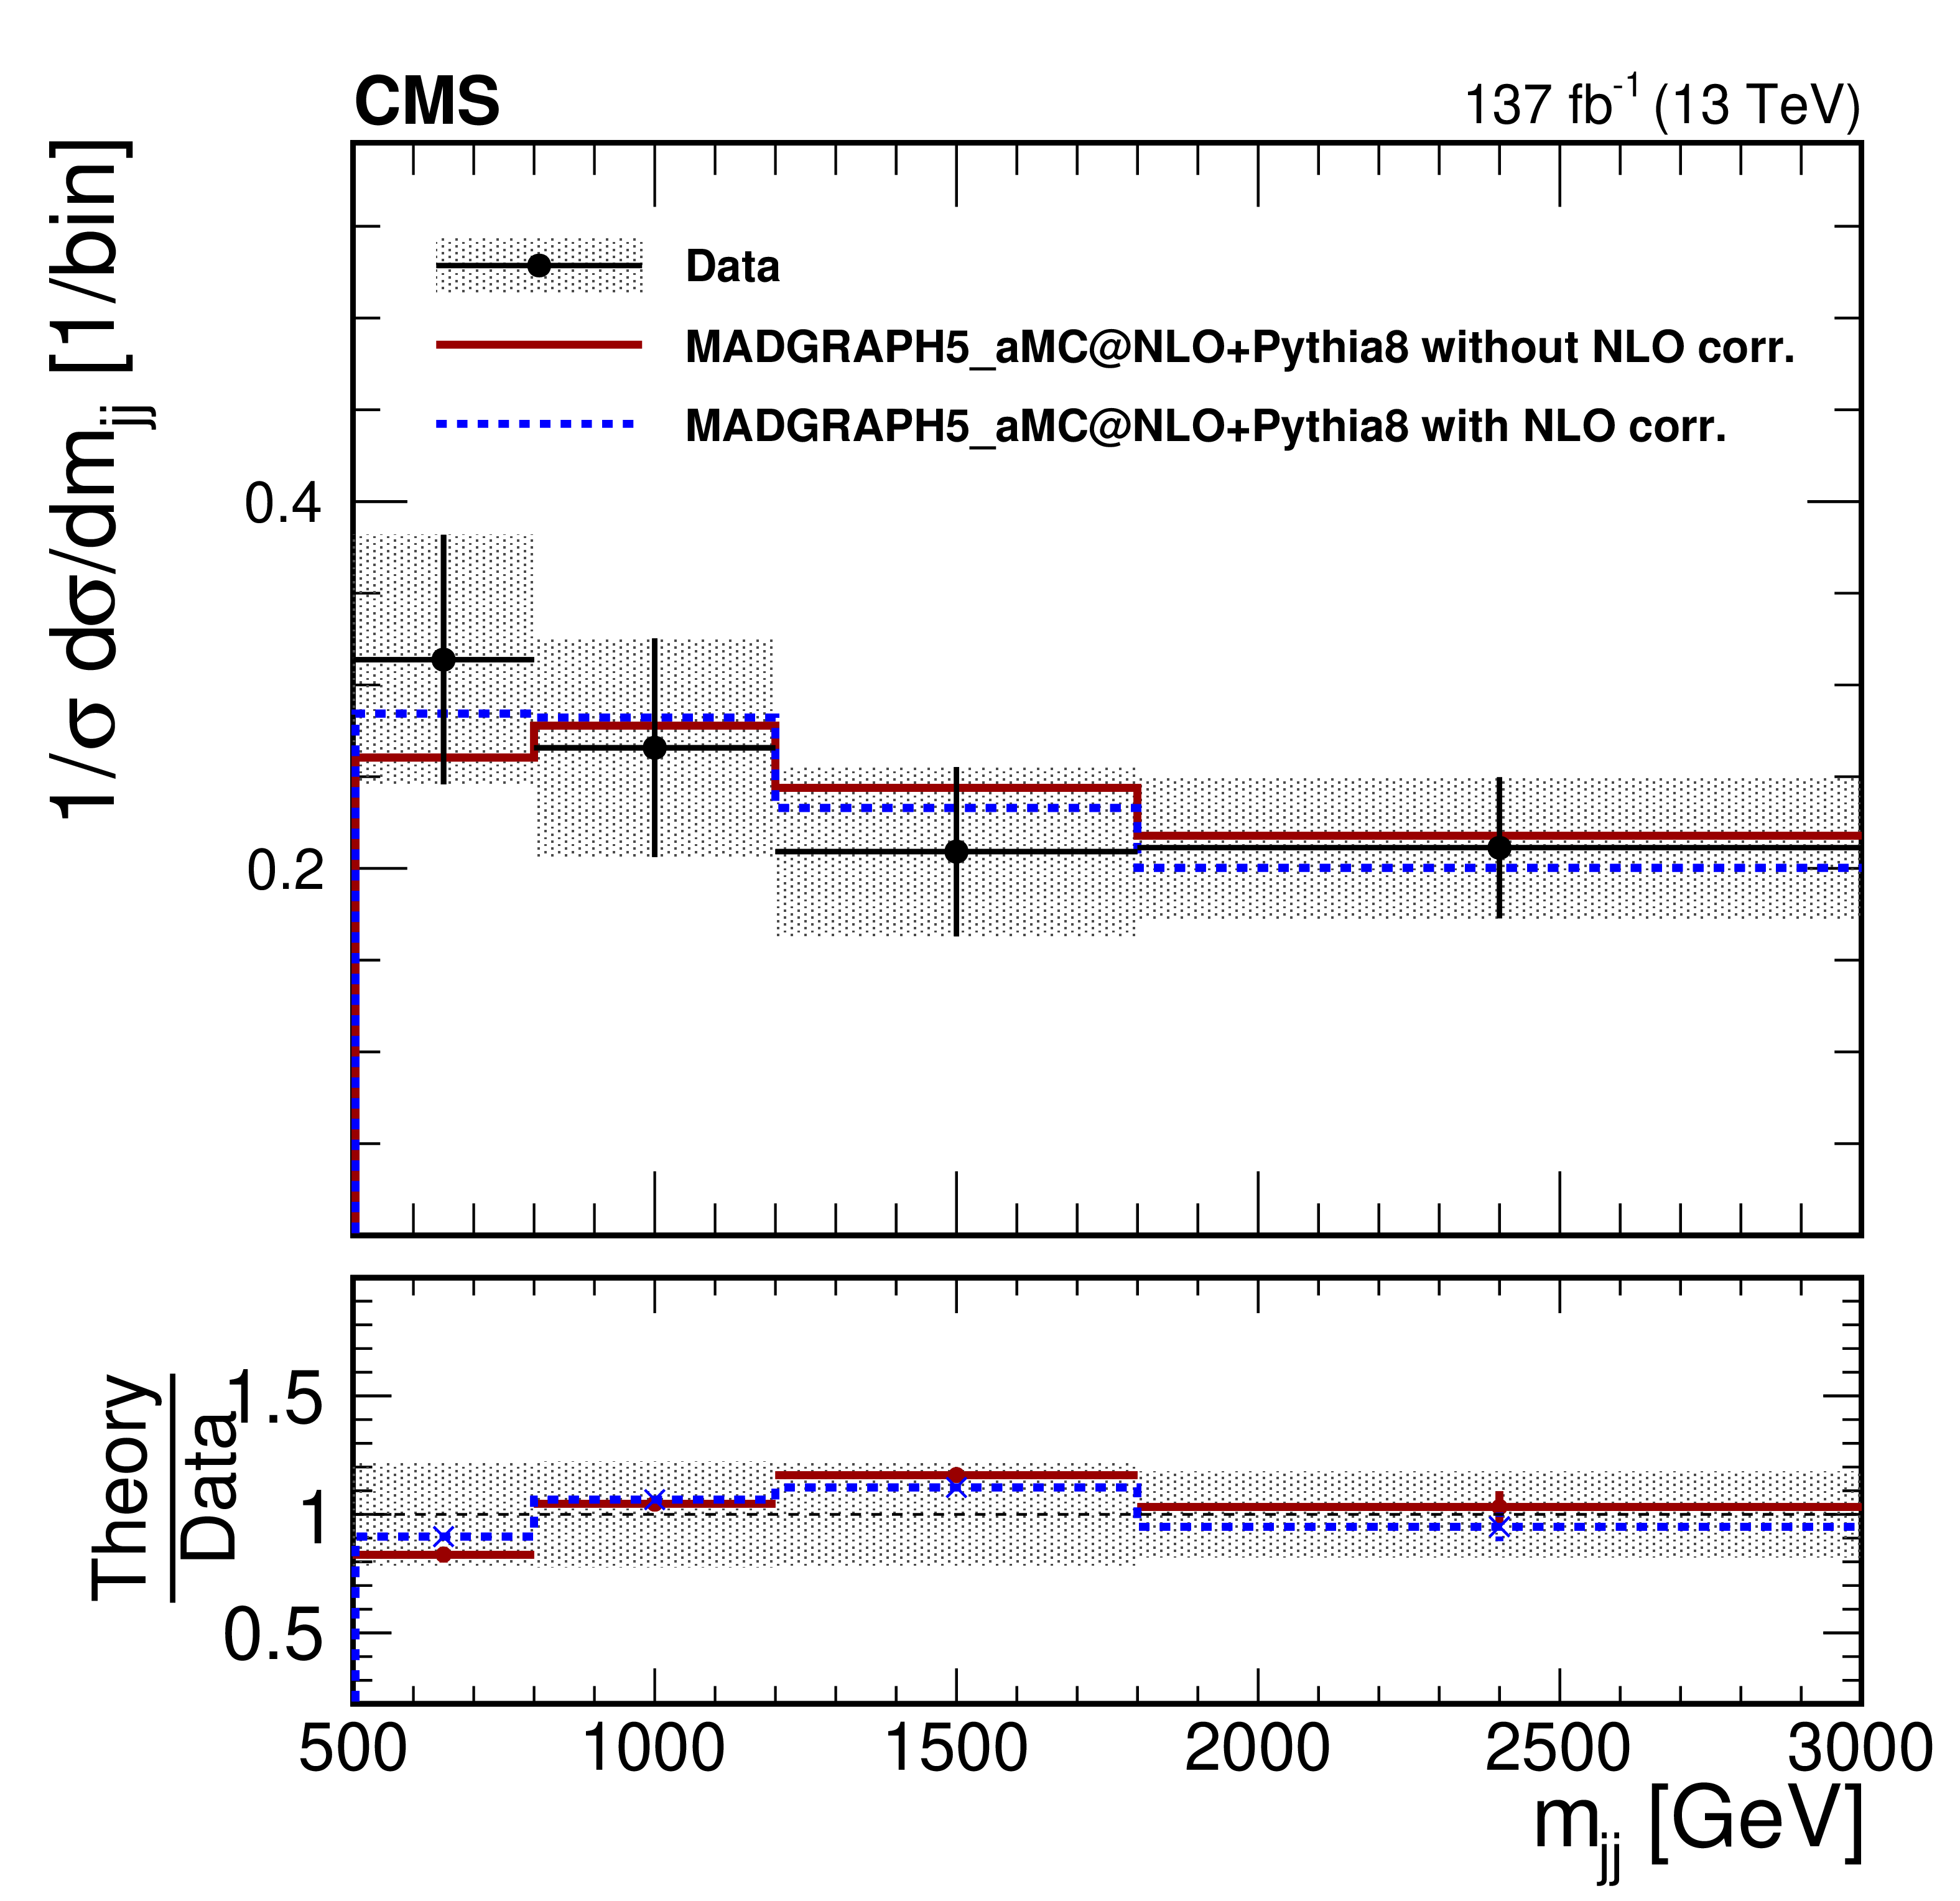
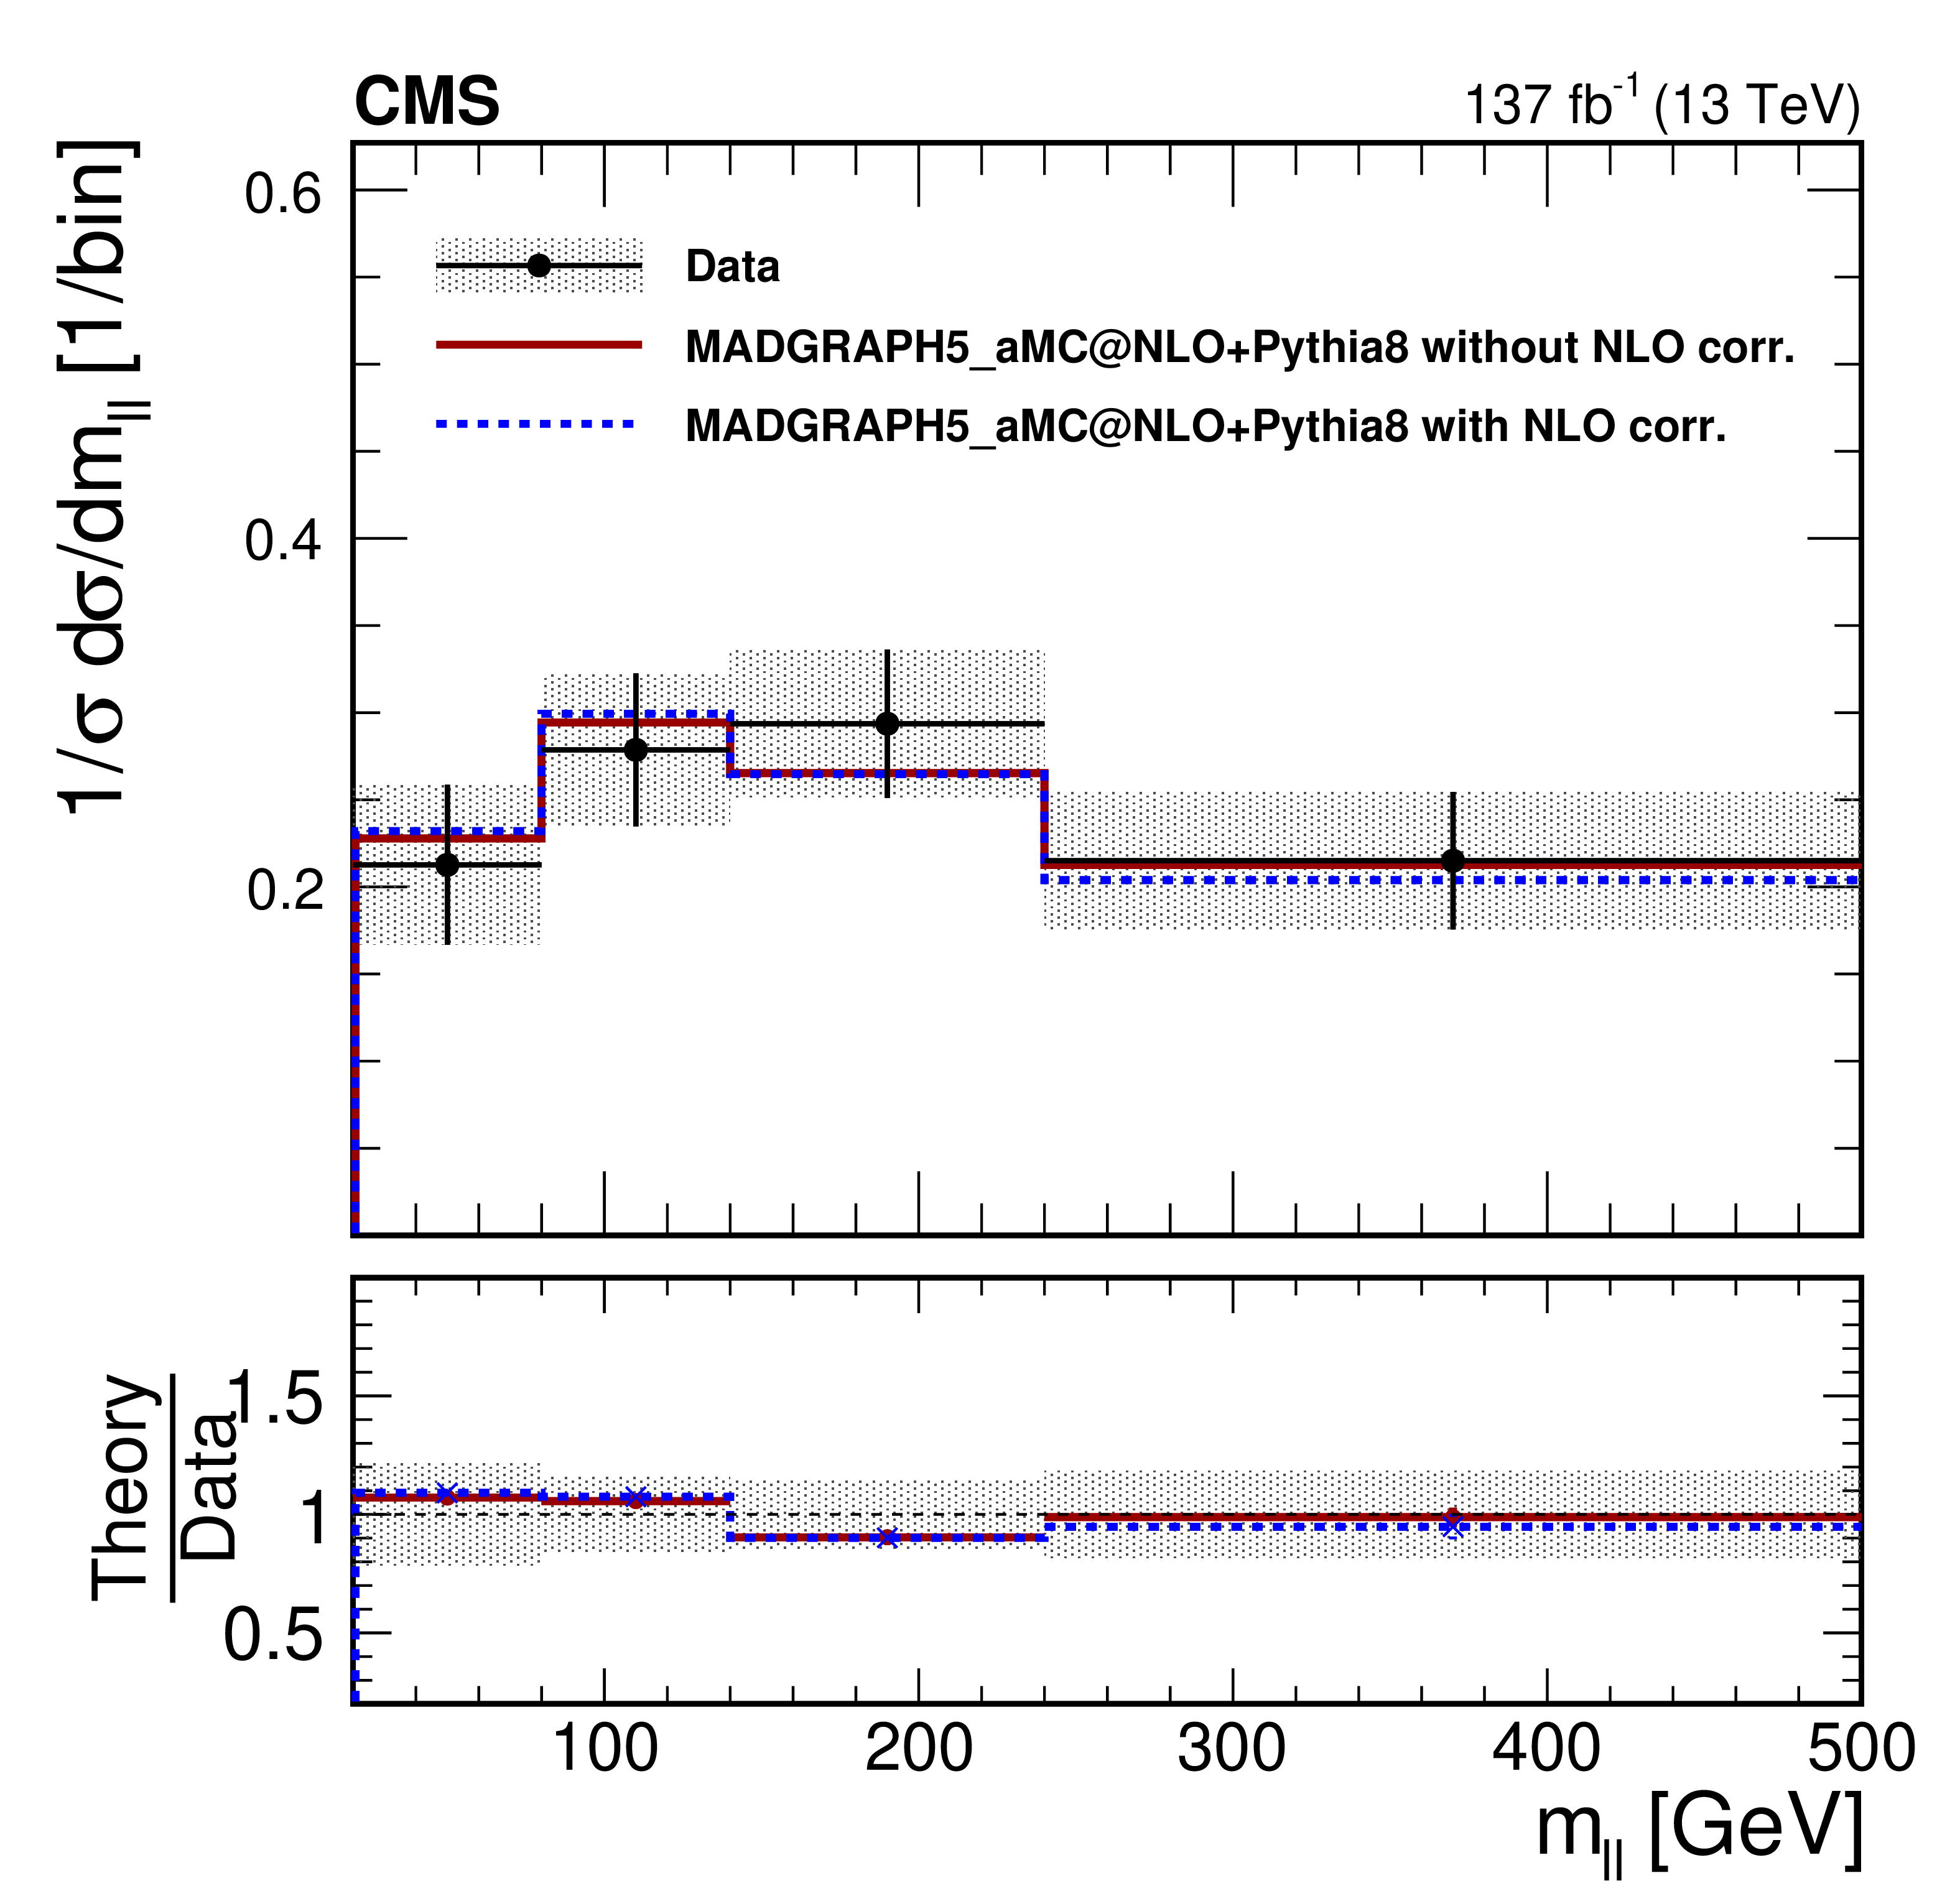
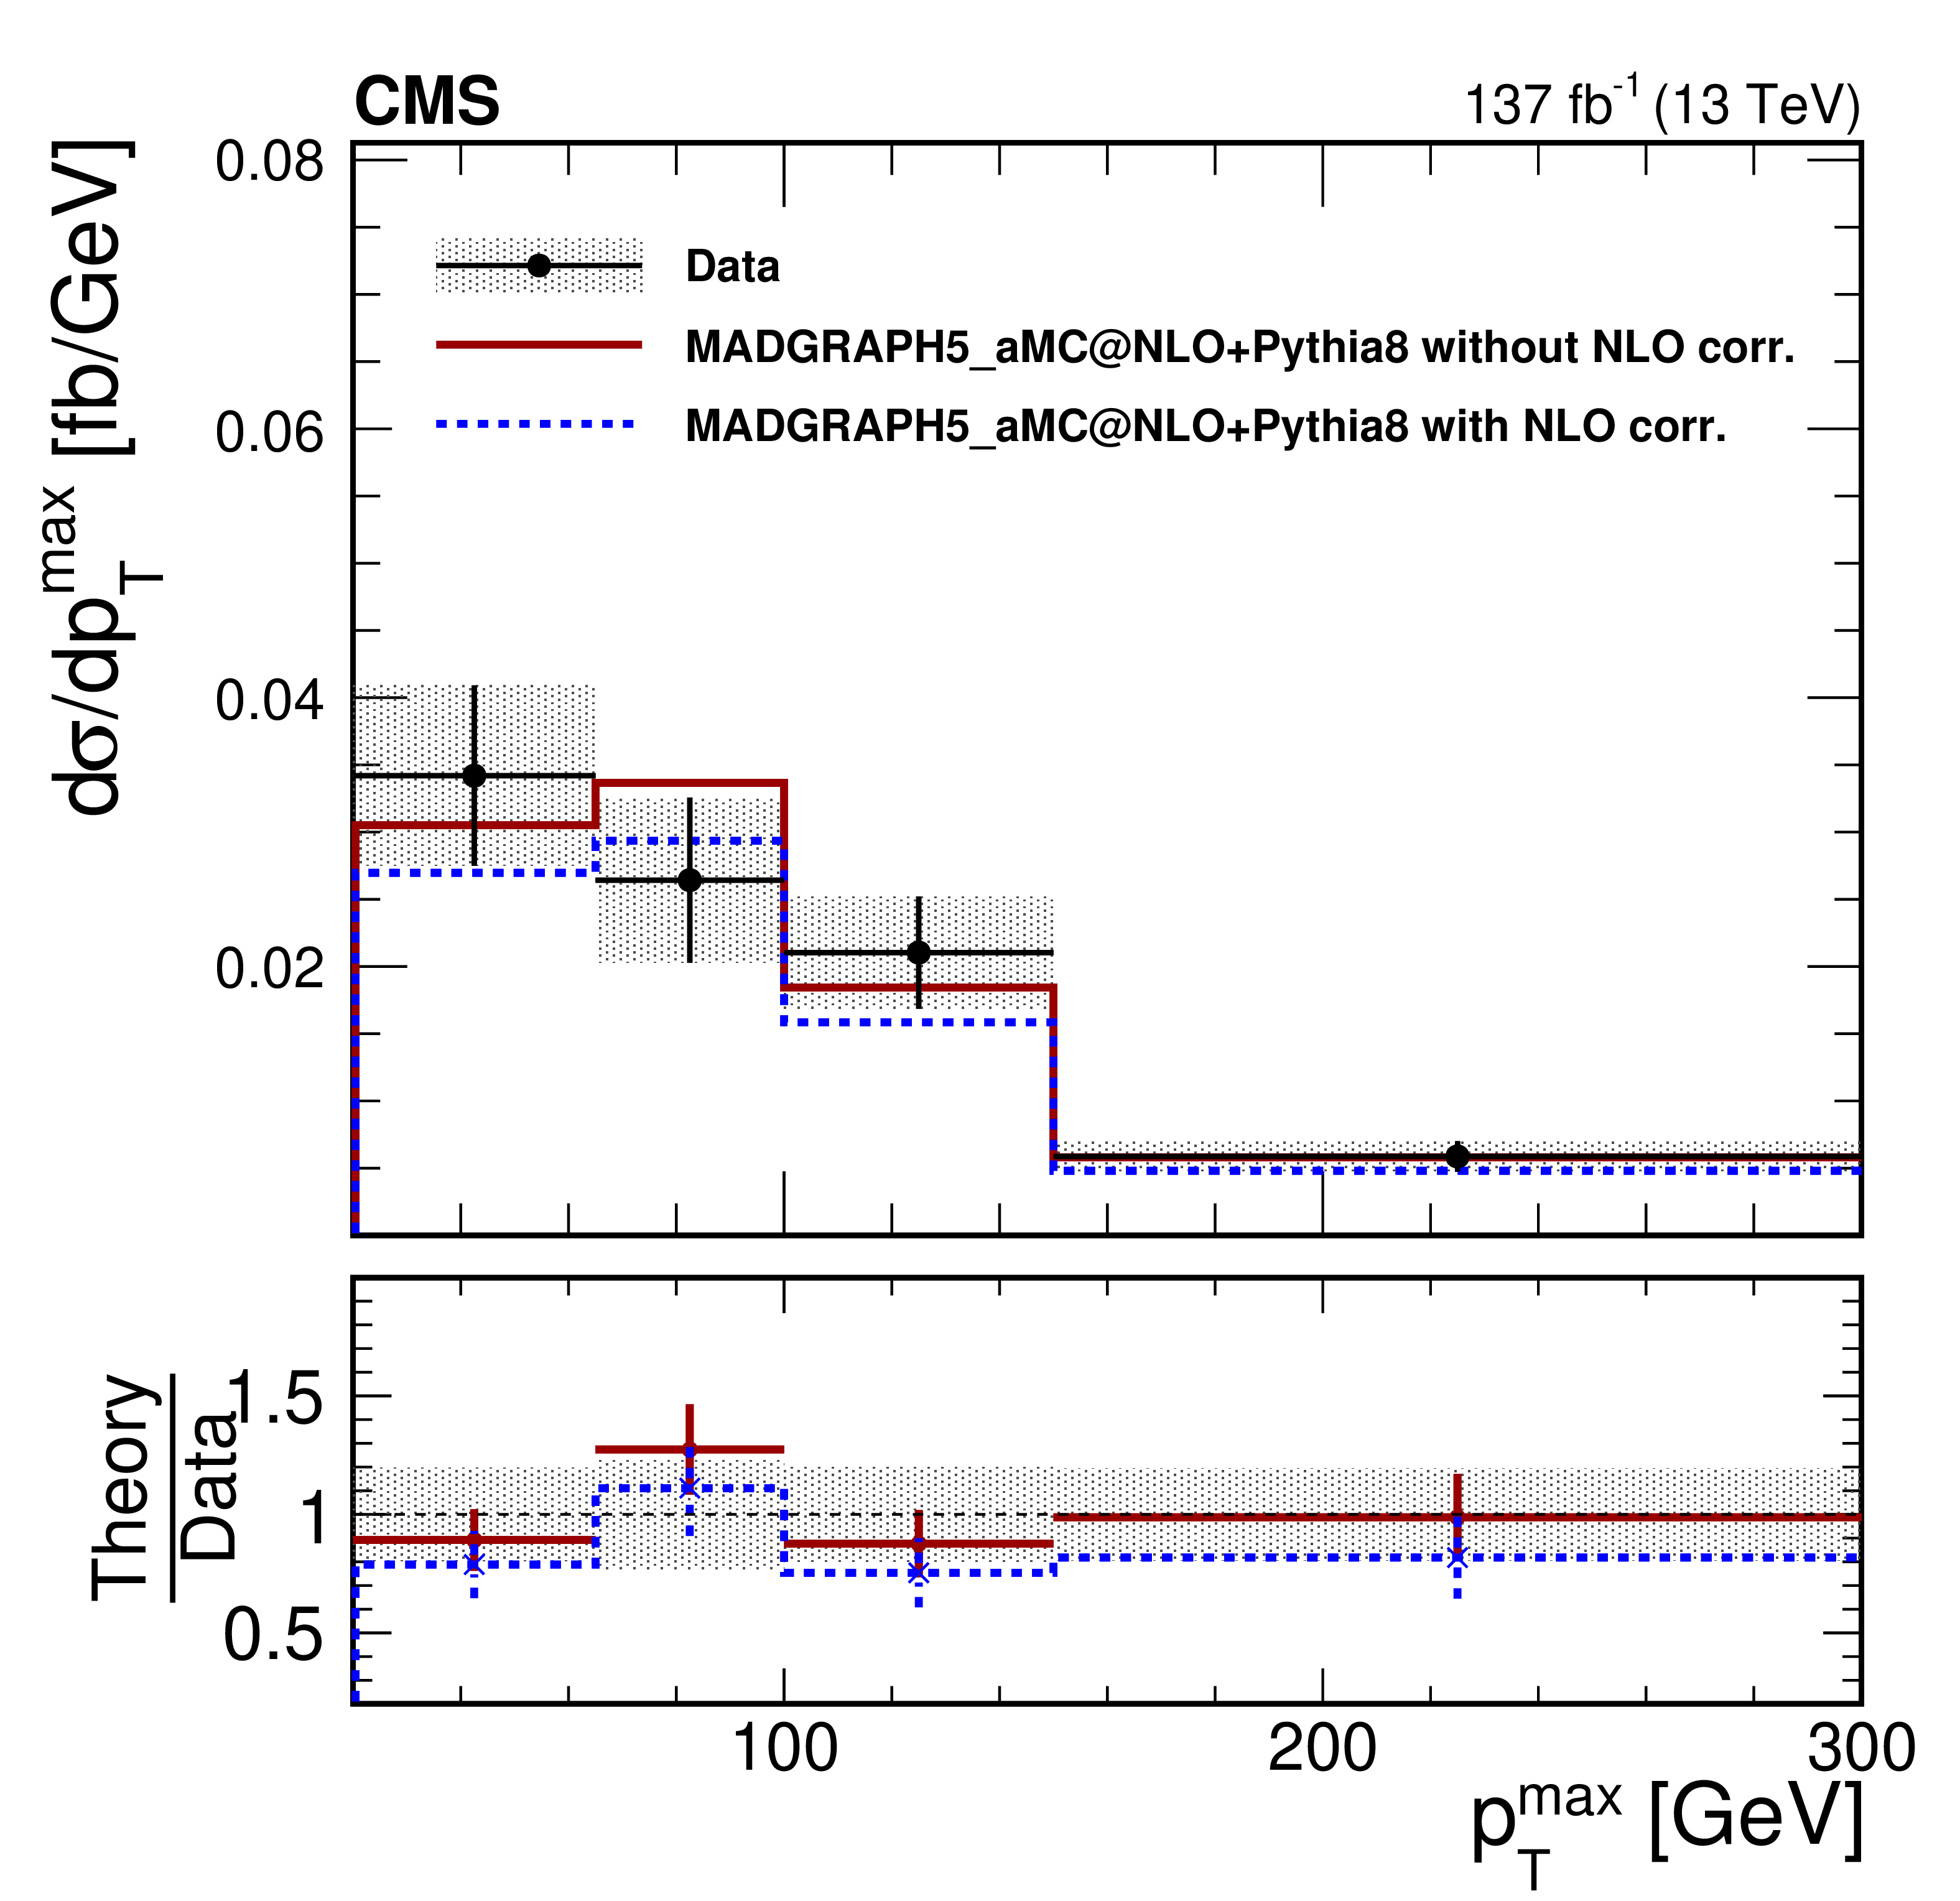
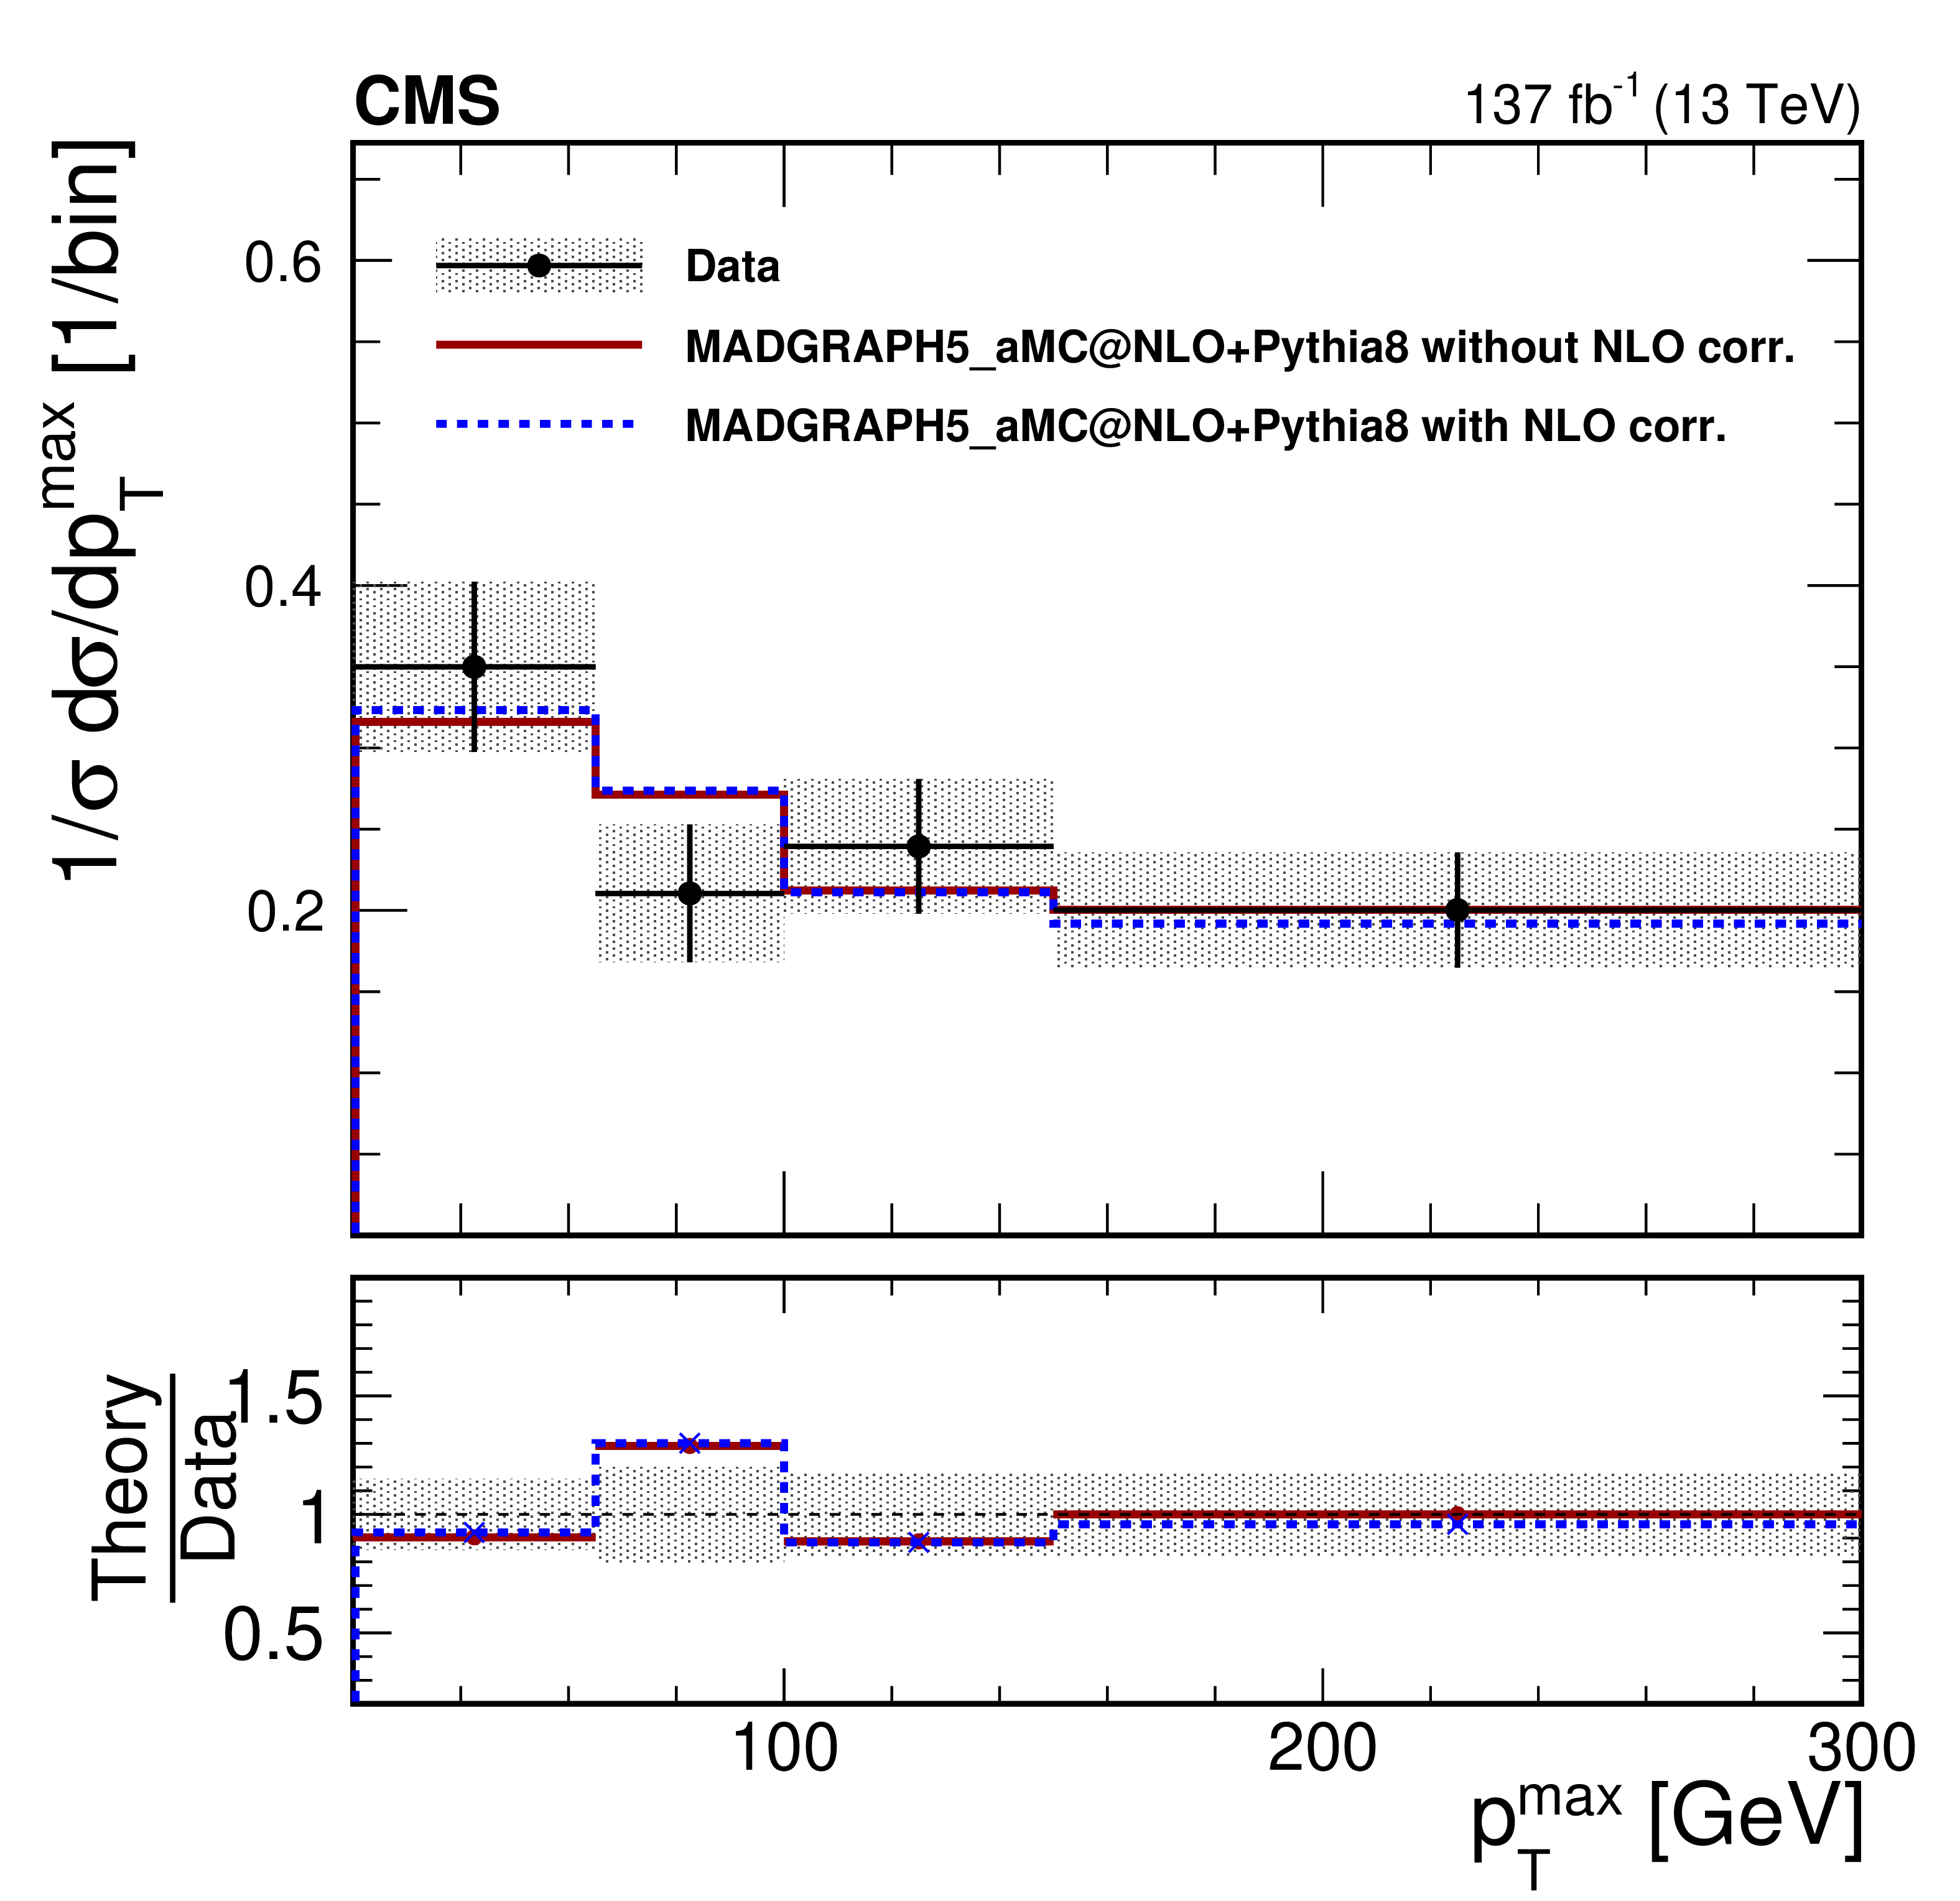
Figure 4:
The measured absolute (left) and normalized (right) $ {\mathrm{W} ^\pm \mathrm{W} ^\pm} $ cross section measurements in bins of $ {m_{{\mathrm {j}} {\mathrm {j}}}} $ (upper), $ {m_{\ell \ell}} $ (middle), and $ {{p_{\mathrm {T}}} ^{\text {max}}} $ (lower). The ratios of the predictions to the data are also shown. The measurements are compared with the predictions from MadGraph 5_aMC@NLO at LO. The shaded bands around the data points correspond to the measurement uncertainty. The error bars around the predictions correspond to the combined statistical, PDF, and scale uncertainties. Predictions with applying the $\mathcal {O}({\alpha _S} \alpha ^6)$ and $\mathcal {O}(\alpha ^7)$ corrections to the MadGraph 5_aMC@NLO LO cross sections, as described in the text, are also shown (dashed blue). |
png pdf |
Figure 4-a:
The measured absolute $ {\mathrm{W} ^\pm \mathrm{W} ^\pm} $ cross section measurements in bins of $ {m_{{\mathrm {j}} {\mathrm {j}}}} $. The ratios of the predictions to the data are also shown. The measurements are compared with the predictions from MadGraph 5_aMC@NLO at LO. The shaded bands around the data points correspond to the measurement uncertainty. The error bars around the predictions correspond to the combined statistical, PDF, and scale uncertainties. Predictions with applying the $\mathcal {O}({\alpha _S} \alpha ^6)$ and $\mathcal {O}(\alpha ^7)$ corrections to the MadGraph 5_aMC@NLO LO cross sections, as described in the text, are also shown (dashed blue). |
png pdf |
Figure 4-b:
The measured normalized $ {\mathrm{W} ^\pm \mathrm{W} ^\pm} $ cross section measurements in bins of $ {m_{{\mathrm {j}} {\mathrm {j}}}} $. The ratios of the predictions to the data are also shown. The measurements are compared with the predictions from MadGraph 5_aMC@NLO at LO. The shaded bands around the data points correspond to the measurement uncertainty. The error bars around the predictions correspond to the combined statistical, PDF, and scale uncertainties. Predictions with applying the $\mathcal {O}({\alpha _S} \alpha ^6)$ and $\mathcal {O}(\alpha ^7)$ corrections to the MadGraph 5_aMC@NLO LO cross sections, as described in the text, are also shown (dashed blue). |

png pdf |
Figure 4-c:
The measured absolute $ {\mathrm{W} ^\pm \mathrm{W} ^\pm} $ cross section measurements in bins of $ {m_{\ell \ell}} $. The ratios of the predictions to the data are also shown. The measurements are compared with the predictions from MadGraph 5_aMC@NLO at LO. The shaded bands around the data points correspond to the measurement uncertainty. The error bars around the predictions correspond to the combined statistical, PDF, and scale uncertainties. Predictions with applying the $\mathcal {O}({\alpha _S} \alpha ^6)$ and $\mathcal {O}(\alpha ^7)$ corrections to the MadGraph 5_aMC@NLO LO cross sections, as described in the text, are also shown (dashed blue). |
png pdf |
Figure 4-d:
The measured normalized $ {\mathrm{W} ^\pm \mathrm{W} ^\pm} $ cross section measurements in bins of $ {m_{\ell \ell}} $. The ratios of the predictions to the data are also shown. The measurements are compared with the predictions from MadGraph 5_aMC@NLO at LO. The shaded bands around the data points correspond to the measurement uncertainty. The error bars around the predictions correspond to the combined statistical, PDF, and scale uncertainties. Predictions with applying the $\mathcal {O}({\alpha _S} \alpha ^6)$ and $\mathcal {O}(\alpha ^7)$ corrections to the MadGraph 5_aMC@NLO LO cross sections, as described in the text, are also shown (dashed blue). |
png pdf |
Figure 4-e:
The measured absolute $ {\mathrm{W} ^\pm \mathrm{W} ^\pm} $ cross section measurements in bins of $ {{p_{\mathrm {T}}} ^{\text {max}}} $. The ratios of the predictions to the data are also shown. The measurements are compared with the predictions from MadGraph 5_aMC@NLO at LO. The shaded bands around the data points correspond to the measurement uncertainty. The error bars around the predictions correspond to the combined statistical, PDF, and scale uncertainties. Predictions with applying the $\mathcal {O}({\alpha _S} \alpha ^6)$ and $\mathcal {O}(\alpha ^7)$ corrections to the MadGraph 5_aMC@NLO LO cross sections, as described in the text, are also shown (dashed blue). |
png pdf |
Figure 4-f:
The measured normalized $ {\mathrm{W} ^\pm \mathrm{W} ^\pm} $ cross section measurements in bins of $ {{p_{\mathrm {T}}} ^{\text {max}}} $. The ratios of the predictions to the data are also shown. The measurements are compared with the predictions from MadGraph 5_aMC@NLO at LO. The shaded bands around the data points correspond to the measurement uncertainty. The error bars around the predictions correspond to the combined statistical, PDF, and scale uncertainties. Predictions with applying the $\mathcal {O}({\alpha _S} \alpha ^6)$ and $\mathcal {O}(\alpha ^7)$ corrections to the MadGraph 5_aMC@NLO LO cross sections, as described in the text, are also shown (dashed blue). |
png pdf |
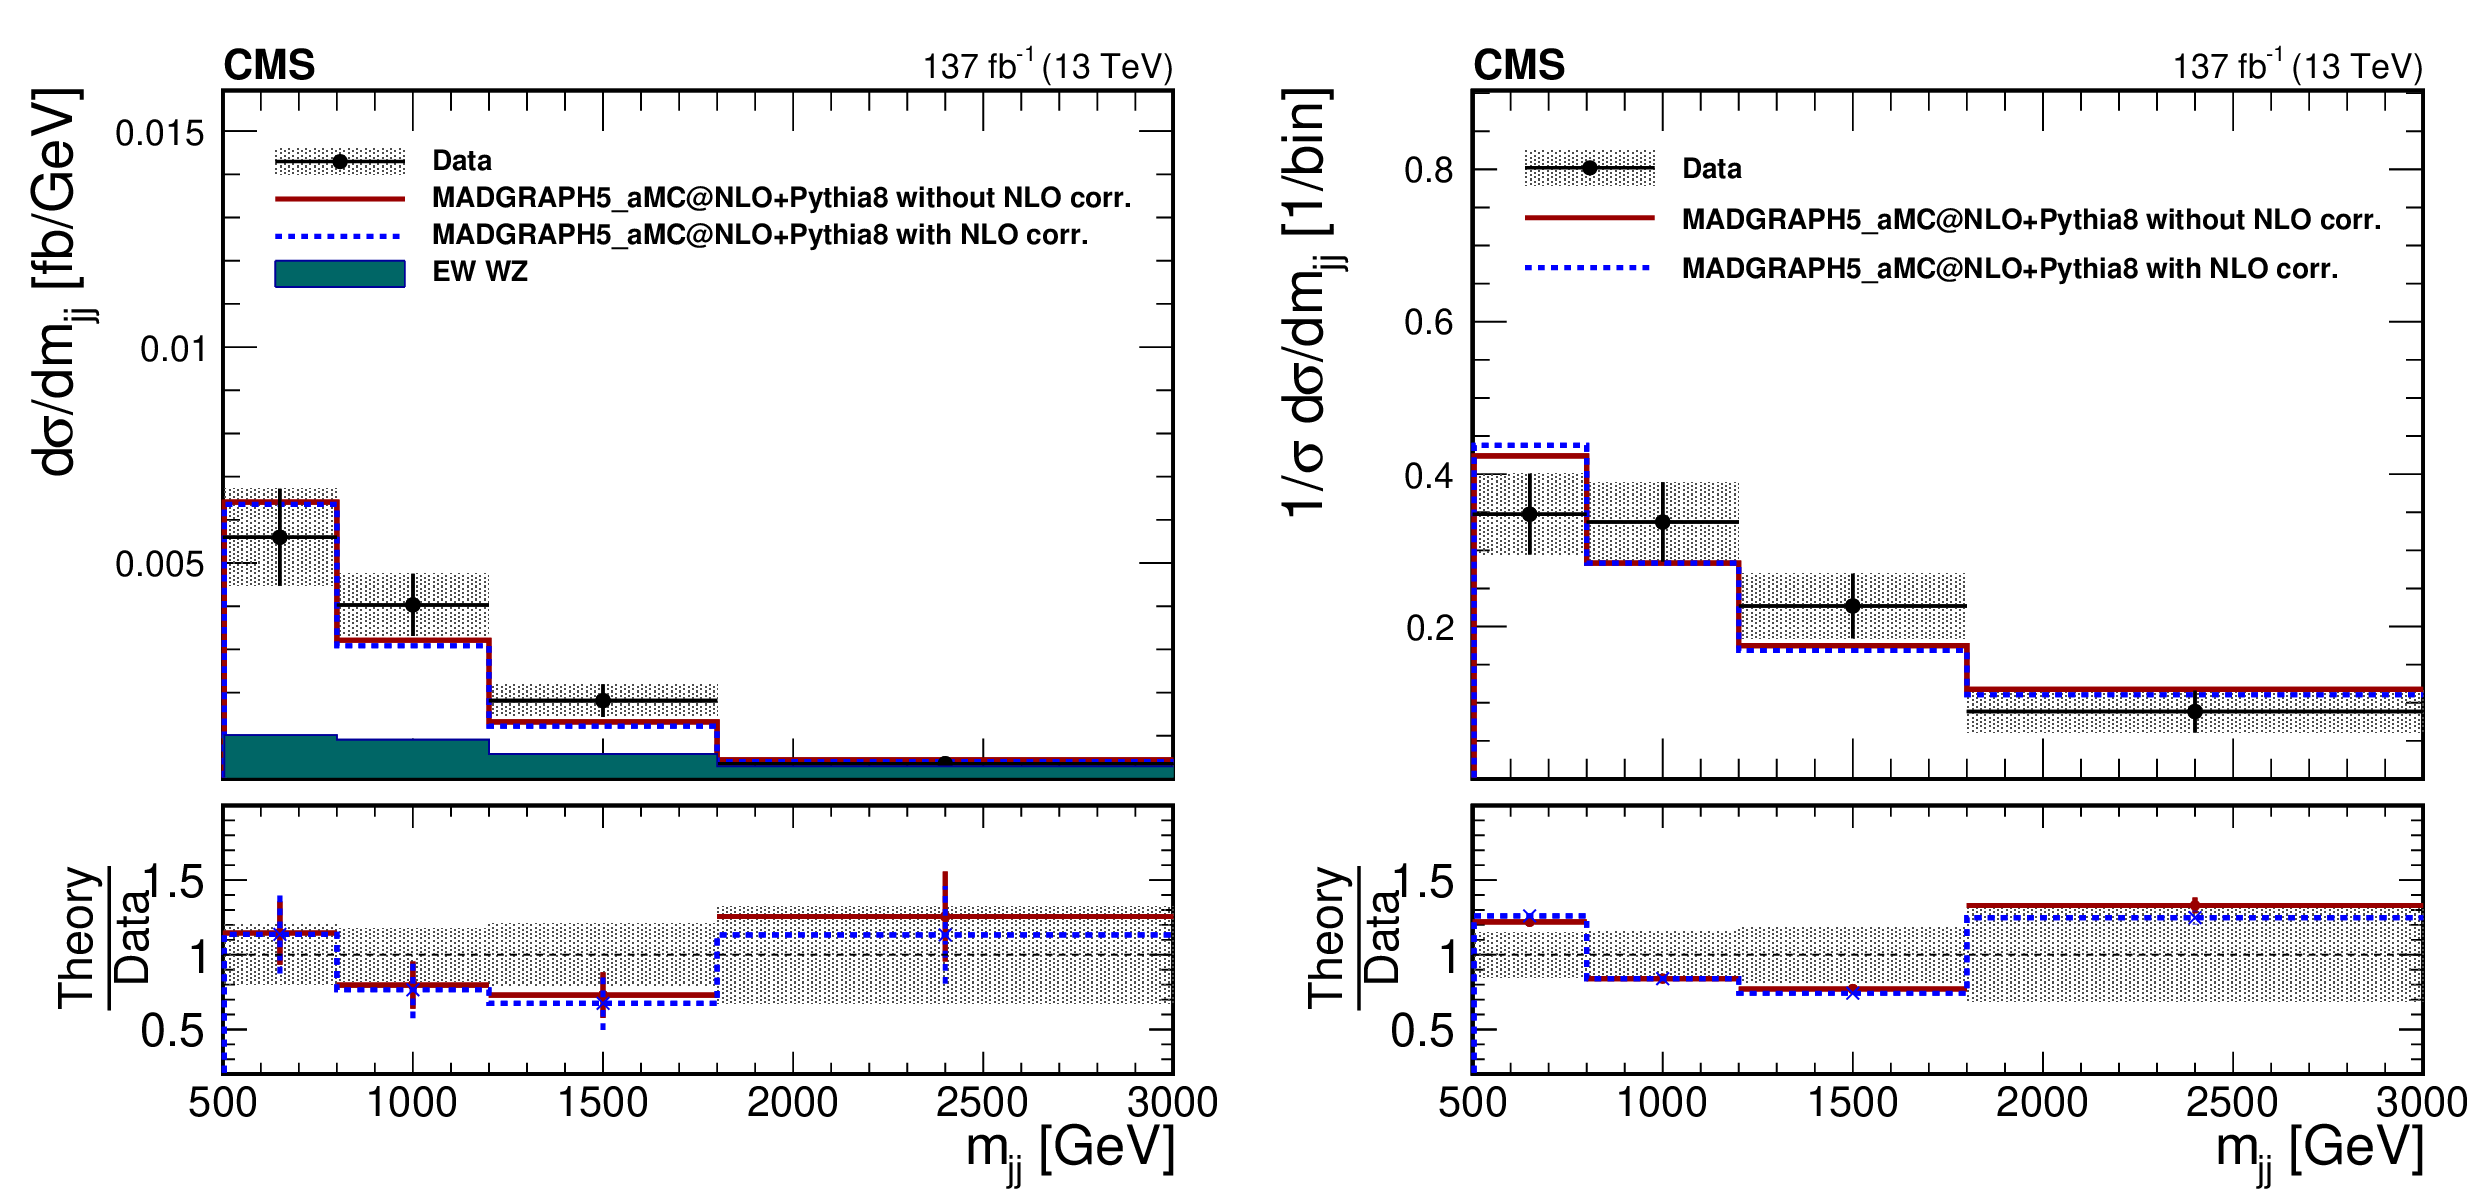
Figure 5:
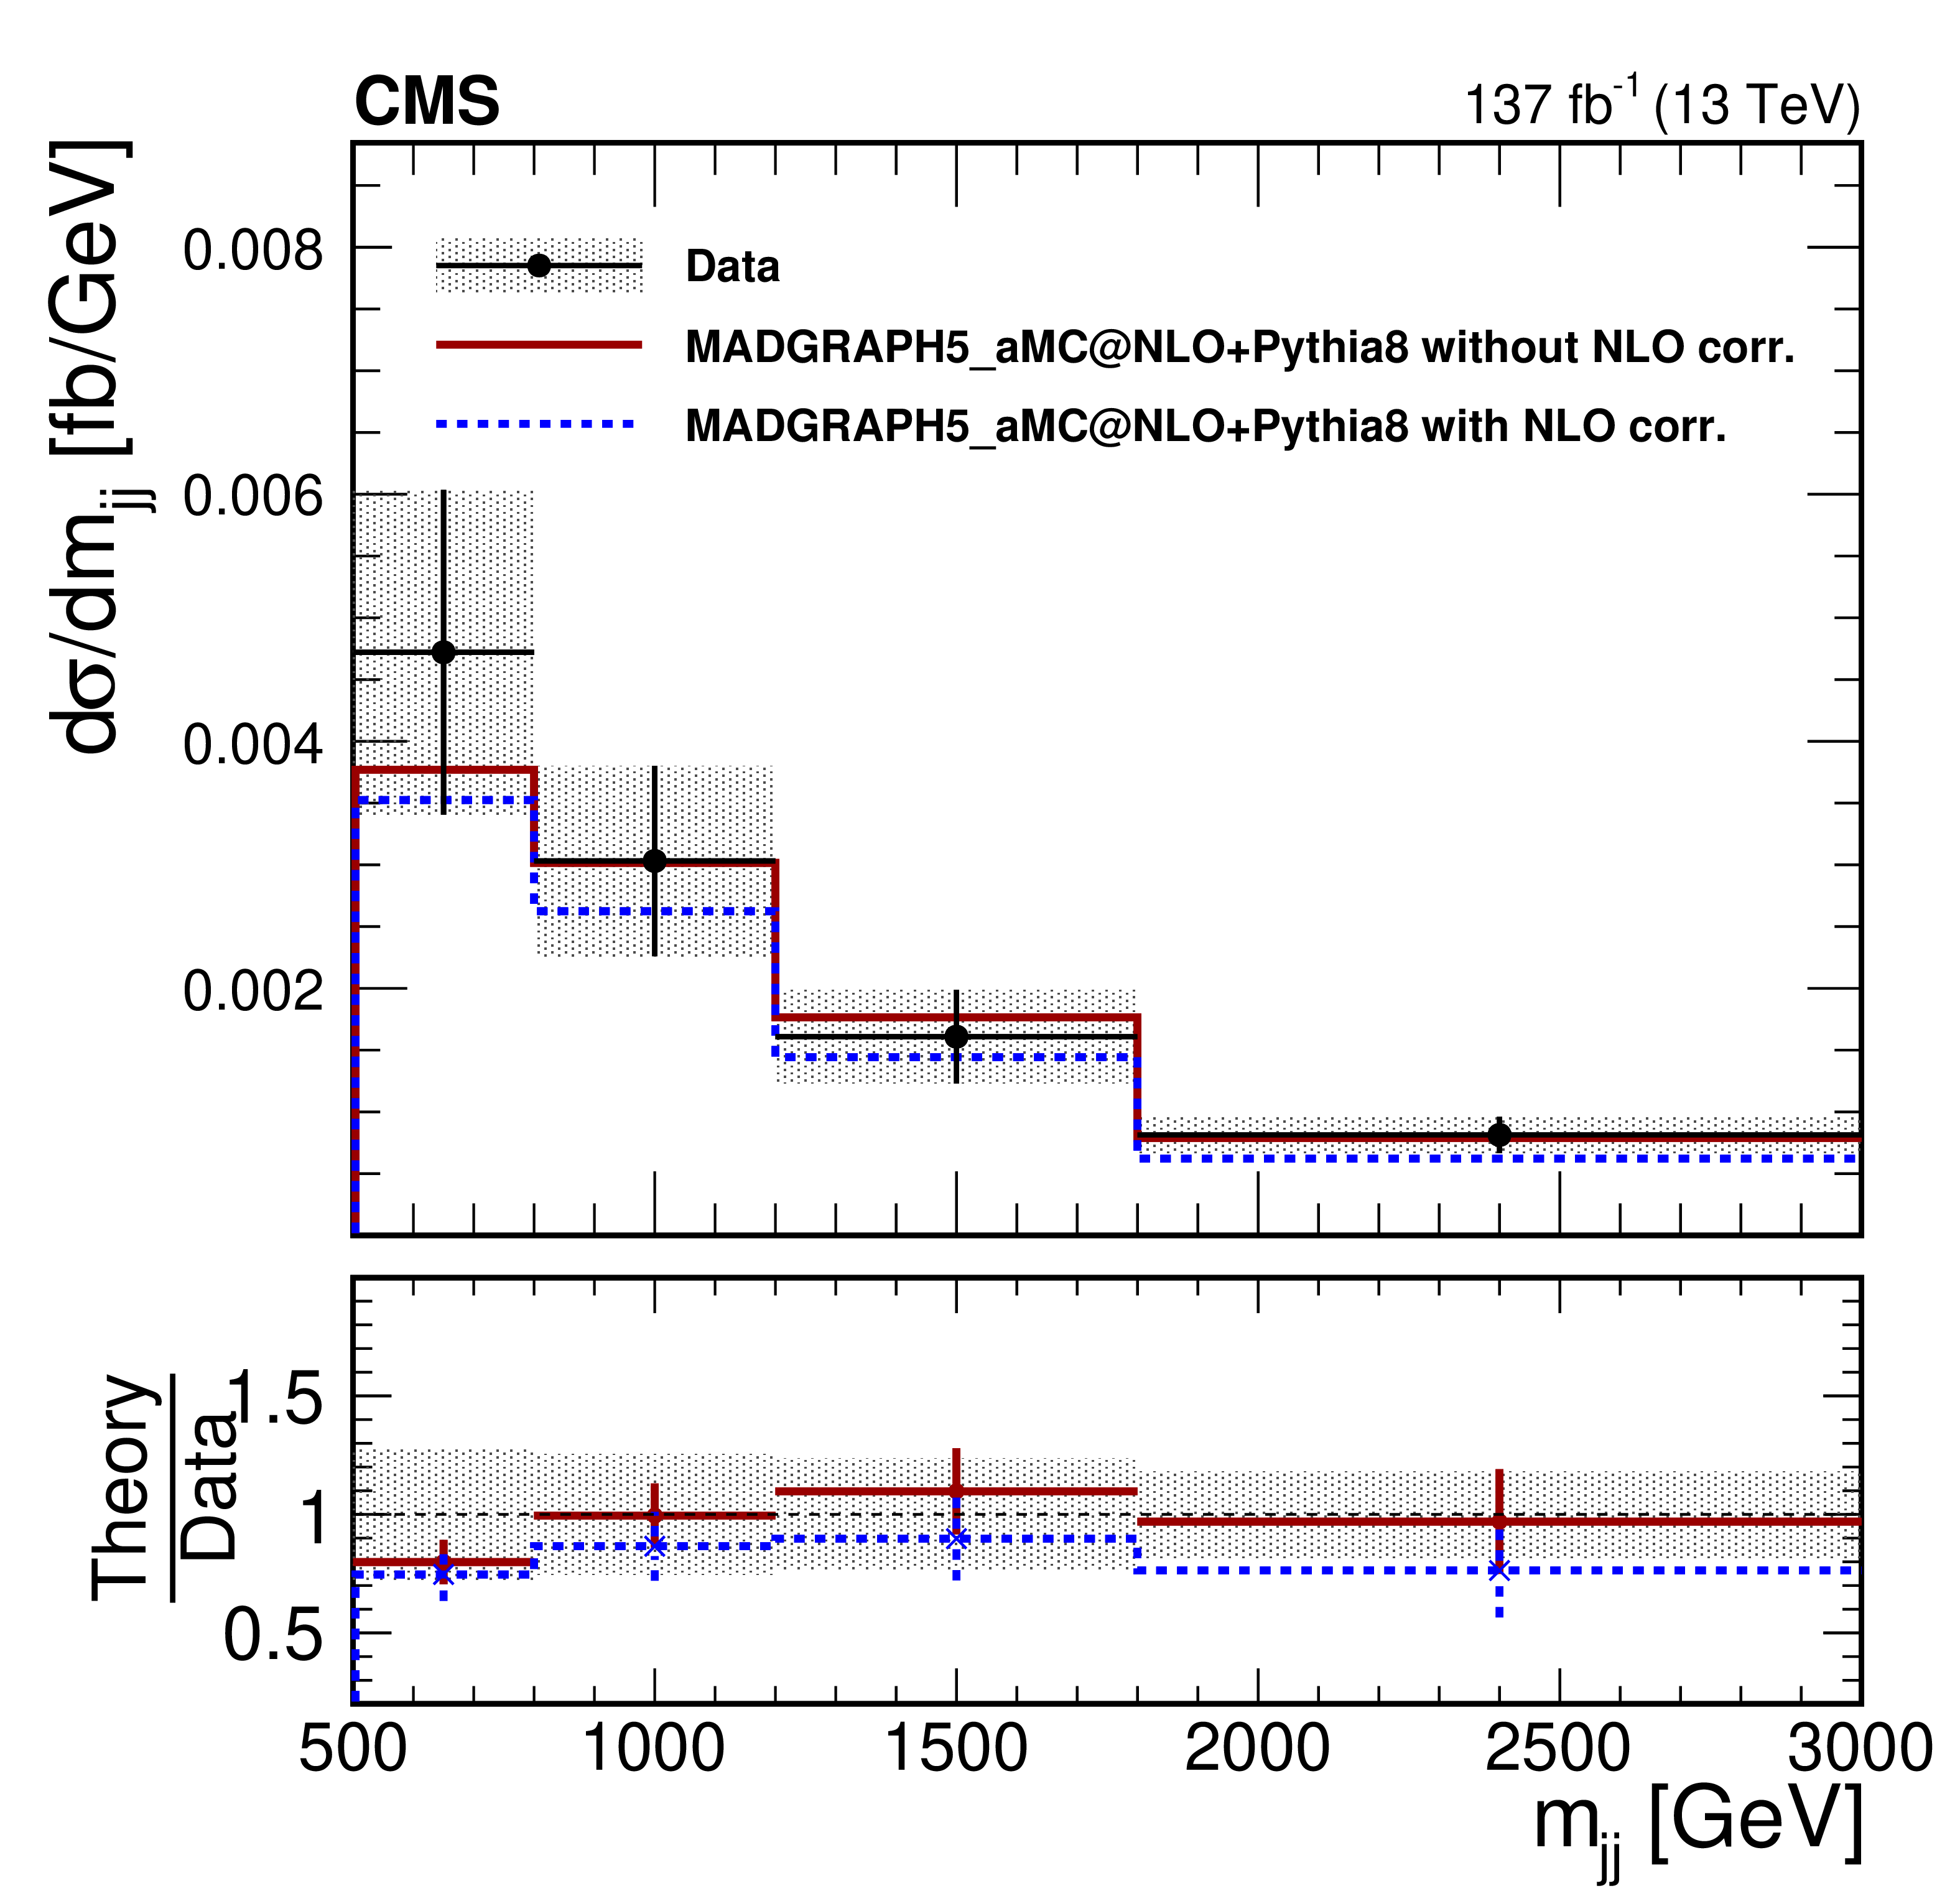
The measured absolute (left) and normalized (right) $ {\mathrm{W} \mathrm{Z}} $ cross section measurements in bins of $ {m_{{\mathrm {j}} {\mathrm {j}}}} $. The ratios of the predictions to the data are also shown. The measurements are compared with the predictions from MadGraph 5_aMC@NLO at LO. The shaded bands around the data points correspond to the measurement uncertainty. The error bars around the predictions correspond to the combined statistical, PDF, and scale uncertainties. Predictions with applying the $\mathcal {O}({\alpha _S} \alpha ^6)$ and $\mathcal {O}(\alpha ^7)$ corrections to the MadGraph 5_aMC@NLO LO cross sections, as described in the text, are shown (dashed blue). The MadGraph 5_aMC@NLO predictions in the EW total cross sections are also shown ((dark cyan). |
png pdf |
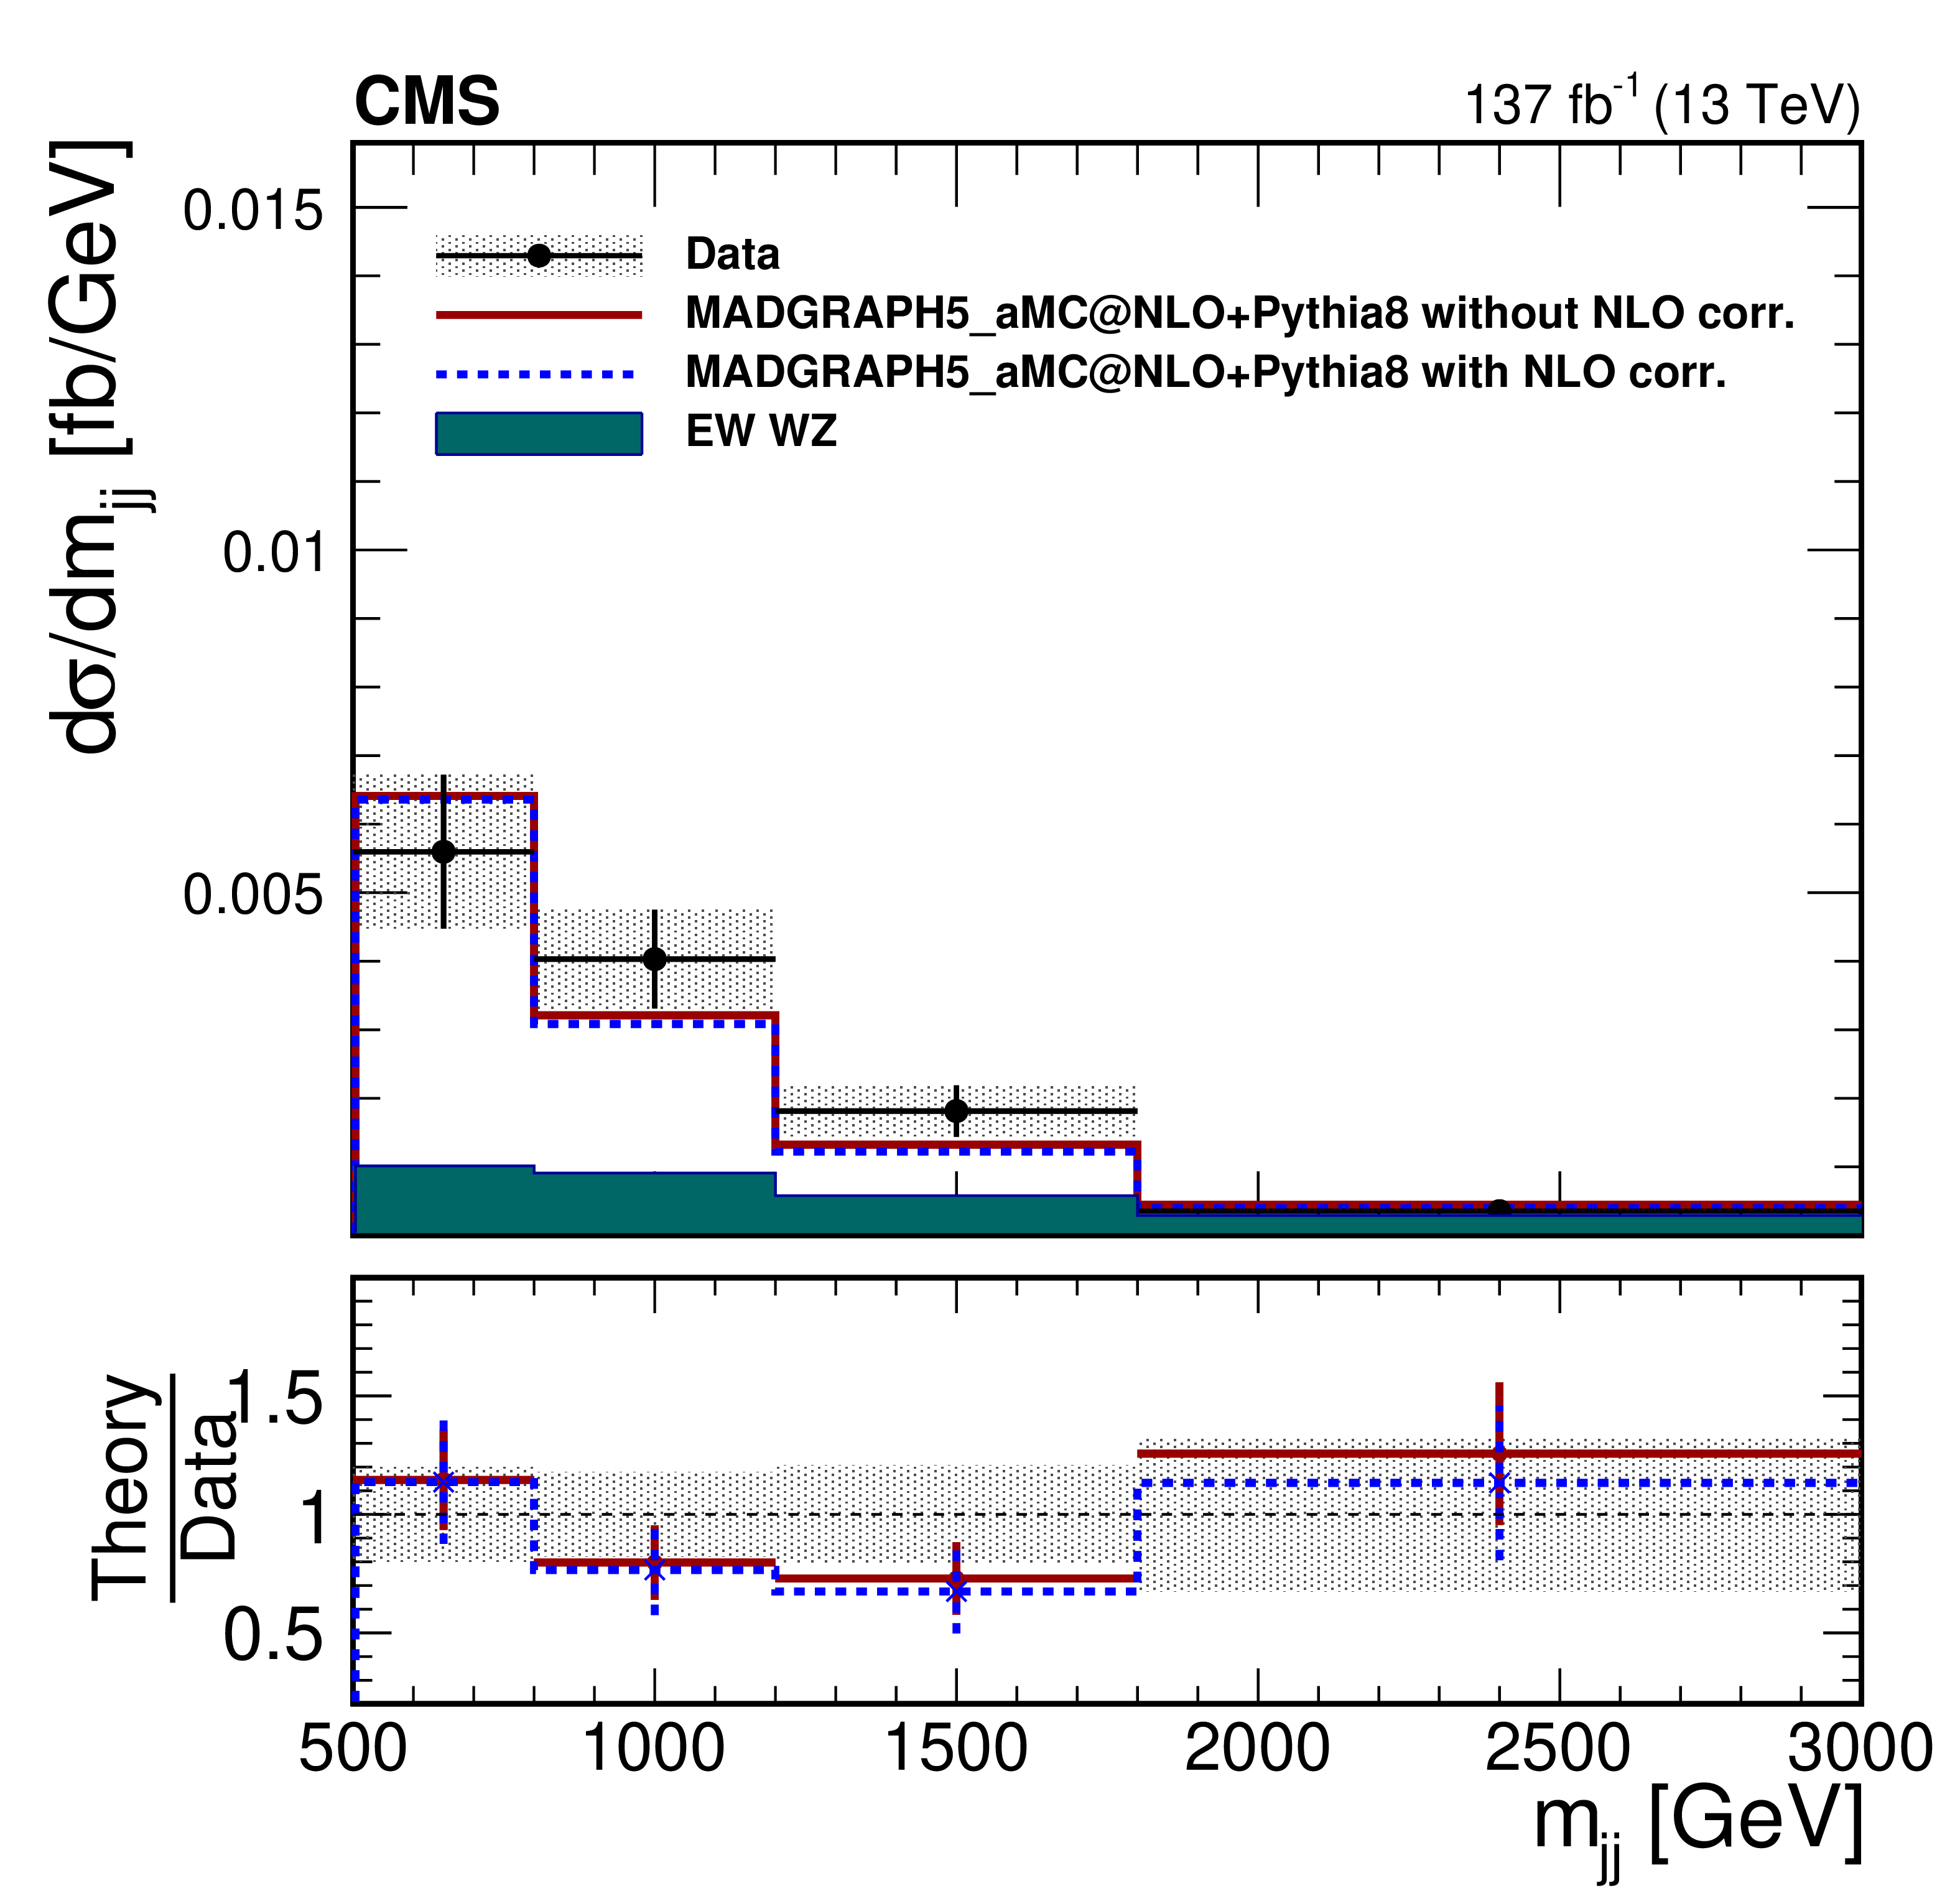
Figure 5-a:
The measured absolute $ {\mathrm{W} \mathrm{Z}} $ cross section measurements in bins of $ {m_{{\mathrm {j}} {\mathrm {j}}}} $. The ratios of the predictions to the data are also shown. The measurements are compared with the predictions from MadGraph 5_aMC@NLO at LO. The shaded bands around the data points correspond to the measurement uncertainty. The error bars around the predictions correspond to the combined statistical, PDF, and scale uncertainties. Predictions with applying the $\mathcal {O}({\alpha _S} \alpha ^6)$ and $\mathcal {O}(\alpha ^7)$ corrections to the MadGraph 5_aMC@NLO LO cross sections, as described in the text, are shown (dashed blue). The MadGraph 5_aMC@NLO predictions in the EW total cross sections are also shown ((dark cyan). |
png pdf |
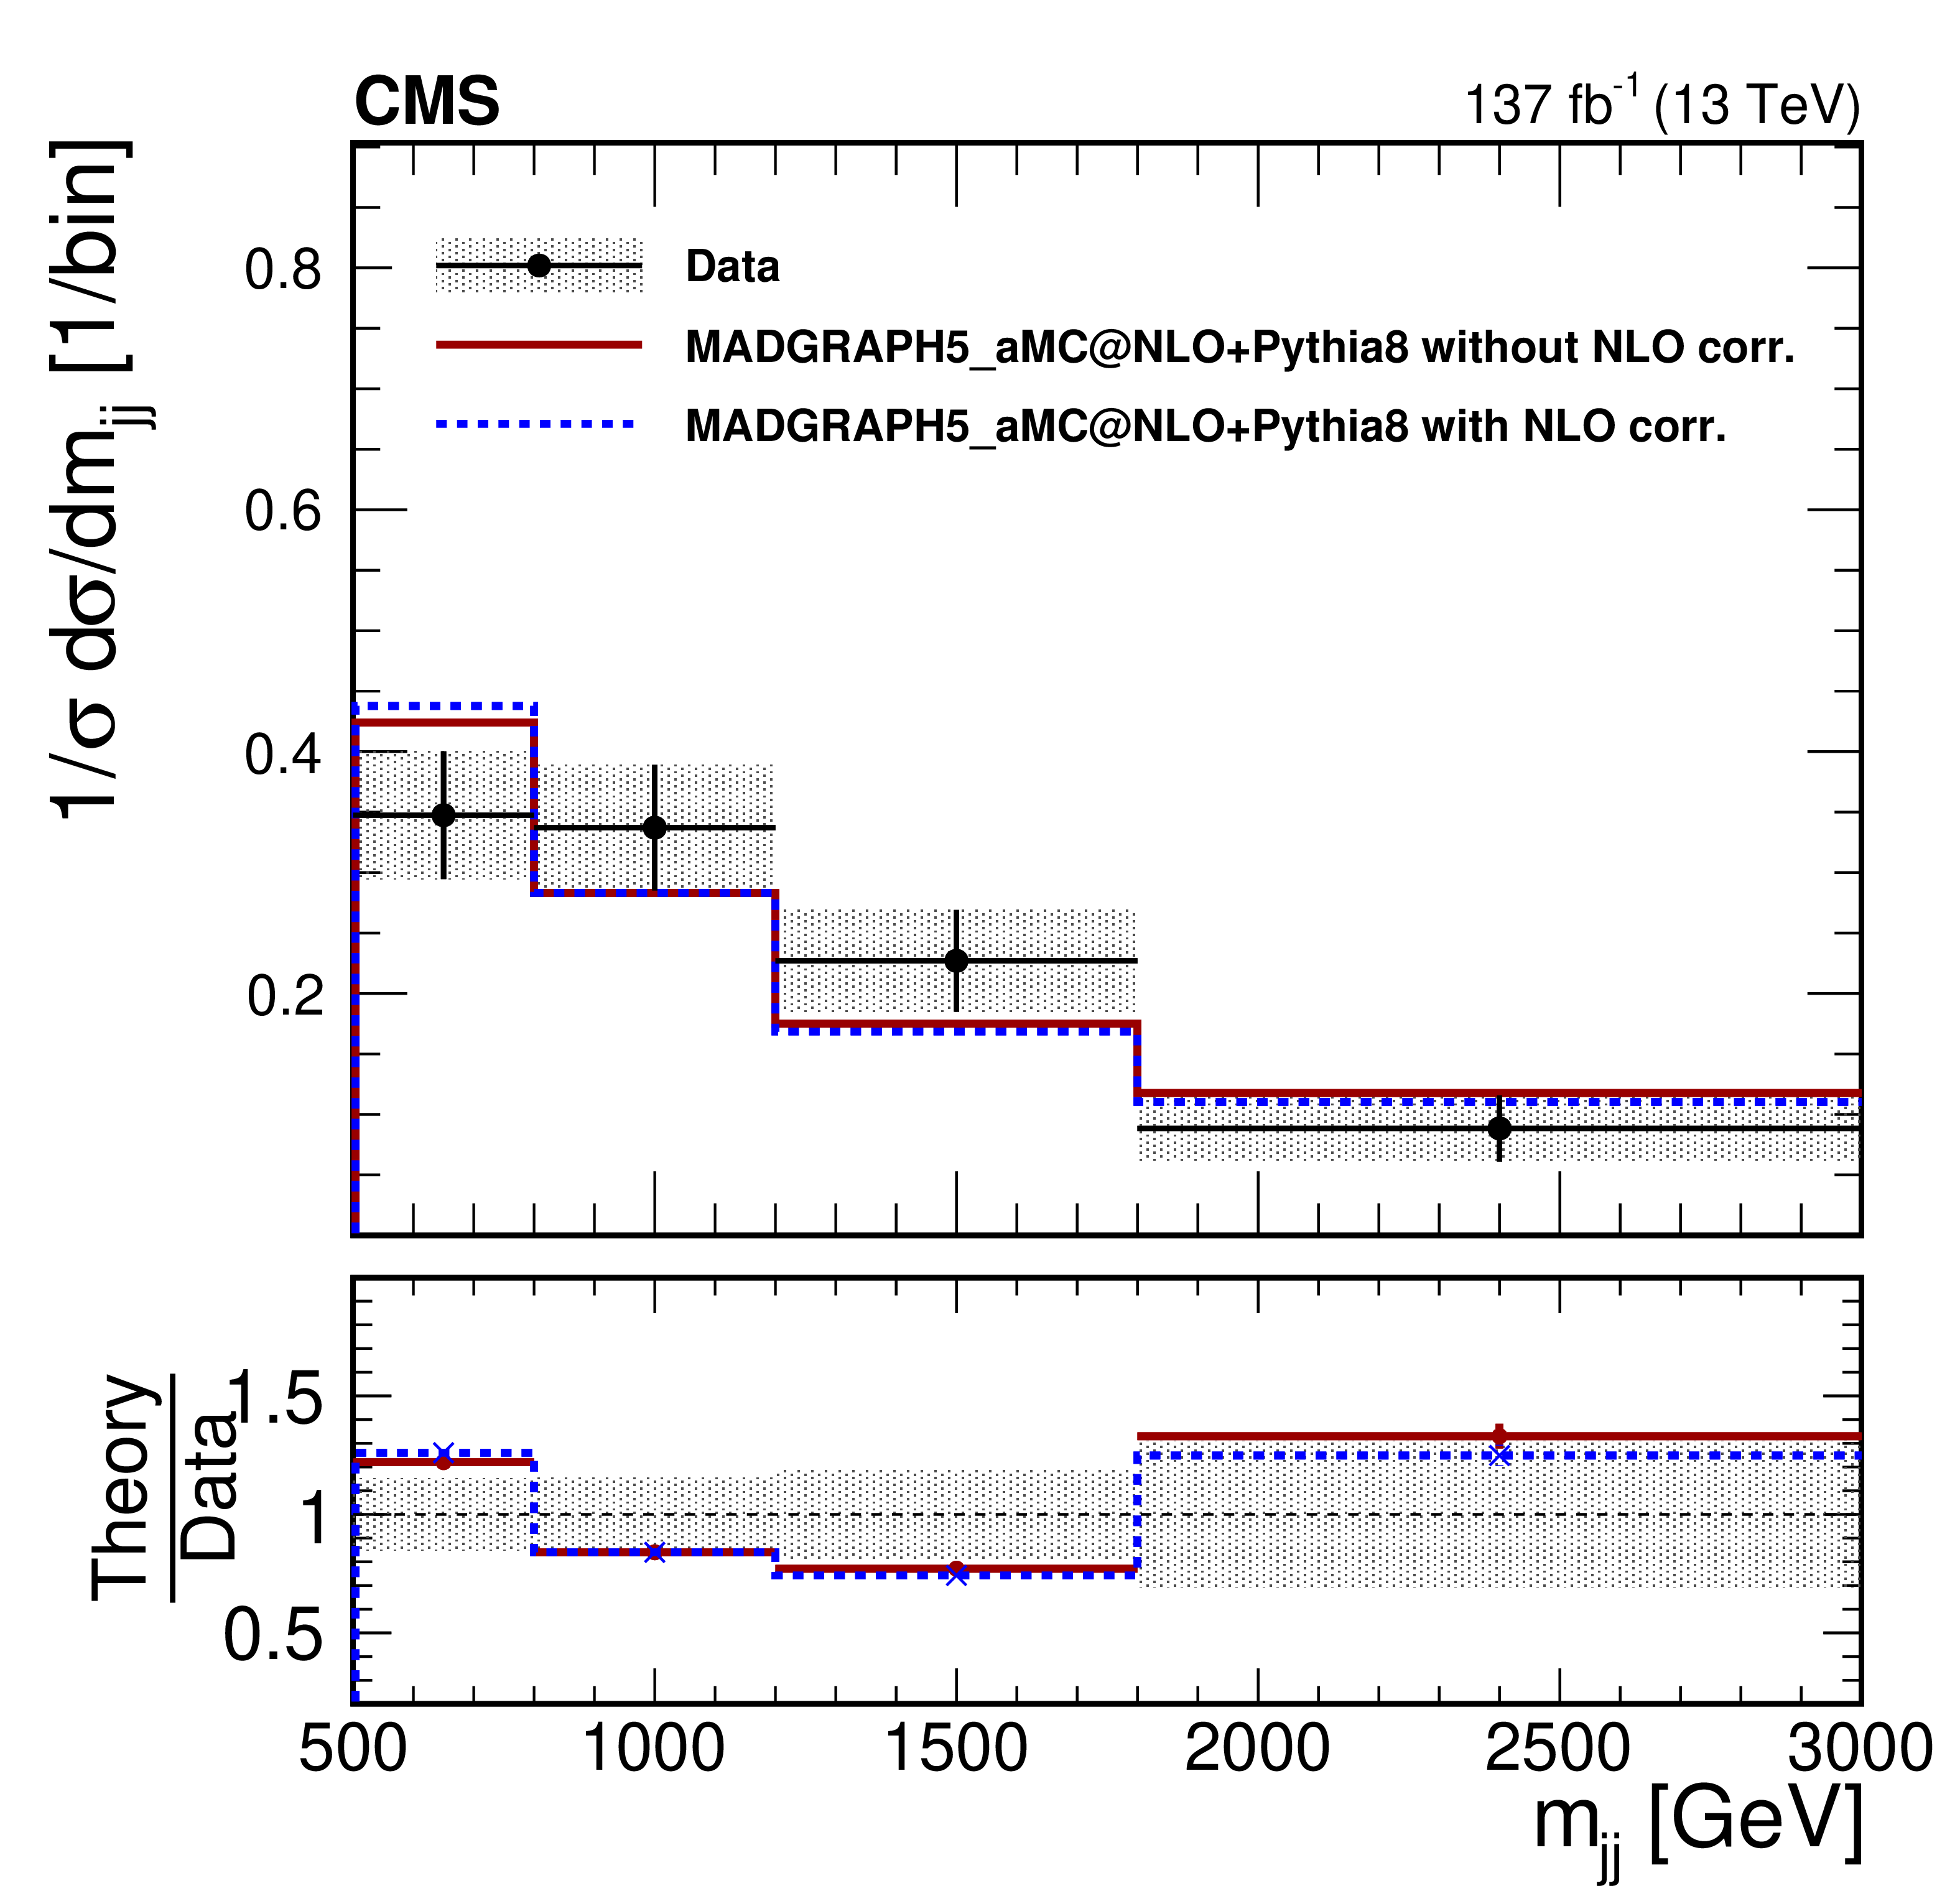
Figure 5-b:
The measured normalized $ {\mathrm{W} \mathrm{Z}} $ cross section measurements in bins of $ {m_{{\mathrm {j}} {\mathrm {j}}}} $. The ratios of the predictions to the data are also shown. The measurements are compared with the predictions from MadGraph 5_aMC@NLO at LO. The shaded bands around the data points correspond to the measurement uncertainty. The error bars around the predictions correspond to the combined statistical, PDF, and scale uncertainties. Predictions with applying the $\mathcal {O}({\alpha _S} \alpha ^6)$ and $\mathcal {O}(\alpha ^7)$ corrections to the MadGraph 5_aMC@NLO LO cross sections, as described in the text, are shown (dashed blue). The MadGraph 5_aMC@NLO predictions in the EW total cross sections are also shown ((dark cyan). |
png pdf |
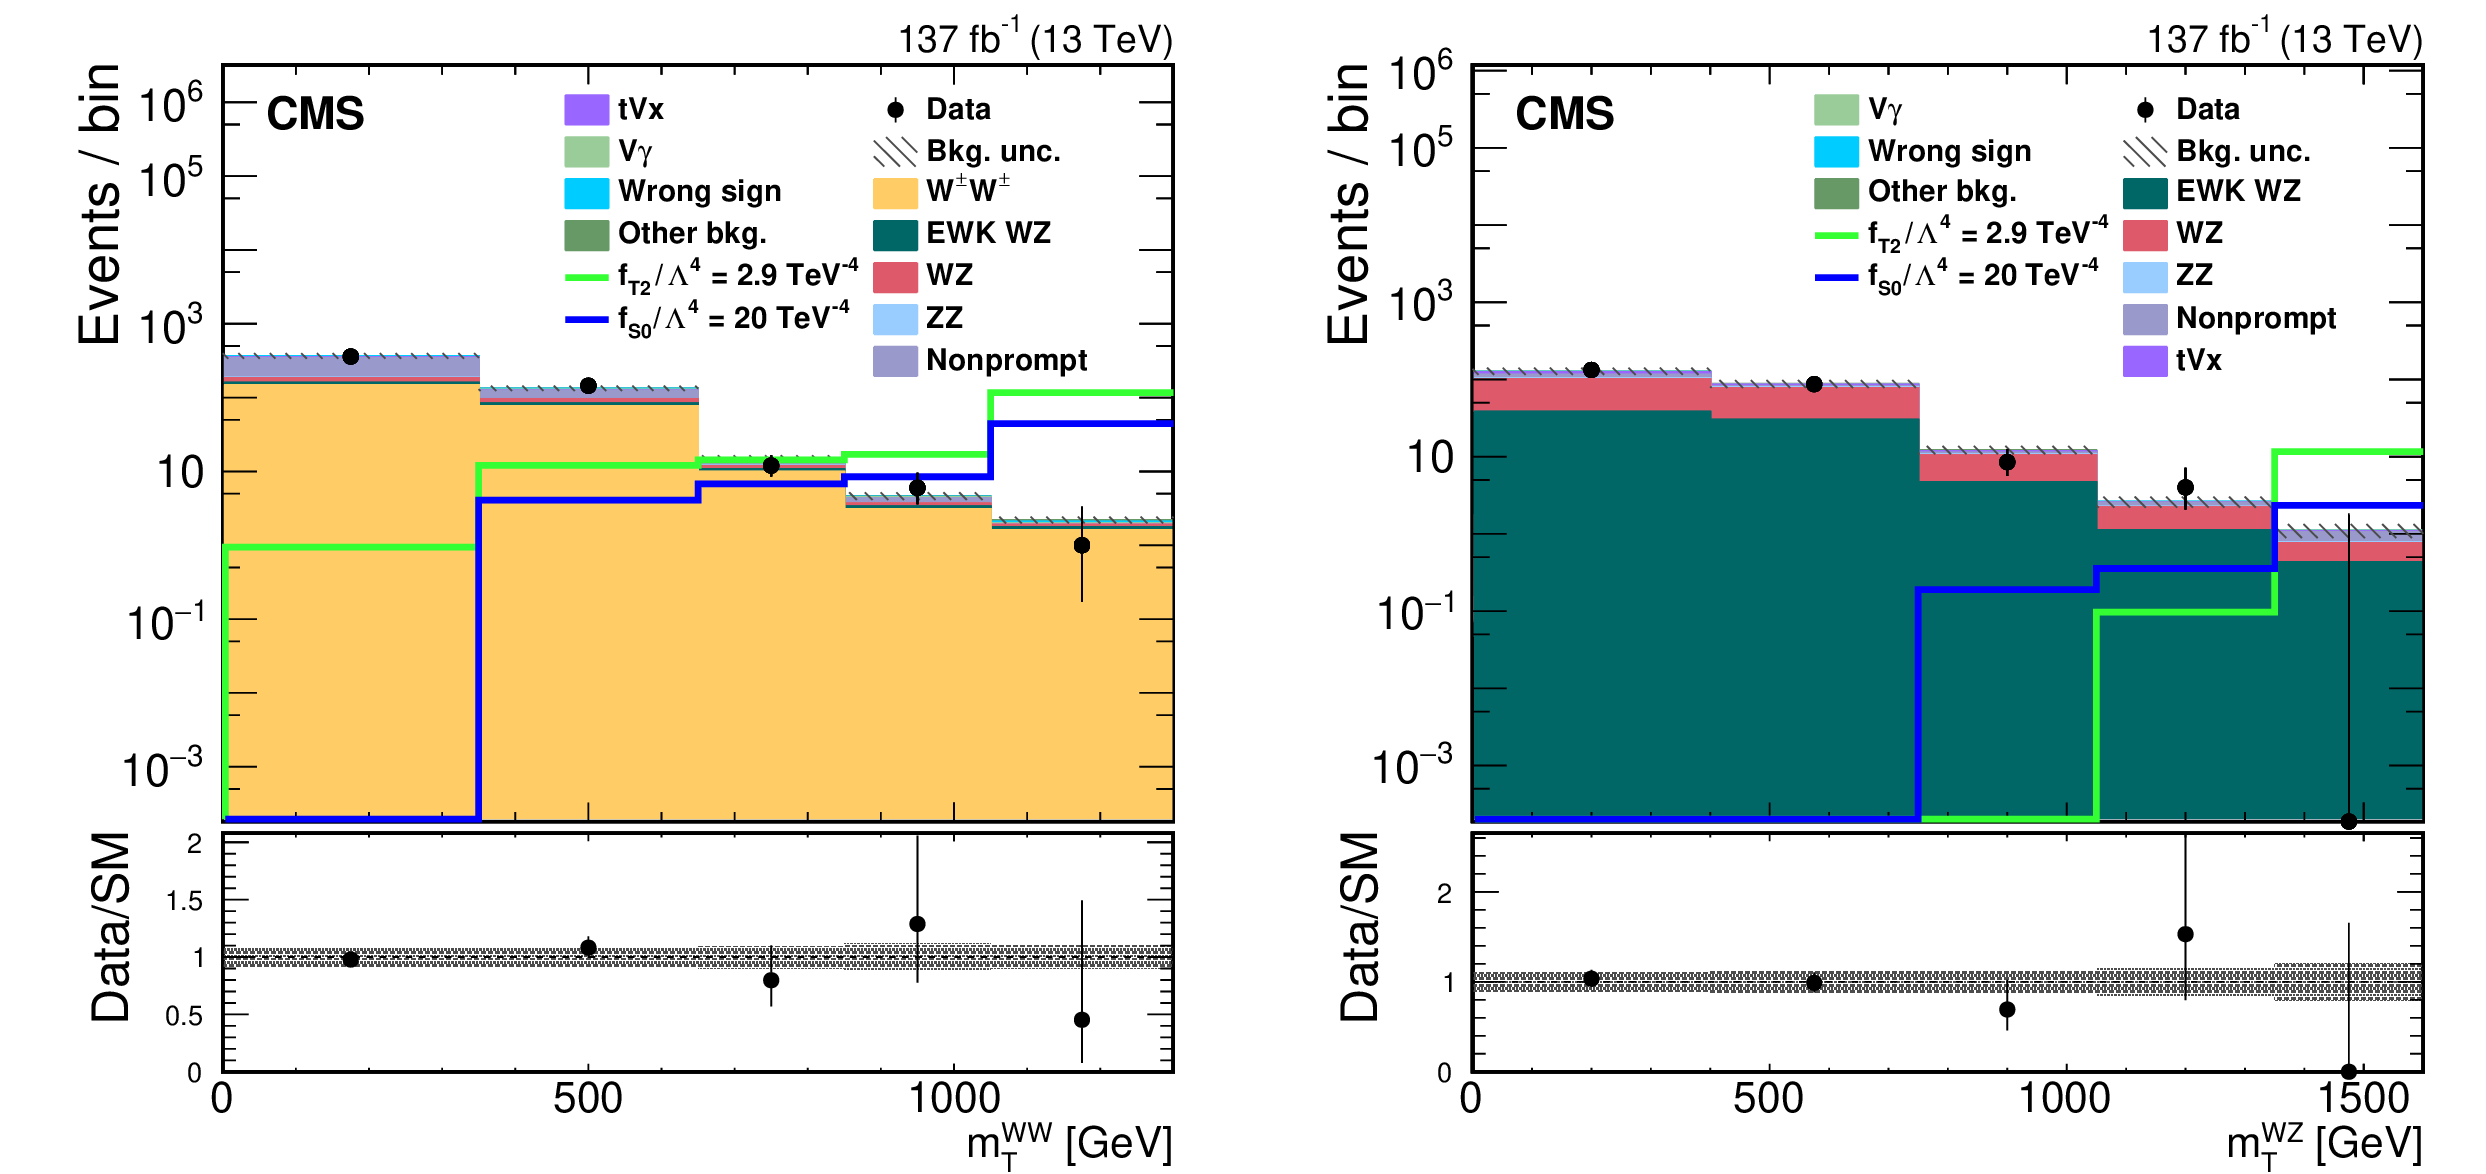
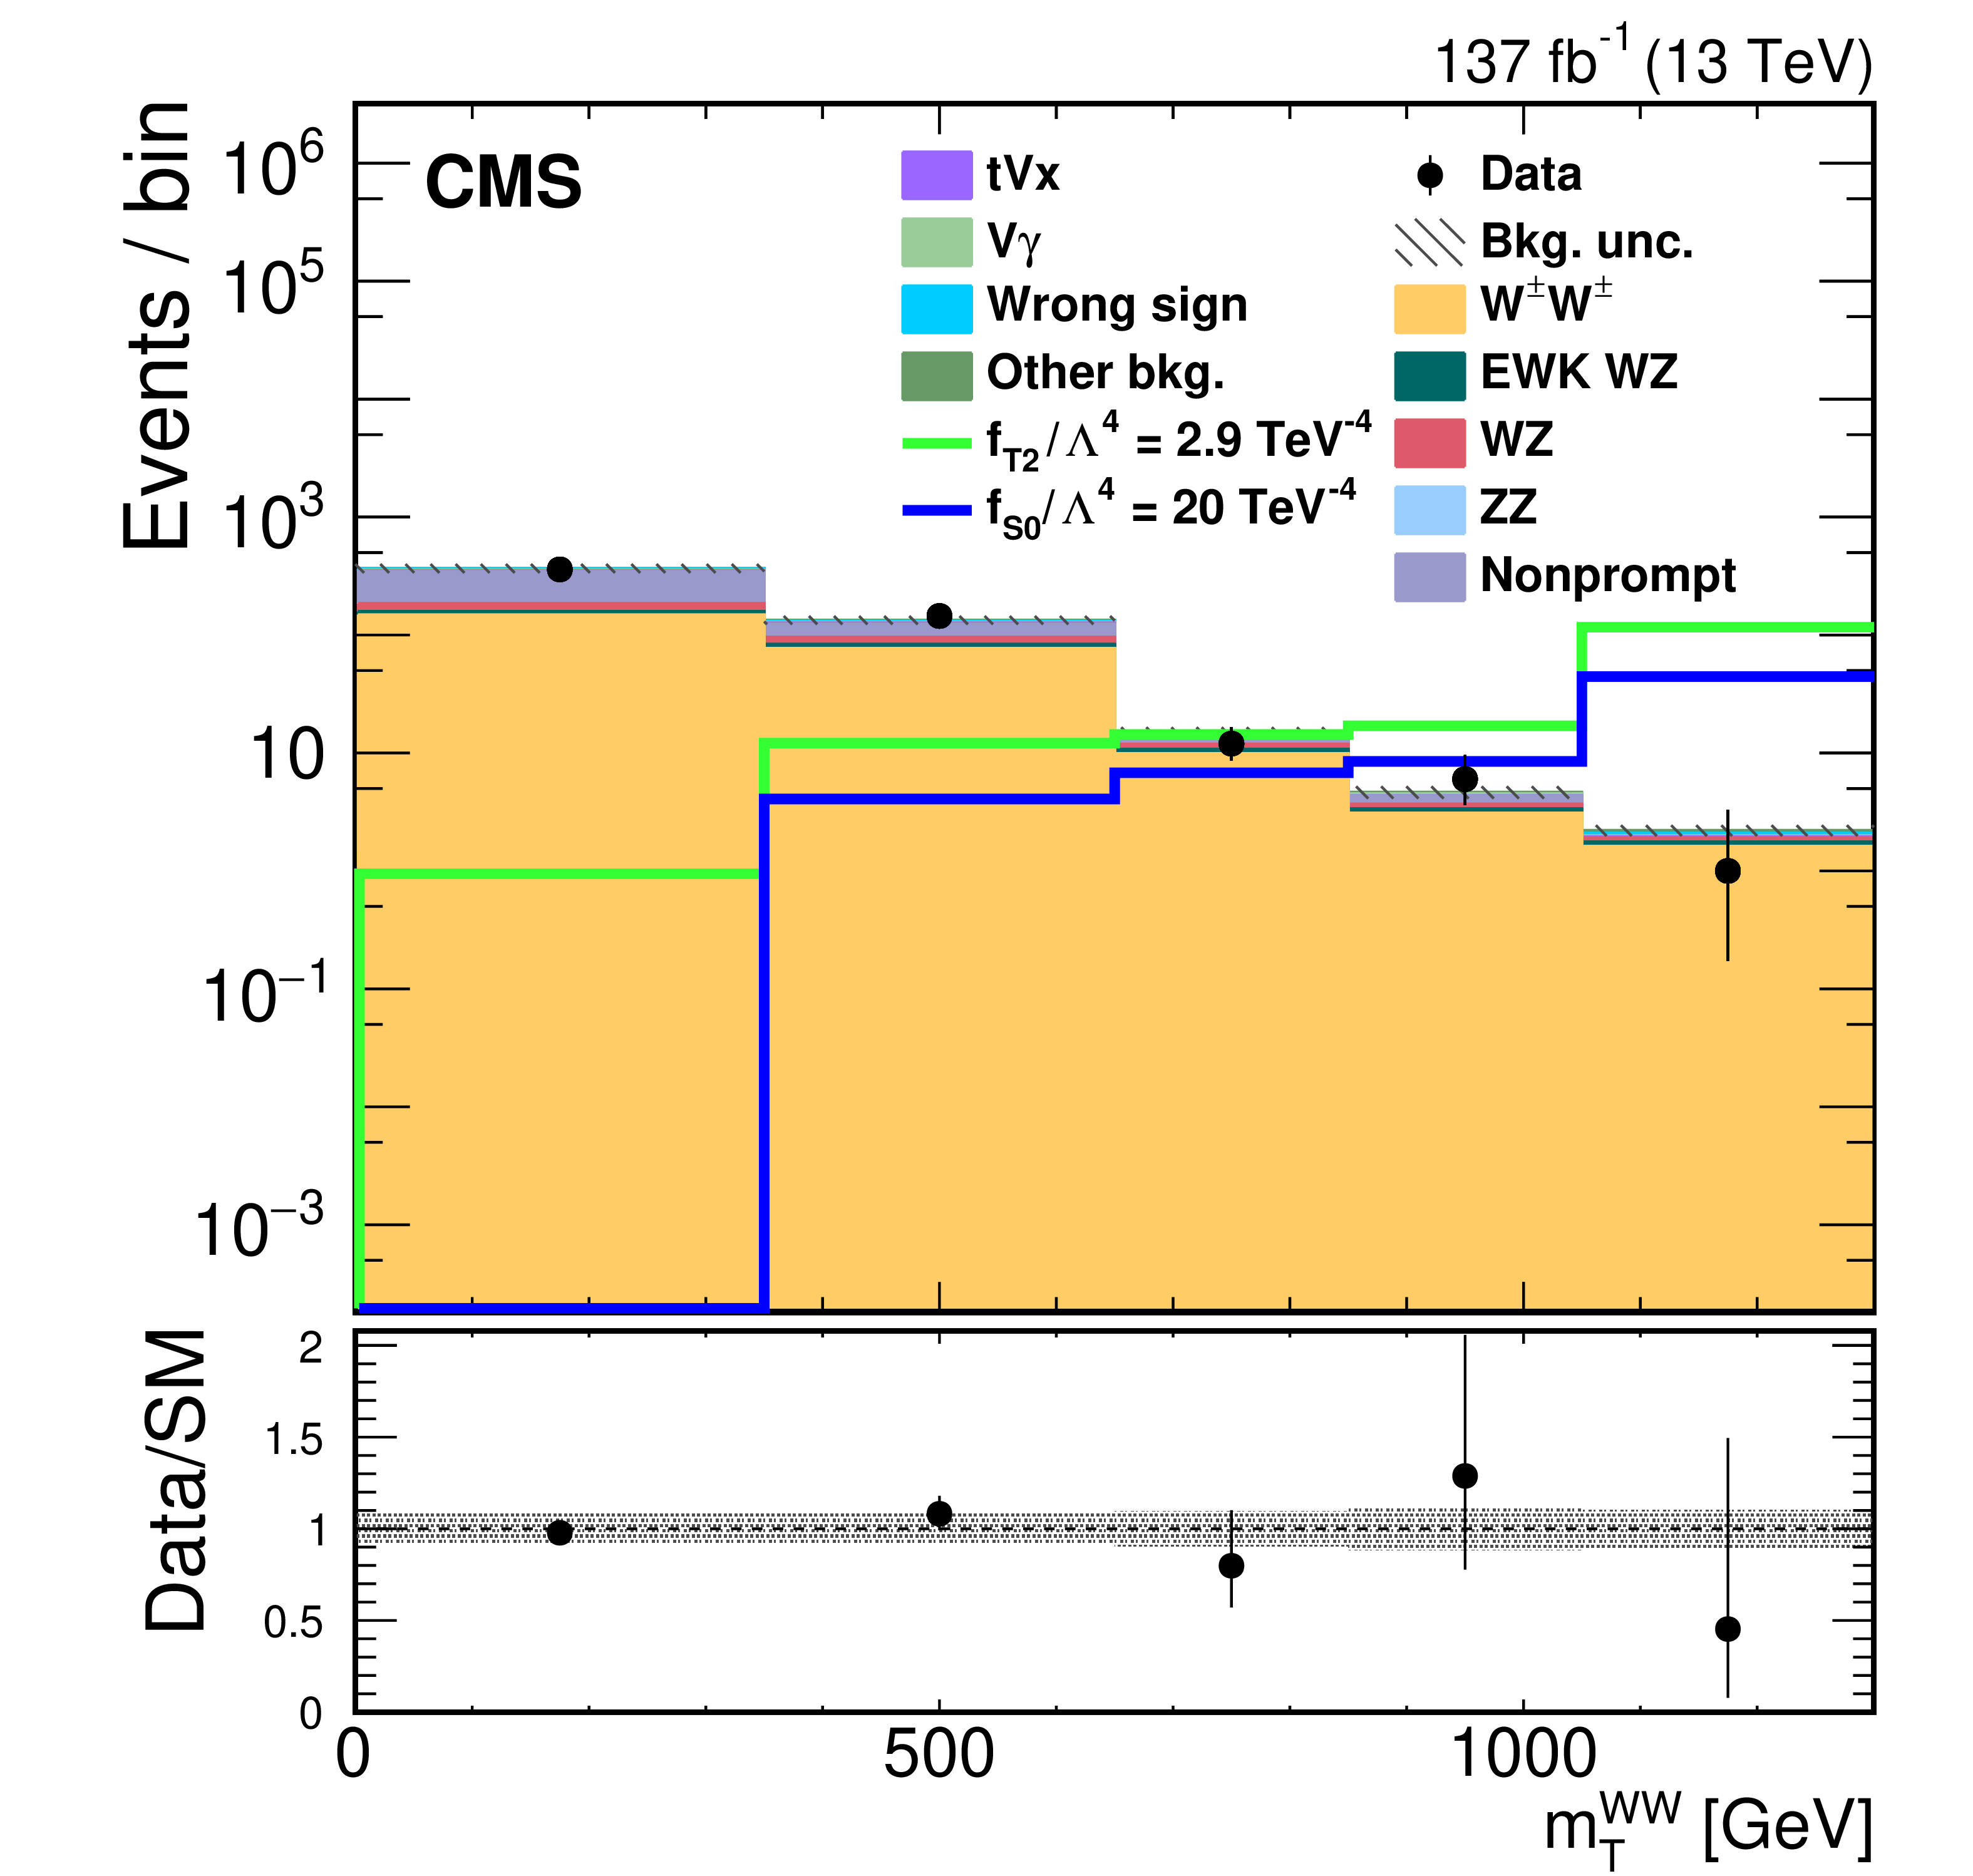
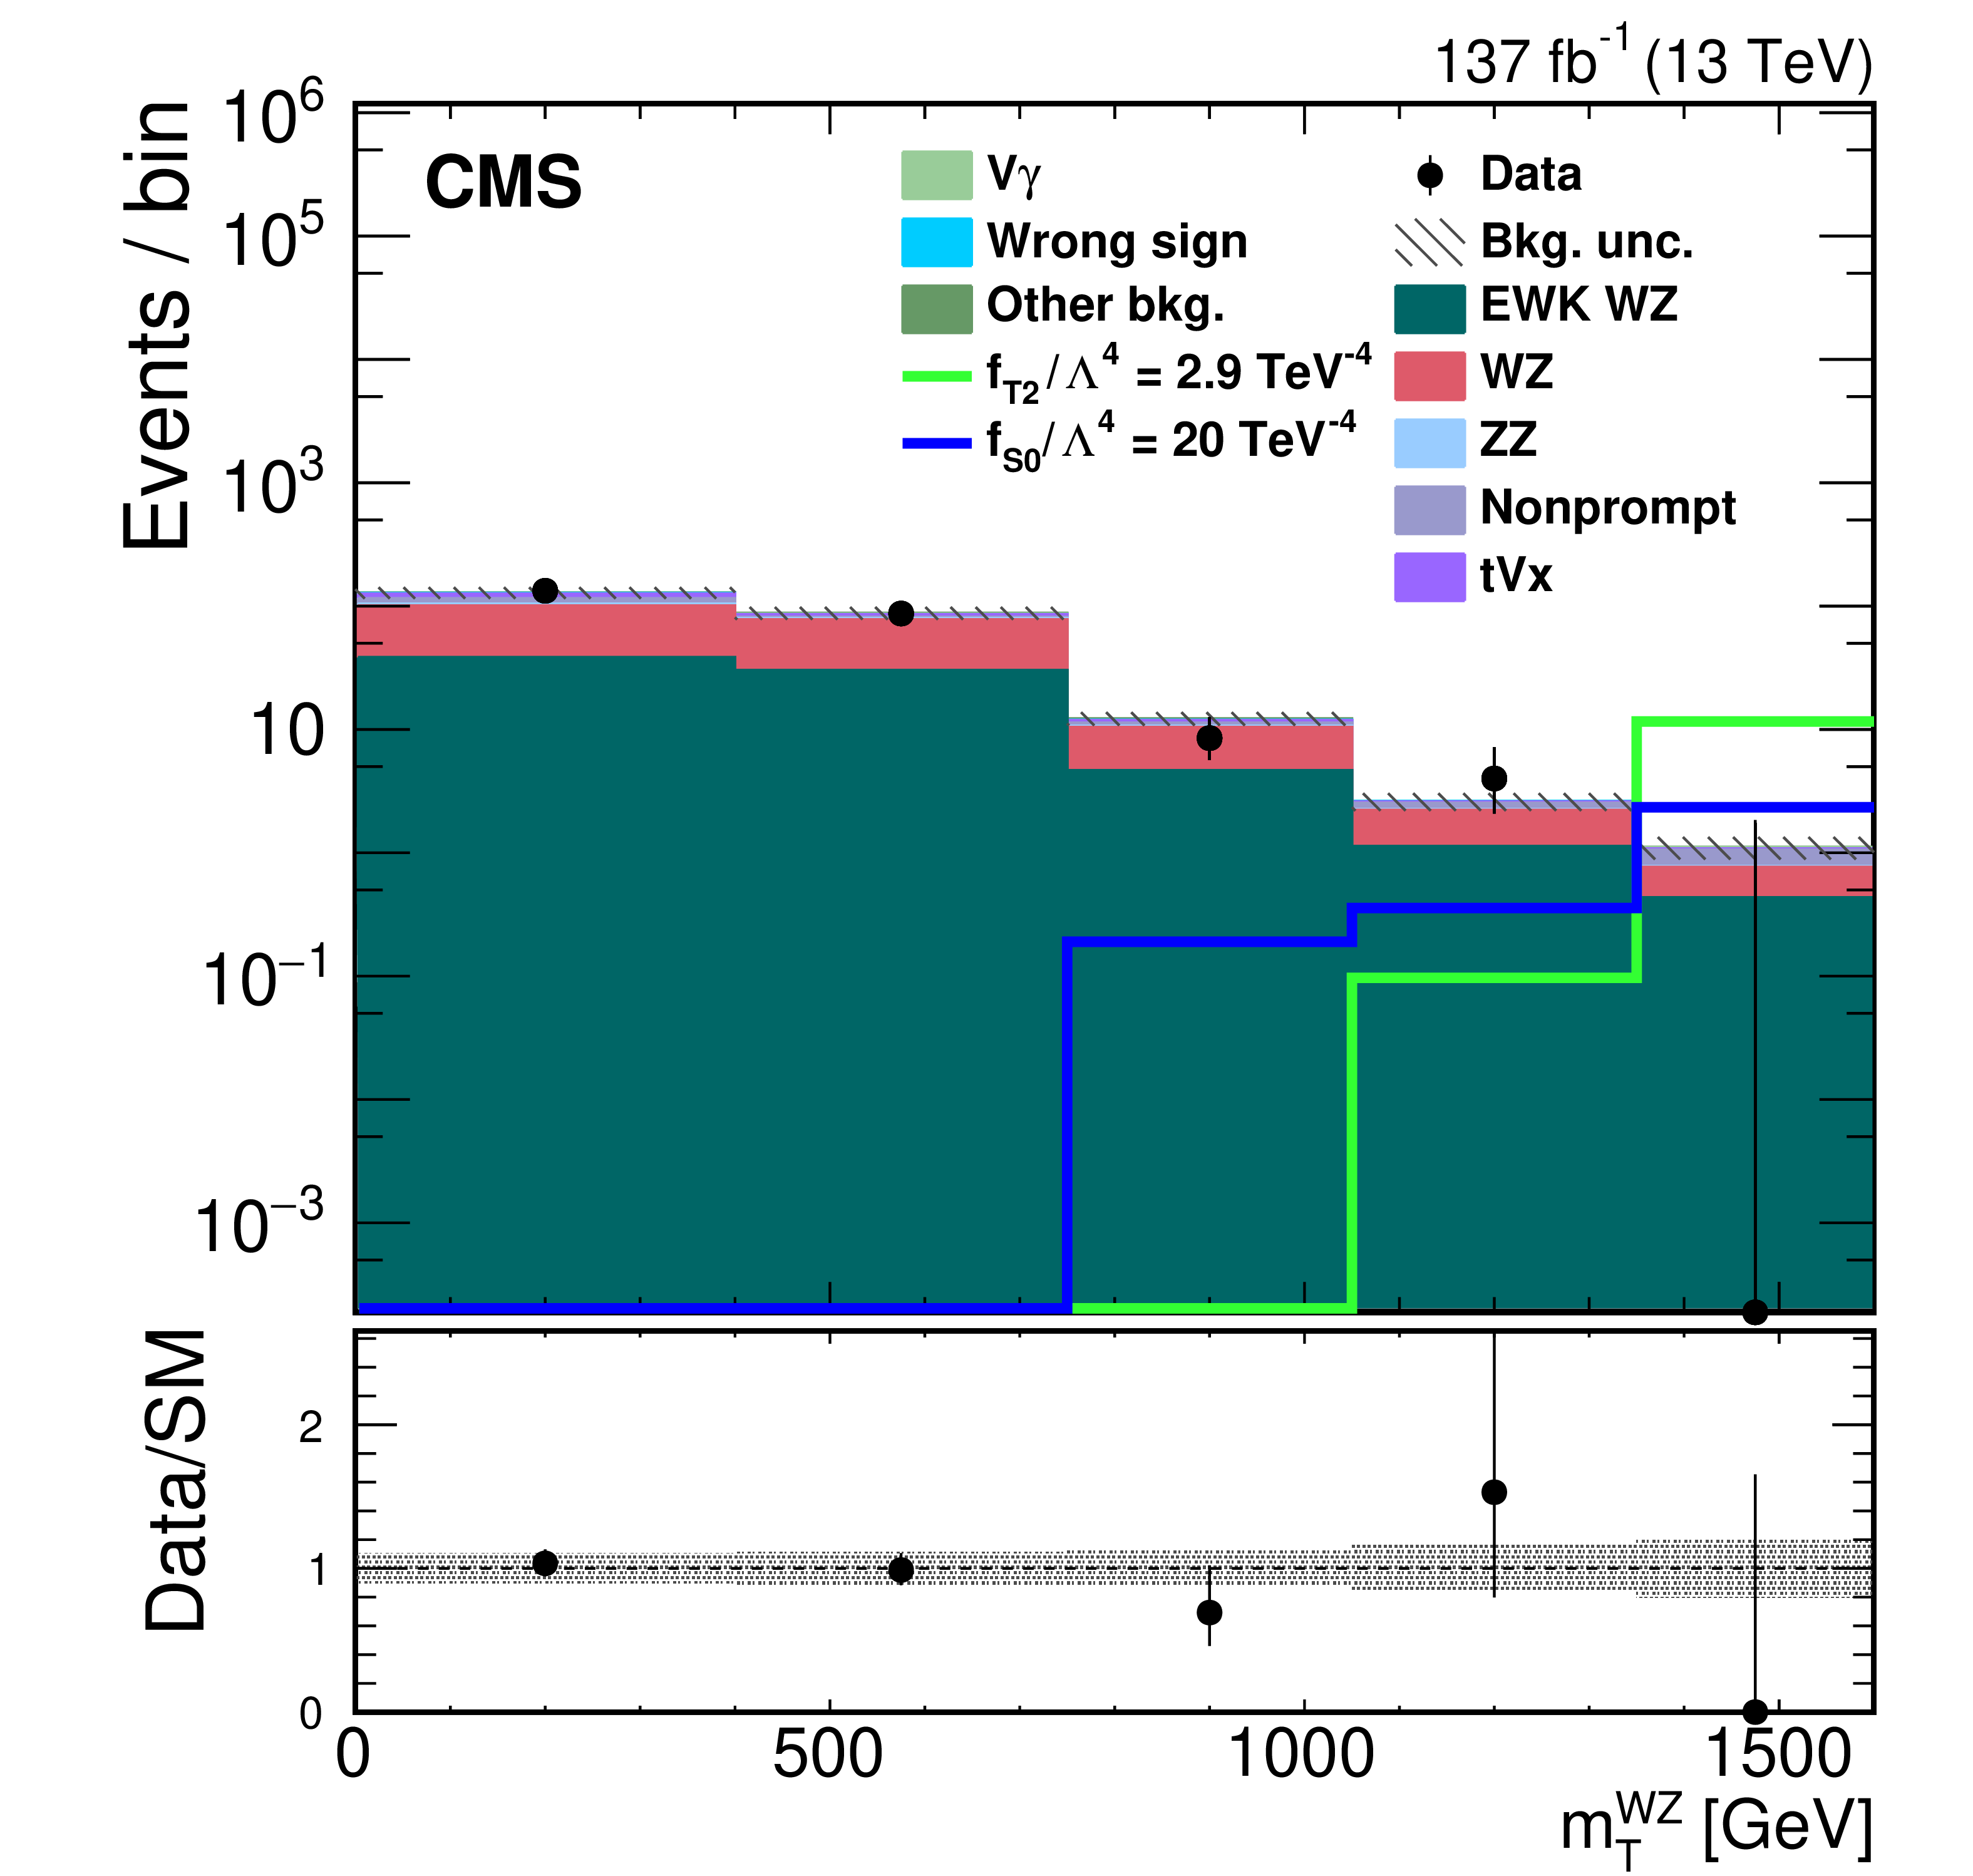
Figure 6:
Distributions of $ {m_{\mathrm {T}}} (\mathrm{W} \mathrm{W})$ (left) in the $ {\mathrm{W} ^\pm \mathrm{W} ^\pm} $ SR and $ {m_{\mathrm {T}}} (\mathrm{W} \mathrm{Z})$ (right) in the $ {\mathrm{W} \mathrm{Z}} $ SR. The gray bands include uncertainties from the predicted yields. The SM predicted yields are shown with their best fit normalizations from the corresponding fits. The overflow is included in the last bin. The bottom panel in each figure shows the ratio of the number of events observed in data to the total SM prediction. The solid lines show the signal predictions for two illustrative aQGC parameters. |
png pdf |
Figure 6-a:
Distribution of $ {m_{\mathrm {T}}} (\mathrm{W} \mathrm{W})$ in the $ {\mathrm{W} ^\pm \mathrm{W} ^\pm} $ SR. The gray bands include uncertainties from the predicted yields. The SM predicted yields are shown with their best fit normalizations from the corresponding fits. The overflow is included in the last bin. The bottom panel shows the ratio of the number of events observed in data to the total SM prediction. The solid lines show the signal predictions for two illustrative aQGC parameters. |
png pdf |
Figure 6-b:
Distribution of $ {m_{\mathrm {T}}} (\mathrm{W} \mathrm{Z})$ (right) in the $ {\mathrm{W} \mathrm{Z}} $ SR. The gray bands include uncertainties from the predicted yields. The SM predicted yields are shown with their best fit normalizations from the corresponding fits. The overflow is included in the last bin. The bottom panel shows the ratio of the number of events observed in data to the total SM prediction. The solid lines show the signal predictions for two illustrative aQGC parameters. |
| Tables | |
png pdf |
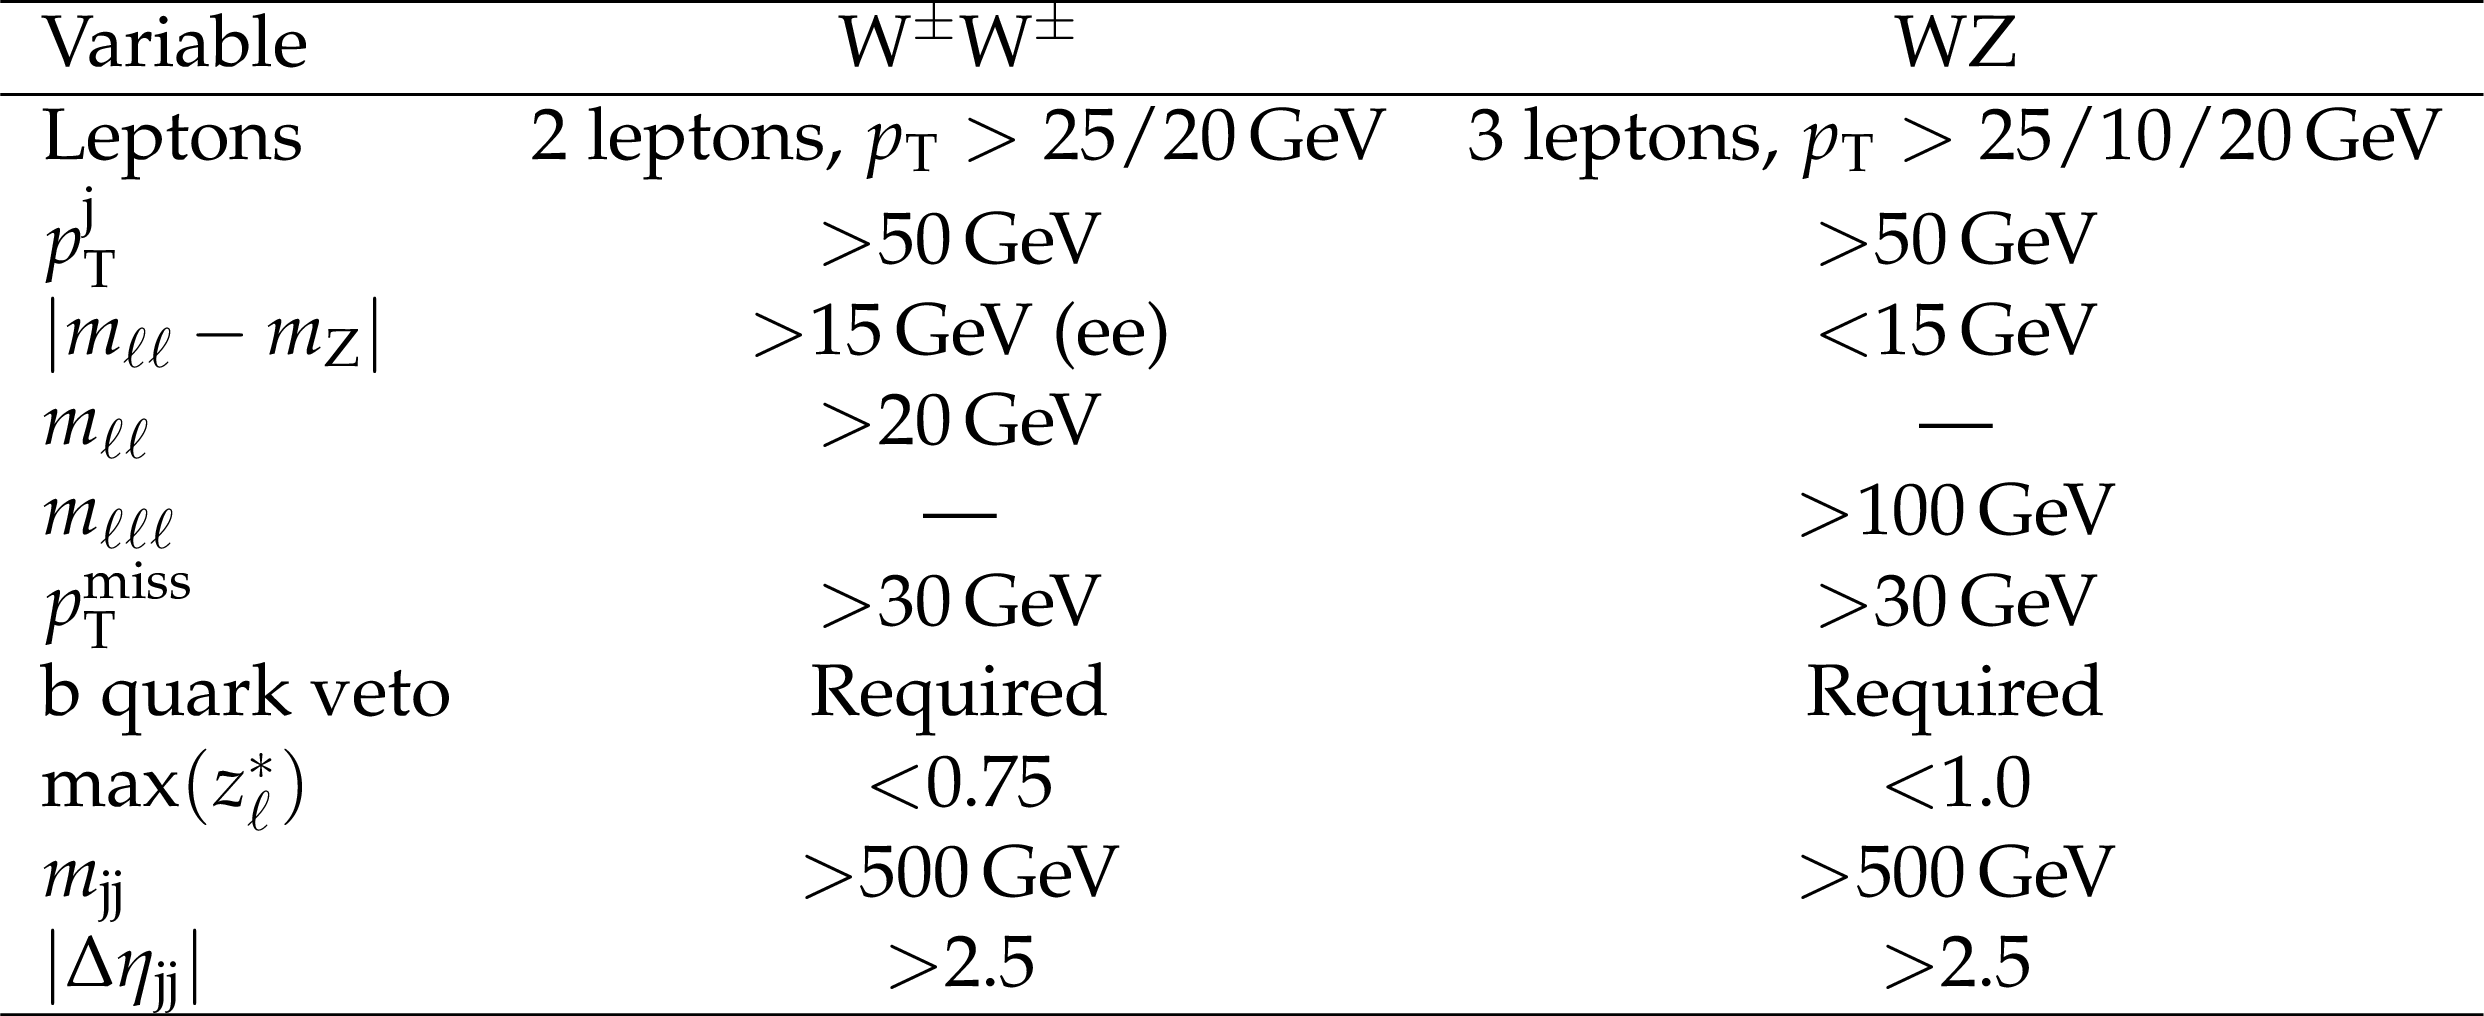
Table 1:
Summary of the selection requirements defining the $ {\mathrm{W} ^\pm \mathrm{W} ^\pm} $ and $ {\mathrm{W} \mathrm{Z}} $ SRs. The looser lepton $ {p_{\mathrm {T}}} $ requirement on the $ {\mathrm{W} \mathrm{Z}} $ selection refers to the trailing lepton from the Z boson decays. The $ {| {m_{\ell \ell}} - m_{\mathrm{Z}} |}$ requirement is applied to the dielectron final state only in the $ {\mathrm{W} ^\pm \mathrm{W} ^\pm} $ SR. |
png pdf |
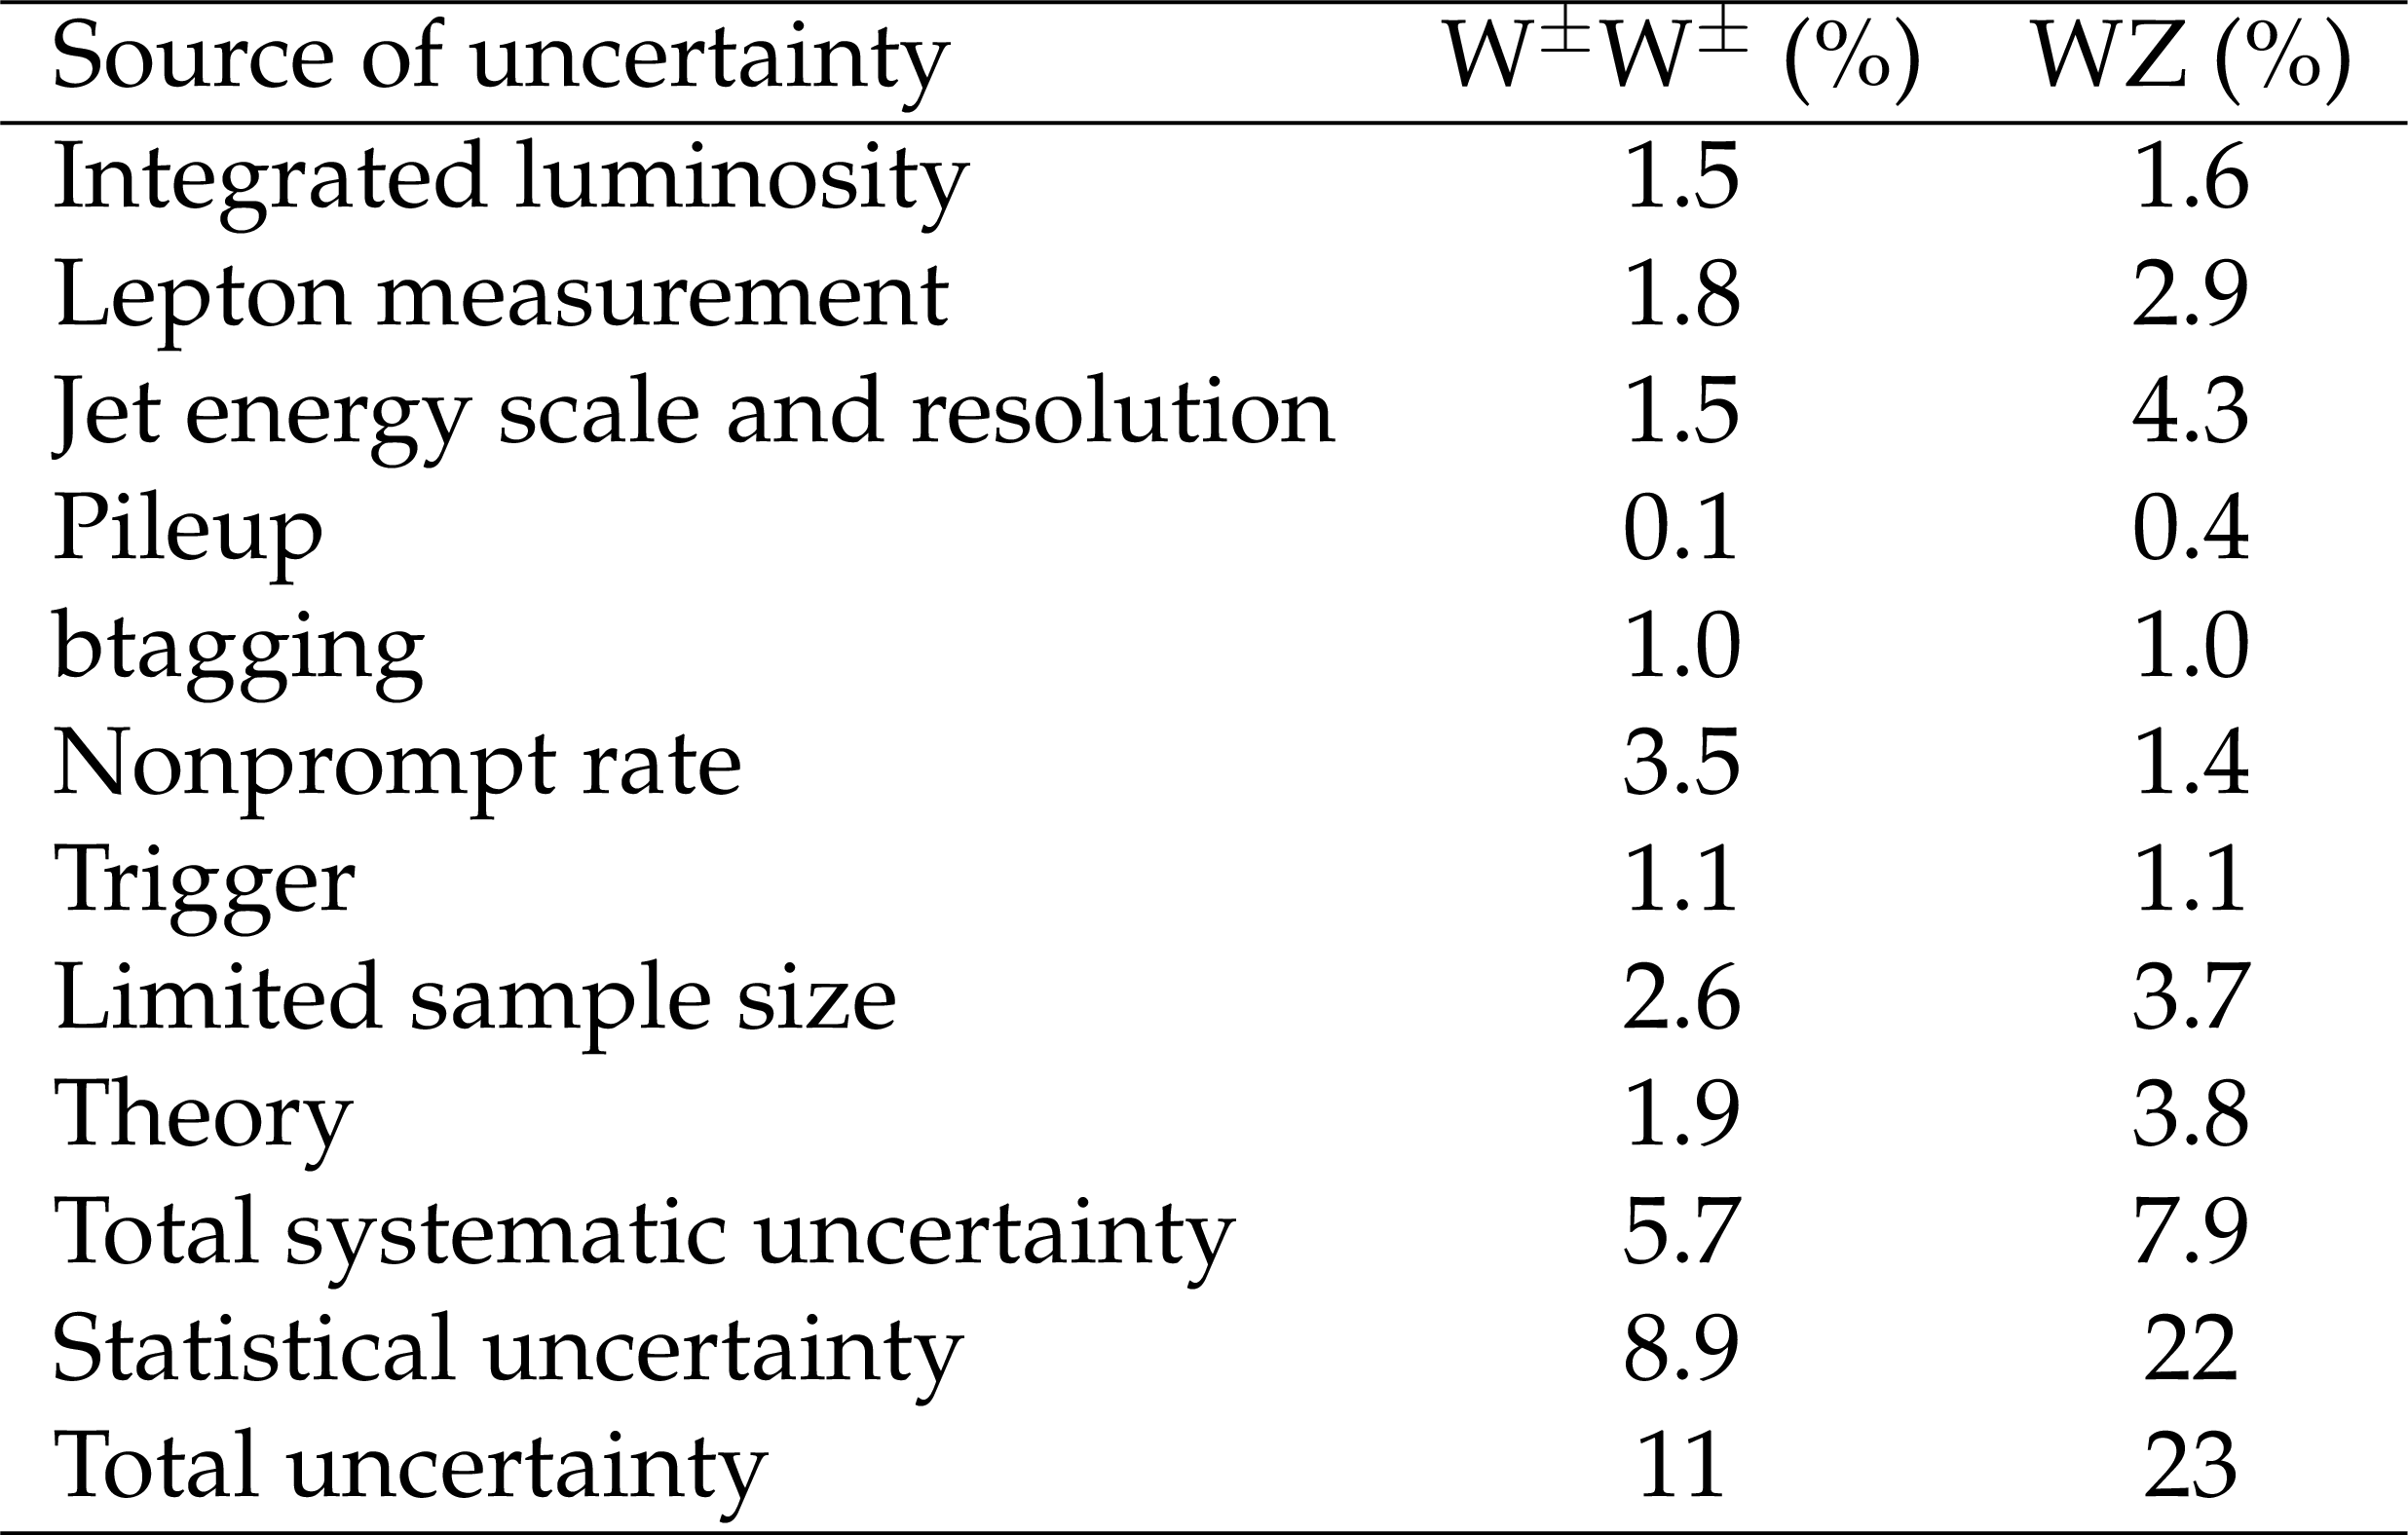
Table 2:
Relative systematic uncertainties in the EW $ {\mathrm{W} ^\pm \mathrm{W} ^\pm} $ and $ {\mathrm{W} \mathrm{Z}} $ cross section measurements in units of percent. |
png pdf |
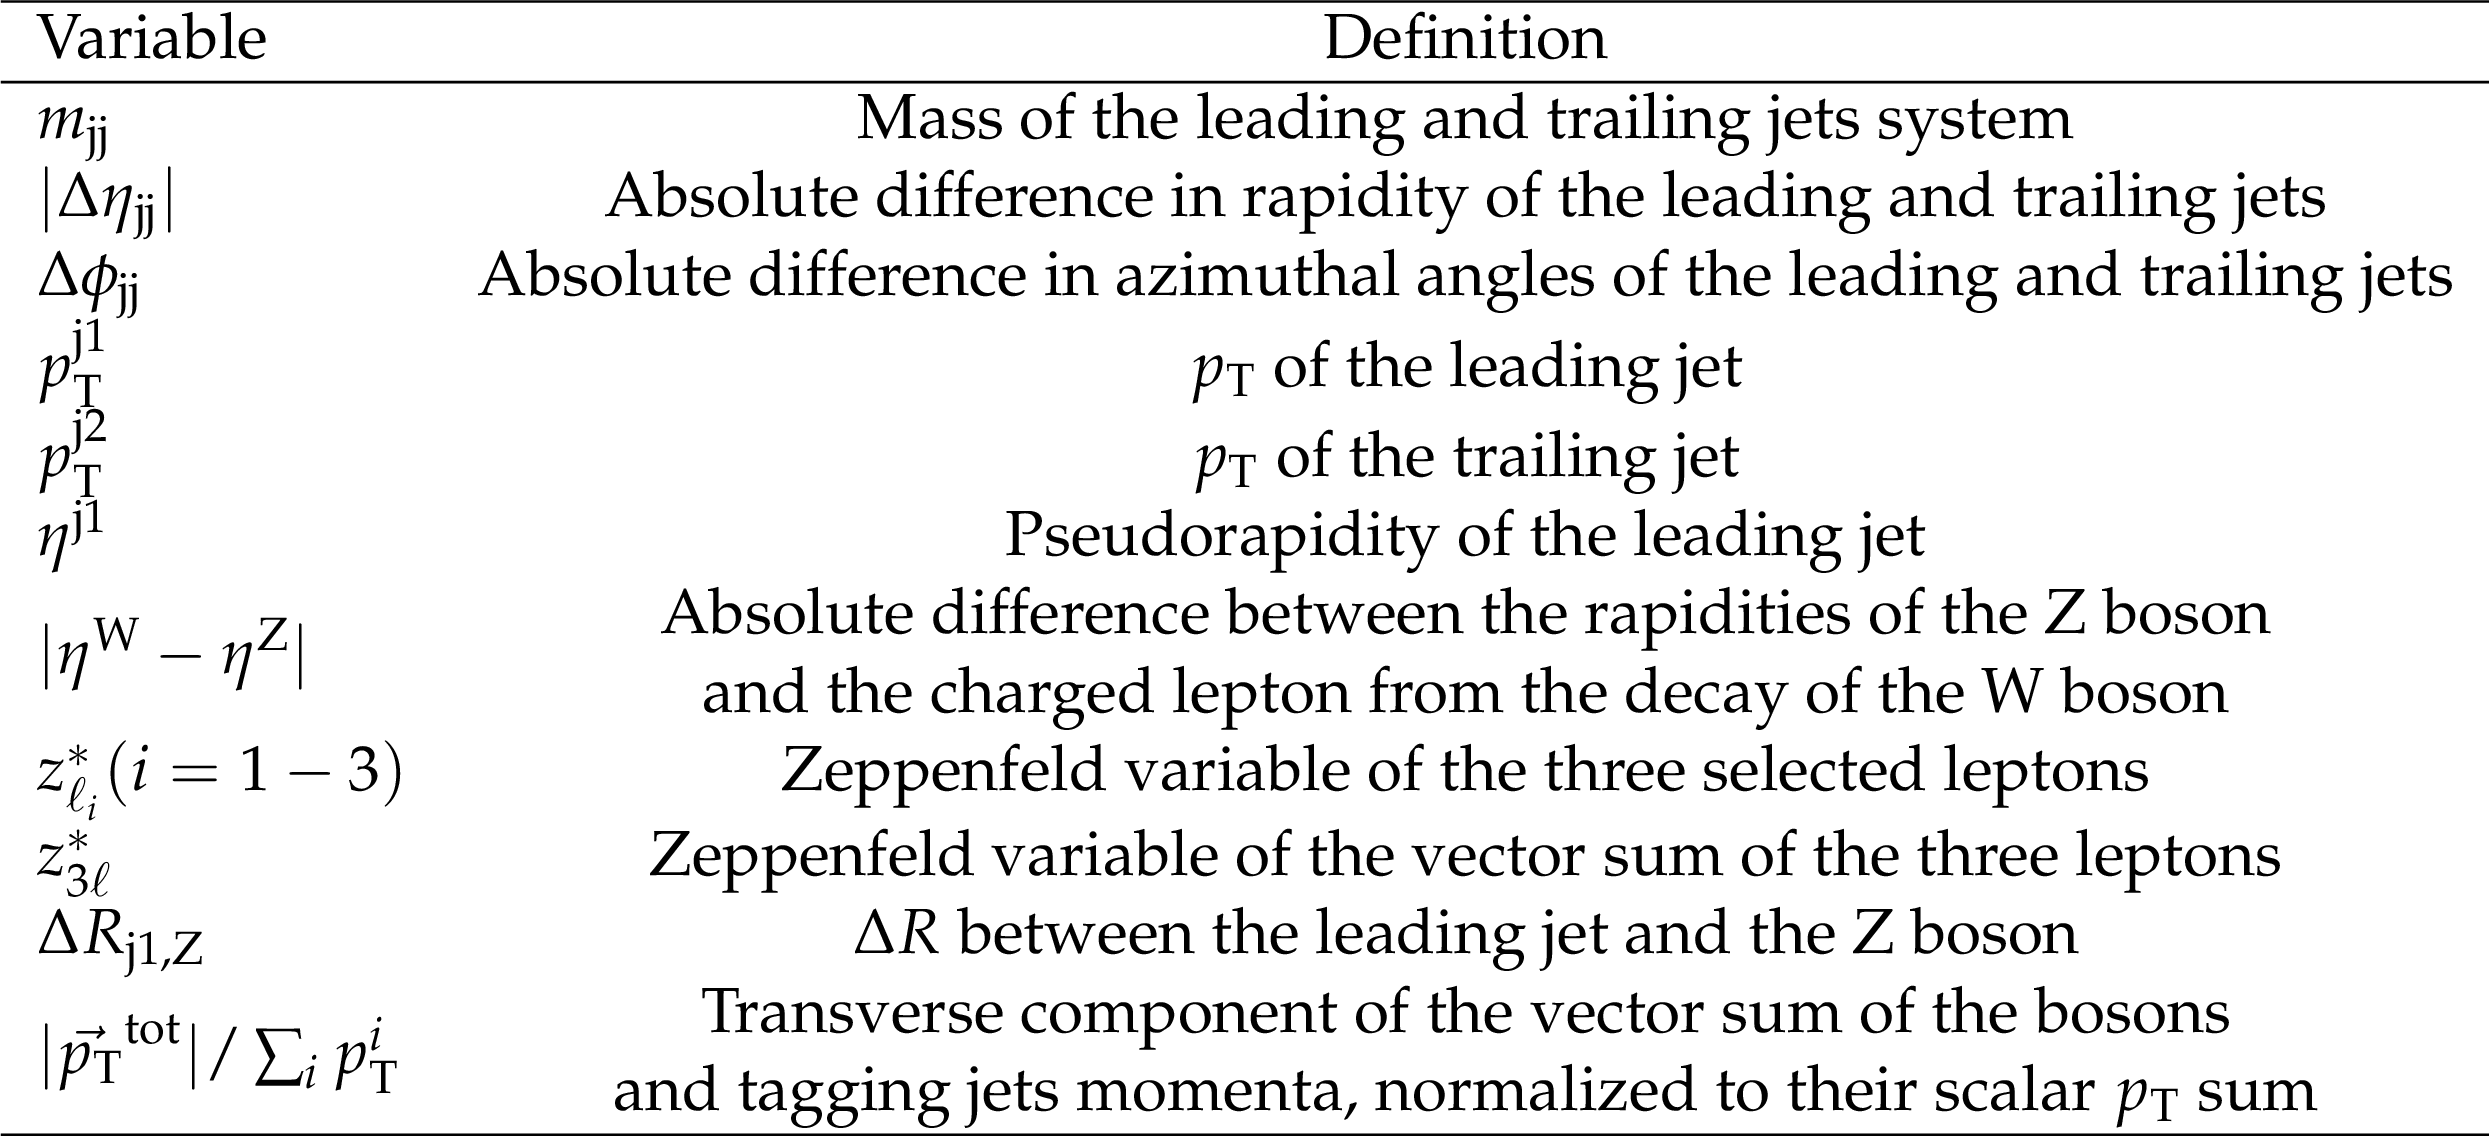
Table 3:
List and description of all the input variables used in the BDT analysis for the $ {\mathrm{W} \mathrm{Z}} $ SR. |
png pdf |
Table 4:
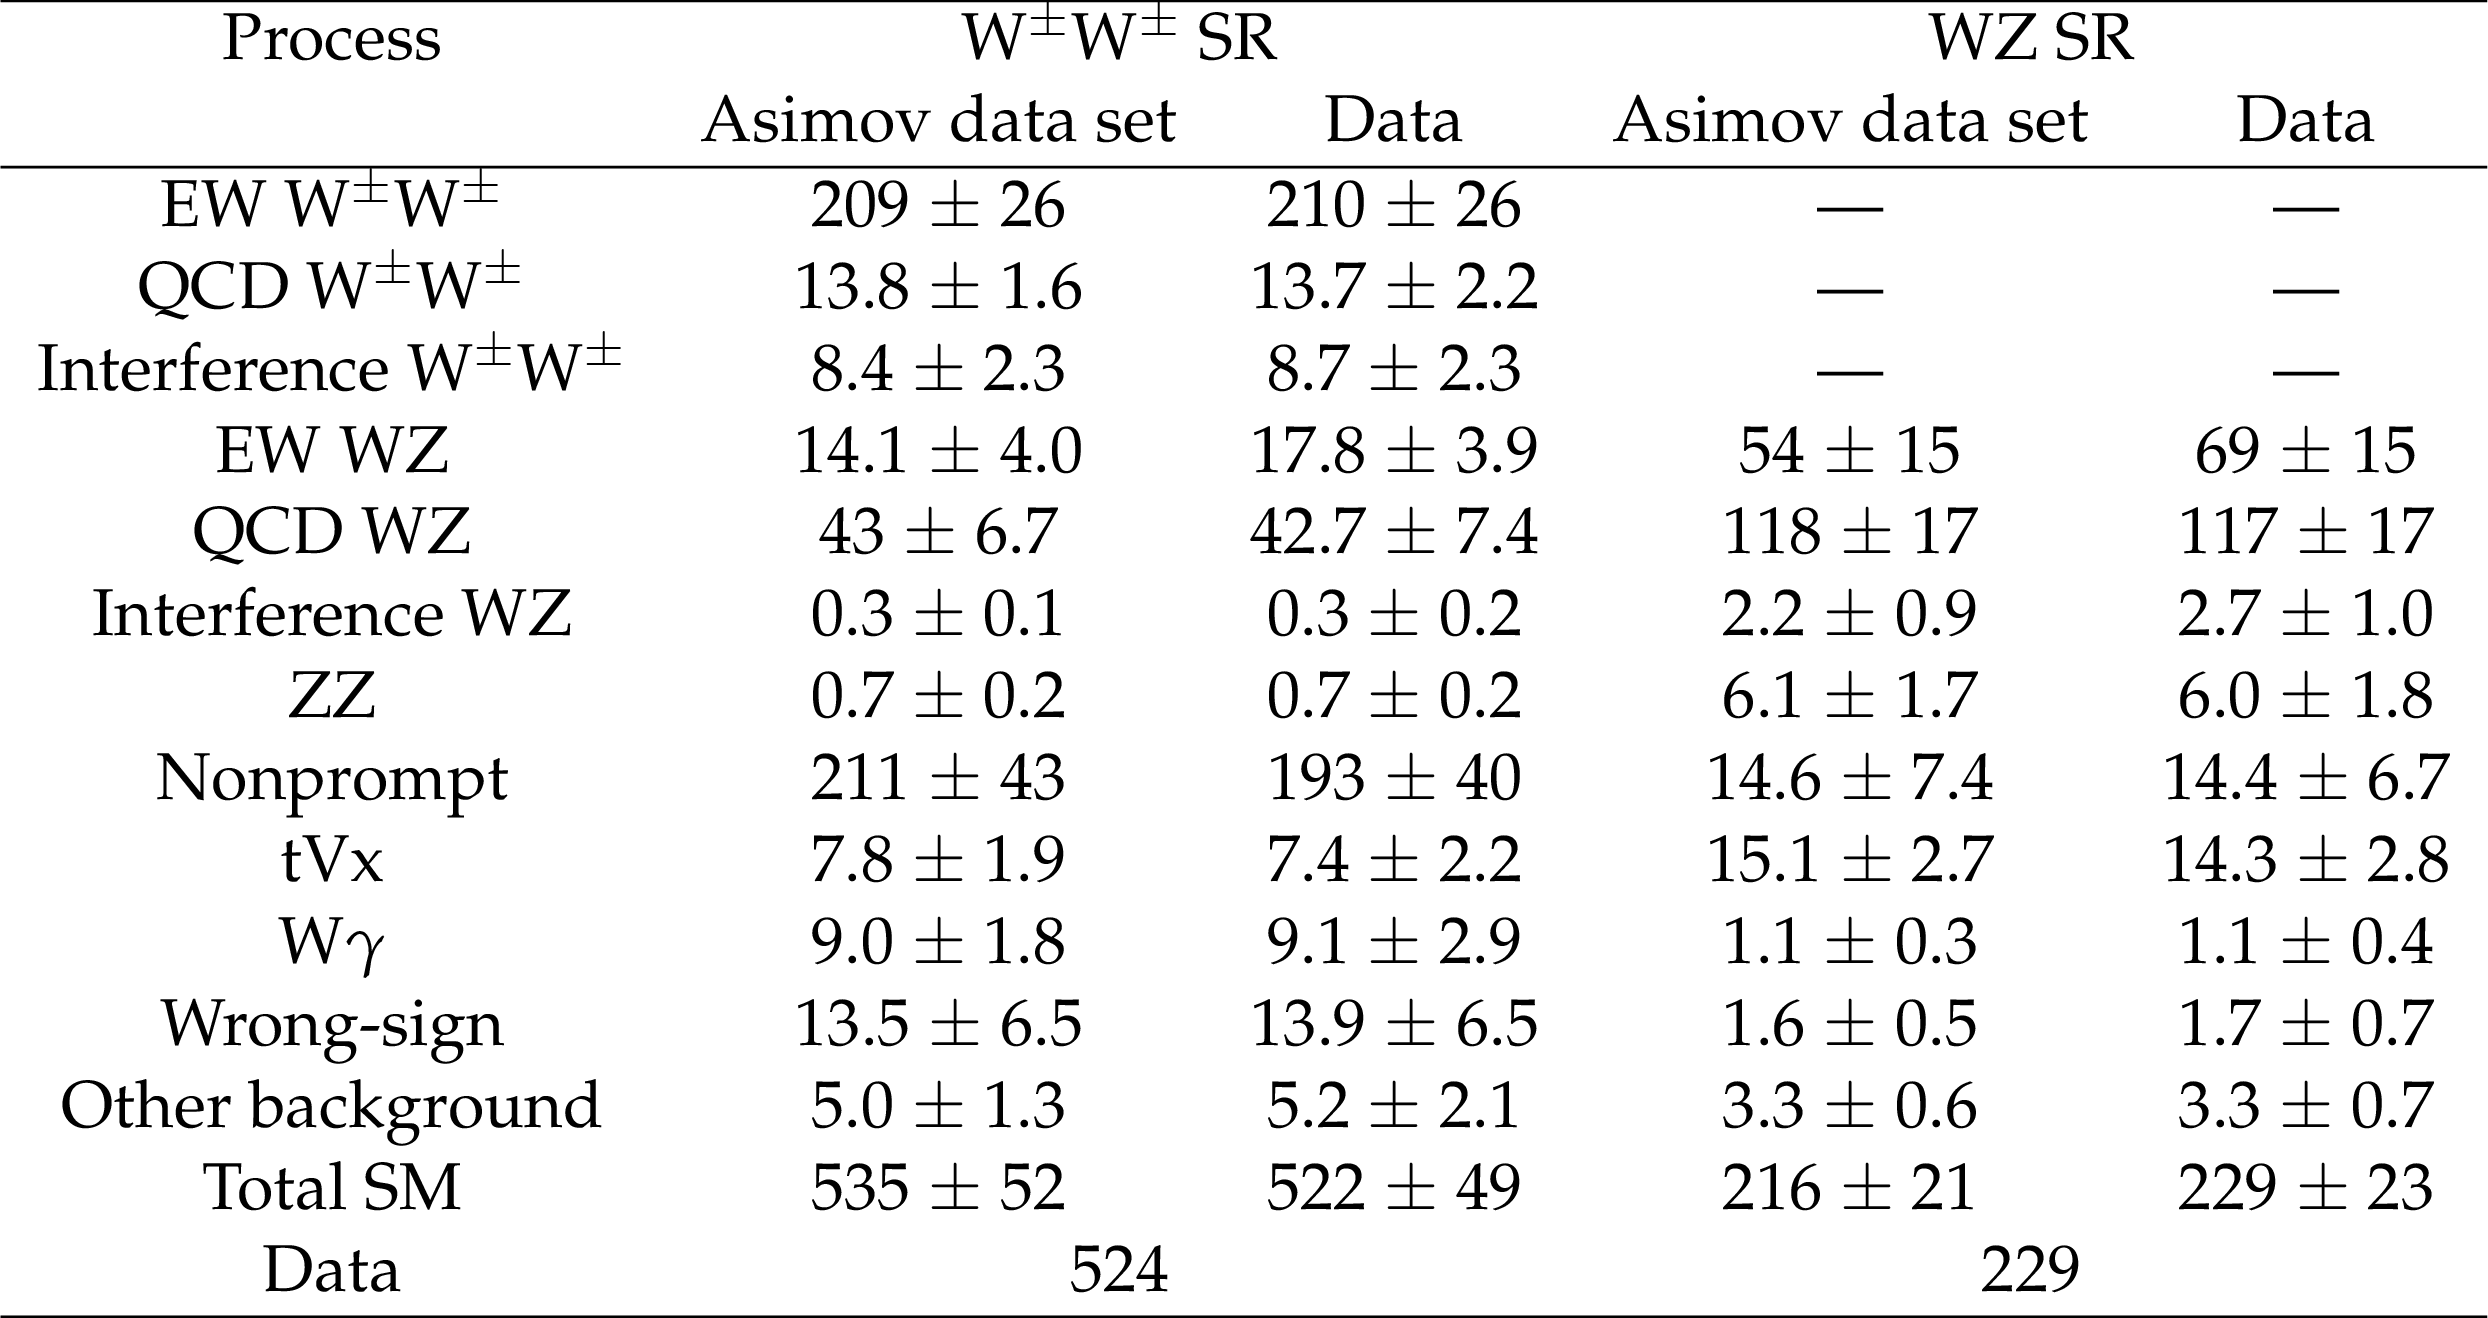
Expected yields from SM processes and observed data events in $ {\mathrm{W} ^\pm \mathrm{W} ^\pm} $ and $ {\mathrm{W} \mathrm{Z}} $ SRs. The combination of the statistical and systematic uncertainties is shown. The expected yields are shown before the fit to the data (pre-fit) and with their best fit normalizations from the simultaneous fit (post-fit). The pre-fit uncertainties consider the expected values before the simultaneous fit to the data. |
png pdf |
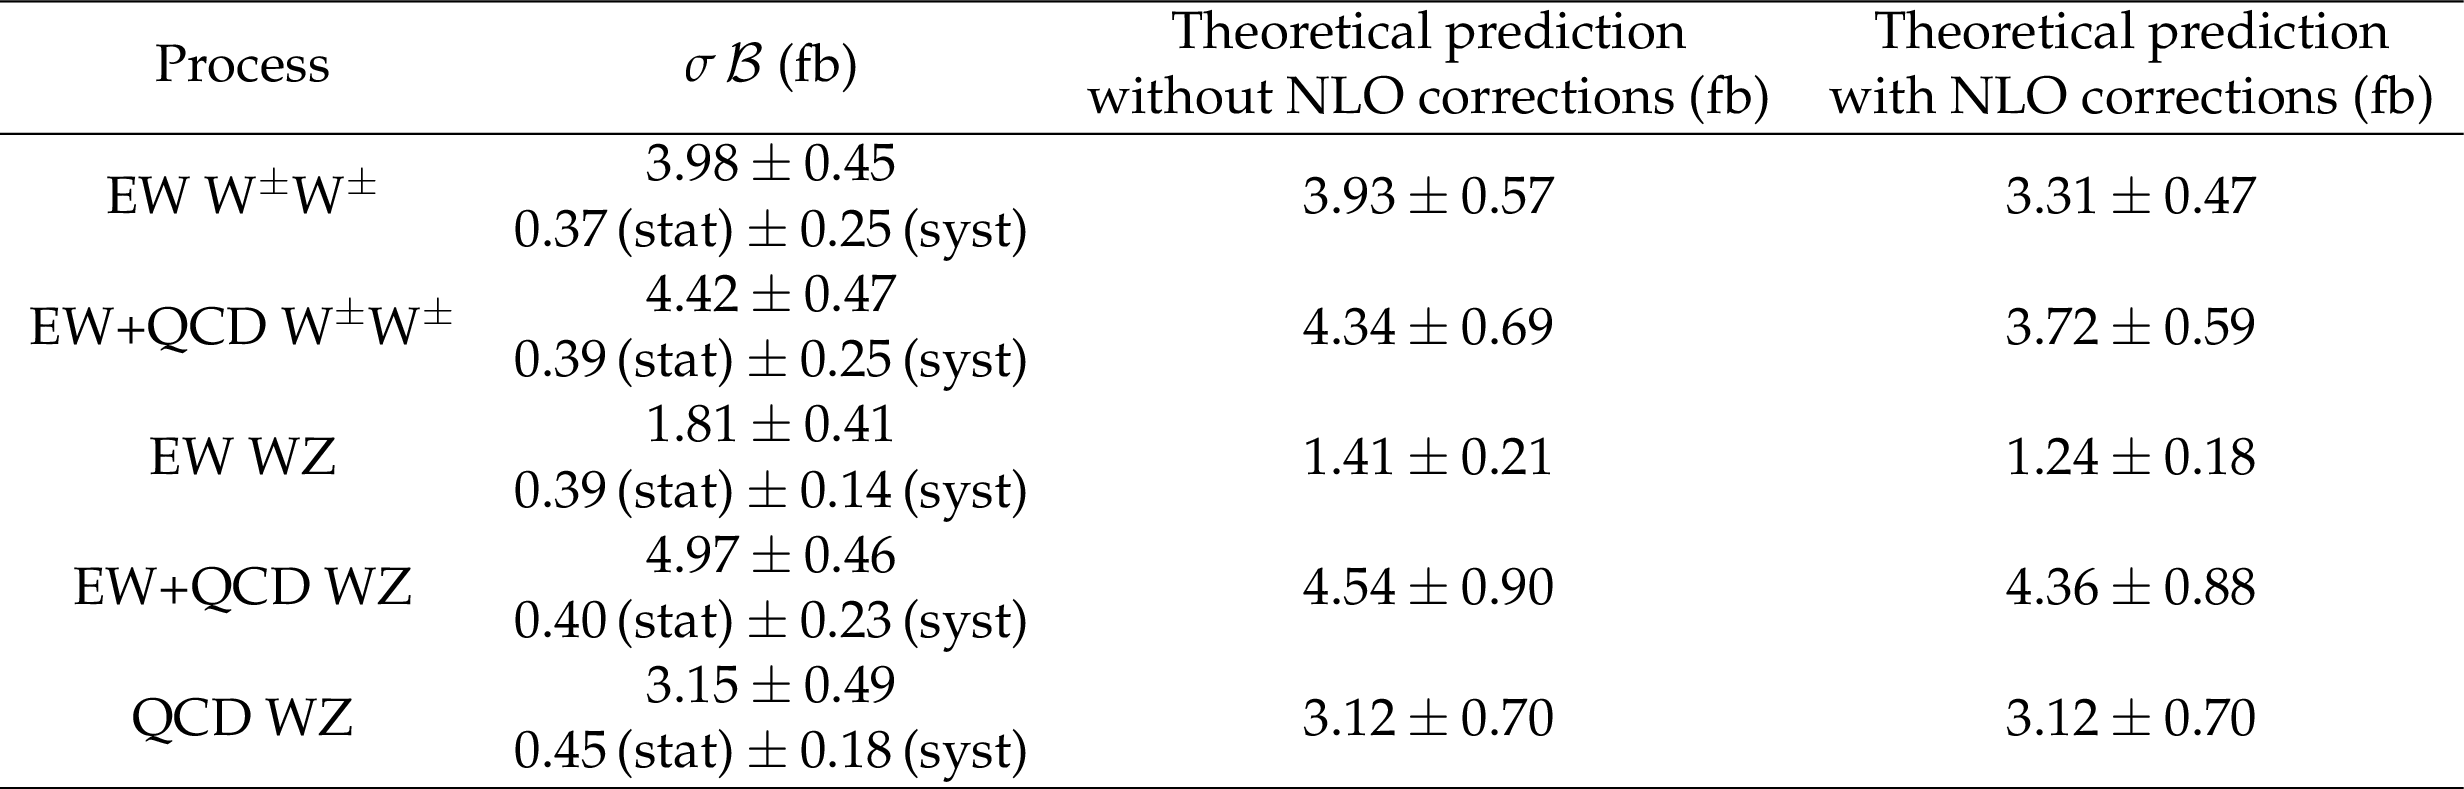
Table 5:
The measured inclusive cross sections for the EW $ {\mathrm{W} ^\pm \mathrm{W} ^\pm} $, EW+QCD $ {\mathrm{W} ^\pm \mathrm{W} ^\pm} $, EW $ {\mathrm{W} \mathrm{Z}} $, EW+QCD $ {\mathrm{W} \mathrm{Z}} $, and QCD $ {\mathrm{W} \mathrm{Z}} $ processes and the theoretical predictions with MadGraph 5_aMC@NLO at LO. The EW processes include the corresponding interference contributions. The theoretical uncertainties include statistical, PDF, and scale uncertainties. Predictions with applying the $\mathcal {O}({\alpha _S} \alpha ^6)$ and $\mathcal {O}(\alpha ^7)$ corrections to the MadGraph 5_aMC@NLO LO cross sections, as described in the text, are also shown. The predictions of the QCD $ {\mathrm{W} ^\pm \mathrm{W} ^\pm} $ and $ {\mathrm{W} \mathrm{Z}} $ processes do not include additional corrections. All reported values are in fb. |
png pdf |
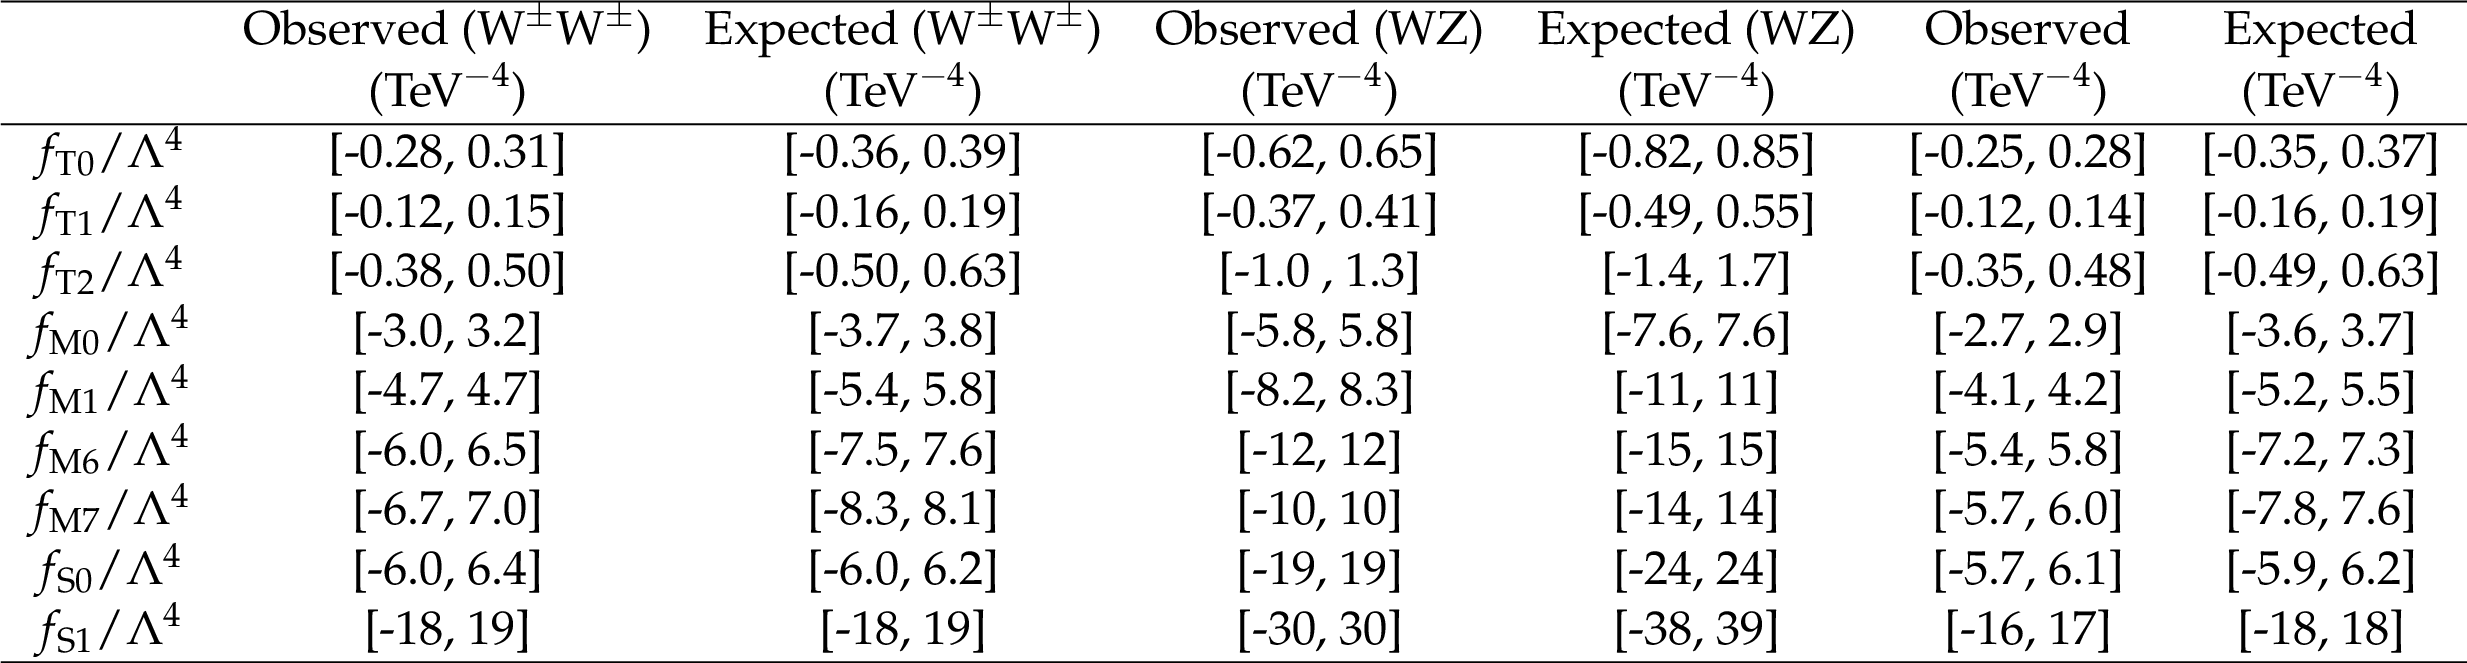
Table 6:
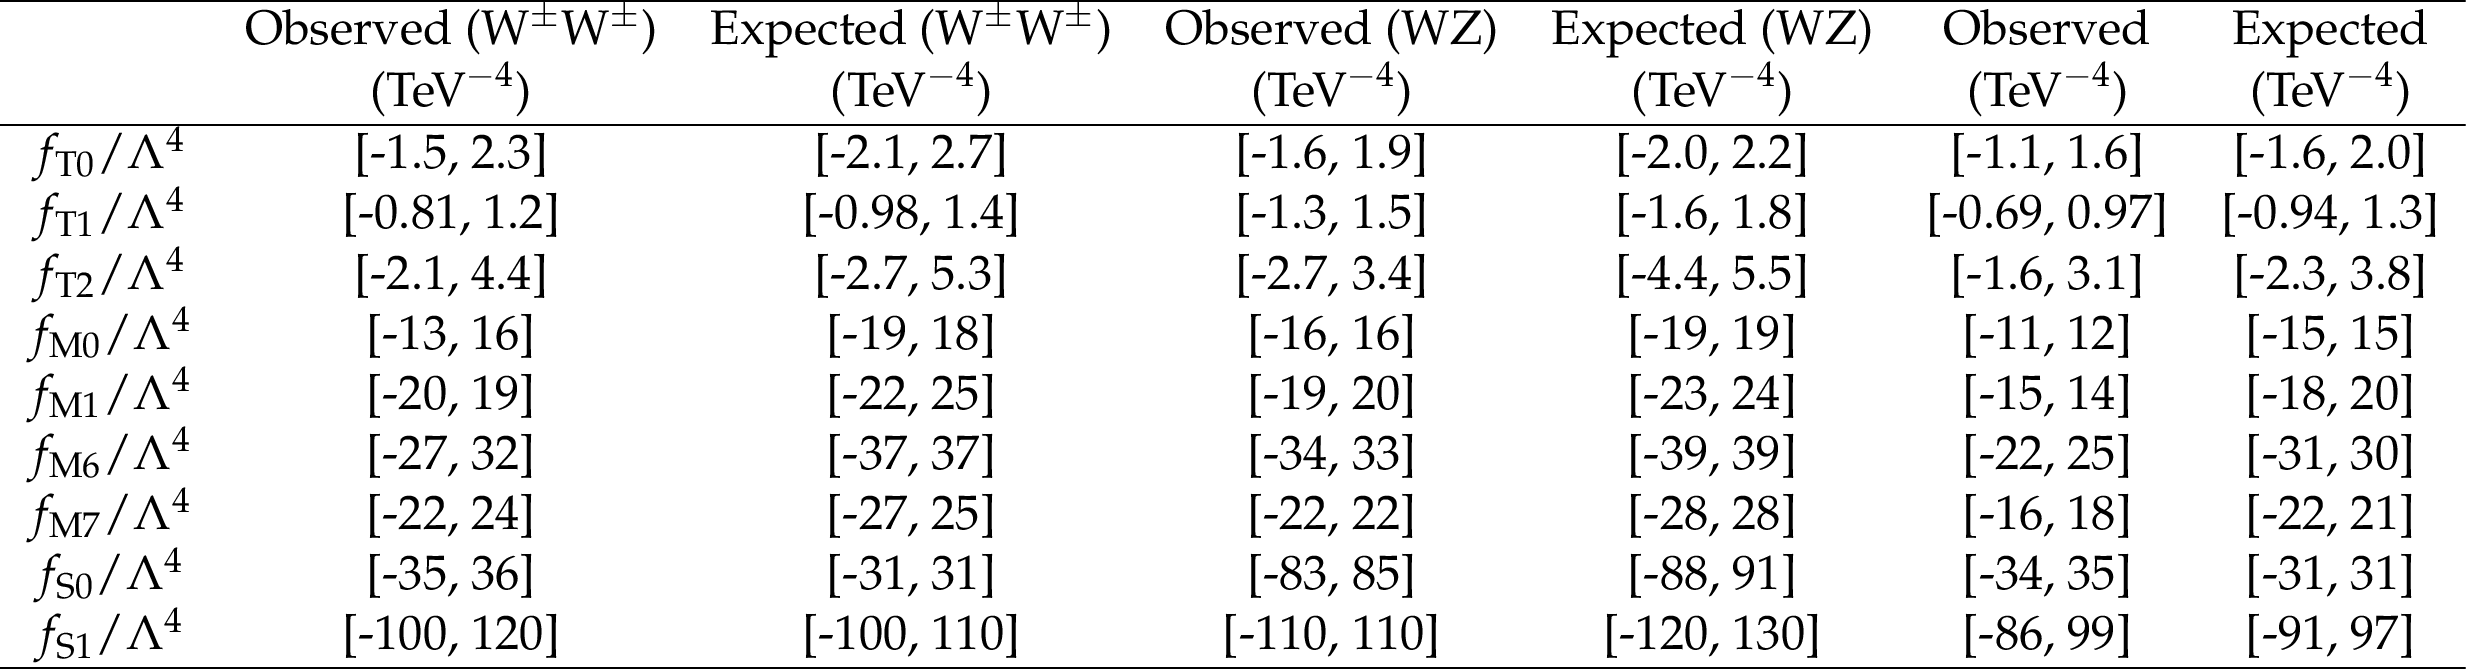
Observed and expected lower and upper 95% CL limits on the parameters of the quartic operators T0, T1, T2, M0, M1, M6, M7, S0, and S1 in $ {\mathrm{W} ^\pm \mathrm{W} ^\pm} $ and $ {\mathrm{W} \mathrm{Z}} $ channels, obtained without using any unitarization procedure. The last two columns show the observed and expected limits for the combination of the $ {\mathrm{W} ^\pm \mathrm{W} ^\pm} $ and $ {\mathrm{W} \mathrm{Z}} $ channels. Results are obtained by setting all other aQGCs parameters to zero. |
png pdf |
Table 7:
Observed and expected lower and upper 95% CL limits on the parameters of the quartic operators T0, T1, T2, M0, M1, M6, M7, S0, and S1 in $ {\mathrm{W} ^\pm \mathrm{W} ^\pm} $ and $ {\mathrm{W} \mathrm{Z}} $ channels by cutting the EFT expansion at the unitarity limit. The last two columns show the observed and expected limits for the combination of the $ {\mathrm{W} ^\pm \mathrm{W} ^\pm} $ and $ {\mathrm{W} \mathrm{Z}} $ channels. Results are obtained by setting all other aQGCs parameters to zero. |
| Summary |
| The production cross sections of WZ and same-sign WW boson pairs in association with two jets are measured in proton-proton collisions at a center-of-mass energy of 13 TeV. The data sample corresponds to an integrated luminosity of 137 fb$^{-1}$, collected with the CMS detector during 2016-18. The measurements are performed in the leptonic decay modes $\mathrm{W}^\pm\mathrm{Z} \to \ell^\pm\nu\ell'^\pm\ell'^\mp$ and ${\mathrm{W}^\pm\mathrm{W}^\pm} \to \ell^\pm\nu\ell'^\pm\nu$, where $\ell, \ell' = $ e, $\mu$. An observation of electroweak production of WZ boson pairs is reported with an observed (expected) significance of 6.8 (5.3) standard deviations. Differential cross sections as functions of the invariant masses of the jet and charged lepton pairs, as well as the leading-lepton transverse momentum, are measured for ${\mathrm{W}^\pm\mathrm{W}^\pm} $ production and are compared to the standard model predictions. Differential cross sections as a function of the invariant mass of the jet pair are also measured for WZ production. Stringent limits are set in the framework of effective field theory, with and without consideration of tree-level unitarity violation, on the dimension-8 operators T0, T1, T2, M0, M1, M6, M7, S0, and S1. |
| Additional Figures | |
png pdf |
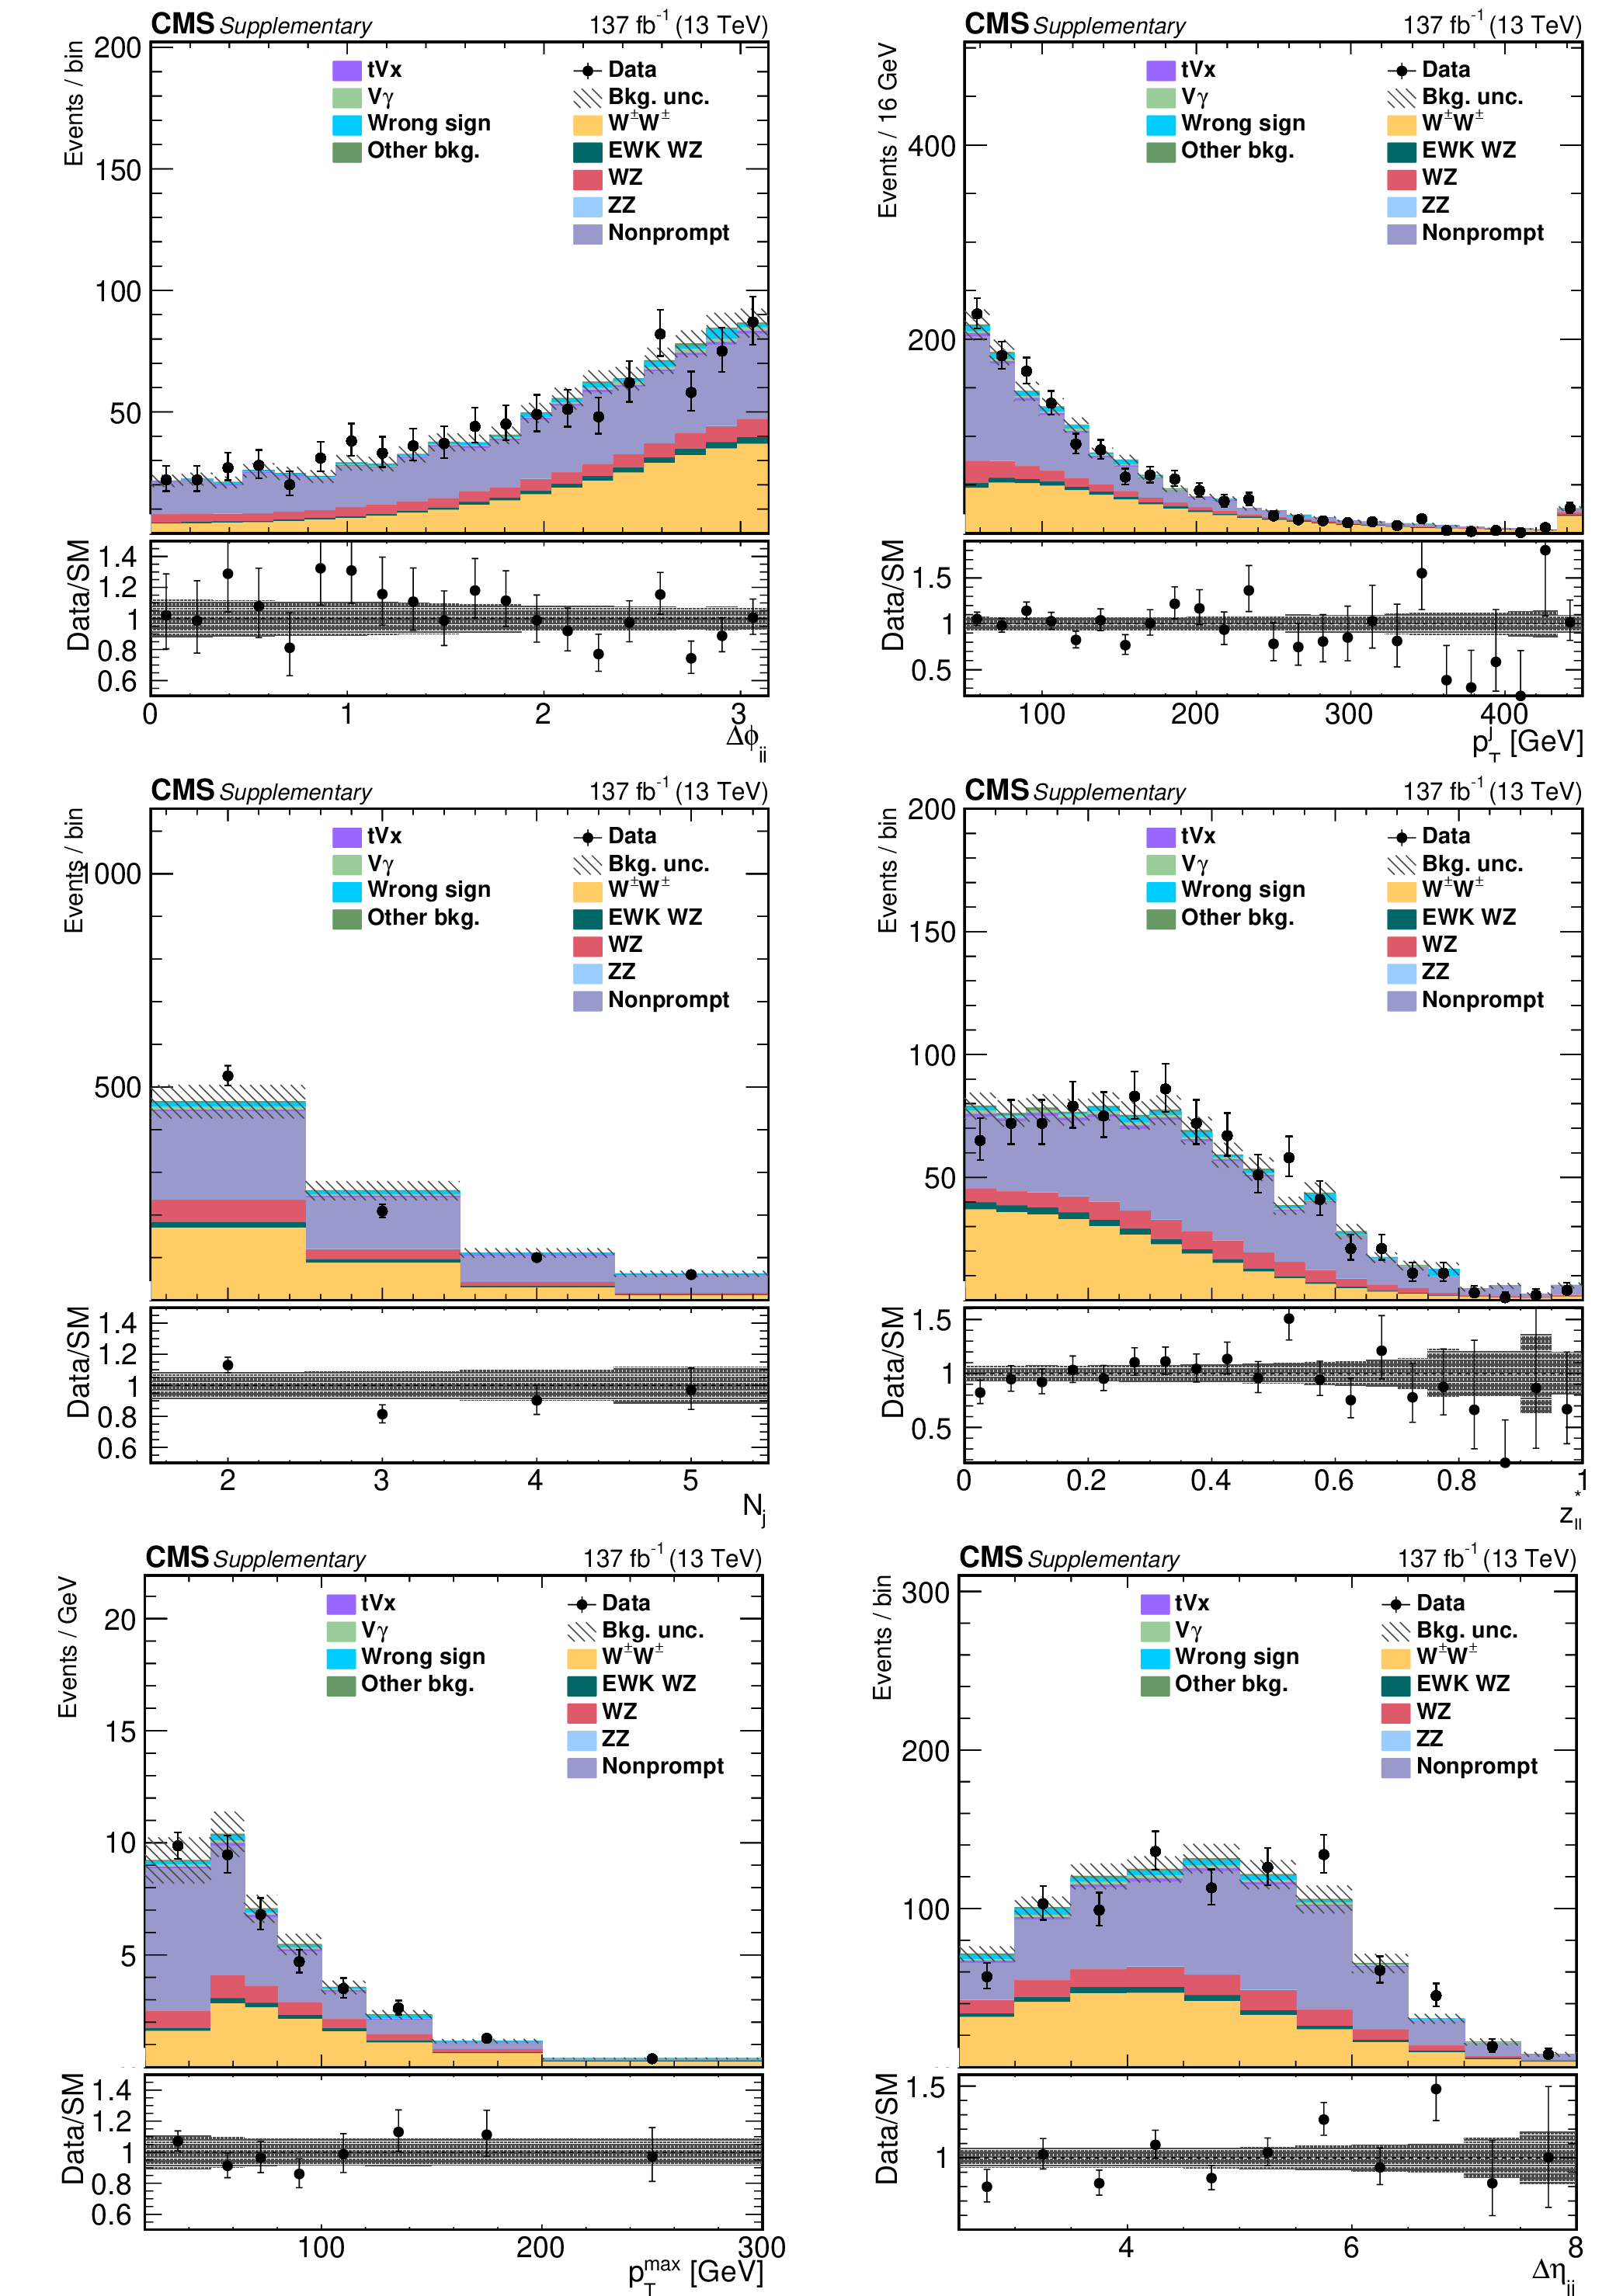
Additional Figure 1:
Distributions of $ {\Delta \phi _{{\mathrm {j}} {\mathrm {j}}}} $ (upper left), the $ {p_{\mathrm {T}}} $ of the two leading jets (upper right), the jet multiplicity by counting jets with $ {p_{\mathrm {T}}} > $ 30 GeV and $| \eta | < $ 4.7 (center left), $z_{\ell \ell}^{*}$ (center right), $ {{p_{\mathrm {T}}} ^{\mathrm {max}}} $ (bottom left), and $ {{| \Delta \eta _{{\mathrm {j}} {\mathrm {j}}} |}} $ (bottom right) in the $ {{\mathrm {W}}^\pm {\mathrm {W}}^\pm} $ SR. The predicted yields are shown with their best-fit normalizations from the simultaneous fit. The overflow is included in the last bin. The bottom panel in each figure shows the ratio of the number of events observed in data to that of the total SM prediction. The gray bands represent the uncertainties from the predicted yields. |

png pdf |
Additional Figure 1-a:
Distribution of $ {\Delta \phi _{{\mathrm {j}} {\mathrm {j}}}} $ in the $ {{\mathrm {W}}^\pm {\mathrm {W}}^\pm} $ SR. The predicted yields are shown with their best-fit normalizations from the simultaneous fit. The overflow is included in the last bin. The bottom panel shows the ratio of the number of events observed in data to that of the total SM prediction. The gray bands represent the uncertainties from the predicted yields. |
png pdf |
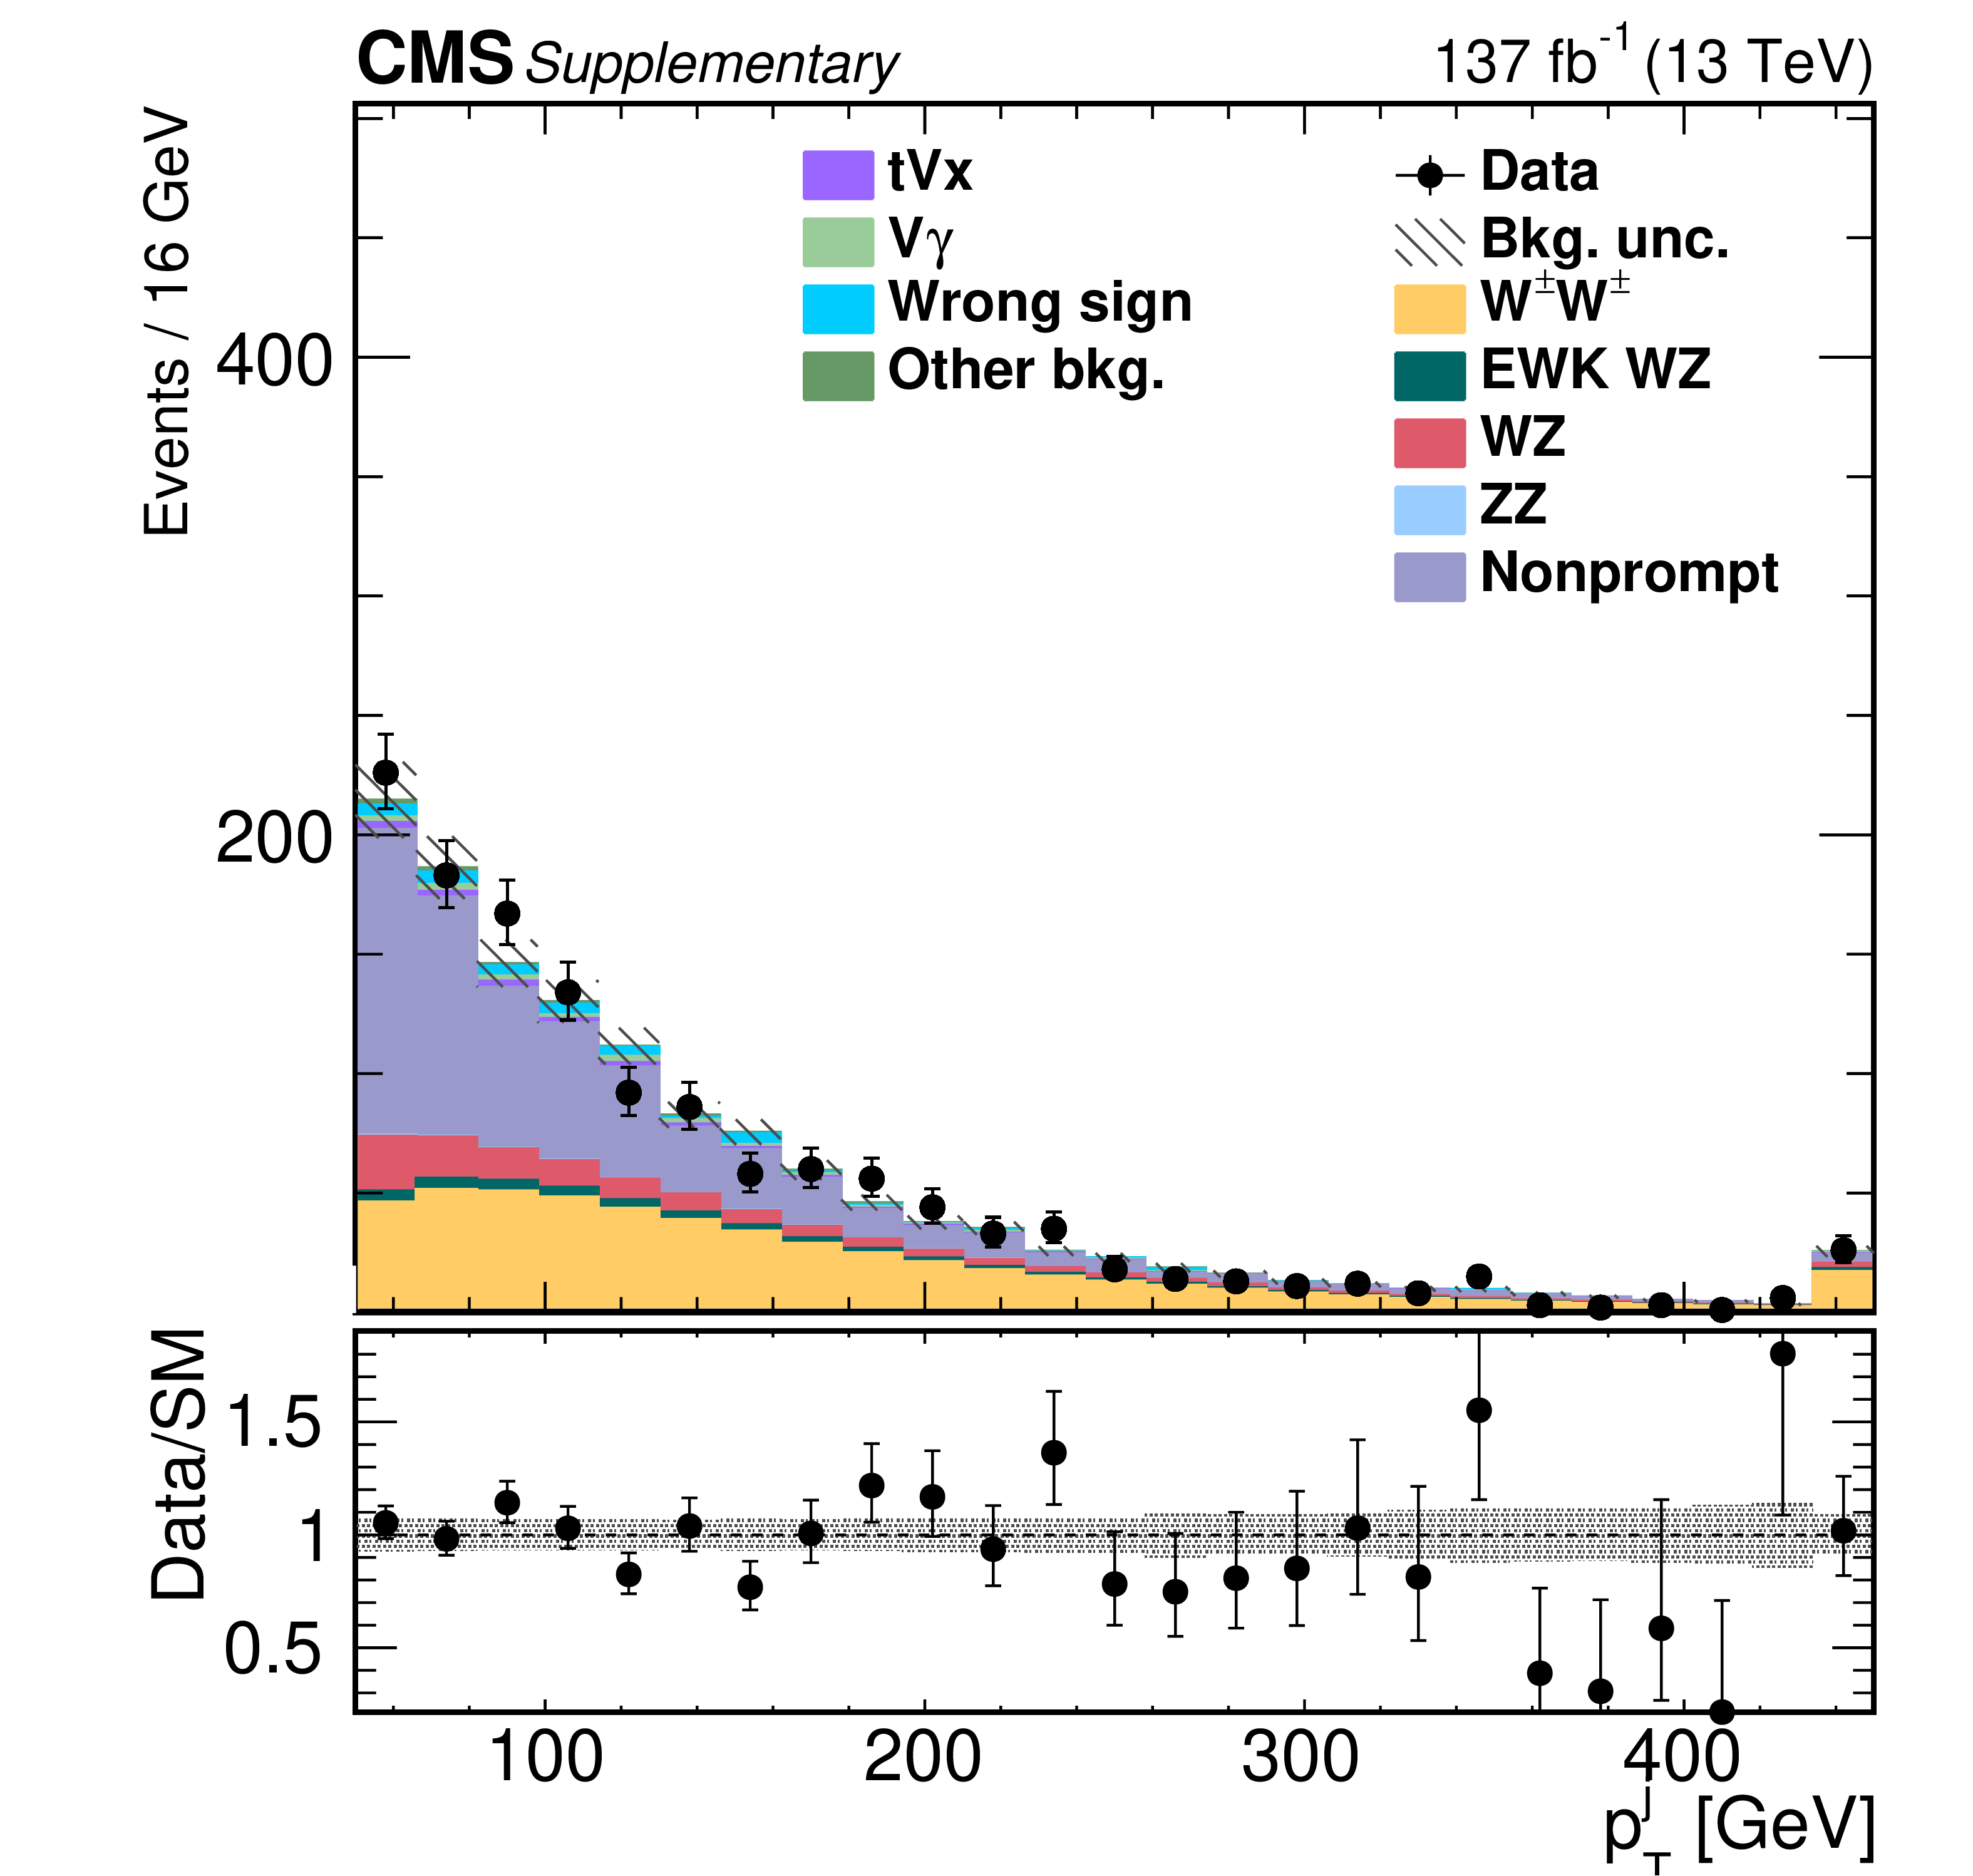
Additional Figure 1-b:
Distribution of $ {p_{\mathrm {T}}} $ of the two leading jets in the $ {{\mathrm {W}}^\pm {\mathrm {W}}^\pm} $ SR. The predicted yields are shown with their best-fit normalizations from the simultaneous fit. The overflow is included in the last bin. The bottom panel shows the ratio of the number of events observed in data to that of the total SM prediction. The gray bands represent the uncertainties from the predicted yields. |

png pdf |
Additional Figure 1-c:
Distribution of the jet multiplicity by counting jets with $ {p_{\mathrm {T}}} > $ 30 GeV and $| \eta | < $ 4.7 in the $ {{\mathrm {W}}^\pm {\mathrm {W}}^\pm} $ SR. The predicted yields are shown with their best-fit normalizations from the simultaneous fit. The overflow is included in the last bin. The bottom panel shows the ratio of the number of events observed in data to that of the total SM prediction. The gray bands represent the uncertainties from the predicted yields. |
png pdf |
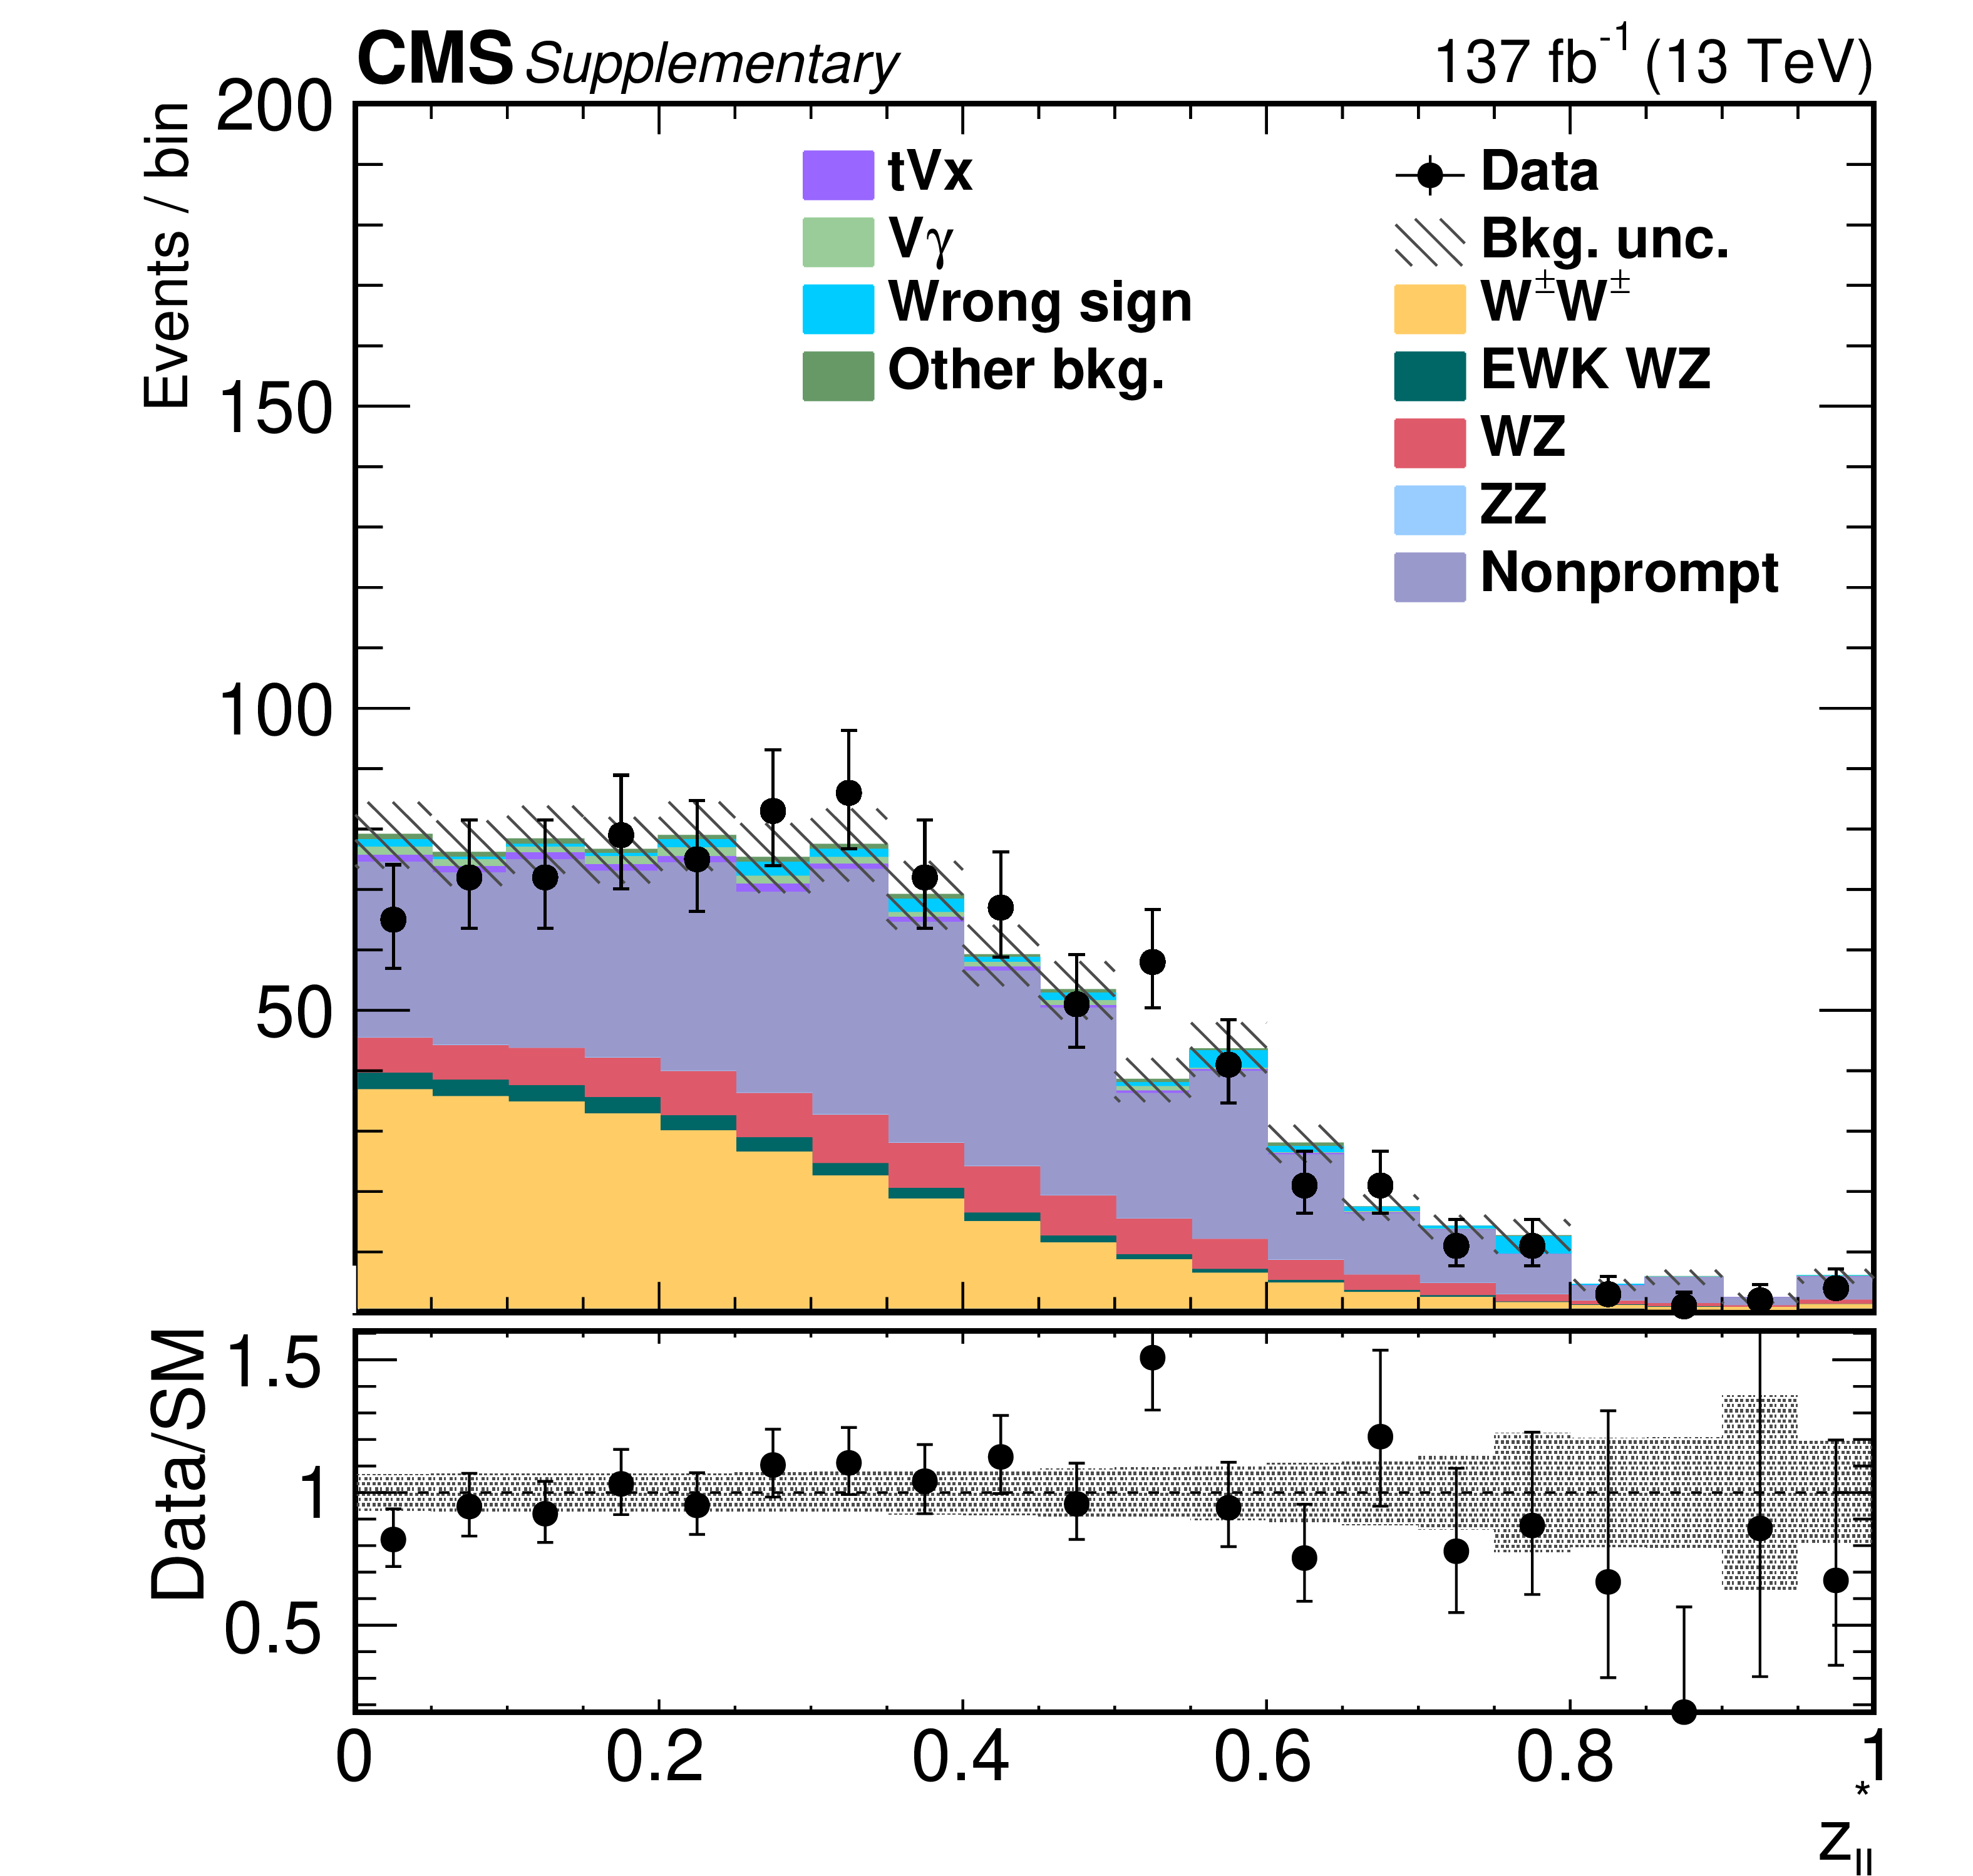
Additional Figure 1-d:
Distribution of $z_{\ell \ell}^{*}$ in the $ {{\mathrm {W}}^\pm {\mathrm {W}}^\pm} $ SR. The predicted yields are shown with their best-fit normalizations from the simultaneous fit. The overflow is included in the last bin. The bottom panel shows the ratio of the number of events observed in data to that of the total SM prediction. The gray bands represent the uncertainties from the predicted yields. |
png pdf |
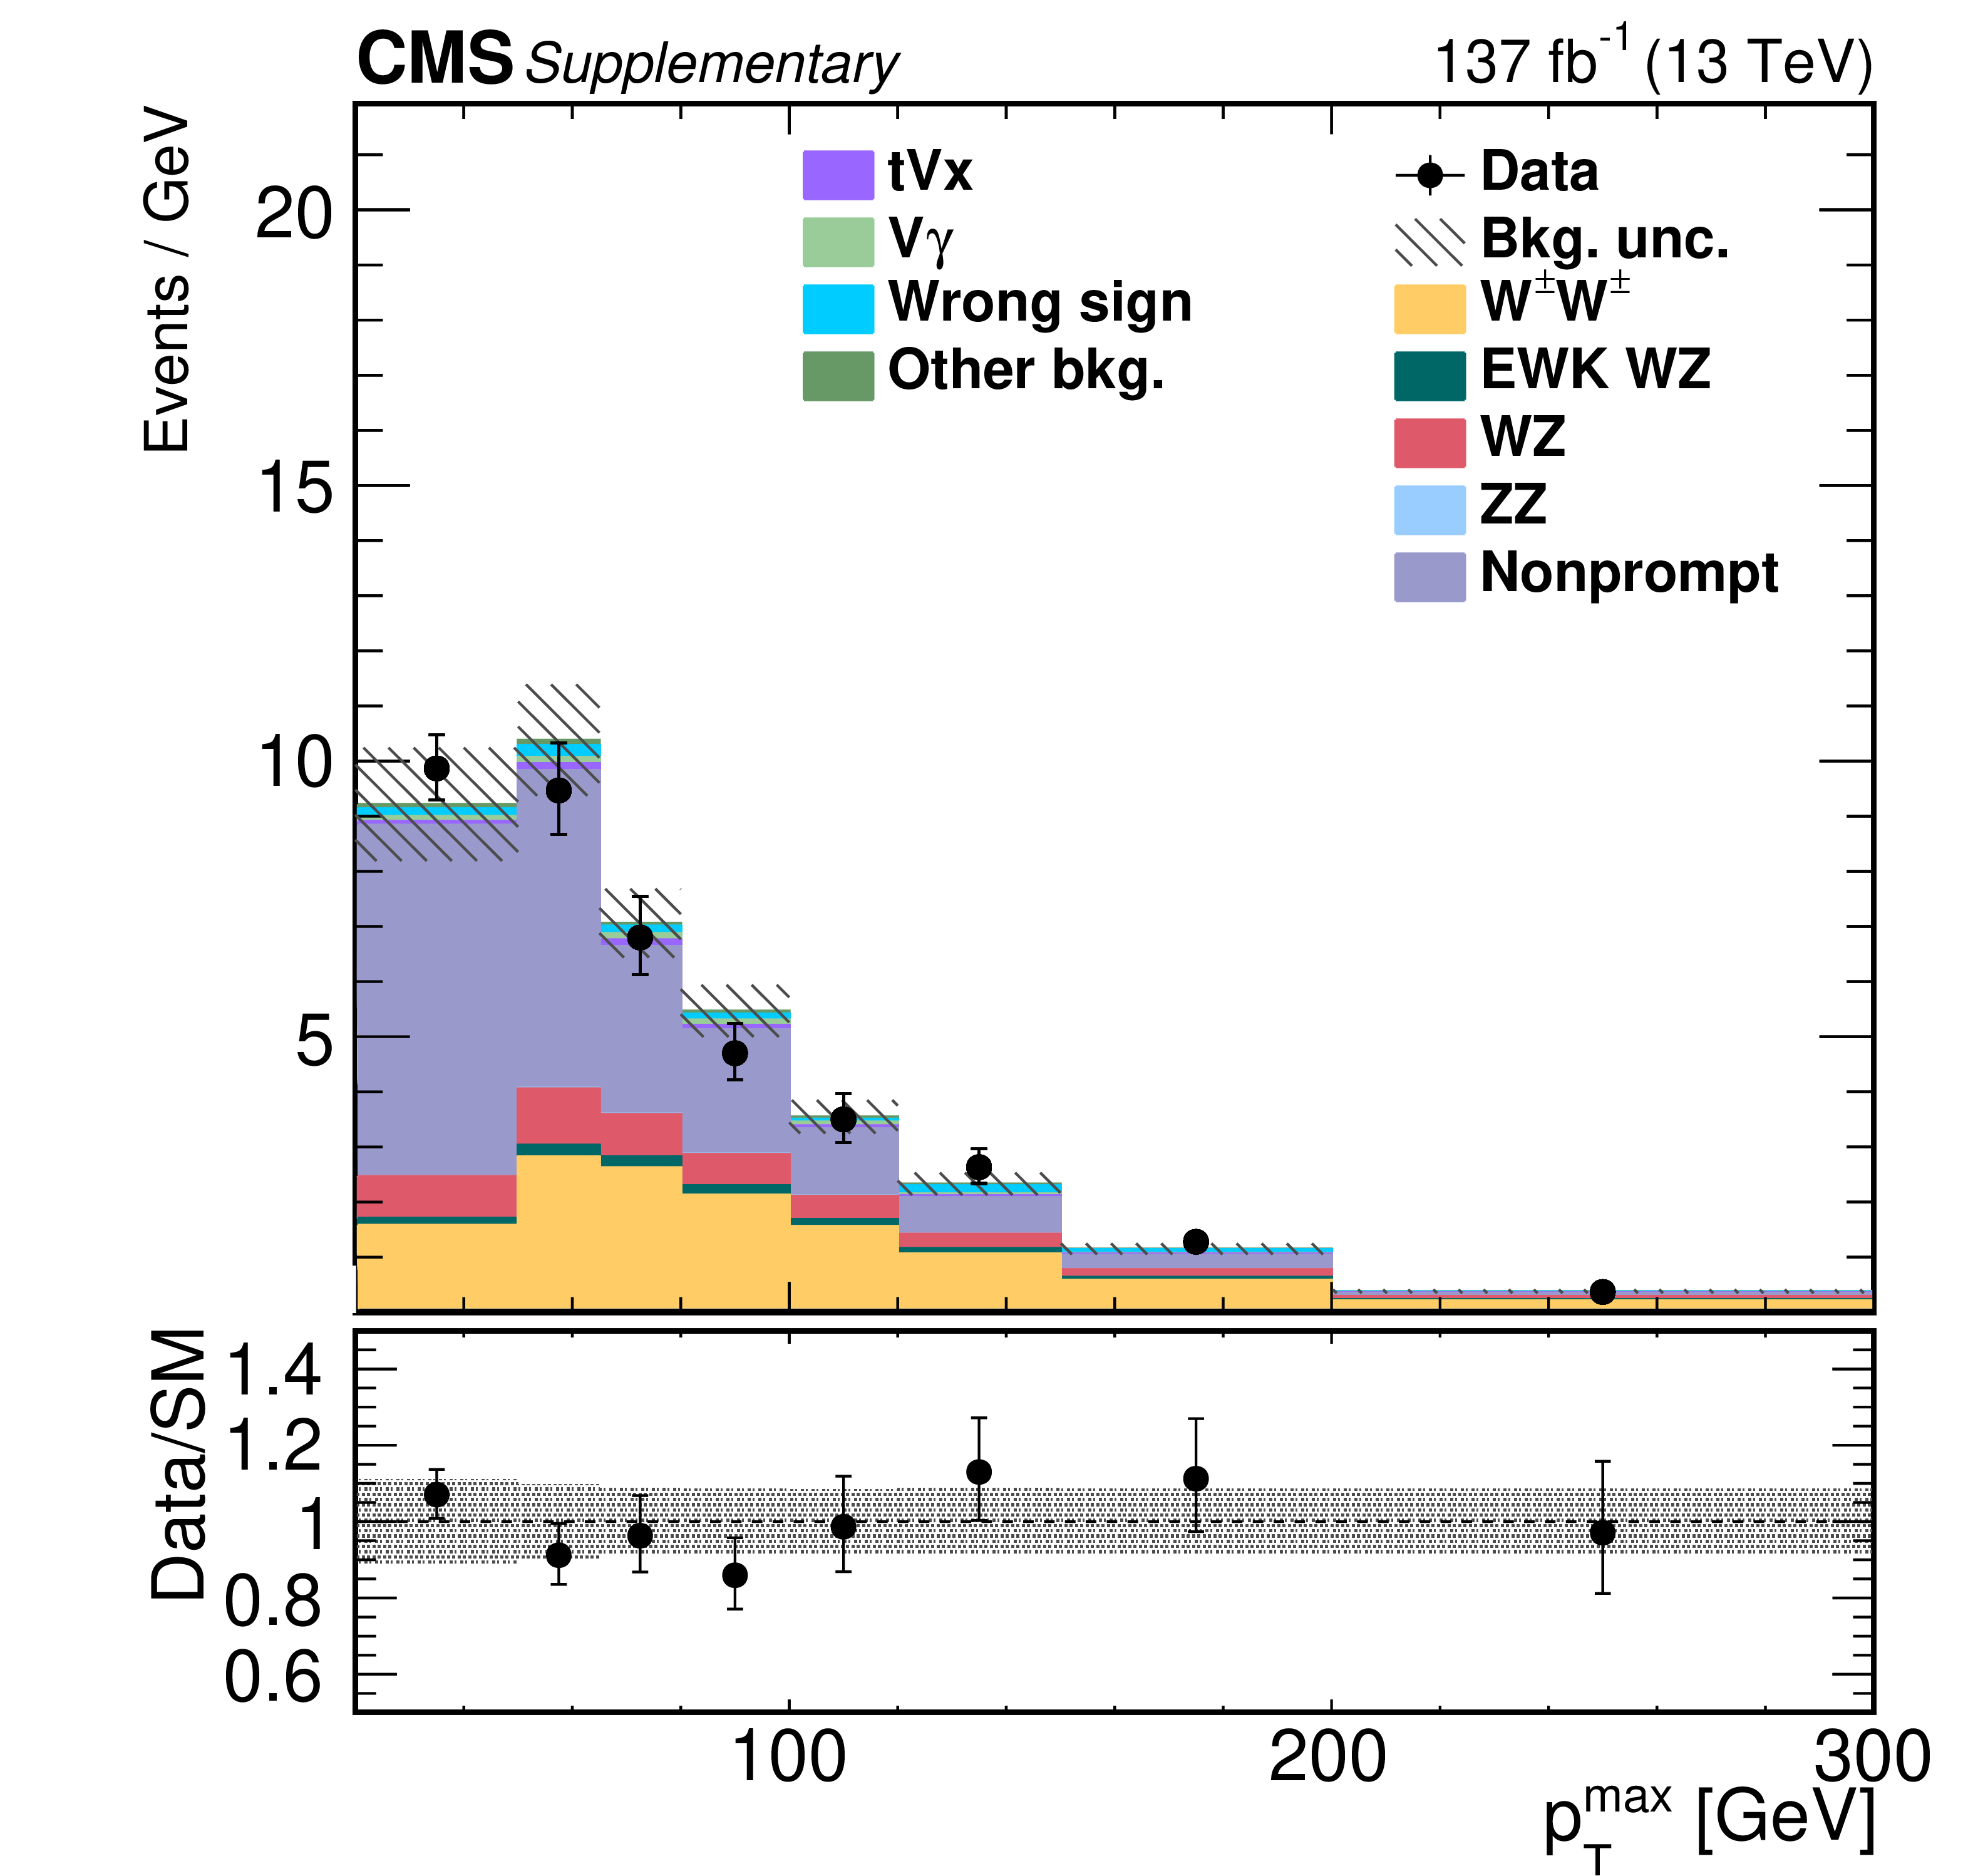
Additional Figure 1-e:
Distribution of $ {{p_{\mathrm {T}}} ^{\mathrm {max}}} $ in the $ {{\mathrm {W}}^\pm {\mathrm {W}}^\pm} $ SR. The predicted yields are shown with their best-fit normalizations from the simultaneous fit. The overflow is included in the last bin. The bottom panel shows the ratio of the number of events observed in data to that of the total SM prediction. The gray bands represent the uncertainties from the predicted yields. |

png pdf |
Additional Figure 1-f:
Distribution of $ {{| \Delta \eta _{{\mathrm {j}} {\mathrm {j}}} |}} $ in the $ {{\mathrm {W}}^\pm {\mathrm {W}}^\pm} $ SR. The predicted yields are shown with their best-fit normalizations from the simultaneous fit. The overflow is included in the last bin. The bottom panel shows the ratio of the number of events observed in data to that of the total SM prediction. The gray bands represent the uncertainties from the predicted yields. |
png pdf |
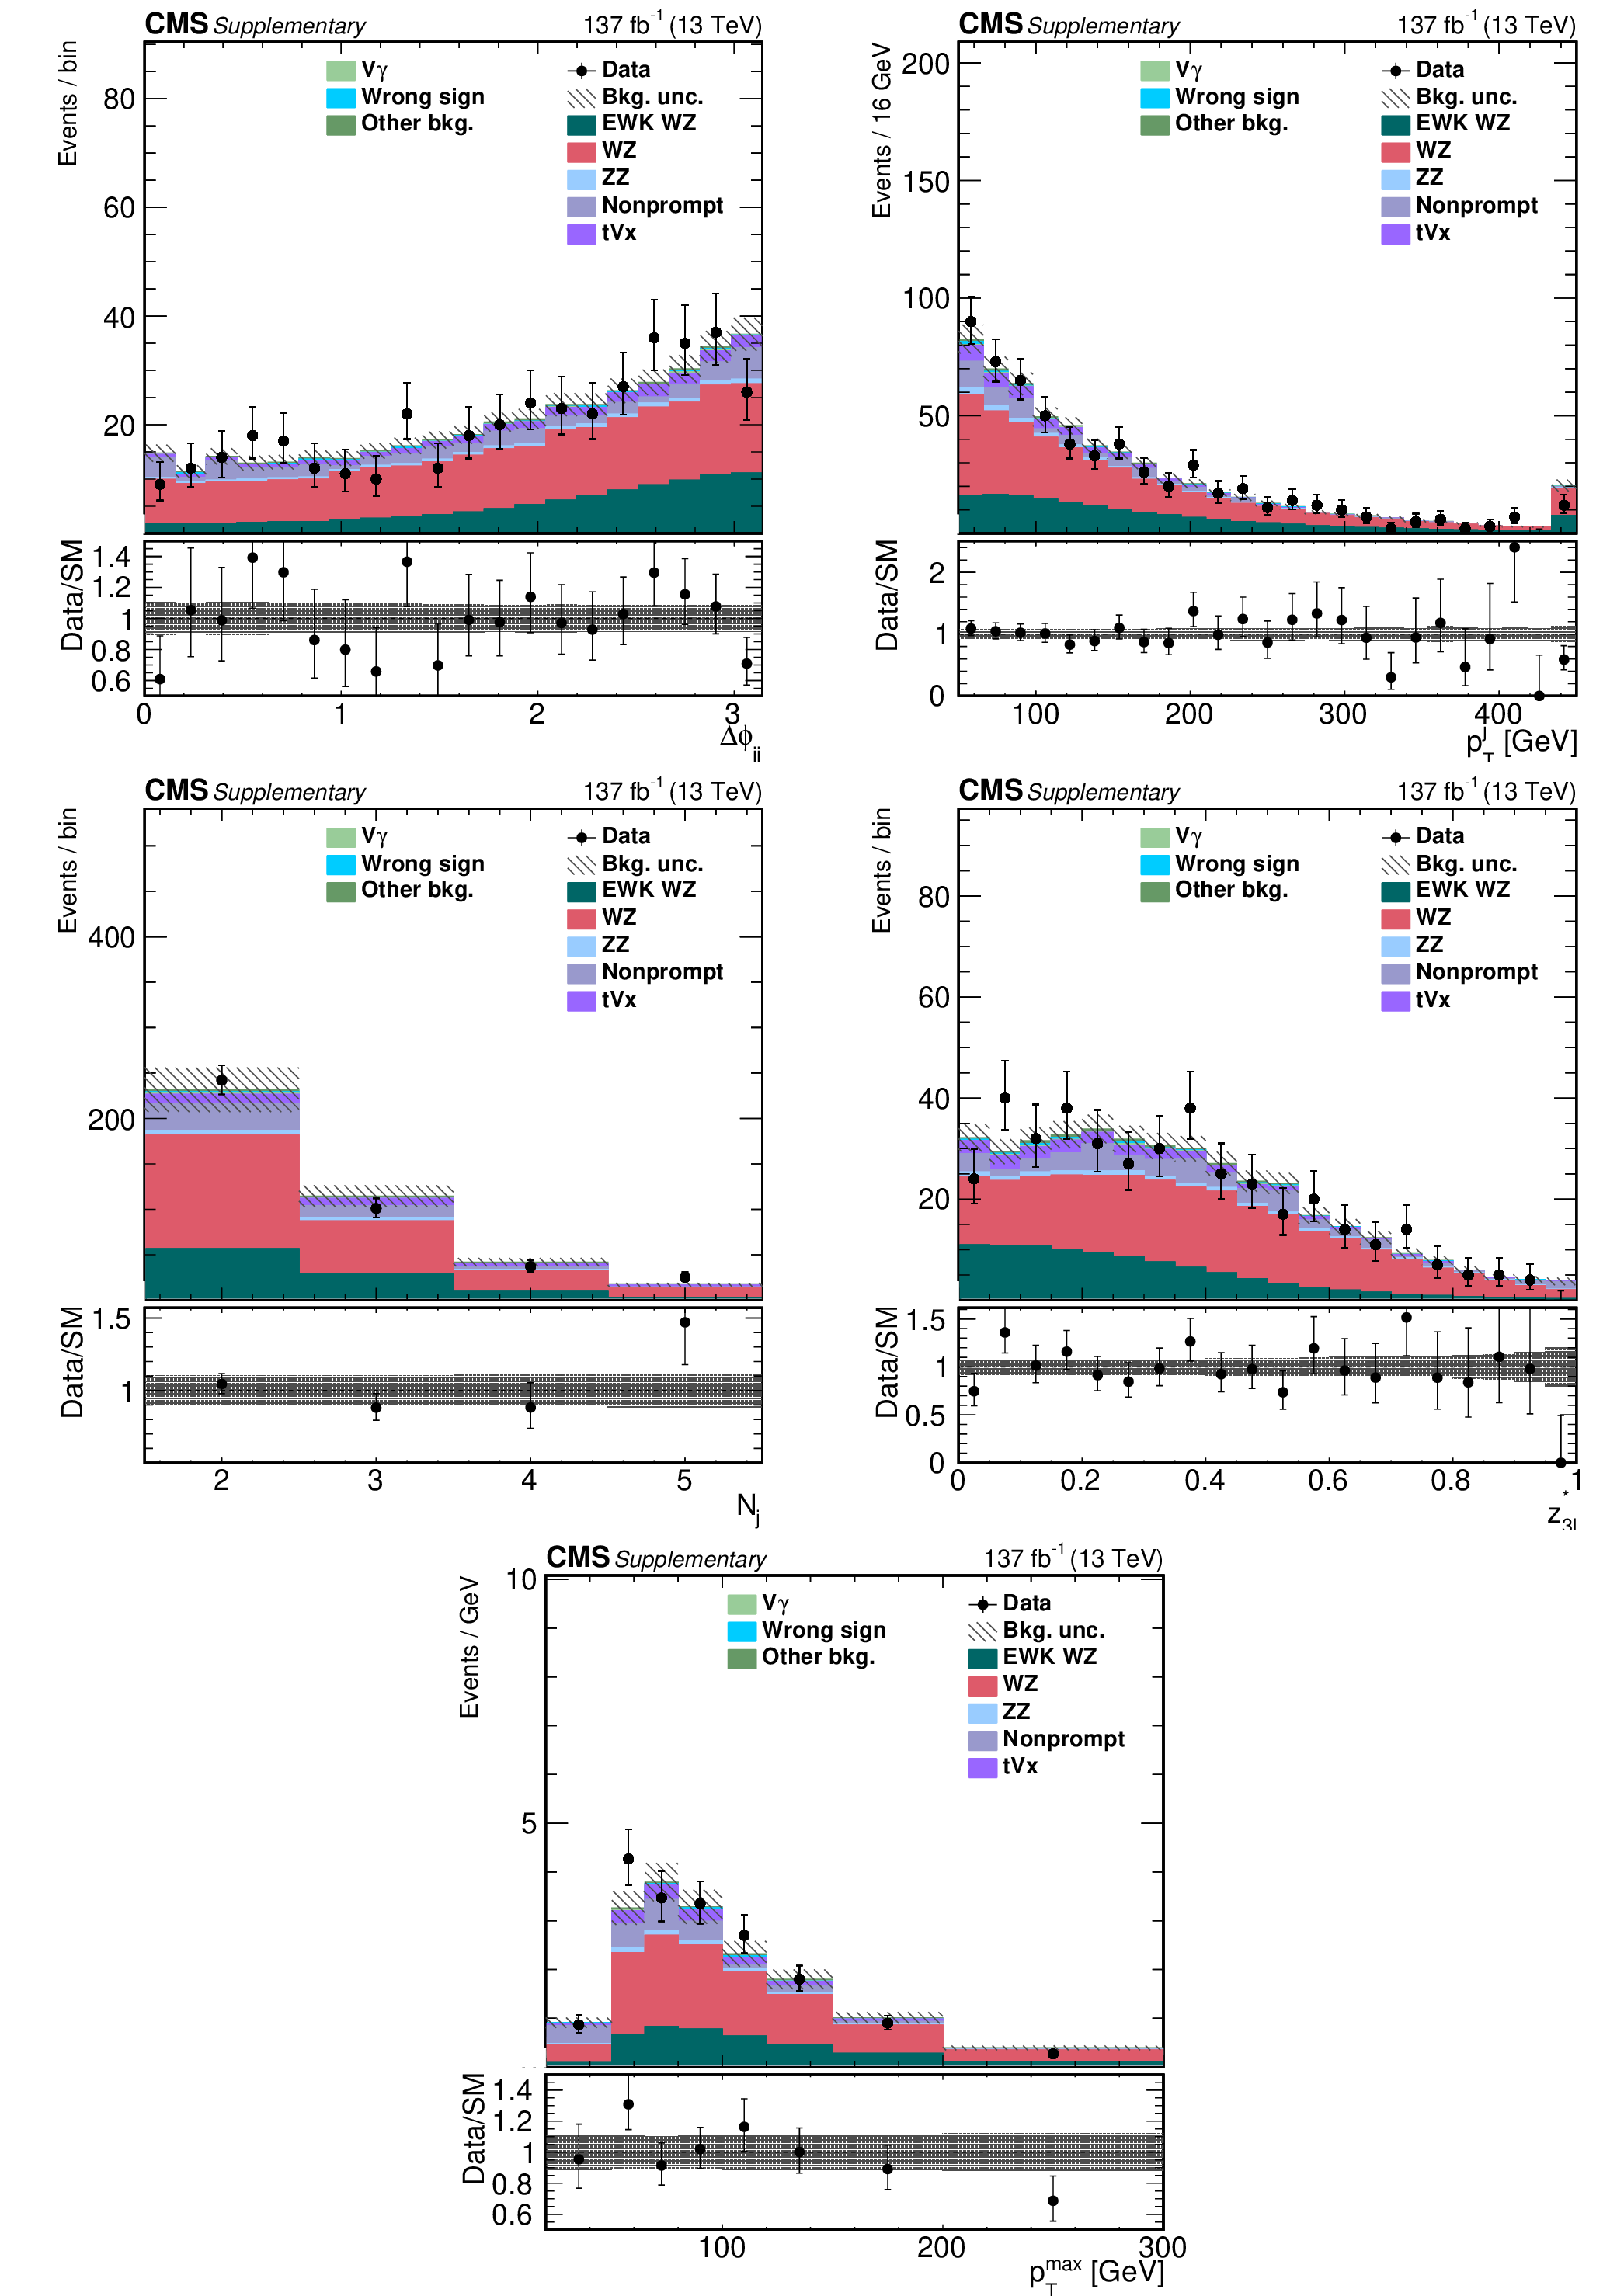
Additional Figure 2:
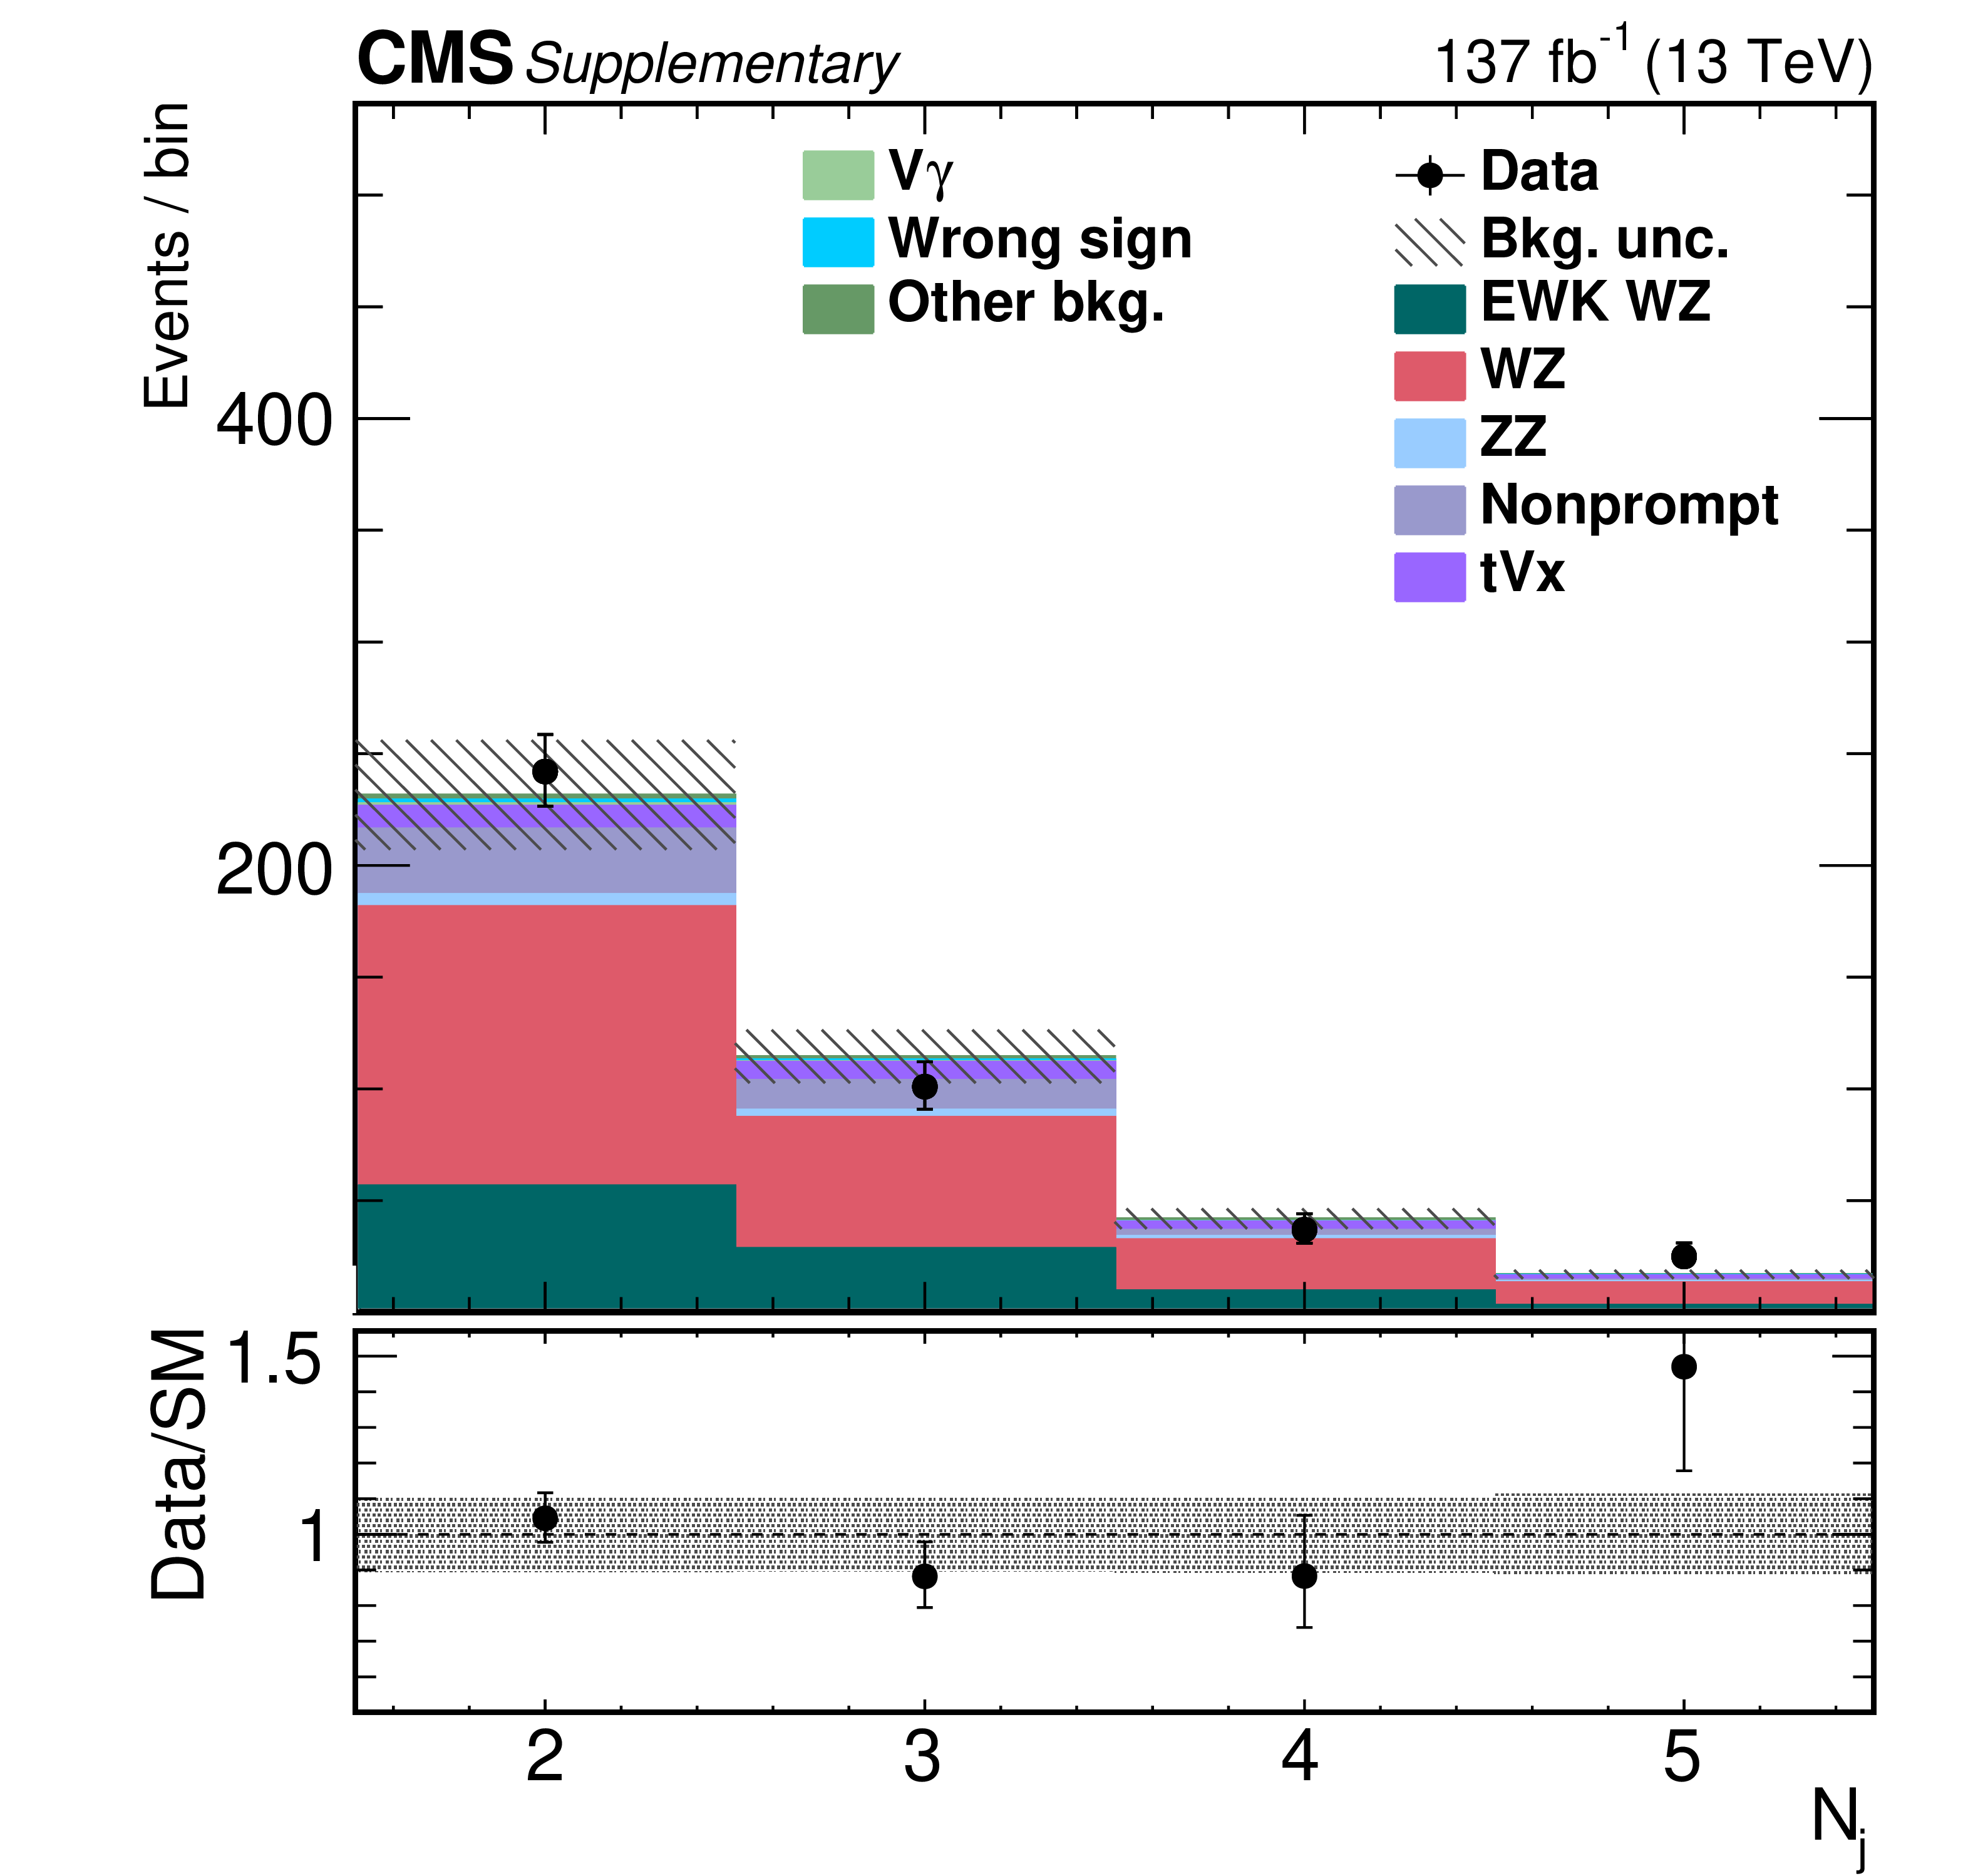
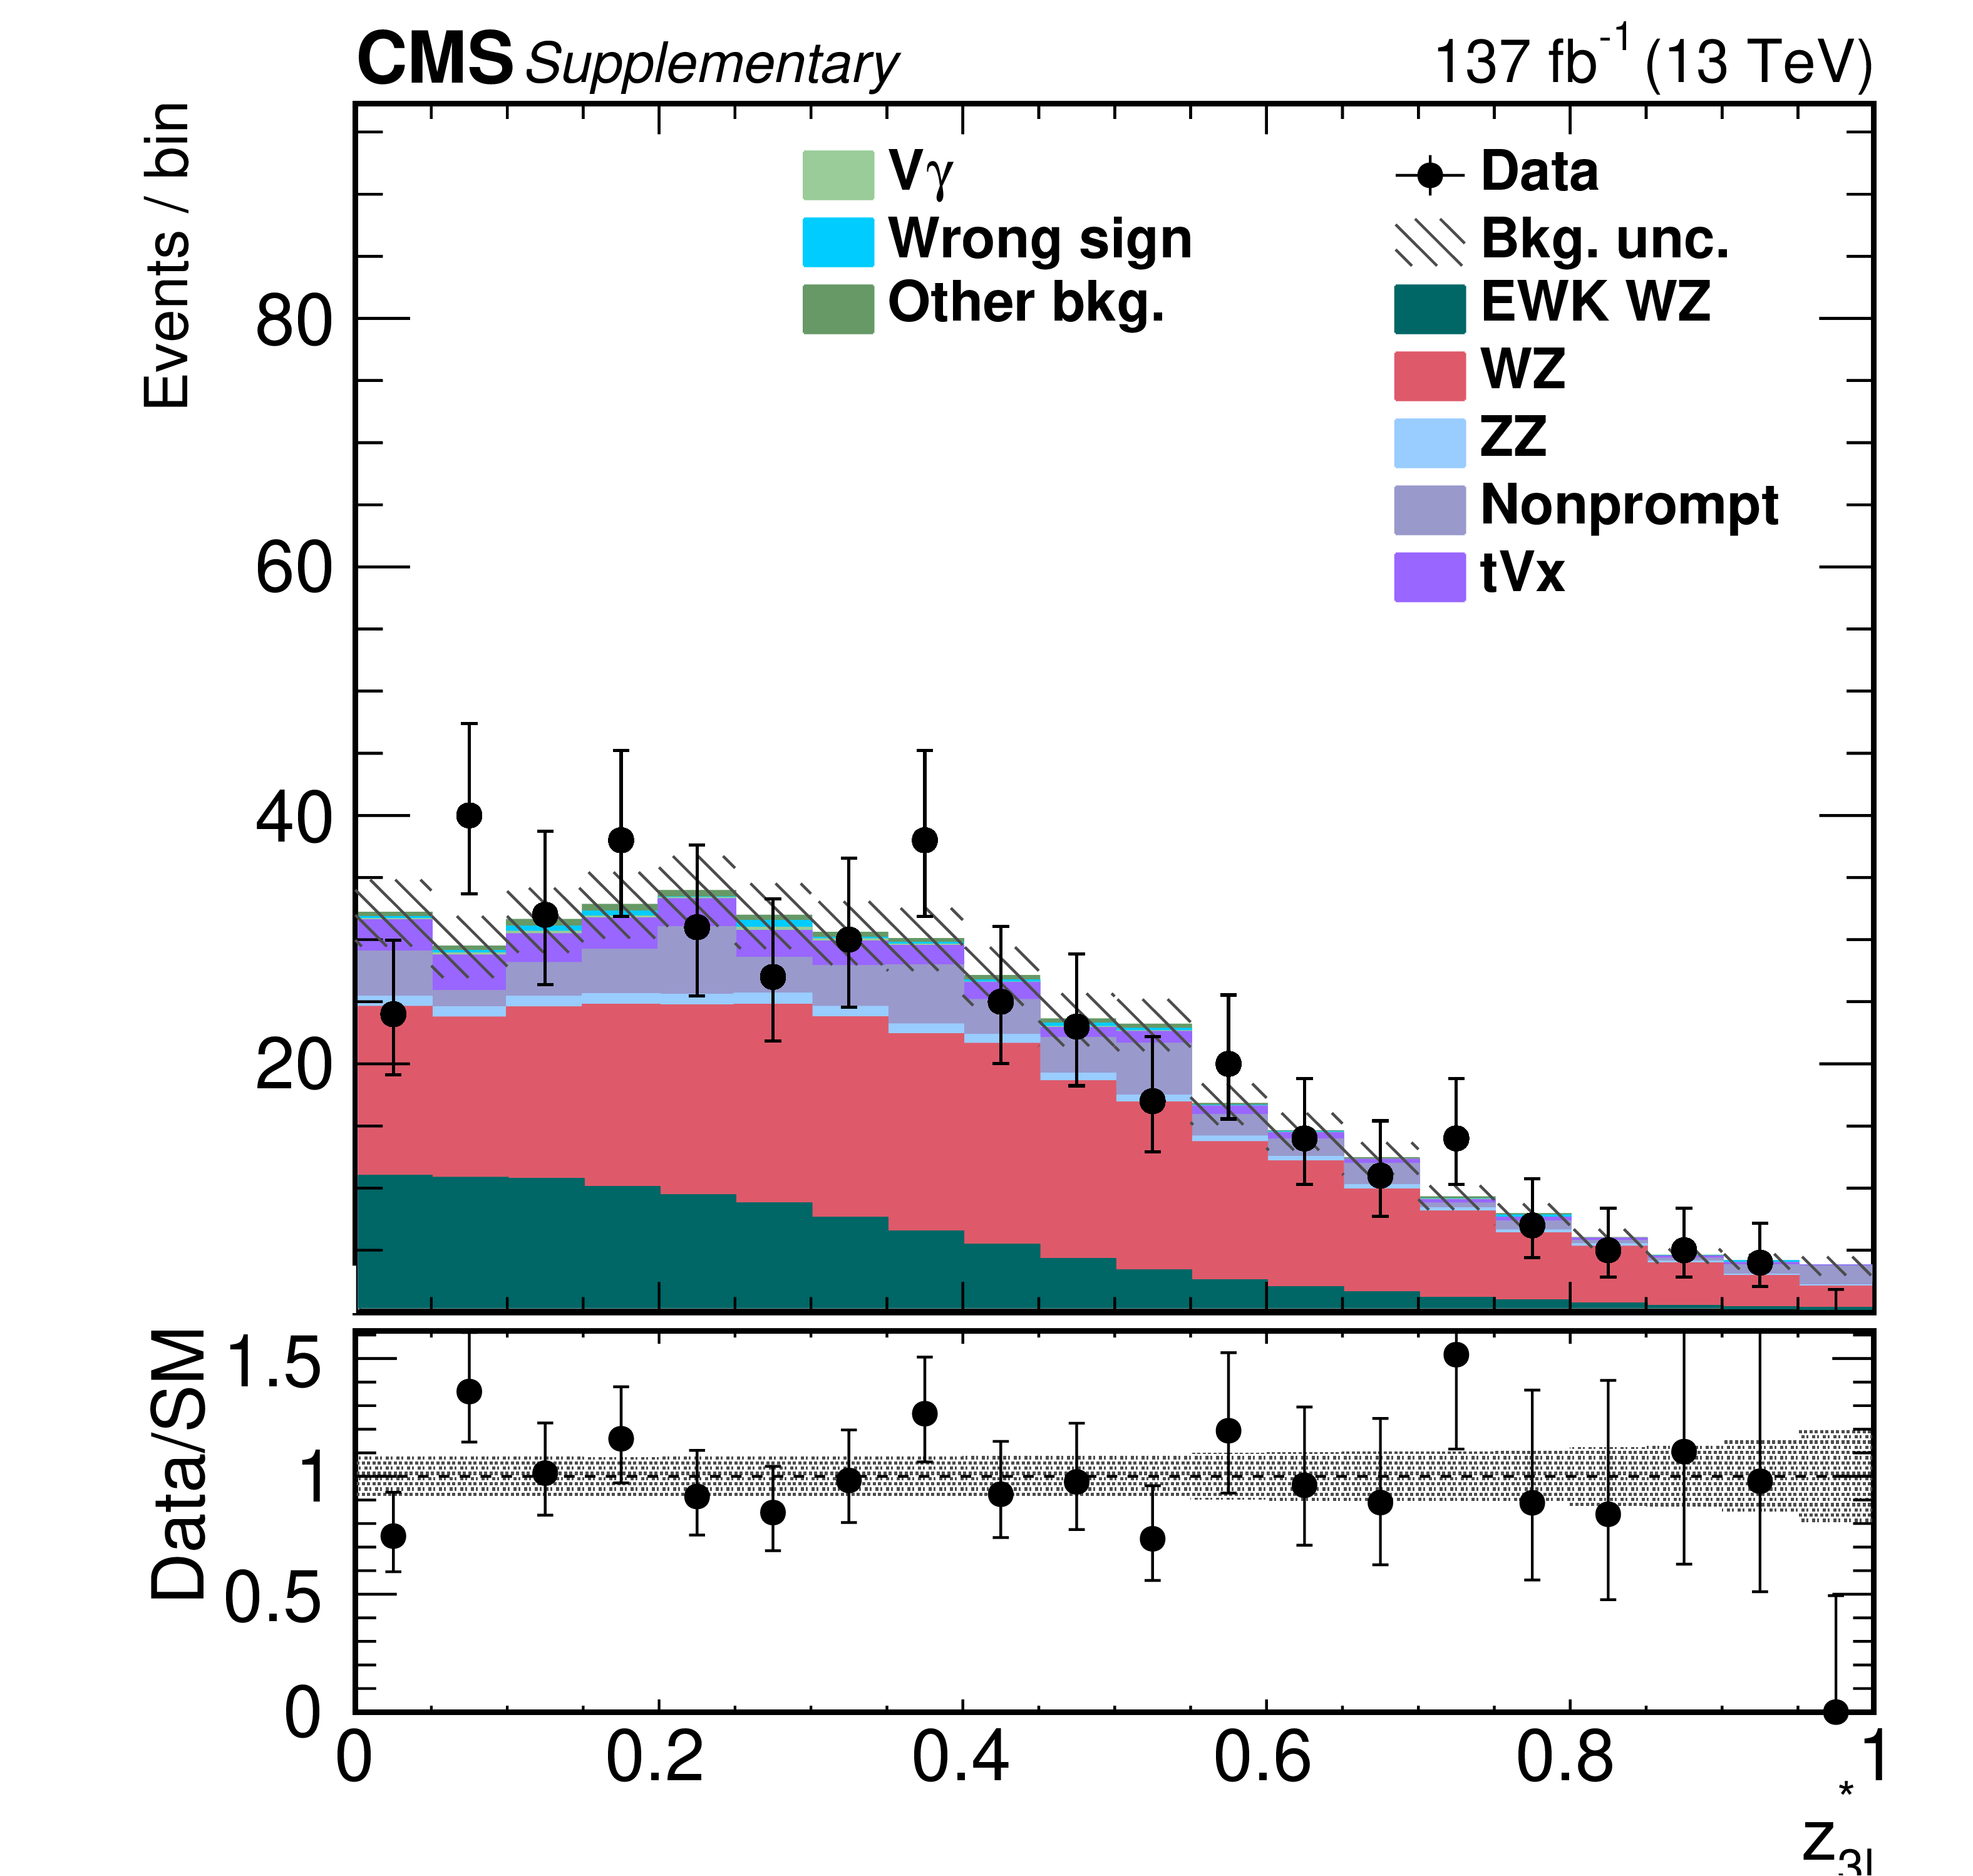
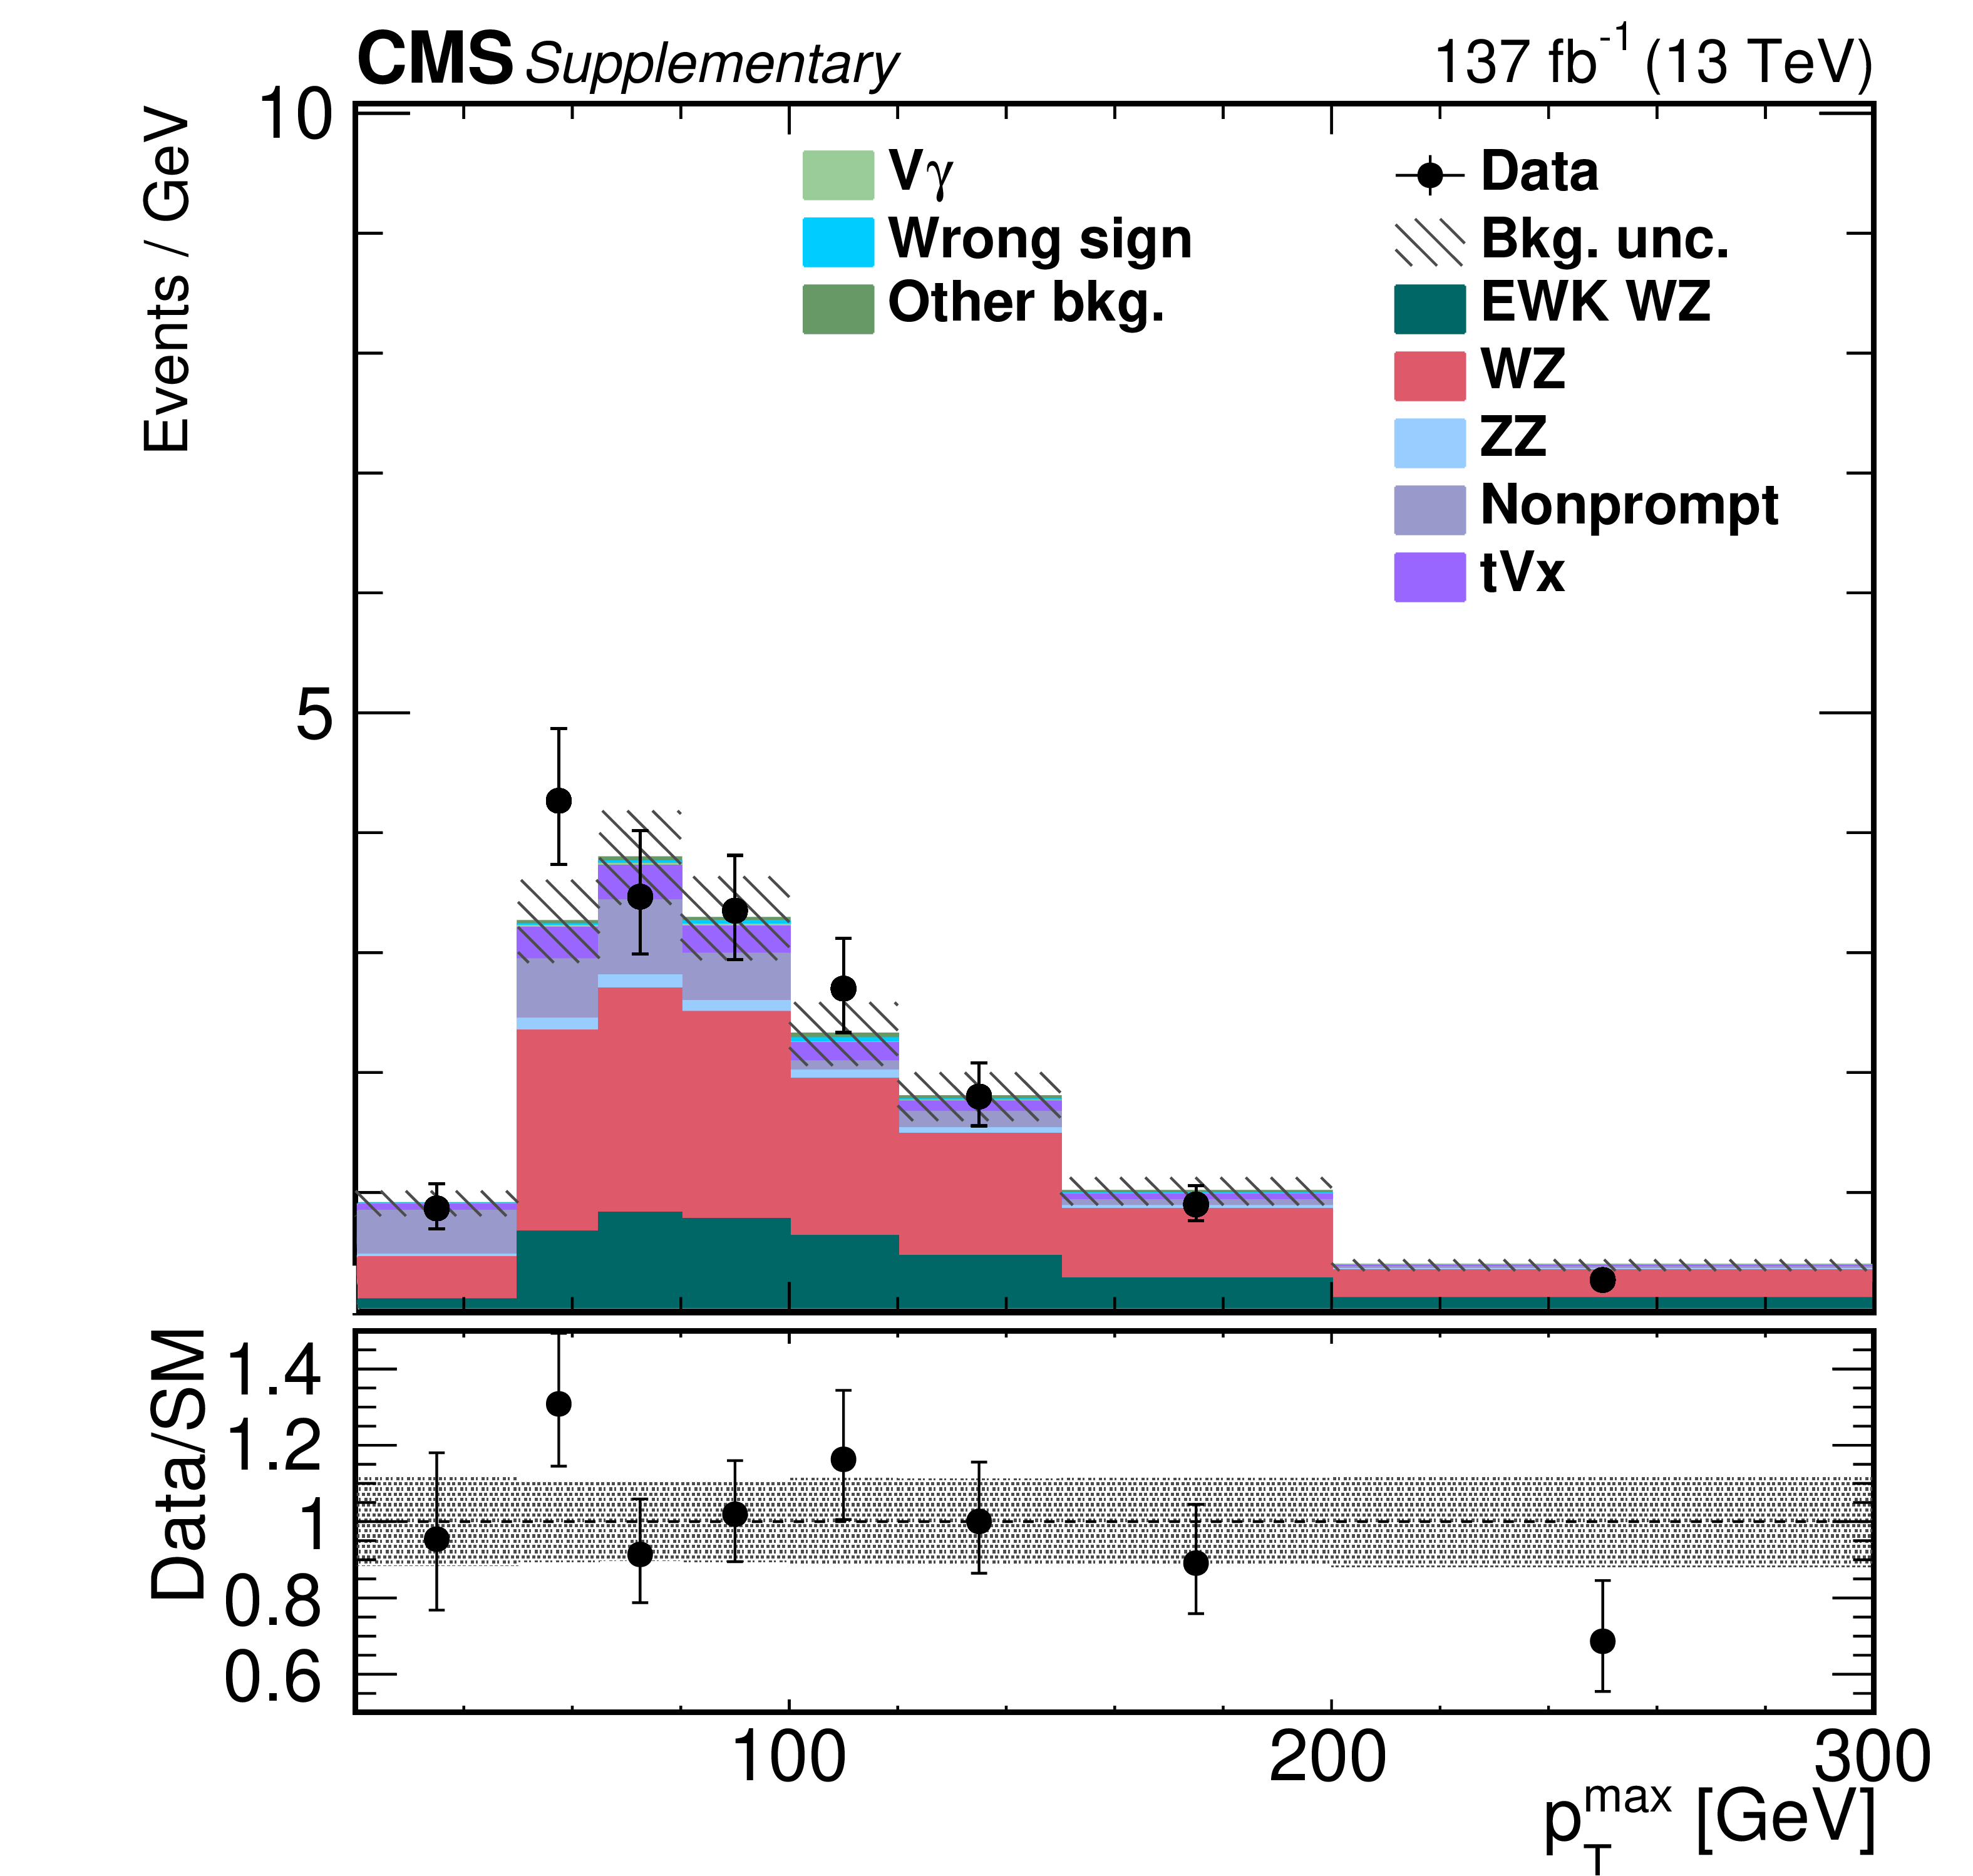
Distributions of $ {\Delta \phi _{{\mathrm {j}} {\mathrm {j}}}} $ (upper left), the $ {p_{\mathrm {T}}} $ of the two leading jets (upper right), the jet multiplicity by counting jets with $ {p_{\mathrm {T}}} > $ 30 GeV and $| \eta | < $ 4.7 (center left), $z_{3\ell}^{*}$ (center right), and $ {{p_{\mathrm {T}}} ^{\mathrm {max}}} $ (bottom) in the WZ SR. The predicted yields are shown with their best-fit normalizations from the simultaneous fit. The overflow is included in the last bin. The bottom panel in each figure shows the ratio of the number of events observed in data to that of the total SM prediction. The gray bands represent the uncertainties from the predicted yields. |
png pdf |
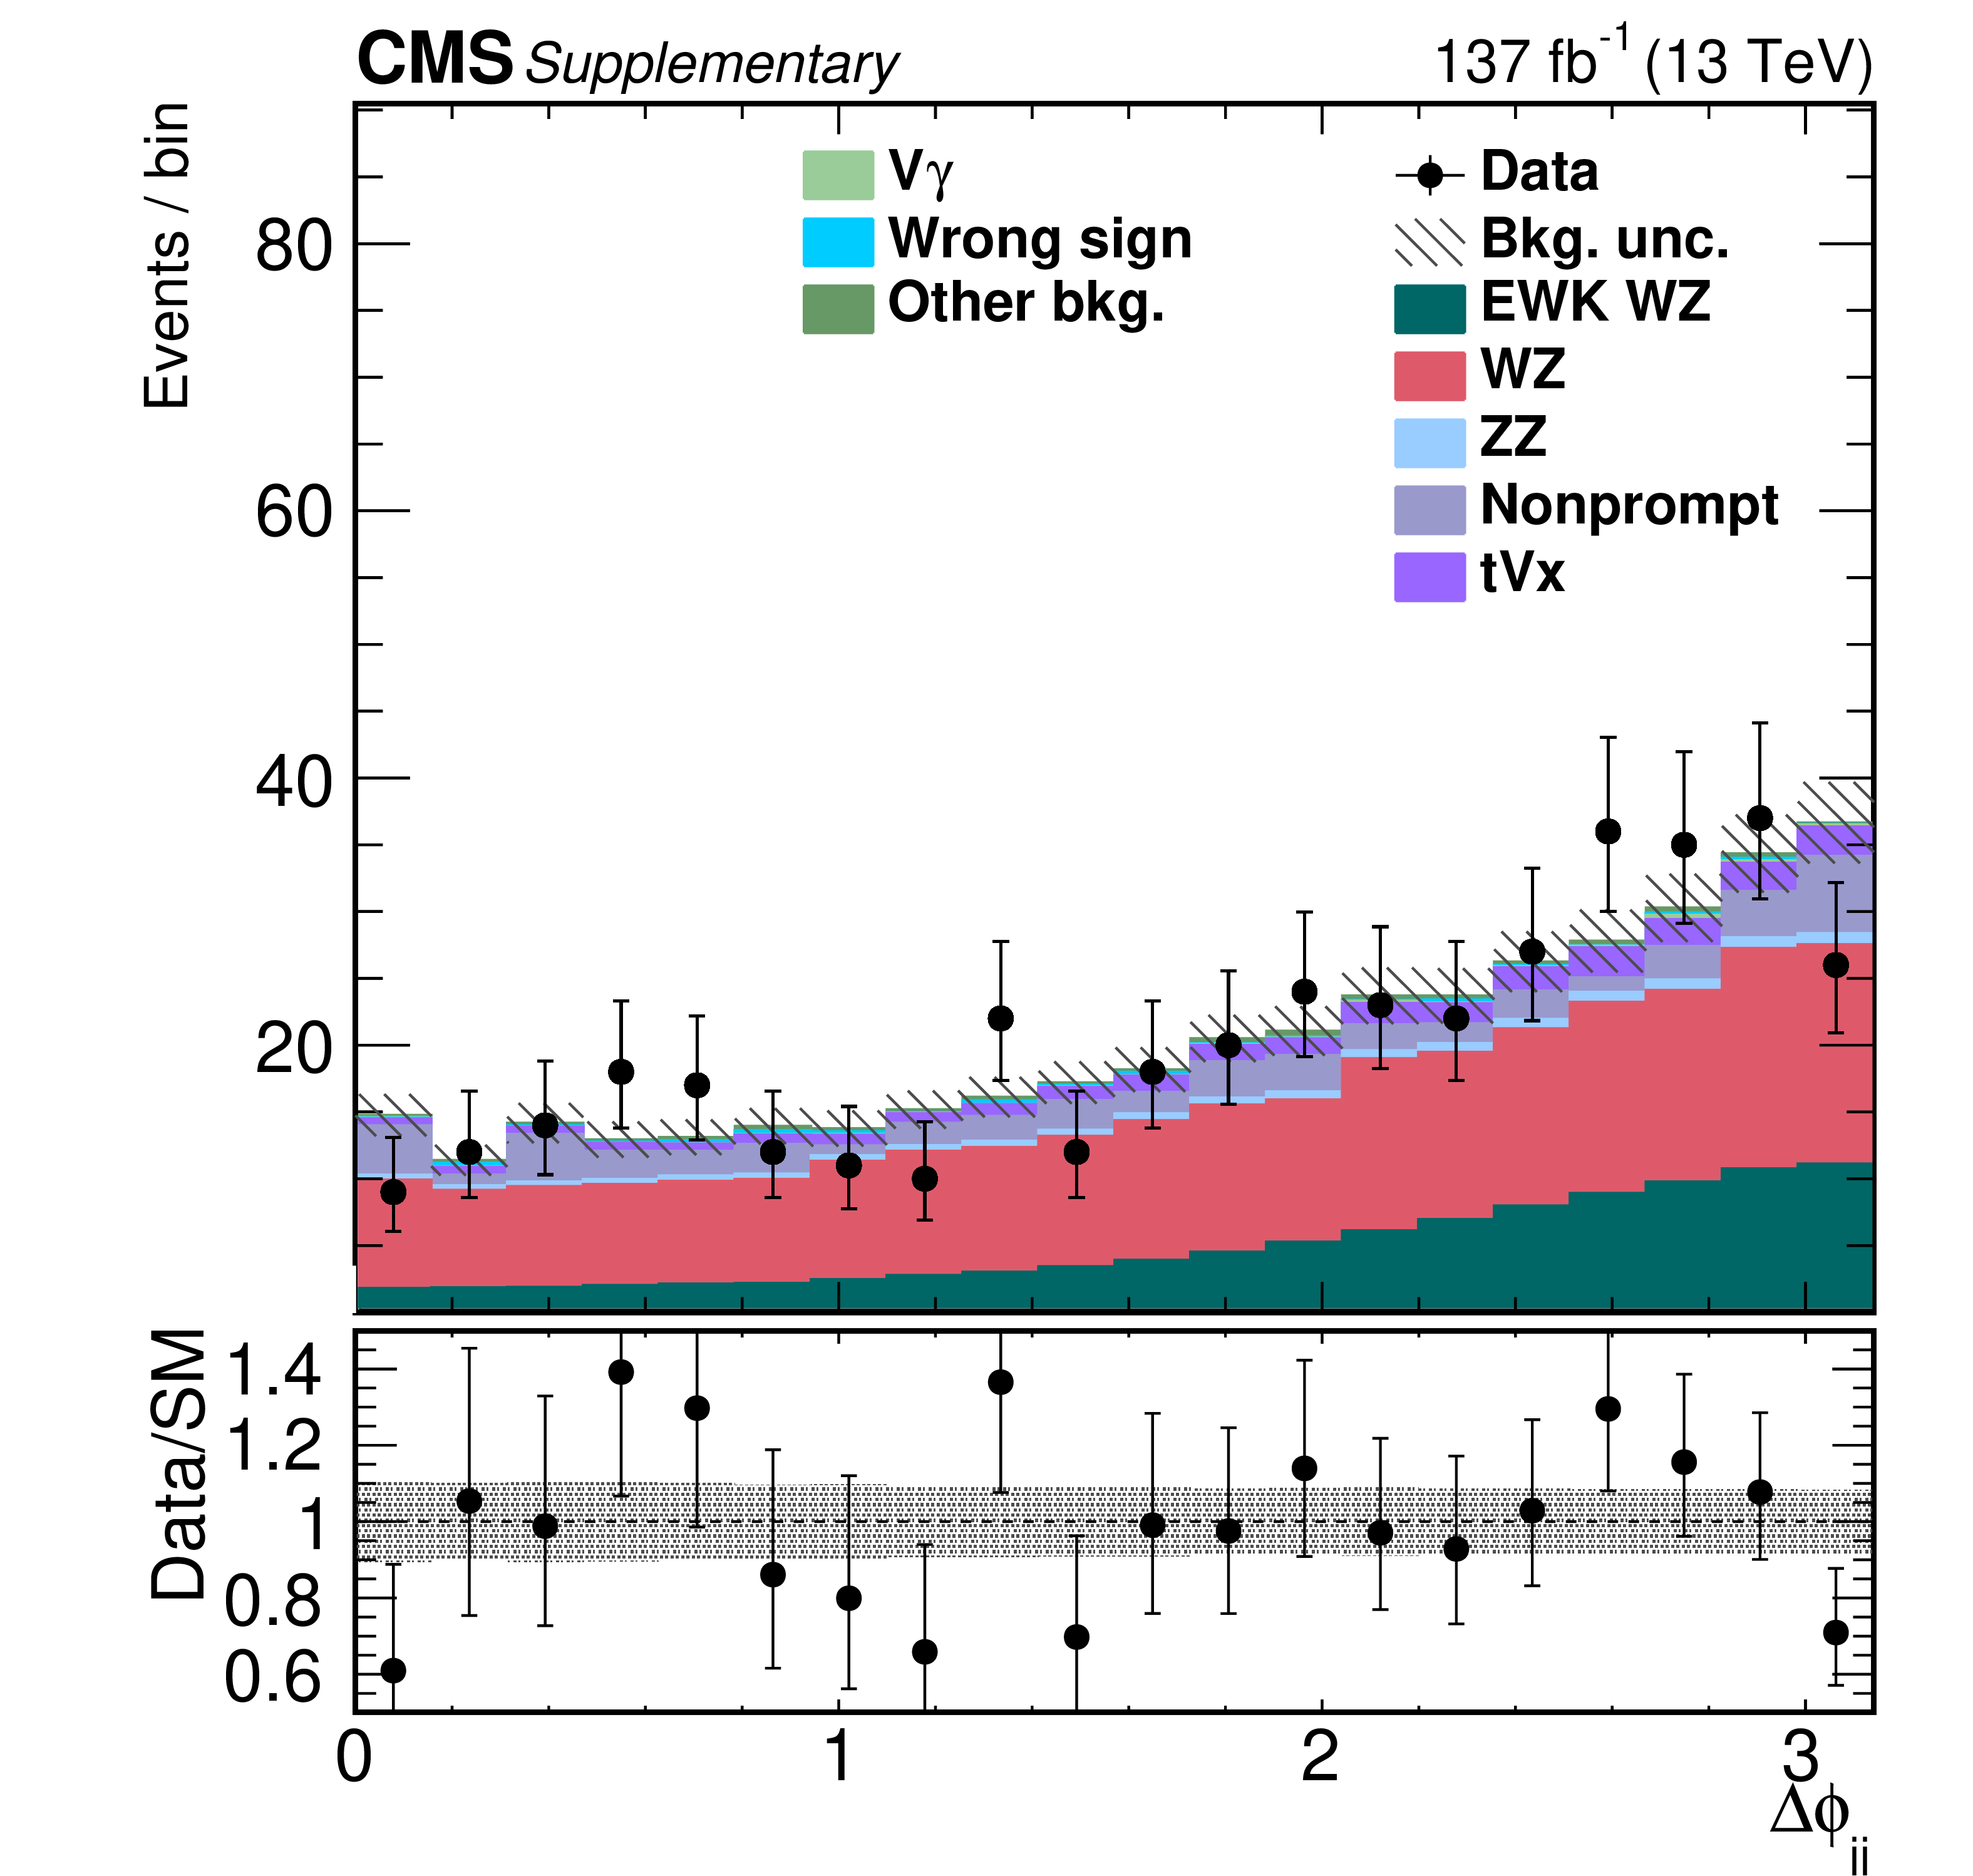
Additional Figure 2-a:
Distribution of $ {\Delta \phi _{{\mathrm {j}} {\mathrm {j}}}} $ in the WZ SR. The predicted yields are shown with their best-fit normalizations from the simultaneous fit. The overflow is included in the last bin. The bottom panel shows the ratio of the number of events observed in data to that of the total SM prediction. The gray bands represent the uncertainties from the predicted yields. |
png pdf |
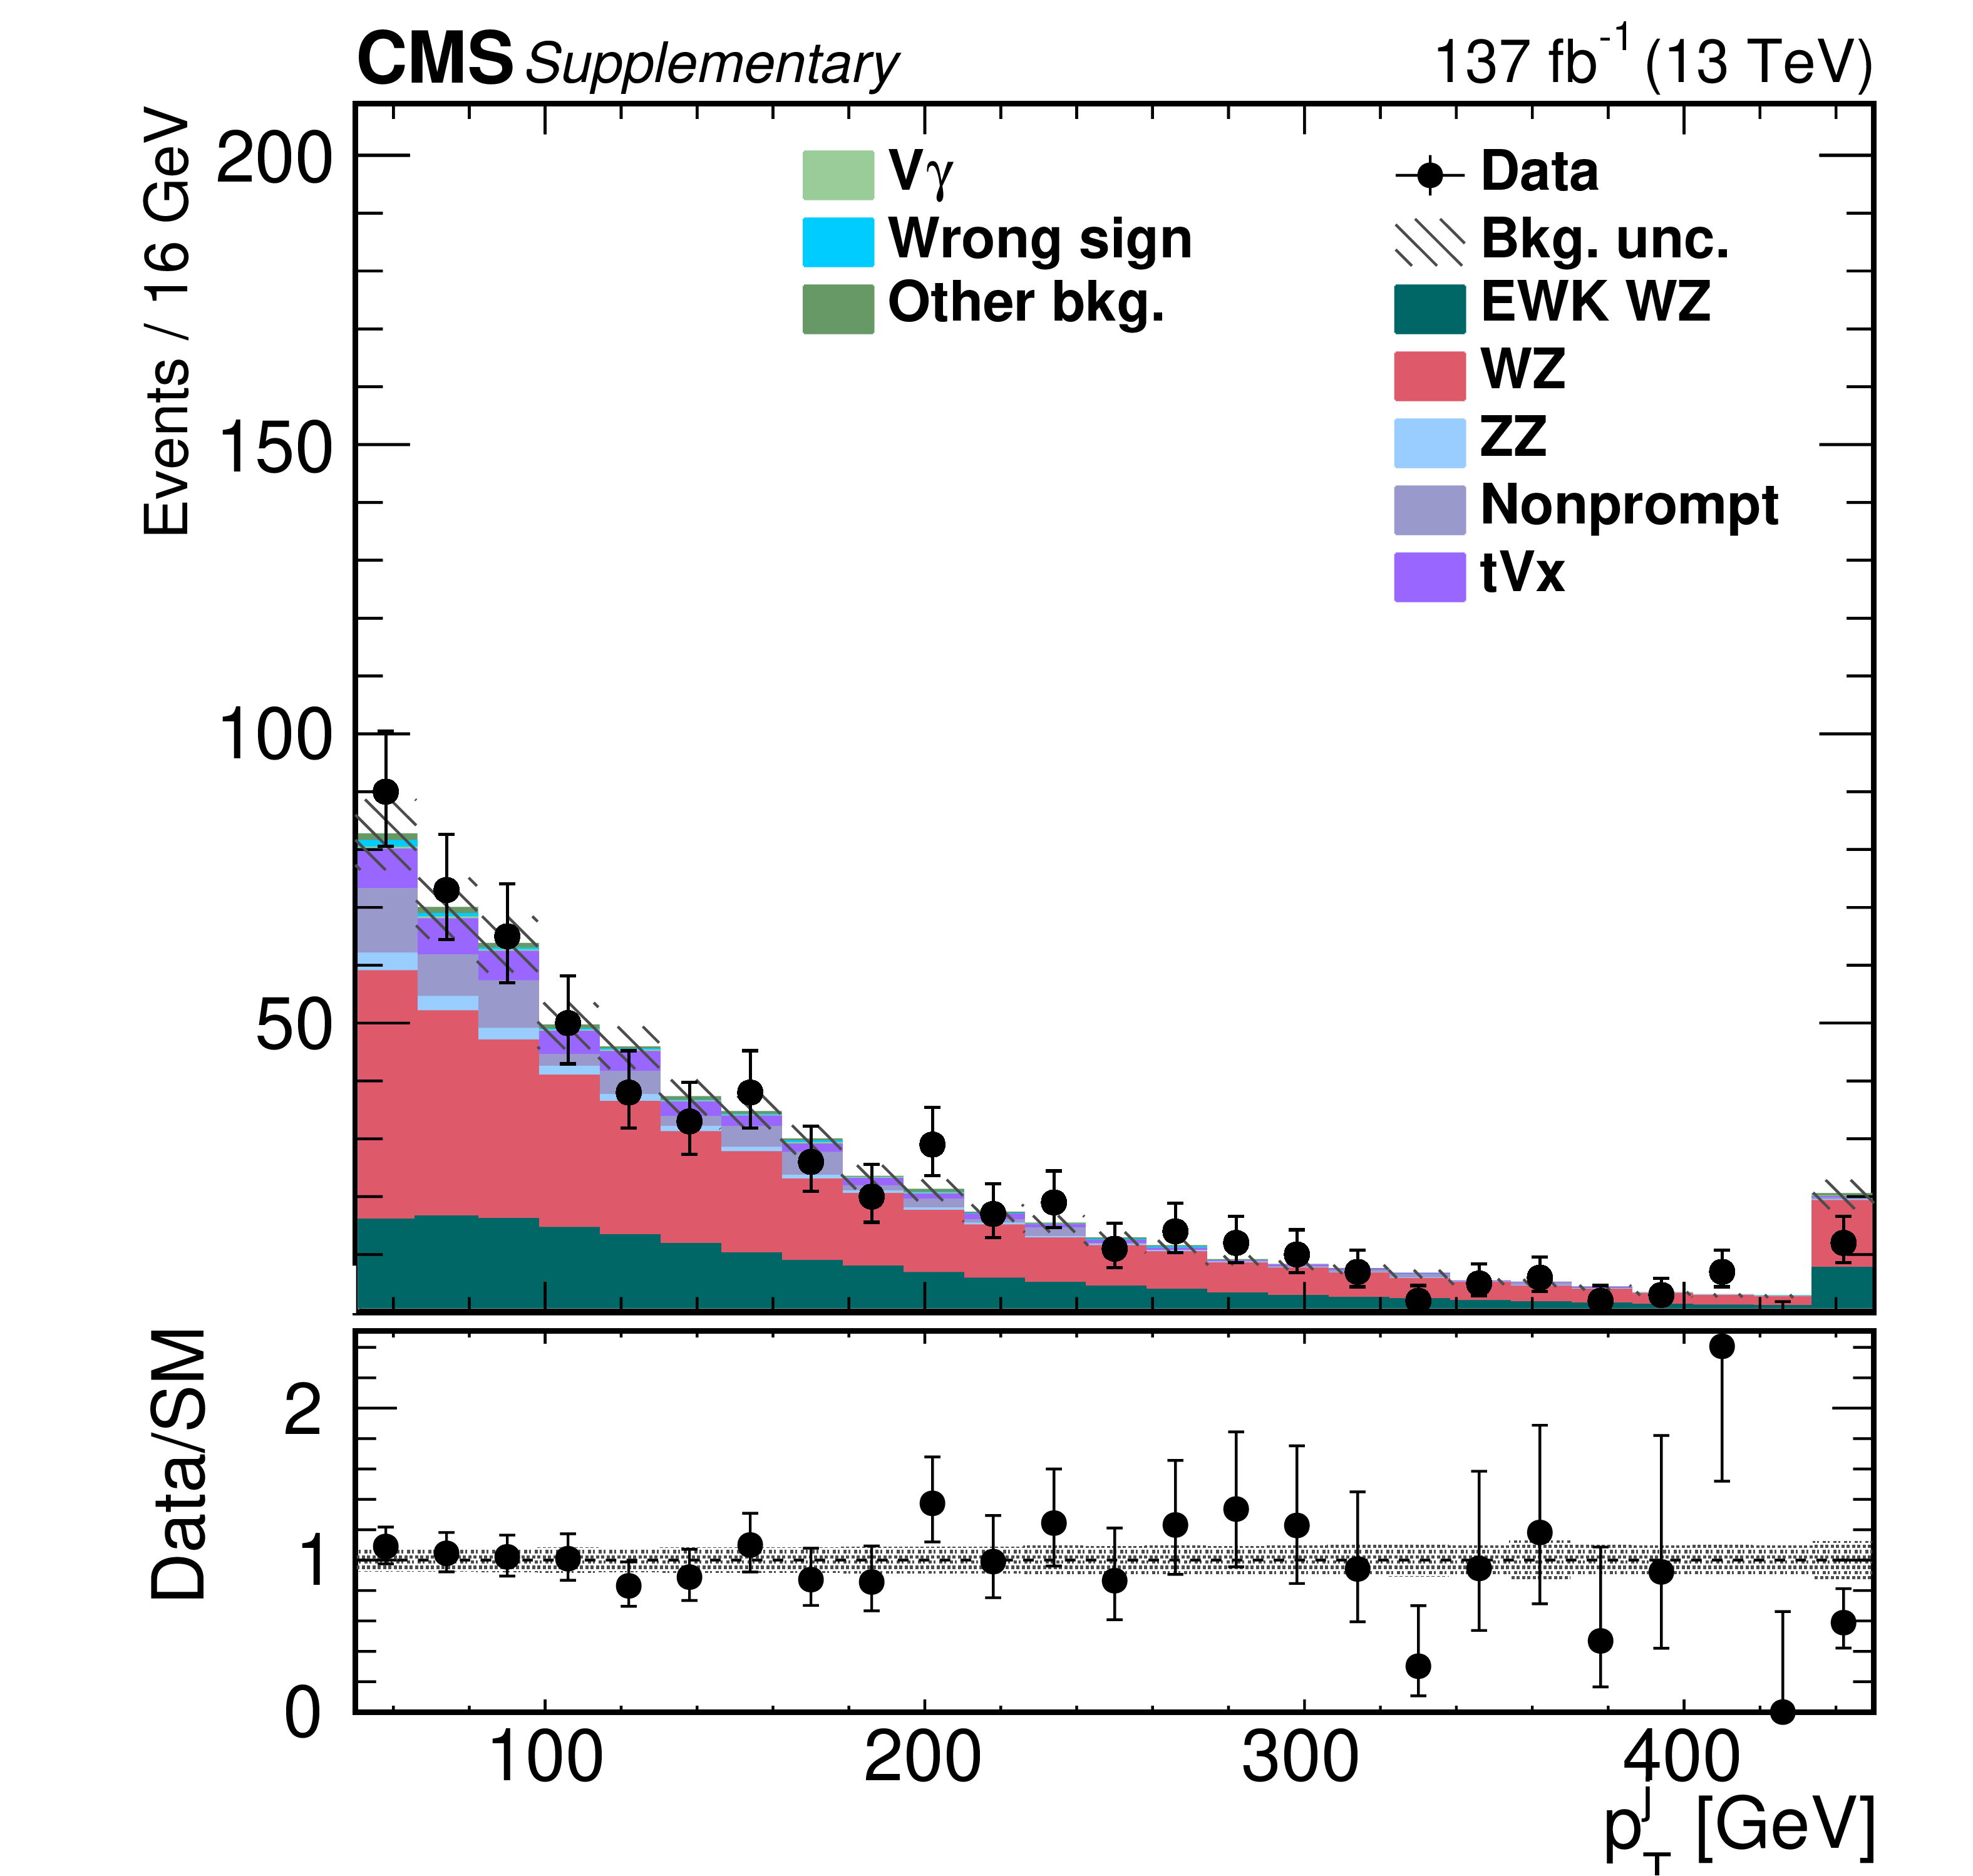
Additional Figure 2-b:
Distribution of $ {p_{\mathrm {T}}} $ of the two leading jets in the WZ SR. The predicted yields are shown with their best-fit normalizations from the simultaneous fit. The overflow is included in the last bin. The bottom panel shows the ratio of the number of events observed in data to that of the total SM prediction. The gray bands represent the uncertainties from the predicted yields. |
png pdf |
Additional Figure 2-c:
Distribution of the jet multiplicity by counting jets with $ {p_{\mathrm {T}}} > $ 30 GeV and $| \eta | < $ 4.7 in the WZ SR. The predicted yields are shown with their best-fit normalizations from the simultaneous fit. The overflow is included in the last bin. The bottom panel shows the ratio of the number of events observed in data to that of the total SM prediction. The gray bands represent the uncertainties from the predicted yields. |
png pdf |
Additional Figure 2-d:
Distribution of $z_{3\ell}^{*}$ in the WZ SR. The predicted yields are shown with their best-fit normalizations from the simultaneous fit. The overflow is included in the last bin. The bottom panel shows the ratio of the number of events observed in data to that of the total SM prediction. The gray bands represent the uncertainties from the predicted yields. |
png pdf |
Additional Figure 2-e:
Distribution of $ {{p_{\mathrm {T}}} ^{\mathrm {max}}} $ in the WZ SR. The predicted yields are shown with their best-fit normalizations from the simultaneous fit. The overflow is included in the last bin. The bottom panel shows the ratio of the number of events observed in data to that of the total SM prediction. The gray bands represent the uncertainties from the predicted yields. |
| References | ||||
| 1 | ATLAS Collaboration | Observation of a new particle in the search for the standard model Higgs boson with the ATLAS detector at the LHC | PLB 716 (2012) 1 | 1207.7214 |
| 2 | CMS Collaboration | Observation of a new boson at a mass of 125 GeV with the CMS experiment at the LHC | PLB 716 (2012) 30 | CMS-HIG-12-028 1207.7235 |
| 3 | CMS Collaboration | Observation of a new boson with mass near 125 GeV in pp collisions at $ \sqrt{s} = $ 7 and 8 TeV | JHEP 06 (2013) 081 | CMS-HIG-12-036 1303.4571 |
| 4 | F. Englert and R. Brout | Broken symmetry and the mass of gauge vector mesons | PRL 13 (1964) 321 | |
| 5 | P. W. Higgs | Broken symmetries, massless particles and gauge fields | PL12 (1964) 132 | |
| 6 | P. W. Higgs | Broken symmetries and the masses of gauge bosons | PRL 13 (1964) 508 | |
| 7 | G. S. Guralnik, C. R. Hagen, and T. W. B. Kibble | Global conservation laws and massless particles | PRL 13 (1964) 585 | |
| 8 | P. W. Higgs | Spontaneous symmetry breakdown without massless bosons | PR145 (1966) 1156 | |
| 9 | T. W. B. Kibble | Symmetry breaking in non-Abelian gauge theories | PR155 (1967) 1554 | |
| 10 | D. Espriu and B. Yencho | Longitudinal WW scattering in light of the Higgs boson discovery | PRD 87 (2013) 055017 | 1212.4158 |
| 11 | J. Chang, K. Cheung, C.-T. Lu, and T.-C. Yuan | WW scattering in the era of post-Higgs-boson discovery | PRD 87 (2013) 093005 | 1303.6335 |
| 12 | B. W. Lee, C. Quigg, and H. B. Thacker | The strength of weak interactions at very high-energies and the Higgs boson mass | PRL 38 (1977) 883 | |
| 13 | B. W. Lee, C. Quigg, and H. B. Thacker | Weak interactions at very high-energies: the role of the Higgs boson mass | PRD 16 (1977) 1519 | |
| 14 | O. J. P. \'Eboli, M. C. Gonzalez-Garcia, and J. K. Mizukoshi | pp $ \to $ jj$ e^{\pm} \mu^{\pm} \nu \nu $ and jj$ e^{\pm} \mu^{\mp} \nu \nu $ at $ \mathcal{O}(\alpha_\textrm{em}^{6}) $ and $ \mathcal{O}(\alpha_\textrm{em}^4 \alpha_\textrm{s}^2) $ for the study of the quartic electroweak gauge boson vertex at CERN LHC | PRD 74 (2006) 073005 | hep-ph/0606118 |
| 15 | CMS Collaboration | CMS luminosity measurement for the 2016 data-taking period | CMS-PAS-LUM-15-001 | CMS-PAS-LUM-15-001 |
| 16 | CMS Collaboration | CMS luminosity measurement for the 2017 data-taking period at $ \sqrt{s} = $ 13 TeV | CMS-PAS-LUM-17-004 | CMS-PAS-LUM-17-004 |
| 17 | CMS Collaboration | CMS luminosity measurement for the 2018 data-taking period at $ \sqrt{s} = $ 13 TeV | CMS-PAS-LUM-18-002 | CMS-PAS-LUM-18-002 |
| 18 | CMS Collaboration | The CMS Experiment at the CERN LHC | JINST 3 (2008) S08004 | CMS-00-001 |
| 19 | CMS Collaboration | Study of vector boson scattering and search for new physics in events with two same-sign leptons and two jets | PRL 114 (2015) 051801 | CMS-SMP-13-015 1410.6315 |
| 20 | ATLAS Collaboration | Evidence for electroweak production of $ W^{\pm}W^{\pm} $jj in pp collisions at $ \sqrt{s}= $ 8 TeV with the ATLAS detector | PRL 113 (2014) 141803 | 1405.6241 |
| 21 | CMS Collaboration | Observation of electroweak production of same-sign W boson pairs in the two jet and two same-sign lepton final state in proton-proton collisions at $ \sqrt{s} = $ 13 TeV | PRL 120 (2018) 081801 | CMS-SMP-17-004 1709.05822 |
| 22 | ATLAS Collaboration | Observation of electroweak production of a same-sign $ W $ boson pair in association with two jets in pp collisions at $ \sqrt{s}= $ 13 TeV with the ATLAS detector | PRL 123 (2019) 161801 | 1906.03203 |
| 23 | ATLAS Collaboration | Measurements of $ \mathrm{W}^\pm \mathrm{Z} $ production cross sections in $ {\mathrm{p}}{\mathrm{p}} $ collisions at $ \sqrt{s} = $ 8 TeV with the ATLAS detector and limits on anomalous gauge boson self-couplings | PRD 93 (2016) 092004 | 1603.02151 |
| 24 | CMS Collaboration | Measurement of electroweak WZ boson production and search for new physics in WZ + two jets events in pp collisions at $ \sqrt{s} = $ 13 TeV | PLB 795 (2019) 281 | CMS-SMP-18-001 1901.04060 |
| 25 | ATLAS Collaboration | Observation of electroweak $ W^{\pm}Z $ boson pair production in association with two jets in pp collisions at $ \sqrt{s} = $ 13 TeV with the ATLAS detector | PLB 793 (2019) 469 | 1812.09740 |
| 26 | ATLAS Collaboration | Search for the electroweak diboson production in association with a high-mass dijet system in semileptonic final states in $ {\mathrm{p}}{\mathrm{p}} $ collisions at $ \sqrt{s}= $ 13 TeV with the ATLAS detector | PRD 100 (2019) 032007 | 1905.07714 |
| 27 | ATLAS Collaboration | Search for anomalous electroweak production of $ \mathrm{W}\mathrm{W}/\mathrm{W}\mathrm{Z} $ in association with a high-mass dijet system in $ {\mathrm{p}}{\mathrm{p}} $ collisions at $ \sqrt{s} = $ 8 TeV with the ATLAS detector | PRD 95 (2017) 032001 | 1609.05122 |
| 28 | CMS Collaboration | Search for anomalous electroweak production of vector boson pairs in association with two jets in proton-proton collisions at 13 TeV | PLB 798 (2019) 134985 | CMS-SMP-18-006 1905.07445 |
| 29 | CMS Collaboration | The CMS trigger system | JINST 12 (2017) P01020 | CMS-TRG-12-001 1609.02366 |
| 30 | J. Alwall et al. | The automated computation of tree-level and next-to-leading order differential cross sections, and their matching to parton shower simulations | JHEP 07 (2014) 079 | 1405.0301 |
| 31 | J. Alwall et al. | MadGraph 5: going beyond | JHEP 06 (2011) 128 | 1106.0522 |
| 32 | R. Frederix and S. Frixione | Merging meets matching in MC@NLO | JHEP 12 (2012) 061 | 1209.6215 |
| 33 | P. Artoisenet, V. Lemaitre, F. Maltoni, and O. Mattelaer | Automation of the matrix element reweighting method | JHEP 12 (2010) 068 | 1007.3300 |
| 34 | J. Alwall et al. | Comparative study of various algorithms for the merging of parton showers and matrix elements in hadronic collisions | EPJC 53 (2008) 473 | 0706.2569 |
| 35 | M. Grazzini, S. Kallweit, D. Rathlev, and M. Wiesemann | $ \mathrm{W}^{\pm}\mathrm{Z} $ production at hadron colliders in NNLO QCD | PLB 761 (2016) 179 | 1604.08576 |
| 36 | B. Biedermann, A. Denner, and M. Pellen | Large electroweak corrections to vector boson scattering at the Large Hadron Collider | PRL 118 (2017) 261801 | 1611.02951 |
| 37 | B. Biedermann, A. Denner, and M. Pellen | Complete NLO corrections to W$ ^{+} $W$ ^{+} $ scattering and its irreducible background at the LHC | JHEP 10 (2017) 124 | 1708.00268 |
| 38 | A. Denner et al. | QCD and electroweak corrections to WZ scattering at the LHC | JHEP 06 (2019) 067 | 1904.00882 |
| 39 | S. Frixione and B. R. Webber | Matching NLO QCD computations and parton shower simulations | JHEP 06 (2002) 029 | hep-ph/0204244 |
| 40 | P. Nason | A new method for combining NLO QCD with shower Monte Carlo algorithms | JHEP 11 (2004) 040 | hep-ph/0409146 |
| 41 | S. Frixione, P. Nason, and C. Oleari | Matching NLO QCD computations with parton shower simulations: the POWHEG method | JHEP 11 (2007) 070 | 0709.2092 |
| 42 | S. Alioli, P. Nason, C. Oleari, and E. Re | NLO vector-boson production matched with shower in POWHEG | JHEP 07 (2008) 060 | 0805.4802 |
| 43 | S. Alioli, P. Nason, C. Oleari, and E. Re | A general framework for implementing NLO calculations in shower Monte Carlo programs: the POWHEG BOX | JHEP 06 (2010) 043 | 1002.2581 |
| 44 | CMS Collaboration | Measurement of the associated production of a single top quark and a Z boson in pp collisions at $ \sqrt{s} = $ 13 TeV | PLB 779 (2018) 358 | CMS-TOP-16-020 1712.02825 |
| 45 | T. Sjostrand et al. | An Introduction to PYTHIA 8.2 | CPC 191 (2015) 159 | 1410.3012 |
| 46 | NNPDF Collaboration | Parton distributions for the LHC Run II | JHEP 04 (2015) 040 | 1410.8849 |
| 47 | NNPDF Collaboration | Parton distributions from high-precision collider data | EPJC 77 (2017) 663 | 1706.00428 |
| 48 | P. Skands, S. Carrazza, and J. Rojo | Tuning PYTHIA 8.1: the Monash 2013 tune | EPJC 74 (2014) 3024 | 1404.5630 |
| 49 | CMS Collaboration | Event generator tunes obtained from underlying event and multiparton scattering measurements | EPJC 76 (2016) 155 | CMS-GEN-14-001 1512.00815 |
| 50 | CMS Collaboration | Extraction and validation of a new set of CMS PYTHIA8 tunes from underlying-event measurements | EPJC 80 (2020) 4 | CMS-GEN-17-001 1903.12179 |
| 51 | \GEANTfour Collaboration | GEANT4 --- a simulation toolkit | NIMA 506 (2003) 250 | |
| 52 | CMS Collaboration | Particle-flow reconstruction and global event description with the CMS detector | JINST 12 (2017) P10003 | CMS-PRF-14-001 1706.04965 |
| 53 | M. Cacciari, G. P. Salam, and G. Soyez | The anti-$ {k_{\mathrm{T}}} $ jet clustering algorithm | JHEP 04 (2008) 063 | 0802.1189 |
| 54 | CMS Collaboration | Jet energy scale and resolution in the CMS experiment in pp collisions at 8 TeV | JINST 12 (2017) P02014 | CMS-JME-13-004 1607.03663 |
| 55 | CMS Collaboration | Jet energy scale and resolution performance with 13 TeV data collected by CMS in 2016-2018 | CDS | |
| 56 | CMS Collaboration | Pileup mitigation at CMS in 13 TeV data | Submitted to JINST | CMS-JME-18-001 2003.00503 |
| 57 | CMS Collaboration | Performance of missing transverse momentum reconstruction in proton-proton collisions at $ \sqrt{s} = $ 13 TeV using the CMS detector | JINST 14 (2019) P07004 | CMS-JME-17-001 1903.06078 |
| 58 | M. Cacciari, G. P. Salam, and G. Soyez | FastJet user manual | EPJC 72 (2012) 1896 | 1111.6097 |
| 59 | CMS Collaboration | Identification of heavy-flavour jets with the CMS detector in pp collisions at 13 TeV | JINST 13 (2018) P05011 | CMS-BTV-16-002 1712.07158 |
| 60 | CMS Collaboration | Performance of electron reconstruction and selection with the CMS detector in proton-proton collisions at $ \sqrt{s} = $ 8 TeV | JINST 10 (2015) P06005 | CMS-EGM-13-001 1502.02701 |
| 61 | CMS Collaboration | Performance of the CMS muon detector and muon reconstruction with proton-proton collisions at $ \sqrt{s} = $ 13 TeV | JINST 13 (2018) P06015 | CMS-MUO-16-001 1804.04528 |
| 62 | CMS Collaboration | Measurements of properties of the Higgs boson decaying to a W boson pair in pp collisions at $ \sqrt{s}= $ 13 TeV | PLB 791 (2019) 96 | CMS-HIG-16-042 1806.05246 |
| 63 | CMS Collaboration | Performance of CMS muon reconstruction in cosmic-ray events | JINST 5 (2010) T03022 | CMS-CFT-09-014 0911.4994 |
| 64 | CMS Collaboration | Performance of the reconstruction and identification of high-momentum muons in proton-proton collisions at $ \sqrt{s} = $ 13 TeV | JINST 15 (2020) P02027 | CMS-MUO-17-001 1912.03516 |
| 65 | Particle Data Group, M. Tanabashi et al. | Review of particle physics | PRD 98 (2018) 030001 | |
| 66 | D. L. Rainwater, R. Szalapski, and D. Zeppenfeld | Probing color singlet exchange in $ Z $ + two jet events at the CERN LHC | PRD 54 (1996) 6680 | hep-ph/9605444 |
| 67 | CMS Collaboration | Electron and photon performance in cms with the full 2017 data sample and additional 2016 highlights for the calor 2018 conference | CDS | |
| 68 | ATLAS Collaboration | Measurement of the inelastic proton-proton cross section at $ \sqrt{s} = $ 13 TeV with the ATLAS detector at the LHC | PRL 117 (2016) 182002 | 1606.02625 |
| 69 | CMS Collaboration | Measurement of the inelastic proton-proton cross section at $ \sqrt{s}= $ 13 TeV | JHEP 07 (2018) 161 | CMS-FSQ-15-005 1802.02613 |
| 70 | CMS Collaboration | Measurements of differential Z boson production cross sections in proton-proton collisions at $ \sqrt{s} = $ 13 TeV | JHEP 12 (2019) 061 | CMS-SMP-17-010 1909.04133 |
| 71 | J. Butterworth et al. | PDF4LHC recommendations for LHC Run II | JPG 43 (2016) 023001 | 1510.03865 |
| 72 | T. Junk | Confidence level computation for combining searches with small statistics | NIMA 434 (1999) 435 | hep-ex/9902006 |
| 73 | A. L. Read | Presentation of search results: the CL$ _{s} $ technique | JPG 28 (2002) 2693 | |
| 74 | H. Voss, A. Hocker, J. Stelzer, and F. Tegenfeldt | TMVA, the toolkit for multivariate data analysis with ROOT | in XIth International Workshop on Advanced Computing and Analysis Techniques in Physics Research (ACAT), p. 40 2007 [PoS(ACAT)040] | physics/0703039 |
| 75 | G. Cowan, K. Cranmer, E. Gross, and O. Vitells | Asymptotic formulae for likelihood-based tests of new physics | EPJC 71 (2011) 1554 | 1007.1727 |
| 76 | C. Degrande et al. | Effective field theory: A modern approach to anomalous couplings | Ann. Phys. 335 (2013) 21 | 1205.4231 |
| 77 | J. Kalinowski et al. | Same-sign WW scattering at the LHC: can we discover BSM effects before discovering new states? | EPJC 78 (2018) 403 | 1802.02366 |
| 78 | K. Arnold et al. | VBFNLO: A parton level Monte Carlo for processes with electroweak bosons | CPC 180 (2009) 1661 | 0811.4559 |
| 79 | J. Baglio et al. | VBFNLO: A parton level Monte Carlo for processes with electroweak bosons -- manual for version 2.7.0 | 1107.4038 | |
| 80 | J. Baglio et al. | Release note -- VBFNLO 2.7.0 | 1404.3940 | |
|
|
Compact Muon Solenoid LHC, CERN |
|

|

|

|

|

|