

Compact Muon Solenoid
LHC, CERN
| CMS-SMP-21-011 ; CERN-EP-2022-223 | ||
| Measurement of the electroweak production of W$ \gamma $ in association with two jets in proton-proton collisions at $ \sqrt{s}= $ 13 TeV | ||
| CMS Collaboration | ||
| 23 December 2022 | ||
| Phys. Rev. D 108 (2023) 032017 | ||
| Abstract: A measurement is presented for the electroweak production of a W boson, a photon ($ \gamma $), and two jets (j) in proton-proton collisions. The leptonic decay of the W boson is selected by requiring one identified electron or muon and large missing transverse momentum. The two jets are required to have large invariant dijet mass and large separation in pseudorapidity. The measurement is performed with the data collected by the CMS detector at a center-of-mass energy of 13 TeV, corresponding to an integrated luminosity of 138 fb$ ^{-1} $. The cross section for the electroweak W$ \gamma $jj production is 23.5 $ ^{+4.9}_{-4.7} $ fb, whereas the total cross section for W$ \gamma $jj production is 113 $ \pm $ 13 fb. Differential cross sections are also measured with the distributions unfolded to the particle level. All results are in agreement with the standard model expectations. Constraints are placed on anomalous quartic gauge couplings (aQGCs) in terms of dimension-8 effective field theory operators. These are the most stringent limits to date on the aQGCs parameters $f_{\mathrm{M},2{-}5}/\Lambda^4$ and $f_{\mathrm{T},6{-}7}/\Lambda^4$. | ||
| Links: e-print arXiv:2212.12592 [hep-ex] (PDF) ; CDS record ; inSPIRE record ; HepData record ; Physics Briefing ; CADI line (restricted) ; | ||
| Figures | |
png pdf |
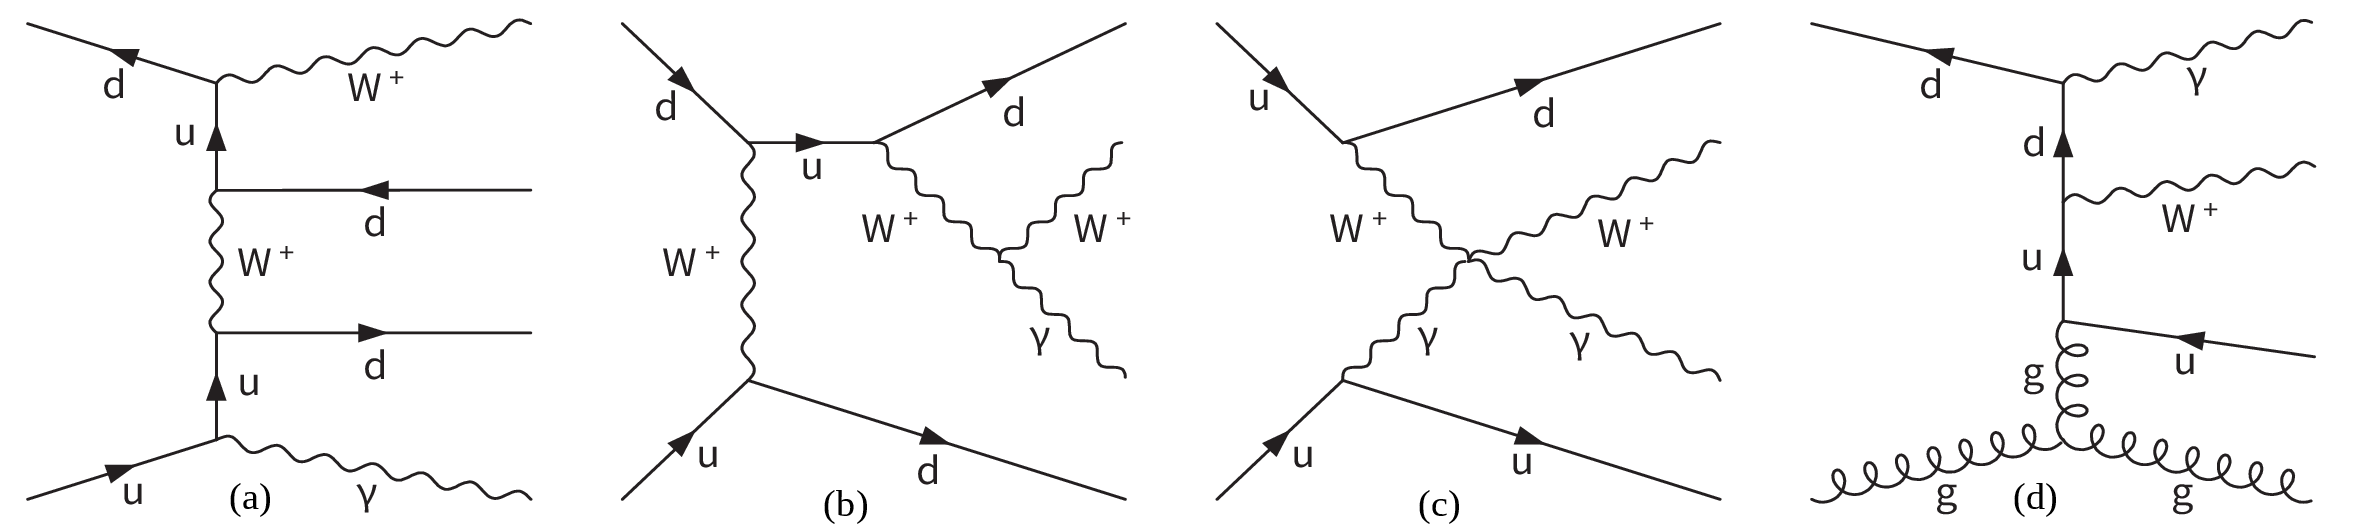
Figure 1:
Representative Feynman diagrams for W$ \gamma $jj production at the LHC: EW (left), EW through triple (middle left) and quartic (middle right) gauge boson couplings, and QCD-induced (right). |
png pdf |
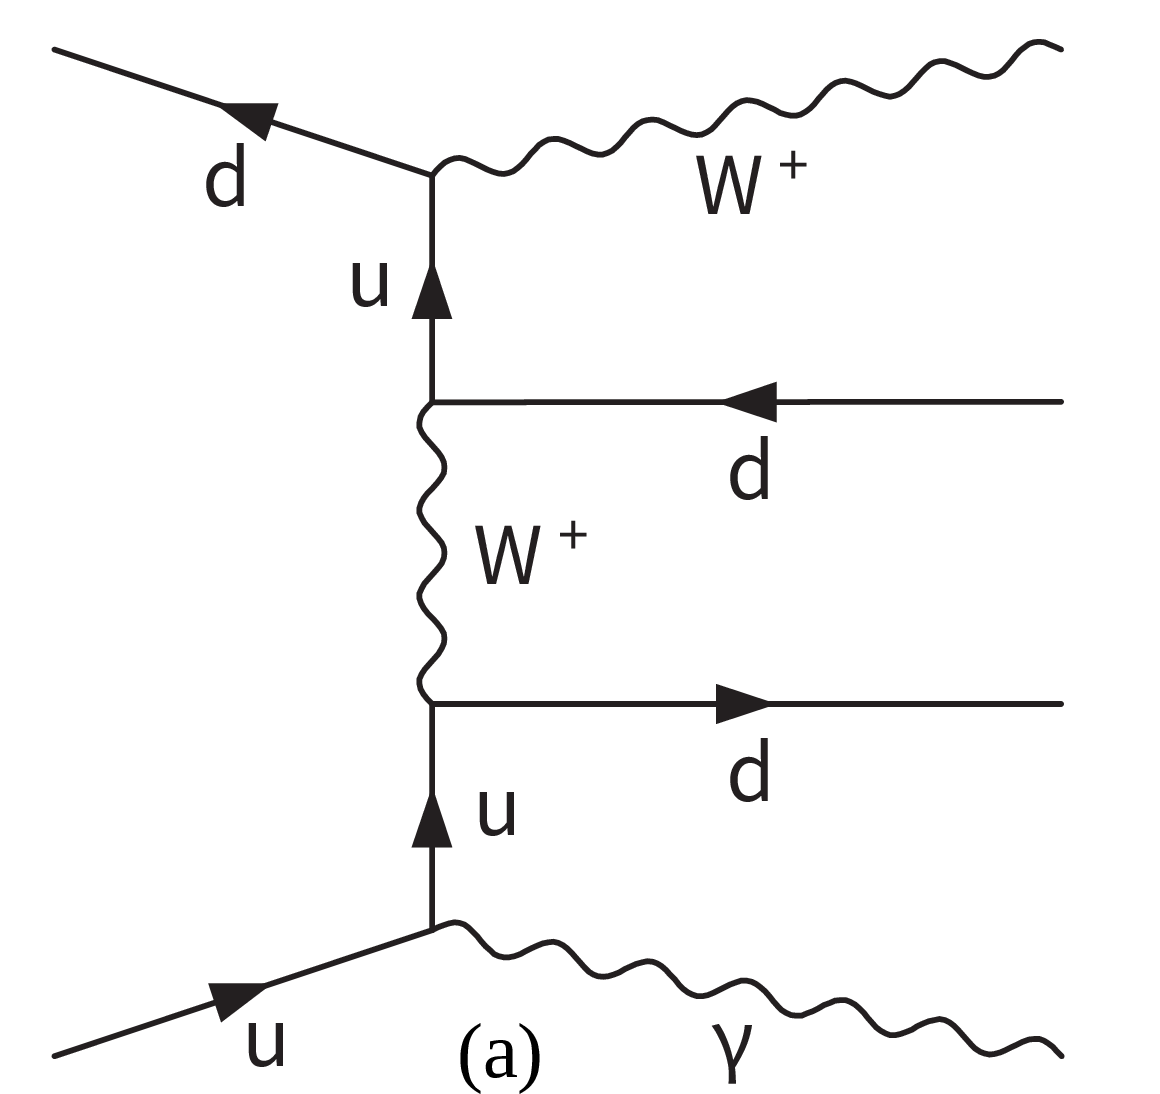
Figure 1-a:
Representative Feynman diagram for W$ \gamma $jj EW production at the LHC. |
png pdf |
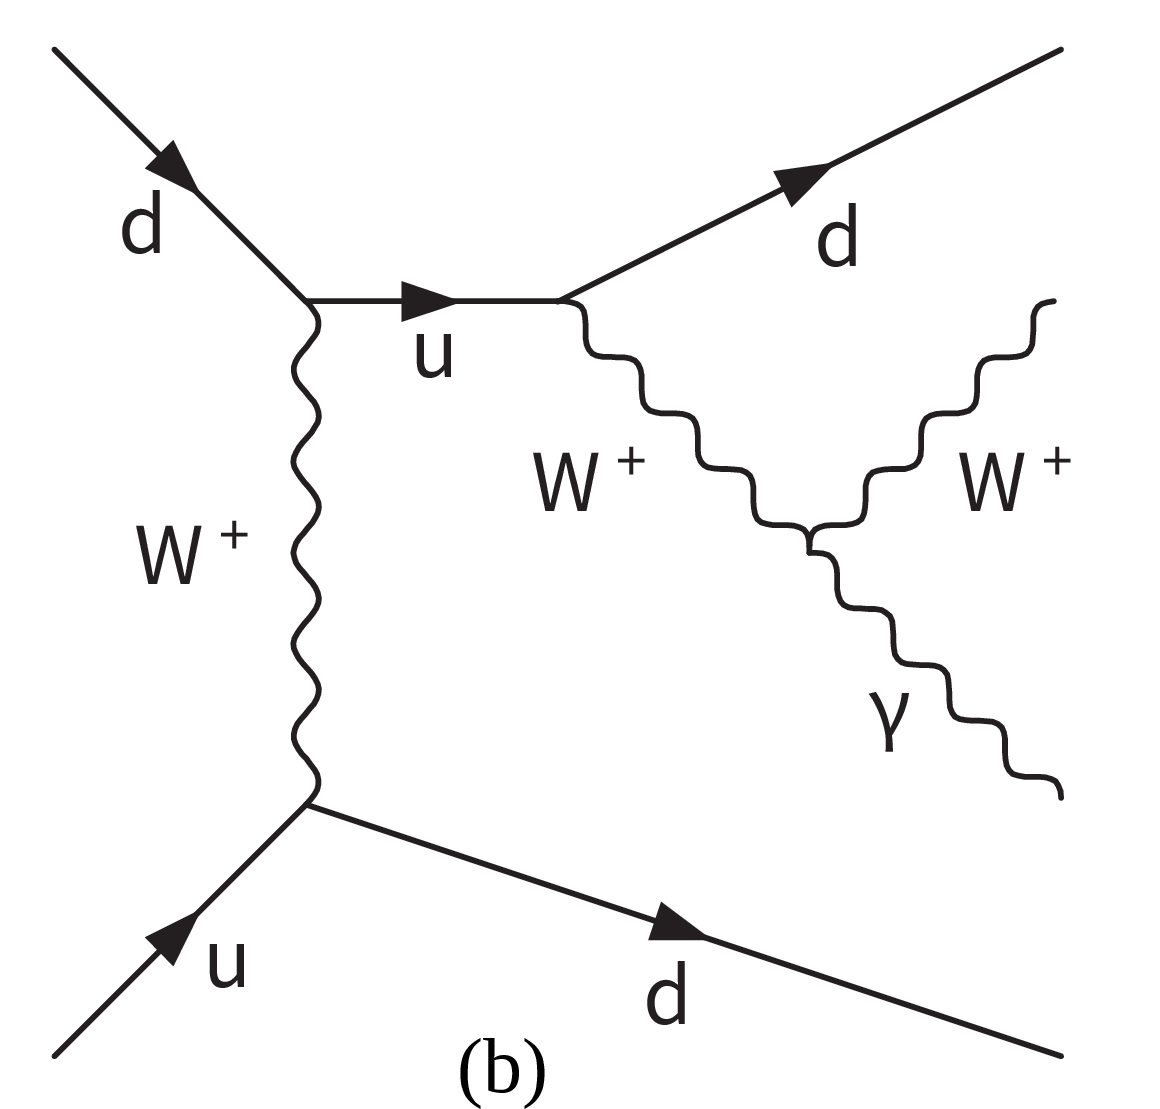
Figure 1-b:
Representative Feynman diagram for W$ \gamma $jj EW through triple gauge boson couplings production at the LHC. |
png pdf |
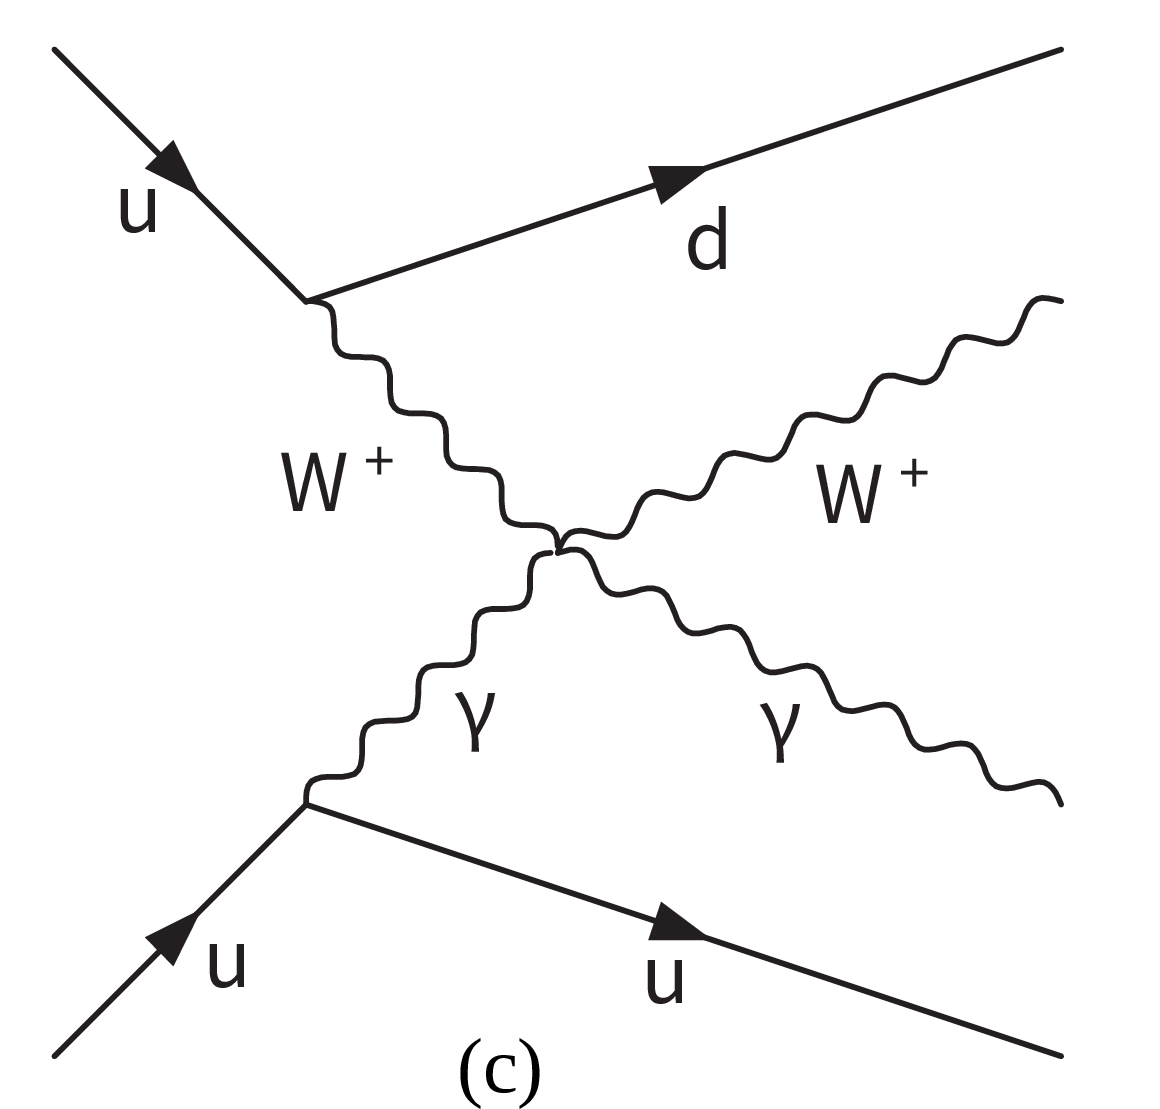
Figure 1-c:
Representative Feynman diagram for W$ \gamma $jj EW through quartic gauge boson couplings production at the LHC. |
png pdf |
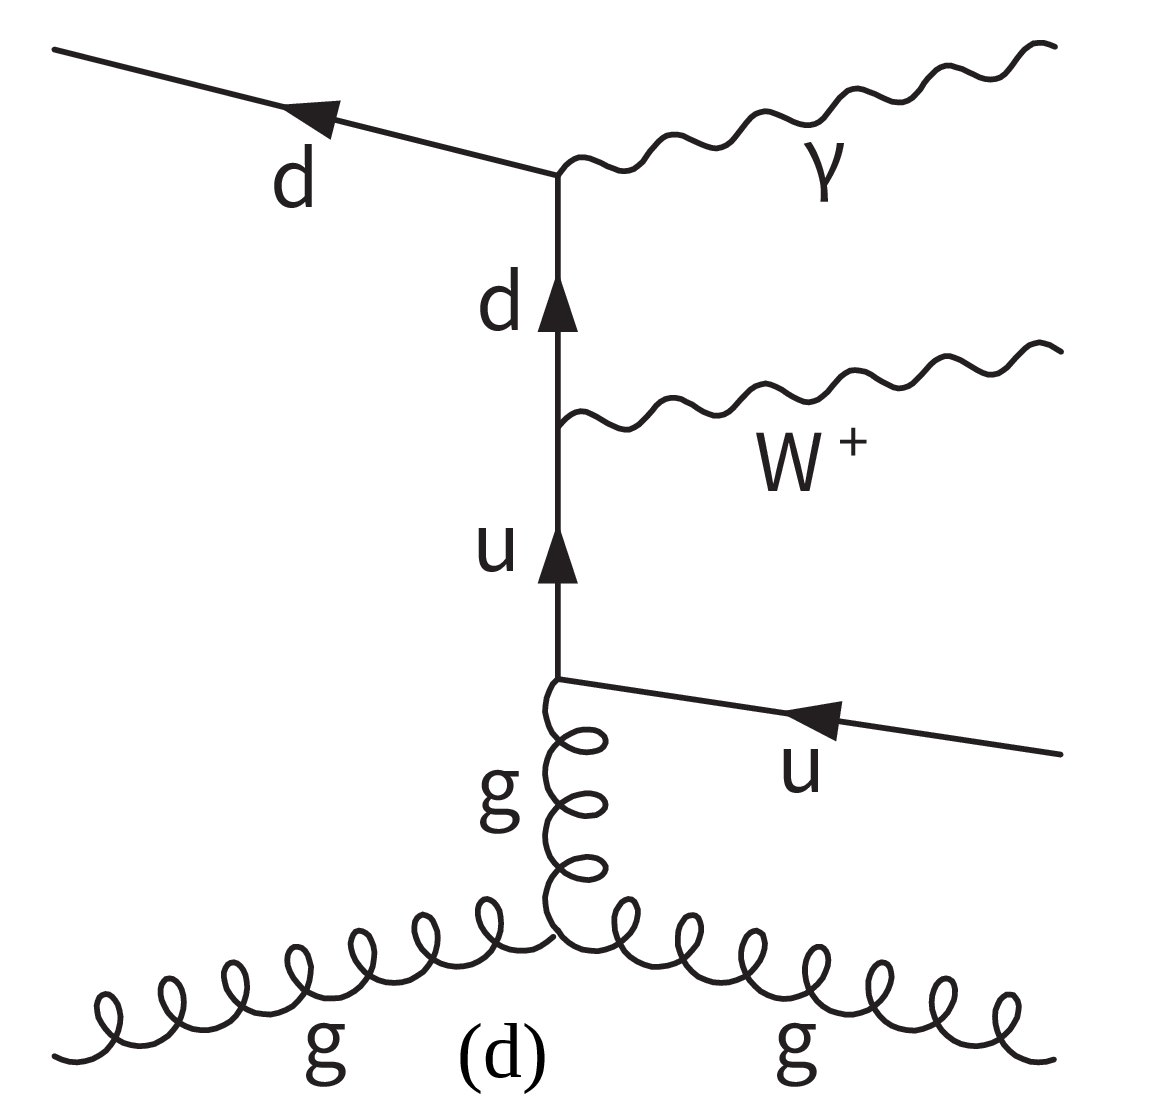
Figure 1-d:
Representative Feynman diagram for W$ \gamma $jj QCD-induced production at the LHC. |
png pdf |
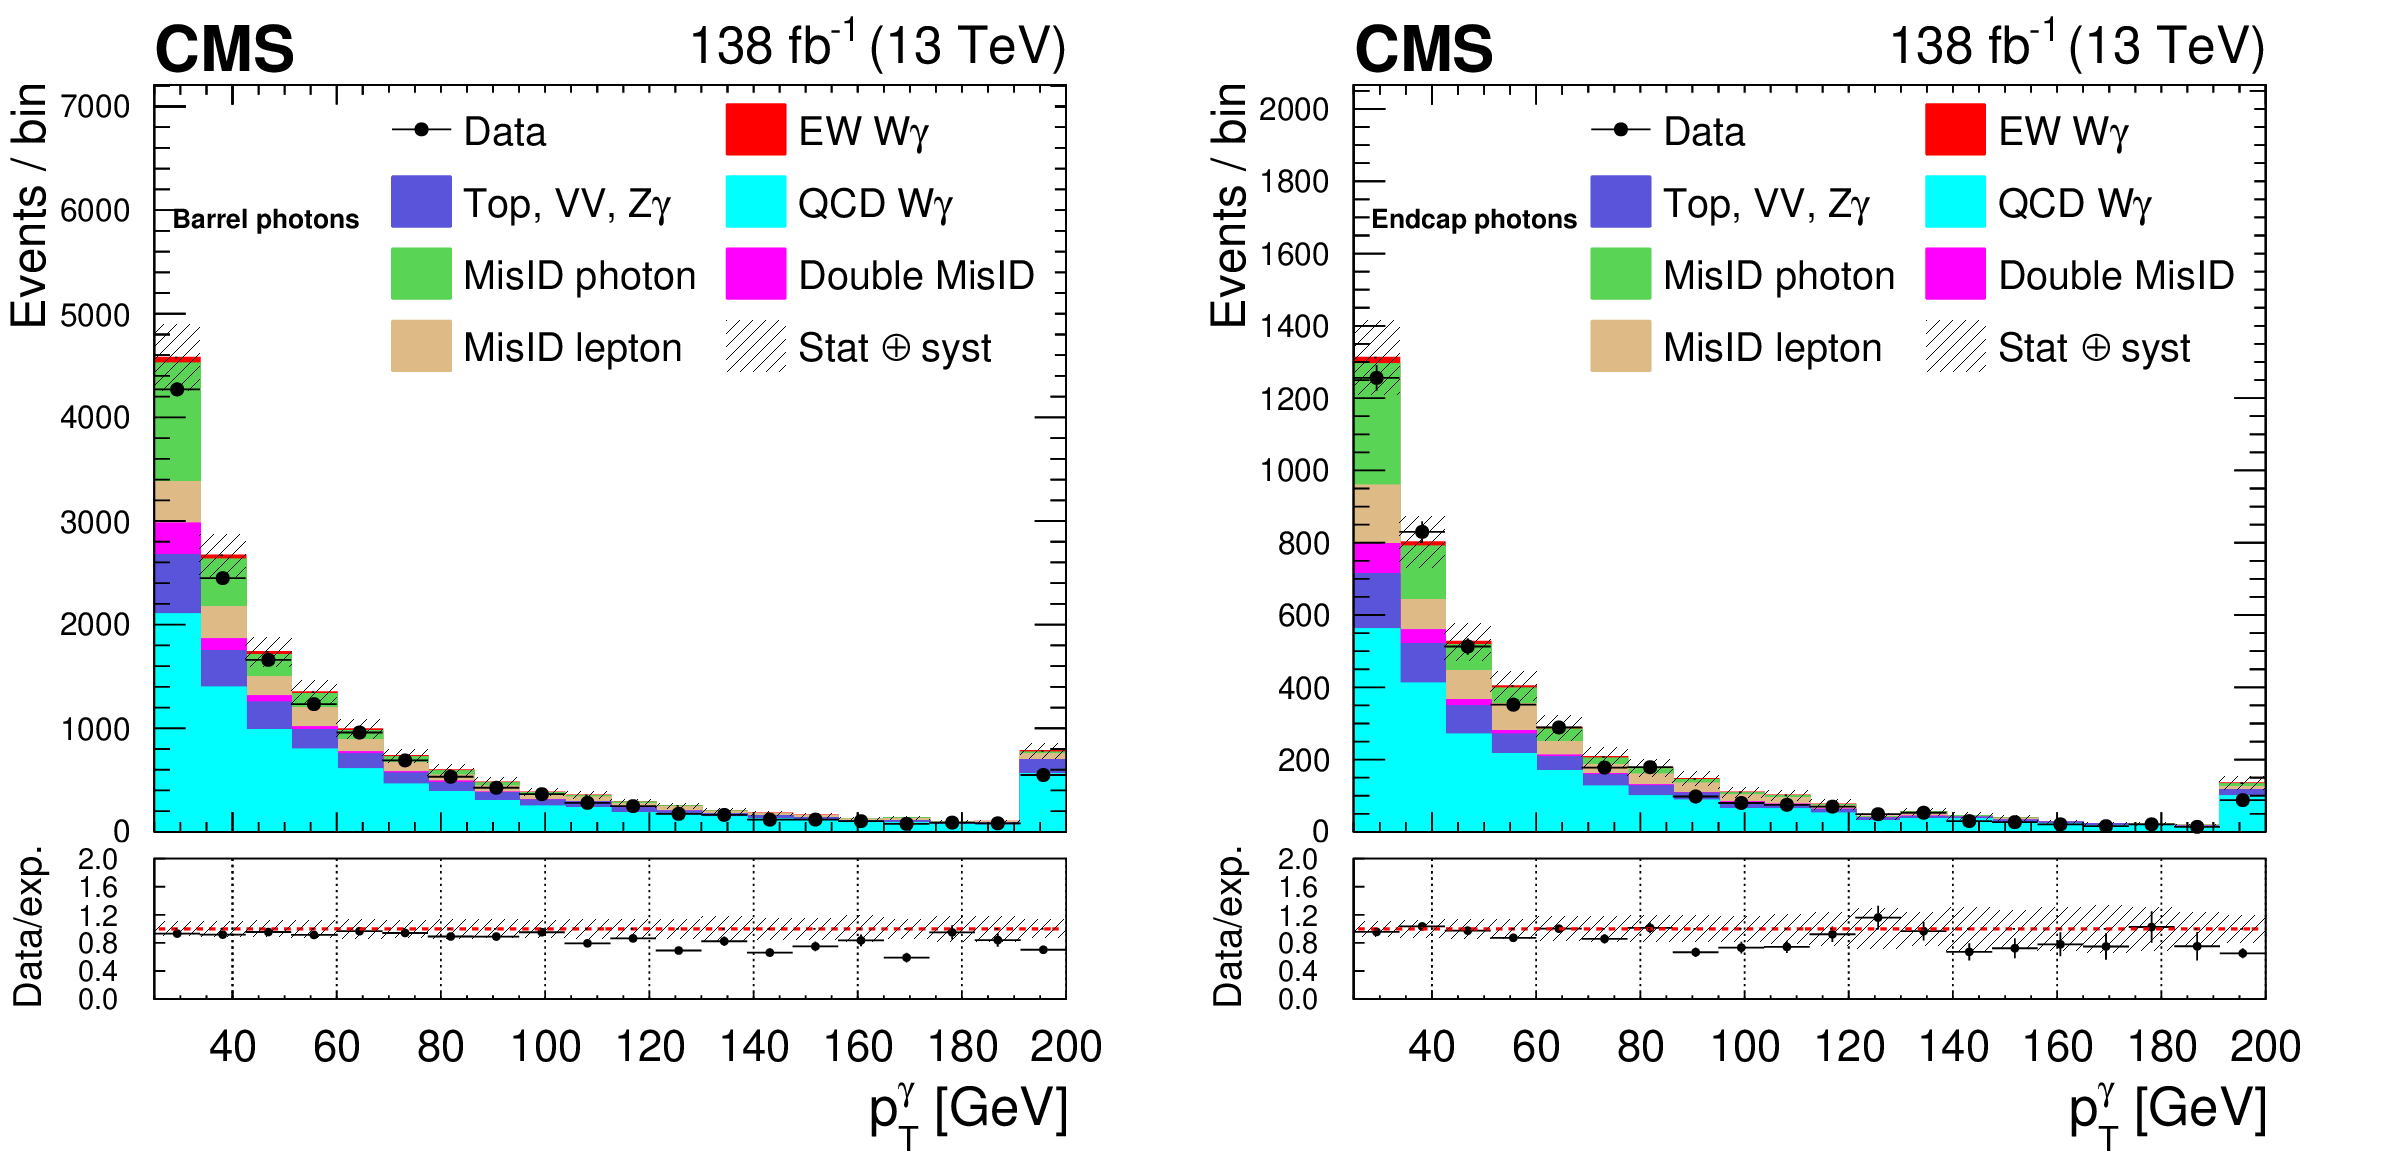
Figure 2:
The $ p_{\mathrm{T}} $ distributions for photons in the barrel (left) and in the endcaps (right) in the control region for data and from background estimations before the fit to the data. The misID backgrounds are derived from data, whereas the remaining backgrounds are estimated from simulation. All events with a photon $ p_{\mathrm{T}} > $ 200 GeV are included in the last bin. The hatched bands represent the combined statistical and systematic uncertainties on the predicted yields. The vertical bars on the data points represent the statistical uncertainties of data. The bottom panels show the ratios of the data to the predicted yields. |

png pdf |
Figure 2-a:
The $ p_{\mathrm{T}} $ distributions for photons in the barrel in the control region for data and from background estimations before the fit to the data. The misID backgrounds are derived from data, whereas the remaining backgrounds are estimated from simulation. All events with a photon $ p_{\mathrm{T}} > $ 200 GeV are included in the last bin. The hatched bands represent the combined statistical and systematic uncertainties on the predicted yields. The vertical bars on the data points represent the statistical uncertainties of data. The bottom panel shows the ratios of the data to the predicted yields. |
png pdf |
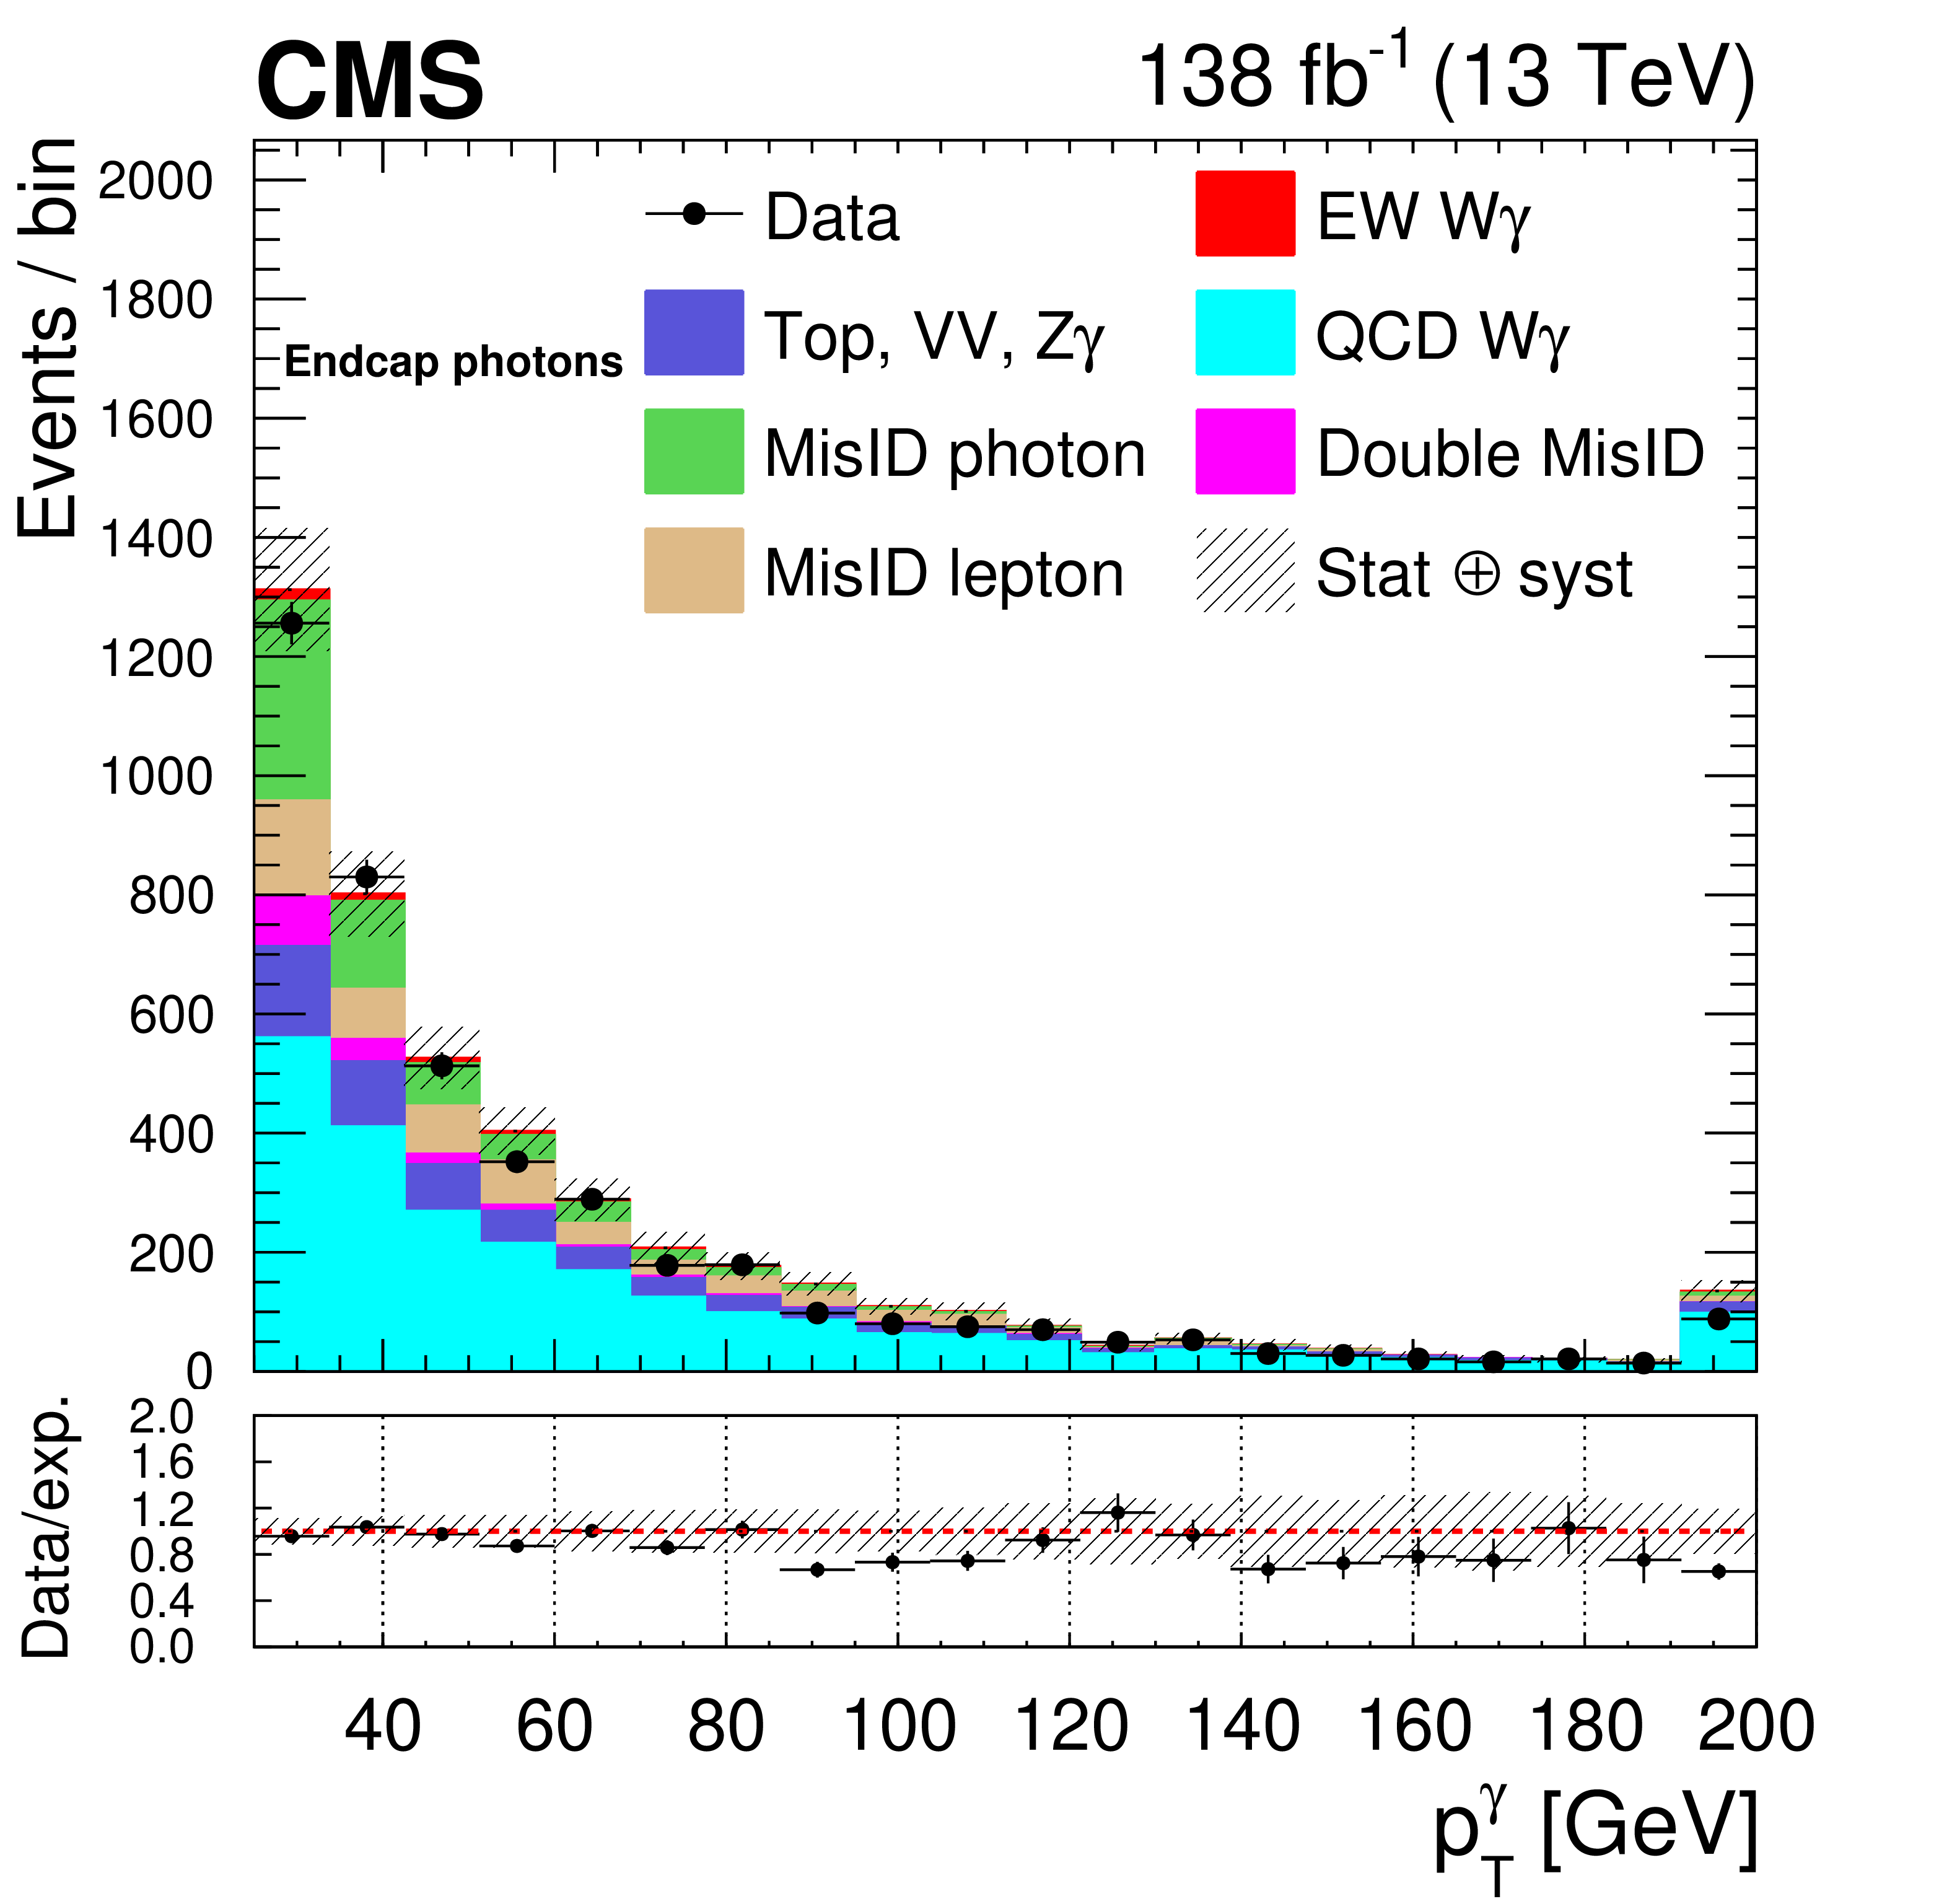
Figure 2-b:
The $ p_{\mathrm{T}} $ distributions for photons in the endcaps in the control region for data and from background estimations before the fit to the data. The misID backgrounds are derived from data, whereas the remaining backgrounds are estimated from simulation. All events with a photon $ p_{\mathrm{T}} > $ 200 GeV are included in the last bin. The hatched bands represent the combined statistical and systematic uncertainties on the predicted yields. The vertical bars on the data points represent the statistical uncertainties of data. The bottom panel shows the ratios of the data to the predicted yields. |
png pdf |
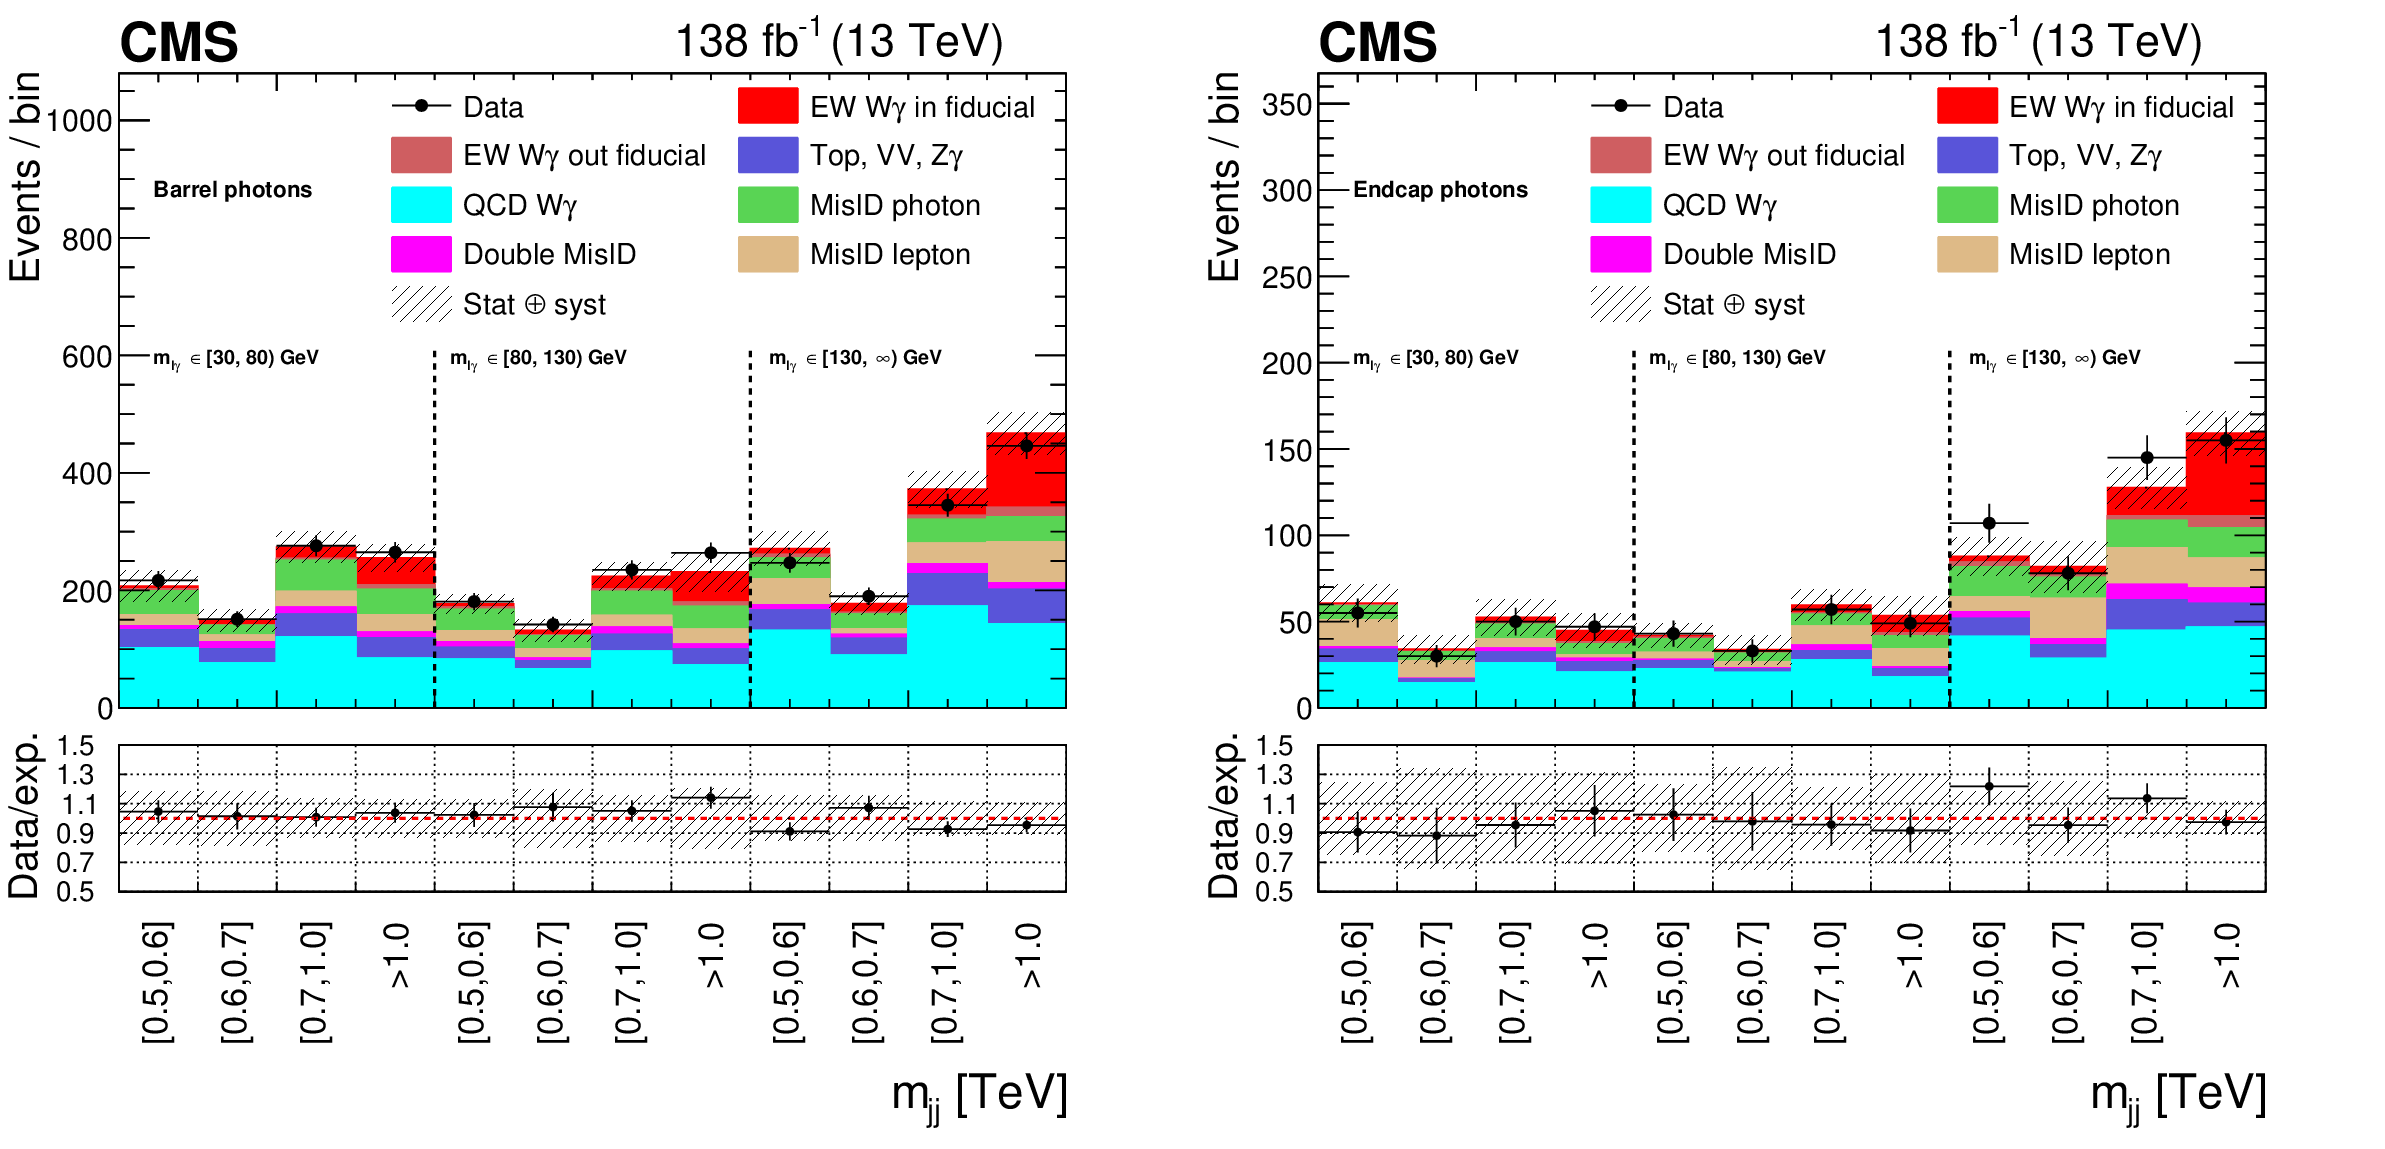
Figure 3:
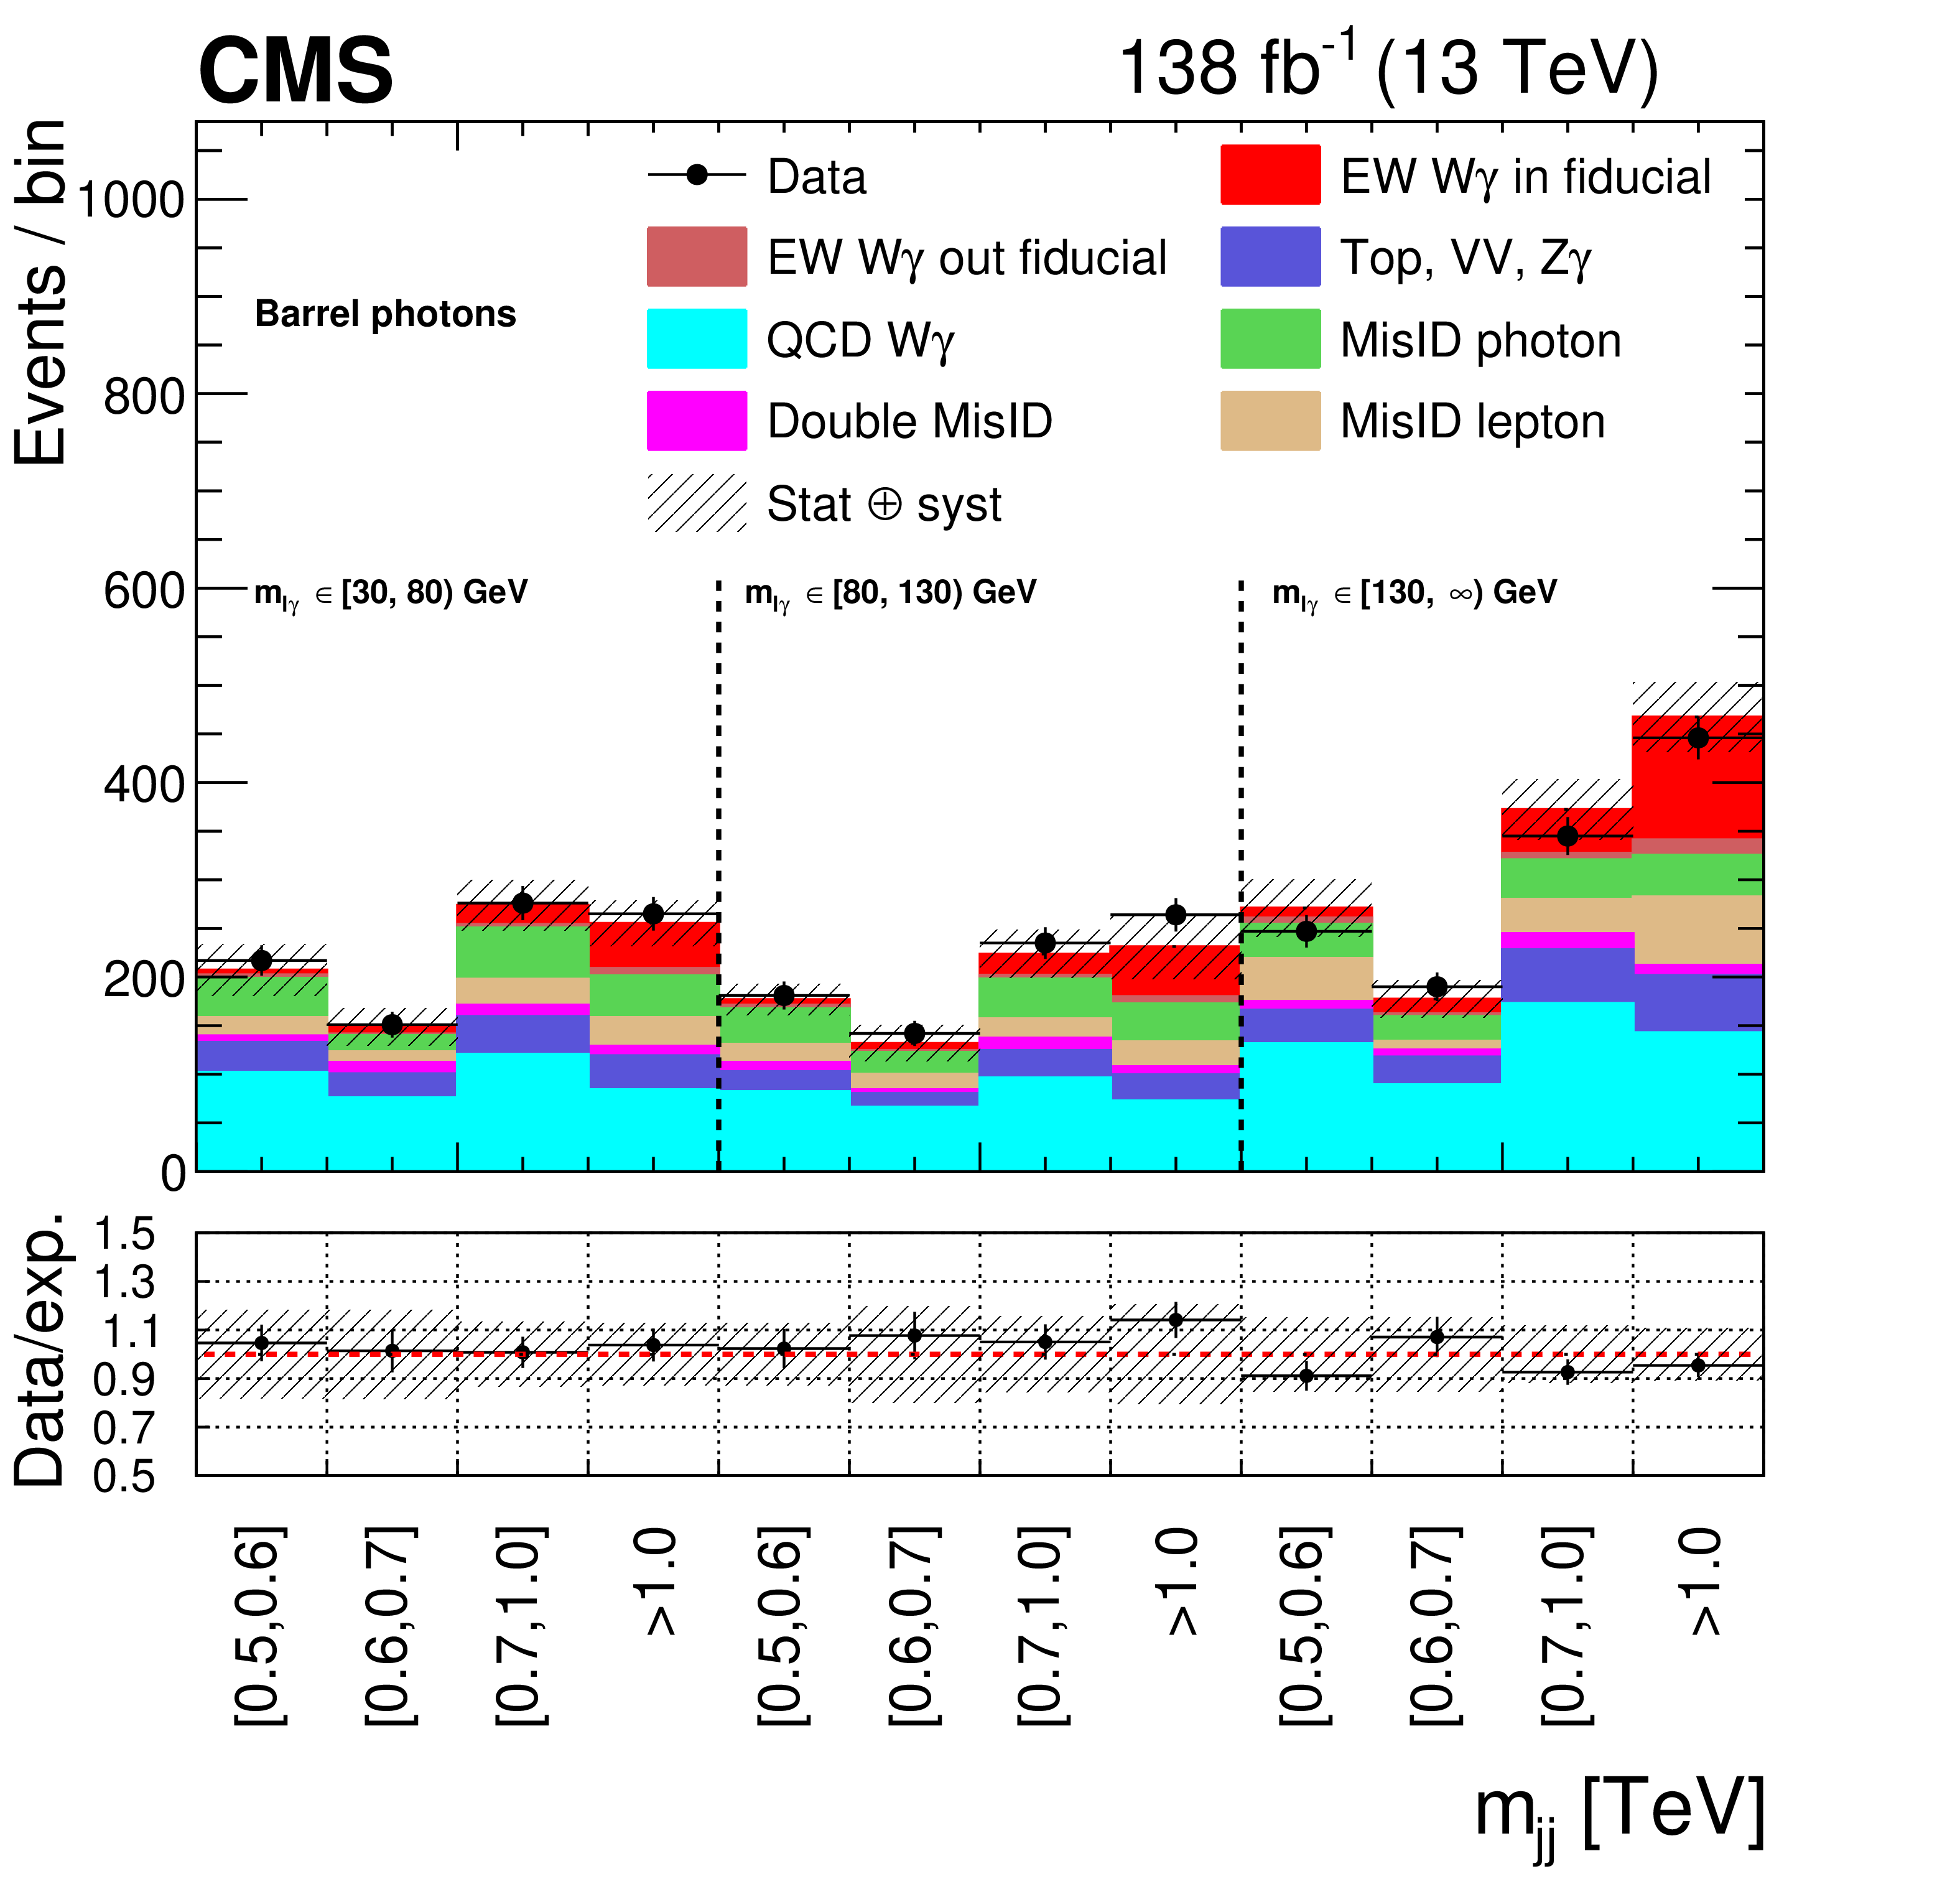
The 2D distributions used in the fit for the total EW W$ \gamma $ cross section measurement. The hatched bands represent the combined statistical and systematic uncertainties in the predicted yields. The vertical bars on the data points represent the statistical uncertainties of data. The expectation is shown after the fit to the data. EW W$ \gamma $ in (out of) fiducial region stands for the events of EW W$ \gamma $ falling in (out of) the fiducial region defined in Sec. 9. |
png pdf |
Figure 3-a:
Barrel photons: The 2D distribution used in the fit for the total EW W$ \gamma $ cross section measurement. The hatched bands represent the combined statistical and systematic uncertainties in the predicted yields. The vertical bars on the data points represent the statistical uncertainties of data. The expectation is shown after the fit to the data. EW W$ \gamma $ in (out of) fiducial region stands for the events of EW W$ \gamma $ falling in (out of) the fiducial region defined in Sec. 9. |

png pdf |
Figure 3-b:
Endcap photons: The 2D distribution used in the fit for the total EW W$ \gamma $ cross section measurement. The hatched bands represent the combined statistical and systematic uncertainties in the predicted yields. The vertical bars on the data points represent the statistical uncertainties of data. The expectation is shown after the fit to the data. EW W$ \gamma $ in (out of) fiducial region stands for the events of EW W$ \gamma $ falling in (out of) the fiducial region defined in Sec. 9. |
png pdf |
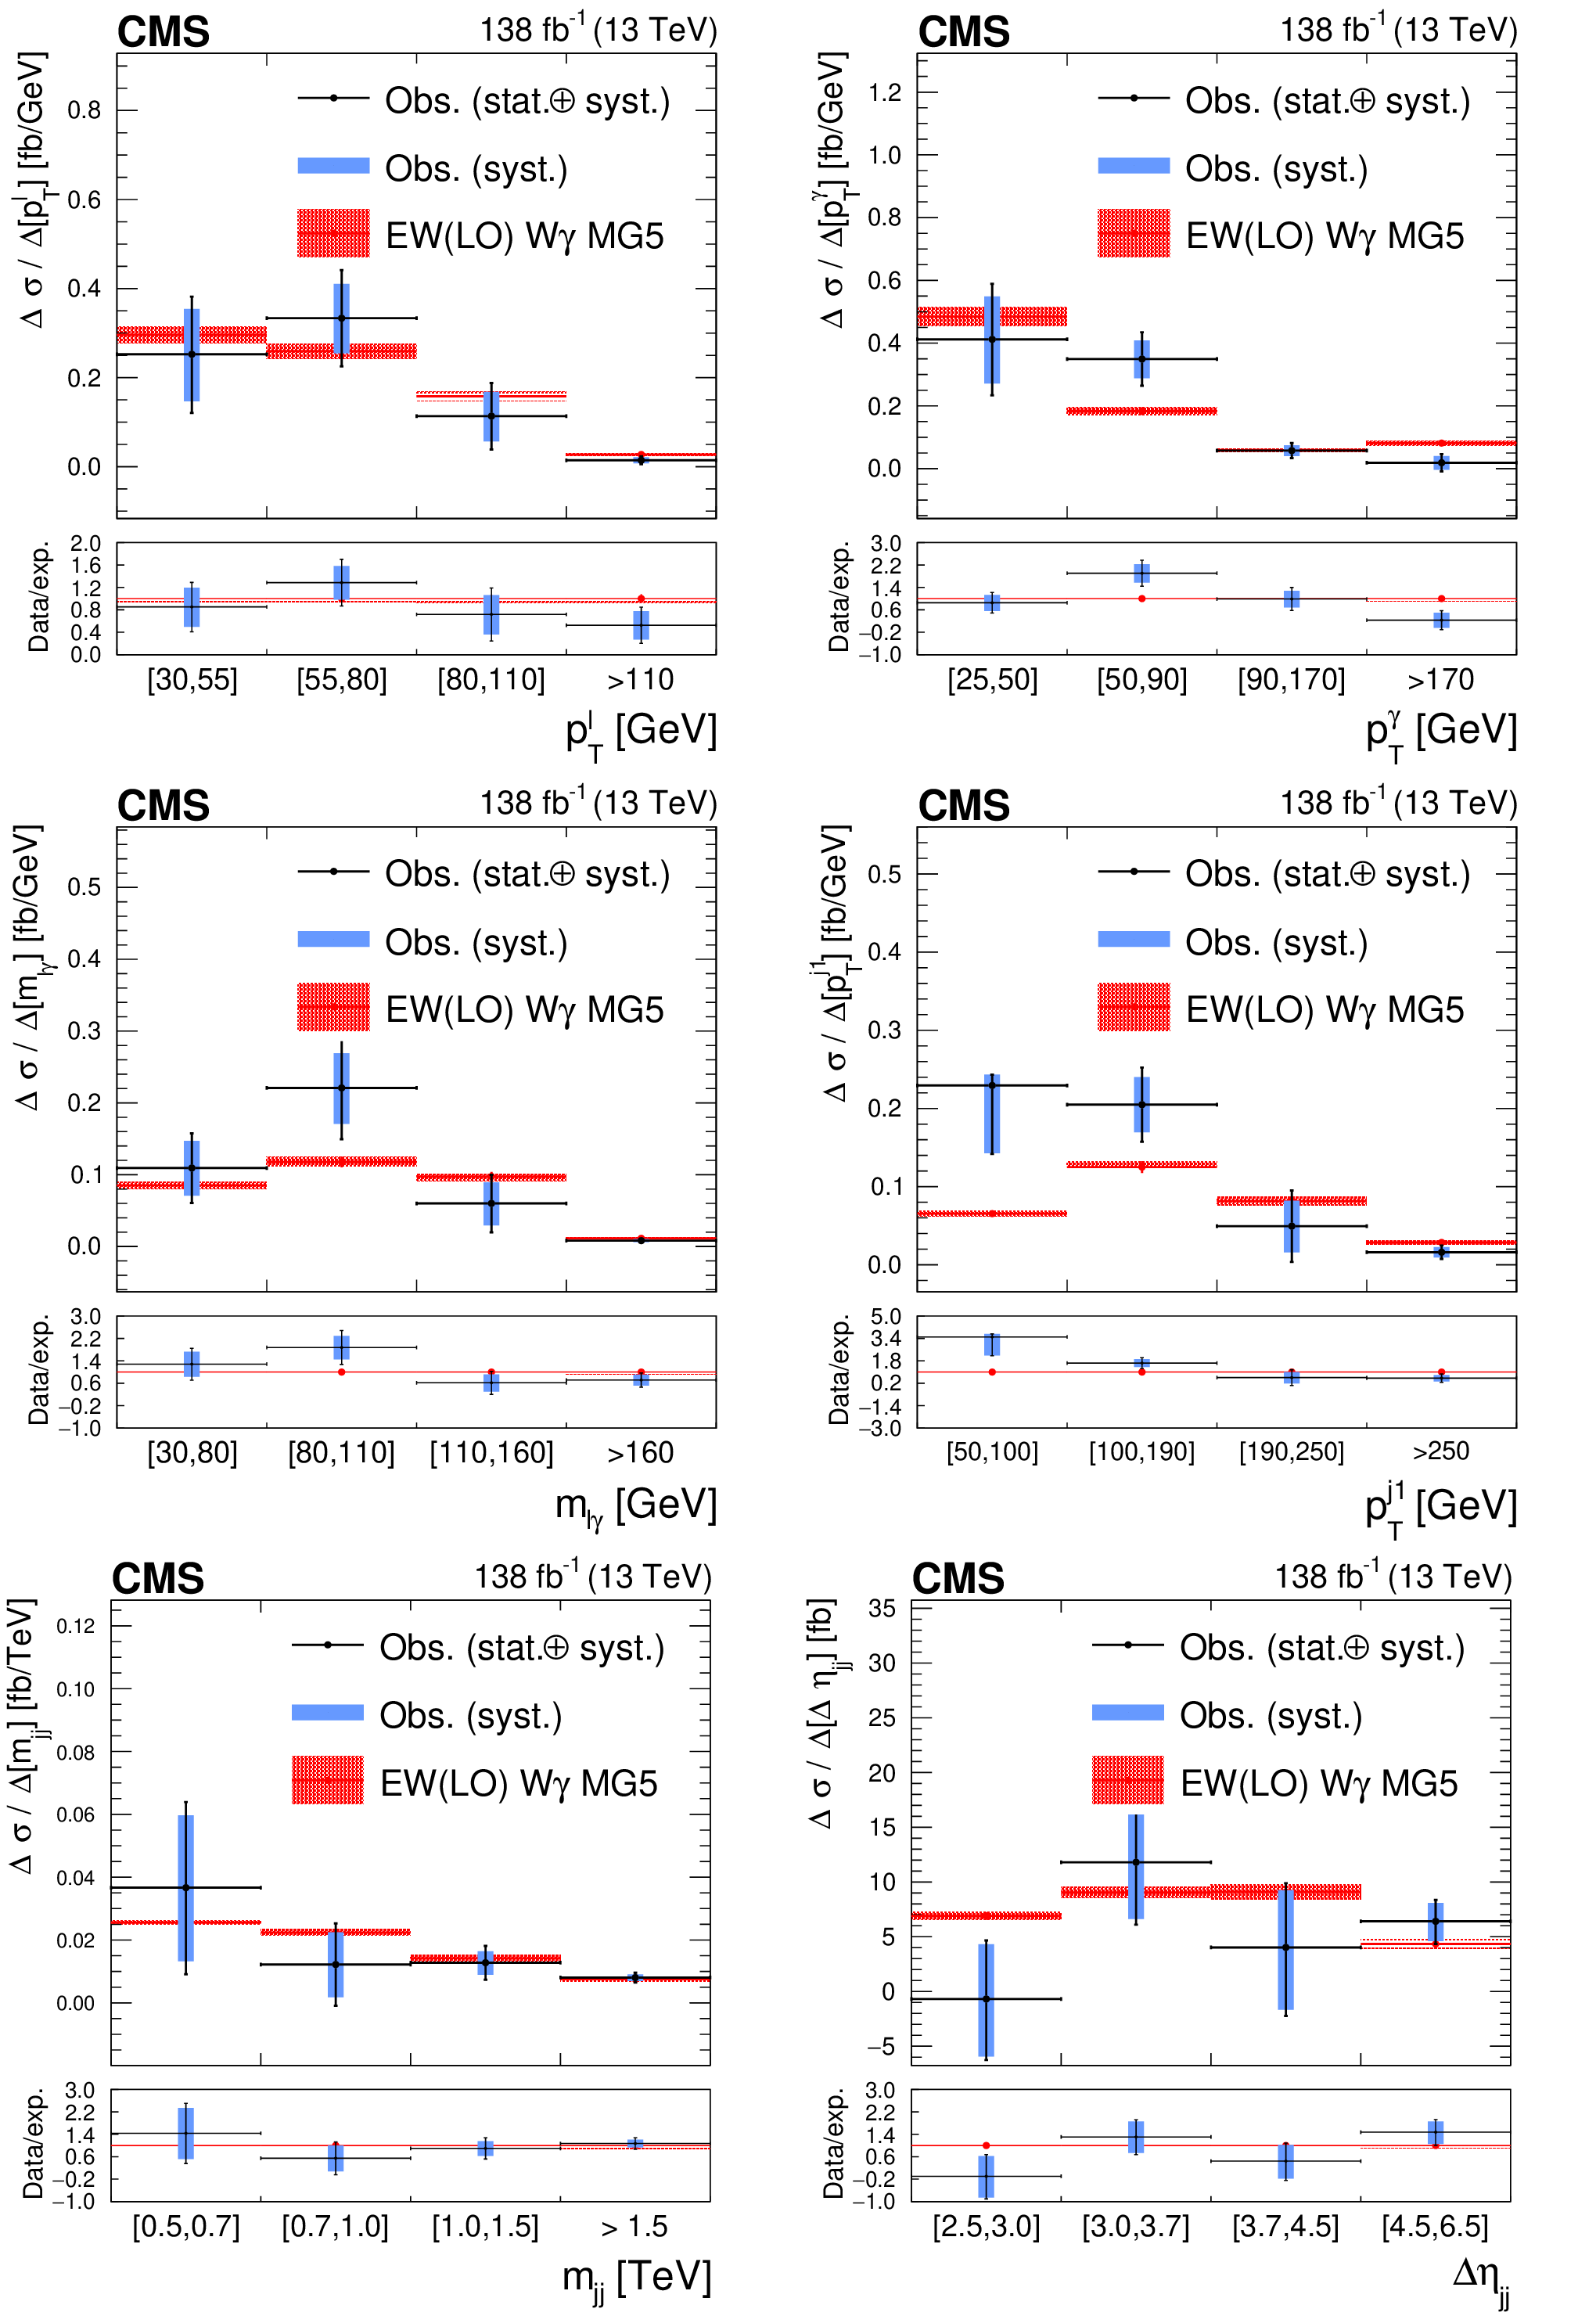
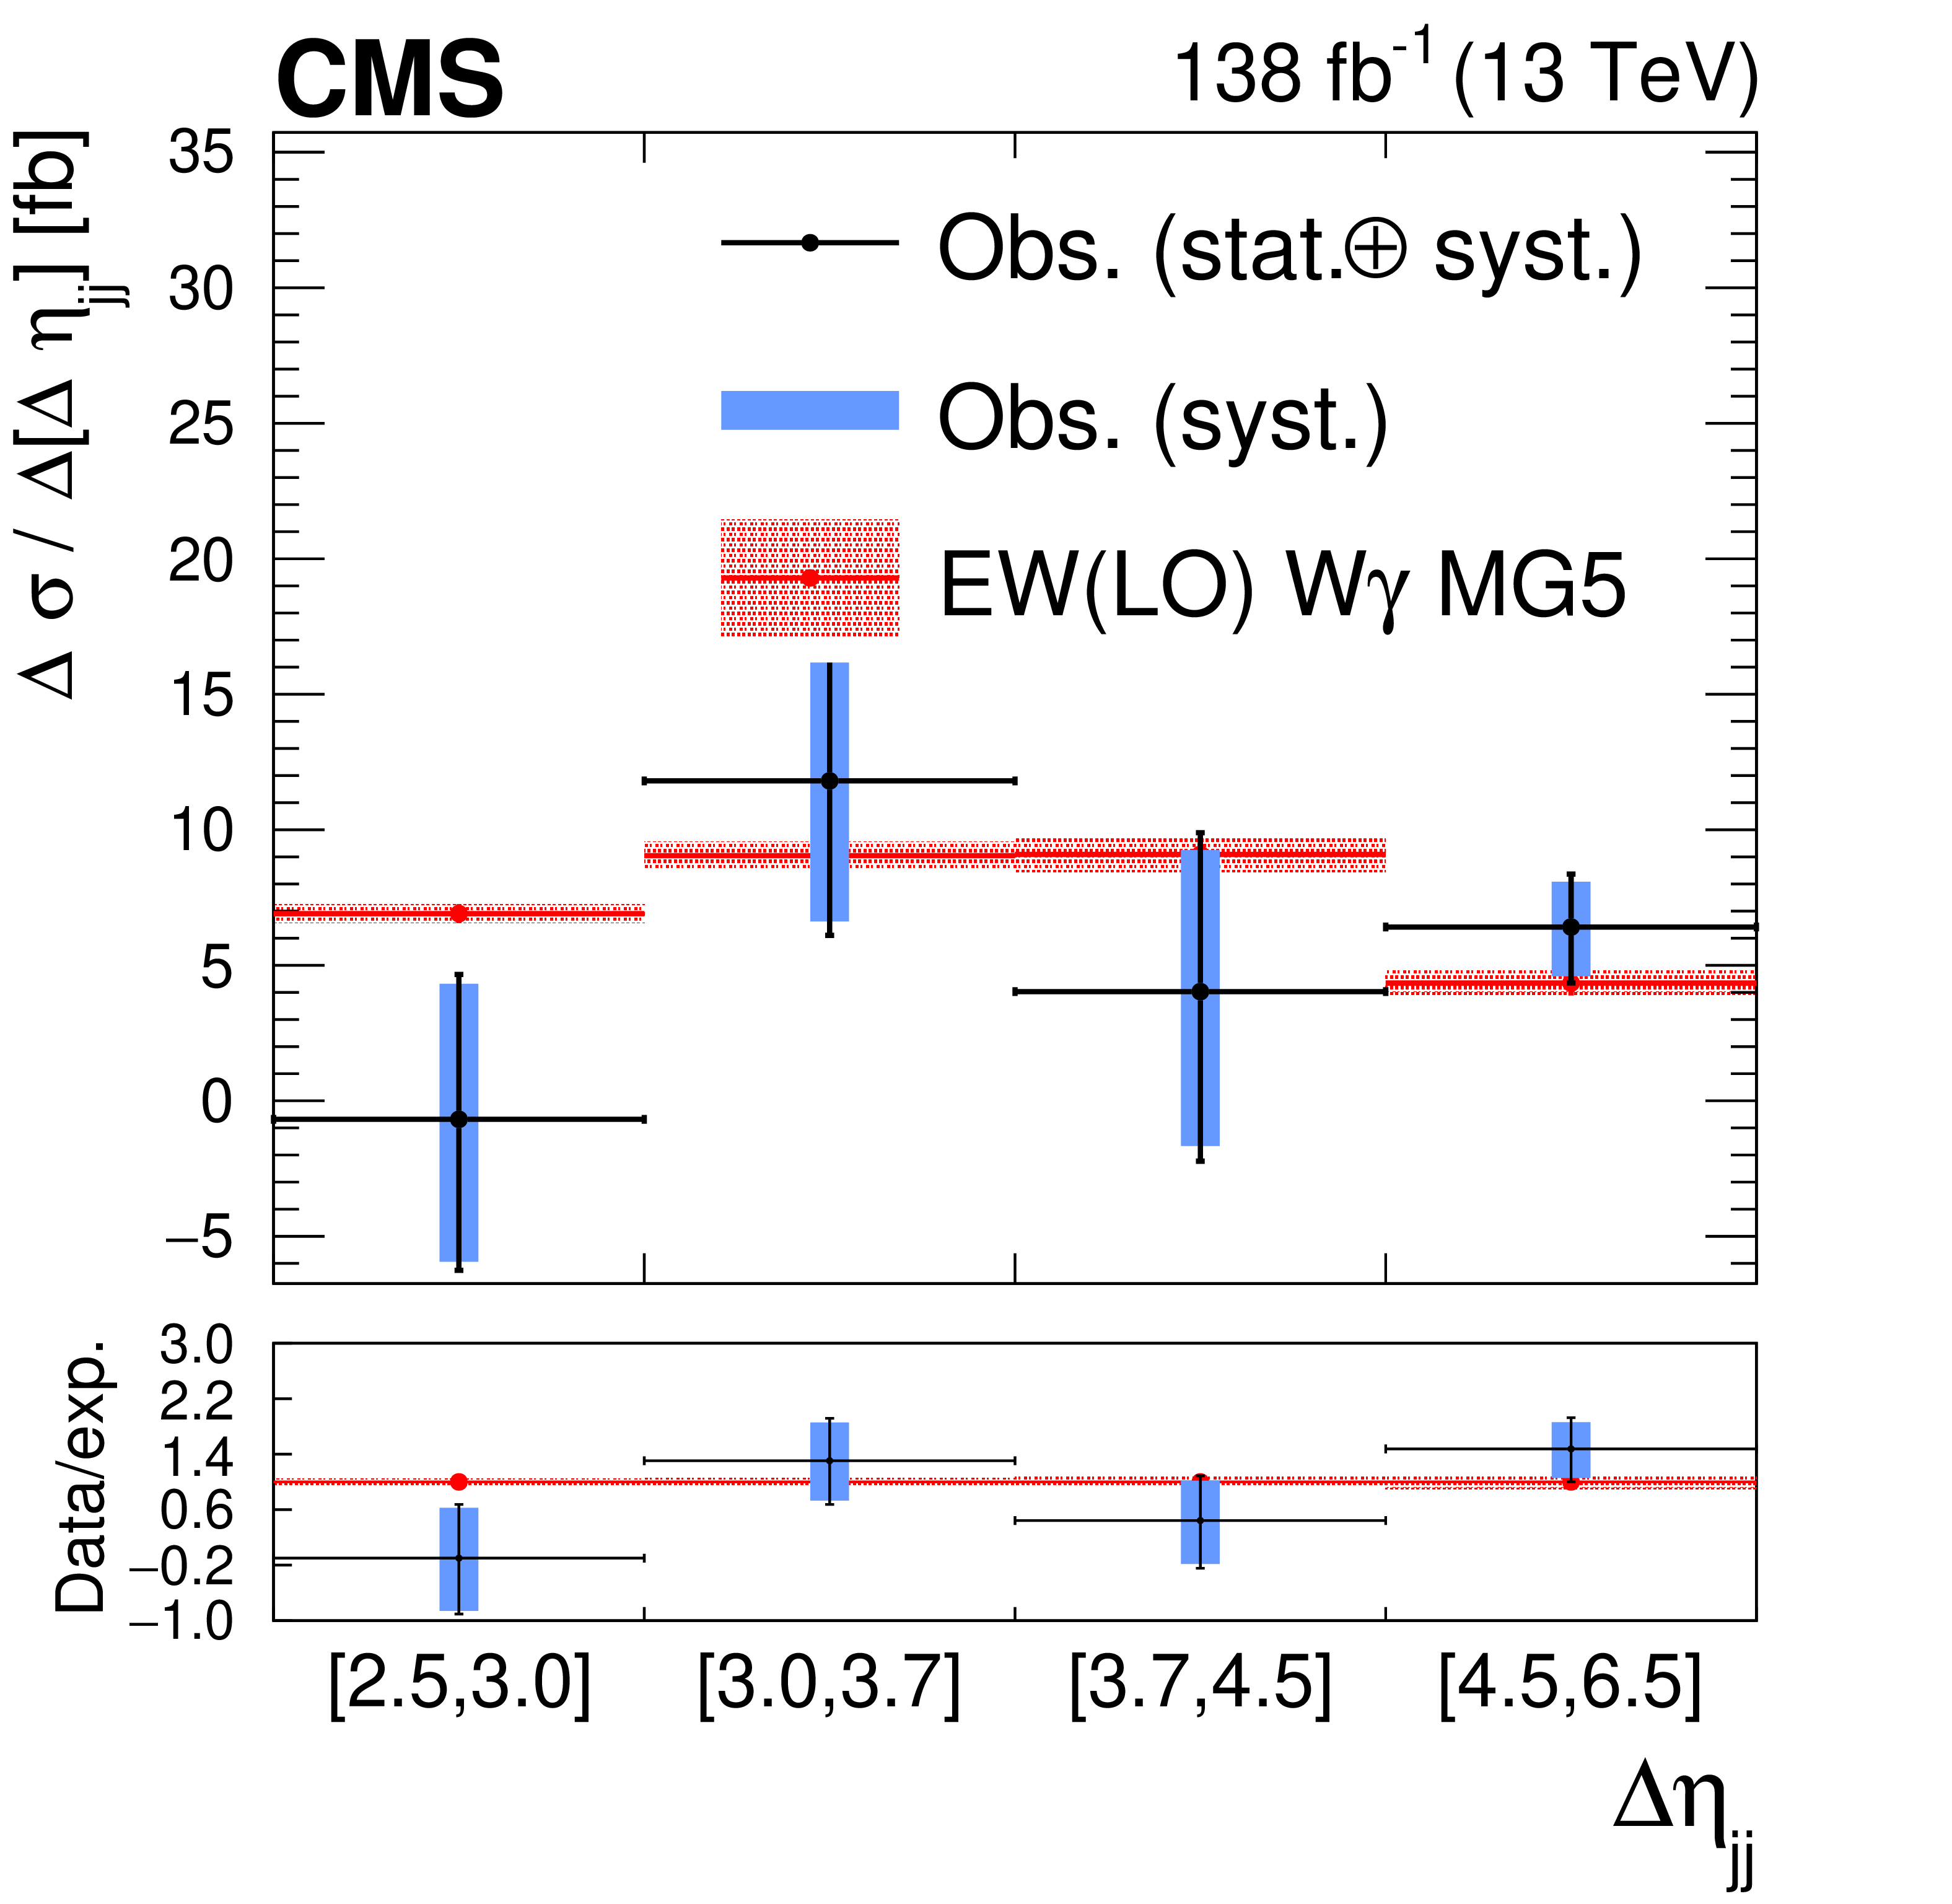
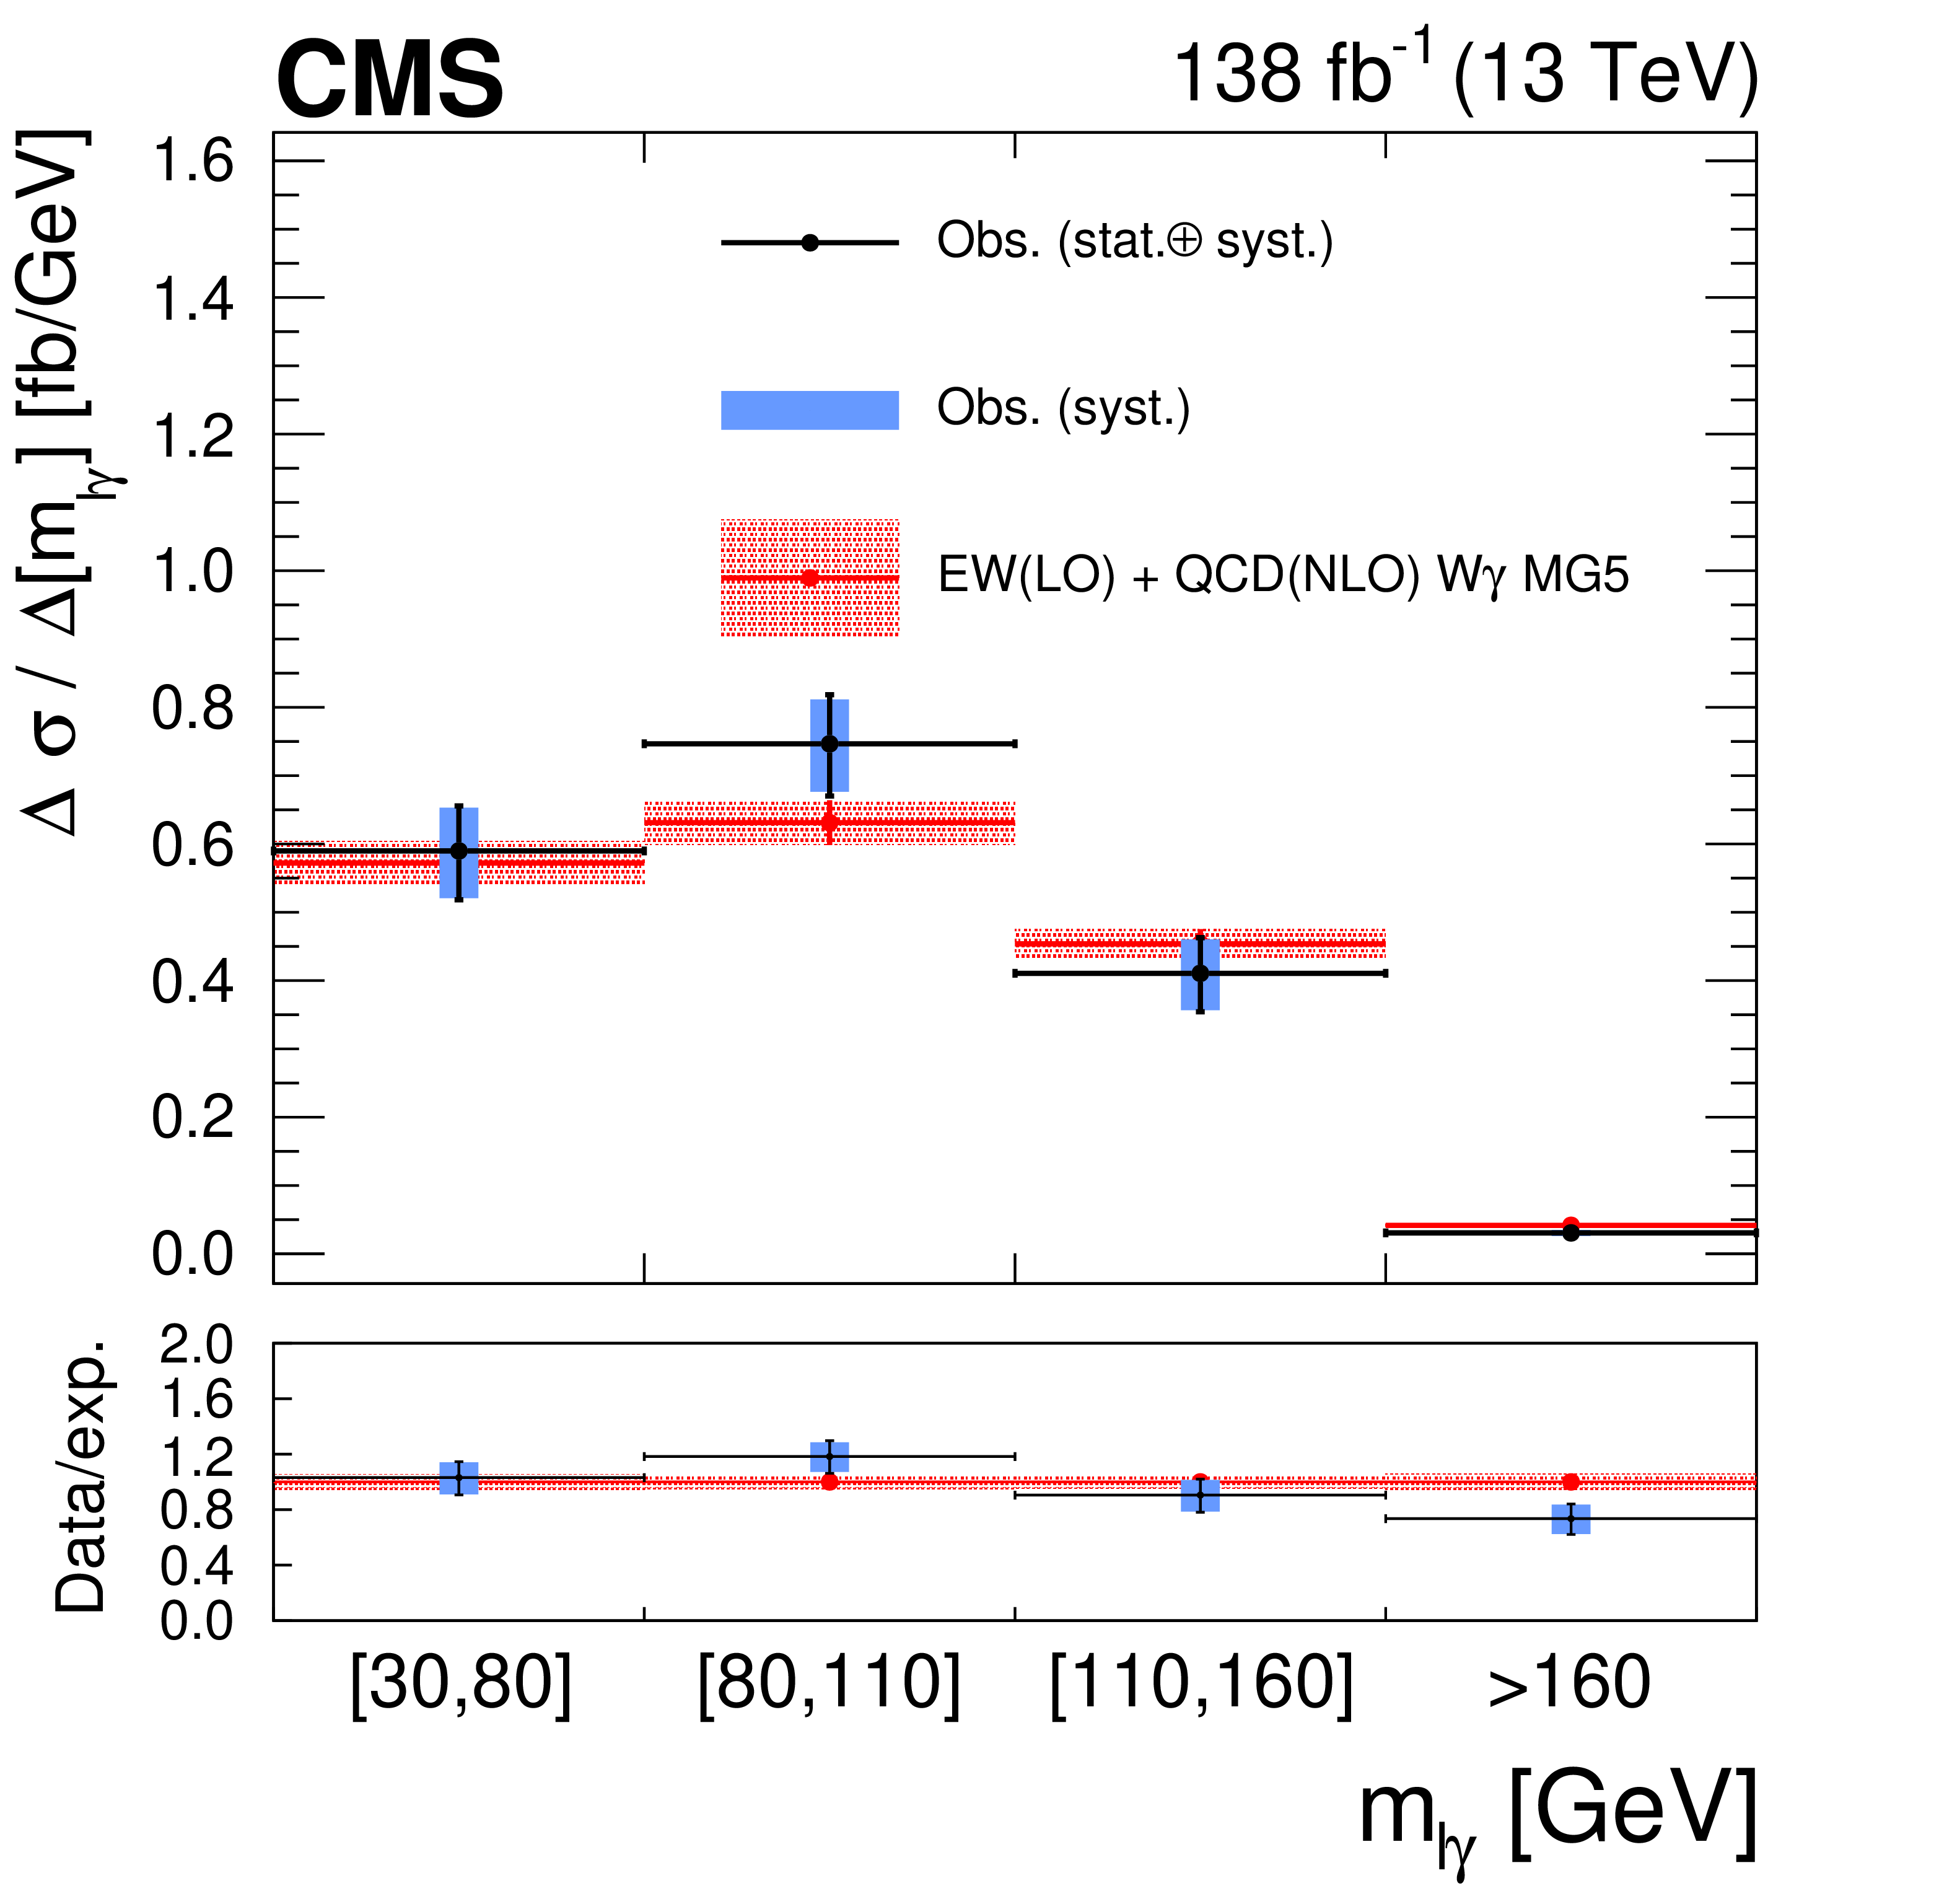
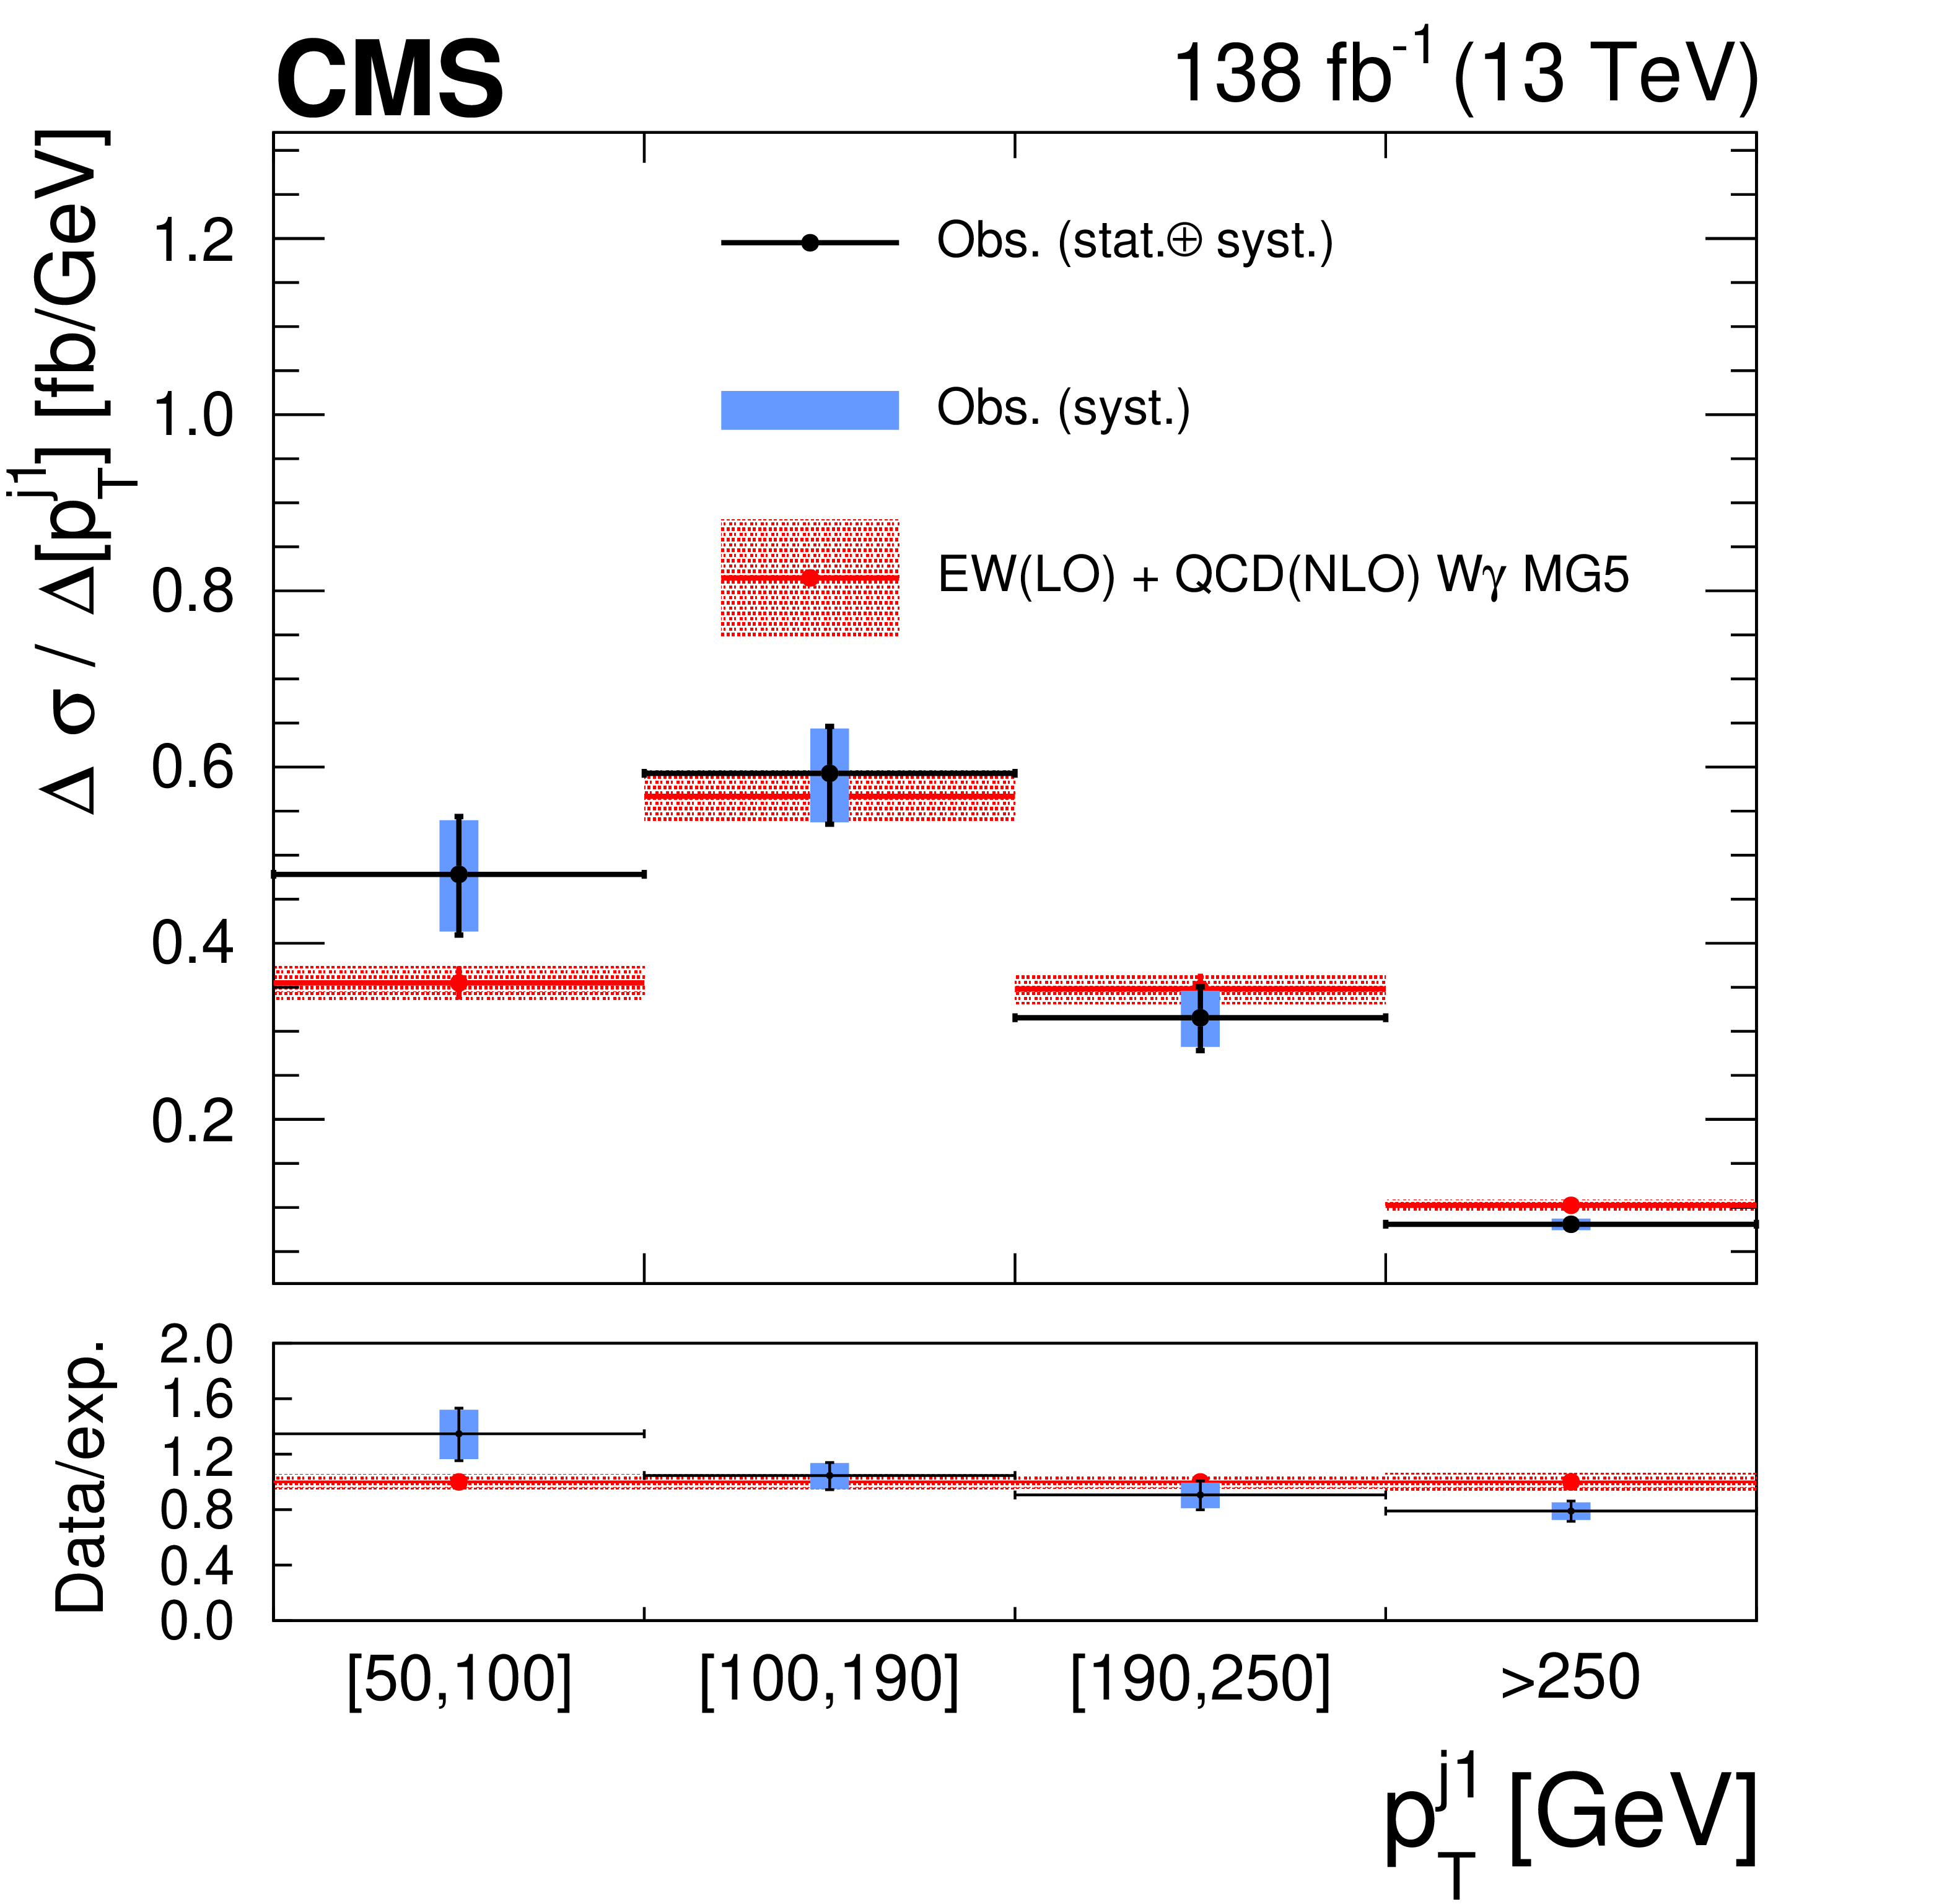
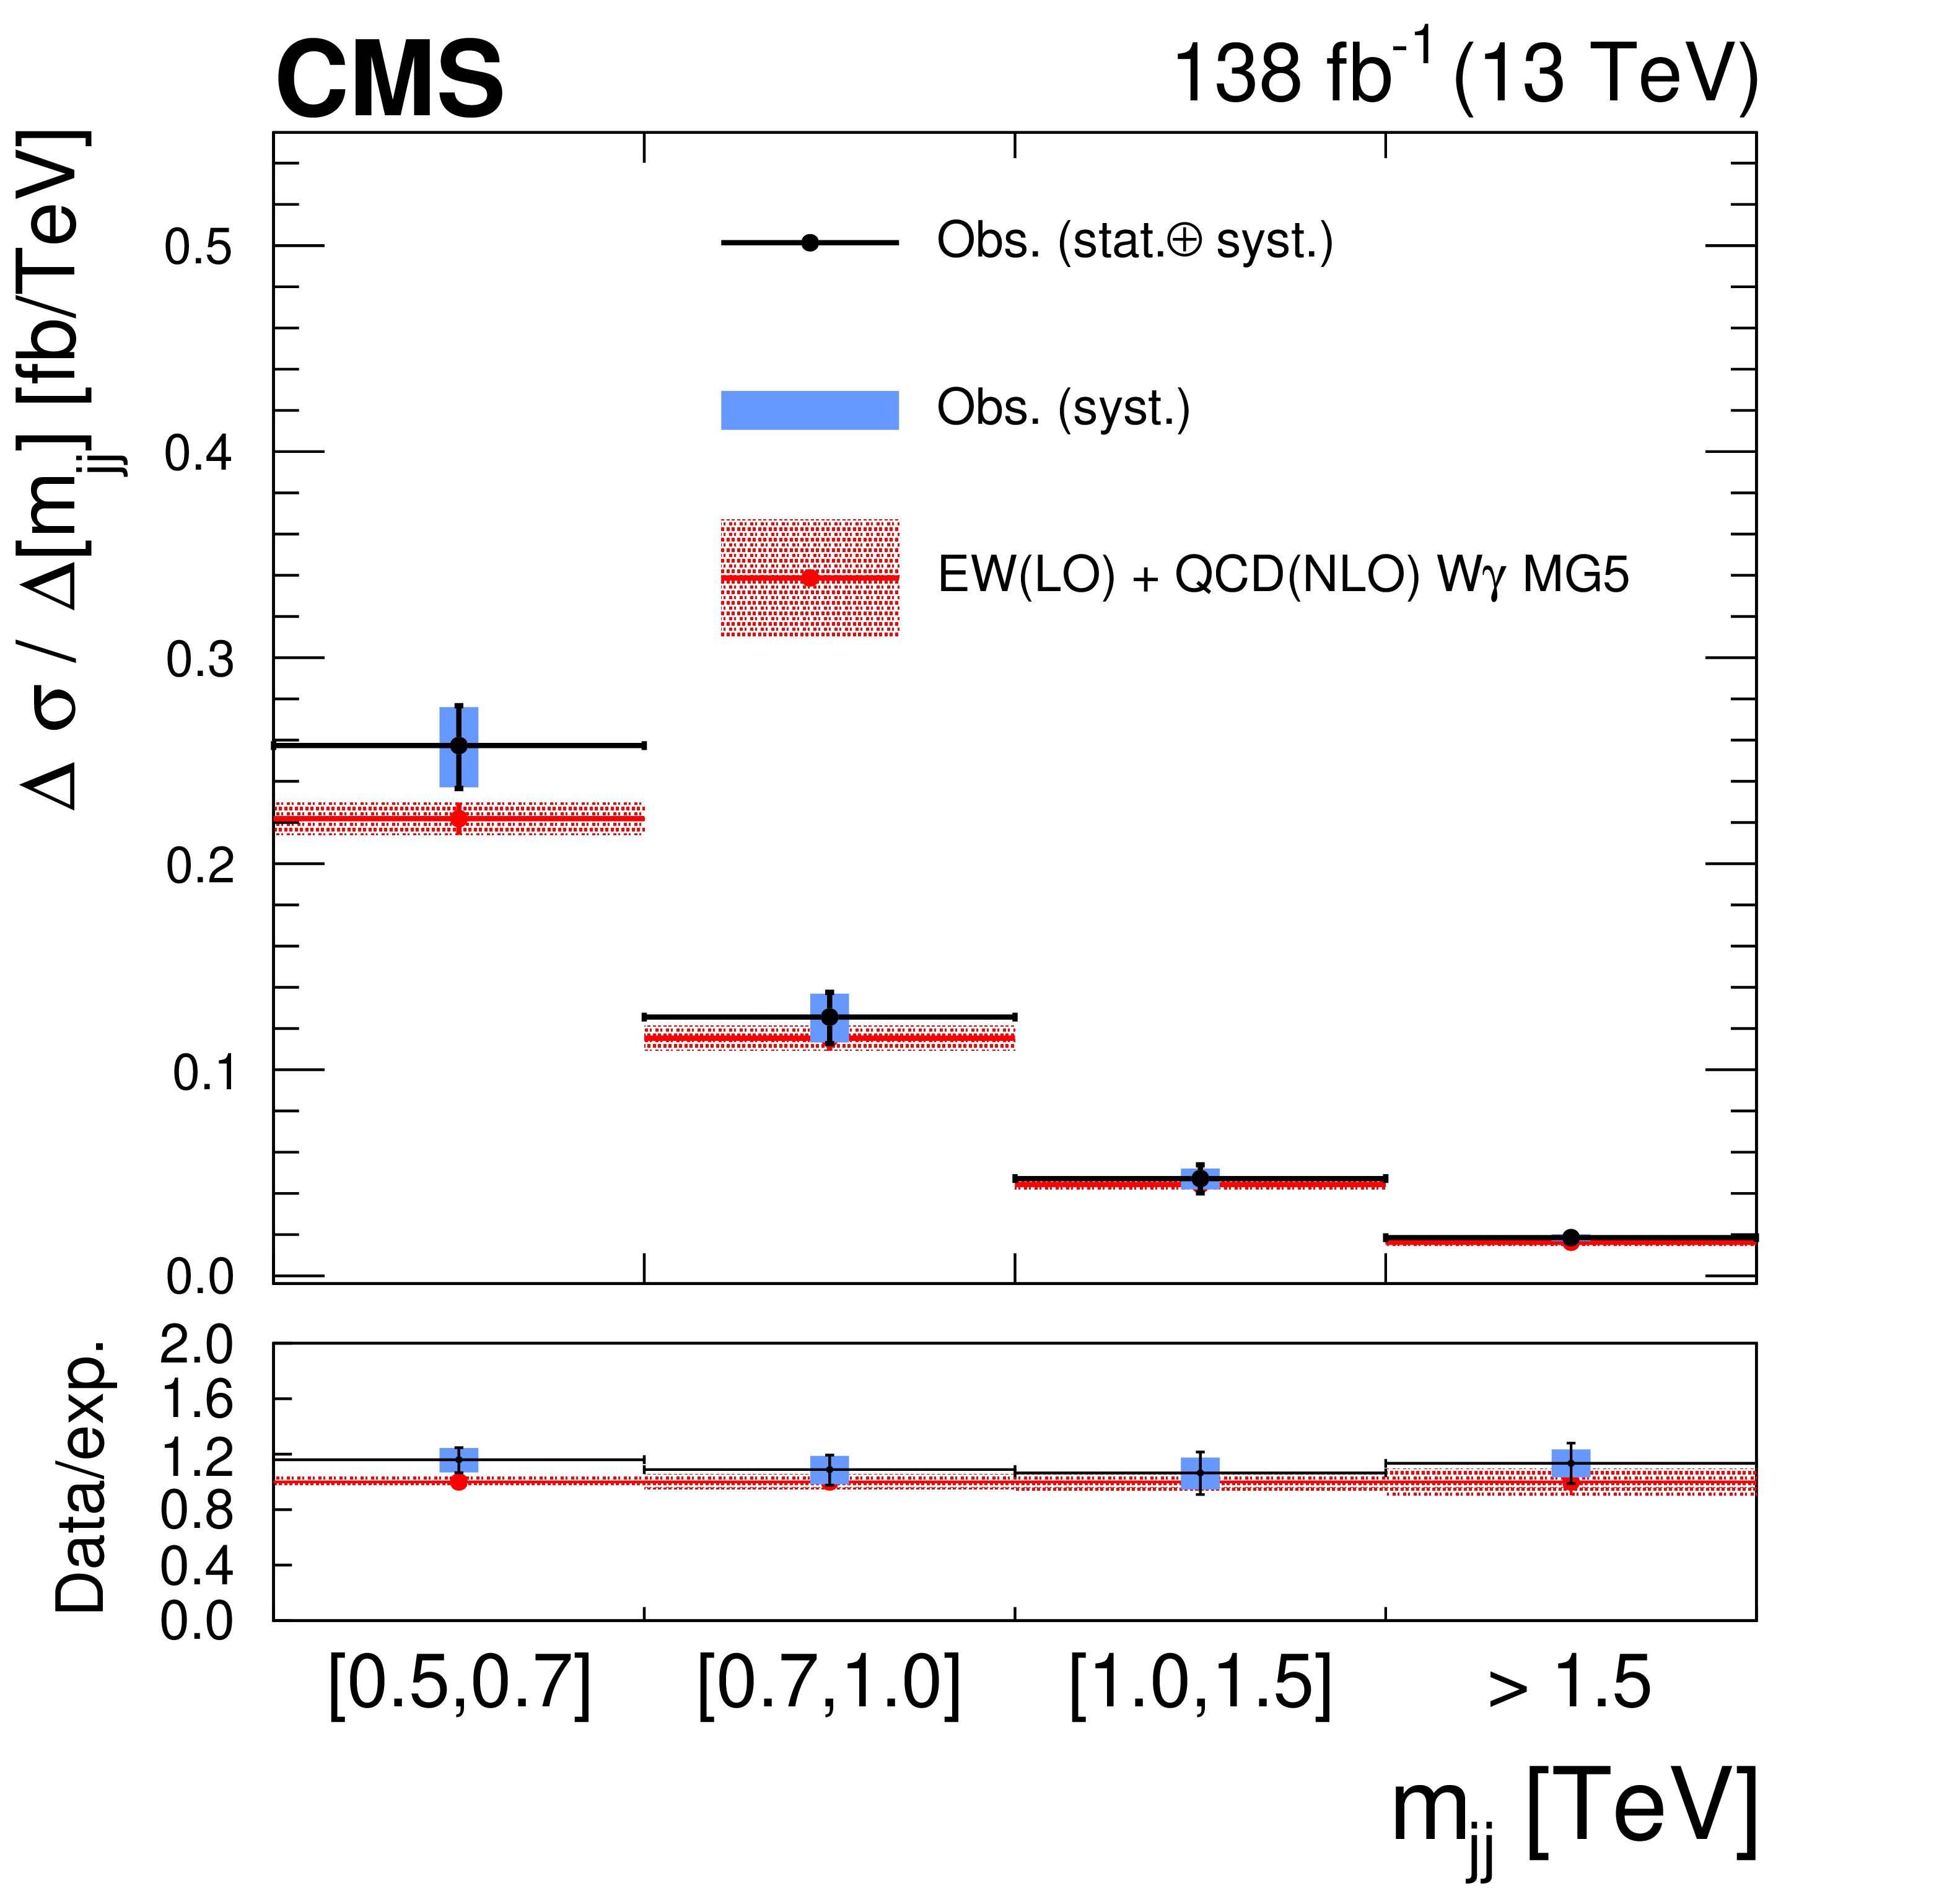
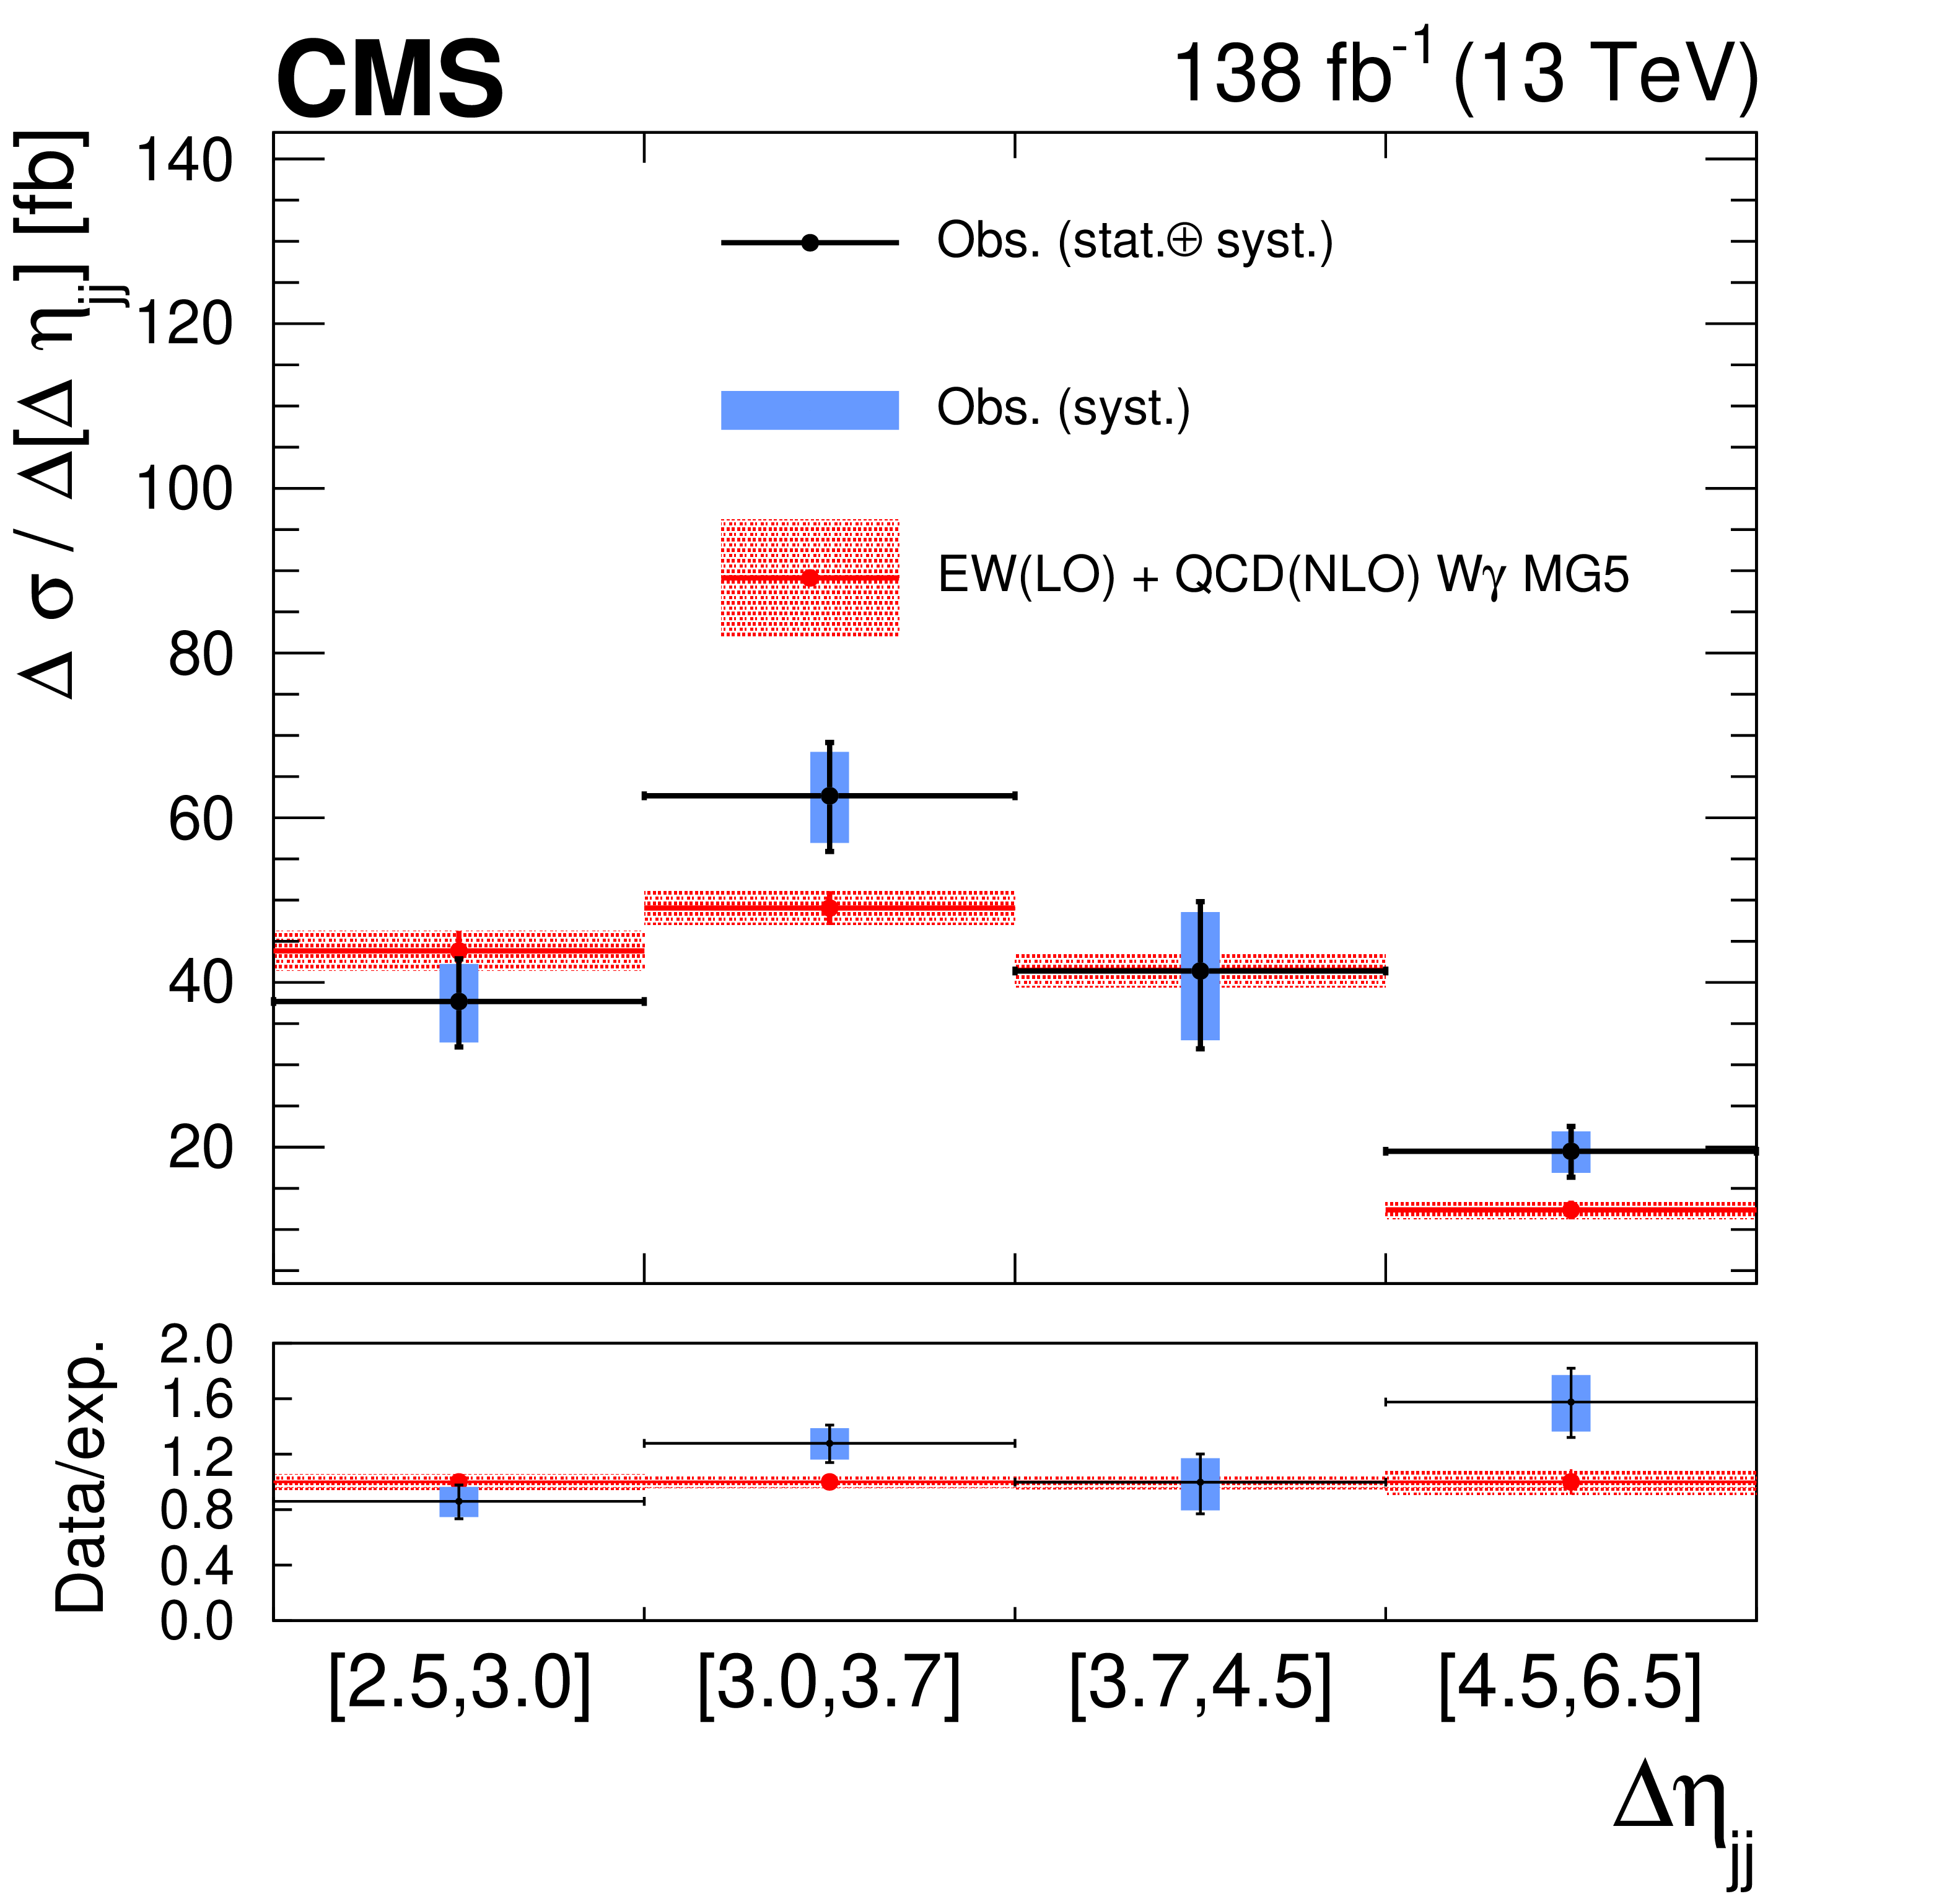
Figure 4:
Differential cross sections for the EW W$ \gamma $jj production as functions of $ p_{\mathrm{T}}^{\ell} $, $ p_{\mathrm{T}}^{\gamma} $, $ p_{\mathrm{T}}^{\mathrm{j}1} $, $ m_{\ell\gamma} $, $ m_{\text{jj}} $, and $ \Delta\eta_{\text{jj}} $. Since the ranges of some variables extend to infinity, the last bins accommodate all the events up to infinity as marked by the bin label, but the bin widths that are used as the denominator are finite and are (110, 400), (170, 200), (160, 1000), (250, 500), and (1500, 2000) GeV for $ p_{\mathrm{T}}^{\ell} $, $ p_{\mathrm{T}}^{\gamma} $, $ m_{\ell\gamma} $, $ p_{\mathrm{T}}^{\mathrm{j}1} $ and $ m_{\text{jj}} $ respectively. The blue bands stand for the systematic uncertainties and the black bands represent the total uncertainties. |

png pdf |
Figure 4-a:
Differential cross section for the EW W$ \gamma $jj production as functions of $ p_{\mathrm{T}}^{\ell} $. Since the range of the variable extends to infinity, the last bin accommodates all the events up to infinity as marked by the bin label, but the bin width that is used as the denominator is finite and is (110, 400) GeV.The blue bands stand for the systematic uncertainties and the black bands represent the total uncertainties. |
png pdf |
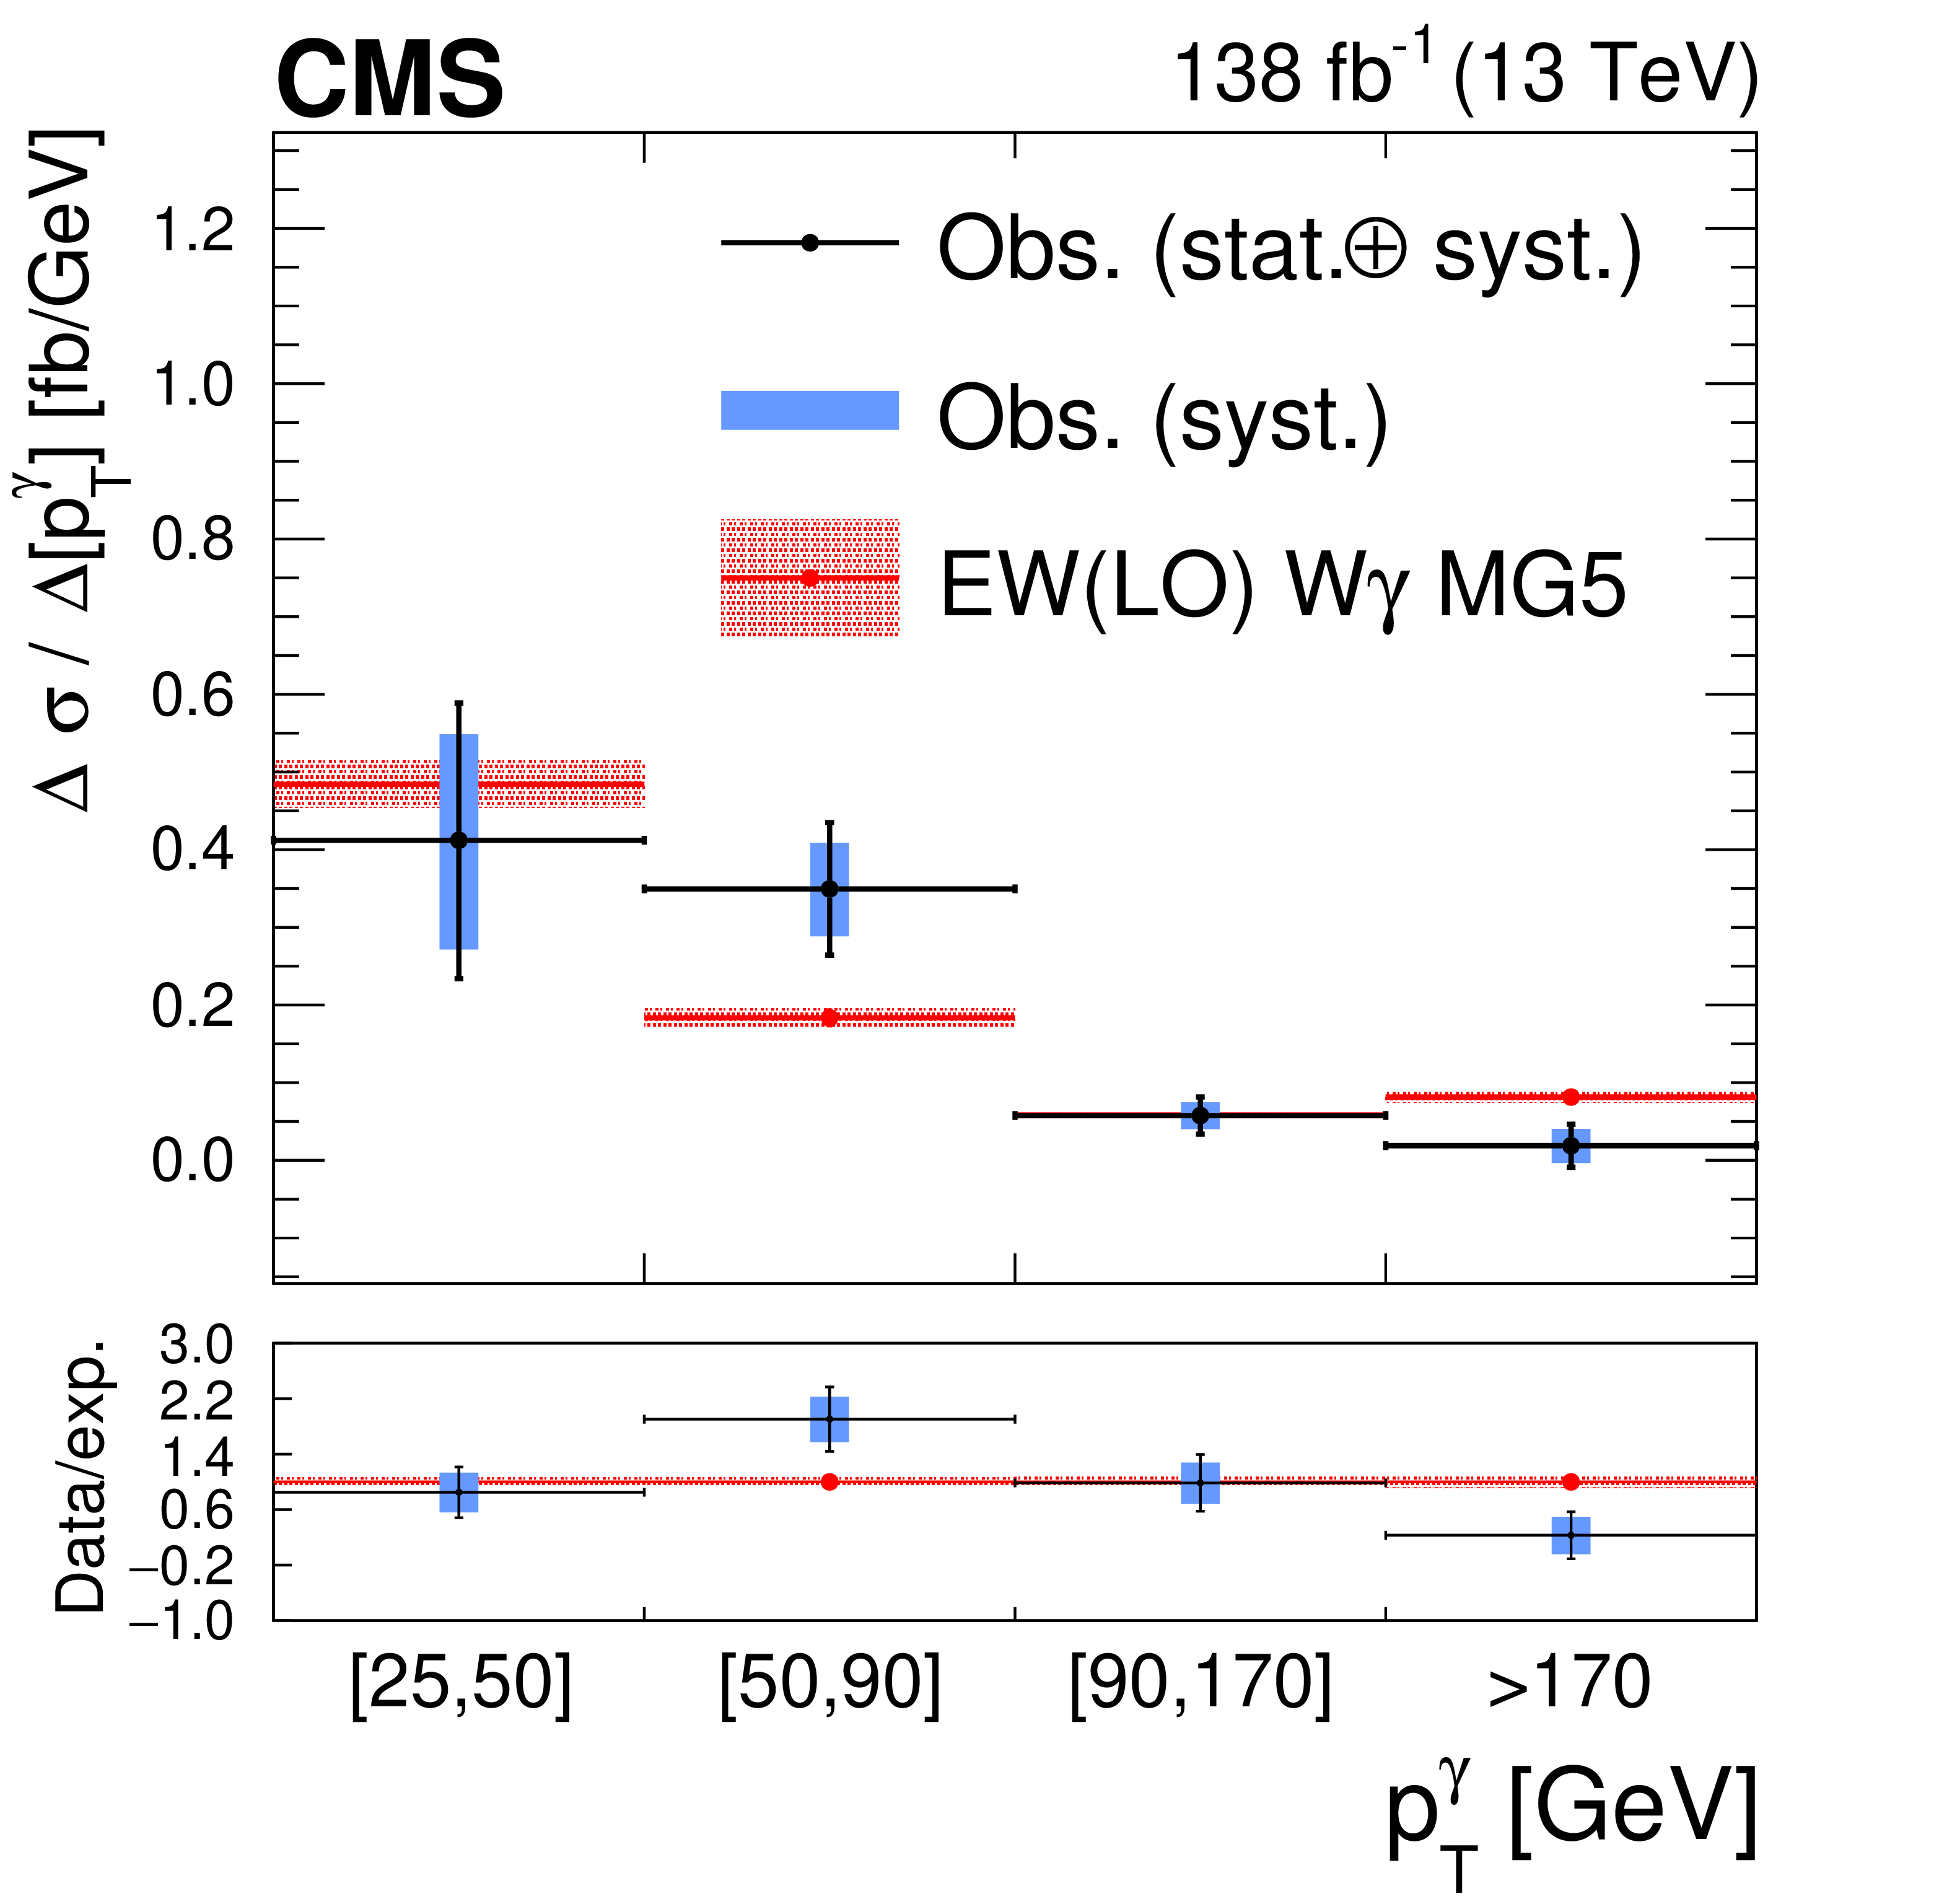
Figure 4-b:
Differential cross section for the EW W$ \gamma $jj production as functions of $ p_{\mathrm{T}}^{\gamma} $. Since the range of the variable extends to infinity, the last bin accommodates all the events up to infinity as marked by the bin label, but the bin width that is used as the denominator is finite and is (170 200) GeV. The blue bands stand for the systematic uncertainties and the black bands represent the total uncertainties. |

png pdf |
Figure 4-c:
Differential cross section for the EW W$ \gamma $jj production as functions of $ p_{\mathrm{T}}^{\mathrm{j}1} $. Since the range of the variable extends to infinity, the last bin accommodates all the events up to infinity as marked by the bin label, but the bin width that is used as the denominator is finite and is (160, 1000) GeV. The blue bands stand for the systematic uncertainties and the black bands represent the total uncertainties. |

png pdf |
Figure 4-d:
Differential cross section for the EW W$ \gamma $jj production as functions of $ m_{\ell\gamma} $. $ \Delta\eta_{\text{jj}} $. |
png pdf |
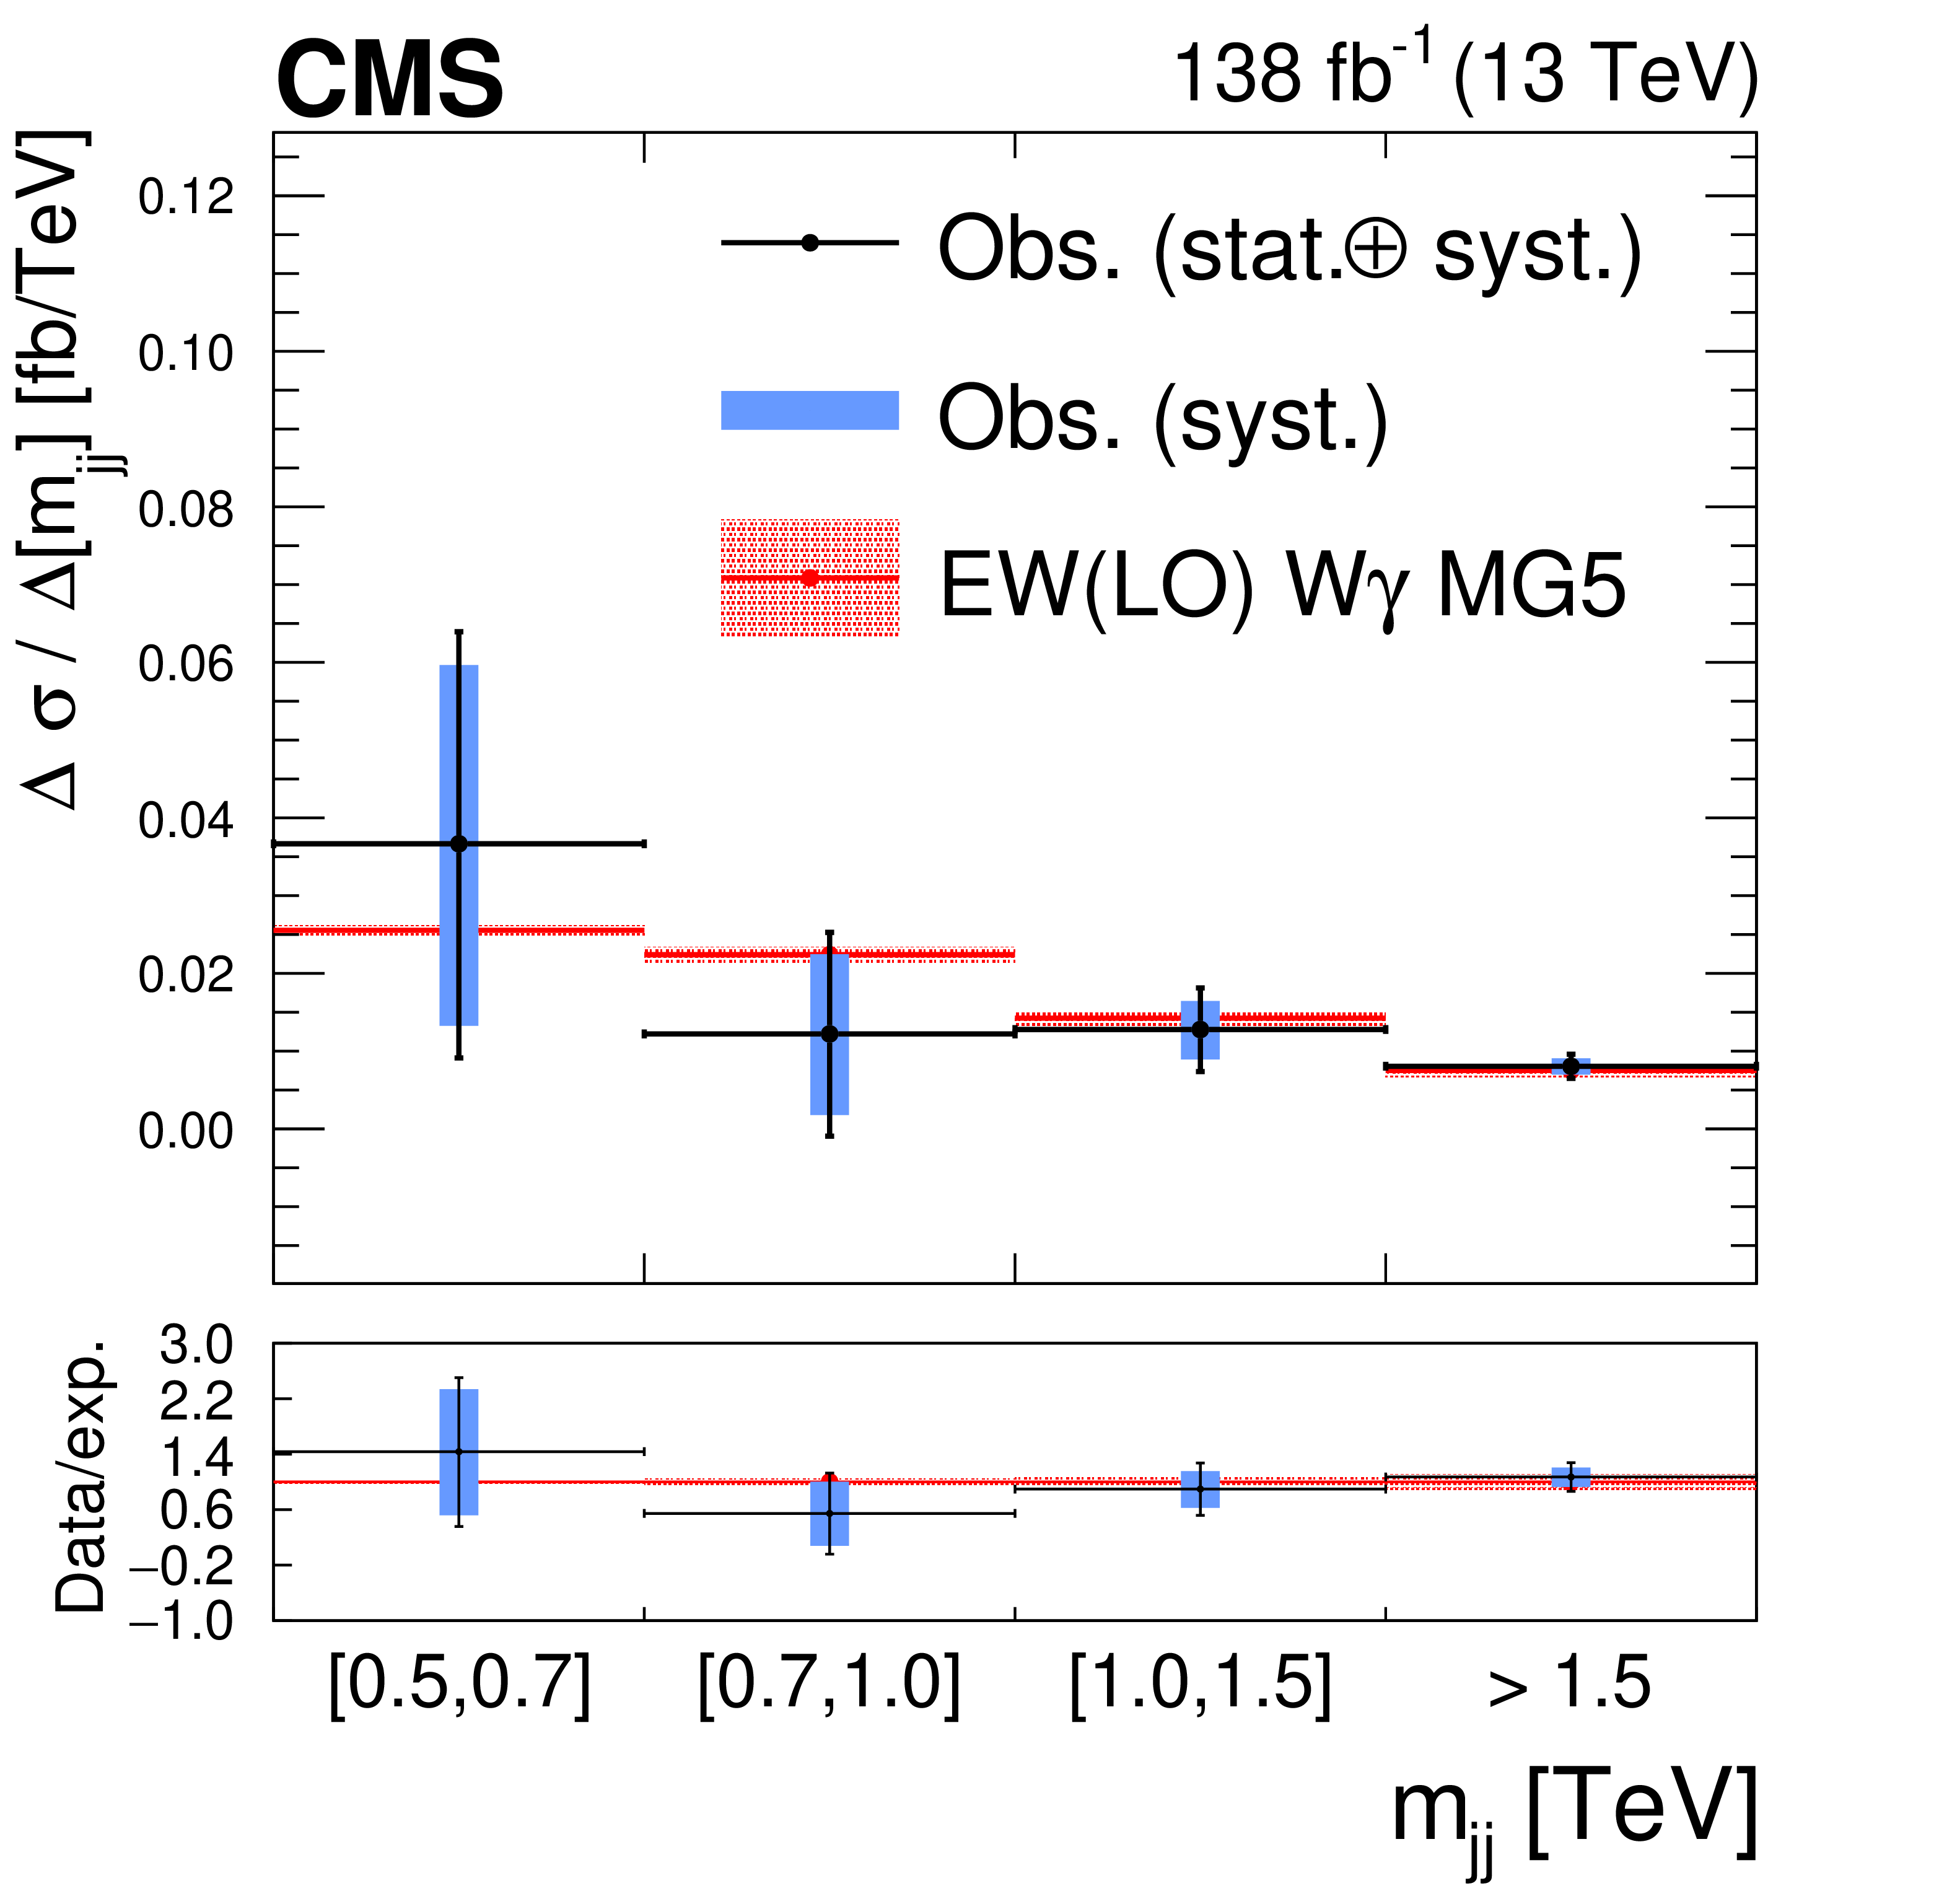
Figure 4-e:
Differential cross section for the EW W$ \gamma $jj production as functions of $ m_{\text{jj}} $. Since the range of the variable extends to infinity, the last bin accommodates all the events up to infinity as marked by the bin label, but the bin width that is used as the denominator is finite and is (1500, 2000) GeV. The blue bands stand for the systematic uncertainties and the black bands represent the total uncertainties. |
png pdf |
Figure 4-f:
Differential cross section for the EW W$ \gamma $jj production as functions of $ \Delta\eta_{\text{jj}} $. The blue bands stand for the systematic uncertainties and the black bands represent the total uncertainties. |
png pdf |
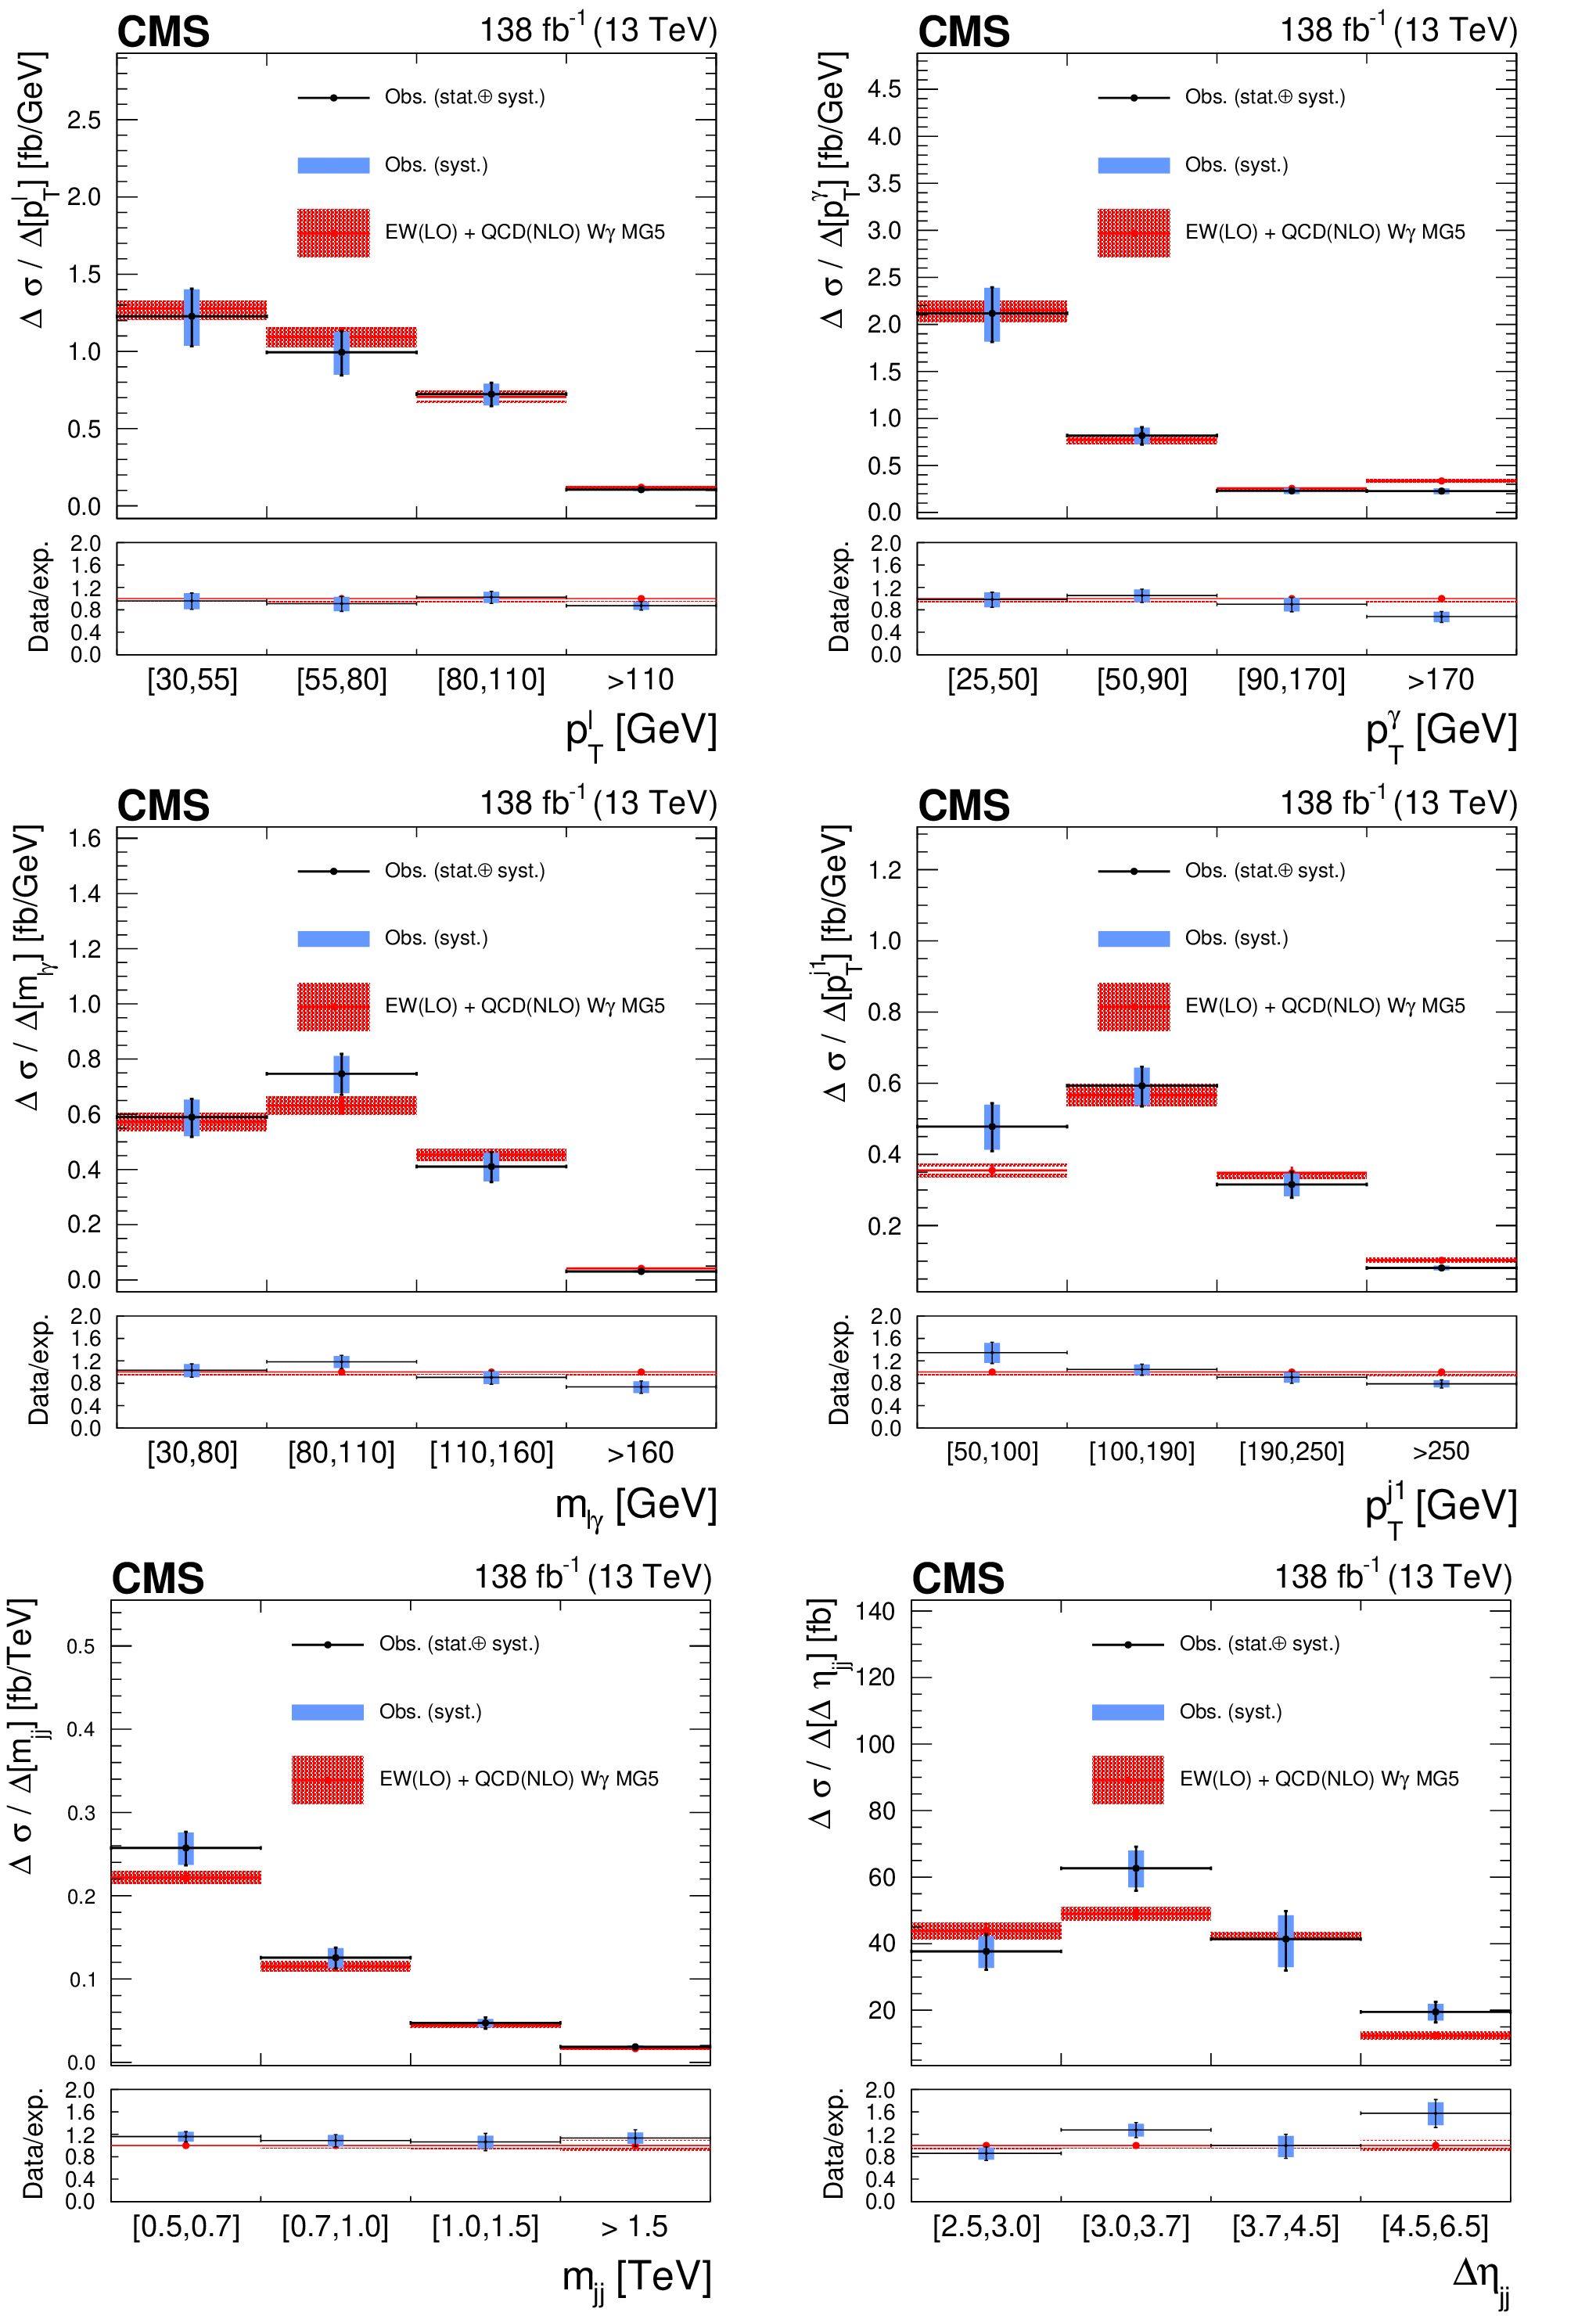
Figure 5:
Differential cross sections for the EW+QCD W$ \gamma $jj production as functions of $ p_{\mathrm{T}}^{\ell} $, $ p_{\mathrm{T}}^{\gamma} $, $ p_{\mathrm{T}}^{\mathrm{j}1} $, $ m_{\ell\gamma} $, $ m_{\text{jj}} $, and $ \Delta\eta_{\text{jj}} $. The details of this figure are the same as for Fig. 4 |
png pdf |
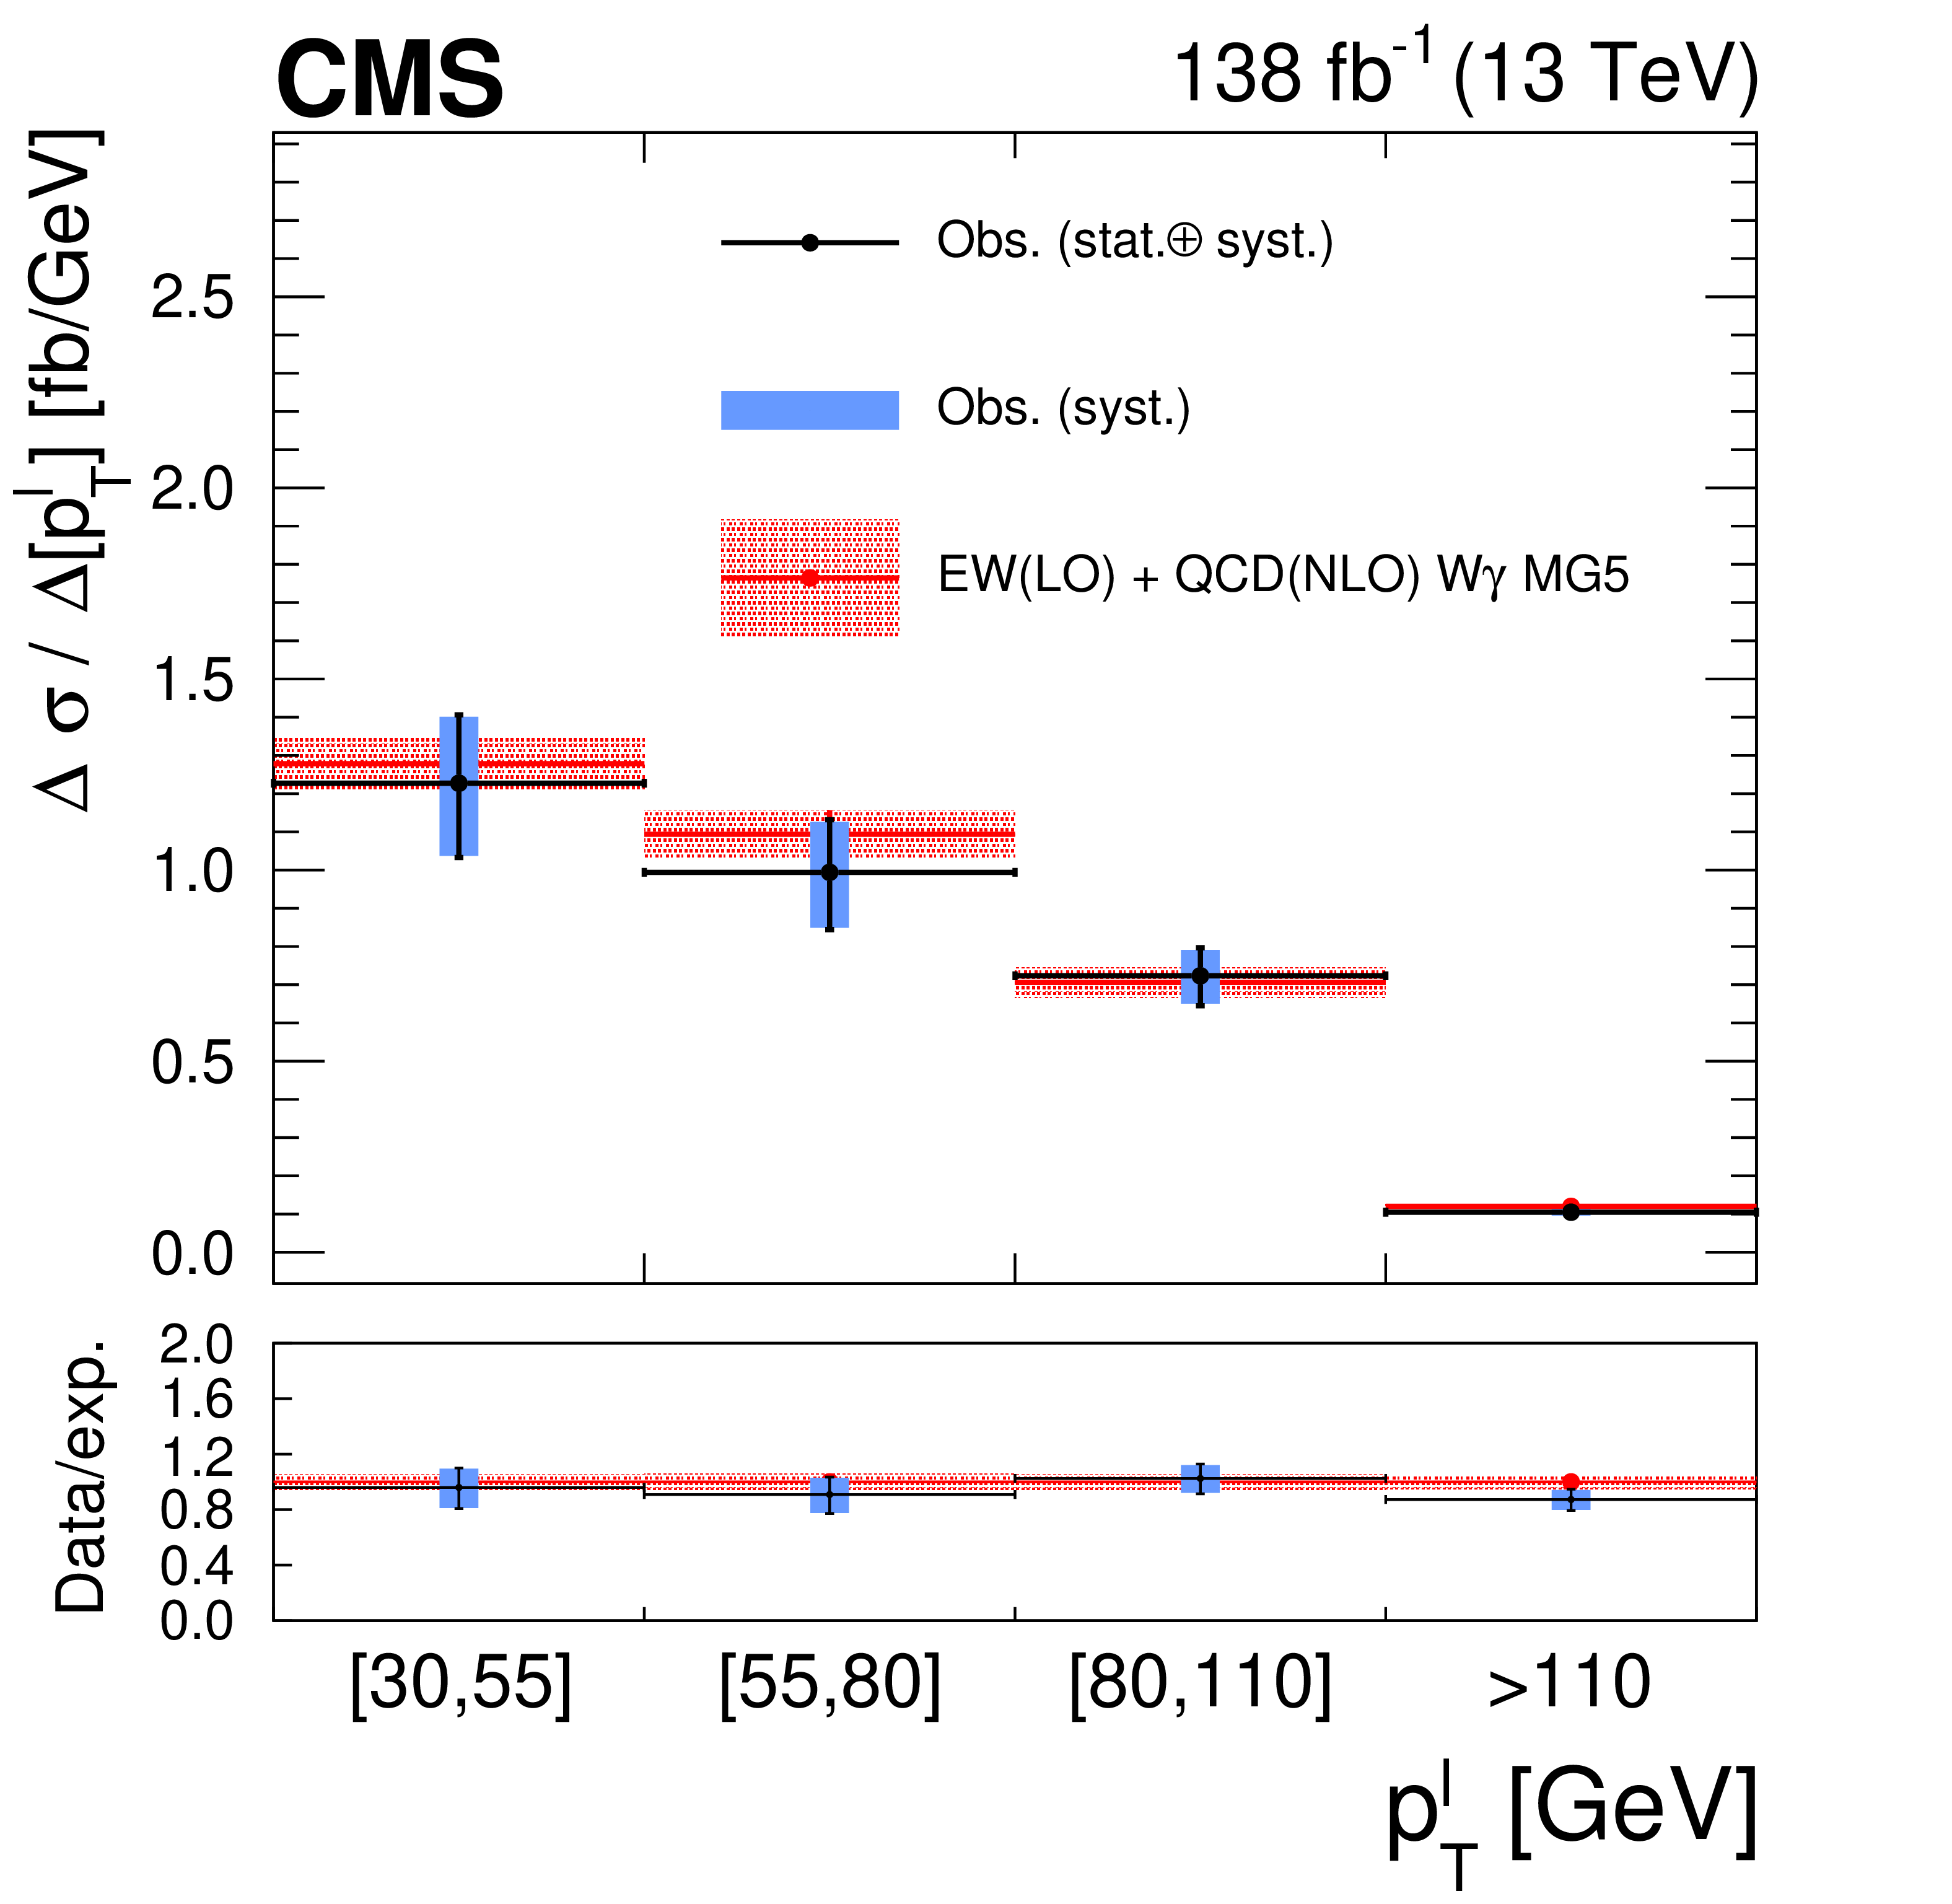
Figure 5-a:
Differential cross section for the EW+QCD W$ \gamma $jj production as functions of $ p_{\mathrm{T}}^{\ell} $. The details of this figure are the same as for Fig. 4-a. |
png pdf |
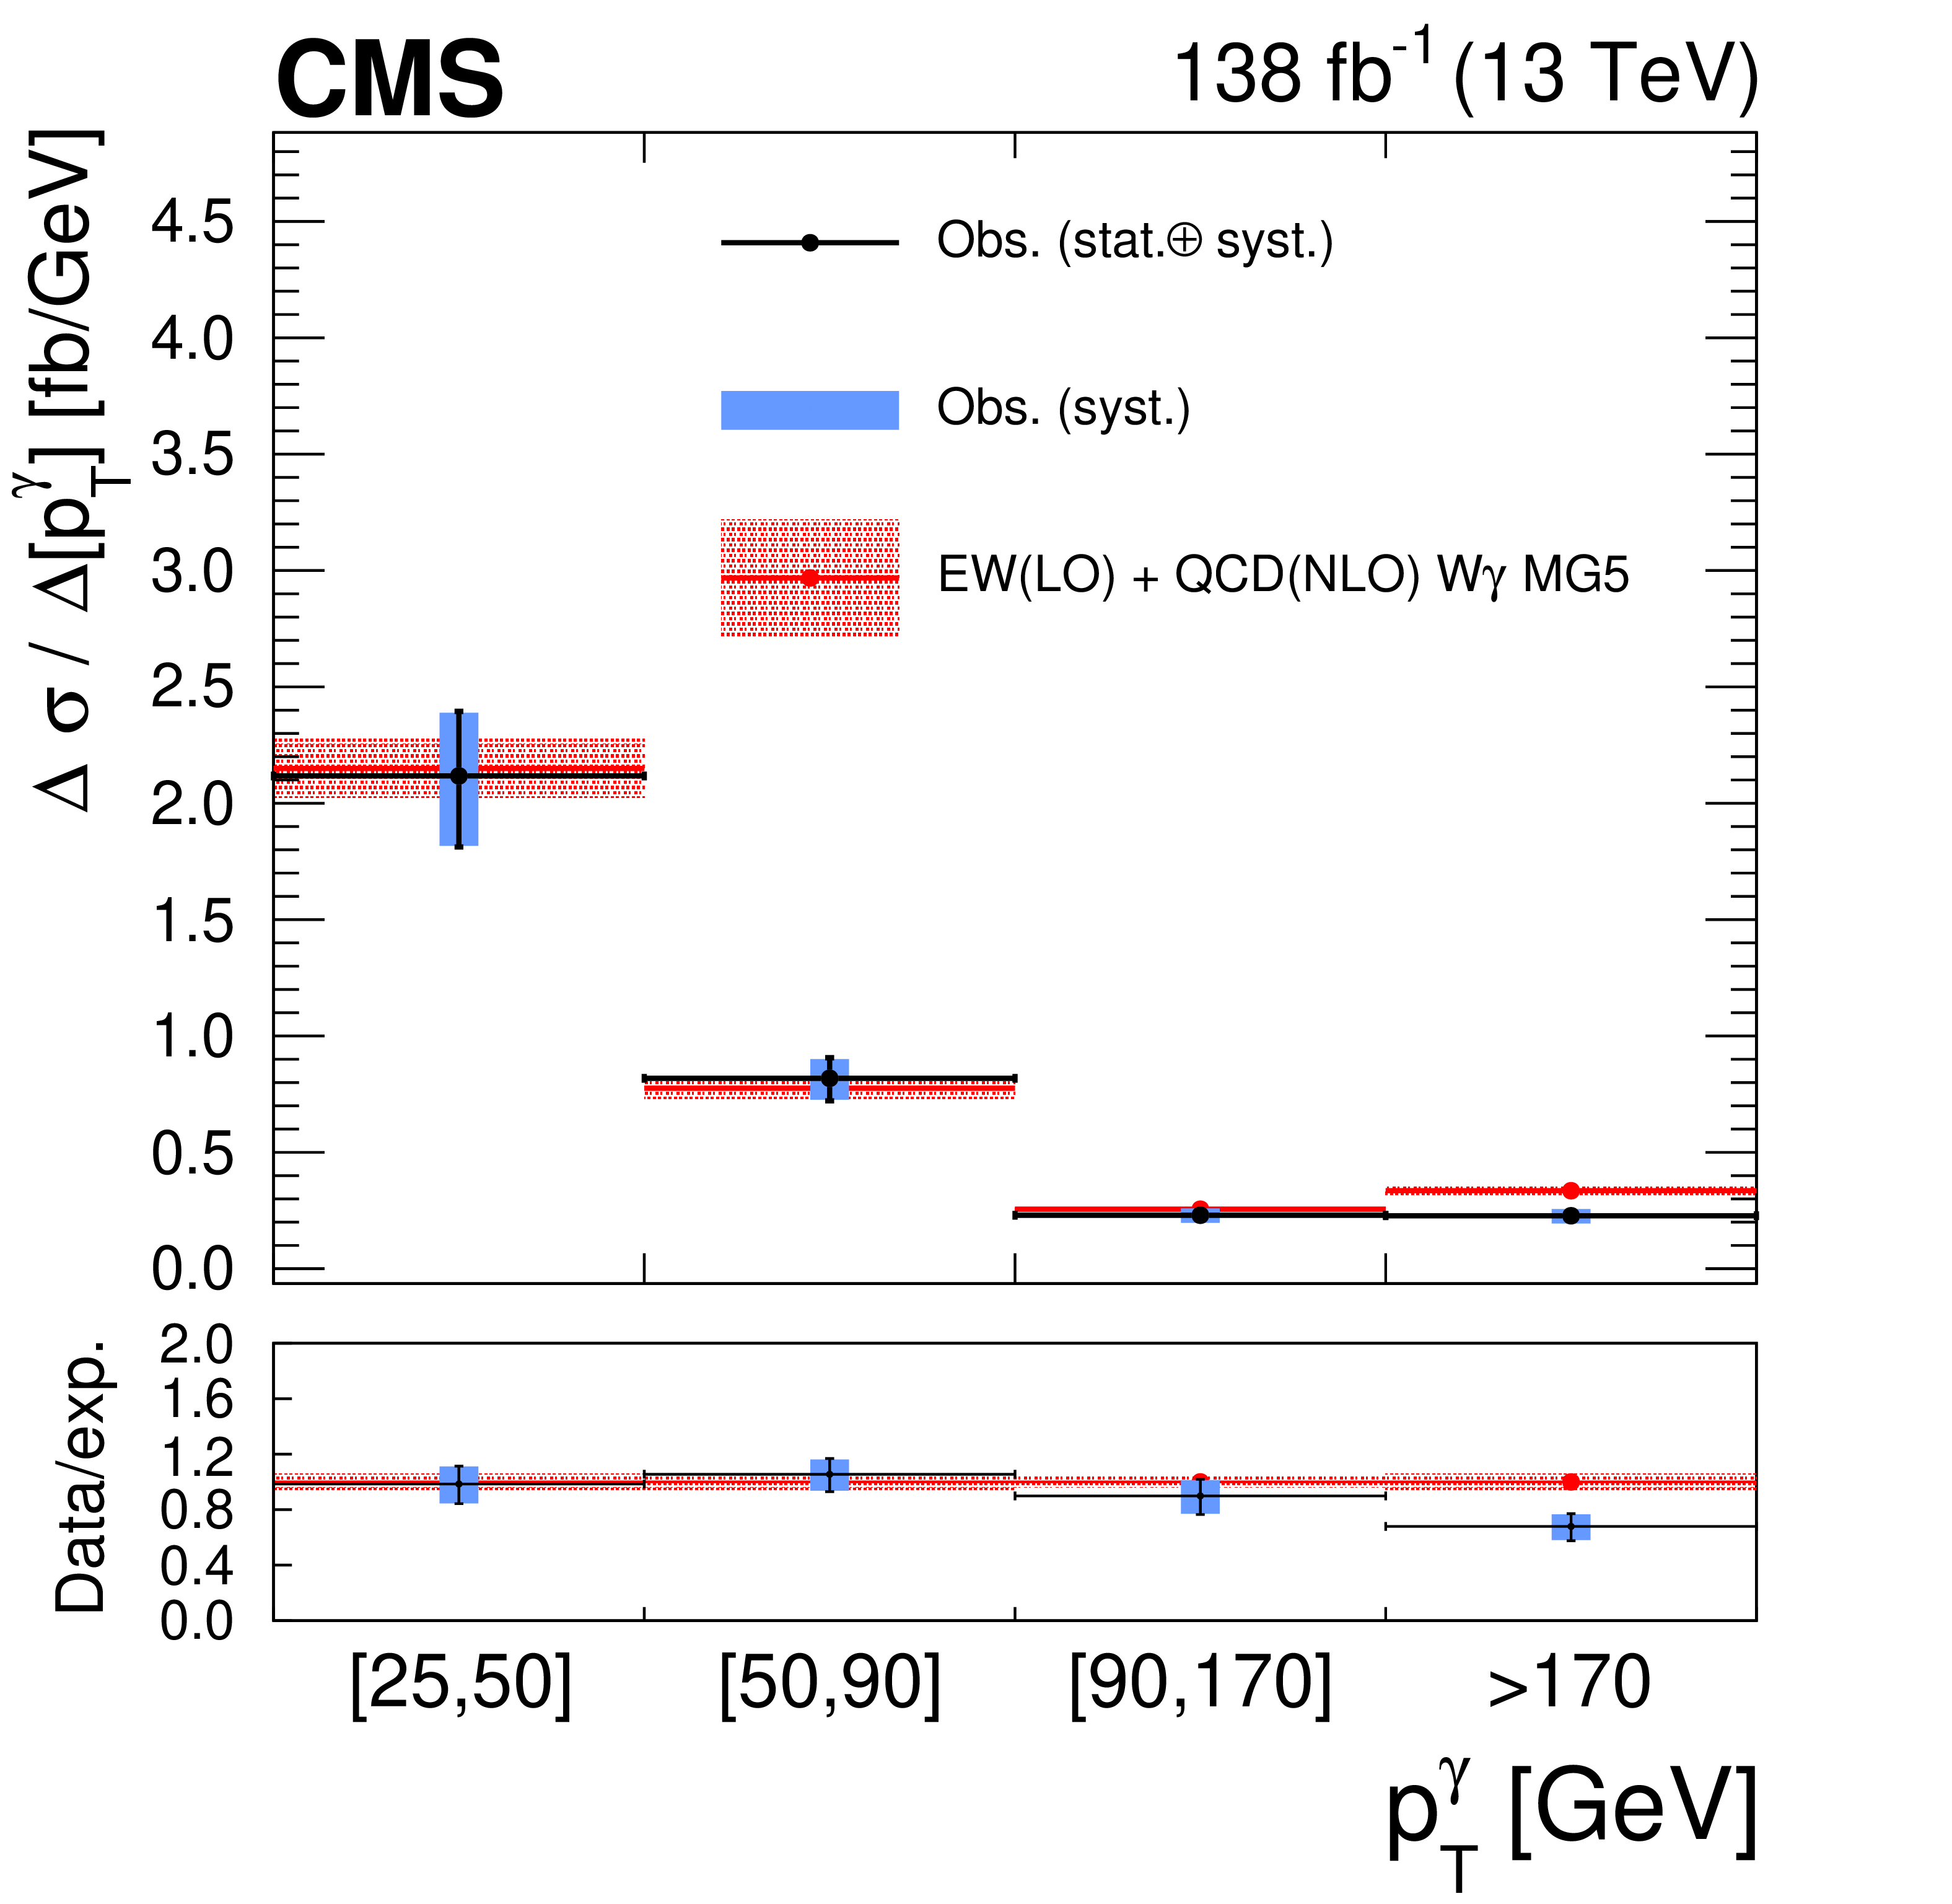
Figure 5-b:
Differential cross section for the EW+QCD W$ \gamma $jj production as functions of $ p_{\mathrm{T}}^{\gamma} $. The details of this figure are the same as for Fig. 4-b. |
png pdf |
Figure 5-c:
Differential cross section for the EW+QCD W$ \gamma $jj production as functions of $ p_{\mathrm{T}}^{\mathrm{j}1} $. The details of this figure are the same as for Fig. 4-c. |
png pdf |
Figure 5-d:
Differential cross section for the EW+QCD W$ \gamma $jj production as functions of $ m_{\ell\gamma} $. The details of this figure are the same as for Fig. 4-d. |
png pdf |
Figure 5-e:
Differential cross section for the EW+QCD W$ \gamma $jj production as functions of $ m_{\text{jj}} $. The details of this figure are the same as for Fig. 4-e. |
png pdf |
Figure 5-f:
Differential cross section for the EW+QCD W$ \gamma $jj production as functions of $ \Delta\eta_{\text{jj}} $. The details of this figure are the same as for Fig. 4-f. |
png pdf |
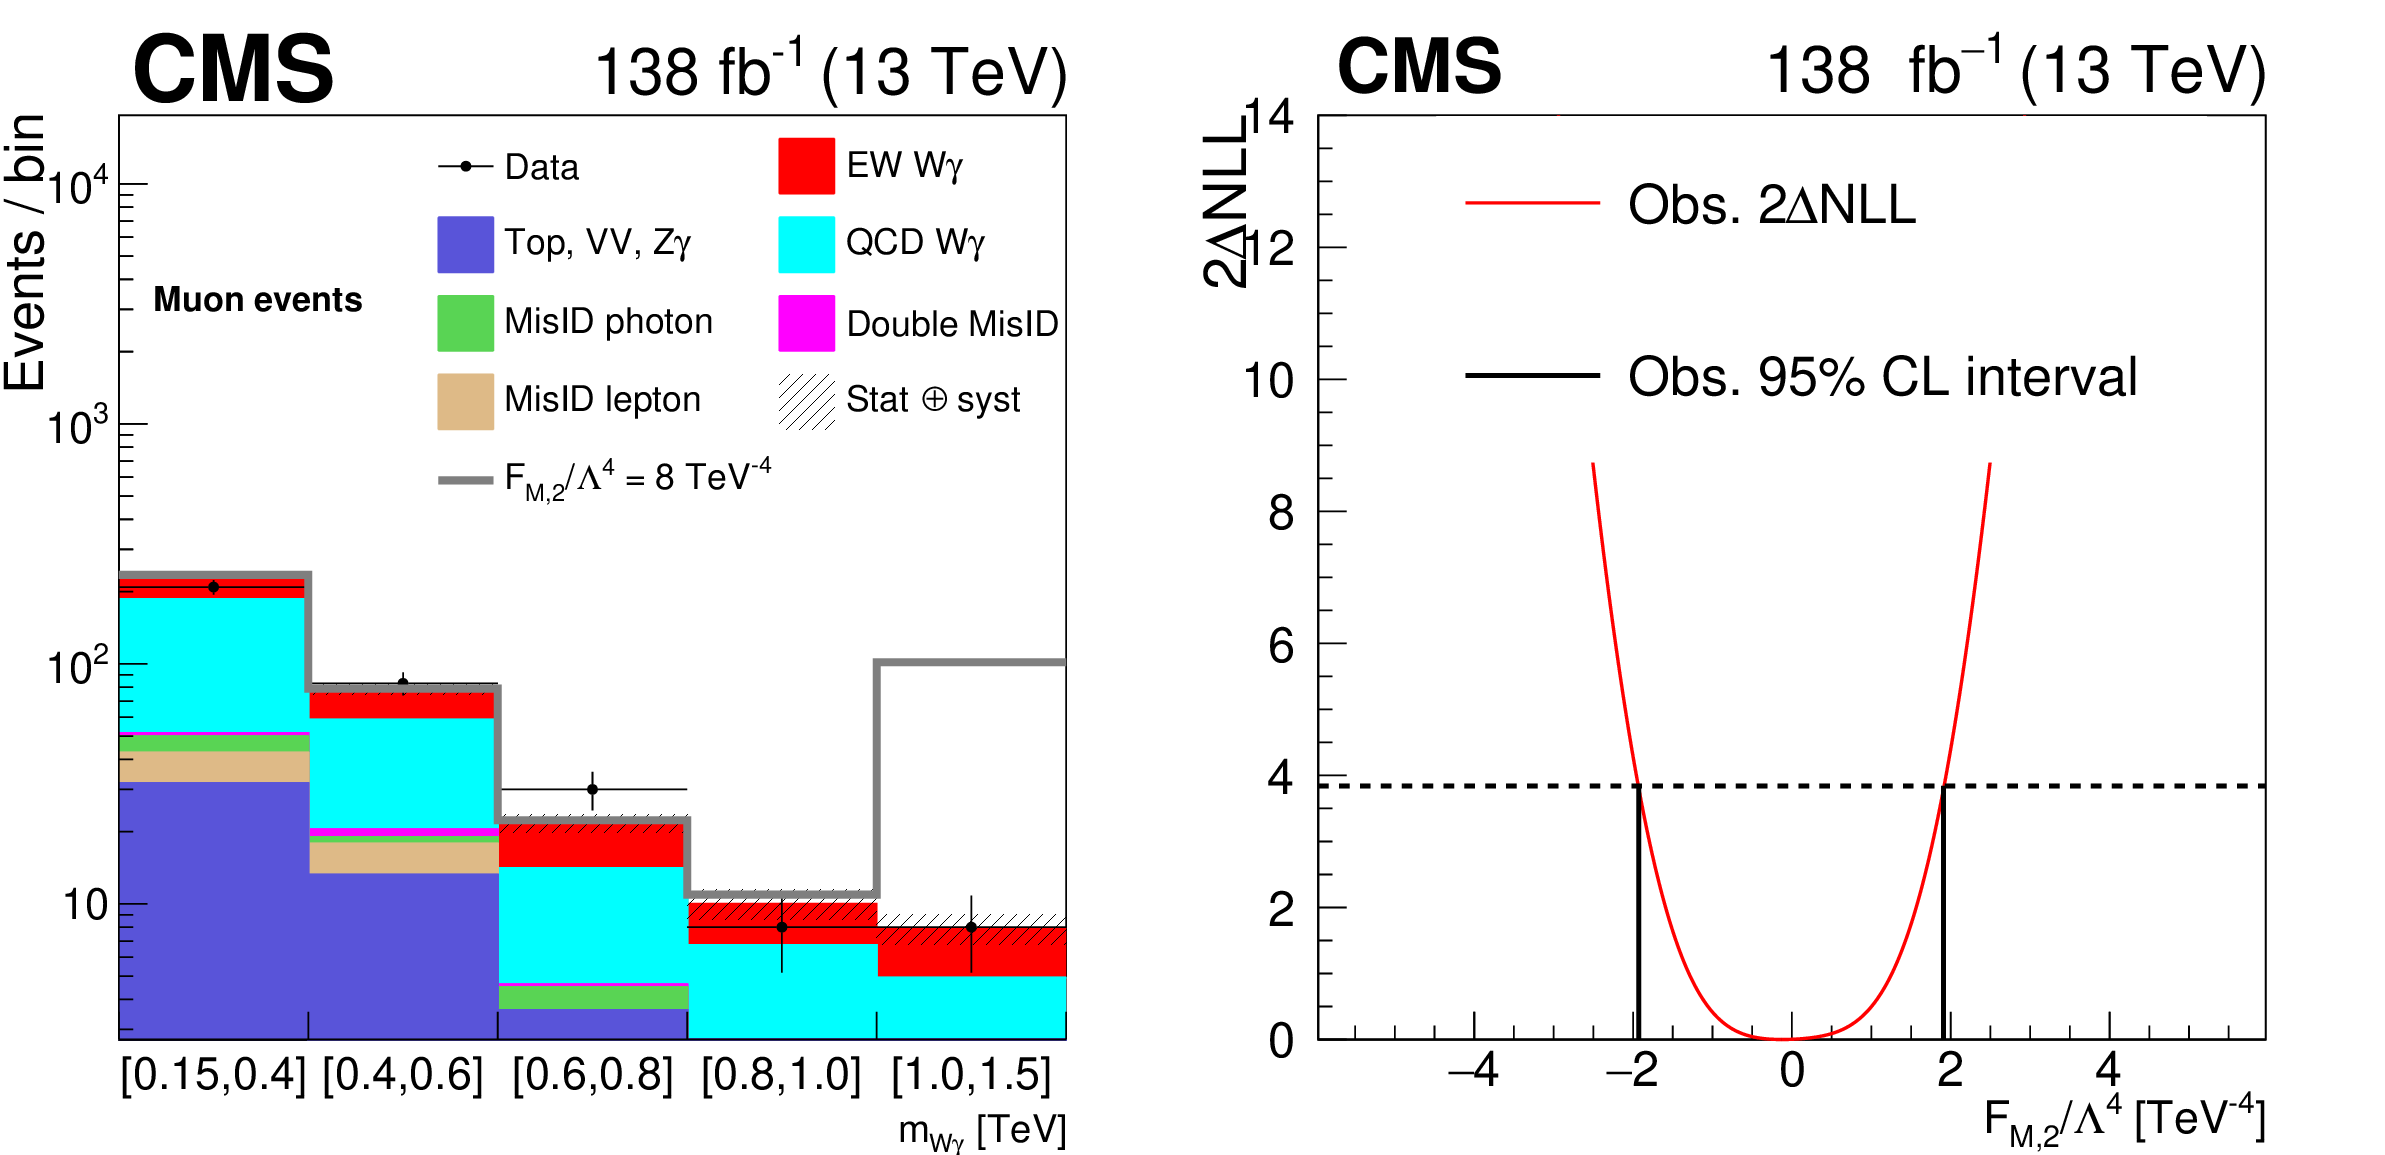
Figure 6:
The $ m_{\mathrm{W}\gamma} $ distribution for muon events satisfying the aQGC region selection and used to set constraints on the anomalous gauge coupling parameters (left). Electron events, not shown here, are also used. The gray line represents a nonzero $ f_{\mathrm{M},2}/\Lambda^4 $ setting. Events with $ m_{\mathrm{W}\gamma} > $ 1500 GeV are included in the last bin. The hatched bands represent the combined statistical and systematic uncertainties on the predicted yields. The vertical bars on the data points represent the statistical uncertainties of data. Likelihood scan and the observed 95% CL interval for the aQGC parameter $ f_{\mathrm{M},2}/\Lambda^4 $ (right). |
png pdf |
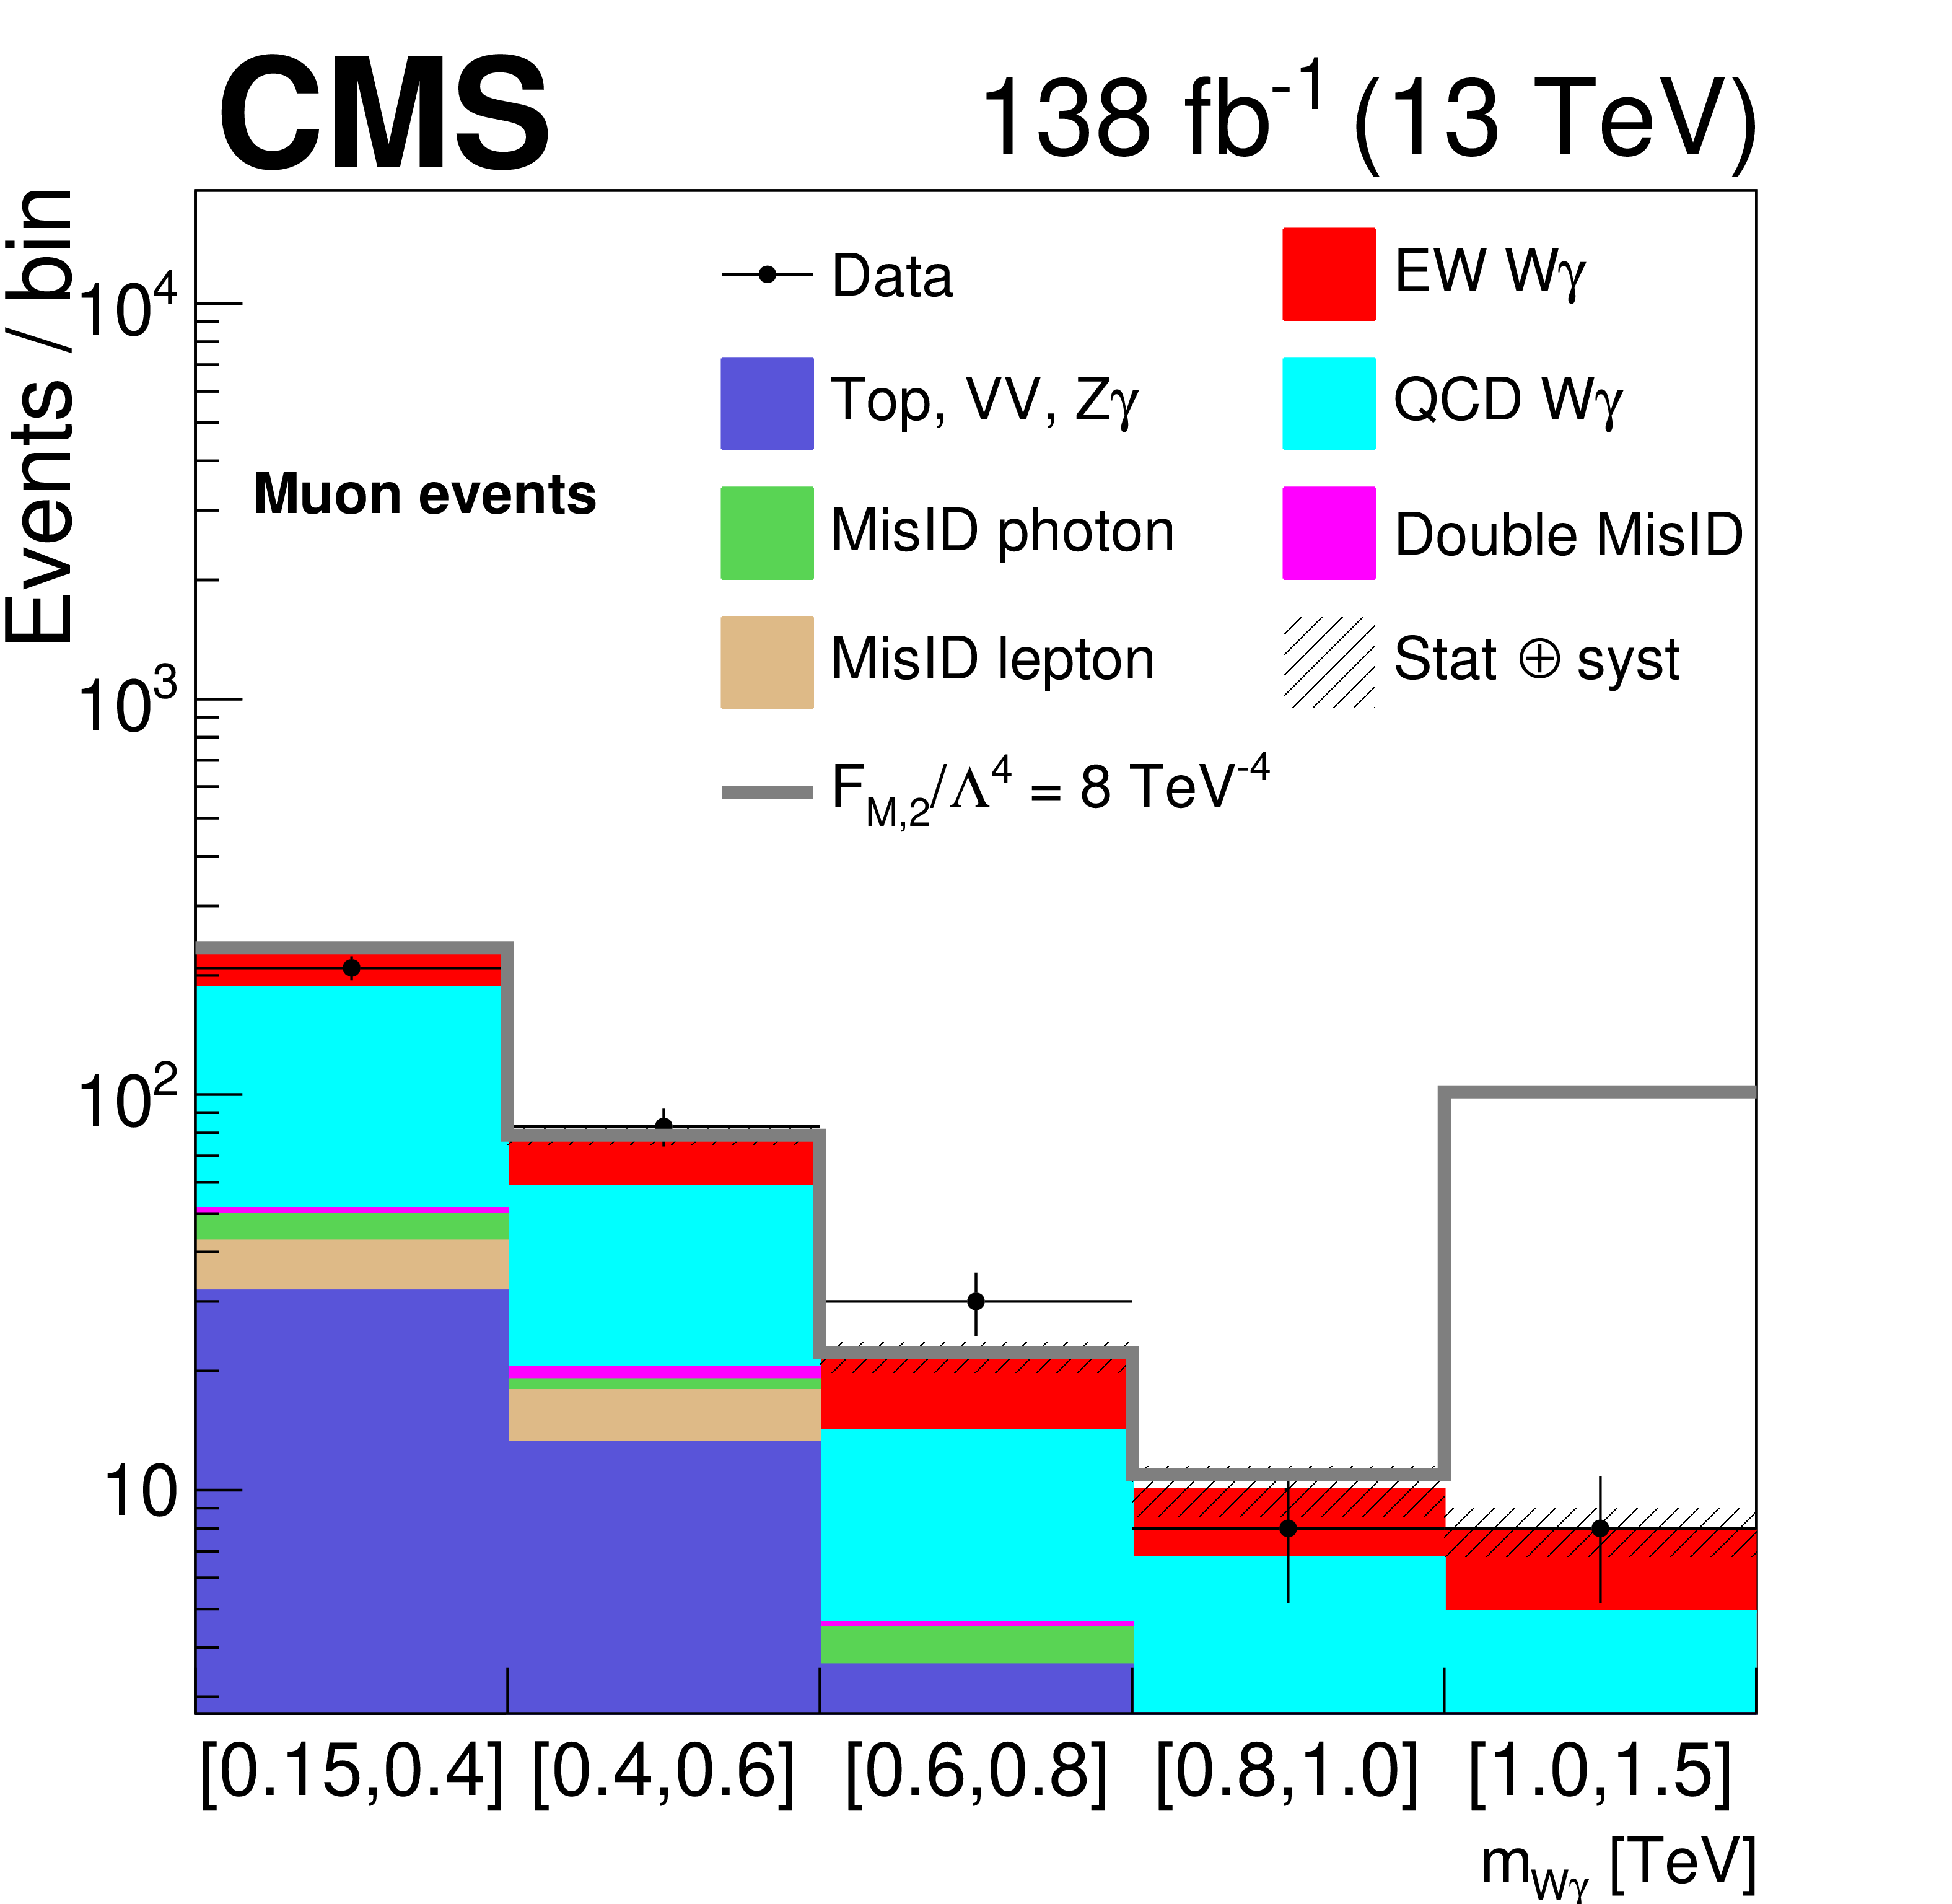
Figure 6-a:
The $ m_{\mathrm{W}\gamma} $ distribution for muon events satisfying the aQGC region selection and used to set constraints on the anomalous gauge coupling parameters. Electron events, not shown here, are also used. The gray line represents a nonzero $ f_{\mathrm{M},2}/\Lambda^4 $ setting. Events with $ m_{\mathrm{W}\gamma} > $ 1500 GeV are included in the last bin. The hatched bands represent the combined statistical and systematic uncertainties on the predicted yields. The vertical bars on the data points represent the statistical uncertainties of data. |
png pdf |
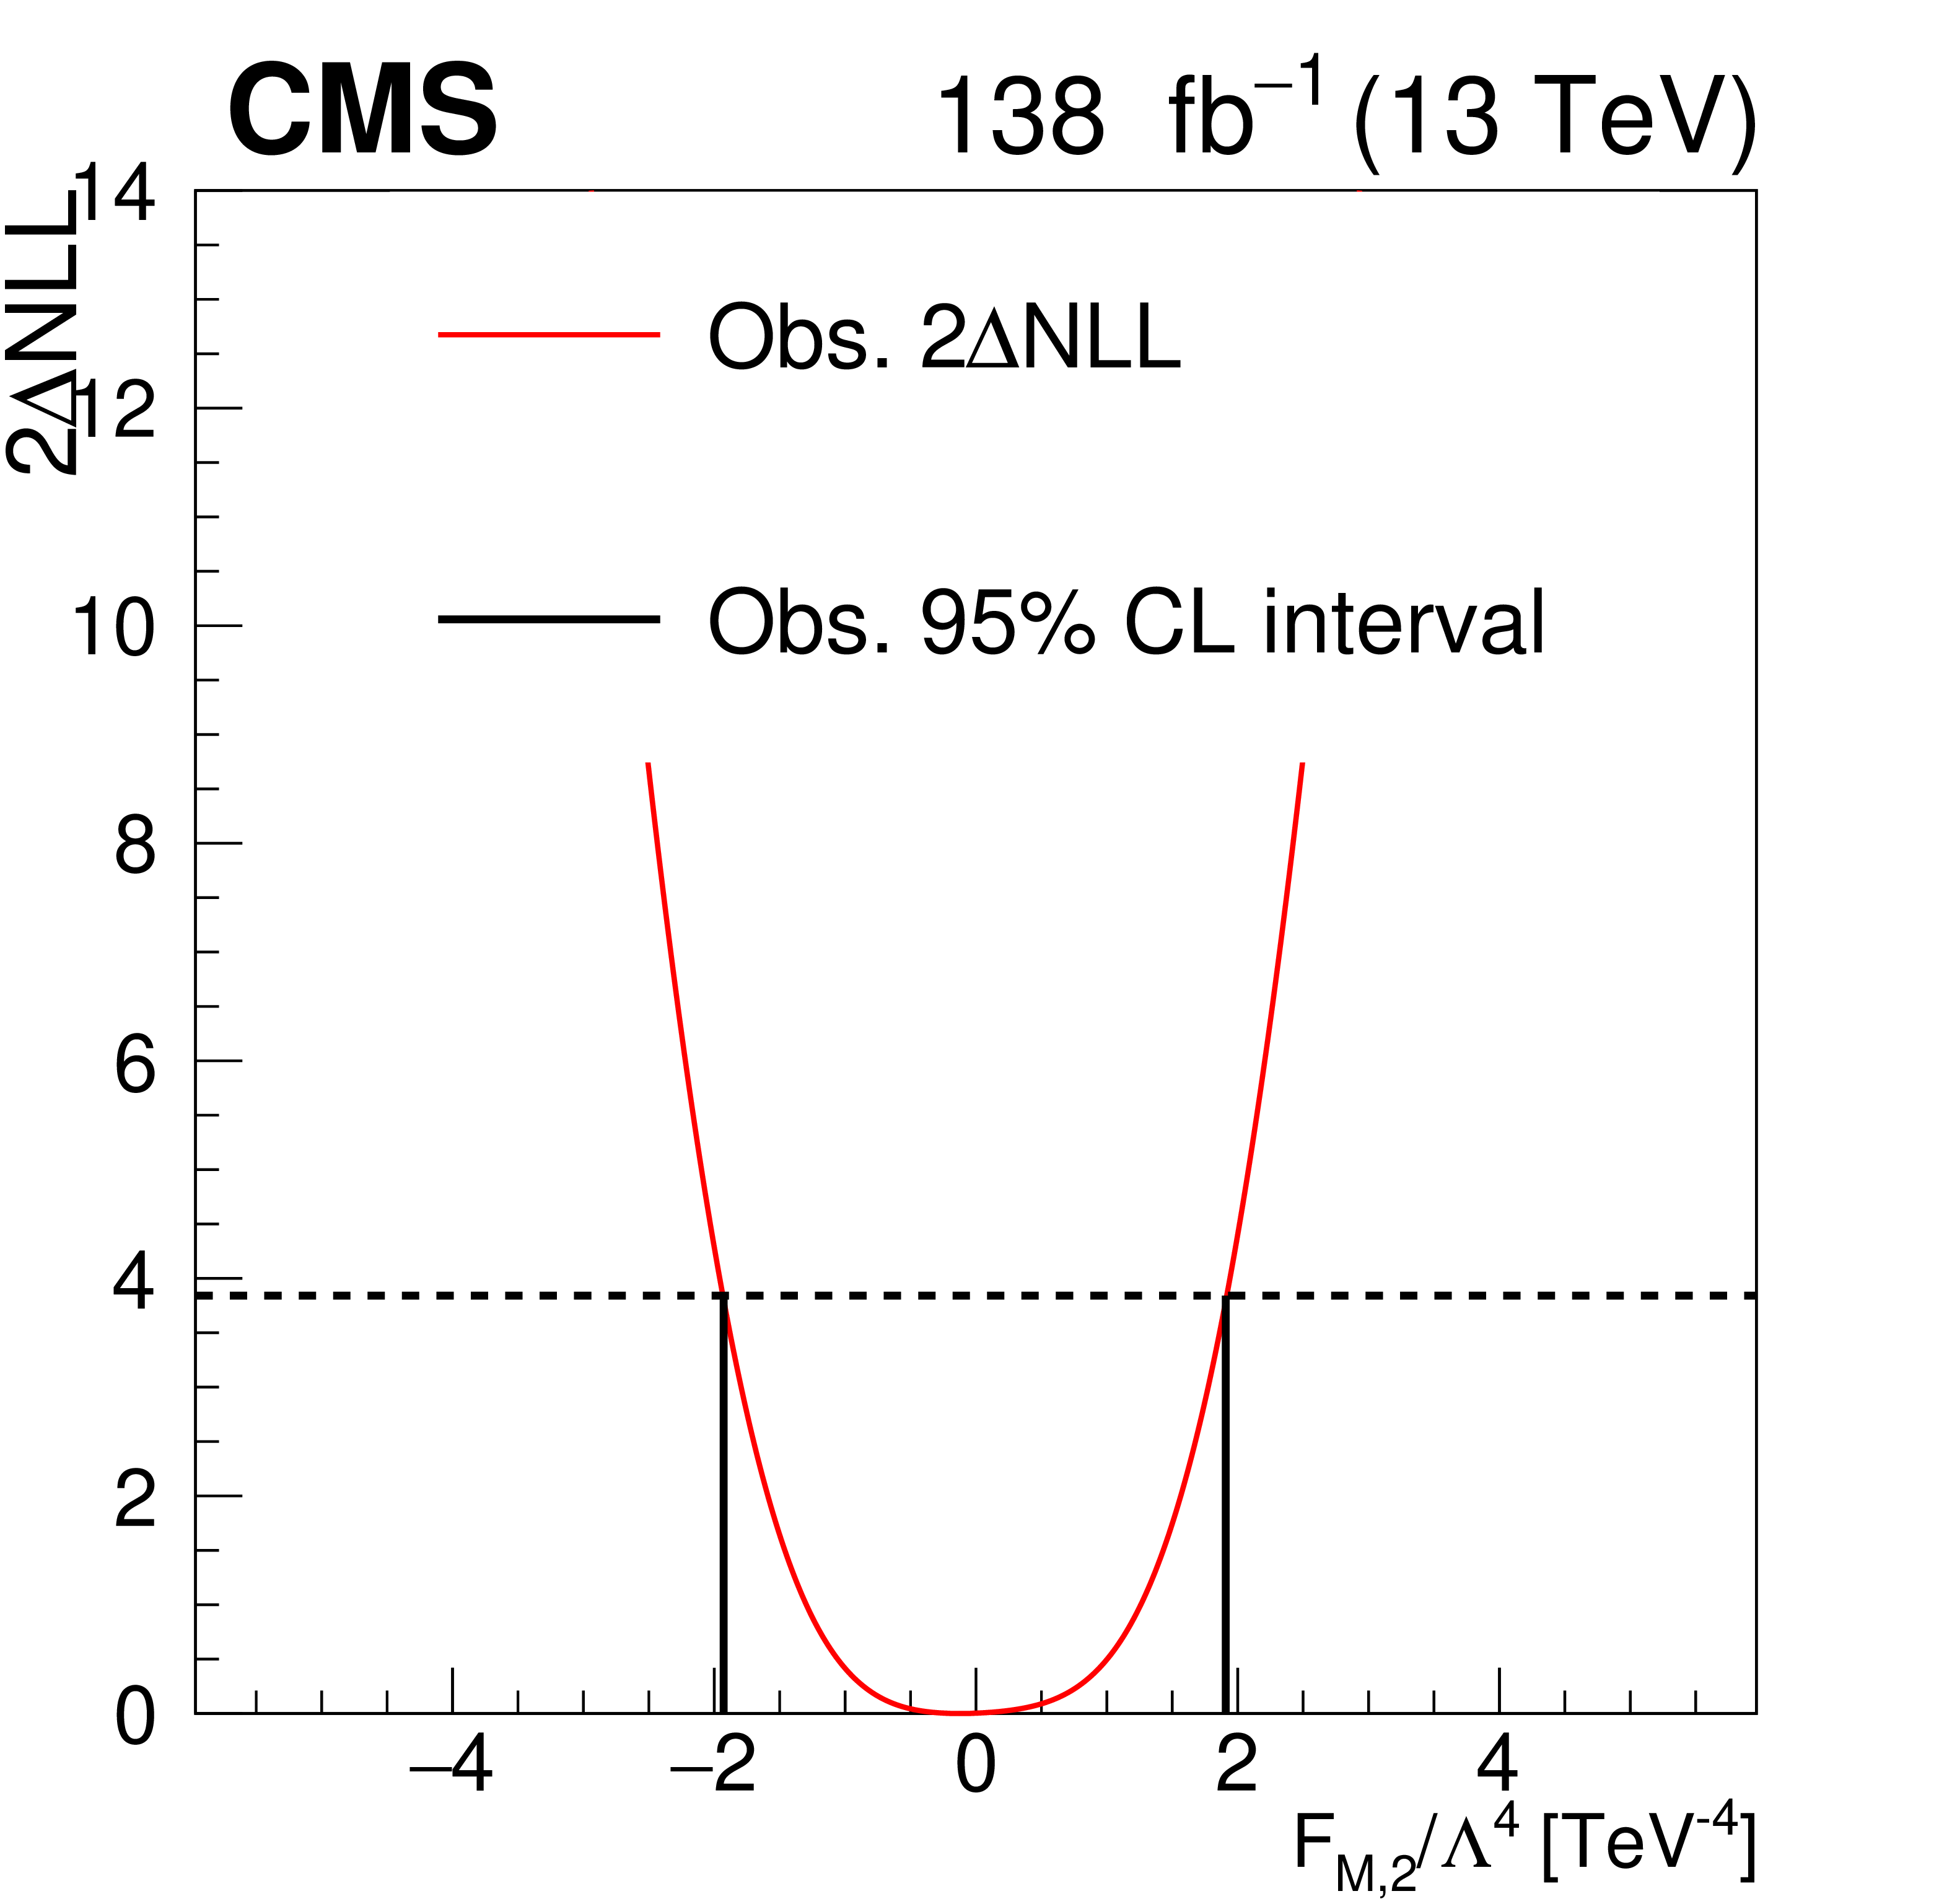
Figure 6-b:
Likelihood scan and the observed 95% CL interval for the aQGC parameter $ f_{\mathrm{M},2}/\Lambda^4 $. |
| Tables | |
png pdf |
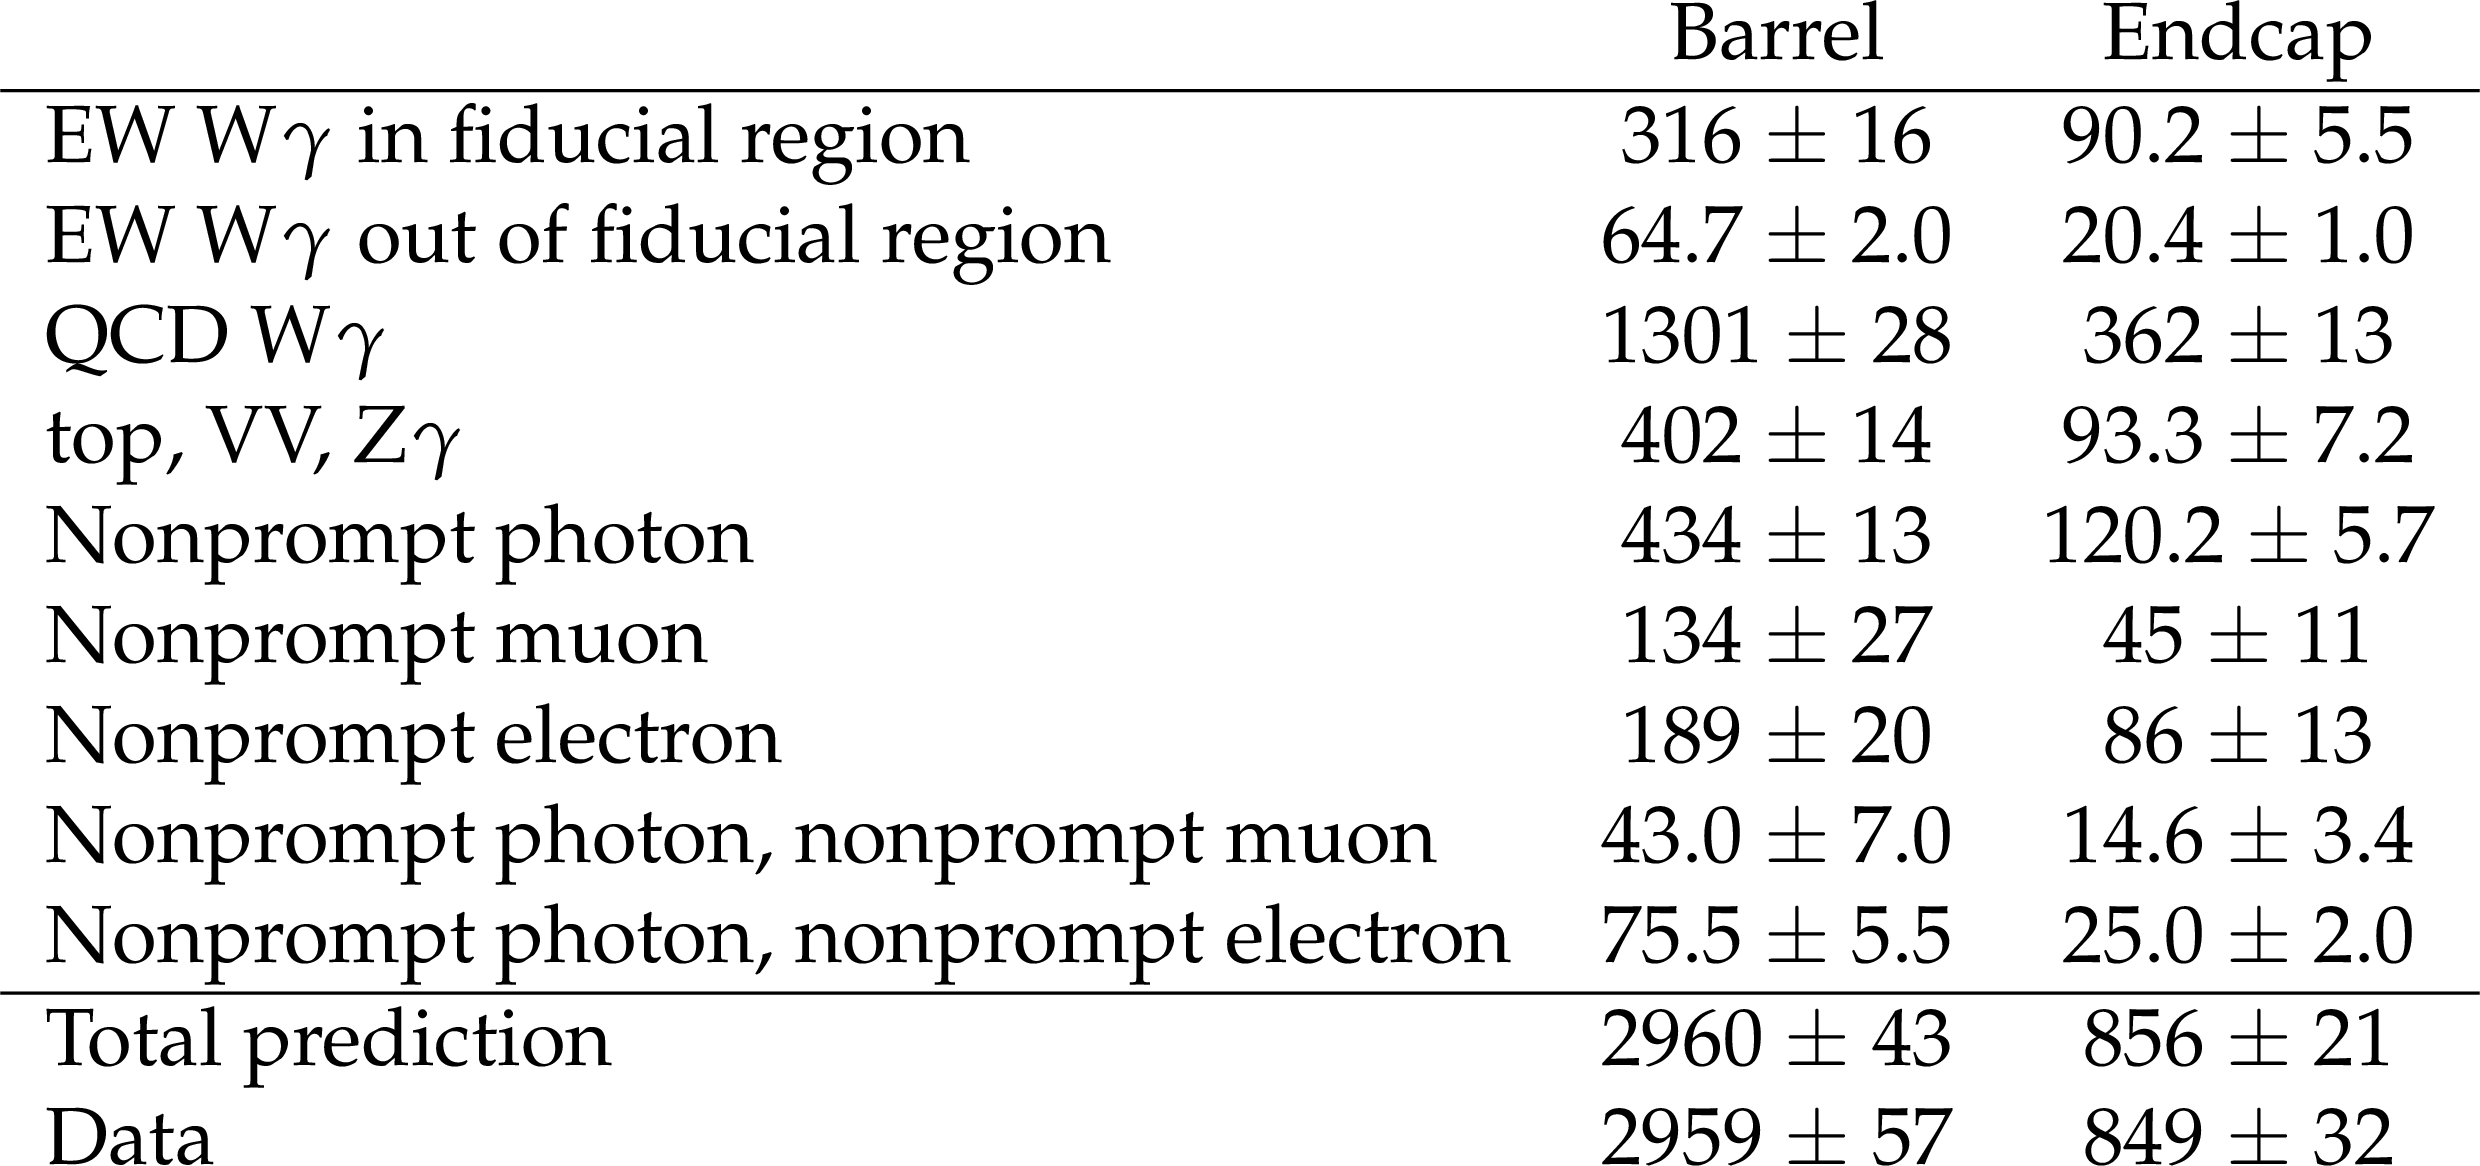
Table 1:
Signal, background, and data yields for the EW W$ \gamma $ fiducial cross section measurement from the fit to the data in the signal region. Statistical and systematic uncertainties are added in quadrature. EW W$ \gamma $ in (out of) fiducial region stands for the number of events of EW W$ \gamma $ falling in (out of) the fiducial region defined in Sec. 9. |

png pdf |
Table 2:
Exclusion limits at the 95% CL for each aQGC coefficient, derived from the $ m_{\mathrm{W}\gamma} $ distribution, assuming all other coefficients are set to zero. Unitarity bounds corresponding to each operator are also listed. All coupling parameter limits are in TeV$ ^{-4} $, while $ U_{\text{bound}} $ values are in TeV. |
| Summary |
| Measurements of the electroweak (EW) production of a W boson, a photon, and two jets in proton-proton collisions at a center-of-mass energy of 13 TeV have been presented. The data correspond to an integrated luminosity of 138 fb$ ^{-1} $ in Run 2 collected with the CMS detector. Events are selected by requiring one isolated lepton (electron or muon) with high transverse momentum ($ p_{\mathrm{T}} $), a moderate missing transverse momentum, one high-$ p_{\mathrm{T}} $ isolated photon, and two jets with a large rapidity separation and a large dijet mass. The signal is observed for the first time at 13 TeV, with an observed (expected) significance of 6.0 (6.8) standard deviations, where the expectation is based on the standard model predictions. In a restricted fiducial region, the cross section for the EW W$ \gamma $jj production is 23.5 $ ^{+4.9}_{-4.7} $ fb and the cross section for the total EW+QCD W$ \gamma $jj production is 113 $ \pm $ 13 fb. Both measurements are consistent with standard model predictions. For the first time, differential cross sections for EW W$ \gamma $jj and for EW+QCD W$ \gamma $jj production are measured. Constraints placed on anomalous quartic gauge couplings in terms of dimension-8 effective field theory operators are extracted and are the most stringent limits to date on the aQGC parameters $f_{\mathrm{M},2{-}5}/\Lambda^4$ and $f_{\mathrm{T},6{-}7}/\Lambda^4$. |
| References | ||||
| 1 | ATLAS Collaboration | Observation of a new particle in the search for the standard model Higgs boson with the ATLAS detector at the LHC | PLB 716 (2012) 1 | 1207.7214 |
| 2 | CMS Collaboration | Observation of a new boson at a mass of 125 GeV with the CMS experiment at the LHC | PLB 716 (2012) 30 | CMS-HIG-12-028 1207.7235 |
| 3 | CMS Collaboration | Observation of a new boson with mass near 125 GeV in pp collisions at $ \sqrt{s}= $ 7 and 8 TeV | JHEP 06 (2013) 081 | CMS-HIG-12-036 1303.4571 |
| 4 | CMS Collaboration | Observation of electroweak production of W$ \gamma $ with two jets in proton-proton collisions at $ \sqrt {s} = $ 13 TeV | PLB 811 (2020) 135988 | CMS-SMP-19-008 2008.10521 |
| 5 | CMS Collaboration | HEPData record for this analysis | link | |
| 6 | V. A. Khoze, M. G. Ryskin, W. J. Stirling, and P. H. Williams | A Z-monitor to calibrate Higgs production via vector boson fusion with rapidity gaps at the LHC | EPJC 26 (2003) 429 | hep-ph/0207365 |
| 7 | C. Oleari and D. Zeppenfeld | QCD corrections to electroweak $ \ell\nu_{\ell}\mathrm{jj} $ and $ \ell^{+}\ell^{-}\mathrm{jj} $ production | PRD 69 (2004) 093004 | hep-ph/0310156 |
| 8 | C. Degrande et al. | Effective field theory: A modern approach to anomalous couplings | Ann. Phys. 335 (2013) 21 | 1205.4231 |
| 9 | CMS Collaboration | The CMS experiment at the CERN LHC | JINST 3 (2008) S08004 | |
| 10 | CMS Collaboration | The CMS trigger system | JINST 12 (2017) P01020 | CMS-TRG-12-001 1609.02366 |
| 11 | CMS Collaboration | Performance of the CMS Level-1 trigger in proton-proton collisions at $ \sqrt{s} = $ 13 TeV | JINST 15 (2020) P10017 | CMS-TRG-17-001 2006.10165 |
| 12 | J. Alwall et al. | The automated computation of tree-level and next-to-leading order differential cross sections, and their matching to parton shower simulations | JHEP 07 (2014) 079 | 1405.0301 |
| 13 | R. Frederix and S. Frixione | Merging meets matching in MC@NLO | JHEP 12 (2012) 061 | 1209.6215 |
| 14 | T. Sjöstrand et al. | An introduction to PYTHIA 8.2 | Comput. Phys. Commun. 191 (2015) 159 | 1410.3012 |
| 15 | P. Nason | A new method for combining NLO QCD with shower Monte Carlo algorithms | JHEP 11 (2004) 040 | hep-ph/0409146 |
| 16 | S. Frixione, P. Nason, and C. Oleari | Matching NLO QCD computations with parton shower simulations: the POWHEG method | JHEP 11 (2007) 070 | 0709.2092 |
| 17 | R. Frederix, E. Re, and P. Torrielli | Single-top t-channel hadroproduction in the four-flavour scheme with POWHEG and aMC@NLO | JHEP 09 (2012) 130 | 1207.5391 |
| 18 | S. Alioli, P. Nason, C. Oleari, and E. Re | NLO single-top production matched with shower in POWHEG: s- and t-channel contributions | JHEP 09 (2009) 111 | 0907.4076 |
| 19 | E. Re | Single-top Wt-channel production matched with parton showers using the POWHEG method | EPJC 71 (2011) 1547 | 1009.2450 |
| 20 | P. Skands, S. Carrazza, and J. Rojo | Tuning PYTHIA 8.1: the Monash 2013 tune | EPJC 74 (2014) 3024 | 1404.5630 |
| 21 | CMS Collaboration | Event generator tunes obtained from underlying event and multiparton scattering measurements | EPJC 76 (2016) 155 | CMS-GEN-14-001 1512.00815 |
| 22 | CMS Collaboration | Extraction and validation of a new set of CMS PYTHIA8 tunes from underlying-event measurements | EPJC 80 (2020) 4 | CMS-GEN-17-001 1903.12179 |
| 23 | NNPDF Collaboration | Parton distributions for the LHC Run II | JHEP 04 (2015) 040 | 1410.8849 |
| 24 | GEANT4 Collaboration | GEANT 4 --- a simulation toolkit | NIM A 506 (2003) 250 | |
| 25 | CMS Collaboration | Measurement of the Inclusive W and Z Production Cross Sections in pp Collisions at $ \sqrt{s}= $ 7 TeV | JHEP 10 (2011) 132 | CMS-EWK-10-005 1107.4789 |
| 26 | CMS Collaboration | Particle-flow reconstruction and global event description with the CMS detector | JINST 12 (2017) P10003 | CMS-PRF-14-001 1706.04965 |
| 27 | CMS Collaboration | Description and performance of track and primary-vertex reconstruction with the CMS tracker | JINST 9 (2014) P10009 | CMS-TRK-11-001 1405.6569 |
| 28 | M. Cacciari, G. P. Salam, and G. Soyez | The anti-$ k_{\mathrm{T}} $ jet clustering algorithm | JHEP 04 (2008) 063 | 0802.1189 |
| 29 | M. Cacciari, G. P. Salam, and G. Soyez | FastJet user manual | EPJC 72 (2012) 1896 | 1111.6097 |
| 30 | CMS Collaboration | Performance of electron reconstruction and selection with the CMS detector in proton-proton collisions at $ \sqrt{s}= $ 8 TeV | JINST 10 (2015) P06005 | CMS-EGM-13-001 1502.02701 |
| 31 | CMS Collaboration | Energy calibration and resolution of the CMS electromagnetic calorimeter in pp collision at $ \sqrt{s}= $ 7 TeV | JINST 8 (2013) P09009 | CMS-EGM-11-001 1306.2016 |
| 32 | CMS Collaboration | Performance of the reconstruction and identification of high-momentum muons in proton-proton collisions at $ \sqrt{s}= $ 13 TeV | JINST 15 (2020) P02027 | CMS-MUO-17-001 1912.03516 |
| 33 | CMS Collaboration | Performance of the CMS muon detector and muon reconstruction with proton-proton collisions at $ \sqrt{s}= $ 13 TeV | JINST 13 (2018) P06015 | CMS-MUO-16-001 1804.04528 |
| 34 | CMS Collaboration | Performance of photon reconstruction and identification with the CMS detector in proton-proton collisions at $ \sqrt{s}= $ 8 TeV | JINST 10 (2015) P08010 | CMS-EGM-14-001 1502.02702 |
| 35 | M. Cacciari and G. P. Salam | Pileup subtraction using jet areas | PLB 659 (2008) 119 | 0707.1378 |
| 36 | CMS Collaboration | Determination of jet energy calibration and transverse momentum resolution in CMS | JINST 6 (2011) P11002 | CMS-JME-10-011 1107.4277 |
| 37 | CMS Collaboration | Jet performance in pp collisions at $ \sqrt{s}= $ 7 TeV | CMS Physics Analysis Summary, 2010 link |
|
| 38 | CMS Collaboration | Performance of missing transverse momentum reconstruction in proton-proton collisions at $ \sqrt{s} = $ 13 TeV using the CMS detector | JINST 14 (2019) P07004 | CMS-JME-17-001 1903.06078 |
| 39 | Particle Data Group , M. Tanabashi et al. | Review of particle physics | PRD 98 (2018) 030001 | |
| 40 | CMS Collaboration | Search for a heavy resonance decaying to a pair of vector bosons in the lepton plus merged jet final state at $ \sqrt{s}= $ 13 TeV | JHEP 05 (2018) 088 | 1802.09407 |
| 41 | D. Rainwater, R. Szalapski, and D. Zeppenfeld | Probing color singlet exchange in Z+2-jet events at the CERN LHC | PRD 54 (1996) 6680 | hep-ph/9605444 |
| 42 | CMS Collaboration | Measurement of the cross section for electroweak production of a Z boson, a photon and two jets in proton-proton collisions at $ \sqrt{s} = $ 13 TeV and constraints on anomalous quartic couplings | JHEP 06 (2020) 076 | CMS-SMP-18-007 2002.09902 |
| 43 | CMS Collaboration | Observation of electroweak production of same-sign W boson pairs in the two jet and two same-sign lepton final state in proton-proton collisions at $ \sqrt{s}= $ 13 TeV | PRL 120 (2018) 081801 | CMS-SMP-17-004 1709.05822 |
| 44 | CMS Collaboration | Electron and photon reconstruction and identification with the CMS experiment at the CERN LHC | JINST 16 (2021) P05014 | CMS-EGM-17-001 2012.06888 |
| 45 | CMS Collaboration | Precision luminosity measurement in proton-proton collisions at $ \sqrt{s} = $ 13 TeV in 2015 and 2016 at CMS | EPJC 81 (2021) 800 | CMS-LUM-17-003 2104.01927 |
| 46 | CMS Collaboration | CMS luminosity measurement for the 2017 data-taking period at $ \sqrt{s} = $ 13 TeV | CMS Physics Analysis Summary, 2018 link |
CMS-PAS-LUM-17-004 |
| 47 | CMS Collaboration | CMS luminosity measurement for the 2018 data-taking period at $ \sqrt{s} $ = 13 TeV | CMS Physics Analysis Summary, 2019 link |
CMS-PAS-LUM-18-002 |
| 48 | CMS Collaboration | Measurement of the cross section for electroweak production of $ \mathrm{Z}\gamma $ in association with two jets and constraints on anomalous quartic gauge couplings in proton-proton collisions at $ \sqrt{s}= $ 8 TeV | PLB 770 (2017) 380 | CMS-SMP-14-018 1702.03025 |
| 49 | J. Butterworth et al. | PDF4LHC recommendations for LHC Run II | JPG 43 (2016) 023001 | 1510.03865 |
| 50 | S. S. Wilks | The large-sample distribution of the likelihood ratio for testing composite hypotheses | Ann. Math. Statist. 9 (1938) 60 | |
| 51 | G. Cowan, K. Cranmer, E. Gross, and O. Vitells | Asymptotic formulae for likelihood-based tests of new physics | EPJC 71 (2011) 1554 | 1007.1727 |
| 52 | O. J. P. Éboli, M. C. Gonzalez-Garcia, and J. K. Mizukoshi | $ {\mathrm{p}\mathrm{p}}\to \mathrm{jj}{\mathrm{e}^\pm\mu^\pm\nu\nu} $ and $ \mathrm{jj} \mathrm{e}^\pm \mu^\mp \nu \nu $ at $ \mathcal{O}(\alpha^6_\mathrm{em}) $ and $ \mathcal{O}(\alpha_\mathrm{em}^4\, \alpha_\mathrm{s}^2) $ for the study of the quartic electroweak gauge boson vertex at CERN LHC | PRD 74 (2006) 073005 | hep-ph/0606118 |
| 53 | B. Biedermann, A. Denner, and M. Pellen | Large electroweak corrections to vector boson scattering at the Large Hadron Collider | PRL 118 (2017) 261801 | 1611.02951 |
| 54 | B. Biedermann, A. Denner, and M. Pellen | Complete NLO corrections to W$ ^{+} $W$ ^{+} $ scattering and its irreducible background at the LHC | JHEP 10 (2017) 124 | 1708.00268 |
| 55 | E. d. S. Almeida, O. J. P. Éboli, and M. C. Gonzalez-Garcia | Unitarity constraints on anomalous quartic couplings | PRD 101 (2020) 113003 | 2004.05174 |
|
|
Compact Muon Solenoid LHC, CERN |
|

|

|

|

|

|