

Compact Muon Solenoid
LHC, CERN
| CMS-SUS-19-008 ; CERN-EP-2020-001 | ||
| Search for physics beyond the standard model in events with jets and two same-sign or at least three charged leptons in proton-proton collisions at $\sqrt{s}=$ 13 TeV | ||
| CMS Collaboration | ||
| 27 January 2020 | ||
| Eur. Phys. J. C 80 (2020) 752 | ||
| Abstract: A data sample of events from proton-proton collisions with at least two jets, and two isolated same-sign or three or more charged leptons, is studied in a search for signatures of new physics phenomena. The data correspond to an integrated luminosity of 137 fb$^{-1}$ at a center-of-mass energy of 13 TeV, collected in 2016-2018 by the CMS experiment at the LHC. The search is performed using a total of 168 signal regions defined using several kinematic variables. The properties of the events are found to be consistent with the expectations from standard model processes. Exclusion limits at 95% confidence level are set on cross sections for the pair production of gluinos or squarks for various decay scenarios in the context of supersymmetric models conserving or violating R parity. The observed lower mass limits are as large as 2.1 TeV for gluinos and 0.9 TeV for top and bottom squarks. To facilitate reinterpretations, model-independent limits are provided in a set of simplified signal regions. | ||
| Links: e-print arXiv:2001.10086 [hep-ex] (PDF) ; CDS record ; inSPIRE record ; HepData record ; CADI line (restricted) ; | ||
| Figures | |
png pdf |
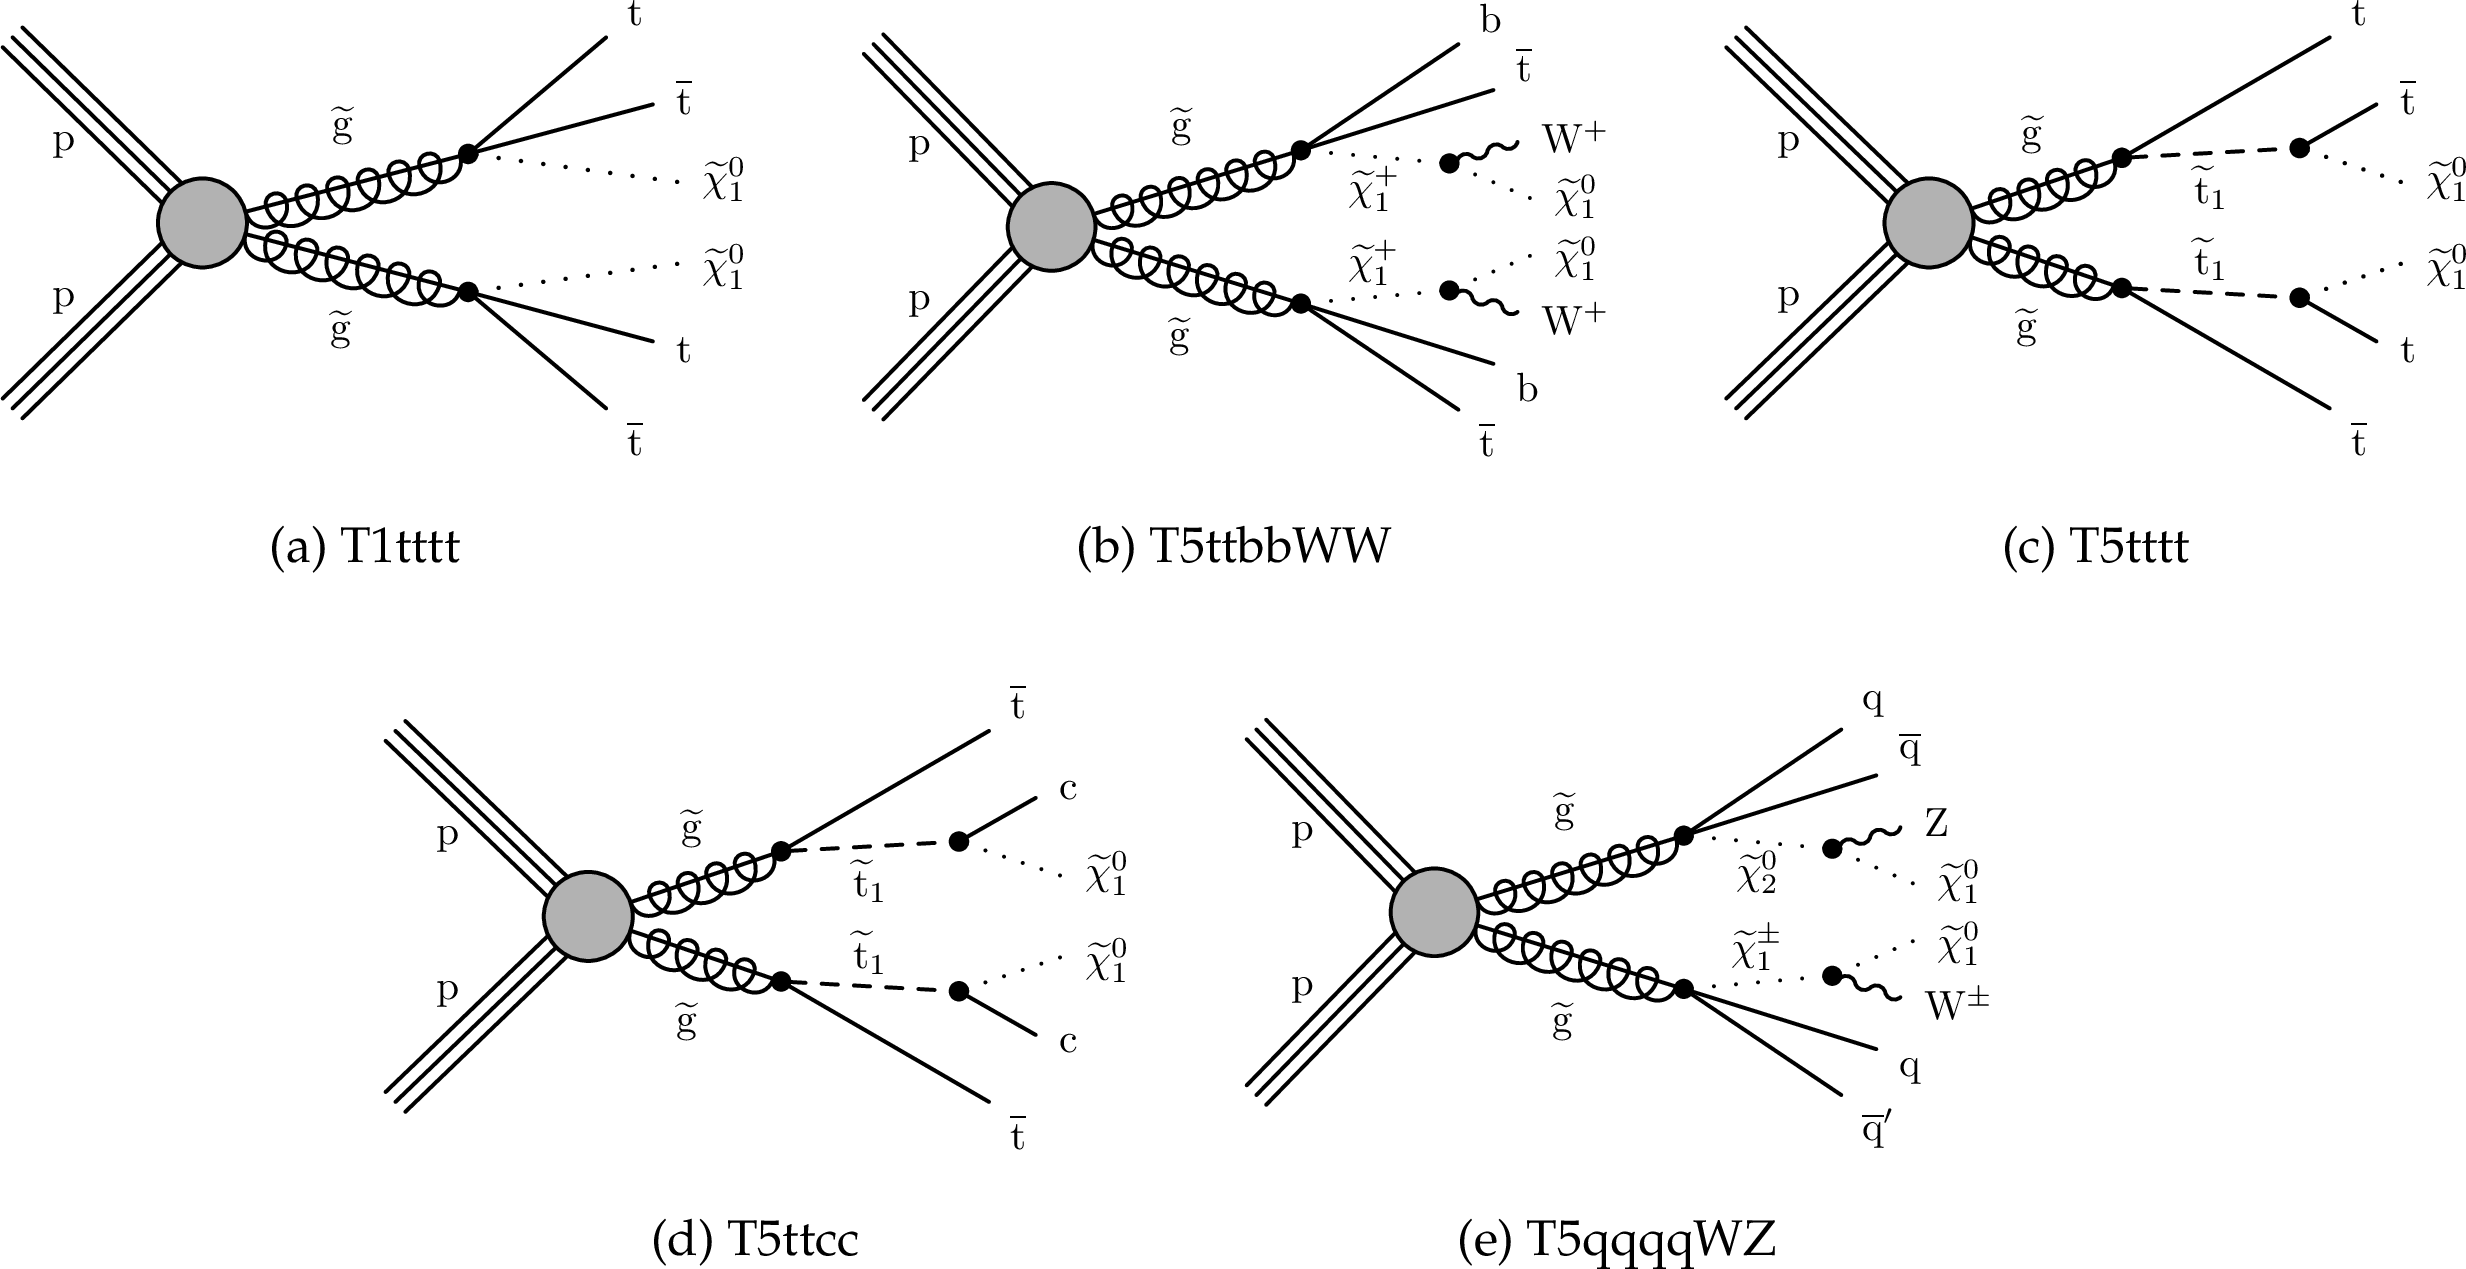
Figure 1:
Diagrams illustrating the simplified RPC SUSY models with gluino production considered in this analysis. |
png pdf |
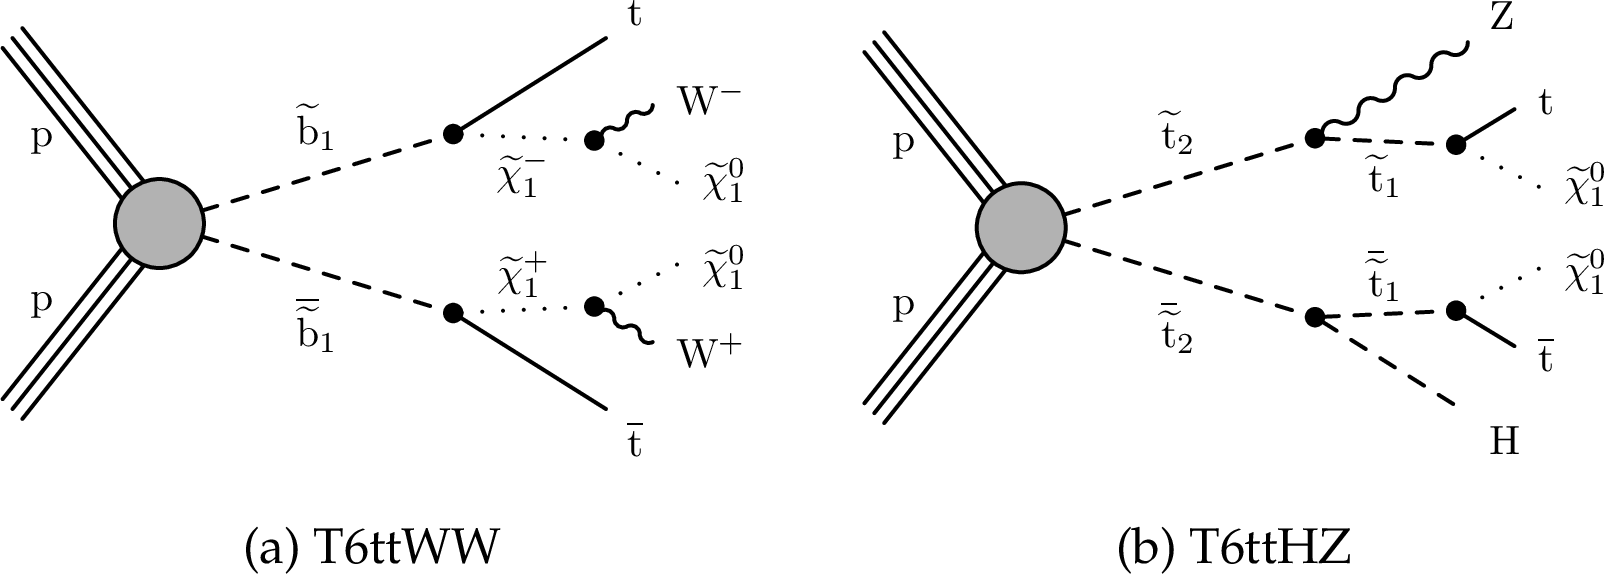
Figure 2:
Diagrams illustrating the simplified RPC SUSY models with squark production considered in this analysis. |
png pdf |
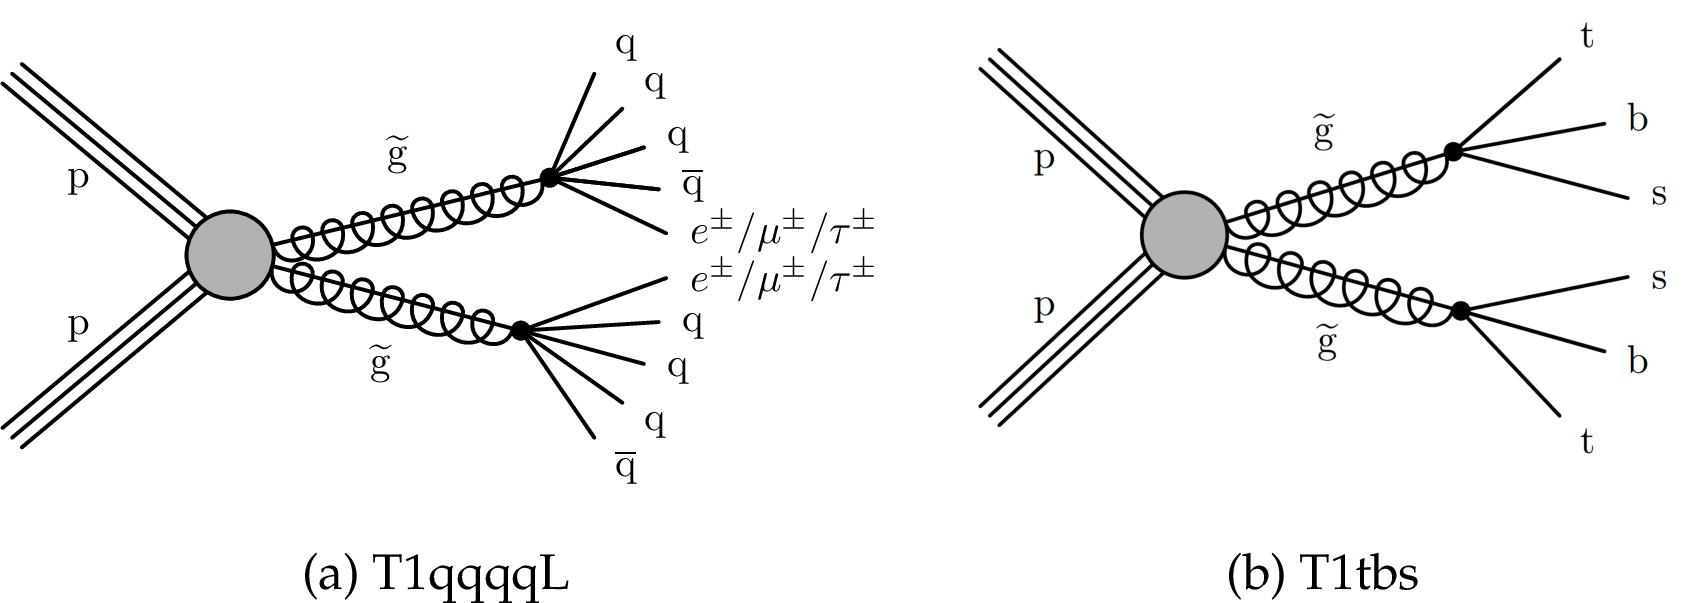
Figure 3:
Diagrams illustrating the two simplified RPV SUSY models considered in this analysis. |
png pdf |
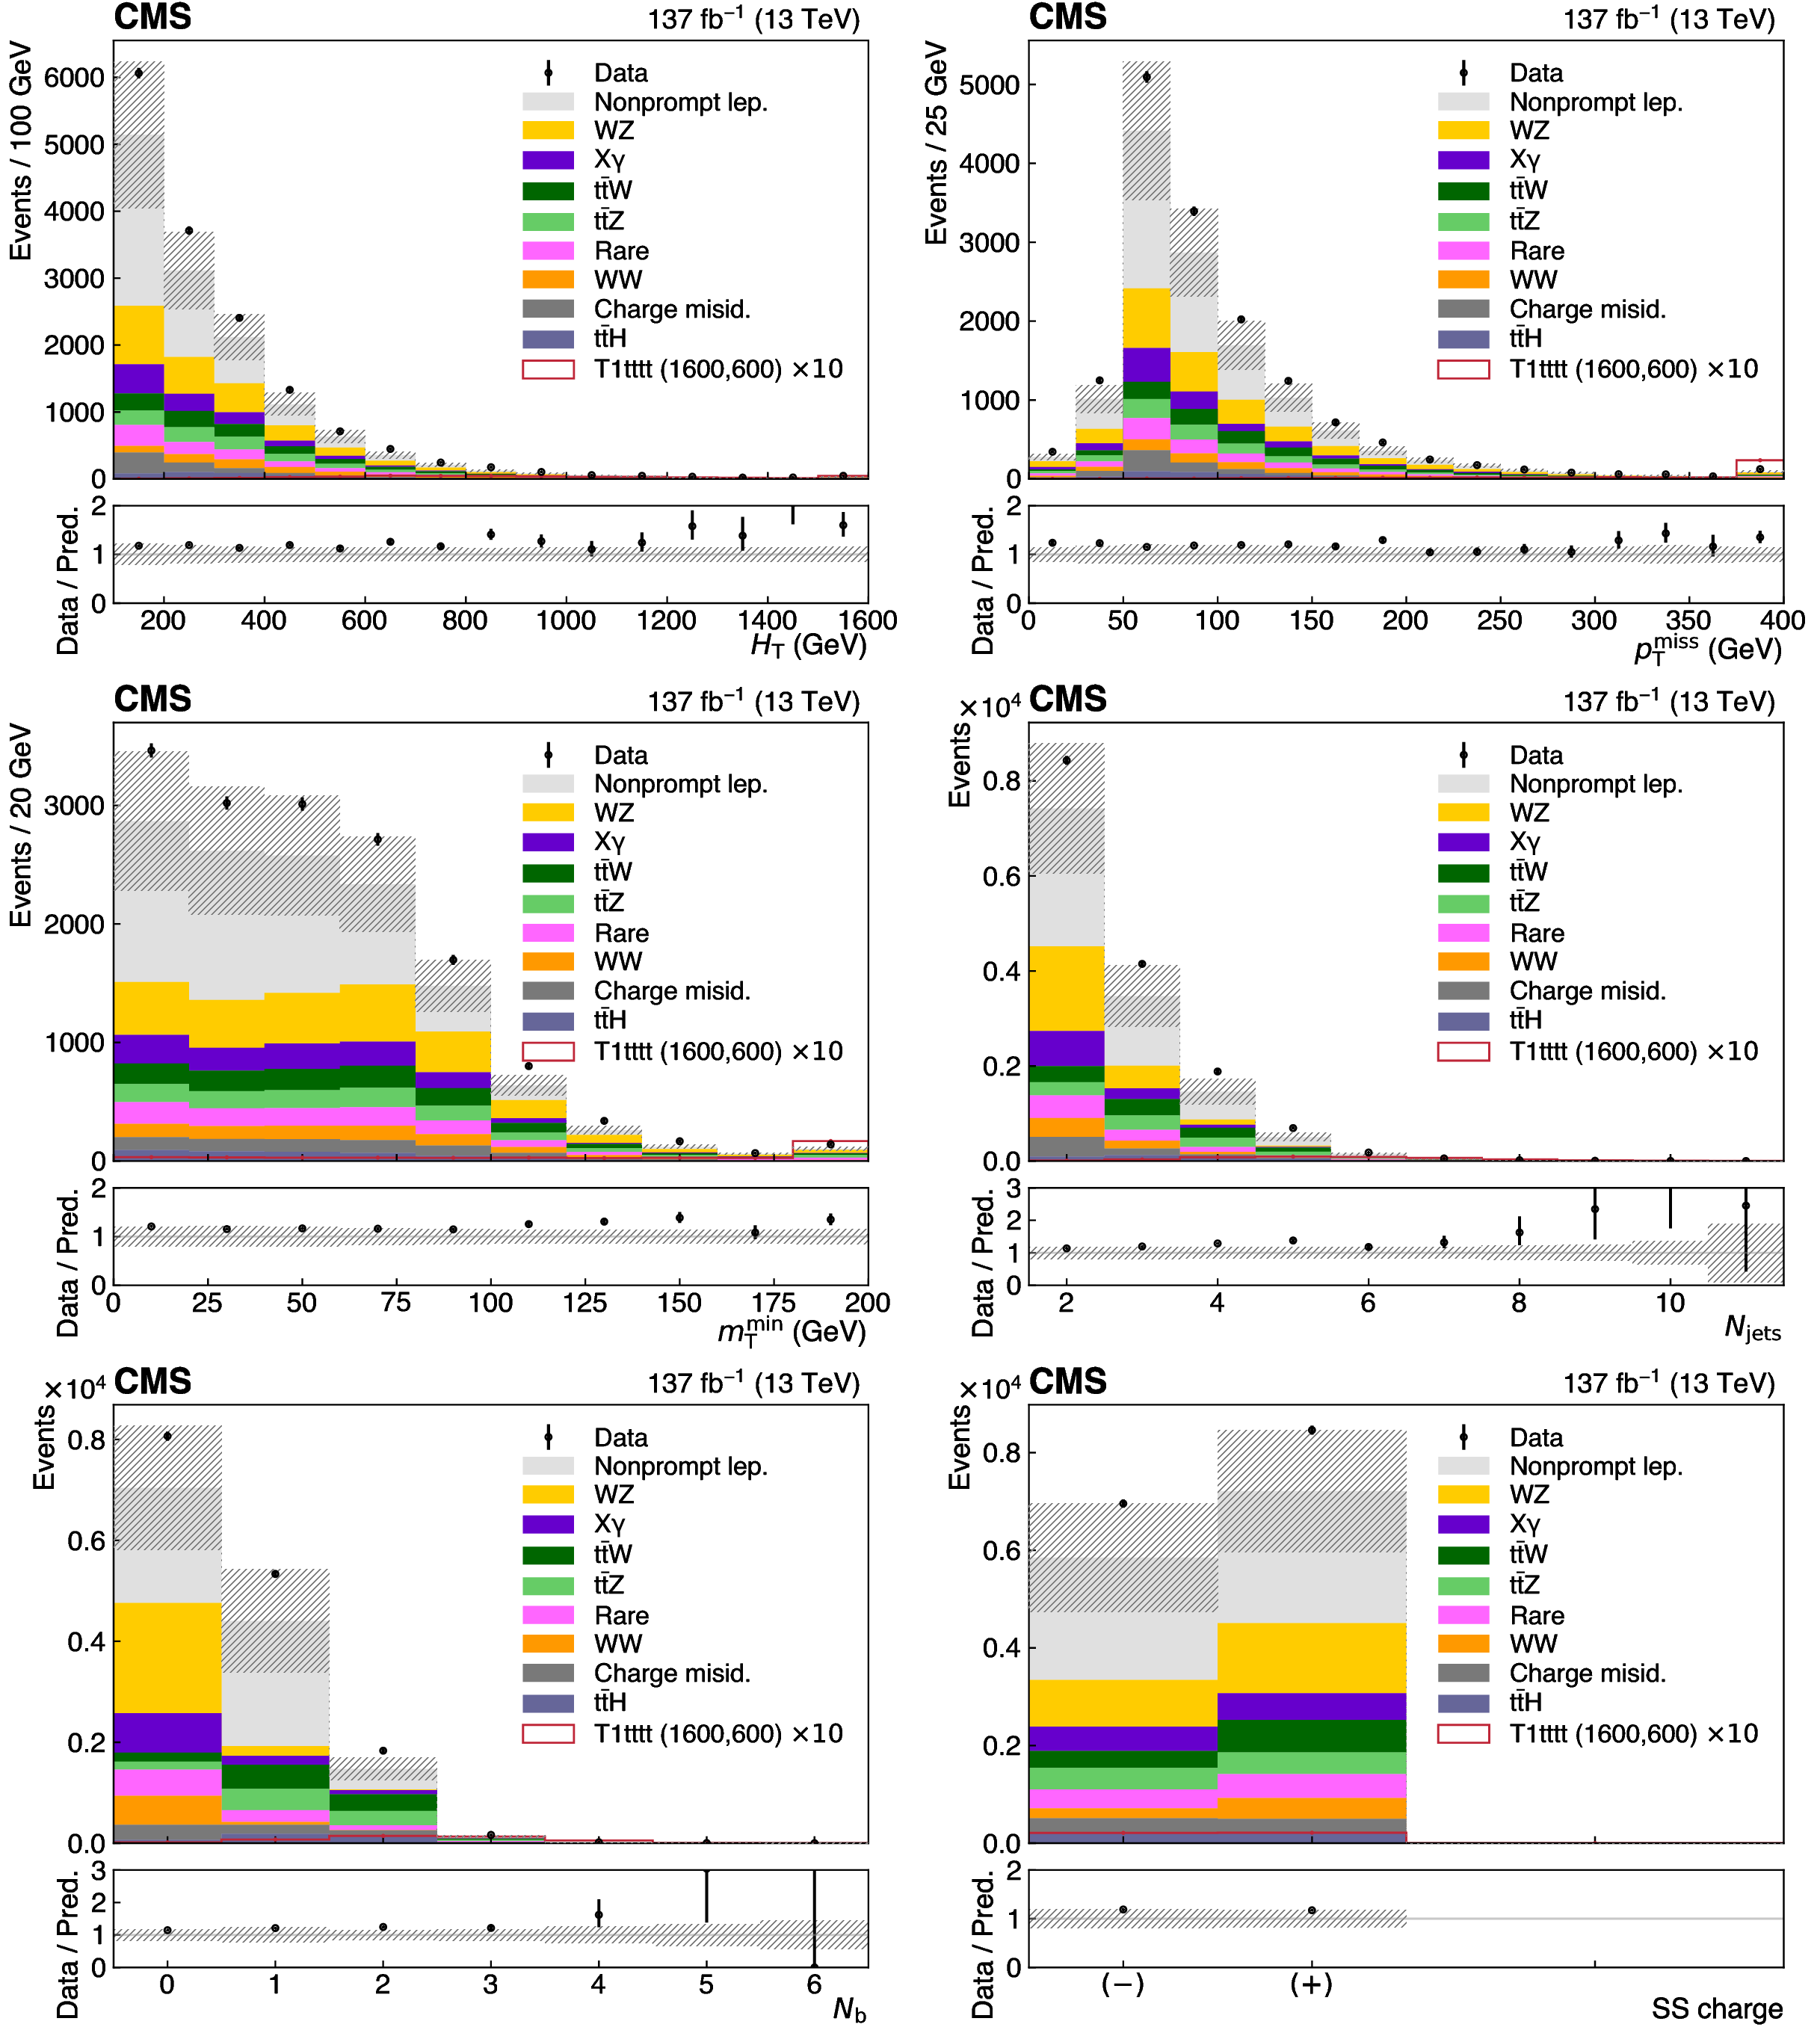
Figure 4:
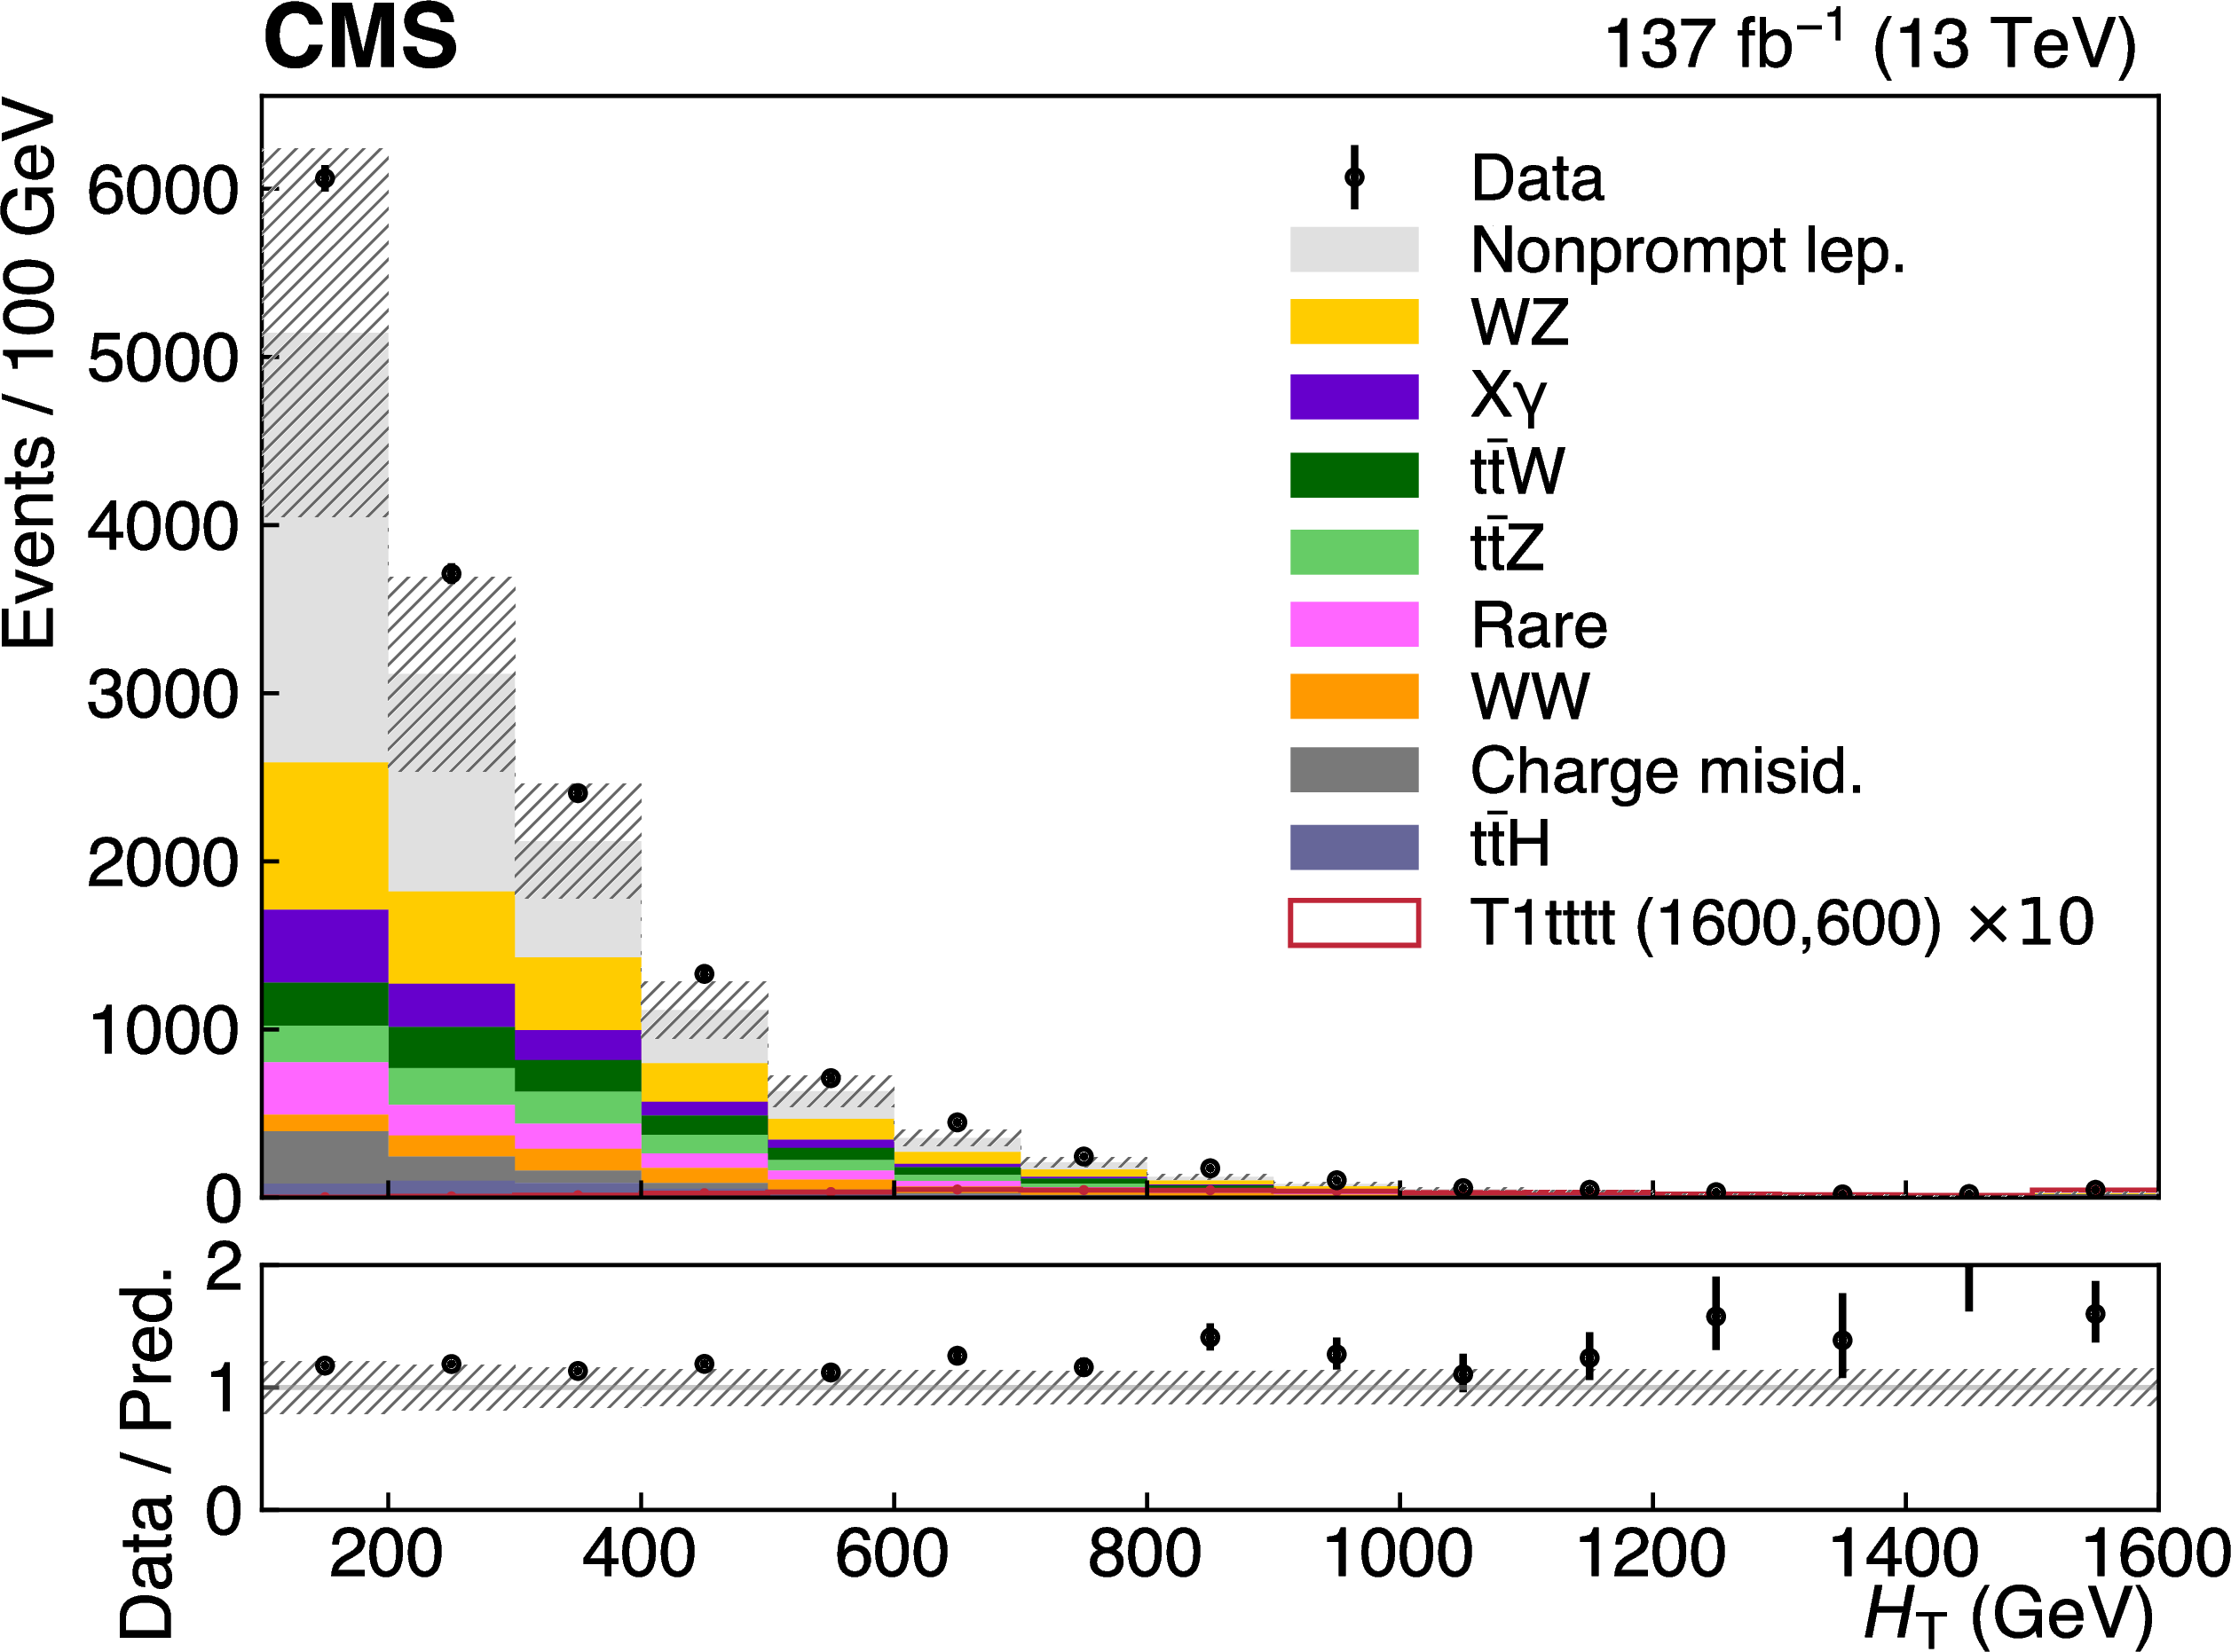
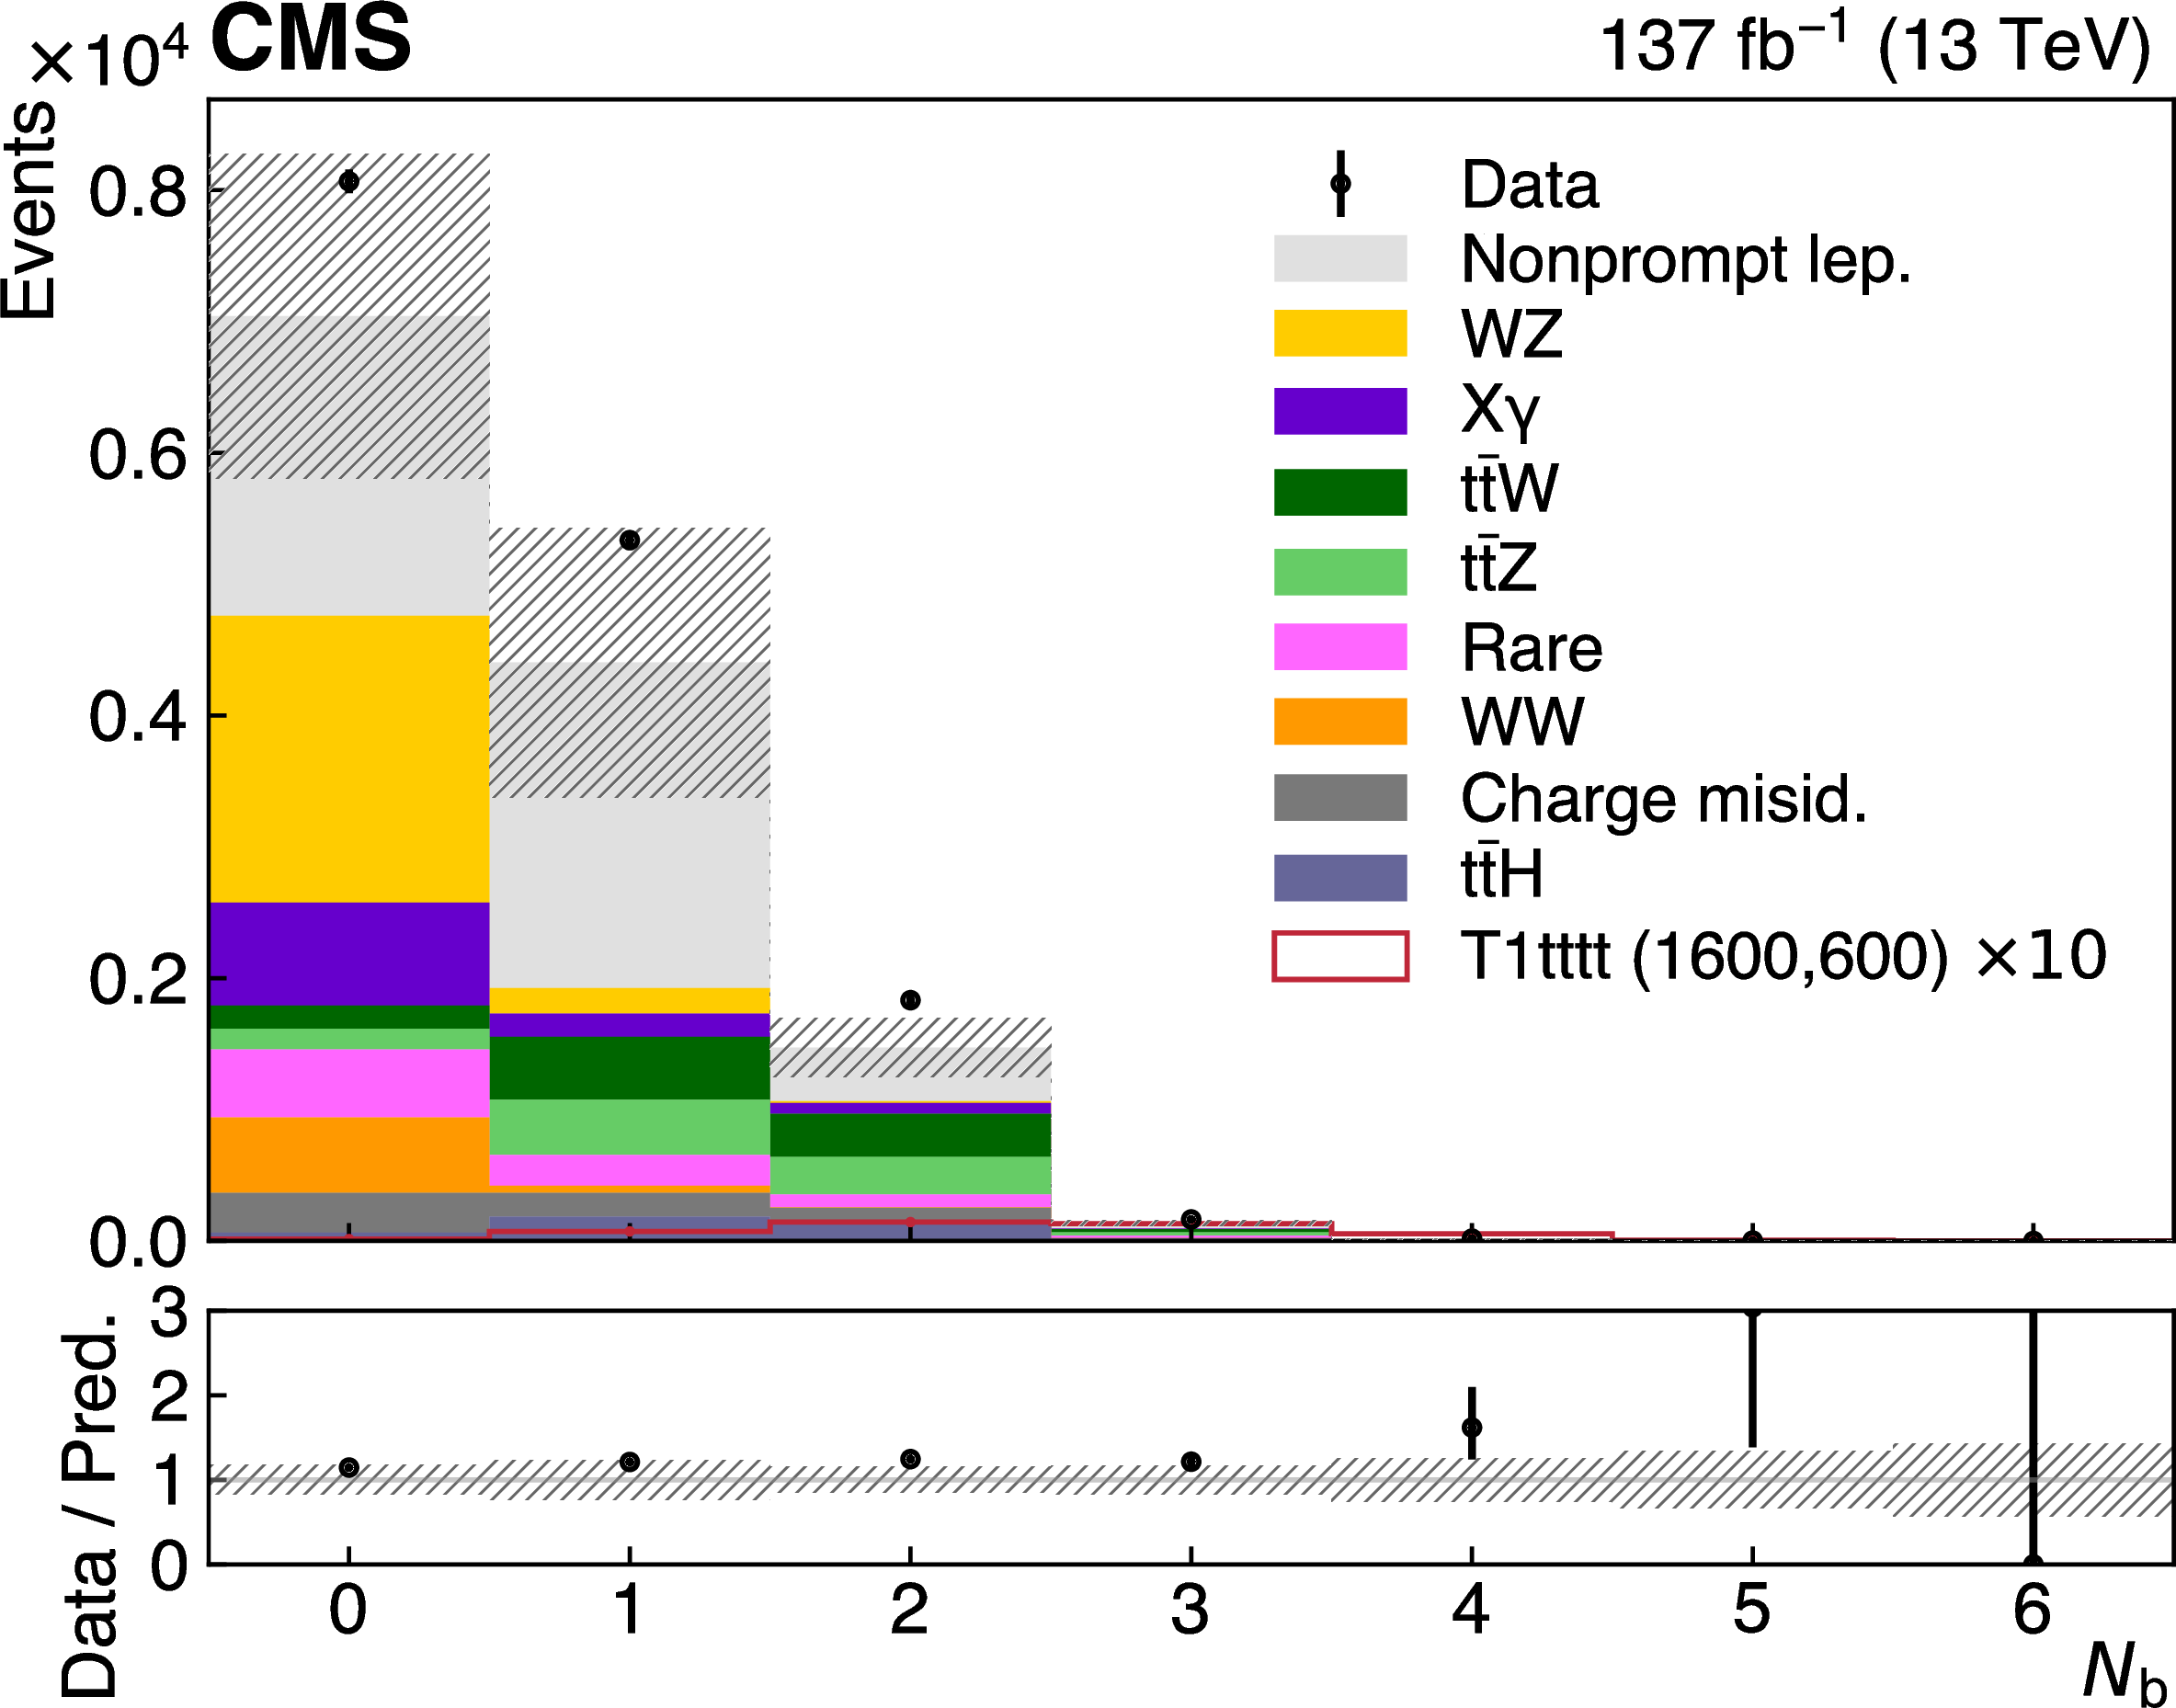
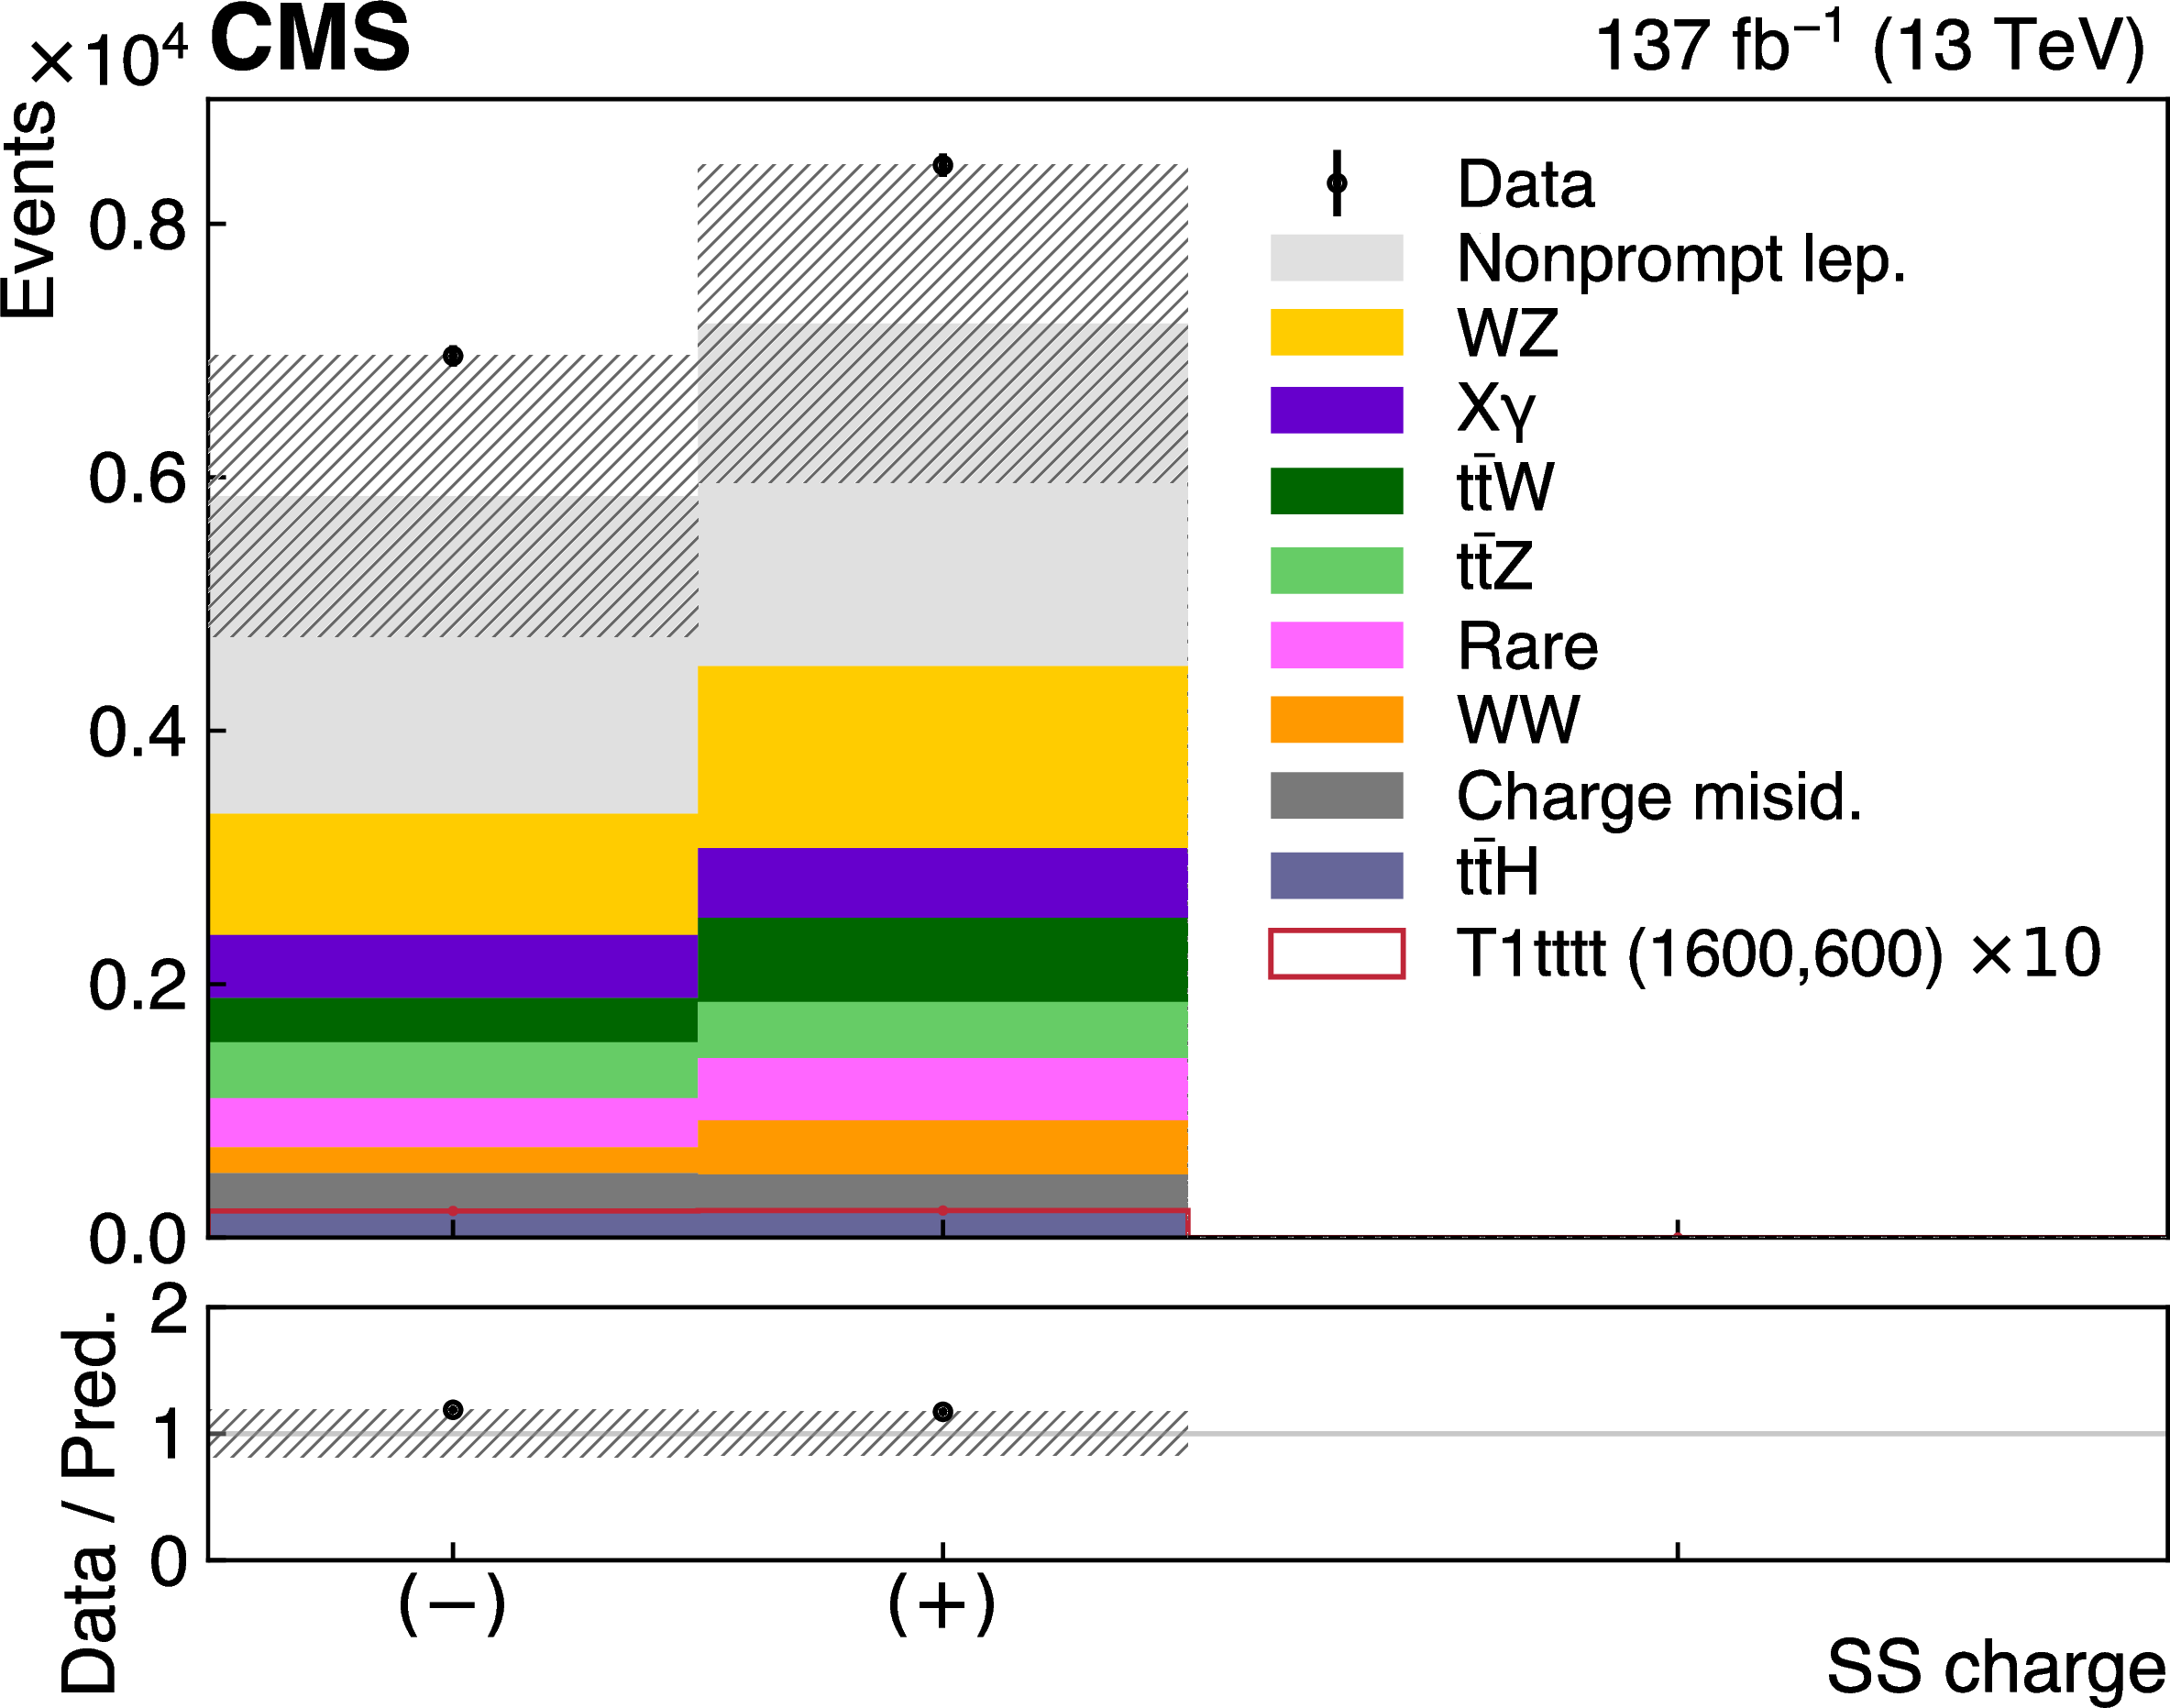
Distributions of the main analysis variables after the event selection: ${H_{\mathrm {T}}}$, ${{p_{\mathrm {T}}} ^\text {miss}}$, ${{m_{\mathrm {T}}} ^{\text {min}}}$, ${N_\text {jets}}$, ${N_{\mathrm{b}}}$, and the charge of the SS pair, where the last bin includes the overflow (where applicable). The hatched area represents the total statistical and systematic uncertainty in the background prediction. The lower panels show the ratio of the observed event yield to the background prediction. The prediction for the SUSY model T1tttt with $m_{{\mathrm{\widetilde{g}}}} = $ 1600 GeV and $m_{\tilde{\chi}^0_1} = $ 600 GeV is overlaid. |
png pdf |
Figure 4-a:
Distribution of ${H_{\mathrm {T}}}$. The last bin includes the overflow. The hatched area represents the total statistical and systematic uncertainty in the background prediction. The lower panel shows the ratio of the observed event yield to the background prediction. The prediction for the SUSY model T1tttt with $m_{{\mathrm{\widetilde{g}}}} = $ 1600 GeV and $m_{\tilde{\chi}^0_1} = $ 600 GeV is overlaid. |
png pdf |
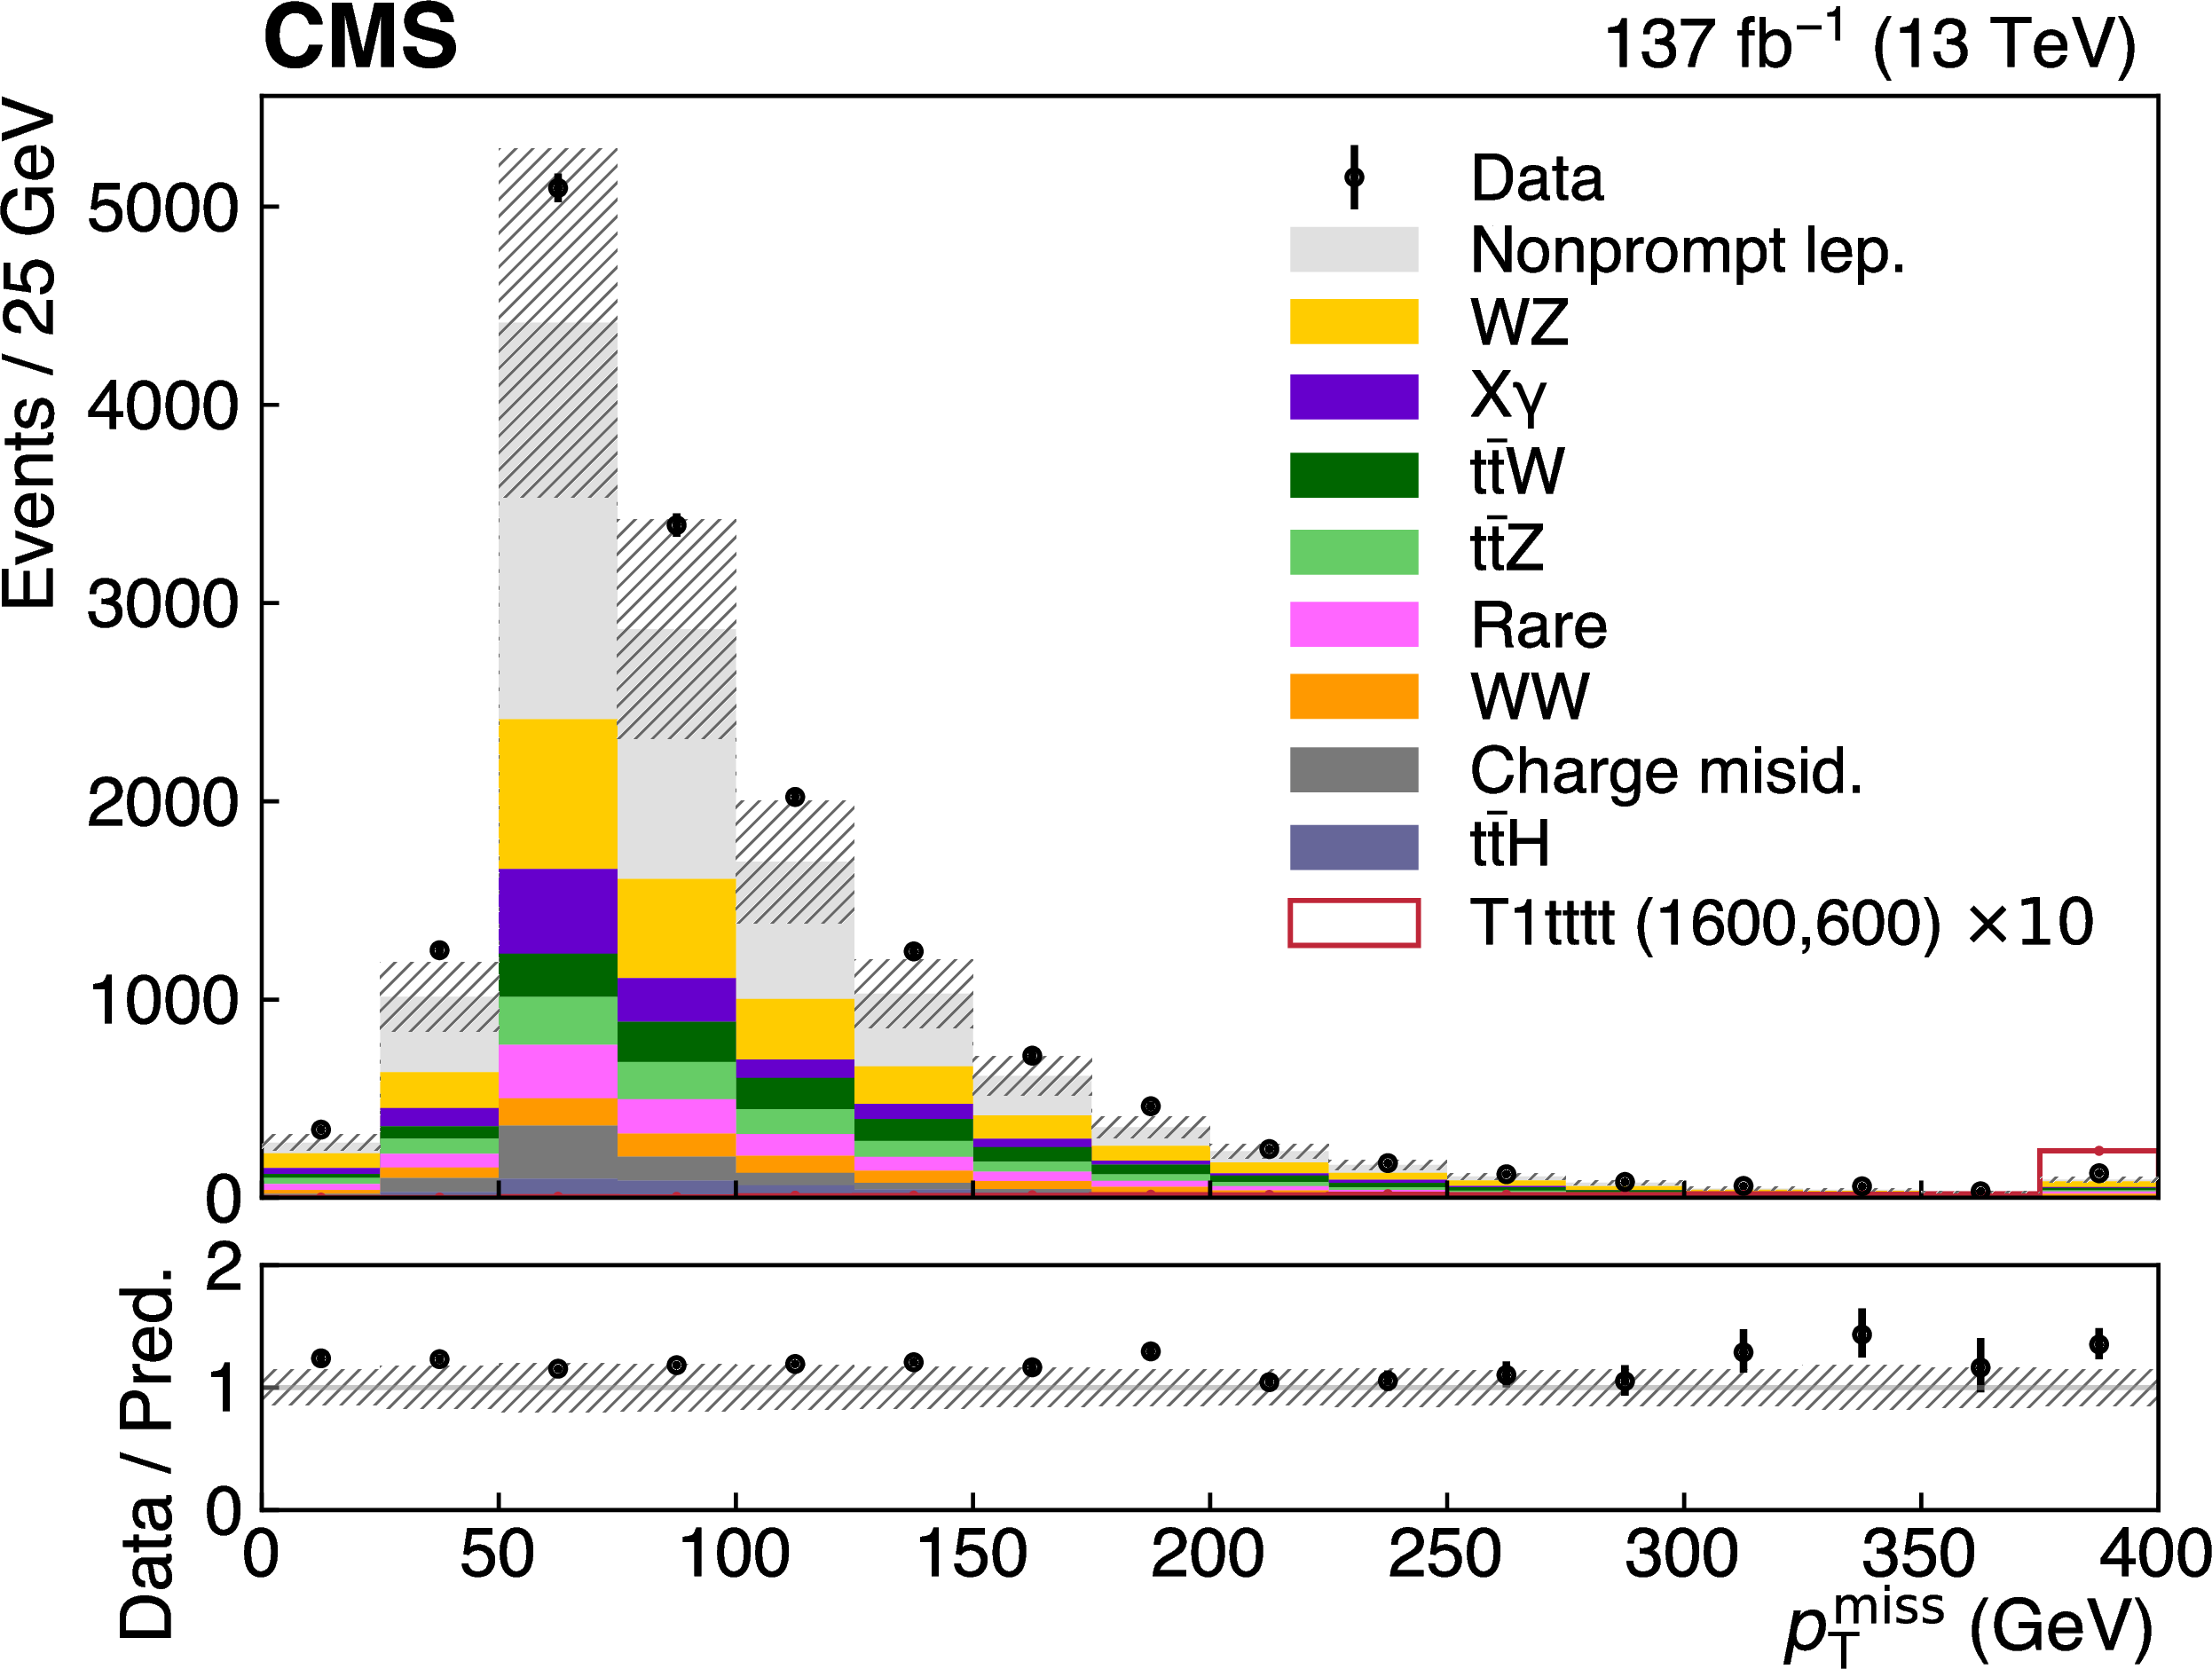
Figure 4-b:
Distribution of ${{p_{\mathrm {T}}} ^\text {miss}}$. The last bin includes the overflow. The hatched area represents the total statistical and systematic uncertainty in the background prediction. The lower panel shows the ratio of the observed event yield to the background prediction. The prediction for the SUSY model T1tttt with $m_{{\mathrm{\widetilde{g}}}} = $ 1600 GeV and $m_{\tilde{\chi}^0_1} = $ 600 GeV is overlaid. |
png pdf |
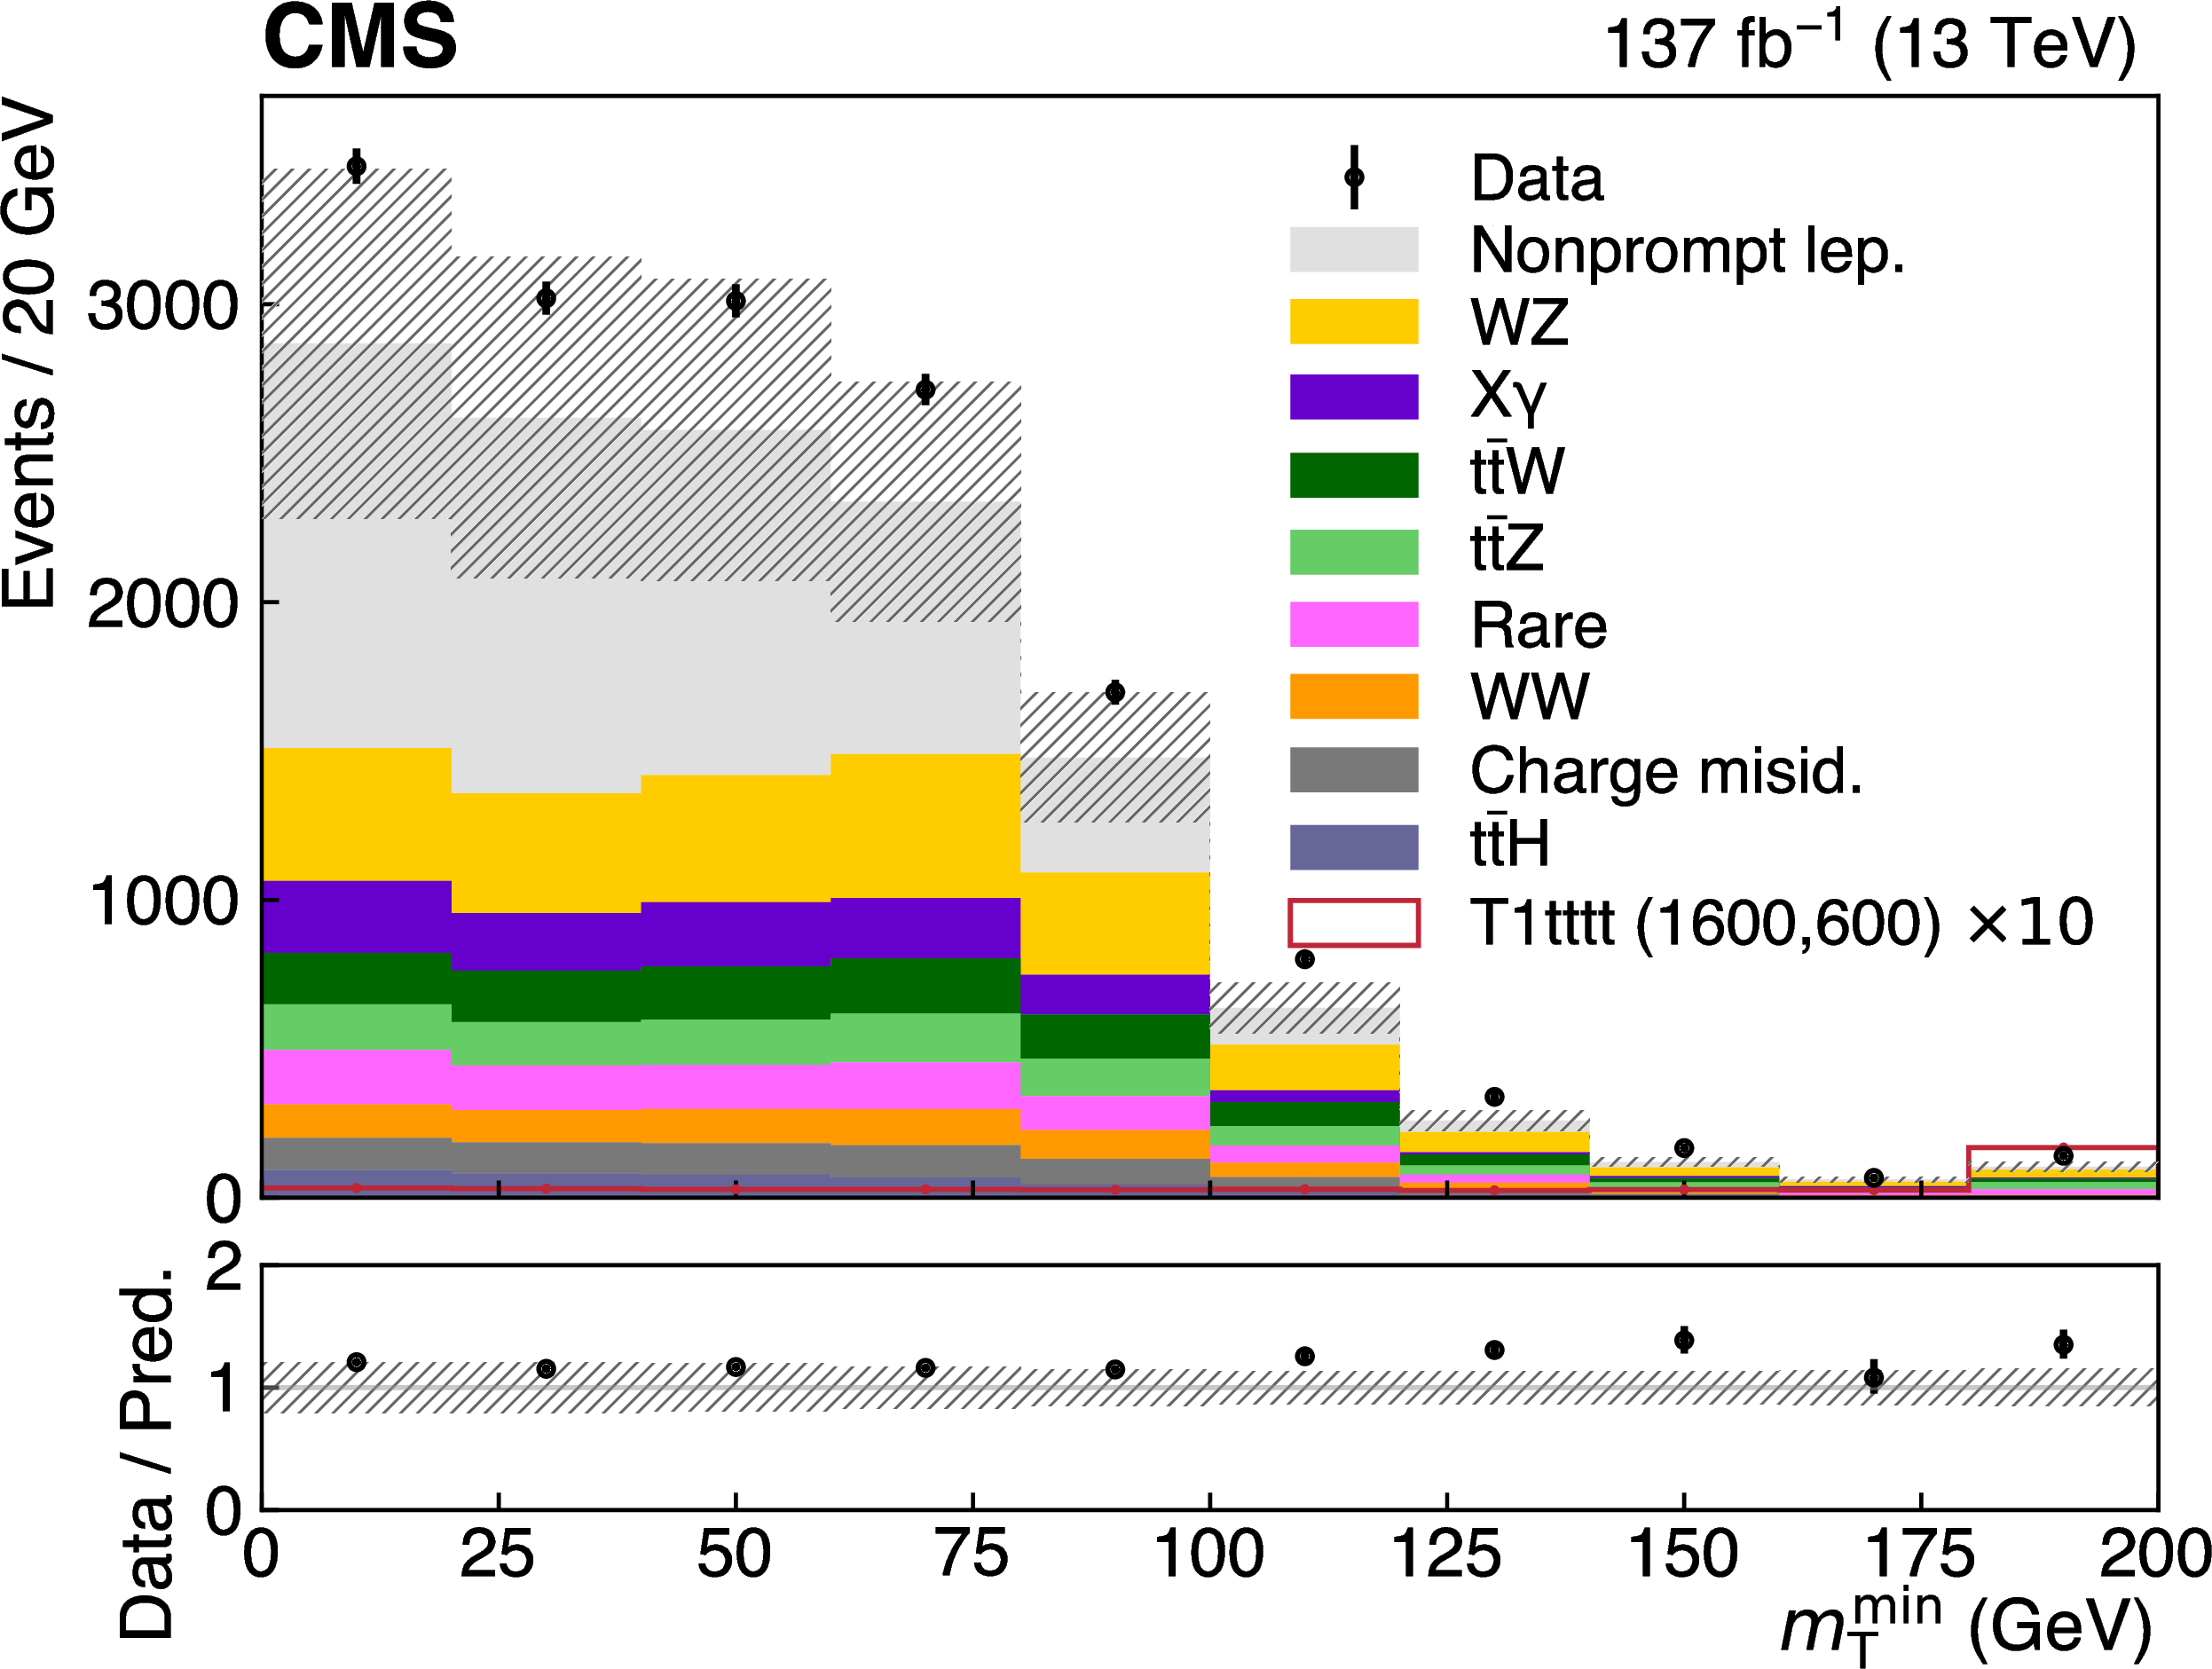
Figure 4-c:
Distribution of ${{m_{\mathrm {T}}} ^{\text {min}}}$. The last bin includes the overflow. The hatched area represents the total statistical and systematic uncertainty in the background prediction. The lower panel shows the ratio of the observed event yield to the background prediction. The prediction for the SUSY model T1tttt with $m_{{\mathrm{\widetilde{g}}}} = $ 1600 GeV and $m_{\tilde{\chi}^0_1} = $ 600 GeV is overlaid. |
png pdf |
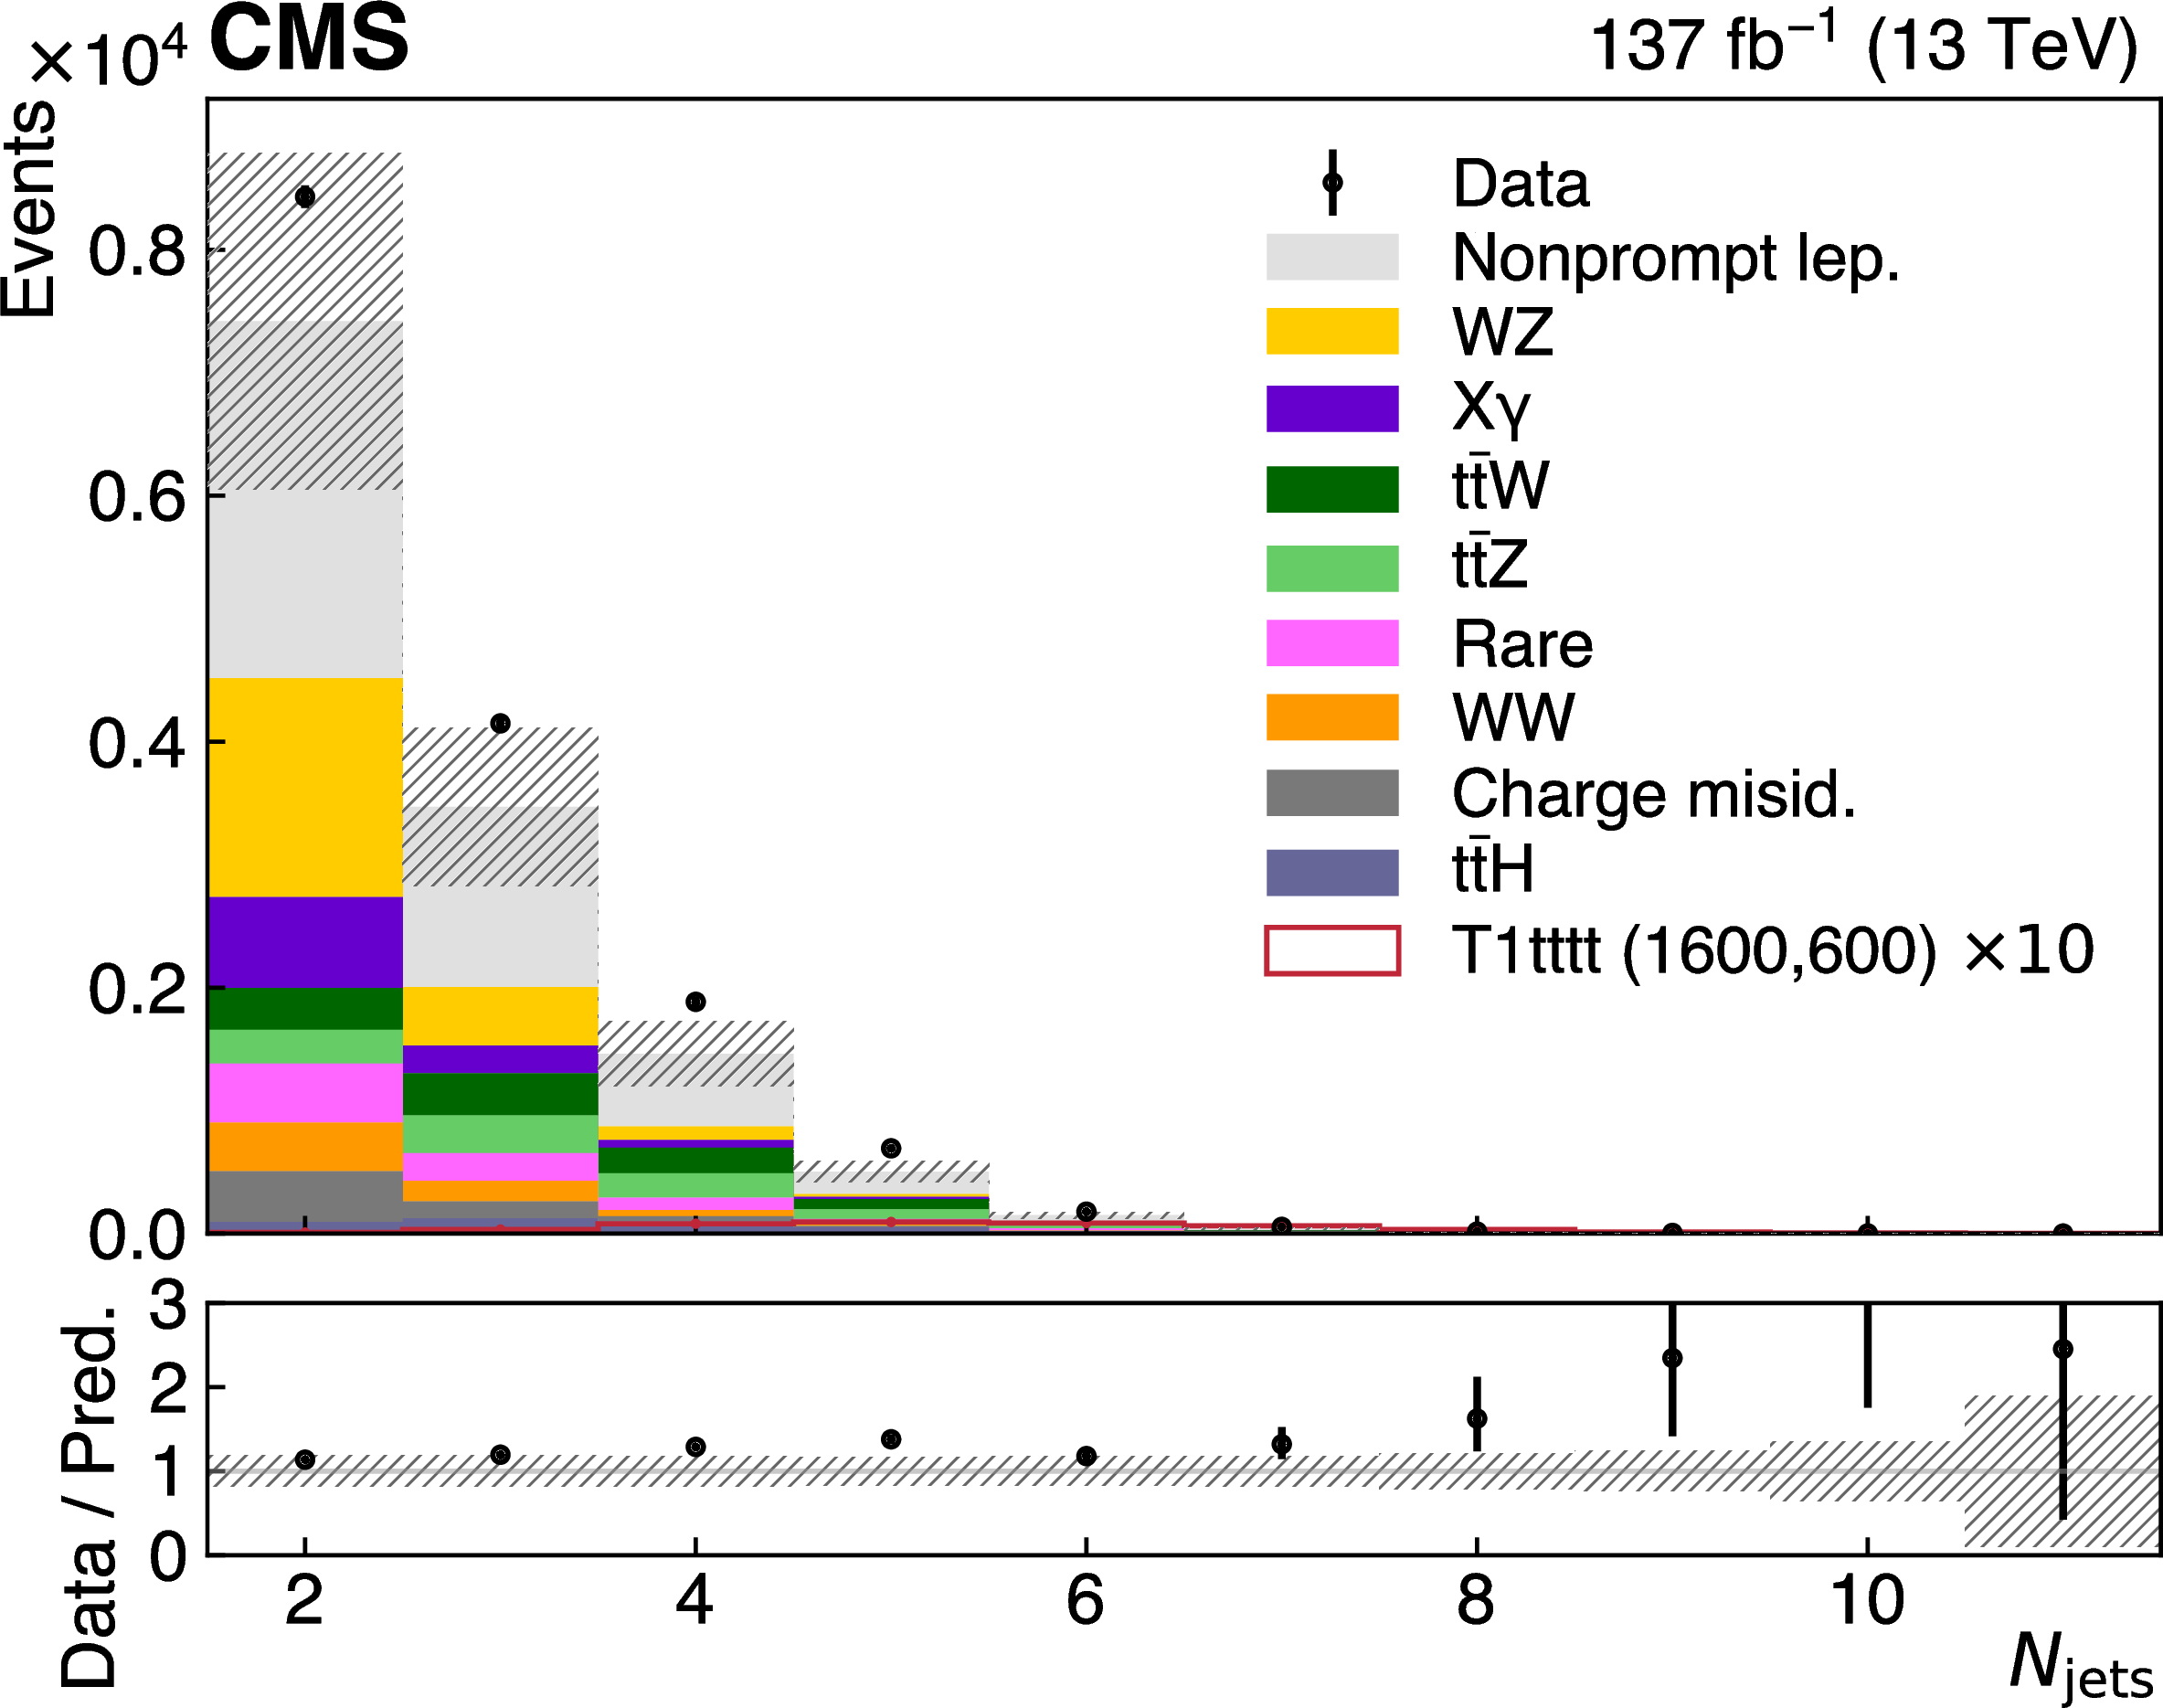
Figure 4-d:
Distribution of ${N_\text {jets}}$. The last bin includes the overflow. The hatched area represents the total statistical and systematic uncertainty in the background prediction. The lower panel shows the ratio of the observed event yield to the background prediction. The prediction for the SUSY model T1tttt with $m_{{\mathrm{\widetilde{g}}}} = $ 1600 GeV and $m_{\tilde{\chi}^0_1} = $ 600 GeV is overlaid. |
png pdf |
Figure 4-e:
Distribution of ${N_{\mathrm{b}}}$. The hatched area represents the total statistical and systematic uncertainty in the background prediction. The lower panel shows the ratio of the observed event yield to the background prediction. The prediction for the SUSY model T1tttt with $m_{{\mathrm{\widetilde{g}}}} = $ 1600 GeV and $m_{\tilde{\chi}^0_1} = $ 600 GeV is overlaid. |
png pdf |
Figure 4-f:
Distribution of the charge of the SS pair. The hatched area represents the total statistical and systematic uncertainty in the background prediction. The lower panel shows the ratio of the observed event yield to the background prediction. The prediction for the SUSY model T1tttt with $m_{{\mathrm{\widetilde{g}}}} = $ 1600 GeV and $m_{\tilde{\chi}^0_1} = $ 600 GeV is overlaid. |
png pdf |
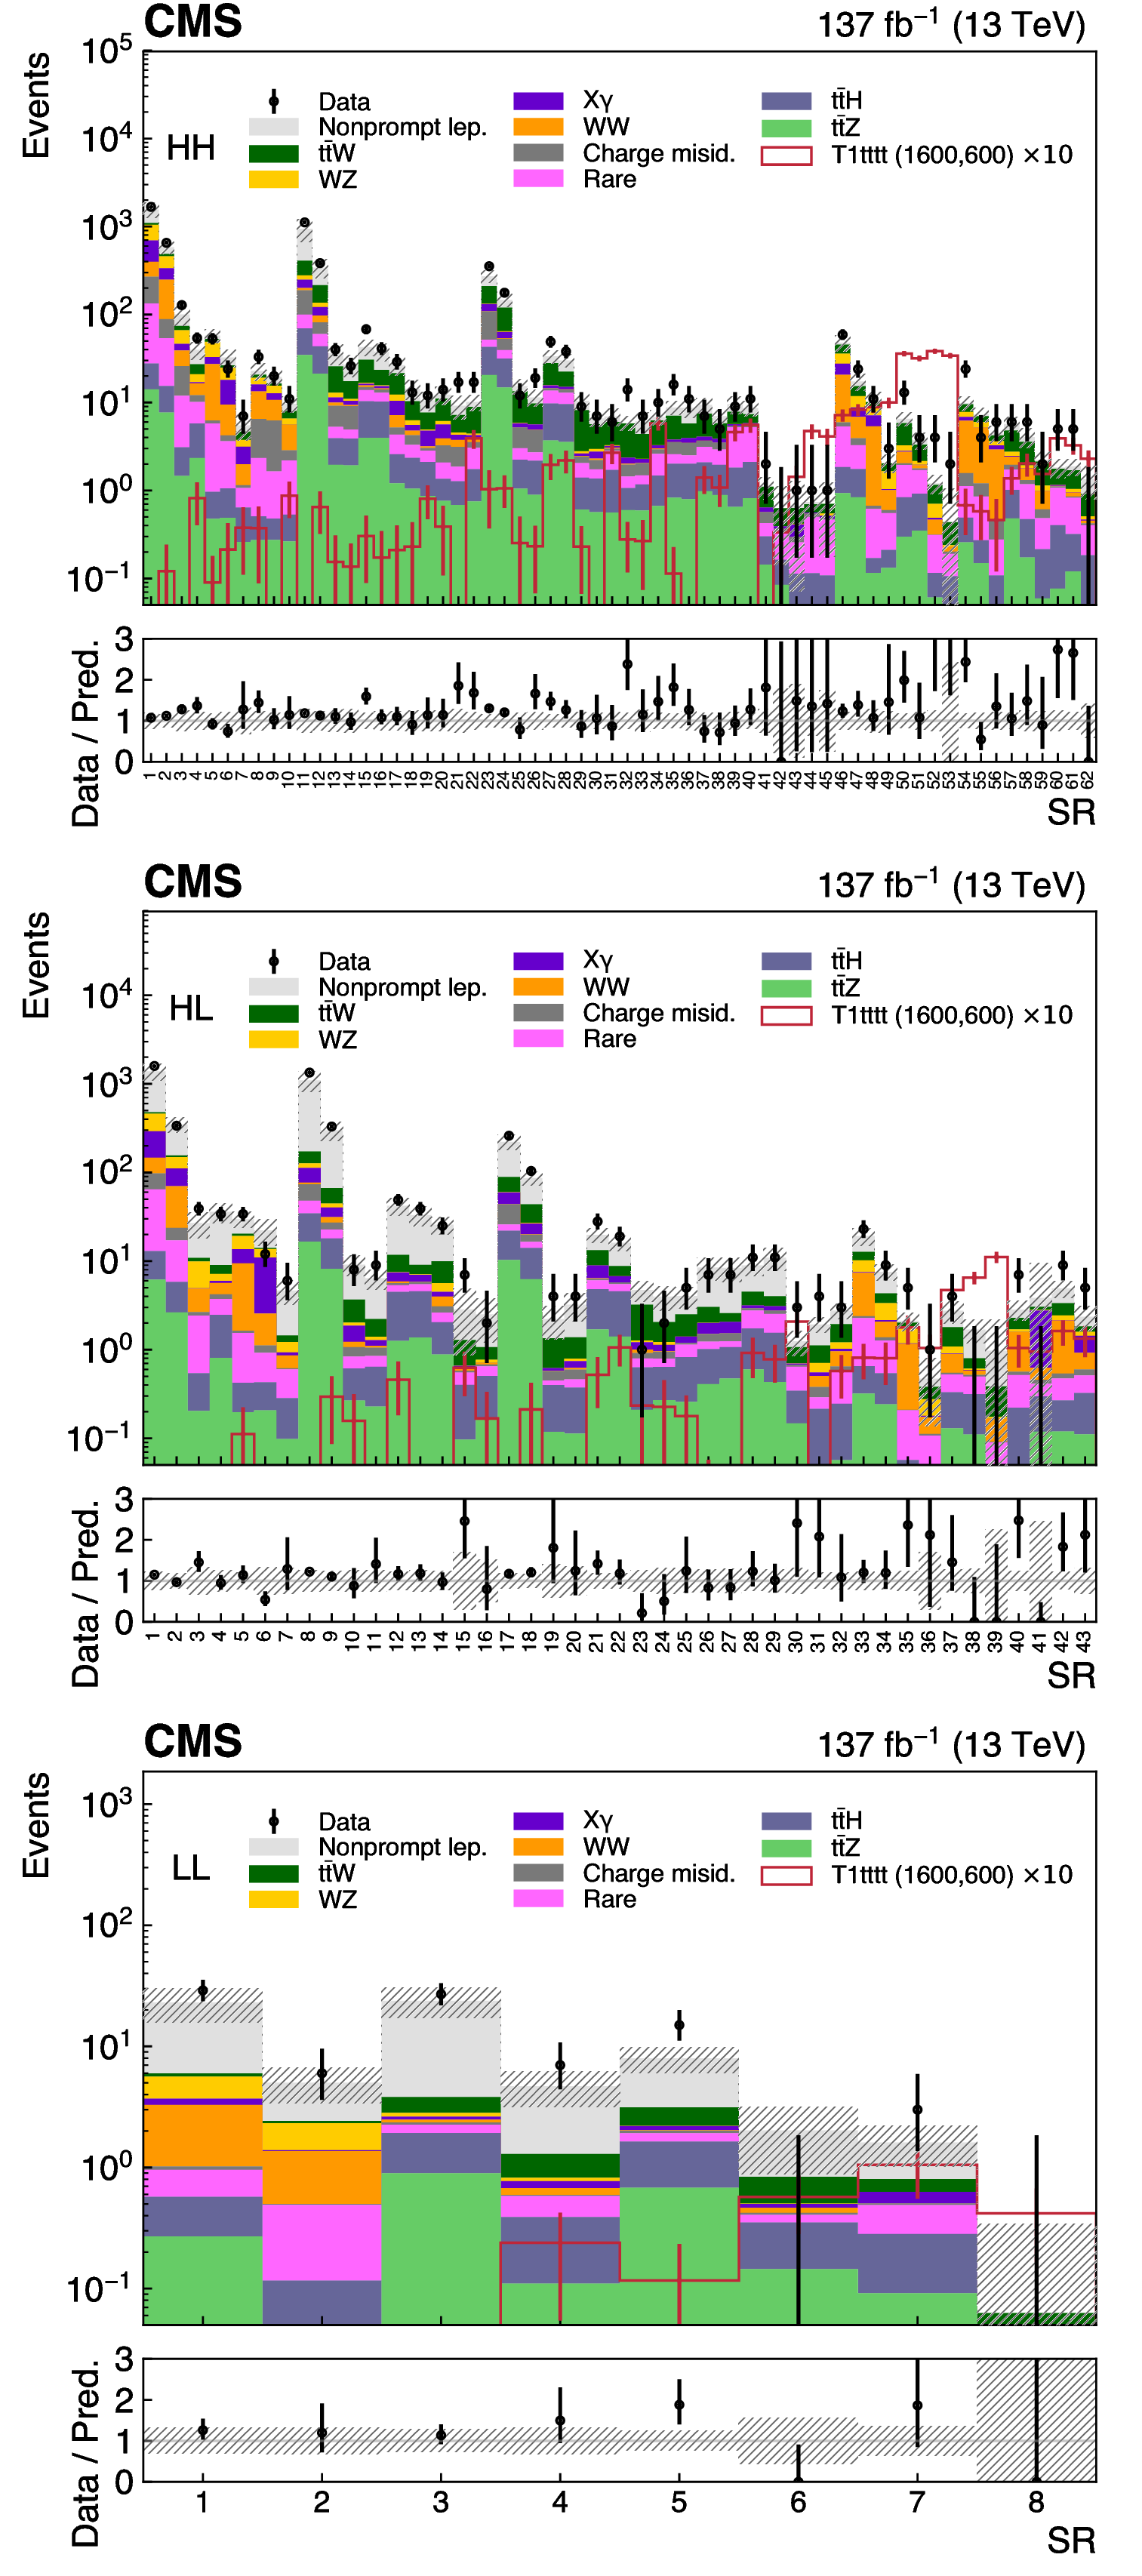
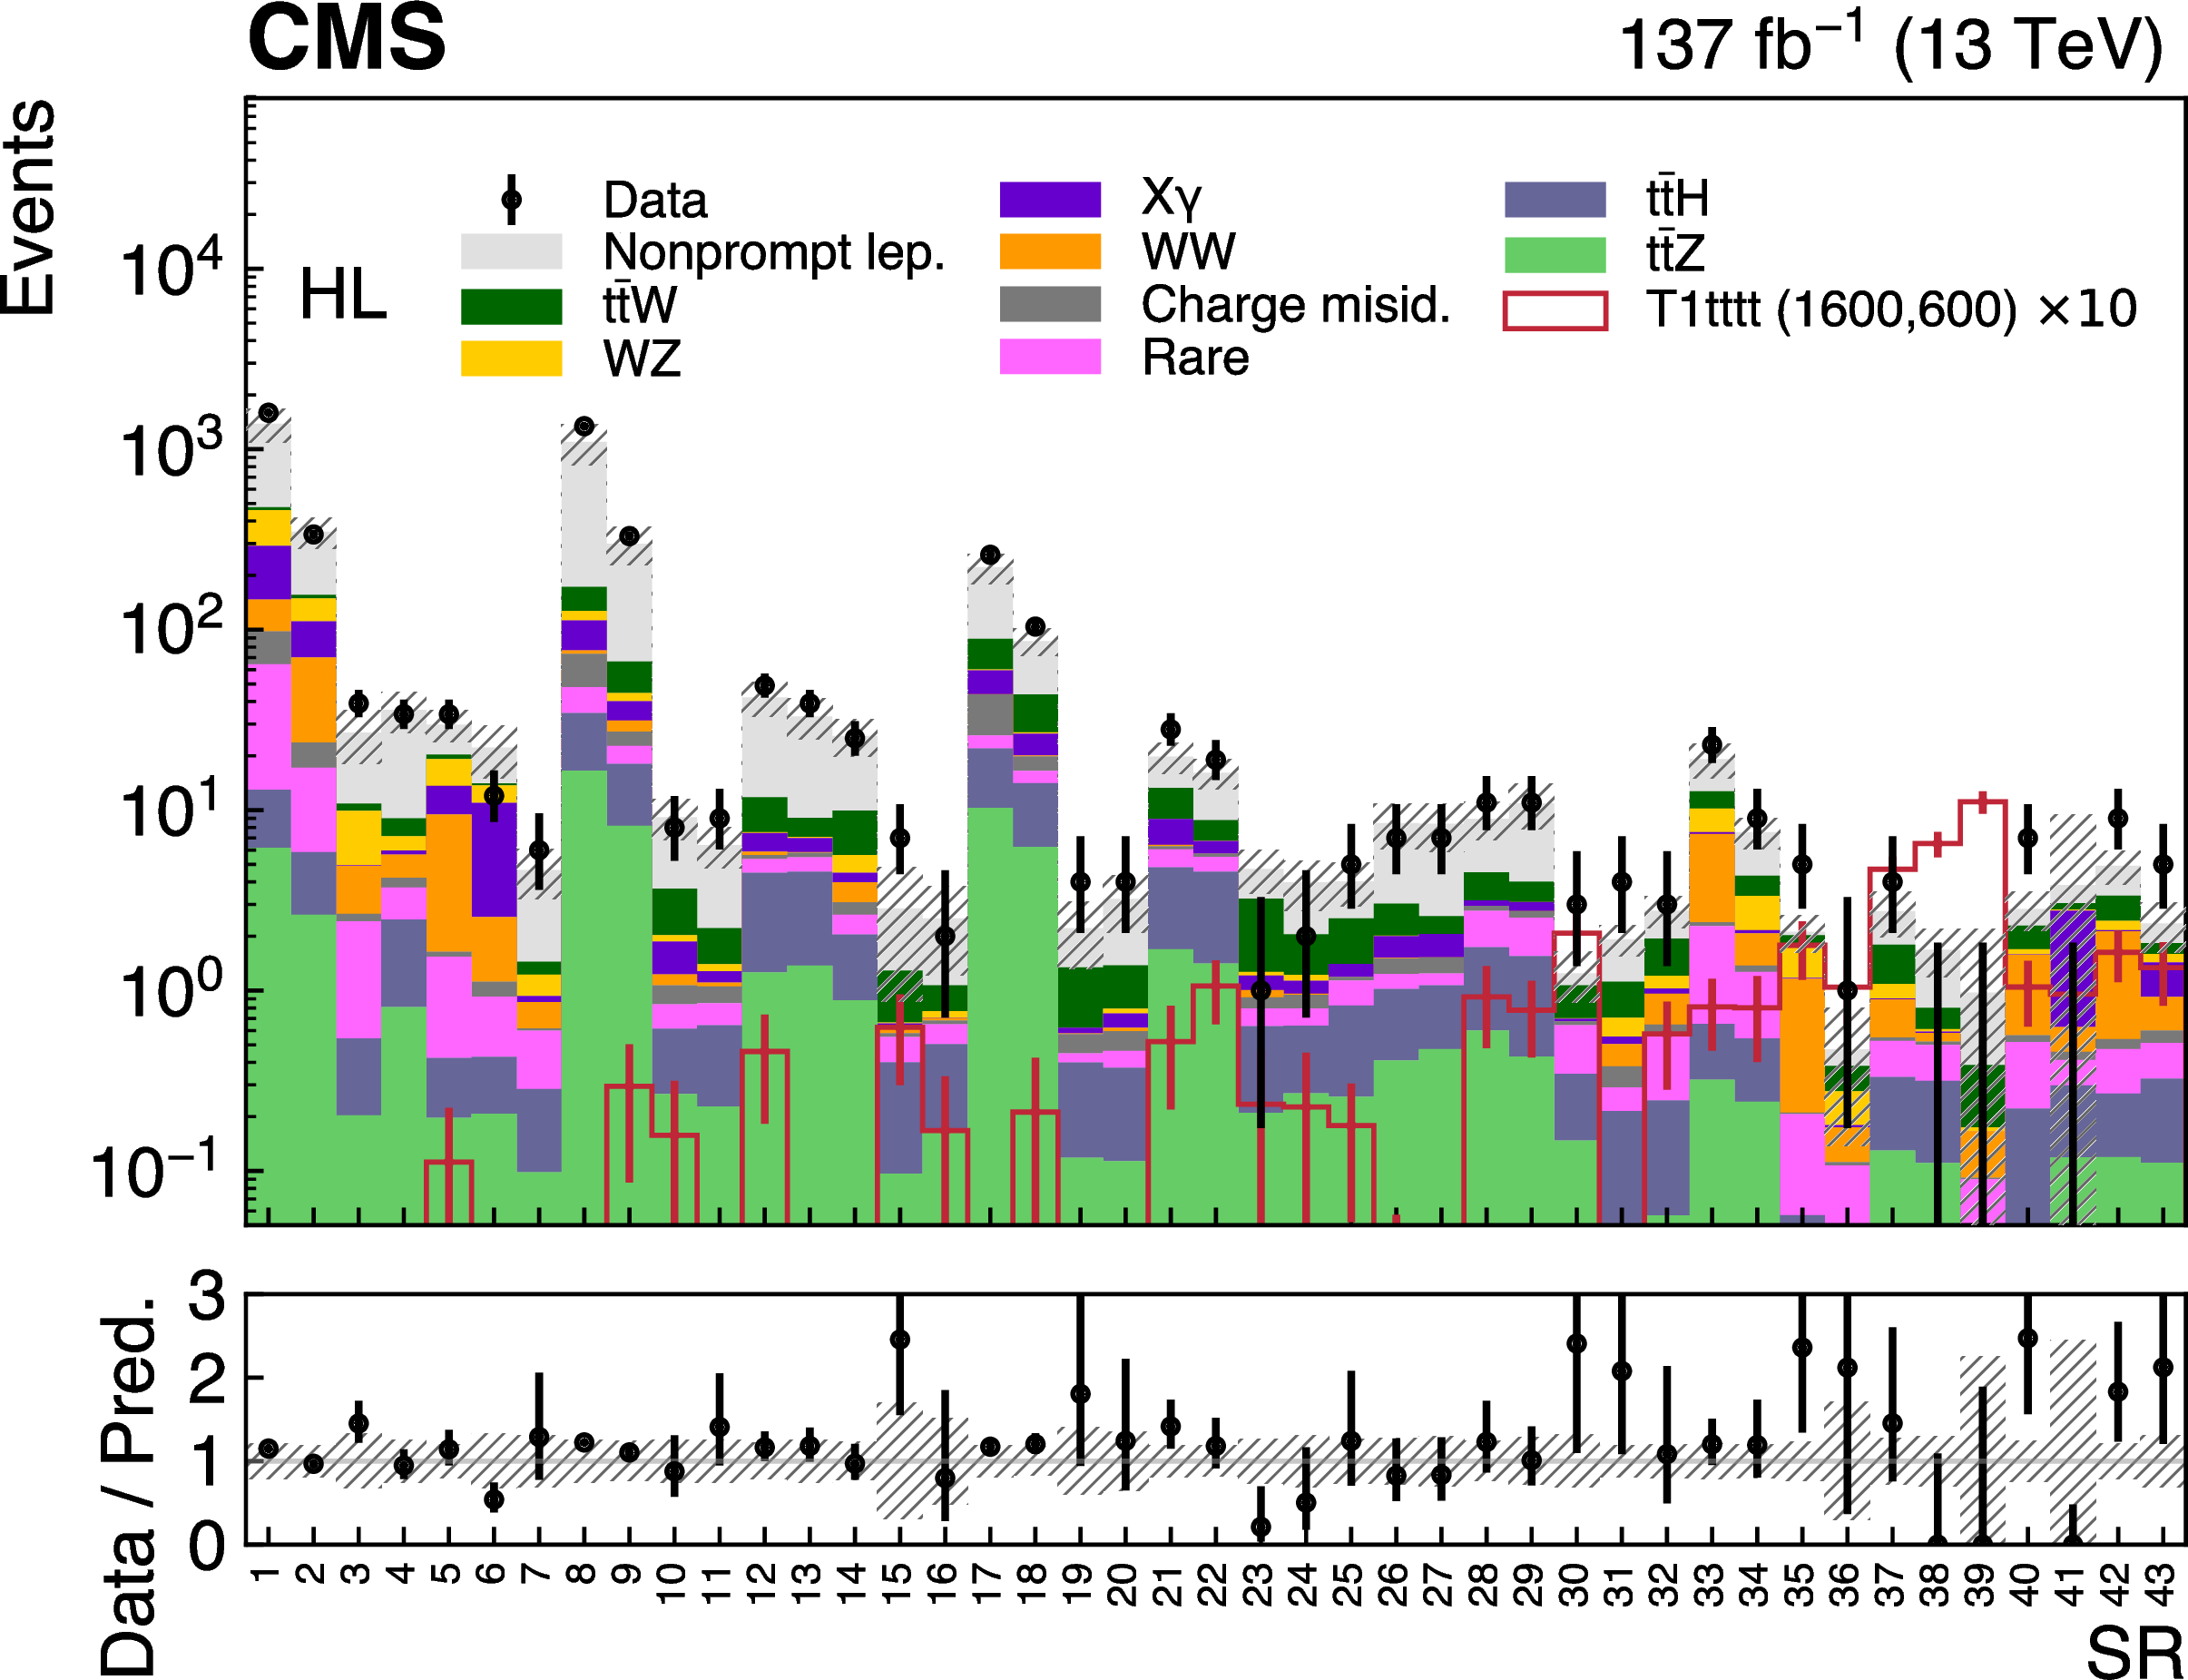
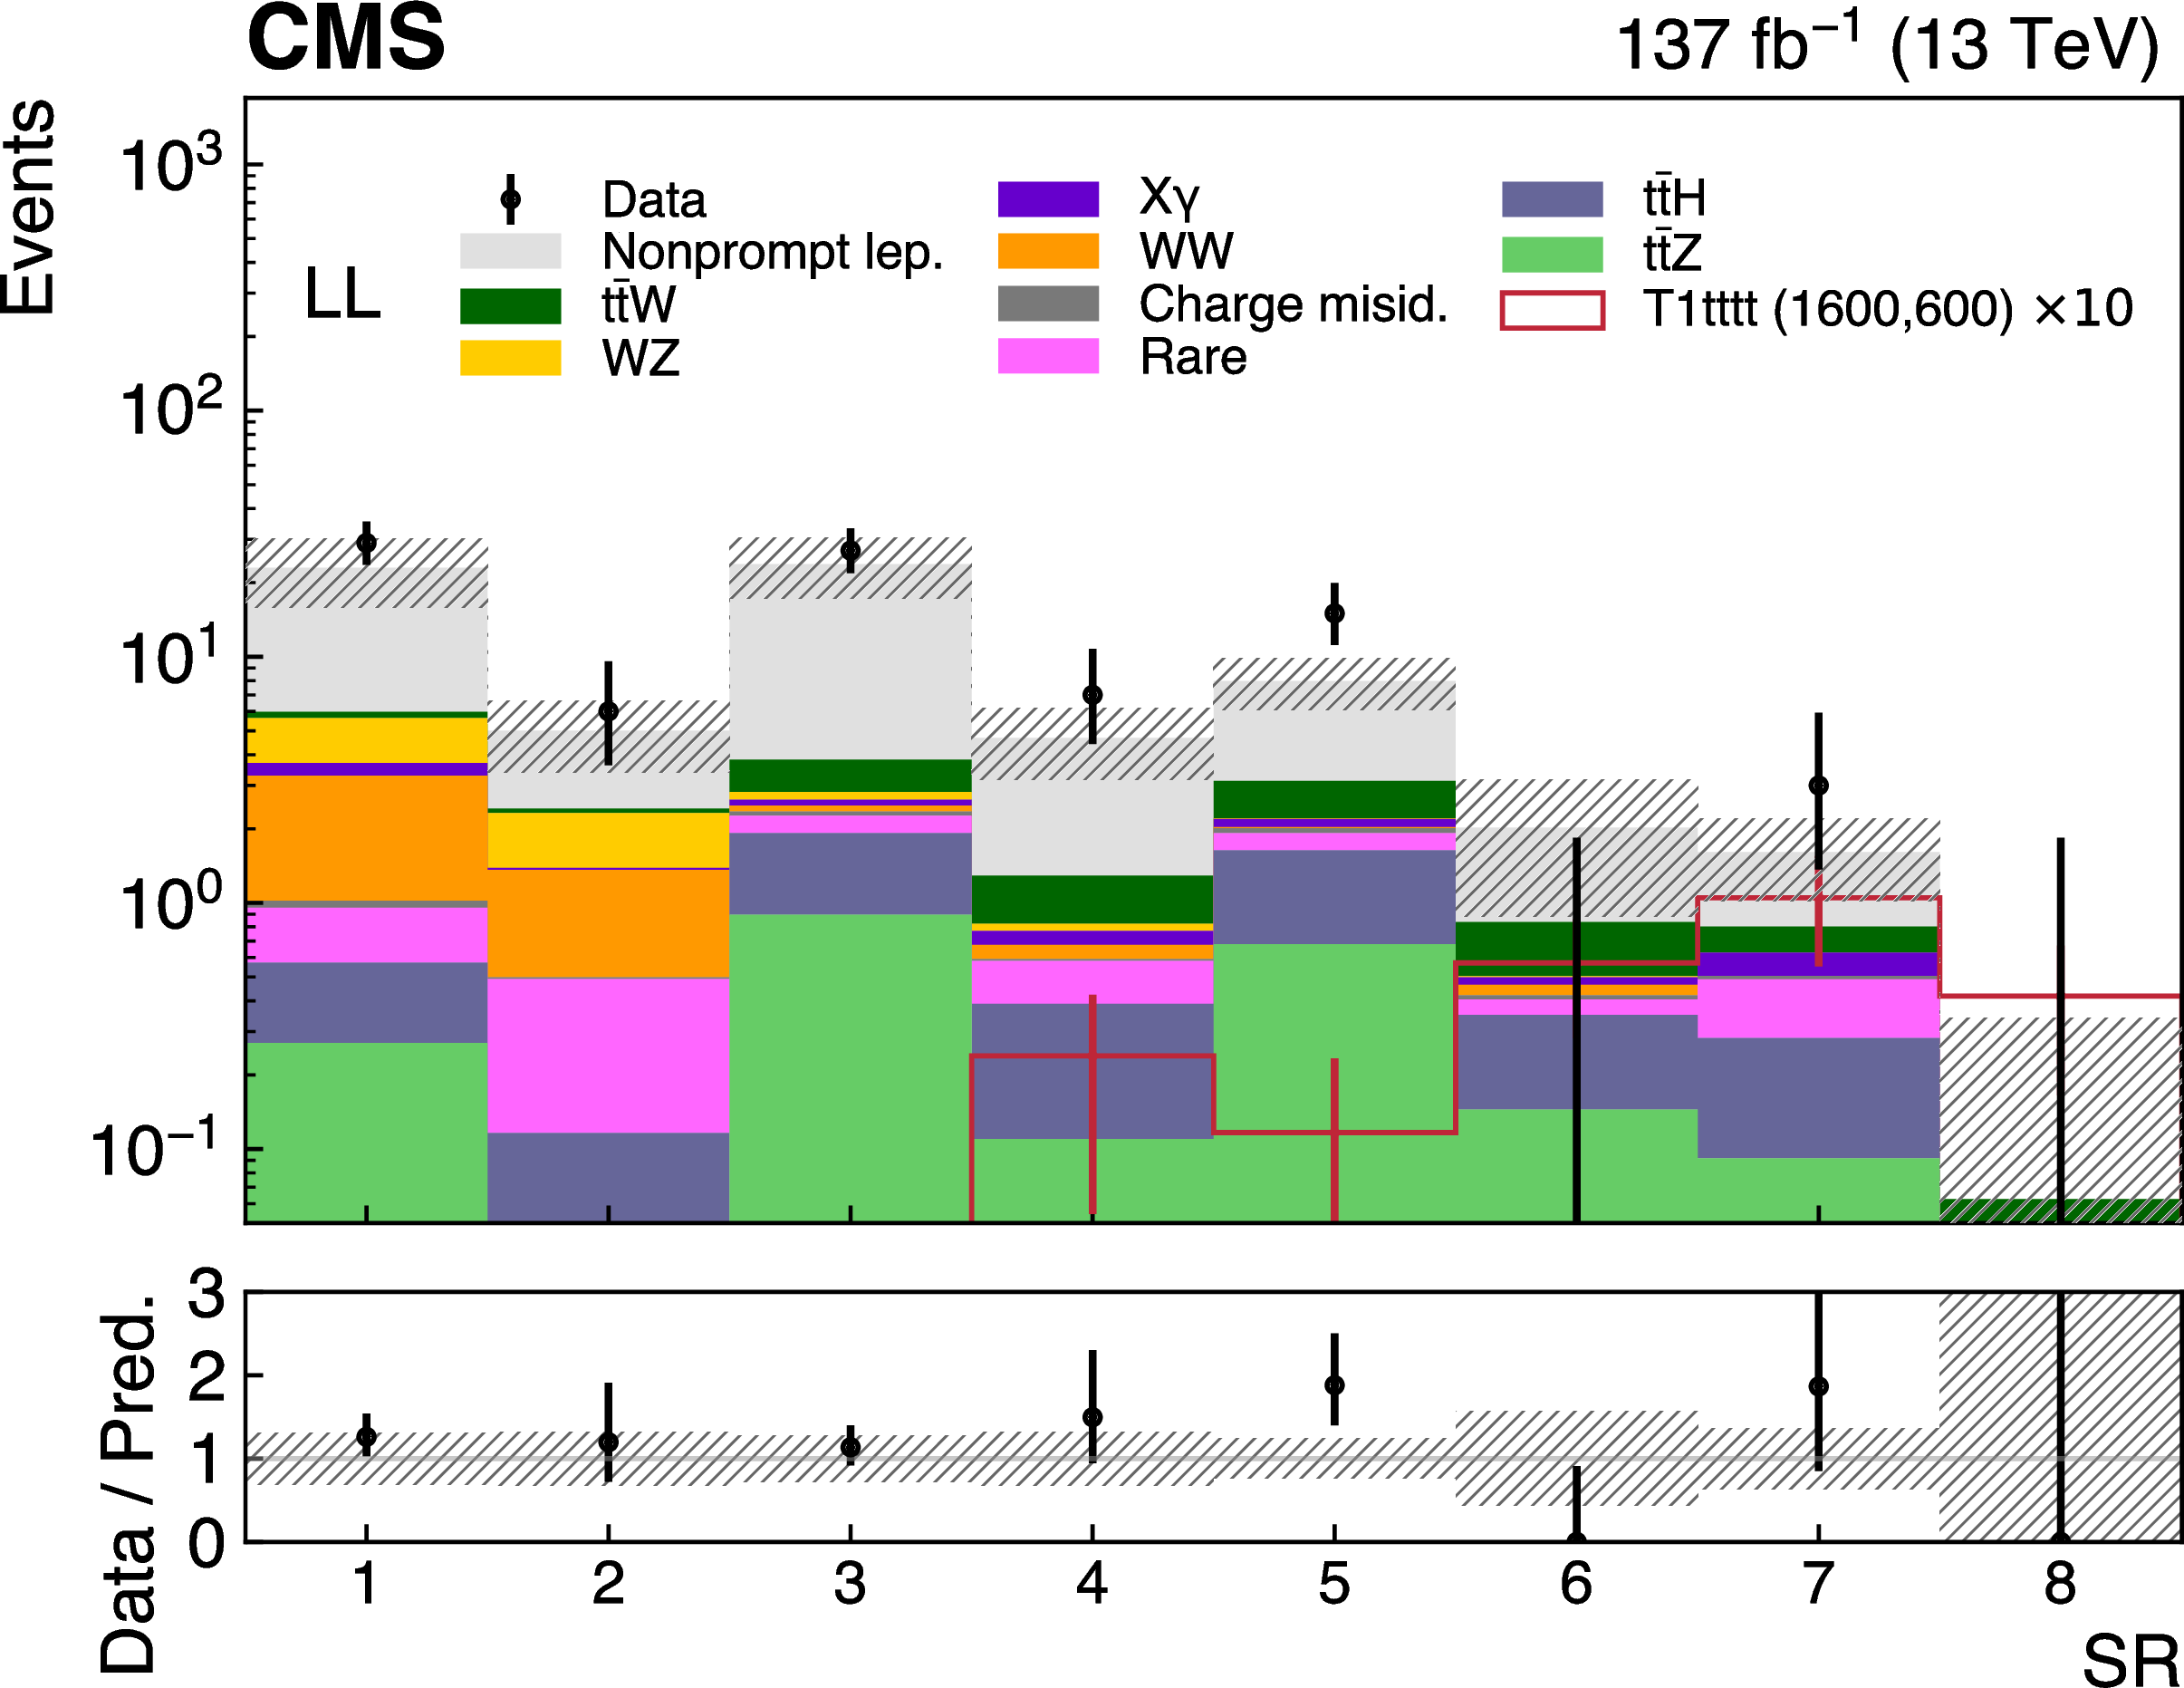
Figure 5:
Expected and observed SR yields for the HH, HL, LL signal categories. The hatched area represents the total statistical and systematic uncertainty in the background prediction. |

png pdf |
Figure 5-a:
Expected and observed SR yields for the HH signal category. The hatched area represents the total statistical and systematic uncertainty in the background prediction. |
png pdf |
Figure 5-b:
Expected and observed SR yields for the HL signal category. The hatched area represents the total statistical and systematic uncertainty in the background prediction. |
png pdf |
Figure 5-c:
Expected and observed SR yields for the LL signal category. The hatched area represents the total statistical and systematic uncertainty in the background prediction. |

png pdf |
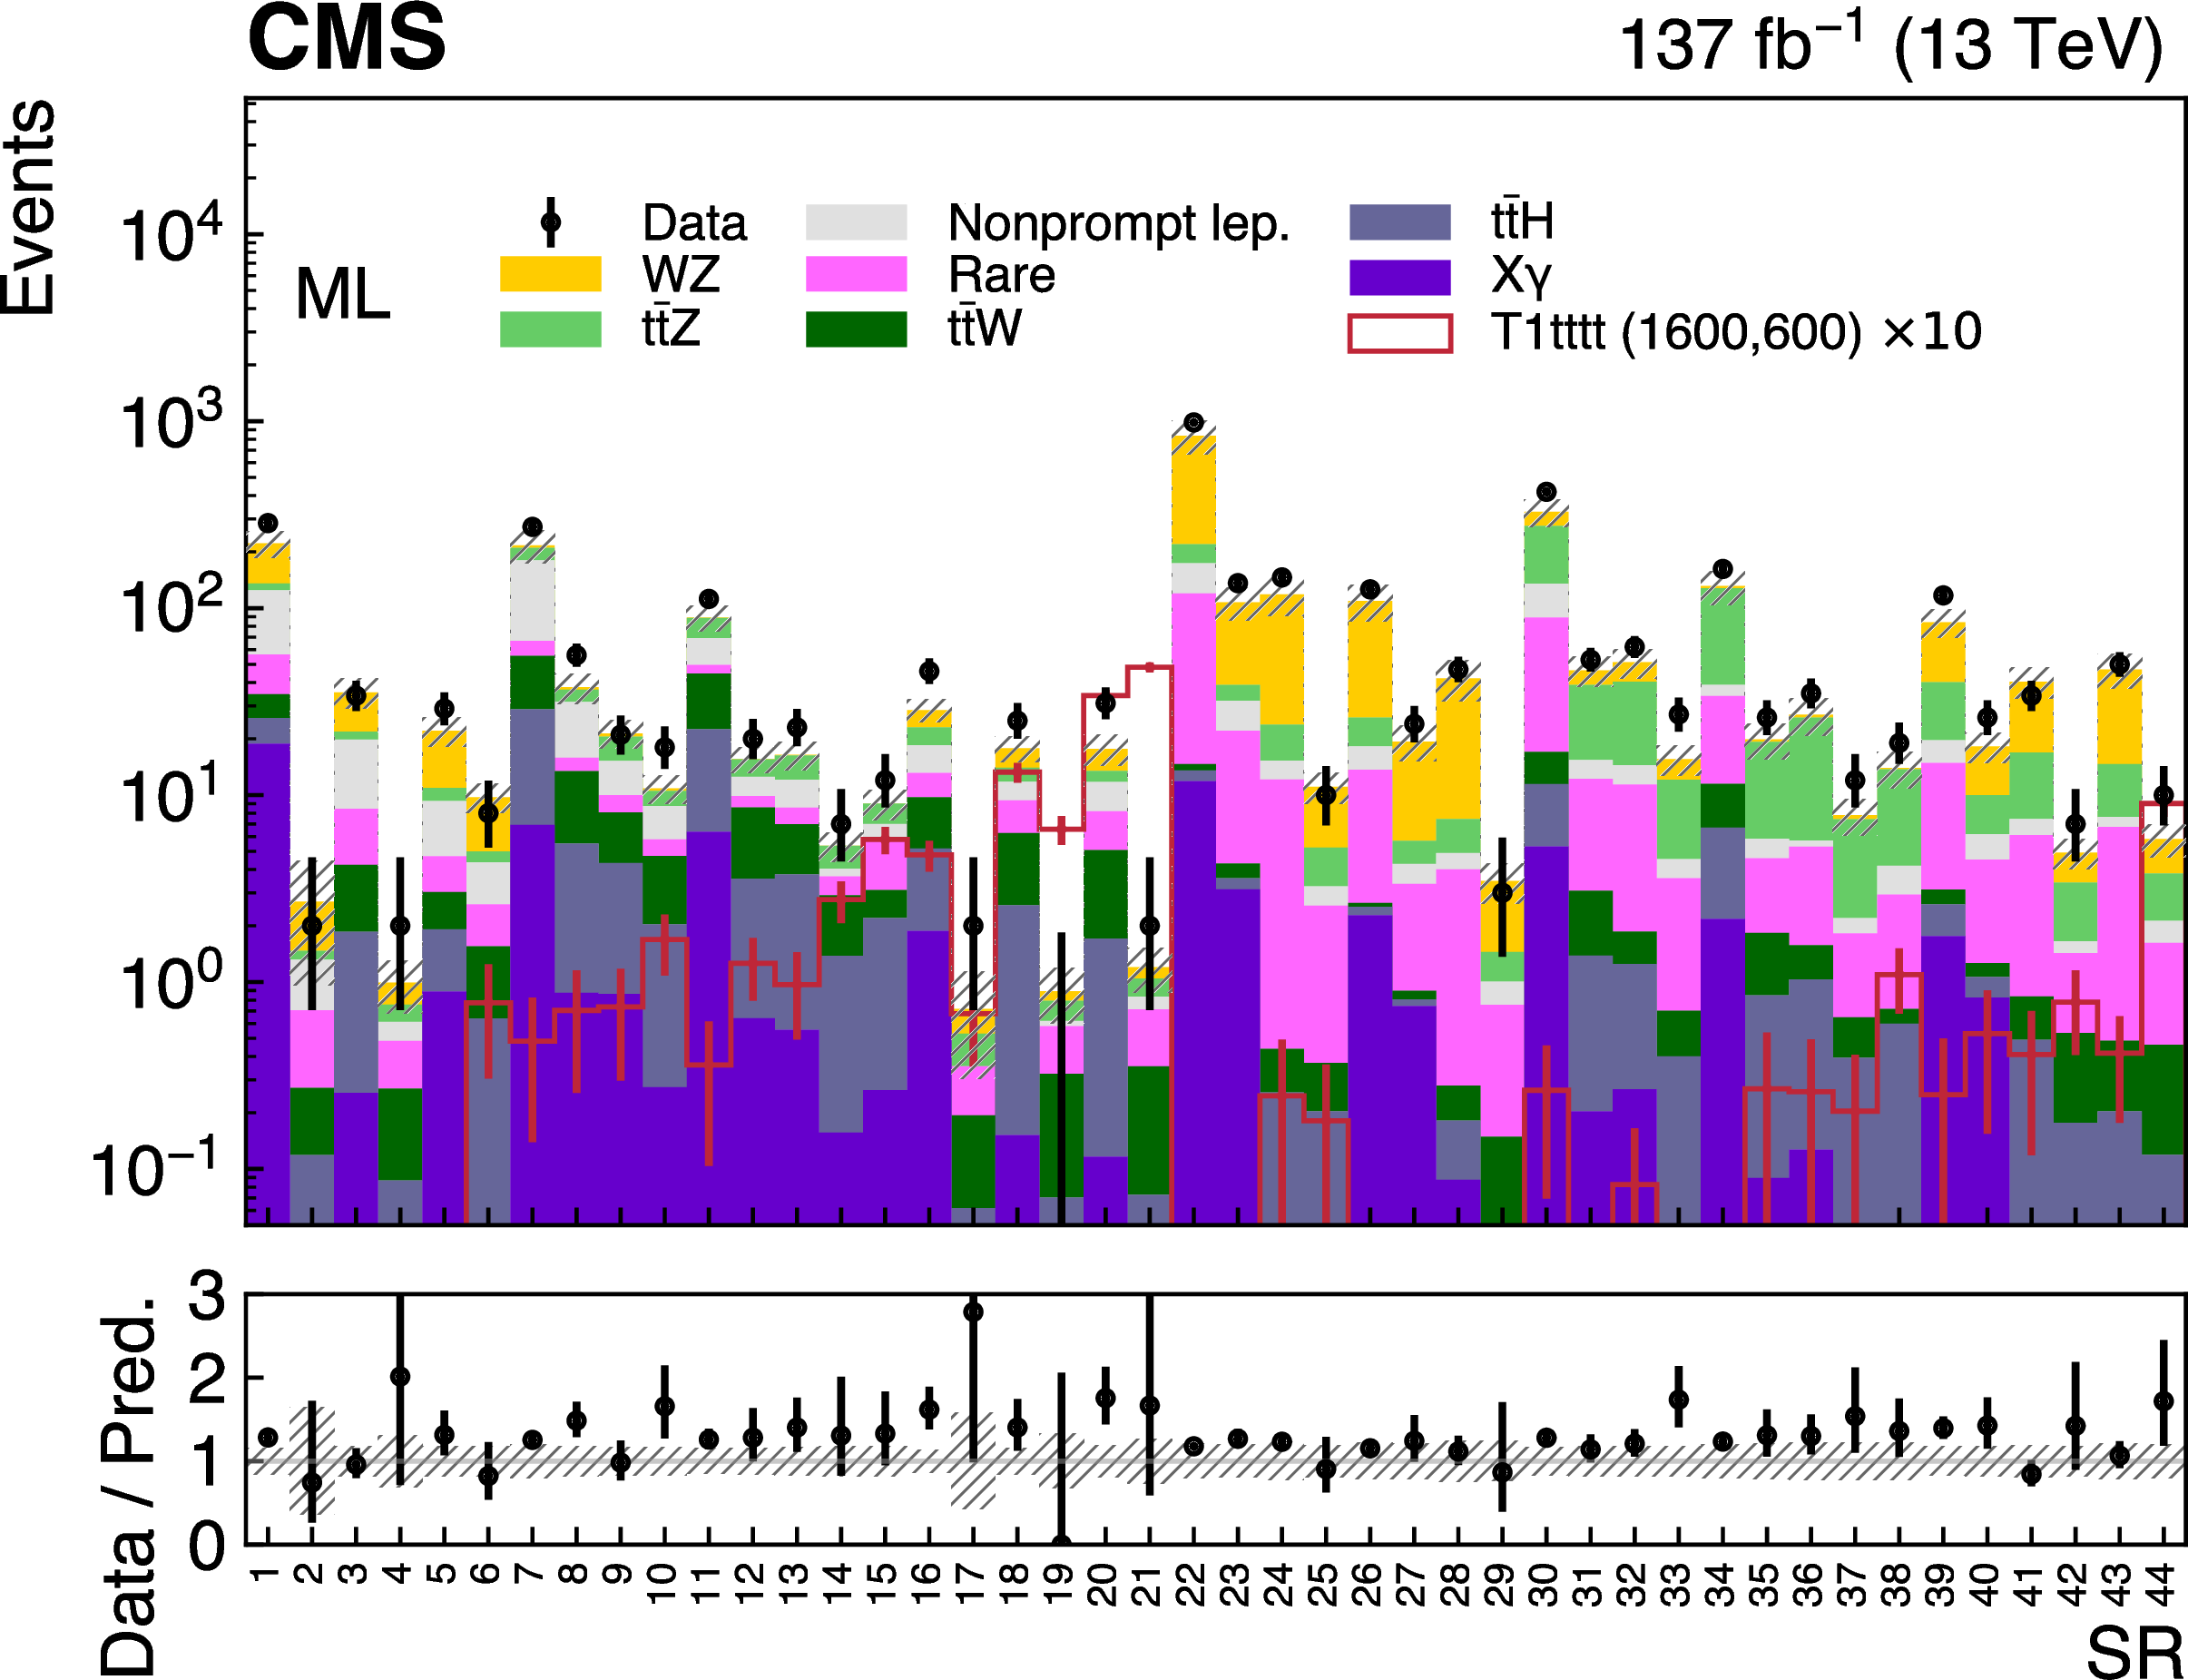
Figure 6:
Expected and observed SR yields for the LM and ML signal categories. The hatched area represents the total statistical and systematic uncertainty in the background prediction. |

png pdf |
Figure 6-a:
Expected and observed SR yields for the LM signal category. The hatched area represents the total statistical and systematic uncertainty in the background prediction. |
png pdf |
Figure 6-b:
Expected and observed SR yields for the ML signal category. The hatched area represents the total statistical and systematic uncertainty in the background prediction. |
png pdf |
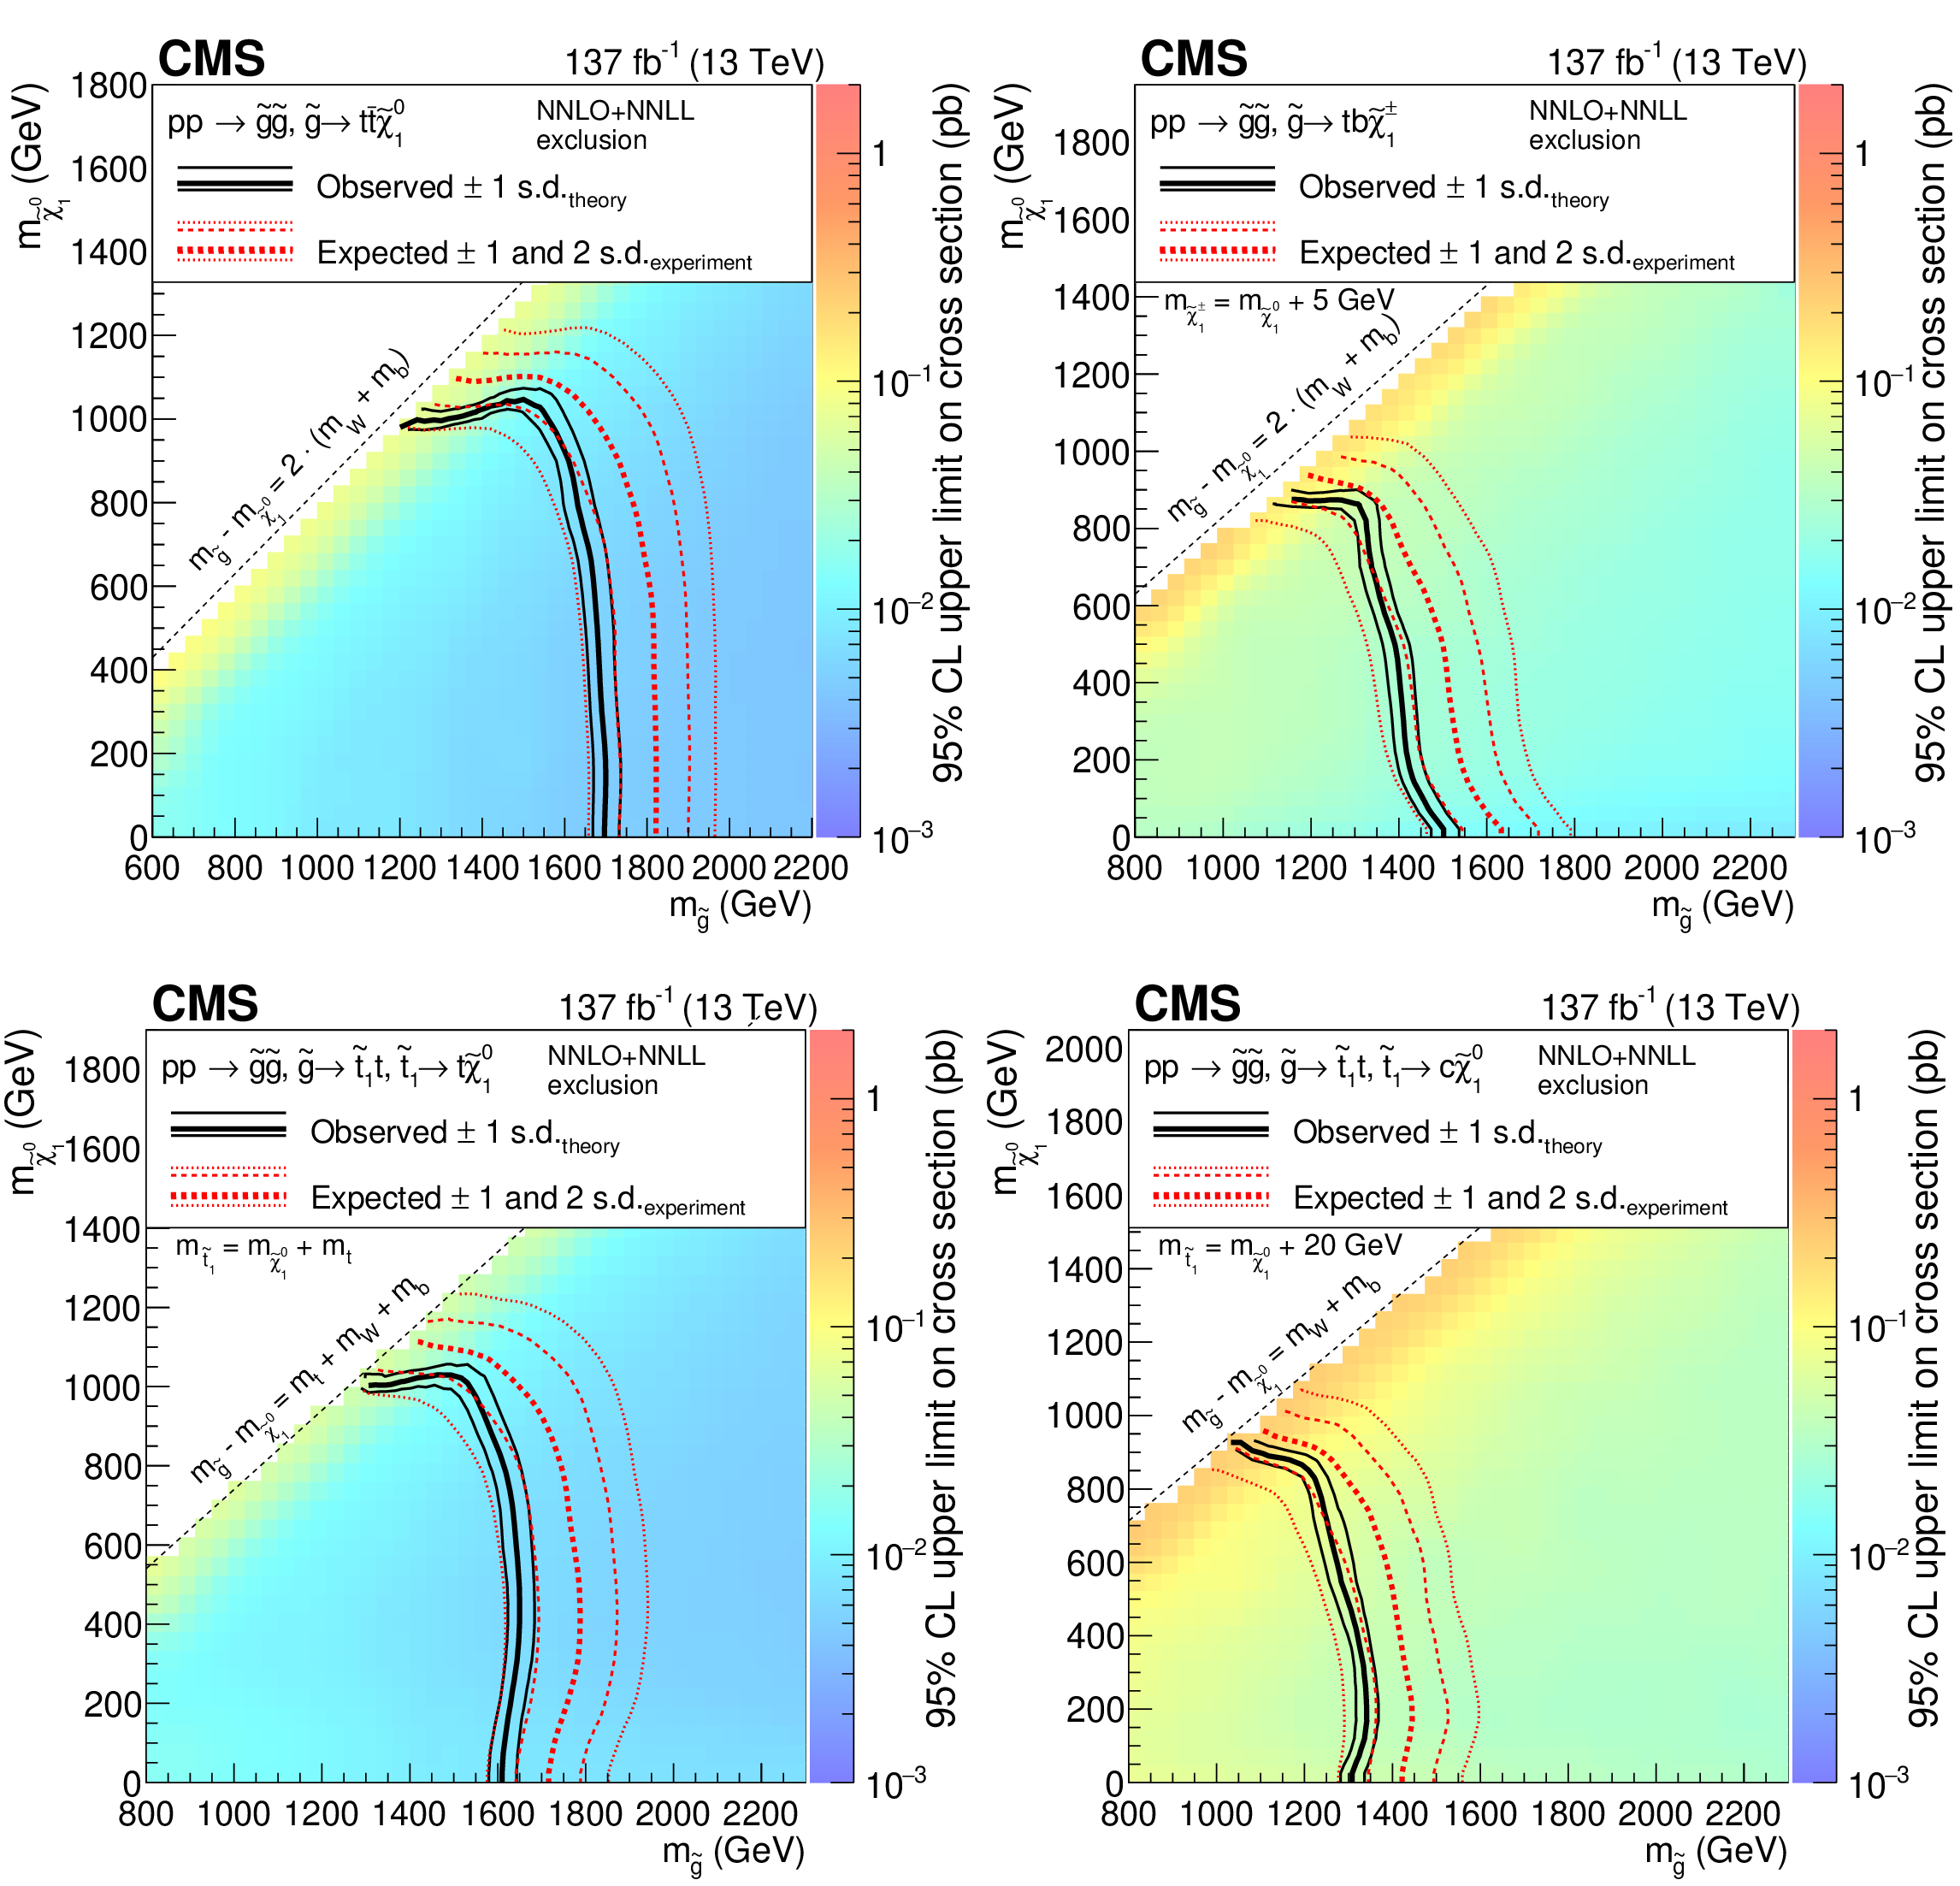
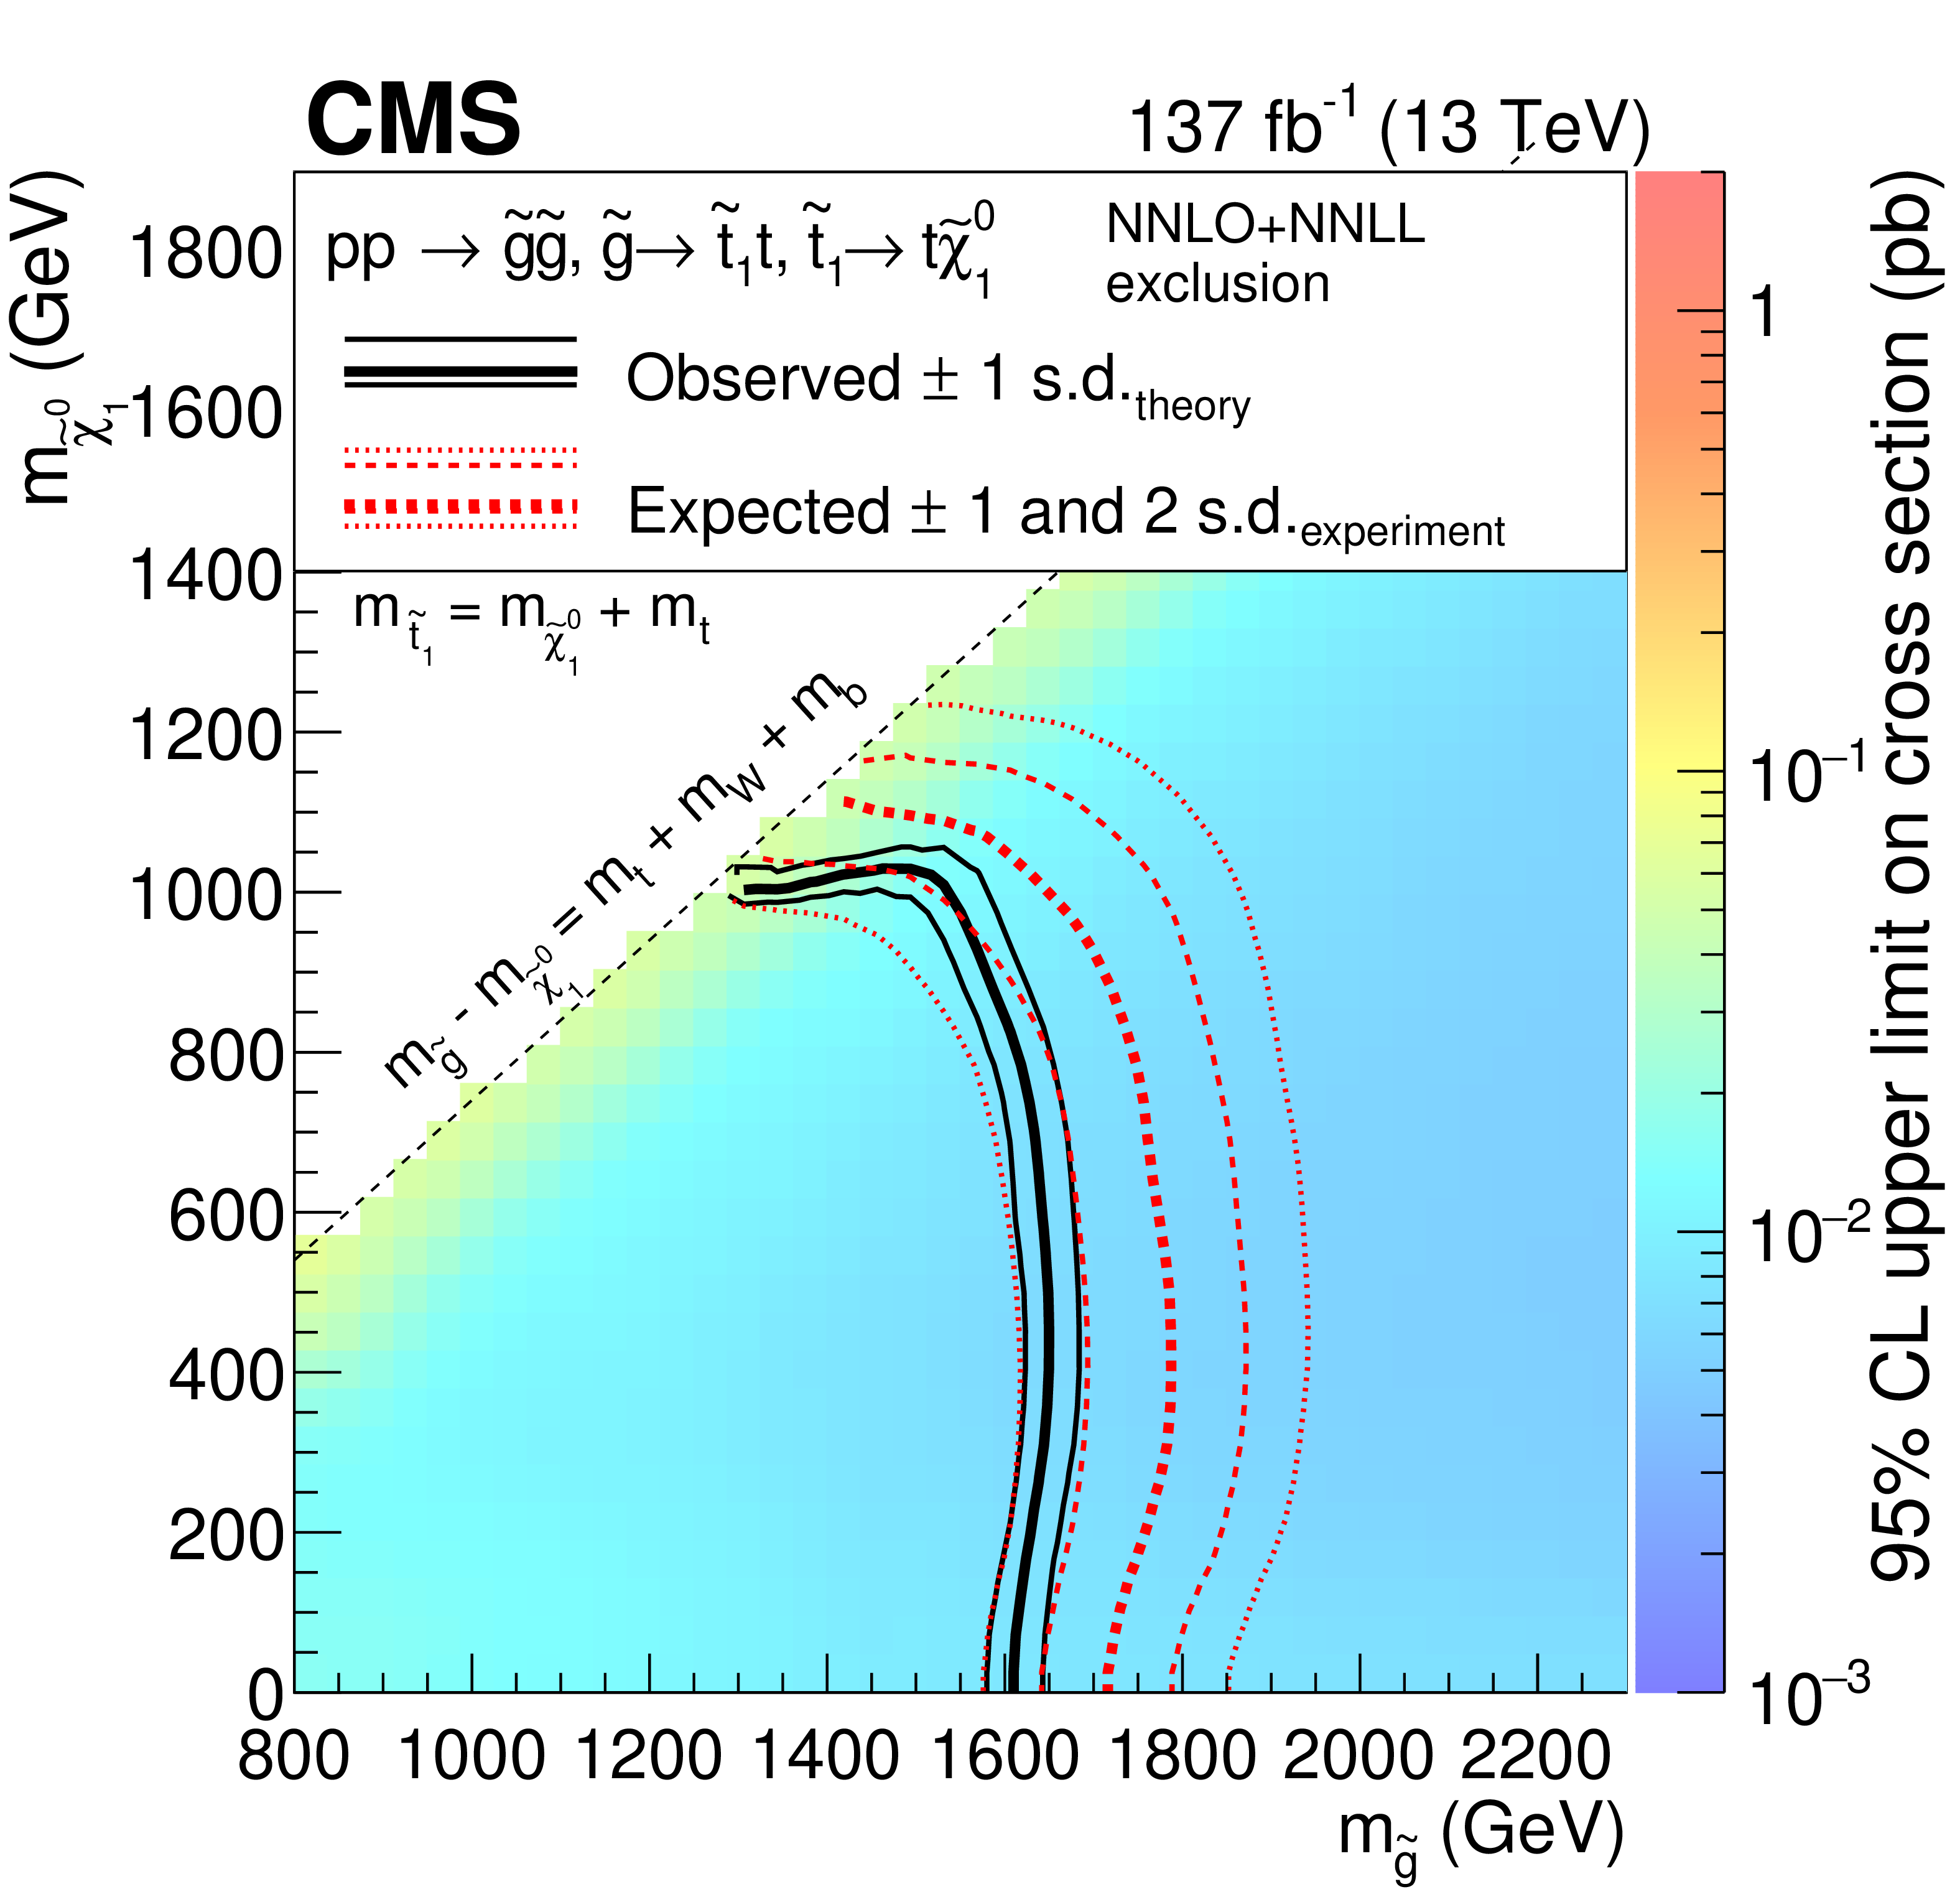
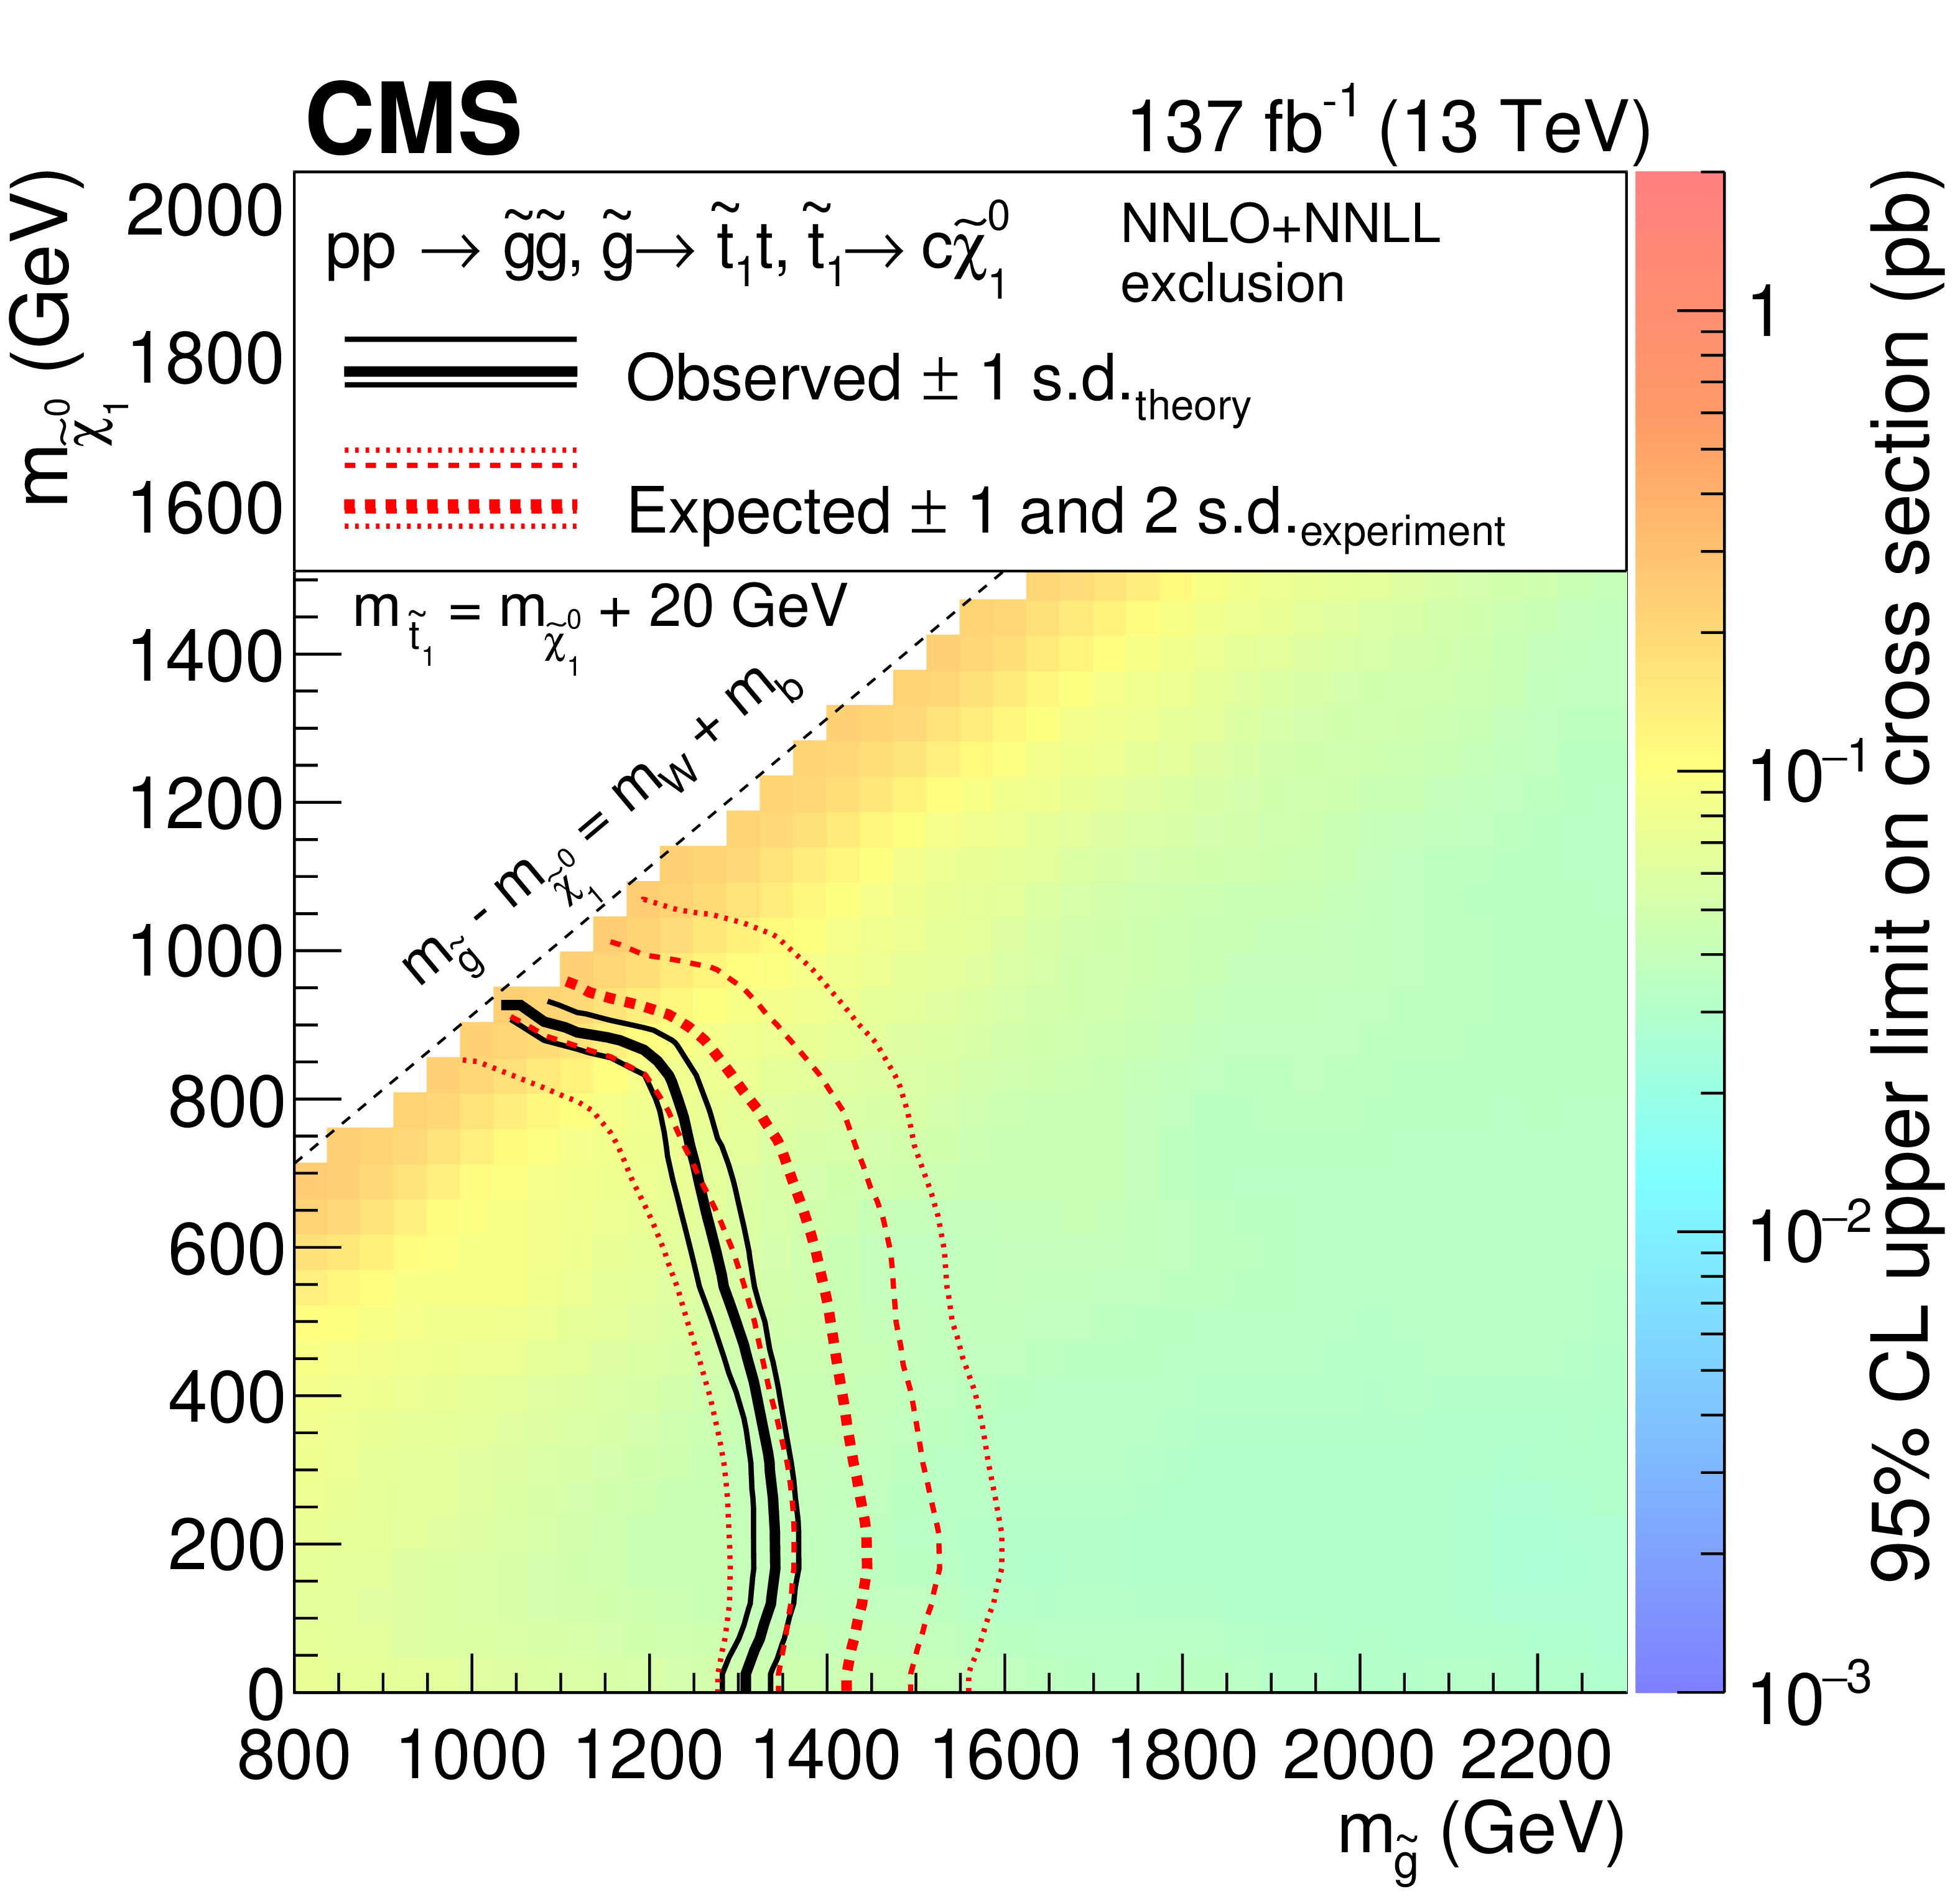
Figure 7:
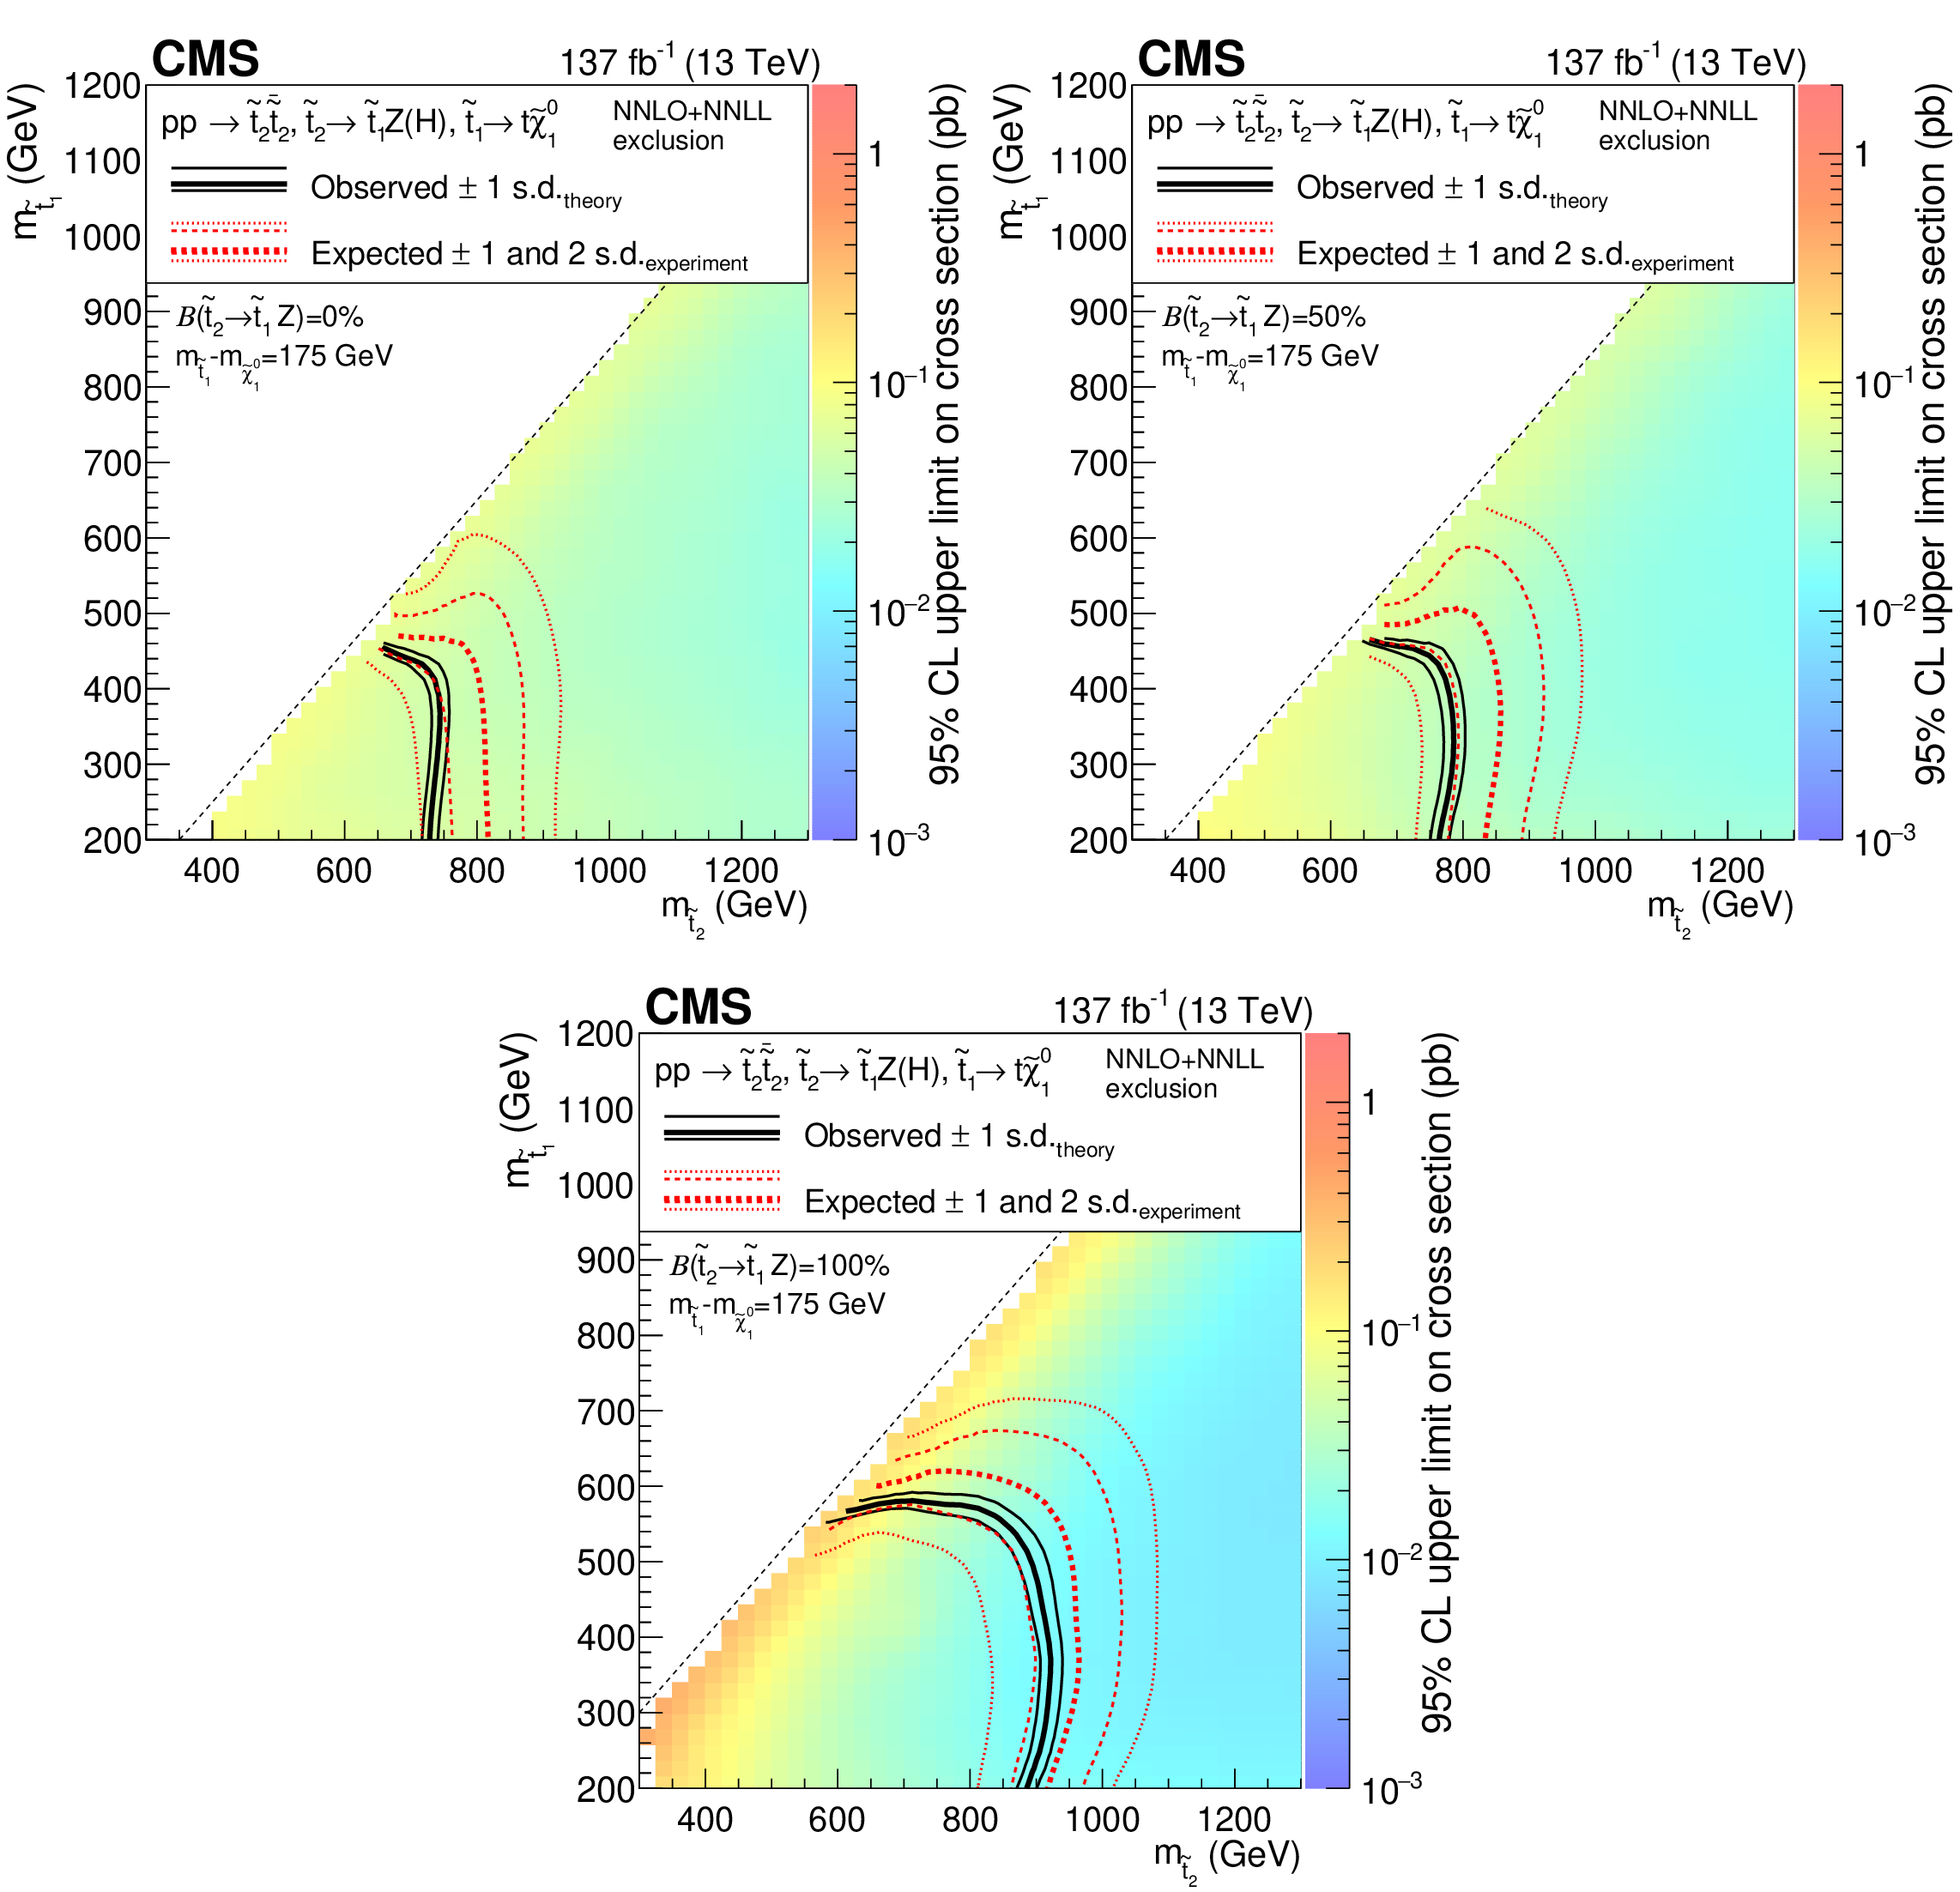
Exclusion regions at 95% CL in the $m_{\tilde{\chi}^0_1}$ versus $m_{{\mathrm{\widetilde{g}}}}$ plane for the T1tttt (upper left) and T5ttbbWW (upper right) models, with off-shell third-generation squarks, and the T5tttt (lower left) and T5ttcc (lower right) models, with on-shell third-generation squarks. For the T5ttbbWW model, $m_{\tilde{\chi}^{\pm}_1} = m_{\tilde{\chi}^0_1} + $ 5 GeV, for the T5tttt model, $m_{\tilde{\mathrm{t}}} - m_{\tilde{\chi}^0_1} = m_{\mathrm{t}}$, and for the T5ttcc model, $m_{\tilde{\mathrm{t}}} - m_{\tilde{\chi}^0_1} = $ 20 GeV and the decay proceeds through $\tilde{\mathrm{t}} \to \mathrm{c} \tilde{\chi}^0_1 $. The right-hand side color scale indicates the excluded cross section values for a given point in the SUSY particle mass plane. The solid black curves represent the observed exclusion limits assuming the approximate-NNLO+NNLL cross sections [45,46,47,48,49,50,57] (thick line), or their variations of $ \pm $1 standard deviations (s.d.) (thin lines). The dashed red curves show the expected limits with the corresponding $ \pm $1 s.d. and $ \pm $2 s.d. uncertainties. Excluded regions are to the left and below the limit curves. |
png pdf |
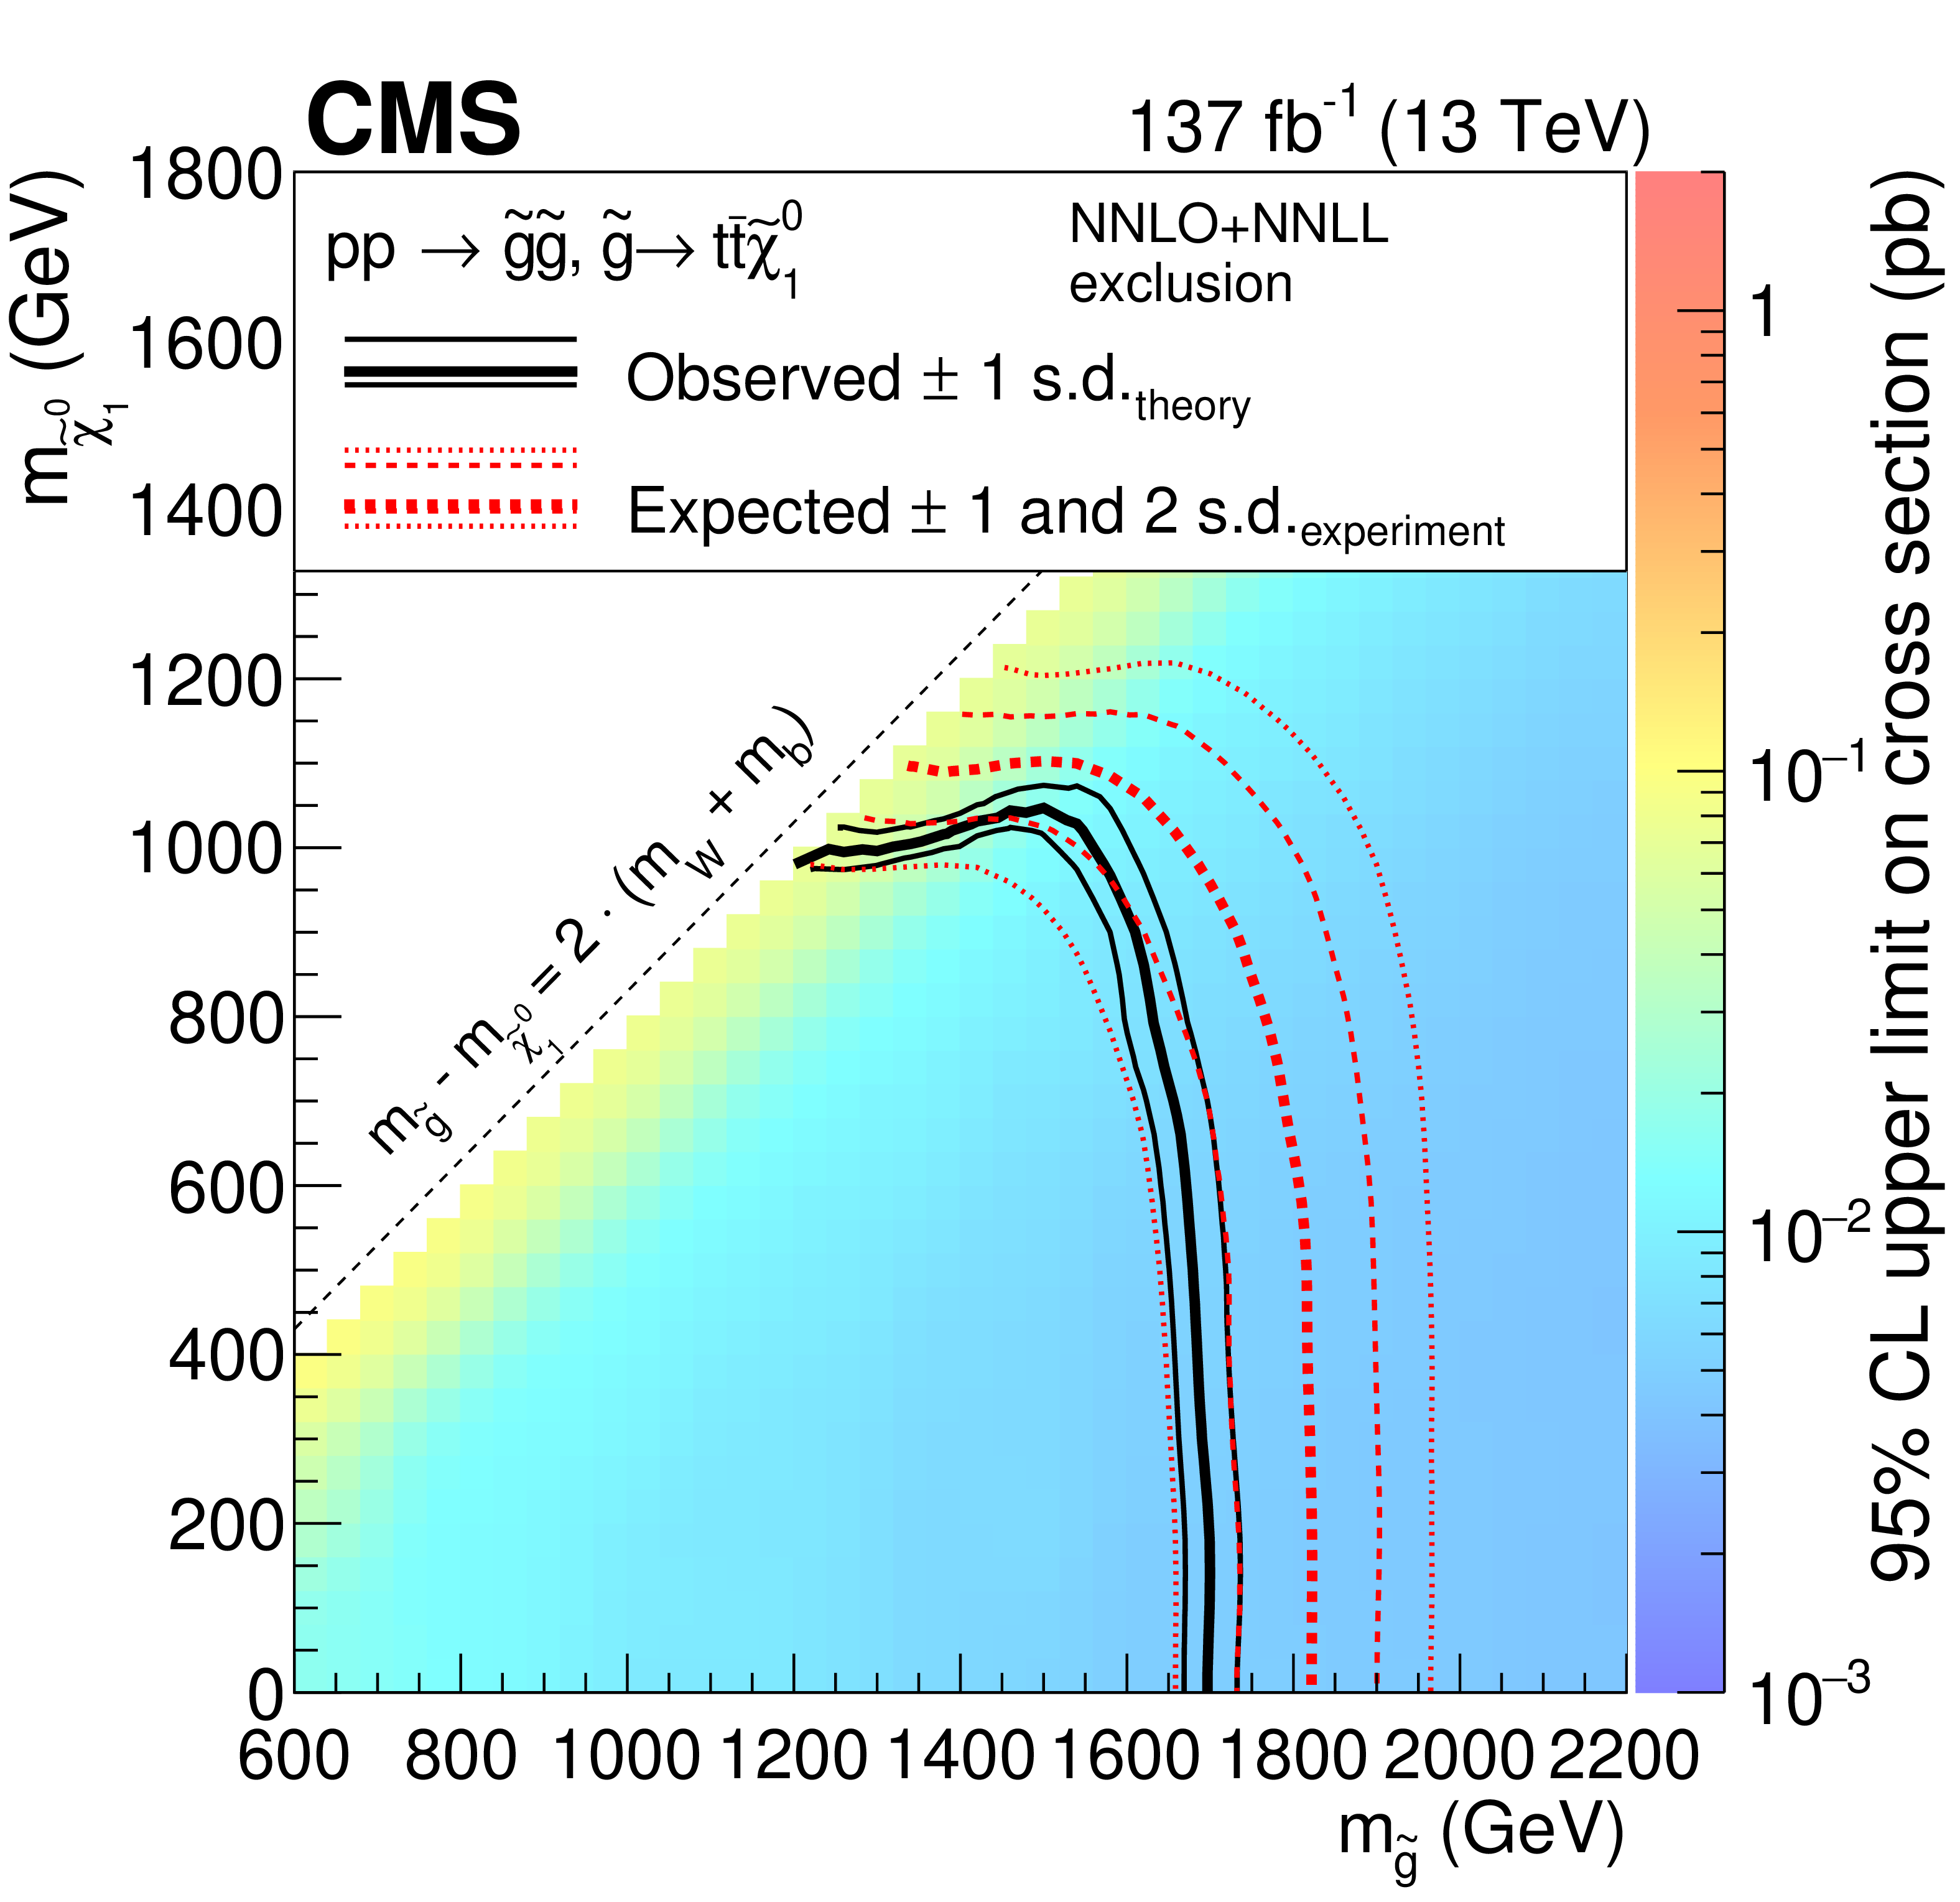
Figure 7-a:
Exclusion region at 95% CL in the $m_{\tilde{\chi}^0_1}$ versus $m_{{\mathrm{\widetilde{g}}}}$ plane for the T1tttt model, with off-shell third-generation squarks. The right-hand side color scale indicates the excluded cross section values for a given point in the SUSY particle mass plane. The solid black curves represent the observed exclusion limits assuming the approximate-NNLO+NNLL cross sections [45,46,47,48,49,50,57] (thick line), or their variations of $ \pm $1 standard deviations (s.d.) (thin lines). The dashed red curves show the expected limits with the corresponding $ \pm $1 s.d. and $ \pm $2 s.d. uncertainties. Excluded regions are to the left and below the limit curves. |

png pdf |
Figure 7-b:
Exclusion region at 95% CL in the $m_{\tilde{\chi}^0_1}$ versus $m_{{\mathrm{\widetilde{g}}}}$ plane for the T5ttbbWW model, with off-shell third-generation squarks. For this model, $m_{\tilde{\chi}^{\pm}_1} = m_{\tilde{\chi}^0_1} + $ 5 GeV. The right-hand side color scale indicates the excluded cross section values for a given point in the SUSY particle mass plane. The solid black curves represent the observed exclusion limits assuming the approximate-NNLO+NNLL cross sections [45,46,47,48,49,50,57] (thick line), or their variations of $ \pm $1 standard deviations (s.d.) (thin lines). The dashed red curves show the expected limits with the corresponding $ \pm $1 s.d. and $ \pm $2 s.d. uncertainties. Excluded regions are to the left and below the limit curves. |
png pdf |
Figure 7-c:
Exclusion region at 95% CL in the $m_{\tilde{\chi}^0_1}$ versus $m_{{\mathrm{\widetilde{g}}}}$ plane for the T5tttt model, with on-shell third-generation squarks. For this model, $m_{\tilde{\mathrm{t}}} - m_{\tilde{\chi}^0_1} = m_{\mathrm{t}}$. The right-hand side color scale indicates the excluded cross section values for a given point in the SUSY particle mass plane. The solid black curves represent the observed exclusion limits assuming the approximate-NNLO+NNLL cross sections [45,46,47,48,49,50,57] (thick line), or their variations of $ \pm $1 standard deviations (s.d.) (thin lines). The dashed red curves show the expected limits with the corresponding $ \pm $1 s.d. and $ \pm $2 s.d. uncertainties. Excluded regions are to the left and below the limit curves. |
png pdf |
Figure 7-d:
Exclusion region at 95% CL in the $m_{\tilde{\chi}^0_1}$ versus $m_{{\mathrm{\widetilde{g}}}}$ plane for the T5ttcc model, with on-shell third-generation squarks. For this model, $m_{\tilde{\mathrm{t}}} - m_{\tilde{\chi}^0_1} = $ 20 GeV and the decay proceeds through $\tilde{\mathrm{t}} \to \mathrm{c} \tilde{\chi}^0_1 $. The right-hand side color scale indicates the excluded cross section values for a given point in the SUSY particle mass plane. The solid black curves represent the observed exclusion limits assuming the approximate-NNLO+NNLL cross sections [45,46,47,48,49,50,57] (thick line), or their variations of $ \pm $1 standard deviations (s.d.) (thin lines). The dashed red curves show the expected limits with the corresponding $ \pm $1 s.d. and $ \pm $2 s.d. uncertainties. Excluded regions are to the left and below the limit curves. |
png pdf |
Figure 8:
Exclusion regions at 95% CL in the plane of $m_{\tilde{\chi}^0_1}$ versus $m_{{\mathrm{\widetilde{g}}}}$ for the T5qqqqWZ model with $m_{\tilde{\chi}^{\pm}_1}=0.5(m_{{\mathrm{\widetilde{g}}}} + m_{\tilde{\chi}^0_1})$ (left) and with $m_{\tilde{\chi}^{\pm}_1} = m_{\tilde{\chi}^0_1} +$ 20 GeV (right). The notations are as in Fig. 7. |
png pdf |
Figure 8-a:
Exclusion region at 95% CL in the plane of $m_{\tilde{\chi}^0_1}$ versus $m_{{\mathrm{\widetilde{g}}}}$ for the T5qqqqWZ model with $m_{\tilde{\chi}^{\pm}_1}=0.5(m_{{\mathrm{\widetilde{g}}}} + m_{\tilde{\chi}^0_1})$. The notations are as in Fig. 7. |
png pdf |
Figure 8-b:
Exclusion region at 95% CL in the plane of $m_{\tilde{\chi}^0_1}$ versus $m_{{\mathrm{\widetilde{g}}}}$ for the T5qqqqWZ model with $m_{\tilde{\chi}^{\pm}_1} = m_{\tilde{\chi}^0_1} +$ 20 GeV. The notations are as in Fig. 7. |
png pdf |
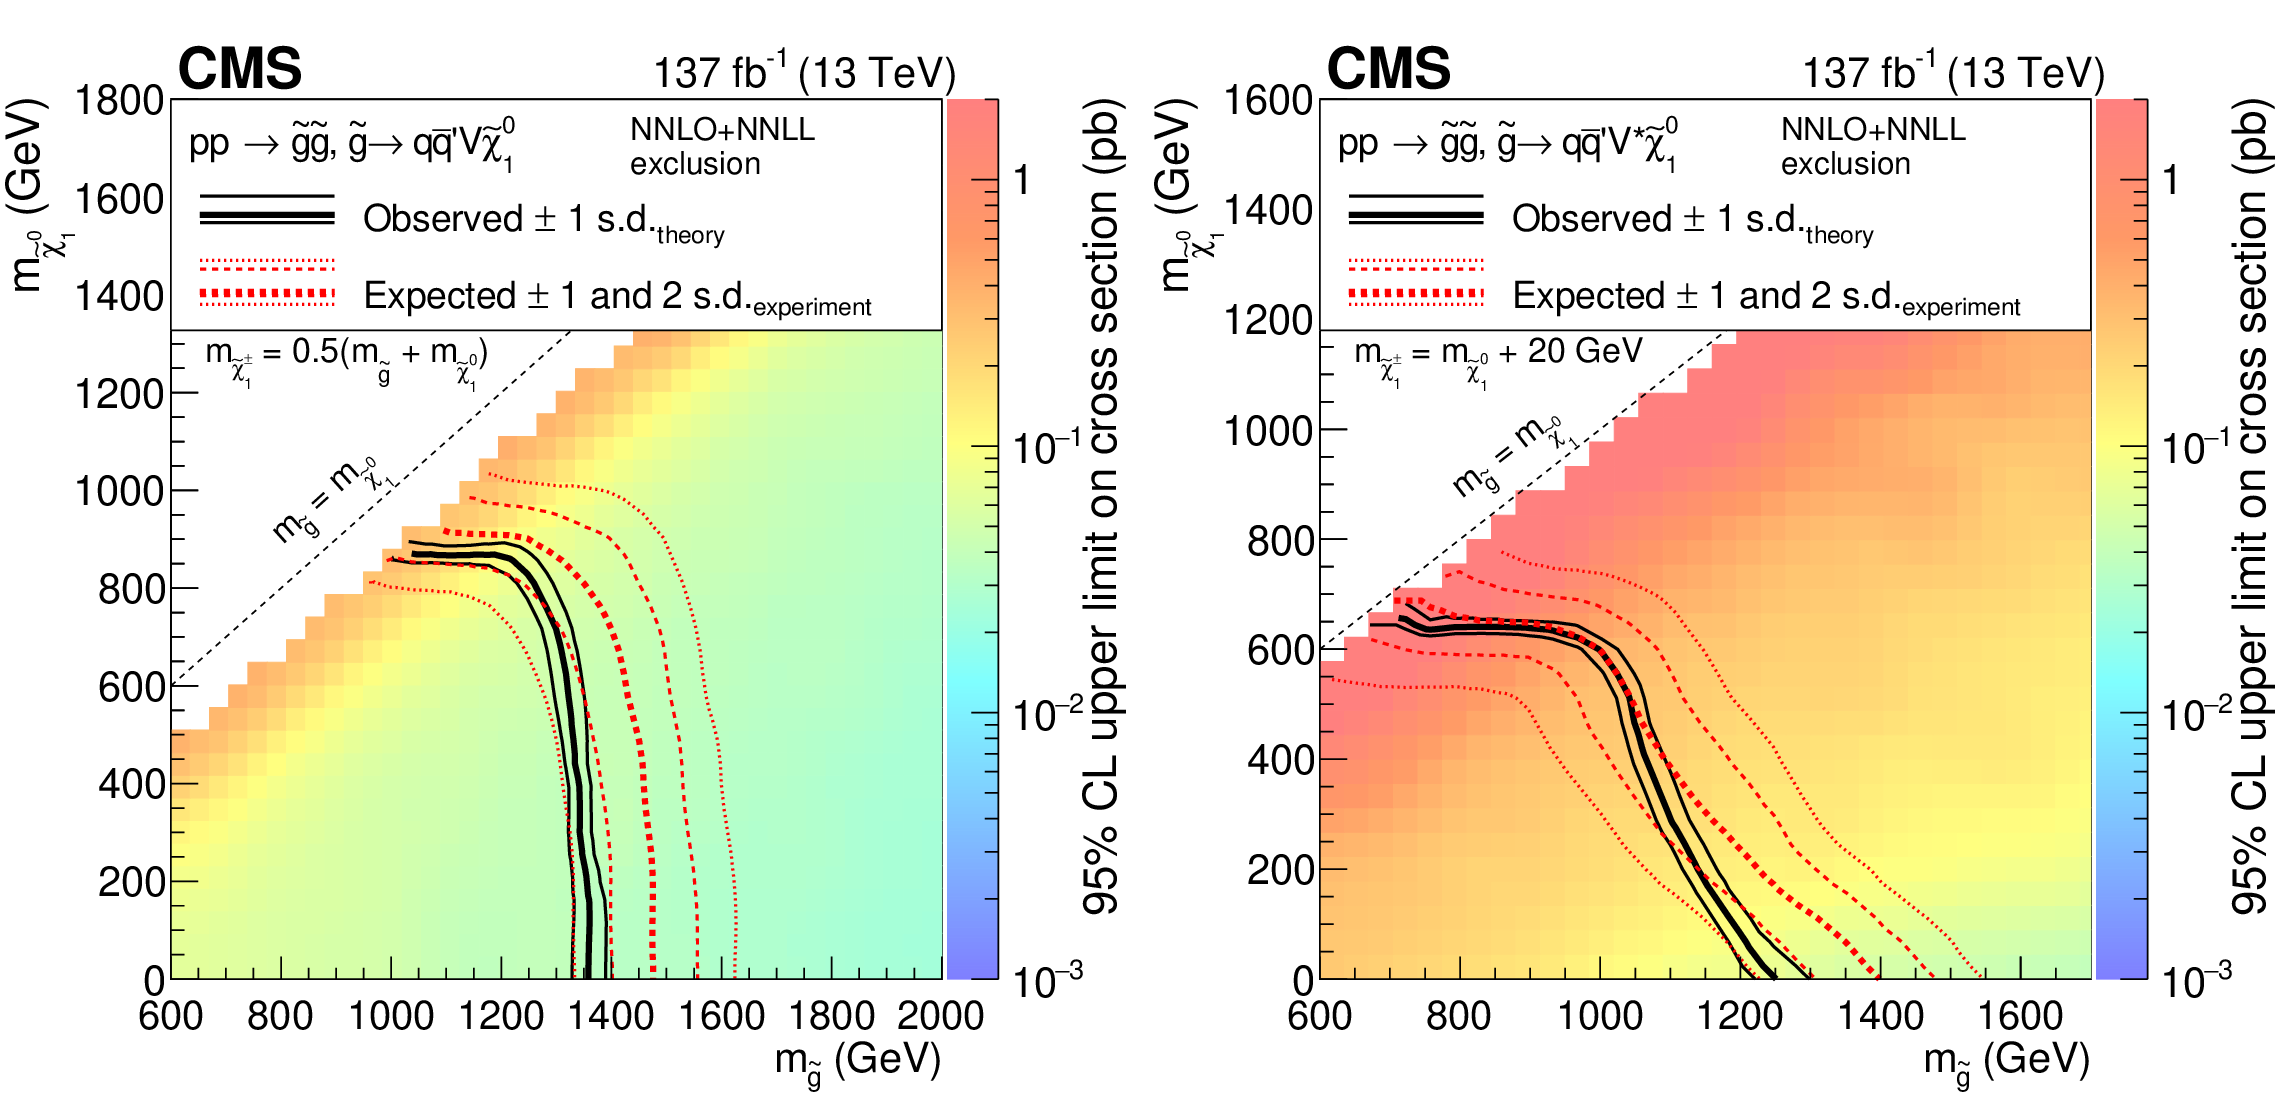
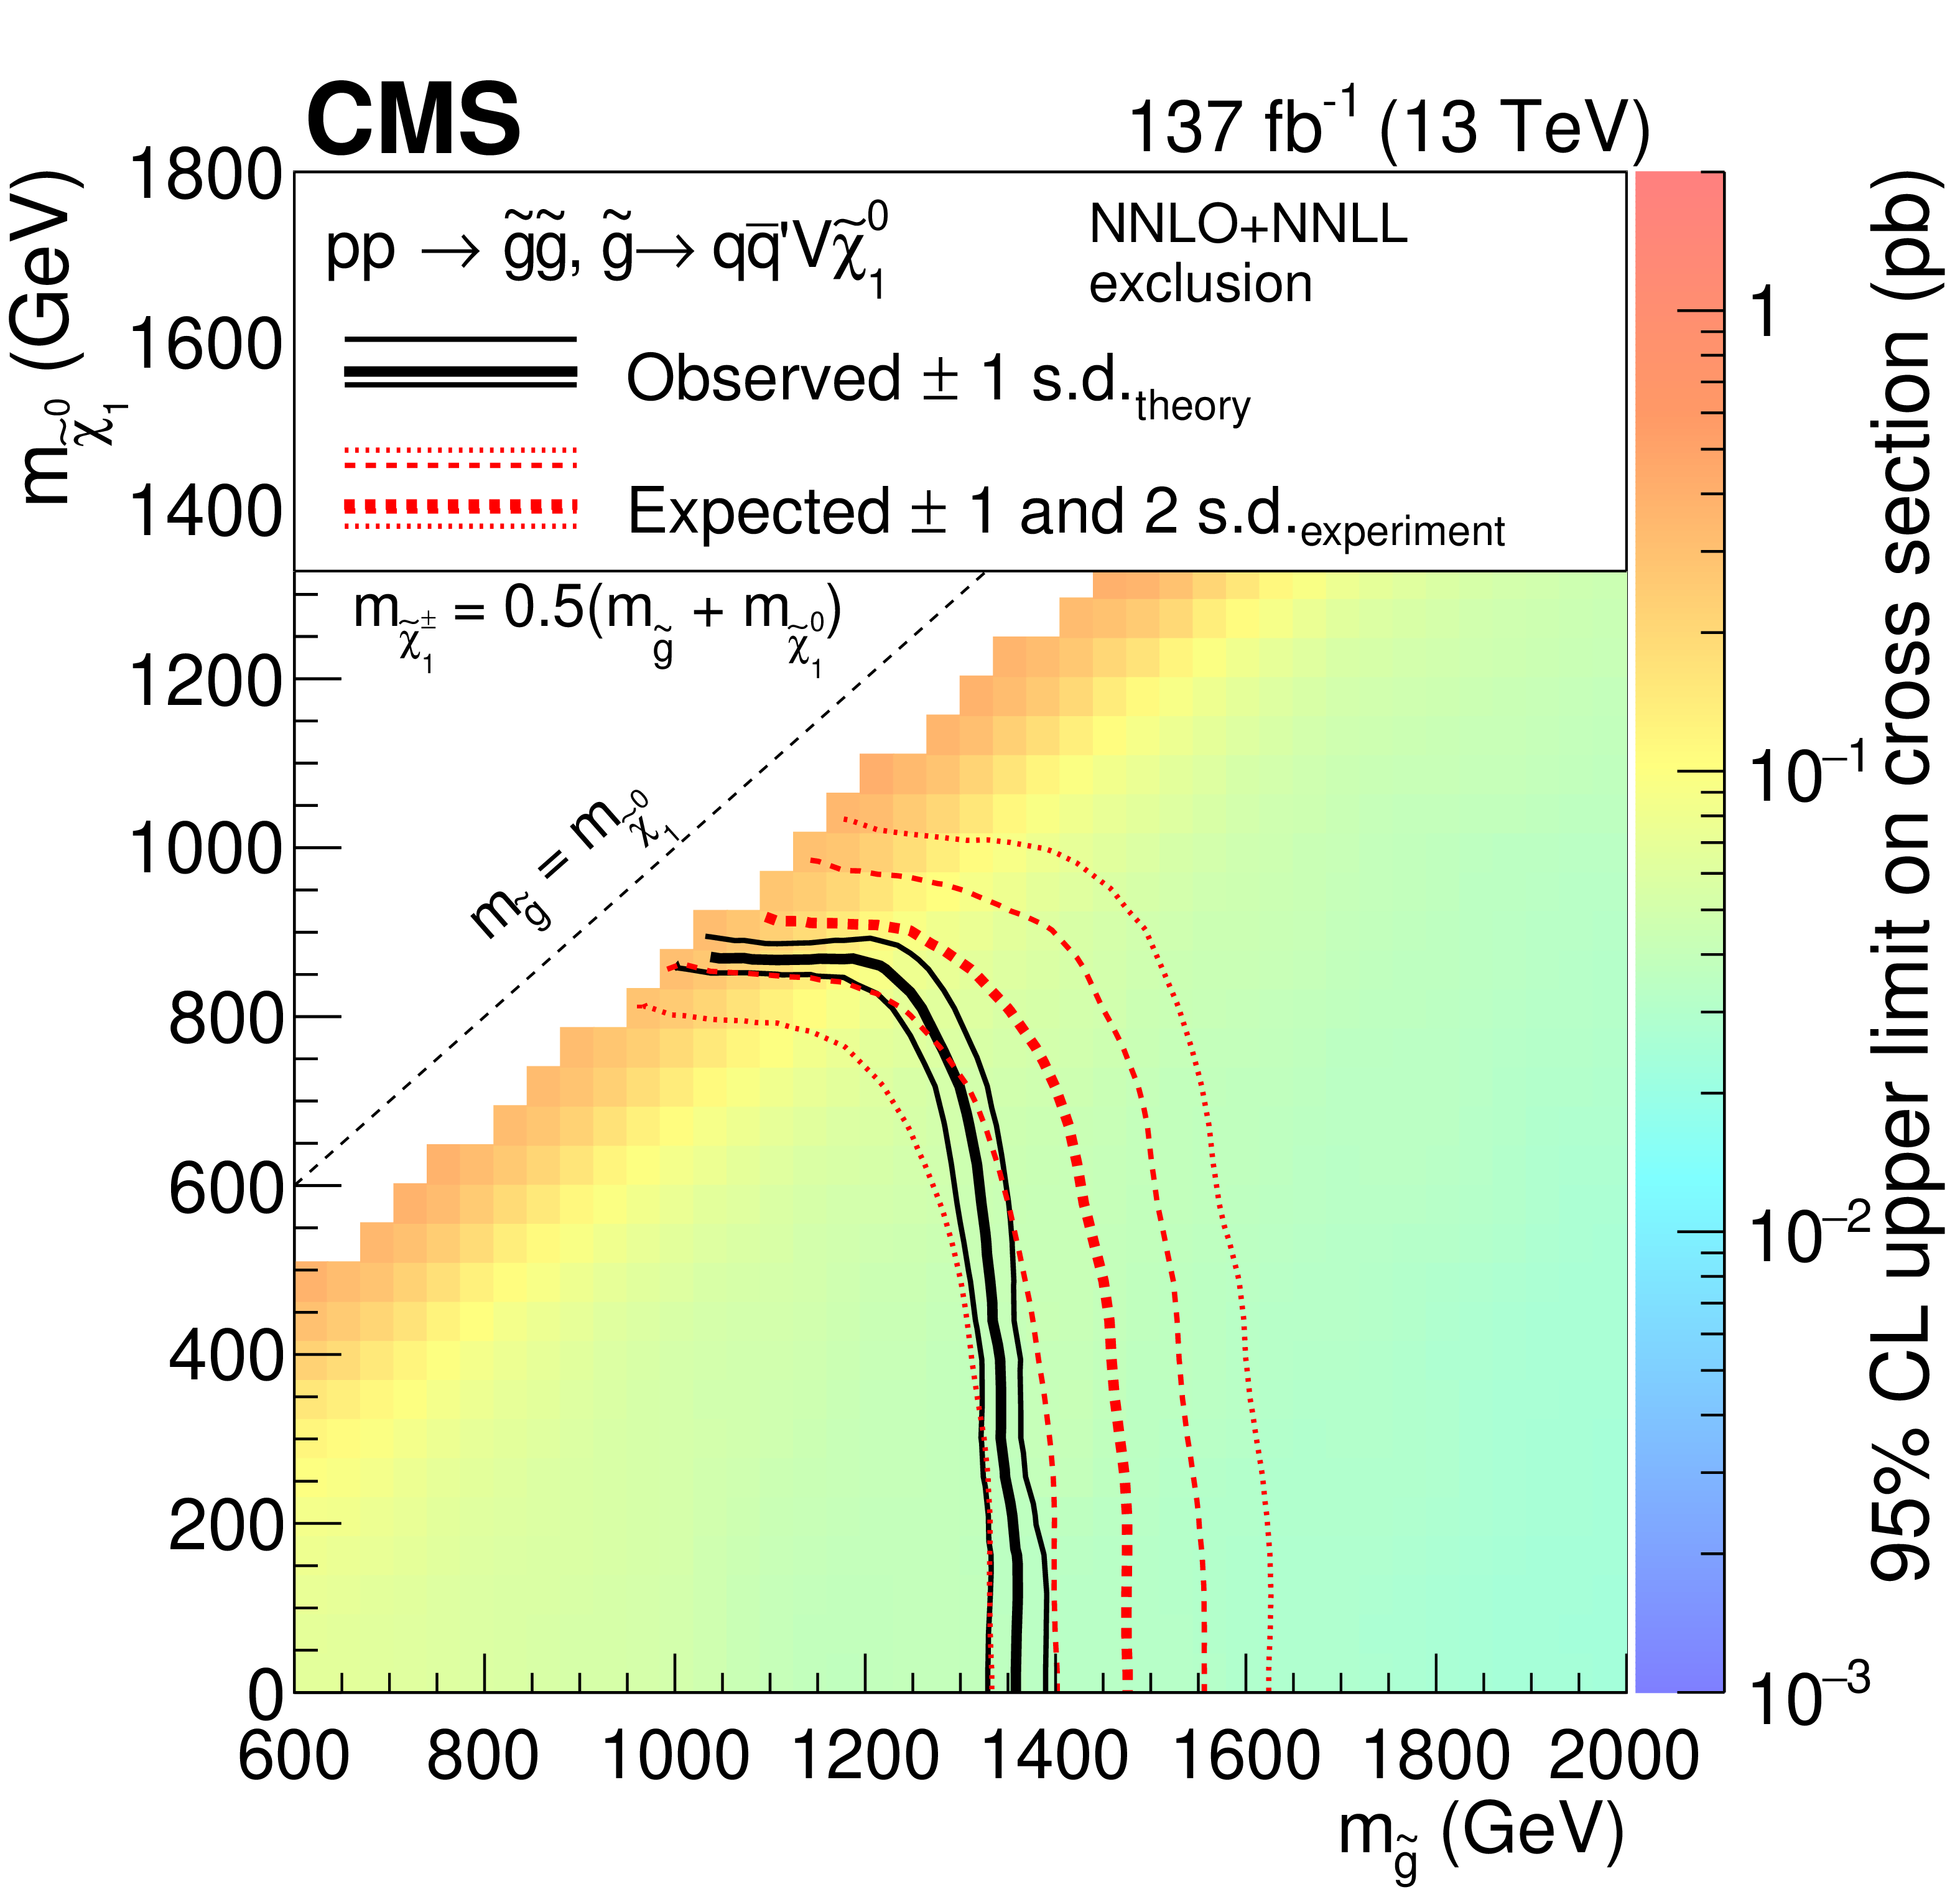
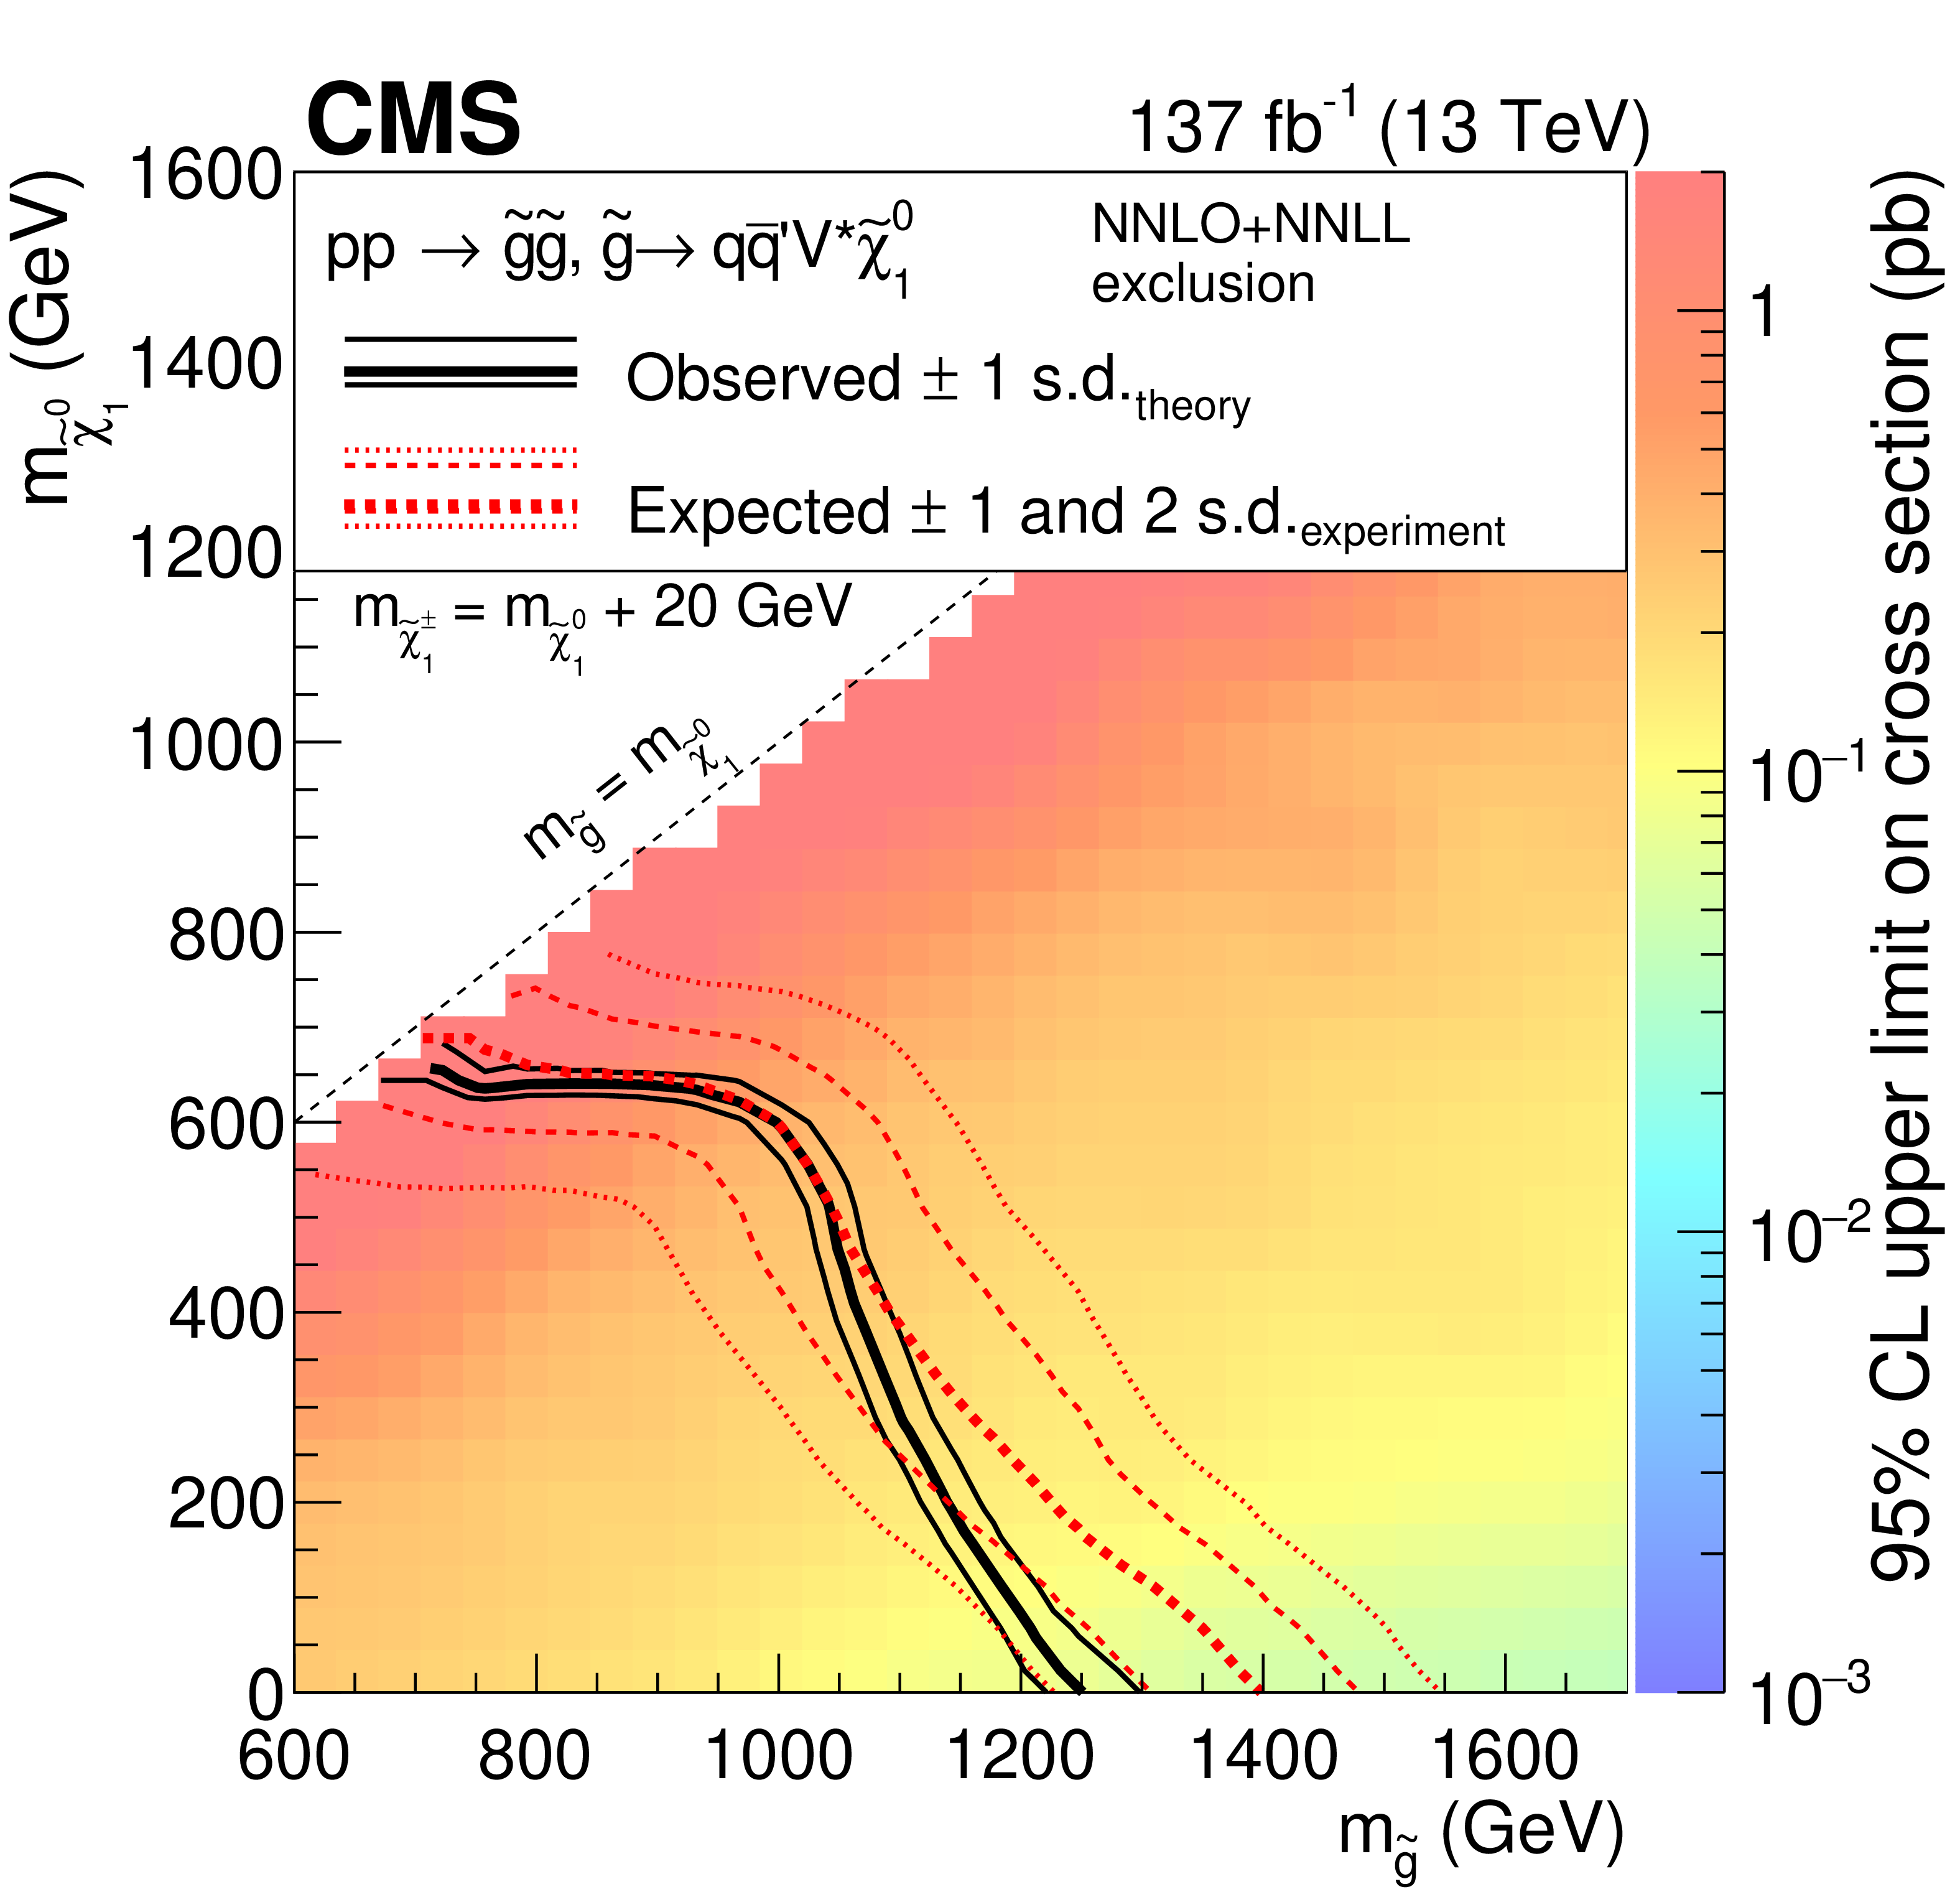
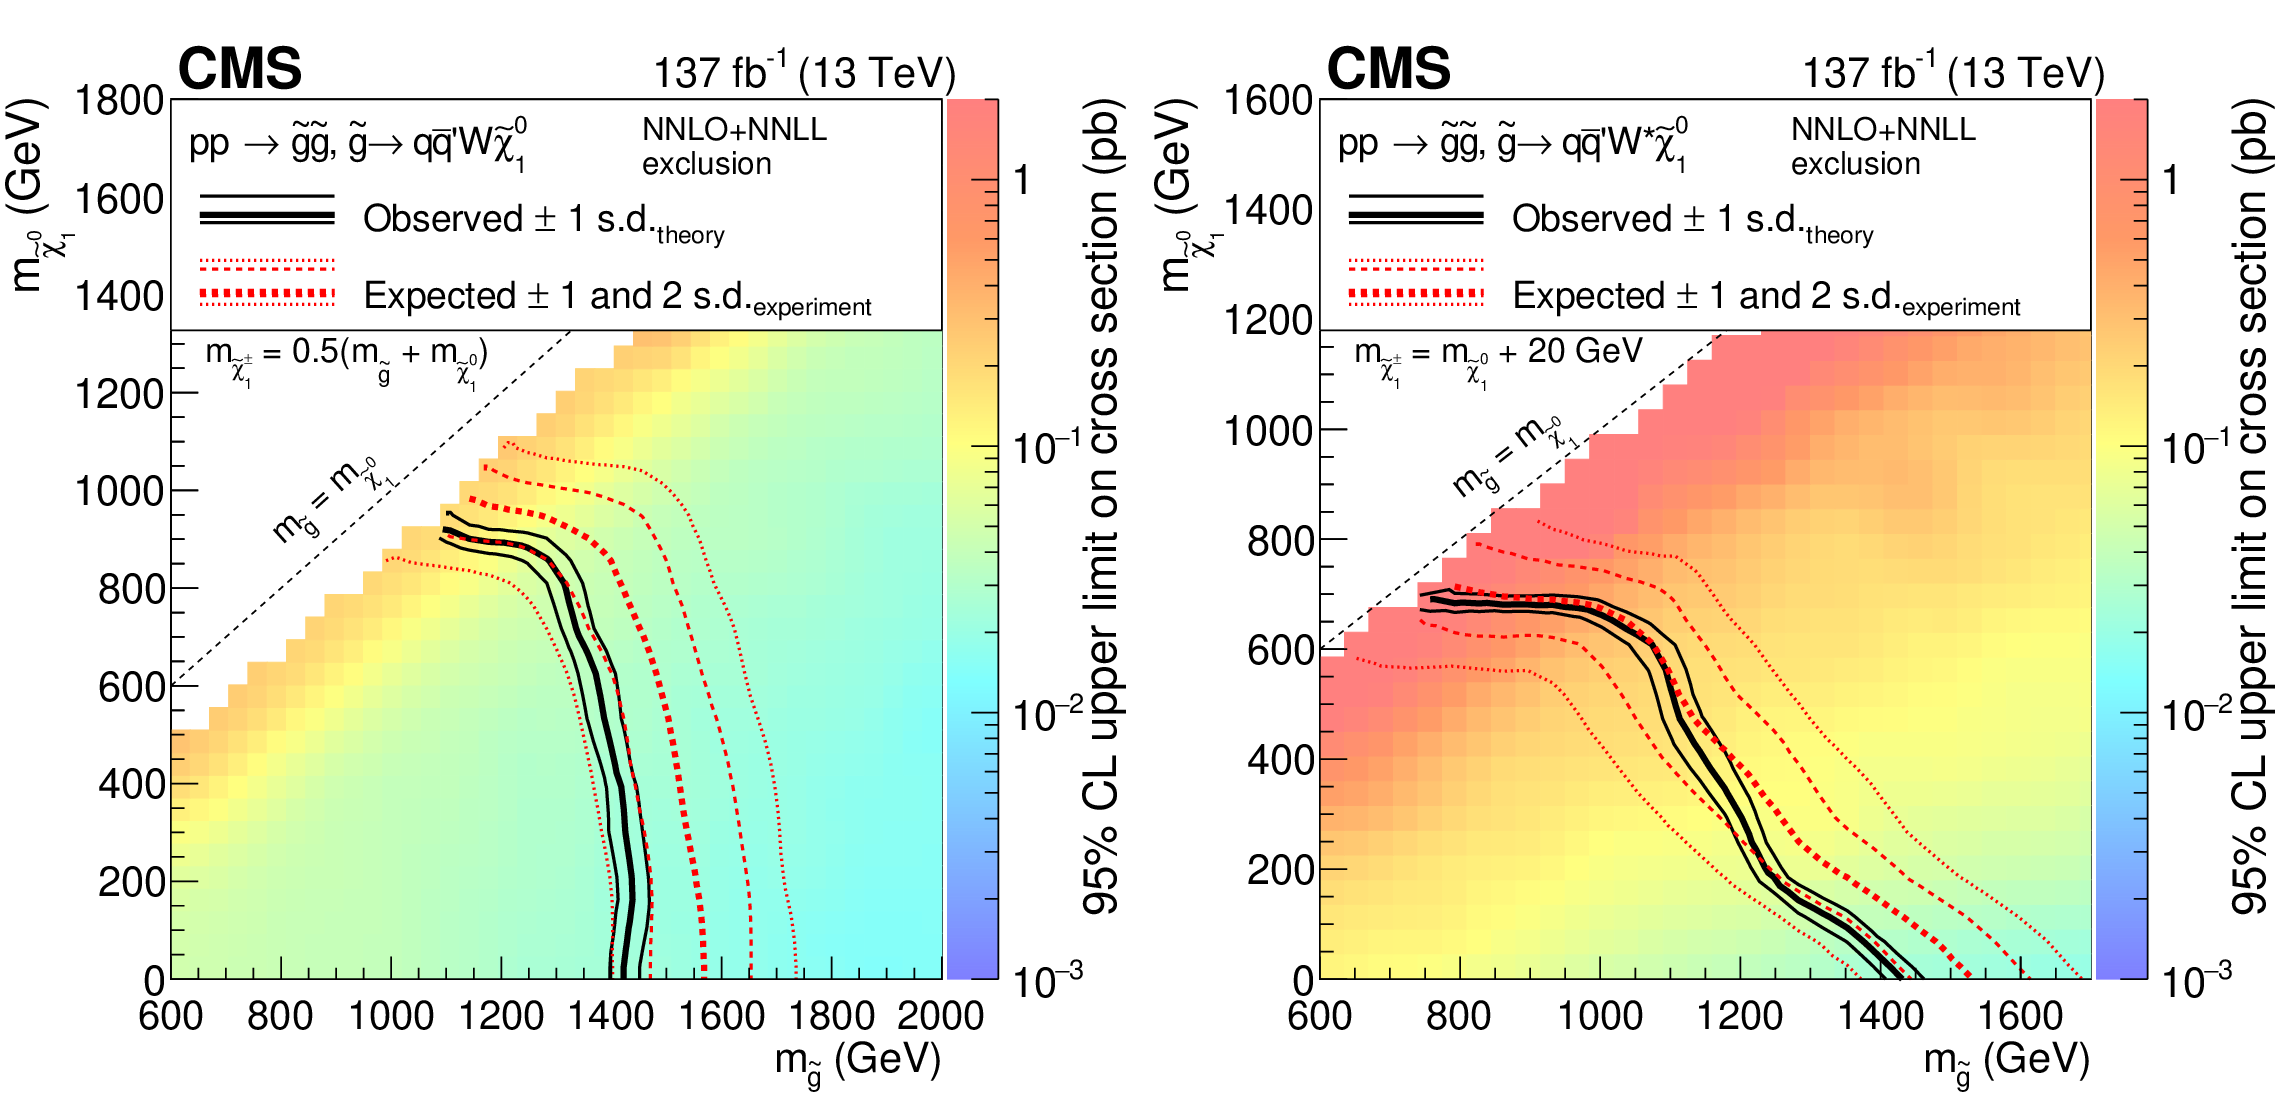
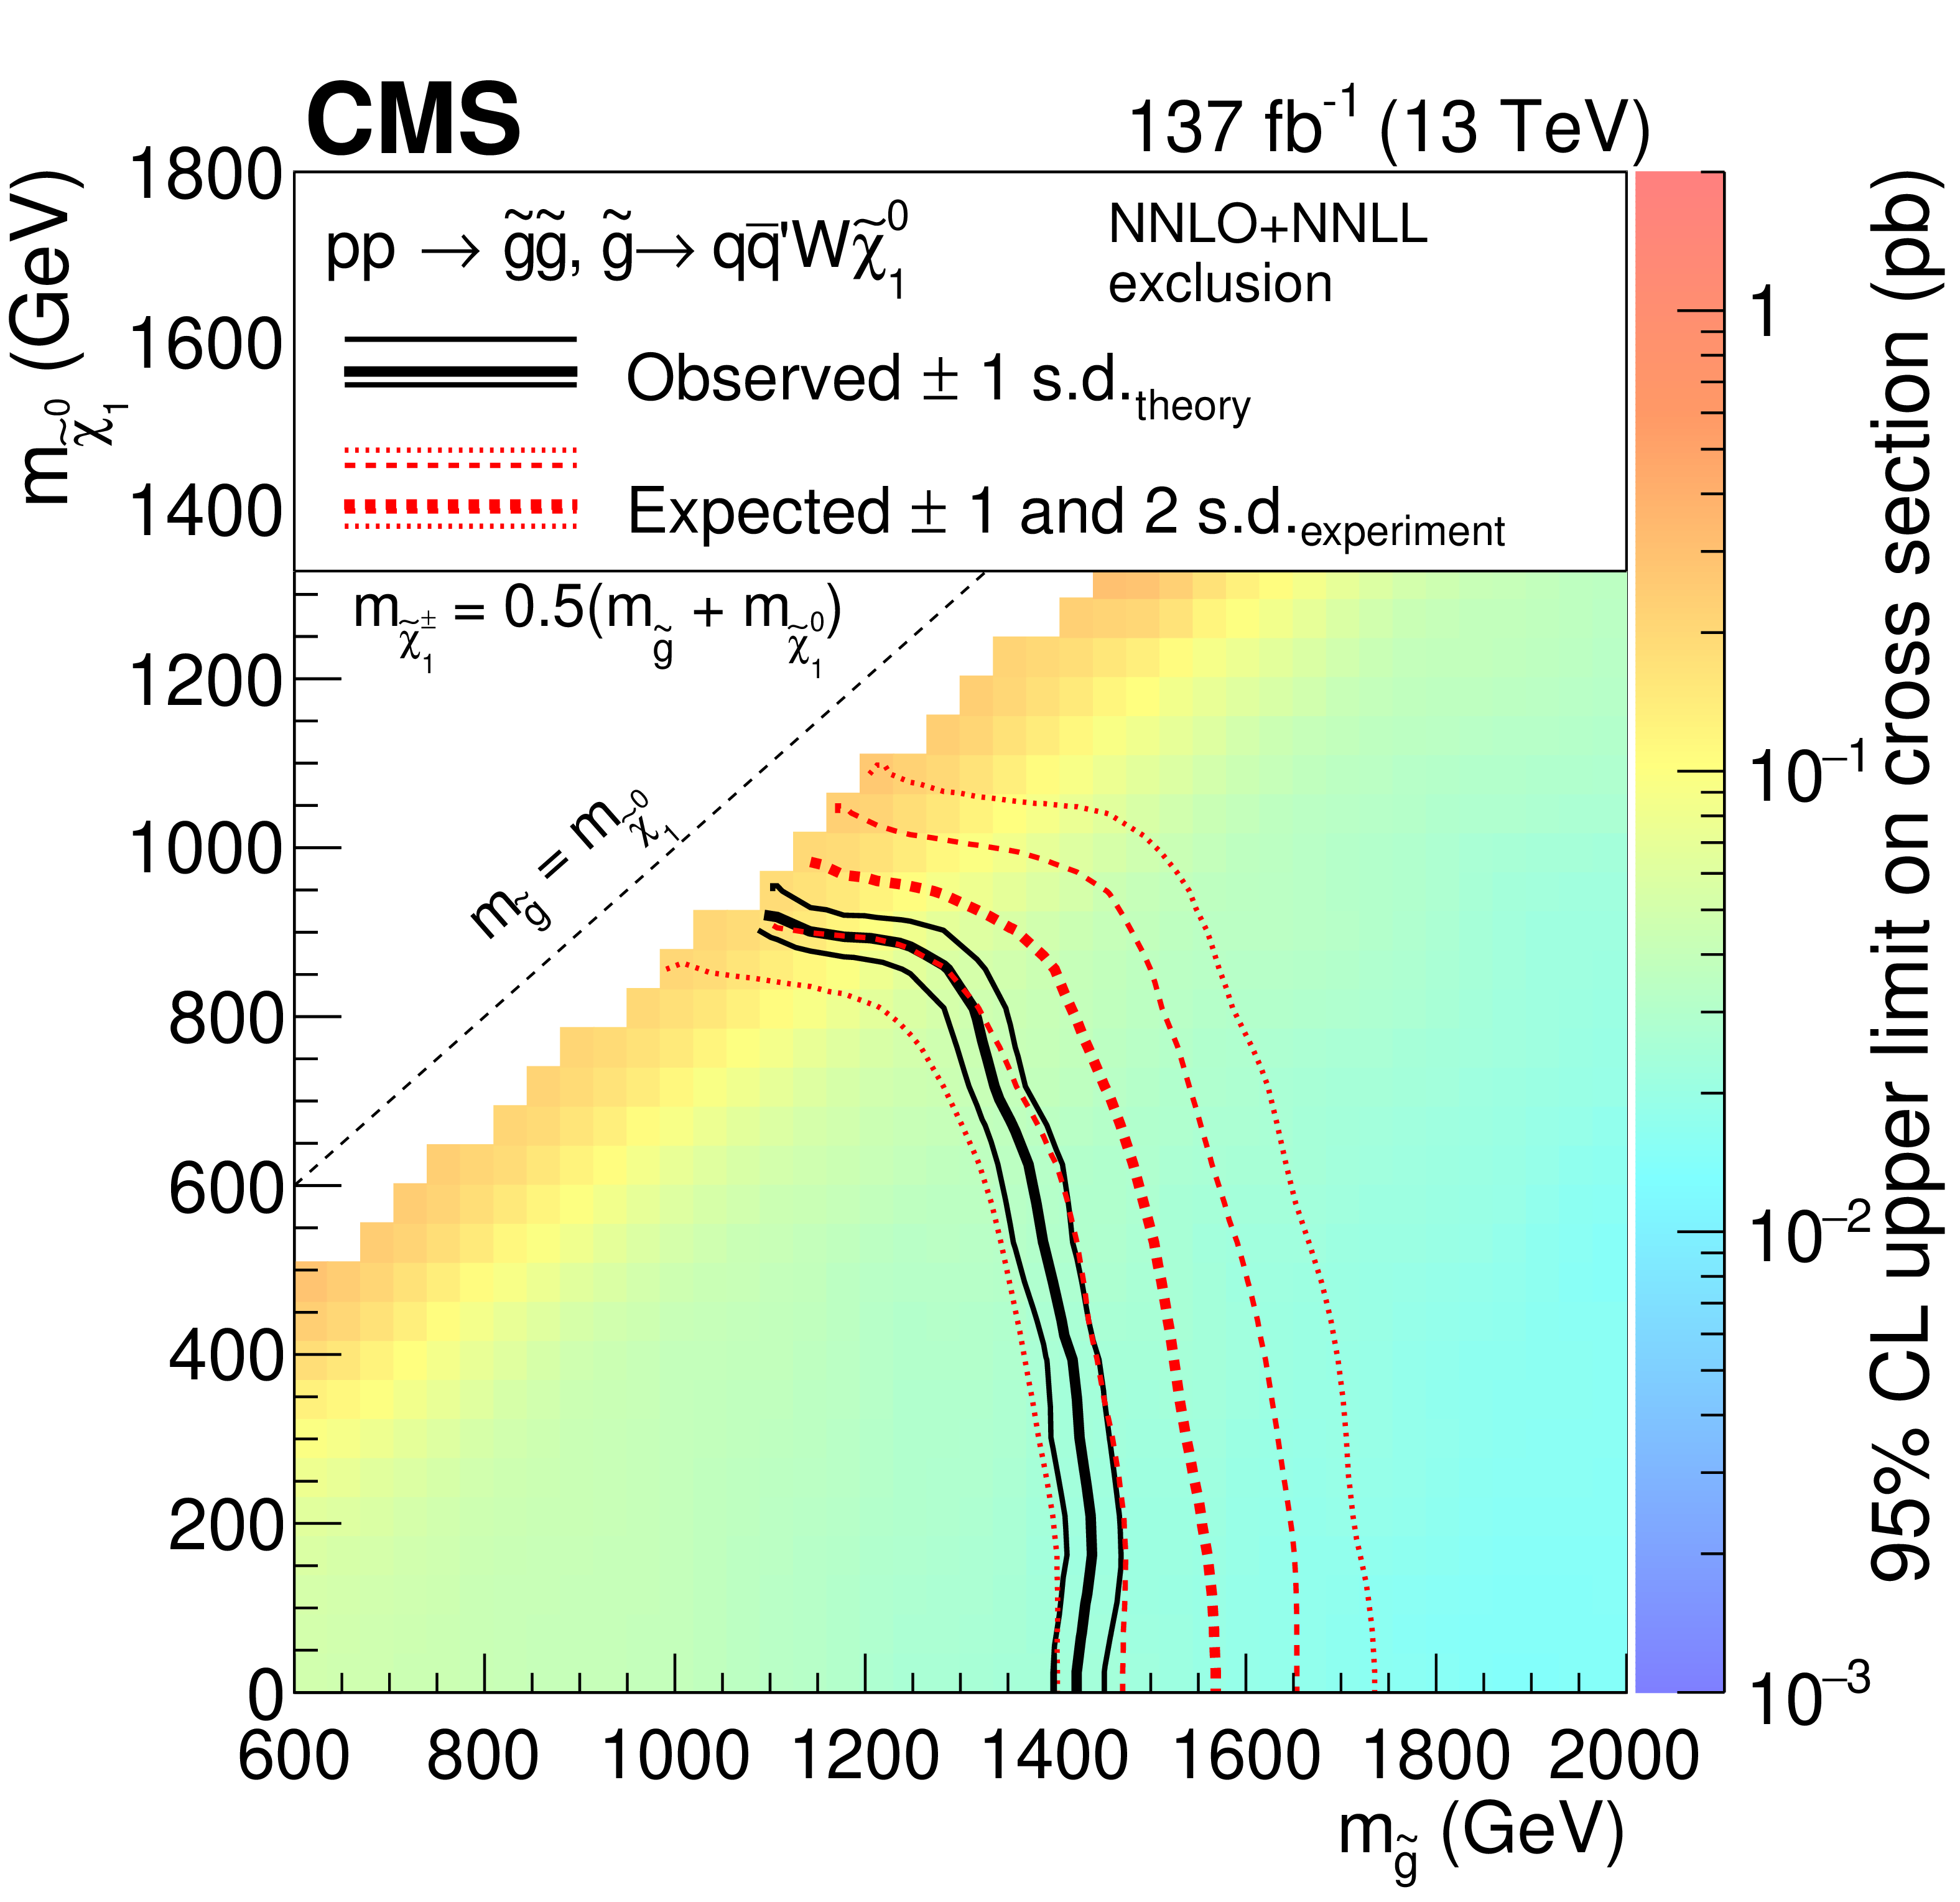
Figure 9:
Exclusion regions at 95% CL in the plane of $m_{\tilde{\chi}^0_1}$ versus $m_{{\mathrm{\widetilde{g}}}}$ for the T5qqqqWW model with $m_{\tilde{\chi}^{\pm}_1}=0.5(m_{{\mathrm{\widetilde{g}}}} + m_{\tilde{\chi}^0_1})$ (left) and with $m_{\tilde{\chi}^{\pm}_1} = m_{\tilde{\chi}^0_1} + $ 20 GeV (right). The notations are as in Fig. 7. |
png pdf |
Figure 9-a:
Exclusion region at 95% CL in the plane of $m_{\tilde{\chi}^0_1}$ versus $m_{{\mathrm{\widetilde{g}}}}$ for the T5qqqqWW model with $m_{\tilde{\chi}^{\pm}_1}=0.5(m_{{\mathrm{\widetilde{g}}}} + m_{\tilde{\chi}^0_1})$. The notations are as in Fig. 7. |

png pdf |
Figure 9-b:
Exclusion region at 95% CL in the plane of $m_{\tilde{\chi}^0_1}$ versus $m_{{\mathrm{\widetilde{g}}}}$ for the T5qqqqWW model with $m_{\tilde{\chi}^{\pm}_1} = m_{\tilde{\chi}^0_1} + $ 20 GeV. The notations are as in Fig. 7. |
png pdf |
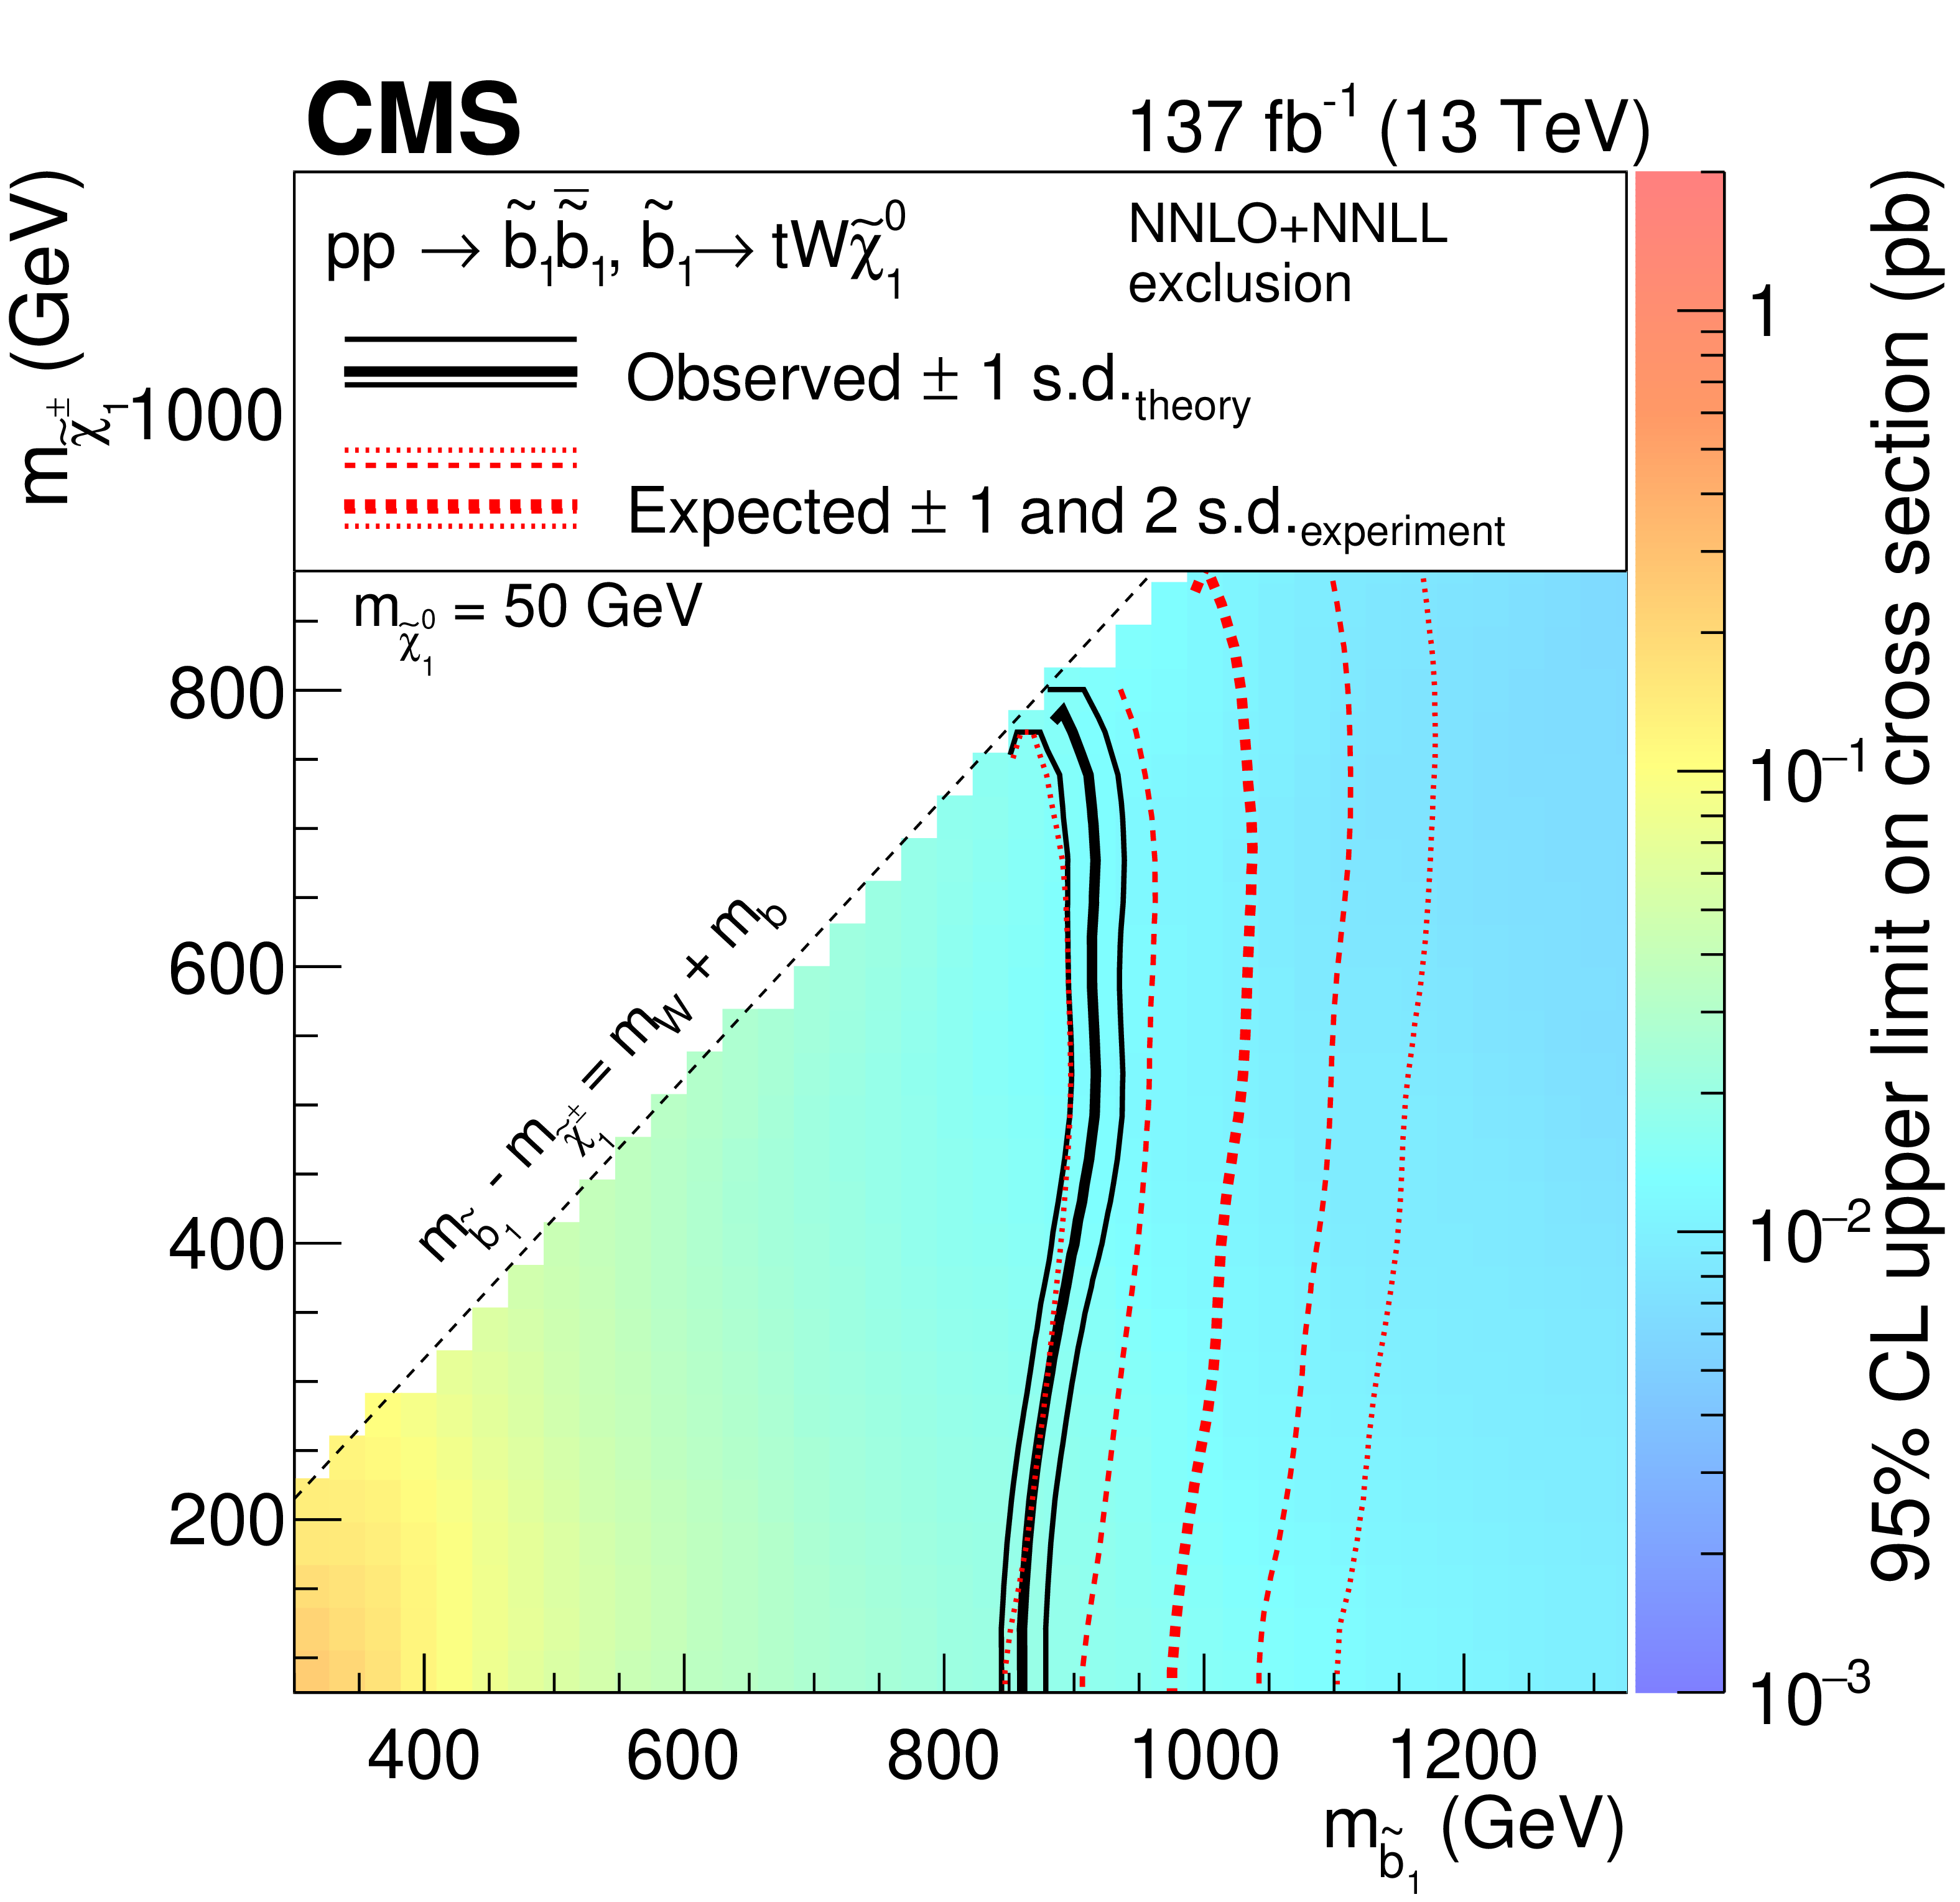
Figure 10:
Exclusion regions at 95% CL in the plane of $m_{\tilde{\chi}^{\pm}_1}$ versus $m_{\tilde{\mathrm{b}} _{1}}$ for the T6ttWW model with $m_{\tilde{\chi}^0_1} = $ 50 GeV. The notations are as in Fig. 7. |
png pdf |
Figure 11:
Exclusion regions at 95% CL in the plane of $m(\tilde{\mathrm{t}} _{1})$ versus $m(\tilde{\mathrm{t}} _{2})$ for the T6ttHZ model with $m(\tilde{\mathrm{t}} _{1})-m(\tilde{\chi}^0_1) = $ 175 GeV. The three exclusions represent $\mathcal {B}(\tilde{\mathrm{t}} _{2}\to \tilde{\mathrm{t}} _{1}\mathrm{Z})$ of 0, 50, and 100%, respectively. The notations are as in Fig. 7. |
png pdf |
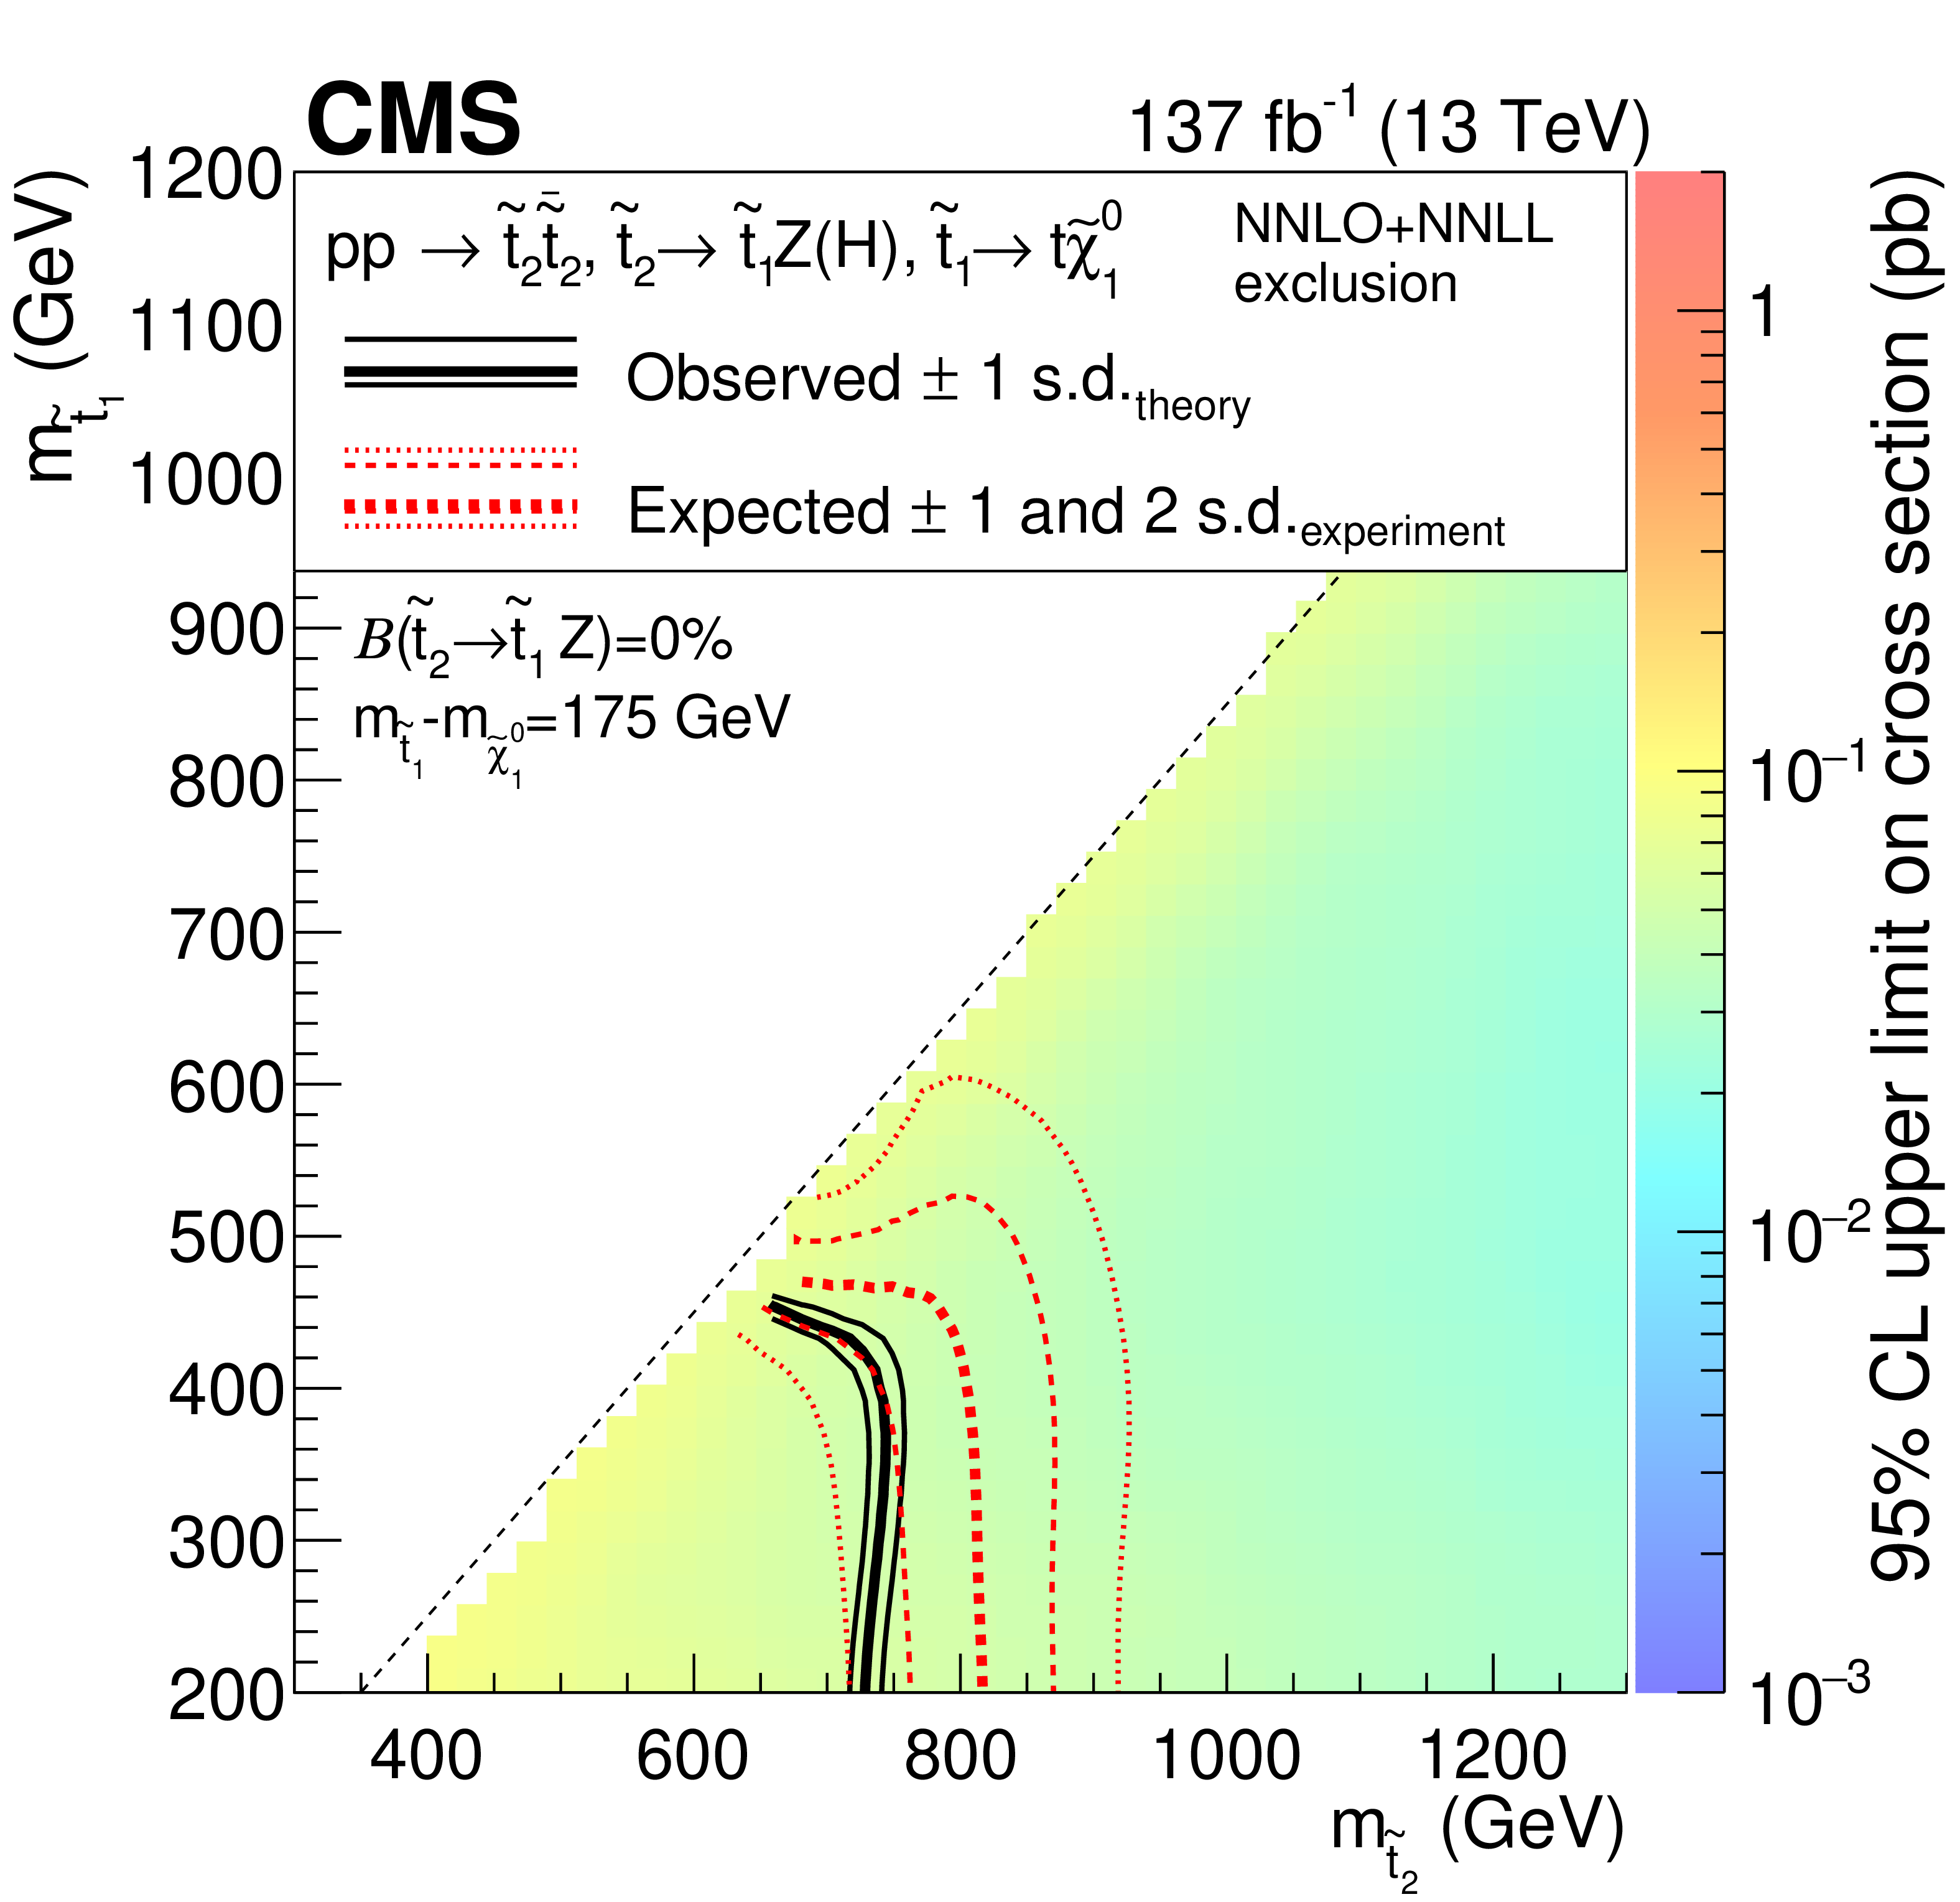
Figure 11-a:
Exclusion regions at 95% CL in the plane of $m(\tilde{\mathrm{t}} _{1})$ versus $m(\tilde{\mathrm{t}} _{2})$ for the T6ttHZ model with $m(\tilde{\mathrm{t}} _{1})-m(\tilde{\chi}^0_1) = $ 175 GeV. The three exclusions represent $\mathcal {B}(\tilde{\mathrm{t}} _{2}\to \tilde{\mathrm{t}} _{1}\mathrm{Z})$ of 0%. The notations are as in Fig. 7. |
png pdf |
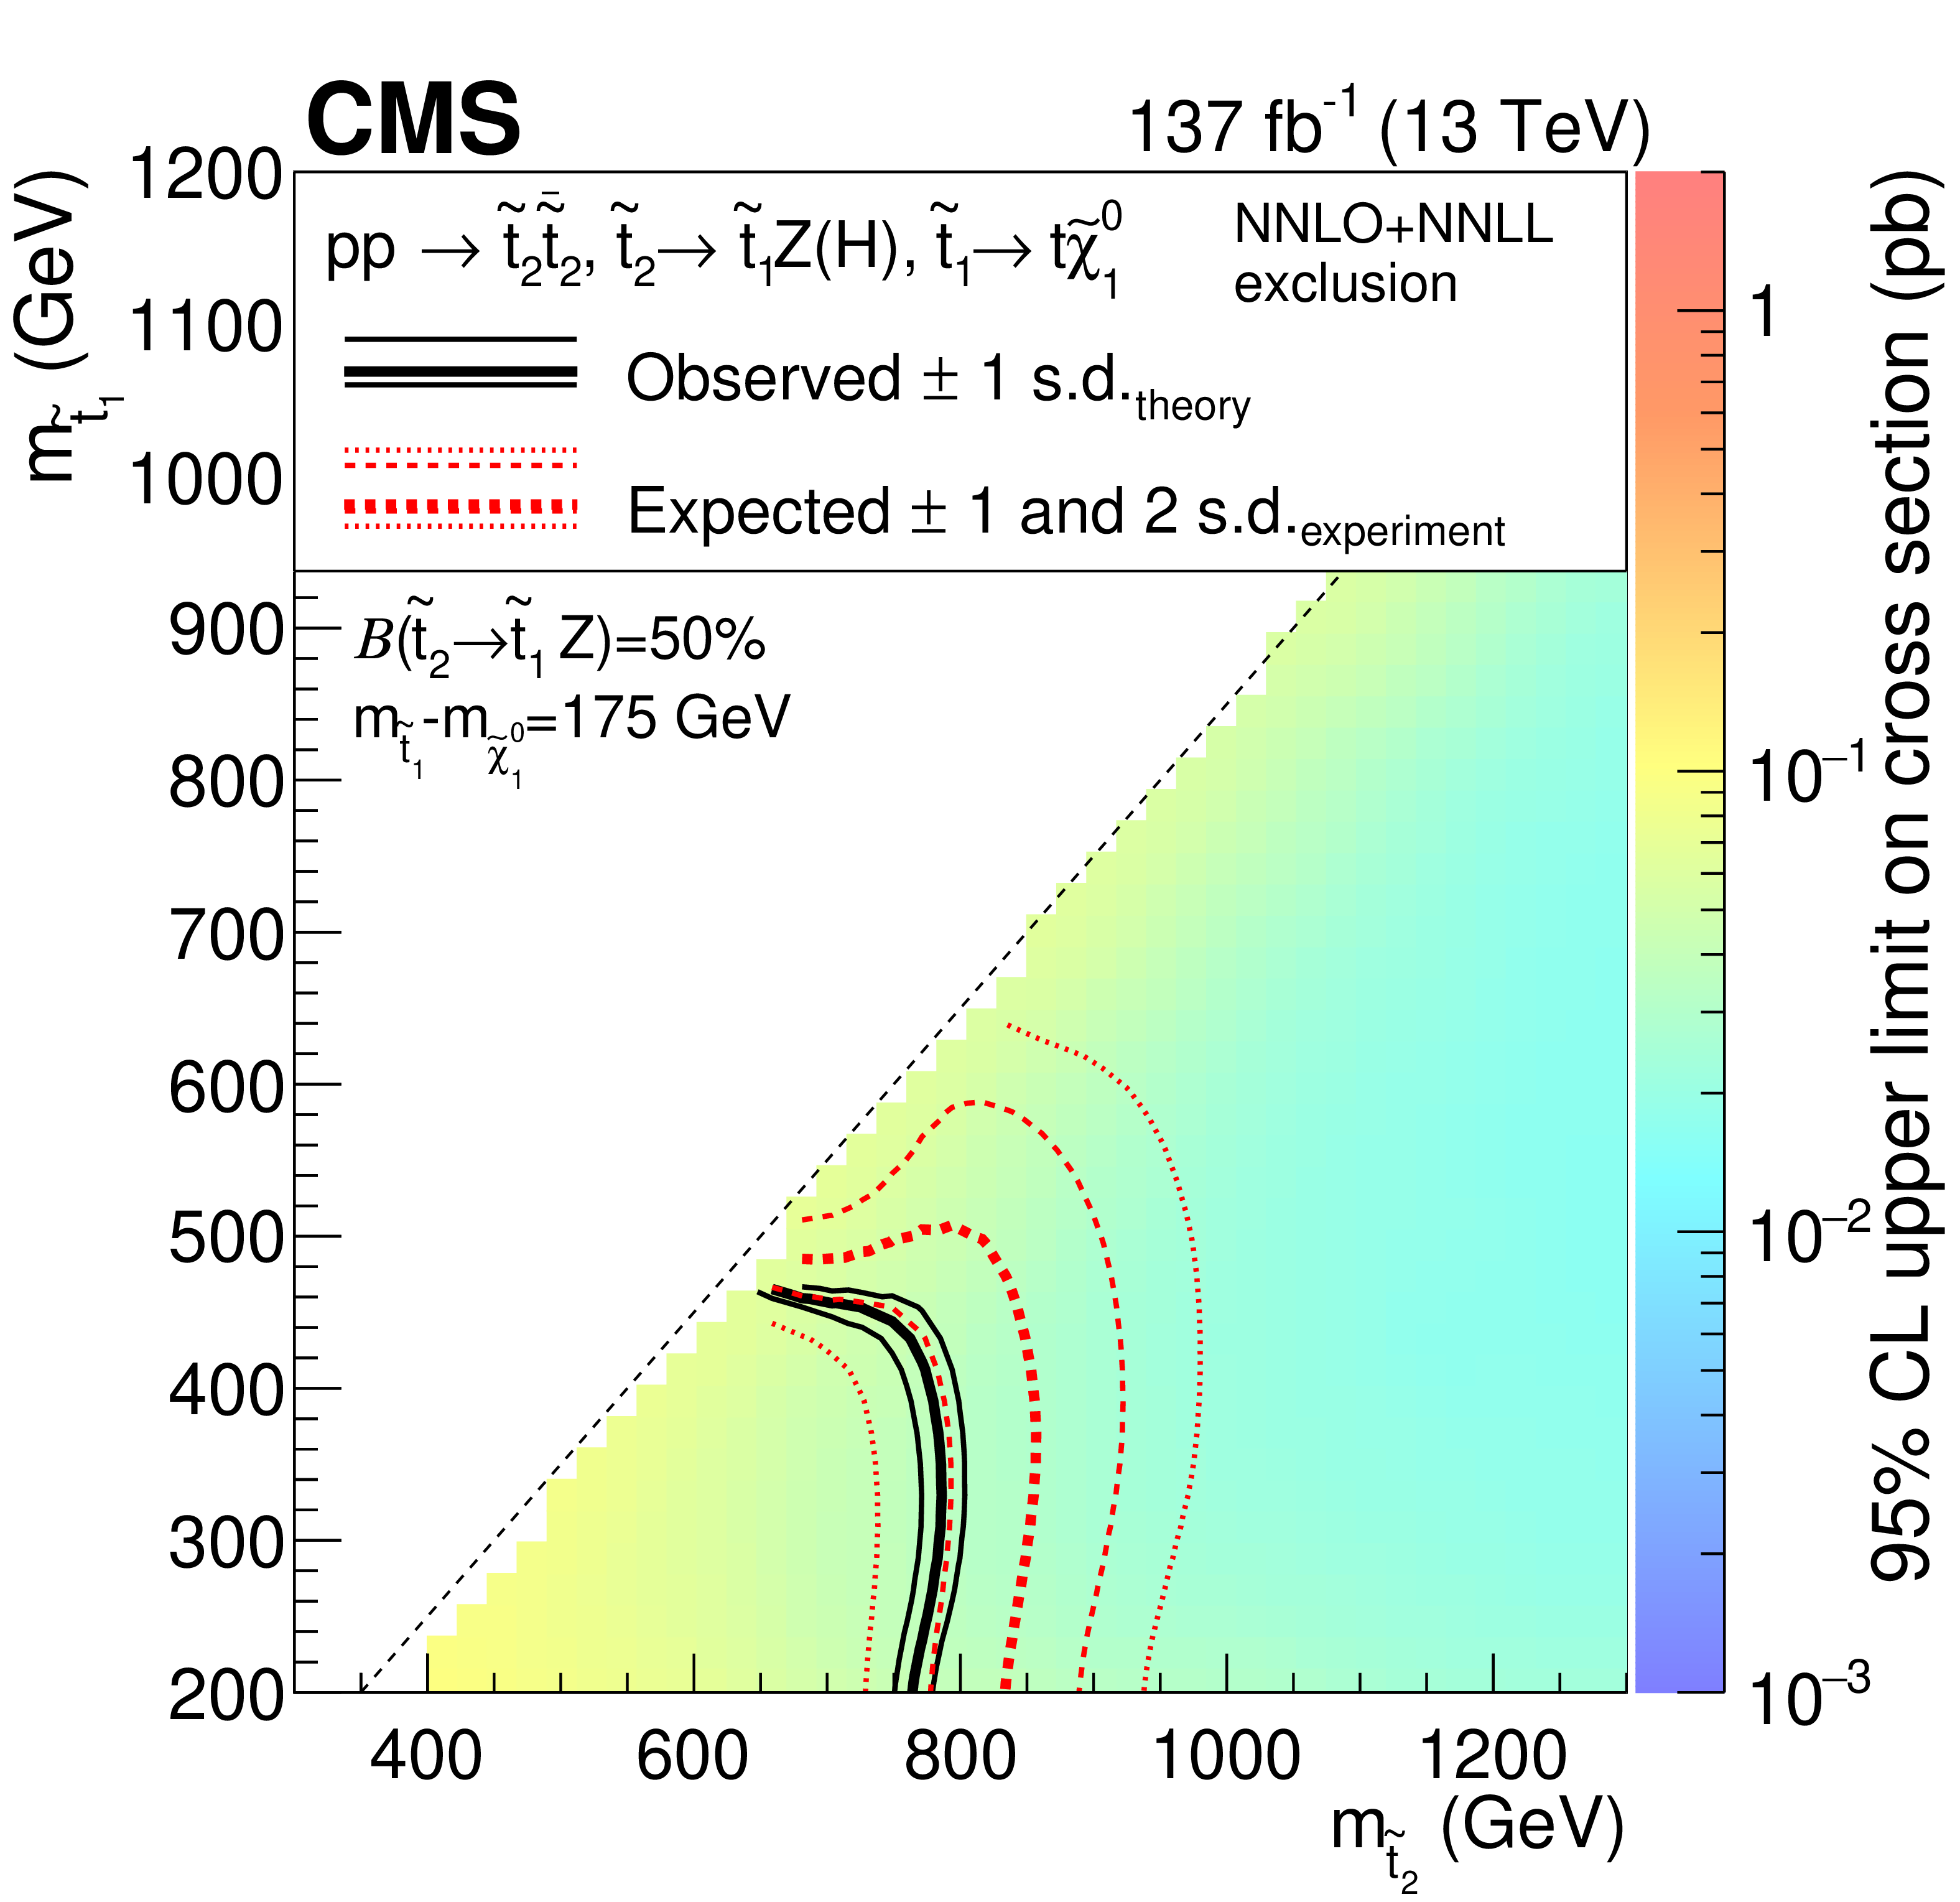
Figure 11-b:
Exclusion regions at 95% CL in the plane of $m(\tilde{\mathrm{t}} _{1})$ versus $m(\tilde{\mathrm{t}} _{2})$ for the T6ttHZ model with $m(\tilde{\mathrm{t}} _{1})-m(\tilde{\chi}^0_1) = $ 175 GeV. The three exclusions represent $\mathcal {B}(\tilde{\mathrm{t}} _{2}\to \tilde{\mathrm{t}} _{1}\mathrm{Z})$ of 50%. The notations are as in Fig. 7. |
png pdf |
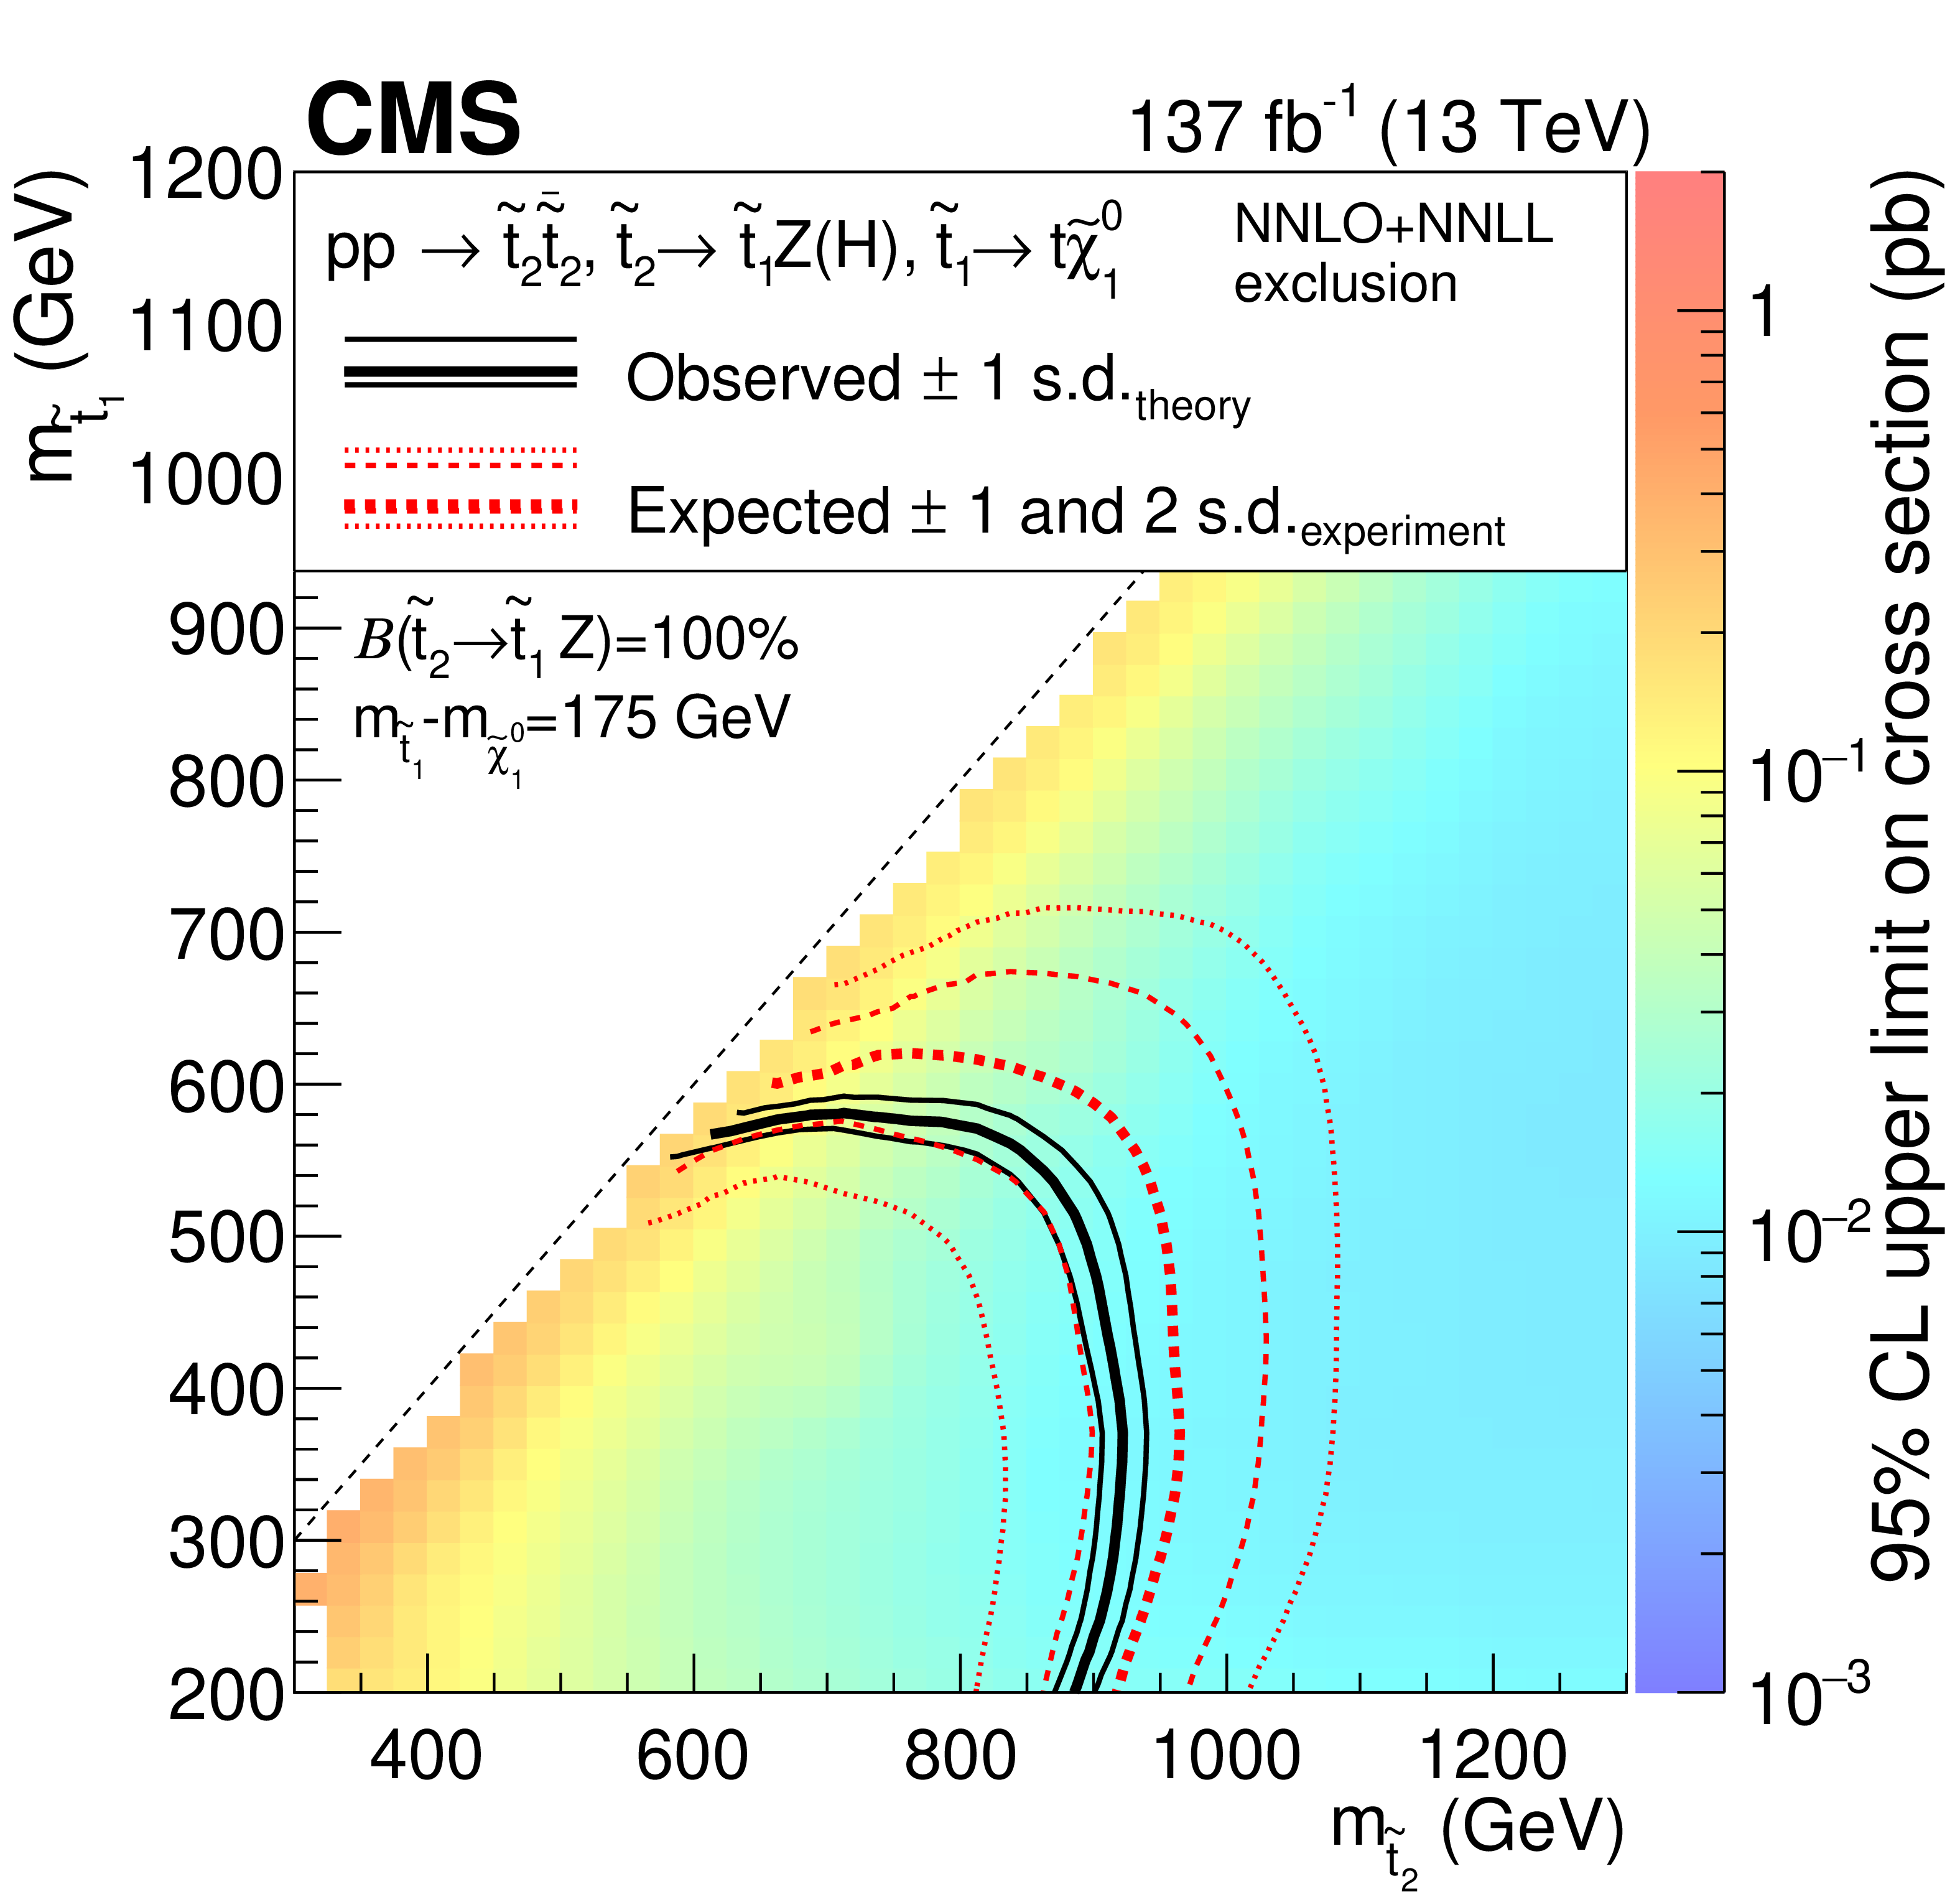
Figure 11-c:
Exclusion regions at 95% CL in the plane of $m(\tilde{\mathrm{t}} _{1})$ versus $m(\tilde{\mathrm{t}} _{2})$ for the T6ttHZ model with $m(\tilde{\mathrm{t}} _{1})-m(\tilde{\chi}^0_1) = $ 175 GeV. The three exclusions represent $\mathcal {B}(\tilde{\mathrm{t}} _{2}\to \tilde{\mathrm{t}} _{1}\mathrm{Z})$ of 100%. The notations are as in Fig. 7. |
png pdf |
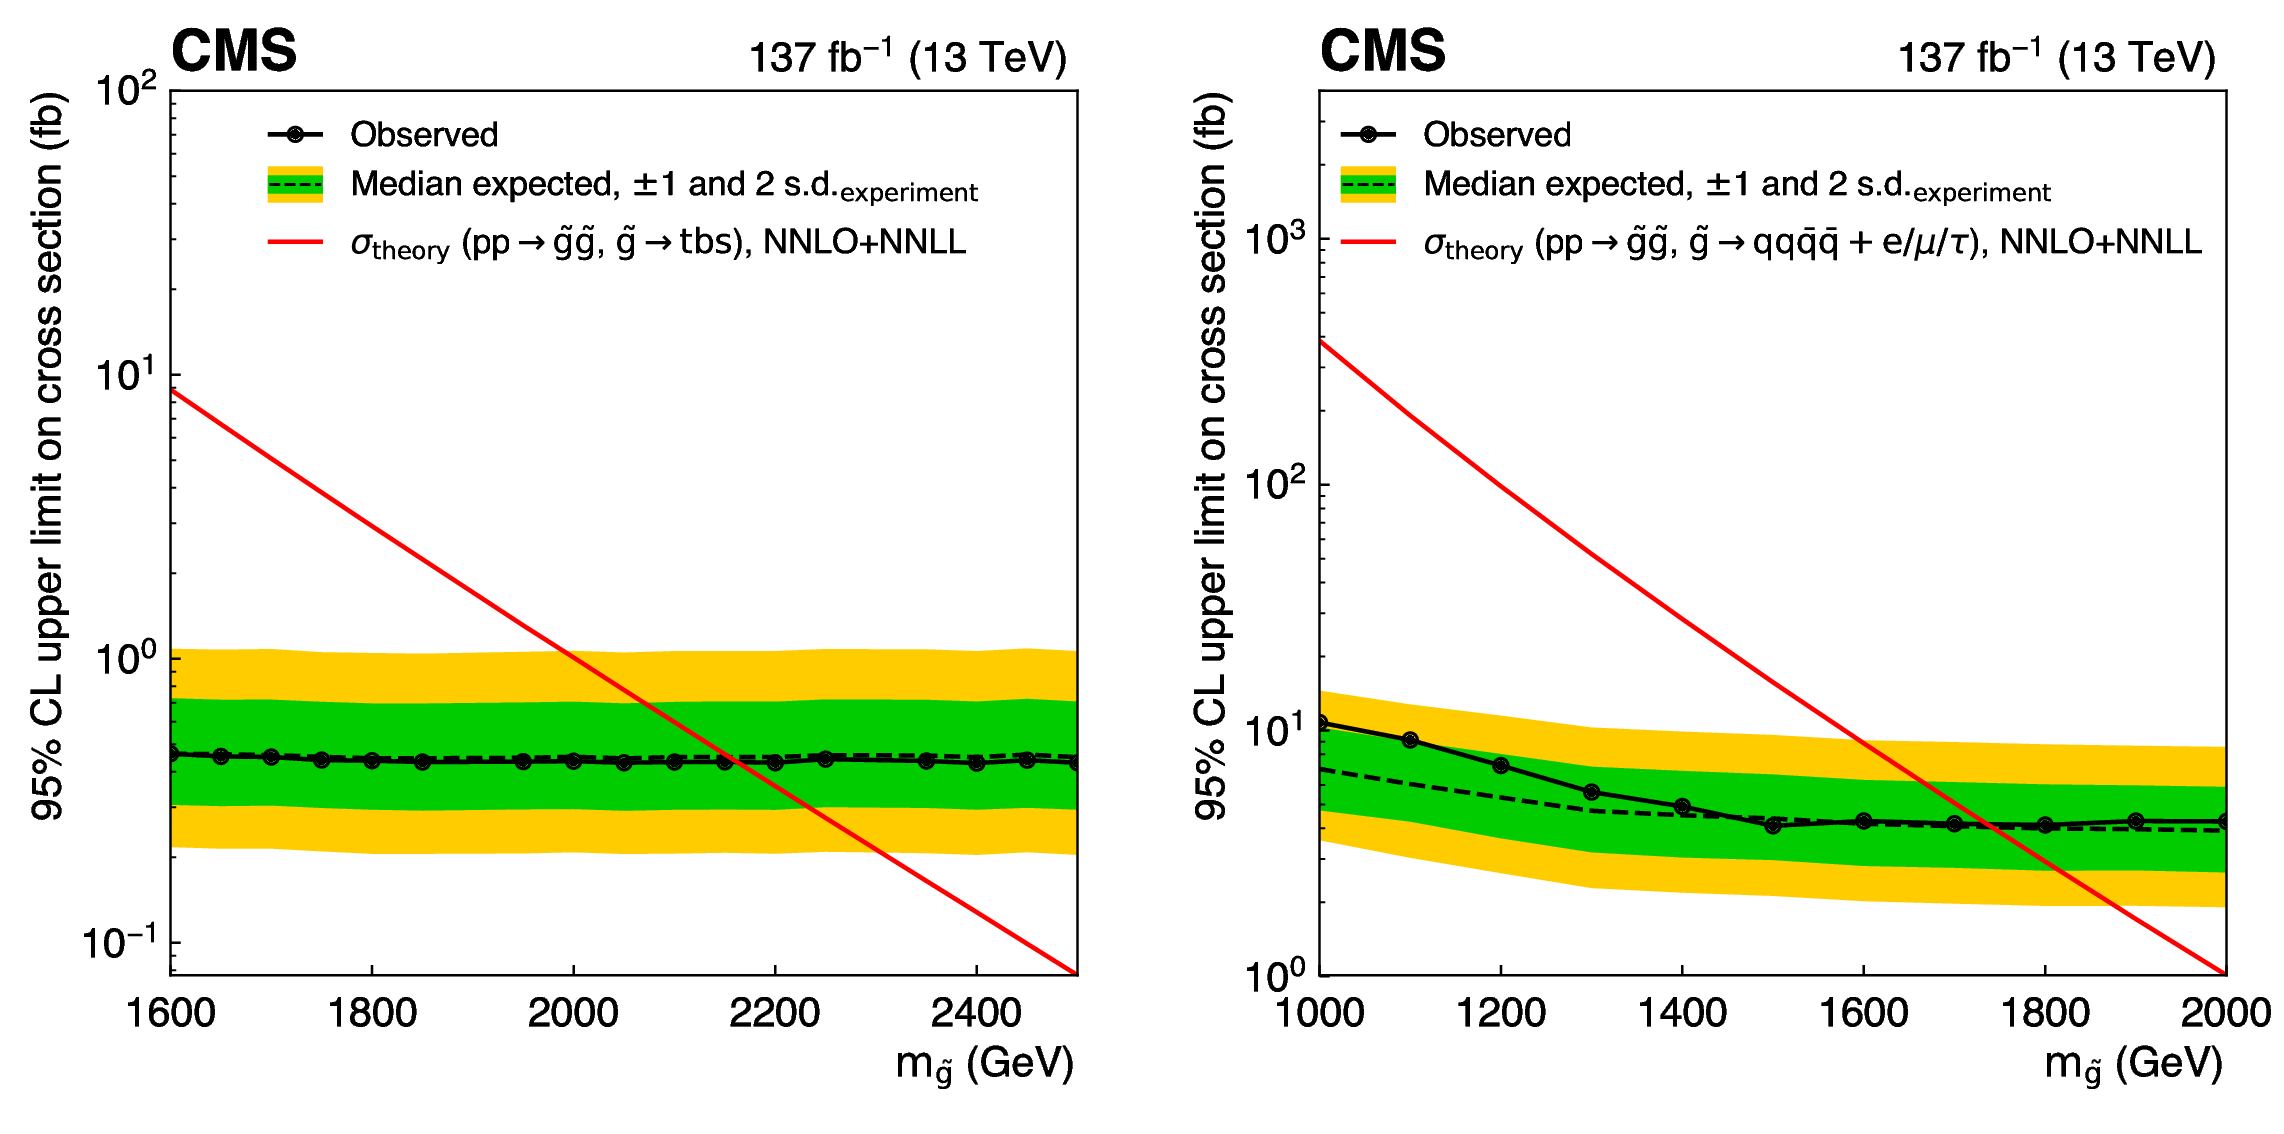
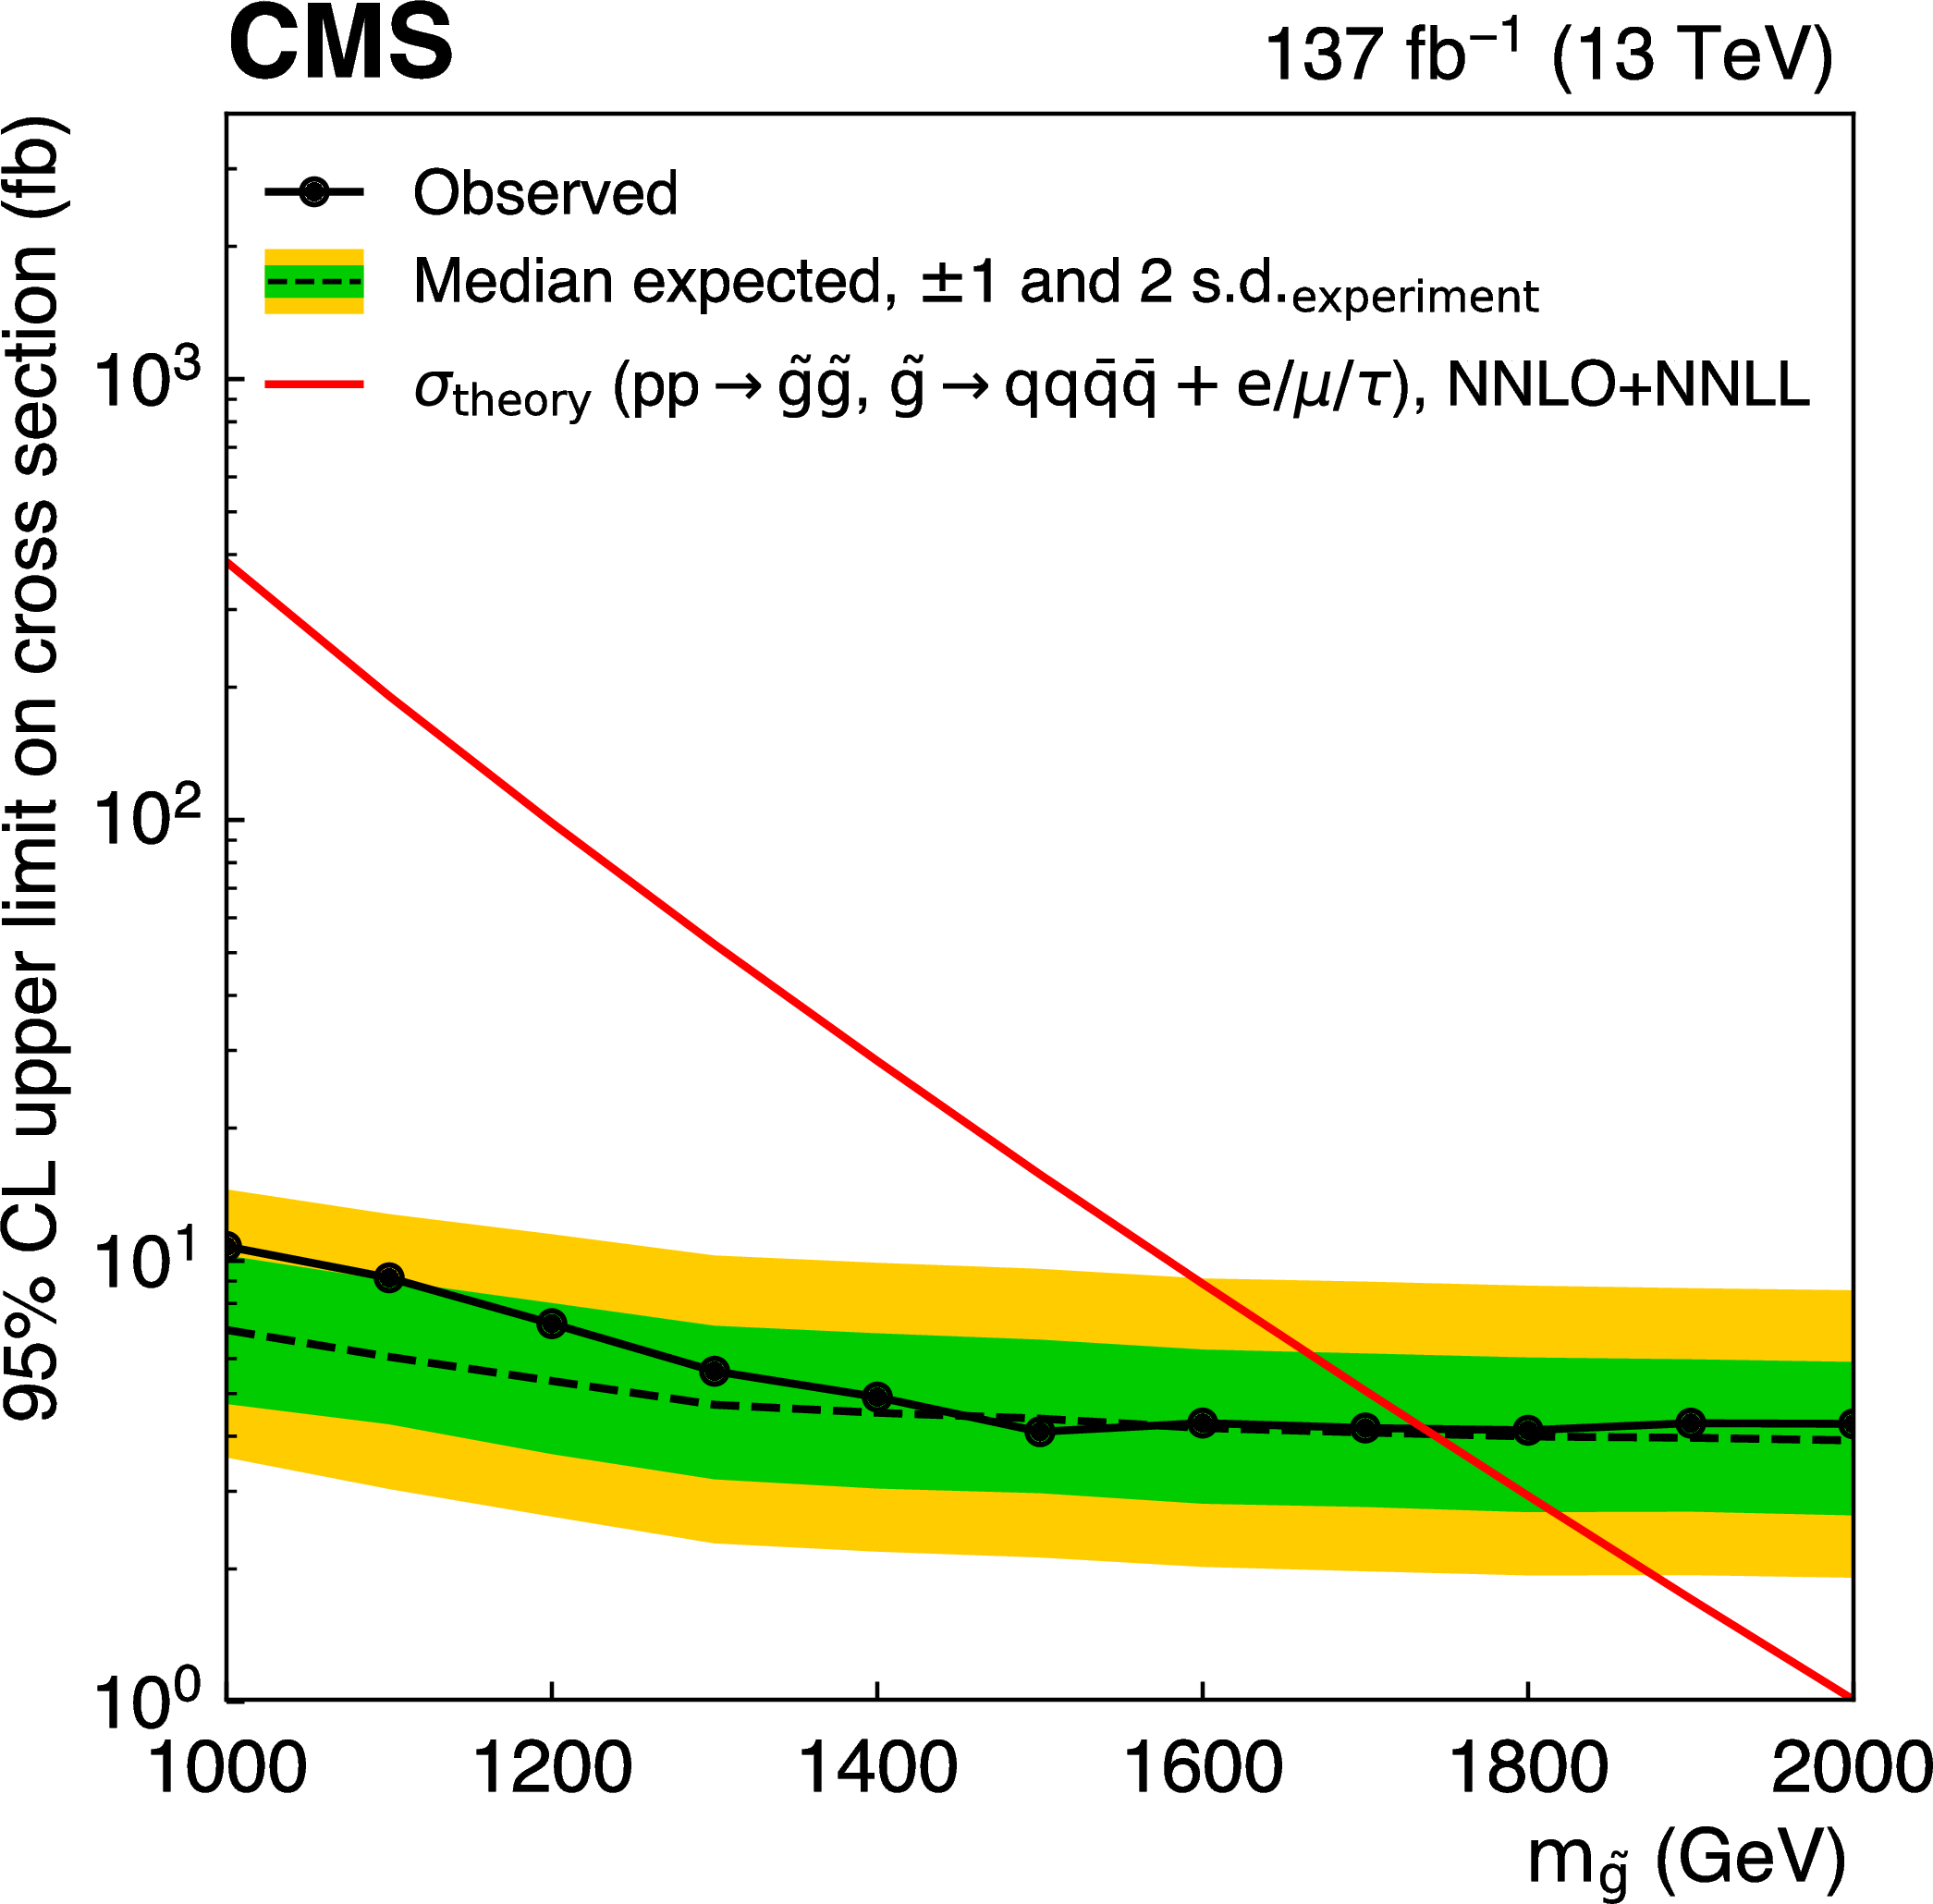
Figure 12:
Upper limits at 95% CL on the cross section for RPV gluino pair production with each gluino decaying into four quarks and one lepton (T1qqqqL, left), and each gluino decaying into a top, bottom, and strange quarks (T1tbs, right). |

png pdf |
Figure 12-a:
Upper limits at 95% CL on the cross section for RPV gluino pair production with each gluino decaying into four quarks and one lepton (T1qqqqL). |
png pdf |
Figure 12-b:
Upper limits at 95% CL on the cross section for RPV gluino pair production with each gluino decaying into a top, bottom, and strange quarks (T1tbs). |

png pdf |
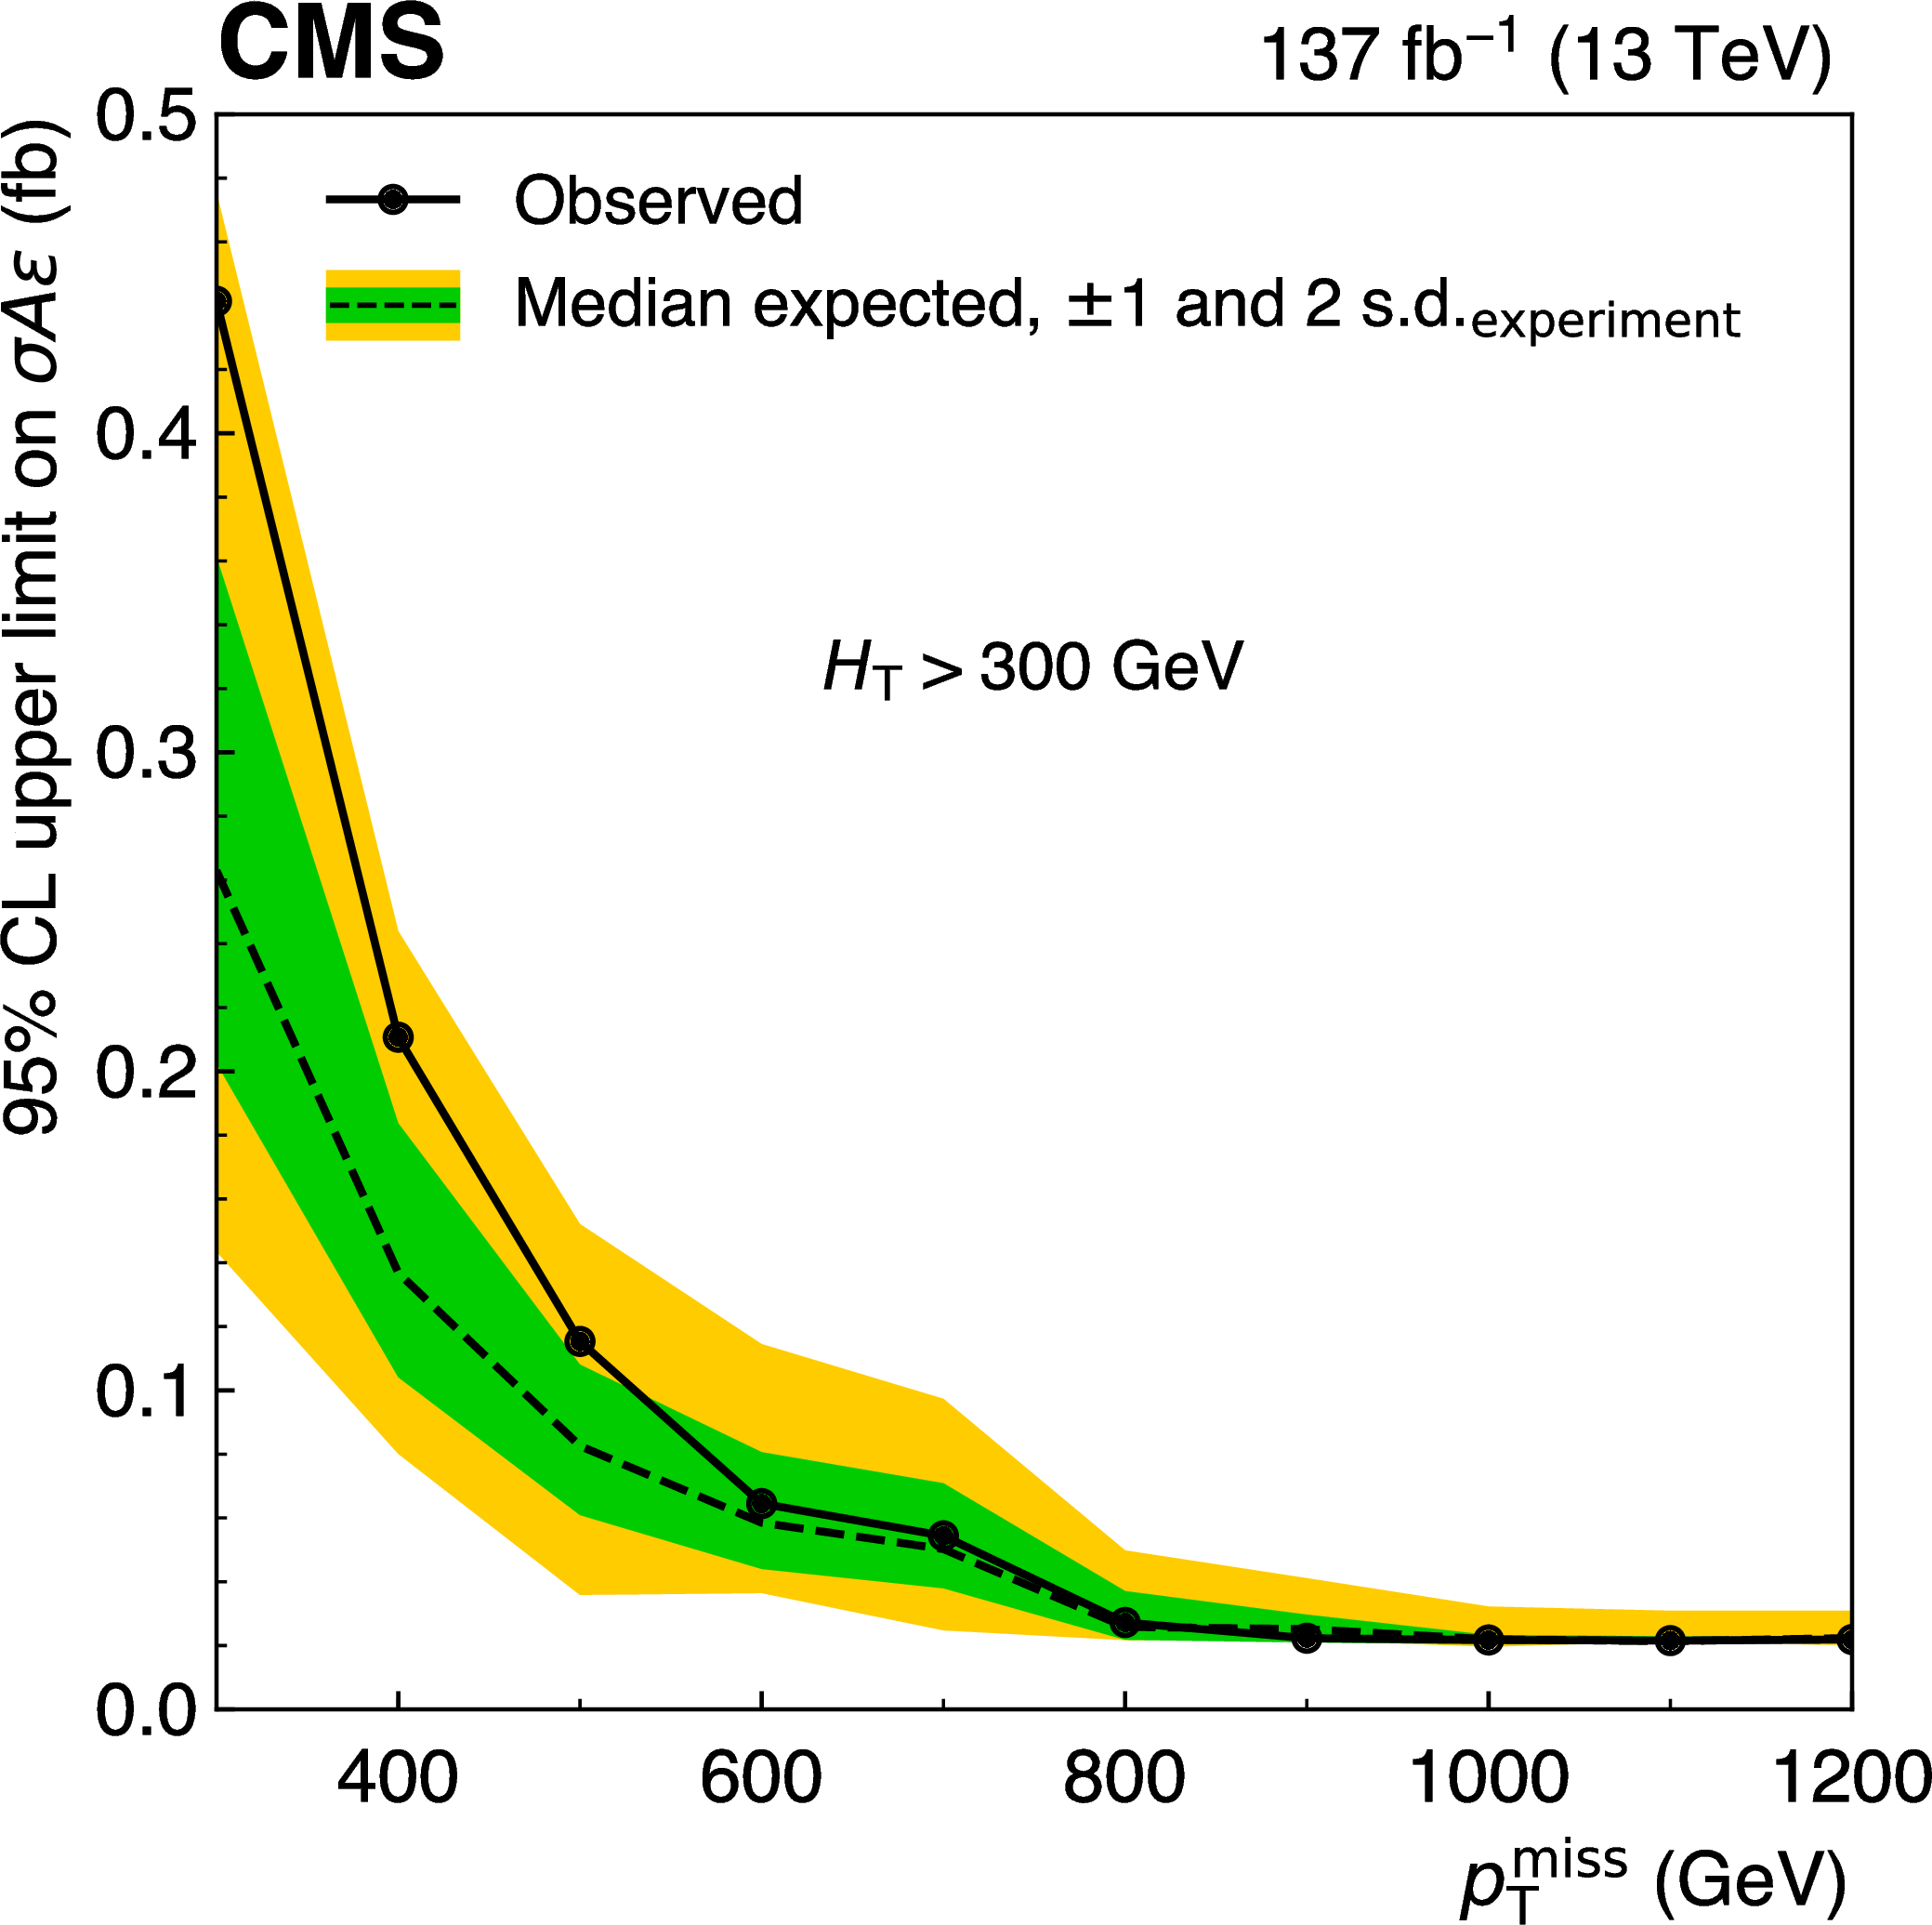
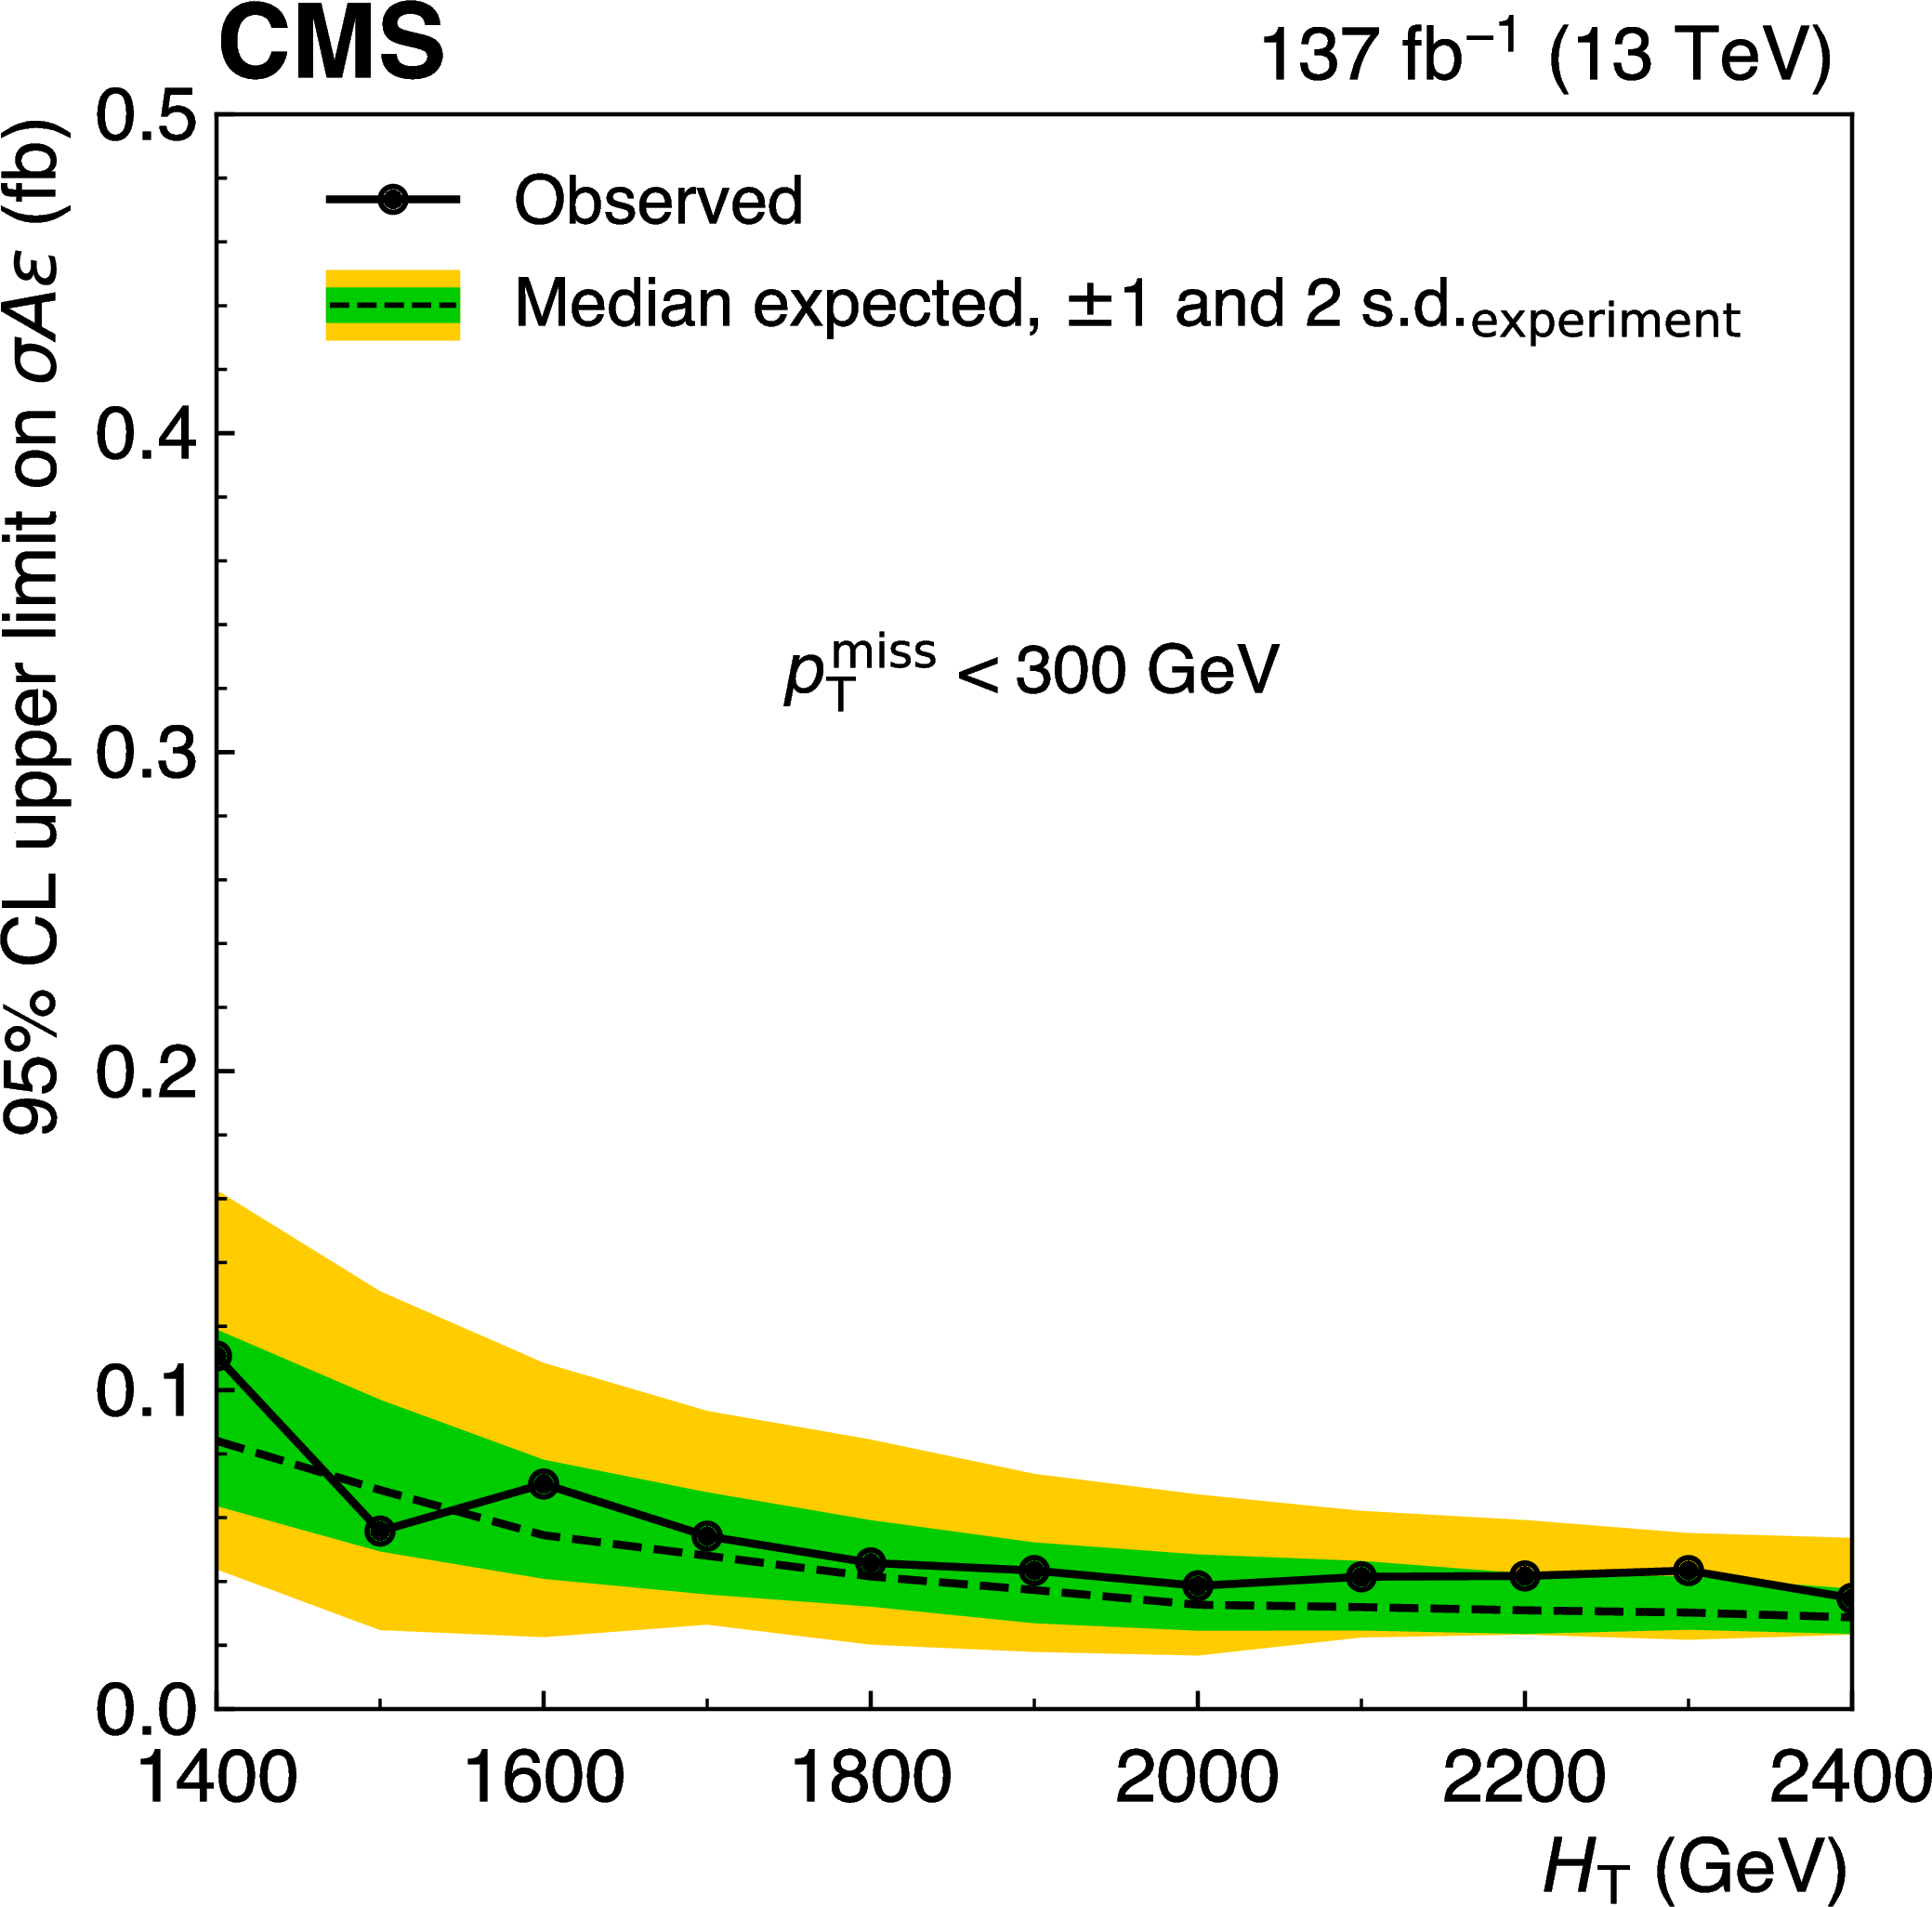
Figure 13:
Upper limits at 95% CL on the product of cross section, detector acceptance, and selection efficiency, $\sigma \, \mathcal {A} \epsilon $, for the production of an SS lepton pair with at least two jets, as a function of the minimum ${{p_{\mathrm {T}}} ^\text {miss}}$ threshold, when $ {H_{\mathrm {T}}} > $ 300 GeV (left), or the minimum ${H_{\mathrm {T}}}$ threshold, when $ {{p_{\mathrm {T}}} ^\text {miss}} < $ 300 GeV (right). |
png pdf |
Figure 13-a:
Upper limit at 95% CL on the product of cross section, detector acceptance, and selection efficiency, $\sigma \, \mathcal {A} \epsilon $, for the production of an SS lepton pair with at least two jets, as a function of the minimum ${{p_{\mathrm {T}}} ^\text {miss}}$ threshold, when $ {H_{\mathrm {T}}} > $ 300 GeV. |
png pdf |
Figure 13-b:
Upper limit at 95% CL on the product of cross section, detector acceptance, and selection efficiency, $\sigma \, \mathcal {A} \epsilon $, for the production of an SS lepton pair with at least two jets, as a function of the minimum ${H_{\mathrm {T}}}$ threshold, when $ {{p_{\mathrm {T}}} ^\text {miss}} < $ 300 GeV. |
| Tables | |
png pdf |
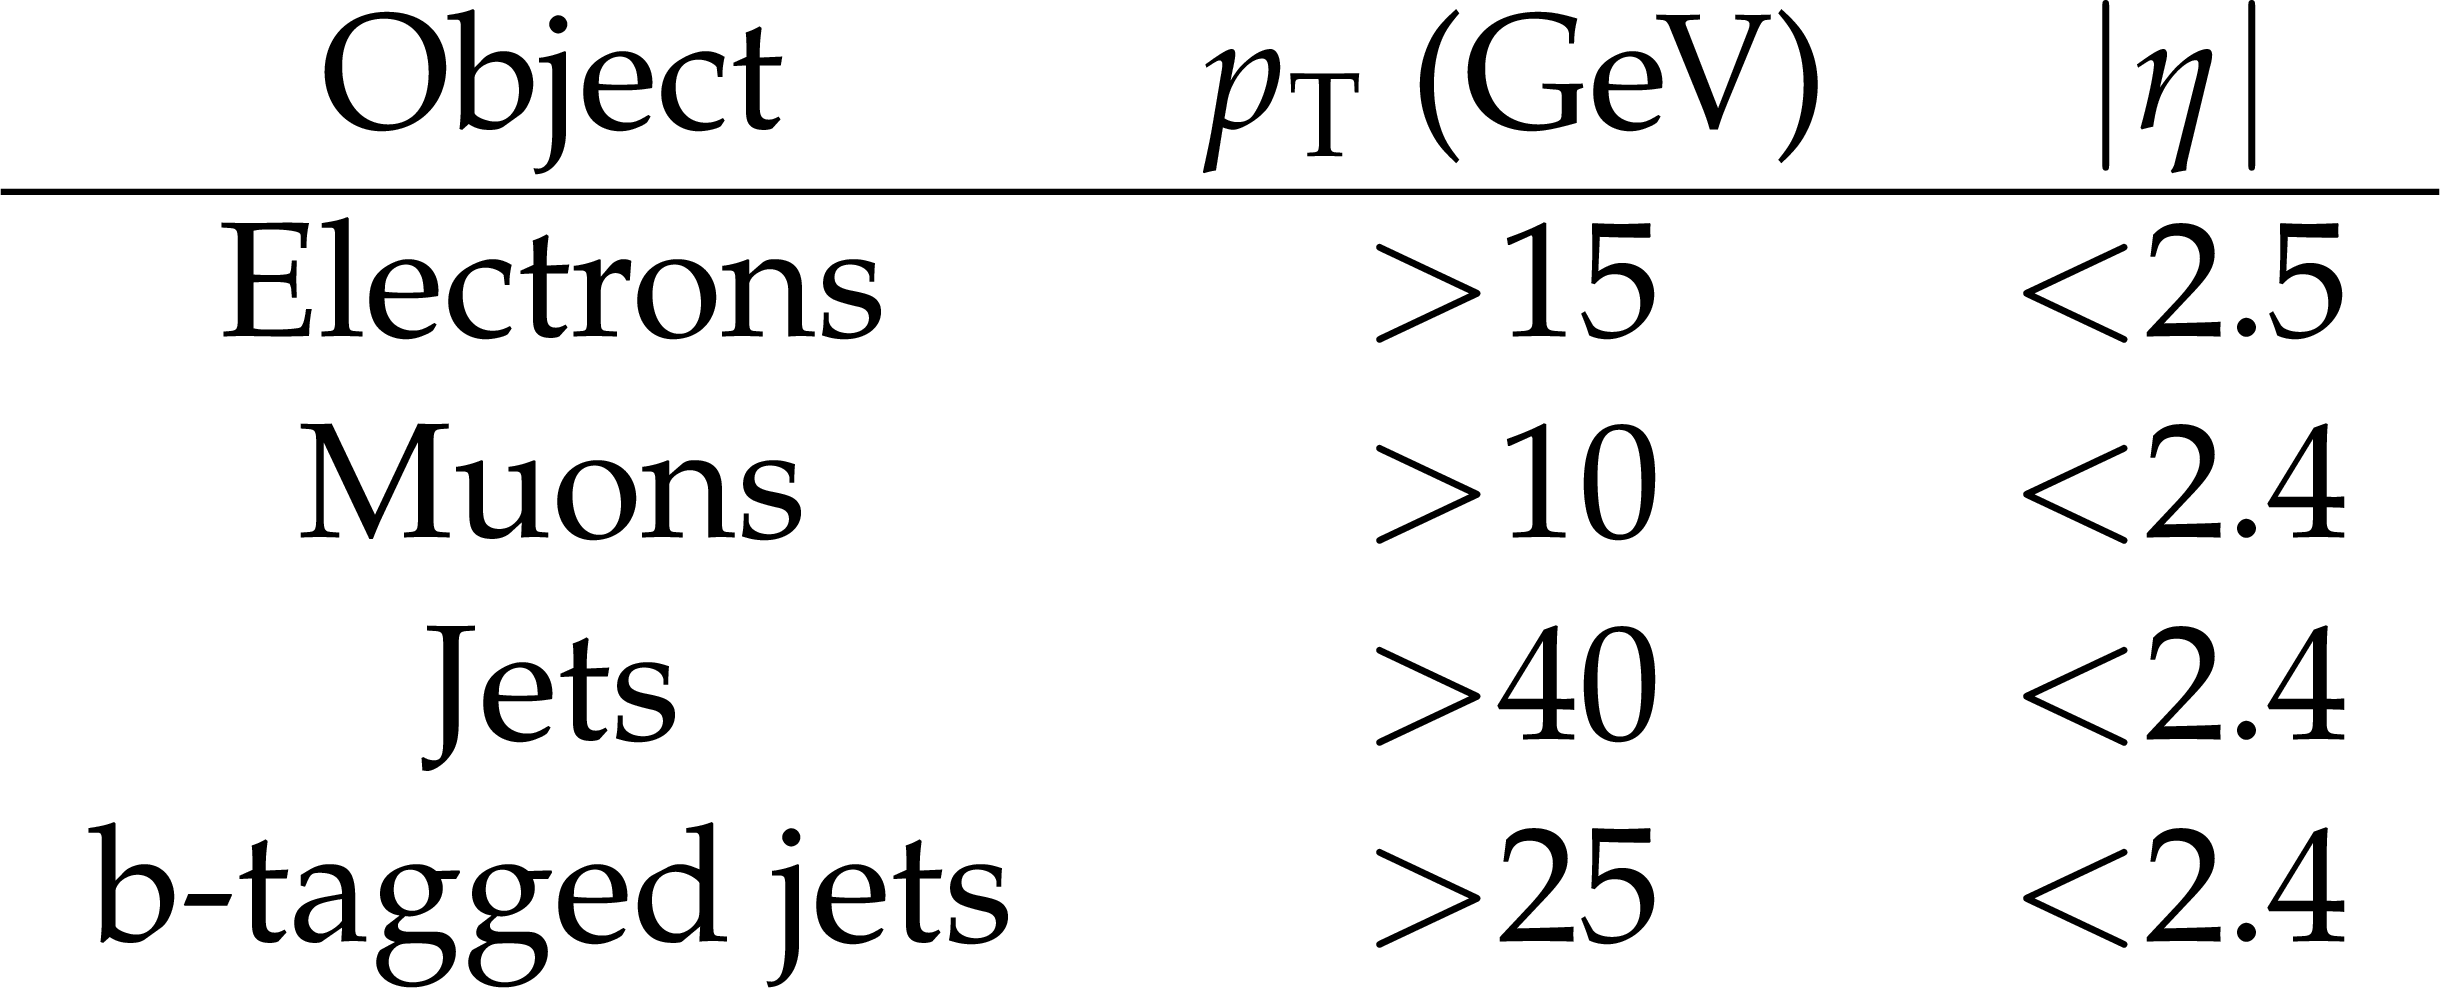
Table 1:
Transverse momentum and pseudorapidity requirements for leptons and jets. Note that the $ {p_{\mathrm {T}}} $ thresholds to count jets and b-tagged jets are different; the jet multiplicity ${N_\text {jets}}$ includes b-tagged jets if their ${p_{\mathrm {T}}}$ exceeds 40 GeV. |
png pdf |
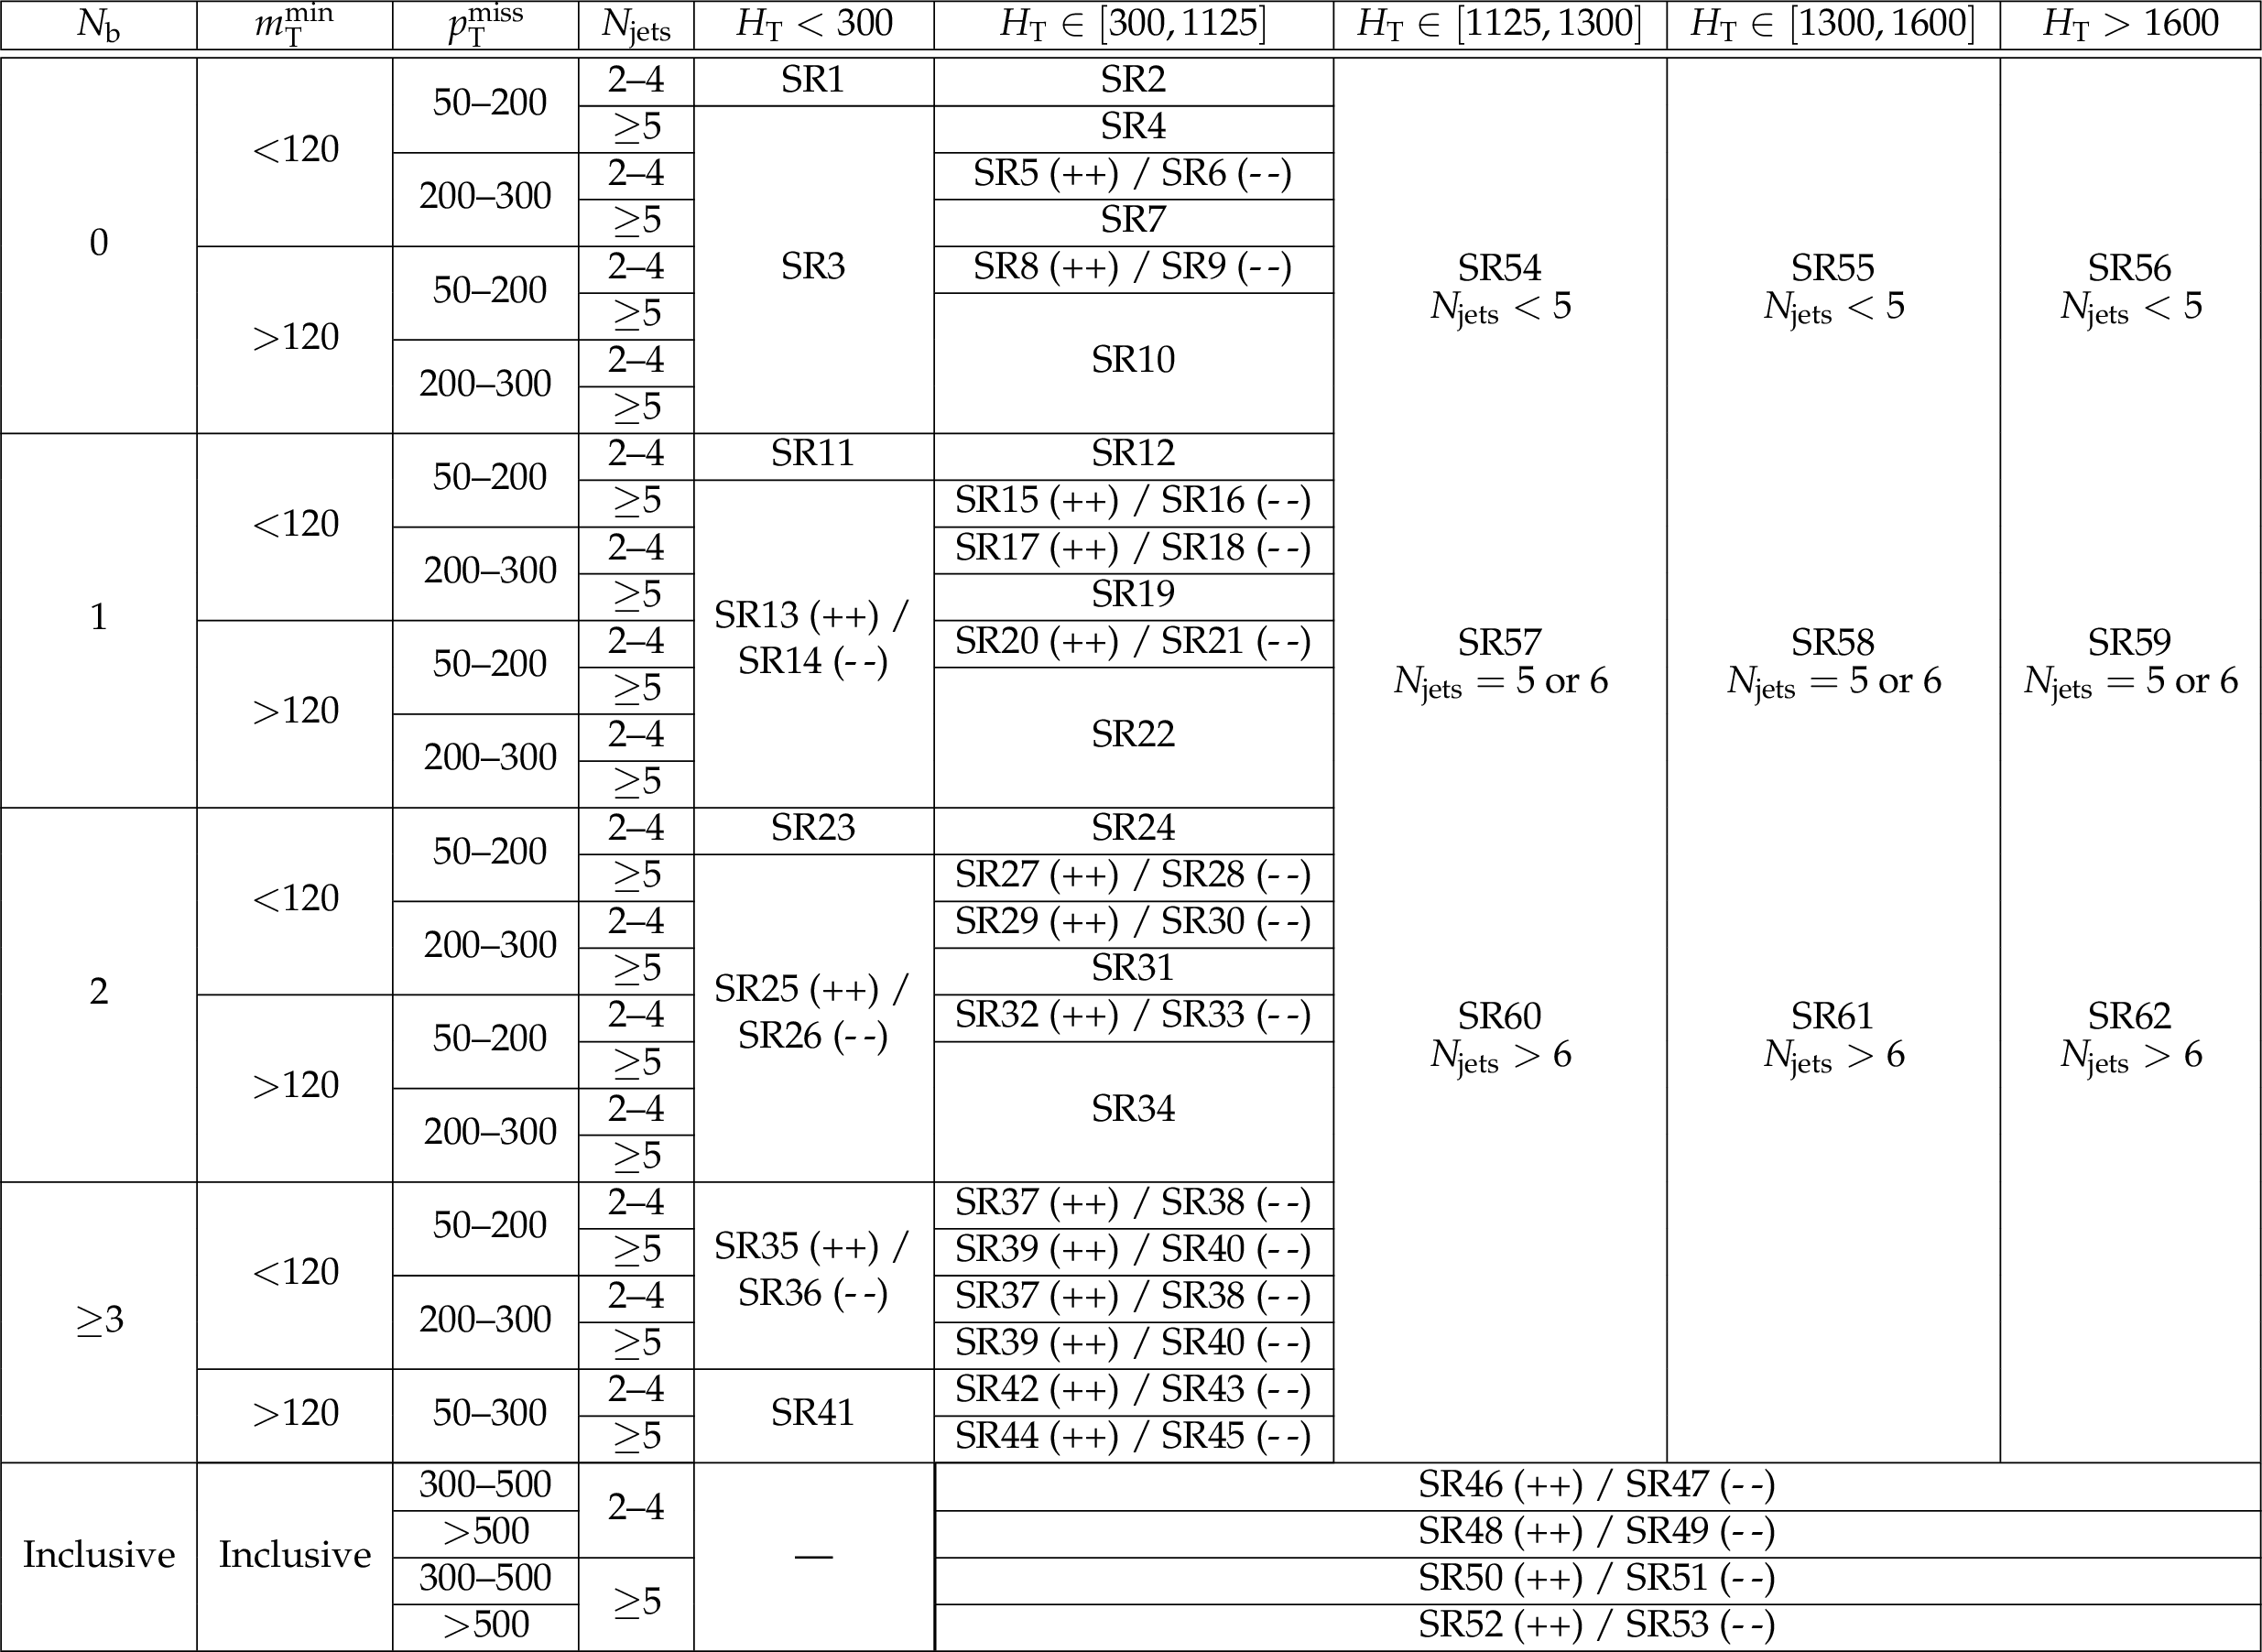
Table 2:
The SR definitions for the HH category. Charge-split regions are indicated with ($++$) and ($- -$). The three highest $ {H_{\mathrm {T}}} $ regions are split only by $ {N_\text {jets}} $, resulting in 62 regions in total. Quantities are specified in units of GeV where applicable. |

png pdf |
Table 3:
The SR definitions for the HL category. Charge-split regions are indicated with ($++$) and ($- -$). There are 43 regions in total. Quantities are specified in units of GeV where applicable. |
png pdf |
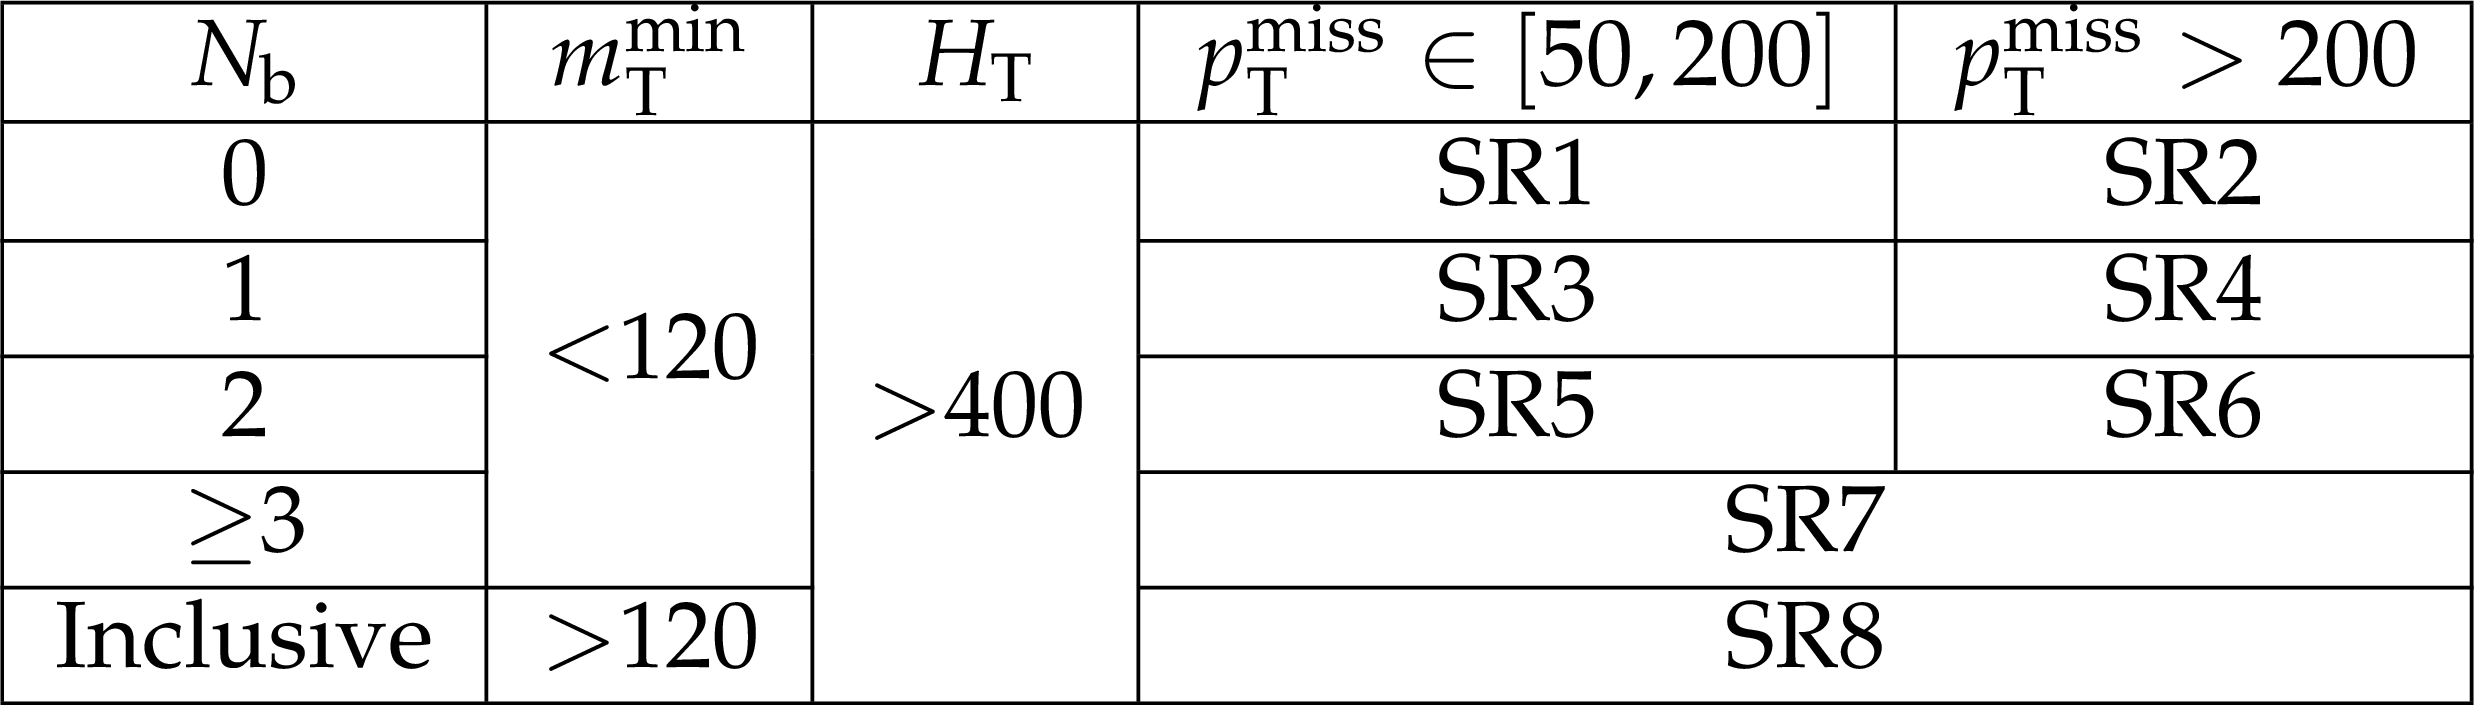
Table 4:
The SR definitions for the LL category. All SRs in this category require $ {N_\text {jets}} \geq $ 2. There are 8 regions in total. Quantities are specified in units of GeV where applicable. |
png pdf |
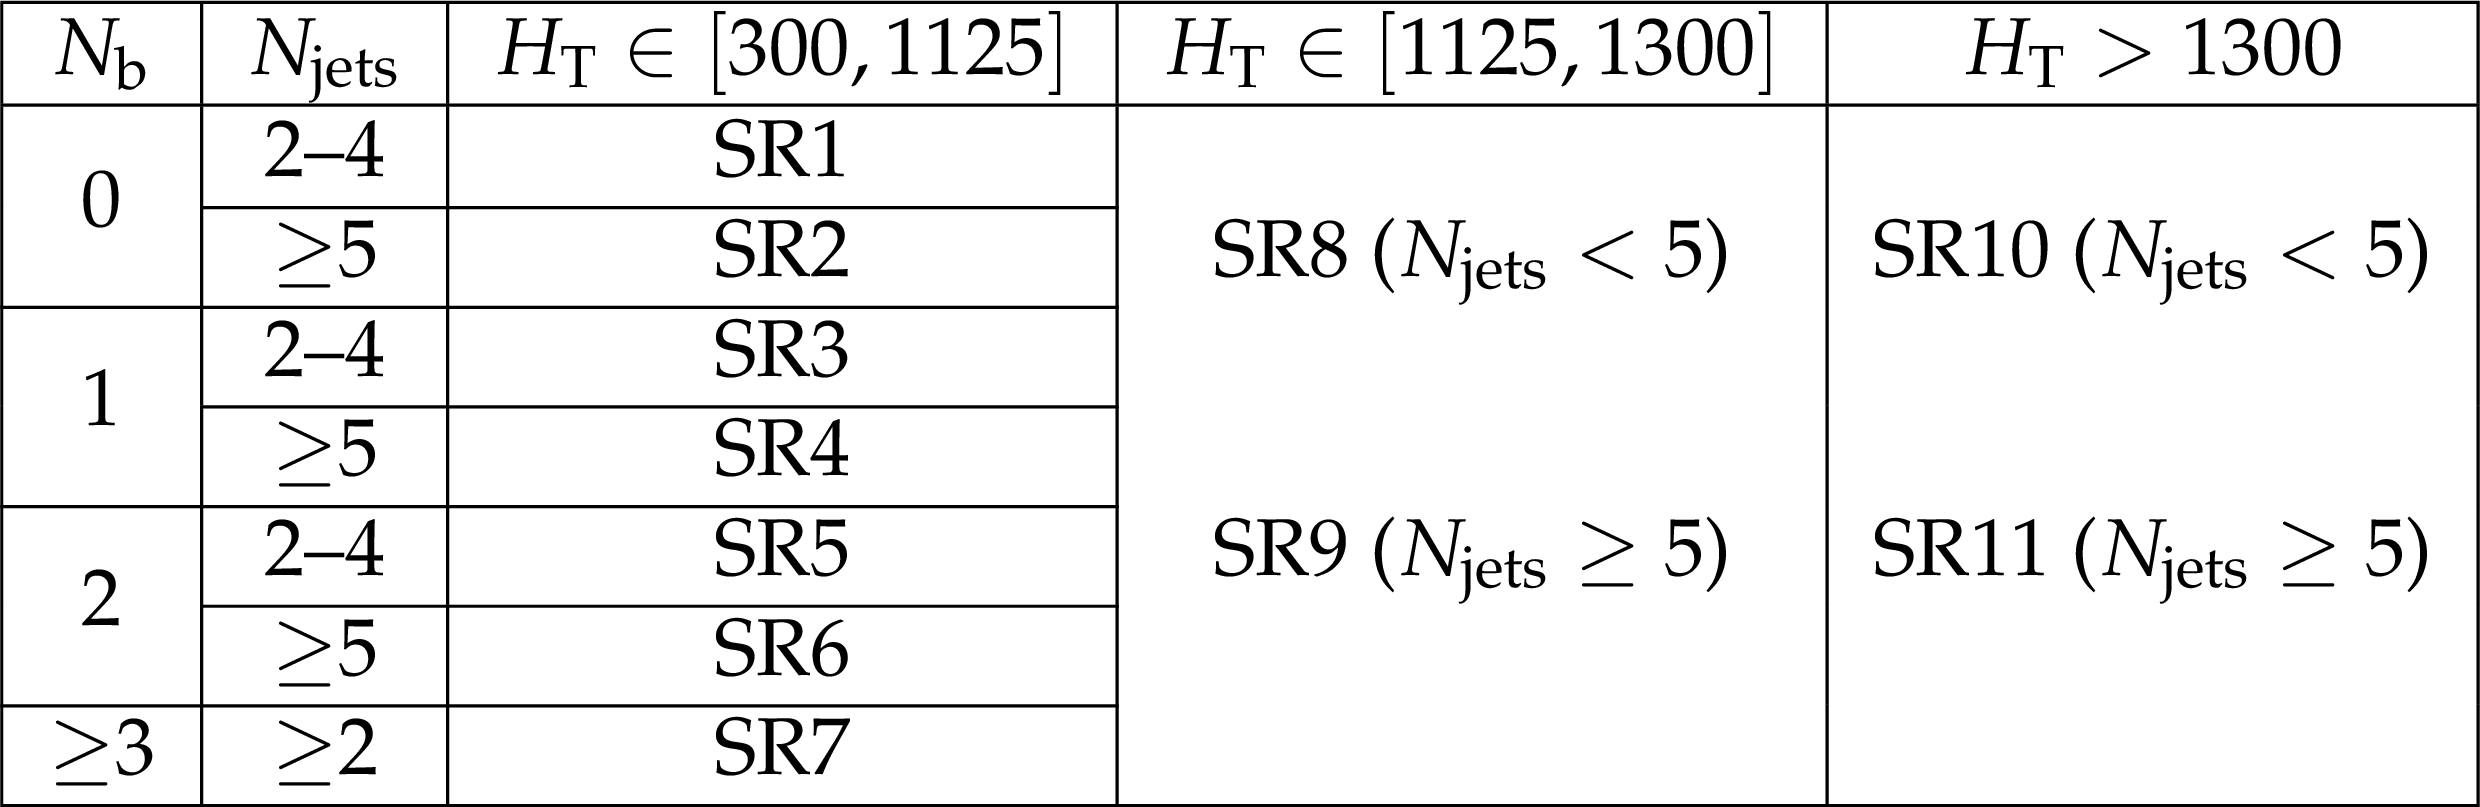
Table 5:
The SR definitions for the LM category. All SRs in this category require $ {{p_{\mathrm {T}}} ^\text {miss}} < $ 50 GeV and $ {H_{\mathrm {T}}} > $ 300 GeV. The two high-$ {H_{\mathrm {T}}} $ regions are split only by $ {N_\text {jets}} $, resulting in 11 regions in total. Quantities are specified in units of GeV where applicable. |
png pdf |
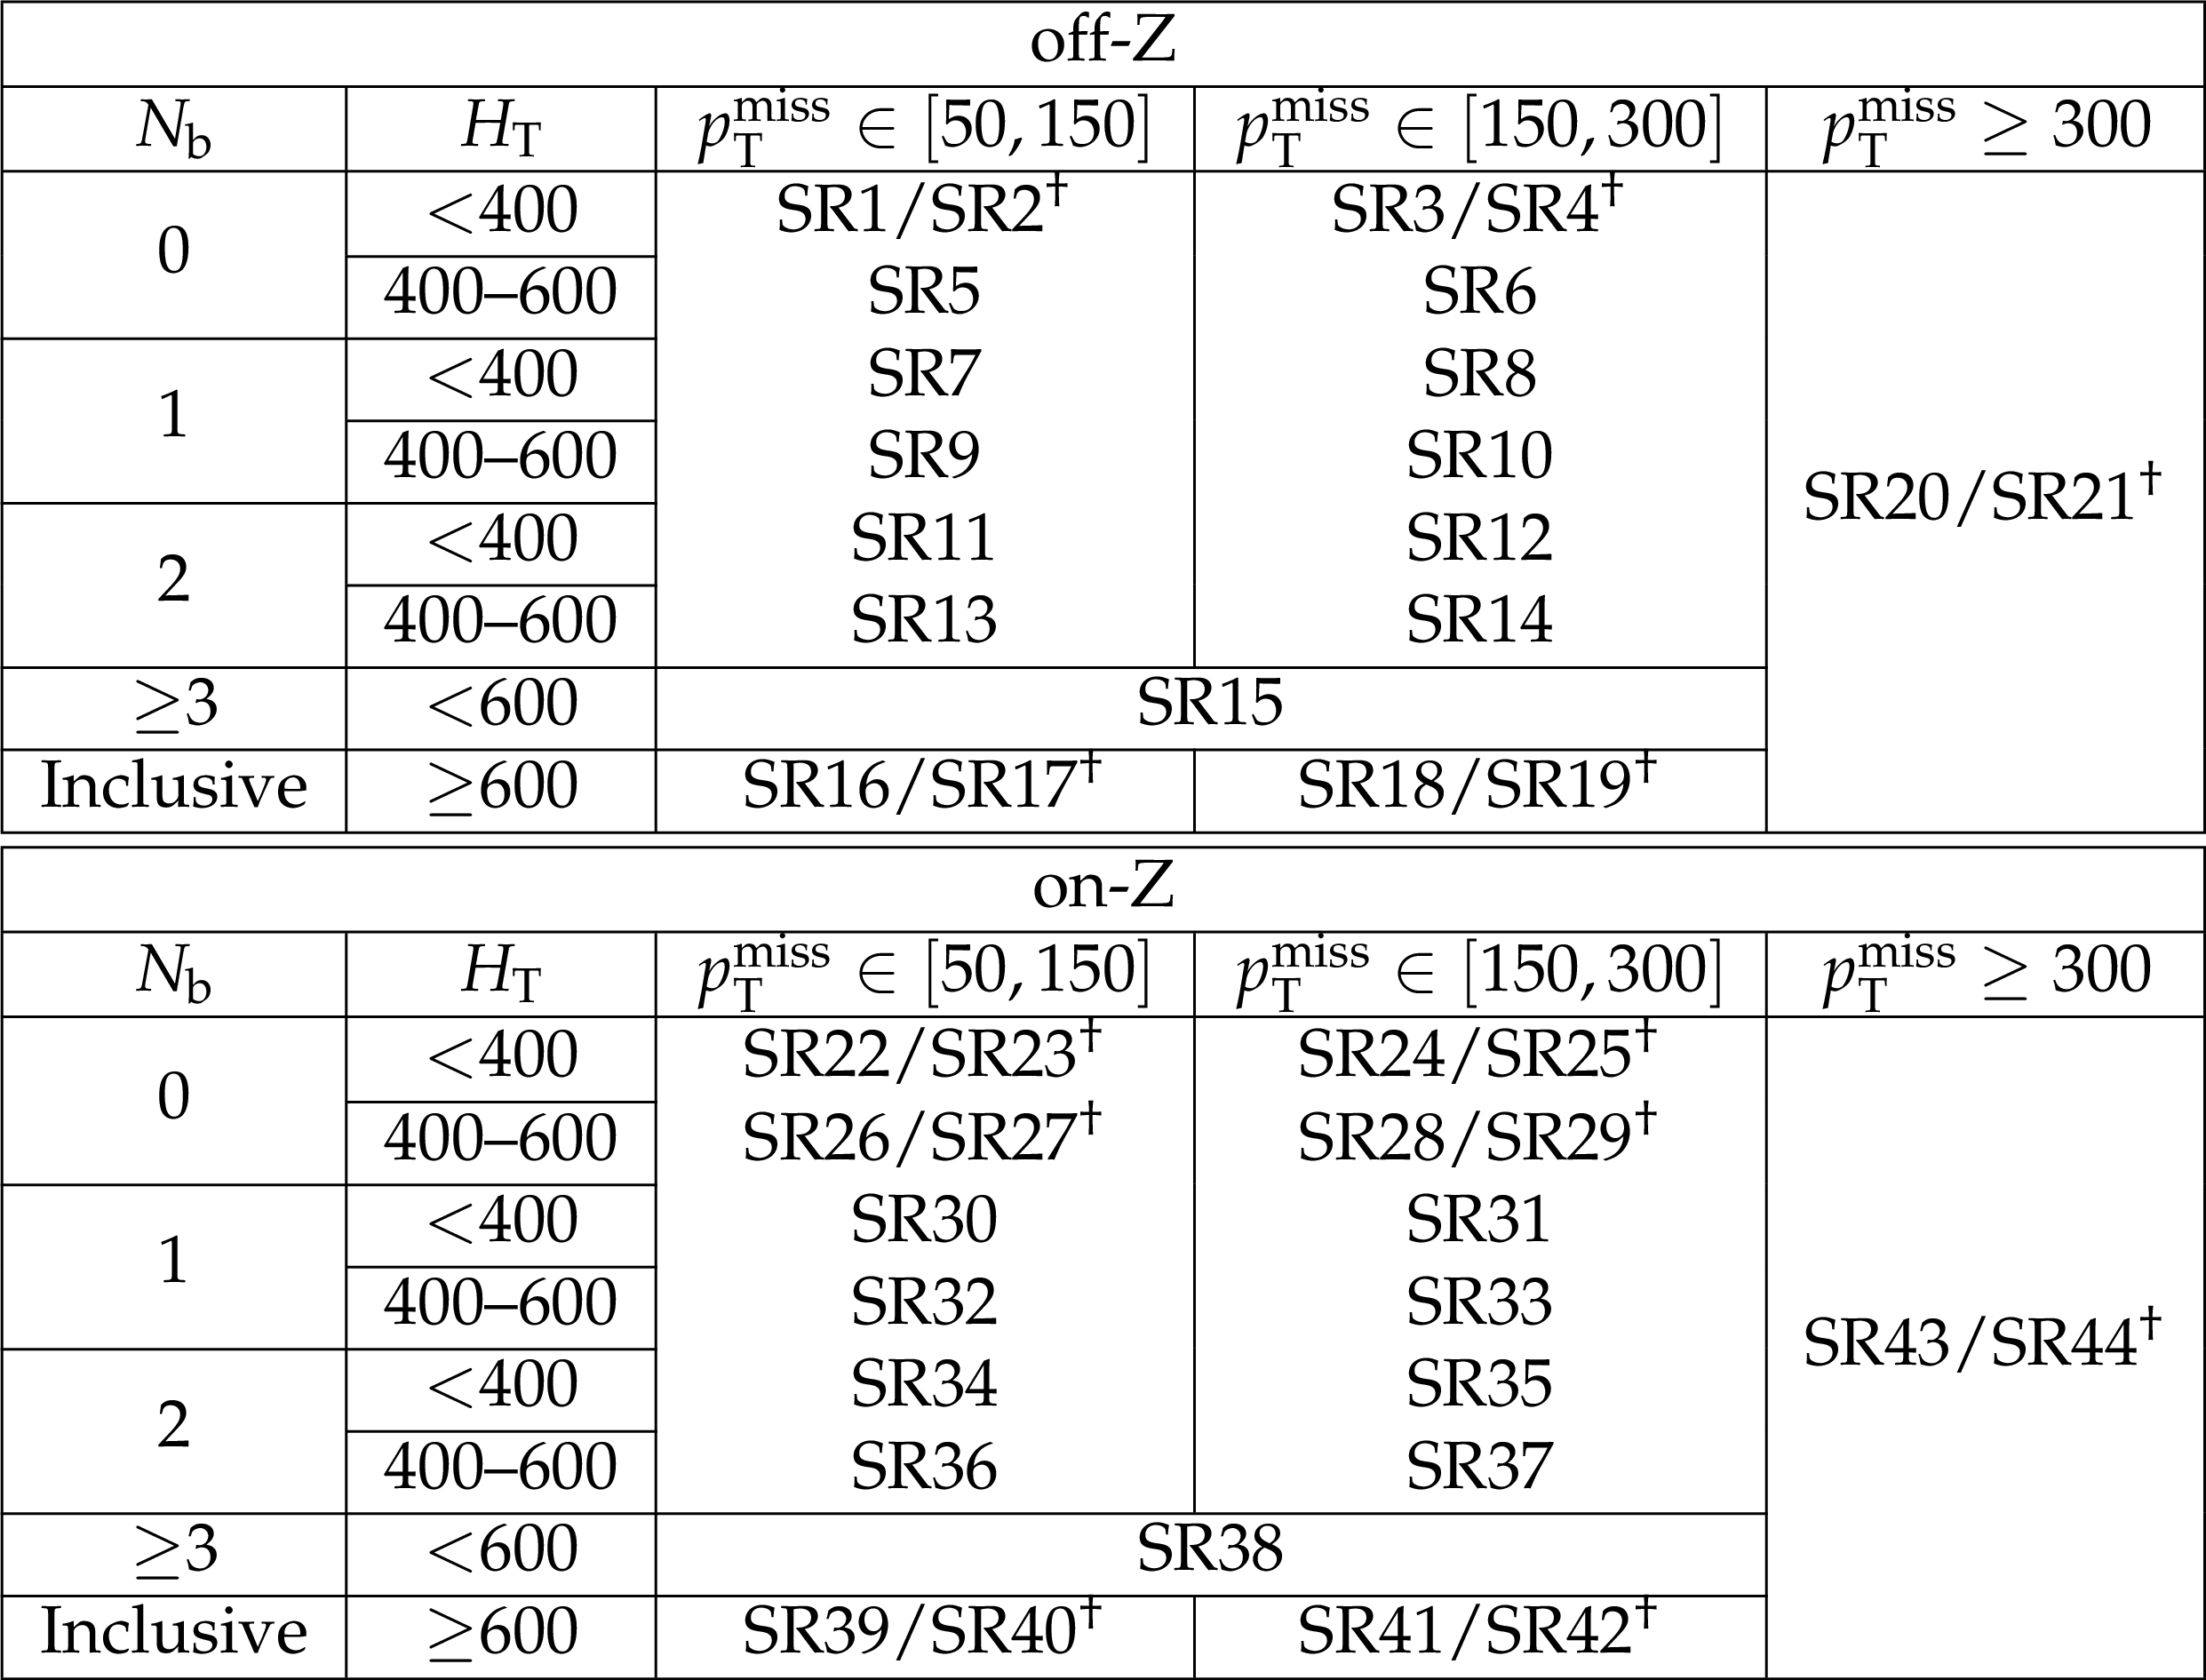
Table 6:
The SR definitions for the ML category. All SRs in these categories require $ {N_\text {jets}} \geq $ 2. Regions marked with ${}^\dagger $ are split by $ {{m_{\mathrm {T}}} ^{\text {min}}} = $ 120 GeV, with the high-$ {{m_{\mathrm {T}}} ^{\text {min}}} $ region specified by the second SR label. On-Z regions events include an OS same-flavor pair with 76 $ < m_{\ell \ell} < $ 106 GeV. There are 44 regions in total. Quantities are specified in units of GeV where applicable. |

png pdf |
Table 7:
Summary of the sources of systematic uncertainty and their effect on the yields of different processes in the SRs. The first two groups list experimental and theoretical uncertainties assigned to processes estimated using simulation, while the last group lists uncertainties assigned to processes whose yield is estimated from the data. The uncertainties in the first group also apply to signal samples. Reported values are representative for the most relevant signal regions. |
png pdf |
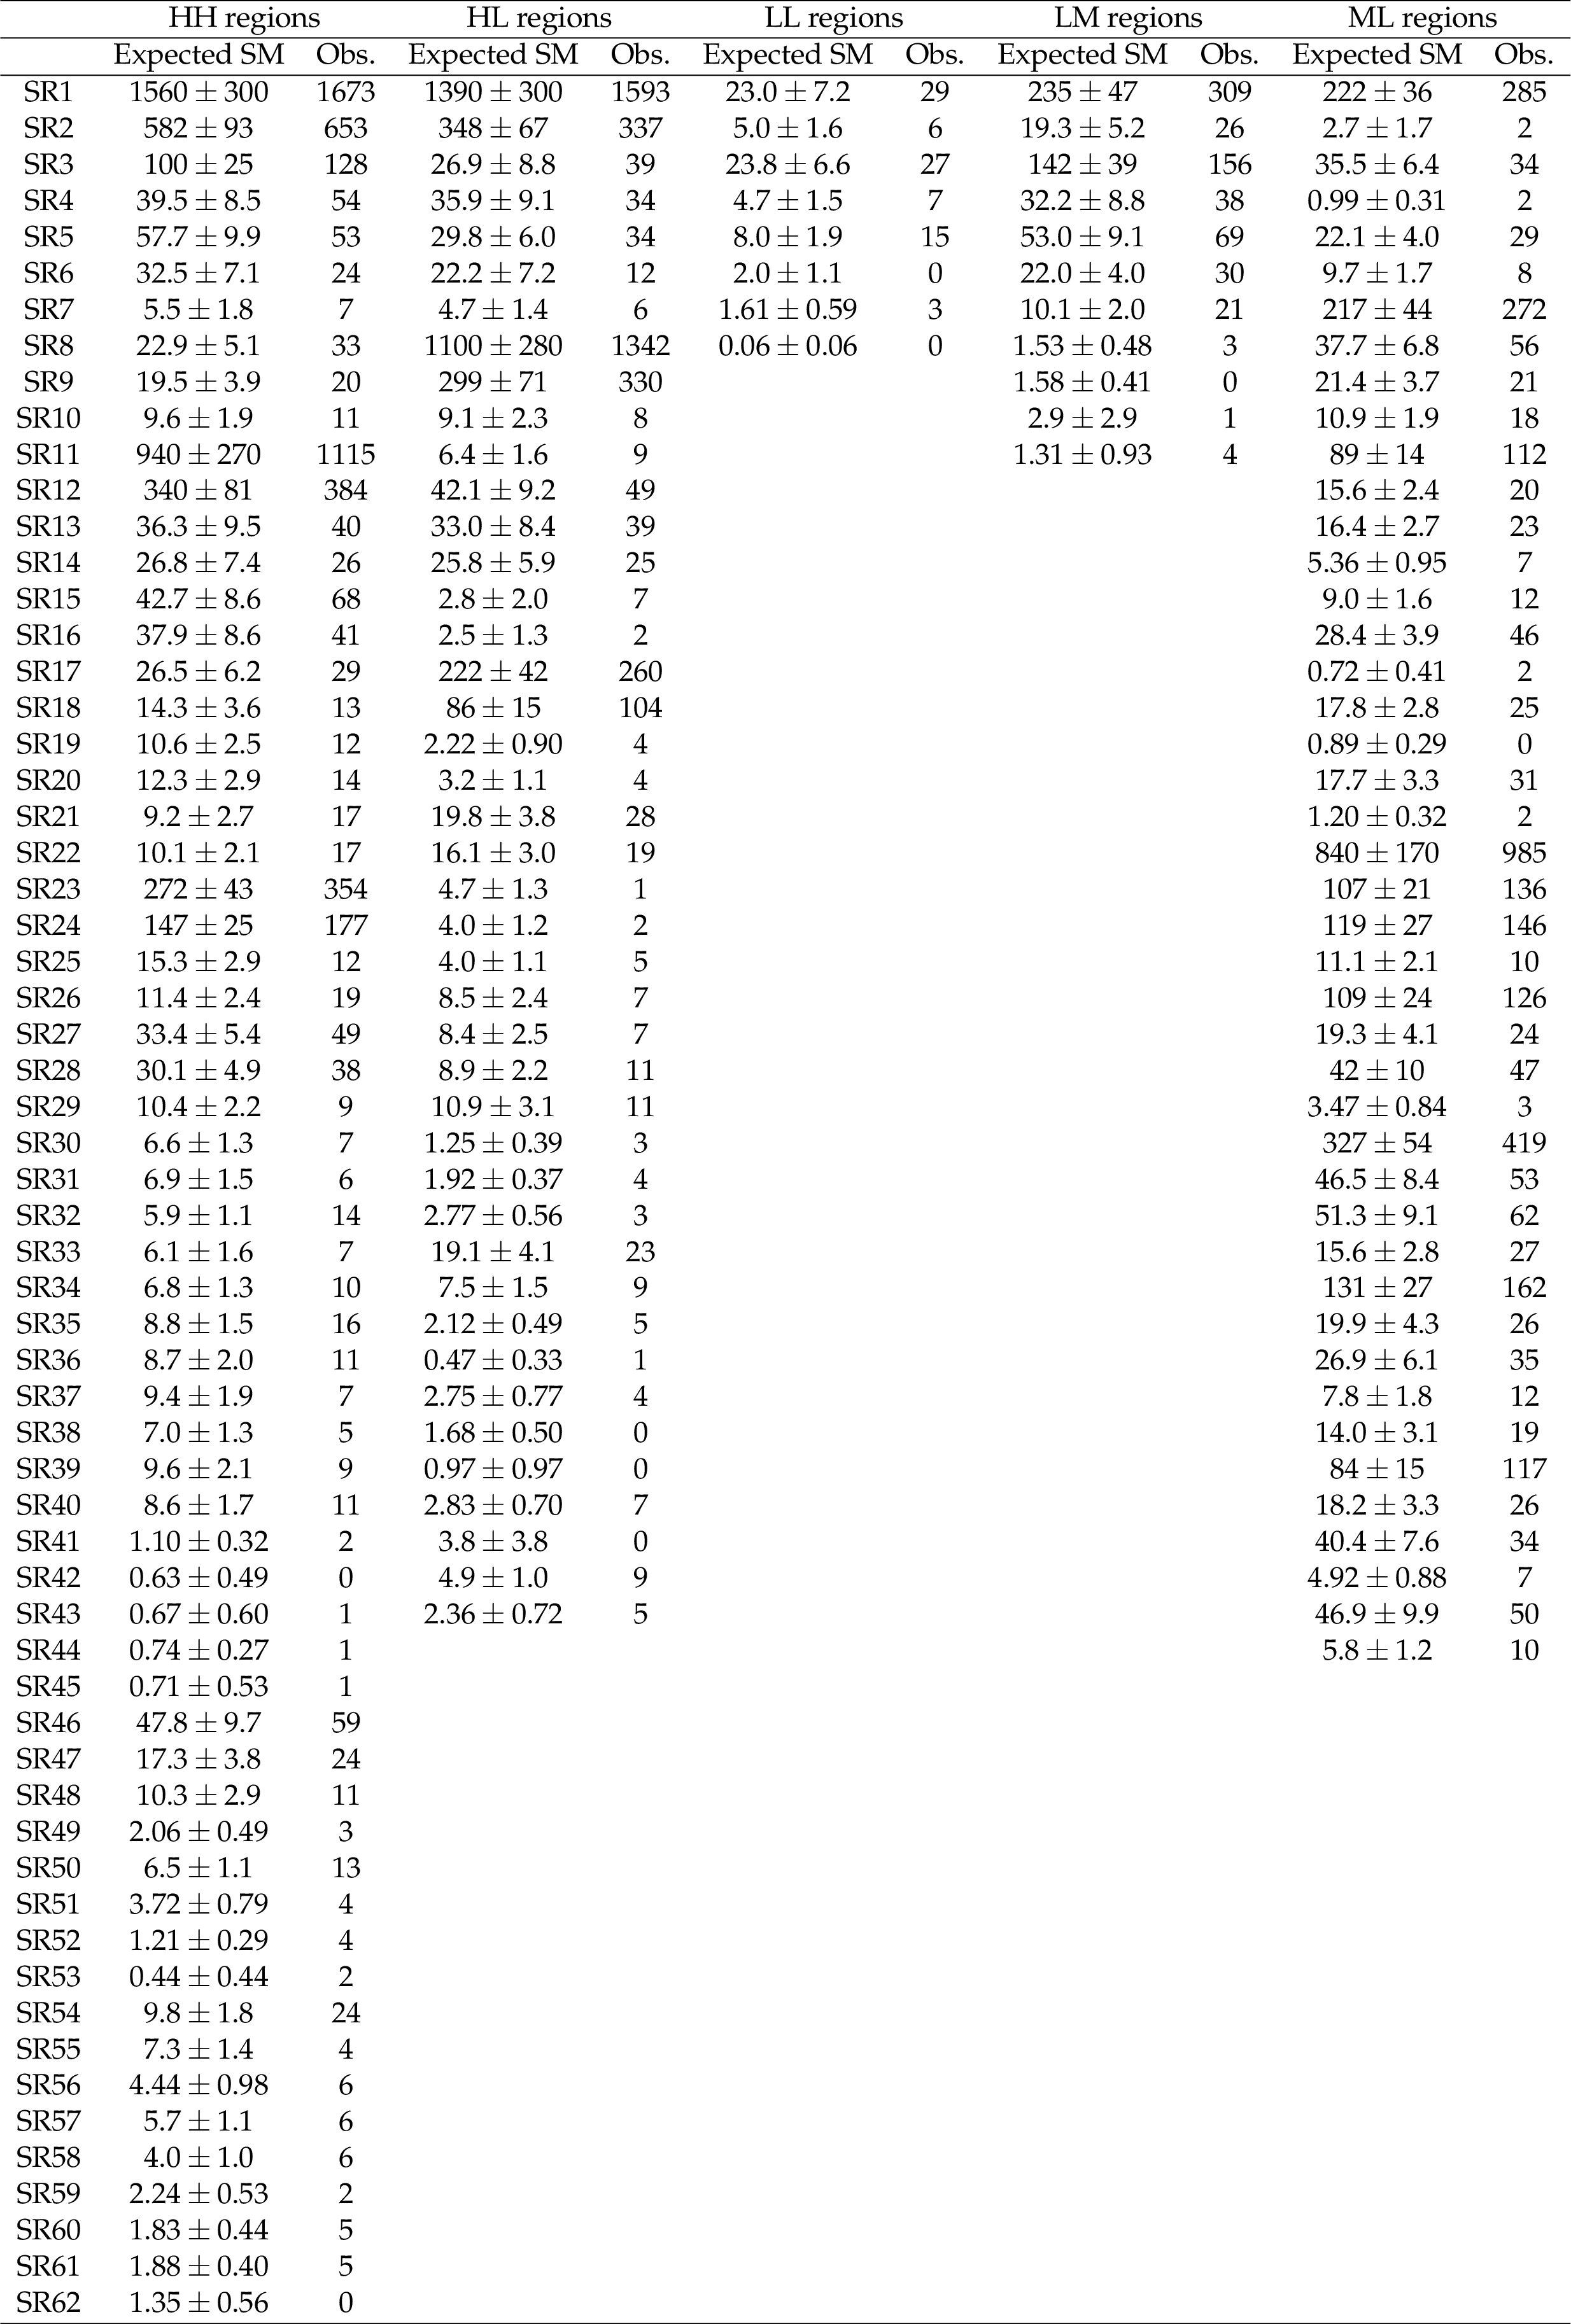
Table 8:
Expected background event yields, total uncertainties, and observed event yields in the SRs used in this search. |
png pdf |
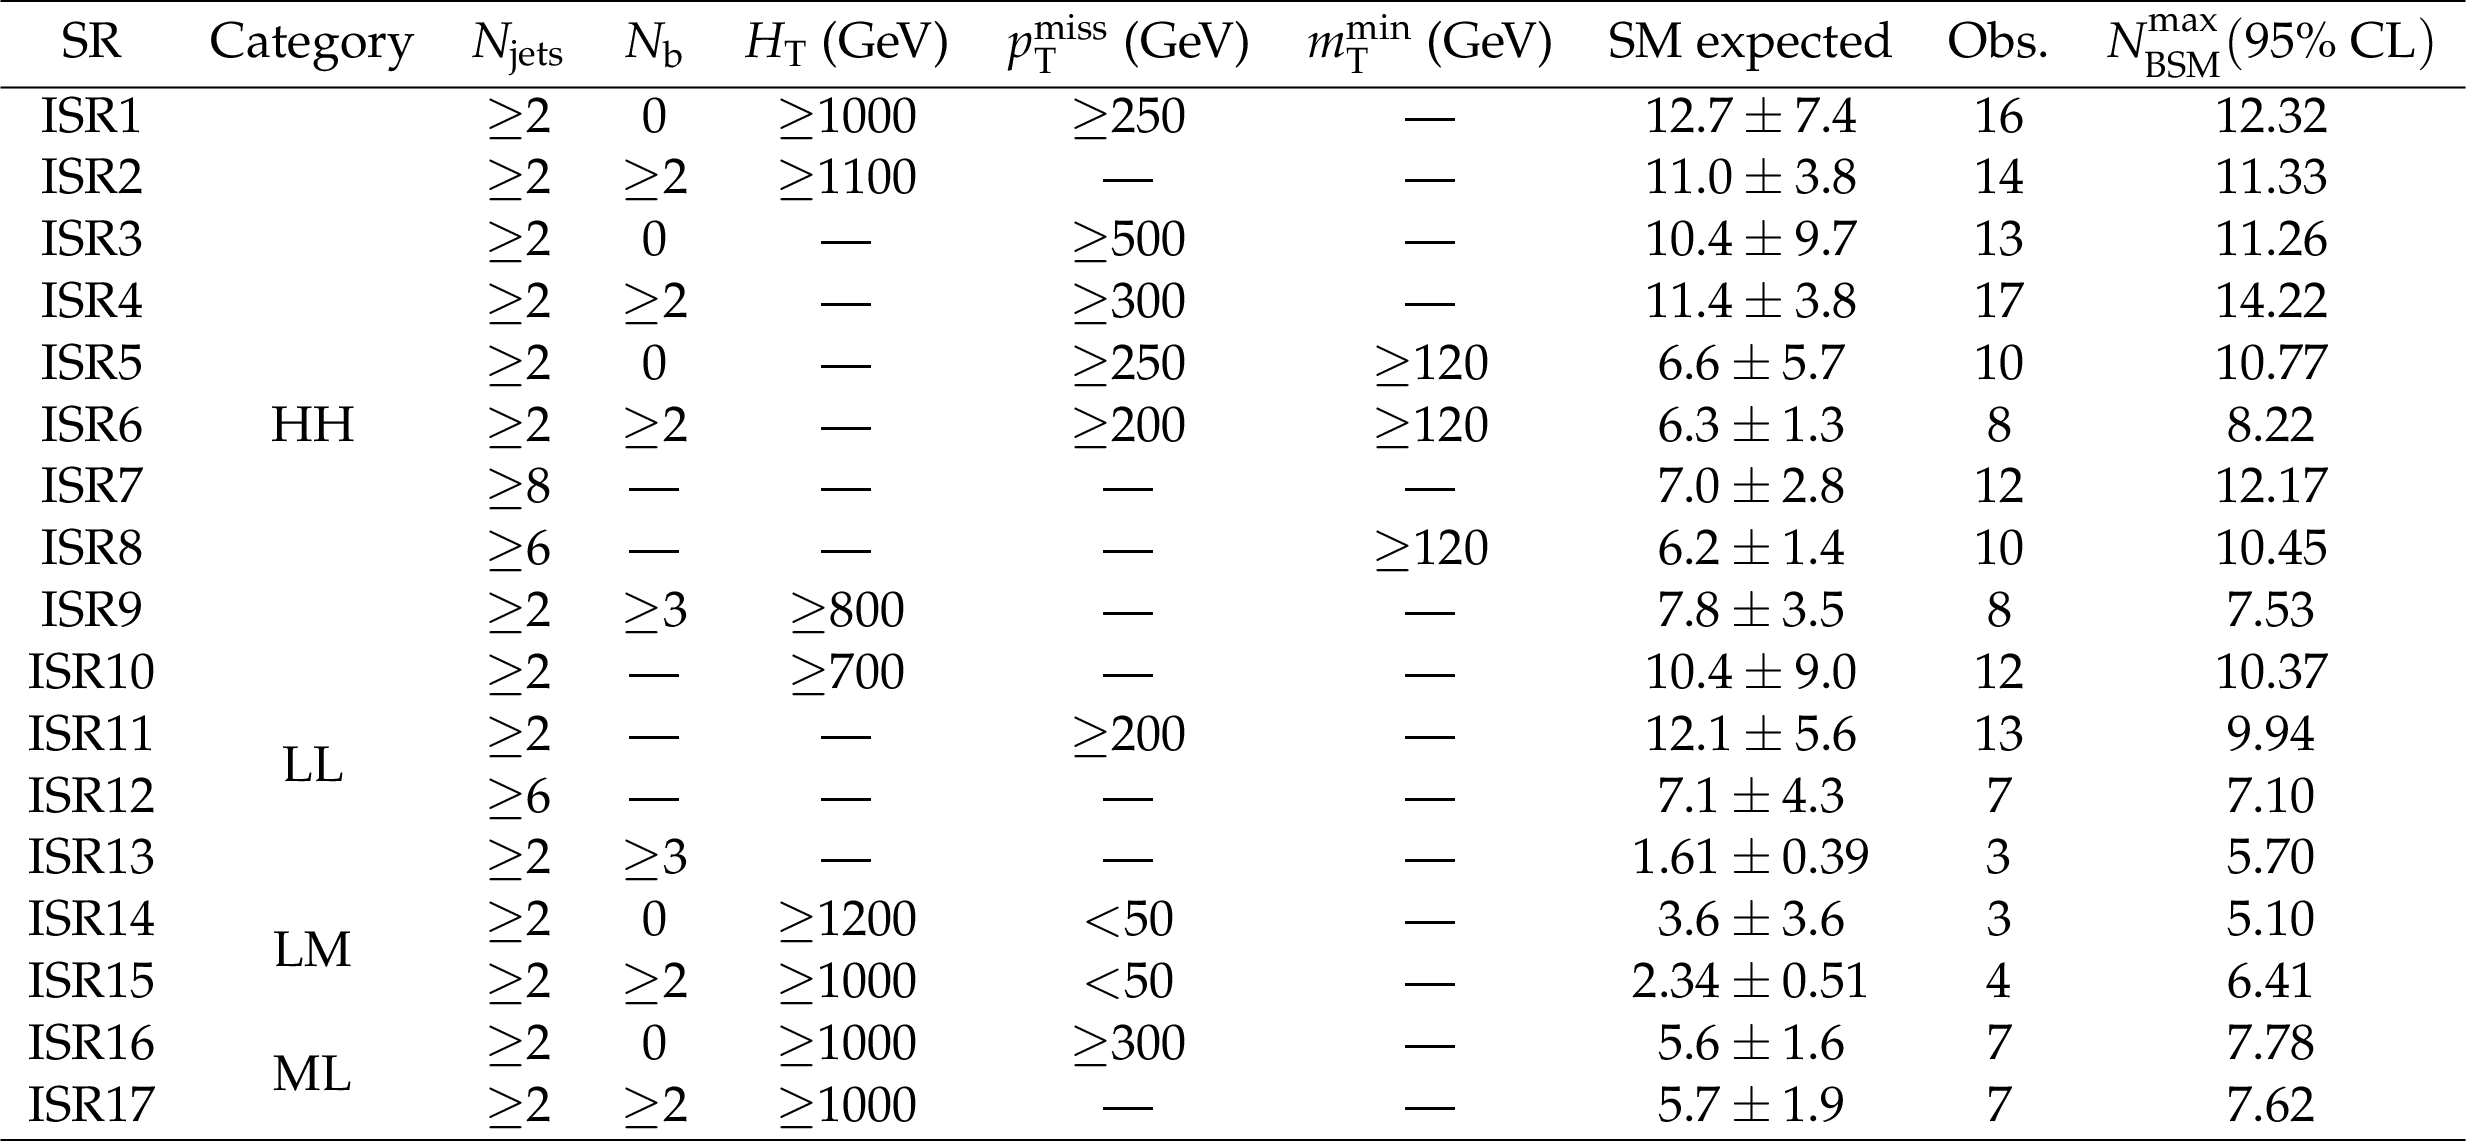
Table 9:
Inclusive SR definitions, expected background yields and uncertainties, and observed yields, as well as the observed 95% CL upper limits on the number of BSM events contributing to each region. No uncertainty in the signal acceptance is assumed in calculating these limits. A dash ($- -$) indicates that a particular selection is not required. |
| Summary |
| A sample of events with two same-sign or at least three charged leptons produced in association with several jets in proton-proton collisions at 13 TeV, corresponding to an integrated luminosity of 137 fb$^{-1}$, has been studied to search for manifestations of physics beyond the standard model. The data are found to be consistent with the standard model expectations. The results are interpreted as limits on cross sections at 95% confidence level for the production of new particles in simplified supersymmetric models, considering both R parity conserving and violating scenarios. Using calculations for these cross sections as functions of particle masses, the limits are translated into lower mass limits that are as large as 2.1 TeV for gluinos and 0.9 TeV for top and bottom squarks, depending on the details of the model. The results extend the gluino and squark mass observed and expected exclusions by up to 200 GeV, compared to the previous versions of this analysis. Finally, to facilitate further interpretations of the search, model-independent limits are provided as a function of the missing transverse momentum and the scalar sum of jet transverse momenta in an event, together with the background prediction and data yields in a set of simplified signal regions. |
| References | ||||
| 1 | R. M. Barnett, J. F. Gunion, and H. E. Haber | Discovering supersymmetry with like-sign dileptons | PLB 315 (1993) 349 | hep-ph/9306204 |
| 2 | M. Guchait and D. P. Roy | Like-sign dilepton signature for gluino production at CERN LHC including top quark and Higgs boson effects | PRD 52 (1995) 133 | hep-ph/9412329 |
| 3 | Y. Bai and Z. Han | Top-antitop and top-top resonances in the dilepton channel at the CERN LHC | JHEP 04 (2009) 056 | 0809.4487 |
| 4 | E. L. Berger et al. | Top quark forward-backward asymmetry and same-sign top quark pairs | PRL 106 (2011) 201801 | 1101.5625 |
| 5 | T. Plehn and T. M. P. Tait | Seeking sgluons | JPG 36 (2009) 075001 | 0810.3919 |
| 6 | S. Calvet, B. Fuks, P. Gris, and L. Valery | Searching for sgluons in multitop events at a center-of-mass energy of 8 TeV | JHEP 04 (2013) 043 | 1212.3360 |
| 7 | K. J. F. Gaemers and F. Hoogeveen | Higgs production and decay into heavy flavors with the gluon fusion mechanism | PLB 146 (1984) 347 | |
| 8 | G. C. Branco et al. | Theory and phenomenology of two-Higgs-doublet models | PR 516 (2012) 1 | 1106.0034 |
| 9 | F. M. L. Almeida, Jr. et al. | Same-sign dileptons as a signature for heavy Majorana neutrinos in hadron-hadron collisions | PLB 400 (1997) 331 | hep-ph/9703441 |
| 10 | R. Contino and G. Servant | Discovering the top partners at the LHC using same-sign dilepton final states | JHEP 06 (2008) 026 | 0801.1679 |
| 11 | P. Ramond | Dual theory for free fermions | PRD 3 (1971) 2415 | |
| 12 | Y. A. Gol'fand and E. P. Likhtman | Extension of the algebra of Poincar$ \'e $ group generators and violation of P invariance | JEPTL 13 (1971)323 | |
| 13 | A. Neveu and J. H. Schwarz | Factorizable dual model of pions | NPB 31 (1971) 86 | |
| 14 | D. V. Volkov and V. P. Akulov | Possible universal neutrino interaction | JEPTL 16 (1972)438 | |
| 15 | J. Wess and B. Zumino | A Lagrangian model invariant under supergauge transformations | PLB 49 (1974) 52 | |
| 16 | J. Wess and B. Zumino | Supergauge transformations in four-dimensions | NPB 70 (1974) 39 | |
| 17 | P. Fayet | Supergauge invariant extension of the Higgs mechanism and a model for the electron and its neutrino | NPB 90 (1975) 104 | |
| 18 | H. P. Nilles | Supersymmetry, supergravity and particle physics | PR 110 (1984) 1 | |
| 19 | S. P. Martin | A supersymmetry primer | in Perspectives on Supersymmetry II, G. L. Kane, ed., p. 1 World Scientific, 2010 Adv. Ser. Direct. High Energy Phys., vol. 21 | |
| 20 | G. R. Farrar and P. Fayet | Phenomenology of the production, decay, and detection of new hadronic states associated with supersymmetry | PLB 76 (1978) 575 | |
| 21 | E. Nikolidakis and C. Smith | Minimal Flavor Violation, Seesaw, and R-parity | PRD 77 (2008) 015021 | 0710.3129 |
| 22 | C. Csaki, Y. Grossman, and B. Heidenreich | MFV SUSY: A Natural Theory for R-Parity Violation | PRD 85 (2012) 095009 | 1111.1239 |
| 23 | ATLAS Collaboration | Search for supersymmetry in final states with two same-sign or three leptons and jets using 36 fb$ ^{-1} $ of $ \sqrt{s}=13 TeV pp $ collision data with the ATLAS detector | JHEP 09 (2017) 084 | 1706.03731 |
| 24 | CMS Collaboration | Search for physics beyond the standard model in events with two leptons of same sign, missing transverse momentum, and jets in proton-proton collisions at $ \sqrt{s} = $ 13 TeV | EPJC 77 (2017) 578 | CMS-SUS-16-035 1704.07323 |
| 25 | CMS Collaboration | Search for supersymmetry in events with at least three electrons or muons, jets, and missing transverse momentum in proton-proton collisions at $ \sqrt{s}= $ 13 TeV | JHEP 02 (2018) 067 | CMS-SUS-16-041 1710.09154 |
| 26 | J. Alwall et al. | The automated computation of tree-level and next-to-leading order differential cross sections, and their matching to parton shower simulations | JHEP 07 (2014) 079 | 1405.0301 |
| 27 | J. Alwall et al. | Comparative study of various algorithms for the merging of parton showers and matrix elements in hadronic collisions | EPJC 53 (2008) 473 | 0706.2569 |
| 28 | R. Frederix and S. Frixione | Merging meets matching in MC@NLO | JHEP 12 (2012) 061 | 1209.6215 |
| 29 | P. Nason | A new method for combining NLO QCD with shower Monte Carlo algorithms | JHEP 11 (2004) 040 | hep-ph/0409146 |
| 30 | S. Frixione, P. Nason, and C. Oleari | Matching NLO QCD computations with parton shower simulations: the POWHEG method | JHEP 11 (2007) 070 | 0709.2092 |
| 31 | S. Alioli, P. Nason, C. Oleari, and E. Re | A general framework for implementing NLO calculations in shower Monte Carlo programs: the POWHEG BOX | JHEP 06 (2010) 043 | 1002.2581 |
| 32 | T. Melia, P. Nason, R. Rontsch, and G. Zanderighi | W$ ^+ $W$ ^- $, WZ and ZZ production in the POWHEG BOX | JHEP 11 (2011) 078 | 1107.5051 |
| 33 | P. Nason and G. Zanderighi | $ \mathrm{W}^+ \mathrm{W}^- $ , $ \mathrm{W} \mathrm{Z} $ and $ \mathrm{Z} \mathrm{Z} $ production in the POWHEG BOX V2 | EPJC 74 (2014) 2702 | 1311.1365 |
| 34 | NNPDF Collaboration | Parton distributions for the LHC Run II | JHEP 04 (2015) 040 | 1410.8849 |
| 35 | NNPDF Collaboration | Parton distributions from high-precision collider data | EPJC 77 (2017) 663 | 1706.00428 |
| 36 | T. Sjostrand et al. | An Introduction to PYTHIA 8.2 | CPC 191 (2015) 159 | 1410.3012 |
| 37 | P. Skands, S. Carrazza, and J. Rojo | Tuning PYTHIA 8.1: the Monash 2013 tune | EPJC 74 (2014) 3024 | 1404.5630 |
| 38 | CMS Collaboration | Event generator tunes obtained from underlying event and multiparton scattering measurements | EPJC 76 (2016) 155 | CMS-GEN-14-001 1512.00815 |
| 39 | CMS Collaboration | Extraction and validation of a new set of CMS PYTHIA8 tunes from underlying-event measurements | EPJC 80 (2020) 4 | CMS-GEN-17-001 1903.12179 |
| 40 | GEANT4 Collaboration | GEANT4 --- a simulation toolkit | NIMA 506 (2003) 250 | |
| 41 | S. Abdullin et al. | The fast simulation of the CMS detector at LHC | J. Phys. Conf. Ser. 331 (2011) 032049 | |
| 42 | A. Giammanco | The fast simulation of the CMS experiment | J. Phys. Conf. Ser. 513 (2014) 022012 | |
| 43 | D. Alves et al. | Simplified models for LHC new physics searches | JPG 39 (2012) 105005 | 1105.2838 |
| 44 | CMS Collaboration | Interpretation of searches for supersymmetry with simplified models | PRD 88 (2013) 052017 | CMS-SUS-11-016 1301.2175 |
| 45 | W. Beenakker et al. | NNLL-fast: predictions for coloured supersymmetric particle production at the LHC with threshold and Coulomb resummation | JHEP 12 (2016) 133 | 1607.07741 |
| 46 | W. Beenakker, R. Hopker, M. Spira, and P. M. Zerwas | Squark and gluino production at hadron colliders | NPB 492 (1997) 51 | hep-ph/9610490 |
| 47 | A. Kulesza and L. Motyka | Threshold resummation for squark-antisquark and gluino-pair production at the LHC | PRL 102 (2009) 111802 | 0807.2405 |
| 48 | A. Kulesza and L. Motyka | Soft gluon resummation for the production of gluino-gluino and squark-antisquark pairs at the LHC | PRD 80 (2009) 095004 | 0905.4749 |
| 49 | W. Beenakker et al. | Soft-gluon resummation for squark and gluino hadroproduction | JHEP 12 (2009) 041 | 0909.4418 |
| 50 | W. Beenakker et al. | Squark and gluino hadroproduction | Int. J. Mod. Phys. A 26 (2011) 2637 | 1105.1110 |
| 51 | W. Beenakker et al. | NNLL resummation for squark-antisquark pair production at the LHC | JHEP 01 (2012) 076 | 1110.2446 |
| 52 | W. Beenakker et al. | Towards NNLL resummation: hard matching coefficients for squark and gluino hadroproduction | JHEP 10 (2013) 120 | 1304.6354 |
| 53 | W. Beenakker et al. | NNLL resummation for squark and gluino production at the LHC | JHEP 12 (2014) 023 | 1404.3134 |
| 54 | W. Beenakker et al. | Stop production at hadron colliders | NPB 515 (1998) 3 | hep-ph/9710451 |
| 55 | W. Beenakker et al. | Supersymmetric top and bottom squark production at hadron colliders | JHEP 08 (2010) 098 | 1006.4771 |
| 56 | W. Beenakker et al. | NNLL resummation for stop pair-production at the LHC | JHEP 05 (2016) 153 | 1601.02954 |
| 57 | C. Borschensky et al. | Squark and gluino production cross sections in pp collisions at $ \sqrt{s} = $ 13, 14, 33 and 100 TeV | EPJC 74 (2014) 3174 | 1407.5066 |
| 58 | CMS Collaboration | The CMS experiment at the CERN LHC | JINST 3 (2008) S08004 | CMS-00-001 |
| 59 | CMS Collaboration | The CMS trigger system | JINST 12 (2017) P01020 | CMS-TRG-12-001 1609.02366 |
| 60 | M. Cacciari, G. P. Salam, and G. Soyez | The anti-$ {k_{\mathrm{T}}} $ jet clustering algorithm | JHEP 04 (2008) 063 | 0802.1189 |
| 61 | M. Cacciari, G. P. Salam, and G. Soyez | FastJet user manual | EPJC 72 (2012) 1896 | 1111.6097 |
| 62 | CMS Collaboration | Particle-flow reconstruction and global event description with the CMS detector | JINST 12 (2017) P10003 | CMS-PRF-14-001 1706.04965 |
| 63 | CMS Collaboration | Performance of electron reconstruction and selection with the CMS detector in proton-proton collisions at $ \sqrt{s} = $ 8 TeV | JINST 10 (2015) P06005 | CMS-EGM-13-001 1502.02701 |
| 64 | CMS Collaboration | Performance of the CMS muon detector and muon reconstruction with proton-proton collisions at $ \sqrt{s}= $ 13 TeV | JINST 13 (2018) P06015 | CMS-MUO-16-001 1804.04528 |
| 65 | M. Cacciari and G. P. Salam | Pileup subtraction using jet areas | PLB 659 (2008) 119 | 0707.1378 |
| 66 | CMS Collaboration | Jet energy scale and resolution in the CMS experiment in pp collisions at 8 TeV | JINST 12 (2016) P02014 | CMS-JME-13-004 1607.03663 |
| 67 | CMS Collaboration | Jet algorithms performance in 13 TeV data | CMS-PAS-JME-16-003 | CMS-PAS-JME-16-003 |
| 68 | CMS Collaboration | Identification of heavy-flavour jets with the CMS detector in pp collisions at 13 TeV | JINST 13 (2018) P05011 | CMS-BTV-16-002 1712.07158 |
| 69 | CMS Collaboration | Performance of missing transverse momentum reconstruction in proton-proton collisions at $ \sqrt{s} = $ 13 TeV using the CMS detector | JINST 14 (2019) P07004 | CMS-JME-17-001 1903.06078 |
| 70 | CMS Collaboration | Search for new physics in same-sign dilepton events in proton-proton collisions at $ \sqrt{s} = $ 13 TeV | EPJC 76 (2016) 439 | CMS-SUS-15-008 1605.03171 |
| 71 | CMS Collaboration | Performance of CMS muon reconstruction in pp collision events at $ \sqrt{s}= $ 7 TeV | JINST 7 (2012) P10002 | CMS-MUO-10-004 1206.4071 |
| 72 | CMS Collaboration | CMS luminosity measurements for the 2016 data-taking period | CMS-PAS-LUM-17-001 | CMS-PAS-LUM-17-001 |
| 73 | CMS Collaboration | CMS luminosity measurement for the 2017 data-taking period at $ \sqrt{s} = $ 13 TeV | CMS-PAS-LUM-17-004 | CMS-PAS-LUM-17-004 |
| 74 | CMS Collaboration | CMS luminosity measurement for the 2018 data-taking period at $ \sqrt{s} = $ 13 TeV | CMS-PAS-LUM-18-002 | CMS-PAS-LUM-18-002 |
| 75 | CMS Collaboration | Measurement of the inelastic proton-proton cross section at $ \sqrt{s}= $ 13 TeV | JHEP 07 (2018) 161 | CMS-FSQ-15-005 1802.02613 |
| 76 | A. Kalogeropoulos and J. Alwall | The SysCalc code: A tool to derive theoretical systematic uncertainties | 1801.08401 | |
| 77 | ATLAS Collaboration | Measurement of the $ {\rm t\bar{t}Z} $ and $ {\rm t\bar{t}W} $ cross sections in proton-proton collisions at $ \sqrt{s}= $ 13 TeV with the ATLAS detector | PRD 99 (2019) 072009 | 1901.03584 |
| 78 | CMS Collaboration | Measurement of the cross section for top quark pair production in association with a W or Z boson in proton-proton collisions at $ \sqrt{s} = $ 13 TeV | JHEP 08 (2018) 011 | CMS-TOP-17-005 1711.02547 |
| 79 | CMS Collaboration | Measurements of $ {\rm t\bar{t}} $ cross sections in association with b jets and inclusive jets and their ratio using dilepton final states in pp collisions at $ \sqrt{s} = $ 13 TeV | PLB 776 (2018) 355 | CMS-TOP-16-010 1705.10141 |
| 80 | T. Junk | Confidence level computation for combining searches with small statistics | NIMA 434 (1999) 435 | hep-ex/9902006 |
| 81 | A. L. Read | Presentation of search results: the $ \mathrm{CL}_\mathrm{s} $ technique | in Durham IPPP Workshop: Advanced Statistical Techniques in Particle Physics, p. 2693 JPG 28 (2002) 2693 | |
| 82 | ATLAS and CMS Collaborations | Procedure for the LHC Higgs boson search combination in summer 2011 | ATL-PHYS-PUB-2011-011, CMS NOTE-2011/005 | |
| 83 | G. Cowan, K. Cranmer, E. Gross, and O. Vitells | Asymptotic formulae for likelihood-based tests of new physics | EPJC 71 (2011) 1554 | 1007.1727 |
|
|
Compact Muon Solenoid LHC, CERN |
|

|

|

|

|

|