

Compact Muon Solenoid
LHC, CERN
| CMS-SUS-16-041 ; CERN-EP-2017-243 | ||
| Search for supersymmetry in events with at least three electrons or muons, jets, and missing transverse momentum in proton-proton collisions at $\sqrt{s} = $ 13 TeV | ||
| CMS Collaboration | ||
| 23 October 2017 | ||
| JHEP 02 (2018) 067 | ||
| Abstract: A search for new physics is carried out in events with at least three electrons or muons in any combination, jets, and missing transverse momentum. Results are based on the sample of proton-proton collision data produced by the LHC at a center-of-mass energy of 13 TeV and collected by the CMS experiment in 2016. The data sample analyzed corresponds to an integrated luminosity of 35.9 fb$^{-1}$. Events are classified according to the number of b jets, missing transverse momentum, hadronic transverse momentum, and the invariant mass of same-flavor dilepton pairs with opposite charge. No significant excess above the expected standard model background is observed. Exclusion limits at 95% confidence level are computed for four different supersymmetric simplified models with pair production of gluinos or third-generation squarks. In the model with gluino pair production, with subsequent decays into a top quark-antiquark pair and a neutralino, gluinos with masses smaller than 1610 GeV are excluded for a massless lightest supersymmetric particle. In the case of bottom squark pair production, the bottom squark masses are excluded up to 840 GeV for charginos lighter than 200 GeV. For a simplified model of heavy top squark pair production, the $\mathrm{\widetilde{\text{t}}_2}$ mass is excluded up to 720, 780, or 710 GeV for models with an exclusive $\mathrm{\widetilde{\text{t}}_2}\rightarrow\mathrm{\widetilde{\text{t}}_1}\mathrm{H}$ decay, an exclusive $\mathrm{\widetilde{\text{t}}_2}\rightarrow\mathrm{\widetilde{\text{t}}_1}\mathrm{Z}$ decay, or an equally probable mix of those two decays. In order to provide a simplified version of the analysis for easier interpretation, a small set of aggregate signal regions also has been defined, providing a compromise between simplicity and analysis sensitivity. | ||
| Links: e-print arXiv:1710.09154 [hep-ex] (PDF) ; CDS record ; inSPIRE record ; CADI line (restricted) ; | ||
| Figures & Tables | Summary | Additional Tables | References | CMS Publications |
|---|
|
Additional information on efficiencies needed for reinterpretation of
these results are available here.
Additional technical material for CMS speakers can be found here |
| Figures | |
png pdf |
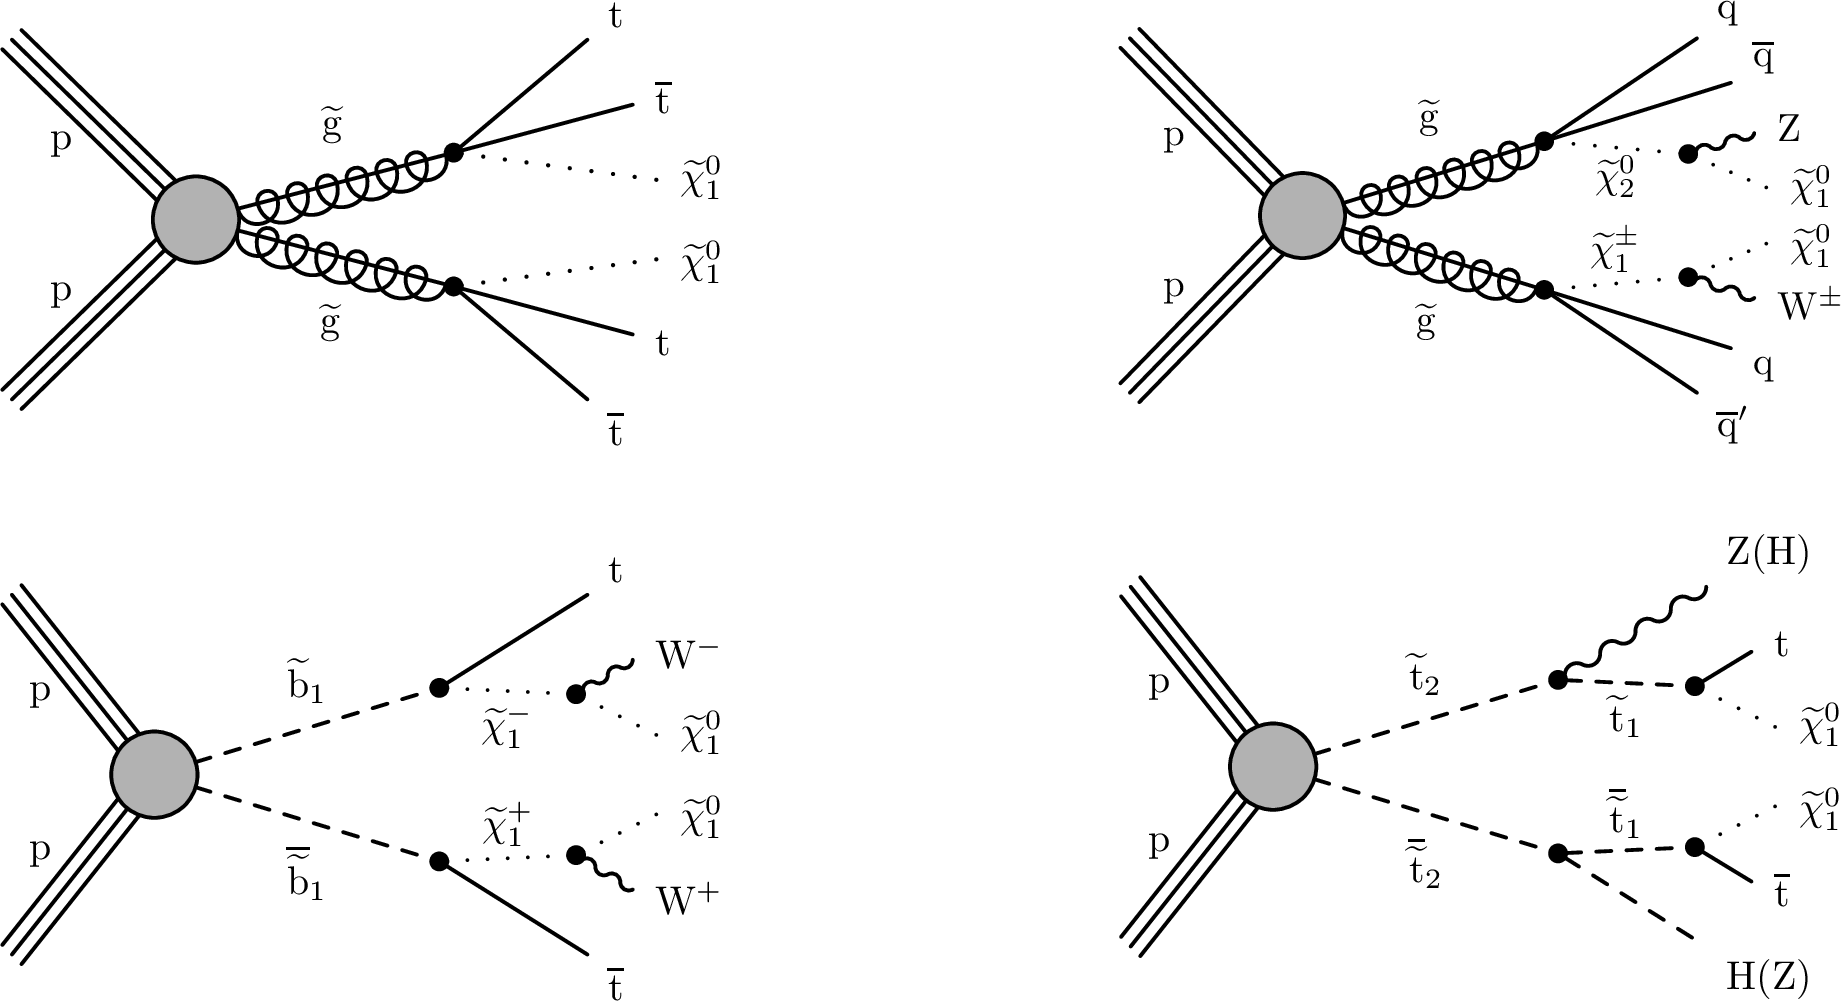
Figure 1:
Diagrams for models with gluino pair production leading to four top quarks, T1tttt (upper left), or four quarks and two vector bosons, T5qqqqVV (upper right) in the final state, in both cases accompanied by two LSPs. Models of bottom, T6ttWW, and top squark, T6ttHZ, pair production lead to two top quarks, two LSPs and either two W bosons (lower left) or two neutral bosons as SM Higgs (H) and/or Z bosons (lower right). |
png pdf |
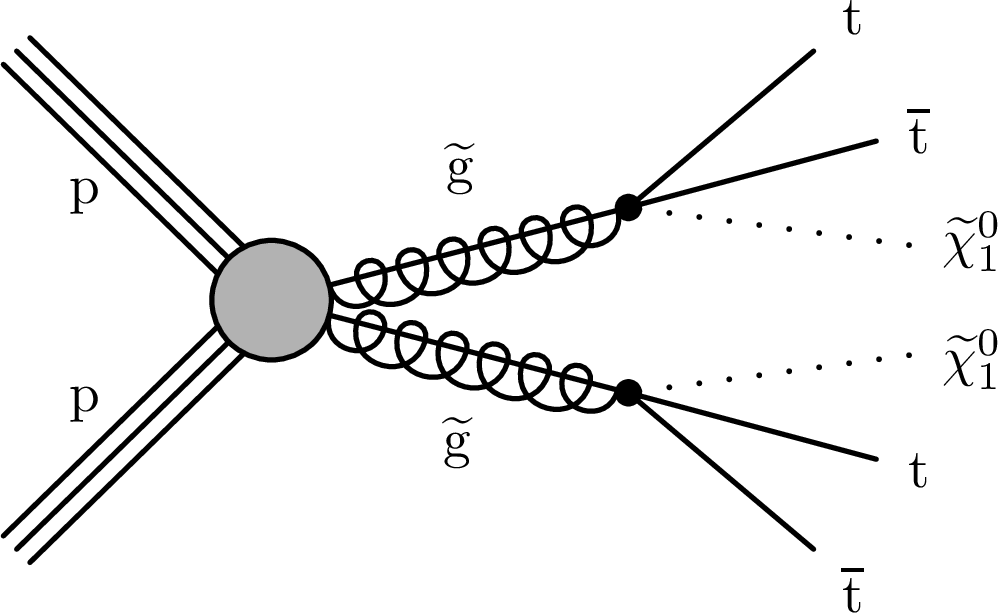
Figure 1-a:
Diagram for the T1tttt model with gluino pair production leading to |
png pdf |
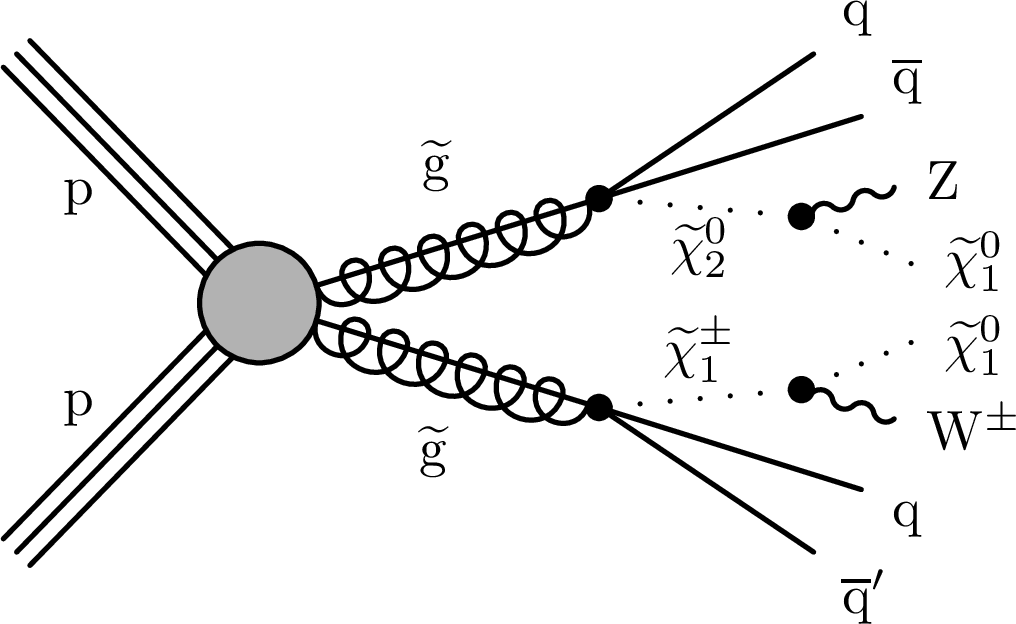
Figure 1-b:
Diagram for the T5qqqqVV model with gluino pair production leading to four quarks and two vector bosons in the final state, accompanied by two LSPs. |

png pdf |
Figure 1-c:
Diagram for the T6ttWW model of bottom squark pair production with two top quarks, two LSPs and either two W bosons. |
png pdf |
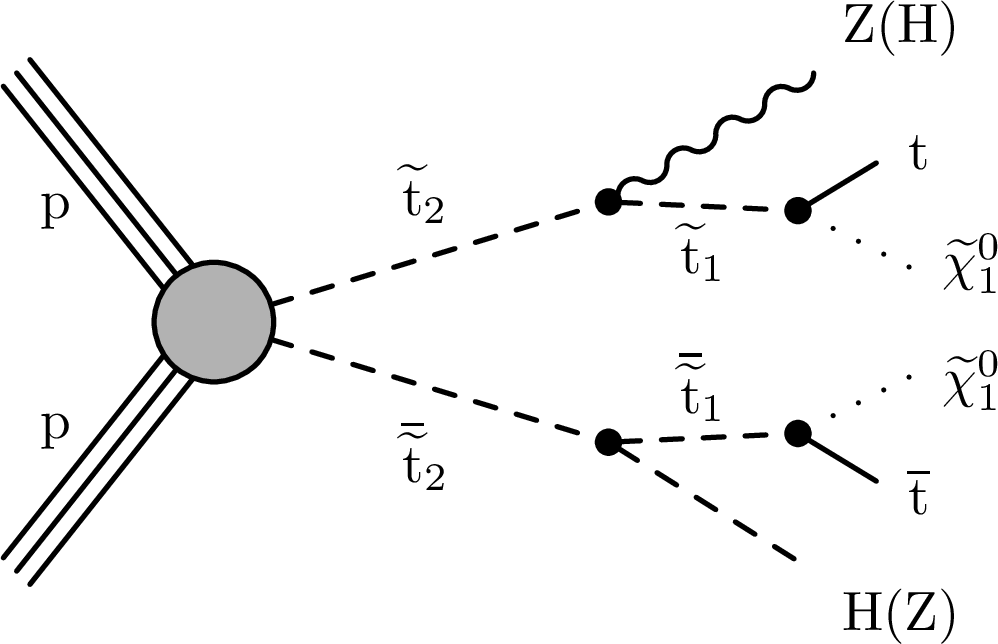
Figure 1-d:
Diagram for the T6ttHZ model of top squark pair production with two top quarks, two LSPs and two neutral bosons as SM Higgs (H) and/or Z bosons. |
png pdf |
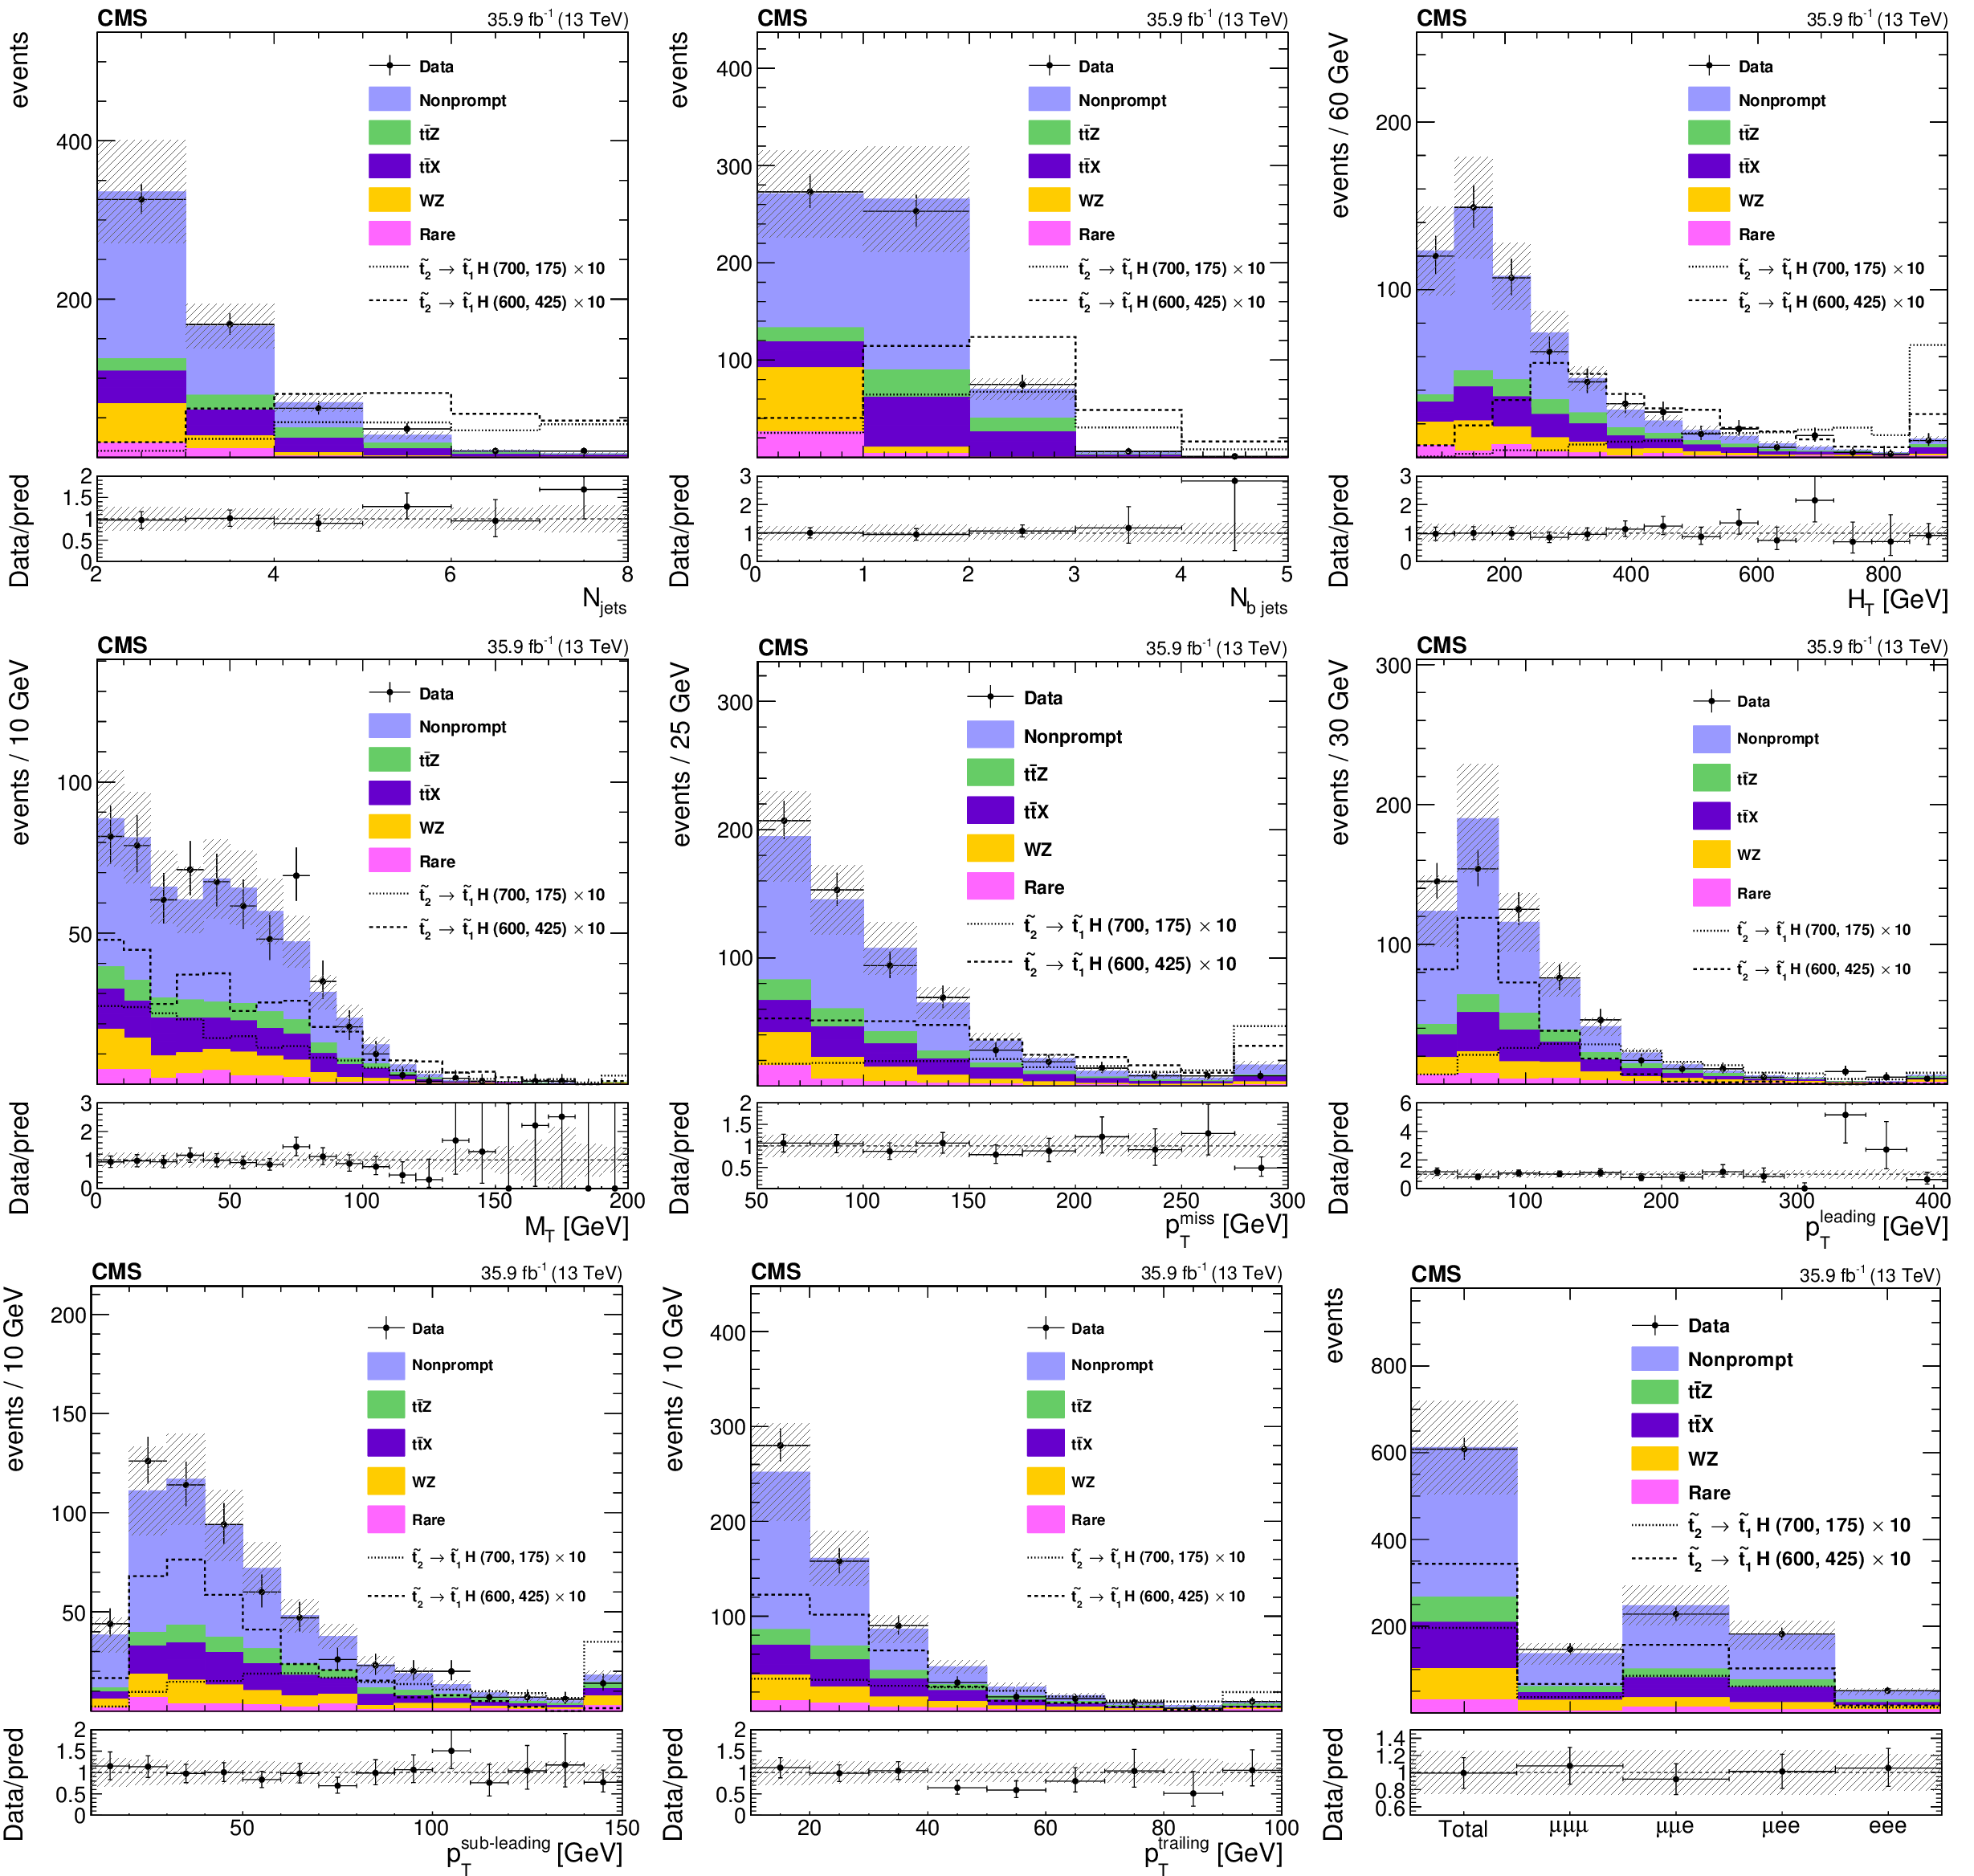
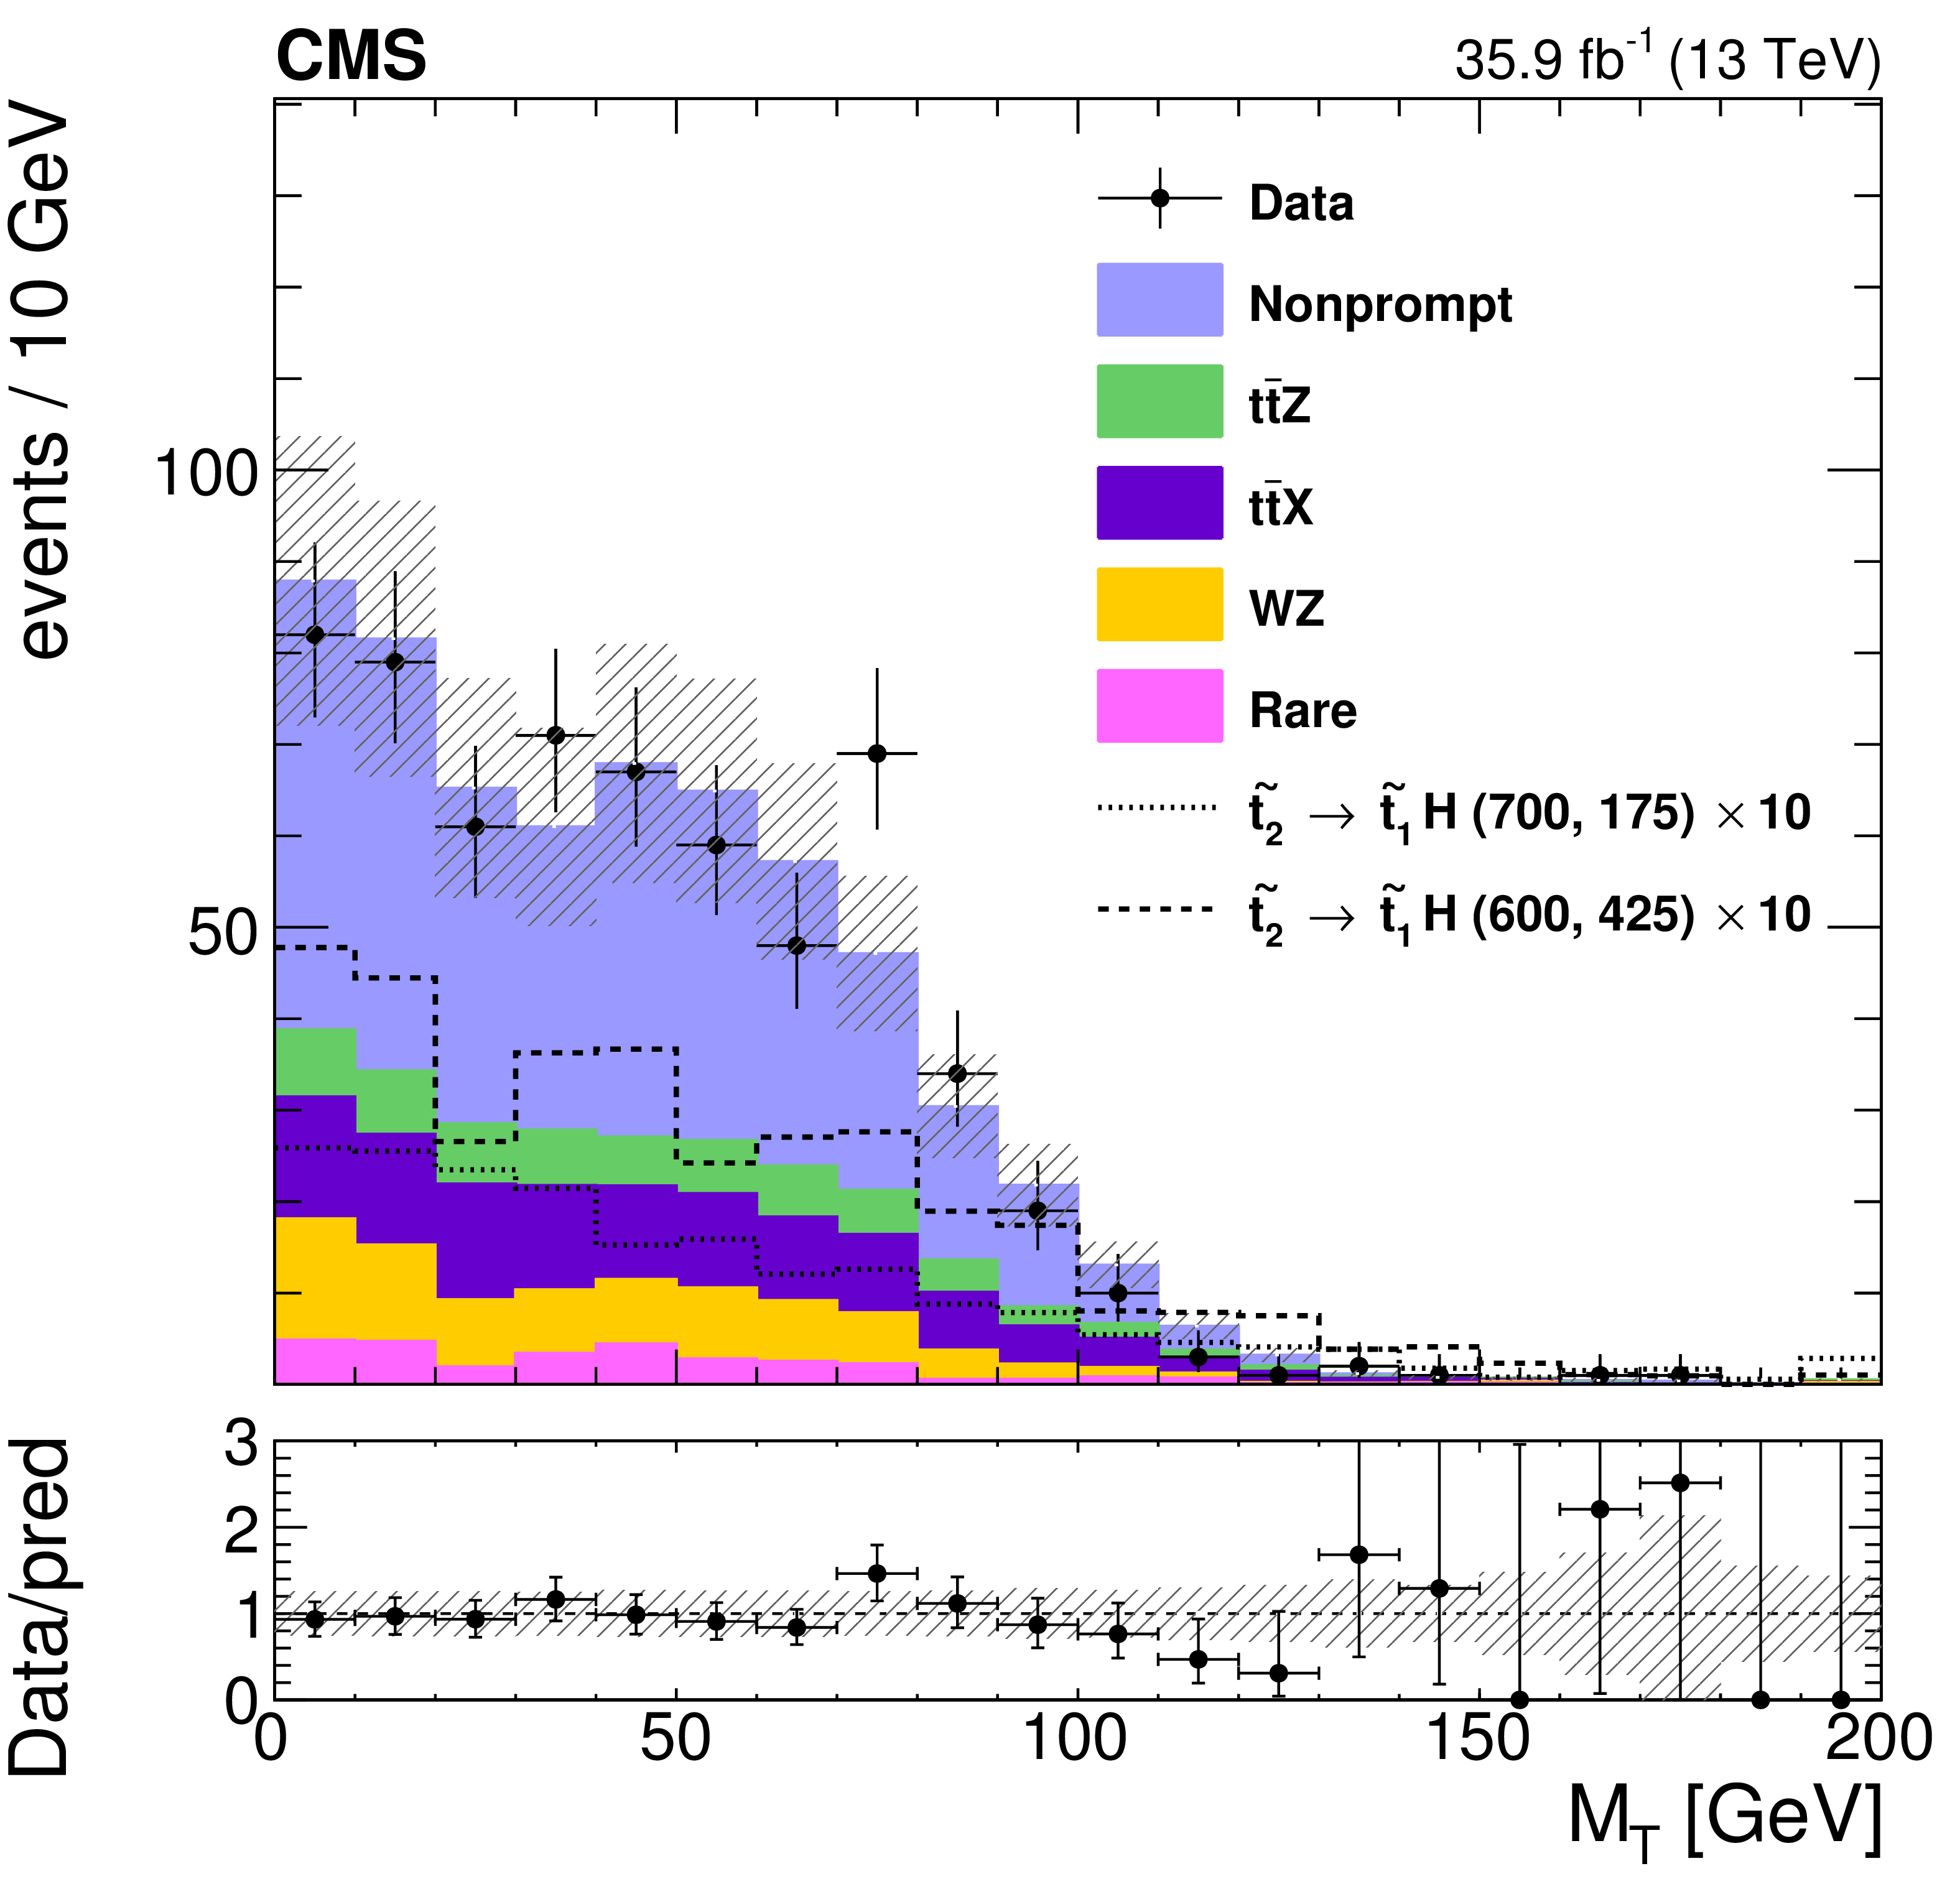
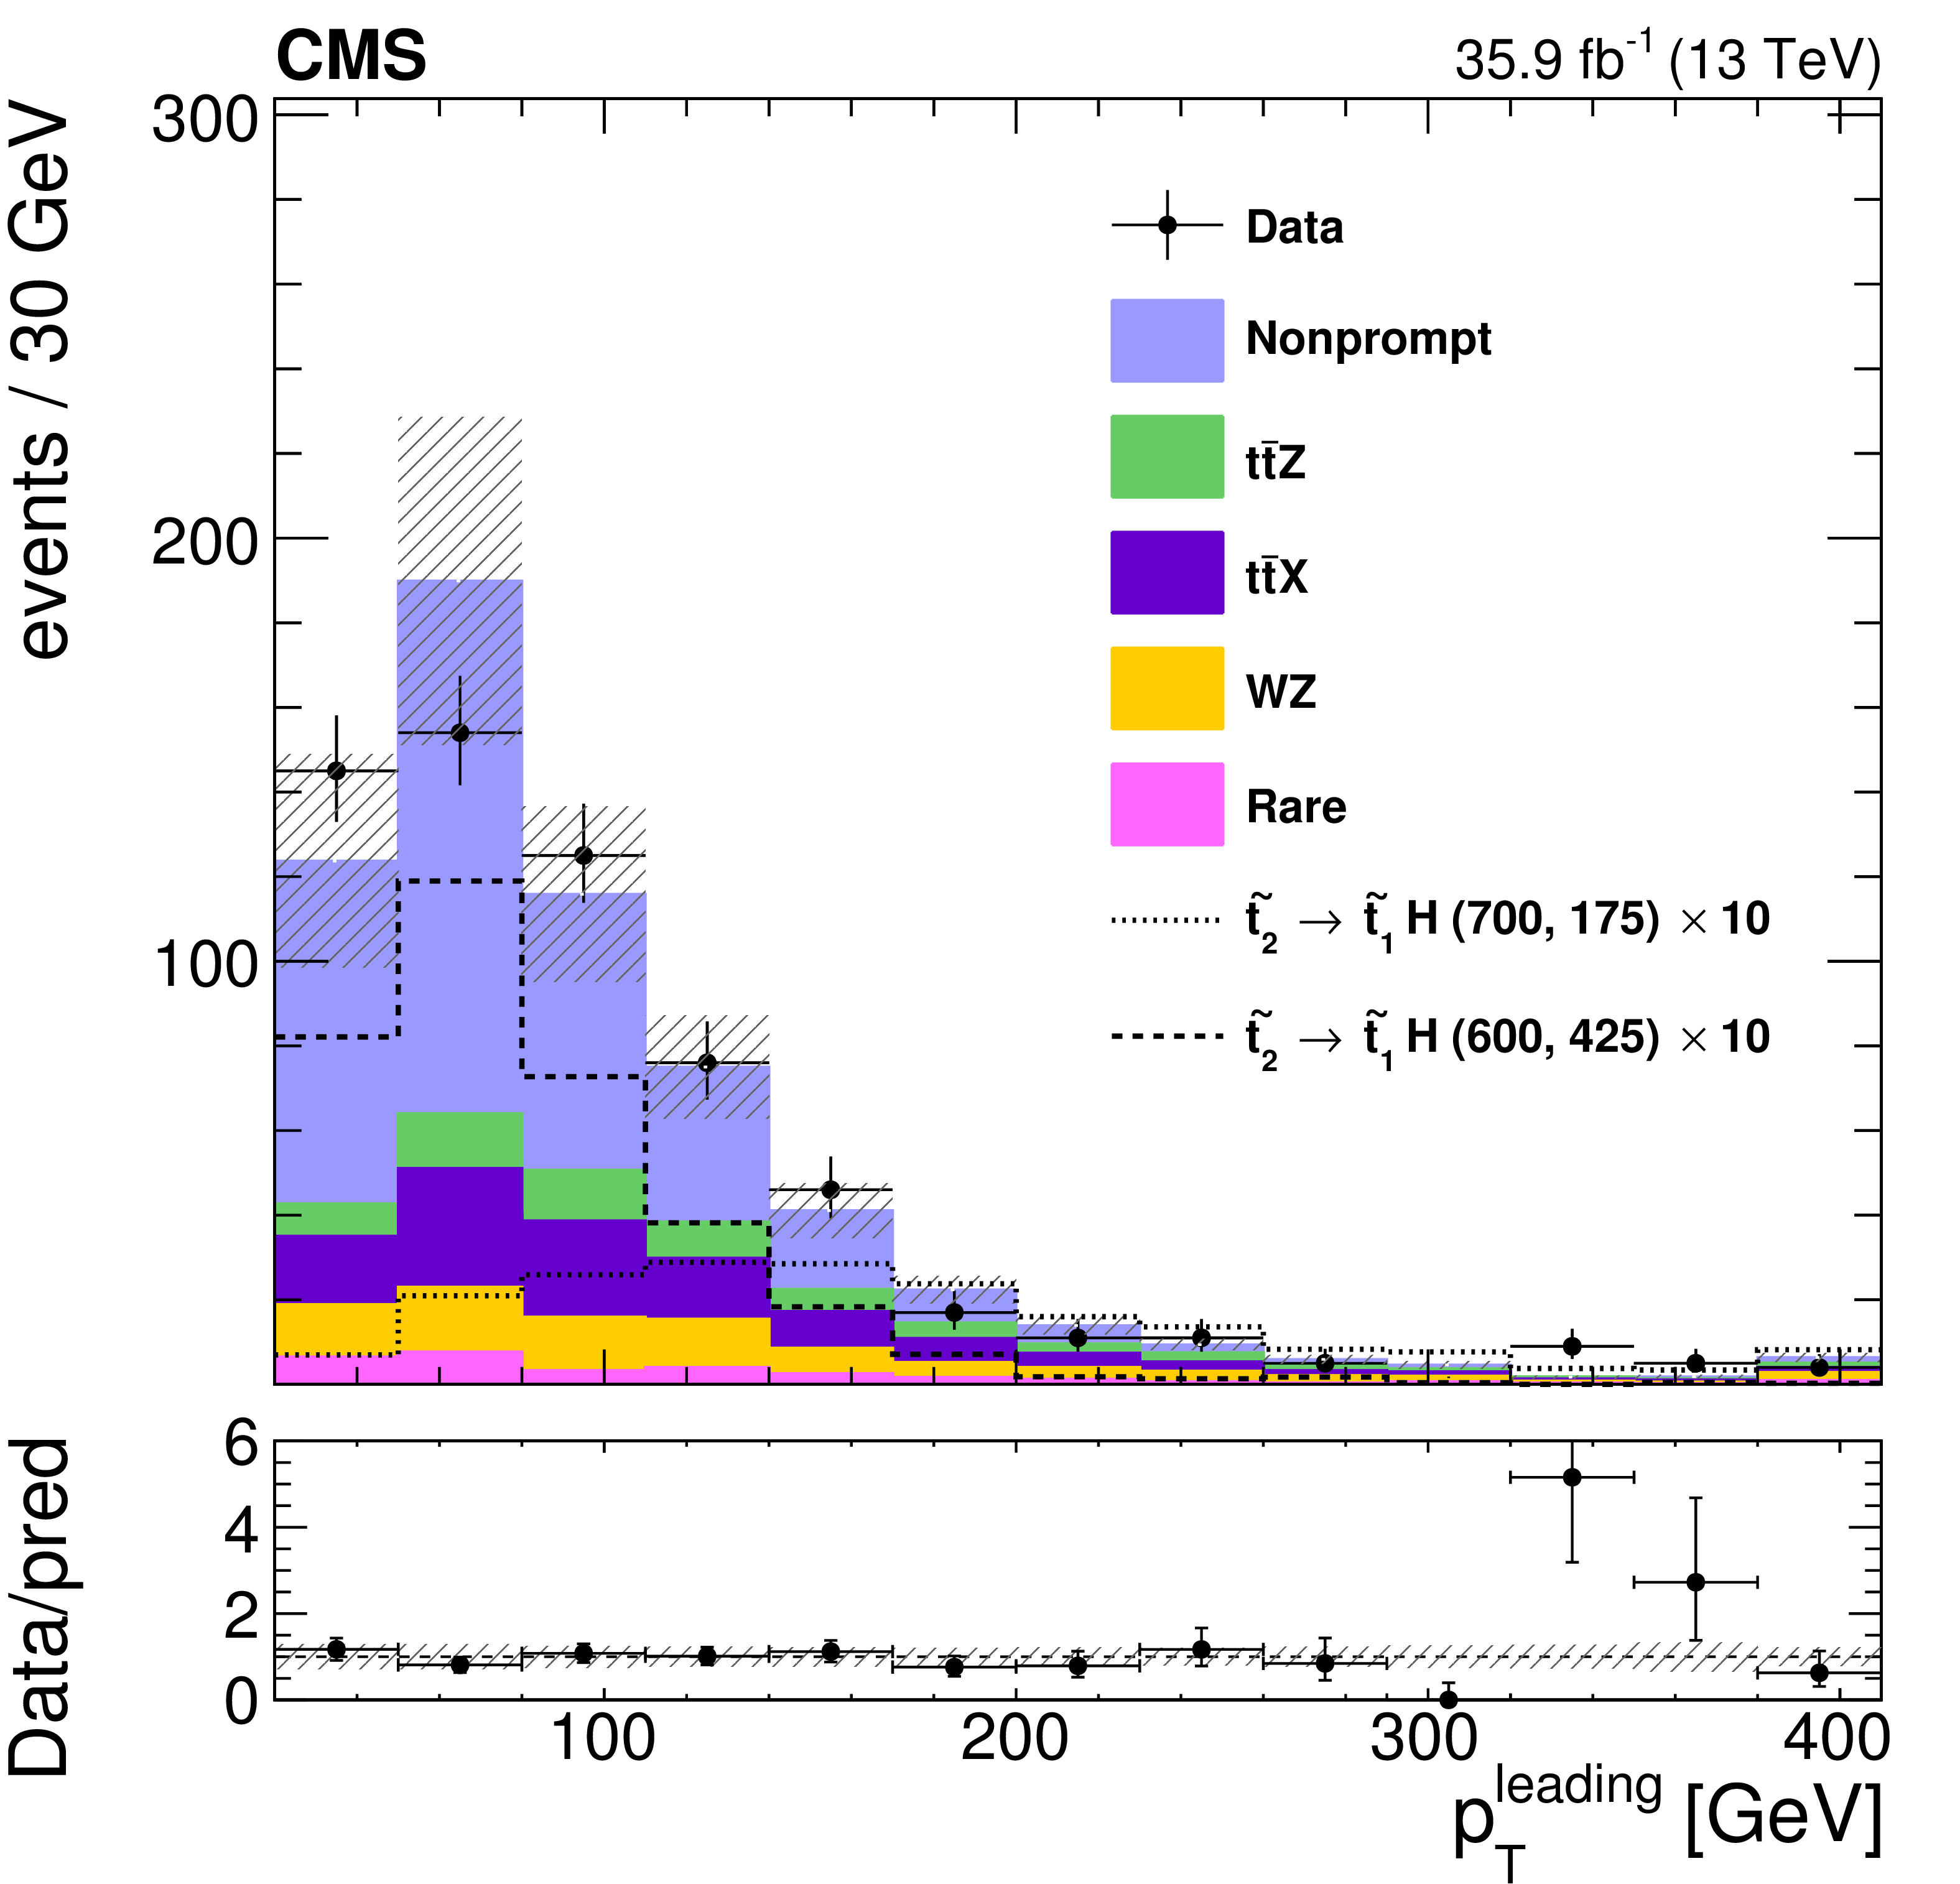
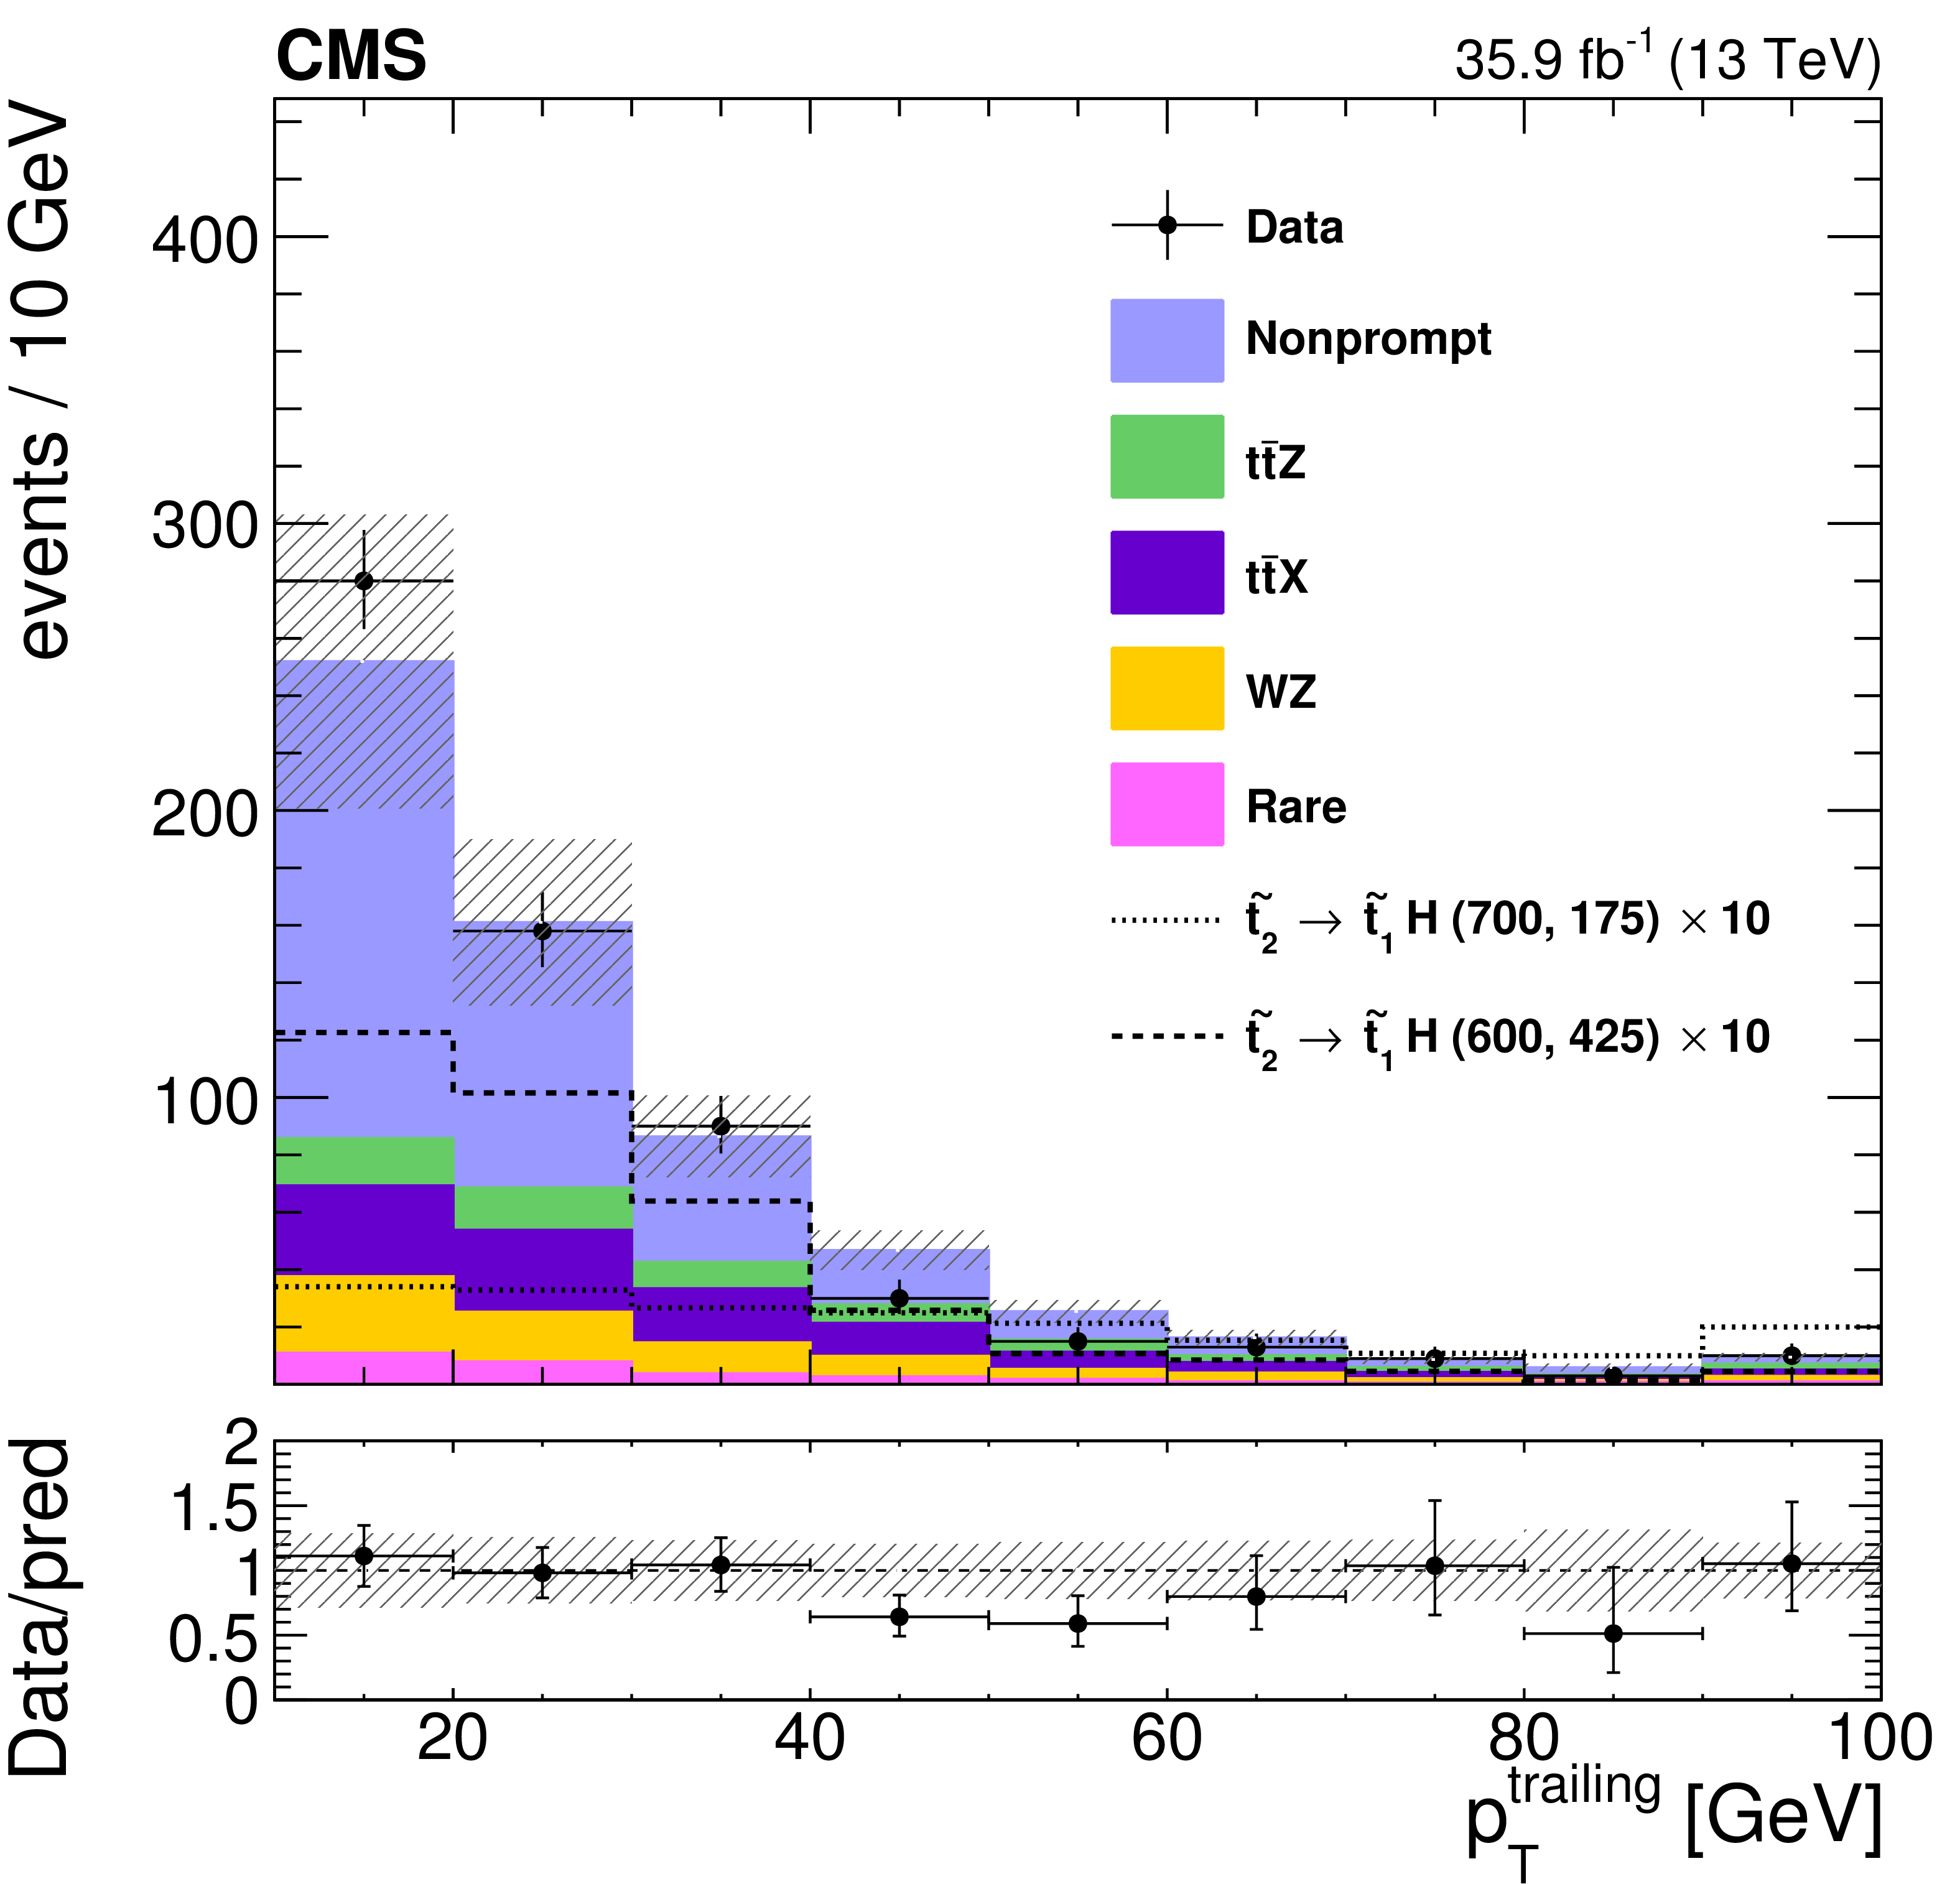
Figure 2:
Background prediction and the observed event yields in the key observables for the off-Z baseline selection: the number of jets and b jets, ${H_{\mathrm {T}}}$, ${M_{\text {T}}}$, ${{p_{\mathrm {T}}} ^\text {miss}}$, the lepton ${p_{\mathrm {T}}}$ spectra and the event yields by flavor category are shown. The background events containing top quark(s) in association with a W, Z or Higgs boson, except ${{\mathrm{t} {}\mathrm{\bar{t}}} \mathrm{Z}}$, or another pair of top quarks are denoted as ${\mathrm{t} {}\mathrm{\bar{t}}} \mathrm{X}$. The last bin includes the overflow events, and the hatched area represents the statistical and combined systematic uncertainties in the prediction. The lower panels show the ratio of the observed and predicted yields in each bin. For illustration the yields, multiplied by a factor 10, for two signal mass points in the T6ttHZ model, where the $\mathcal {B}(\tilde{\mathrm {t}}_2 \rightarrow \tilde{\mathrm {t}}_1 \mathrm{H} ) =$ 100%, are displayed for non-compressed ($ m(\tilde{\mathrm {t}}_2) = $ 700 GeV and $ m(\tilde{\mathrm {t}}_1) = $175 GeV) and compressed ($ m(\tilde{\mathrm {t}}_2) = $ 600 GeV and $ m(\tilde{\mathrm {t}}_1) = $ 425 GeV) scenarios. |
png pdf |
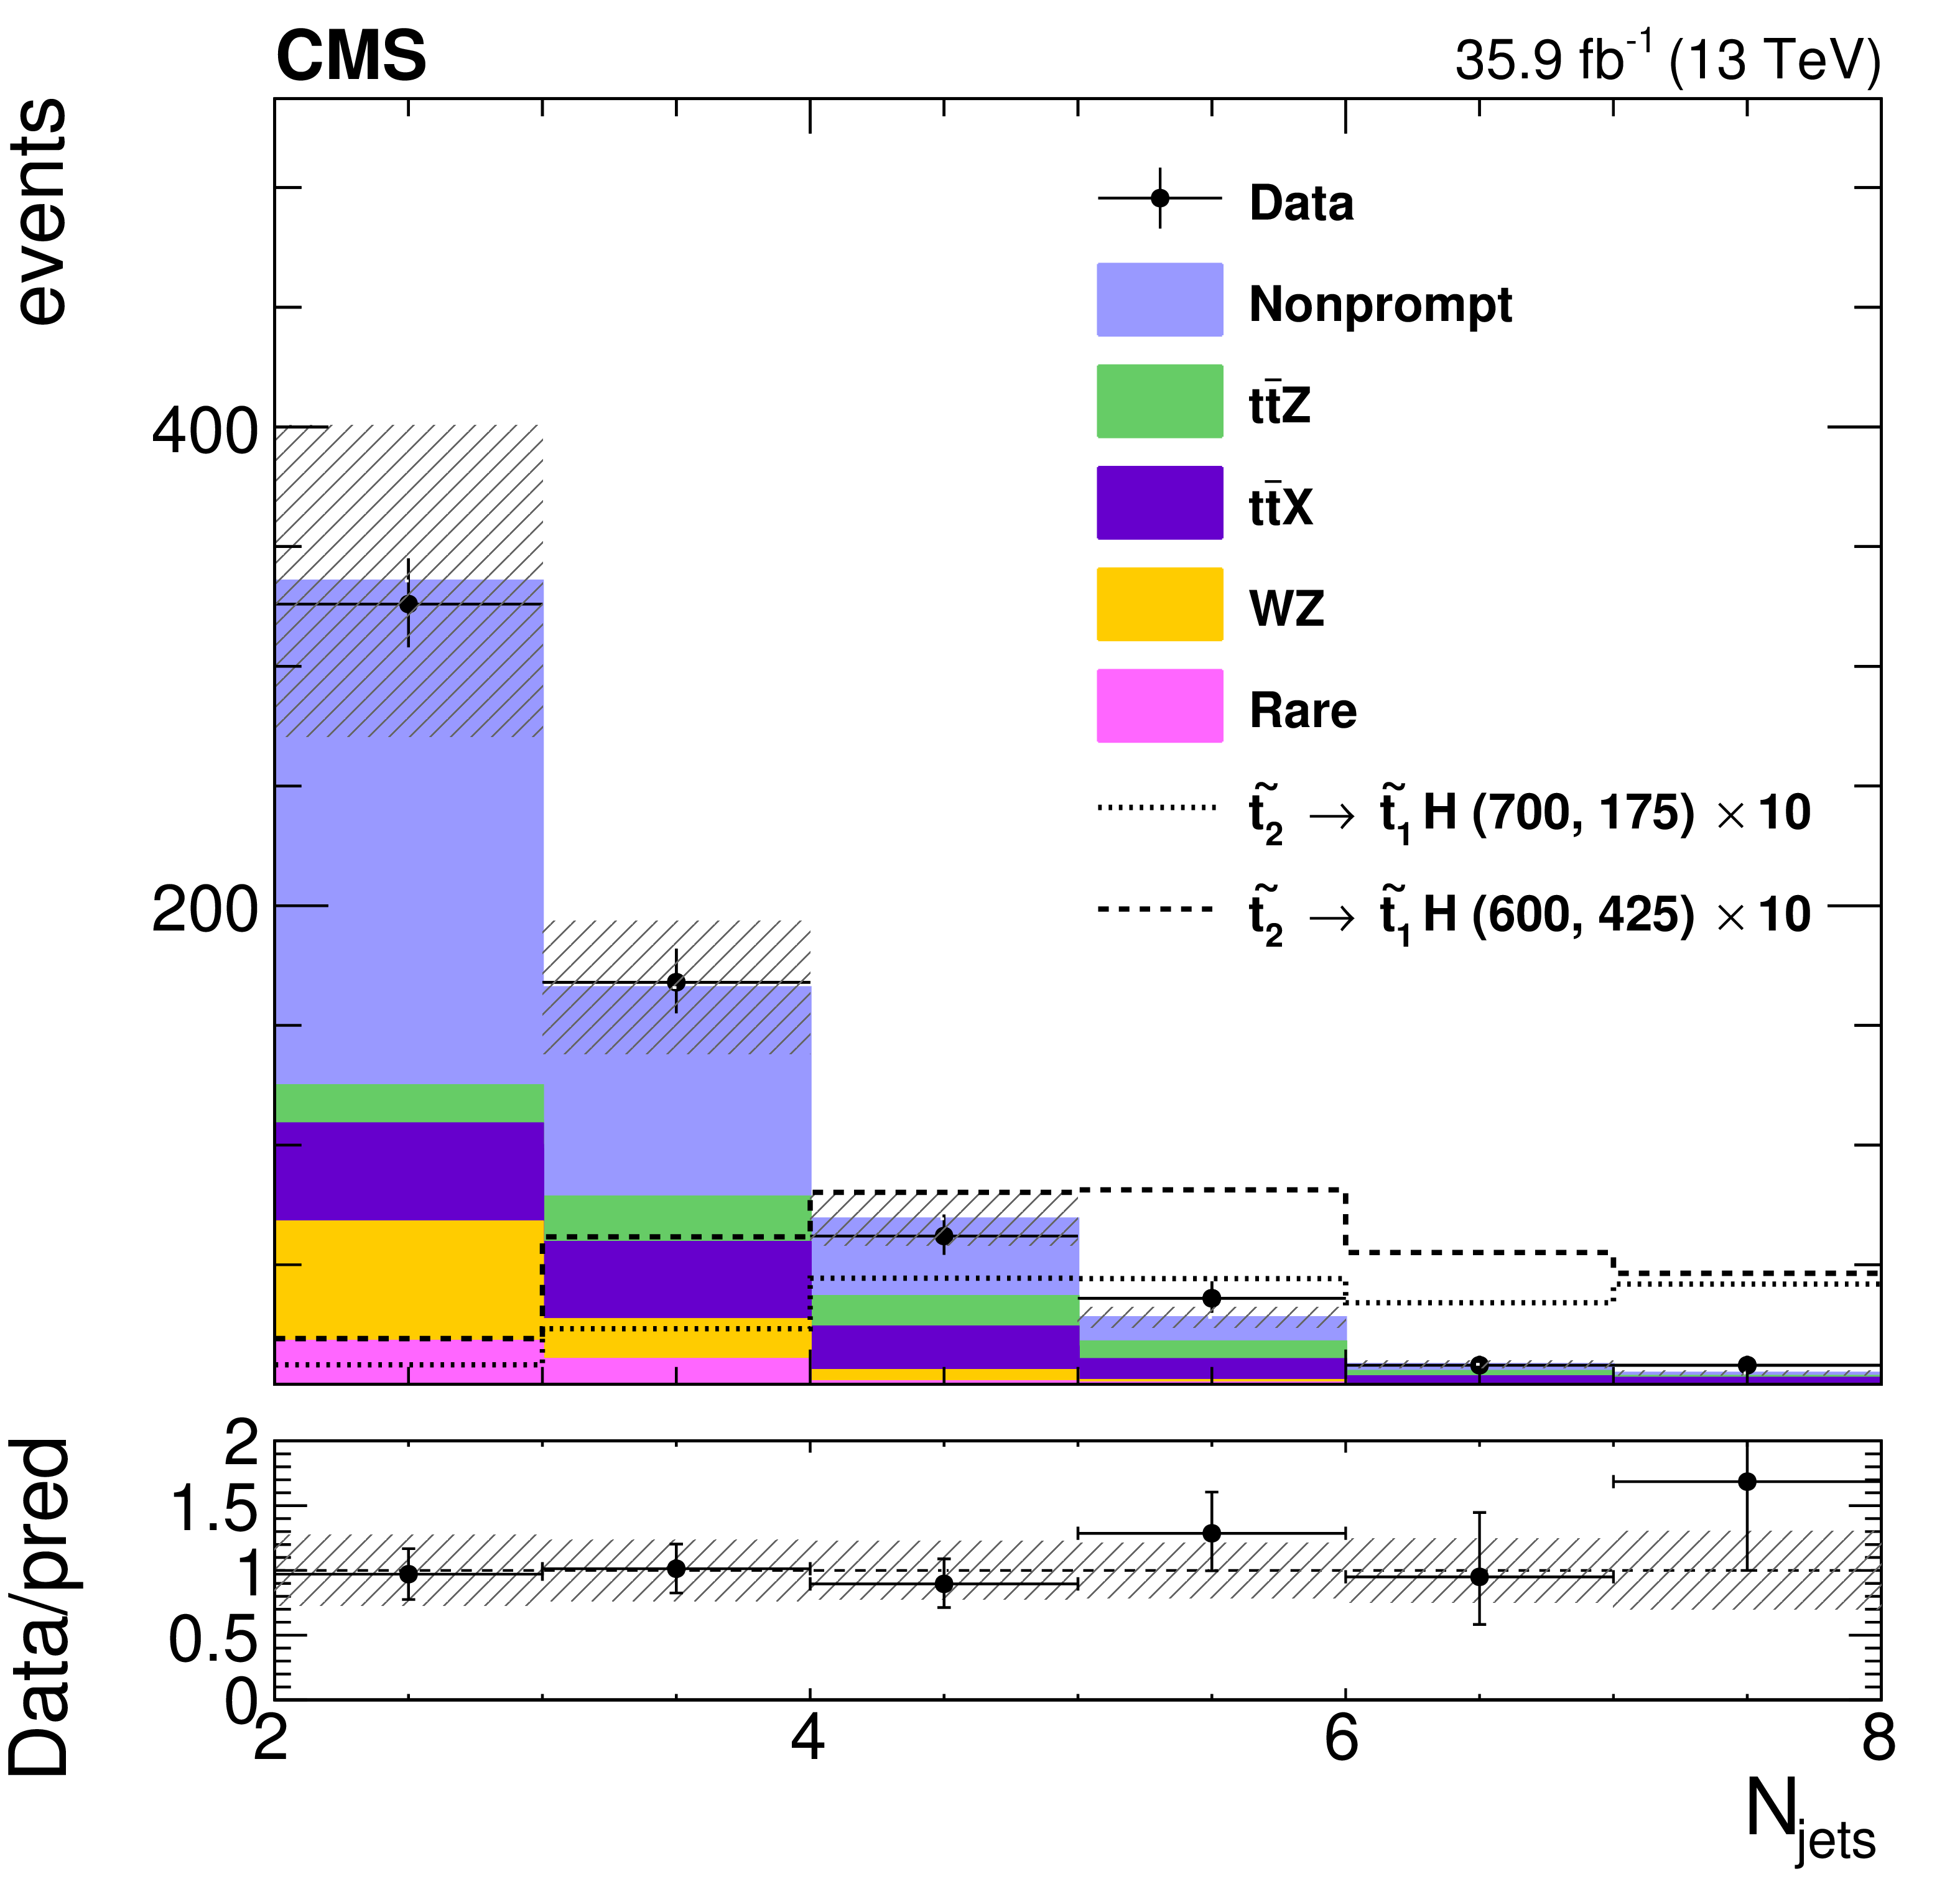
Figure 2-a:
Background prediction and the observed event yields in the number of jets for the off-Z baseline selection. The background events containing top quark(s) in association with a W, Z or Higgs boson, except ${{\mathrm{t} {}\mathrm{\bar{t}}} \mathrm{Z}}$, or another pair of top quarks are denoted as ${\mathrm{t} {}\mathrm{\bar{t}}} \mathrm{X}$. The last bin includes the overflow events, and the hatched area represents the statistical and combined systematic uncertainties in the prediction. The lower panel shows the ratio of the observed and predicted yields in each bin. For illustration the yields, multiplied by a factor 10, for two signal mass points in the T6ttHZ model, where the $\mathcal {B}(\tilde{\mathrm {t}}_2 \rightarrow \tilde{\mathrm {t}}_1 \mathrm{H} ) =$ 100%, are displayed for non-compressed ($ m(\tilde{\mathrm {t}}_2) = $ 700 GeV and $ m(\tilde{\mathrm {t}}_1) = $175 GeV) and compressed ($ m(\tilde{\mathrm {t}}_2) = $ 600 GeV and $ m(\tilde{\mathrm {t}}_1) = $ 425 GeV) scenarios. |
png pdf |
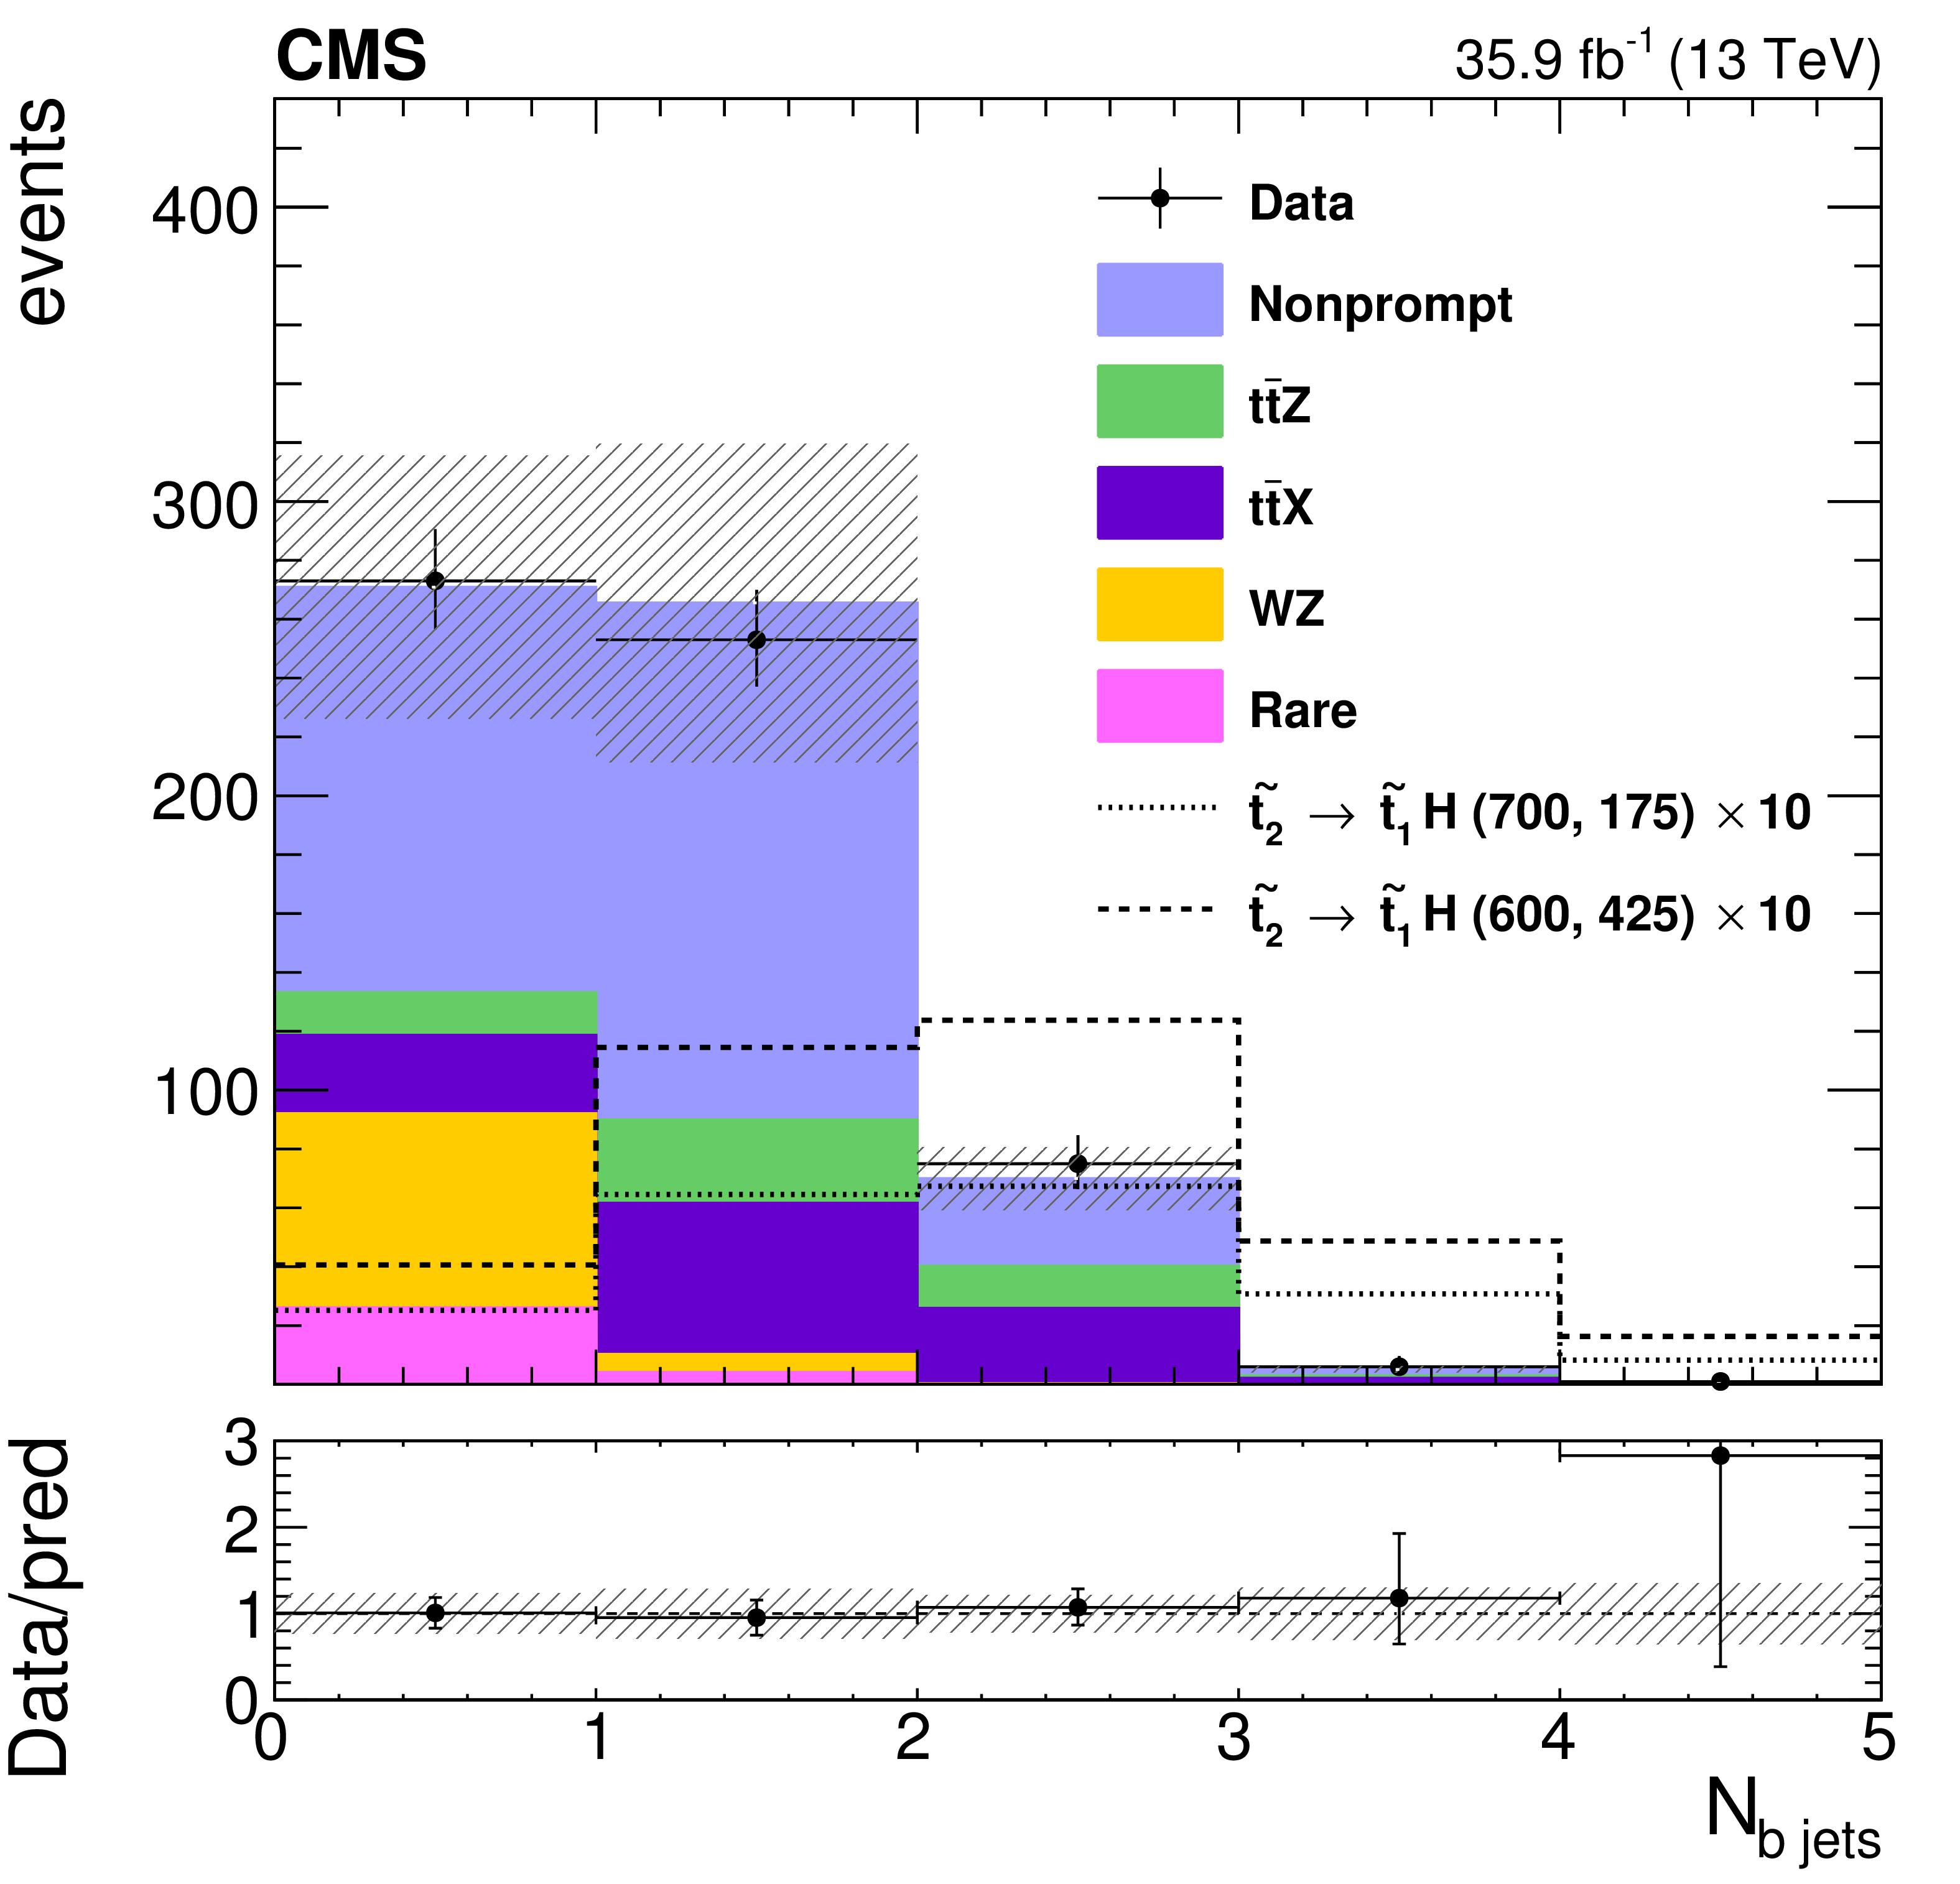
Figure 2-b:
Background prediction and the observed event yields in the number of b jets for the off-Z baseline selection. The background events containing top quark(s) in association with a W, Z or Higgs boson, except ${{\mathrm{t} {}\mathrm{\bar{t}}} \mathrm{Z}}$, or another pair of top quarks are denoted as ${\mathrm{t} {}\mathrm{\bar{t}}} \mathrm{X}$. The last bin includes the overflow events, and the hatched area represents the statistical and combined systematic uncertainties in the prediction. The lower panel shows the ratio of the observed and predicted yields in each bin. For illustration the yields, multiplied by a factor 10, for two signal mass points in the T6ttHZ model, where the $\mathcal {B}(\tilde{\mathrm {t}}_2 \rightarrow \tilde{\mathrm {t}}_1 \mathrm{H} ) =$ 100%, are displayed for non-compressed ($ m(\tilde{\mathrm {t}}_2) = $ 700 GeV and $ m(\tilde{\mathrm {t}}_1) = $175 GeV) and compressed ($ m(\tilde{\mathrm {t}}_2) = $ 600 GeV and $ m(\tilde{\mathrm {t}}_1) = $ 425 GeV) scenarios. |
png pdf |
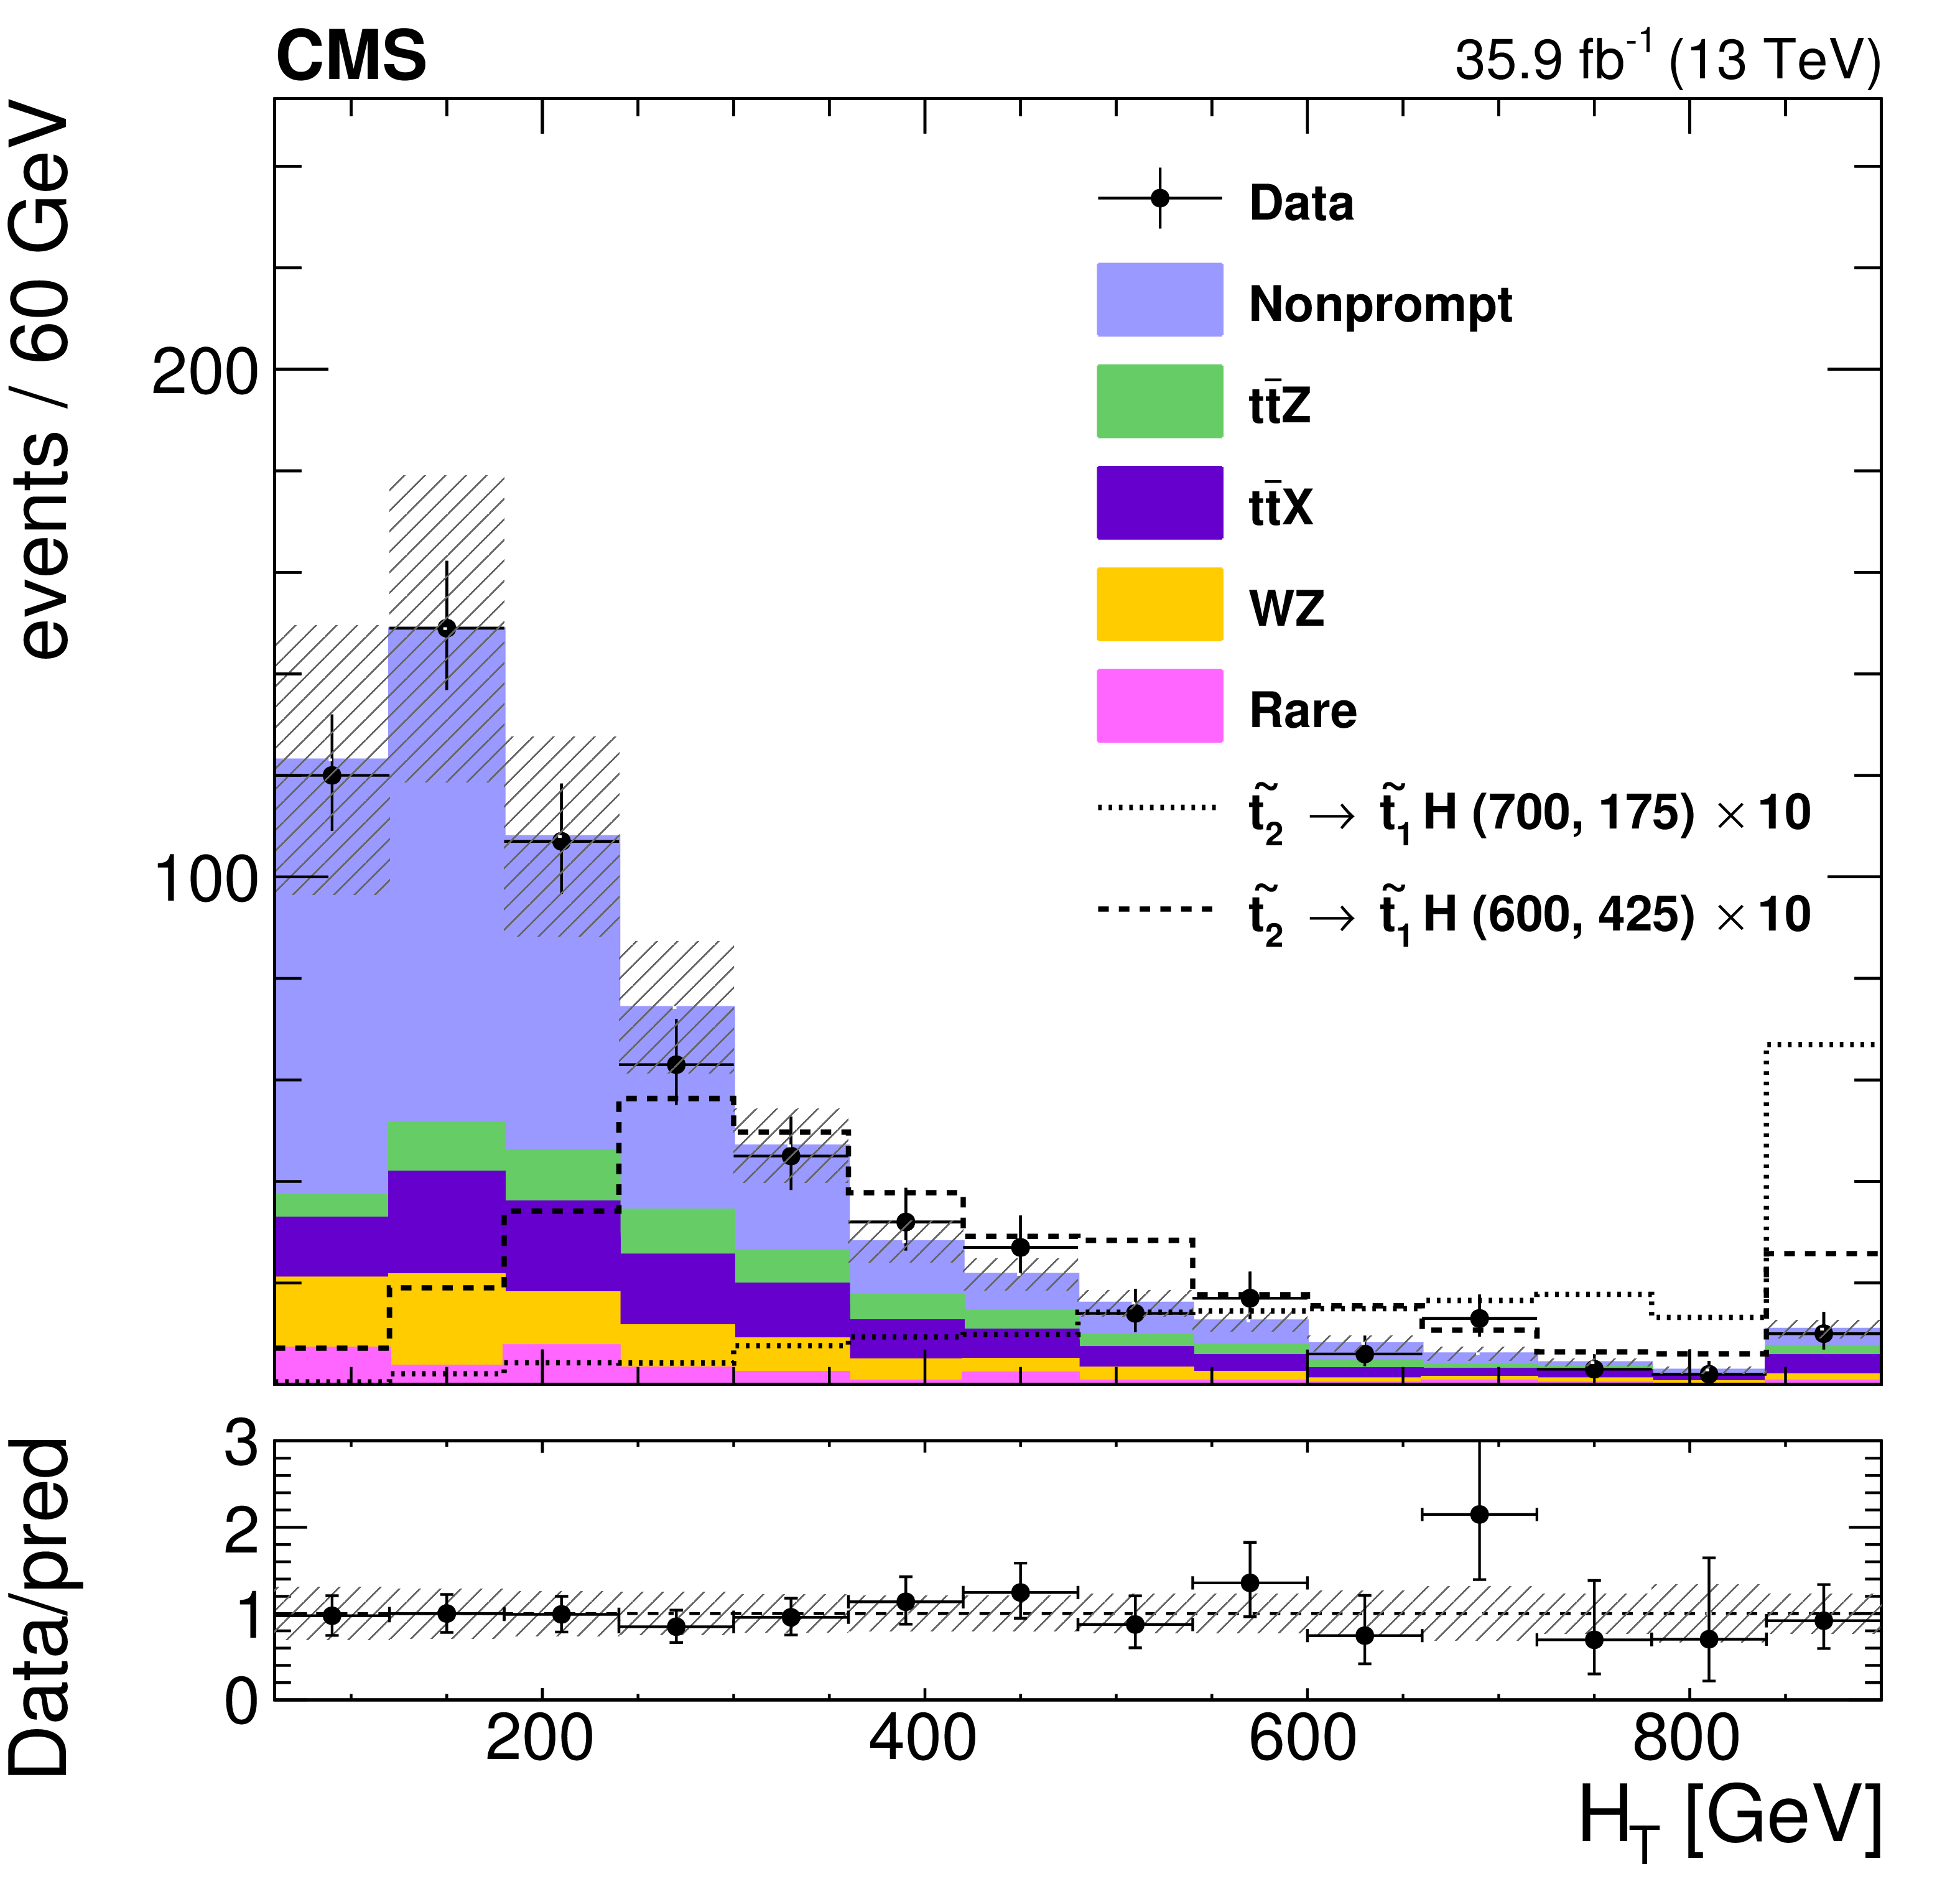
Figure 2-c:
Background prediction and the observed event yields in ${H_{\mathrm {T}}}$ for the off-Z baseline selection. The background events containing top quark(s) in association with a W, Z or Higgs boson, except ${{\mathrm{t} {}\mathrm{\bar{t}}} \mathrm{Z}}$, or another pair of top quarks are denoted as ${\mathrm{t} {}\mathrm{\bar{t}}} \mathrm{X}$. The last bin includes the overflow events, and the hatched area represents the statistical and combined systematic uncertainties in the prediction. The lower panel shows the ratio of the observed and predicted yields in each bin. For illustration the yields, multiplied by a factor 10, for two signal mass points in the T6ttHZ model, where the $\mathcal {B}(\tilde{\mathrm {t}}_2 \rightarrow \tilde{\mathrm {t}}_1 \mathrm{H} ) =$ 100%, are displayed for non-compressed ($ m(\tilde{\mathrm {t}}_2) = $ 700 GeV and $ m(\tilde{\mathrm {t}}_1) = $175 GeV) and compressed ($ m(\tilde{\mathrm {t}}_2) = $ 600 GeV and $ m(\tilde{\mathrm {t}}_1) = $ 425 GeV) scenarios. |
png pdf |
Figure 2-d:
Background prediction and the observed event yields in ${M_{\text {T}}}$ for the off-Z baseline selection. The background events containing top quark(s) in association with a W, Z or Higgs boson, except ${{\mathrm{t} {}\mathrm{\bar{t}}} \mathrm{Z}}$, or another pair of top quarks are denoted as ${\mathrm{t} {}\mathrm{\bar{t}}} \mathrm{X}$. The last bin includes the overflow events, and the hatched area represents the statistical and combined systematic uncertainties in the prediction. The lower panel shows the ratio of the observed and predicted yields in each bin. For illustration the yields, multiplied by a factor 10, for two signal mass points in the T6ttHZ model, where the $\mathcal {B}(\tilde{\mathrm {t}}_2 \rightarrow \tilde{\mathrm {t}}_1 \mathrm{H} ) =$ 100%, are displayed for non-compressed ($ m(\tilde{\mathrm {t}}_2) = $ 700 GeV and $ m(\tilde{\mathrm {t}}_1) = $175 GeV) and compressed ($ m(\tilde{\mathrm {t}}_2) = $ 600 GeV and $ m(\tilde{\mathrm {t}}_1) = $ 425 GeV) scenarios. |

png pdf |
Figure 2-e:
Background prediction and the observed event yields in ${{p_{\mathrm {T}}} ^\text {miss}}$ for the off-Z baseline selection. The background events containing top quark(s) in association with a W, Z or Higgs boson, except ${{\mathrm{t} {}\mathrm{\bar{t}}} \mathrm{Z}}$, or another pair of top quarks are denoted as ${\mathrm{t} {}\mathrm{\bar{t}}} \mathrm{X}$. The last bin includes the overflow events, and the hatched area represents the statistical and combined systematic uncertainties in the prediction. The lower panel shows the ratio of the observed and predicted yields in each bin. For illustration the yields, multiplied by a factor 10, for two signal mass points in the T6ttHZ model, where the $\mathcal {B}(\tilde{\mathrm {t}}_2 \rightarrow \tilde{\mathrm {t}}_1 \mathrm{H} ) =$ 100%, are displayed for non-compressed ($ m(\tilde{\mathrm {t}}_2) = $ 700 GeV and $ m(\tilde{\mathrm {t}}_1) = $175 GeV) and compressed ($ m(\tilde{\mathrm {t}}_2) = $ 600 GeV and $ m(\tilde{\mathrm {t}}_1) = $ 425 GeV) scenarios. |
png pdf |
Figure 2-f:
Background prediction and the observed event yields in the leading lepton ${p_{\mathrm {T}}}$ for the off-Z baseline selection. The background events containing top quark(s) in association with a W, Z or Higgs boson, except ${{\mathrm{t} {}\mathrm{\bar{t}}} \mathrm{Z}}$, or another pair of top quarks are denoted as ${\mathrm{t} {}\mathrm{\bar{t}}} \mathrm{X}$. The last bin includes the overflow events, and the hatched area represents the statistical and combined systematic uncertainties in the prediction. The lower panel shows the ratio of the observed and predicted yields in each bin. For illustration the yields, multiplied by a factor 10, for two signal mass points in the T6ttHZ model, where the $\mathcal {B}(\tilde{\mathrm {t}}_2 \rightarrow \tilde{\mathrm {t}}_1 \mathrm{H} ) =$ 100%, are displayed for non-compressed ($ m(\tilde{\mathrm {t}}_2) = $ 700 GeV and $ m(\tilde{\mathrm {t}}_1) = $175 GeV) and compressed ($ m(\tilde{\mathrm {t}}_2) = $ 600 GeV and $ m(\tilde{\mathrm {t}}_1) = $ 425 GeV) scenarios. |

png pdf |
Figure 2-g:
Background prediction and the observed event yields in the sub-leading lepton ${p_{\mathrm {T}}}$ for the off-Z baseline selection. The background events containing top quark(s) in association with a W, Z or Higgs boson, except ${{\mathrm{t} {}\mathrm{\bar{t}}} \mathrm{Z}}$, or another pair of top quarks are denoted as ${\mathrm{t} {}\mathrm{\bar{t}}} \mathrm{X}$. The last bin includes the overflow events, and the hatched area represents the statistical and combined systematic uncertainties in the prediction. The lower panel shows the ratio of the observed and predicted yields in each bin. For illustration the yields, multiplied by a factor 10, for two signal mass points in the T6ttHZ model, where the $\mathcal {B}(\tilde{\mathrm {t}}_2 \rightarrow \tilde{\mathrm {t}}_1 \mathrm{H} ) =$ 100%, are displayed for non-compressed ($ m(\tilde{\mathrm {t}}_2) = $ 700 GeV and $ m(\tilde{\mathrm {t}}_1) = $175 GeV) and compressed ($ m(\tilde{\mathrm {t}}_2) = $ 600 GeV and $ m(\tilde{\mathrm {t}}_1) = $ 425 GeV) scenarios. |
png pdf |
Figure 2-h:
Background prediction and the observed event yields in the trailing lepton ${p_{\mathrm {T}}}$ for the off-Z baseline selection. The background events containing top quark(s) in association with a W, Z or Higgs boson, except ${{\mathrm{t} {}\mathrm{\bar{t}}} \mathrm{Z}}$, or another pair of top quarks are denoted as ${\mathrm{t} {}\mathrm{\bar{t}}} \mathrm{X}$. The last bin includes the overflow events, and the hatched area represents the statistical and combined systematic uncertainties in the prediction. The lower panel shows the ratio of the observed and predicted yields in each bin. For illustration the yields, multiplied by a factor 10, for two signal mass points in the T6ttHZ model, where the $\mathcal {B}(\tilde{\mathrm {t}}_2 \rightarrow \tilde{\mathrm {t}}_1 \mathrm{H} ) =$ 100%, are displayed for non-compressed ($ m(\tilde{\mathrm {t}}_2) = $ 700 GeV and $ m(\tilde{\mathrm {t}}_1) = $175 GeV) and compressed ($ m(\tilde{\mathrm {t}}_2) = $ 600 GeV and $ m(\tilde{\mathrm {t}}_1) = $ 425 GeV) scenarios. |

png pdf |
Figure 2-i:
Background prediction and the observed event yields in the event yields by flavor category for the off-Z baseline selection. The background events containing top quark(s) in association with a W, Z or Higgs boson, except ${{\mathrm{t} {}\mathrm{\bar{t}}} \mathrm{Z}}$, or another pair of top quarks are denoted as ${\mathrm{t} {}\mathrm{\bar{t}}} \mathrm{X}$. The last bin includes the overflow events, and the hatched area represents the statistical and combined systematic uncertainties in the prediction. The lower panel shows the ratio of the observed and predicted yields in each bin. For illustration the yields, multiplied by a factor 10, for two signal mass points in the T6ttHZ model, where the $\mathcal {B}(\tilde{\mathrm {t}}_2 \rightarrow \tilde{\mathrm {t}}_1 \mathrm{H} ) =$ 100%, are displayed for non-compressed ($ m(\tilde{\mathrm {t}}_2) = $ 700 GeV and $ m(\tilde{\mathrm {t}}_1) = $175 GeV) and compressed ($ m(\tilde{\mathrm {t}}_2) = $ 600 GeV and $ m(\tilde{\mathrm {t}}_1) = $ 425 GeV) scenarios. |
png pdf |
Figure 3:
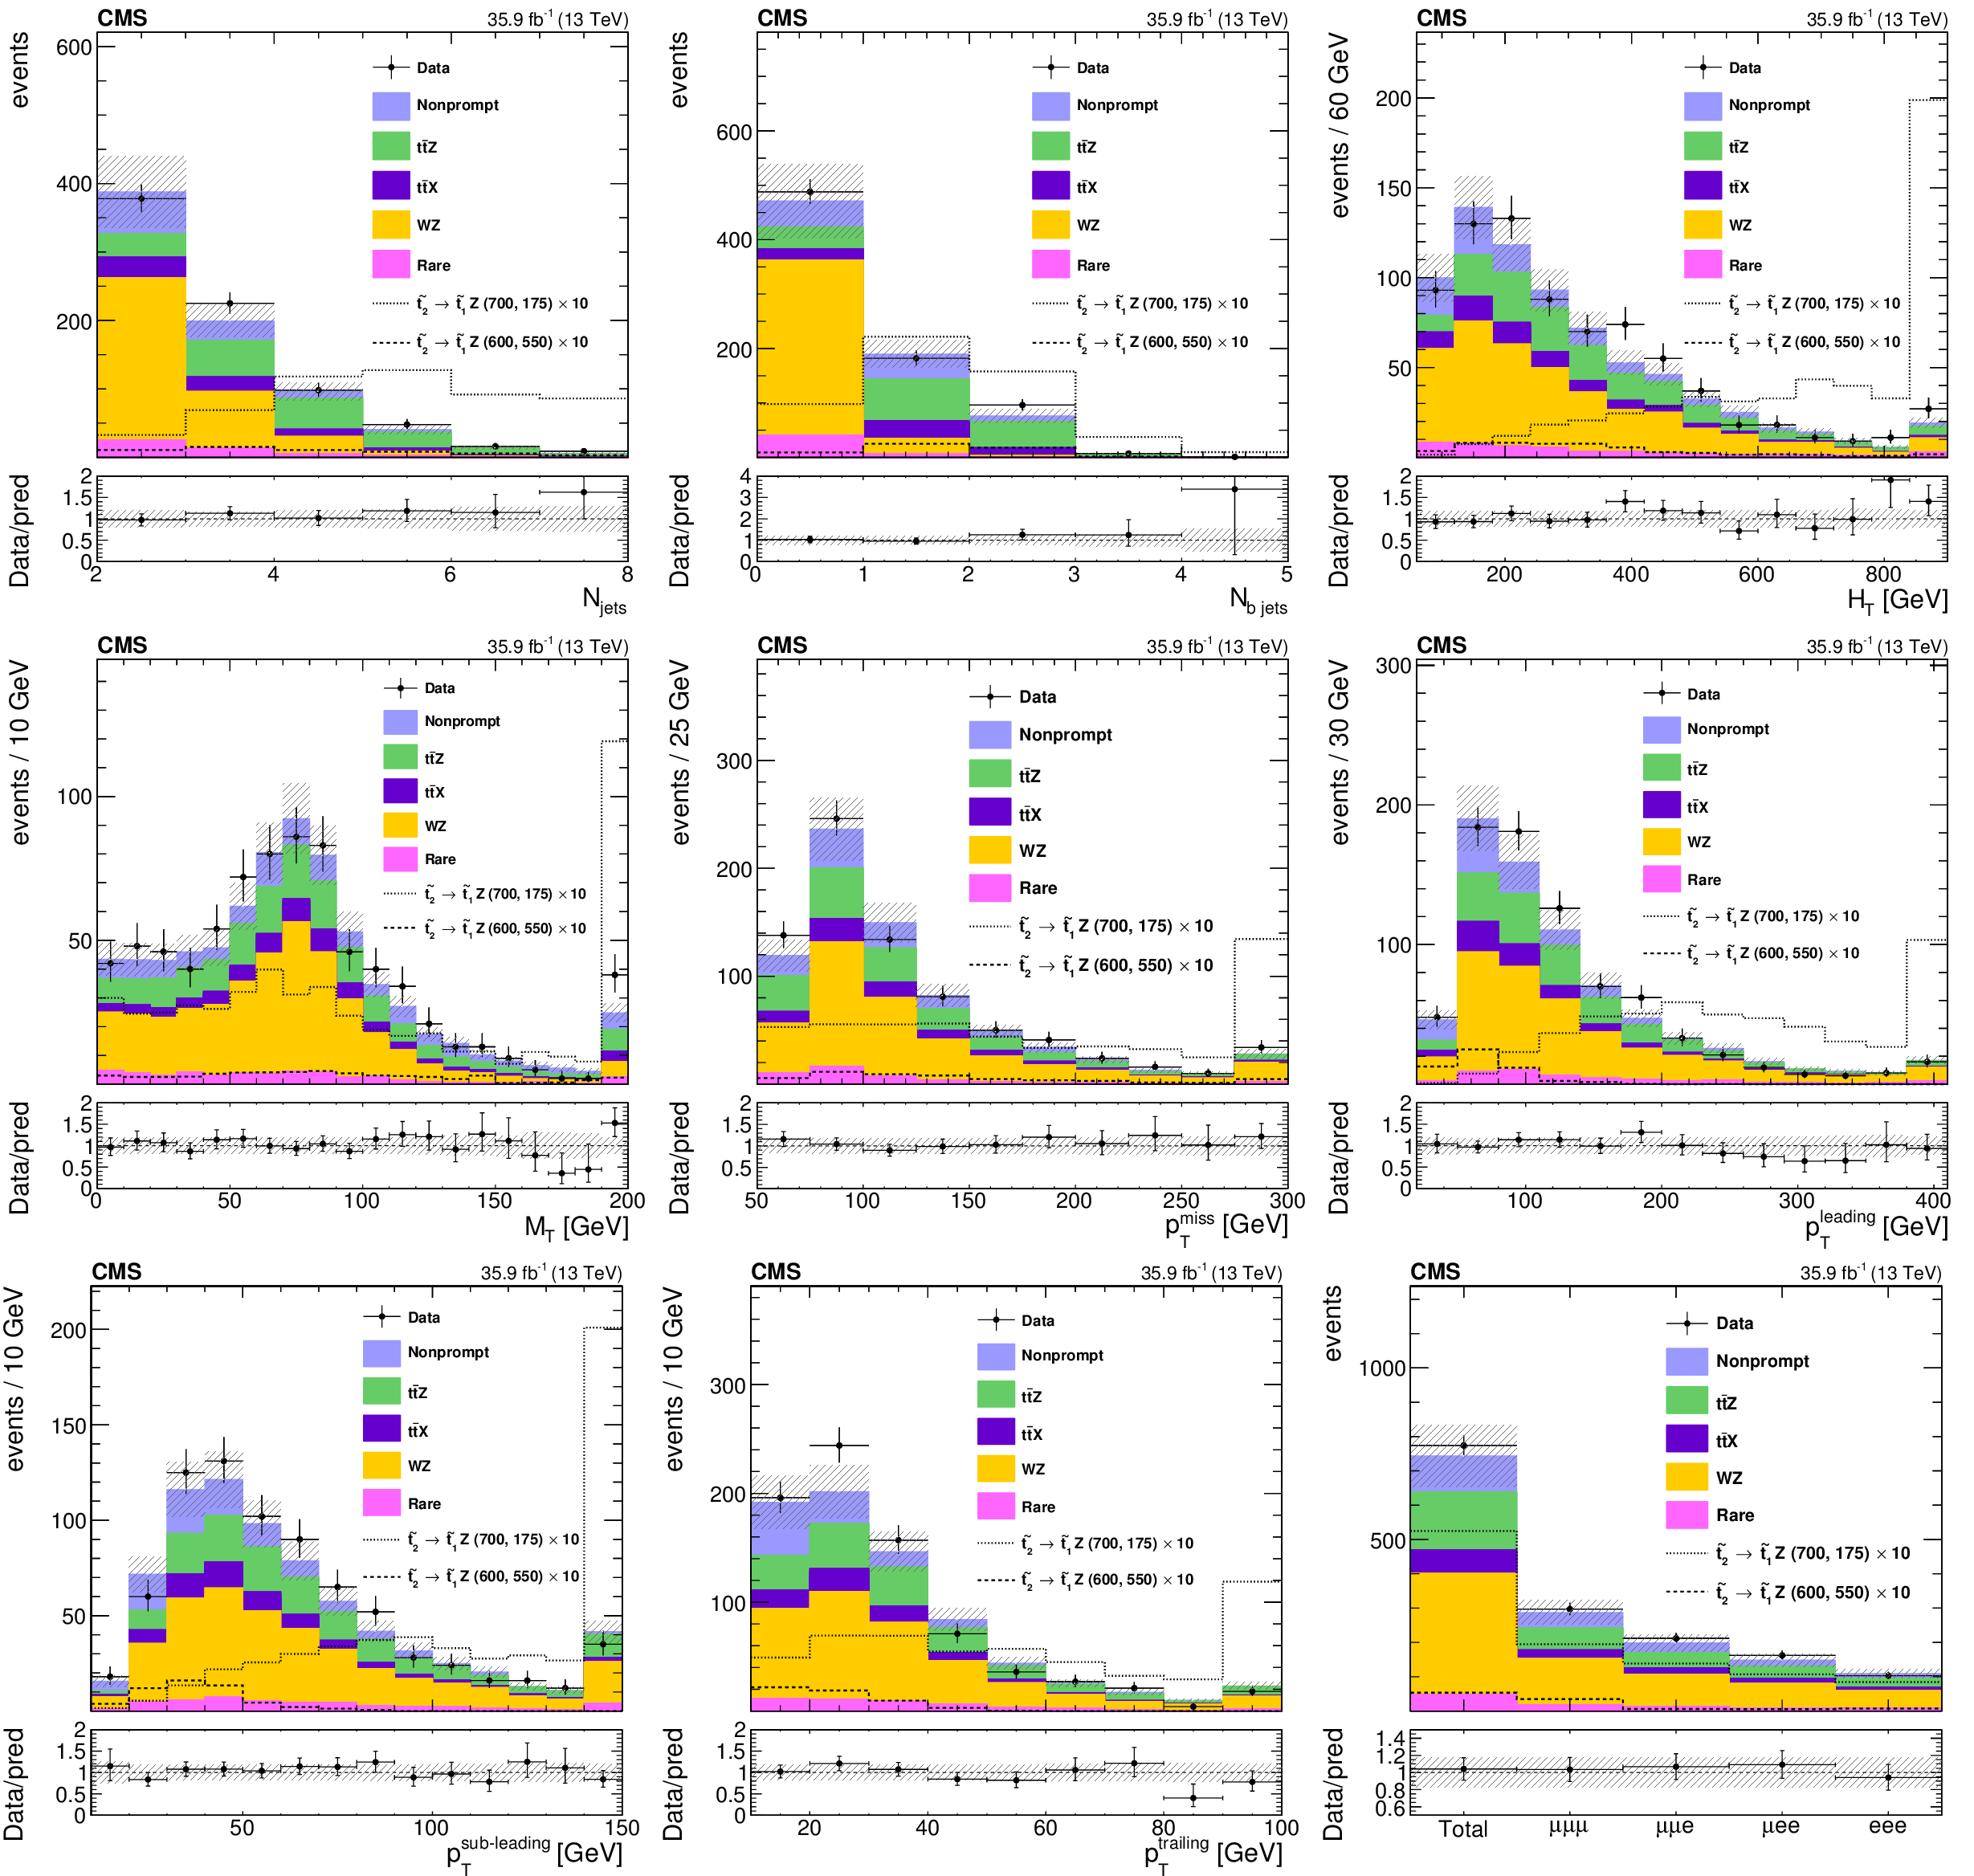
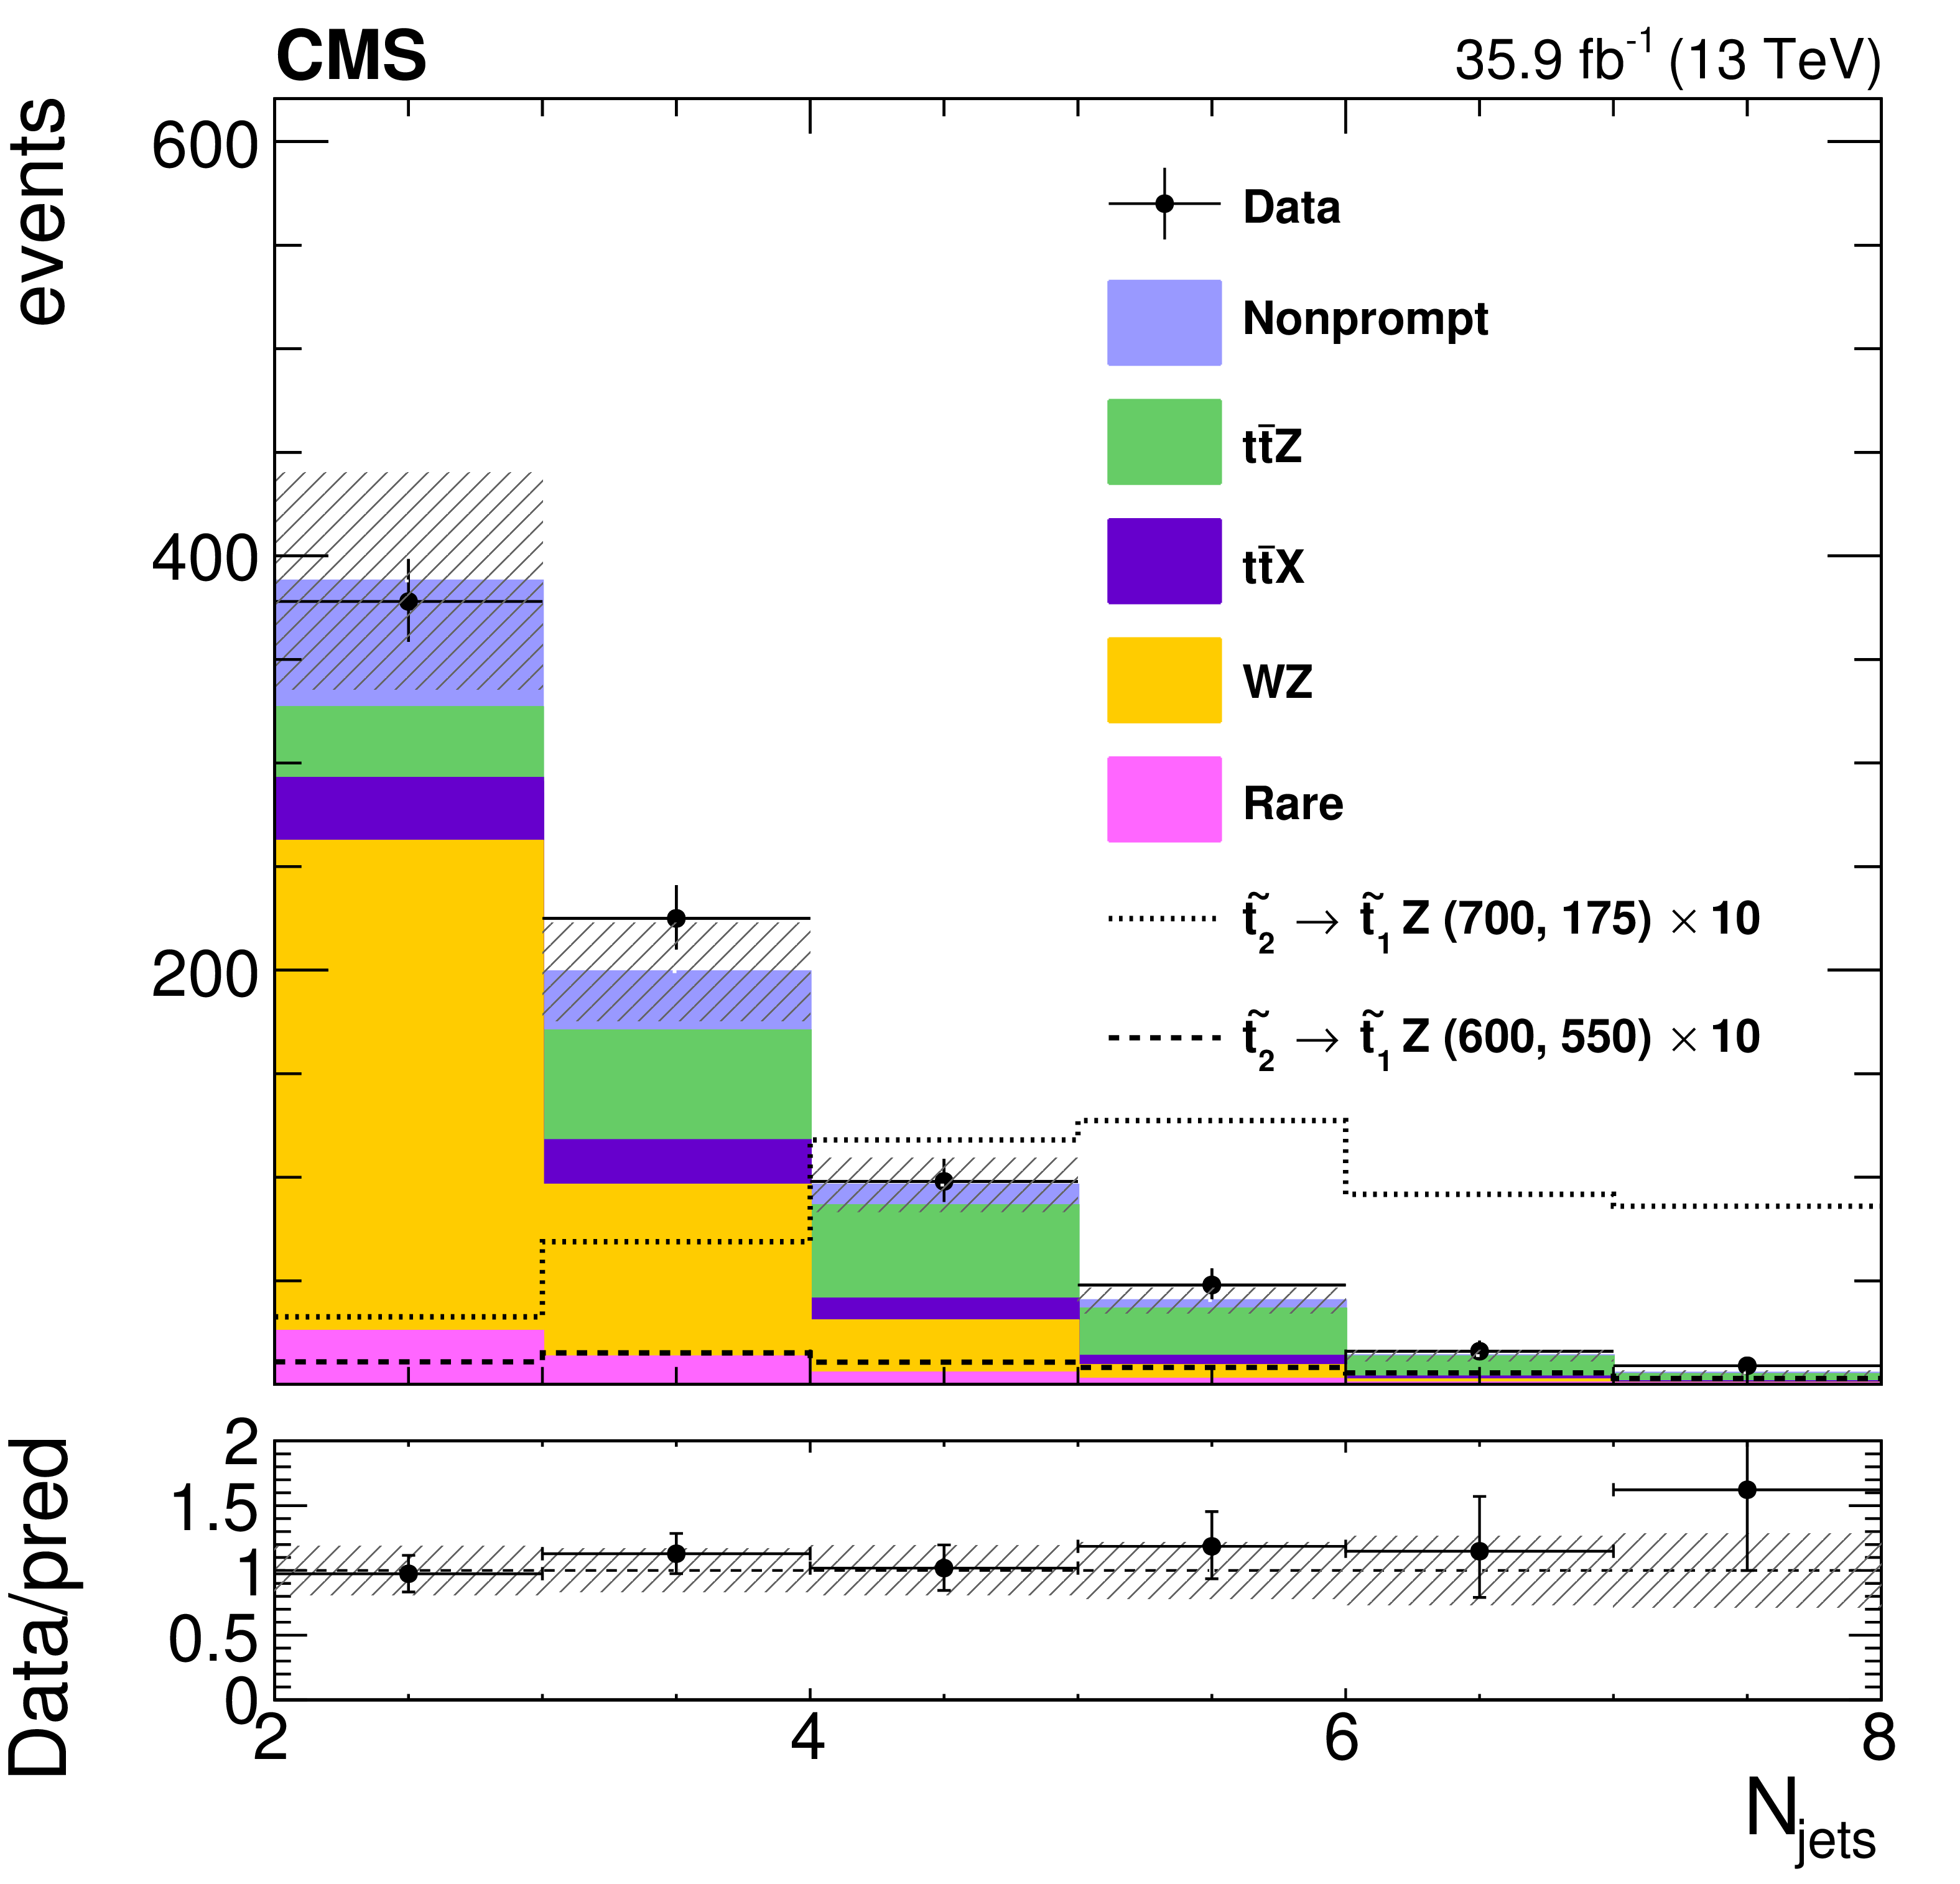
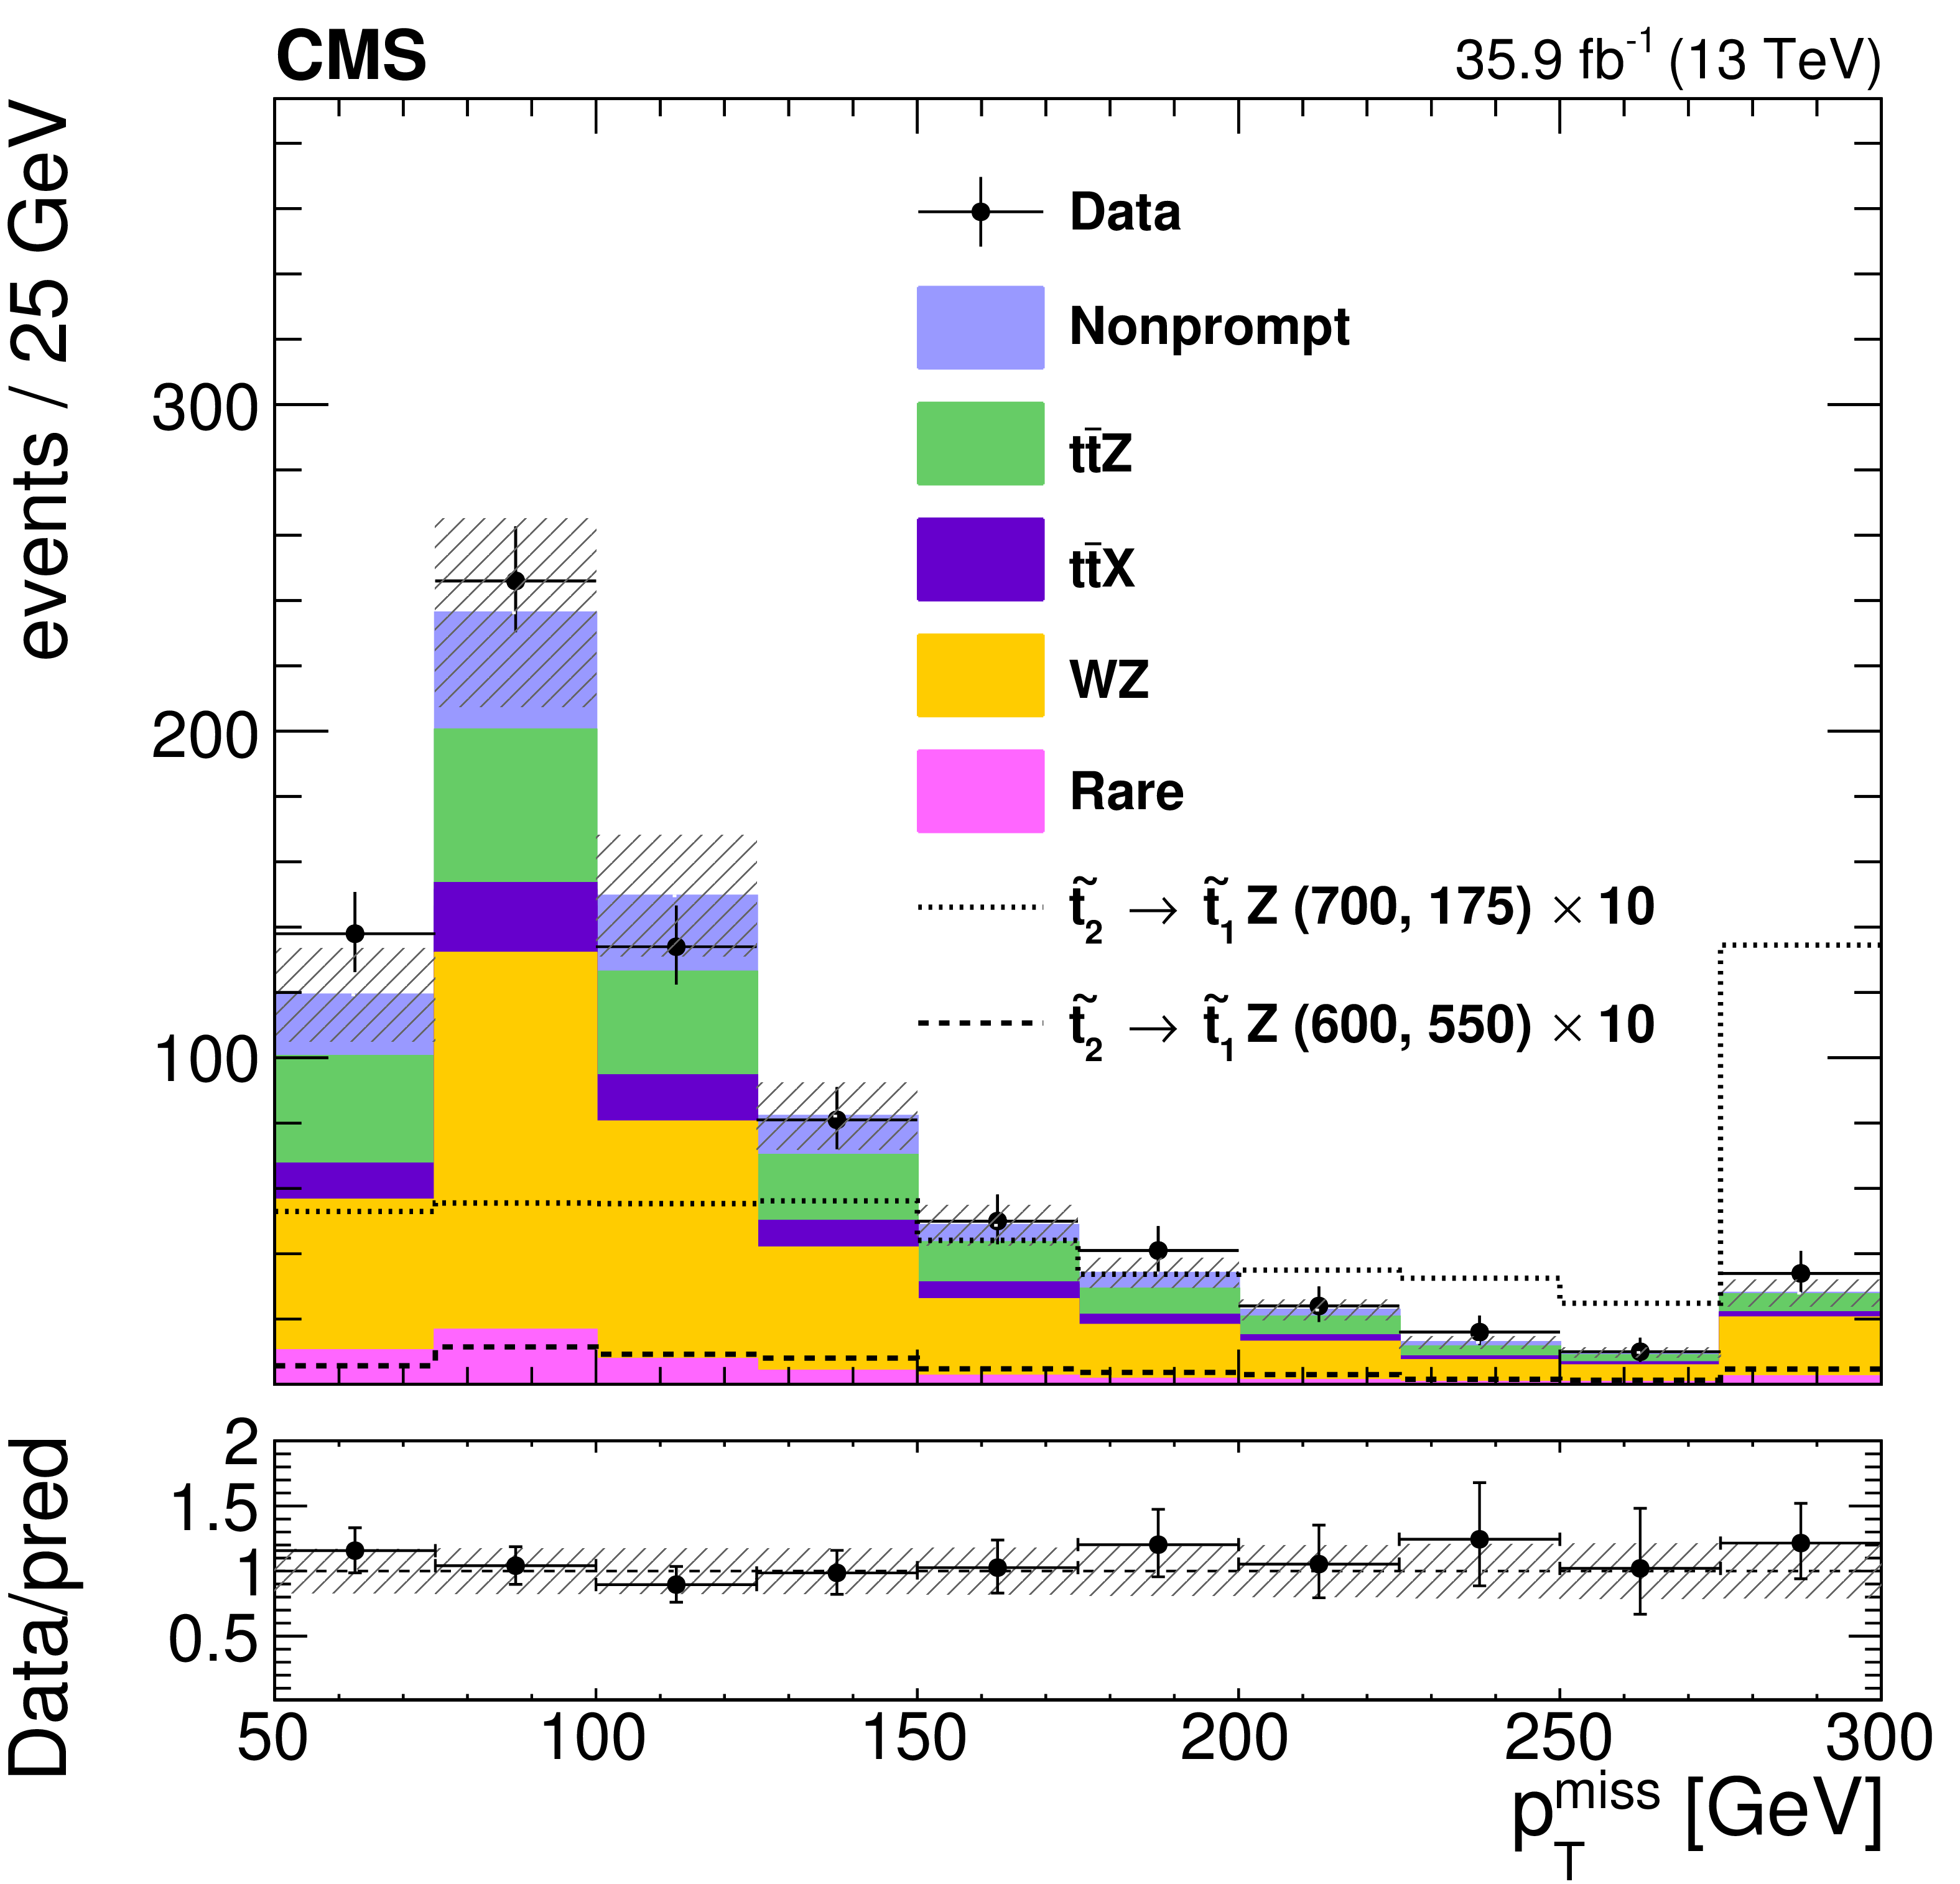
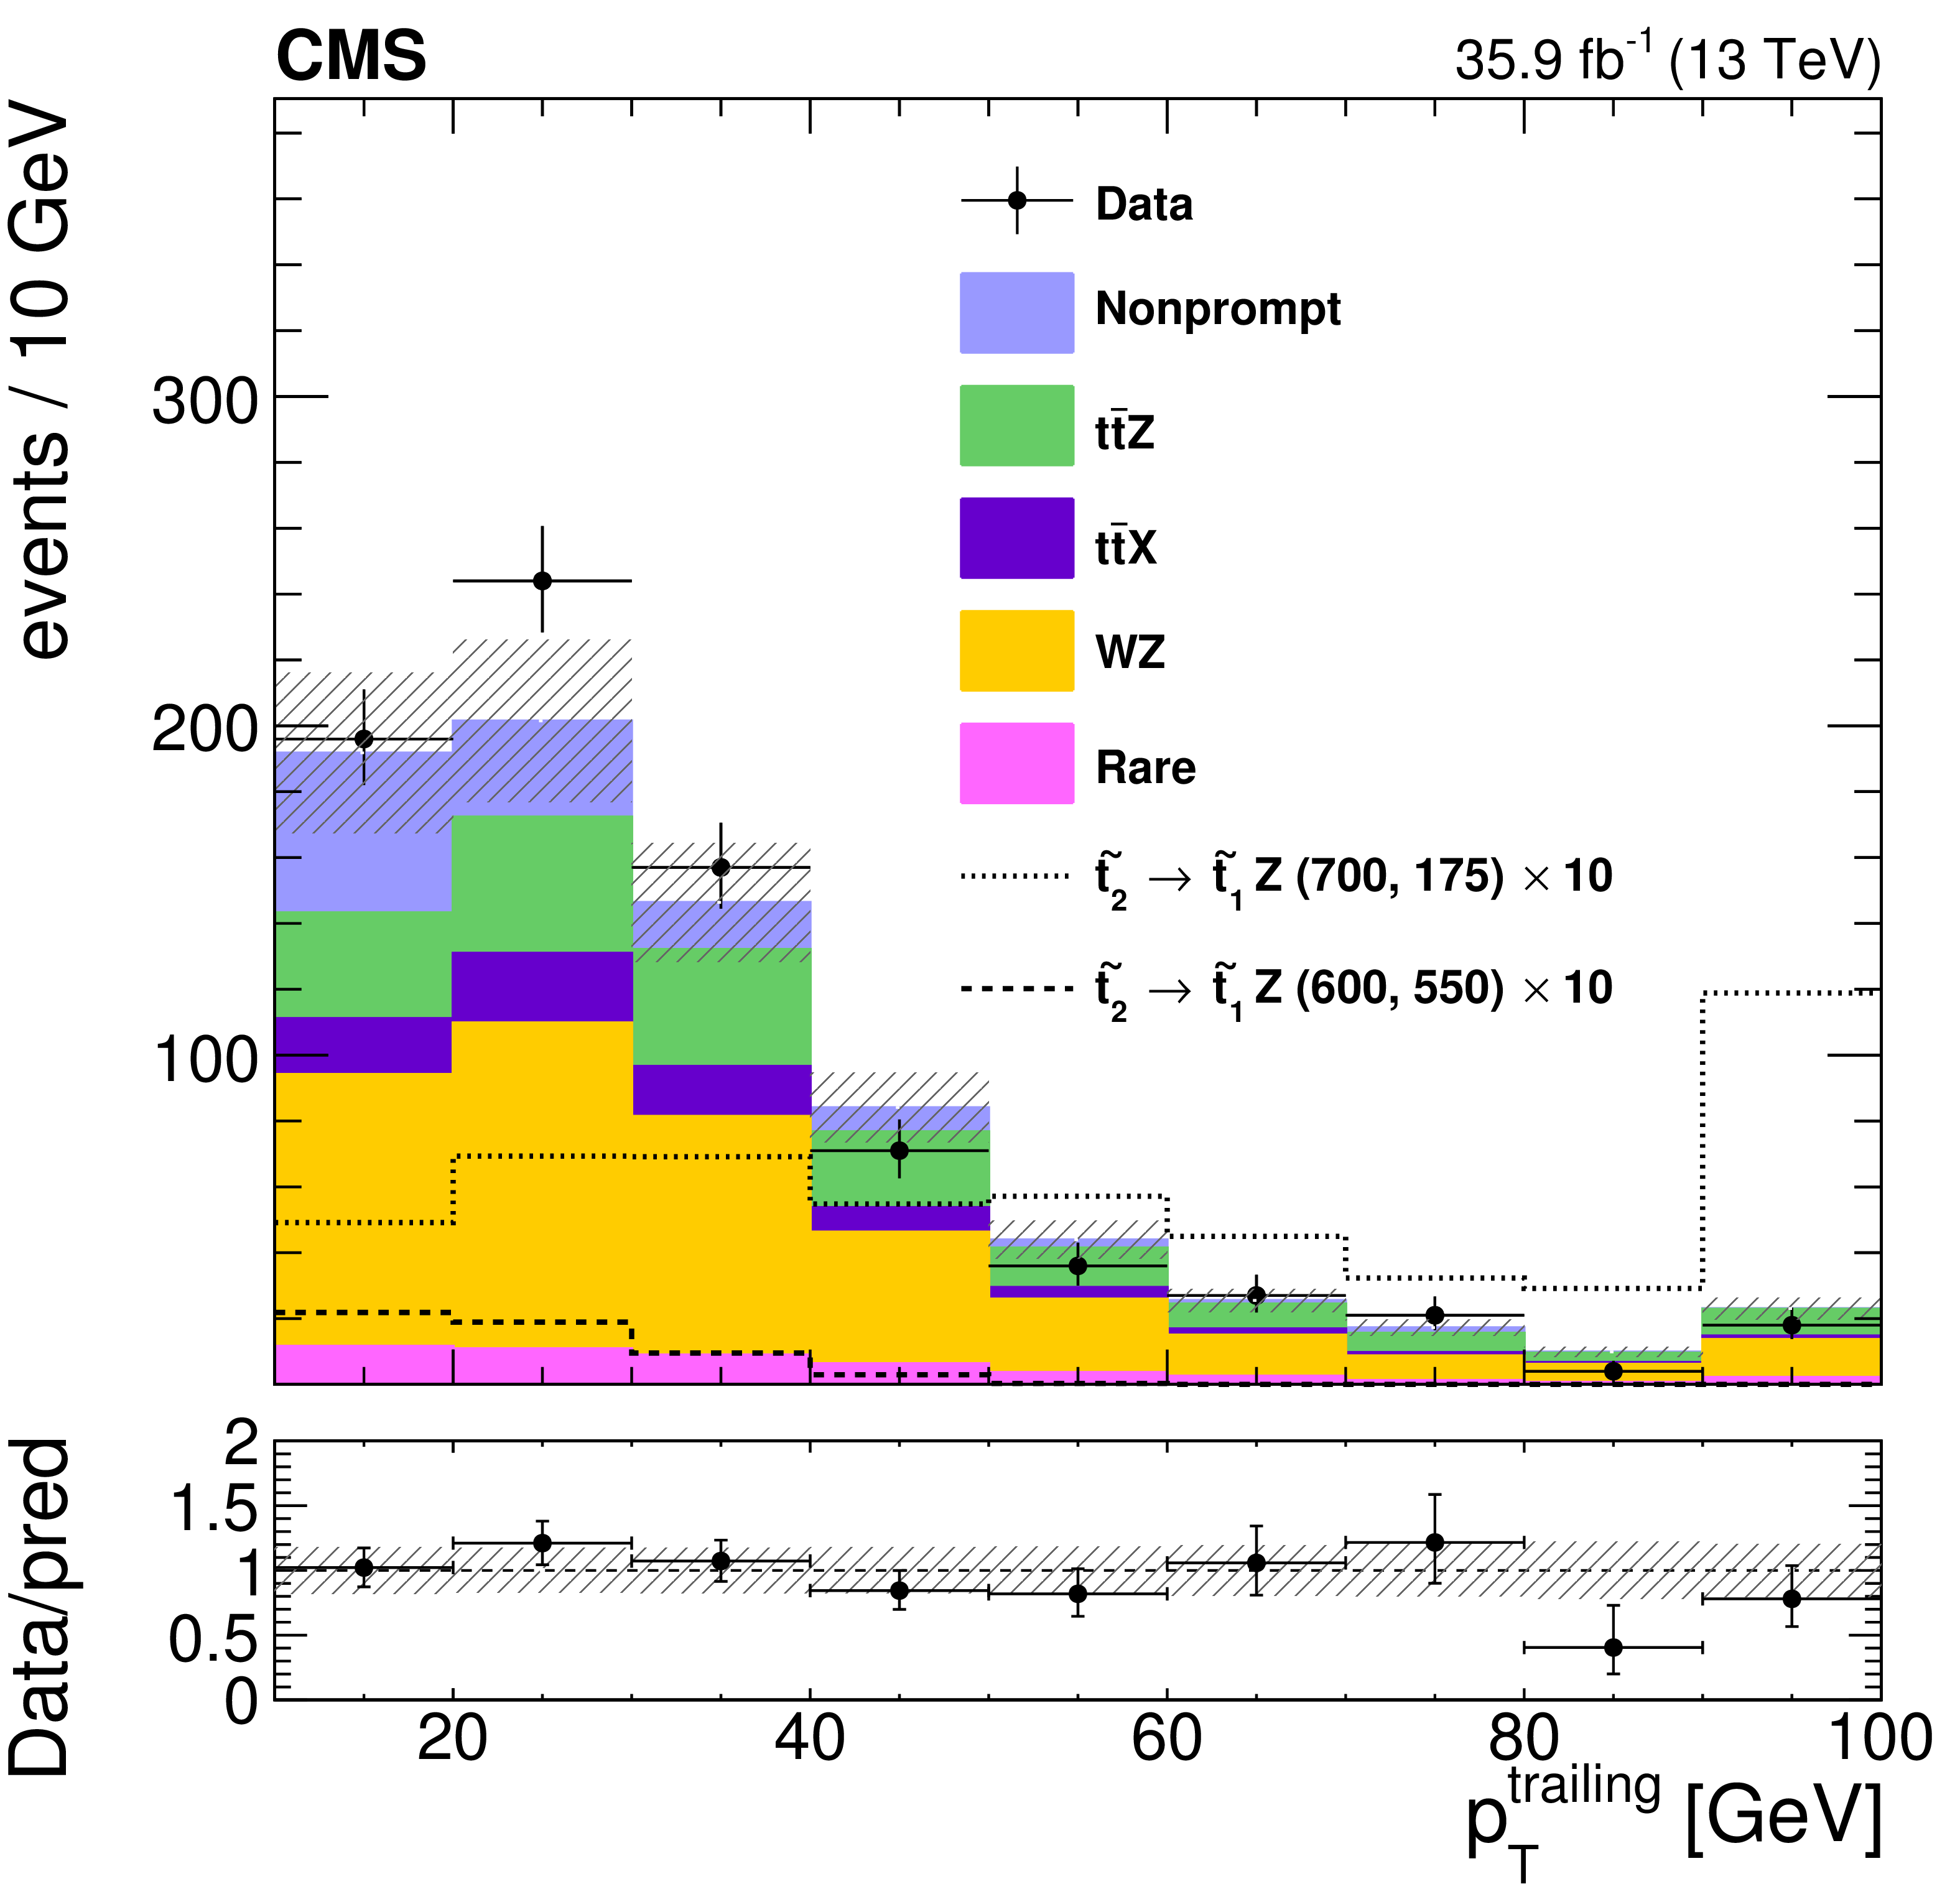
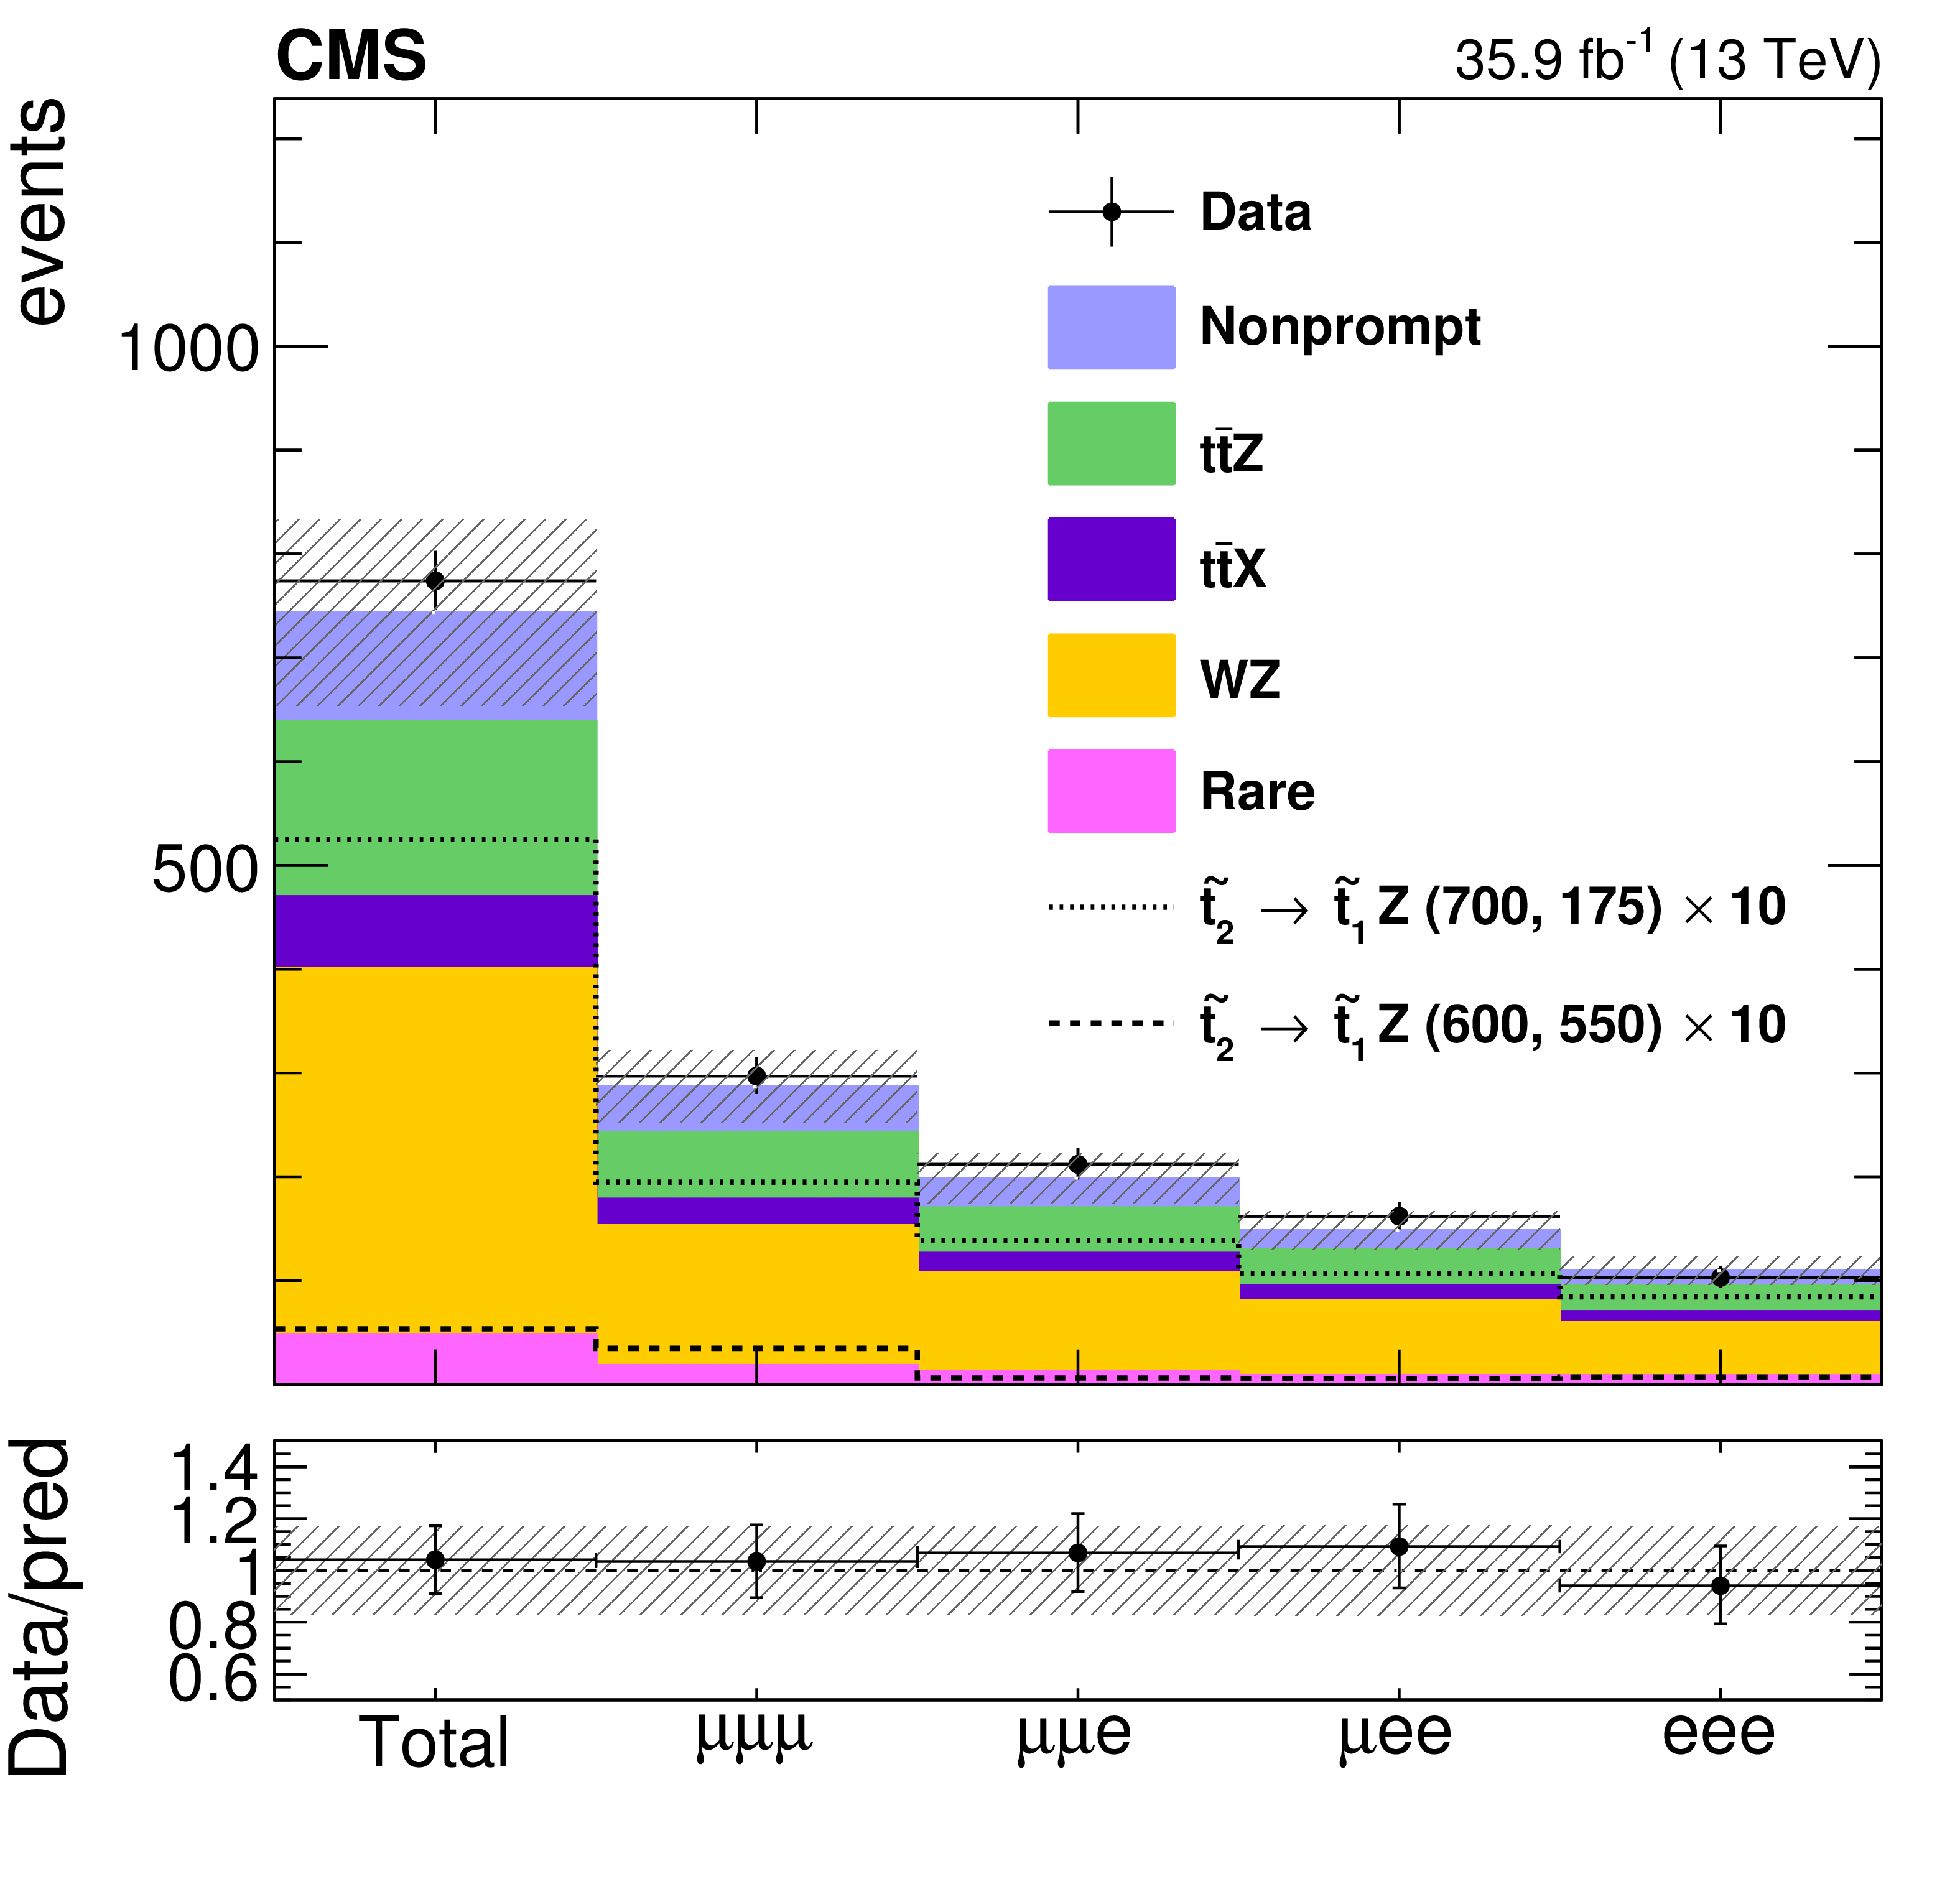
Background prediction and the observed event yields in the key observables of the on-Z baseline selection: the number of jets and b jets, ${H_{\mathrm {T}}}$, ${M_{\text {T}}}$, ${{p_{\mathrm {T}}} ^\text {miss}}$, the lepton ${p_{\mathrm {T}}}$ spectra and the event yields by flavor category are shown. The background events containing top quark(s) in association with a W, Z or Higgs boson, except ${{\mathrm{t} {}\mathrm{\bar{t}}} \mathrm{Z}}$, or another pair of top quarks are denoted as ${\mathrm{t} \mathrm{\bar{t}}} \mathrm{X}$. The last bin includes the overflow events, and the hatched area represents the combined statistical and systematic uncertainties in the prediction. The lower panels show the ratio of the observed and predicted yields in each bin. For illustration the yields, multiplied by a factor 10, for two signal mass points in the T6ttHZ model, where the $\mathcal {B}(\tilde{\text {t}}_2 \rightarrow \tilde{\text {t}}_1 \mathrm{Z} ) = $ 100%, are displayed for non-compressed ($m(\tilde{\text {t}}_2) = $ 700 GeV and $ m(\tilde{\text {t}}_1) = $ 175 GeV) and compressed ($ m(\tilde{\text {t}}_2) = $ 600 GeV and $ m(\tilde{\text {t}}_1) = $ 550 GeV) scenarios. |
png pdf |
Figure 3-a:
Background prediction and the observed event yields in the number of jets for the on-Z baseline selection. The background events containing top quark(s) in association with a W, Z or Higgs boson, except ${{\mathrm{t} {}\mathrm{\bar{t}}} \mathrm{Z}}$, or another pair of top quarks are denoted as ${\mathrm{t} \mathrm{\bar{t}}} \mathrm{X}$. The last bin includes the overflow events, and the hatched area represents the combined statistical and systematic uncertainties in the prediction. The lower panel shows the ratio of the observed and predicted yields in each bin. For illustration the yields, multiplied by a factor 10, for two signal mass points in the T6ttHZ model, where the $\mathcal {B}(\tilde{\text {t}}_2 \rightarrow \tilde{\text {t}}_1 \mathrm{Z} ) = $ 100%, are displayed for non-compressed ($m(\tilde{\text {t}}_2) = $ 700 GeV and $ m(\tilde{\text {t}}_1) = $ 175 GeV) and compressed ($ m(\tilde{\text {t}}_2) = $ 600 GeV and $ m(\tilde{\text {t}}_1) = $ 550 GeV) scenarios. |
png pdf |
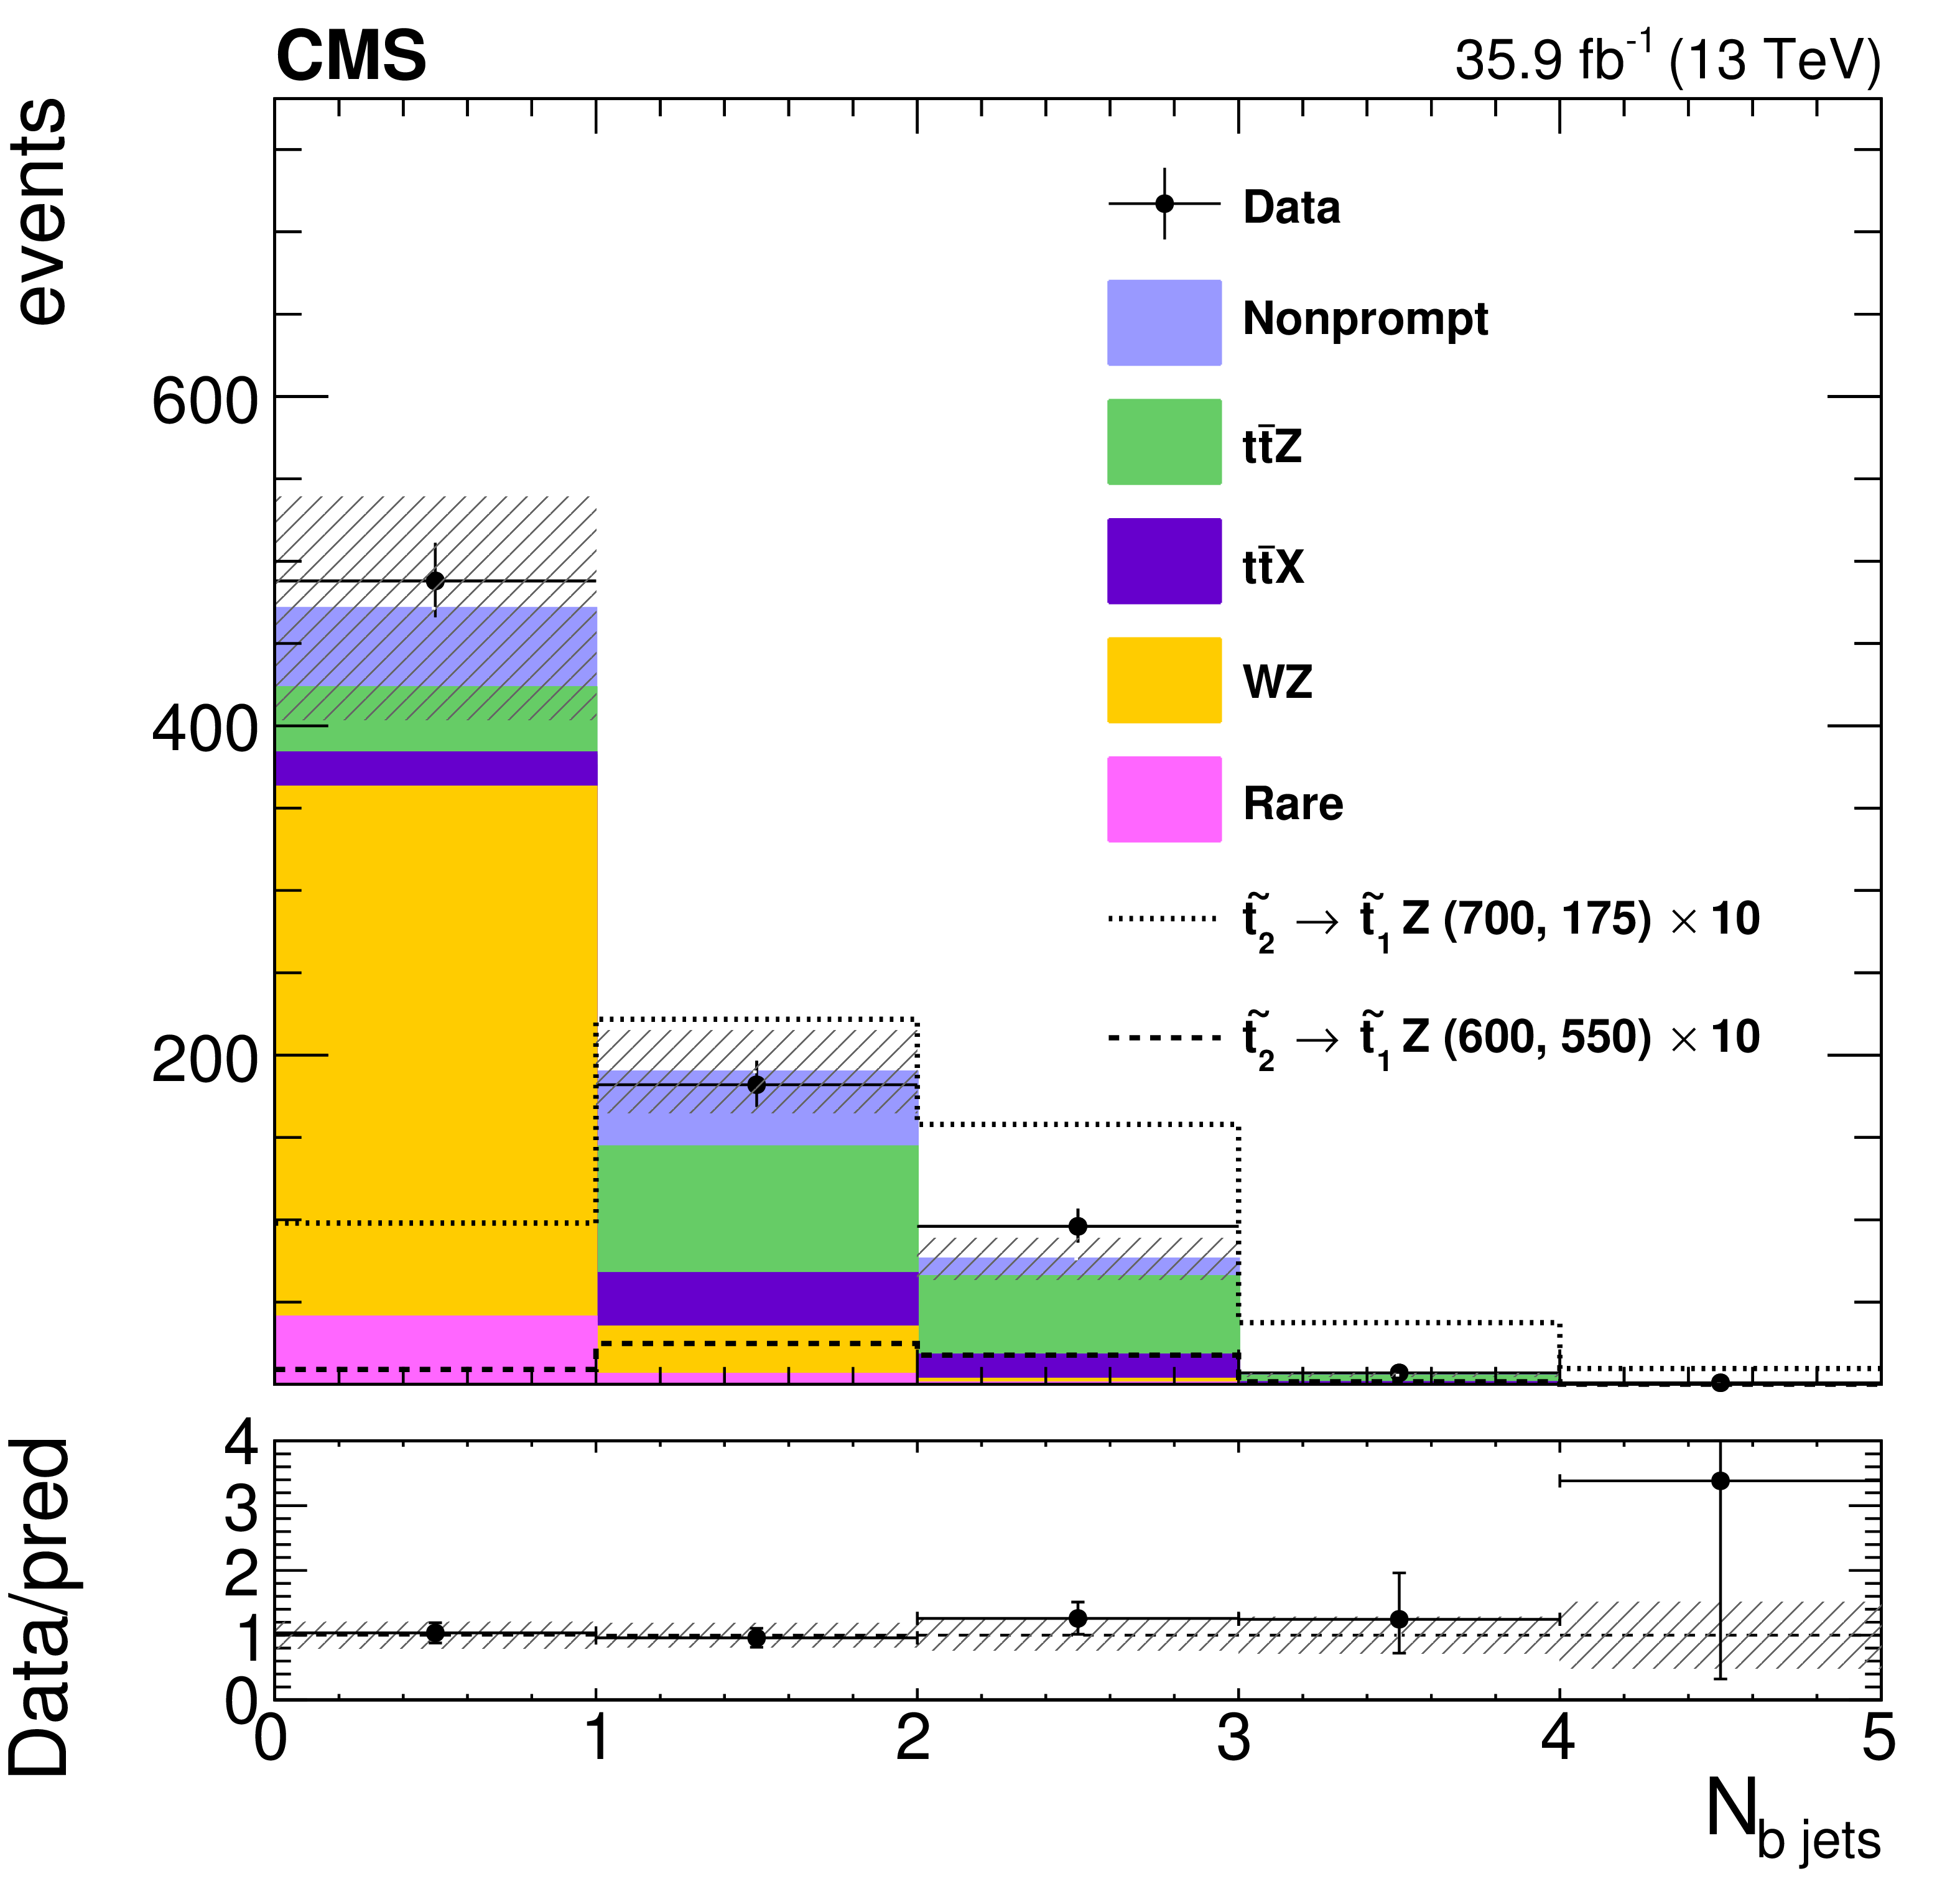
Figure 3-b:
Background prediction and the observed event yields in the number of b jets for the on-Z baseline selection. The background events containing top quark(s) in association with a W, Z or Higgs boson, except ${{\mathrm{t} {}\mathrm{\bar{t}}} \mathrm{Z}}$, or another pair of top quarks are denoted as ${\mathrm{t} \mathrm{\bar{t}}} \mathrm{X}$. The last bin includes the overflow events, and the hatched area represents the combined statistical and systematic uncertainties in the prediction. The lower panel shows the ratio of the observed and predicted yields in each bin. For illustration the yields, multiplied by a factor 10, for two signal mass points in the T6ttHZ model, where the $\mathcal {B}(\tilde{\text {t}}_2 \rightarrow \tilde{\text {t}}_1 \mathrm{Z} ) = $ 100%, are displayed for non-compressed ($m(\tilde{\text {t}}_2) = $ 700 GeV and $ m(\tilde{\text {t}}_1) = $ 175 GeV) and compressed ($ m(\tilde{\text {t}}_2) = $ 600 GeV and $ m(\tilde{\text {t}}_1) = $ 550 GeV) scenarios. |
png pdf |
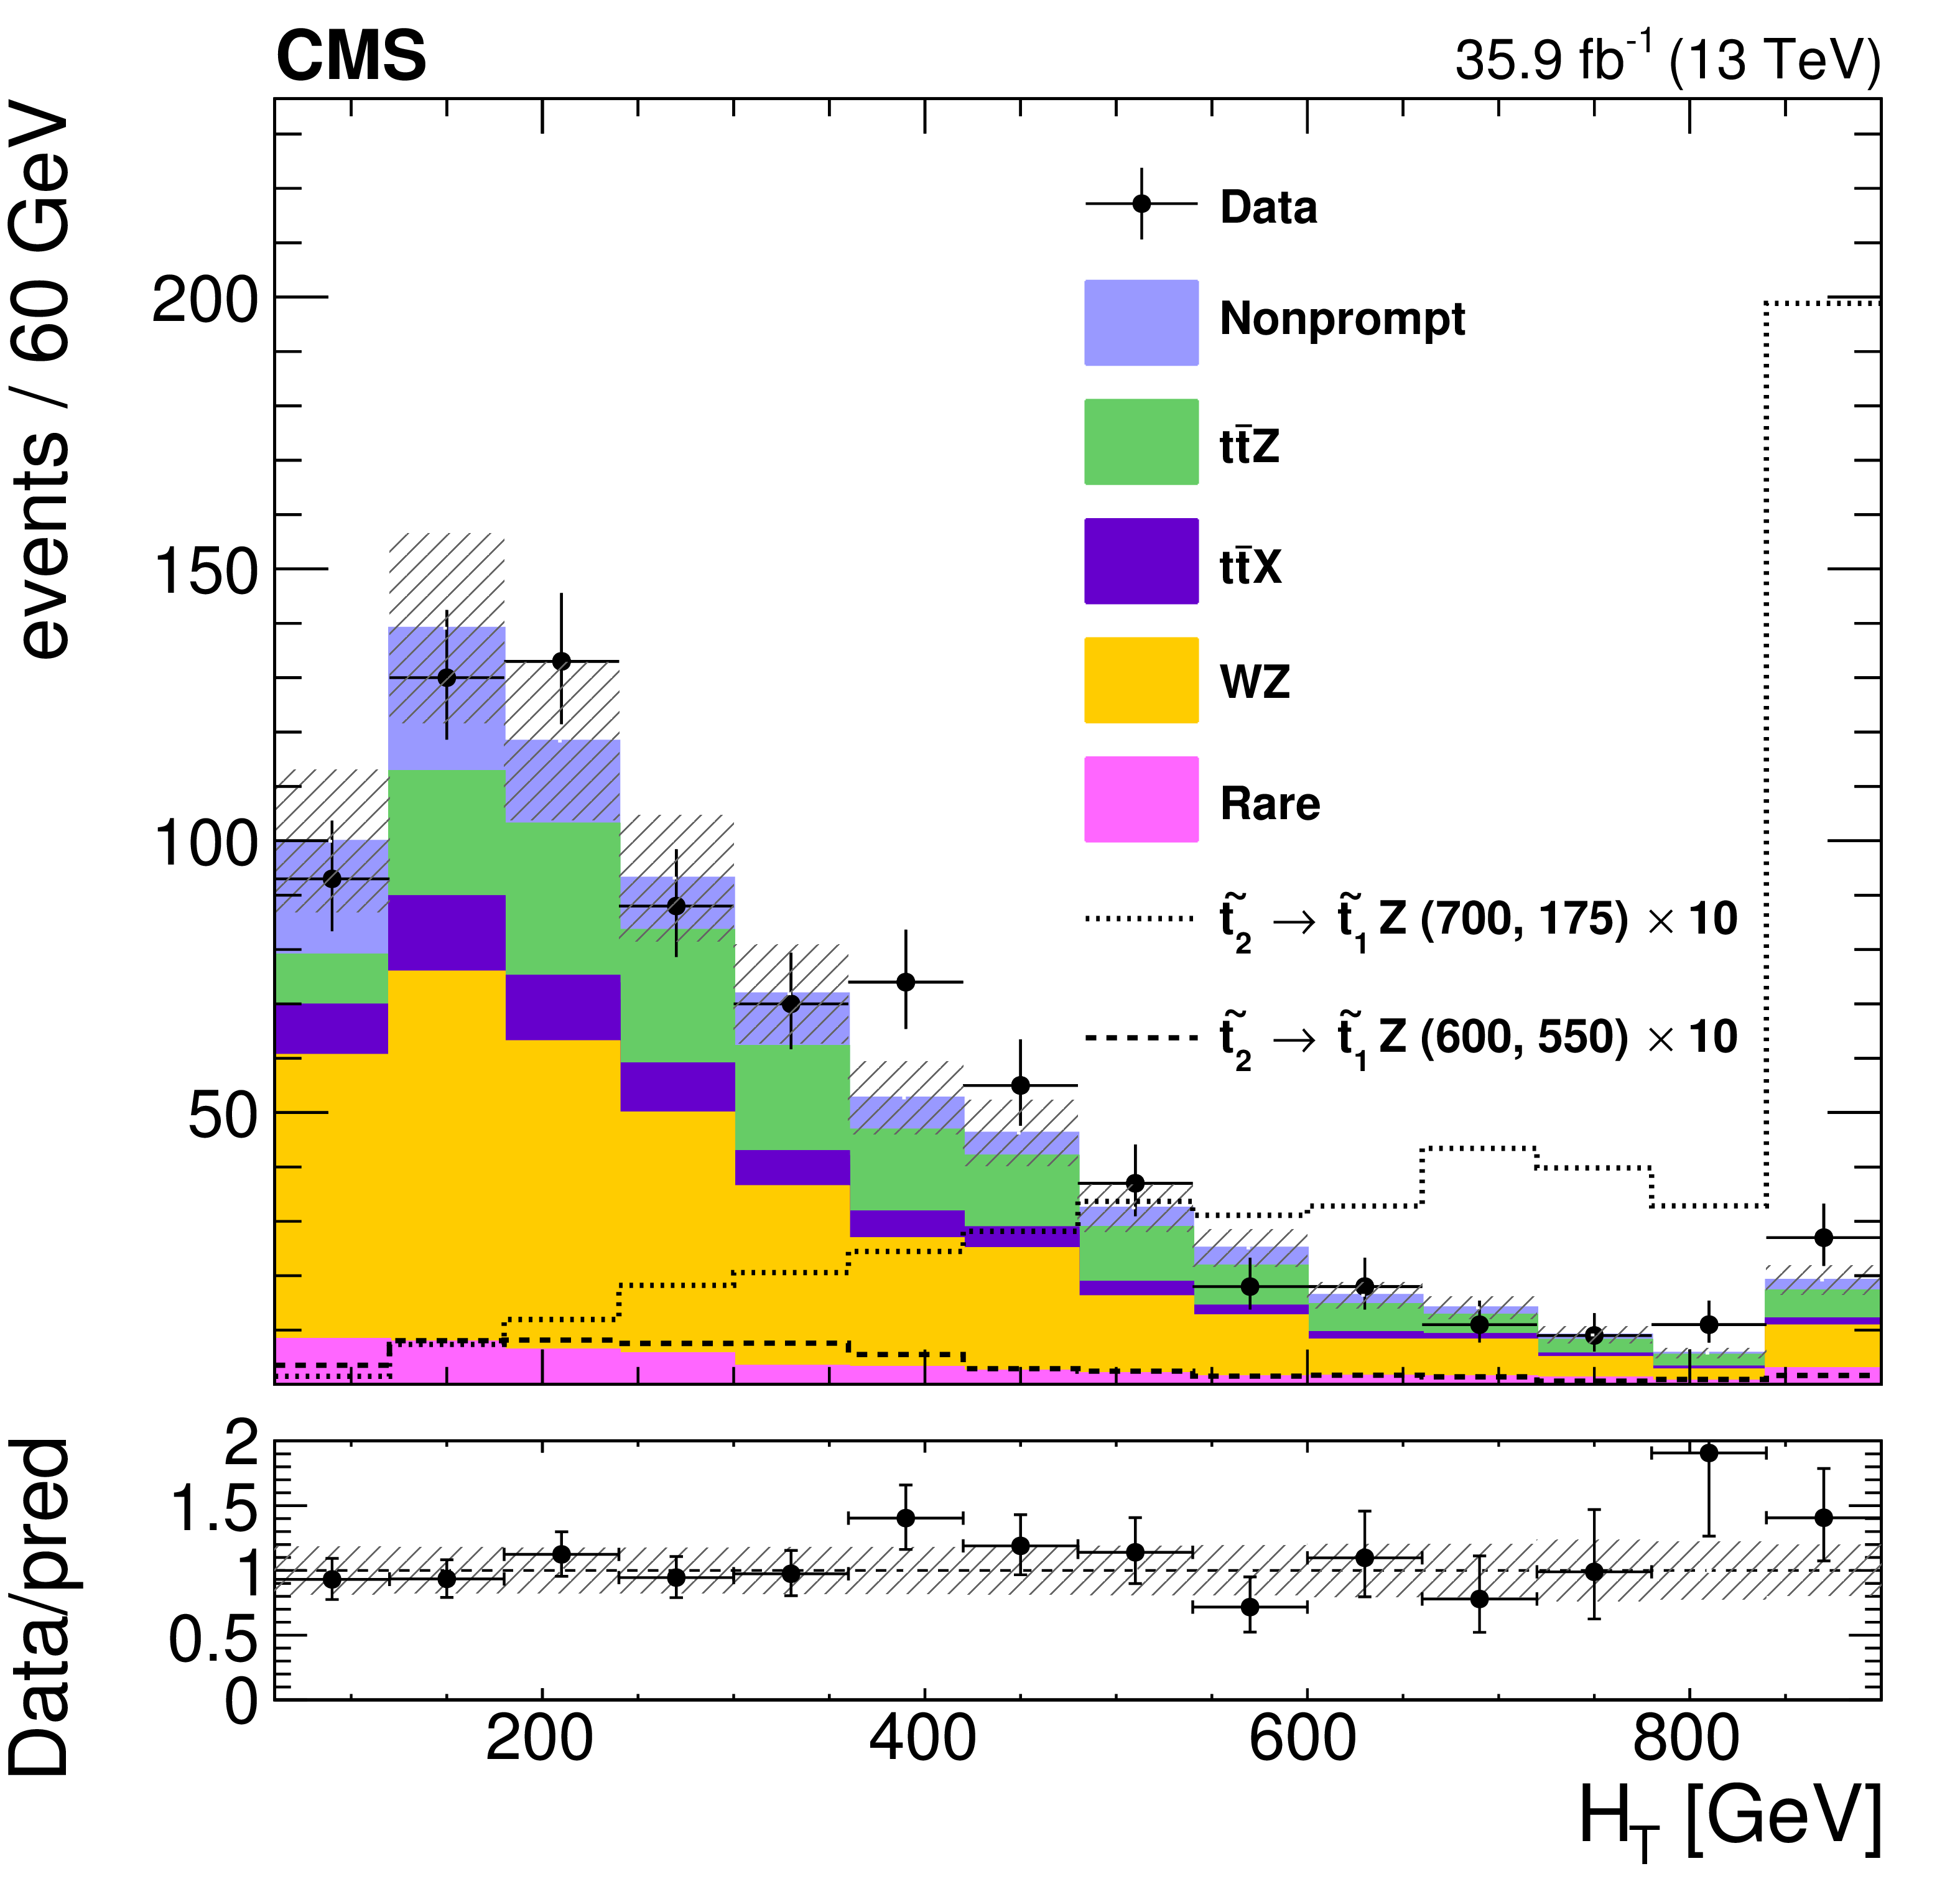
Figure 3-c:
Background prediction and the observed event yields in ${H_{\mathrm {T}}}$ for the on-Z baseline selection. The background events containing top quark(s) in association with a W, Z or Higgs boson, except ${{\mathrm{t} {}\mathrm{\bar{t}}} \mathrm{Z}}$, or another pair of top quarks are denoted as ${\mathrm{t} \mathrm{\bar{t}}} \mathrm{X}$. The last bin includes the overflow events, and the hatched area represents the combined statistical and systematic uncertainties in the prediction. The lower panel shows the ratio of the observed and predicted yields in each bin. For illustration the yields, multiplied by a factor 10, for two signal mass points in the T6ttHZ model, where the $\mathcal {B}(\tilde{\text {t}}_2 \rightarrow \tilde{\text {t}}_1 \mathrm{Z} ) = $ 100%, are displayed for non-compressed ($m(\tilde{\text {t}}_2) = $ 700 GeV and $ m(\tilde{\text {t}}_1) = $ 175 GeV) and compressed ($ m(\tilde{\text {t}}_2) = $ 600 GeV and $ m(\tilde{\text {t}}_1) = $ 550 GeV) scenarios. |
png pdf |
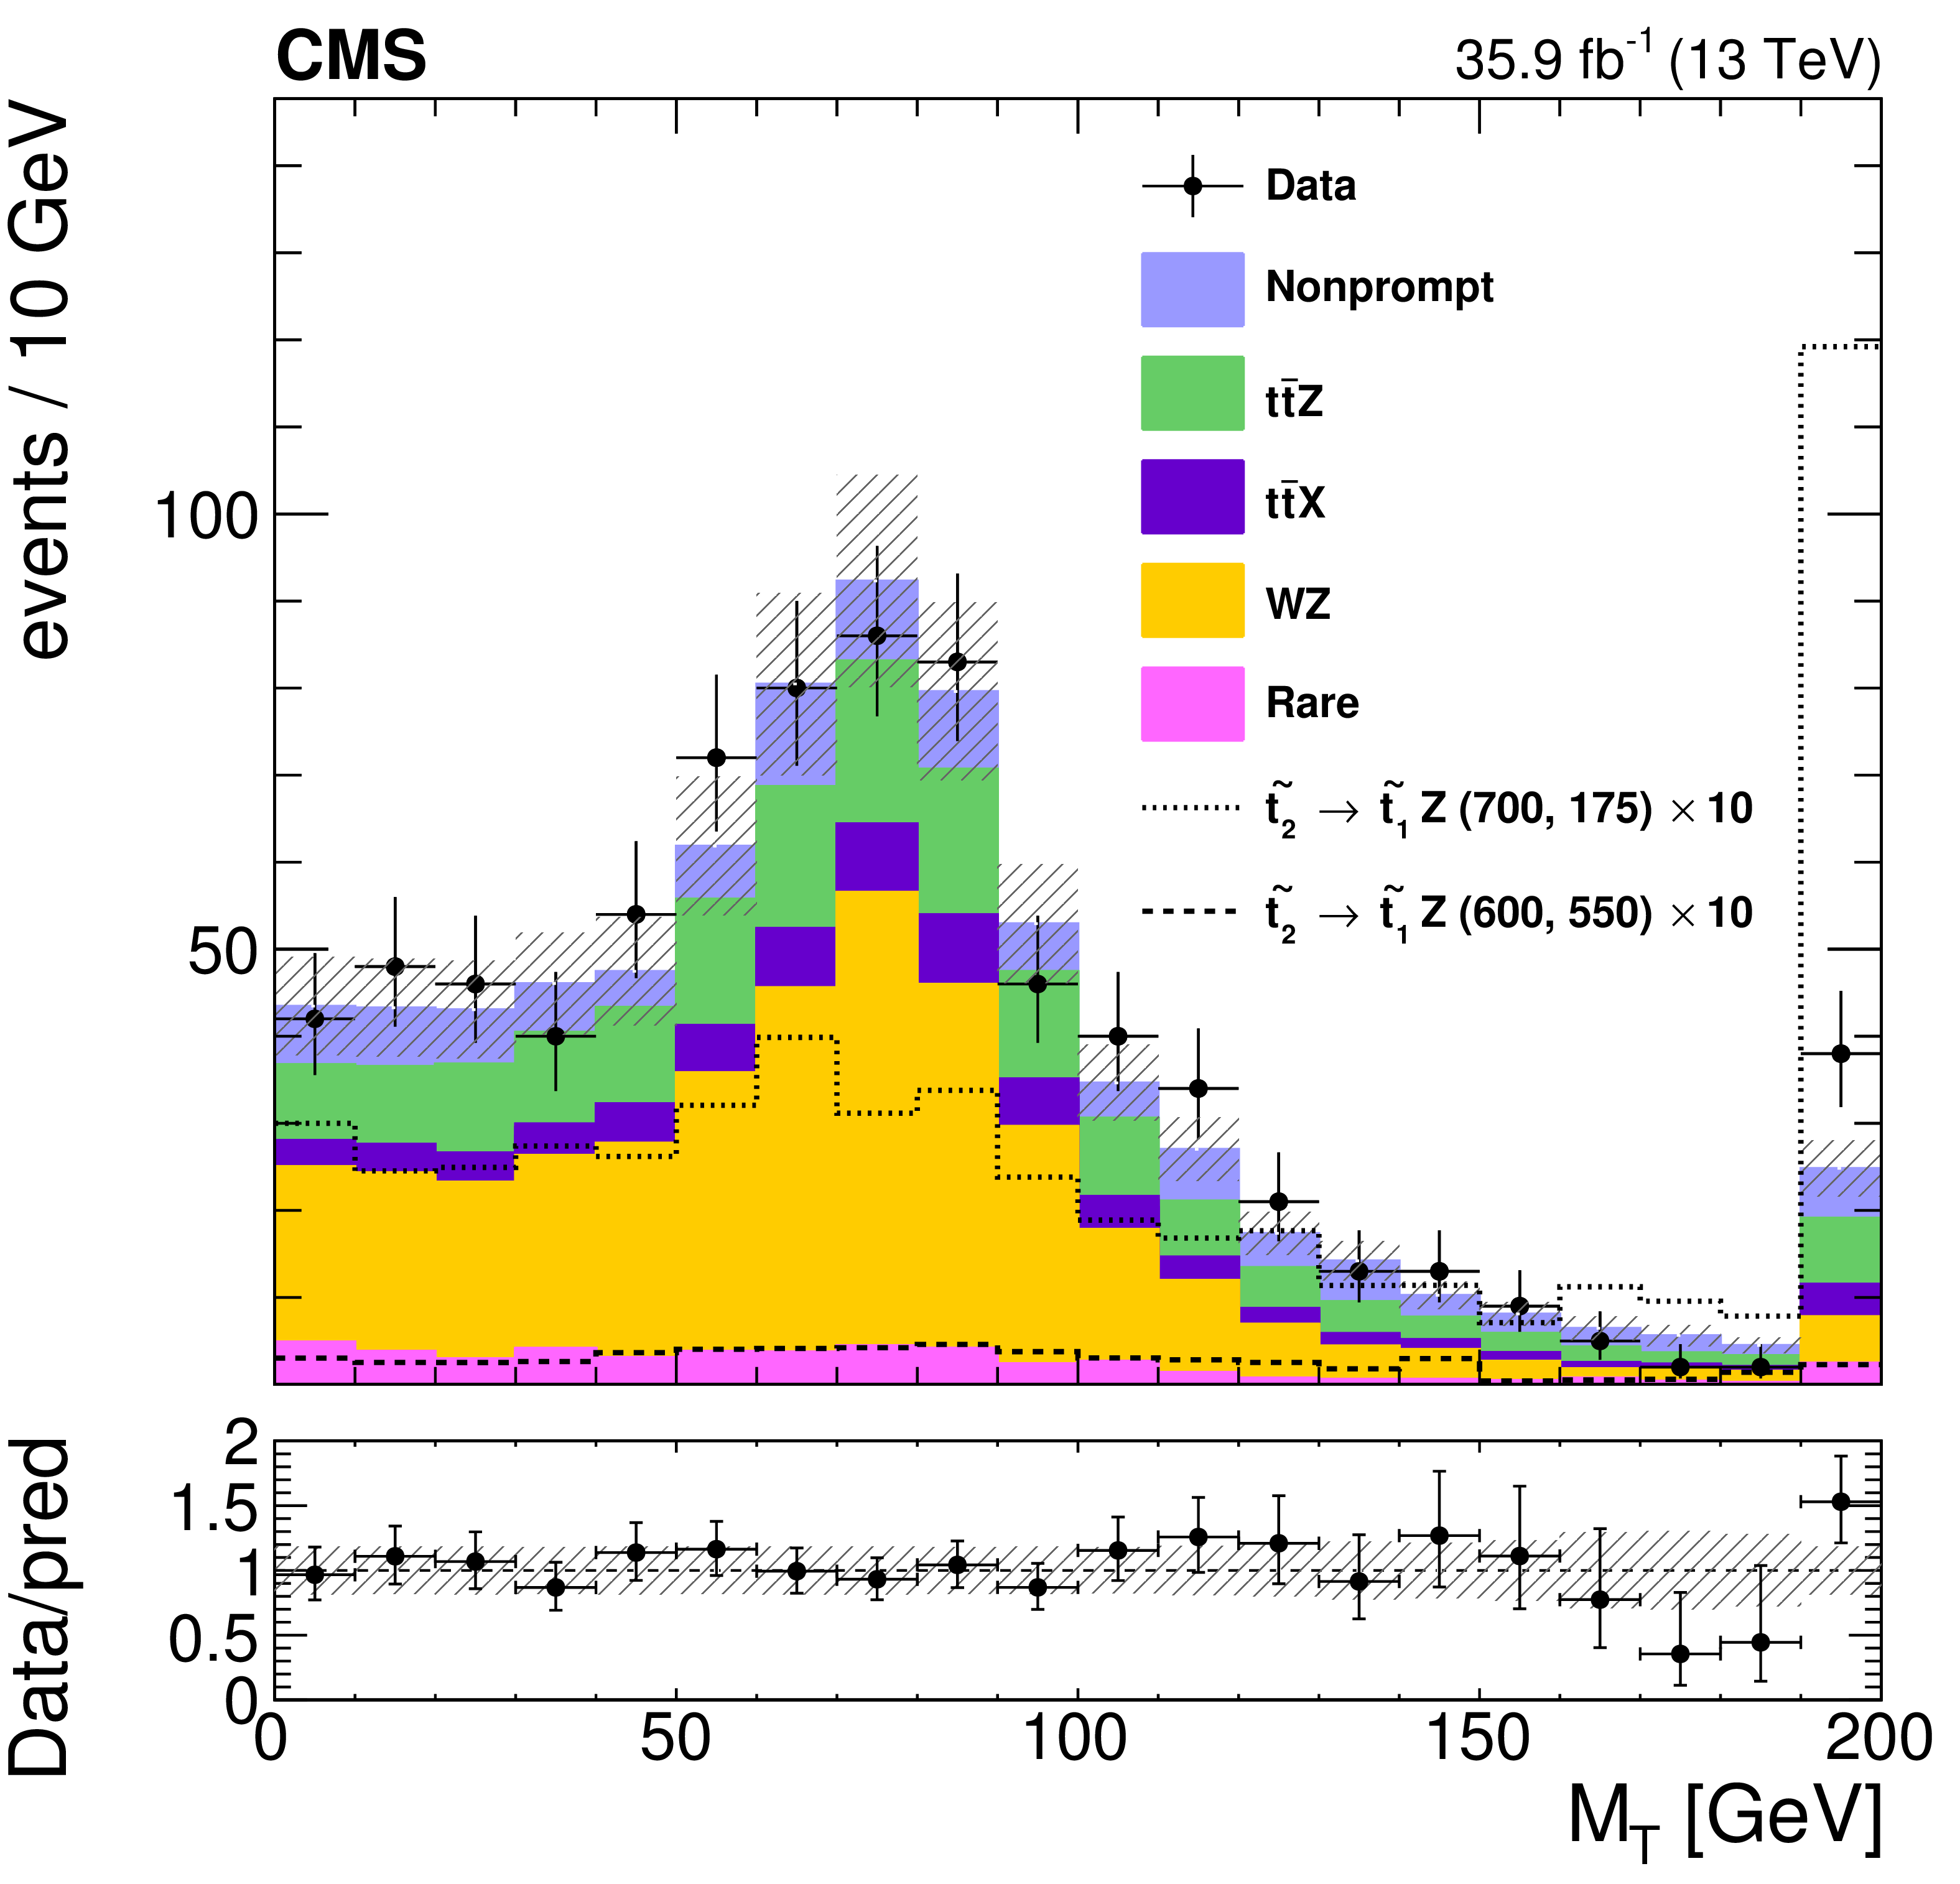
Figure 3-d:
Background prediction and the observed event yields in ${M_{\text {T}}}$ for the on-Z baseline selection. The background events containing top quark(s) in association with a W, Z or Higgs boson, except ${{\mathrm{t} {}\mathrm{\bar{t}}} \mathrm{Z}}$, or another pair of top quarks are denoted as ${\mathrm{t} \mathrm{\bar{t}}} \mathrm{X}$. The last bin includes the overflow events, and the hatched area represents the combined statistical and systematic uncertainties in the prediction. The lower panel shows the ratio of the observed and predicted yields in each bin. For illustration the yields, multiplied by a factor 10, for two signal mass points in the T6ttHZ model, where the $\mathcal {B}(\tilde{\text {t}}_2 \rightarrow \tilde{\text {t}}_1 \mathrm{Z} ) = $ 100%, are displayed for non-compressed ($m(\tilde{\text {t}}_2) = $ 700 GeV and $ m(\tilde{\text {t}}_1) = $ 175 GeV) and compressed ($ m(\tilde{\text {t}}_2) = $ 600 GeV and $ m(\tilde{\text {t}}_1) = $ 550 GeV) scenarios. |
png pdf |
Figure 3-e:
Background prediction and the observed event yields in ${{p_{\mathrm {T}}} ^\text {miss}}$ for the on-Z baseline selection. The background events containing top quark(s) in association with a W, Z or Higgs boson, except ${{\mathrm{t} {}\mathrm{\bar{t}}} \mathrm{Z}}$, or another pair of top quarks are denoted as ${\mathrm{t} \mathrm{\bar{t}}} \mathrm{X}$. The last bin includes the overflow events, and the hatched area represents the combined statistical and systematic uncertainties in the prediction. The lower panel shows the ratio of the observed and predicted yields in each bin. For illustration the yields, multiplied by a factor 10, for two signal mass points in the T6ttHZ model, where the $\mathcal {B}(\tilde{\text {t}}_2 \rightarrow \tilde{\text {t}}_1 \mathrm{Z} ) = $ 100%, are displayed for non-compressed ($m(\tilde{\text {t}}_2) = $ 700 GeV and $ m(\tilde{\text {t}}_1) = $ 175 GeV) and compressed ($ m(\tilde{\text {t}}_2) = $ 600 GeV and $ m(\tilde{\text {t}}_1) = $ 550 GeV) scenarios. |

png pdf |
Figure 3-f:
Background prediction and the observed event yields in the leading lepton ${p_{\mathrm {T}}}$ for the on-Z baseline selection. The background events containing top quark(s) in association with a W, Z or Higgs boson, except ${{\mathrm{t} {}\mathrm{\bar{t}}} \mathrm{Z}}$, or another pair of top quarks are denoted as ${\mathrm{t} \mathrm{\bar{t}}} \mathrm{X}$. The last bin includes the overflow events, and the hatched area represents the combined statistical and systematic uncertainties in the prediction. The lower panel shows the ratio of the observed and predicted yields in each bin. For illustration the yields, multiplied by a factor 10, for two signal mass points in the T6ttHZ model, where the $\mathcal {B}(\tilde{\text {t}}_2 \rightarrow \tilde{\text {t}}_1 \mathrm{Z} ) = $ 100%, are displayed for non-compressed ($m(\tilde{\text {t}}_2) = $ 700 GeV and $ m(\tilde{\text {t}}_1) = $ 175 GeV) and compressed ($ m(\tilde{\text {t}}_2) = $ 600 GeV and $ m(\tilde{\text {t}}_1) = $ 550 GeV) scenarios. |

png pdf |
Figure 3-g:
Background prediction and the observed event yields in the sub-leading lepton ${p_{\mathrm {T}}}$ for the on-Z baseline selection. The background events containing top quark(s) in association with a W, Z or Higgs boson, except ${{\mathrm{t} {}\mathrm{\bar{t}}} \mathrm{Z}}$, or another pair of top quarks are denoted as ${\mathrm{t} \mathrm{\bar{t}}} \mathrm{X}$. The last bin includes the overflow events, and the hatched area represents the combined statistical and systematic uncertainties in the prediction. The lower panel shows the ratio of the observed and predicted yields in each bin. For illustration the yields, multiplied by a factor 10, for two signal mass points in the T6ttHZ model, where the $\mathcal {B}(\tilde{\text {t}}_2 \rightarrow \tilde{\text {t}}_1 \mathrm{Z} ) = $ 100%, are displayed for non-compressed ($m(\tilde{\text {t}}_2) = $ 700 GeV and $ m(\tilde{\text {t}}_1) = $ 175 GeV) and compressed ($ m(\tilde{\text {t}}_2) = $ 600 GeV and $ m(\tilde{\text {t}}_1) = $ 550 GeV) scenarios. |
png pdf |
Figure 3-h:
Background prediction and the observed event yields in the trailing lepton ${p_{\mathrm {T}}}$ for the on-Z baseline selection. The background events containing top quark(s) in association with a W, Z or Higgs boson, except ${{\mathrm{t} {}\mathrm{\bar{t}}} \mathrm{Z}}$, or another pair of top quarks are denoted as ${\mathrm{t} \mathrm{\bar{t}}} \mathrm{X}$. The last bin includes the overflow events, and the hatched area represents the combined statistical and systematic uncertainties in the prediction. The lower panel shows the ratio of the observed and predicted yields in each bin. For illustration the yields, multiplied by a factor 10, for two signal mass points in the T6ttHZ model, where the $\mathcal {B}(\tilde{\text {t}}_2 \rightarrow \tilde{\text {t}}_1 \mathrm{Z} ) = $ 100%, are displayed for non-compressed ($m(\tilde{\text {t}}_2) = $ 700 GeV and $ m(\tilde{\text {t}}_1) = $ 175 GeV) and compressed ($ m(\tilde{\text {t}}_2) = $ 600 GeV and $ m(\tilde{\text {t}}_1) = $ 550 GeV) scenarios. |
png pdf |
Figure 3-i:
Background prediction and the observed event yields in the event yields by flavor category for the on-Z baseline selection. The background events containing top quark(s) in association with a W, Z or Higgs boson, except ${{\mathrm{t} {}\mathrm{\bar{t}}} \mathrm{Z}}$, or another pair of top quarks are denoted as ${\mathrm{t} \mathrm{\bar{t}}} \mathrm{X}$. The last bin includes the overflow events, and the hatched area represents the combined statistical and systematic uncertainties in the prediction. The lower panel shows the ratio of the observed and predicted yields in each bin. For illustration the yields, multiplied by a factor 10, for two signal mass points in the T6ttHZ model, where the $\mathcal {B}(\tilde{\text {t}}_2 \rightarrow \tilde{\text {t}}_1 \mathrm{Z} ) = $ 100%, are displayed for non-compressed ($m(\tilde{\text {t}}_2) = $ 700 GeV and $ m(\tilde{\text {t}}_1) = $ 175 GeV) and compressed ($ m(\tilde{\text {t}}_2) = $ 600 GeV and $ m(\tilde{\text {t}}_1) = $ 550 GeV) scenarios. |
png pdf |
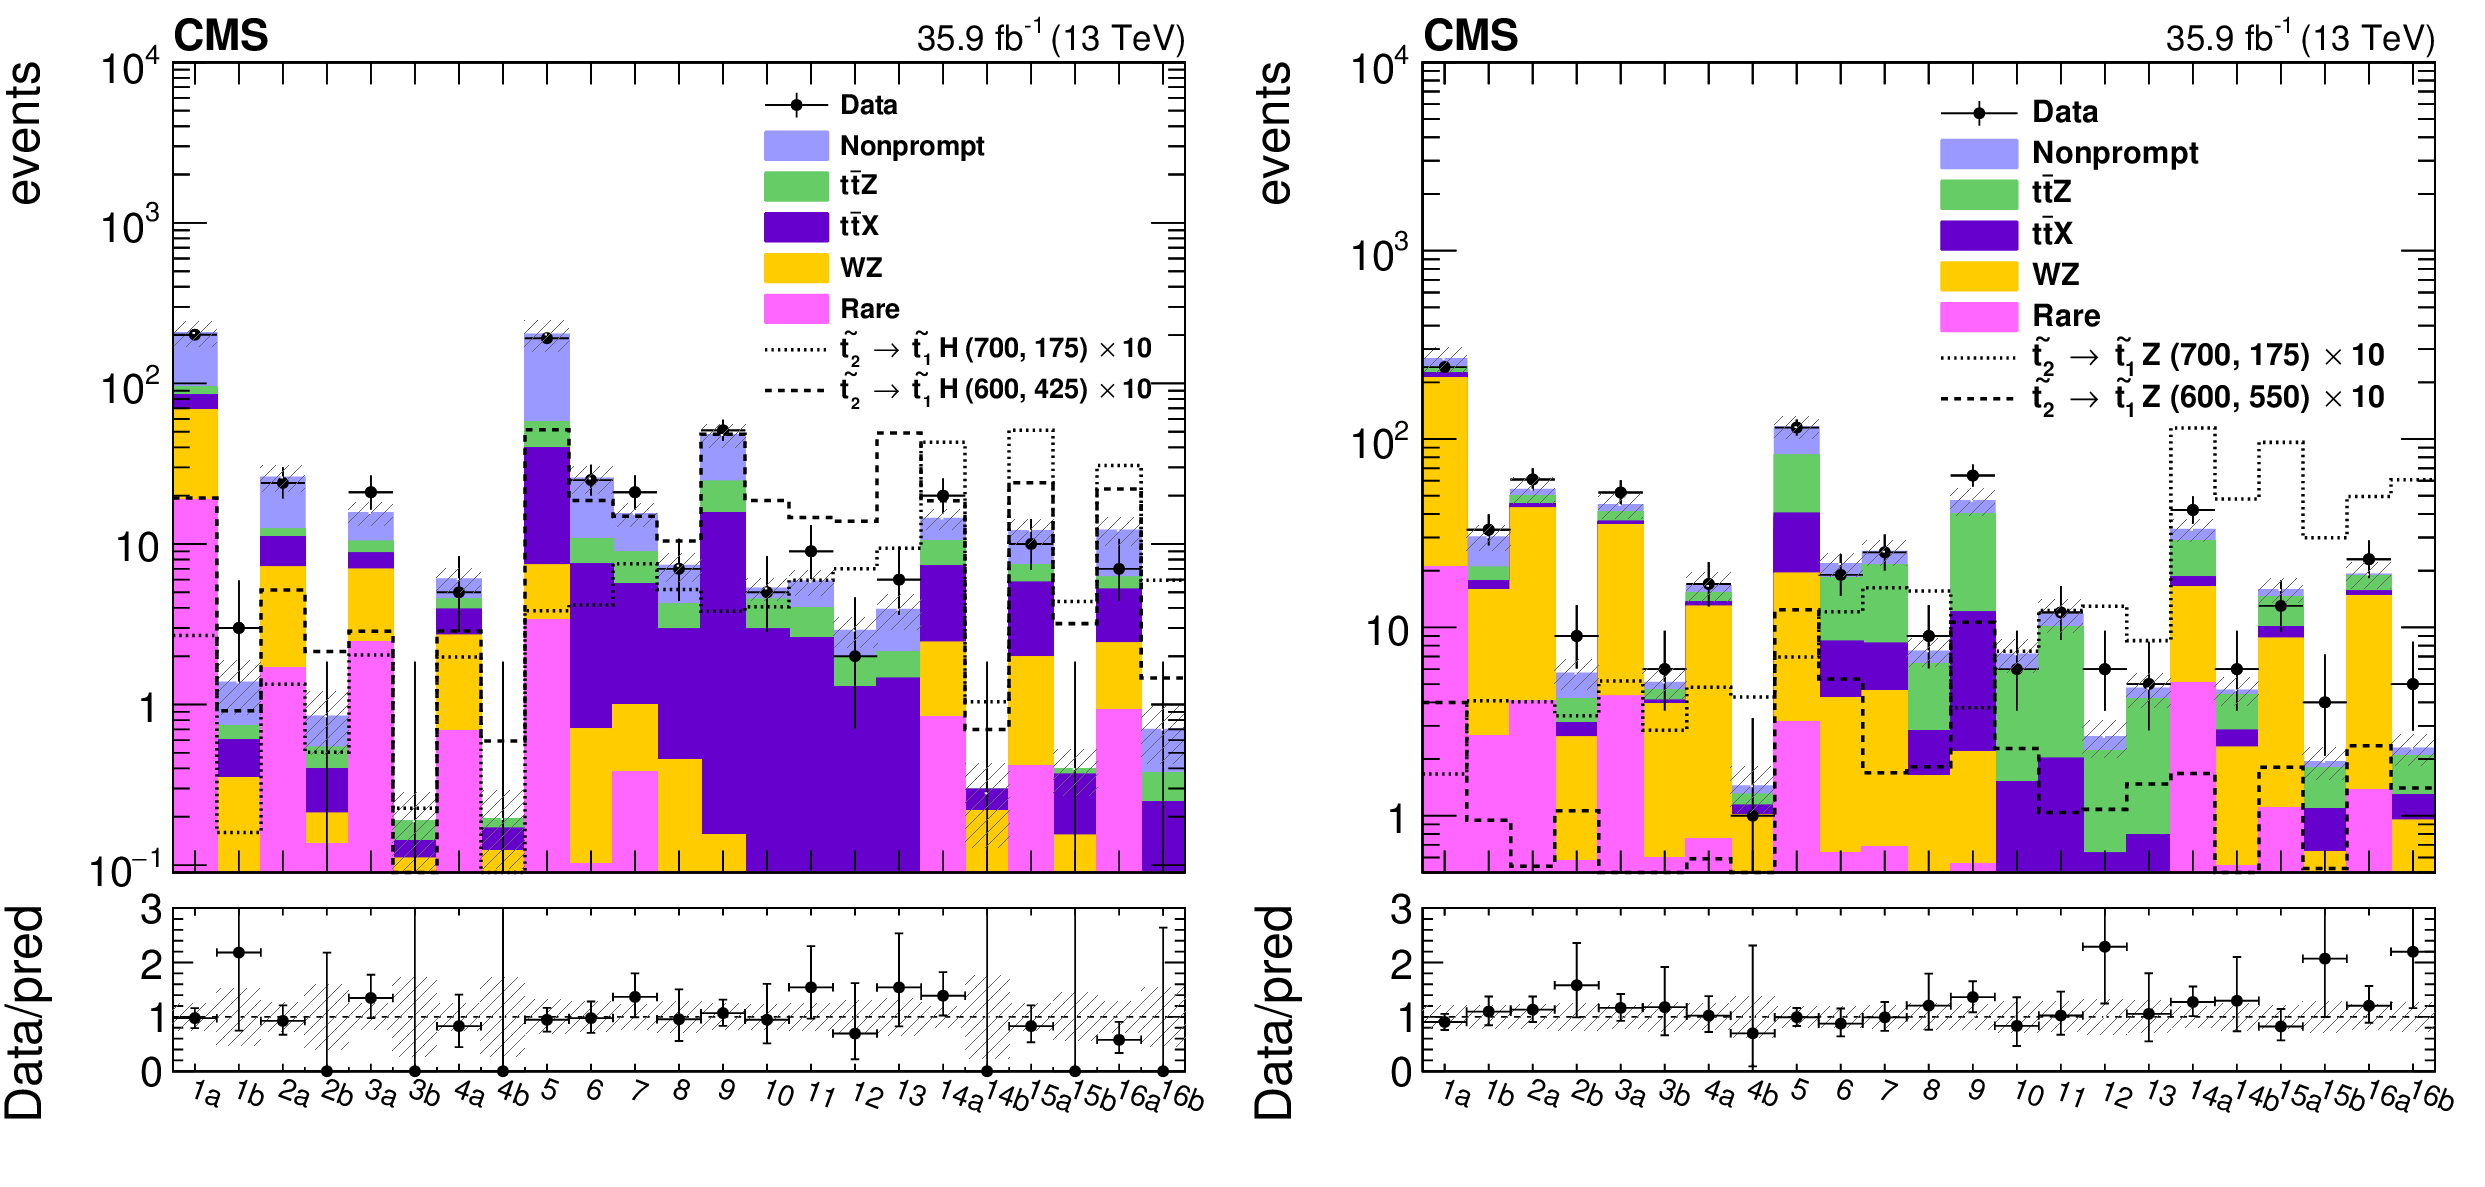
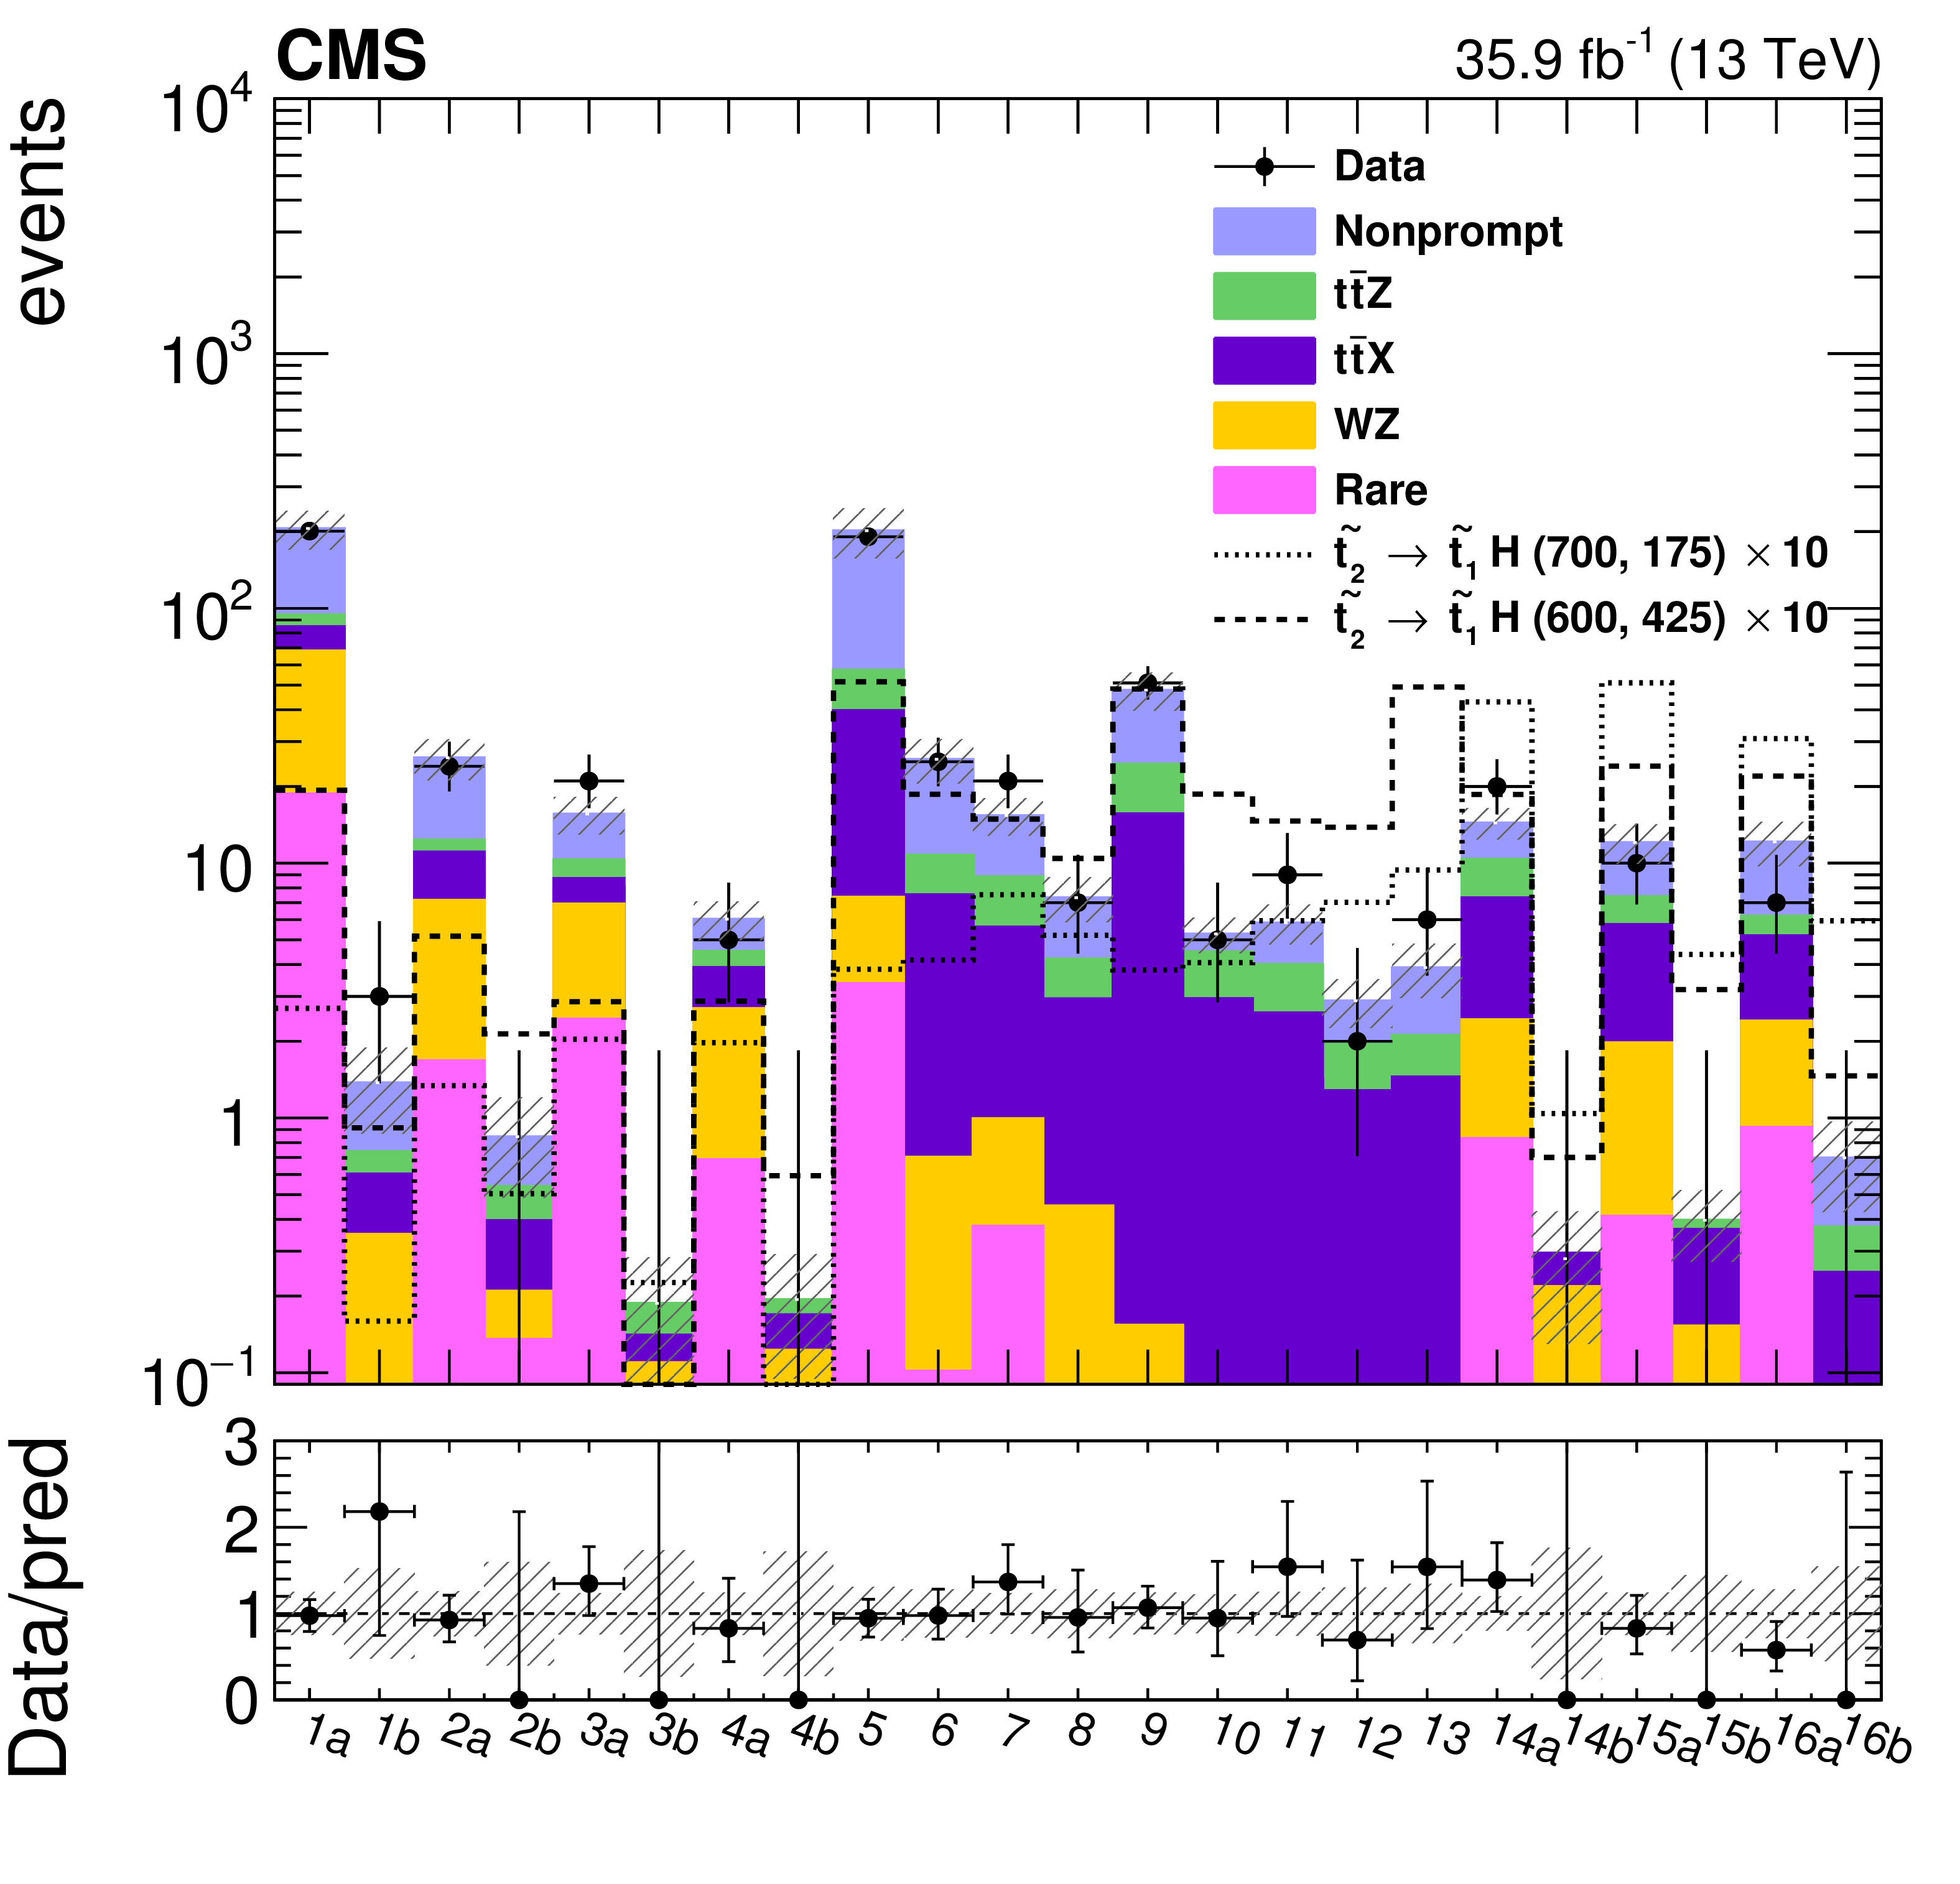
Figure 4:
Background prediction and observed event yields in the 23 off-Z (left) and the 23 on-Z (right) signal regions. The background events containing top quark(s) in association with a W, Z or Higgs boson, except ${{\mathrm{t} {}\mathrm{\bar{t}}} \mathrm{Z}}$, or another pair of top quarks are denoted as ${\mathrm{t} {}\mathrm{\bar{t}}} \mathrm{X}$. The hatched area represents the statistical and systematic uncertainties on the prediction. The lower panels show the ratio of the observed and predicted yields in each bin. For illustration the yields, multiplied by a factor 10, for $ \tilde{ \mathrm{t} }_2 \rightarrow \tilde{ \mathrm{t} }_1 \mathrm{H} $ (left) and $ \tilde{ \mathrm{t} }_2 \rightarrow \tilde{ \mathrm{t} }_1 \mathrm{Z} $ (right) decays are displayed for two signal mass points in the T6ttHZ model to represent compressed and non-compressed scenarios. |
png pdf |
Figure 4-a:
Background prediction and observed event yields in the 23 off-Z signal regions. The background events containing top quark(s) in association with a W, Z or Higgs boson, except ${{\mathrm{t} {}\mathrm{\bar{t}}} \mathrm{Z}}$, or another pair of top quarks are denoted as ${\mathrm{t} {}\mathrm{\bar{t}}} \mathrm{X}$. The hatched area represents the statistical and systematic uncertainties on the prediction. The lower panel shows the ratio of the observed and predicted yields in each bin. For illustration the yields, multiplied by a factor 10, for $ \tilde{ \mathrm{t} }_2 \rightarrow \tilde{ \mathrm{t} }_1 \mathrm{H} $ decays are displayed for two signal mass points in the T6ttHZ model to represent compressed and non-compressed scenarios. |

png pdf |
Figure 4-b:
Background prediction and observed event yields in the 23 on-Z signal regions. The background events containing top quark(s) in association with a W, Z or Higgs boson, except ${{\mathrm{t} {}\mathrm{\bar{t}}} \mathrm{Z}}$, or another pair of top quarks are denoted as ${\mathrm{t} {}\mathrm{\bar{t}}} \mathrm{X}$. The hatched area represents the statistical and systematic uncertainties on the prediction. The lower panel shows the ratio of the observed and predicted yields in each bin. For illustration the yields, multiplied by a factor 10, for $ \tilde{ \mathrm{t} }_2 \rightarrow \tilde{ \mathrm{t} }_1 \mathrm{Z} $ decays are displayed for two signal mass points in the T6ttHZ model to represent compressed and non-compressed scenarios. |

png pdf |
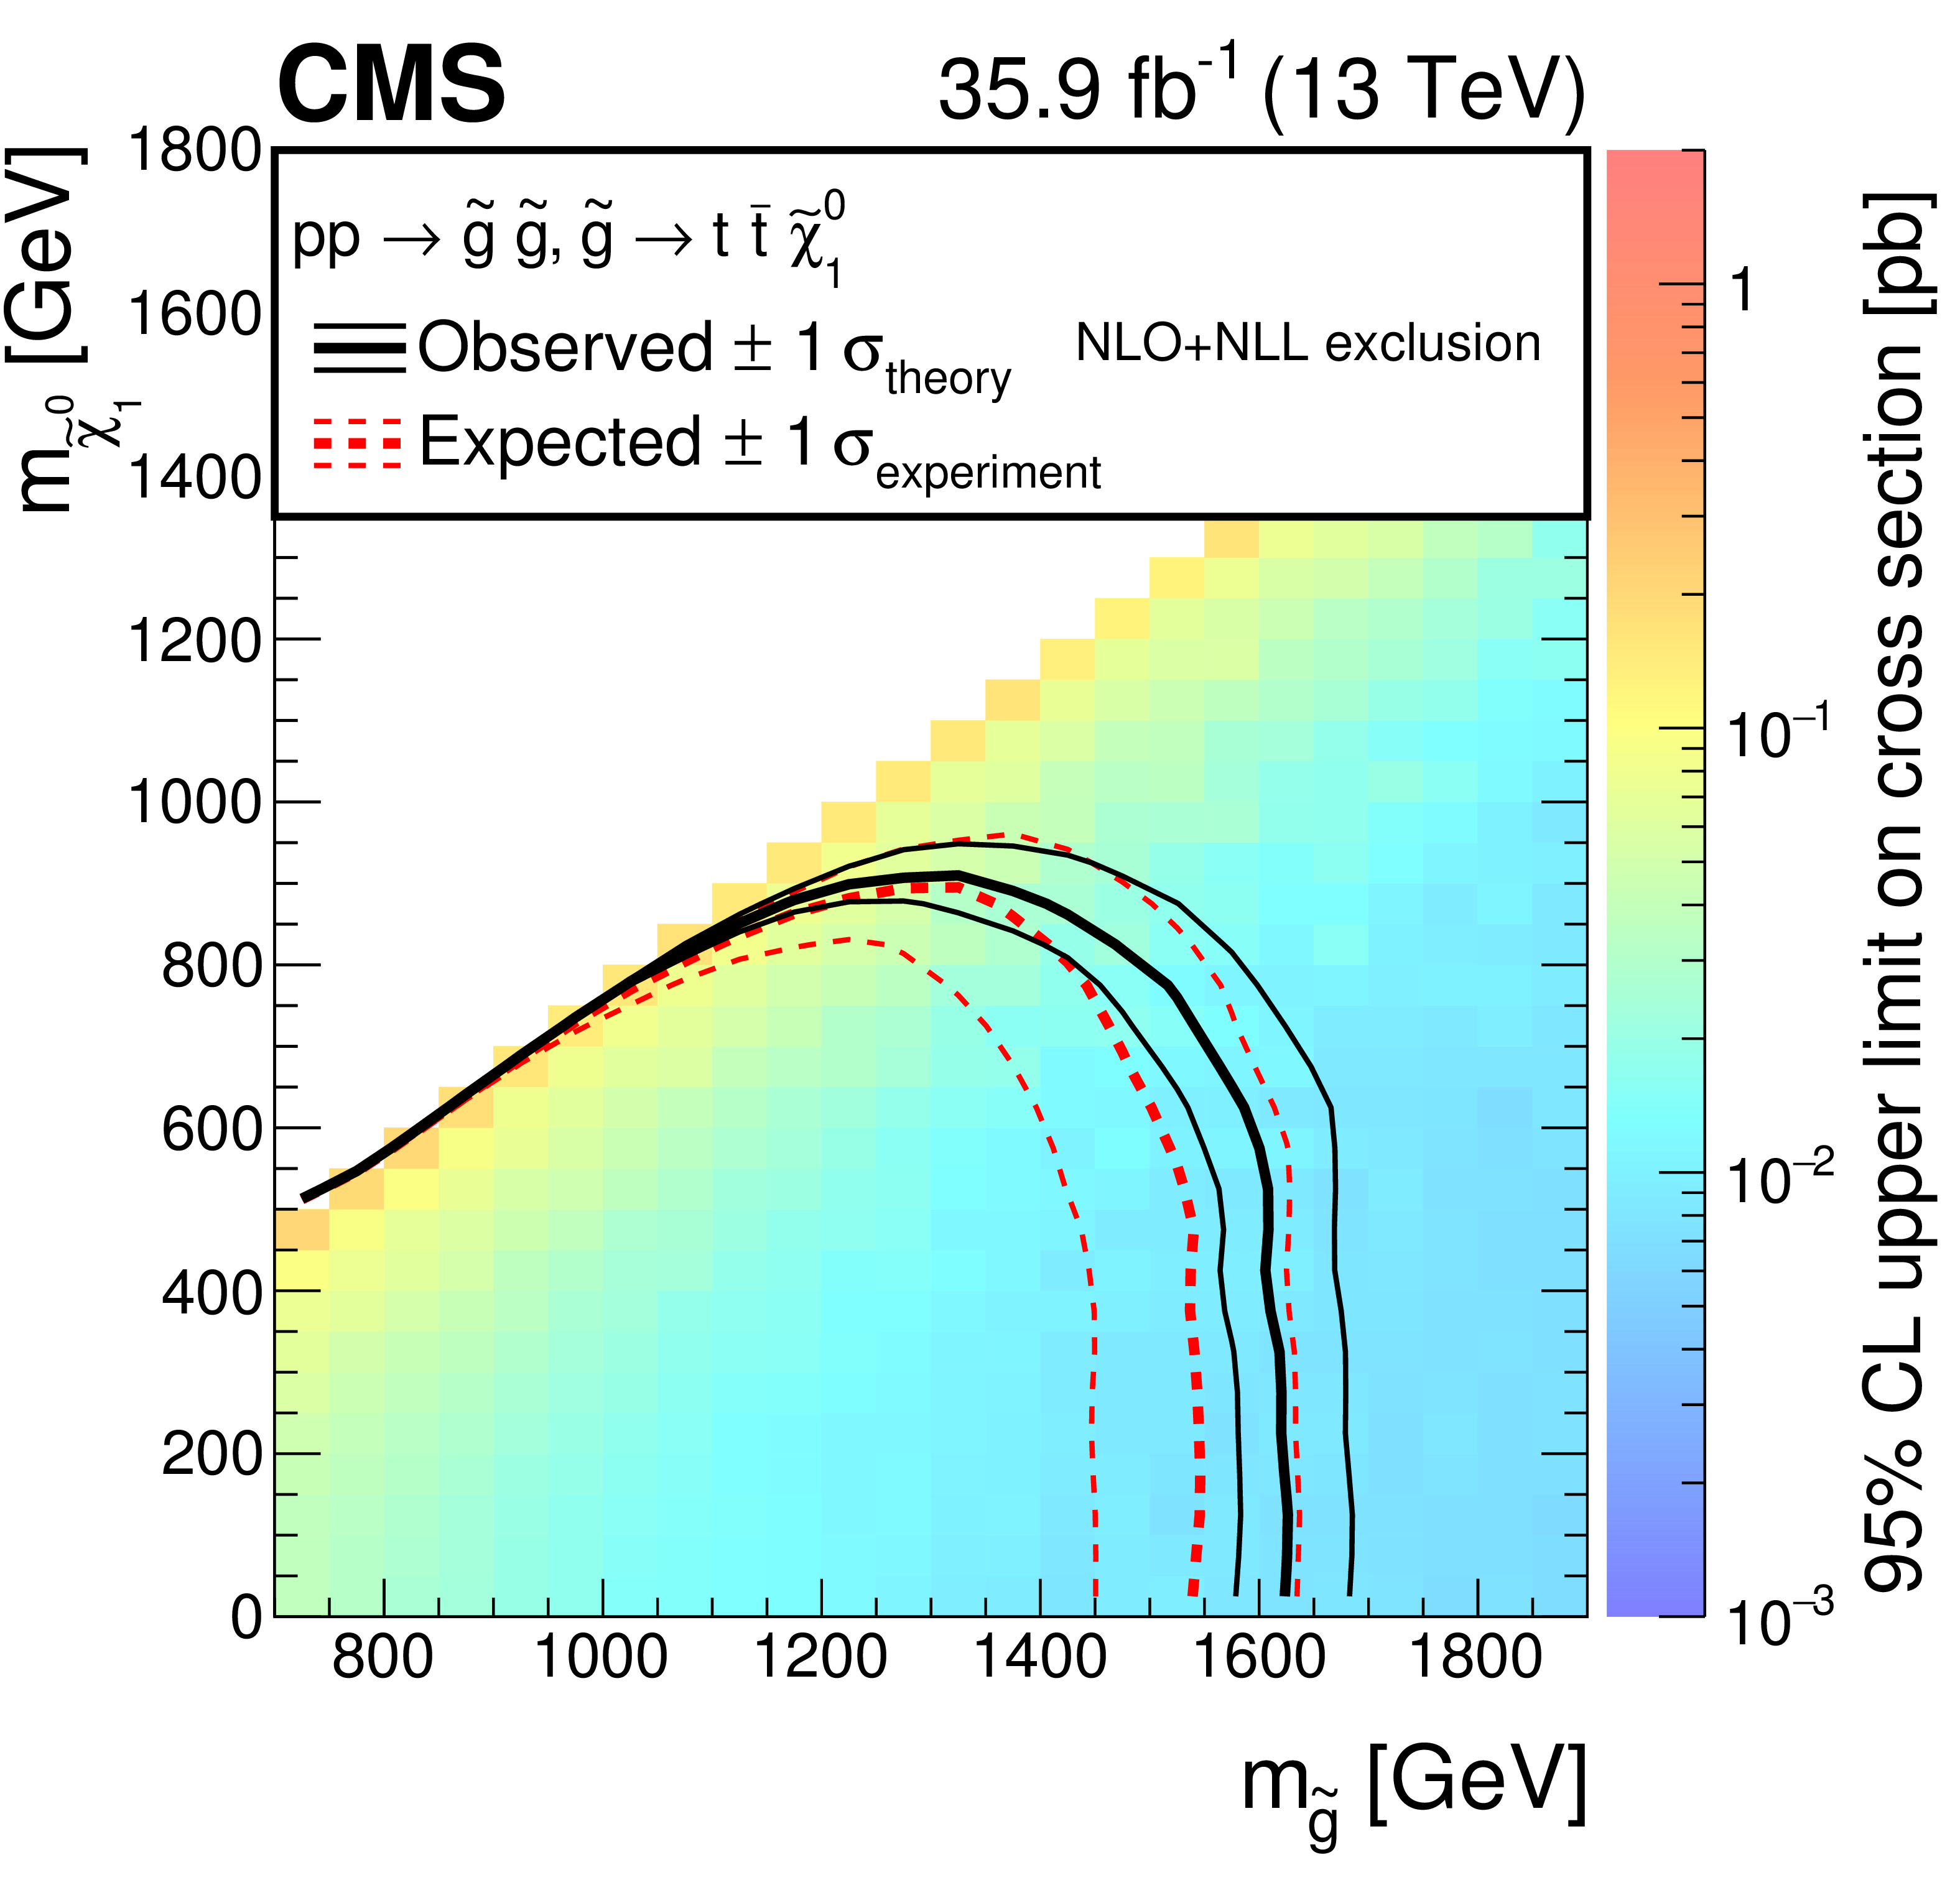
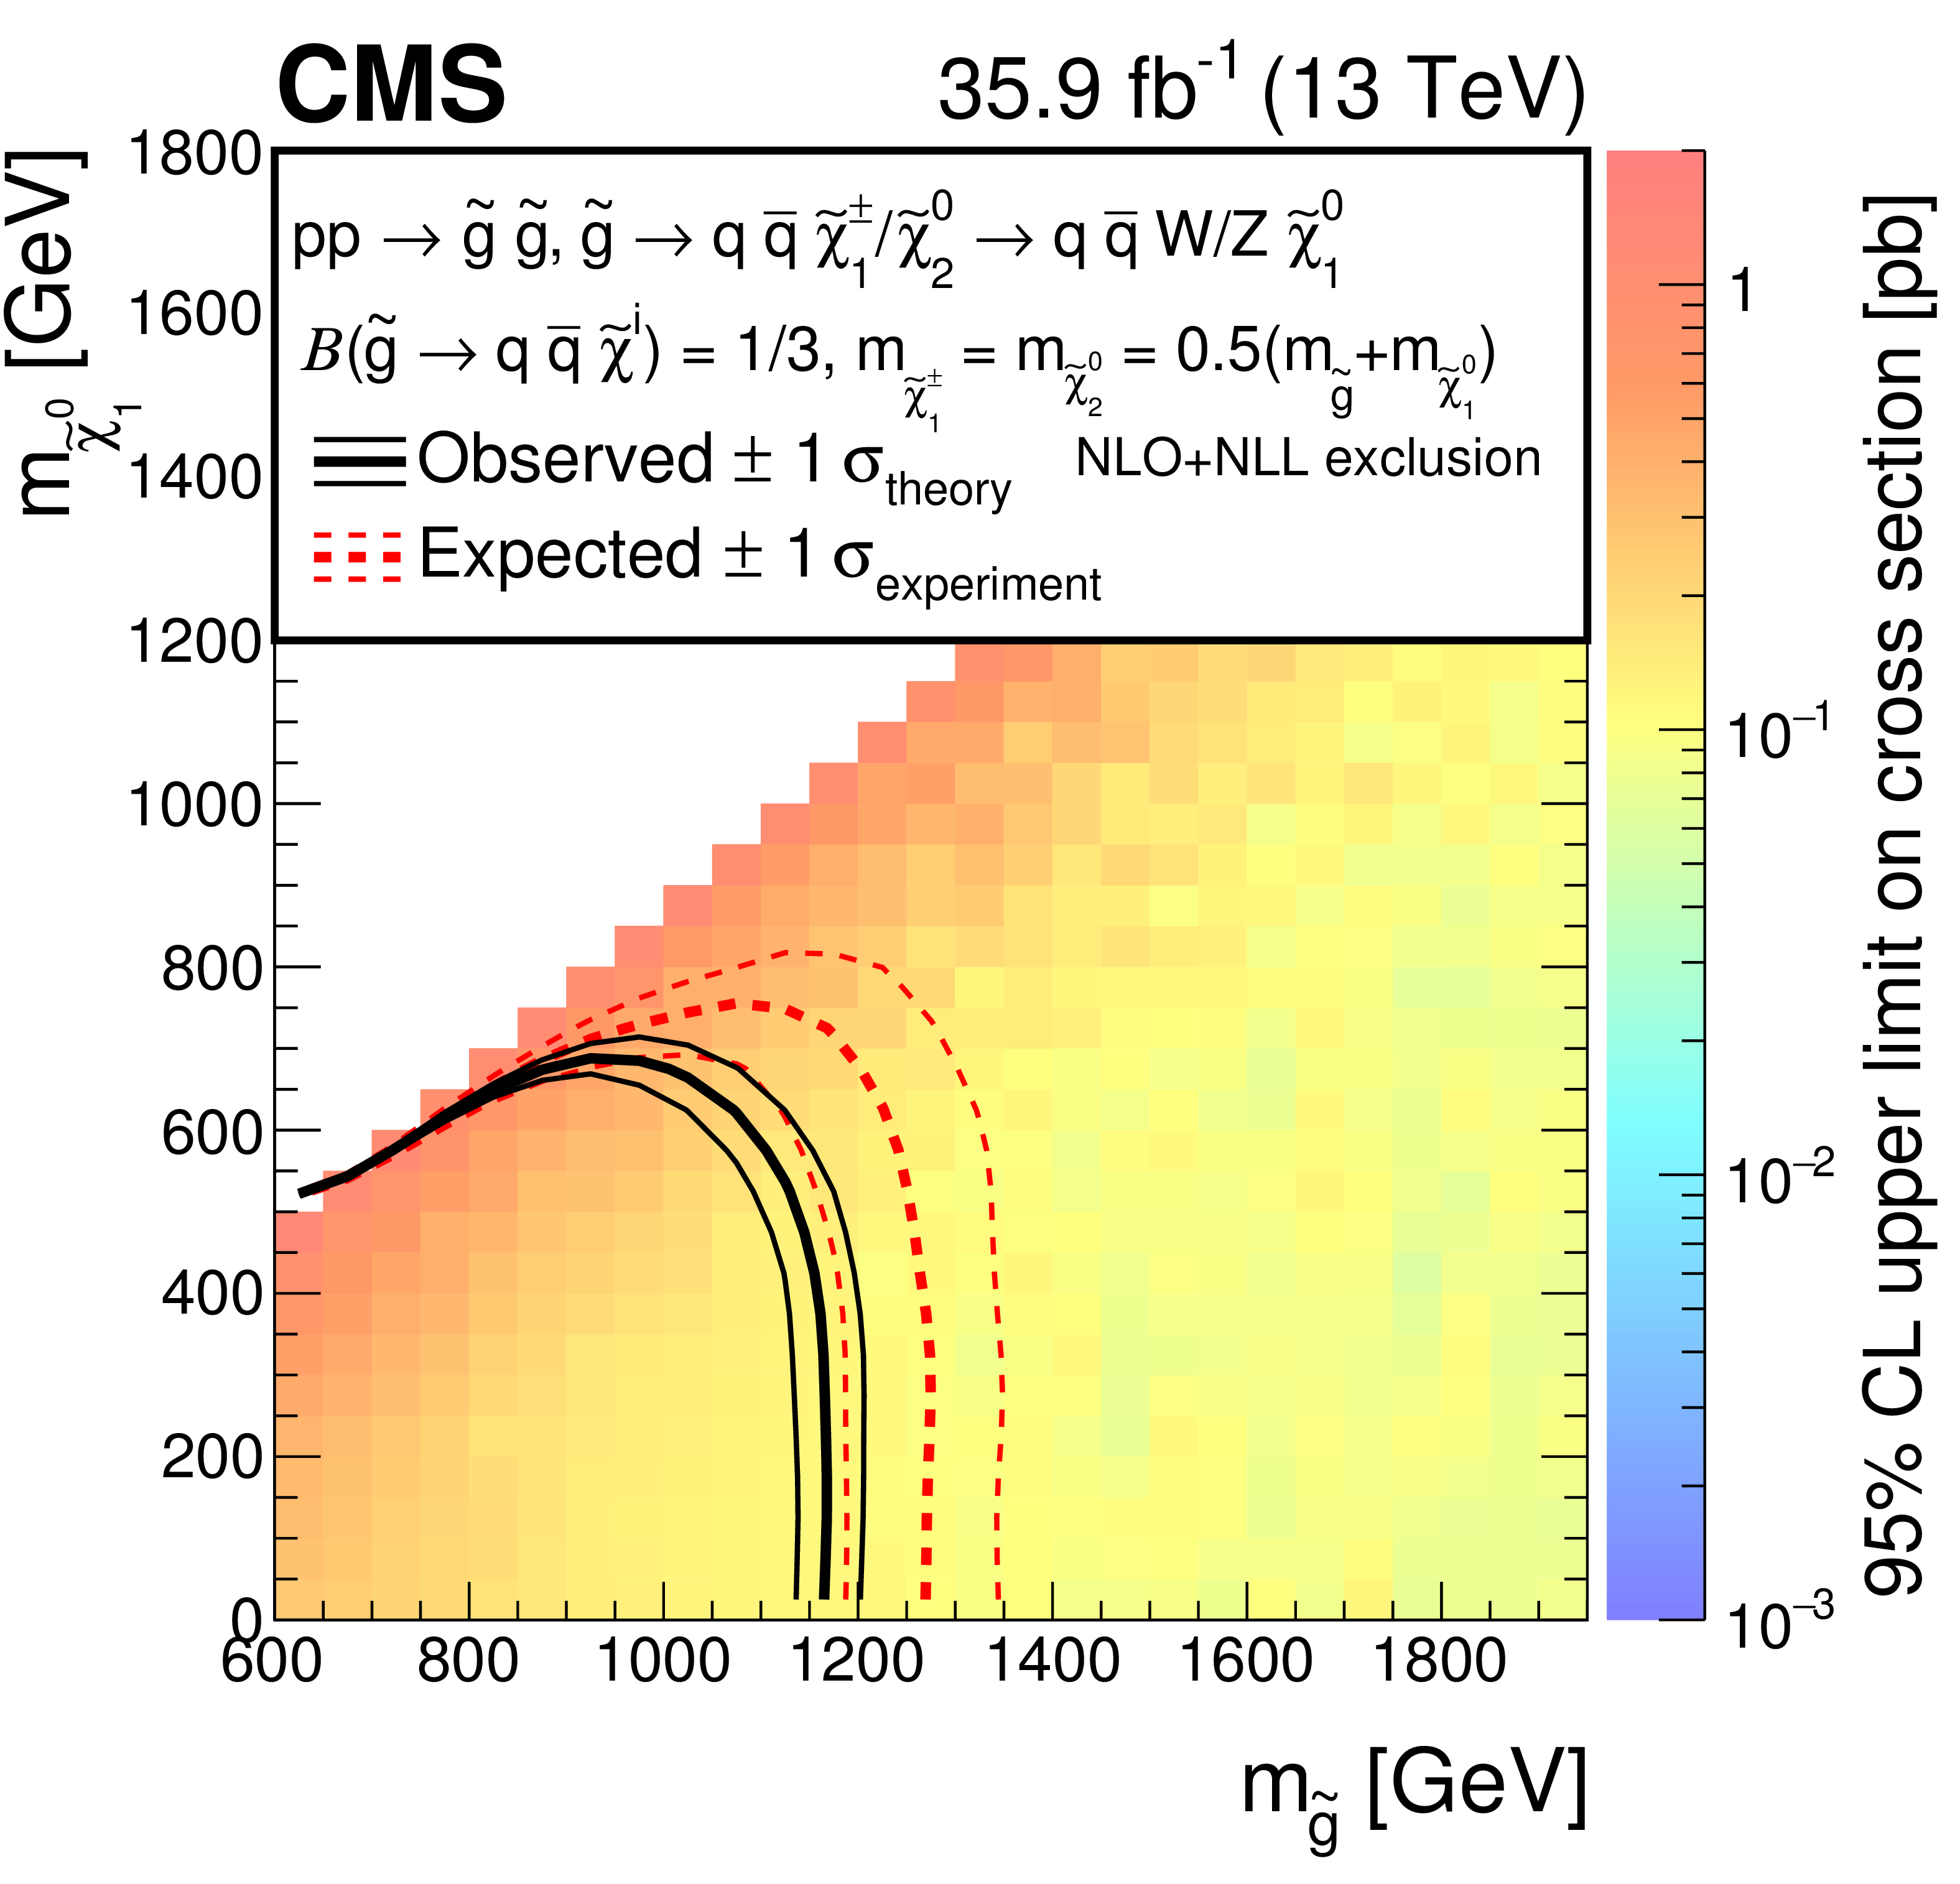
Figure 5:
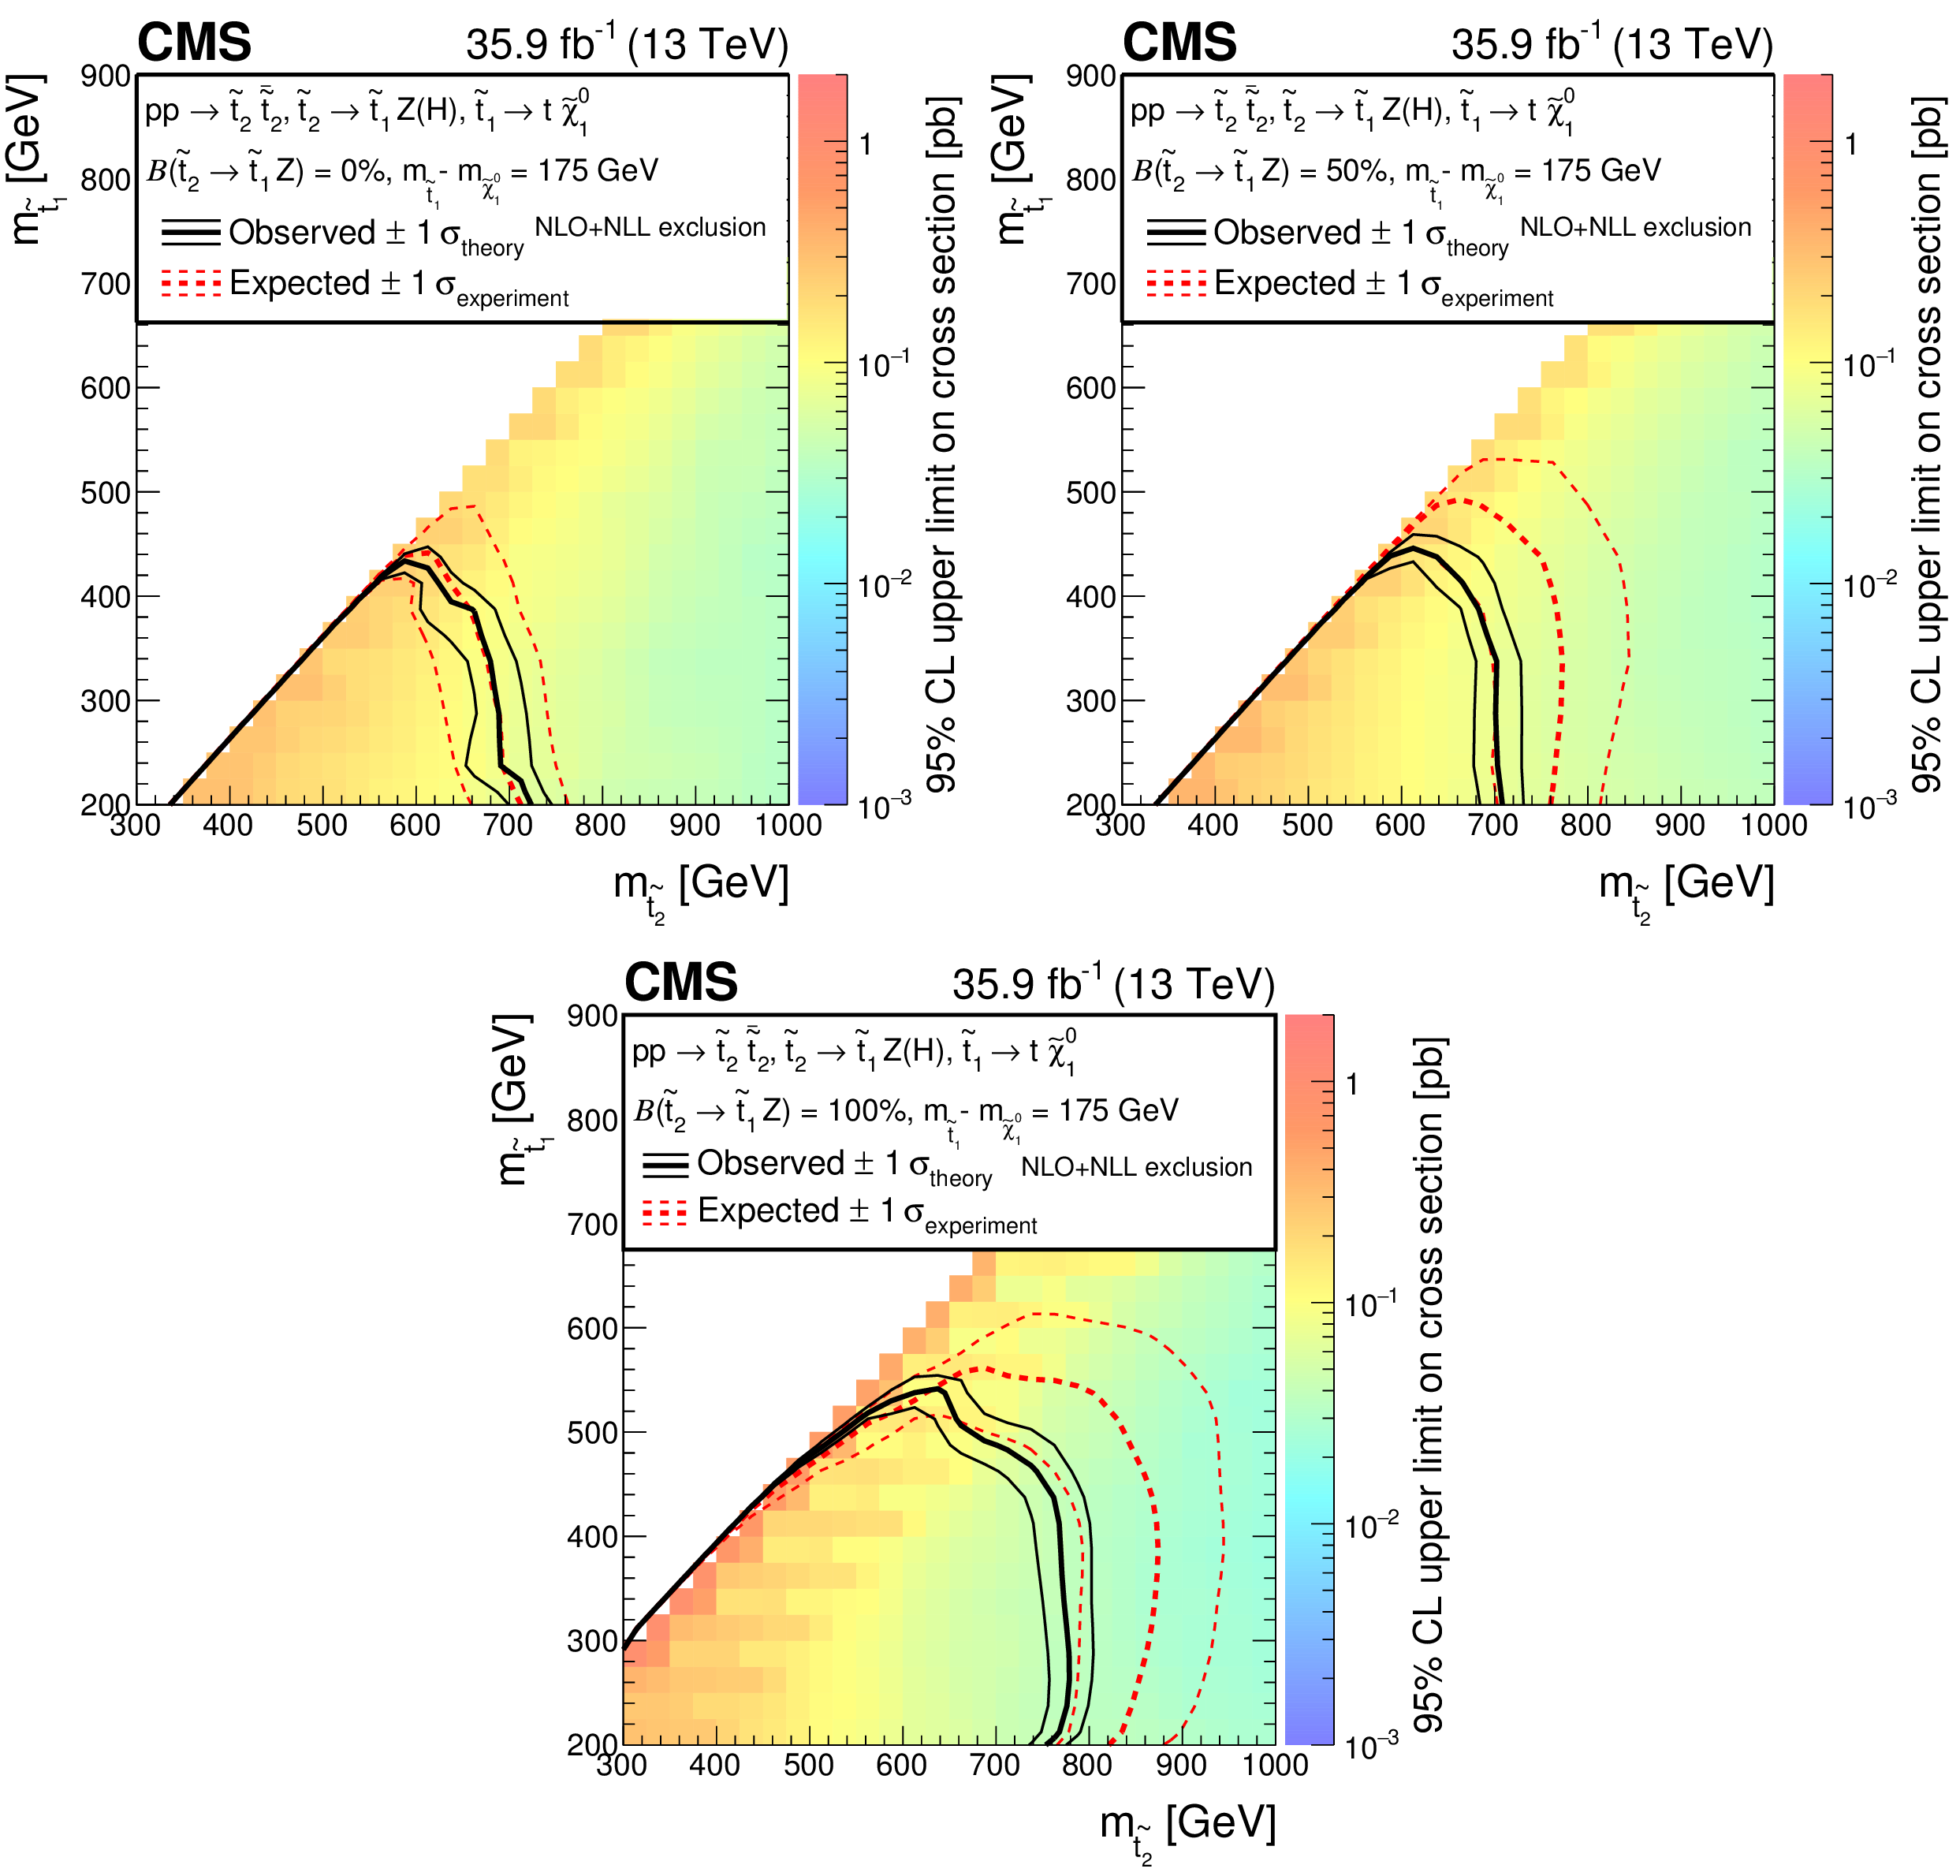
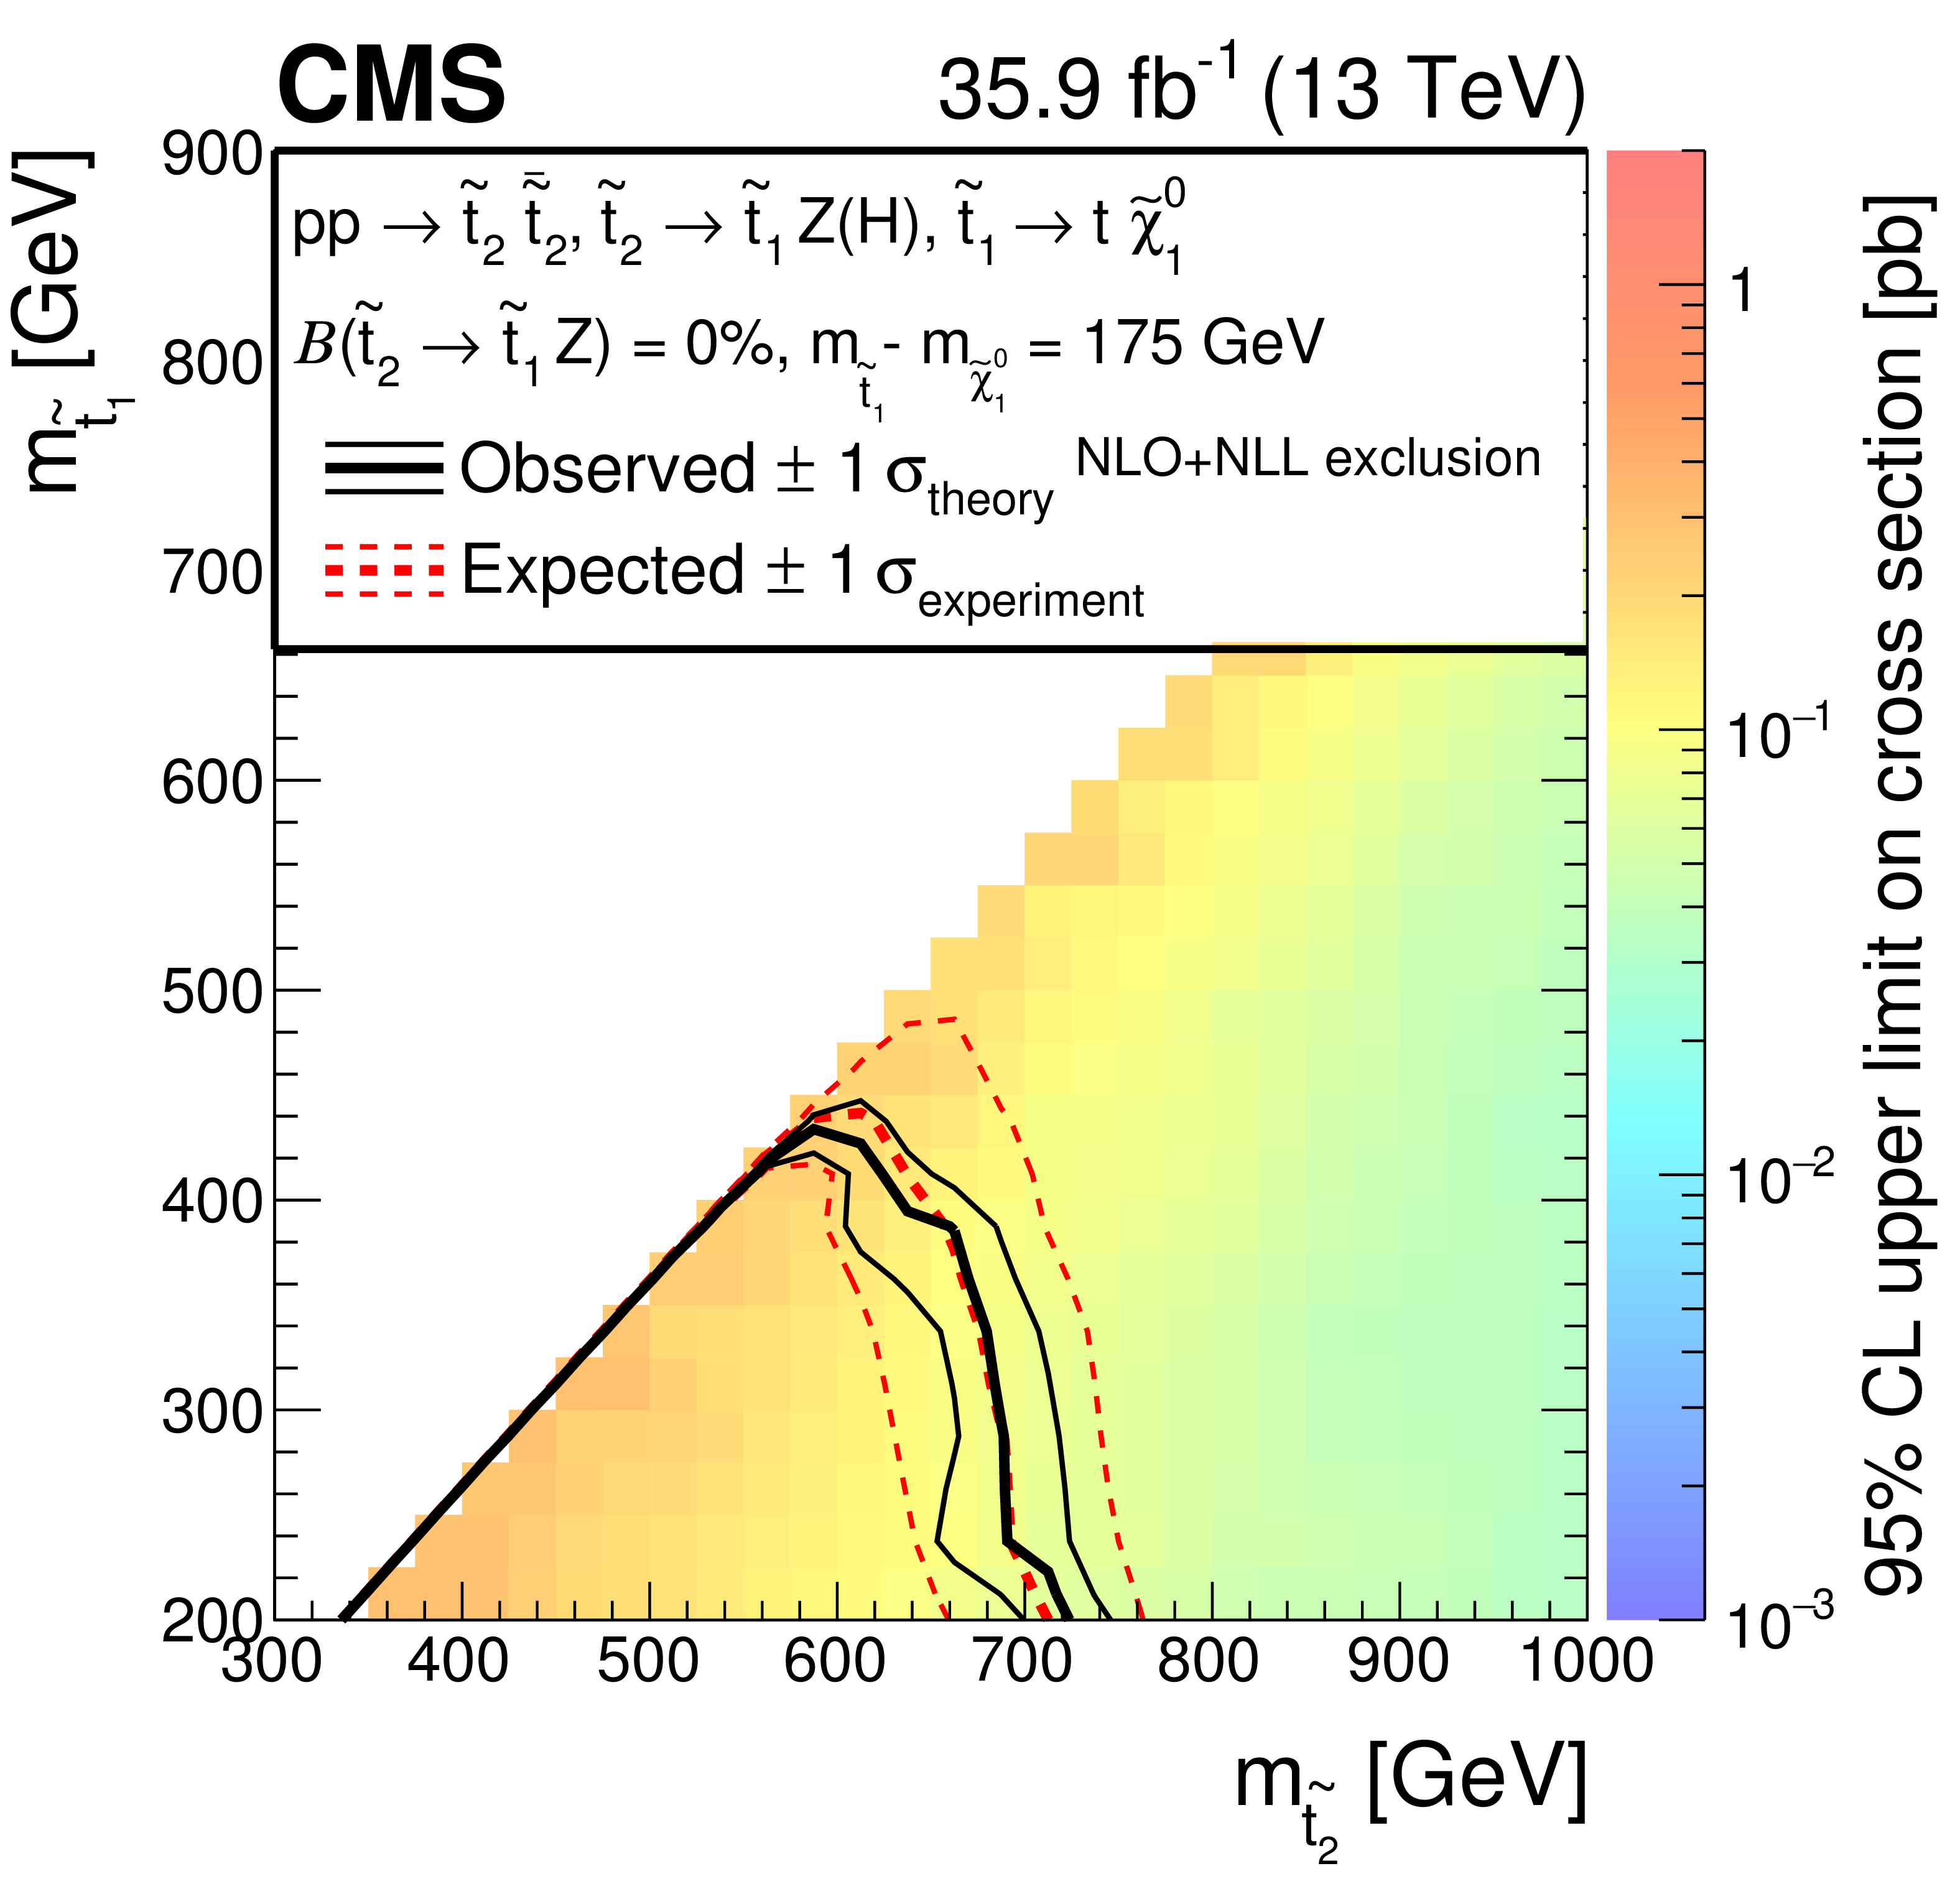
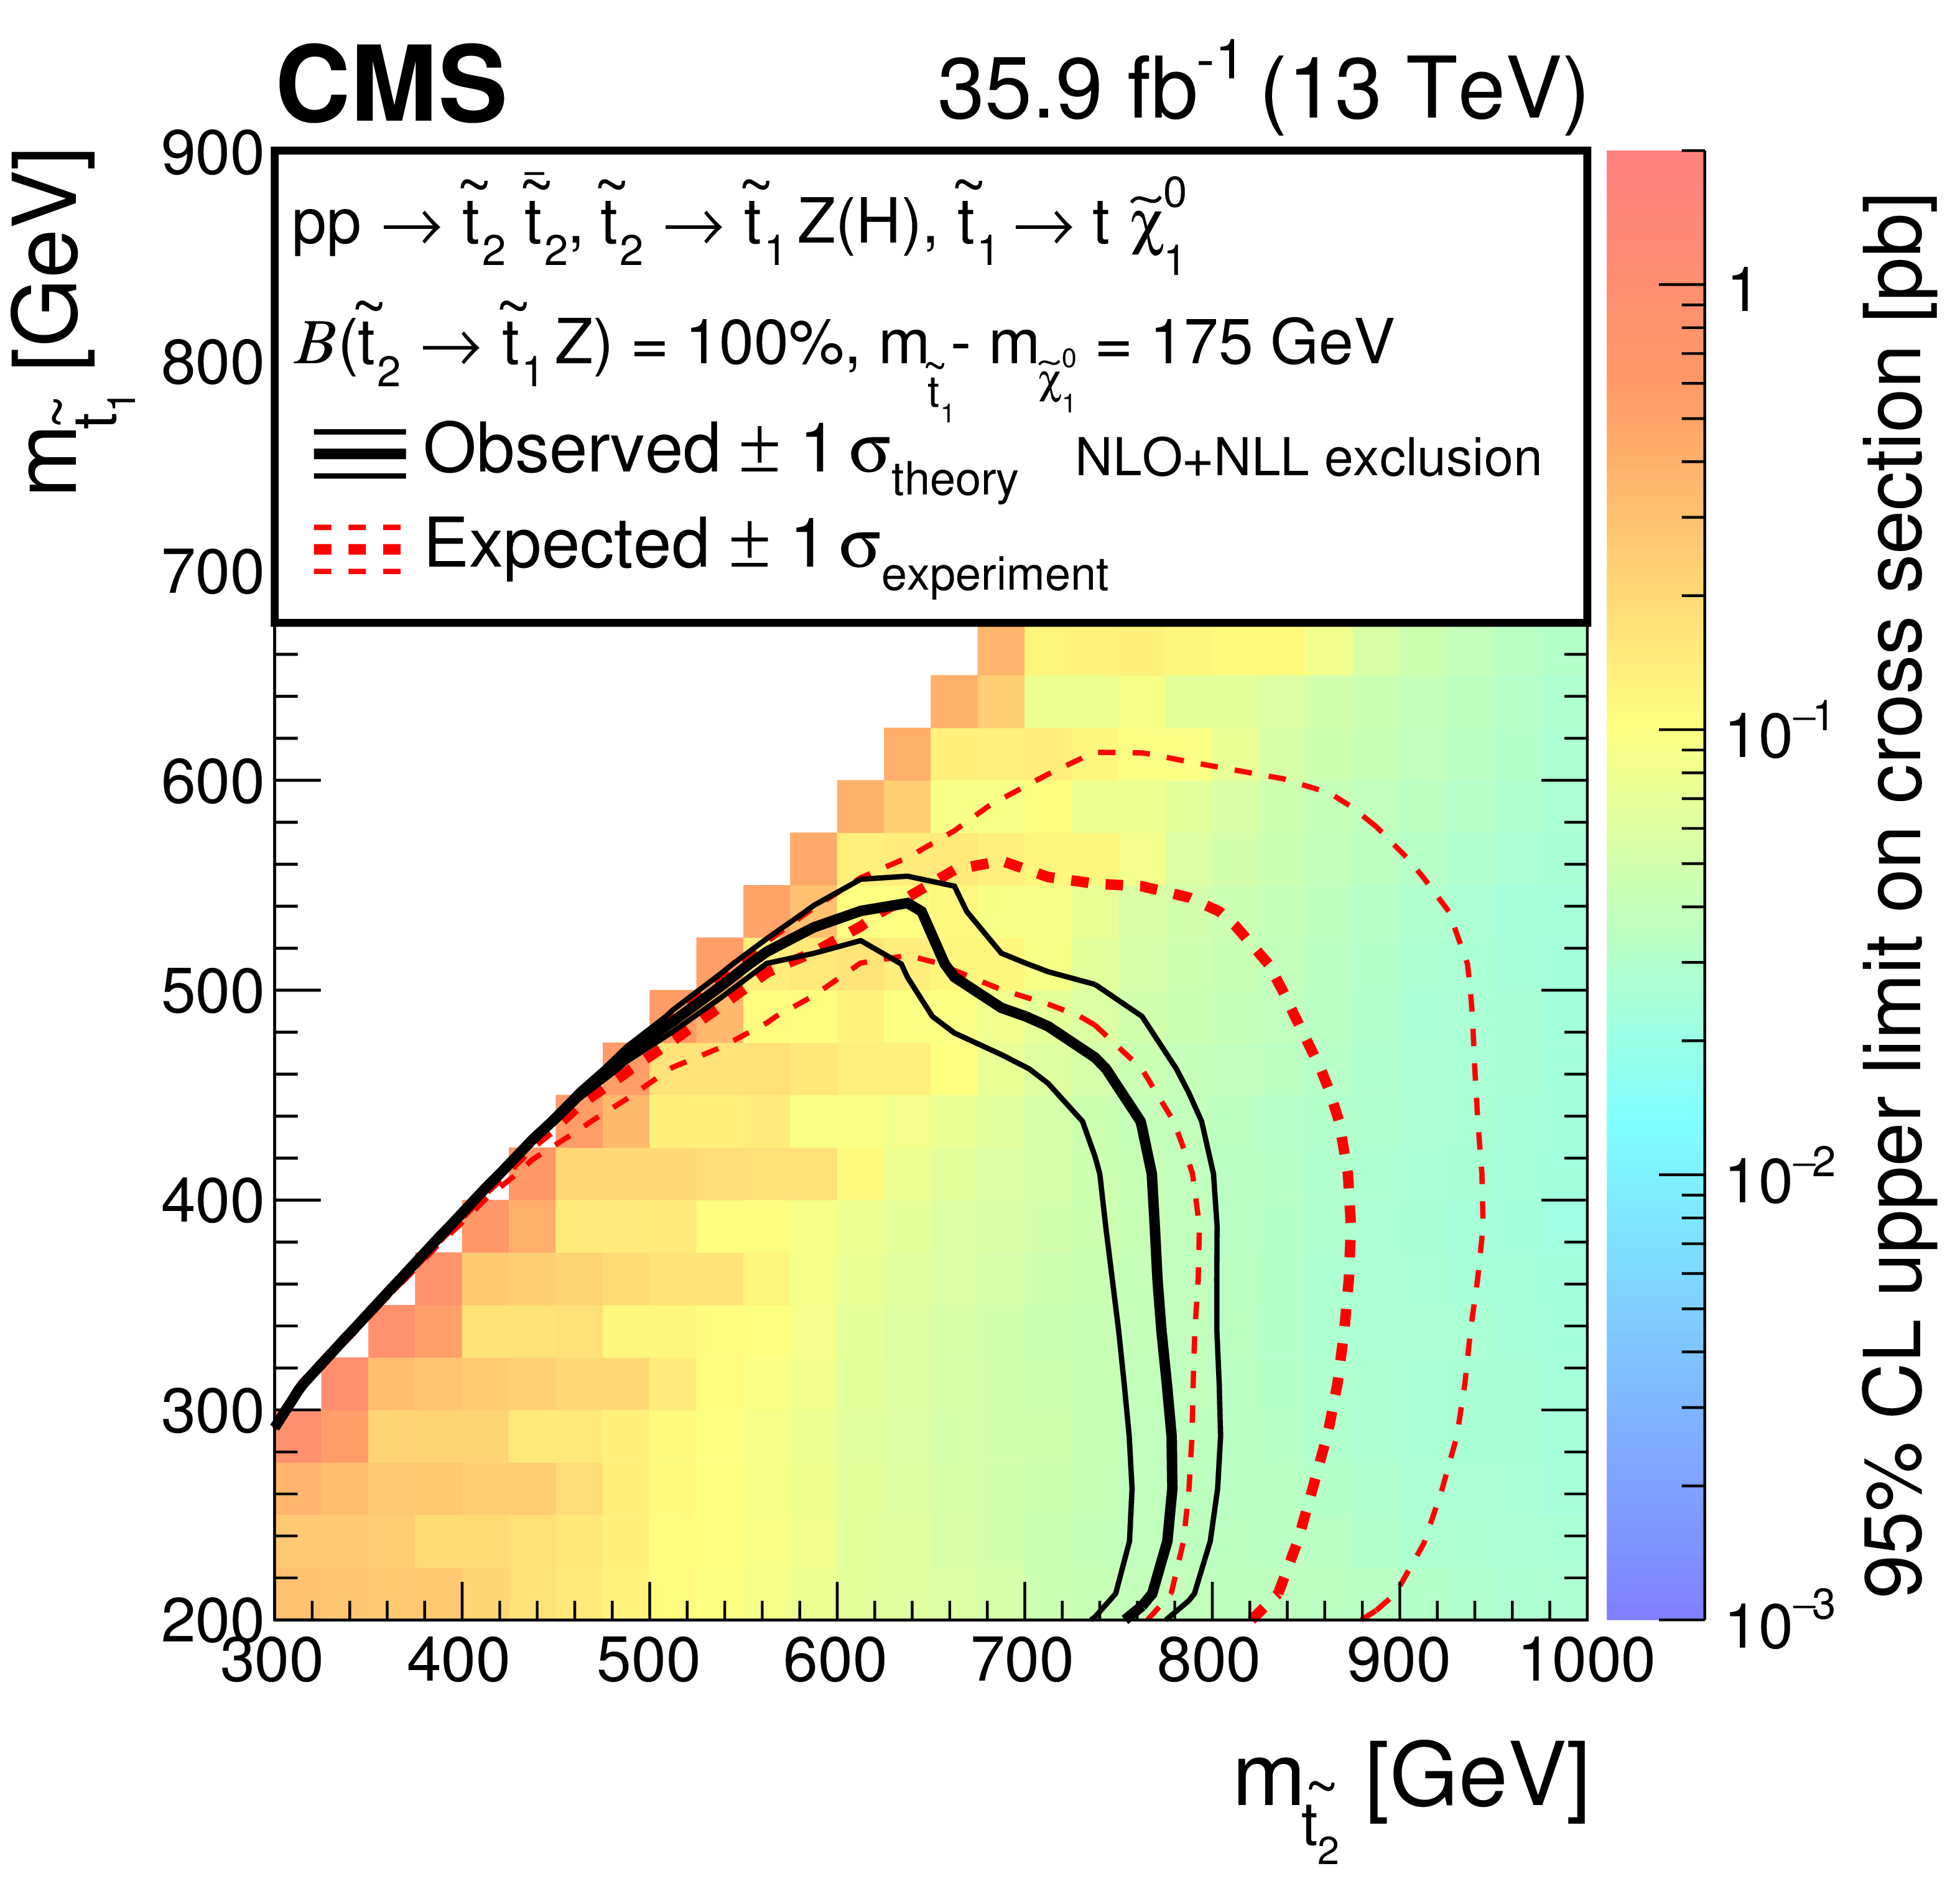
Cross section upper limits at 95% CL in the $m_{\tilde{ \chi }^0 _1}$ versus $m_{{\mathrm{\widetilde{g}}}}$ plane for T1tttt (left) and T5qqqqVV (right) simplified models. For the latter model the branching fraction of gluino decay to neutralino or chargino is equal to 1/3 and $m_{\tilde{ \chi }^{\pm} _{1}} = m_{\tilde{ \chi }^0 _2} = 0.5(m_{\tilde{ \mathrm{g} }} + m_{\tilde{ \chi }^0_1})$. The excluded regions are to the left and below the observed and expected limit curves. The color scale indicates the excluded cross section at a given point in the mass plane. |
png pdf root |
Figure 5-a:
Cross section upper limits at 95% CL in the $m_{\tilde{ \chi }^0 _1}$ versus $m_{{\mathrm{\widetilde{g}}}}$ plane for T1tttt simplified model. The excluded regions are to the left and below the observed and expected limit curves. The color scale indicates the excluded cross section at a given point in the mass plane. |
png pdf root |
Figure 5-b:
Cross section upper limits at 95% CL in the $m_{\tilde{ \chi }^0 _1}$ versus $m_{{\mathrm{\widetilde{g}}}}$ plane for T5qqqqVV simplified model.The branching fraction of gluino decay to neutralino or chargino is equal to 1/3 and $m_{\tilde{ \chi }^{\pm} _{1}} = m_{\tilde{ \chi }^0 _2} = 0.5(m_{\tilde{ \mathrm{g} }} + m_{\tilde{ \chi }^0_1})$. The excluded regions are to the left and below the observed and expected limit curves. The color scale indicates the excluded cross section at a given point in the mass plane. |
png pdf root |
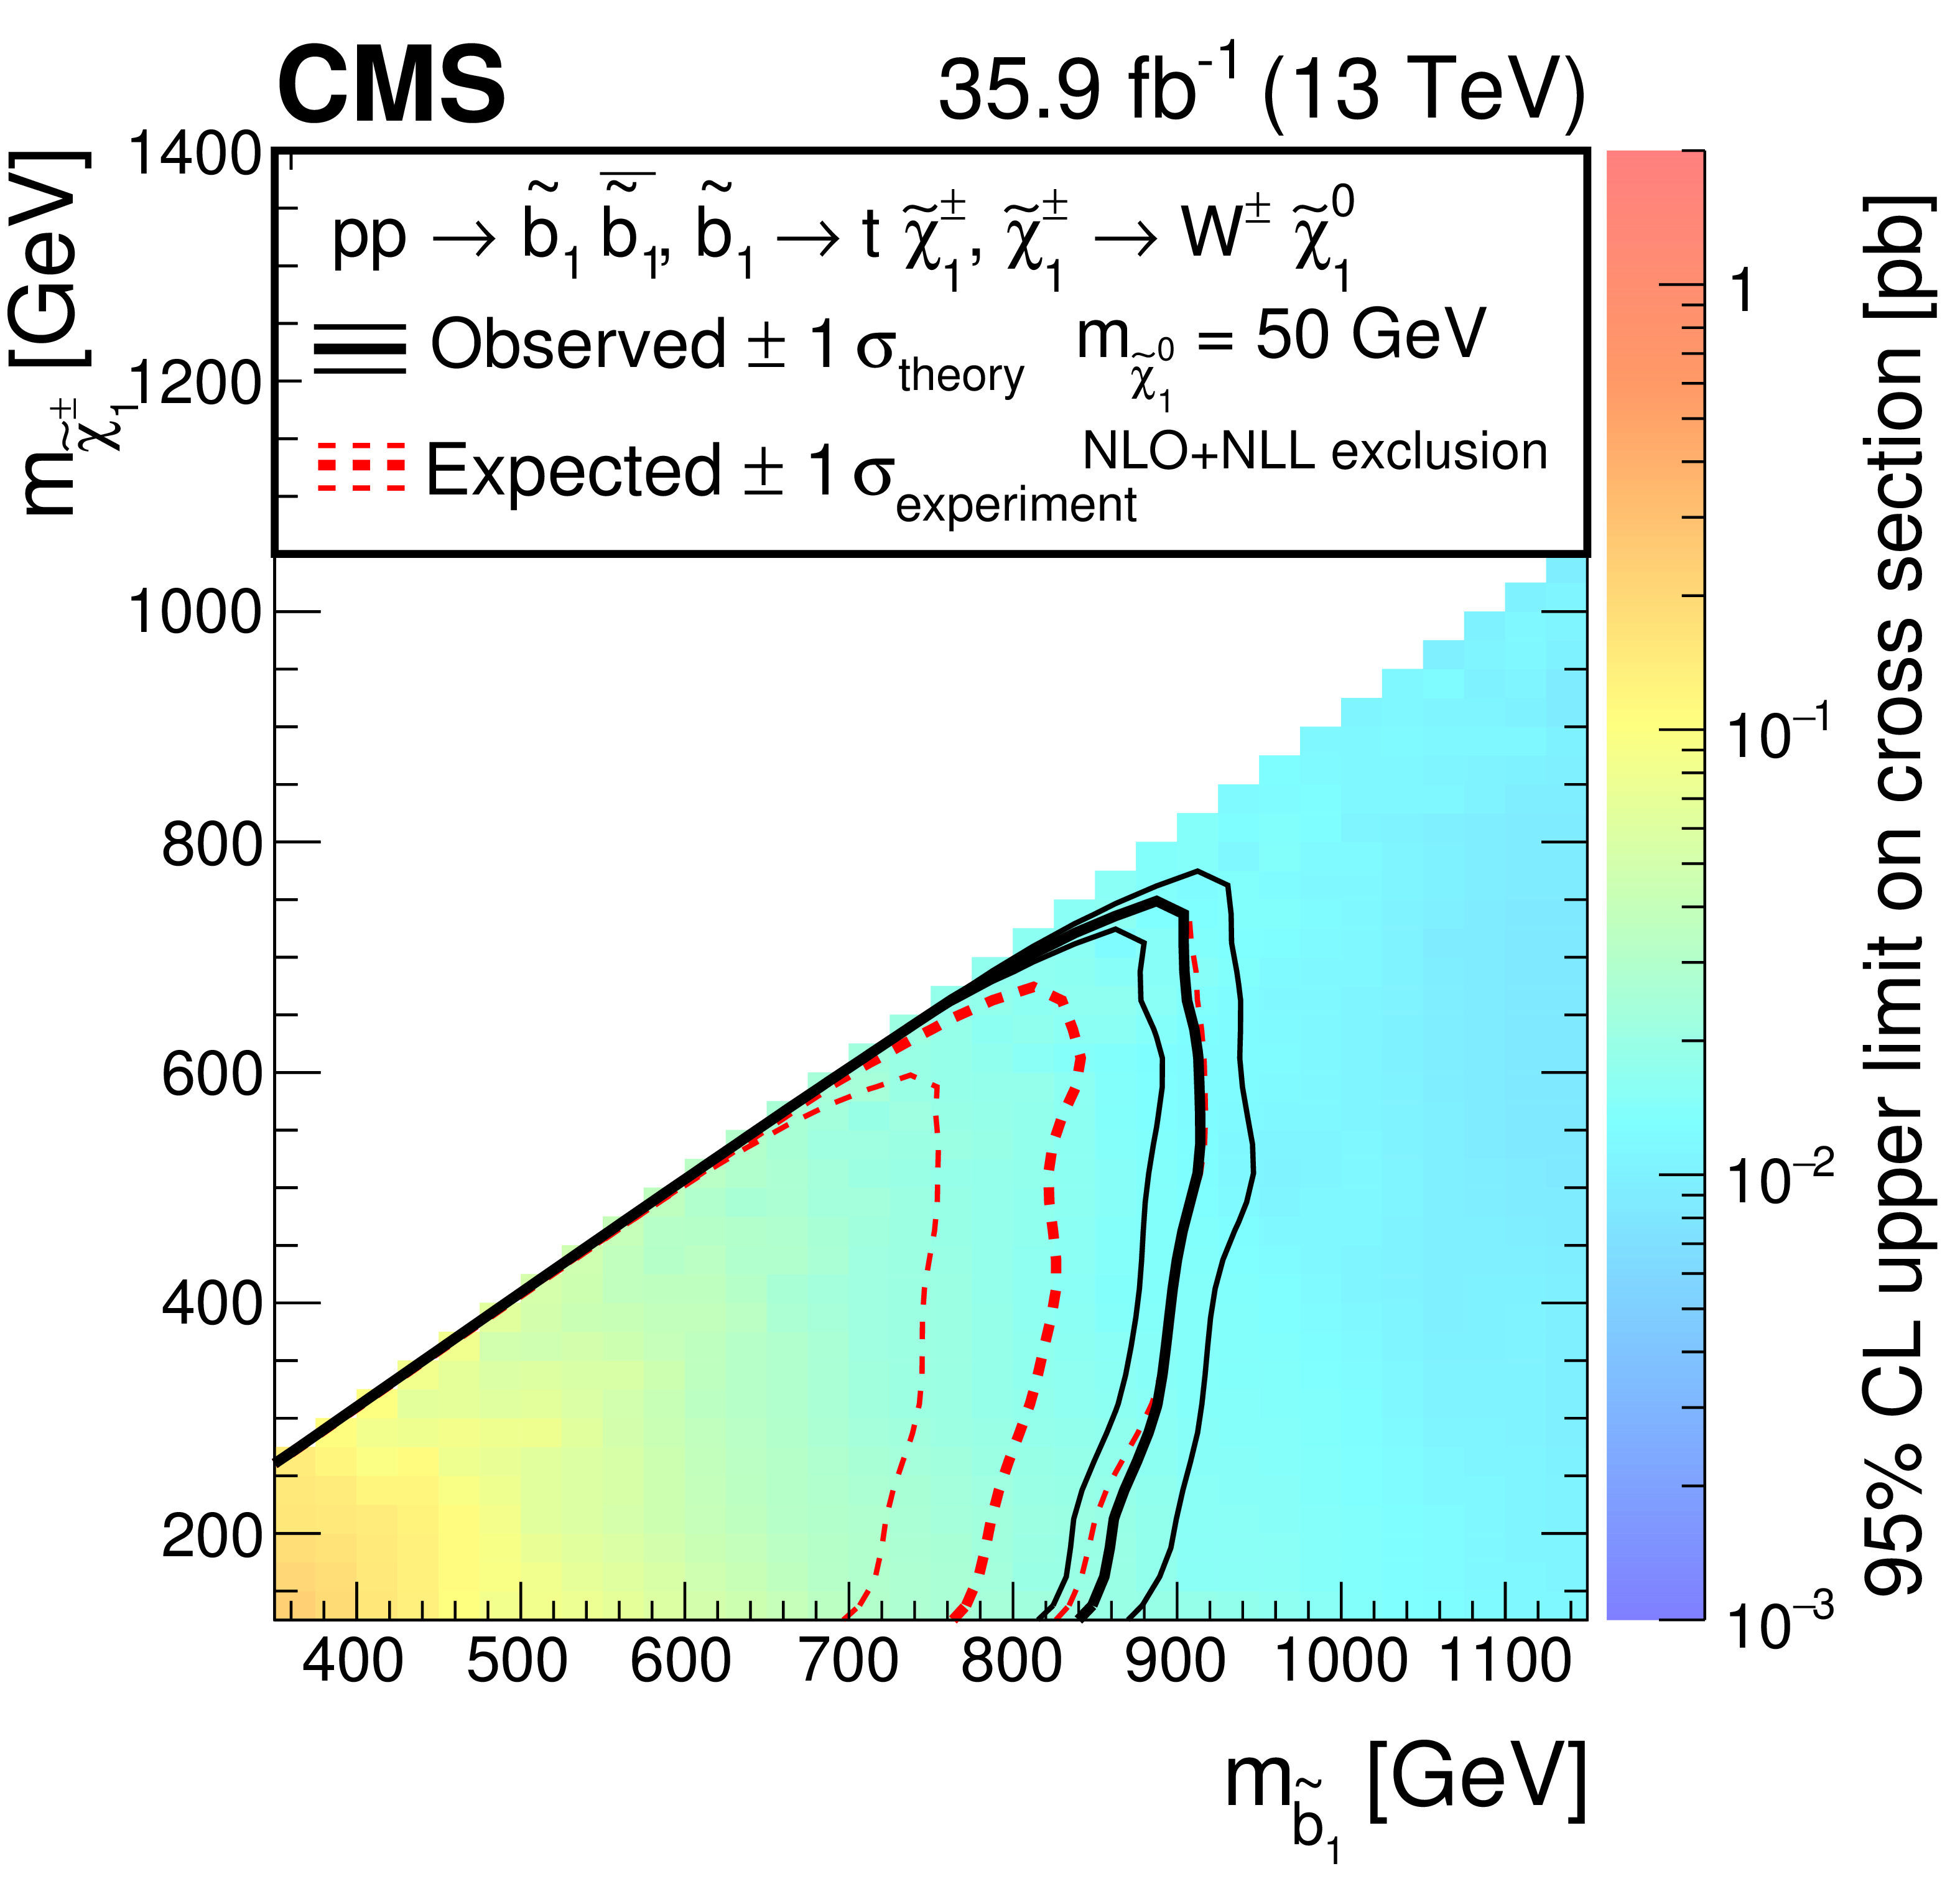
Figure 6:
Cross section upper limits at 95% CL in the $m_{\tilde{ \chi }^{\pm} _1}$ versus $m_{\tilde{ \mathrm{b} }_1}$ plane for T6ttWW simplified model. The mass of the neutralino is set to 50 GeV. The descriptions of the excluded regions and color scale are the same as in Fig. 5. |
png pdf |
Figure 7:
Cross section upper limits at 95% CL in the $m_{\tilde{ \mathrm{t} }_1}$ versus $m_{\tilde{ \mathrm{t} }_2}$ plane for T6ttHZ simplified model. Different branching fractions of the decay $ \tilde{ \mathrm{t} }_2 \rightarrow \tilde{ \mathrm{t} }_1\mathrm{Z} $ are considered: 0% (top left), 50% (top right), and 100% (bottom). The mass difference between the lighter top squark ($\tilde{ \mathrm{t} }_1$) and a neutralino is close to the mass of the top quark. The descriptions of the excluded regions and color scale are the same as in Fig. 5. |
png pdf root |
Figure 7-a:
Cross section upper limits at 95% CL in the $m_{\tilde{ \mathrm{t} }_1}$ versus $m_{\tilde{ \mathrm{t} }_2}$ plane for T6ttHZ simplified model. The branching fraction of the decay $ \tilde{ \mathrm{t} }_2 \rightarrow \tilde{ \mathrm{t} }_1\mathrm{Z} $ considered is 0%. The mass difference between the lighter top squark ($\tilde{ \mathrm{t} }_1$) and a neutralino is close to the mass of the top quark. The descriptions of the excluded regions and color scale are the same as in Fig. 5. |

png pdf root |
Figure 7-b:
Cross section upper limits at 95% CL in the $m_{\tilde{ \mathrm{t} }_1}$ versus $m_{\tilde{ \mathrm{t} }_2}$ plane for T6ttHZ simplified model. The branching fraction of the decay $ \tilde{ \mathrm{t} }_2 \rightarrow \tilde{ \mathrm{t} }_1\mathrm{Z} $ considered is 50%. The mass difference between the lighter top squark ($\tilde{ \mathrm{t} }_1$) and a neutralino is close to the mass of the top quark. The descriptions of the excluded regions and color scale are the same as in Fig. 5. |
png pdf root |
Figure 7-c:
Cross section upper limits at 95% CL in the $m_{\tilde{ \mathrm{t} }_1}$ versus $m_{\tilde{ \mathrm{t} }_2}$ plane for T6ttHZ simplified model. The branching fraction of the decay $ \tilde{ \mathrm{t} }_2 \rightarrow \tilde{ \mathrm{t} }_1\mathrm{Z} $ considered is 100%. The mass difference between the lighter top squark ($\tilde{ \mathrm{t} }_1$) and a neutralino is close to the mass of the top quark. The descriptions of the excluded regions and color scale are the same as in Fig. 5. |
| Tables | |
png pdf |
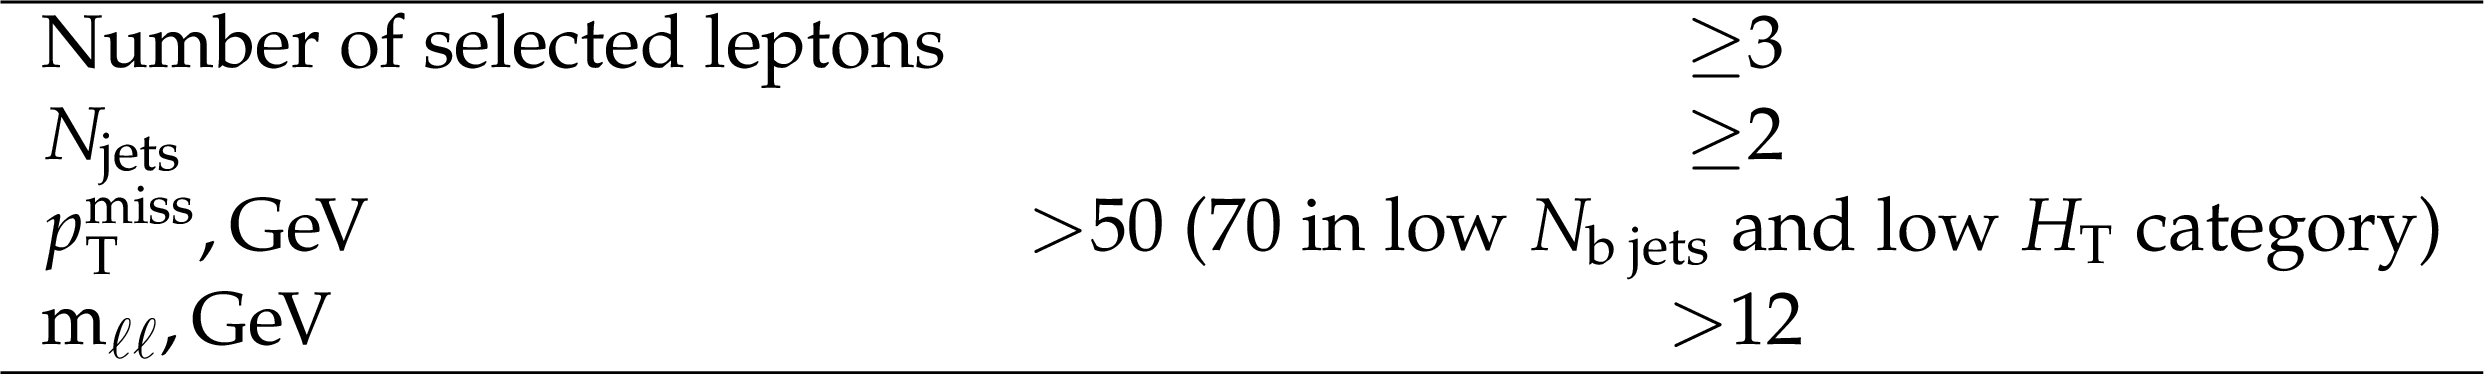
Table 1:
Summary of all requirements used in baseline selection criteria. |
png pdf |
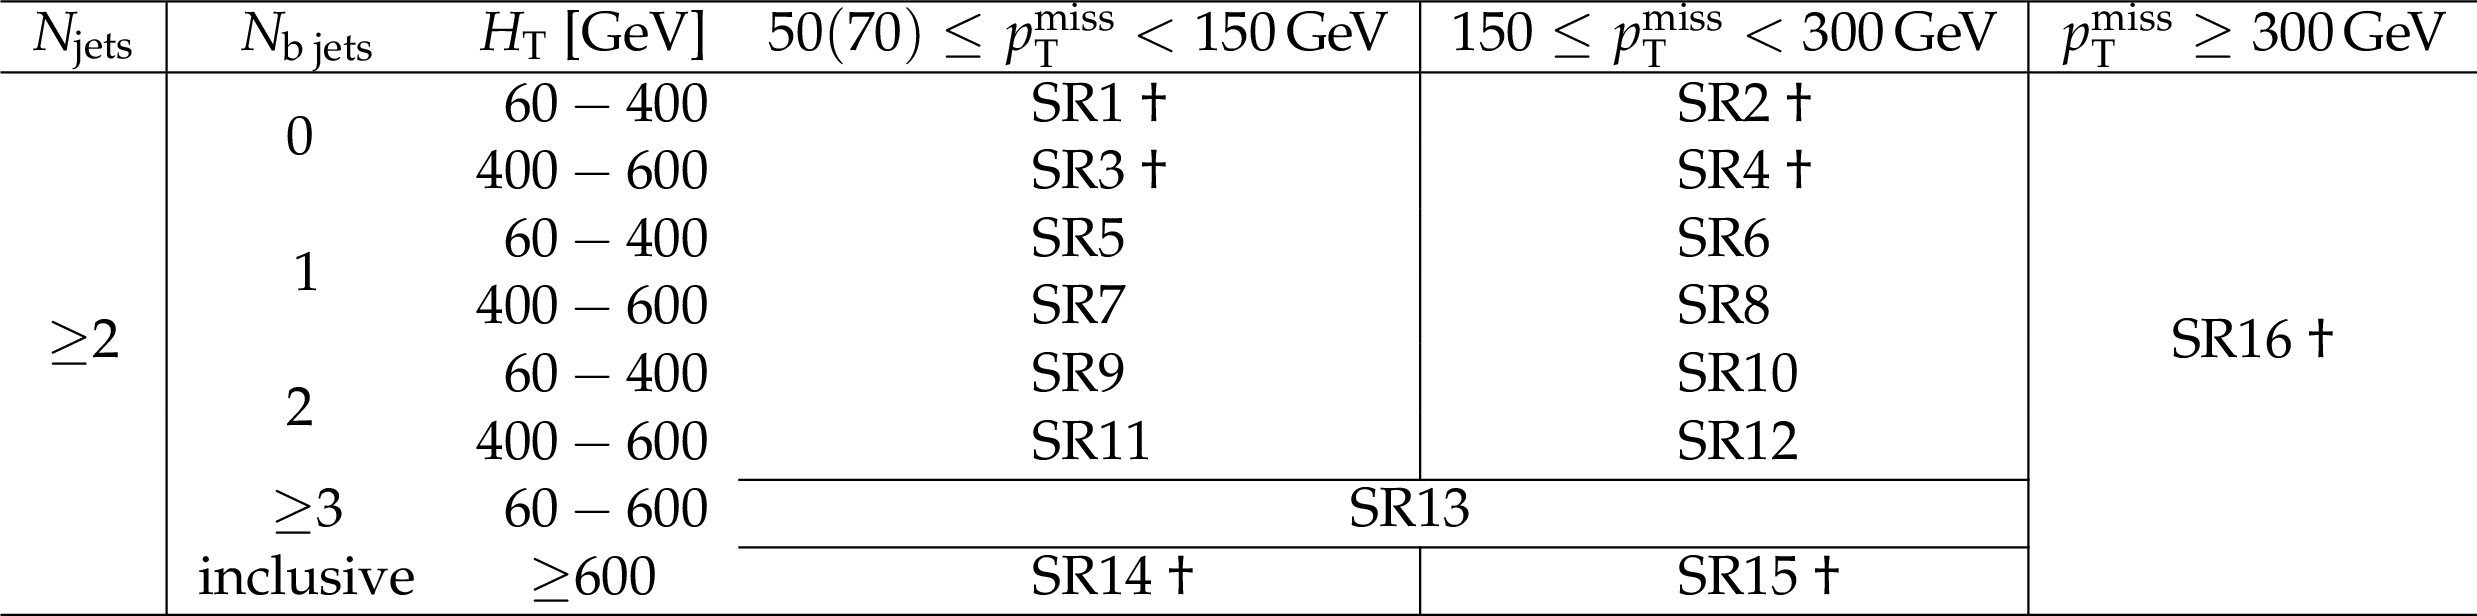
Table 2:
Summary of the signal region definitions. The minimum $ {{p_{\mathrm {T}}} ^\text {miss}}$ requirement is raised from 50 to 70 GeV only for the on-Z SR1 and SR5. Signal regions that are further subdivided at ${M_{\text {T}}} = $ 120 GeV are indicated with $\dagger $. The search regions are mirrored for on- and off-Z categories. |
png pdf |
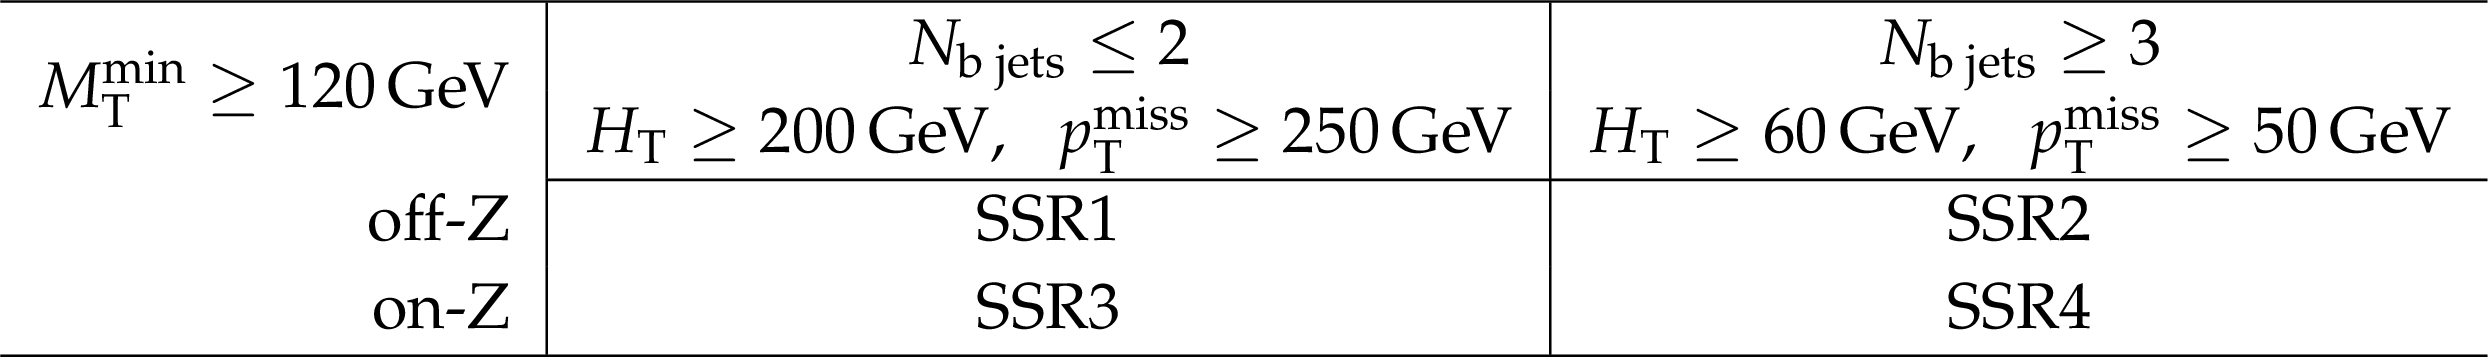
Table 3:
Definition of the aggregate super signal regions (SSRs). This simpler classification is proposed for reinterpretations, depending on the presence of a Z boson candidate and the number of b jets, along with additional simultaneous requirements on ${M_{\text {T}}}$, ${{p_{\mathrm {T}}} ^\text {miss}}$, and ${H_{\mathrm {T}}}$. |
png pdf |
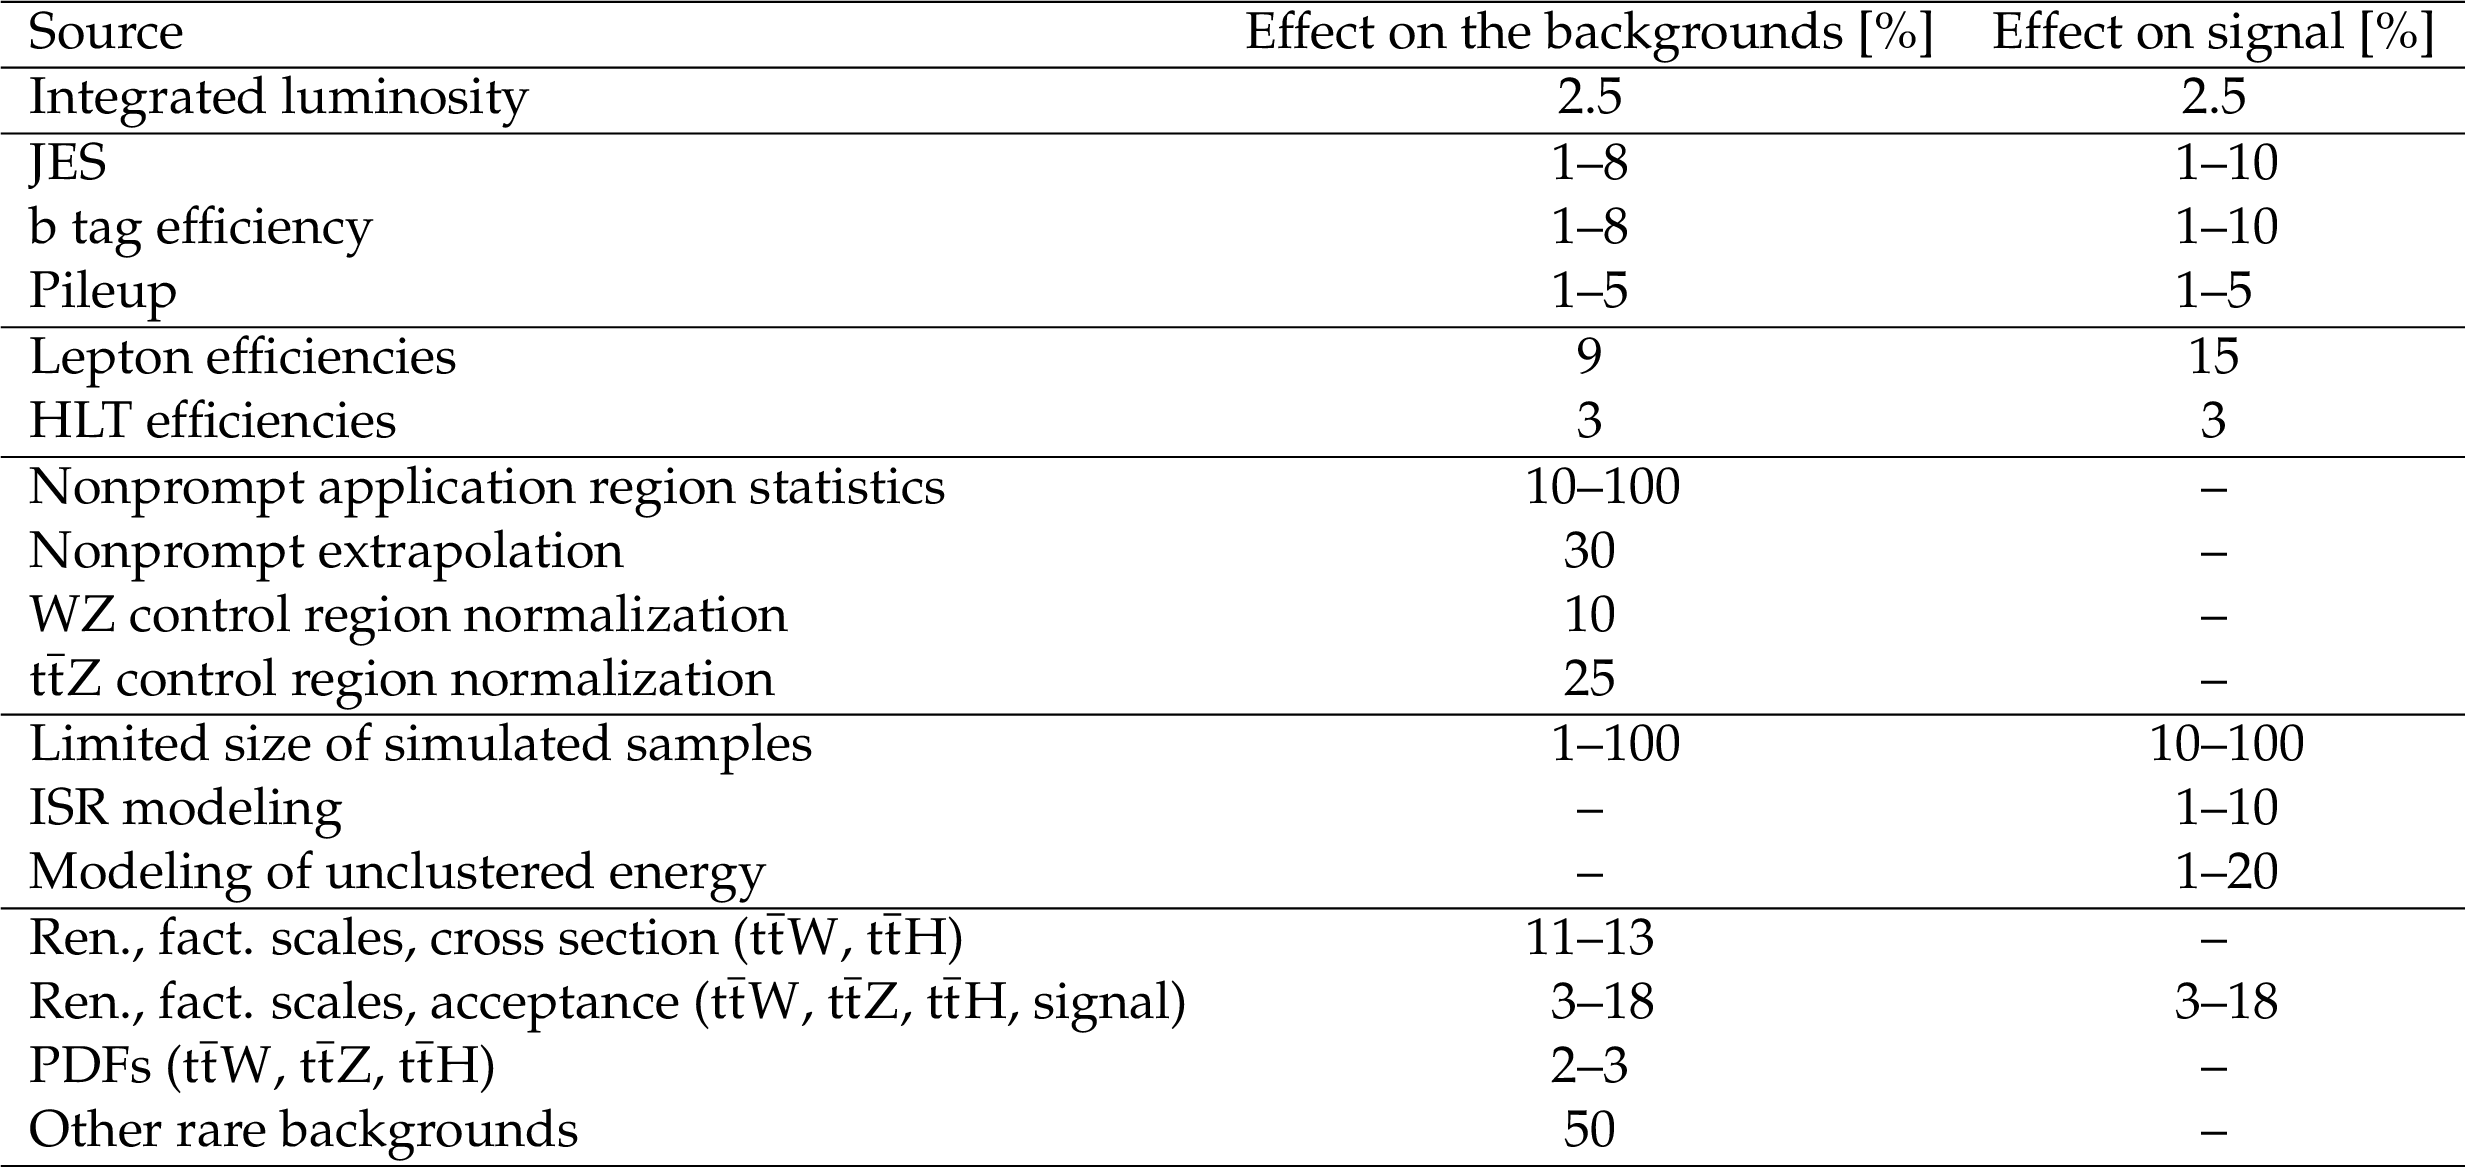
Table 4:
The effect of the systematic uncertainties on the event yields of the backgrounds and signal processes. |

png pdf |
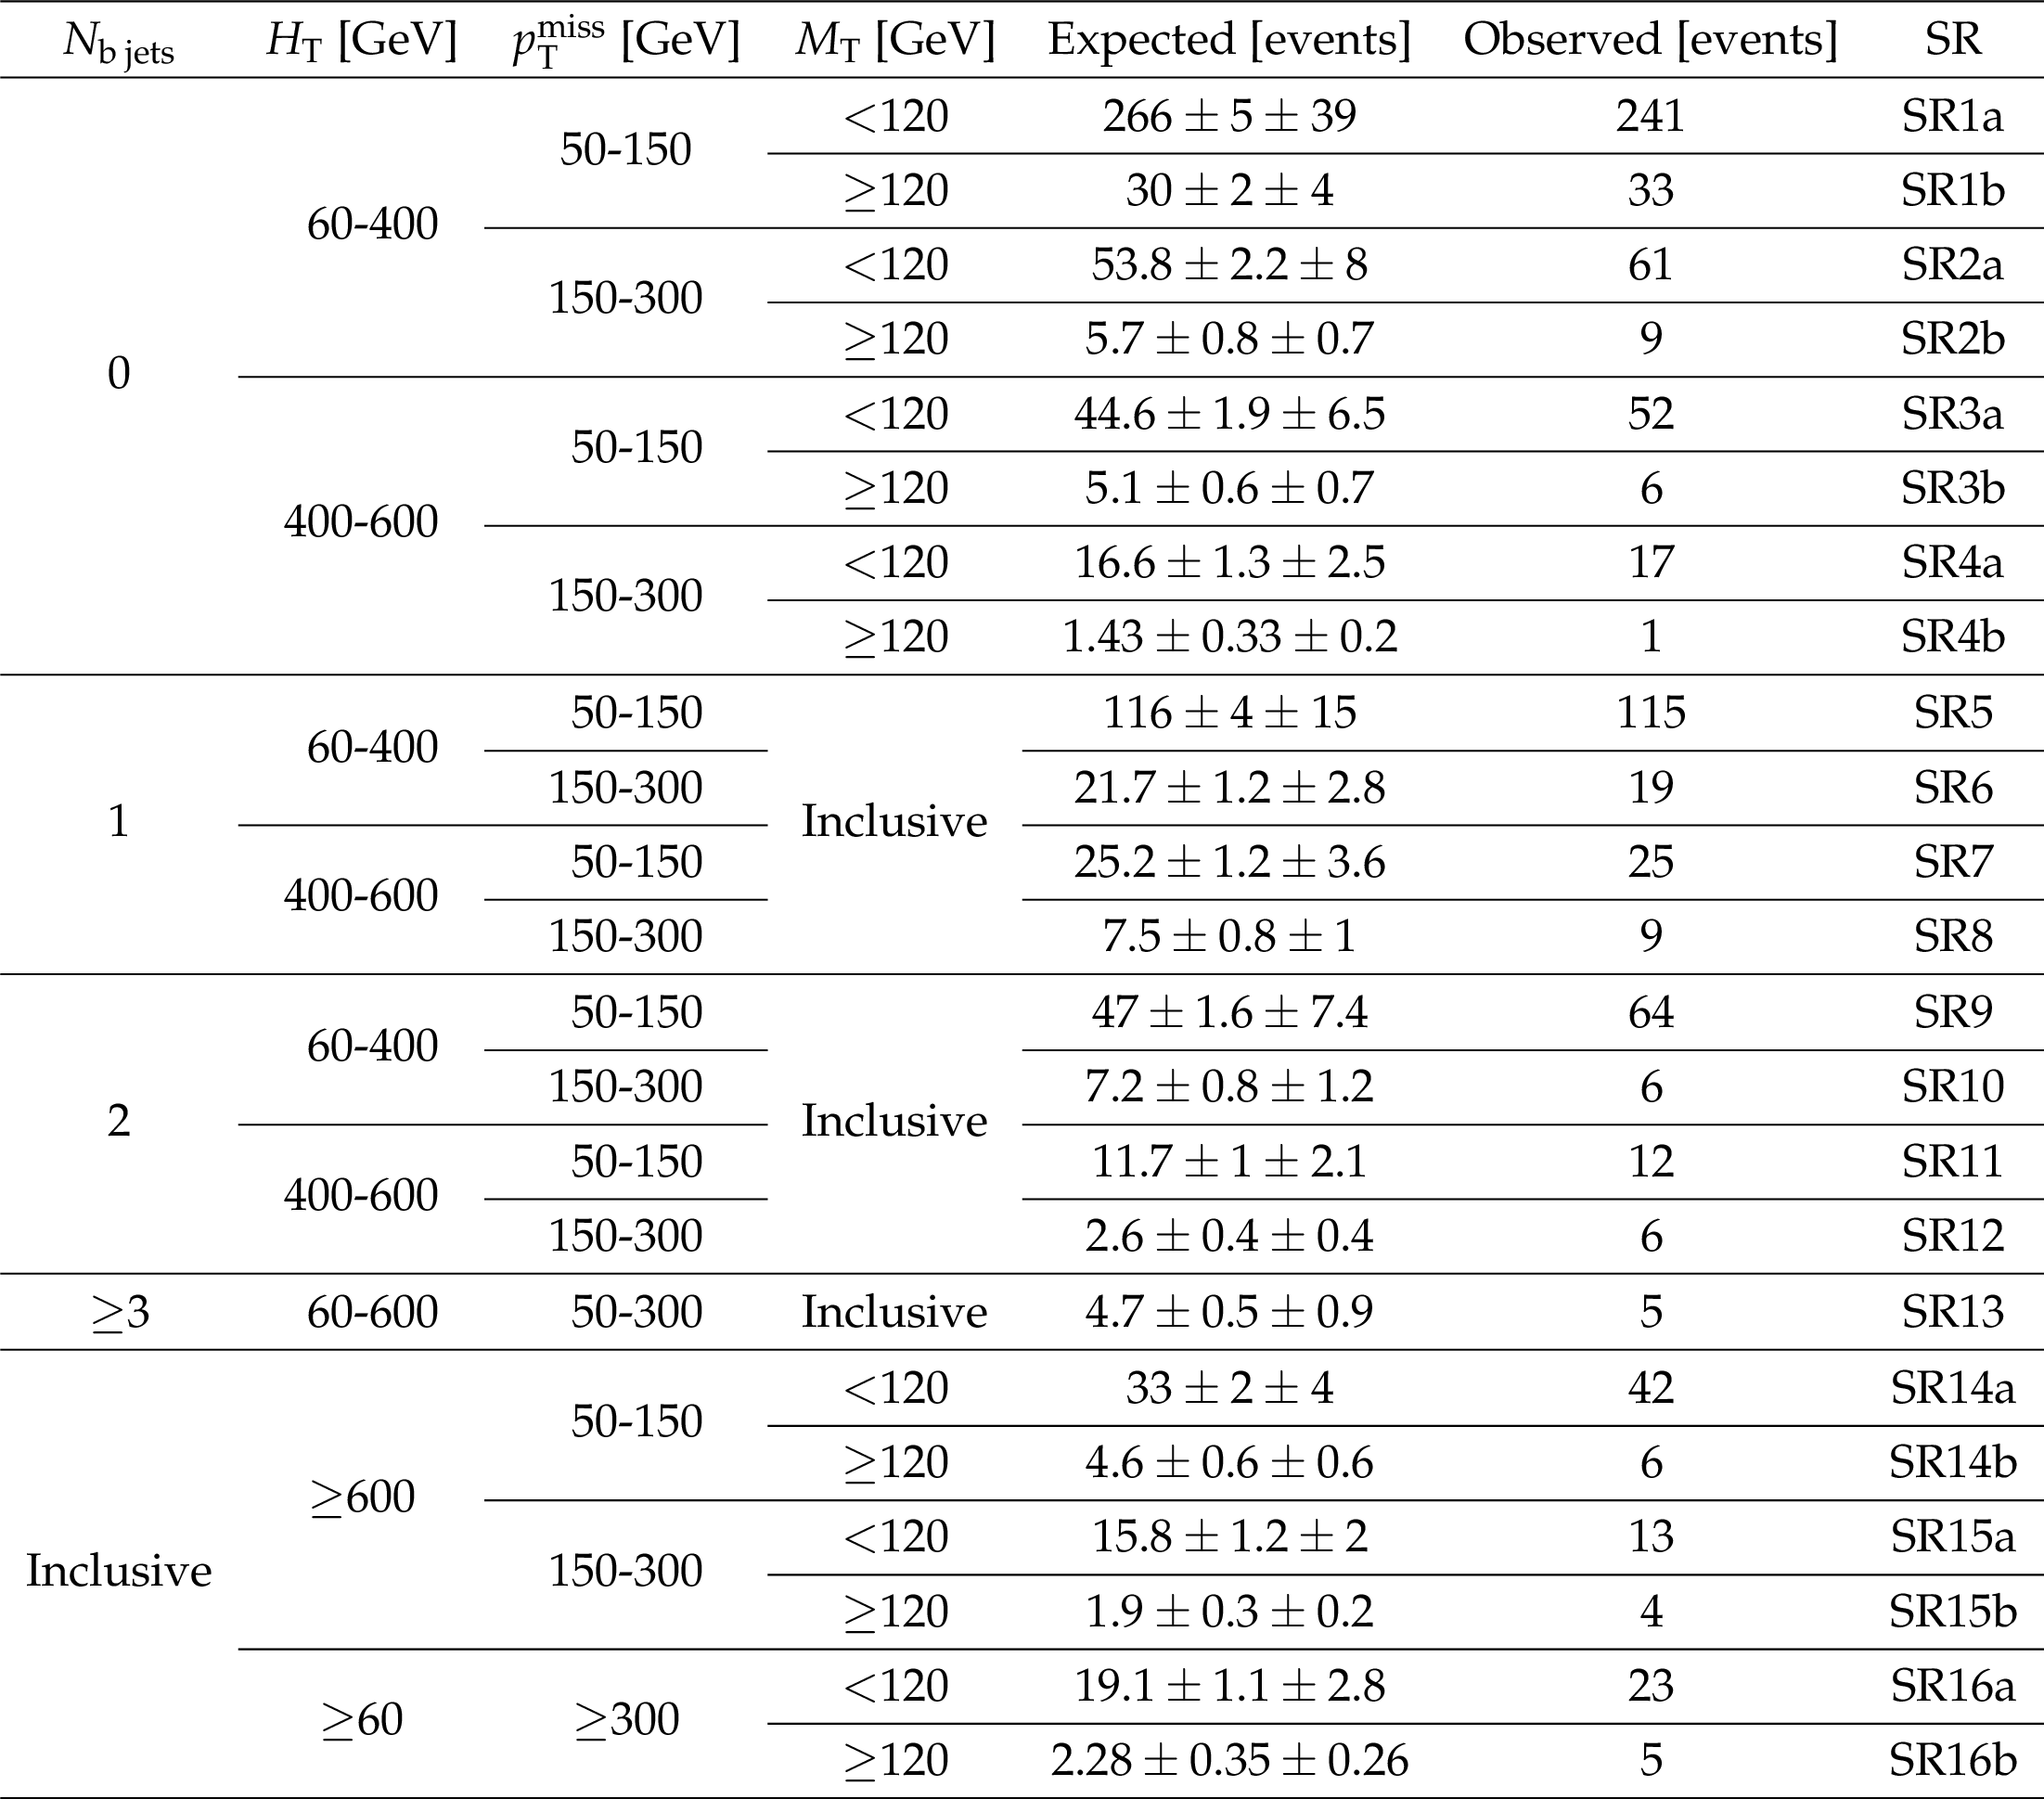
Table 5:
Expected and observed yields in the off-Z search regions. The first uncertainty states the statistical uncertainty, while the second represents the systematic uncertainty. |
png pdf |
Table 6:
Expected and observed yields in the on-Z search regions. The first uncertainty states the statistical uncertainty, while the second represents the systematic uncertainty. |

png pdf |
Table 7:
Expected and observed yields in the super signal regions. The background events containing top quark(s) in association with a W, Z or Higgs boson, except ${{\mathrm{t} {}\mathrm{\bar{t}}} \mathrm{Z}}$, or another pair of top quarks are denoted as ${\mathrm{t} {}\mathrm{\bar{t}}} \mathrm{X}$. The first uncertainty states the statistical uncertainty, while the second represents the systematic uncertainty. |
| Summary |
|
A search for physics beyond the standard model in final states with at least three electrons or muons in any combination, jets, and missing transverse momentum has been presented using data collected by the CMS detector in 2016 at $\sqrt{s} = $ 13 TeV, corresponding to an integrated luminosity of 35.9 fb$^{-1}$. The analysis makes use of control regions in data to estimate reducible backgrounds and to validate simulations used to estimate irreducible background processes. To maximize sensitivity to a broad range of possible signal models, 46 exclusive signal regions are defined. No significant deviation from the expected standard model background is observed in any of these signal regions. The results are interpreted using a simplified gluino-pair production model that features cascade decays producing four top quarks and two neutralinos. In this model, gluinos with a mass up to 1610 GeV are excluded in the case of a massless LSP. The maximum excluded LSP mass is 900 GeV. This represents an improvement of approximately 435 and 250 GeV, respectively, compared to the exclusion limit set in a similar search based on data collected with the CMS detector in 2015, corresponding to an integrated luminosity of 2.3 fb$^{-1}$ [39]. For the simplified model of gluino-gluino production with decay to light-flavor quark jets, two vector bosons and neutralinos, gluino masses up to 1160 GeV and neutralino masses up to 650 GeV can be excluded. The limit on gluino and neutralino masses extends the corresponding limit from the previous analysis by about 335 and 150 GeV, respectively. For a simplified model of bottom squark pair production decaying to top quarks, W bosons and neutralinos, bottom squark masses up to 840 GeV are excluded for a low mass chargino, while chargino masses are excluded up to 740 GeV. These extend the previous limits by 390 and 440 GeV for each particle, respectively. Finally, for a simplified heavy top squark pair production model with further decays to two top quarks, Higgs or Z bosons, and neutralinos, the ${\widetilde{\text{t}}_2} $ mass is excluded up to 720, 710, and 780 GeV for models with an exclusive ${\widetilde{\text{t}}_2} \rightarrow {\widetilde{\text{t}}_1} \mathrm{H} $ decay, an exclusive ${\widetilde{\text{t}}_2} \rightarrow {\widetilde{\text{t}}_1} \mathrm{Z} $ decay, or an equally probable mix of those two decays, while the ${\widetilde{\text{t}}_1} $ mass is excluded up to 440, 460, and 540 GeV for the same branching fractions. This significantly improves the results obtained with the 8 TeV dataset [36]. |
| Additional Tables | |
png pdf |
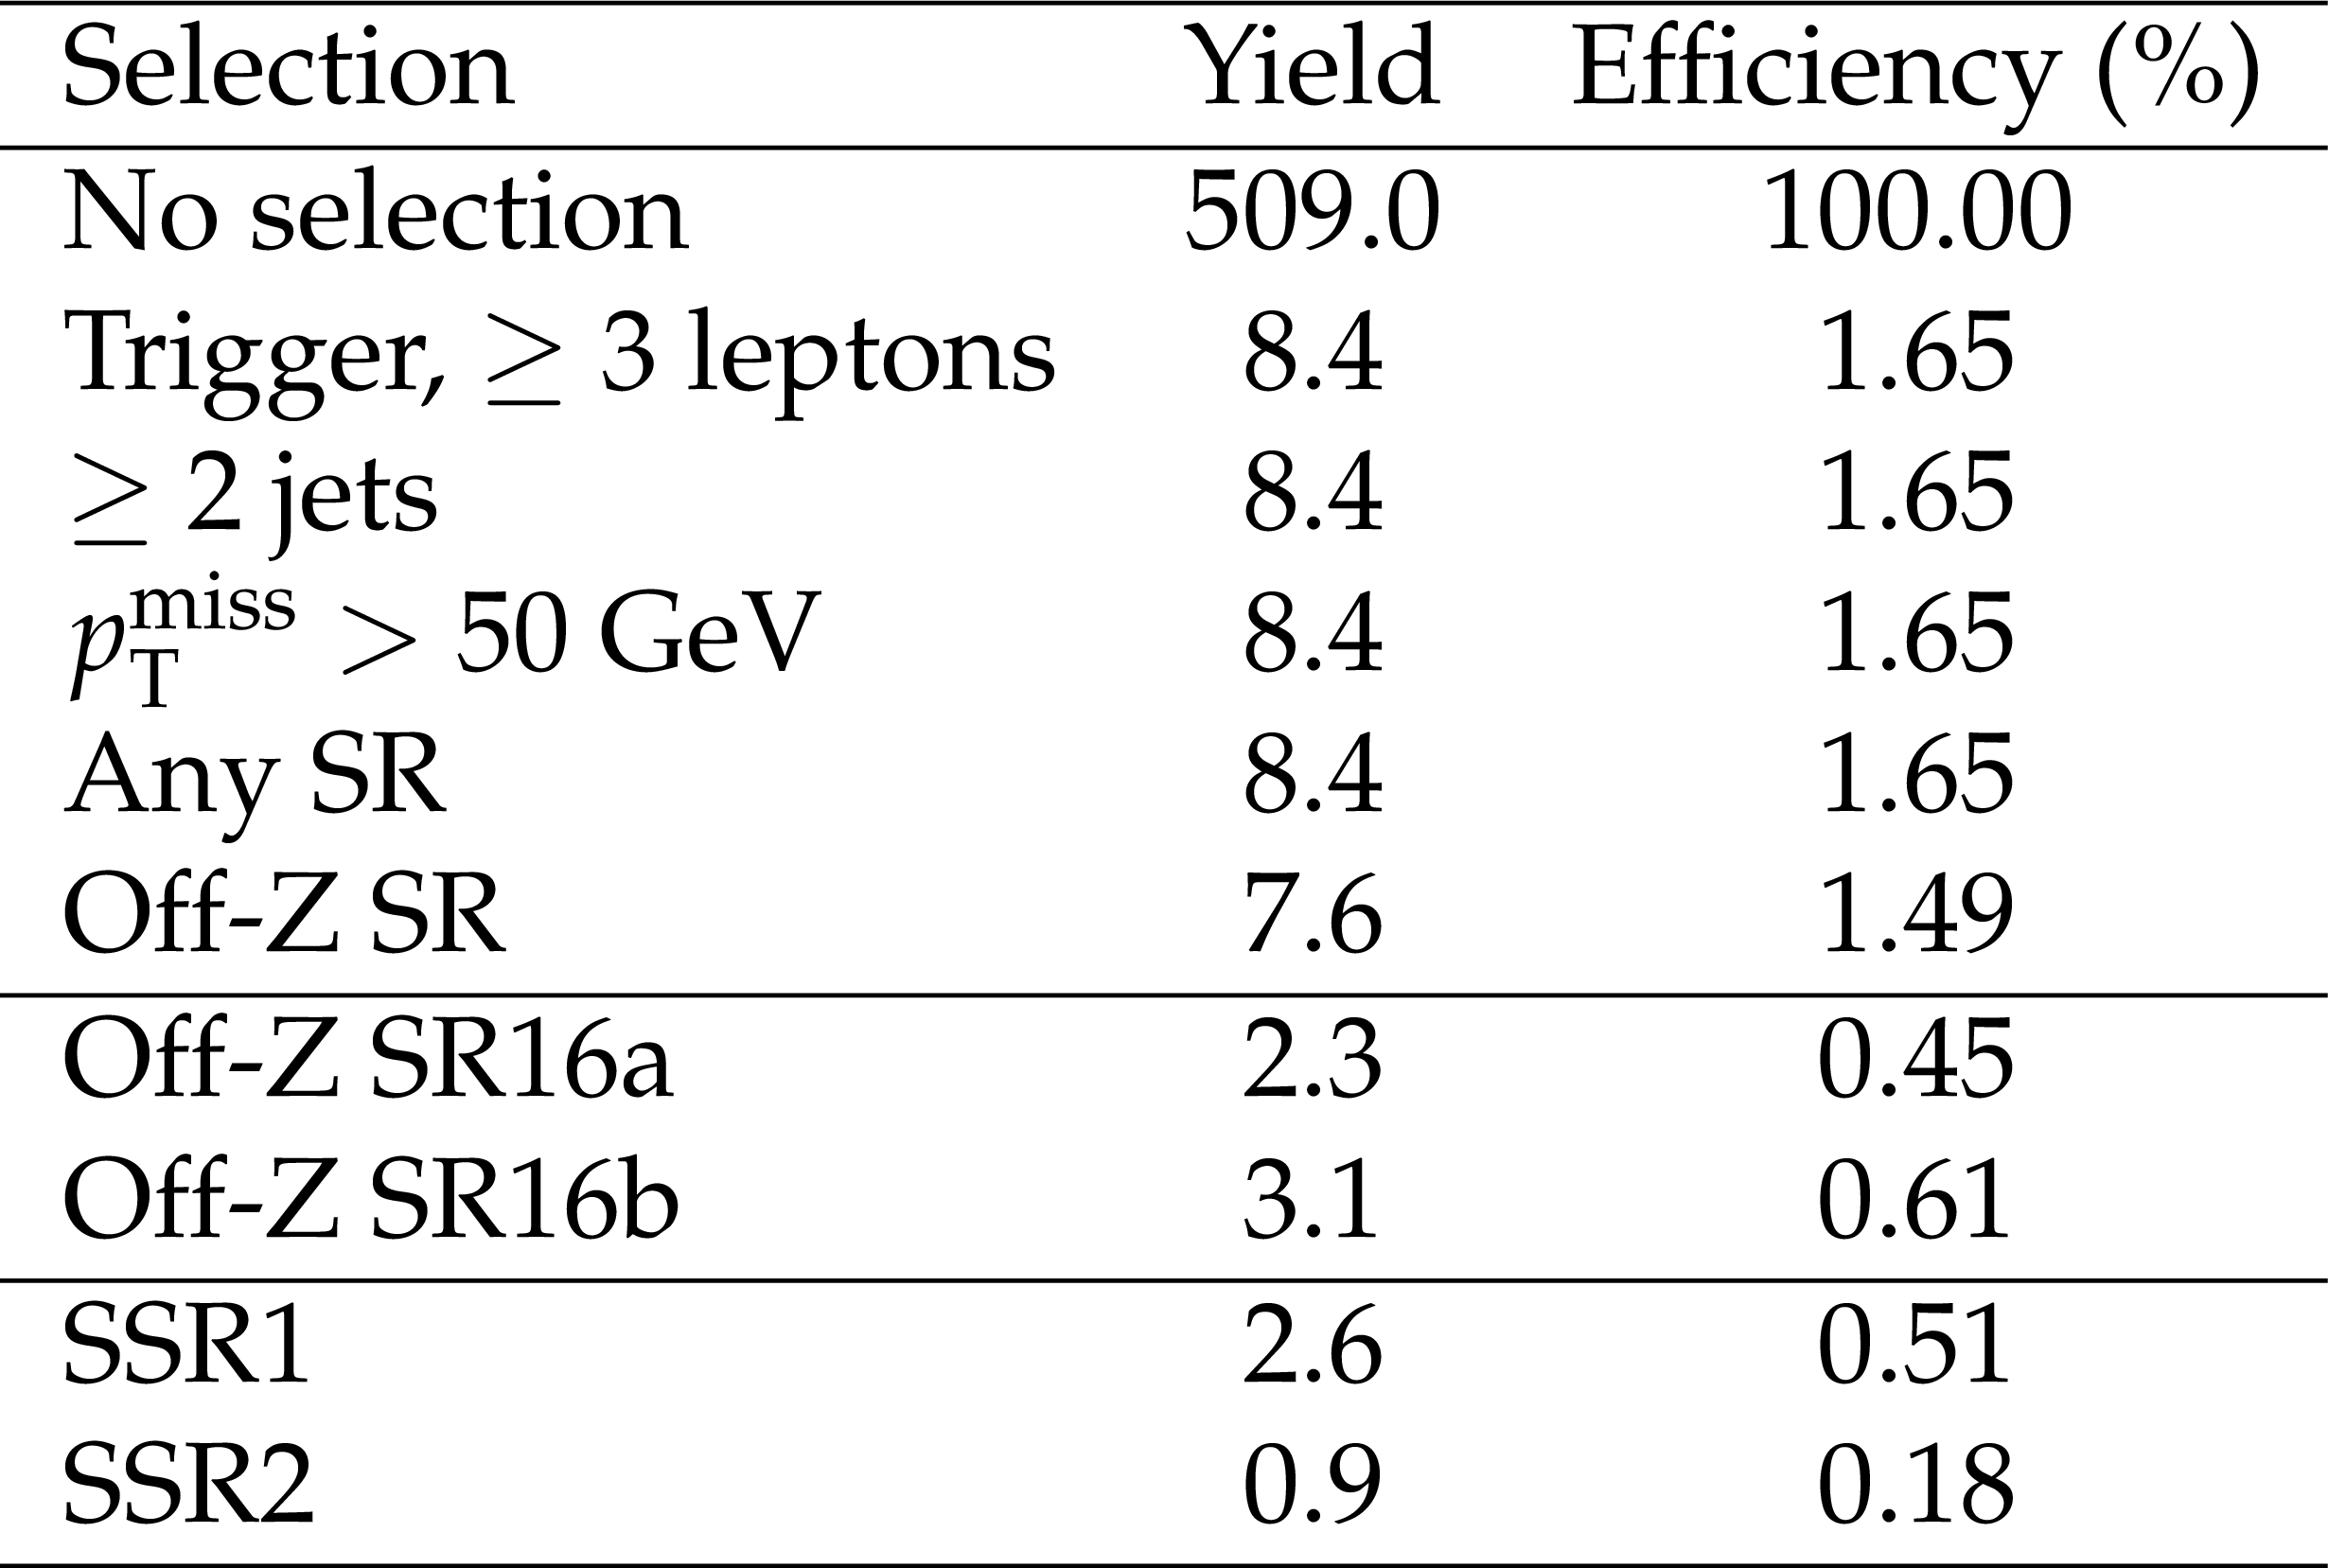
Additional Table 1:
Cutflow table for the gluino pair production model with four top quarks in the final state, assuming gluino and LSP masses equal to 1500 and 200 GeV, respectively. The last two lines correspond to the most populated search regions. The yields correspond to the integrated luminosity of 35.9 fb$^{-1}$ and the assumed cross section for this model is 0.0142 pb. |
png pdf |
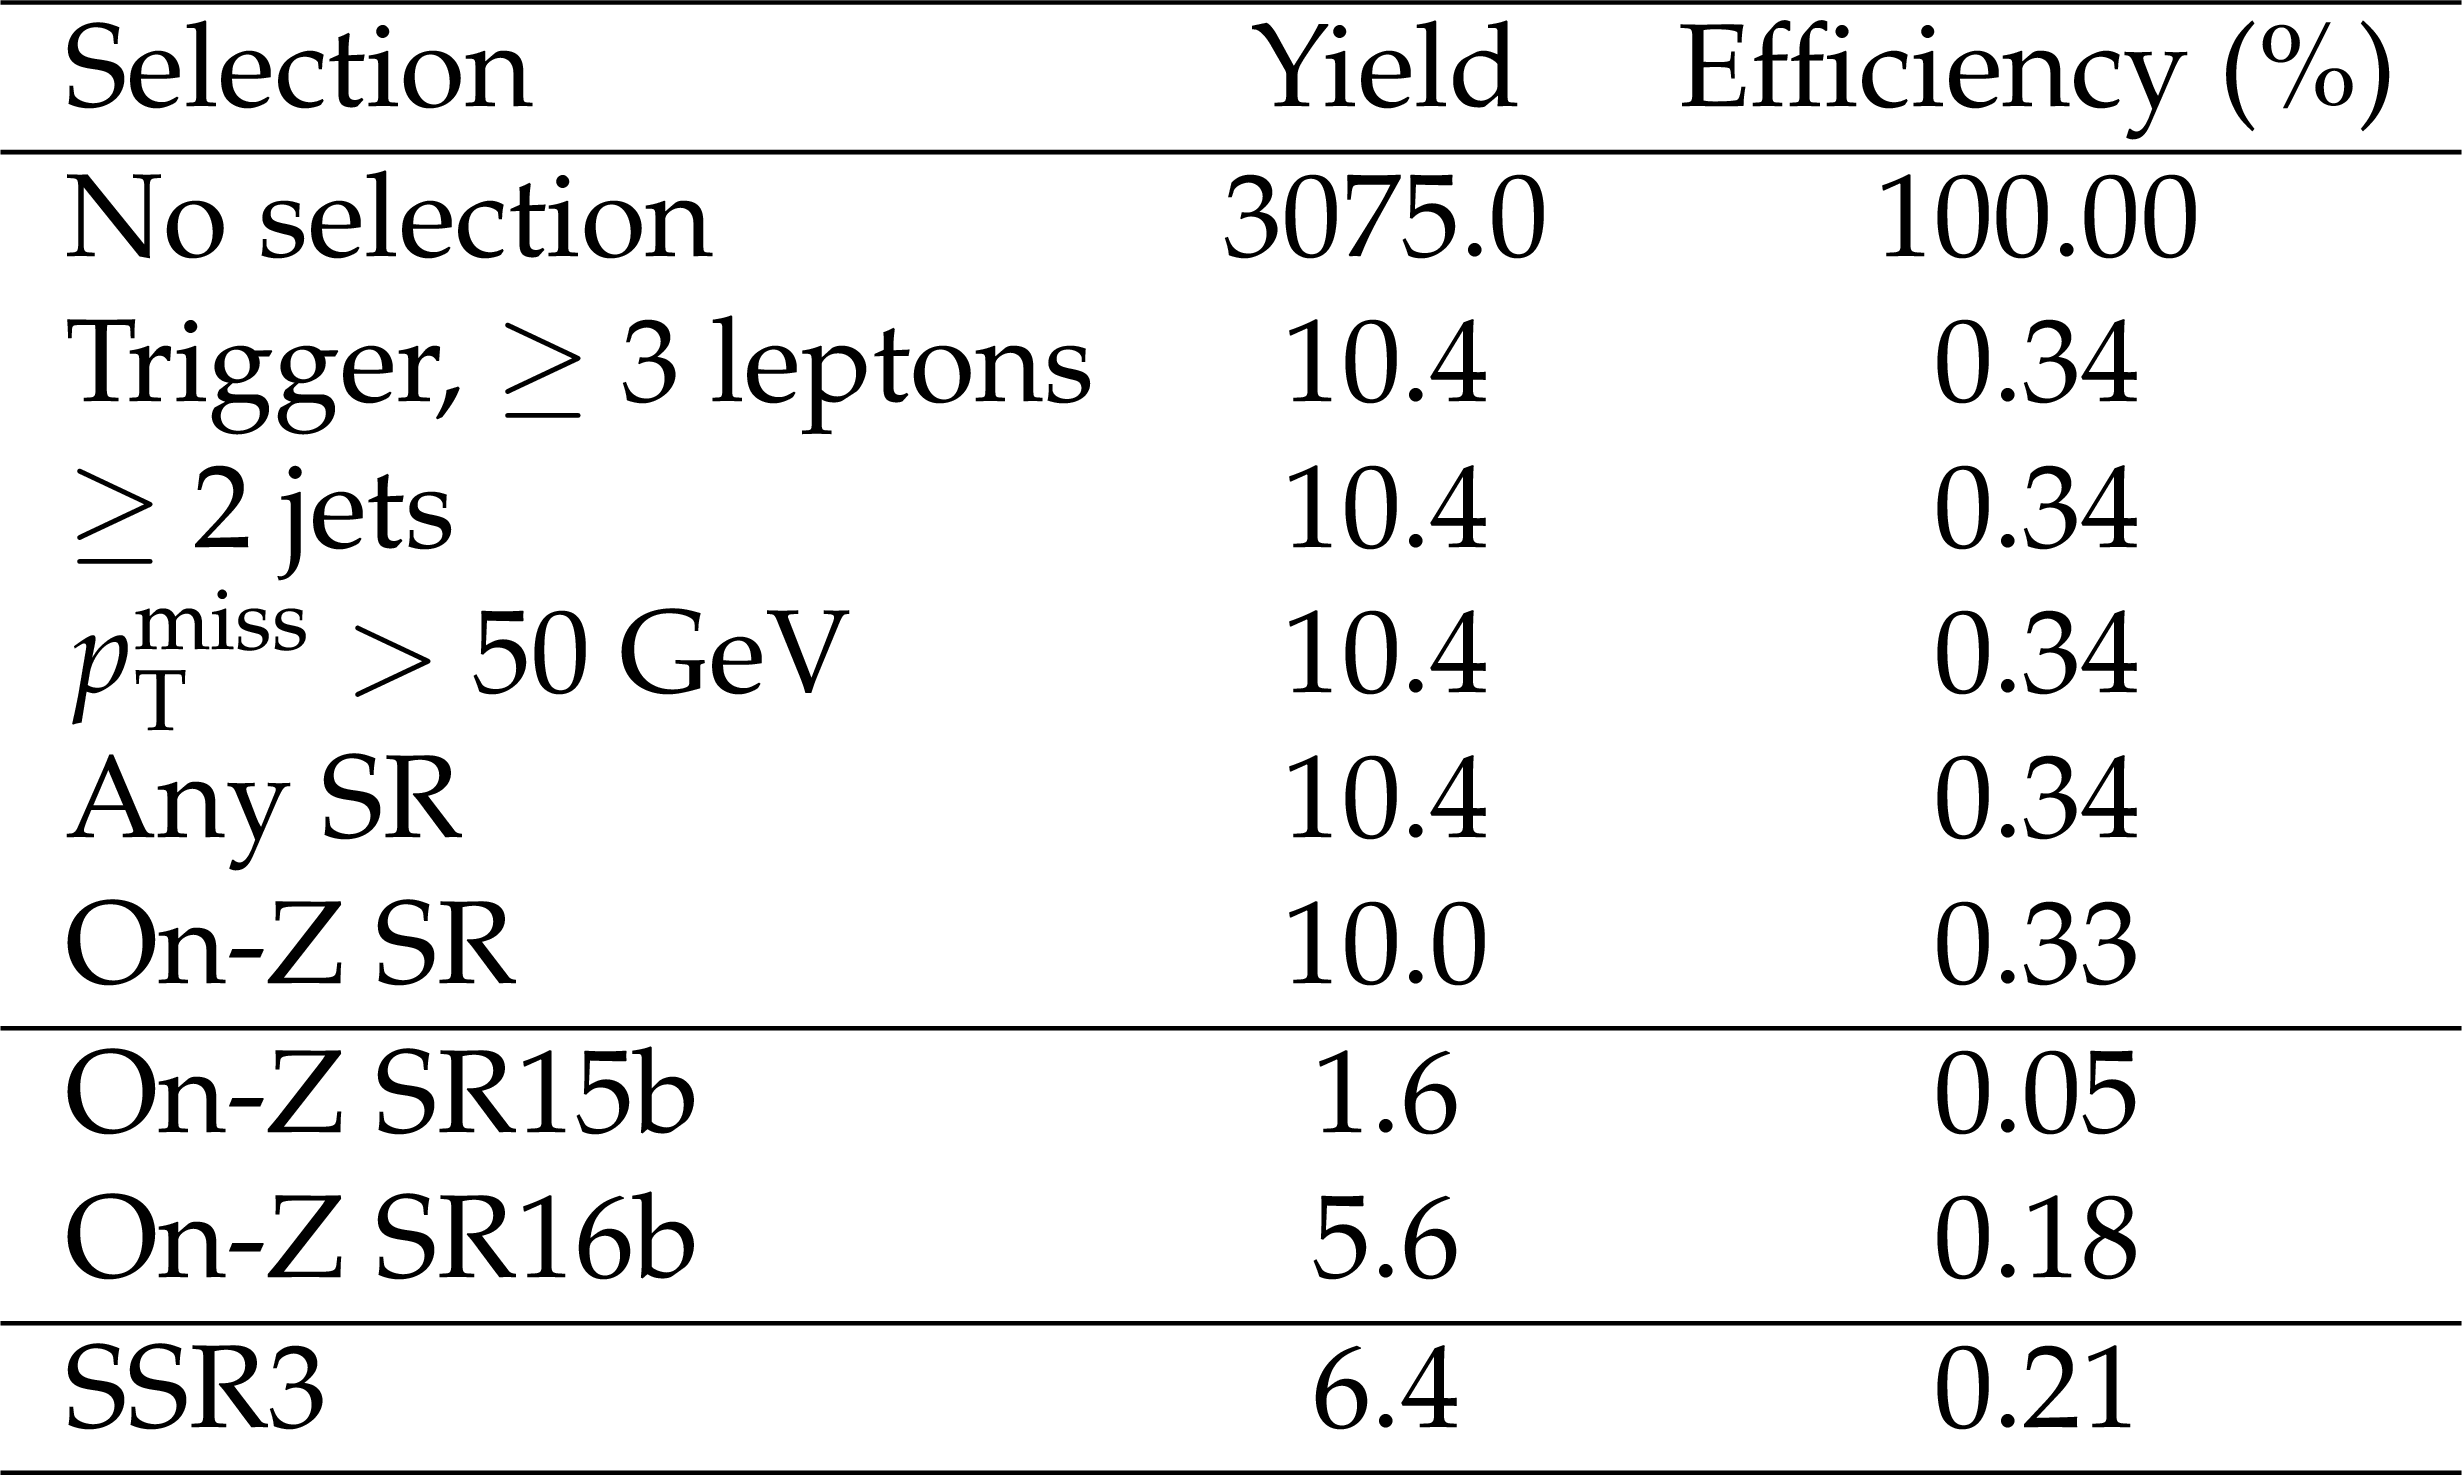
Additional Table 2:
Cutflow table for the gluino pair production model with two vector bosons and light jets in the final state, assuming gluino and LSP masses equal to 1200 and 400 GeV, respectively. The last two lines correspond to the most populated search regions. The yields correspond to the integrated luminosity of 35.9 fb$^{-1}$. The assumed cross section for this model is 0.0856 pb, with branching fraction values of 2/3 and 1/3 for $ \tilde{ \mathrm{g} } \rightarrow \tilde{ \chi }^{\pm} \mathrm{ q \bar{q}' } $ and $ \tilde{ \mathrm{g} } \rightarrow \tilde{ \chi }^{0}_2 \mathrm{ q \bar{q} } $ respectively. |
| References | ||||
| 1 | O. J. P. Eboli, R. Zukanovich Funchal, and T. L. Lungov | Multilepton signatures for leptoquarks | PRD 59 (1999) 035002 | hep-ph/9808288 |
| 2 | N. Craig et al. | Searching for $ t \to c h $ with multi-leptons | PRD 86 (2012) 075002 | 1207.6794 |
| 3 | N. Craig et al. | Heavy Higgs bosons at low $ \tan \beta $: from the LHC to 100 TeV | JHEP 01 (2017) 018 | 1605.08744 |
| 4 | N. Craig et al. | Multi-lepton signals of multiple Higgs bosons | JHEP 02 (2013) 033 | 1210.0559 |
| 5 | C.-S. Chen and Y.-J. Zheng | LHC signatures for the cascade seesaw mechanism | PTEP 2015 (2015) 103B02 | 1312.7207 |
| 6 | A. Lazopoulos, T. McElmurry, K. Melnikov, and F. Petriello | Next-to-leading order QCD corrections to $ \mathrm{t\bar{t}}\mathrm{Z} $ production at the LHC | PLB 666 (2008) 62 | 0804.2220 |
| 7 | A. Kardos, Z. Trocsanyi, and C. Papadopoulos | Top quark pair production in association with a $ \mathrm{Z} $-boson at NLO accuracy | PRD 85 (2012) 054015 | 1111.0610 |
| 8 | J. M. Campbell and R. K. Ellis | $ \mathrm{t\bar{t}}\mathrm{W}^{\pm} $ production and decay at NLO | JHEP 07 (2012) 052 | 1204.5678 |
| 9 | J. Campbell, R. K. Ellis, and R. Rontsch | Single top production in association with a $ \mathrm{Z} $ boson at the LHC | PRD 87 (2013) 114006 | 1302.3856 |
| 10 | A. Kulesza, L. Motyka, T. Stebel, and V. Theeuwes | Soft gluon resummation for associated $ \mathrm{t\bar{t}}\mathrm{H} $ production at the LHC | JHEP 03 (2016) 065 | 1509.02780 |
| 11 | A. Broggio et al. | Associated production of a top pair and a Higgs boson beyond NLO | JHEP 03 (2016) 124 | 1510.01914 |
| 12 | M. Grazzini, S. Kallweit, D. Rathlev, and M. Wiesemann | $ \mathrm{W}^\pm\mathrm{Z} $ production at the LHC: fiducial cross sections and distributions in NNLO QCD | JHEP 05 (2017) 139 | 1703.09065 |
| 13 | F. Cascioli et al. | ZZ production at hadron colliders in NNLO QCD | PLB 735 (2014) 311 | 1405.2219 |
| 14 | F. Caola, K. Melnikov, R. Rontsch, and L. Tancredi | QCD corrections to ZZ production in gluon fusion at the LHC | PRD 92 (2015) 094028 | 1509.06734 |
| 15 | J. M. Campbell, R. K. Ellis, M. Czakon, and S. Kirchner | Two loop correction to interference in $ \mathrm{g}\mathrm{g} \to \mathrm{Z}\mathrm{Z} $ | JHEP 08 (2016) 011 | 1605.01380 |
| 16 | T. Binoth, G. Ossola, C. G. Papadopoulos, and R. Pittau | NLO QCD corrections to tri-boson production | JHEP 06 (2008) 082 | 0804.0350 |
| 17 | D. T. Nhung, L. D. Ninh, and M. M. Weber | NLO corrections to WWZ production at the LHC | JHEP 12 (2013) 096 | 1307.7403 |
| 18 | S. Yong-Bai et al. | NLO QCD + NLO EW corrections to WZZ productions with leptonic decays at the LHC | JHEP 10 (2015) 186 | 1507.03693 |
| 19 | Y.-B. Shen et al. | NLO QCD and electroweak corrections to WWW production at the LHC | PRD 95 (2017) 073005 | 1605.00554 |
| 20 | W. Hong et al. | NLO QCD + EW corrections to ZZZ production with subsequent leptonic decays at the LHC | JPG 43 (2016) 115001 | 1610.05876 |
| 21 | ATLAS Collaboration | Measurement of the $ \mathrm{t\bar{t}}\mathrm{Z} $ and $ \mathrm{t\bar{t}}\mathrm{W} $ production cross sections in multilepton final states using 3.2$ fb$^{-1} of pp collisions at $ \sqrt{s} = $ 13 TeV with the ATLAS detector | EPJC 77 (2017) 40 | 1609.01599 |
| 22 | ATLAS Collaboration | Measurement of the $ \mathrm{W}^{\pm}\mathrm{Z} $ boson pair-production cross section in pp collisions at $ \sqrt{s} = $ 13 TeV with the ATLAS detector | PLB 762 (2016) 1 | 1606.04017 |
| 23 | CMS Collaboration | Measurement of the WZ production cross section in pp collisions at $ \sqrt{s} = $ 13 TeV | PLB 766 (2017) 268 | CMS-SMP-16-002 1607.06943 |
| 24 | ATLAS Collaboration | Measurement of the $ ZZ $ production cross section in $ pp $ collisions at $ \sqrt{s} = $ 13 TeV with the ATLAS detector | PRL 116 (2016) 101801 | 1512.05314 |
| 25 | CMS Collaboration | Measurement of the ZZ production cross section and $ \mathrm{Z}\to \ell^+\ell^-\ell'^+\ell'^- $ branching fraction in pp collisions at $ \sqrt {s} = $ 13 TeV | PLB 763 (2016) 280 | CMS-SMP-16-001 1607.08834 |
| 26 | P. Ramond | Dual theory for free fermions | PRD 3 (1971) 2415 | |
| 27 | \relax Yu. A. Golfand and E. P. Likhtman | Extension of the algebra of Poincare group generators and violation of P invariance | JEPTL 13 (1971) 323.[\it Pisma Zh. Eksp. Teor. Fiz. \bf 13 (1971) 452] | |
| 28 | A. Neveu and J. H. Schwarz | Factorizable dual model of pions | NPB 31 (1971) 86 | |
| 29 | D. V. Volkov and V. P. Akulov | Possible universal neutrino interaction | JEPTL 16 (1972) 438.[\it Pisma Zh. Eksp. Teor. Fiz. \bf 16 (1972) 621] | |
| 30 | J. Wess and B. Zumino | A lagrangian model invariant under supergauge transformations | PLB 49 (1974) 52 | |
| 31 | J. Wess and B. Zumino | Supergauge transformations in four-dimensions | NPB 70 (1974) 39 | |
| 32 | P. Fayet | Supergauge invariant extension of the Higgs mechanism and a model for the electron and its neutrino | NPB 90 (1975) 104 | |
| 33 | H. P. Nilles | Supersymmetry, supergravity and particle physics | PR 110 (1984) 1 | |
| 34 | S. P. Martin | A supersymmetry primer | Adv. Ser. Direct. High Energy Phys. 21 (2010) 1 | hep-ph/9709356 |
| 35 | D. Alves et al. | Simplified models for LHC new physics searches | JPG 39 (2012) 105005 | 1105.2838 |
| 36 | CMS Collaboration | Search for top-squark pairs decaying into Higgs or Z bosons in pp collisions at $ \sqrt{s} = $ 8 TeV | PLB 736 (2014) 371 | CMS-SUS-13-024 1405.3886 |
| 37 | ATLAS Collaboration | Search for direct top squark pair production in events with a Higgs or $ \mathrm{Z} $ boson, and missing transverse momentum in $ \sqrt{s} = $ 13 TeV pp collisions with the ATLAS detector | JHEP 08 (2017) 006 | 1706.03986 |
| 38 | ATLAS Collaboration | Search for supersymmetry in final states with two same-sign or three leptons and jets using 36$ fb$^{-1} of $ \sqrt{s} = $ 13 TeV pp collision data with the ATLAS detector | JHEP 09 (2017) 084 | 1706.03731 |
| 39 | CMS Collaboration | Search for supersymmetry with multiple charged leptons in proton-proton collisions at $ \sqrt{s} = $ 13 TeV | Accepted by EPJC | CMS-SUS-16-003 1701.06940 |
| 40 | CMS Collaboration | Performance of photon reconstruction and identification with the CMS detector in proton-proton collisions at $ \sqrt{s} = $ 8 TeV | JINST 10 (2015) P08010 | CMS-EGM-14-001 1502.02702 |
| 41 | CMS Collaboration | Performance of CMS muon reconstruction in pp collision events at $ \sqrt{s} = $ 7 TeV | JINST 7 (2012) P10002 | CMS-MUO-10-004 1206.4071 |
| 42 | CMS Collaboration | The CMS trigger system | JINST 12 (2017) P01020 | CMS-TRG-12-001 1609.02366 |
| 43 | CMS Collaboration | The CMS experiment at the CERN LHC | JINST 3 (2008) S08004 | CMS-00-001 |
| 44 | CMS Collaboration | Particle-flow reconstruction and global event description with the CMS detector | JINST 12 (2017) P10003 | CMS-PRF-14-001 1706.04965 |
| 45 | M. Cacciari, G. P. Salam, and G. Soyez | The anti-$ k_{t} $ jet clustering algorithm | JHEP 04 (2008) 063 | 0802.1189 |
| 46 | M. Cacciari, G. P. Salam, and G. Soyez | FastJet user manual | EPJC 72 (2012) 1896 | 1111.6097 |
| 47 | CMS Collaboration | Determination of jet energy calibration and transverse momentum resolution in CMS | JINST 6 (2011) P11002 | CMS-JME-10-011 1107.4277 |
| 48 | CMS Collaboration | Jet energy scale and resolution in the CMS experiment in pp collisions at 8 TeV | JINST 12 (2016) P02014 | CMS-JME-13-004 1607.03663 |
| 49 | CMS Collaboration | Identification of b-quark jets with the CMS experiment | JINST 8 (2013) P04013 | CMS-BTV-12-001 1211.4462 |
| 50 | CMS Collaboration | Identification of b quark jets at the CMS experiment in the LHC Run 2 | CMS-PAS-BTV-15-001 | CMS-PAS-BTV-15-001 |
| 51 | CMS Collaboration | Performance of the CMS missing transverse momentum reconstruction in pp data at $ \sqrt{s} = $ 8 TeV | JINST 10 (2015) P02006 | CMS-JME-13-003 1411.0511 |
| 52 | CMS Collaboration | Performance of missing energy reconstruction in 13 TeV pp collision data using the CMS detector | CMS-PAS-JME-16-004 | CMS-PAS-JME-16-004 |
| 53 | CMS Collaboration | Performance of electron reconstruction and selection with the CMS detector in proton-proton collisions at $ \sqrt{s} = $ 8 TeV | JINST 10 (2015) P06005 | CMS-EGM-13-001 1502.02701 |
| 54 | CMS Collaboration | Search for new physics in same-sign dilepton events in proton-proton collisions at $ \sqrt{s} = $ 13 TeV | EPJC 76 (2016) 439 | CMS-SUS-15-008 1605.03171 |
| 55 | J. Alwall et al. | The automated computation of tree-level and next-to-leading order differential cross sections, and their matching to parton shower simulations | JHEP 07 (2014) 079 | 1405.0301 |
| 56 | S. Alioli, P. Nason, C. Oleari, and E. Re | A general framework for implementing NLO calculations in shower Monte Carlo programs: the POWHEG BOX | JHEP 06 (2010) 043 | 1002.2581 |
| 57 | H. B. Hartanto, B. Jager, L. Reina, and D. Wackeroth | Higgs boson production in association with top quarks in the POWHEG BOX | PRD 91 (2015) 094003 | 1501.04498 |
| 58 | T. Melia, P. Nason, R. Rontsch, and G. Zanderighi | $ \mathrm{W}^+ \mathrm{W}^- $, $ \mathrm{W} \mathrm{Z} $ and $ \mathrm{Z} \mathrm{Z} $ production in the POWHEG BOX | JHEP 11 (2011) 078 | 1107.5051 |
| 59 | P. Nason and G. Zanderighi | $ \mathrm{W}^+ \mathrm{W}^- $, $ \mathrm{W} \mathrm{Z} $ and $ \mathrm{Z} \mathrm{Z} $ production in the POWHEG-BOX-V2 | EPJC 74 (2014) 2702 | 1311.1365 |
| 60 | NNPDF Collaboration | Parton distributions for the LHC Run II | JHEP 04 (2015) 040 | 1410.8849 |
| 61 | T. Sj ostrand, S. Mrenna, and P. Z. Skands | A brief introduction to PYTHIA 8.1 | CPC 178 (2008) 852 | 0710.3820 |
| 62 | P. Skands, S. Carrazza, and J. Rojo | Tuning PYTHIA 8.1: the Monash 2013 tune | EPJC 74 (2014) 3024 | 1404.5630 |
| 63 | CMS Collaboration | Event generator tunes obtained from underlying event and multiparton scattering measurements | EPJC 76 (2016) 155 | CMS-GEN-14-001 1512.00815 |
| 64 | J. Alwall et al. | Comparative study of various algorithms for the merging of parton showers and matrix elements in hadronic collisions | EPJC 53 (2008) 473 | 0706.2569 |
| 65 | R. Frederix and S. Frixione | Merging meets matching in MC@NLO | JHEP 12 (2012) 061 | 1209.6215 |
| 66 | GEANT4 Collaboration | GEANT4---a simulation toolkit | NIMA 506 (2003) 250 | |
| 67 | S. Abdullin et al. | The fast simulation of the CMS detector at LHC | J. Phys. Conf. Ser. 331 (2011) 032049 | |
| 68 | W. Beenakker, R. Hopker, M. Spira, and P. M. Zerwas | Squark and gluino production at hadron colliders | NPB 492 (1997) 51 | hep-ph/9610490 |
| 69 | A. Kulesza and L. Motyka | Threshold resummation for squark-antisquark and gluino-pair production at the LHC | PRL 102 (2009) 111802 | 0807.2405 |
| 70 | A. Kulesza and L. Motyka | Soft gluon resummation for the production of gluino-gluino and squark-antisquark pairs at the LHC | PRD 80 (2009) 095004 | 0905.4749 |
| 71 | W. Beenakker et al. | Soft-gluon resummation for squark and gluino hadroproduction | JHEP 12 (2009) 041 | 0909.4418 |
| 72 | W. Beenakker et al. | Squark and gluino hadroproduction | Int. J. Mod. Phys. A 26 (2011) 2637 | 1105.1110 |
| 73 | C. Borschensky et al. | Squark and gluino production cross sections in pp collisions at $ \sqrt{s} = $ 13, 14, 33 and 100 TeV | EPJC 74 (2014) 3174 | 1407.5066 |
| 74 | Particle Data Group | Review of particle physics | CPC 40 (2016) 100001 | |
| 75 | T. Junk | Confidence level computation for combining searches with small statistics | NIMA 434 (1999) 435 | hep-ex/9902006 |
| 76 | A. L. Read | Presentation of search results: the $ \rm CL_s $ technique | JPG 28 (2002) 2693 | |
| 77 | ATLAS and CMS Collaborations | Procedure for the LHC higgs boson search combination in summer 2011 | CMS-NOTE-2011-005 | |
| 78 | G. Cowan, K. Cranmer, E. Gross, and O. Vitells | Asymptotic formulae for likelihood-based tests of new physics | EPJC 71 (2011) 1554 | 1007.1727 |
|
|
Compact Muon Solenoid LHC, CERN |
|

|

|

|

|

|