

Compact Muon Solenoid
LHC, CERN
| CMS-TOP-17-013 ; CERN-EP-2018-214 | ||
| Measurement of jet substructure observables in $\mathrm{t\bar{t}}$ events from proton-proton collisions at $\sqrt{s} = $ 13 TeV | ||
| CMS Collaboration | ||
| 22 August 2018 | ||
| Phys. Rev. D 98 (2018) 092014 | ||
| Abstract: A measurement of jet substructure observables is presented using $\mathrm{t\bar{t}}$ events in the lepton+jets channel from proton-proton collisions at $\sqrt{s} = $ 13 TeV recorded by the CMS experiment at the LHC, corresponding to an integrated luminosity of 35.9 fb$^{-1}$. Multiple jet substructure observables are measured for jets identified as bottom, light-quark, and gluon jets, as well as for inclusive jets (no flavor information). The results are unfolded to the particle level and compared to next-to-leading-order predictions from POWHEG interfaced with the parton shower generators PYTHIA 8 and HERWIG 7, as well as from SHERPA 2 and DIRE 2. A value of the strong coupling at the Z boson mass, ${\alpha_{S}(m_{\mathrm{Z}})} =$ 0.115$^{+0.015}_{-0.013}$, is extracted from the substructure data at leading-order plus leading-log accuracy. | ||
| Links: e-print arXiv:1808.07340 [hep-ex] (PDF) ; CDS record ; inSPIRE record ; HepData record ; CADI line (restricted) ; | ||
| Figures | |

png pdf |
Figure 1:
Multiplicity of b-tagged jets in events with exactly one isolated lepton and four jets (left), and multiplicity of untagged jets yielding a W boson candidate with $ {| m_{jj}-80.4 |} < $ 15 GeV after requiring two b-tagged jets (right). These reconstruction-level plots show the sum of the expected contributions from each process (stacked histograms) compared to the data points (upper panels), and the ratio of the MC prediction (POWHEG+PYTHIA-8) to the data (lower panels) where the black shaded band represents the statistical uncertainty on the data. The systematic uncertainties on the MC prediction are represented by hatched areas, taking into account either the total uncertainty or shape variations only. |

png pdf |
Figure 1-a:
Multiplicity of b-tagged jets in events with exactly one isolated lepton and four jets. This reconstruction-level plot shows the sum of the expected contributions from each process (stacked histograms) compared to the data points (upper panels), and the ratio of the MC prediction (POWHEG+PYTHIA-8) to the data (lower panel) where the black shaded band represents the statistical uncertainty on the data. The systematic uncertainties on the MC prediction are represented by hatched areas, taking into account either the total uncertainty or shape variations only. |

png pdf |
Figure 1-b:
Multiplicity of untagged jets yielding a W boson candidate with $ {| m_{jj}-80.4 |} < $ 15 GeV after requiring two b-tagged jets. This reconstruction-level plot shows the sum of the expected contributions from each process (stacked histograms) compared to the data points (upper panels), and the ratio of the MC prediction (POWHEG+PYTHIA-8) to the data (lower panel) where the black shaded band represents the statistical uncertainty on the data. The systematic uncertainties on the MC prediction are represented by hatched areas, taking into account either the total uncertainty or shape variations only. |
png pdf |
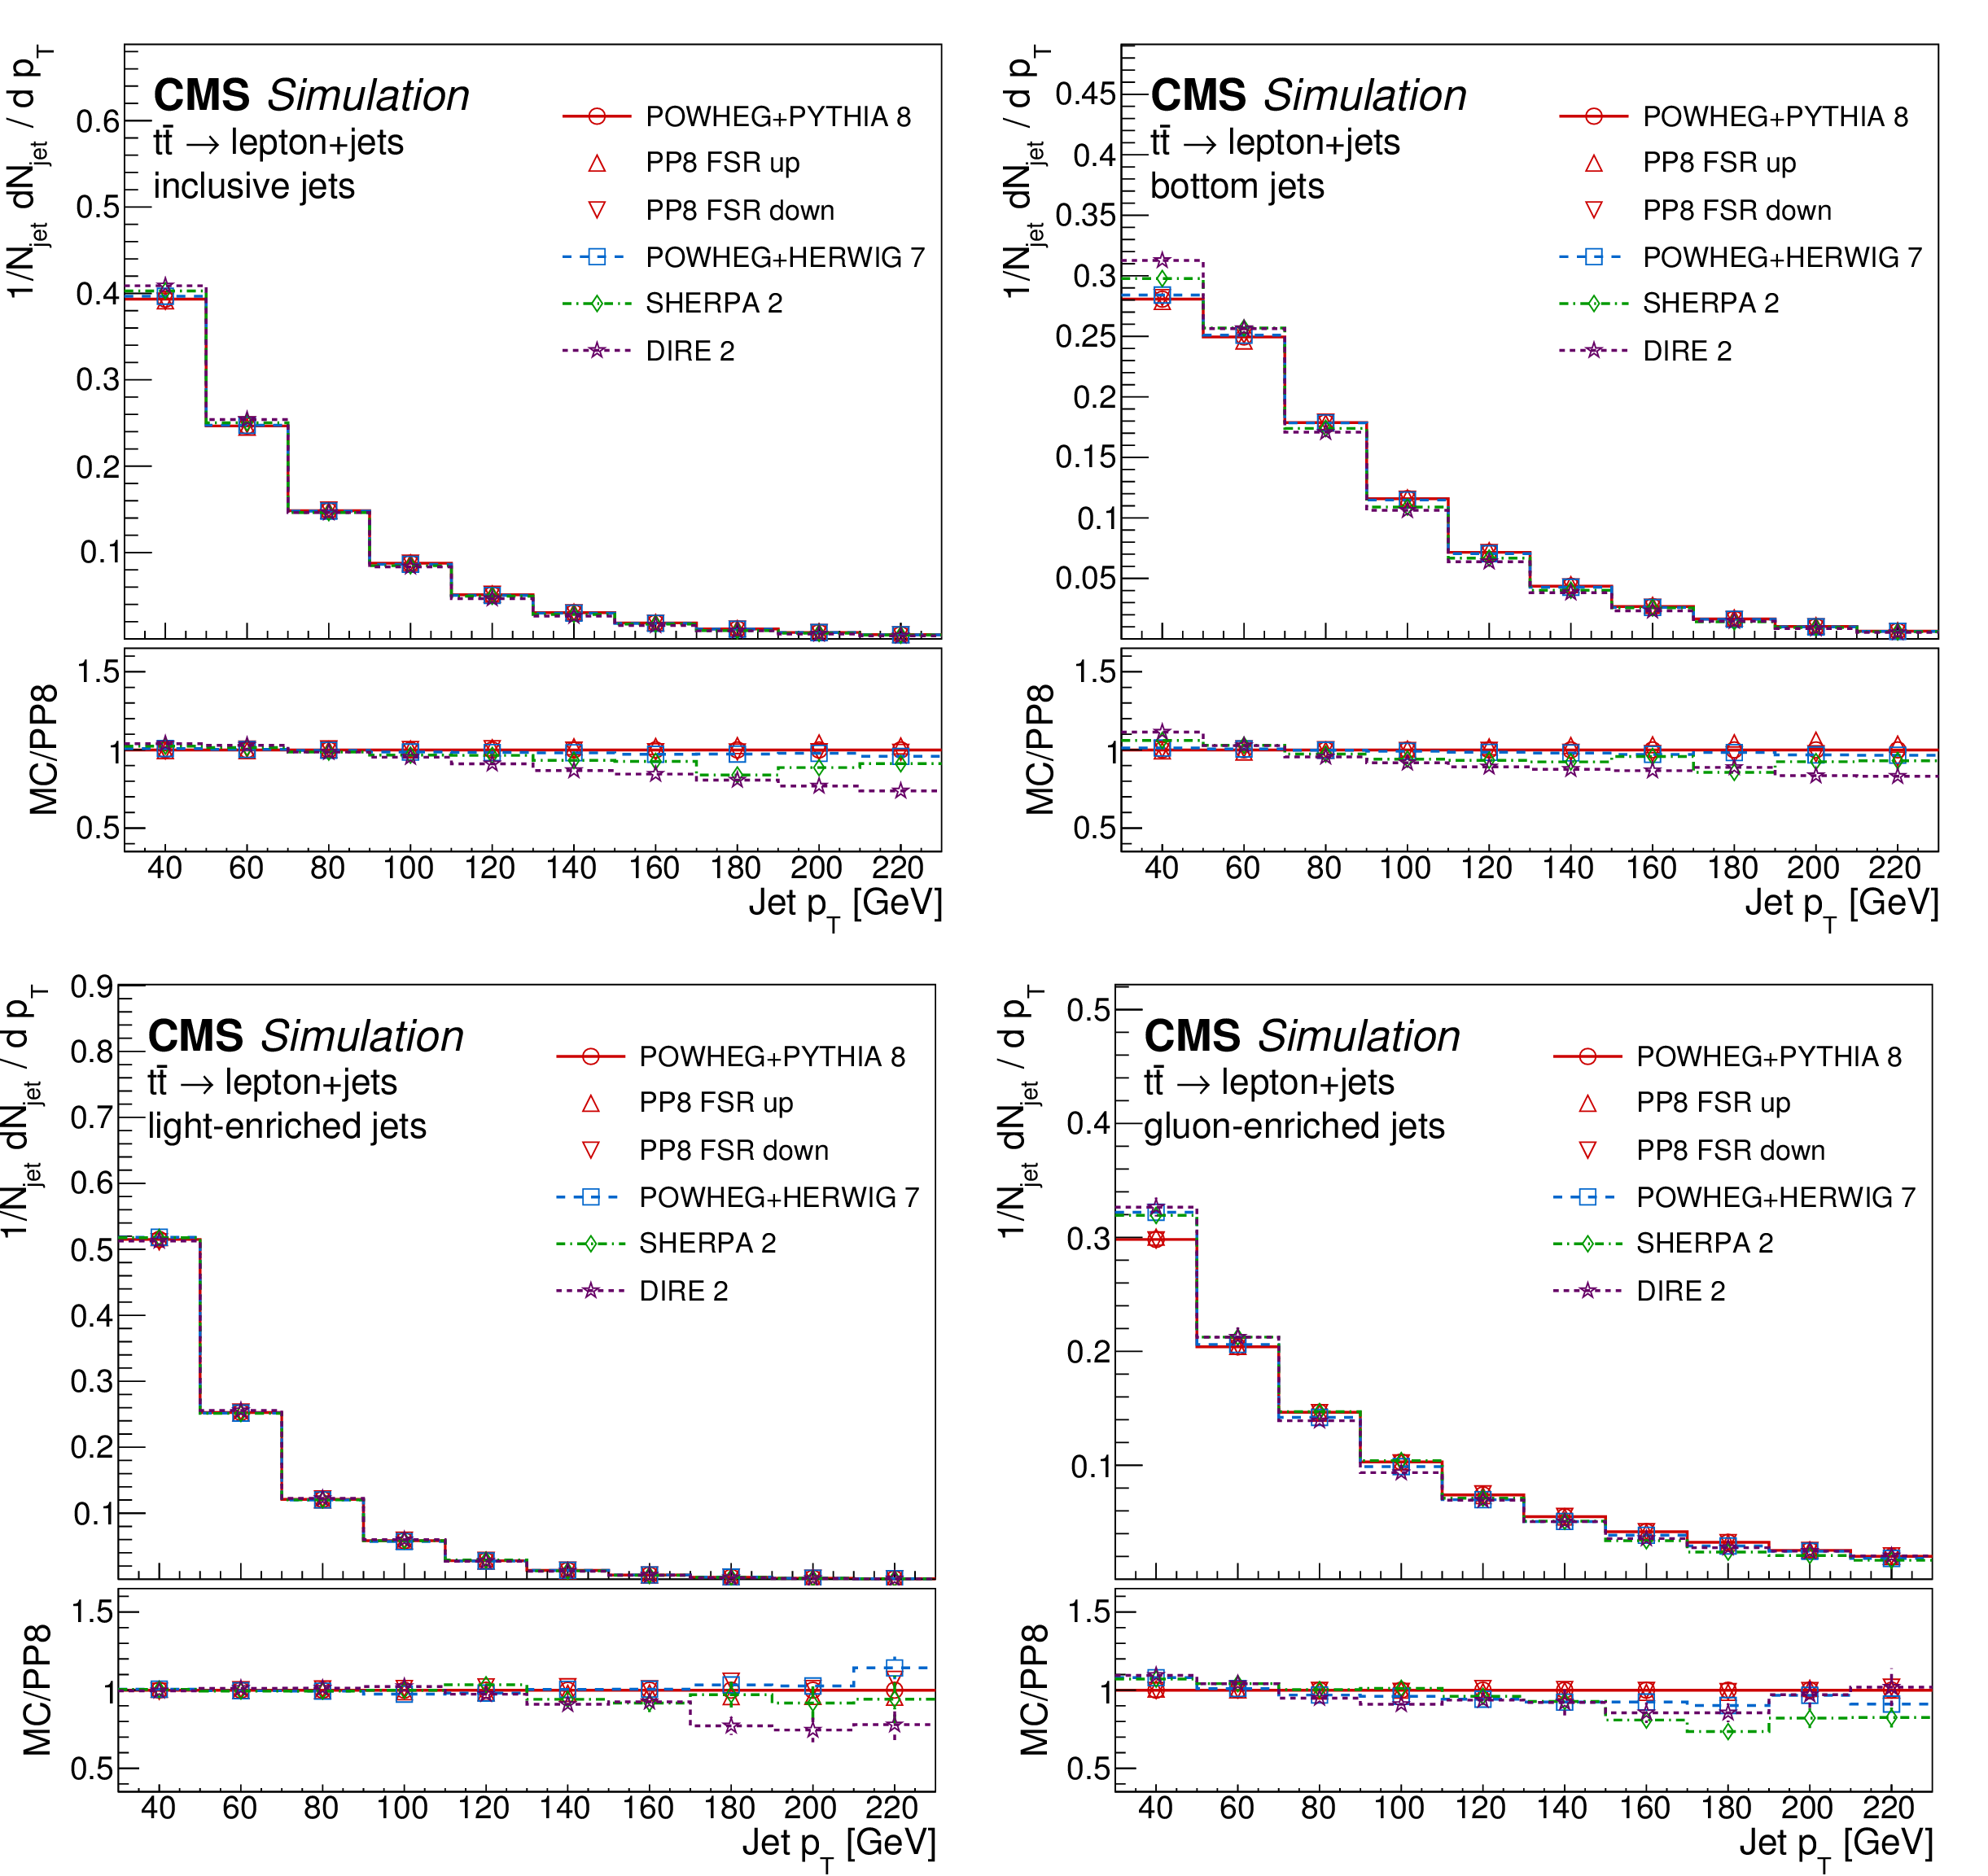
Figure 2:
Transverse momentum distribution at the particle level for inclusive jets (upper left), bottom-quark jets (upper right), light-quark-enriched jets (lower left), and gluon-enriched jets (lower right). The sub-panels show the corresponding ratios of the different MC predictions over POWHEG+PYTHIA-8 (PP8). |

png pdf |
Figure 2-a:
Transverse momentum distribution at the particle level for inclusive jets. The sub-panel shows the corresponding ratios of the different MC predictions over POWHEG+PYTHIA-8 (PP8). |
png pdf |
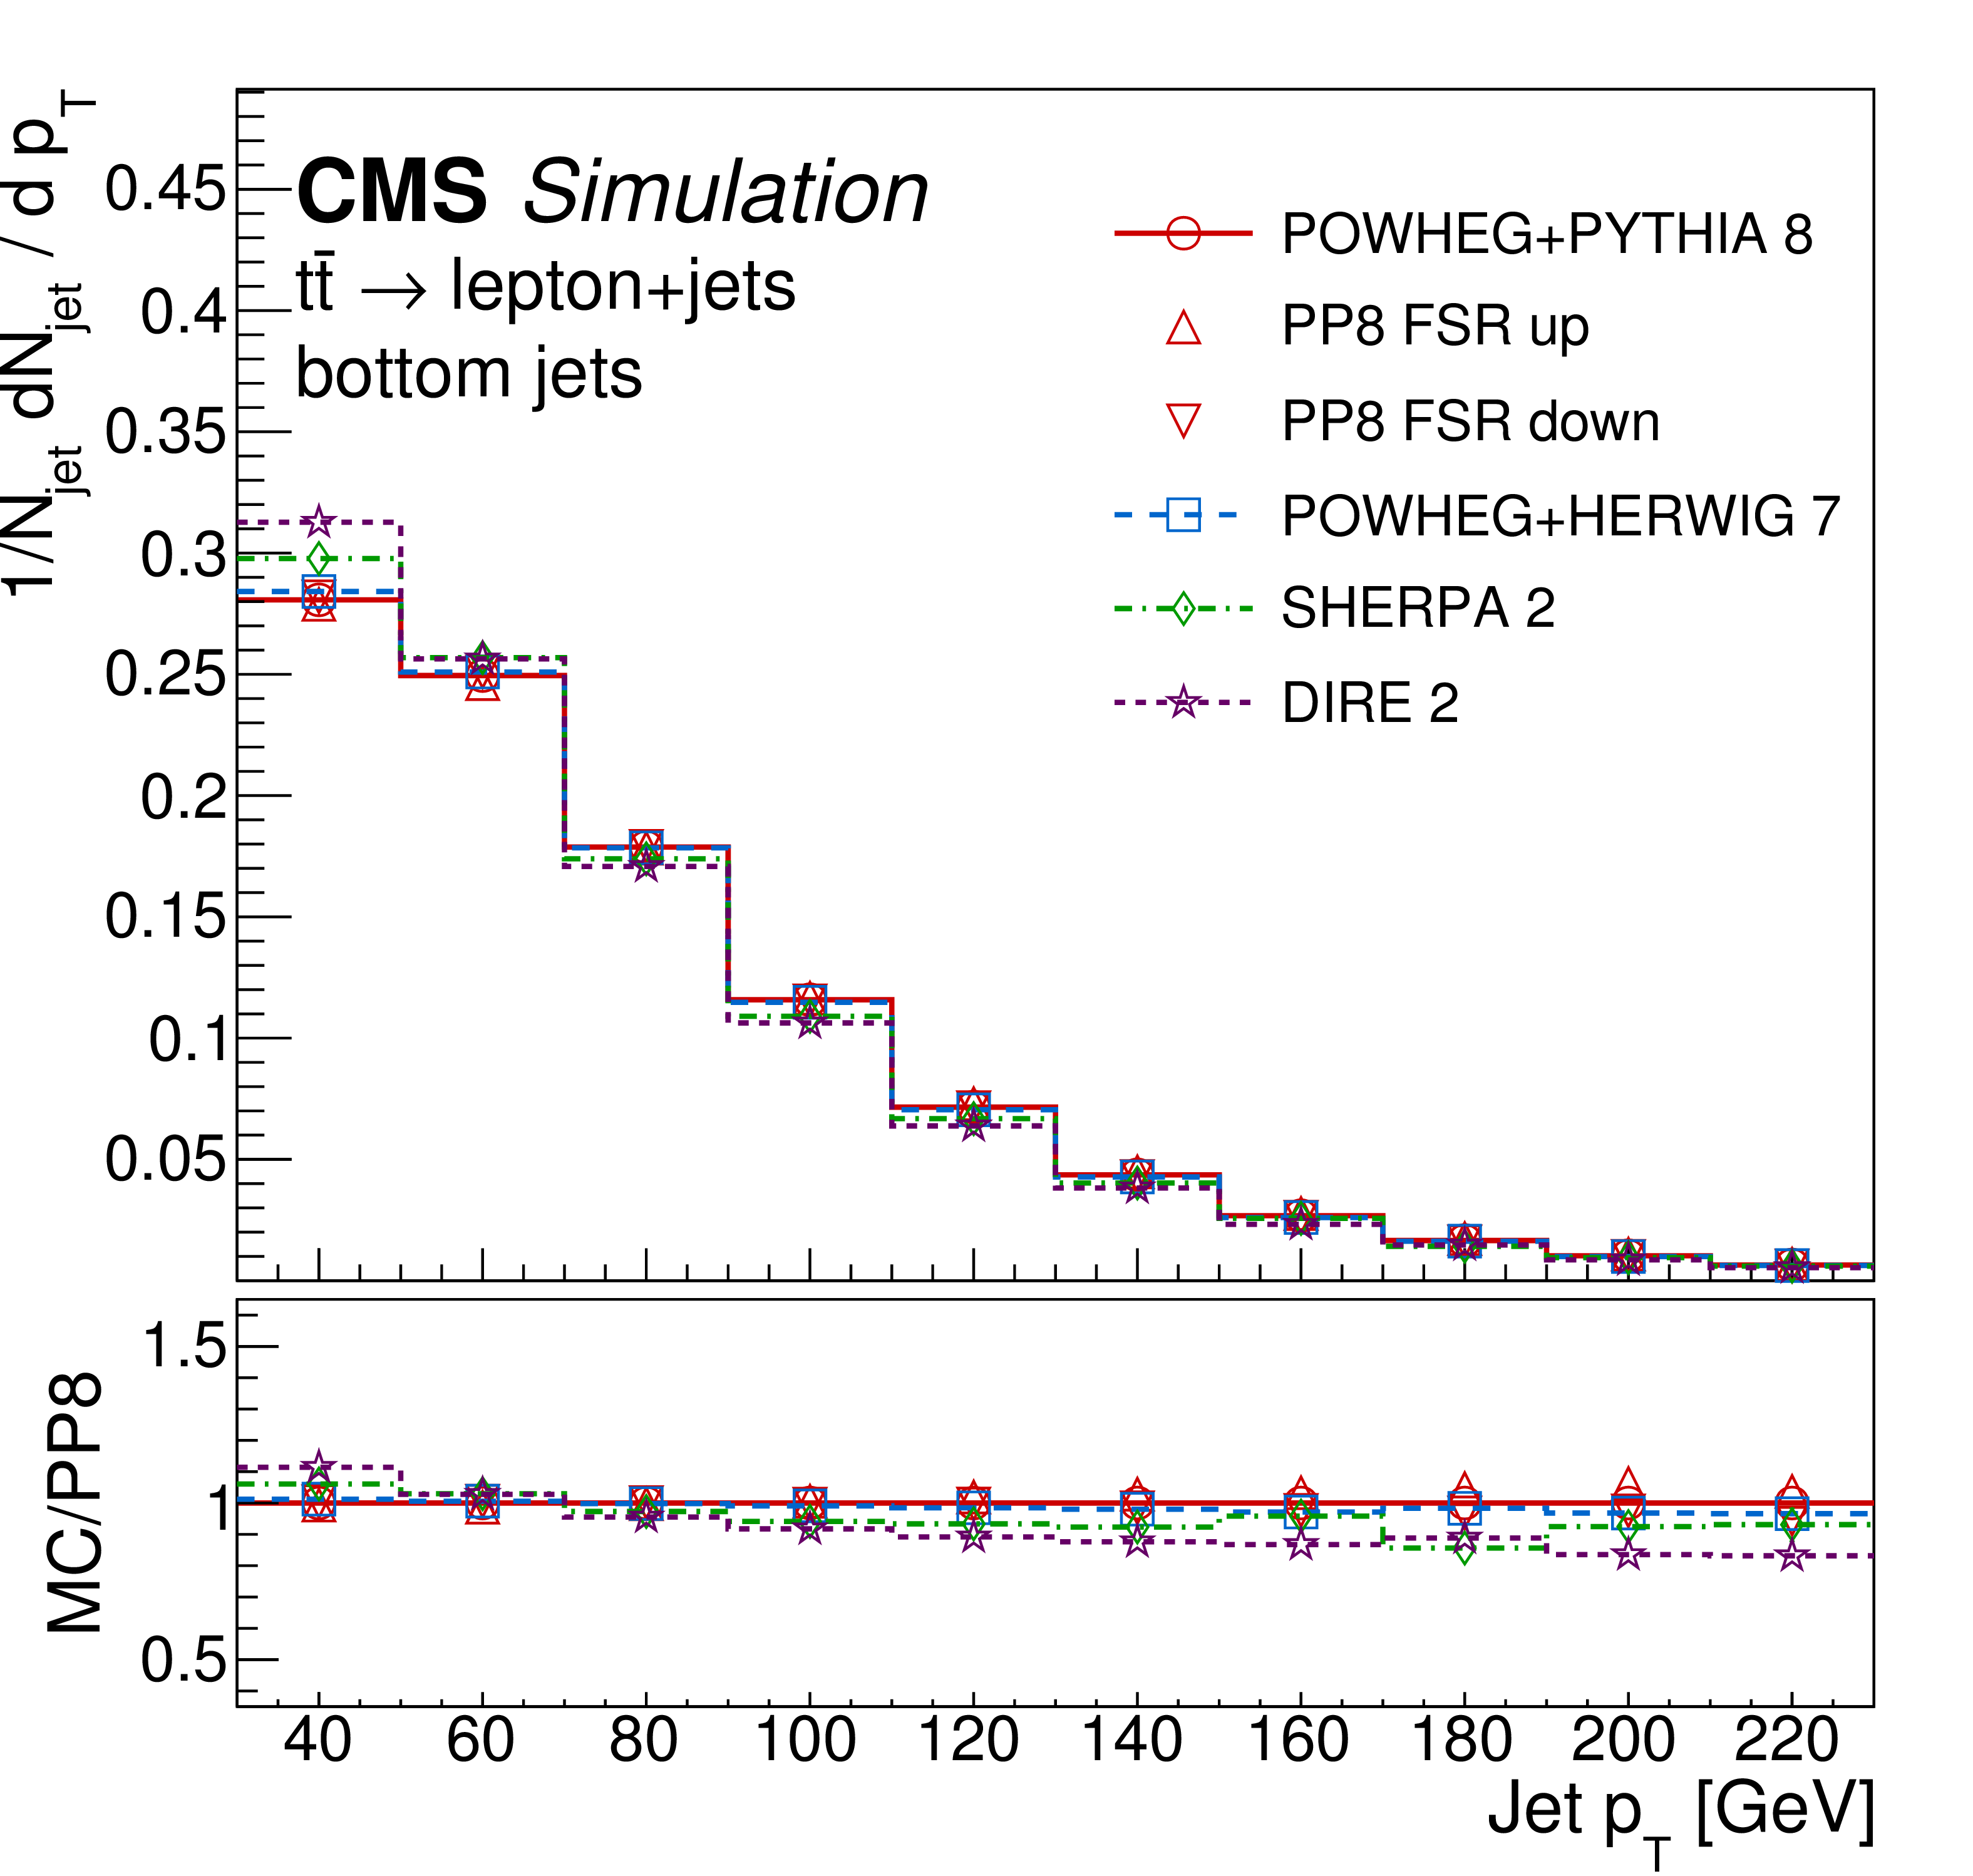
Figure 2-b:
Transverse momentum distribution at the particle level for bottom-quark jets. The sub-panel shows the corresponding ratios of the different MC predictions over POWHEG+PYTHIA-8 (PP8). |

png pdf |
Figure 2-c:
Transverse momentum distribution at the particle level for light-quark-enriched jets. The sub-panel shows the corresponding ratios of the different MC predictions over POWHEG+PYTHIA-8 (PP8). |
png pdf |
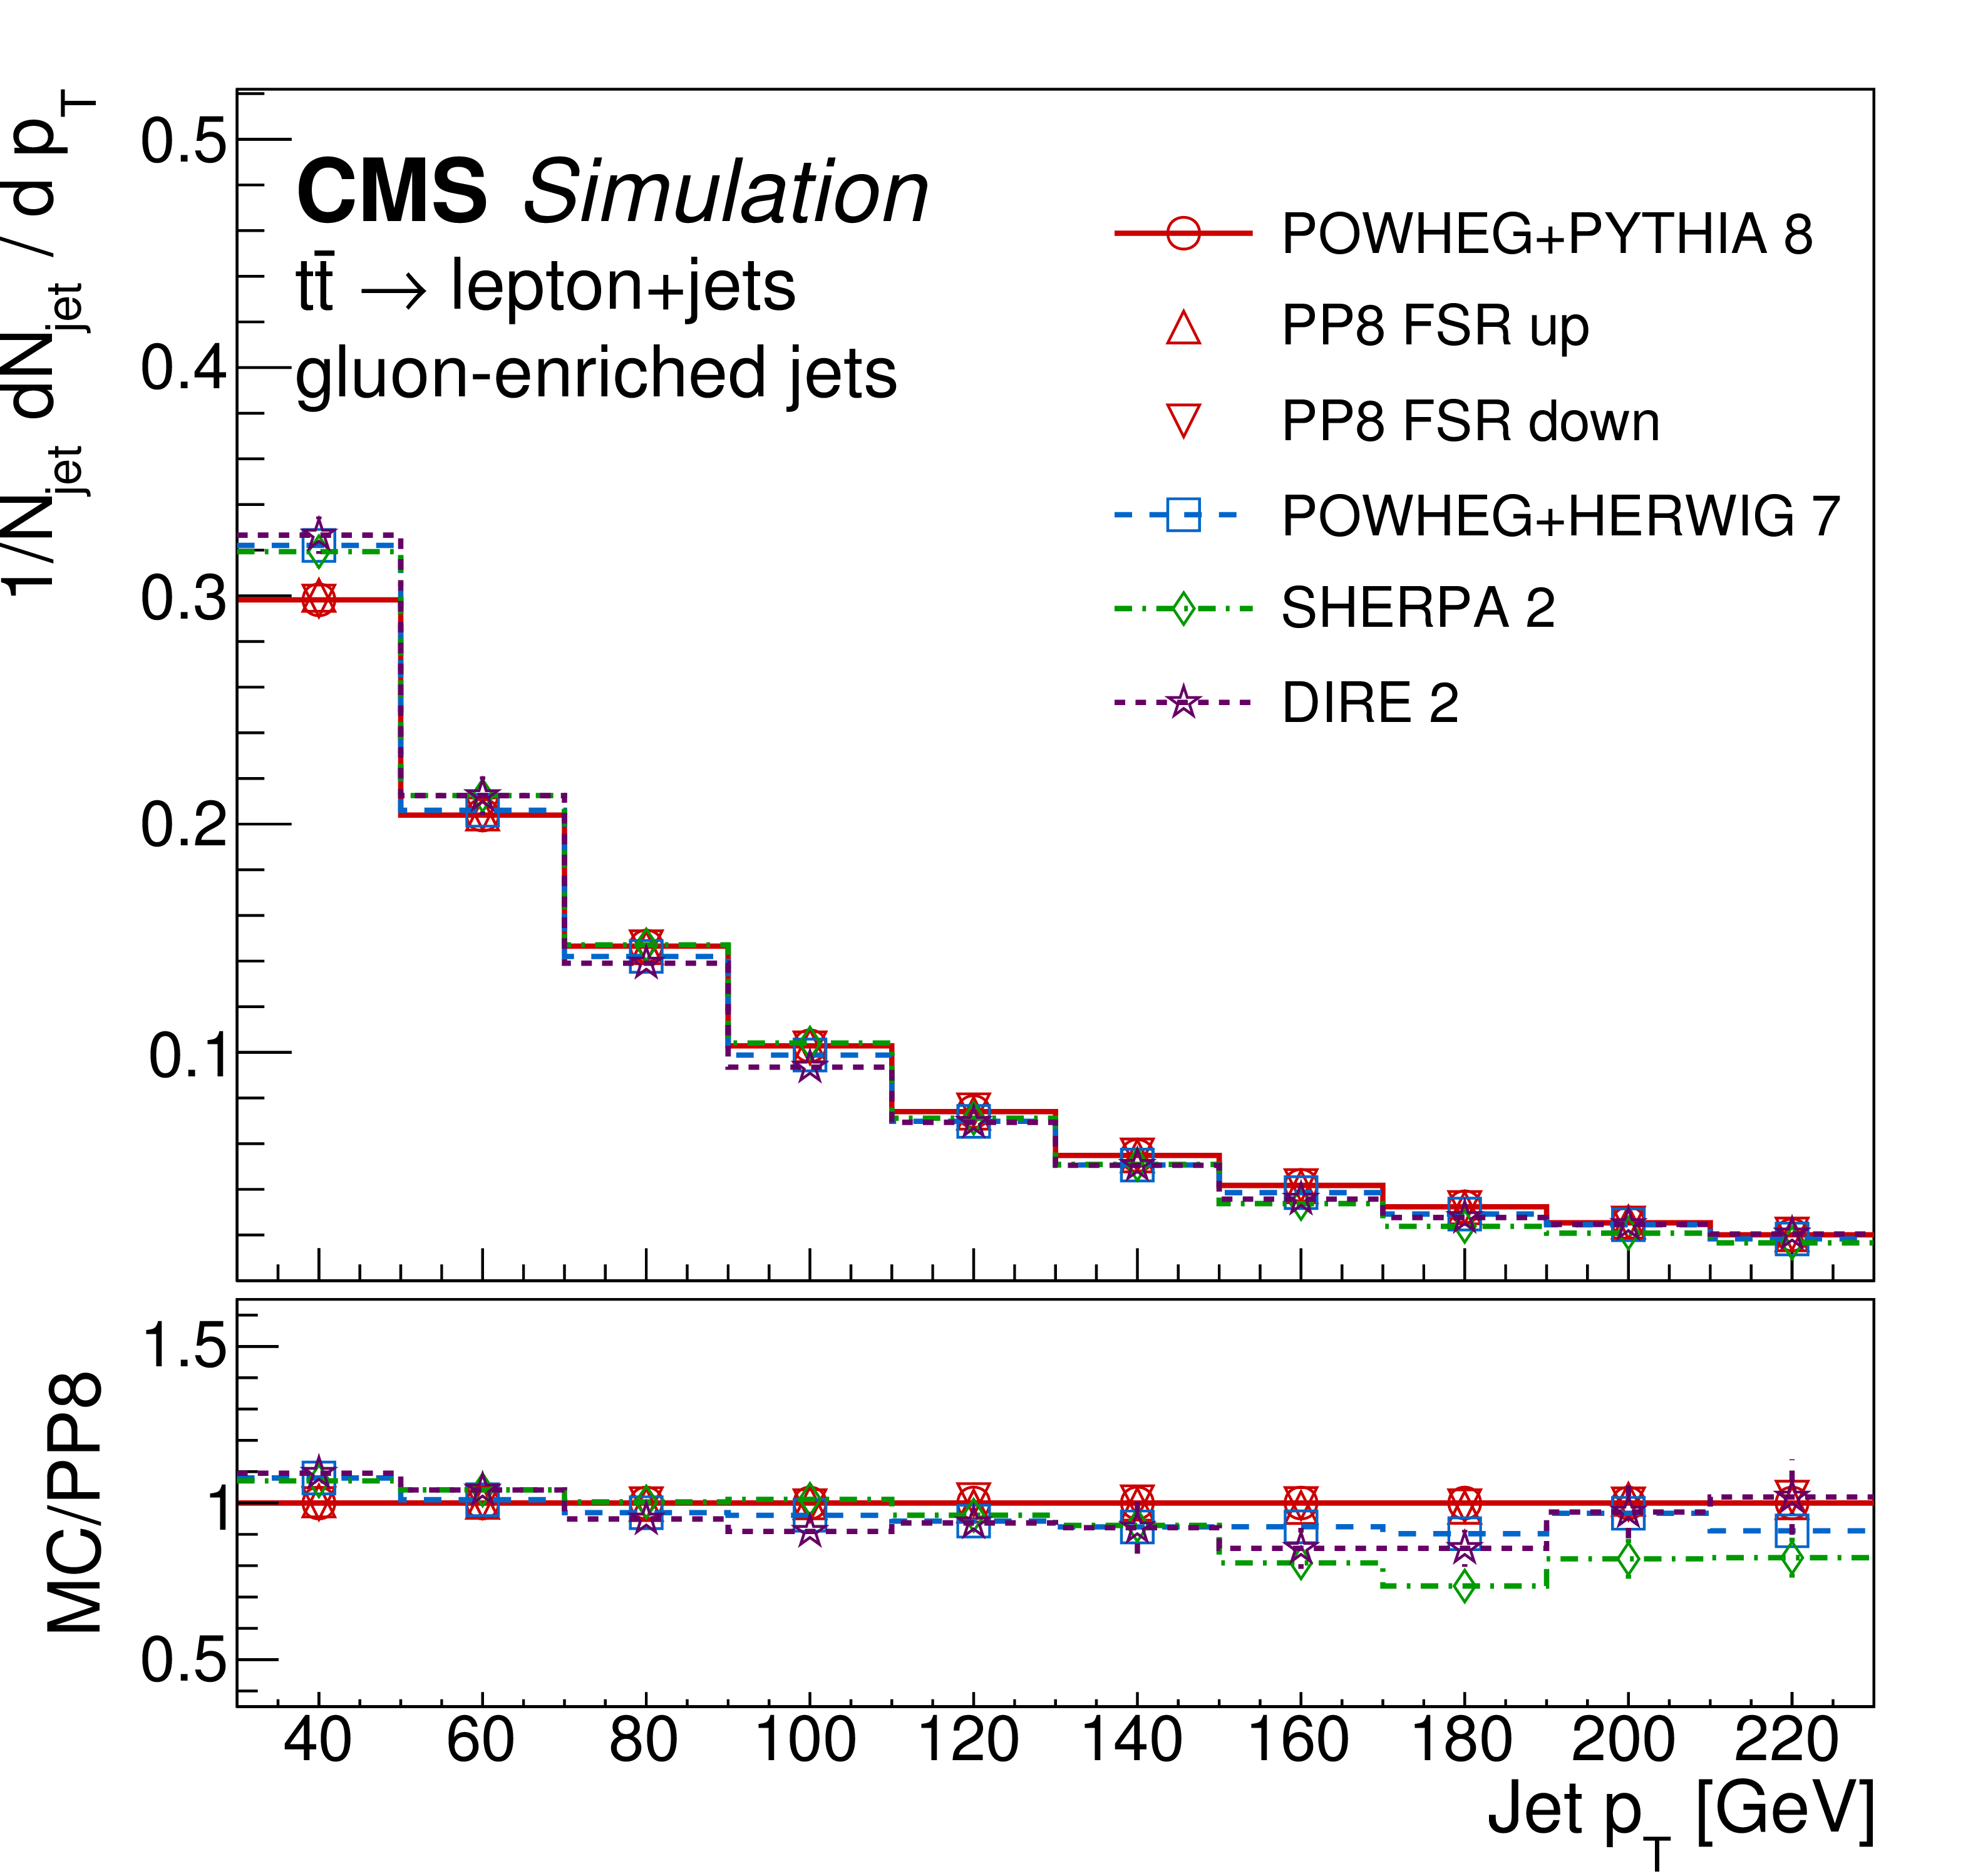
Figure 2-d:
Transverse momentum distribution at the particle level for gluon-enriched jets. The sub-panel shows the corresponding ratios of the different MC predictions over POWHEG+PYTHIA-8 (PP8). |
png pdf |
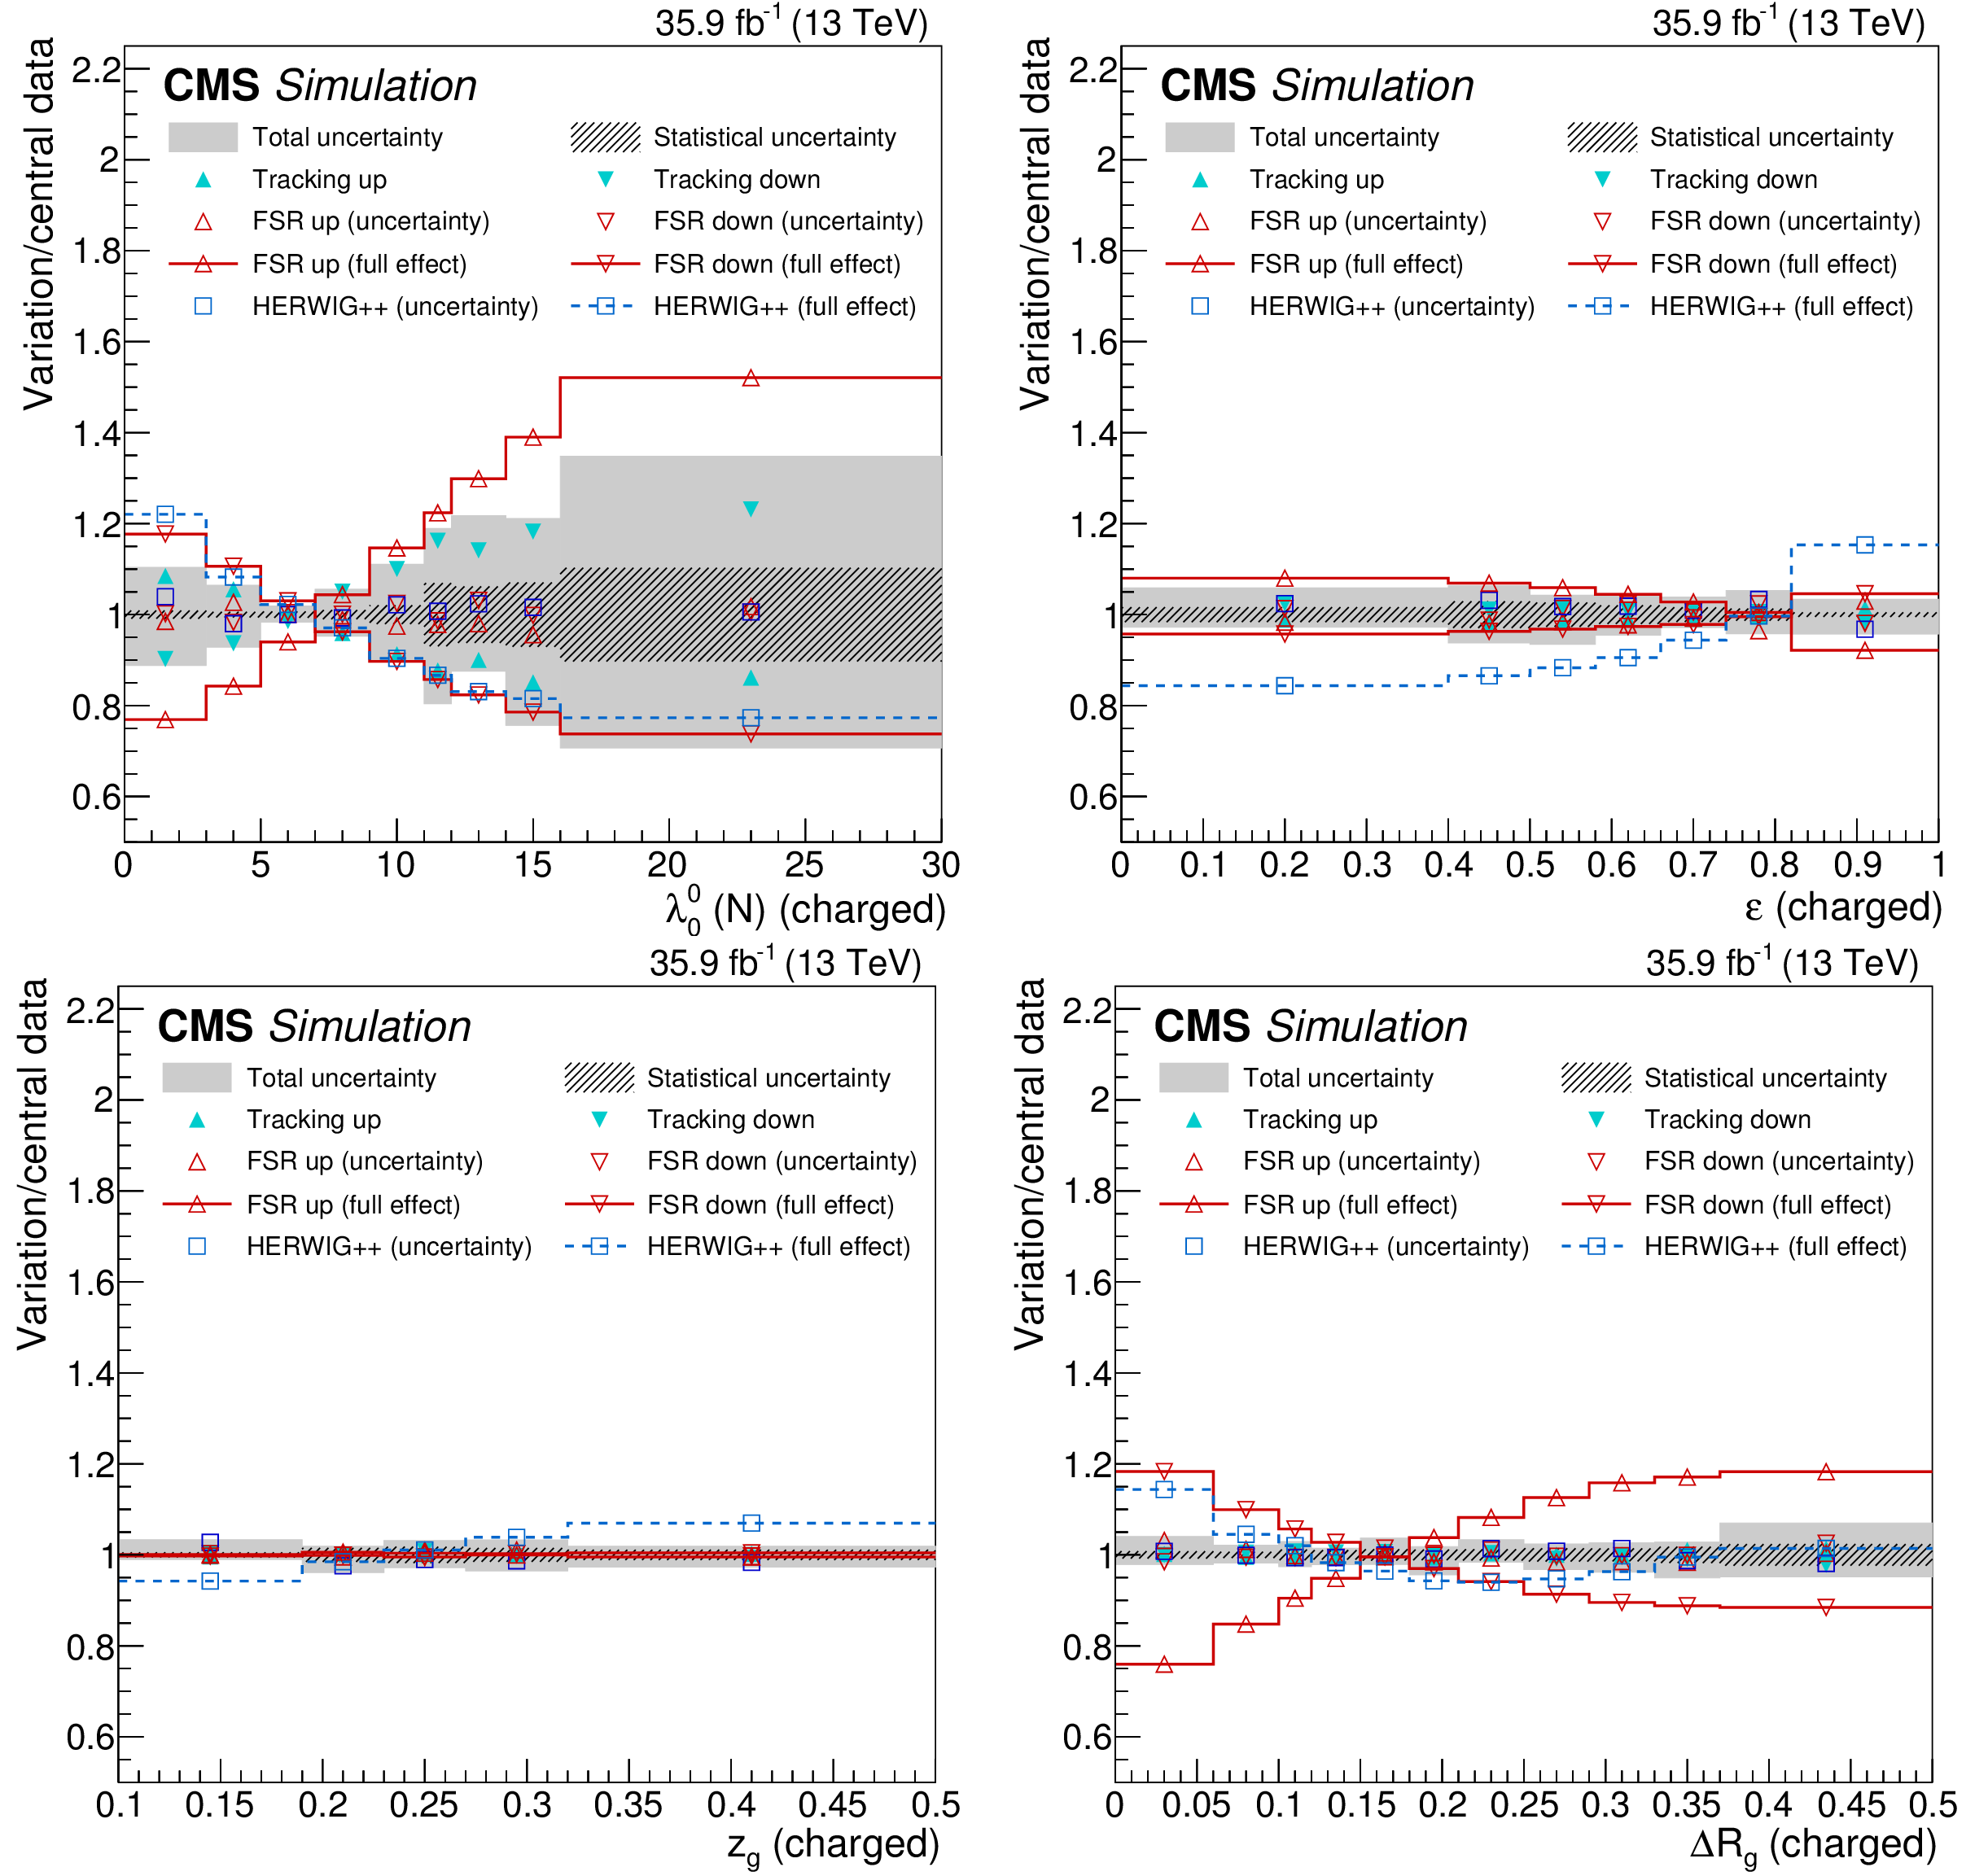
Figure 3:
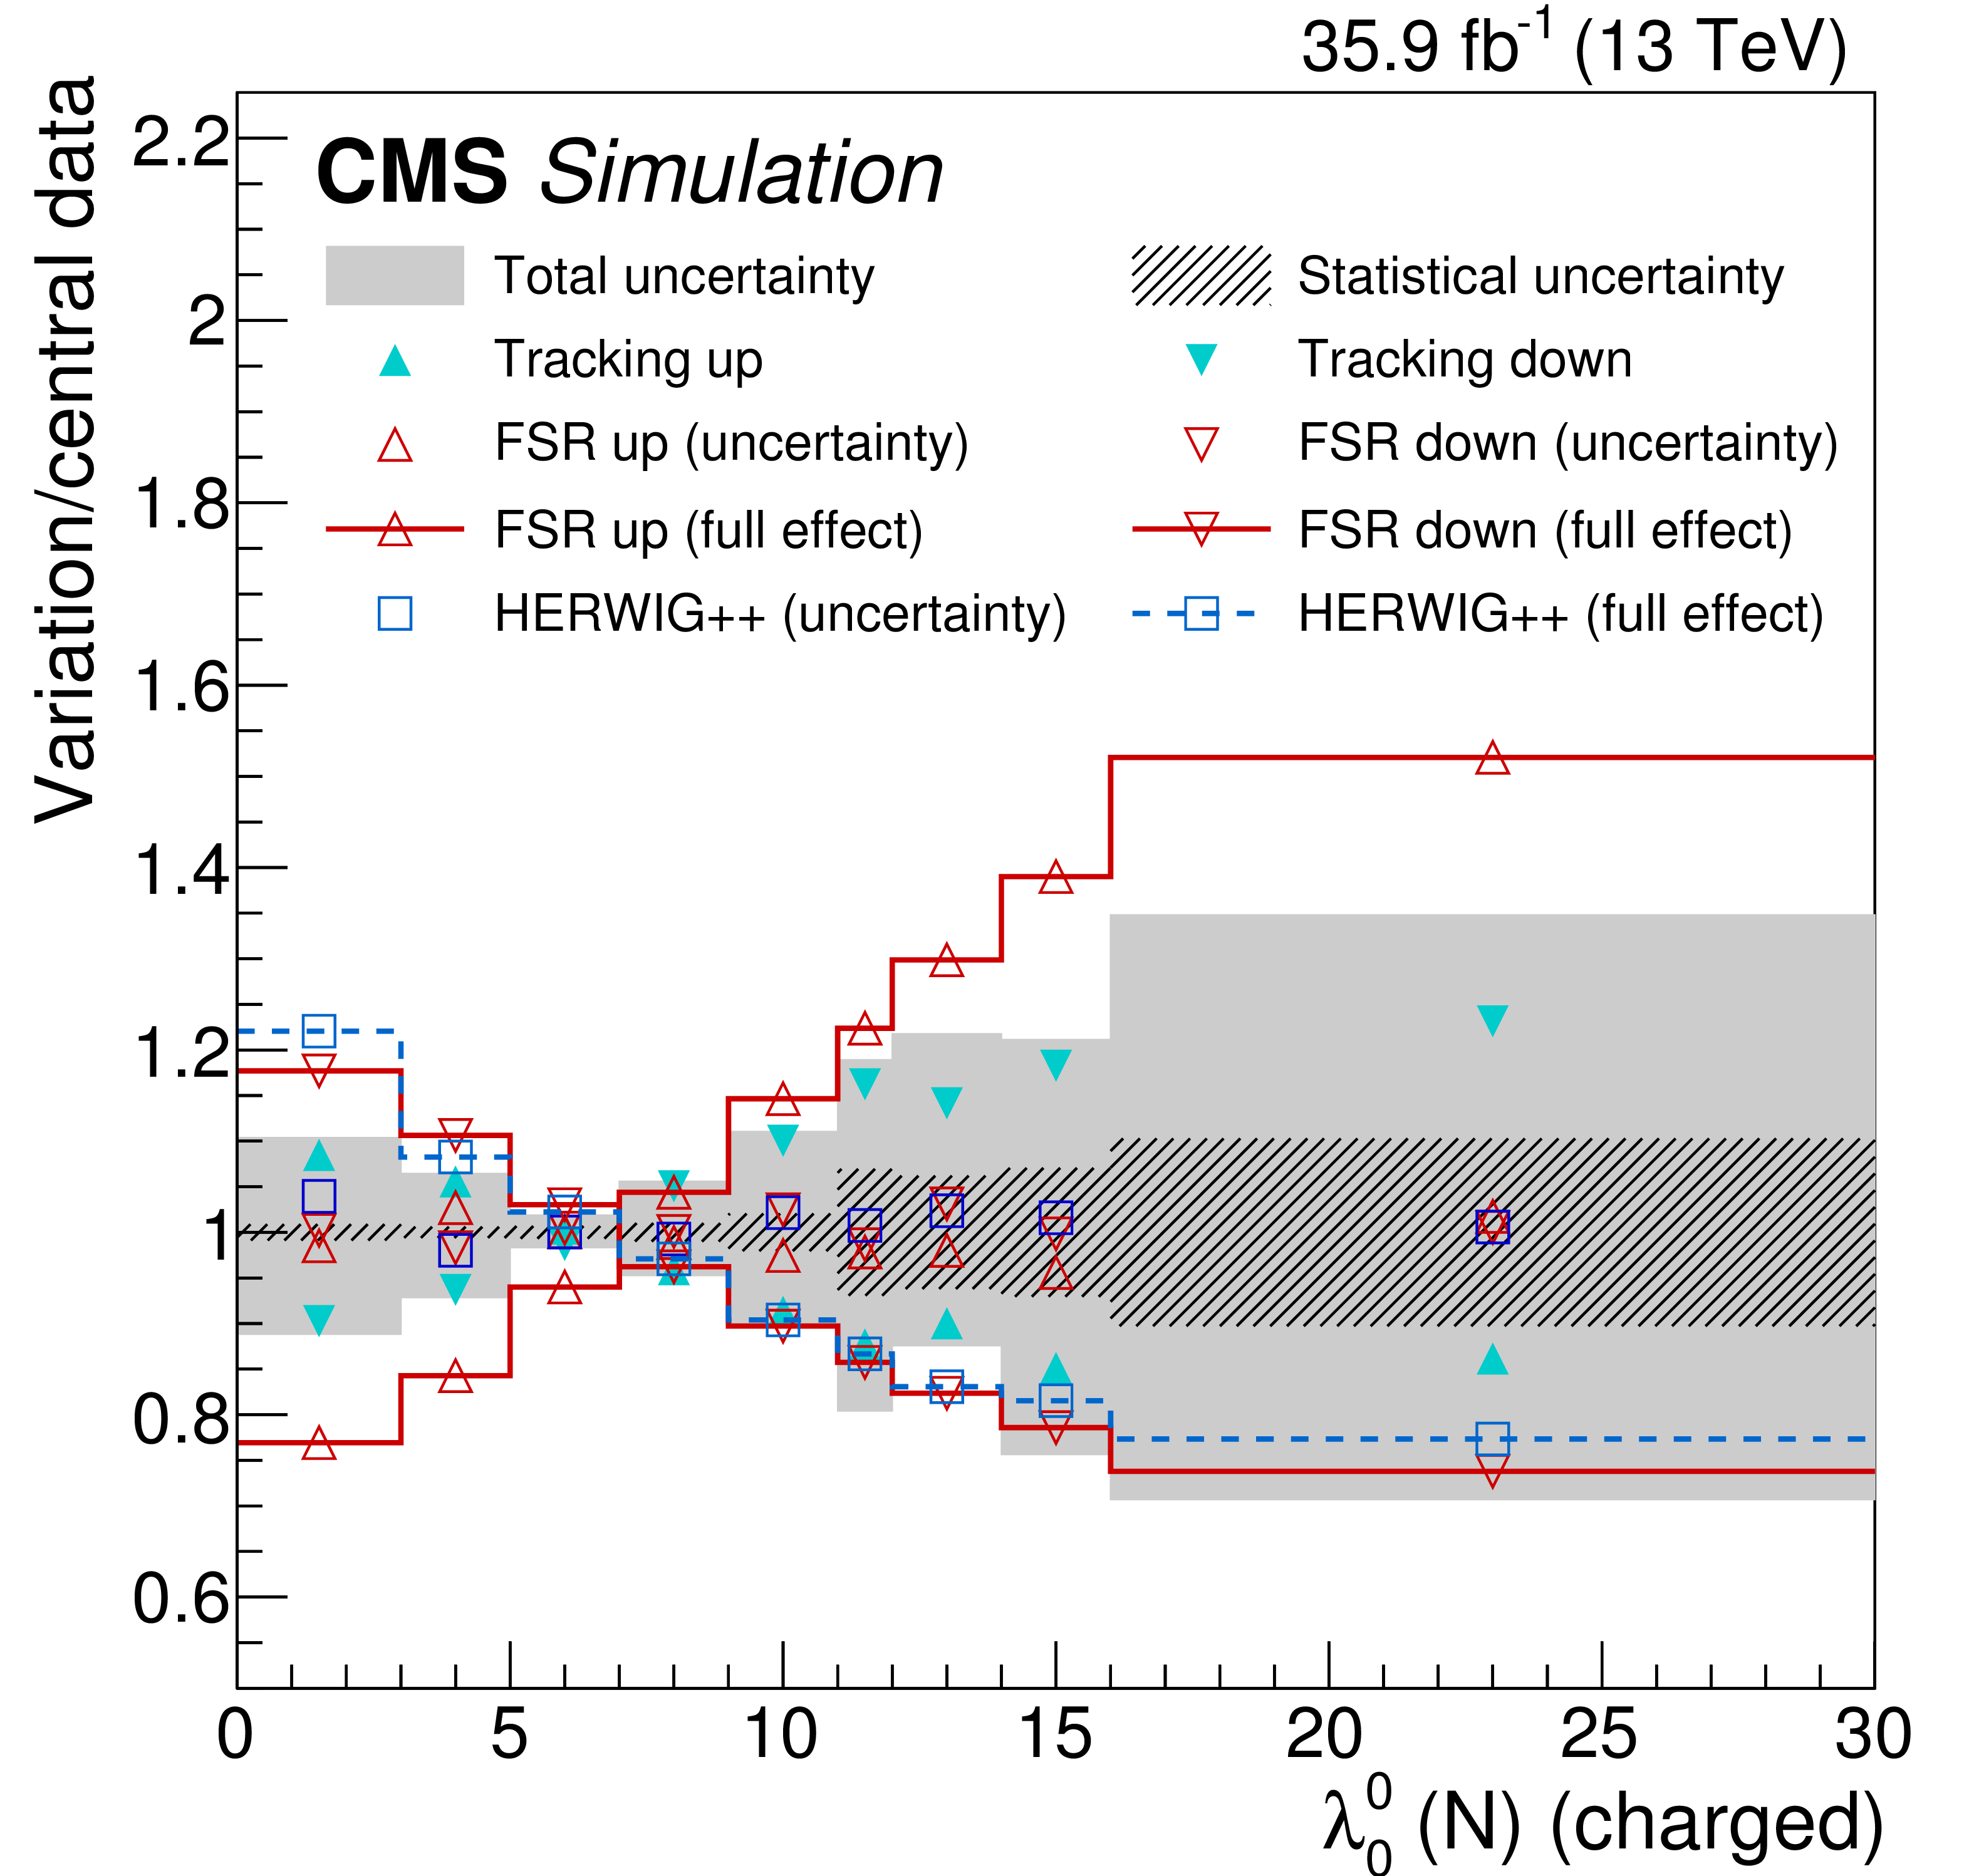
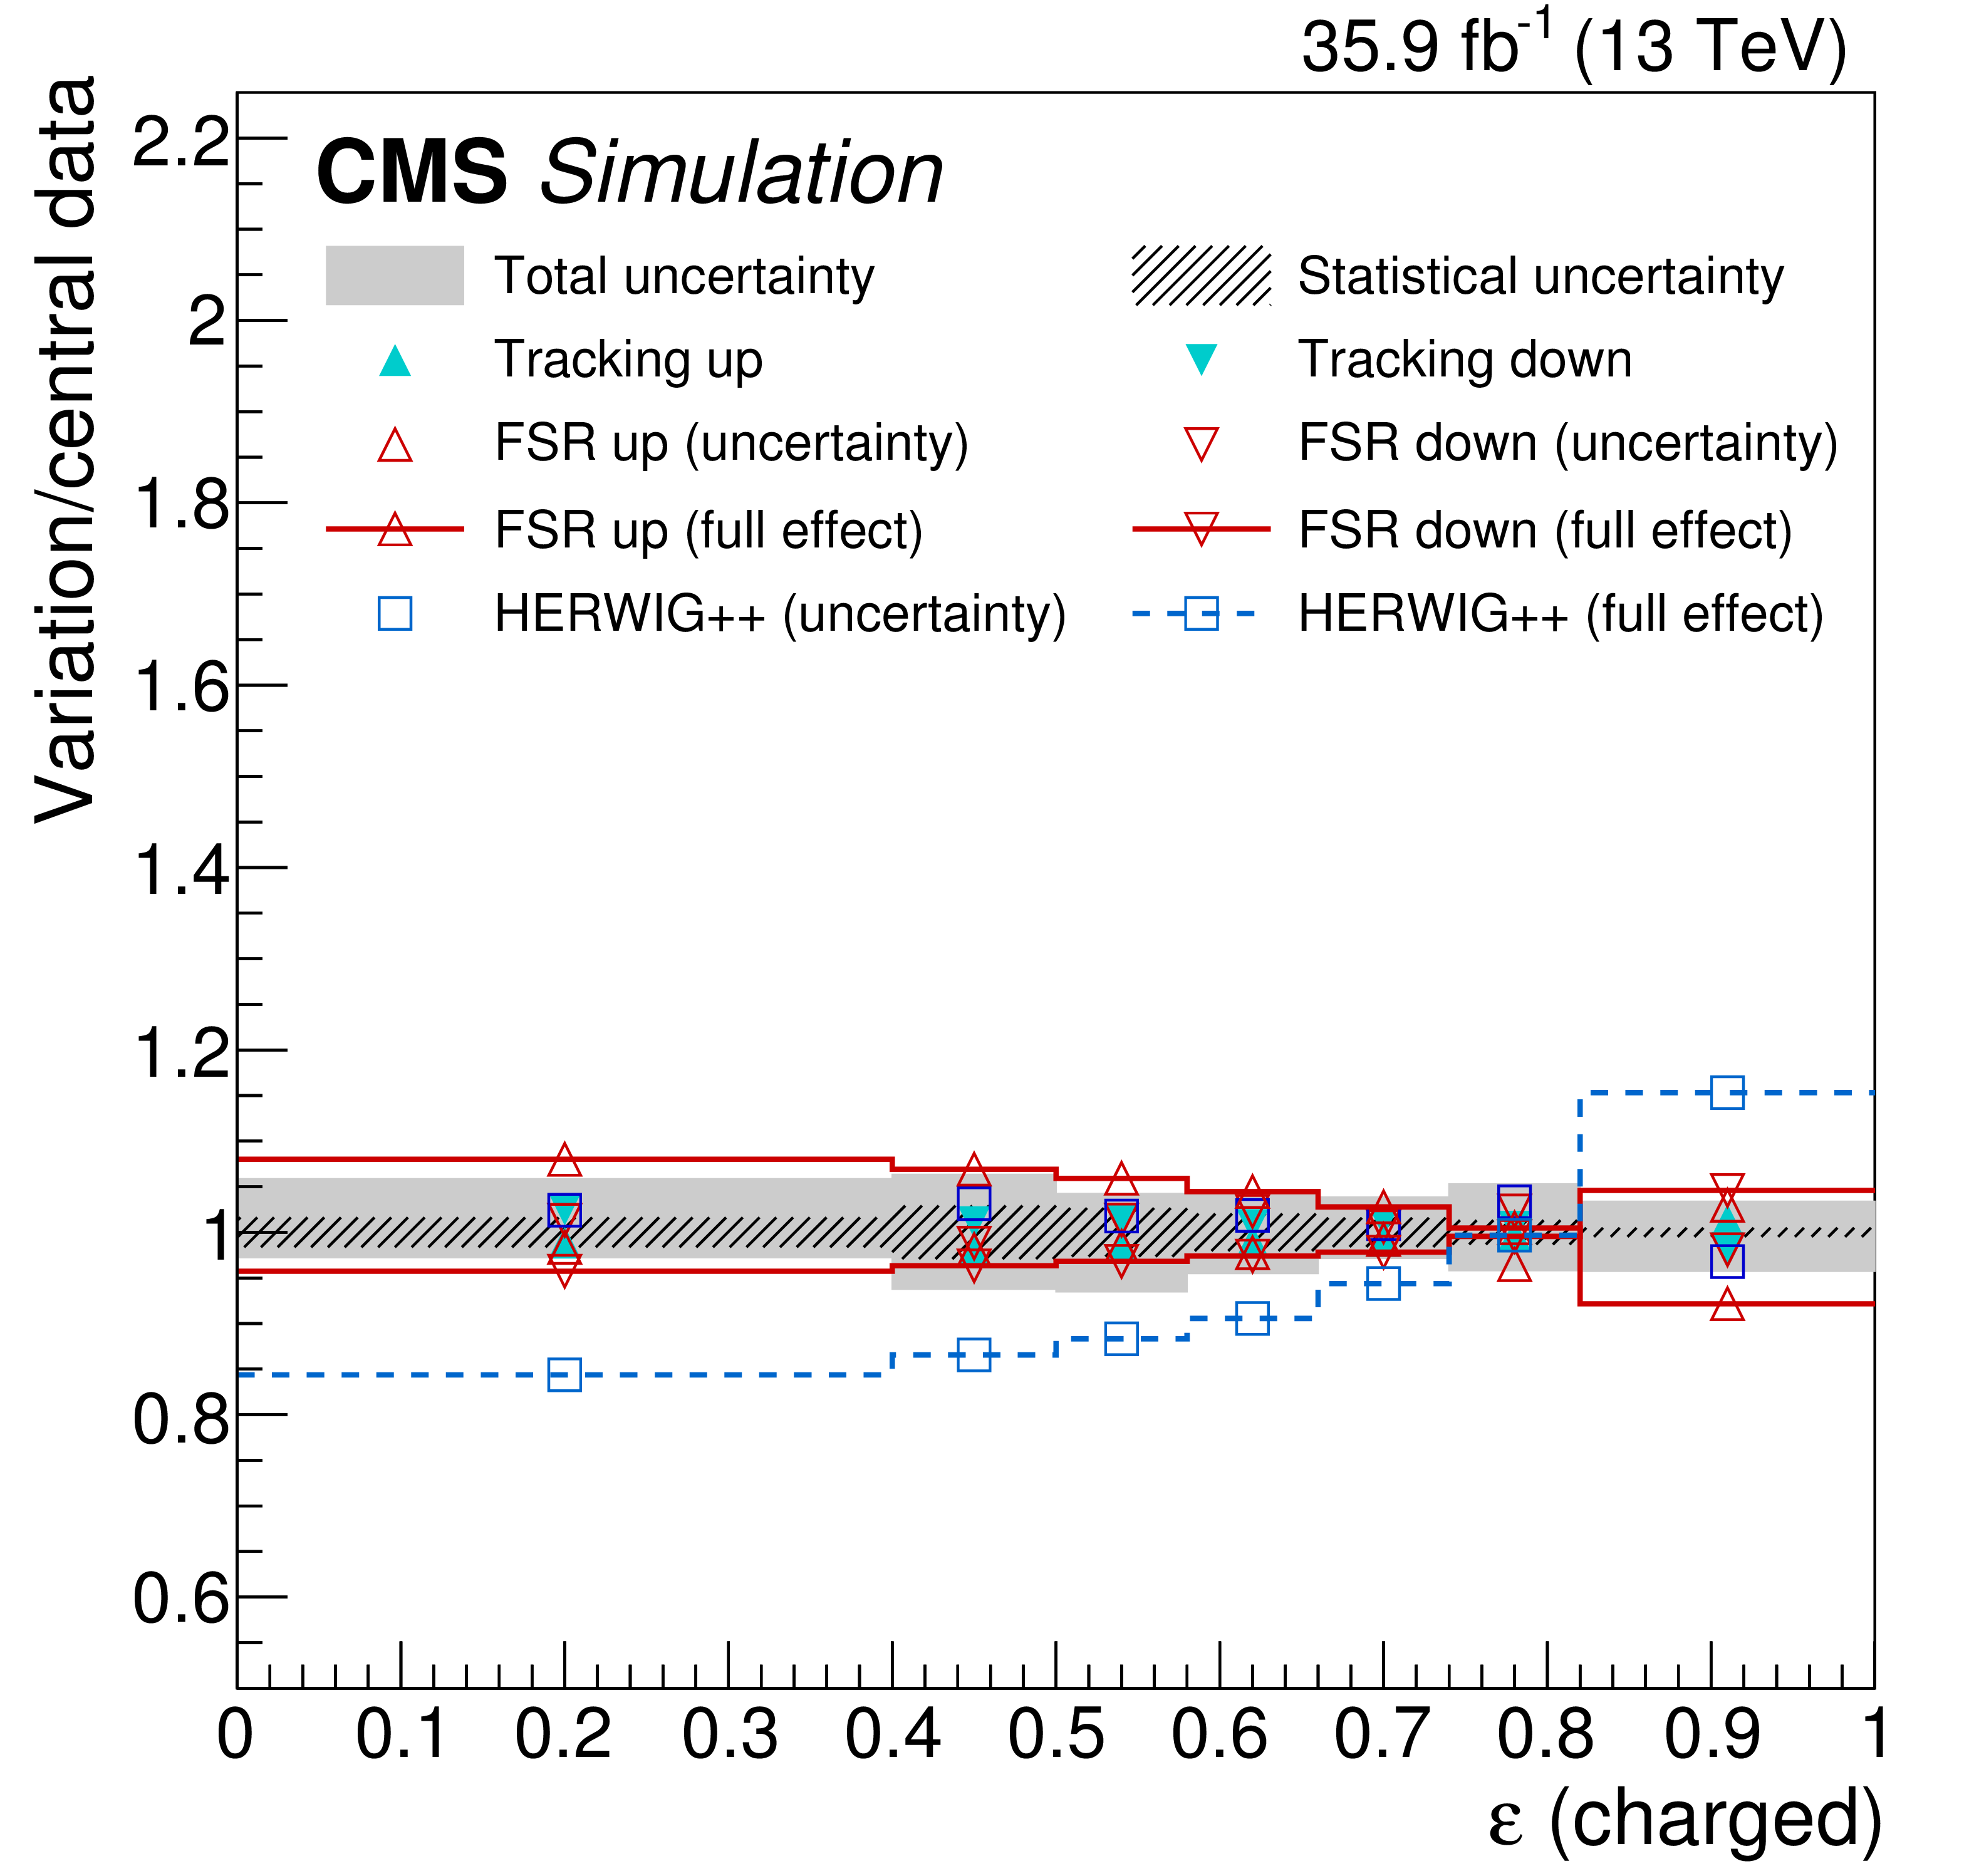
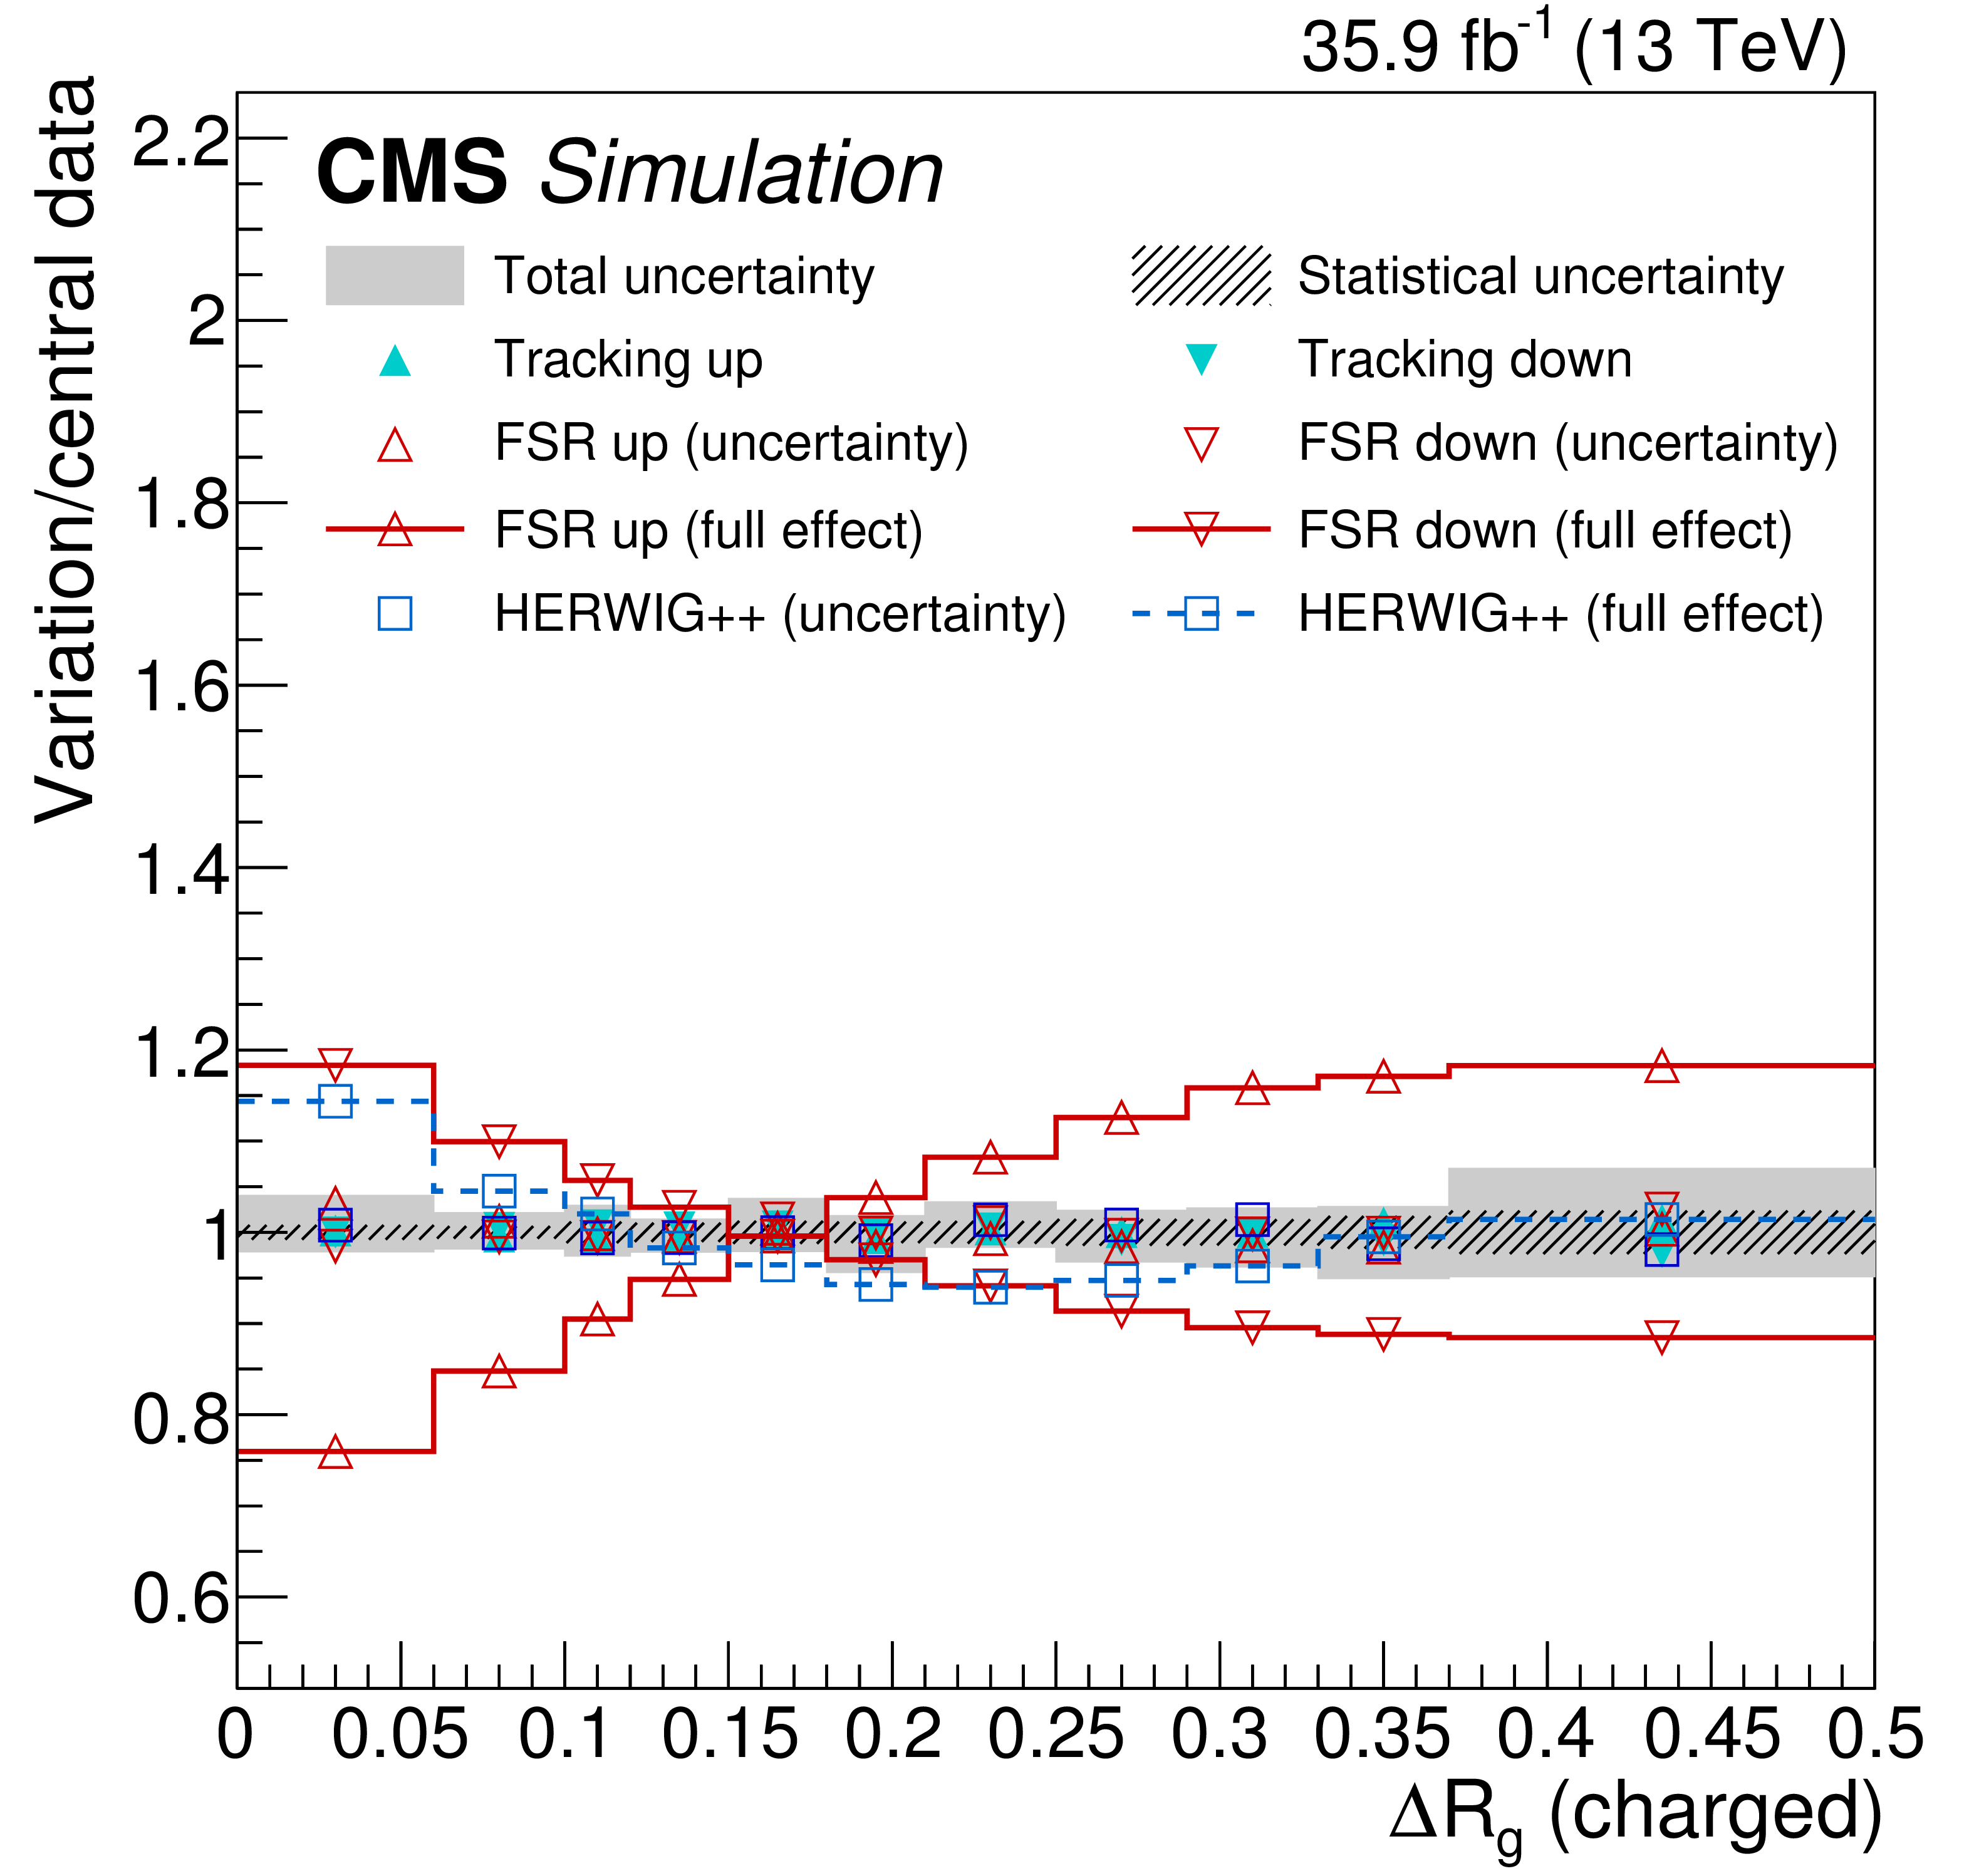
Systematic uncertainties for the charged multiplicity $\lambda _{0}^{0}$ ($N$) (upper left), jet eccentricity $\varepsilon $ (upper right), groomed momentum fraction $z_\mathrm {g}$ (lower left), and angle between the groomed subjets $\Delta R_\mathrm {g}$ (lower right). The uncertainties from FSR and HERWIG (open markers) are compared to the full effect of these variations at the particle level (open markers with lines). |
png pdf |
Figure 3-a:
Systematic uncertainties for the charged multiplicity $\lambda _{0}^{0}$ ($N$). The uncertainties from FSR and HERWIG (open markers) are compared to the full effect of these variations at the particle level (open markers with lines). |
png pdf |
Figure 3-b:
Systematic uncertainties for the jet eccentricity $\varepsilon $. The uncertainties from FSR and HERWIG (open markers) are compared to the full effect of these variations at the particle level (open markers with lines). |

png pdf |
Figure 3-c:
Systematic uncertainties for the groomed momentum fraction $z_\mathrm {g}$. The uncertainties from FSR and HERWIG (open markers) are compared to the full effect of these variations at the particle level (open markers with lines). |
png pdf |
Figure 3-d:
Systematic uncertainties for the angle between the groomed subjets $\Delta R_\mathrm {g}$. The uncertainties from FSR and HERWIG (open markers) are compared to the full effect of these variations at the particle level (open markers with lines). |

png pdf |
Figure 4:
Charged particle multiplicity $\lambda _{0}^{0}$ ($N$) at the reconstructed level after full event selection. The lower panel shows the ratio of the MC prediction (POWHEG+PYTHIA-8) to the data (lower panels) where the black shaded band represents the statistical uncertainty on the data. The systematic uncertainties on the MC prediction are represented by hatched areas, taking into account either the total uncertainty or shape variations only. |
png pdf |
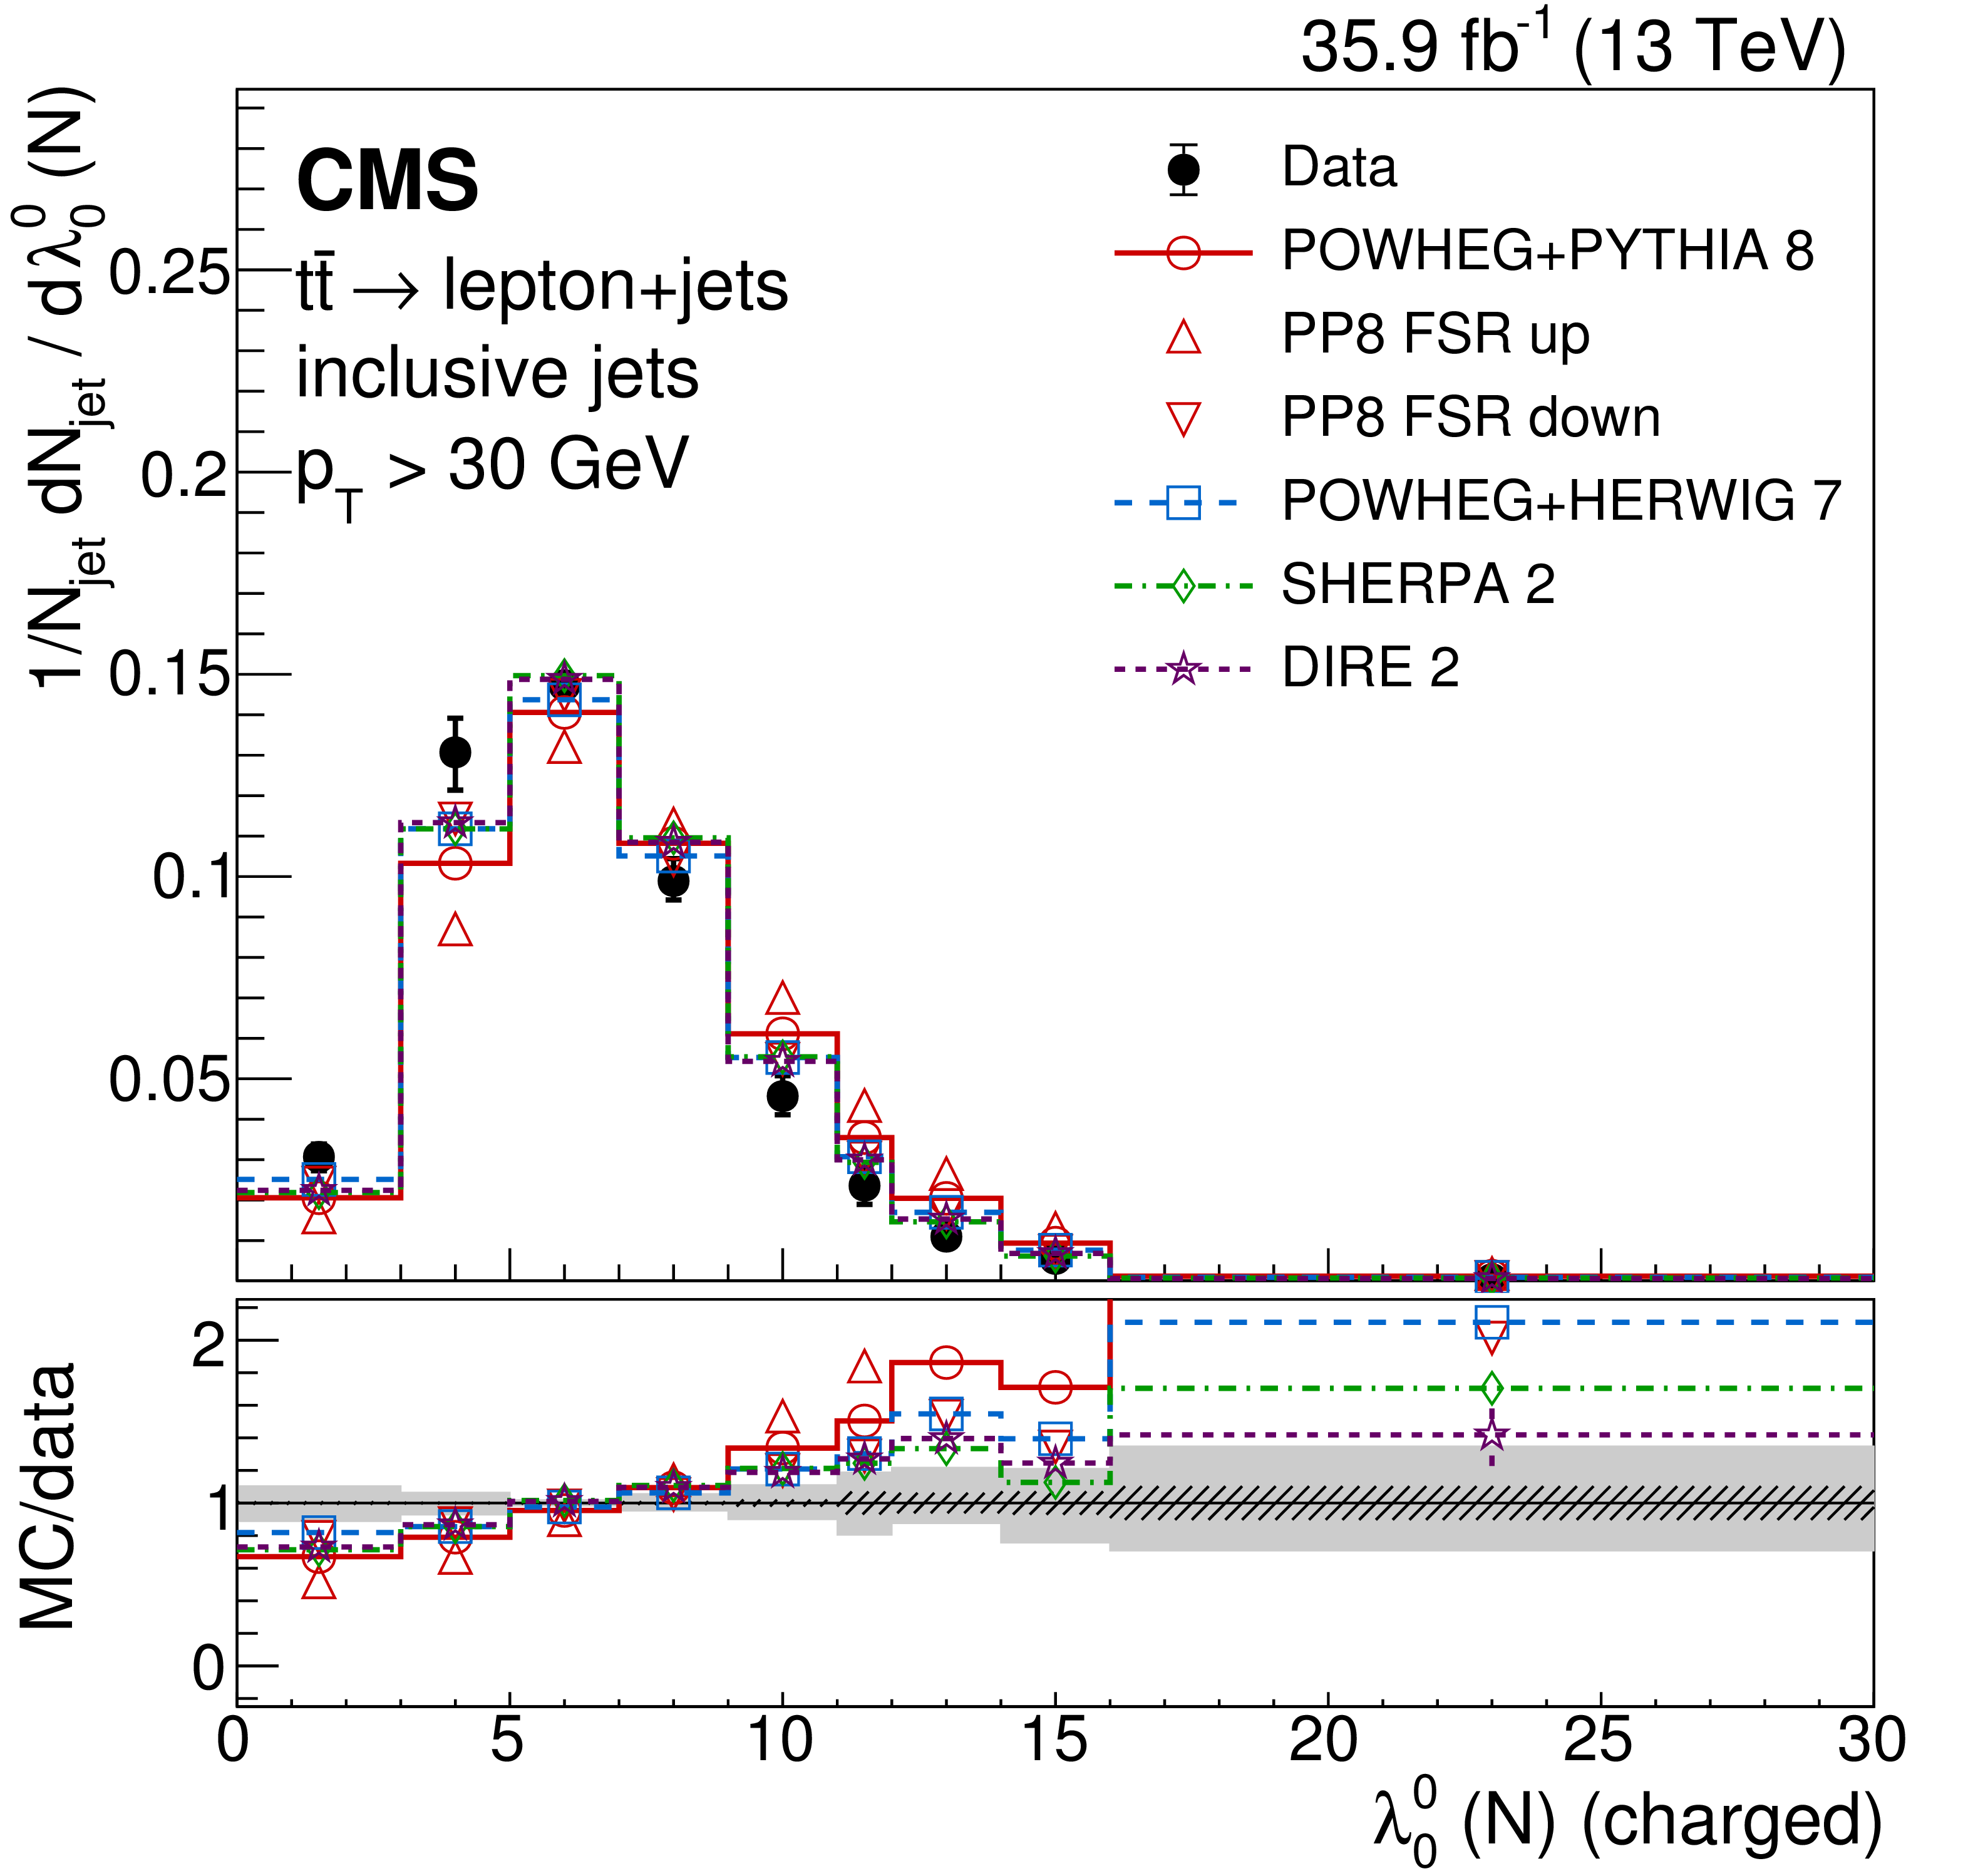
Figure 5:
Charged particle multiplicity $\lambda _{0}^{0}$ ($N$) normalized and unfolded to the particle level, for inclusive jets. Data (points) are compared to different MC predictions (upper), and as MC/data ratios (lower). The hatched and shaded bands represent the statistical and total uncertainties, respectively. |
png pdf |
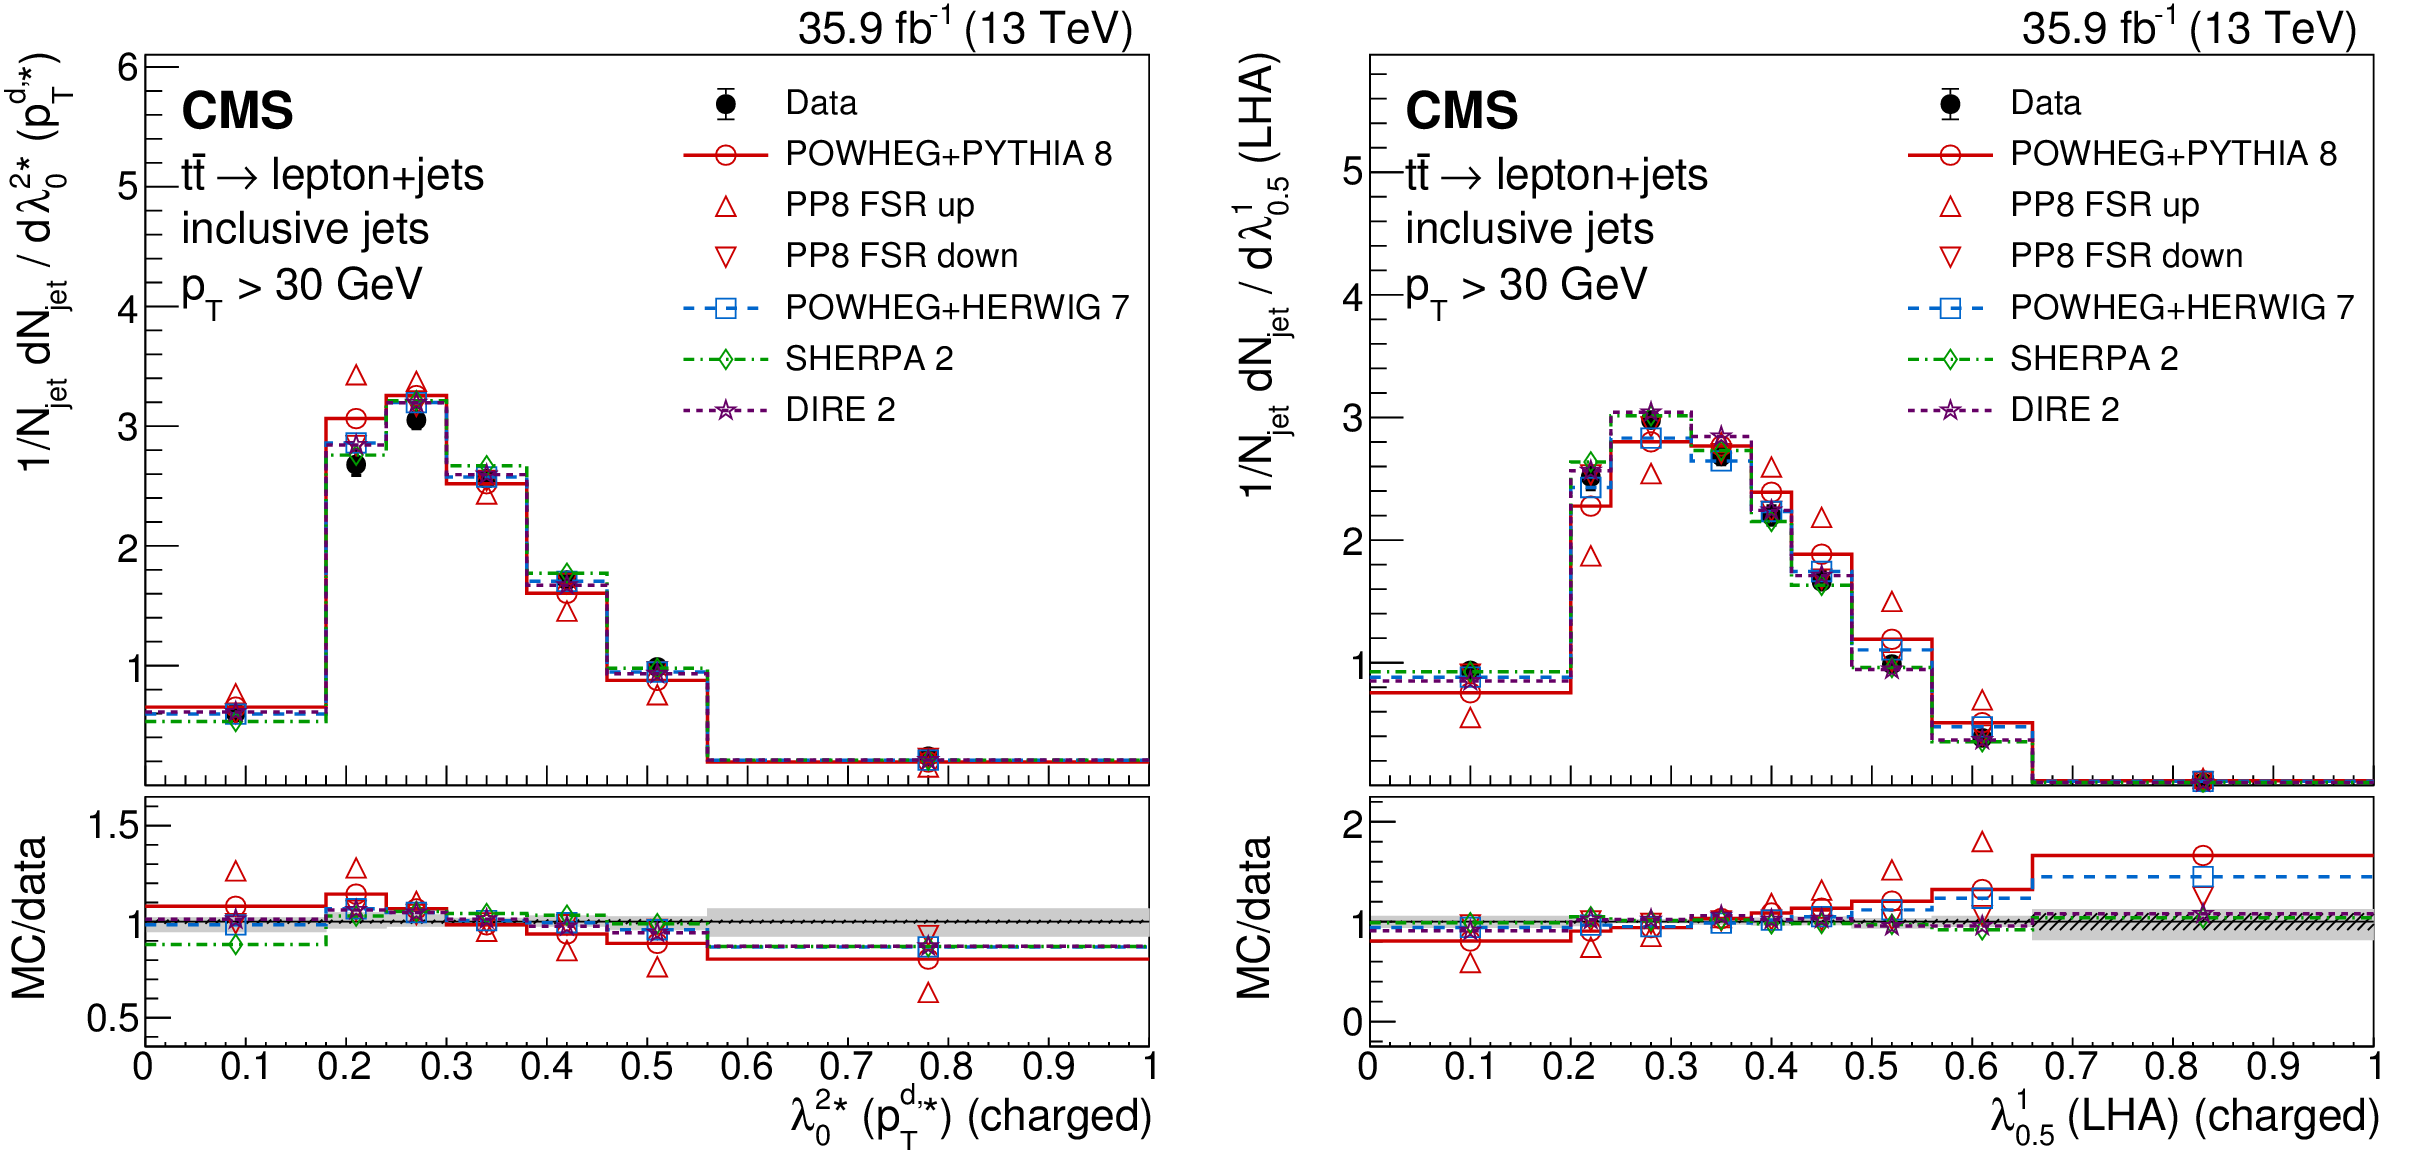
Figure 6:
Distributions of the scaled ${p_{\mathrm {T}}}$ dispersion ($\lambda _0^{2*}$, left) and Les Houches angularity ($\lambda _{0.5}^1$, right), unfolded to the particle level, for inclusive jets reconstructed with charged particles. Data (points) are compared to different MC predictions (upper), and as MC/data ratios (lower). The hatched and shaded bands represent the statistical and total uncertainties, respectively. |

png pdf |
Figure 6-a:
Distribution of the scaled ${p_{\mathrm {T}}}$ dispersion ($\lambda _0^{2*}$), unfolded to the particle level, for inclusive jets reconstructed with charged particles. Data (points) are compared to different MC predictions (upper), and as MC/data ratios (lower). The hatched and shaded bands represent the statistical and total uncertainties, respectively. |

png pdf |
Figure 6-b:
Distribution of Les Houches angularity ($\lambda _{0.5}^1$), unfolded to the particle level, for inclusive jets reconstructed with charged particles. Data (points) are compared to different MC predictions (upper), and as MC/data ratios (lower). The hatched and shaded bands represent the statistical and total uncertainties, respectively. |
png pdf |
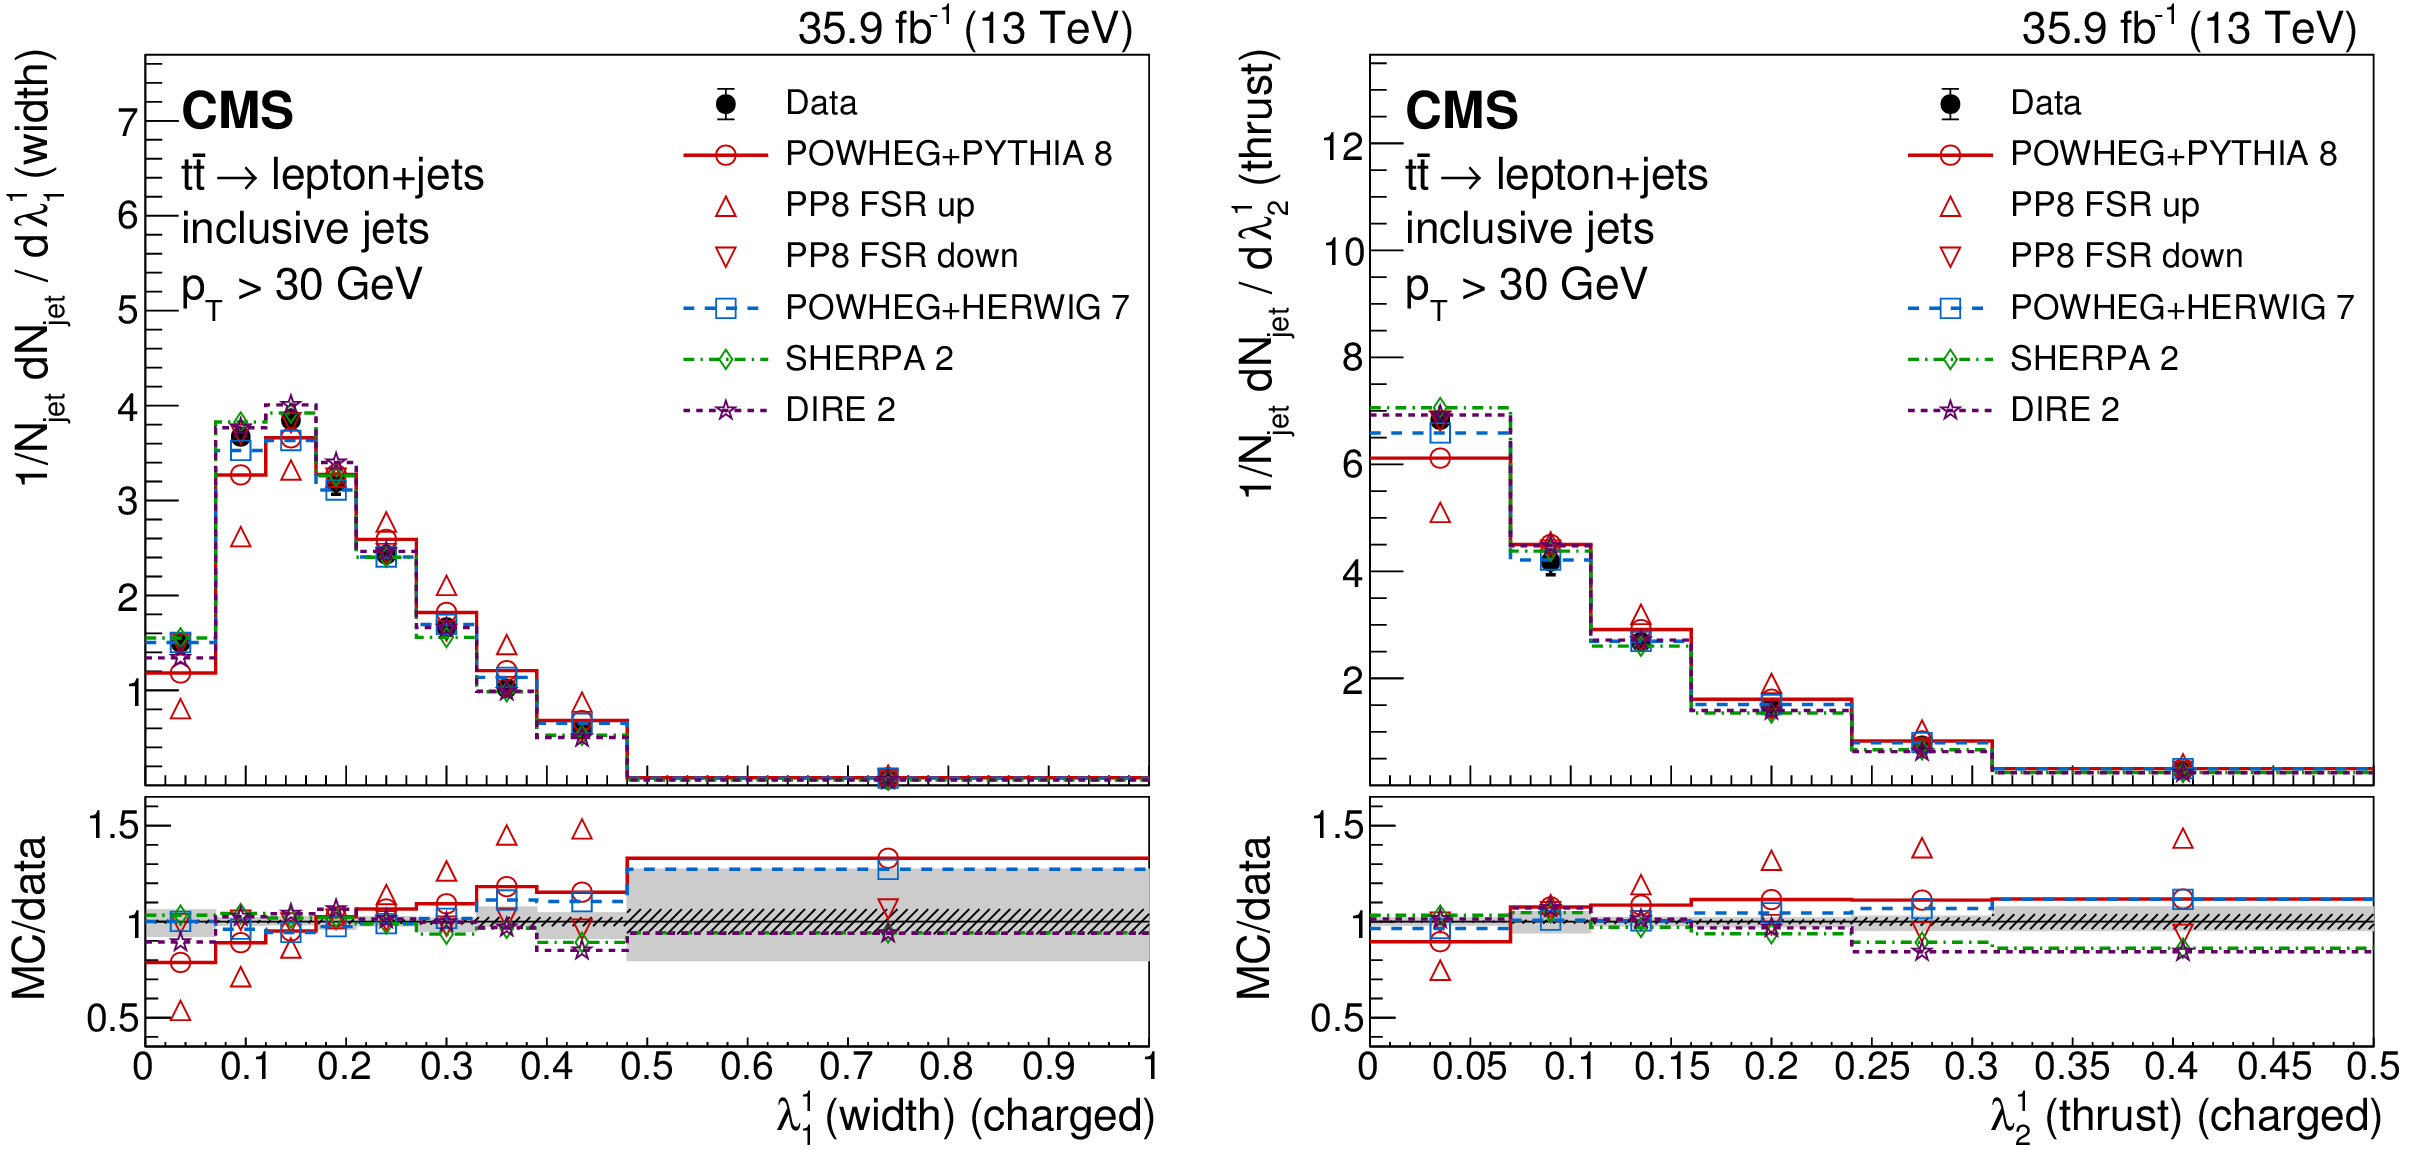
Figure 7:
Distributions of the jet width ($\lambda _1^1$, left) and thrust ($\lambda _2^1$, right), unfolded to the particle level, for inclusive jets reconstructed with charged particles. Data (points) are compared to different MC predictions (upper), and as MC/data ratios (lower). The hatched and shaded bands represent the statistical and total uncertainties, respectively. |

png pdf |
Figure 7-a:
Distribution of the jet width ($\lambda _1^1$), unfolded to the particle level, for inclusive jets reconstructed with charged particles. Data (points) are compared to different MC predictions (upper), and as MC/data ratios (lower). The hatched and shaded bands represent the statistical and total uncertainties, respectively. |

png pdf |
Figure 7-b:
Distribution of the thrust ($\lambda _2^1$), unfolded to the particle level, for inclusive jets reconstructed with charged particles. Data (points) are compared to different MC predictions (upper), and as MC/data ratios (lower). The hatched and shaded bands represent the statistical and total uncertainties, respectively. |
png pdf |
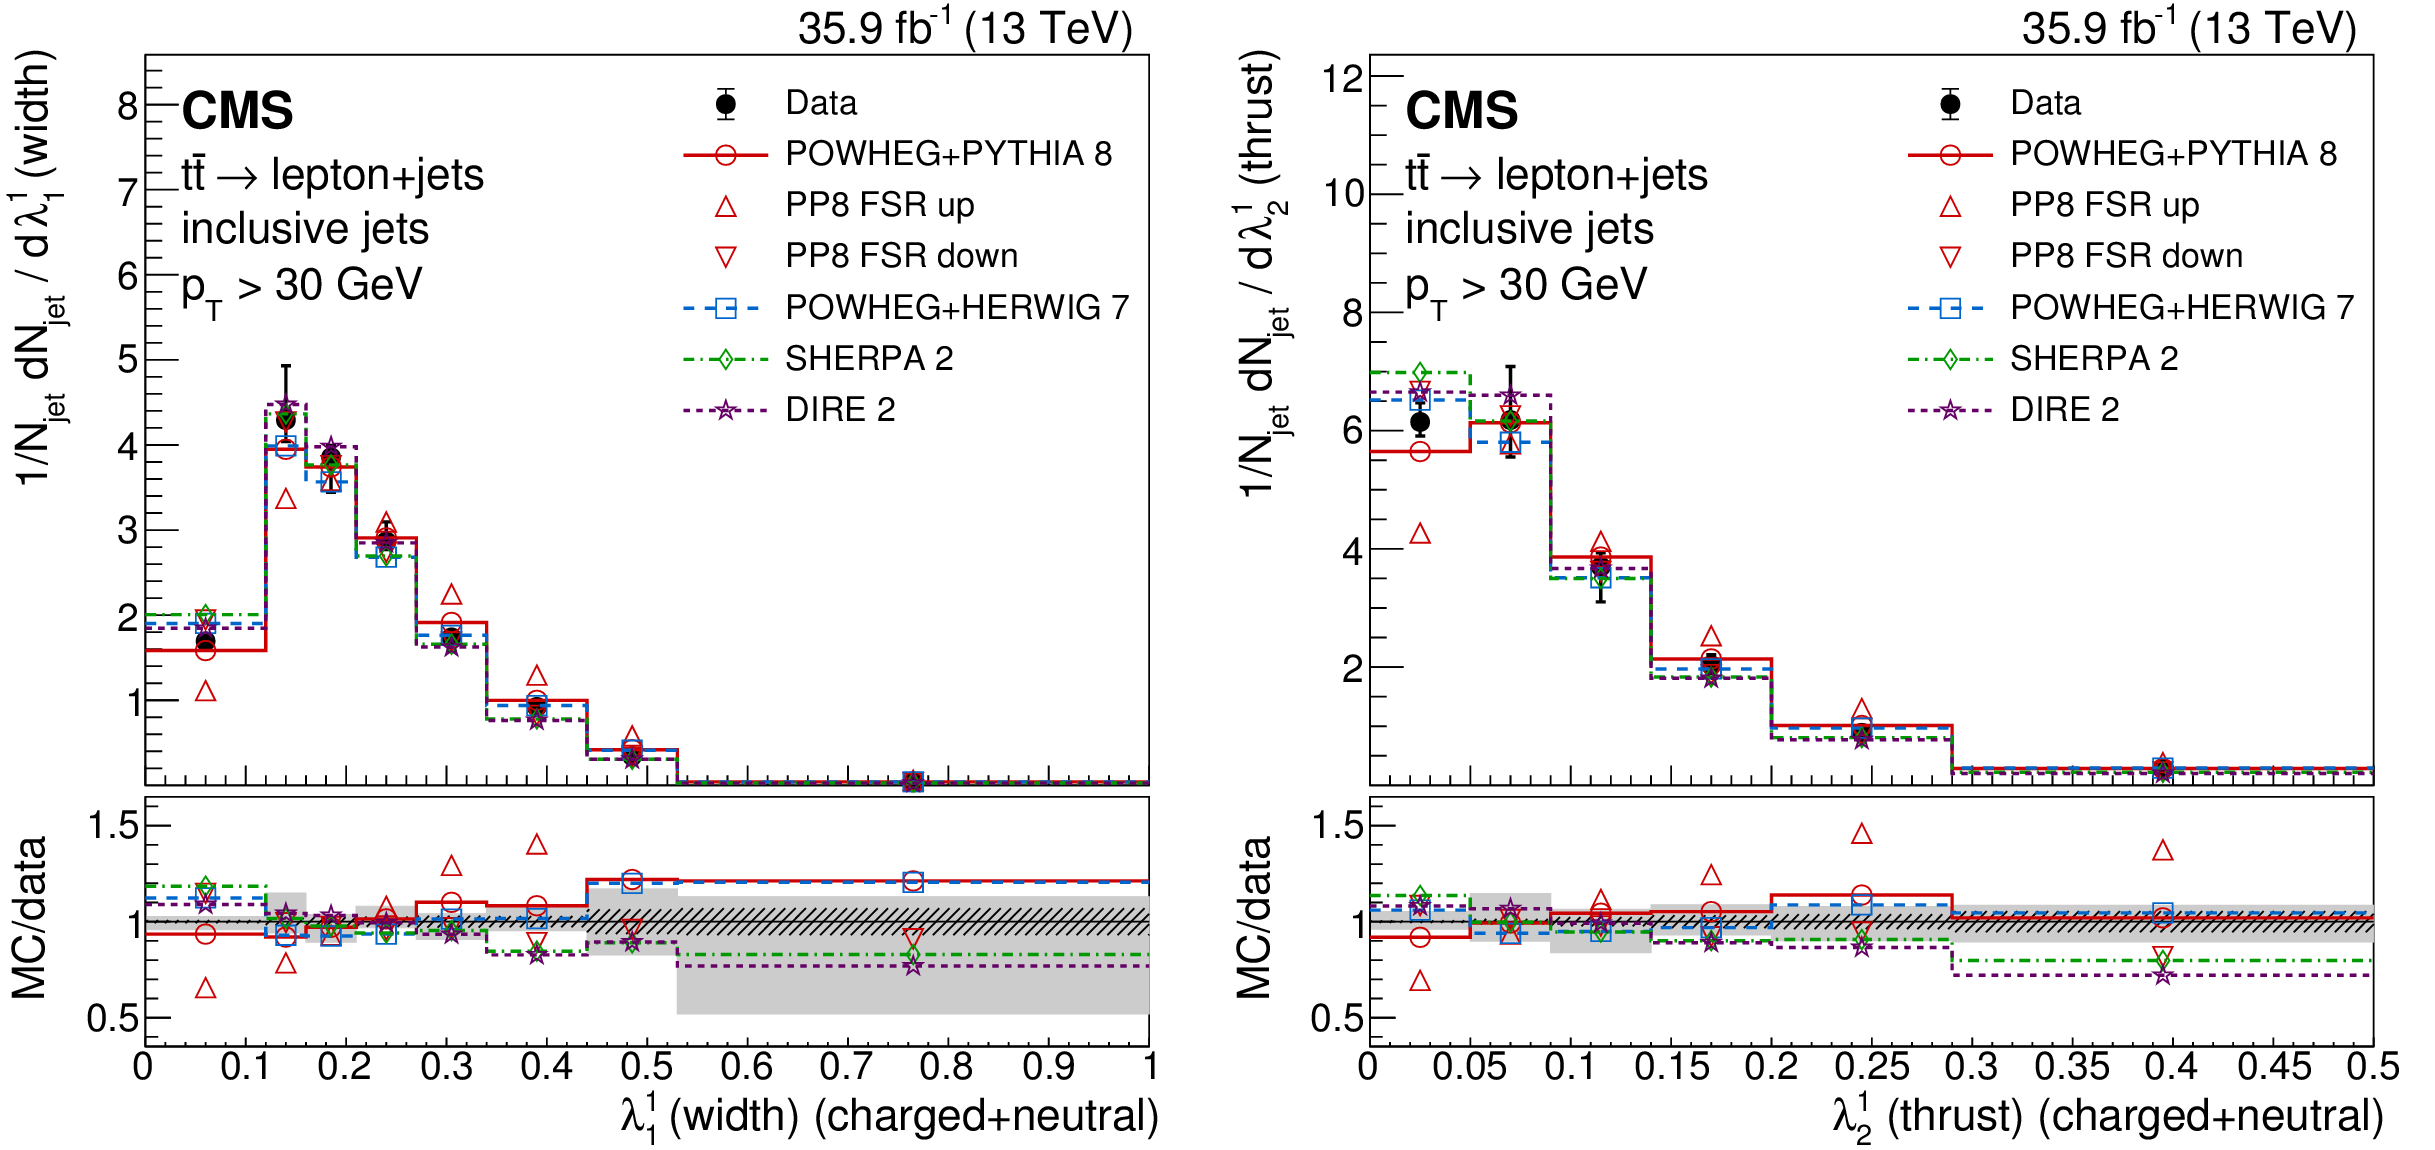
Figure 8:
Distributions of the jet width ($\lambda _1^1$, left) and thrust ($\lambda _2^1$, right), unfolded to the particle level, for inclusive jets reconstructed with charged+neutral particles. Data (points) are compared to different MC predictions (upper), and as MC/data ratios (lower). The hatched and shaded bands represent the statistical and total uncertainties, respectively. |

png pdf |
Figure 8-a:
Distribution of the jet width ($\lambda _1^1$), unfolded to the particle level, for inclusive jets reconstructed with charged+neutral particles. Data (points) are compared to different MC predictions (upper), and as MC/data ratios (lower). The hatched and shaded bands represent the statistical and total uncertainties, respectively. |
png pdf |
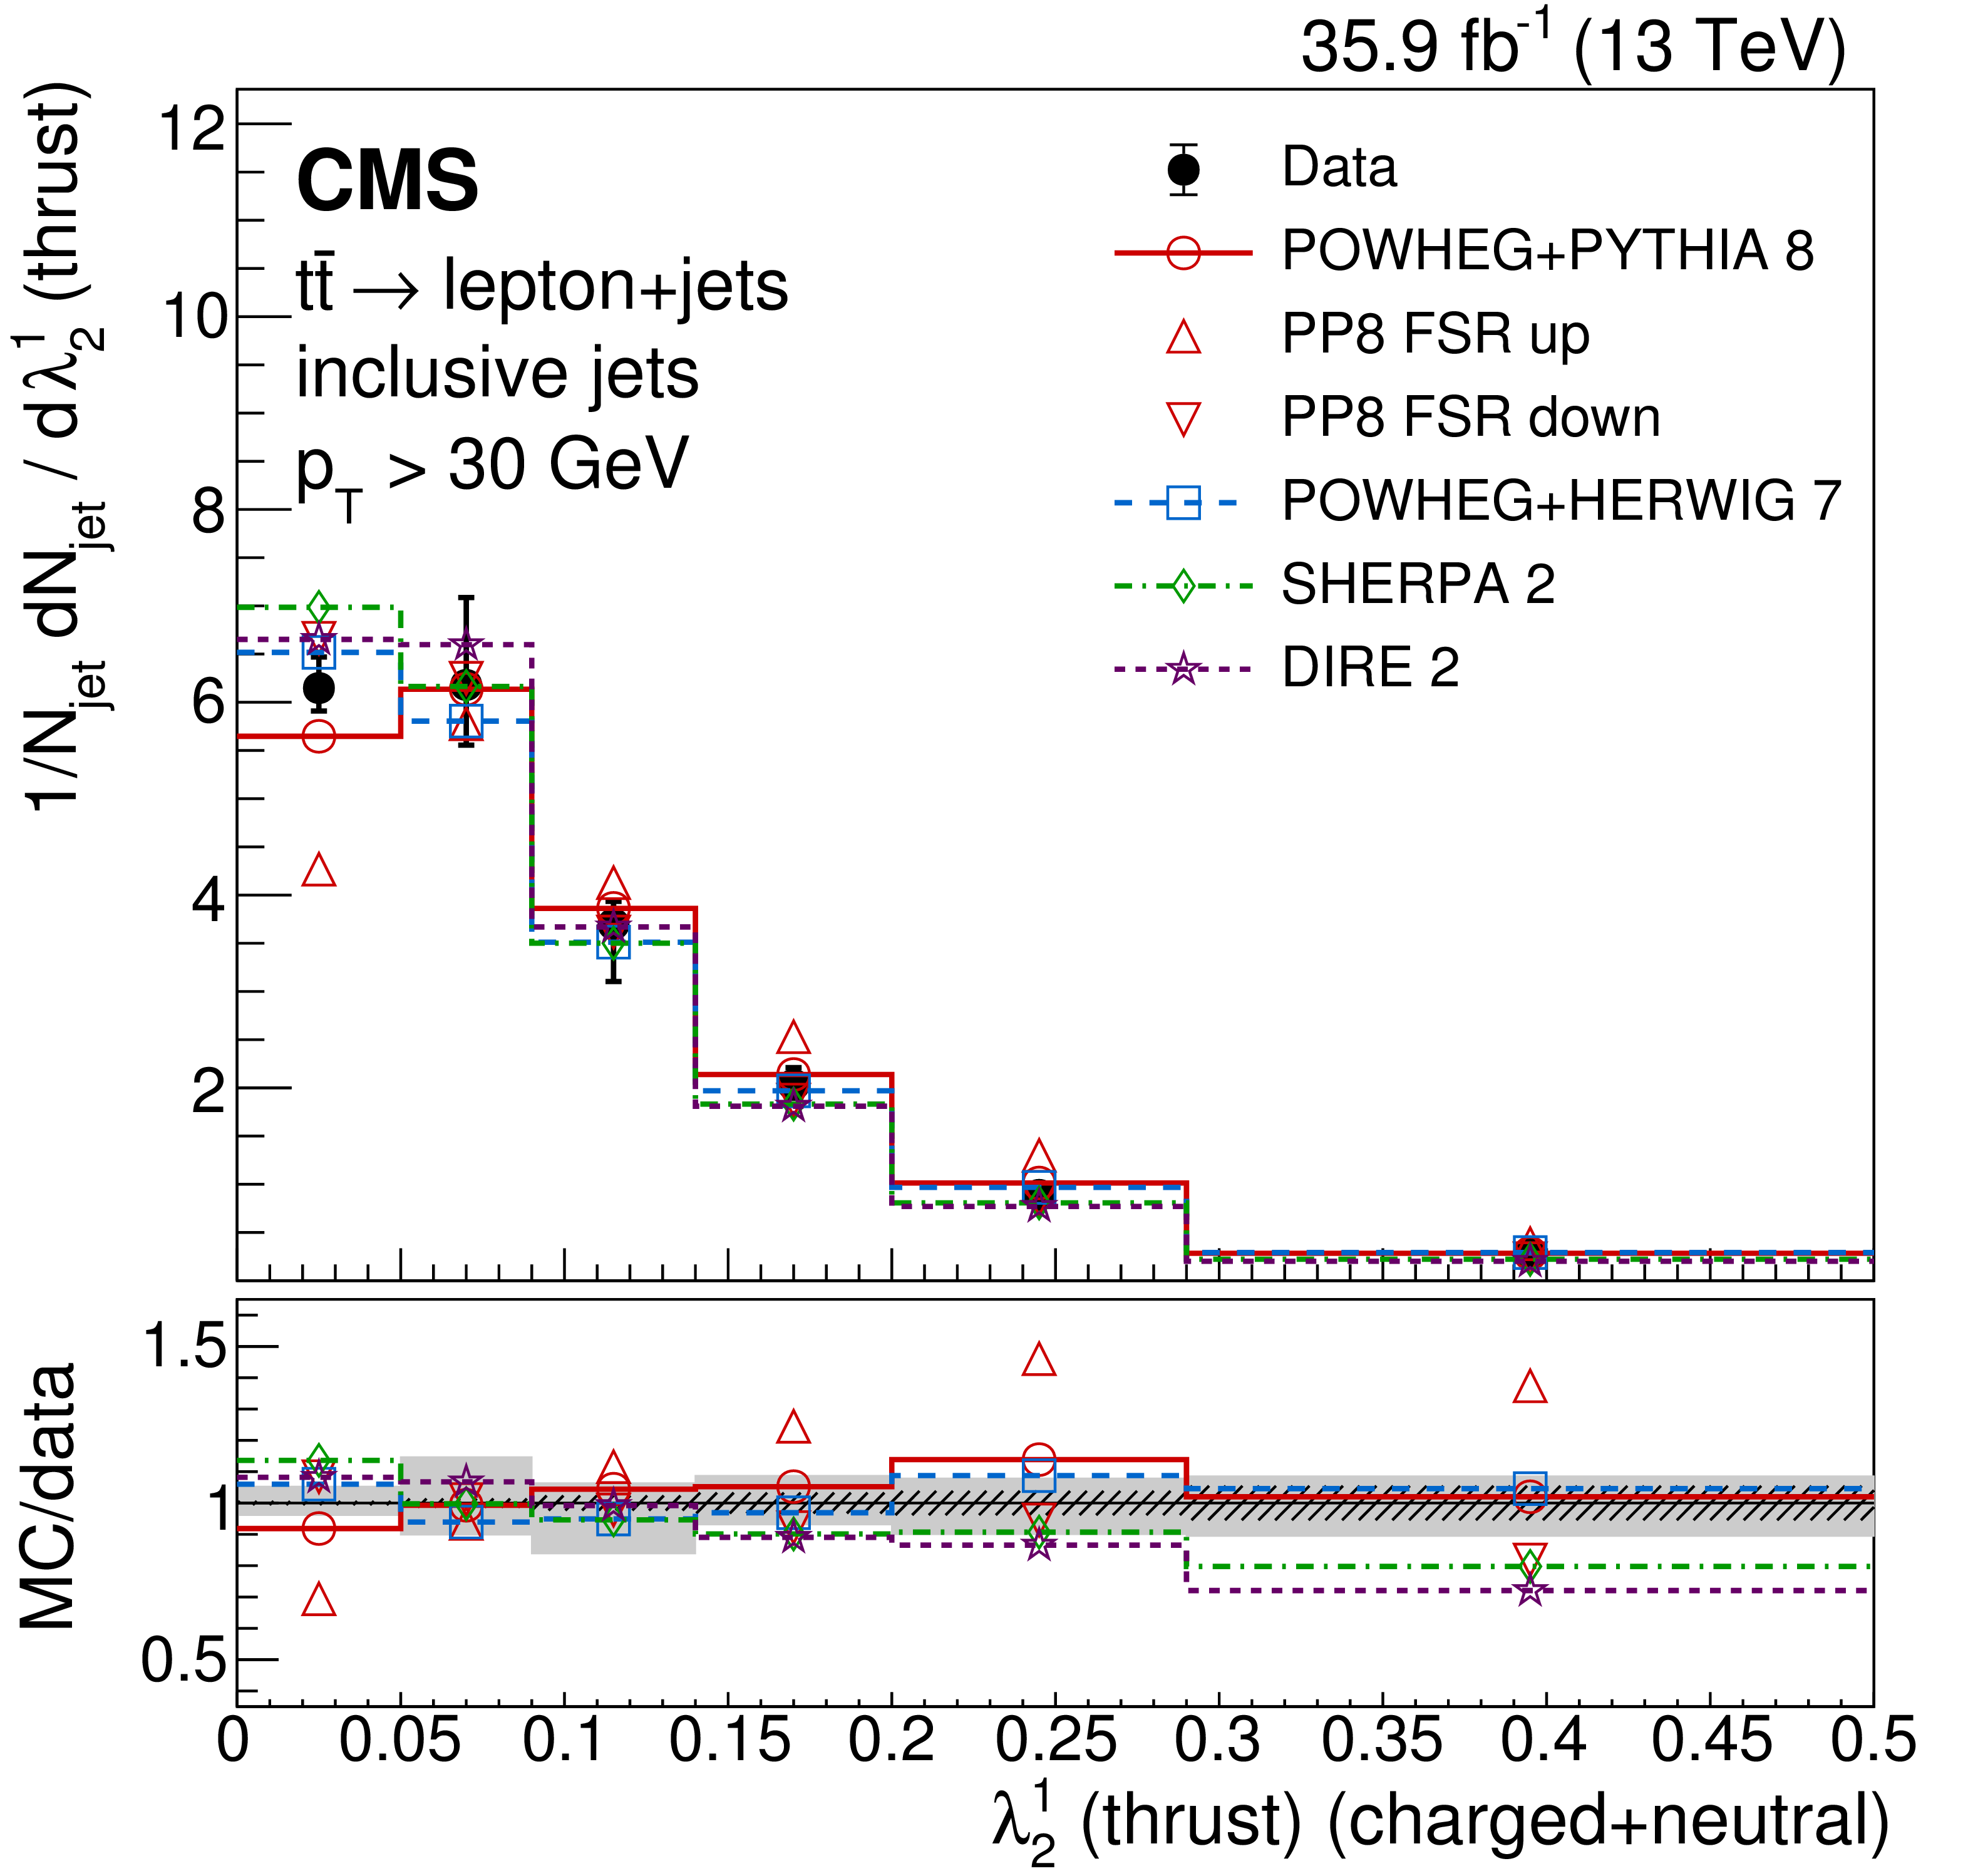
Figure 8-b:
Distribution of the thrust ($\lambda _2^1$), unfolded to the particle level, for inclusive jets reconstructed with charged+neutral particles. Data (points) are compared to different MC predictions (upper), and as MC/data ratios (lower). The hatched and shaded bands represent the statistical and total uncertainties, respectively. |

png pdf |
Figure 9:
Distribution of the eccentricity $\varepsilon $, unfolded to the particle level, for inclusive jets reconstructed with charged particles. Data (points) are compared to different MC predictions (upper), and as MC/data ratios (lower). The hatched and shaded bands represent the statistical and total uncertainties, respectively. |
png pdf |
Figure 10:
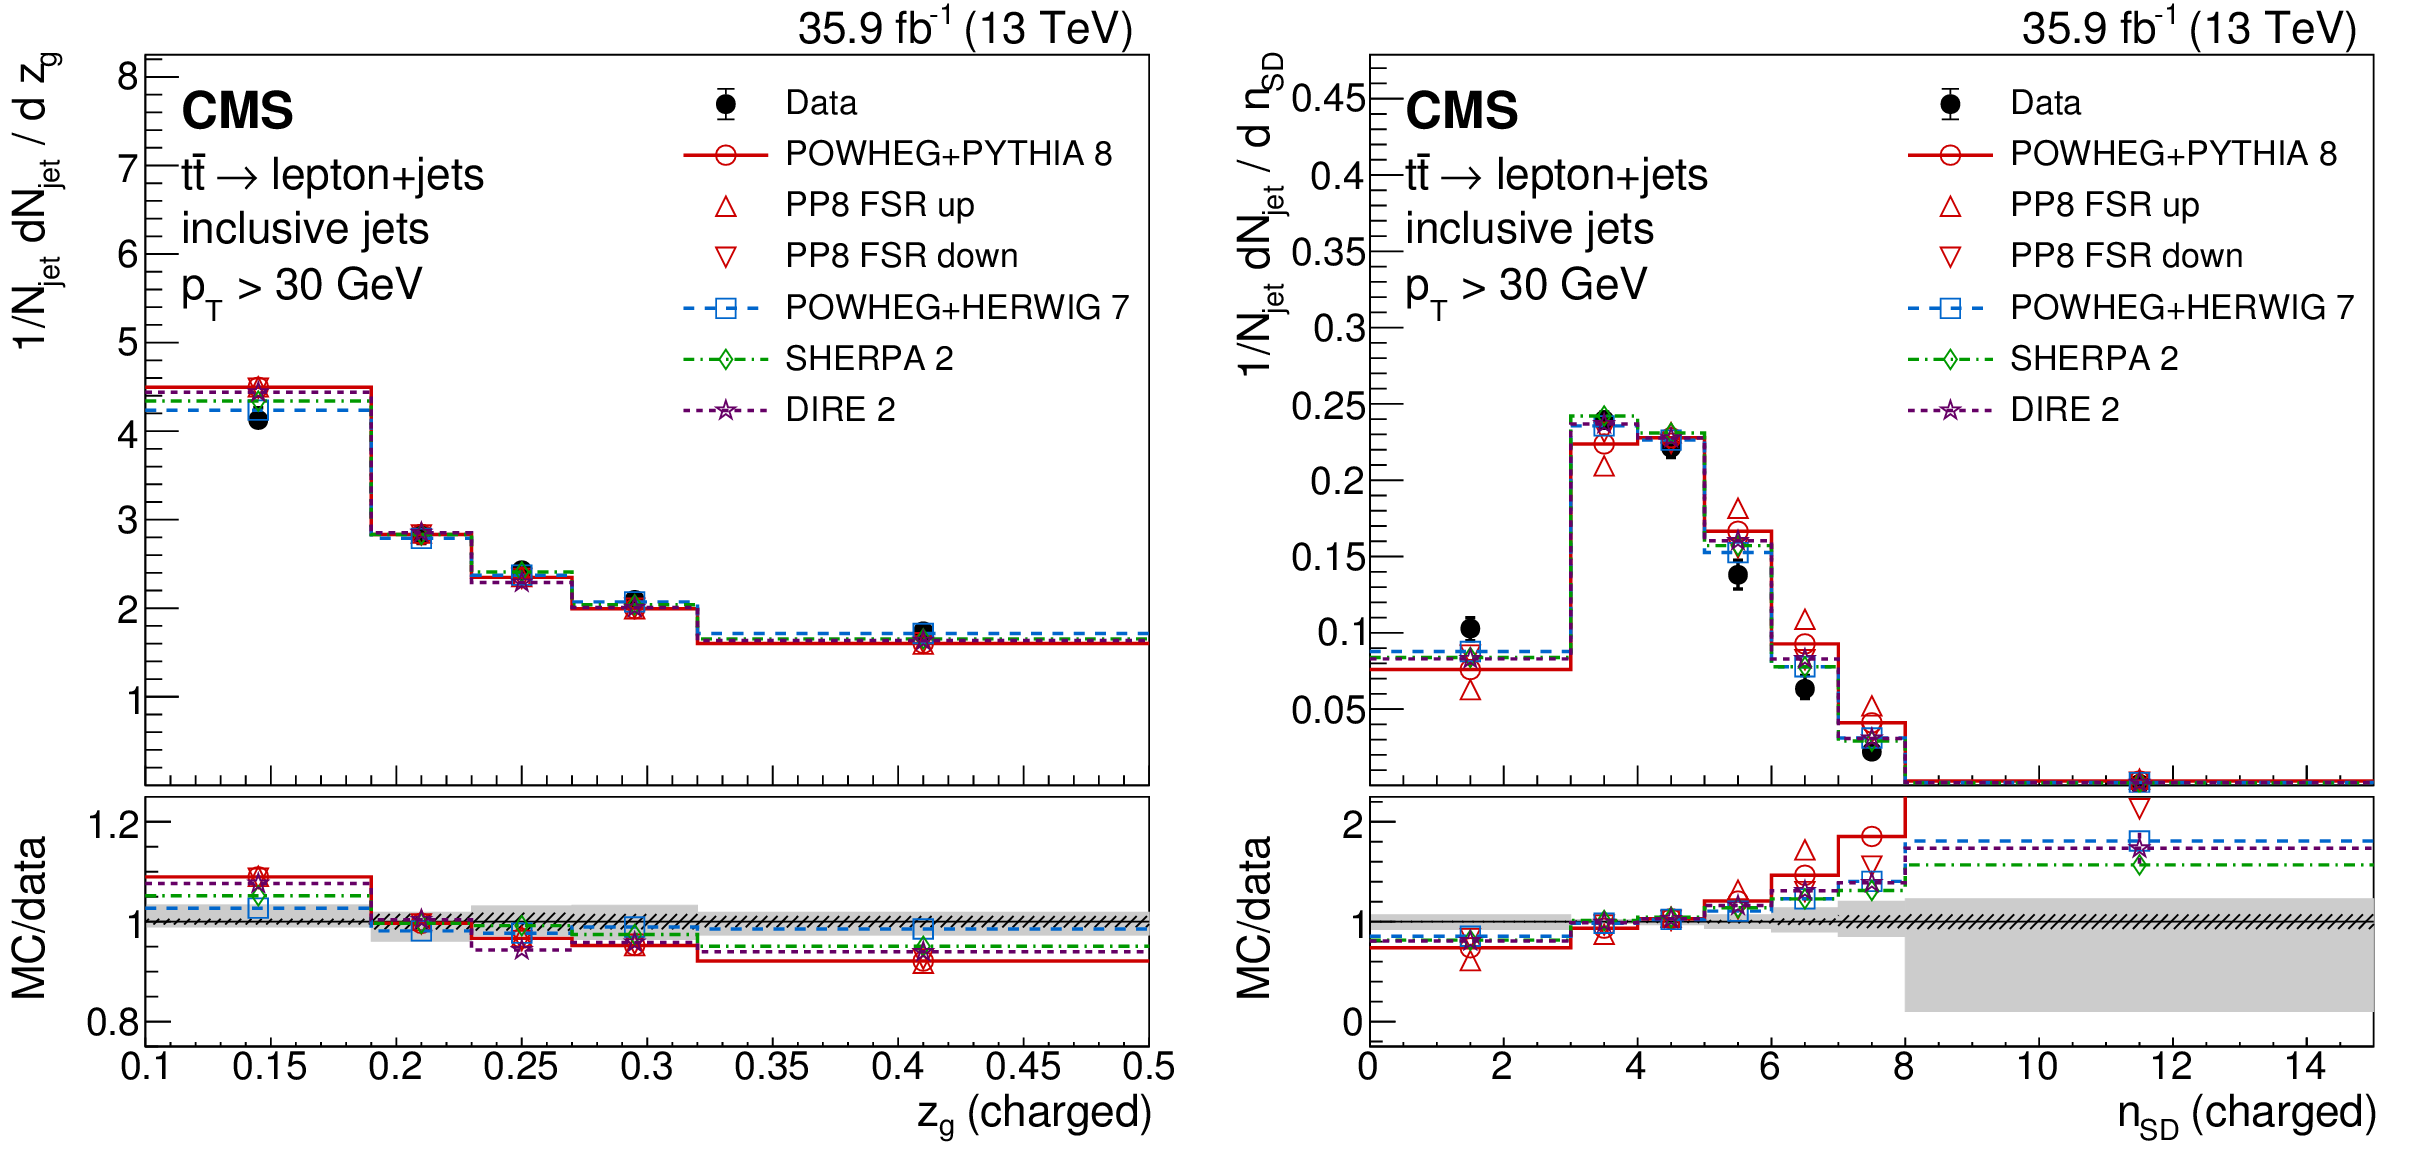
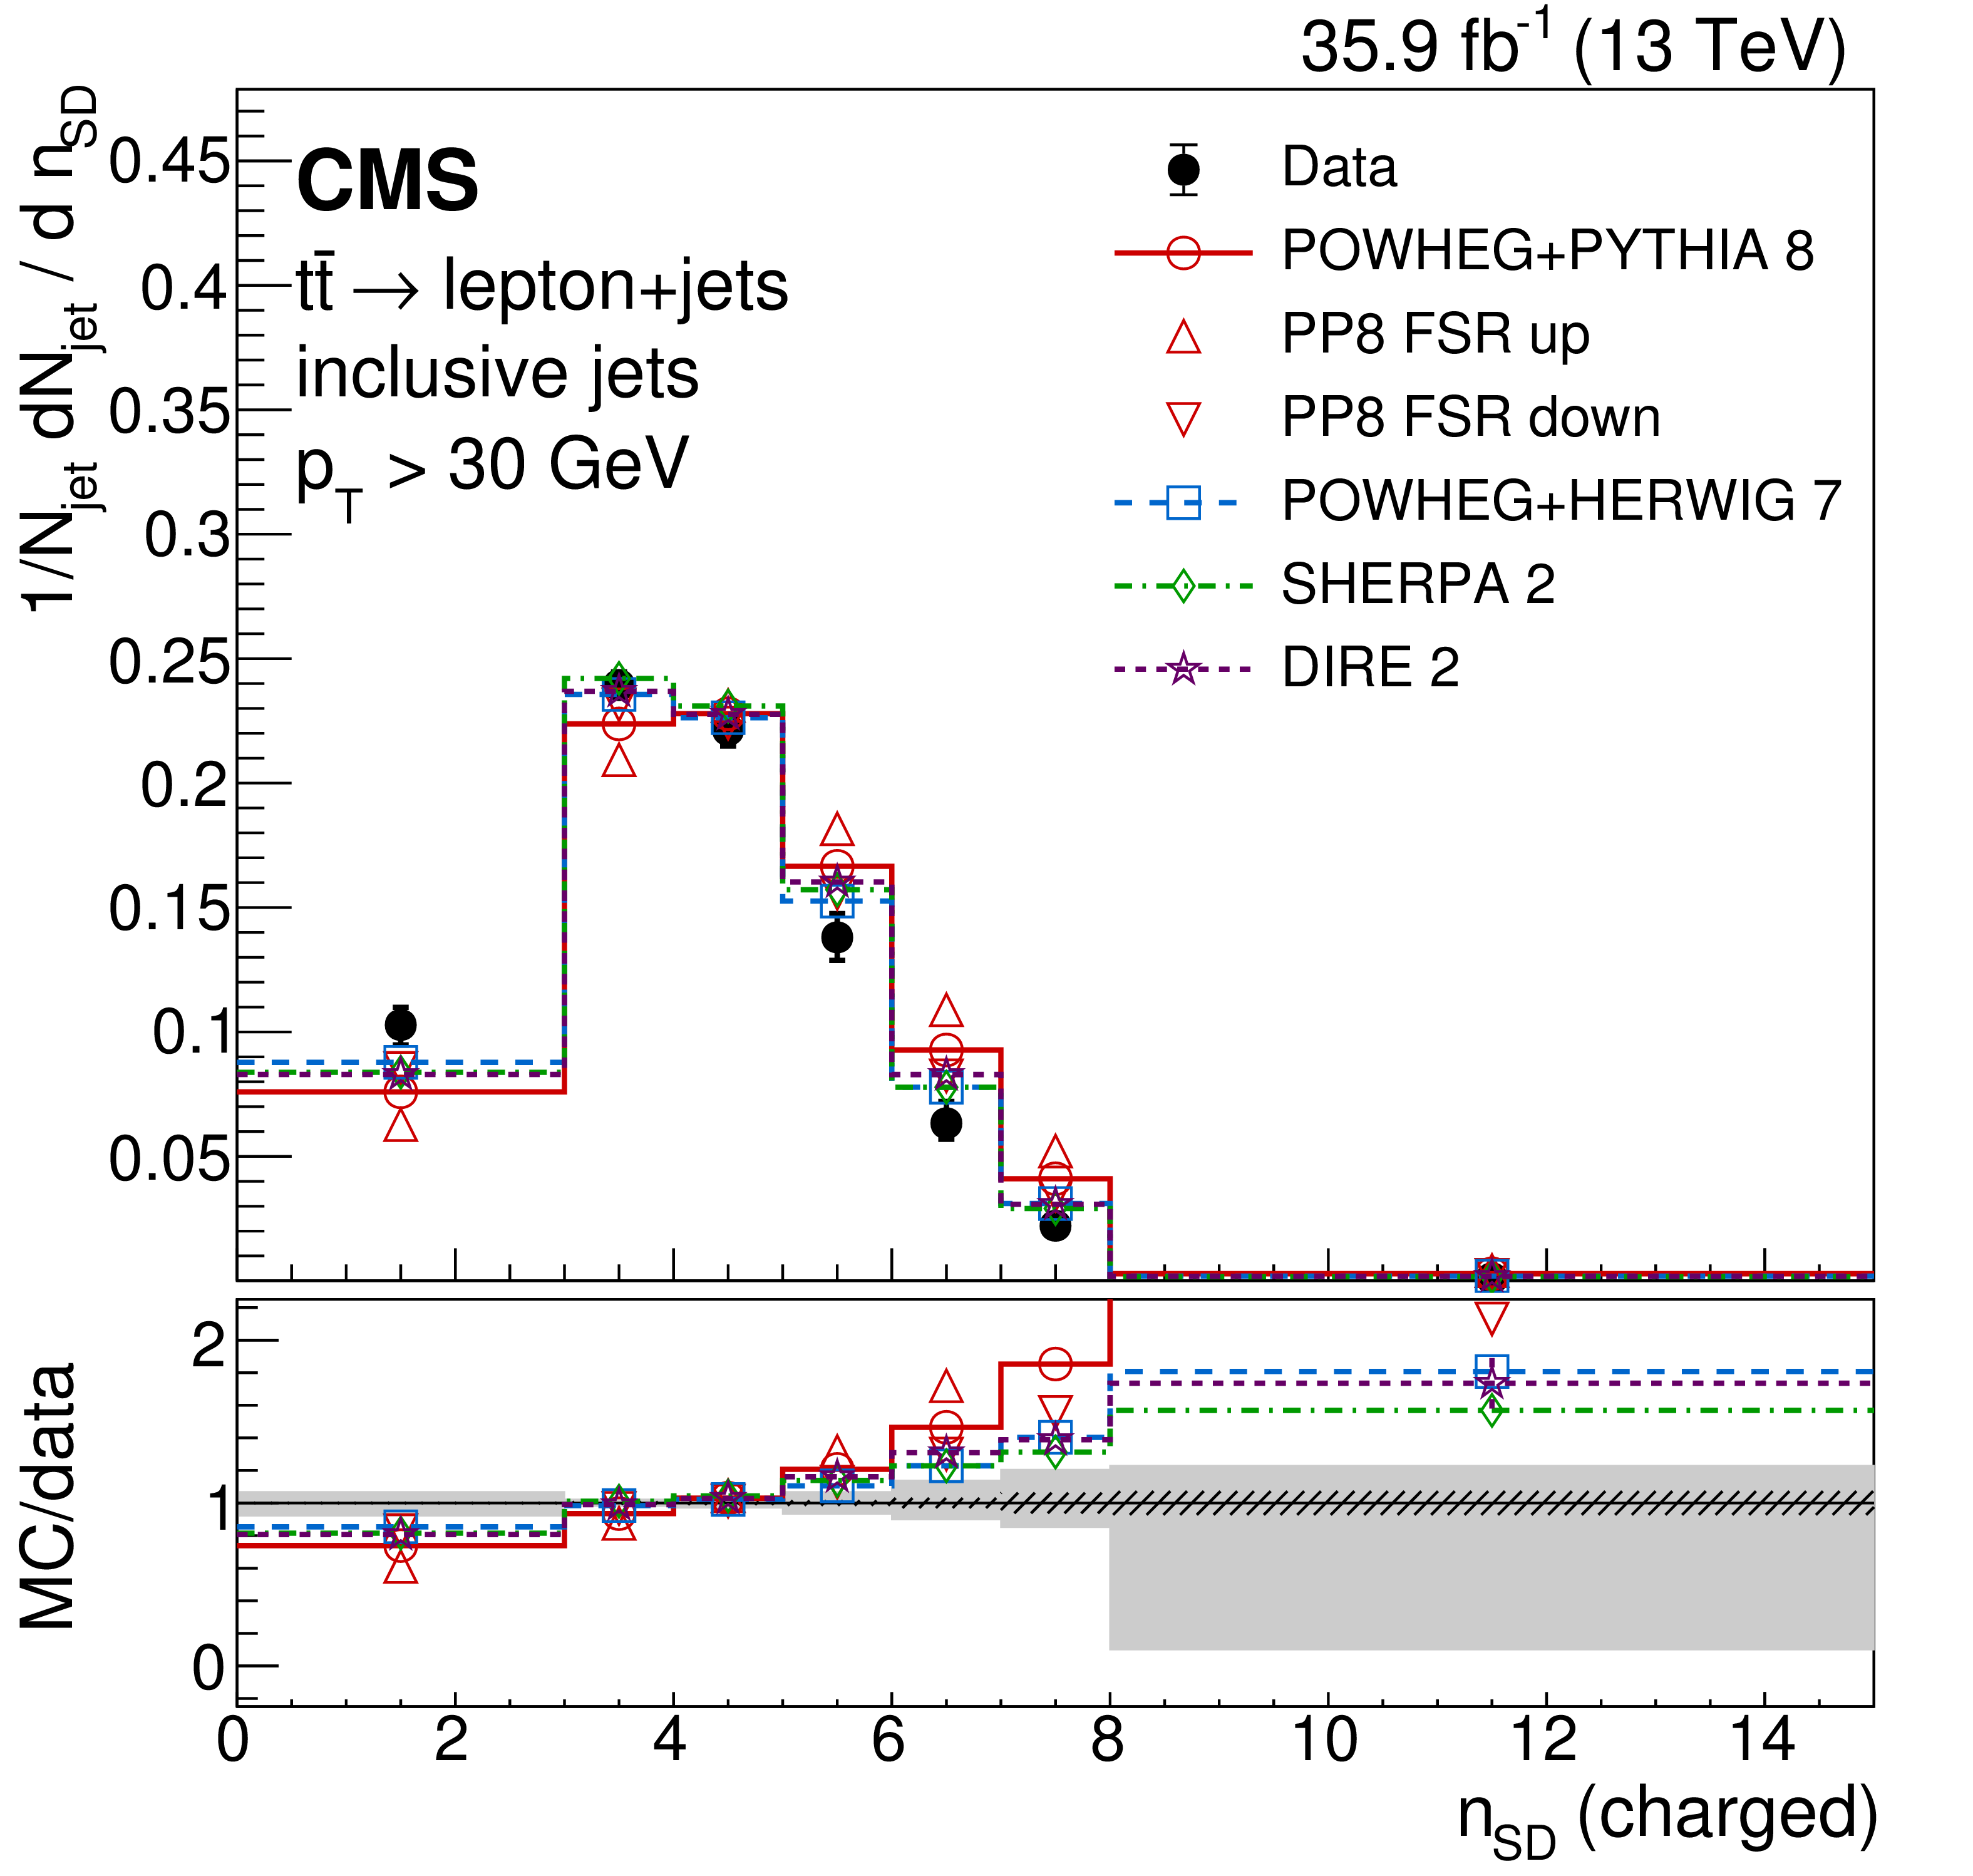
Distributions of the groomed momentum fraction $z_\mathrm {g}$ (left) and the soft-drop multiplicity $n_\mathrm {SD}$ (right), unfolded to the particle level, for inclusive jets reconstructed with charged particles. Data (points) are compared to different MC predictions (upper), and as MC/data ratios (lower). The hatched and shaded bands represent the statistical and total uncertainties, respectively. |

png pdf |
Figure 10-a:
Distribution of the groomed momentum fraction $z_\mathrm {g}$, unfolded to the particle level, for inclusive jets reconstructed with charged particles. Data (points) are compared to different MC predictions (upper), and as MC/data ratios (lower). The hatched and shaded bands represent the statistical and total uncertainties, respectively. |
png pdf |
Figure 10-b:
Distribution of the soft-drop multiplicity $n_\mathrm {SD}$, unfolded to the particle level, for inclusive jets reconstructed with charged particles. Data (points) are compared to different MC predictions (upper), and as MC/data ratios (lower). The hatched and shaded bands represent the statistical and total uncertainties, respectively. |

png pdf |
Figure 11:
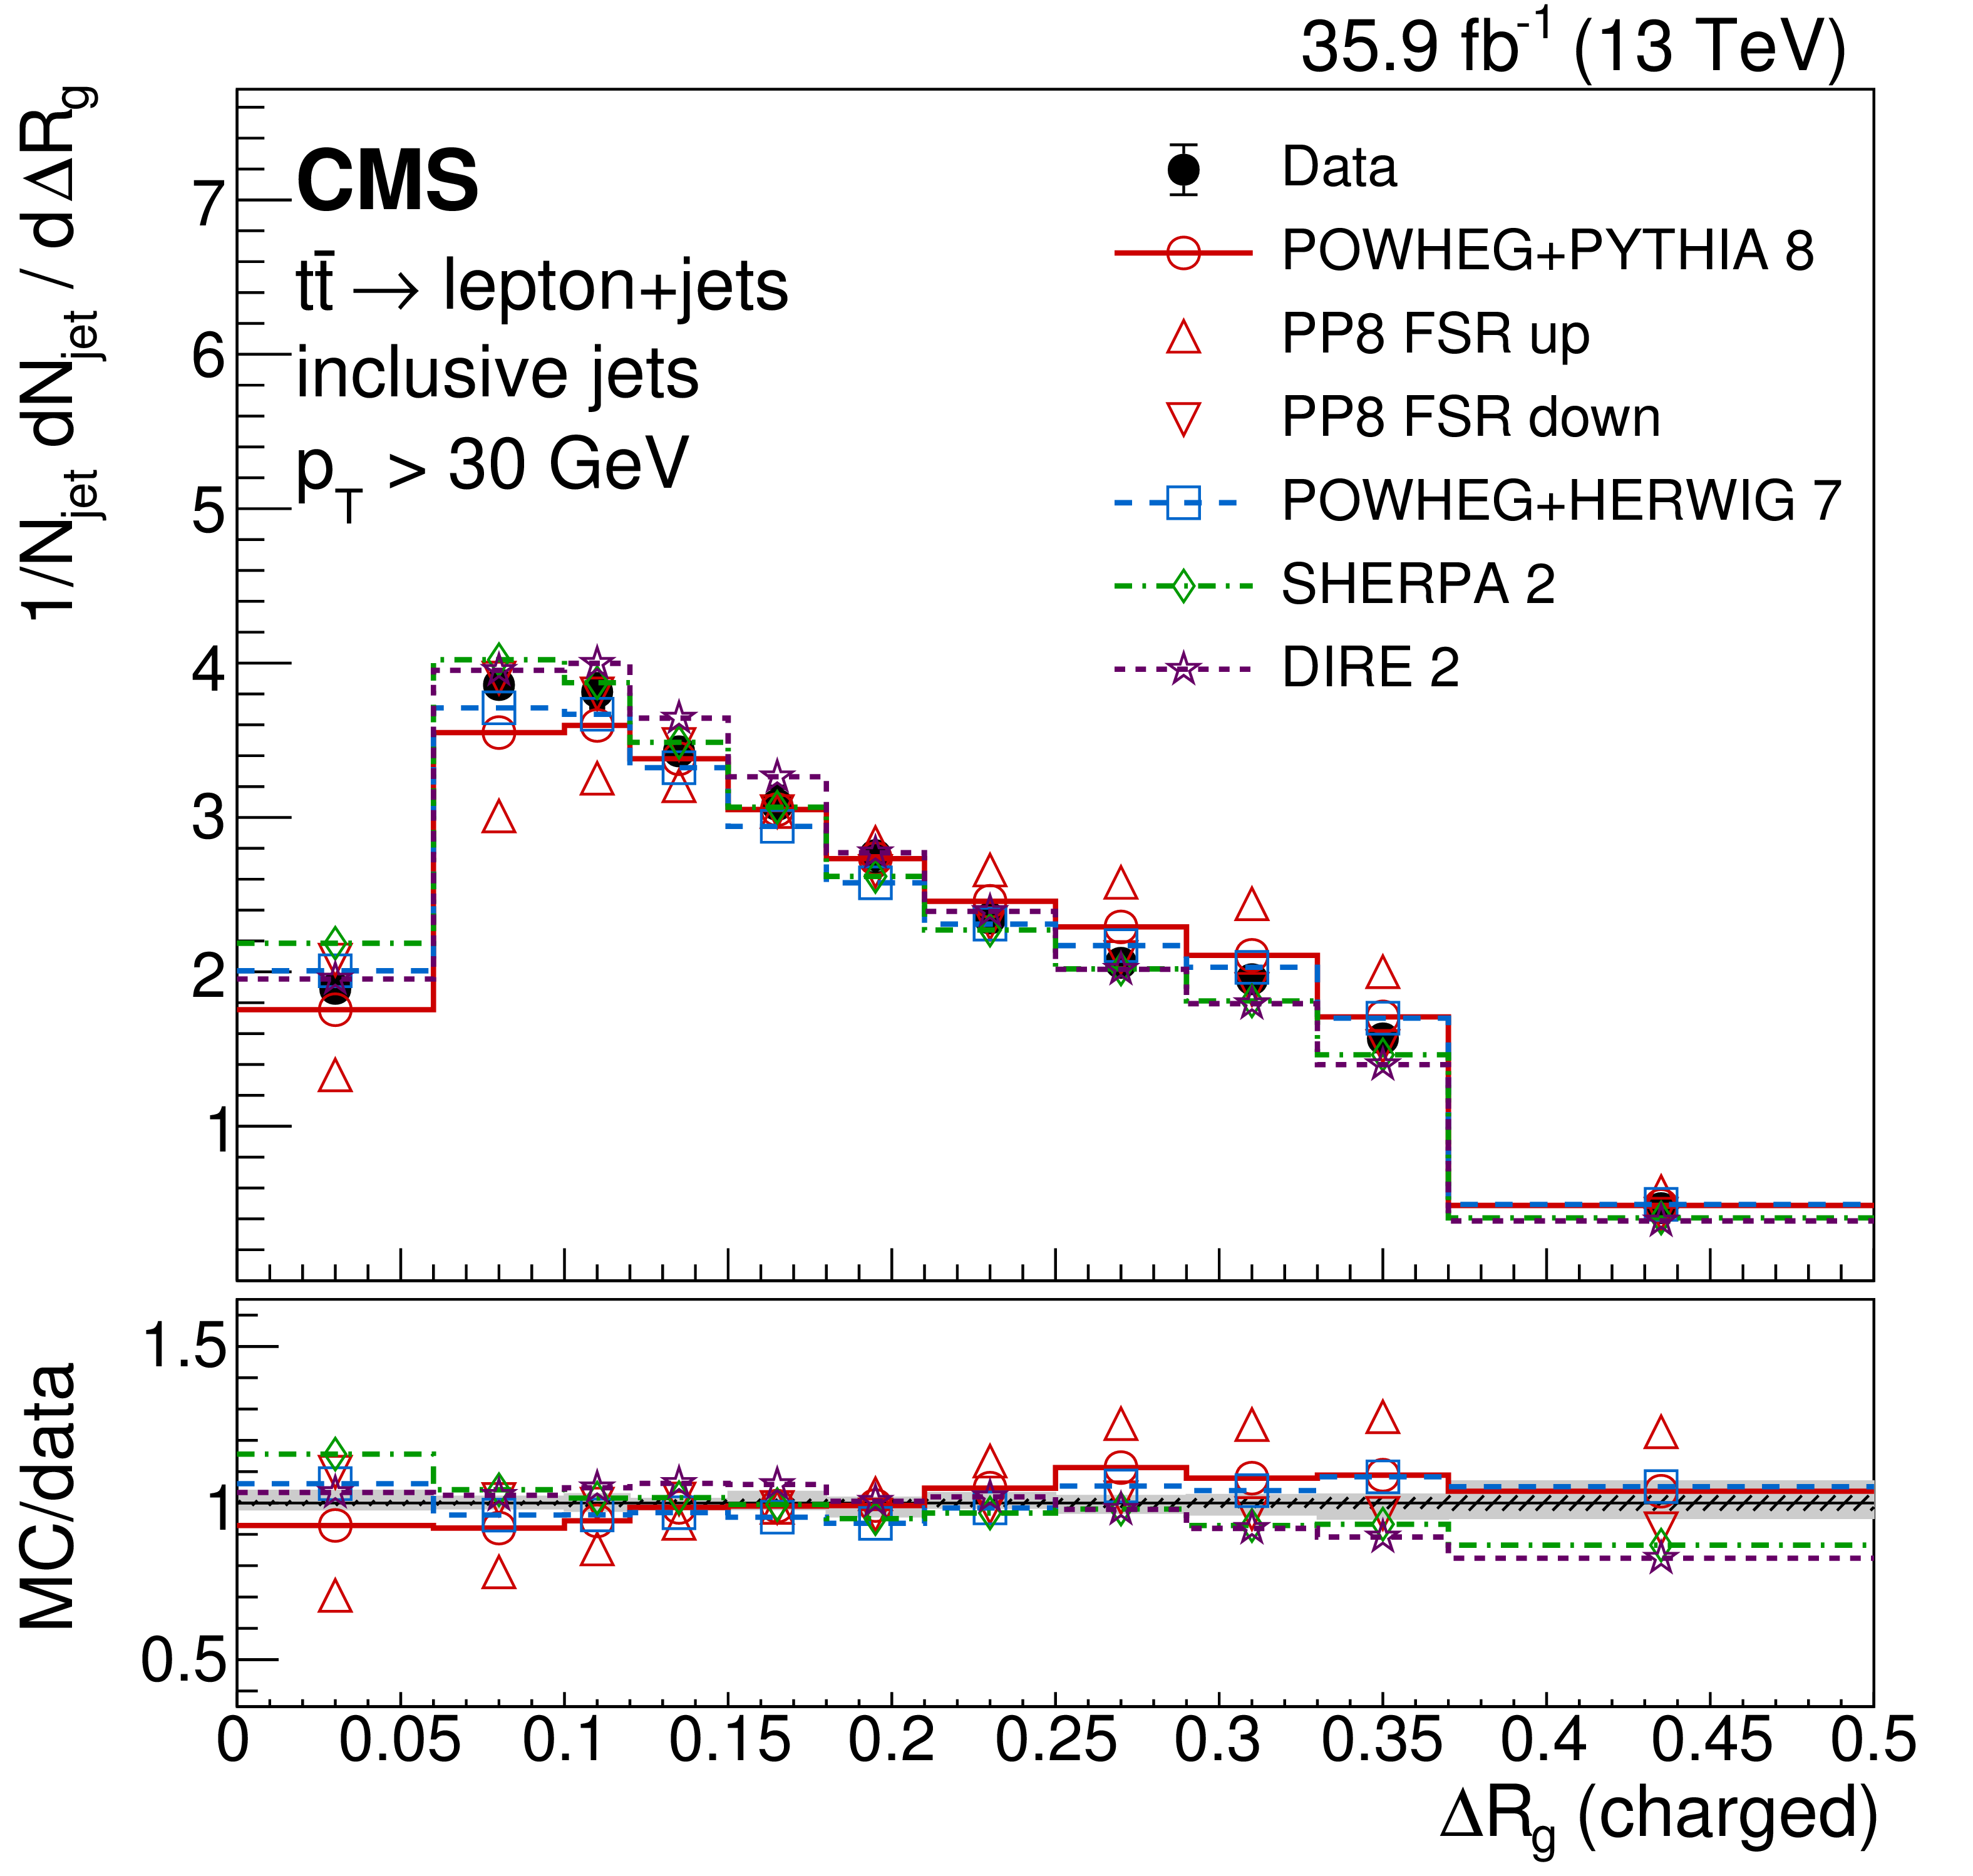
Distributions of the angle between the groomed subjets $\Delta R_\mathrm {g}$, unfolded to the particle level, for inclusive jets reconstructed with charged (left) and charged+neutral particles (right). Data (points) are compared to different MC predictions (upper), and as MC/data ratios (lower). The hatched and shaded bands represent the statistical and total uncertainties, respectively. |
png pdf |
Figure 11-a:
Distribution of the angle between the groomed subjets $\Delta R_\mathrm {g}$, unfolded to the particle level, for inclusive jets reconstructed with charged particles. Data (points) are compared to different MC predictions (upper), and as MC/data ratios (lower). The hatched and shaded bands represent the statistical and total uncertainties, respectively. |

png pdf |
Figure 11-b:
Distribution of the angle between the groomed subjets $\Delta R_\mathrm {g}$, unfolded to the particle level, for inclusive jets reconstructed with charged+neutral particles. Data (points) are compared to different MC predictions (upper), and as MC/data ratios (lower). The hatched and shaded bands represent the statistical and total uncertainties, respectively. |

png pdf |
Figure 12:
Distributions of the $\mathcal {N}$-subjettiness ratios $\tau _{21}$ (left) and $\tau _{32}$ (right), unfolded to the particle level, for inclusive jets reconstructed with charged particles. Data (points) are compared to different MC predictions (upper), and as MC/data ratios (lower). The hatched and shaded bands represent the statistical and total uncertainties, respectively. |

png pdf |
Figure 12-a:
Distribution of the $\mathcal {N}$-subjettiness ratio $\tau _{21}$, unfolded to the particle level, for inclusive jets reconstructed with charged particles. Data (points) are compared to different MC predictions (upper), and as MC/data ratios (lower). The hatched and shaded bands represent the statistical and total uncertainties, respectively. |

png pdf |
Figure 12-b:
Distribution of the $\mathcal {N}$-subjettiness ratio $\tau _{32}$, unfolded to the particle level, for inclusive jets reconstructed with charged particles. Data (points) are compared to different MC predictions (upper), and as MC/data ratios (lower). The hatched and shaded bands represent the statistical and total uncertainties, respectively. |

png pdf |
Figure 13:
Distributions of the $\mathcal {N}$-subjettiness ratio $\tau _{43}$, unfolded to the particle level, for inclusive jets reconstructed with charged (left) and charged+neutral particles (right). Data (points) are compared to different MC predictions (upper), and as MC/data ratios (lower). The hatched and shaded bands represent the statistical and total uncertainties, respectively. |

png pdf |
Figure 13-a:
Distribution of the $\mathcal {N}$-subjettiness ratio $\tau _{43}$, unfolded to the particle level, for inclusive jets reconstructed with charged particles. Data (points) are compared to different MC predictions (upper), and as MC/data ratios (lower). The hatched and shaded bands represent the statistical and total uncertainties, respectively. |

png pdf |
Figure 13-b:
Distribution of the $\mathcal {N}$-subjettiness ratio $\tau _{43}$, unfolded to the particle level, for inclusive jets reconstructed with charged+neutral particles. Data (points) are compared to different MC predictions (upper), and as MC/data ratios (lower). The hatched and shaded bands represent the statistical and total uncertainties, respectively. |
png pdf |
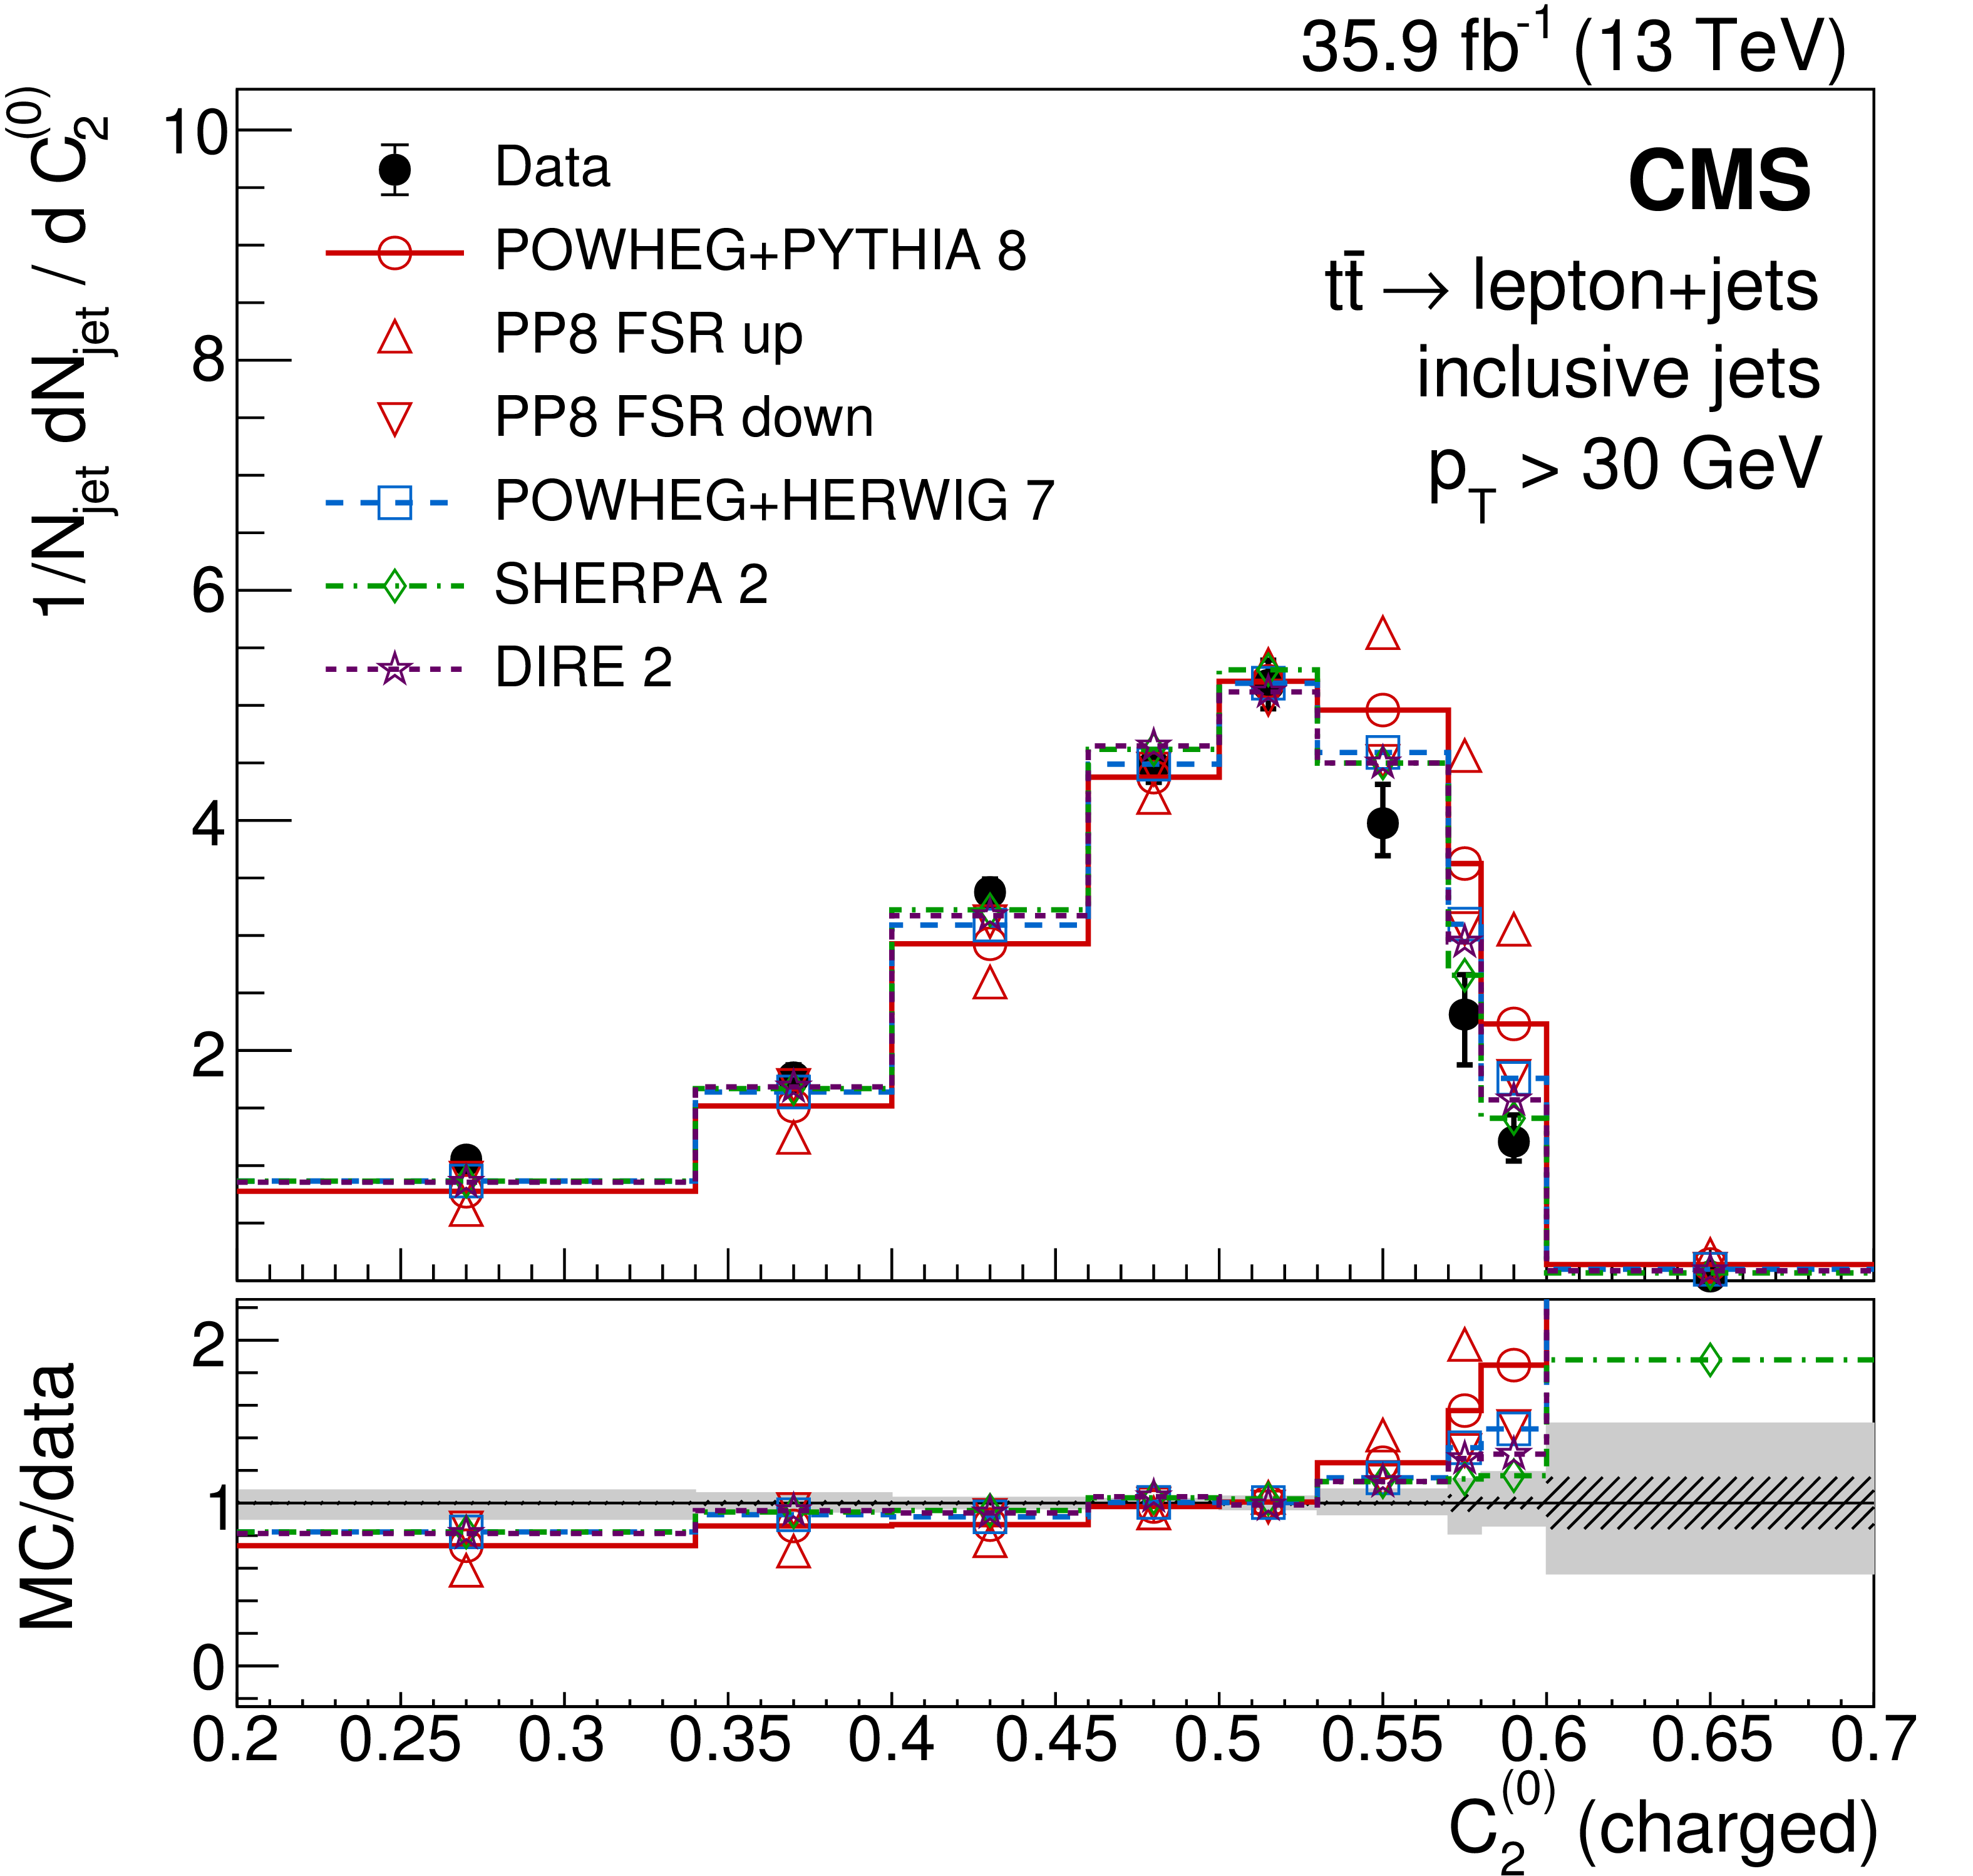
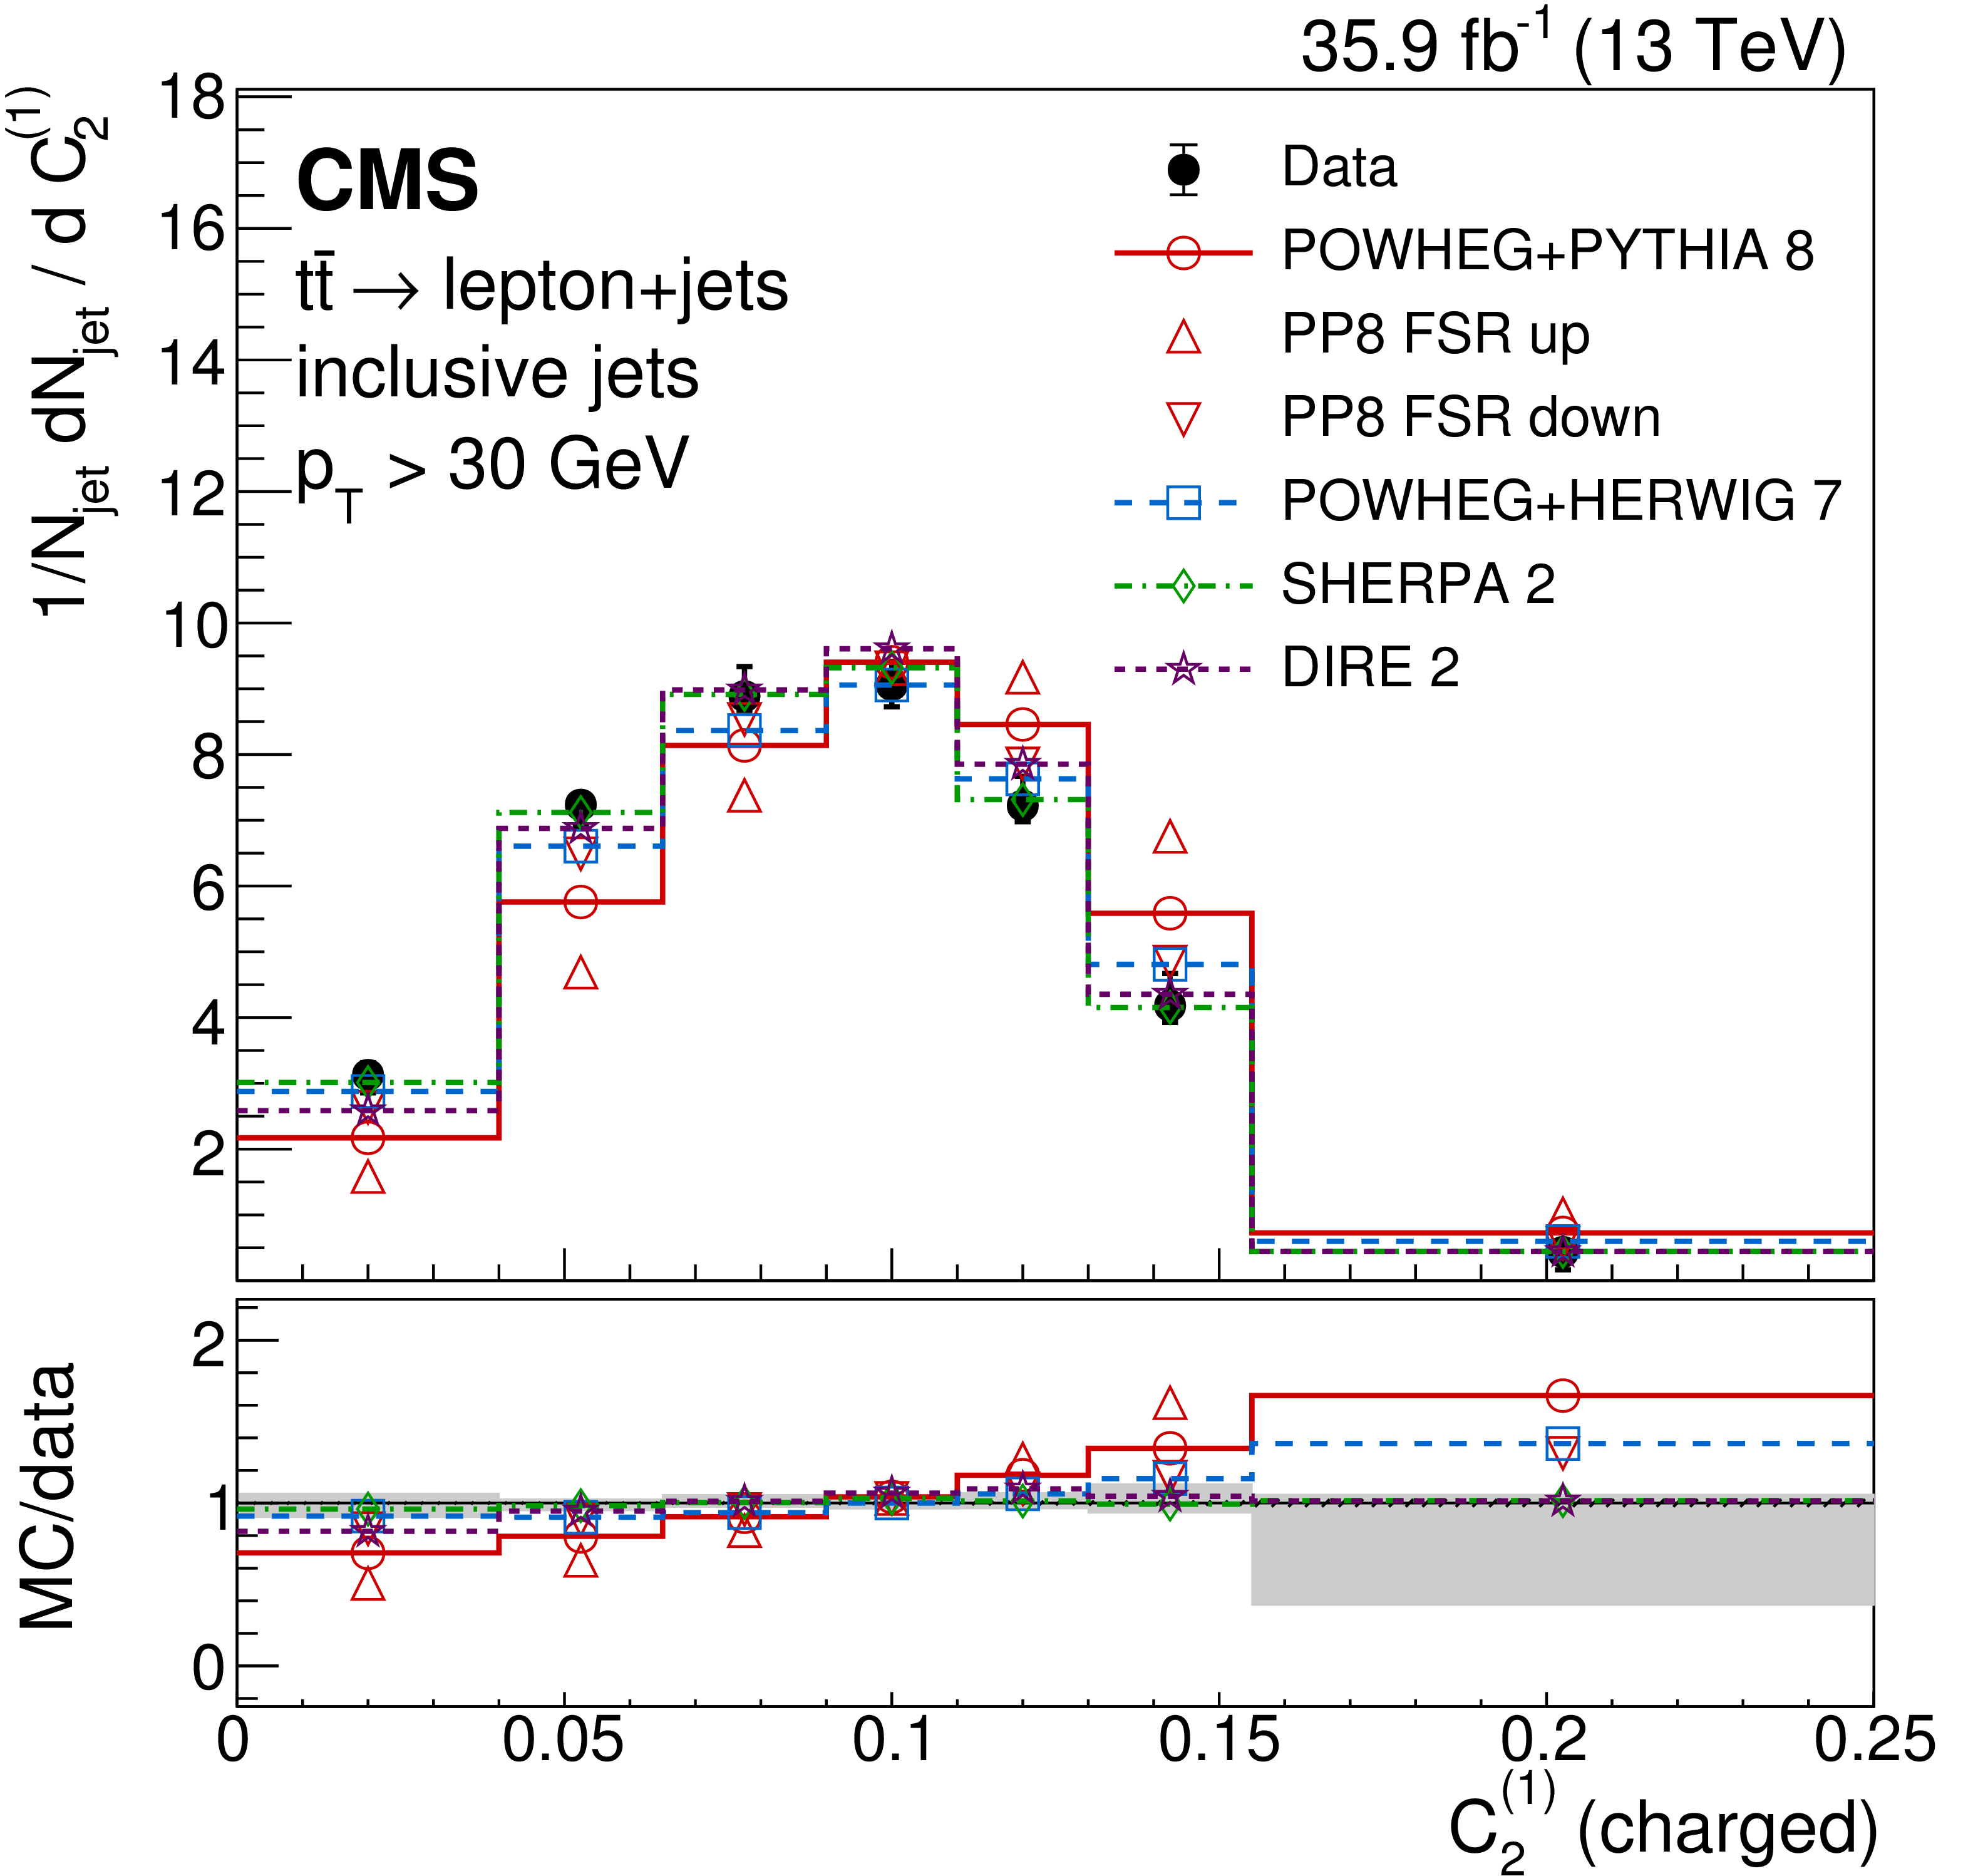
Figure 14:
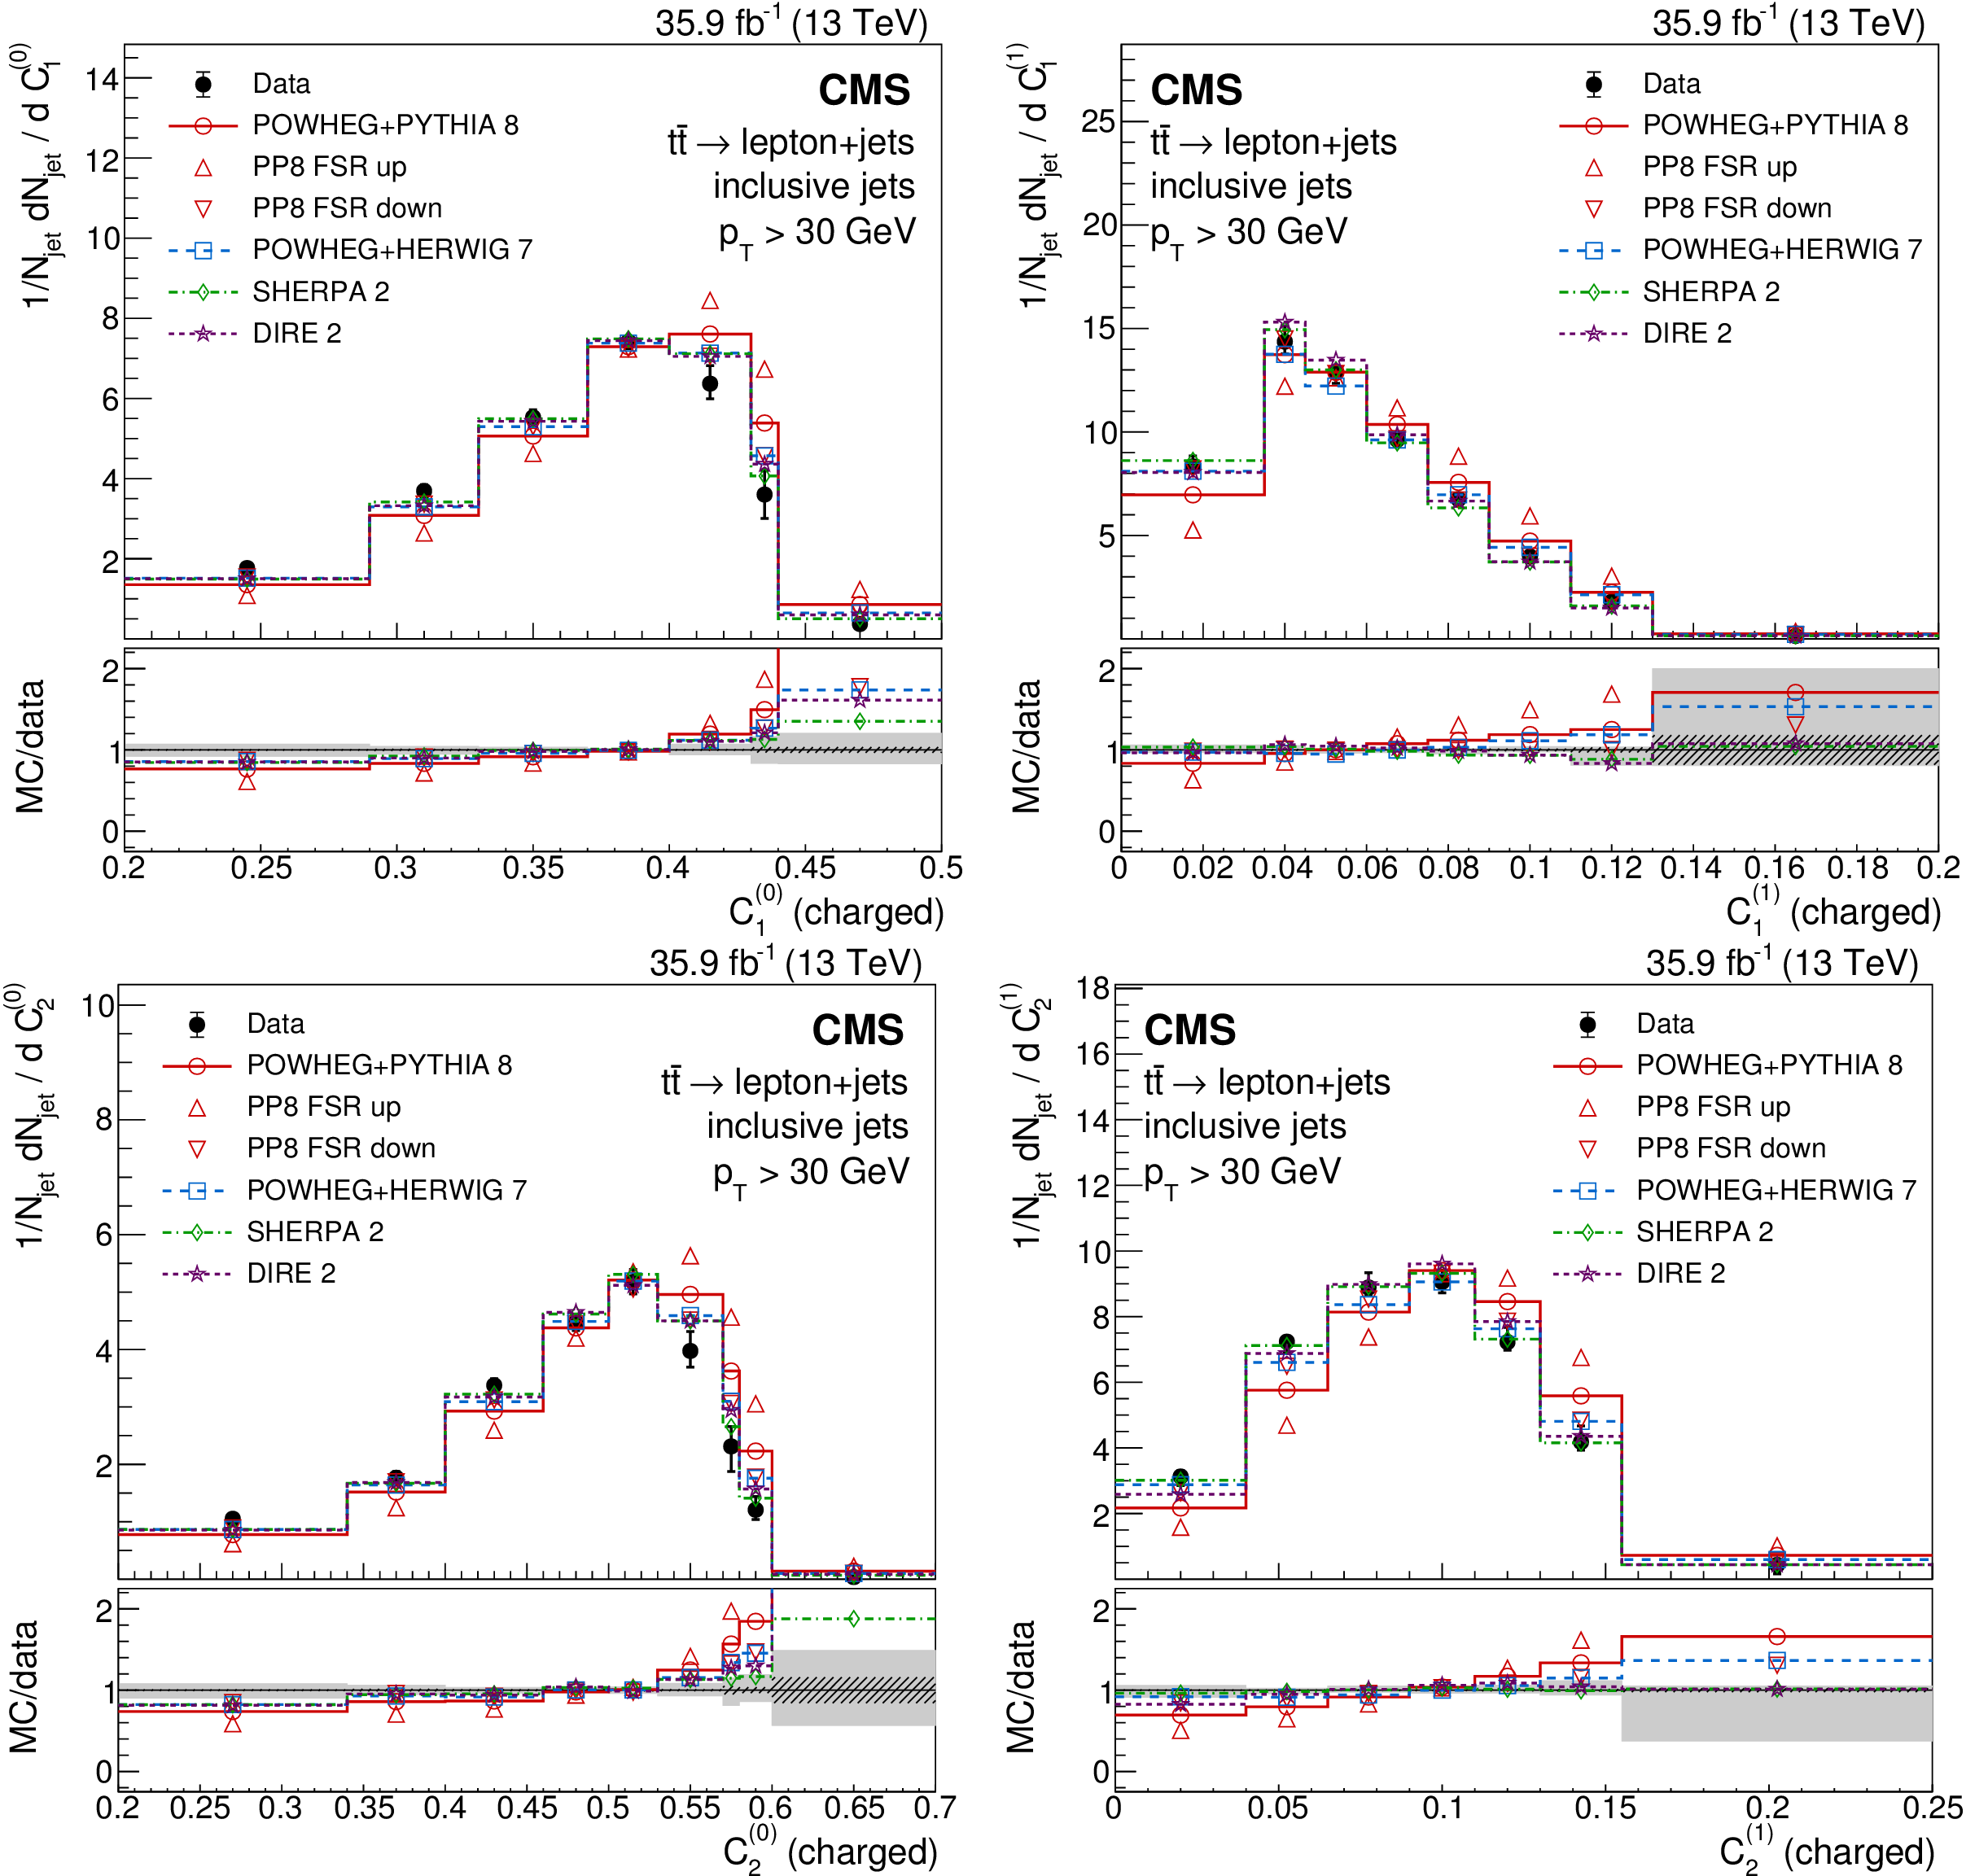
Distributions of energy correlation ratios $C_{1}^{\left (0\right)}$ (upper left), $C_{1}^{\left (1\right)}$ (upper right), $C_{2}^{\left (0\right)}$ (lower left) and $C_{2}^{\left (1\right)}$ (lower right), unfolded to the particle level, for inclusive jets reconstructed with charged particles. Data (points) are compared to different MC predictions (upper), and as MC/data ratios (lower). The hatched and shaded bands represent the statistical and total uncertainties, respectively. |

png pdf |
Figure 14-a:
Distribution of energy correlation ratio $C_{1}^{\left (0\right)}$, unfolded to the particle level, for inclusive jets reconstructed with charged particles. Data (points) are compared to different MC predictions (upper), and as MC/data ratios (lower). The hatched and shaded bands represent the statistical and total uncertainties, respectively. |

png pdf |
Figure 14-b:
Distribution of energy correlation ratio $C_{1}^{\left (1\right)}$, unfolded to the particle level, for inclusive jets reconstructed with charged particles. Data (points) are compared to different MC predictions (upper), and as MC/data ratios (lower). The hatched and shaded bands represent the statistical and total uncertainties, respectively. |
png pdf |
Figure 14-c:
Distribution of energy correlation ratio $C_{2}^{\left (0\right)}$, unfolded to the particle level, for inclusive jets reconstructed with charged particles. Data (points) are compared to different MC predictions (upper), and as MC/data ratios (lower). The hatched and shaded bands represent the statistical and total uncertainties, respectively. |
png pdf |
Figure 14-d:
Distribution of energy correlation ratio $C_{2}^{\left (1\right)}$, unfolded to the particle level, for inclusive jets reconstructed with charged particles. Data (points) are compared to different MC predictions (upper), and as MC/data ratios (lower). The hatched and shaded bands represent the statistical and total uncertainties, respectively. |

png pdf |
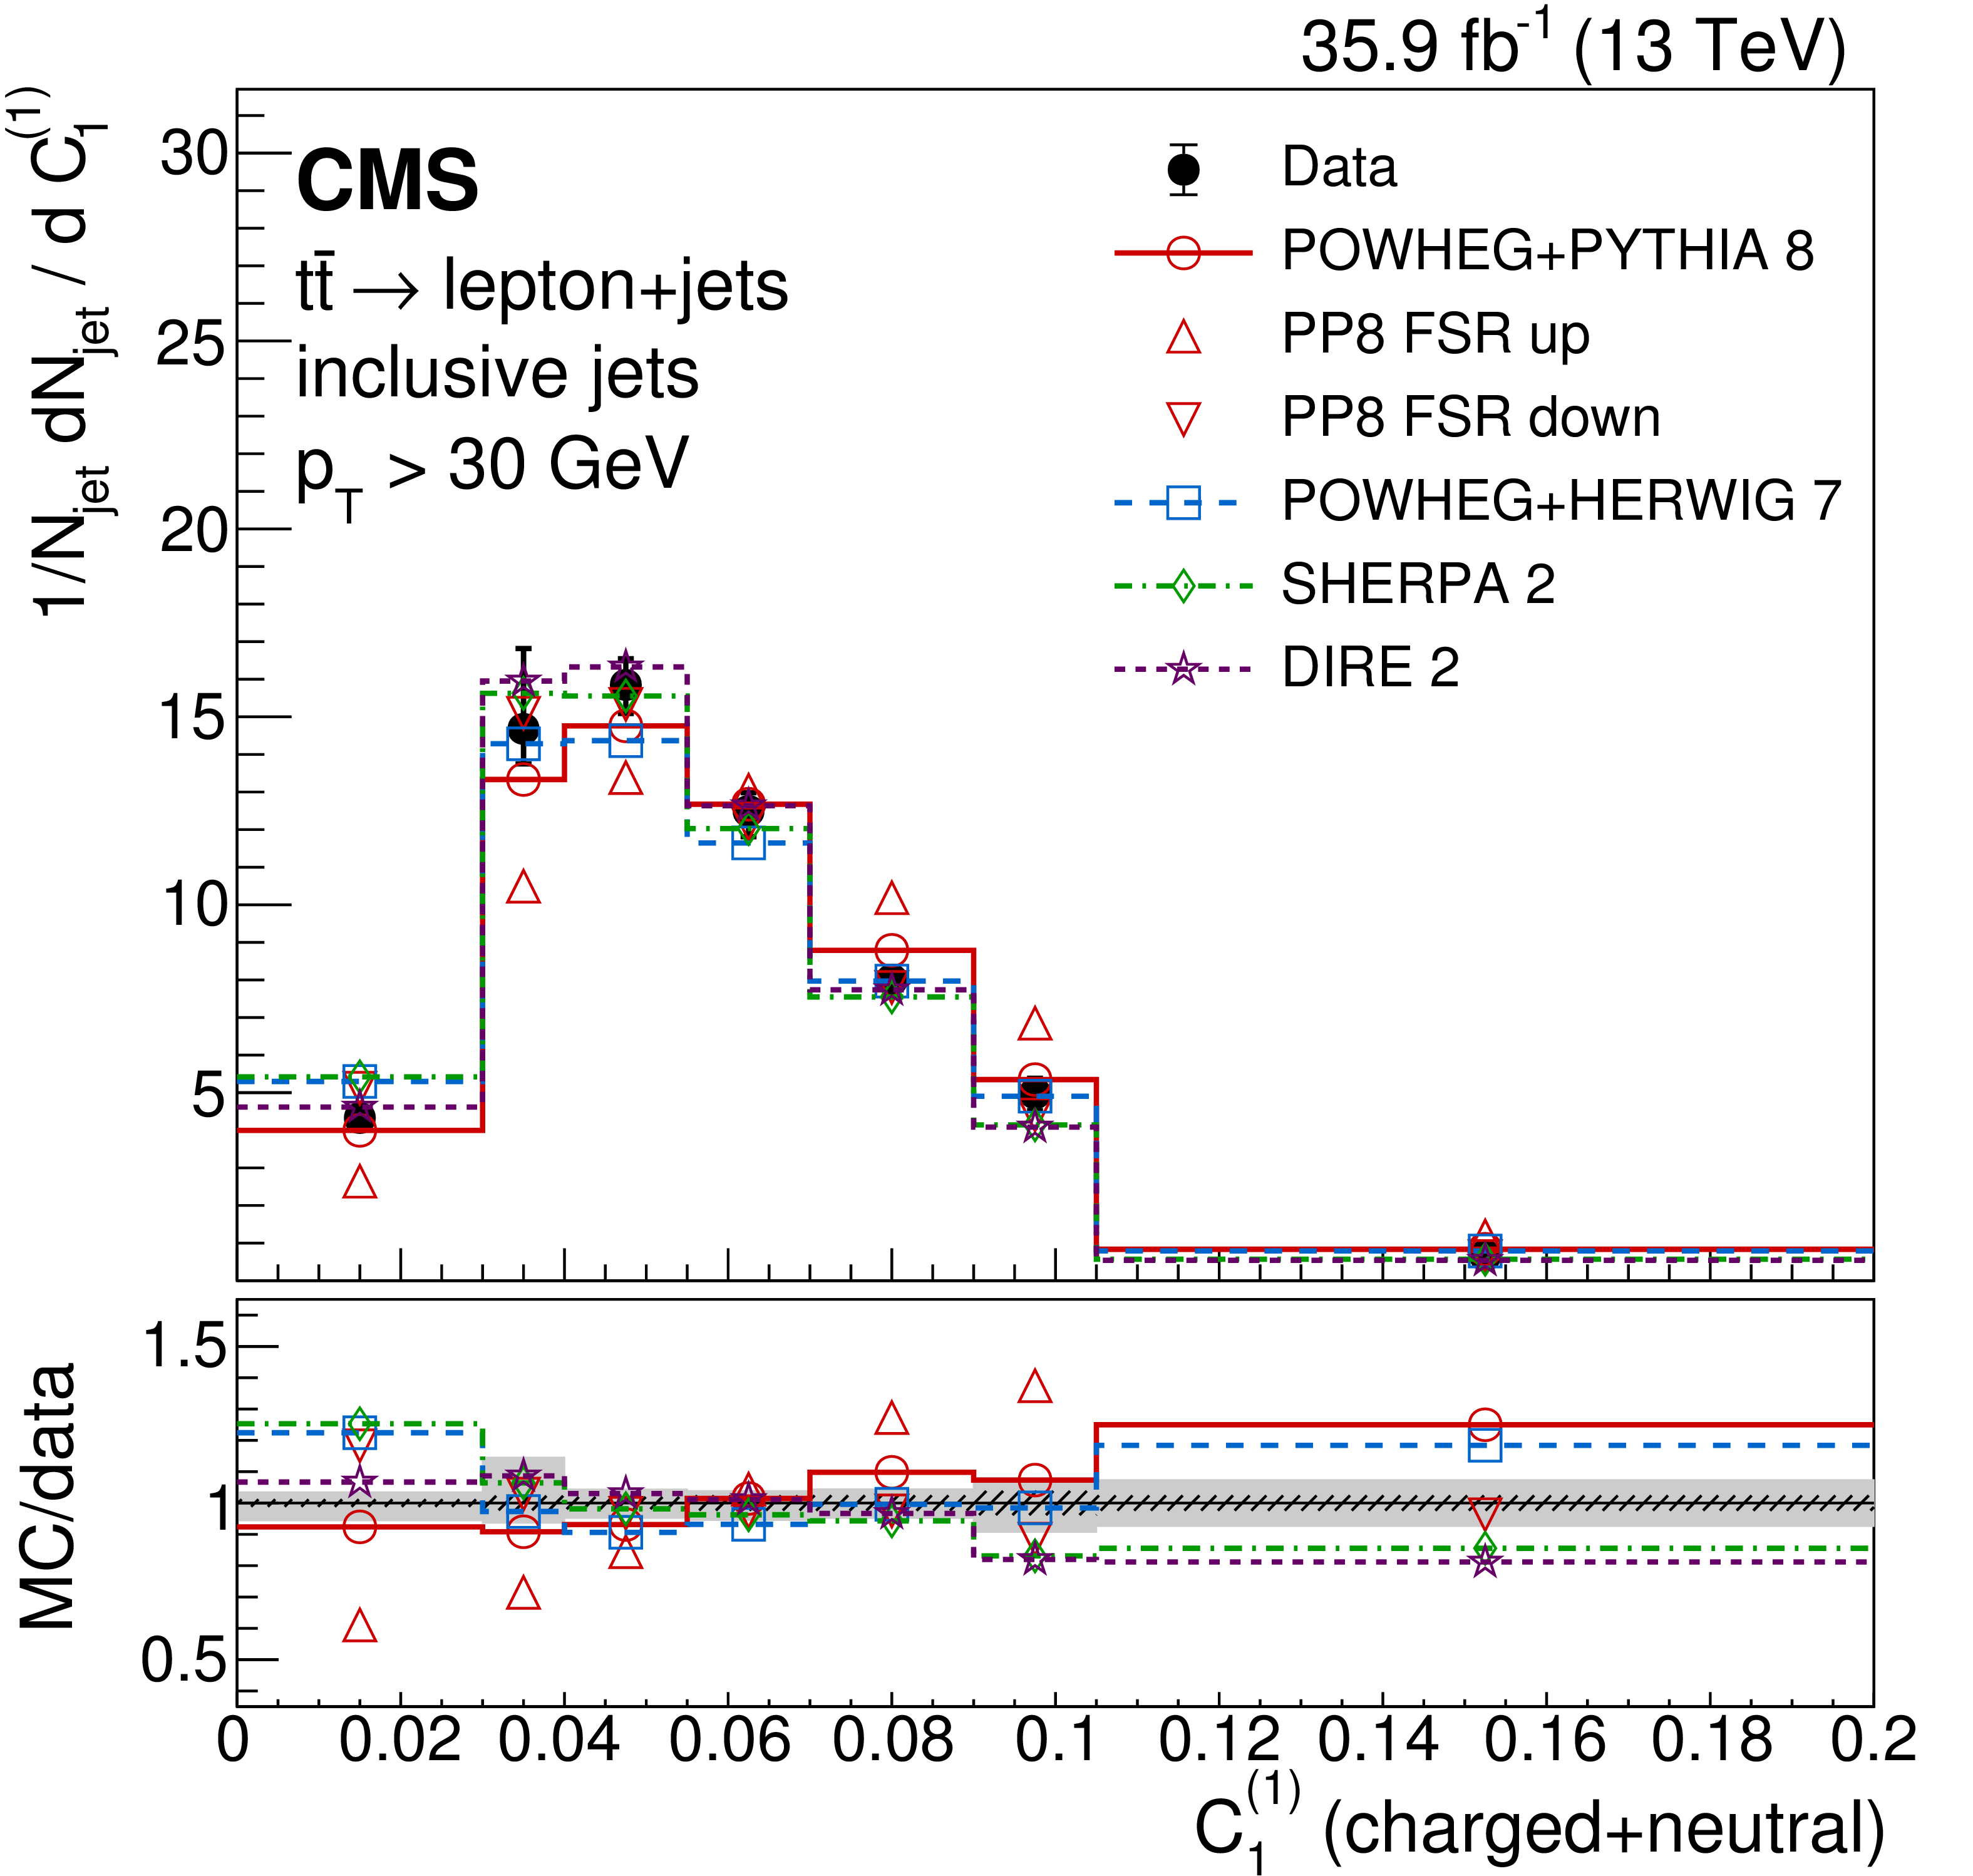
Figure 15:
Distributions of energy correlation ratios $C_{1}^{\left (0\right)}$ (left) and $C_{1}^{\left (1\right)}$ (right), unfolded to the particle level, for inclusive jets reconstructed with charged+neutral particles. Data (points) are compared to different MC predictions (upper), and as MC/data ratios (lower). The hatched and shaded bands represent the statistical and total uncertainties, respectively. |

png pdf |
Figure 15-a:
Distribution of energy correlation ratio $C_{1}^{\left (0\right)}$, unfolded to the particle level, for inclusive jets reconstructed with charged+neutral particles. Data (points) are compared to different MC predictions (upper), and as MC/data ratios (lower). The hatched and shaded bands represent the statistical and total uncertainties, respectively. |
png pdf |
Figure 15-b:
Distribution of energy correlation ratio $C_{1}^{\left (1\right)}$, unfolded to the particle level, for inclusive jets reconstructed with charged+neutral particles. Data (points) are compared to different MC predictions (upper), and as MC/data ratios (lower). The hatched and shaded bands represent the statistical and total uncertainties, respectively. |

png pdf |
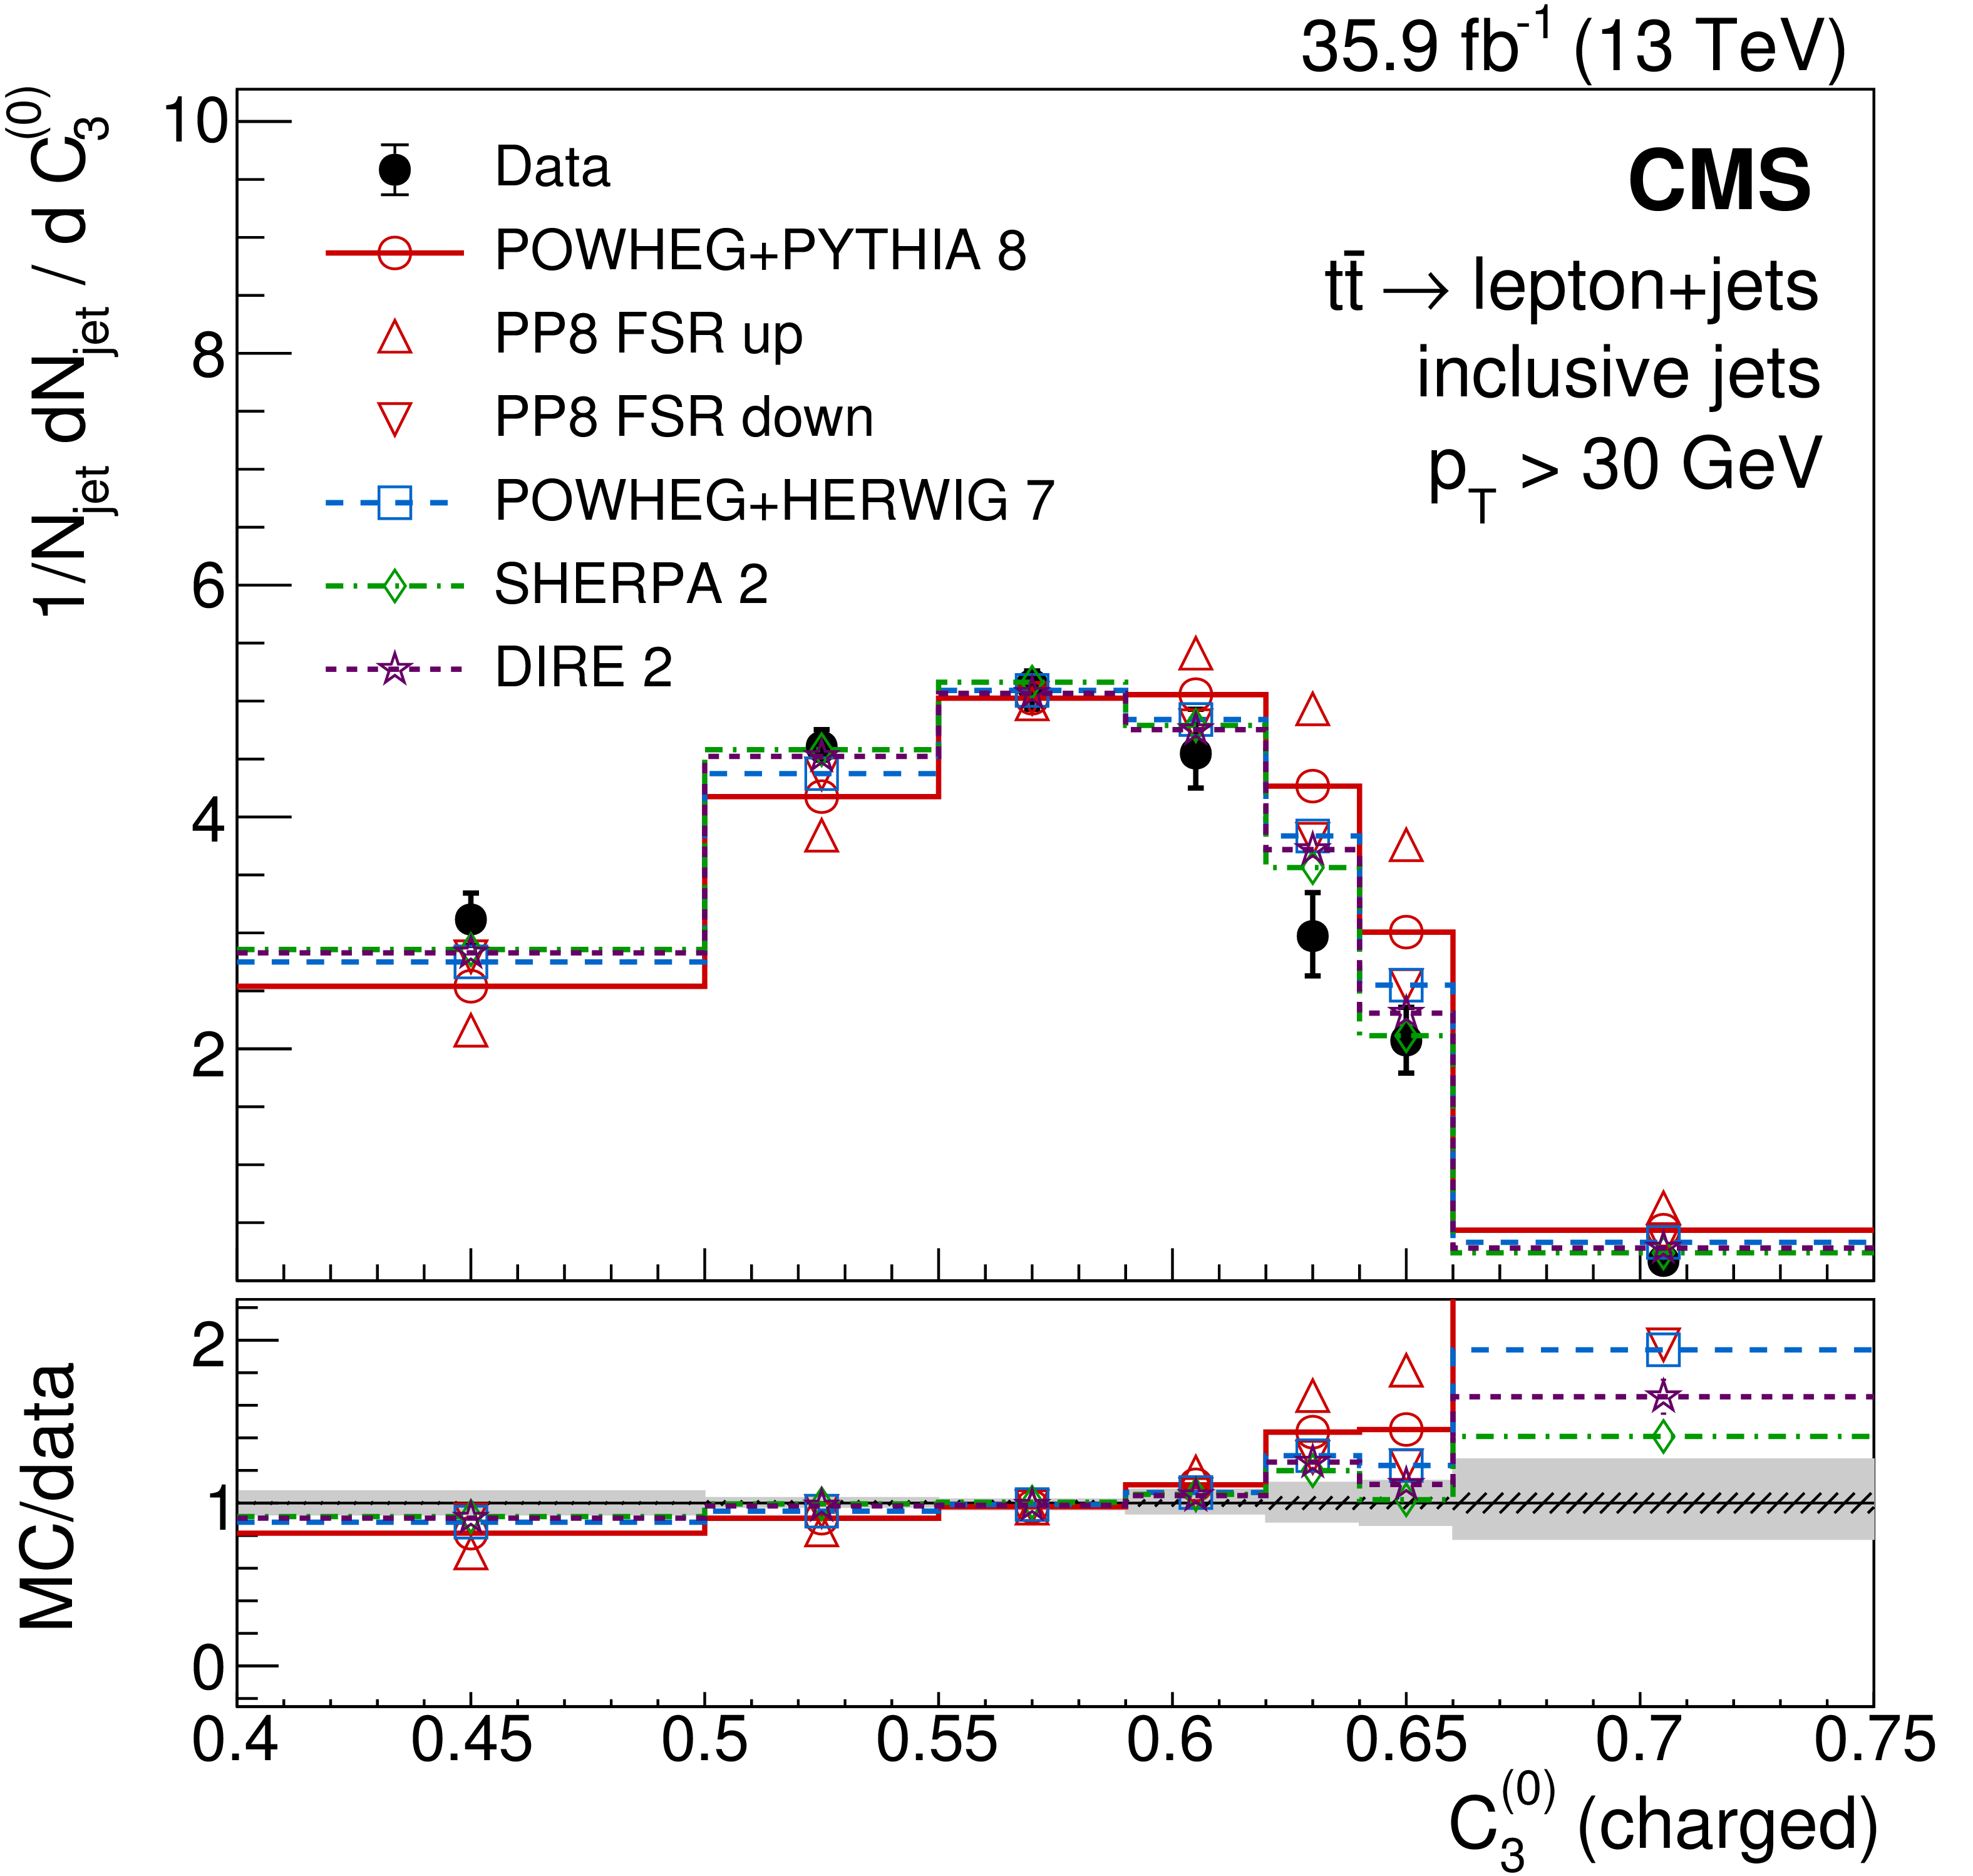
Figure 16:
Distributions of energy correlation ratios $C_{3}^{\left (0\right)}$ (left) and $C_{3}^{\left (1\right)}$ (right), unfolded to the particle level, for inclusive jets reconstructed with charged particles. Data (points) are compared to different MC predictions (upper), and as MC/data ratios (lower). The hatched and shaded bands represent the statistical and total uncertainties, respectively. |
png pdf |
Figure 16-a:
Distribution of the energy correlation ratio $C_{3}^{\left (0\right)}$, unfolded to the particle level, for inclusive jets reconstructed with charged particles. Data (points) are compared to different MC predictions (upper), and as MC/data ratios (lower). The hatched and shaded bands represent the statistical and total uncertainties, respectively. |

png pdf |
Figure 16-b:
Distribution of the energy correlation ratio $C_{3}^{\left (1\right)}$, unfolded to the particle level, for inclusive jets reconstructed with charged particles. Data (points) are compared to different MC predictions (upper), and as MC/data ratios (lower). The hatched and shaded bands represent the statistical and total uncertainties, respectively. |
png pdf |
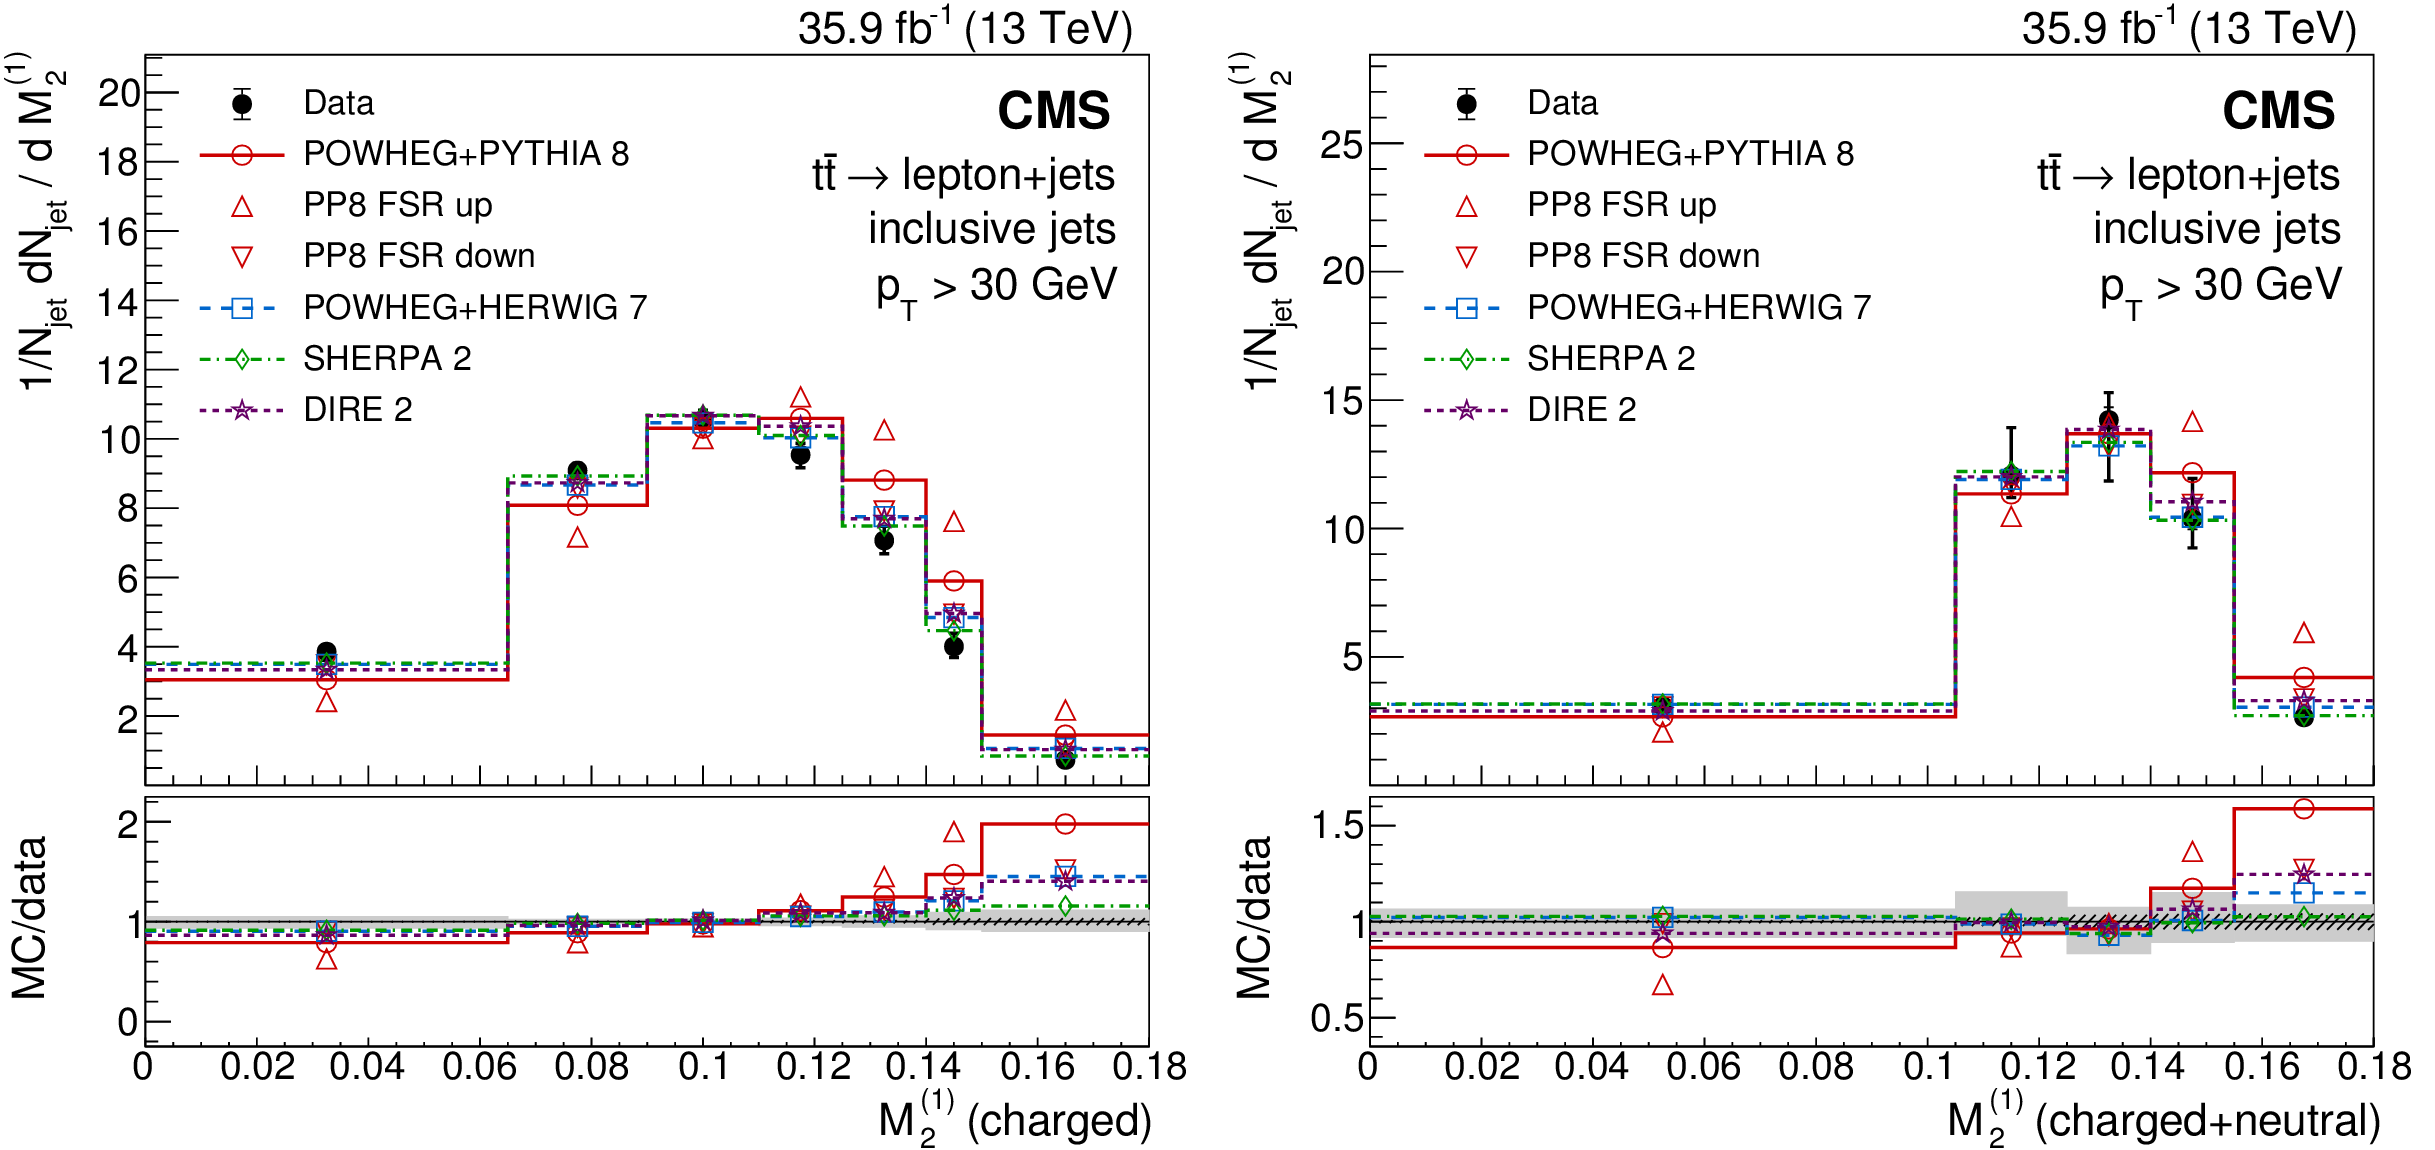
Figure 17:
Distributions of the energy correlation ratio $\mathrm {M}_{2}^{\left (1\right)}$, unfolded to the particle level, for inclusive jets reconstructed with charged (left) or charged+neutral particles (right). Data (points) are compared to different MC predictions (upper), and as MC/data ratios (lower). The hatched and shaded bands represent the statistical and total uncertainties, respectively. |

png pdf |
Figure 17-a:
Distribution of the energy correlation ratio $\mathrm {M}_{2}^{\left (1\right)}$, unfolded to the particle level, for inclusive jets reconstructed with charged particles. Data (points) are compared to different MC predictions (upper), and as MC/data ratios (lower). The hatched and shaded bands represent the statistical and total uncertainties, respectively. |

png pdf |
Figure 17-b:
Distribution of the energy correlation ratio $\mathrm {M}_{2}^{\left (1\right)}$, unfolded to the particle level, for inclusive jets reconstructed with charged+neutral particles. Data (points) are compared to different MC predictions (upper), and as MC/data ratios (lower). The hatched and shaded bands represent the statistical and total uncertainties, respectively. |
png pdf |
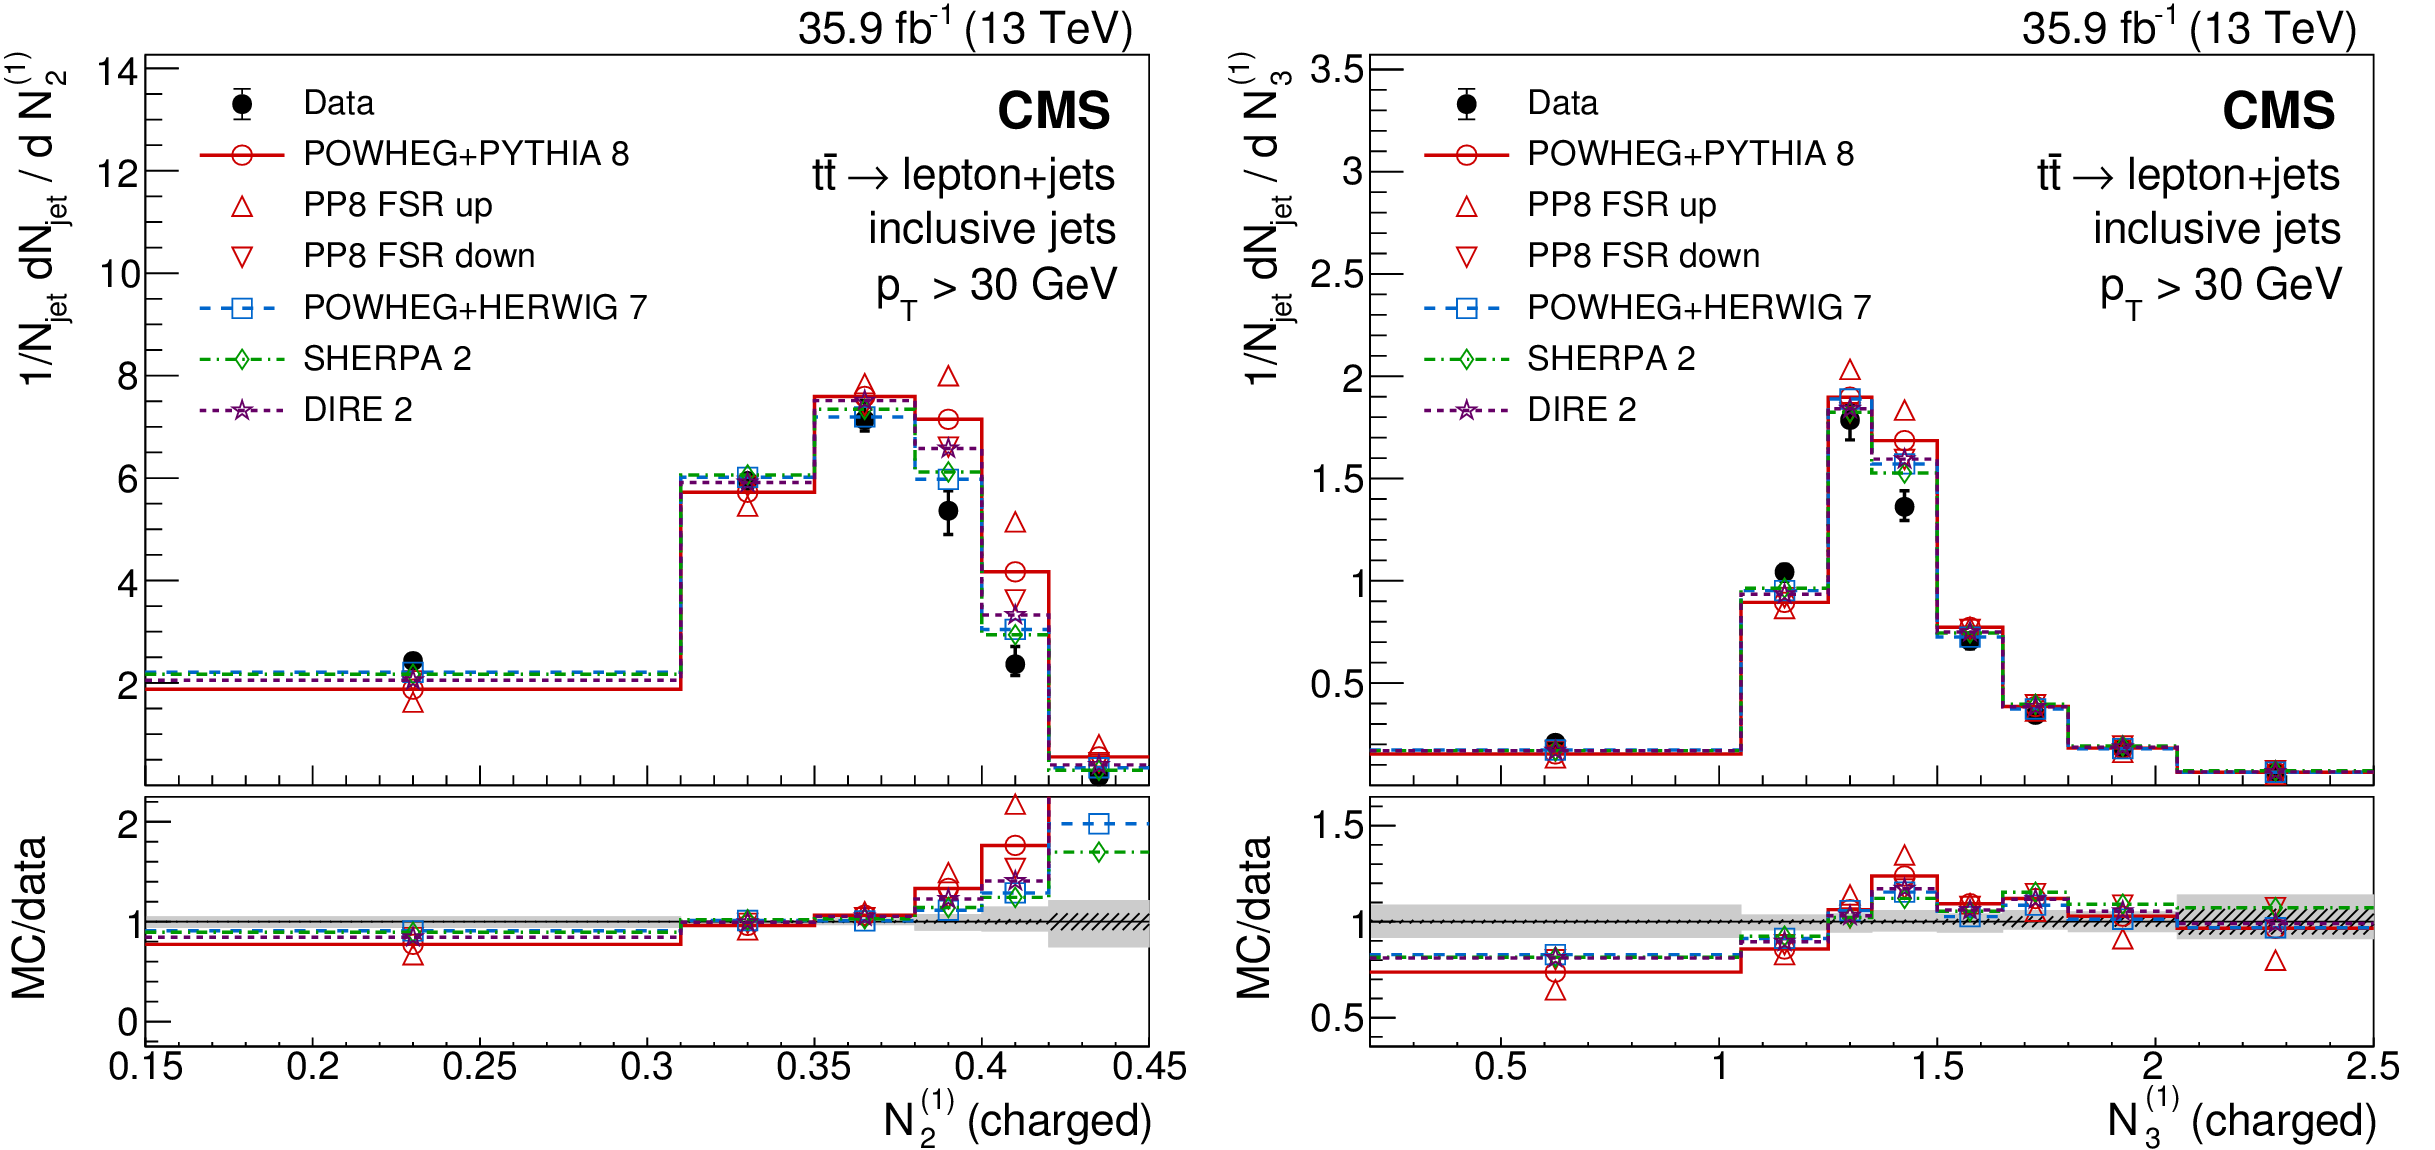
Figure 18:
Distribution of the energy correlation ratios $\mathrm {N}_{2}^{\left (1\right)}$ (left) and $\mathrm {N}_{3}^{\left (1\right)}$ (right), unfolded to the particle level, for inclusive jets reconstructed with charged particles. Data (points) are compared to different MC predictions (upper), and as MC/data ratios (lower). The hatched and shaded bands represent the statistical and total uncertainties, respectively. |

png pdf |
Figure 18-a:
Distribution of the energy correlation ratio $\mathrm {N}_{2}^{\left (1\right)}$, unfolded to the particle level, for inclusive jets reconstructed with charged particles. Data (points) are compared to different MC predictions (upper), and as MC/data ratios (lower). The hatched and shaded bands represent the statistical and total uncertainties, respectively. |

png pdf |
Figure 18-b:
Distribution of the energy correlation ratio $\mathrm {N}_{3}^{\left (1\right)}$, unfolded to the particle level, for inclusive jets reconstructed with charged particles. Data (points) are compared to different MC predictions (upper), and as MC/data ratios (lower). The hatched and shaded bands represent the statistical and total uncertainties, respectively. |
png pdf |
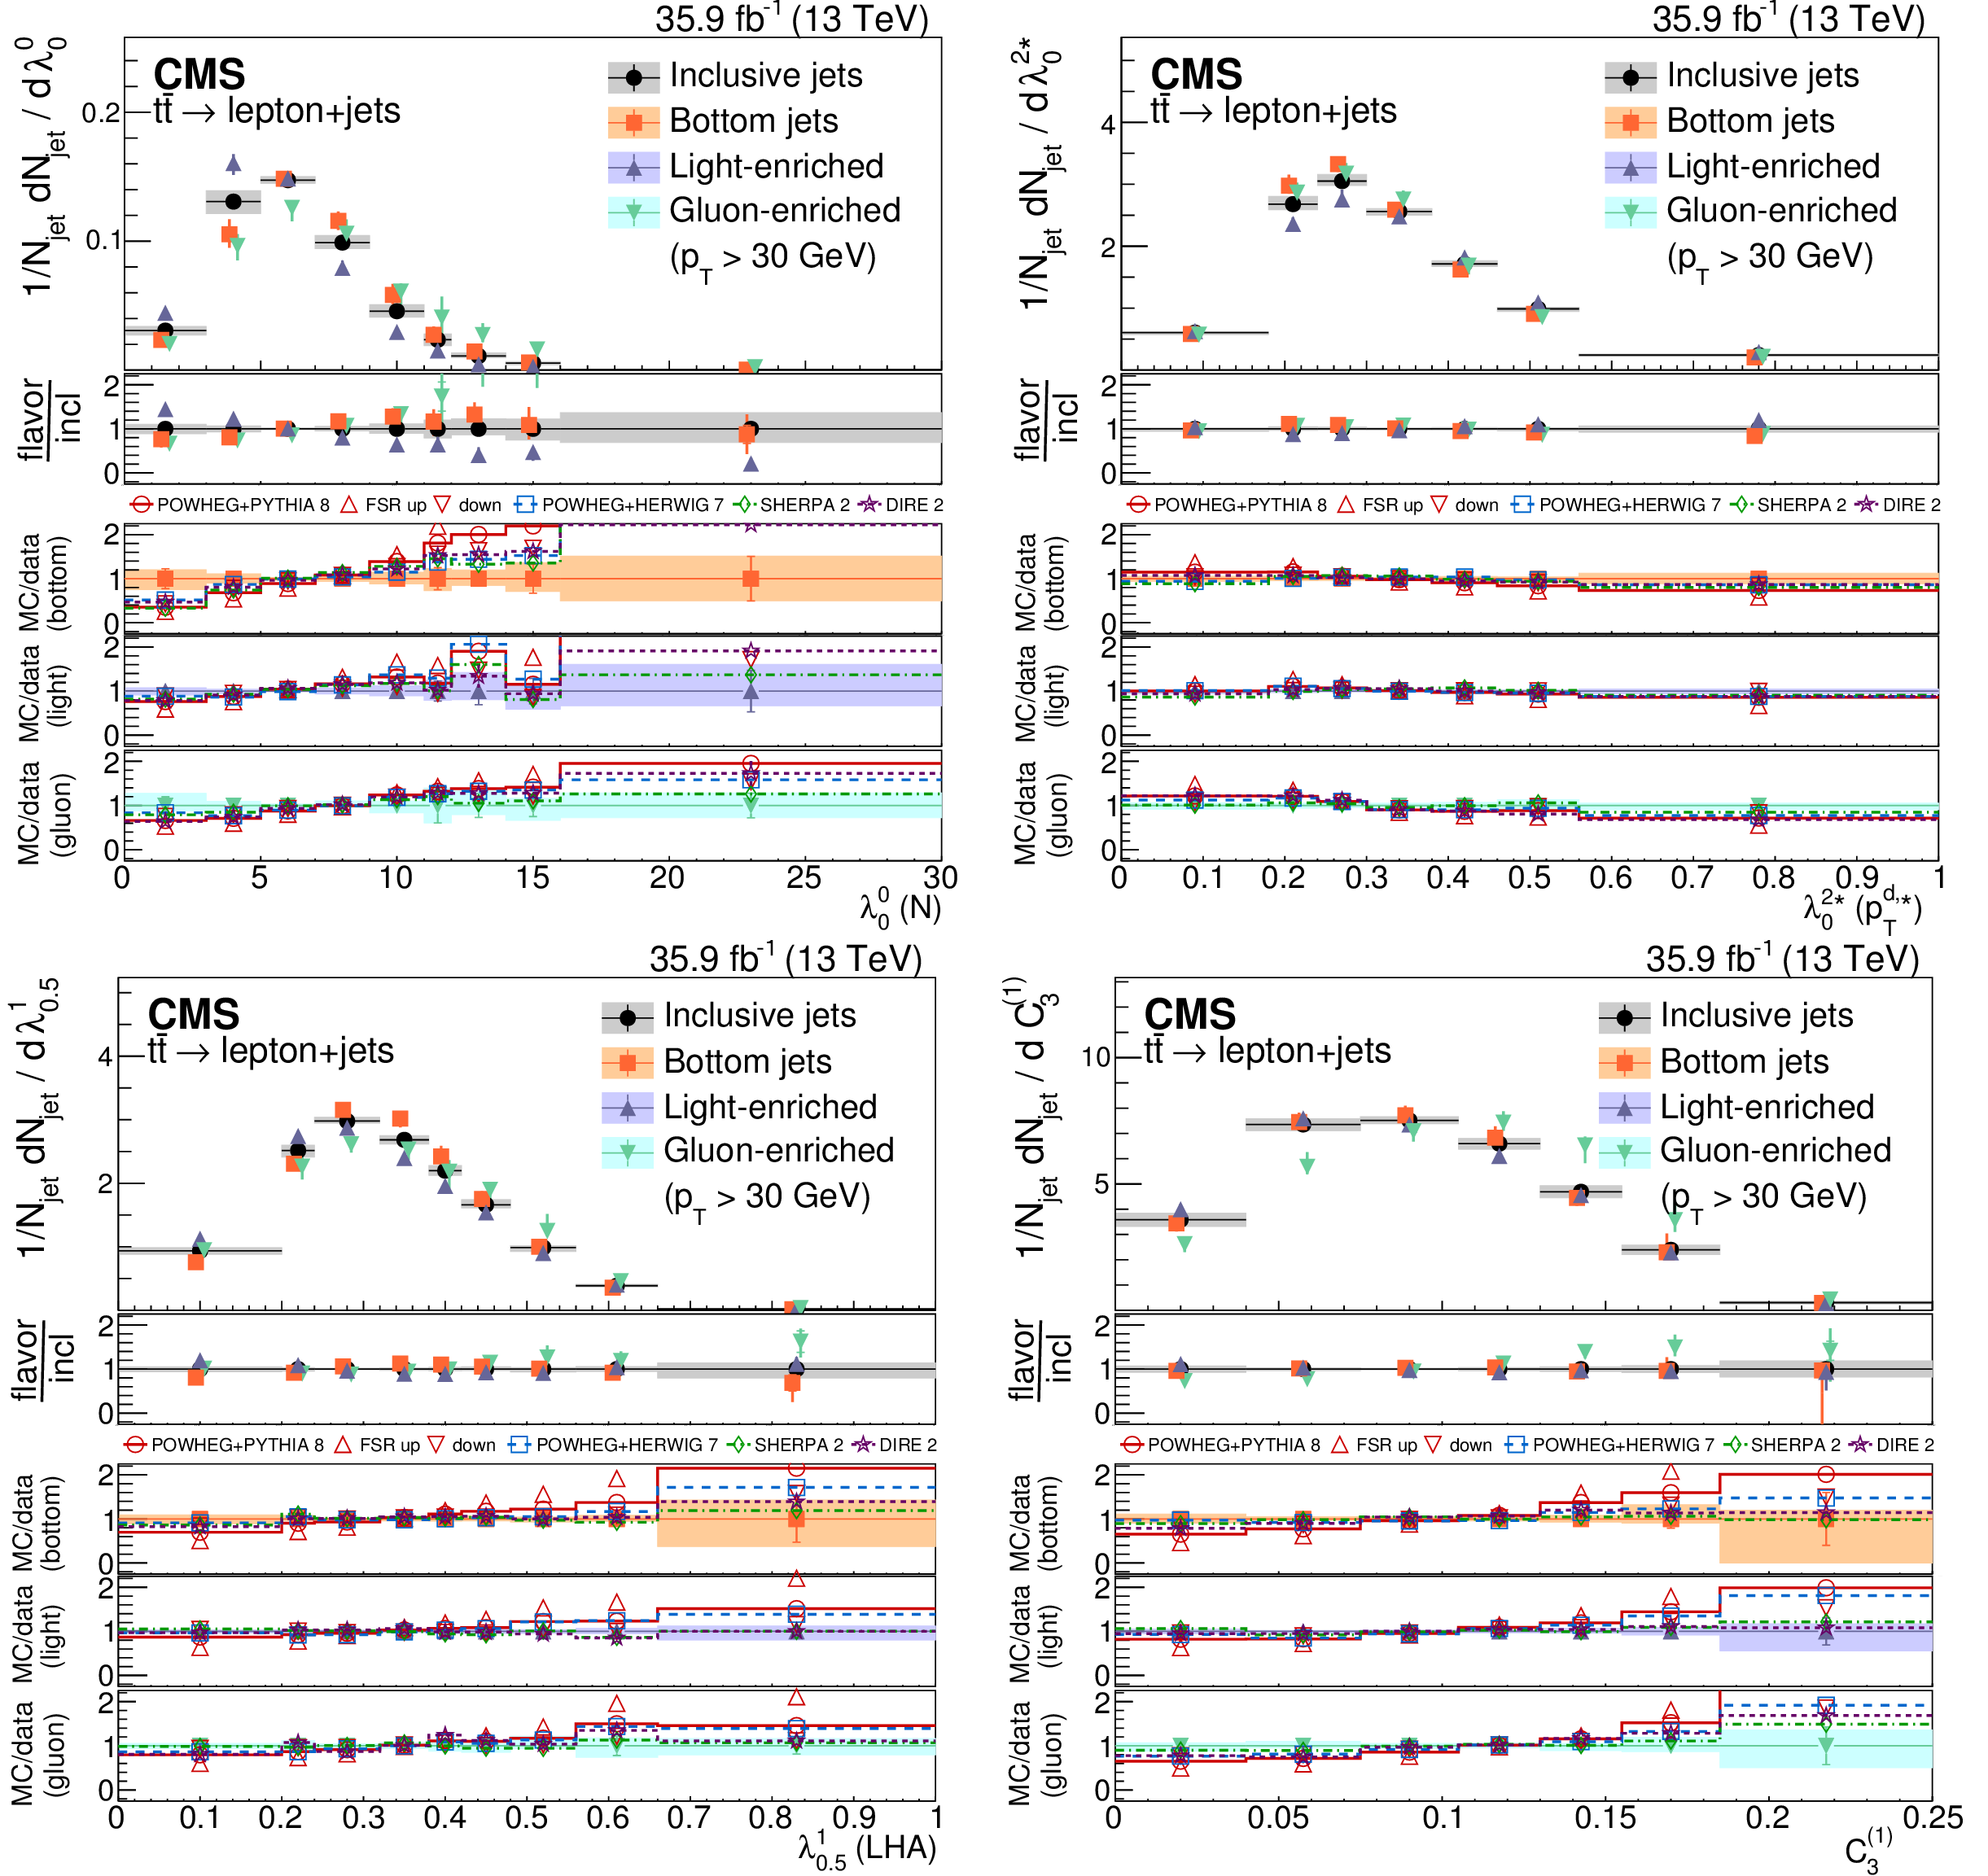
Figure 19:
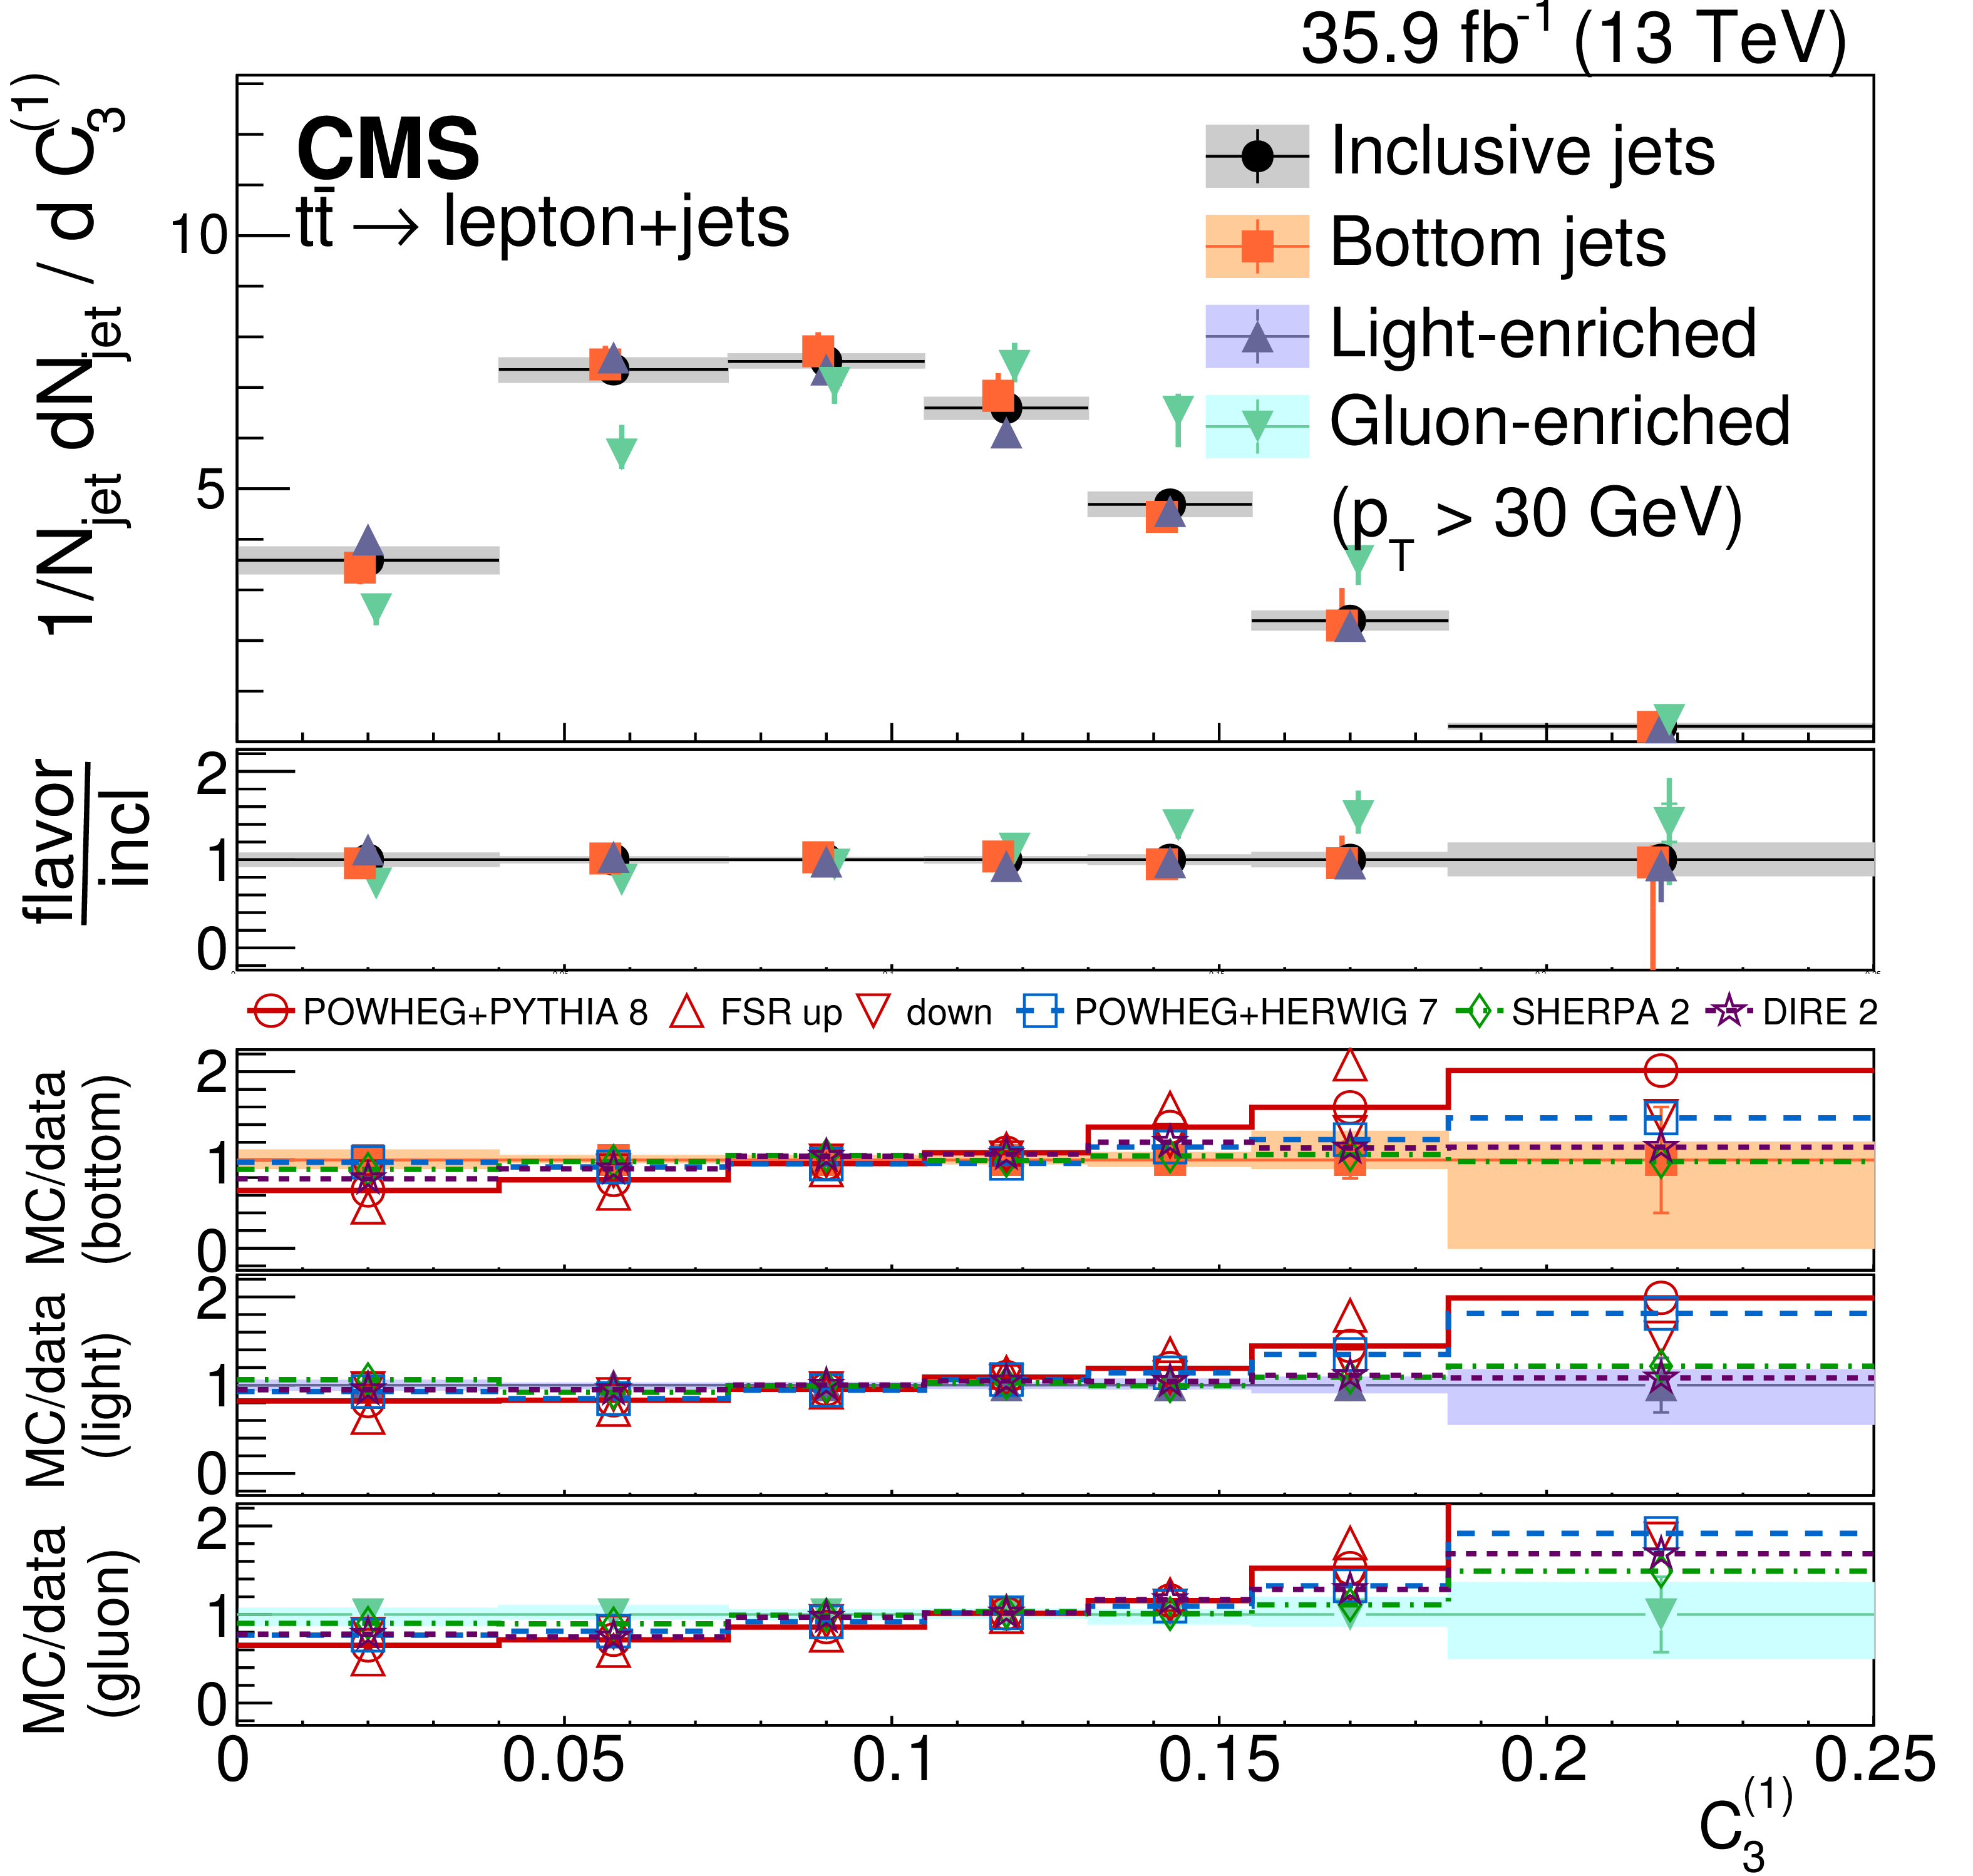
Distributions of the charged multiplicity (upper left), scaled ${p_{\mathrm {T}}}$ dispersion ($\lambda _0^{2*}$) (upper right), Les Houches angularity ($\lambda _{0.5}^1$) (lower left), and the energy correlation ratio $C_{3}^{\left (1\right)}$ (lower right), unfolded to the particle level, for jets of different flavors. The second panel shows the corresponding ratios of the different flavors over the inclusive jets data. The sub-panels show the ratios of the different MC predictions over the bottom, light-quark-enriched, and gluon-enriched jet data. |

png pdf |
Figure 19-a:
Distribution of the charged multiplicity, unfolded to the particle level, for jets of different flavors. The second panel shows the corresponding ratios of the different flavors over the inclusive jets data. The sub-panel shows the ratios of the different MC predictions over the bottom, light-quark-enriched, and gluon-enriched jet data. |
png pdf |
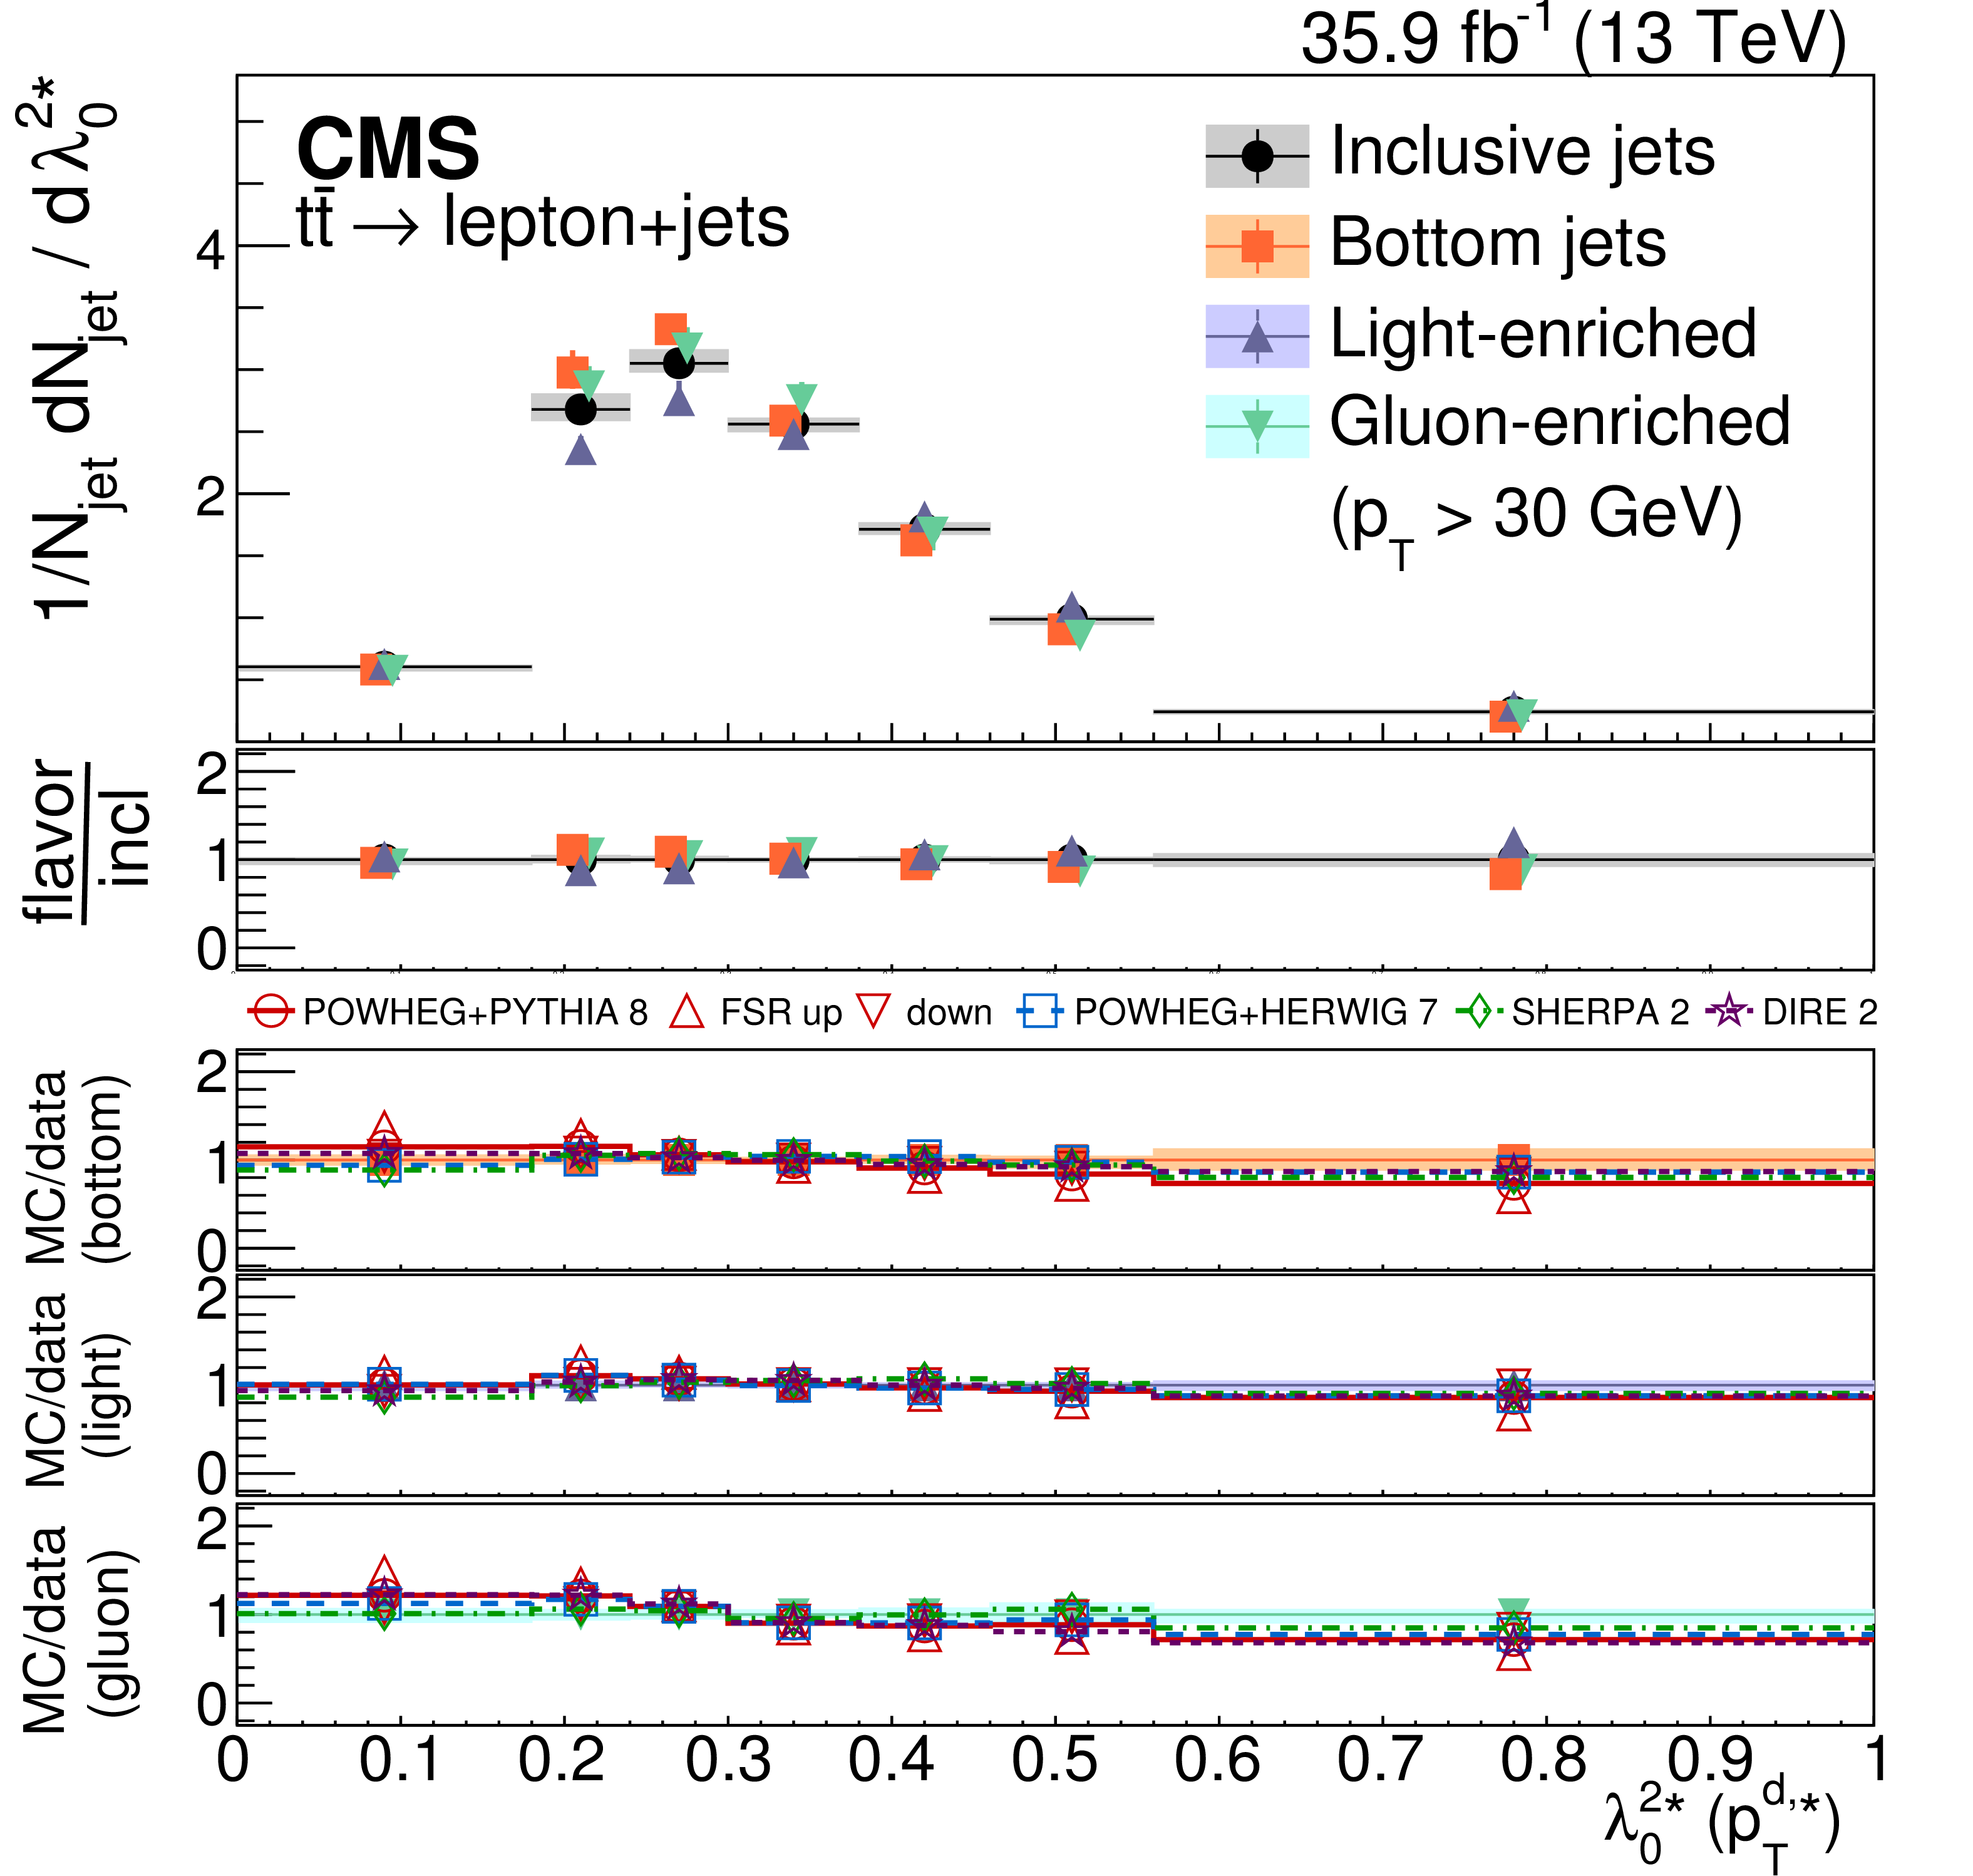
Figure 19-b:
Distribution of the scaled ${p_{\mathrm {T}}}$ dispersion ($\lambda _0^{2*}$), unfolded to the particle level, for jets of different flavors. The second panel shows the corresponding ratios of the different flavors over the inclusive jets data. The sub-panel shows the ratios of the different MC predictions over the bottom, light-quark-enriched, and gluon-enriched jet data. |

png pdf |
Figure 19-c:
Distribution of the Les Houches angularity ($\lambda _{0.5}^1$), unfolded to the particle level, for jets of different flavors. The second panel shows the corresponding ratios of the different flavors over the inclusive jets data. The sub-panel shows the ratios of the different MC predictions over the bottom, light-quark-enriched, and gluon-enriched jet data. |
png pdf |
Figure 19-d:
Distribution of the energy correlation ratio $C_{3}^{\left (1\right)}$, unfolded to the particle level, for jets of different flavors. The second panel shows the corresponding ratios of the different flavors over the inclusive jets data. The sub-panel shows the ratios of the different MC predictions over the bottom, light-quark-enriched, and gluon-enriched jet data. |

png pdf |
Figure 20:
Correlations of the jet-substructure observables used in this analysis obtained at the particle level. |
png pdf |
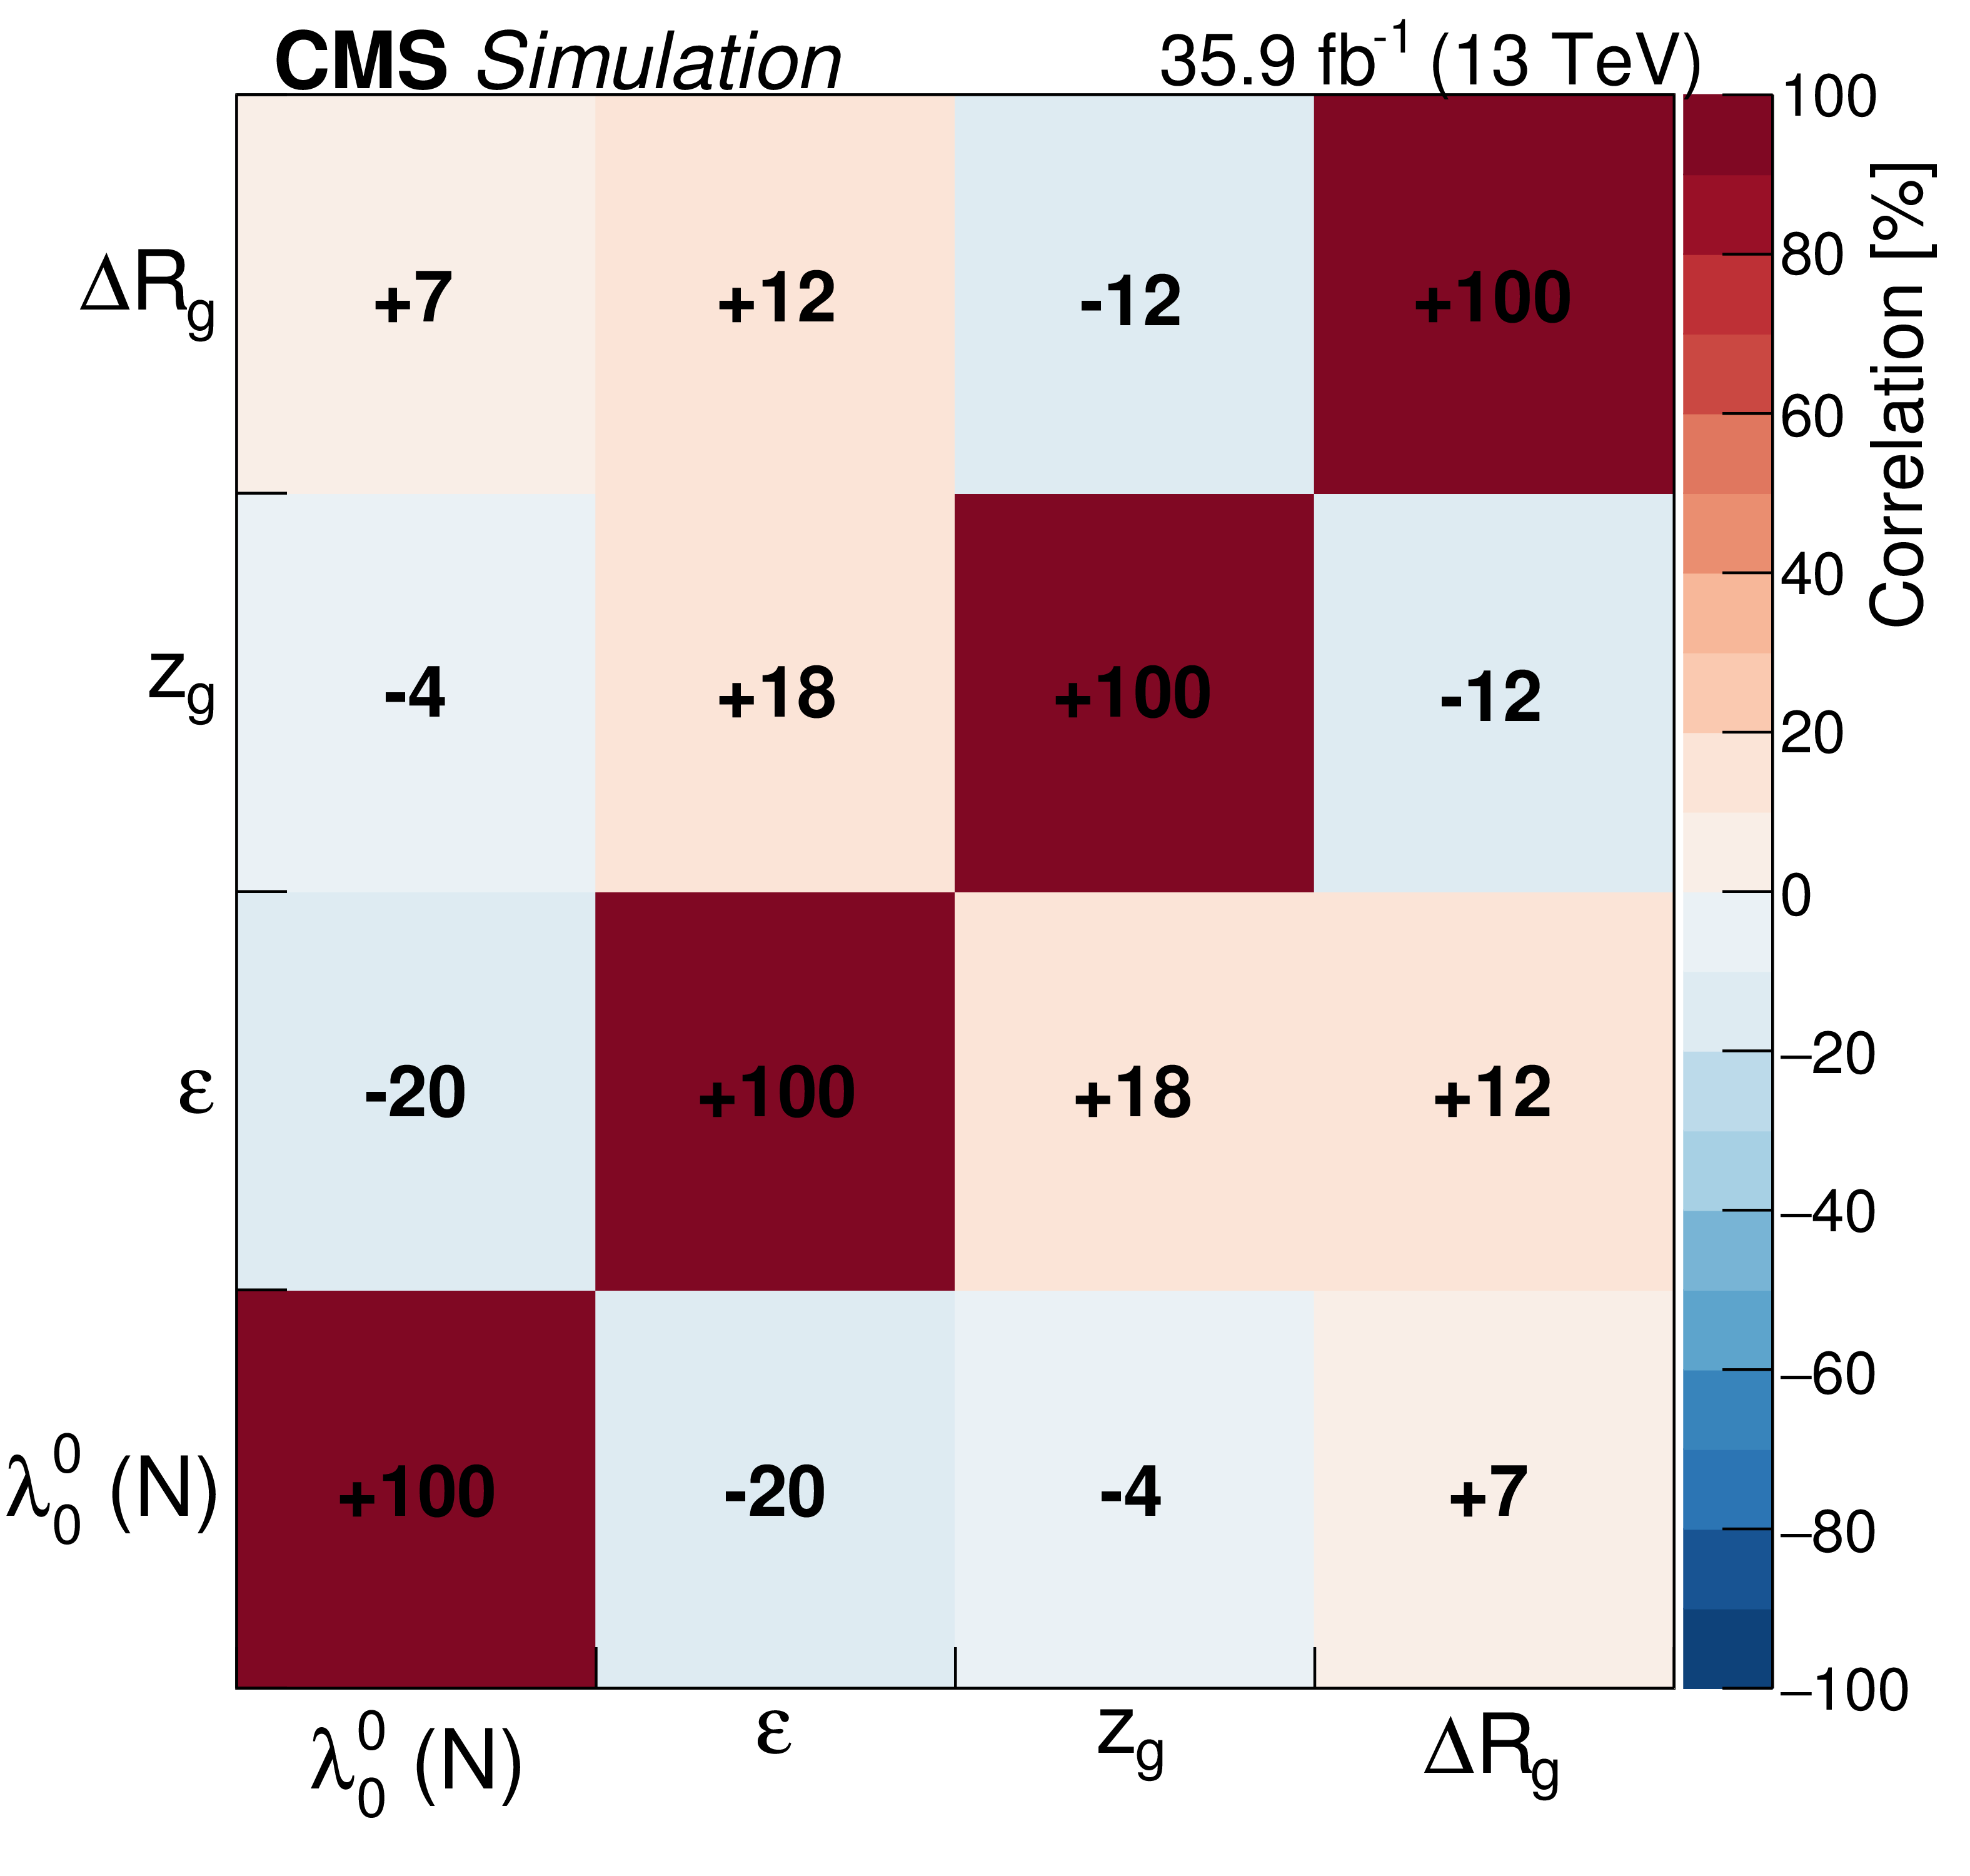
Figure 21:
Correlations of the jet-substructure observables used in this analysis obtained at the particle level for the set of four minimally correlated observables. |
png pdf |
Figure 22:
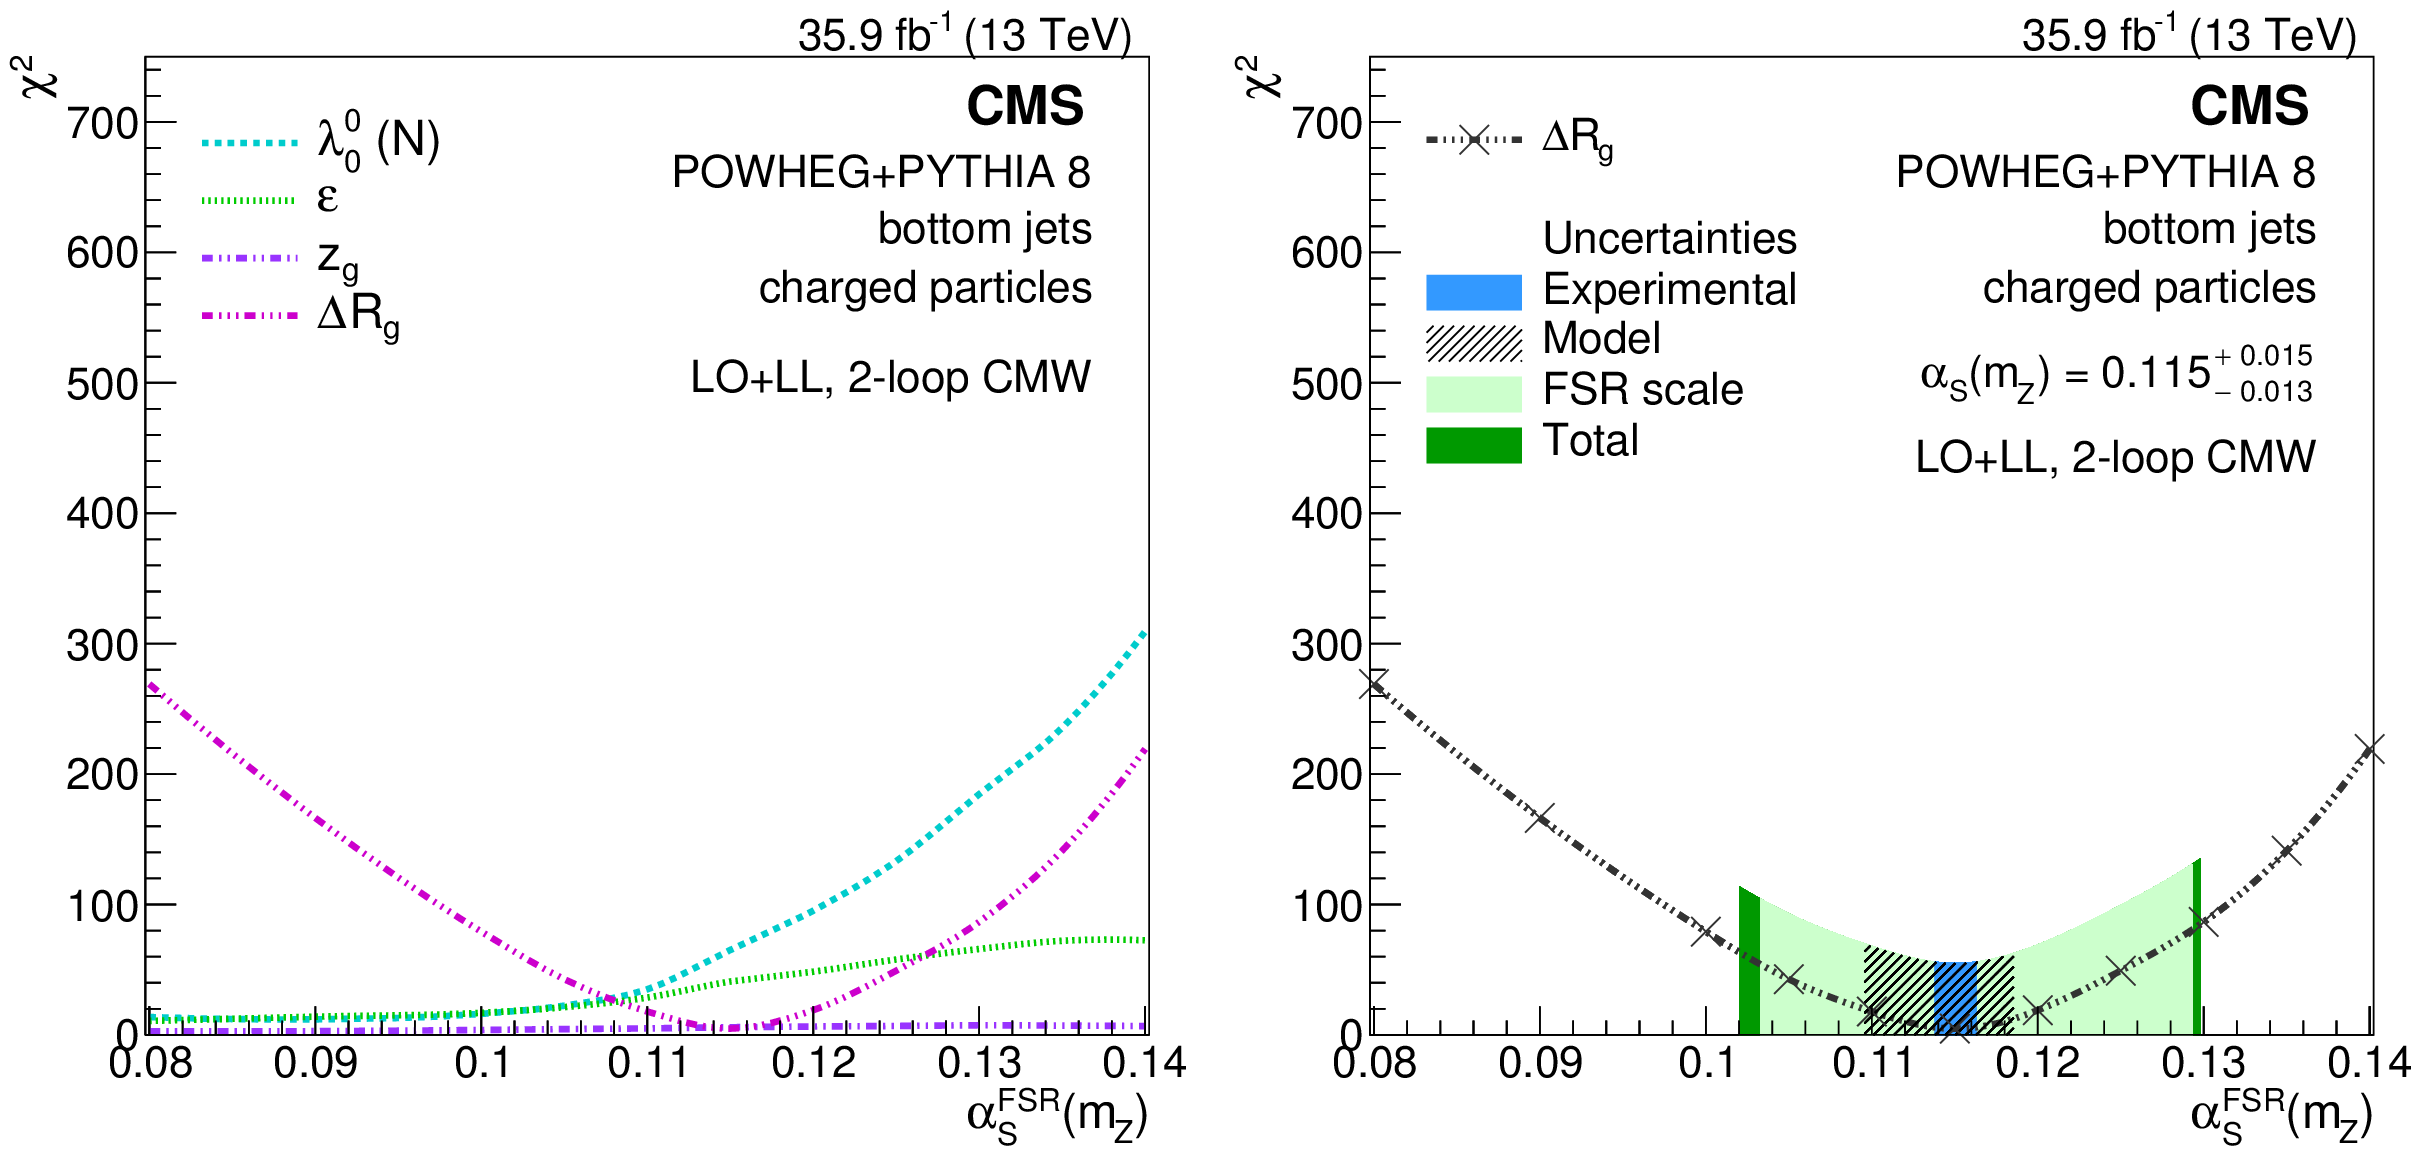
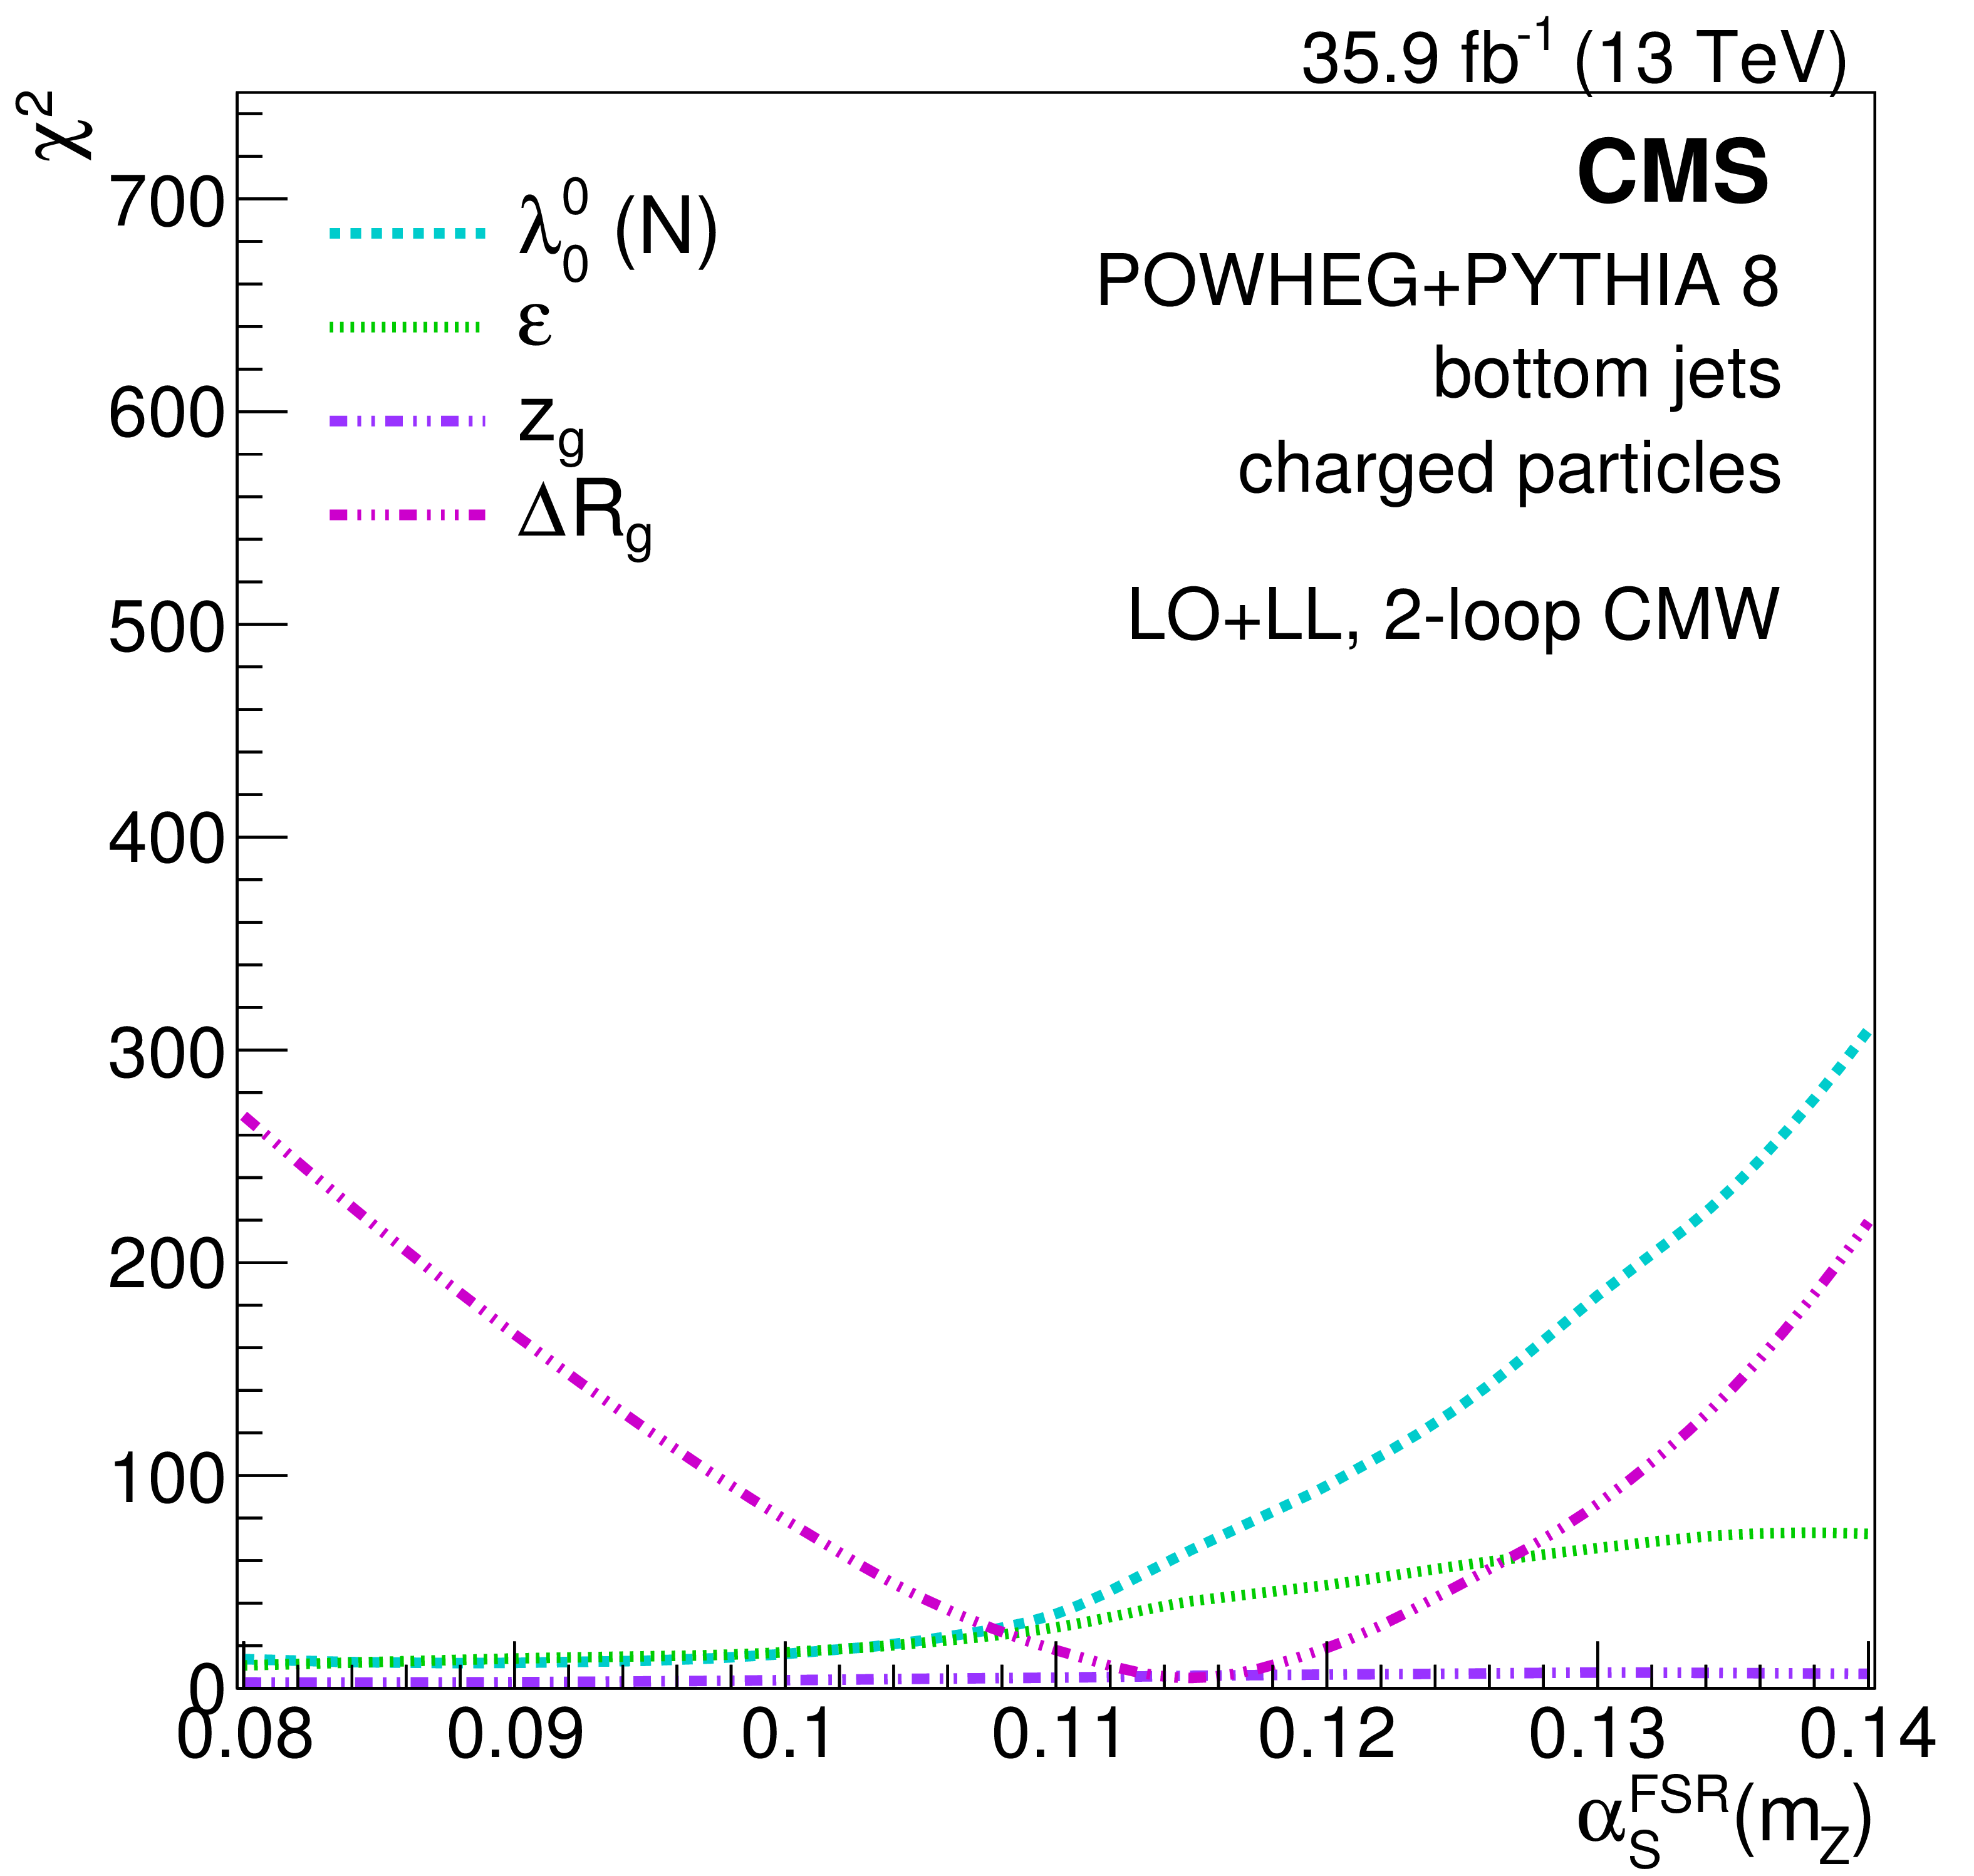
Scans of $\chi ^2$ as a function of ${\alpha _{S}^{\text {FSR}}(m_{{\mathrm {Z}}})}$, derived from the bottom-quark jet sample, for the minimally-correlated observables $\lambda _0^0$ ($N$), $\varepsilon $, $z_\mathrm {g}$, and $\Delta R_\mathrm {g}$ (left), and for $\Delta R_\mathrm {g}$ alone with uncertainties indicated by the shaded areas (right). |
png pdf |
Figure 22-a:
Scan of $\chi ^2$ as a function of ${\alpha _{S}^{\text {FSR}}(m_{{\mathrm {Z}}})}$, derived from the bottom-quark jet sample, for the minimally-correlated observables $\lambda _0^0$ ($N$), $\varepsilon $, $z_\mathrm {g}$, and $\Delta R_\mathrm {g}$. |

png pdf |
Figure 22-b:
Scan of $\chi ^2$ as a function of ${\alpha _{S}^{\text {FSR}}(m_{{\mathrm {Z}}})}$, derived from the bottom-quark jet sample, for $\Delta R_\mathrm {g}$ alone with uncertainties indicated by the shaded areas. |
| Tables | |

png pdf |
Table 1:
Overview of the theoretical accuracy and ${\alpha _{S}^{\text {FSR}}(m_{{\mathrm {Z}}})}$ settings of the generator setups used for predicting the jet substructure. The acronym "nLL'' stands for approximate next-to-leading-log accuracy. |
png pdf |
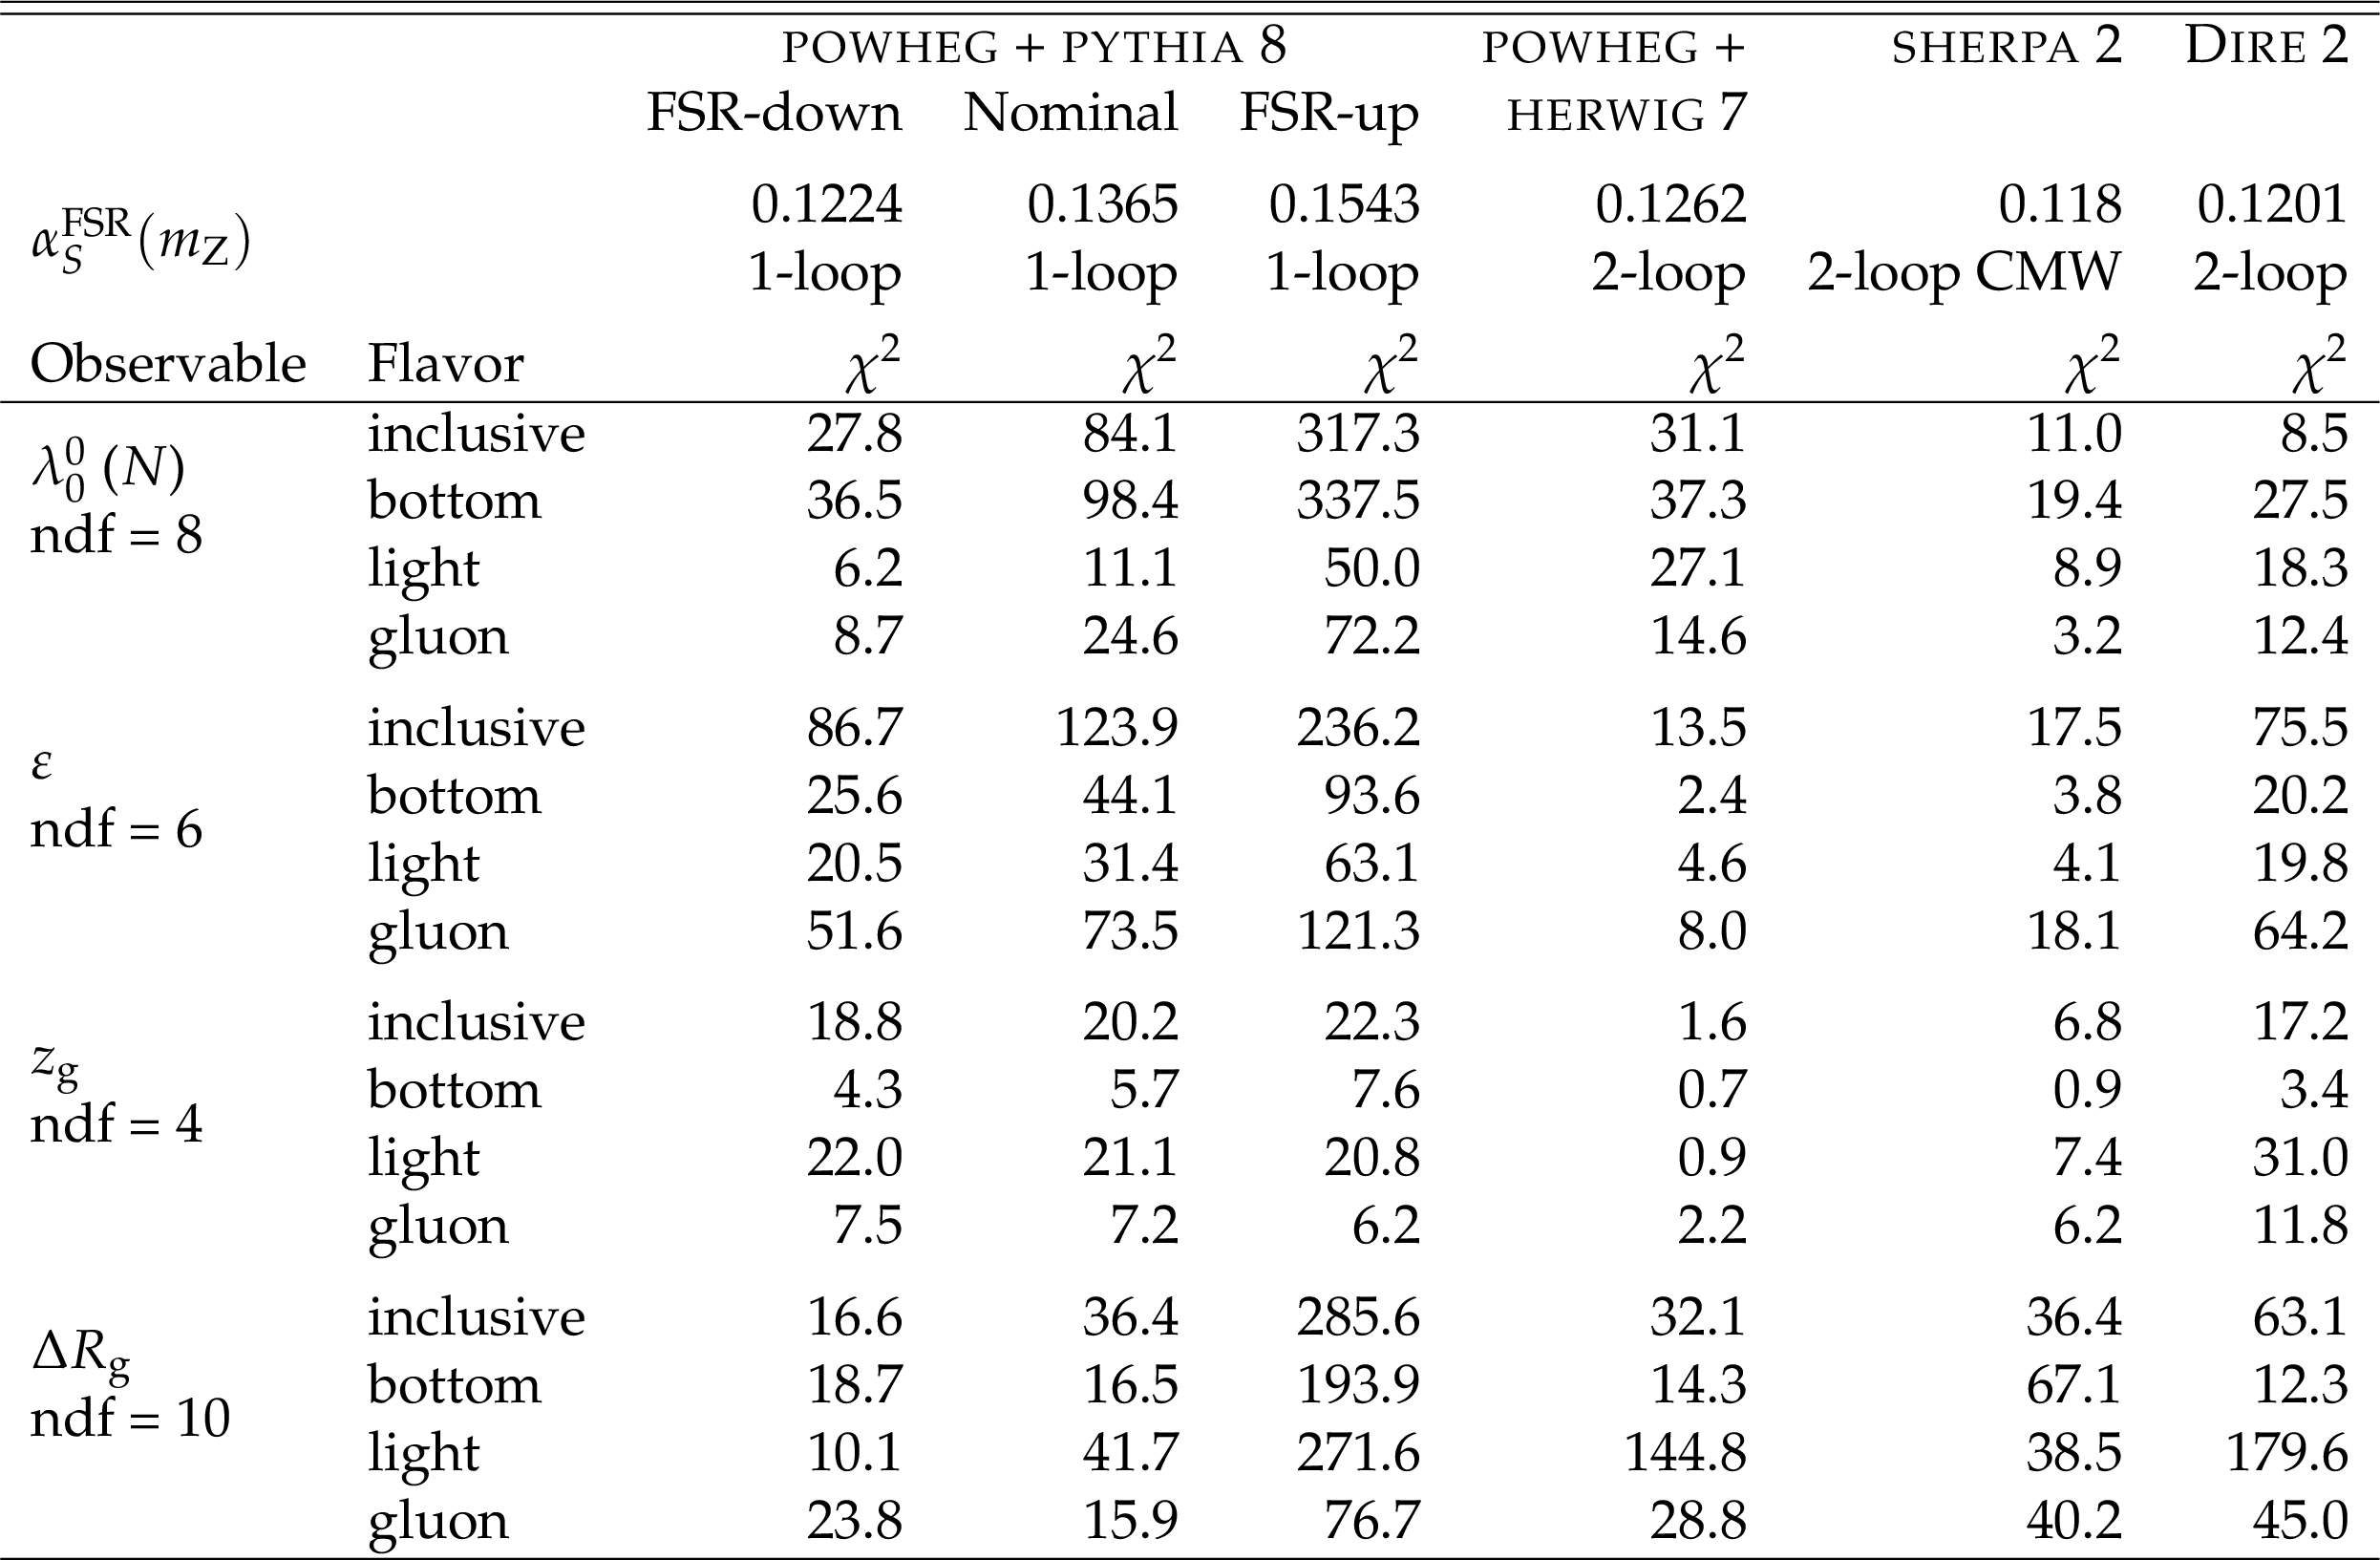
Table 2:
$\chi ^{2}$ values and the numbers of degrees of freedom (ndf) for the data-to-simulation comparison of the distributions of the four weakly-correlated jet substructure observables, $\lambda _{0}^{0}$ ($N$), $\varepsilon $, $z_\mathrm {g}$, and $\Delta R_\mathrm {g}$, for four different jet flavors and six MC generator setups. |

png pdf |
Table 3:
$\chi ^{2}$ values and the numbers of degrees of freedom (ndf) for the data-to-simulation comparison of the distributions of the four weakly-correlated jet substructure observables, $\lambda _{0}^{0}$ ($N$), $\varepsilon $, $z_\mathrm {g}$, and $\Delta R_\mathrm {g}$, for four different jet flavors and seven POWHEG+PYTHIA-8 model variations. The value of the strong coupling is $ {\alpha _{S}^{\text {FSR}}(m_{{\mathrm {Z}}})} = $ 0.1365 for all predictions. |
| Summary |
|
A measurement of jet substructure observables in resolved $\mathrm{t\bar{t}}$ lepton+jets events from pp collisions at $\sqrt{s} = $ 13 TeV has been presented, including several variables relevant for quark-gluon discrimination and for heavy Lorentz-boosted object identification. The investigated observables provide valuable insights on the perturbative and nonperturbative phases of jet evolution. Their unfolded distributions have been derived for inclusive jets, as well as for samples enriched in jets originating from bottom quarks, light quarks, or gluons. Data are compared to theoretical predictions either based on next-to-leading-order (NLO) matrix-element calculations (POWHEG) interfaced with different generators for the parton shower and hadronization (either PYTHIA 8 or HERWIG 7), or based on SHERPA 2 with NLO corrections, as well as on the DIRE 2 shower model. The correlations between all jet substructure variables have been studied. Eliminating observables with a high level of correlation, a set of four variables is identified and used for quantifying the level of data-simulation agreement. With the default Monte Carlo (MC) generator tunes, none of the predictions yields a good overall reproduction of the experimental distributions. Thus, some further tuning of the models is required, with special attention to the data/MC disagreement observed in the particle multiplicity $\lambda_0^0$ and correlated observables, including those designed for quark/gluon discrimination. The groomed momentum fraction $z_\mathrm{g}$ is directly sensitive to the parton-shower splitting functions, thereby providing a useful handle to improve their modeling in the MC generators. The angle between the groomed subjets, $\Delta R_\mathrm{g}$, is a powerful observable for extracting the value of the strong coupling in final-state parton radiation (FSR) processes. A value of ${\alpha_{S}(m_{\mathrm{Z}})} = $ 0.115$^{+0.015}_{-0.013}$ including experimental as well as model uncertainties, has been extracted at leading-order plus leading-log accuracy, where the precision is limited by the FSR scale uncertainty of the PYTHIA 8 prediction. Besides tuning and improving final-state parton showers, the present data also provide useful tests for improved quantum chromodynamics analytical calculations, including higher-order fixed and logarithmic corrections, for infrared- and/or collinear-safe observables. |
| References | ||||
| 1 | A. Buckley et al. | General-purpose event generators for LHC physics | Phys. Rep. 504 (2011) 145 | 1101.2599 |
| 2 | CDF Collaboration | Study of jet shapes in inclusive jet production in $ {\mathrm{p}}\mathrm{\bar{p}} $ collisions at $ \sqrt{s}= $ 1.96 TeV | PRD 71 (2005) 112002 | hep-ex/0505013 |
| 3 | CDF Collaboration | Measurement of b jet shapes in inclusive jet production in $ {\mathrm{p}}\mathrm{\bar{p}} $ collisions at $ \sqrt{s} = $ 1.96 TeV | PRD 78 (2008) 072005 | 0806.1699 |
| 4 | CDF Collaboration | Study of substructure of high transverse momentum jets produced in proton-antiproton collisions at $ \sqrt{s} = $ 1.96 TeV | PRD 85 (2012) 091101 | 1106.5952 |
| 5 | ZEUS Collaboration | Measurement of subjet multiplicities in neutral current deep inelastic scattering at HERA and determination of $ {\alpha_S} $ | PLB 558 (2003) 41 | hep-ex/0212030 |
| 6 | ZEUS Collaboration | Substructure dependence of jet cross sections at HERA and determination of $ {\alpha_S} $ | NPB 700 (2004) 3 | hep-ex/0405065 |
| 7 | ZEUS Collaboration | Subjet distributions in deep inelastic scattering at HERA | EPJC 63 (2009) 527 | 0812.2864 |
| 8 | ALEPH Collaboration | Studies of QCD at $ \mathrm{e^{+}}\mathrm{e^{-}} $ centre-of-mass energies between 91 GeV and 209 GeV | EPJC 35 (2004) 457 | |
| 9 | DELPHI Collaboration | Tuning and test of fragmentation models based on identified particles and precision event shape data | Z. Phys. C 73 (1996) 11 | |
| 10 | DELPHI Collaboration | A study of the b-quark fragmentation function with the DELPHI detector at LEP I and an averaged distribution obtained at the Z pole | EPJC 71 (2011) 1557 | 1102.4748 |
| 11 | L3 Collaboration | Studies of hadronic event structure in $ \mathrm{e^{+}}\mathrm{e^{-}} $ annihilation from 30 GeV to 209 GeV with the L3 detector | Phys. Rep. 399 (2004) 71 | hep-ex/0406049 |
| 12 | OPAL Collaboration | Measurement of event shape distributions and moments in $ \mathrm{e^{+}}\mathrm{e^{-}} \to $ hadrons at 91 GeV - 209 GeV and a determination of $ \alpha_s $ | EPJC 40 (2005) 287 | hep-ex/0503051 |
| 13 | OPAL Collaboration | Measurements of flavor dependent fragmentation functions in Z$ ^0\to q \bar{q} $ events | EPJC 7 (1999) 369 | hep-ex/9807004 |
| 14 | SLD Collaboration | Production of $ \pi^+, K^+, K^0, K^{* 0}, \phi, p $ and $ {\lambda}bda^0 $ in hadronic Z$ ^0 $ decays | PRD 59 (1999) 052001 | hep-ex/9805029 |
| 15 | SLD Collaboration | Measurement of the b quark fragmentation function in Z$ ^0 $ decays | PRD 65 (2002) 092006 | hep-ex/0202031 |
| 16 | S. D. Ellis, C. K. Vermilion, and J. R. Walsh | Techniques for improved heavy particle searches with jet substructure | PRD 80 (2009) 051501 | 0903.5081 |
| 17 | A. Altheimer et al. | Boosted objects and jet substructure at the LHC. Report of BOOST2012, held at IFIC Valencia, 23rd-27th of July 2012 | EPJC 74 (2014) 2792 | 1311.2708 |
| 18 | D. d'Enterria and P. Z. Skands, eds. | Parton radiation and fragmentation from LHC to FCC-ee | 1702.01329 | |
| 19 | A. J. Larkoski, I. Moult, and B. Nachman | Jet substructure at the Large Hadron Collider: a review of recent advances in theory and machine learning | 1709.04464 | |
| 20 | S. Marzani, L. Schunk, and G. Soyez | A study of jet mass distributions with grooming | JHEP 07 (2017) 132 | 1704.02210 |
| 21 | C. Frye, A. J. Larkoski, M. D. Schwartz, and K. Yan | Factorization for groomed jet substructure beyond the next-to-leading logarithm | JHEP 07 (2016) 064 | 1603.09338 |
| 22 | ATLAS Collaboration | Study of jet shapes in inclusive jet production in $ pp $ collisions at $ \sqrt{s}= $ 7 TeV using the ATLAS detector | PRD 83 (2011) 052003 | 1101.0070 |
| 23 | ATLAS Collaboration | ATLAS measurements of the properties of jets for boosted particle searches | PRD 86 (2012) 072006 | 1206.5369 |
| 24 | CMS Collaboration | Studies of jet mass in dijet and W/Z+jet events | JHEP 05 (2013) 090 | CMS-SMP-12-019 1303.4811 |
| 25 | CMS Collaboration | Measurements of jet charge with dijet events in pp collisions at $ \sqrt{s}= $ 8 TeV | JHEP 10 (2017) 131 | CMS-SMP-15-003 1706.05868 |
| 26 | ATLAS Collaboration | A measurement of the soft-drop jet mass in pp collisions at $ \sqrt{s} = $ 13 TeV with the ATLAS detector | Submitted to PRLett | 1711.08341 |
| 27 | CMS Collaboration | Measurements of the differential jet cross section as a function of the jet mass in dijet events from proton-proton collisions at $ \sqrt{s} = $ 13 TeV | Submitted to JHEP | CMS-SMP-16-010 1807.05974 |
| 28 | ATLAS Collaboration | Measurement of jet shapes in top-quark pair events at $ \sqrt{s} = $ 7 TeV using the ATLAS detector | EPJC 73 (2013) 2676 | 1307.5749 |
| 29 | CMS Collaboration | Measurement of the jet mass in highly boosted $ {\mathrm{t}}\overline{\mathrm{t}} $ events from pp collisions at $ \sqrt{s}= $ 8 TeV | EPJC 77 (2017) 467 | CMS-TOP-15-015 1703.06330 |
| 30 | CMS Collaboration | The CMS trigger system | JINST 12 (2017) P01020 | CMS-TRG-12-001 1609.02366 |
| 31 | CMS Collaboration | The CMS experiment at the CERN LHC | JINST 3 (2008) S08004 | CMS-00-001 |
| 32 | P. Nason | A new method for combining NLO QCD with shower Monte Carlo algorithms | JHEP 11 (2004) 040 | hep-ph/0409146 |
| 33 | S. Frixione, P. Nason, and C. Oleari | Matching NLO QCD computations with parton shower simulations: the POWHEG method | JHEP 11 (2007) 070 | 0709.2092 |
| 34 | S. Alioli, P. Nason, C. Oleari, and E. Re | A general framework for implementing NLO calculations in shower Monte Carlo programs: the POWHEG BOX | JHEP 06 (2010) 043 | 1002.2581 |
| 35 | S. Frixione, P. Nason, and G. Ridolfi | A positive-weight next-to-leading-order Monte Carlo for heavy flavour hadroproduction | JHEP 09 (2007) 126 | 0707.3088 |
| 36 | M. Czakon and A. Mitov | Top++: A program for the calculation of the top-pair cross-section at hadron colliders | CPC 185 (2014) 2930 | 1112.5675 |
| 37 | J. Alwall et al. | The automated computation of tree-level and next-to-leading order differential cross sections, and their matching to parton shower simulations | JHEP 07 (2014) 079 | 1405.0301 |
| 38 | R. Frederix and S. Frixione | Merging meets matching in MC@NLO | JHEP 12 (2012) 061 | 1209.6215 |
| 39 | J. Alwall et al. | Comparative study of various algorithms for the merging of parton showers and matrix elements in hadronic collisions | EPJC 53 (2008) 473 | 0706.2569 |
| 40 | T. Melia, P. Nason, R. Rontsch, and G. Zanderighi | W$ ^+ $W$ ^- $, WZ and ZZ production in the POWHEG BOX | JHEP 11 (2011) 078 | 1107.5051 |
| 41 | E. Re | Single-top Wt-channel production matched with parton showers using the POWHEG method | EPJC 71 (2011) 1547 | 1009.2450 |
| 42 | S. Alioli, P. Nason, C. Oleari, and E. Re | NLO single-top production matched with shower in POWHEG: $ s $- and $ t $-channel contributions | JHEP 09 (2009) 111 | 0907.4076 |
| 43 | S. Frixione, E. Laenen, P. Motylinski, and B. R. Webber | Angular correlations of lepton pairs from vector boson and top quark decays in Monte Carlo simulations | JHEP 04 (2007) 081 | hep-ph/0702198 |
| 44 | P. Artoisenet, R. Frederix, O. Mattelaer, and R. Rietkerk | Automatic spin-entangled decays of heavy resonances in Monte Carlo simulations | JHEP 03 (2013) 015 | 1212.3460 |
| 45 | T. Sjostrand et al. | An introduction to PYTHIA 8.2 | CPC 191 (2015) 159 | 1410.3012 |
| 46 | NNPDF Collaboration | Parton distributions for the LHC Run II | JHEP 04 (2015) 040 | 1410.8849 |
| 47 | E. Norrbin and T. Sjostrand | QCD radiation off heavy particles | NPB 603 (2001) 297 | hep-ph/0010012 |
| 48 | B. Andersson, G. Gustafson, G. Ingelman, and T. Sjostrand | Parton fragmentation and string dynamics | Phys. Rep. 97 (1983) 31 | |
| 49 | T. Sjostrand | Jet fragmentation of nearby partons | NPB 248 (1984) 469 | |
| 50 | M. G. Bowler | $ \mathrm{e^{+}}\mathrm{e^{-}} $ production of heavy quarks in the string model | Z. Phys. C 11 (1981) 169 | |
| 51 | CMS Collaboration | Investigations of the impact of the parton shower tuning in $ PYTHIA 8 $ in the modelling of $ \mathrm{t\overline{t}} $ at $ \sqrt{s}= $ 8 and 13 TeV | CMS-PAS-TOP-16-021 | CMS-PAS-TOP-16-021 |
| 52 | CMS Collaboration | Event generator tunes obtained from underlying event and multiparton scattering measurements | EPJC 76 (2016) 155 | CMS-GEN-14-001 1512.00815 |
| 53 | M. Bahr et al. | HERWIG++ physics and manual | EPJC 58 (2008) 639 | 0803.0883 |
| 54 | S. Gieseke, P. Stephens, and B. Webber | New formalism for QCD parton showers | JHEP 12 (2003) 045 | hep-ph/0310083 |
| 55 | B. R. Webber | A QCD model for jet fragmentation including soft gluon interference | NPB 238 (1984) 492 | |
| 56 | GEANT4 Collaboration | GEANT 4---a simulation toolkit | NIMA 506 (2003) 250 | |
| 57 | J. Bellm et al. | HERWIG 7.0/ HERWIG++ 3.0 release note | EPJC 76 (2016) 196 | 1512.01178 |
| 58 | T. Gleisberg et al. | Event generation with SHERPA 1.1 | JHEP 02 (2009) 007 | 0811.4622 |
| 59 | S. Frixione and B. R. Webber | Matching NLO QCD computations and parton shower simulations | JHEP 06 (2002) 029 | hep-ph/0204244 |
| 60 | S. Schumann and F. Krauss | A parton shower algorithm based on Catani-Seymour dipole factorisation | JHEP 03 (2008) 038 | 0709.1027 |
| 61 | J.-C. Winter, F. Krauss, and G. Soff | A modified cluster hadronization model | EPJC 36 (2004) 381 | hep-ph/0311085 |
| 62 | S. Catani, B. R. Webber, and G. Marchesini | QCD coherent branching and semiinclusive processes at large x | NPB 349 (1991) 635 | |
| 63 | S. Hoche and S. Prestel | The midpoint between dipole and parton showers | EPJC 75 (2015) 461 | 1506.05057 |
| 64 | S. Hoche and S. Prestel | Triple collinear emissions in parton showers | PRD 96 (2017) 074017 | 1705.00742 |
| 65 | S. Hoche, F. Krauss, and S. Prestel | Implementing NLO DGLAP evolution in parton showers | JHEP 10 (2017) 093 | 1705.00982 |
| 66 | T. Sjostrand and M. van Zijl | A multiple interaction model for the event structure in hadron collisions | PRD 36 (1987) 2019 | |
| 67 | J. M. Butterworth, J. R. Forshaw, and M. H. Seymour | Multiparton interactions in photoproduction at HERA | Z. Phys. C 72 (1996) 637 | hep-ph/9601371 |
| 68 | I. Borozan and M. H. Seymour | An eikonal model for multiparticle production in hadron hadron interactions | JHEP 09 (2002) 015 | hep-ph/0207283 |
| 69 | M. Bahr, S. Gieseke, and M. H. Seymour | Simulation of multiple partonic interactions in HERWIG++ | JHEP 07 (2008) 076 | 0803.3633 |
| 70 | S. Gieseke, C. Rohr, and A. Siodmok | Colour reconnections in HERWIG++ | EPJC 72 (2012) 2225 | 1206.0041 |
| 71 | CMS Collaboration | Particle-flow reconstruction and global event description with the CMS detector | JINST 12 (2017) P10003 | CMS-PRF-14-001 1706.04965 |
| 72 | M. Cacciari, G. P. Salam, and G. Soyez | The anti-$ k_t $ jet clustering algorithm | JHEP 04 (2008) 063 | 0802.1189 |
| 73 | M. Cacciari, G. P. Salam, and G. Soyez | FastJet user manual | EPJC 72 (2012) 1896 | 1111.6097 |
| 74 | CMS Collaboration | Jet energy scale and resolution in the CMS experiment in pp collisions at 8 TeV | JINST 12 (2017) P02014 | CMS-JME-13-004 1607.03663 |
| 75 | CMS Collaboration | Performance of electron reconstruction and selection with the CMS detector in proton-proton collisions at $ \sqrt{s} = $ 8 TeV | JINST 10 (2015) P06005 | CMS-EGM-13-001 1502.02701 |
| 76 | CMS Collaboration | Performance of the CMS muon detector and muon reconstruction with proton-proton collisions at $ \sqrt{s} = $ 13 TeV | JINST 13 (2018) P06015 | CMS-MUO-16-001 1804.04528 |
| 77 | CMS Collaboration | Identification of b-quark jets with the CMS experiment | JINST 8 (2013) P04013 | CMS-BTV-12-001 1211.4462 |
| 78 | CMS Collaboration | Identification of heavy-flavour jets with the CMS detector in pp collisions at 13 TeV | JINST 13 (2018) P05011 | CMS-BTV-16-002 1712.07158 |
| 79 | CMS Collaboration | Object definitions for top quark analyses at the particle level | CDS | |
| 80 | M. Cacciari, G. P. Salam, and G. Soyez | The catchment area of jets | JHEP 04 (2008) 005 | 0802.1188 |
| 81 | S. Schmitt | TUnfold: an algorithm for correcting migration effects in high energy physics | JINST 7 (2012) T10003 | 1205.6201 |
| 82 | CMS Collaboration | Measurement of the inelastic proton-proton cross section at $ \sqrt{s} = $ 13 TeV | JHEP 07 (2018) 161 | CMS-FSQ-15-005 1802.02613 |
| 83 | M. Aliev et al. | HATHOR: HAdronic Top and Heavy quarks crOss section calculatoR | CPC 182 (2011) 1034 | 1007.1327 |
| 84 | P. Kant et al. | HatHor for single top-quark production: Updated predictions and uncertainty estimates for single top-quark production in hadronic collisions | CPC 191 (2015) 74 | 1406.4403 |
| 85 | N. Kidonakis | Two-loop soft anomalous dimensions for single top quark associated production with a W- or H- | PRD 82 (2010) 054018 | 1005.4451 |
| 86 | N. Kidonakis | Top quark production | in Proceedings, Helmholtz International Summer School on Physics of Heavy Quarks and Hadrons (HQ 2013), JINR, Dubna, 2013 | 1311.0283 |
| 87 | S. Dulat et al. | New parton distribution functions from a global analysis of quantum chromodynamics | PRD 93 (2016) 033006 | 1506.07443 |
| 88 | L. A. Harland-Lang, A. D. Martin, P. Motylinski, and R. S. Thorne | Parton distributions in the LHC era: MMHT 2014 PDFs | EPJC 75 (2015) 204 | 1412.3989 |
| 89 | J. R. Christiansen and P. Z. Skands | String formation beyond leading colour | JHEP 08 (2015) 003 | 1505.01681 |
| 90 | S. Argyropoulos and T. Sjostrand | Effects of color reconnection on $ t\bar{t} $ final states at the LHC | JHEP 11 (2014) 043 | 1407.6653 |
| 91 | ALEPH Collaboration | Study of the fragmentation of b quarks into B mesons at the Z peak | PLB 512 (2001) 30 | hep-ex/0106051 |
| 92 | OPAL Collaboration | Inclusive analysis of the b quark fragmentation function in Z decays at LEP | EPJC 29 (2003) 463 | hep-ex/0210031 |
| 93 | C. Peterson, D. Schlatter, I. Schmitt, and P. M. Zerwas | Scaling violations in inclusive $ \mathrm{e^{+}}\mathrm{e^{-}} $ annihilation spectra | PRD 27 (1983) 105 | |
| 94 | Particle Data Group Collaboration | Review of particle physics | CPC 40 (2016) 100001 | |
| 95 | CMS Collaboration | Measurement of the top quark mass using proton-proton data at $ {\sqrt{s}} = $ 7 and 8 TeV | PRD 93 (2016) 072004 | CMS-TOP-14-022 1509.04044 |
| 96 | CMS Collaboration | Measurement of differential cross sections for top quark pair production using the lepton+jets final state in proton-proton collisions at 13 TeV | PRD 95 (2017) 092001 | CMS-TOP-16-008 1610.04191 |
| 97 | CMS Collaboration | Measurement of normalized differential $ \mathrm{t}\overline{\mathrm{t}} $ cross sections in the dilepton channel from pp collisions at $ \sqrt{s}= $ 13 TeV | JHEP 04 (2018) 060 | CMS-TOP-16-007 1708.07638 |
| 98 | CMS Collaboration | Description and performance of track and primary-vertex reconstruction with the CMS tracker | JINST 9 (2014) P10009 | CMS-TRK-11-001 1405.6569 |
| 99 | A. Buckley and M. Whalley | HepData reloaded: reinventing the HEP data archive | in Proceedings, 13th International Workshop on Advanced computing and analysis techniques in physics research (ACAT2010), p. 067 Jaipur, India, February, 2010 [PoS(ACAT2010)067] | 1006.0517 |
| 100 | E. Maguire, L. Heinrich, and G. Watt | HEPData: a repository for high energy physics data | J. Phys. Conf. Ser. 898 (2017) 102006 | 1704.05473 |
| 101 | A. J. Larkoski, J. Thaler, and W. J. Waalewijn | Gaining (mutual) information about quark/gluon discrimination | JHEP 11 (2014) 129 | 1408.3122 |
| 102 | D. Bertolini, T. Chan, and J. Thaler | Jet observables without jet algorithms | JHEP 04 (2014) 013 | 1310.7584 |
| 103 | A. J. Larkoski, D. Neill, and J. Thaler | Jet shapes with the broadening axis | JHEP 04 (2014) 017 | 1401.2158 |
| 104 | A. J. Larkoski, S. Marzani, and J. Thaler | Sudakov safety in perturbative QCD | PRD 91 (2015) 111501 | 1502.01719 |
| 105 | ATLAS Collaboration | ATLAS run 1 $ PYTHIA 8 $ tunes | ATL-PHYS-PUB-2014-021 | |
| 106 | ATLAS Collaboration | Measurement of the charged-particle multiplicity inside jets from $ \sqrt{s}= $ 8 TeV pp collisions with the ATLAS detector | EPJC 76 (2016) 322 | 1602.00988 |
| 107 | CMS Collaboration | Search for a Higgs boson in the decay channel $ \mathrm{H} \to \mathrm{Z}\mathrm{Z}^{(*)} \to \mathrm{q\bar{q}} \ell^- \ell^+ $ in pp collisions at $ \sqrt{s}= $ 7 TeV | JHEP 04 (2012) 036 | CMS-HIG-11-027 1202.1416 |
| 108 | J. R. Andersen et al. | Les Houches 2015: Physics at TeV Colliders Standard Model Working Group Report | in 9th Les Houches Workshop on Physics at TeV Colliders (PhysTeV 2015) Les Houches, France, June 1-19 | 1605.04692 |
| 109 | S. Catani, G. Turnock, and B. Webber | Jet broadening measures in $ \mathrm{e^{+}}\mathrm{e^{-}} $ annihilation | PLB 295 (1992) 269 | |
| 110 | P. Rakow and B. Webber | Transverse momentum moments of hadron distributions in QCD jets | NPB 191 (1981) 63 | |
| 111 | R. K. Ellis and B. R. Webber | QCD jet broadening in hadron hadron collisions | Conf. Proc. C 860623 (1986)74 | |
| 112 | E. Farhi | Quantum chromodynamics test for jets | PRL 39 (1977) 1587 | |
| 113 | S. V. Chekanov and J. Proudfoot | Searches for TeV-scale particles at the LHC using jet shapes | PRD 81 (2010) 114038 | 1002.3982 |
| 114 | Y. L. Dokshitzer, G. D. Leder, S. Moretti, and B. R. Webber | Better jet clustering algorithms | JHEP 08 (1997) 001 | hep-ph/9707323 |
| 115 | M. Wobisch and T. Wengler | Hadronization corrections to jet cross sections in deep- inelastic scattering | hep-ph/9907280 | |
| 116 | A. J. Larkoski, S. Marzani, G. Soyez, and J. Thaler | Soft drop | JHEP 05 (2014) 146 | 1402.2657 |
| 117 | M. Dasgupta, A. Fregoso, S. Marzani, and G. P. Salam | Towards an understanding of jet substructure | JHEP 09 (2013) 029 | 1307.0007 |
| 118 | A. Larkoski et al. | Exposing the QCD splitting function with CMS Open Data | PRL 119 (2017) 132003 | 1704.05066 |
| 119 | CMS Collaboration | Measurement of the splitting function in pp and PbPb collisions at $ \sqrt{s_{_{\mathrm{NN}}}}= $ 5.02 TeV | PRL 120 (2018) 142302 | CMS-HIN-16-006 1708.09429 |
| 120 | C. Frye, A. J. Larkoski, J. Thaler, and K. Zhou | Casimir meets Poisson: improved quark/gluon discrimination with counting observables | JHEP 09 (2017) 083 | 1704.06266 |
| 121 | S. D. Ellis and D. E. Soper | Successive combination jet algorithm for hadron collisions | PRD 48 (1993) 3160 | hep-ph/9305266 |
| 122 | J. Thaler and K. Van Tilburg | Identifying boosted objects with N-subjettiness | JHEP 03 (2011) 015 | 1011.2268 |
| 123 | J. Thaler and K. Van Tilburg | Maximizing boosted top identification by minimizing N-subjettiness | JHEP 02 (2012) 093 | 1108.2701 |
| 124 | A. J. Larkoski, G. P. Salam, and J. Thaler | Energy correlation functions for jet substructure | JHEP 06 (2013) 108 | 1305.0007 |
| 125 | I. Moult, L. Necib, and J. Thaler | New angles on energy correlation functions | JHEP 12 (2016) 153 | 1609.07483 |
| 126 | C. Bierlich, G. Gustafson, L. Lonnblad, and A. Tarasov | Effects of overlapping strings in pp collisions | JHEP 03 (2015) 148 | 1412.6259 |
|
|
Compact Muon Solenoid LHC, CERN |
|

|

|

|

|

|