

Compact Muon Solenoid
LHC, CERN
| CMS-TOP-18-011 ; CERN-EP-2019-183 | ||
| Measurement of the $\mathrm{t\bar{t}}\mathrm{b\bar{b}}$ production cross section in the all-jet final state in pp collisions at $\sqrt{s} = $ 13 TeV | ||
| CMS Collaboration | ||
| 11 September 2019 | ||
| Phys. Lett. B 803 (2020) 135285 | ||
| Abstract: A measurement of the production cross section of top quark pairs in association with two b jets ($\mathrm{t\bar{t}}\mathrm{b\bar{b}}$) is presented using data collected in proton-proton collisions at $\sqrt{s} = $ 13 TeV by the CMS detector at the LHC corresponding to an integrated luminosity of 35.9 fb$^{-1}$ . The cross section is measured in the all-jet decay channel of the top quark pair by selecting events containing at least eight jets, of which at least two are identified as originating from the hadronization of b quarks. A combination of multivariate analysis techniques is used to reduce the large background from multijet events not containing a top quark pair, and to help discriminate between jets originating from top quark decays and other additional jets. The cross section is determined for the total phase space to be 5.5 $\pm$ 0.3 (stat) $^{+1.6}_{-1.3}$ (syst) pb and also measured for two fiducial $\mathrm{t\bar{t}}\mathrm{b\bar{b}}$ definitions. The measured cross sections are found to be larger than theoretical predictions by a factor of 1.5-2.4, corresponding to 1-2 standard deviations. | ||
| Links: e-print arXiv:1909.05306 [hep-ex] (PDF) ; CDS record ; inSPIRE record ; HepData record ; CADI line (restricted) ; | ||
| Figures | |
png pdf |
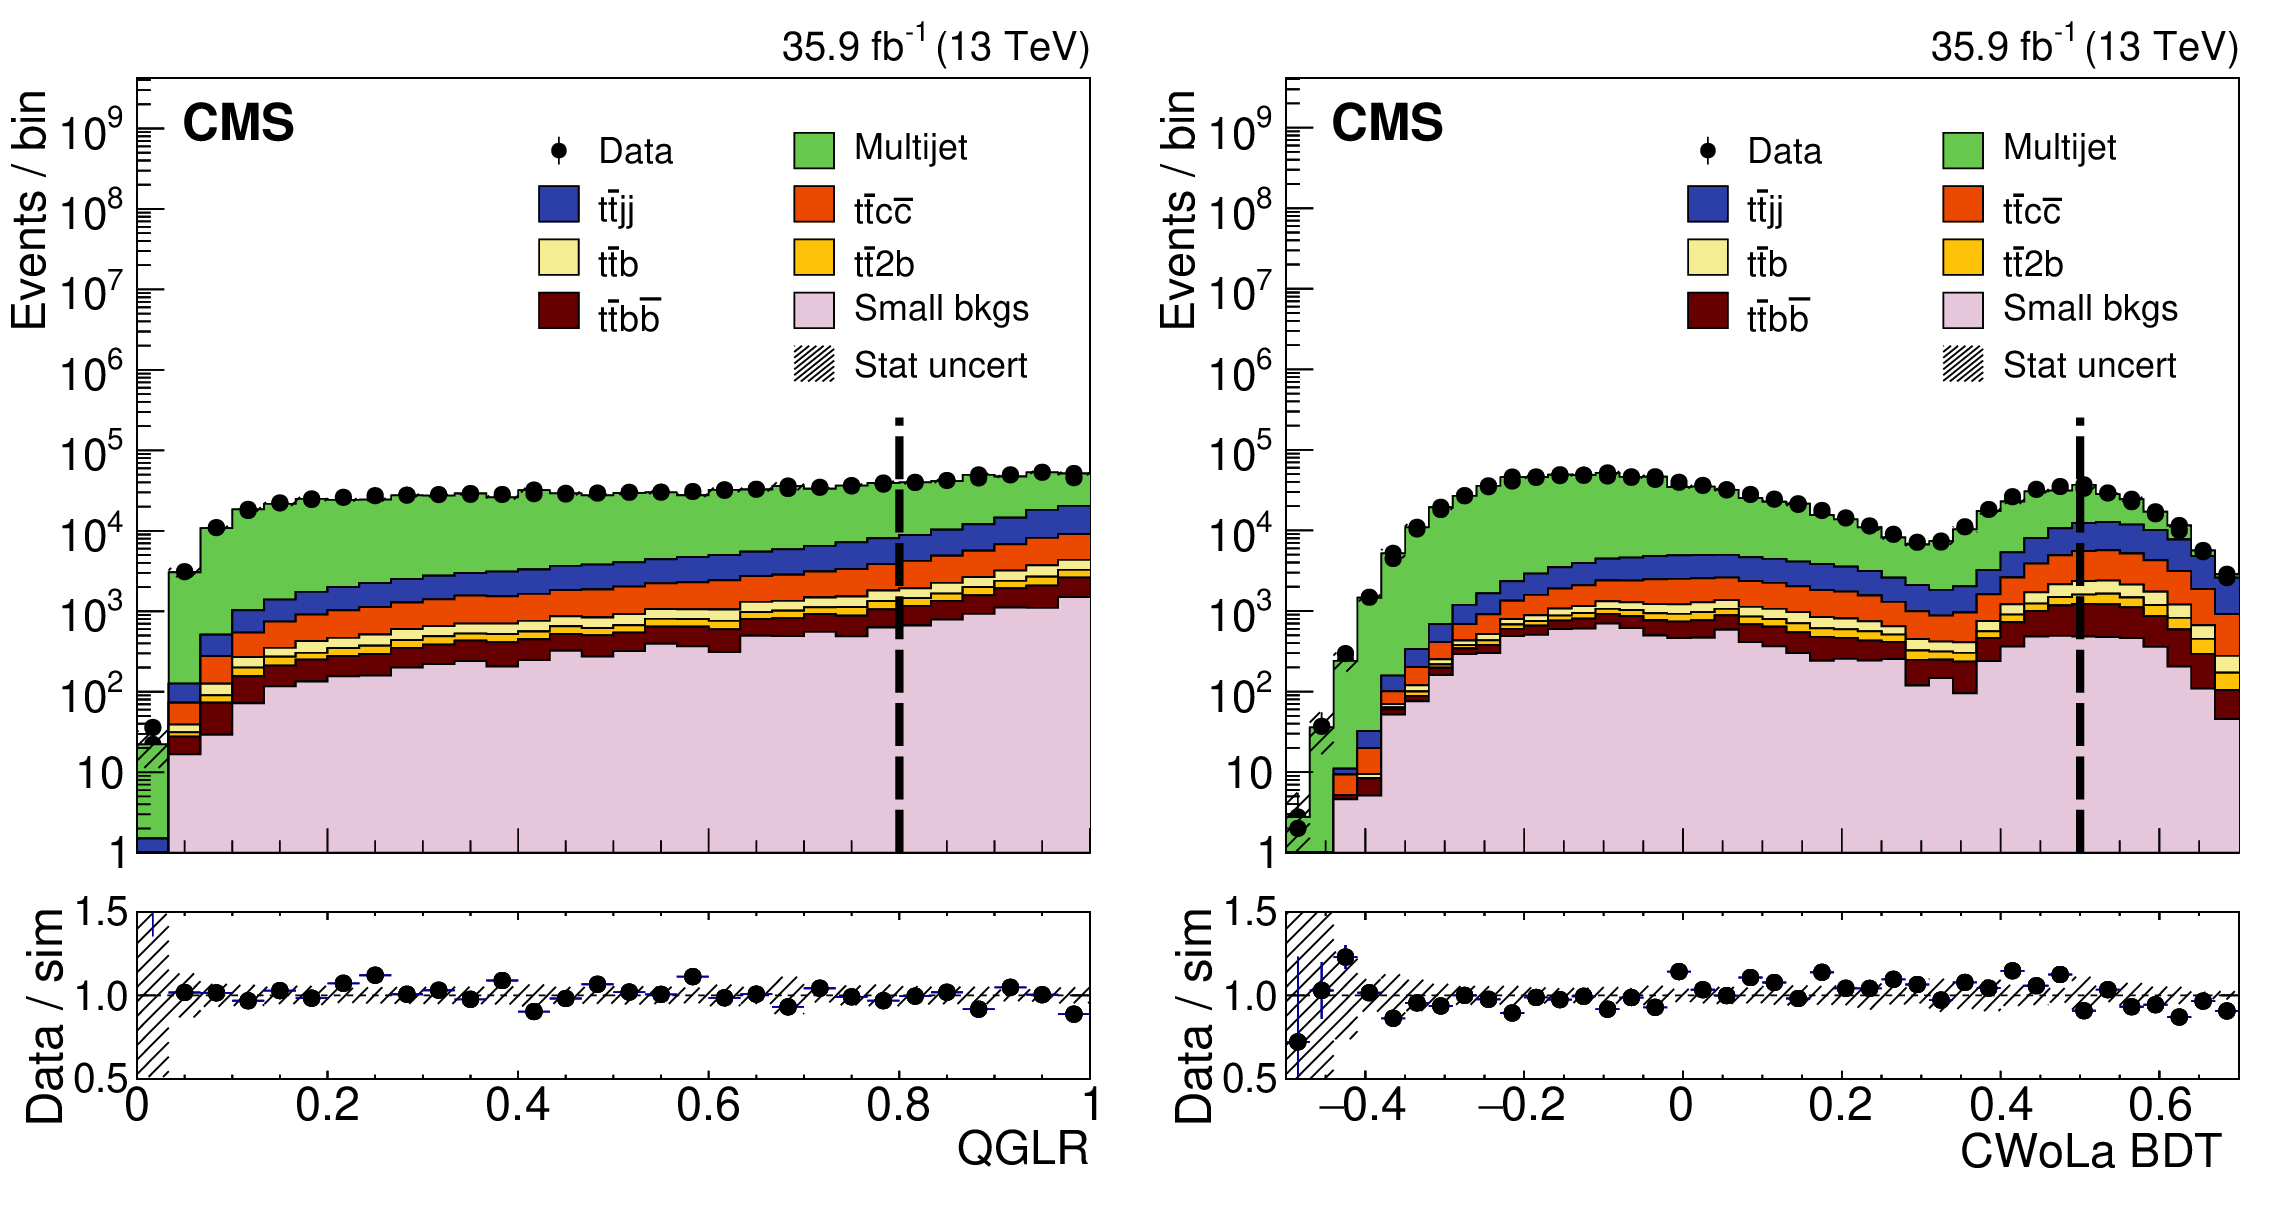
Figure 1:
Distributions in the QGLR (left) and the CWoLa BDT discriminants (right). Both are after preselection, requiring $P(\chi ^2) > 10^{-6}$ and at least eight selected jets. All the contributions are based on simulation. The multijet contribution is scaled to match the total yields in data, after the other processes including the ${{\mathrm{t} \mathrm{\bar{t}}} \mathrm{b} \mathrm{\bar{b}}}$ signal have been normalized to their corresponding theoretical cross sections. This choice takes into account only the effect of the shape variation from the multijet background. The small backgrounds include ${\mathrm{t} \mathrm{\bar{t}}} {\mathrm{V}} $, ${\mathrm{t} \mathrm{\bar{t}}} \mathrm{H} $, single top quark, V+jets, and diboson production. The lower panels show the ratio between the observed data and the predictions. The dashed lines indicate the boundaries between the signal and control regions defined in Section 6. Hatched bands indicate the statistical uncertainty in the predictions without considering the systematic sources, dominated by the uncertainties in the simulated multijet background. |
png pdf |
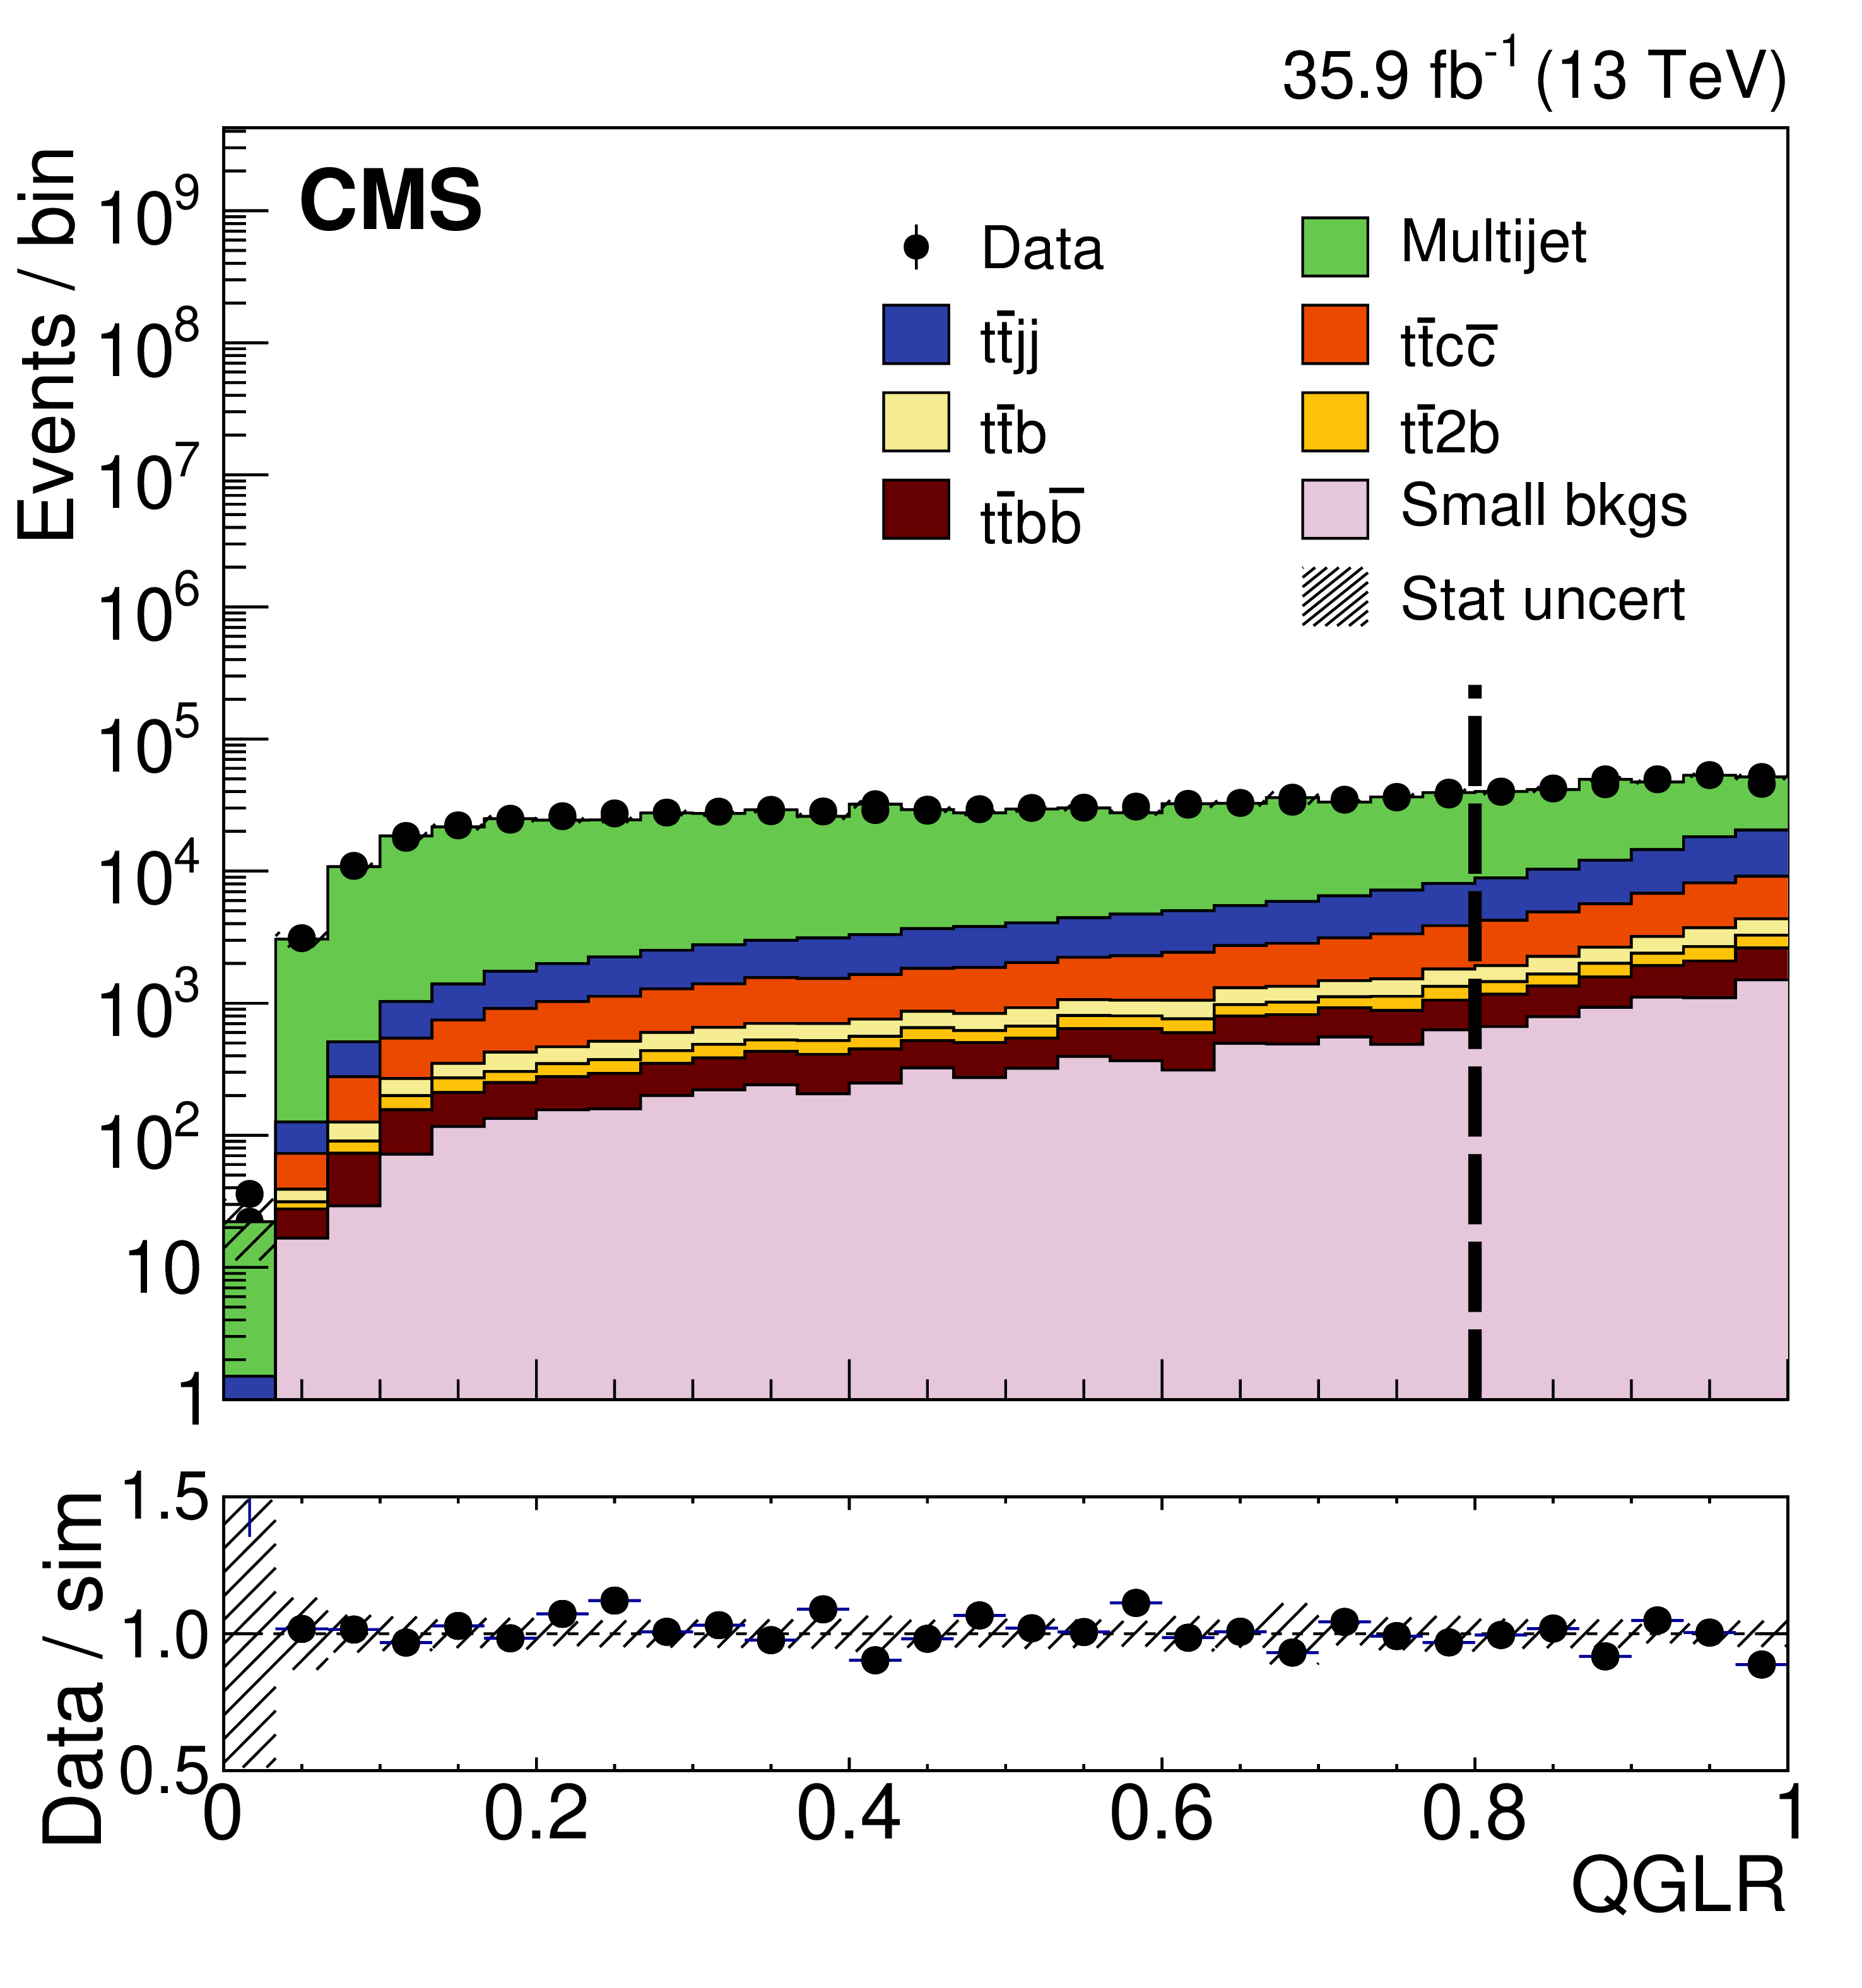
Figure 1-a:
Distribution in the QGLR BDT discriminant, after preselection, requiring $P(\chi ^2) > 10^{-6}$ and at least eight selected jets. All the contributions are based on simulation. The multijet contribution is scaled to match the total yields in data, after the other processes including the ${{\mathrm{t} \mathrm{\bar{t}}} \mathrm{b} \mathrm{\bar{b}}}$ signal have been normalized to their corresponding theoretical cross sections. This choice takes into account only the effect of the shape variation from the multijet background. The small backgrounds include ${\mathrm{t} \mathrm{\bar{t}}} {\mathrm{V}} $, ${\mathrm{t} \mathrm{\bar{t}}} \mathrm{H} $, single top quark, V+jets, and diboson production. The lower panel shows the ratio between the observed data and the predictions. The dashed lines indicate the boundaries between the signal and control regions defined in Section 6. Hatched bands indicate the statistical uncertainty in the predictions without considering the systematic sources, dominated by the uncertainties in the simulated multijet background. |
png pdf |
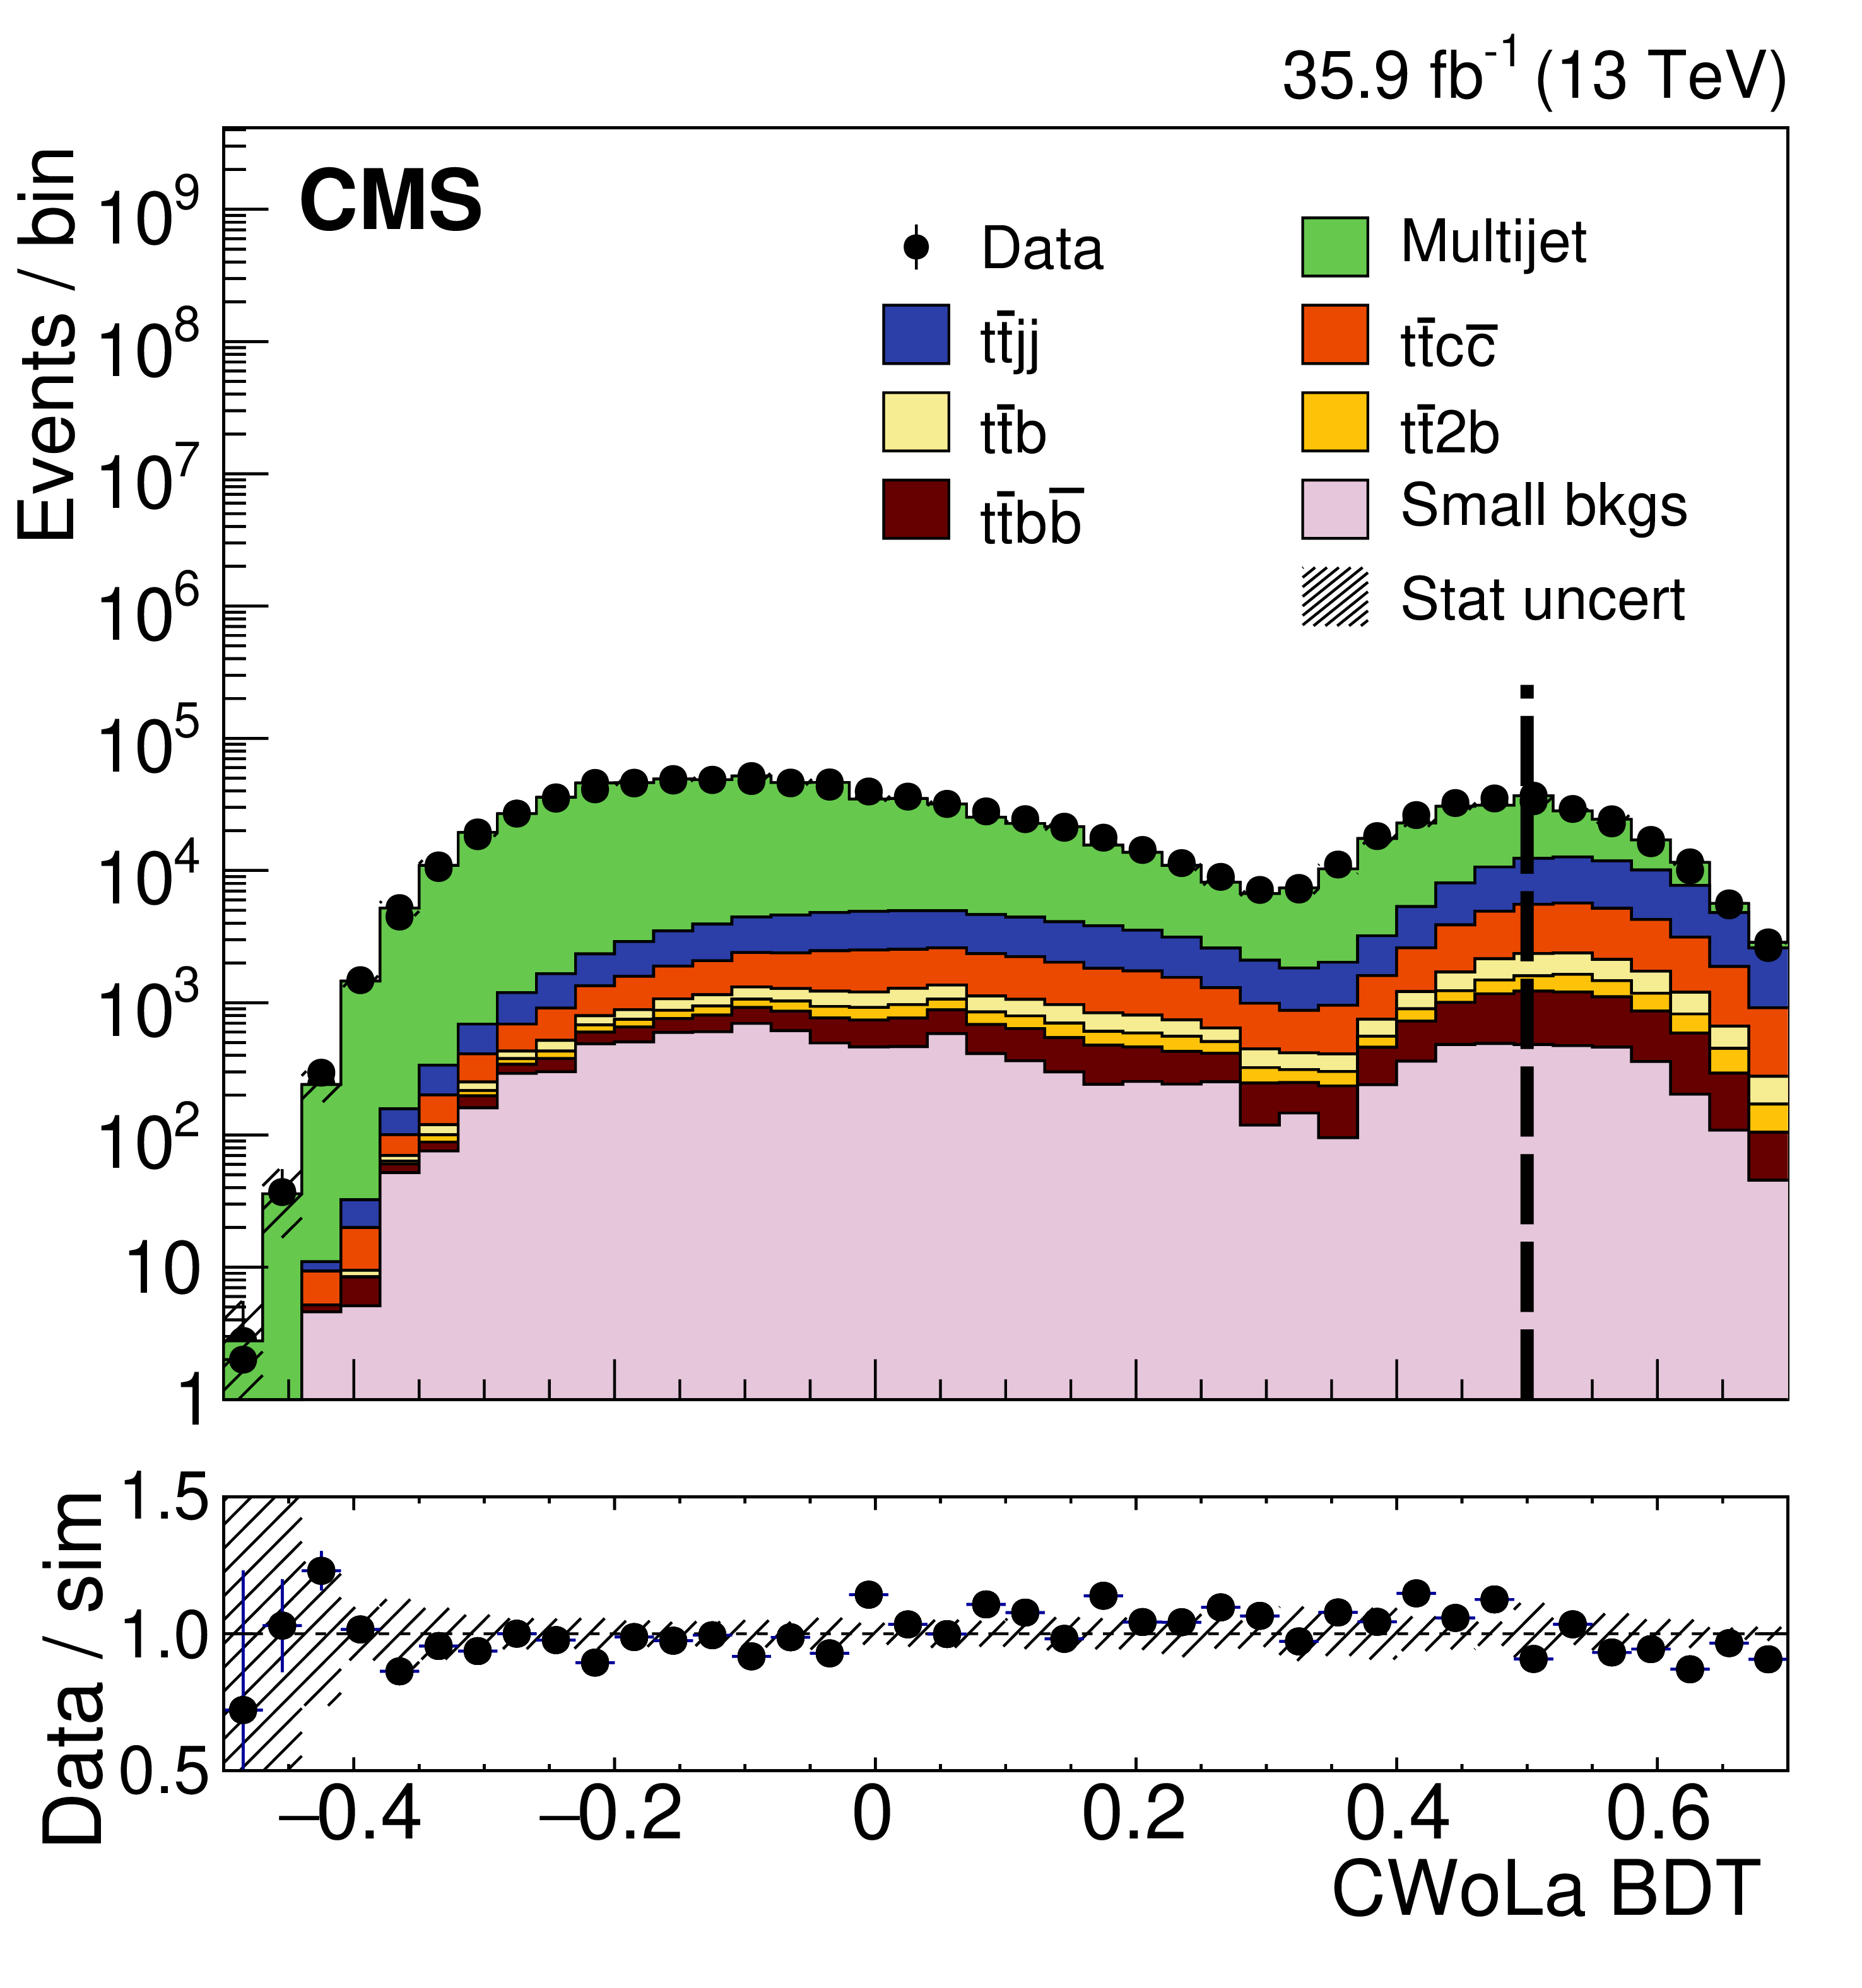
Figure 1-b:
Distribution in the CWoLa BDT discriminant, after preselection, requiring $P(\chi ^2) > 10^{-6}$ and at least eight selected jets. All the contributions are based on simulation. The multijet contribution is scaled to match the total yields in data, after the other processes including the ${{\mathrm{t} \mathrm{\bar{t}}} \mathrm{b} \mathrm{\bar{b}}}$ signal have been normalized to their corresponding theoretical cross sections. This choice takes into account only the effect of the shape variation from the multijet background. The small backgrounds include ${\mathrm{t} \mathrm{\bar{t}}} {\mathrm{V}} $, ${\mathrm{t} \mathrm{\bar{t}}} \mathrm{H} $, single top quark, V+jets, and diboson production. The lower panel shows the ratio between the observed data and the predictions. The dashed lines indicate the boundaries between the signal and control regions defined in Section 6. Hatched bands indicate the statistical uncertainty in the predictions without considering the systematic sources, dominated by the uncertainties in the simulated multijet background. |

png pdf |
Figure 2:
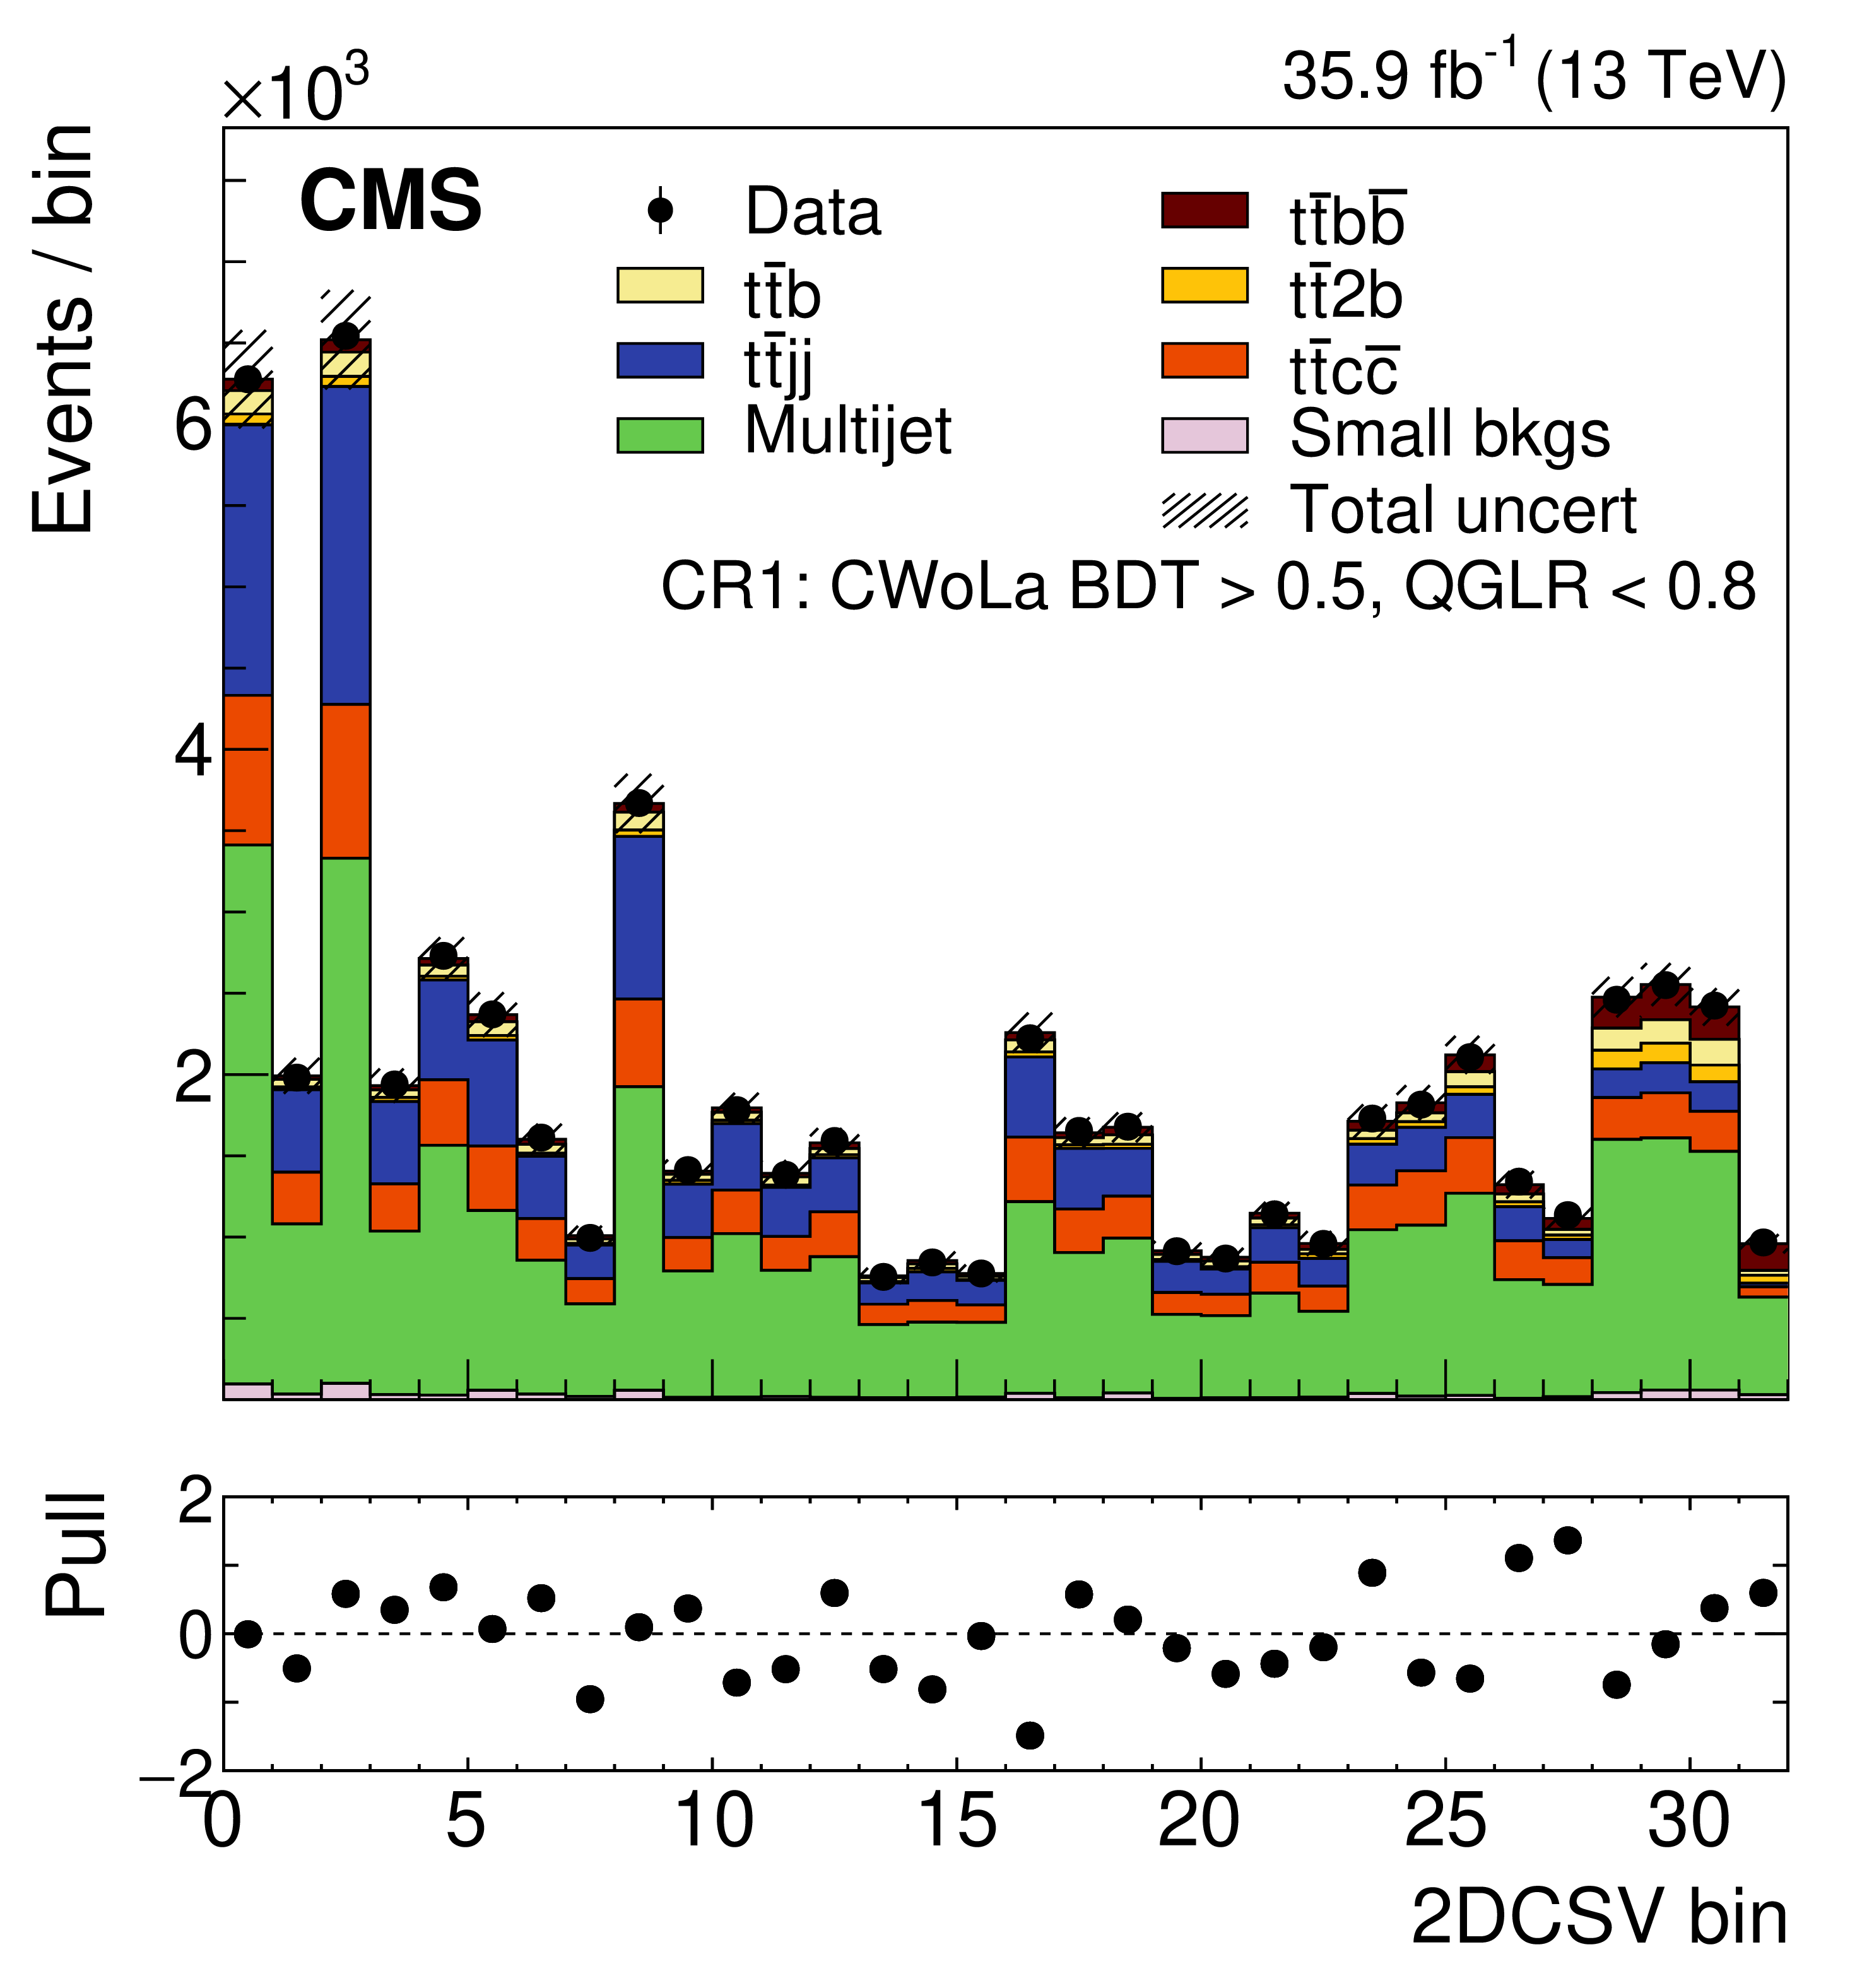
Distribution in the 2DCSV in the SR (upper left), CR1 (upper right), CR2 (lower right), and CR3 (lower left) regions. For clarity, the two-dimensional distribution with largest and next-to-largest b tagging discriminant scores for the additional jets have been unrolled to one dimension, and the resulting bins ordered according to increasing values of the ratio between expected signal and background yields in each bin of the SR. The small backgrounds include ${\mathrm{t} \mathrm{\bar{t}}} {\mathrm{V}} $, ${\mathrm{t} \mathrm{\bar{t}}} \mathrm{H} $, single top quark, V+jets, and diboson production. Hatched bands correspond to uncertainties. The bottom panels show the pull distribution. The pull is defined as the bin by bin difference between data and predicted yields after the fit, divided by the uncertainties accounted for correlations between data and predictions after the fit. |
png pdf |
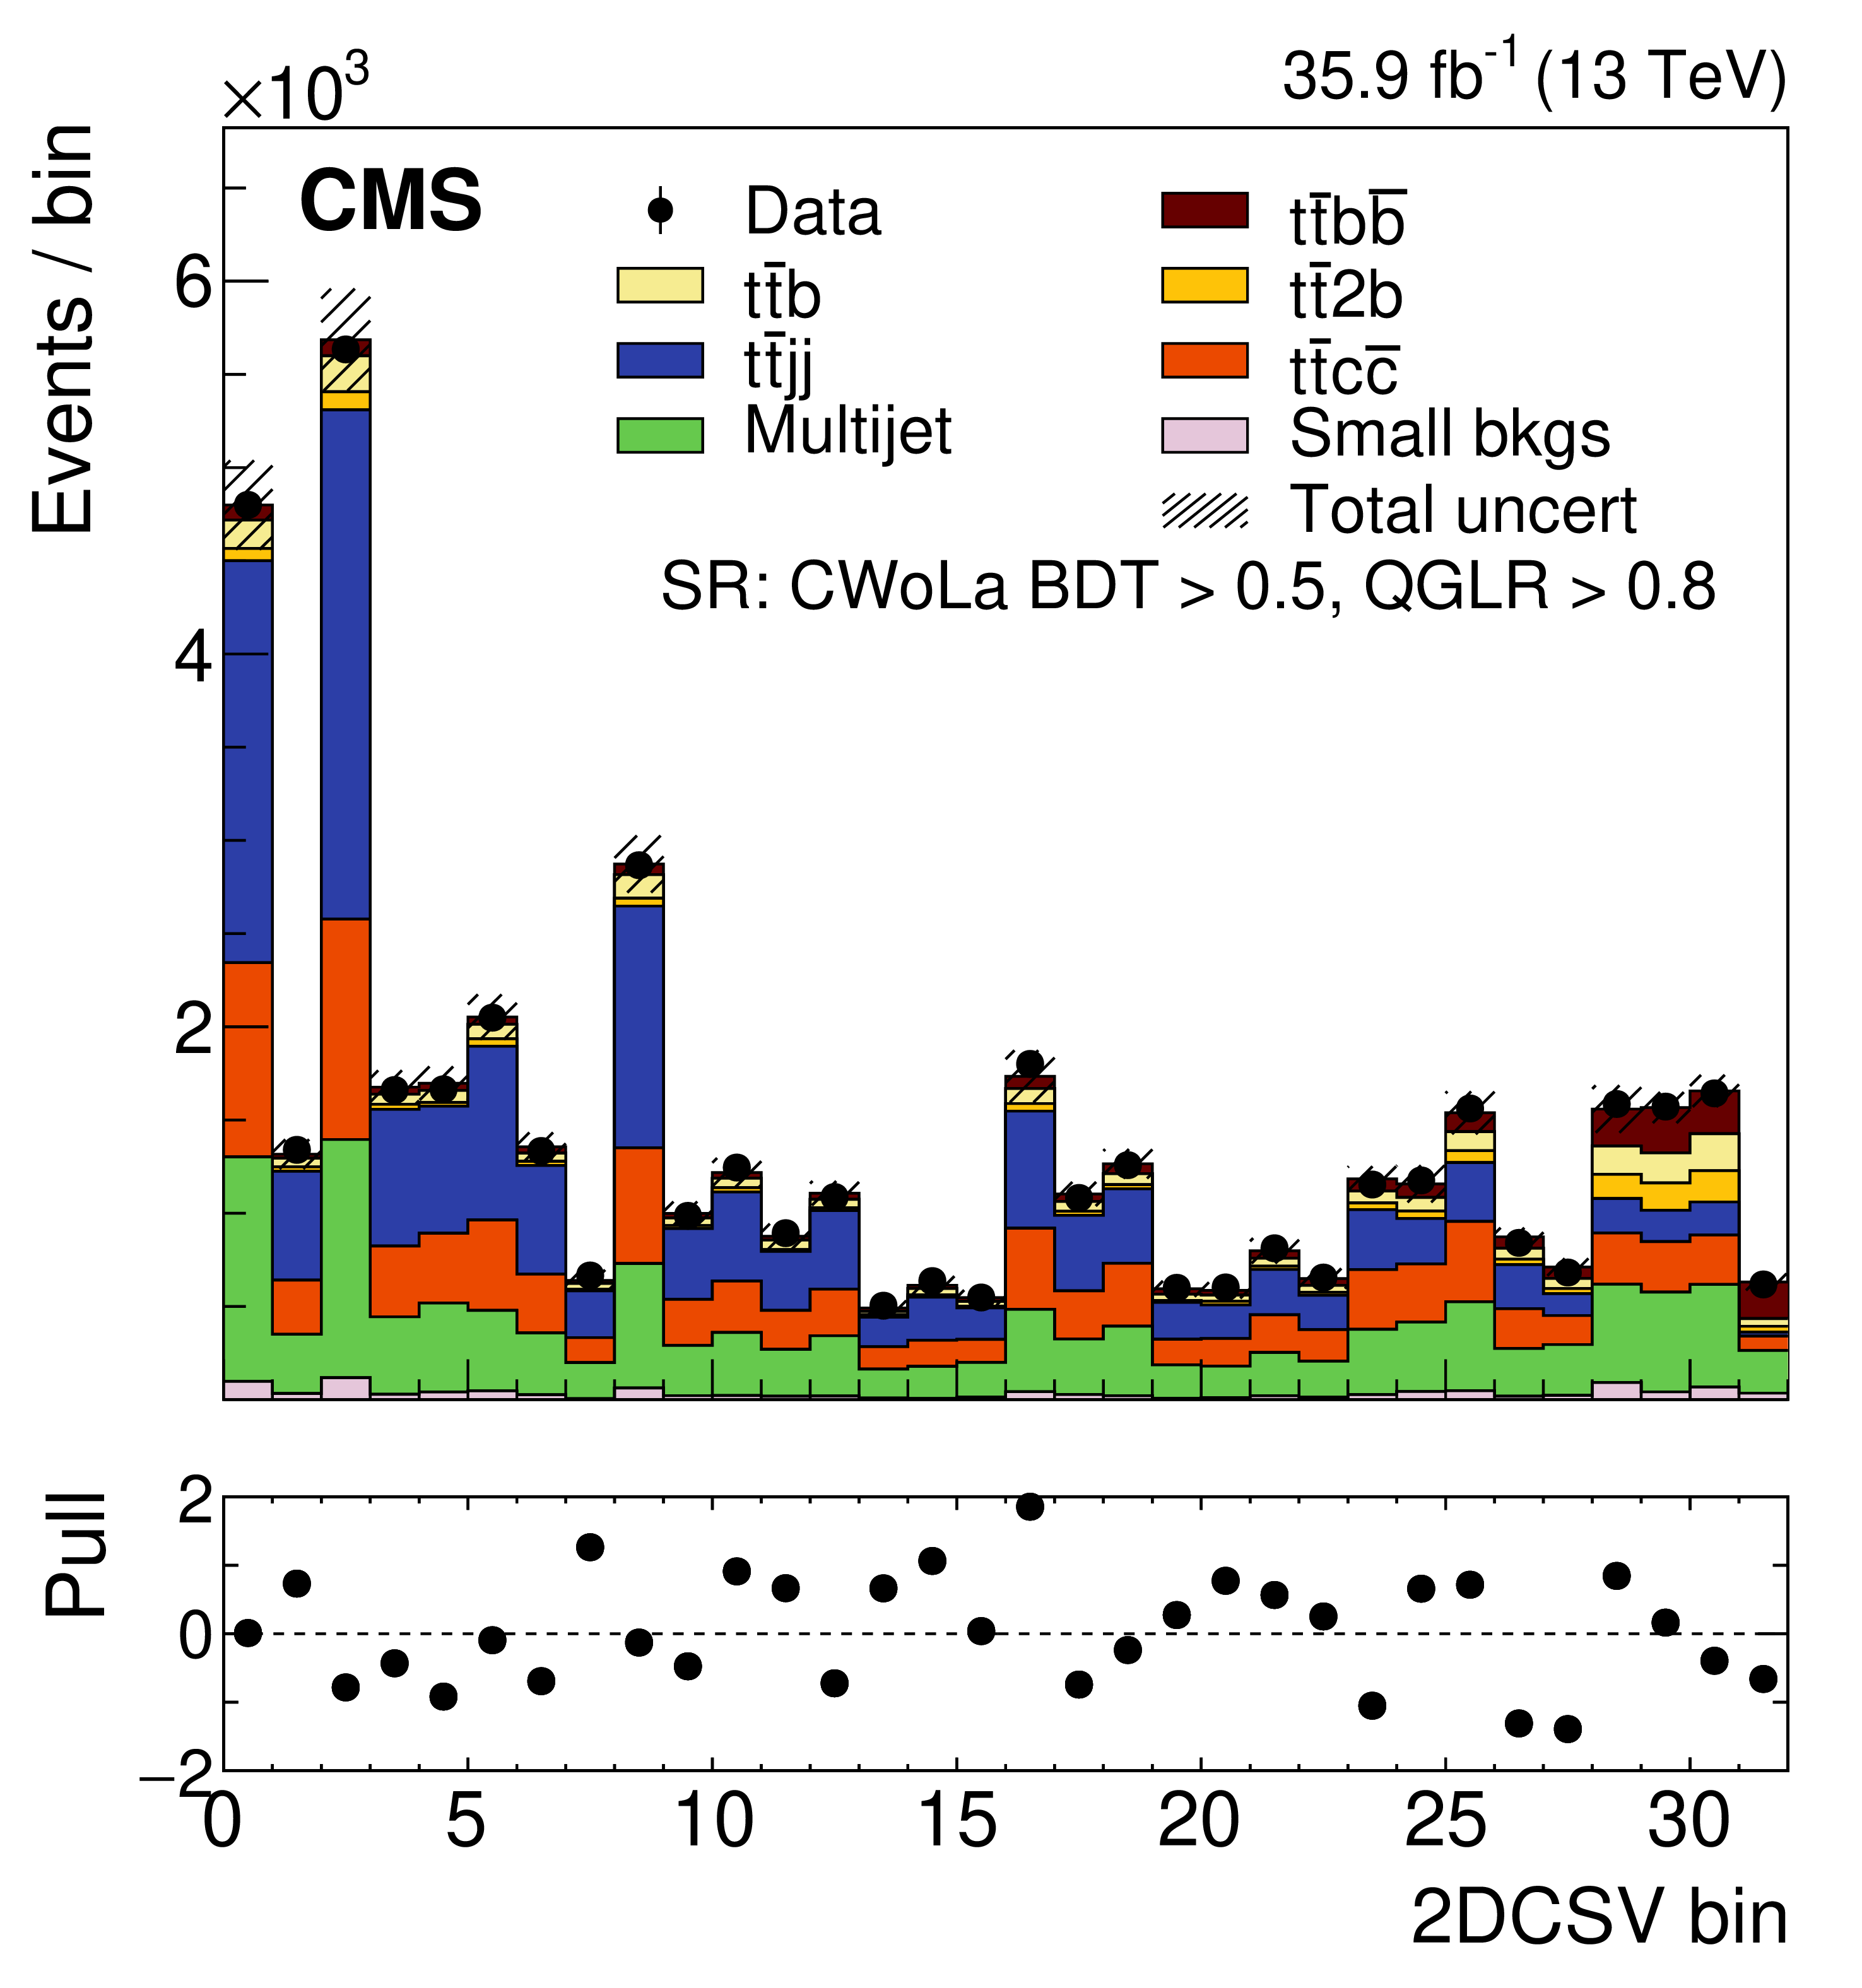
Figure 2-a:
Distribution in the 2DCSV in the SR region. For clarity, the two-dimensional distribution with largest and next-to-largest b tagging discriminant scores for the additional jets have been unrolled to one dimension, and the resulting bins ordered according to increasing values of the ratio between expected signal and background yields in each bin of the SR. The small backgrounds include ${\mathrm{t} \mathrm{\bar{t}}} {\mathrm{V}} $, ${\mathrm{t} \mathrm{\bar{t}}} \mathrm{H} $, single top quark, V+jets, and diboson production. Hatched bands correspond to uncertainties. The bottom panel shows the pull distribution. The pull is defined as the bin by bin difference between data and predicted yields after the fit, divided by the uncertainties accounted for correlations between data and predictions after the fit. |
png pdf |
Figure 2-b:
Distribution in the 2DCSV in the CR1 region. For clarity, the two-dimensional distribution with largest and next-to-largest b tagging discriminant scores for the additional jets have been unrolled to one dimension, and the resulting bins ordered according to increasing values of the ratio between expected signal and background yields in each bin of the SR. The small backgrounds include ${\mathrm{t} \mathrm{\bar{t}}} {\mathrm{V}} $, ${\mathrm{t} \mathrm{\bar{t}}} \mathrm{H} $, single top quark, V+jets, and diboson production. Hatched bands correspond to uncertainties. The bottom panel shows the pull distribution. The pull is defined as the bin by bin difference between data and predicted yields after the fit, divided by the uncertainties accounted for correlations between data and predictions after the fit. |

png pdf |
Figure 2-c:
Distribution in the 2DCSV in the CR2 region. For clarity, the two-dimensional distribution with largest and next-to-largest b tagging discriminant scores for the additional jets have been unrolled to one dimension, and the resulting bins ordered according to increasing values of the ratio between expected signal and background yields in each bin of the SR. The small backgrounds include ${\mathrm{t} \mathrm{\bar{t}}} {\mathrm{V}} $, ${\mathrm{t} \mathrm{\bar{t}}} \mathrm{H} $, single top quark, V+jets, and diboson production. Hatched bands correspond to uncertainties. The bottom panel shows the pull distribution. The pull is defined as the bin by bin difference between data and predicted yields after the fit, divided by the uncertainties accounted for correlations between data and predictions after the fit. |

png pdf |
Figure 2-d:
Distribution in the 2DCSV in the CR3 region. For clarity, the two-dimensional distribution with largest and next-to-largest b tagging discriminant scores for the additional jets have been unrolled to one dimension, and the resulting bins ordered according to increasing values of the ratio between expected signal and background yields in each bin of the SR. The small backgrounds include ${\mathrm{t} \mathrm{\bar{t}}} {\mathrm{V}} $, ${\mathrm{t} \mathrm{\bar{t}}} \mathrm{H} $, single top quark, V+jets, and diboson production. Hatched bands correspond to uncertainties. The bottom panel shows the pull distribution. The pull is defined as the bin by bin difference between data and predicted yields after the fit, divided by the uncertainties accounted for correlations between data and predictions after the fit. |

png pdf |
Figure 3:
Comparison of the measured ${{\mathrm{t} \mathrm{\bar{t}}} \mathrm{b} \mathrm{\bar{b}}}$ production cross sections (vertical lines) with predictions from several Monte Carlo generators (squares), for three definitions of our ${{\mathrm{t} \mathrm{\bar{t}}} \mathrm{b} \mathrm{\bar{b}}}$ regions of phase space: fiducial PI (left), fiducial PB (middle), total (right). The dark (light) shaded bands show the statistical (total) uncertainties in the measured value. Uncertainty intervals in the theoretical cross sections include the statistical uncertainty as well as the uncertainties in the PDFs and the $\mu _\mathrm {R}$ and $\mu _\mathrm {F}$ scales. |
| Tables | |
png pdf |
Table 1:
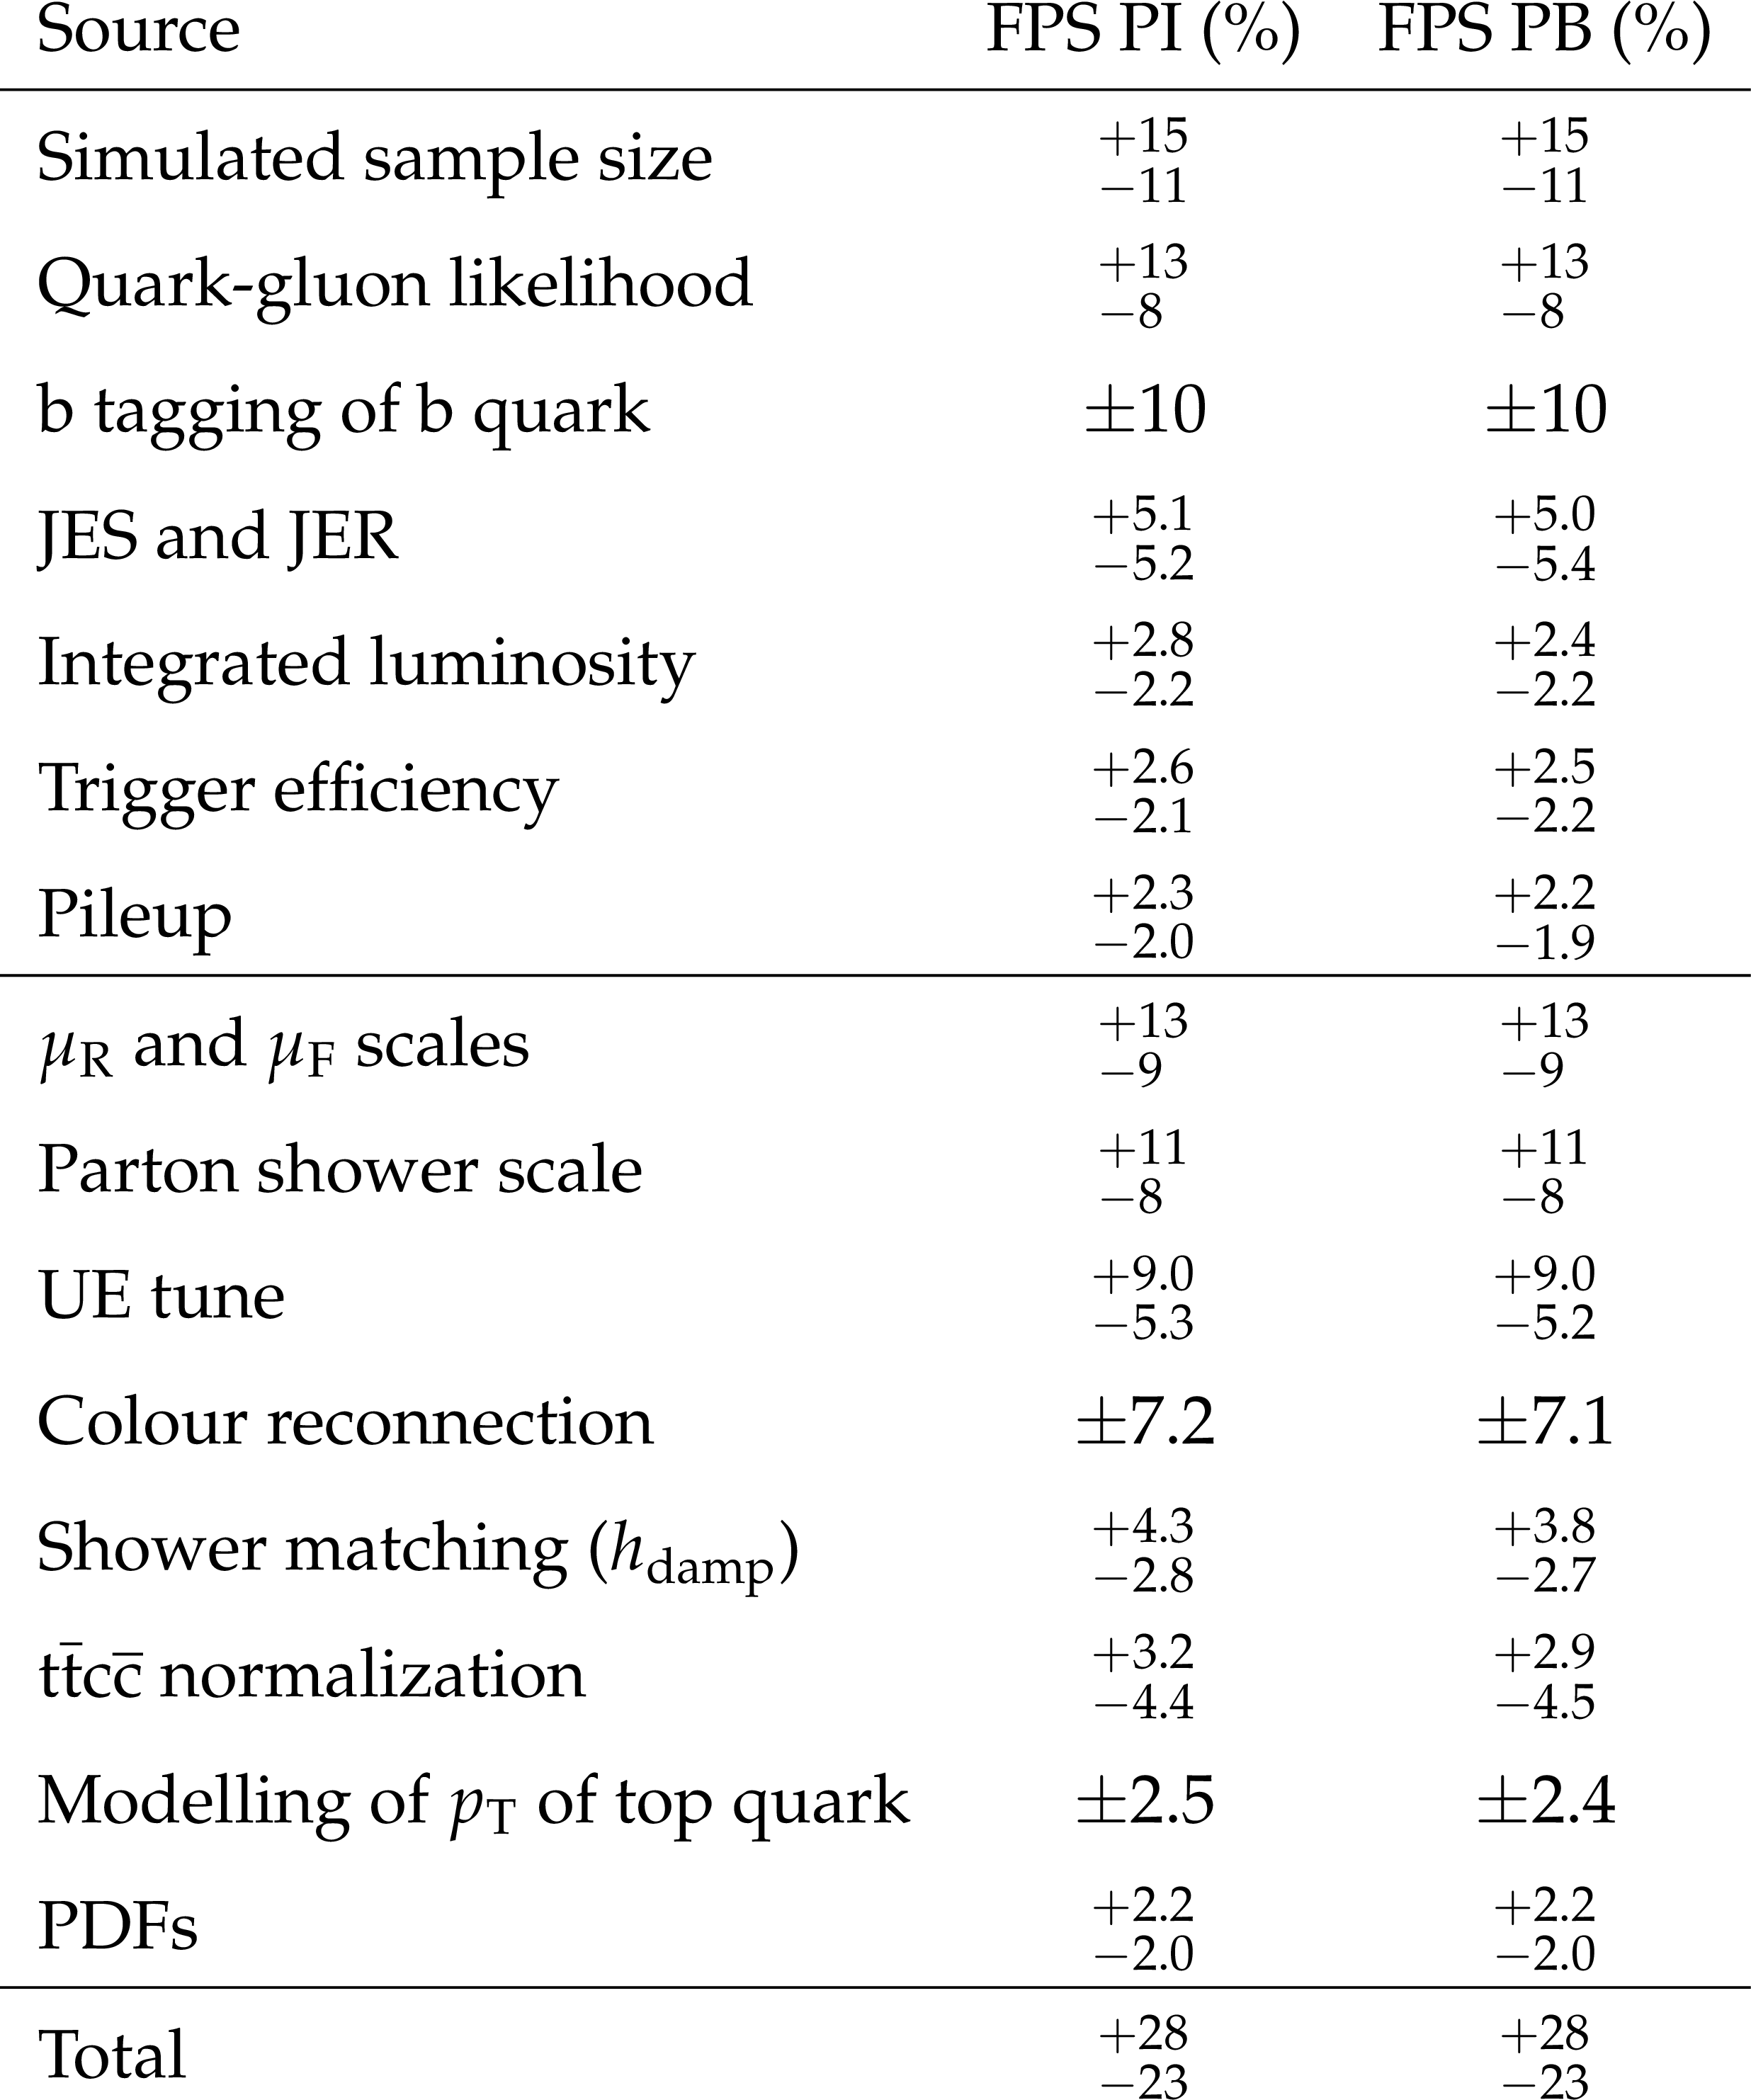
The considered sources of systematic uncertainties and their respective contributions to the total systematic uncertainty in the measured ${{\mathrm{t} \mathrm{\bar{t}}} \mathrm{b} \mathrm{\bar{b}}}$ cross section in the FPS for the two defined ${{\mathrm{t} \mathrm{\bar{t}}} \mathrm{b} \mathrm{\bar{b}}}$. The upper (lower) portion of the table lists uncertainties related to the experimental conditions (theoretical modelling). The numbers are obtained by taking the difference in quadrature of the profile likelihood width when fixing nuisance parameters corresponding to a given source of uncertainty and leaving the others free to vary. |
png pdf |
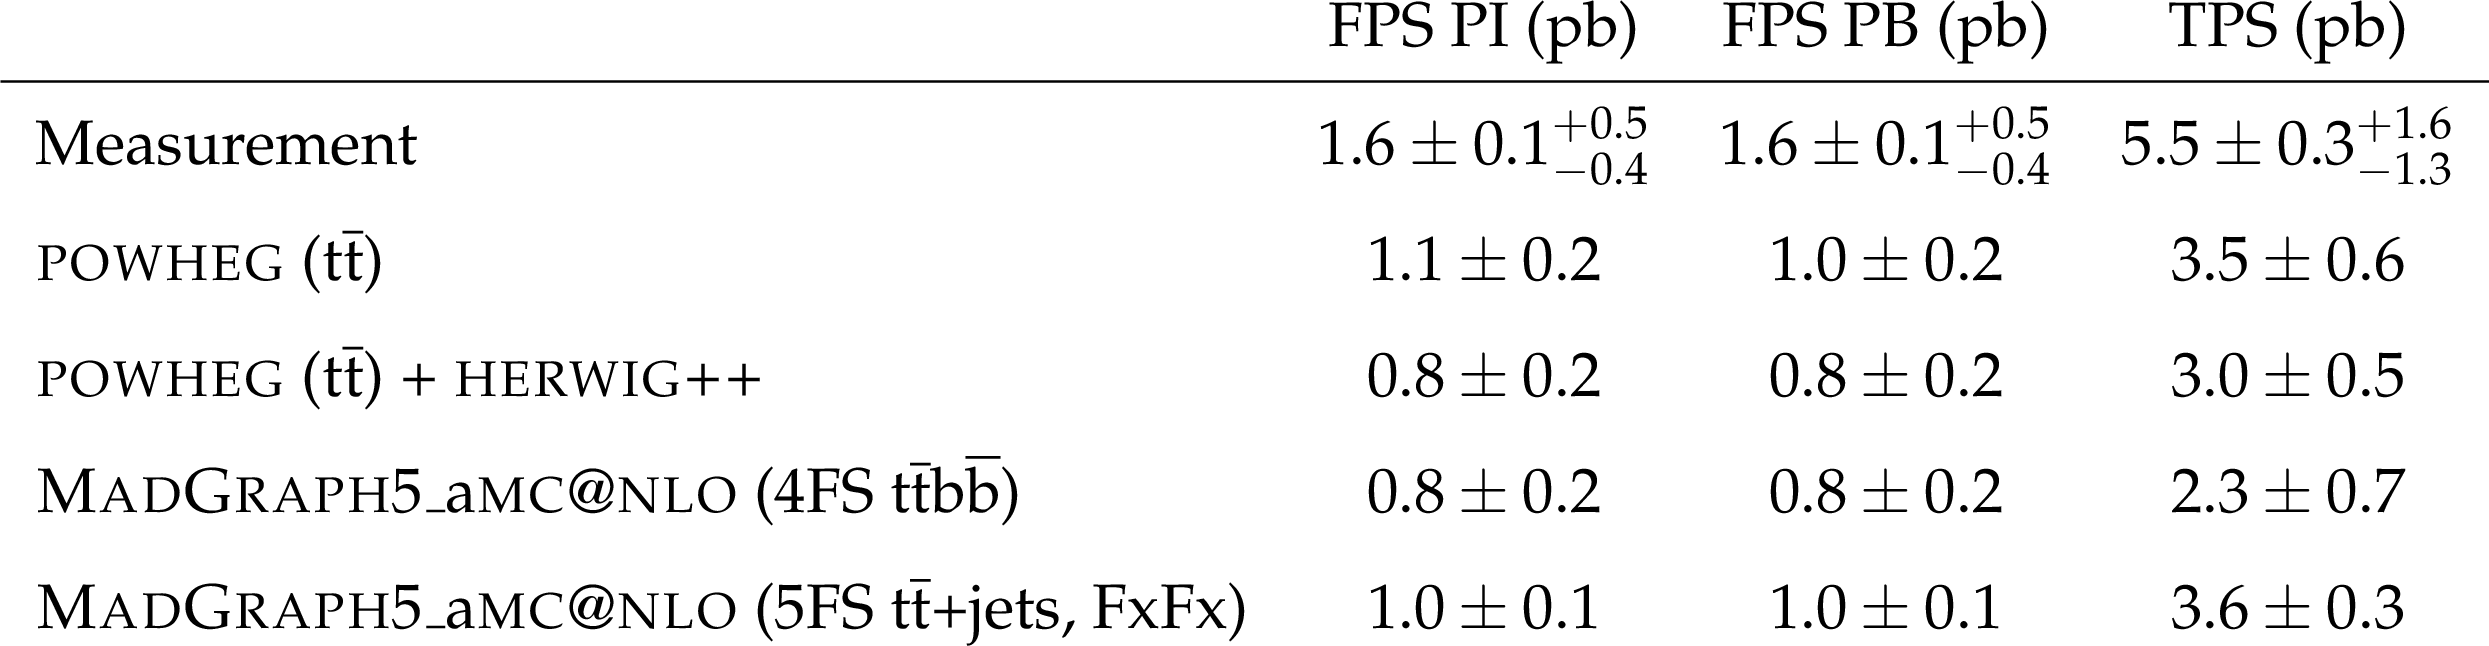
Table 2:
Measured and predicted cross sections for the different definitions of the ${{\mathrm{t} \mathrm{\bar{t}}} \mathrm{b} \mathrm{\bar{b}}}$ phase space considered in this analysis. For measurements, the first uncertainty is statistical, while the second one is from the systematic sources. The uncertainties in the predicted cross sections include the statistical uncertainty, the PDF uncertainties, and the $\mu _\mathrm {R}$ and $\mu _\mathrm {F}$ dependences on changes in scale. The uncertainties in scale for parton showers are not included, and amount to about 15% for POWHEG+PYTHIA. Unless specified otherwise, {pythia} is used for the modelling the parton shower, hadronization, and the underlying event. |
| Summary |
| The first measurement of the $\mathrm{t\bar{t}}\mathrm{b\bar{b}}$ cross section in the all-jet final state was presented, using 35.9 fb$^{-1}$ of data collected in pp collisions at $\sqrt{s} = $ 13 TeV. The cross section is first measured in a fiducial region of particle-level phase space by defining two categories of $\mathrm{t\bar{t}}\mathrm{b\bar{b}}$ events, and subsequently this result is corrected to the total phase space. One of the defined fiducial regions corresponds to ignoring parton-level information, while the other uses parton-level information to identify the particle-level jets that do not originate from the decay of top quarks. For both definitions, the cross section is measured to be 1.6 $\pm$ 0.1 (stat)$^{+0.5}_{-0.4}$ (syst) pb. The cross section in the total phase space is obtained by correcting this measurement for the experimental acceptance on the jets originating from the top quarks, which yields 5.5 $\pm$ 0.3 (stat)$^{+1.6}_{-1.3}$ (syst) pb. This measurement provides valuable input to studies of the $\mathrm{t\bar{t}}\mathrm{H}$ process, where the Higgs boson decays into a pair of b quarks, and for which the normalization and modelling of the $\mathrm{t\bar{t}}\mathrm{b\bar{b}}$ process represent a leading source of systematic uncertainty. Furthermore, these results represent a stringent test of perturbative quantum chromodynamics at the LHC. Predictions from several generators are compared with measurements and found to be smaller than the measured values by a factor of 1.5-2.4, corresponding to 1-2 standard deviations. This is consistent with previous results for the $\mathrm{t\bar{t}}\mathrm{b\bar{b}}$ cross section and calls for further experimental and theoretical studies of the associated production of top quark pairs and b jets. |
| References | ||||
| 1 | A. Bredenstein, A. Denner, S. Dittmaier, and S. Pozzorini | NLO QCD corrections to $ \mathrm{t}\mathrm{\bar{t}}\mathrm{b}\mathrm{\bar{b}} $ production at the LHC: 2. Full hadronic results | JHEP 03 (2010) 021 | 1001.4006 |
| 2 | ATLAS Collaboration | Observation of Higgs boson production in association with a top quark pair at the LHC with the ATLAS detector | PLB 784 (2018) 173 | 1806.00425 |
| 3 | CMS Collaboration | Observation of $ \mathrm{t}\mathrm{\bar{t}}\mathrm{H} $ production | PRL 120 (2018) 231801 | CMS-HIG-17-035 1804.02610 |
| 4 | ATLAS Collaboration | Search for the standard model Higgs boson produced in association with top quarks and decaying into a $ \mathrm{b}\mathrm{\bar{b}} $ pair in $ {\mathrm{p}}{\mathrm{p}} $ collisions at $ \sqrt{s} = $ 13 TeV with the ATLAS detector | PRD 97 (2018) 072016 | 1712.08895 |
| 5 | ATLAS Collaboration | Search for the standard model Higgs boson decaying into $ \mathrm{b}\mathrm{\bar{b}} $ produced in association with top quarks decaying hadronically in $ {\mathrm{p}}{\mathrm{p}} $ collisions at $ \sqrt{s} = $ 8 TeV with the ATLAS detector | JHEP 05 (2016) 160 | 1604.03812 |
| 6 | CMS Collaboration | Search for $ \mathrm{t}\mathrm{\bar{t}}\mathrm{H} $ production in the all-jet final state in proton-proton collisions at $ \sqrt{s} = $ 13 TeV | JHEP 06 (2018) 101 | CMS-HIG-17-022 1803.06986 |
| 7 | CMS Collaboration | Search for $ \mathrm{t}\mathrm{\bar{t}}\mathrm{H} $ production in the $ \mathrm{H} \to \mathrm{b}\mathrm{\bar{b}} $ decay channel with leptonic $ \mathrm{t}\mathrm{\bar{t}} $ decays in proton-proton collisions at $ \sqrt{s} = $ 13 TeV | JHEP 03 (2019) 026 | CMS-HIG-17-026 1804.03682 |
| 8 | ATLAS Collaboration | Search for four-top-quark production in the single-lepton and opposite-sign dilepton final states in $ {\mathrm{p}}{\mathrm{p}} $ collisions at $ \sqrt{s} = $ 13 TeV with the ATLAS detector | PRD 99 (2019) 052009 | 1811.02305 |
| 9 | CMS Collaboration | Search for standard model production of four top quarks in the lepton + jets channel in $ {\mathrm{p}}{\mathrm{p}} $ collisions at $ \sqrt{s} = $ 8 TeV | JHEP 11 (2014) 154 | CMS-TOP-13-012 1409.7339 |
| 10 | CMS Collaboration | Search for standard model production of four top quarks in proton-proton collisions at $ \sqrt{s} = $ 13 TeV | PLB 772 (2017) 336 | CMS-TOP-16-016 1702.06164 |
| 11 | Q.-H. Cao, S.-L. Chen, and Y. Liu | Probing Higgs width and top quark Yukawa coupling from $ \mathrm{t}\mathrm{\bar{t}}\mathrm{H} $ and $ \mathrm{t}\mathrm{\bar{t}}\mathrm{t}\mathrm{\bar{t}} $ productions | PRD 95 (2017) 053004 | 1602.01934 |
| 12 | Q.-H. Cao et al. | Limiting top quark-Higgs boson interaction and Higgs-boson width from multitop productions | PRD 99 (2019) 113003 | 1901.04567 |
| 13 | S. Hoche et al. | Next-to-leading order QCD predictions for top-quark pair production with up to two jets merged with a parton shower | PLB 748 (2015) 74 | 1402.6293 |
| 14 | J. Alwall et al. | The automated computation of tree-level and next-to-leading order differential cross sections, and their matching to parton shower simulations | JHEP 07 (2014) 079 | 1405.0301 |
| 15 | R. Frederix and S. Frixione | Merging meets matching in MC@NLO | JHEP 12 (2012) 061 | 1209.6215 |
| 16 | M. V. Garzelli, A. Kardos, and Z. Tr\'ocs\'anyi | Hadroproduction of $ \mathrm{t}\mathrm{\bar{t}}\mathrm{b}\mathrm{\bar{b}} $ final states at LHC: predictions at NLO accuracy matched with parton shower | JHEP 03 (2015) 083 | 1408.0266 |
| 17 | F. Cascioli et al. | NLO matching for $ \mathrm{t}\mathrm{\bar{t}}\mathrm{b}\mathrm{\bar{b}} $ production with massive $ \mathrm{b} $-quarks | PLB 734 (2014) 210 | 1309.5912 |
| 18 | G. Bevilacqua, M. V. Garzelli, and A. Kardos | $ \mathrm{t}\mathrm{\bar{t}}\mathrm{b}\mathrm{\bar{b}} $ hadroproduction with massive bottom quarks with PowHel | 1709.06915 | |
| 19 | T. Je\vzo, J. M. Lindert, N. Moretti, and S. Pozzorini | New NLOPS predictions for $ \mathrm{t}\mathrm{\bar{t}} $ + $ \mathrm{b} $-jet production at the LHC | EPJC 78 (2018) 502 | 1802.00426 |
| 20 | ATLAS Collaboration | Measurements of fiducial cross-sections for $ \mathrm{t}\mathrm{\bar{t}} $ production with one or two additional $ \mathrm{b} $-jets in $ {\mathrm{p}}{\mathrm{p}} $ collisions at $ \sqrt{s} = $ 8 TeV using the ATLAS detector | EPJC 76 (2016) 11 | 1508.06868 |
| 21 | ATLAS Collaboration | Measurements of inclusive and differential fiducial cross-sections of $ \mathrm{t}\mathrm{\bar{t}} $ production with additional heavy-flavour jets in proton-proton collisions at $ \sqrt{s} = $ 13 TeV with the ATLAS detector | JHEP 04 (2019) 046 | 1811.12113 |
| 22 | CMS Collaboration | Measurement of the cross section ratio $ \sigma_{\mathrm{t}\mathrm{\bar{t}}\mathrm{b}\mathrm{\bar{b}}} / \sigma_\mathrm{\mathrm{t}\mathrm{\bar{t}} \mathrm{jj}} $ in $ {\mathrm{p}}{\mathrm{p}} $ collisions at $ \sqrt{s} = $ 8 TeV | PLB 746 (2015) 132 | CMS-TOP-13-010 1411.5621 |
| 23 | CMS Collaboration | Measurement of $ \mathrm{t}\mathrm{\bar{t}} $ production with additional jet activity, including $ \mathrm{b} $ quark jets, in the dilepton decay channel using $ {\mathrm{p}}{\mathrm{p}} $ collisions at $ \sqrt{s} = $ 8 TeV | EPJC 76 (2016) 379 | CMS-TOP-12-041 1510.03072 |
| 24 | CMS Collaboration | Measurements of $ \mathrm{t}\mathrm{\bar{t}} $ cross sections in association with $ \mathrm{b} $ jets and inclusive jets and their ratio using dilepton final states in $ {\mathrm{p}}{\mathrm{p}} $ collisions at $ \sqrt{s} = $ 13 TeV | PLB 776 (2018) 355 | CMS-TOP-16-010 1705.10141 |
| 25 | CMS Collaboration | CMS luminosity measurements for the 2016 data taking period | CMS-PAS-LUM-17-001 | CMS-PAS-LUM-17-001 |
| 26 | CMS Collaboration | The CMS experiment at the CERN LHC | JINST 3 (2008) S08004 | CMS-00-001 |
| 27 | P. Nason | A new method for combining NLO QCD with shower Monte Carlo algorithms | JHEP 11 (2004) 040 | hep-ph/0409146 |
| 28 | S. Frixione, P. Nason, and C. Oleari | Matching NLO QCD computations with parton shower simulations: the POWHEG method | JHEP 11 (2007) 070 | 0709.2092 |
| 29 | S. Alioli, P. Nason, C. Oleari, and E. Re | A general framework for implementing NLO calculations in shower Monte Carlo programs: the POWHEG BOX | JHEP 06 (2010) 043 | 1002.2581 |
| 30 | S. Frixione, P. Nason, and G. Ridolfi | A positive-weight next-to-leading-order Monte Carlo for heavy flavour hadroproduction | JHEP 09 (2007) 126 | 0707.3088 |
| 31 | S. Alioli, P. Nason, C. Oleari, and E. Re | NLO single-top production matched with shower in POWHEG: $ s $- and $ t $-channel contributions | JHEP 09 (2009) 111 | 0907.4076 |
| 32 | E. Re | Single-top $ \mathrm{W}\mathrm{t} $-channel production matched with parton showers using the POWHEG method | EPJC 71 (2011) 1547 | 1009.2450 |
| 33 | H. B. Hartanto, B. Jager, L. Reina, and D. Wackeroth | Higgs boson production in association with top quarks in the POWHEG BOX | PRD 91 (2015) 094003 | 1501.04498 |
| 34 | J. Alwall et al. | Comparative study of various algorithms for the merging of parton showers and matrix elements in hadronic collisions | EPJC 53 (2008) 473 | 0706.2569 |
| 35 | T. Sjostrand et al. | An introduction to PYTHIA 8.2 | CPC 191 (2015) 159 | 1410.3012 |
| 36 | NNPDF Collaboration | Parton distributions for the LHC Run II | JHEP 04 (2015) 040 | 1410.8849 |
| 37 | CMS Collaboration | Event generator tunes obtained from underlying event and multiparton scattering measurements | EPJC 76 (2015) 155 | CMS-GEN-14-001 1512.00815 |
| 38 | CMS Collaboration | Investigations of the impact of the parton shower tuning in Pythia 8 in the modelling of $ \mathrm{t}\mathrm{\bar{t}} $ at $ \sqrt{s}= $ 8 and 13 TeV | CDS | |
| 39 | \GEANTfour Collaboration | GEANT4--a simulation toolkit | NIMA 506 (2003) 250 | |
| 40 | M. Czakon and A. Mitov | Top++: A program for the calculation of the top-pair cross-section at hadron colliders | CPC 185 (2014) 2930 | 1112.5675 |
| 41 | N. Kidonakis | Top quark production | 1311.0283 | |
| 42 | Y. Li and F. Petriello | Combining QCD and electroweak corrections to dilepton production in the framework of the FEWZ simulation code | PRD 86 (2012) 094034 | 1208.5967 |
| 43 | T. Gehrmann et al. | $ \mathrm{W}^+\mathrm{W}^- $ production at hadron colliders in next to next to leading order QCD | PRL 113 (2014) 212001 | 1408.5243 |
| 44 | J. M. Campbell, R. K. Ellis, and C. Williams | Vector boson pair production at the LHC | JHEP 07 (2011) 018 | 1105.0020 |
| 45 | M. Cacciari, G. P. Salam, and G. Soyez | The anti-$ {k_{\mathrm{T}}} $ jet clustering algorithm | JHEP 04 (2008) 063 | 0802.1189 |
| 46 | M. Cacciari, G. P. Salam, and G. Soyez | FastJet user manual | EPJC 72 (2012) 1896 | 1111.6097 |
| 47 | M. Cacciari and G. P. Salam | Pileup subtraction using jet areas | PLB 659 (2008) 119 | 0707.1378 |
| 48 | CMS Collaboration | Particle-flow reconstruction and global event description with the CMS detector | JINST 12 (2017) P10003 | CMS-PRF-14-001 1706.04965 |
| 49 | CMS Collaboration | Jet energy scale and resolution in the CMS experiment in $ {\mathrm{p}}{\mathrm{p}} $ collisions at 8 TeV | JINST 12 (2017) P02014 | CMS-JME-13-004 1607.03663 |
| 50 | CMS Collaboration | Identification of heavy-flavour jets with the CMS detector in $ {\mathrm{p}}{\mathrm{p}} $ collisions at 13 TeV | JINST 13 (2018) P05011 | CMS-BTV-16-002 1712.07158 |
| 51 | CMS Collaboration | The CMS trigger system | JINST 12 (2017) P01020 | CMS-TRG-12-001 1609.02366 |
| 52 | CMS Collaboration | Performance of the CMS muon detector and muon reconstruction with proton-proton collisions at $ \sqrt{s}= $ 13 TeV | JINST 13 (2018) P06015 | CMS-MUO-16-001 1804.04528 |
| 53 | CMS Collaboration | Performance of electron reconstruction and selection with the CMS detector in proton-proton collisions at $ \sqrt{s} = $ 8 TeV | JINST 10 (2015) P06005 | CMS-EGM-13-001 1502.02701 |
| 54 | CMS Collaboration | Performance of quark/gluon discrimination in 8 $ TeV {\mathrm{p}}{\mathrm{p}} $ data | CMS-PAS-JME-13-002 | CMS-PAS-JME-13-002 |
| 55 | CMS Collaboration | Performance of quark/gluon discrimination in 13 TeV data | CDS | |
| 56 | H. Voss, H. Hocker, J. Stelzer, and F. Tegenfeldt | TMVA: Toolkit for Multivariate Data Analysis with ROOT | PoS ACAT (2007) 040 | physics/0703039 |
| 57 | E. M. Metodiev, B. Nachman, and J. Thaler | Classification without labels: learning from mixed samples in high energy physics | JHEP 10 (2017) 174 | 1708.02949 |
| 58 | ATLAS Collaboration | Measurement of the inelastic proton-proton cross section at $ \sqrt{s} = $ 13 TeV with the ATLAS detector at the LHC | PRL 117 (2016) 182002 | 1606.02625 |
| 59 | J. R. Christiansen and P. Z. Skands | String formation beyond leading colour | JHEP 08 (2015) 003 | 1505.01681 |
| 60 | S. Argyropoulos and T. Sjostrand | Effects of color reconnection on $ \mathrm{t}\mathrm{\bar{t}} $ final states at the LHC | JHEP 11 (2014) 043 | 1407.6653 |
| 61 | CMS Collaboration | Measurement of differential cross sections for the production of top quark pairs and of additional jets in lepton+jets events from $ {\mathrm{p}}{\mathrm{p}} $ collisions at $ \sqrt{s} = $ 13 TeV | PRD 97 (2018) 112003 | CMS-TOP-17-002 1803.08856 |
| 62 | M. Bahr et al. | Herwig++ physics and manual | EPJC 58 (2008) 639 | 0803.0883 |
| 63 | S. Gieseke, C. Rohr, and A. Siodmok | Colour reconnections in Herwig++ | EPJC 72 (2012) 2225 | 1206.0041 |
|
|
Compact Muon Solenoid LHC, CERN |
|

|

|

|

|

|