

Compact Muon Solenoid
LHC, CERN
| CMS-TOP-19-002 ; CERN-EP-2021-241 | ||
| Search for flavor-changing neutral current interactions of the top quark and the Higgs boson decaying to a bottom quark-antiquark pair at $\sqrt{s} = $ 13 TeV | ||
| CMS Collaboration | ||
| 17 December 2021 | ||
| JHEP 02 (2022) 169 | ||
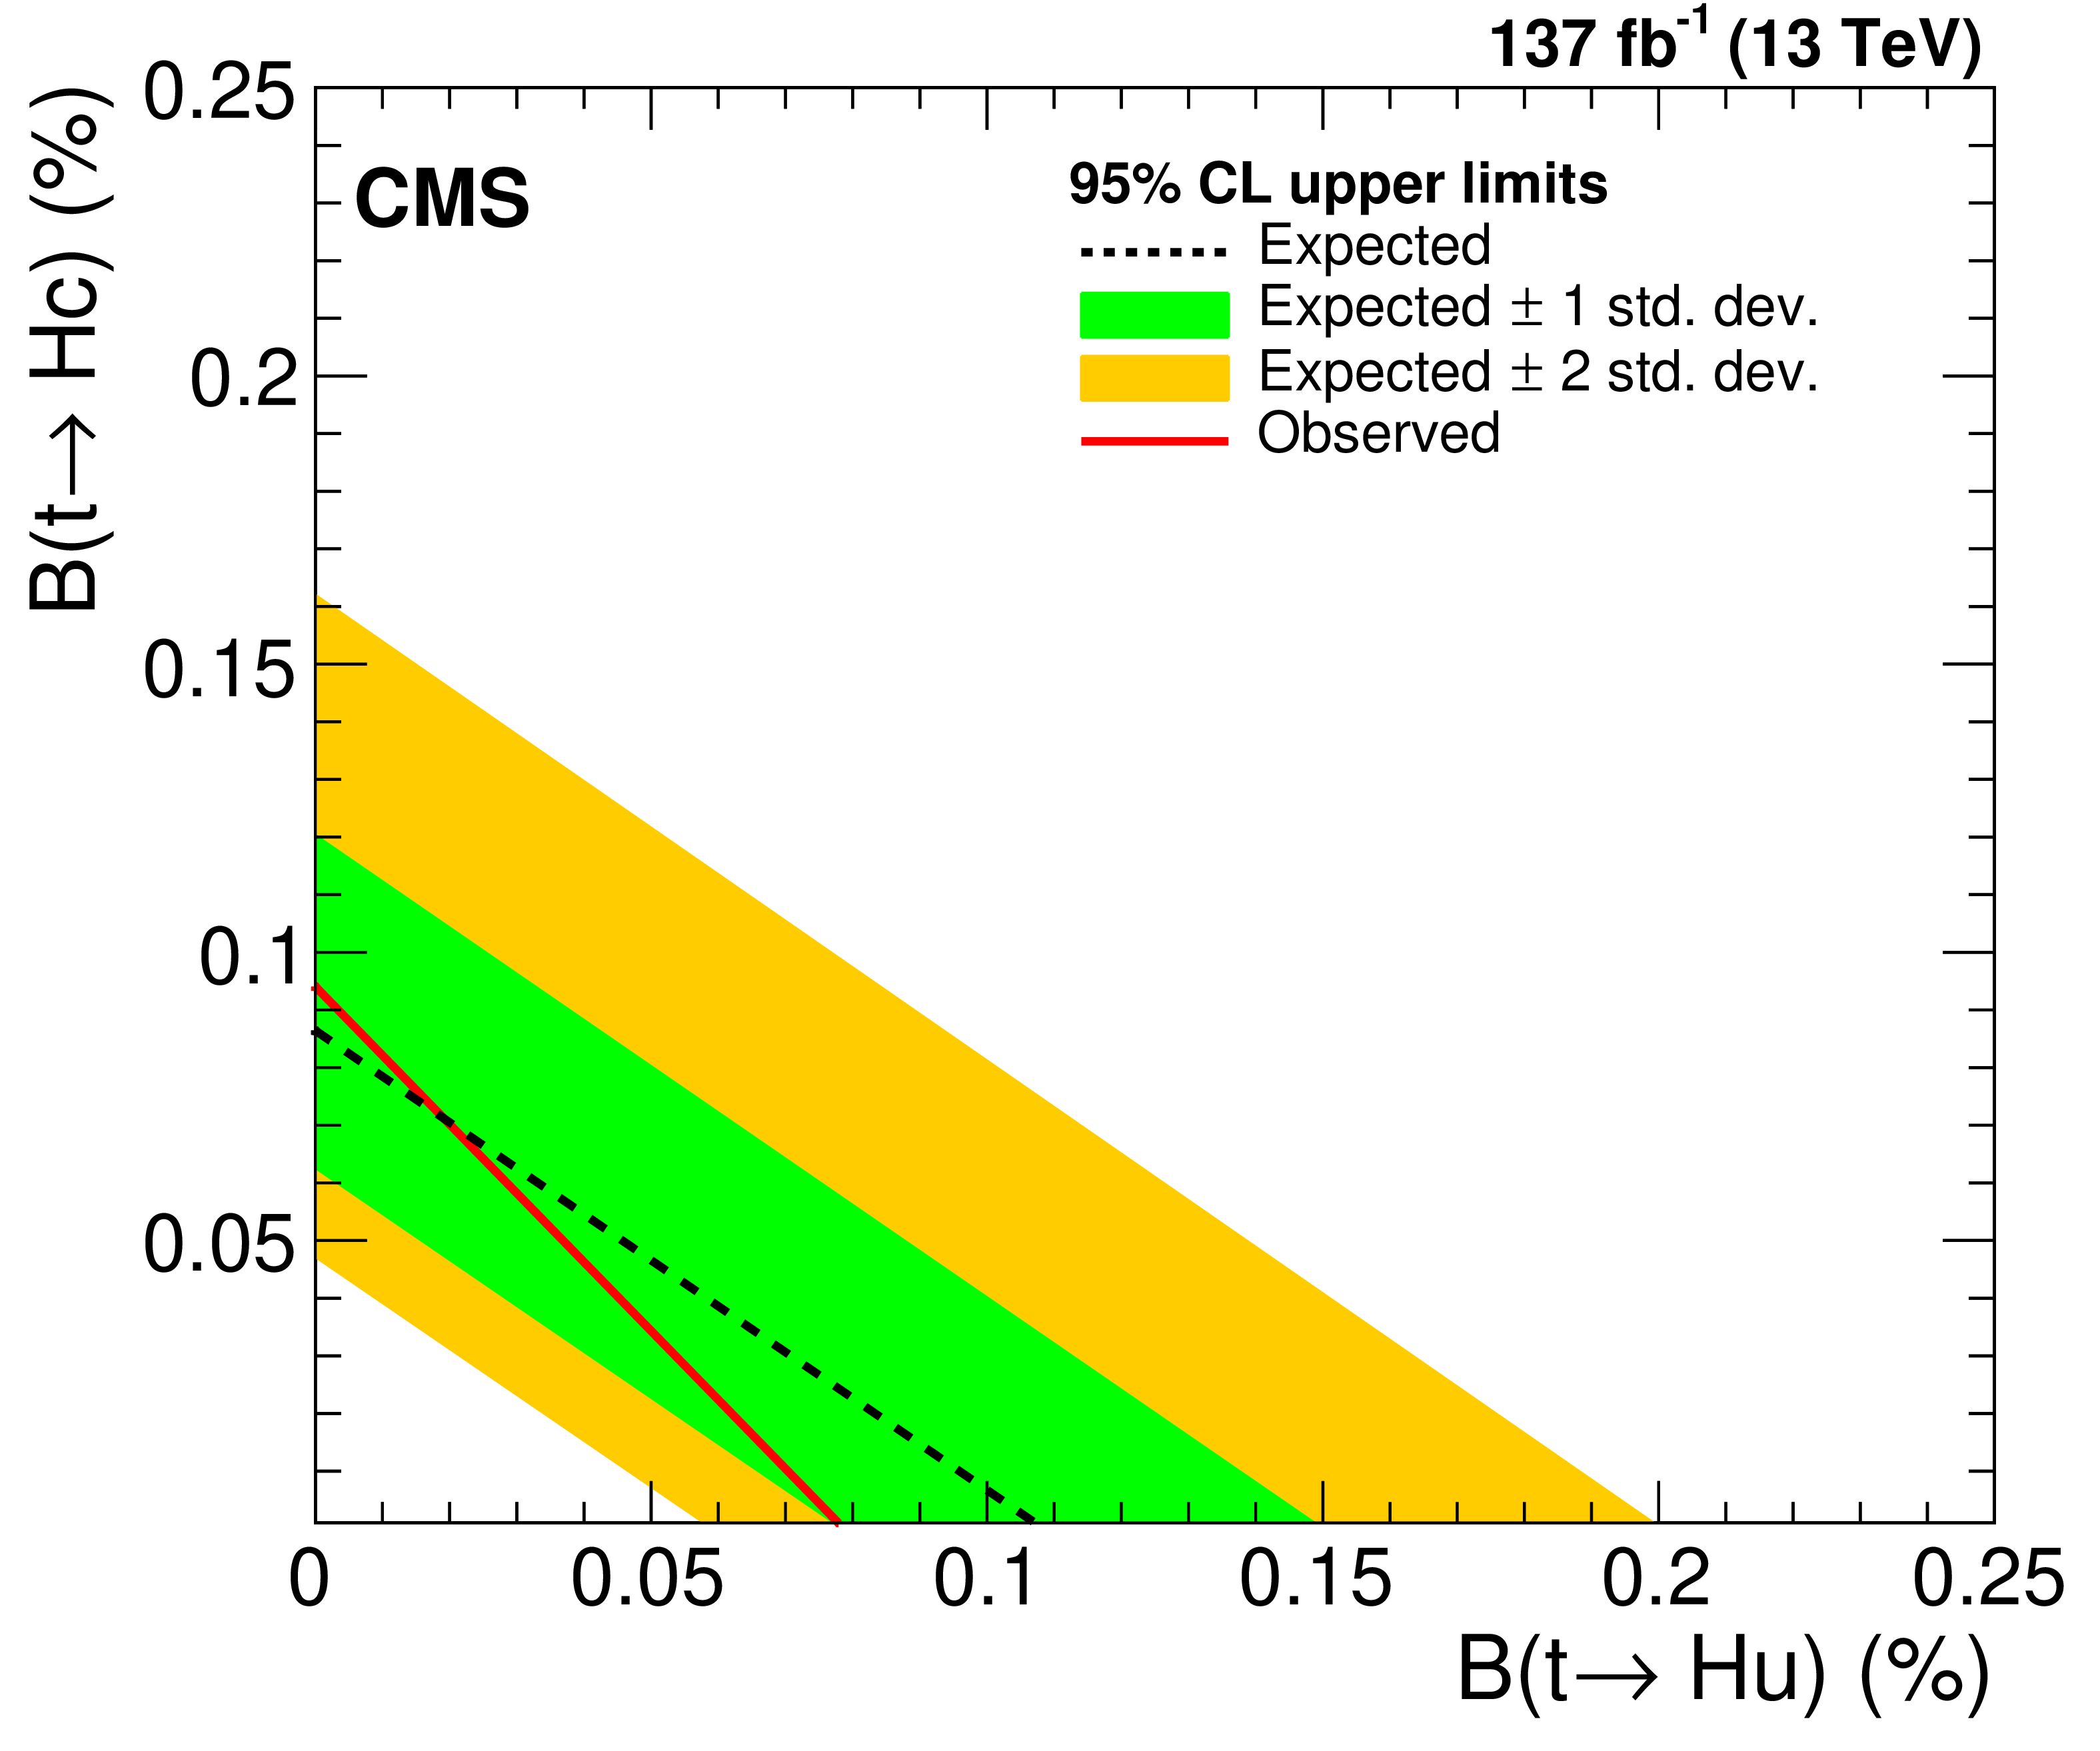
| Abstract: A search for flavor-changing neutral current interactions of the top quark (t) and the Higgs boson (H) is presented. The search is based on a data sample corresponding to an integrated luminosity of 137 fb$^{-1}$ recorded by the CMS experiment at the LHC in proton-proton collisions at $\sqrt{s} = $ 13 TeV. Events containing exactly one lepton (muon or electron) and at least three jets, among which at least two are identified as originating from the hadronization of a bottom quark, are analyzed. A set of deep neural networks is used for kinematic event reconstruction, while boosted decision trees distinguish the signal from the background events. No significant excess over the background predictions is observed, and upper limits on the signal production cross sections are extracted. These limits are interpreted in terms of top quark decay branching fractions ($\mathcal{B}$) to the Higgs boson and an up (u) or a charm quark (c). Assuming one nonvanishing extra coupling at a time, the observed (expected) upper limits at 95% confidence level are $\mathcal{B}({\mathrm{t} \to \mathrm{H}\mathrm{u}} ) < $ 0.079 (0.11)% and $\mathcal{B}({\mathrm{t} \to \mathrm{H}\mathrm{c}} ) < $ 0.094 (0.086)%. | ||
| Links: e-print arXiv:2112.09734 [hep-ex] (PDF) ; CDS record ; inSPIRE record ; HepData record ; Physics Briefing ; CADI line (restricted) ; | ||
| Figures | |
png pdf |
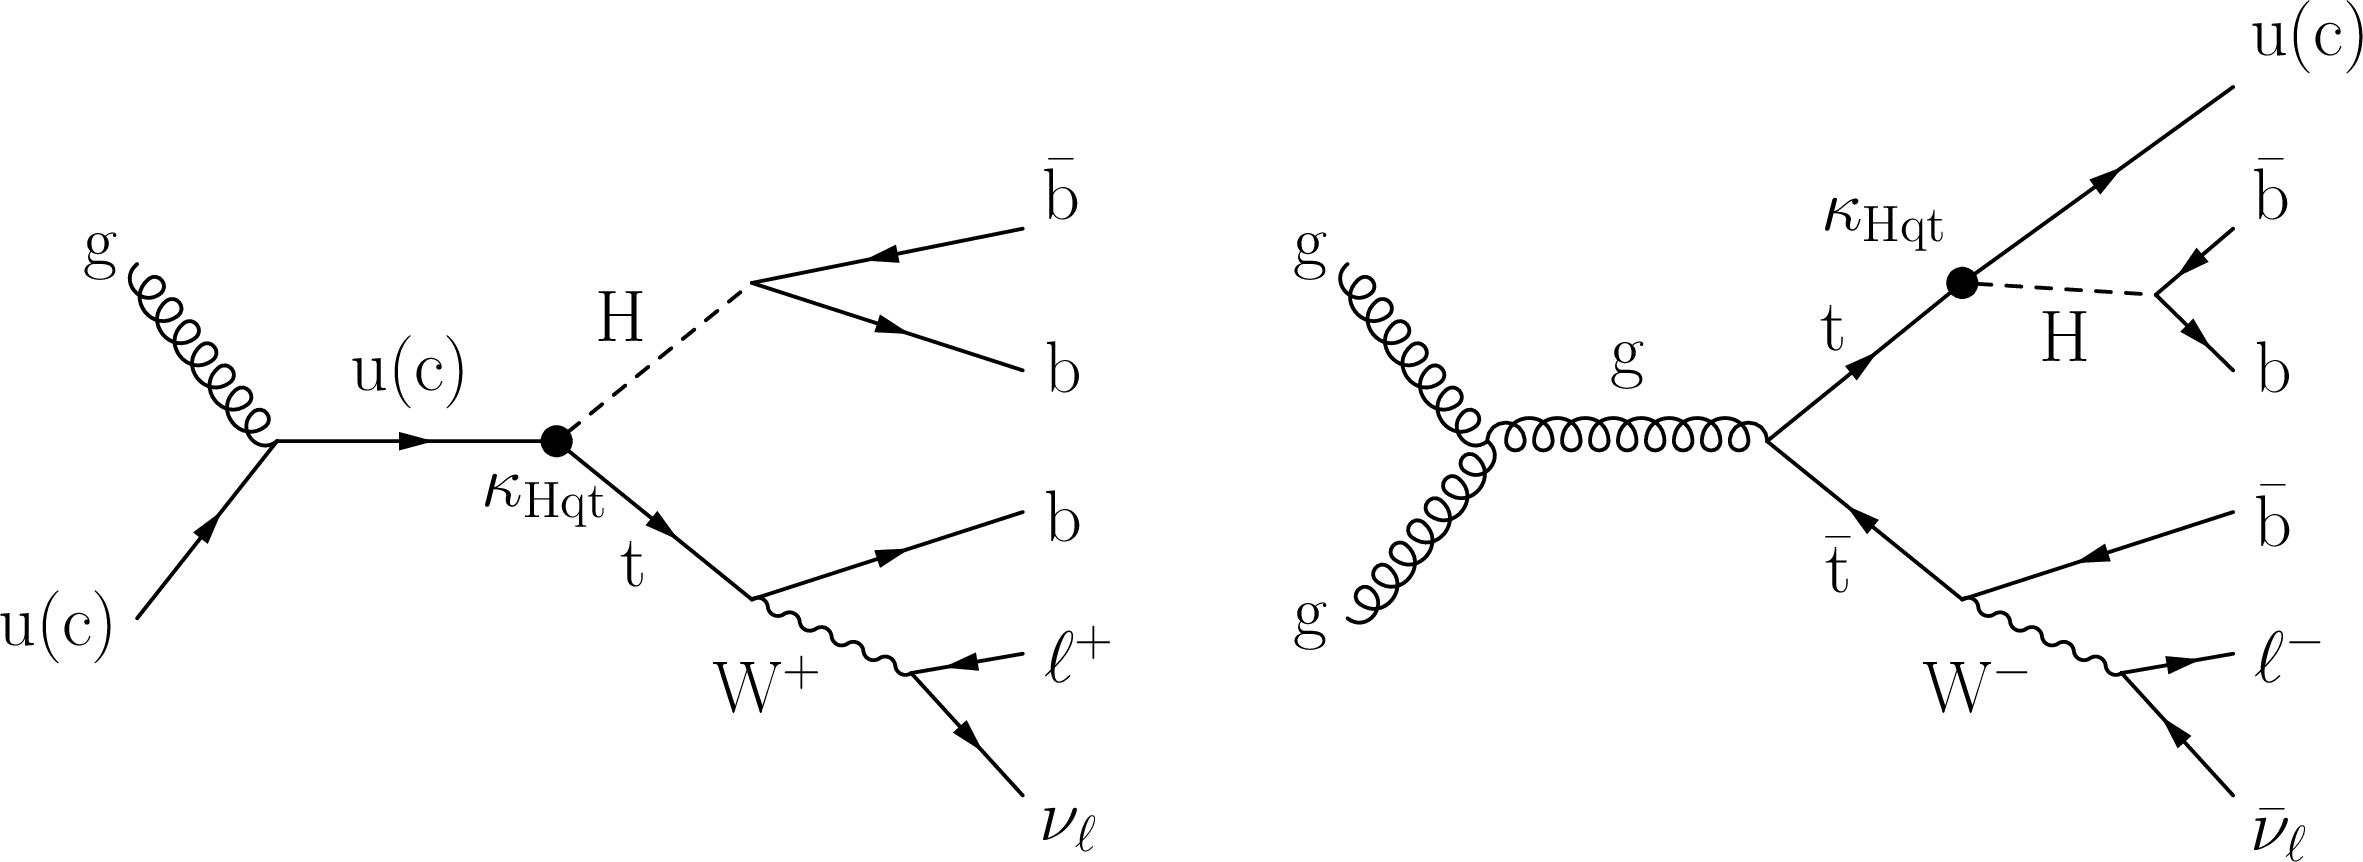
Figure 1:
Illustrative Feynman diagrams for Hqt FCNC interactions: the production of a single top quark with the Higgs boson (left), and FCNC decay of the top quark in ${\mathrm{t} {}\mathrm{\bar{t}}}$ events (right), where q = u or c. |
png pdf |
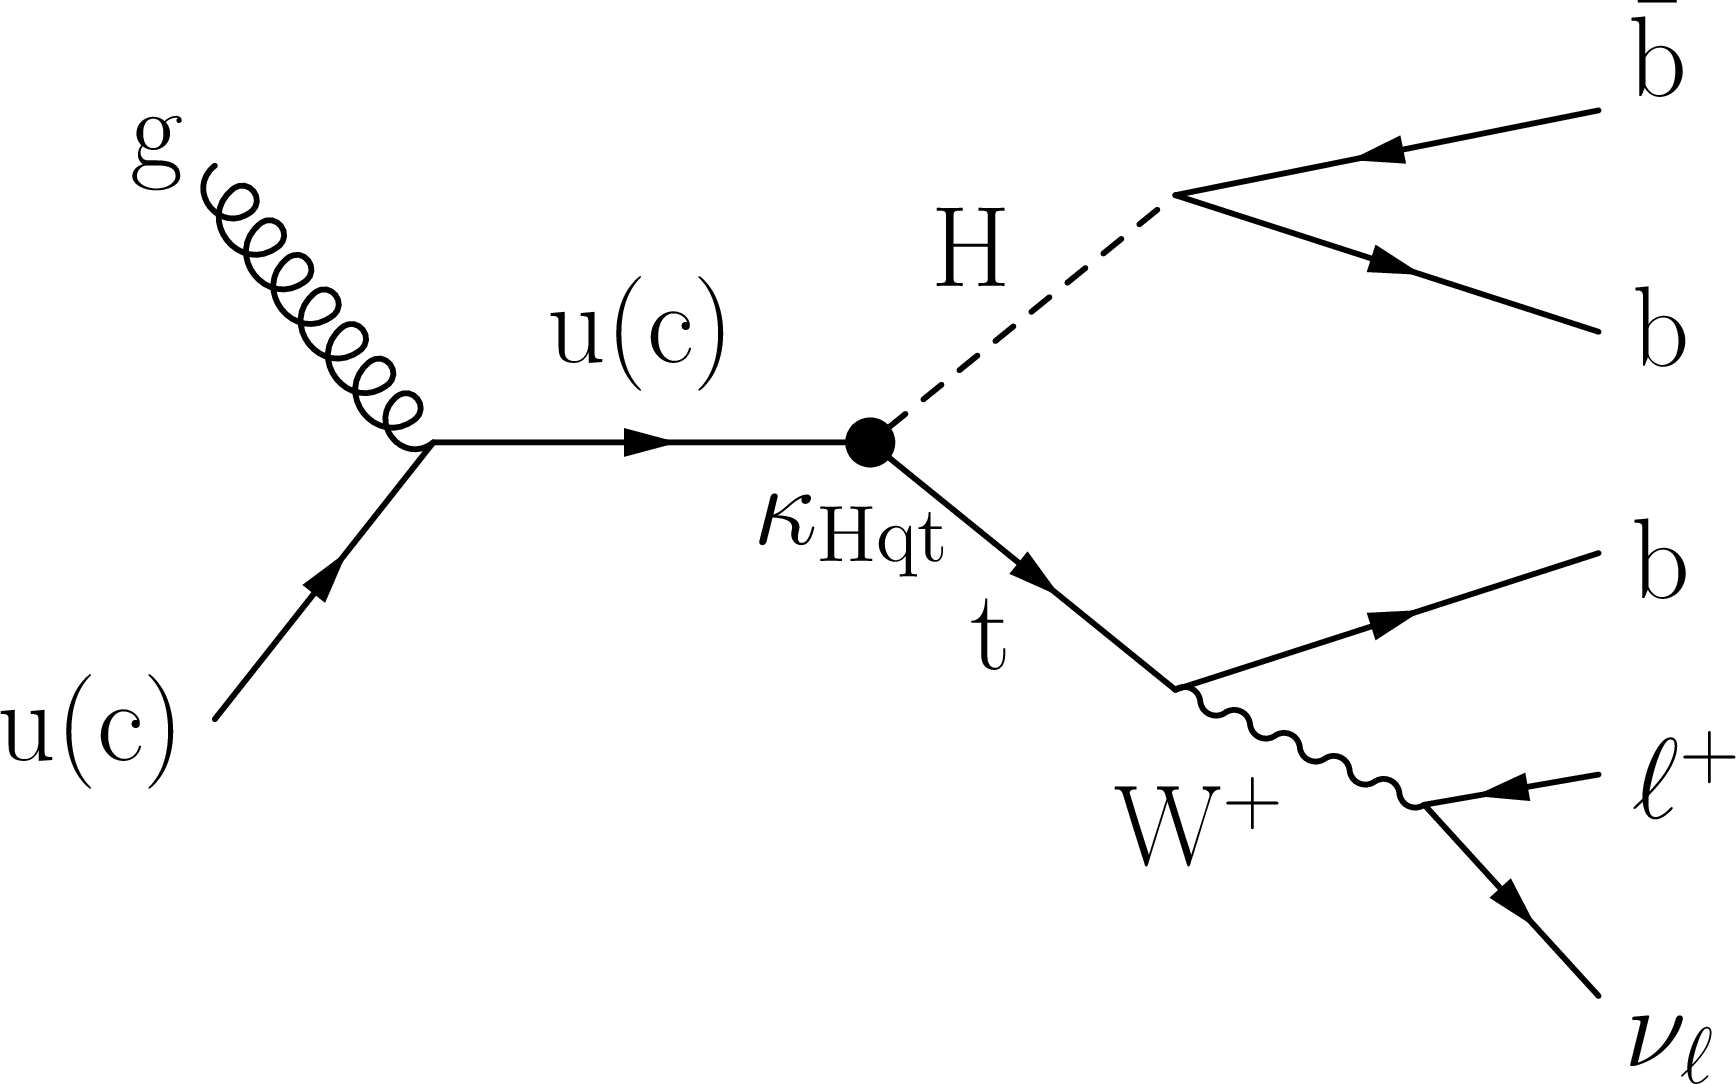
Figure 1-a:
Illustrative Feynman diagram for Hqt FCNC interactions: the production of a single top quark with the Higgs boson. |
png pdf |
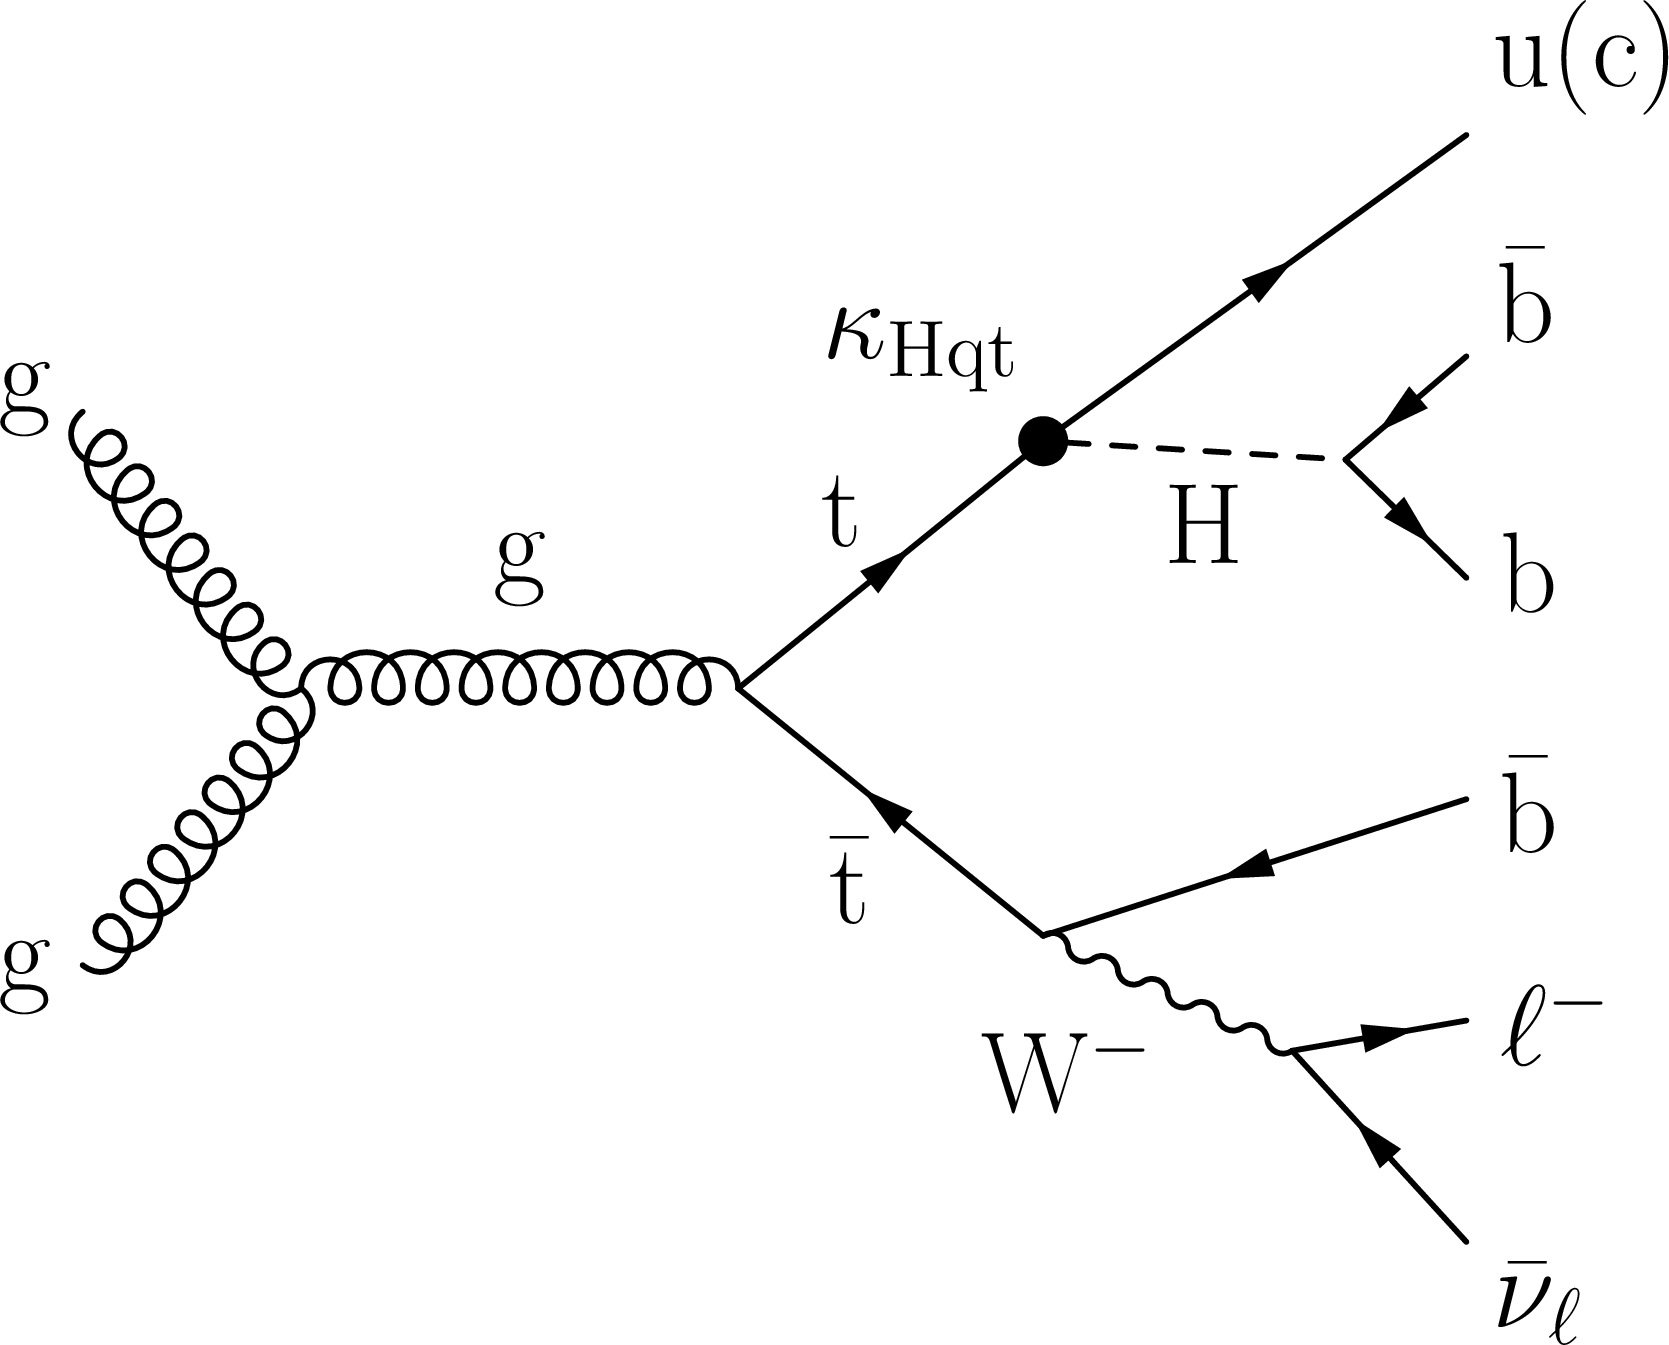
Figure 1-b:
Illustrative Feynman diagram for Hqt FCNC interactions: FCNC decay of the top quark in ${\mathrm{t} {}\mathrm{\bar{t}}}$ events, where q = u or c. |
png pdf |
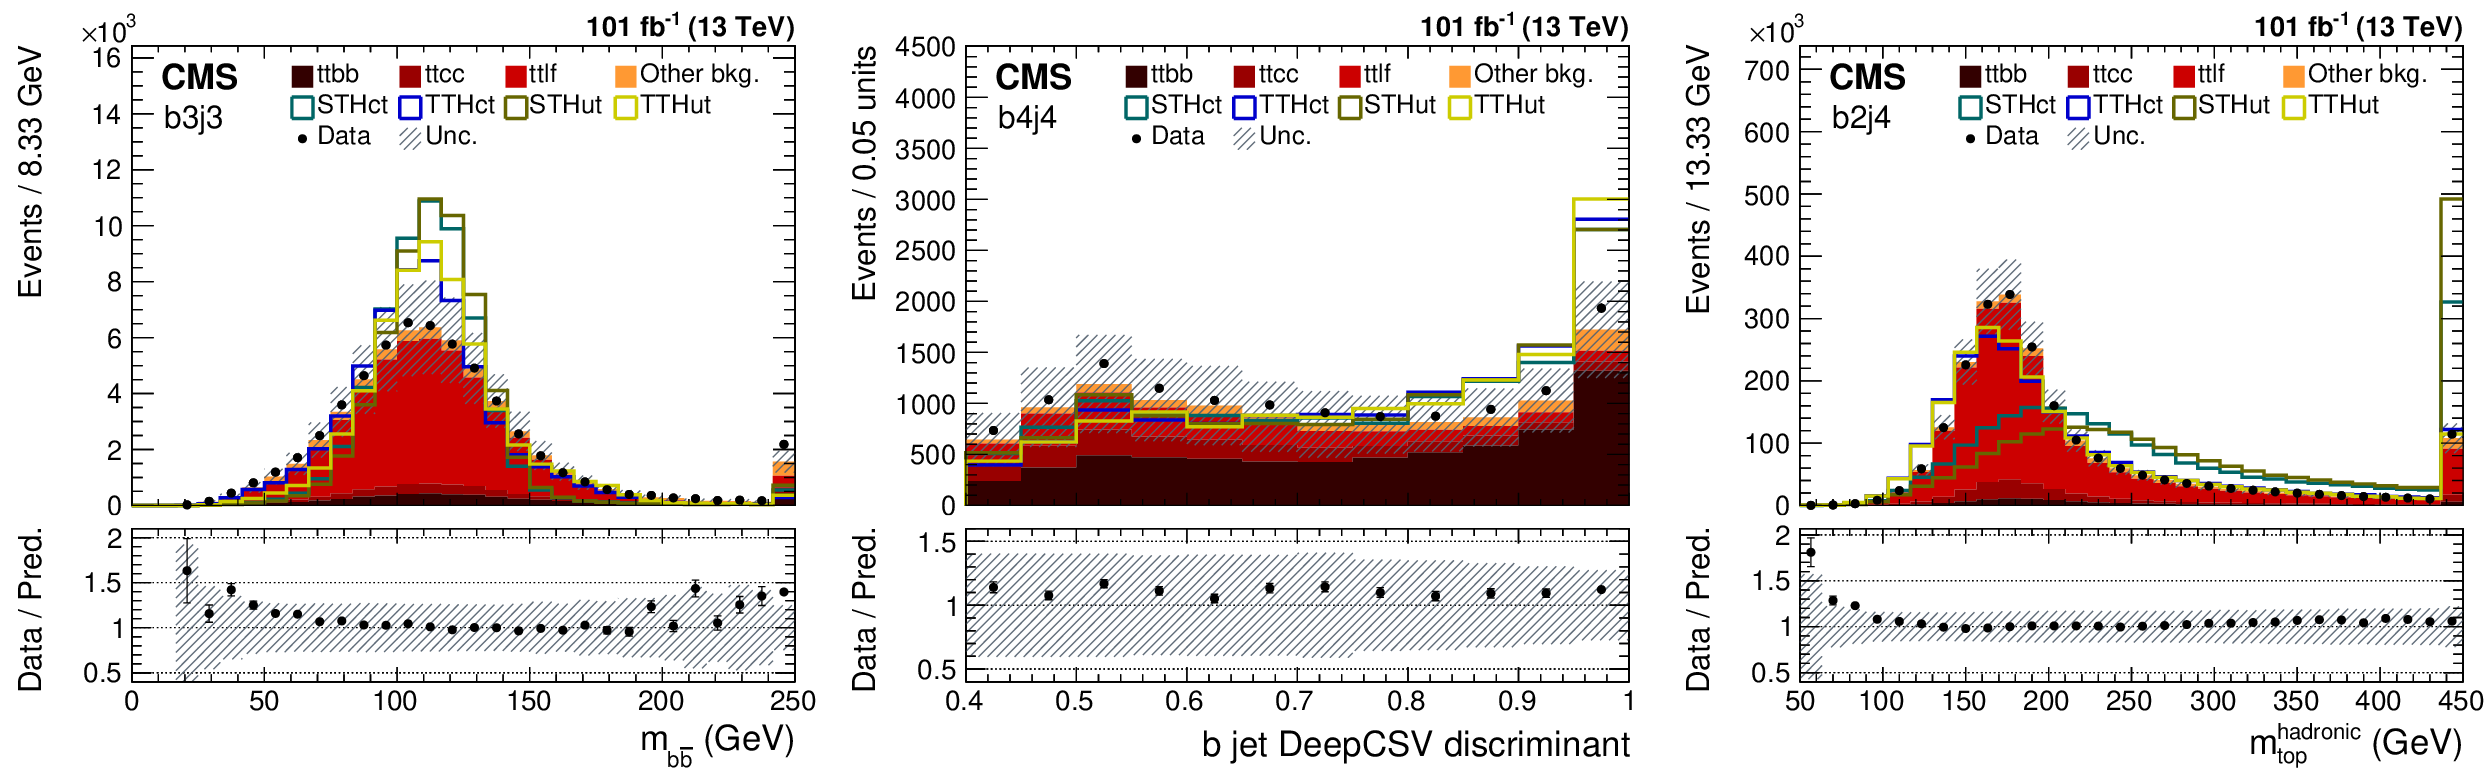
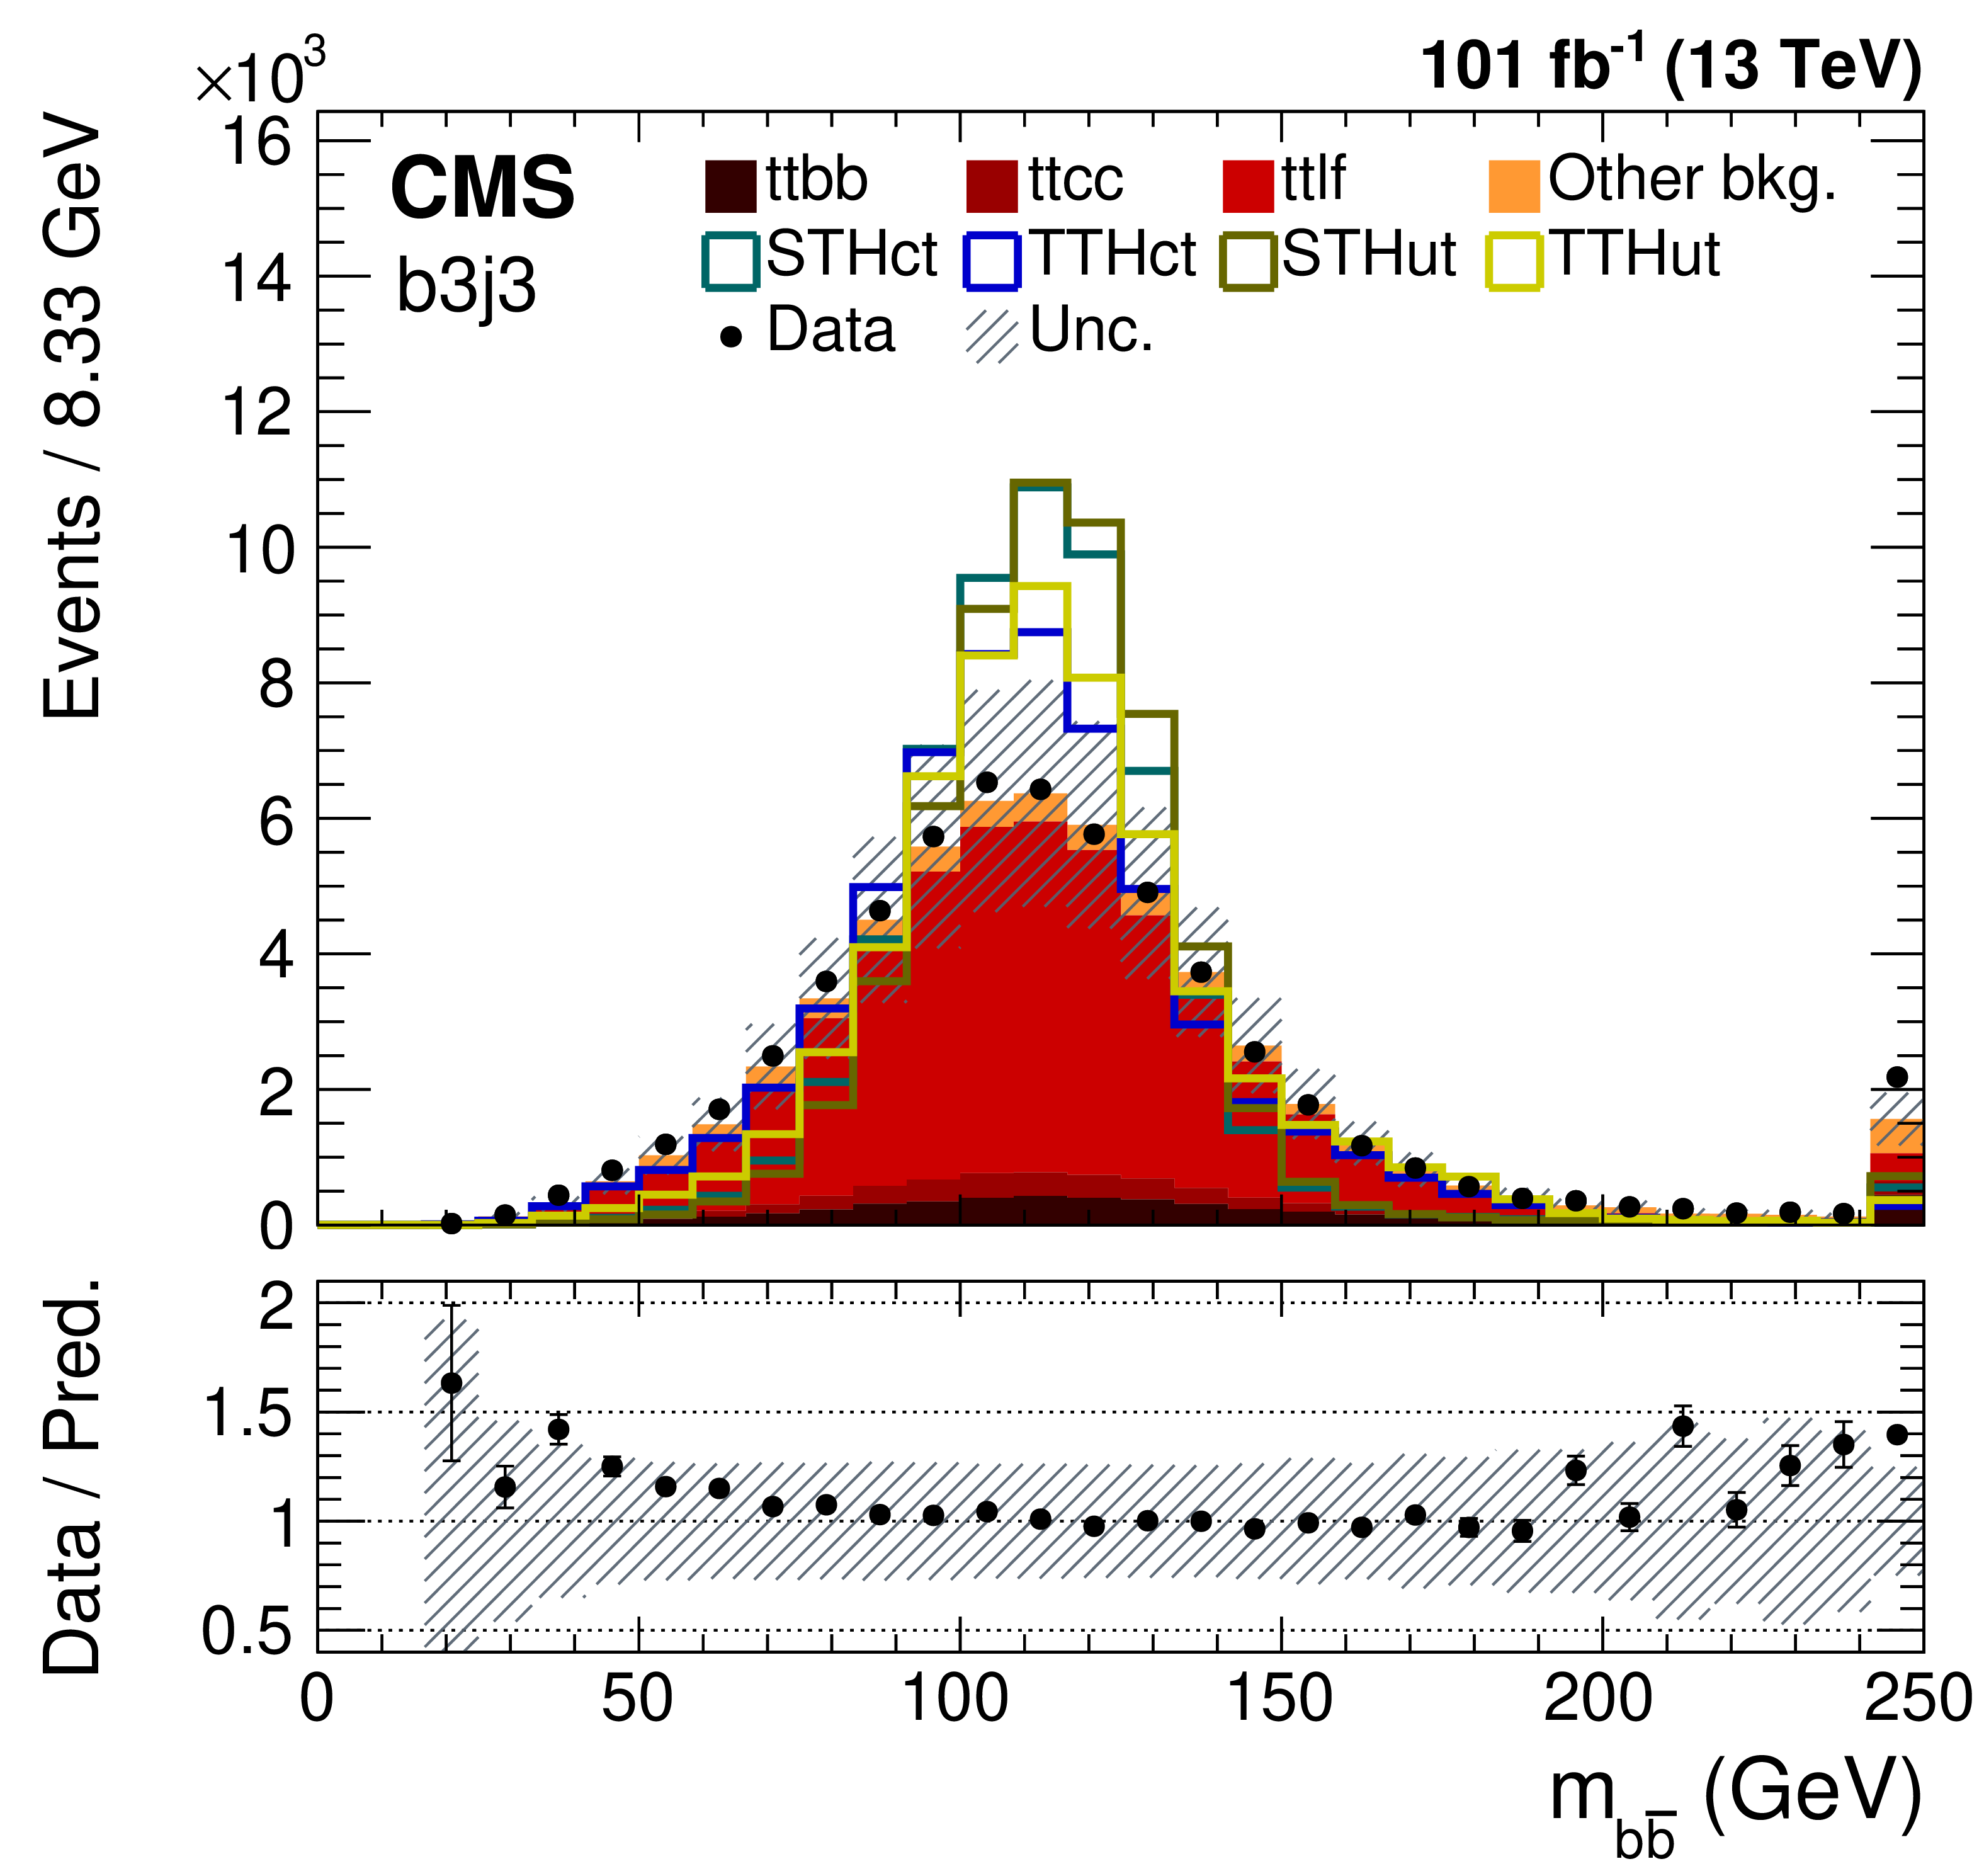
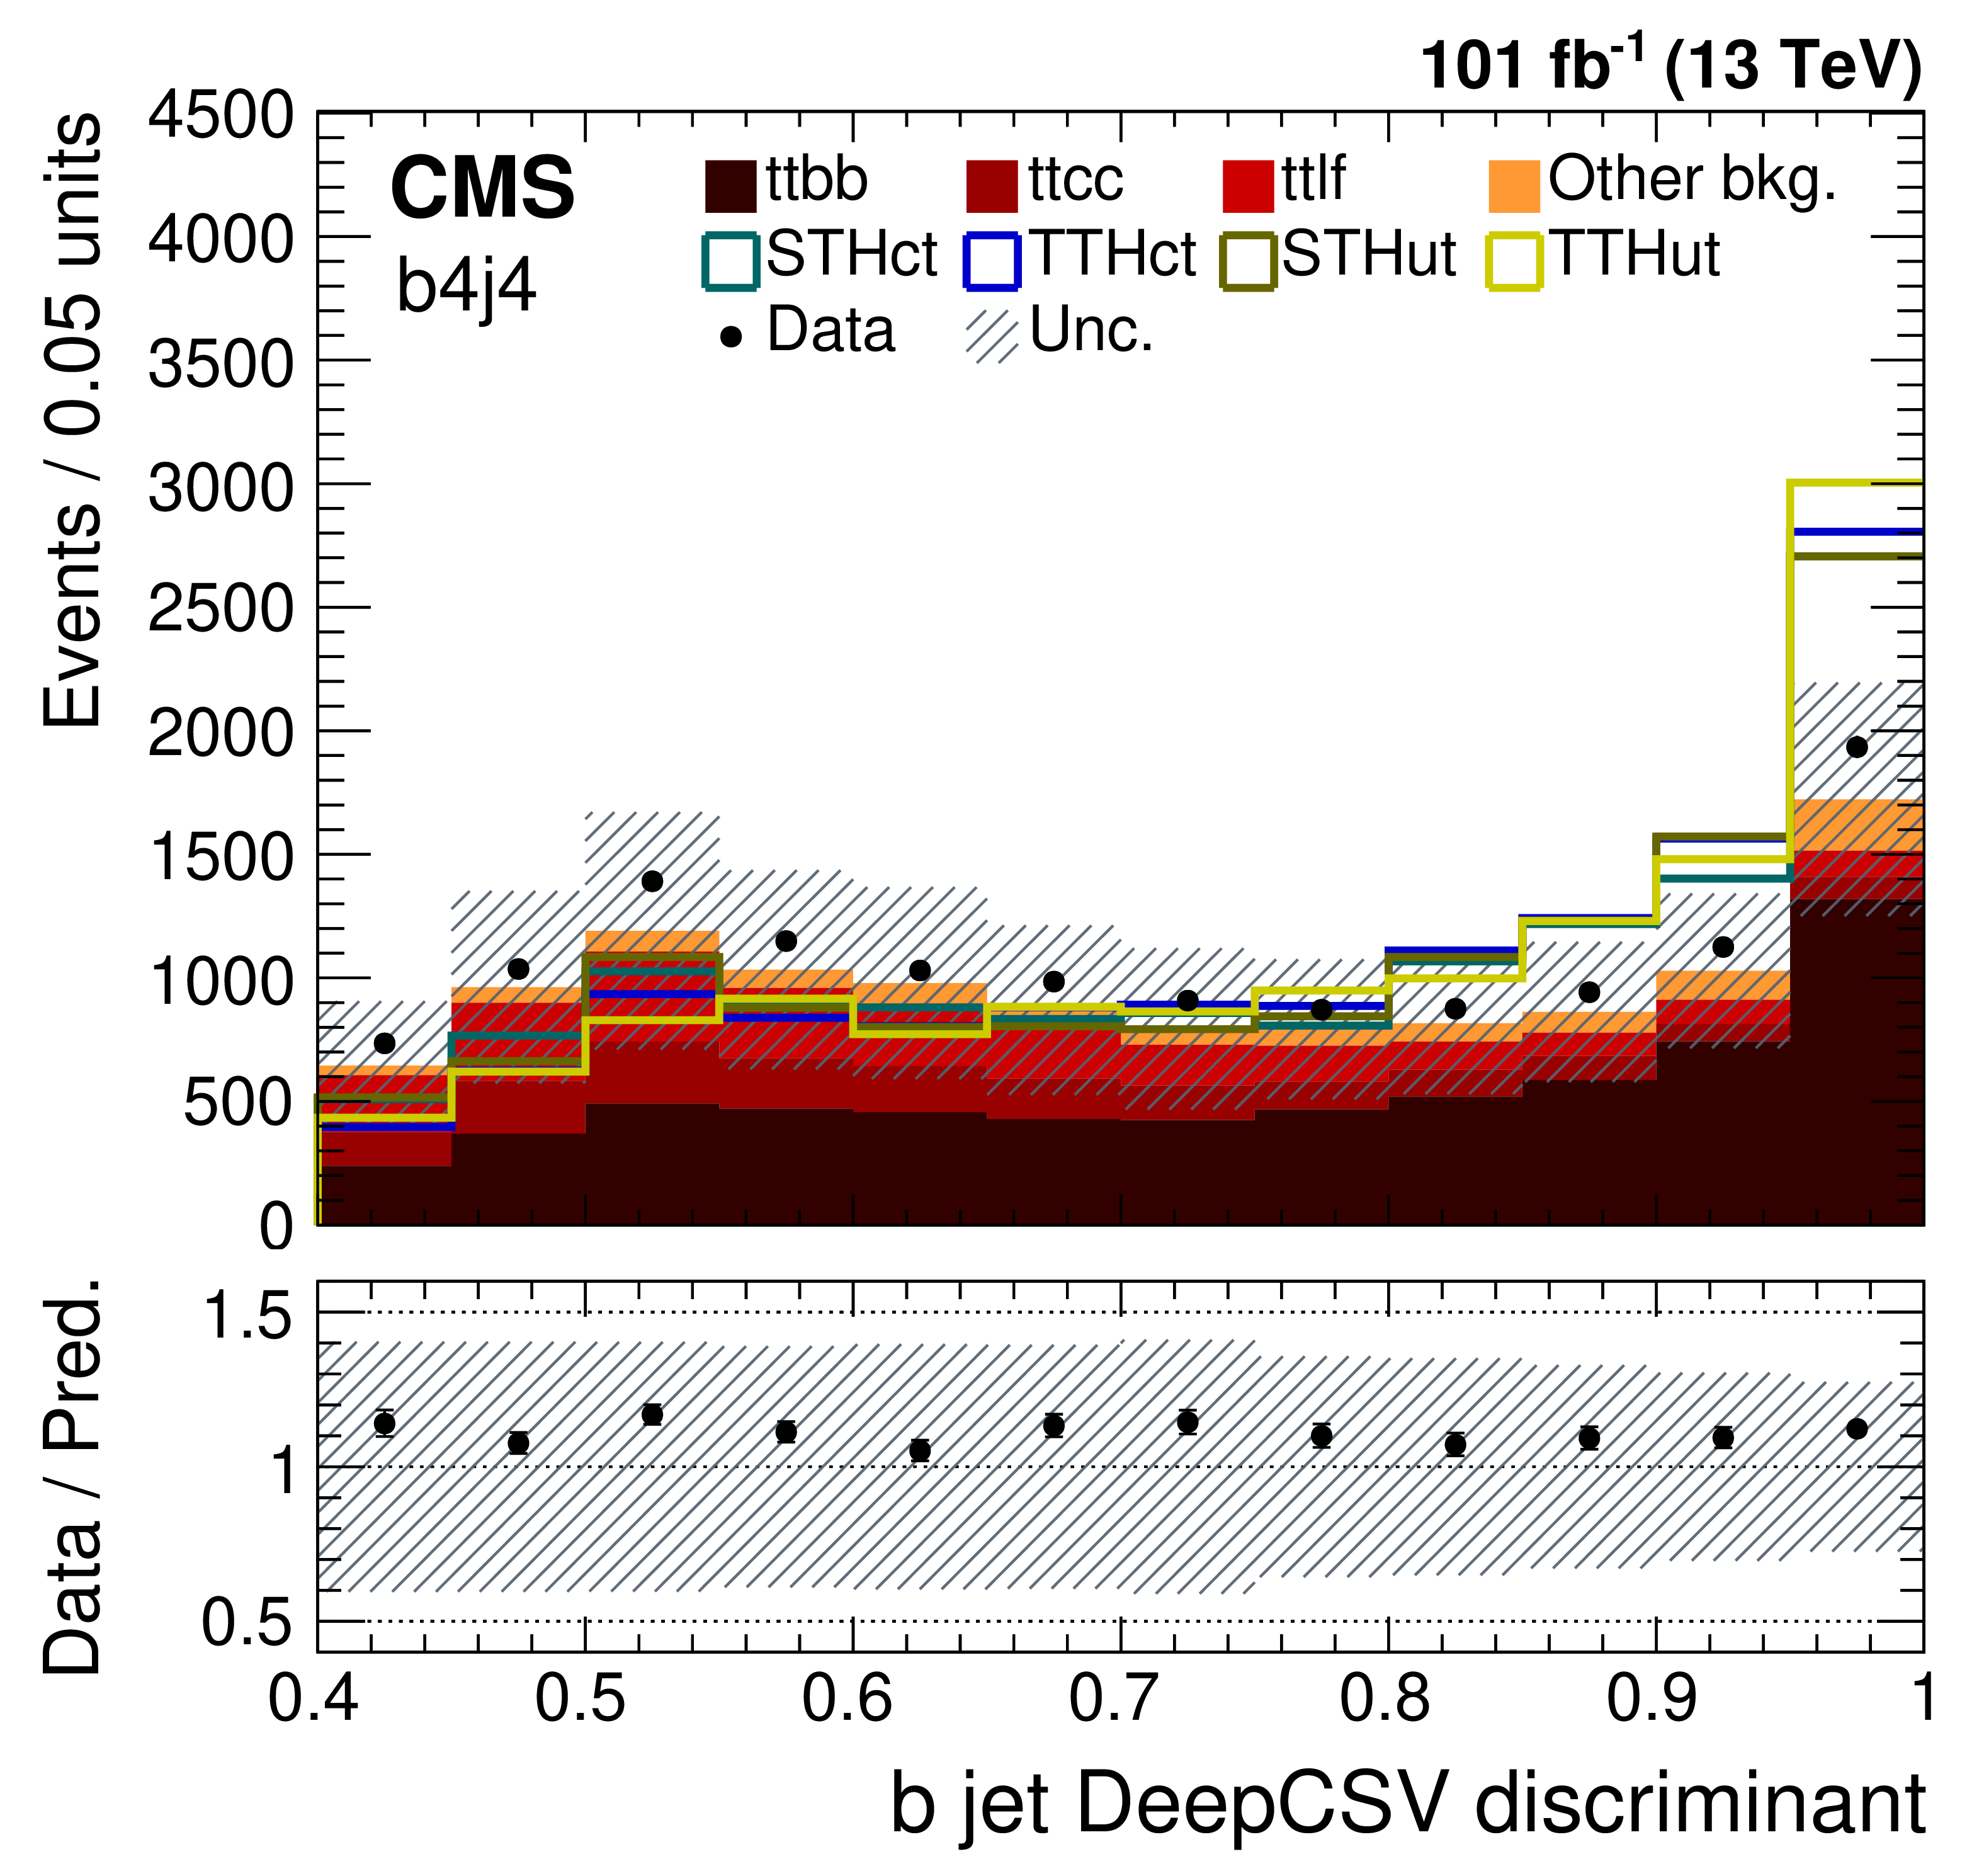
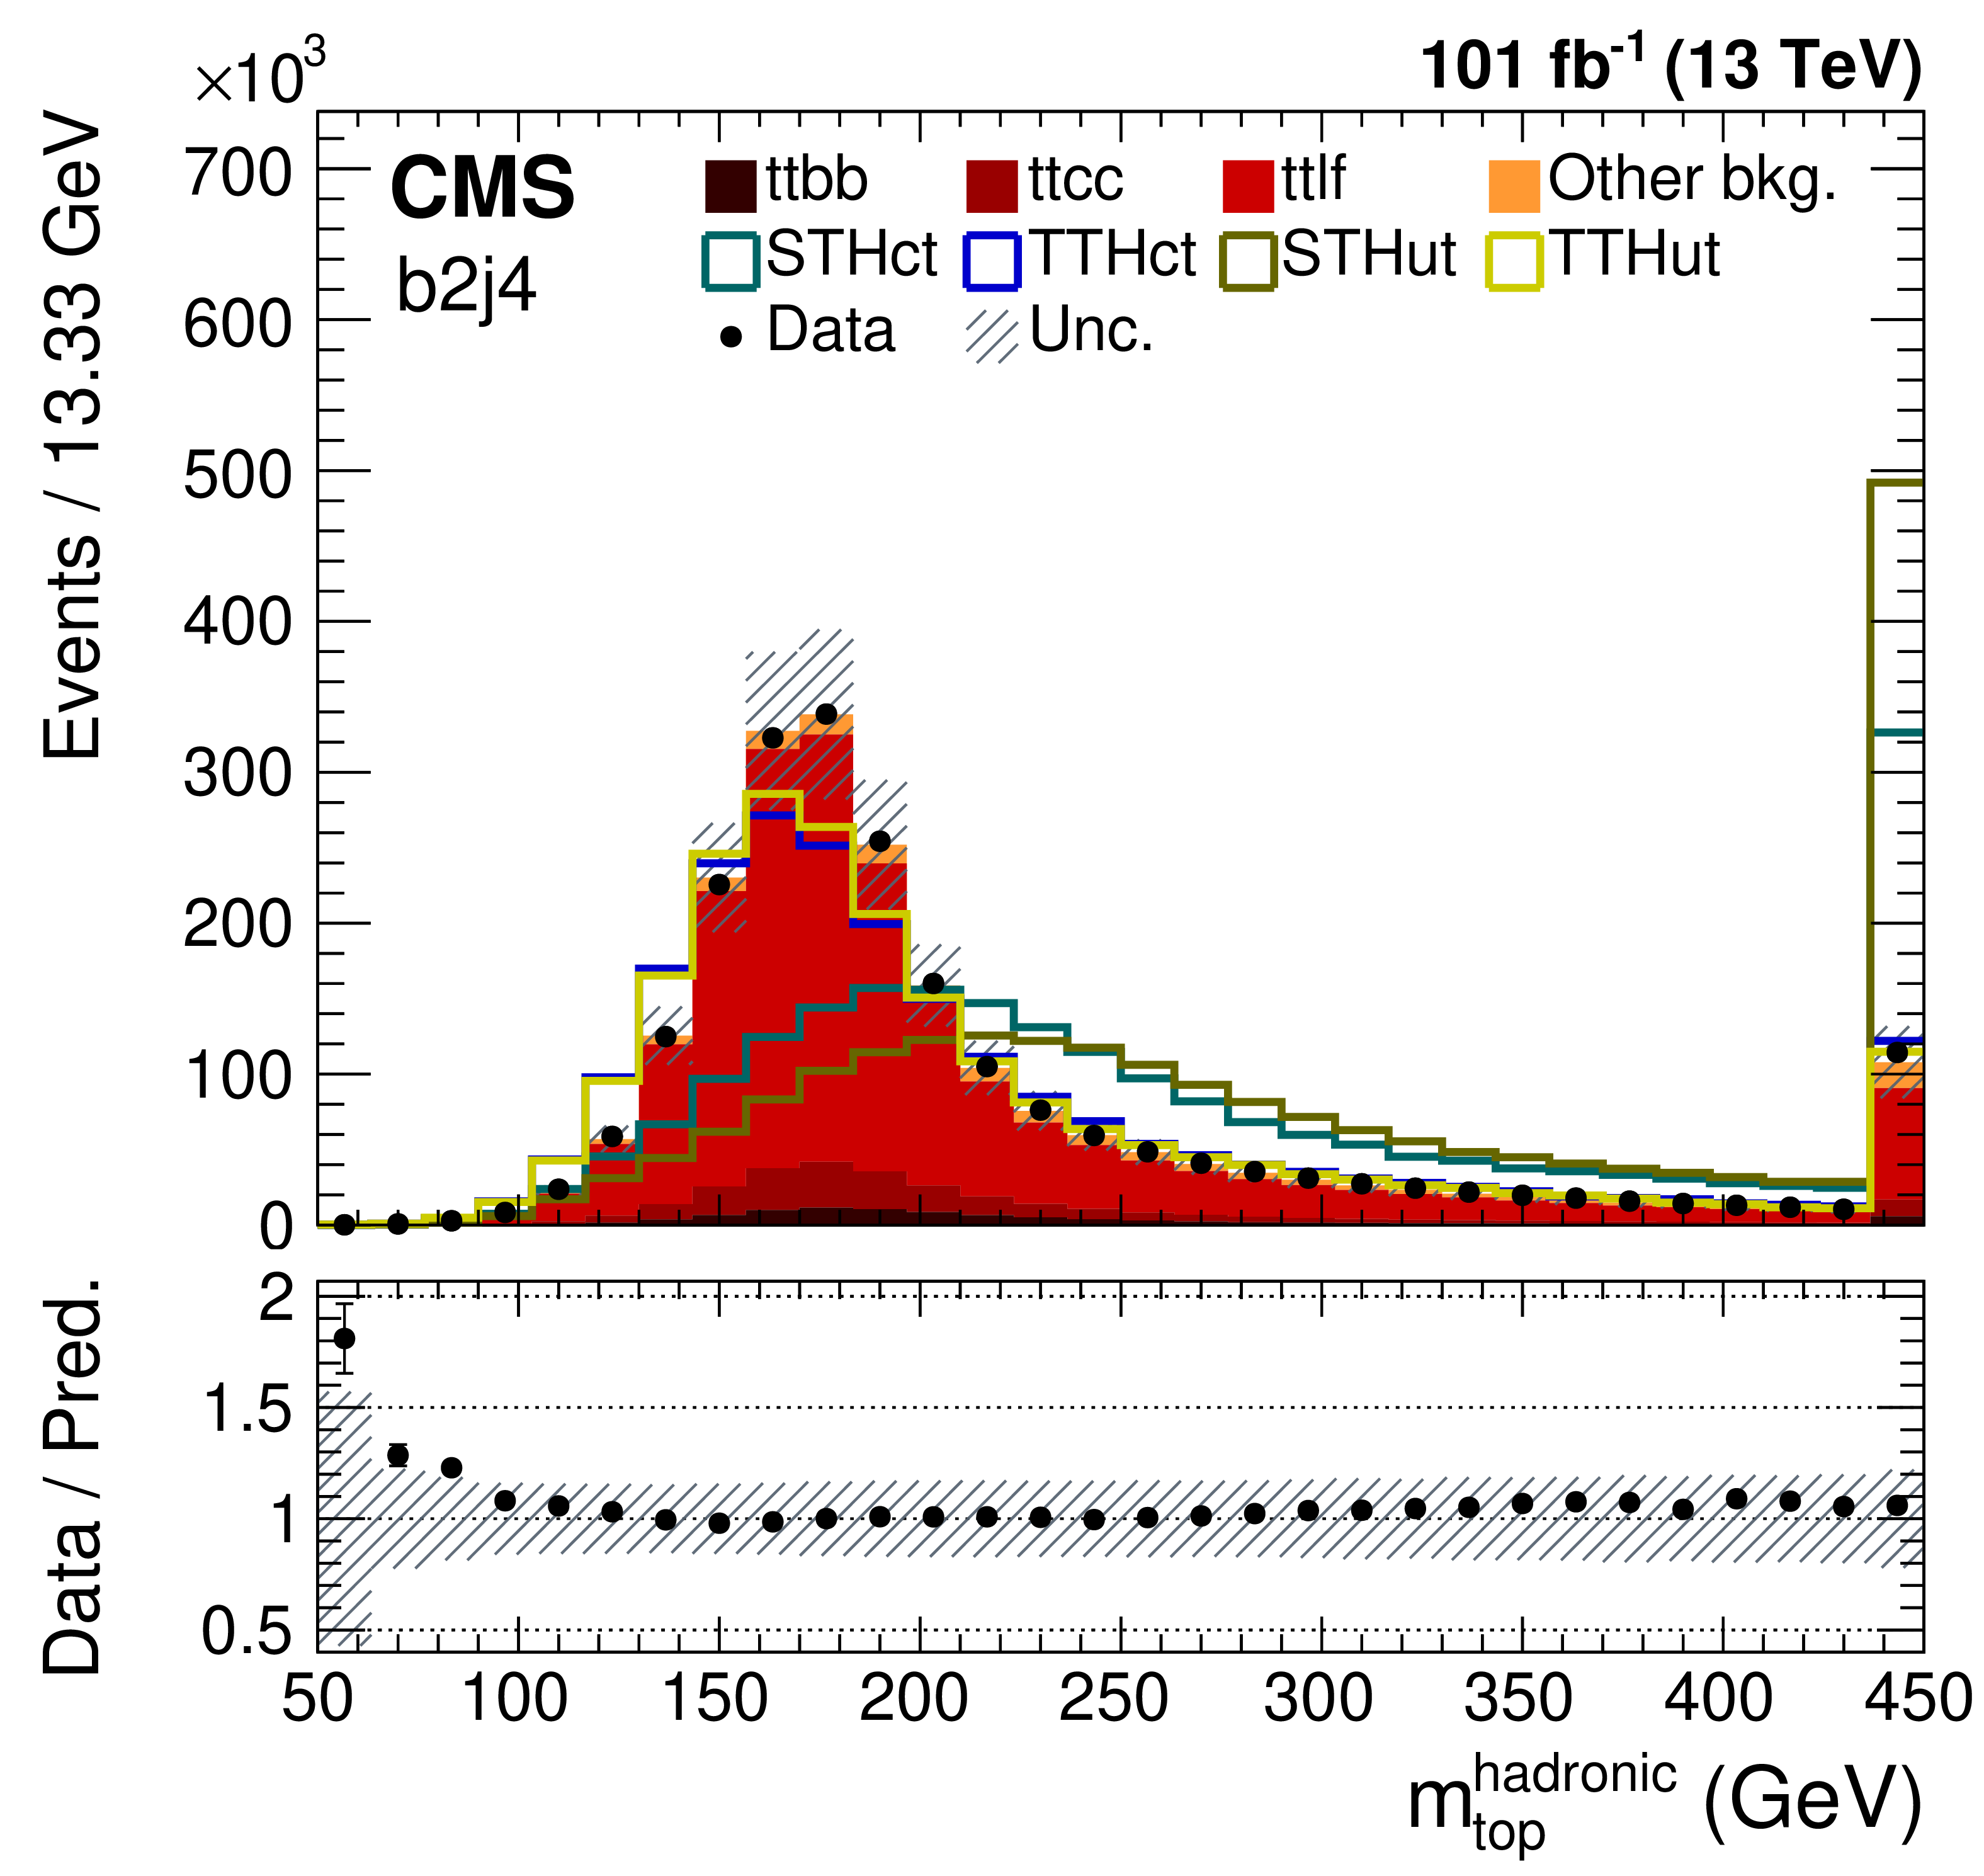
Figure 2:
The reconstructed $m_{\mathrm{b} {}\mathrm{\bar{b}}}$ (Higgs boson candidate mass) in the b3j3 category for the ST signal scenario (left), the distribution of the second largest DeepCSV value for the b-tagged jet from the Higgs boson decay in the b4j4 category for the TT signal scenario (middle), and the mass of the hadronically decaying top quark in the b2j4 category for the SM ${\mathrm{t} {}\mathrm{\bar{t}}}$ background scenario (right) for the combined 2017+2018 data. The lower panel shows the ratio of observed data to the SM prediction. The shaded band corresponds to the total uncertainty in the predicted background. For the mass plots the last bin contains the overflow events. |
png pdf |
Figure 2-a:
The reconstructed $m_{\mathrm{b} {}\mathrm{\bar{b}}}$ (Higgs boson candidate mass) in the b3j3 category for the ST signal scenario for the combined 2017+2018 data. The lower panel shows the ratio of observed data to the SM prediction. The shaded band corresponds to the total uncertainty in the predicted background. |
png pdf |
Figure 2-b:
The distribution of the second largest DeepCSV value for the b-tagged jet from the Higgs boson decay in the b4j4 category for the TT signal scenario for the combined 2017+2018 data. The lower panel shows the ratio of observed data to the SM prediction. The shaded band corresponds to the total uncertainty in the predicted background. |
png pdf |
Figure 2-c:
The mass of the hadronically decaying top quark in the b2j4 category for the SM ${\mathrm{t} {}\mathrm{\bar{t}}}$ background scenario for the combined 2017+2018 data. The lower panel shows the ratio of observed data to the SM prediction. The shaded band corresponds to the total uncertainty in the predicted background. |
png pdf |
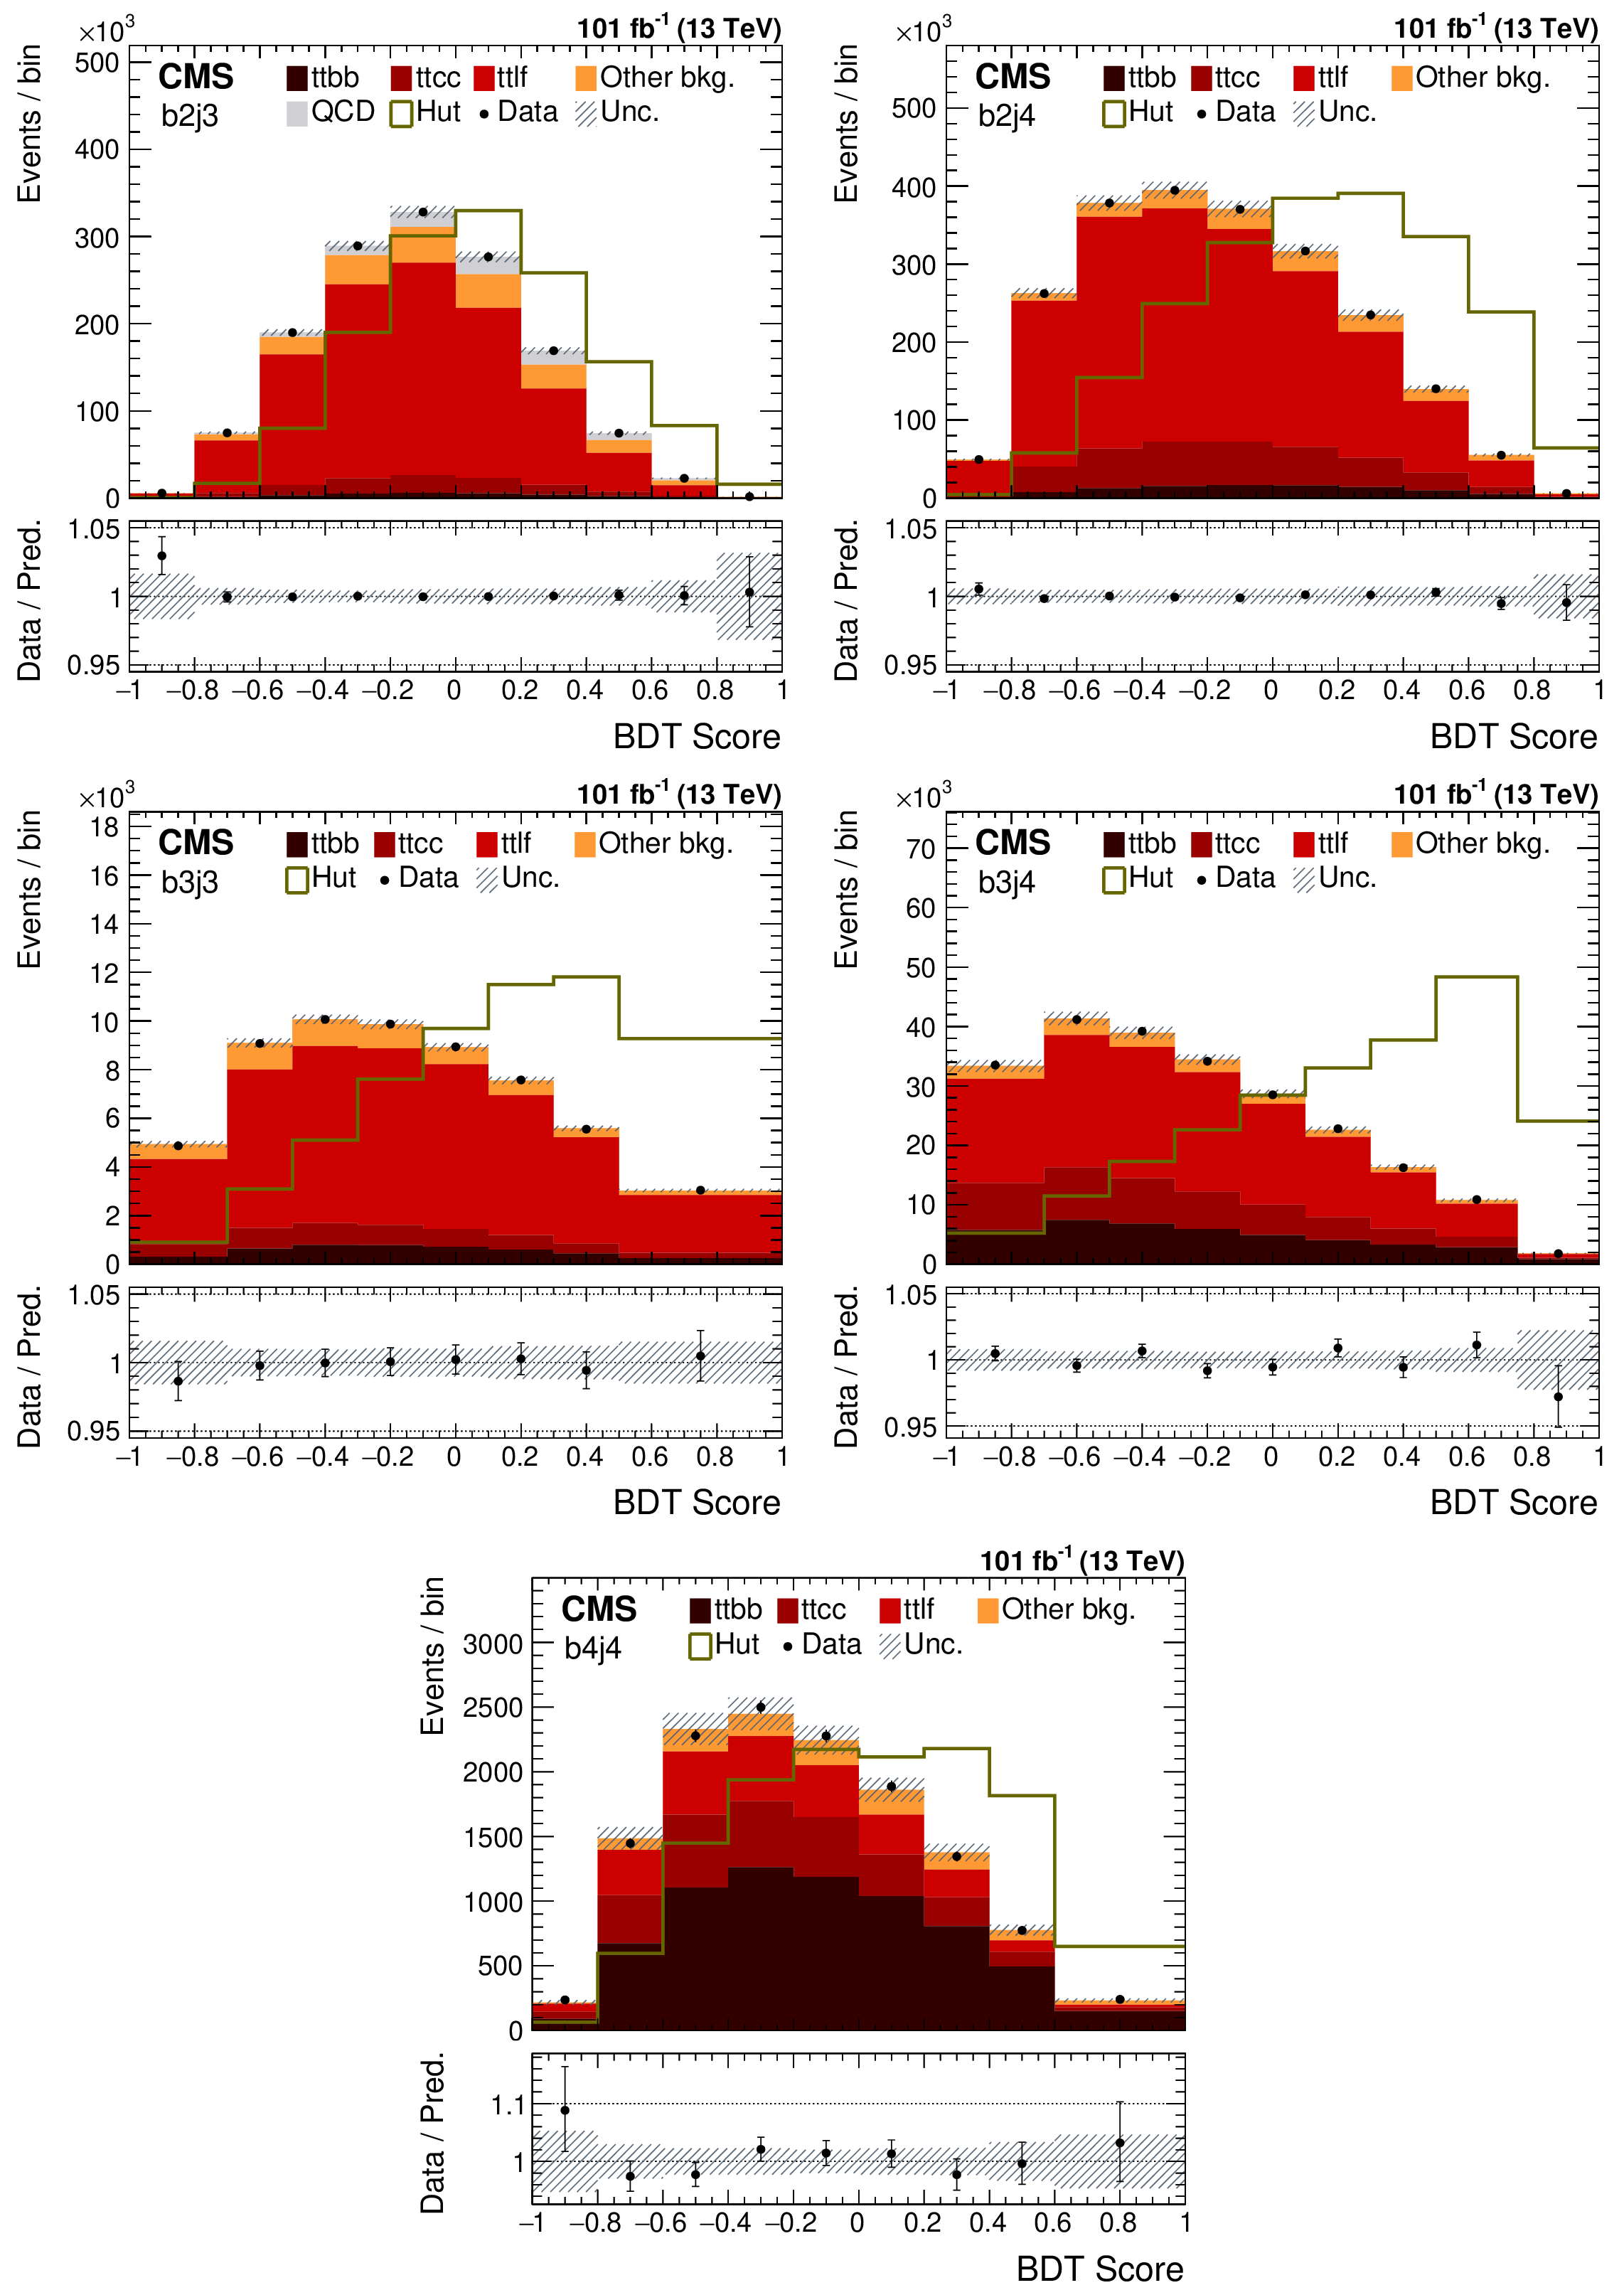
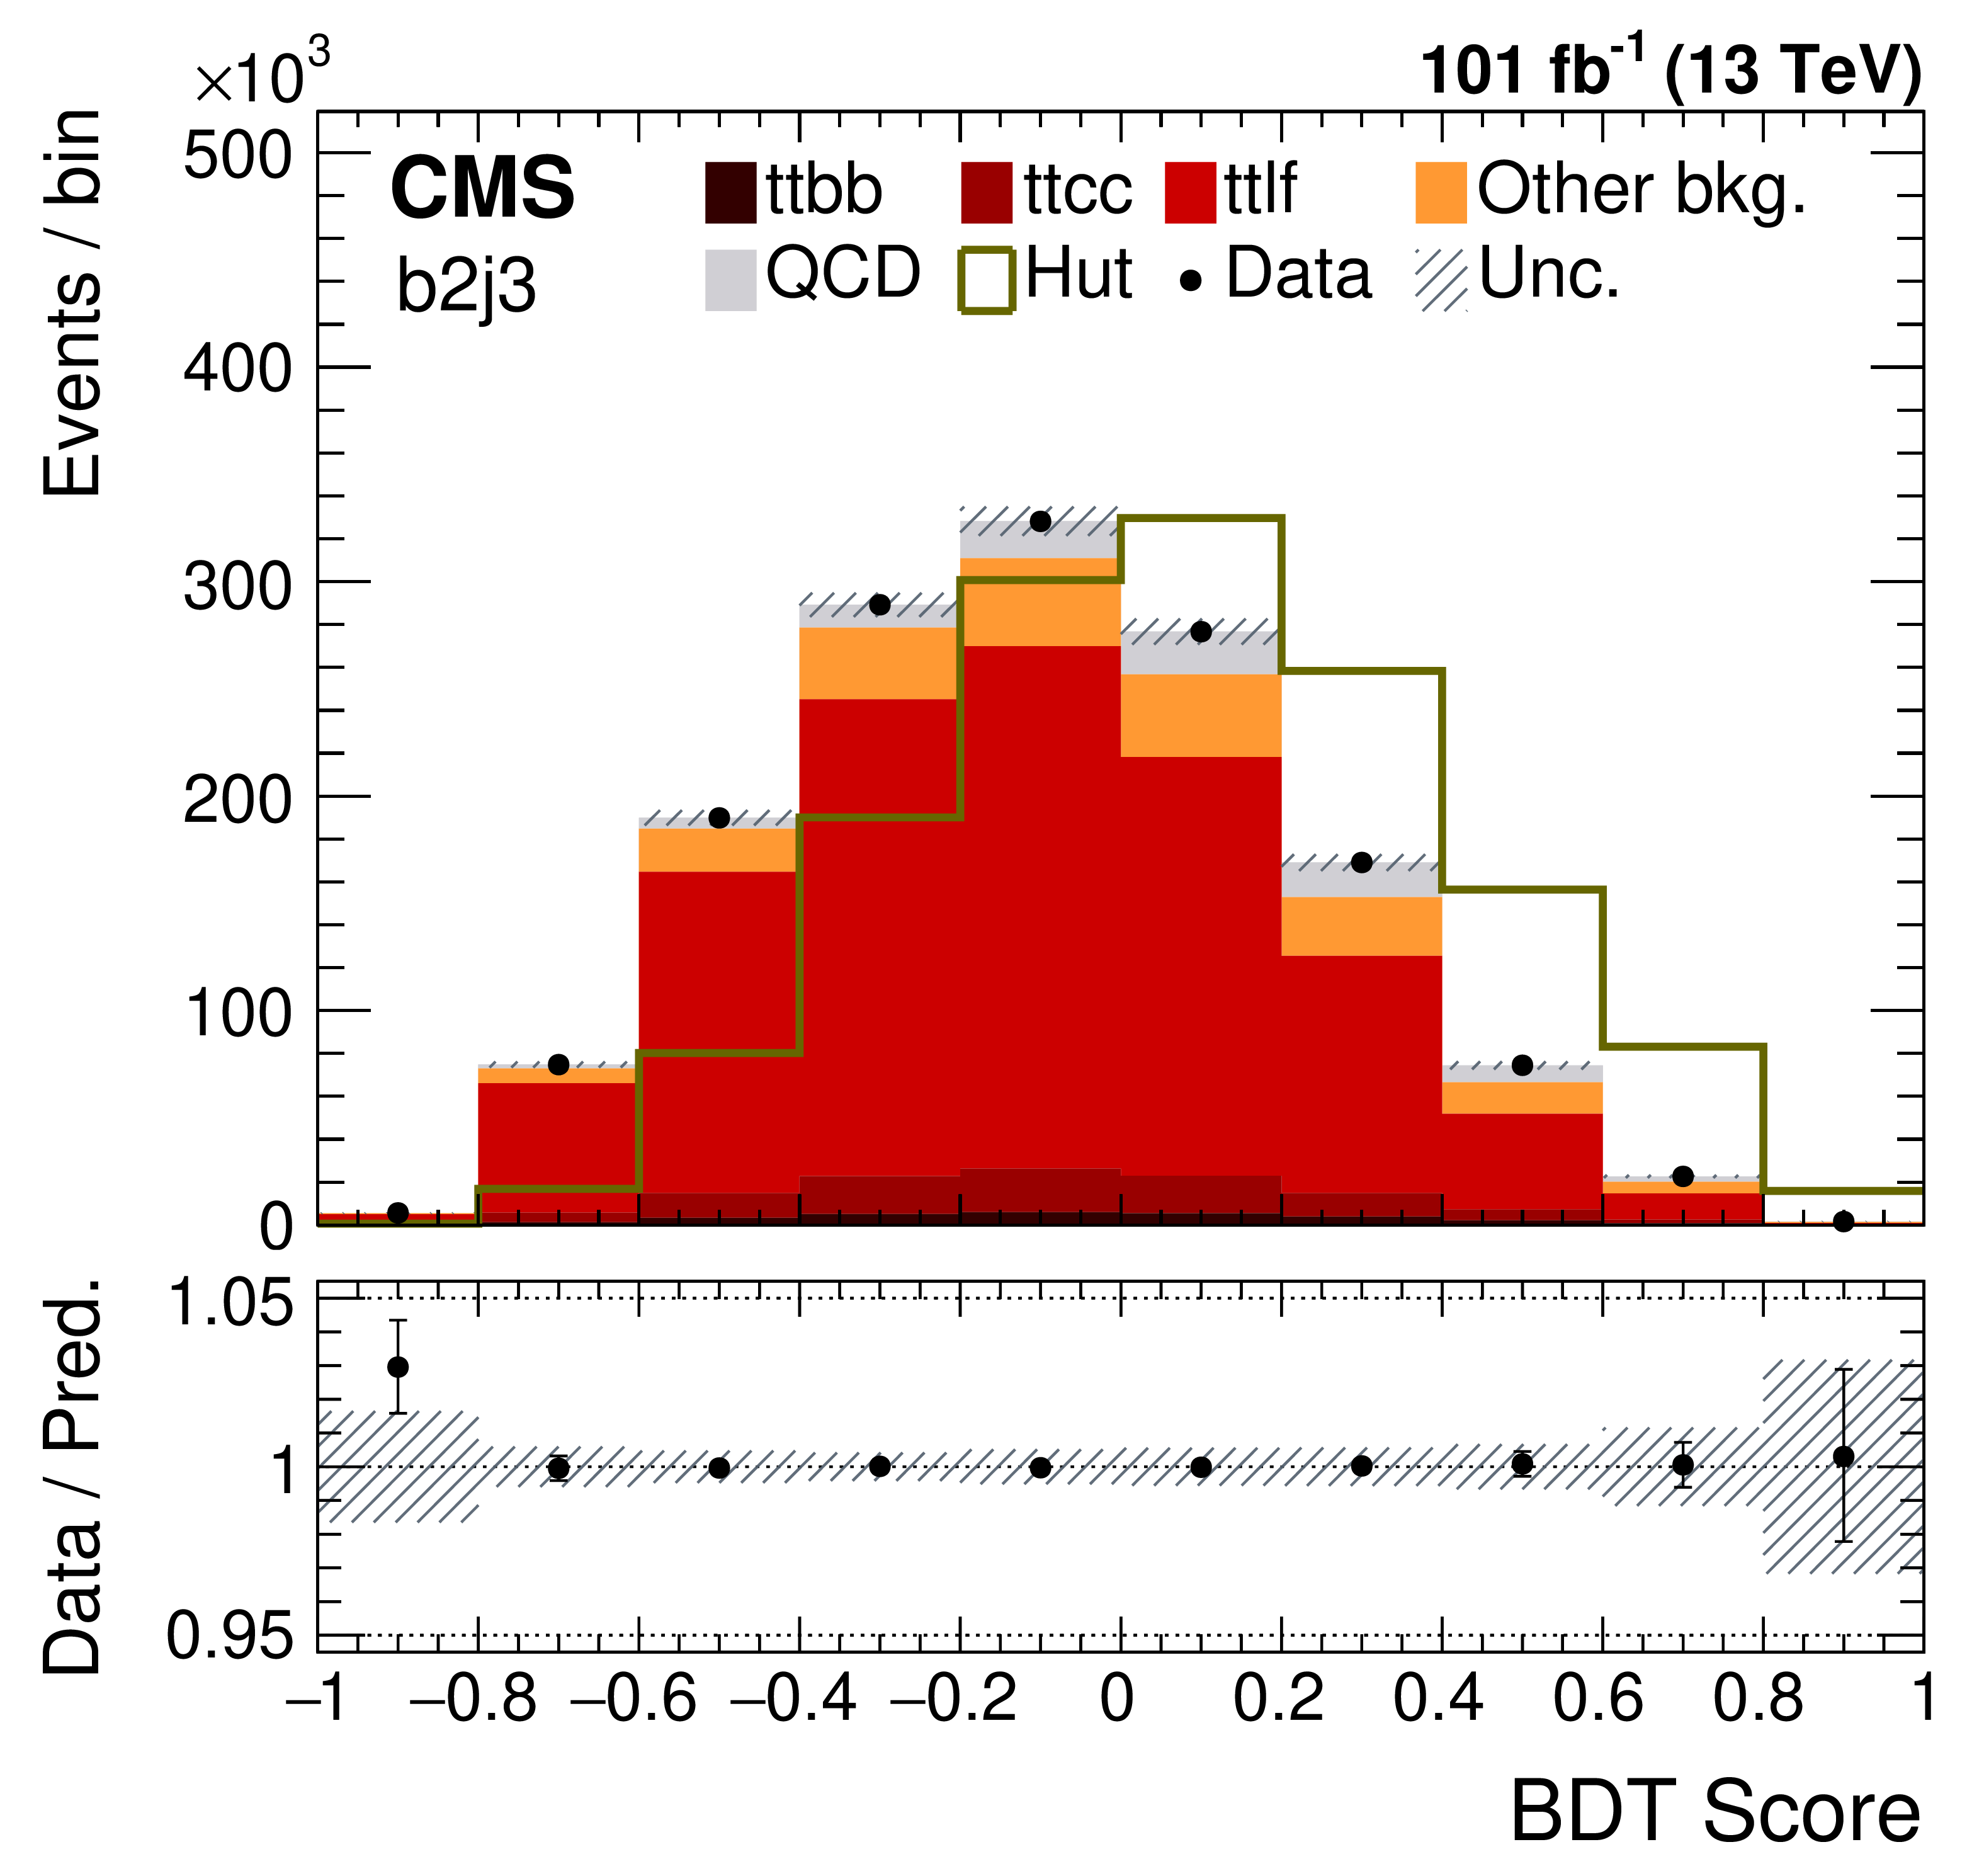
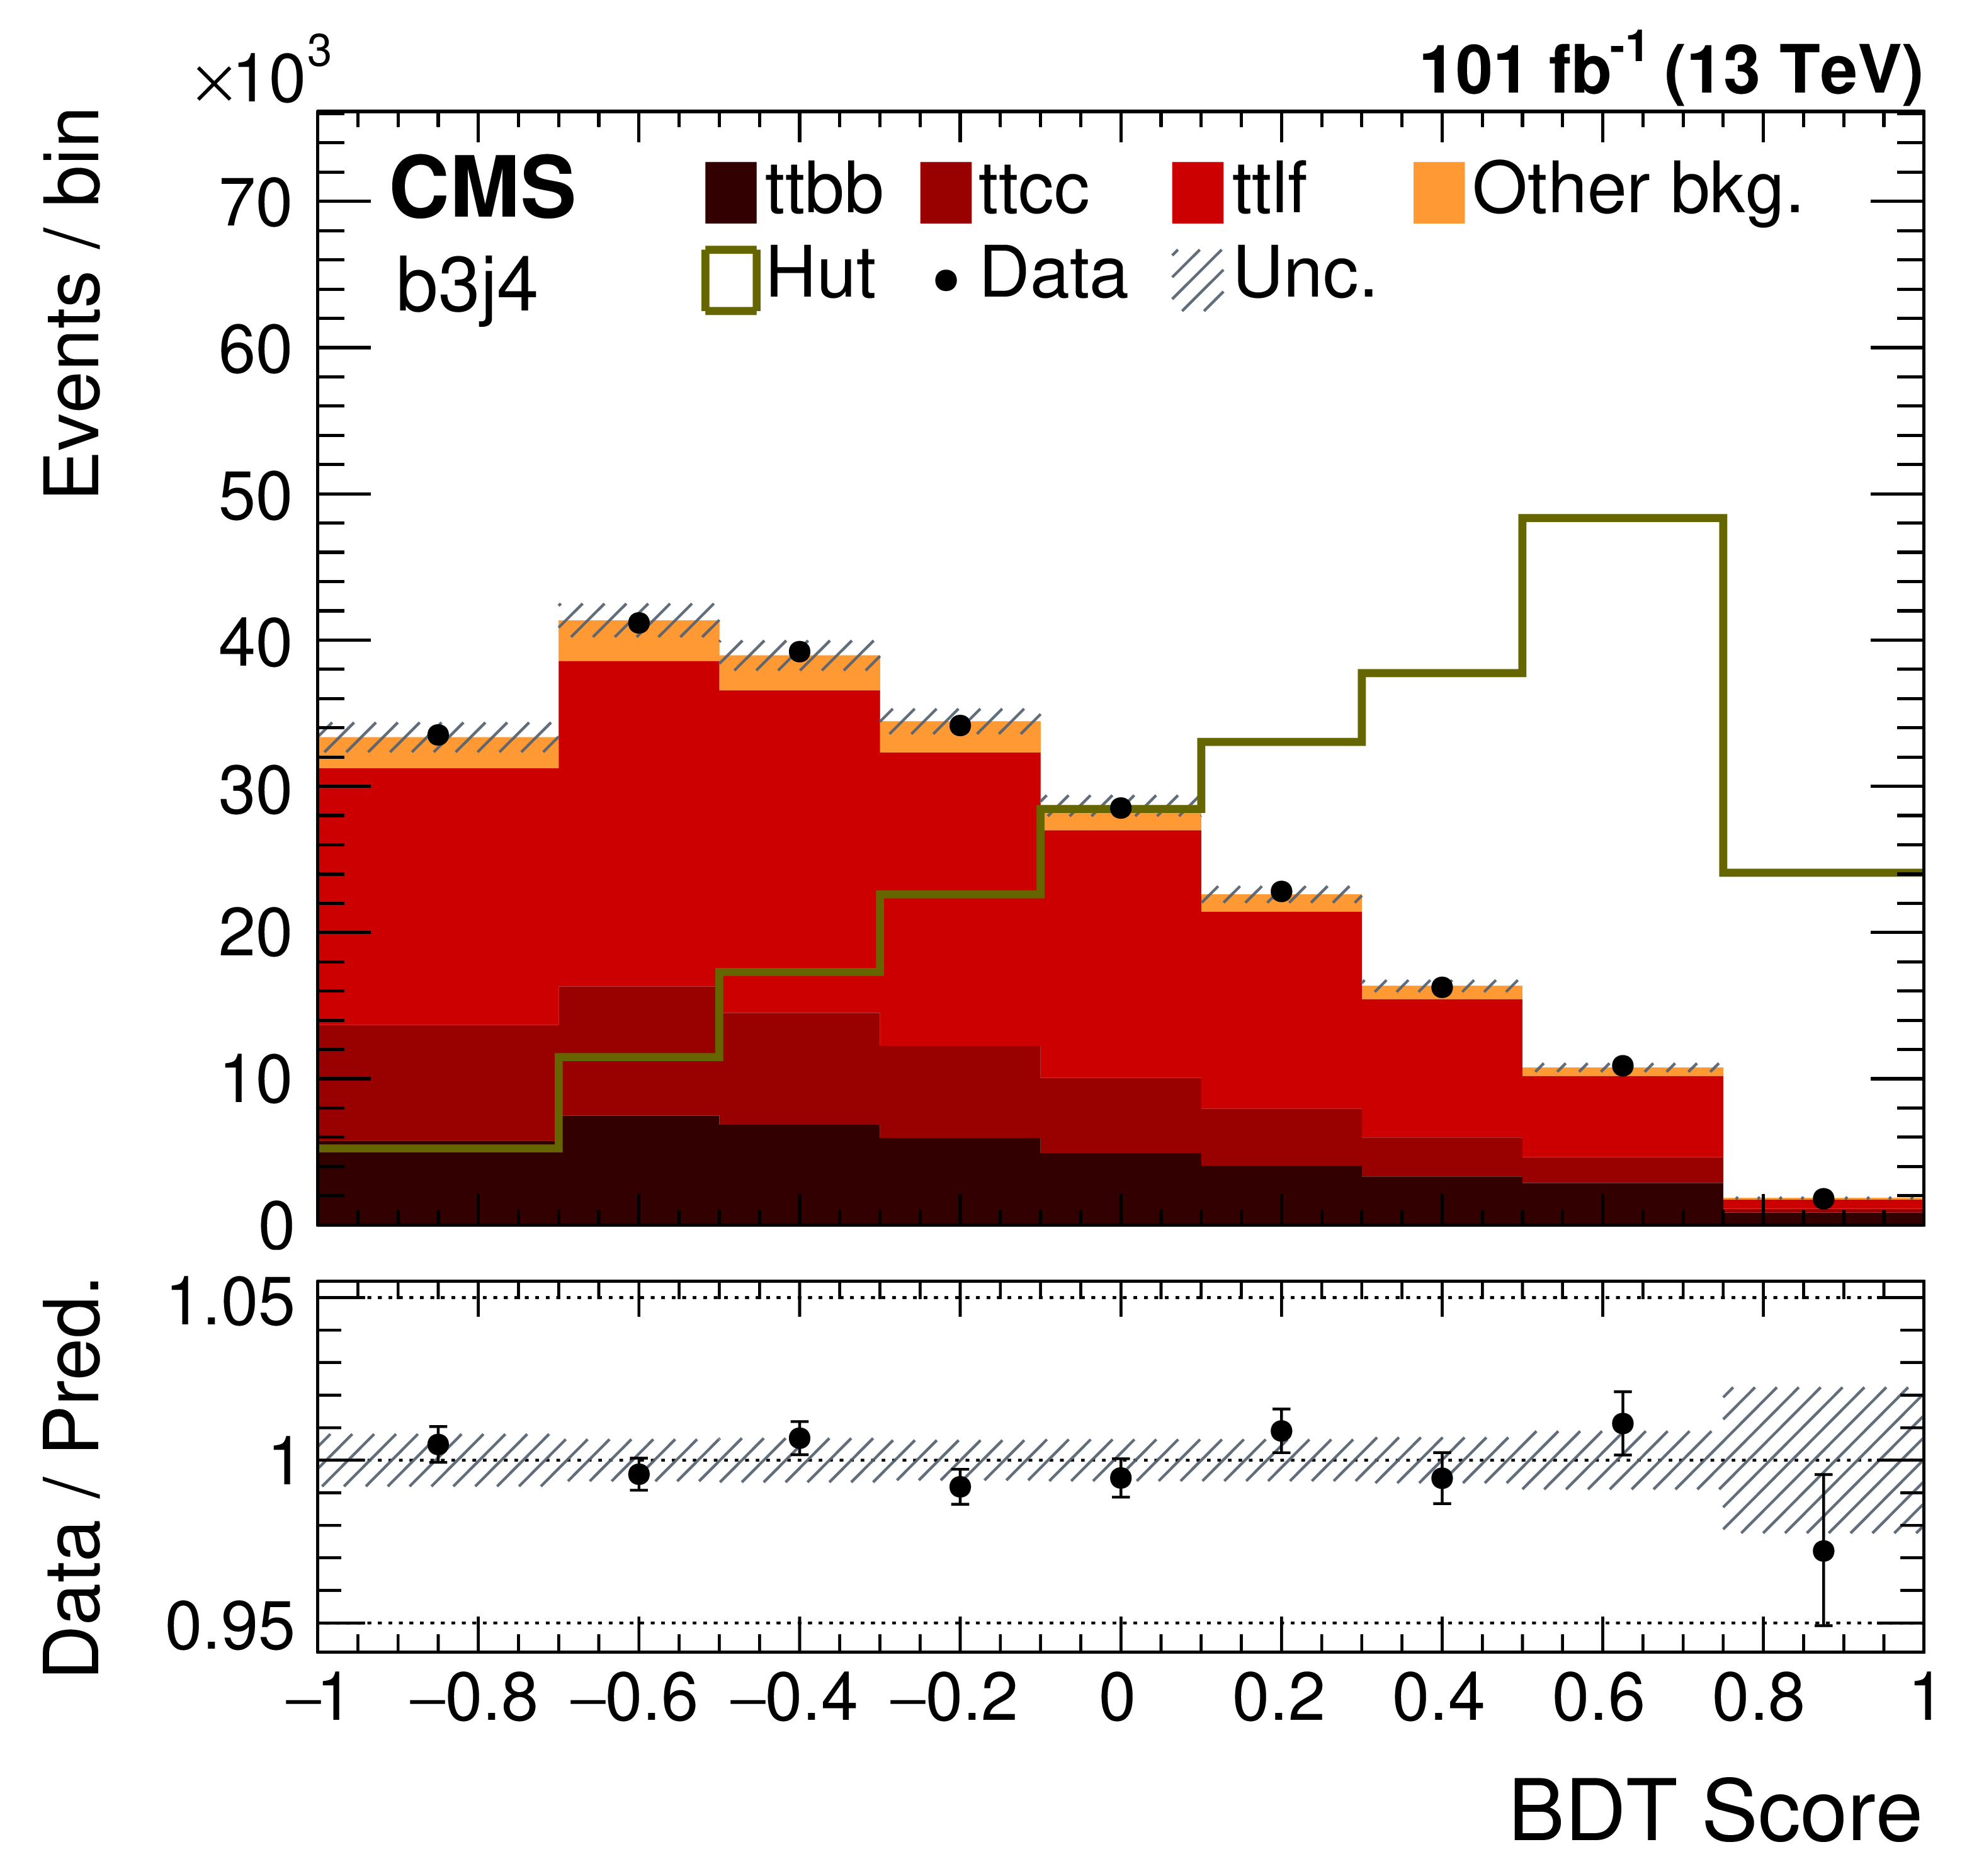
Figure 3:
The BDT output distributions for the combined 2017+2018 data and simulation for the different jet categories, assuming the Hut coupling. The lower panel shows the ratio of observed data to the SM prediction. The shaded bands correspond to the post-fit total uncertainty in the predicted background. The signal contributions are normalized to the total number of events in data. |
png pdf |
Figure 3-a:
The BDT output distributions for the combined 2017+2018 data and simulation for the b2j3 jet category, assuming the Hut coupling. The lower panel shows the ratio of observed data to the SM prediction. The shaded bands correspond to the post-fit total uncertainty in the predicted background. The signal contributions are normalized to the total number of events in data. |

png pdf |
Figure 3-b:
The BDT output distributions for the combined 2017+2018 data and simulation for the b2j4 jet category, assuming the Hut coupling. The lower panel shows the ratio of observed data to the SM prediction. The shaded bands correspond to the post-fit total uncertainty in the predicted background. The signal contributions are normalized to the total number of events in data. |

png pdf |
Figure 3-c:
The BDT output distributions for the combined 2017+2018 data and simulation for the b3j3 jet category, assuming the Hut coupling. The lower panel shows the ratio of observed data to the SM prediction. The shaded bands correspond to the post-fit total uncertainty in the predicted background. The signal contributions are normalized to the total number of events in data. |
png pdf |
Figure 3-d:
The BDT output distributions for the combined 2017+2018 data and simulation for the b3j4 jet category, assuming the Hut coupling. The lower panel shows the ratio of observed data to the SM prediction. The shaded bands correspond to the post-fit total uncertainty in the predicted background. The signal contributions are normalized to the total number of events in data. |

png pdf |
Figure 3-e:
The BDT output distributions for the combined 2017+2018 data and simulation for the b4j4 jet category, assuming the Hut coupling. The lower panel shows the ratio of observed data to the SM prediction. The shaded bands correspond to the post-fit total uncertainty in the predicted background. The signal contributions are normalized to the total number of events in data. |
png pdf |
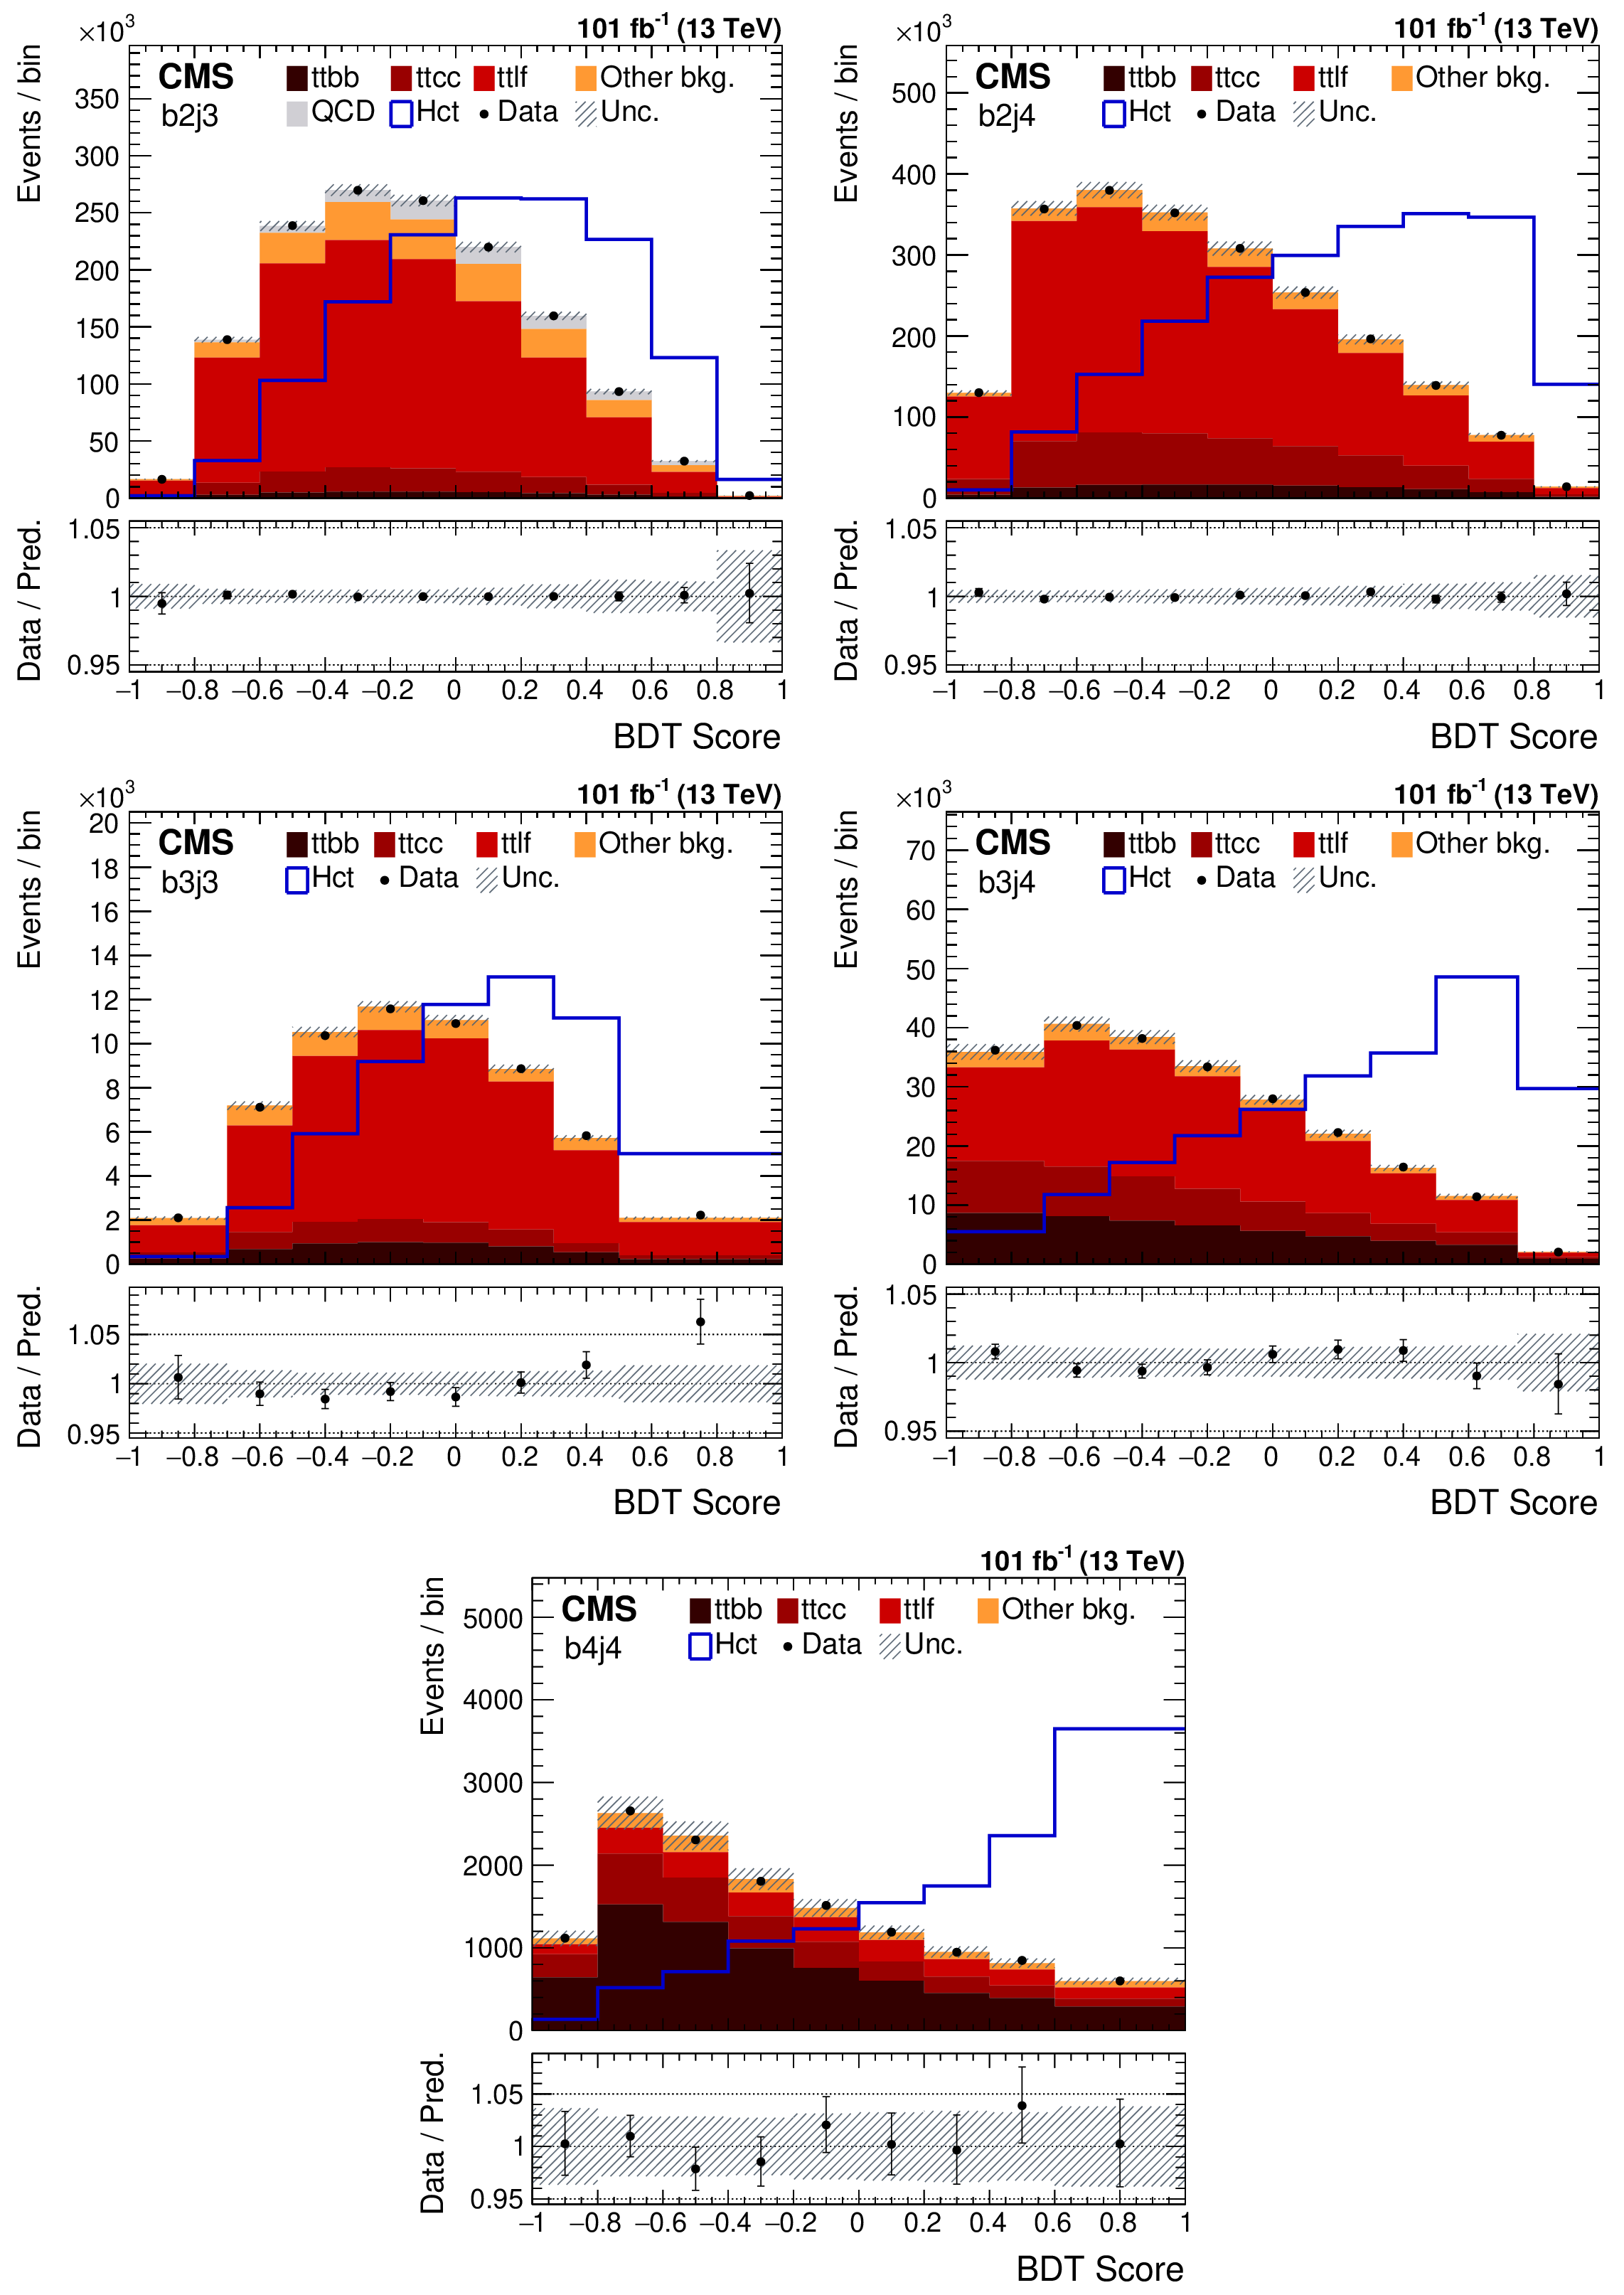
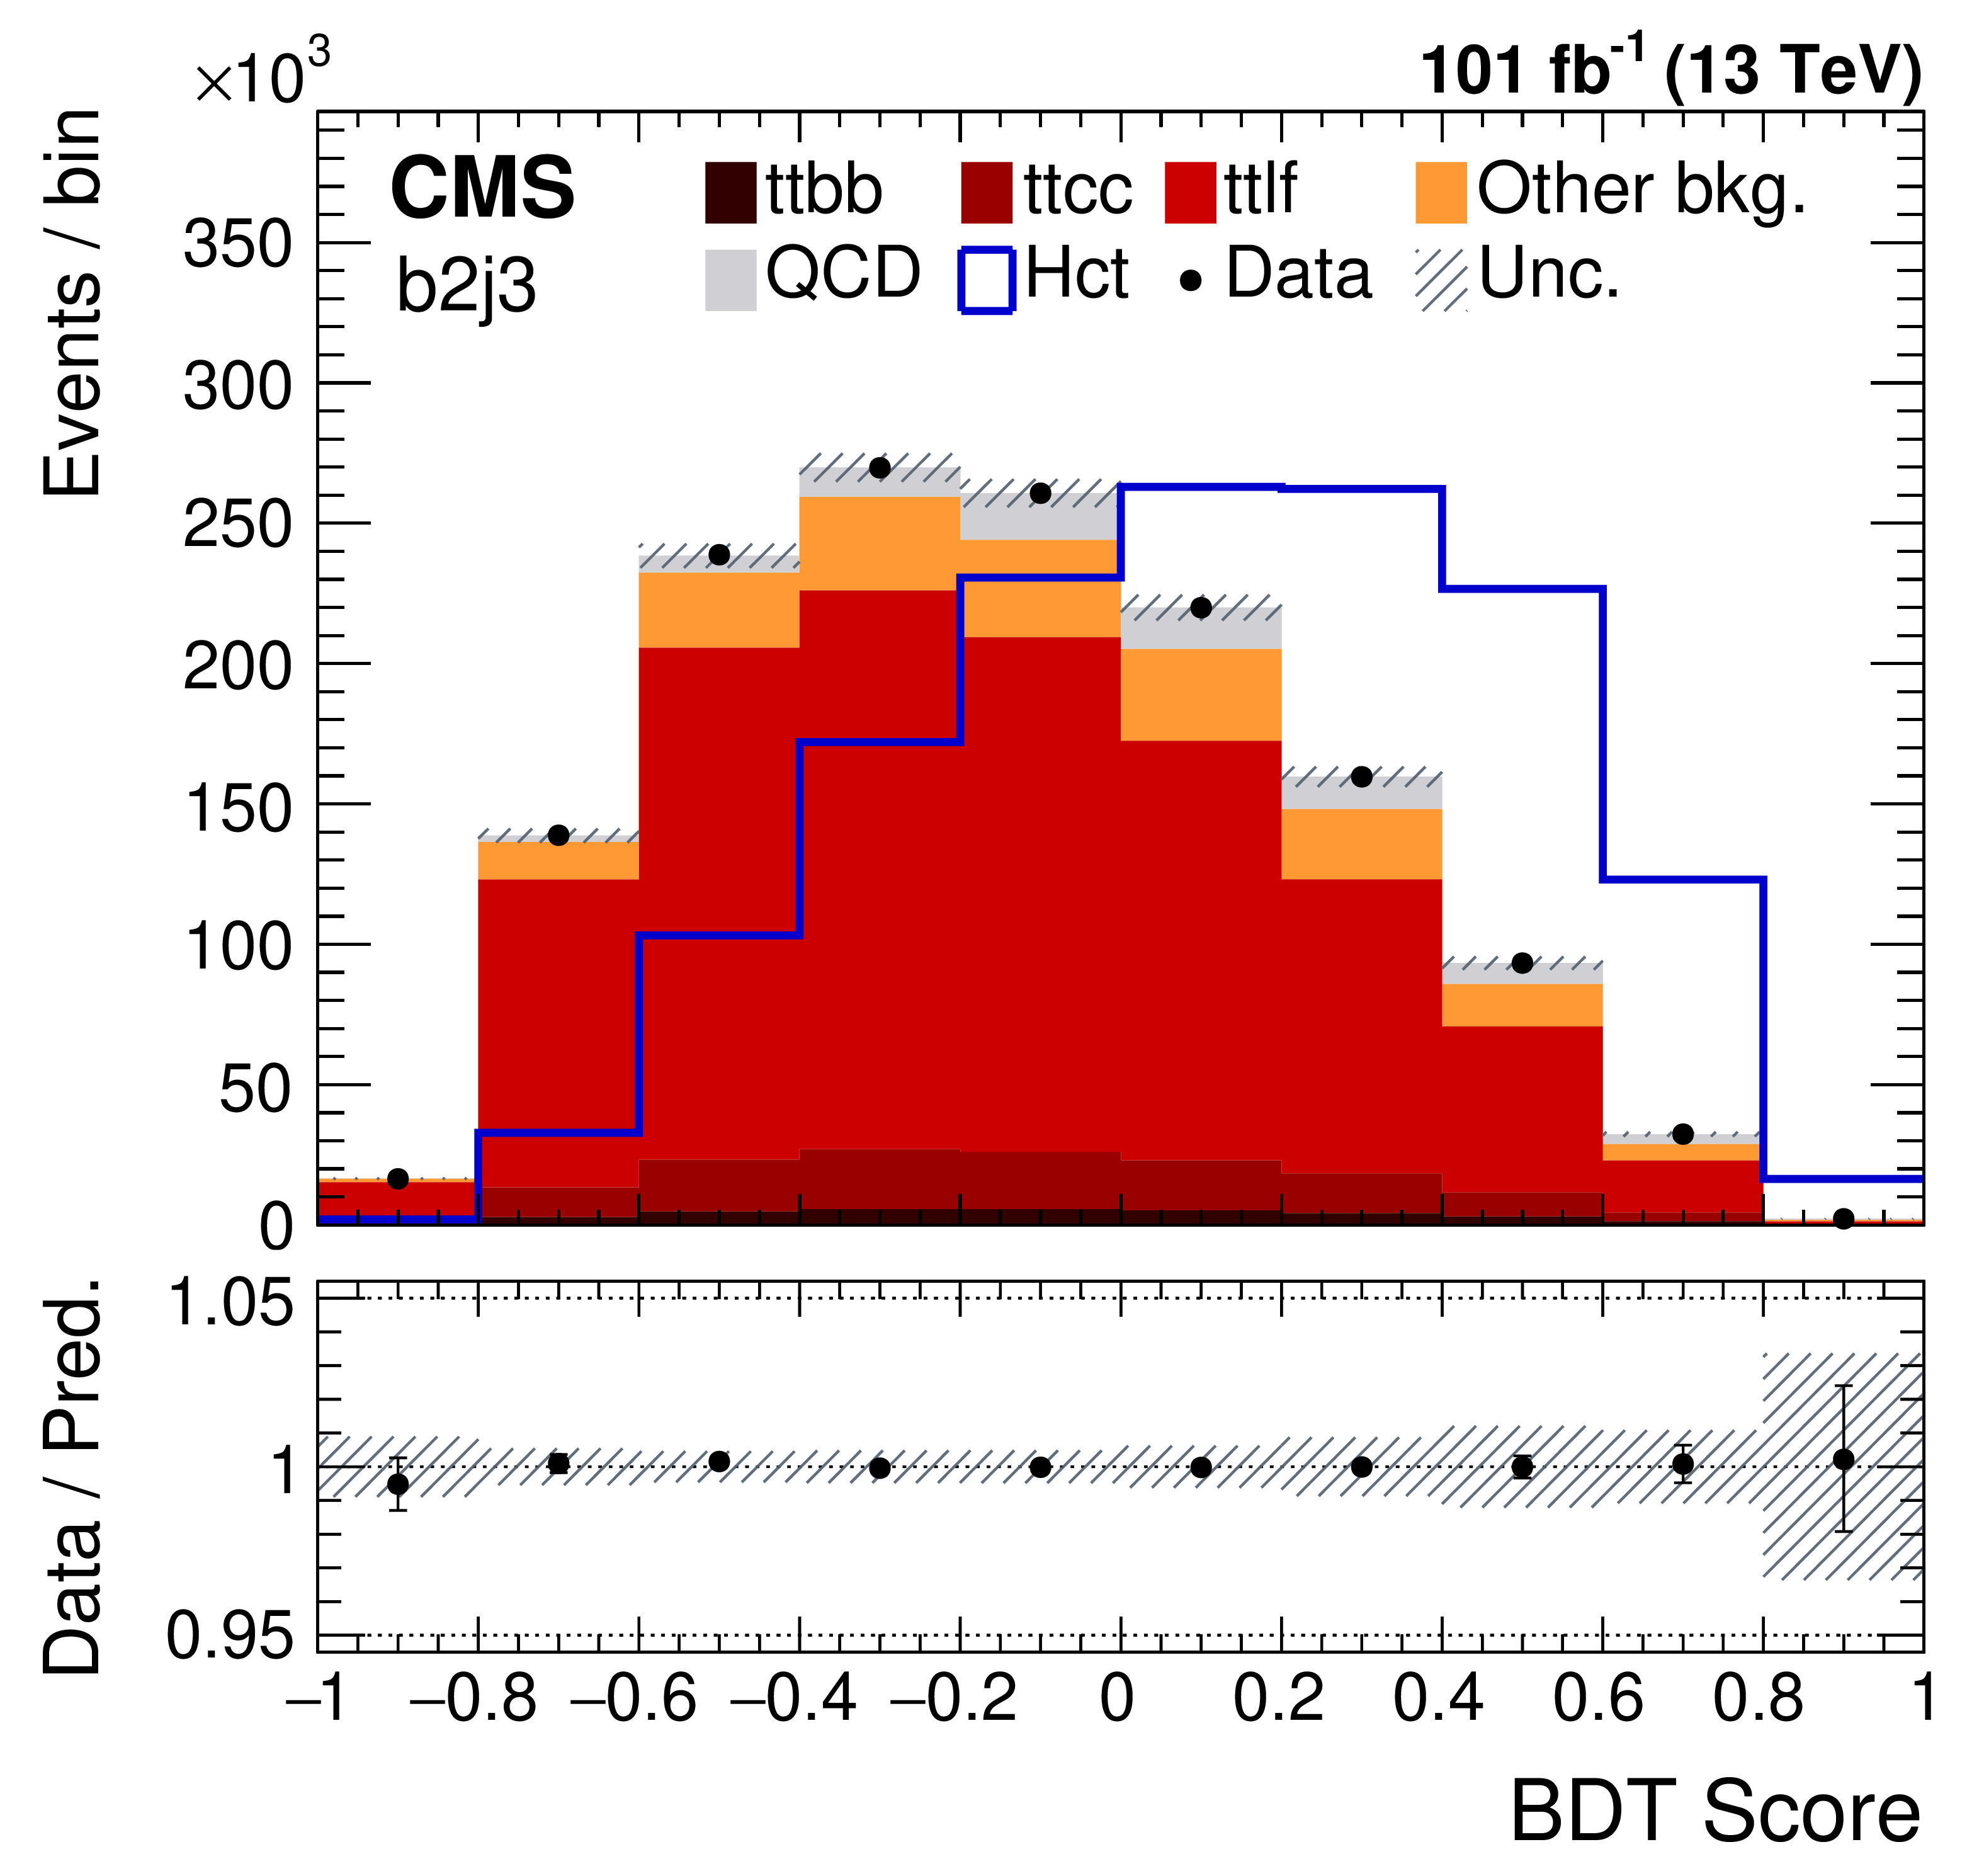
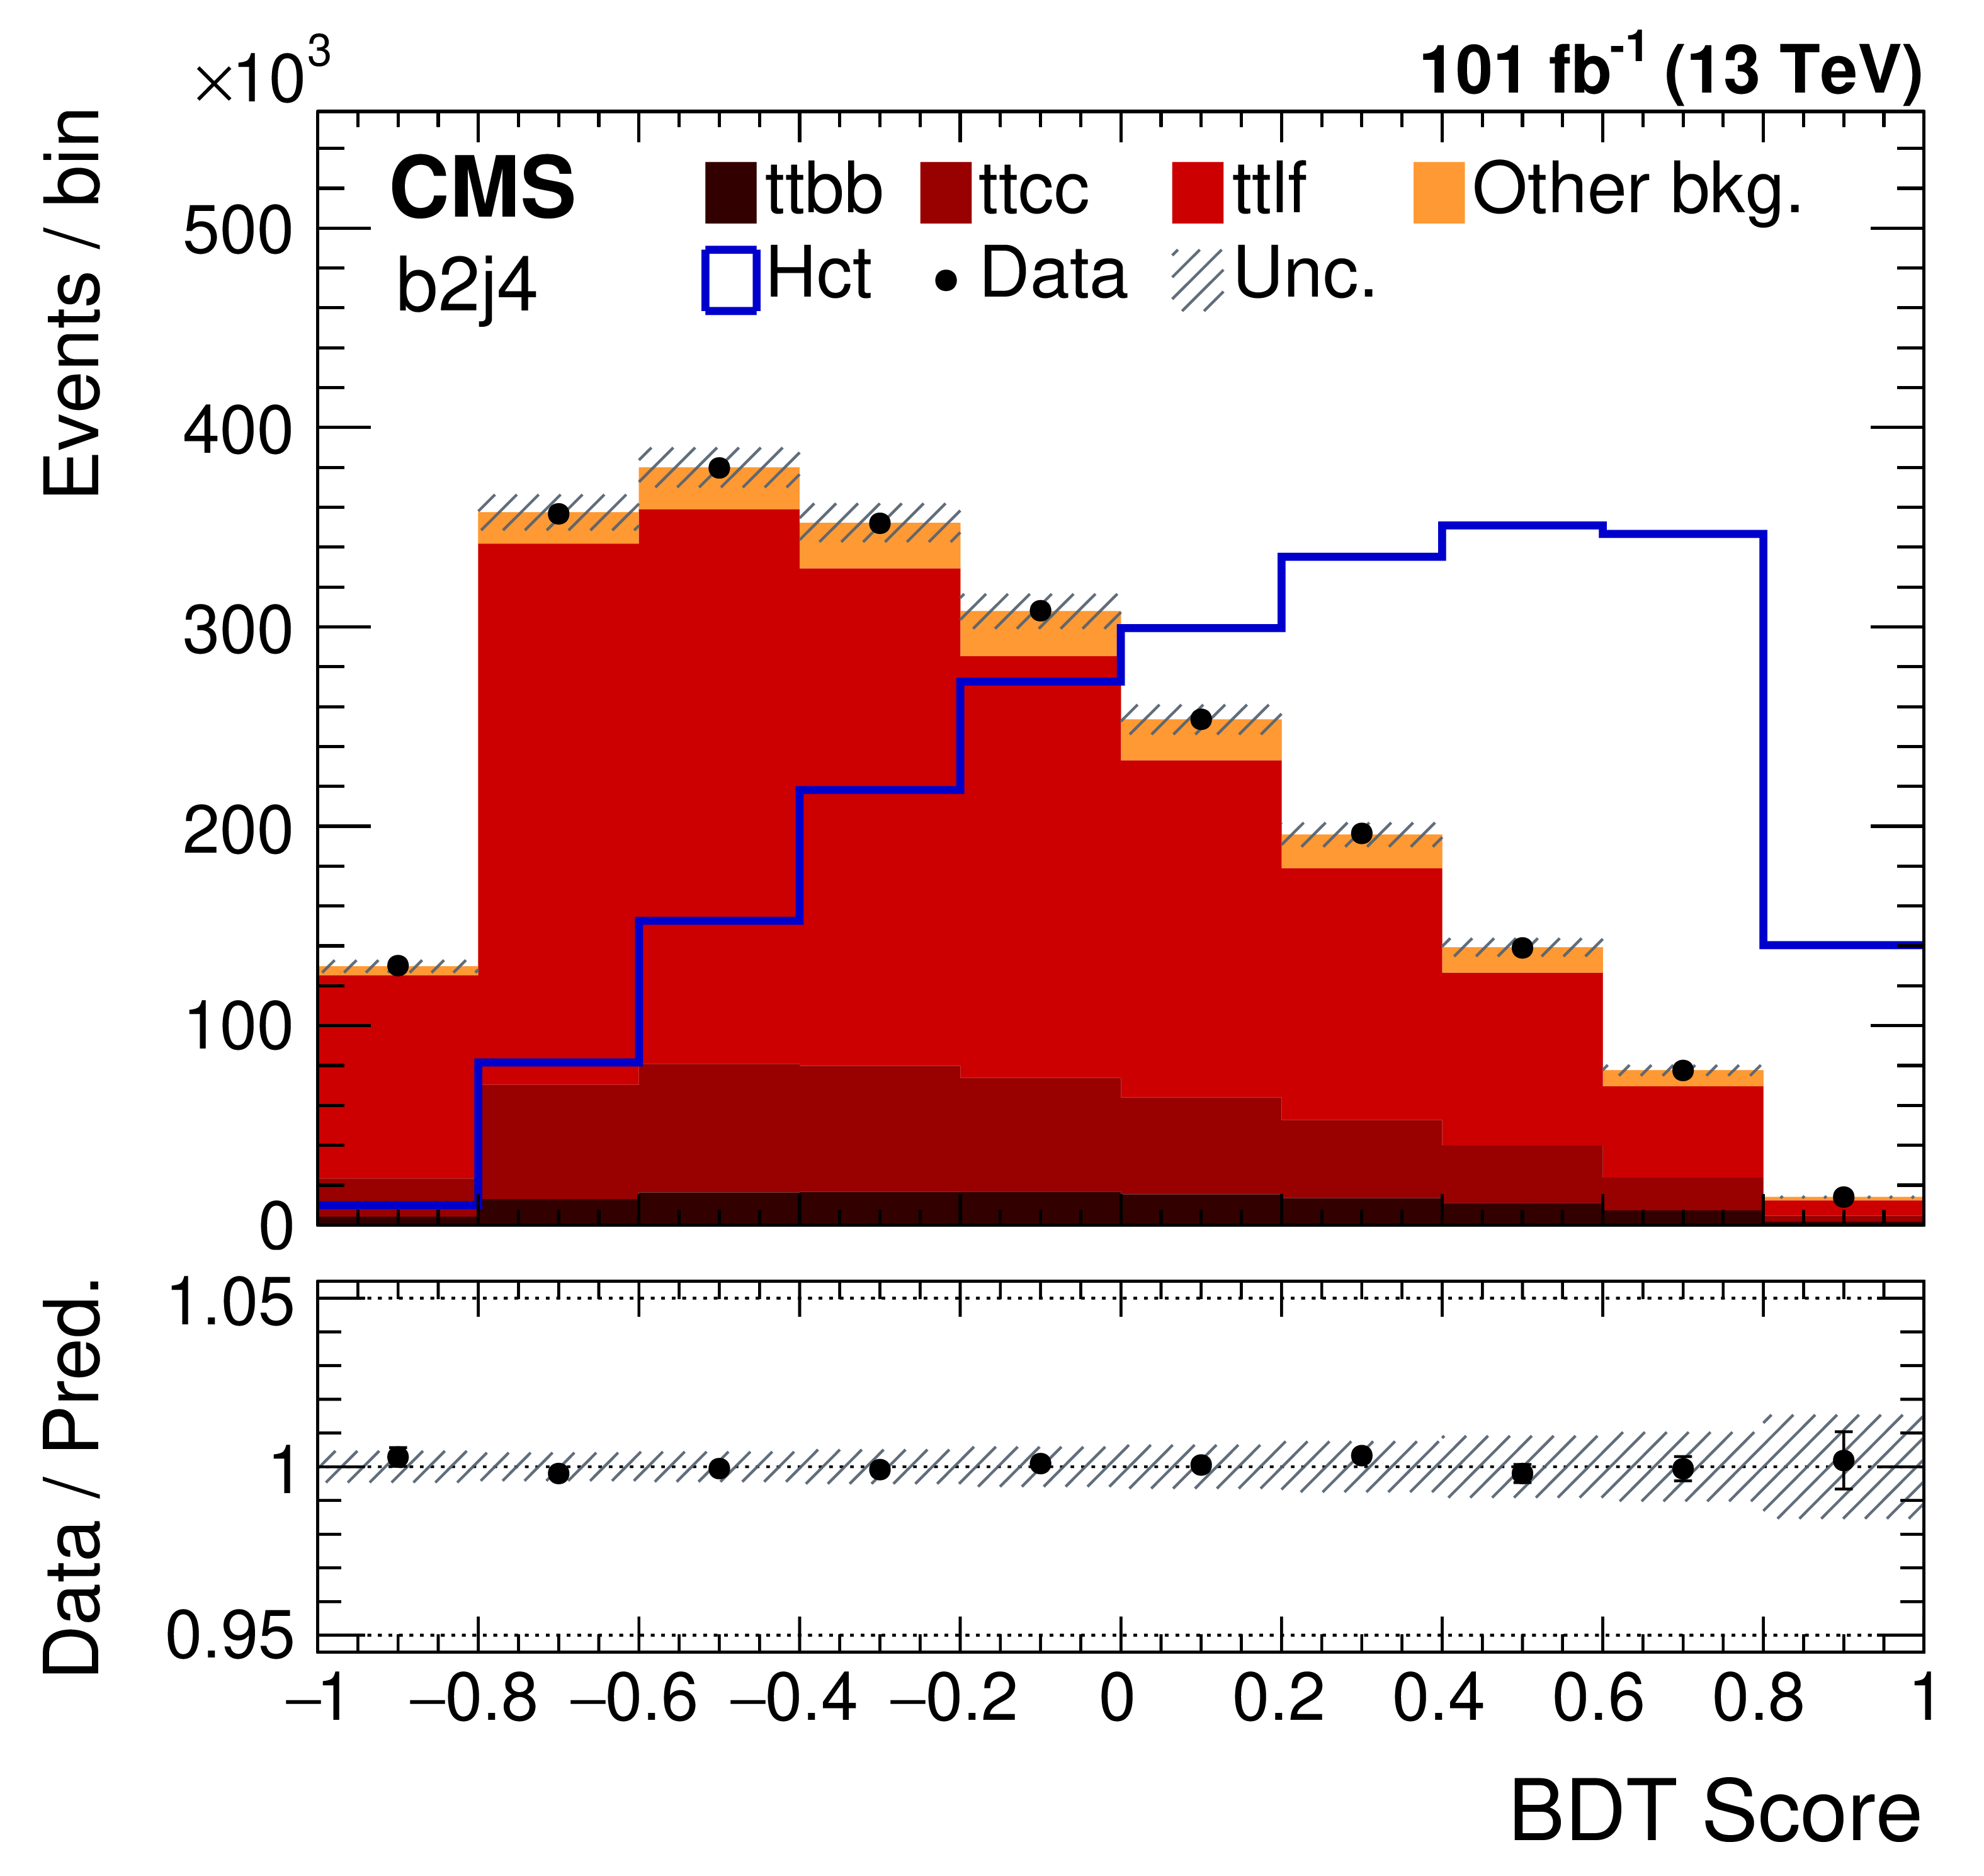
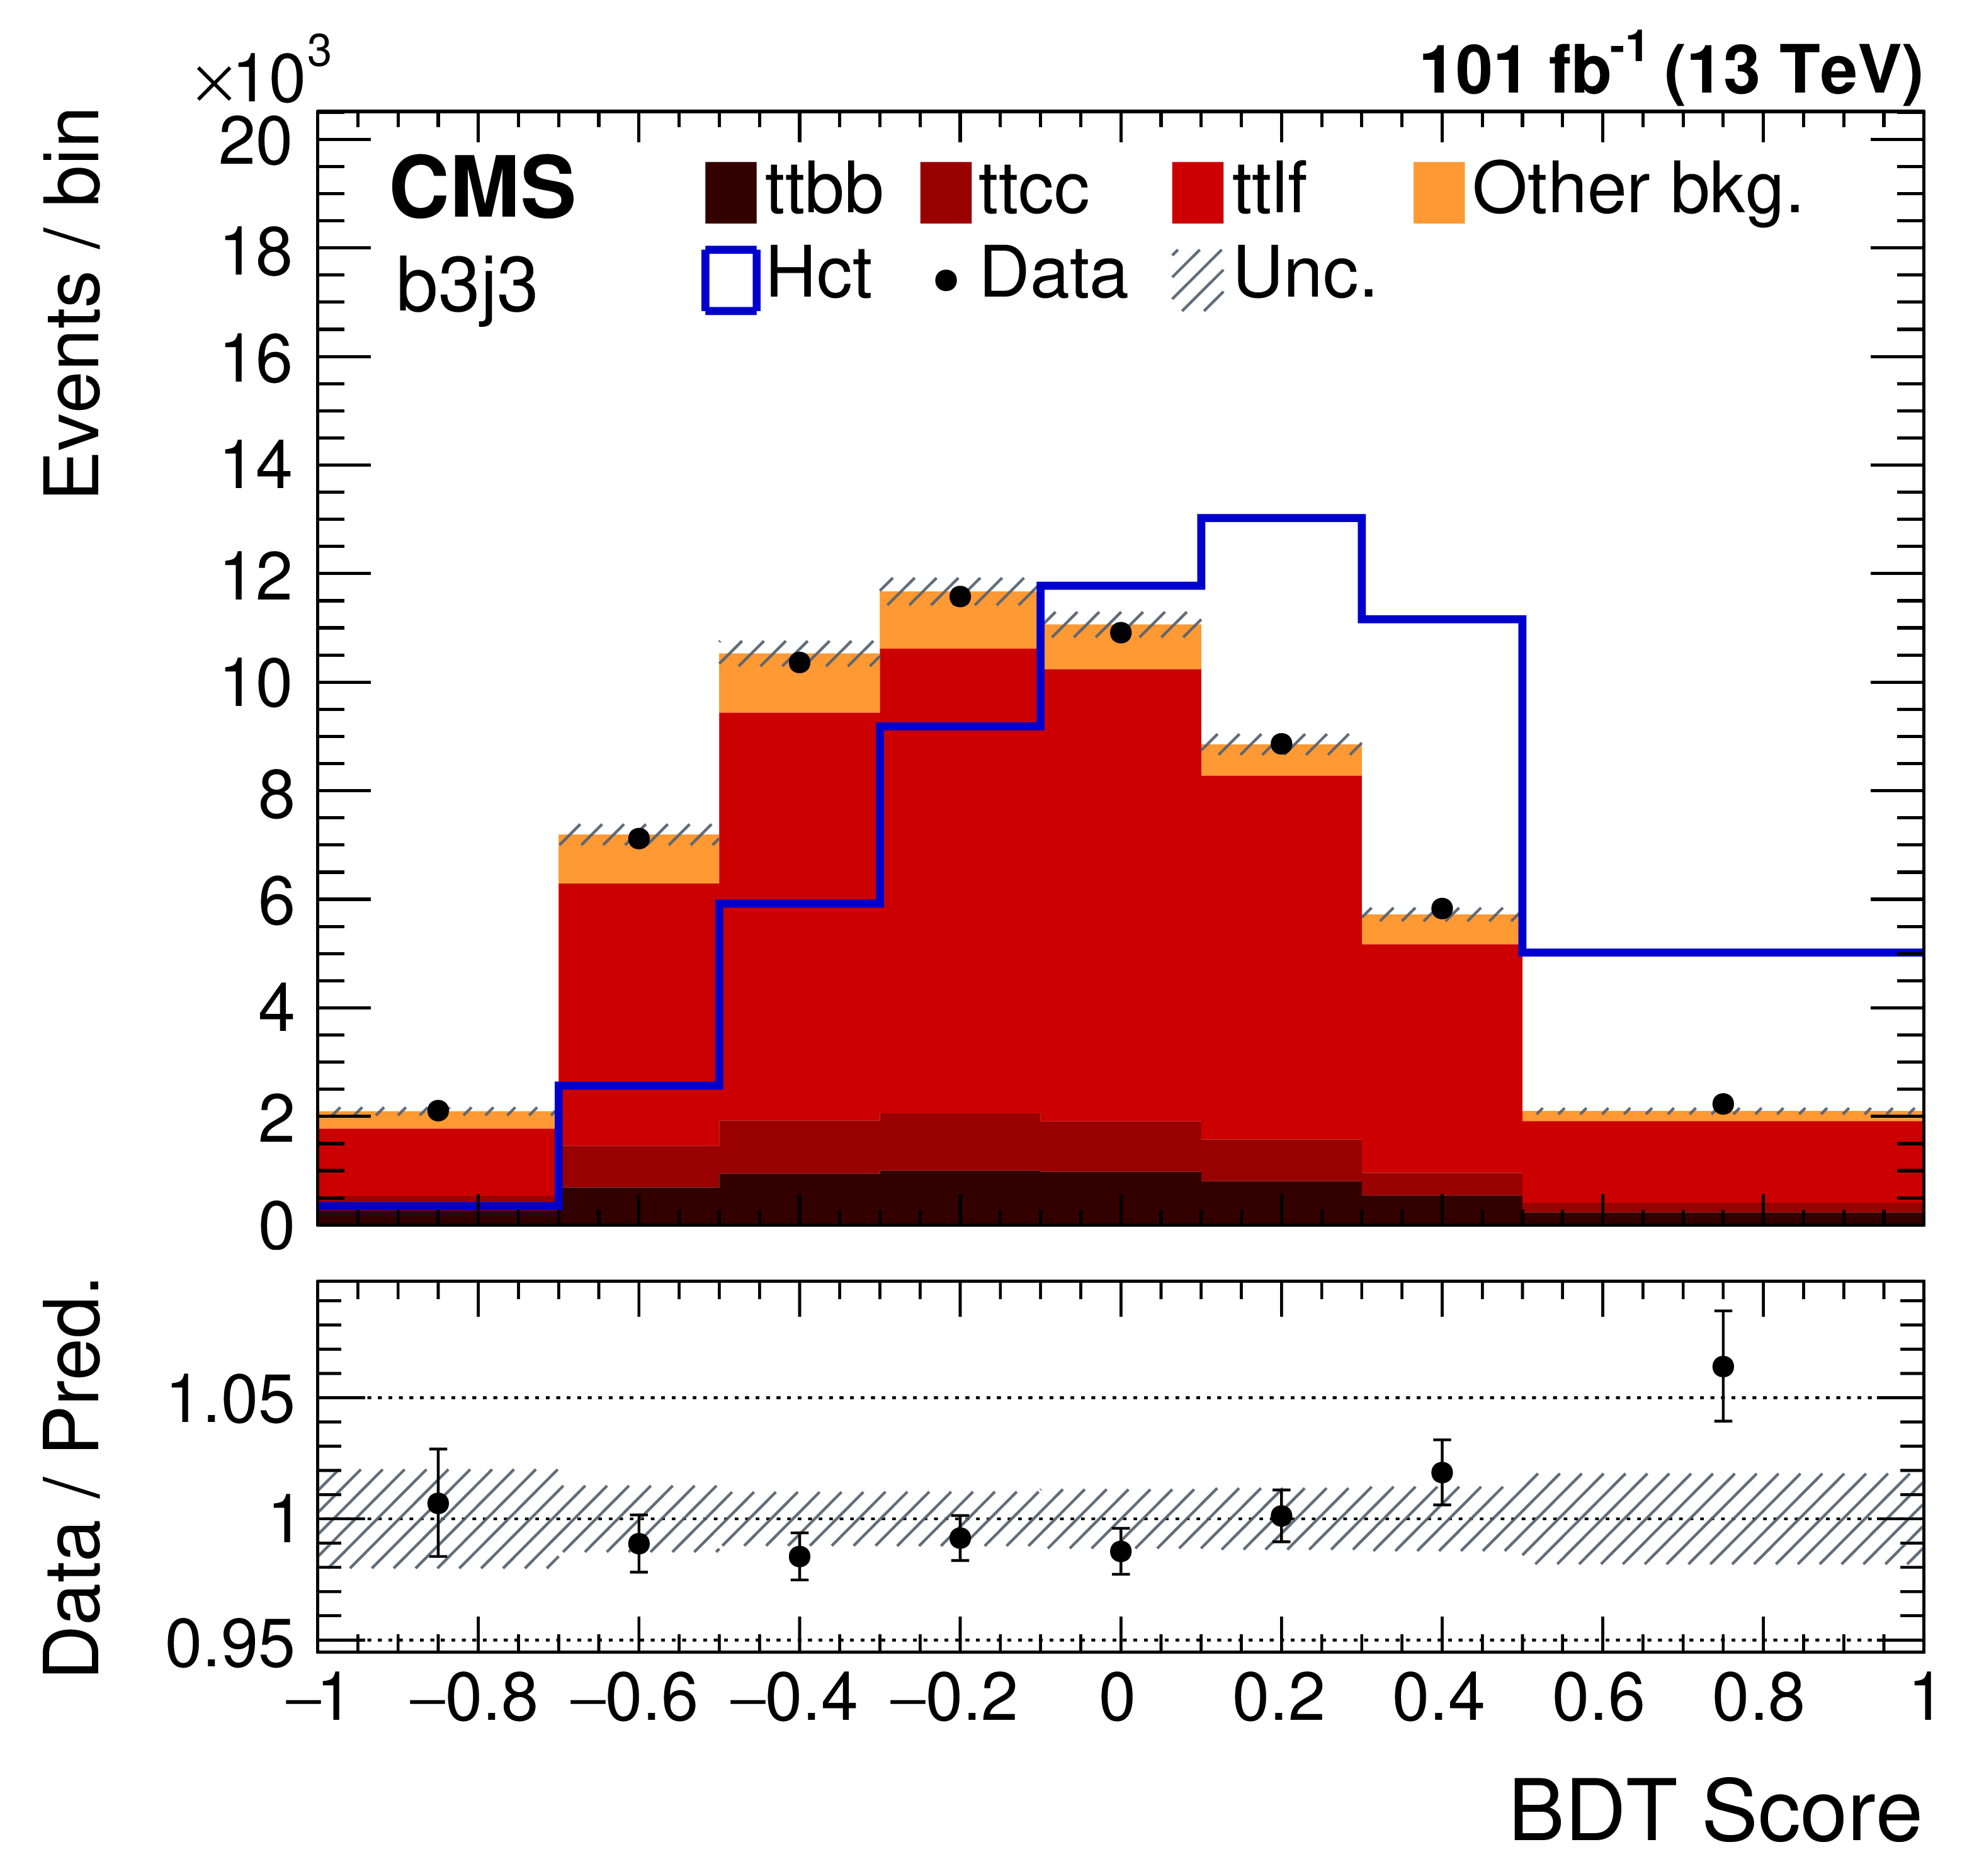
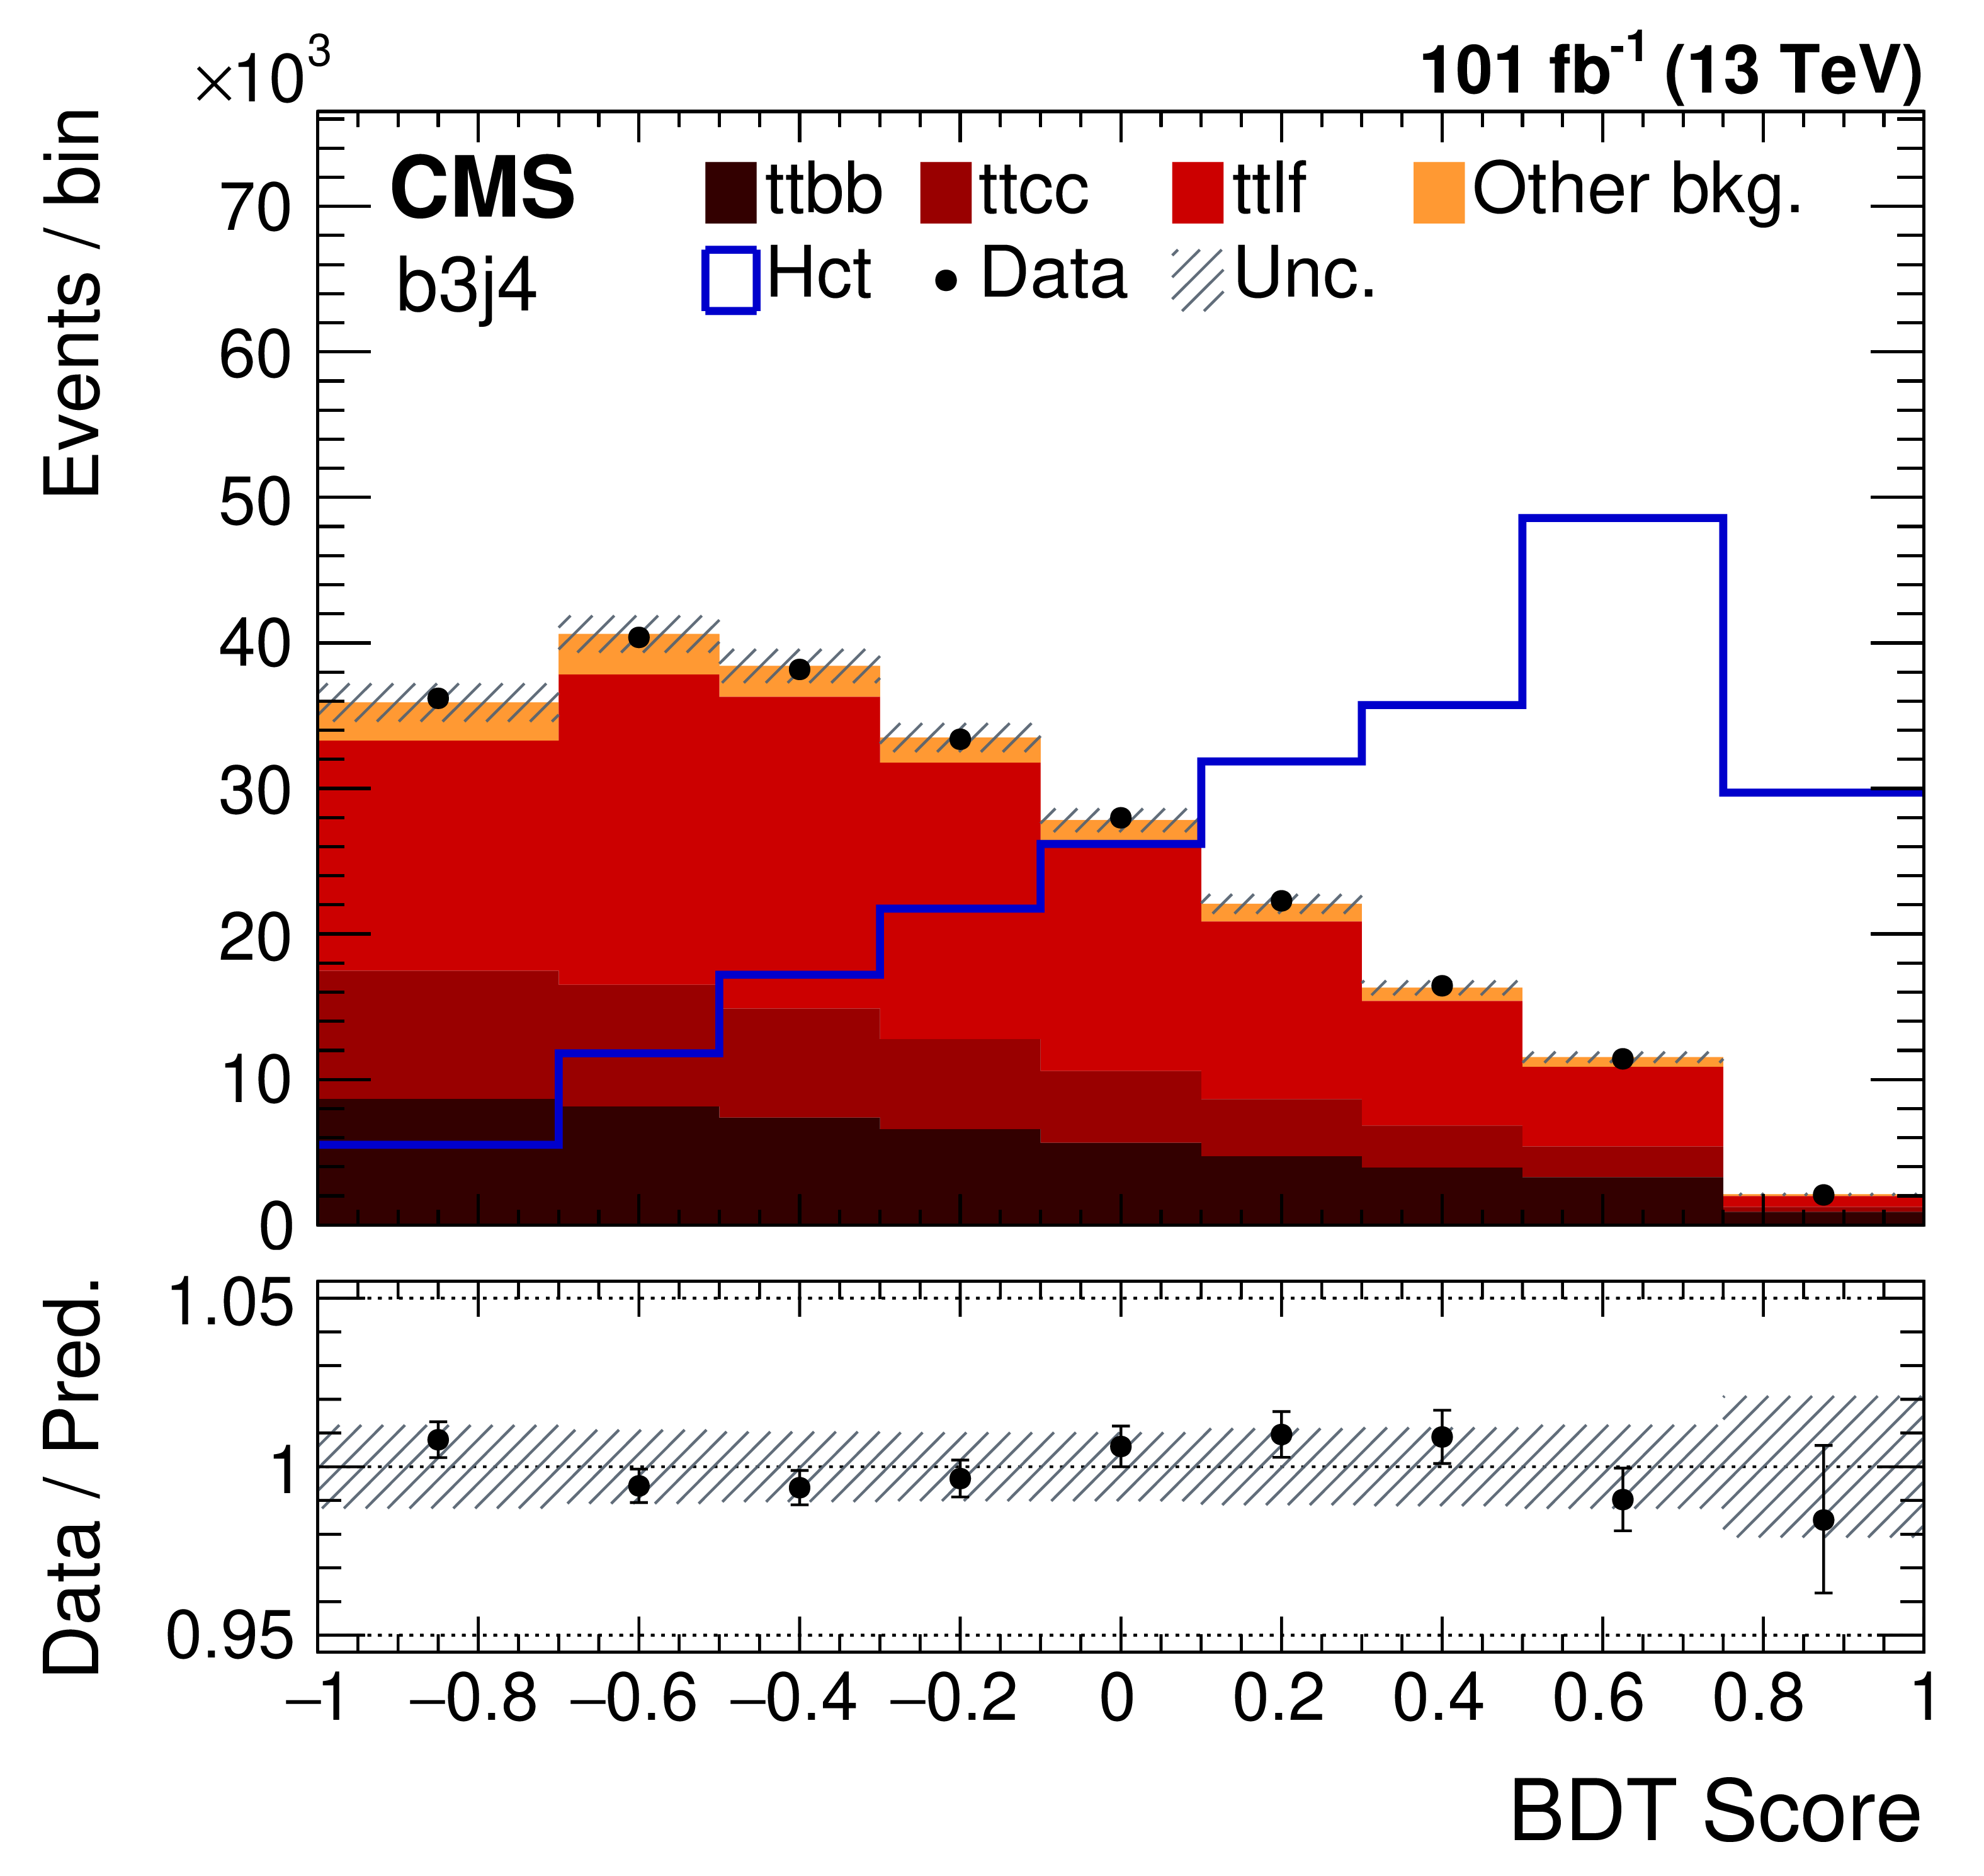
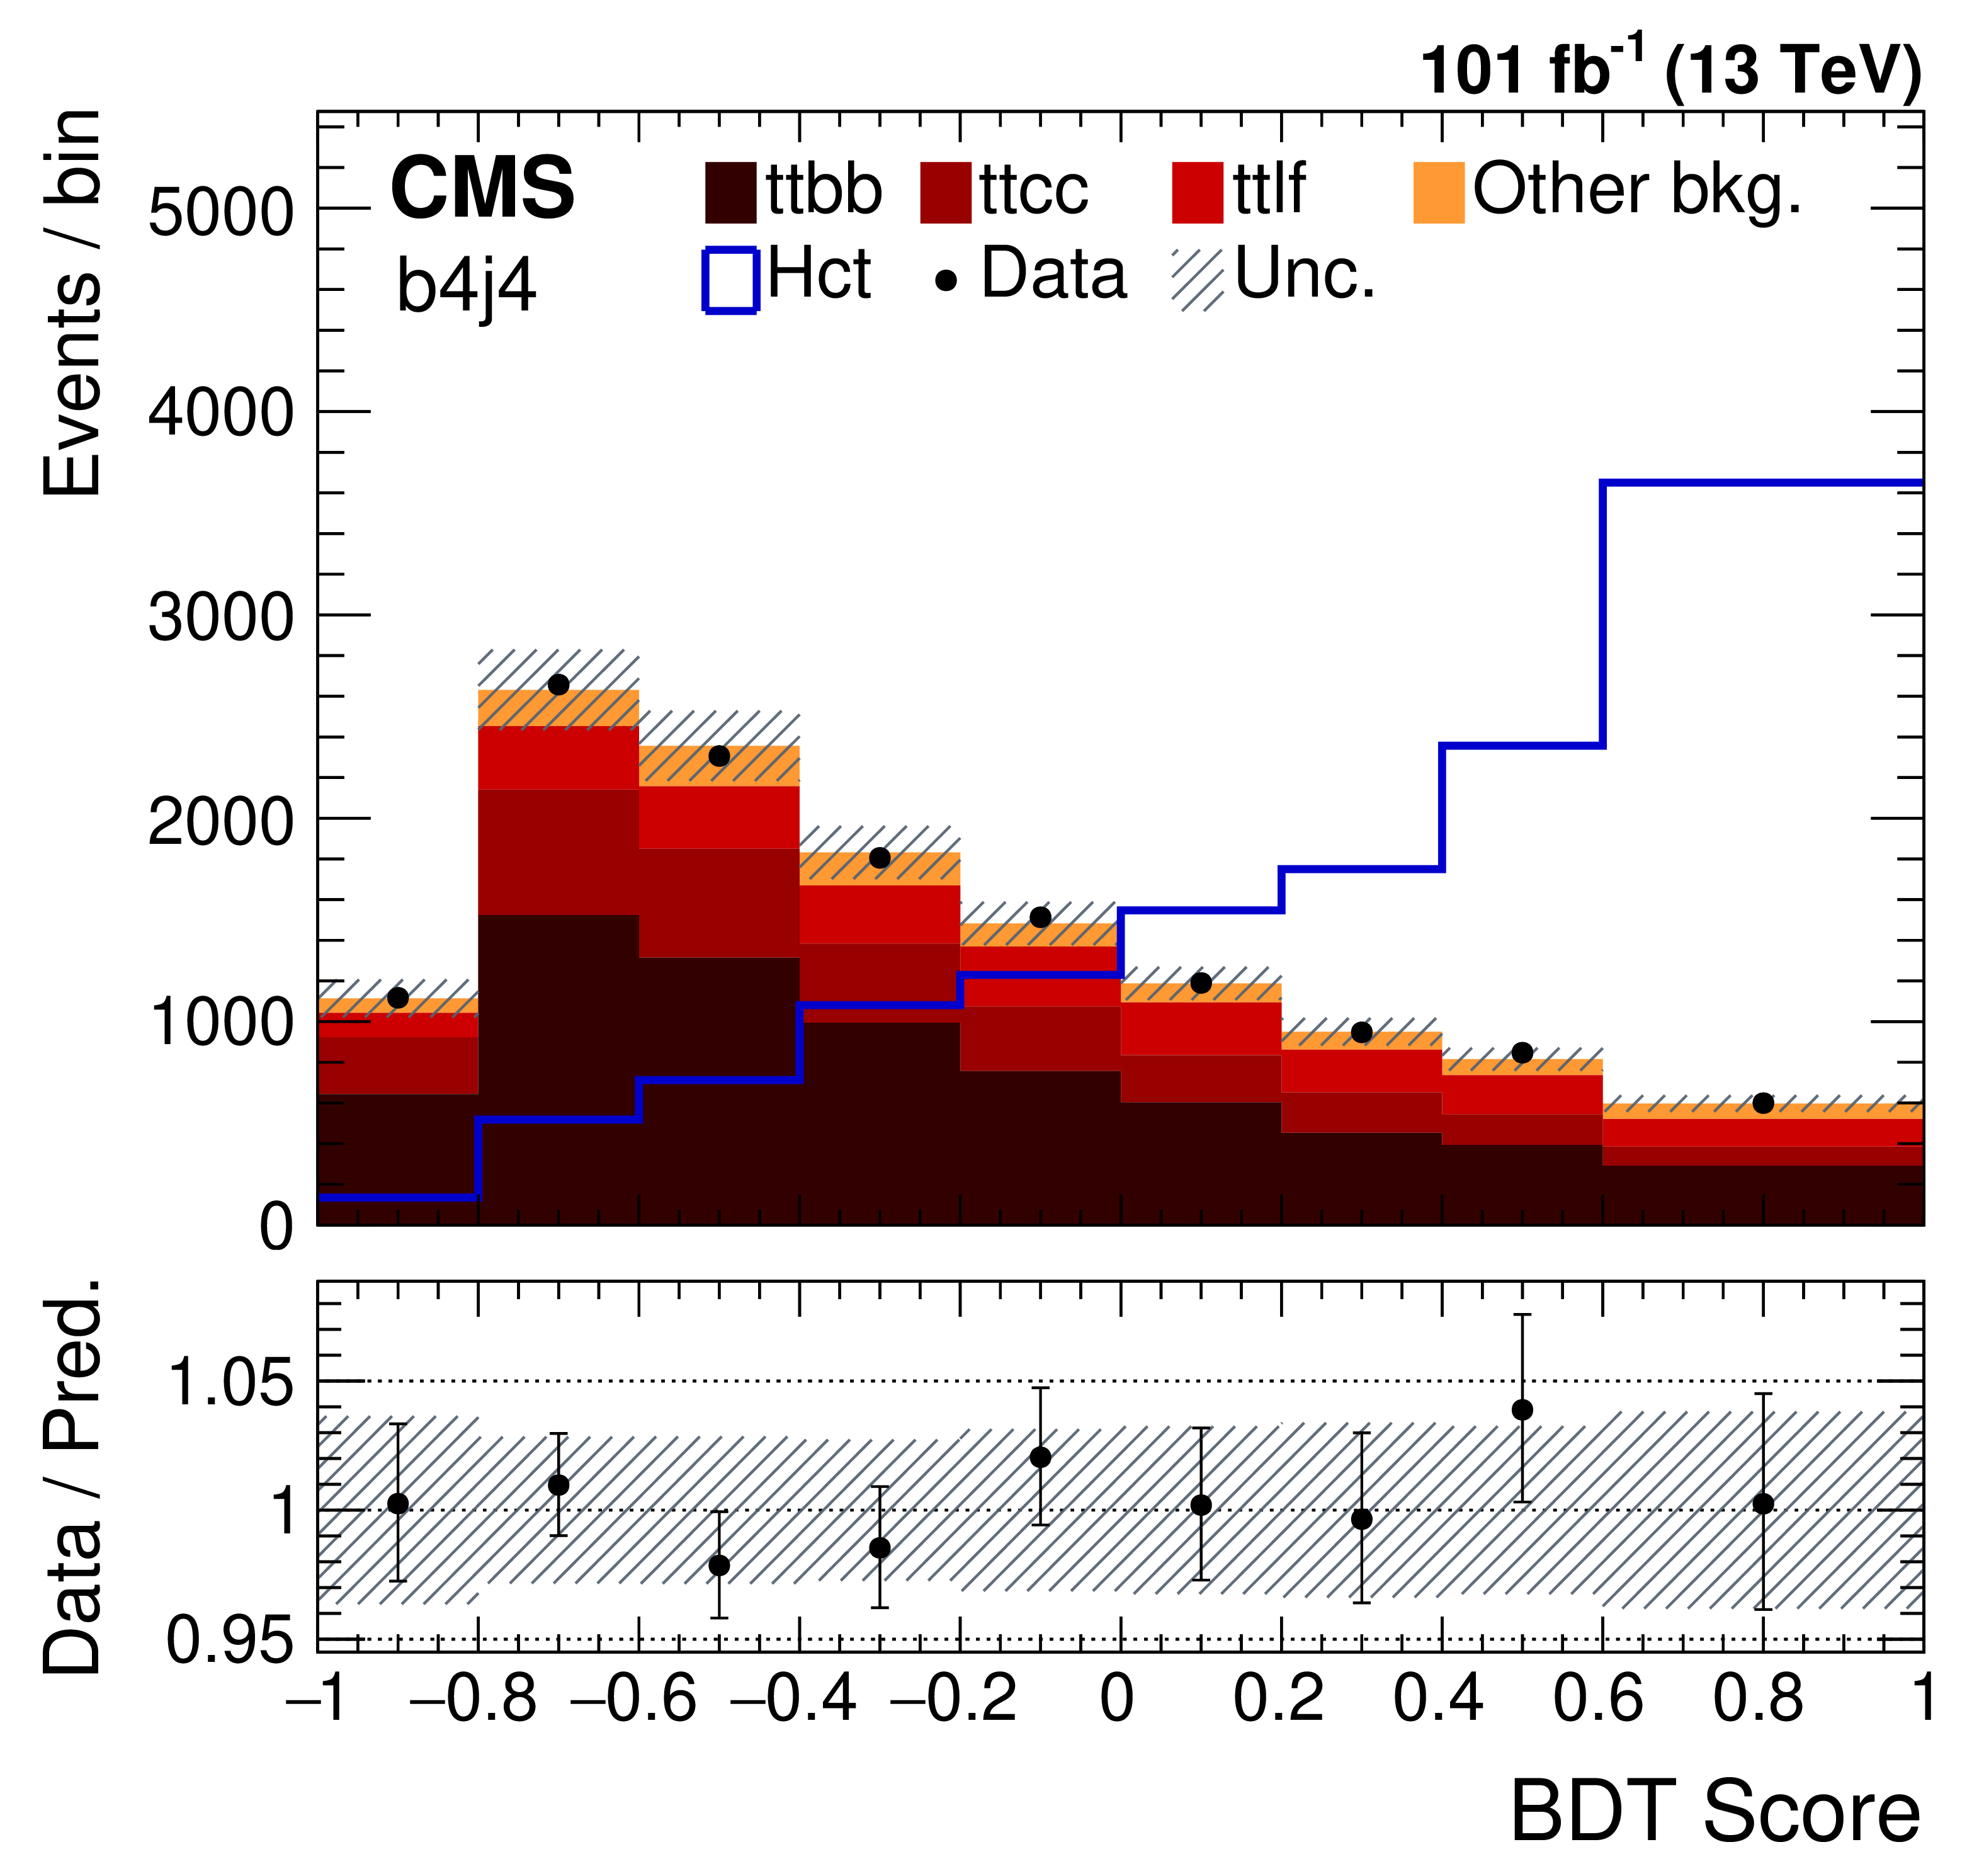
Figure 4:
The BDT output distributions for the combined 2017+2018 data and simulation for the different jet categories, assuming the Hct coupling. The lower panel shows the ratio of observed data to the SM prediction. The shaded bands correspond to the post-fit total uncertainty in the predicted background. The signal contributions are normalized to the total number of events in data. |
png pdf |
Figure 4-a:
The BDT output distributions for the combined 2017+2018 data and simulation for the b2j3 jet category, assuming the Hct coupling. The lower panel shows the ratio of observed data to the SM prediction. The shaded bands correspond to the post-fit total uncertainty in the predicted background. The signal contributions are normalized to the total number of events in data. |
png pdf |
Figure 4-b:
The BDT output distributions for the combined 2017+2018 data and simulation for the b2j4 jet category, assuming the Hct coupling. The lower panel shows the ratio of observed data to the SM prediction. The shaded bands correspond to the post-fit total uncertainty in the predicted background. The signal contributions are normalized to the total number of events in data. |
png pdf |
Figure 4-c:
The BDT output distributions for the combined 2017+2018 data and simulation for the b3j3 jet category, assuming the Hct coupling. The lower panel shows the ratio of observed data to the SM prediction. The shaded bands correspond to the post-fit total uncertainty in the predicted background. The signal contributions are normalized to the total number of events in data. |
png pdf |
Figure 4-d:
The BDT output distributions for the combined 2017+2018 data and simulation for the b3j4 jet category, assuming the Hct coupling. The lower panel shows the ratio of observed data to the SM prediction. The shaded bands correspond to the post-fit total uncertainty in the predicted background. The signal contributions are normalized to the total number of events in data. |
png pdf |
Figure 4-e:
The BDT output distributions for the combined 2017+2018 data and simulation for the b4j4 jet category, assuming the Hct coupling. The lower panel shows the ratio of observed data to the SM prediction. The shaded bands correspond to the post-fit total uncertainty in the predicted background. The signal contributions are normalized to the total number of events in data. |
png pdf |
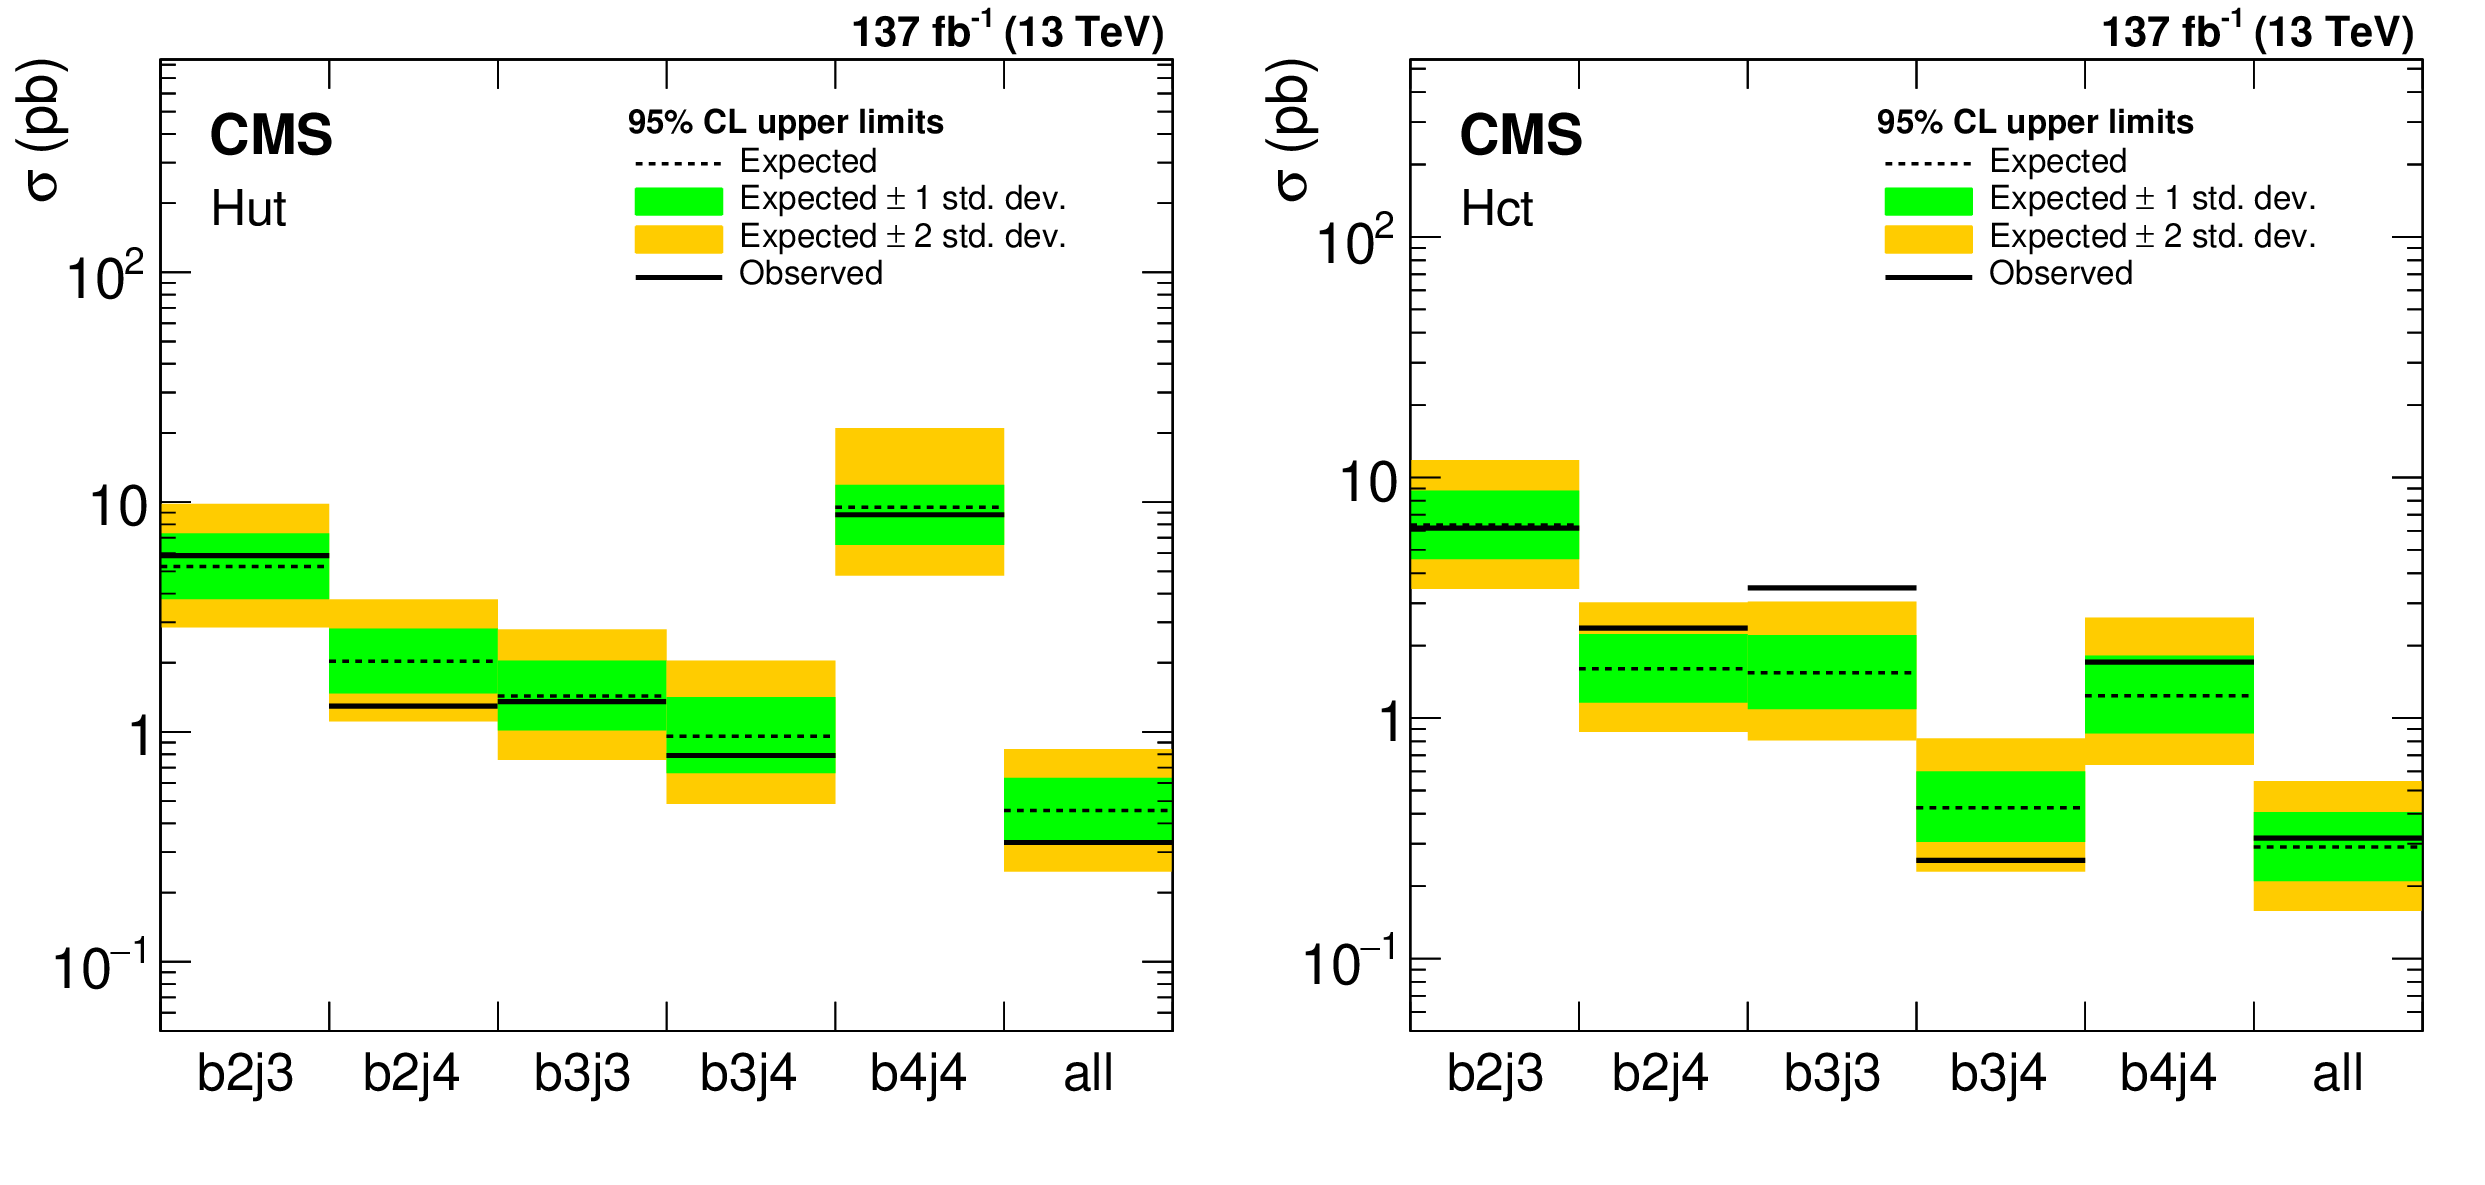
Figure 5:
Excluded limits on the product of the cross section and branching fraction at 95% CL for the Hut (left) and Hct (right) couplings obtained using the BDT distributions. Each jet category and their combination are shown separately. |
png pdf |
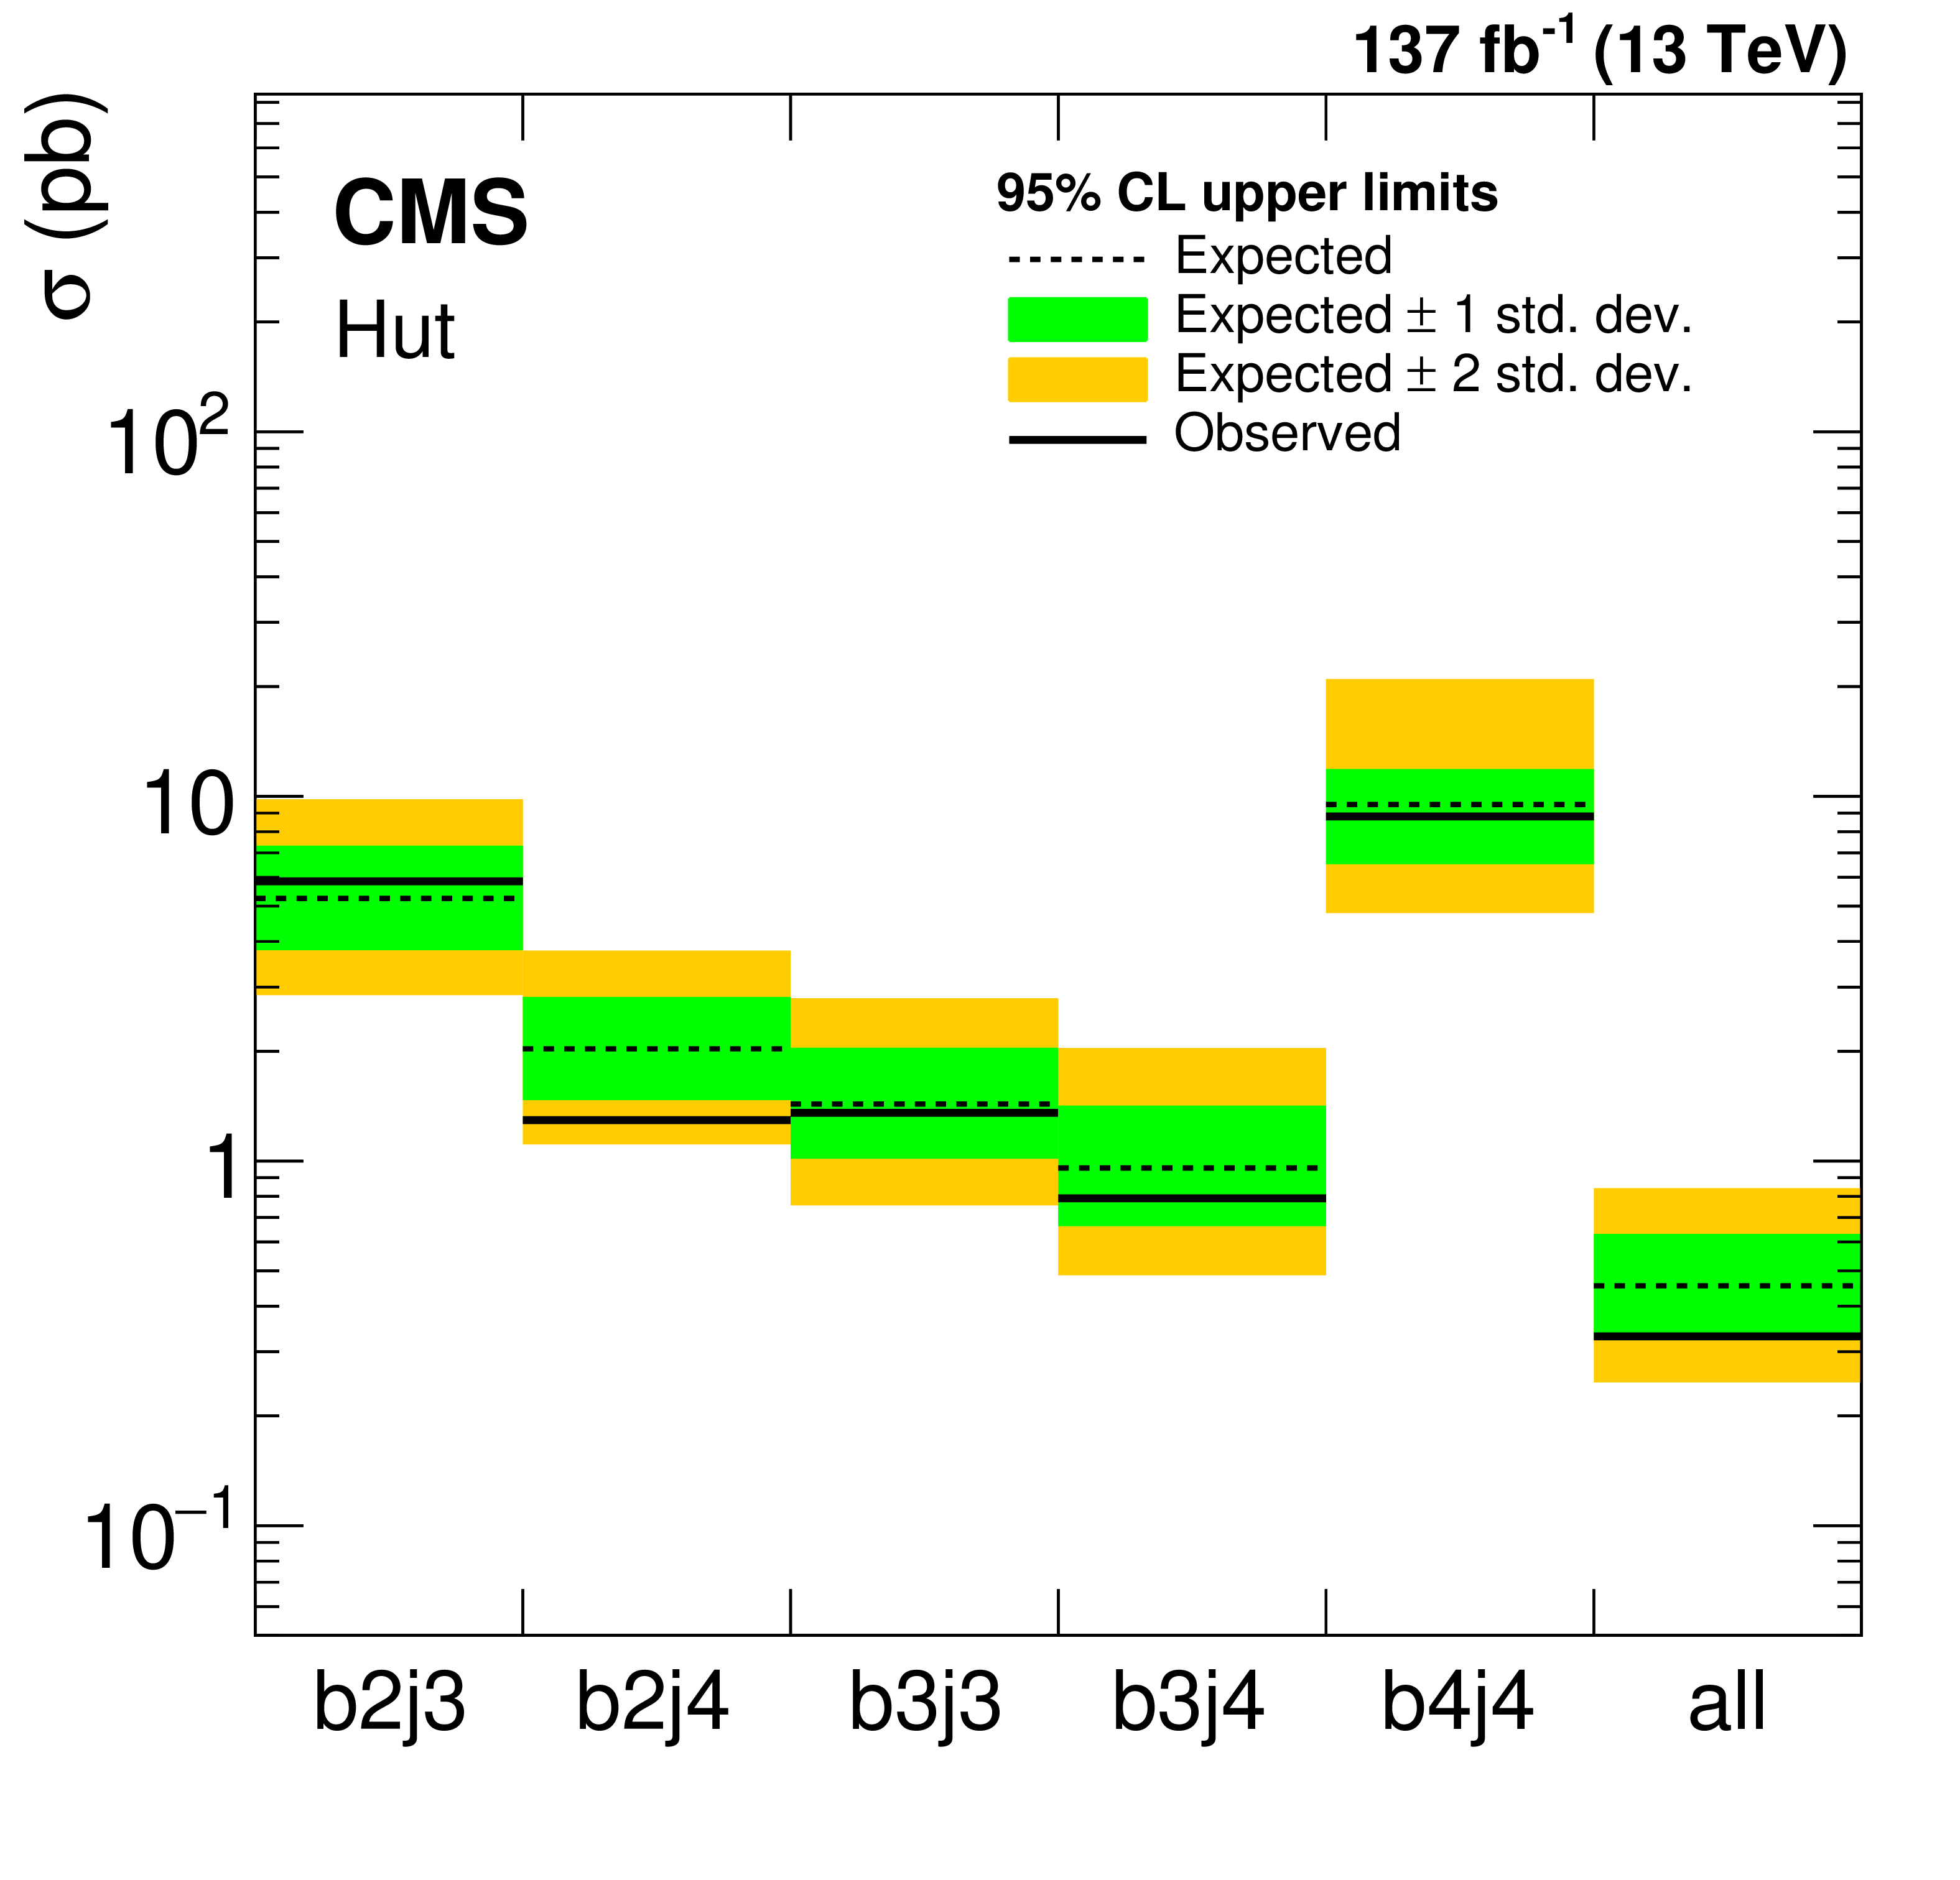
Figure 5-a:
Excluded limits on the product of the cross section and branching fraction at 95% CL for the Hut coupling obtained using the BDT distributions. Each jet category and their combination are shown separately. |

png pdf |
Figure 5-b:
Excluded limits on the product of the cross section and branching fraction at 95% CL for the Hct coupling obtained using the BDT distributions. Each jet category and their combination are shown separately. |
png pdf |
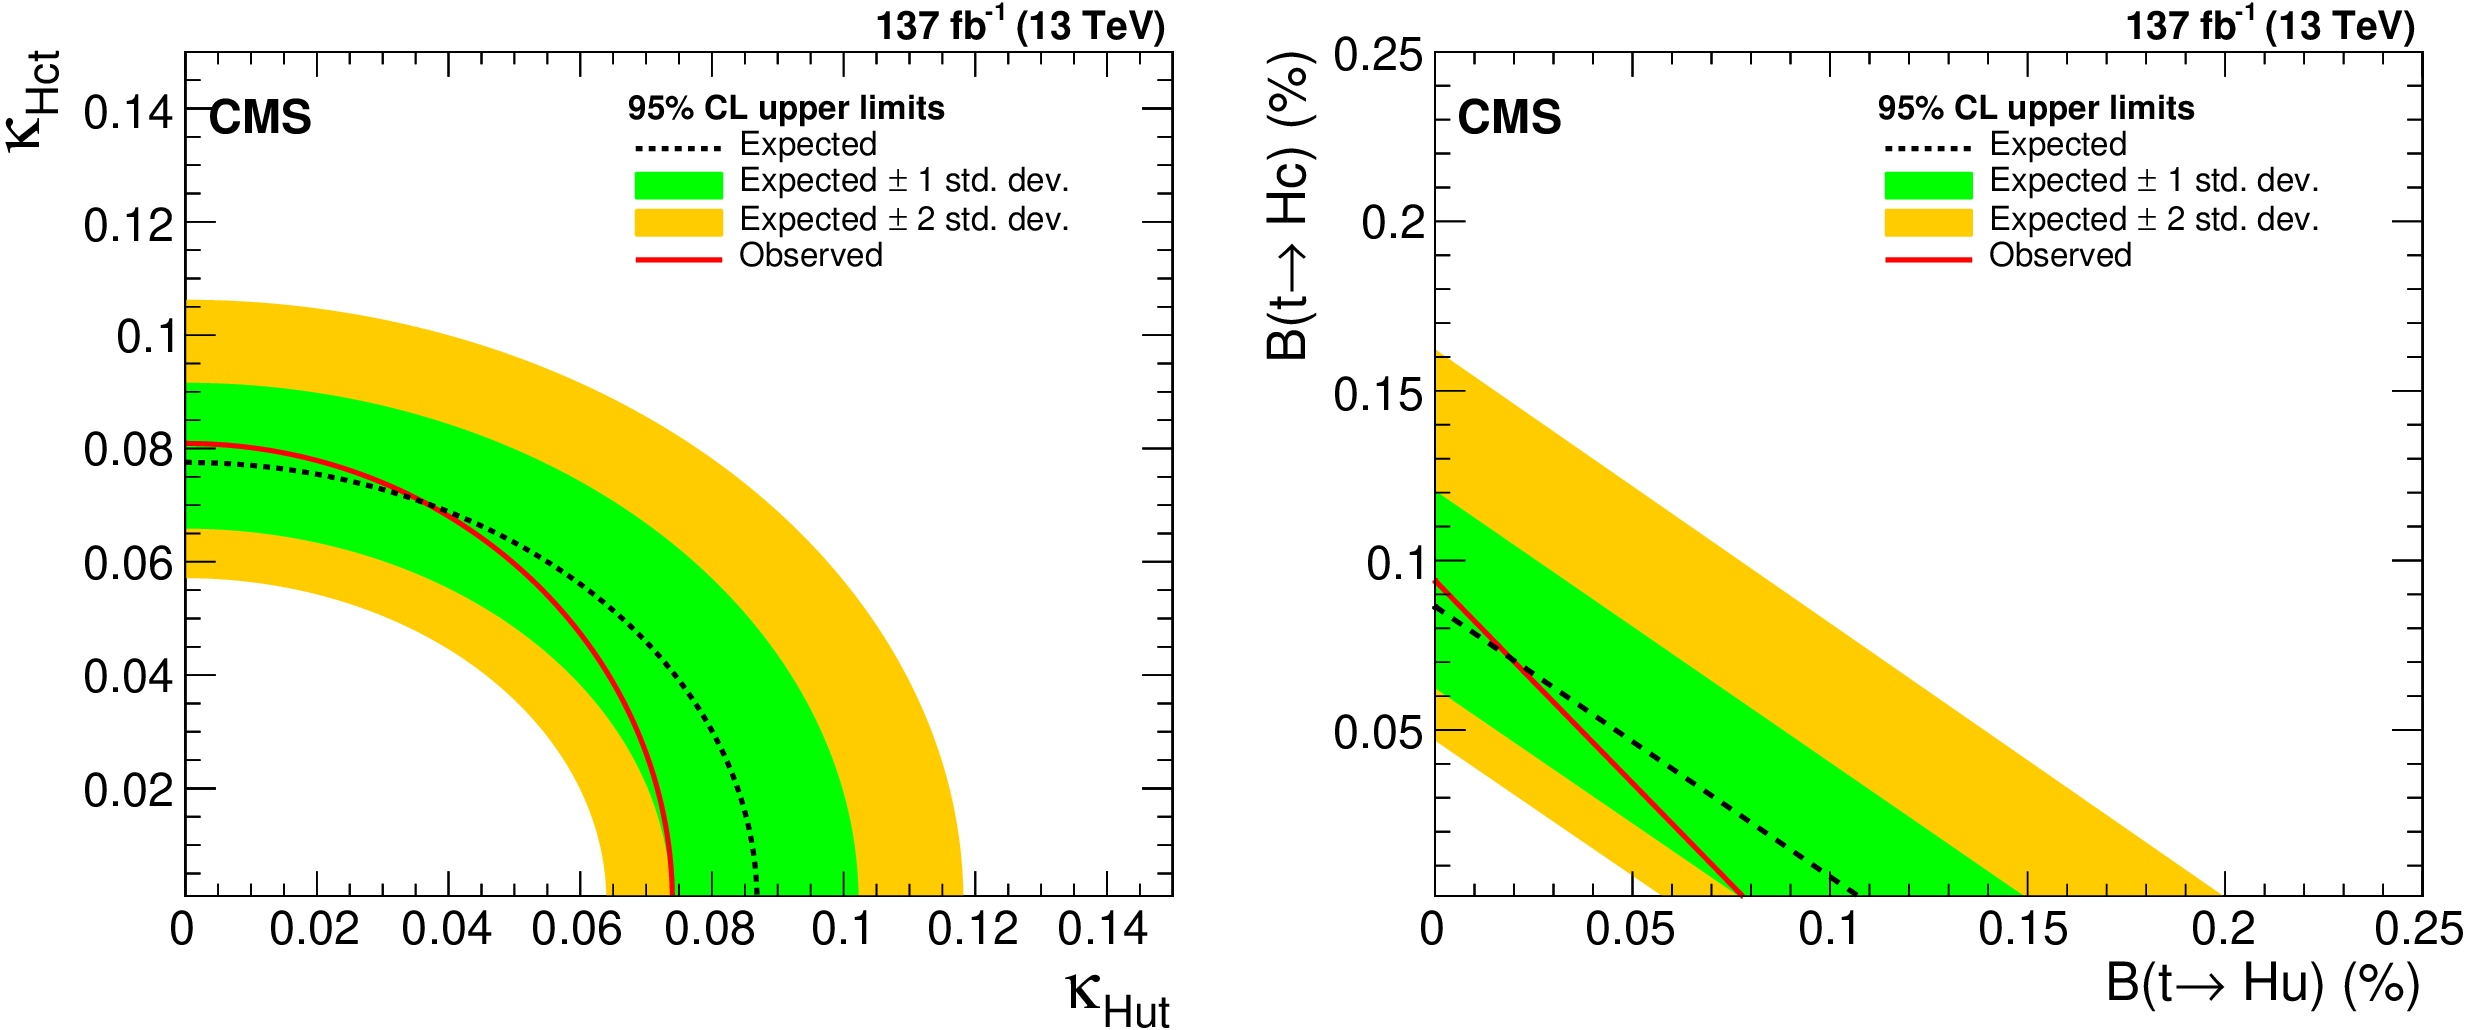
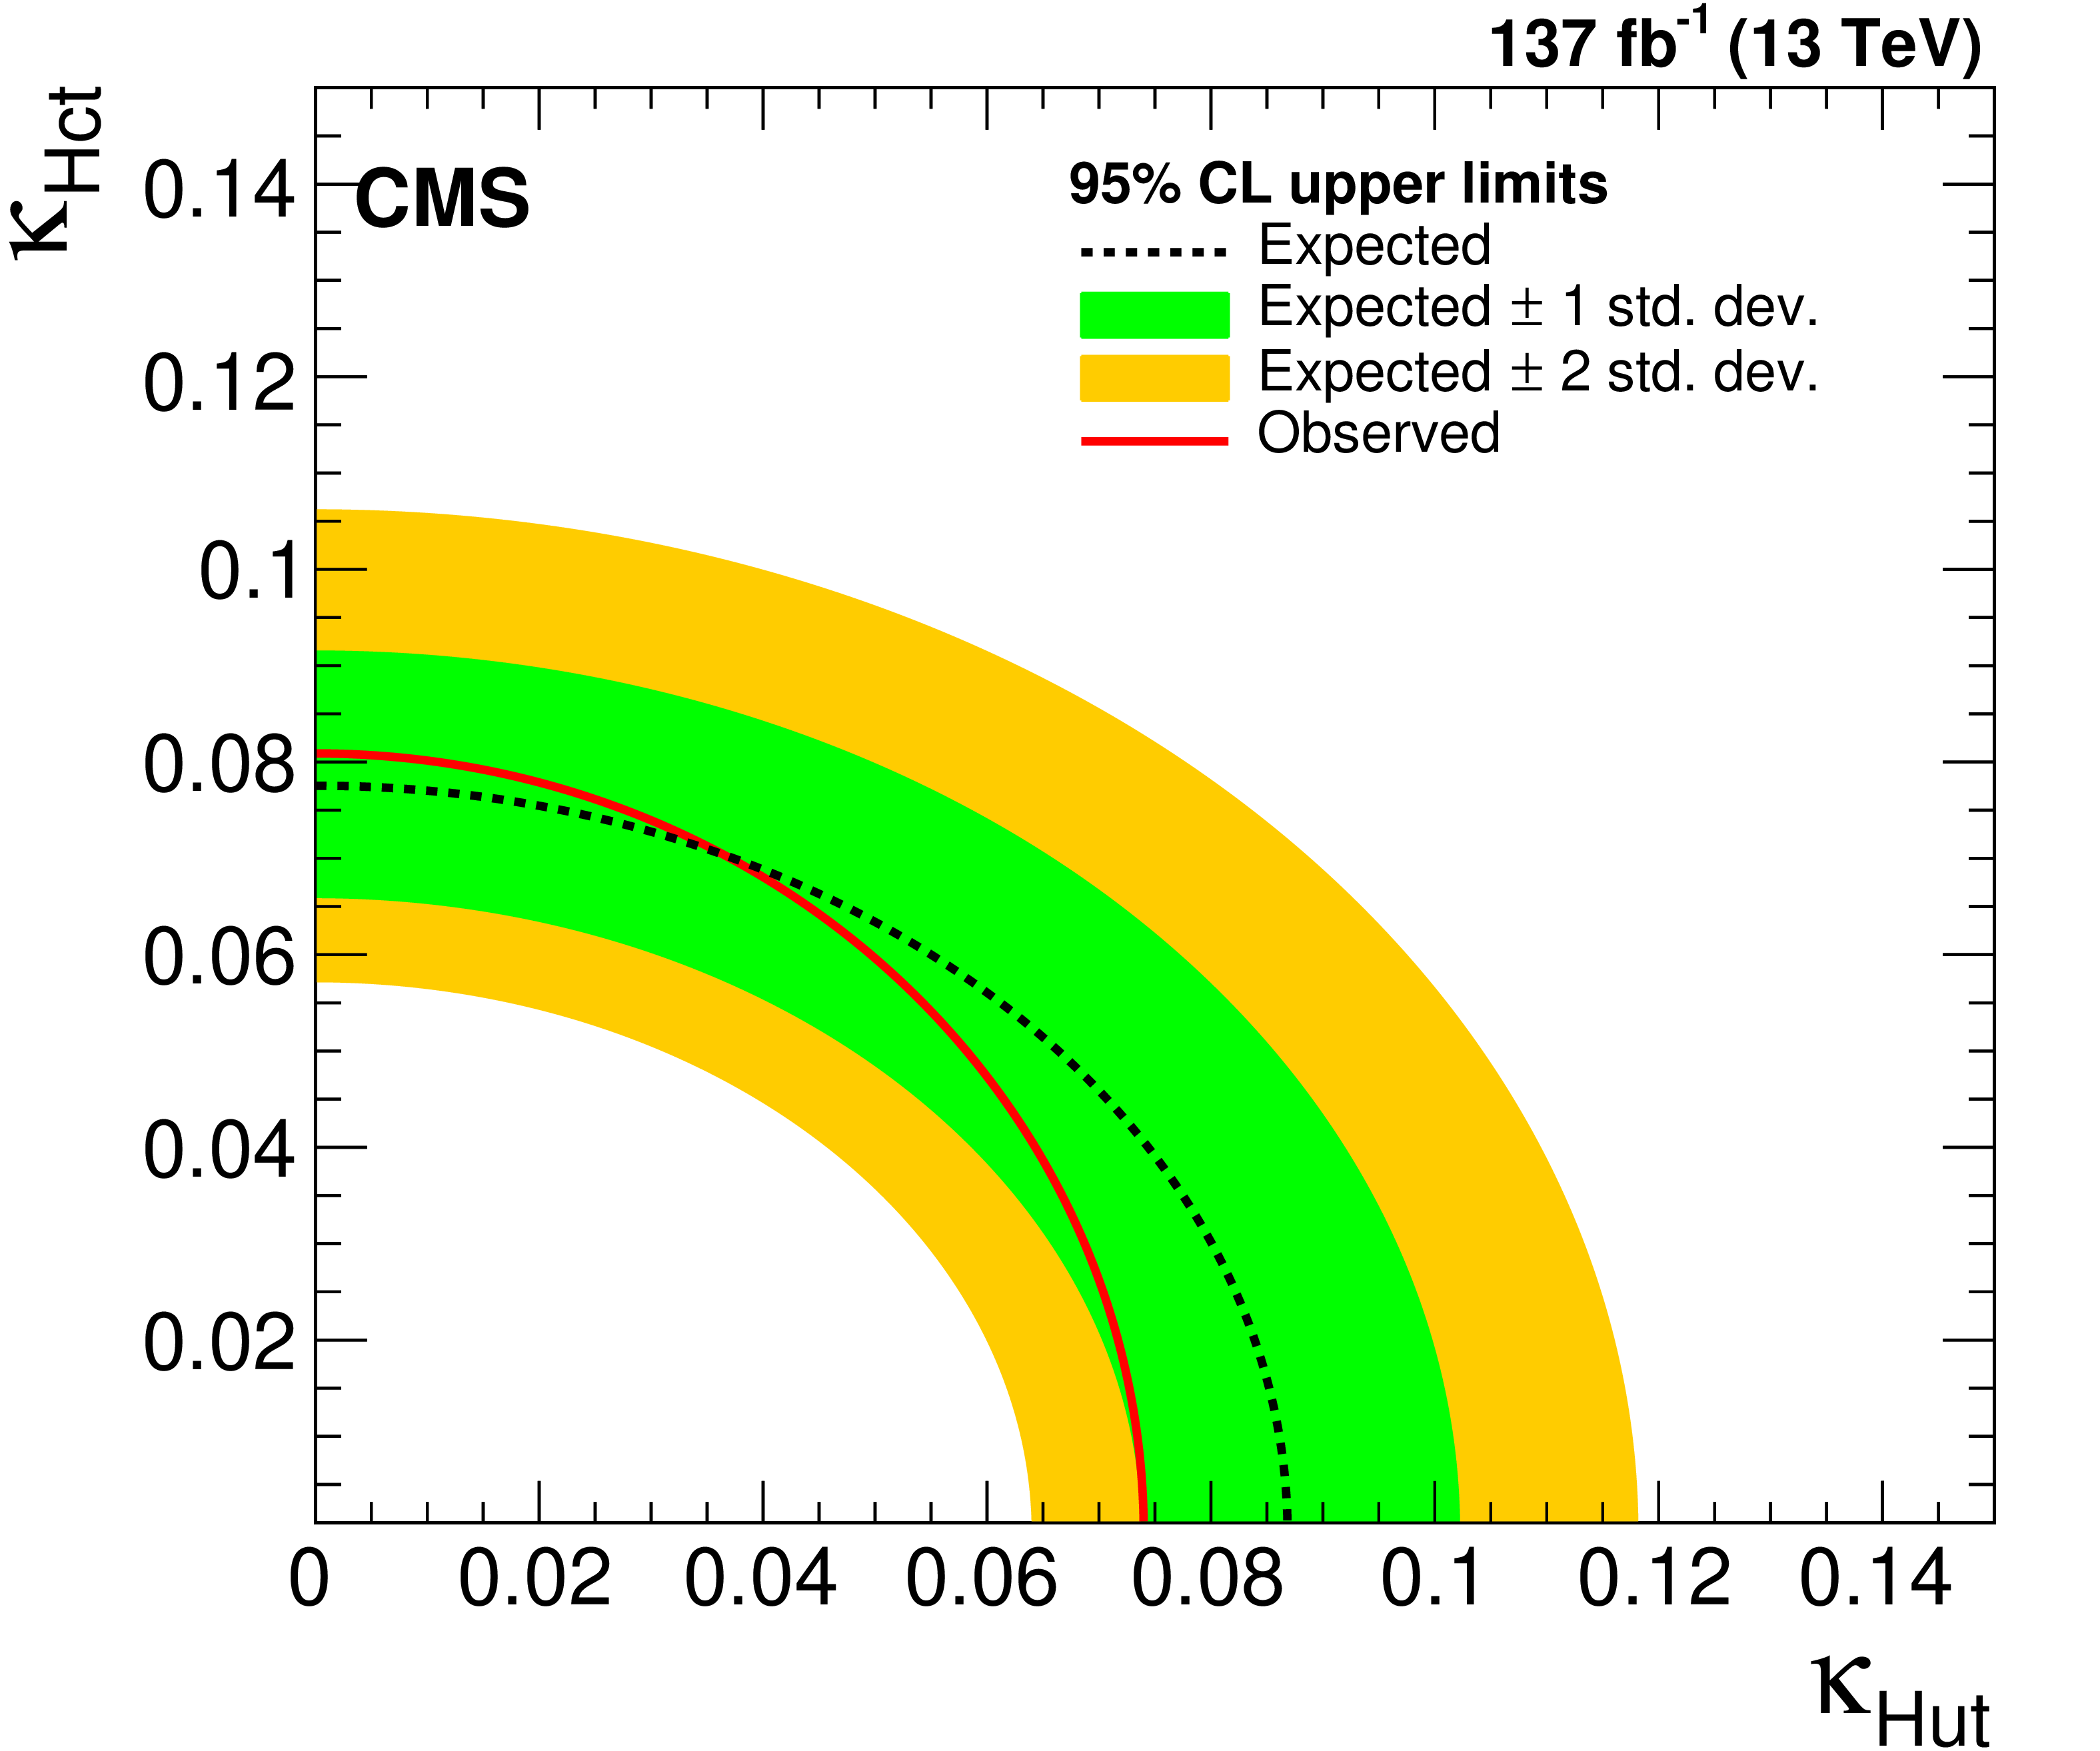
Figure 6:
Upper limits on the couplings ${\kappa _{{\mathrm{H} \mathrm{u} \mathrm{t}}}}$ and ${\kappa _{{\mathrm{H} \mathrm{c} \mathrm{t}}}}$ (left), and the branching fractions $\mathcal {B}({\mathrm{t} \to \mathrm{H} \mathrm{u}})$ and $\mathcal {B}({\mathrm{t} \to \mathrm{H} \mathrm{c}})$ (right) at 95% CL. |
png pdf |
Figure 6-a:
Upper limits on the couplings ${\kappa _{{\mathrm{H} \mathrm{u} \mathrm{t}}}}$ and ${\kappa _{{\mathrm{H} \mathrm{c} \mathrm{t}}}}$ at 95% CL. |
png pdf |
Figure 6-b:
Upper limits on the branching fractions $\mathcal {B}({\mathrm{t} \to \mathrm{H} \mathrm{u}})$ and $\mathcal {B}({\mathrm{t}\to\mathrm{H} \mathrm{c}})$ at 95% CL. |
| Tables | |
png pdf |
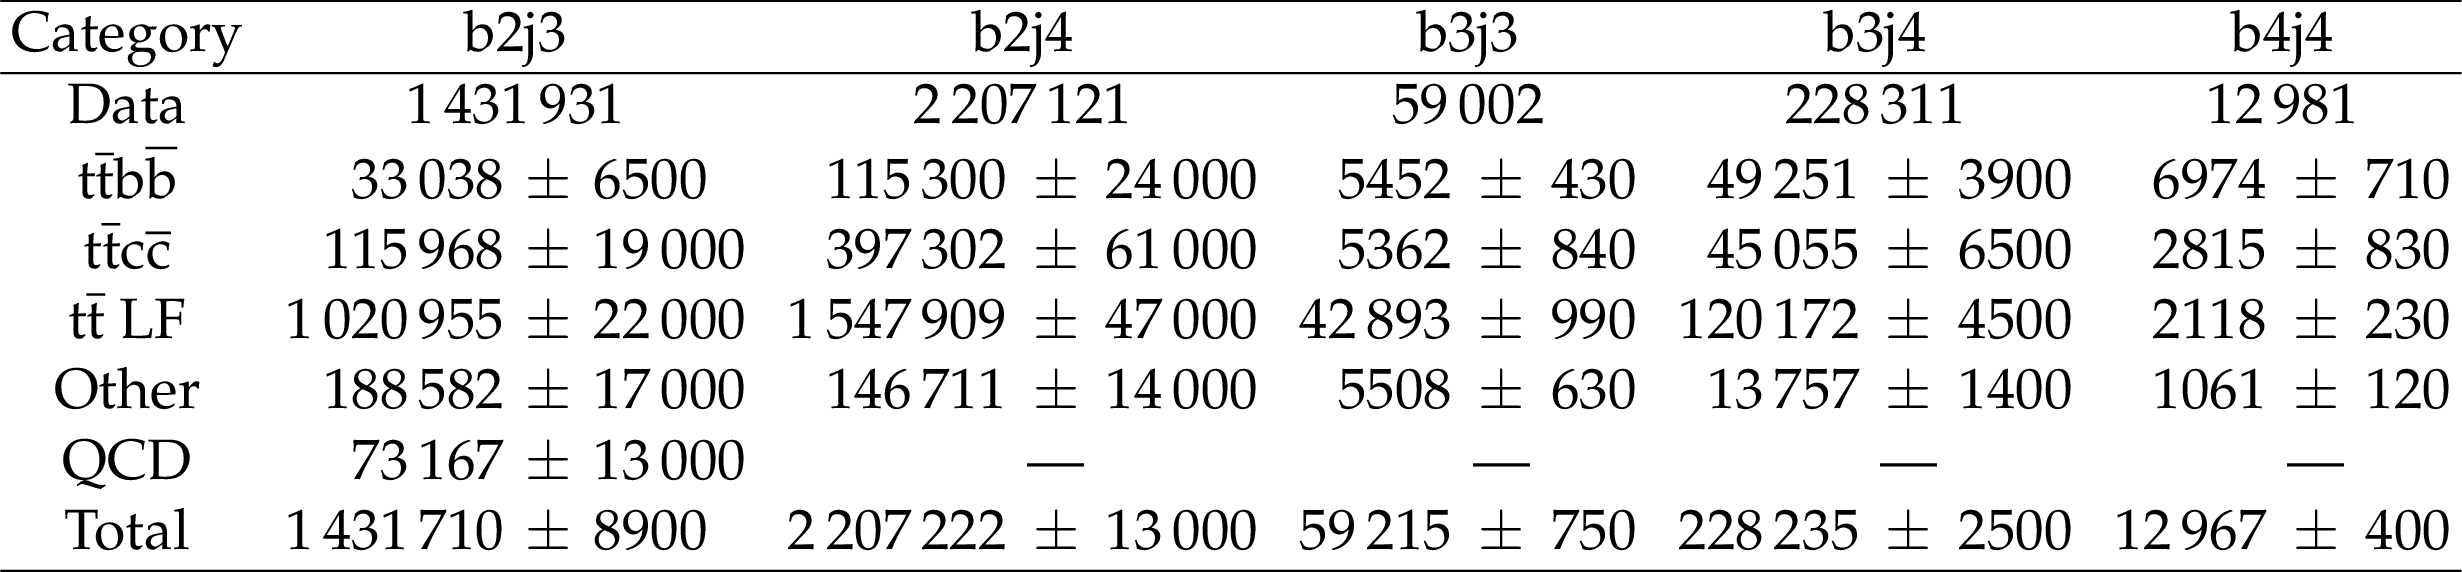
Table 1:
Number of events in the combined 2017+2018 data and prediction for the backgrounds assuming absence of the signal events, shown separately for each jet category, with uncertainties obtained from the fit on the BDT distributions of Hct coupling. |
| Summary |
| A search for flavor-changing neutral current interactions in events with a top quark (t) decaying leptonically and a Higgs boson (H) decaying to a bottom quark-antiquark pair has been presented. The search uses the LHC data, collected at $\sqrt{s} = $ 13 TeV in 2016-2018 and corresponding to an integrated luminosity of 137 fb$^{-1}$ of proton-proton collisions. Events are analyzed, in the single-lepton channel containing a muon or electron in addition to the presence of at least three jets, where at least two of them are identified as originating from the hadronization of a bottom quark. No significant deviation from the standard model prediction has been observed and upper limits on the branching fractions $\mathcal{B}({\mathrm{t} \to \mathrm{H}\mathrm{q}} )$ have been set where q refers to the up (u) and charm quarks (c); their observed (expected) excluded values at 95% confidence level are $\mathcal{B}({\mathrm{t} \to \mathrm{H}\mathrm{u}} ) < $ 0.079(0.11)% and $\mathcal{B}({\mathrm{t} \to \mathrm{H}\mathrm{c}} ) < $ 0.094 (0.086)%. The observed limits reach the order of 10$^{-4}$ in terms of branching fraction compared to the prediction from several well-known extensions of standard model that predict the values as high as 10$^{-5}$ to 10$^{-3}$. This search substantially improves upon previous CMS results in the same final state by exploiting the larger integrated luminosity of 137 fb$^{-1}$ and by using advanced multivariate analysis techniques to perform the kinematic event reconstruction and signal extraction. |
| References | ||||
| 1 | ATLAS Collaboration | Observation of a new particle in the search for the standard model Higgs boson with the ATLAS detector at the LHC | PLB 716 (2012) 1 | 1207.7214 |
| 2 | CMS Collaboration | Observation of a new boson at a mass of 125 GeV with the CMS experiment at the LHC | PLB 716 (2012) 30 | CMS-HIG-12-028 1207.7235 |
| 3 | CMS Collaboration | Observation of a new boson with mass near 125 GeV in pp collisions at $ \sqrt{s}= $ 7 and 8 TeV | JHEP 06 (2013) 081 | CMS-HIG-12-036 1303.4571 |
| 4 | ATLAS and CMS Collaborations | Measurements of the Higgs boson production and decay rates and constraints on its couplings from a combined ATLAS and CMS analysis of the LHC pp collision data at $ \sqrt{s}= $ 7 and 8 TeV | JHEP 08 (2016) 045 | 1606.02266 |
| 5 | CMS Collaboration | Measurement of the top quark Yukawa coupling from $ \mathrm{t\bar{t}} $ kinematic distributions in the dilepton final state in proton-proton collisions at $ \sqrt{s} = $ 13 TeV | PRD 102 (2020) 092013 | CMS-TOP-19-008 2009.07123 |
| 6 | B. A. Dobrescu and C. T. Hill | Electroweak symmetry breaking via top condensation seesaw | PRL 81 (1998) 2634 | hep-ph/9712319 |
| 7 | R. S. Chivukula, B. A. Dobrescu, H. Georgi, and C. T. Hill | Top quark seesaw theory of electroweak symmetry breaking | PRD 59 (1999) 075003 | hep-ph/9809470 |
| 8 | D. Delepine, J. M. Gerard, and R. Gonzalez Felipe | Is the standard Higgs scalar elementary? | PLB 372 (1996) 271 | hep-ph/9512339 |
| 9 | S. L. Glashow, J. Iliopoulos, and L. Maiani | Weak interactions with lepton-hadron symmetry | PRD 2 (1970) 1285 | |
| 10 | J. A. Aguilar-Saavedra | Top flavor-changing neutral interactions: Theoretical expectations and experimental detection | Acta Phys. Polon. B 35 (2004) 2695 | hep-ph/0409342 |
| 11 | B. Mele, S. Petrarca, and A. Soddu | A new evaluation of the $ \mathrm{t} \to \mathrm{c}\mathrm{H} $ decay width in the standard model | PLB 435 (1998) 401 | hep-ph/9805498 |
| 12 | G. Eilam, J. L. Hewett, and A. Soni | Rare decays of the top quark in the standard and two Higgs doublet models | PRD 44 (1991) 1473 | |
| 13 | J. Guasch and J. Sola | FCNC top quark decay in the MSSM: A door to SUSY physics in high luminosity colliders? | NPB 562 (1999) 3 | hep-ph/9906268 |
| 14 | G. Eilam et al. | Top-quark rare decay $ \mathrm{t} \to \mathrm{c} \tilde{\mathrm{h}} $ in R-parity violating SUSY | PLB 510 (2001) 227 | hep-ph/0102037 |
| 15 | T. P. Cheng and M. Sher | Mass matrix ansatz and flavor nonconservation in models with multiple Higgs doublets | PRD 35 (1987) 3484 | |
| 16 | D. Atwood, L. Reina, and A. Soni | Phenomenology of two Higgs doublet models with flavor changing neutral currents | PRD 55 (1997) 3156 | hep-ph/9609279 |
| 17 | S. Bejar, J. Guasch, and J. Sola | Loop induced flavor changing neutral decays of the top quark in a general two Higgs doublet model | NPB 600 (2001) 21 | hep-ph/0011091 |
| 18 | J. A. Aguilar-Saavedra | Effects of mixing with quark singlets | PRD 67 (2003) 035003 | hep-ph/0210112 |
| 19 | A. Azatov, M. Toharia, and L. Zhu | Higgs mediated FCNC's in warped extra dimensions | PRD 80 (2009) 035016 | 0906.1990 |
| 20 | A. Crivellin, J. Heeck, and P. Stoffer | A perturbed lepton-specific two-Higgs-doublet model facing experimental hints for physics beyond the standard model | PRL 116 (2016) 081801 | 1507.07567 |
| 21 | ATLAS Collaboration | Search for top quark decays $ \mathrm{t} \to \mathrm{q} \mathrm{H} $, with $ \mathrm{H} \to \gamma\gamma $, in $ \sqrt{s} = $ 13 TeV pp collisions using the ATLAS detector | JHEP 10 (2017) 129 | 1707.01404 |
| 22 | ATLAS Collaboration | Search for flavor-changing neutral currents in top quark decays $ \mathrm{t} \to \mathrm{H} \mathrm{c} $ and $ \mathrm{t} \to \mathrm{H} \mathrm{u} $ in multilepton final states in proton-proton collisions at $ \sqrt{s} = $ 13 TeV with the ATLAS detector | PRD 98 (2018) 032002 | 1805.03483 |
| 23 | ATLAS Collaboration | Search for top-quark decays $ \mathrm{t} \to \mathrm{H} \mathrm{q} $ with 36 fb$^{-1}$ of pp collision data at $ \sqrt{s} = $ 13 TeV with the ATLAS detector | JHEP 05 (2019) 123 | 1812.11568 |
| 24 | CMS Collaboration | Search for the flavor-changing neutral current interactions of the top quark and the Higgs boson which decays into a pair of b quarks at $ \sqrt{s} = $ 13 TeV | JHEP 06 (2018) 102 | CMS-TOP-17-003 1712.02399 |
| 25 | CMS Collaboration | Search for flavor-changing neutral current interactions of the top quark and Higgs boson in final states with two photons in proton-proton collisions at $ \sqrt{s} = $ 13 TeV | Submitted to PRLett | CMS-TOP-20-007 2111.02219 |
| 26 | CMS Collaboration | HEPData record for this analysis | link | |
| 27 | CMS Collaboration | Performance of the CMS Level-1 trigger in proton-proton collisions at $ \sqrt{s} = $ 13 TeV | JINST 15 (2020) P10017 | CMS-TRG-17-001 2006.10165 |
| 28 | CMS Collaboration | The CMS trigger system | JINST 12 (2017) P01020 | CMS-TRG-12-001 1609.02366 |
| 29 | CMS Collaboration | The CMS experiment at the CERN LHC | JINST 3 (2008) S08004 | CMS-00-001 |
| 30 | J. Alwall et al. | The automated computation of tree-level and next-to-leading order differential cross sections, and their matching to parton shower simulations | JHEP 07 (2014) 079 | 1405.0301 |
| 31 | A. Alloul et al. | FeynRules 2.0---A complete toolbox for tree-level phenomenology | CPC 185 (2014) 2250 | 1310.1921 |
| 32 | C. Degrande et al. | UFO---The Universal FeynRules Output | CPC 183 (2012) 1201 | 1108.2040 |
| 33 | J. Alwall et al. | Comparative study of various algorithms for the merging of parton showers and matrix elements in hadronic collisions | EPJC 53 (2008) 473 | 0706.2569 |
| 34 | M. Czakon and A. Mitov | Top++: A program for the calculation of the top-pair cross-section at hadron colliders | CPC 185 (2014) 2930 | 1112.5675 |
| 35 | M. Czakon et al. | Top-pair production at the LHC through NNLO QCD and NLO EW | JHEP 10 (2017) 186 | 1705.04105 |
| 36 | CMS Collaboration | Measurement of differential $ \mathrm{t\bar{t}} $ production cross sections in the full kinematic range using lepton+jets events from proton-proton collisions at $ \sqrt{s} = $ 13 TeV | PRD 104 (2021) 092013 | CMS-TOP-20-001 2108.02803 |
| 37 | P. Nason | A new method for combining NLO QCD with shower Monte Carlo algorithms | JHEP 11 (2004) 040 | hep-ph/0409146 |
| 38 | S. Frixione, P. Nason, and C. Oleari | Matching NLO QCD computations with parton shower simulations: The POWHEG method | JHEP 11 (2007) 070 | 0709.2092 |
| 39 | S. Alioli, P. Nason, C. Oleari, and E. Re | A general framework for implementing NLO calculations in shower Monte Carlo programs: The POWHEG BOX | JHEP 06 (2010) 043 | 1002.2581 |
| 40 | CMS Collaboration | Measurement of the cross section for $ \mathrm{t\bar{t}} $ production with additional jets and $ \mathrm{b} $ jets in pp collisions at $ \sqrt{s}= $ 13 | JHEP 07 (2020) 125 | CMS-TOP-18-002 2003.06467 |
| 41 | E. Re | Single-top $ \mathrm{W}\mathrm{t} $-channel production matched with parton showers using the POWHEG method | EPJC 71 (2011) 1547 | 1009.2450 |
| 42 | M. Aliev et al. | HATHOR: HAdronic Top and Heavy quarks crOss section calculatoR | CPC 182 (2011) 1034 | 1007.1327 |
| 43 | P. Kant et al. | HatHor for single top-quark production: Updated predictions and uncertainty estimates for single top-quark production in hadronic collisions | CPC 191 (2015) 74 | 1406.4403 |
| 44 | N. Kidonakis | Two-loop soft anomalous dimensions for single top quark associated production with a $ \mathrm{W^{-}} $ or $ \mathrm{H}^- $ | PRD 82 (2010) 054018 | 1005.4451 |
| 45 | N. Kidonakis | NNLL threshold resummation for top-pair and single-top production | Phys. Part. Nucl. 45 (2014) 714 | 1210.7813 |
| 46 | T. Sjostrand et al. | An introduction to PYTHIA 8.2 | CPC 191 (2015) 159 | 1410.3012 |
| 47 | NNPDF Collaboration | Parton distributions for the LHC Run II | JHEP 04 (2015) 040 | 1410.8849 |
| 48 | CMS Collaboration | Extraction and validation of a new set of CMS PYTHIA8 tunes from underlying-event measurements | EPJC 80 (2020) 4 | CMS-GEN-17-001 1903.12179 |
| 49 | CMS Collaboration | Measurement of the inelastic proton-proton cross section at $ \sqrt{s} = $ 13 TeV | JHEP 07 (2018) 161 | CMS-FSQ-15-005 1802.02613 |
| 50 | GEANT4 Collaboration | GEANT4--a simulation toolkit | NIMA 506 (2003) 250 | |
| 51 | CMS Collaboration | Particle-flow reconstruction and global event description with the CMS detector | JINST 12 (2017) P10003 | CMS-PRF-14-001 1706.04965 |
| 52 | CMS Collaboration | Performance of missing transverse momentum reconstruction in proton-proton collisions at $ \sqrt{s} = $ 13 TeV using the CMS detector | JINST 14 (2019) P07004 | CMS-JME-17-001 1903.06078 |
| 53 | M. Cacciari, G. P. Salam, and G. Soyez | The anti-$ {k_{\mathrm{T}}} $ jet clustering algorithm | JHEP 04 (2008) 063 | 0802.1189 |
| 54 | M. Cacciari, G. P. Salam, and G. Soyez | FastJet user manual | EPJC 72 (2012) 1896 | 1111.6097 |
| 55 | CMS Collaboration | Determination of jet energy calibration and transverse momentum resolution in CMS | JINST 6 (2011) P11002 | CMS-JME-10-011 1107.4277 |
| 56 | CMS Collaboration | Identification and filtering of uncharacteristic noise in the CMS hadron calorimeter | JINST 5 (2010) T03014 | CMS-CFT-09-019 0911.4881 |
| 57 | CMS Collaboration | Identification of heavy-flavour jets with the CMS detector in pp collisions at 13 TeV | JINST 13 (2018) P05011 | CMS-BTV-16-002 1712.07158 |
| 58 | CMS Collaboration | Measurement of the inclusive $ \mathrm{W} $ and $ \mathrm{Z} $ production cross sections in pp collisions at $ \sqrt{s} = $ 7 TeV | JHEP 10 (2011) 132 | CMS-EWK-10-005 1107.4789 |
| 59 | CMS Collaboration | Performance of the CMS muon detector and muon reconstruction with proton-proton collisions at $ \sqrt{s} = $ 13 TeV | JINST 13 (2018) P06015 | CMS-MUO-16-001 1804.04528 |
| 60 | CMS Collaboration | Electron and photon reconstruction and identification with the CMS experiment at the CERN LHC | JINST 16 (2021) P05014 | CMS-EGM-17-001 2012.06888 |
| 61 | K. He, X. Zhang, S. Ren, and J. Sun | Deep residual learning for image recognition | in 2016 IEEE Conference on Computer Vision and Pattern Recognition (CVPR) 2016 | 1512.03385 |
| 62 | M. Erdmann, B. Fischer, and M. Rieger | Jet-parton assignment in $ \mathrm{t\bar{t}}\mathrm{H} $ events using deep learning | JINST 12 (2017) P08020 | 1706.01117 |
| 63 | CMS Collaboration | CMS luminosity measurement for the 2017 data-taking period at $ \sqrt{s} = $ 13 TeV | CMS-PAS-LUM-17-004 | CMS-PAS-LUM-17-004 |
| 64 | CMS Collaboration | CMS luminosity measurement for the 2018 data-taking period at $ \sqrt{s} = $ 13 TeV | CMS-PAS-LUM-18-002 | CMS-PAS-LUM-18-002 |
| 65 | M. Cacciari et al. | The $ \mathrm{t\bar{t}} $ cross-section at 1.8 and 1.96$ TeV: $ A study of the systematics due to parton densities and scale dependence | JHEP 04 (2004) 068 | hep-ph/0303085 |
| 66 | S. Catani, D. de Florian, M. Grazzini, and P. Nason | Soft gluon resummation for Higgs boson production at hadron colliders | JHEP 07 (2003) 028 | hep-ph/0306211 |
| 67 | J. Butterworth et al. | PDF4LHC recommendations for LHC Run II | JPG 43 (2016) 023001 | 1510.03865 |
| 68 | R. J. Barlow and C. Beeston | Fitting using finite Monte Carlo samples | CPC 77 (1993) 219 | |
| 69 | J. S. Conway | Incorporating nuisance parameters in likelihoods for multisource spectra | in Proceedings, PHYSTAT 2011 Workshop on Statistical Issues Related to Discovery Claims in Search Experiments and Unfolding, CERN 2011 | 1103.0354 |
| 70 | T. Junk | Confidence level computation for combining searches with small statistics | NIMA 434 (1999) 435 | hep-ex/9902006 |
| 71 | A. L. Read | Presentation of search results: The $ CL_s $ technique | JPG 28 (2002) 2693 | |
| 72 | G. Cowan, K. Cranmer, E. Gross, and O. Vitells | Asymptotic formulae for likelihood-based tests of new physics | EPJC 71 (2011) 1554 | 1007.1727 |
| 73 | J. Gao, C. S. Li, and H. X. Zhu | Top-quark decay at next-to-next-to-leading order in QCD | PRL 110 (2013) 042001 | 1210.2808 |
|
|
Compact Muon Solenoid LHC, CERN |
|

|

|

|

|

|