

Compact Muon Solenoid
LHC, CERN
| CMS-TOP-20-001 ; CERN-EP-2021-135 | ||
| Measurement of differential $\mathrm{t\bar{t}}$ production cross sections in the full kinematic range using lepton+jets events from proton-proton collisions at $\sqrt{s} = $ 13 TeV | ||
| CMS Collaboration | ||
| 5 August 2021 | ||
| Phys. Rev. D 104 (2021) 092013 | ||
| Abstract: Measurements of differential and double-differential cross sections of top quark pair ($\mathrm{t\bar{t}}$) production are presented in the lepton+jets channels with a single electron or muon and jets in the final state. The analysis combines for the first time signatures of top quarks with low transverse momentum ${p_{\mathrm{T}}}$, where the top quark decay products can be identified as separated jets and isolated leptons, and with high ${p_{\mathrm{T}}}$, where the decay products are collimated and overlap. The measurements are based on proton-proton collision data at $\sqrt{s} = $ 13 TeV collected by the CMS experiment at the LHC, corresponding to an integrated luminosity of 137 fb$^{-1}$. The cross sections are presented at the parton and particle levels, where the latter minimizes extrapolations based on theoretical assumptions. Most of the measured differential cross sections are well described by standard model predictions with the exception of some double-differential distributions. The inclusive $\mathrm{t\bar{t}}$ production cross section is measured to be $\sigma_\mathrm{t\bar{t}} = $ 791 $\pm$ 25 pb, which constitutes the most precise measurement in the lepton+jets channel to date. | ||
| Links: e-print arXiv:2108.02803 [hep-ex] (PDF) ; CDS record ; inSPIRE record ; HepData record ; CADI line (restricted) ; | ||
| Figures | |
png pdf |
Figure 1:
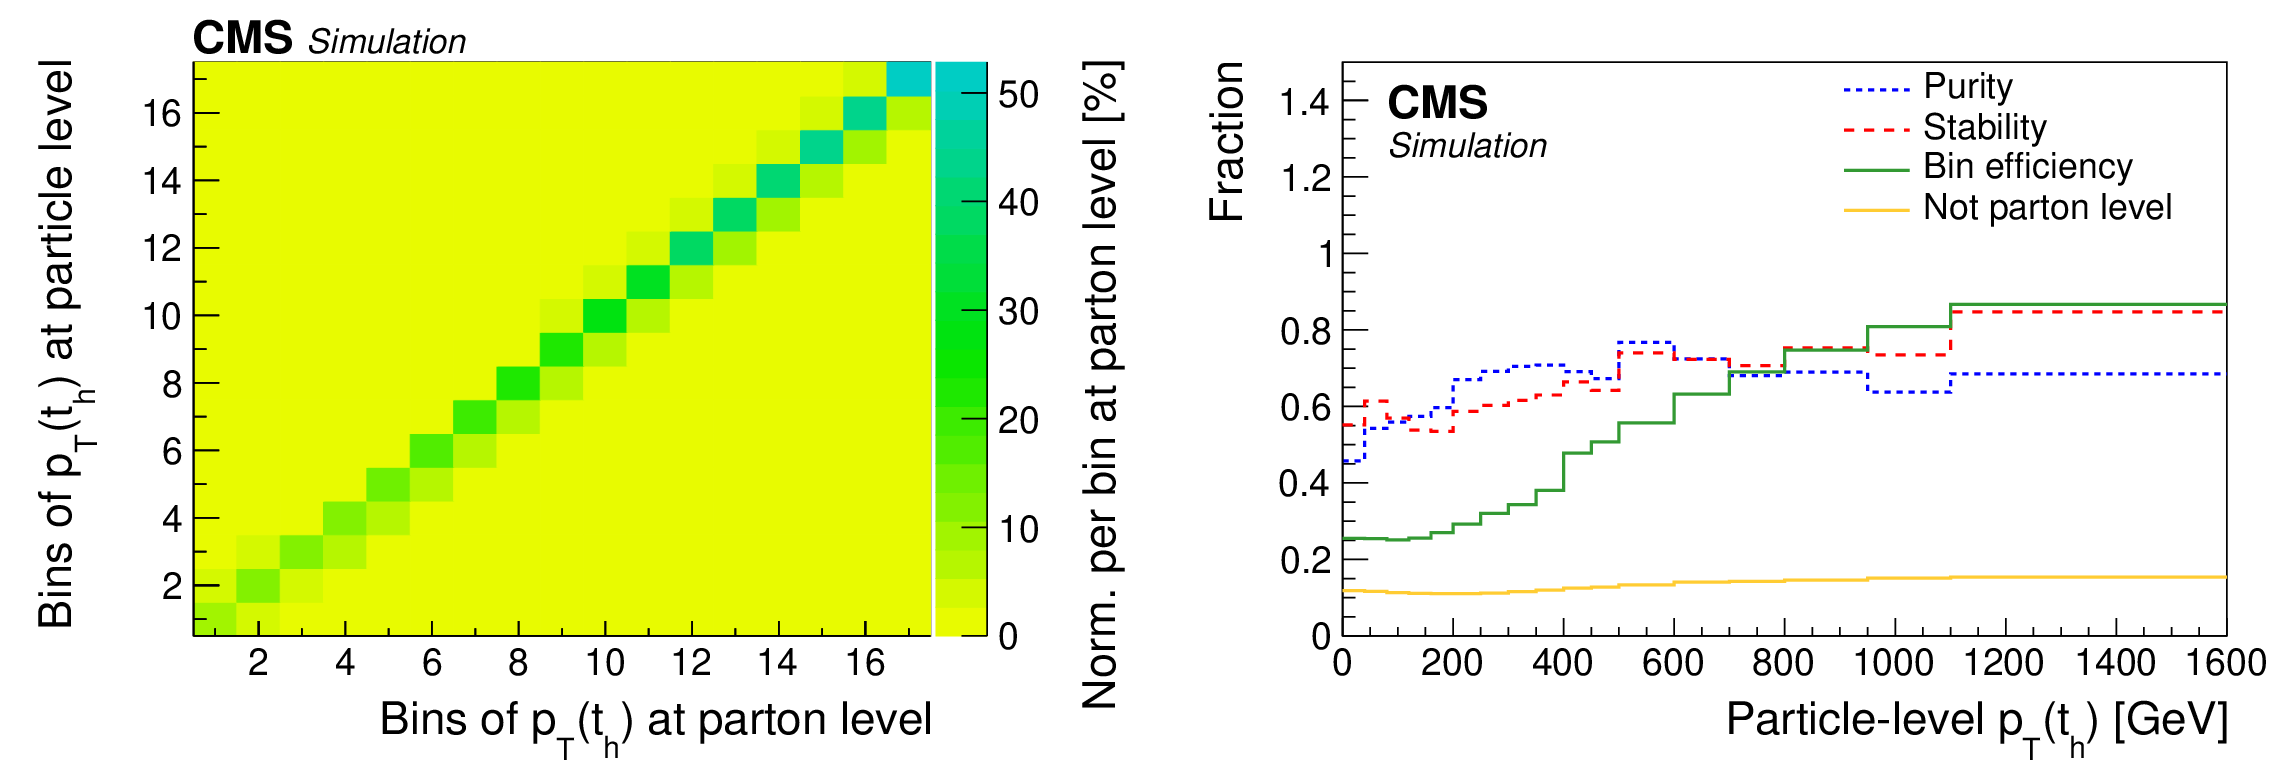
Comparison between the ${{p_{\mathrm {T}}} ({\mathrm{t} _\mathrm {h}})}$ distributions at the particle and parton levels, extracted from the POWHEG+PYTHIA simulation. Left : the percentage of ${p_{\mathrm {T}}} $-bin migration between the particle and parton levels, shown using the color scale to the right of the plot. The bin boundaries are those shown in the right panel. Each column is normalized such that the sum of its entries corresponds to the fraction of particle-level events in this bin at the parton level in the full phase space. Right : fraction of parton-level top quarks in the same ${p_{\mathrm {T}}}$ bin at the particle level (purity), fraction of particle-level top quarks in the same ${p_{\mathrm {T}}}$ bin at the parton level (stability), ratio of the number of particle- to parton-level top quarks (bin efficiency), and the fraction of particle-level events that are not signal events at the parton level. |
png pdf |
Figure 1-a:
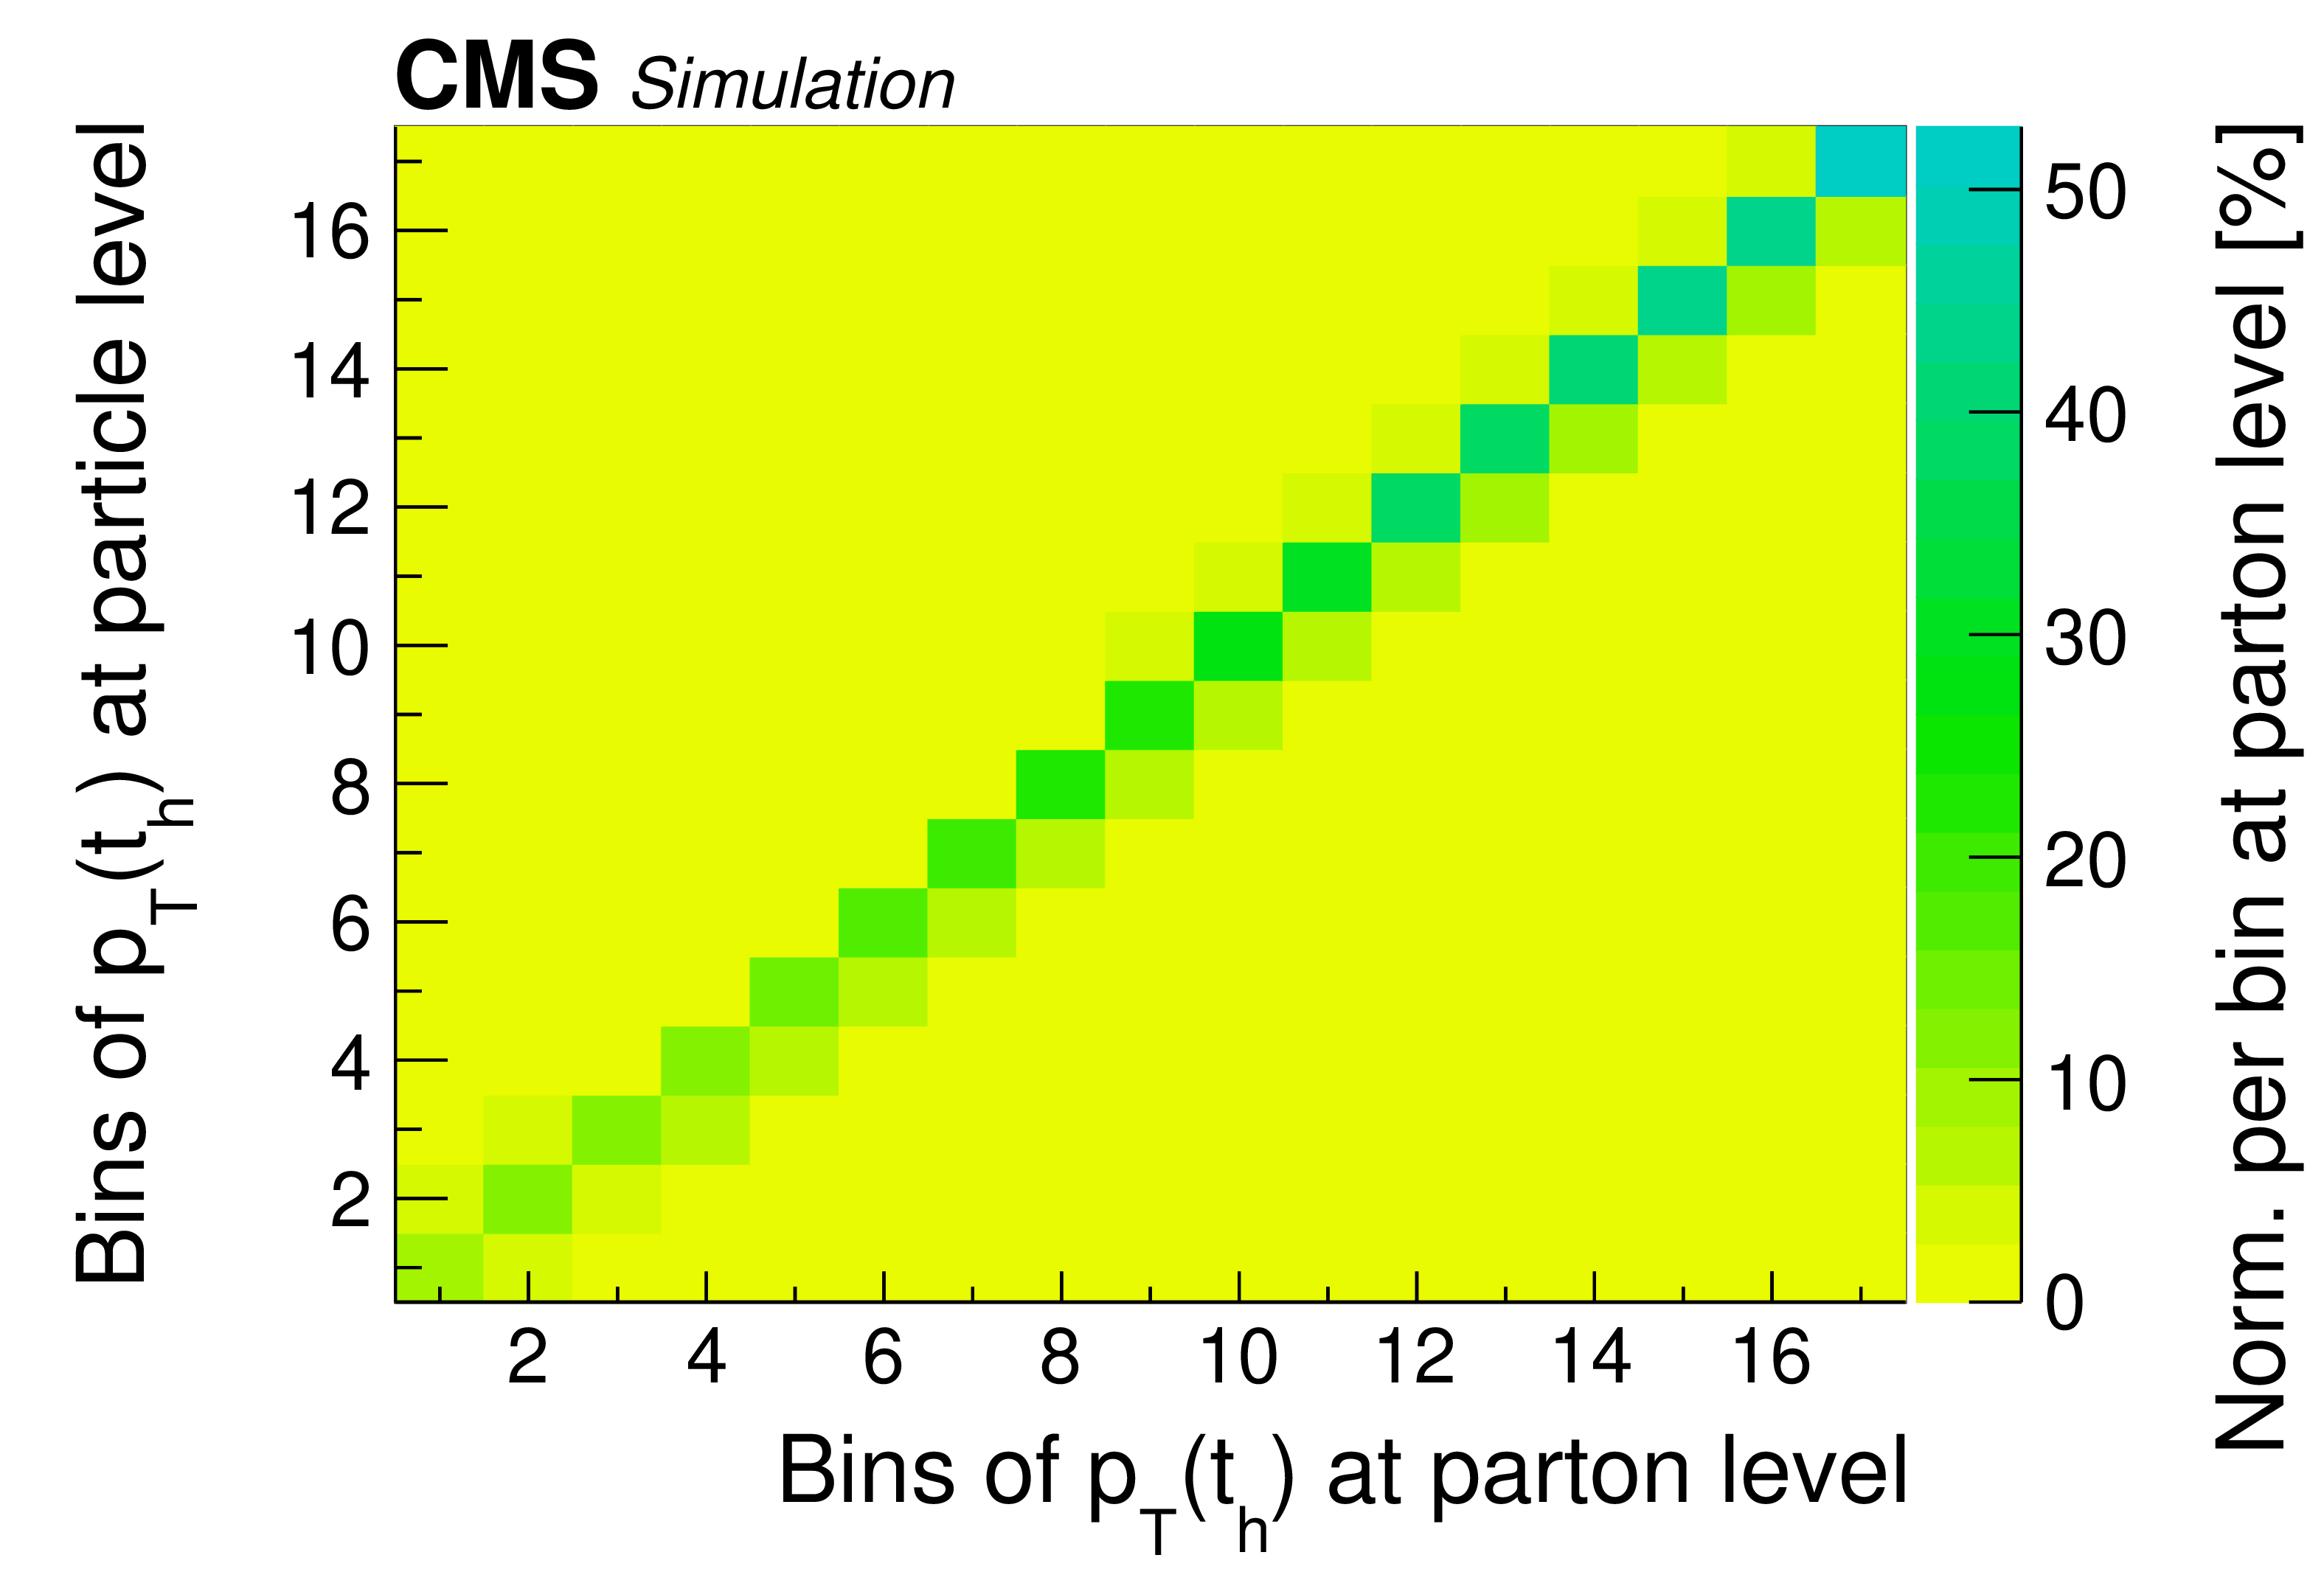
Comparison between the ${{p_{\mathrm {T}}} ({\mathrm{t} _\mathrm {h}})}$ distributions at the particle and parton levels, extracted from the POWHEG+PYTHIA simulation. Left : the percentage of ${p_{\mathrm {T}}} $-bin migration between the particle and parton levels, shown using the color scale to the right of the plot. The bin boundaries are those shown in the right panel. Each column is normalized such that the sum of its entries corresponds to the fraction of particle-level events in this bin at the parton level in the full phase space. Right : fraction of parton-level top quarks in the same ${p_{\mathrm {T}}}$ bin at the particle level (purity), fraction of particle-level top quarks in the same ${p_{\mathrm {T}}}$ bin at the parton level (stability), ratio of the number of particle- to parton-level top quarks (bin efficiency), and the fraction of particle-level events that are not signal events at the parton level. |

png pdf |
Figure 1-b:
Comparison between the ${{p_{\mathrm {T}}} ({\mathrm{t} _\mathrm {h}})}$ distributions at the particle and parton levels, extracted from the POWHEG+PYTHIA simulation. Left : the percentage of ${p_{\mathrm {T}}} $-bin migration between the particle and parton levels, shown using the color scale to the right of the plot. The bin boundaries are those shown in the right panel. Each column is normalized such that the sum of its entries corresponds to the fraction of particle-level events in this bin at the parton level in the full phase space. Right : fraction of parton-level top quarks in the same ${p_{\mathrm {T}}}$ bin at the particle level (purity), fraction of particle-level top quarks in the same ${p_{\mathrm {T}}}$ bin at the parton level (stability), ratio of the number of particle- to parton-level top quarks (bin efficiency), and the fraction of particle-level events that are not signal events at the parton level. |
png pdf |
Figure 2:
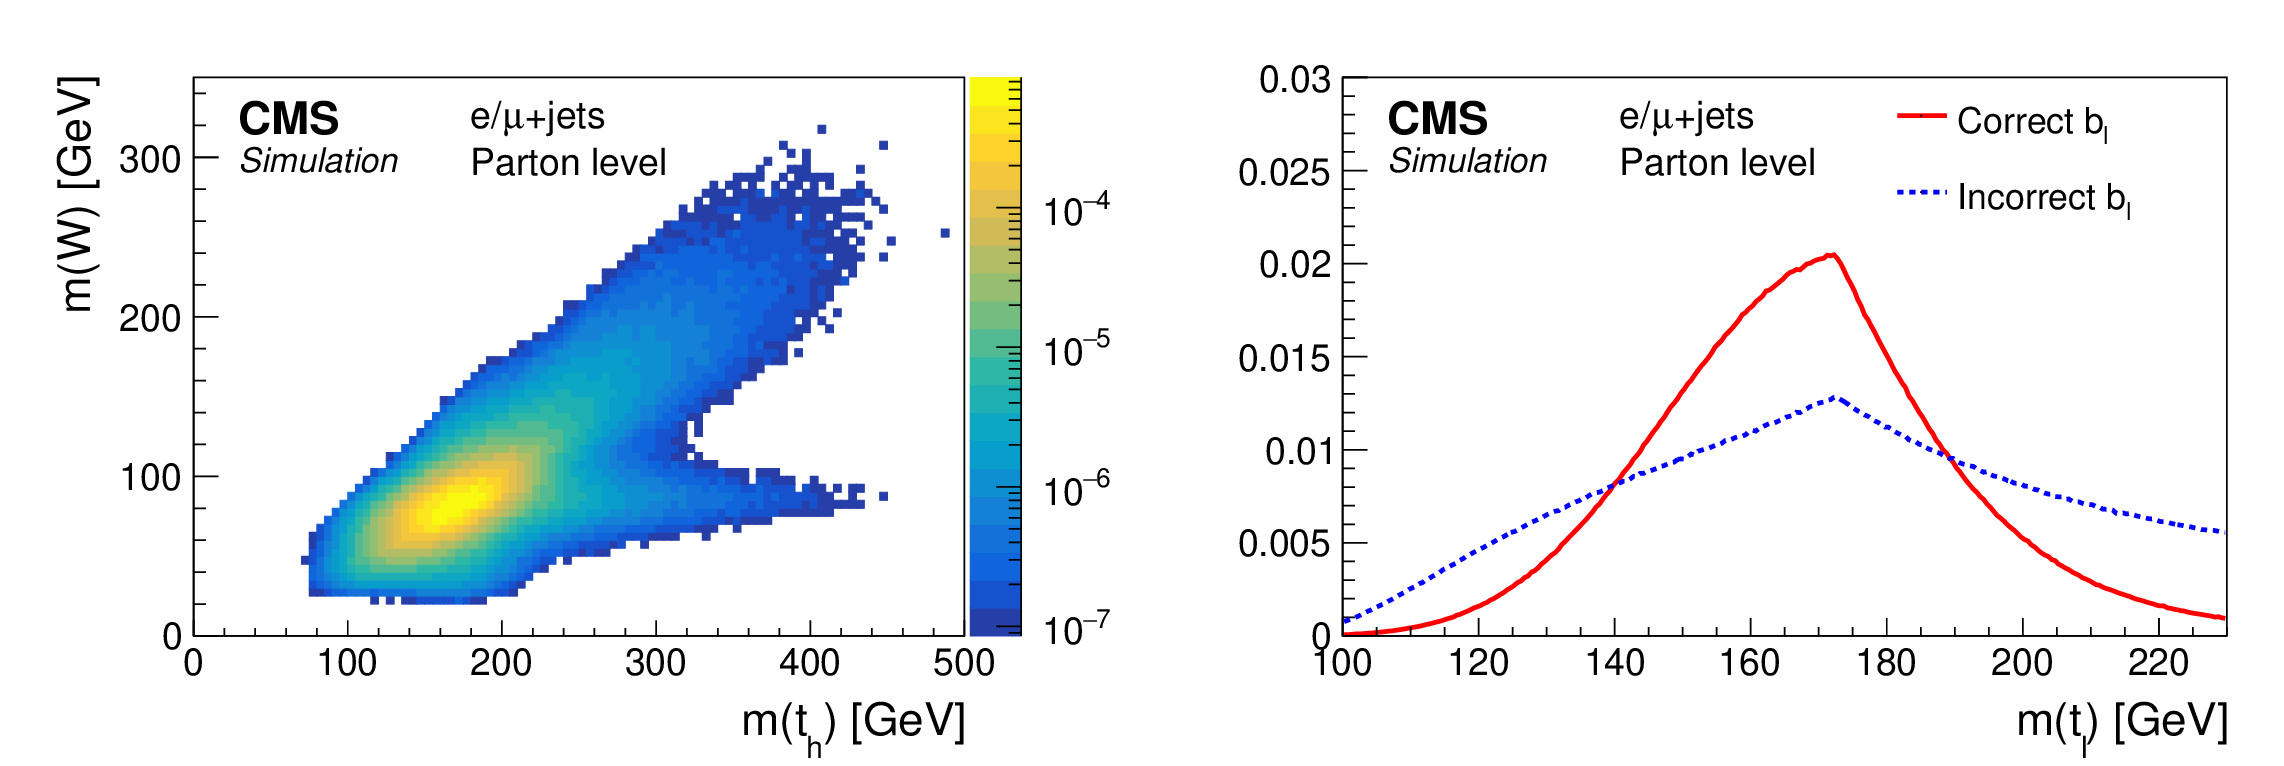
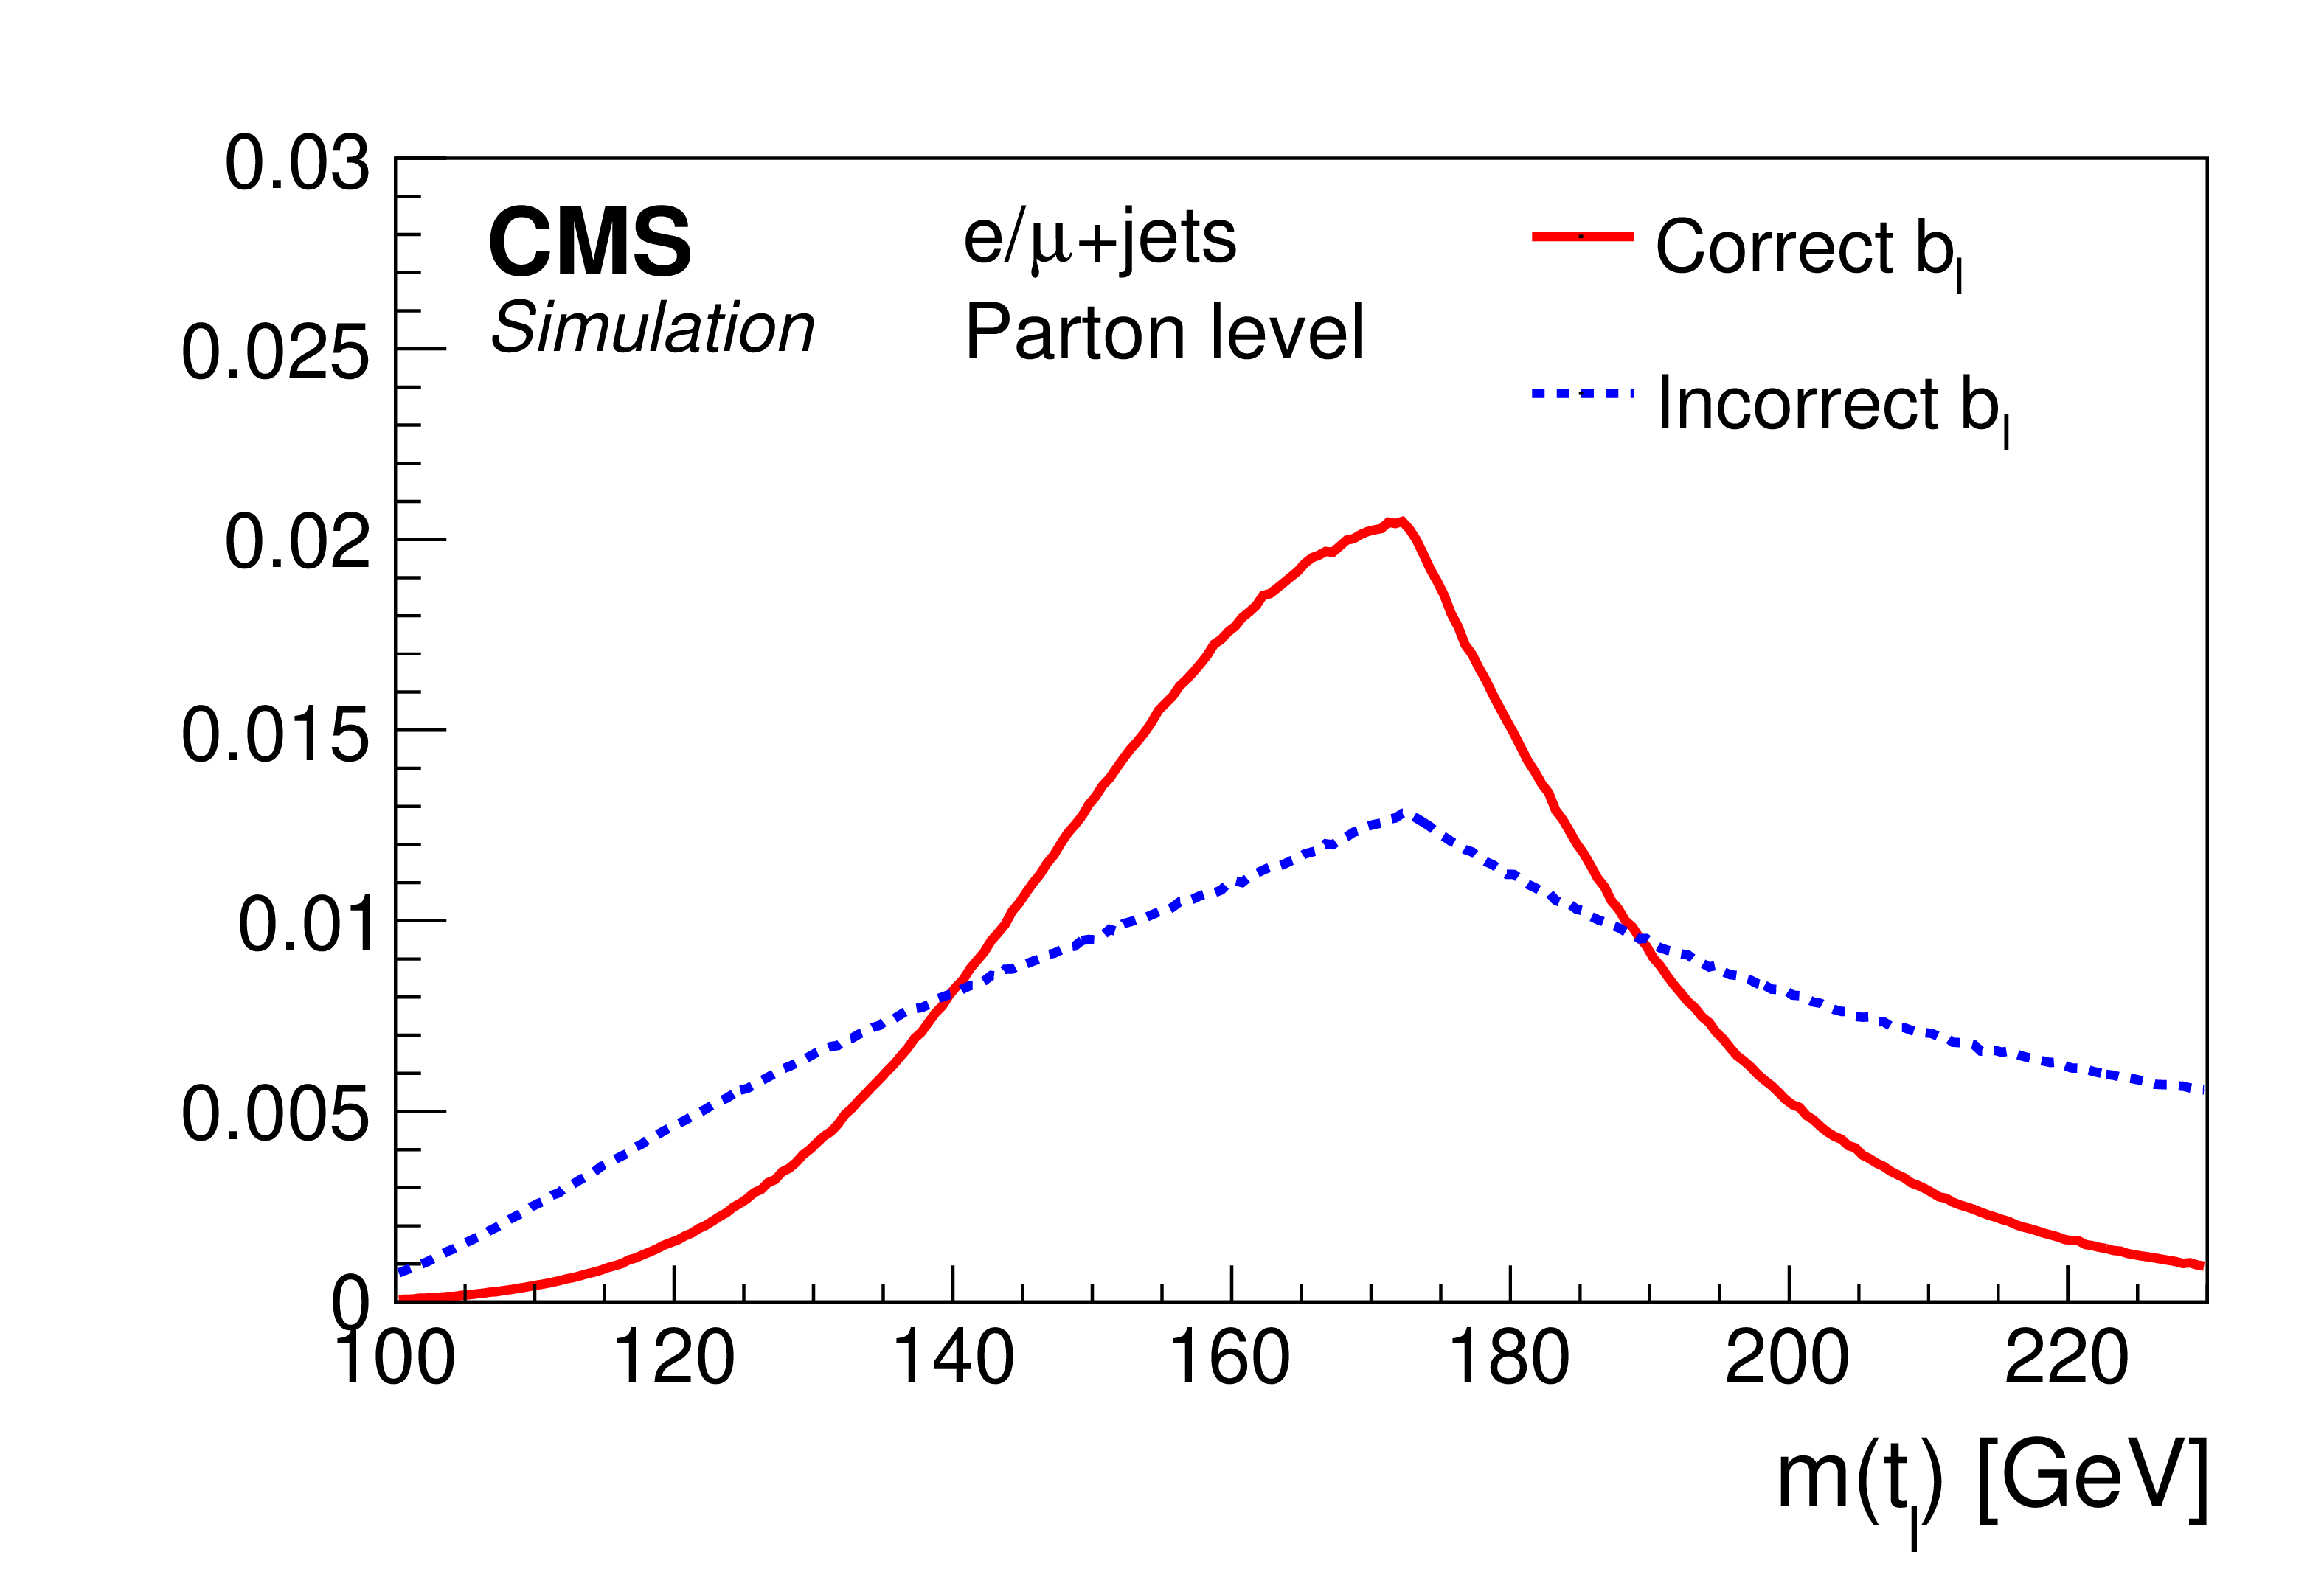
Normalized two-dimensional mass distribution of the correctly reconstructed hadronically decaying W bosons and the correctly reconstructed ${\mathrm{t} _\mathrm {h}}$ candidate (left). Normalized distributions of the reconstructed $m({\mathrm{t} _\ell})$ for correctly (solid red curve) and incorrectly (dashed blue curve) selected ${\mathrm{b} _\ell}$ (right). The distributions are taken from the POWHEG+PYTHIA ${\mathrm{t} \mathrm{\bar{t}}}$ simulation for the parton-level measurement. |
png pdf |
Figure 2-a:
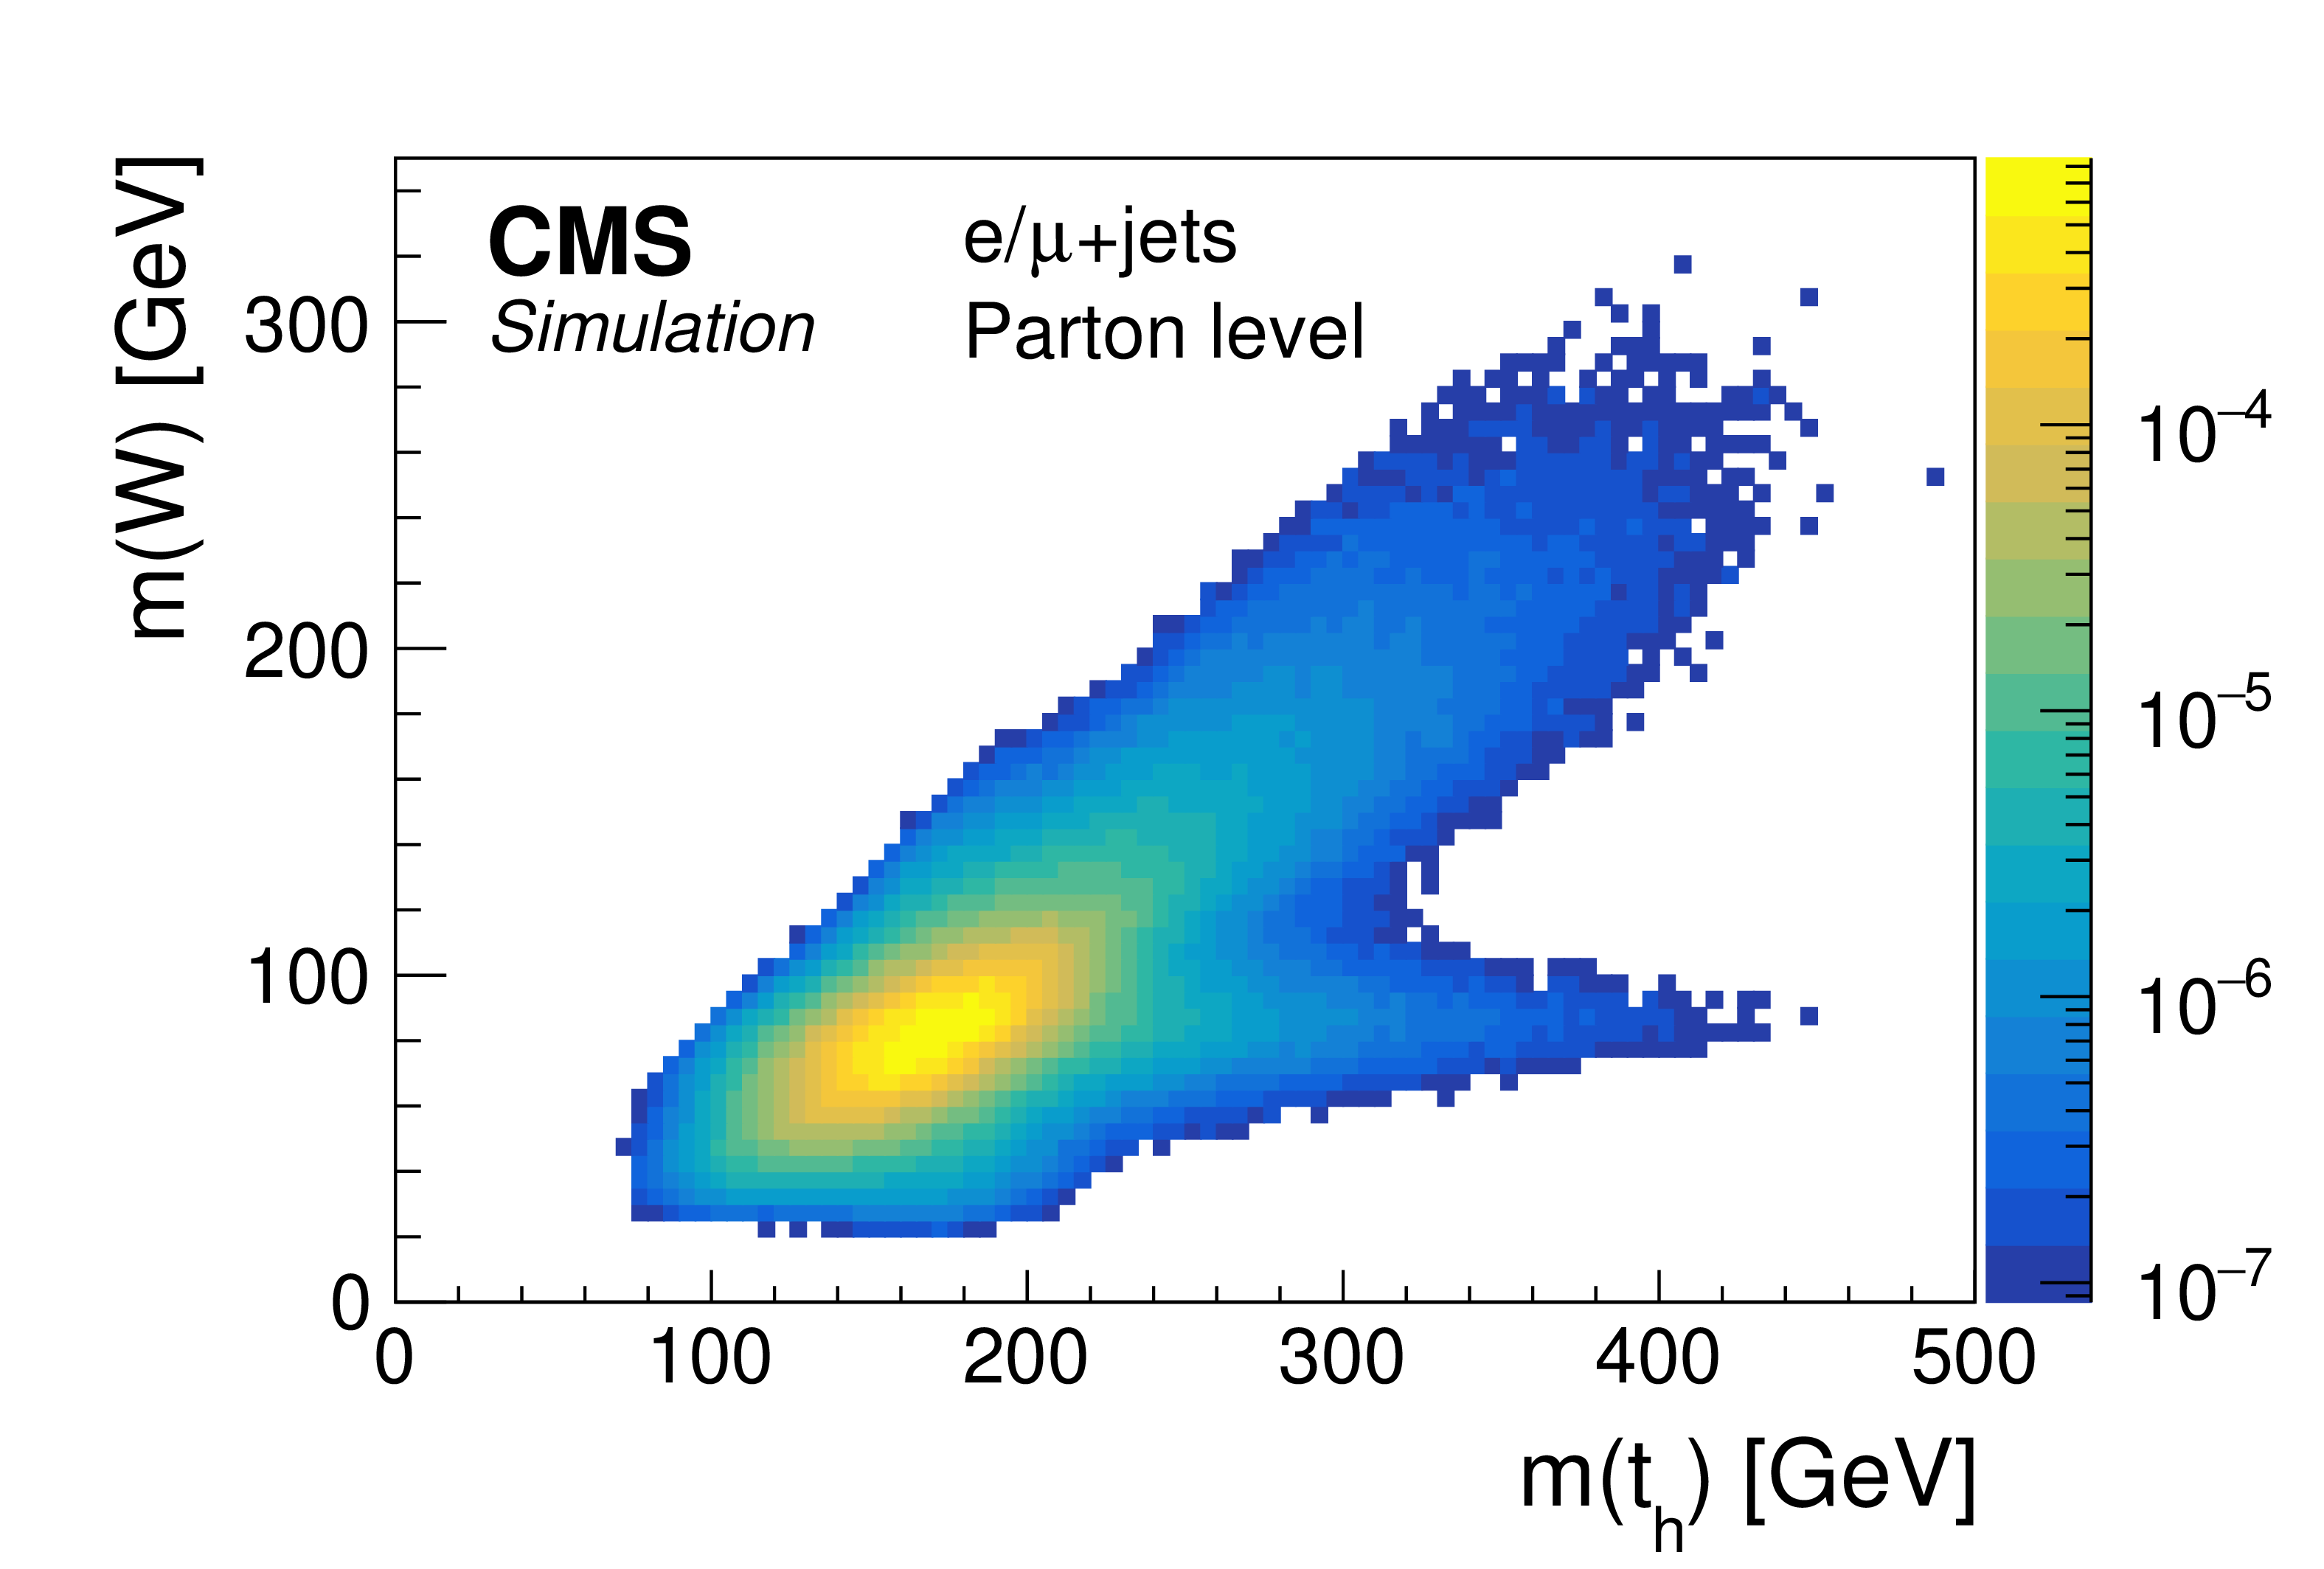
Normalized two-dimensional mass distribution of the correctly reconstructed hadronically decaying W bosons and the correctly reconstructed ${\mathrm{t} _\mathrm {h}}$ candidate (left). Normalized distributions of the reconstructed $m({\mathrm{t} _\ell})$ for correctly (solid red curve) and incorrectly (dashed blue curve) selected ${\mathrm{b} _\ell}$ (right). The distributions are taken from the POWHEG+PYTHIA ${\mathrm{t} \mathrm{\bar{t}}}$ simulation for the parton-level measurement. |
png pdf |
Figure 2-b:
Normalized two-dimensional mass distribution of the correctly reconstructed hadronically decaying W bosons and the correctly reconstructed ${\mathrm{t} _\mathrm {h}}$ candidate (left). Normalized distributions of the reconstructed $m({\mathrm{t} _\ell})$ for correctly (solid red curve) and incorrectly (dashed blue curve) selected ${\mathrm{b} _\ell}$ (right). The distributions are taken from the POWHEG+PYTHIA ${\mathrm{t} \mathrm{\bar{t}}}$ simulation for the parton-level measurement. |
png pdf |
Figure 3:
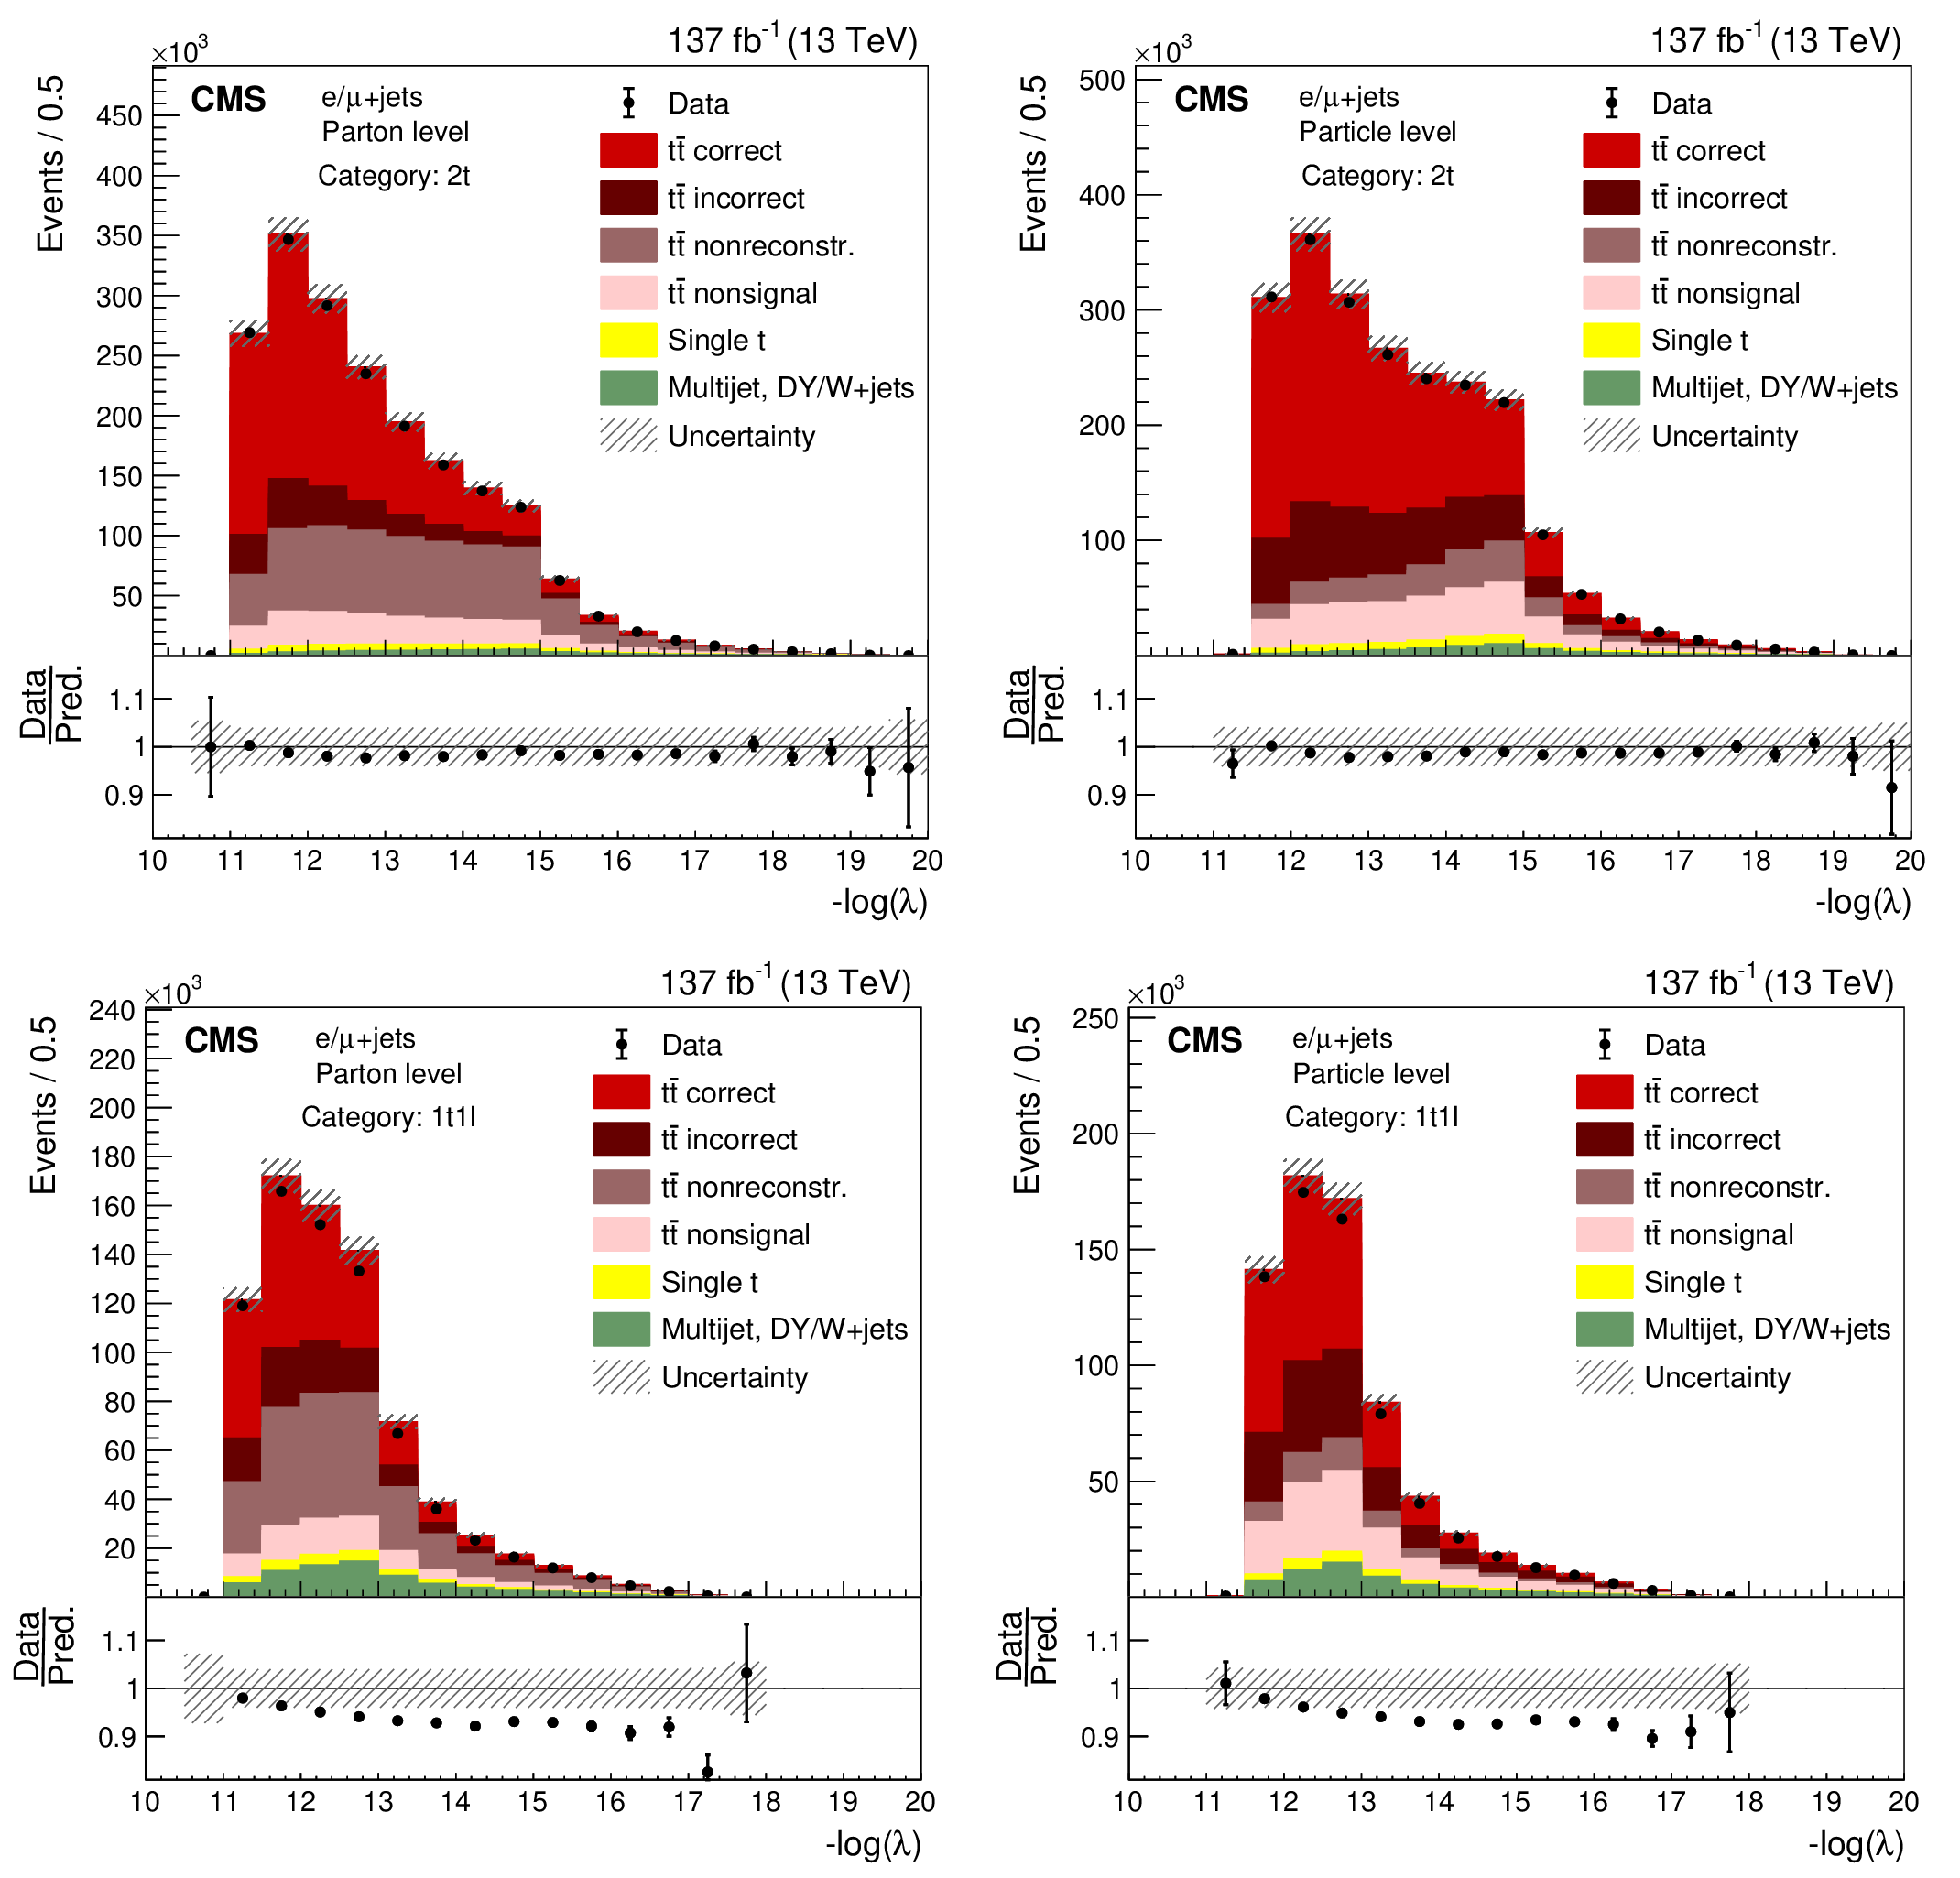
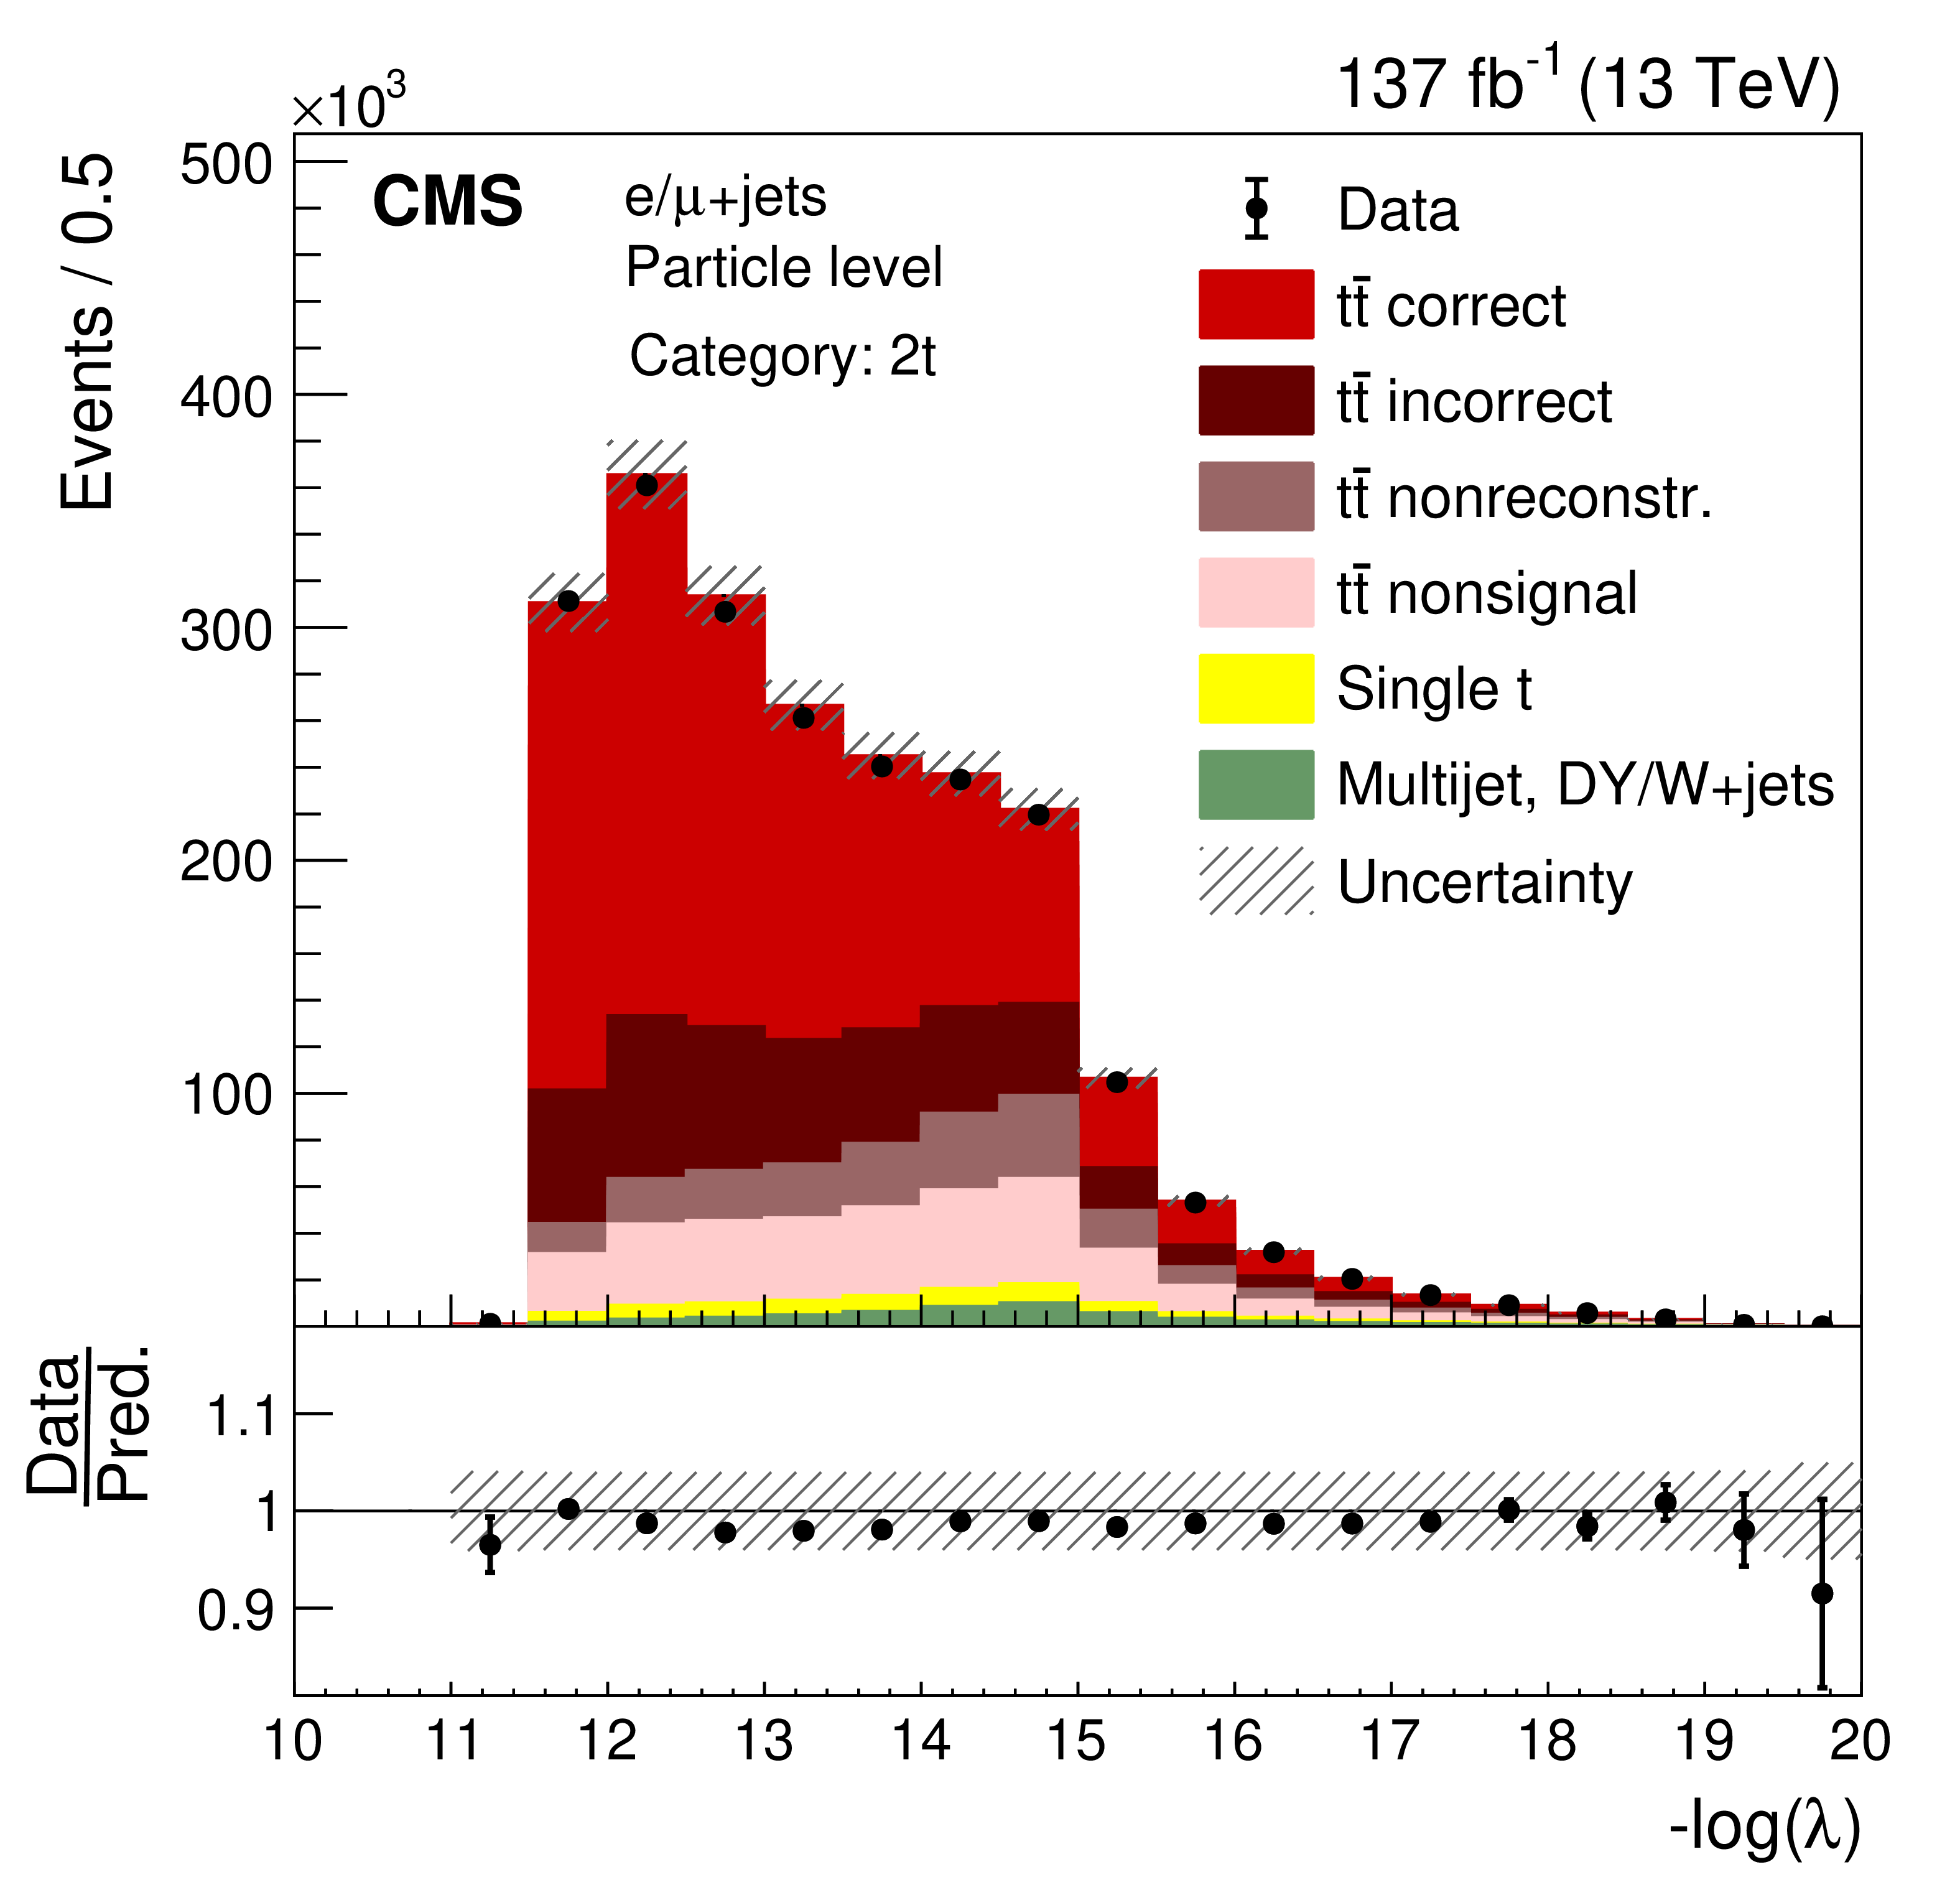
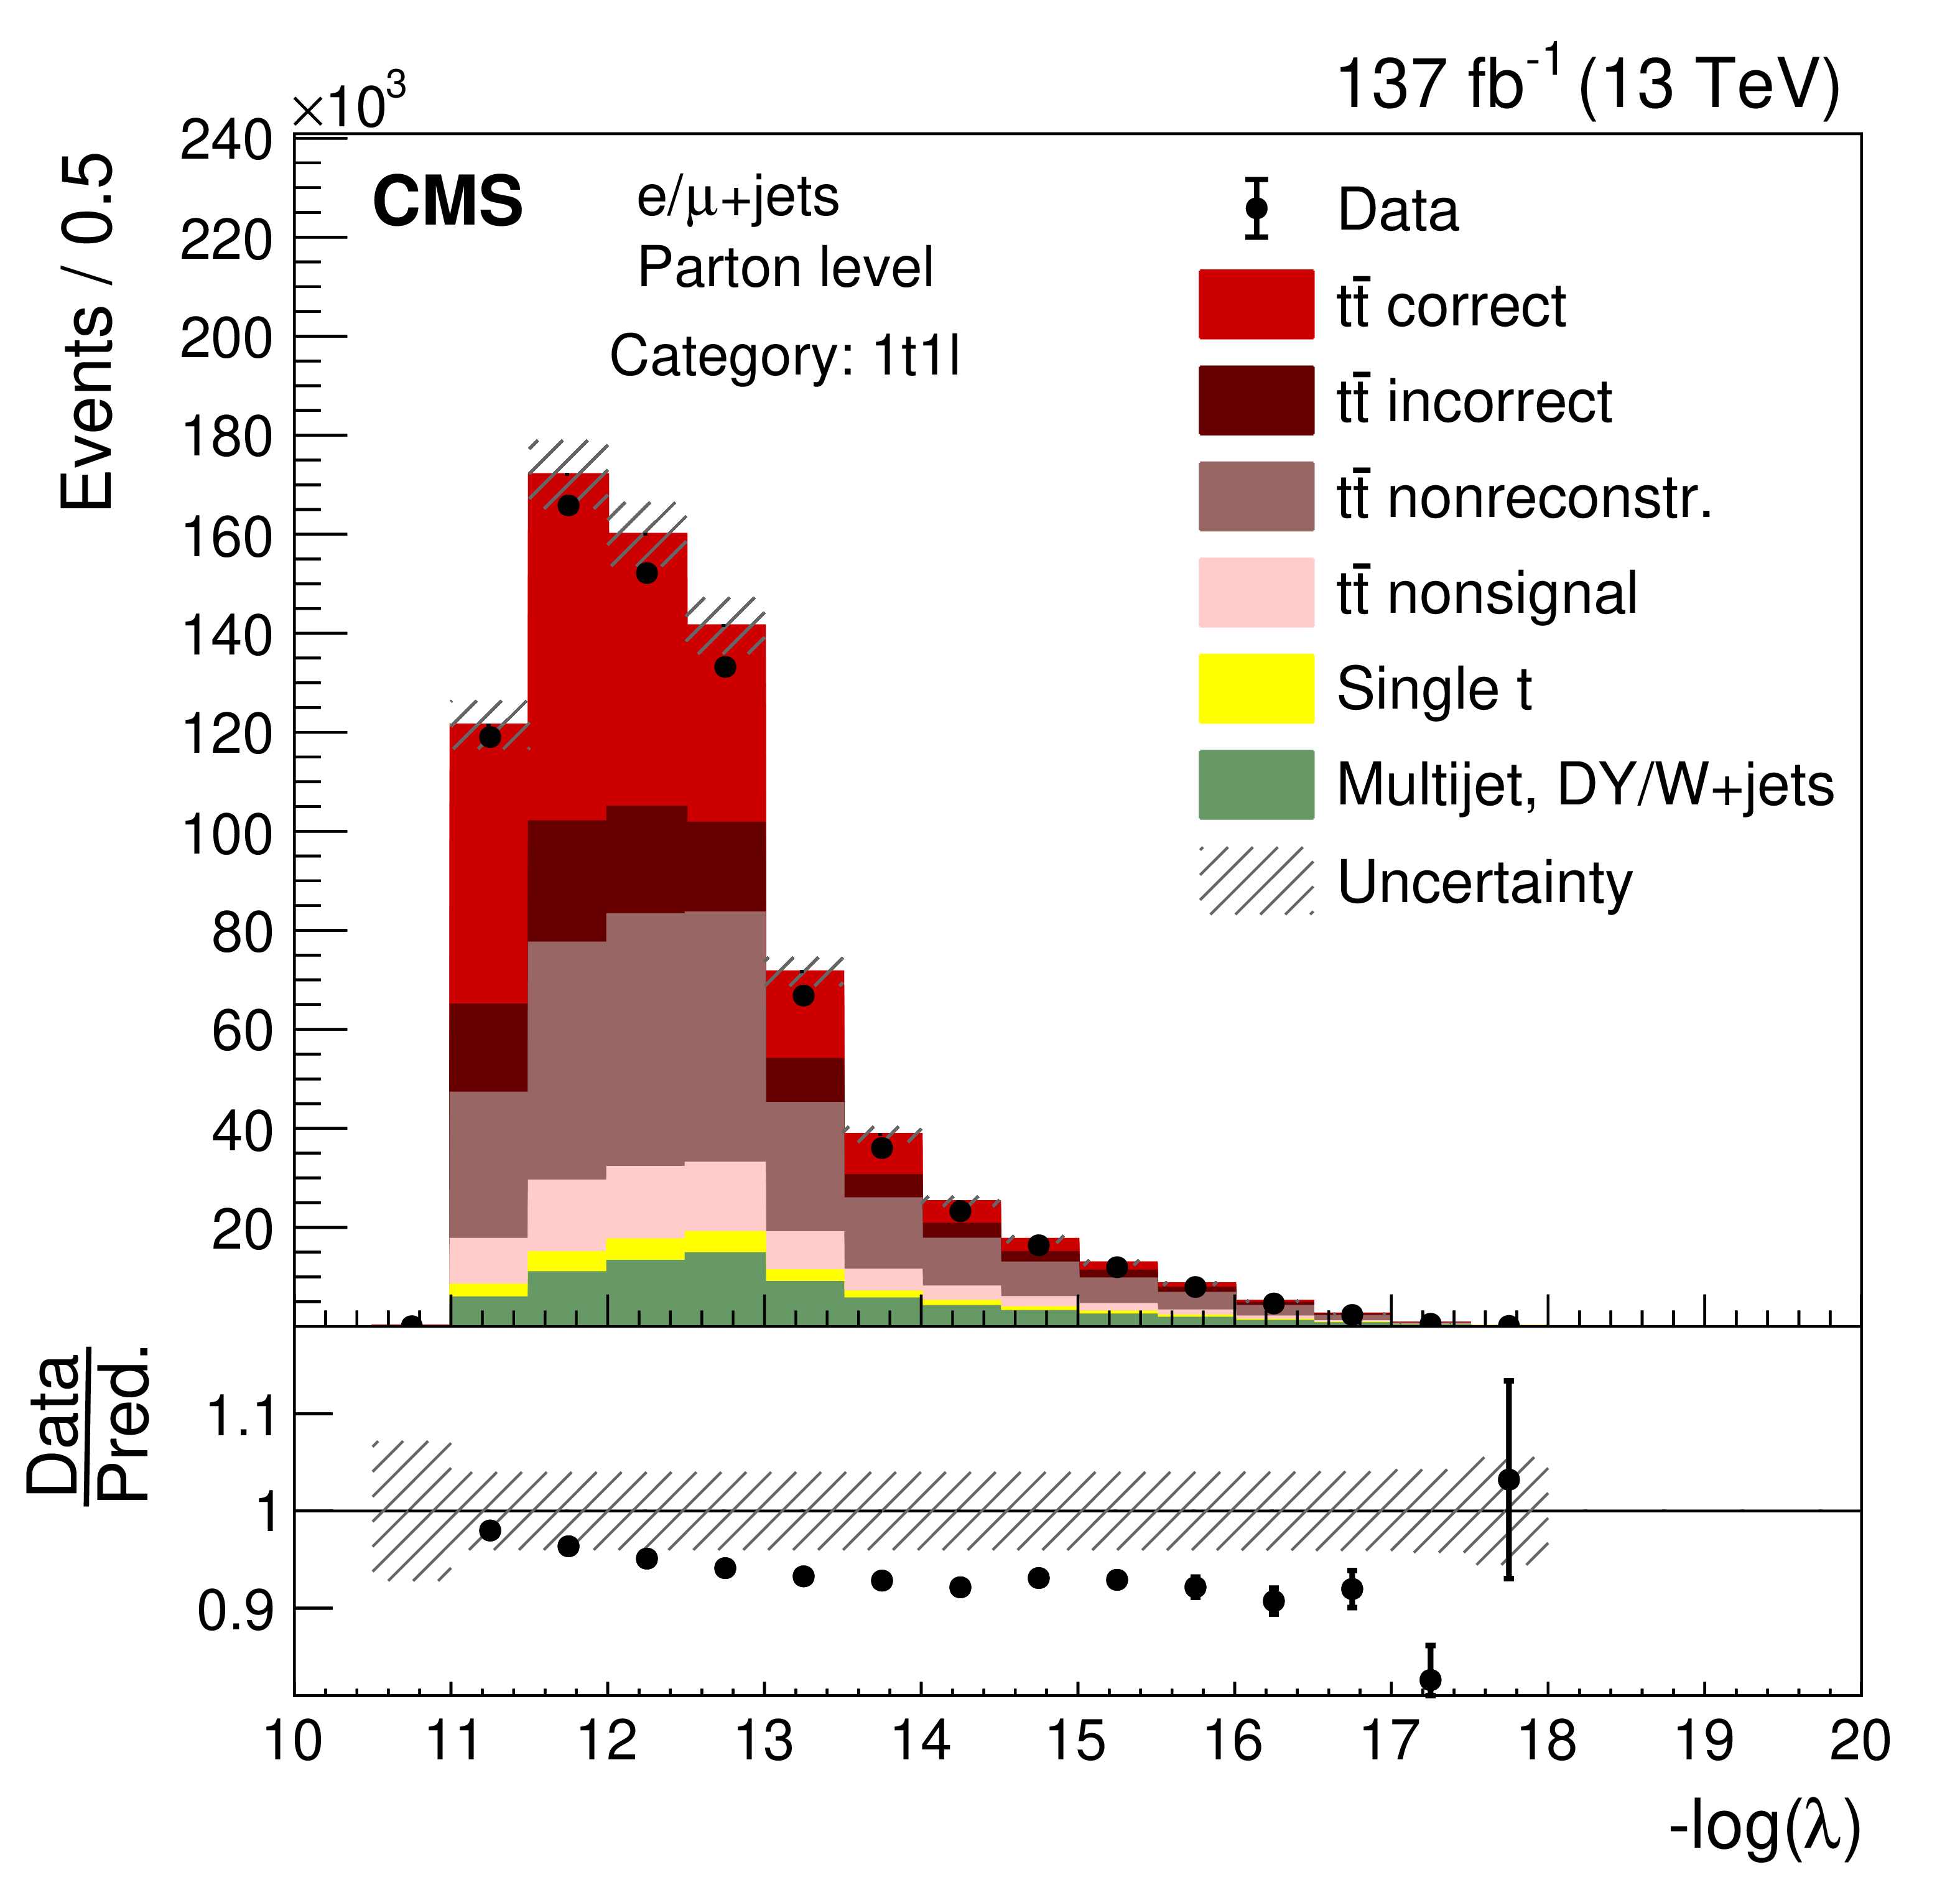
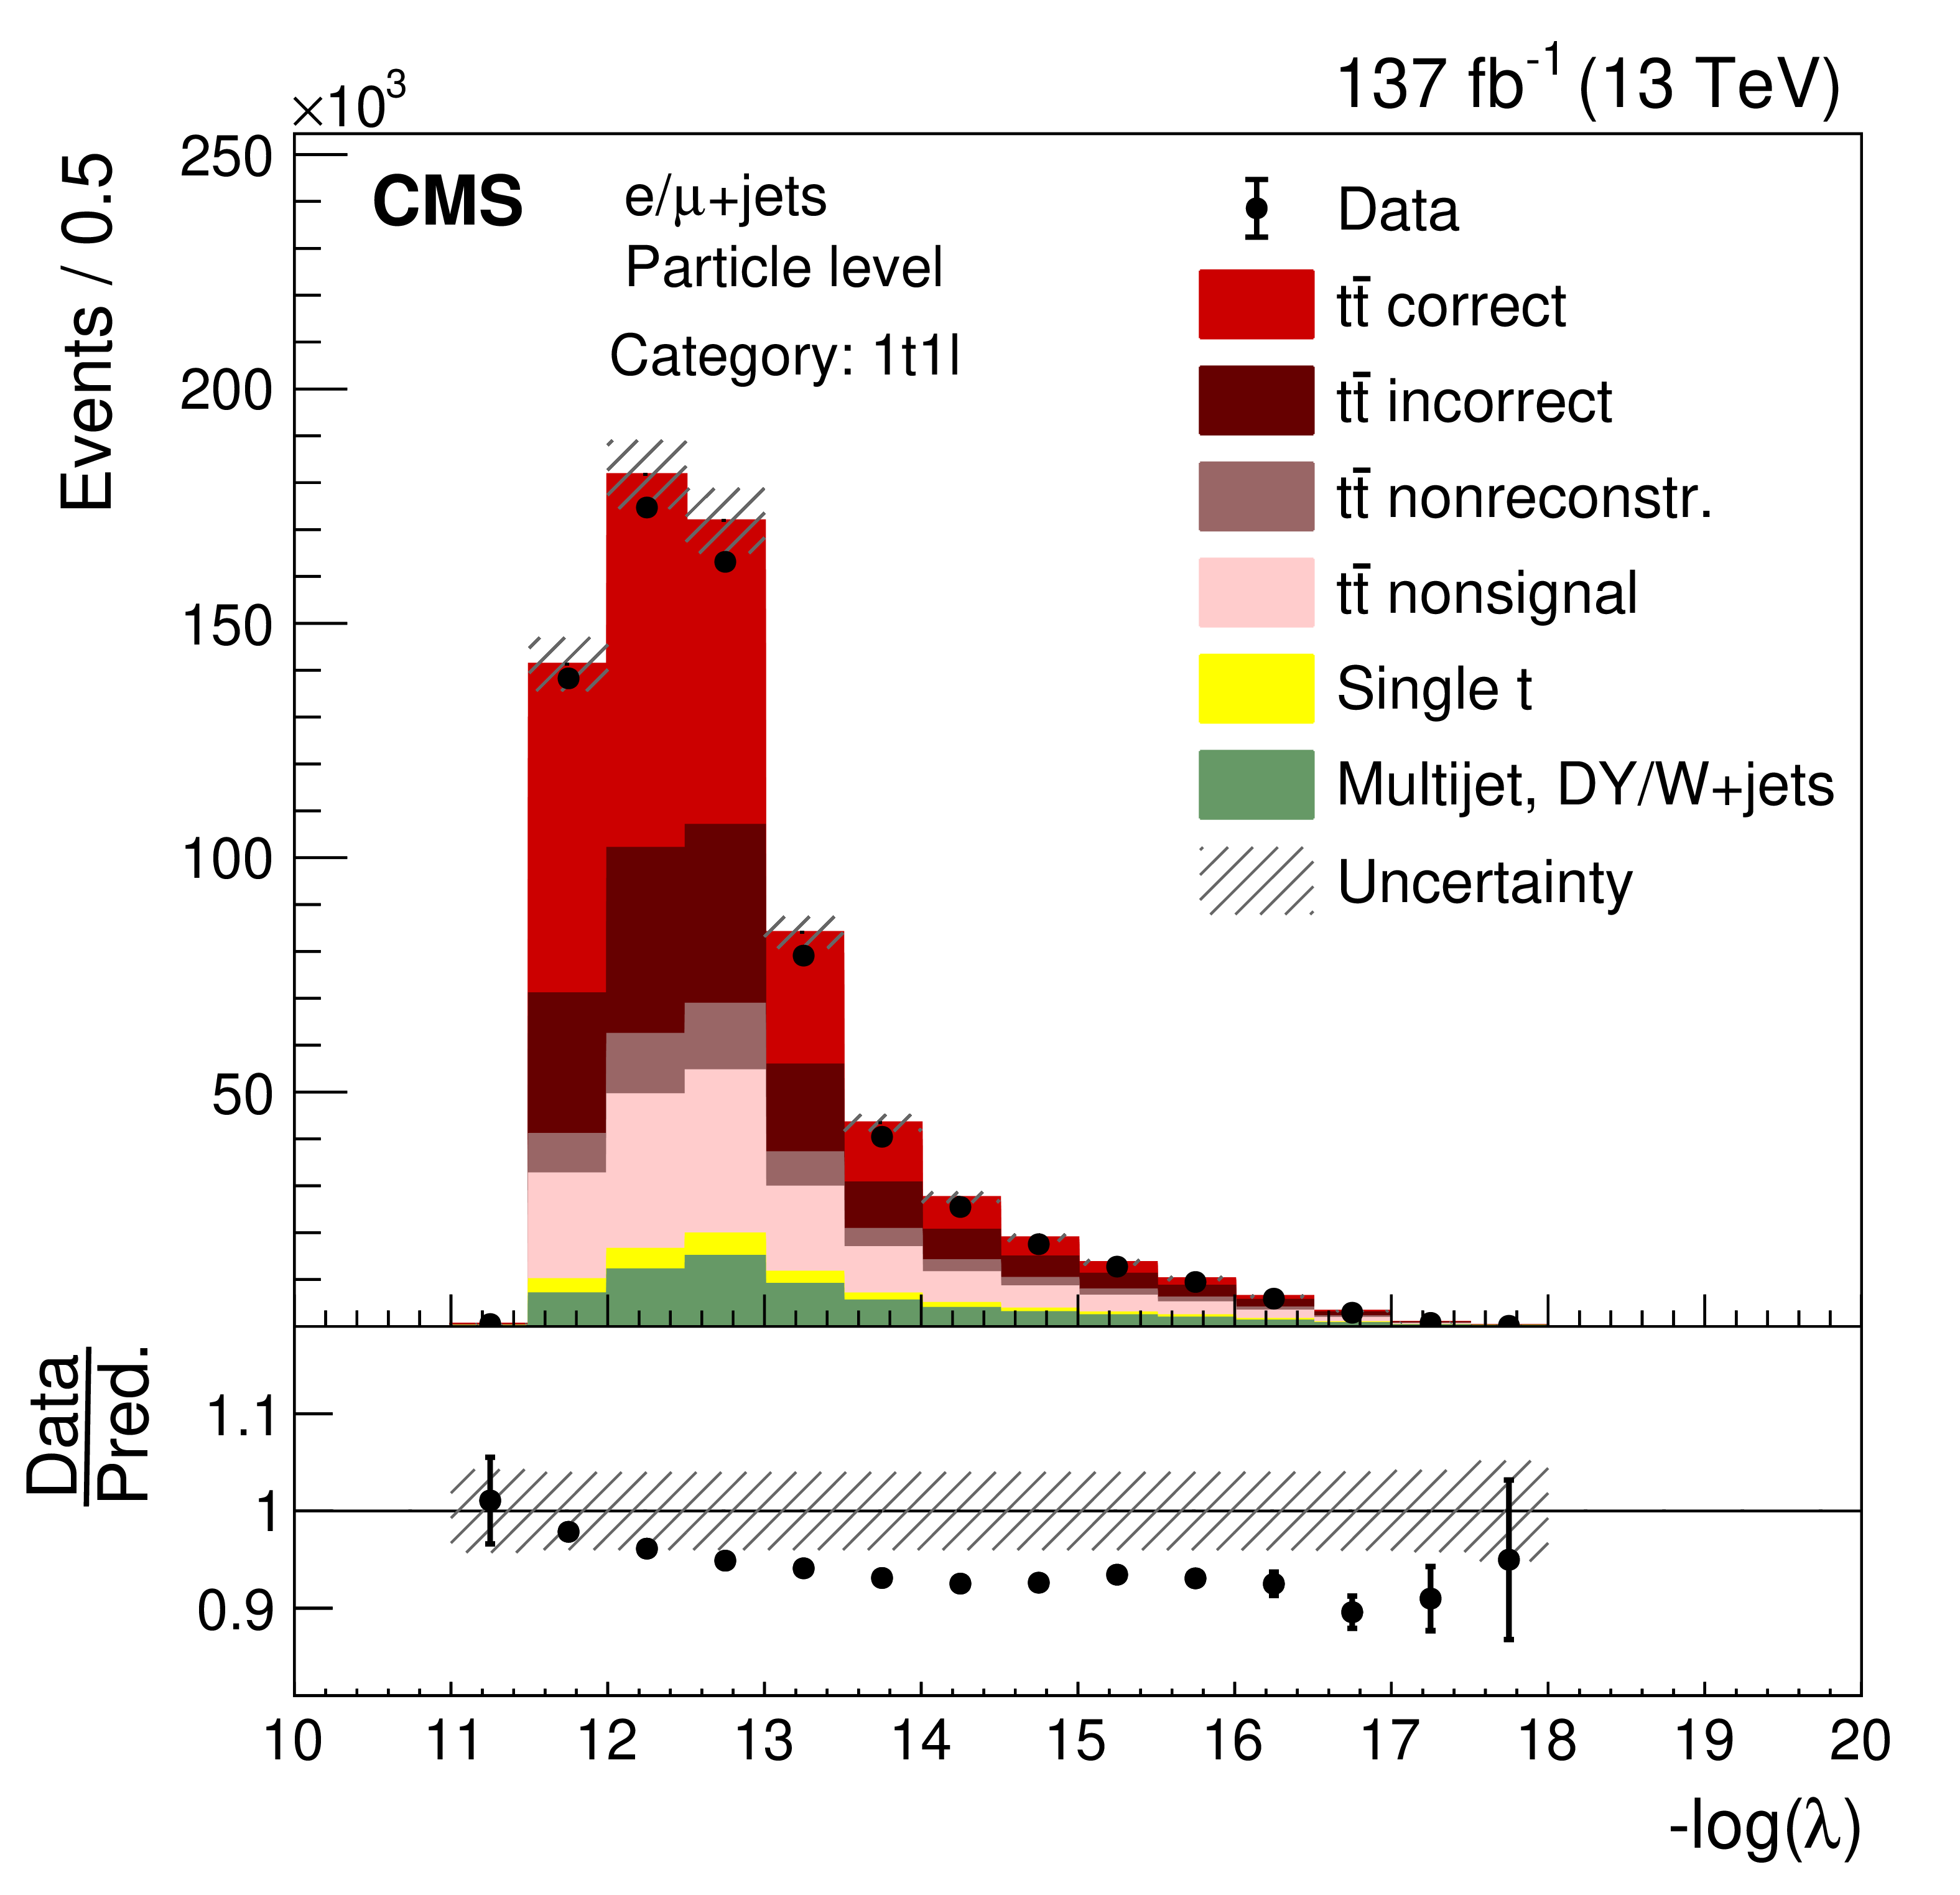
Distributions of the negative log-likelihood for the selected best permutation in the 2t (upper) and 1t1l (lower) categories. The comparisons of data (points) and predictions (colored histograms) are shown for the (left) parton- and (right) particle-level measurements. Events generated with POWHEG+PYTHIA describe ${\mathrm{t} \mathrm{\bar{t}}}$ production. The contribution of multijet, DY, and W boson background events is extracted from the data (cf. Section 10). Combined systematic (cf. Section 13) and statistical uncertainties (hatched area) are shown for the total predicted yields. The vertical bars on the points show the statistical uncertainty. The ratios of data to the sum of the predicted yields are provided in the lower panels. |

png pdf |
Figure 3-a:
Distributions of the negative log-likelihood for the selected best permutation in the 2t (upper) and 1t1l (lower) categories. The comparisons of data (points) and predictions (colored histograms) are shown for the (left) parton- and (right) particle-level measurements. Events generated with POWHEG+PYTHIA describe ${\mathrm{t} \mathrm{\bar{t}}}$ production. The contribution of multijet, DY, and W boson background events is extracted from the data (cf. Section 10). Combined systematic (cf. Section 13) and statistical uncertainties (hatched area) are shown for the total predicted yields. The vertical bars on the points show the statistical uncertainty. The ratios of data to the sum of the predicted yields are provided in the lower panels. |
png pdf |
Figure 3-b:
Distributions of the negative log-likelihood for the selected best permutation in the 2t (upper) and 1t1l (lower) categories. The comparisons of data (points) and predictions (colored histograms) are shown for the (left) parton- and (right) particle-level measurements. Events generated with POWHEG+PYTHIA describe ${\mathrm{t} \mathrm{\bar{t}}}$ production. The contribution of multijet, DY, and W boson background events is extracted from the data (cf. Section 10). Combined systematic (cf. Section 13) and statistical uncertainties (hatched area) are shown for the total predicted yields. The vertical bars on the points show the statistical uncertainty. The ratios of data to the sum of the predicted yields are provided in the lower panels. |
png pdf |
Figure 3-c:
Distributions of the negative log-likelihood for the selected best permutation in the 2t (upper) and 1t1l (lower) categories. The comparisons of data (points) and predictions (colored histograms) are shown for the (left) parton- and (right) particle-level measurements. Events generated with POWHEG+PYTHIA describe ${\mathrm{t} \mathrm{\bar{t}}}$ production. The contribution of multijet, DY, and W boson background events is extracted from the data (cf. Section 10). Combined systematic (cf. Section 13) and statistical uncertainties (hatched area) are shown for the total predicted yields. The vertical bars on the points show the statistical uncertainty. The ratios of data to the sum of the predicted yields are provided in the lower panels. |
png pdf |
Figure 3-d:
Distributions of the negative log-likelihood for the selected best permutation in the 2t (upper) and 1t1l (lower) categories. The comparisons of data (points) and predictions (colored histograms) are shown for the (left) parton- and (right) particle-level measurements. Events generated with POWHEG+PYTHIA describe ${\mathrm{t} \mathrm{\bar{t}}}$ production. The contribution of multijet, DY, and W boson background events is extracted from the data (cf. Section 10). Combined systematic (cf. Section 13) and statistical uncertainties (hatched area) are shown for the total predicted yields. The vertical bars on the points show the statistical uncertainty. The ratios of data to the sum of the predicted yields are provided in the lower panels. |
png pdf |
Figure 4:
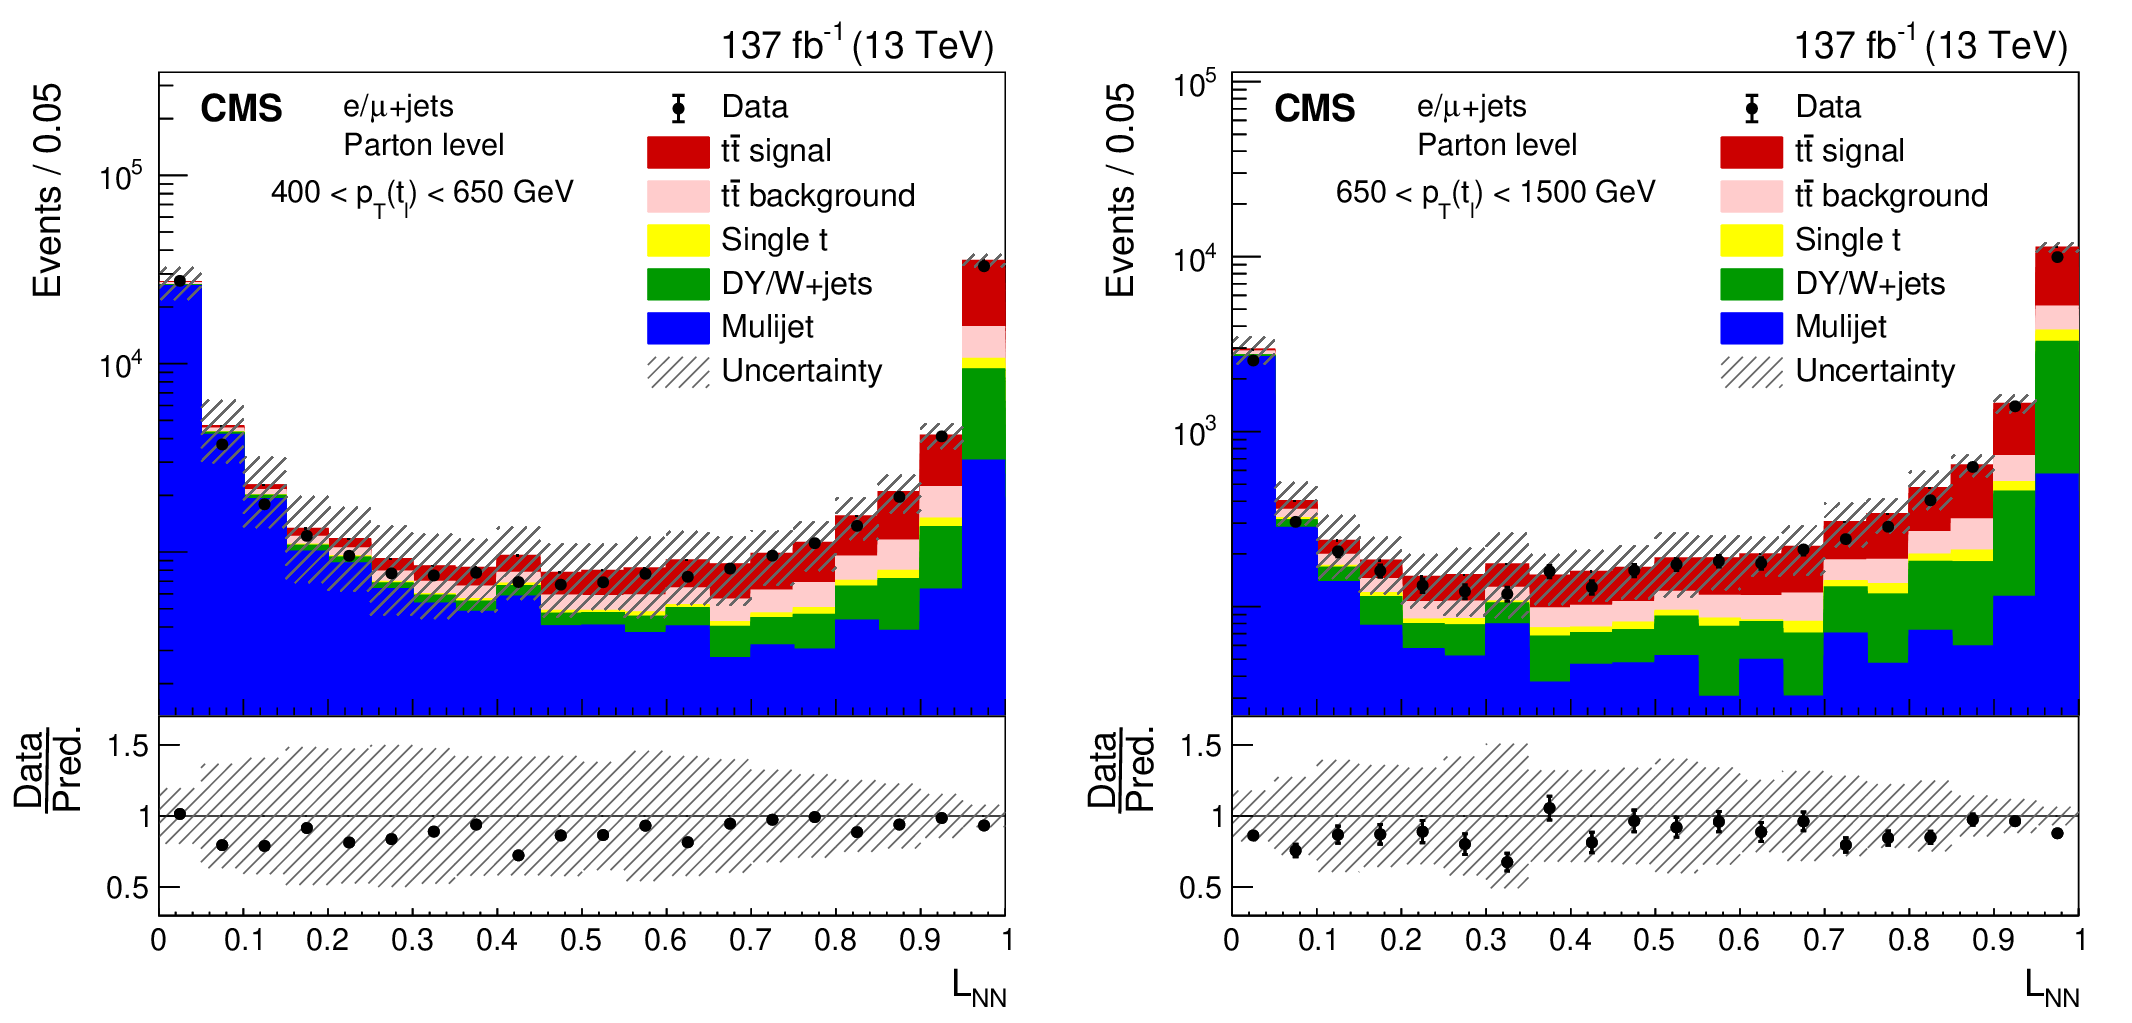
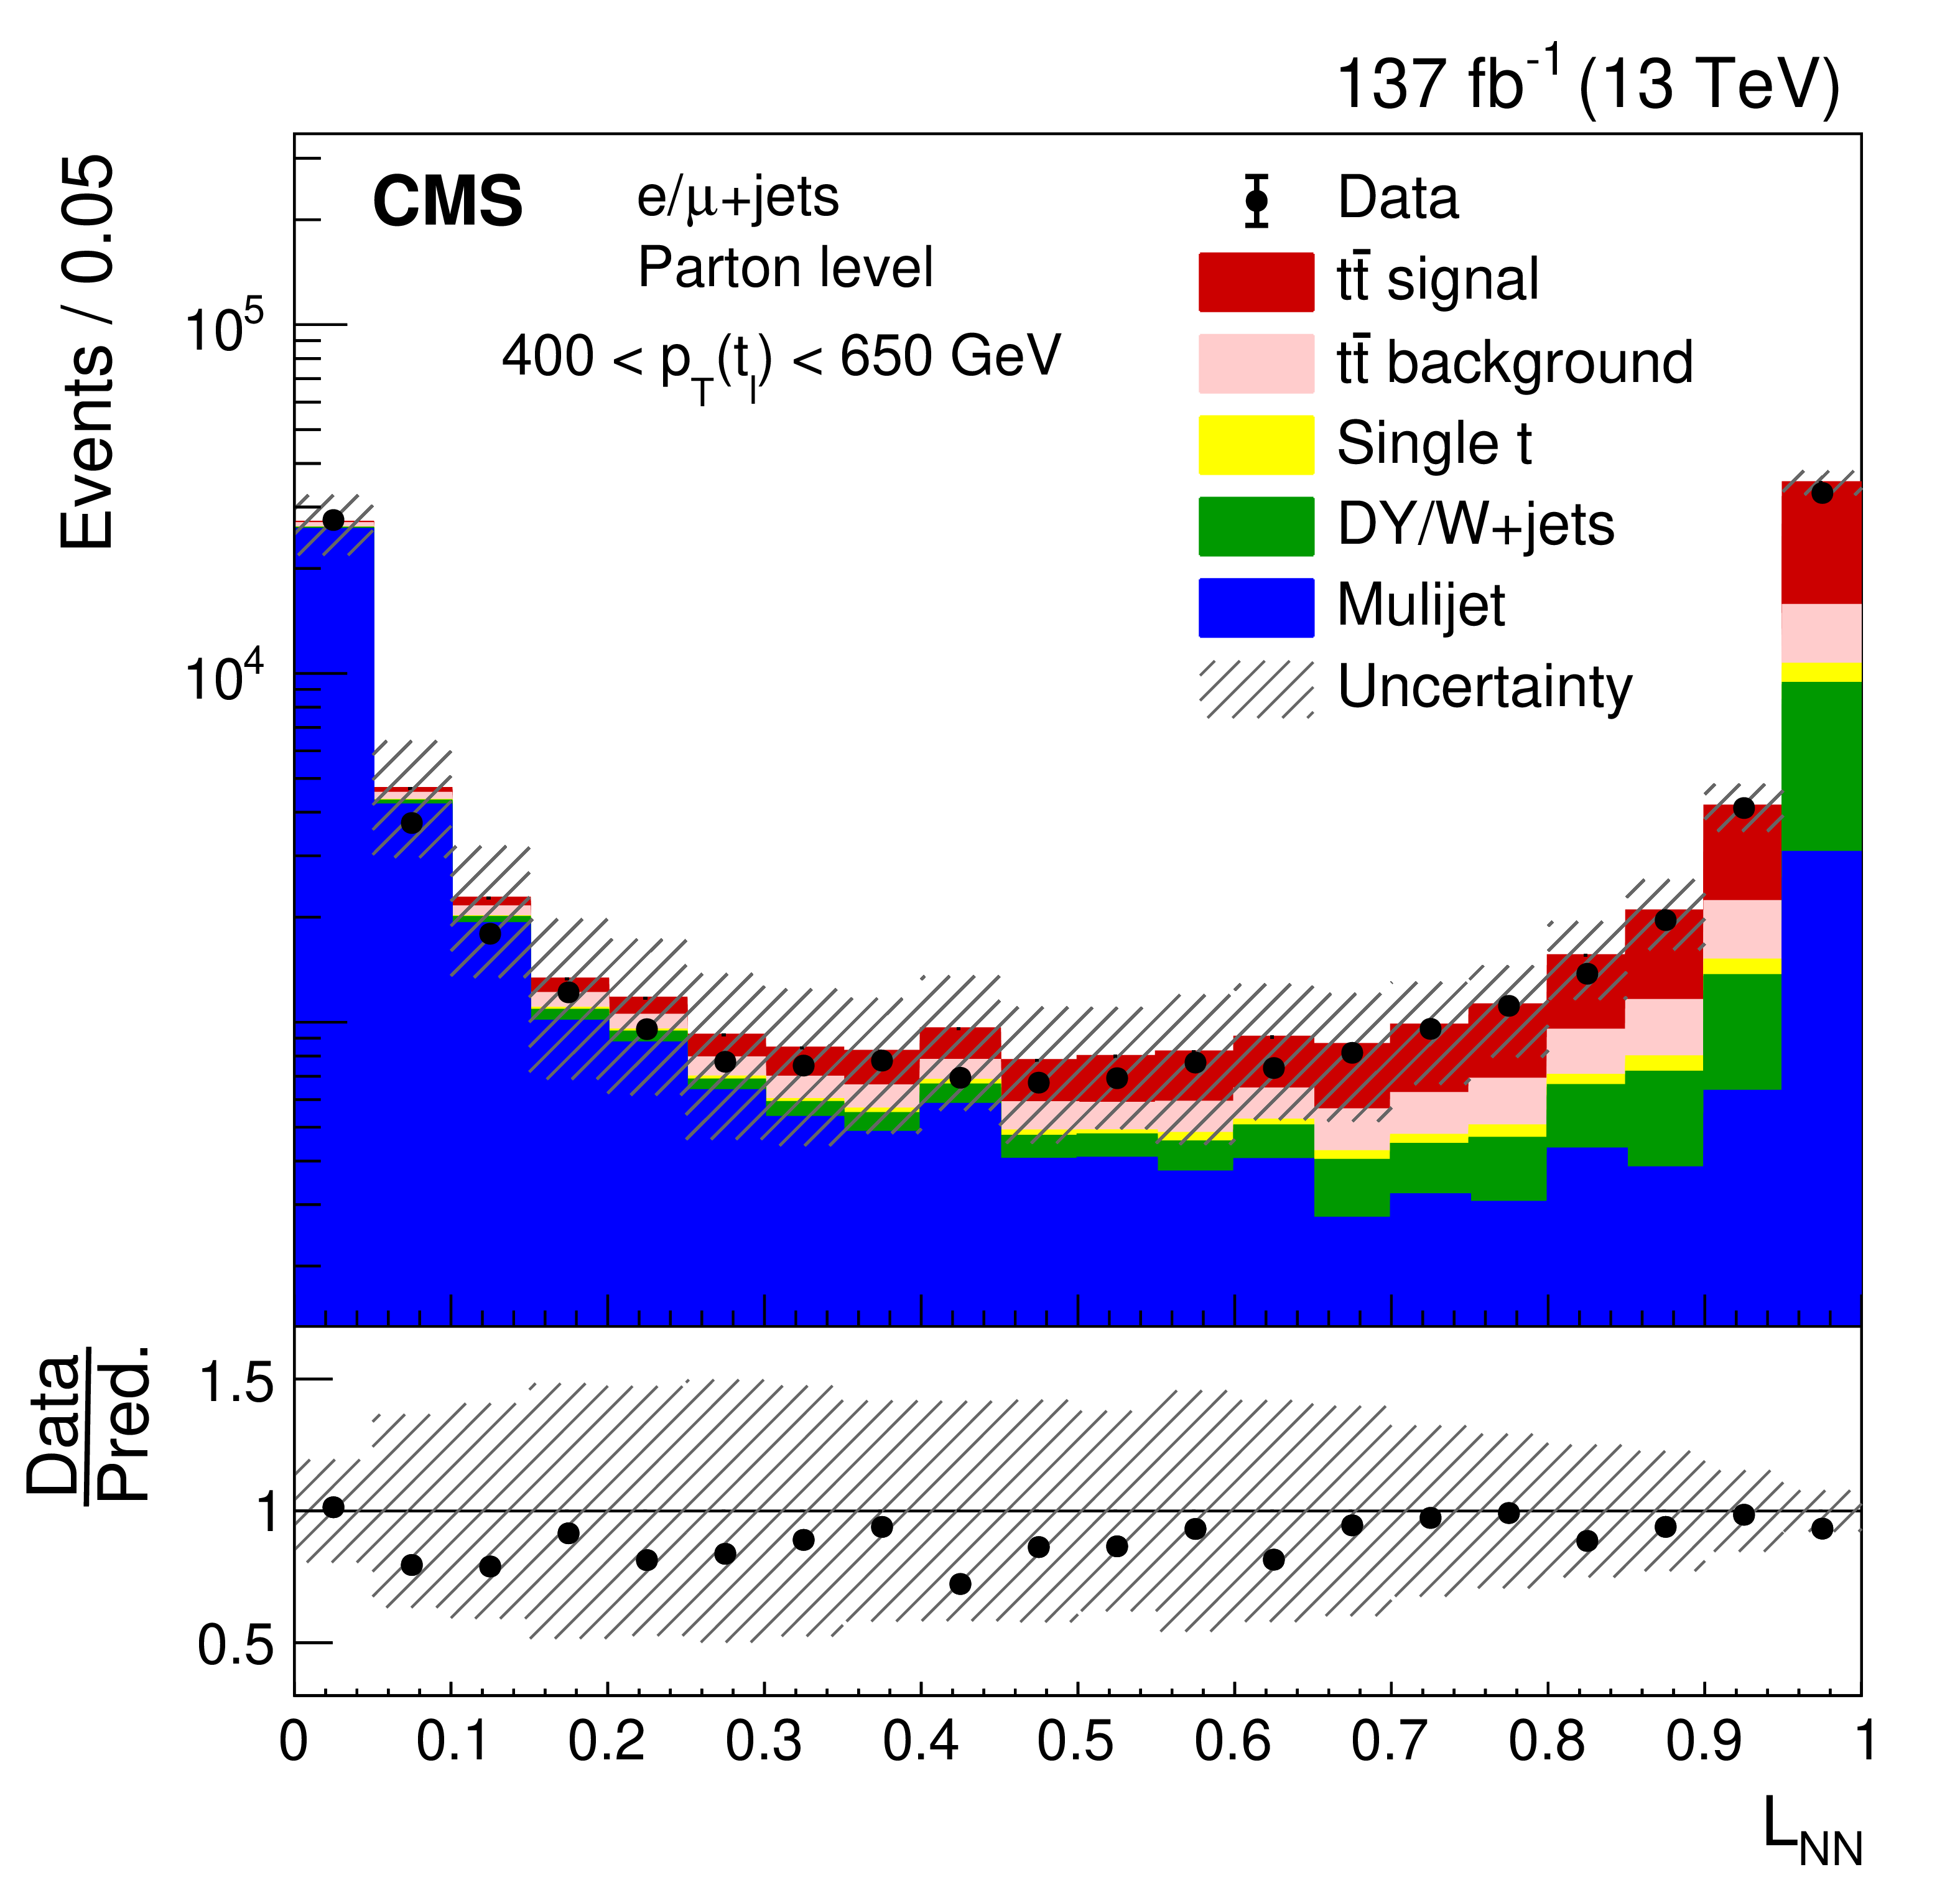
Distributions of the output discriminant ${L_\mathrm {NN}}$ used in the boosted ${\mathrm{t} _\ell}$ identification for the low-${{p_{\mathrm {T}}} ({\mathrm{t} _\ell})}$ (left) and high-${{p_{\mathrm {T}}} ({\mathrm{t} _\ell})}$ (right) regions. The data (points) and predictions from simulation (colored histograms) are shown. The hatched area gives the combined statistical and systematic uncertainties in the prediction. The vertical bars on the points show the statistical uncertainty in the data. The ratio of the data to the sum of the individual predictions is displayed in the lower panels. |
png pdf |
Figure 4-a:
Distributions of the output discriminant ${L_\mathrm {NN}}$ used in the boosted ${\mathrm{t} _\ell}$ identification for the low-${{p_{\mathrm {T}}} ({\mathrm{t} _\ell})}$ (left) and high-${{p_{\mathrm {T}}} ({\mathrm{t} _\ell})}$ (right) regions. The data (points) and predictions from simulation (colored histograms) are shown. The hatched area gives the combined statistical and systematic uncertainties in the prediction. The vertical bars on the points show the statistical uncertainty in the data. The ratio of the data to the sum of the individual predictions is displayed in the lower panels. |

png pdf |
Figure 4-b:
Distributions of the output discriminant ${L_\mathrm {NN}}$ used in the boosted ${\mathrm{t} _\ell}$ identification for the low-${{p_{\mathrm {T}}} ({\mathrm{t} _\ell})}$ (left) and high-${{p_{\mathrm {T}}} ({\mathrm{t} _\ell})}$ (right) regions. The data (points) and predictions from simulation (colored histograms) are shown. The hatched area gives the combined statistical and systematic uncertainties in the prediction. The vertical bars on the points show the statistical uncertainty in the data. The ratio of the data to the sum of the individual predictions is displayed in the lower panels. |
png pdf |
Figure 5:
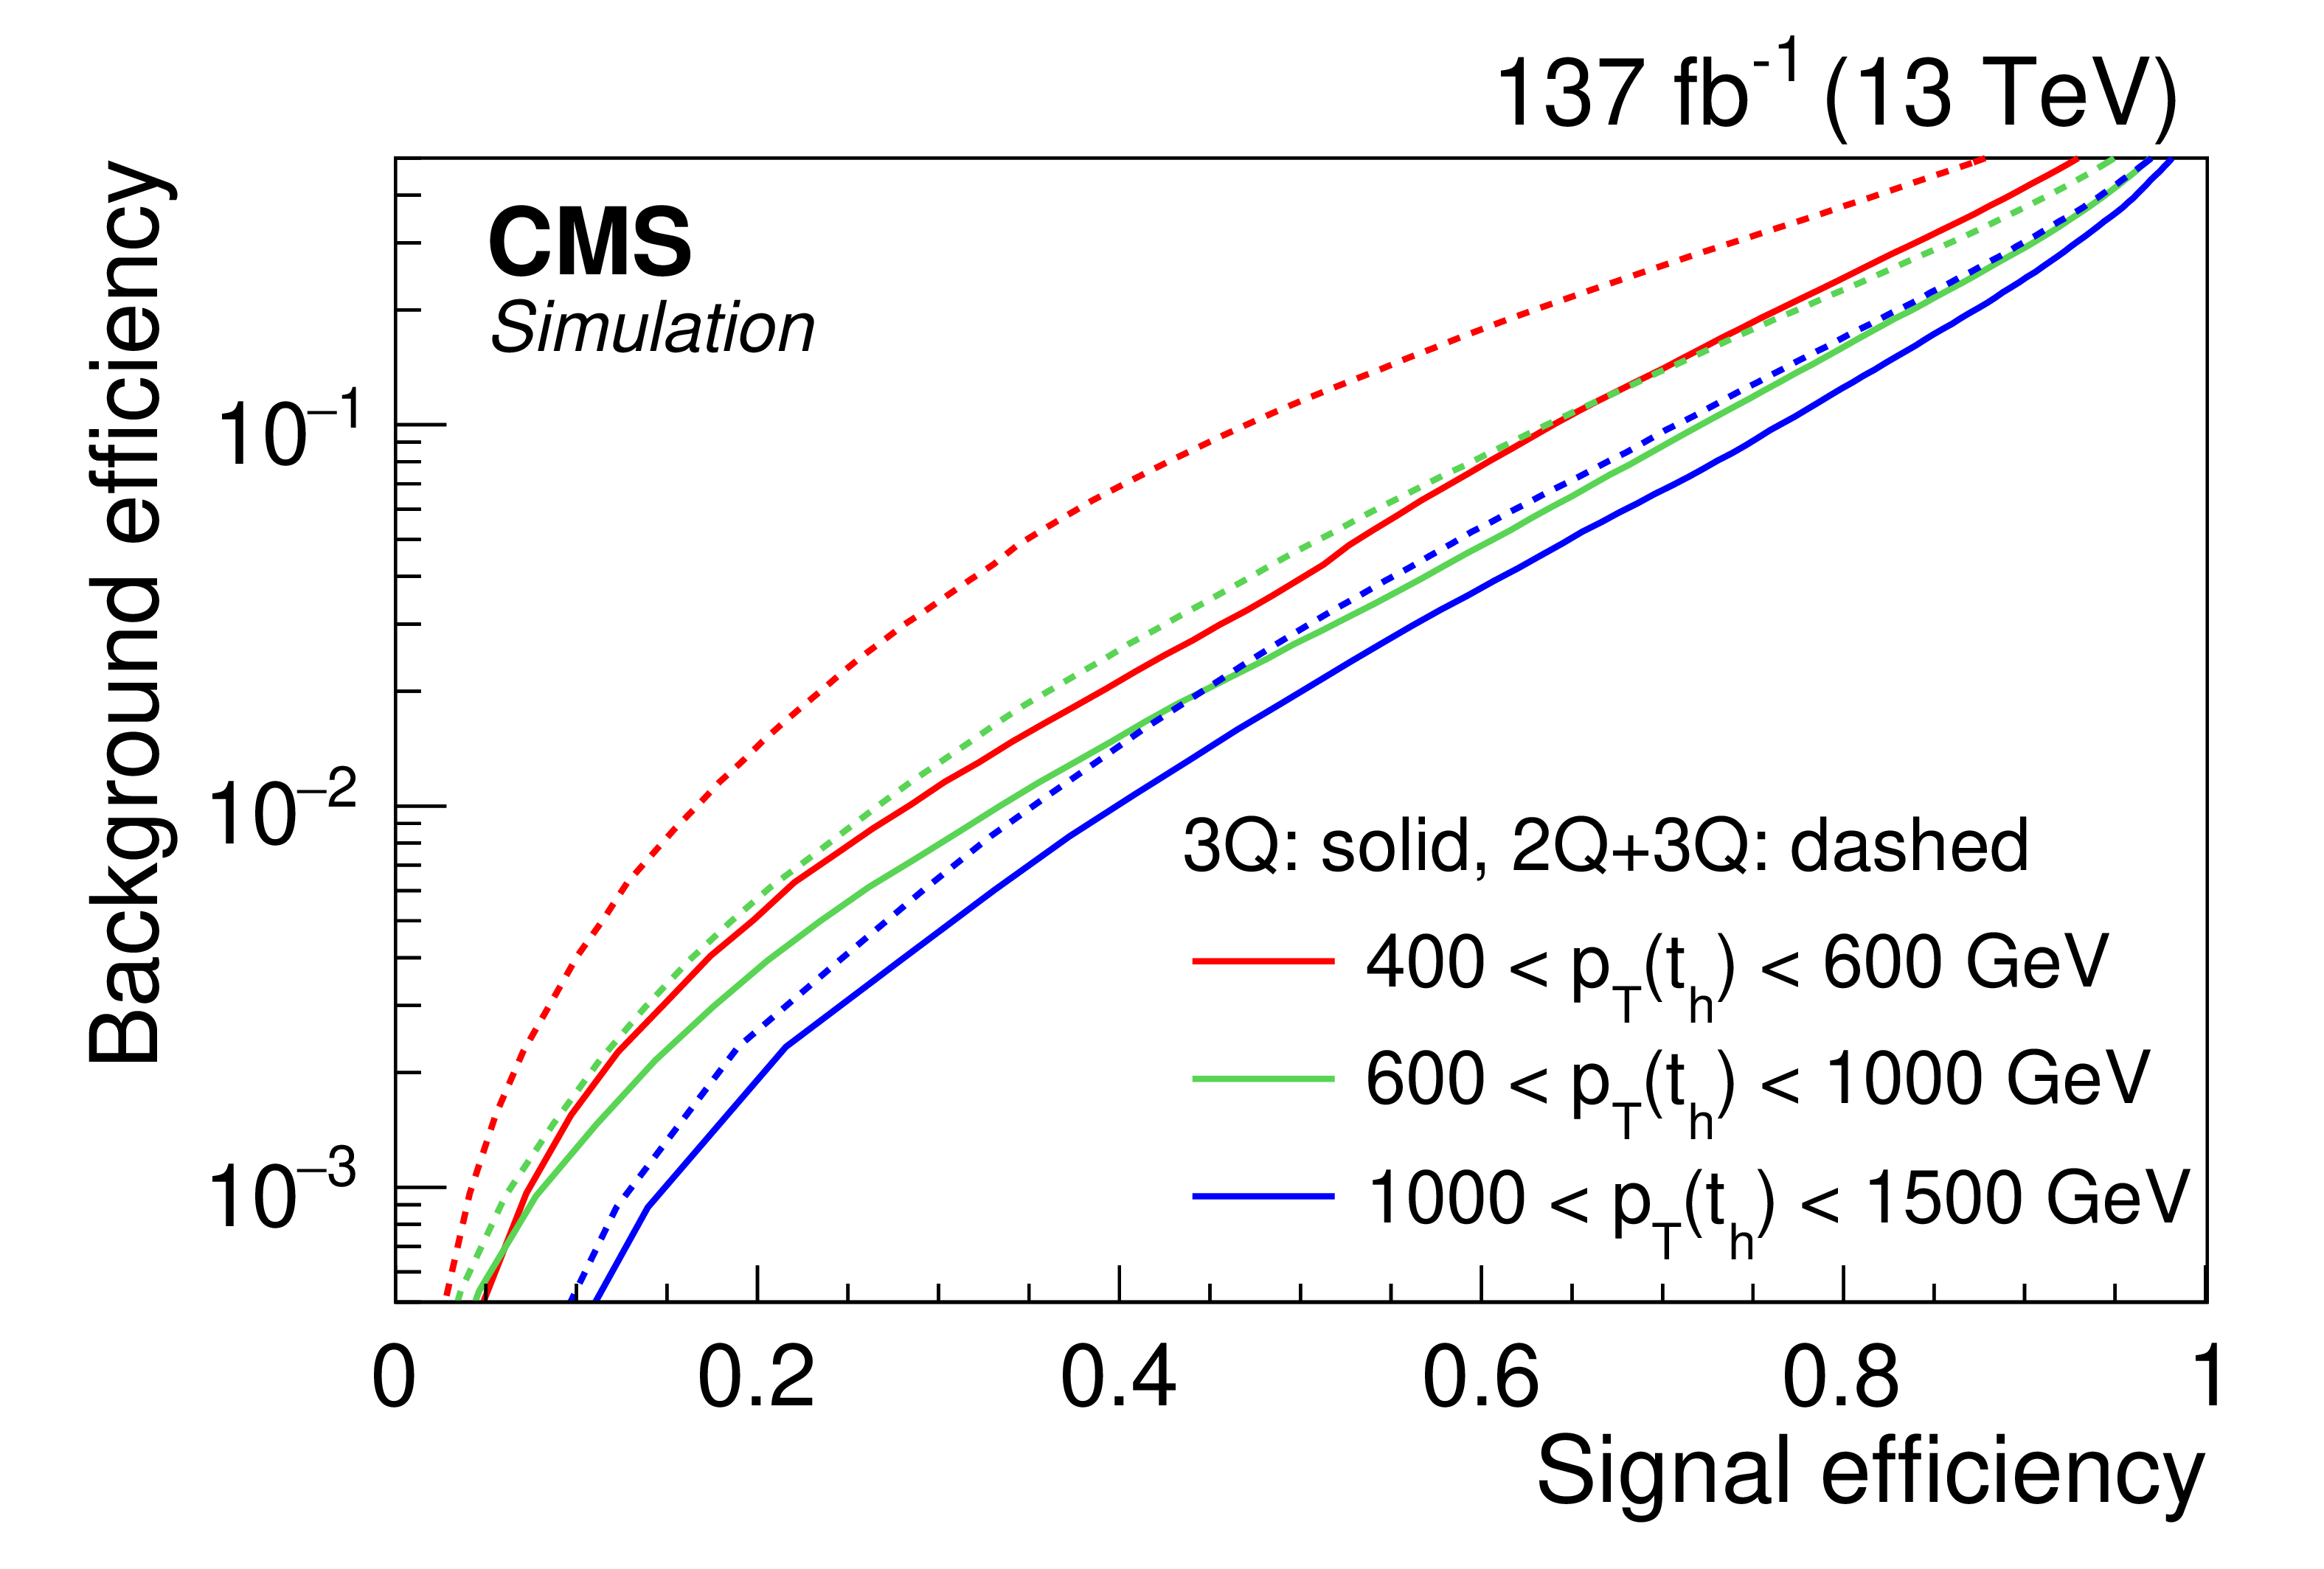
The selection efficiency for background jets as a function of the signal selection efficiency in three ${{p_{\mathrm {T}}} ({\mathrm{t} _\mathrm {h}})}$ ranges for 3Q (solid curves) and 2Q+3Q (dashed curves) jets from simulation. An efficiency of 100% corresponds to the preselection of $ {| \eta |} < $ 2.4 and $m_\mathrm {jet} > $ 120 GeV. |
png pdf |
Figure 6:
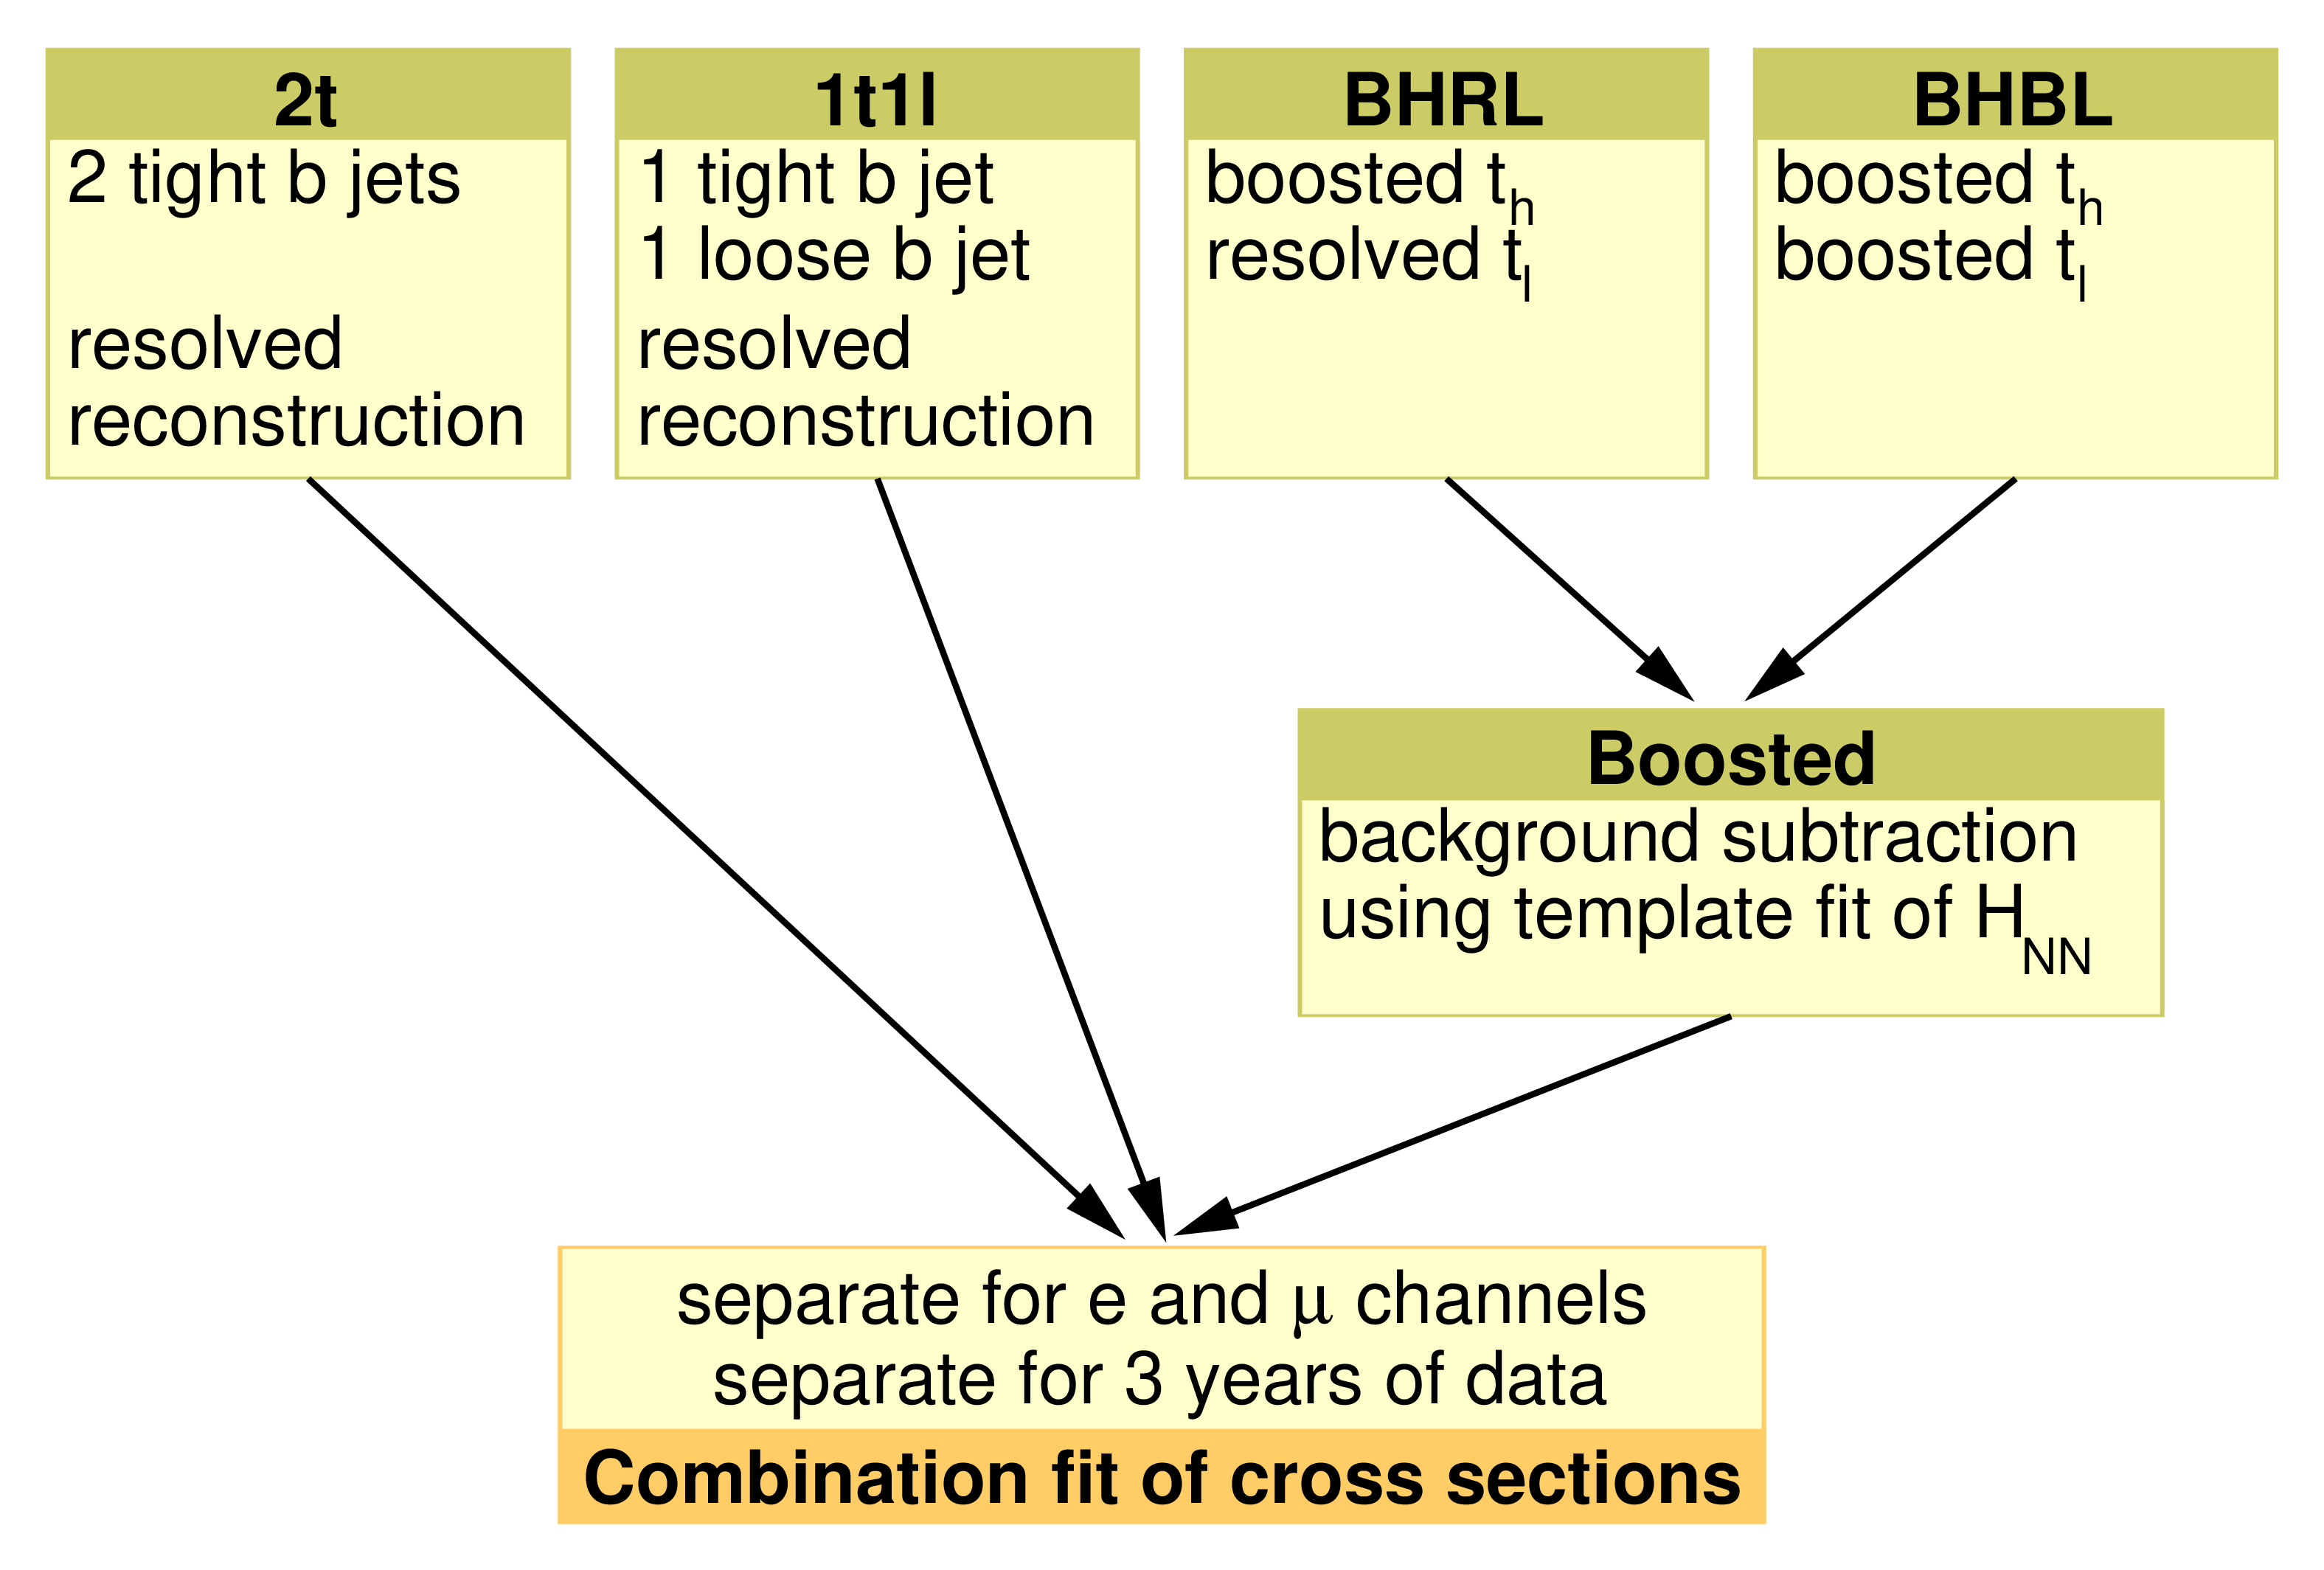
Schematic overview of the categories and how they are used in the analysis. |
png pdf |
Figure 7:
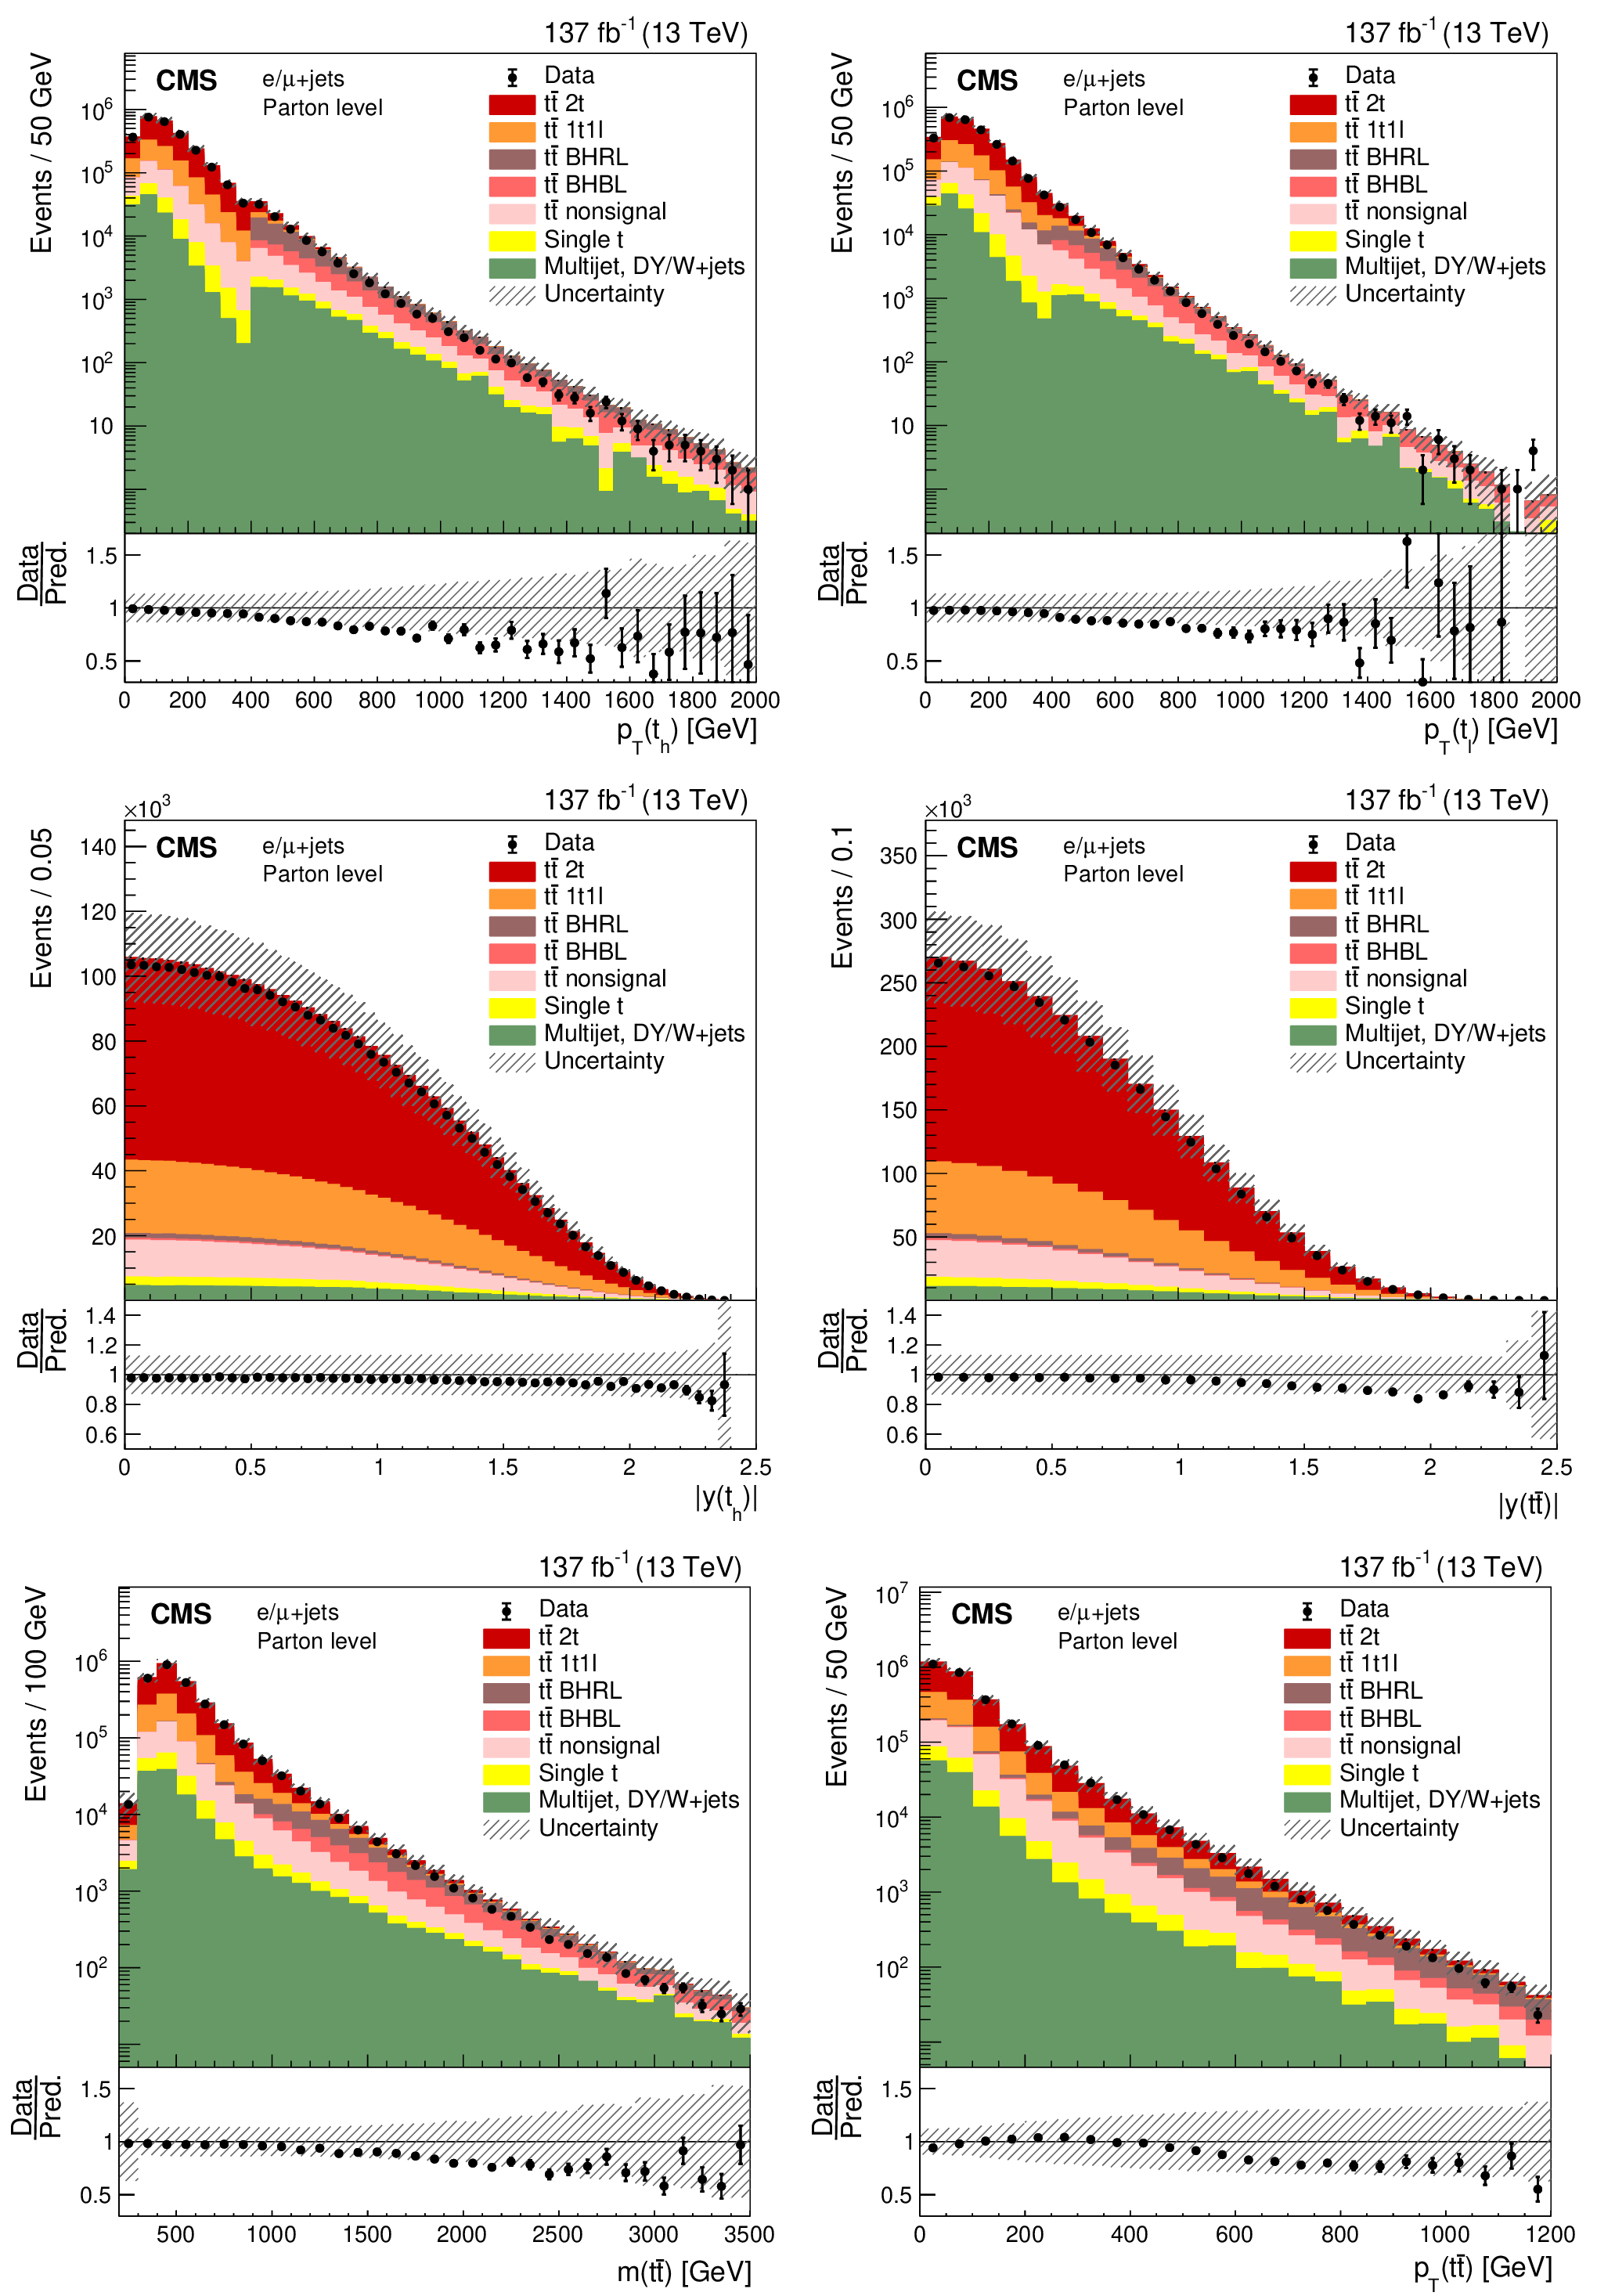
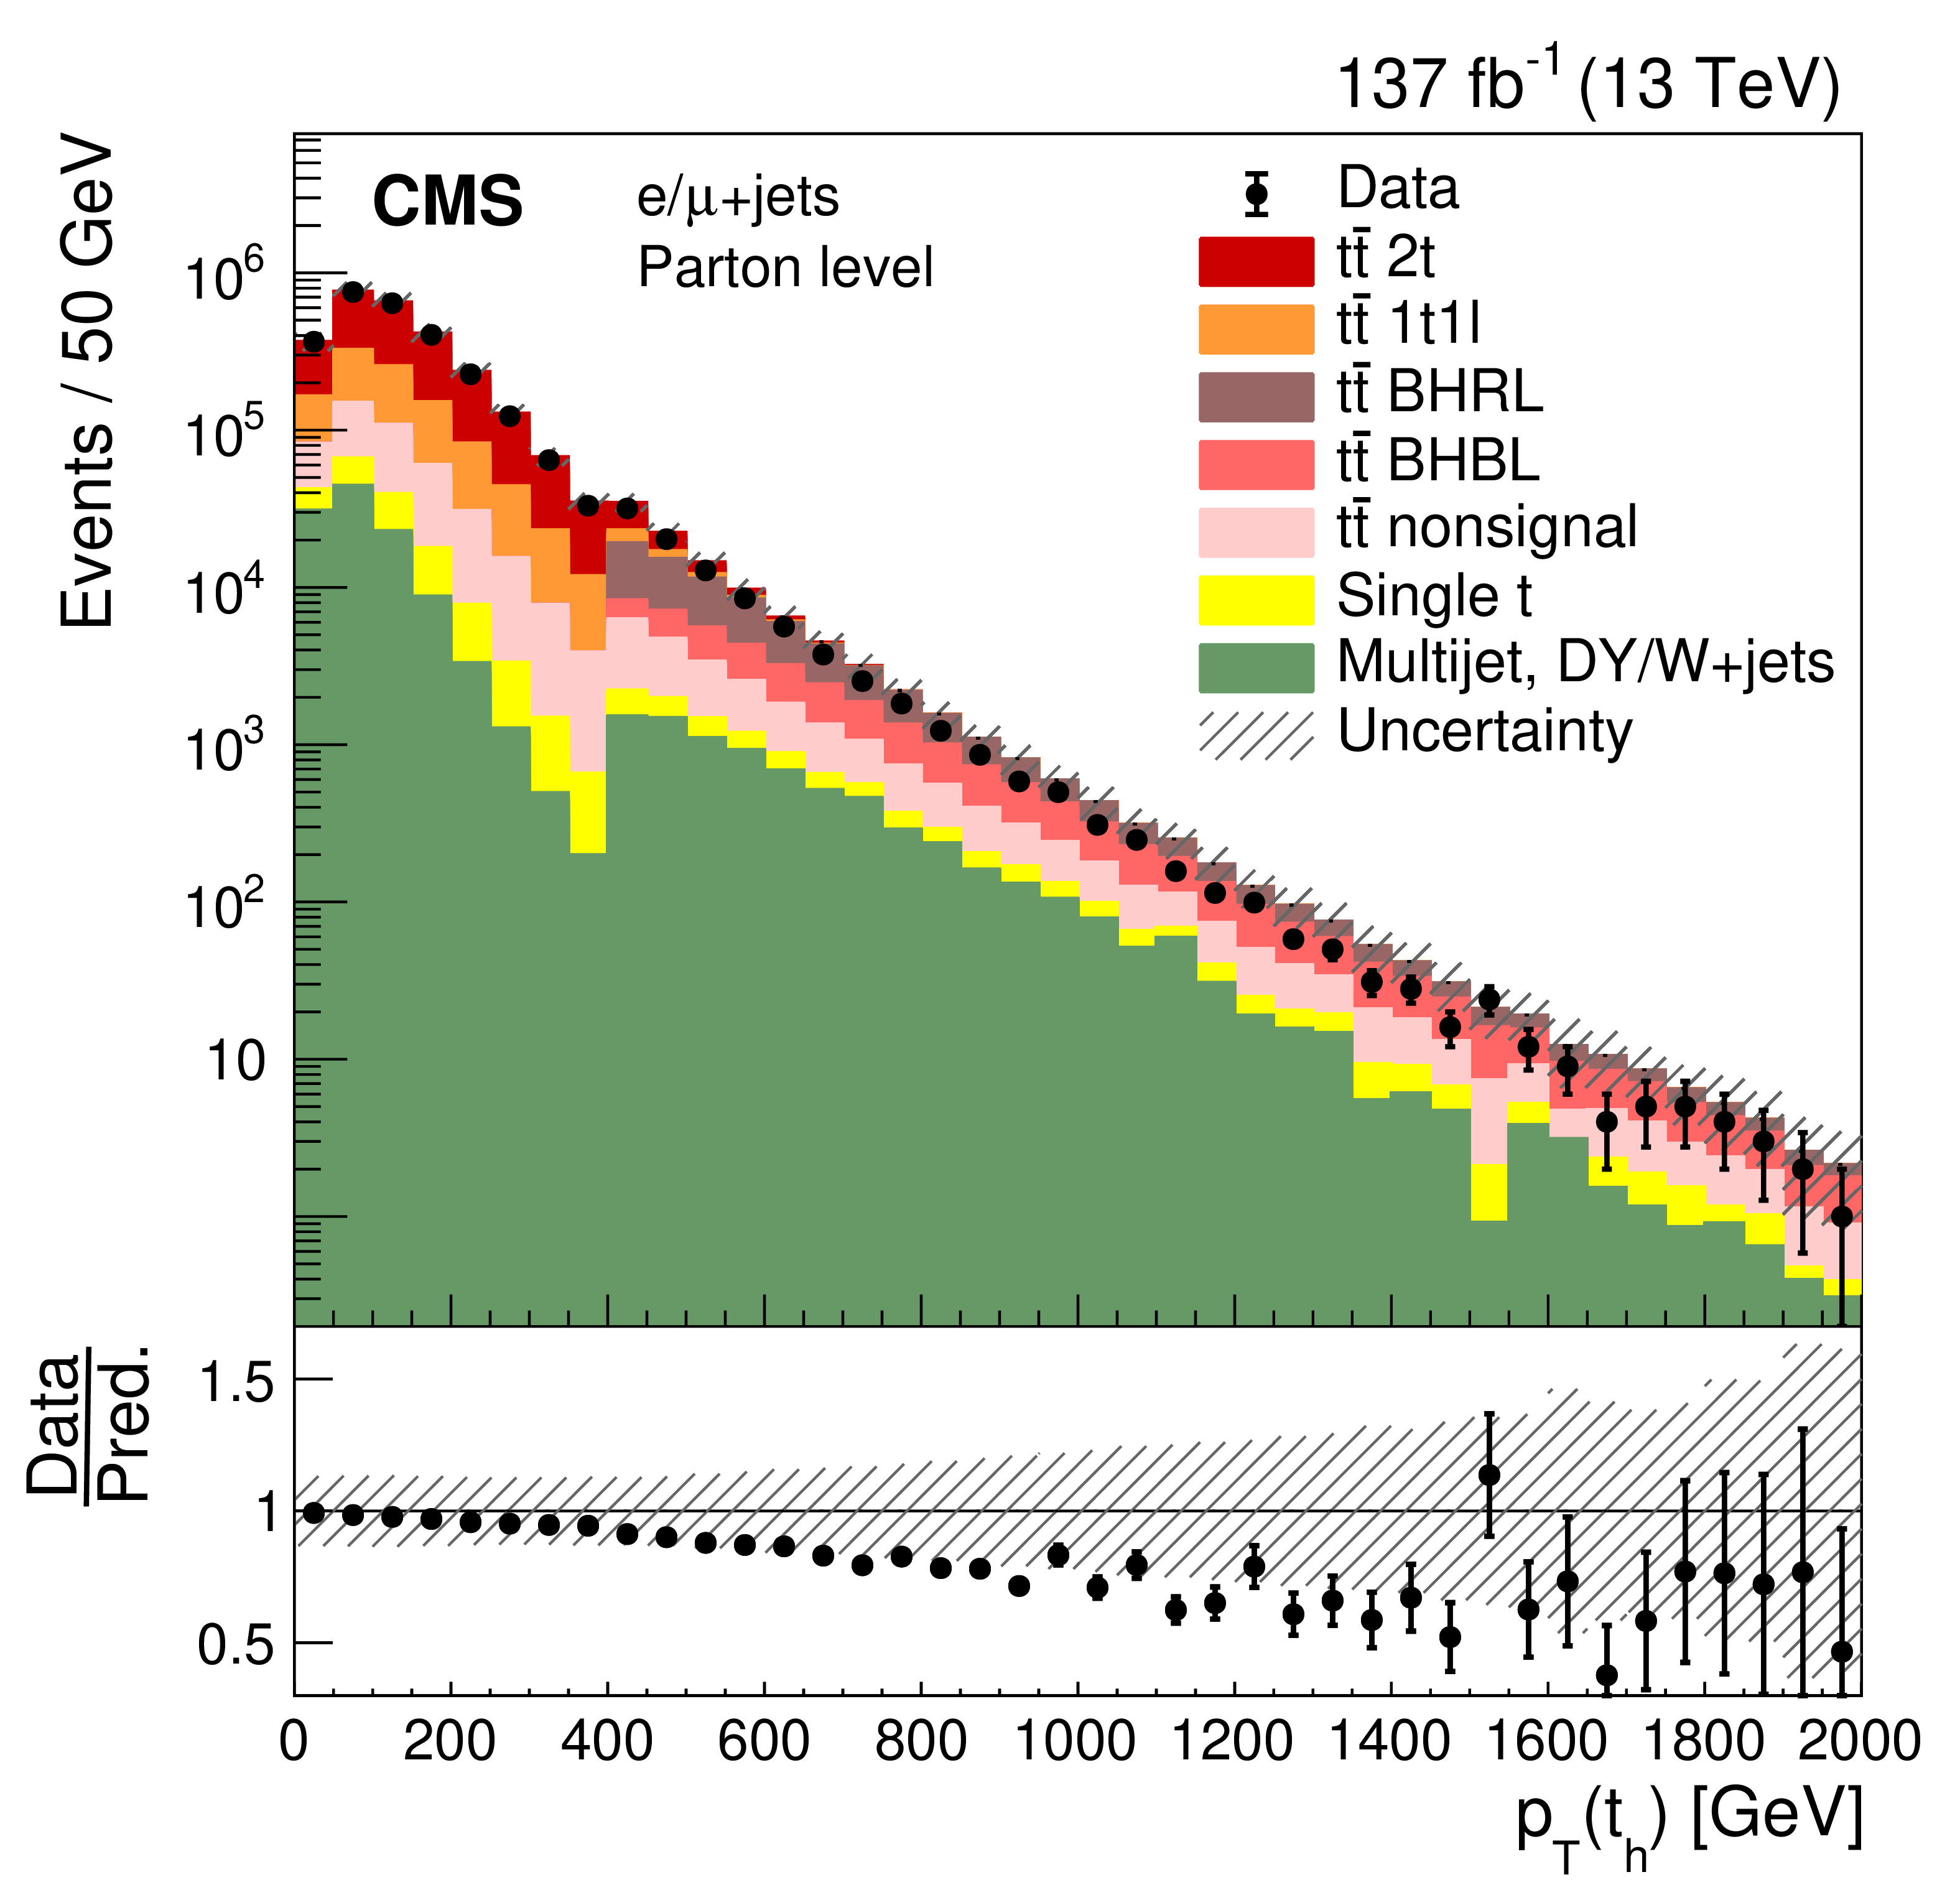
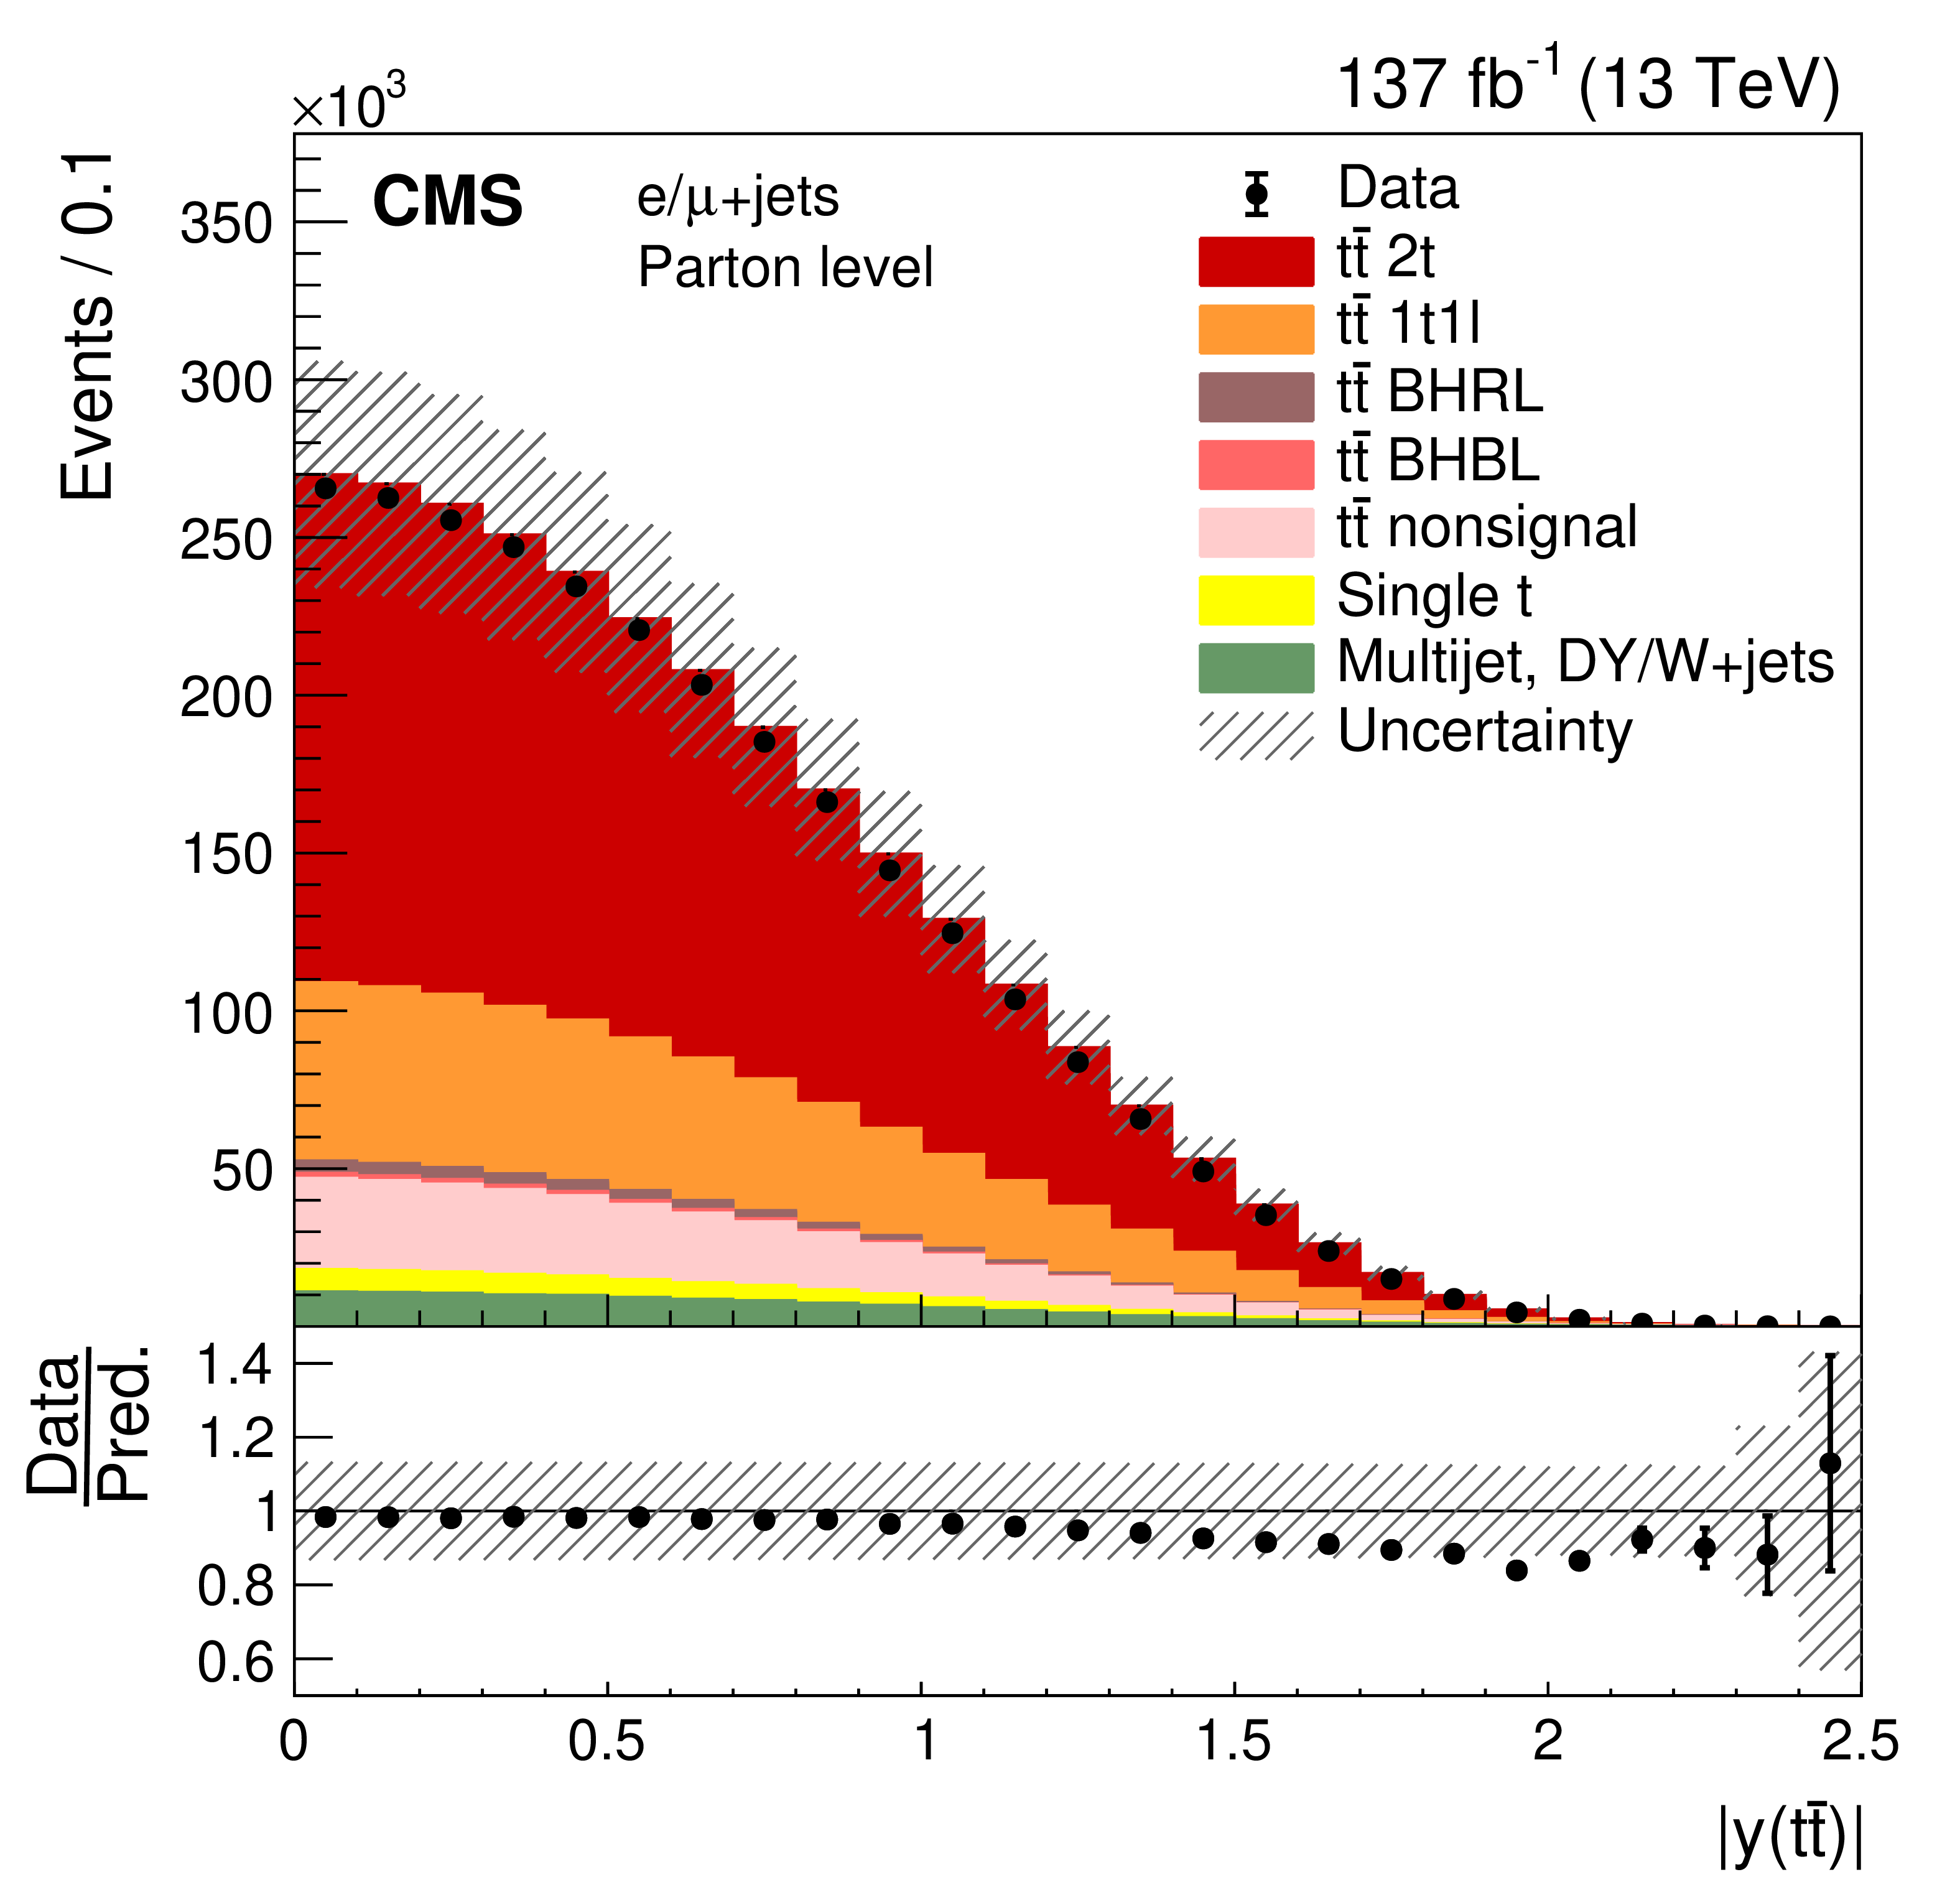
Comparisons of various reconstructed kinematic distributions between data (points) and predictions (colored histograms) obtained for the parton-level measurement. Contributions of the various reconstruction categories are obtained from the POWHEG+PYTHIA ${\mathrm{t} \mathrm{\bar{t}}}$ simulation. The contribution of multijet, DY, and W boson background events in the 2t and 1t1l categories are extracted from the data (cf. Section 10). All other background contributions are taken from simulation. Combined systematic (cf. Section 13) and statistical uncertainties (hatched area) are shown for the total predicted yields. The data points are shown with statistical uncertainties. The ratios of data to the sum of the predicted yields are provided in the lower panels. |
png pdf |
Figure 7-a:
Comparisons of various reconstructed kinematic distributions between data (points) and predictions (colored histograms) obtained for the parton-level measurement. Contributions of the various reconstruction categories are obtained from the POWHEG+PYTHIA ${\mathrm{t} \mathrm{\bar{t}}}$ simulation. The contribution of multijet, DY, and W boson background events in the 2t and 1t1l categories are extracted from the data (cf. Section 10). All other background contributions are taken from simulation. Combined systematic (cf. Section 13) and statistical uncertainties (hatched area) are shown for the total predicted yields. The data points are shown with statistical uncertainties. The ratios of data to the sum of the predicted yields are provided in the lower panels. |

png pdf |
Figure 7-b:
Comparisons of various reconstructed kinematic distributions between data (points) and predictions (colored histograms) obtained for the parton-level measurement. Contributions of the various reconstruction categories are obtained from the POWHEG+PYTHIA ${\mathrm{t} \mathrm{\bar{t}}}$ simulation. The contribution of multijet, DY, and W boson background events in the 2t and 1t1l categories are extracted from the data (cf. Section 10). All other background contributions are taken from simulation. Combined systematic (cf. Section 13) and statistical uncertainties (hatched area) are shown for the total predicted yields. The data points are shown with statistical uncertainties. The ratios of data to the sum of the predicted yields are provided in the lower panels. |

png pdf |
Figure 7-c:
Comparisons of various reconstructed kinematic distributions between data (points) and predictions (colored histograms) obtained for the parton-level measurement. Contributions of the various reconstruction categories are obtained from the POWHEG+PYTHIA ${\mathrm{t} \mathrm{\bar{t}}}$ simulation. The contribution of multijet, DY, and W boson background events in the 2t and 1t1l categories are extracted from the data (cf. Section 10). All other background contributions are taken from simulation. Combined systematic (cf. Section 13) and statistical uncertainties (hatched area) are shown for the total predicted yields. The data points are shown with statistical uncertainties. The ratios of data to the sum of the predicted yields are provided in the lower panels. |
png pdf |
Figure 7-d:
Comparisons of various reconstructed kinematic distributions between data (points) and predictions (colored histograms) obtained for the parton-level measurement. Contributions of the various reconstruction categories are obtained from the POWHEG+PYTHIA ${\mathrm{t} \mathrm{\bar{t}}}$ simulation. The contribution of multijet, DY, and W boson background events in the 2t and 1t1l categories are extracted from the data (cf. Section 10). All other background contributions are taken from simulation. Combined systematic (cf. Section 13) and statistical uncertainties (hatched area) are shown for the total predicted yields. The data points are shown with statistical uncertainties. The ratios of data to the sum of the predicted yields are provided in the lower panels. |
png pdf |
Figure 7-e:
Comparisons of various reconstructed kinematic distributions between data (points) and predictions (colored histograms) obtained for the parton-level measurement. Contributions of the various reconstruction categories are obtained from the POWHEG+PYTHIA ${\mathrm{t} \mathrm{\bar{t}}}$ simulation. The contribution of multijet, DY, and W boson background events in the 2t and 1t1l categories are extracted from the data (cf. Section 10). All other background contributions are taken from simulation. Combined systematic (cf. Section 13) and statistical uncertainties (hatched area) are shown for the total predicted yields. The data points are shown with statistical uncertainties. The ratios of data to the sum of the predicted yields are provided in the lower panels. |
png pdf |
Figure 7-f:
Comparisons of various reconstructed kinematic distributions between data (points) and predictions (colored histograms) obtained for the parton-level measurement. Contributions of the various reconstruction categories are obtained from the POWHEG+PYTHIA ${\mathrm{t} \mathrm{\bar{t}}}$ simulation. The contribution of multijet, DY, and W boson background events in the 2t and 1t1l categories are extracted from the data (cf. Section 10). All other background contributions are taken from simulation. Combined systematic (cf. Section 13) and statistical uncertainties (hatched area) are shown for the total predicted yields. The data points are shown with statistical uncertainties. The ratios of data to the sum of the predicted yields are provided in the lower panels. |
png pdf |
Figure 8:
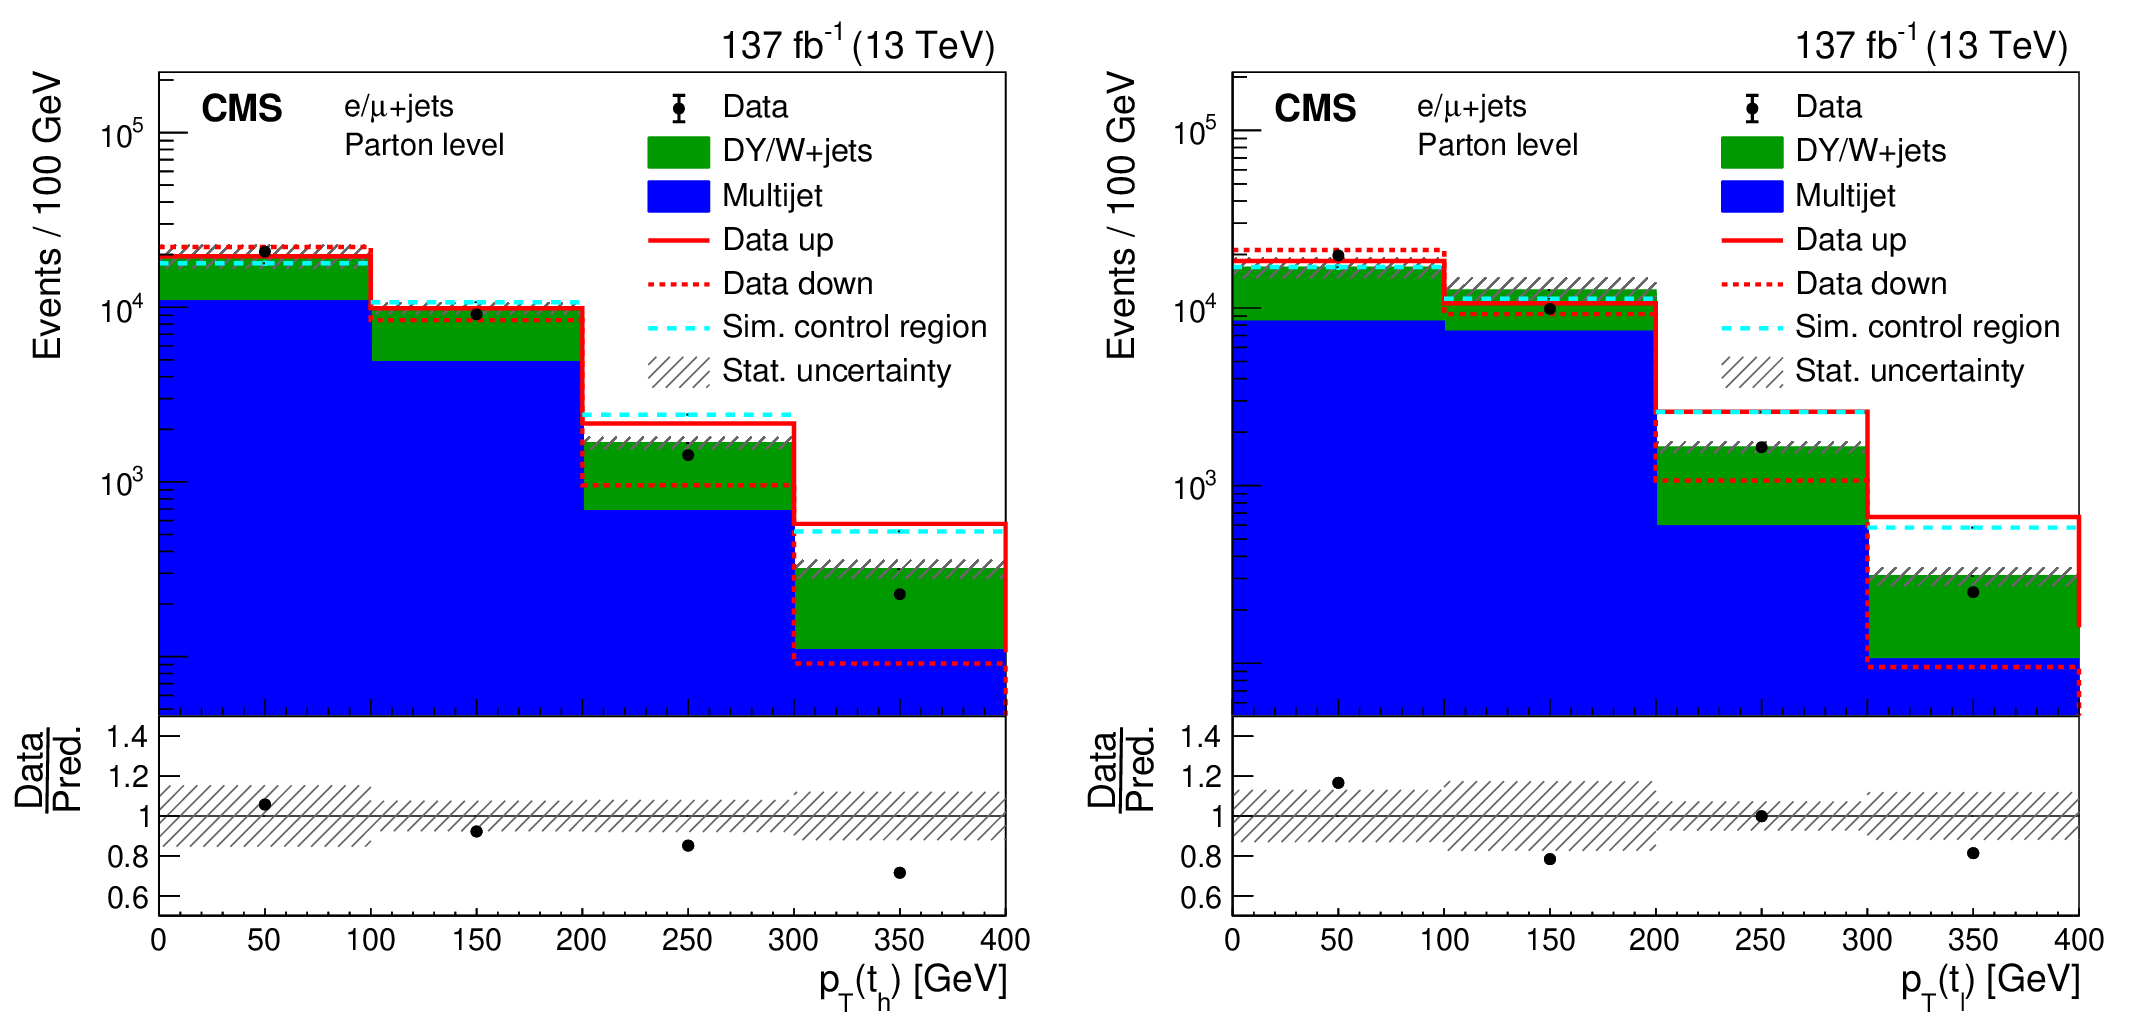
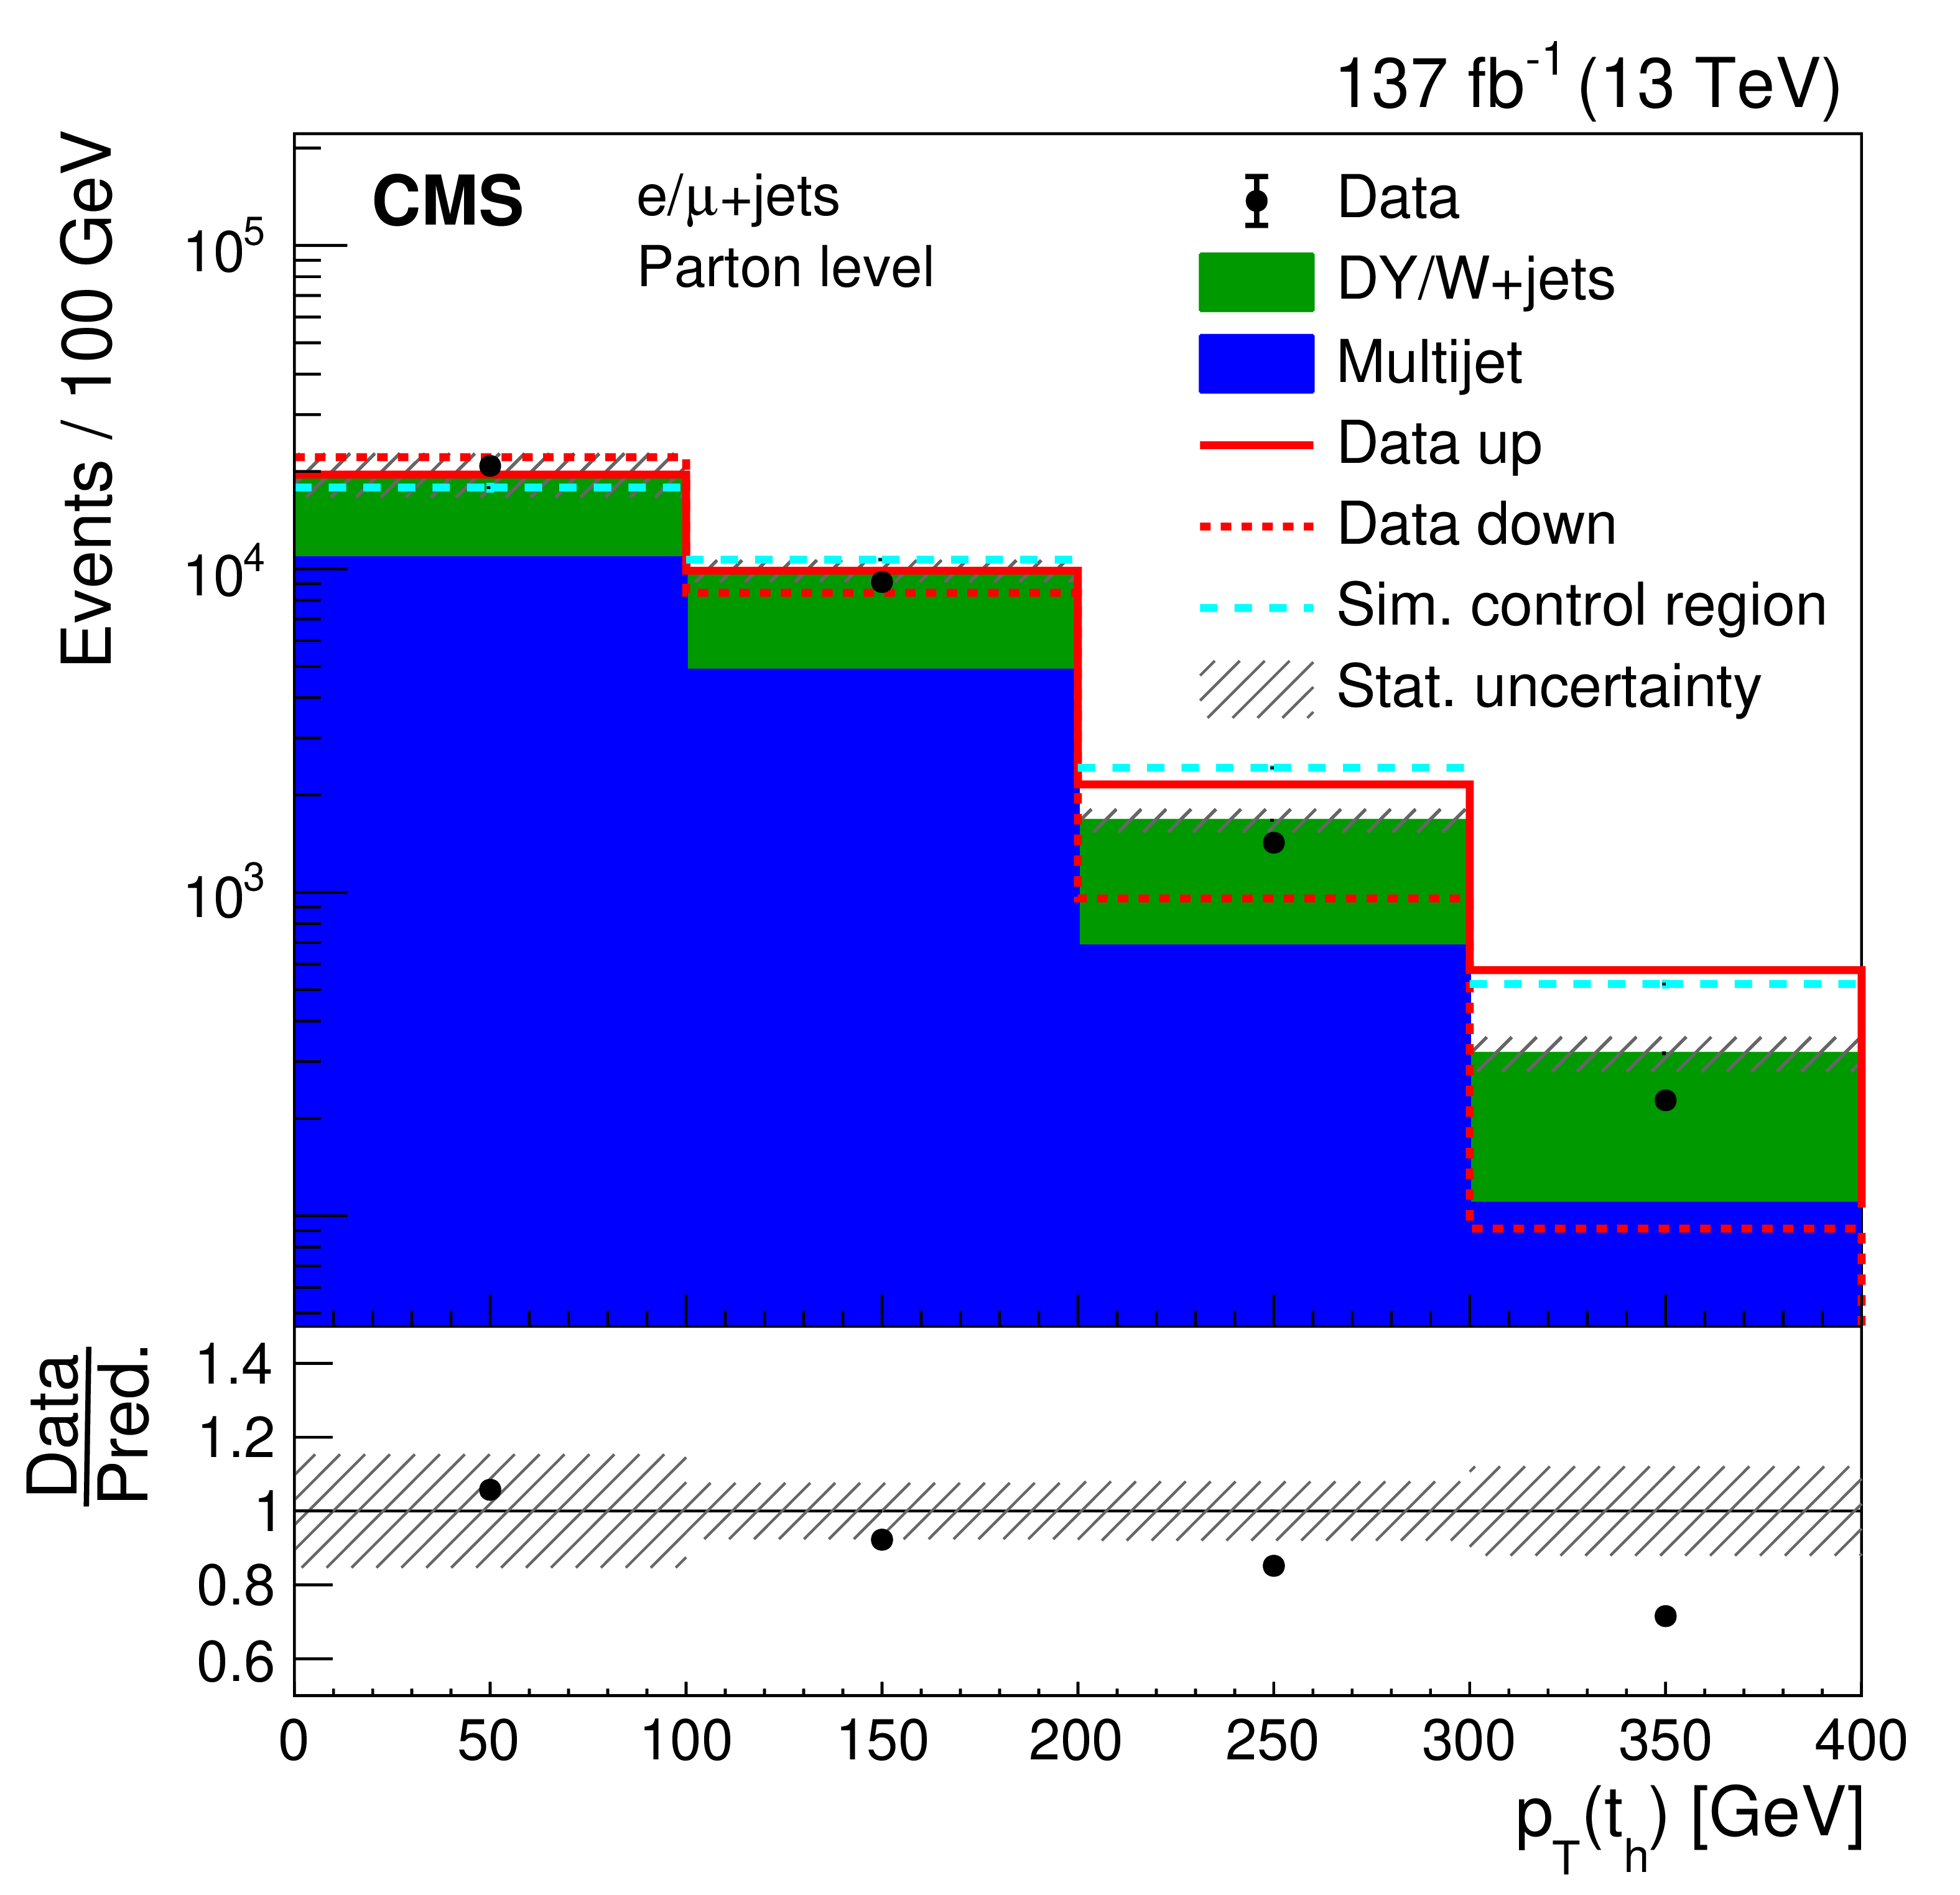
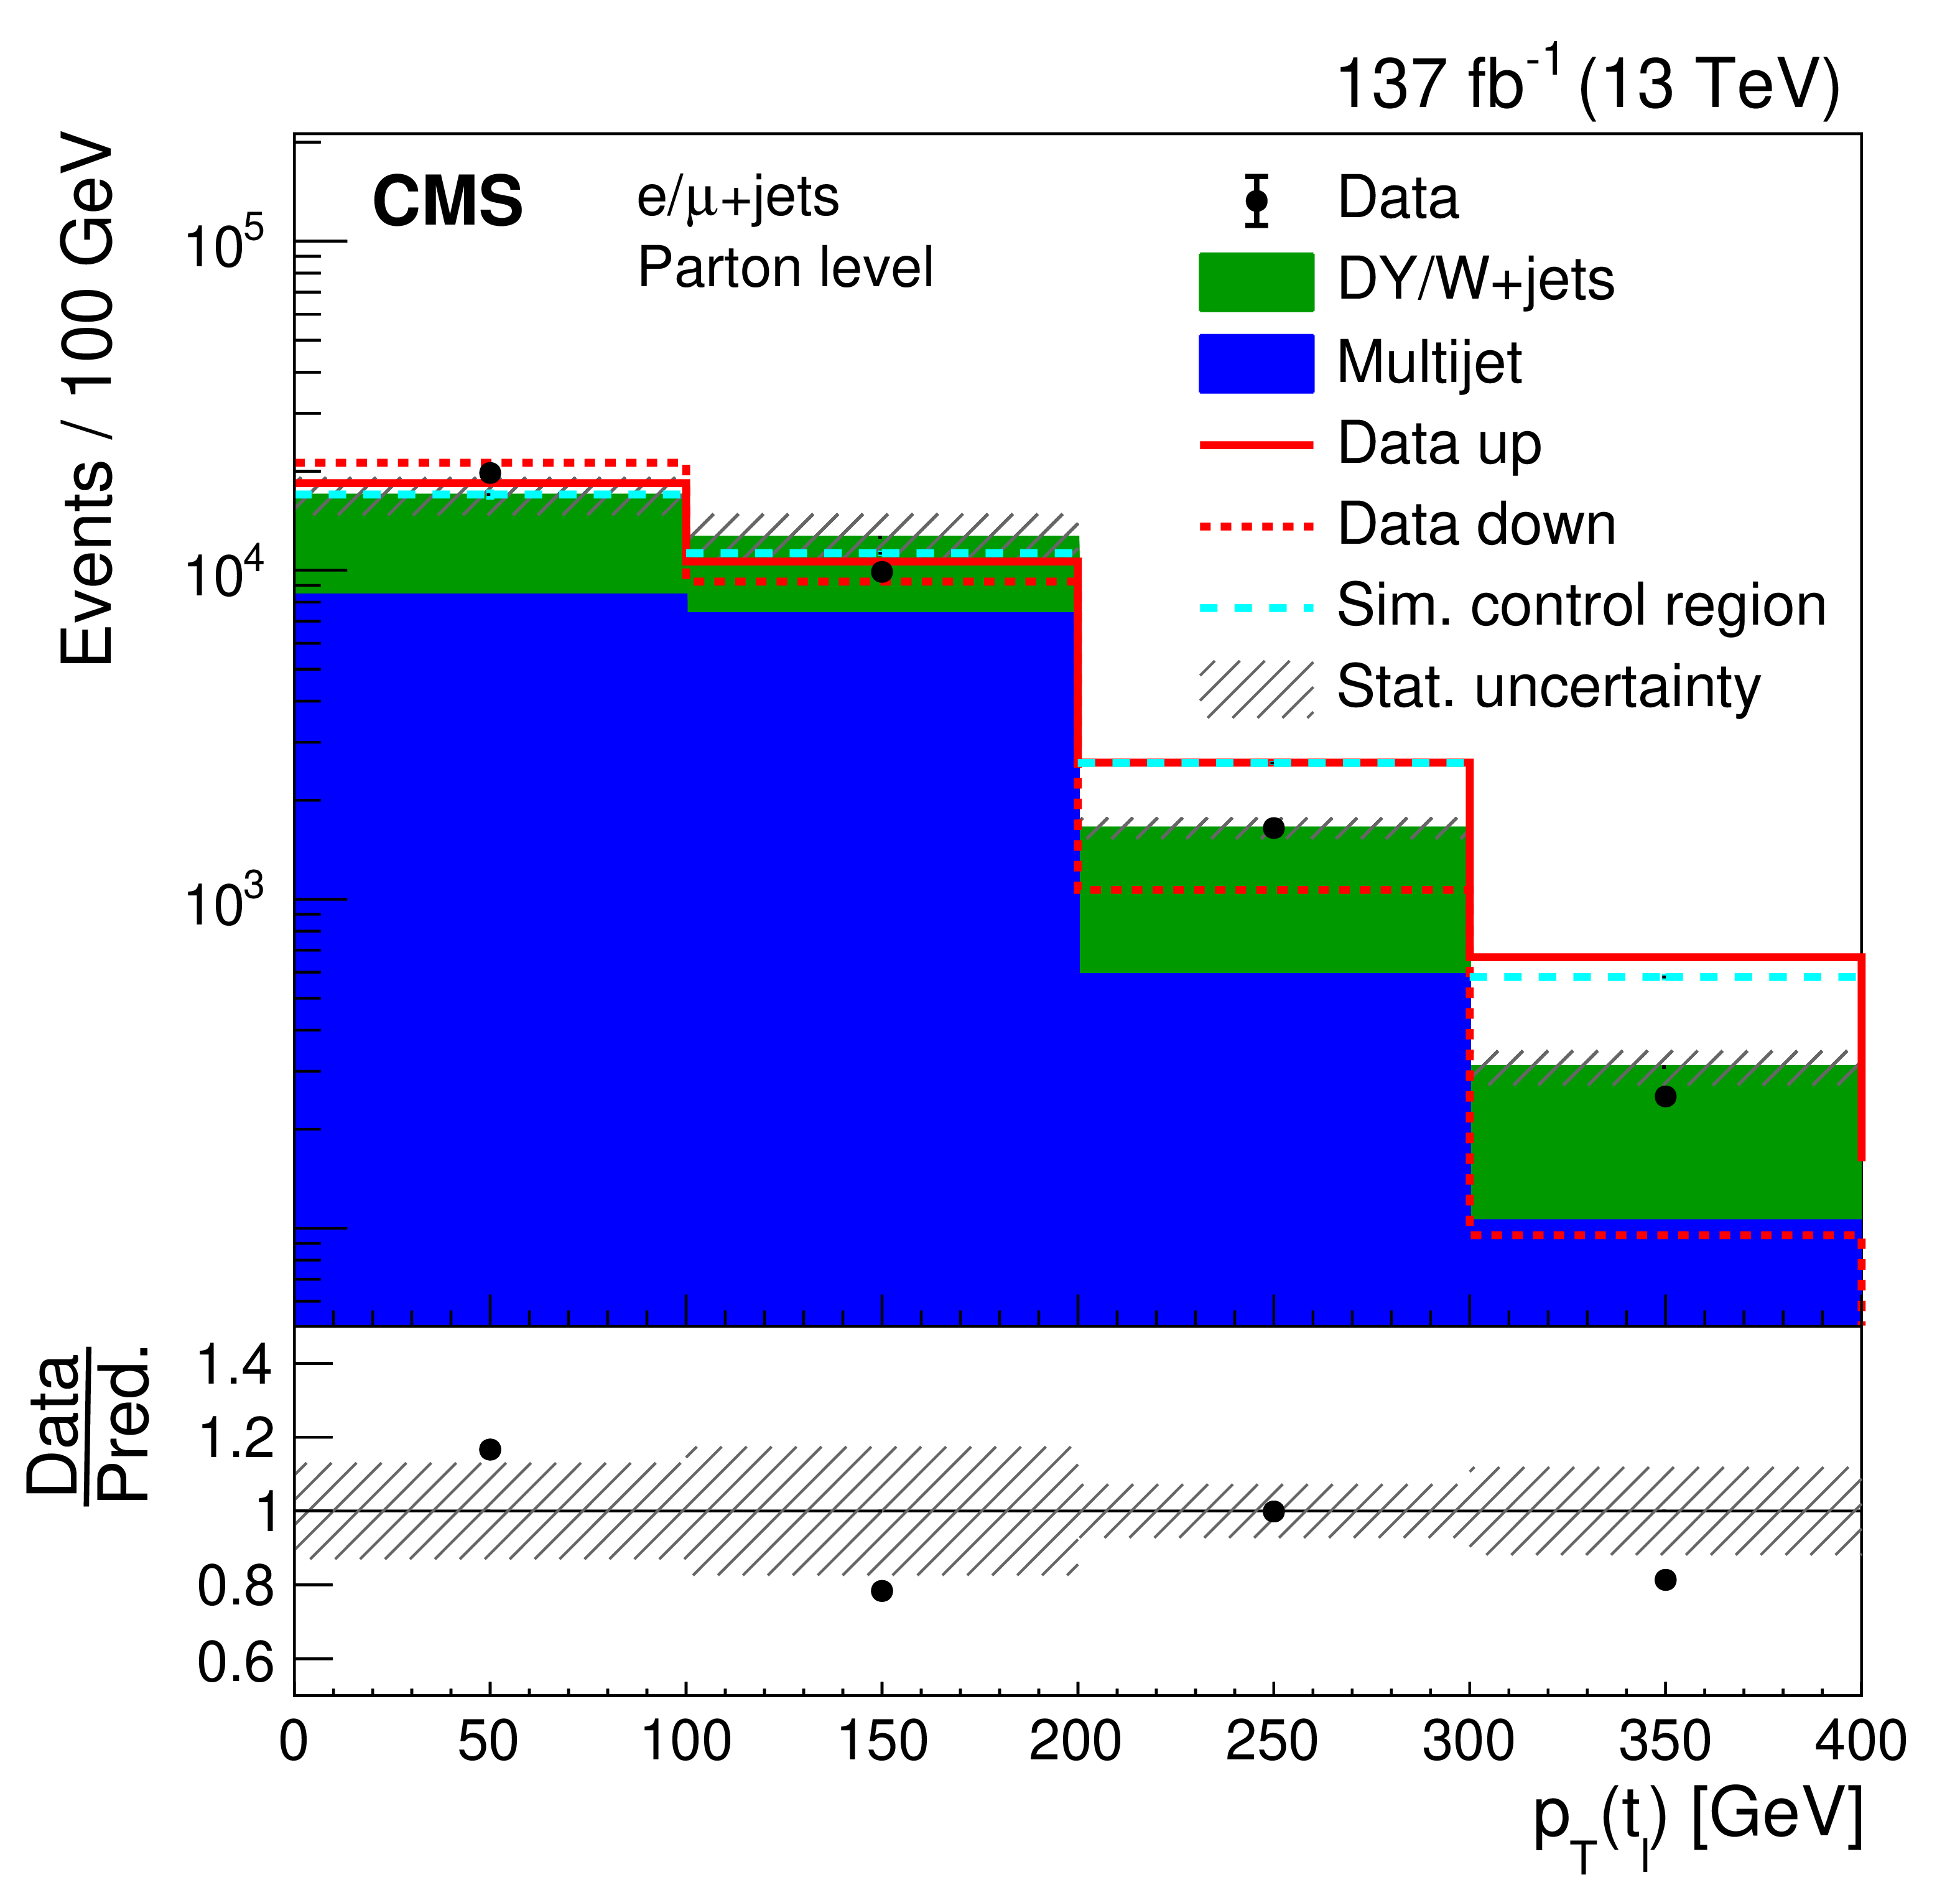
The ${{p_{\mathrm {T}}} ({\mathrm{t} _\mathrm {h}})}$ (left) and ${{p_{\mathrm {T}}} ({\mathrm{t} _\ell})}$ (right) distributions for the multijet and DY/W boson backgrounds from data (points) in the control region and from simulation (colored histograms) in the signal region for the 1t1l category. The red lines show the variations in the control region distribution when shifting the discriminant selection range up (solid lines) and down (dotted lines). The blue dashed line gives the sum of the multijet and DY/W boson predictions in the control region. The hatched band shows the statistical uncertainties in the prediction. The data points are shown with statistical uncertainties. The ratios of data to the predicted yields are provided in the lower panels. |
png pdf |
Figure 8-a:
The ${{p_{\mathrm {T}}} ({\mathrm{t} _\mathrm {h}})}$ (left) and ${{p_{\mathrm {T}}} ({\mathrm{t} _\ell})}$ (right) distributions for the multijet and DY/W boson backgrounds from data (points) in the control region and from simulation (colored histograms) in the signal region for the 1t1l category. The red lines show the variations in the control region distribution when shifting the discriminant selection range up (solid lines) and down (dotted lines). The blue dashed line gives the sum of the multijet and DY/W boson predictions in the control region. The hatched band shows the statistical uncertainties in the prediction. The data points are shown with statistical uncertainties. The ratios of data to the predicted yields are provided in the lower panels. |
png pdf |
Figure 8-b:
The ${{p_{\mathrm {T}}} ({\mathrm{t} _\mathrm {h}})}$ (left) and ${{p_{\mathrm {T}}} ({\mathrm{t} _\ell})}$ (right) distributions for the multijet and DY/W boson backgrounds from data (points) in the control region and from simulation (colored histograms) in the signal region for the 1t1l category. The red lines show the variations in the control region distribution when shifting the discriminant selection range up (solid lines) and down (dotted lines). The blue dashed line gives the sum of the multijet and DY/W boson predictions in the control region. The hatched band shows the statistical uncertainties in the prediction. The data points are shown with statistical uncertainties. The ratios of data to the predicted yields are provided in the lower panels. |
png pdf |
Figure 9:
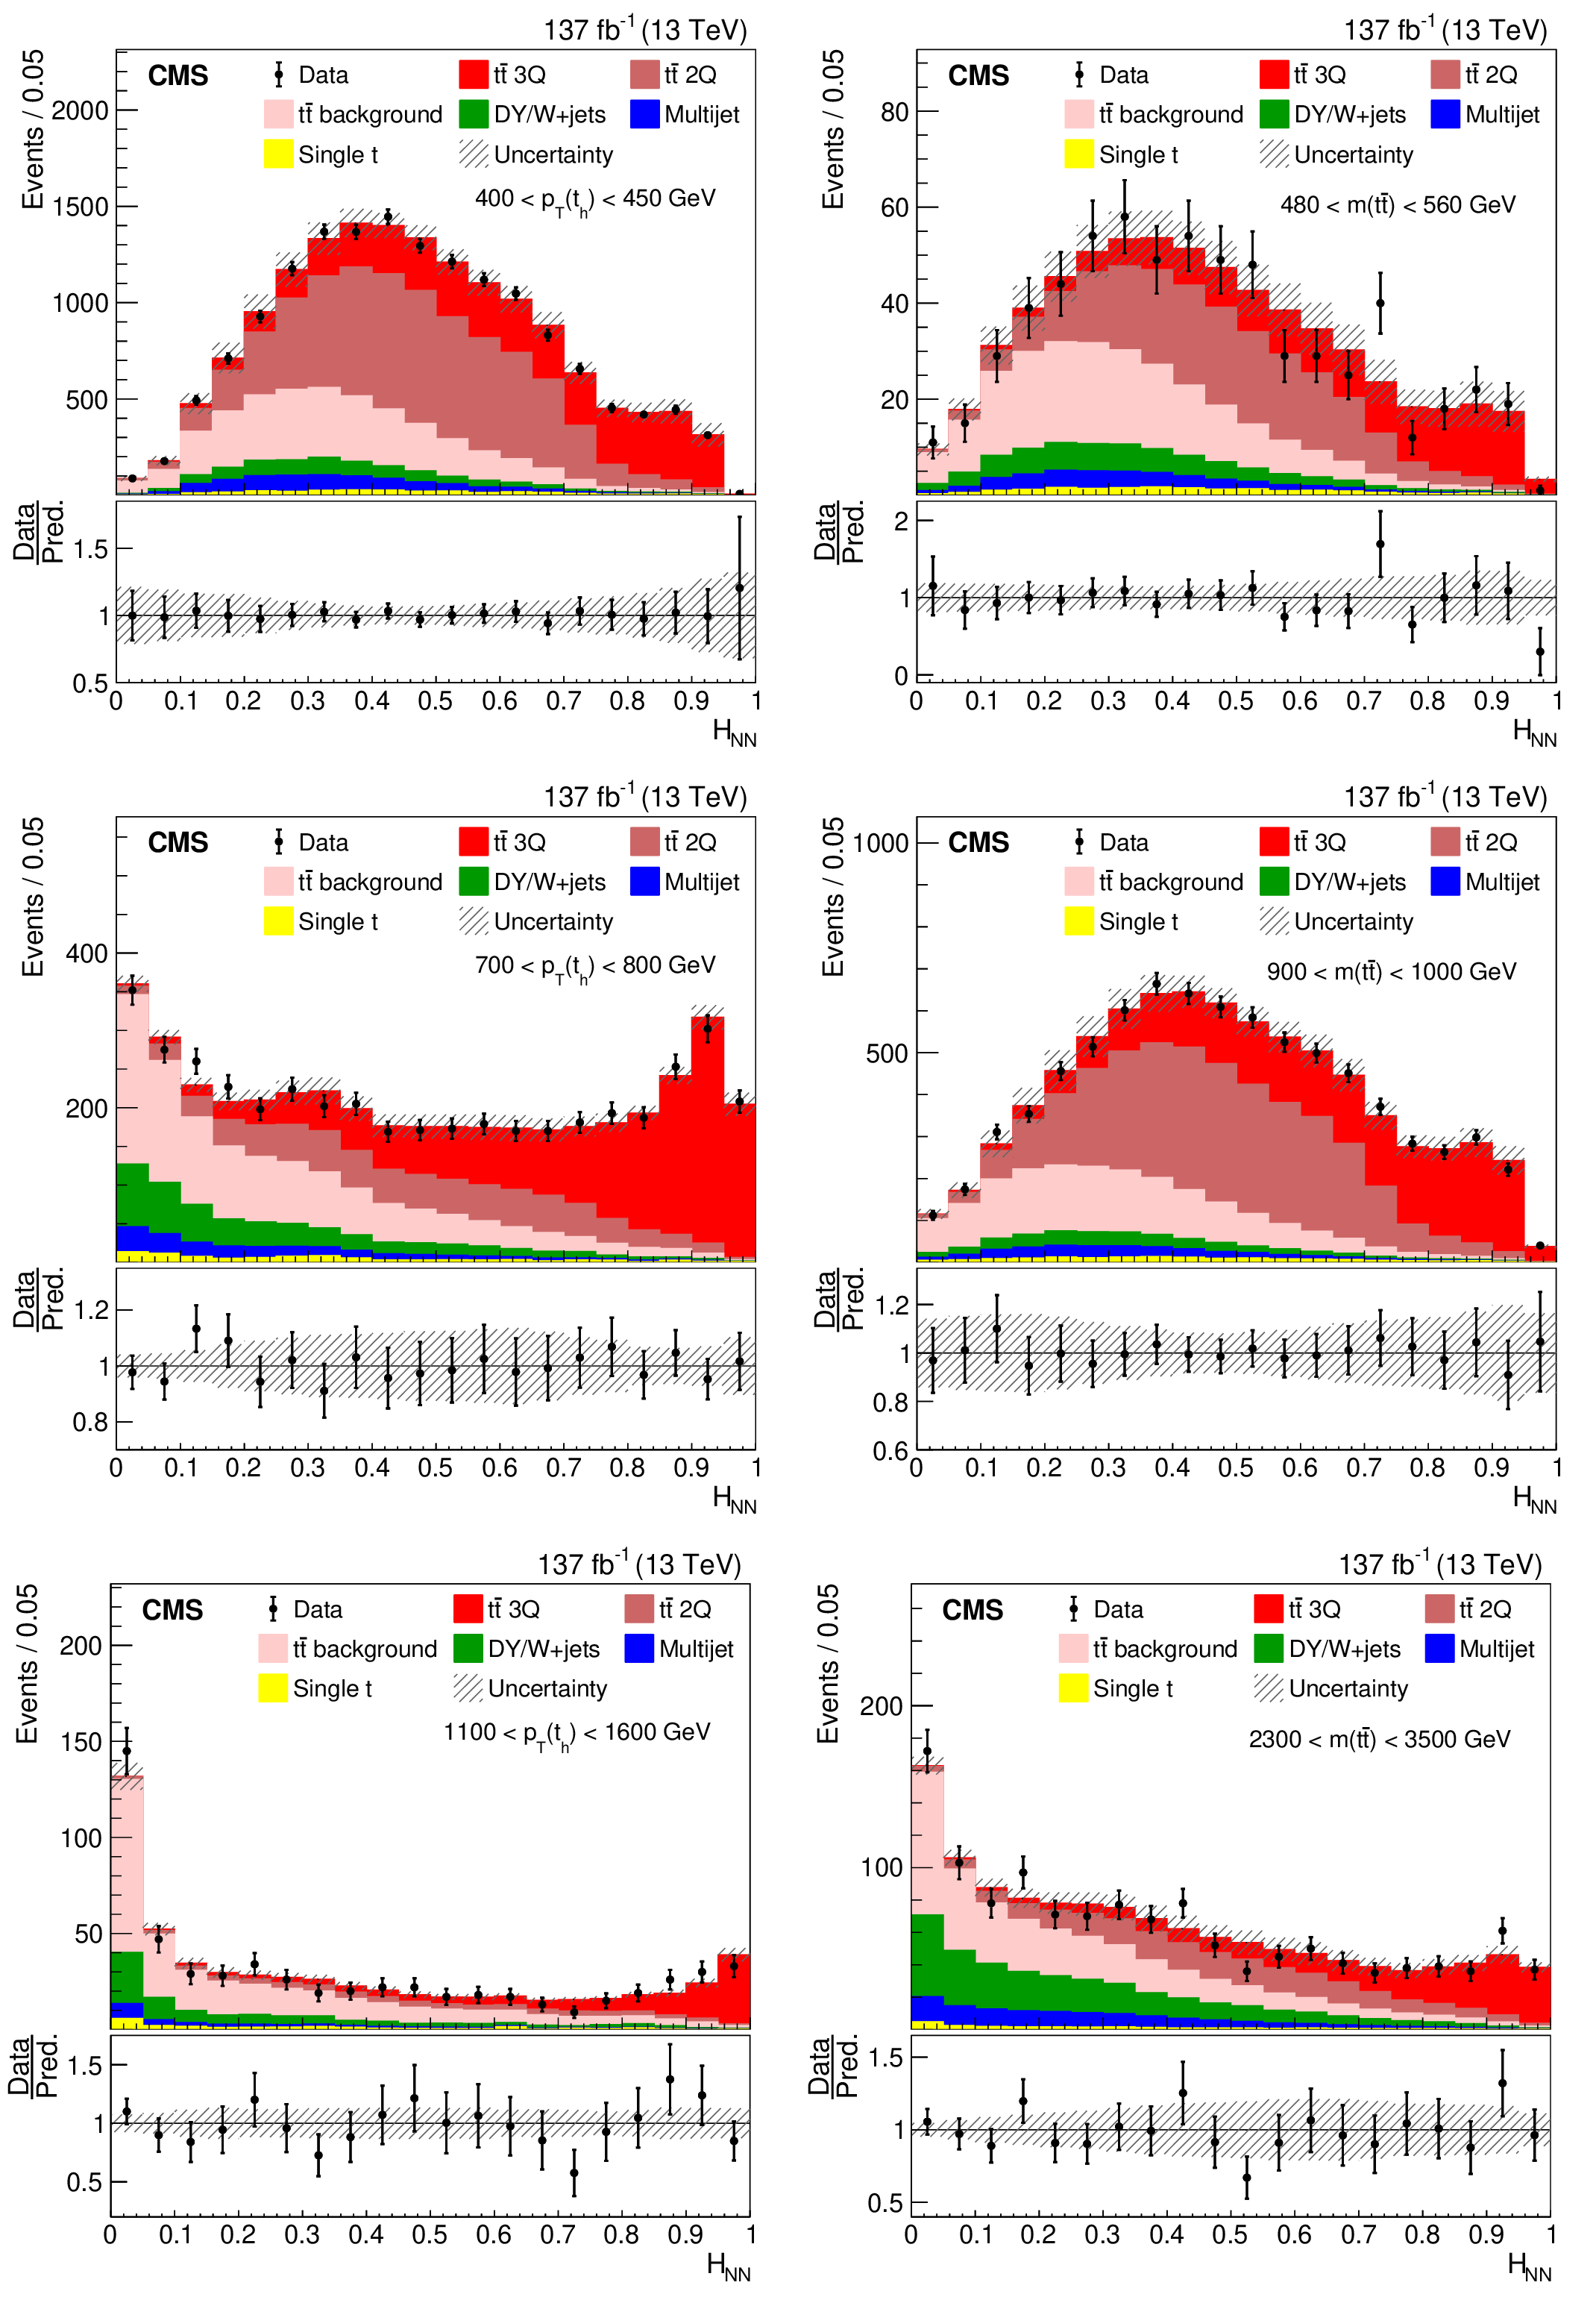
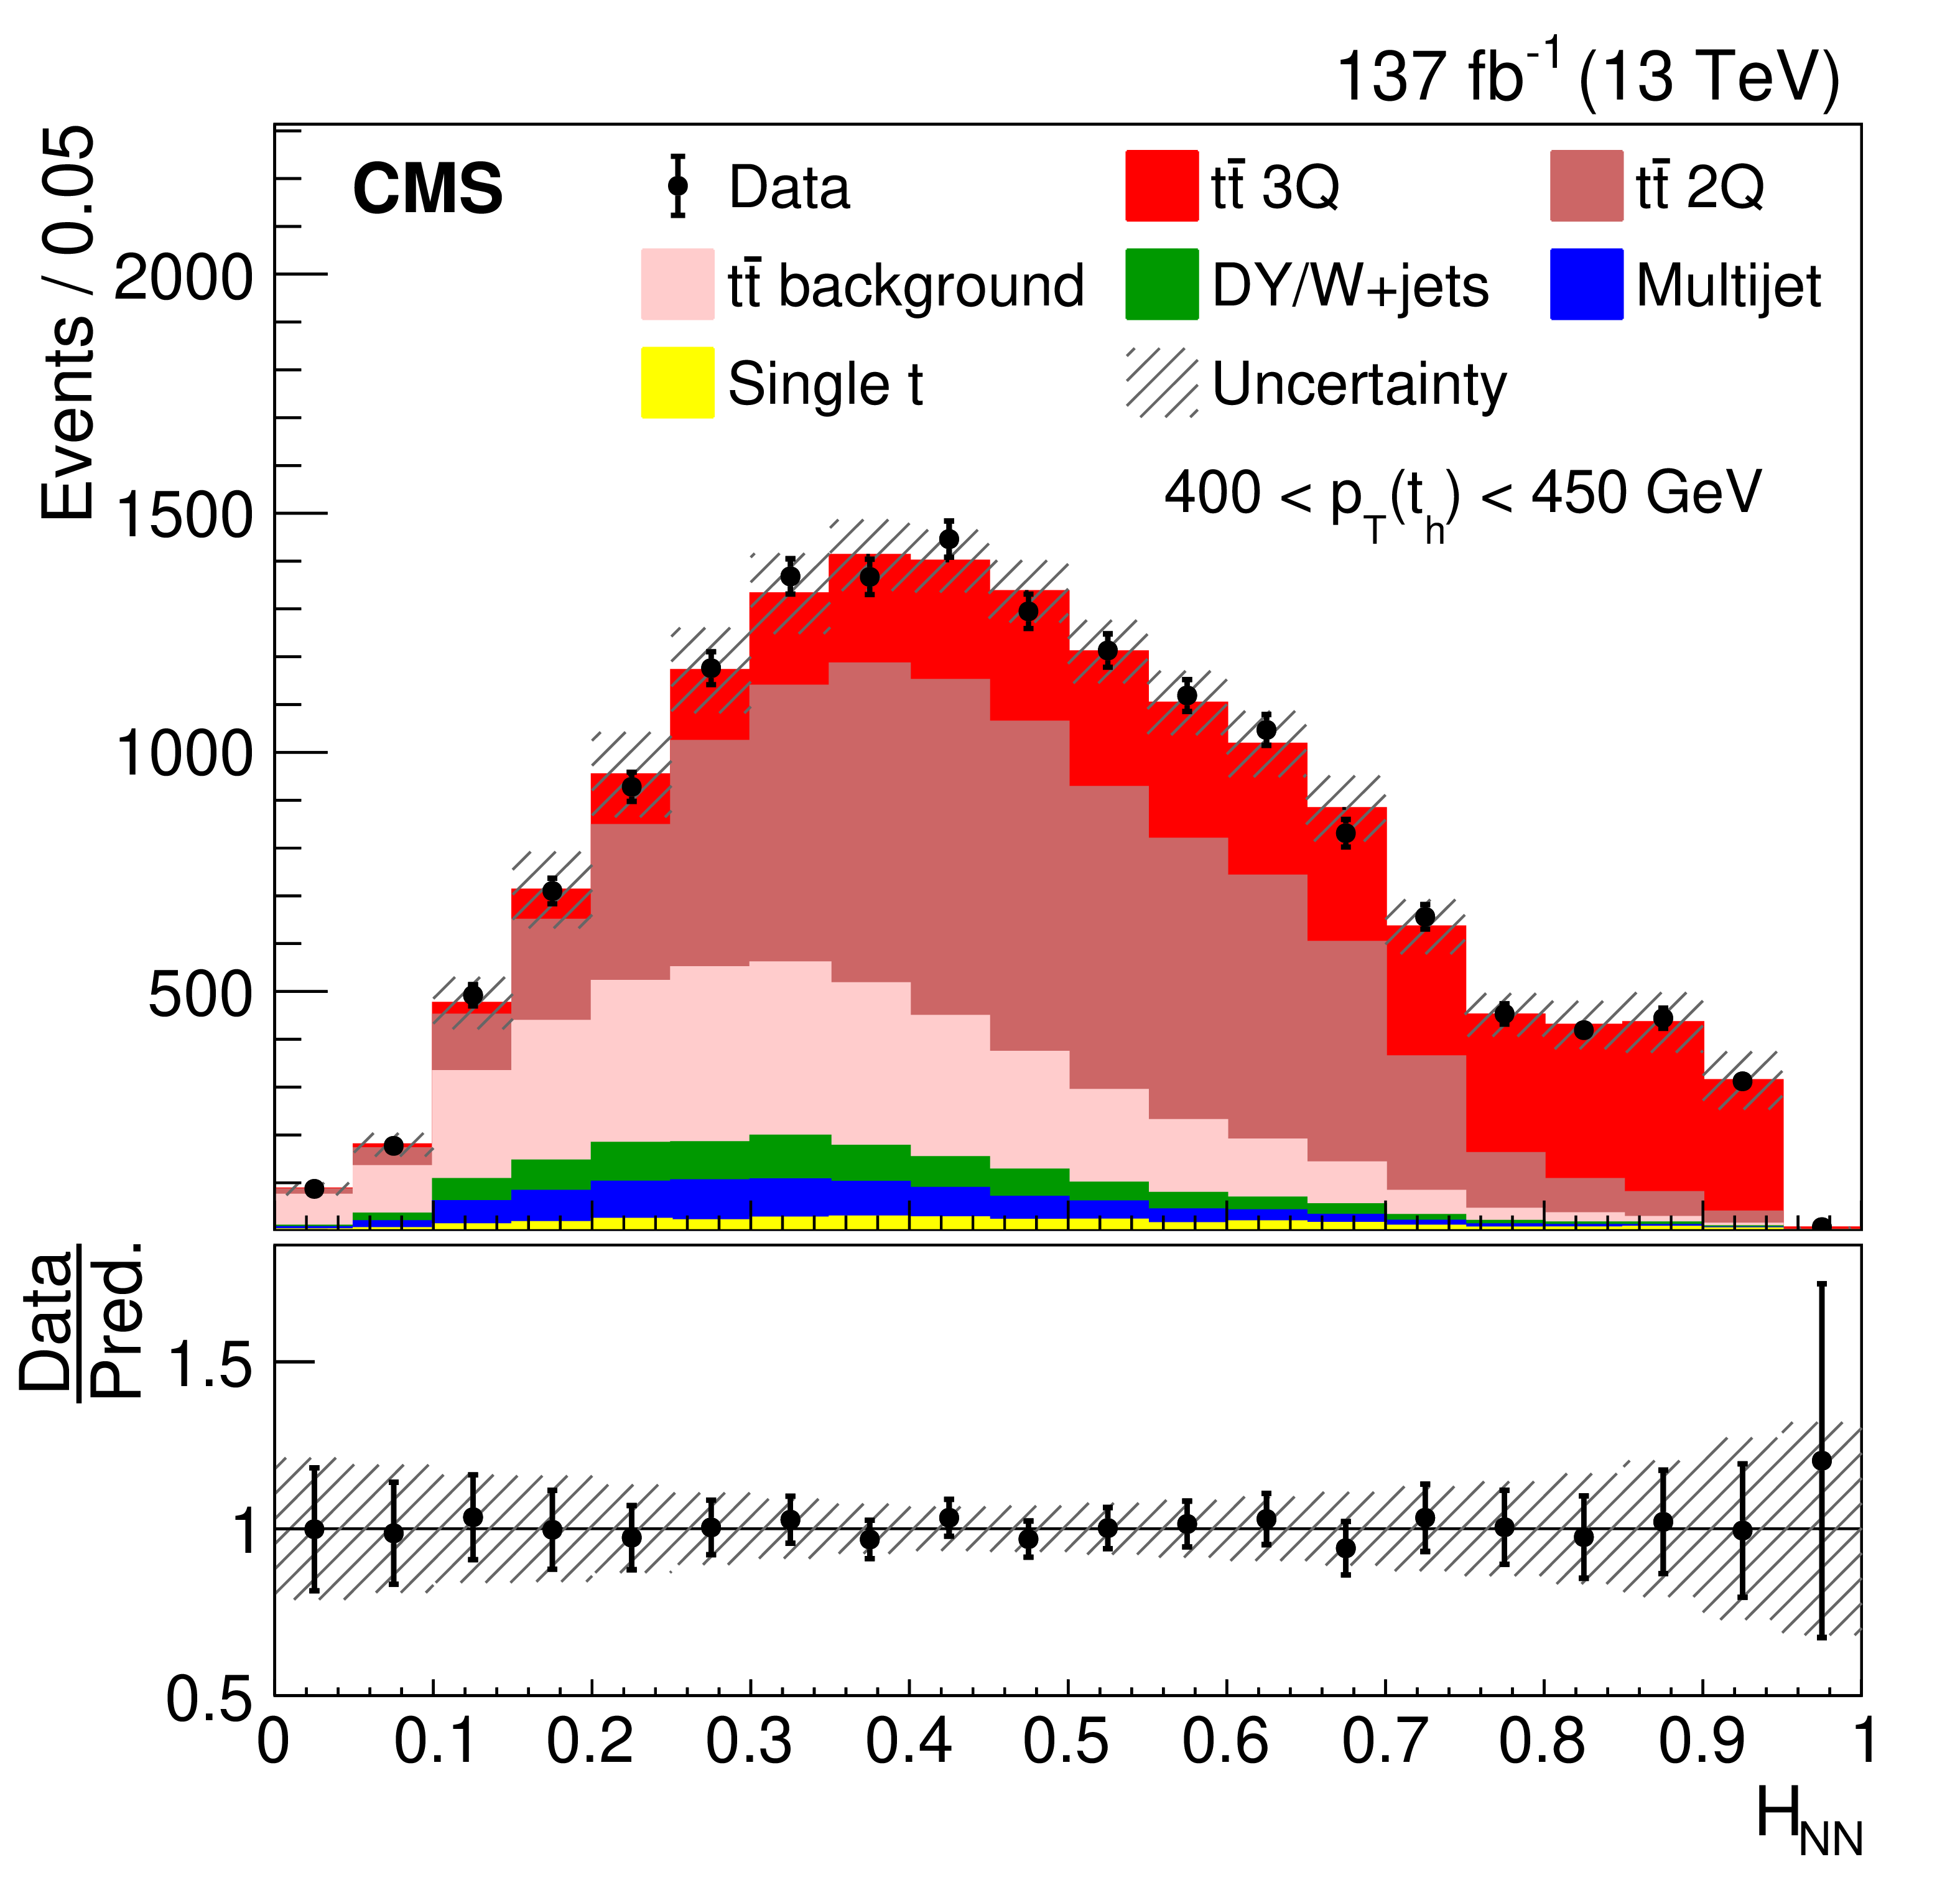
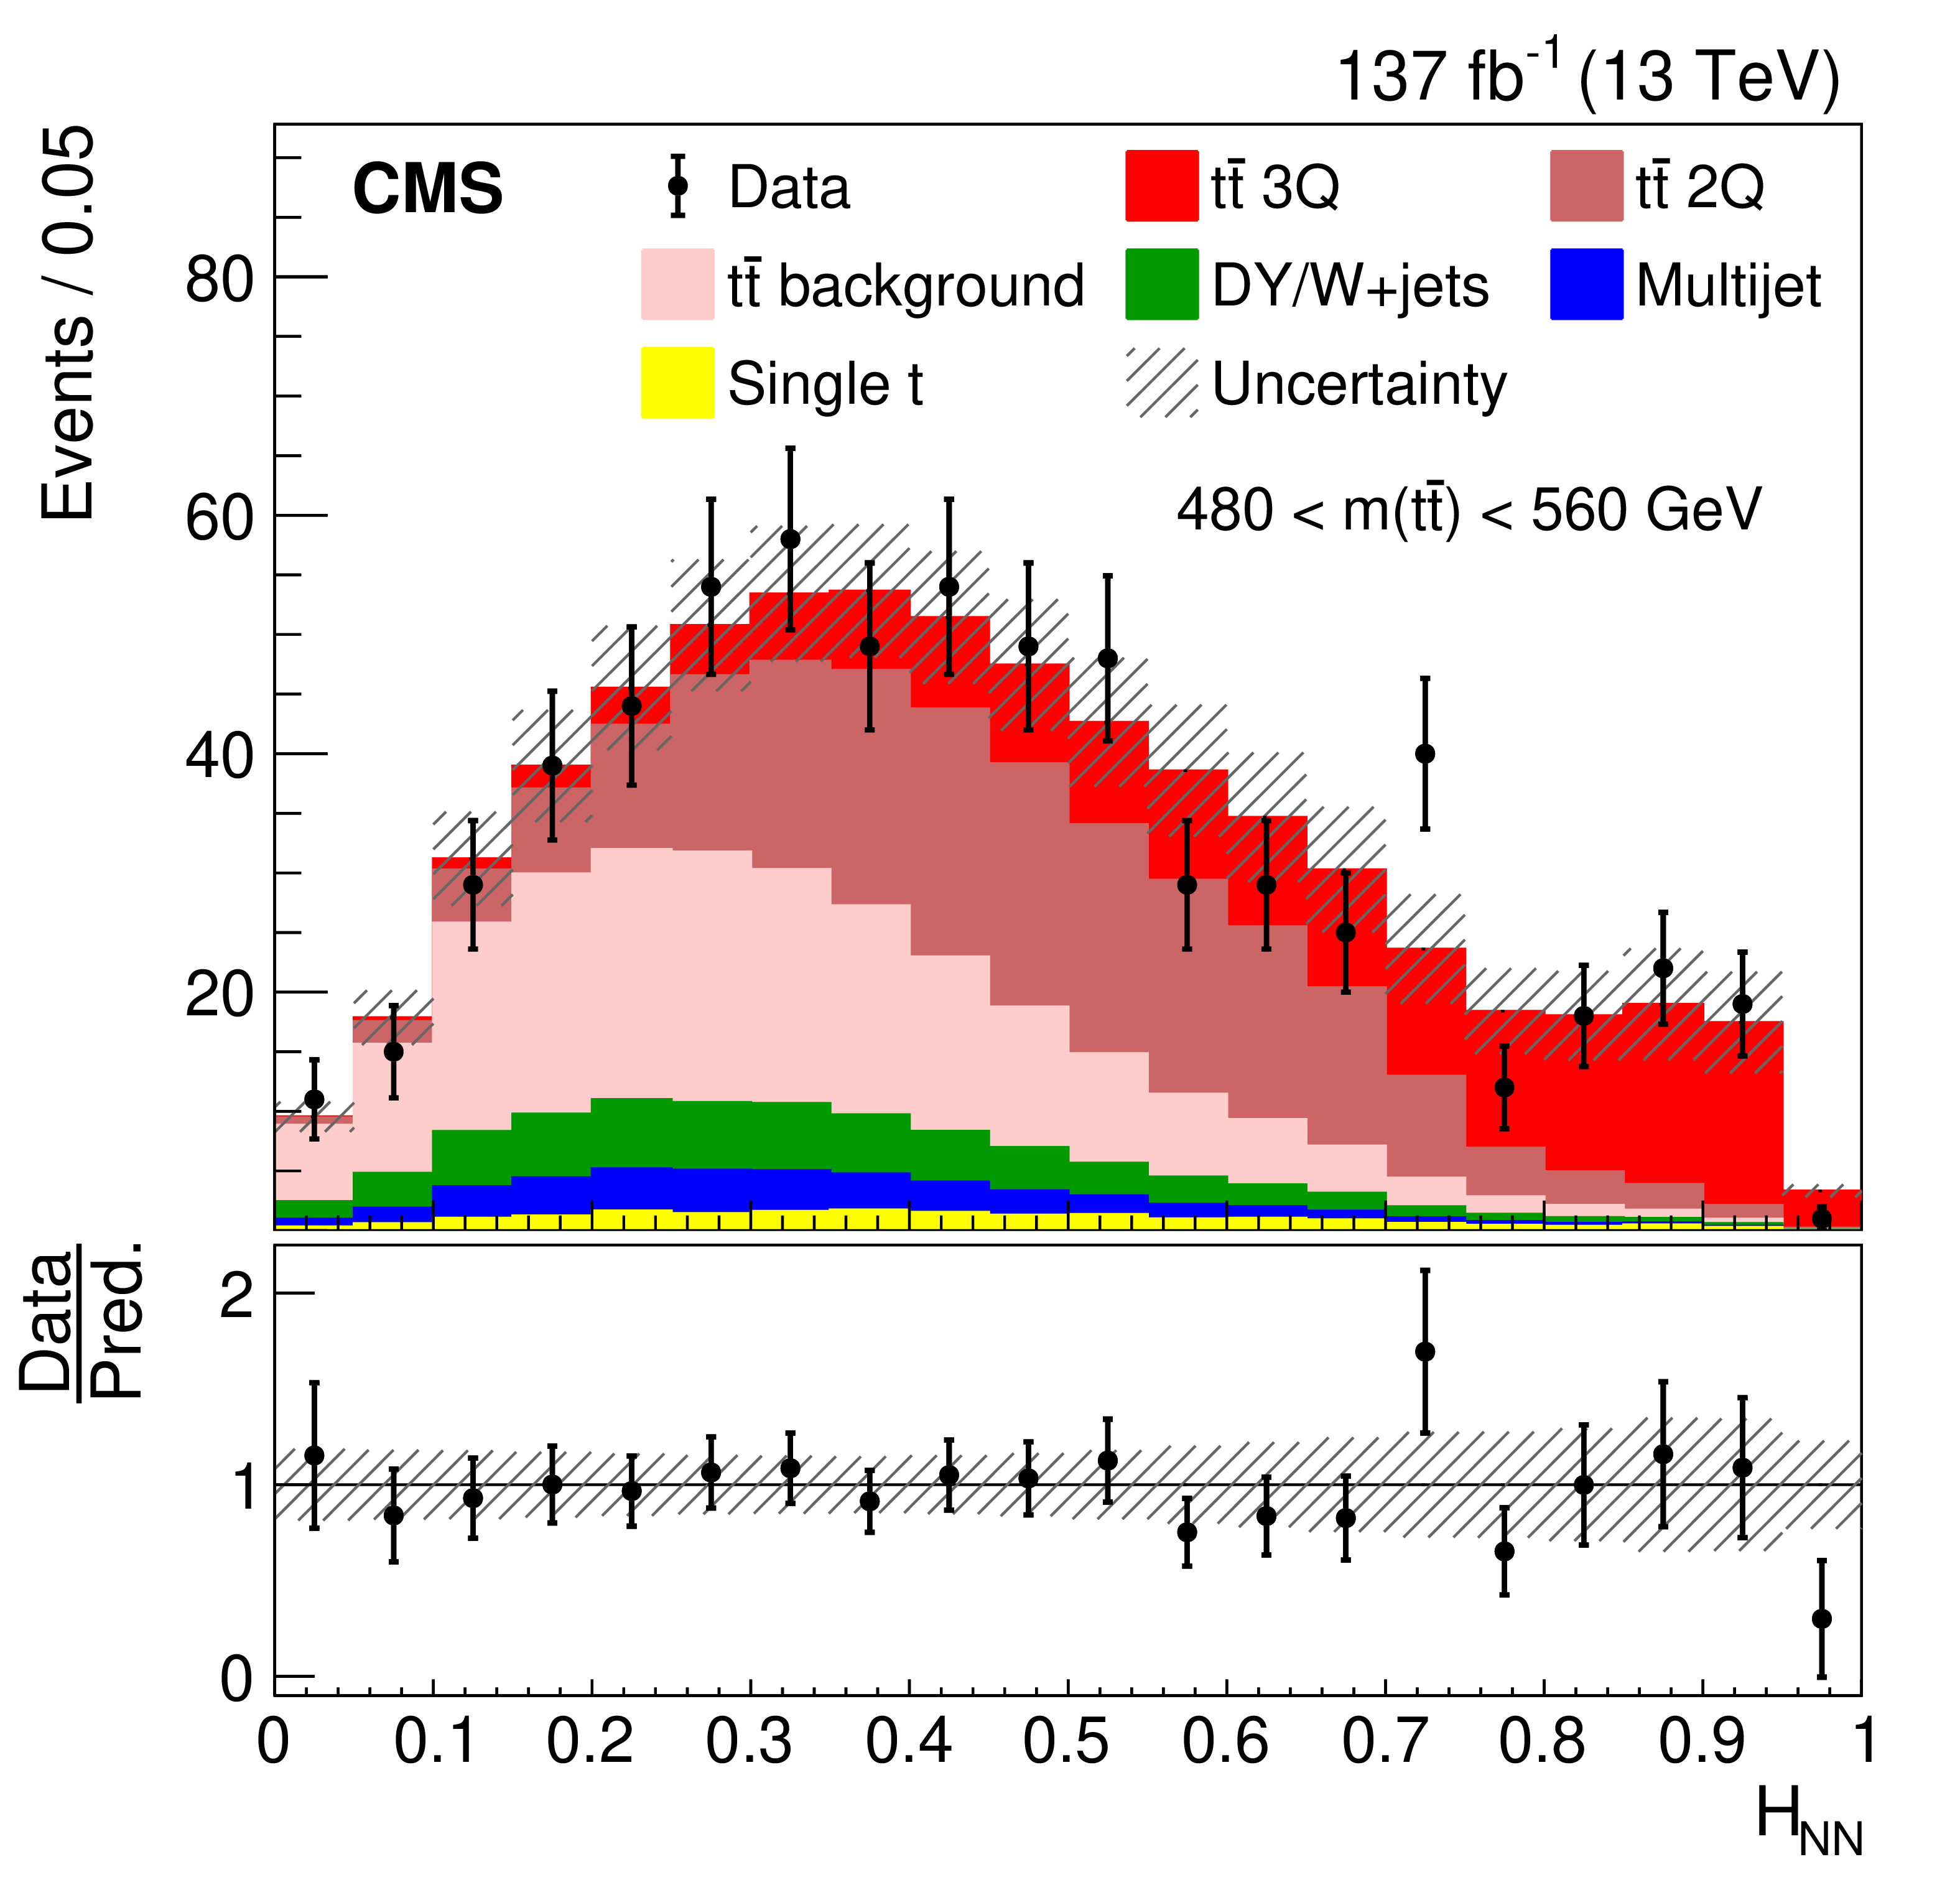
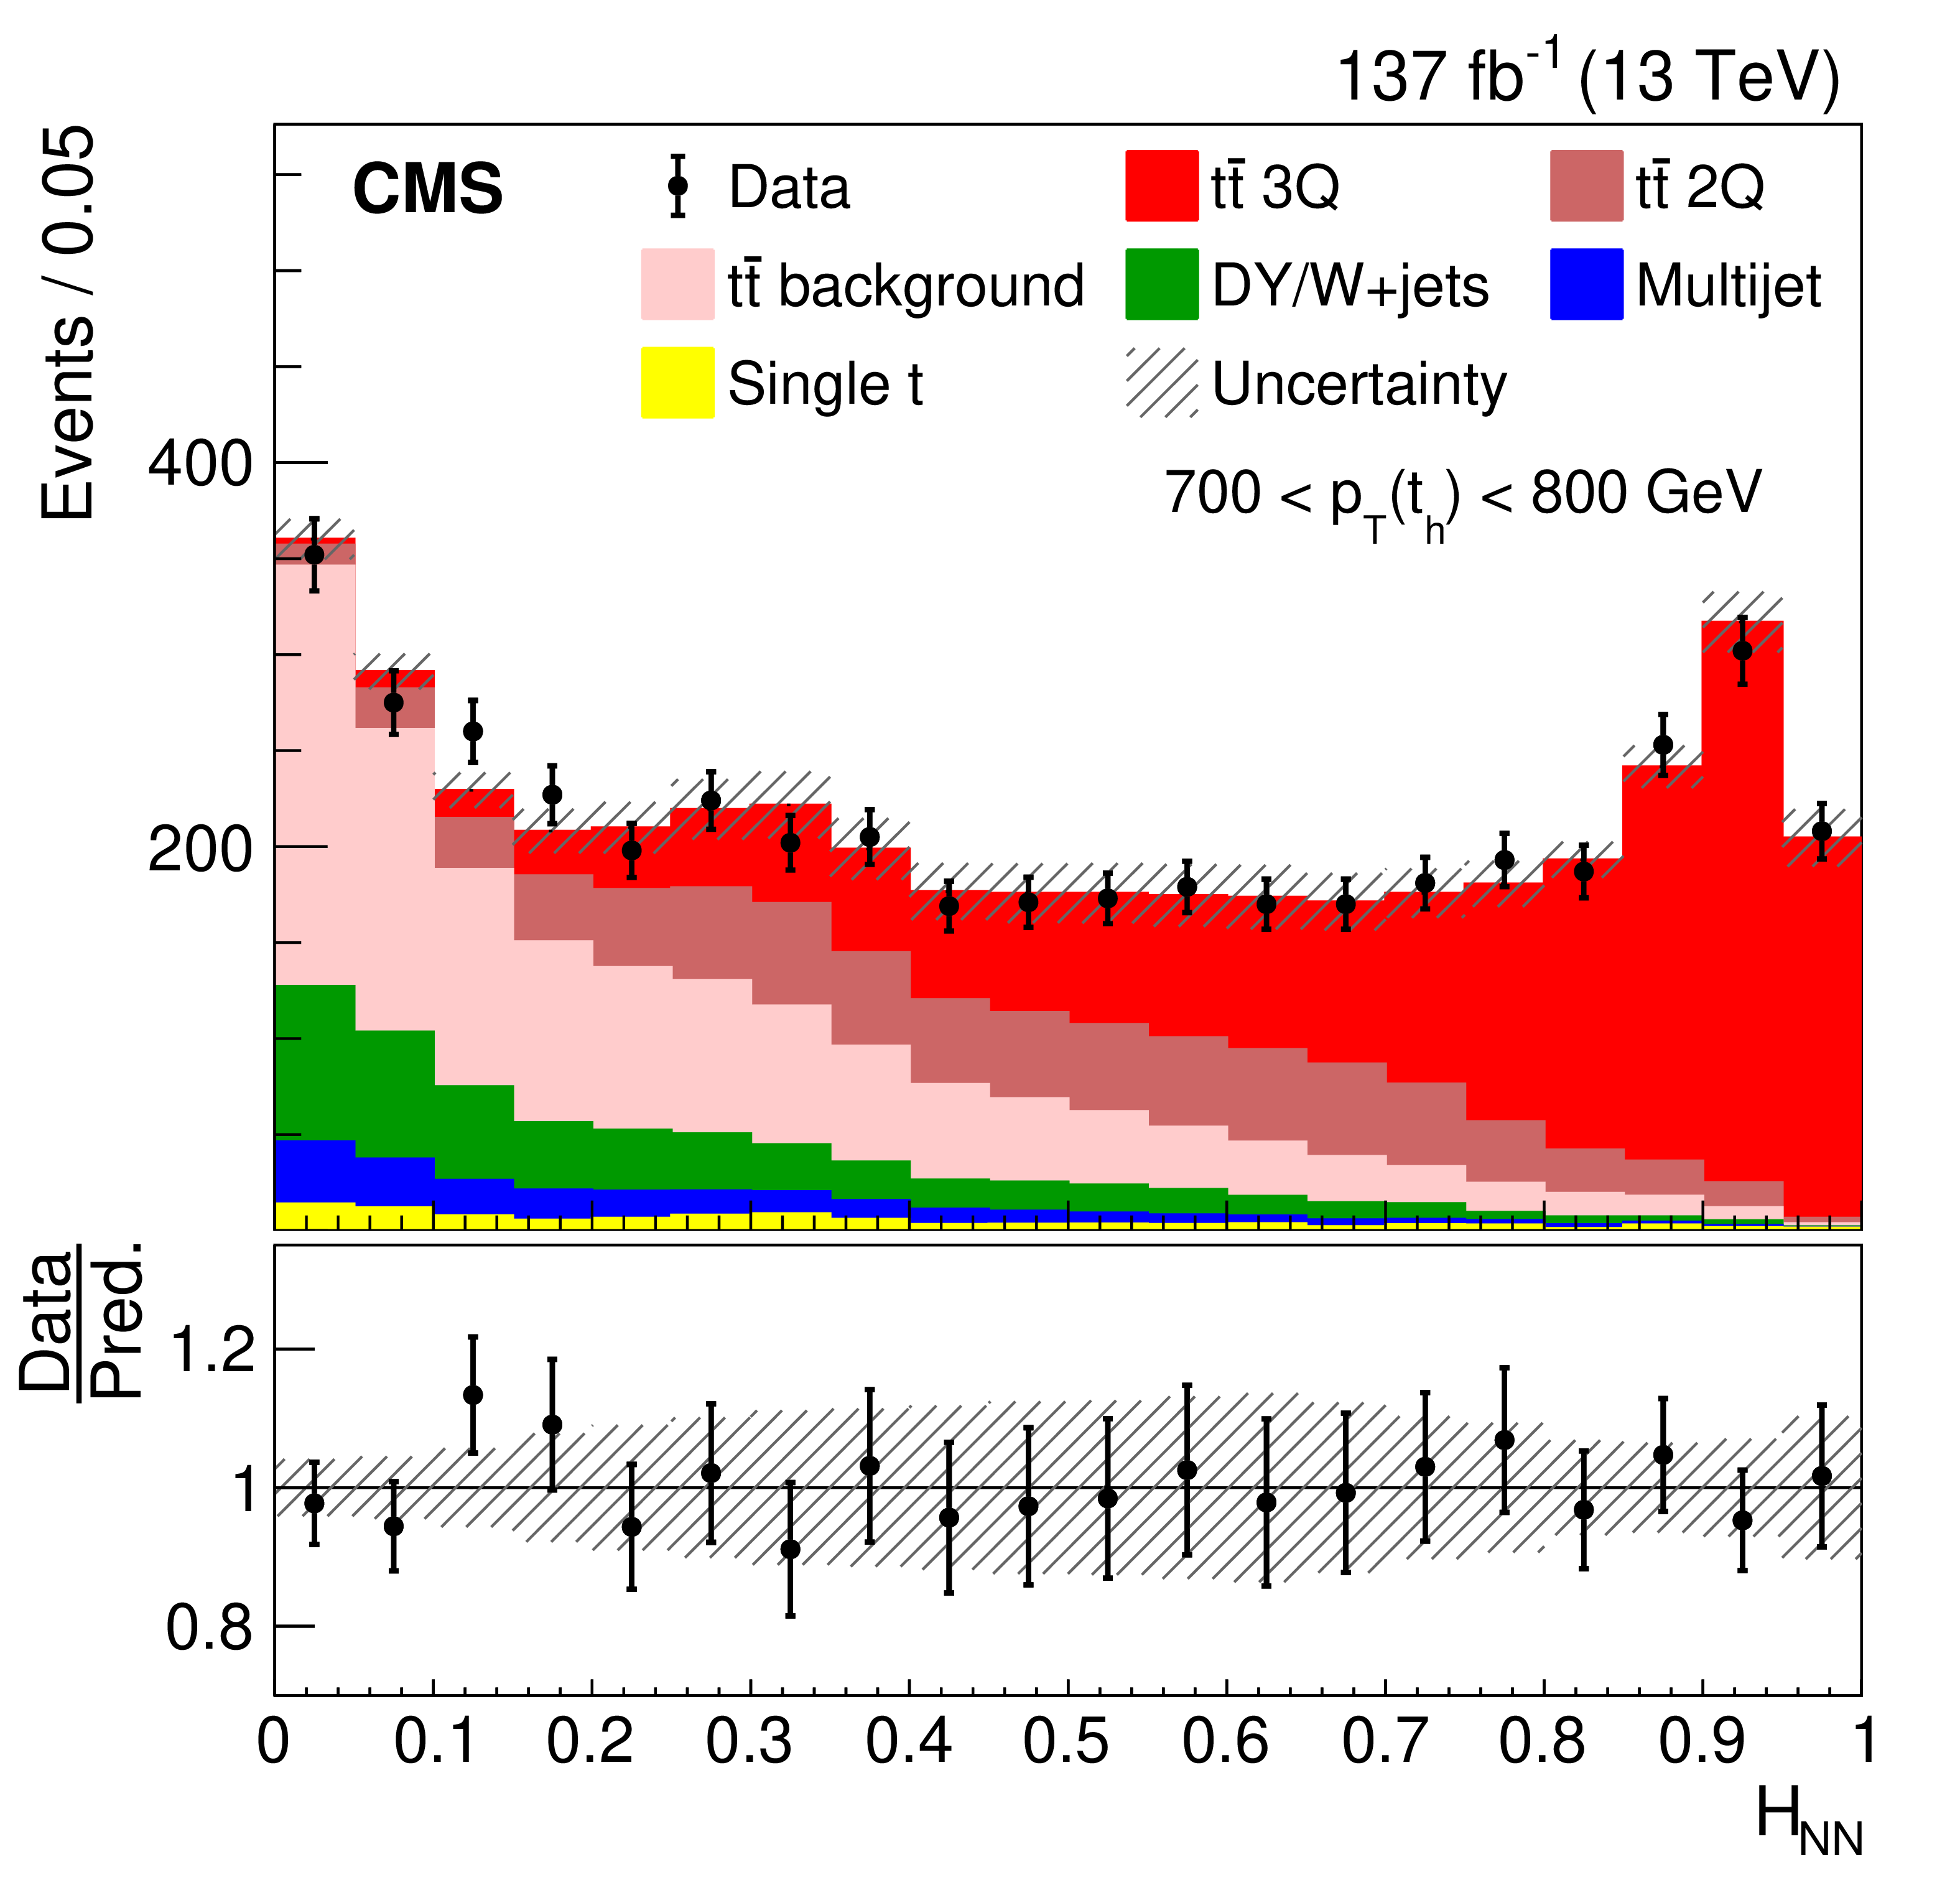
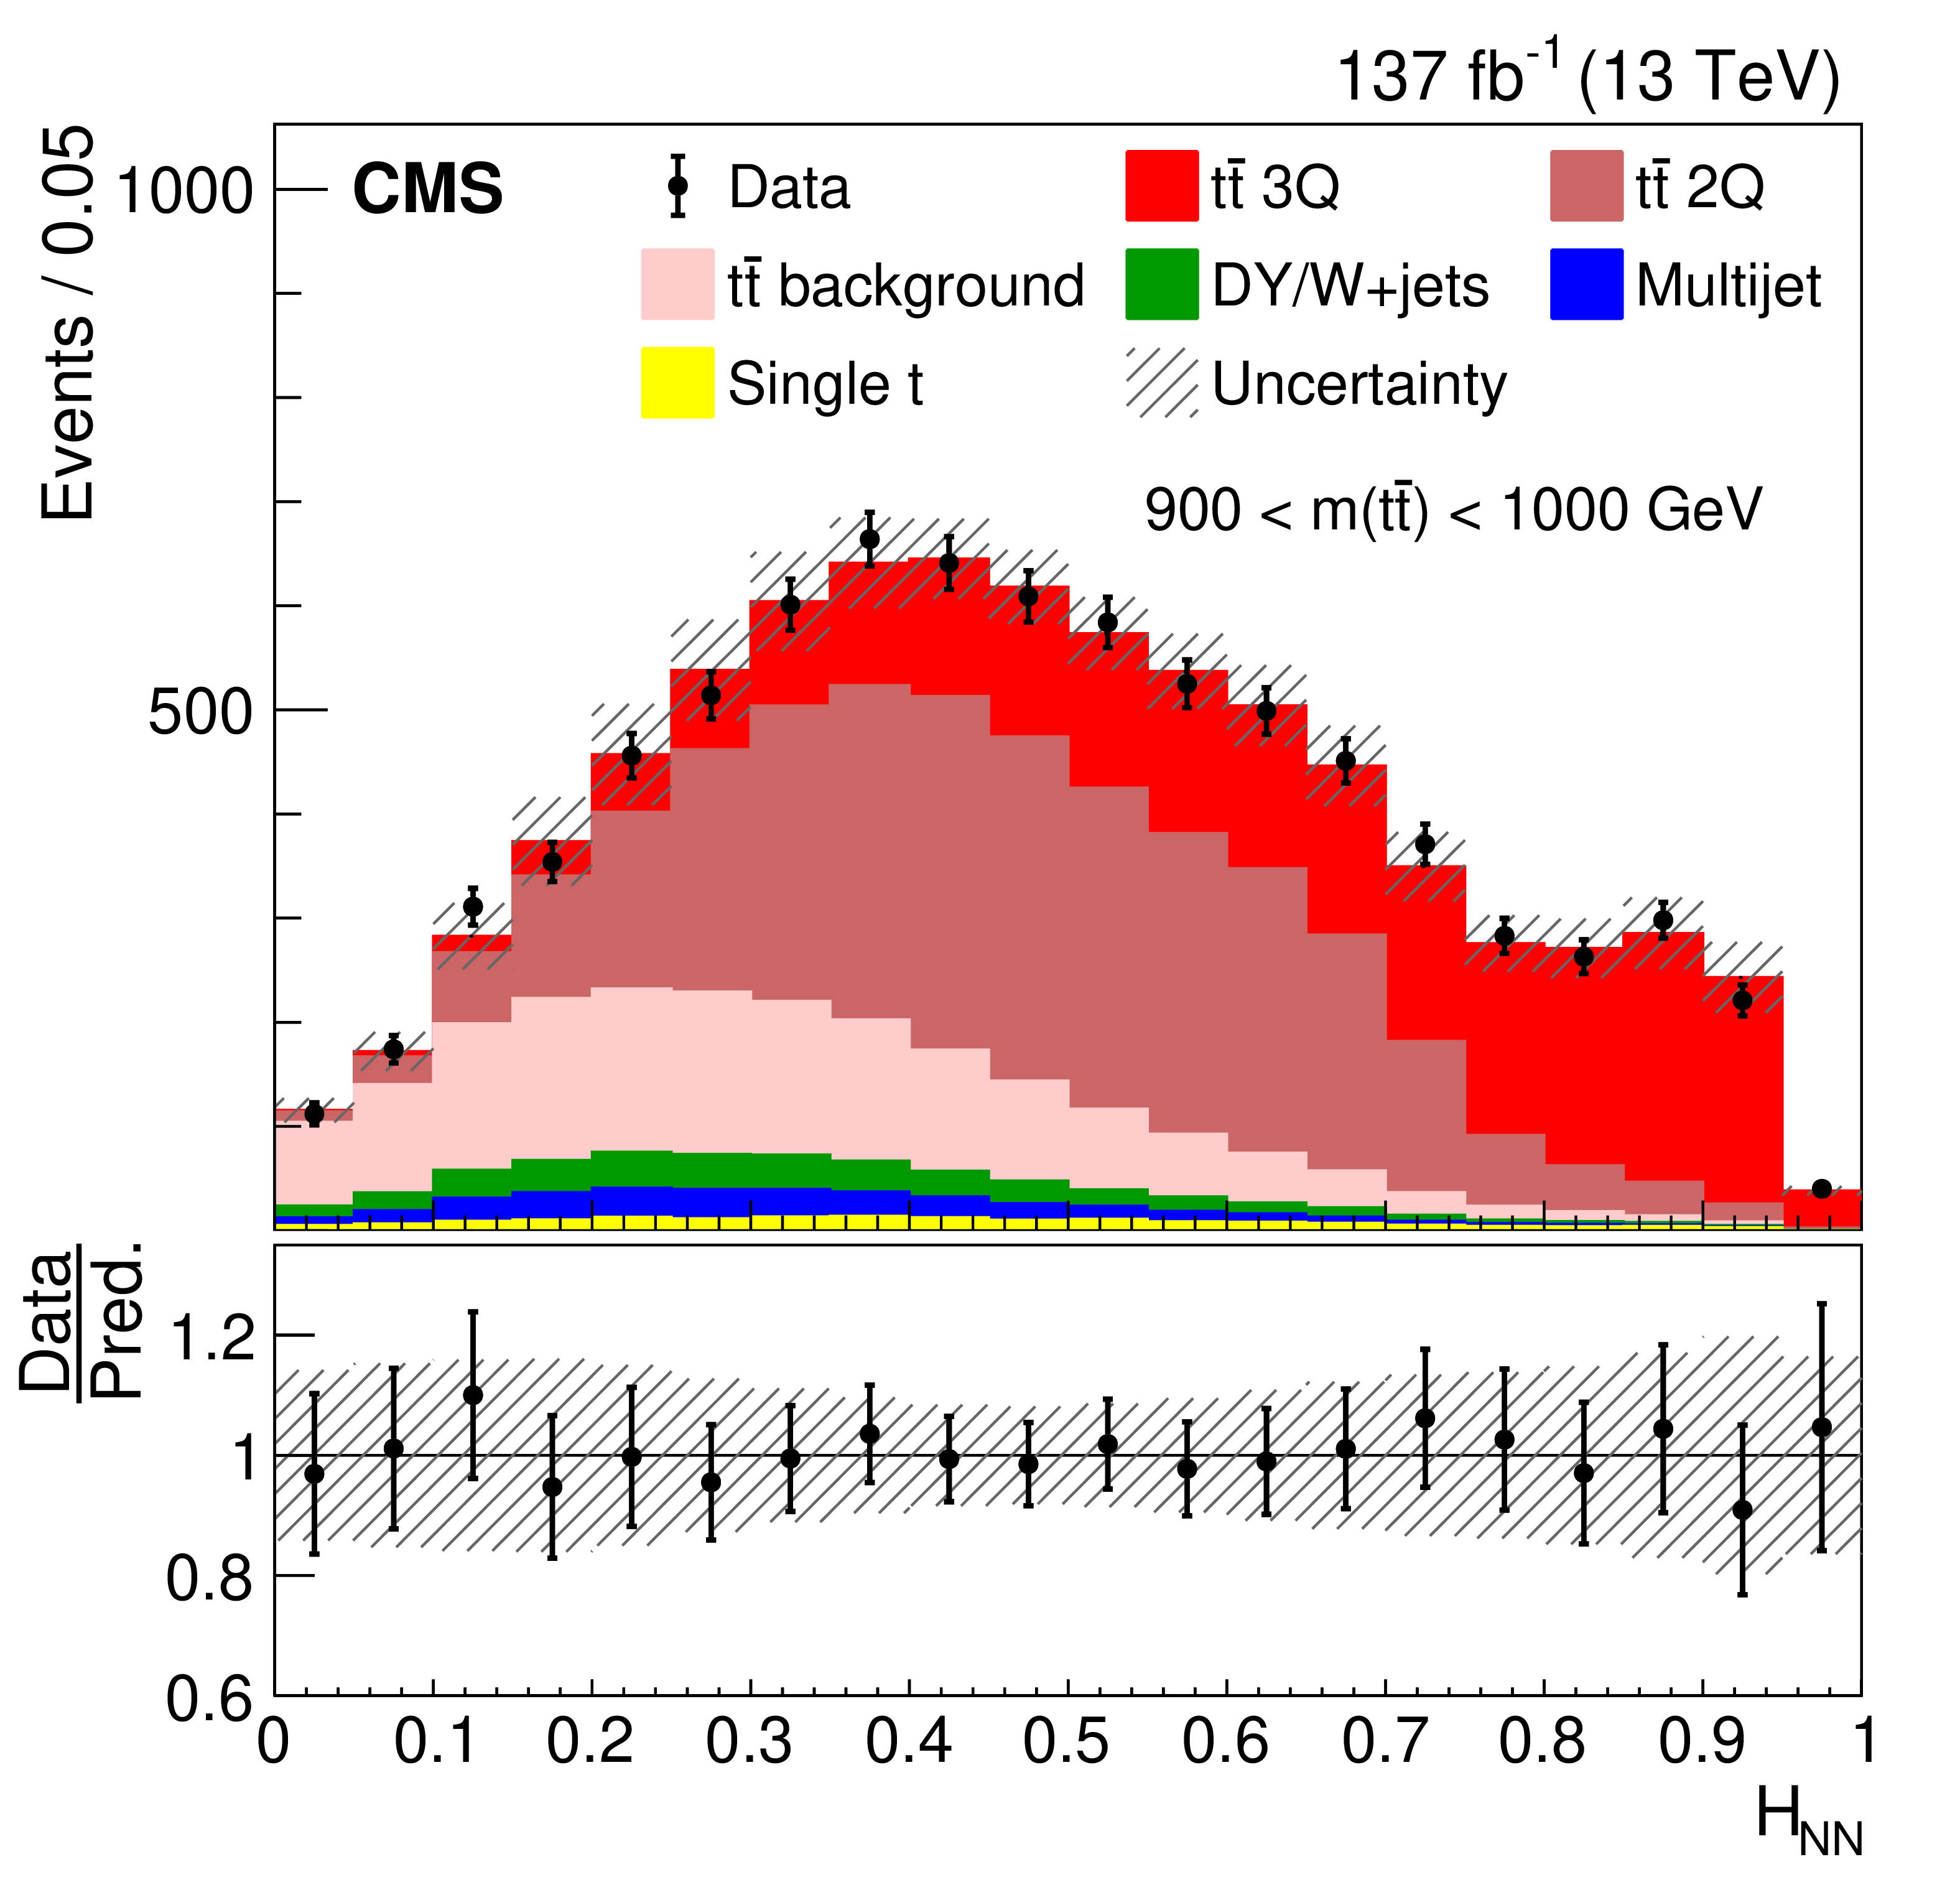
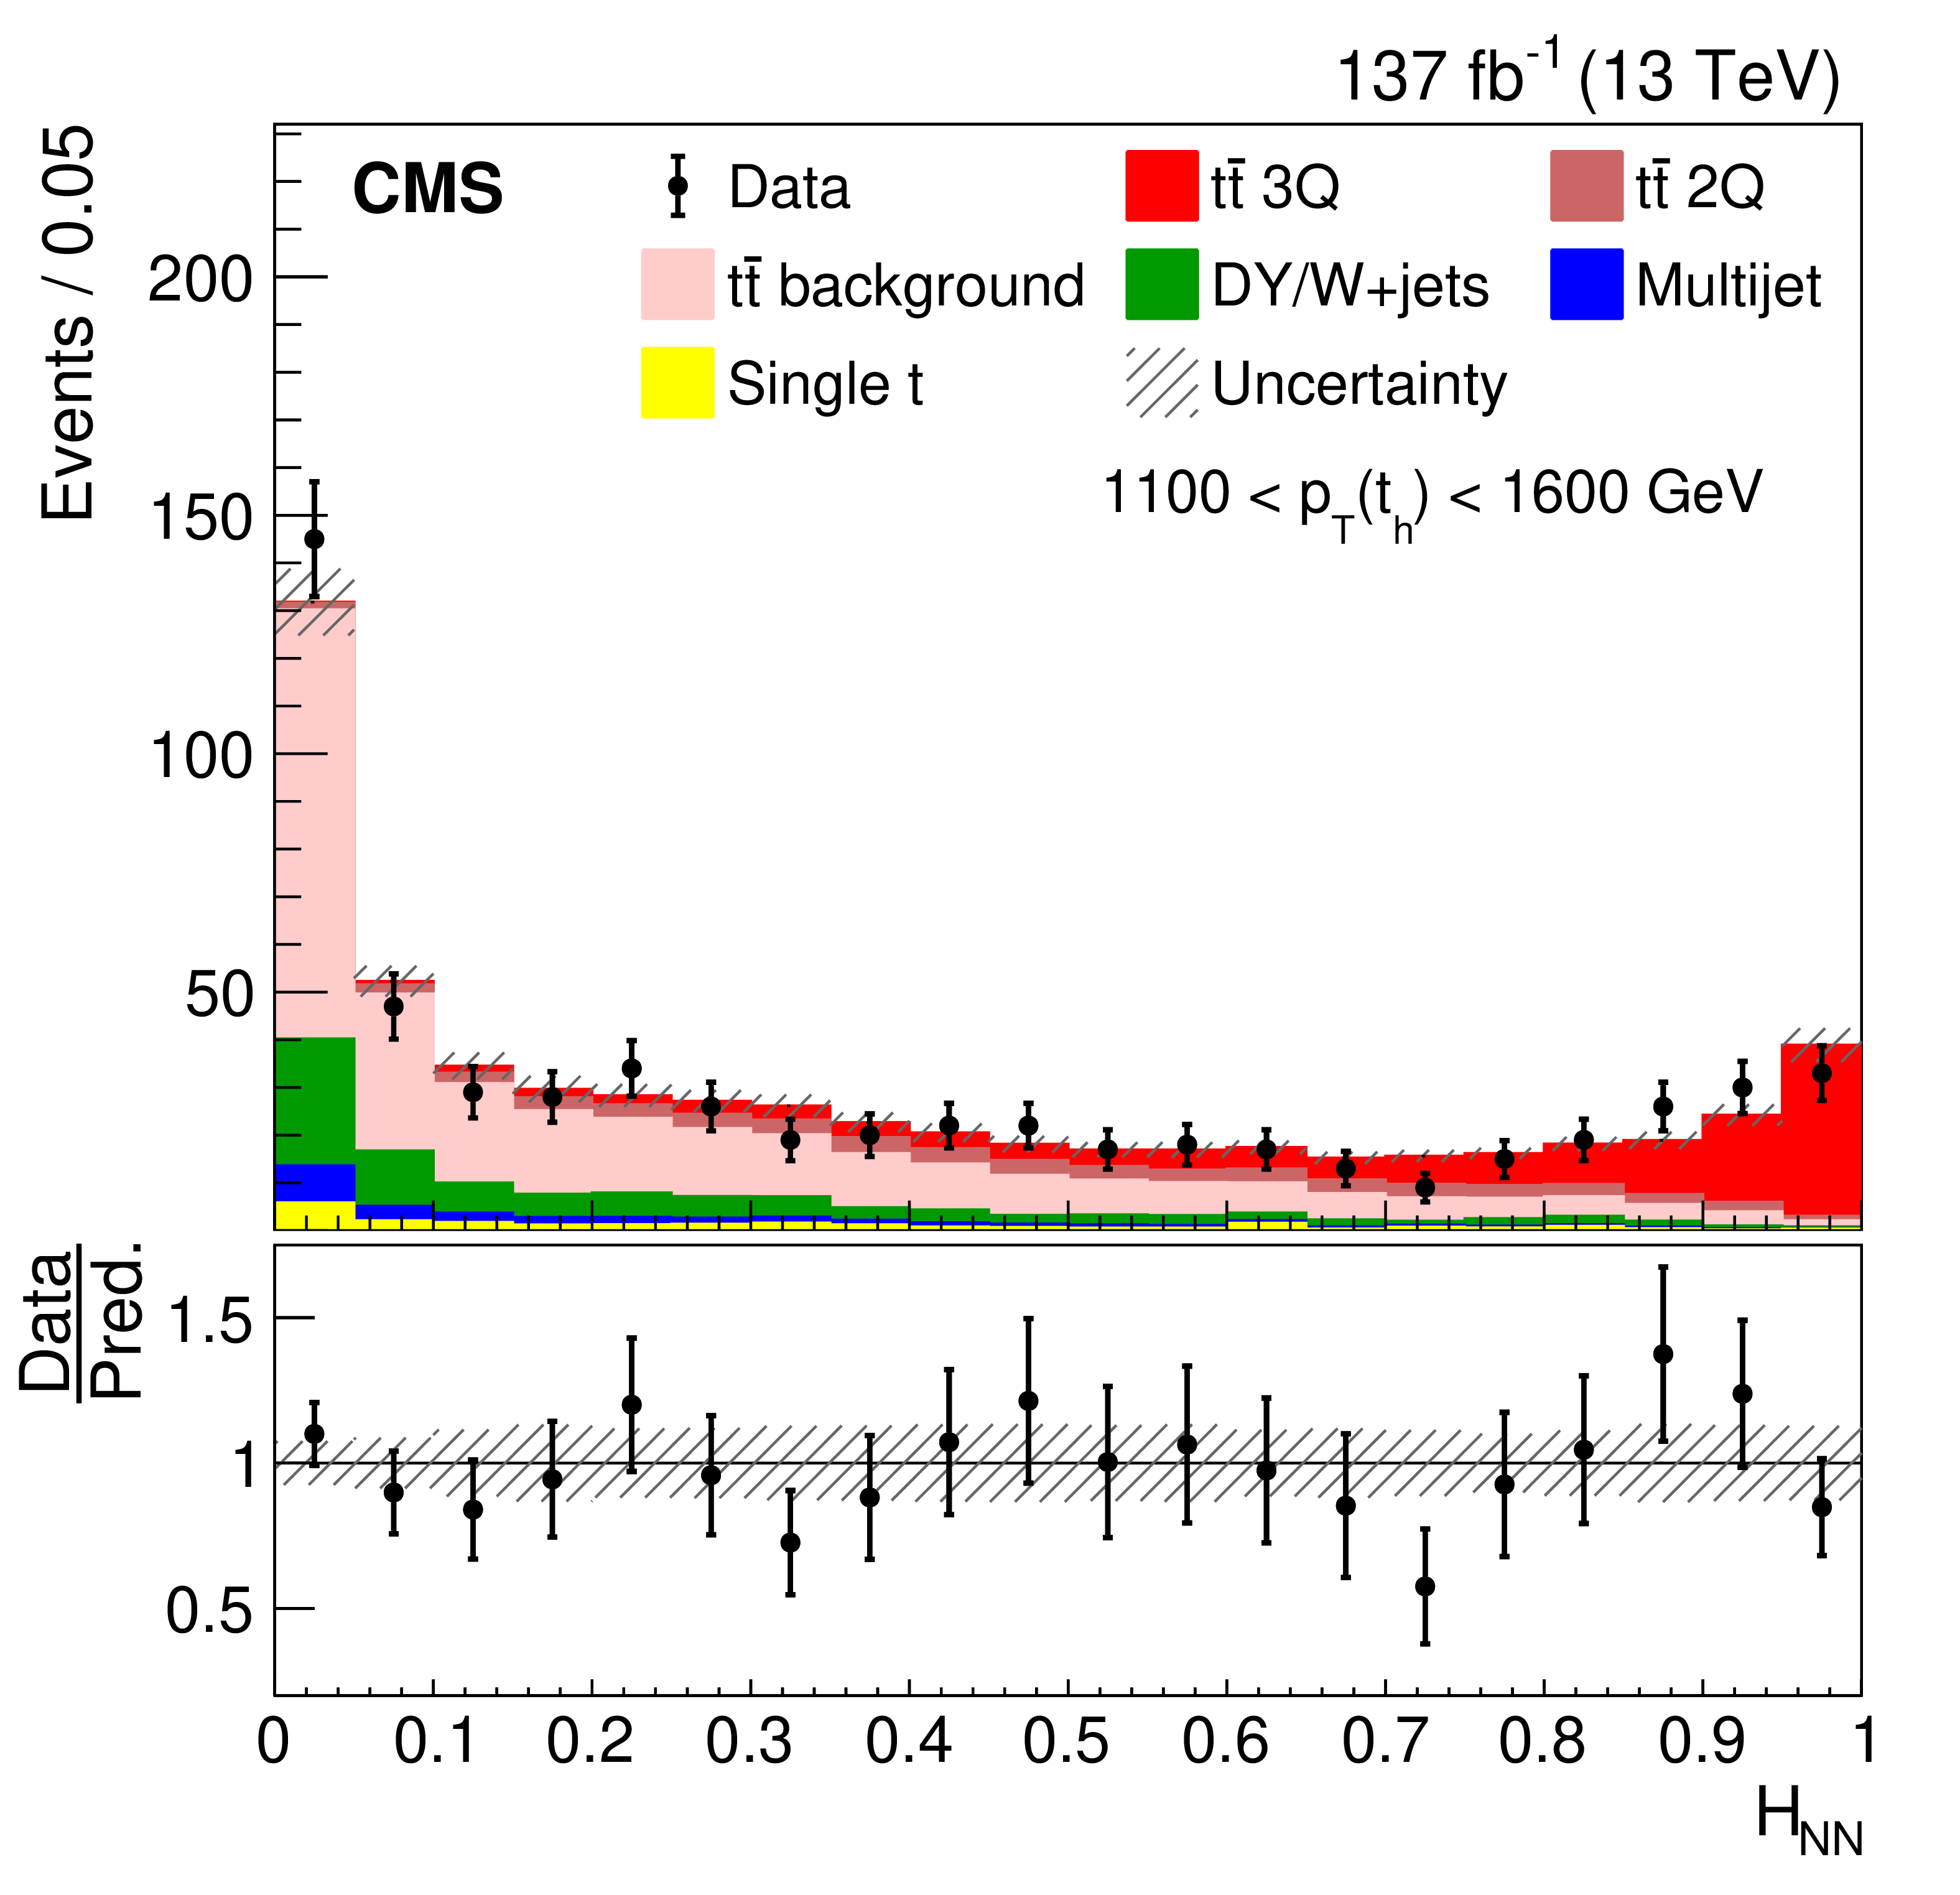
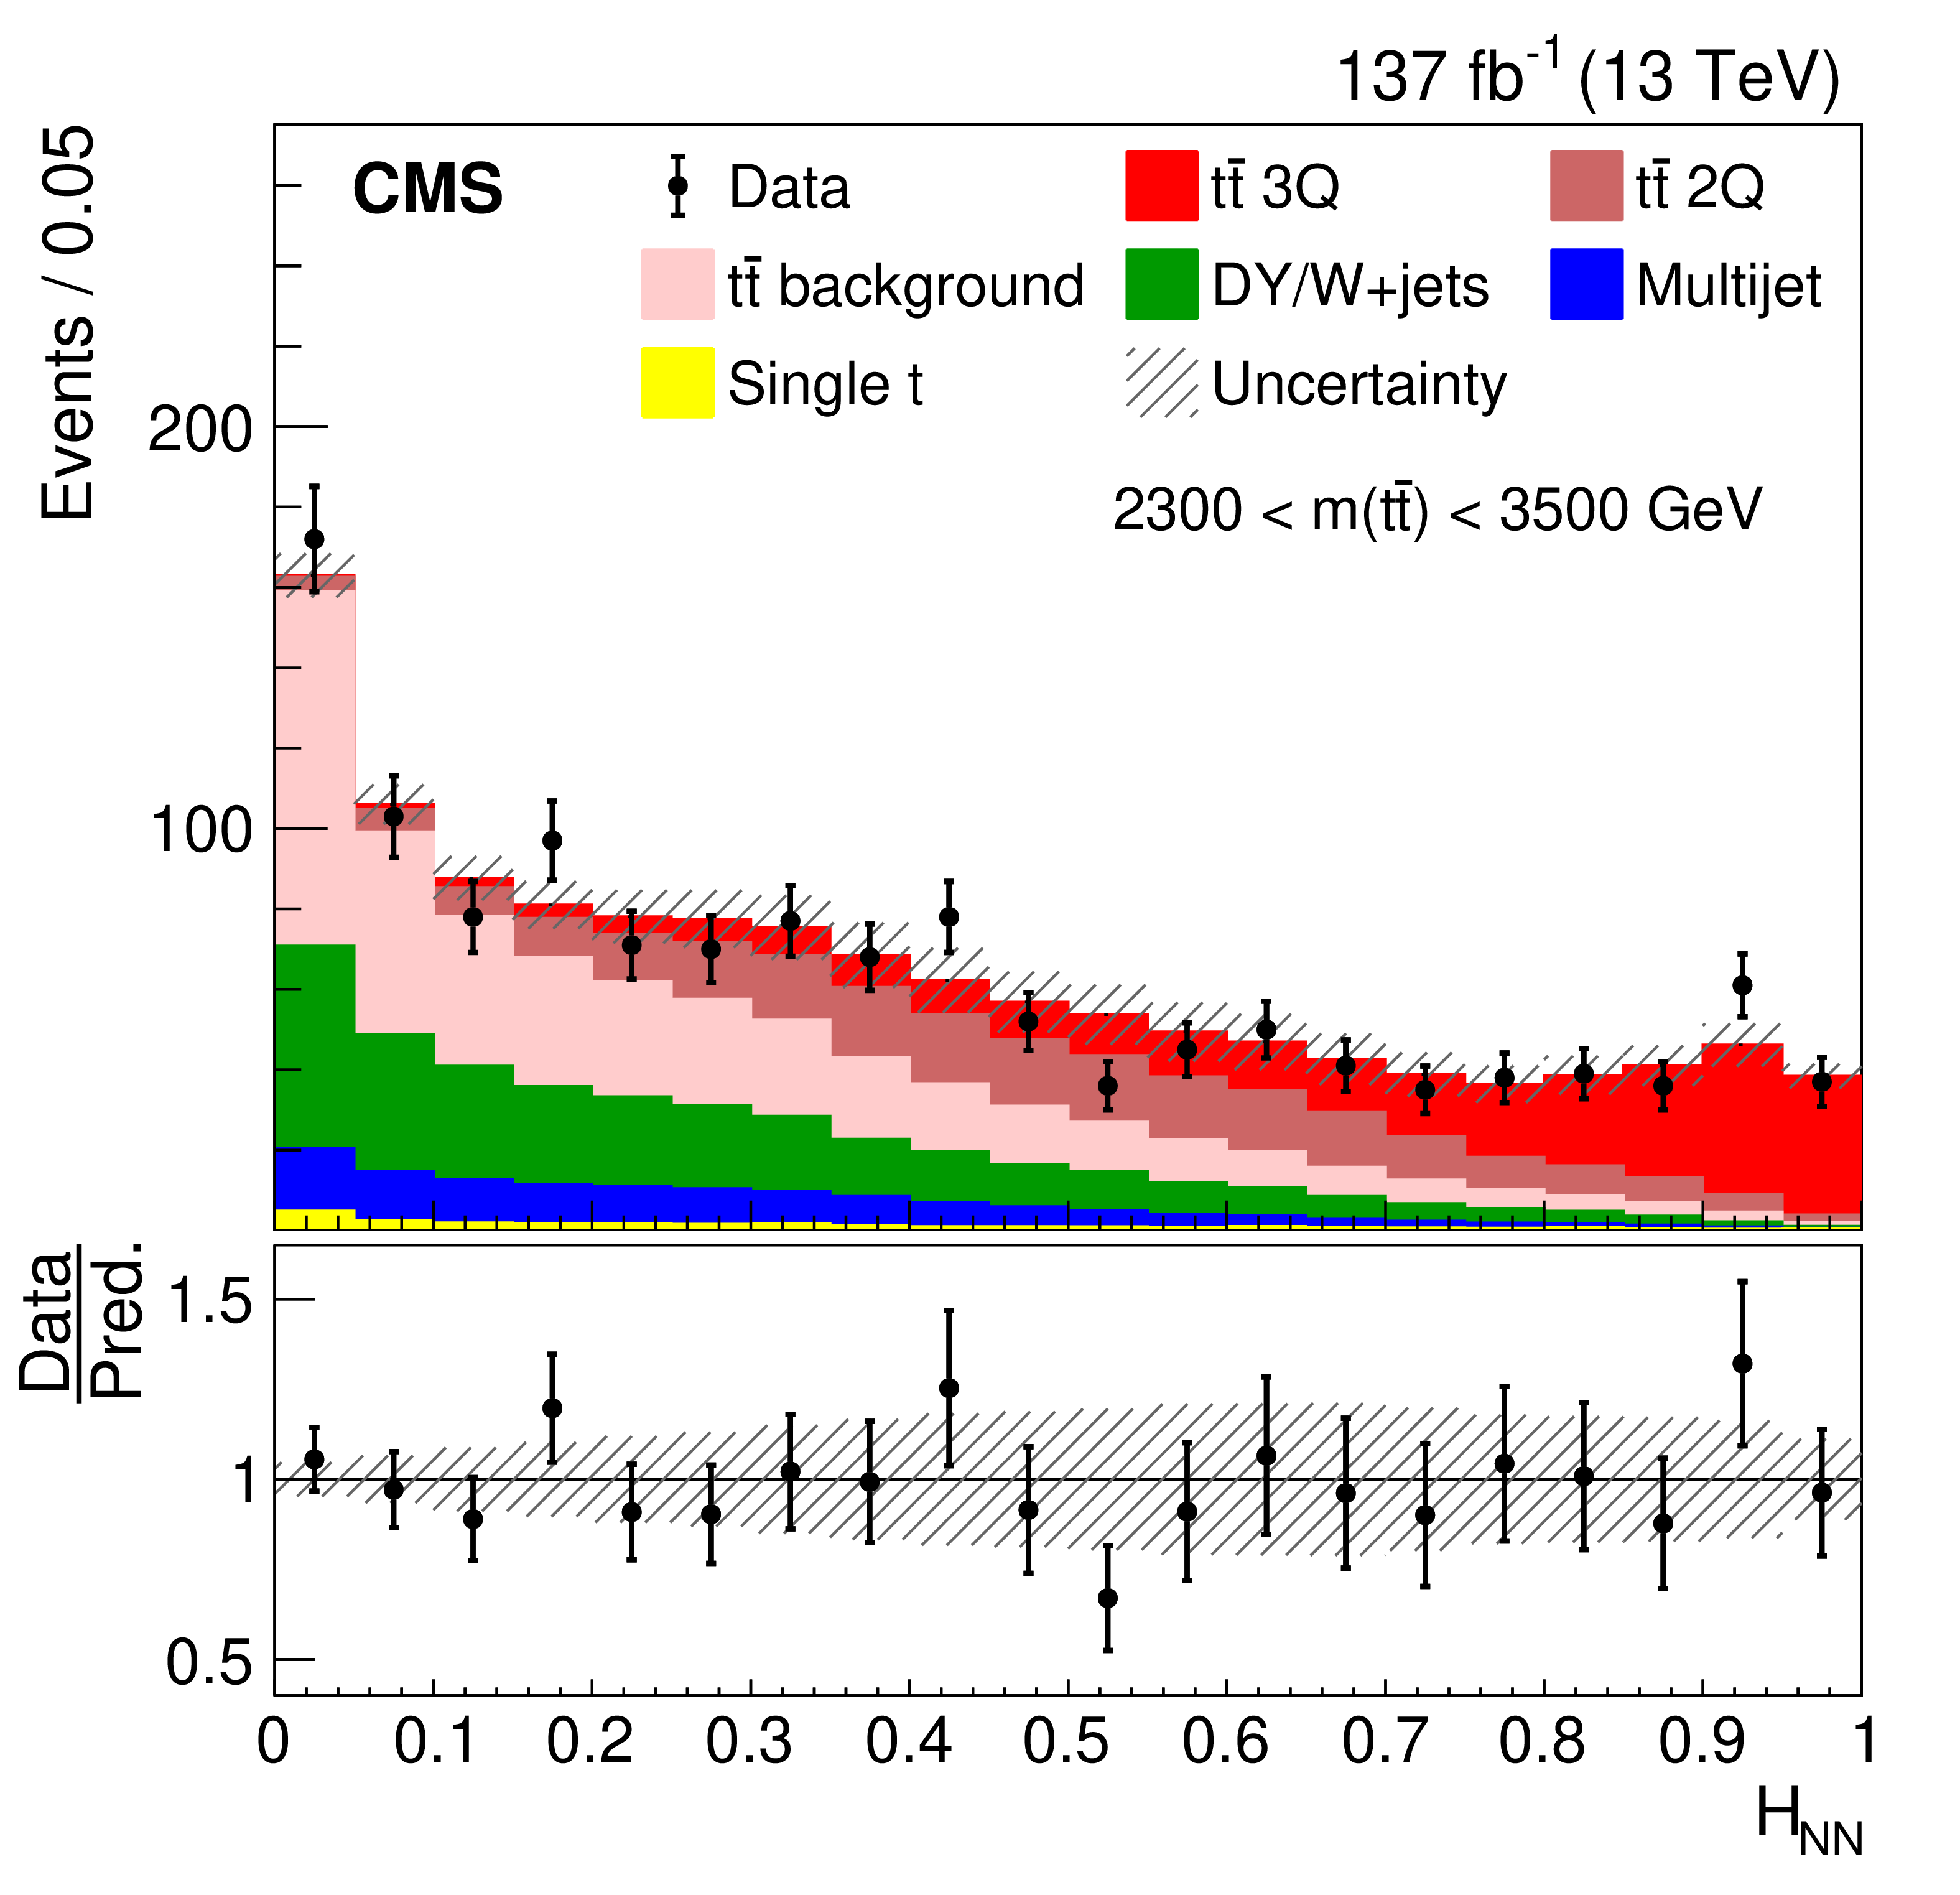
The postfit ${H_\mathrm {NN}}$ distributions in bins of ${{p_{\mathrm {T}}} ({\mathrm{t} _\mathrm {h}})}$ (left) and ${m({\mathrm{t} \mathrm{\bar{t}}})}$ (right) for the data (points) and simulation (colored histograms). The electron and muon events and all three years of data taking have been combined. The hatched area shows the total uncertainties from the fit. The vertical bars on the points represent the statistical uncertainty in the data. The ratios of data to the sum of the fitted yields are provided in the lower panels. |
png pdf |
Figure 9-a:
The postfit ${H_\mathrm {NN}}$ distributions in bins of ${{p_{\mathrm {T}}} ({\mathrm{t} _\mathrm {h}})}$ (left) and ${m({\mathrm{t} \mathrm{\bar{t}}})}$ (right) for the data (points) and simulation (colored histograms). The electron and muon events and all three years of data taking have been combined. The hatched area shows the total uncertainties from the fit. The vertical bars on the points represent the statistical uncertainty in the data. The ratios of data to the sum of the fitted yields are provided in the lower panels. |
png pdf |
Figure 9-b:
The postfit ${H_\mathrm {NN}}$ distributions in bins of ${{p_{\mathrm {T}}} ({\mathrm{t} _\mathrm {h}})}$ (left) and ${m({\mathrm{t} \mathrm{\bar{t}}})}$ (right) for the data (points) and simulation (colored histograms). The electron and muon events and all three years of data taking have been combined. The hatched area shows the total uncertainties from the fit. The vertical bars on the points represent the statistical uncertainty in the data. The ratios of data to the sum of the fitted yields are provided in the lower panels. |
png pdf |
Figure 9-c:
The postfit ${H_\mathrm {NN}}$ distributions in bins of ${{p_{\mathrm {T}}} ({\mathrm{t} _\mathrm {h}})}$ (left) and ${m({\mathrm{t} \mathrm{\bar{t}}})}$ (right) for the data (points) and simulation (colored histograms). The electron and muon events and all three years of data taking have been combined. The hatched area shows the total uncertainties from the fit. The vertical bars on the points represent the statistical uncertainty in the data. The ratios of data to the sum of the fitted yields are provided in the lower panels. |
png pdf |
Figure 9-d:
The postfit ${H_\mathrm {NN}}$ distributions in bins of ${{p_{\mathrm {T}}} ({\mathrm{t} _\mathrm {h}})}$ (left) and ${m({\mathrm{t} \mathrm{\bar{t}}})}$ (right) for the data (points) and simulation (colored histograms). The electron and muon events and all three years of data taking have been combined. The hatched area shows the total uncertainties from the fit. The vertical bars on the points represent the statistical uncertainty in the data. The ratios of data to the sum of the fitted yields are provided in the lower panels. |
png pdf |
Figure 9-e:
The postfit ${H_\mathrm {NN}}$ distributions in bins of ${{p_{\mathrm {T}}} ({\mathrm{t} _\mathrm {h}})}$ (left) and ${m({\mathrm{t} \mathrm{\bar{t}}})}$ (right) for the data (points) and simulation (colored histograms). The electron and muon events and all three years of data taking have been combined. The hatched area shows the total uncertainties from the fit. The vertical bars on the points represent the statistical uncertainty in the data. The ratios of data to the sum of the fitted yields are provided in the lower panels. |
png pdf |
Figure 9-f:
The postfit ${H_\mathrm {NN}}$ distributions in bins of ${{p_{\mathrm {T}}} ({\mathrm{t} _\mathrm {h}})}$ (left) and ${m({\mathrm{t} \mathrm{\bar{t}}})}$ (right) for the data (points) and simulation (colored histograms). The electron and muon events and all three years of data taking have been combined. The hatched area shows the total uncertainties from the fit. The vertical bars on the points represent the statistical uncertainty in the data. The ratios of data to the sum of the fitted yields are provided in the lower panels. |
png pdf |
Figure 10:
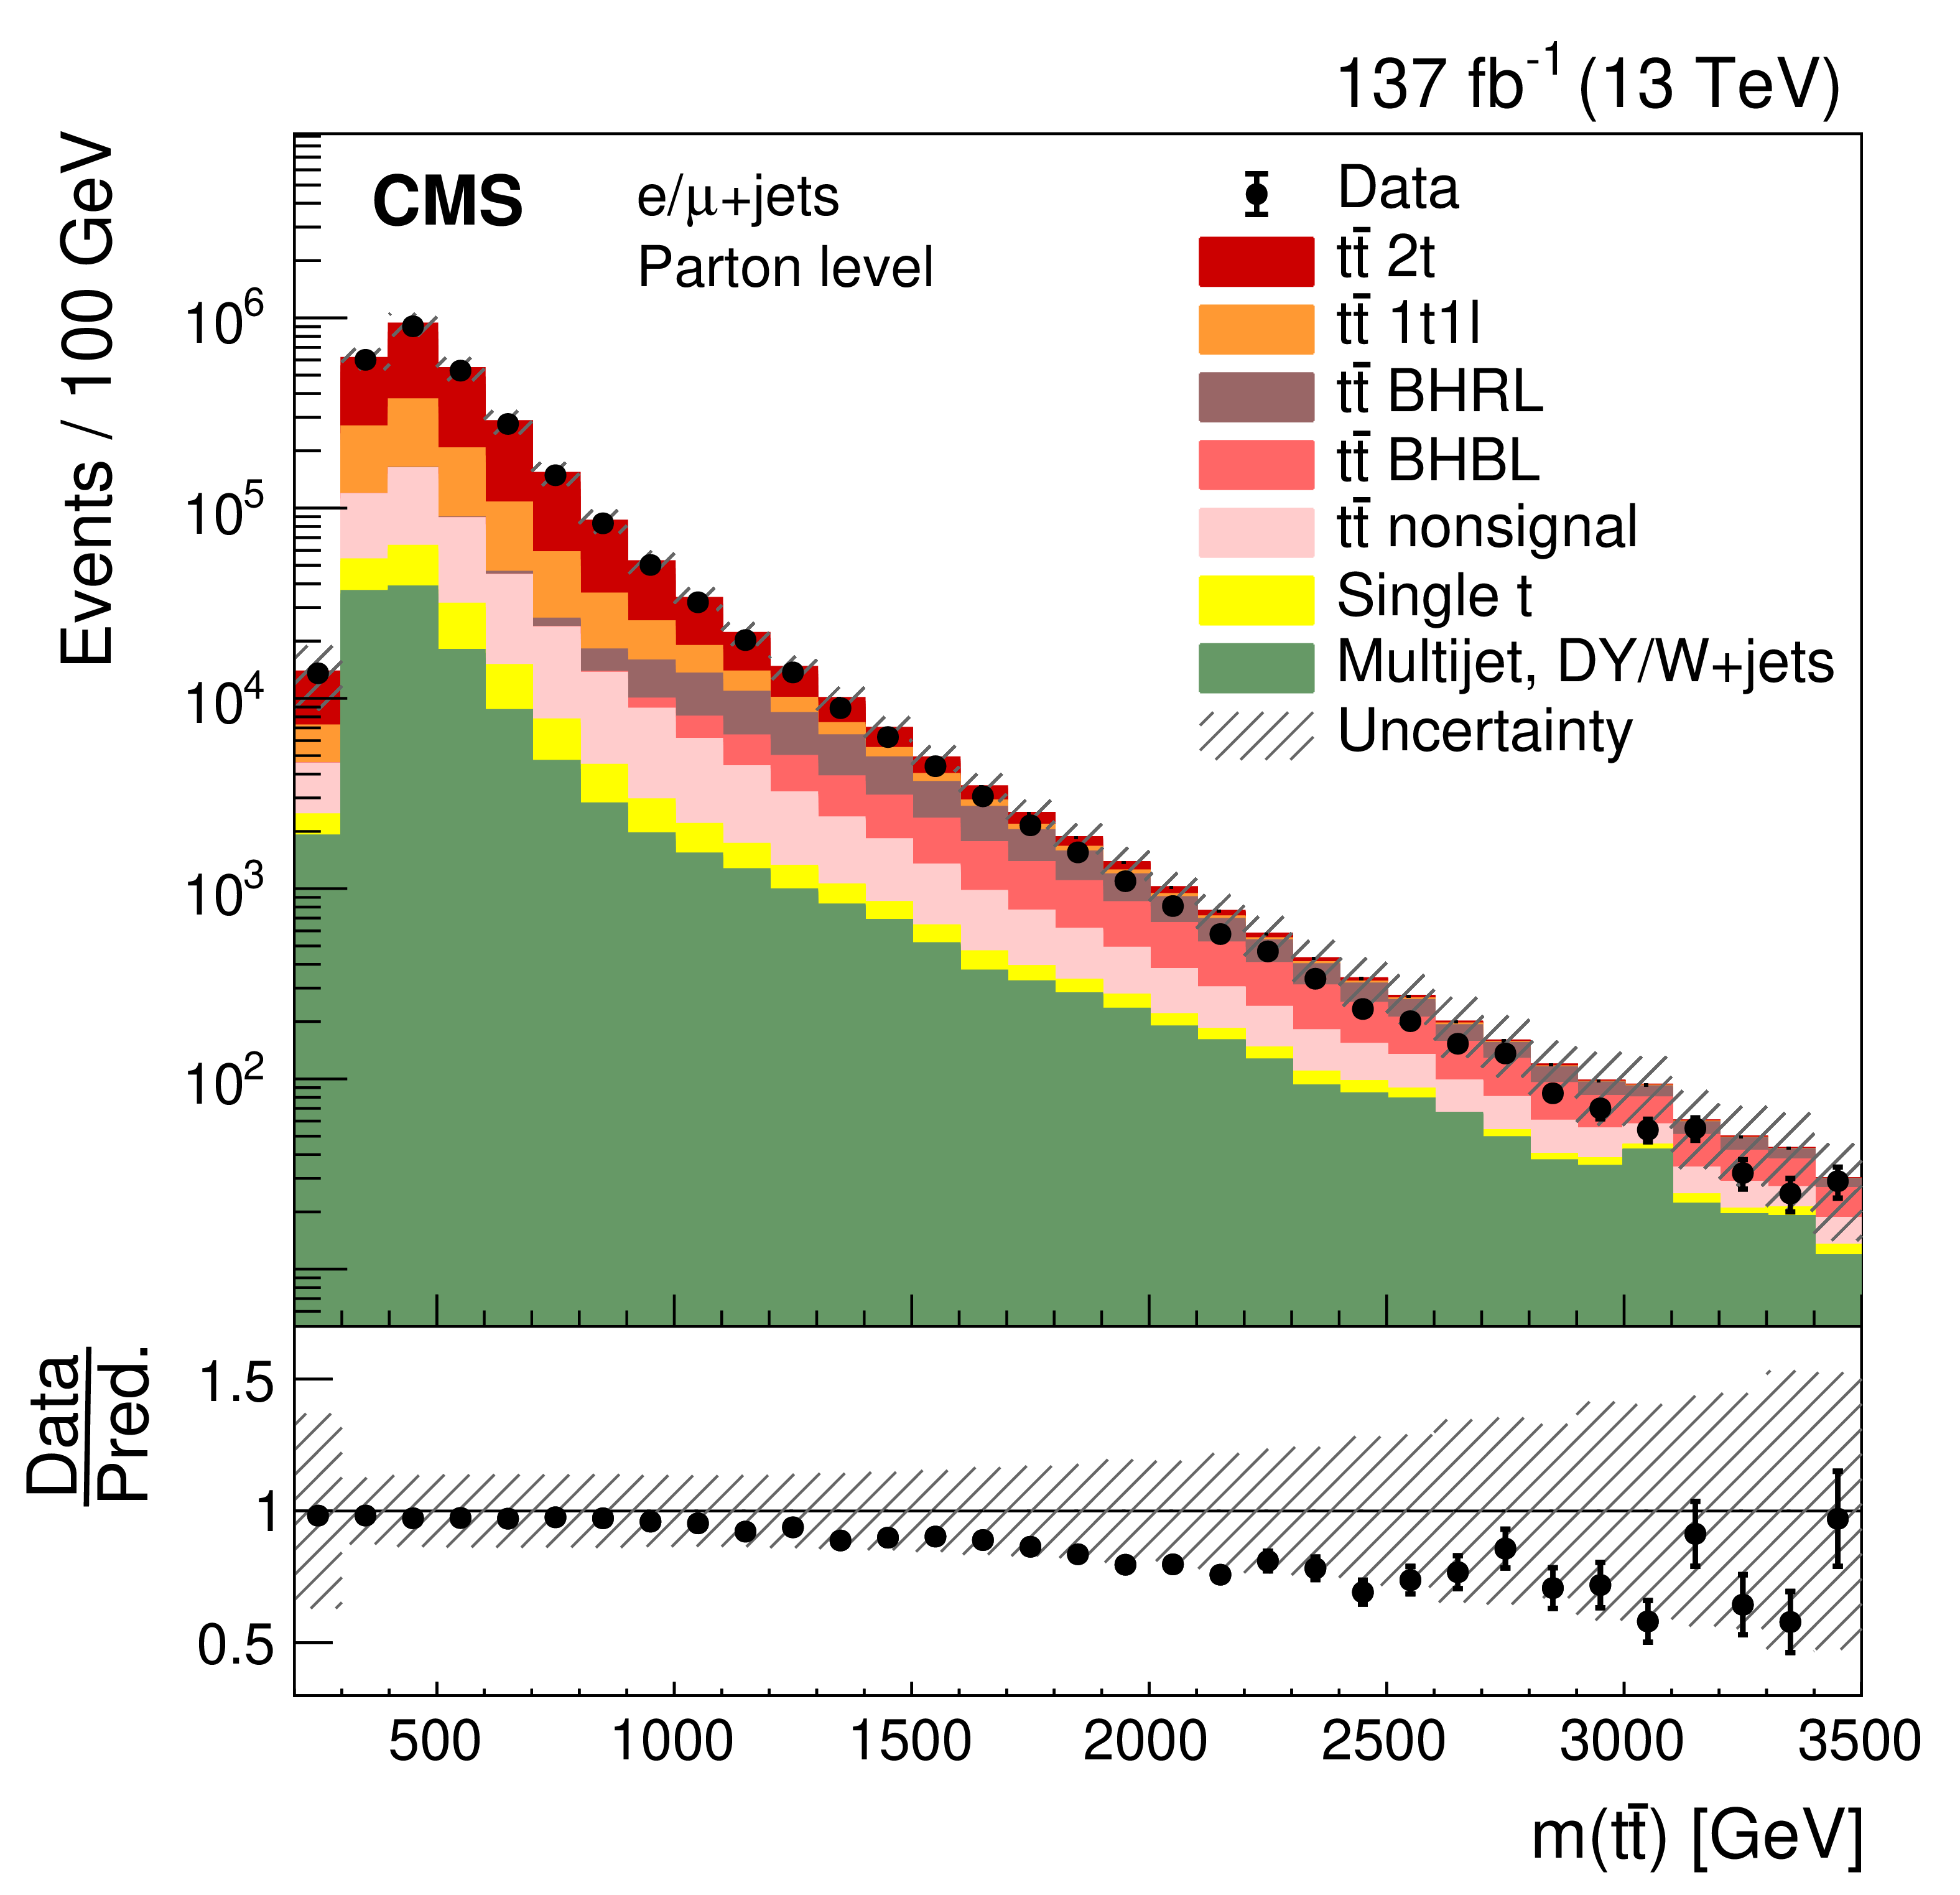
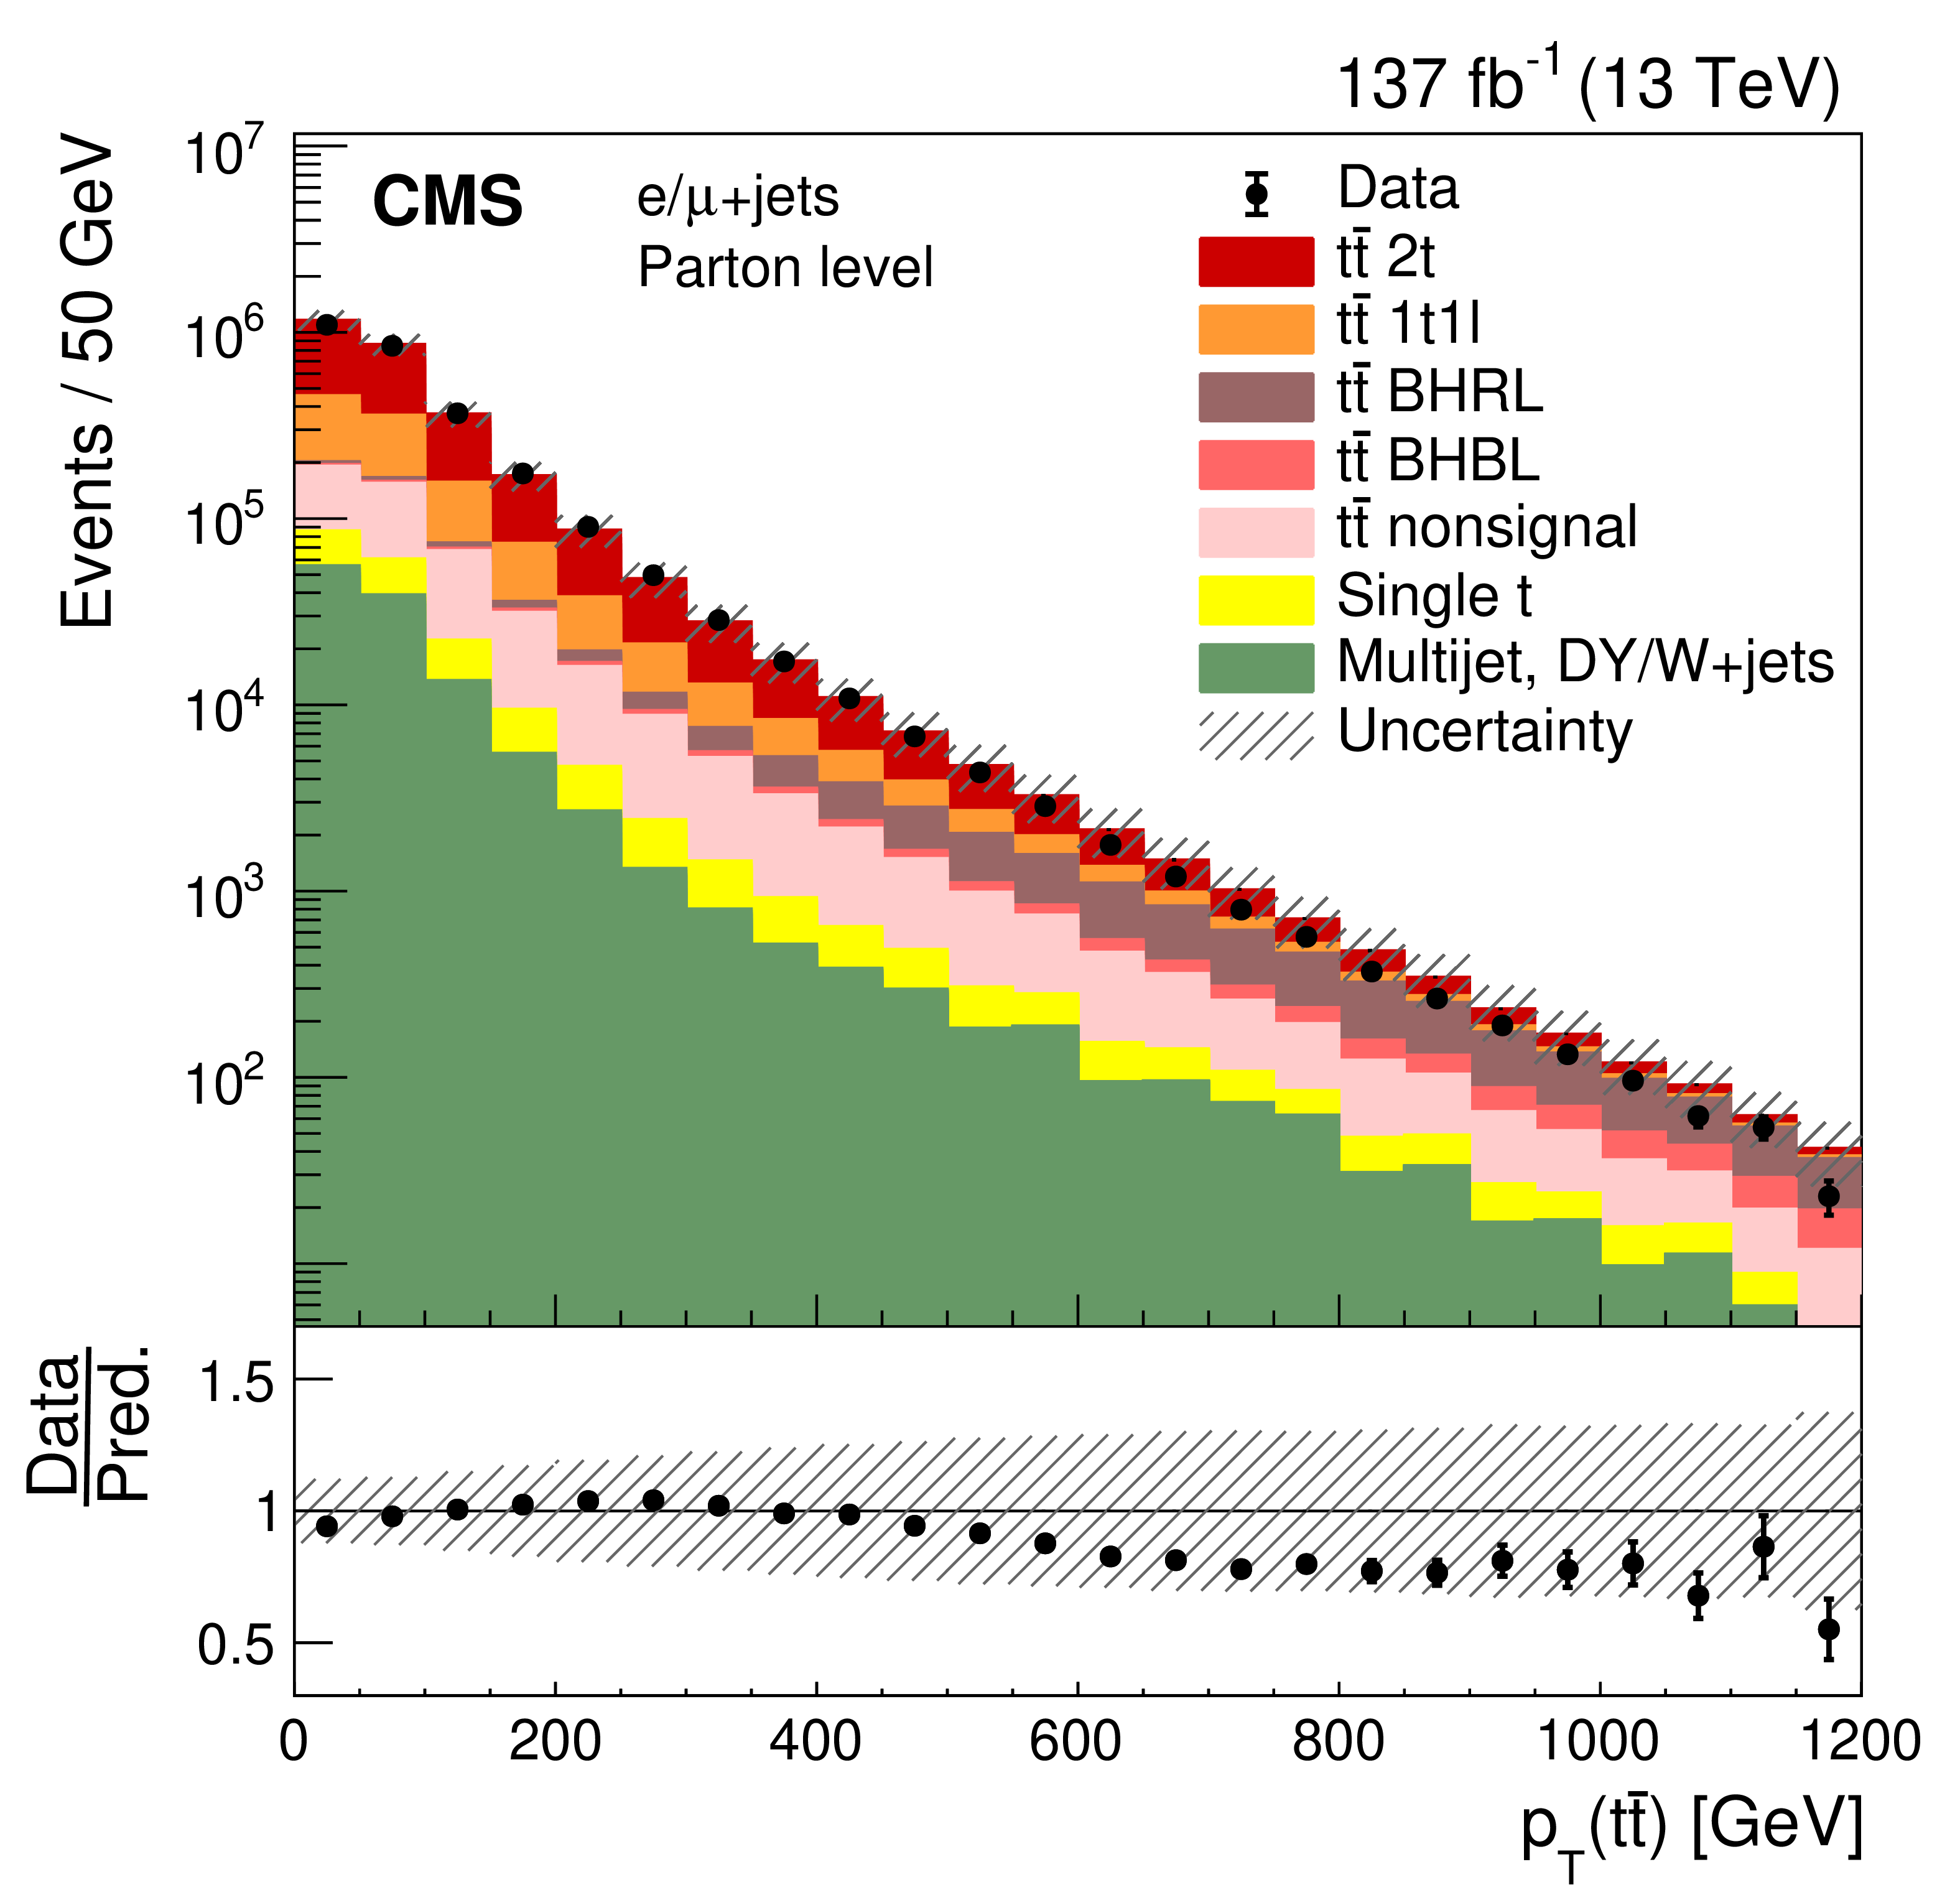
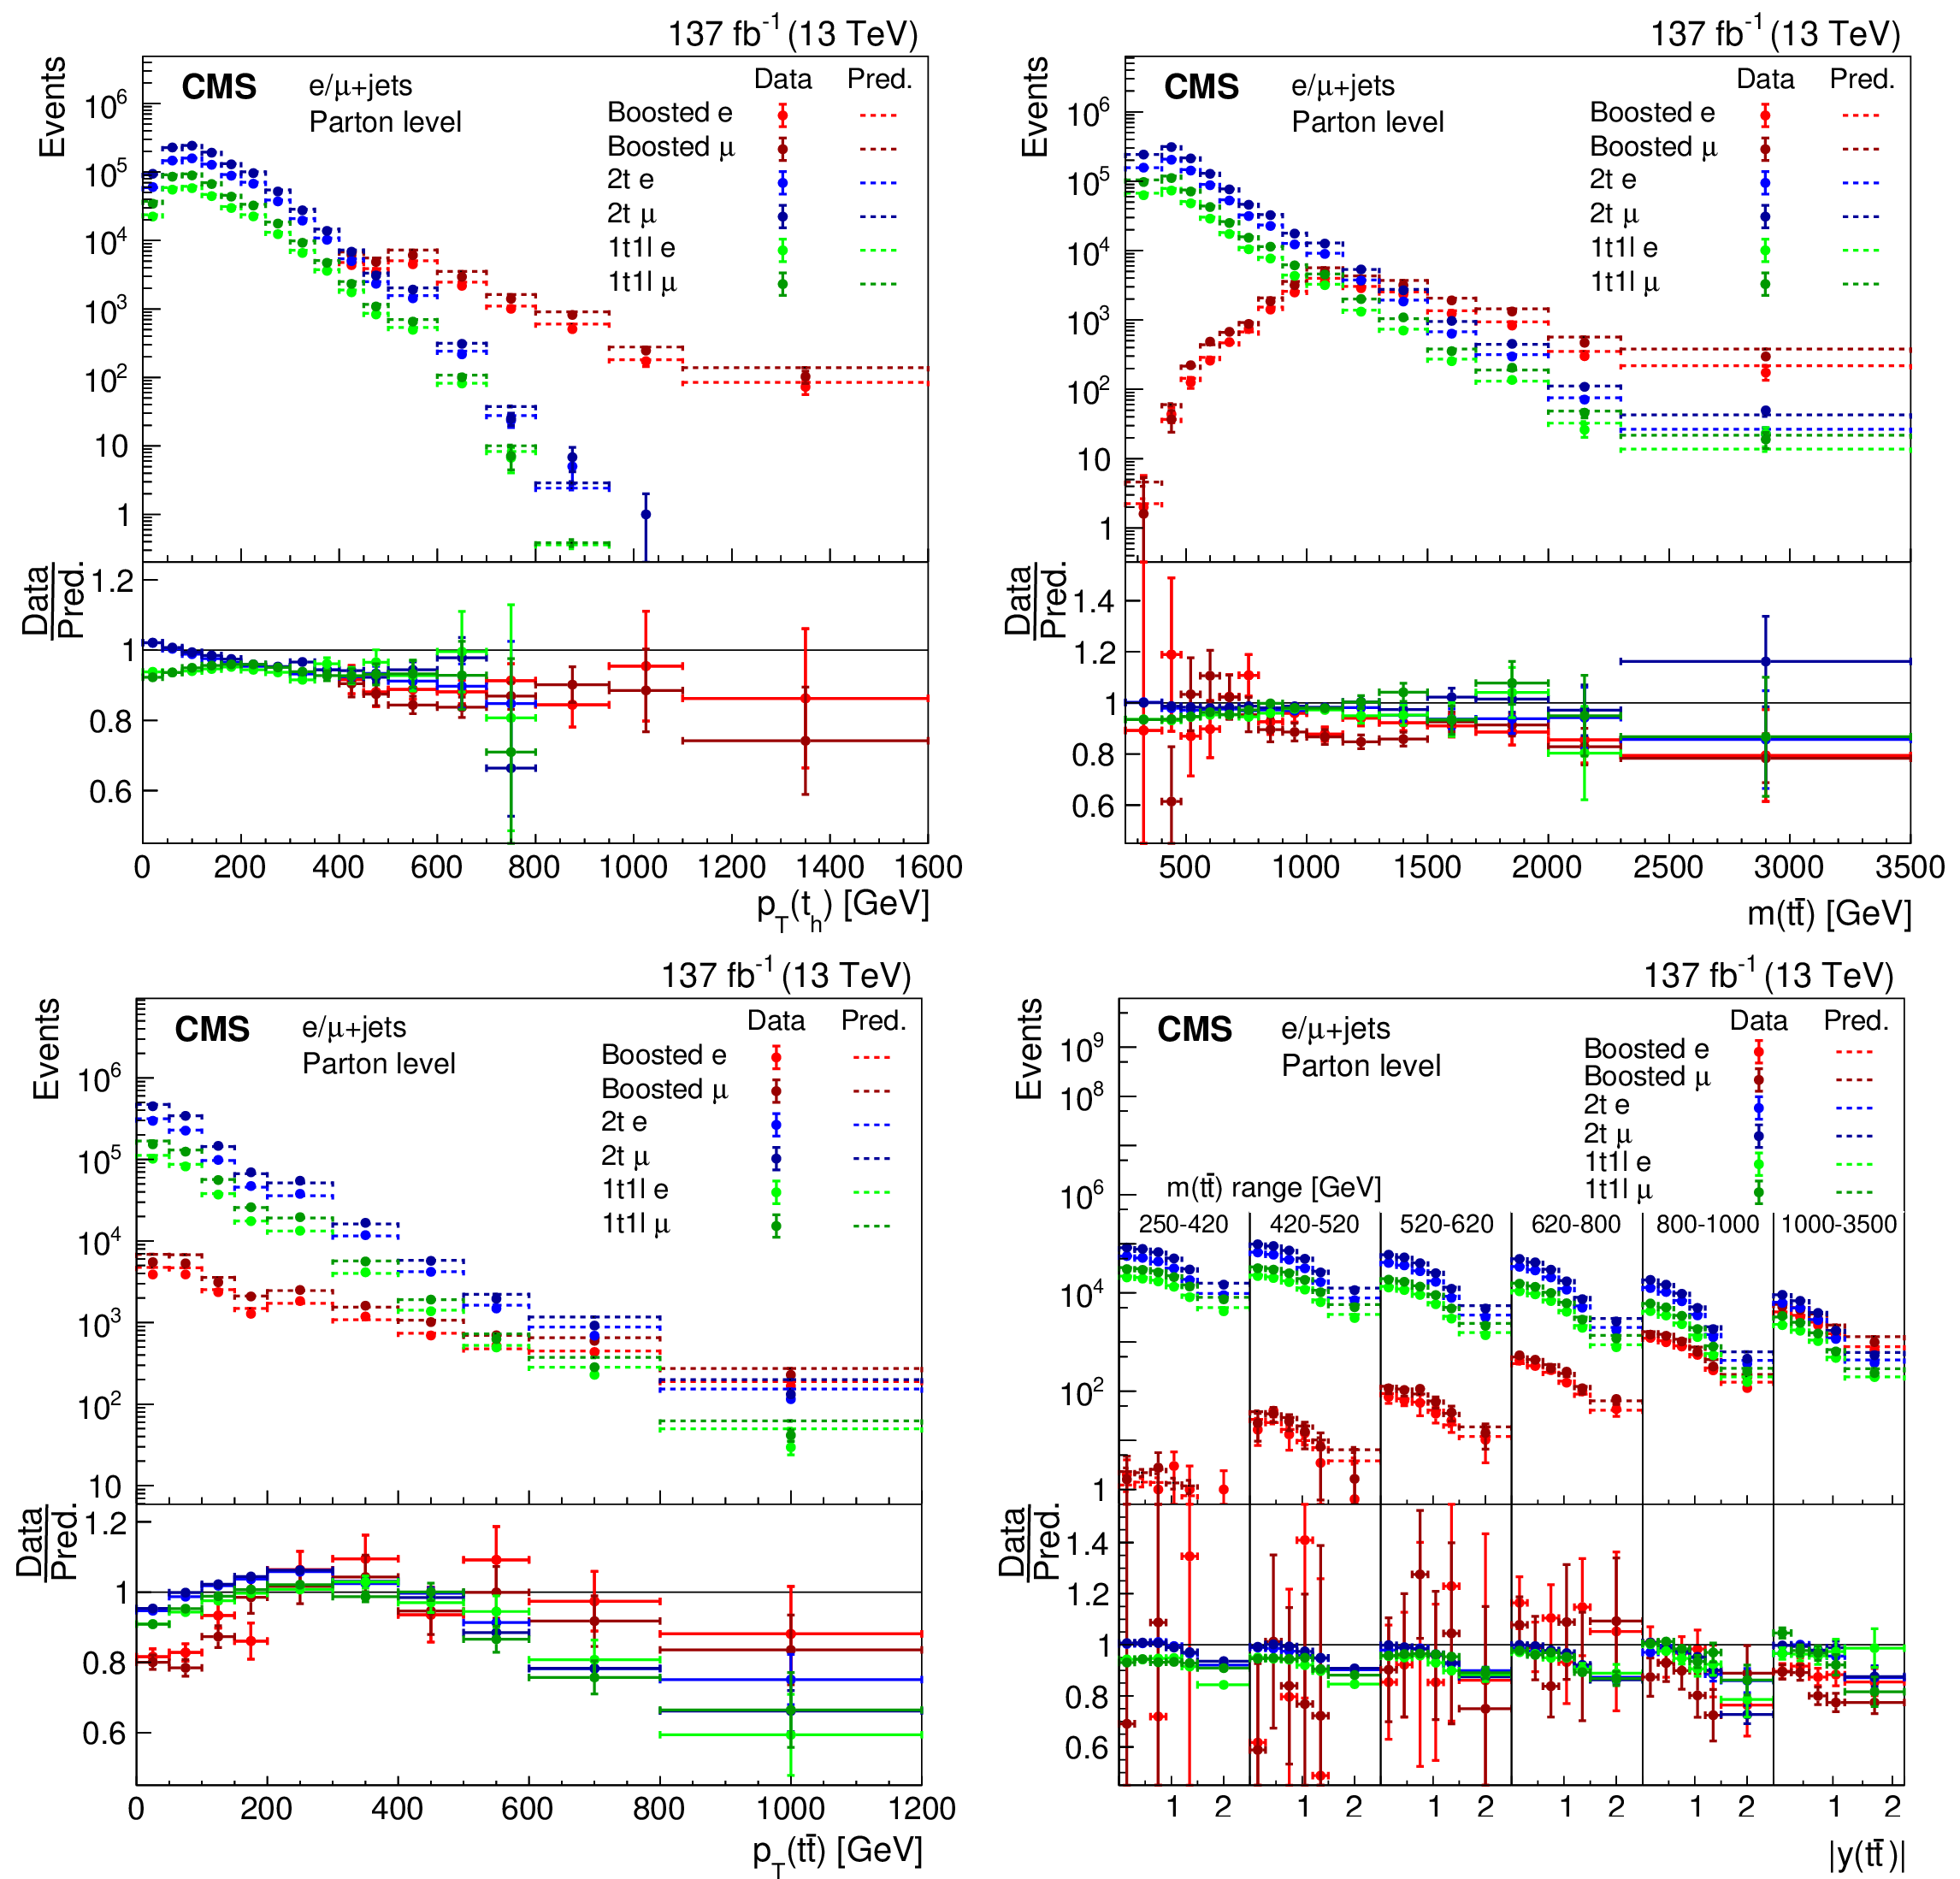
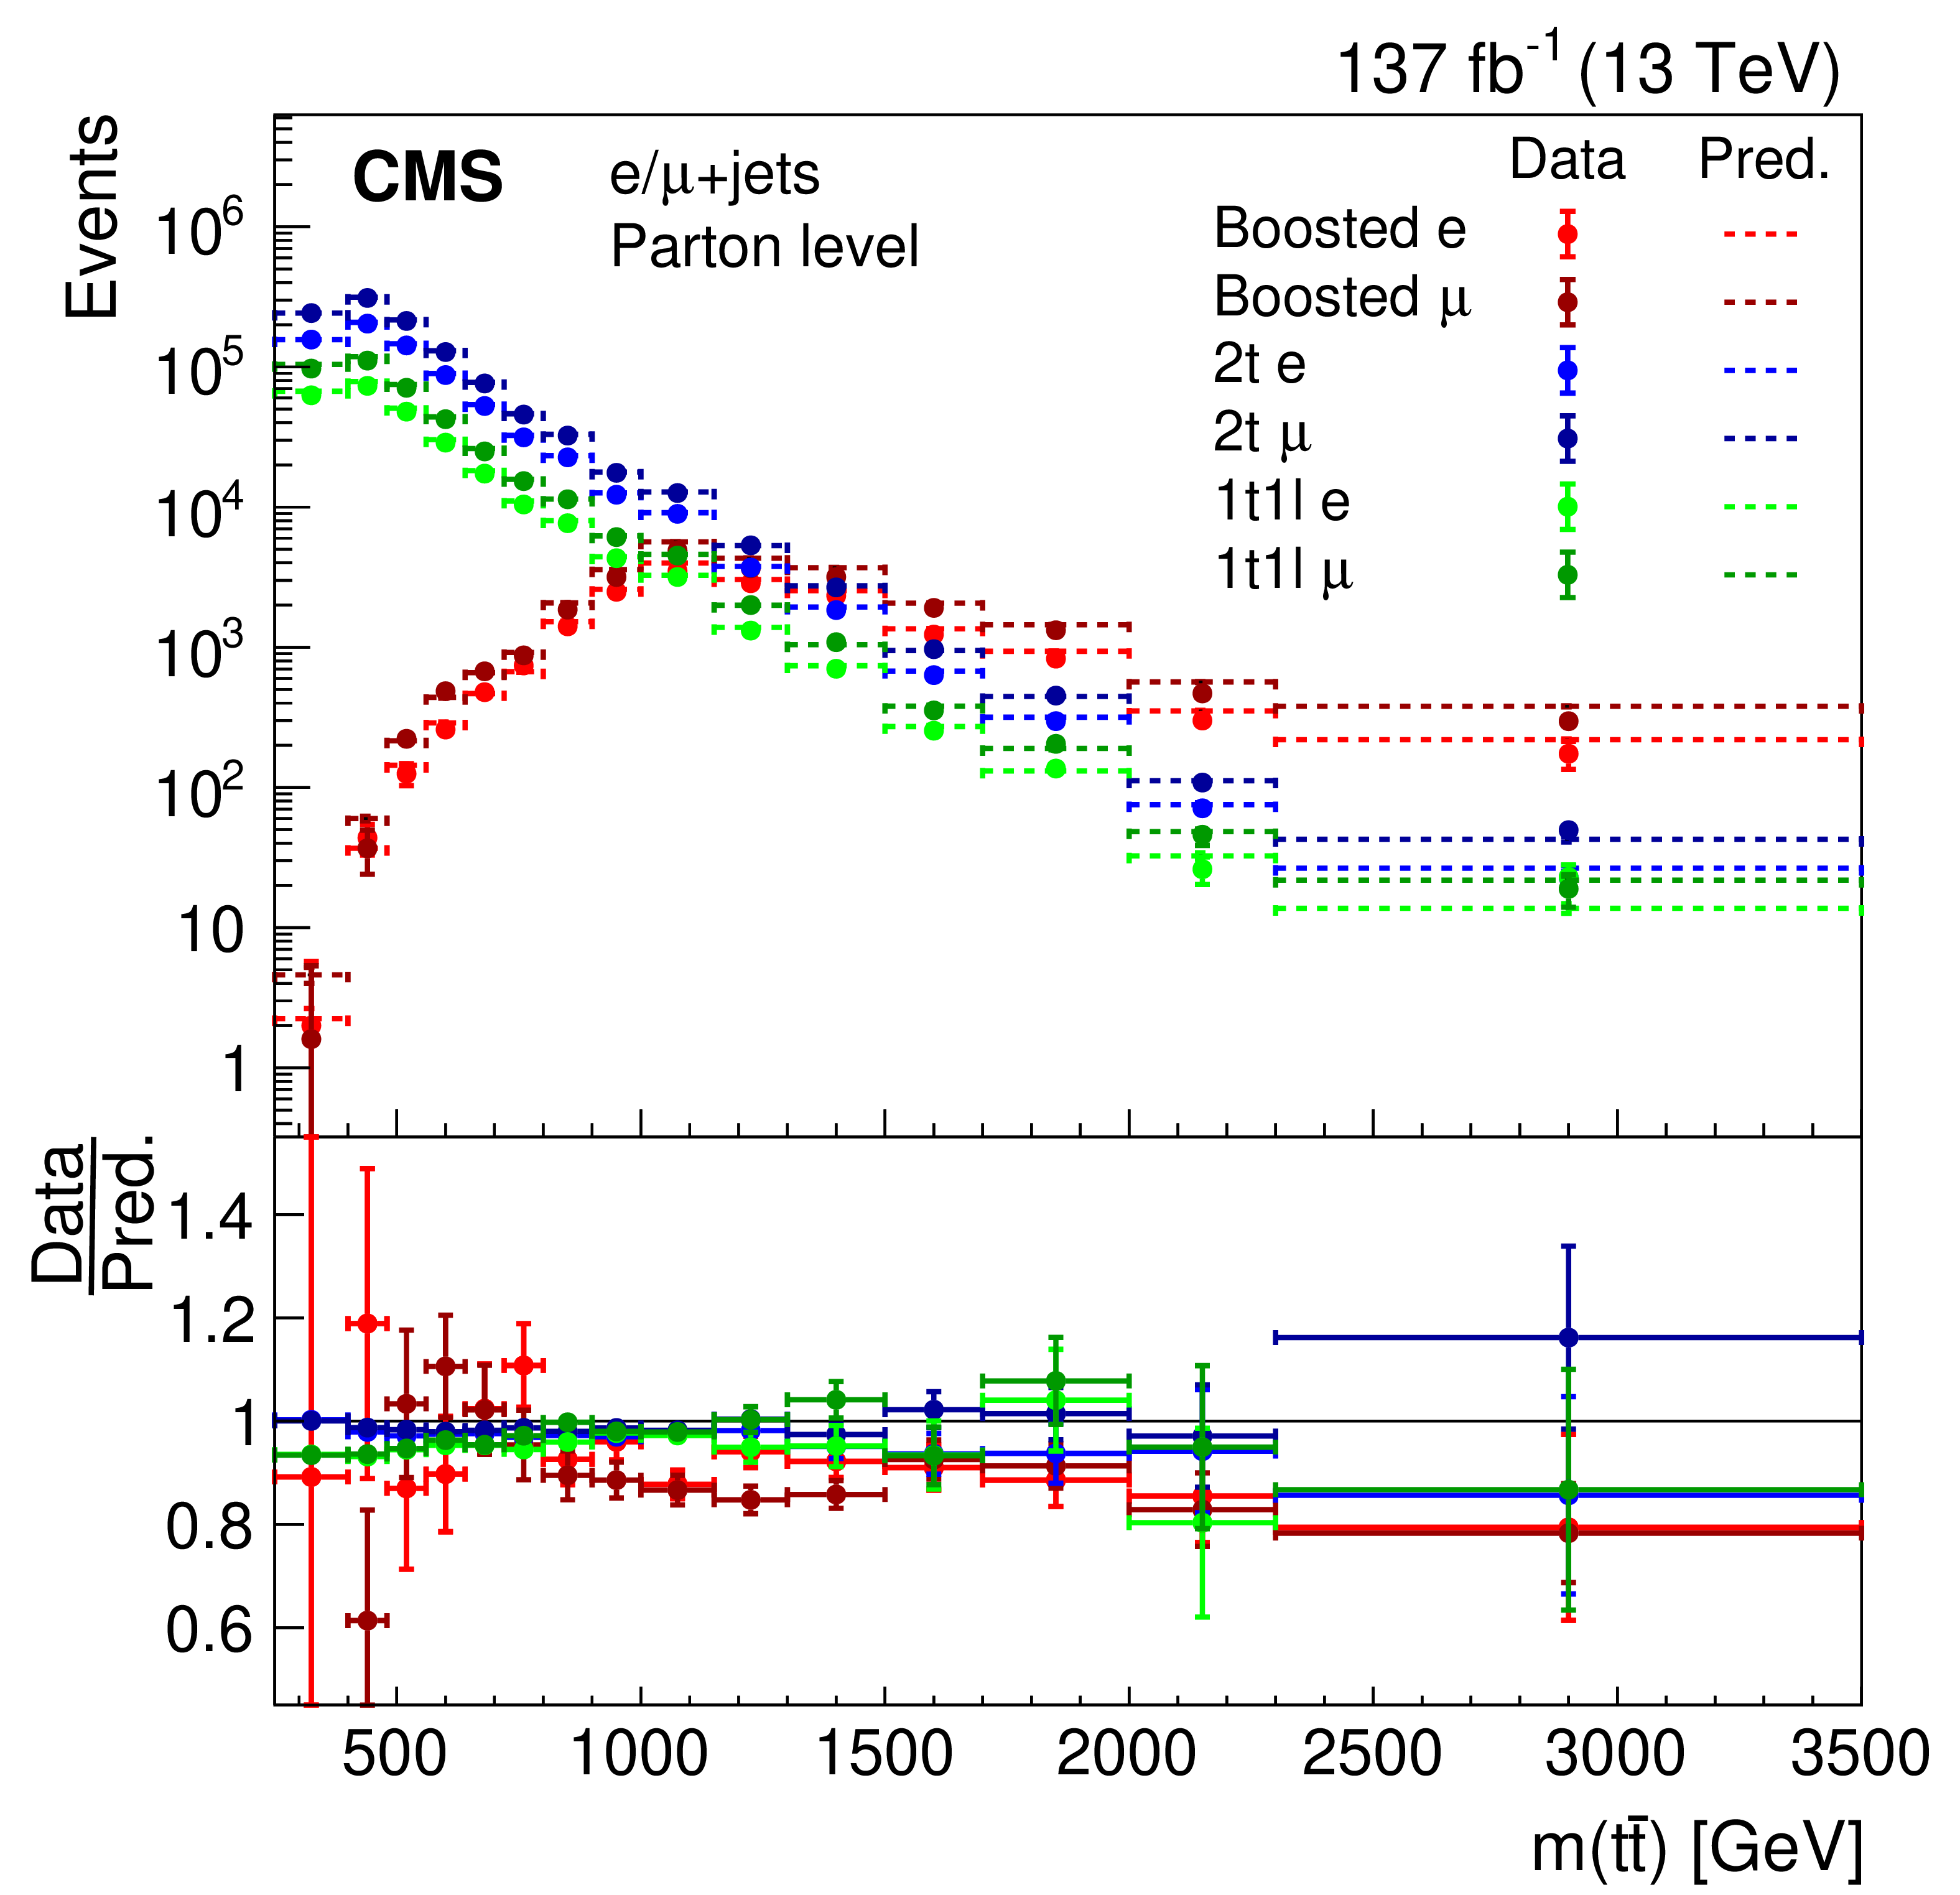
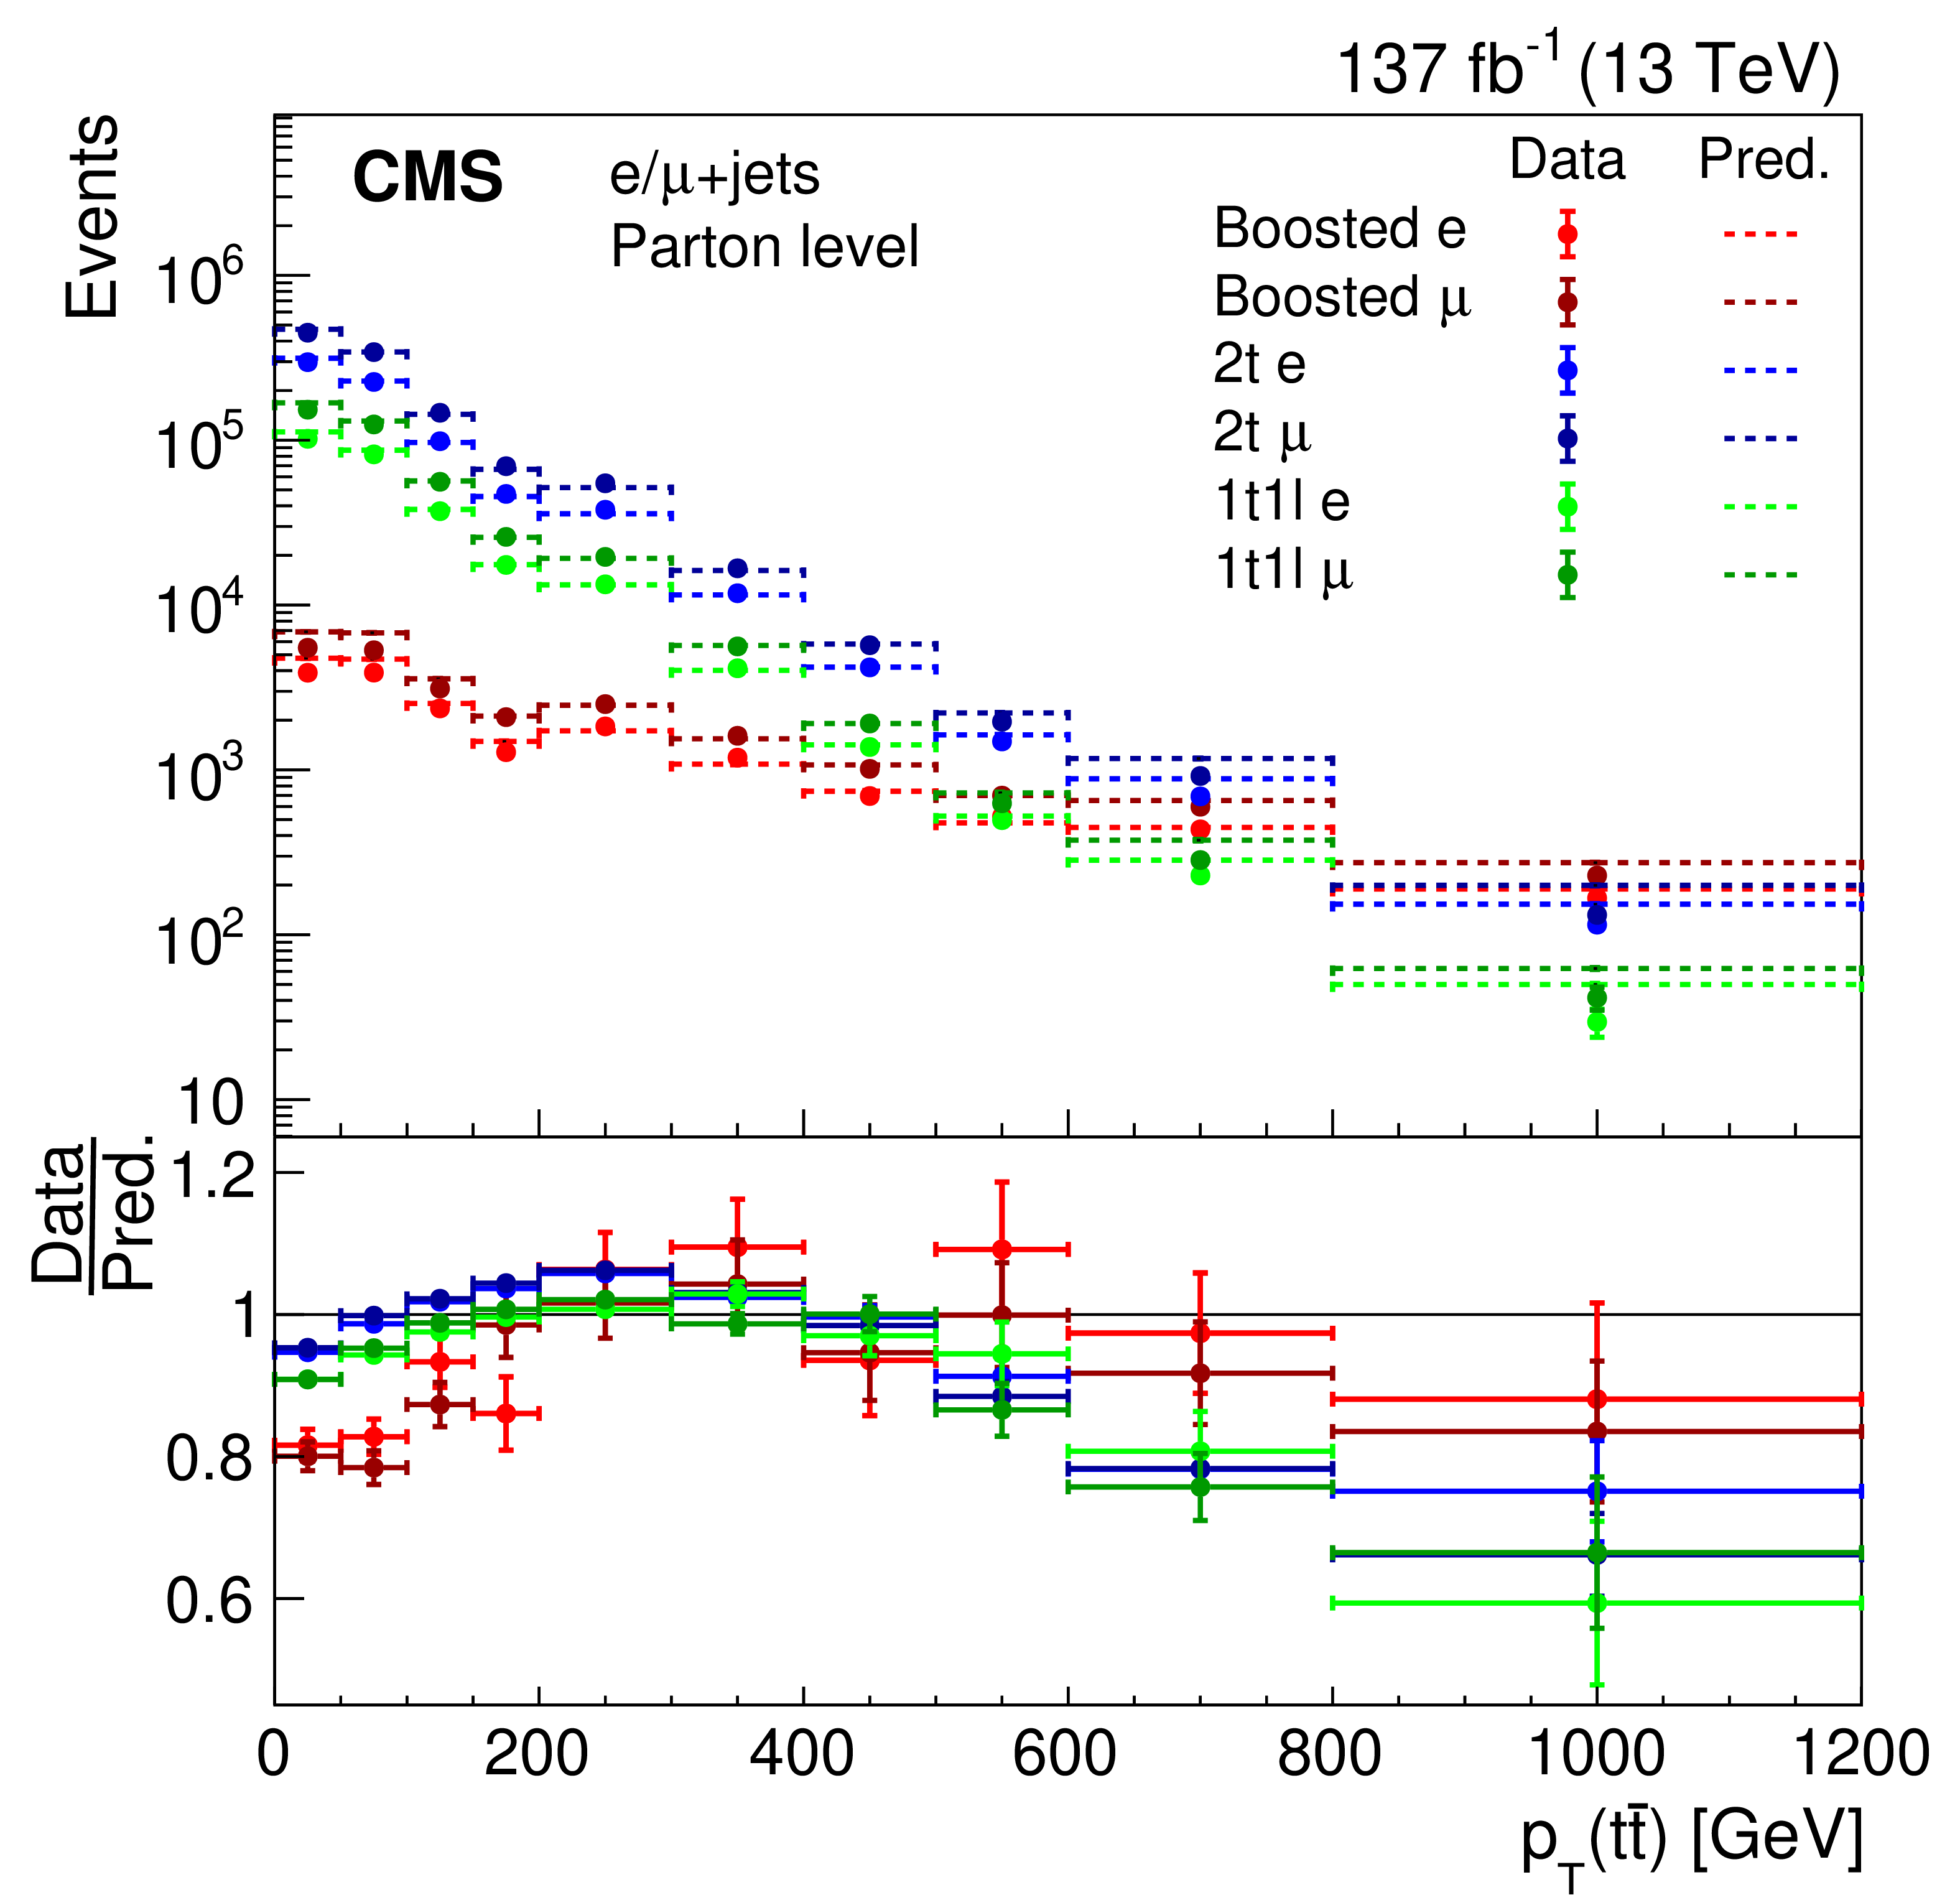
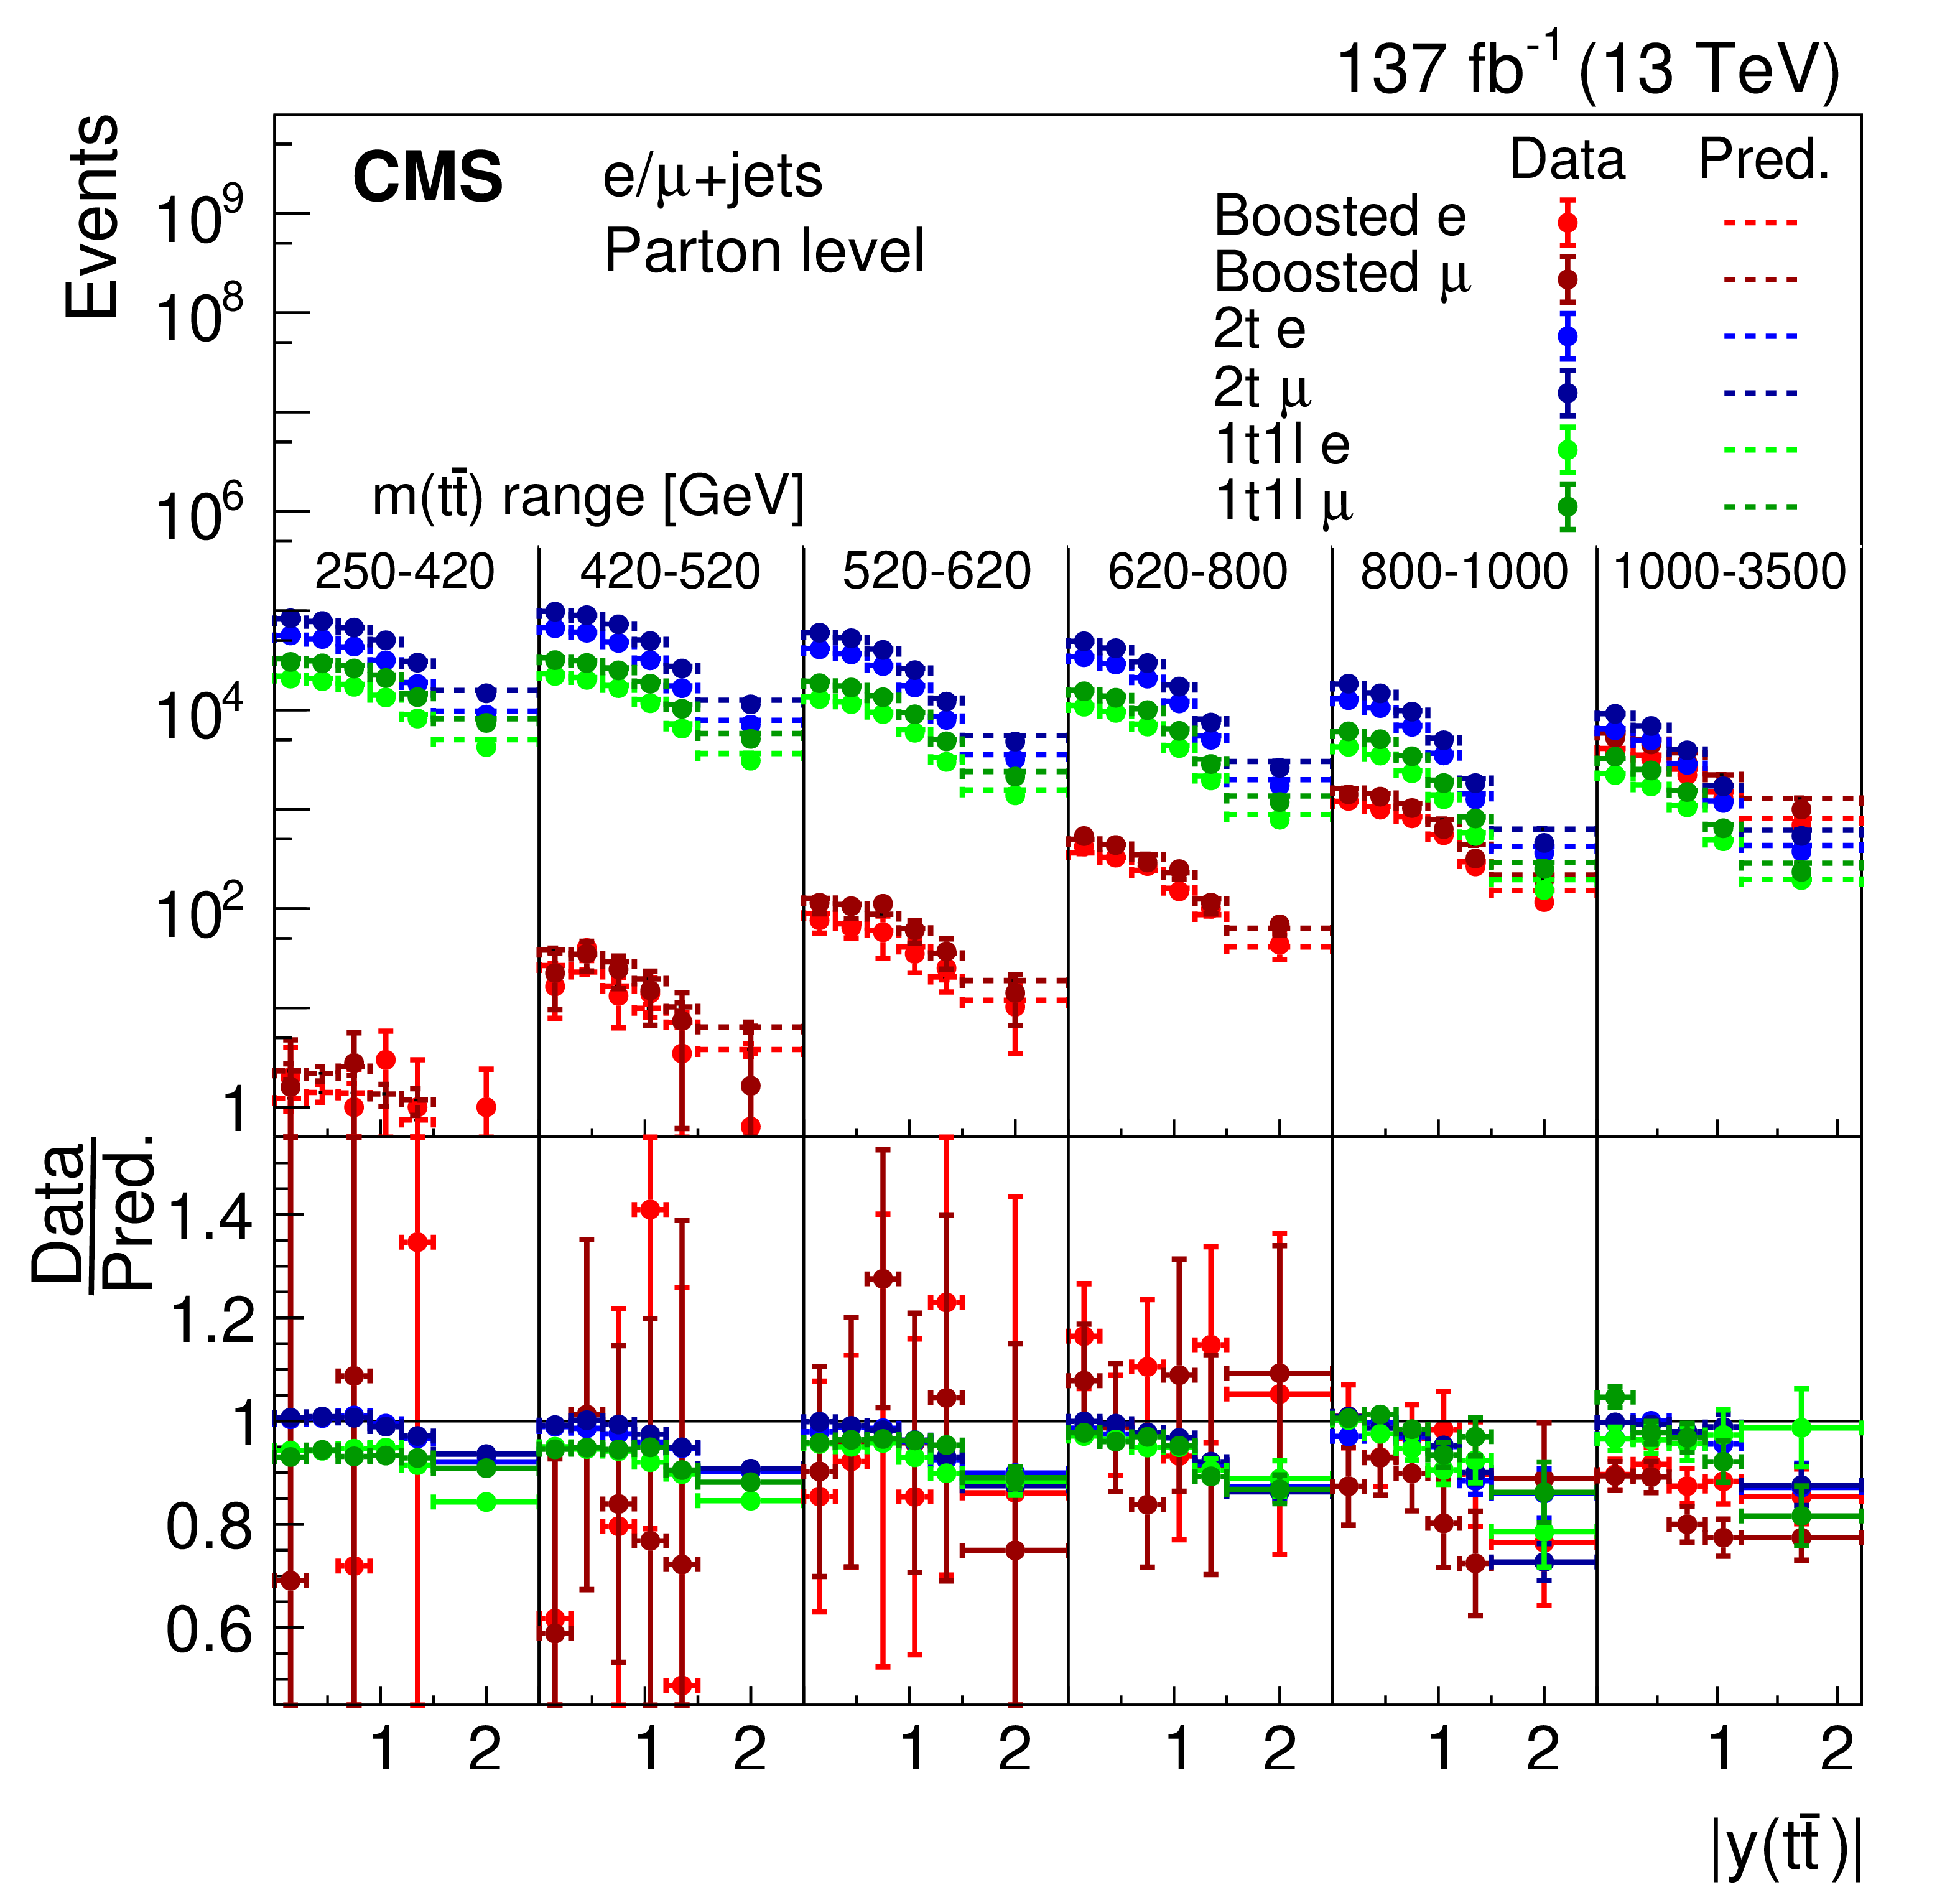
Distributions of ${{p_{\mathrm {T}}} ({\mathrm{t} _\mathrm {h}})}$ (upper left), ${m({\mathrm{t} \mathrm{\bar{t}}})}$ (upper right), ${{p_{\mathrm {T}}} ({\mathrm{t} \mathrm{\bar{t}}})}$ (lower left), and ${m({\mathrm{t} \mathrm{\bar{t}}})}$ vs. ${{| y({\mathrm{t} \mathrm{\bar{t}}}) |}}$ (lower right) after background subtraction. The points show the data and the dashed lines the predictions for the various events types. The lower panels give the ratio of the data to the predictions. The vertical bars on the points give the statistical uncertainties, and the horizontal bars the bin widths. |

png pdf |
Figure 10-a:
Distributions of ${{p_{\mathrm {T}}} ({\mathrm{t} _\mathrm {h}})}$ (upper left), ${m({\mathrm{t} \mathrm{\bar{t}}})}$ (upper right), ${{p_{\mathrm {T}}} ({\mathrm{t} \mathrm{\bar{t}}})}$ (lower left), and ${m({\mathrm{t} \mathrm{\bar{t}}})}$ vs. ${{| y({\mathrm{t} \mathrm{\bar{t}}}) |}}$ (lower right) after background subtraction. The points show the data and the dashed lines the predictions for the various events types. The lower panels give the ratio of the data to the predictions. The vertical bars on the points give the statistical uncertainties, and the horizontal bars the bin widths. |
png pdf |
Figure 10-b:
Distributions of ${{p_{\mathrm {T}}} ({\mathrm{t} _\mathrm {h}})}$ (upper left), ${m({\mathrm{t} \mathrm{\bar{t}}})}$ (upper right), ${{p_{\mathrm {T}}} ({\mathrm{t} \mathrm{\bar{t}}})}$ (lower left), and ${m({\mathrm{t} \mathrm{\bar{t}}})}$ vs. ${{| y({\mathrm{t} \mathrm{\bar{t}}}) |}}$ (lower right) after background subtraction. The points show the data and the dashed lines the predictions for the various events types. The lower panels give the ratio of the data to the predictions. The vertical bars on the points give the statistical uncertainties, and the horizontal bars the bin widths. |
png pdf |
Figure 10-c:
Distributions of ${{p_{\mathrm {T}}} ({\mathrm{t} _\mathrm {h}})}$ (upper left), ${m({\mathrm{t} \mathrm{\bar{t}}})}$ (upper right), ${{p_{\mathrm {T}}} ({\mathrm{t} \mathrm{\bar{t}}})}$ (lower left), and ${m({\mathrm{t} \mathrm{\bar{t}}})}$ vs. ${{| y({\mathrm{t} \mathrm{\bar{t}}}) |}}$ (lower right) after background subtraction. The points show the data and the dashed lines the predictions for the various events types. The lower panels give the ratio of the data to the predictions. The vertical bars on the points give the statistical uncertainties, and the horizontal bars the bin widths. |
png pdf |
Figure 10-d:
Distributions of ${{p_{\mathrm {T}}} ({\mathrm{t} _\mathrm {h}})}$ (upper left), ${m({\mathrm{t} \mathrm{\bar{t}}})}$ (upper right), ${{p_{\mathrm {T}}} ({\mathrm{t} \mathrm{\bar{t}}})}$ (lower left), and ${m({\mathrm{t} \mathrm{\bar{t}}})}$ vs. ${{| y({\mathrm{t} \mathrm{\bar{t}}}) |}}$ (lower right) after background subtraction. The points show the data and the dashed lines the predictions for the various events types. The lower panels give the ratio of the data to the predictions. The vertical bars on the points give the statistical uncertainties, and the horizontal bars the bin widths. |
png pdf |
Figure 11:
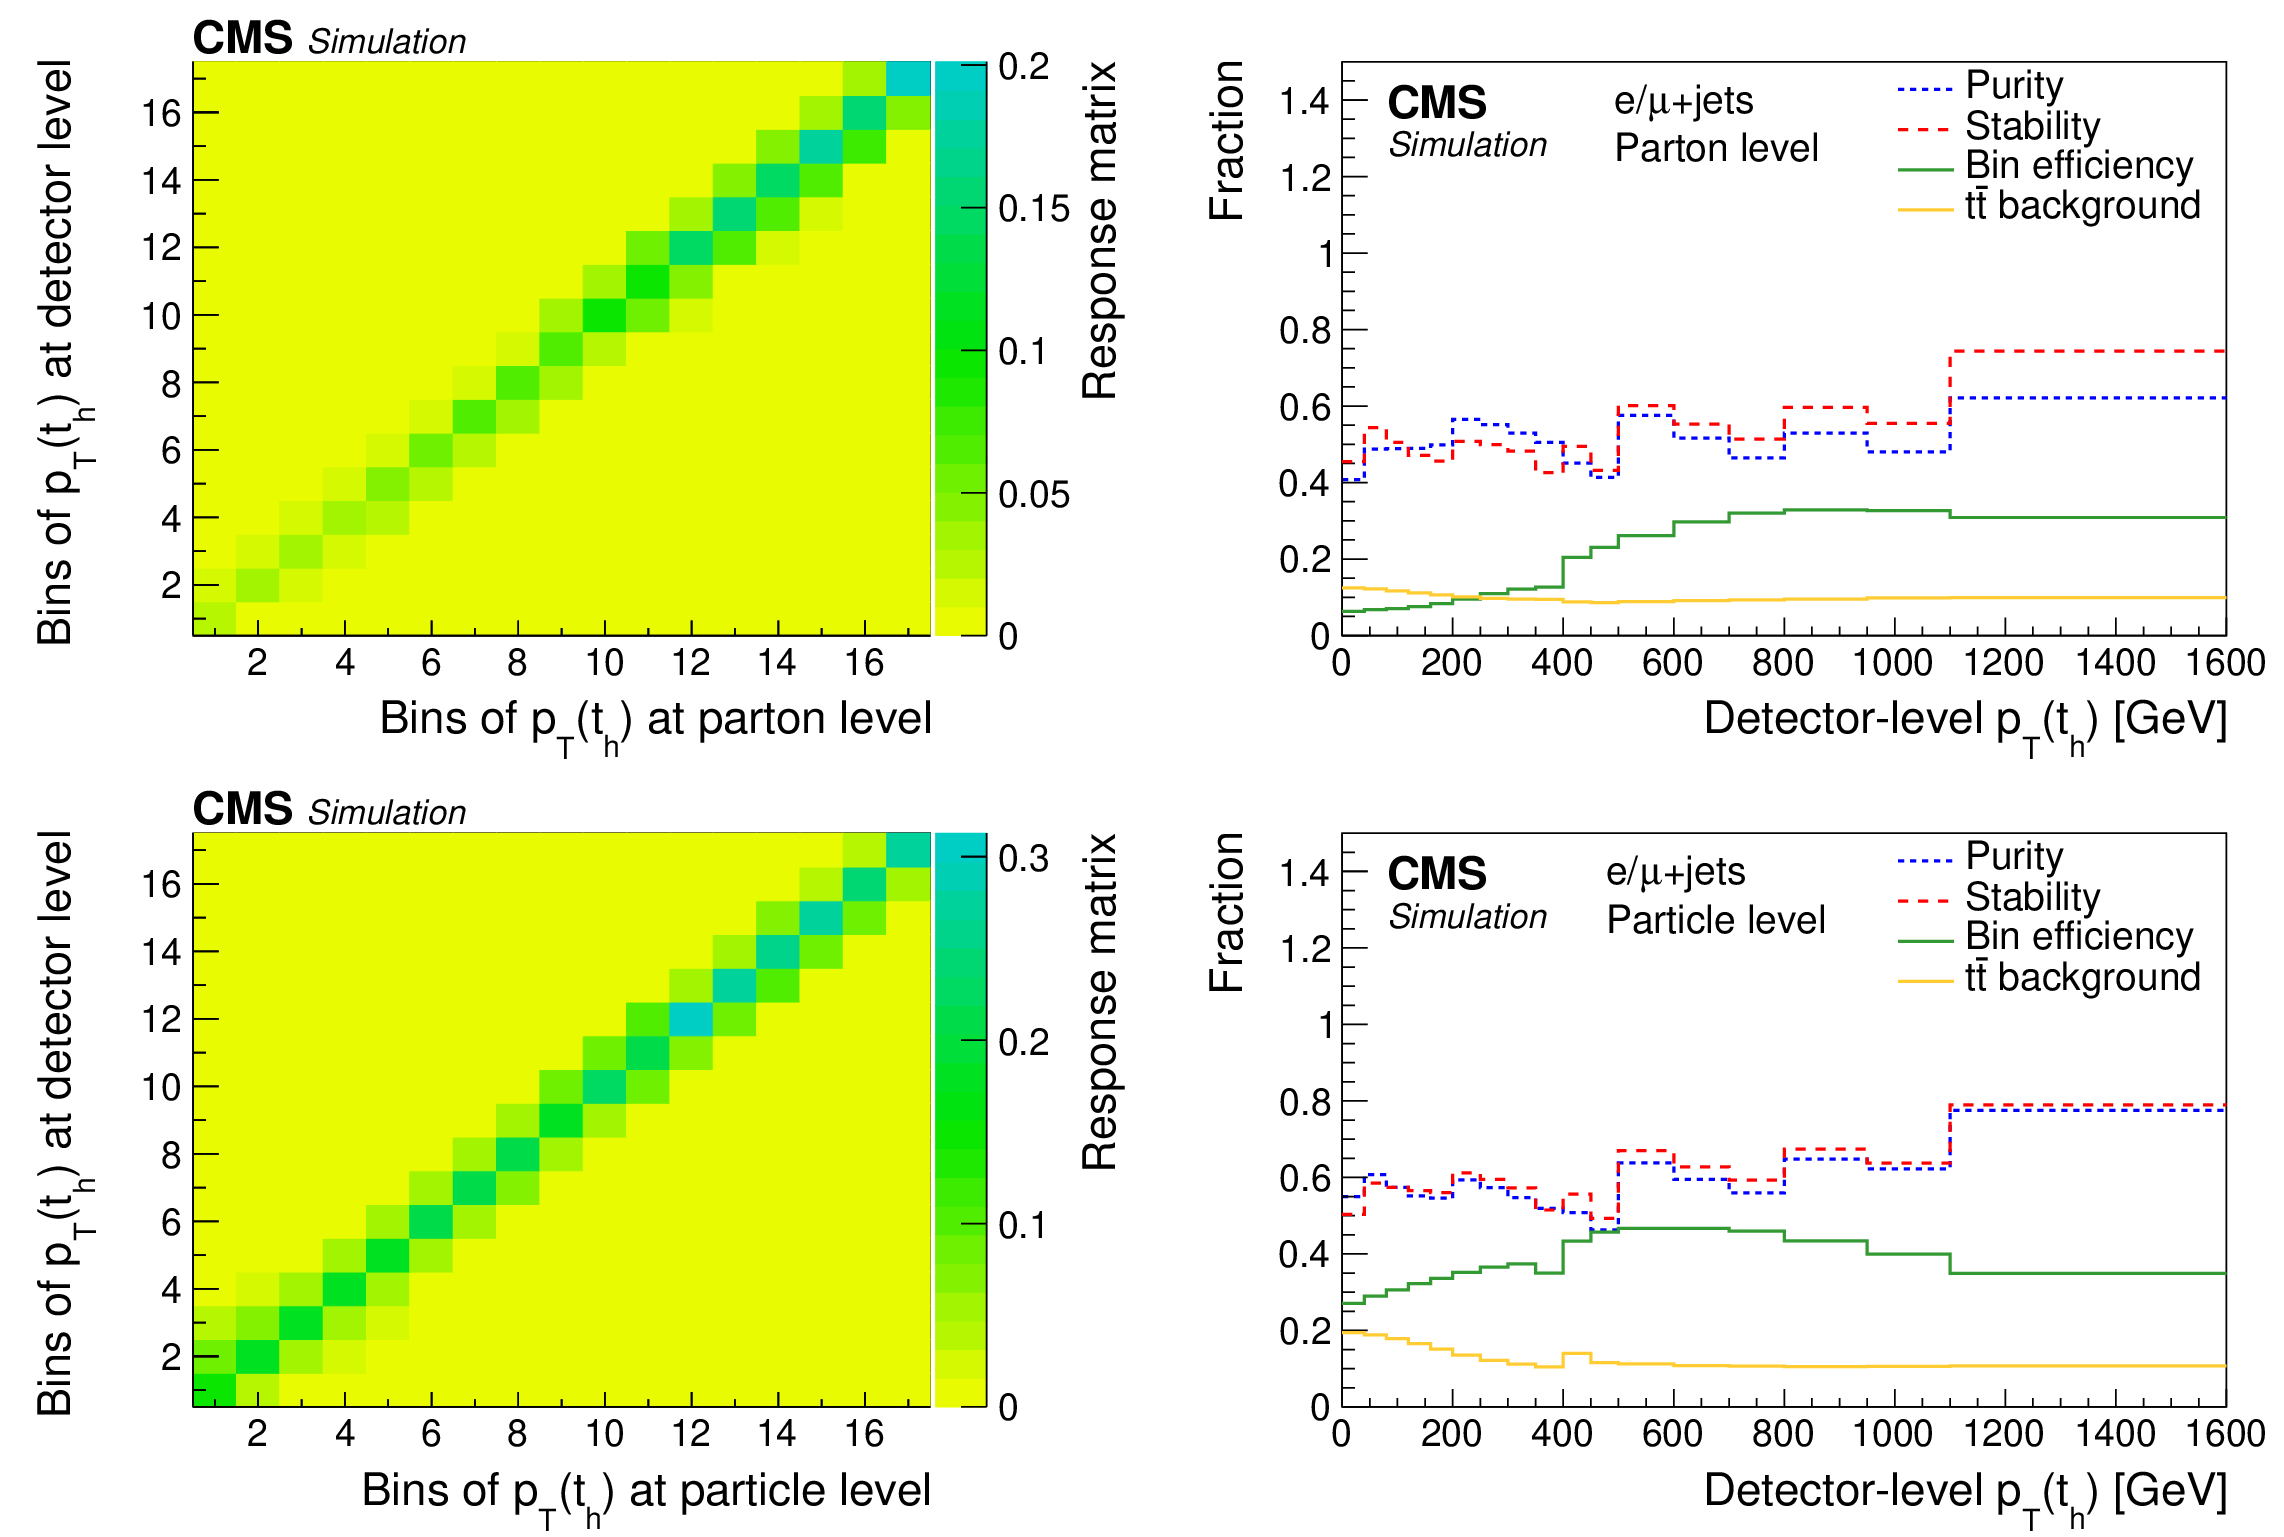
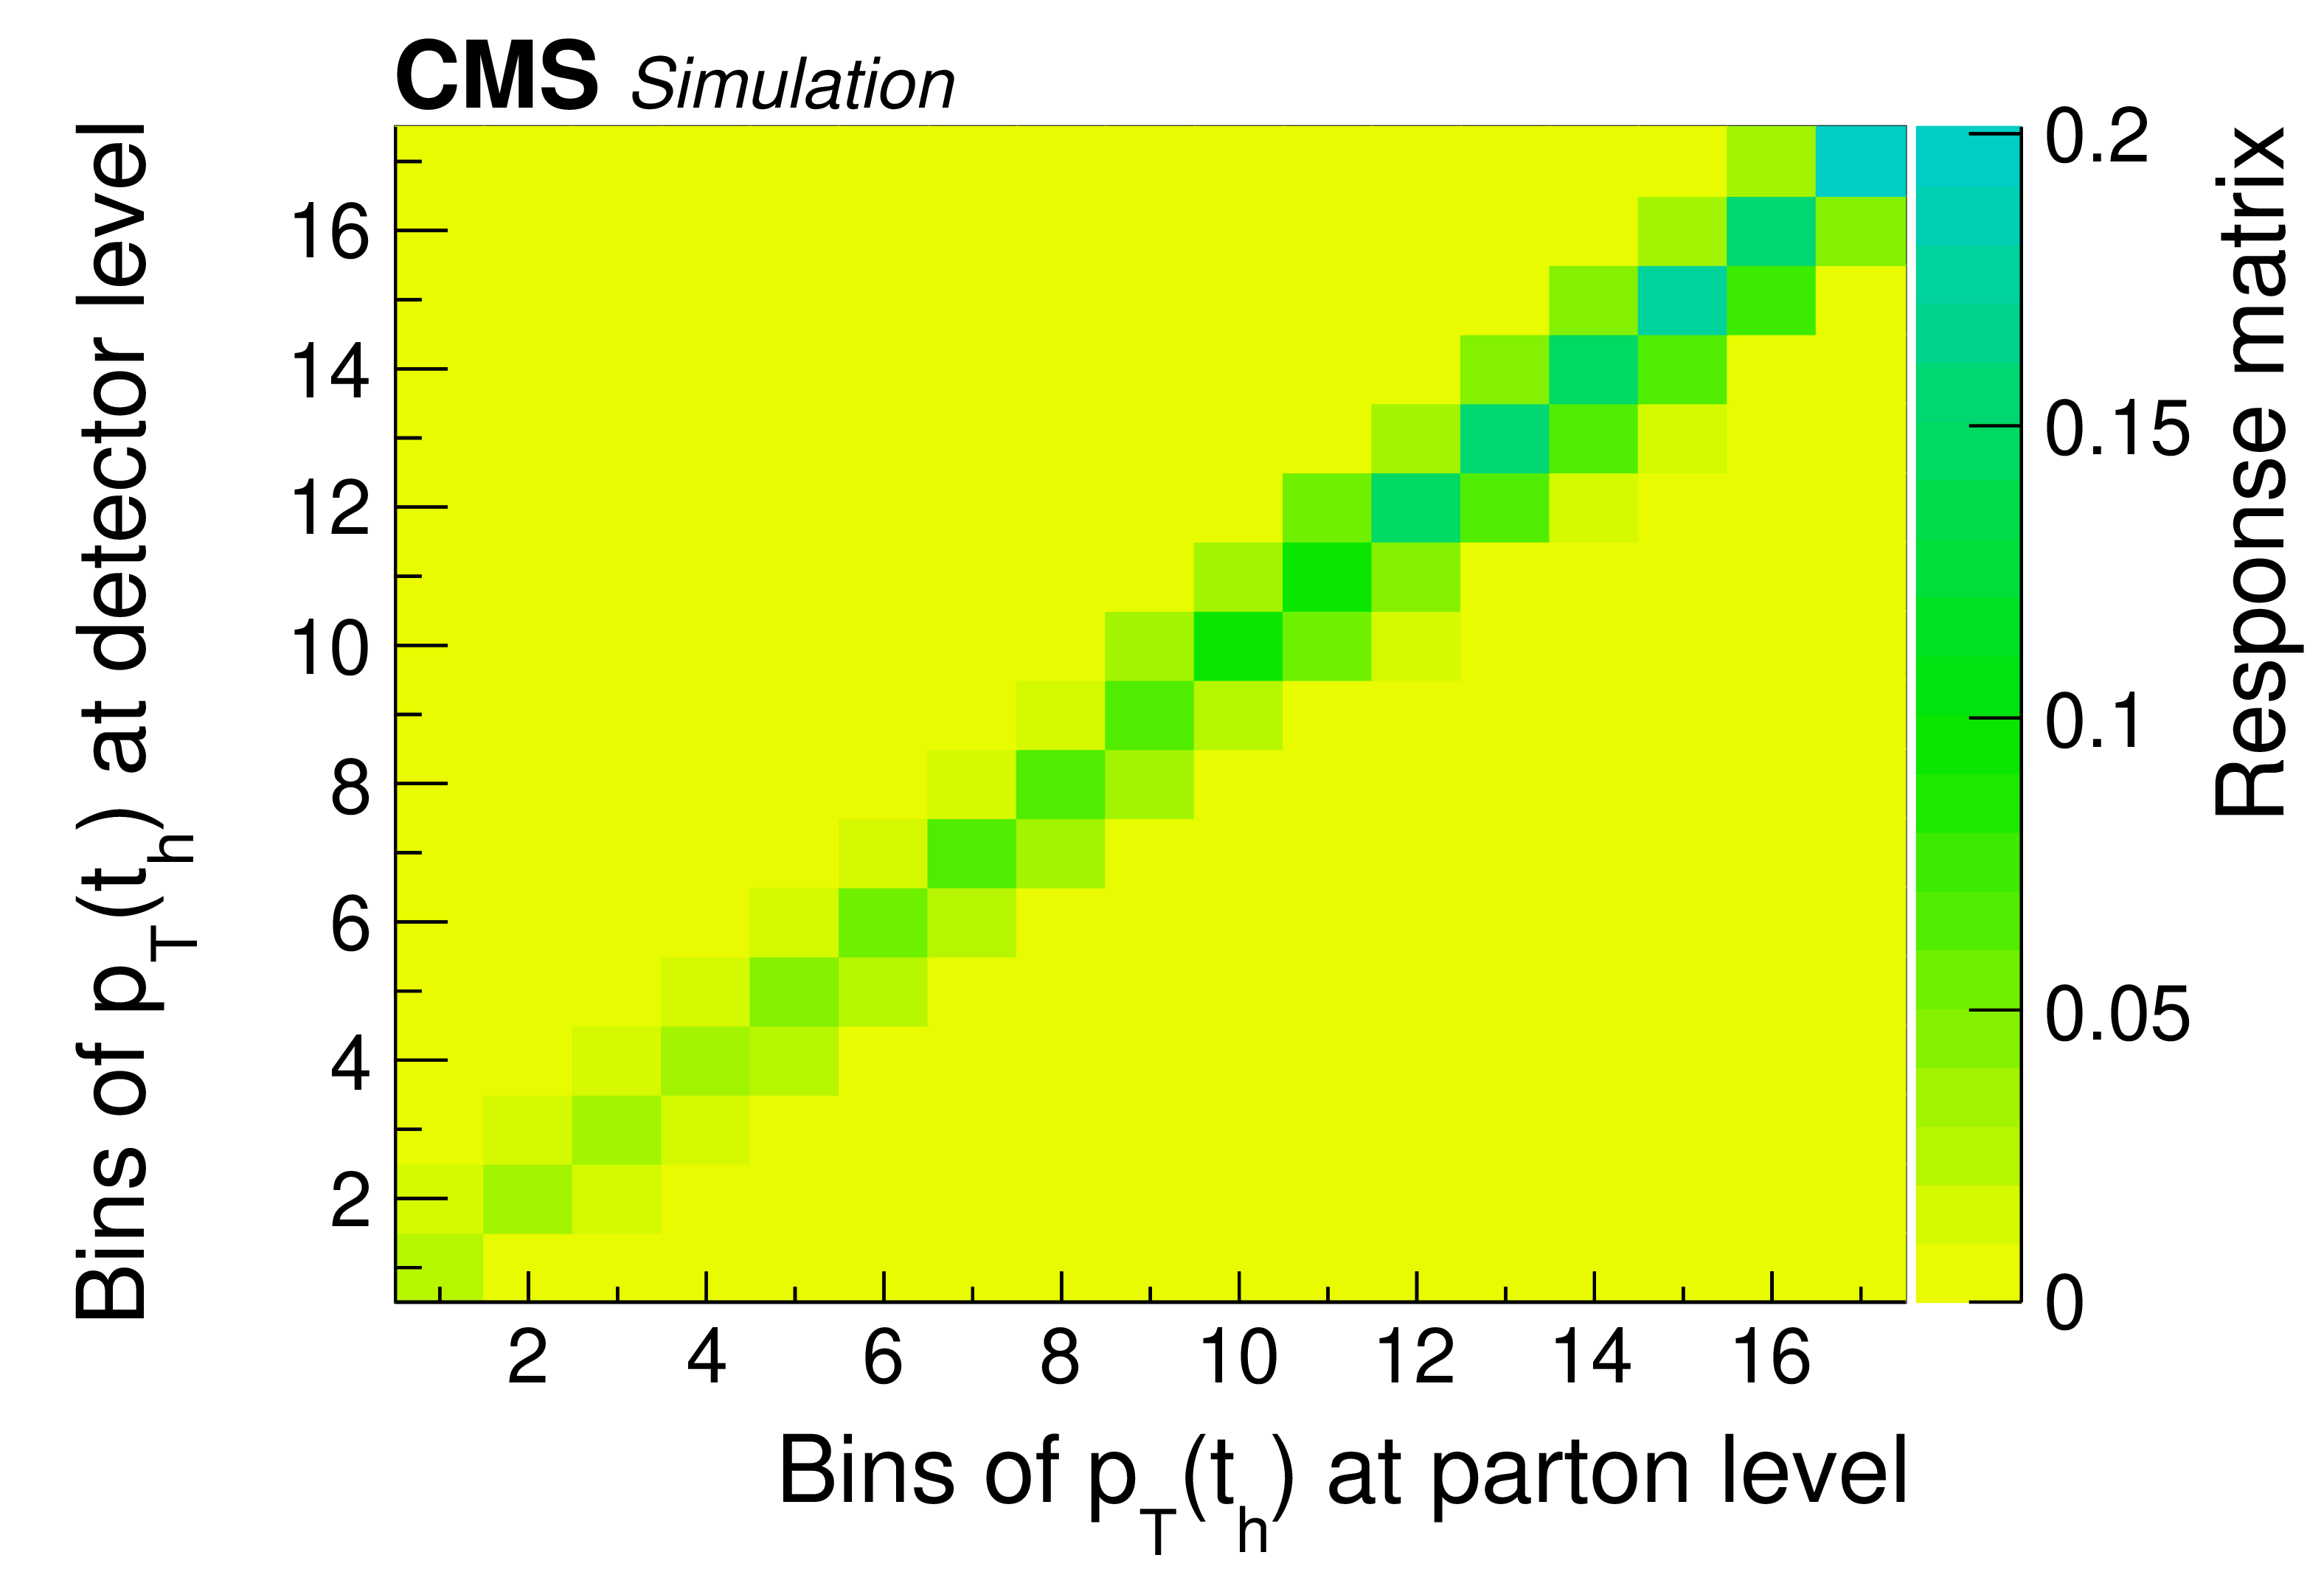
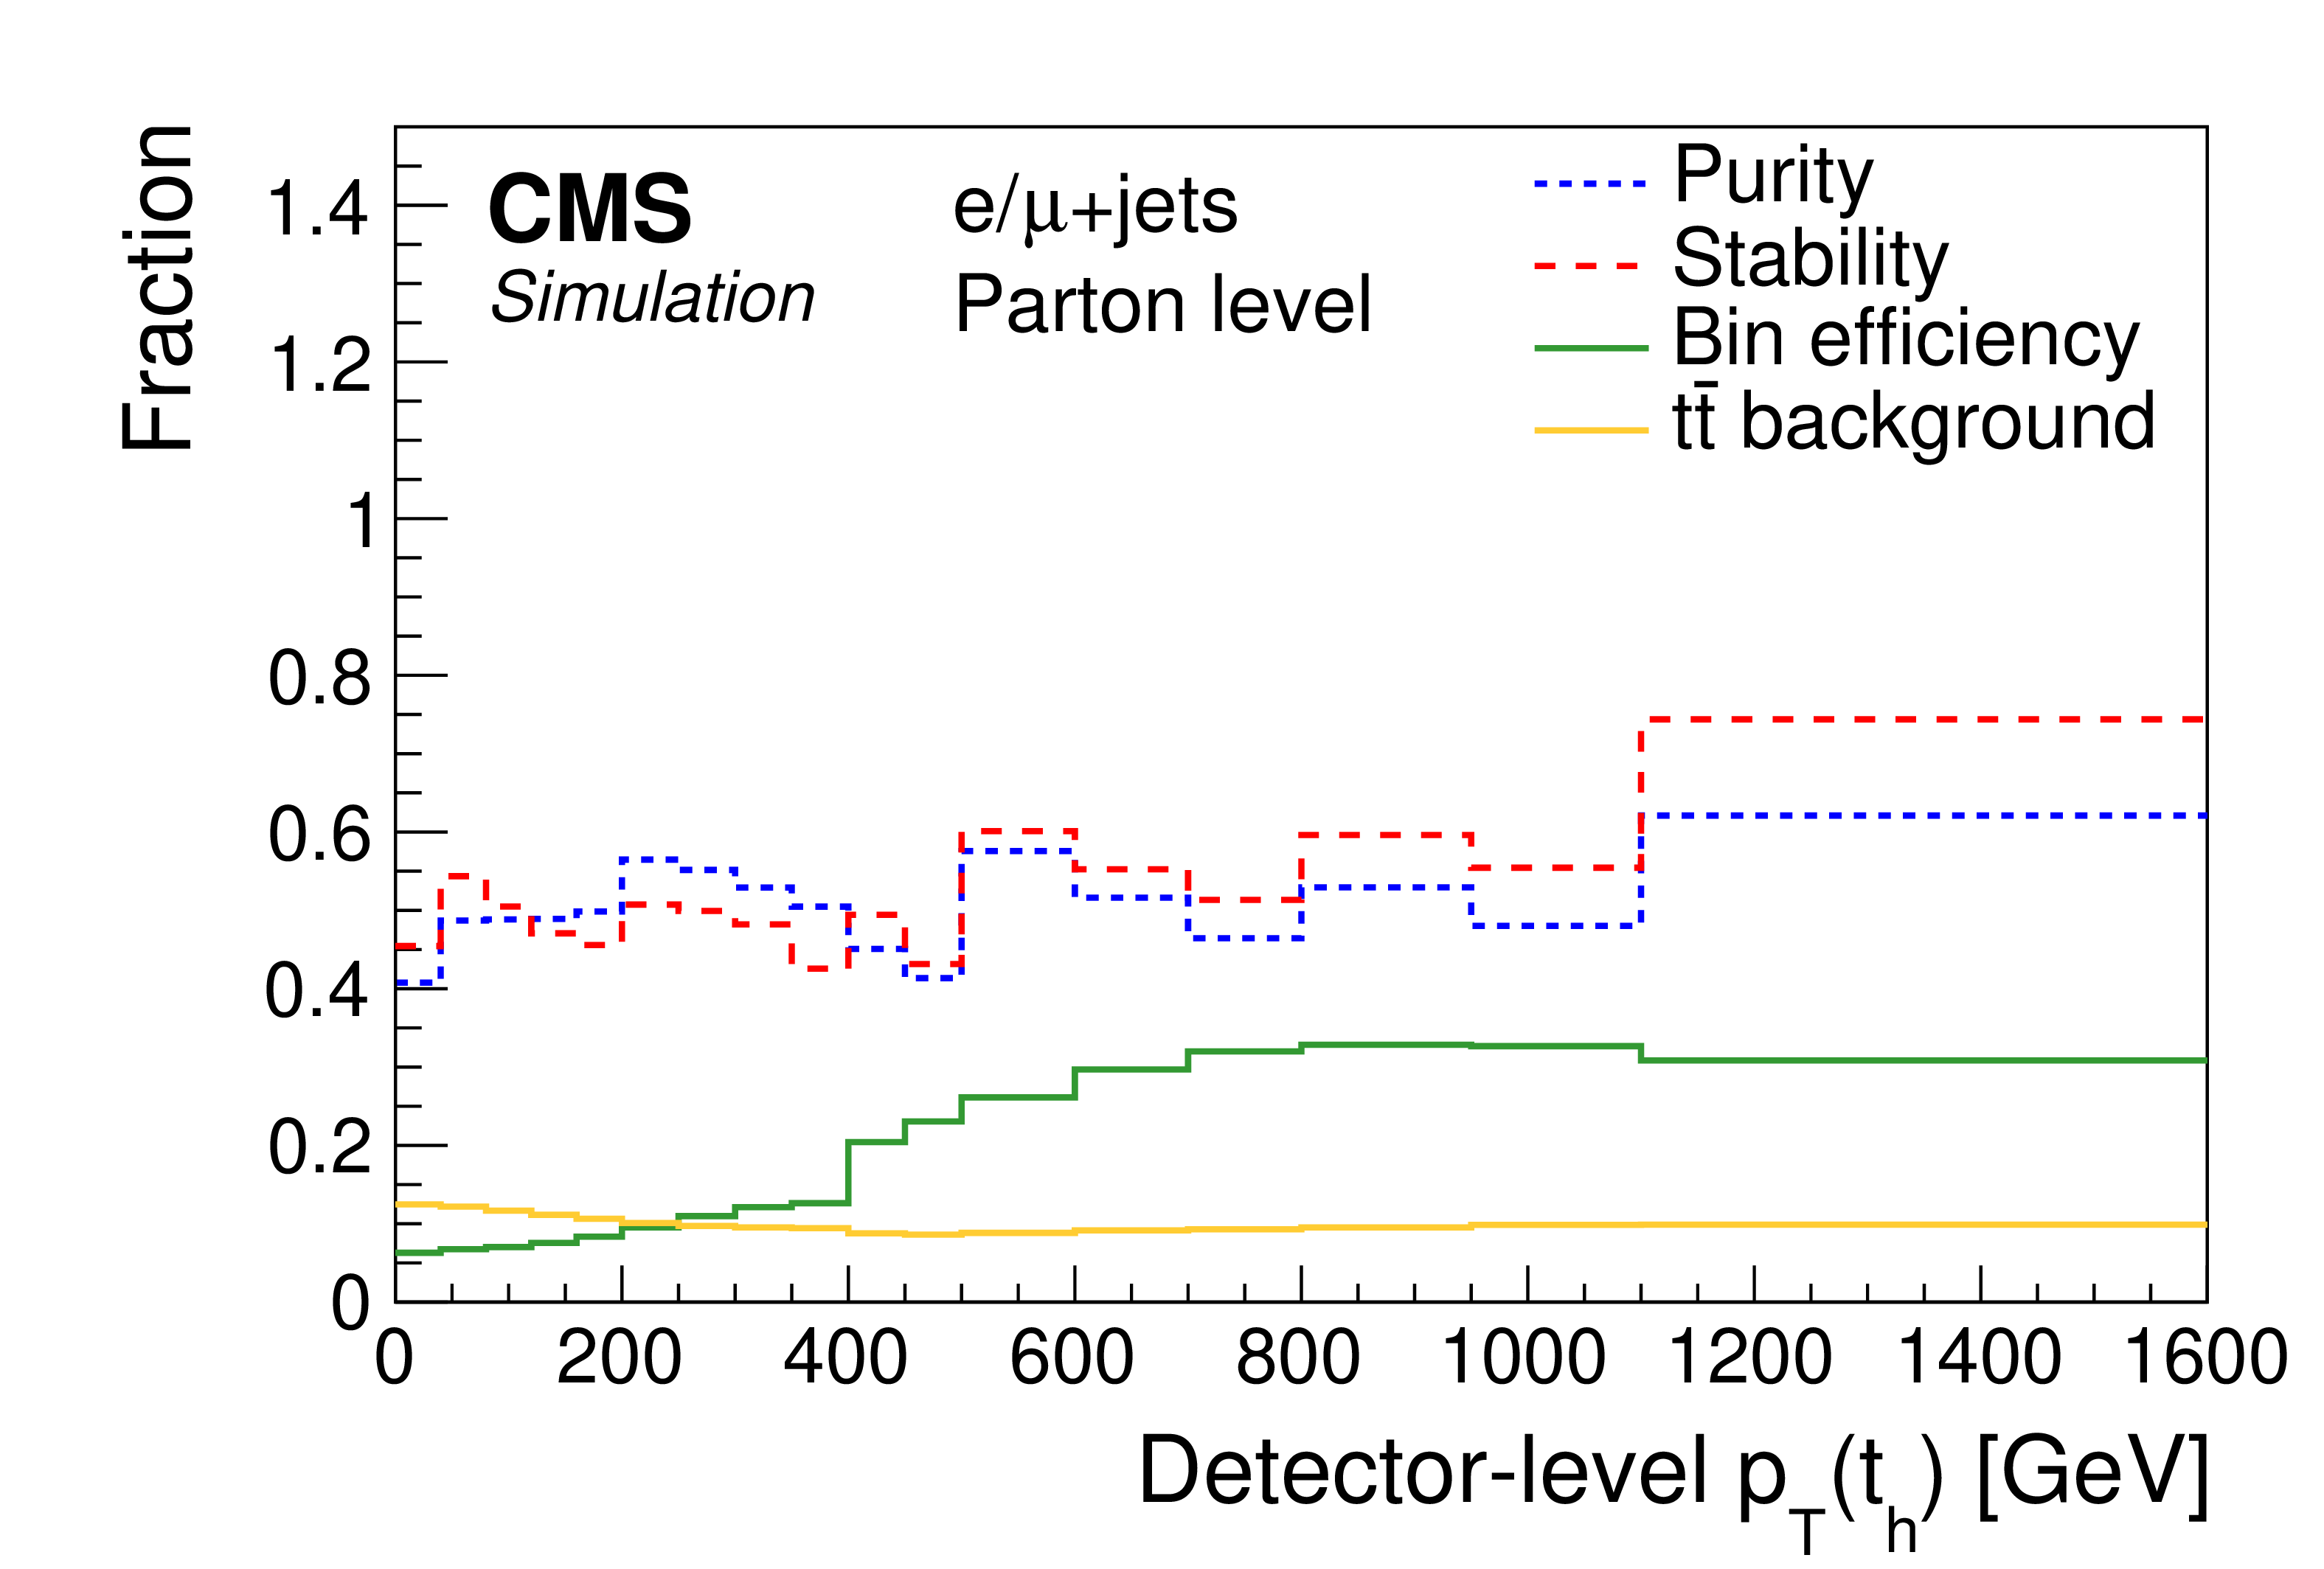
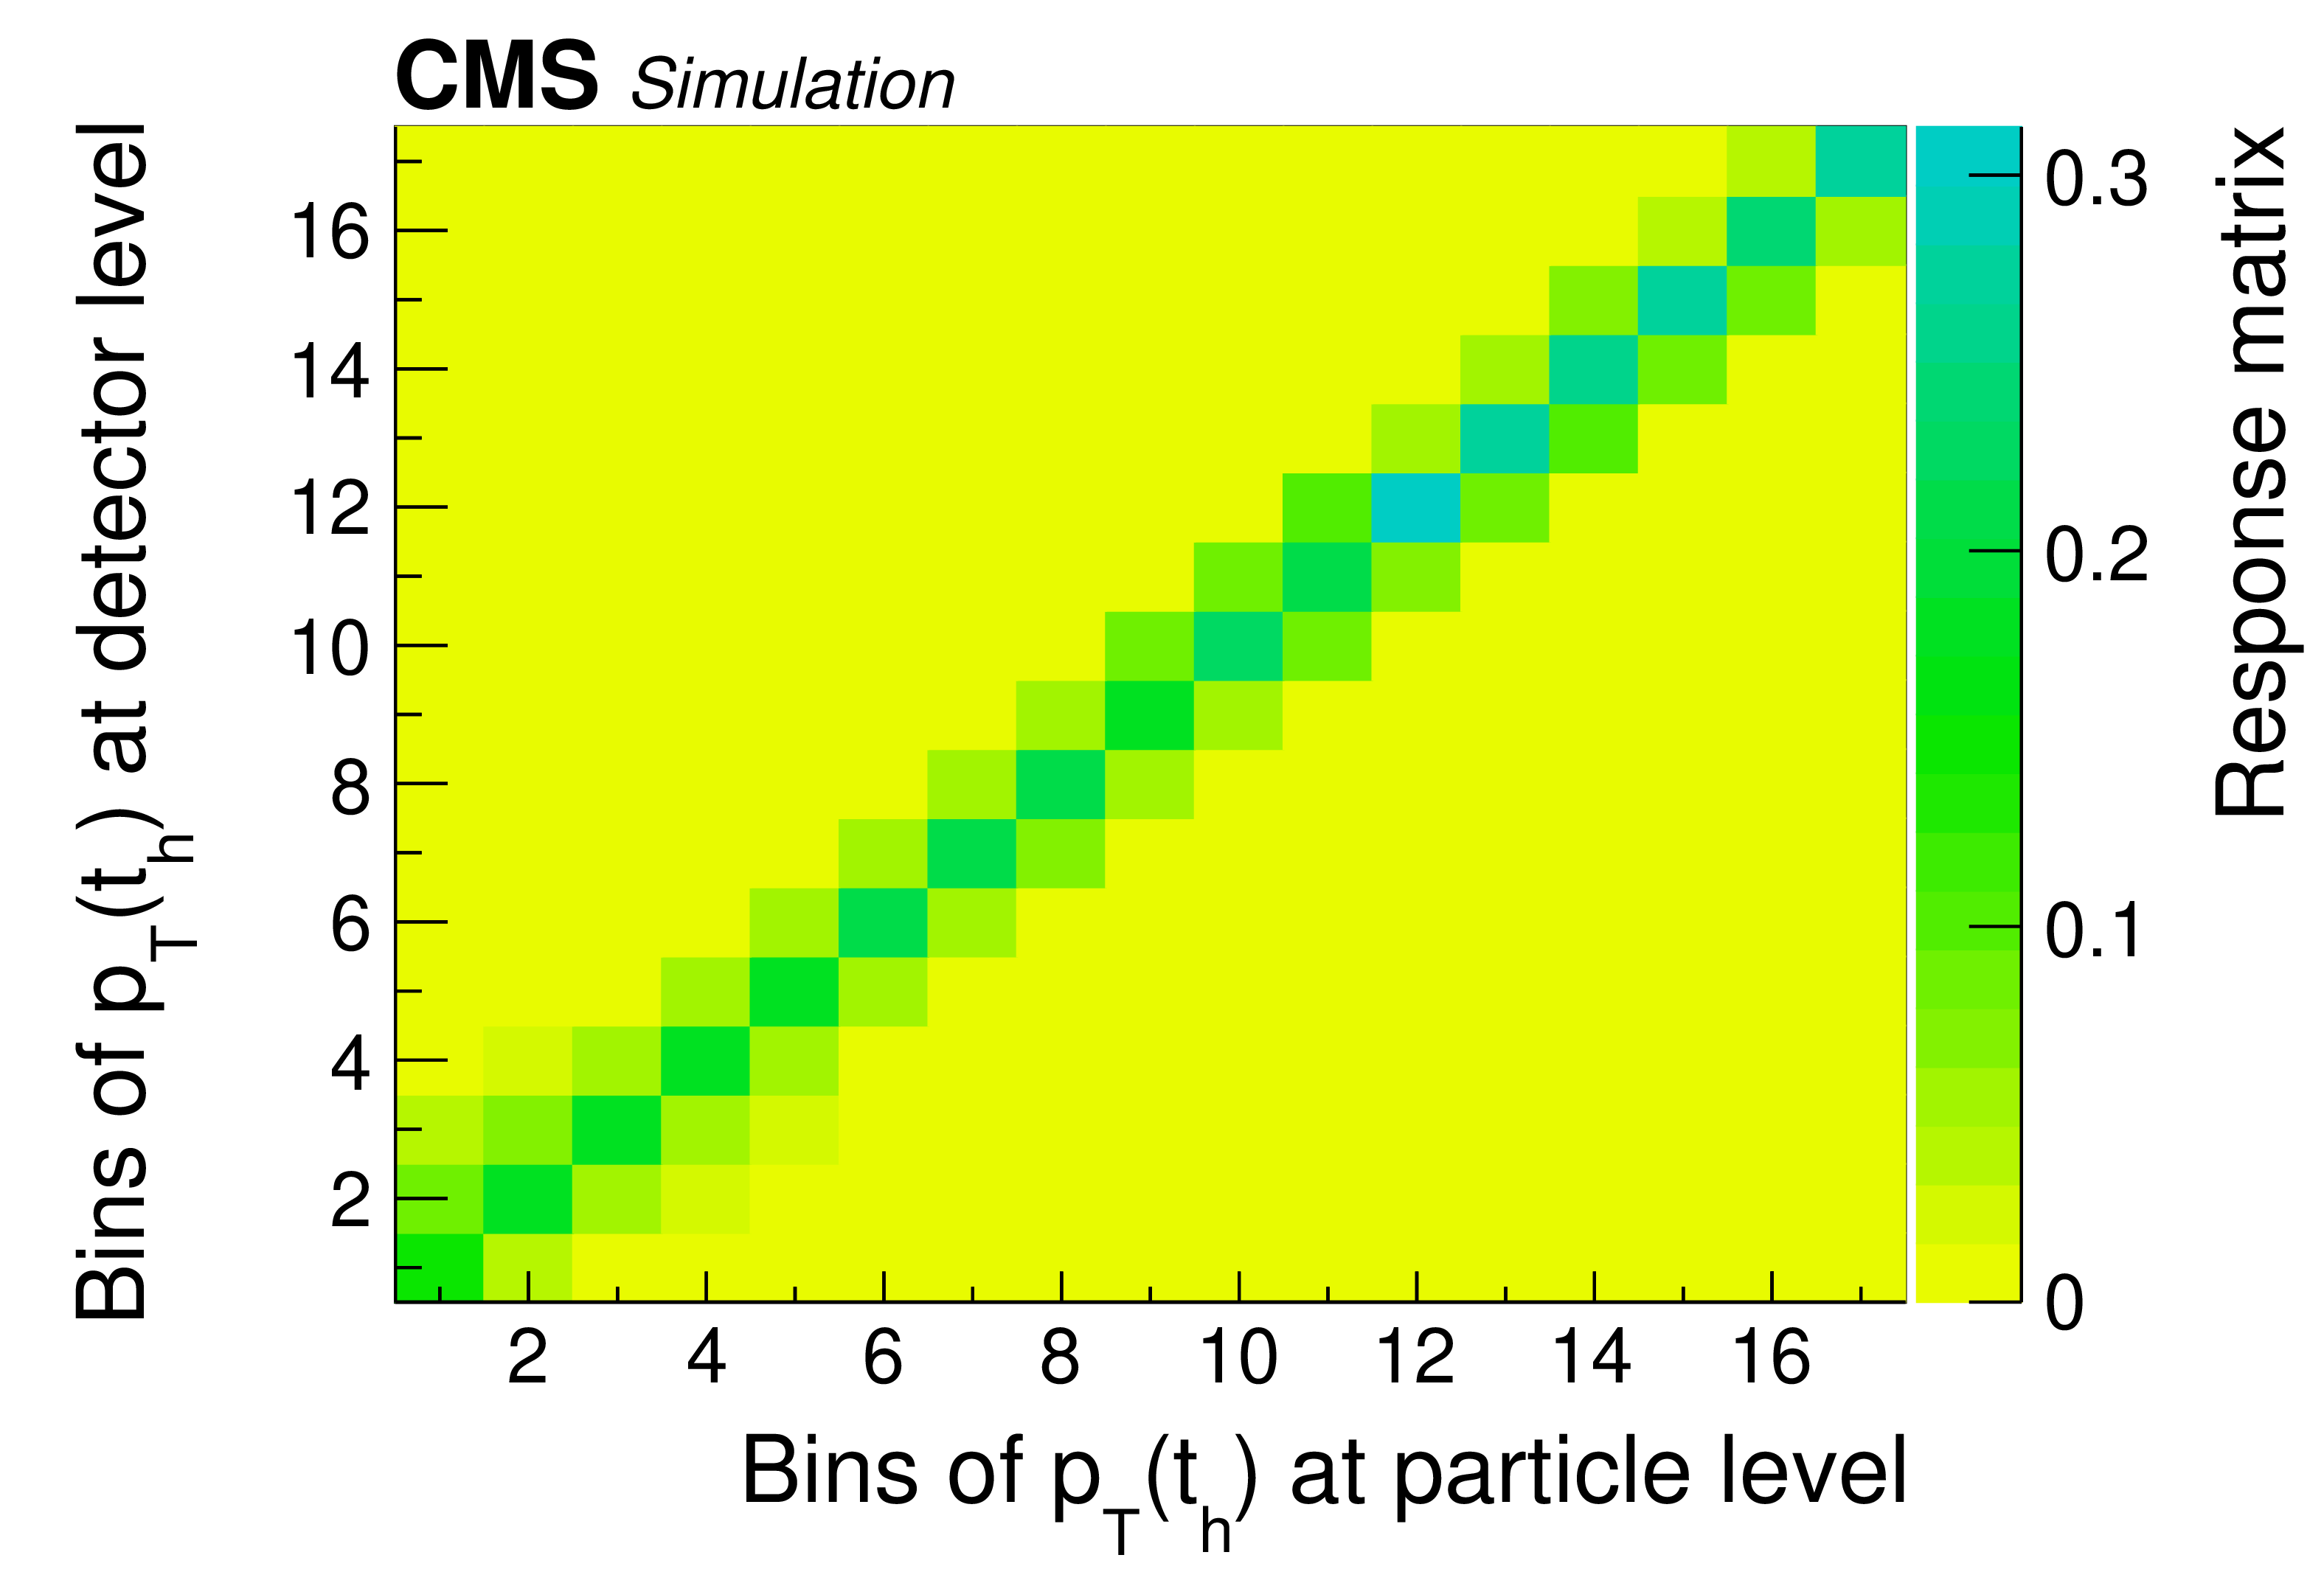
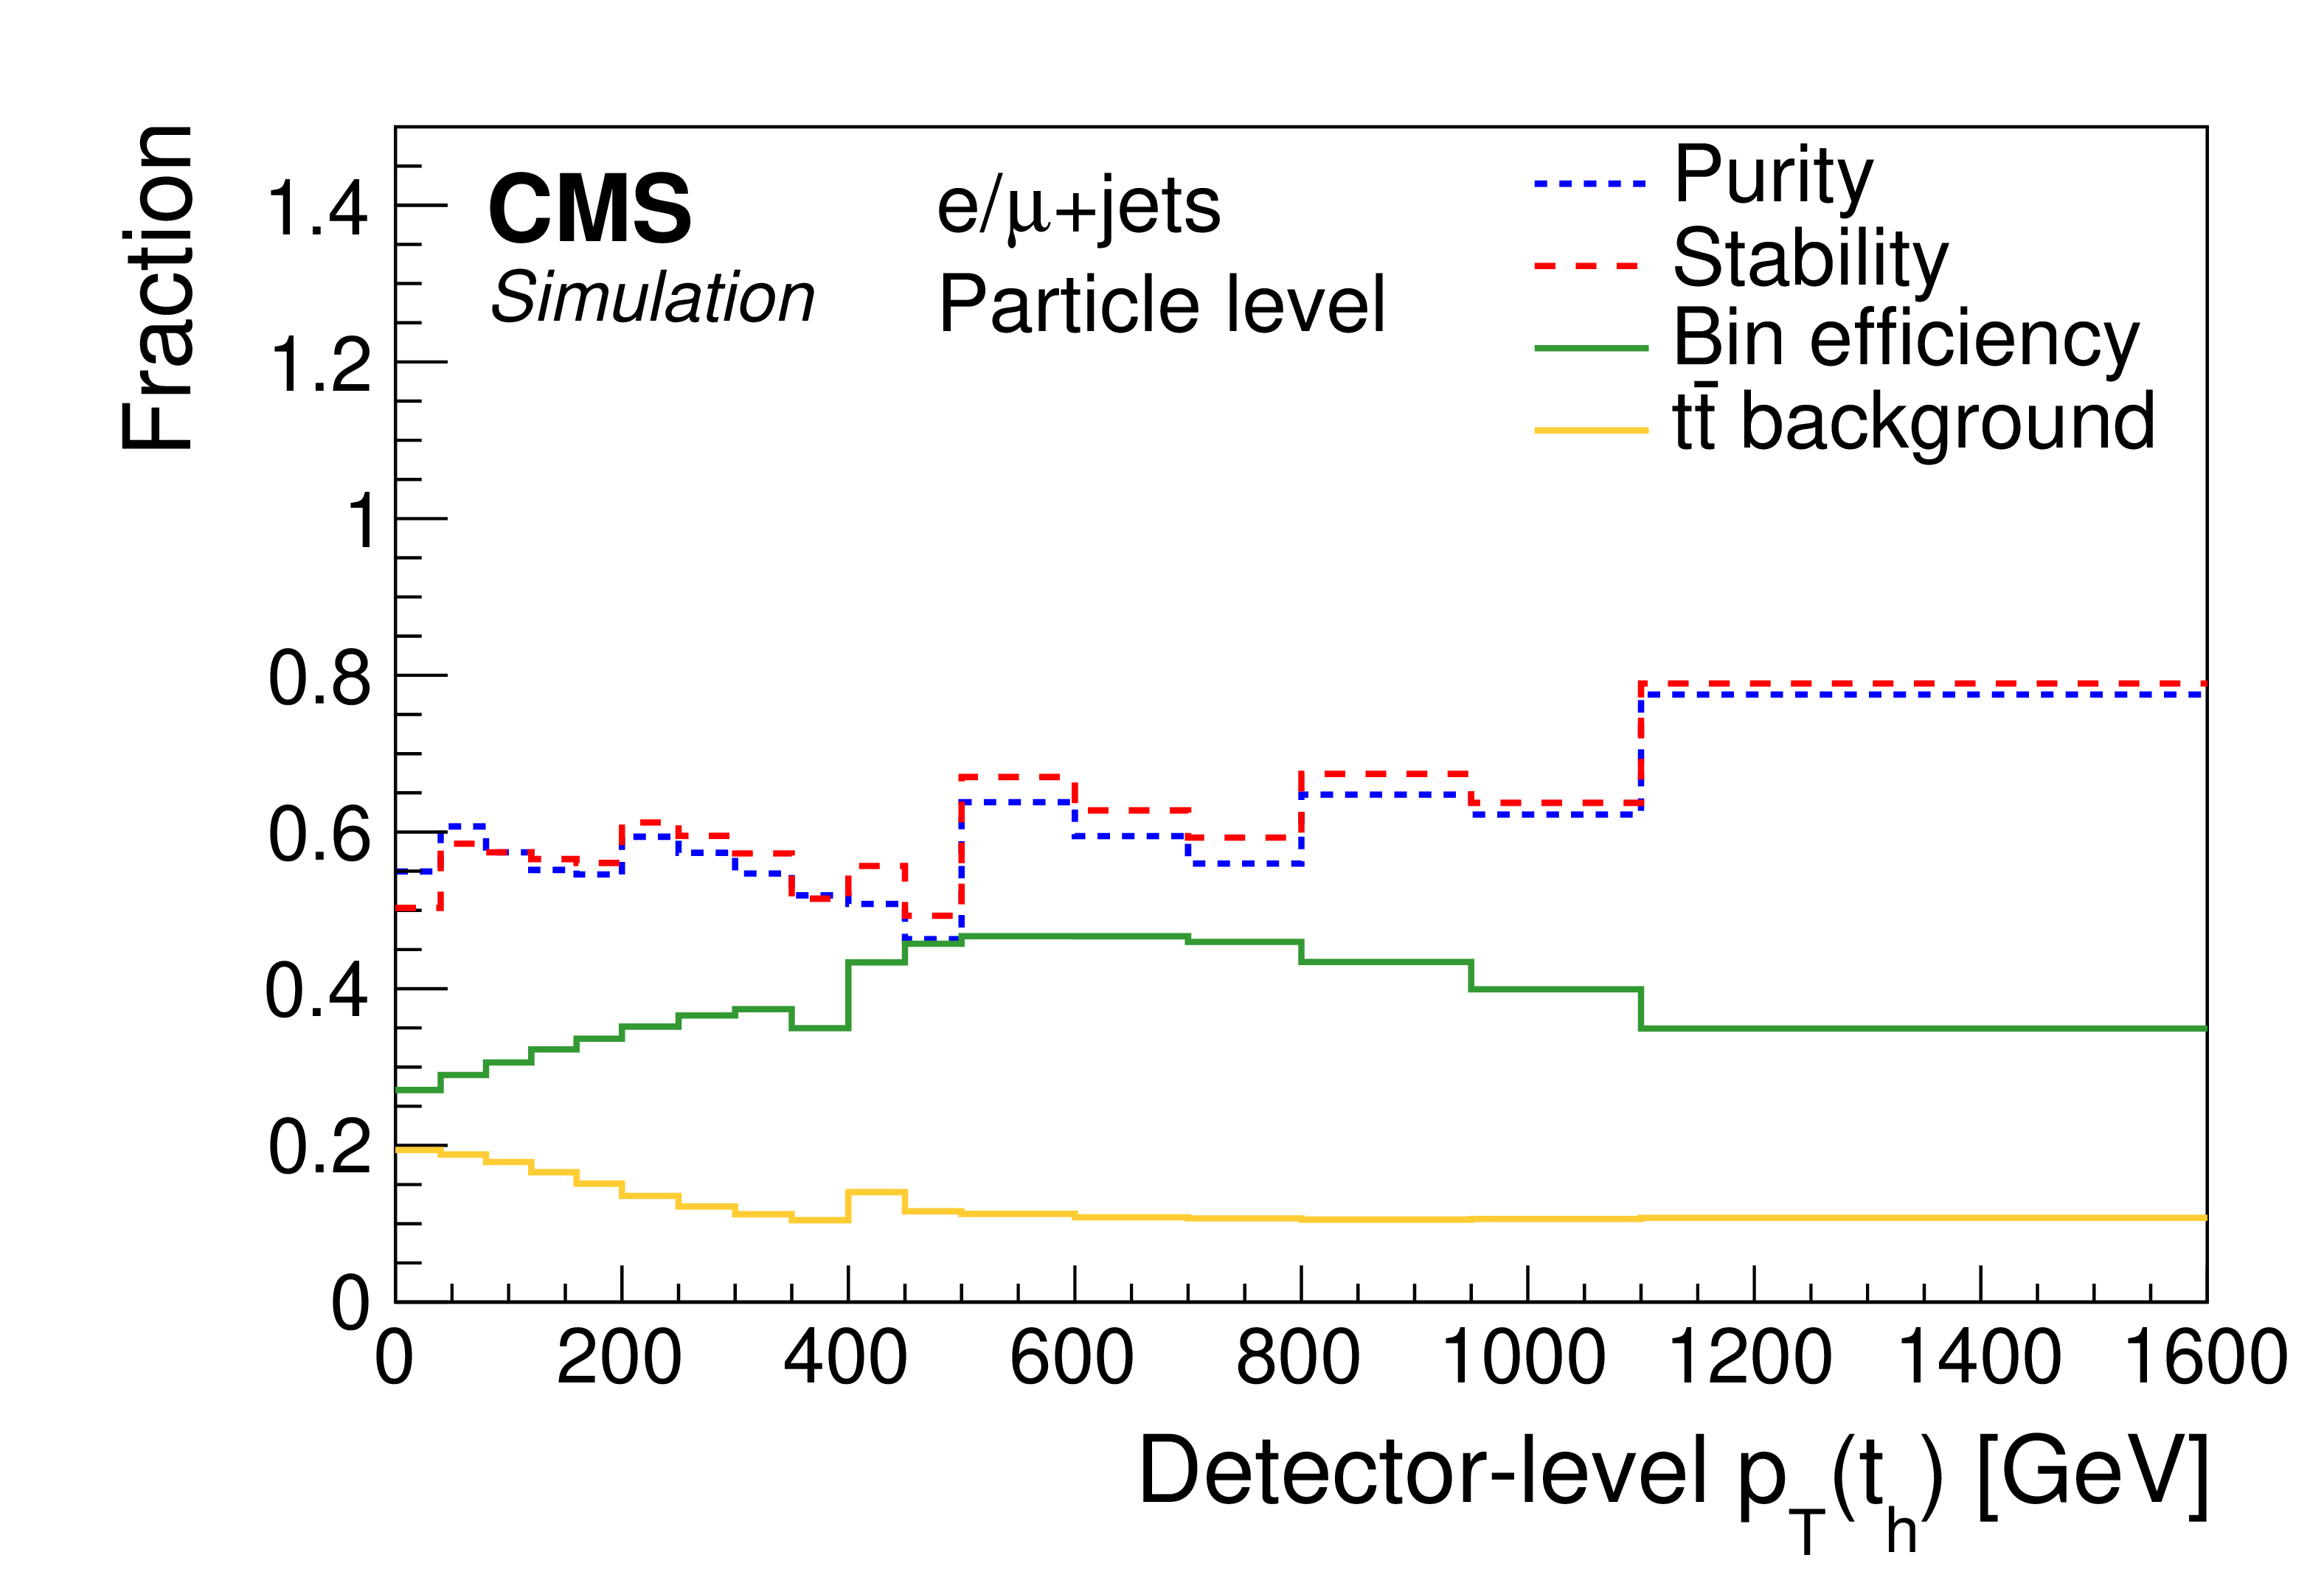
Combined response matrices of all reconstruction categories for the measurements of ${{p_{\mathrm {T}}} ({\mathrm{t} _\mathrm {h}})}$ at parton (upper left) and particle (lower left) levels from the POWHEG+PYTHIA simulation. The purity (fraction of parton-/particle-level events that are reconstructed in the same bin at the detector level), stability (fraction of detector-level events that belong in the same bin at the parton/particle level), the efficiency per bin, and the fraction of ${\mathrm{t} \mathrm{\bar{t}}}$ background for the corresponding parton and particle levels are shown in the right plots. |
png pdf |
Figure 11-a:
Combined response matrices of all reconstruction categories for the measurements of ${{p_{\mathrm {T}}} ({\mathrm{t} _\mathrm {h}})}$ at parton (upper left) and particle (lower left) levels from the POWHEG+PYTHIA simulation. The purity (fraction of parton-/particle-level events that are reconstructed in the same bin at the detector level), stability (fraction of detector-level events that belong in the same bin at the parton/particle level), the efficiency per bin, and the fraction of ${\mathrm{t} \mathrm{\bar{t}}}$ background for the corresponding parton and particle levels are shown in the right plots. |
png pdf |
Figure 11-b:
Combined response matrices of all reconstruction categories for the measurements of ${{p_{\mathrm {T}}} ({\mathrm{t} _\mathrm {h}})}$ at parton (upper left) and particle (lower left) levels from the POWHEG+PYTHIA simulation. The purity (fraction of parton-/particle-level events that are reconstructed in the same bin at the detector level), stability (fraction of detector-level events that belong in the same bin at the parton/particle level), the efficiency per bin, and the fraction of ${\mathrm{t} \mathrm{\bar{t}}}$ background for the corresponding parton and particle levels are shown in the right plots. |
png pdf |
Figure 11-c:
Combined response matrices of all reconstruction categories for the measurements of ${{p_{\mathrm {T}}} ({\mathrm{t} _\mathrm {h}})}$ at parton (upper left) and particle (lower left) levels from the POWHEG+PYTHIA simulation. The purity (fraction of parton-/particle-level events that are reconstructed in the same bin at the detector level), stability (fraction of detector-level events that belong in the same bin at the parton/particle level), the efficiency per bin, and the fraction of ${\mathrm{t} \mathrm{\bar{t}}}$ background for the corresponding parton and particle levels are shown in the right plots. |
png pdf |
Figure 11-d:
Combined response matrices of all reconstruction categories for the measurements of ${{p_{\mathrm {T}}} ({\mathrm{t} _\mathrm {h}})}$ at parton (upper left) and particle (lower left) levels from the POWHEG+PYTHIA simulation. The purity (fraction of parton-/particle-level events that are reconstructed in the same bin at the detector level), stability (fraction of detector-level events that belong in the same bin at the parton/particle level), the efficiency per bin, and the fraction of ${\mathrm{t} \mathrm{\bar{t}}}$ background for the corresponding parton and particle levels are shown in the right plots. |
png pdf |
Figure 12:
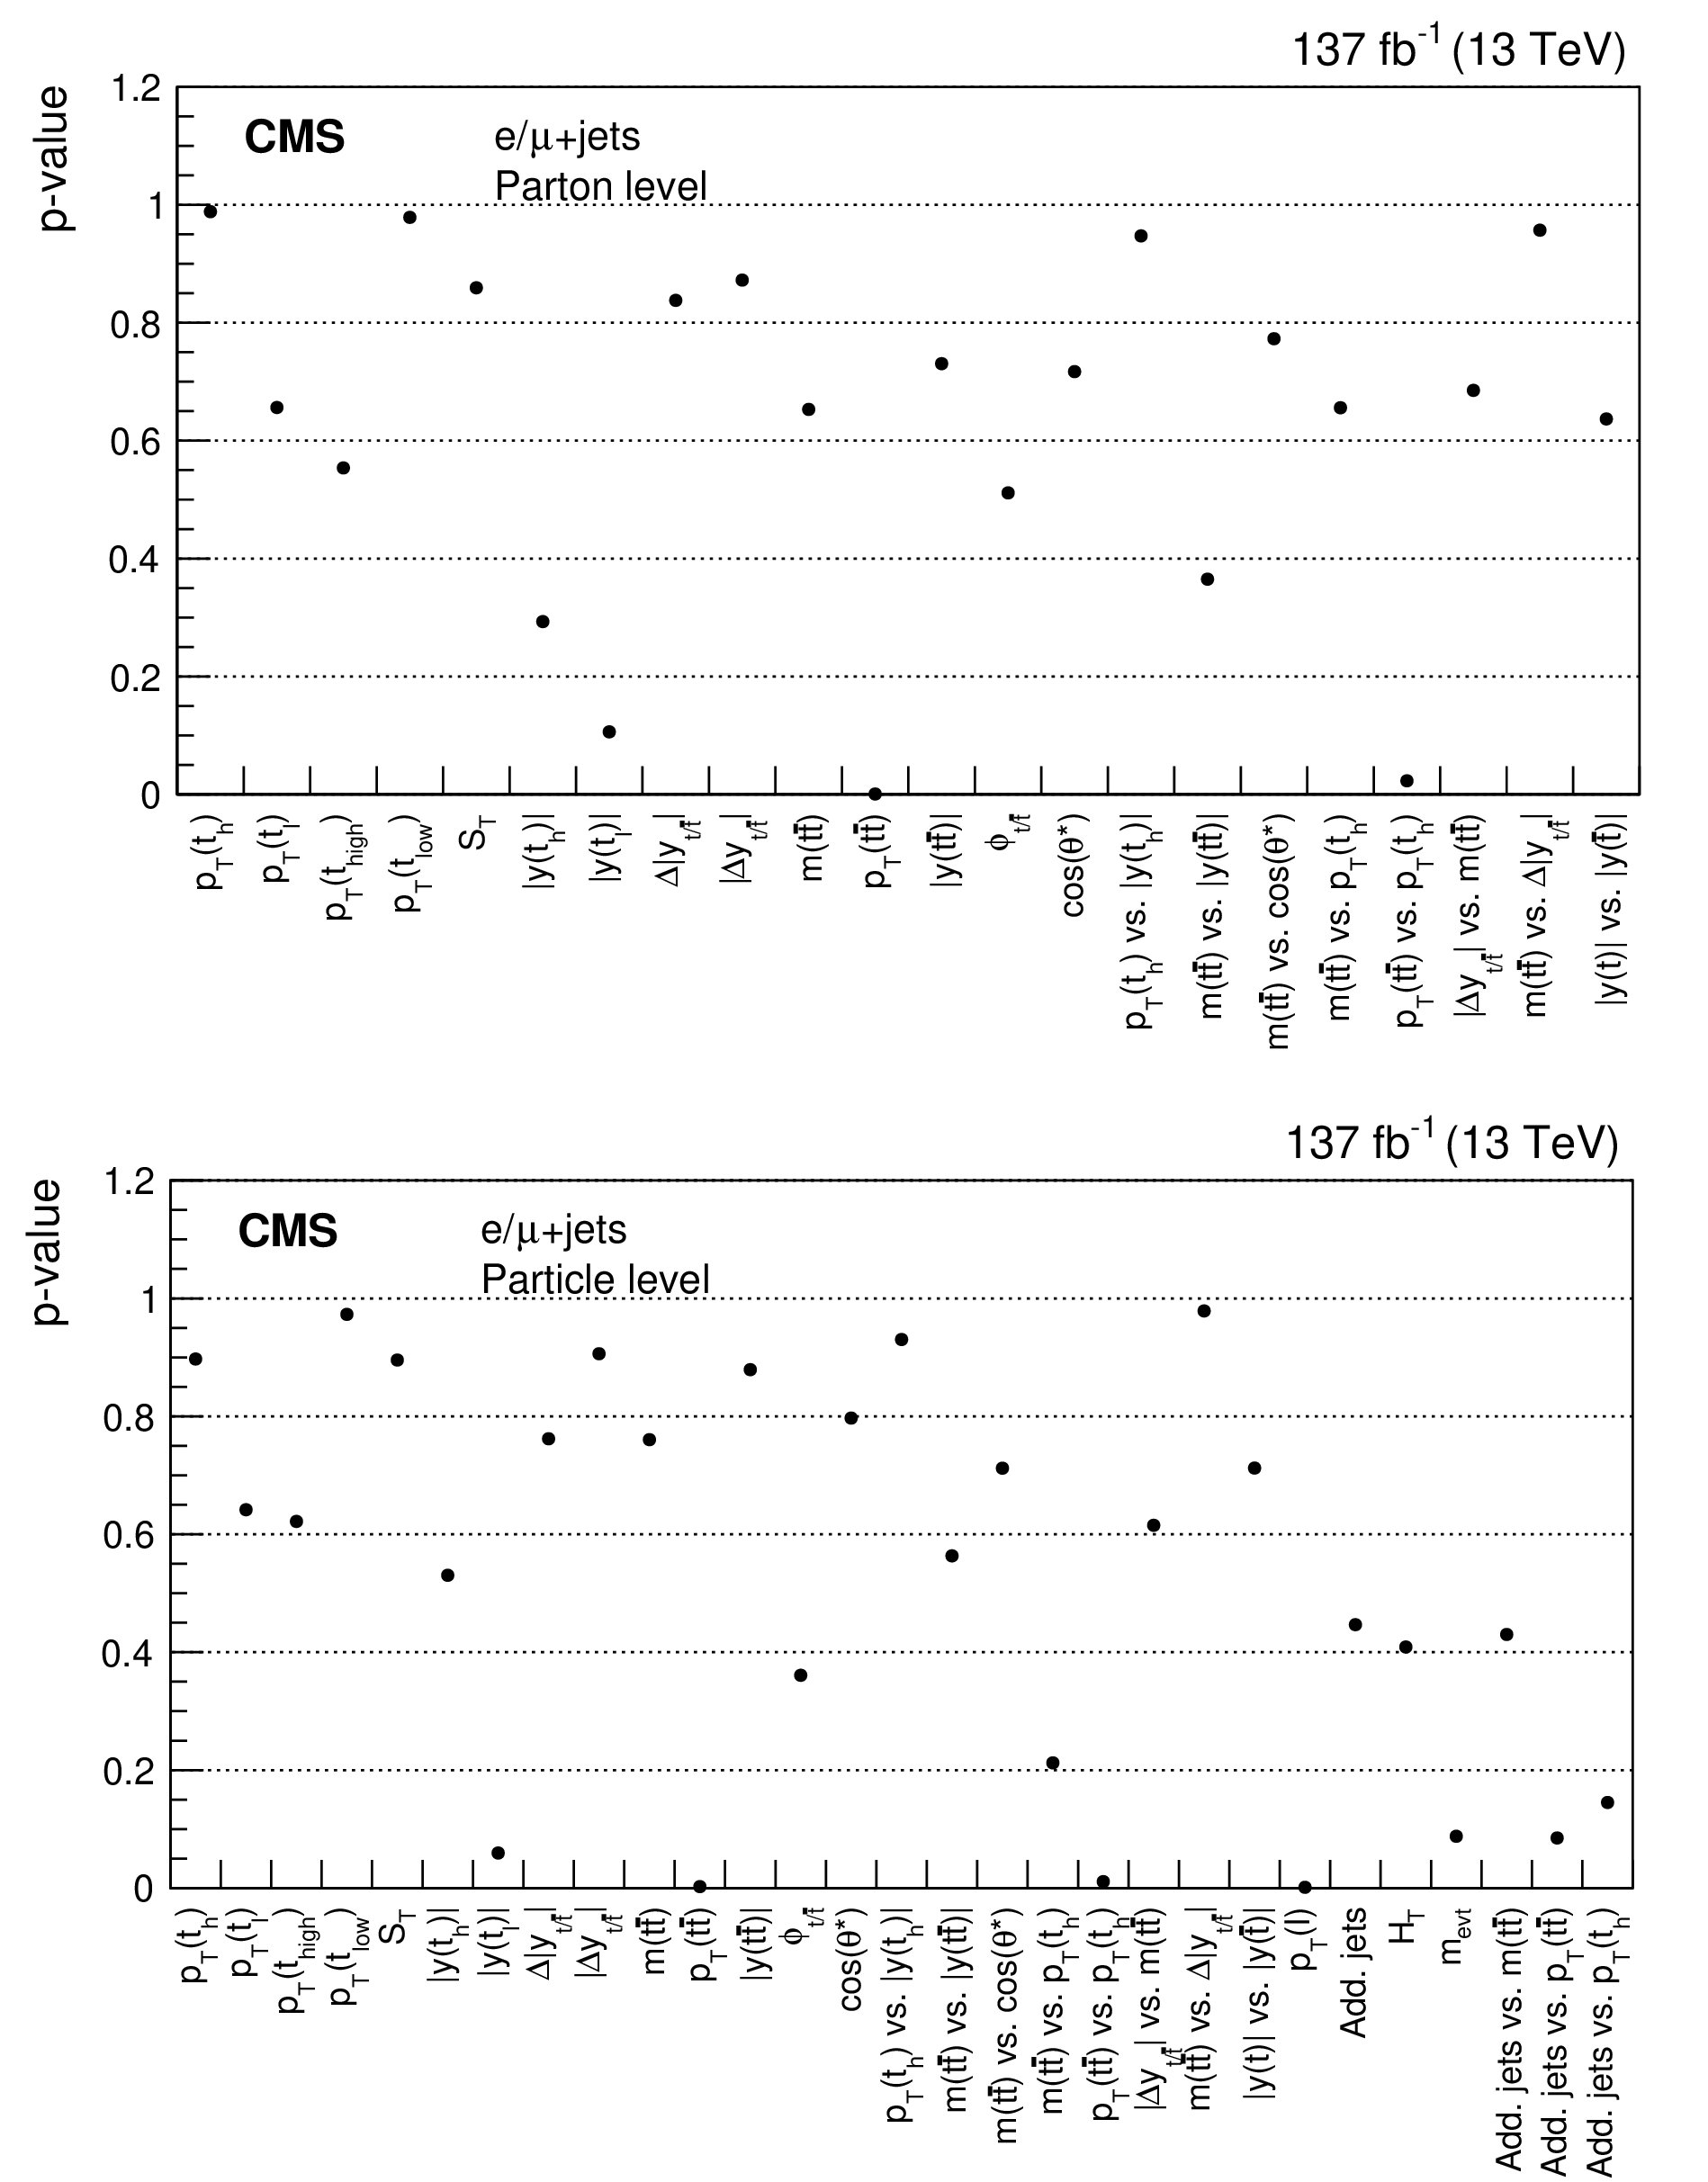
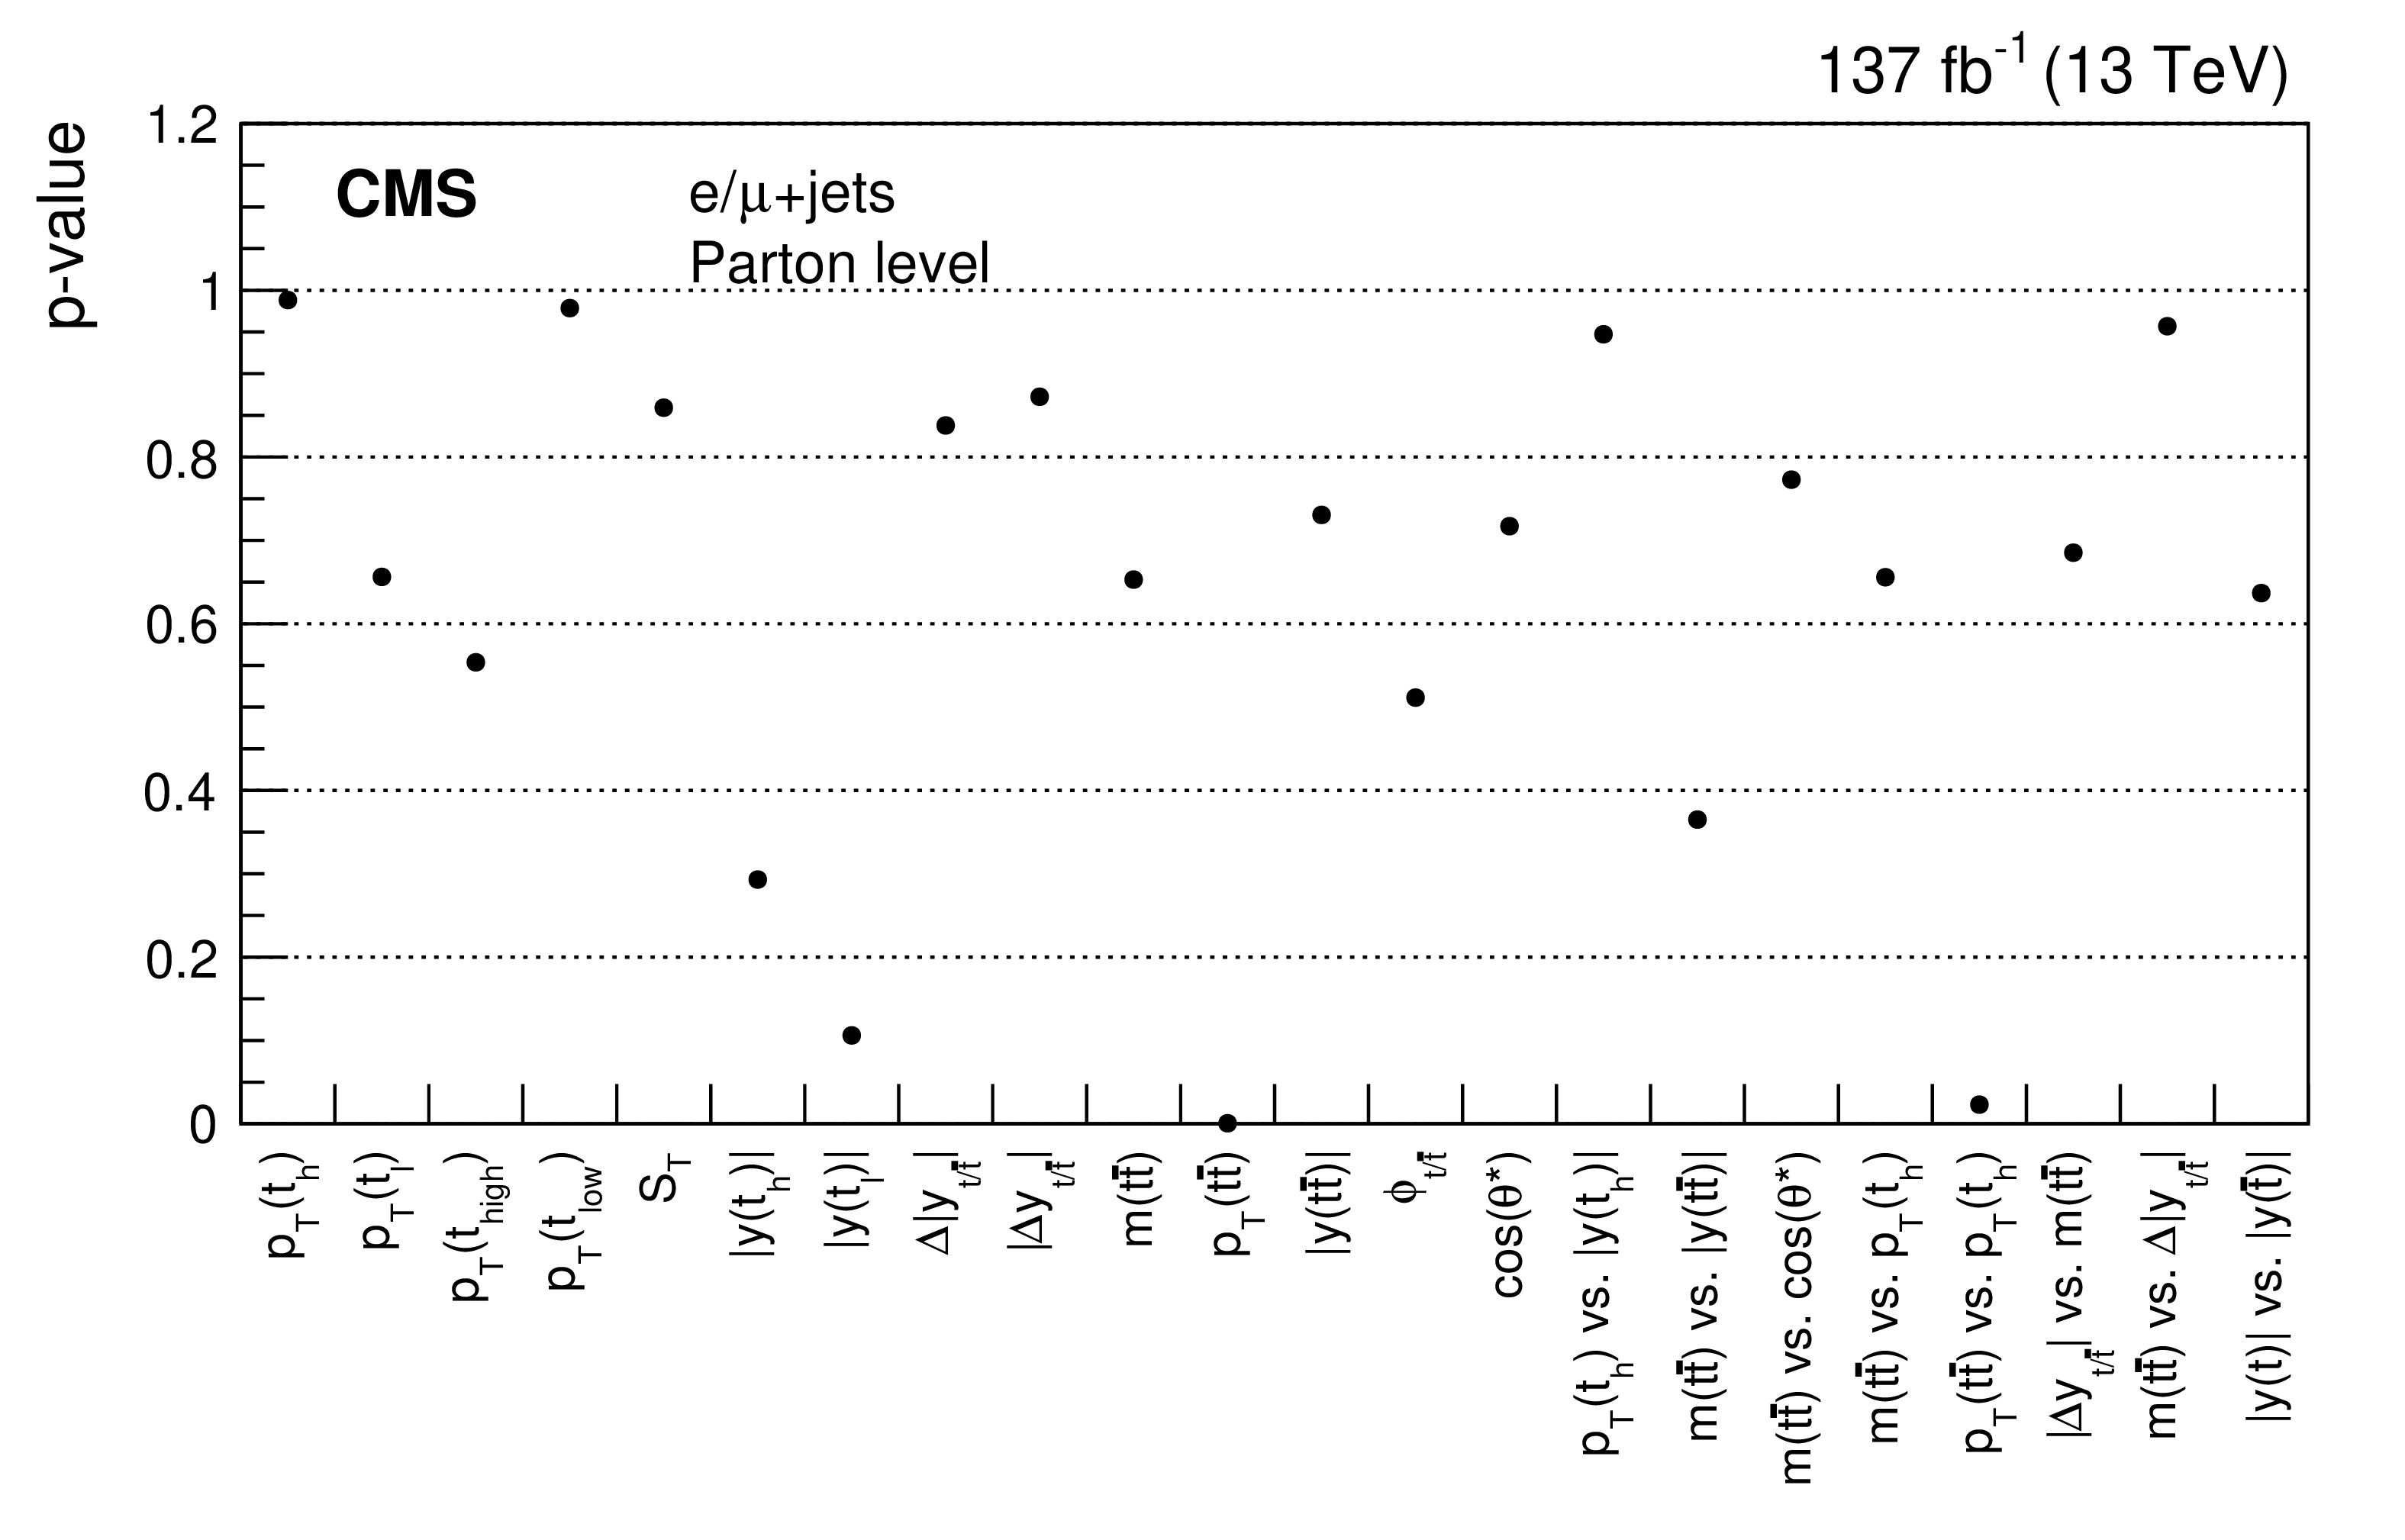
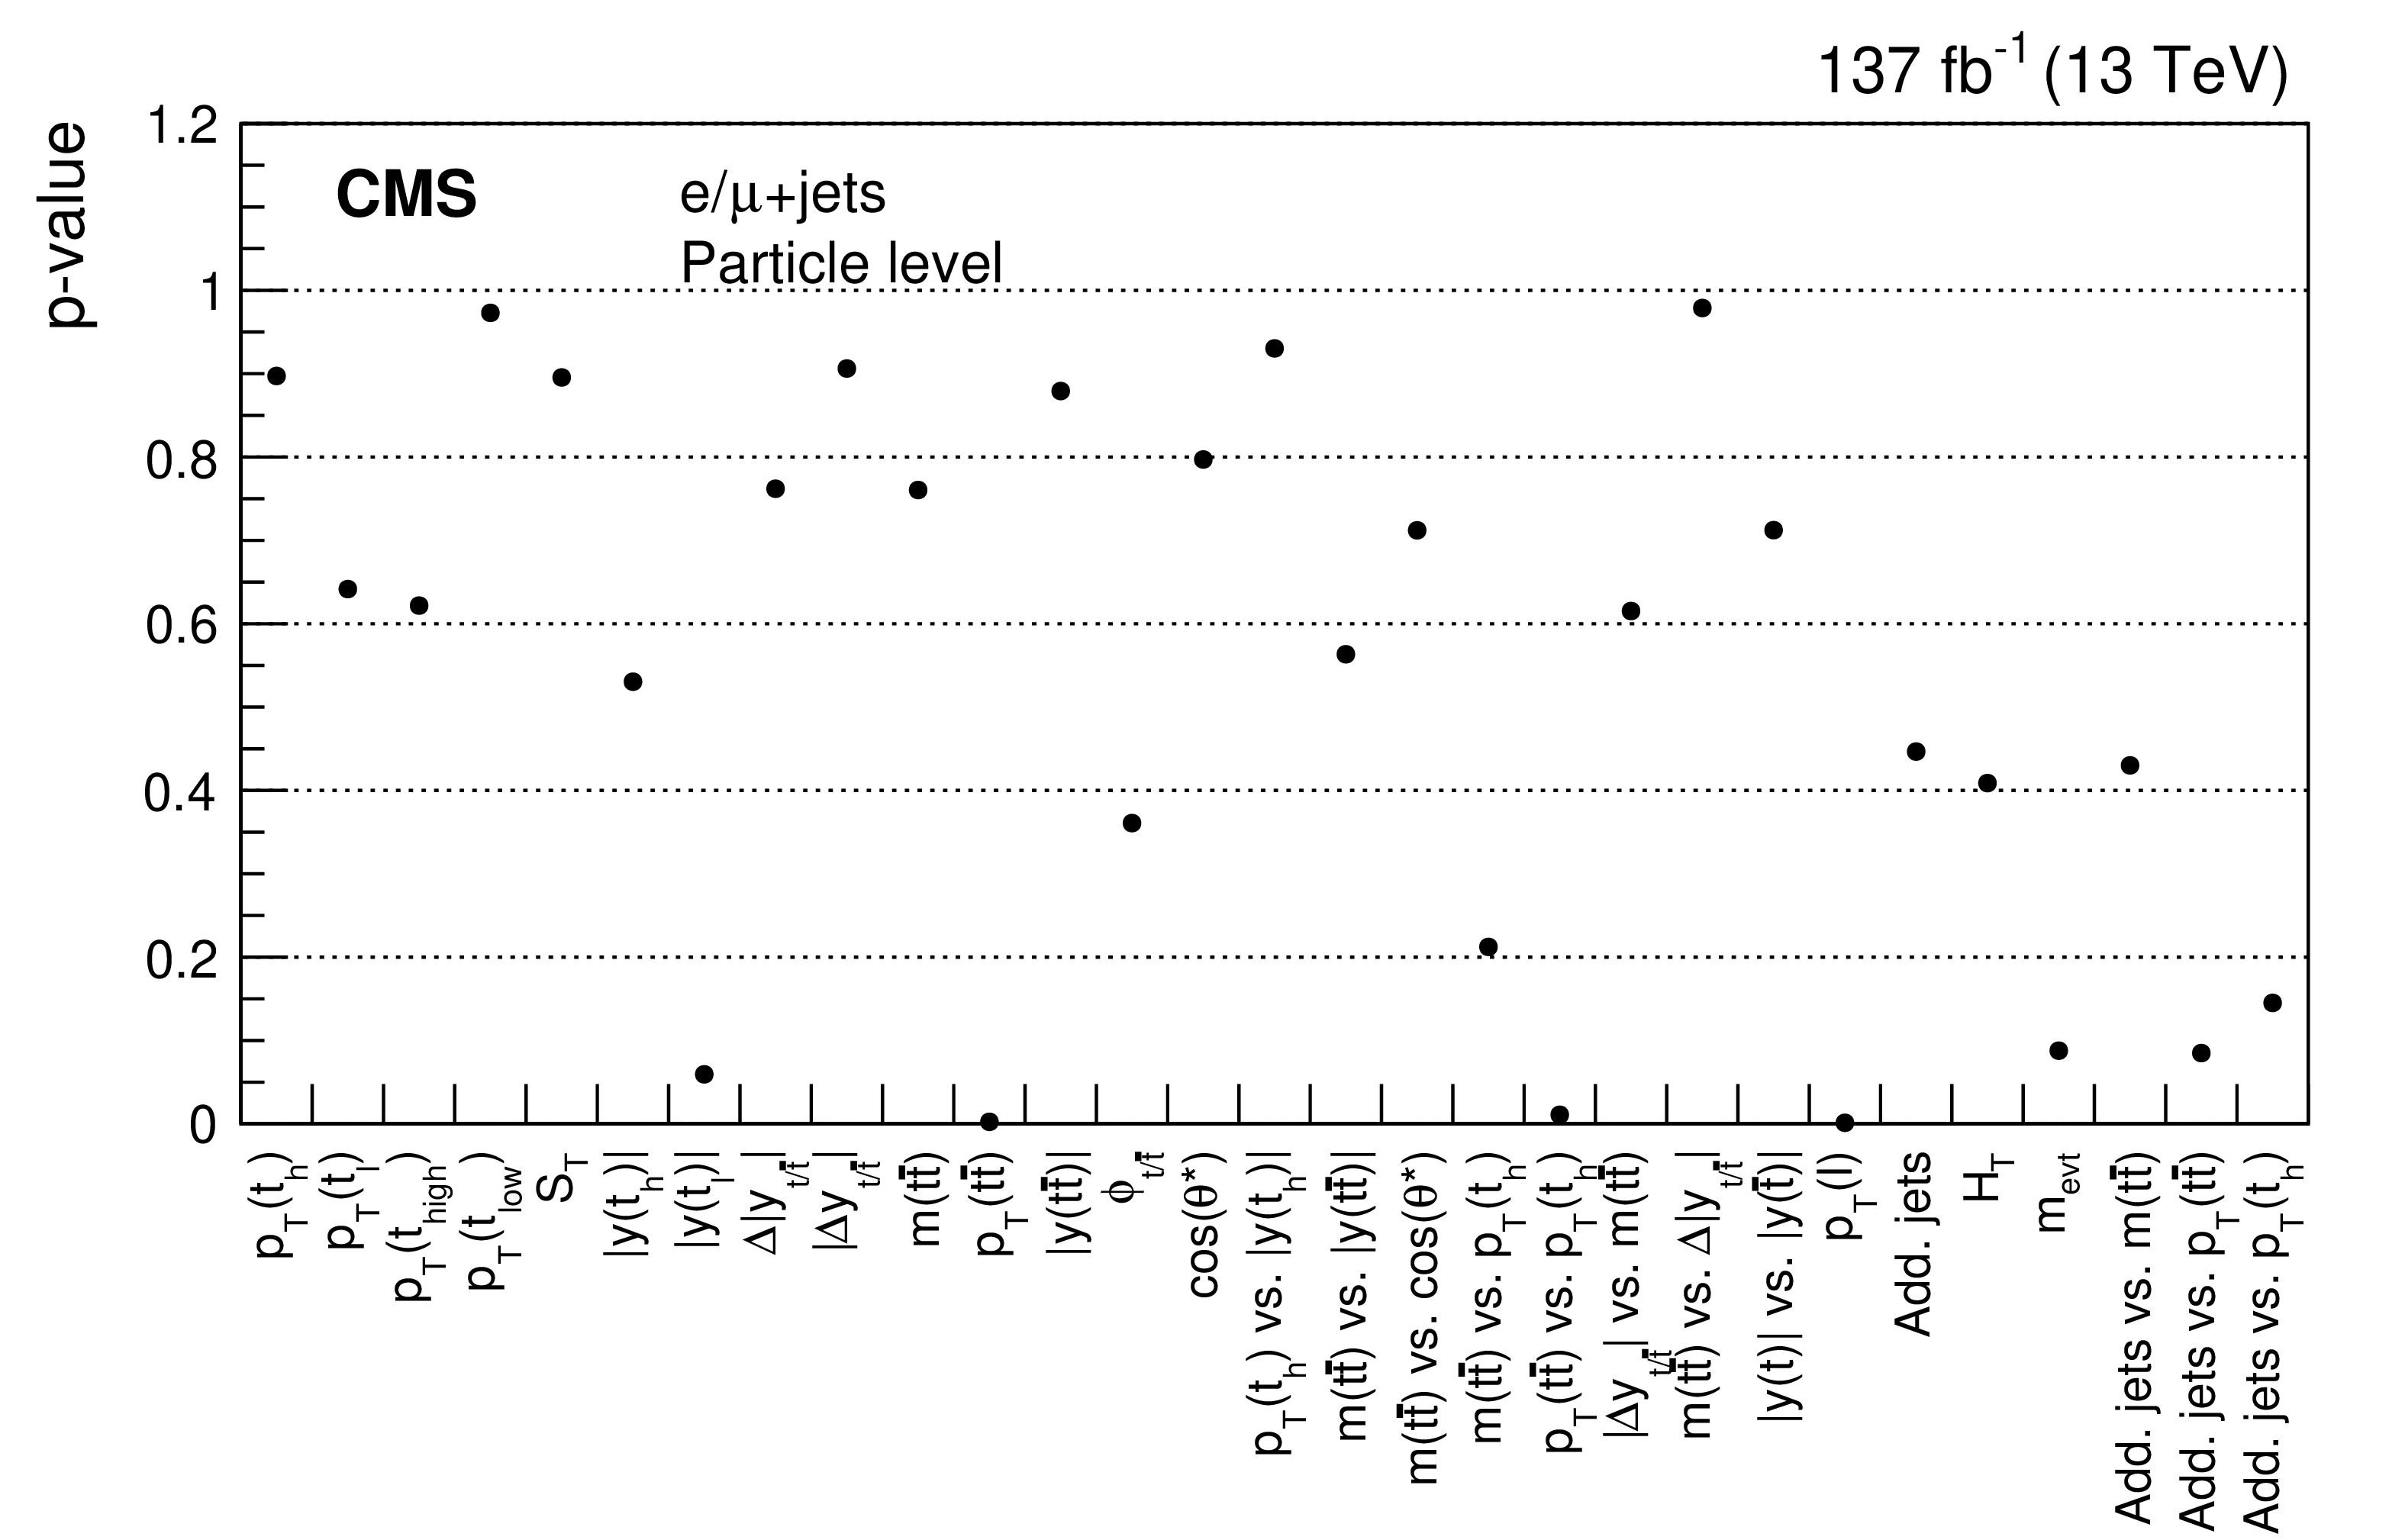
The $p$-values of the $\chi ^2$ fits for the listed variables are shown for the parton- (upper) and particle- (lower) level measurements. |
png pdf |
Figure 12-a:
The $p$-values of the $\chi ^2$ fits for the listed variables are shown for the parton- (upper) and particle- (lower) level measurements. |
png pdf |
Figure 12-b:
The $p$-values of the $\chi ^2$ fits for the listed variables are shown for the parton- (upper) and particle- (lower) level measurements. |
png pdf |
Figure 13:
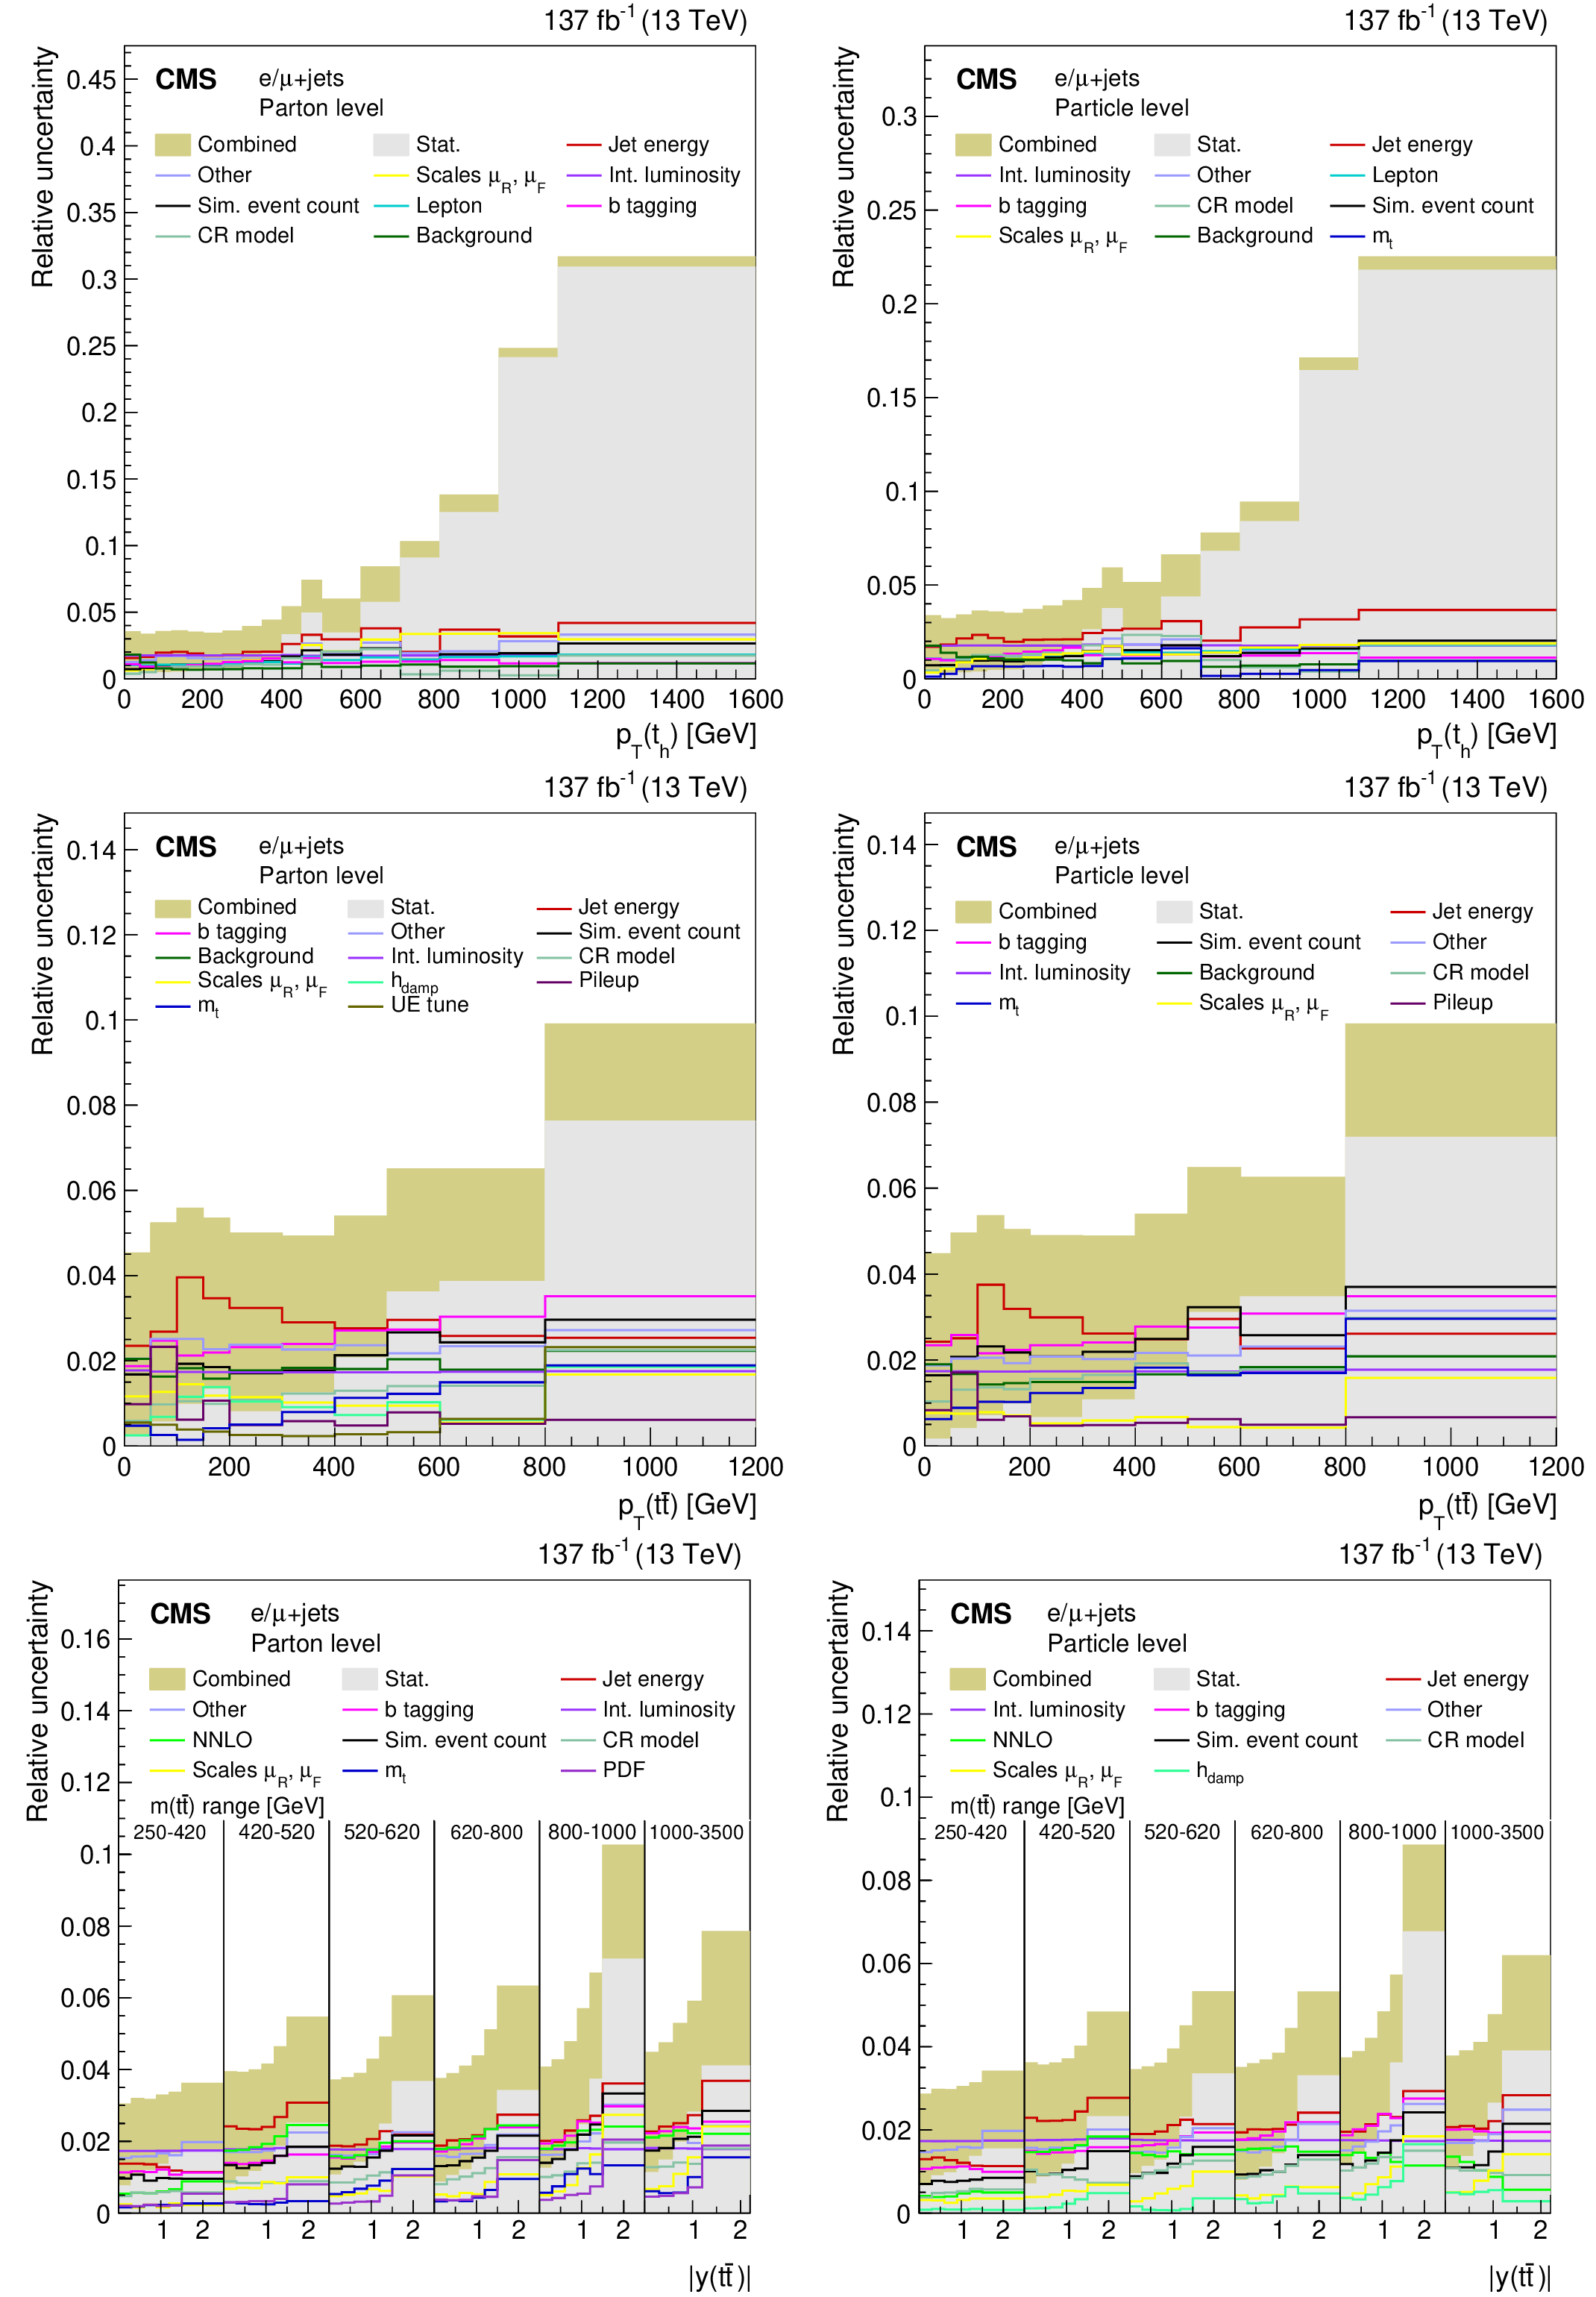
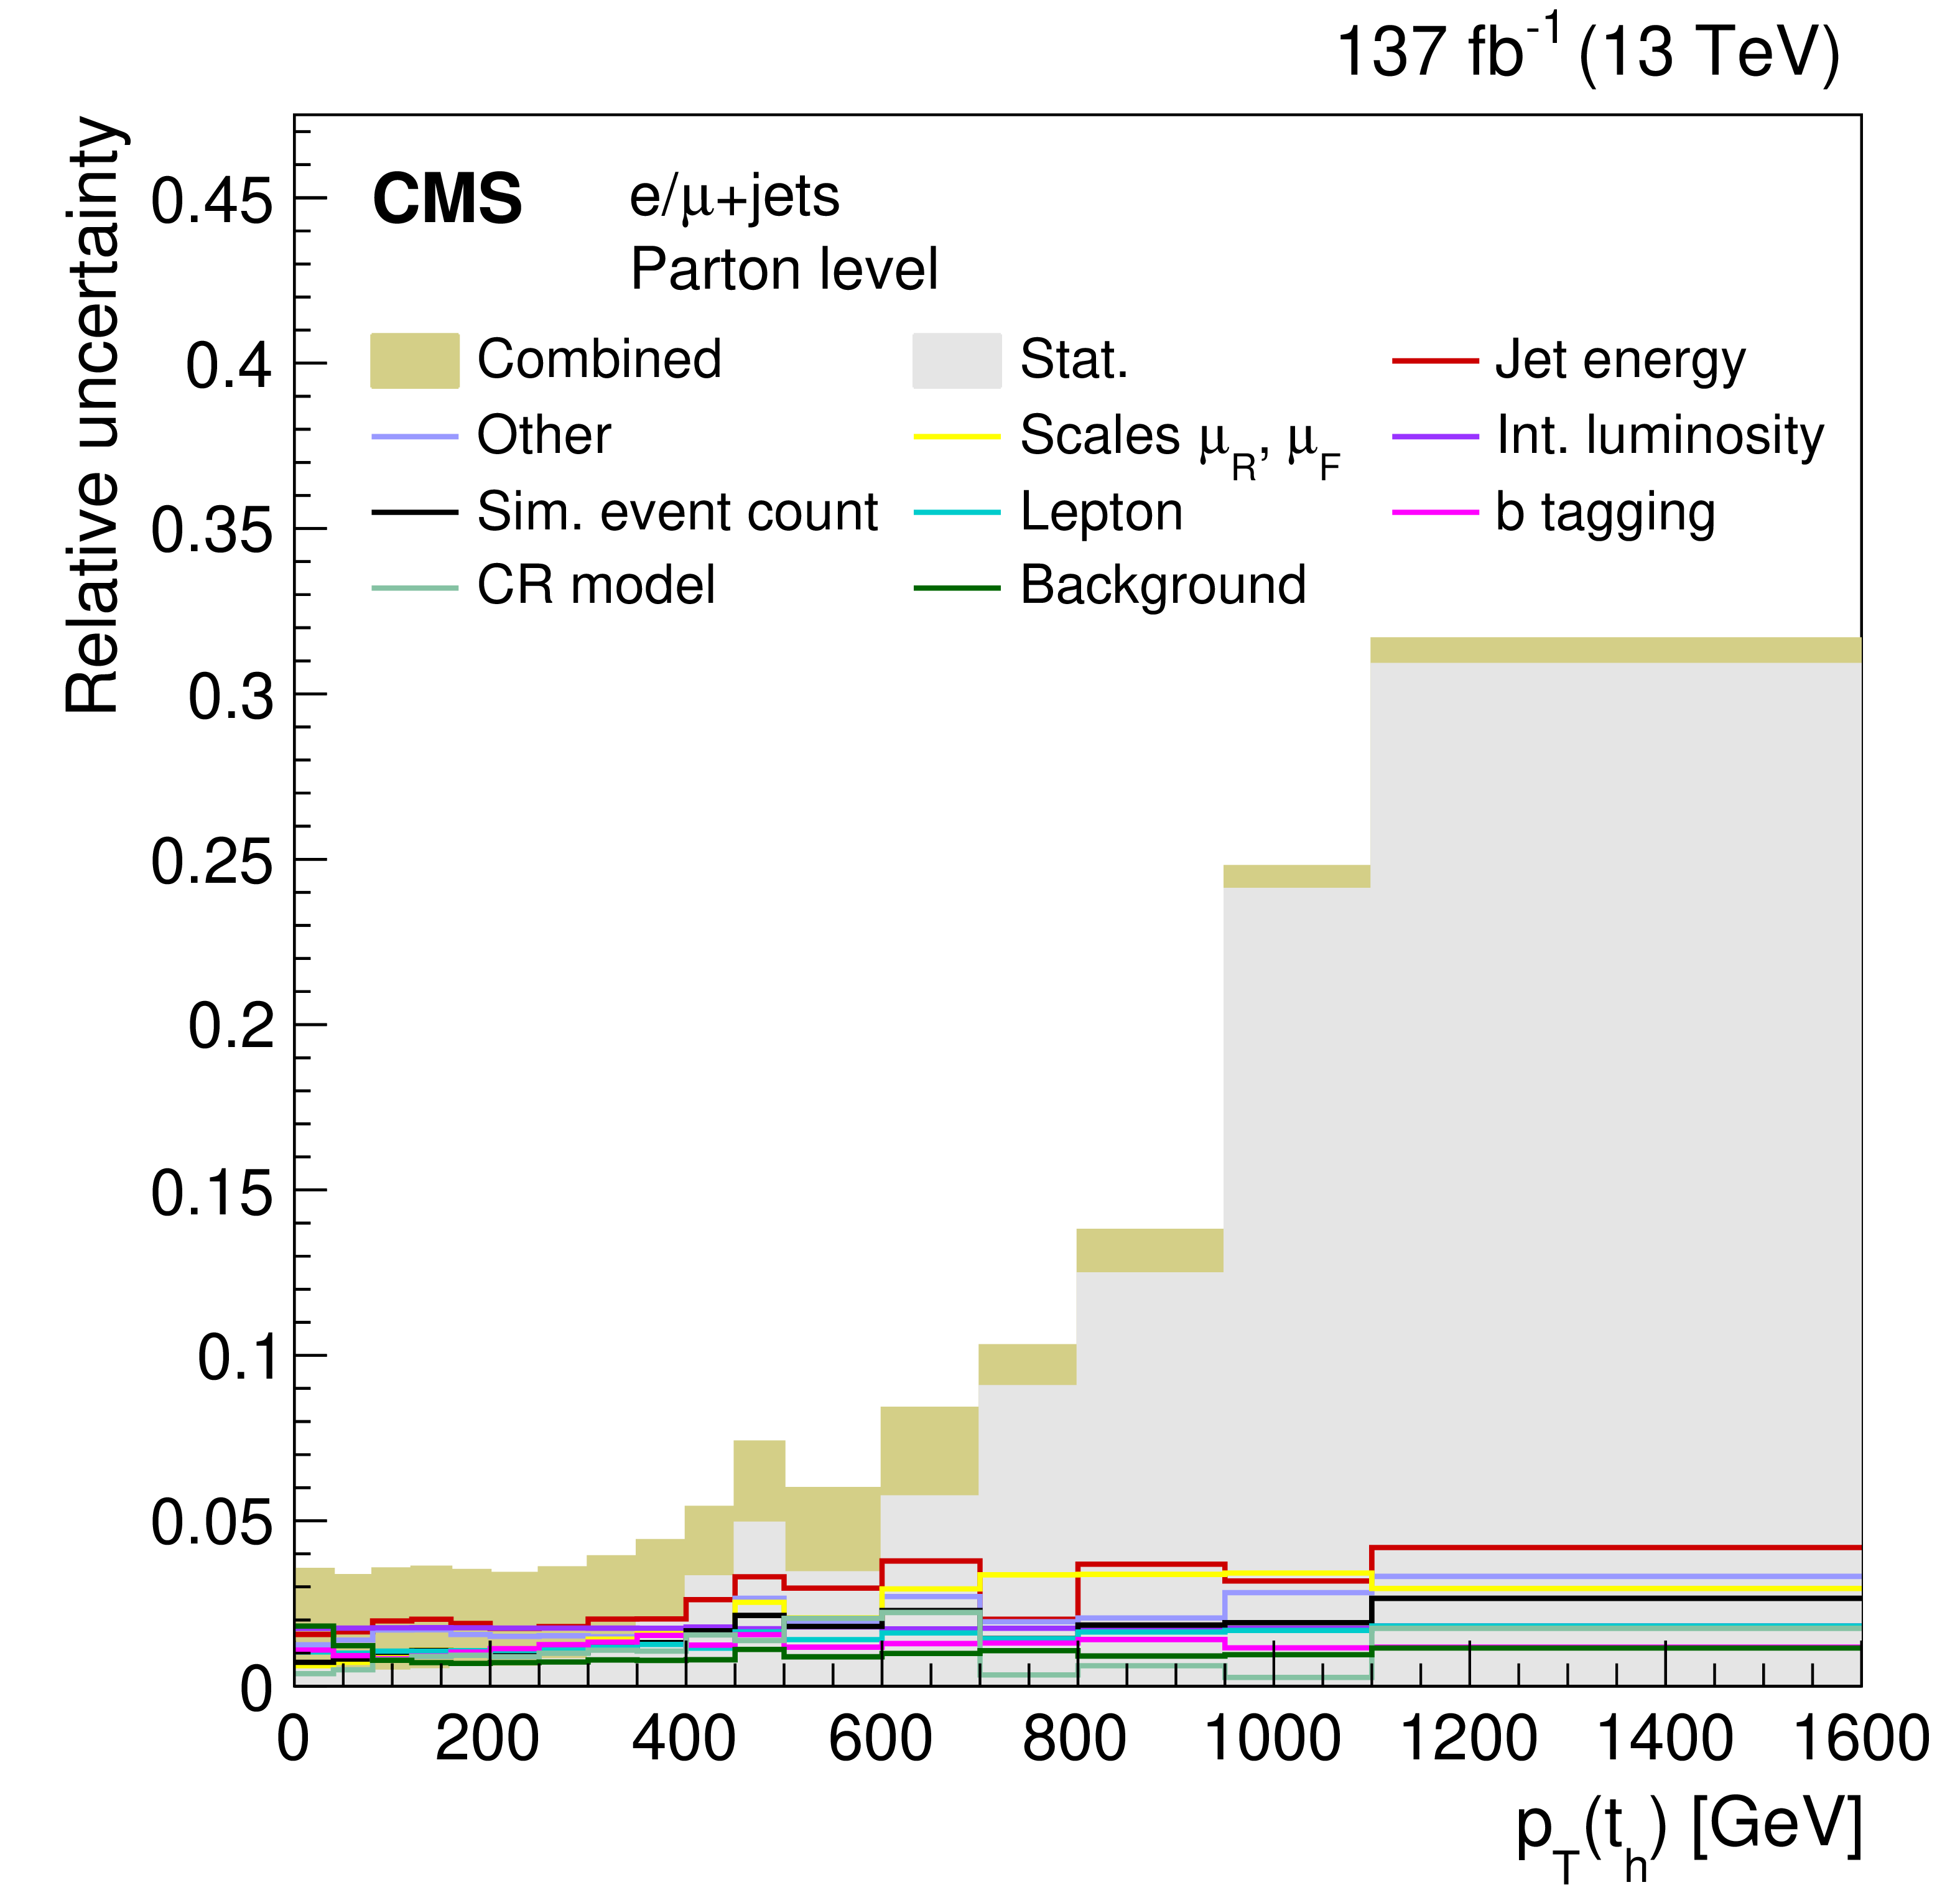
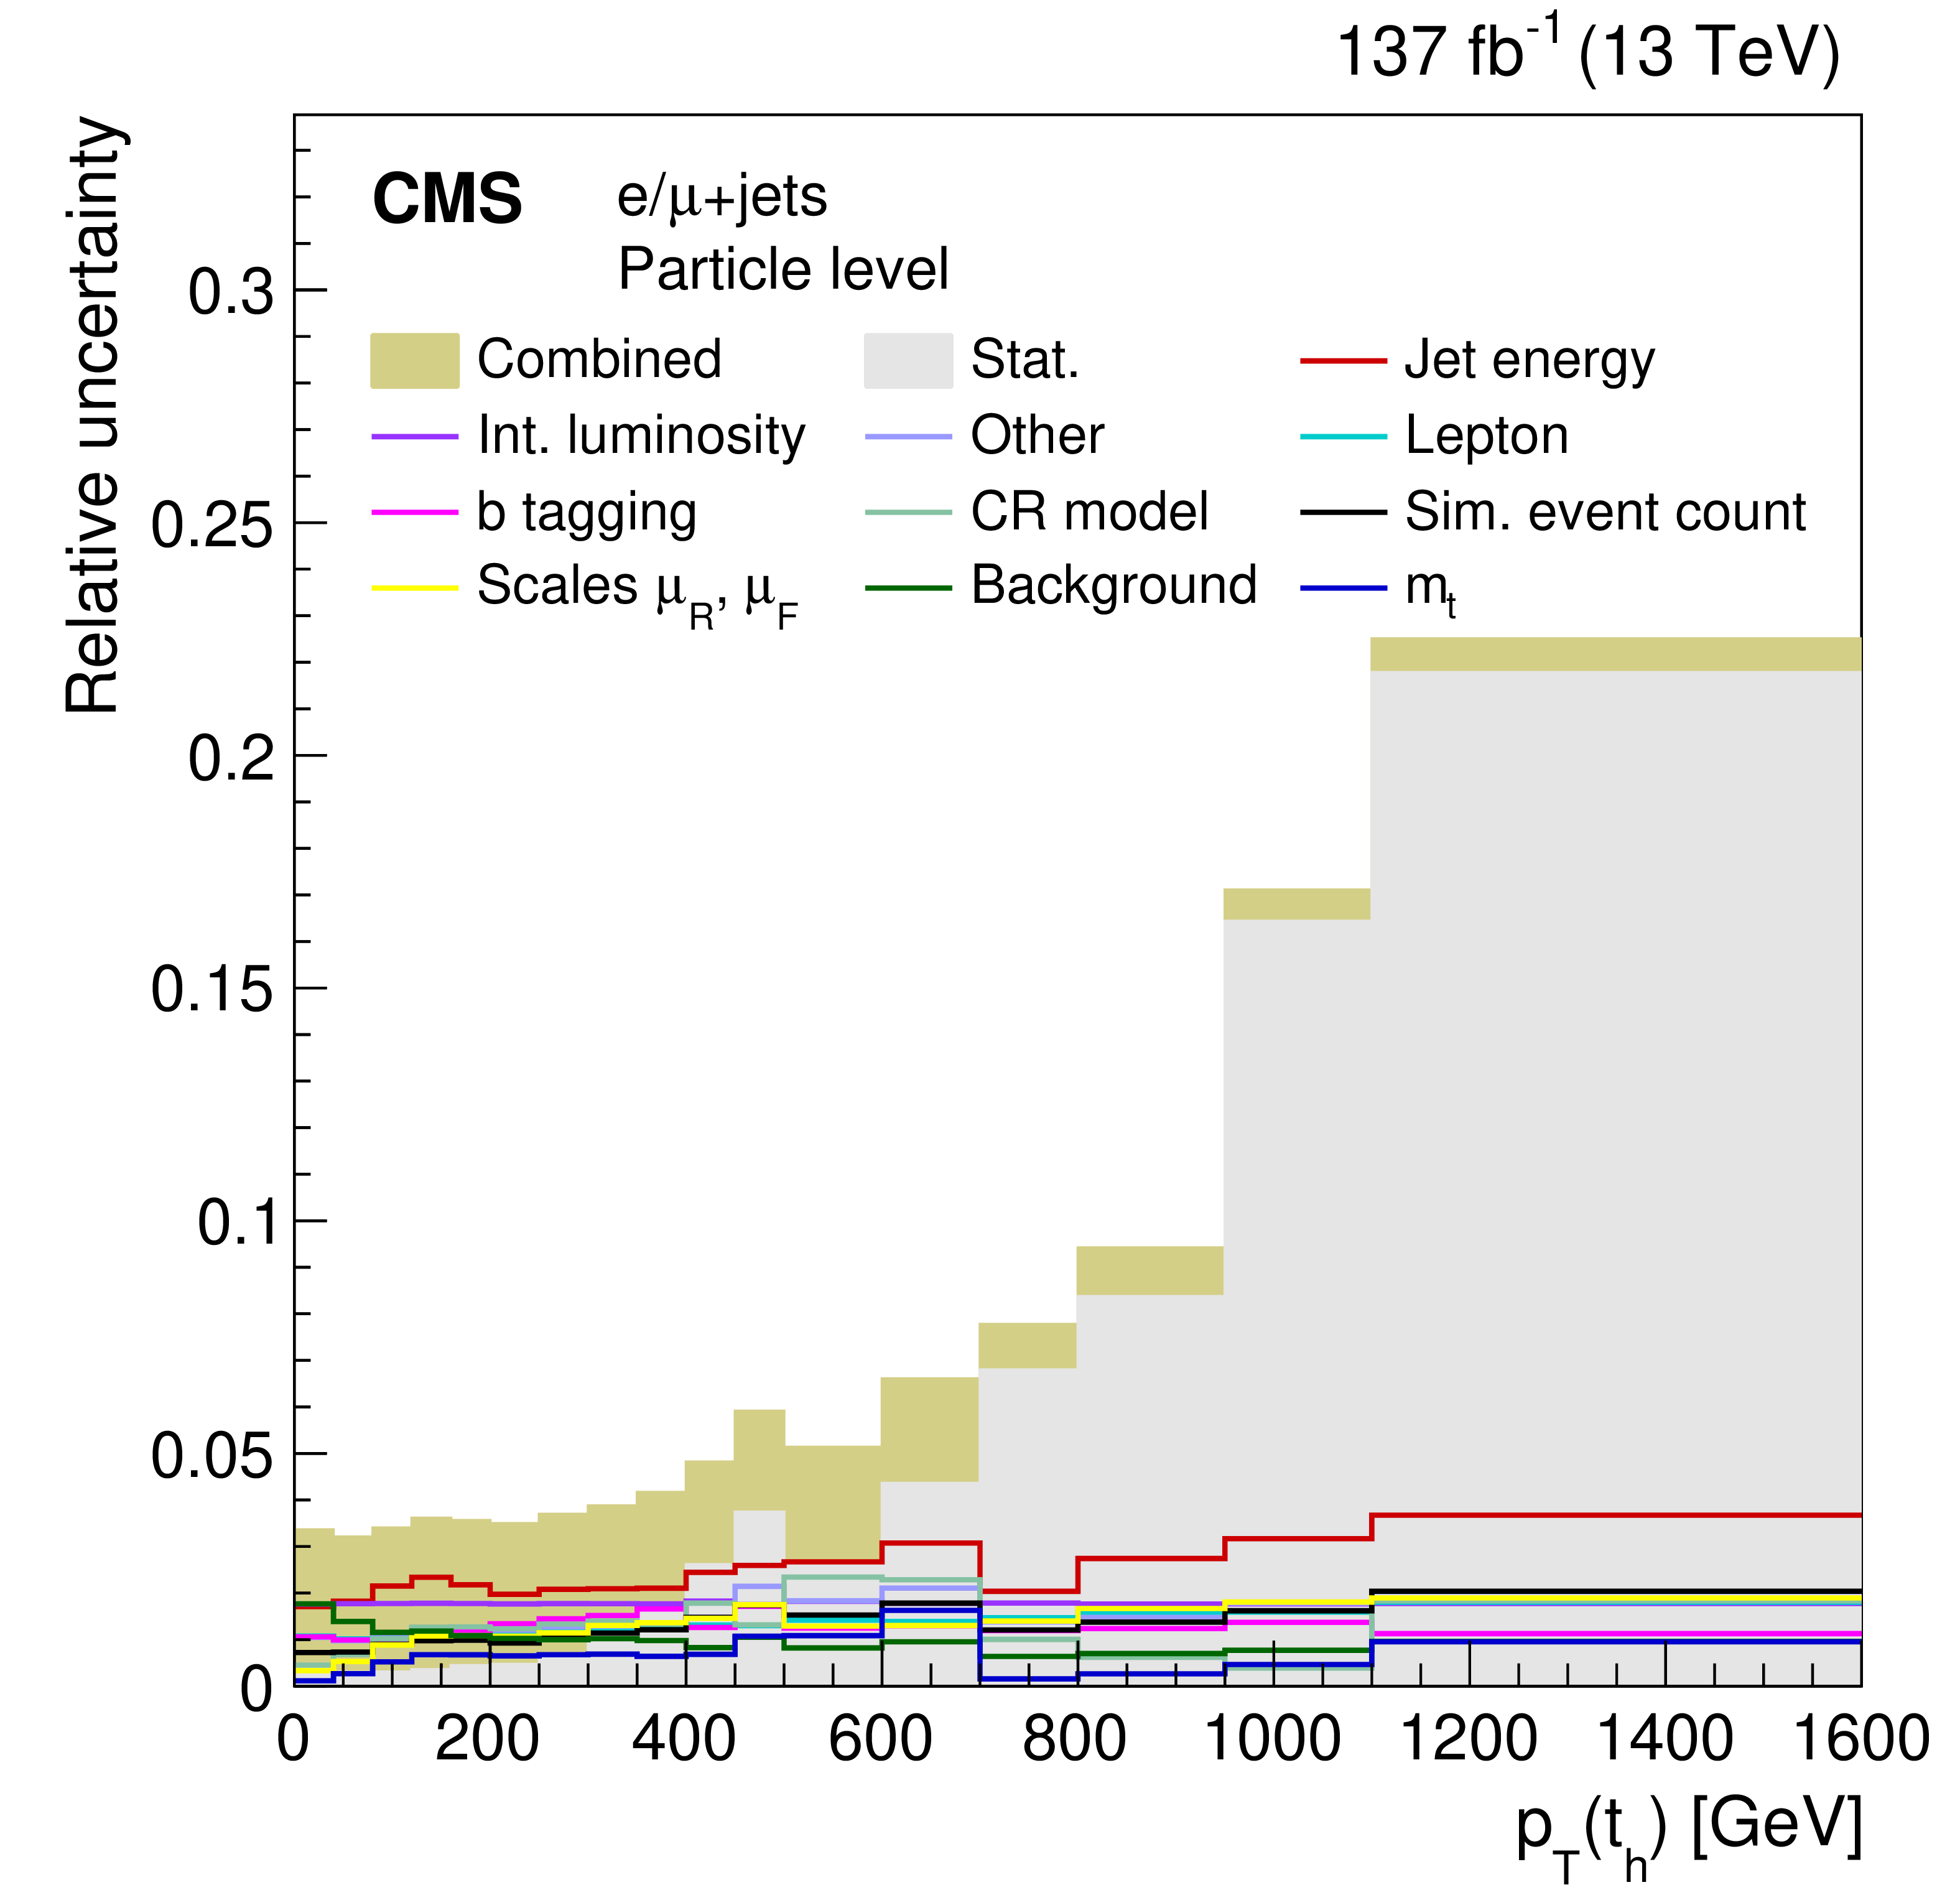
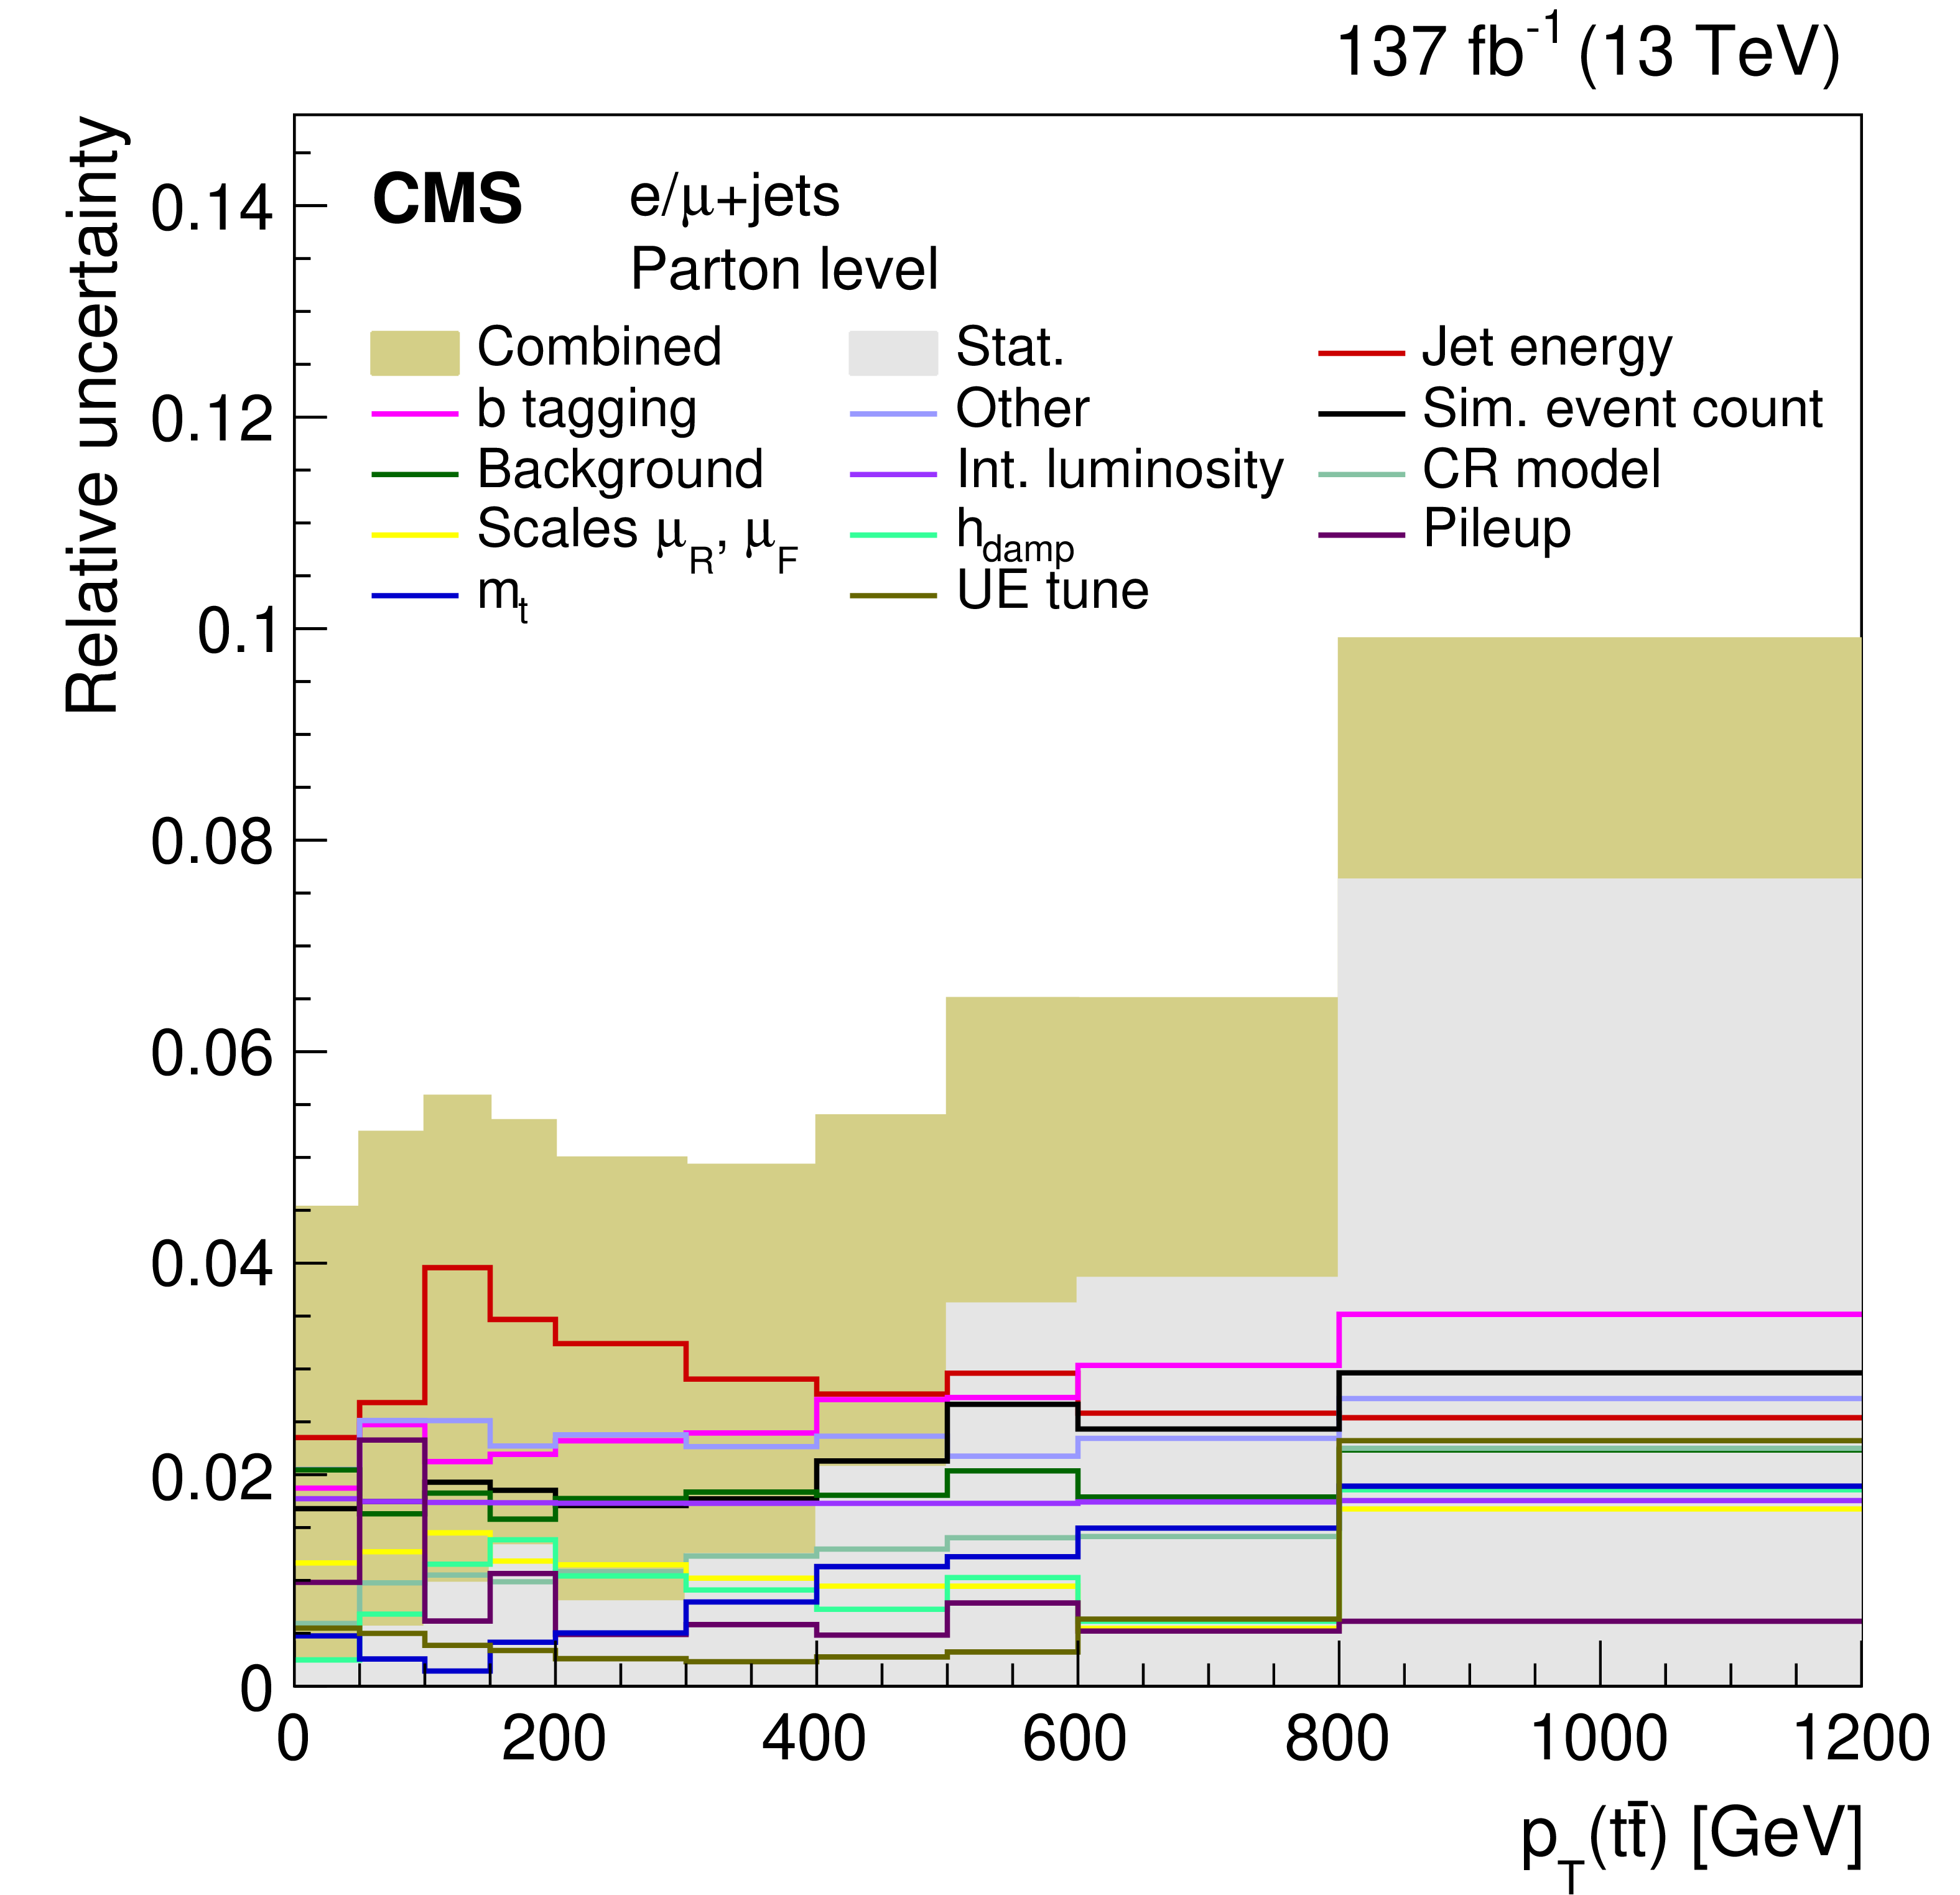
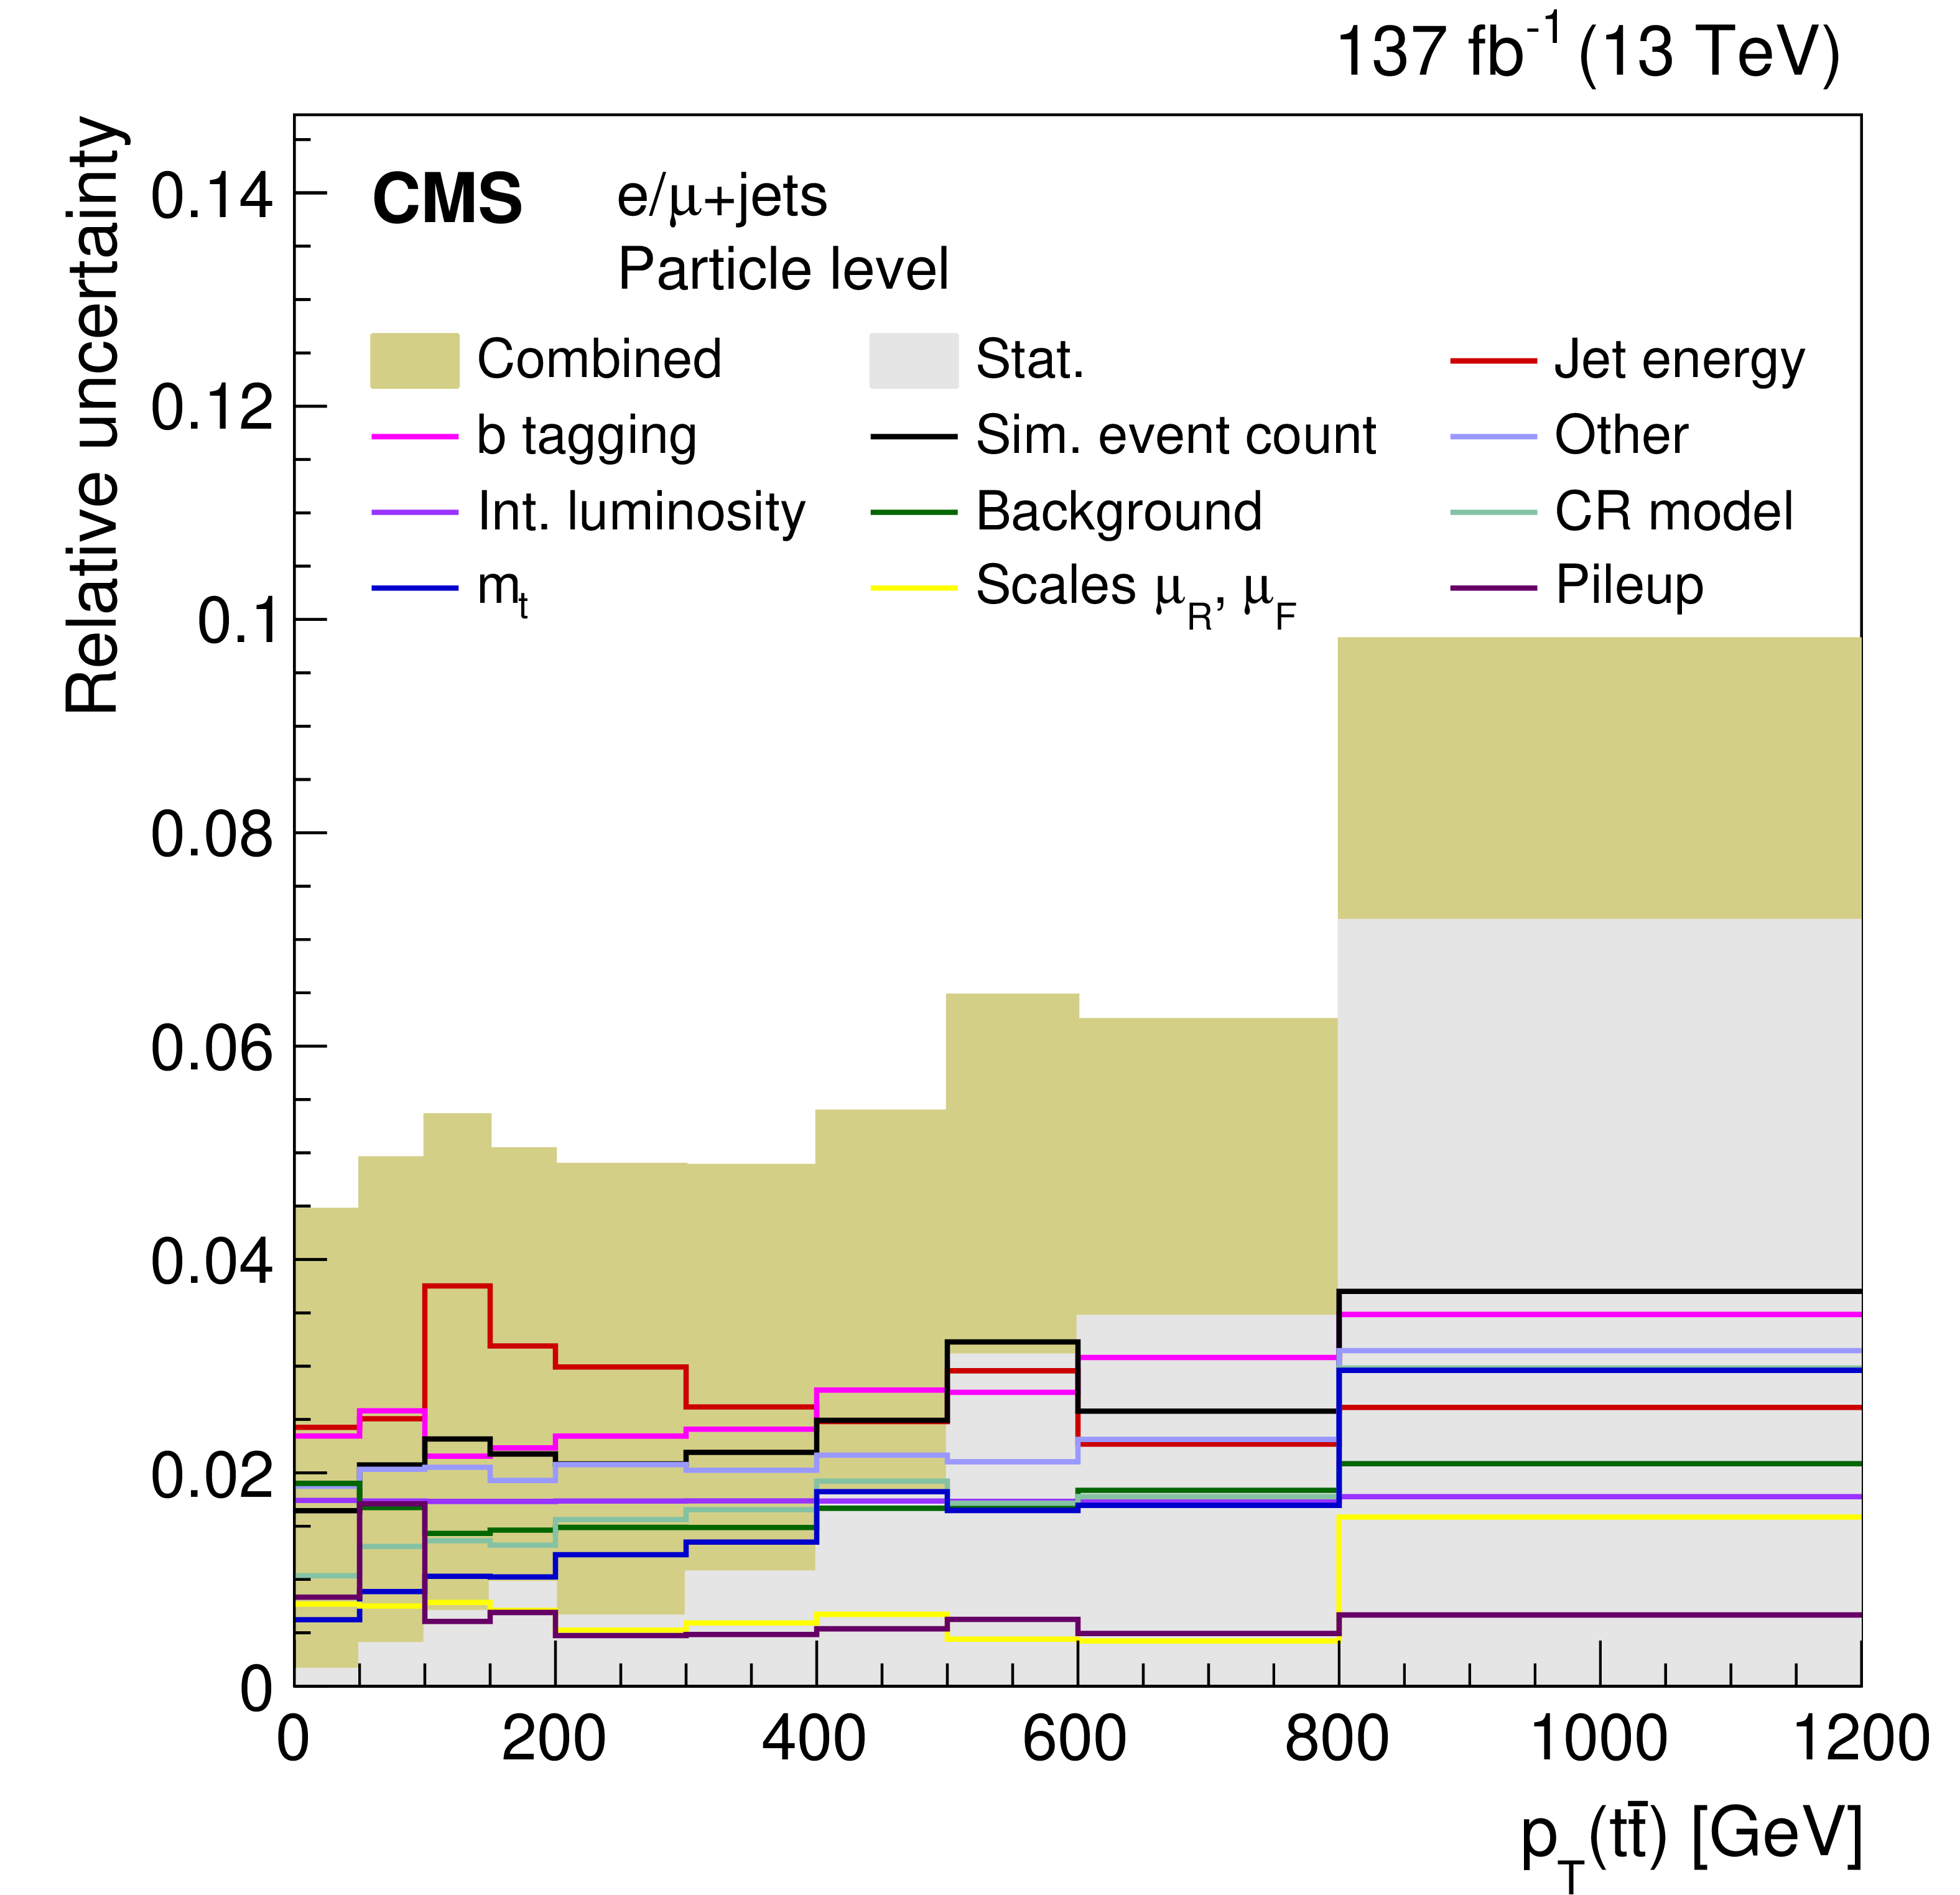
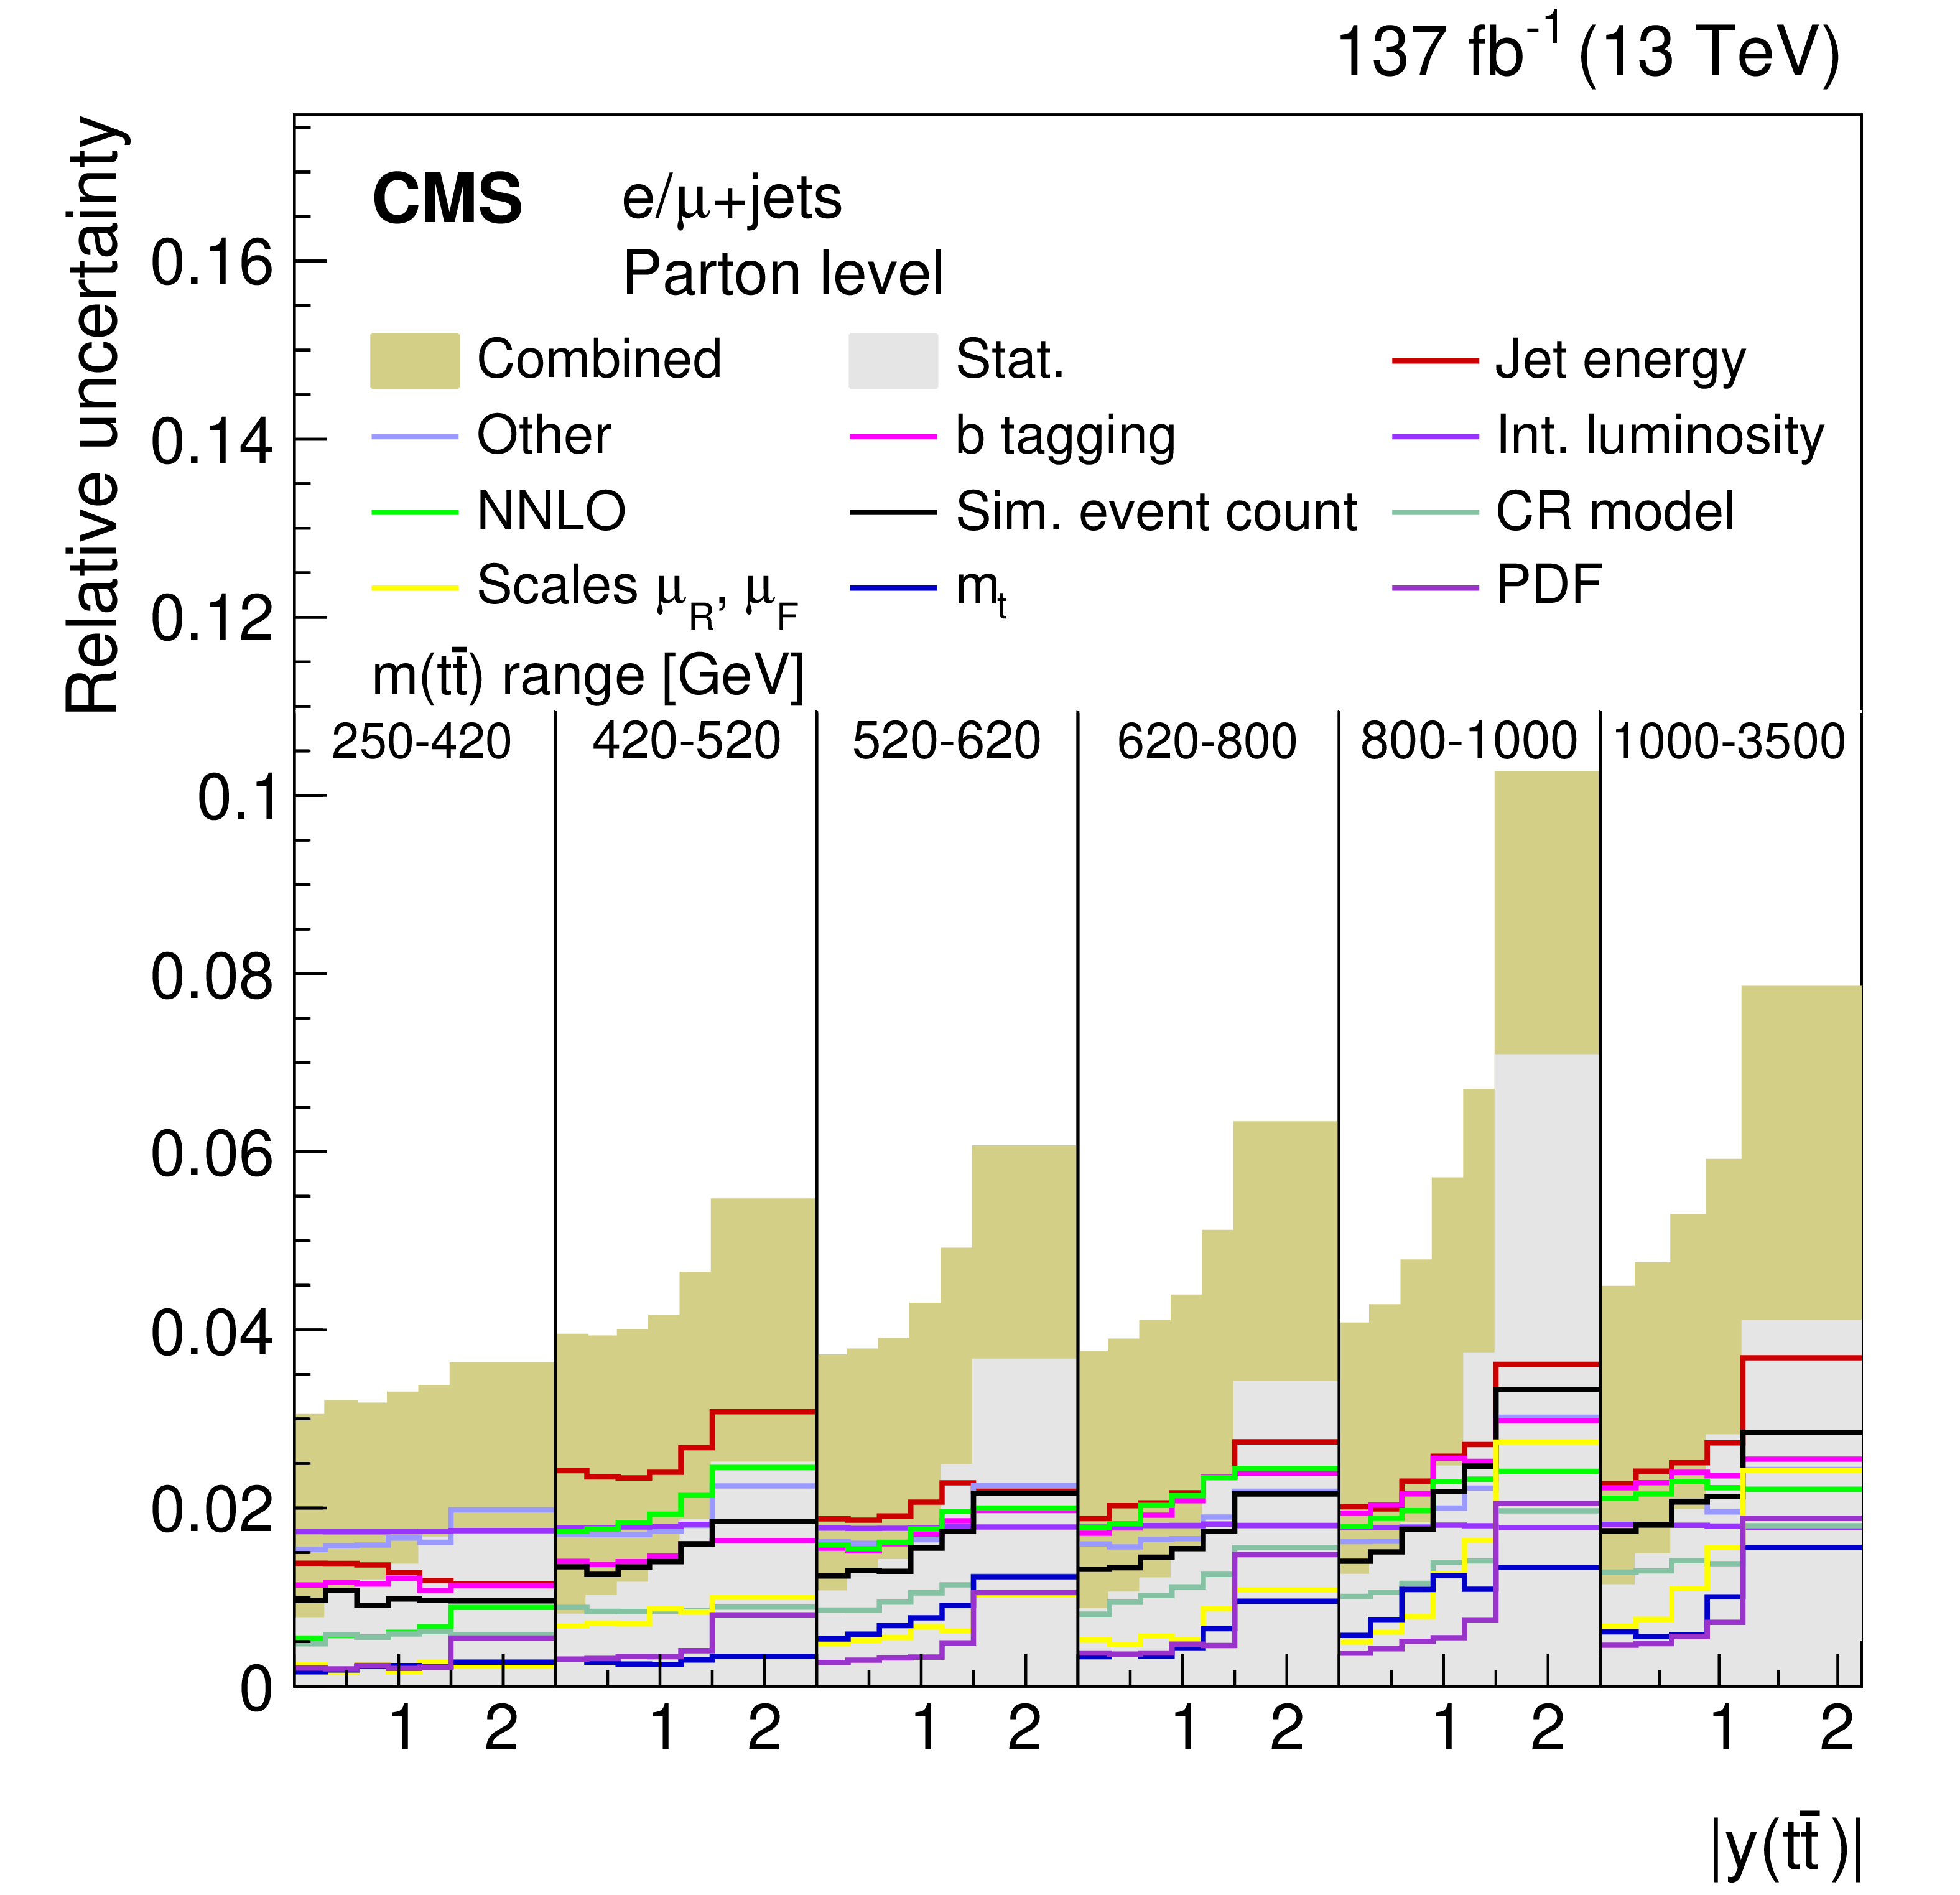
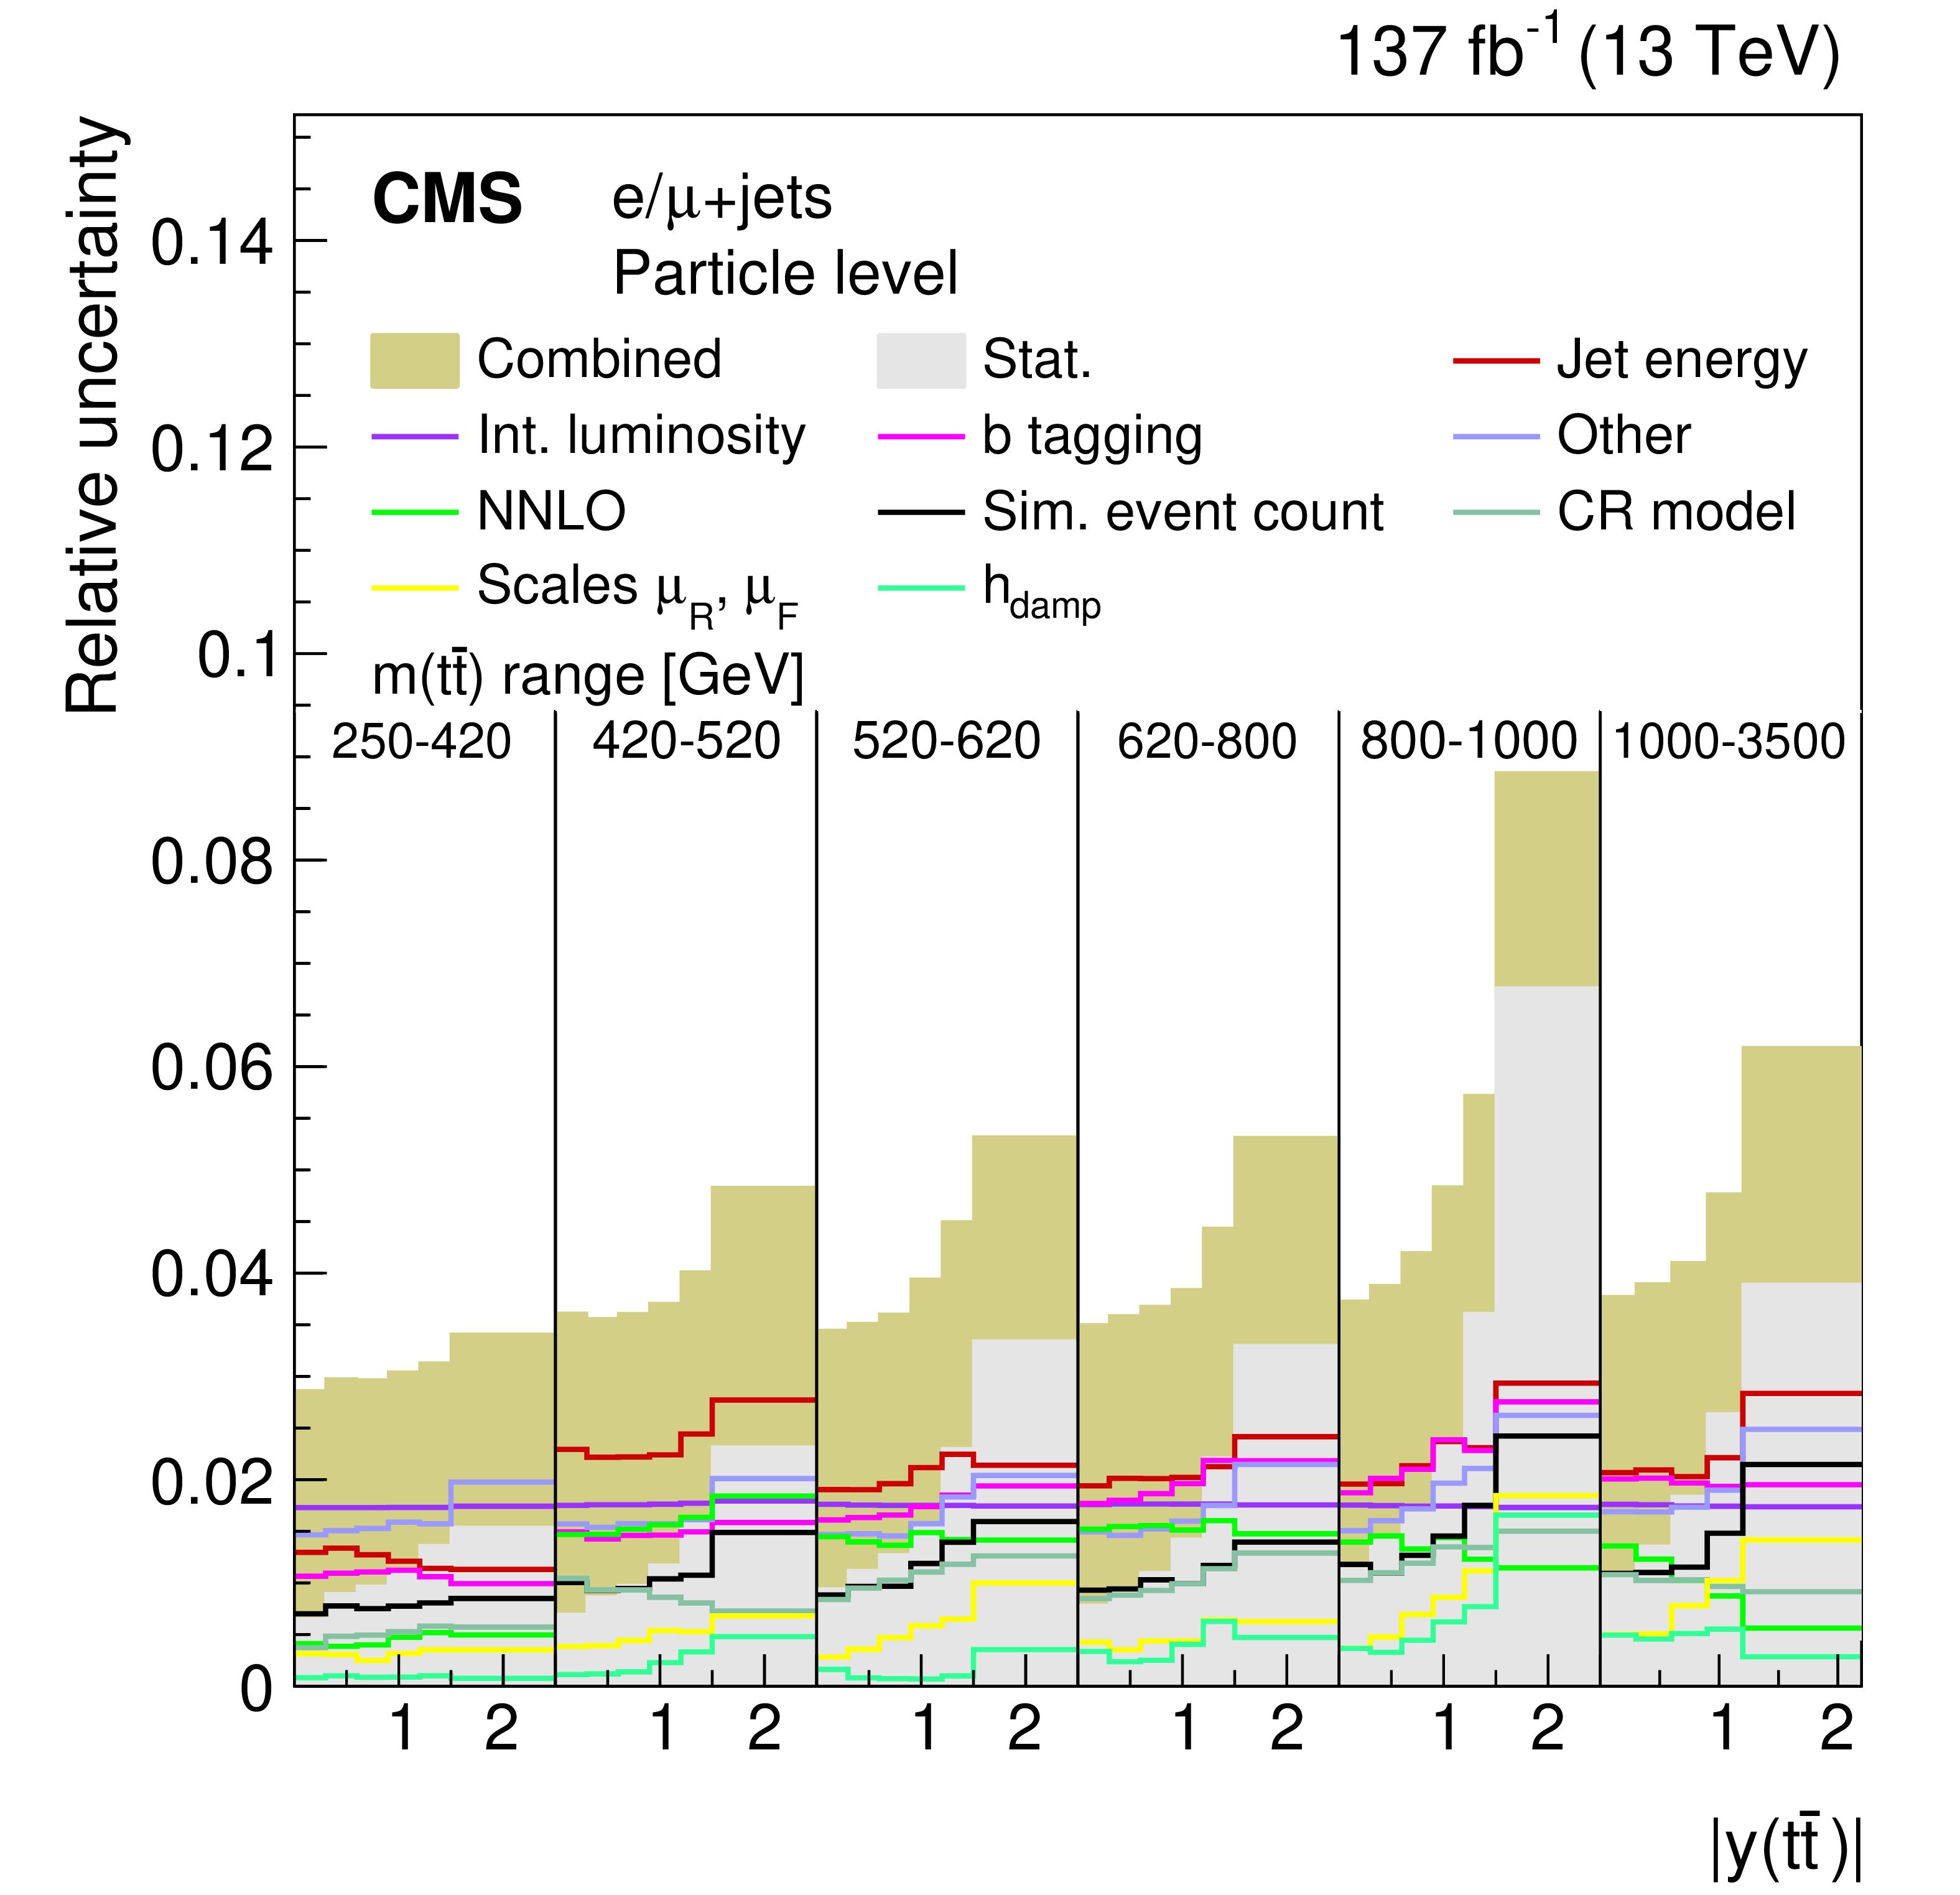
The individual sources of systematic uncertainties in the various parton (left) and particle (right) measurements and their relative contributions to the overall uncertainty. Sources with a maximum uncertainty below 1.5% are combined in the category "Other''. |
png pdf |
Figure 13-a:
The individual sources of systematic uncertainties in the various parton (left) and particle (right) measurements and their relative contributions to the overall uncertainty. Sources with a maximum uncertainty below 1.5% are combined in the category "Other''. |
png pdf |
Figure 13-b:
The individual sources of systematic uncertainties in the various parton (left) and particle (right) measurements and their relative contributions to the overall uncertainty. Sources with a maximum uncertainty below 1.5% are combined in the category "Other''. |
png pdf |
Figure 13-c:
The individual sources of systematic uncertainties in the various parton (left) and particle (right) measurements and their relative contributions to the overall uncertainty. Sources with a maximum uncertainty below 1.5% are combined in the category "Other''. |
png pdf |
Figure 13-d:
The individual sources of systematic uncertainties in the various parton (left) and particle (right) measurements and their relative contributions to the overall uncertainty. Sources with a maximum uncertainty below 1.5% are combined in the category "Other''. |
png pdf |
Figure 13-e:
The individual sources of systematic uncertainties in the various parton (left) and particle (right) measurements and their relative contributions to the overall uncertainty. Sources with a maximum uncertainty below 1.5% are combined in the category "Other''. |
png pdf |
Figure 13-f:
The individual sources of systematic uncertainties in the various parton (left) and particle (right) measurements and their relative contributions to the overall uncertainty. Sources with a maximum uncertainty below 1.5% are combined in the category "Other''. |
png pdf |
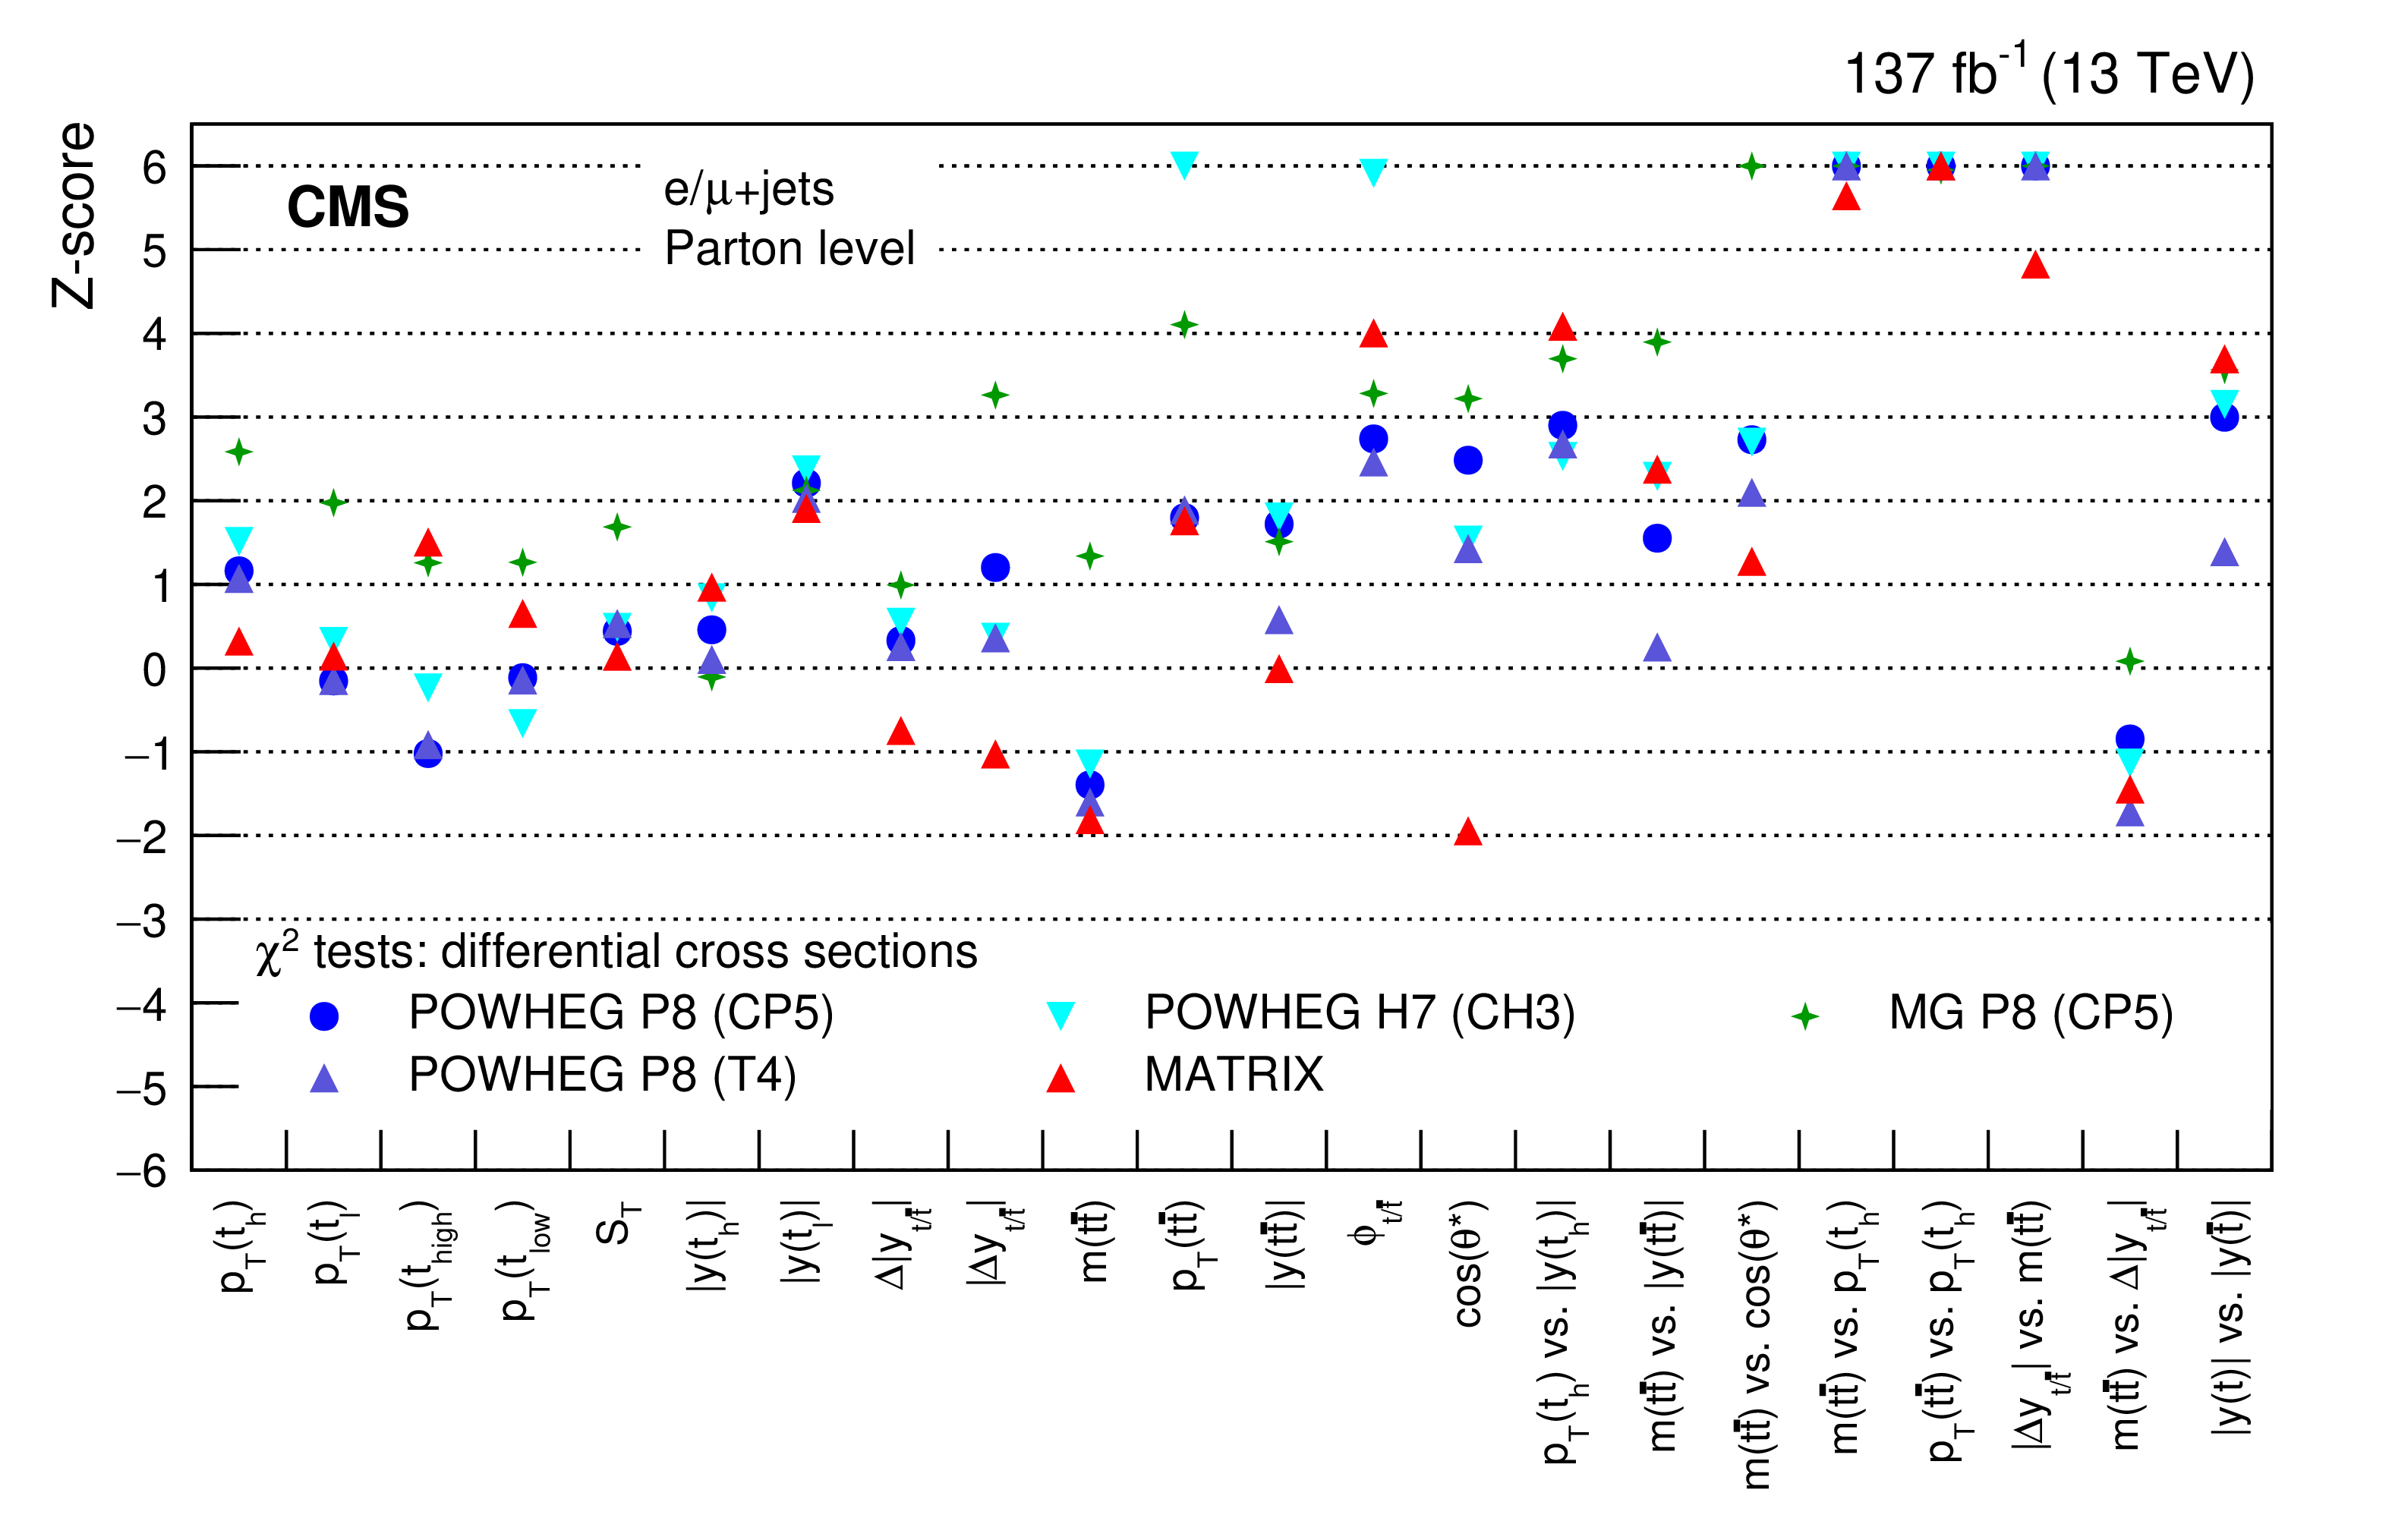
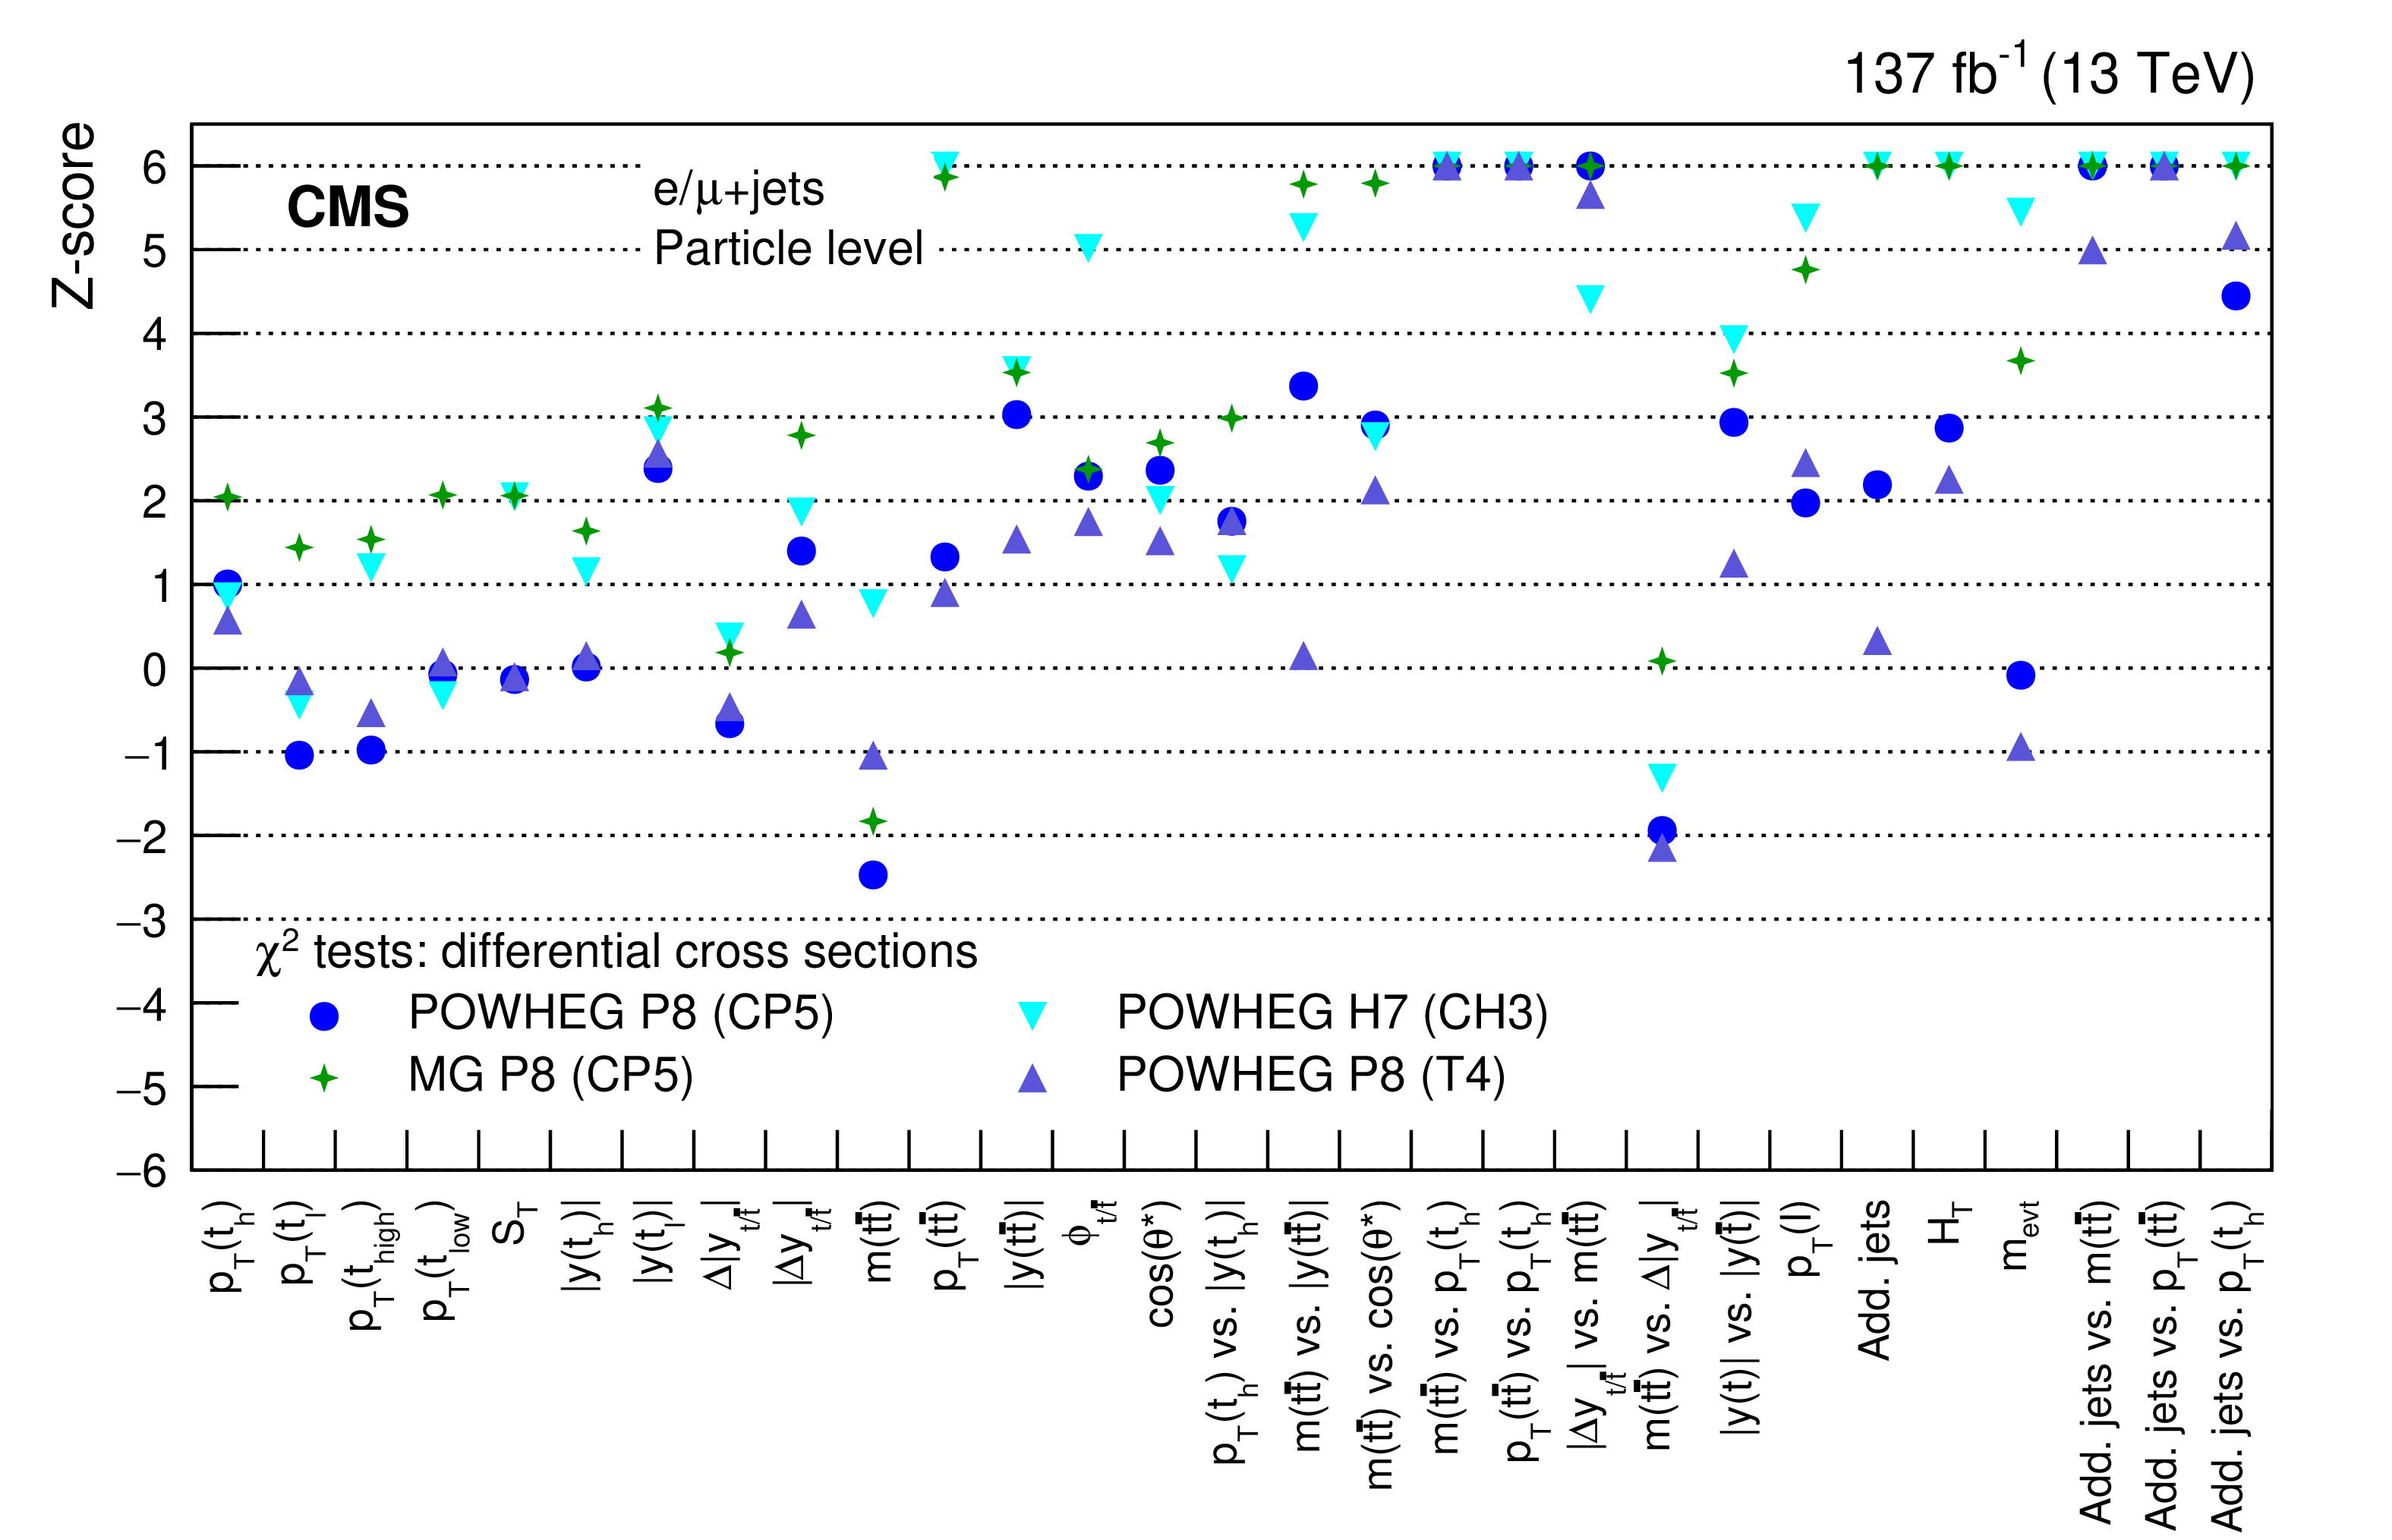
Figure 14:
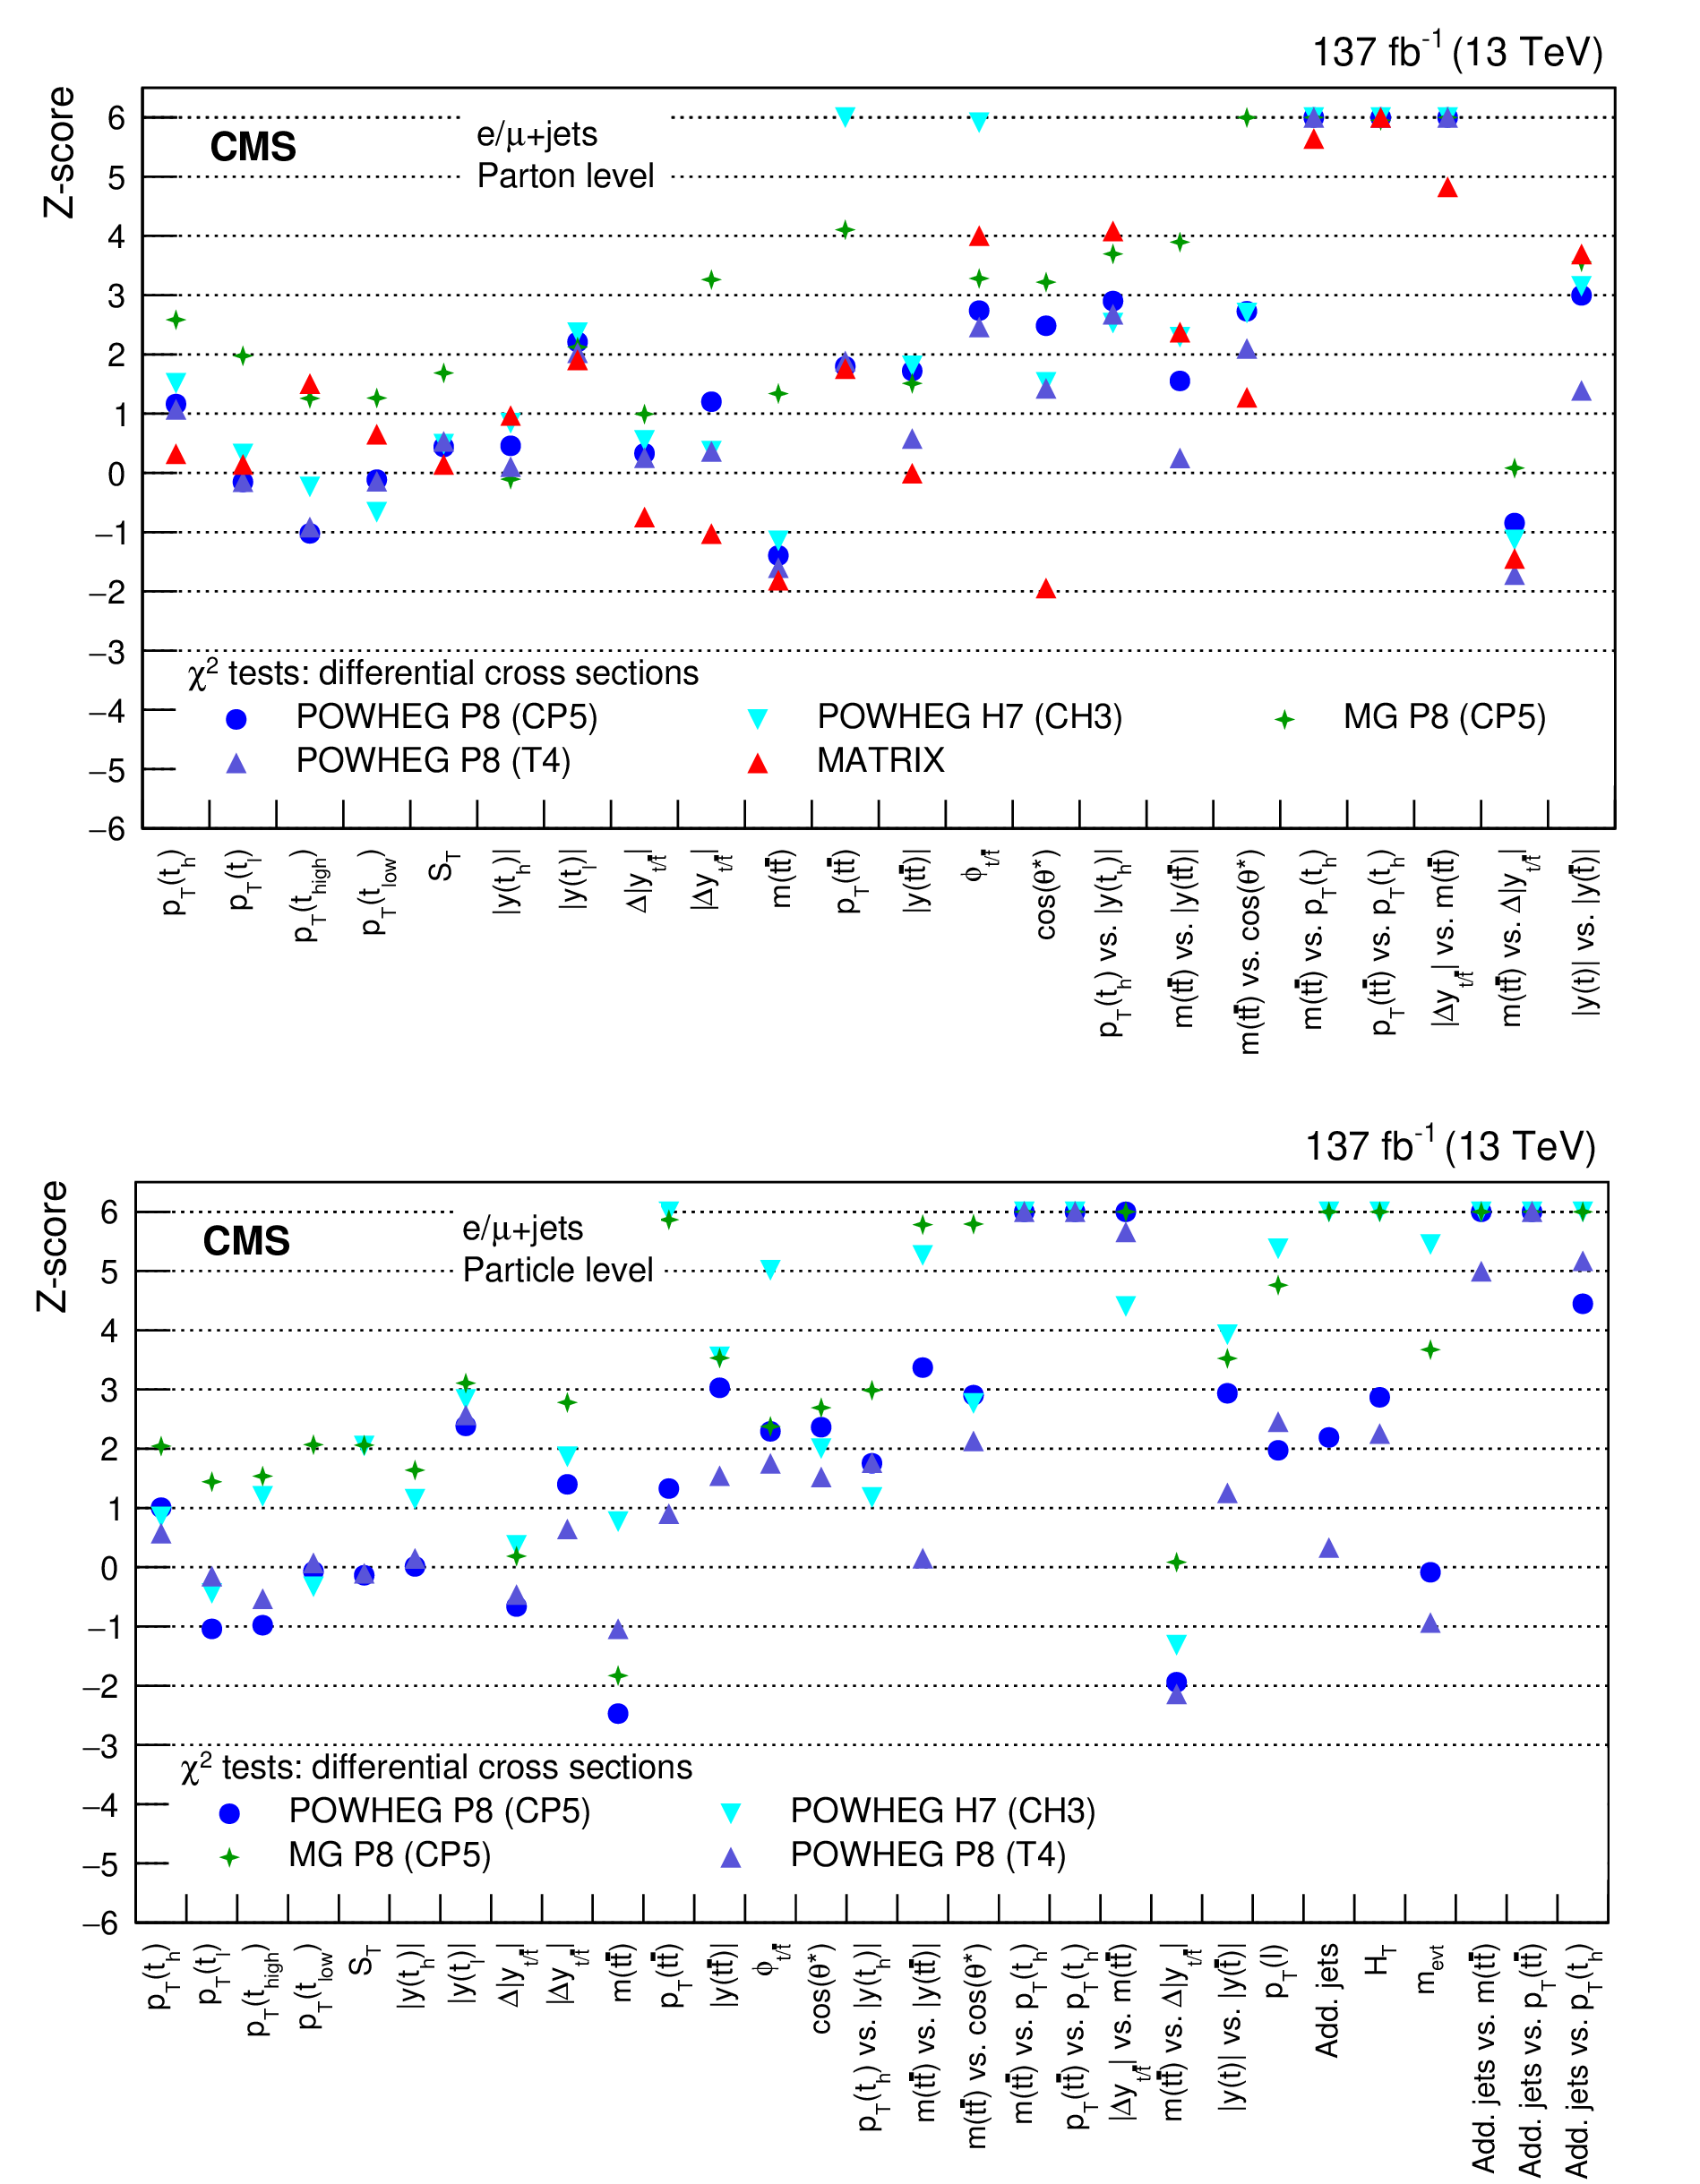
The $Z$-scores from the corresponding $\chi ^2$ tests comparing the measured differential cross sections for the shown variables at the parton (upper) and particle (lower) levels to the predictions of POWHEG+PYTHIA (P8) for the CP5 and CUETP8M2T4 (T4) tunes, POWHEG+HERWIG (H7), the multiparton simulation MG5_aMC@NLO (MG)+PYTHIA FxFx, and the NNLO QCD calculations obtained with Matrix. The $Z$-scores are truncated at an upper limit of six. The uncertainties in the measurements and the predictions are taken into account in the $\chi ^2$ calculation. |
png pdf |
Figure 14-a:
The $Z$-scores from the corresponding $\chi ^2$ tests comparing the measured differential cross sections for the shown variables at the parton (upper) and particle (lower) levels to the predictions of POWHEG+PYTHIA (P8) for the CP5 and CUETP8M2T4 (T4) tunes, POWHEG+HERWIG (H7), the multiparton simulation MG5_aMC@NLO (MG)+PYTHIA FxFx, and the NNLO QCD calculations obtained with Matrix. The $Z$-scores are truncated at an upper limit of six. The uncertainties in the measurements and the predictions are taken into account in the $\chi ^2$ calculation. |
png pdf |
Figure 14-b:
The $Z$-scores from the corresponding $\chi ^2$ tests comparing the measured differential cross sections for the shown variables at the parton (upper) and particle (lower) levels to the predictions of POWHEG+PYTHIA (P8) for the CP5 and CUETP8M2T4 (T4) tunes, POWHEG+HERWIG (H7), the multiparton simulation MG5_aMC@NLO (MG)+PYTHIA FxFx, and the NNLO QCD calculations obtained with Matrix. The $Z$-scores are truncated at an upper limit of six. The uncertainties in the measurements and the predictions are taken into account in the $\chi ^2$ calculation. |

png pdf |
Figure 15:
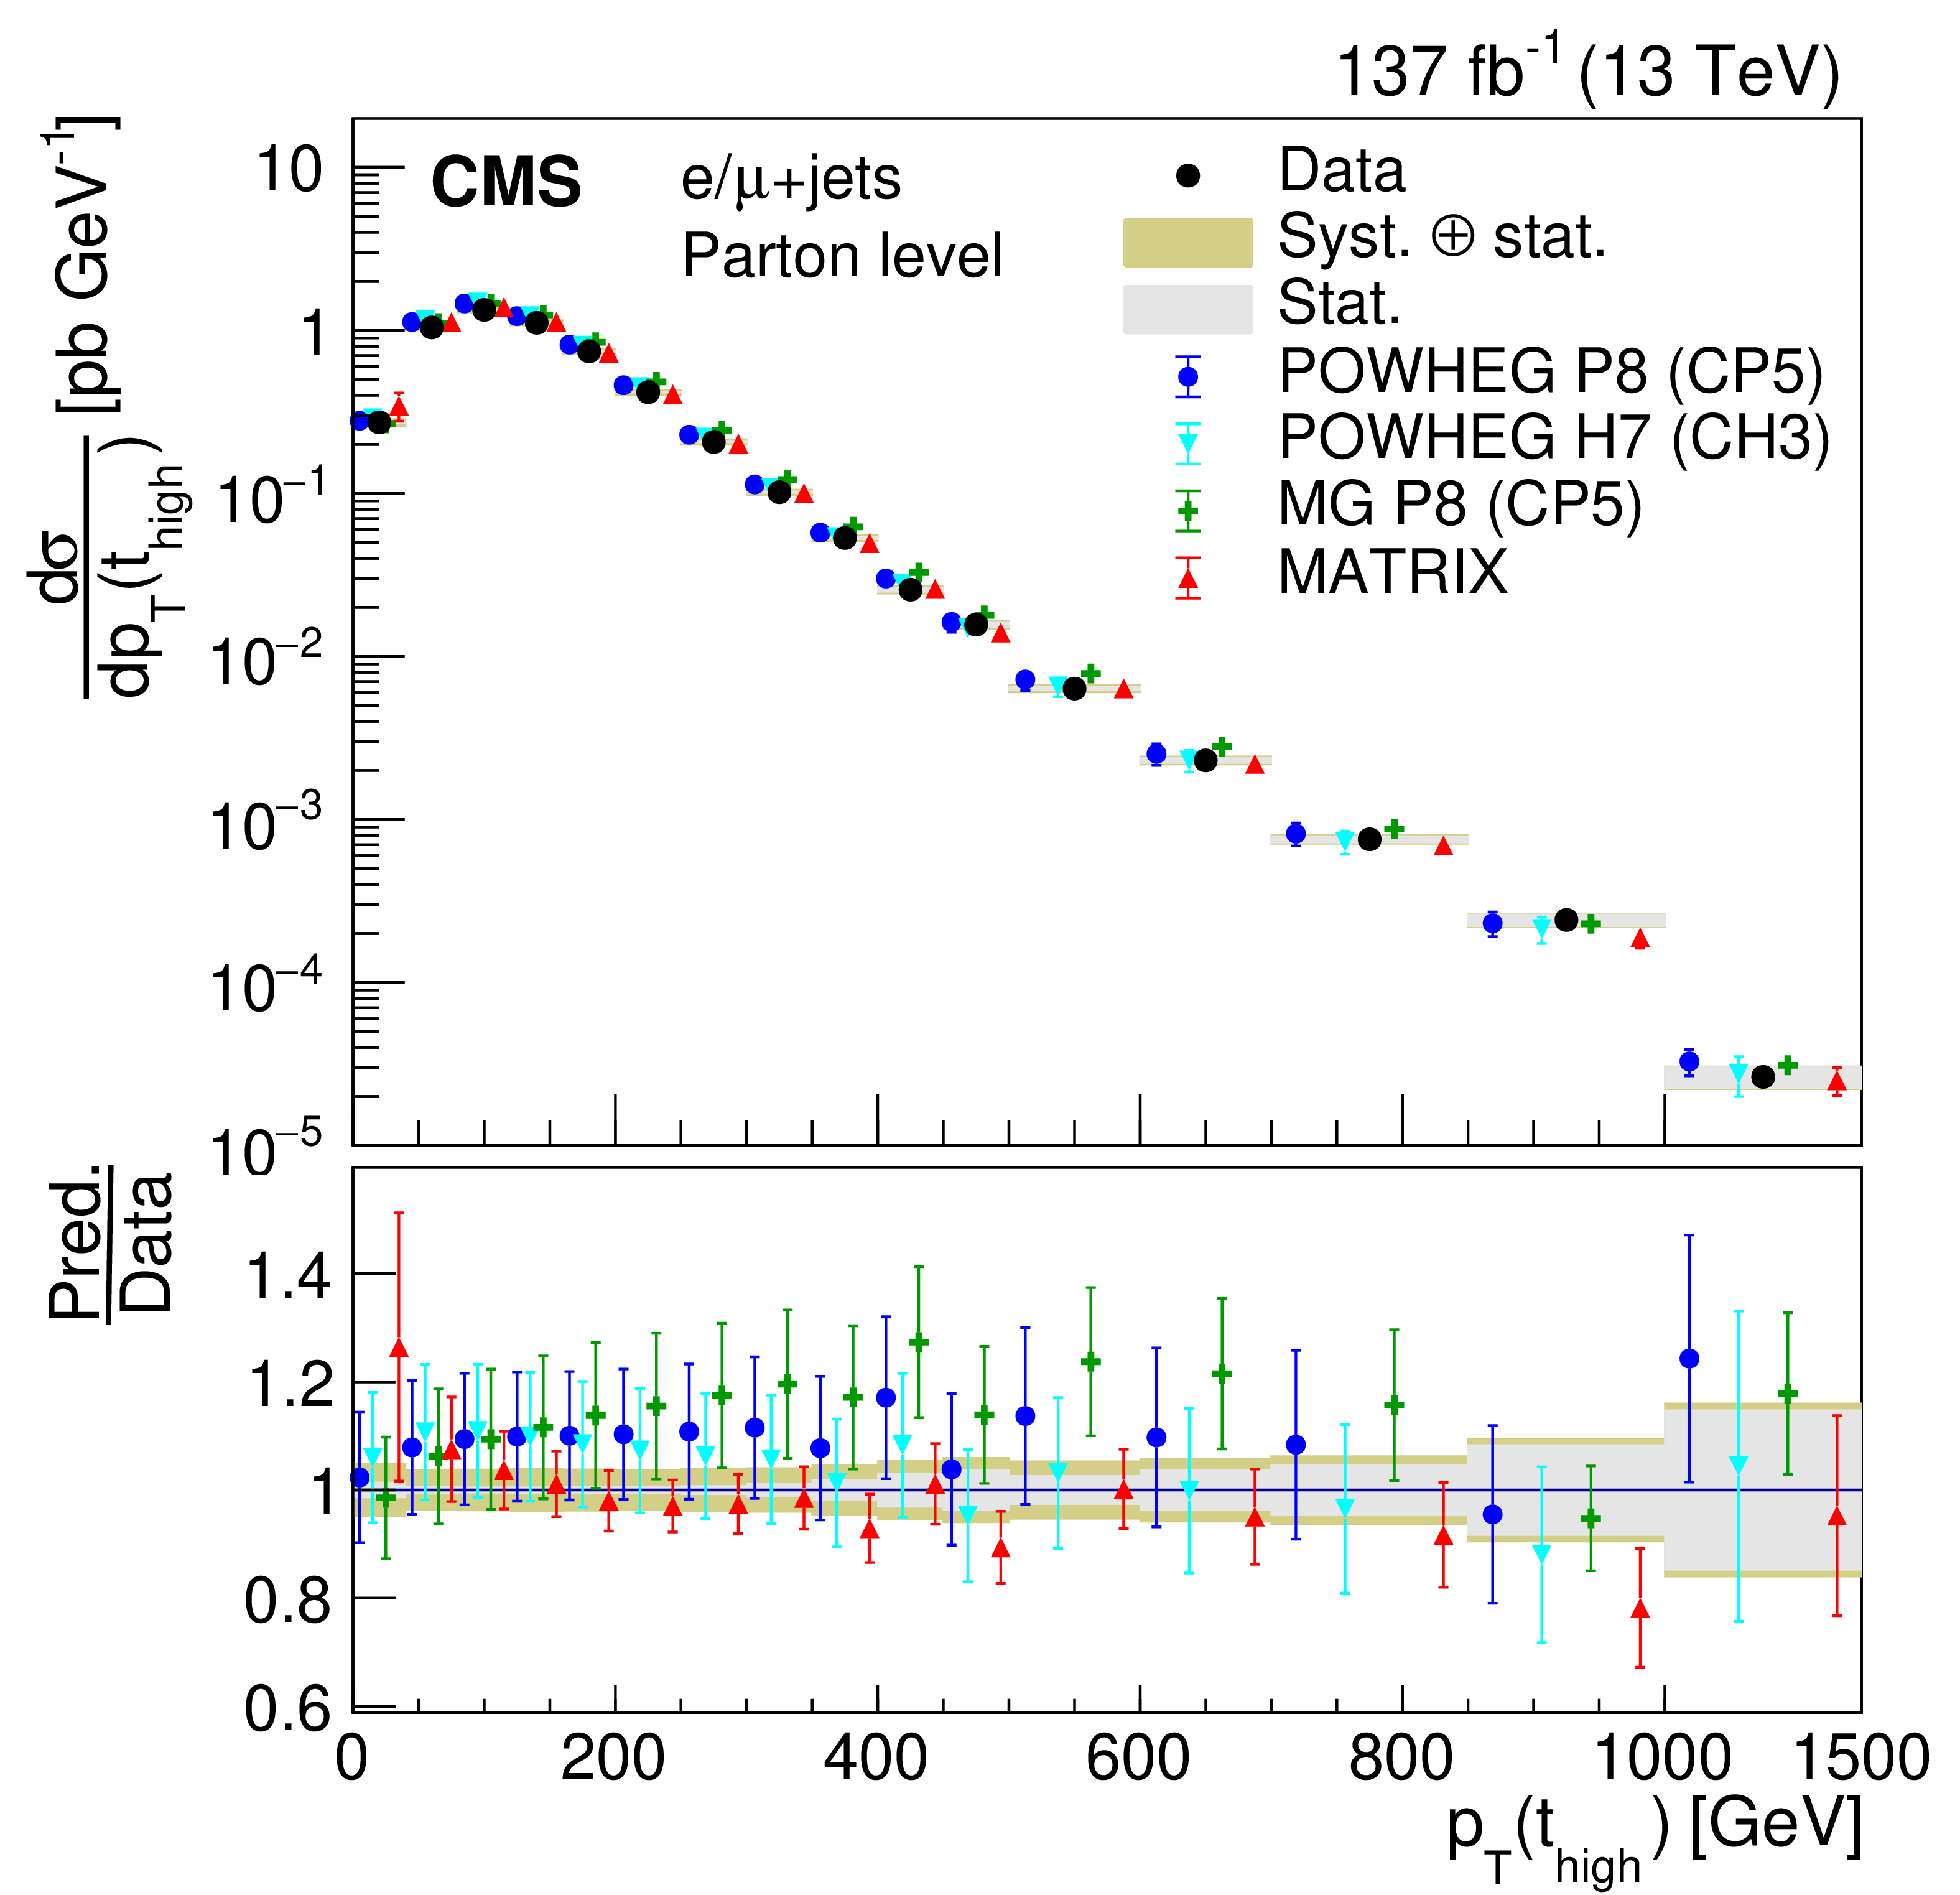
Differential cross sections at the parton level as a function of ${{p_{\mathrm {T}}} ({\mathrm{t} _\mathrm {h}})}$, ${{p_{\mathrm {T}}} ({\mathrm{t} _\ell})}$, ${{p_{\mathrm {T}}} ({\mathrm{t} _\text {high}})}$, ${{p_{\mathrm {T}}} ({\mathrm{t} _\text {low}})}$, and ${S_\mathrm {T}}$. The data are shown as points with gray (yellow) bands indicating the statistical (statistical and systematic) uncertainties. The cross sections are compared to the predictions of POWHEG combined with PYTHIA (P8) or HERWIG (H7), the multiparton simulation MG5_aMC@NLO (MG)+PYTHIA FxFx, and the NNLO QCD calculations obtained with Matrix. The ratios of the various predictions to the measured cross sections are shown in the lower panels. |

png pdf |
Figure 15-a:
Differential cross sections at the parton level as a function of ${{p_{\mathrm {T}}} ({\mathrm{t} _\mathrm {h}})}$, ${{p_{\mathrm {T}}} ({\mathrm{t} _\ell})}$, ${{p_{\mathrm {T}}} ({\mathrm{t} _\text {high}})}$, ${{p_{\mathrm {T}}} ({\mathrm{t} _\text {low}})}$, and ${S_\mathrm {T}}$. The data are shown as points with gray (yellow) bands indicating the statistical (statistical and systematic) uncertainties. The cross sections are compared to the predictions of POWHEG combined with PYTHIA (P8) or HERWIG (H7), the multiparton simulation MG5_aMC@NLO (MG)+PYTHIA FxFx, and the NNLO QCD calculations obtained with Matrix. The ratios of the various predictions to the measured cross sections are shown in the lower panels. |

png pdf |
Figure 15-b:
Differential cross sections at the parton level as a function of ${{p_{\mathrm {T}}} ({\mathrm{t} _\mathrm {h}})}$, ${{p_{\mathrm {T}}} ({\mathrm{t} _\ell})}$, ${{p_{\mathrm {T}}} ({\mathrm{t} _\text {high}})}$, ${{p_{\mathrm {T}}} ({\mathrm{t} _\text {low}})}$, and ${S_\mathrm {T}}$. The data are shown as points with gray (yellow) bands indicating the statistical (statistical and systematic) uncertainties. The cross sections are compared to the predictions of POWHEG combined with PYTHIA (P8) or HERWIG (H7), the multiparton simulation MG5_aMC@NLO (MG)+PYTHIA FxFx, and the NNLO QCD calculations obtained with Matrix. The ratios of the various predictions to the measured cross sections are shown in the lower panels. |
png pdf |
Figure 15-c:
Differential cross sections at the parton level as a function of ${{p_{\mathrm {T}}} ({\mathrm{t} _\mathrm {h}})}$, ${{p_{\mathrm {T}}} ({\mathrm{t} _\ell})}$, ${{p_{\mathrm {T}}} ({\mathrm{t} _\text {high}})}$, ${{p_{\mathrm {T}}} ({\mathrm{t} _\text {low}})}$, and ${S_\mathrm {T}}$. The data are shown as points with gray (yellow) bands indicating the statistical (statistical and systematic) uncertainties. The cross sections are compared to the predictions of POWHEG combined with PYTHIA (P8) or HERWIG (H7), the multiparton simulation MG5_aMC@NLO (MG)+PYTHIA FxFx, and the NNLO QCD calculations obtained with Matrix. The ratios of the various predictions to the measured cross sections are shown in the lower panels. |

png pdf |
Figure 15-d:
Differential cross sections at the parton level as a function of ${{p_{\mathrm {T}}} ({\mathrm{t} _\mathrm {h}})}$, ${{p_{\mathrm {T}}} ({\mathrm{t} _\ell})}$, ${{p_{\mathrm {T}}} ({\mathrm{t} _\text {high}})}$, ${{p_{\mathrm {T}}} ({\mathrm{t} _\text {low}})}$, and ${S_\mathrm {T}}$. The data are shown as points with gray (yellow) bands indicating the statistical (statistical and systematic) uncertainties. The cross sections are compared to the predictions of POWHEG combined with PYTHIA (P8) or HERWIG (H7), the multiparton simulation MG5_aMC@NLO (MG)+PYTHIA FxFx, and the NNLO QCD calculations obtained with Matrix. The ratios of the various predictions to the measured cross sections are shown in the lower panels. |

png pdf |
Figure 15-e:
Differential cross sections at the parton level as a function of ${{p_{\mathrm {T}}} ({\mathrm{t} _\mathrm {h}})}$, ${{p_{\mathrm {T}}} ({\mathrm{t} _\ell})}$, ${{p_{\mathrm {T}}} ({\mathrm{t} _\text {high}})}$, ${{p_{\mathrm {T}}} ({\mathrm{t} _\text {low}})}$, and ${S_\mathrm {T}}$. The data are shown as points with gray (yellow) bands indicating the statistical (statistical and systematic) uncertainties. The cross sections are compared to the predictions of POWHEG combined with PYTHIA (P8) or HERWIG (H7), the multiparton simulation MG5_aMC@NLO (MG)+PYTHIA FxFx, and the NNLO QCD calculations obtained with Matrix. The ratios of the various predictions to the measured cross sections are shown in the lower panels. |

png pdf |
Figure 16:
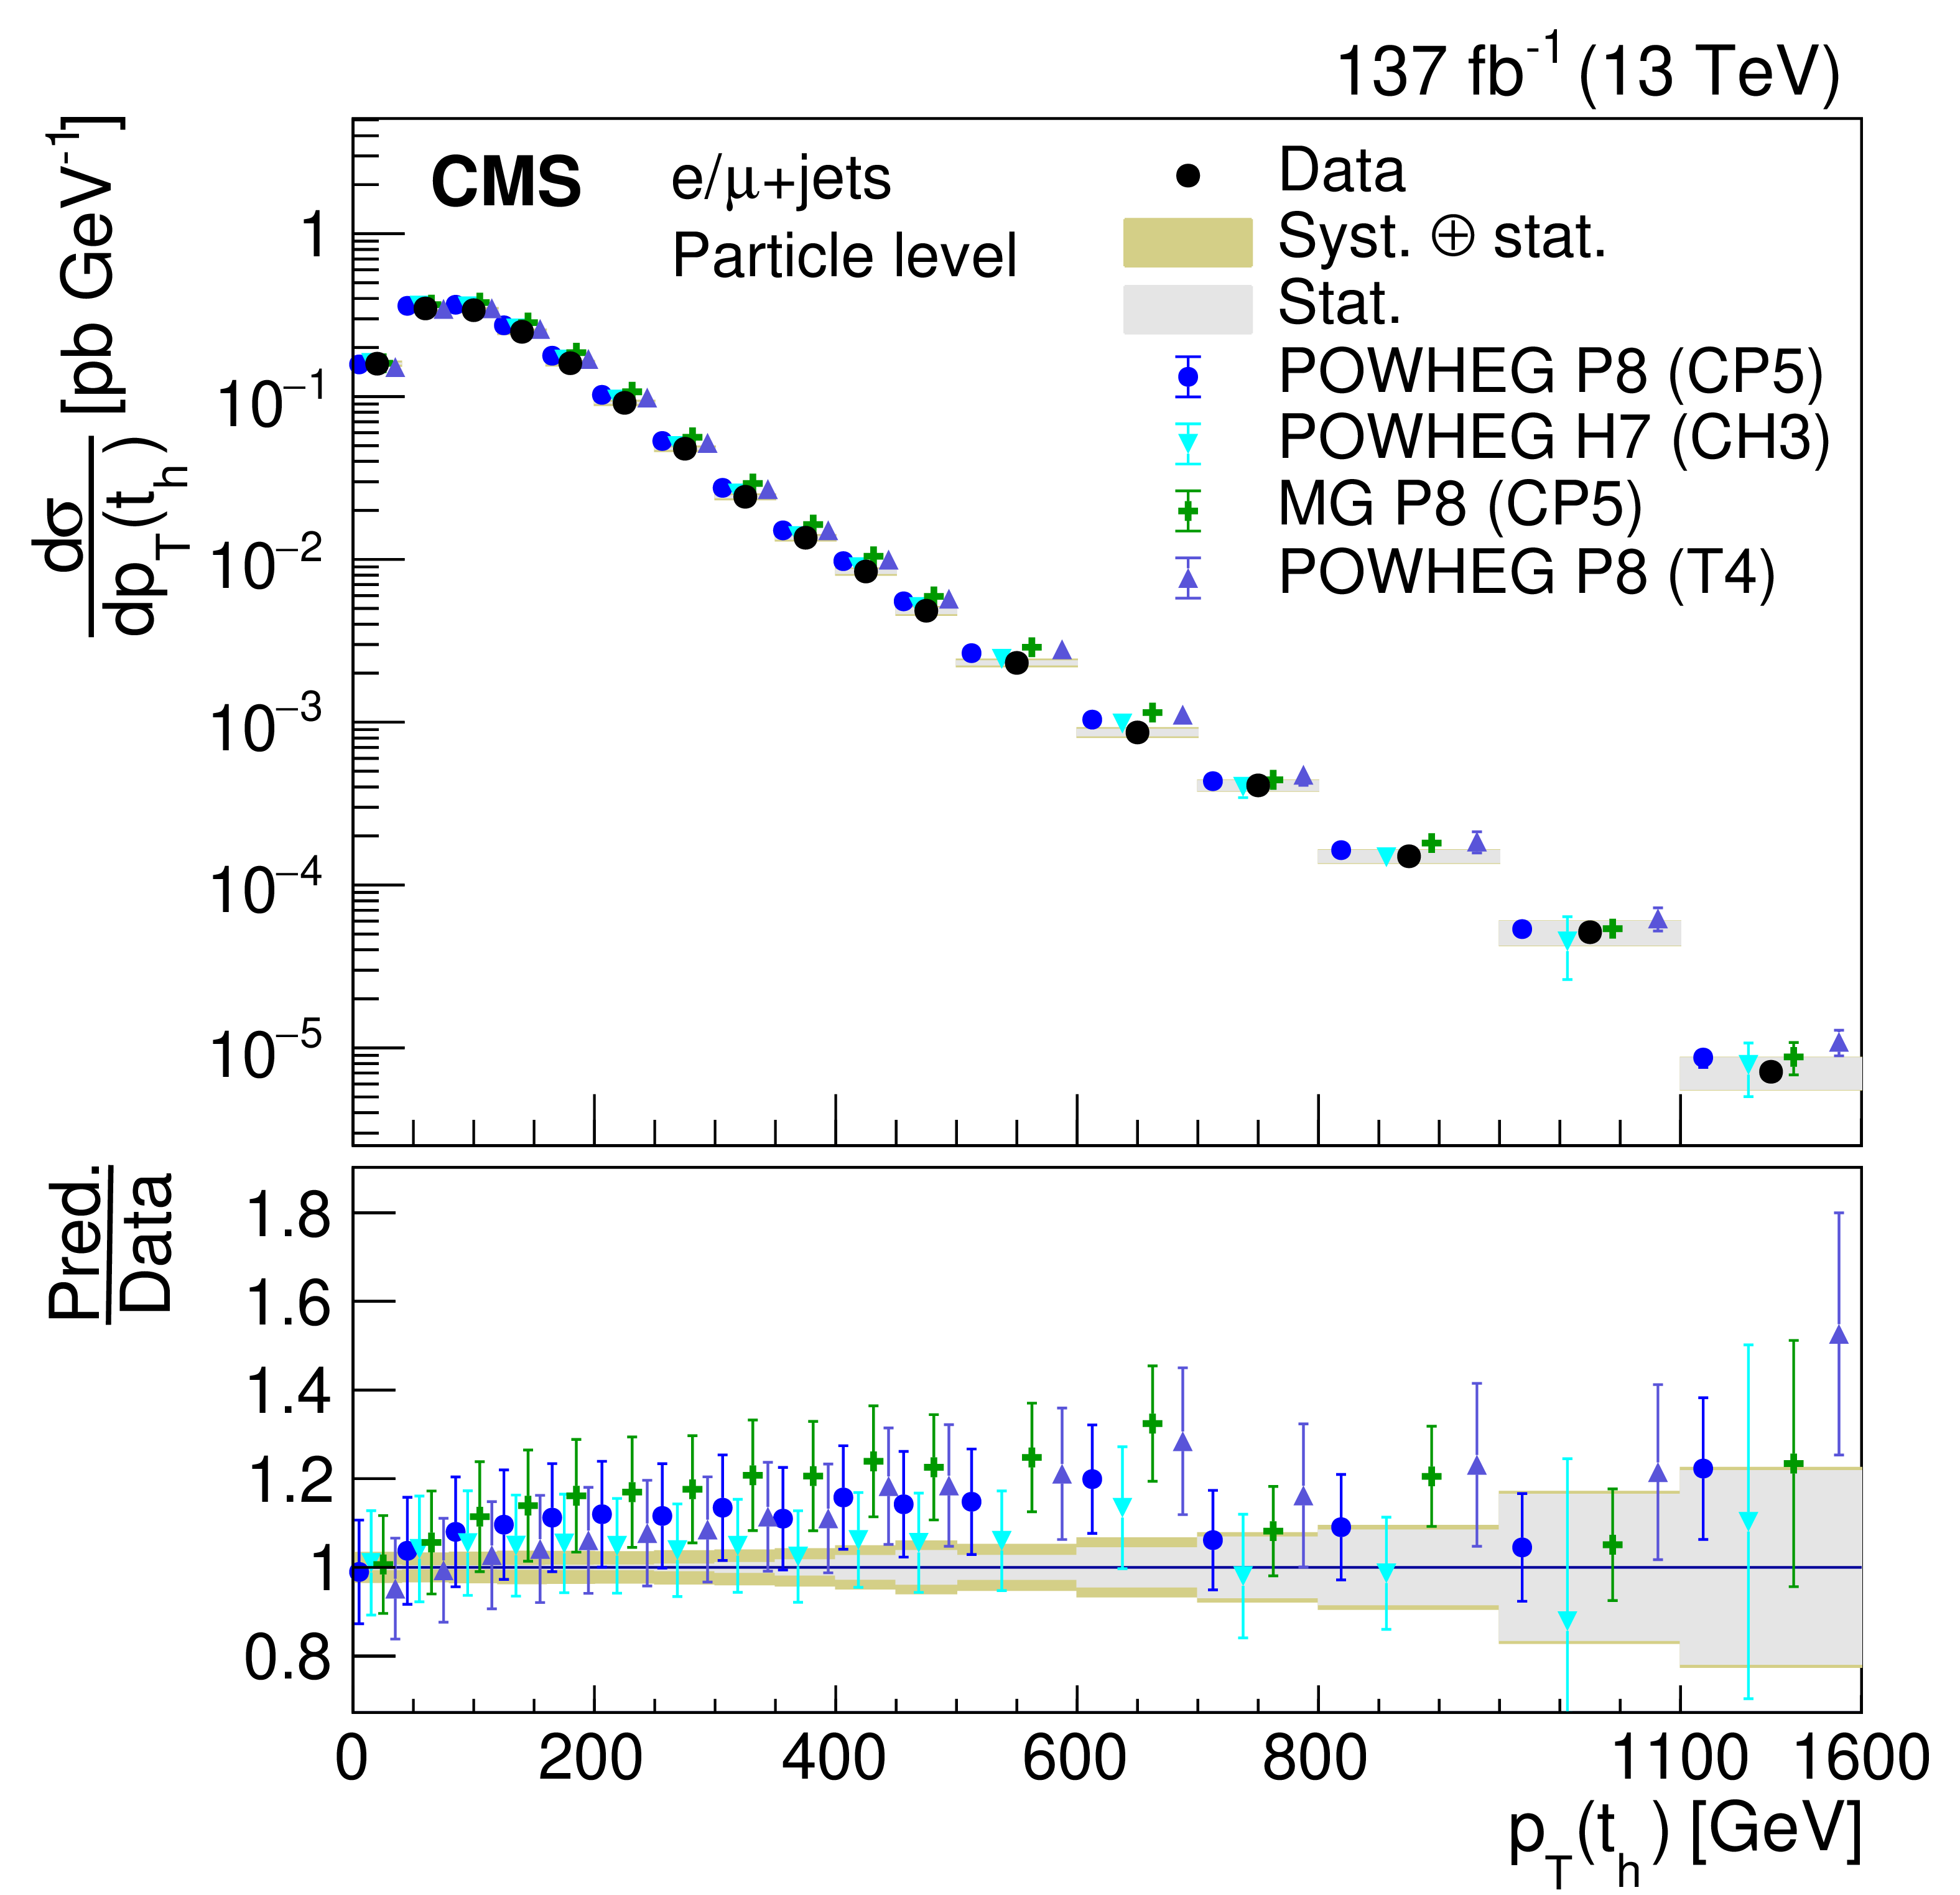
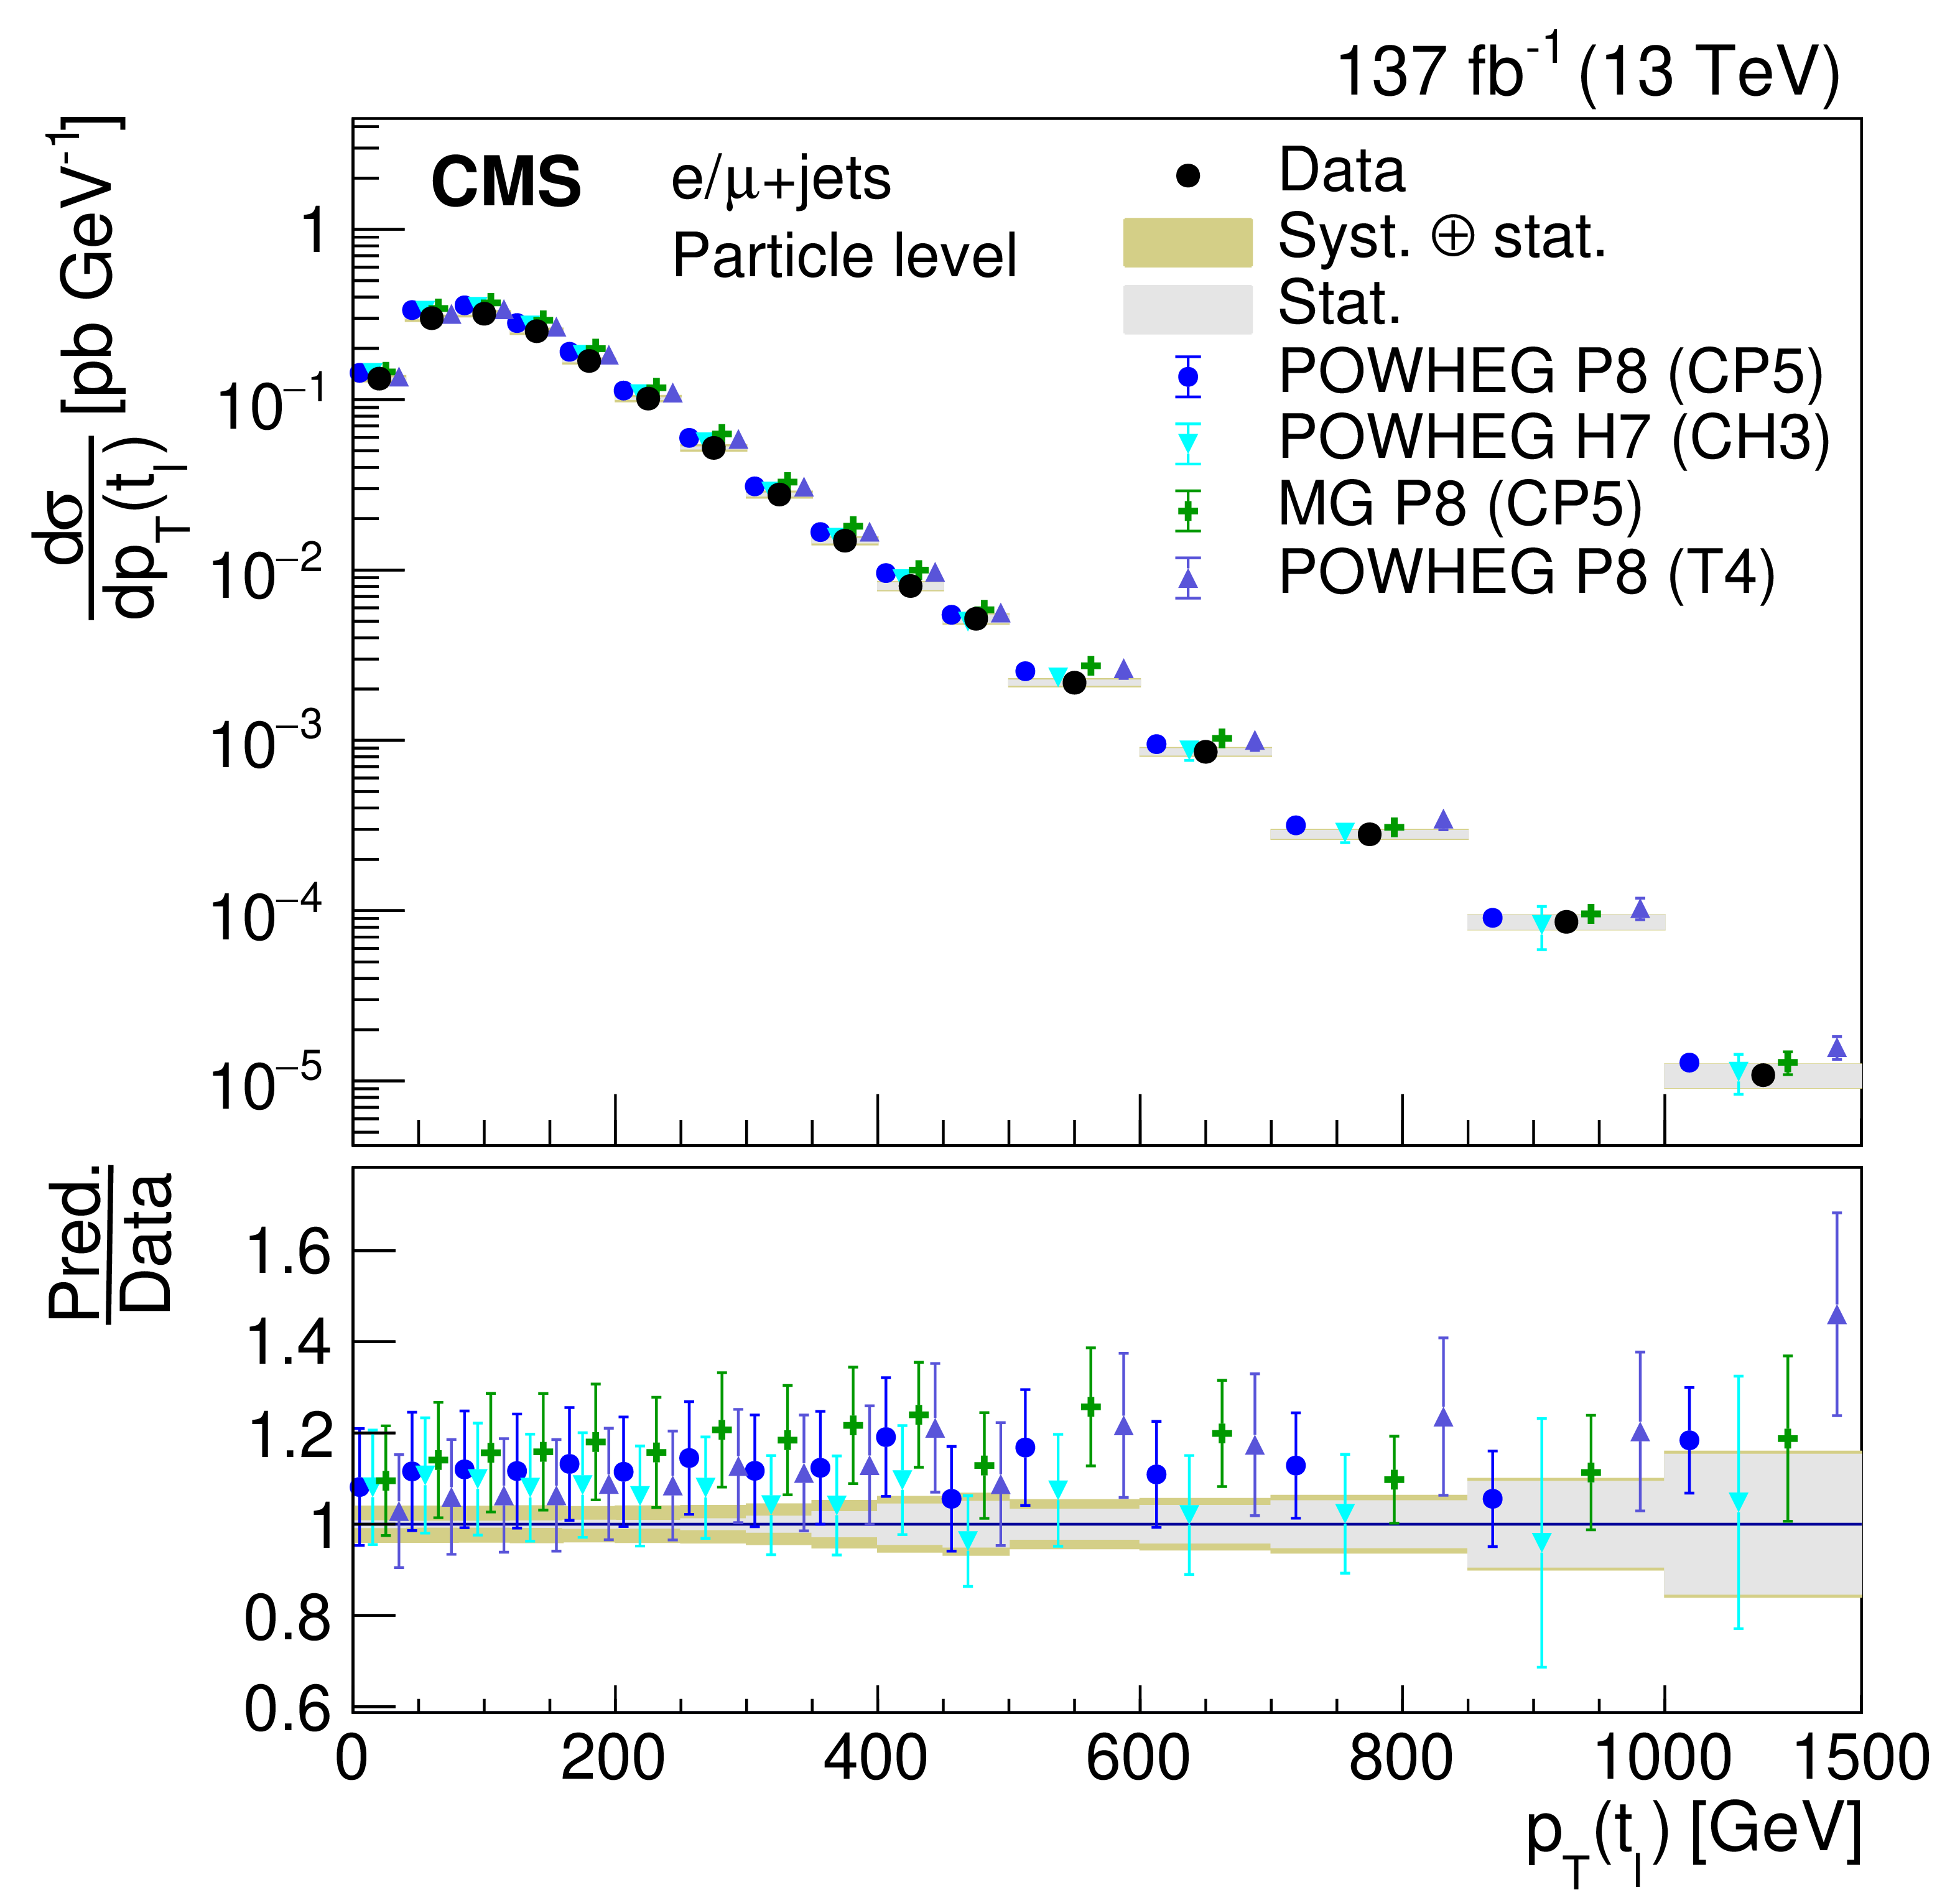
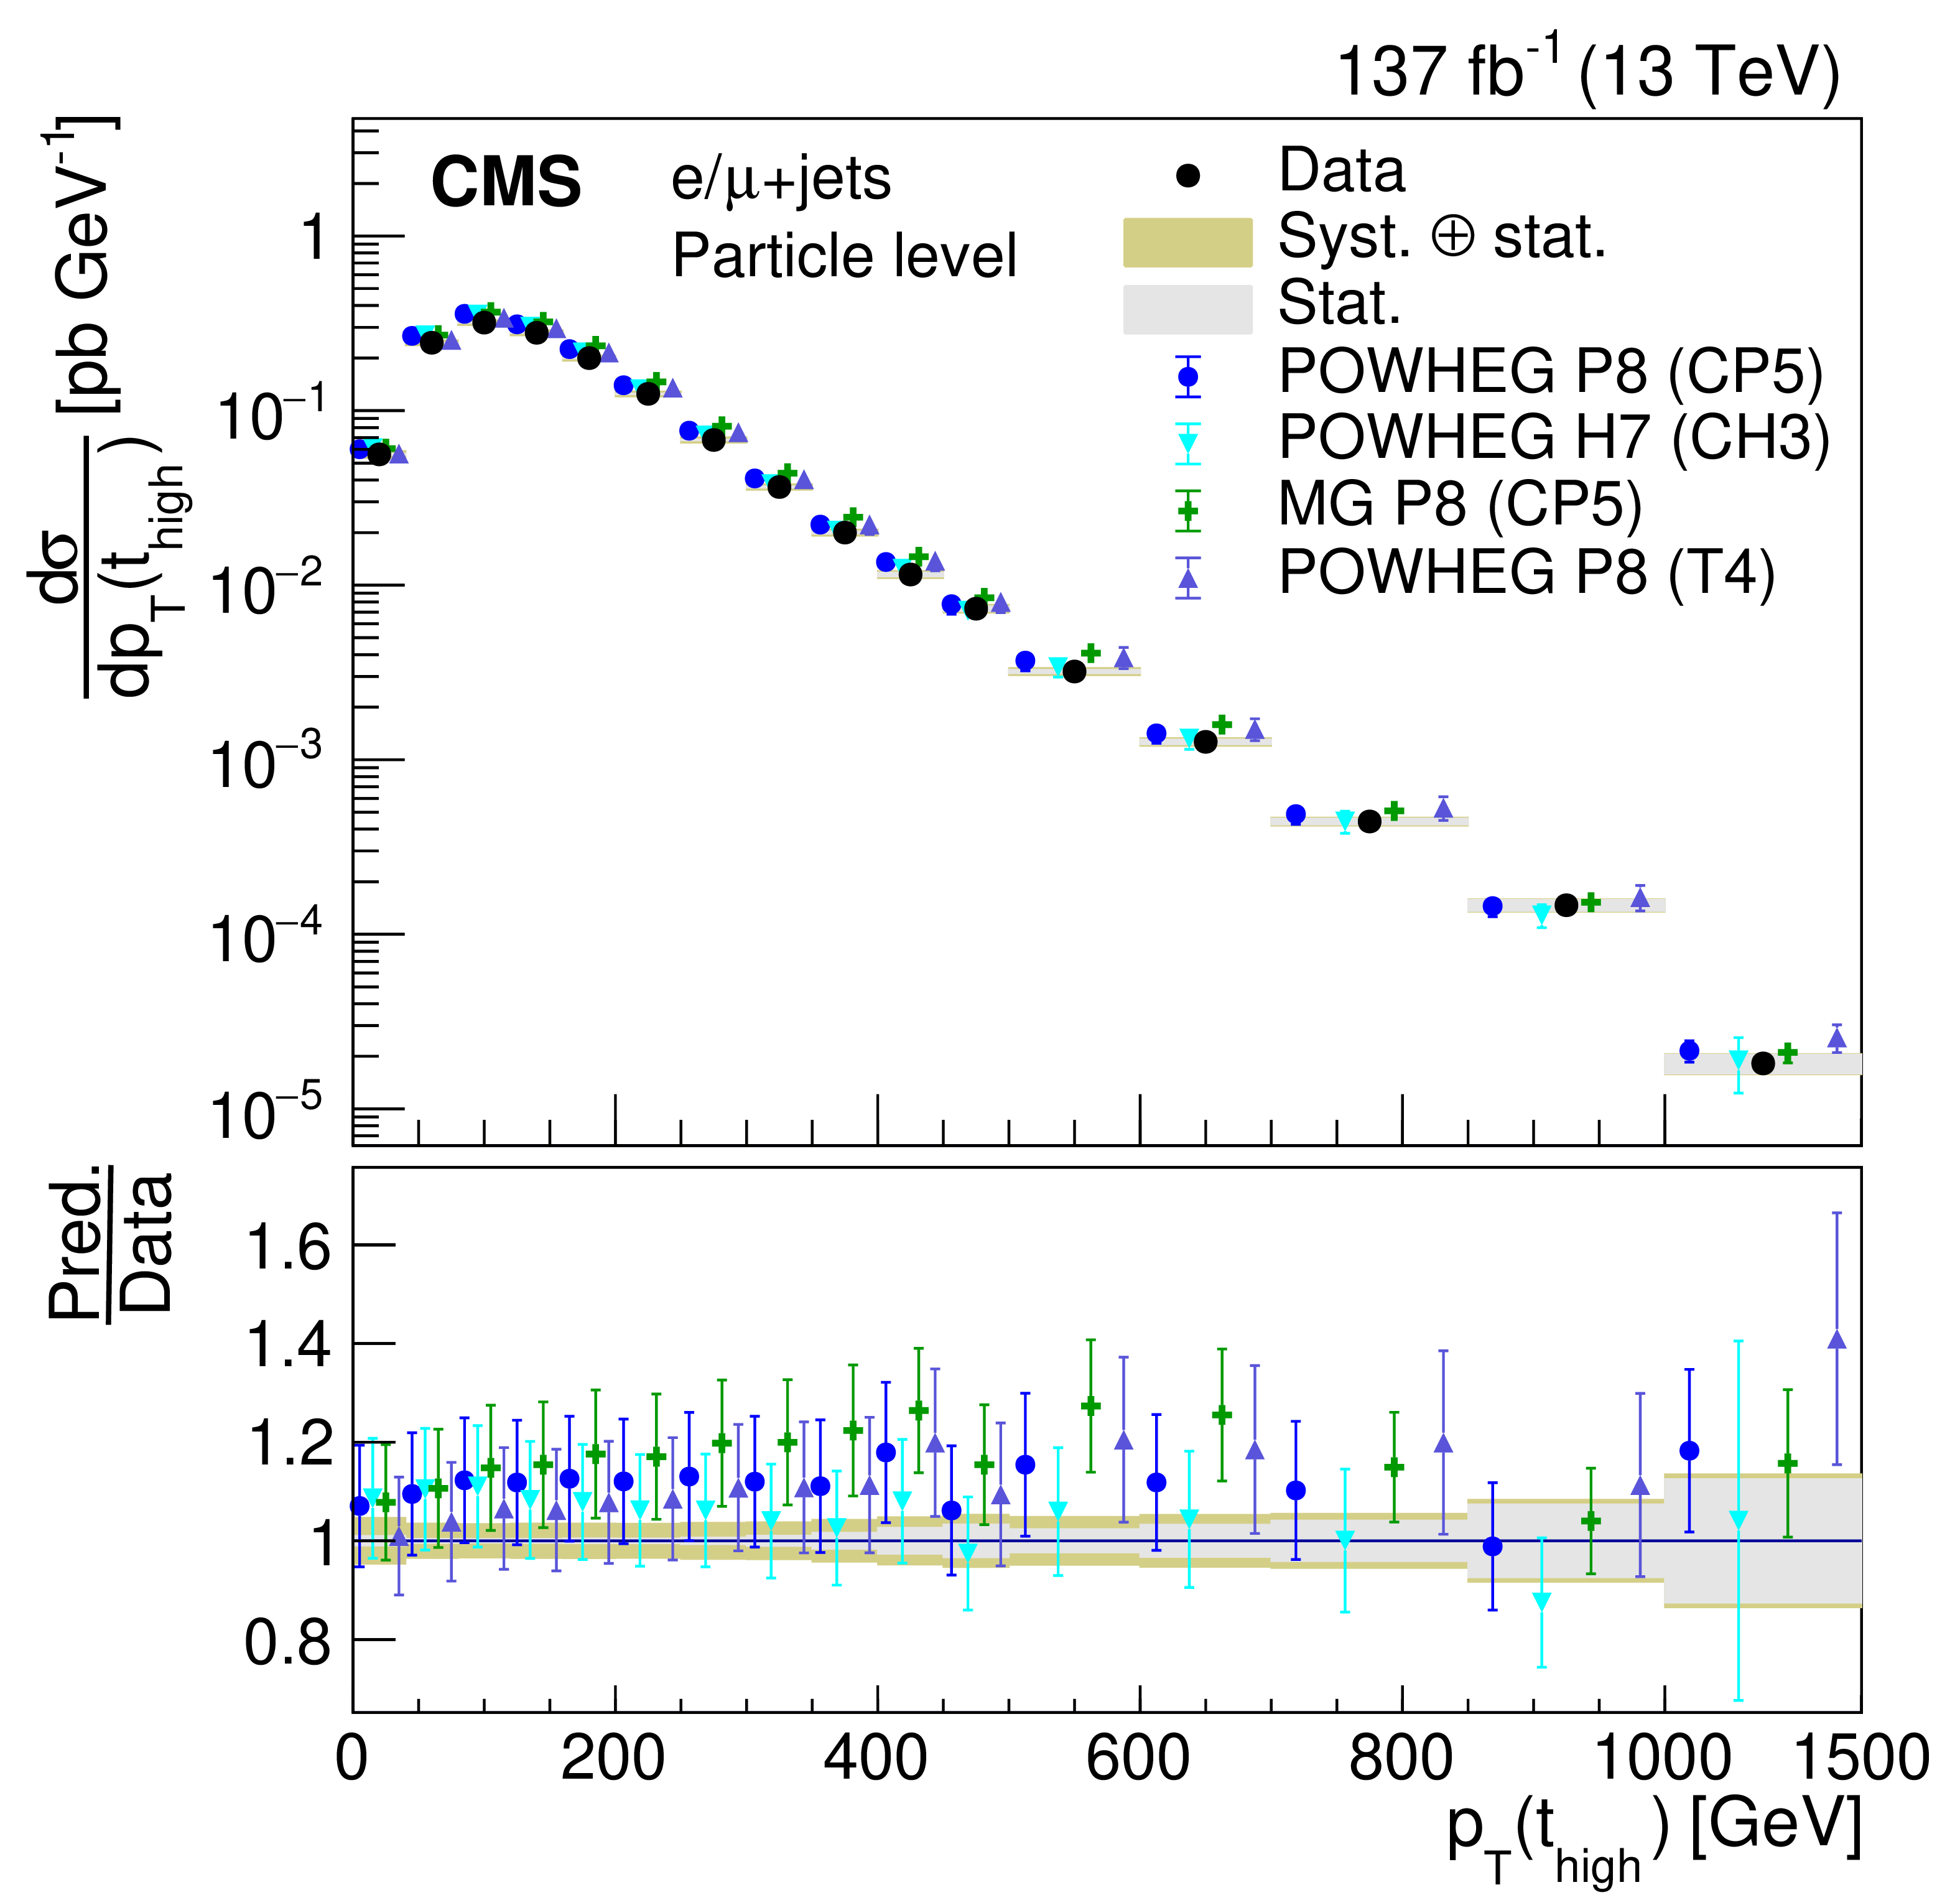
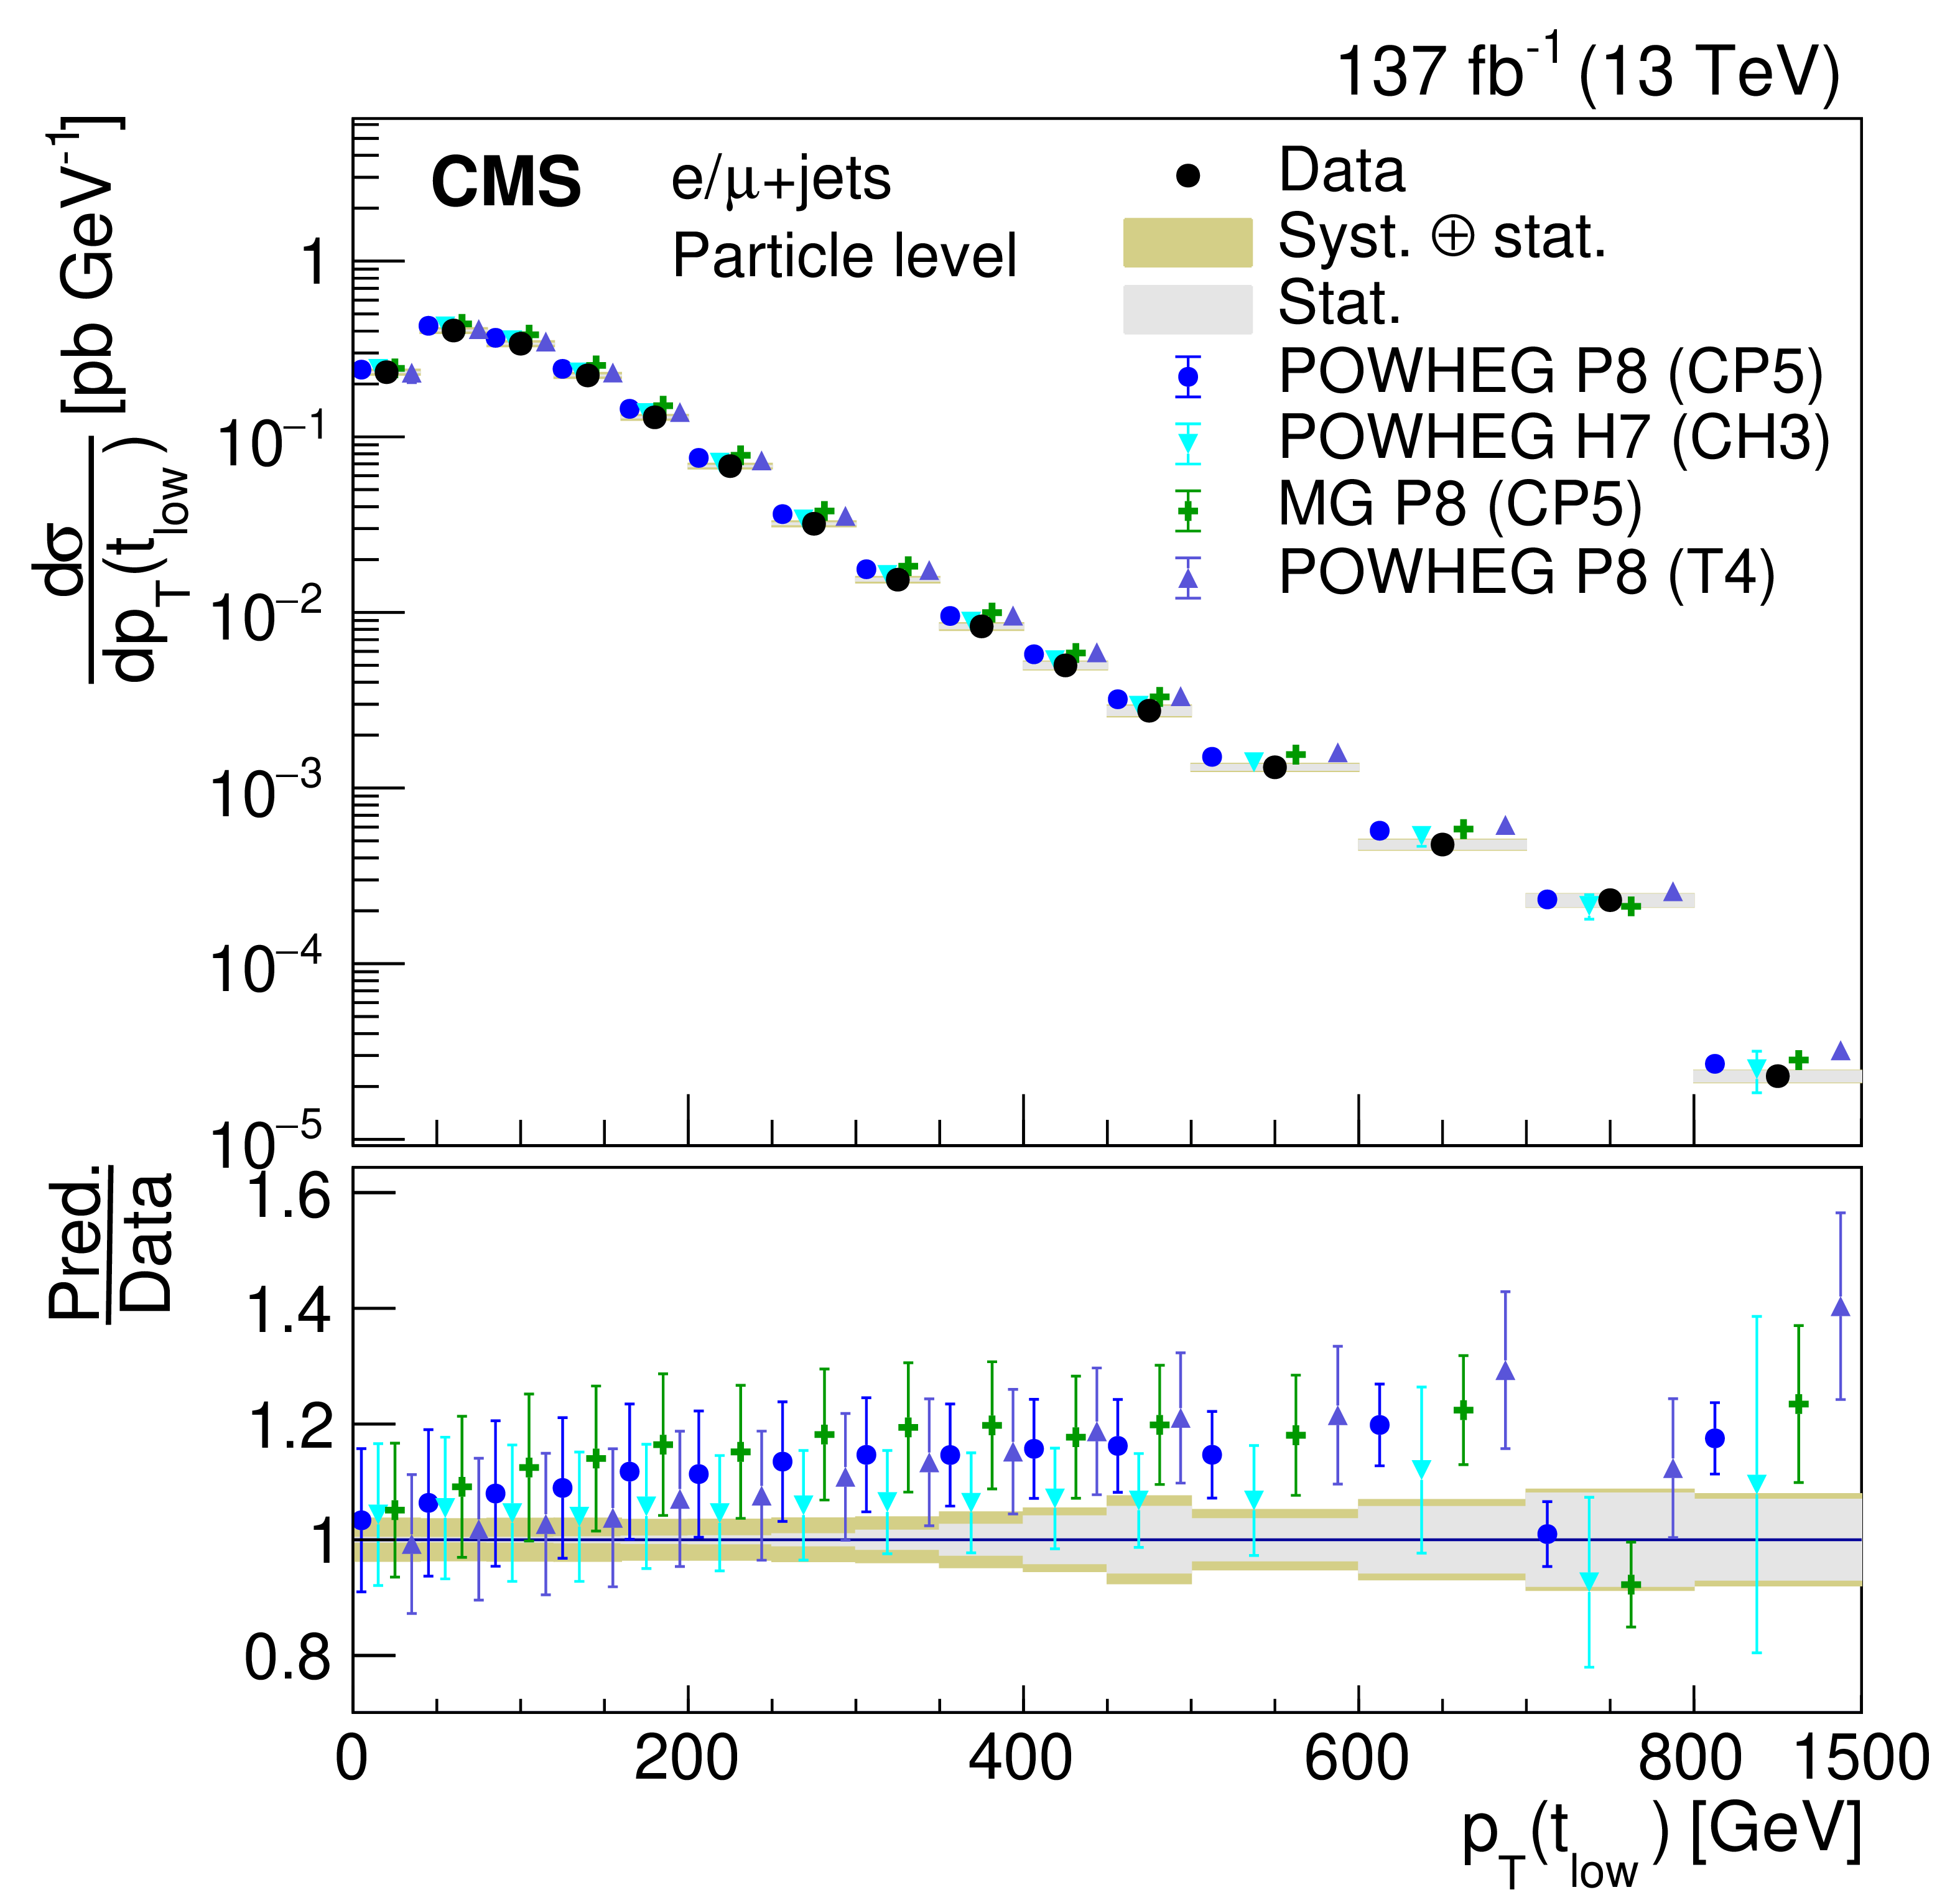
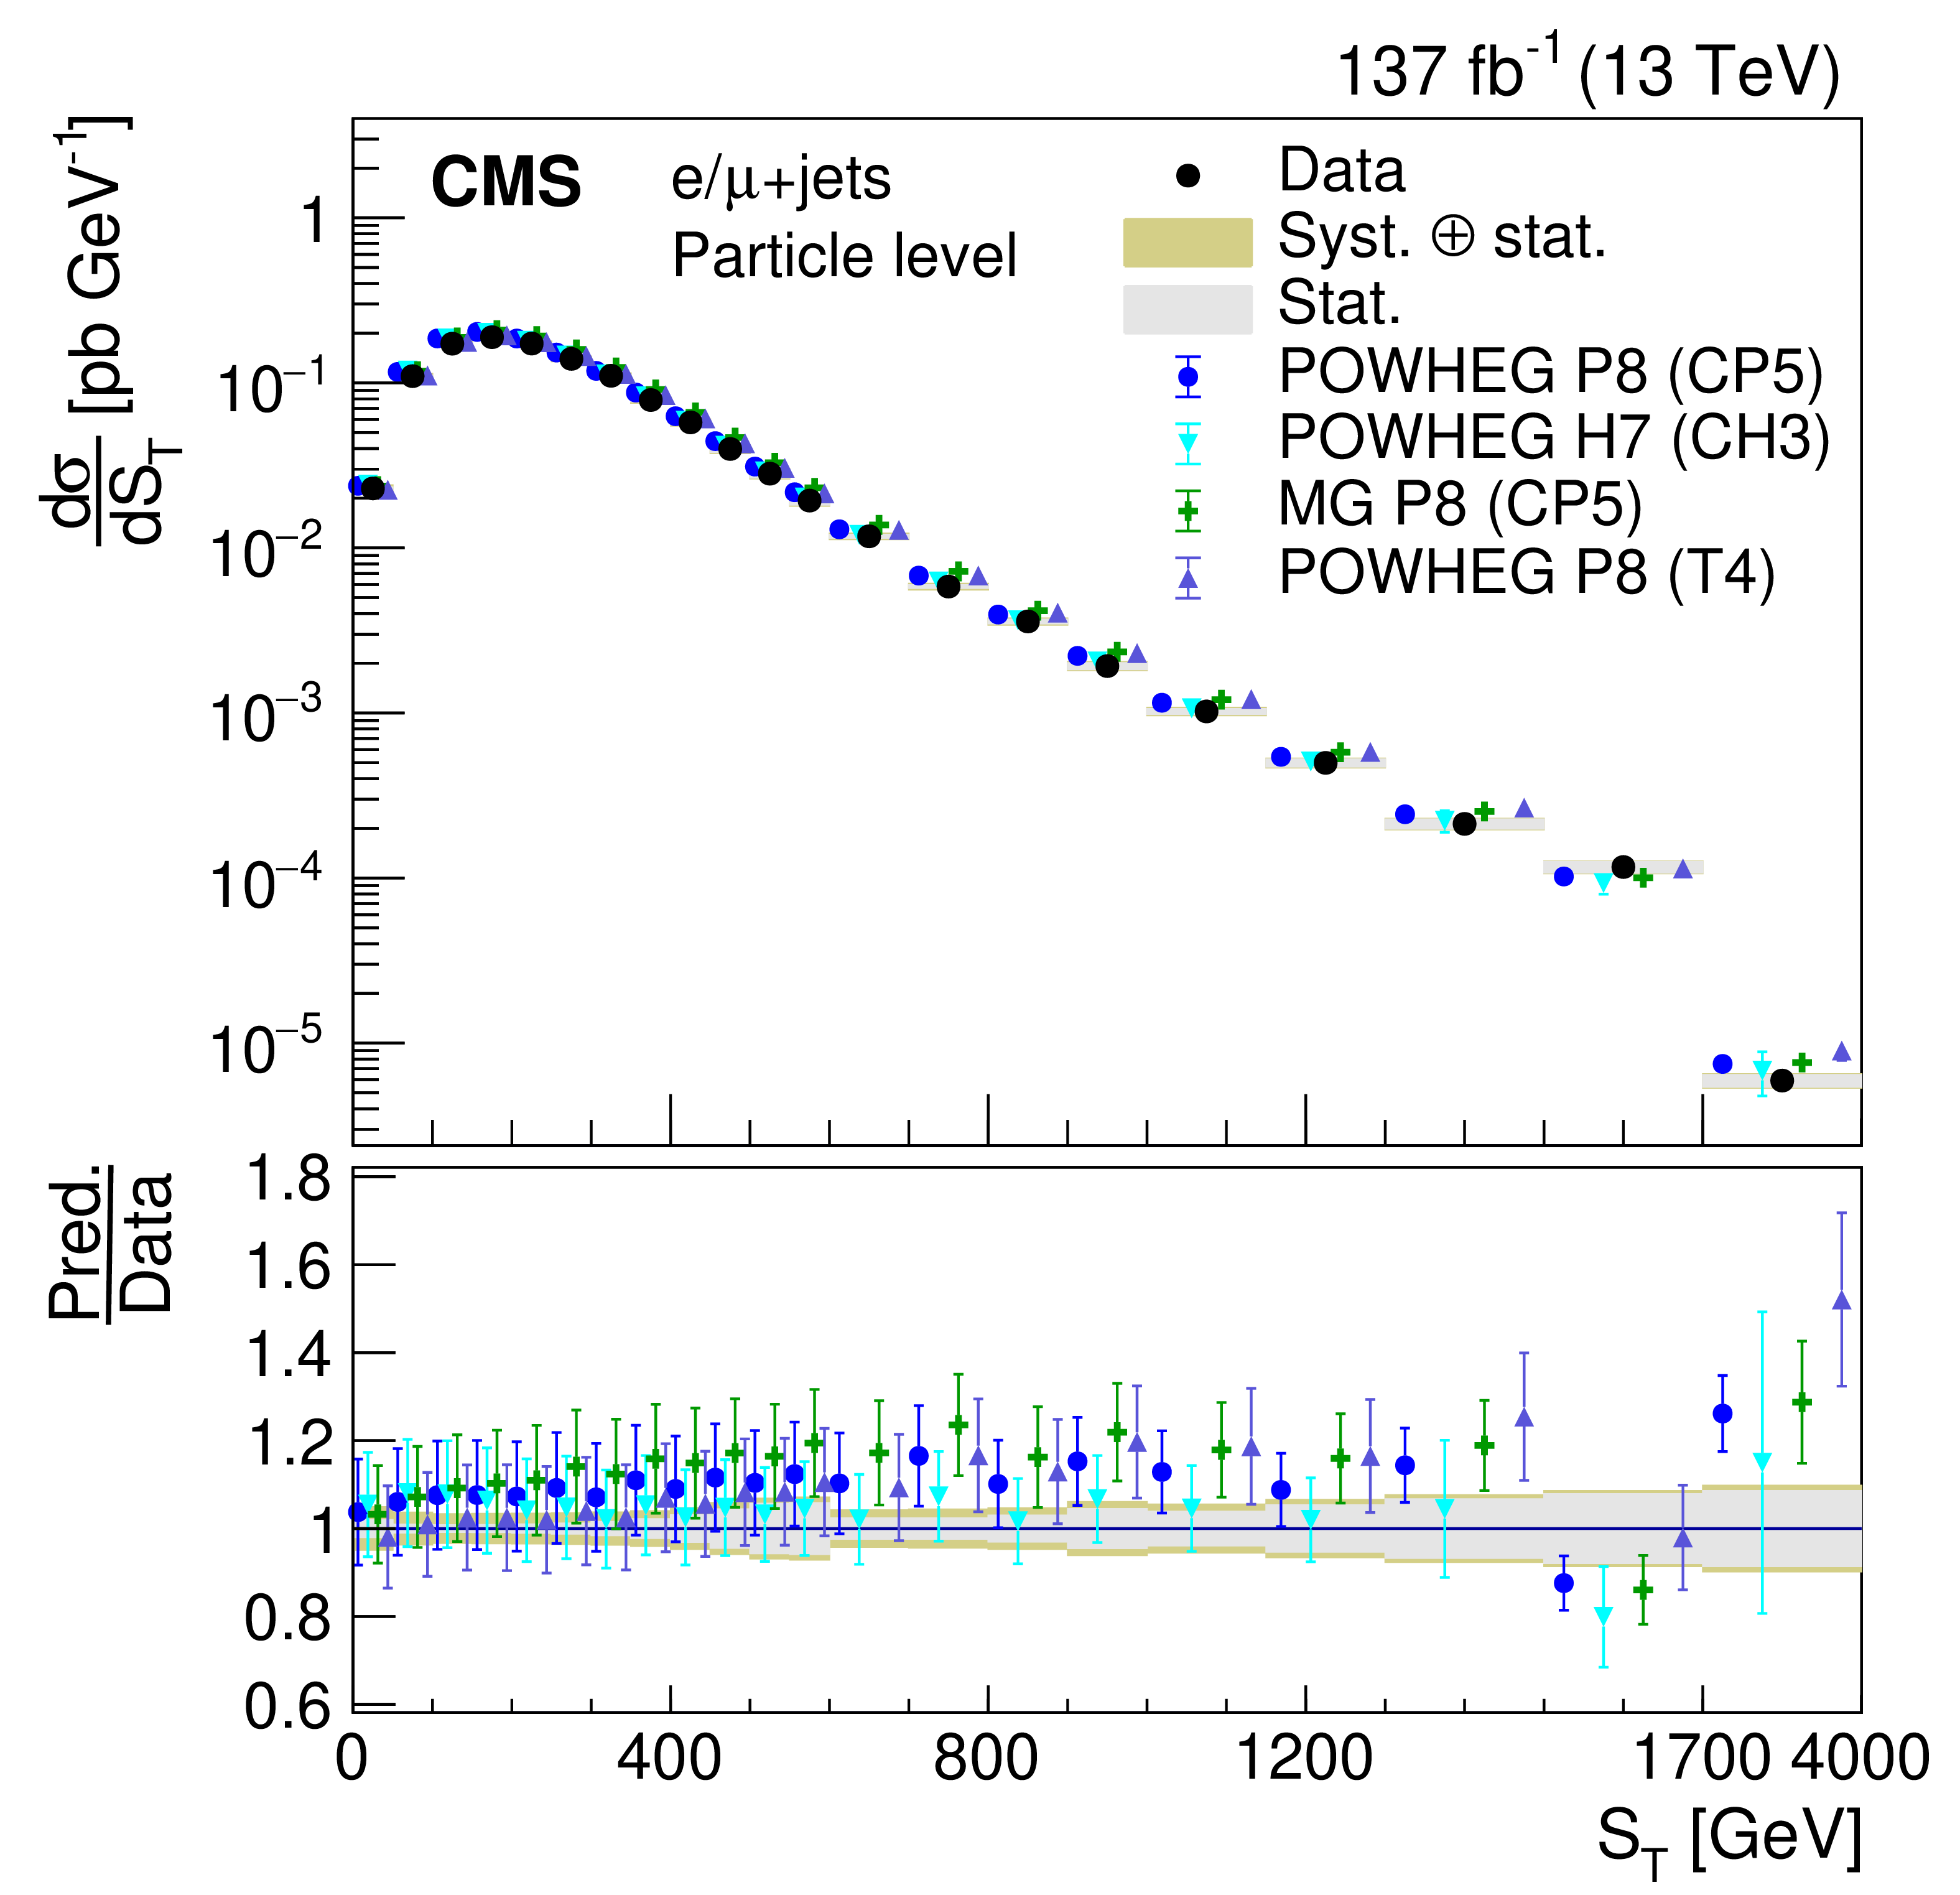
Differential cross sections at the particle level as a function of ${{p_{\mathrm {T}}} ({\mathrm{t} _\mathrm {h}})}$, ${{p_{\mathrm {T}}} ({\mathrm{t} _\ell})}$, ${{p_{\mathrm {T}}} ({\mathrm{t} _\text {high}})}$, ${{p_{\mathrm {T}}} ({\mathrm{t} _\text {low}})}$, and ${S_\mathrm {T}}$. The data are shown as points with gray (yellow) bands indicating the statistical (statistical and systematic) uncertainties. The cross sections are compared to the predictions of POWHEG+PYTHIA (P8) for the CP5 and CUETP8M2T4 (T4) tunes, POWHEG+HERWIG (H7), and the multiparton simulation MG5_aMC@NLO (MG)+PYTHIA. The ratios of the various predictions to the measured cross sections are shown in the lower panels. |
png pdf |
Figure 16-a:
Differential cross sections at the particle level as a function of ${{p_{\mathrm {T}}} ({\mathrm{t} _\mathrm {h}})}$, ${{p_{\mathrm {T}}} ({\mathrm{t} _\ell})}$, ${{p_{\mathrm {T}}} ({\mathrm{t} _\text {high}})}$, ${{p_{\mathrm {T}}} ({\mathrm{t} _\text {low}})}$, and ${S_\mathrm {T}}$. The data are shown as points with gray (yellow) bands indicating the statistical (statistical and systematic) uncertainties. The cross sections are compared to the predictions of POWHEG+PYTHIA (P8) for the CP5 and CUETP8M2T4 (T4) tunes, POWHEG+HERWIG (H7), and the multiparton simulation MG5_aMC@NLO (MG)+PYTHIA. The ratios of the various predictions to the measured cross sections are shown in the lower panels. |
png pdf |
Figure 16-b:
Differential cross sections at the particle level as a function of ${{p_{\mathrm {T}}} ({\mathrm{t} _\mathrm {h}})}$, ${{p_{\mathrm {T}}} ({\mathrm{t} _\ell})}$, ${{p_{\mathrm {T}}} ({\mathrm{t} _\text {high}})}$, ${{p_{\mathrm {T}}} ({\mathrm{t} _\text {low}})}$, and ${S_\mathrm {T}}$. The data are shown as points with gray (yellow) bands indicating the statistical (statistical and systematic) uncertainties. The cross sections are compared to the predictions of POWHEG+PYTHIA (P8) for the CP5 and CUETP8M2T4 (T4) tunes, POWHEG+HERWIG (H7), and the multiparton simulation MG5_aMC@NLO (MG)+PYTHIA. The ratios of the various predictions to the measured cross sections are shown in the lower panels. |
png pdf |
Figure 16-c:
Differential cross sections at the particle level as a function of ${{p_{\mathrm {T}}} ({\mathrm{t} _\mathrm {h}})}$, ${{p_{\mathrm {T}}} ({\mathrm{t} _\ell})}$, ${{p_{\mathrm {T}}} ({\mathrm{t} _\text {high}})}$, ${{p_{\mathrm {T}}} ({\mathrm{t} _\text {low}})}$, and ${S_\mathrm {T}}$. The data are shown as points with gray (yellow) bands indicating the statistical (statistical and systematic) uncertainties. The cross sections are compared to the predictions of POWHEG+PYTHIA (P8) for the CP5 and CUETP8M2T4 (T4) tunes, POWHEG+HERWIG (H7), and the multiparton simulation MG5_aMC@NLO (MG)+PYTHIA. The ratios of the various predictions to the measured cross sections are shown in the lower panels. |
png pdf |
Figure 16-d:
Differential cross sections at the particle level as a function of ${{p_{\mathrm {T}}} ({\mathrm{t} _\mathrm {h}})}$, ${{p_{\mathrm {T}}} ({\mathrm{t} _\ell})}$, ${{p_{\mathrm {T}}} ({\mathrm{t} _\text {high}})}$, ${{p_{\mathrm {T}}} ({\mathrm{t} _\text {low}})}$, and ${S_\mathrm {T}}$. The data are shown as points with gray (yellow) bands indicating the statistical (statistical and systematic) uncertainties. The cross sections are compared to the predictions of POWHEG+PYTHIA (P8) for the CP5 and CUETP8M2T4 (T4) tunes, POWHEG+HERWIG (H7), and the multiparton simulation MG5_aMC@NLO (MG)+PYTHIA. The ratios of the various predictions to the measured cross sections are shown in the lower panels. |
png pdf |
Figure 16-e:
Differential cross sections at the particle level as a function of ${{p_{\mathrm {T}}} ({\mathrm{t} _\mathrm {h}})}$, ${{p_{\mathrm {T}}} ({\mathrm{t} _\ell})}$, ${{p_{\mathrm {T}}} ({\mathrm{t} _\text {high}})}$, ${{p_{\mathrm {T}}} ({\mathrm{t} _\text {low}})}$, and ${S_\mathrm {T}}$. The data are shown as points with gray (yellow) bands indicating the statistical (statistical and systematic) uncertainties. The cross sections are compared to the predictions of POWHEG+PYTHIA (P8) for the CP5 and CUETP8M2T4 (T4) tunes, POWHEG+HERWIG (H7), and the multiparton simulation MG5_aMC@NLO (MG)+PYTHIA. The ratios of the various predictions to the measured cross sections are shown in the lower panels. |
png pdf |
Figure 17:
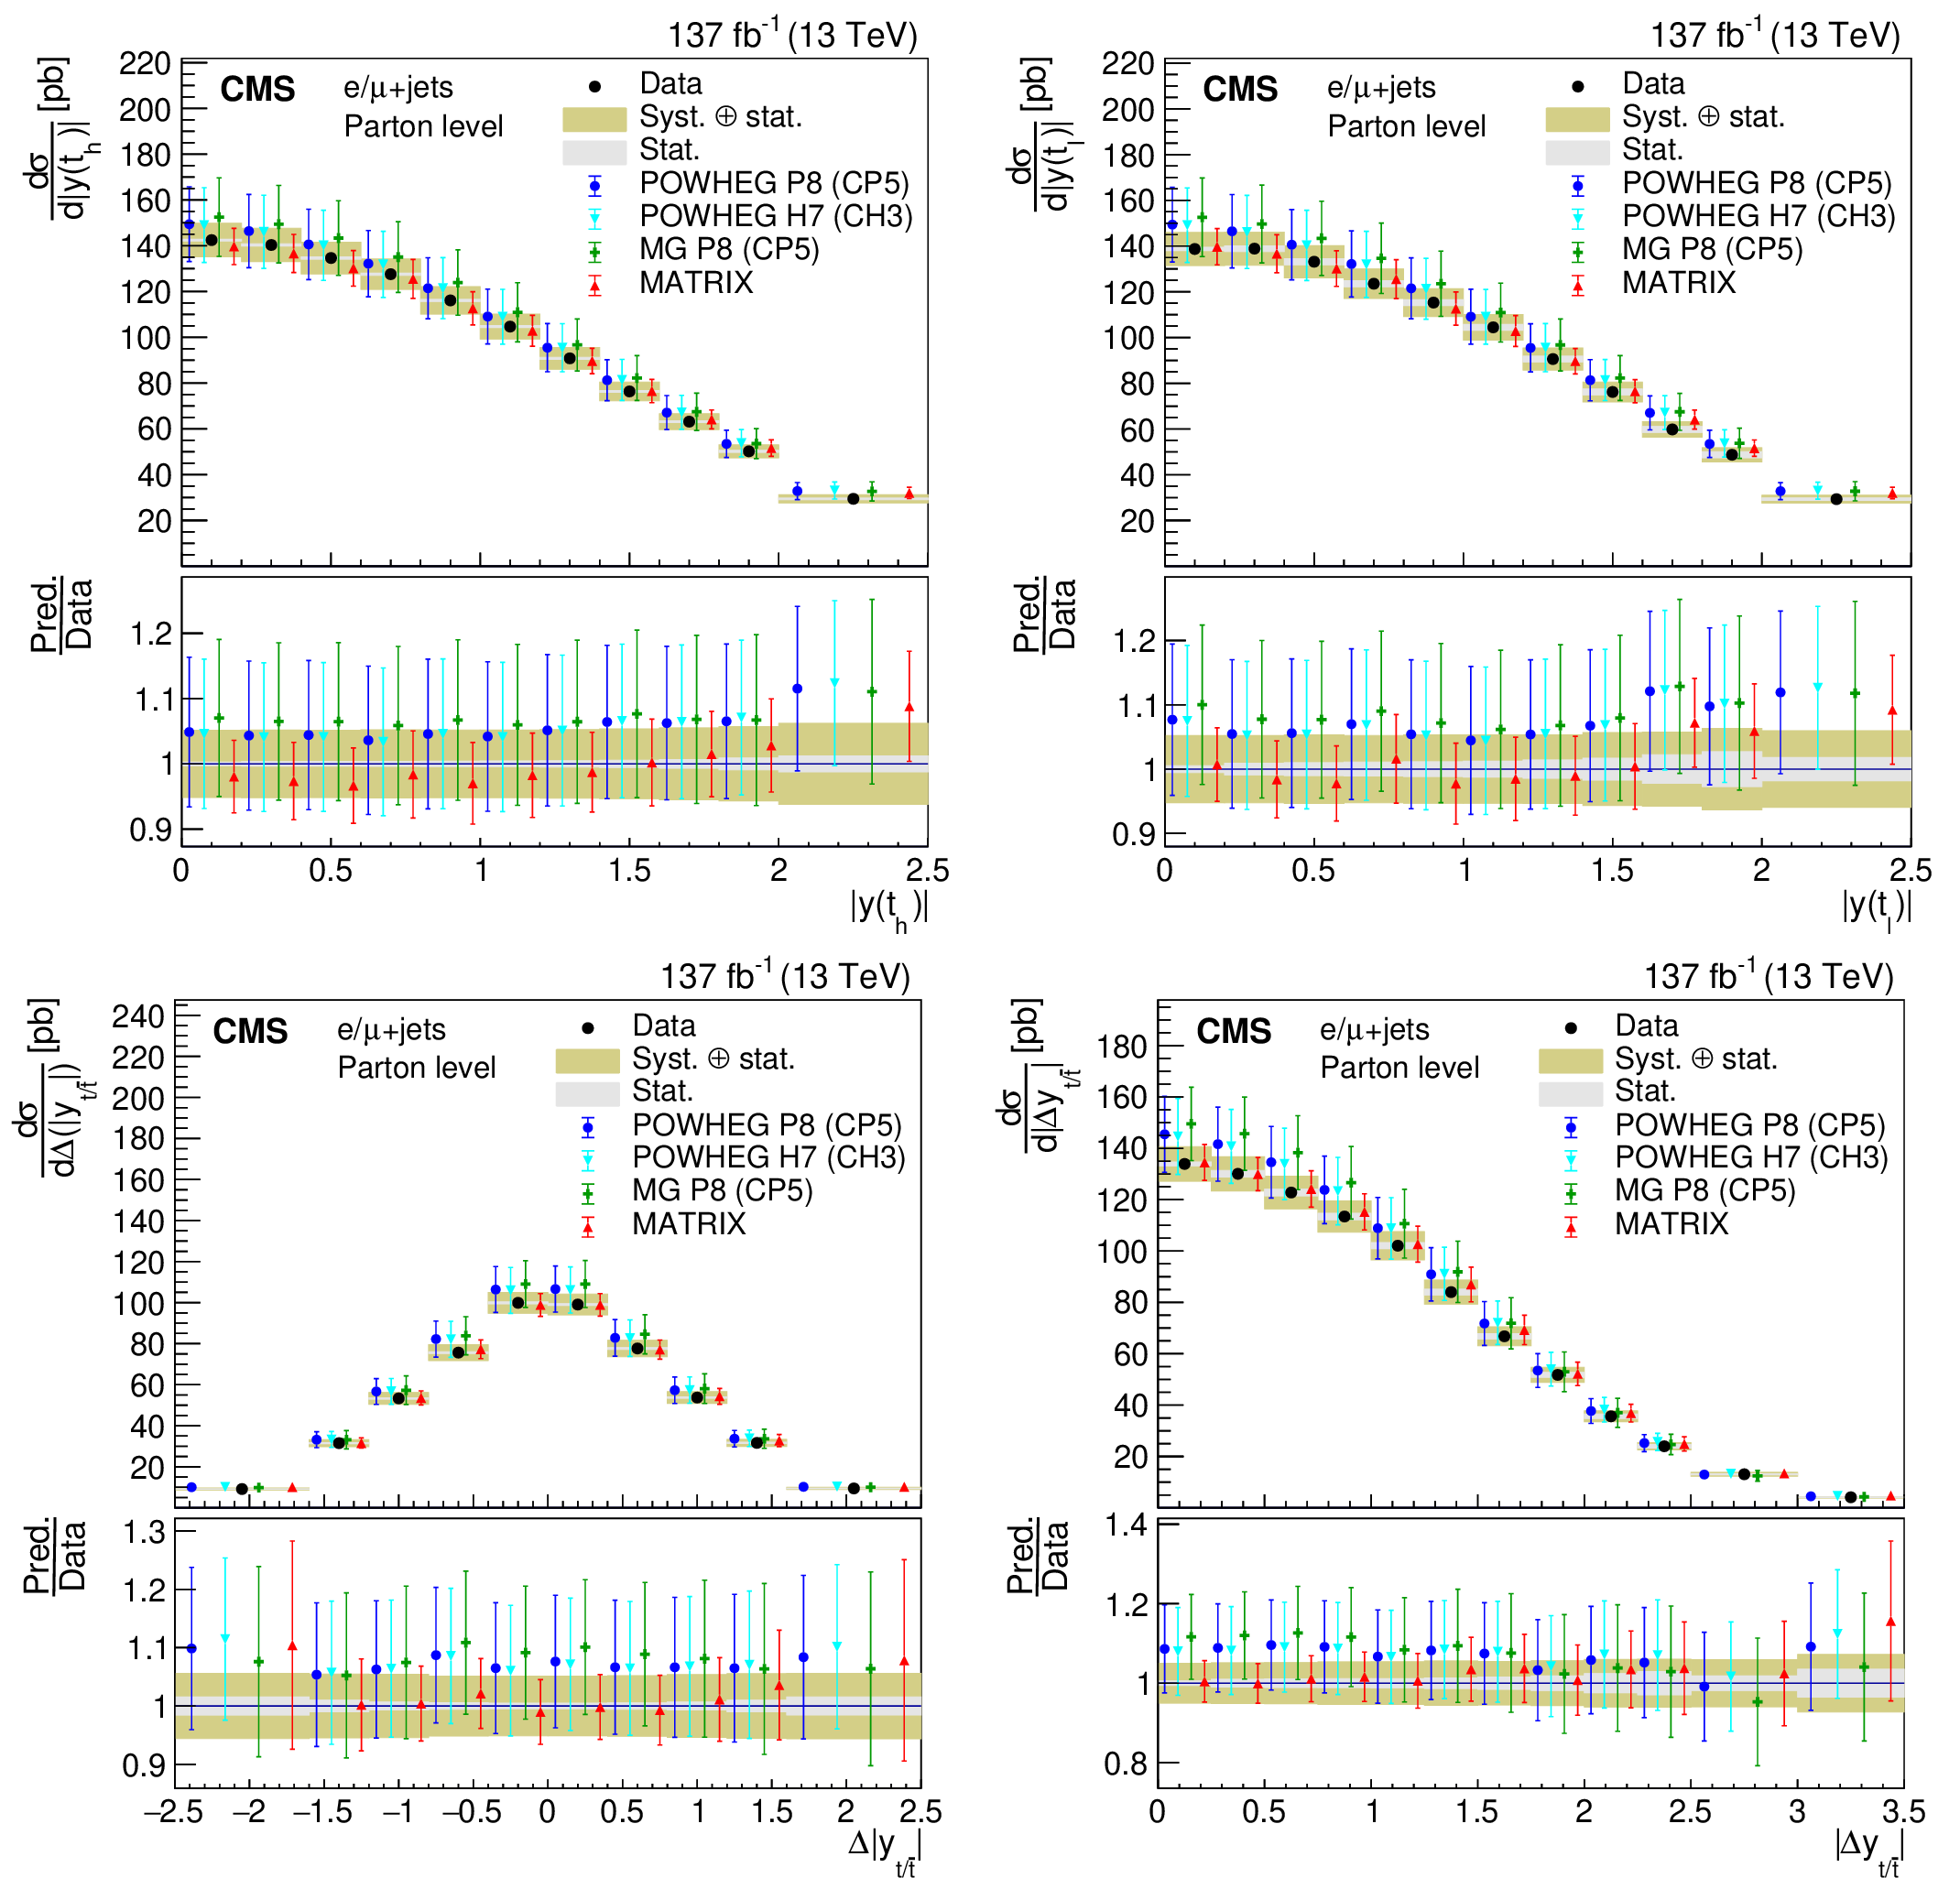
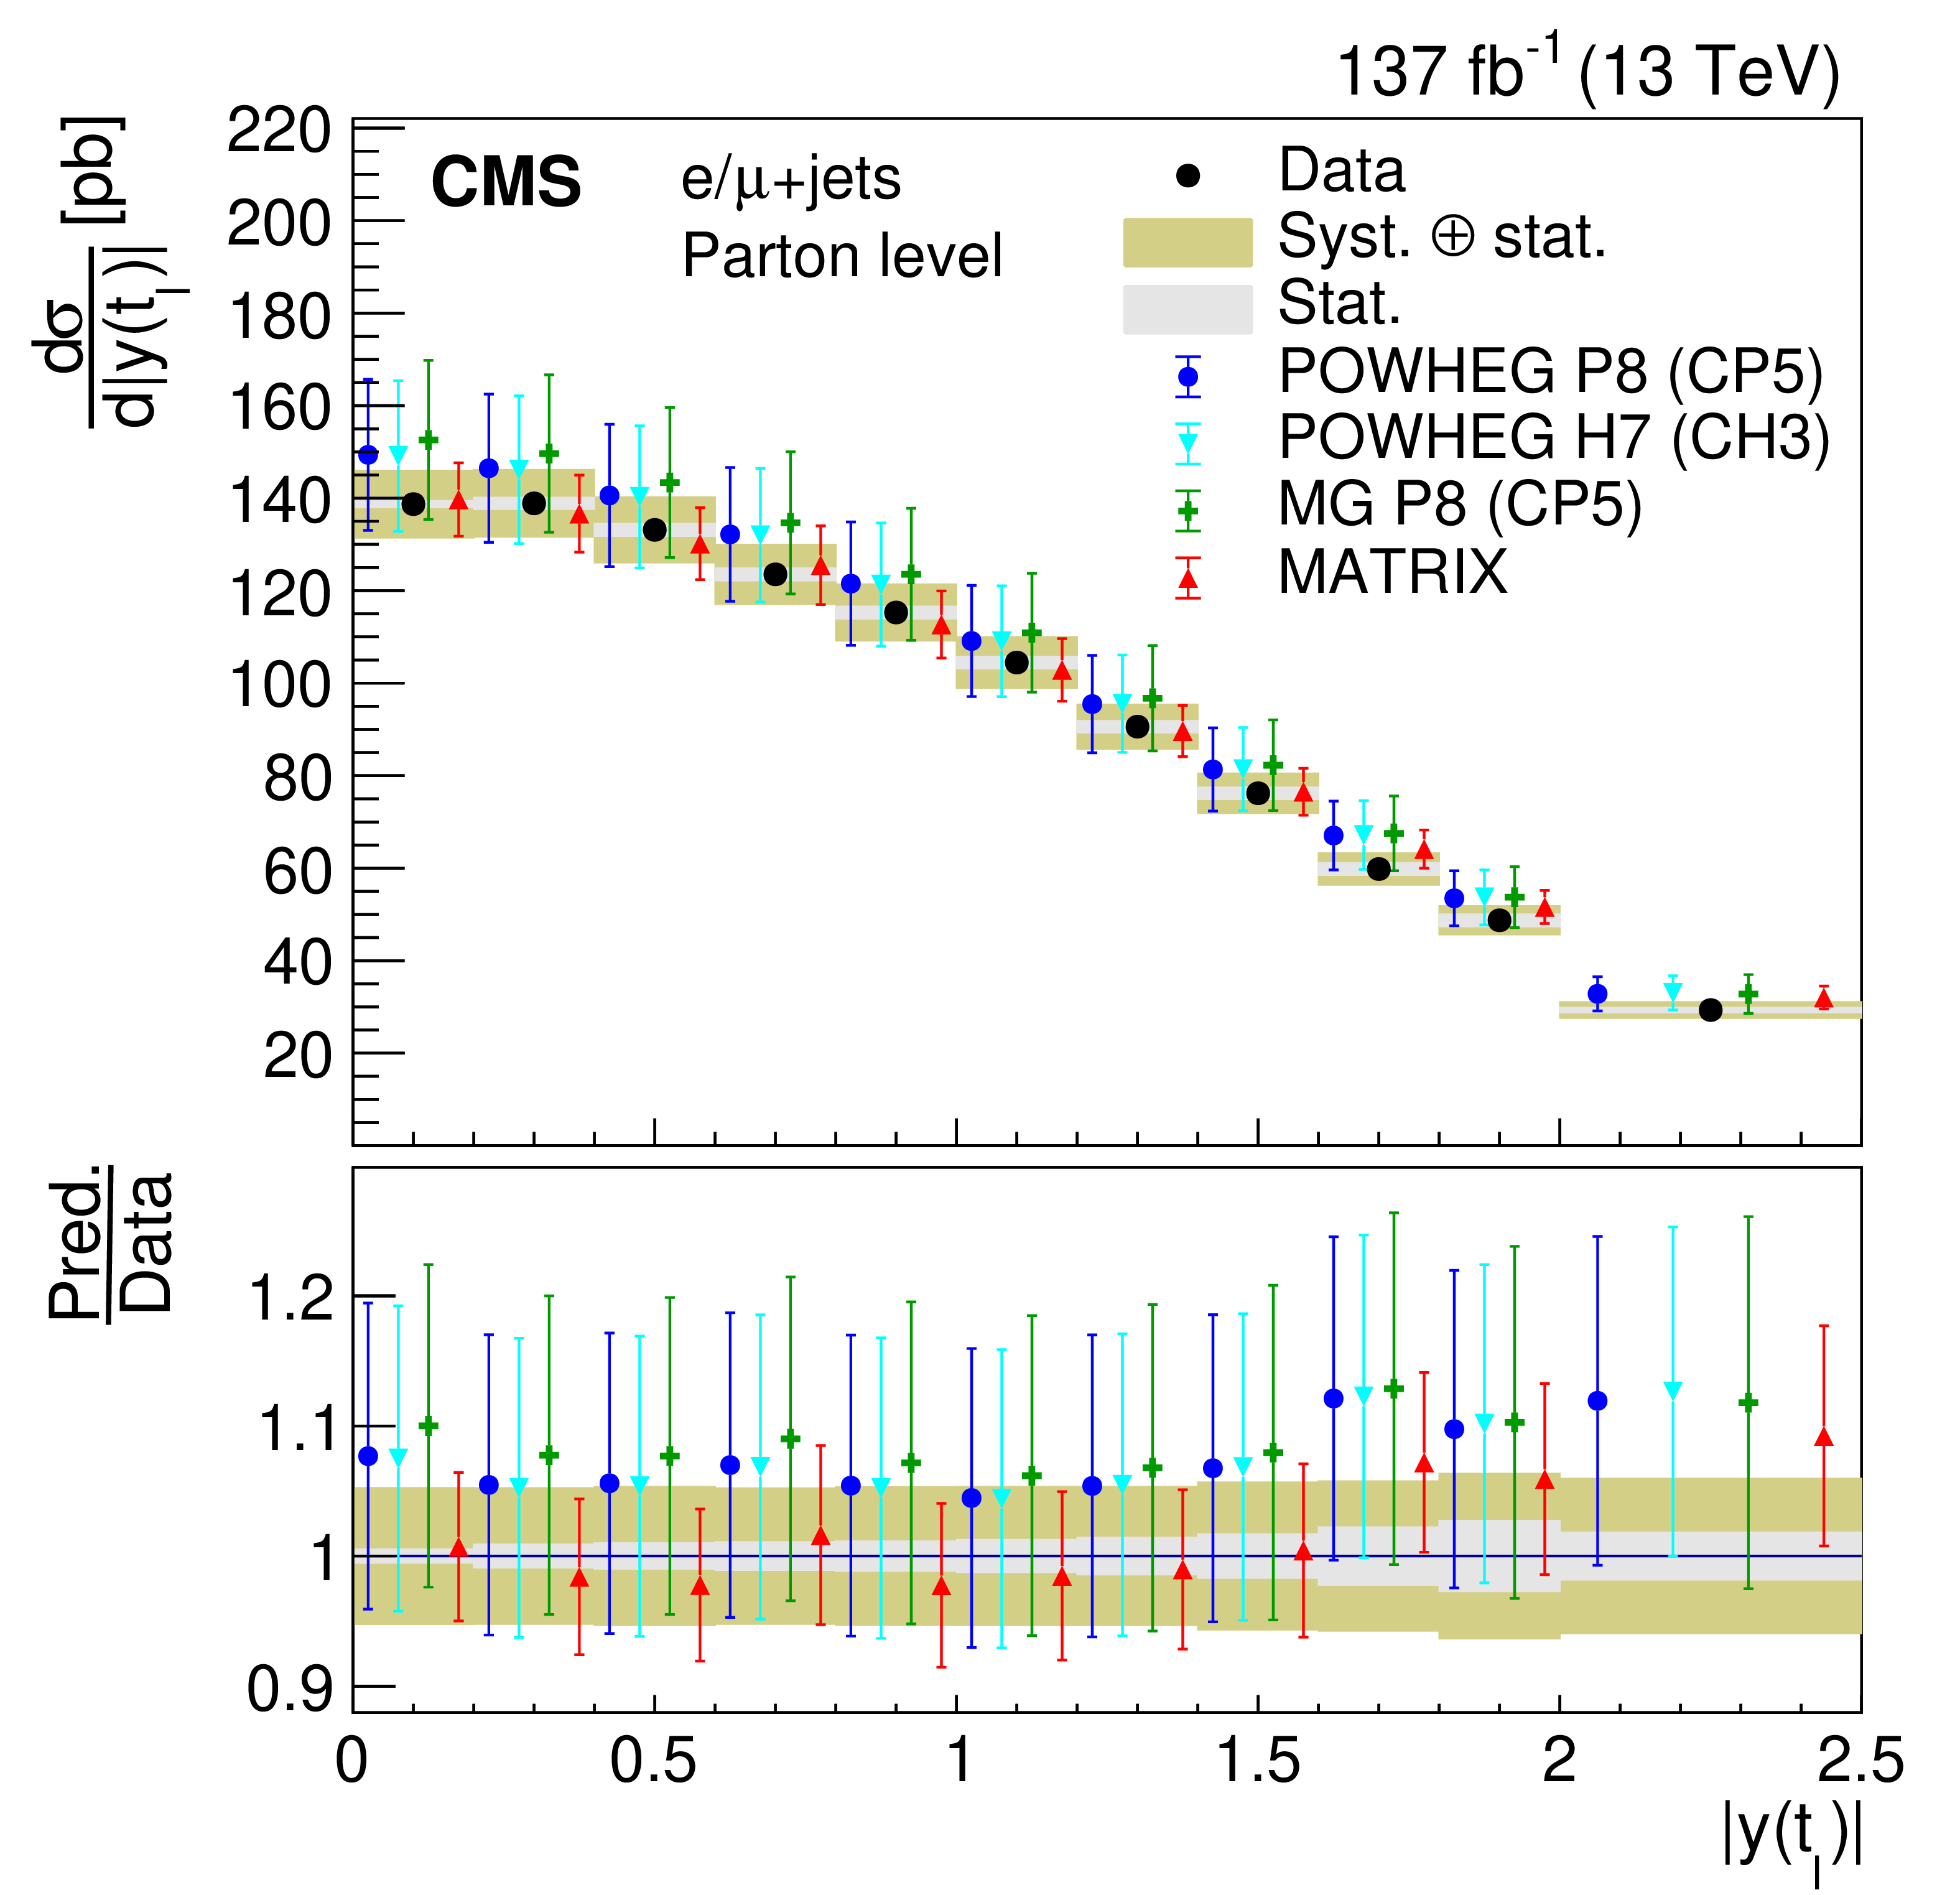
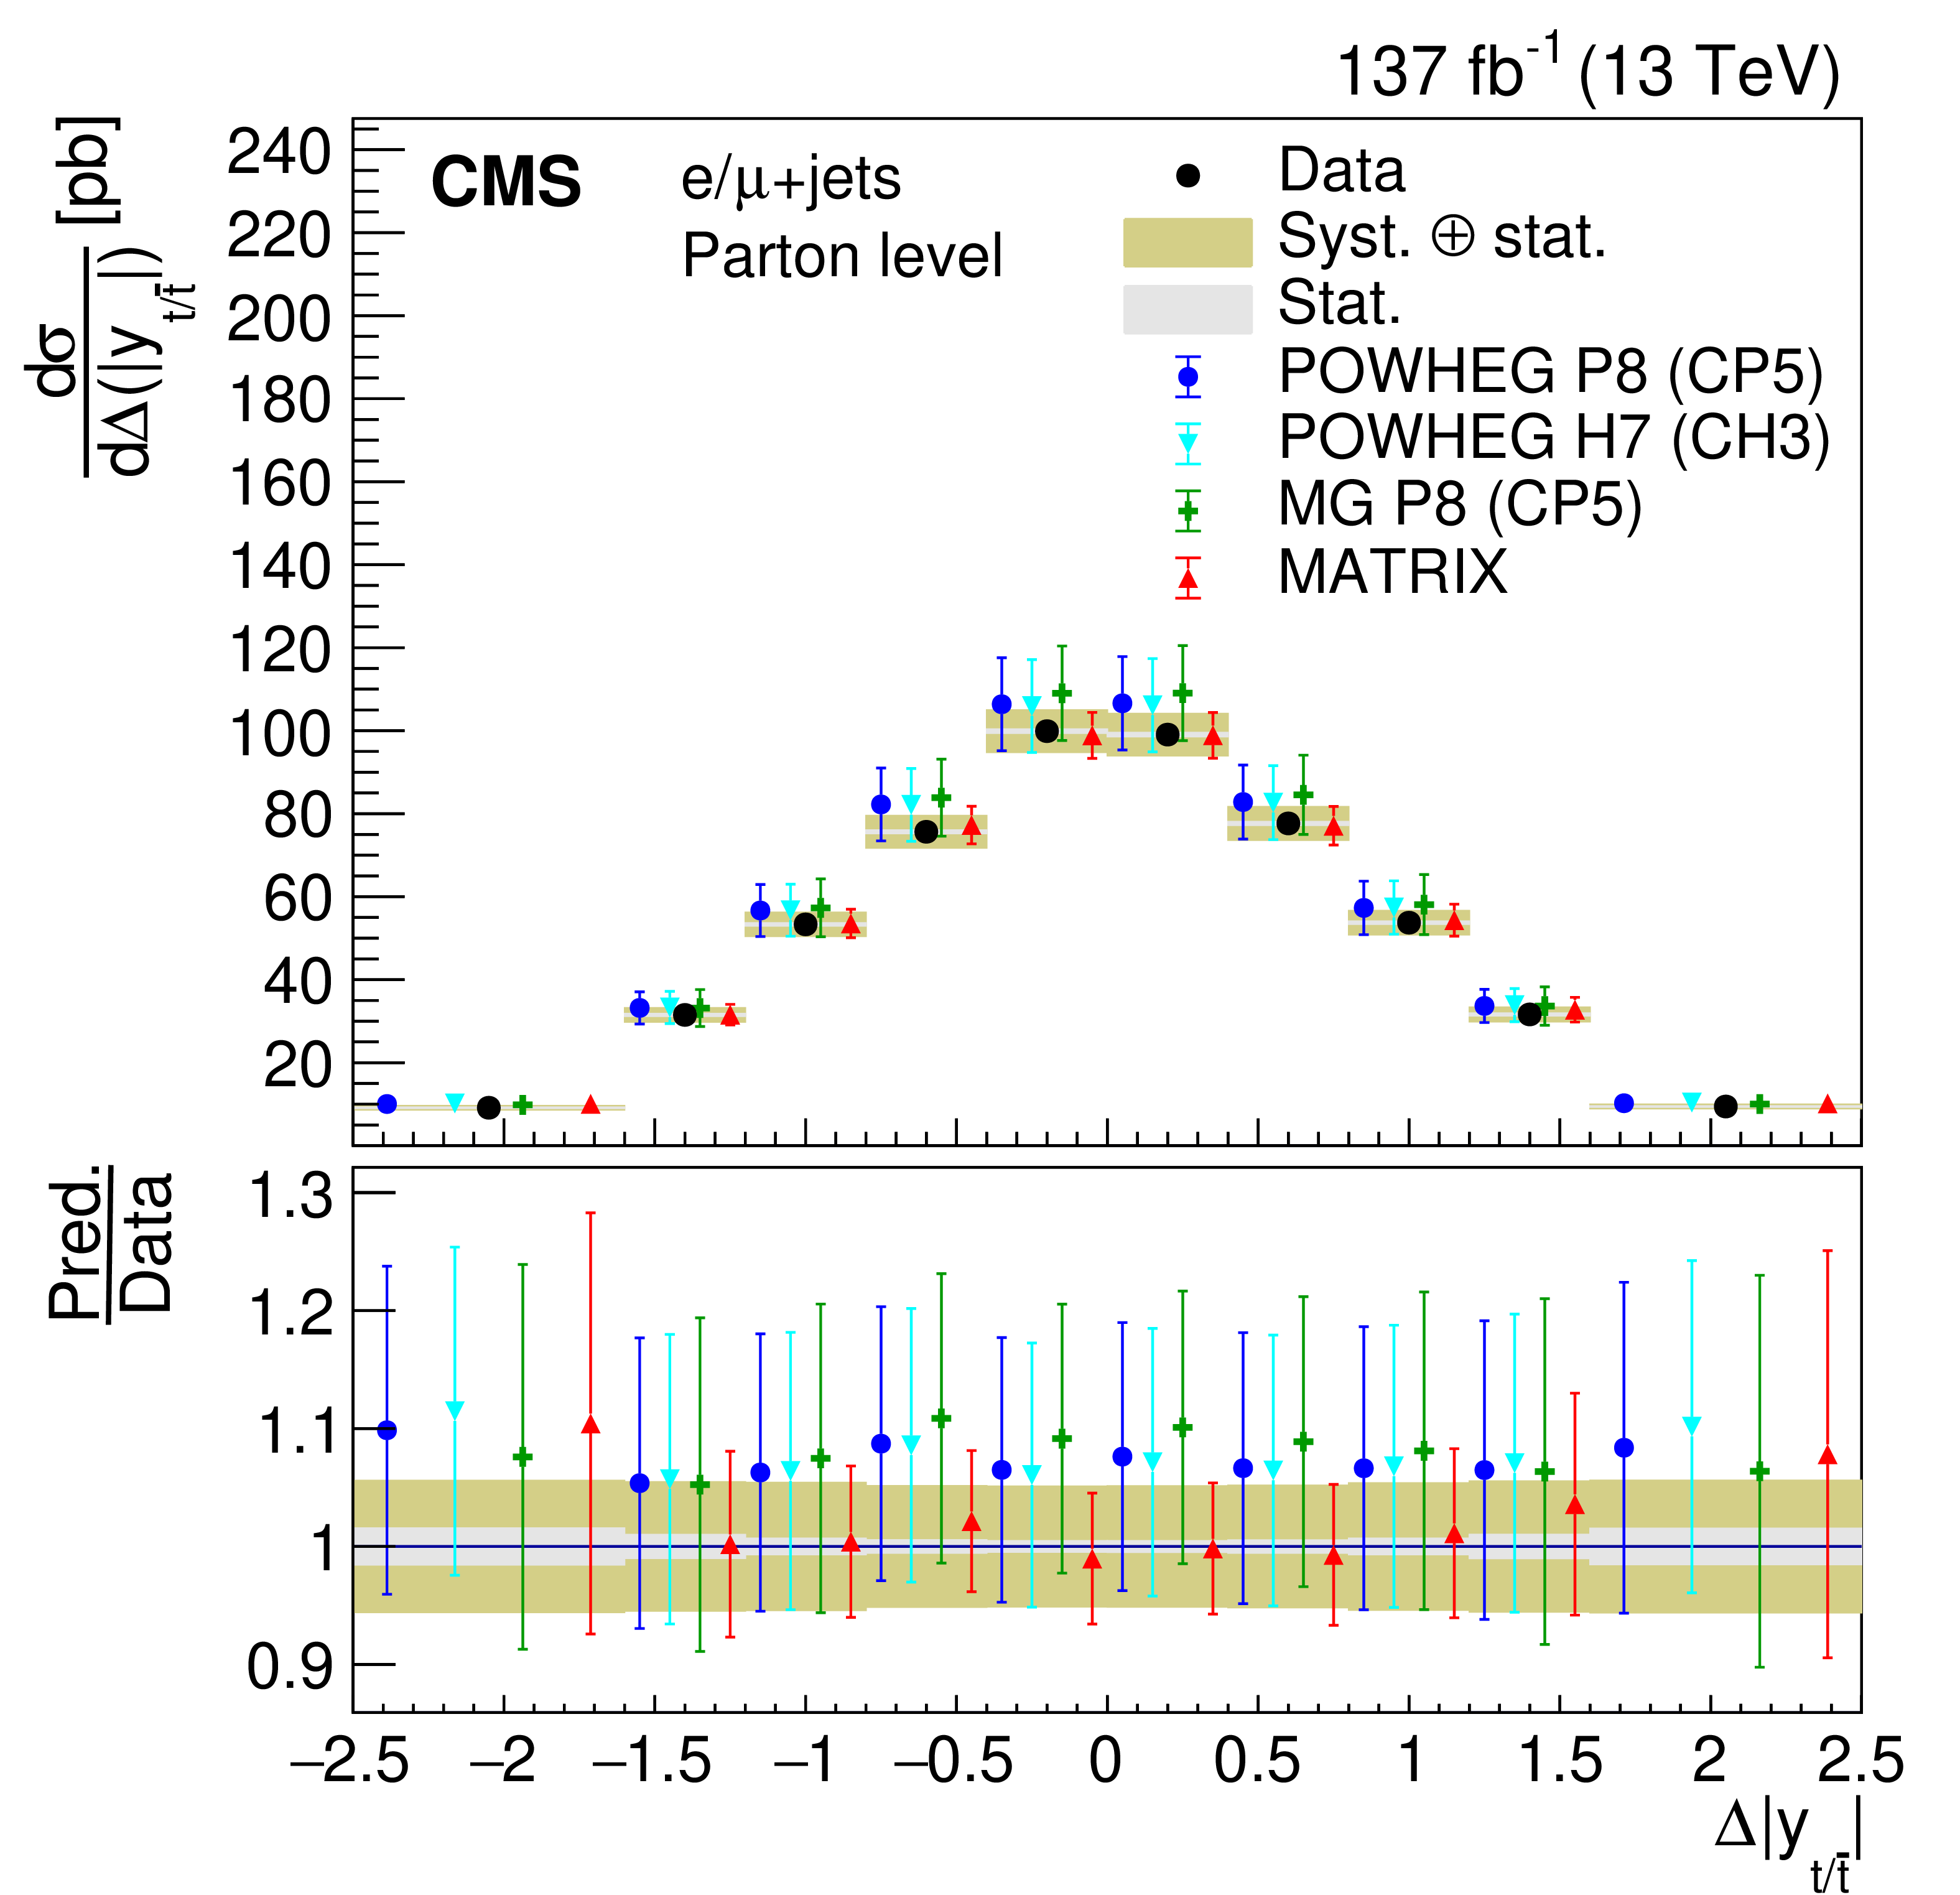
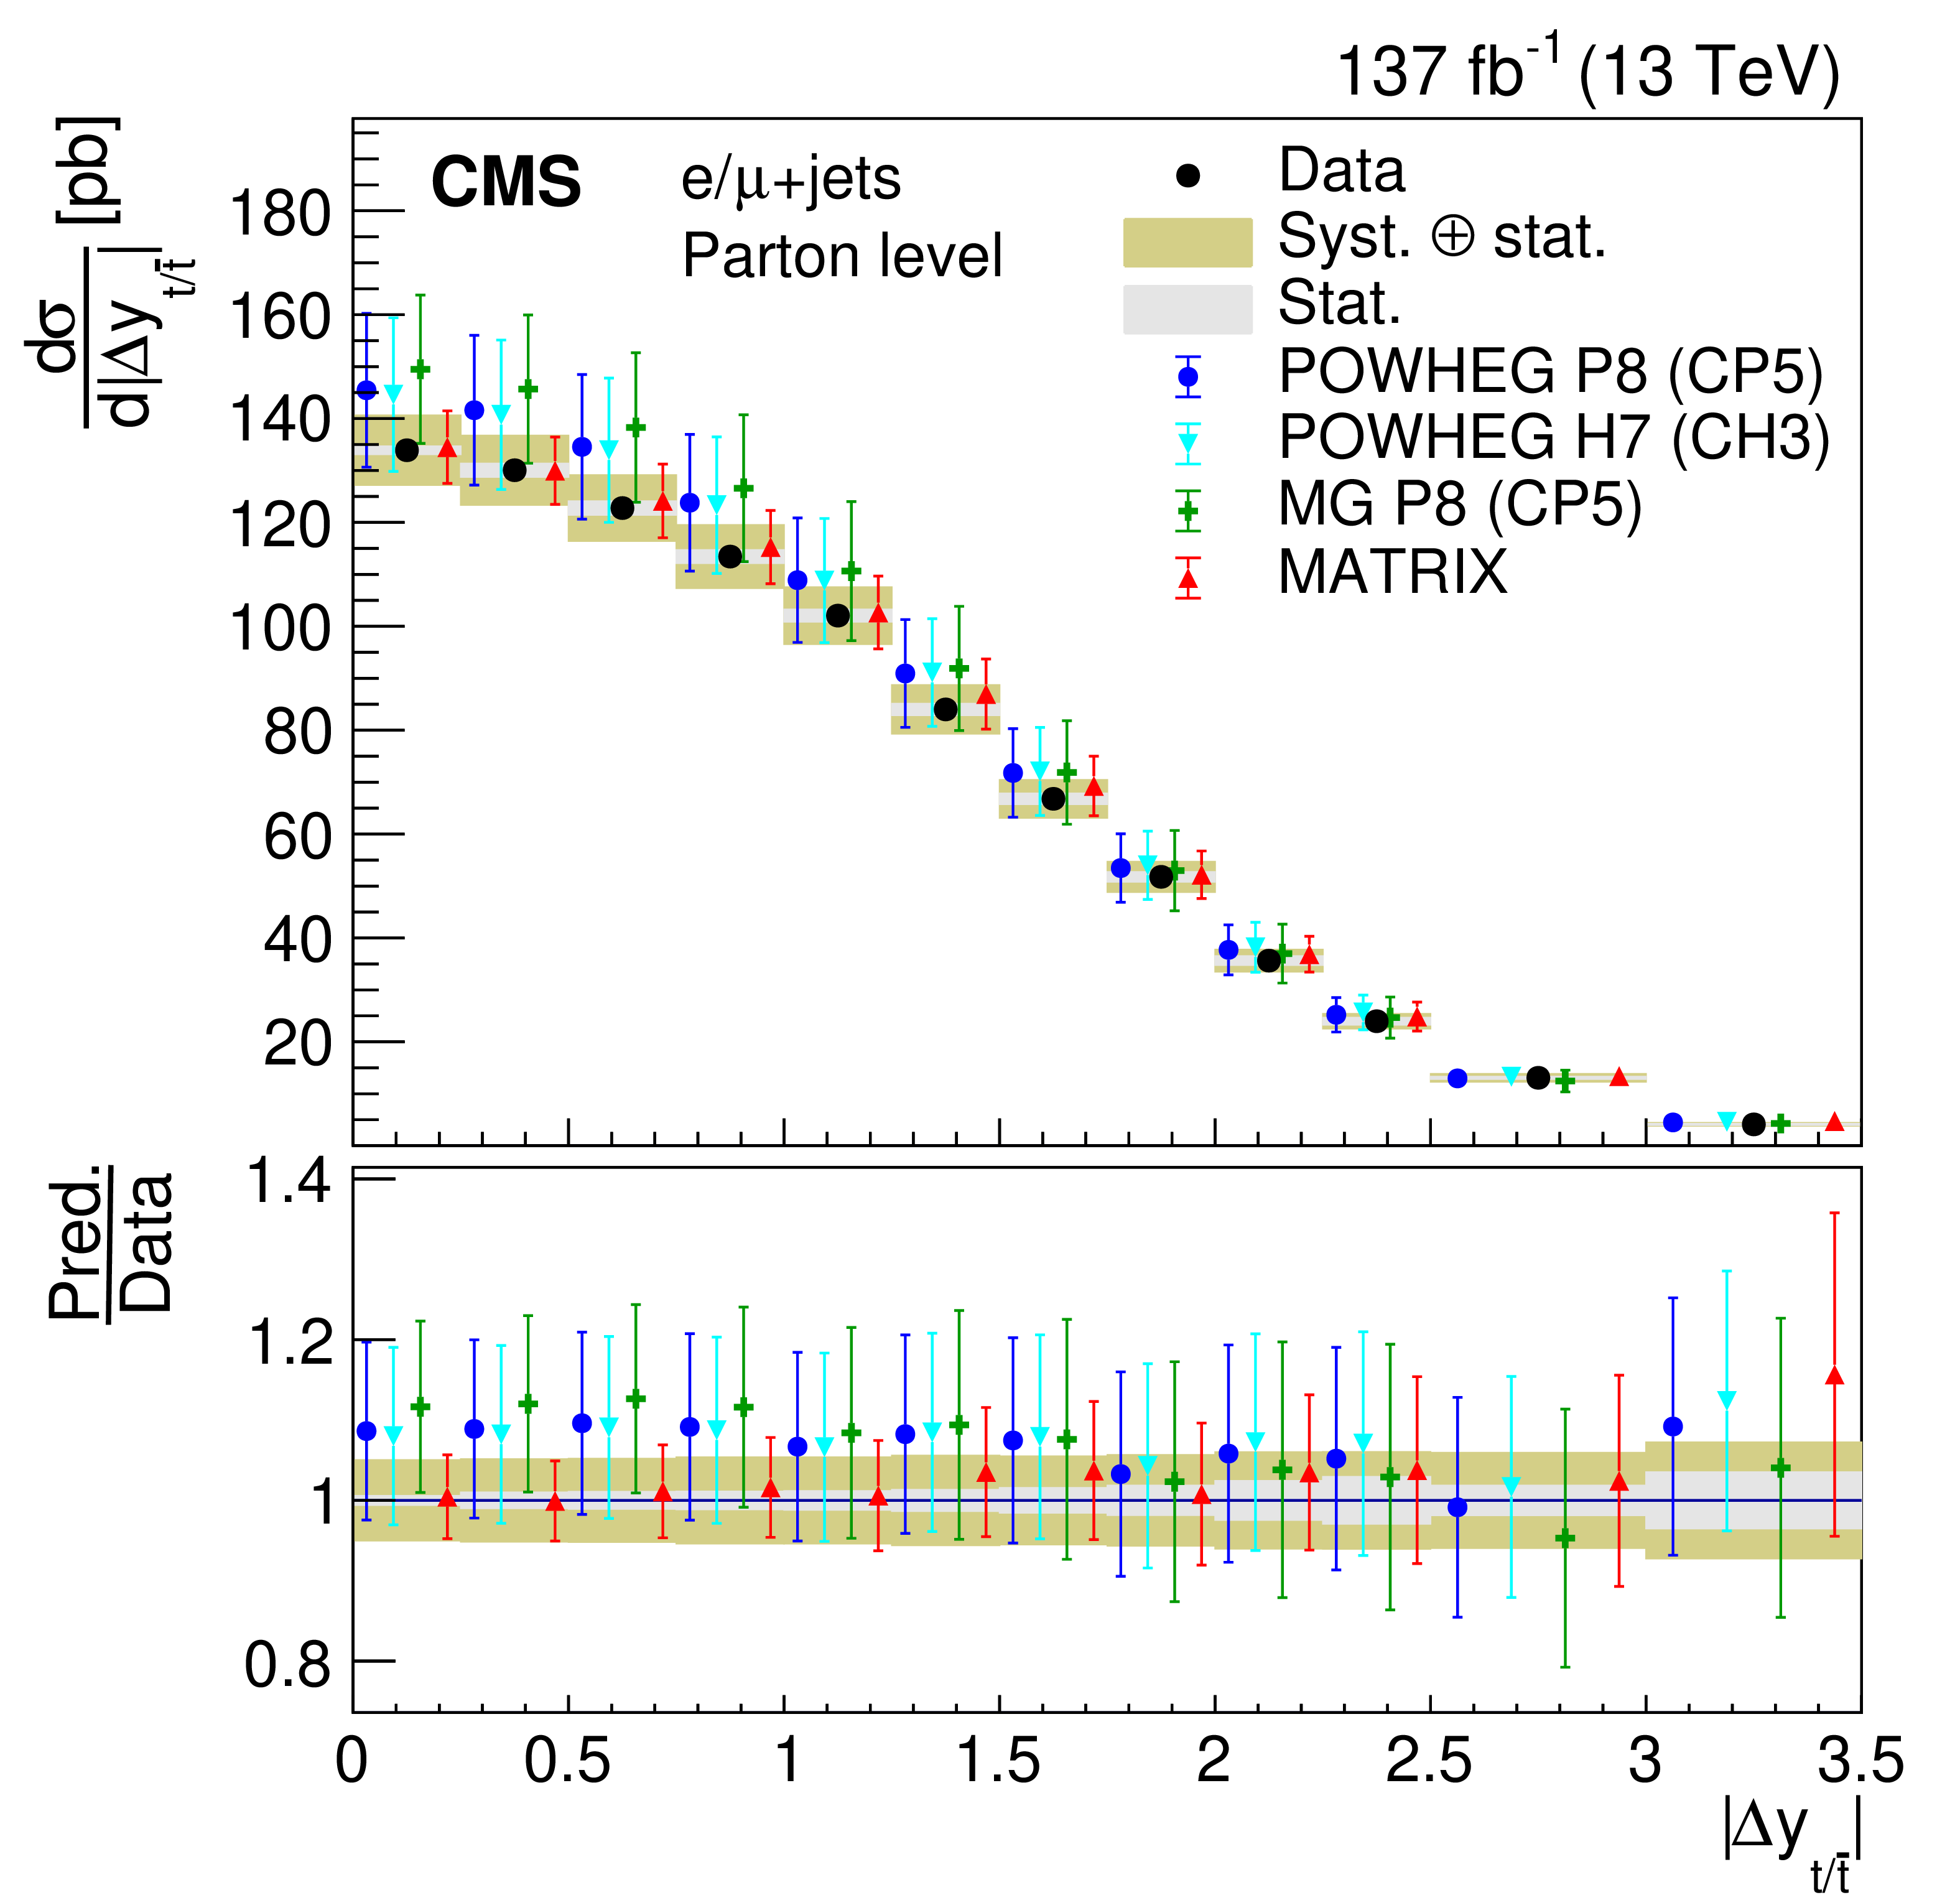
Differential cross sections at the parton level as a function of ${{| y({\mathrm{t} _\mathrm {h}}) |}}$, ${{| y({\mathrm{t} _\ell}) |}}$, and the differences ${\Delta {| y_{\mathrm{t} /\mathrm{\bar{t}}} |}}$ and ${{| \Delta y_{\mathrm{t} /\mathrm{\bar{t}}} |}}$. The data are shown as points with gray (yellow) bands indicating the statistical (statistical and systematic) uncertainties. The cross sections are compared to the predictions of POWHEG combined with PYTHIA (P8) or HERWIG (H7), the multiparton simulation MG5_aMC@NLO (MG)+PYTHIA FxFx, and the NNLO QCD calculations obtained with Matrix. The ratios of the various predictions to the measured cross sections are shown in the lower panels. |
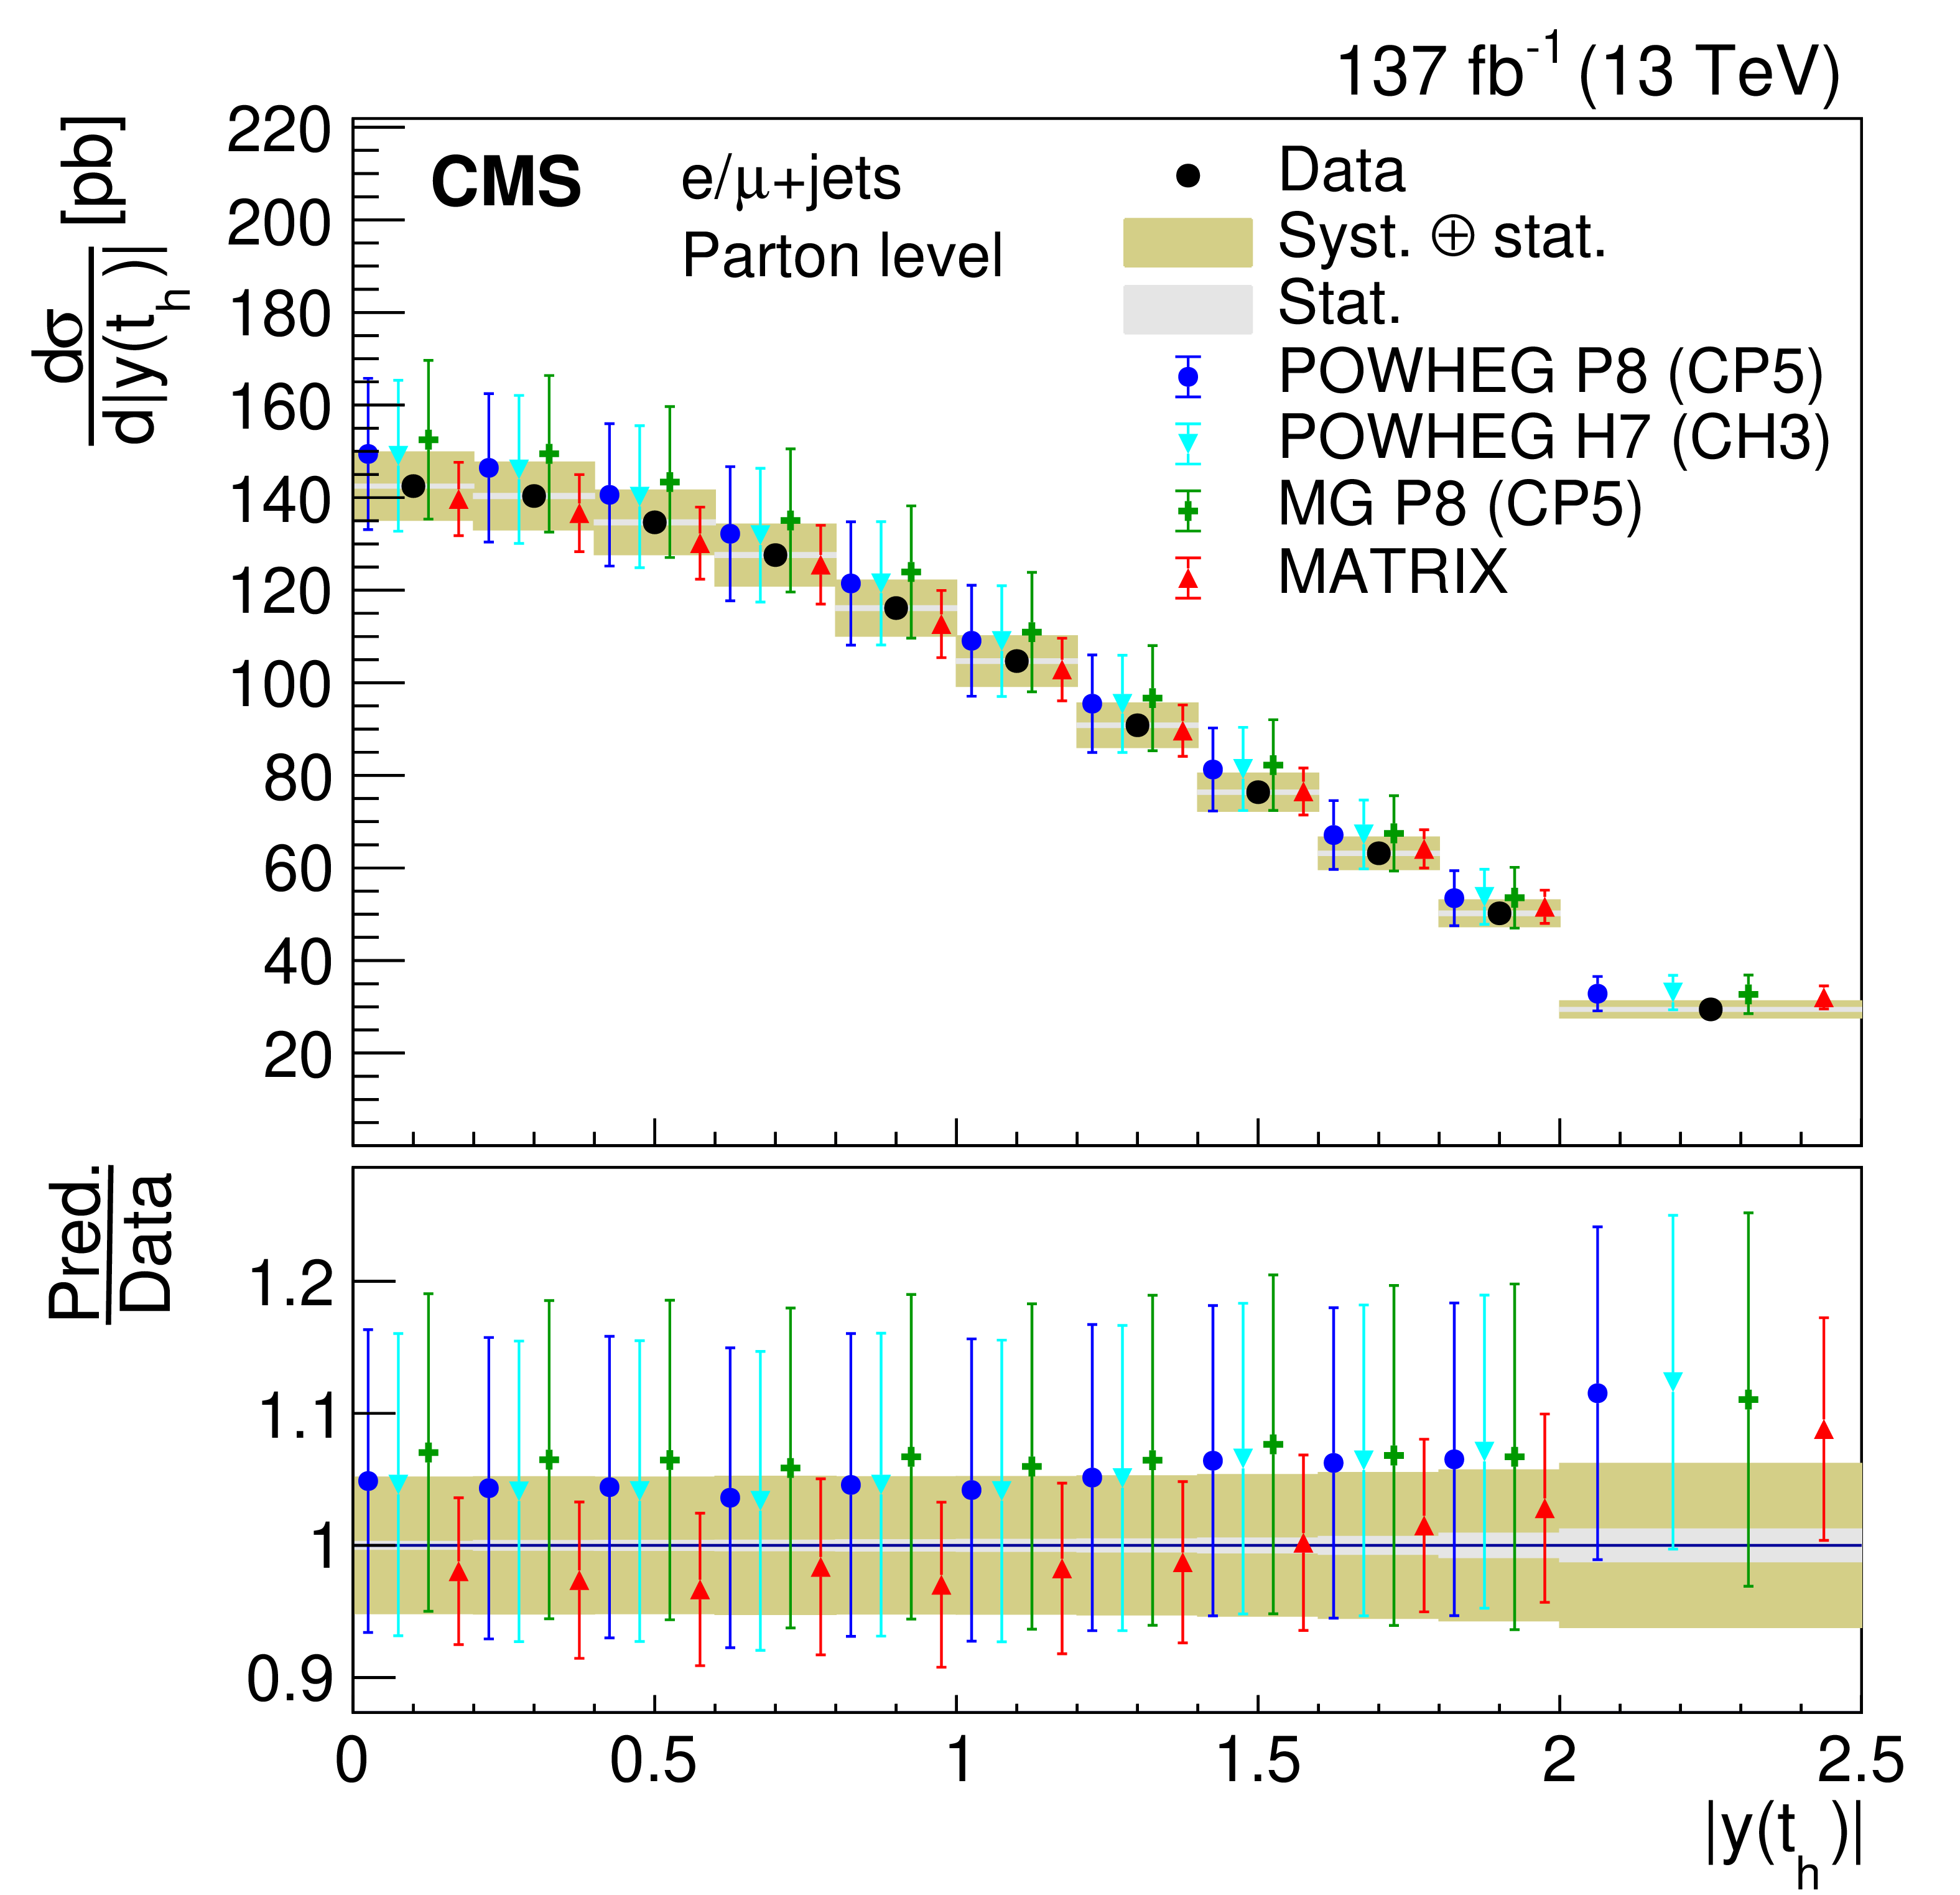
png pdf |
Figure 17-a:
Differential cross sections at the parton level as a function of ${{| y({\mathrm{t} _\mathrm {h}}) |}}$, ${{| y({\mathrm{t} _\ell}) |}}$, and the differences ${\Delta {| y_{\mathrm{t} /\mathrm{\bar{t}}} |}}$ and ${{| \Delta y_{\mathrm{t} /\mathrm{\bar{t}}} |}}$. The data are shown as points with gray (yellow) bands indicating the statistical (statistical and systematic) uncertainties. The cross sections are compared to the predictions of POWHEG combined with PYTHIA (P8) or HERWIG (H7), the multiparton simulation MG5_aMC@NLO (MG)+PYTHIA FxFx, and the NNLO QCD calculations obtained with Matrix. The ratios of the various predictions to the measured cross sections are shown in the lower panels. |
png pdf |
Figure 17-b:
Differential cross sections at the parton level as a function of ${{| y({\mathrm{t} _\mathrm {h}}) |}}$, ${{| y({\mathrm{t} _\ell}) |}}$, and the differences ${\Delta {| y_{\mathrm{t} /\mathrm{\bar{t}}} |}}$ and ${{| \Delta y_{\mathrm{t} /\mathrm{\bar{t}}} |}}$. The data are shown as points with gray (yellow) bands indicating the statistical (statistical and systematic) uncertainties. The cross sections are compared to the predictions of POWHEG combined with PYTHIA (P8) or HERWIG (H7), the multiparton simulation MG5_aMC@NLO (MG)+PYTHIA FxFx, and the NNLO QCD calculations obtained with Matrix. The ratios of the various predictions to the measured cross sections are shown in the lower panels. |
png pdf |
Figure 17-c:
Differential cross sections at the parton level as a function of ${{| y({\mathrm{t} _\mathrm {h}}) |}}$, ${{| y({\mathrm{t} _\ell}) |}}$, and the differences ${\Delta {| y_{\mathrm{t} /\mathrm{\bar{t}}} |}}$ and ${{| \Delta y_{\mathrm{t} /\mathrm{\bar{t}}} |}}$. The data are shown as points with gray (yellow) bands indicating the statistical (statistical and systematic) uncertainties. The cross sections are compared to the predictions of POWHEG combined with PYTHIA (P8) or HERWIG (H7), the multiparton simulation MG5_aMC@NLO (MG)+PYTHIA FxFx, and the NNLO QCD calculations obtained with Matrix. The ratios of the various predictions to the measured cross sections are shown in the lower panels. |
png pdf |
Figure 17-d:
Differential cross sections at the parton level as a function of ${{| y({\mathrm{t} _\mathrm {h}}) |}}$, ${{| y({\mathrm{t} _\ell}) |}}$, and the differences ${\Delta {| y_{\mathrm{t} /\mathrm{\bar{t}}} |}}$ and ${{| \Delta y_{\mathrm{t} /\mathrm{\bar{t}}} |}}$. The data are shown as points with gray (yellow) bands indicating the statistical (statistical and systematic) uncertainties. The cross sections are compared to the predictions of POWHEG combined with PYTHIA (P8) or HERWIG (H7), the multiparton simulation MG5_aMC@NLO (MG)+PYTHIA FxFx, and the NNLO QCD calculations obtained with Matrix. The ratios of the various predictions to the measured cross sections are shown in the lower panels. |
png pdf |
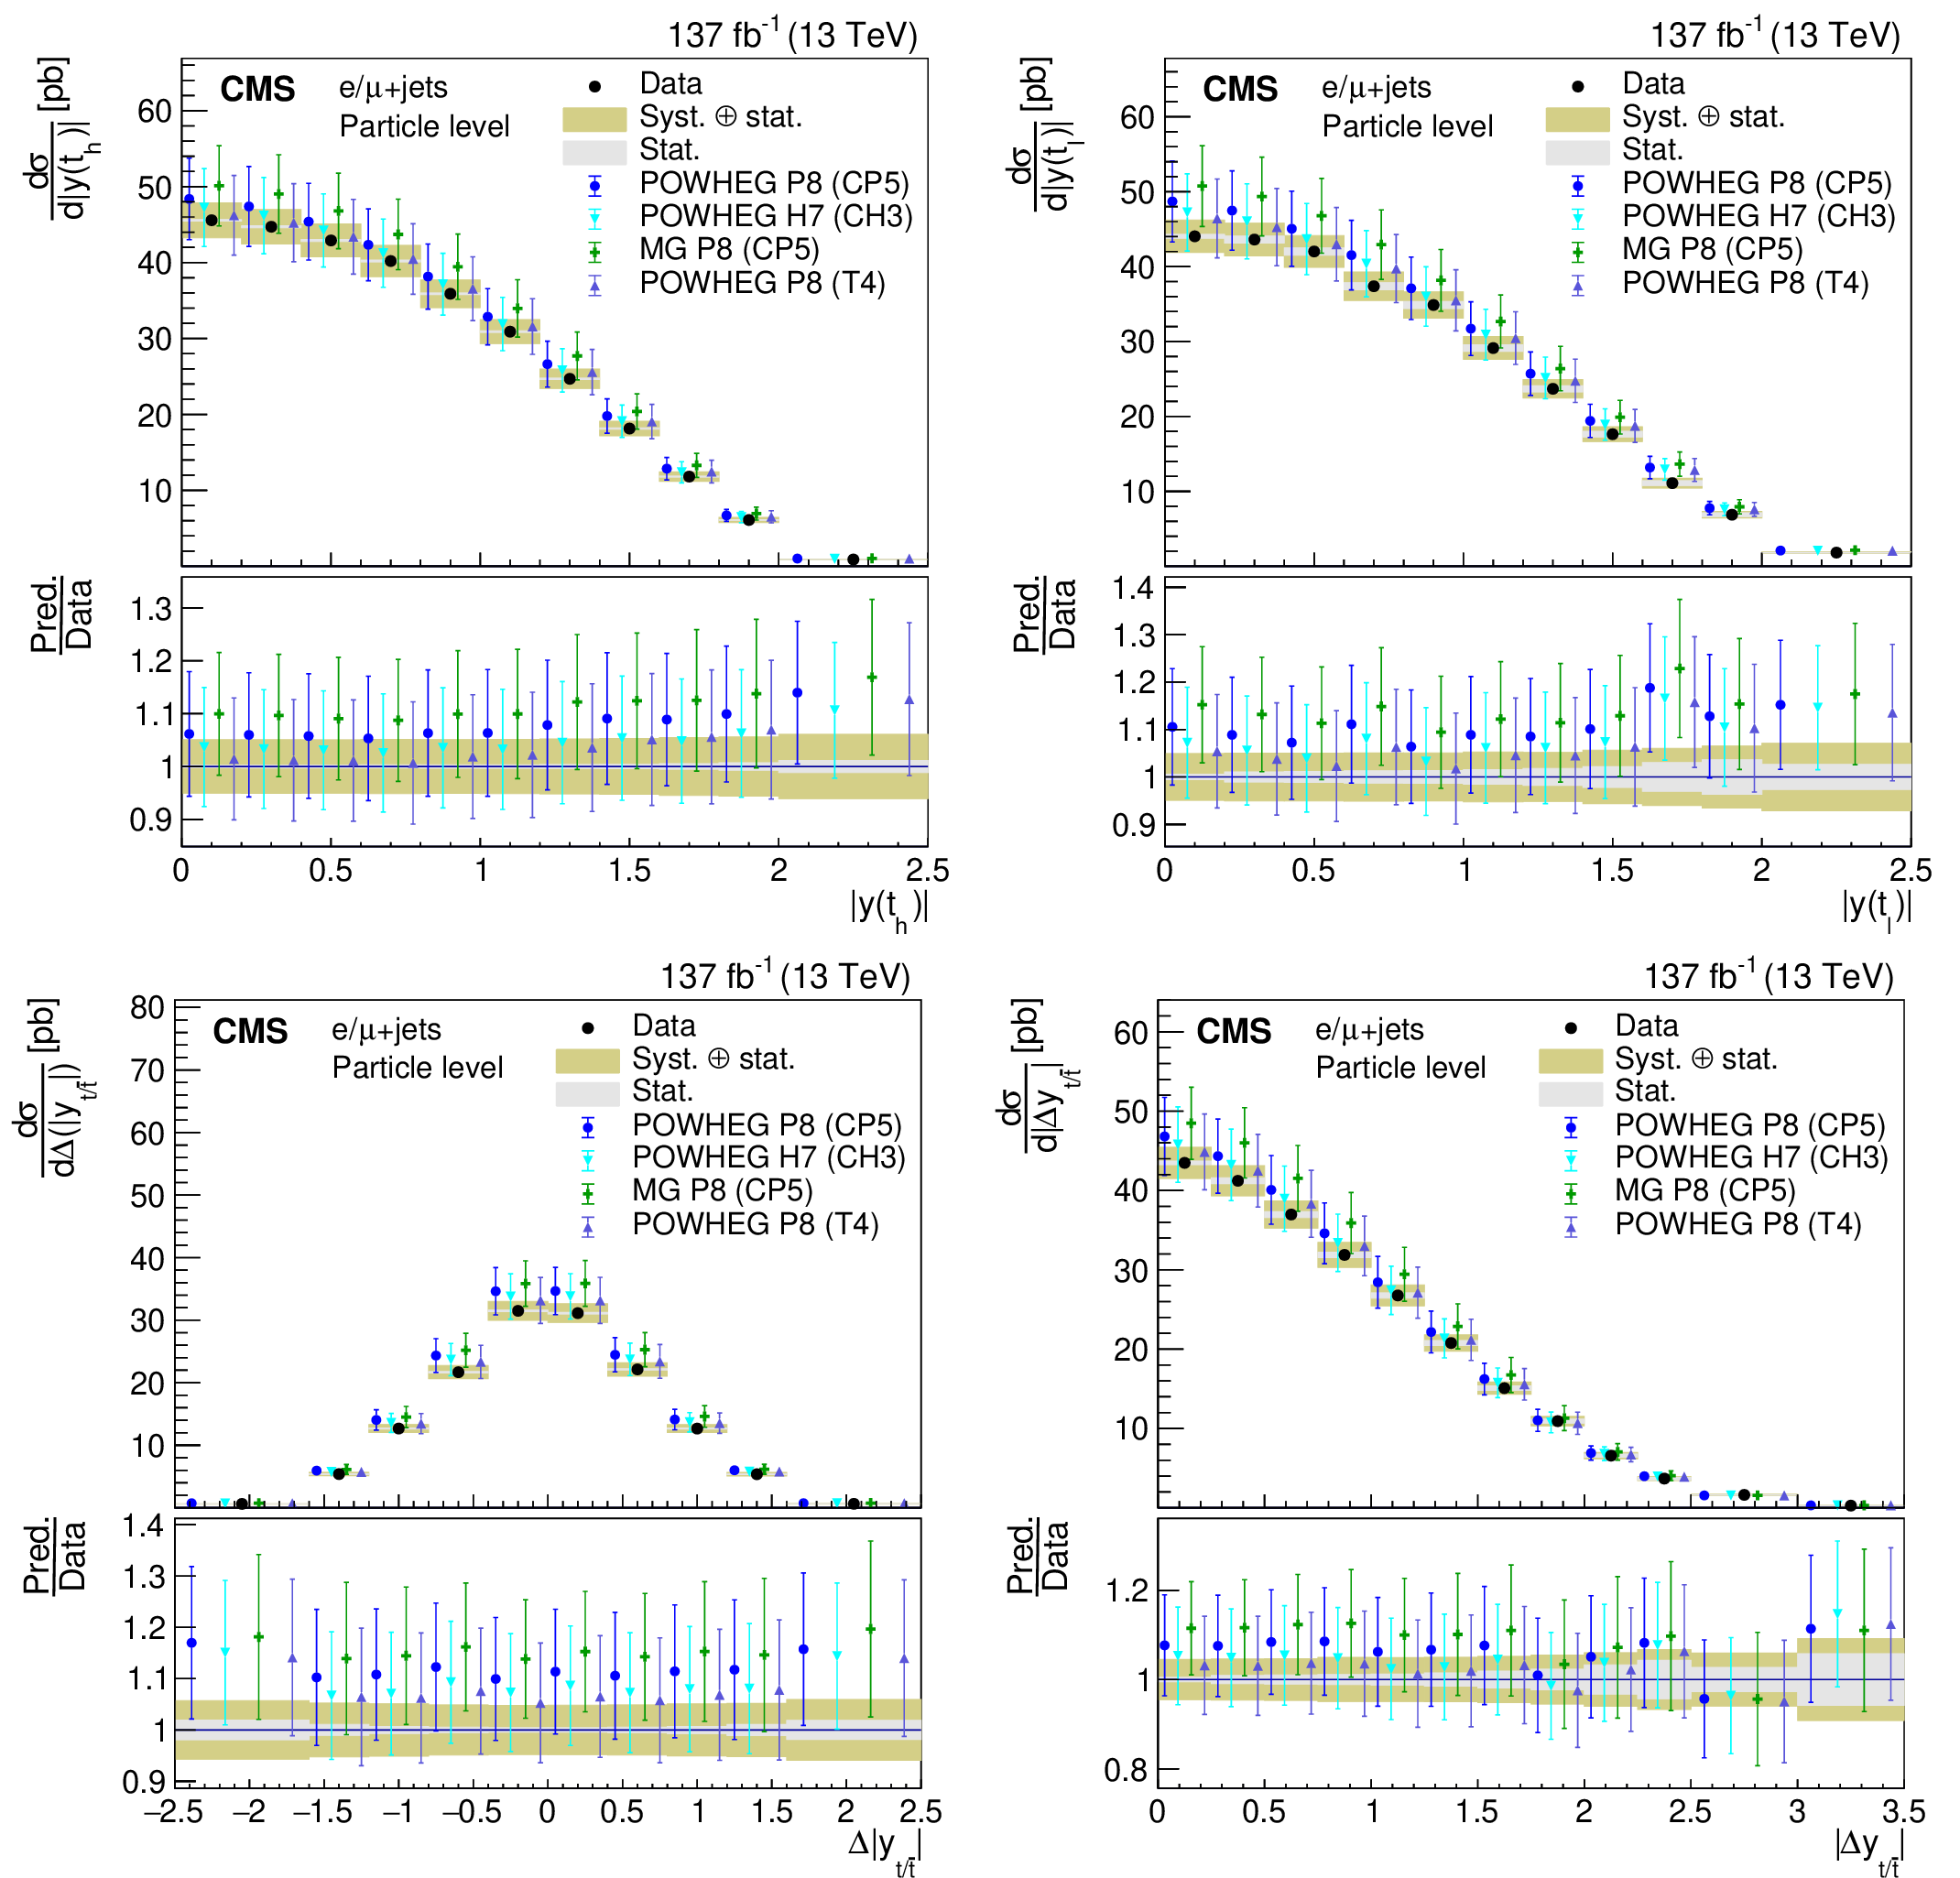
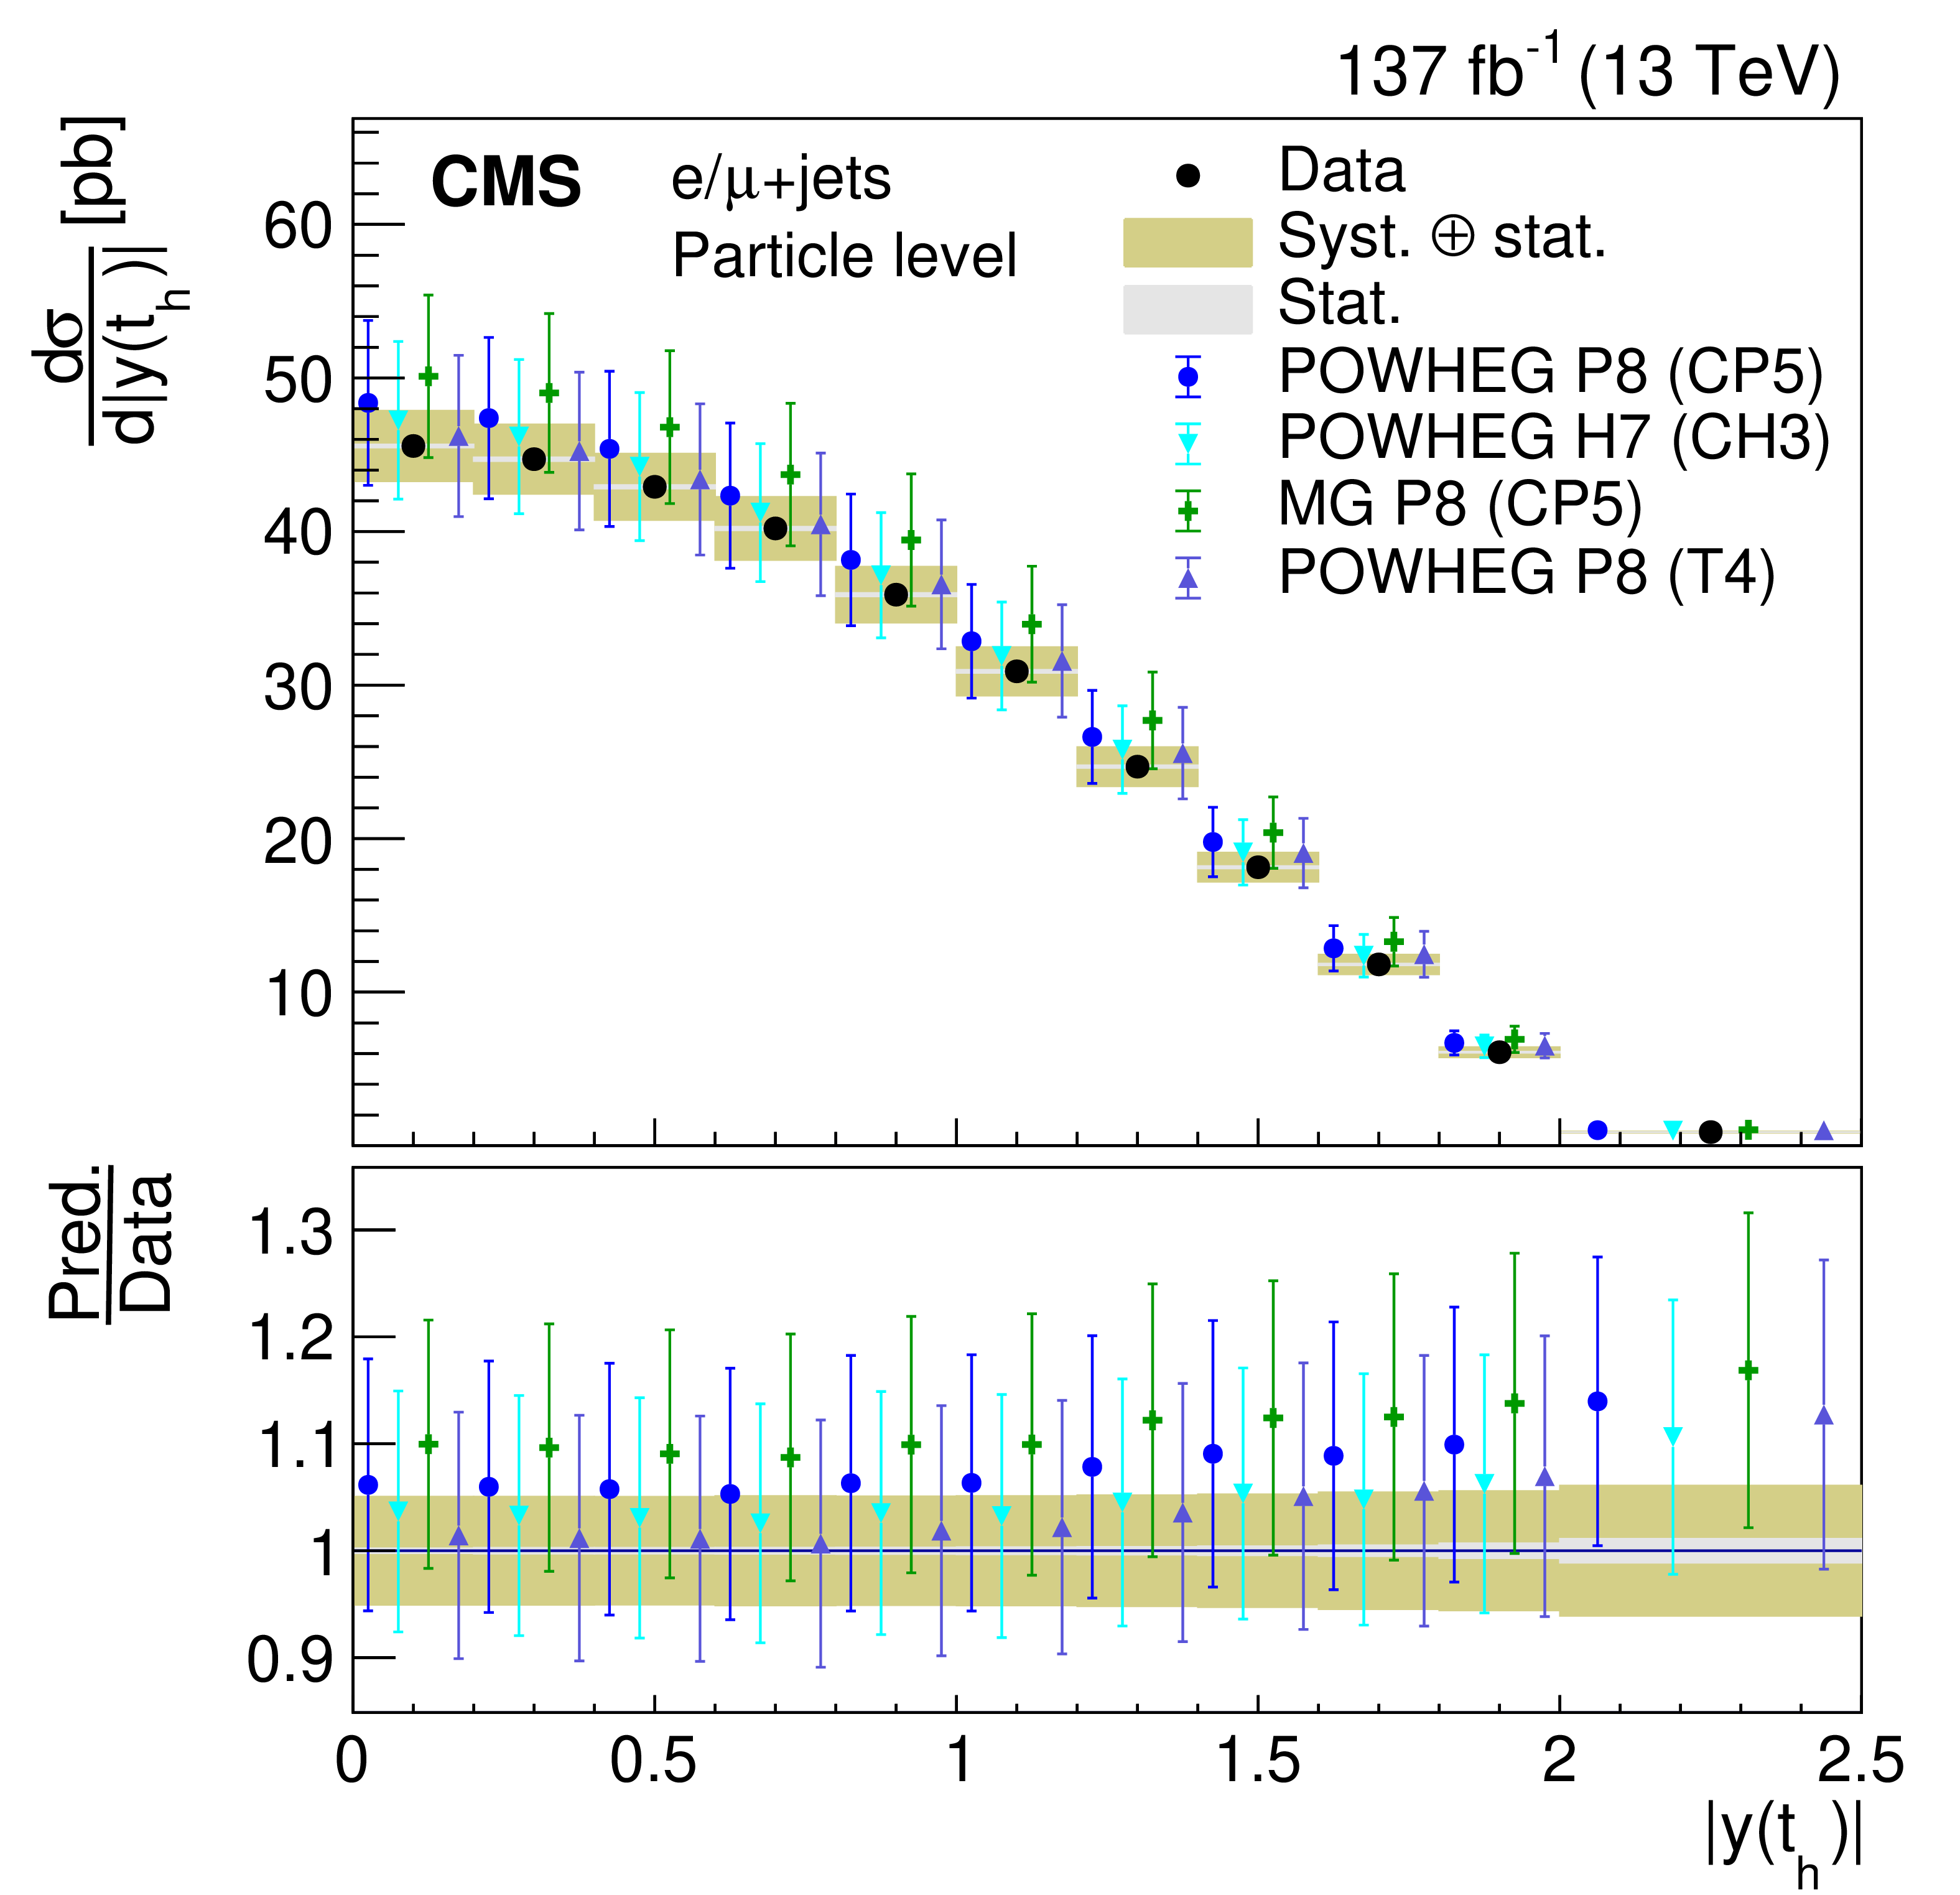
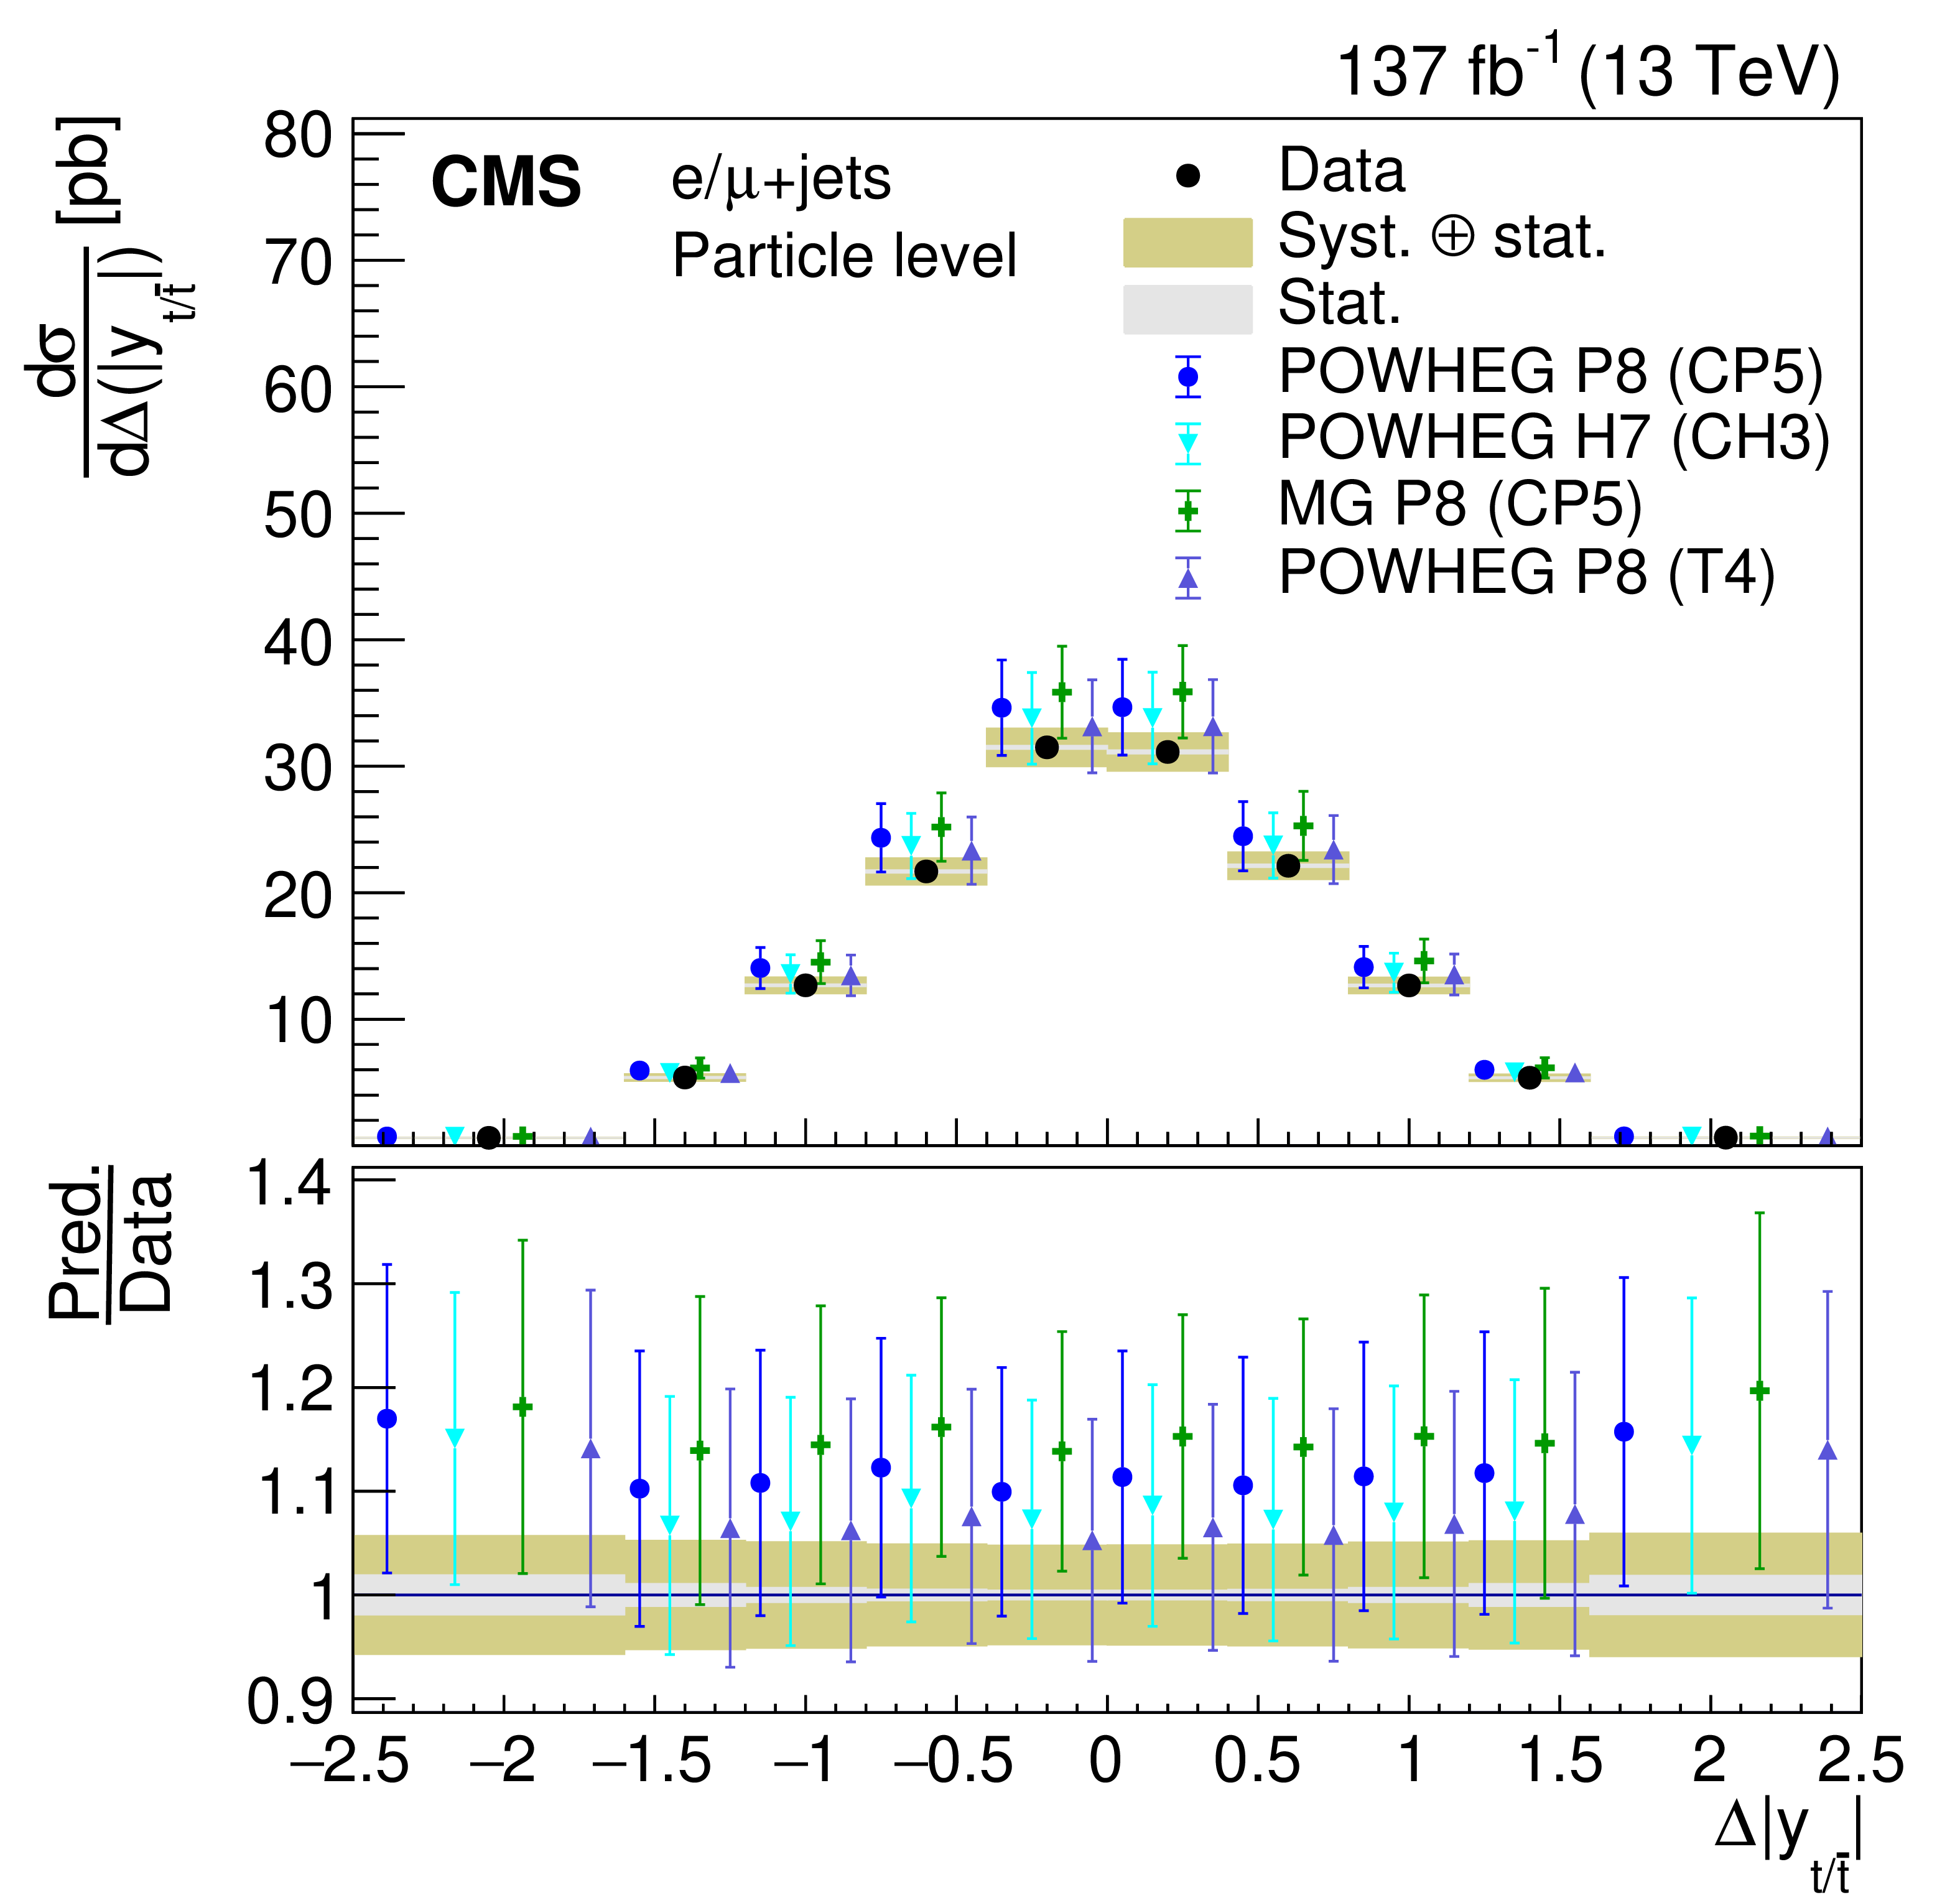
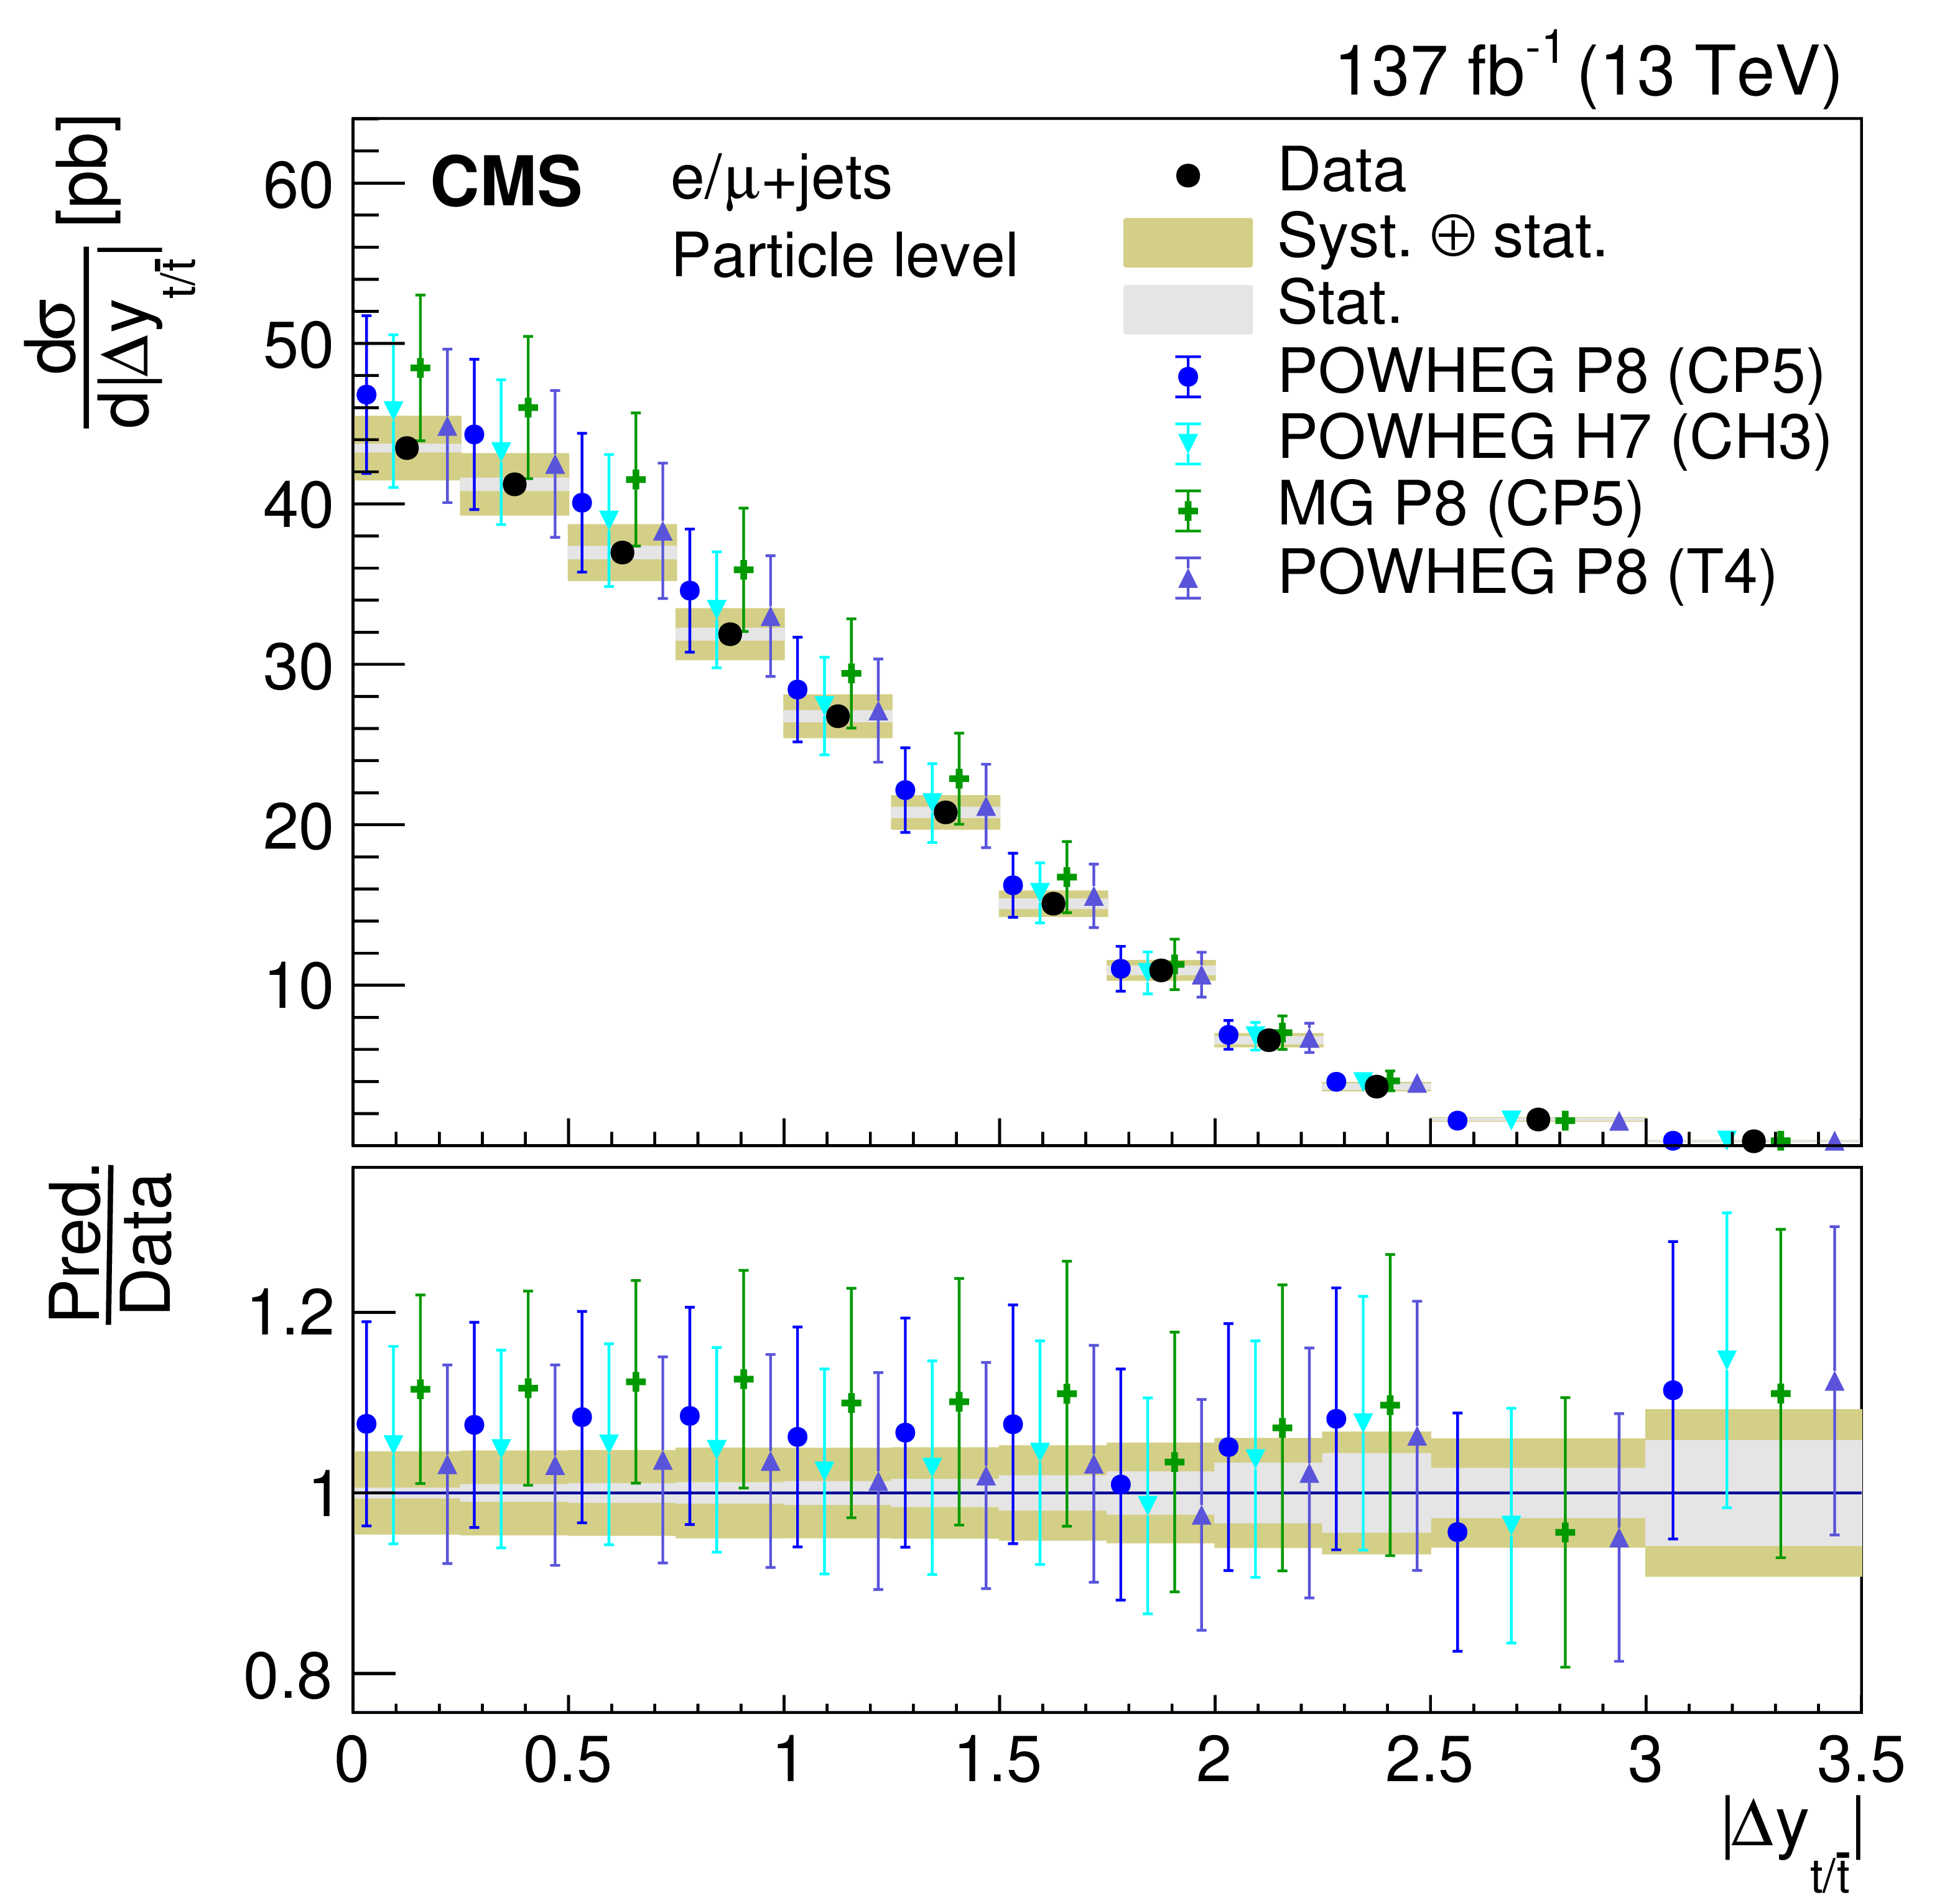
Figure 18:
Differential cross sections at the particle level as a function of ${{| y({\mathrm{t} _\mathrm {h}}) |}}$, ${{| y({\mathrm{t} _\ell}) |}}$, and the differences ${\Delta {| y_{\mathrm{t} /\mathrm{\bar{t}}} |}}$ and ${{| \Delta y_{\mathrm{t} /\mathrm{\bar{t}}} |}}$. The data are shown as points with gray (yellow) bands indicating the statistical (statistical and systematic) uncertainties. The cross sections are compared to the predictions of POWHEG+PYTHIA (P8) for the CP5 and CUETP8M2T4 (T4) tunes, POWHEG+HERWIG (H7), and the multiparton simulation MG5_aMC@NLO (MG)+PYTHIA. The ratios of the various predictions to the measured cross sections are shown in the lower panels. |
png pdf |
Figure 18-a:
Differential cross sections at the particle level as a function of ${{| y({\mathrm{t} _\mathrm {h}}) |}}$, ${{| y({\mathrm{t} _\ell}) |}}$, and the differences ${\Delta {| y_{\mathrm{t} /\mathrm{\bar{t}}} |}}$ and ${{| \Delta y_{\mathrm{t} /\mathrm{\bar{t}}} |}}$. The data are shown as points with gray (yellow) bands indicating the statistical (statistical and systematic) uncertainties. The cross sections are compared to the predictions of POWHEG+PYTHIA (P8) for the CP5 and CUETP8M2T4 (T4) tunes, POWHEG+HERWIG (H7), and the multiparton simulation MG5_aMC@NLO (MG)+PYTHIA. The ratios of the various predictions to the measured cross sections are shown in the lower panels. |
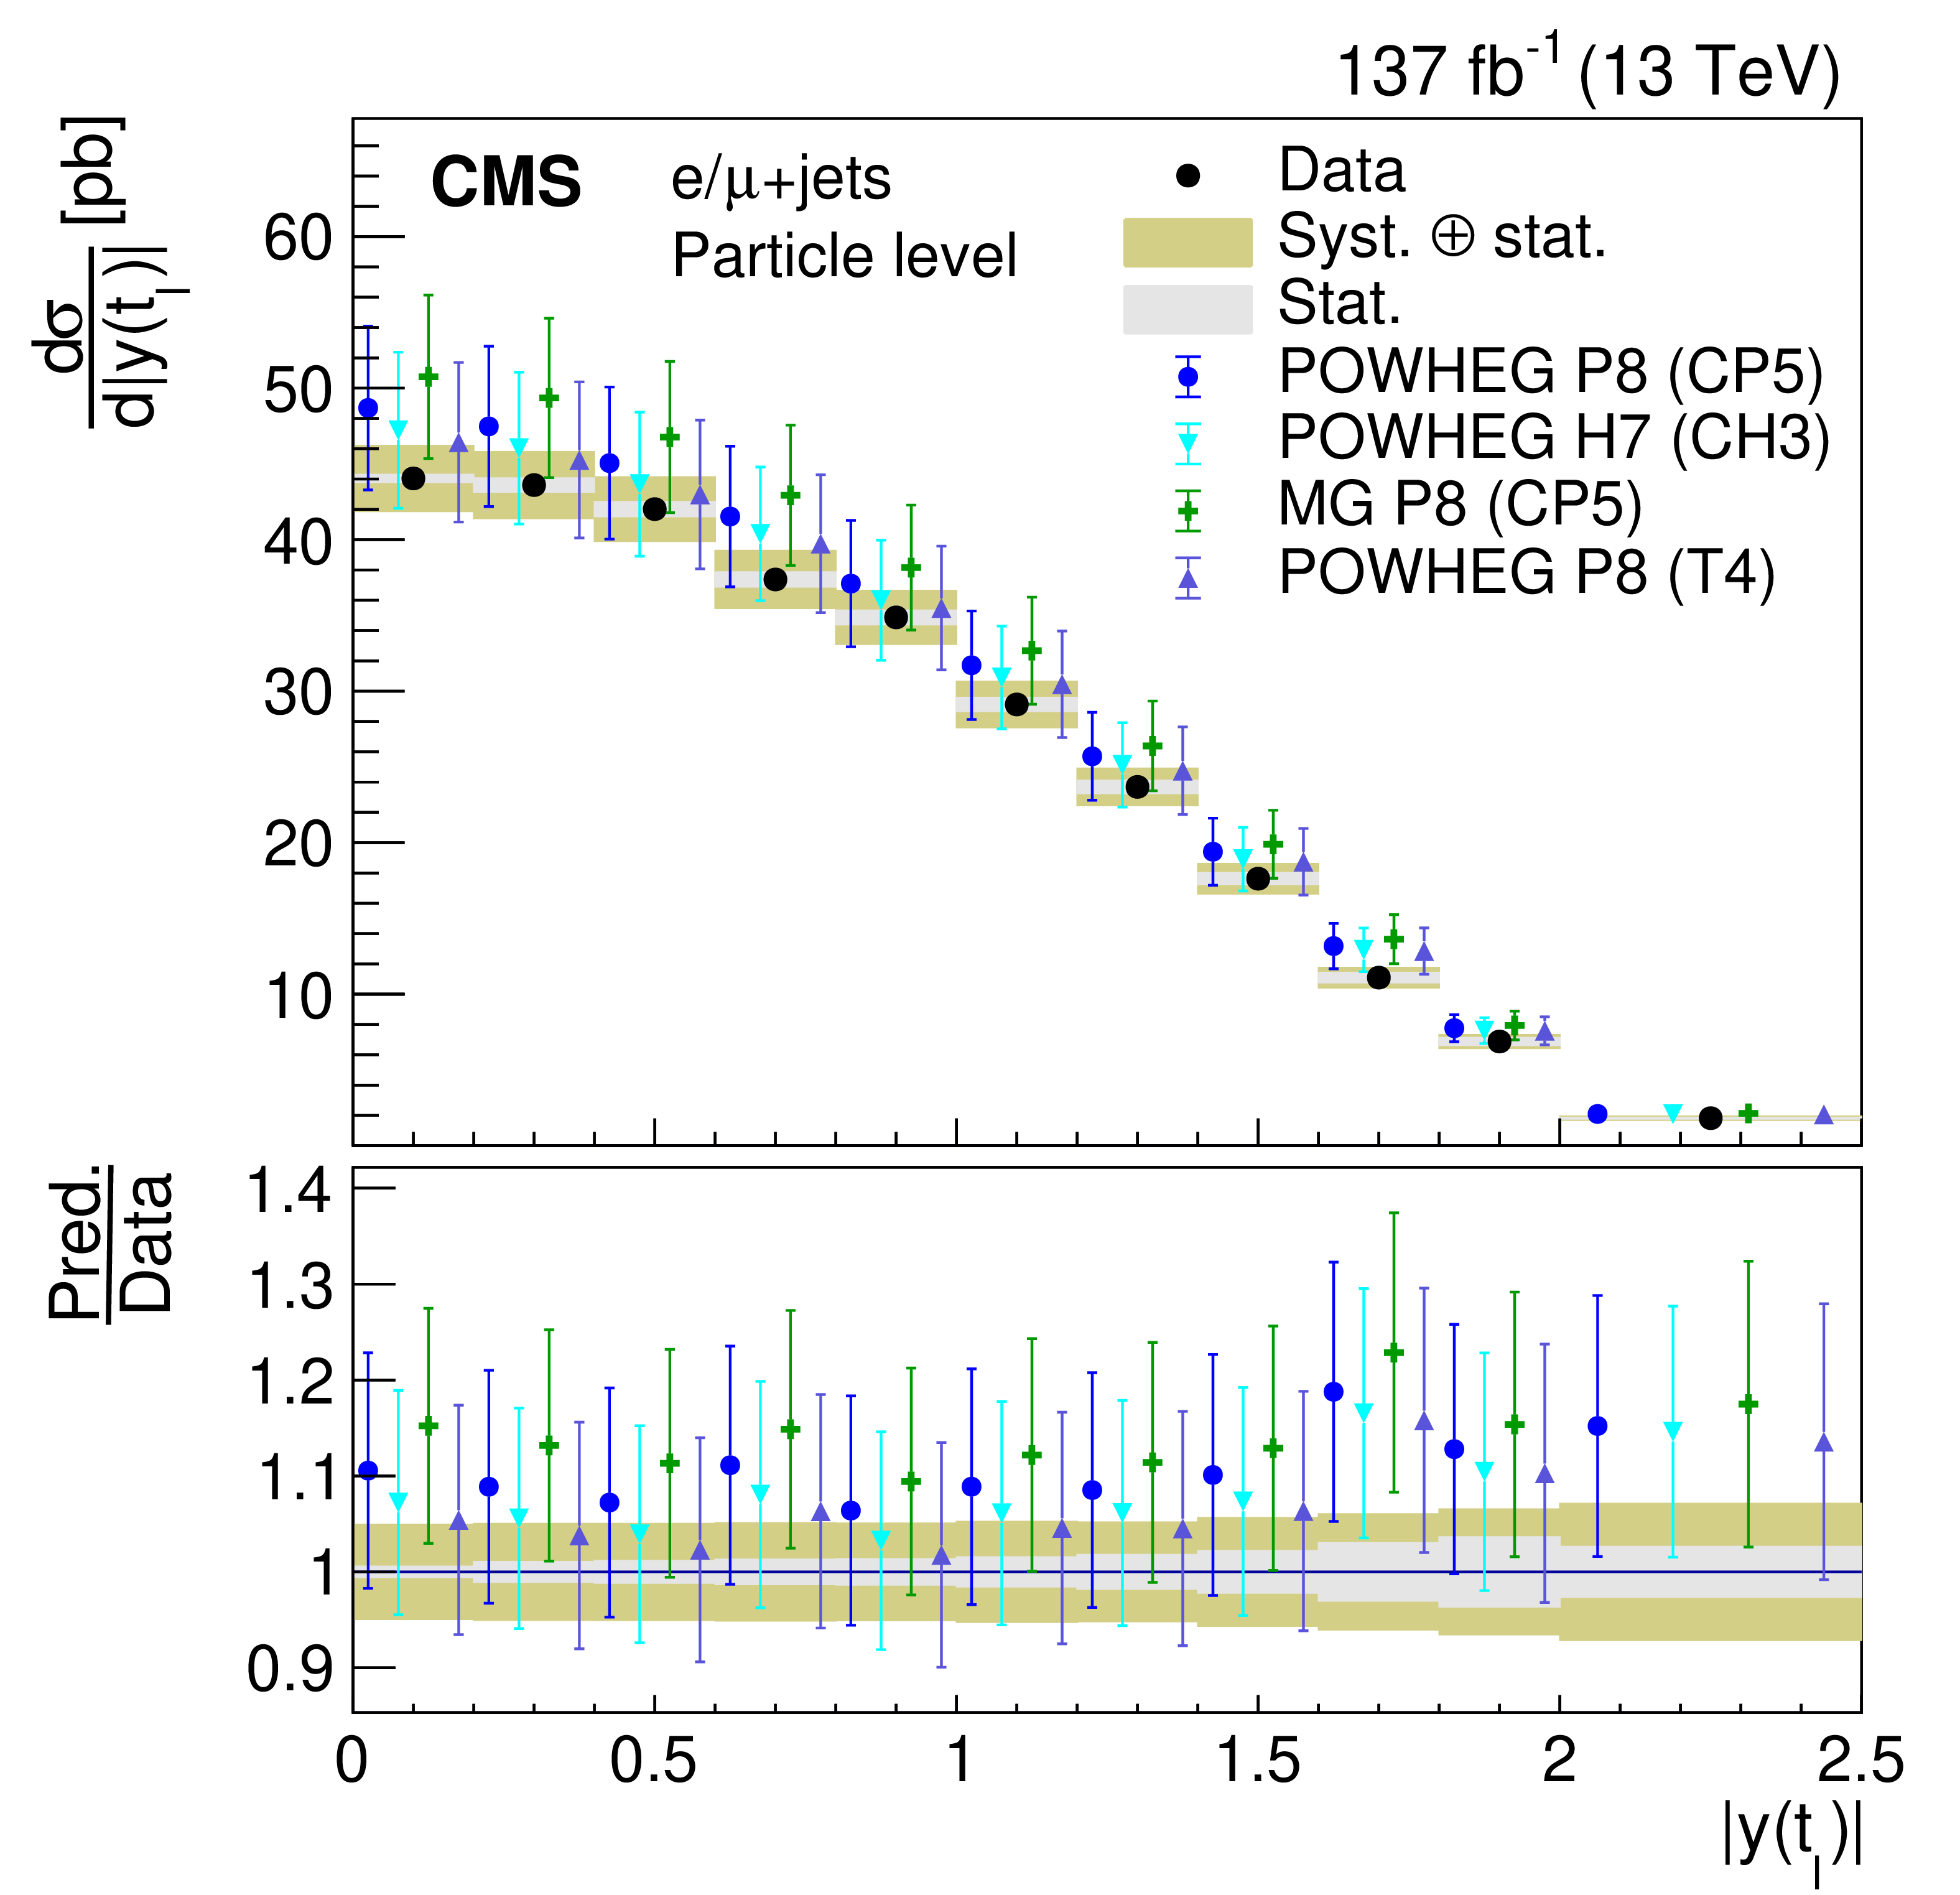
png pdf |
Figure 18-b:
Differential cross sections at the particle level as a function of ${{| y({\mathrm{t} _\mathrm {h}}) |}}$, ${{| y({\mathrm{t} _\ell}) |}}$, and the differences ${\Delta {| y_{\mathrm{t} /\mathrm{\bar{t}}} |}}$ and ${{| \Delta y_{\mathrm{t} /\mathrm{\bar{t}}} |}}$. The data are shown as points with gray (yellow) bands indicating the statistical (statistical and systematic) uncertainties. The cross sections are compared to the predictions of POWHEG+PYTHIA (P8) for the CP5 and CUETP8M2T4 (T4) tunes, POWHEG+HERWIG (H7), and the multiparton simulation MG5_aMC@NLO (MG)+PYTHIA. The ratios of the various predictions to the measured cross sections are shown in the lower panels. |
png pdf |
Figure 18-c:
Differential cross sections at the particle level as a function of ${{| y({\mathrm{t} _\mathrm {h}}) |}}$, ${{| y({\mathrm{t} _\ell}) |}}$, and the differences ${\Delta {| y_{\mathrm{t} /\mathrm{\bar{t}}} |}}$ and ${{| \Delta y_{\mathrm{t} /\mathrm{\bar{t}}} |}}$. The data are shown as points with gray (yellow) bands indicating the statistical (statistical and systematic) uncertainties. The cross sections are compared to the predictions of POWHEG+PYTHIA (P8) for the CP5 and CUETP8M2T4 (T4) tunes, POWHEG+HERWIG (H7), and the multiparton simulation MG5_aMC@NLO (MG)+PYTHIA. The ratios of the various predictions to the measured cross sections are shown in the lower panels. |
png pdf |
Figure 18-d:
Differential cross sections at the particle level as a function of ${{| y({\mathrm{t} _\mathrm {h}}) |}}$, ${{| y({\mathrm{t} _\ell}) |}}$, and the differences ${\Delta {| y_{\mathrm{t} /\mathrm{\bar{t}}} |}}$ and ${{| \Delta y_{\mathrm{t} /\mathrm{\bar{t}}} |}}$. The data are shown as points with gray (yellow) bands indicating the statistical (statistical and systematic) uncertainties. The cross sections are compared to the predictions of POWHEG+PYTHIA (P8) for the CP5 and CUETP8M2T4 (T4) tunes, POWHEG+HERWIG (H7), and the multiparton simulation MG5_aMC@NLO (MG)+PYTHIA. The ratios of the various predictions to the measured cross sections are shown in the lower panels. |
png pdf |
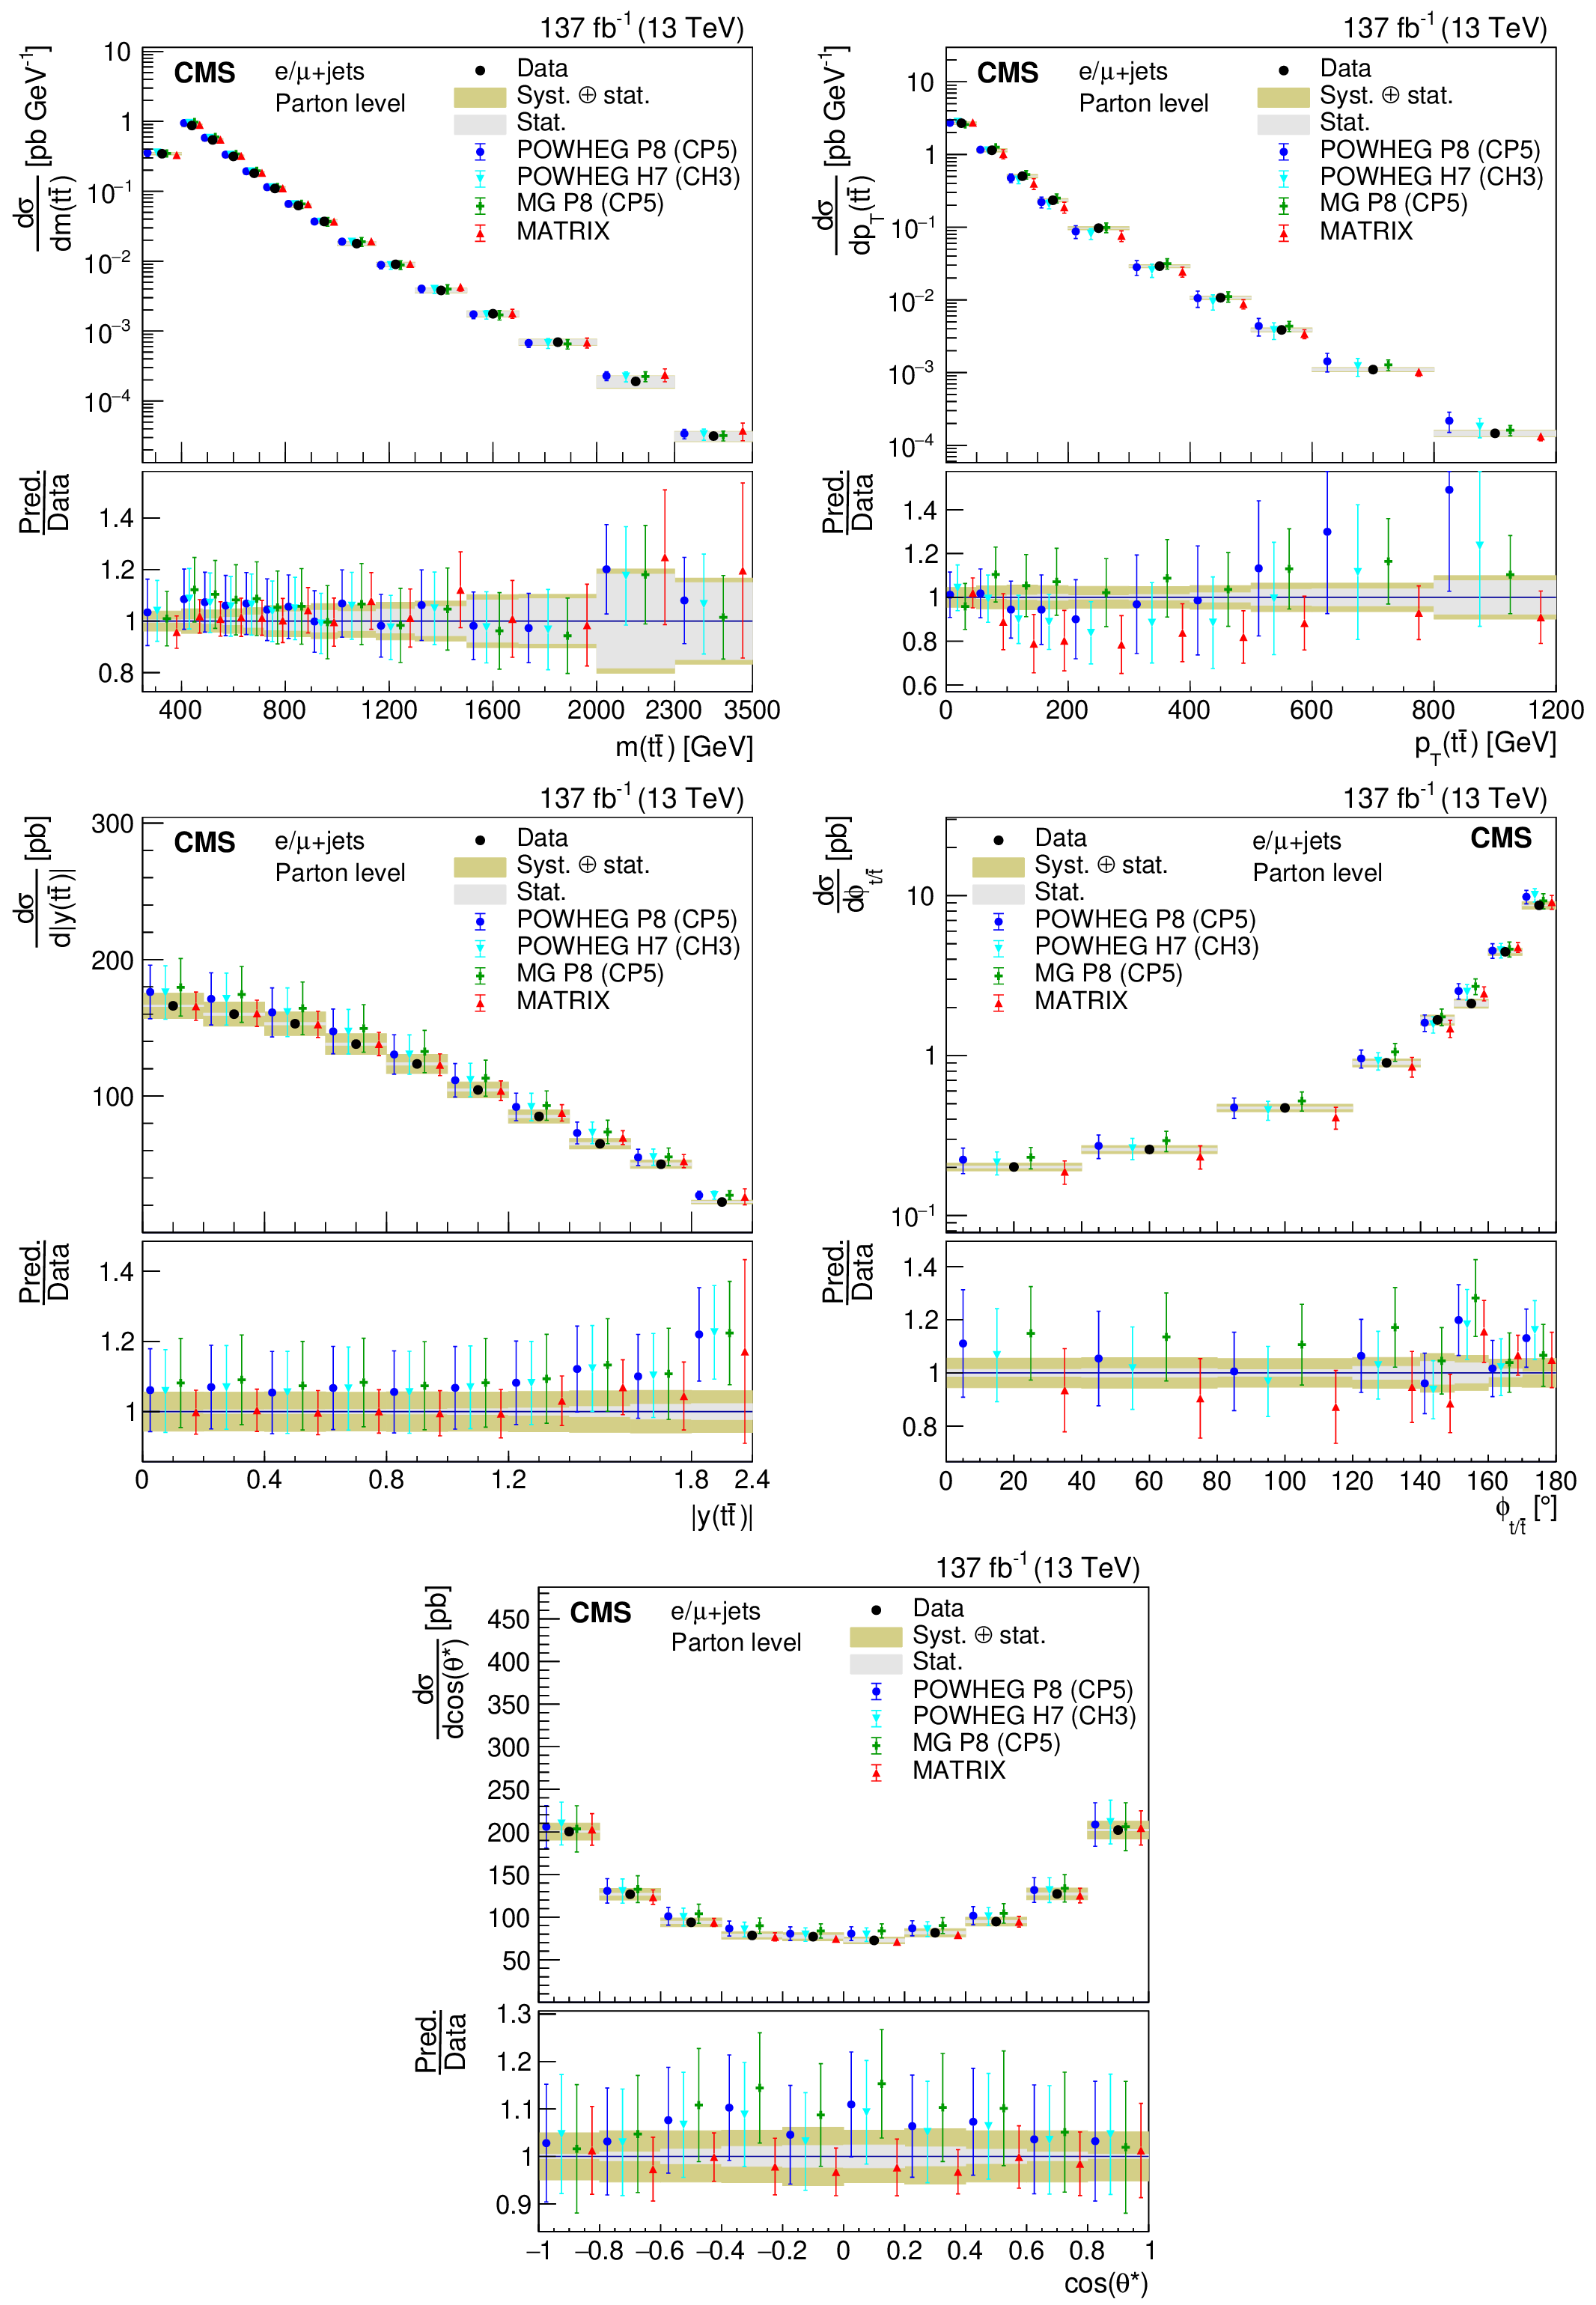
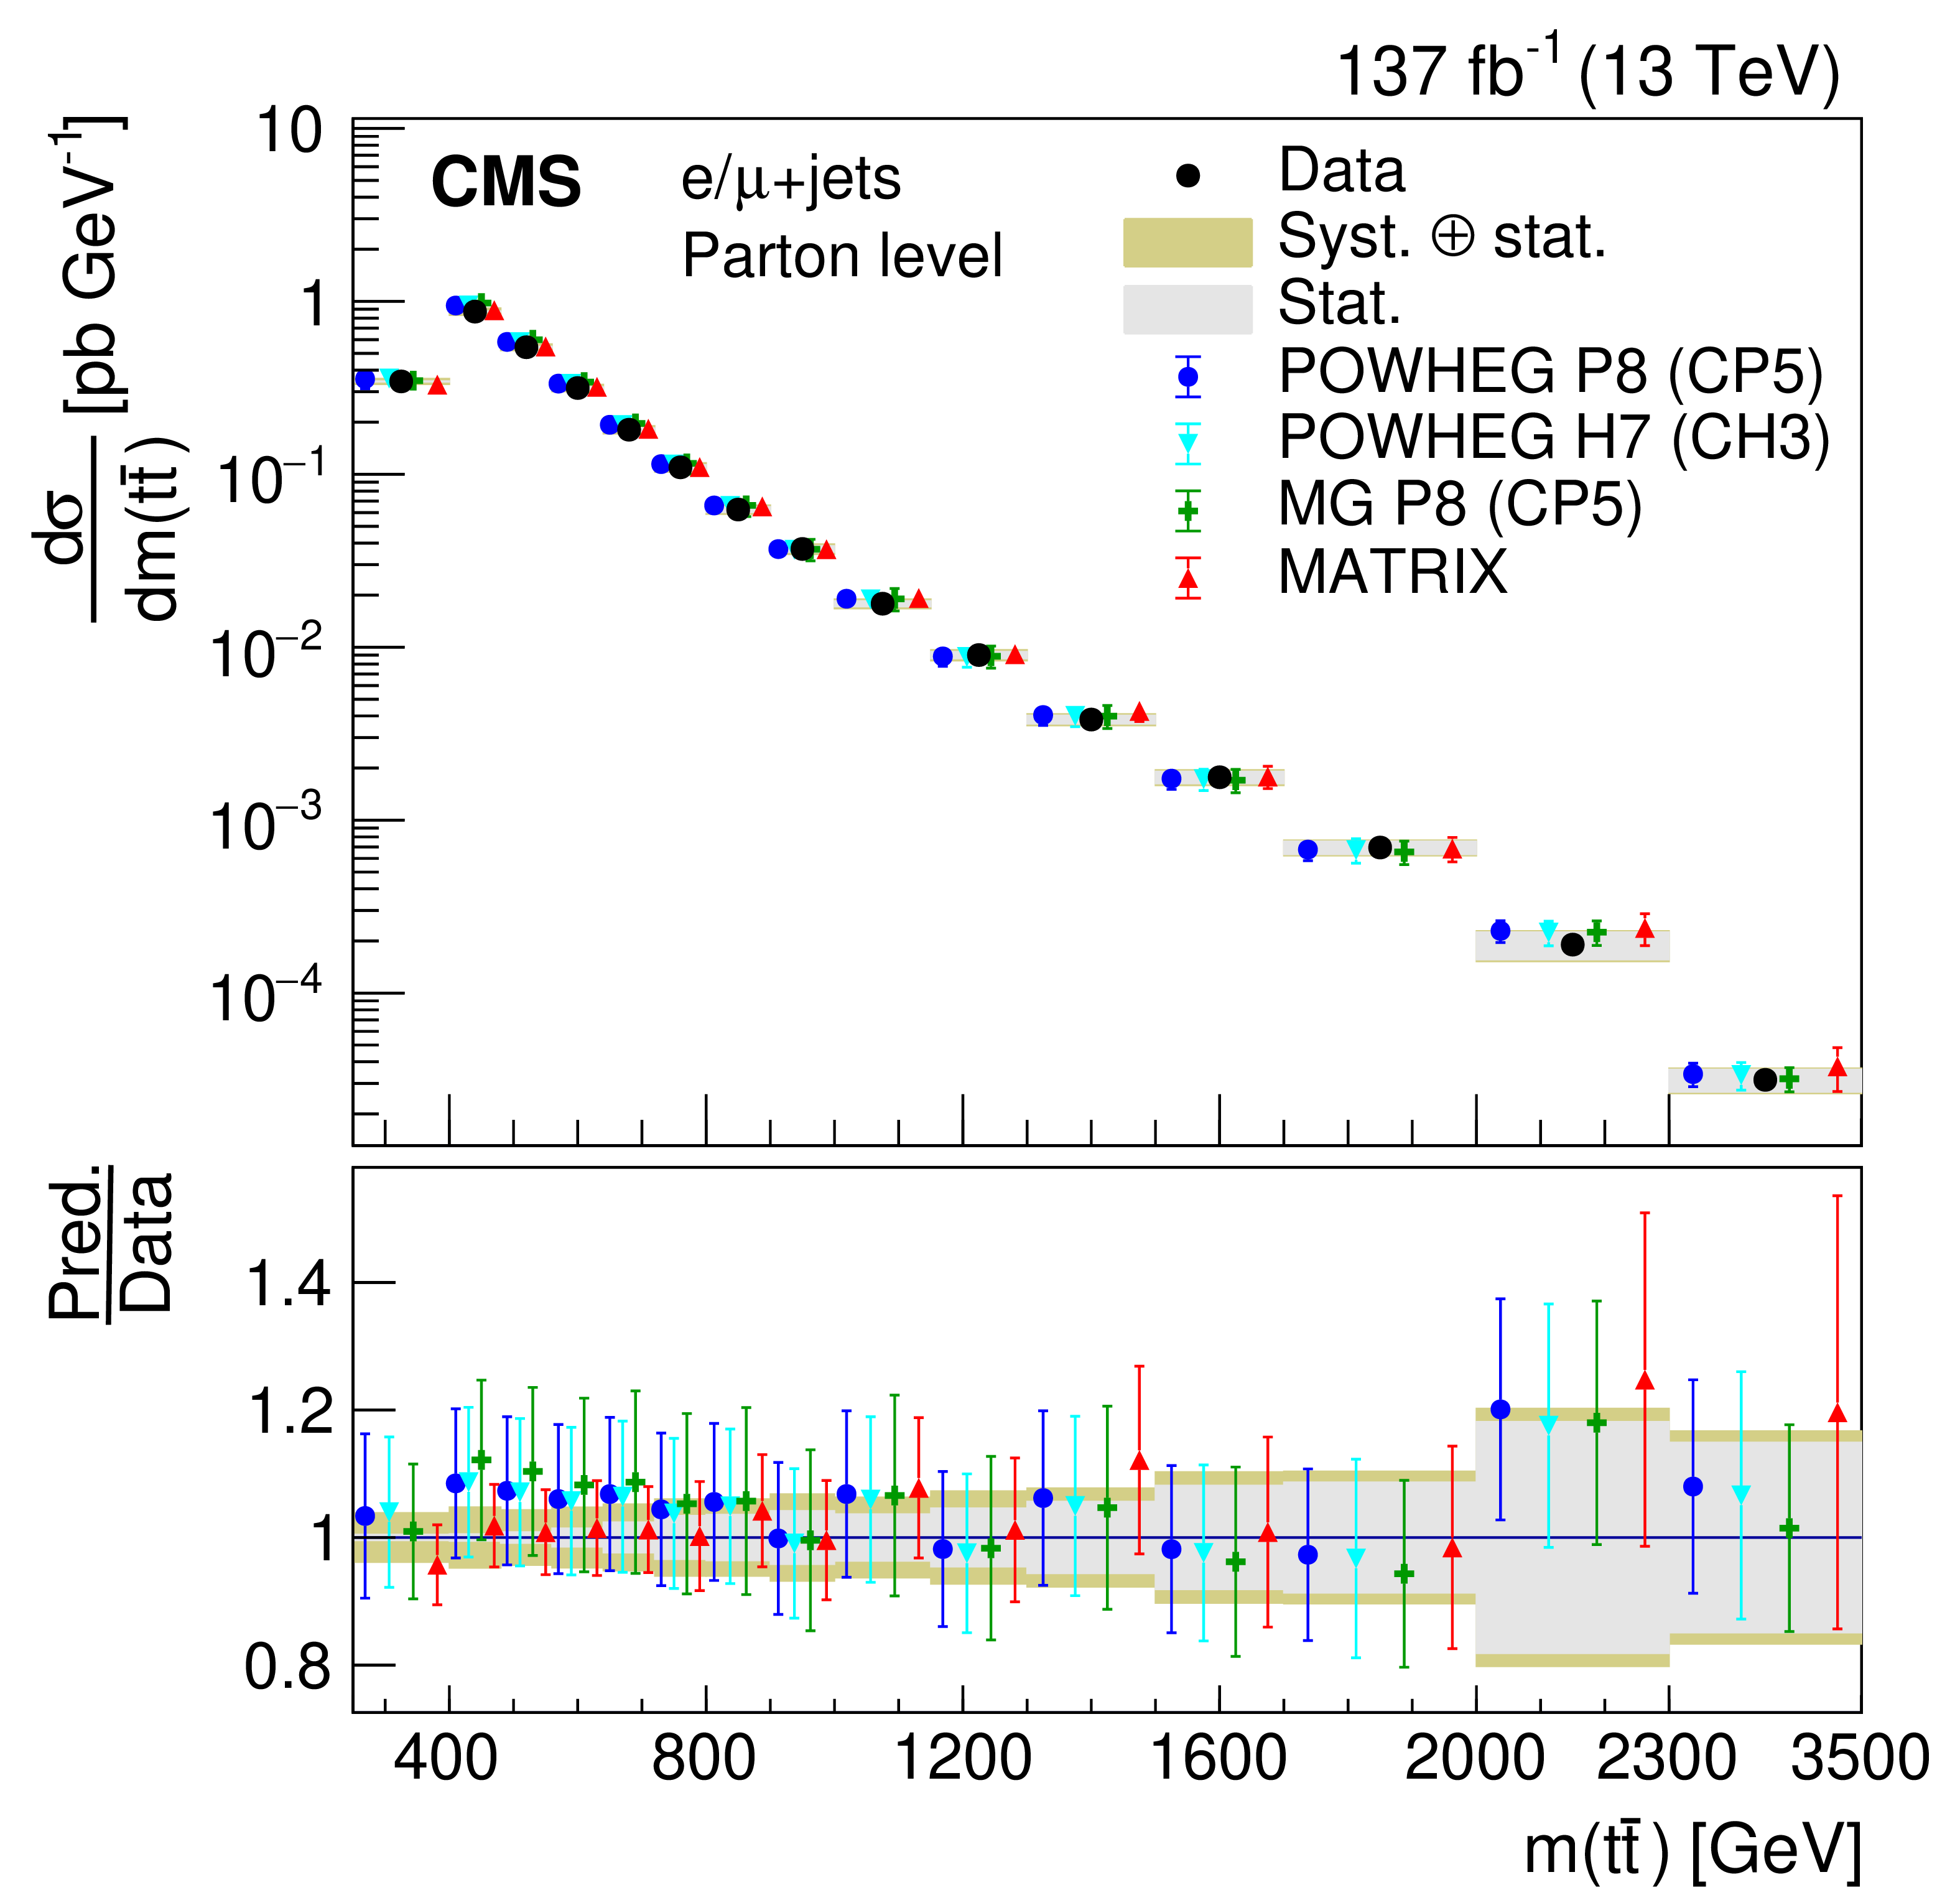
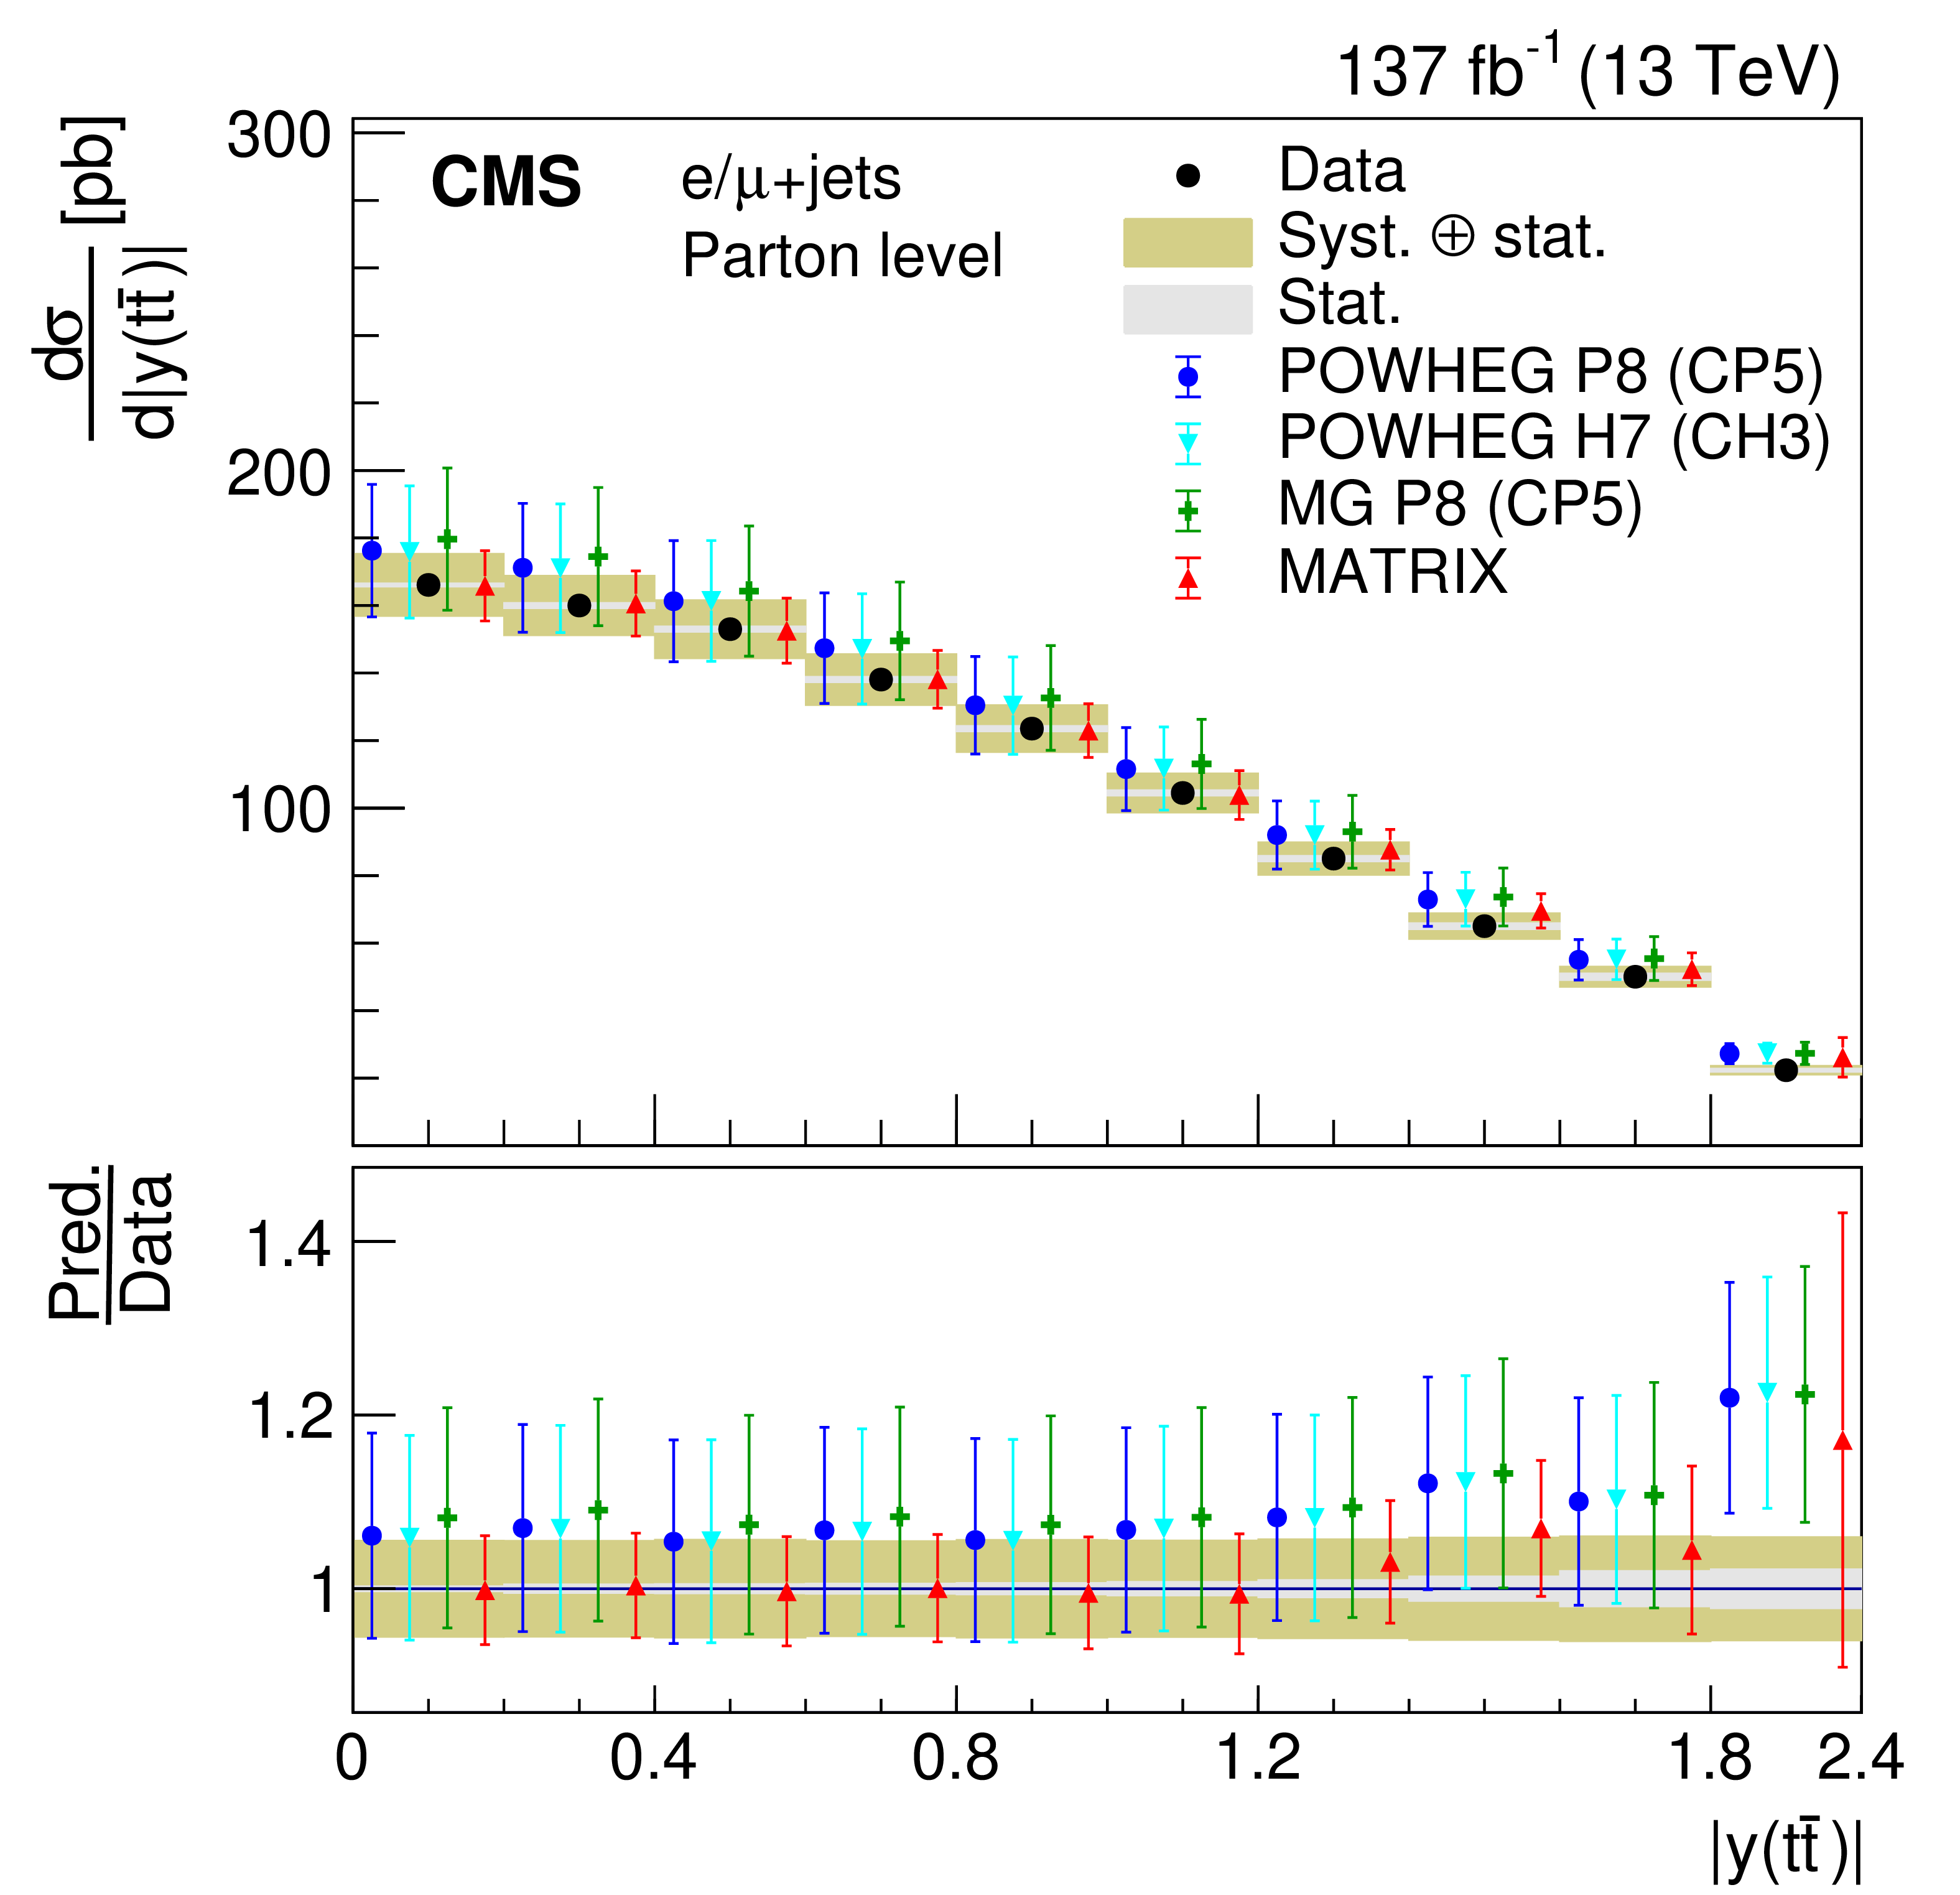
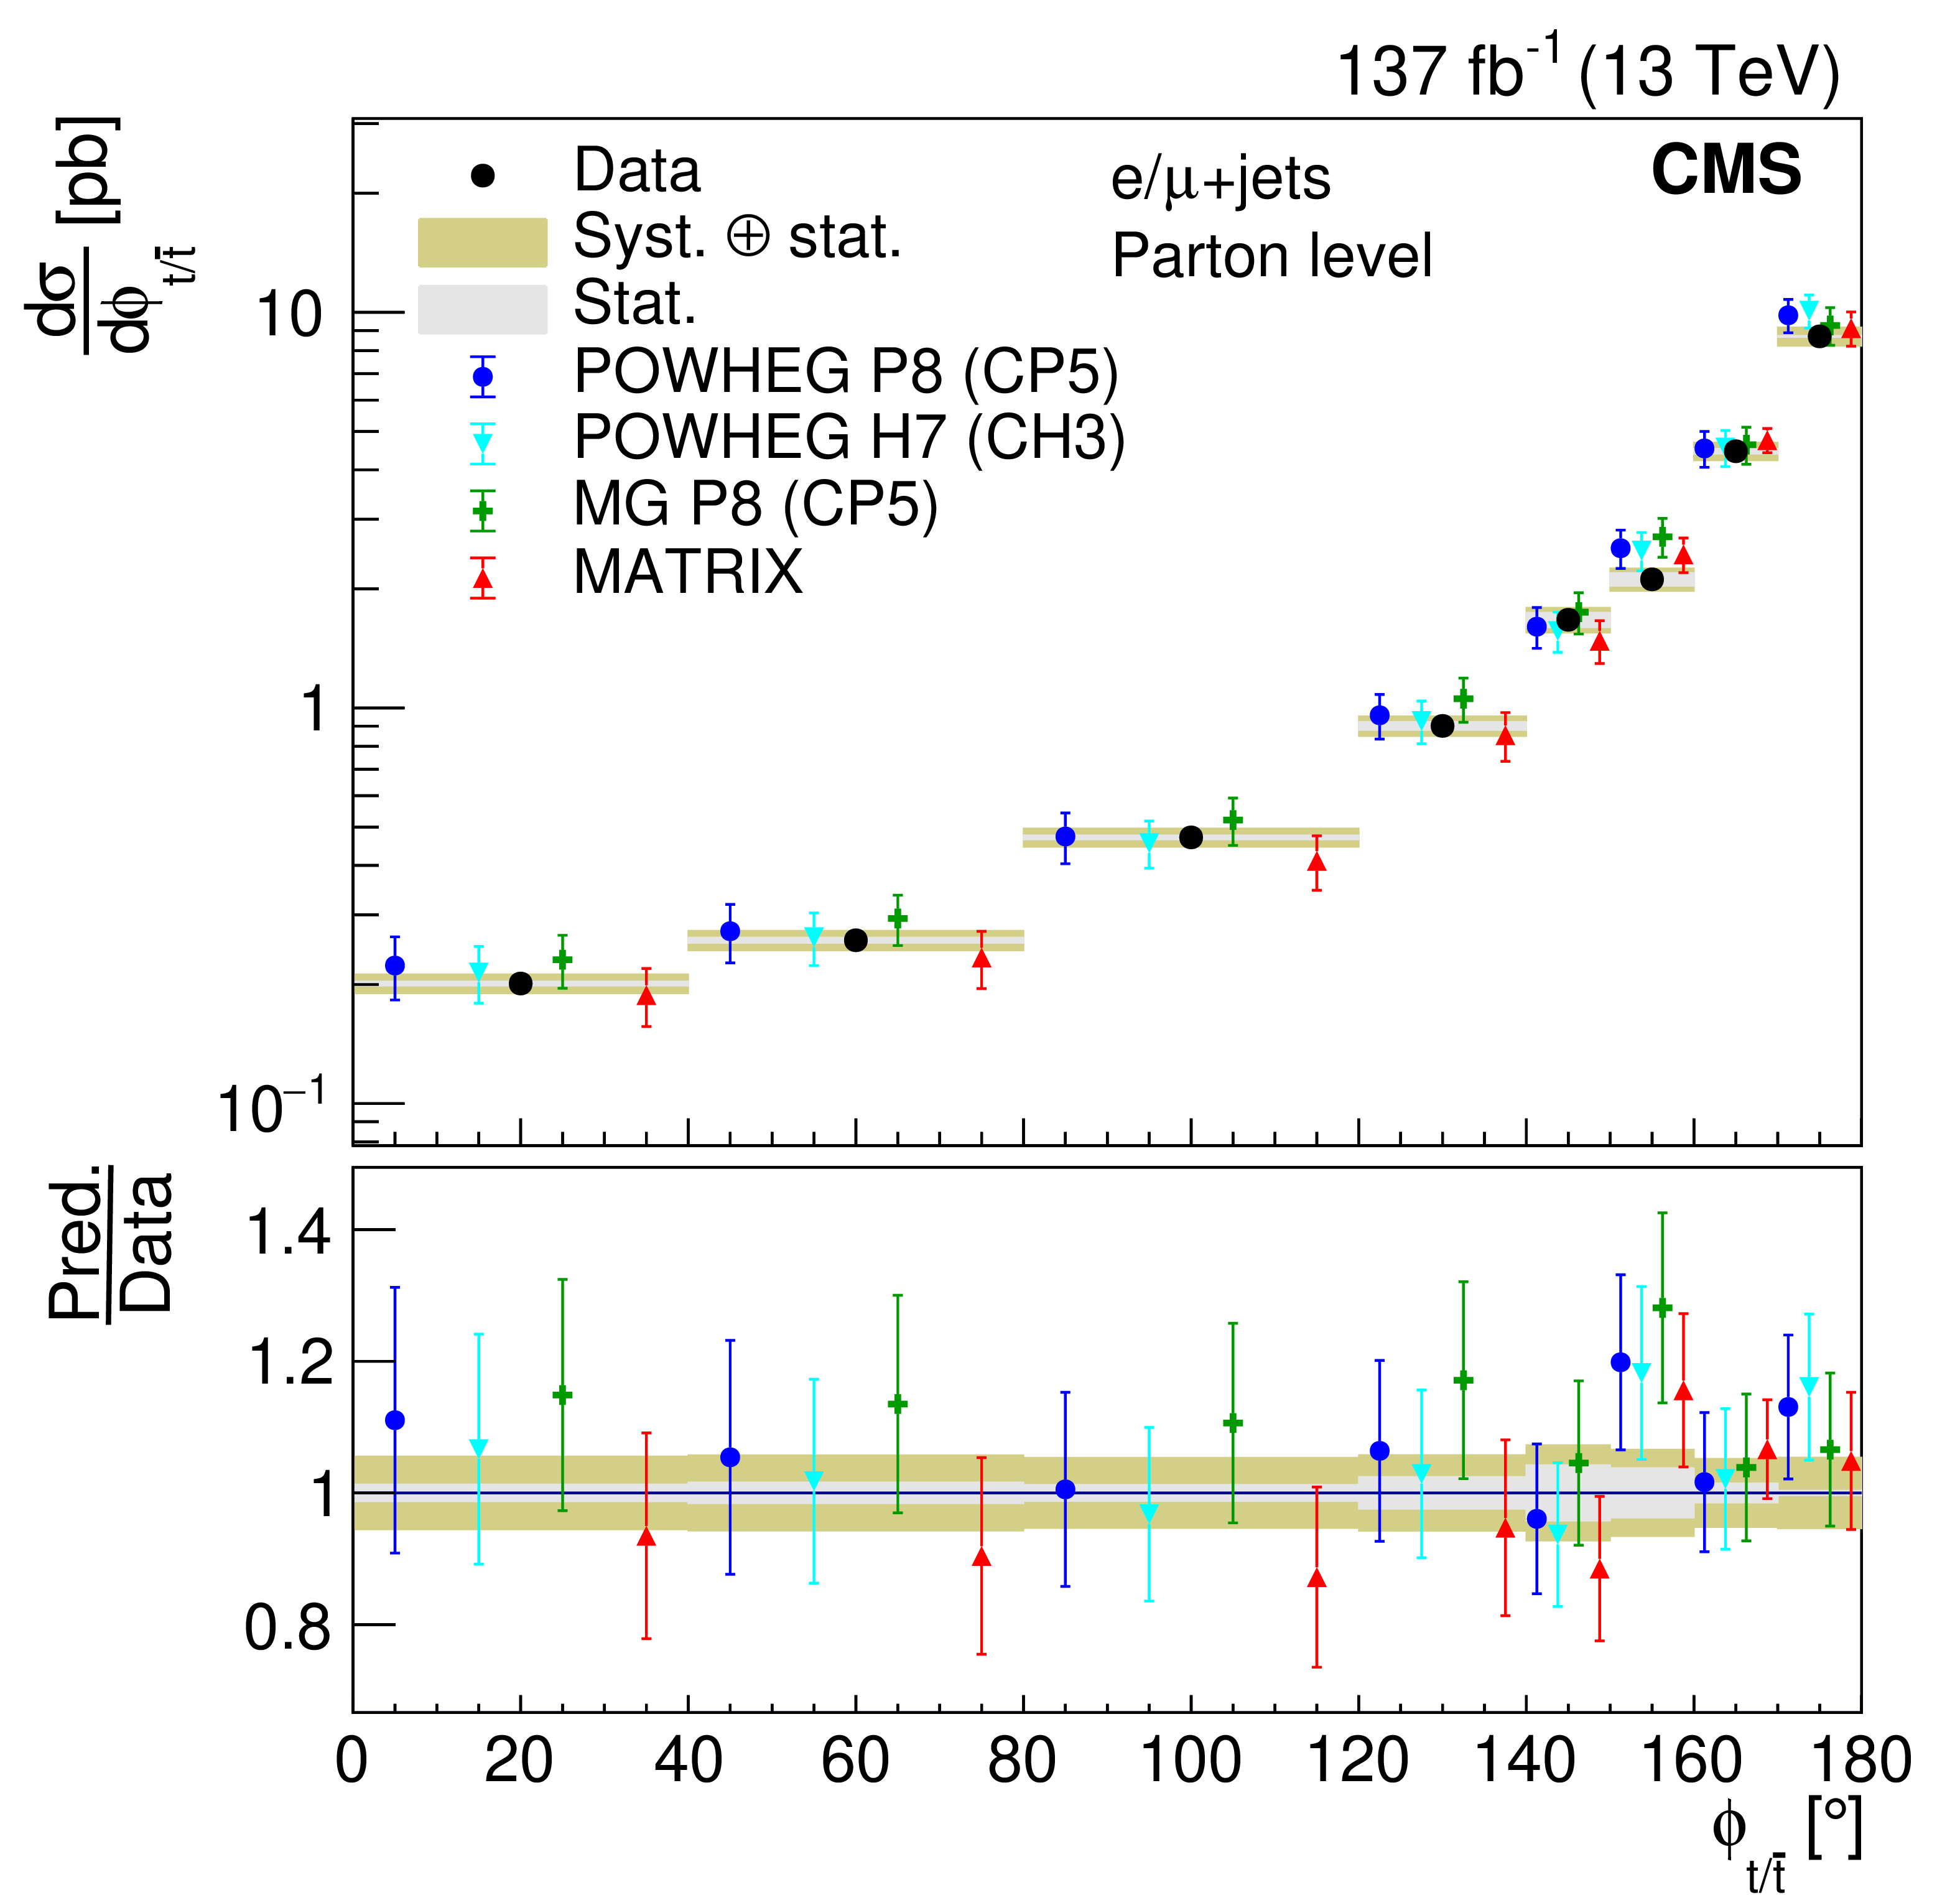
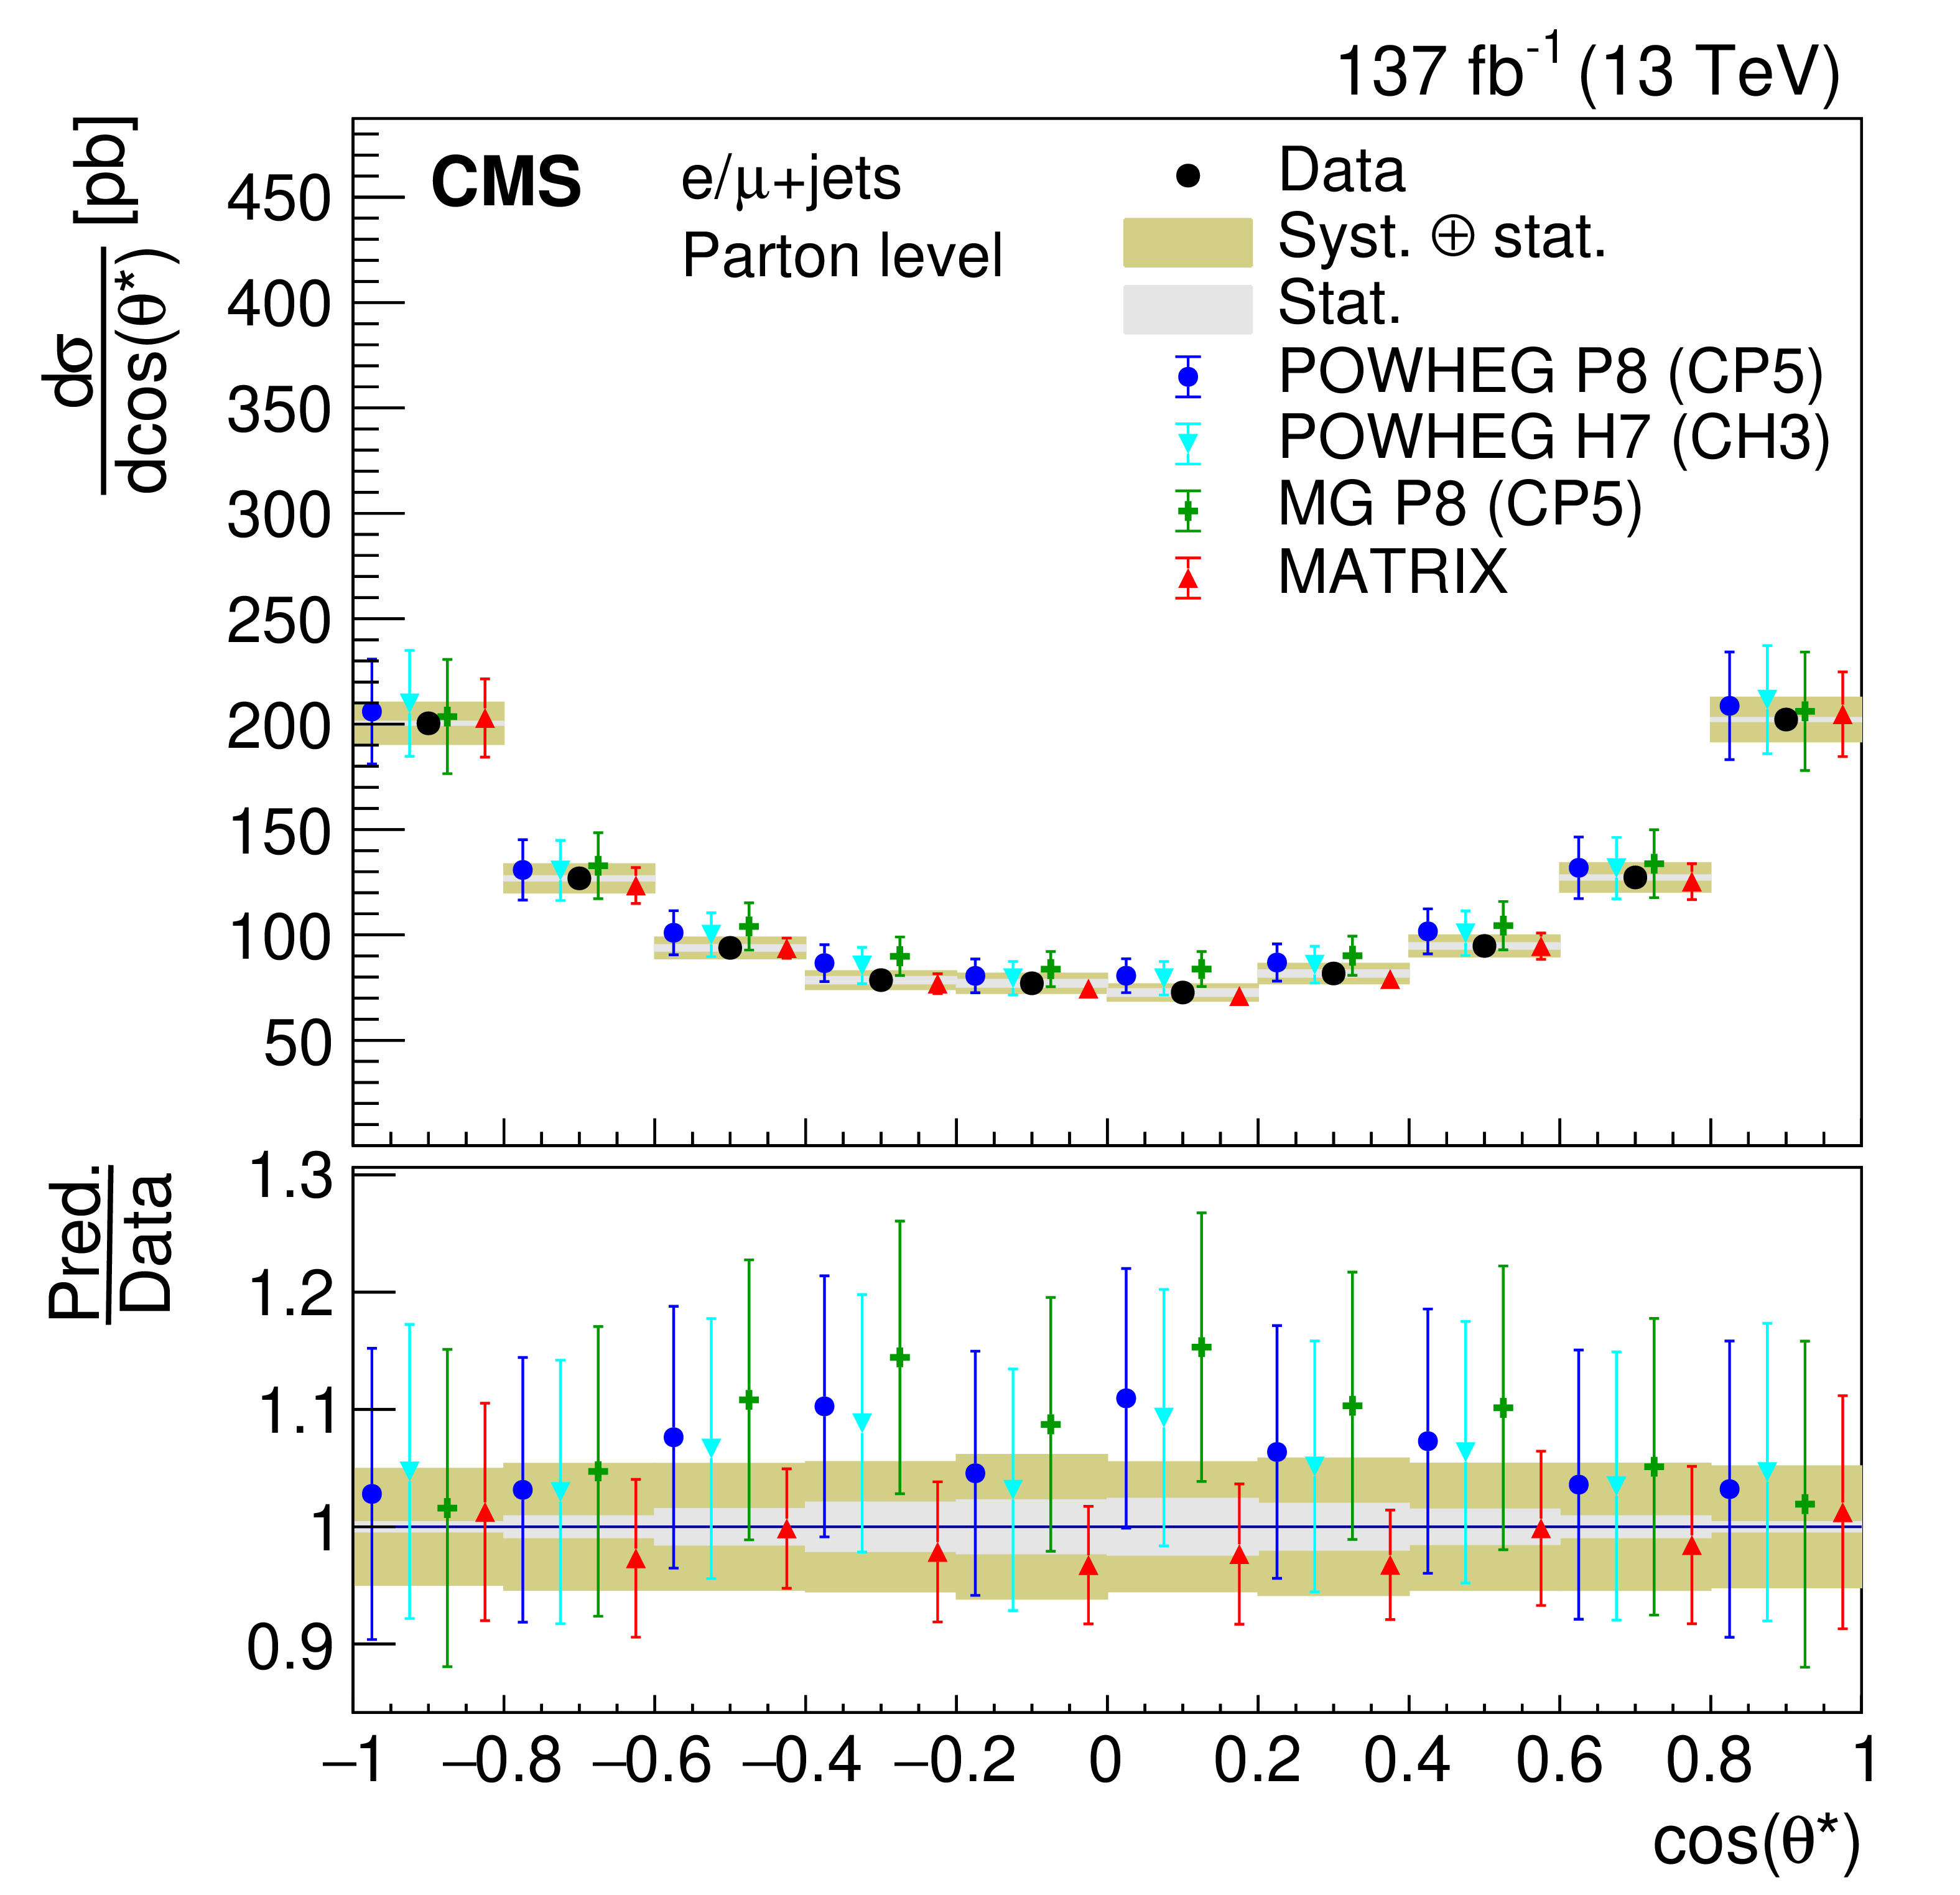
Figure 19:
Differential cross sections at the parton level as a function of kinematic variables of the ${\mathrm{t} \mathrm{\bar{t}}}$ system. The data are shown as points with gray (yellow) bands indicating the statistical (statistical and systematic) uncertainties. The cross sections are compared to the predictions of POWHEG combined with PYTHIA (P8) or HERWIG (H7), the multiparton simulation MG5_aMC@NLO (MG)+PYTHIA FxFx, and the NNLO QCD calculations obtained with Matrix. The ratios of the various predictions to the measured cross sections are shown in the lower panels. |
png pdf |
Figure 19-a:
Differential cross sections at the parton level as a function of kinematic variables of the ${\mathrm{t} \mathrm{\bar{t}}}$ system. The data are shown as points with gray (yellow) bands indicating the statistical (statistical and systematic) uncertainties. The cross sections are compared to the predictions of POWHEG combined with PYTHIA (P8) or HERWIG (H7), the multiparton simulation MG5_aMC@NLO (MG)+PYTHIA FxFx, and the NNLO QCD calculations obtained with Matrix. The ratios of the various predictions to the measured cross sections are shown in the lower panels. |

png pdf |
Figure 19-b:
Differential cross sections at the parton level as a function of kinematic variables of the ${\mathrm{t} \mathrm{\bar{t}}}$ system. The data are shown as points with gray (yellow) bands indicating the statistical (statistical and systematic) uncertainties. The cross sections are compared to the predictions of POWHEG combined with PYTHIA (P8) or HERWIG (H7), the multiparton simulation MG5_aMC@NLO (MG)+PYTHIA FxFx, and the NNLO QCD calculations obtained with Matrix. The ratios of the various predictions to the measured cross sections are shown in the lower panels. |
png pdf |
Figure 19-c:
Differential cross sections at the parton level as a function of kinematic variables of the ${\mathrm{t} \mathrm{\bar{t}}}$ system. The data are shown as points with gray (yellow) bands indicating the statistical (statistical and systematic) uncertainties. The cross sections are compared to the predictions of POWHEG combined with PYTHIA (P8) or HERWIG (H7), the multiparton simulation MG5_aMC@NLO (MG)+PYTHIA FxFx, and the NNLO QCD calculations obtained with Matrix. The ratios of the various predictions to the measured cross sections are shown in the lower panels. |
png pdf |
Figure 19-d:
Differential cross sections at the parton level as a function of kinematic variables of the ${\mathrm{t} \mathrm{\bar{t}}}$ system. The data are shown as points with gray (yellow) bands indicating the statistical (statistical and systematic) uncertainties. The cross sections are compared to the predictions of POWHEG combined with PYTHIA (P8) or HERWIG (H7), the multiparton simulation MG5_aMC@NLO (MG)+PYTHIA FxFx, and the NNLO QCD calculations obtained with Matrix. The ratios of the various predictions to the measured cross sections are shown in the lower panels. |
png pdf |
Figure 19-e:
Differential cross sections at the parton level as a function of kinematic variables of the ${\mathrm{t} \mathrm{\bar{t}}}$ system. The data are shown as points with gray (yellow) bands indicating the statistical (statistical and systematic) uncertainties. The cross sections are compared to the predictions of POWHEG combined with PYTHIA (P8) or HERWIG (H7), the multiparton simulation MG5_aMC@NLO (MG)+PYTHIA FxFx, and the NNLO QCD calculations obtained with Matrix. The ratios of the various predictions to the measured cross sections are shown in the lower panels. |
png pdf |
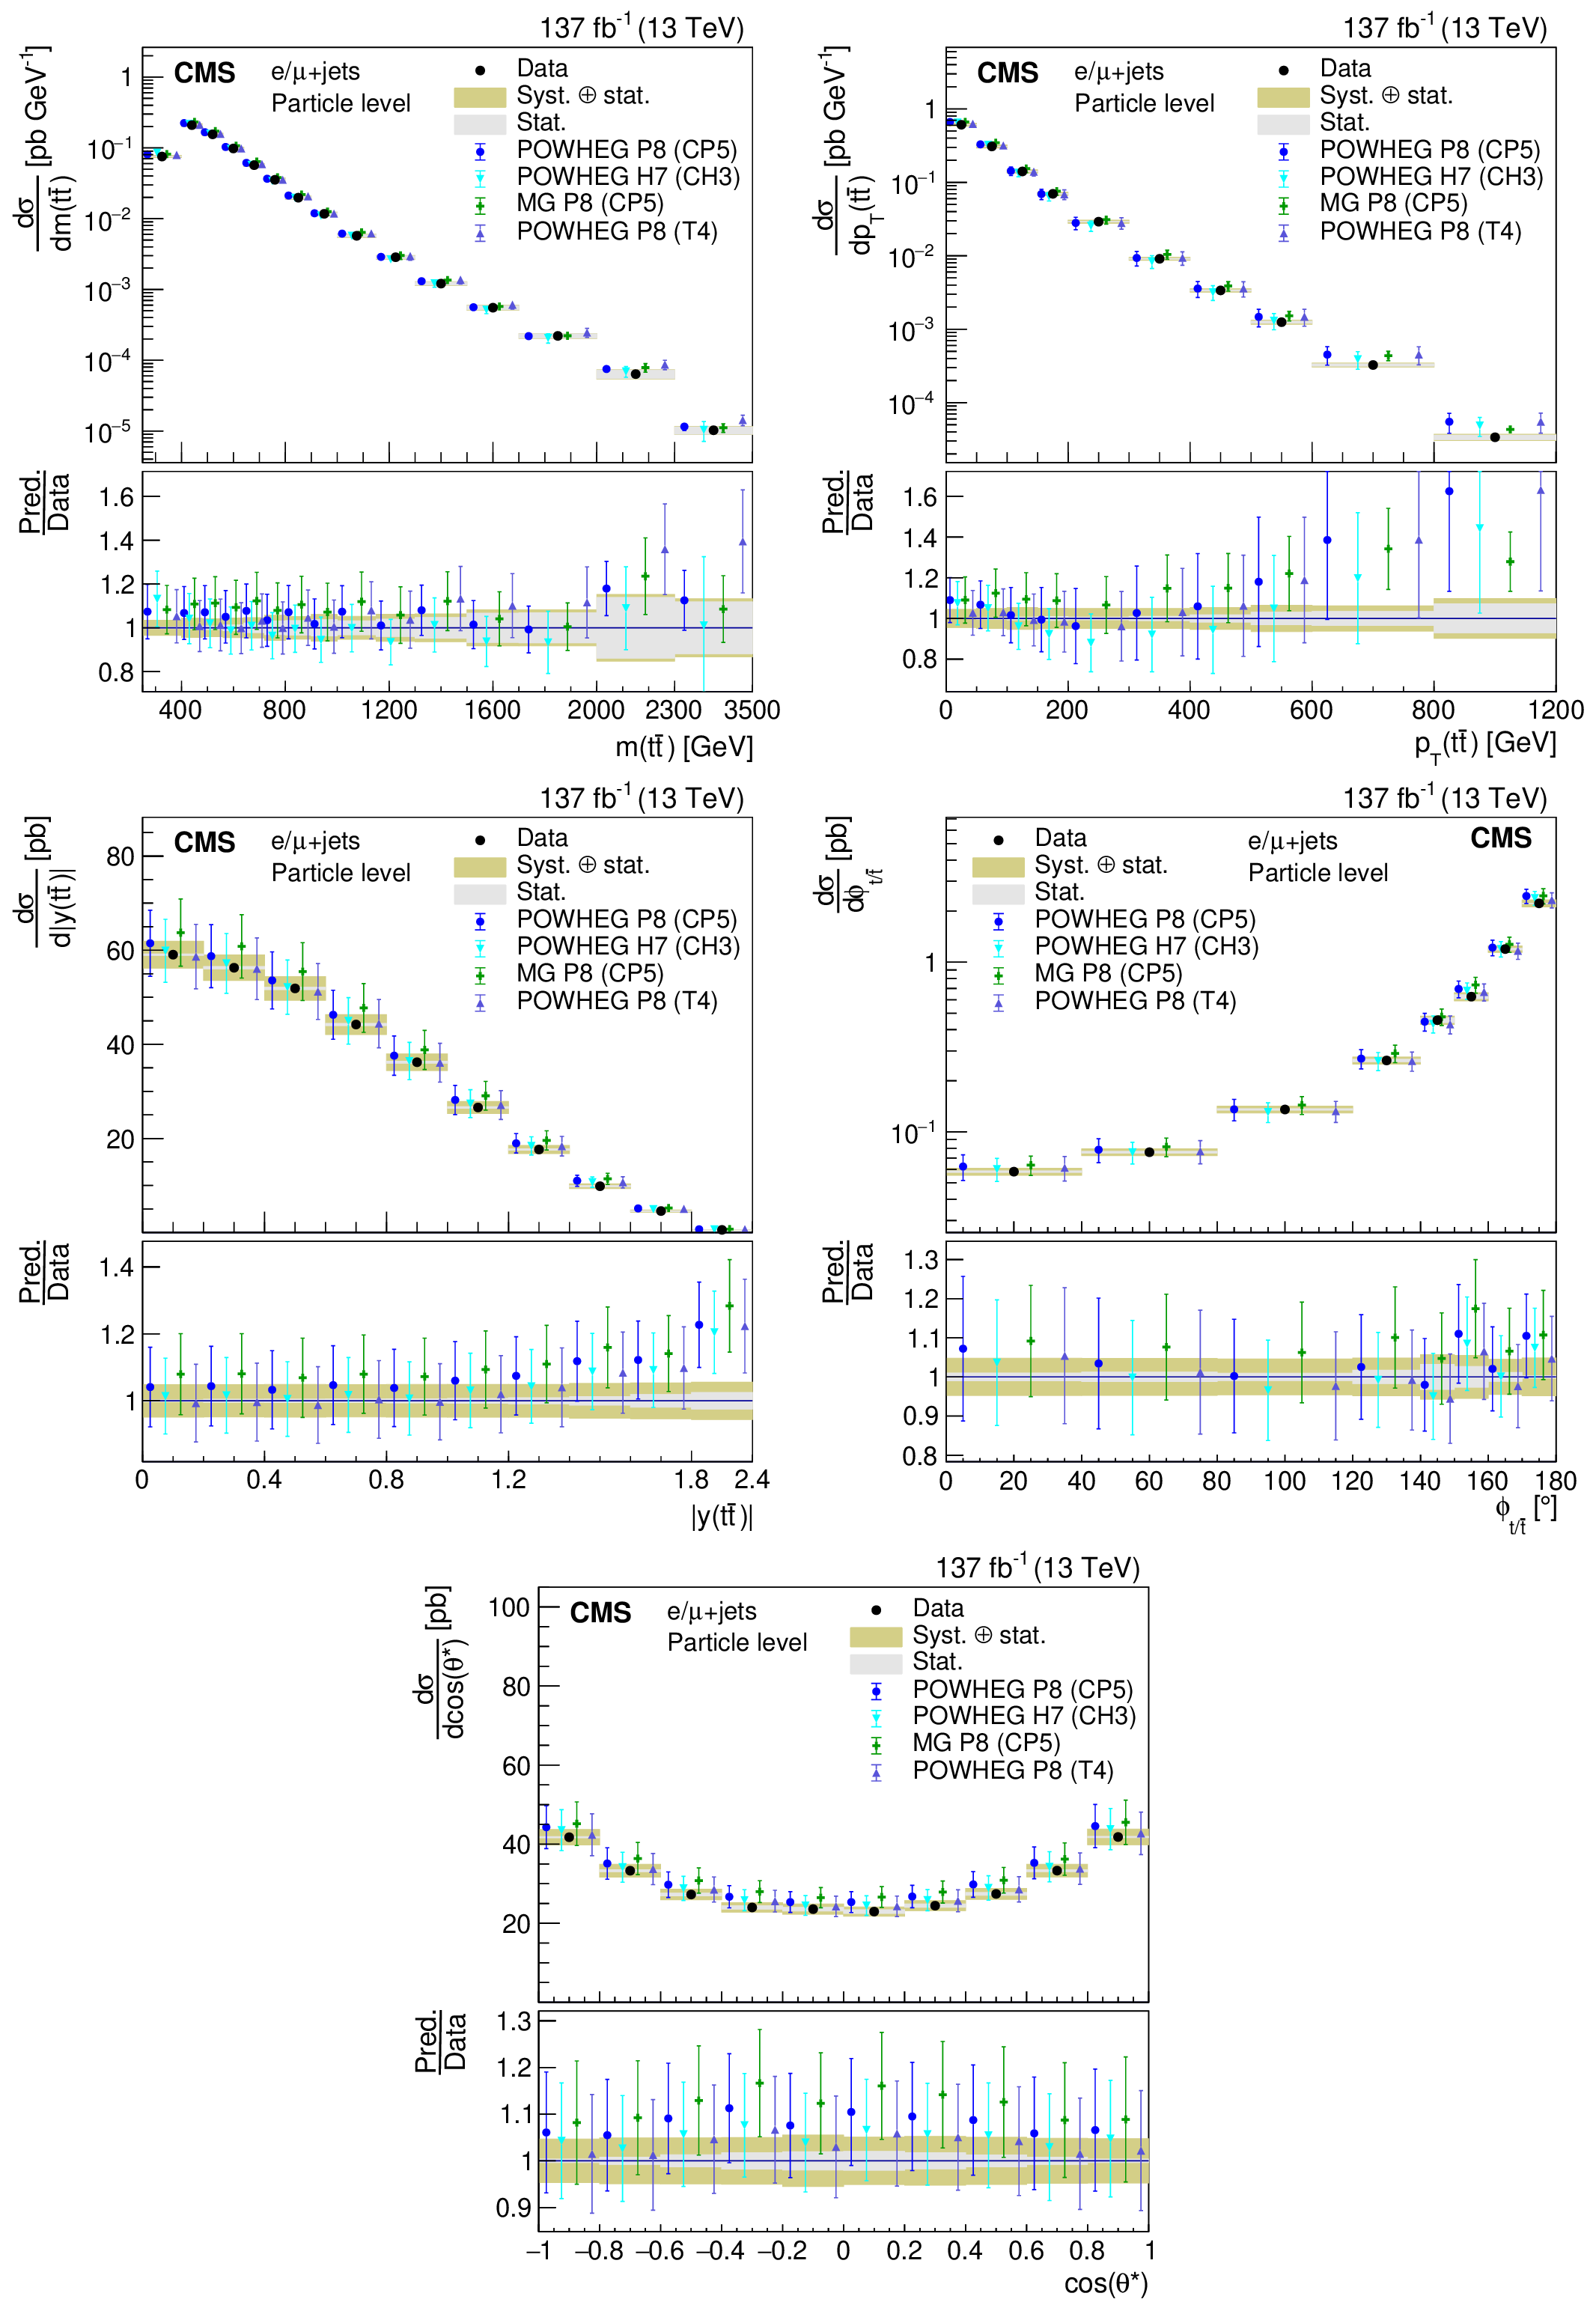
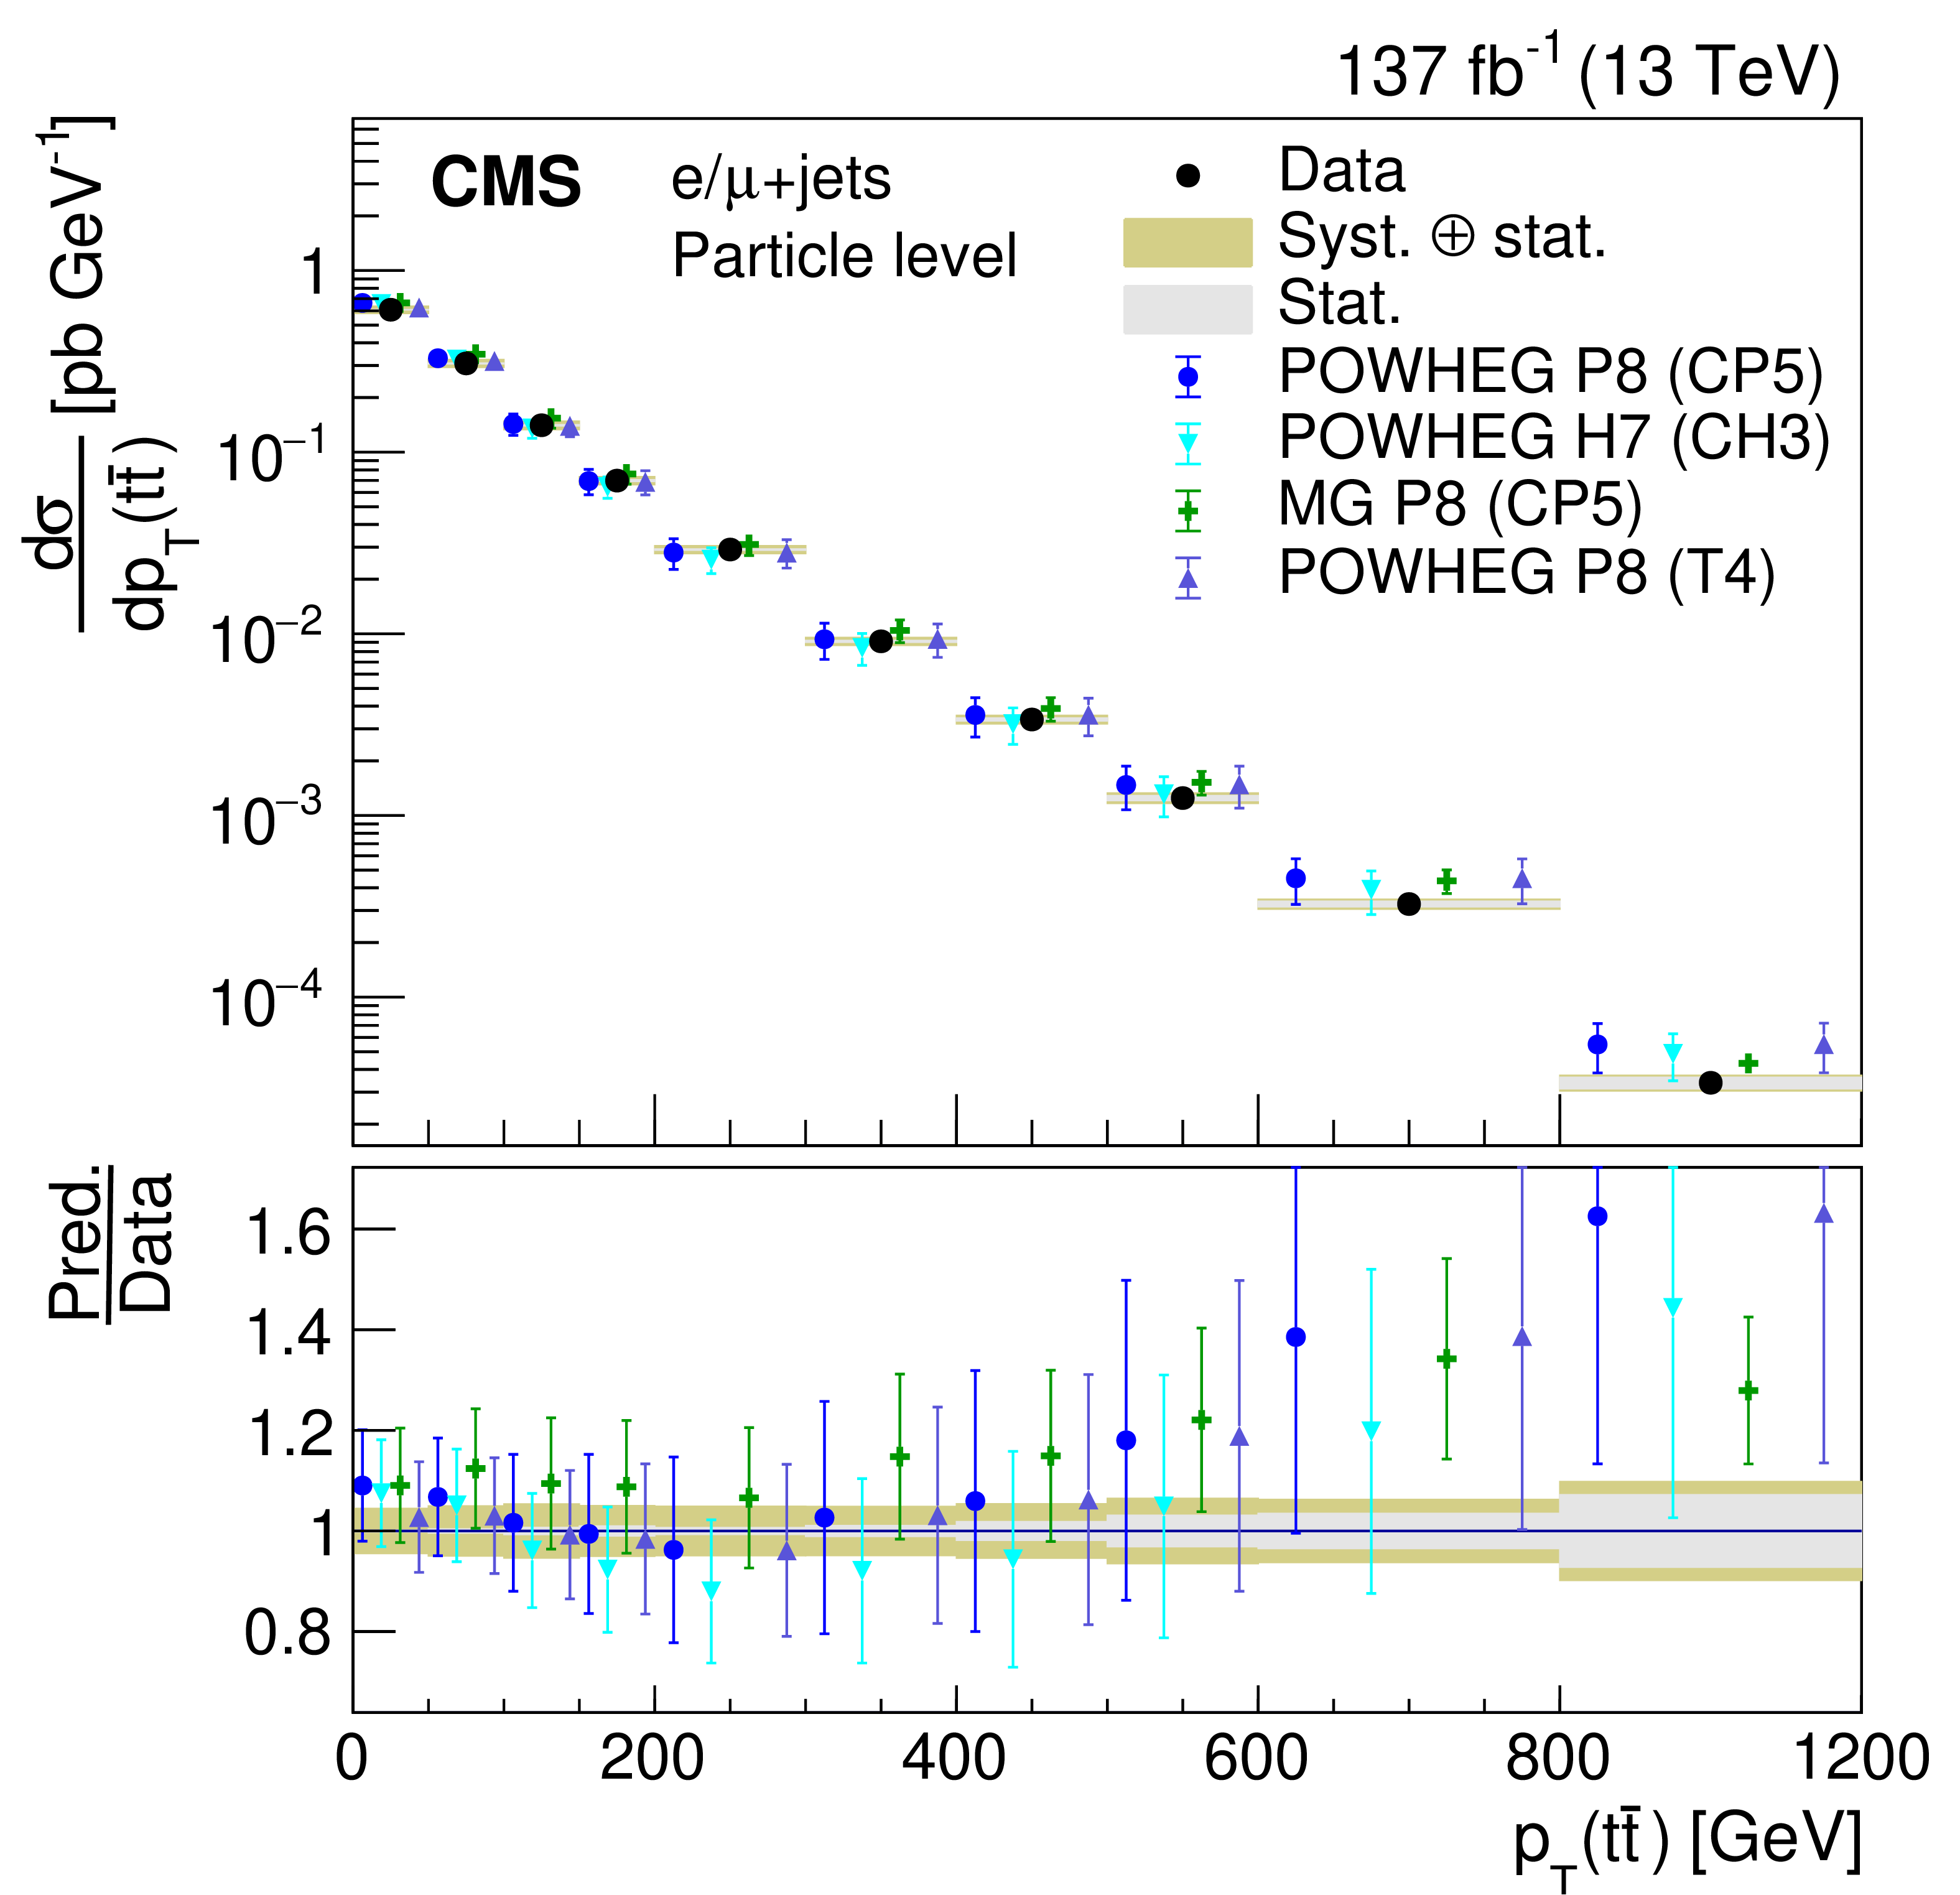
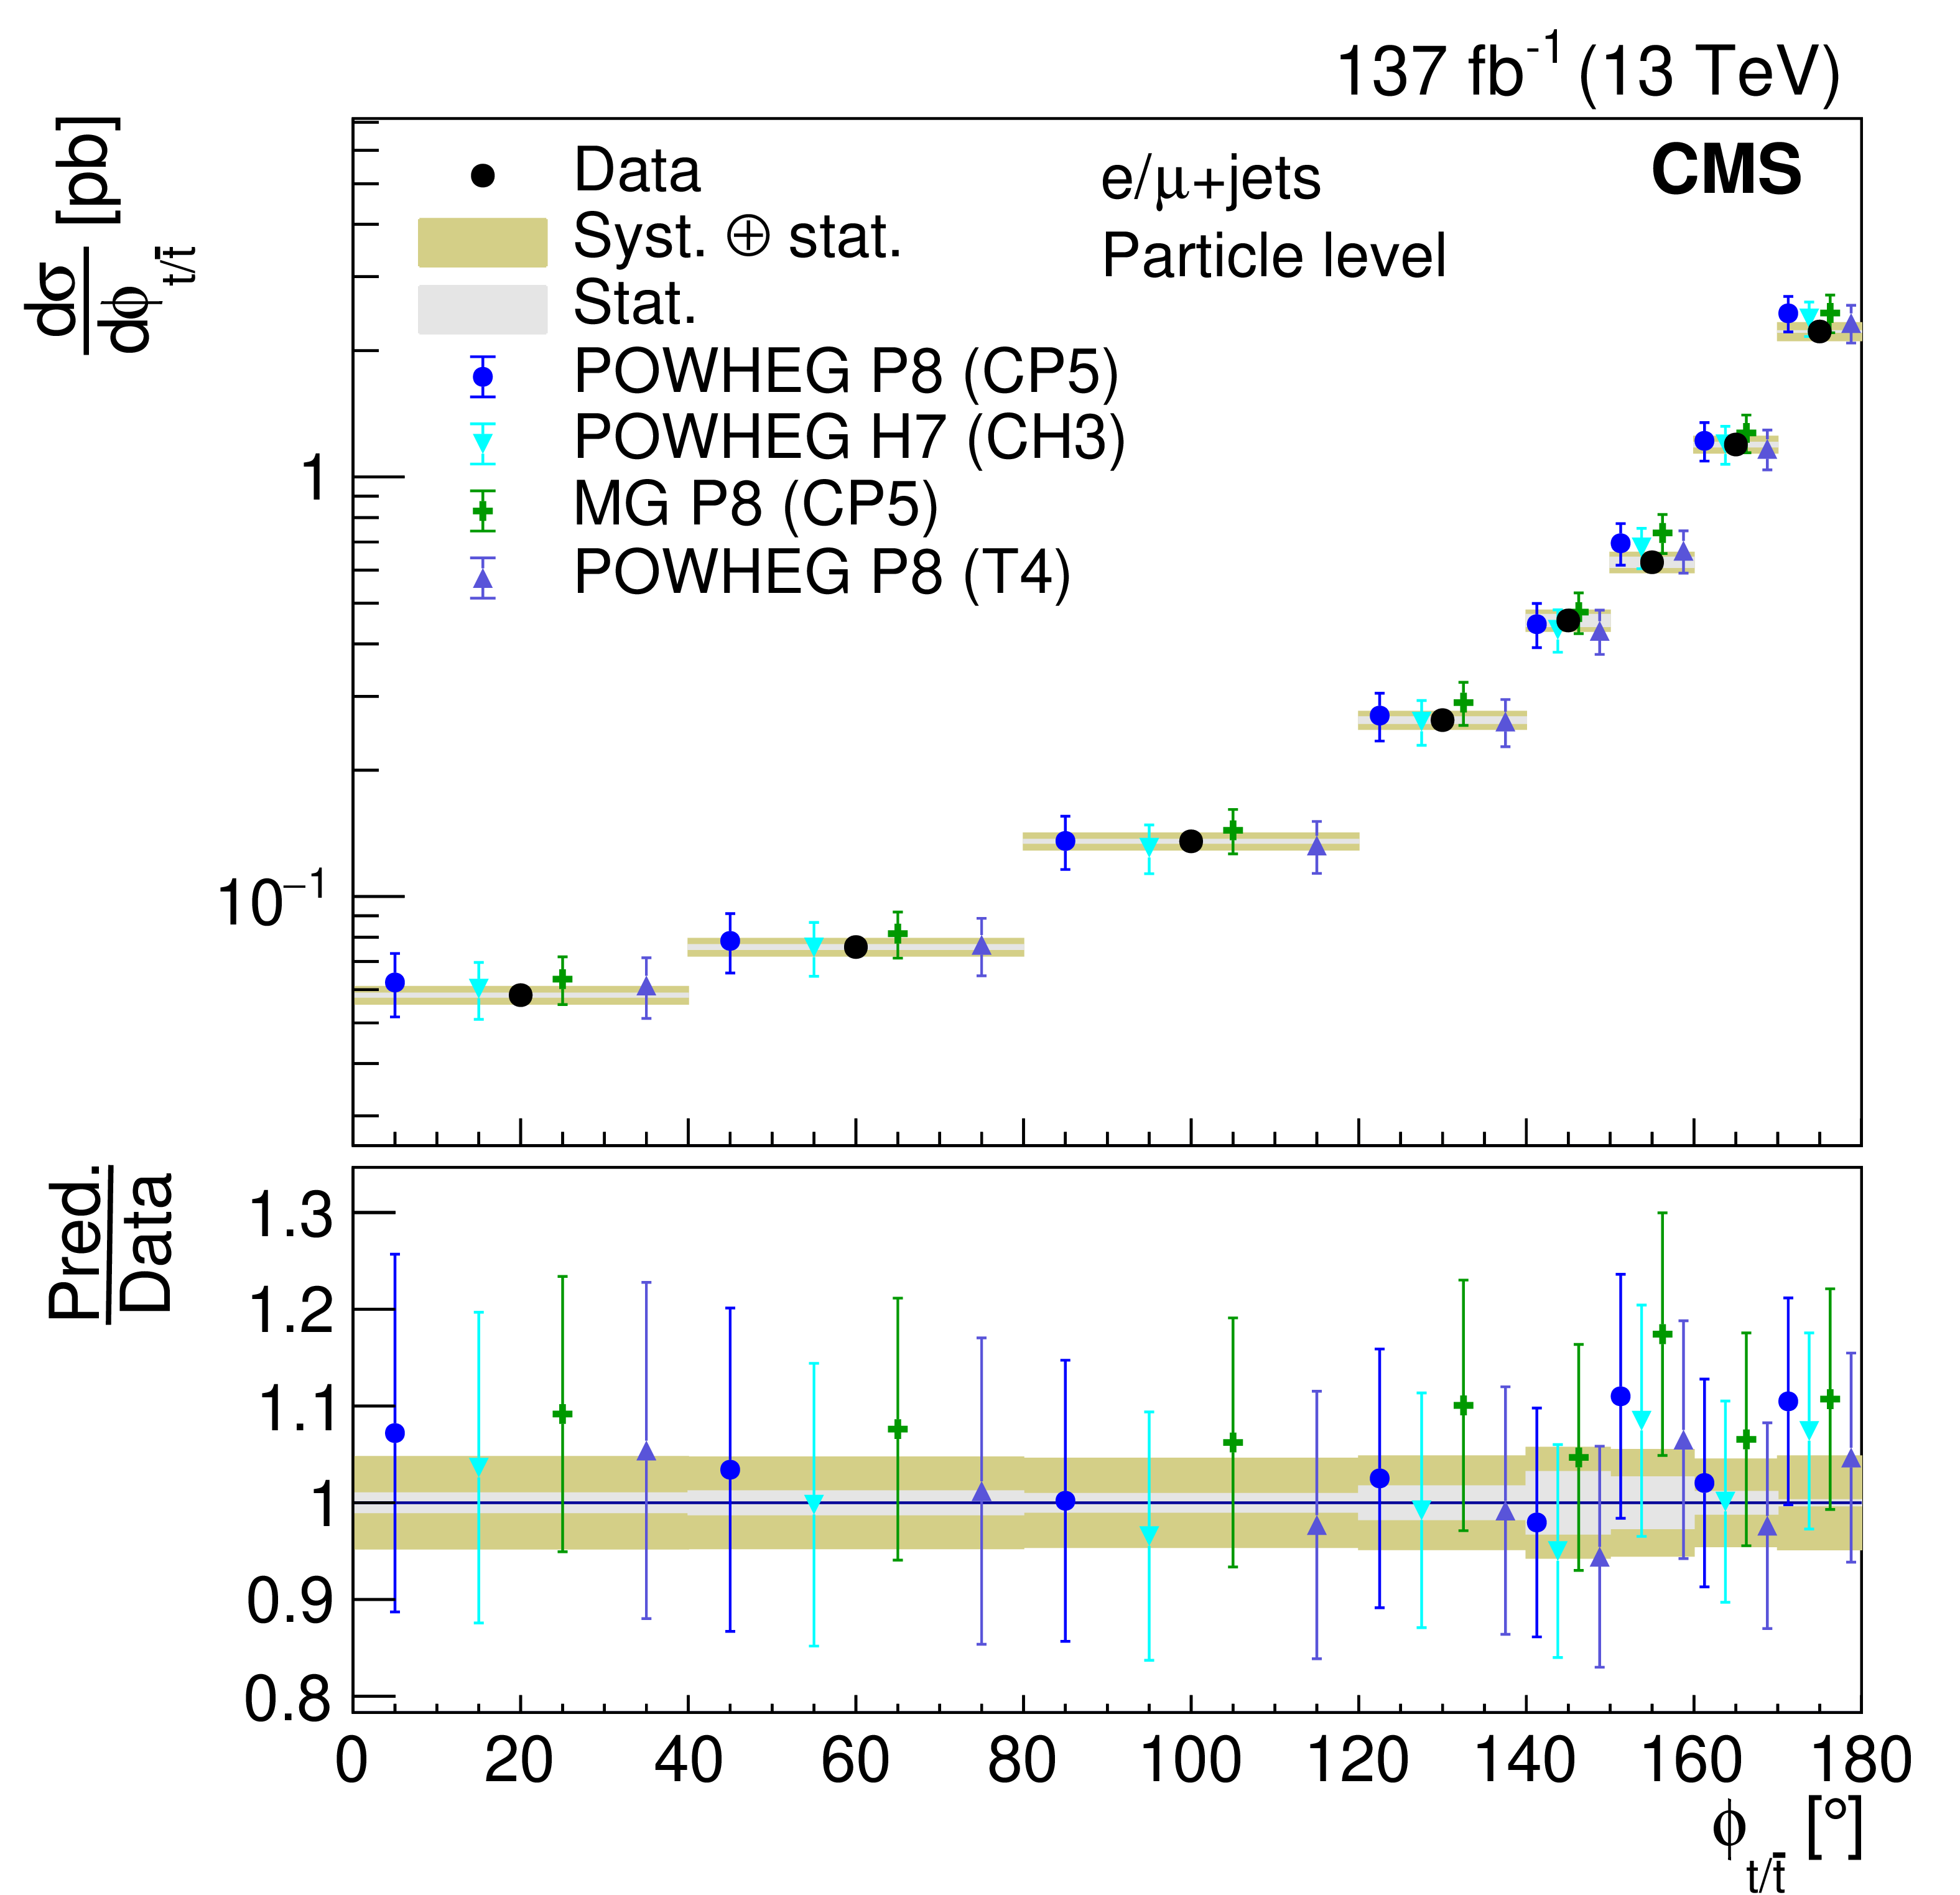
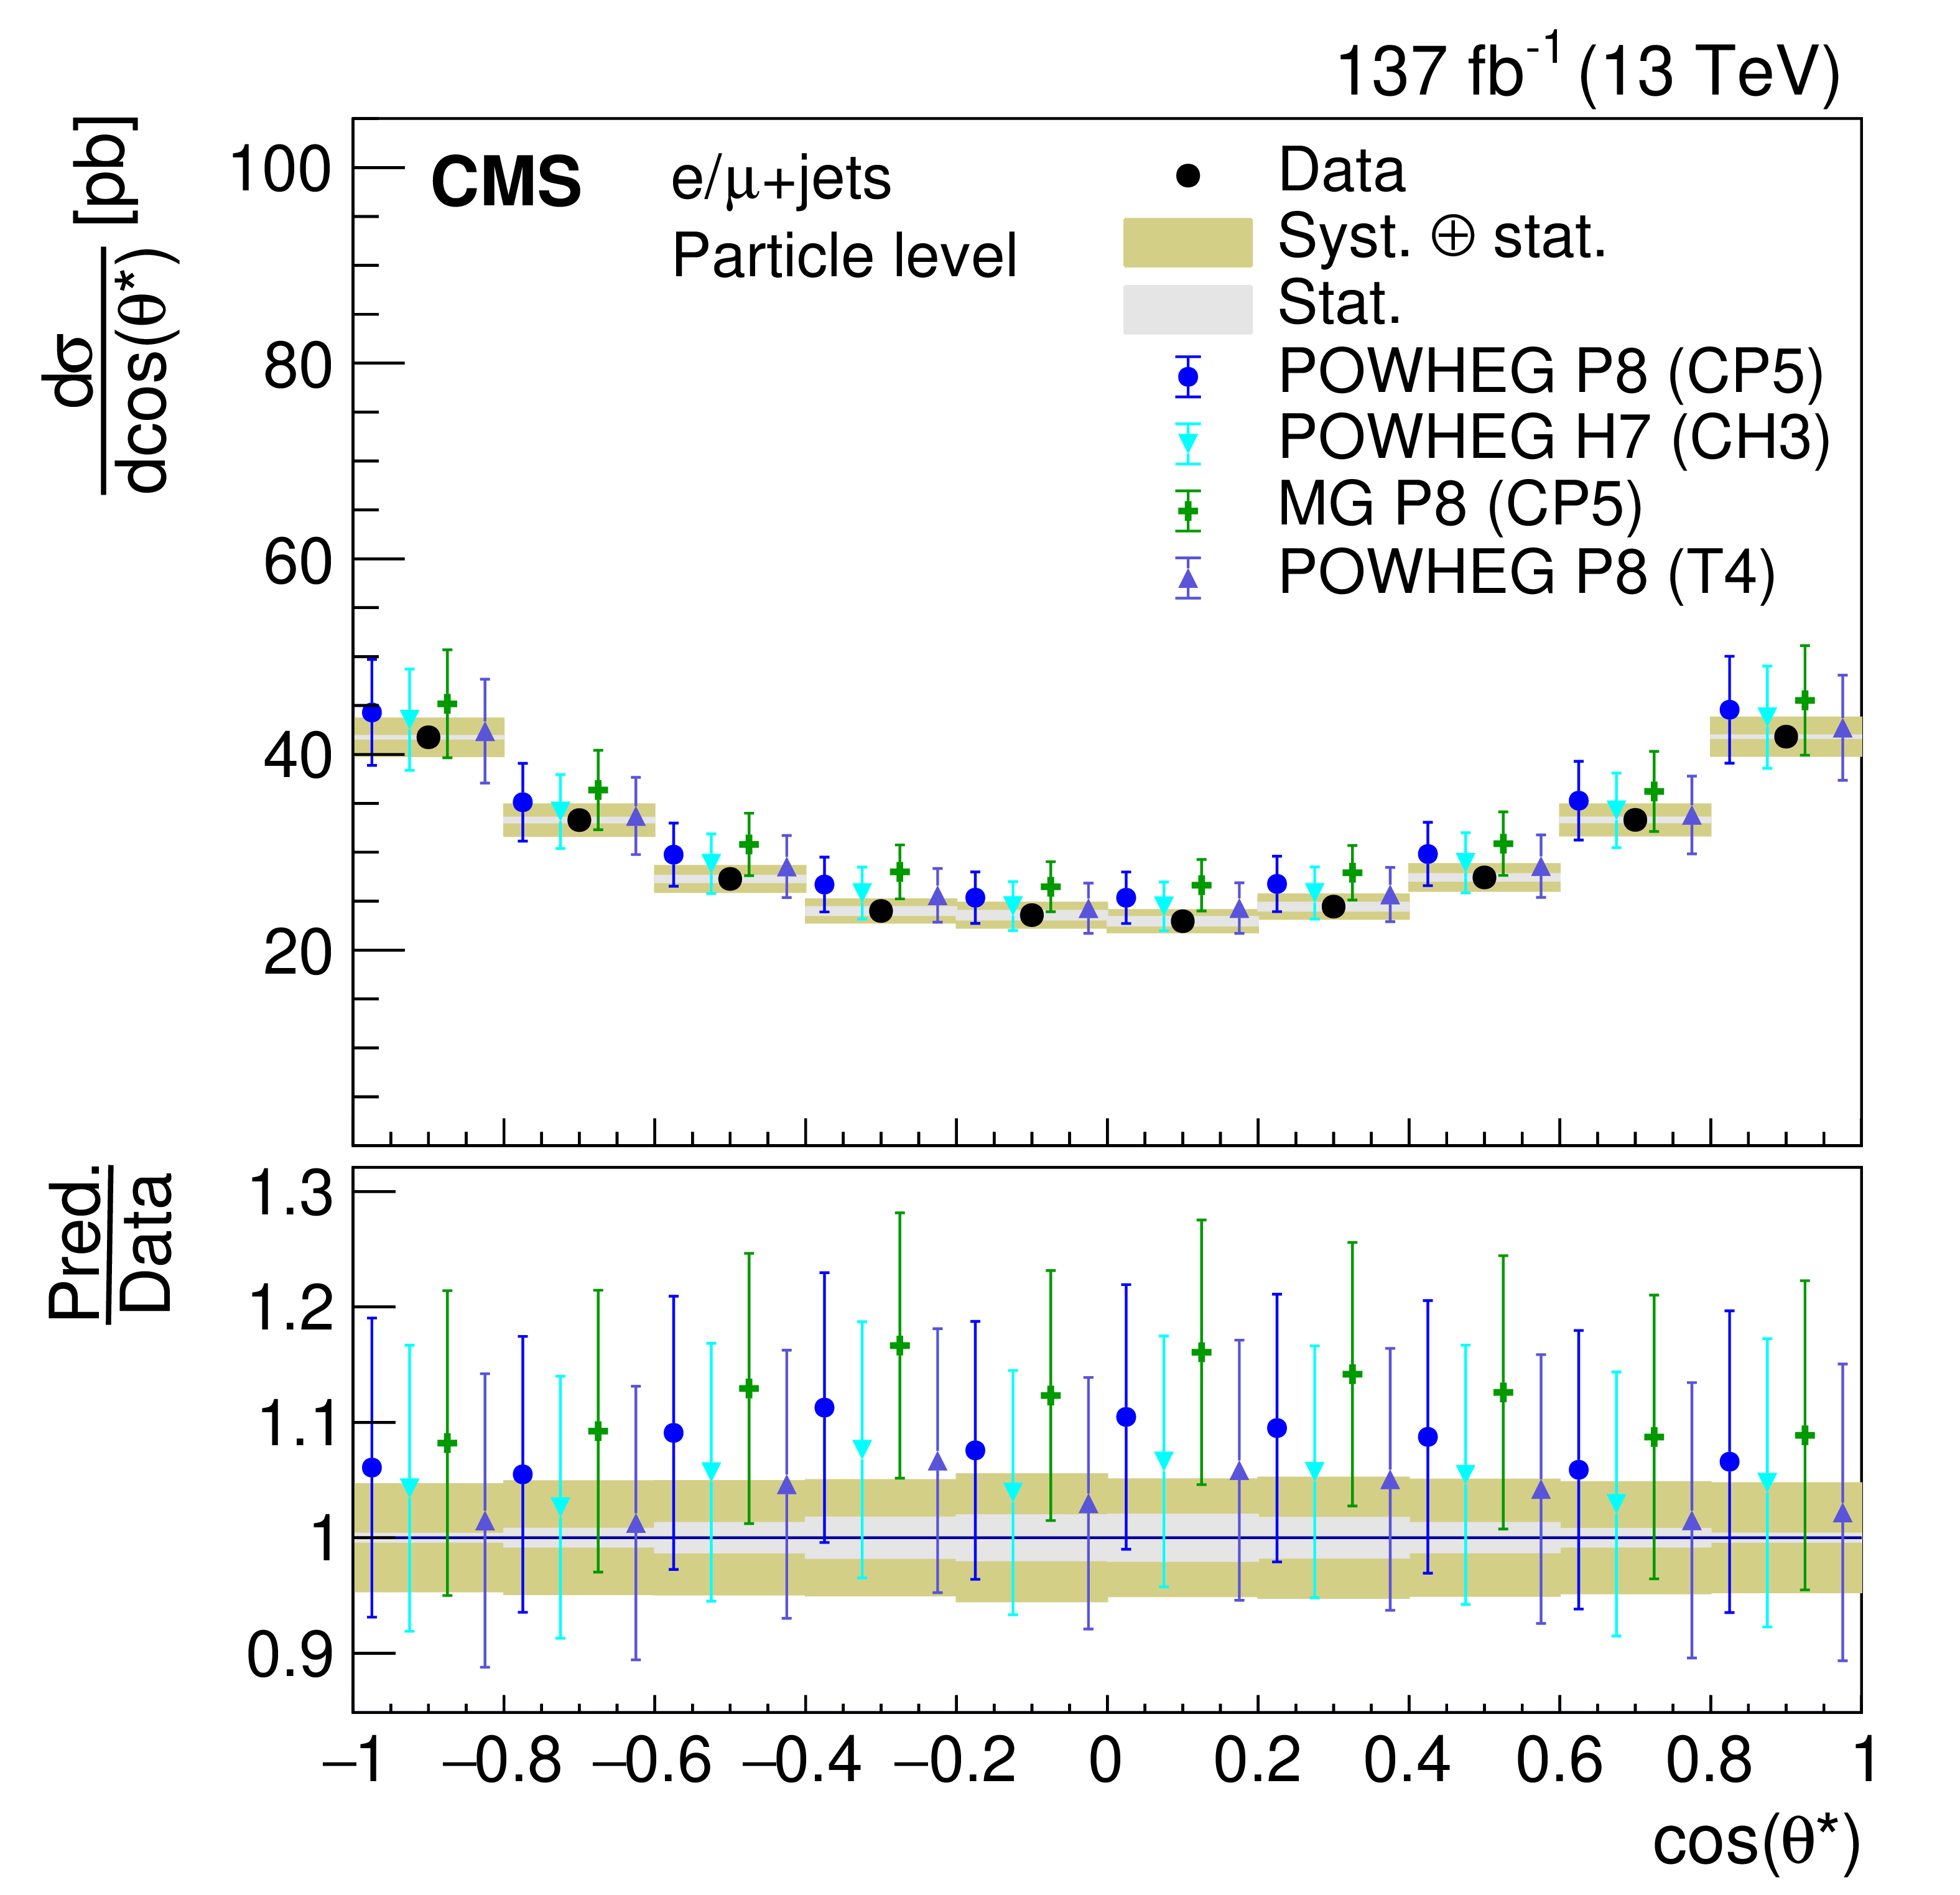
Figure 20:
Differential cross sections at the particle level as a function of kinematic variables of the ${\mathrm{t} \mathrm{\bar{t}}}$ system. The data are shown as points with gray (yellow) bands indicating the statistical (statistical and systematic) uncertainties. The cross sections are compared to the predictions of POWHEG+PYTHIA (P8) for the CP5 and CUETP8M2T4 (T4) tunes, POWHEG+HERWIG (H7), and the multiparton simulation MG5_aMC@NLO (MG)+PYTHIA. The ratios of the various predictions to the measured cross sections are shown in the lower panels. |

png pdf |
Figure 20-a:
Differential cross sections at the particle level as a function of kinematic variables of the ${\mathrm{t} \mathrm{\bar{t}}}$ system. The data are shown as points with gray (yellow) bands indicating the statistical (statistical and systematic) uncertainties. The cross sections are compared to the predictions of POWHEG+PYTHIA (P8) for the CP5 and CUETP8M2T4 (T4) tunes, POWHEG+HERWIG (H7), and the multiparton simulation MG5_aMC@NLO (MG)+PYTHIA. The ratios of the various predictions to the measured cross sections are shown in the lower panels. |
png pdf |
Figure 20-b:
Differential cross sections at the particle level as a function of kinematic variables of the ${\mathrm{t} \mathrm{\bar{t}}}$ system. The data are shown as points with gray (yellow) bands indicating the statistical (statistical and systematic) uncertainties. The cross sections are compared to the predictions of POWHEG+PYTHIA (P8) for the CP5 and CUETP8M2T4 (T4) tunes, POWHEG+HERWIG (H7), and the multiparton simulation MG5_aMC@NLO (MG)+PYTHIA. The ratios of the various predictions to the measured cross sections are shown in the lower panels. |

png pdf |
Figure 20-c:
Differential cross sections at the particle level as a function of kinematic variables of the ${\mathrm{t} \mathrm{\bar{t}}}$ system. The data are shown as points with gray (yellow) bands indicating the statistical (statistical and systematic) uncertainties. The cross sections are compared to the predictions of POWHEG+PYTHIA (P8) for the CP5 and CUETP8M2T4 (T4) tunes, POWHEG+HERWIG (H7), and the multiparton simulation MG5_aMC@NLO (MG)+PYTHIA. The ratios of the various predictions to the measured cross sections are shown in the lower panels. |
png pdf |
Figure 20-d:
Differential cross sections at the particle level as a function of kinematic variables of the ${\mathrm{t} \mathrm{\bar{t}}}$ system. The data are shown as points with gray (yellow) bands indicating the statistical (statistical and systematic) uncertainties. The cross sections are compared to the predictions of POWHEG+PYTHIA (P8) for the CP5 and CUETP8M2T4 (T4) tunes, POWHEG+HERWIG (H7), and the multiparton simulation MG5_aMC@NLO (MG)+PYTHIA. The ratios of the various predictions to the measured cross sections are shown in the lower panels. |
png pdf |
Figure 20-e:
Differential cross sections at the particle level as a function of kinematic variables of the ${\mathrm{t} \mathrm{\bar{t}}}$ system. The data are shown as points with gray (yellow) bands indicating the statistical (statistical and systematic) uncertainties. The cross sections are compared to the predictions of POWHEG+PYTHIA (P8) for the CP5 and CUETP8M2T4 (T4) tunes, POWHEG+HERWIG (H7), and the multiparton simulation MG5_aMC@NLO (MG)+PYTHIA. The ratios of the various predictions to the measured cross sections are shown in the lower panels. |
png pdf |
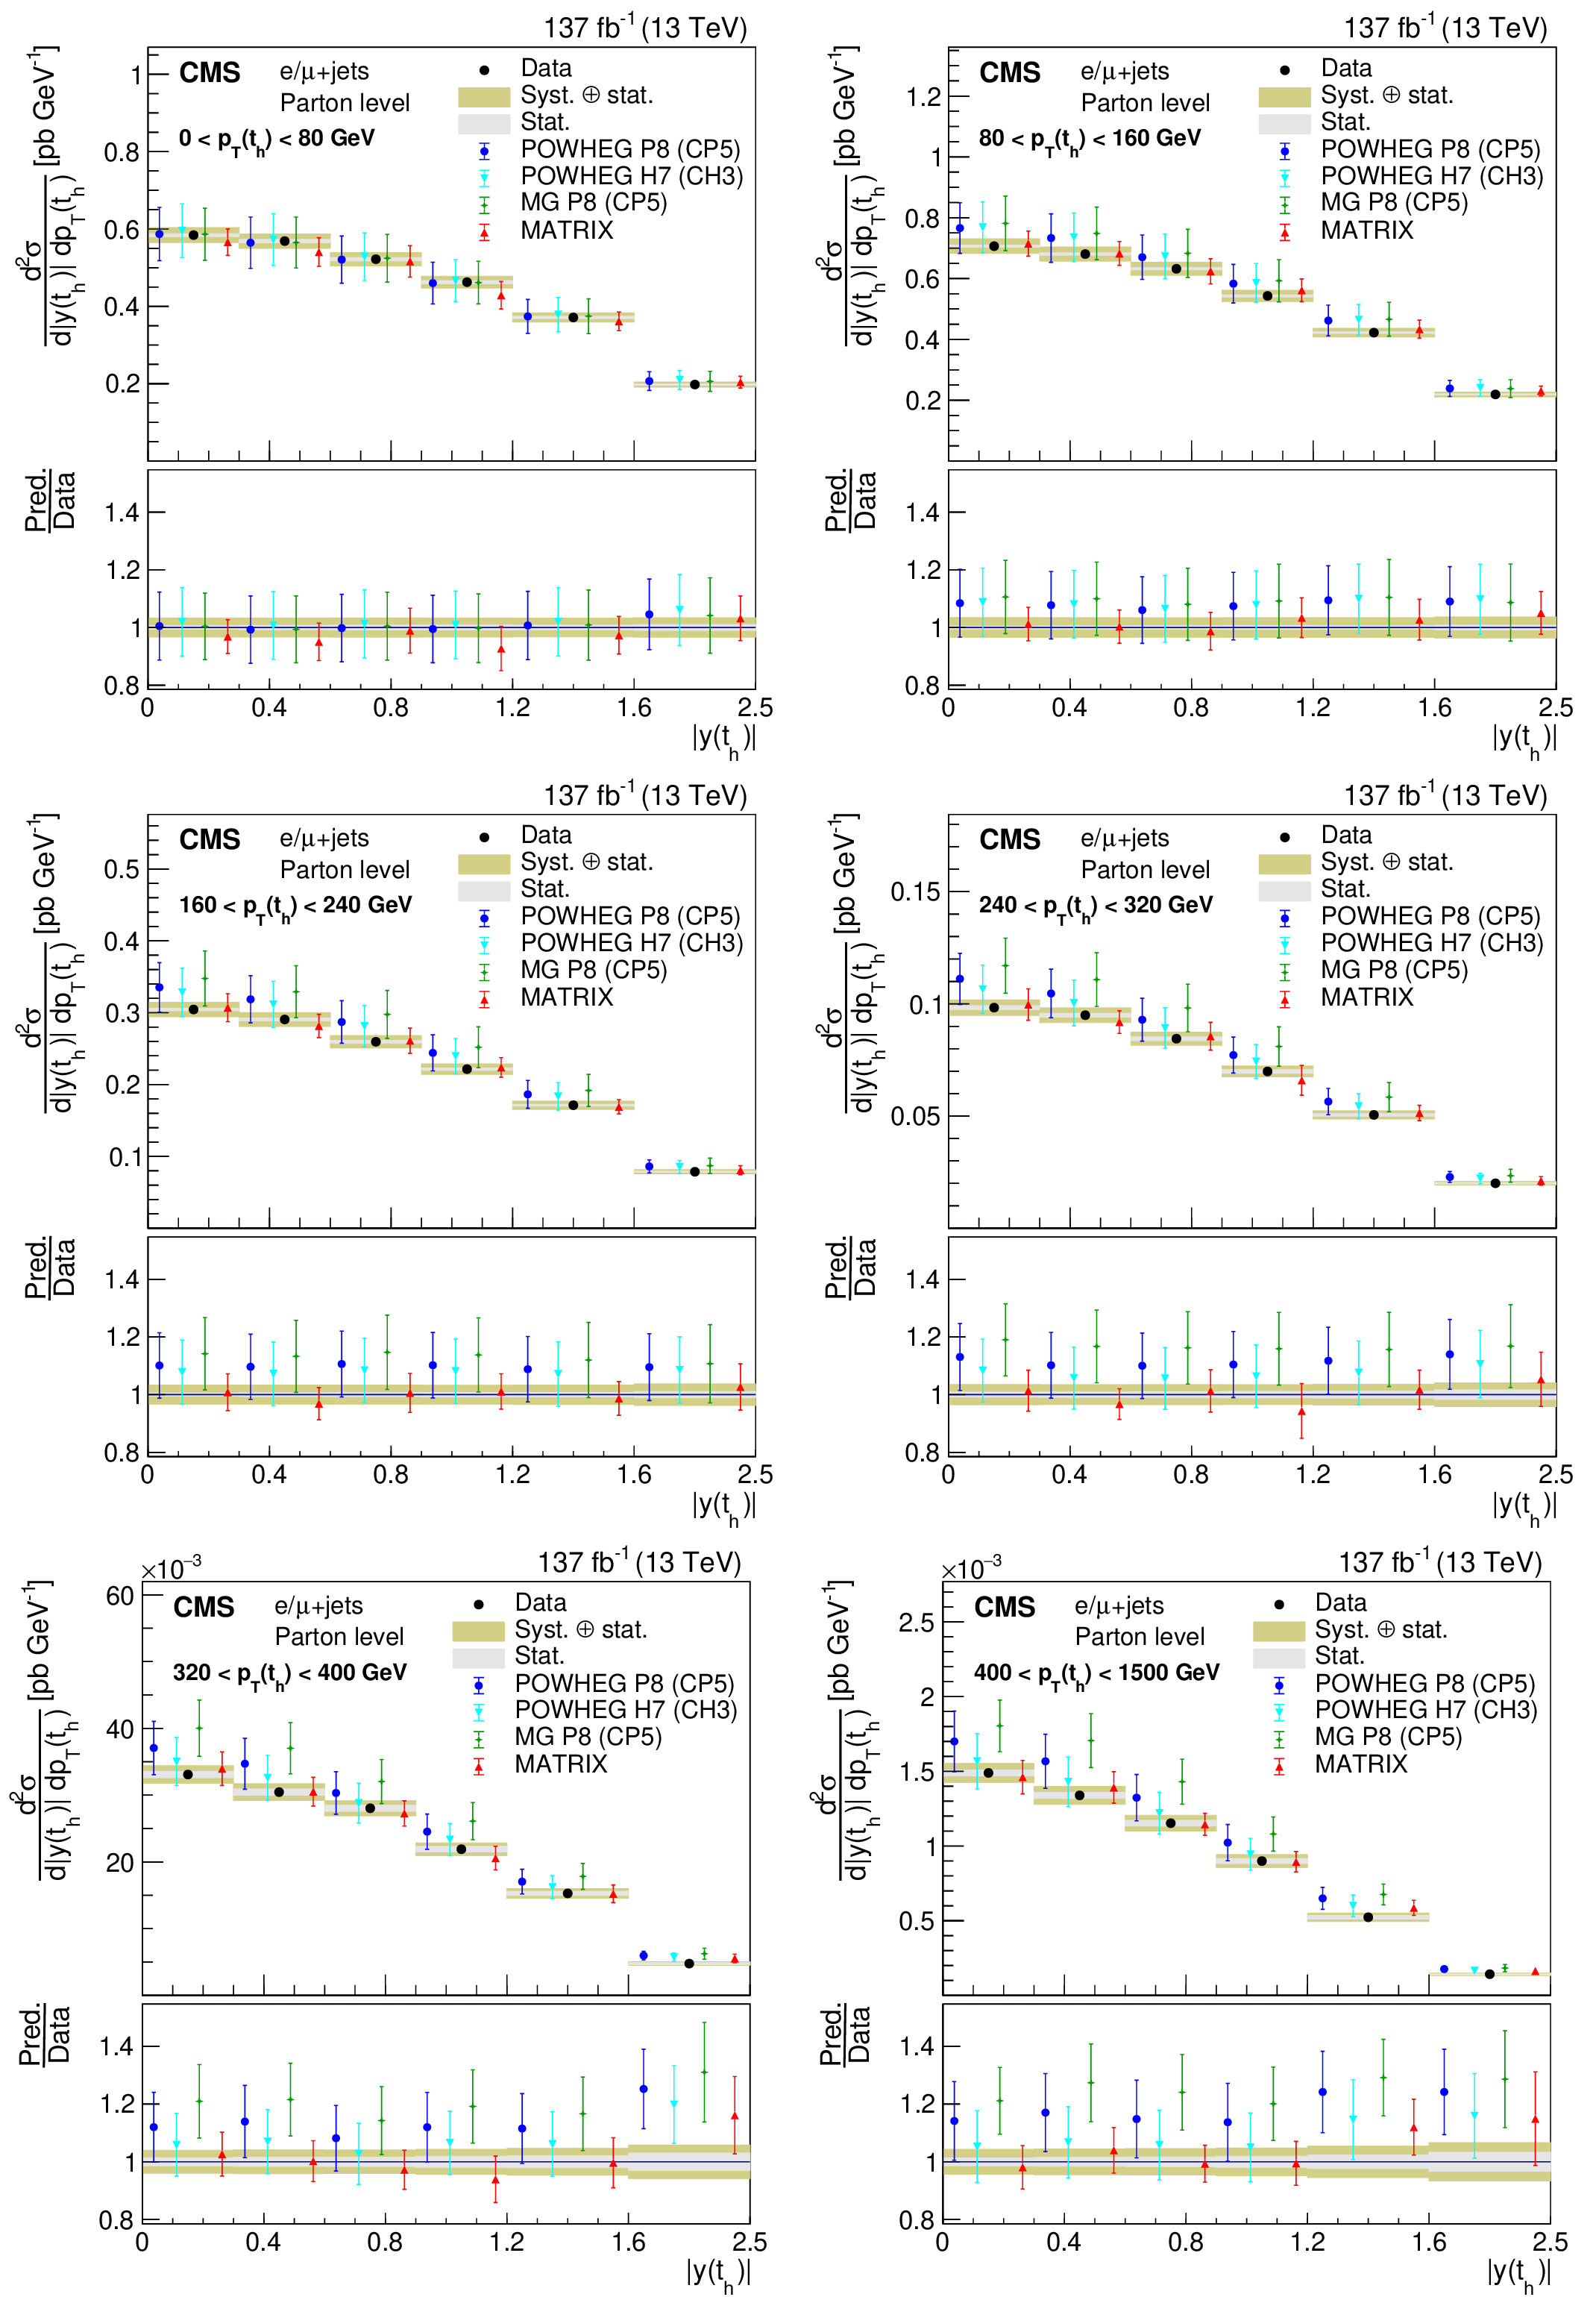
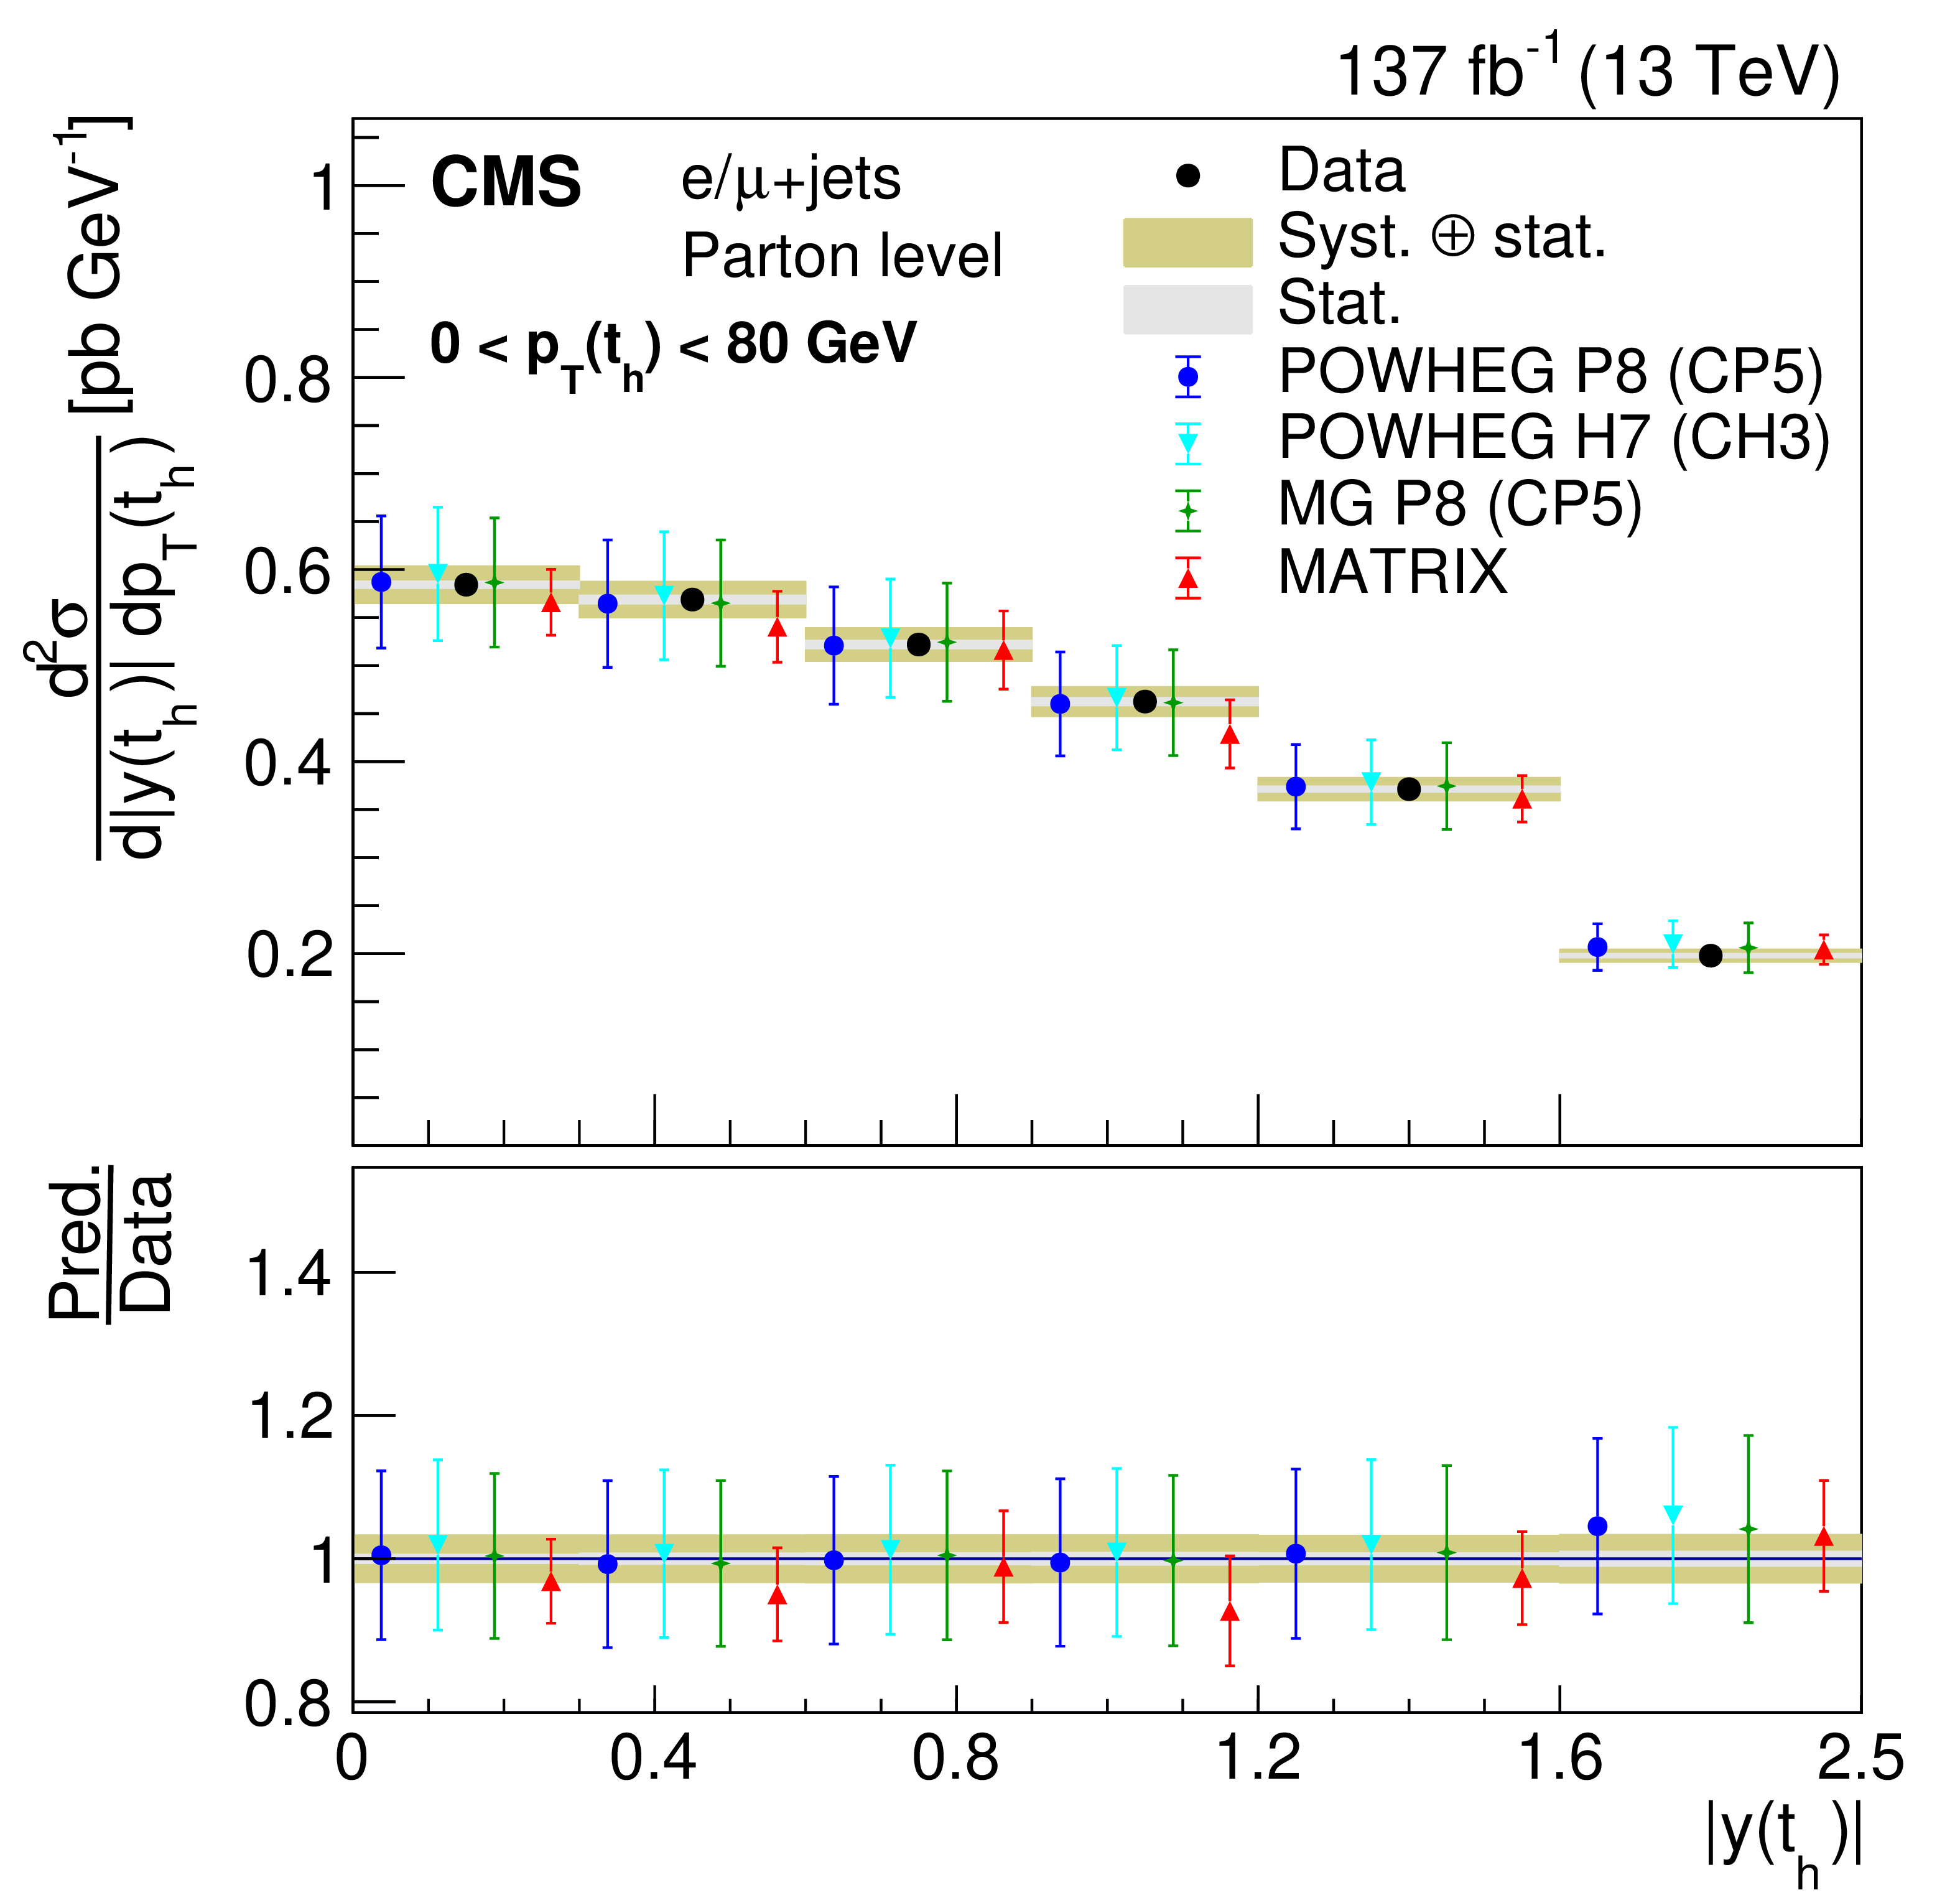
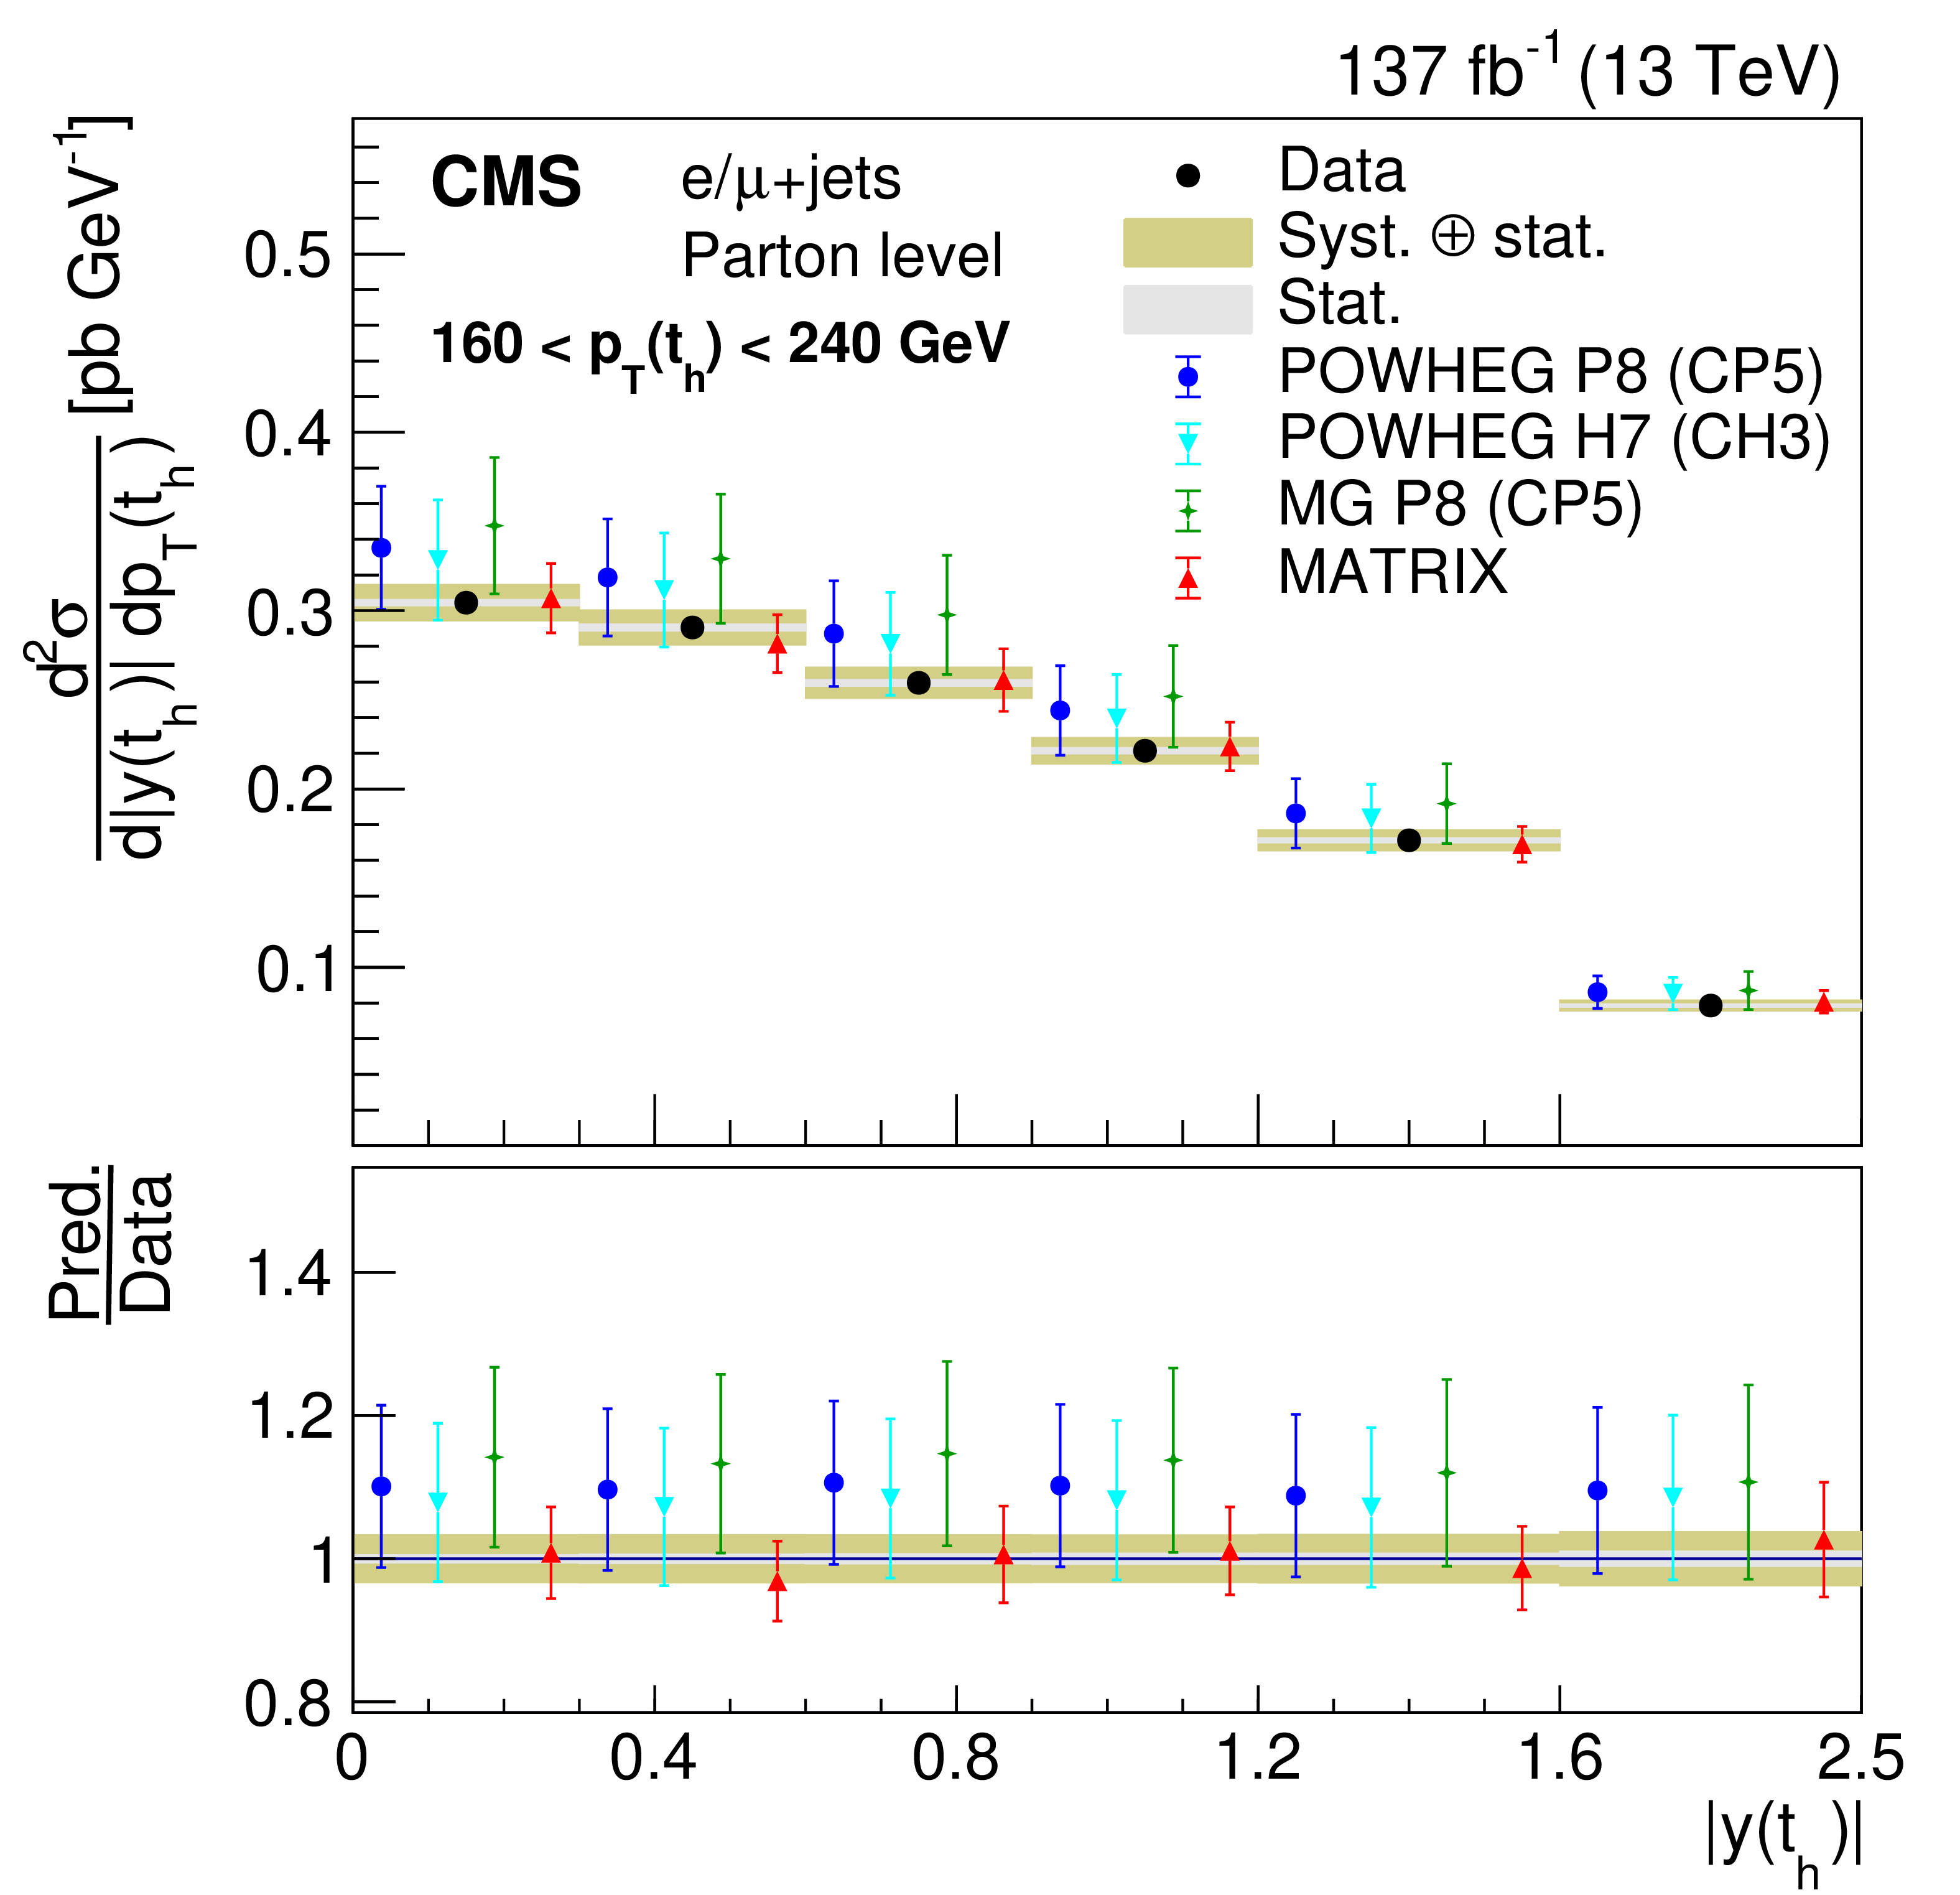
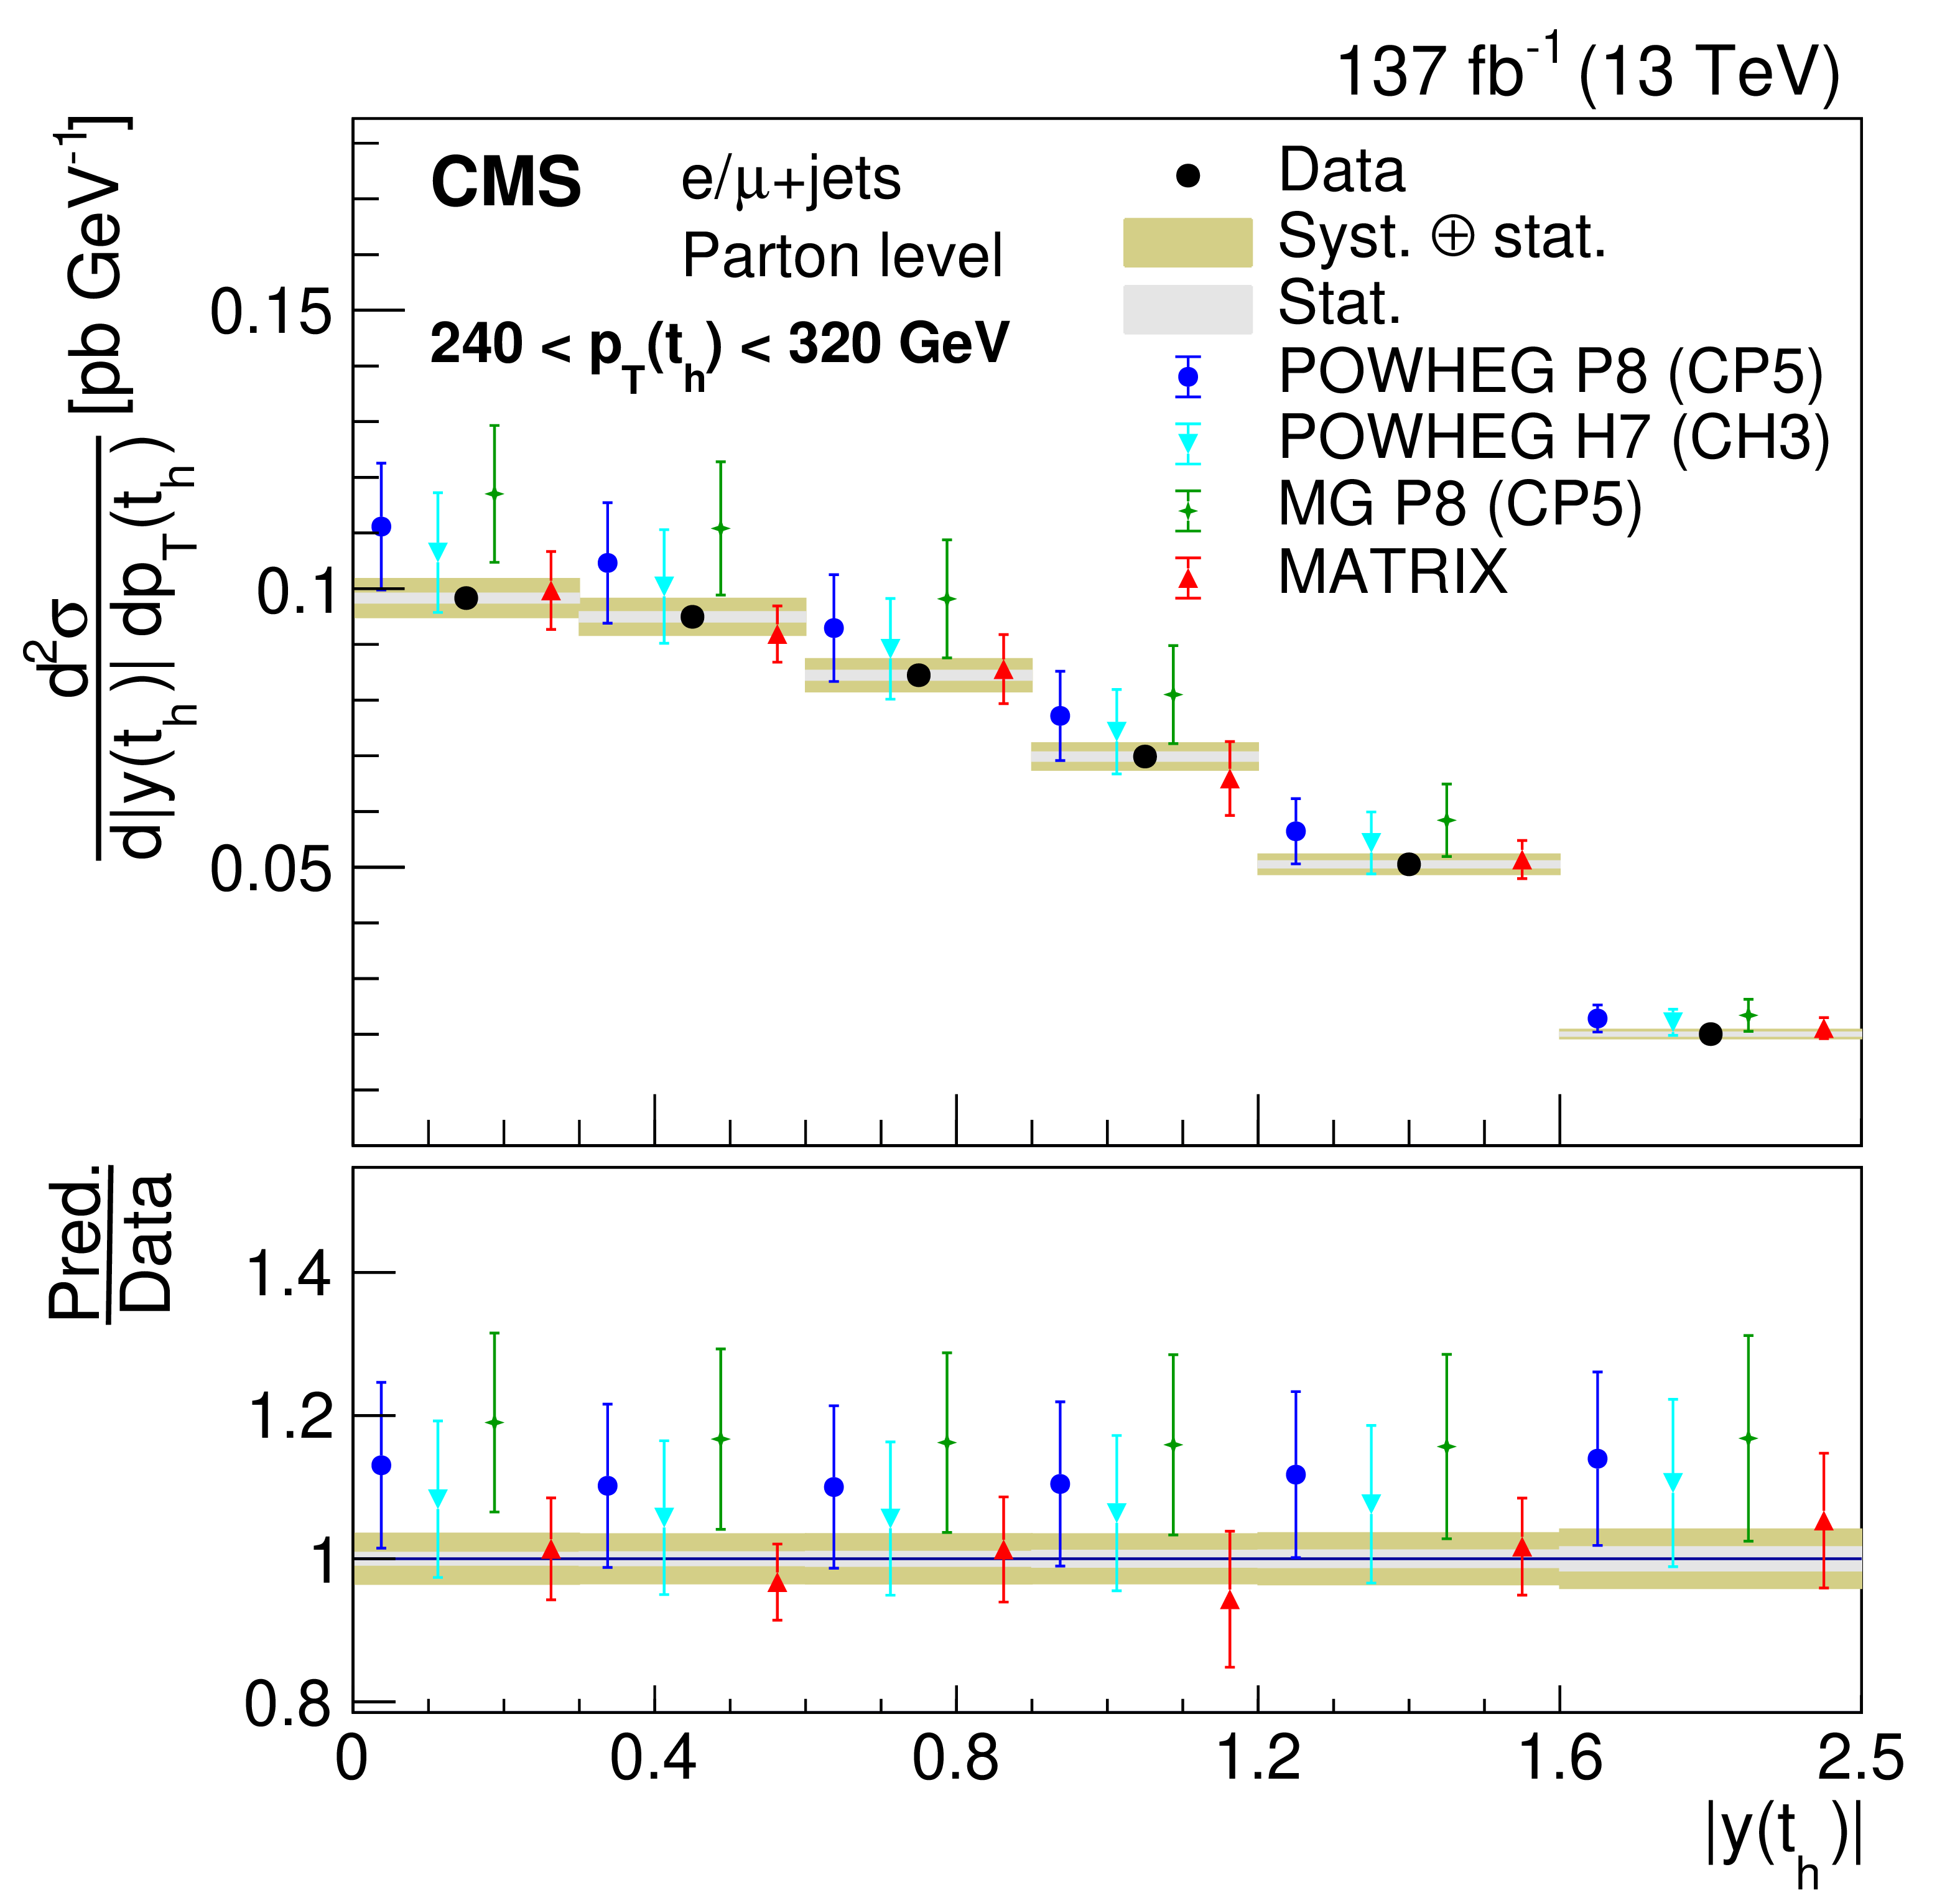
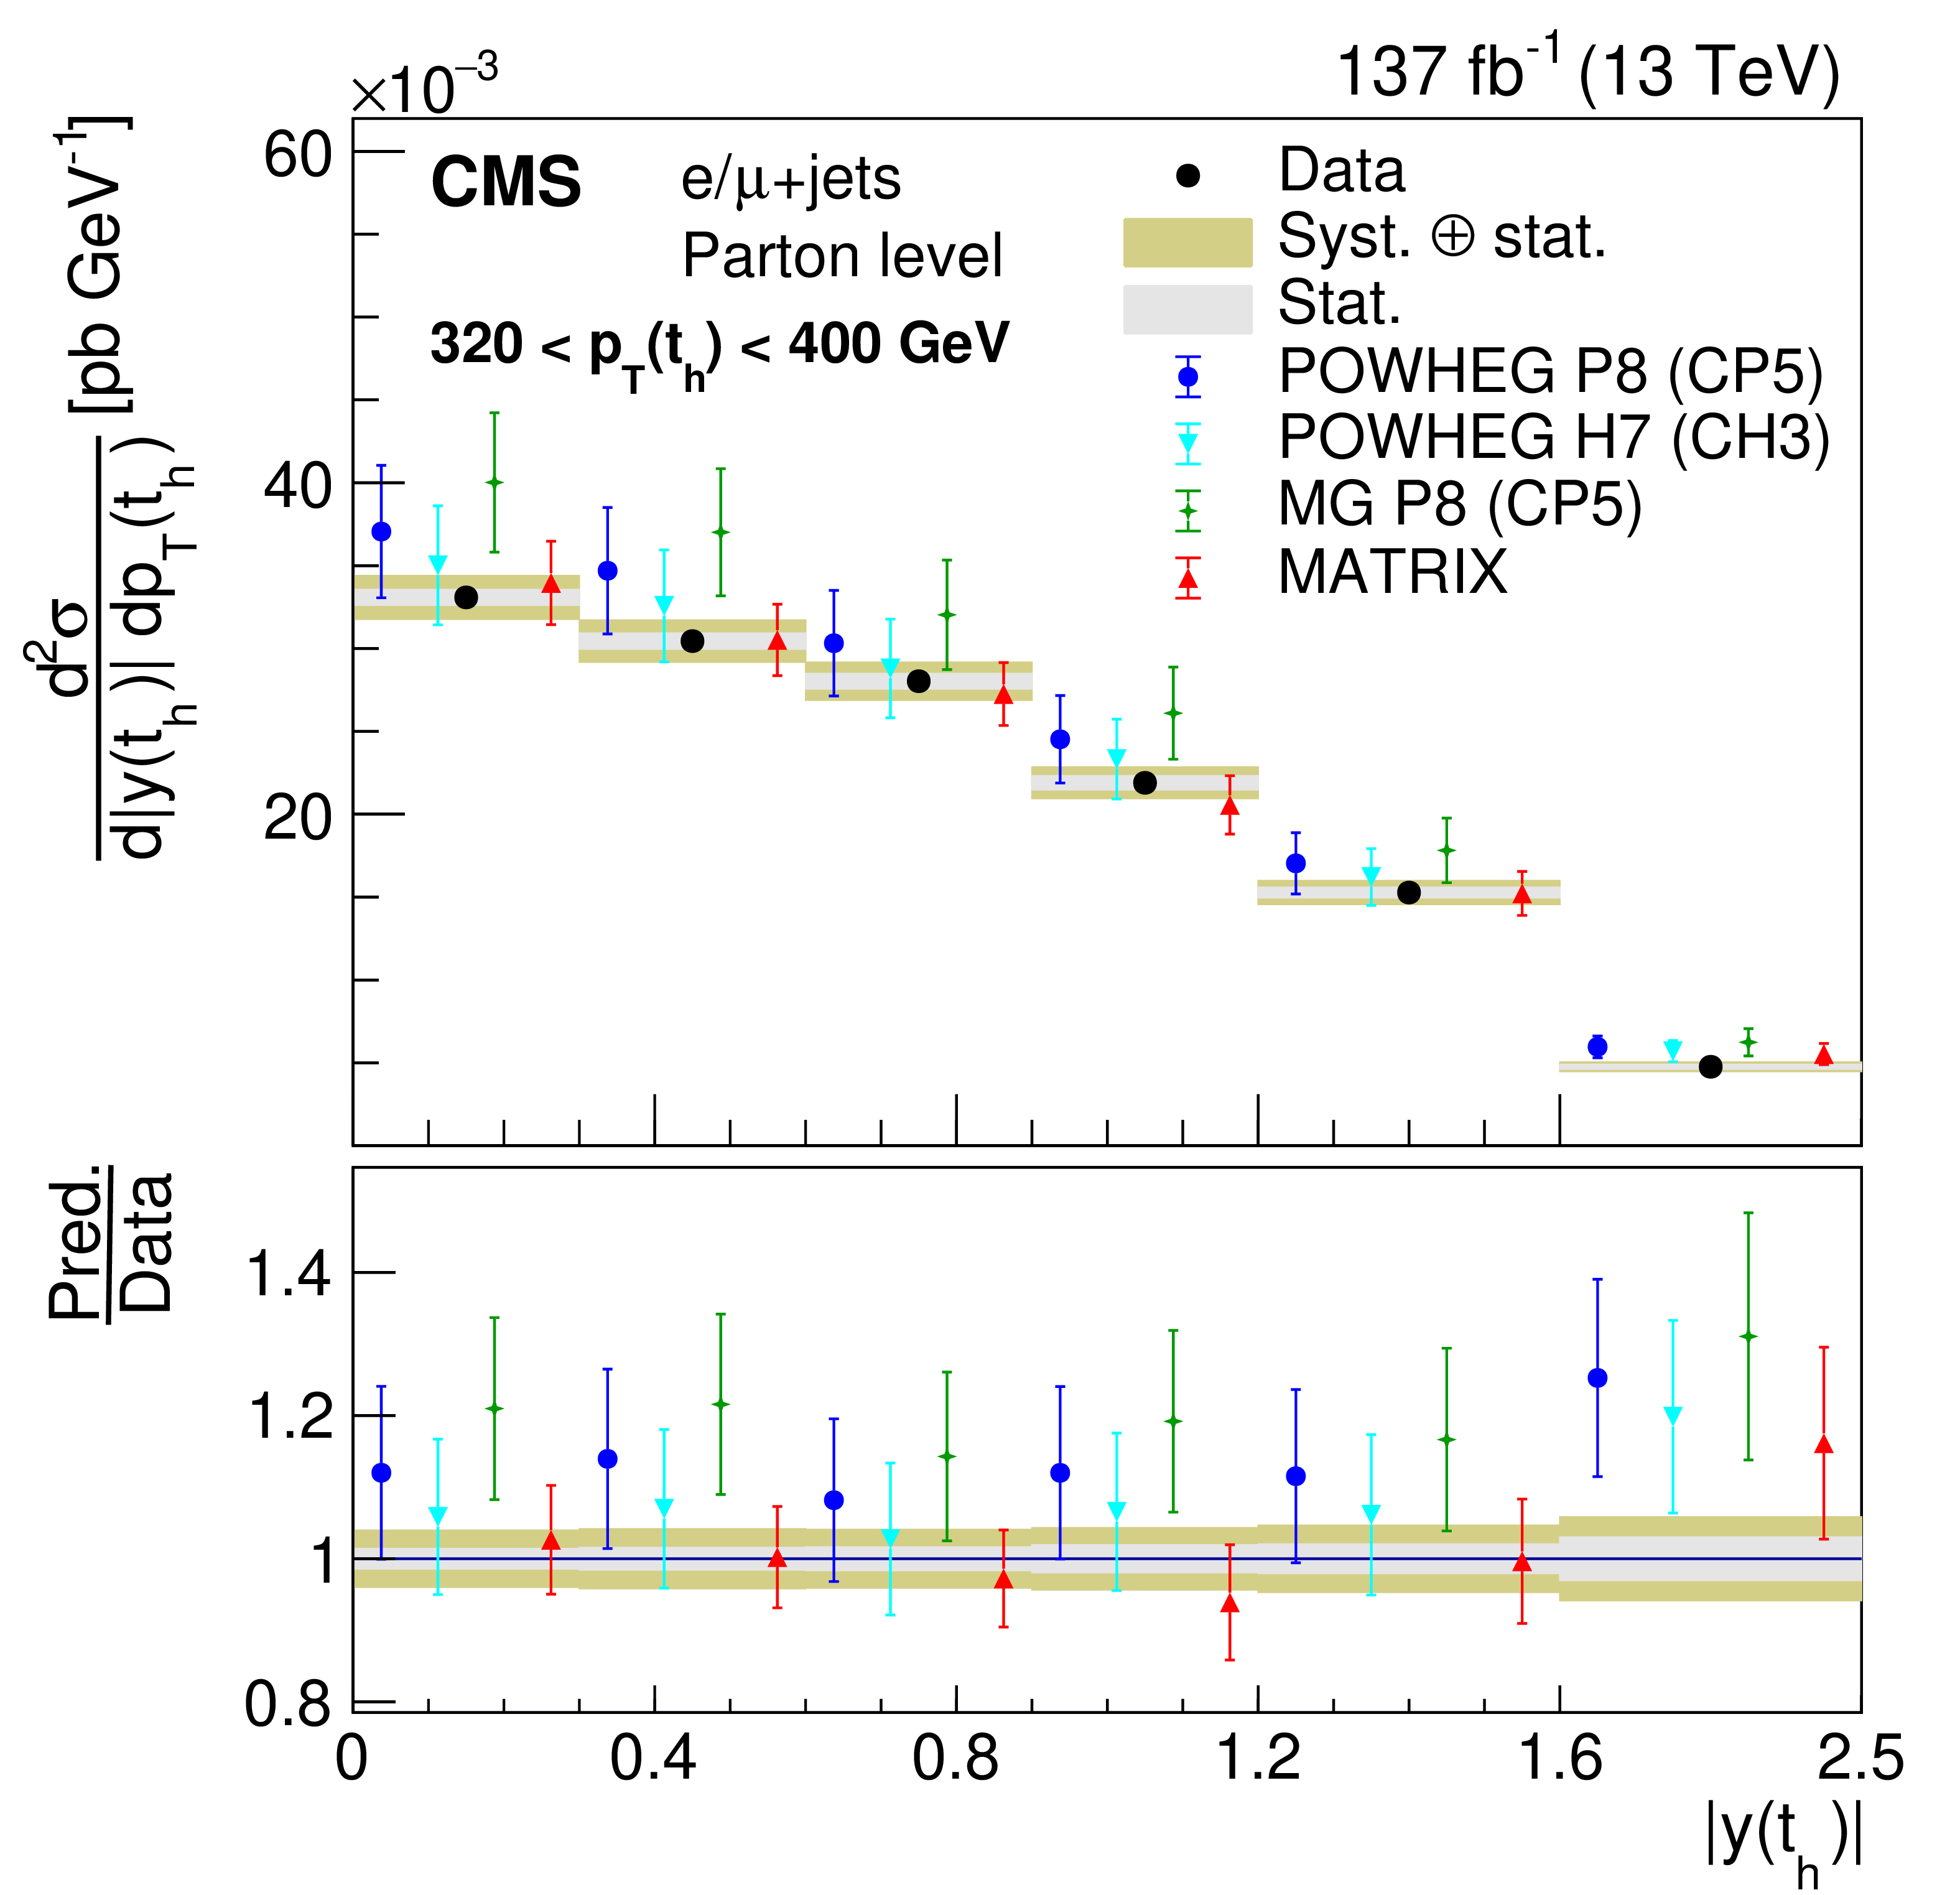
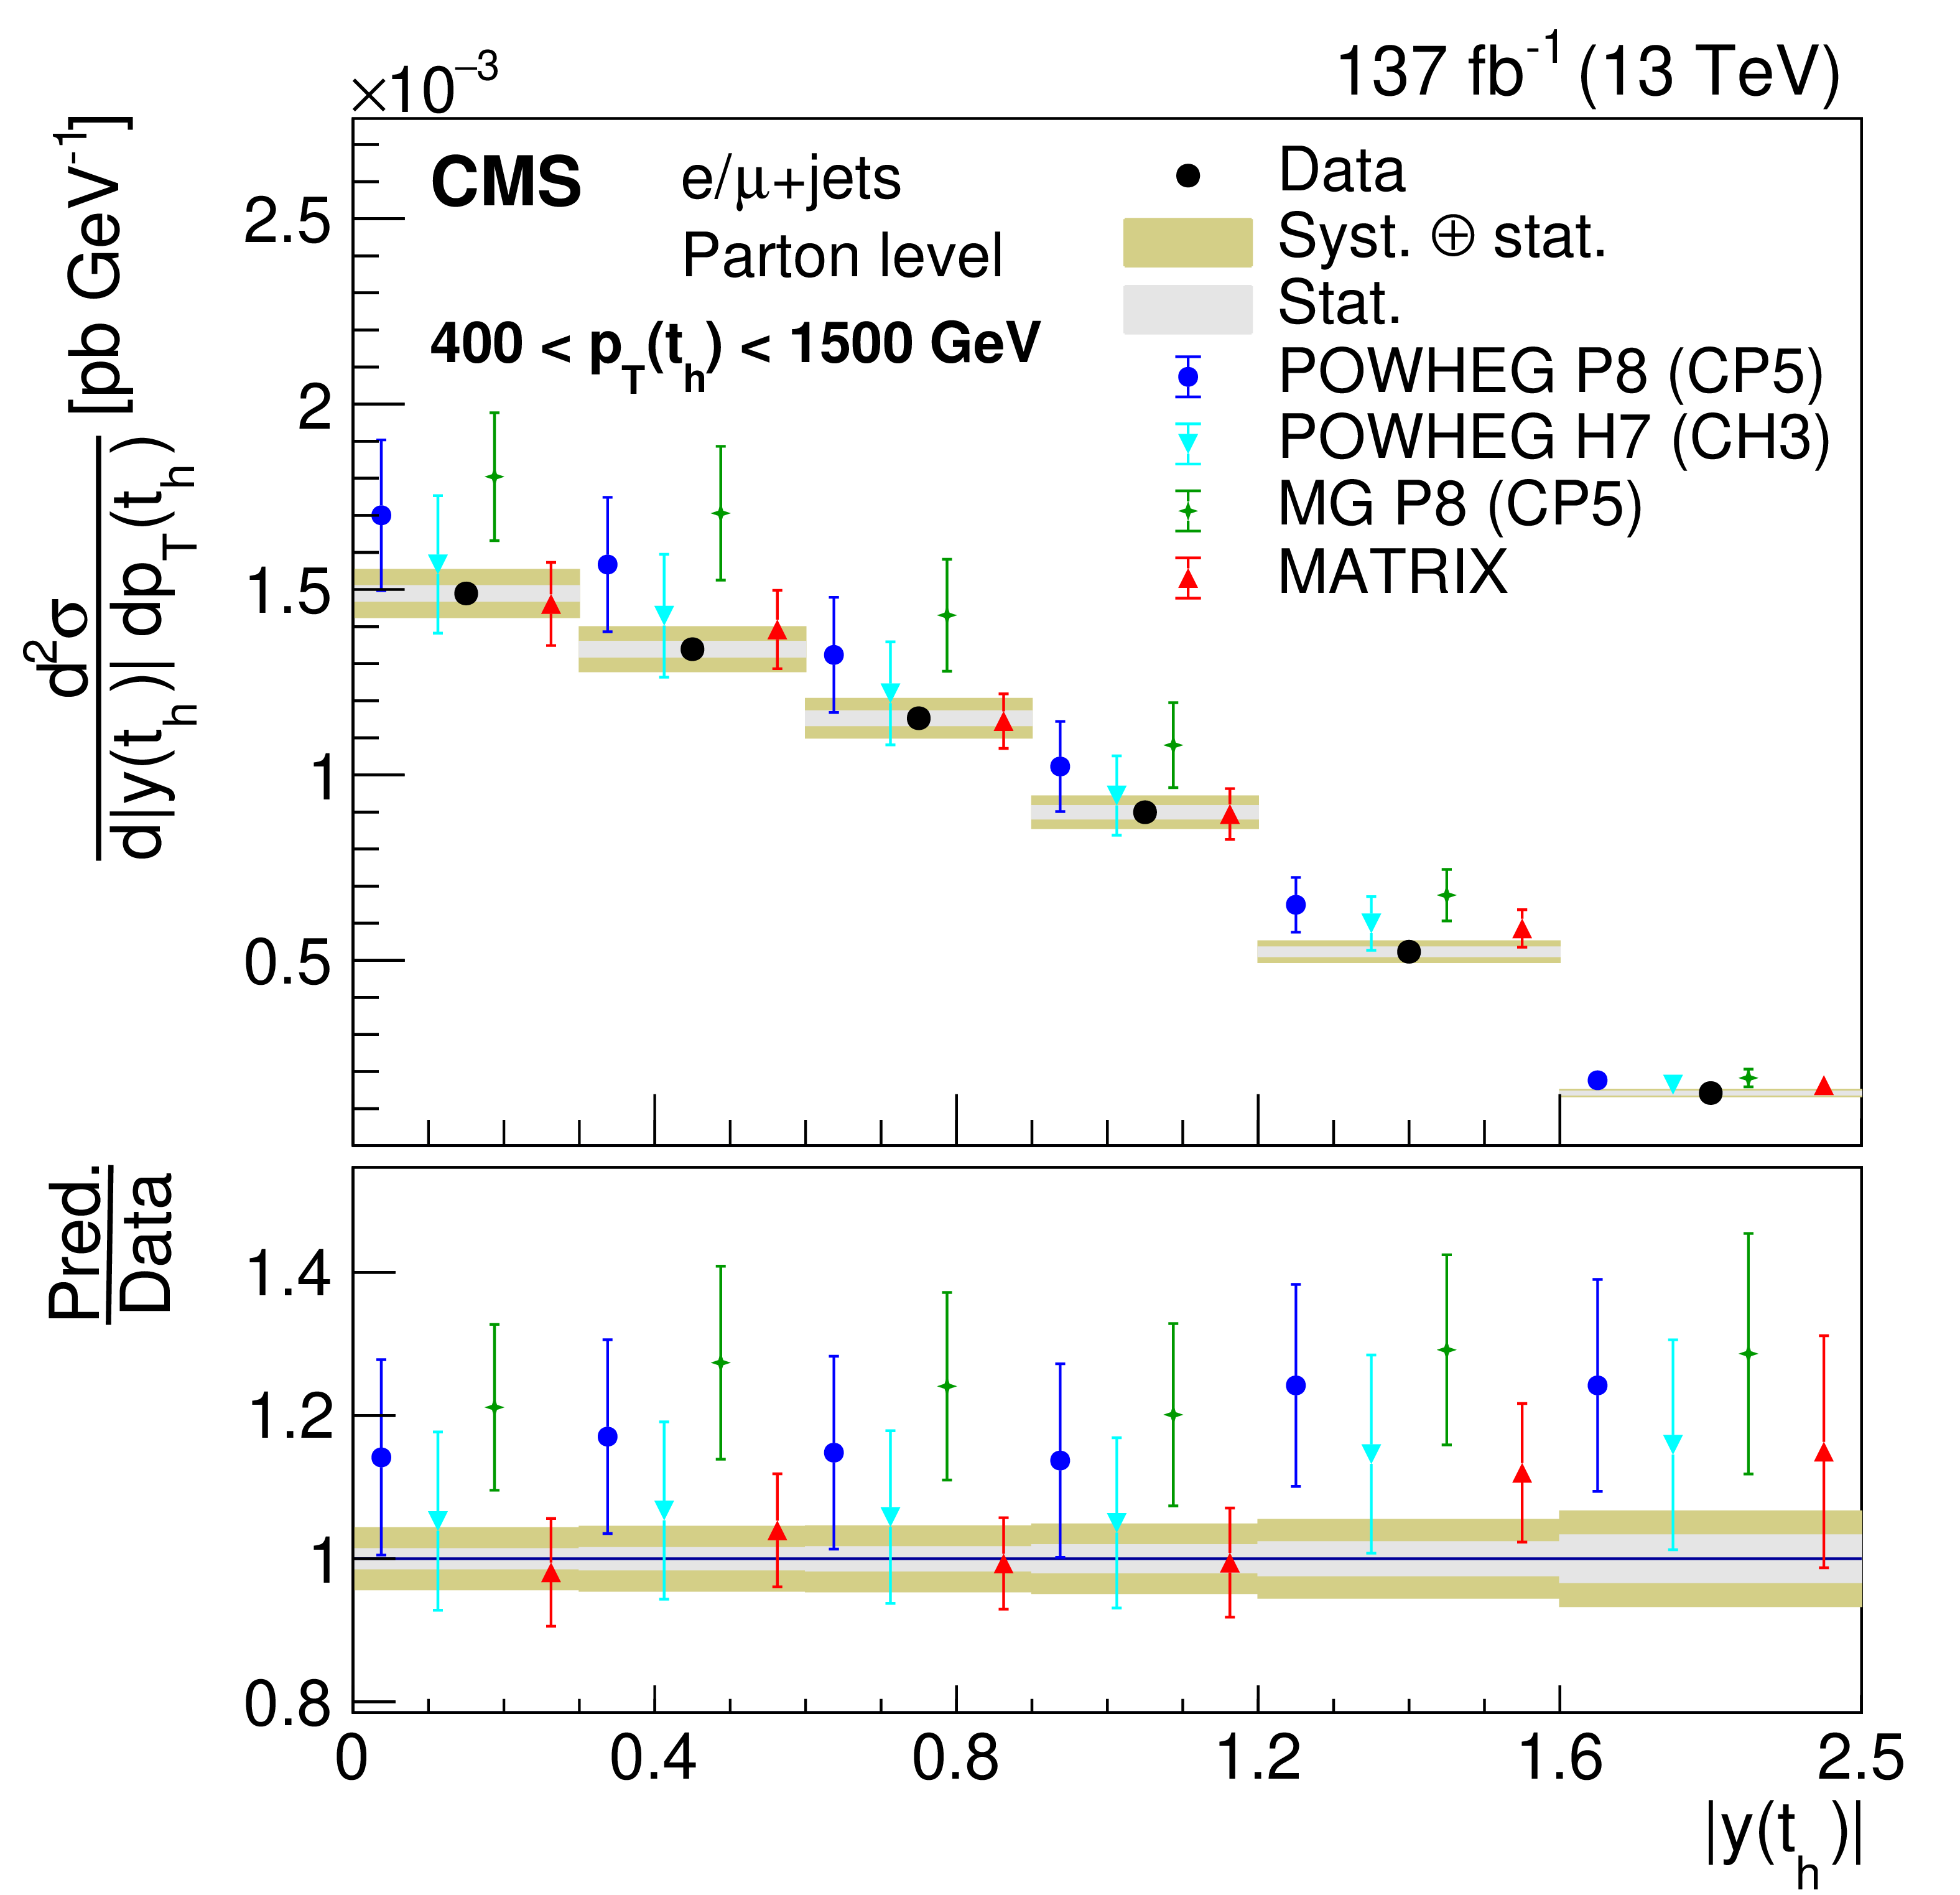
Figure 21:
Double-differential cross section at the parton level as a function of ${{p_{\mathrm {T}}} ({\mathrm{t} _\mathrm {h}})}$ vs. ${{| y({\mathrm{t} _\mathrm {h}}) |}}$. The data are shown as points with gray (yellow) bands indicating the statistical (statistical and systematic) uncertainties. The cross sections are compared to the predictions of POWHEG combined with PYTHIA (P8) or HERWIG (H7), the multiparton simulation MG5_aMC@NLO (MG)+PYTHIA FxFx, and the NNLO QCD calculations obtained with Matrix. The ratios of the various predictions to the measured cross sections are shown in the lower panels. |
png pdf |
Figure 21-a:
Double-differential cross section at the parton level as a function of ${{p_{\mathrm {T}}} ({\mathrm{t} _\mathrm {h}})}$ vs. ${{| y({\mathrm{t} _\mathrm {h}}) |}}$. The data are shown as points with gray (yellow) bands indicating the statistical (statistical and systematic) uncertainties. The cross sections are compared to the predictions of POWHEG combined with PYTHIA (P8) or HERWIG (H7), the multiparton simulation MG5_aMC@NLO (MG)+PYTHIA FxFx, and the NNLO QCD calculations obtained with Matrix. The ratios of the various predictions to the measured cross sections are shown in the lower panels. |

png pdf |
Figure 21-b:
Double-differential cross section at the parton level as a function of ${{p_{\mathrm {T}}} ({\mathrm{t} _\mathrm {h}})}$ vs. ${{| y({\mathrm{t} _\mathrm {h}}) |}}$. The data are shown as points with gray (yellow) bands indicating the statistical (statistical and systematic) uncertainties. The cross sections are compared to the predictions of POWHEG combined with PYTHIA (P8) or HERWIG (H7), the multiparton simulation MG5_aMC@NLO (MG)+PYTHIA FxFx, and the NNLO QCD calculations obtained with Matrix. The ratios of the various predictions to the measured cross sections are shown in the lower panels. |
png pdf |
Figure 21-c:
Double-differential cross section at the parton level as a function of ${{p_{\mathrm {T}}} ({\mathrm{t} _\mathrm {h}})}$ vs. ${{| y({\mathrm{t} _\mathrm {h}}) |}}$. The data are shown as points with gray (yellow) bands indicating the statistical (statistical and systematic) uncertainties. The cross sections are compared to the predictions of POWHEG combined with PYTHIA (P8) or HERWIG (H7), the multiparton simulation MG5_aMC@NLO (MG)+PYTHIA FxFx, and the NNLO QCD calculations obtained with Matrix. The ratios of the various predictions to the measured cross sections are shown in the lower panels. |
png pdf |
Figure 21-d:
Double-differential cross section at the parton level as a function of ${{p_{\mathrm {T}}} ({\mathrm{t} _\mathrm {h}})}$ vs. ${{| y({\mathrm{t} _\mathrm {h}}) |}}$. The data are shown as points with gray (yellow) bands indicating the statistical (statistical and systematic) uncertainties. The cross sections are compared to the predictions of POWHEG combined with PYTHIA (P8) or HERWIG (H7), the multiparton simulation MG5_aMC@NLO (MG)+PYTHIA FxFx, and the NNLO QCD calculations obtained with Matrix. The ratios of the various predictions to the measured cross sections are shown in the lower panels. |
png pdf |
Figure 21-e:
Double-differential cross section at the parton level as a function of ${{p_{\mathrm {T}}} ({\mathrm{t} _\mathrm {h}})}$ vs. ${{| y({\mathrm{t} _\mathrm {h}}) |}}$. The data are shown as points with gray (yellow) bands indicating the statistical (statistical and systematic) uncertainties. The cross sections are compared to the predictions of POWHEG combined with PYTHIA (P8) or HERWIG (H7), the multiparton simulation MG5_aMC@NLO (MG)+PYTHIA FxFx, and the NNLO QCD calculations obtained with Matrix. The ratios of the various predictions to the measured cross sections are shown in the lower panels. |
png pdf |
Figure 21-f:
Double-differential cross section at the parton level as a function of ${{p_{\mathrm {T}}} ({\mathrm{t} _\mathrm {h}})}$ vs. ${{| y({\mathrm{t} _\mathrm {h}}) |}}$. The data are shown as points with gray (yellow) bands indicating the statistical (statistical and systematic) uncertainties. The cross sections are compared to the predictions of POWHEG combined with PYTHIA (P8) or HERWIG (H7), the multiparton simulation MG5_aMC@NLO (MG)+PYTHIA FxFx, and the NNLO QCD calculations obtained with Matrix. The ratios of the various predictions to the measured cross sections are shown in the lower panels. |
png pdf |
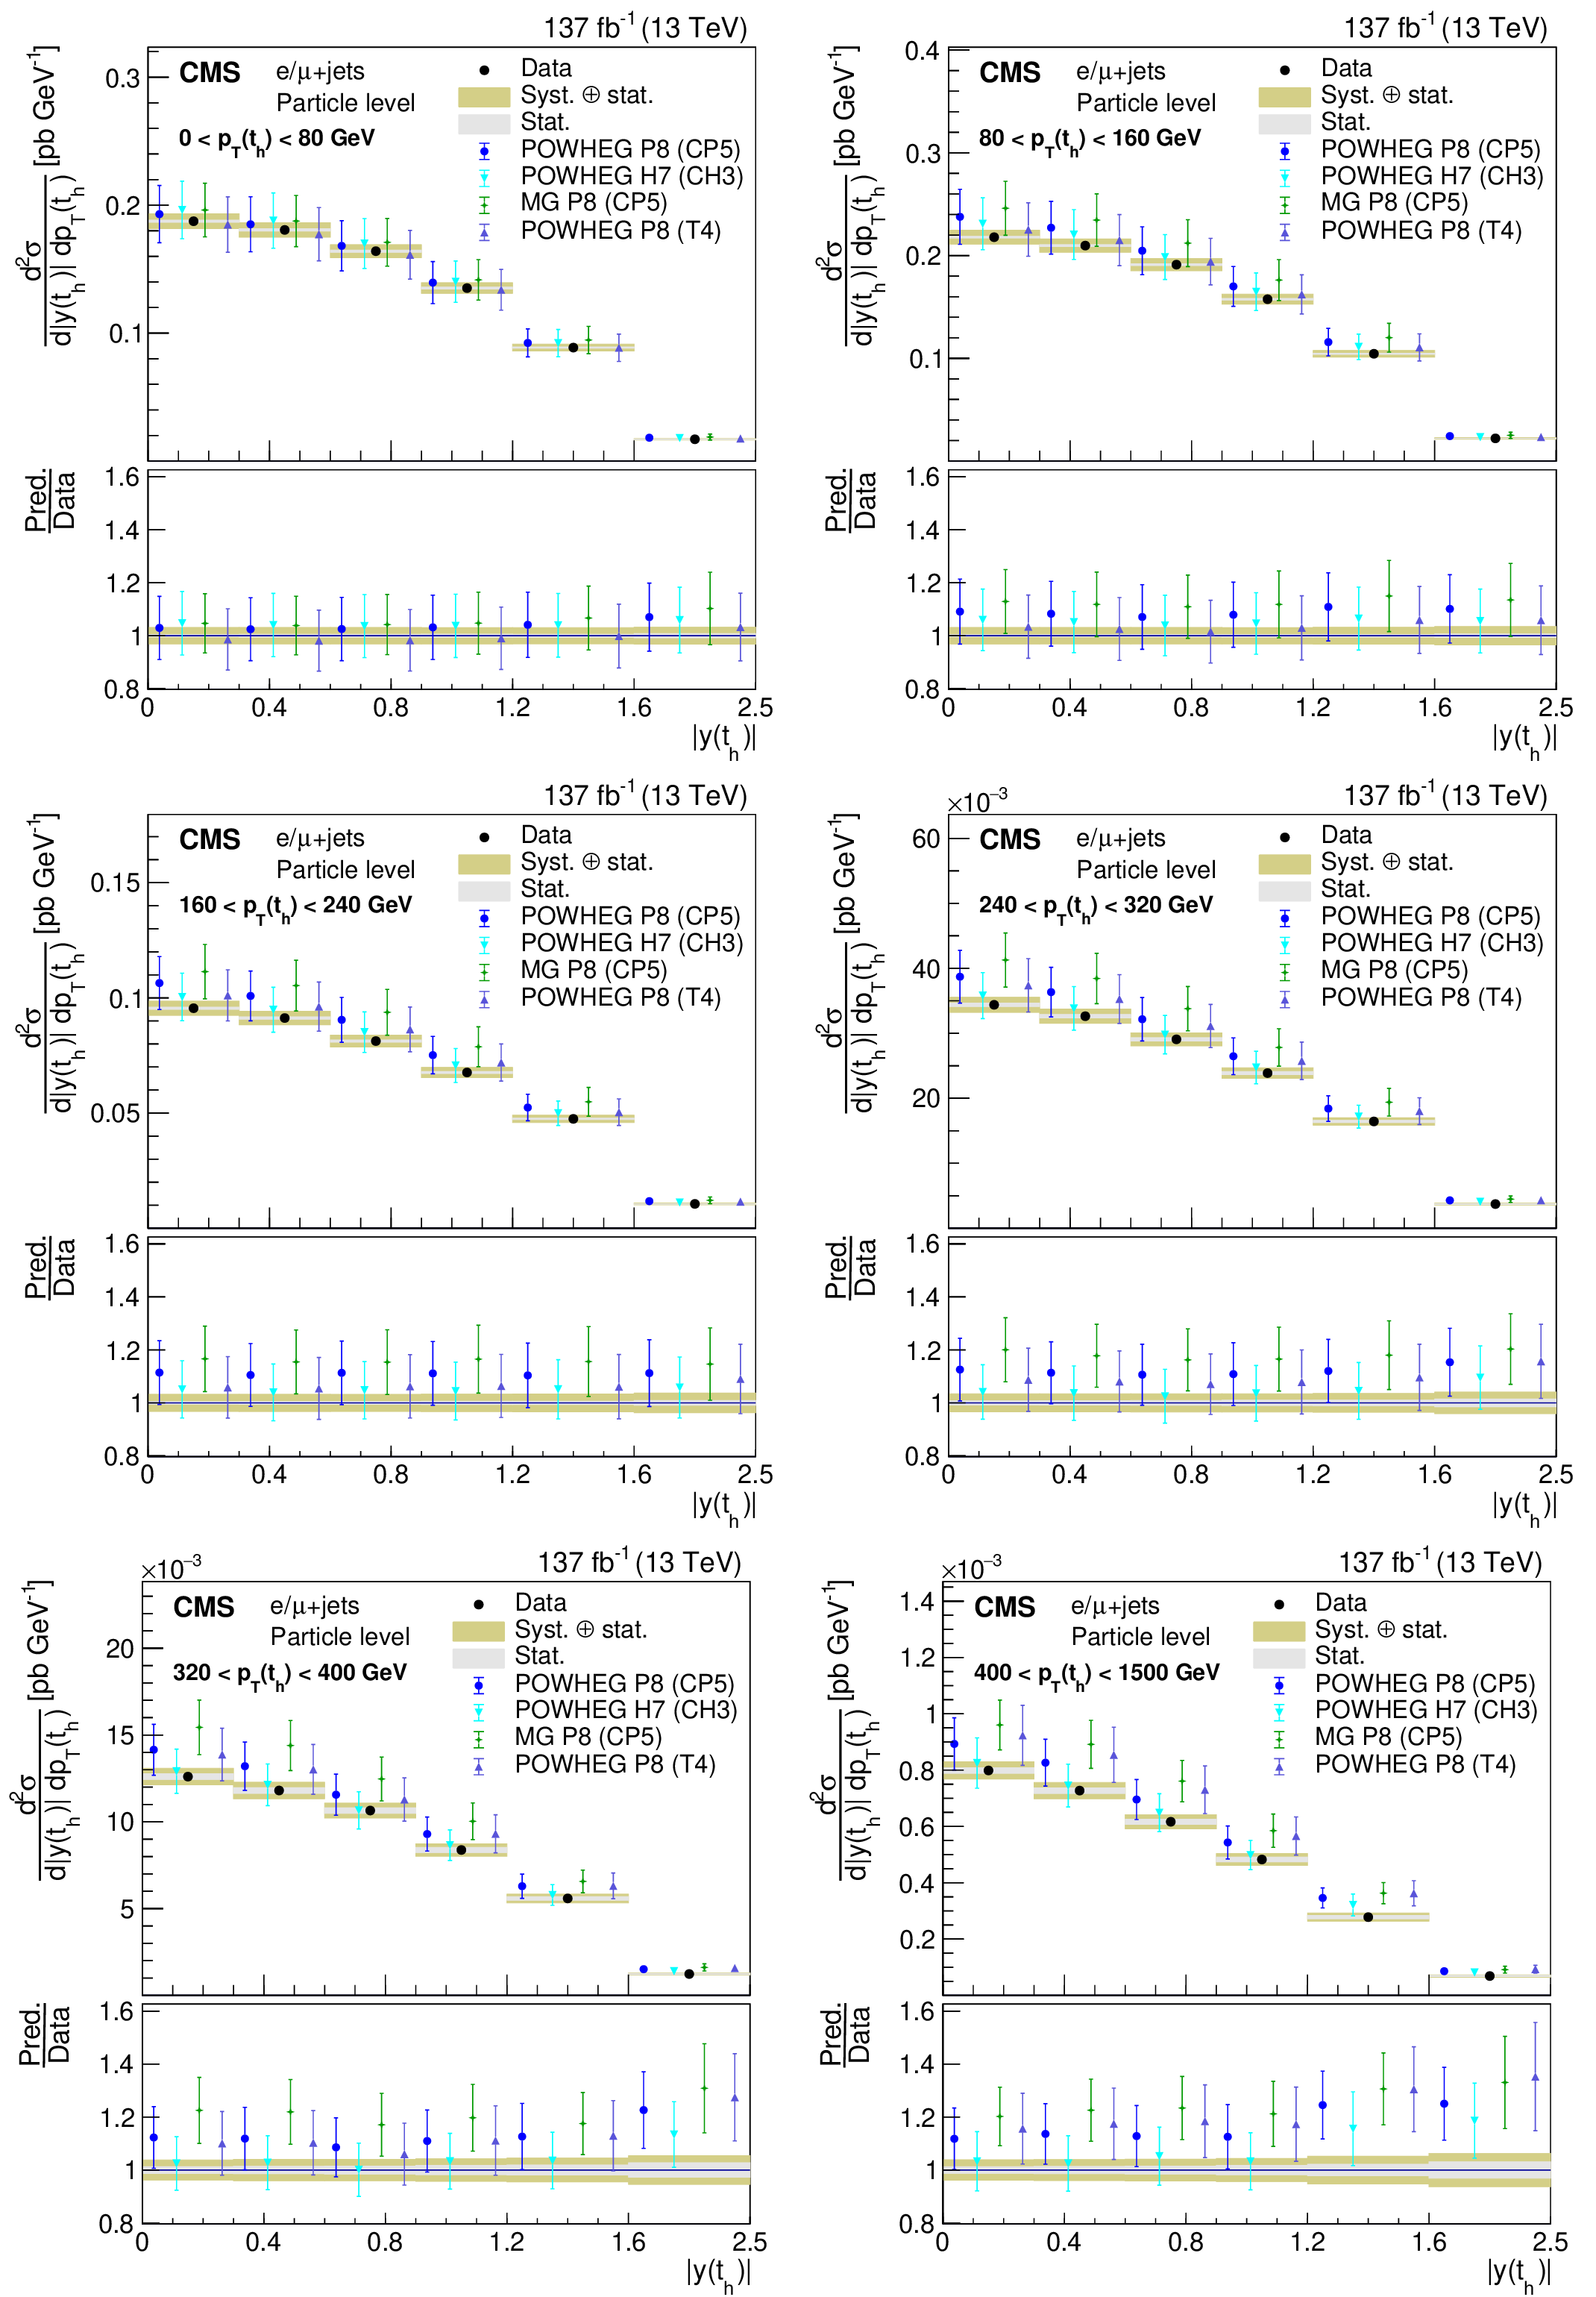
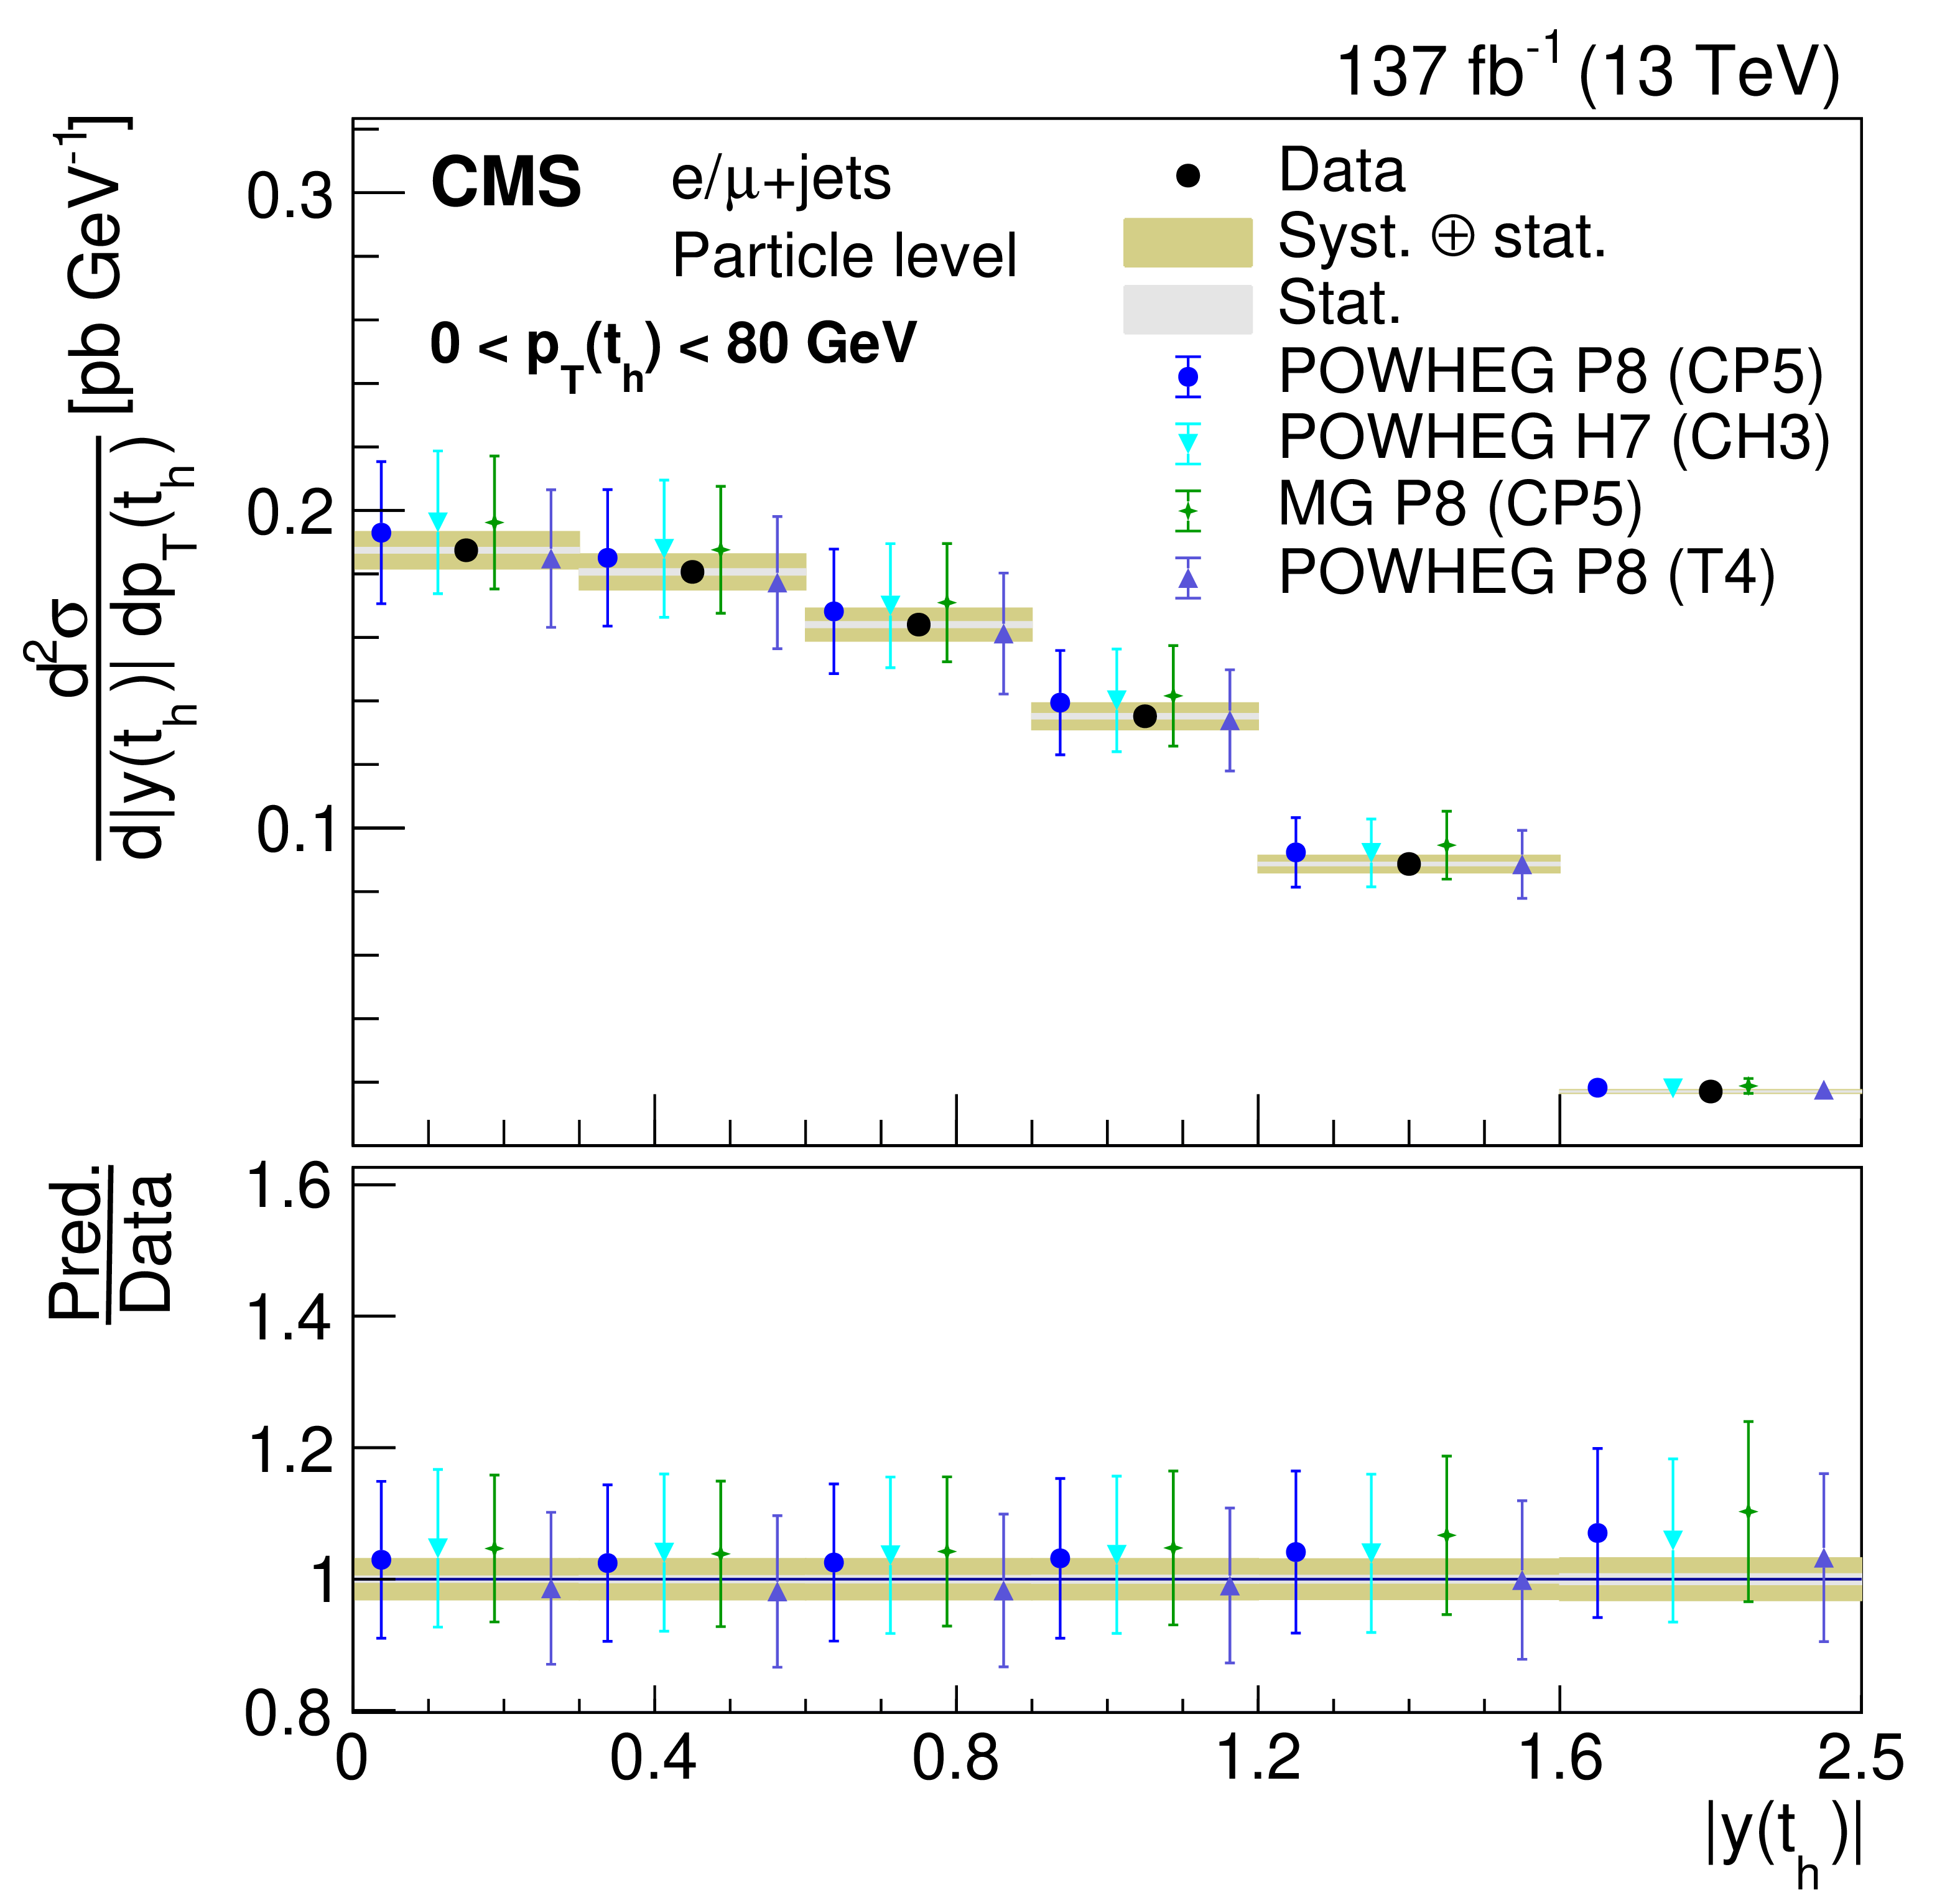
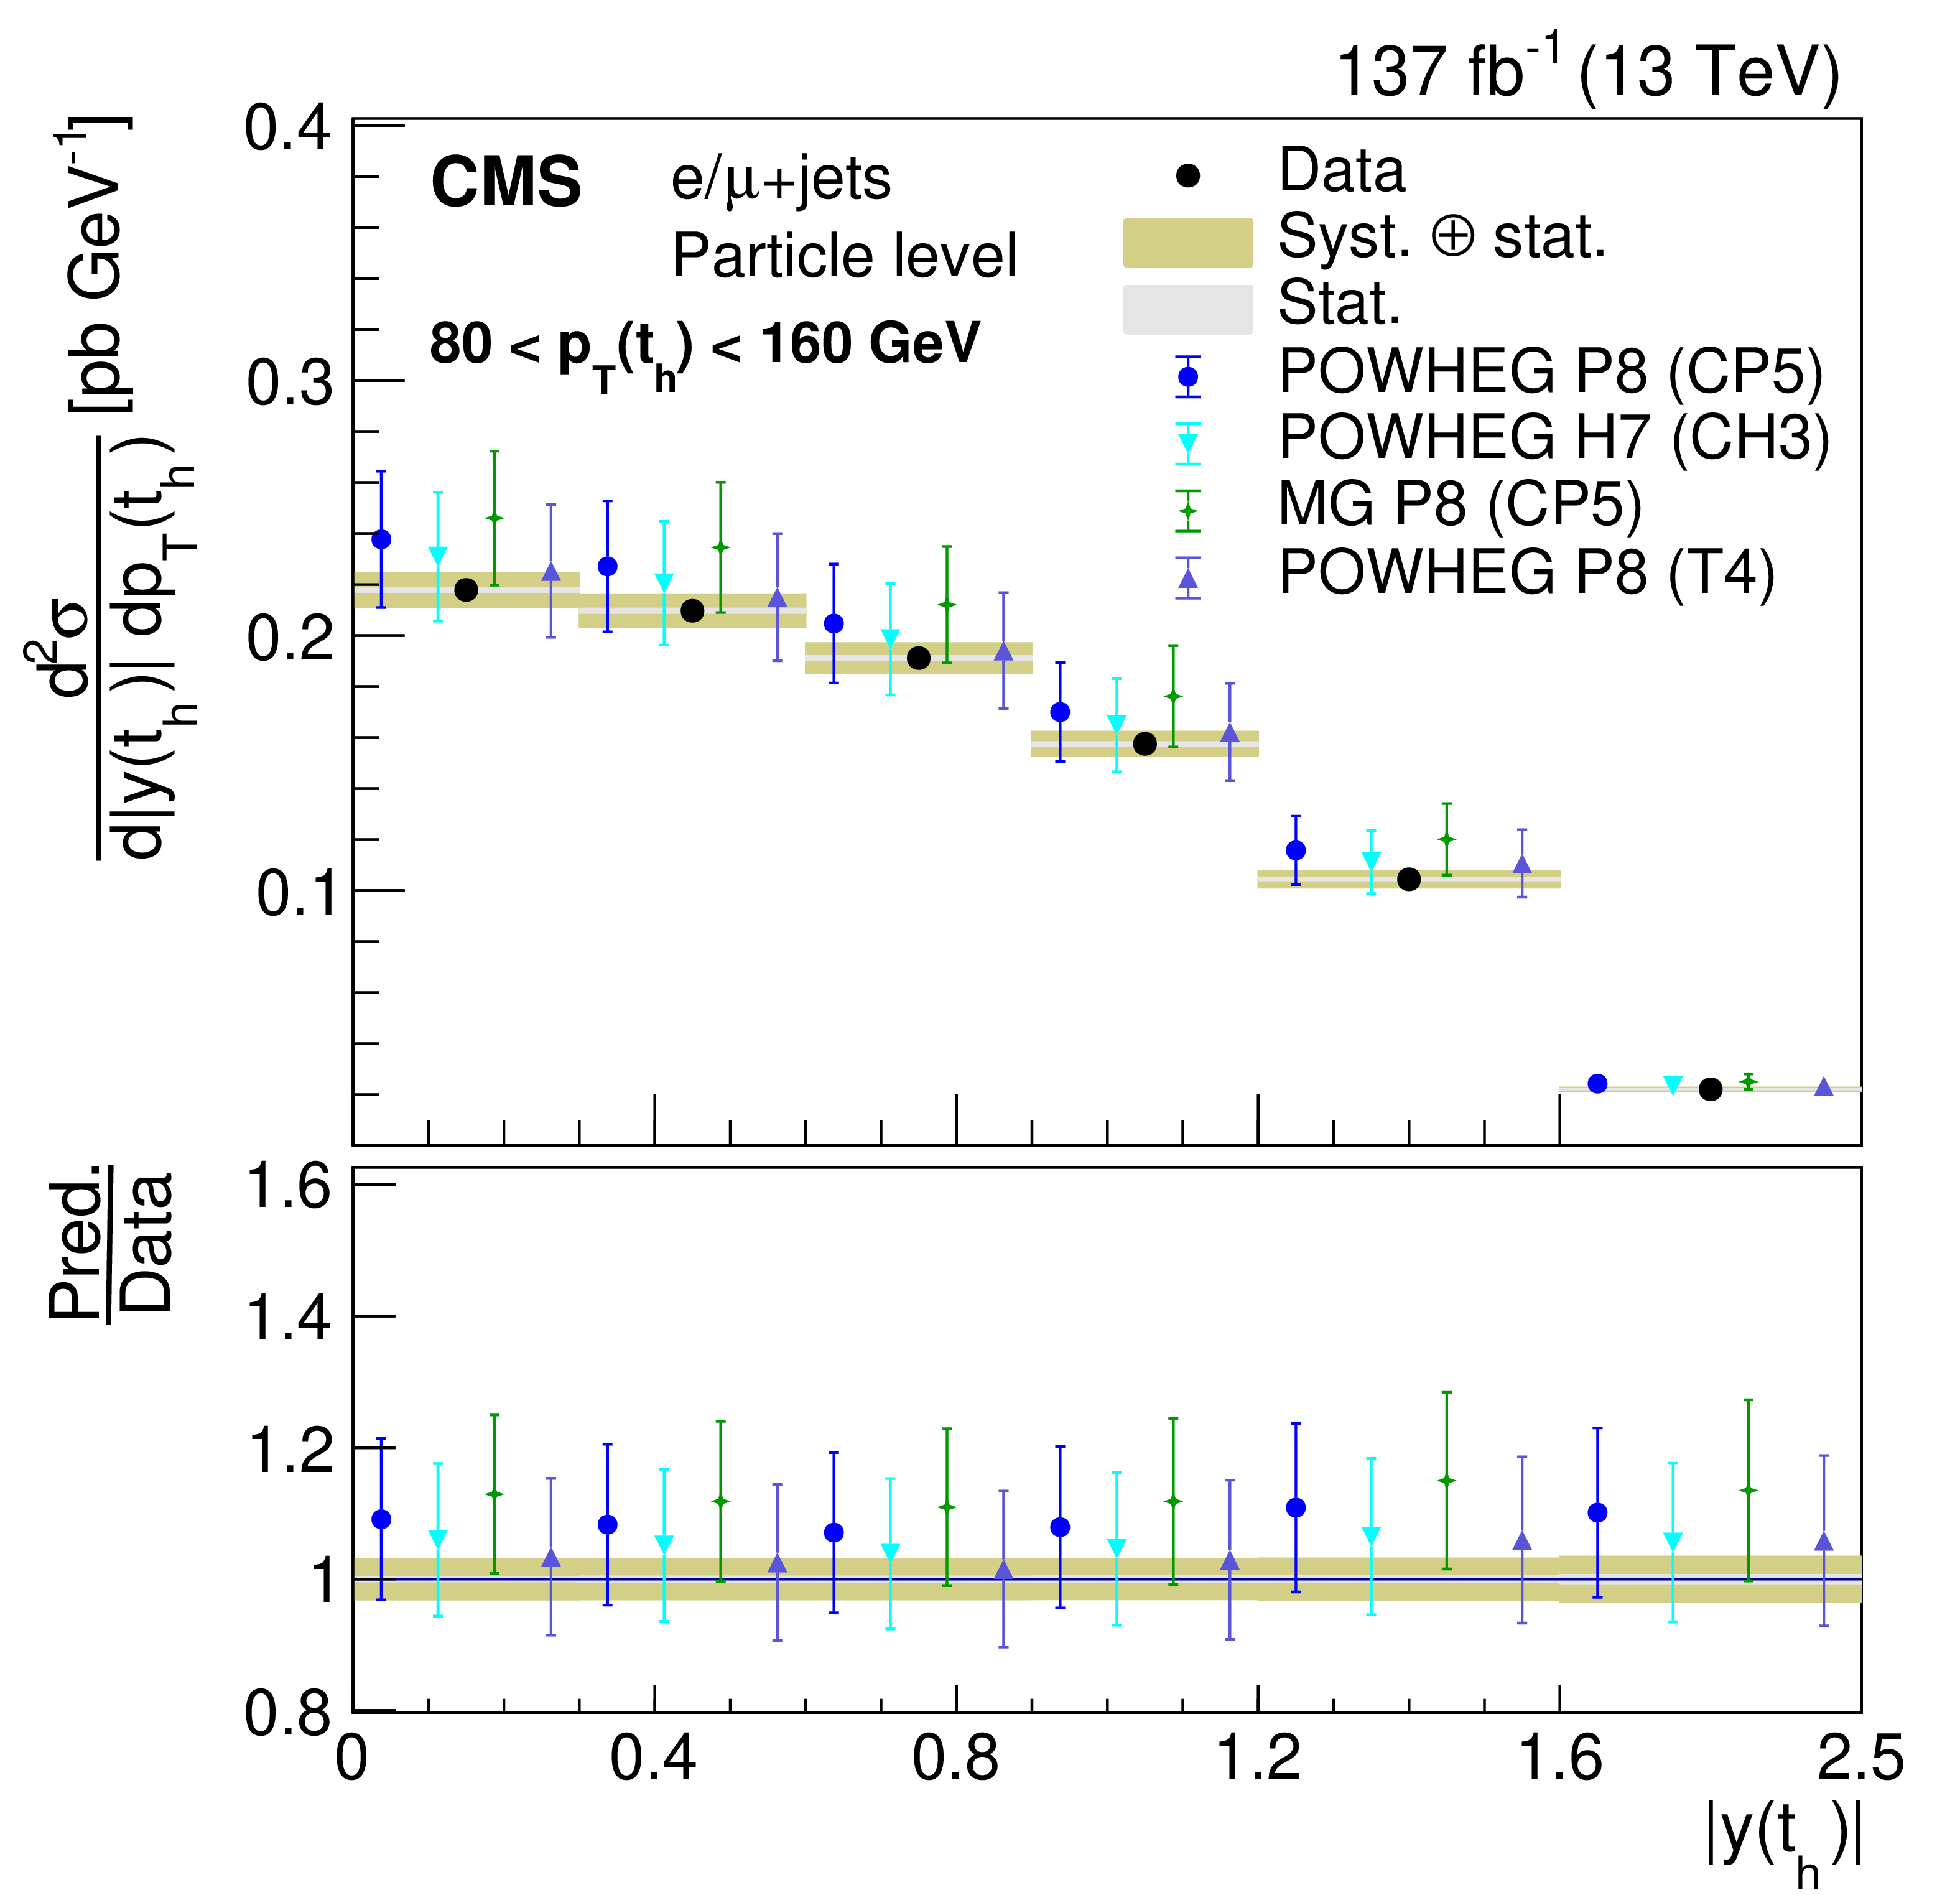
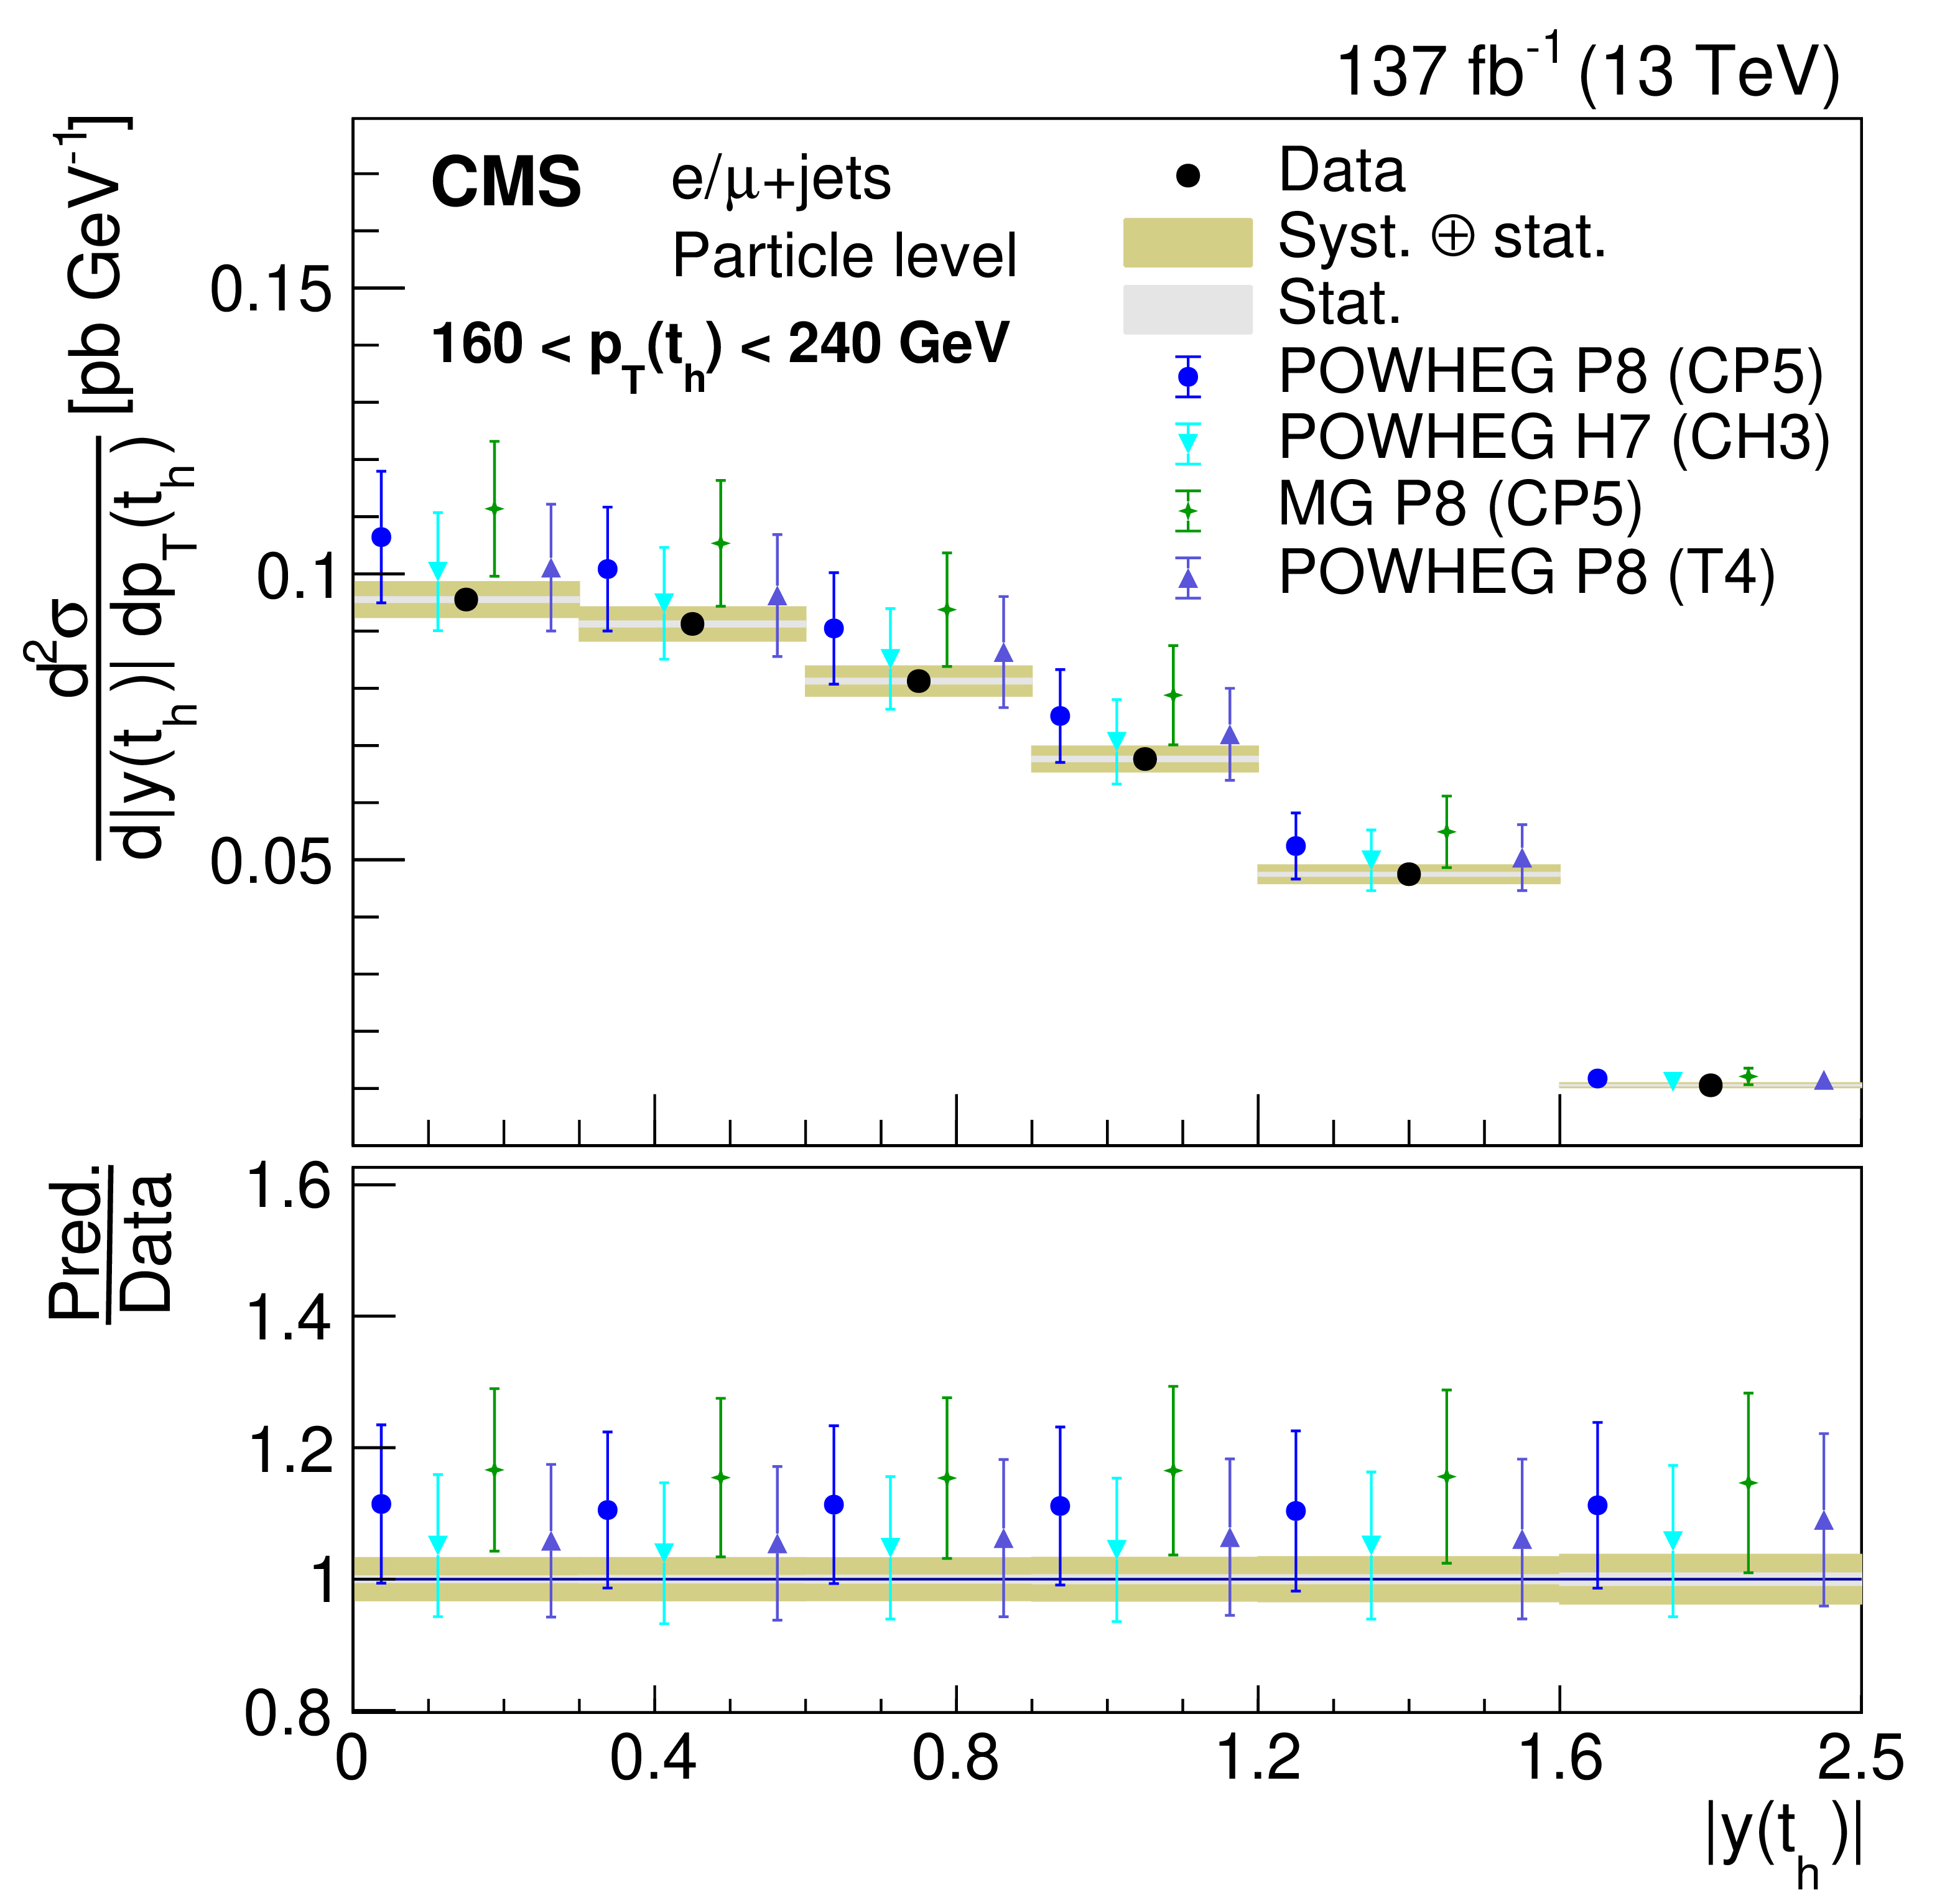
Figure 22:
Double-differential cross section at the particle level as a function of ${{p_{\mathrm {T}}} ({\mathrm{t} _\mathrm {h}})}$ vs. ${{| y({\mathrm{t} _\mathrm {h}}) |}}$. The data are shown as points with gray (yellow) bands indicating the statistical (statistical and systematic) uncertainties. The cross sections are compared to the predictions of POWHEG+PYTHIA (P8) for the CP5 and CUETP8M2T4 (T4) tunes, POWHEG+HERWIG (H7), and the multiparton simulation MG5_aMC@NLO (MG)+PYTHIA. The ratios of the various predictions to the measured cross sections are shown in the lower panels. |
png pdf |
Figure 22-a:
Double-differential cross section at the particle level as a function of ${{p_{\mathrm {T}}} ({\mathrm{t} _\mathrm {h}})}$ vs. ${{| y({\mathrm{t} _\mathrm {h}}) |}}$. The data are shown as points with gray (yellow) bands indicating the statistical (statistical and systematic) uncertainties. The cross sections are compared to the predictions of POWHEG+PYTHIA (P8) for the CP5 and CUETP8M2T4 (T4) tunes, POWHEG+HERWIG (H7), and the multiparton simulation MG5_aMC@NLO (MG)+PYTHIA. The ratios of the various predictions to the measured cross sections are shown in the lower panels. |
png pdf |
Figure 22-b:
Double-differential cross section at the particle level as a function of ${{p_{\mathrm {T}}} ({\mathrm{t} _\mathrm {h}})}$ vs. ${{| y({\mathrm{t} _\mathrm {h}}) |}}$. The data are shown as points with gray (yellow) bands indicating the statistical (statistical and systematic) uncertainties. The cross sections are compared to the predictions of POWHEG+PYTHIA (P8) for the CP5 and CUETP8M2T4 (T4) tunes, POWHEG+HERWIG (H7), and the multiparton simulation MG5_aMC@NLO (MG)+PYTHIA. The ratios of the various predictions to the measured cross sections are shown in the lower panels. |
png pdf |
Figure 22-c:
Double-differential cross section at the particle level as a function of ${{p_{\mathrm {T}}} ({\mathrm{t} _\mathrm {h}})}$ vs. ${{| y({\mathrm{t} _\mathrm {h}}) |}}$. The data are shown as points with gray (yellow) bands indicating the statistical (statistical and systematic) uncertainties. The cross sections are compared to the predictions of POWHEG+PYTHIA (P8) for the CP5 and CUETP8M2T4 (T4) tunes, POWHEG+HERWIG (H7), and the multiparton simulation MG5_aMC@NLO (MG)+PYTHIA. The ratios of the various predictions to the measured cross sections are shown in the lower panels. |

png pdf |
Figure 22-d:
Double-differential cross section at the particle level as a function of ${{p_{\mathrm {T}}} ({\mathrm{t} _\mathrm {h}})}$ vs. ${{| y({\mathrm{t} _\mathrm {h}}) |}}$. The data are shown as points with gray (yellow) bands indicating the statistical (statistical and systematic) uncertainties. The cross sections are compared to the predictions of POWHEG+PYTHIA (P8) for the CP5 and CUETP8M2T4 (T4) tunes, POWHEG+HERWIG (H7), and the multiparton simulation MG5_aMC@NLO (MG)+PYTHIA. The ratios of the various predictions to the measured cross sections are shown in the lower panels. |

png pdf |
Figure 22-e:
Double-differential cross section at the particle level as a function of ${{p_{\mathrm {T}}} ({\mathrm{t} _\mathrm {h}})}$ vs. ${{| y({\mathrm{t} _\mathrm {h}}) |}}$. The data are shown as points with gray (yellow) bands indicating the statistical (statistical and systematic) uncertainties. The cross sections are compared to the predictions of POWHEG+PYTHIA (P8) for the CP5 and CUETP8M2T4 (T4) tunes, POWHEG+HERWIG (H7), and the multiparton simulation MG5_aMC@NLO (MG)+PYTHIA. The ratios of the various predictions to the measured cross sections are shown in the lower panels. |

png pdf |
Figure 22-f:
Double-differential cross section at the particle level as a function of ${{p_{\mathrm {T}}} ({\mathrm{t} _\mathrm {h}})}$ vs. ${{| y({\mathrm{t} _\mathrm {h}}) |}}$. The data are shown as points with gray (yellow) bands indicating the statistical (statistical and systematic) uncertainties. The cross sections are compared to the predictions of POWHEG+PYTHIA (P8) for the CP5 and CUETP8M2T4 (T4) tunes, POWHEG+HERWIG (H7), and the multiparton simulation MG5_aMC@NLO (MG)+PYTHIA. The ratios of the various predictions to the measured cross sections are shown in the lower panels. |
png pdf |
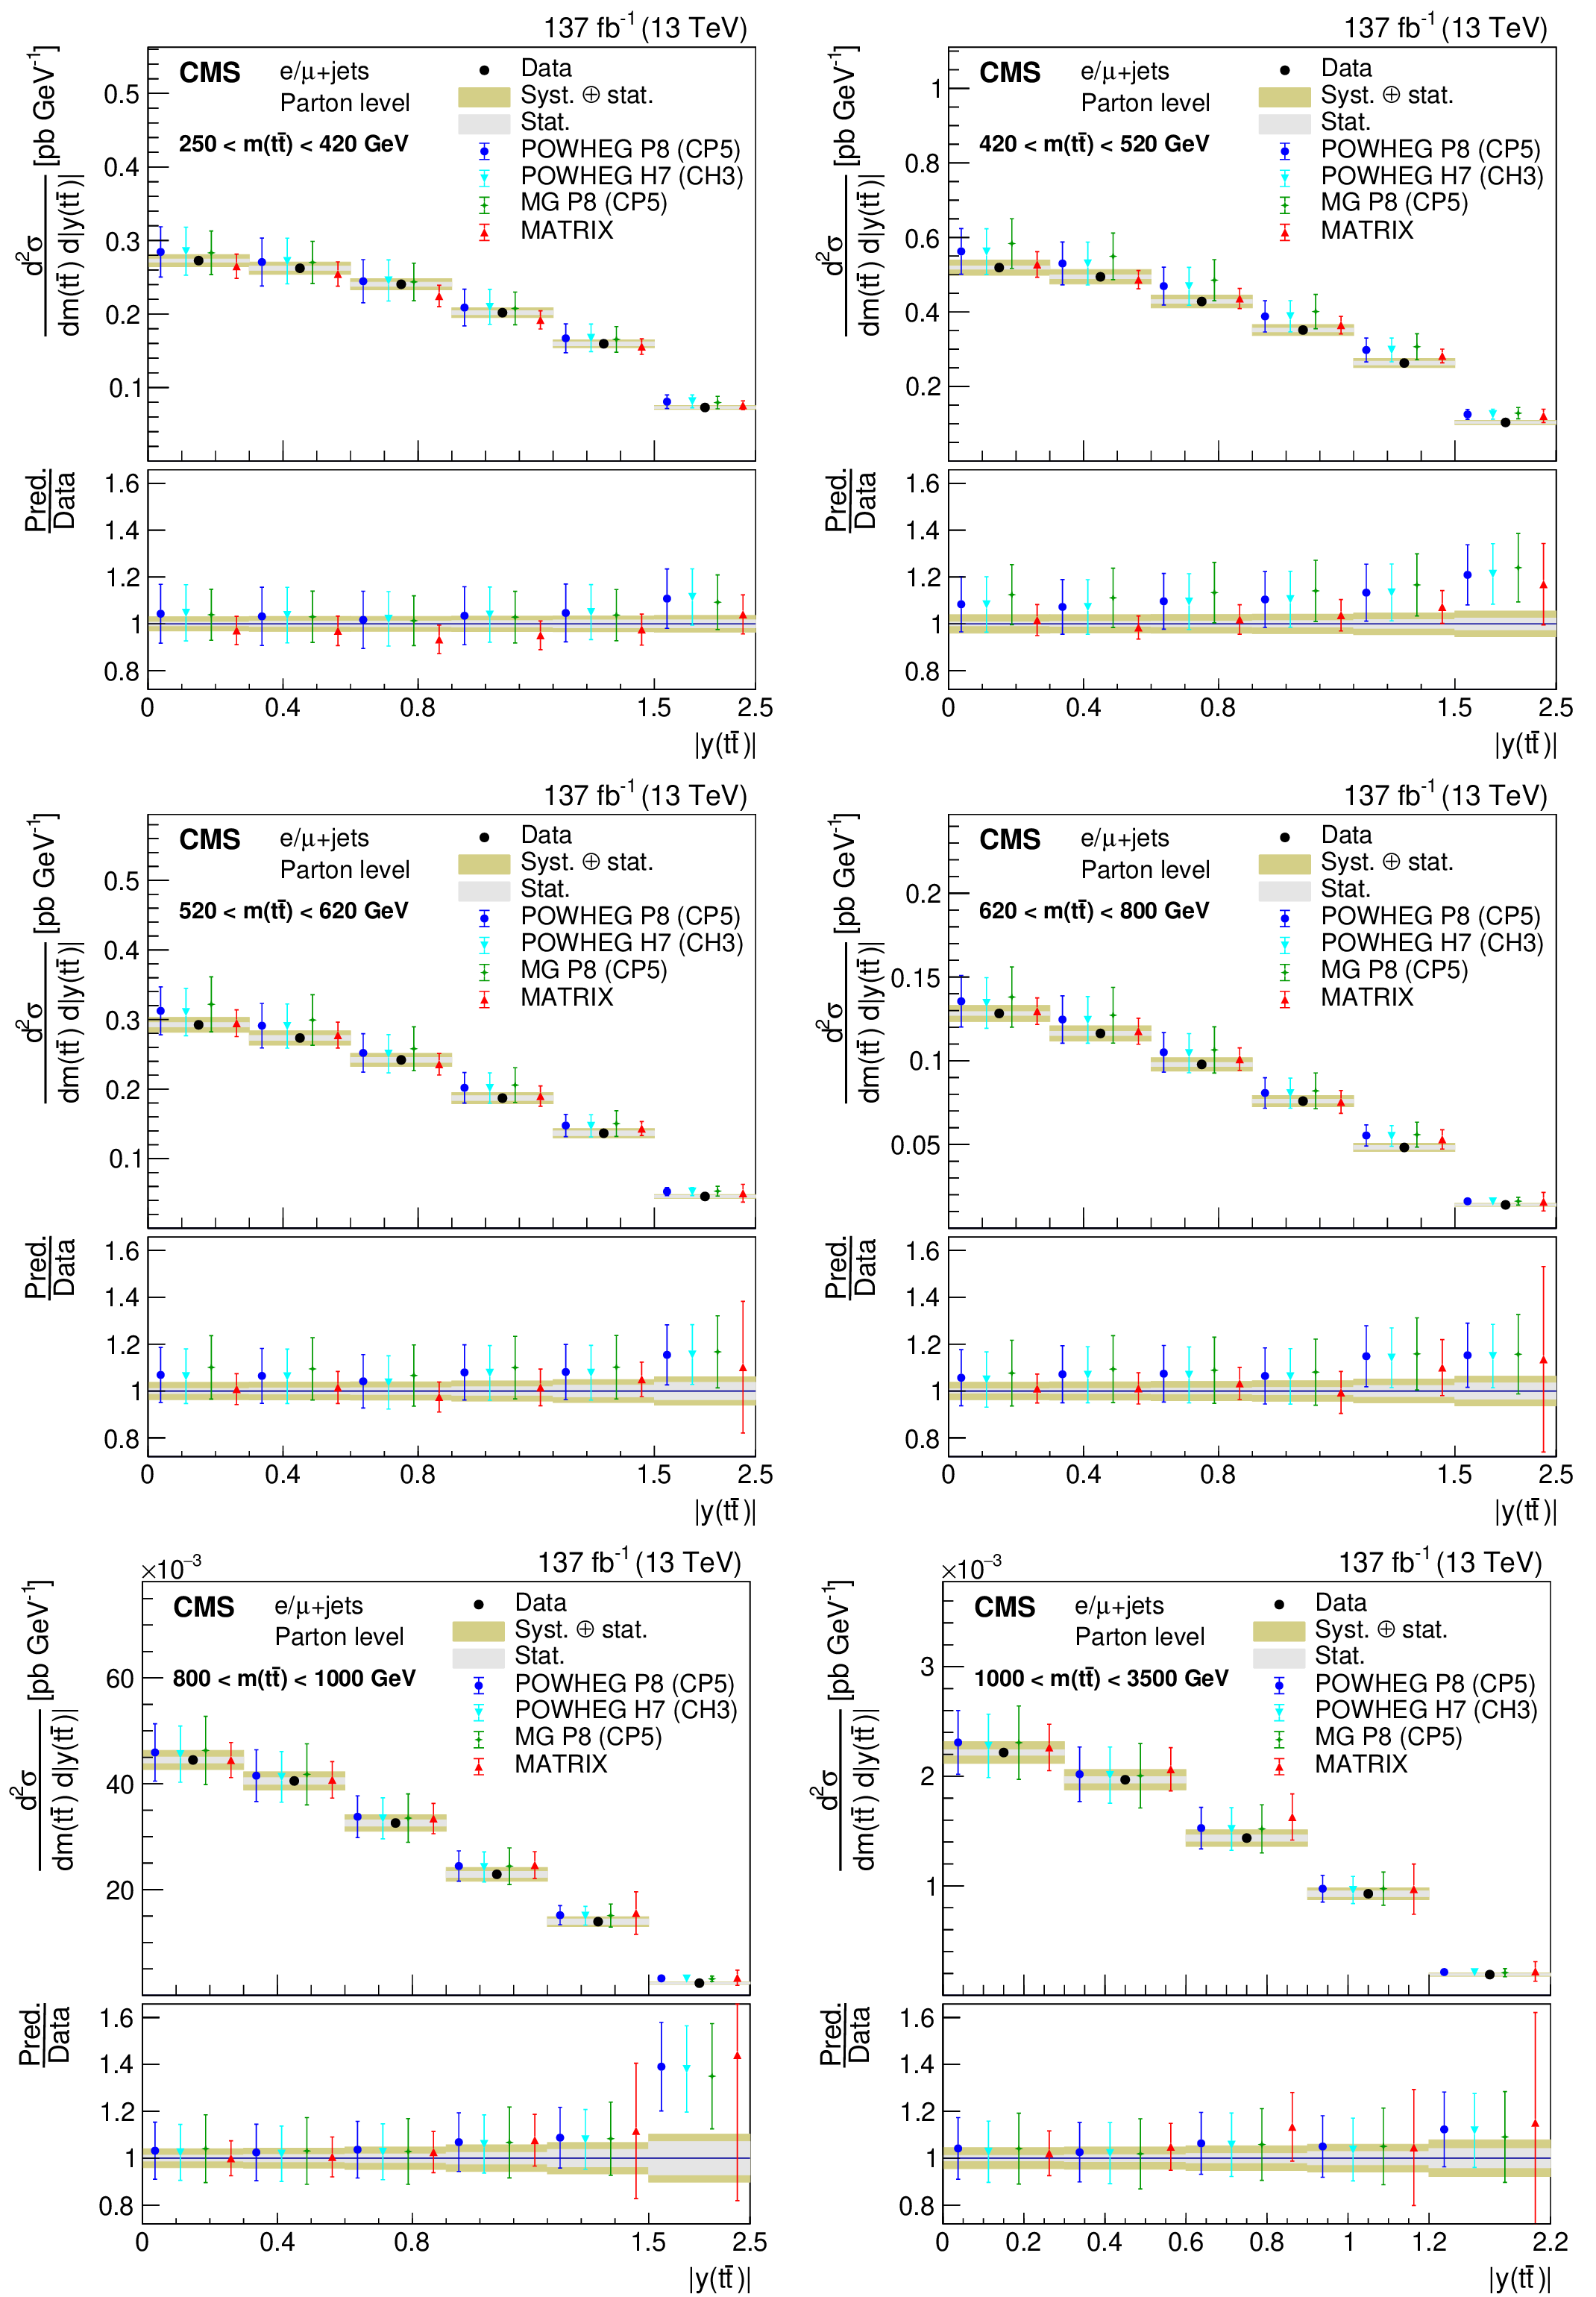
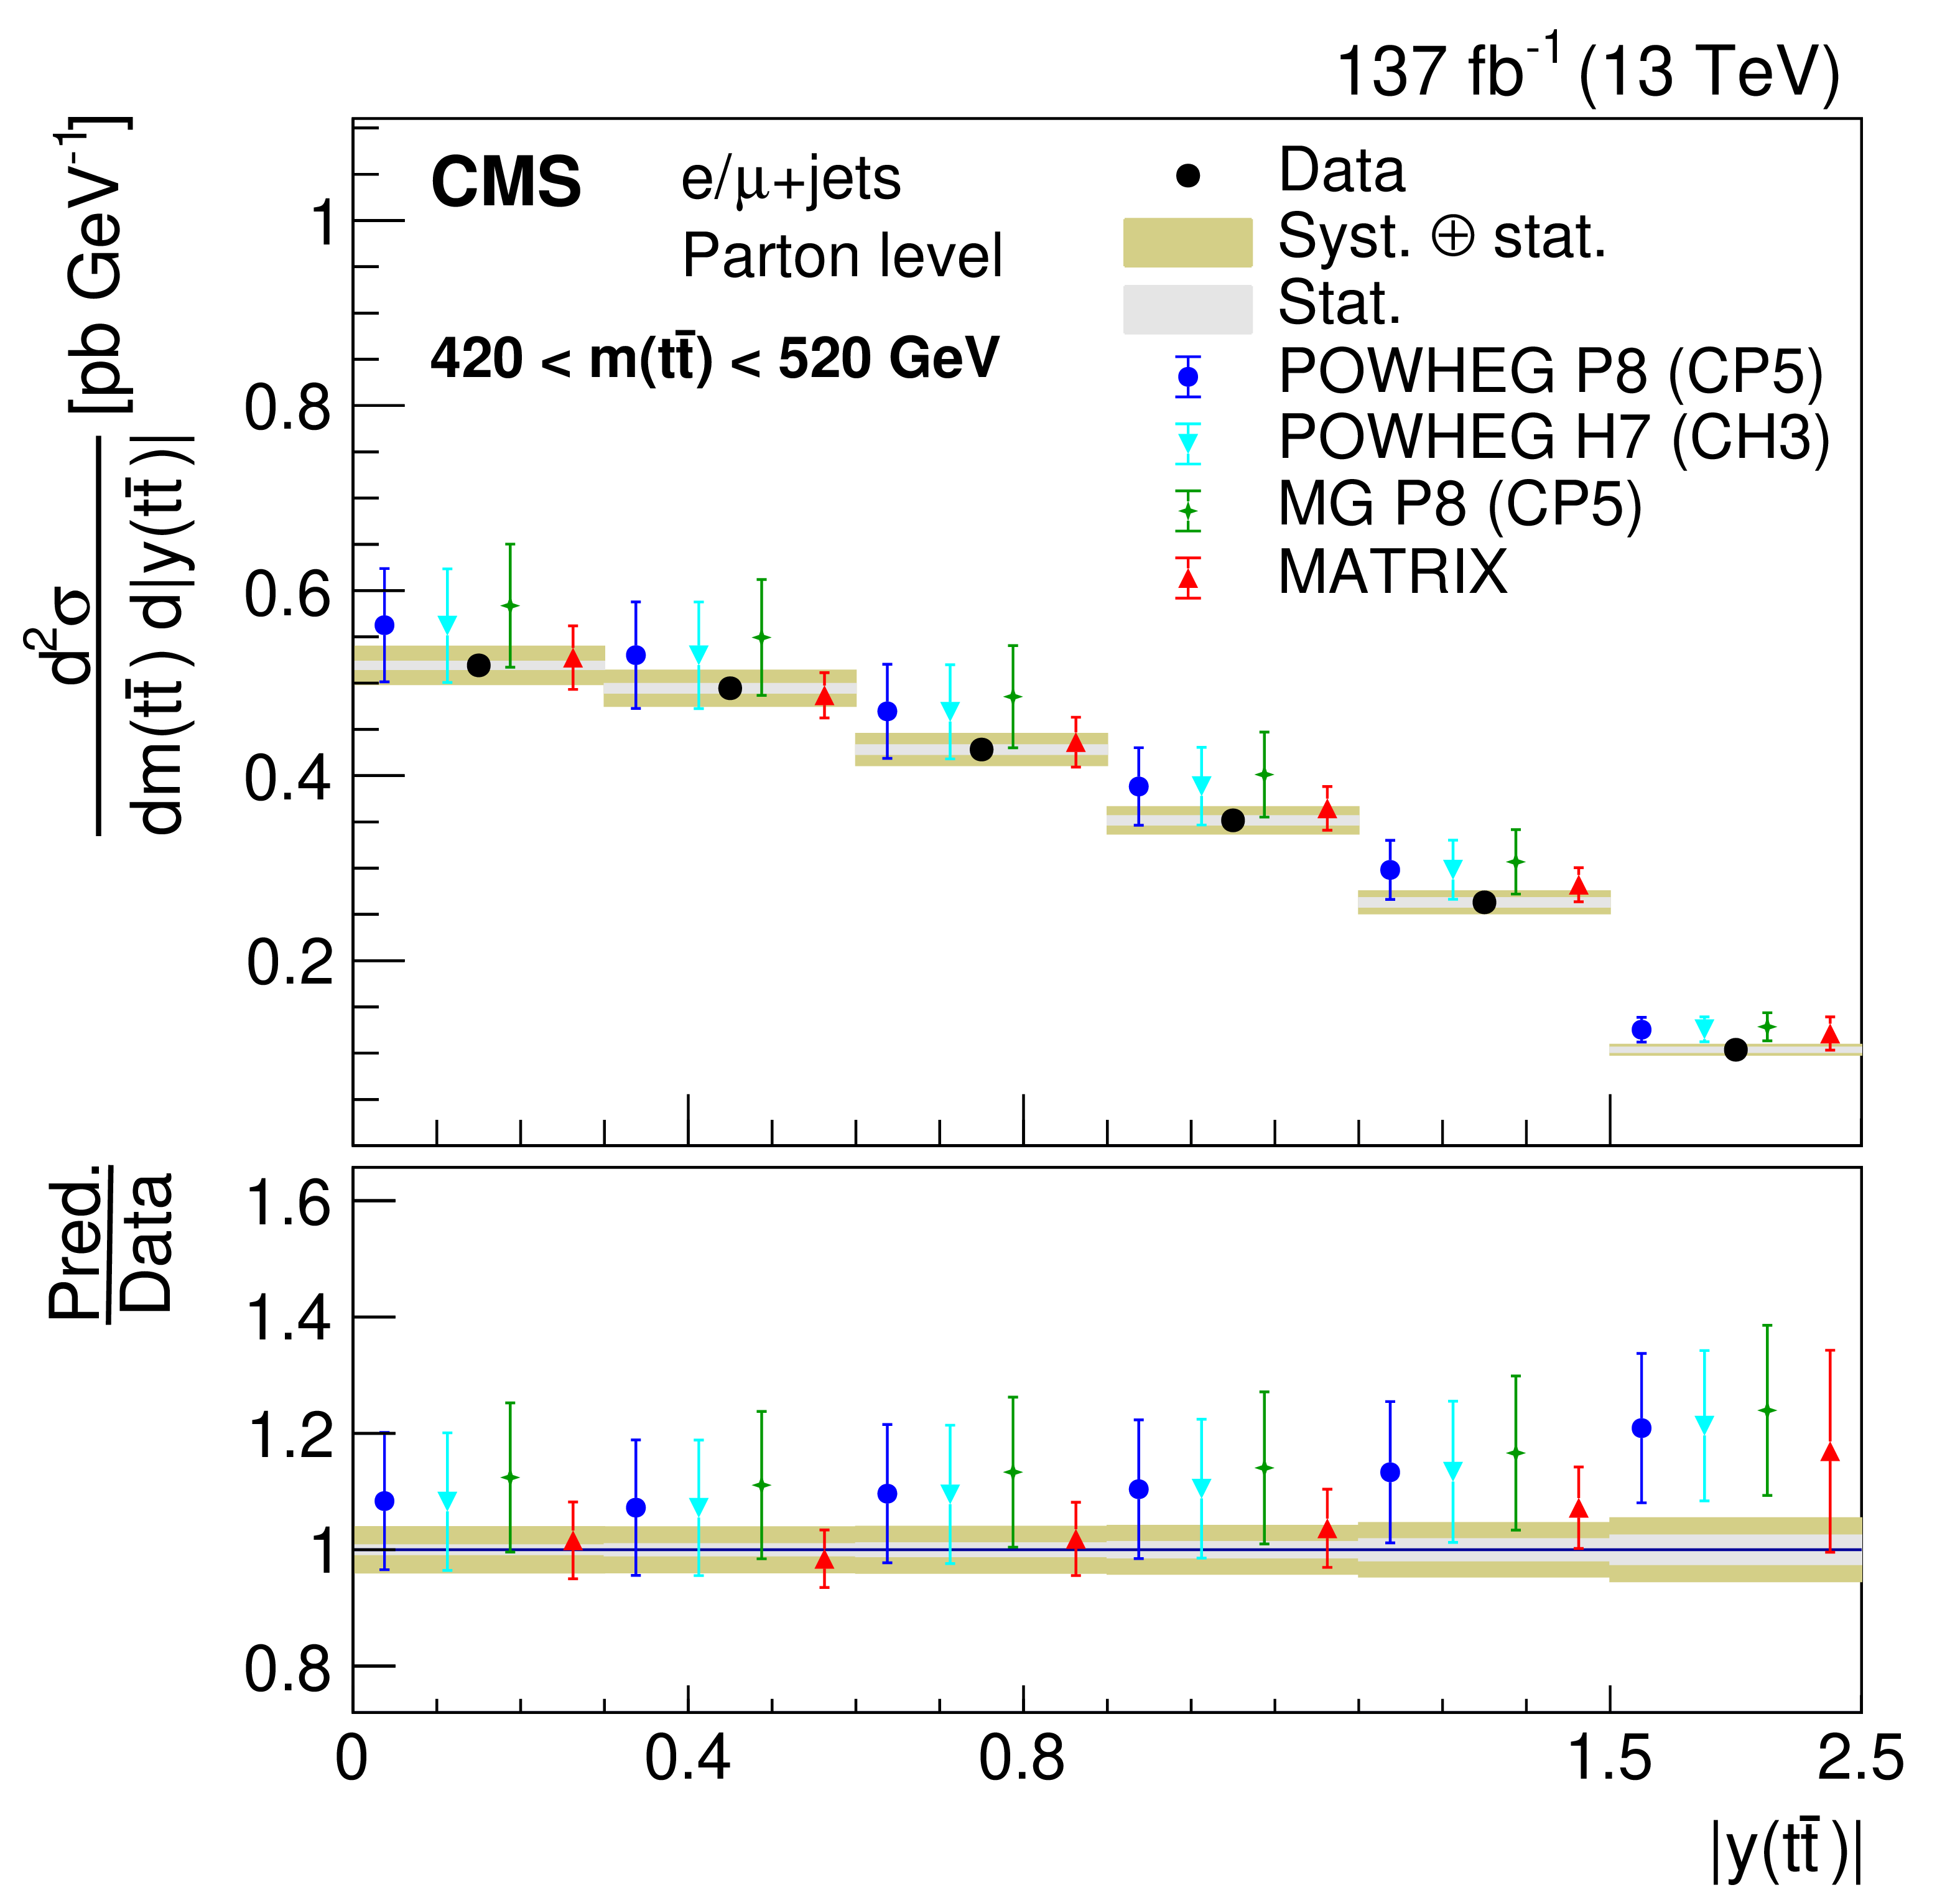
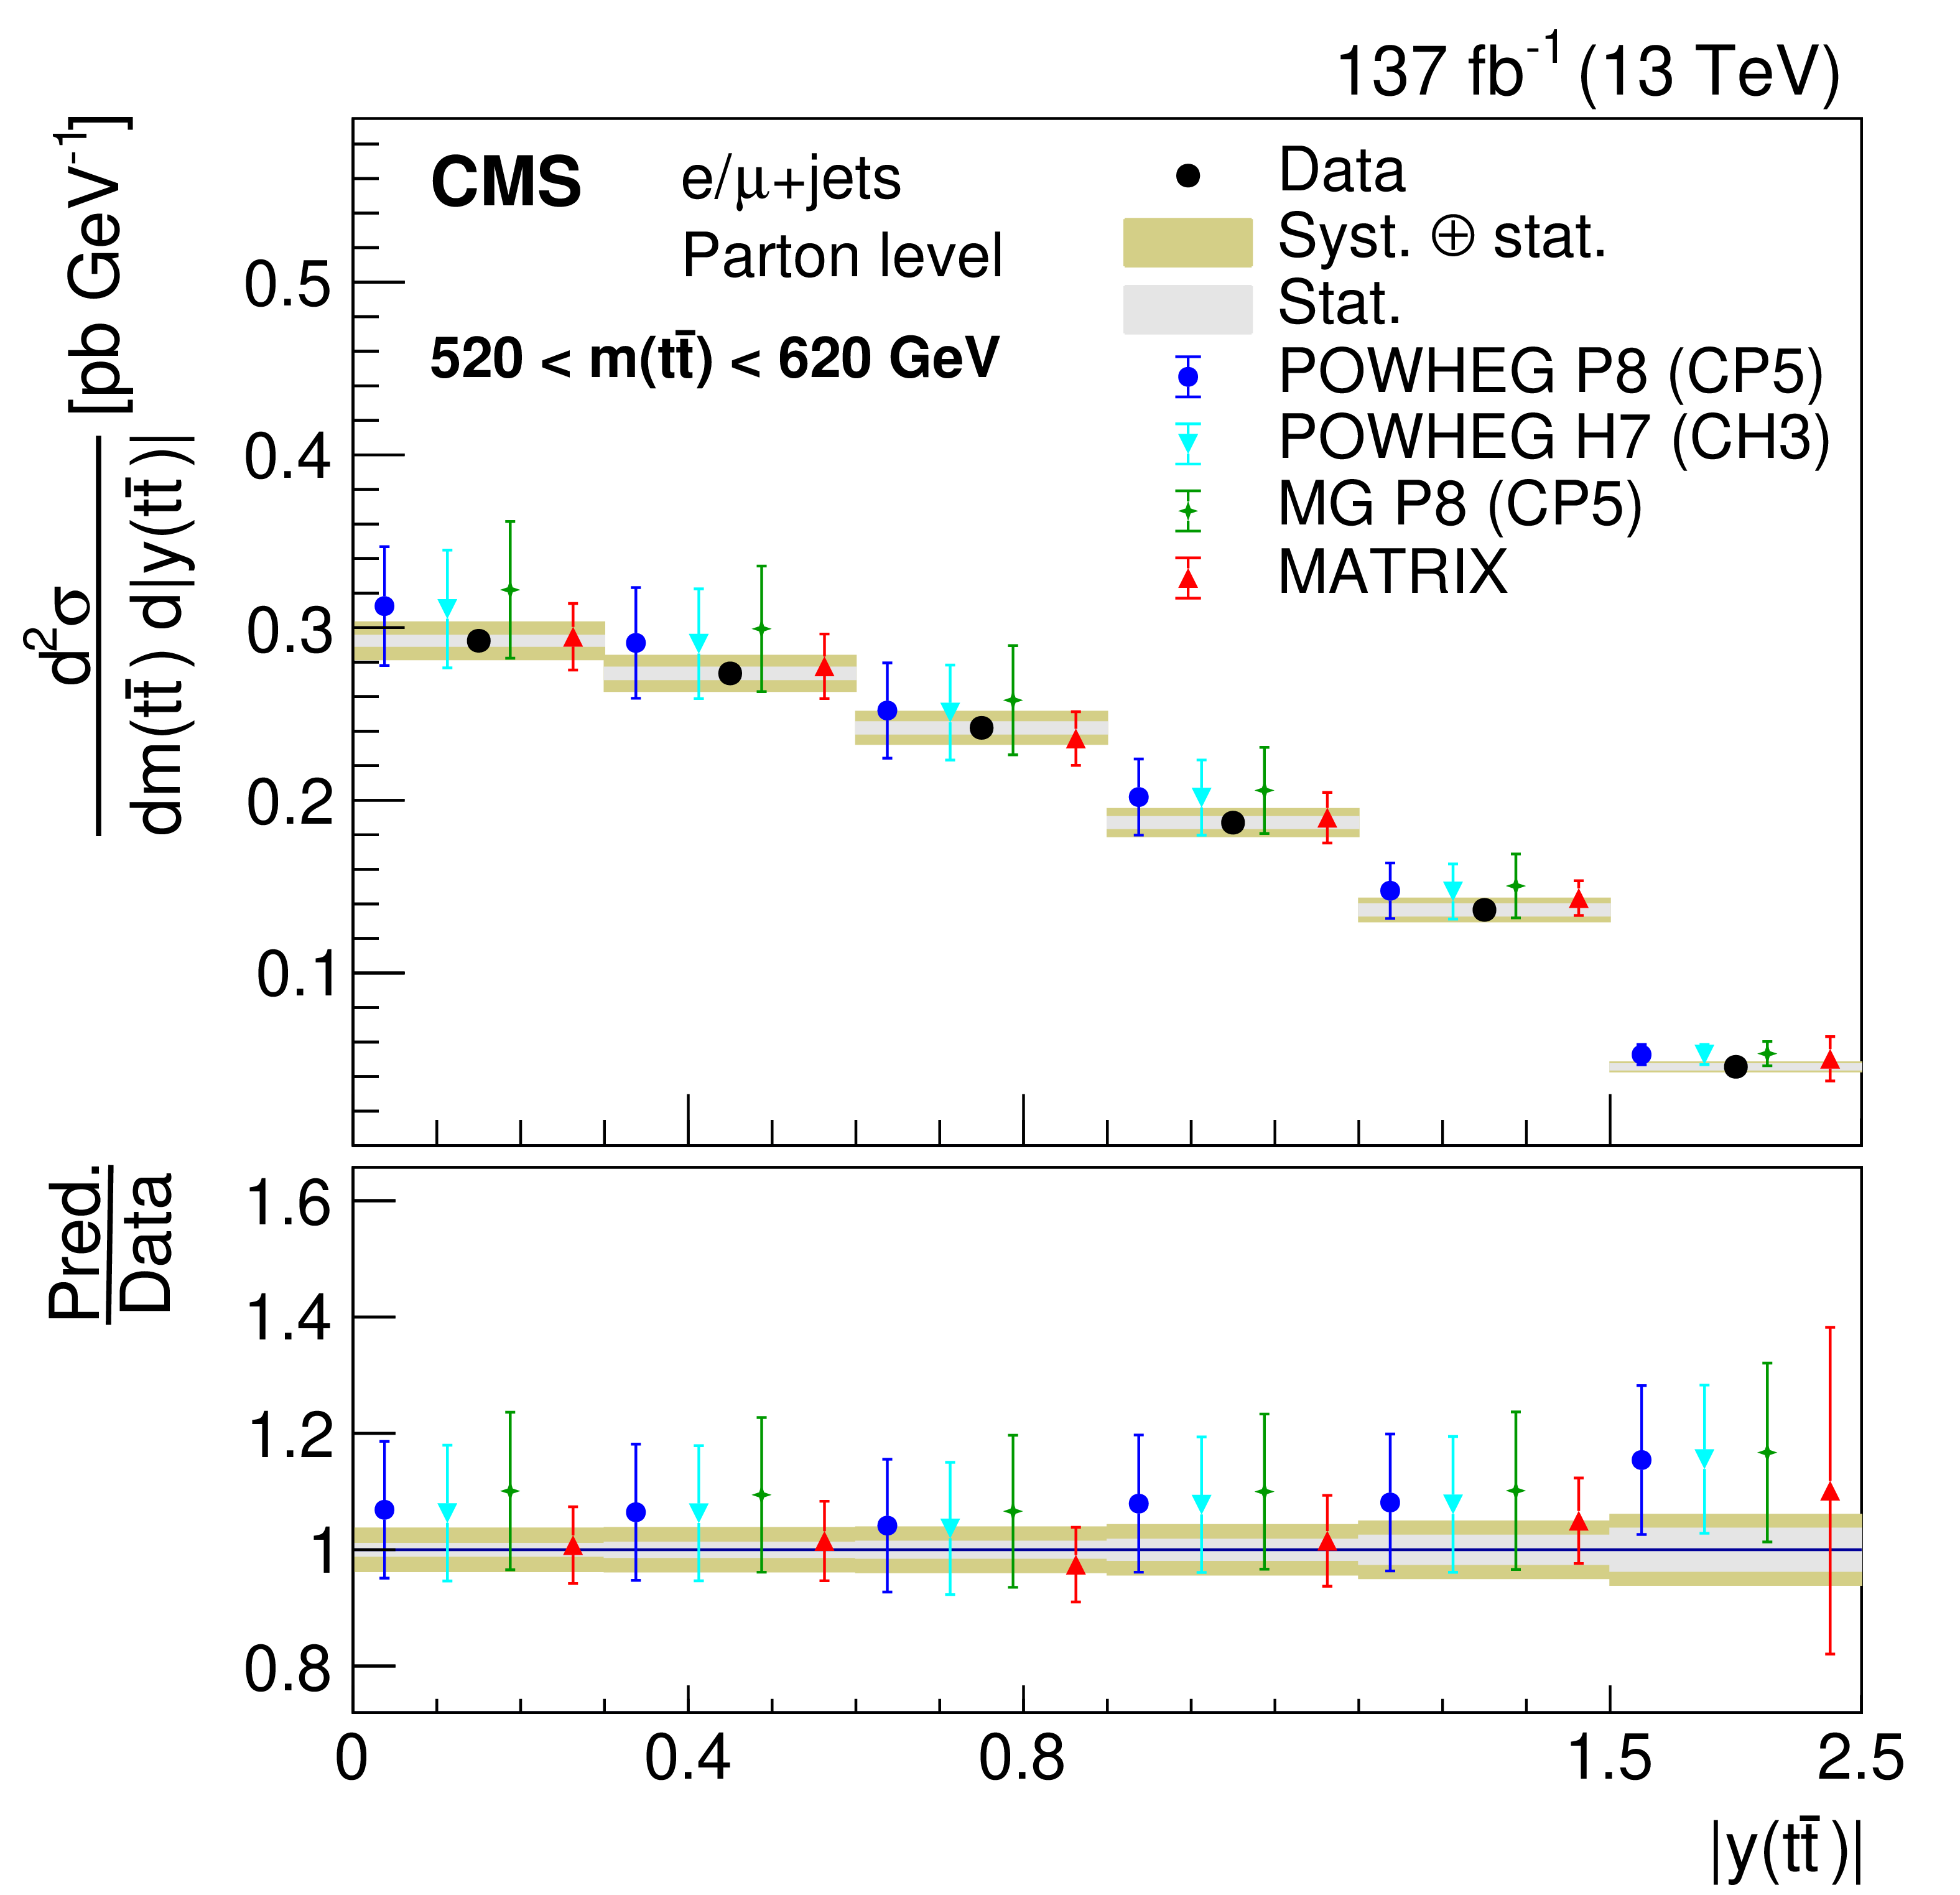
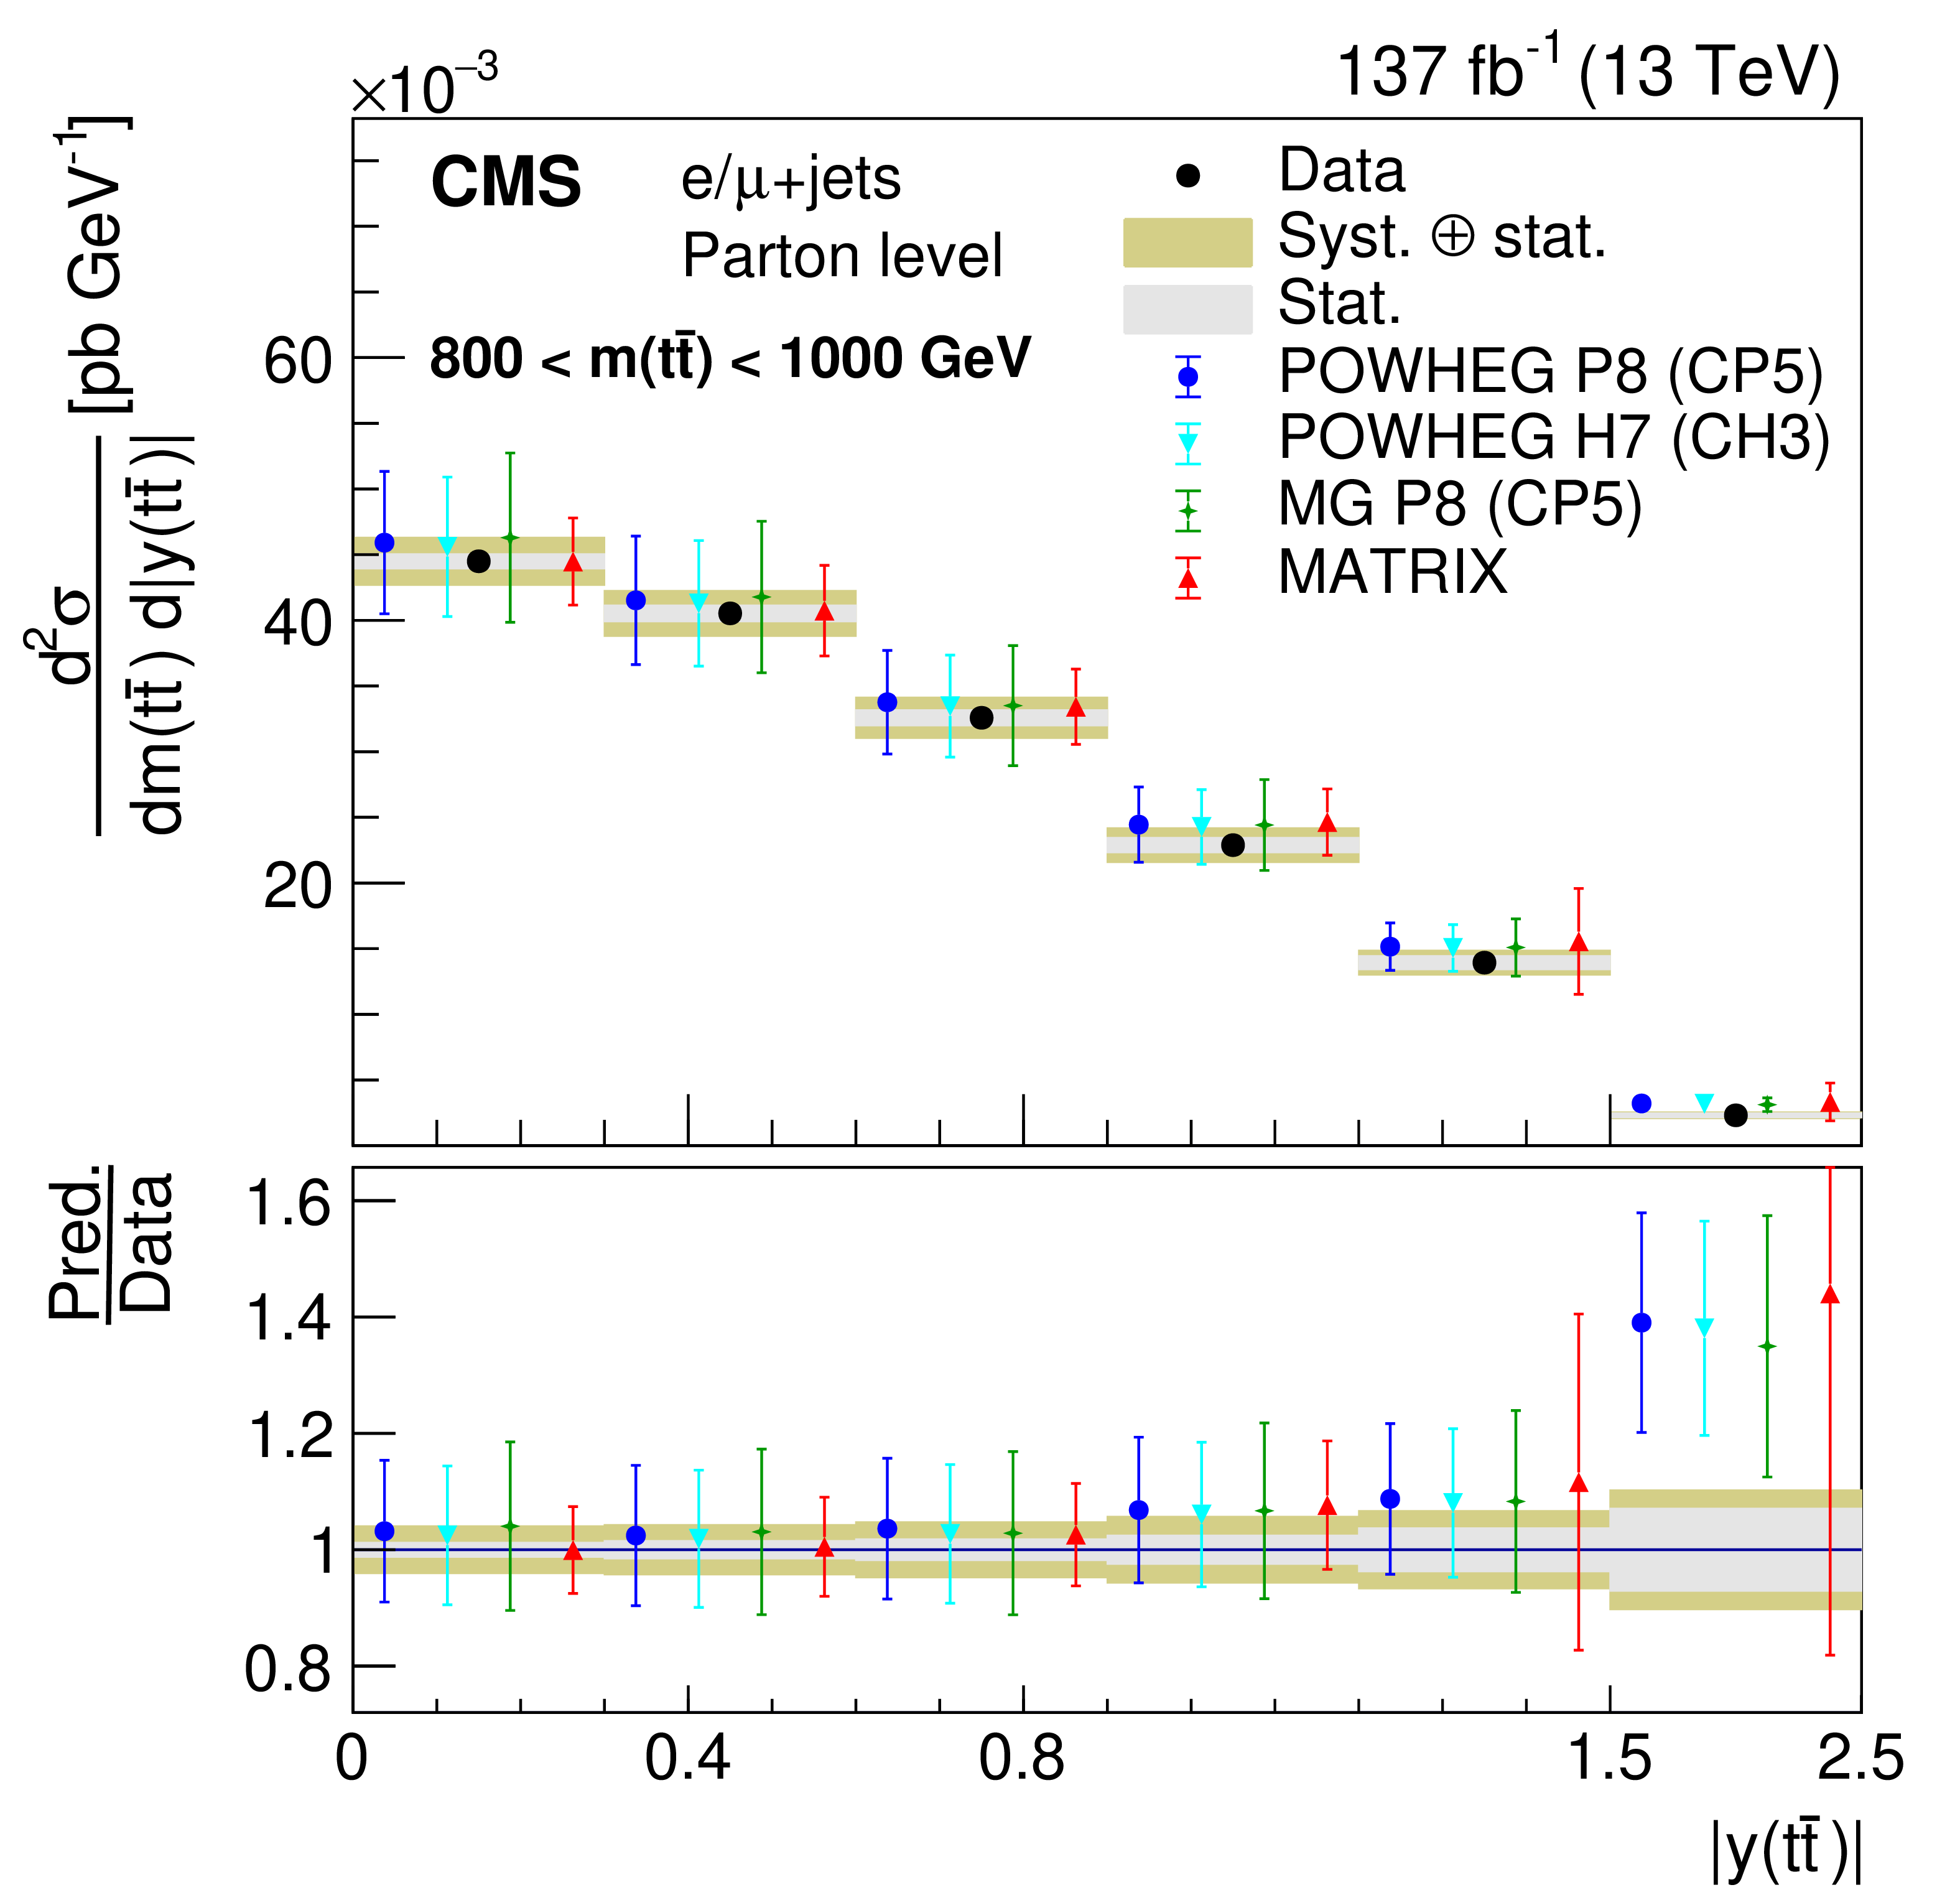
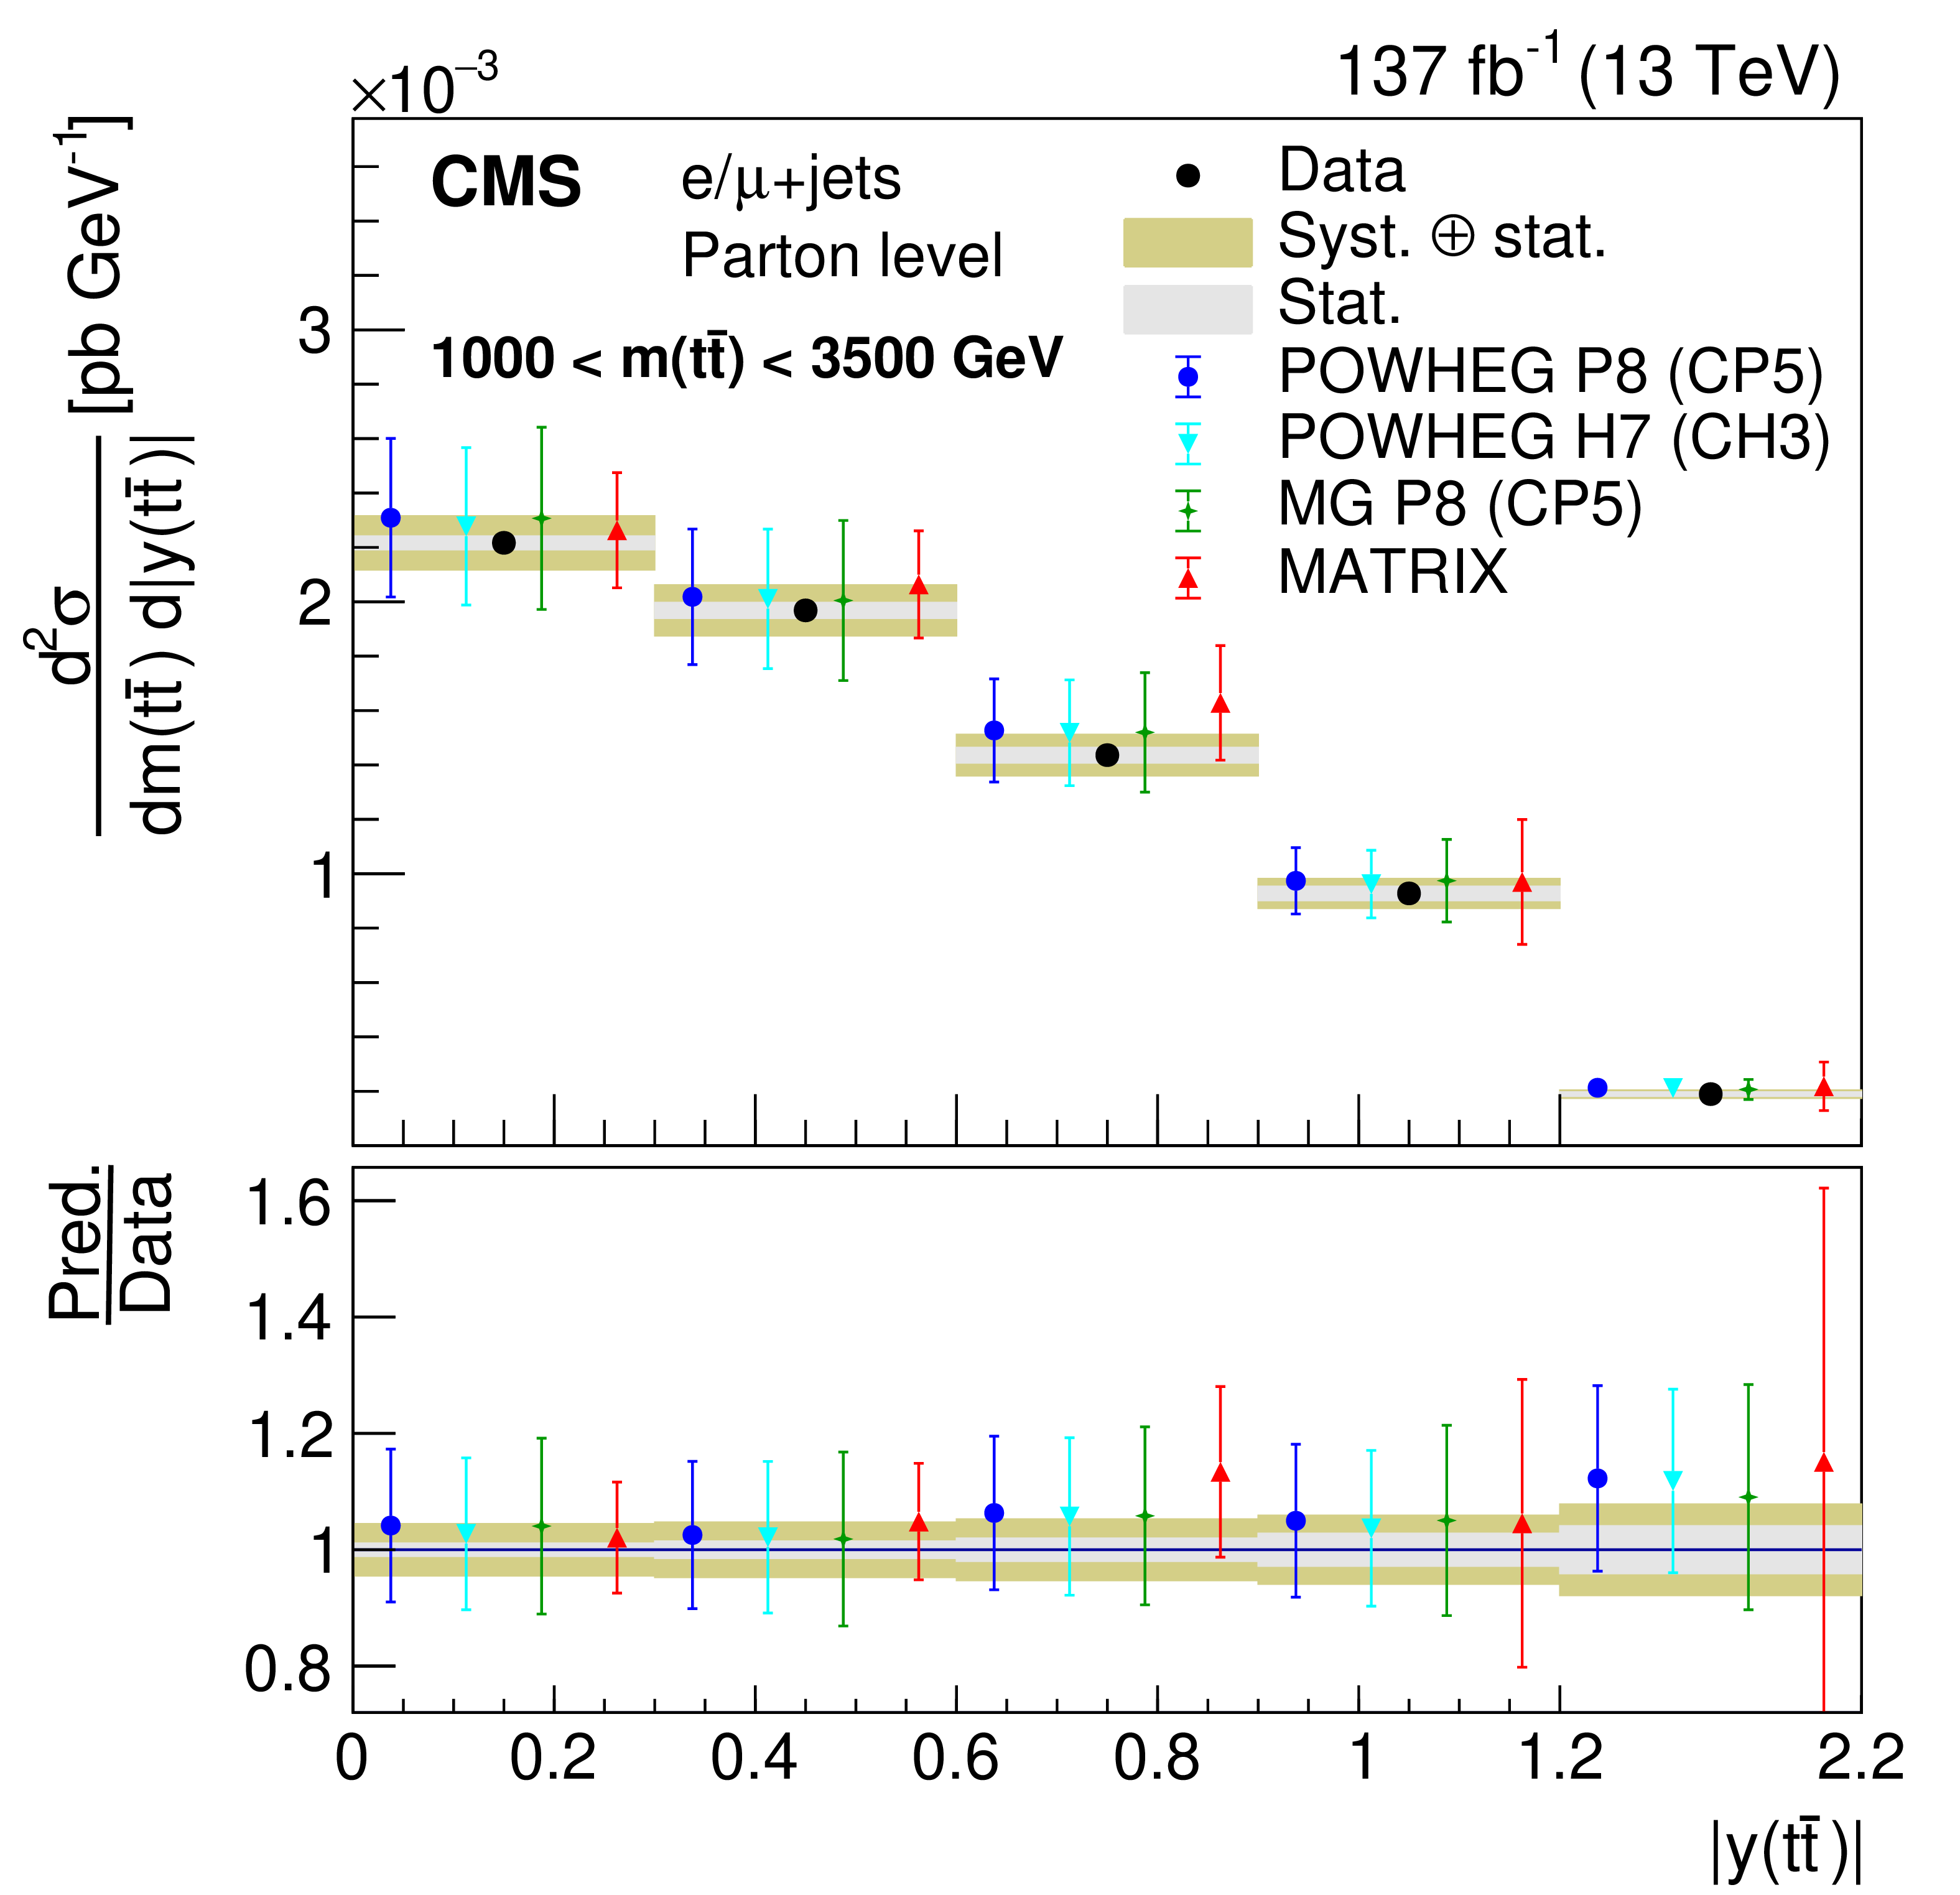
Figure 23:
Double-differential cross section at the parton level as a function of ${m({\mathrm{t} \mathrm{\bar{t}}})}$ vs. ${{| y({\mathrm{t} \mathrm{\bar{t}}}) |}}$. The data are shown as points with gray (yellow) bands indicating the statistical (statistical and systematic) uncertainties. The cross sections are compared to the predictions of POWHEG combined with PYTHIA (P8) or HERWIG (H7), the multiparton simulation MG5_aMC@NLO (MG)+PYTHIA FxFx, and the NNLO QCD calculations obtained with Matrix. The ratios of the various predictions to the measured cross sections are shown in the lower panels. |

png pdf |
Figure 23-a:
Double-differential cross section at the parton level as a function of ${m({\mathrm{t} \mathrm{\bar{t}}})}$ vs. ${{| y({\mathrm{t} \mathrm{\bar{t}}}) |}}$. The data are shown as points with gray (yellow) bands indicating the statistical (statistical and systematic) uncertainties. The cross sections are compared to the predictions of POWHEG combined with PYTHIA (P8) or HERWIG (H7), the multiparton simulation MG5_aMC@NLO (MG)+PYTHIA FxFx, and the NNLO QCD calculations obtained with Matrix. The ratios of the various predictions to the measured cross sections are shown in the lower panels. |
png pdf |
Figure 23-b:
Double-differential cross section at the parton level as a function of ${m({\mathrm{t} \mathrm{\bar{t}}})}$ vs. ${{| y({\mathrm{t} \mathrm{\bar{t}}}) |}}$. The data are shown as points with gray (yellow) bands indicating the statistical (statistical and systematic) uncertainties. The cross sections are compared to the predictions of POWHEG combined with PYTHIA (P8) or HERWIG (H7), the multiparton simulation MG5_aMC@NLO (MG)+PYTHIA FxFx, and the NNLO QCD calculations obtained with Matrix. The ratios of the various predictions to the measured cross sections are shown in the lower panels. |
png pdf |
Figure 23-c:
Double-differential cross section at the parton level as a function of ${m({\mathrm{t} \mathrm{\bar{t}}})}$ vs. ${{| y({\mathrm{t} \mathrm{\bar{t}}}) |}}$. The data are shown as points with gray (yellow) bands indicating the statistical (statistical and systematic) uncertainties. The cross sections are compared to the predictions of POWHEG combined with PYTHIA (P8) or HERWIG (H7), the multiparton simulation MG5_aMC@NLO (MG)+PYTHIA FxFx, and the NNLO QCD calculations obtained with Matrix. The ratios of the various predictions to the measured cross sections are shown in the lower panels. |

png pdf |
Figure 23-d:
Double-differential cross section at the parton level as a function of ${m({\mathrm{t} \mathrm{\bar{t}}})}$ vs. ${{| y({\mathrm{t} \mathrm{\bar{t}}}) |}}$. The data are shown as points with gray (yellow) bands indicating the statistical (statistical and systematic) uncertainties. The cross sections are compared to the predictions of POWHEG combined with PYTHIA (P8) or HERWIG (H7), the multiparton simulation MG5_aMC@NLO (MG)+PYTHIA FxFx, and the NNLO QCD calculations obtained with Matrix. The ratios of the various predictions to the measured cross sections are shown in the lower panels. |
png pdf |
Figure 23-e:
Double-differential cross section at the parton level as a function of ${m({\mathrm{t} \mathrm{\bar{t}}})}$ vs. ${{| y({\mathrm{t} \mathrm{\bar{t}}}) |}}$. The data are shown as points with gray (yellow) bands indicating the statistical (statistical and systematic) uncertainties. The cross sections are compared to the predictions of POWHEG combined with PYTHIA (P8) or HERWIG (H7), the multiparton simulation MG5_aMC@NLO (MG)+PYTHIA FxFx, and the NNLO QCD calculations obtained with Matrix. The ratios of the various predictions to the measured cross sections are shown in the lower panels. |
png pdf |
Figure 23-f:
Double-differential cross section at the parton level as a function of ${m({\mathrm{t} \mathrm{\bar{t}}})}$ vs. ${{| y({\mathrm{t} \mathrm{\bar{t}}}) |}}$. The data are shown as points with gray (yellow) bands indicating the statistical (statistical and systematic) uncertainties. The cross sections are compared to the predictions of POWHEG combined with PYTHIA (P8) or HERWIG (H7), the multiparton simulation MG5_aMC@NLO (MG)+PYTHIA FxFx, and the NNLO QCD calculations obtained with Matrix. The ratios of the various predictions to the measured cross sections are shown in the lower panels. |
png pdf |
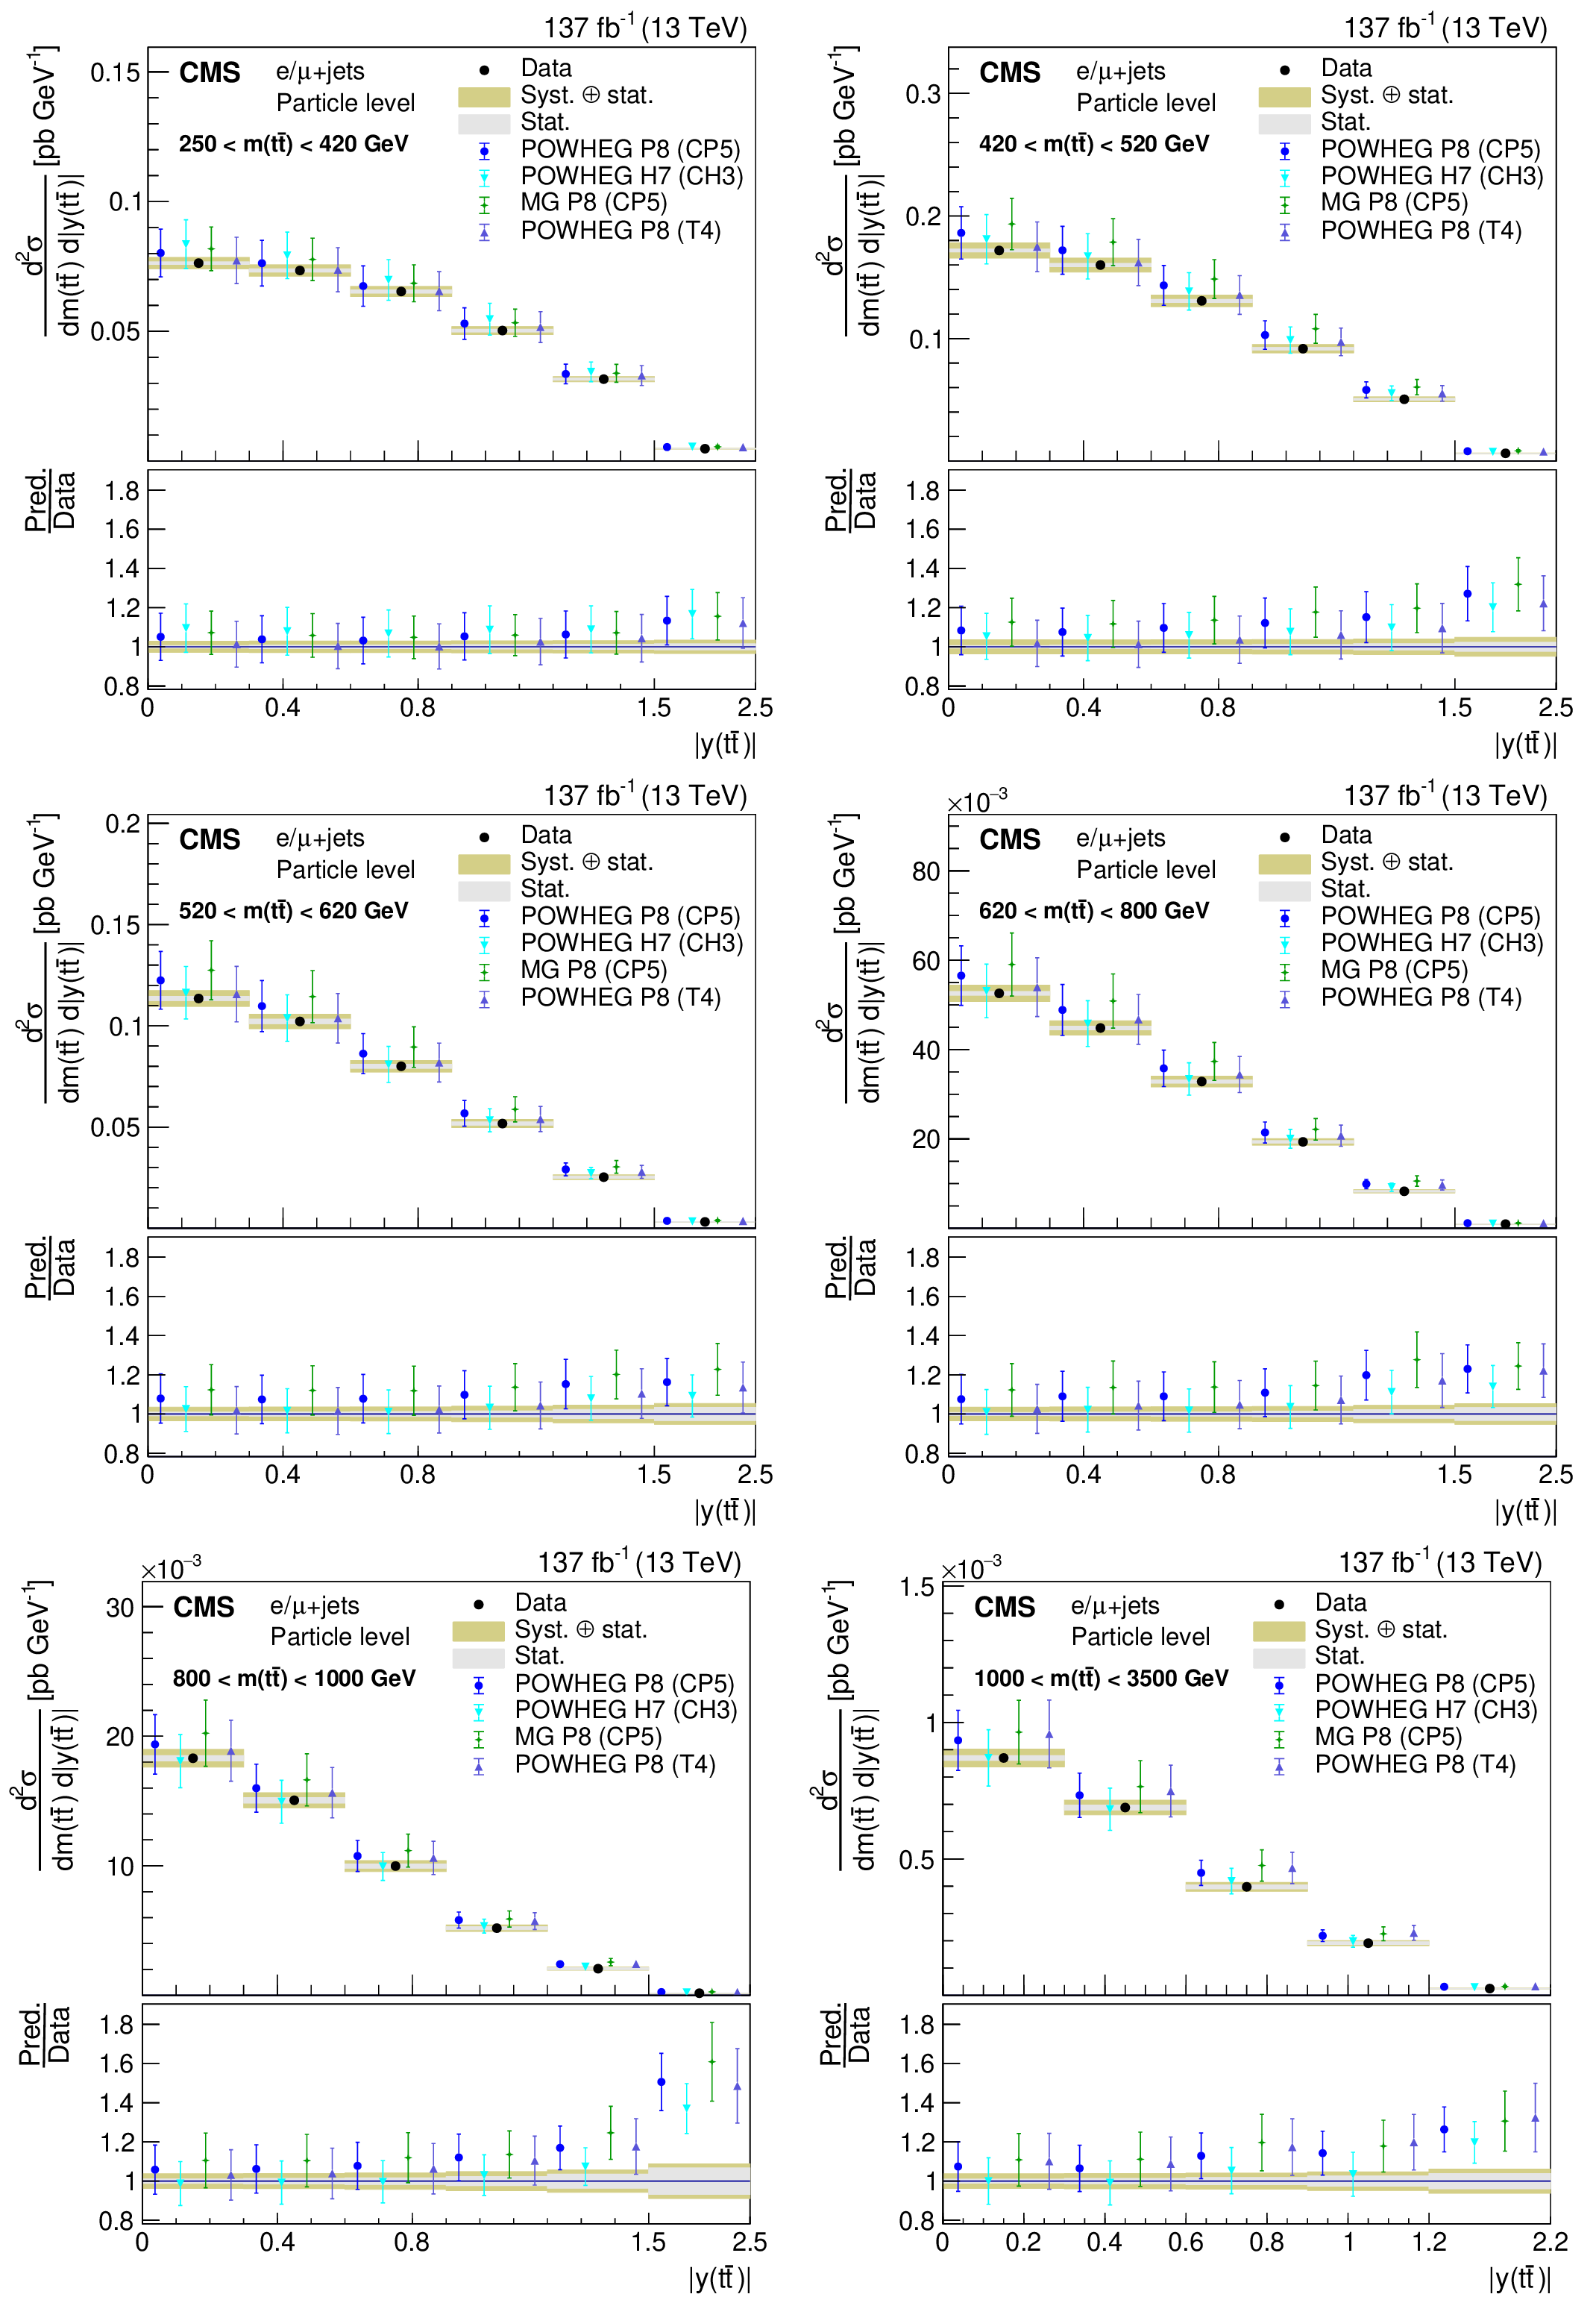
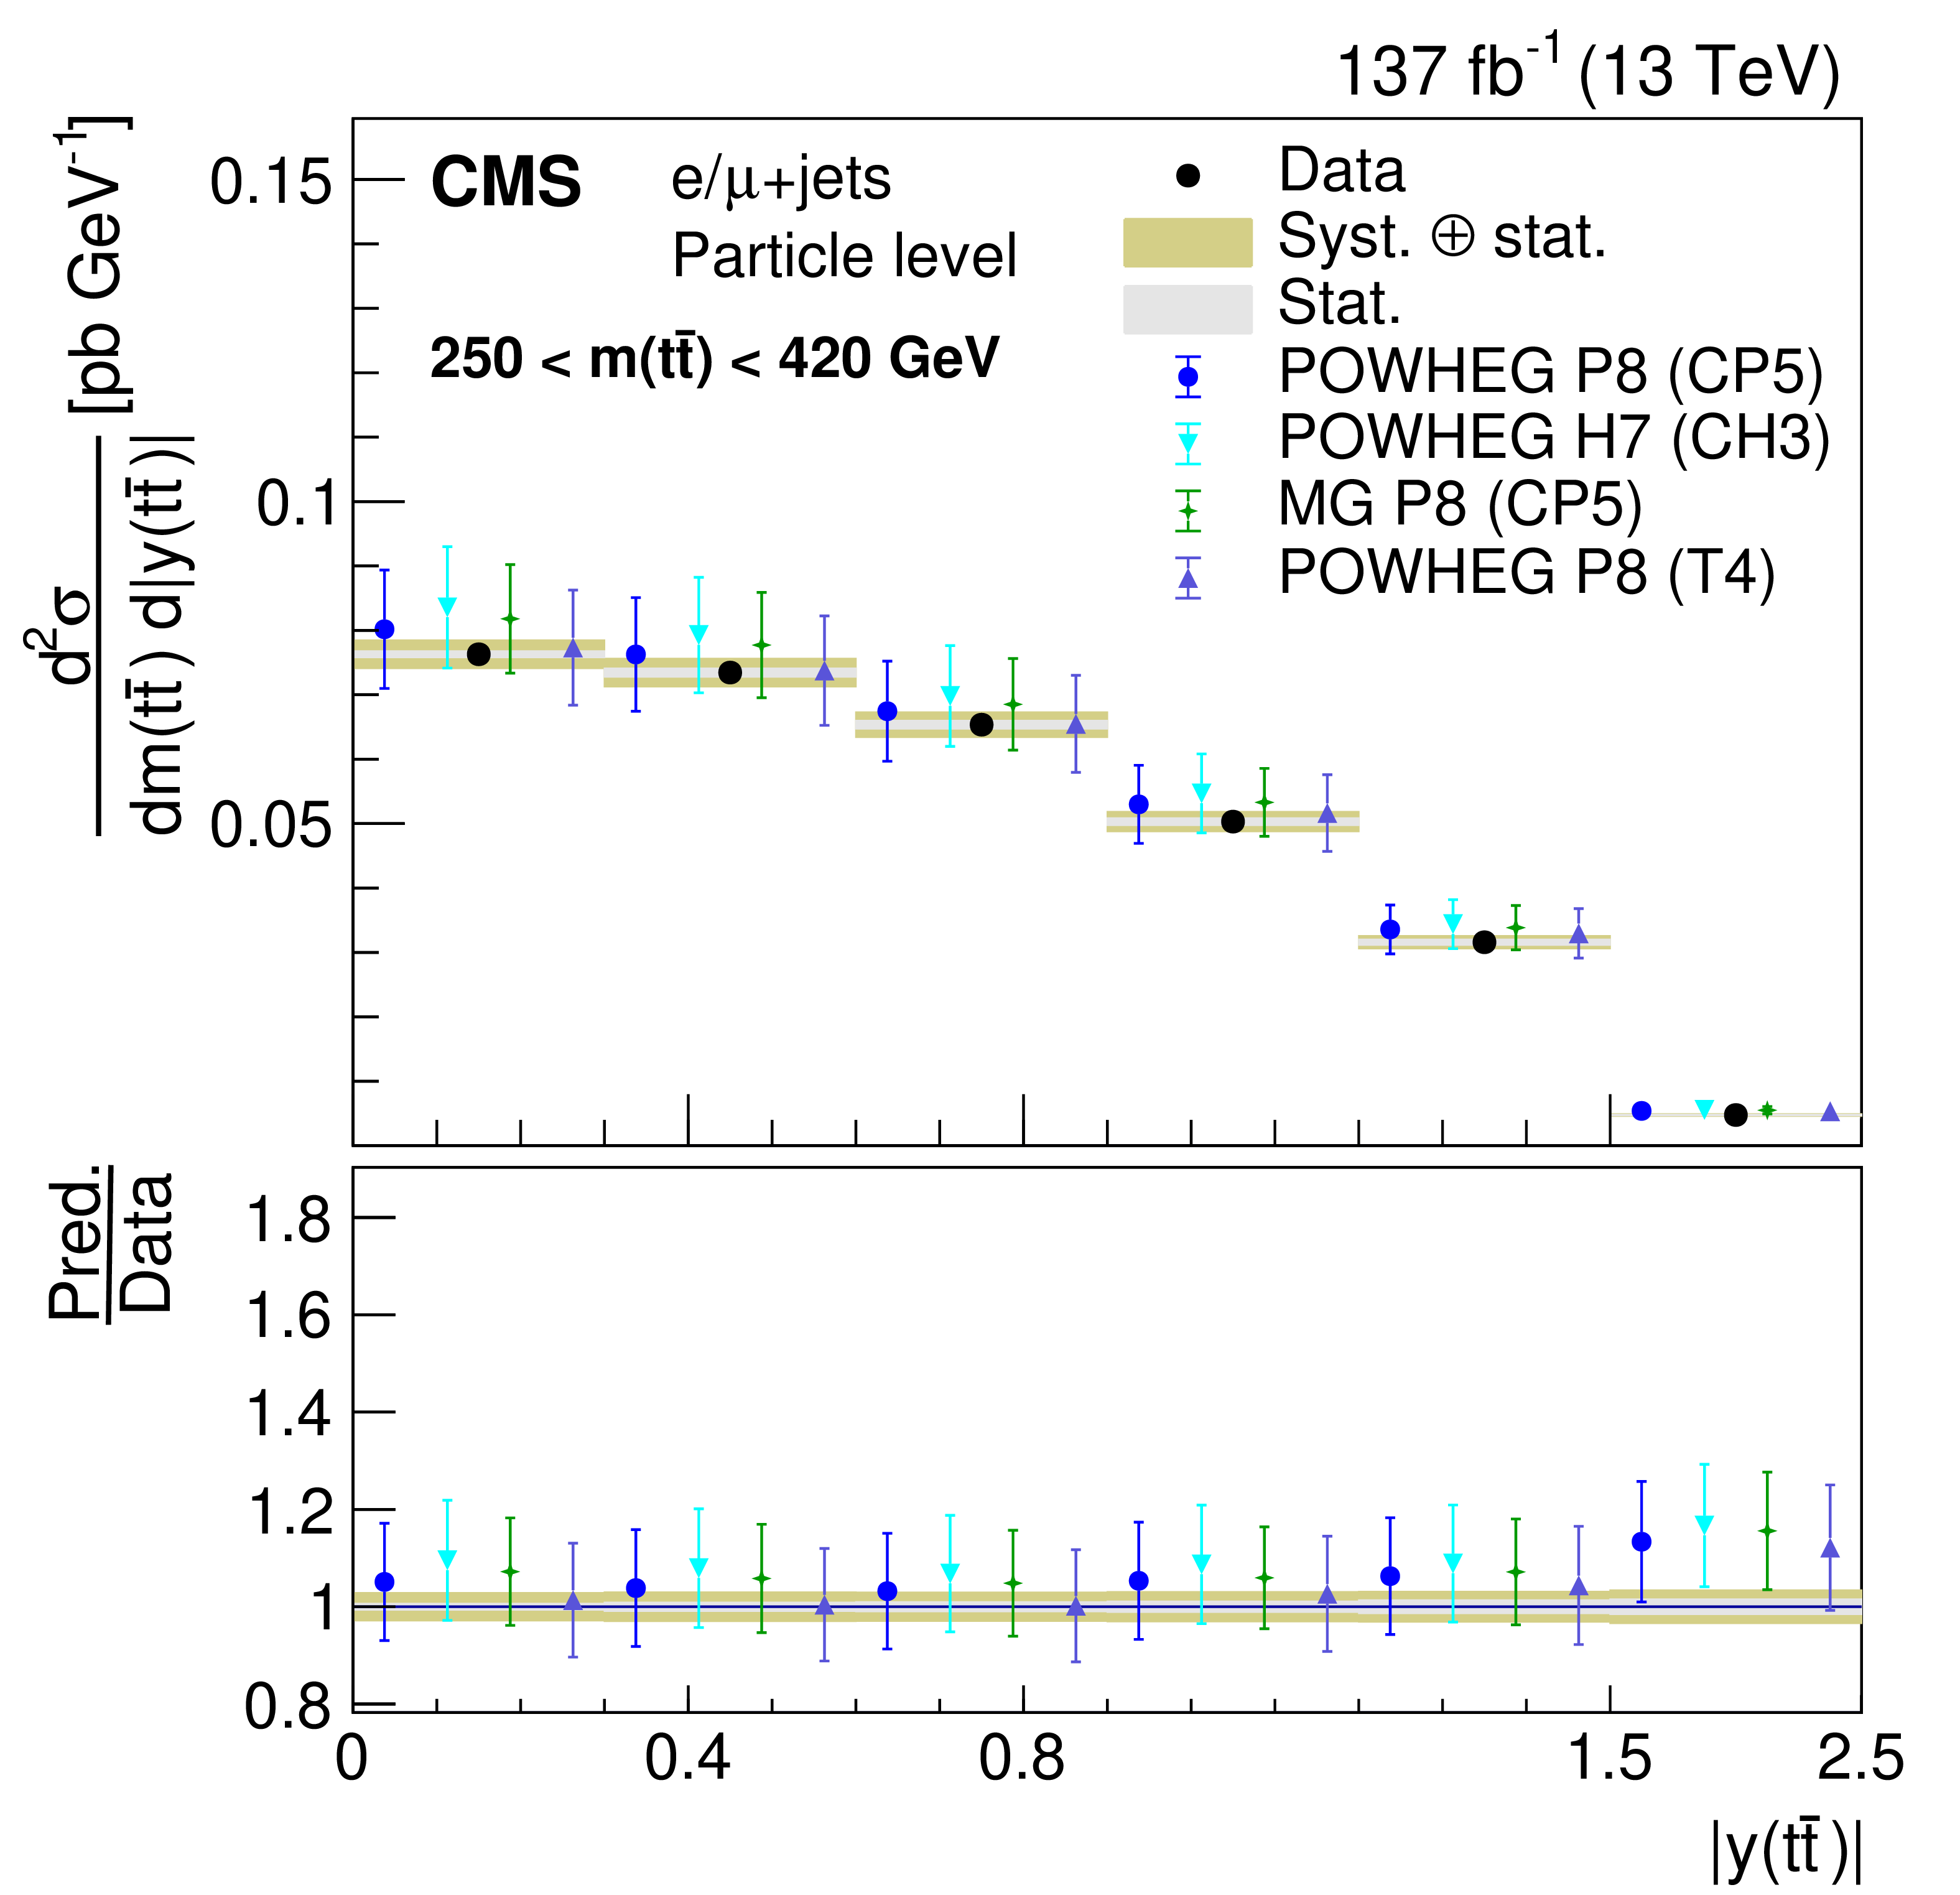
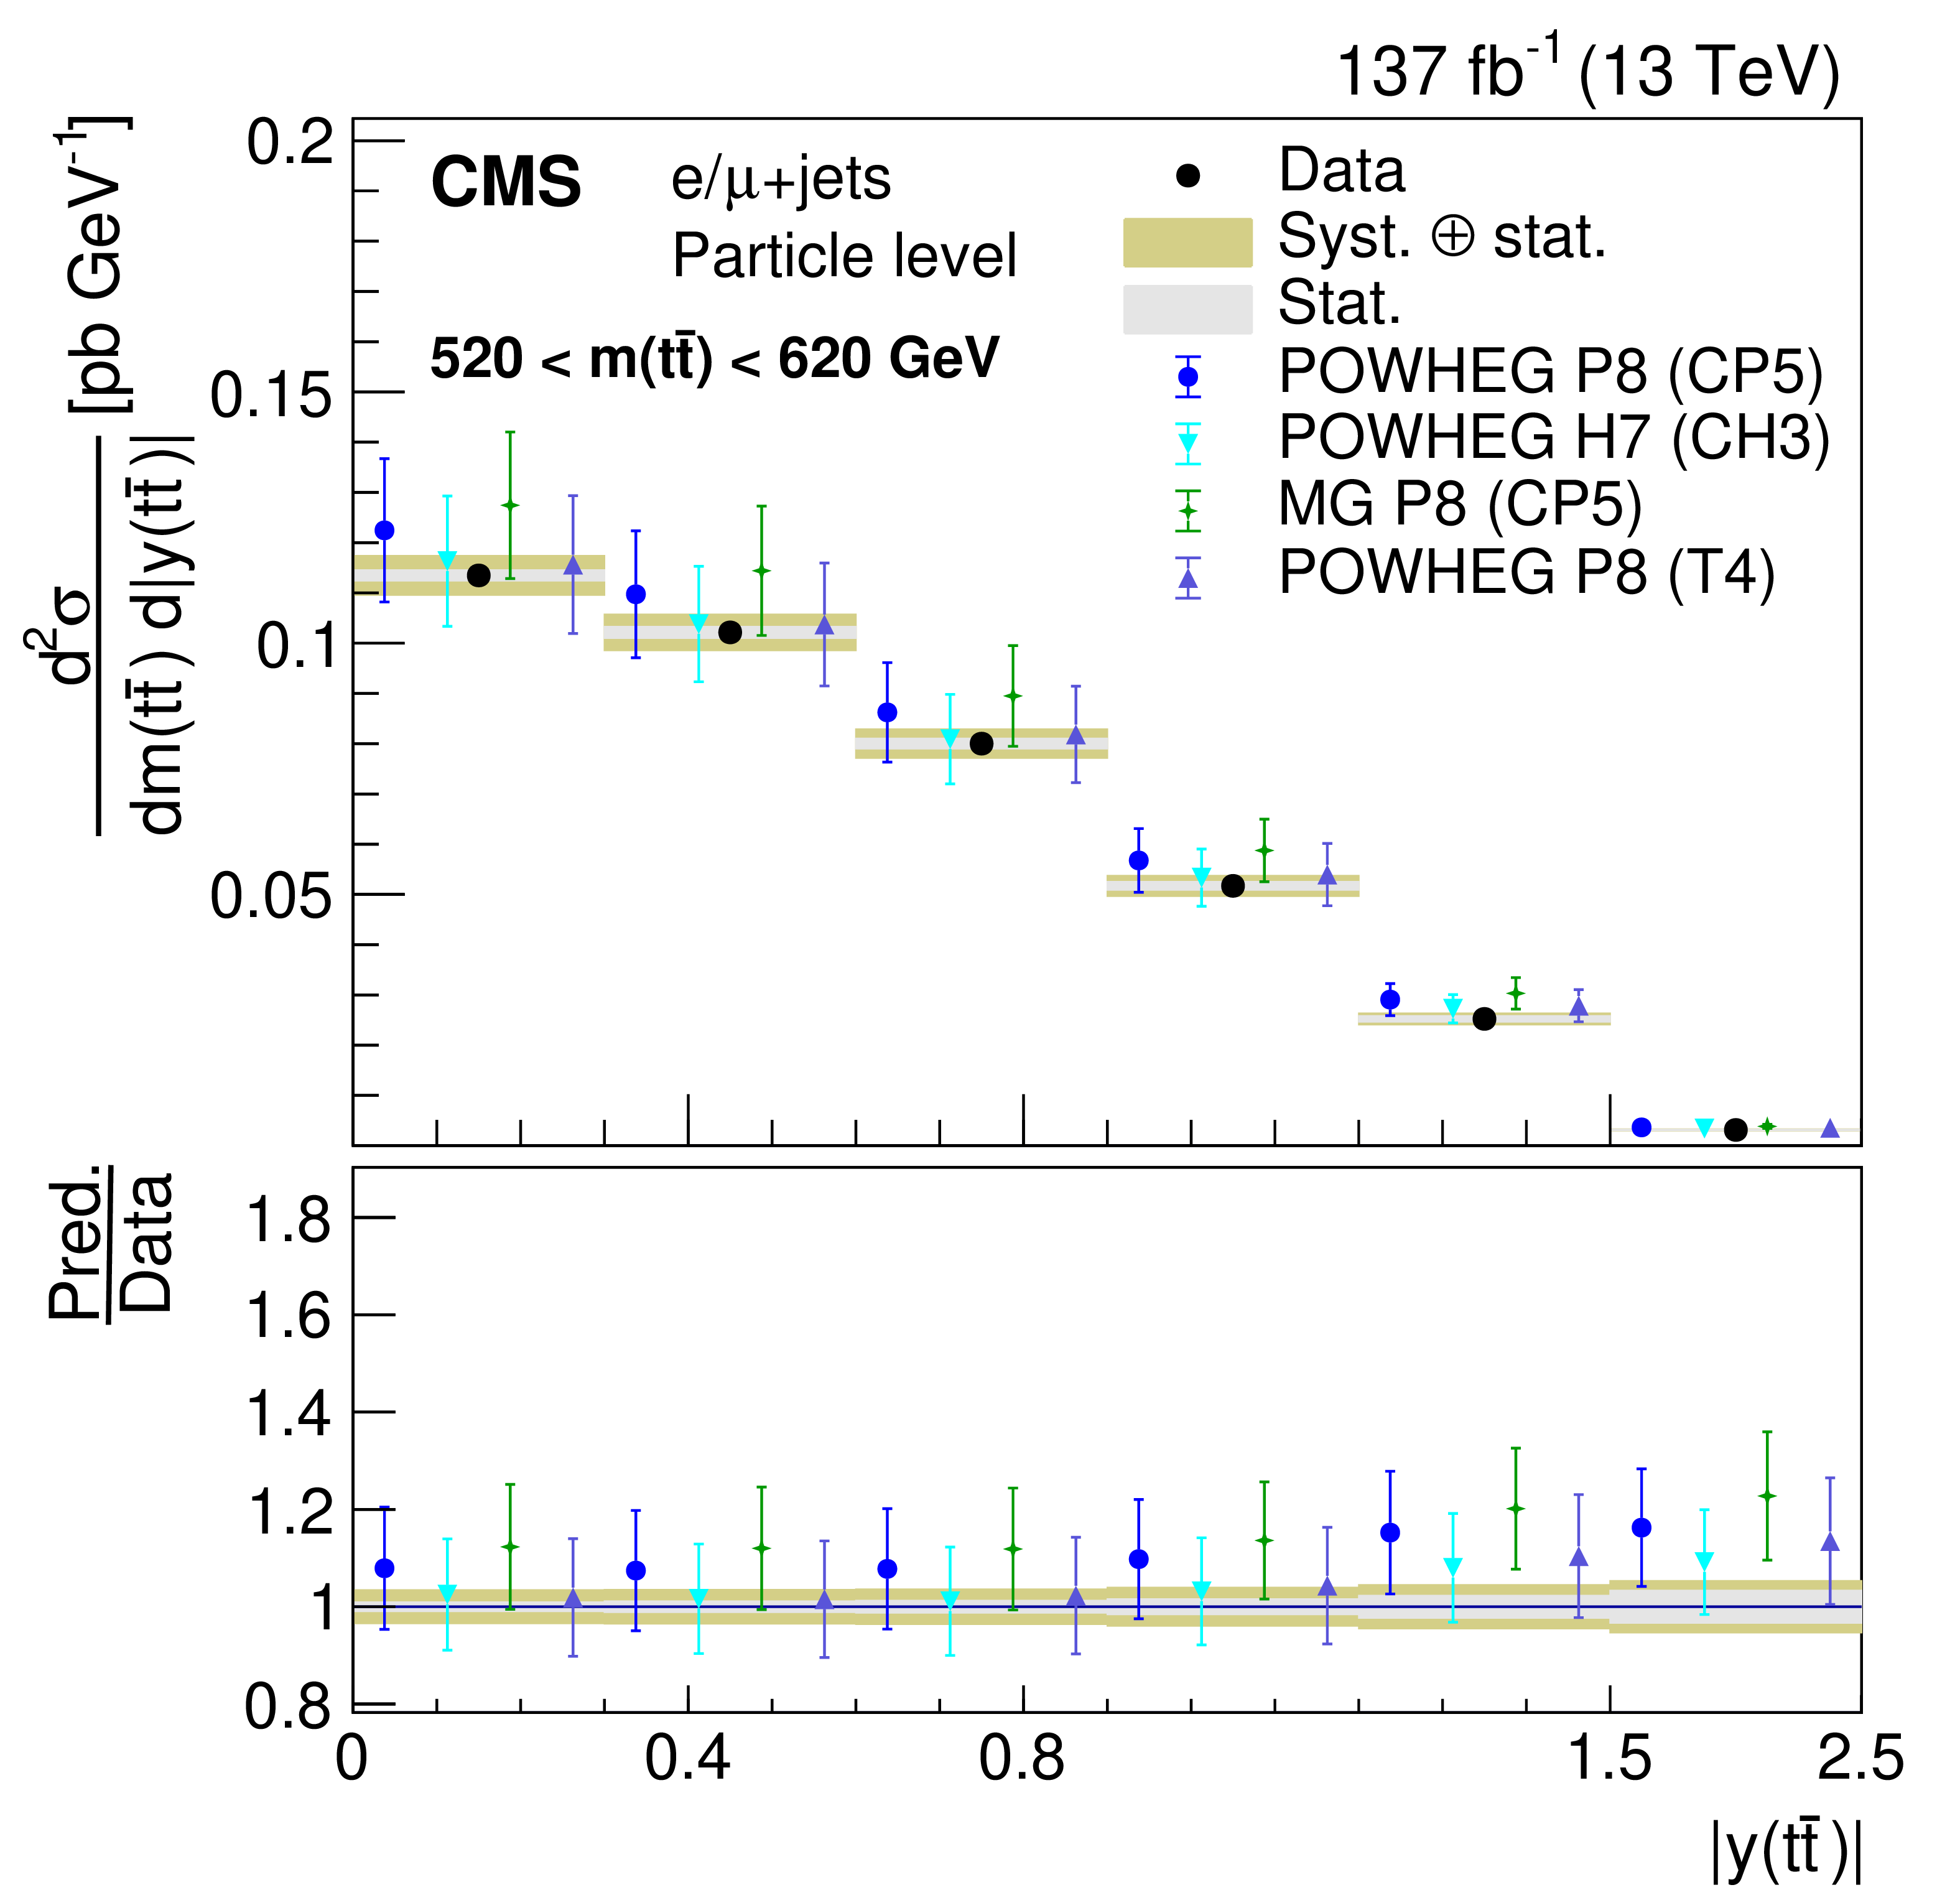
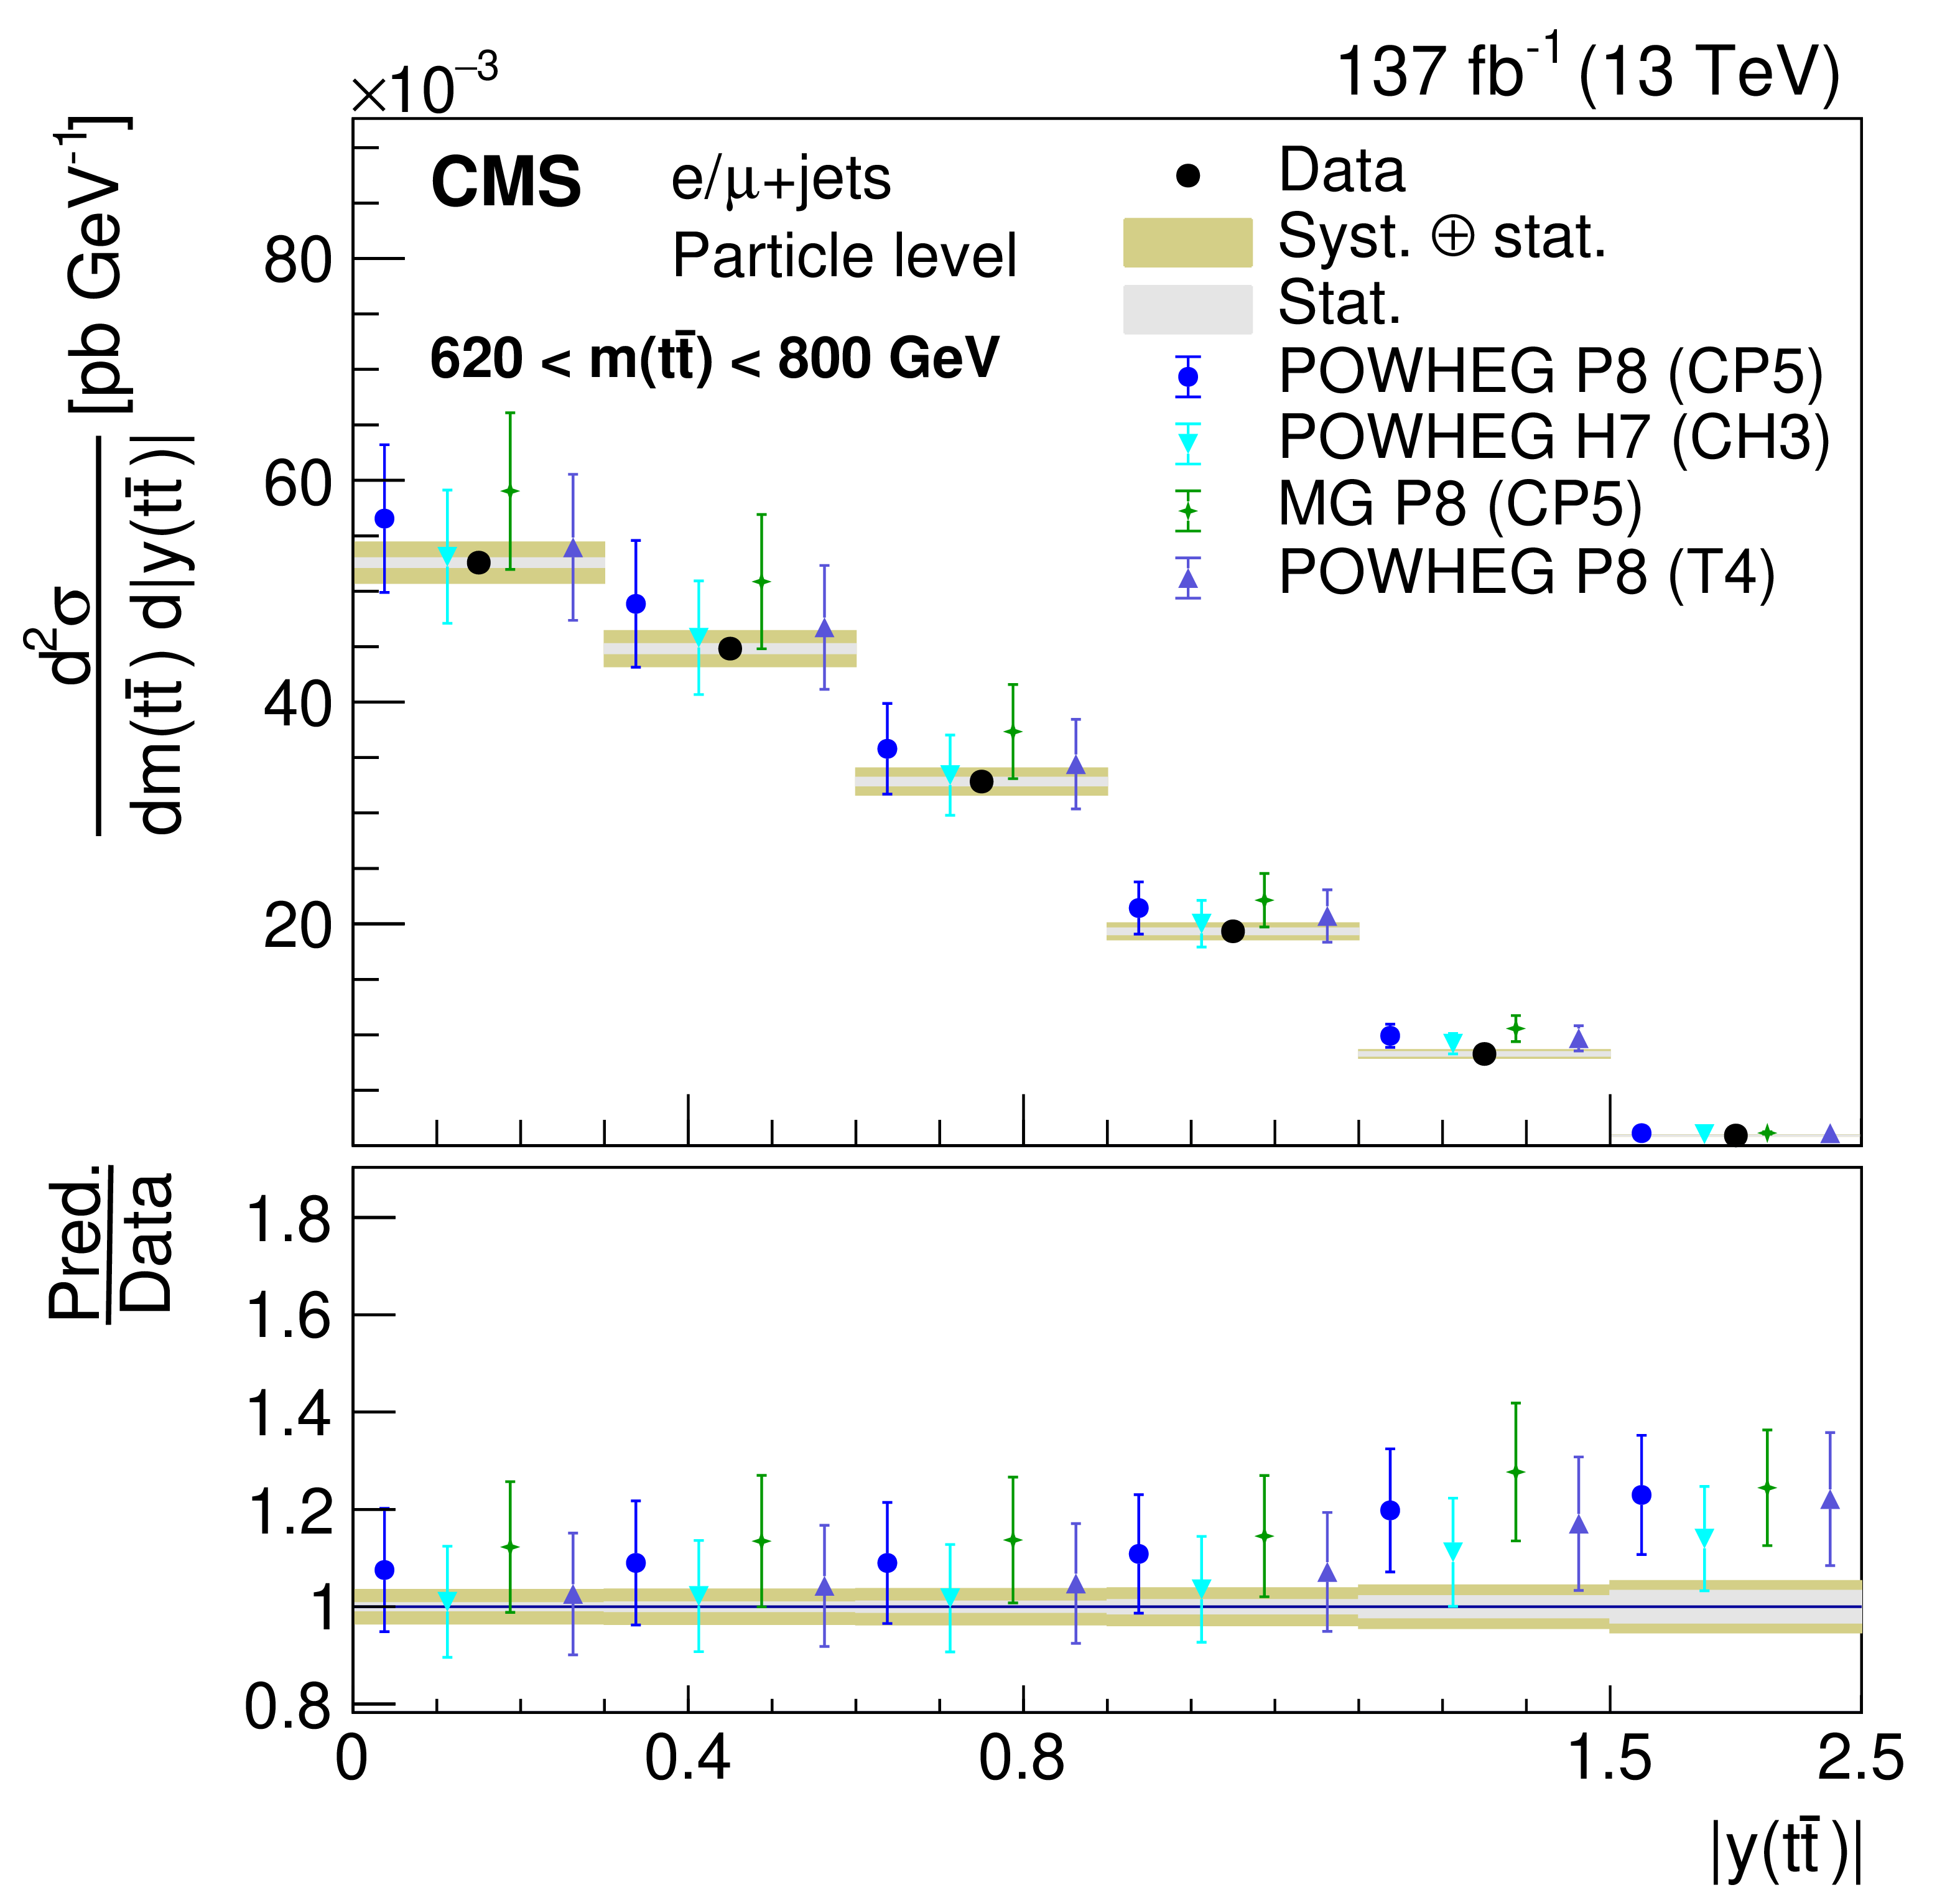
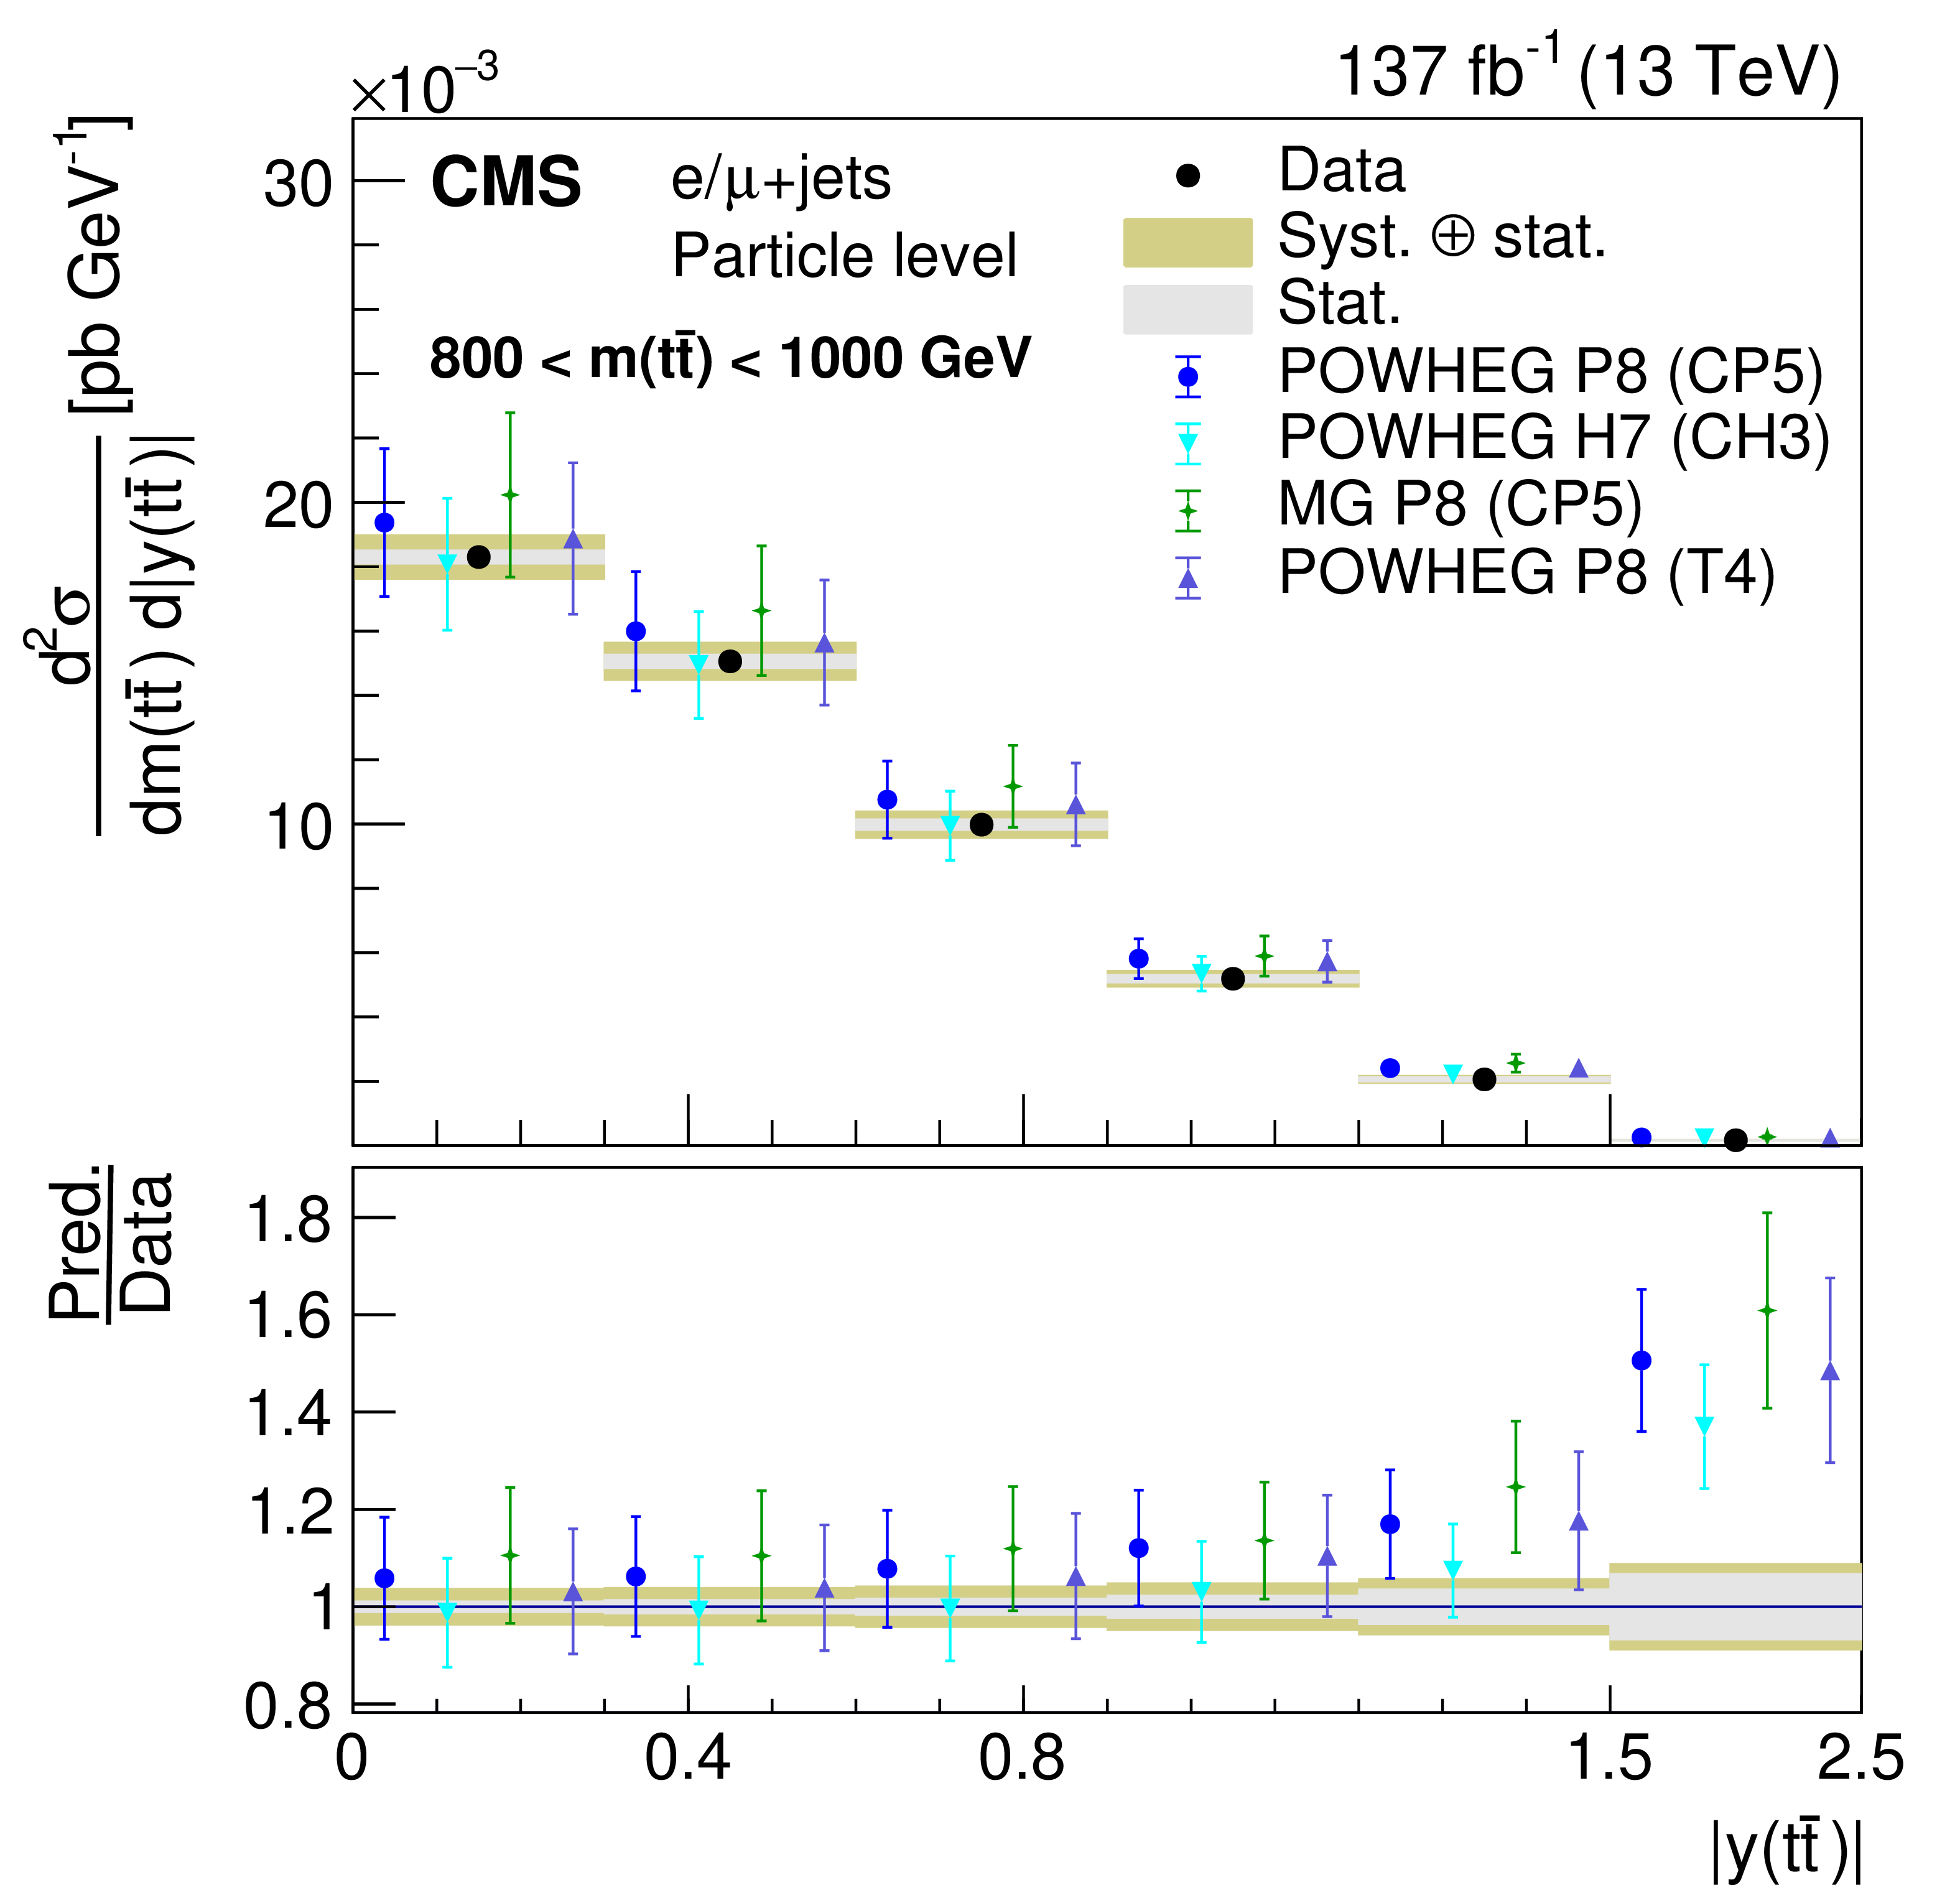
Figure 24:
Double-differential cross section at the particle level as a function of ${m({\mathrm{t} \mathrm{\bar{t}}})}$ vs. ${{| y({\mathrm{t} \mathrm{\bar{t}}}) |}}$. The data are shown as points with gray (yellow) bands indicating the statistical (statistical and systematic) uncertainties. The cross sections are compared to the predictions of POWHEG+PYTHIA (P8) for the CP5 and CUETP8M2T4 (T4) tunes, POWHEG+HERWIG (H7), and the multiparton simulation MG5_aMC@NLO (MG)+PYTHIA. The ratios of the various predictions to the measured cross sections are shown in the lower panels. |
png pdf |
Figure 24-a:
Double-differential cross section at the particle level as a function of ${m({\mathrm{t} \mathrm{\bar{t}}})}$ vs. ${{| y({\mathrm{t} \mathrm{\bar{t}}}) |}}$. The data are shown as points with gray (yellow) bands indicating the statistical (statistical and systematic) uncertainties. The cross sections are compared to the predictions of POWHEG+PYTHIA (P8) for the CP5 and CUETP8M2T4 (T4) tunes, POWHEG+HERWIG (H7), and the multiparton simulation MG5_aMC@NLO (MG)+PYTHIA. The ratios of the various predictions to the measured cross sections are shown in the lower panels. |

png pdf |
Figure 24-b:
Double-differential cross section at the particle level as a function of ${m({\mathrm{t} \mathrm{\bar{t}}})}$ vs. ${{| y({\mathrm{t} \mathrm{\bar{t}}}) |}}$. The data are shown as points with gray (yellow) bands indicating the statistical (statistical and systematic) uncertainties. The cross sections are compared to the predictions of POWHEG+PYTHIA (P8) for the CP5 and CUETP8M2T4 (T4) tunes, POWHEG+HERWIG (H7), and the multiparton simulation MG5_aMC@NLO (MG)+PYTHIA. The ratios of the various predictions to the measured cross sections are shown in the lower panels. |
png pdf |
Figure 24-c:
Double-differential cross section at the particle level as a function of ${m({\mathrm{t} \mathrm{\bar{t}}})}$ vs. ${{| y({\mathrm{t} \mathrm{\bar{t}}}) |}}$. The data are shown as points with gray (yellow) bands indicating the statistical (statistical and systematic) uncertainties. The cross sections are compared to the predictions of POWHEG+PYTHIA (P8) for the CP5 and CUETP8M2T4 (T4) tunes, POWHEG+HERWIG (H7), and the multiparton simulation MG5_aMC@NLO (MG)+PYTHIA. The ratios of the various predictions to the measured cross sections are shown in the lower panels. |
png pdf |
Figure 24-d:
Double-differential cross section at the particle level as a function of ${m({\mathrm{t} \mathrm{\bar{t}}})}$ vs. ${{| y({\mathrm{t} \mathrm{\bar{t}}}) |}}$. The data are shown as points with gray (yellow) bands indicating the statistical (statistical and systematic) uncertainties. The cross sections are compared to the predictions of POWHEG+PYTHIA (P8) for the CP5 and CUETP8M2T4 (T4) tunes, POWHEG+HERWIG (H7), and the multiparton simulation MG5_aMC@NLO (MG)+PYTHIA. The ratios of the various predictions to the measured cross sections are shown in the lower panels. |
png pdf |
Figure 24-e:
Double-differential cross section at the particle level as a function of ${m({\mathrm{t} \mathrm{\bar{t}}})}$ vs. ${{| y({\mathrm{t} \mathrm{\bar{t}}}) |}}$. The data are shown as points with gray (yellow) bands indicating the statistical (statistical and systematic) uncertainties. The cross sections are compared to the predictions of POWHEG+PYTHIA (P8) for the CP5 and CUETP8M2T4 (T4) tunes, POWHEG+HERWIG (H7), and the multiparton simulation MG5_aMC@NLO (MG)+PYTHIA. The ratios of the various predictions to the measured cross sections are shown in the lower panels. |

png pdf |
Figure 24-f:
Double-differential cross section at the particle level as a function of ${m({\mathrm{t} \mathrm{\bar{t}}})}$ vs. ${{| y({\mathrm{t} \mathrm{\bar{t}}}) |}}$. The data are shown as points with gray (yellow) bands indicating the statistical (statistical and systematic) uncertainties. The cross sections are compared to the predictions of POWHEG+PYTHIA (P8) for the CP5 and CUETP8M2T4 (T4) tunes, POWHEG+HERWIG (H7), and the multiparton simulation MG5_aMC@NLO (MG)+PYTHIA. The ratios of the various predictions to the measured cross sections are shown in the lower panels. |
png pdf |
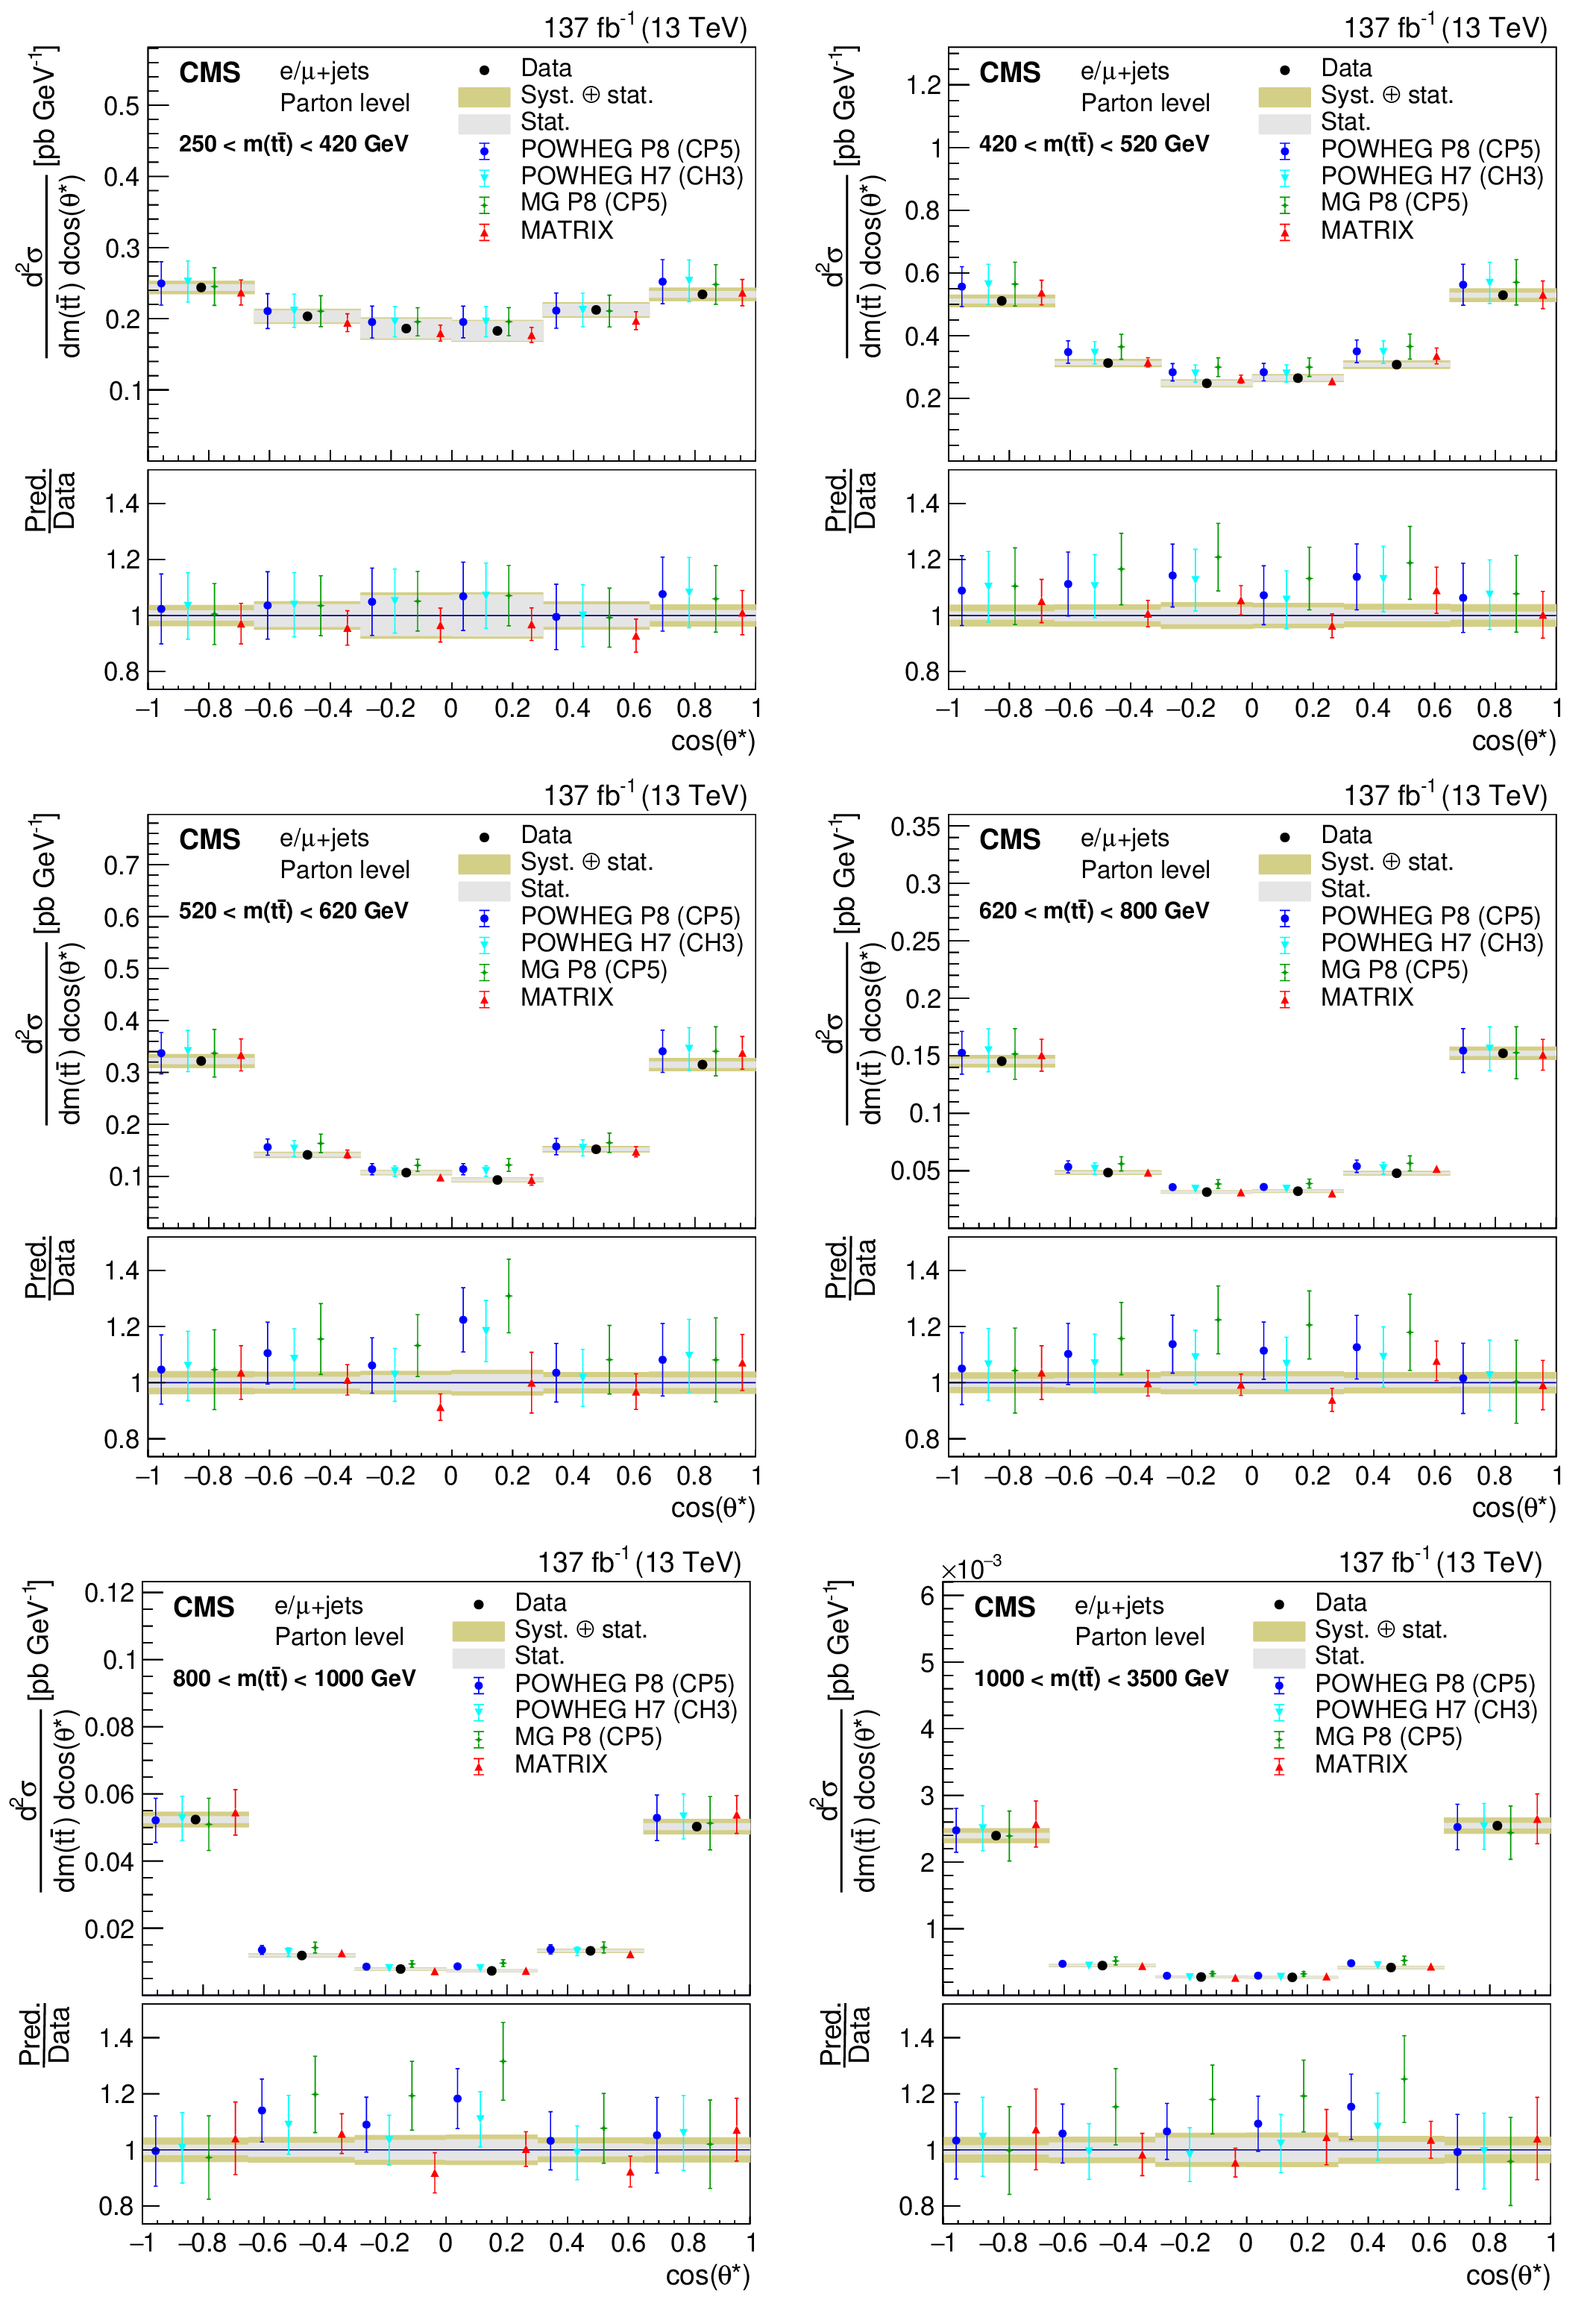
Figure 25:
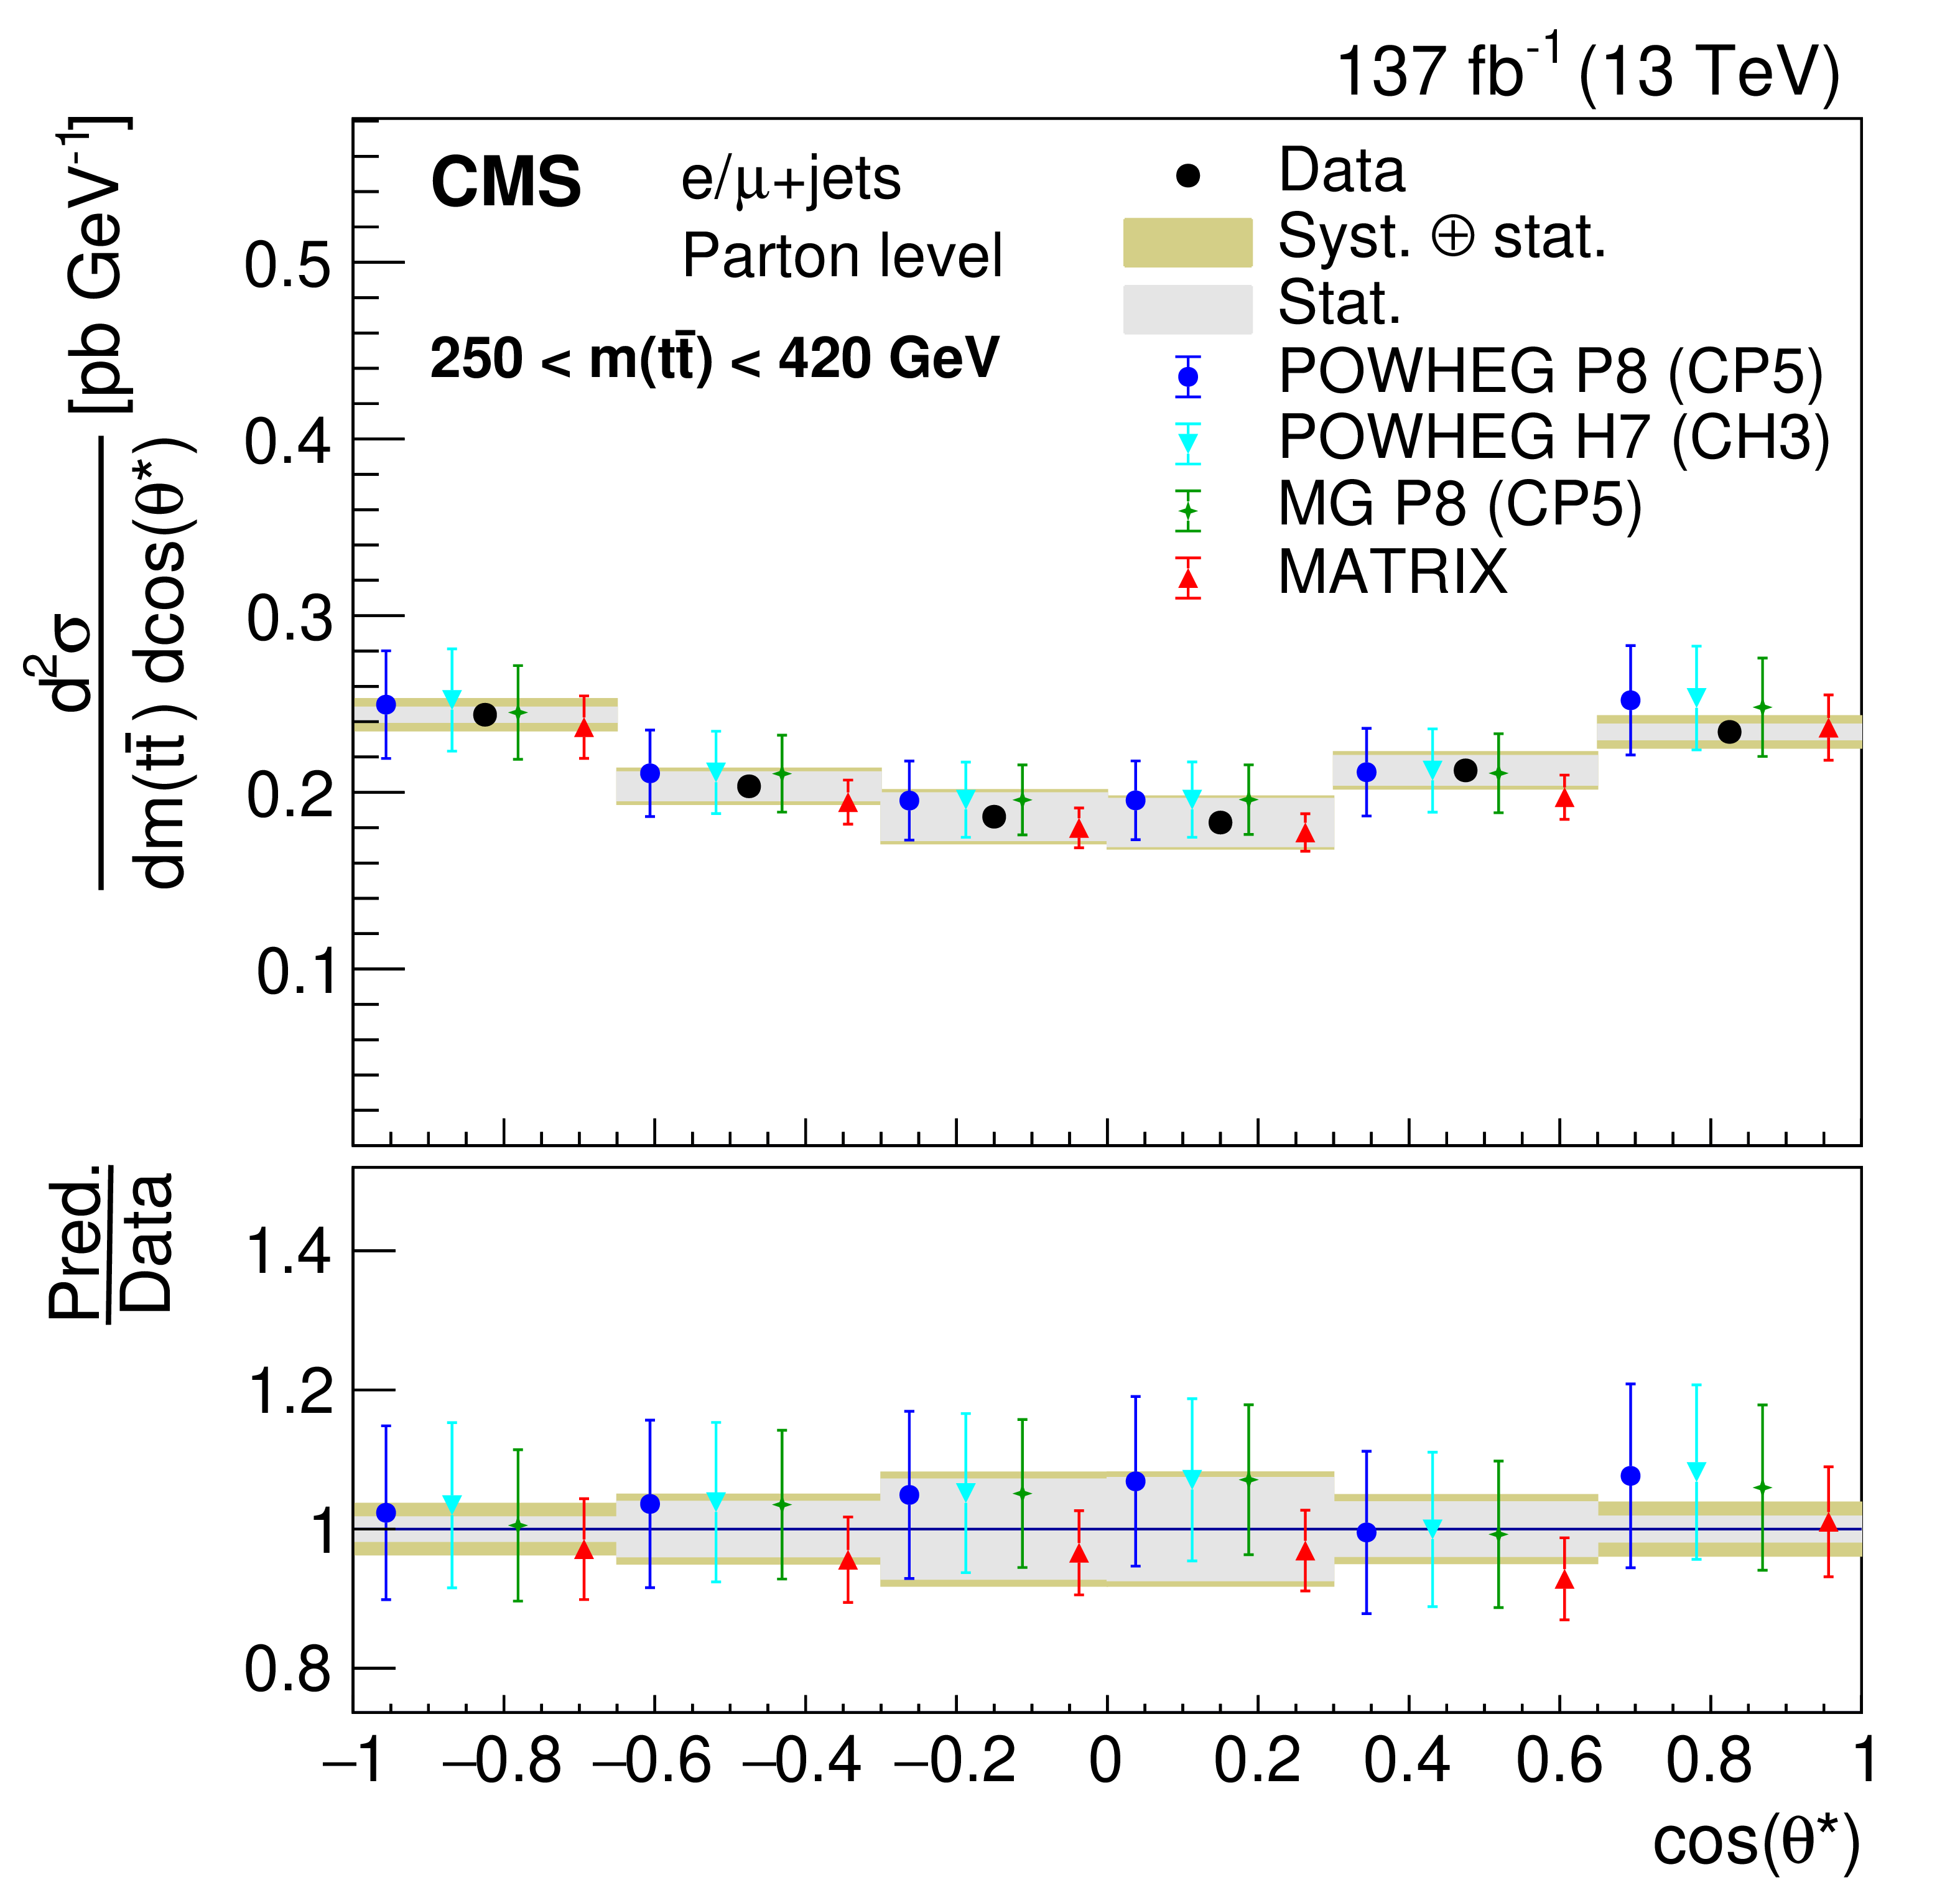
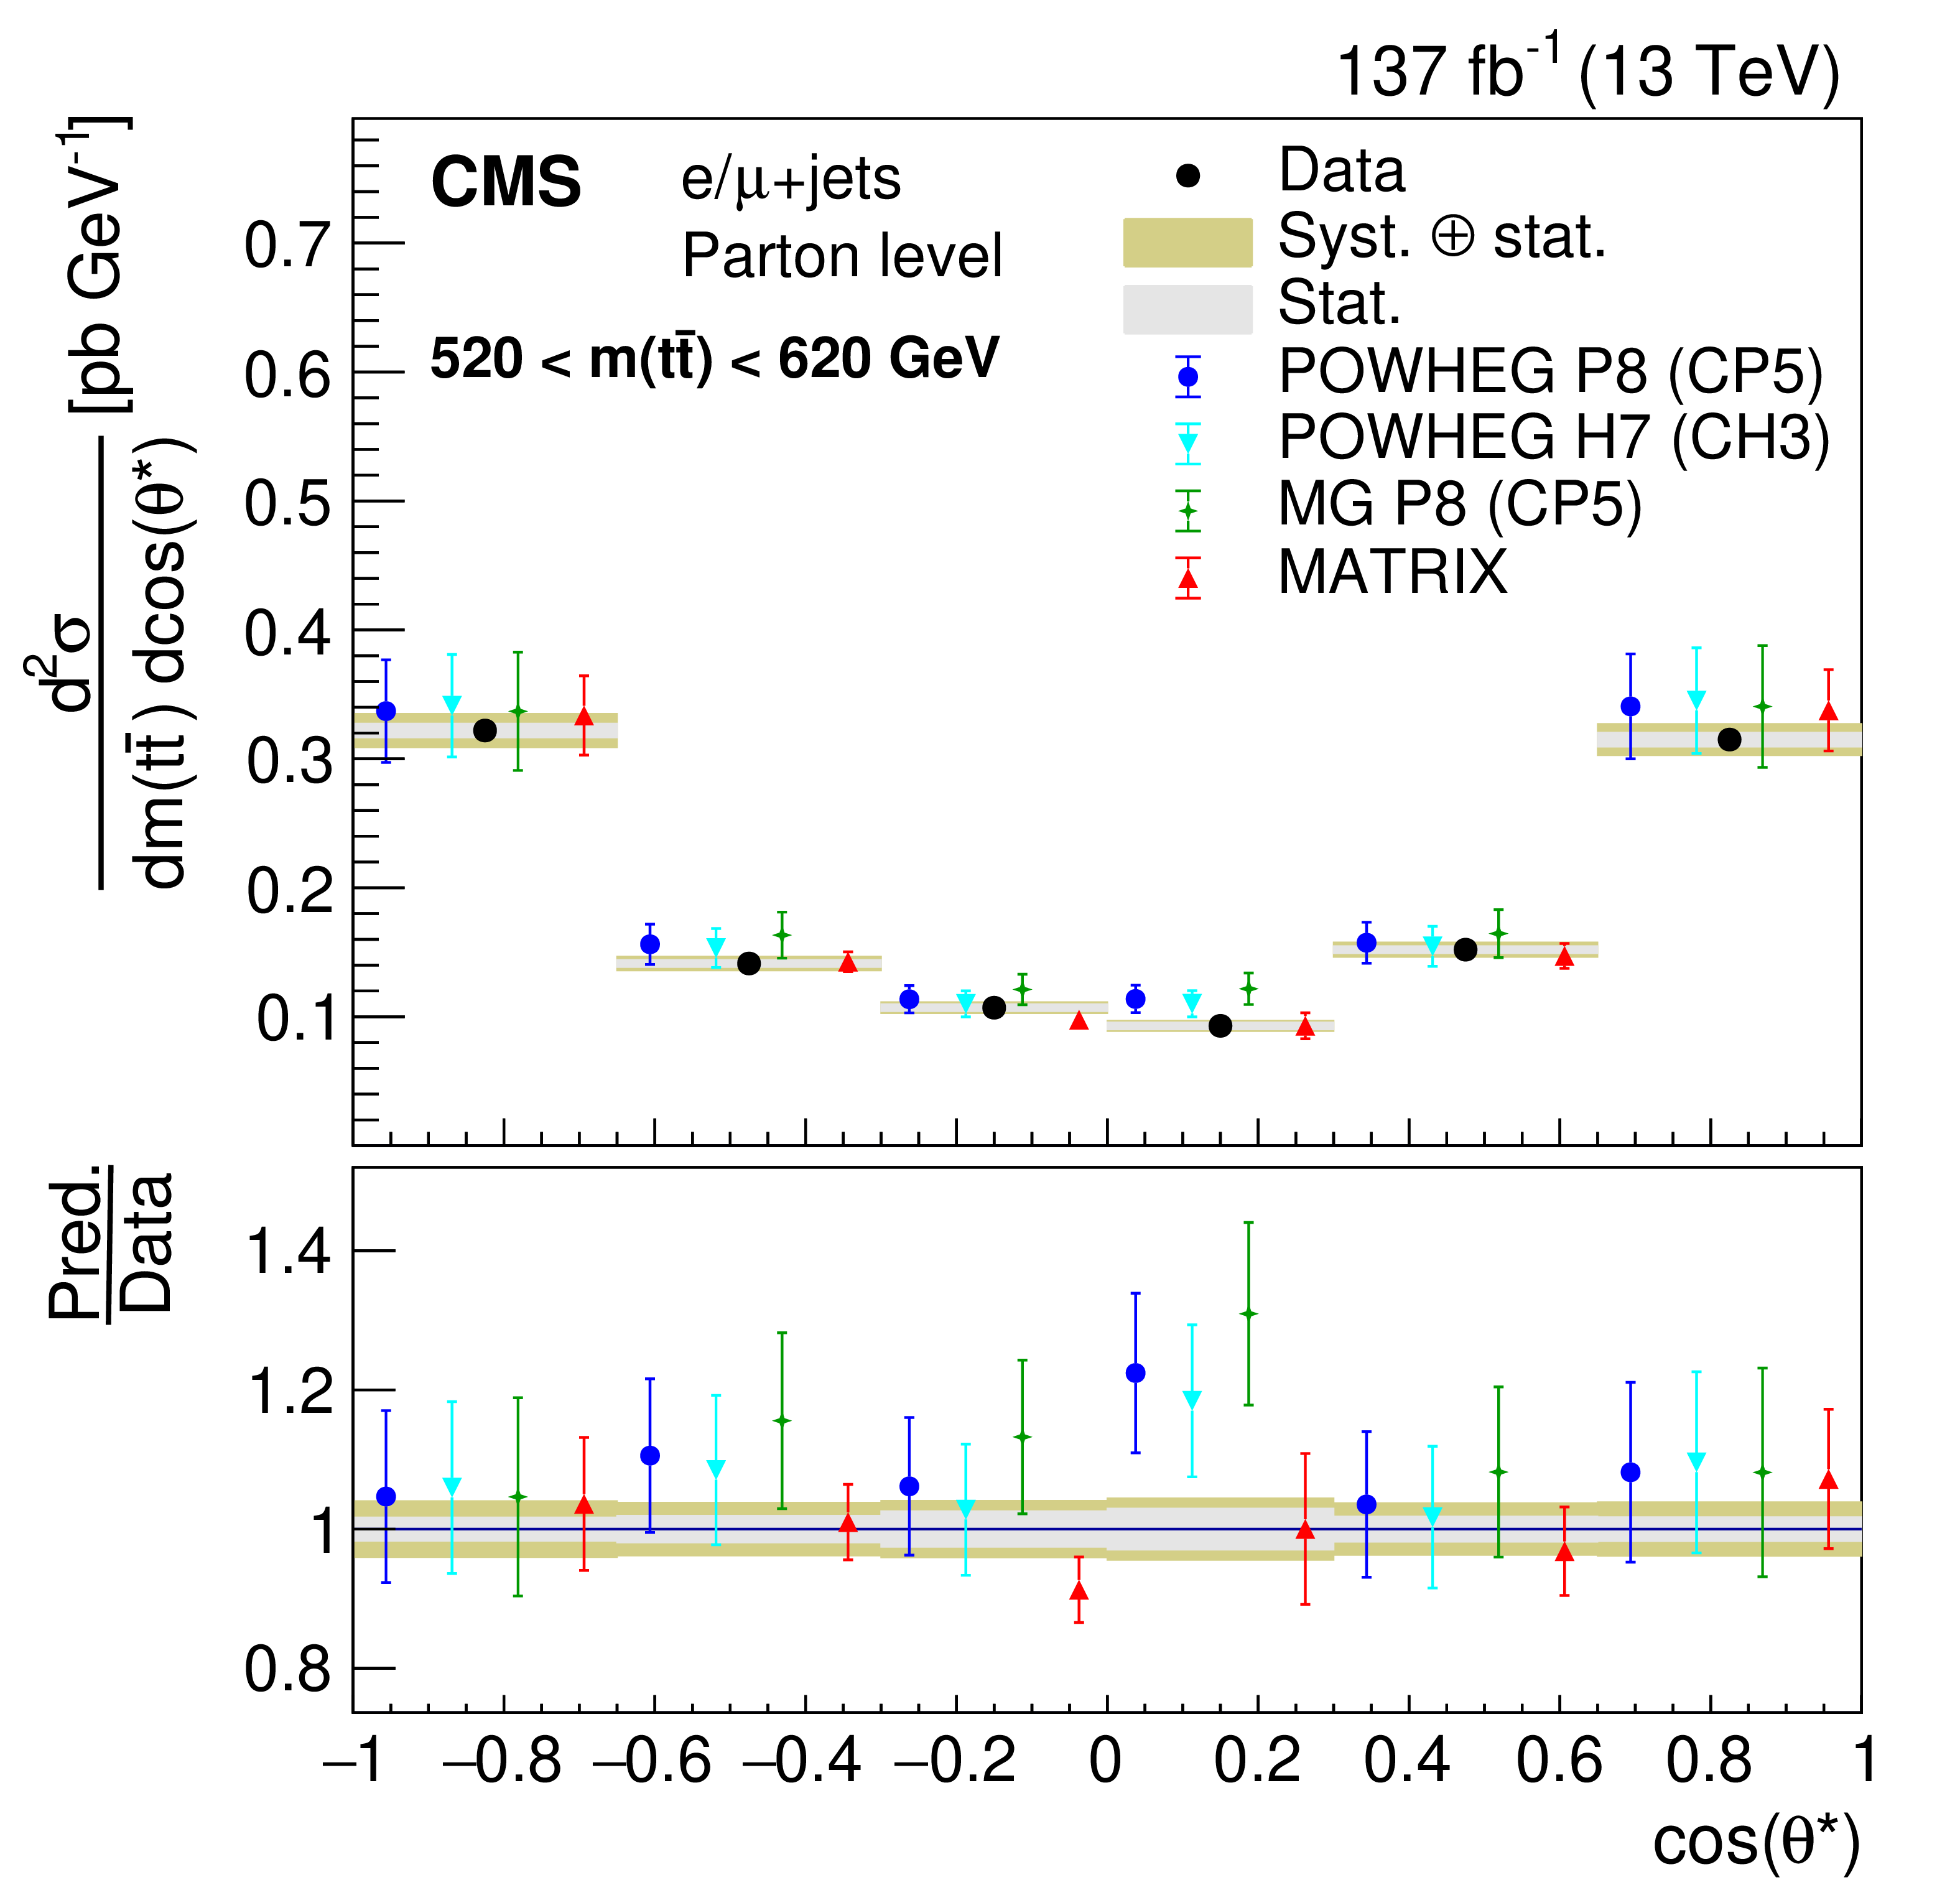
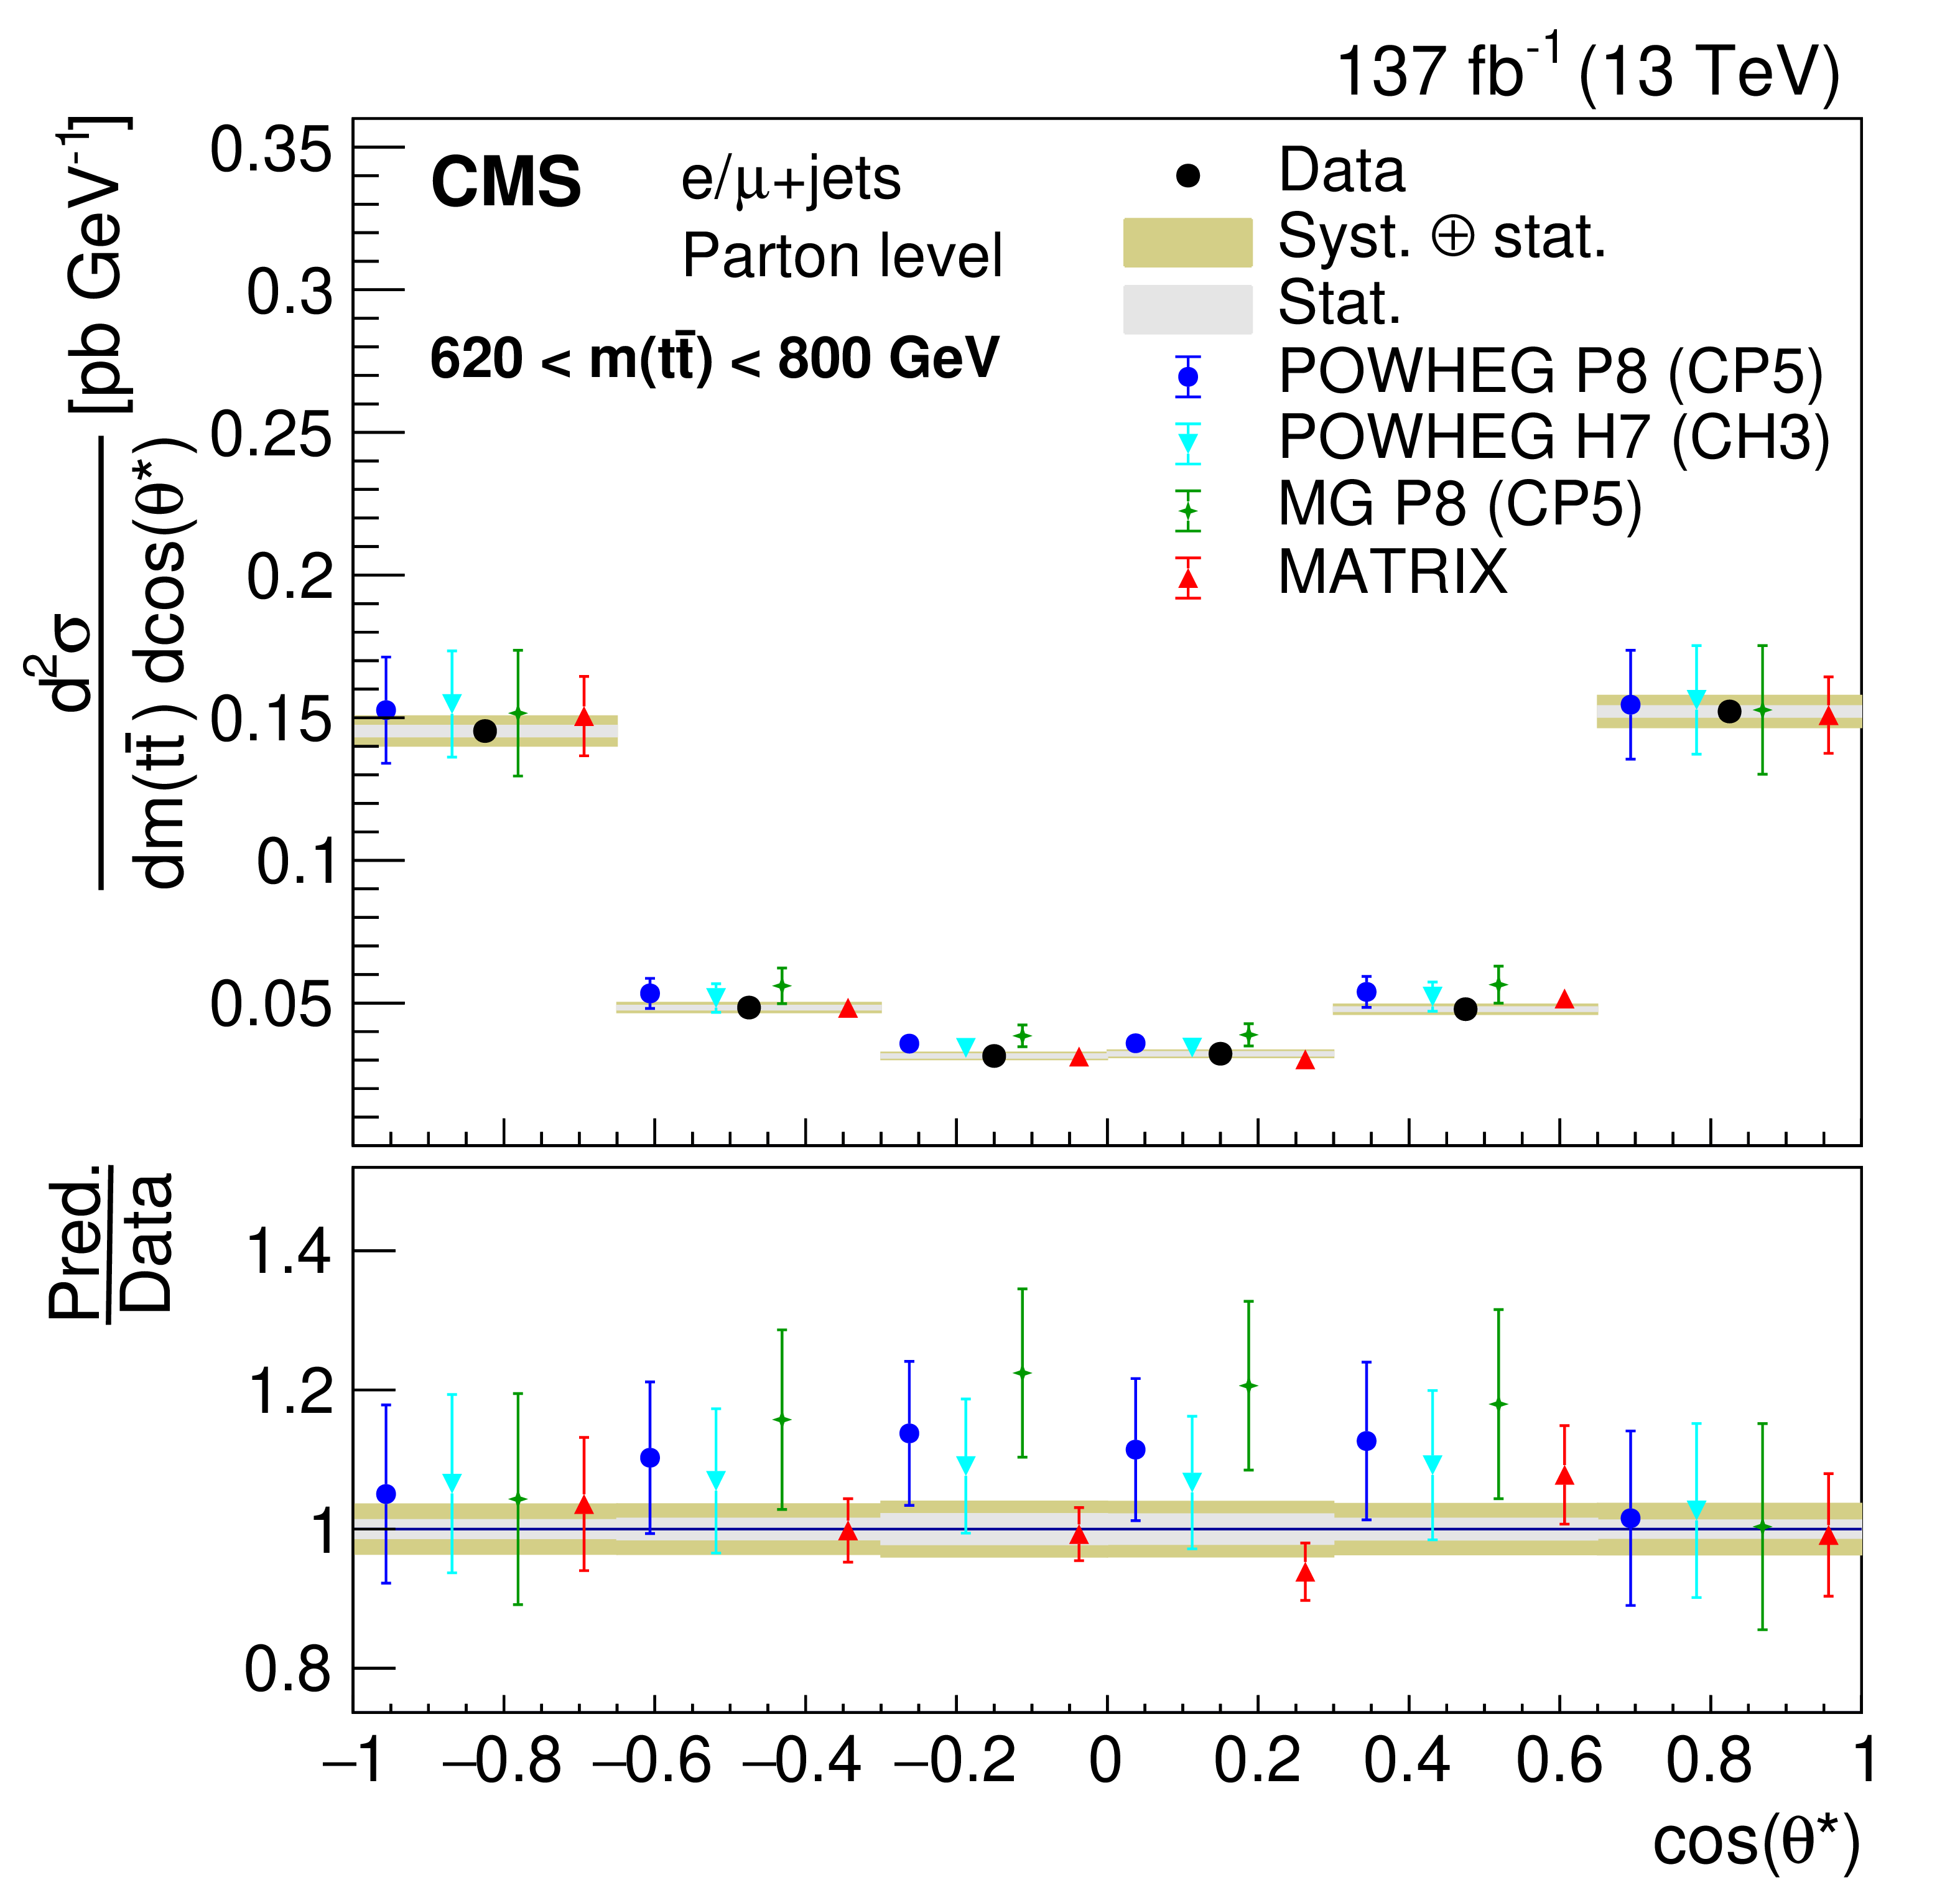
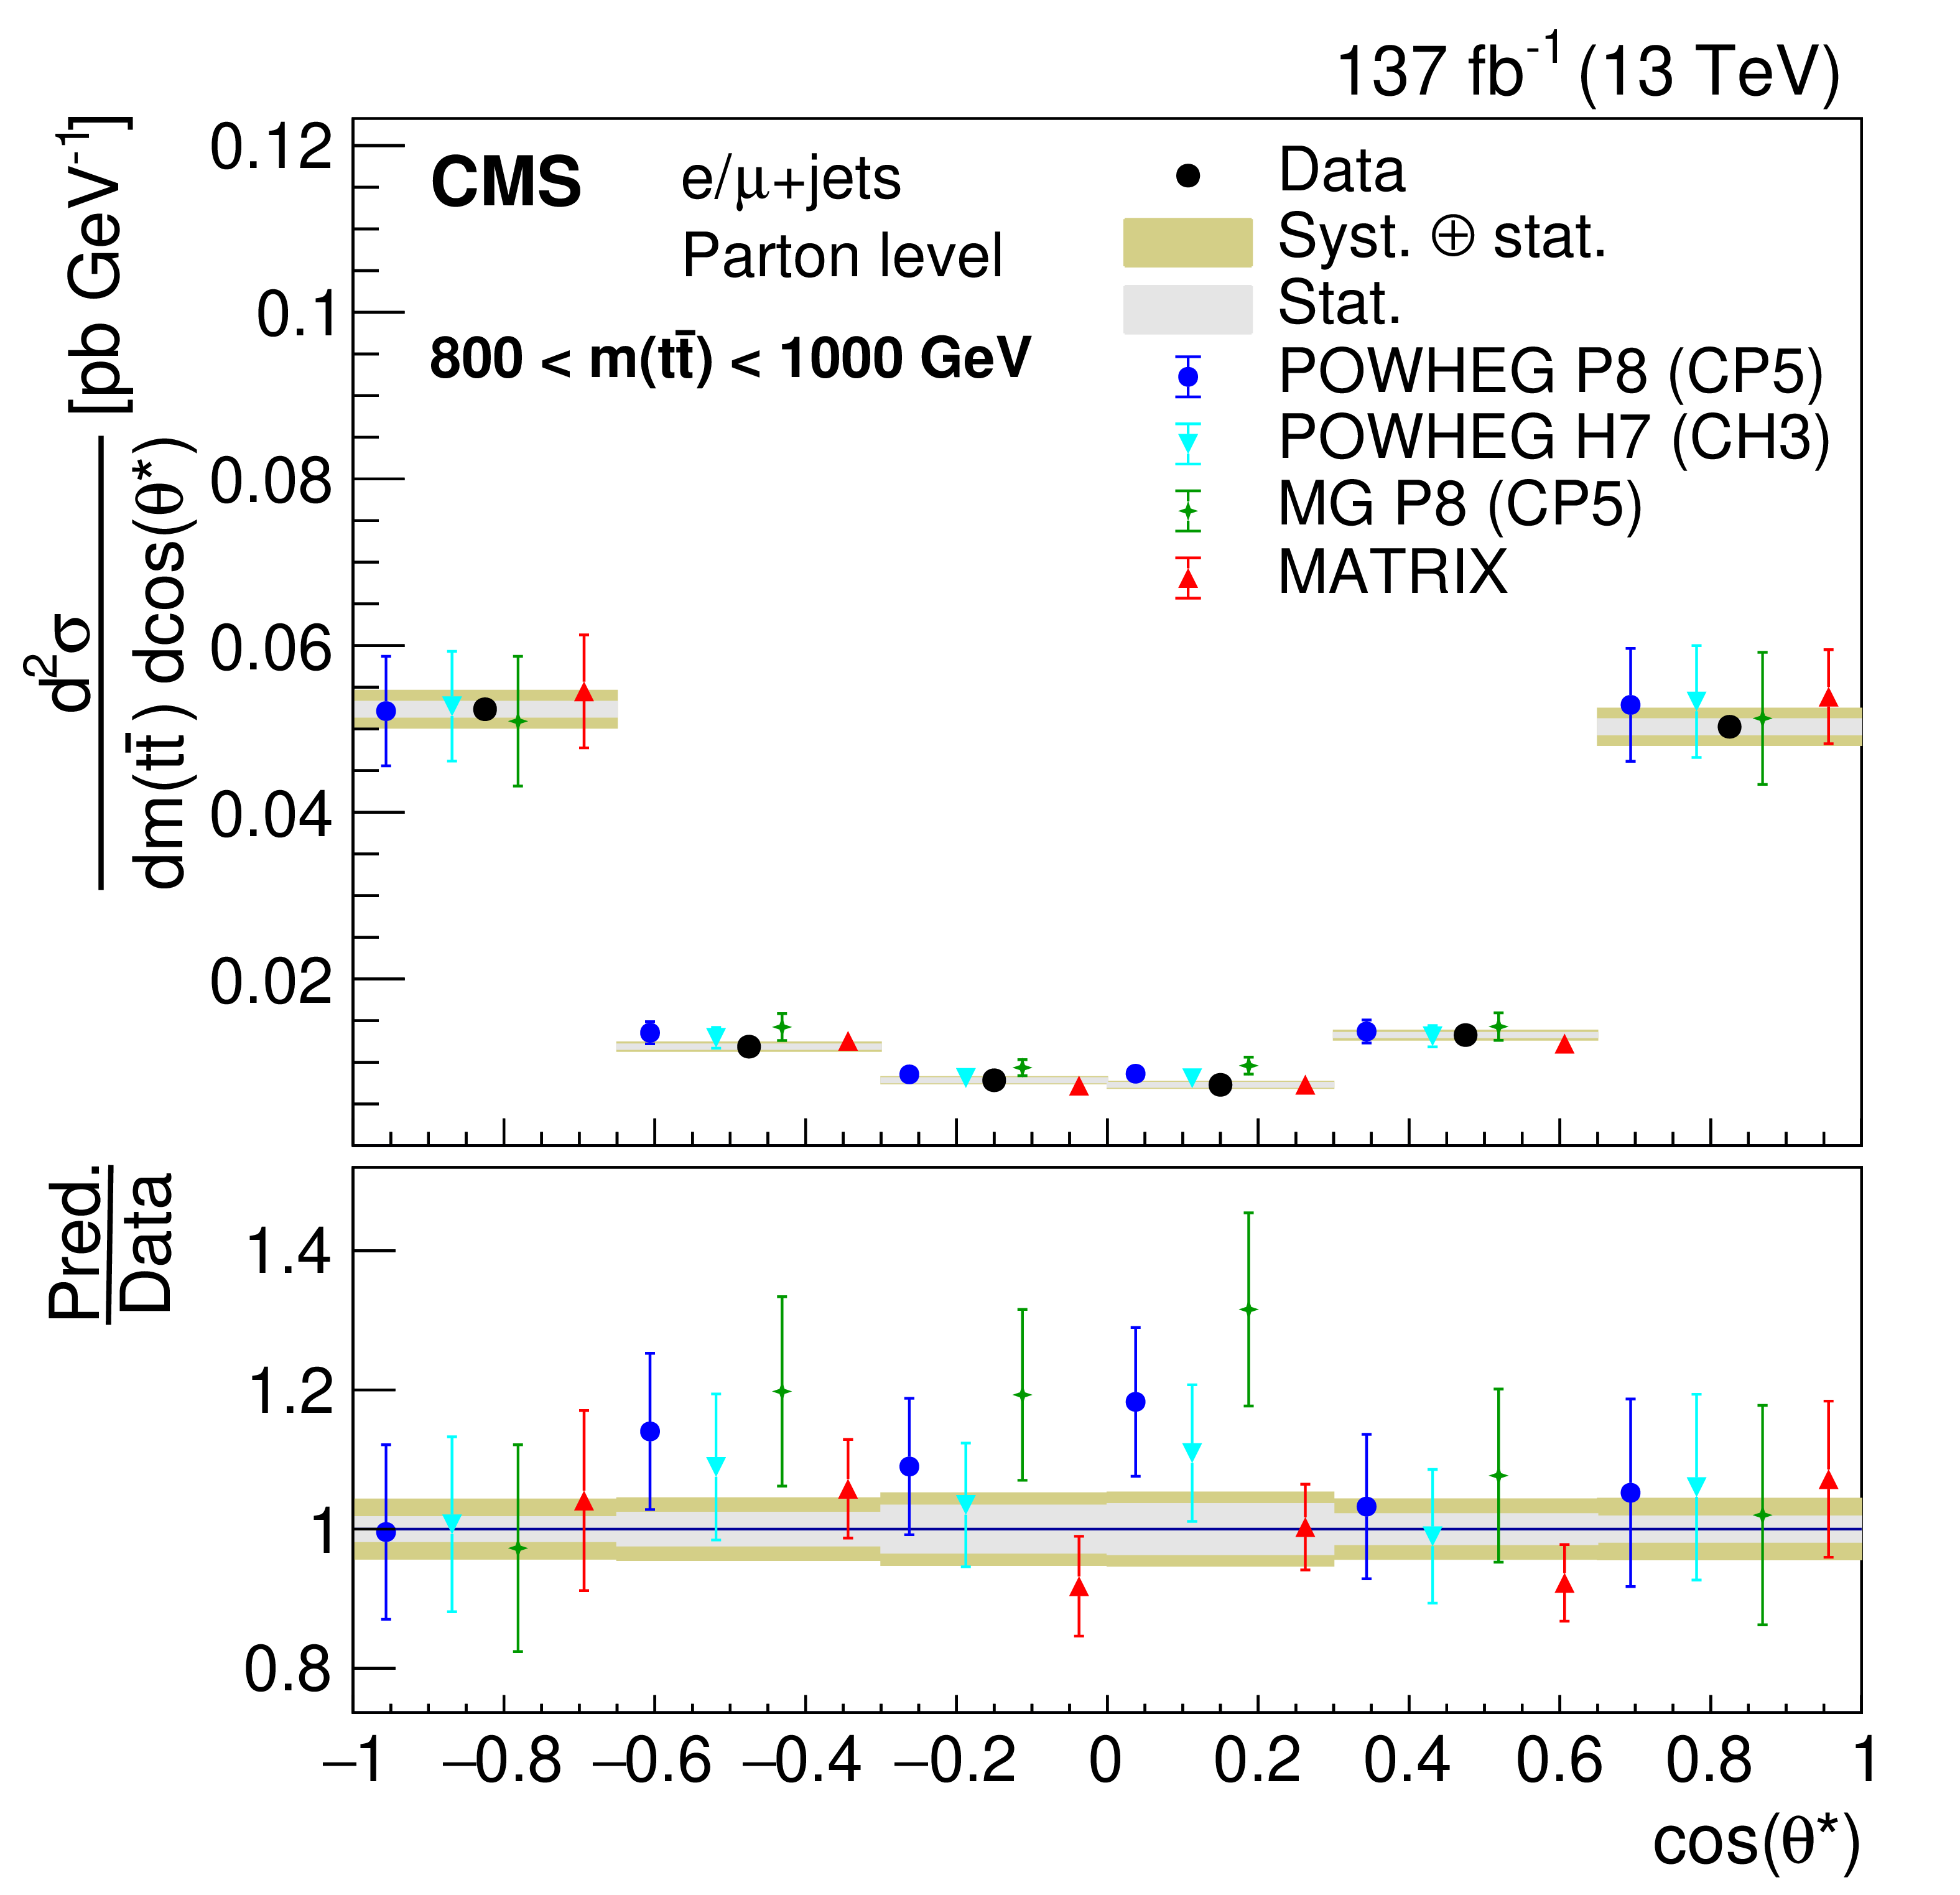
Double-differential cross section at the parton level as a function of ${m({\mathrm{t} \mathrm{\bar{t}}})}$ vs. ${\cos(\theta ^*)}$. The data are shown as points with gray (yellow) bands indicating the statistical (statistical and systematic) uncertainties. The cross sections are compared to the predictions of POWHEG combined with PYTHIA (P8) or HERWIG (H7), the multiparton simulation MG5_aMC@NLO (MG)+PYTHIA FxFx, and the NNLO QCD calculations obtained with Matrix. The ratios of the various predictions to the measured cross sections are shown in the lower panels. |
png pdf |
Figure 25-a:
Double-differential cross section at the parton level as a function of ${m({\mathrm{t} \mathrm{\bar{t}}})}$ vs. ${\cos(\theta ^*)}$. The data are shown as points with gray (yellow) bands indicating the statistical (statistical and systematic) uncertainties. The cross sections are compared to the predictions of POWHEG combined with PYTHIA (P8) or HERWIG (H7), the multiparton simulation MG5_aMC@NLO (MG)+PYTHIA FxFx, and the NNLO QCD calculations obtained with Matrix. The ratios of the various predictions to the measured cross sections are shown in the lower panels. |

png pdf |
Figure 25-b:
Double-differential cross section at the parton level as a function of ${m({\mathrm{t} \mathrm{\bar{t}}})}$ vs. ${\cos(\theta ^*)}$. The data are shown as points with gray (yellow) bands indicating the statistical (statistical and systematic) uncertainties. The cross sections are compared to the predictions of POWHEG combined with PYTHIA (P8) or HERWIG (H7), the multiparton simulation MG5_aMC@NLO (MG)+PYTHIA FxFx, and the NNLO QCD calculations obtained with Matrix. The ratios of the various predictions to the measured cross sections are shown in the lower panels. |
png pdf |
Figure 25-c:
Double-differential cross section at the parton level as a function of ${m({\mathrm{t} \mathrm{\bar{t}}})}$ vs. ${\cos(\theta ^*)}$. The data are shown as points with gray (yellow) bands indicating the statistical (statistical and systematic) uncertainties. The cross sections are compared to the predictions of POWHEG combined with PYTHIA (P8) or HERWIG (H7), the multiparton simulation MG5_aMC@NLO (MG)+PYTHIA FxFx, and the NNLO QCD calculations obtained with Matrix. The ratios of the various predictions to the measured cross sections are shown in the lower panels. |
png pdf |
Figure 25-d:
Double-differential cross section at the parton level as a function of ${m({\mathrm{t} \mathrm{\bar{t}}})}$ vs. ${\cos(\theta ^*)}$. The data are shown as points with gray (yellow) bands indicating the statistical (statistical and systematic) uncertainties. The cross sections are compared to the predictions of POWHEG combined with PYTHIA (P8) or HERWIG (H7), the multiparton simulation MG5_aMC@NLO (MG)+PYTHIA FxFx, and the NNLO QCD calculations obtained with Matrix. The ratios of the various predictions to the measured cross sections are shown in the lower panels. |
png pdf |
Figure 25-e:
Double-differential cross section at the parton level as a function of ${m({\mathrm{t} \mathrm{\bar{t}}})}$ vs. ${\cos(\theta ^*)}$. The data are shown as points with gray (yellow) bands indicating the statistical (statistical and systematic) uncertainties. The cross sections are compared to the predictions of POWHEG combined with PYTHIA (P8) or HERWIG (H7), the multiparton simulation MG5_aMC@NLO (MG)+PYTHIA FxFx, and the NNLO QCD calculations obtained with Matrix. The ratios of the various predictions to the measured cross sections are shown in the lower panels. |
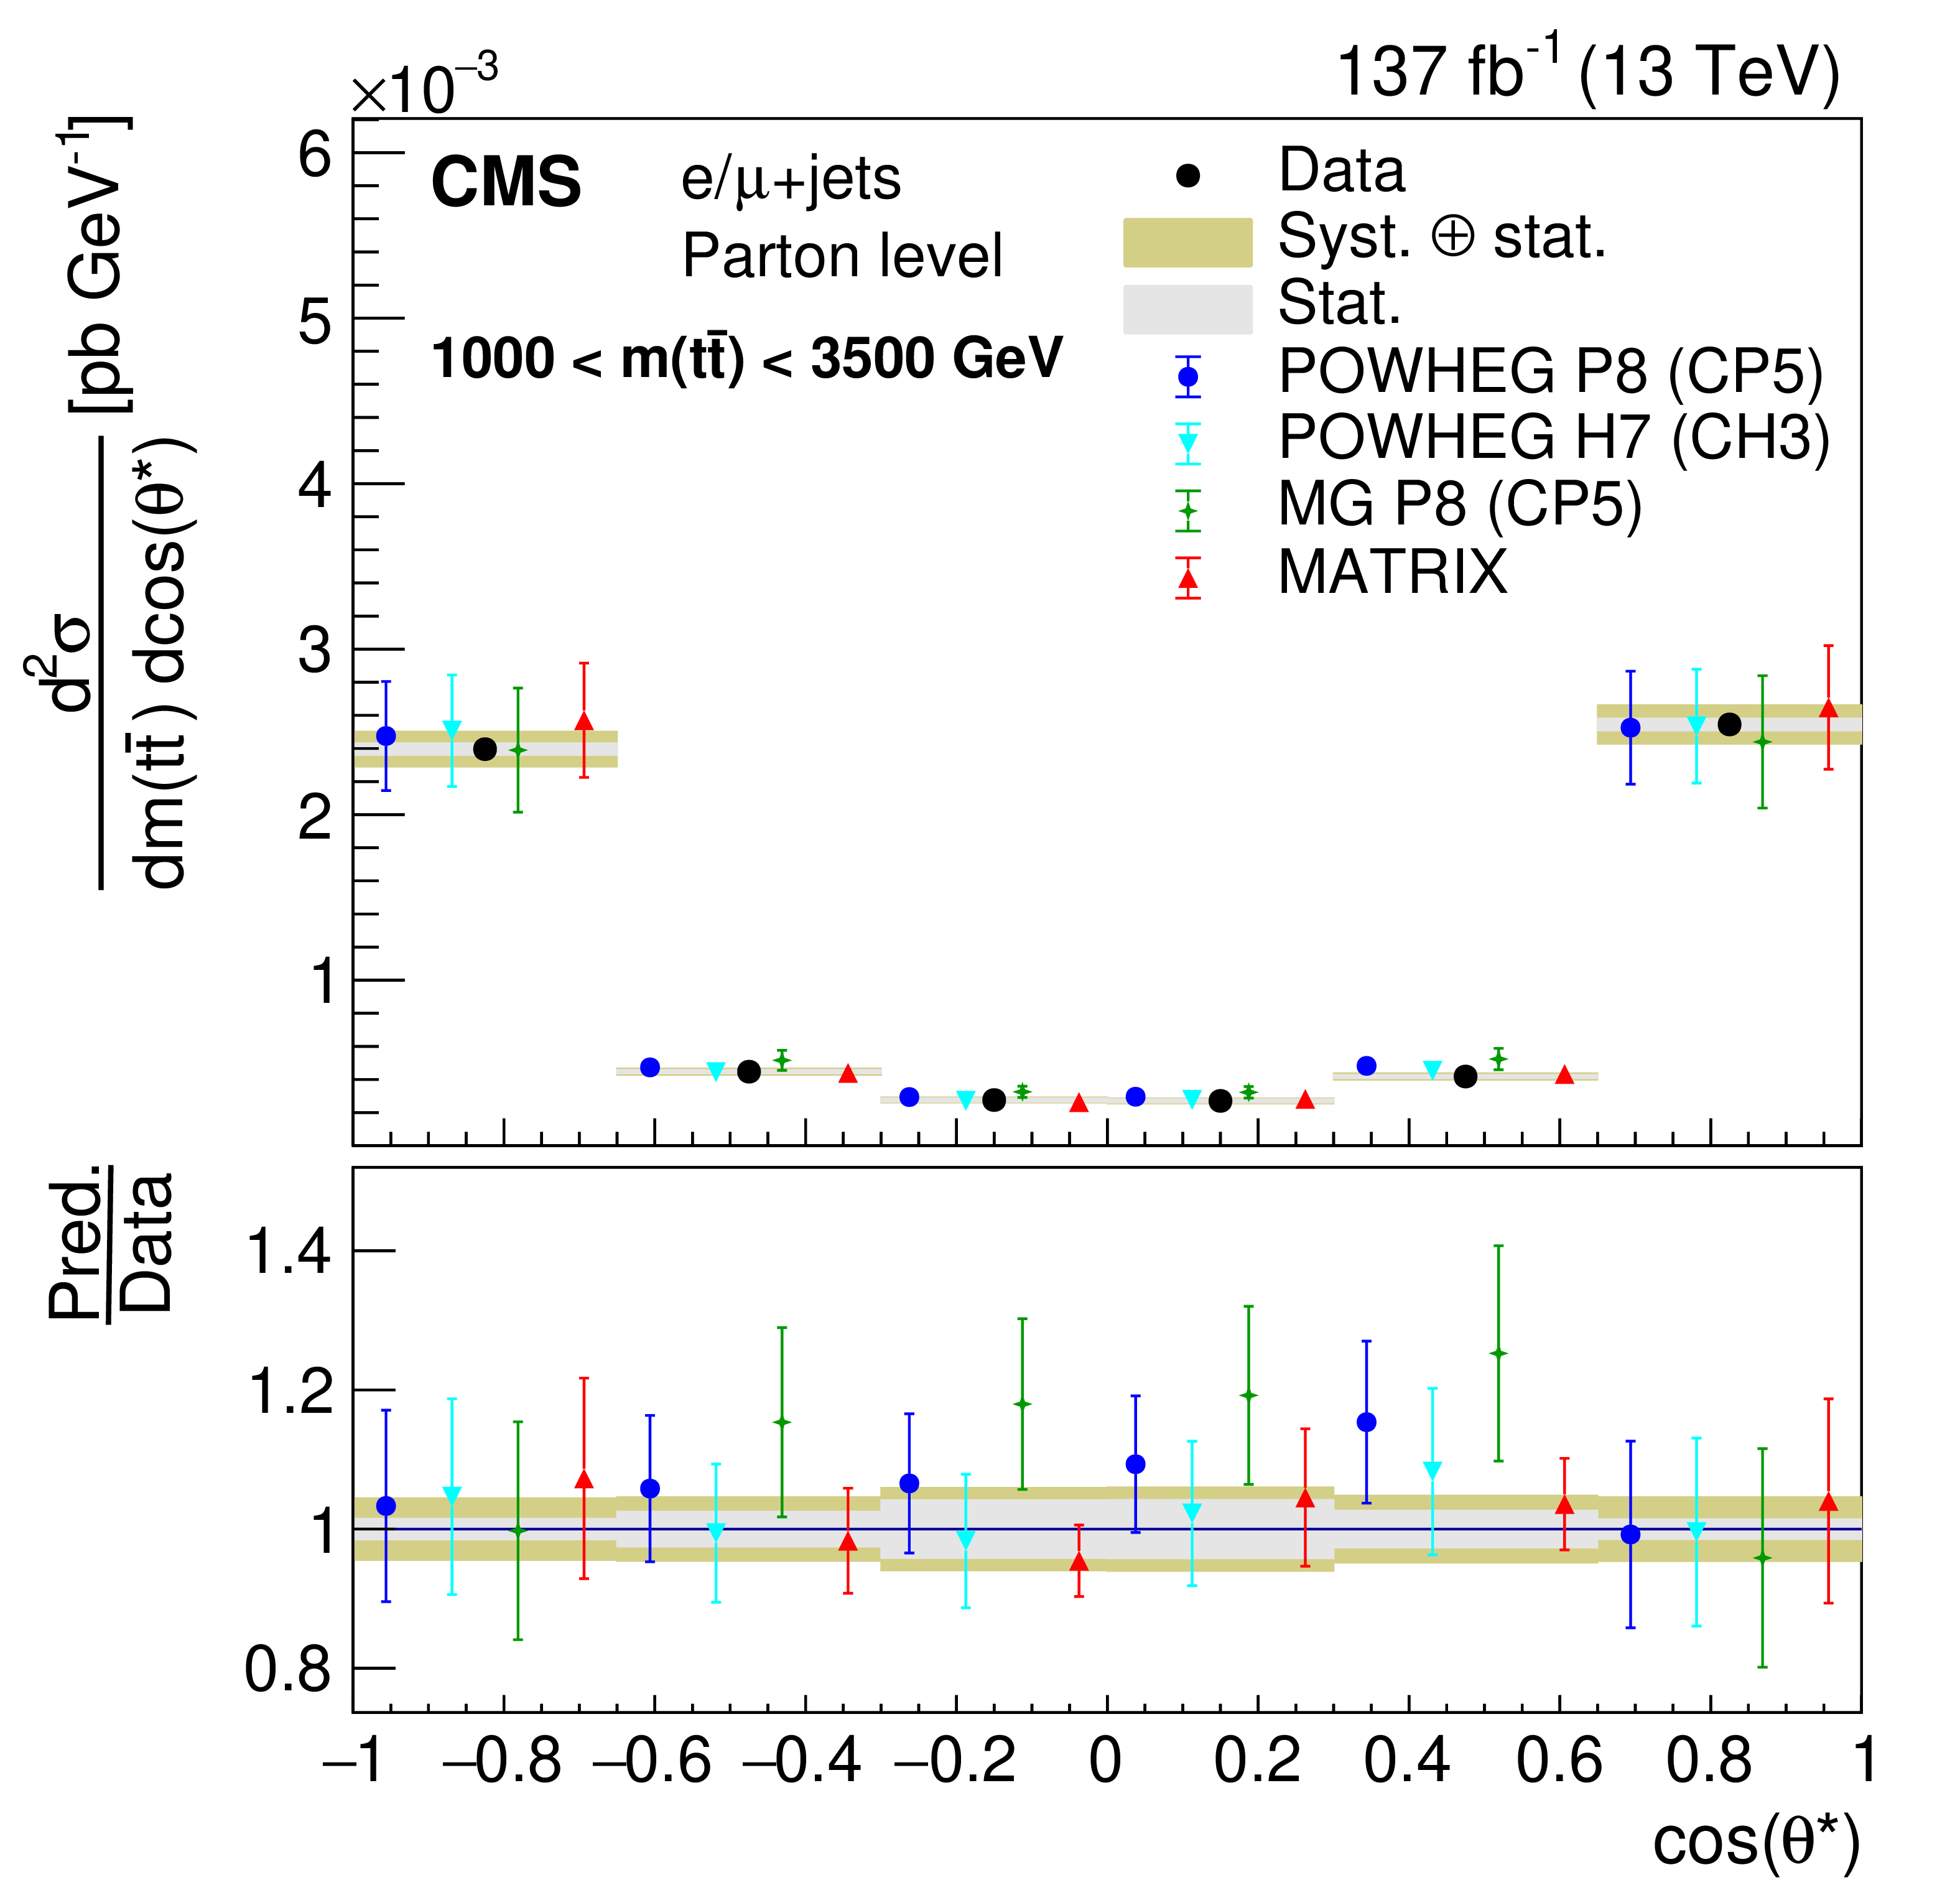
png pdf |
Figure 25-f:
Double-differential cross section at the parton level as a function of ${m({\mathrm{t} \mathrm{\bar{t}}})}$ vs. ${\cos(\theta ^*)}$. The data are shown as points with gray (yellow) bands indicating the statistical (statistical and systematic) uncertainties. The cross sections are compared to the predictions of POWHEG combined with PYTHIA (P8) or HERWIG (H7), the multiparton simulation MG5_aMC@NLO (MG)+PYTHIA FxFx, and the NNLO QCD calculations obtained with Matrix. The ratios of the various predictions to the measured cross sections are shown in the lower panels. |
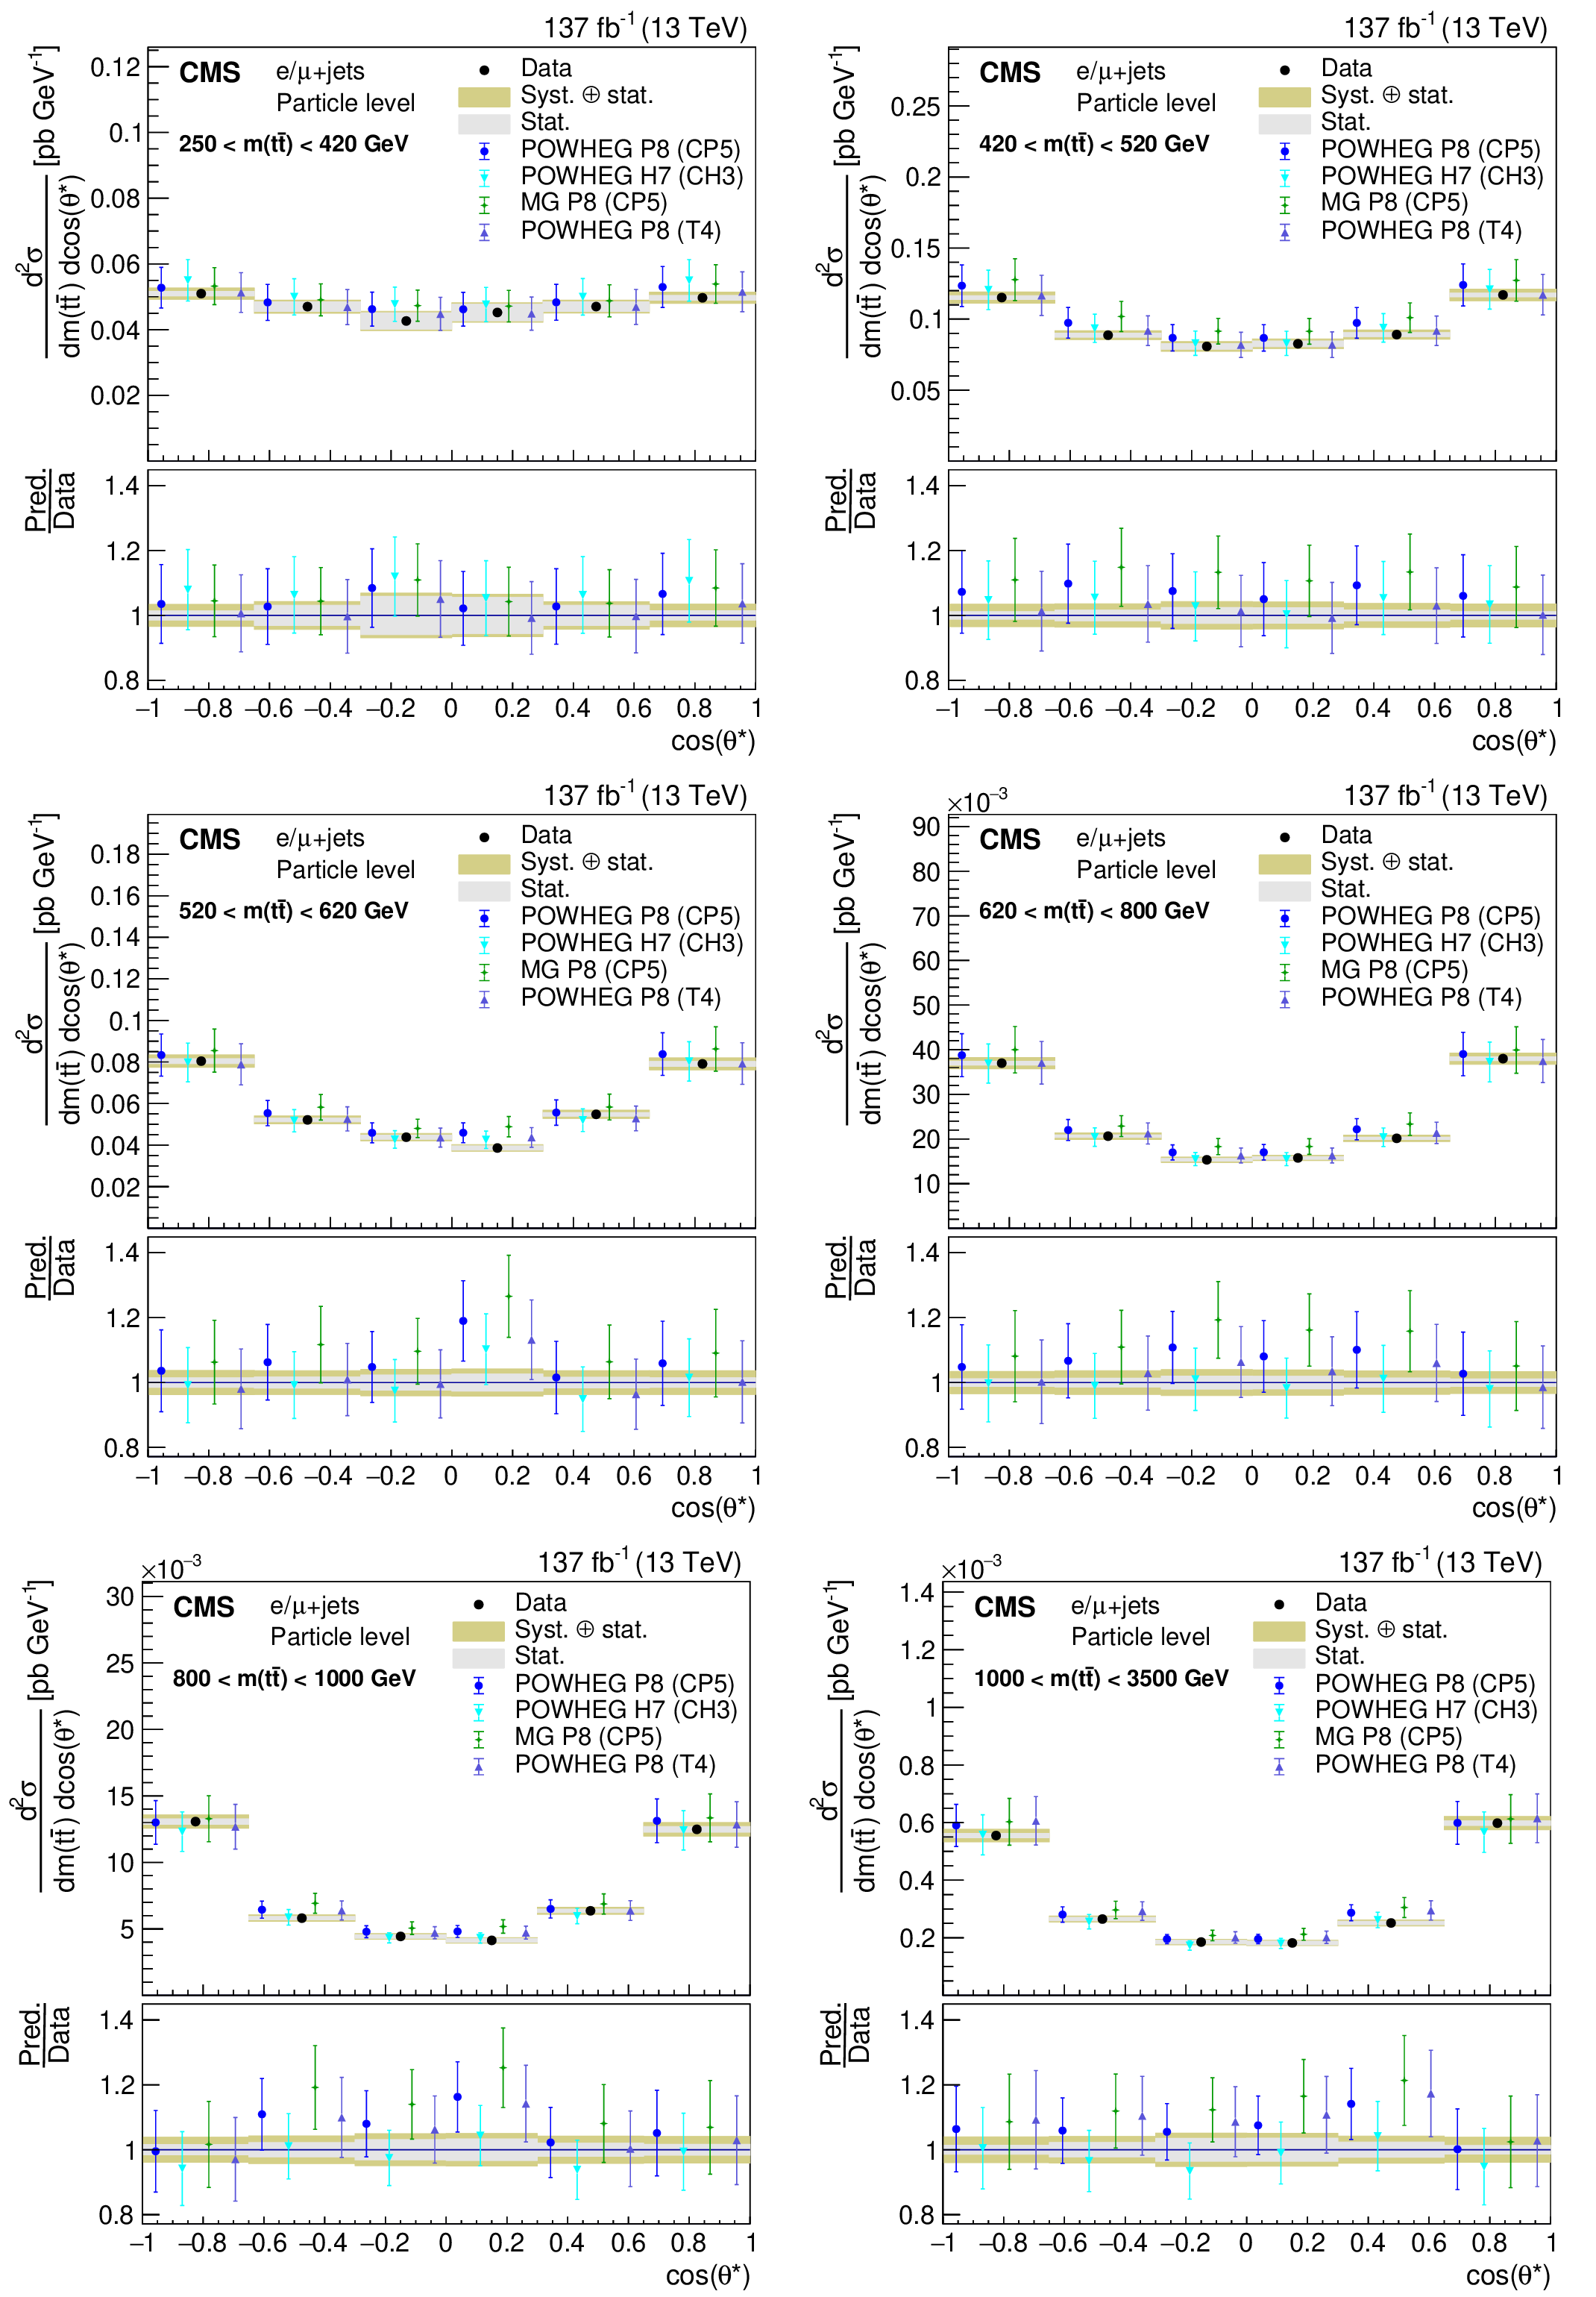
png pdf |
Figure 26:
Double-differential cross section at the particle level as a function of ${m({\mathrm{t} \mathrm{\bar{t}}})}$ vs. ${\cos(\theta ^*)}$. The data are shown as points with gray (yellow) bands indicating the statistical (statistical and systematic) uncertainties. The cross sections are compared to the predictions of POWHEG+PYTHIA (P8) for the CP5 and CUETP8M2T4 (T4) tunes, POWHEG+HERWIG (H7), and the multiparton simulation MG5_aMC@NLO (MG)+PYTHIA. The ratios of the various predictions to the measured cross sections are shown in the lower panels. |
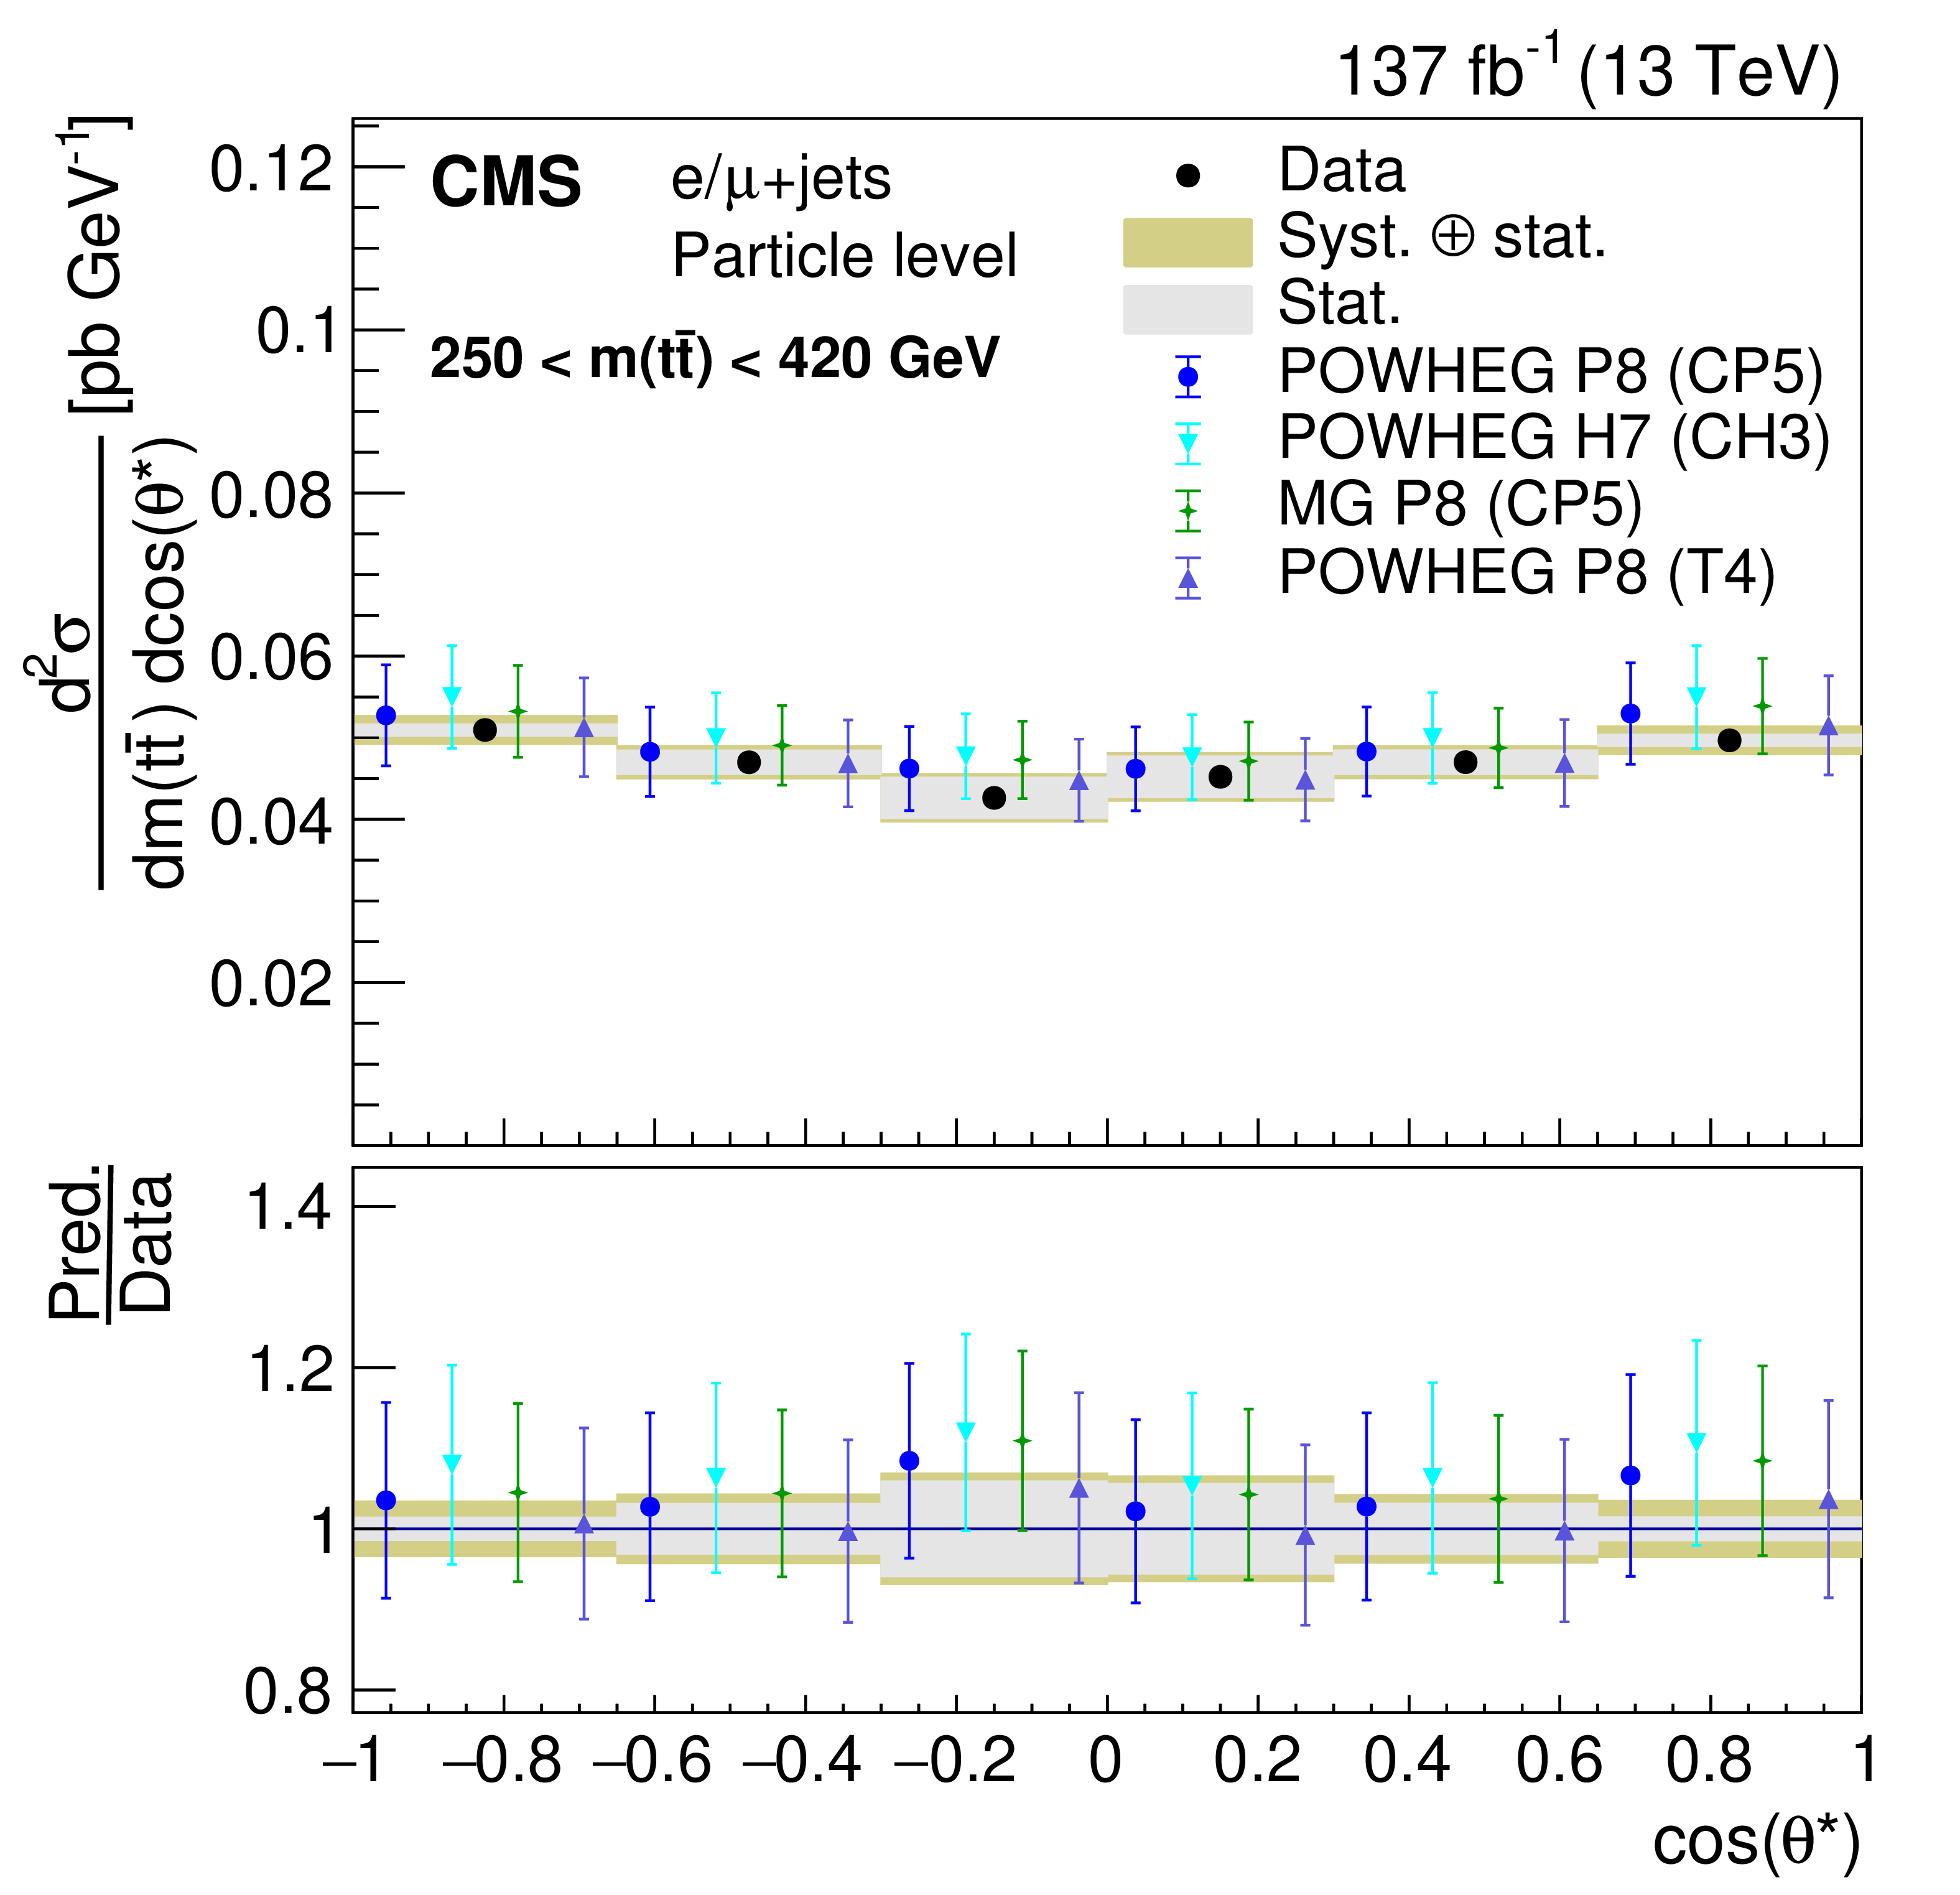
png pdf |
Figure 26-a:
Double-differential cross section at the particle level as a function of ${m({\mathrm{t} \mathrm{\bar{t}}})}$ vs. ${\cos(\theta ^*)}$. The data are shown as points with gray (yellow) bands indicating the statistical (statistical and systematic) uncertainties. The cross sections are compared to the predictions of POWHEG+PYTHIA (P8) for the CP5 and CUETP8M2T4 (T4) tunes, POWHEG+HERWIG (H7), and the multiparton simulation MG5_aMC@NLO (MG)+PYTHIA. The ratios of the various predictions to the measured cross sections are shown in the lower panels. |
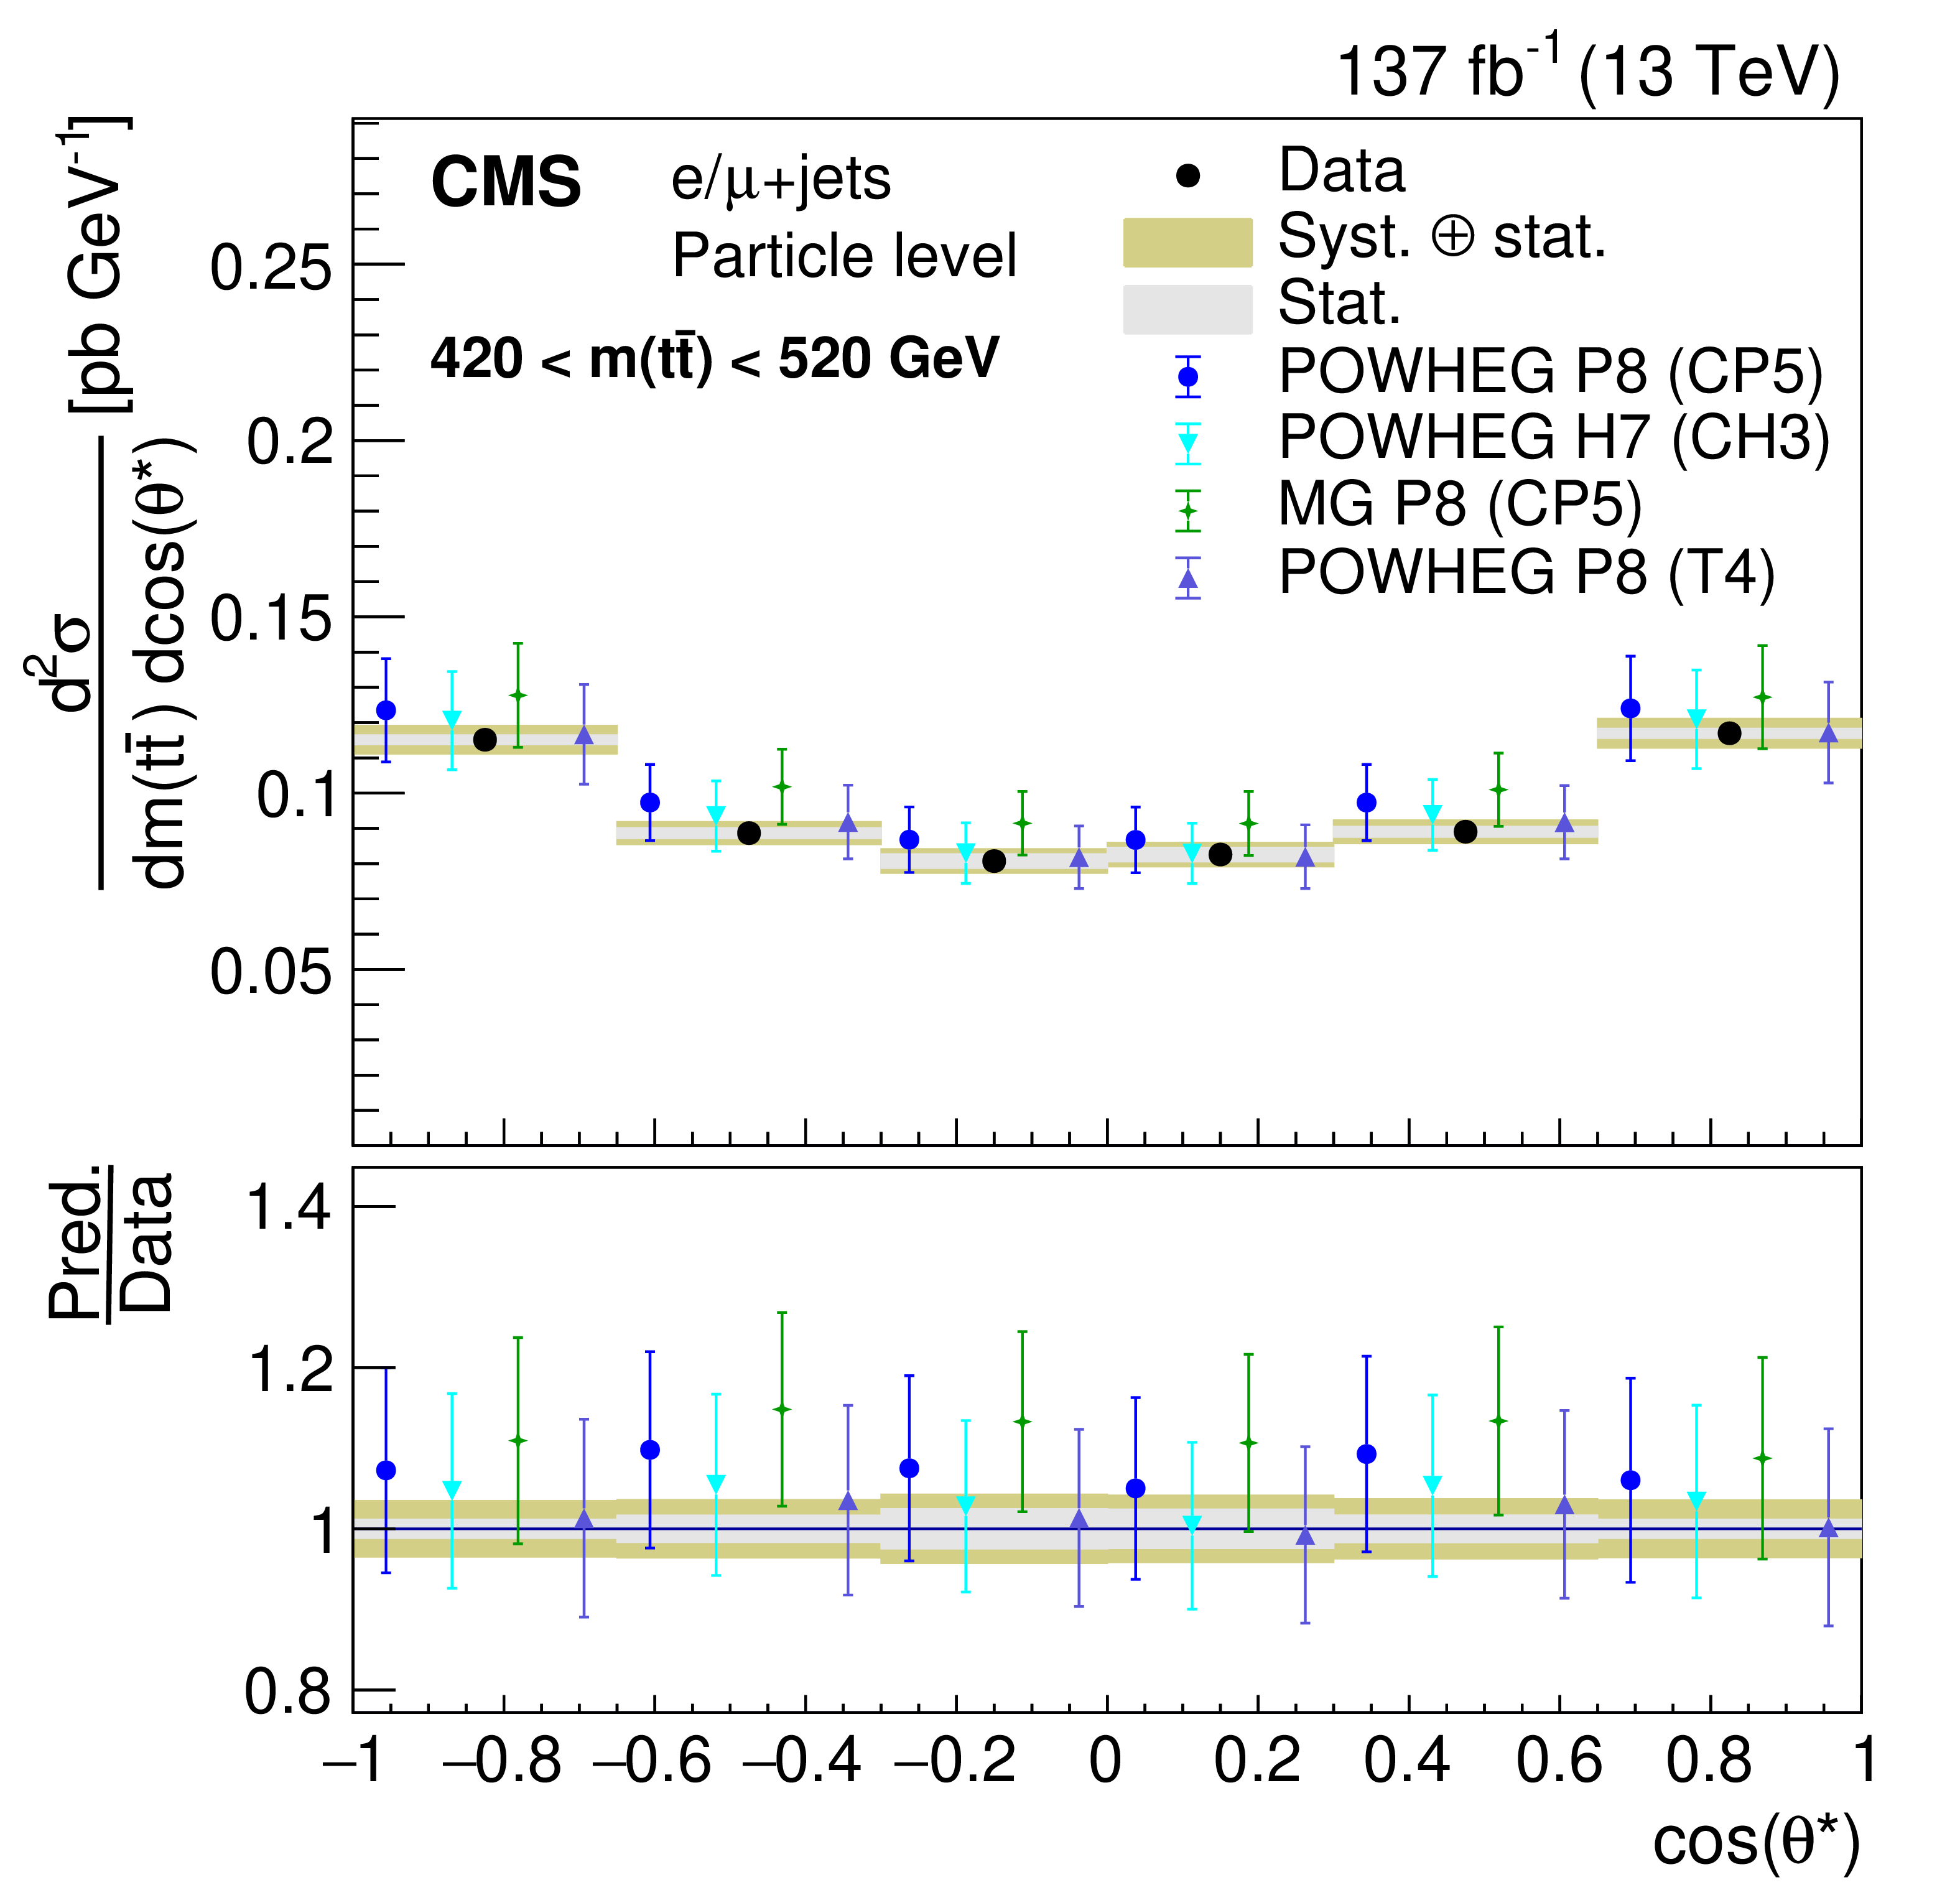
png pdf |
Figure 26-b:
Double-differential cross section at the particle level as a function of ${m({\mathrm{t} \mathrm{\bar{t}}})}$ vs. ${\cos(\theta ^*)}$. The data are shown as points with gray (yellow) bands indicating the statistical (statistical and systematic) uncertainties. The cross sections are compared to the predictions of POWHEG+PYTHIA (P8) for the CP5 and CUETP8M2T4 (T4) tunes, POWHEG+HERWIG (H7), and the multiparton simulation MG5_aMC@NLO (MG)+PYTHIA. The ratios of the various predictions to the measured cross sections are shown in the lower panels. |
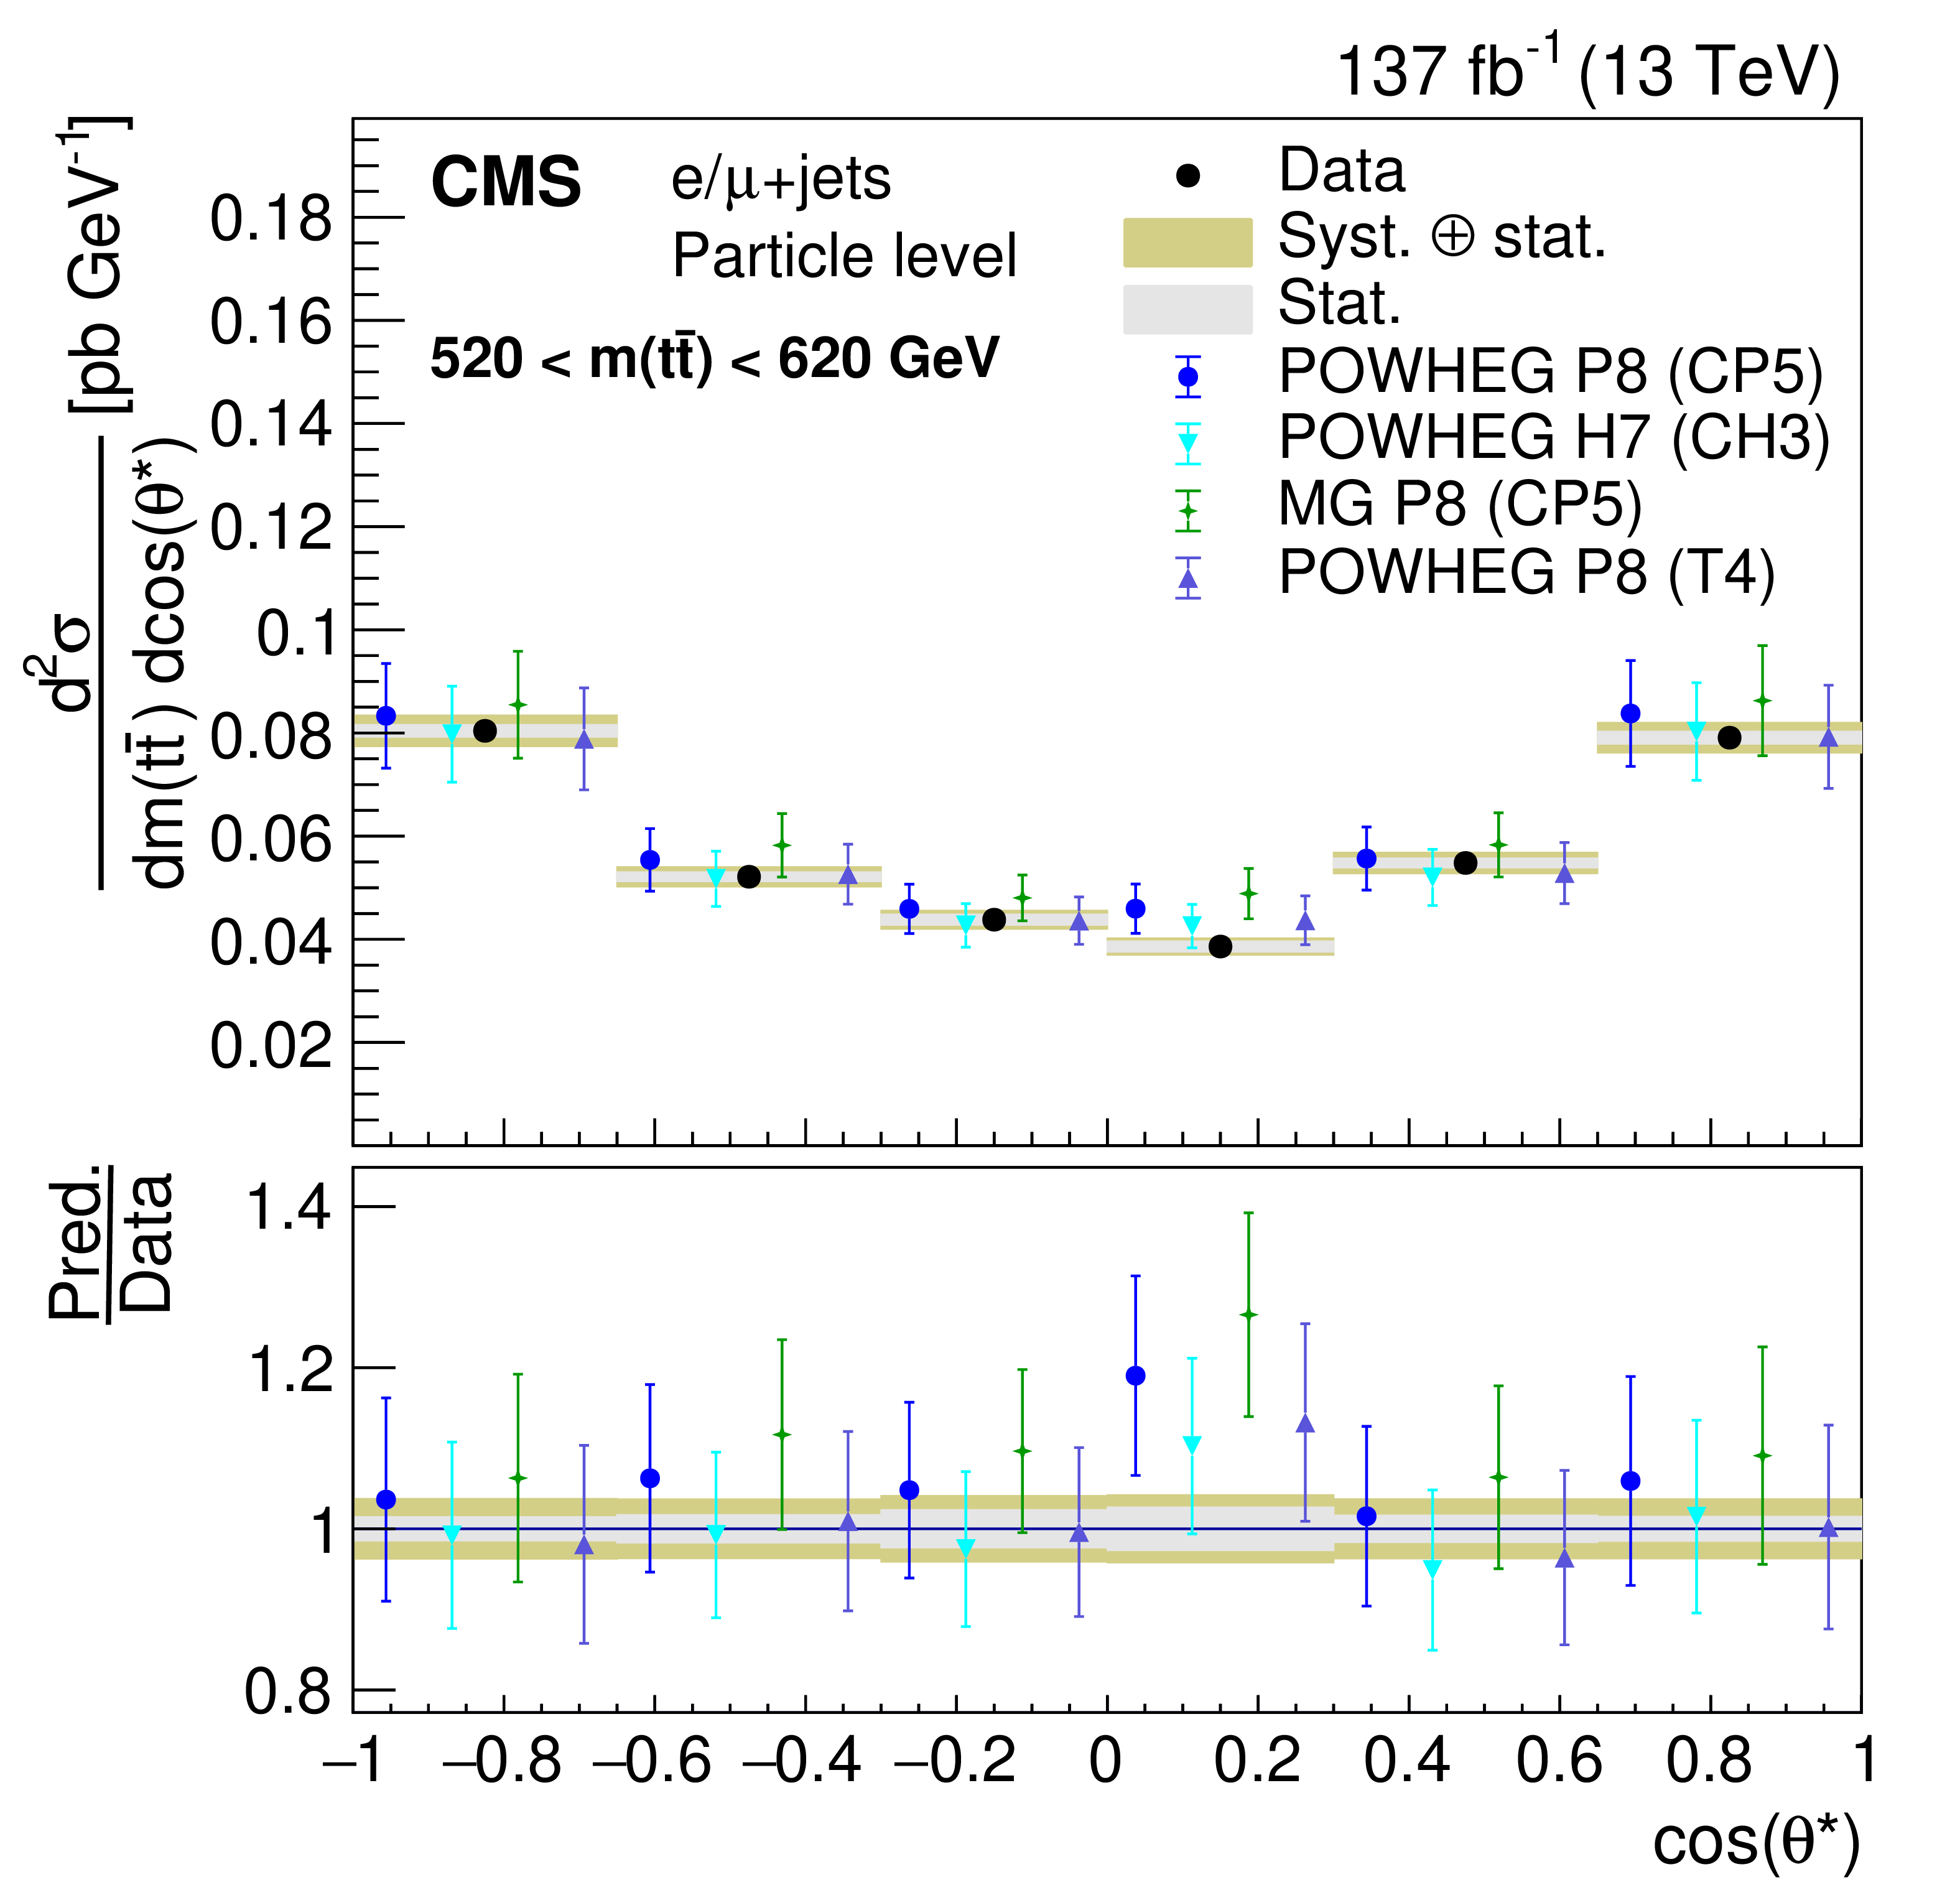
png pdf |
Figure 26-c:
Double-differential cross section at the particle level as a function of ${m({\mathrm{t} \mathrm{\bar{t}}})}$ vs. ${\cos(\theta ^*)}$. The data are shown as points with gray (yellow) bands indicating the statistical (statistical and systematic) uncertainties. The cross sections are compared to the predictions of POWHEG+PYTHIA (P8) for the CP5 and CUETP8M2T4 (T4) tunes, POWHEG+HERWIG (H7), and the multiparton simulation MG5_aMC@NLO (MG)+PYTHIA. The ratios of the various predictions to the measured cross sections are shown in the lower panels. |
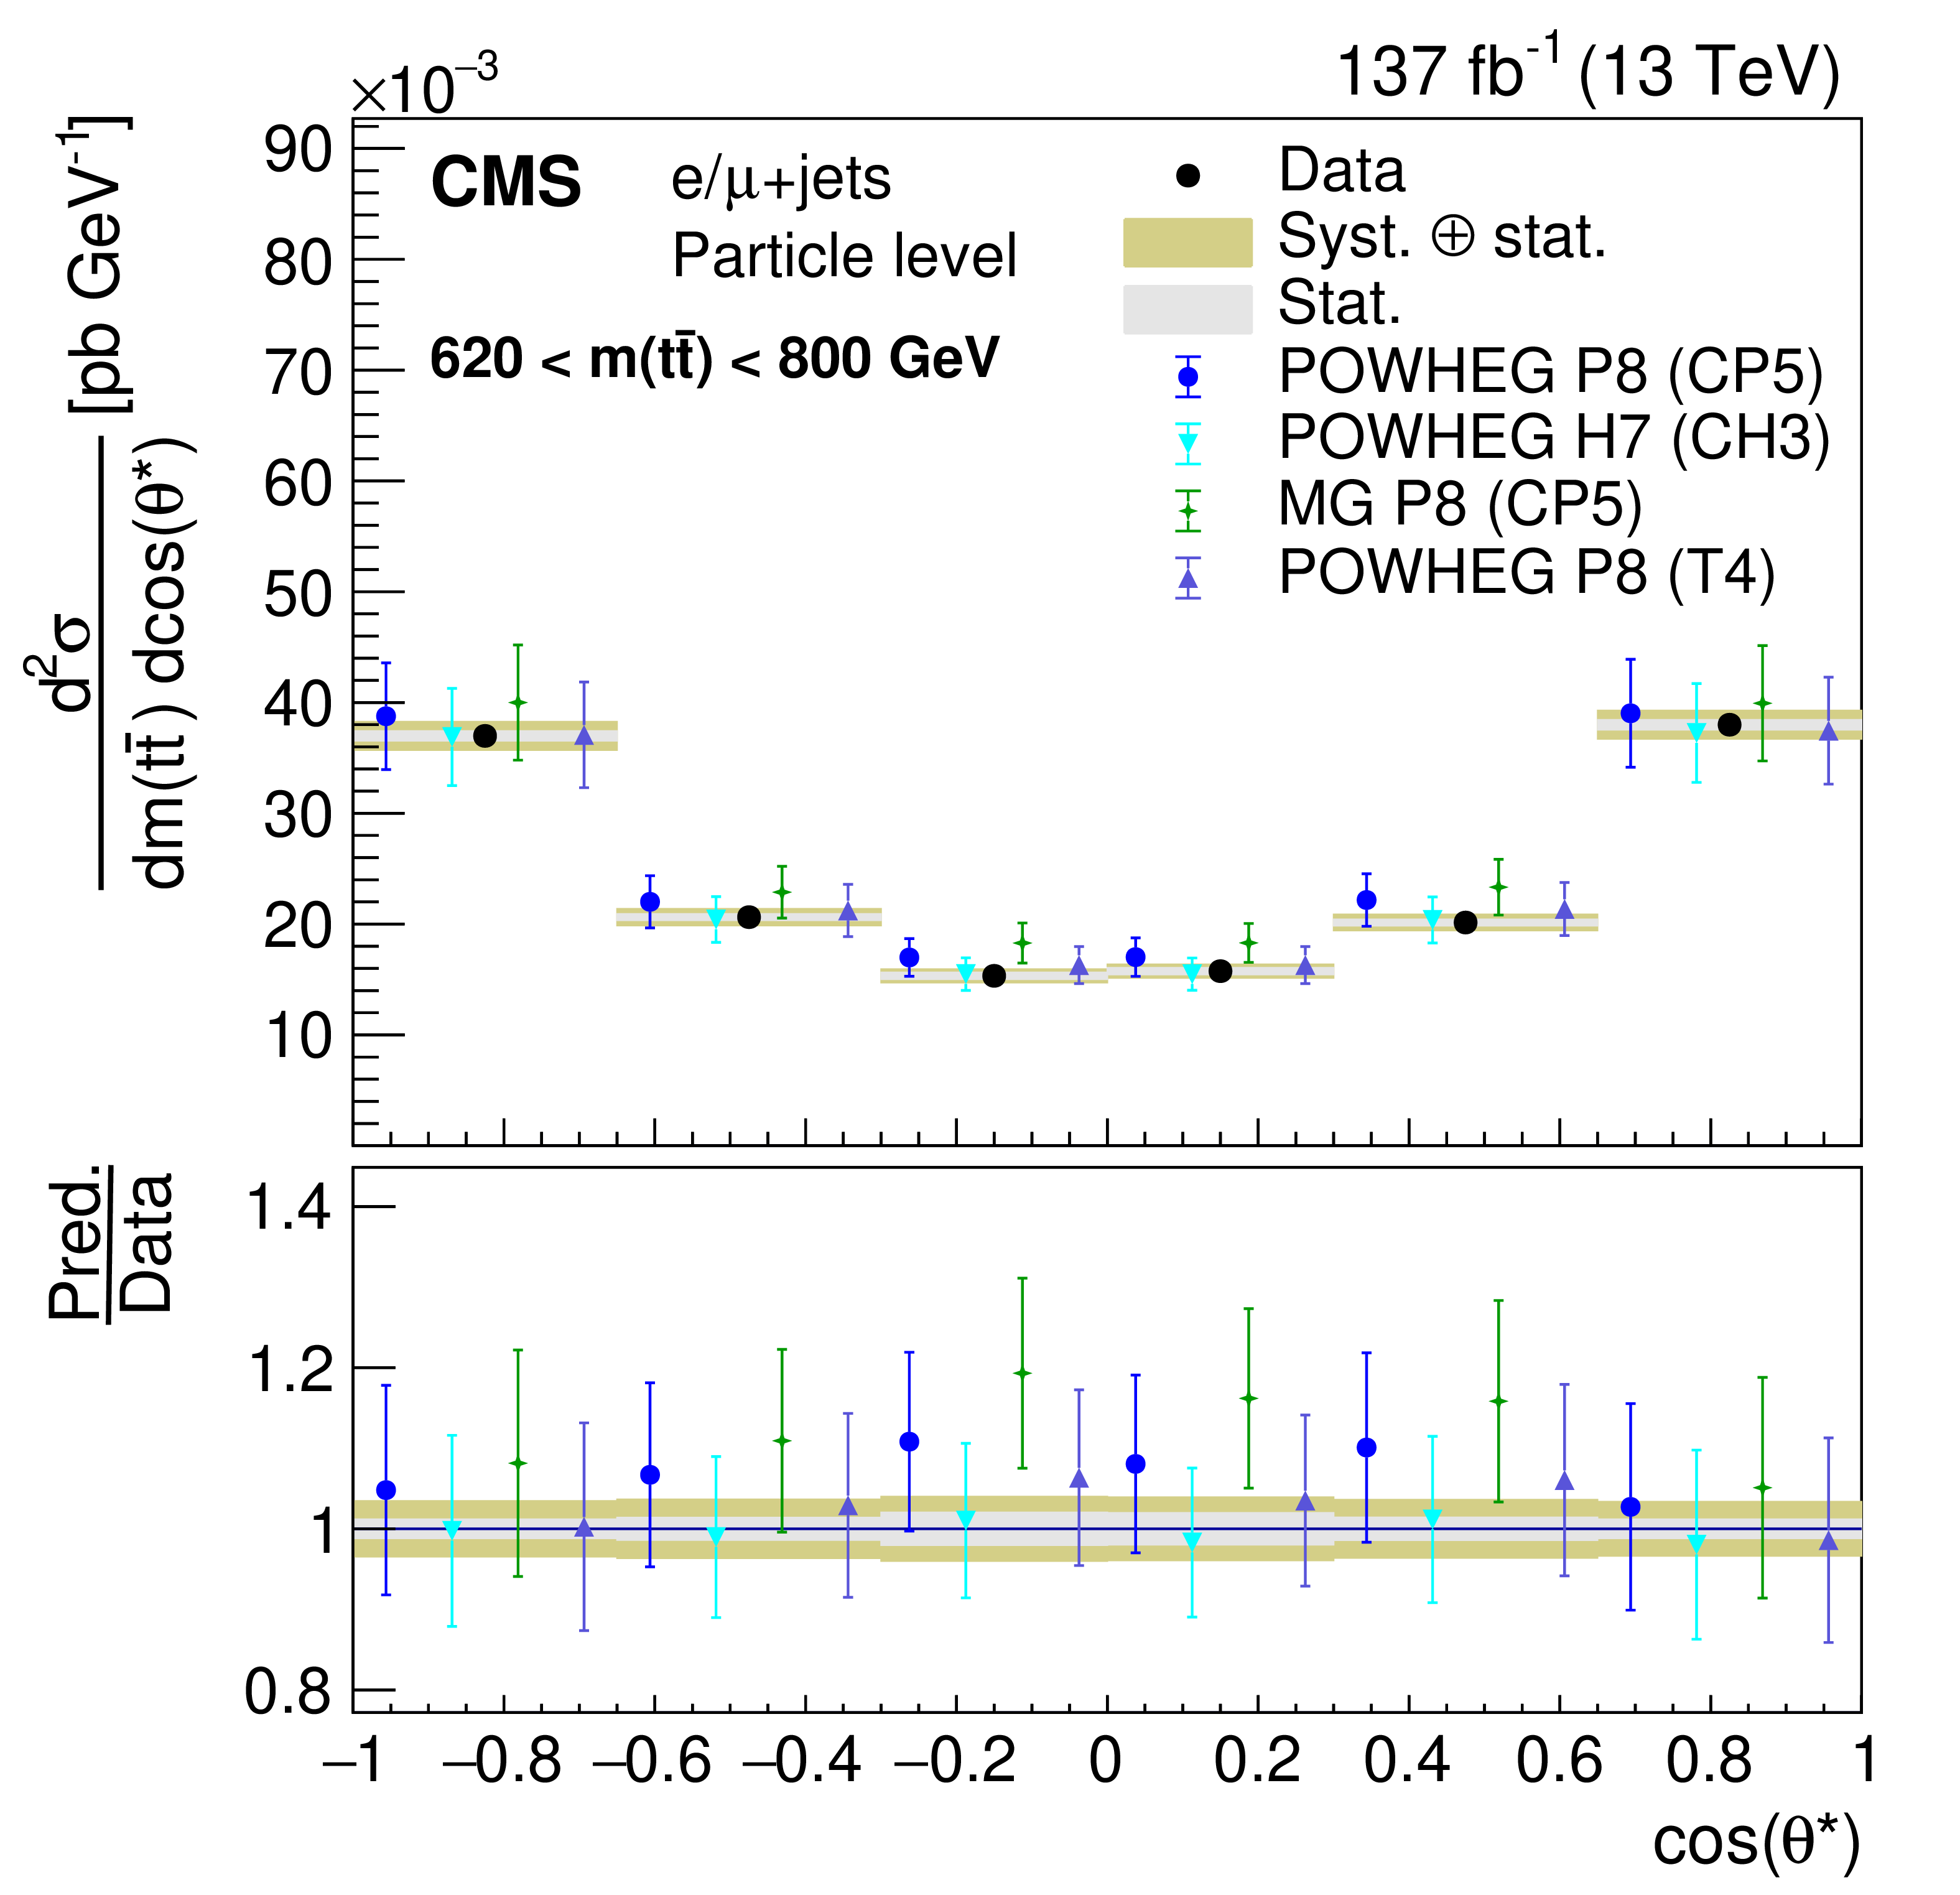
png pdf |
Figure 26-d:
Double-differential cross section at the particle level as a function of ${m({\mathrm{t} \mathrm{\bar{t}}})}$ vs. ${\cos(\theta ^*)}$. The data are shown as points with gray (yellow) bands indicating the statistical (statistical and systematic) uncertainties. The cross sections are compared to the predictions of POWHEG+PYTHIA (P8) for the CP5 and CUETP8M2T4 (T4) tunes, POWHEG+HERWIG (H7), and the multiparton simulation MG5_aMC@NLO (MG)+PYTHIA. The ratios of the various predictions to the measured cross sections are shown in the lower panels. |
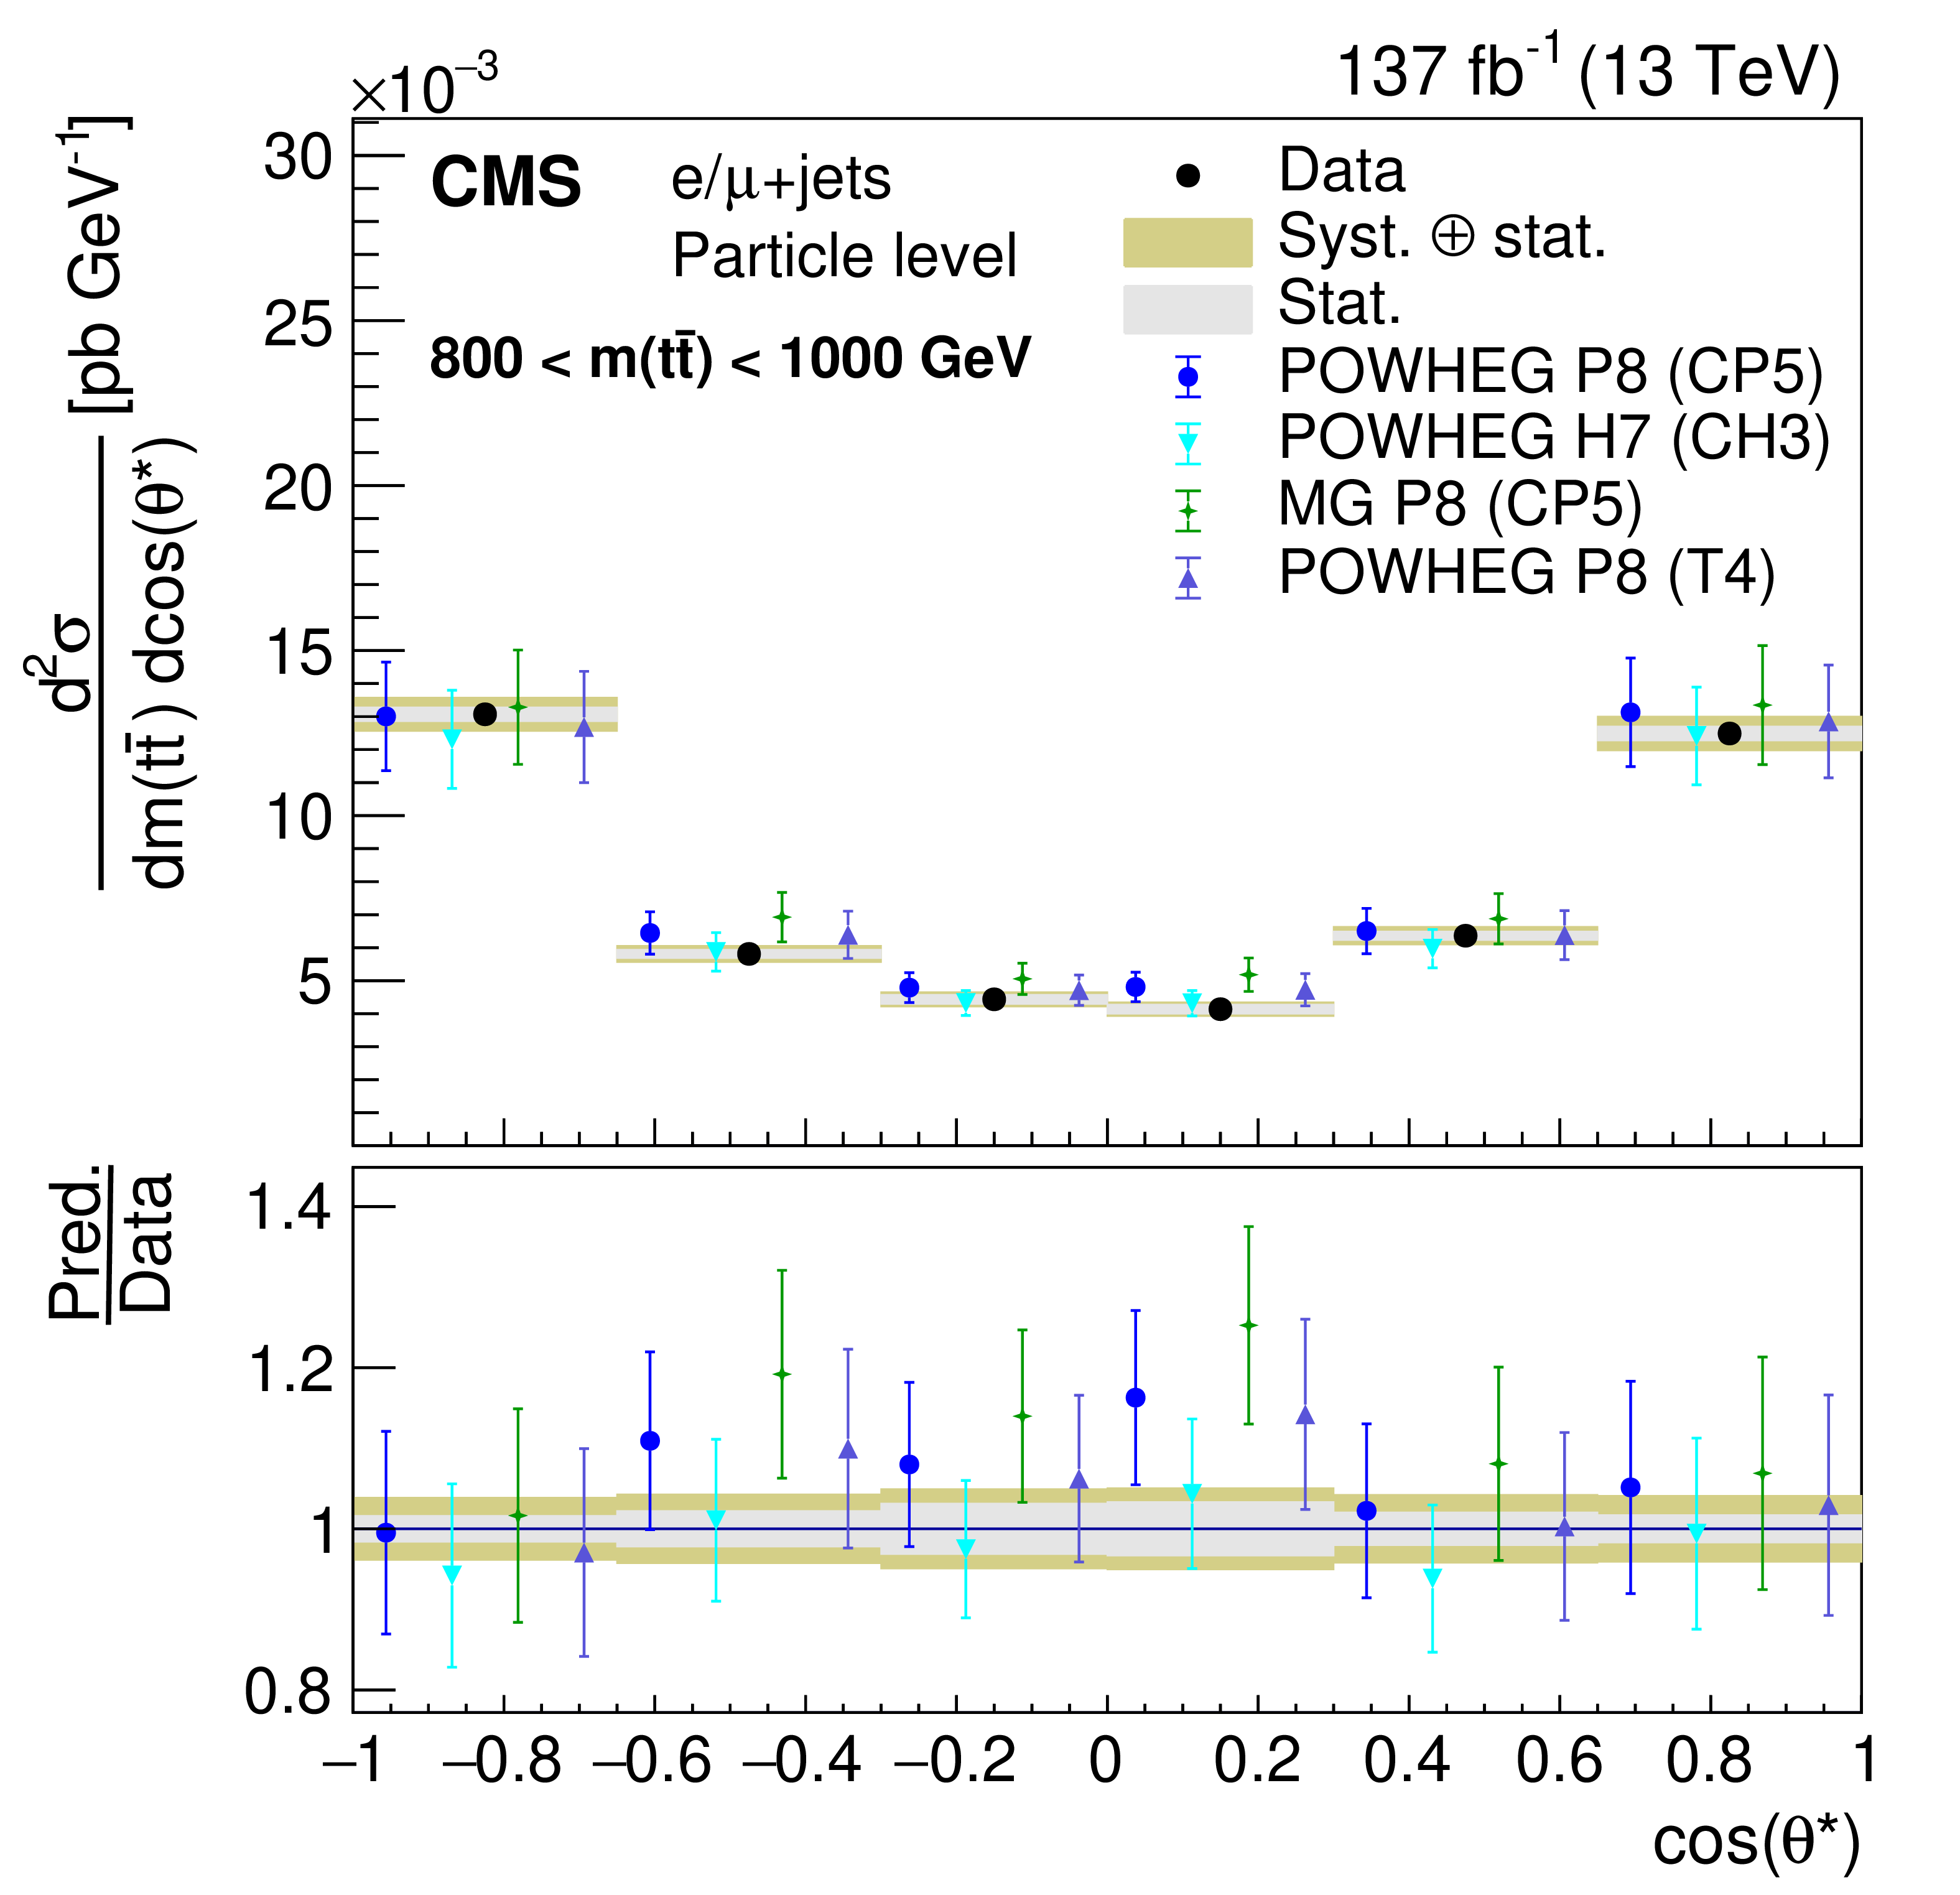
png pdf |
Figure 26-e:
Double-differential cross section at the particle level as a function of ${m({\mathrm{t} \mathrm{\bar{t}}})}$ vs. ${\cos(\theta ^*)}$. The data are shown as points with gray (yellow) bands indicating the statistical (statistical and systematic) uncertainties. The cross sections are compared to the predictions of POWHEG+PYTHIA (P8) for the CP5 and CUETP8M2T4 (T4) tunes, POWHEG+HERWIG (H7), and the multiparton simulation MG5_aMC@NLO (MG)+PYTHIA. The ratios of the various predictions to the measured cross sections are shown in the lower panels. |

png pdf |
Figure 26-f:
Double-differential cross section at the particle level as a function of ${m({\mathrm{t} \mathrm{\bar{t}}})}$ vs. ${\cos(\theta ^*)}$. The data are shown as points with gray (yellow) bands indicating the statistical (statistical and systematic) uncertainties. The cross sections are compared to the predictions of POWHEG+PYTHIA (P8) for the CP5 and CUETP8M2T4 (T4) tunes, POWHEG+HERWIG (H7), and the multiparton simulation MG5_aMC@NLO (MG)+PYTHIA. The ratios of the various predictions to the measured cross sections are shown in the lower panels. |
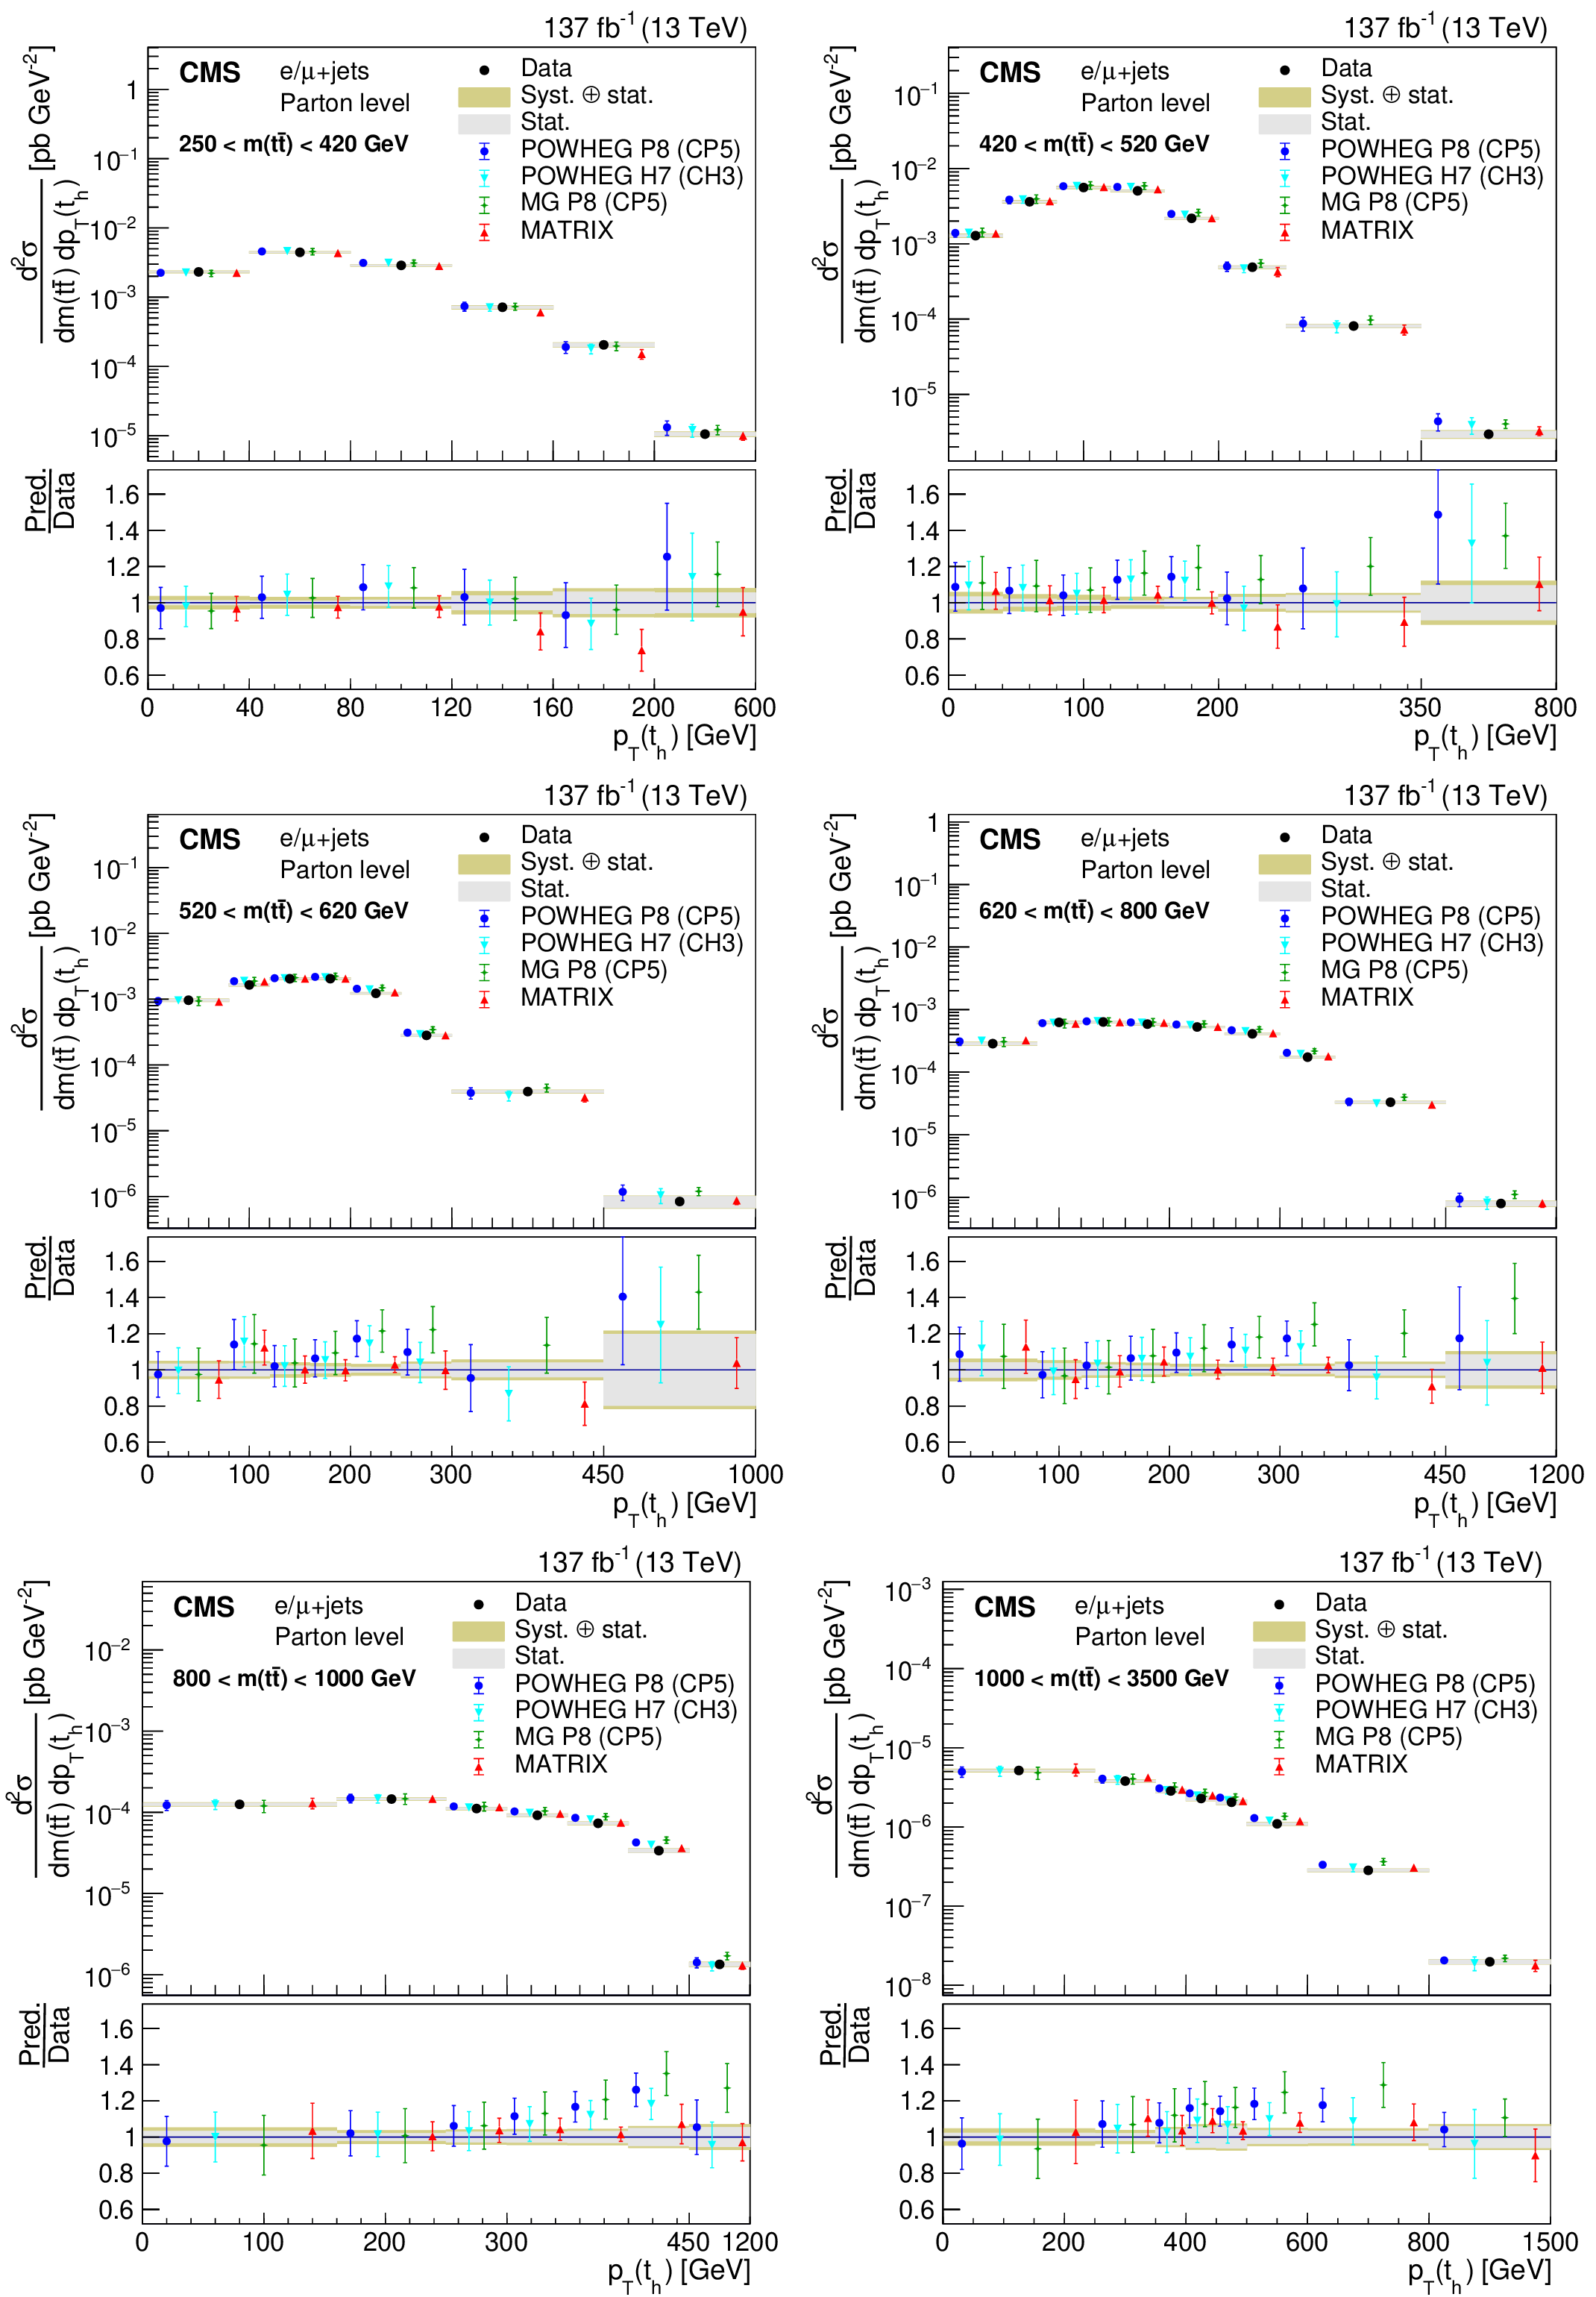
png pdf |
Figure 27:
Double-differential cross section at the parton level as a function of ${m({\mathrm{t} \mathrm{\bar{t}}}}$ vs. ${p_{\mathrm {T}}} ({\mathrm{t} _\mathrm {h}})$. The data are shown as points with gray (yellow) bands indicating the statistical (statistical and systematic) uncertainties. The cross sections are compared to the predictions of POWHEG combined with PYTHIA (P8) or HERWIG (H7), the multiparton simulation MG5_aMC@NLO (MG)+PYTHIA FxFx, and the NNLO QCD calculations obtained with Matrix. The ratios of the various predictions to the measured cross sections are shown in the lower panels. |
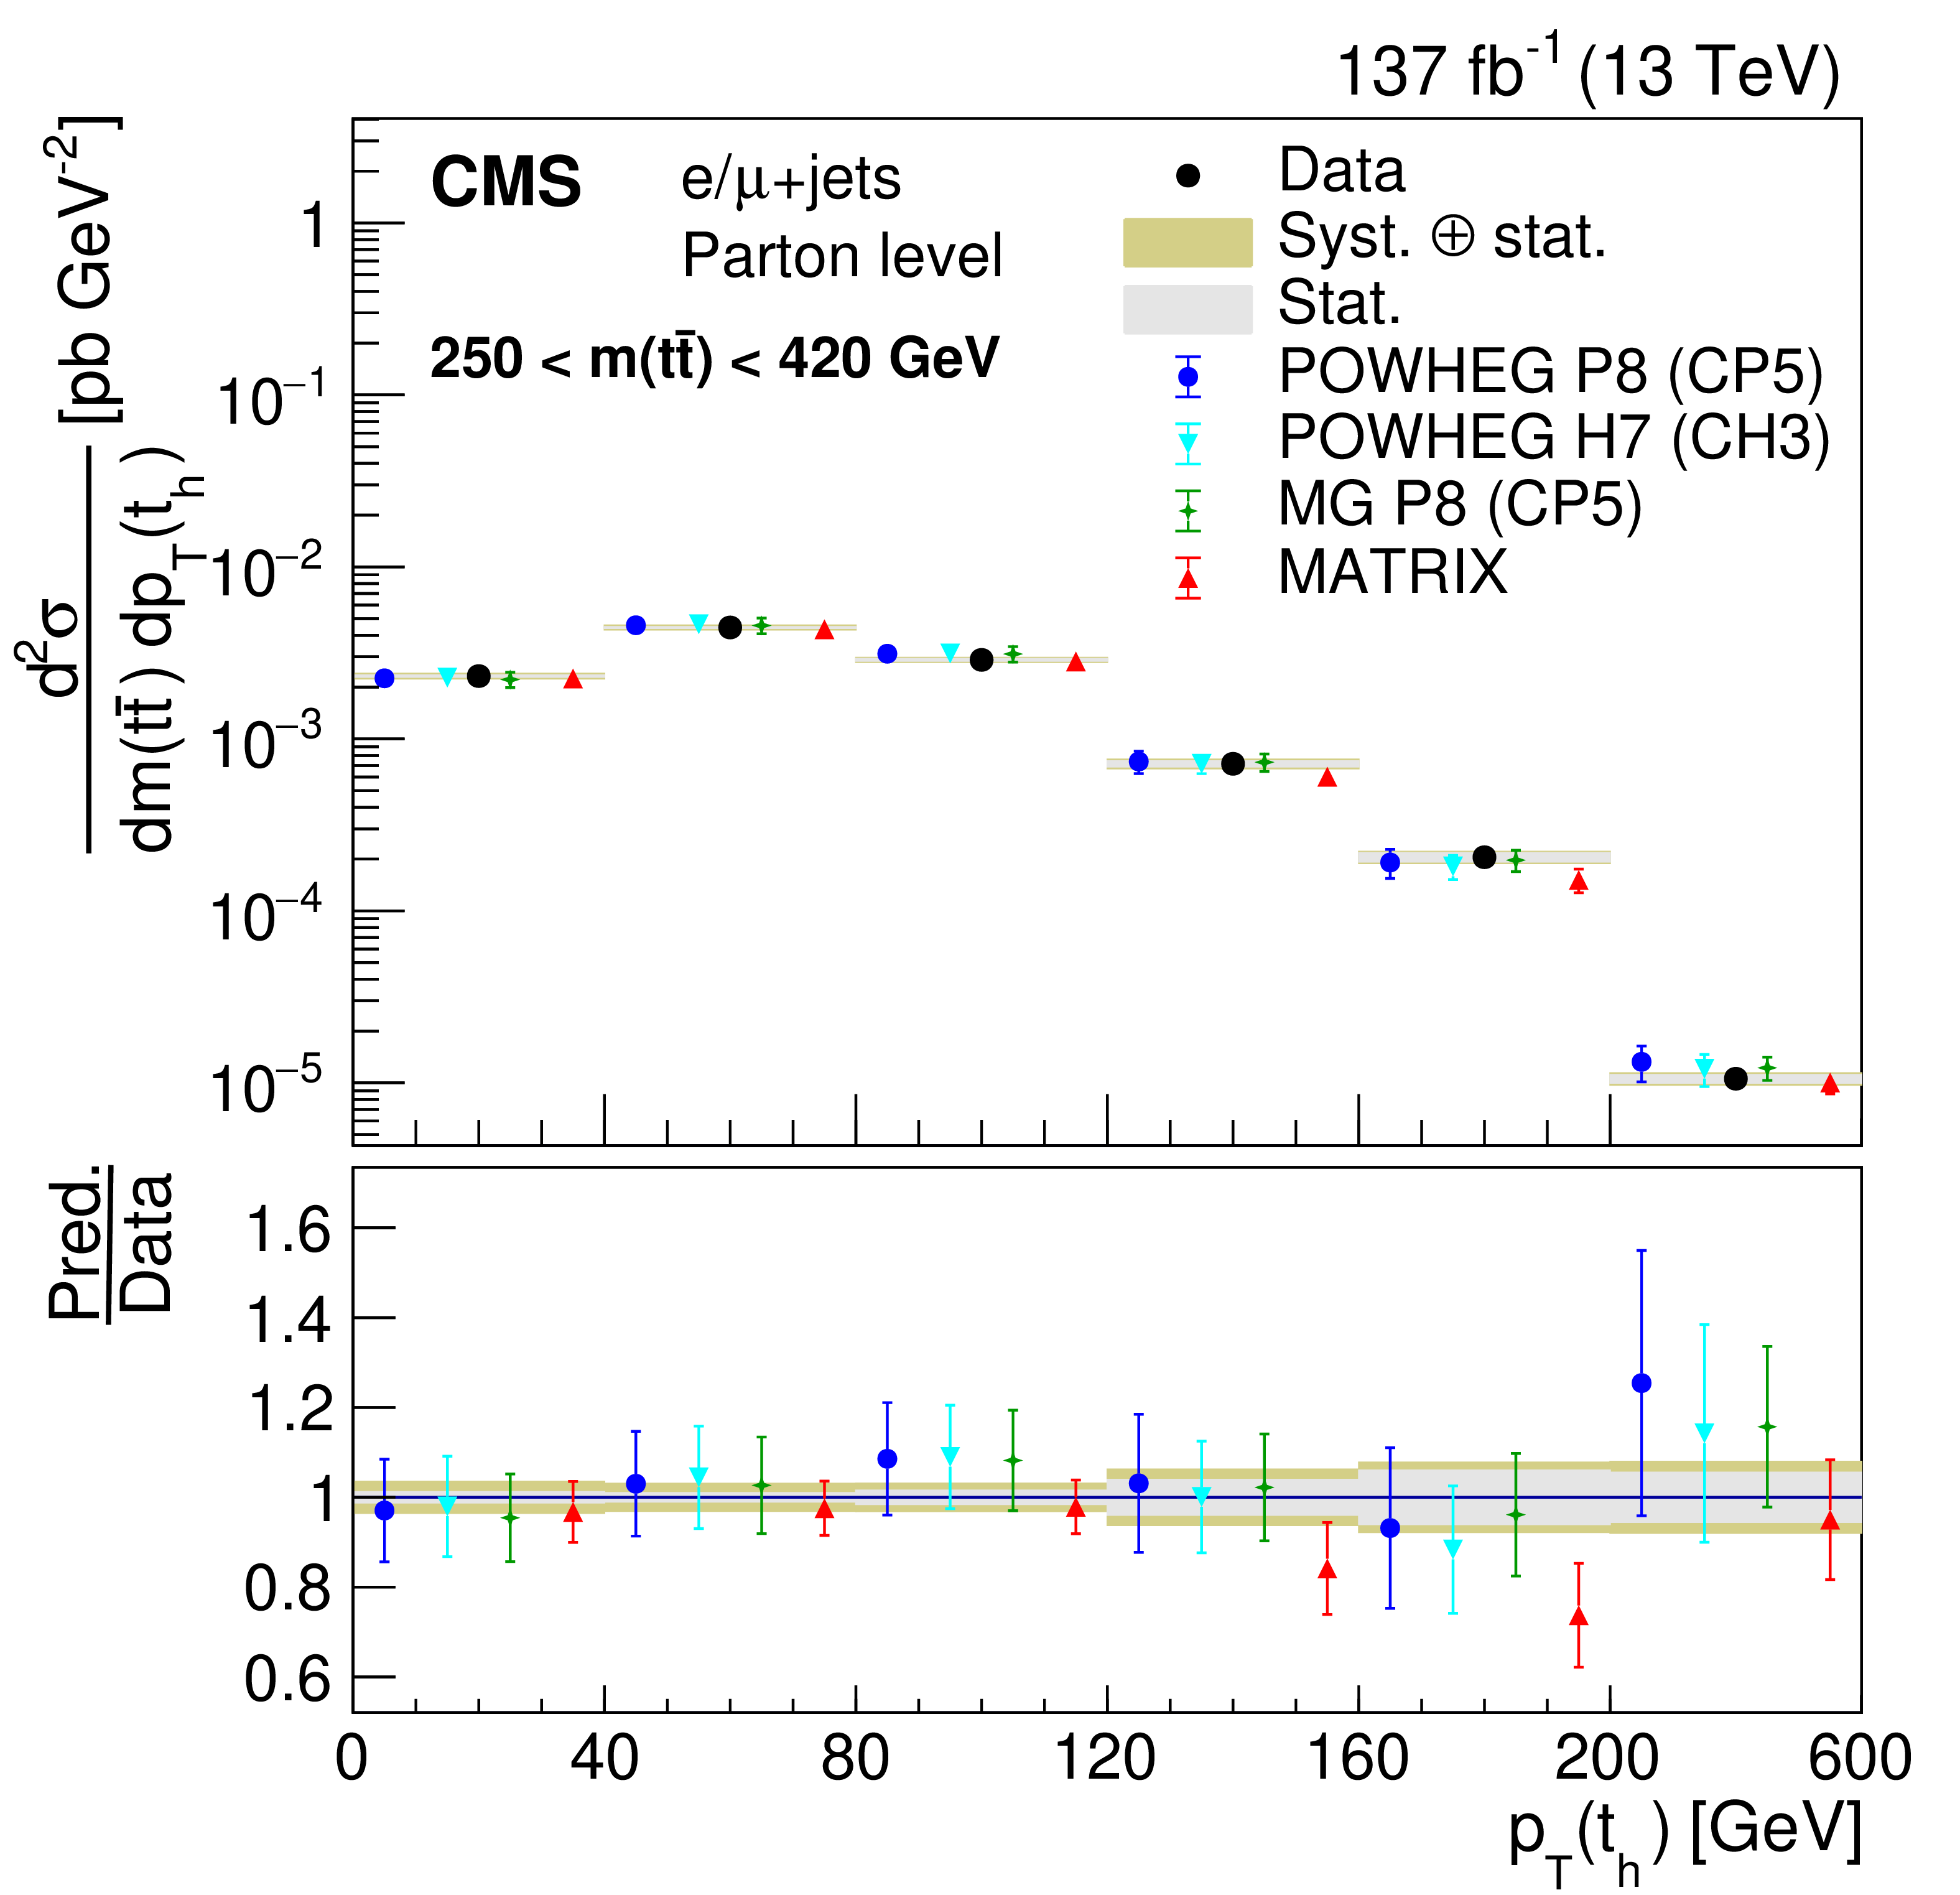
png pdf |
Figure 27-a:
Double-differential cross section at the parton level as a function of ${m({\mathrm{t} \mathrm{\bar{t}}}}$ vs. ${p_{\mathrm {T}}} ({\mathrm{t} _\mathrm {h}})$. The data are shown as points with gray (yellow) bands indicating the statistical (statistical and systematic) uncertainties. The cross sections are compared to the predictions of POWHEG combined with PYTHIA (P8) or HERWIG (H7), the multiparton simulation MG5_aMC@NLO (MG)+PYTHIA FxFx, and the NNLO QCD calculations obtained with Matrix. The ratios of the various predictions to the measured cross sections are shown in the lower panels. |
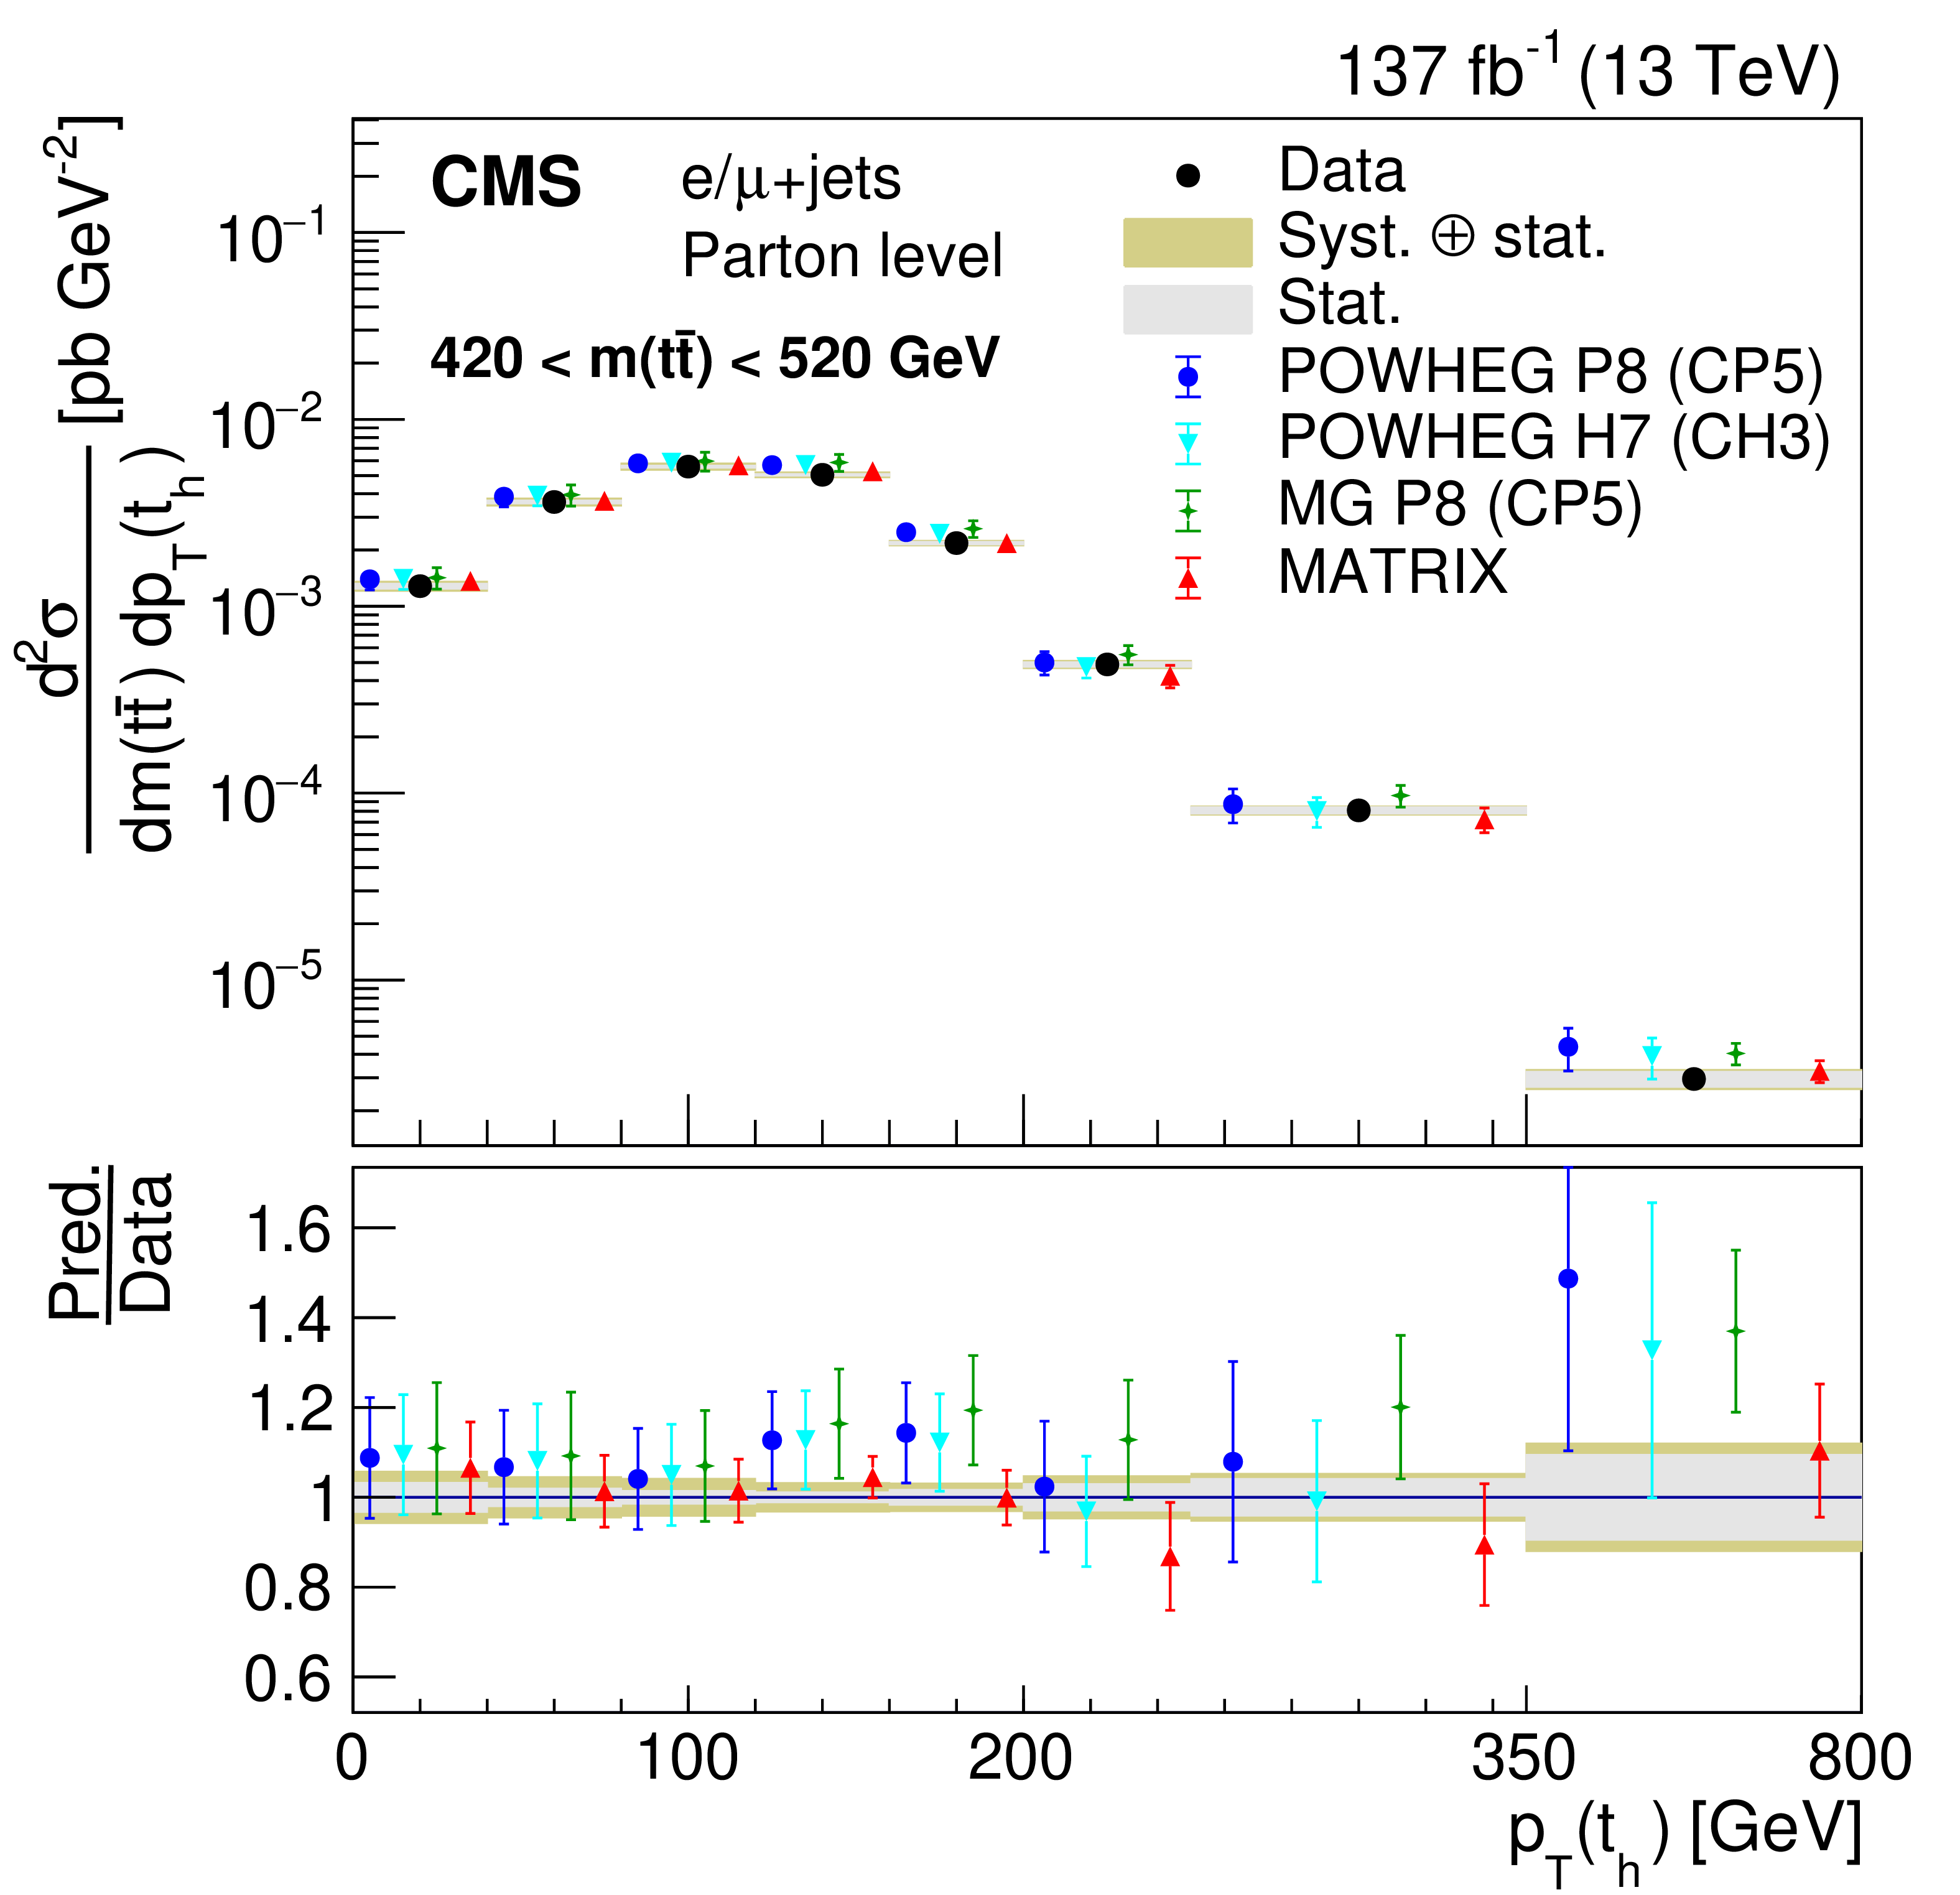
png pdf |
Figure 27-b:
Double-differential cross section at the parton level as a function of ${m({\mathrm{t} \mathrm{\bar{t}}}}$ vs. ${p_{\mathrm {T}}} ({\mathrm{t} _\mathrm {h}})$. The data are shown as points with gray (yellow) bands indicating the statistical (statistical and systematic) uncertainties. The cross sections are compared to the predictions of POWHEG combined with PYTHIA (P8) or HERWIG (H7), the multiparton simulation MG5_aMC@NLO (MG)+PYTHIA FxFx, and the NNLO QCD calculations obtained with Matrix. The ratios of the various predictions to the measured cross sections are shown in the lower panels. |
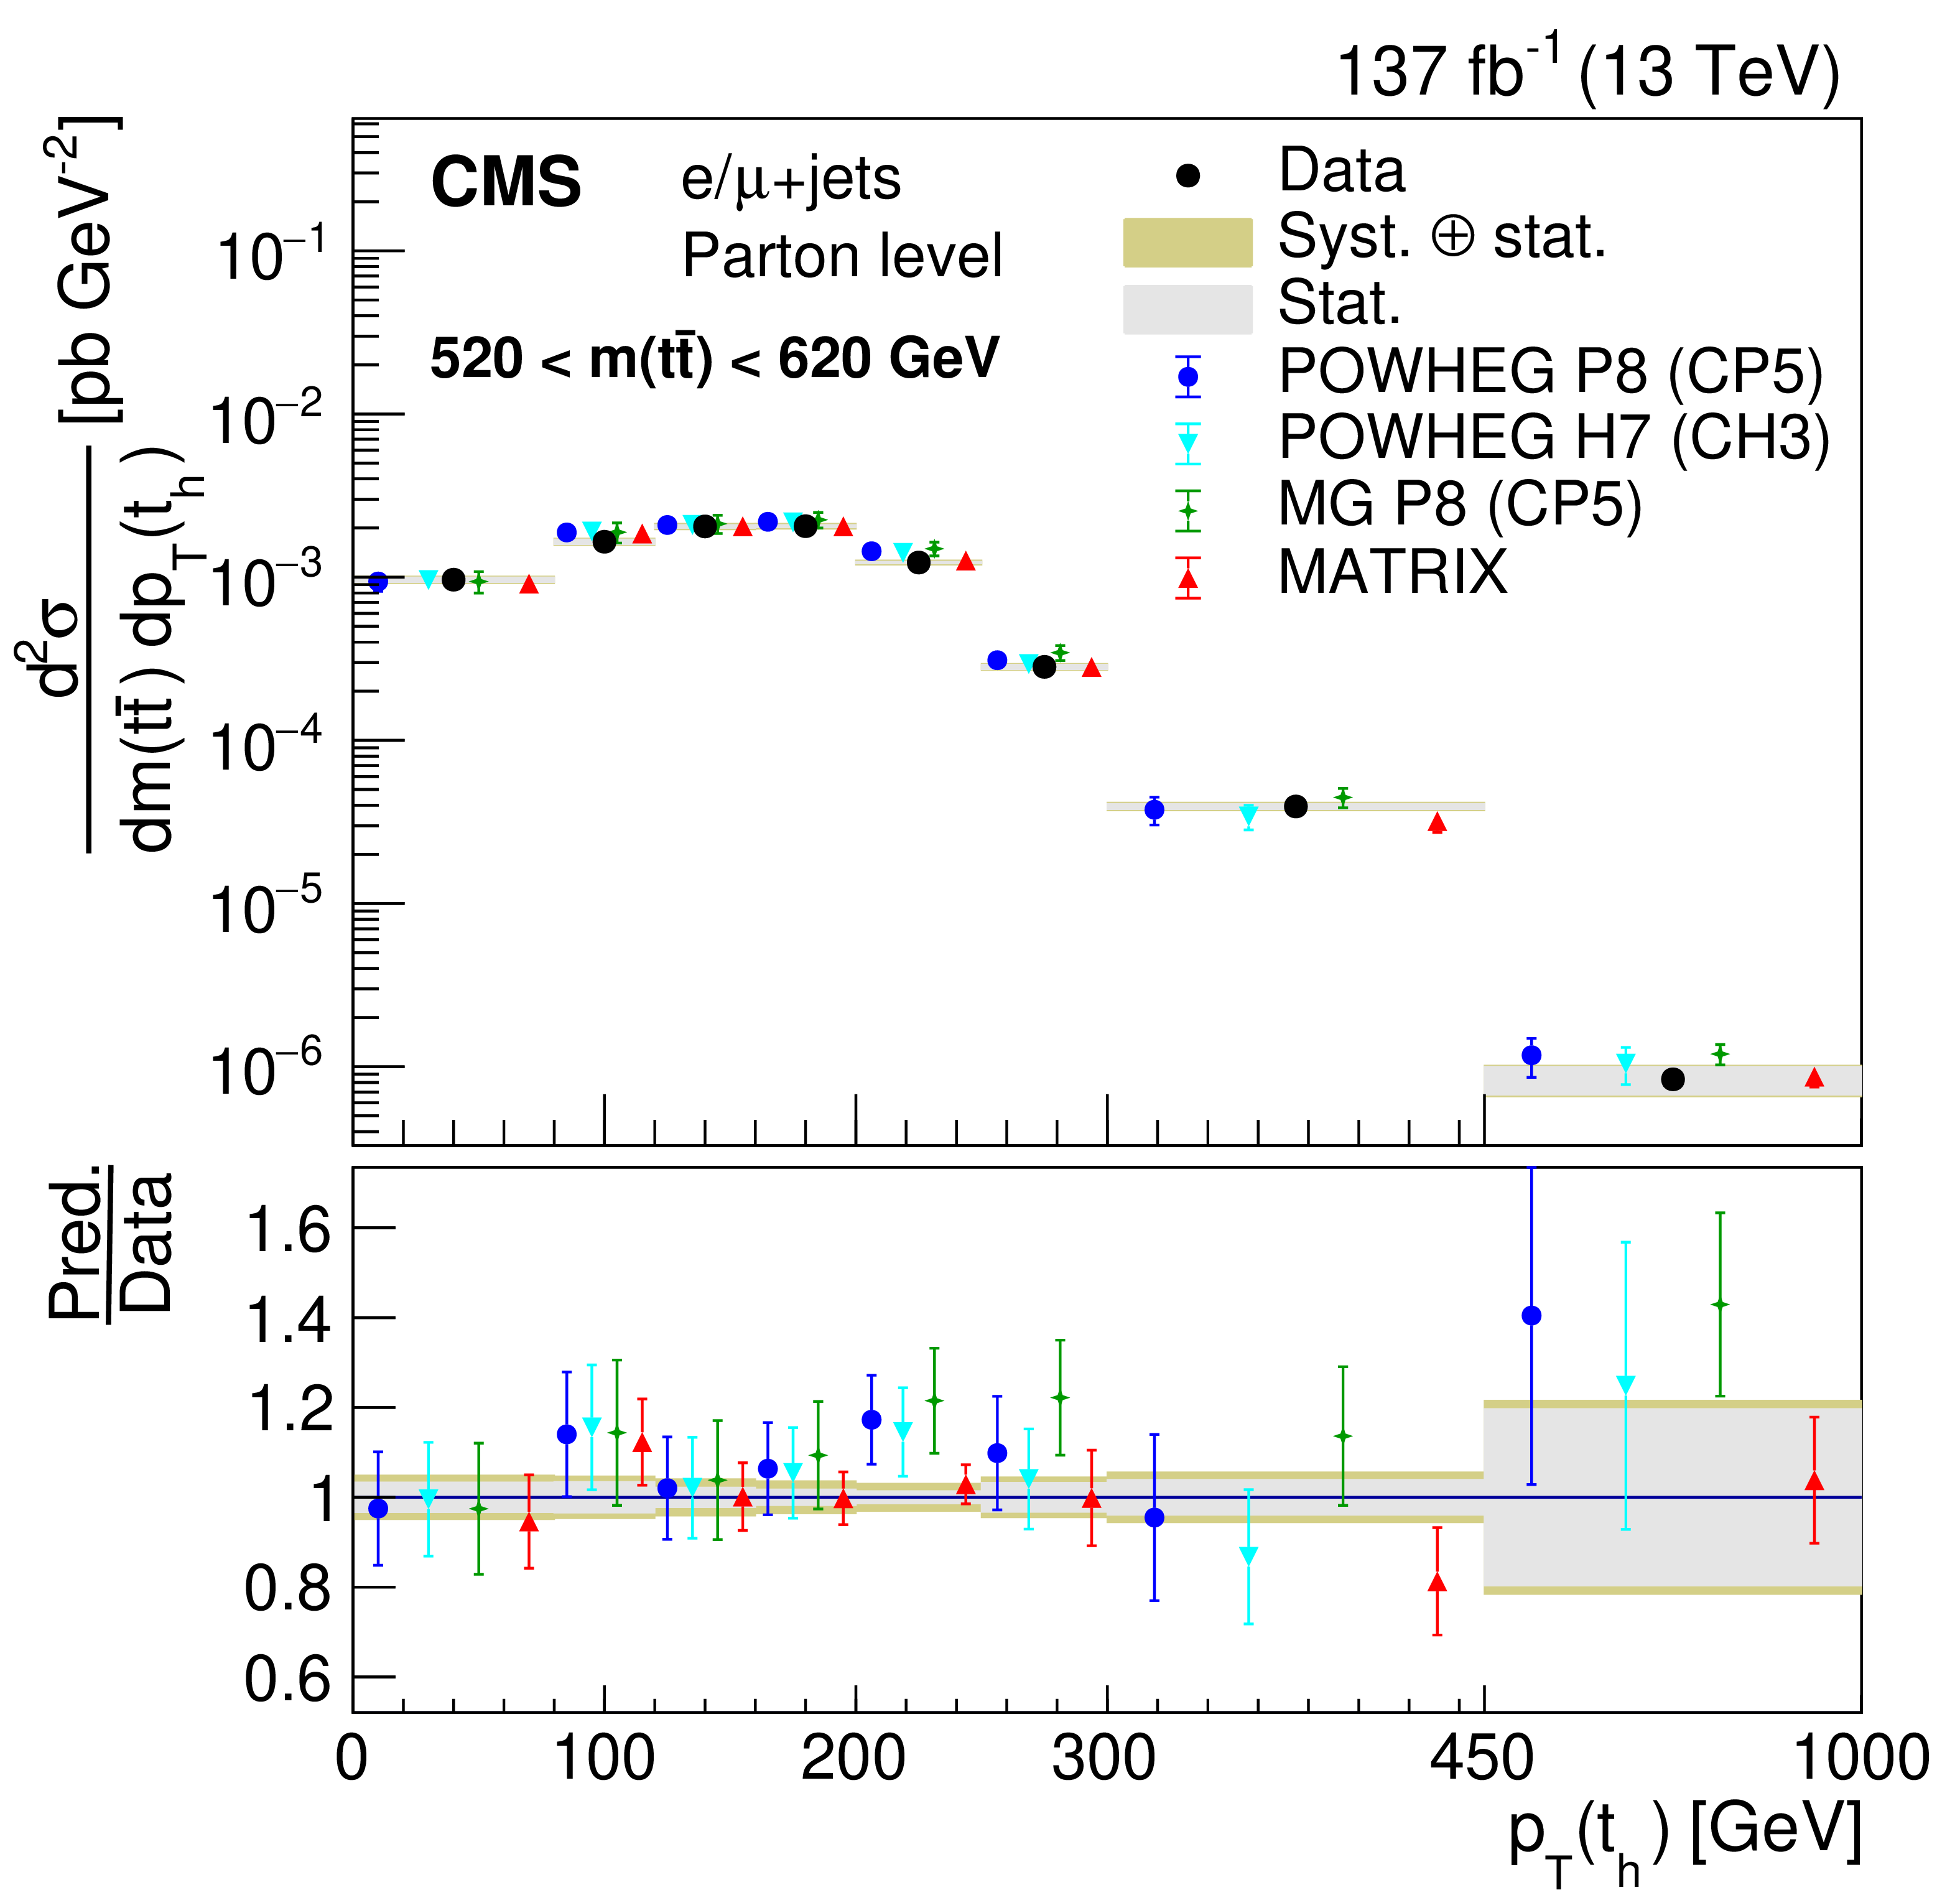
png pdf |
Figure 27-c:
Double-differential cross section at the parton level as a function of ${m({\mathrm{t} \mathrm{\bar{t}}}}$ vs. ${p_{\mathrm {T}}} ({\mathrm{t} _\mathrm {h}})$. The data are shown as points with gray (yellow) bands indicating the statistical (statistical and systematic) uncertainties. The cross sections are compared to the predictions of POWHEG combined with PYTHIA (P8) or HERWIG (H7), the multiparton simulation MG5_aMC@NLO (MG)+PYTHIA FxFx, and the NNLO QCD calculations obtained with Matrix. The ratios of the various predictions to the measured cross sections are shown in the lower panels. |
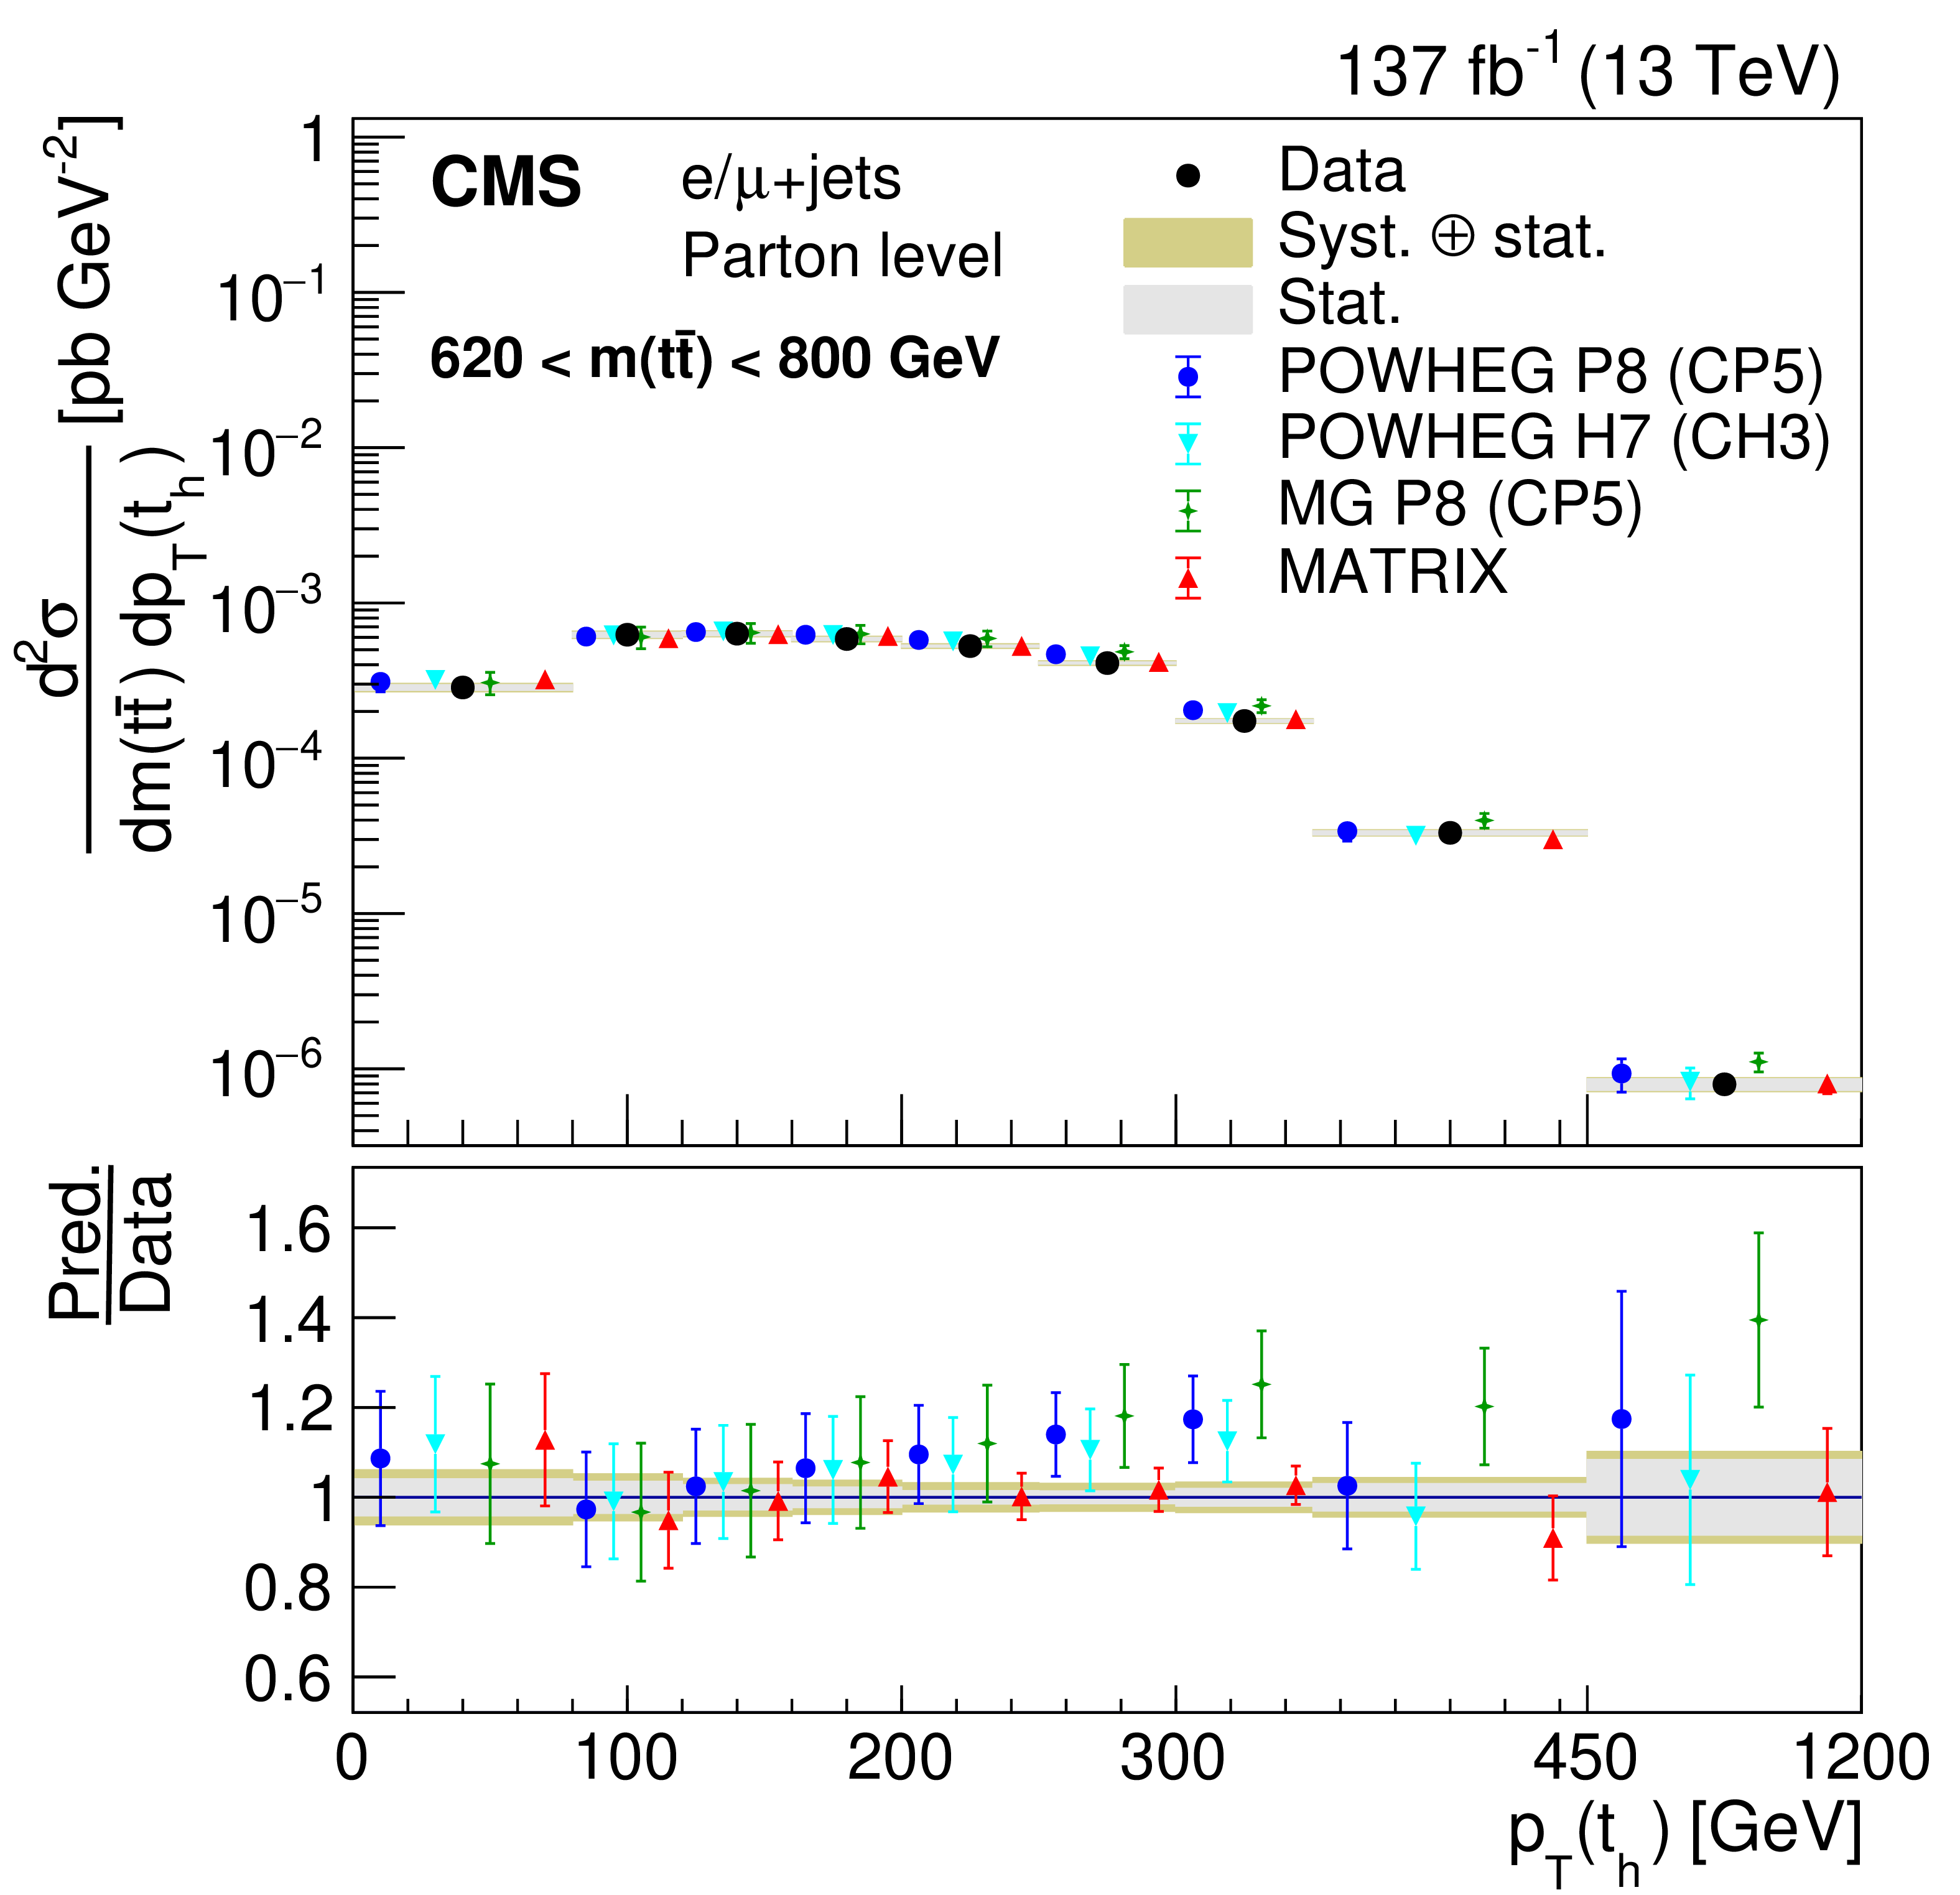
png pdf |
Figure 27-d:
Double-differential cross section at the parton level as a function of ${m({\mathrm{t} \mathrm{\bar{t}}}}$ vs. ${p_{\mathrm {T}}} ({\mathrm{t} _\mathrm {h}})$. The data are shown as points with gray (yellow) bands indicating the statistical (statistical and systematic) uncertainties. The cross sections are compared to the predictions of POWHEG combined with PYTHIA (P8) or HERWIG (H7), the multiparton simulation MG5_aMC@NLO (MG)+PYTHIA FxFx, and the NNLO QCD calculations obtained with Matrix. The ratios of the various predictions to the measured cross sections are shown in the lower panels. |
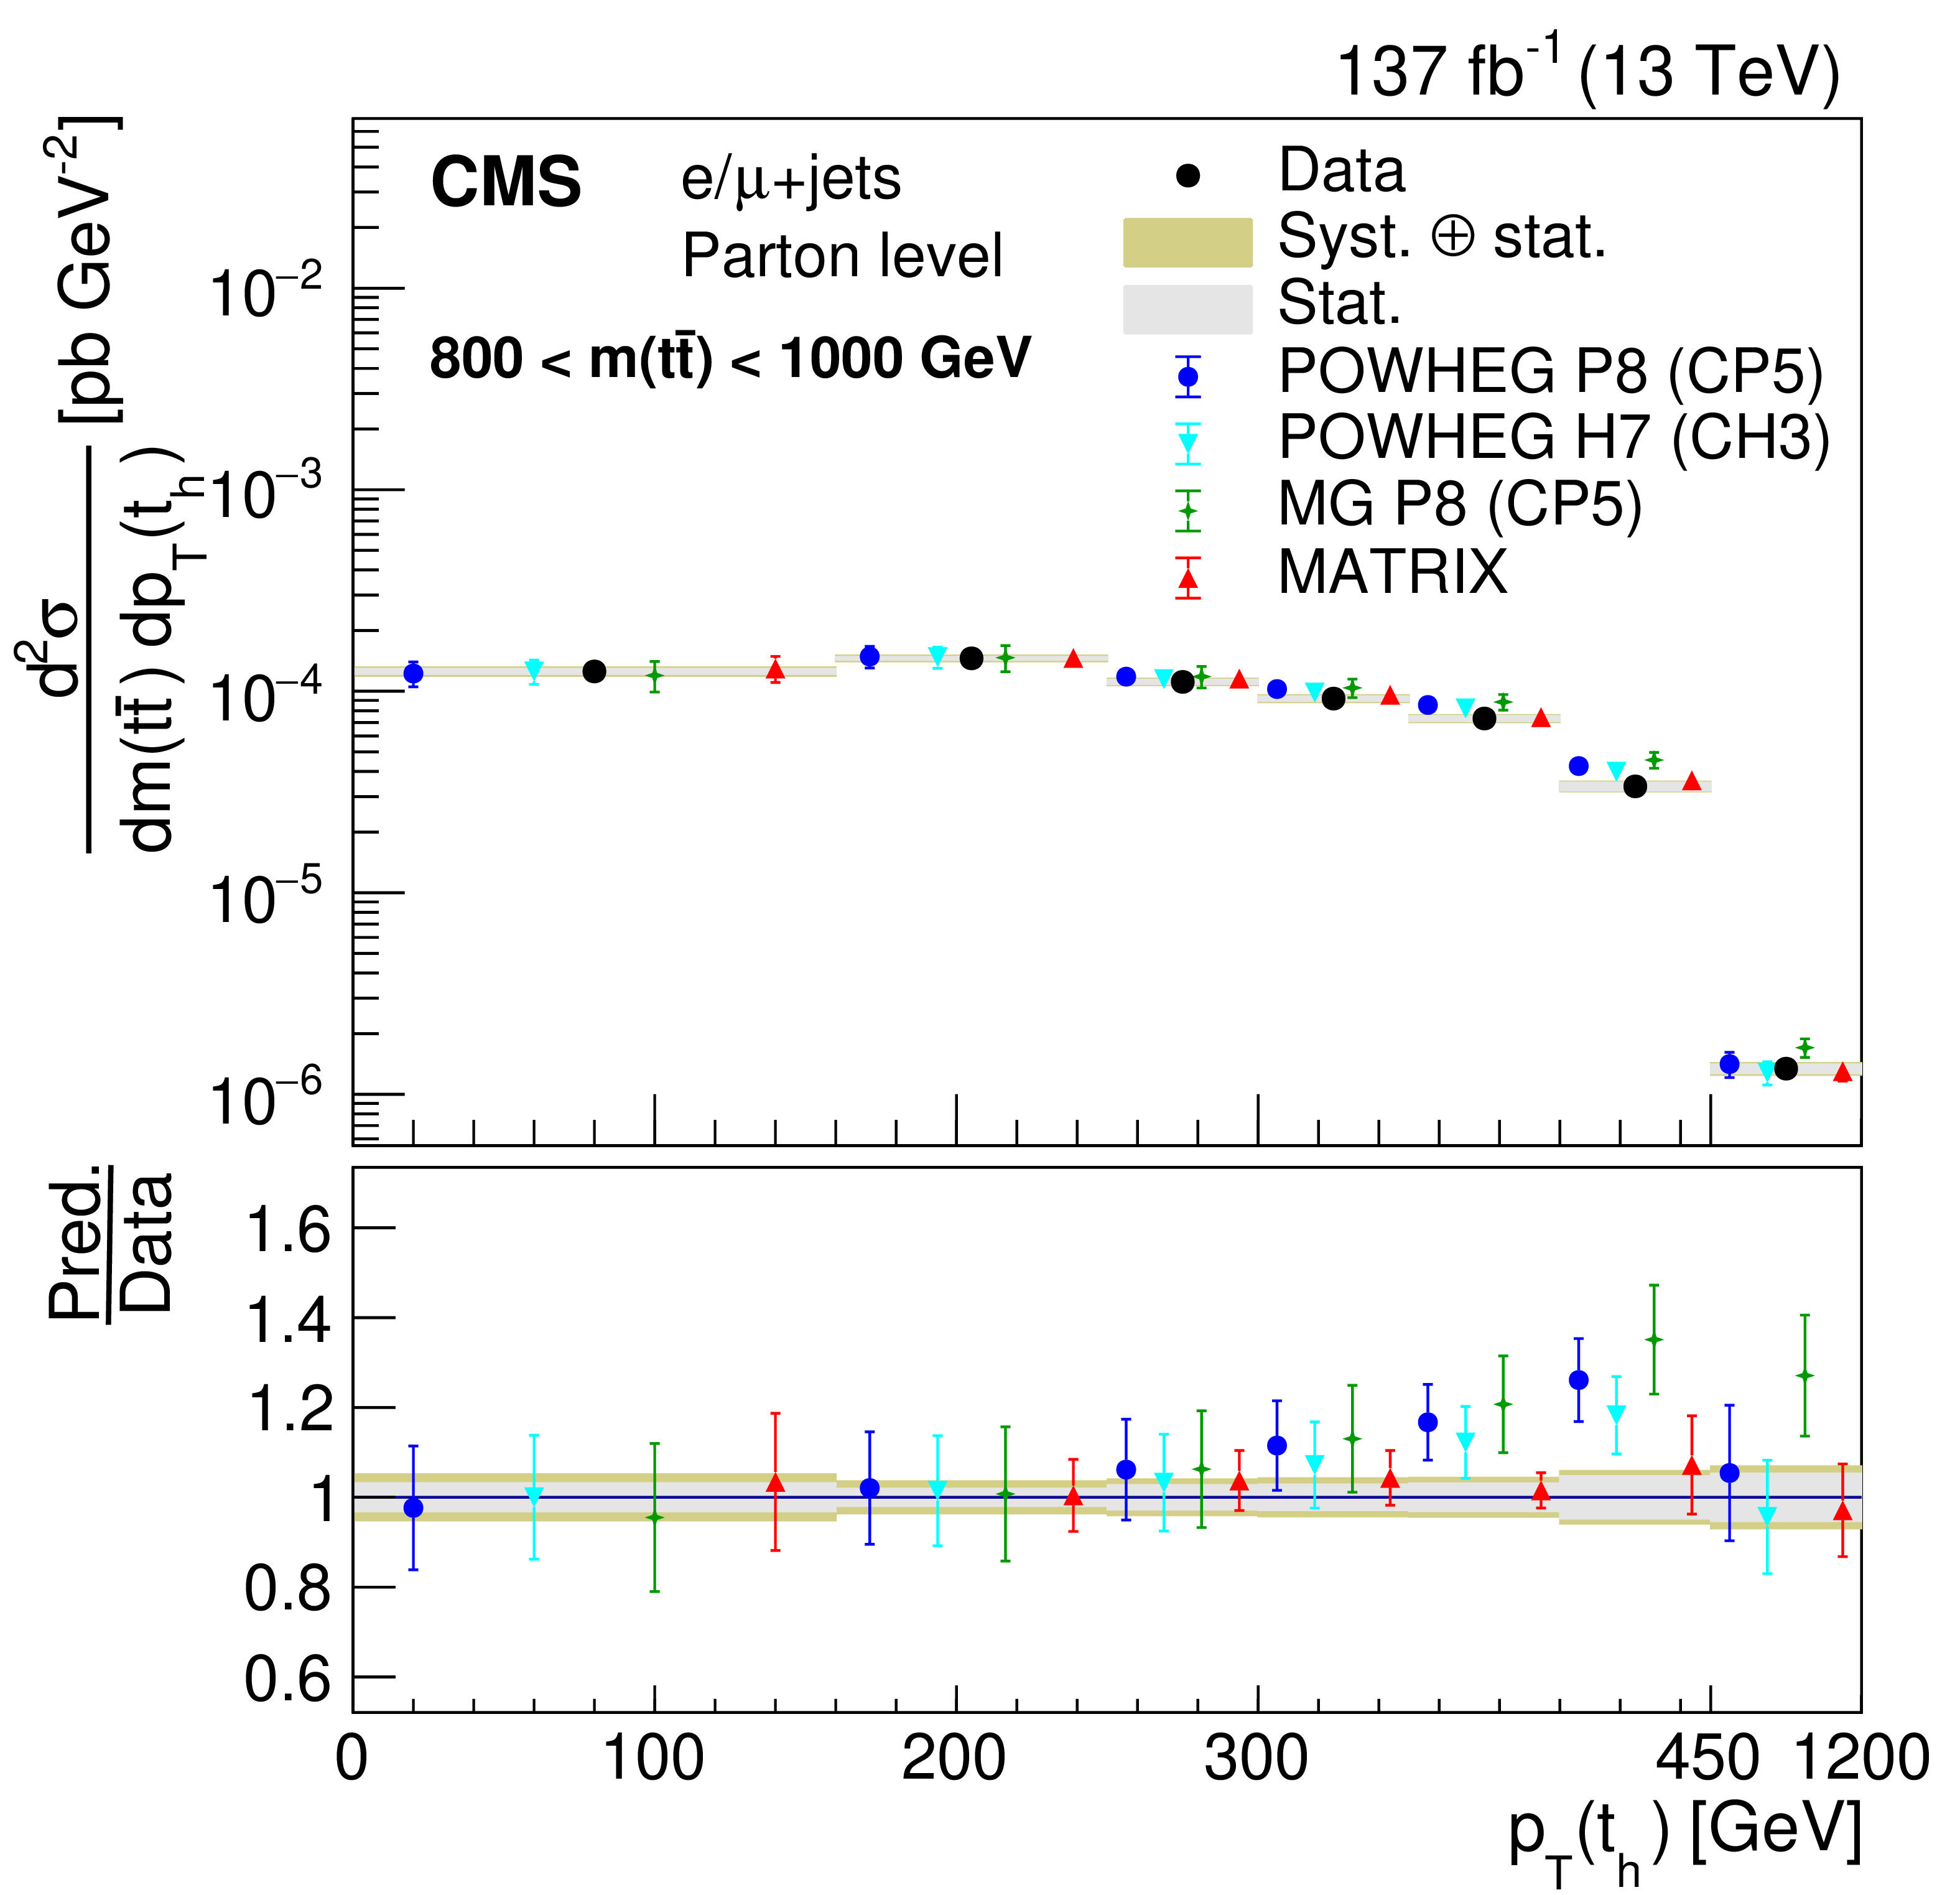
png pdf |
Figure 27-e:
Double-differential cross section at the parton level as a function of ${m({\mathrm{t} \mathrm{\bar{t}}}}$ vs. ${p_{\mathrm {T}}} ({\mathrm{t} _\mathrm {h}})$. The data are shown as points with gray (yellow) bands indicating the statistical (statistical and systematic) uncertainties. The cross sections are compared to the predictions of POWHEG combined with PYTHIA (P8) or HERWIG (H7), the multiparton simulation MG5_aMC@NLO (MG)+PYTHIA FxFx, and the NNLO QCD calculations obtained with Matrix. The ratios of the various predictions to the measured cross sections are shown in the lower panels. |

png pdf |
Figure 27-f:
Double-differential cross section at the parton level as a function of ${m({\mathrm{t} \mathrm{\bar{t}}}}$ vs. ${p_{\mathrm {T}}} ({\mathrm{t} _\mathrm {h}})$. The data are shown as points with gray (yellow) bands indicating the statistical (statistical and systematic) uncertainties. The cross sections are compared to the predictions of POWHEG combined with PYTHIA (P8) or HERWIG (H7), the multiparton simulation MG5_aMC@NLO (MG)+PYTHIA FxFx, and the NNLO QCD calculations obtained with Matrix. The ratios of the various predictions to the measured cross sections are shown in the lower panels. |

png pdf |
Figure 28:
Double-differential cross section at the particle level as a function of ${m({\mathrm{t} \mathrm{\bar{t}}})}$ vs. ${p_{\mathrm {T}}} ({\mathrm{t} _\mathrm {h}})$. The data are shown as points with gray (yellow) bands indicating the statistical (statistical and systematic) uncertainties. The cross sections are compared to the predictions of POWHEG+PYTHIA (P8) for the CP5 and CUETP8M2T4 (T4) tunes, POWHEG+HERWIG (H7), and the multiparton simulation MG5_aMC@NLO (MG)+PYTHIA. The ratios of the various predictions to the measured cross sections are shown in the lower panels. |

png pdf |
Figure 28-a:
Double-differential cross section at the particle level as a function of ${m({\mathrm{t} \mathrm{\bar{t}}})}$ vs. ${p_{\mathrm {T}}} ({\mathrm{t} _\mathrm {h}})$. The data are shown as points with gray (yellow) bands indicating the statistical (statistical and systematic) uncertainties. The cross sections are compared to the predictions of POWHEG+PYTHIA (P8) for the CP5 and CUETP8M2T4 (T4) tunes, POWHEG+HERWIG (H7), and the multiparton simulation MG5_aMC@NLO (MG)+PYTHIA. The ratios of the various predictions to the measured cross sections are shown in the lower panels. |
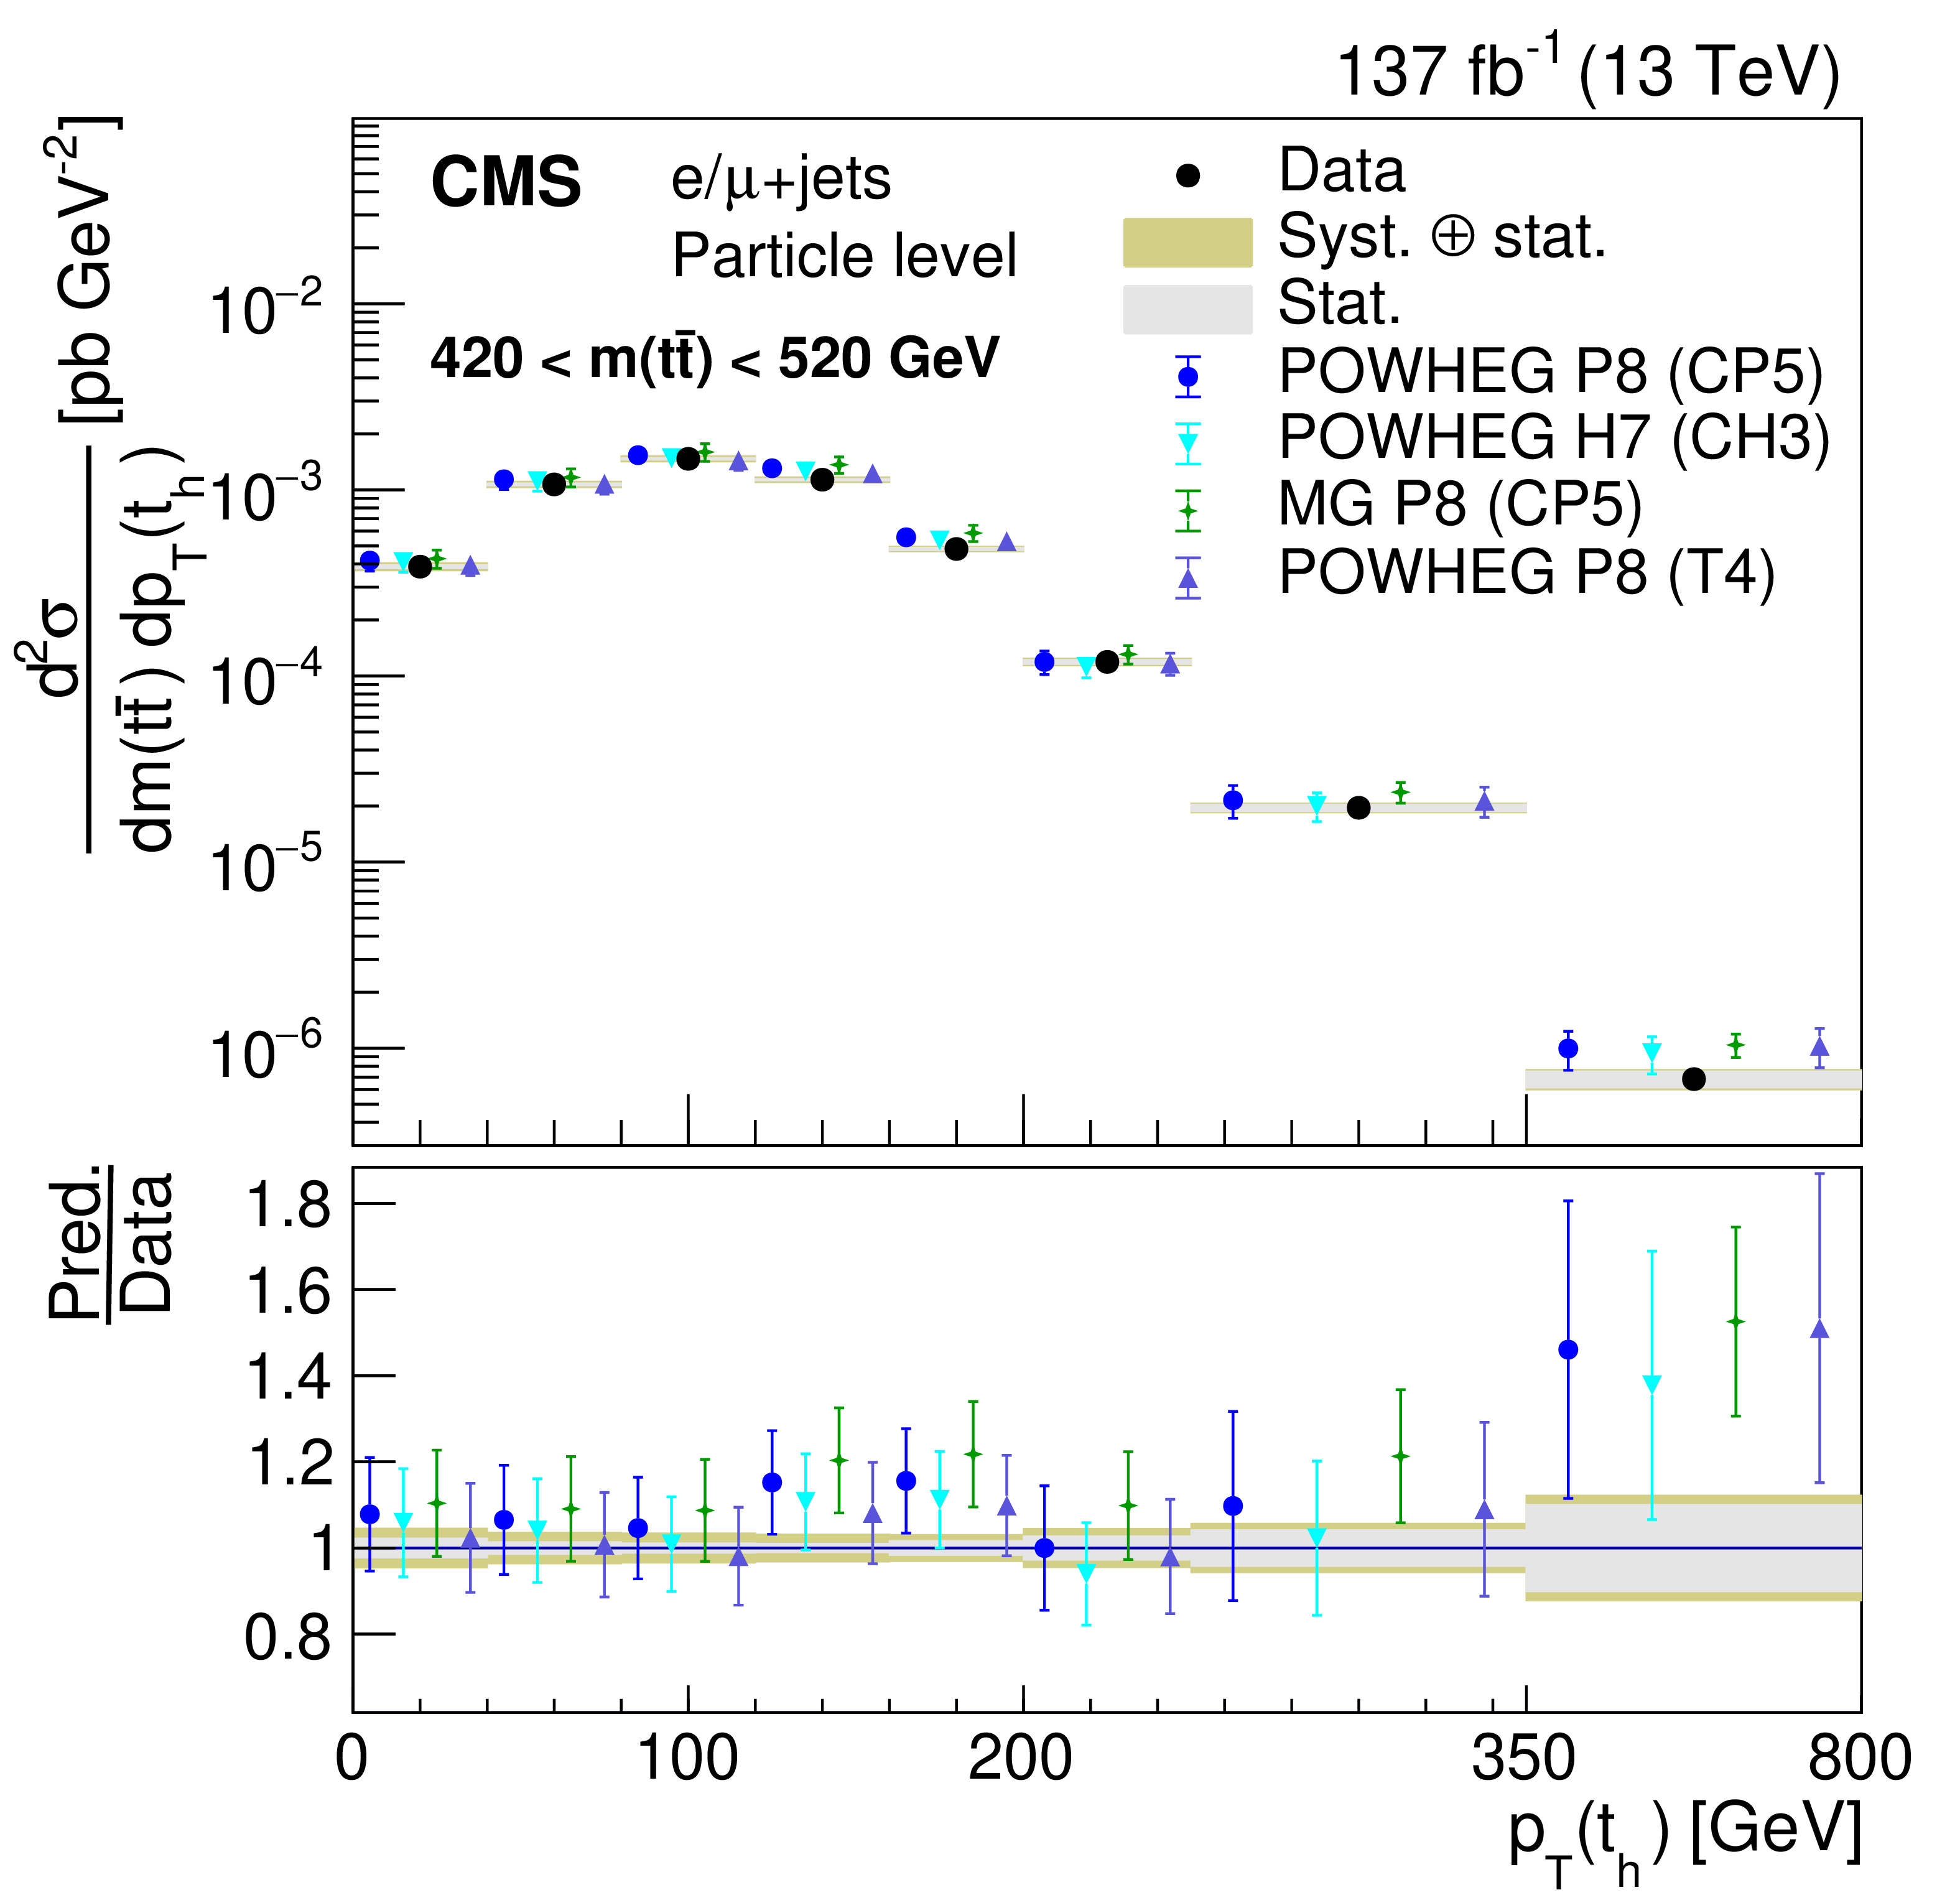
png pdf |
Figure 28-b:
Double-differential cross section at the particle level as a function of ${m({\mathrm{t} \mathrm{\bar{t}}})}$ vs. ${p_{\mathrm {T}}} ({\mathrm{t} _\mathrm {h}})$. The data are shown as points with gray (yellow) bands indicating the statistical (statistical and systematic) uncertainties. The cross sections are compared to the predictions of POWHEG+PYTHIA (P8) for the CP5 and CUETP8M2T4 (T4) tunes, POWHEG+HERWIG (H7), and the multiparton simulation MG5_aMC@NLO (MG)+PYTHIA. The ratios of the various predictions to the measured cross sections are shown in the lower panels. |
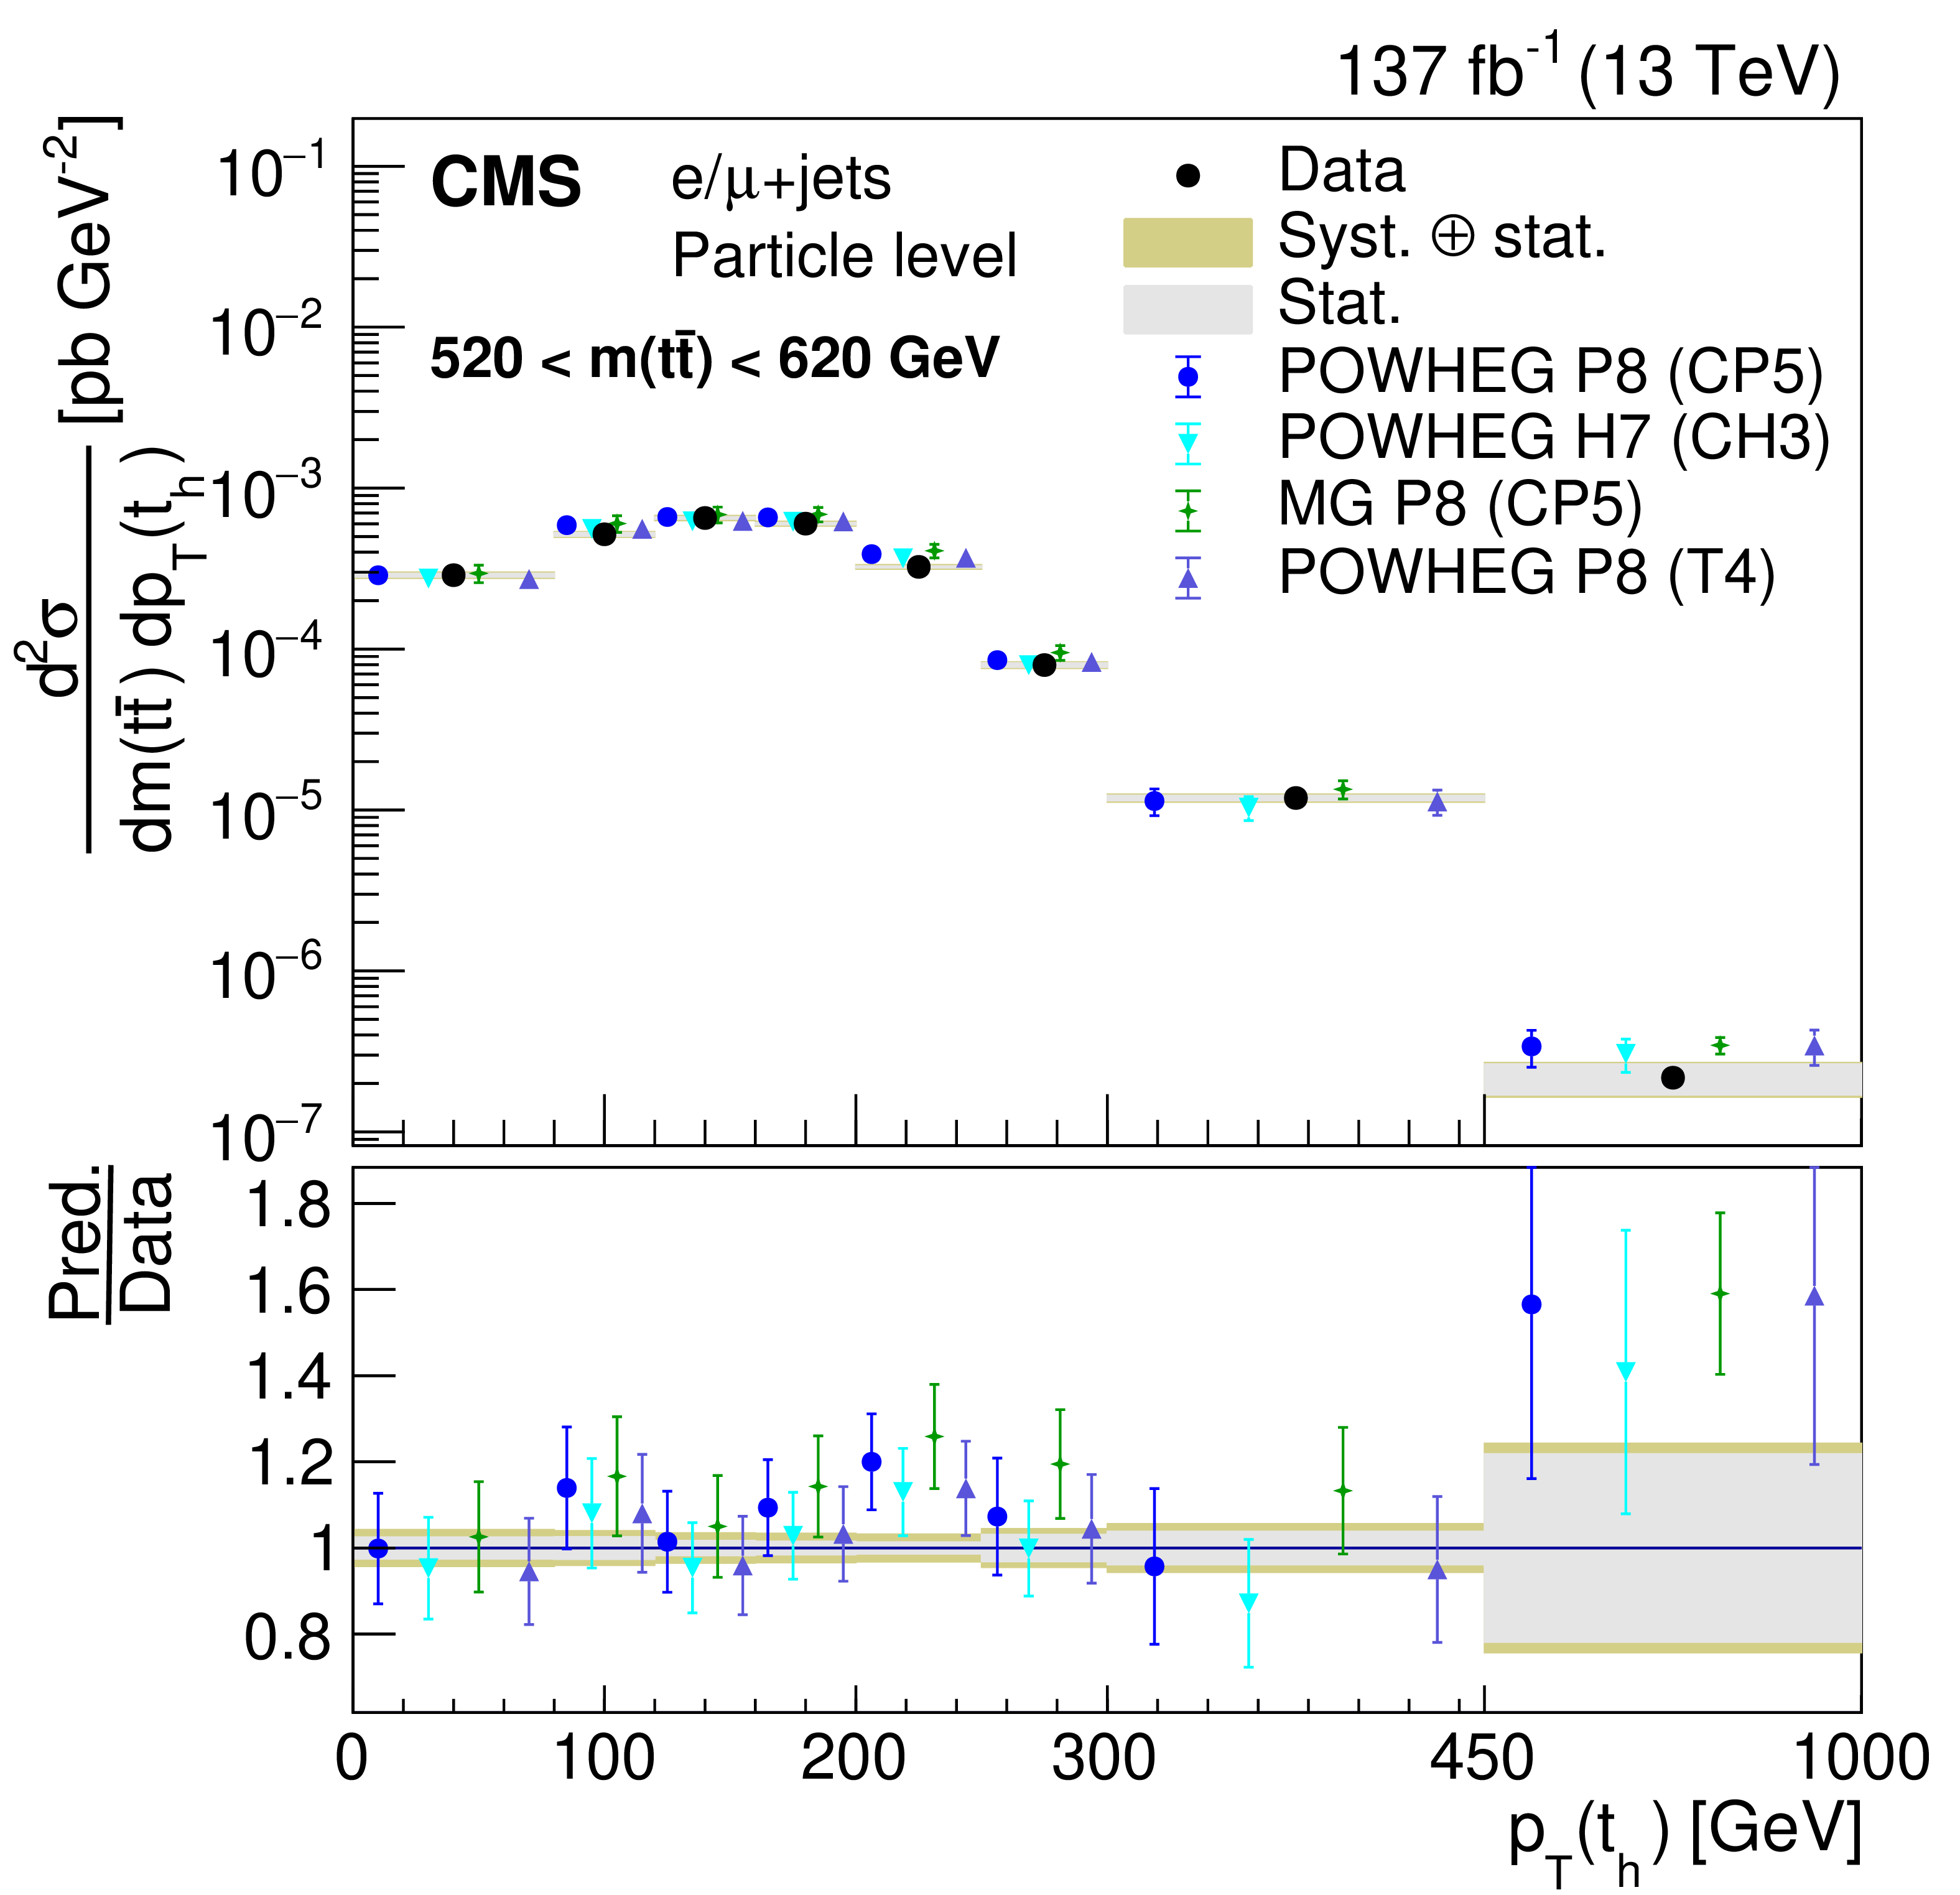
png pdf |
Figure 28-c:
Double-differential cross section at the particle level as a function of ${m({\mathrm{t} \mathrm{\bar{t}}})}$ vs. ${p_{\mathrm {T}}} ({\mathrm{t} _\mathrm {h}})$. The data are shown as points with gray (yellow) bands indicating the statistical (statistical and systematic) uncertainties. The cross sections are compared to the predictions of POWHEG+PYTHIA (P8) for the CP5 and CUETP8M2T4 (T4) tunes, POWHEG+HERWIG (H7), and the multiparton simulation MG5_aMC@NLO (MG)+PYTHIA. The ratios of the various predictions to the measured cross sections are shown in the lower panels. |
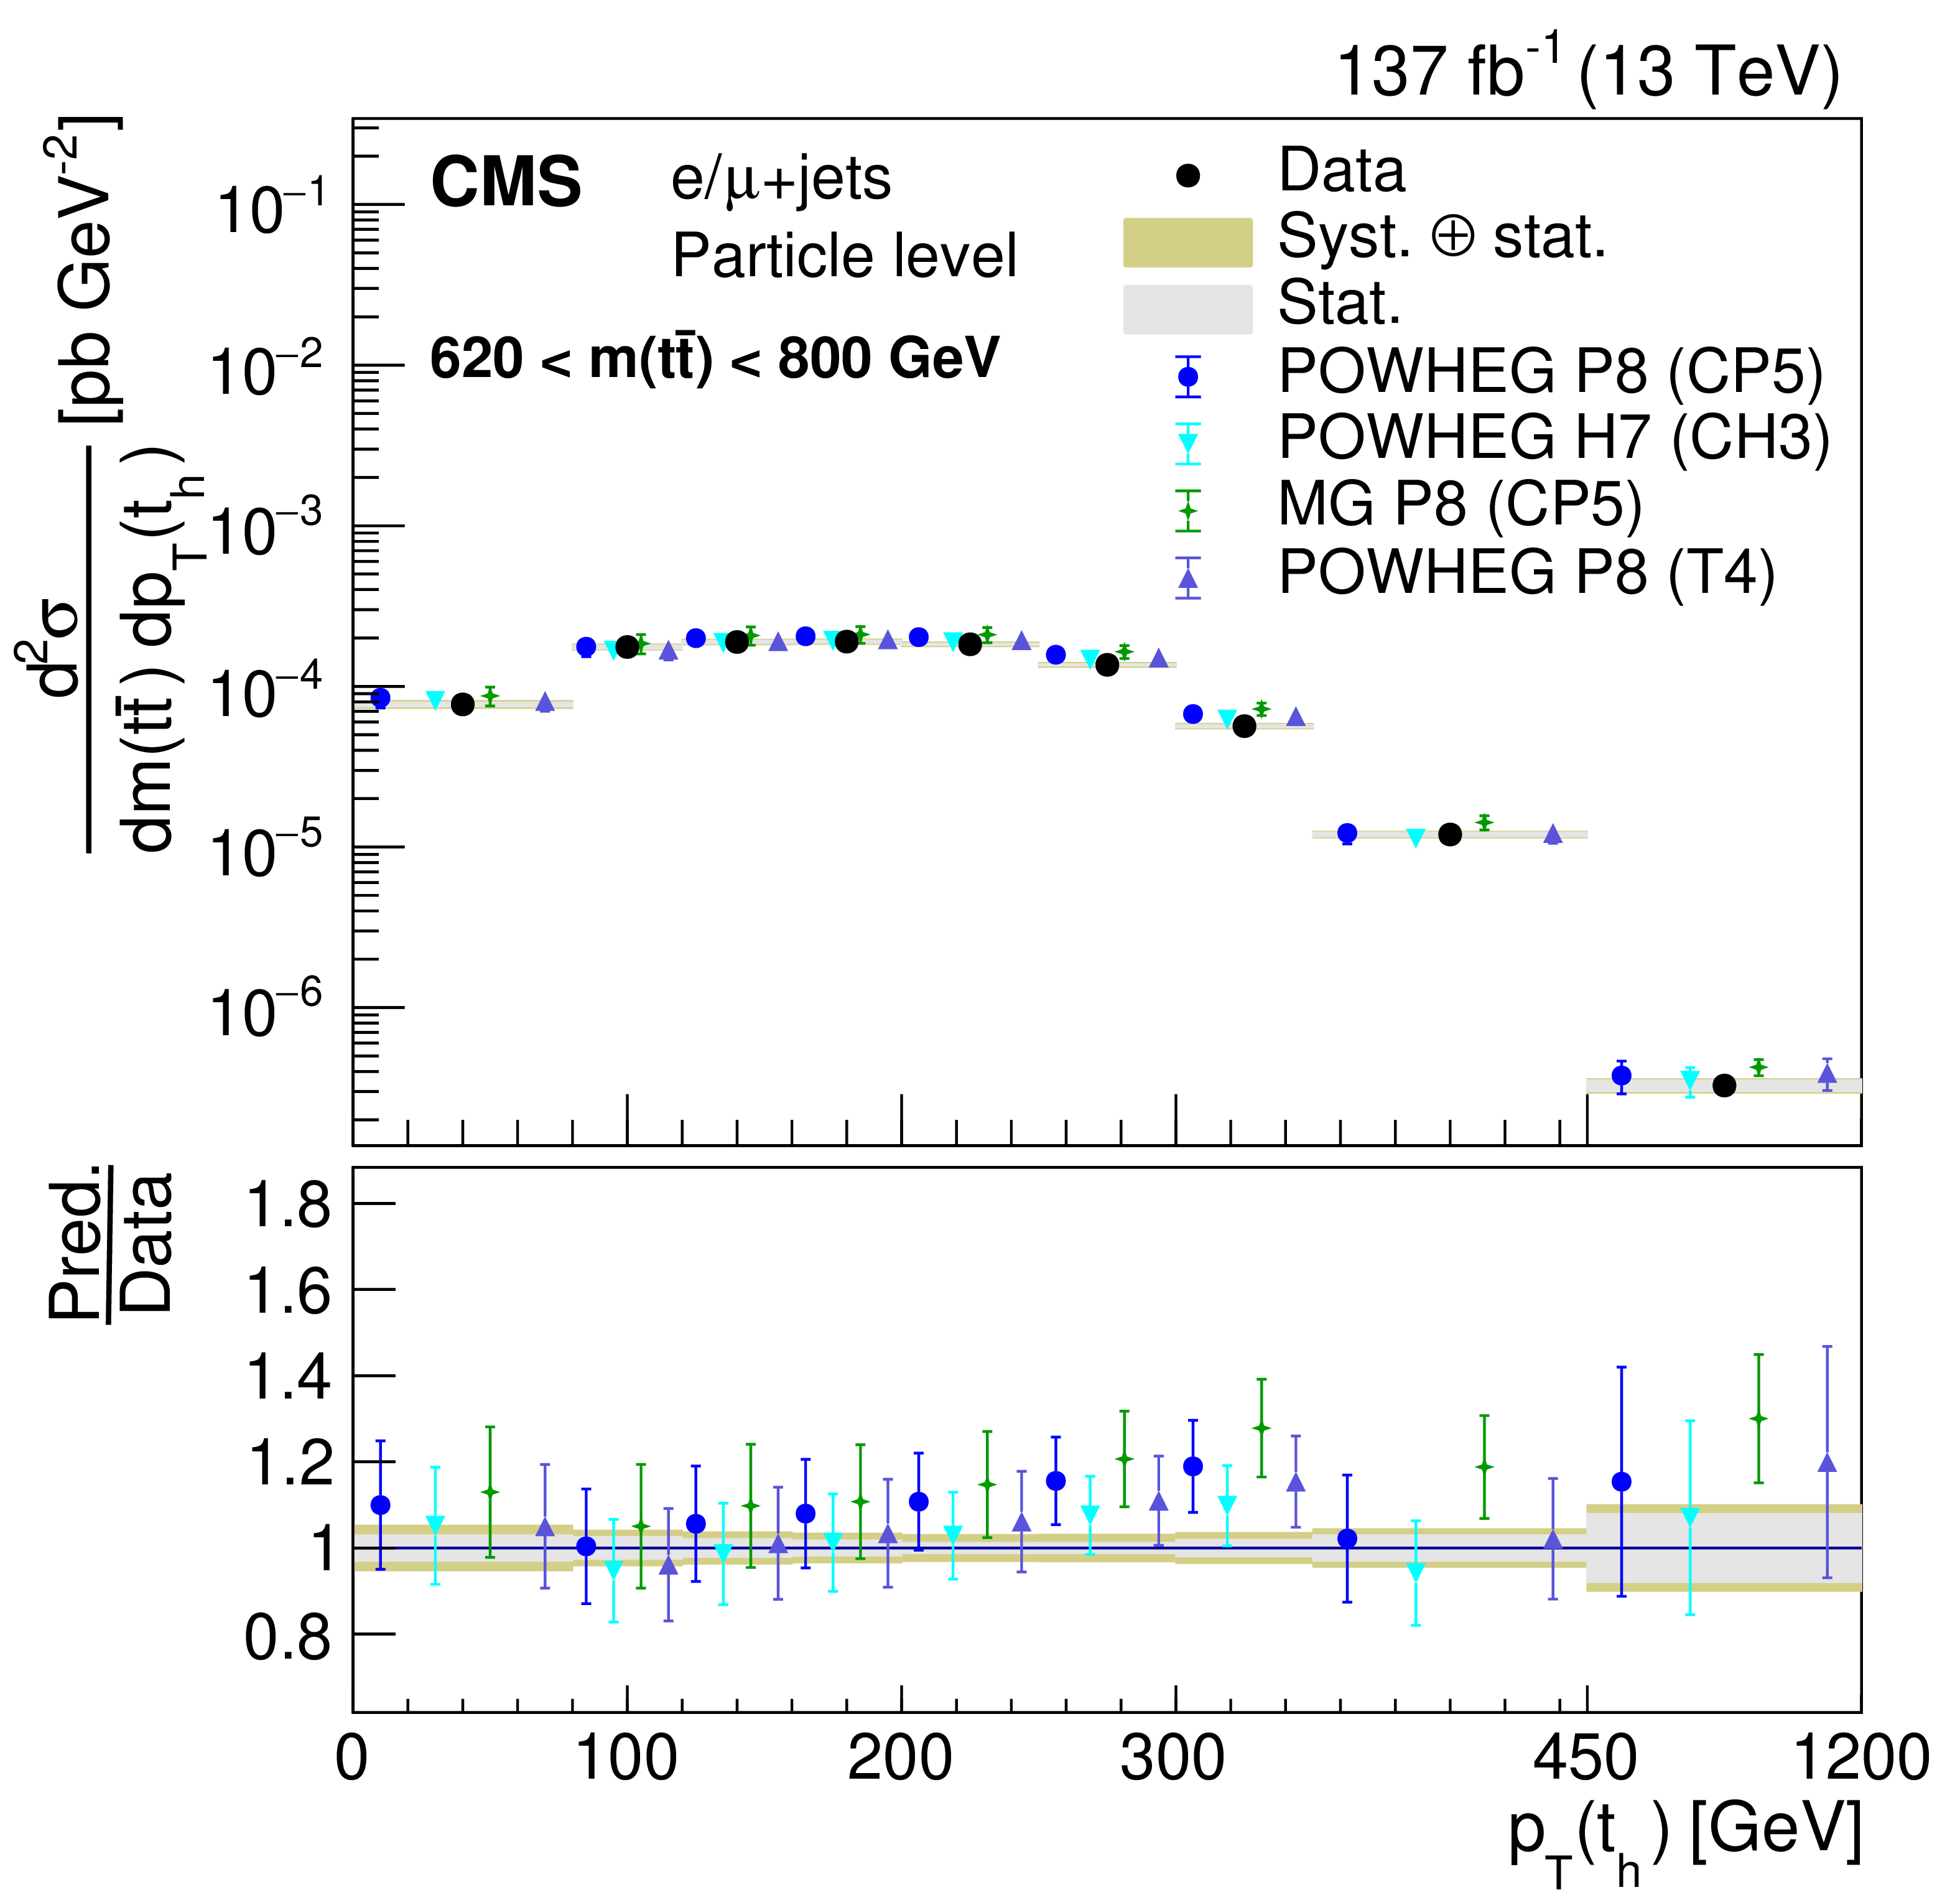
png pdf |
Figure 28-d:
Double-differential cross section at the particle level as a function of ${m({\mathrm{t} \mathrm{\bar{t}}})}$ vs. ${p_{\mathrm {T}}} ({\mathrm{t} _\mathrm {h}})$. The data are shown as points with gray (yellow) bands indicating the statistical (statistical and systematic) uncertainties. The cross sections are compared to the predictions of POWHEG+PYTHIA (P8) for the CP5 and CUETP8M2T4 (T4) tunes, POWHEG+HERWIG (H7), and the multiparton simulation MG5_aMC@NLO (MG)+PYTHIA. The ratios of the various predictions to the measured cross sections are shown in the lower panels. |
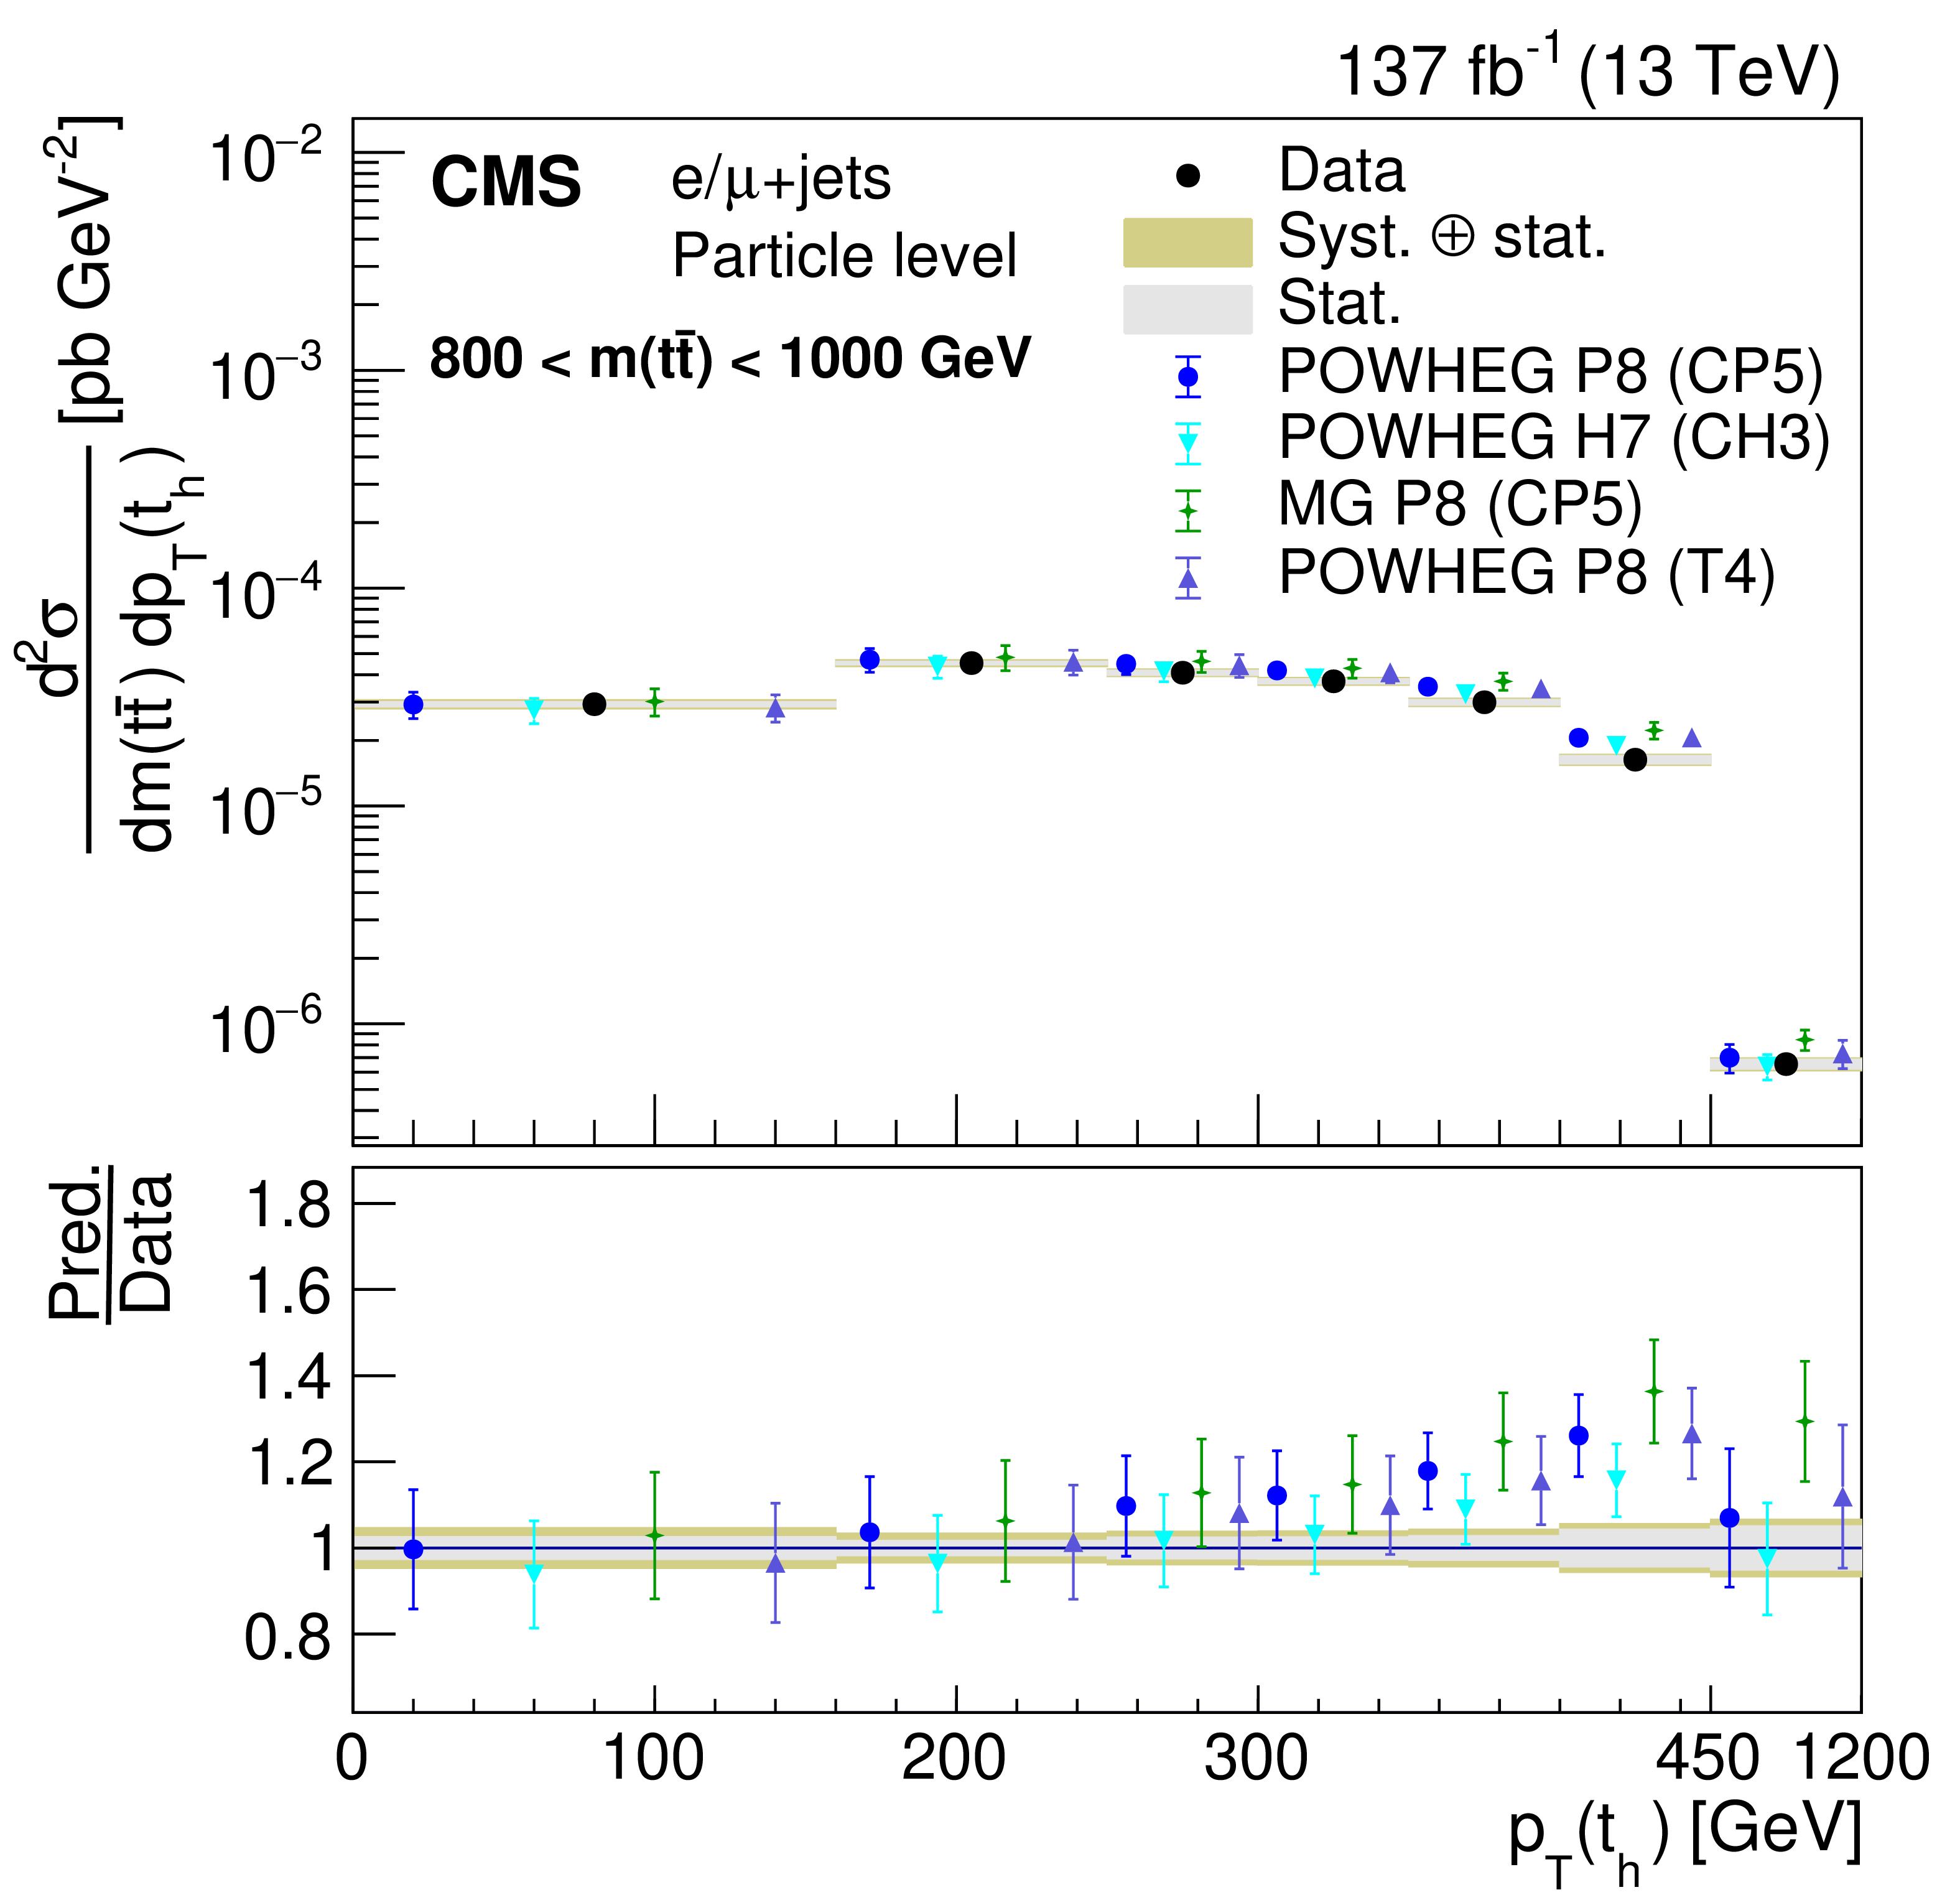
png pdf |
Figure 28-e:
Double-differential cross section at the particle level as a function of ${m({\mathrm{t} \mathrm{\bar{t}}})}$ vs. ${p_{\mathrm {T}}} ({\mathrm{t} _\mathrm {h}})$. The data are shown as points with gray (yellow) bands indicating the statistical (statistical and systematic) uncertainties. The cross sections are compared to the predictions of POWHEG+PYTHIA (P8) for the CP5 and CUETP8M2T4 (T4) tunes, POWHEG+HERWIG (H7), and the multiparton simulation MG5_aMC@NLO (MG)+PYTHIA. The ratios of the various predictions to the measured cross sections are shown in the lower panels. |
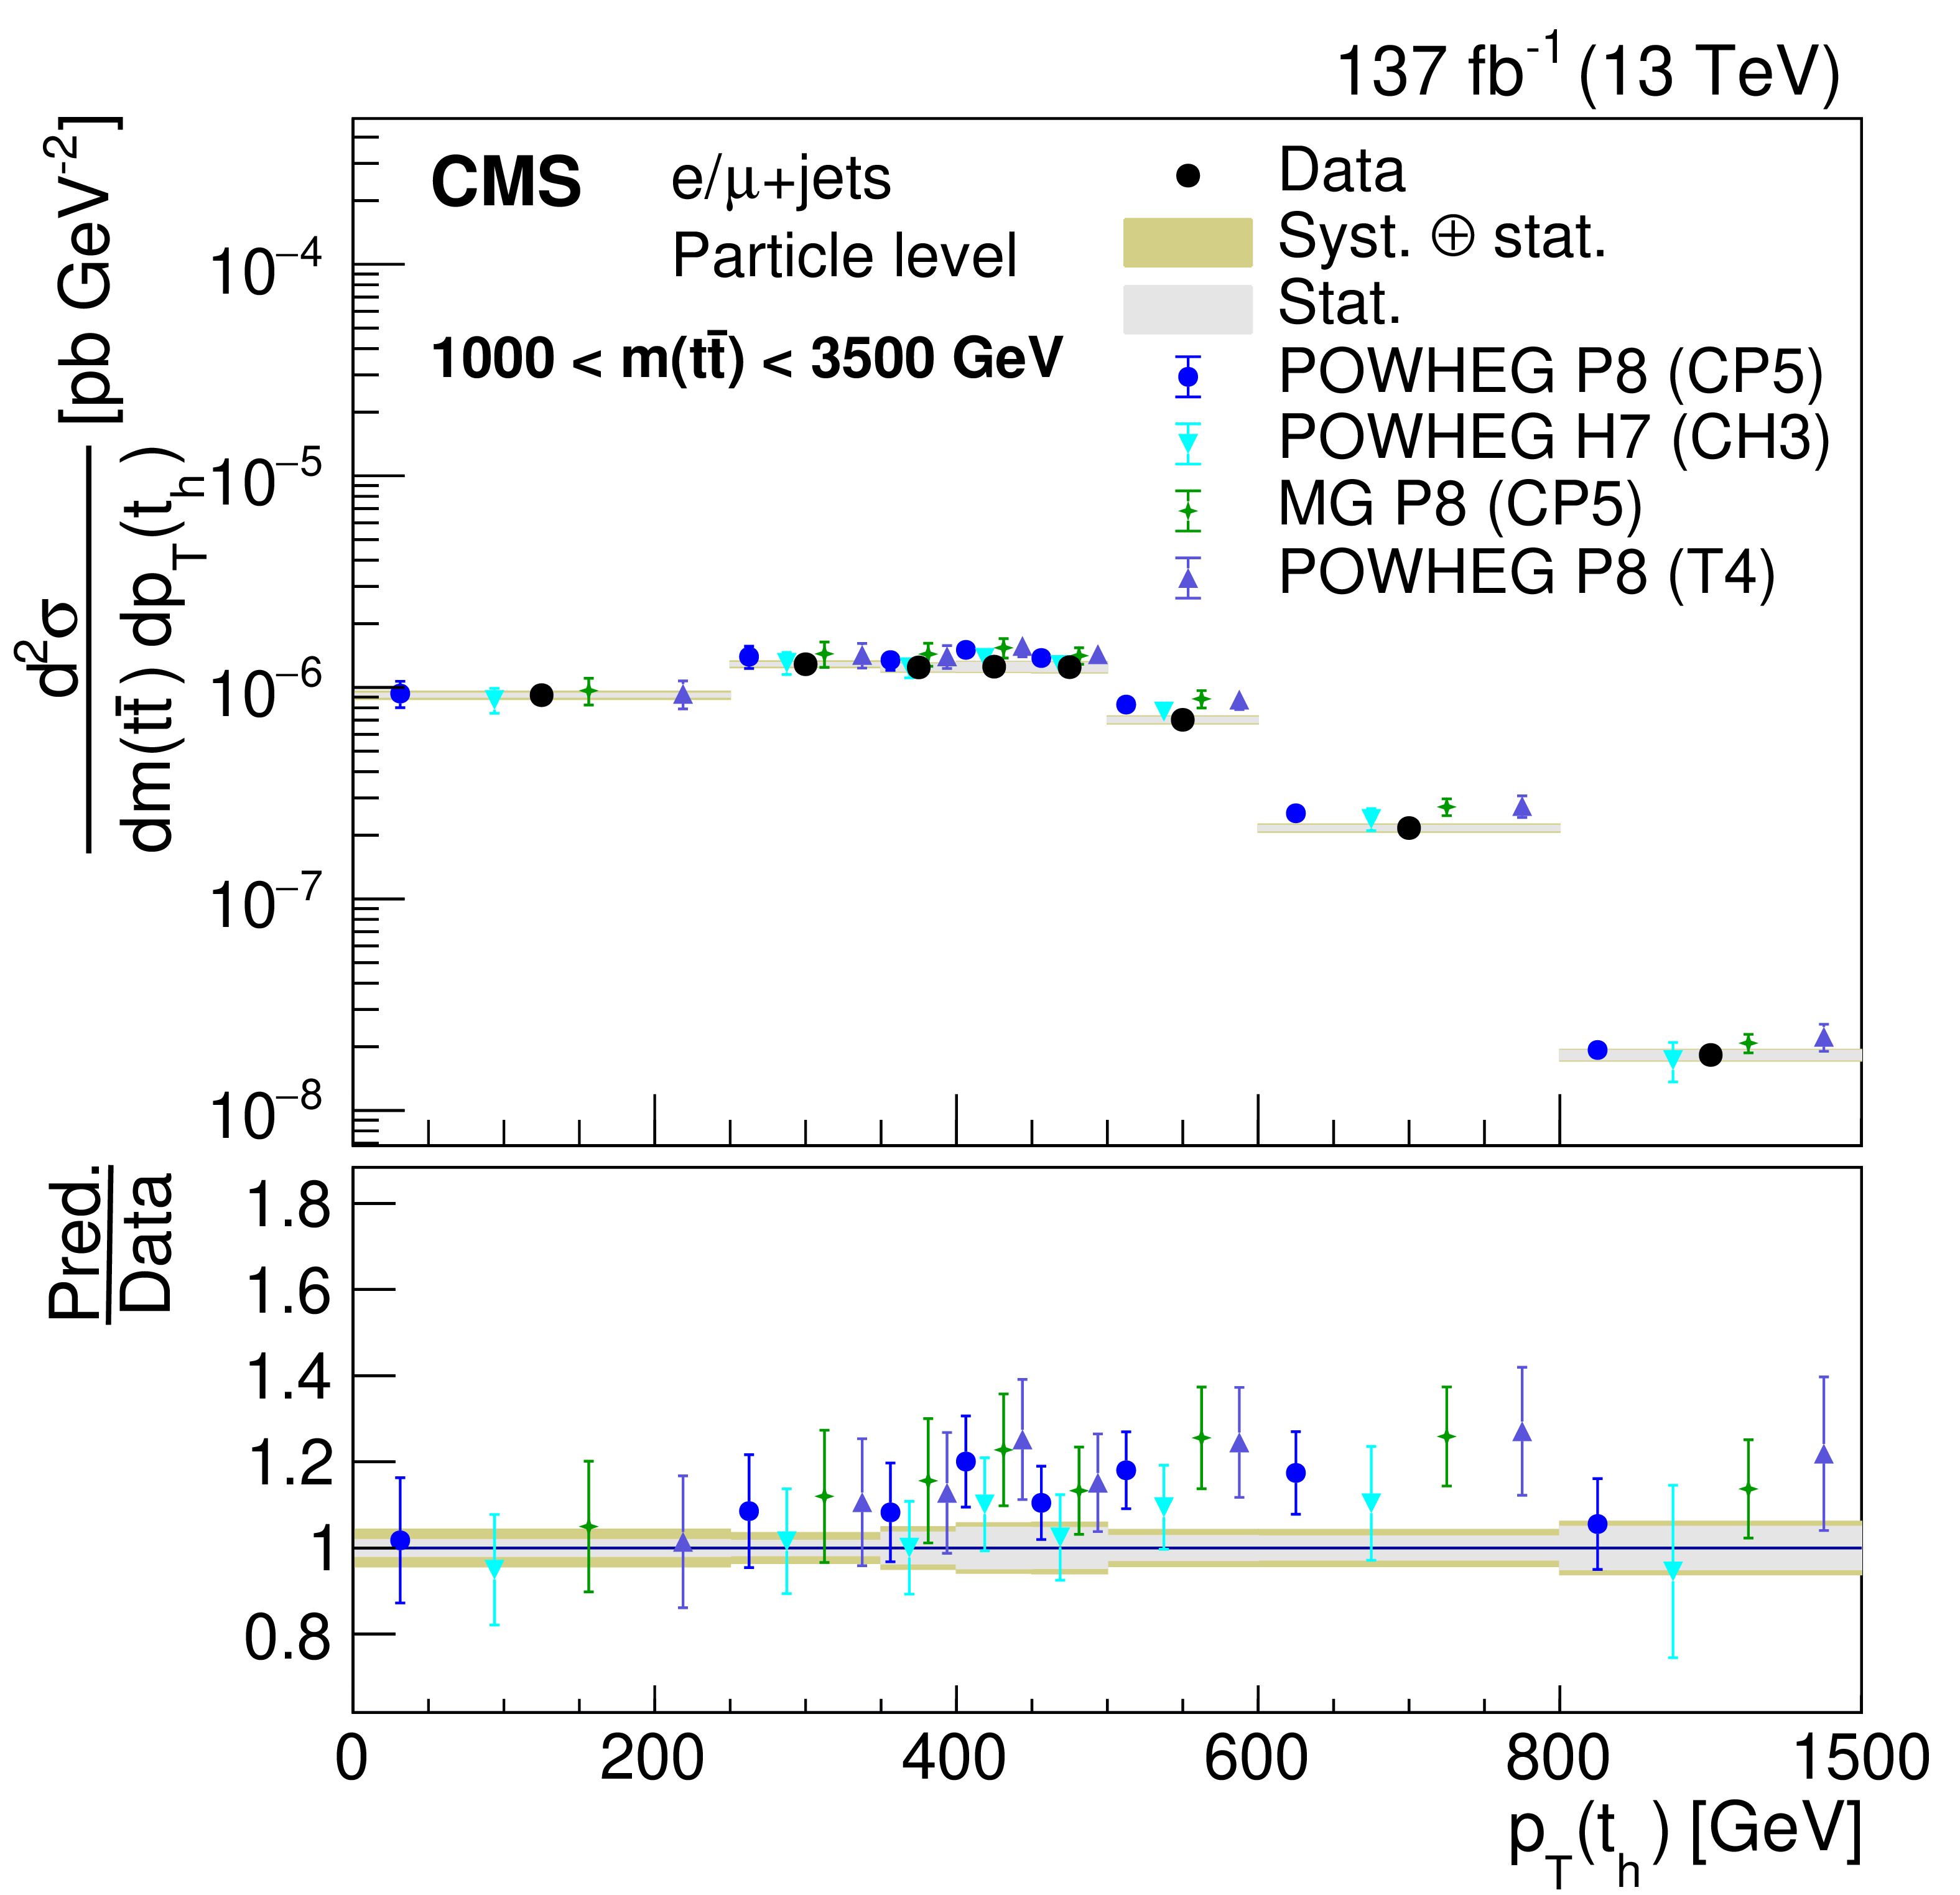
png pdf |
Figure 28-f:
Double-differential cross section at the particle level as a function of ${m({\mathrm{t} \mathrm{\bar{t}}})}$ vs. ${p_{\mathrm {T}}} ({\mathrm{t} _\mathrm {h}})$. The data are shown as points with gray (yellow) bands indicating the statistical (statistical and systematic) uncertainties. The cross sections are compared to the predictions of POWHEG+PYTHIA (P8) for the CP5 and CUETP8M2T4 (T4) tunes, POWHEG+HERWIG (H7), and the multiparton simulation MG5_aMC@NLO (MG)+PYTHIA. The ratios of the various predictions to the measured cross sections are shown in the lower panels. |

png pdf |
Figure 29:
Double-differential cross section at the parton level as a function of ${{p_{\mathrm {T}}} ({\mathrm{t} \mathrm{\bar{t}}})}$ vs. ${{p_{\mathrm {T}}} ({\mathrm{t} _\mathrm {h}})}$. The data are shown as points with gray (yellow) bands indicating the statistical (statistical and systematic) uncertainties. The cross sections are compared to the predictions of POWHEG combined with PYTHIA (P8) or HERWIG (H7), the multiparton simulation MG5_aMC@NLO (MG)+PYTHIA FxFx, and the NNLO QCD calculations obtained with Matrix. The ratios of the various predictions to the measured cross sections are shown in the lower panels. |
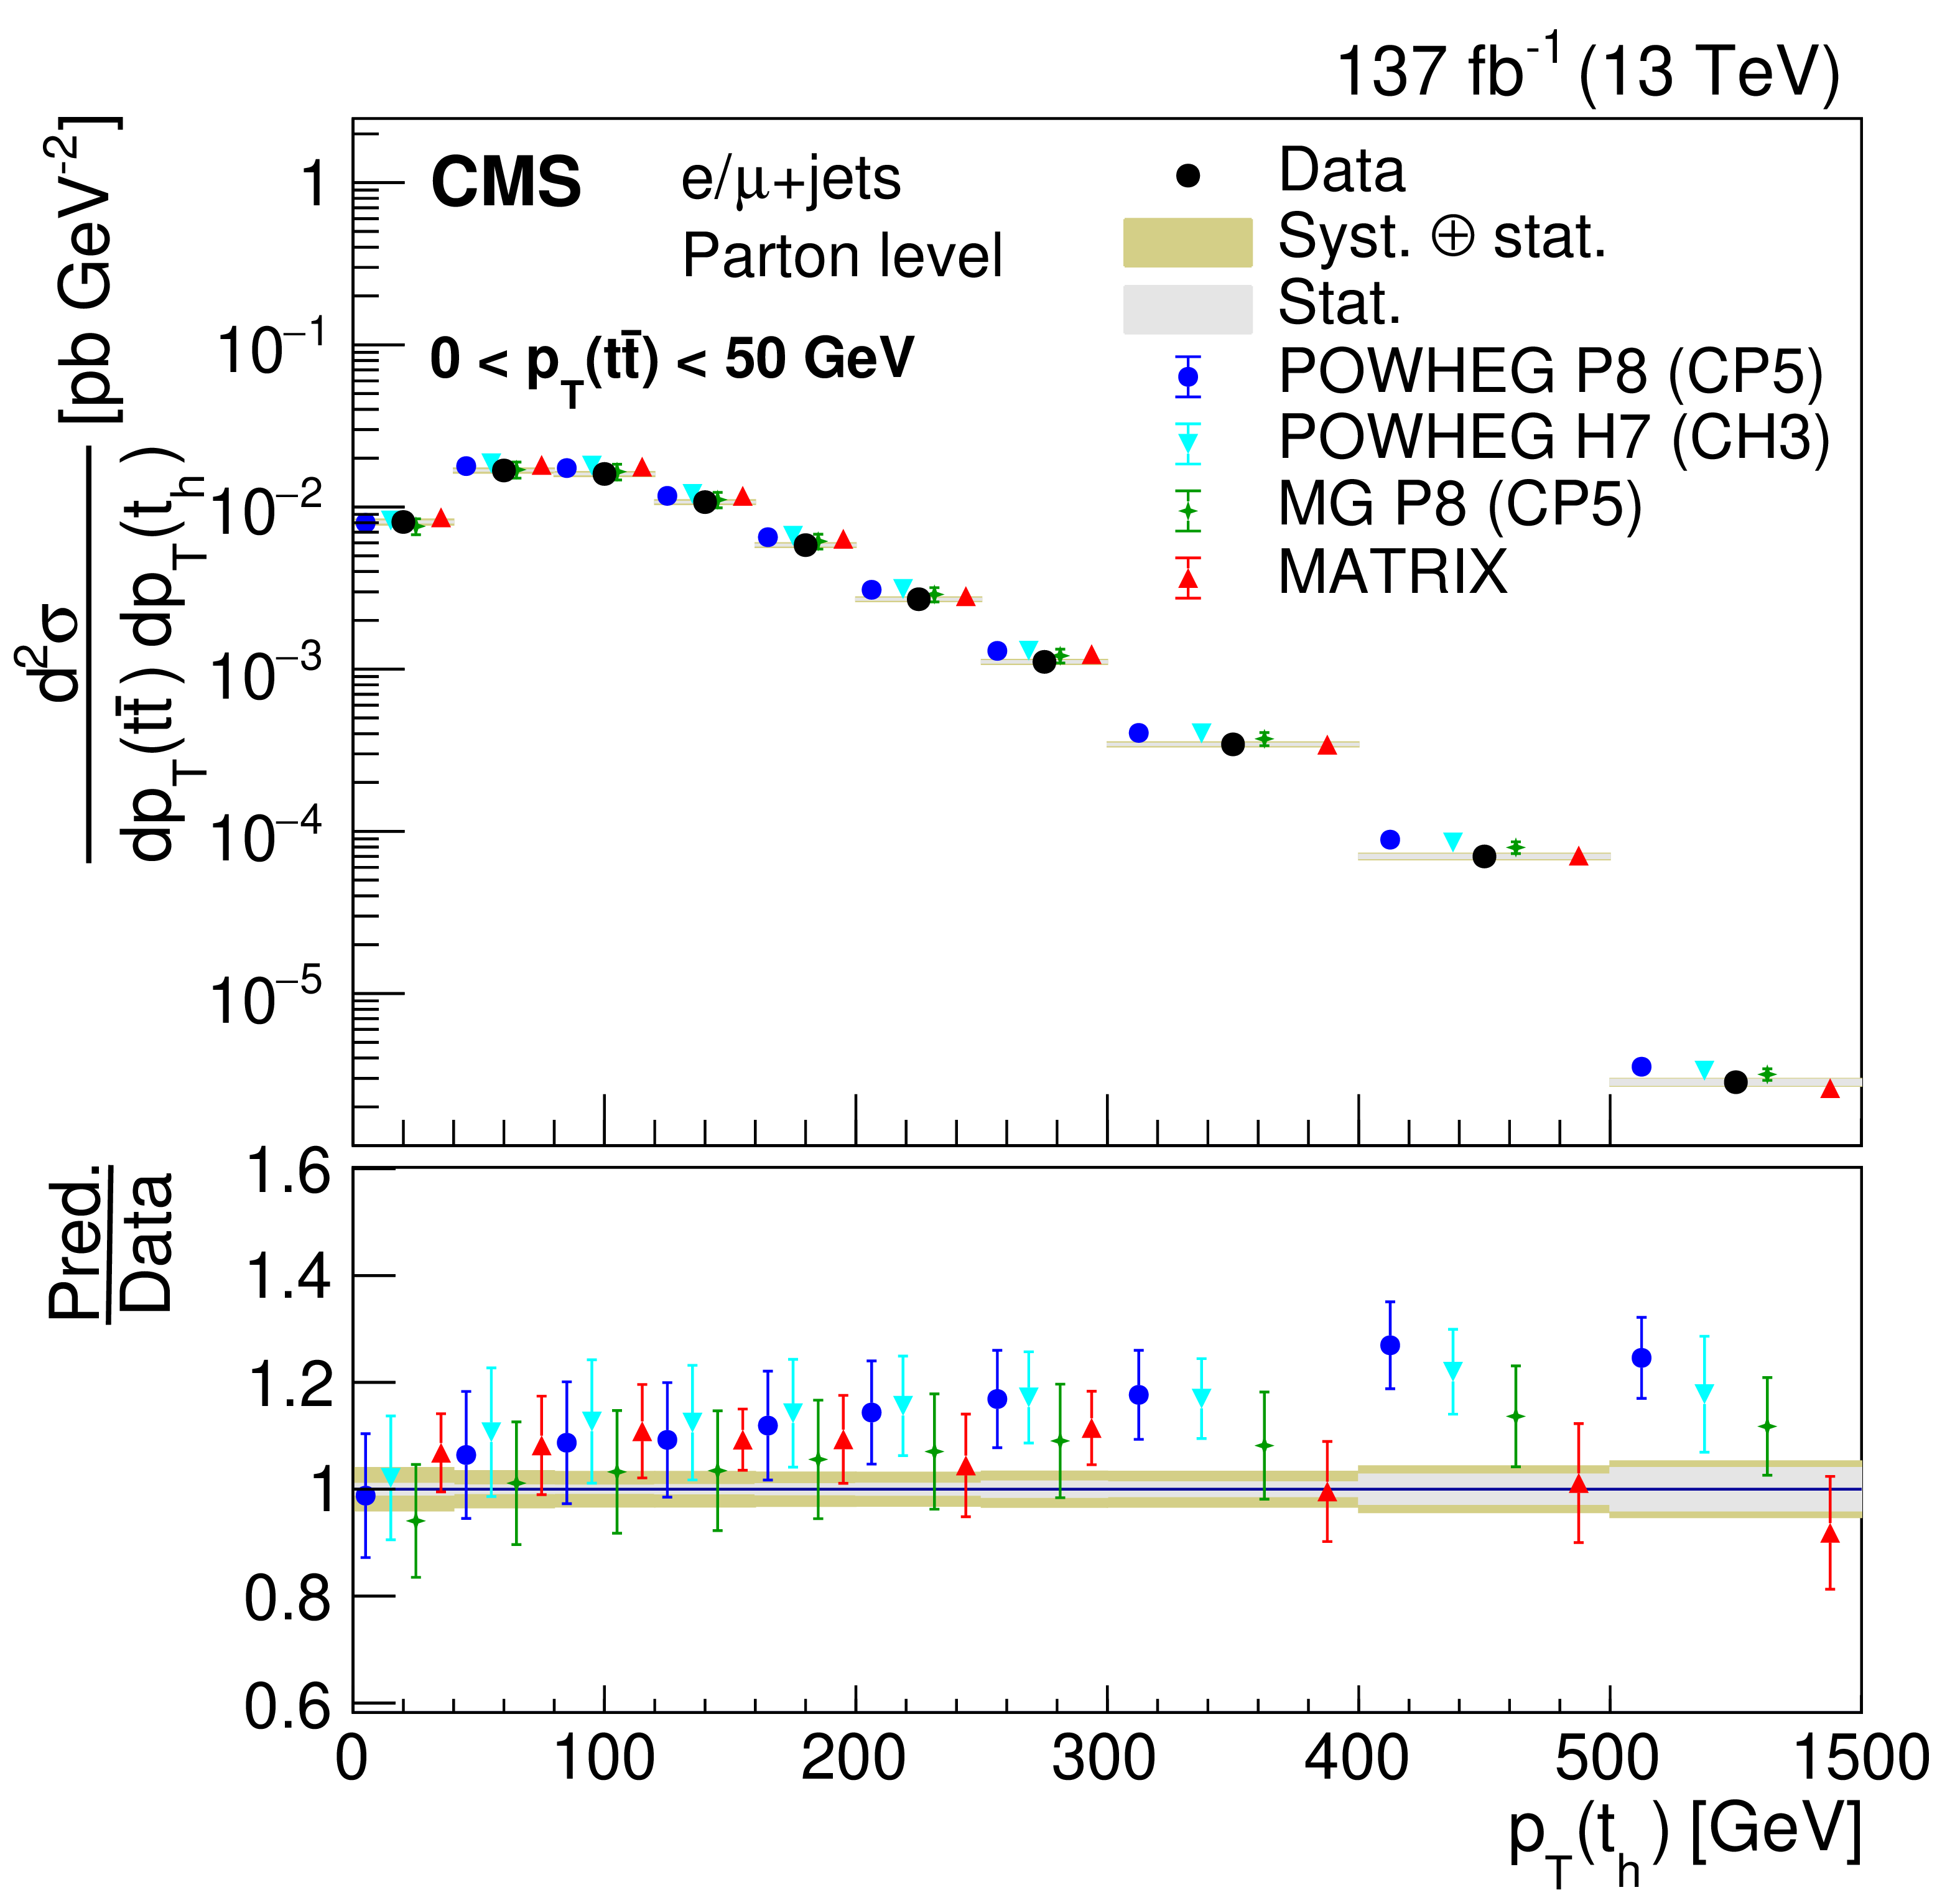
png pdf |
Figure 29-a:
Double-differential cross section at the parton level as a function of ${{p_{\mathrm {T}}} ({\mathrm{t} \mathrm{\bar{t}}})}$ vs. ${{p_{\mathrm {T}}} ({\mathrm{t} _\mathrm {h}})}$. The data are shown as points with gray (yellow) bands indicating the statistical (statistical and systematic) uncertainties. The cross sections are compared to the predictions of POWHEG combined with PYTHIA (P8) or HERWIG (H7), the multiparton simulation MG5_aMC@NLO (MG)+PYTHIA FxFx, and the NNLO QCD calculations obtained with Matrix. The ratios of the various predictions to the measured cross sections are shown in the lower panels. |
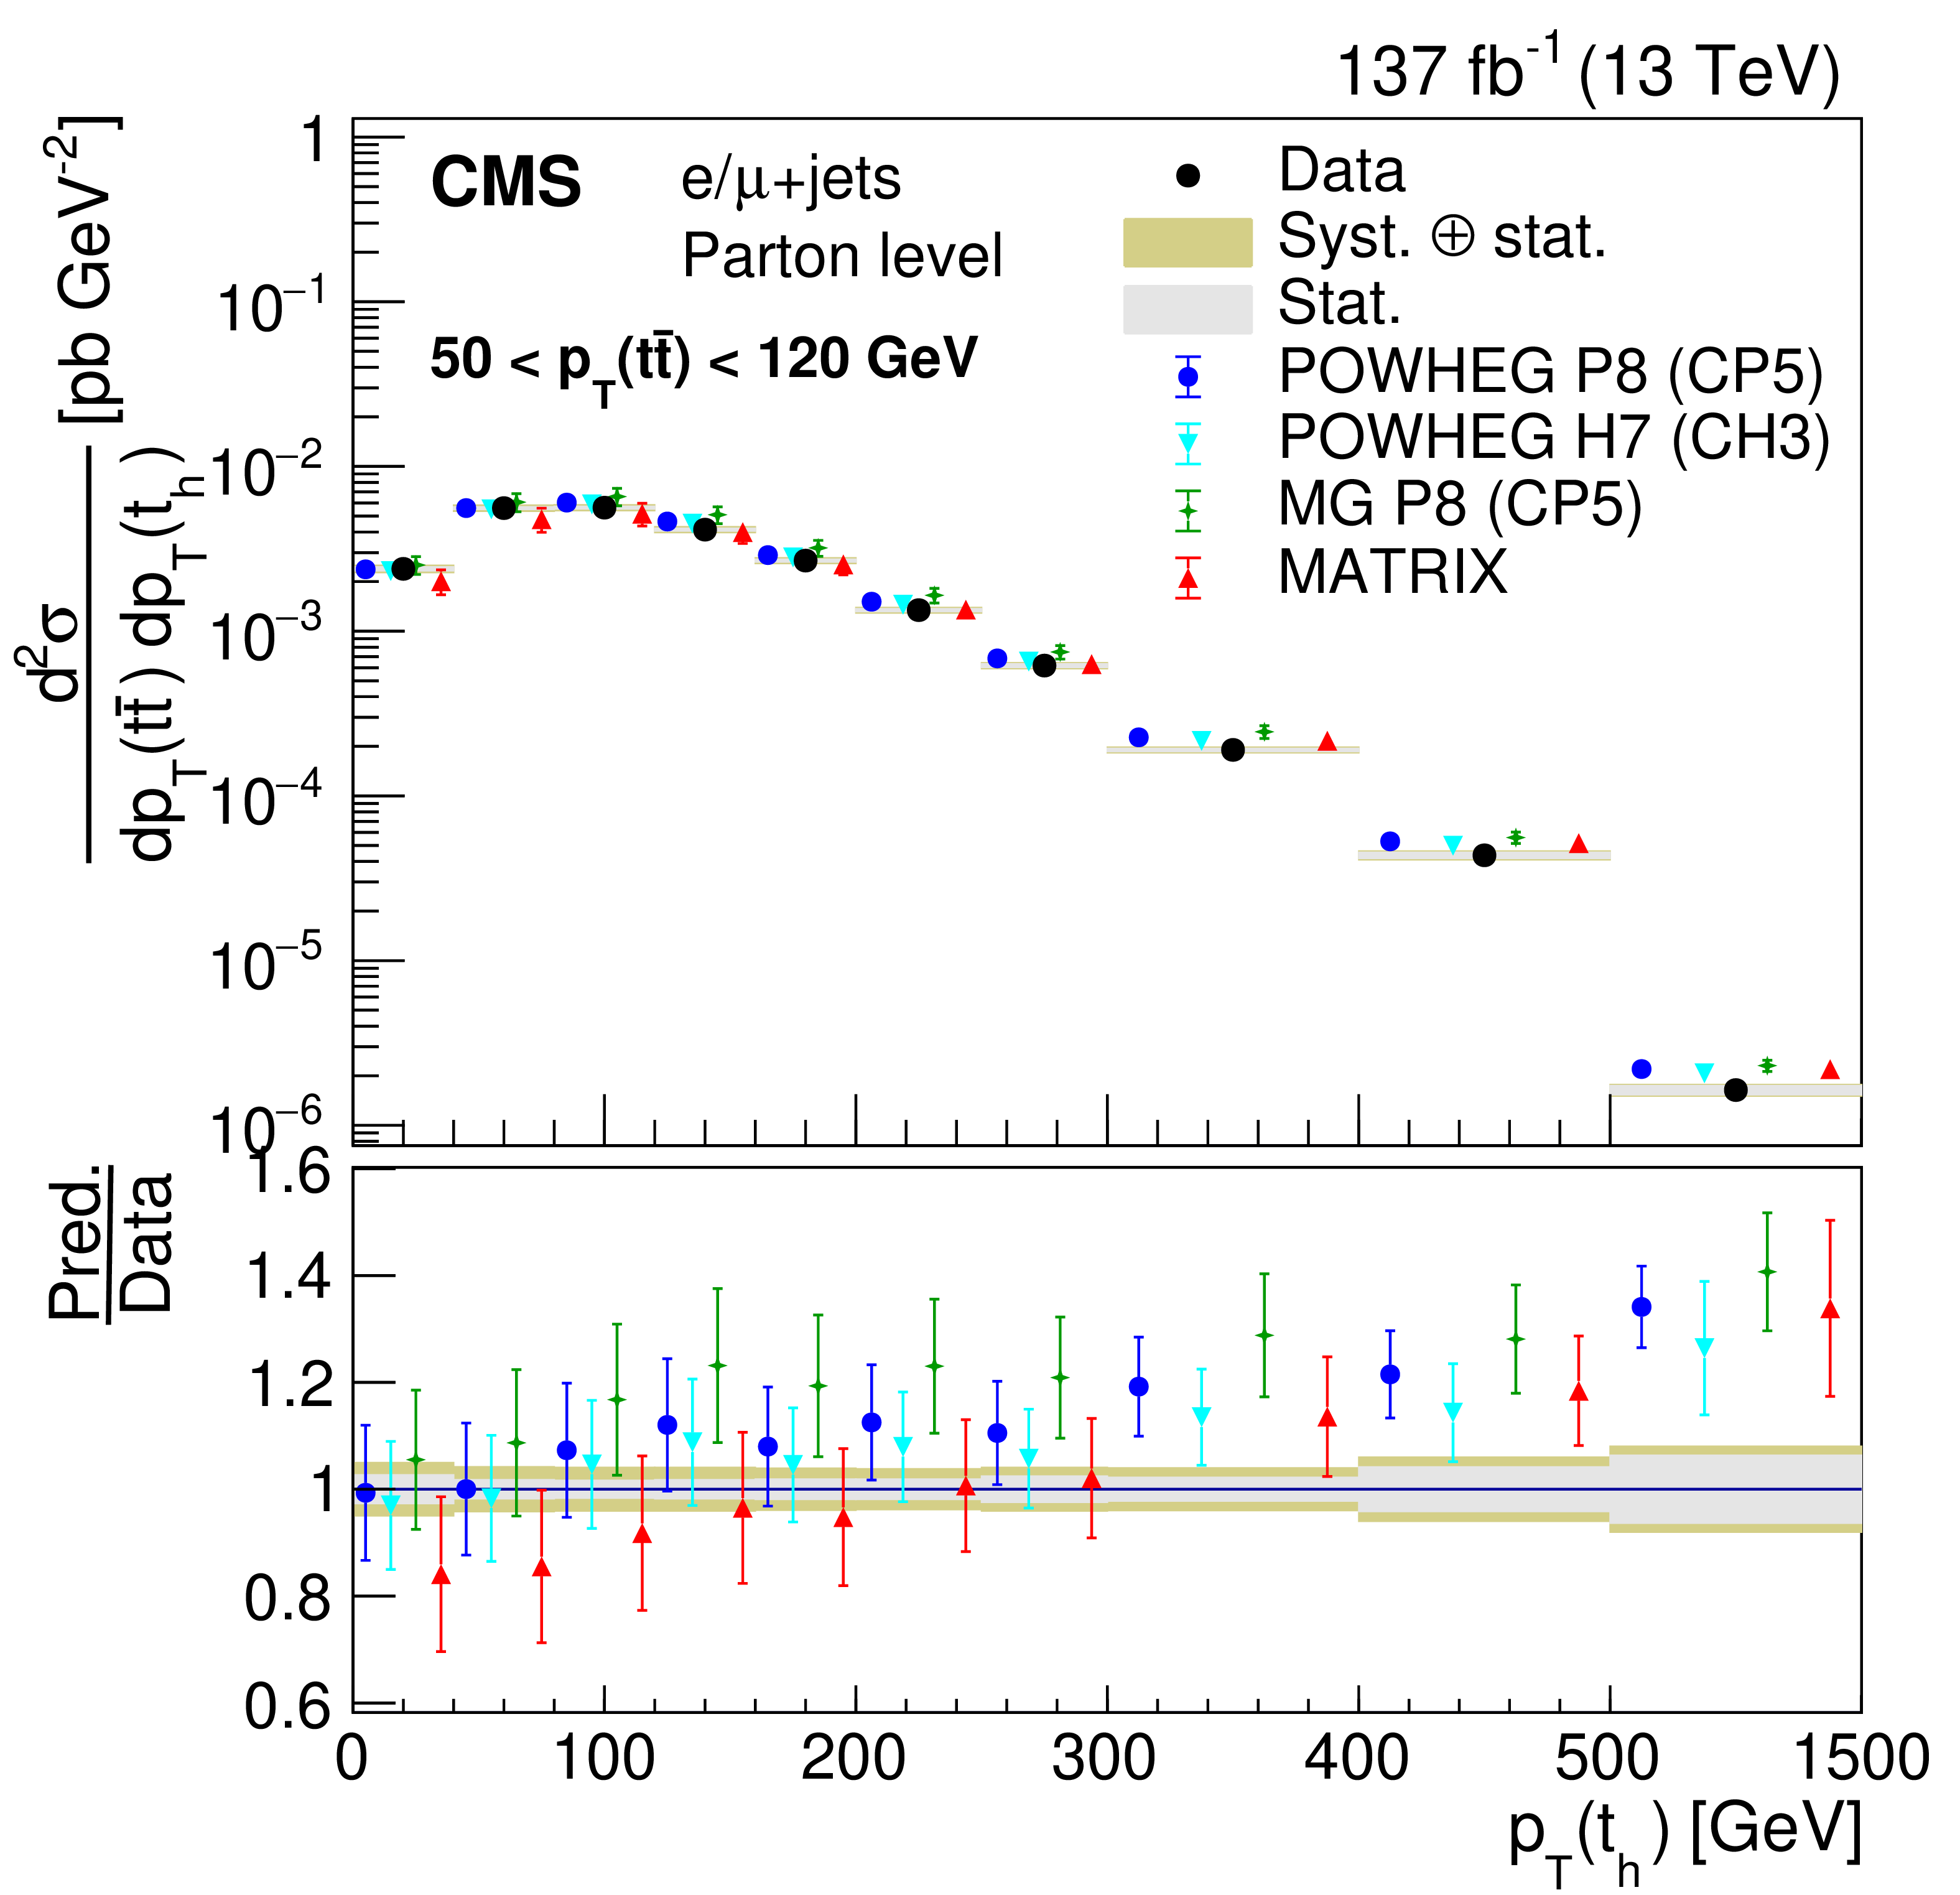
png pdf |
Figure 29-b:
Double-differential cross section at the parton level as a function of ${{p_{\mathrm {T}}} ({\mathrm{t} \mathrm{\bar{t}}})}$ vs. ${{p_{\mathrm {T}}} ({\mathrm{t} _\mathrm {h}})}$. The data are shown as points with gray (yellow) bands indicating the statistical (statistical and systematic) uncertainties. The cross sections are compared to the predictions of POWHEG combined with PYTHIA (P8) or HERWIG (H7), the multiparton simulation MG5_aMC@NLO (MG)+PYTHIA FxFx, and the NNLO QCD calculations obtained with Matrix. The ratios of the various predictions to the measured cross sections are shown in the lower panels. |
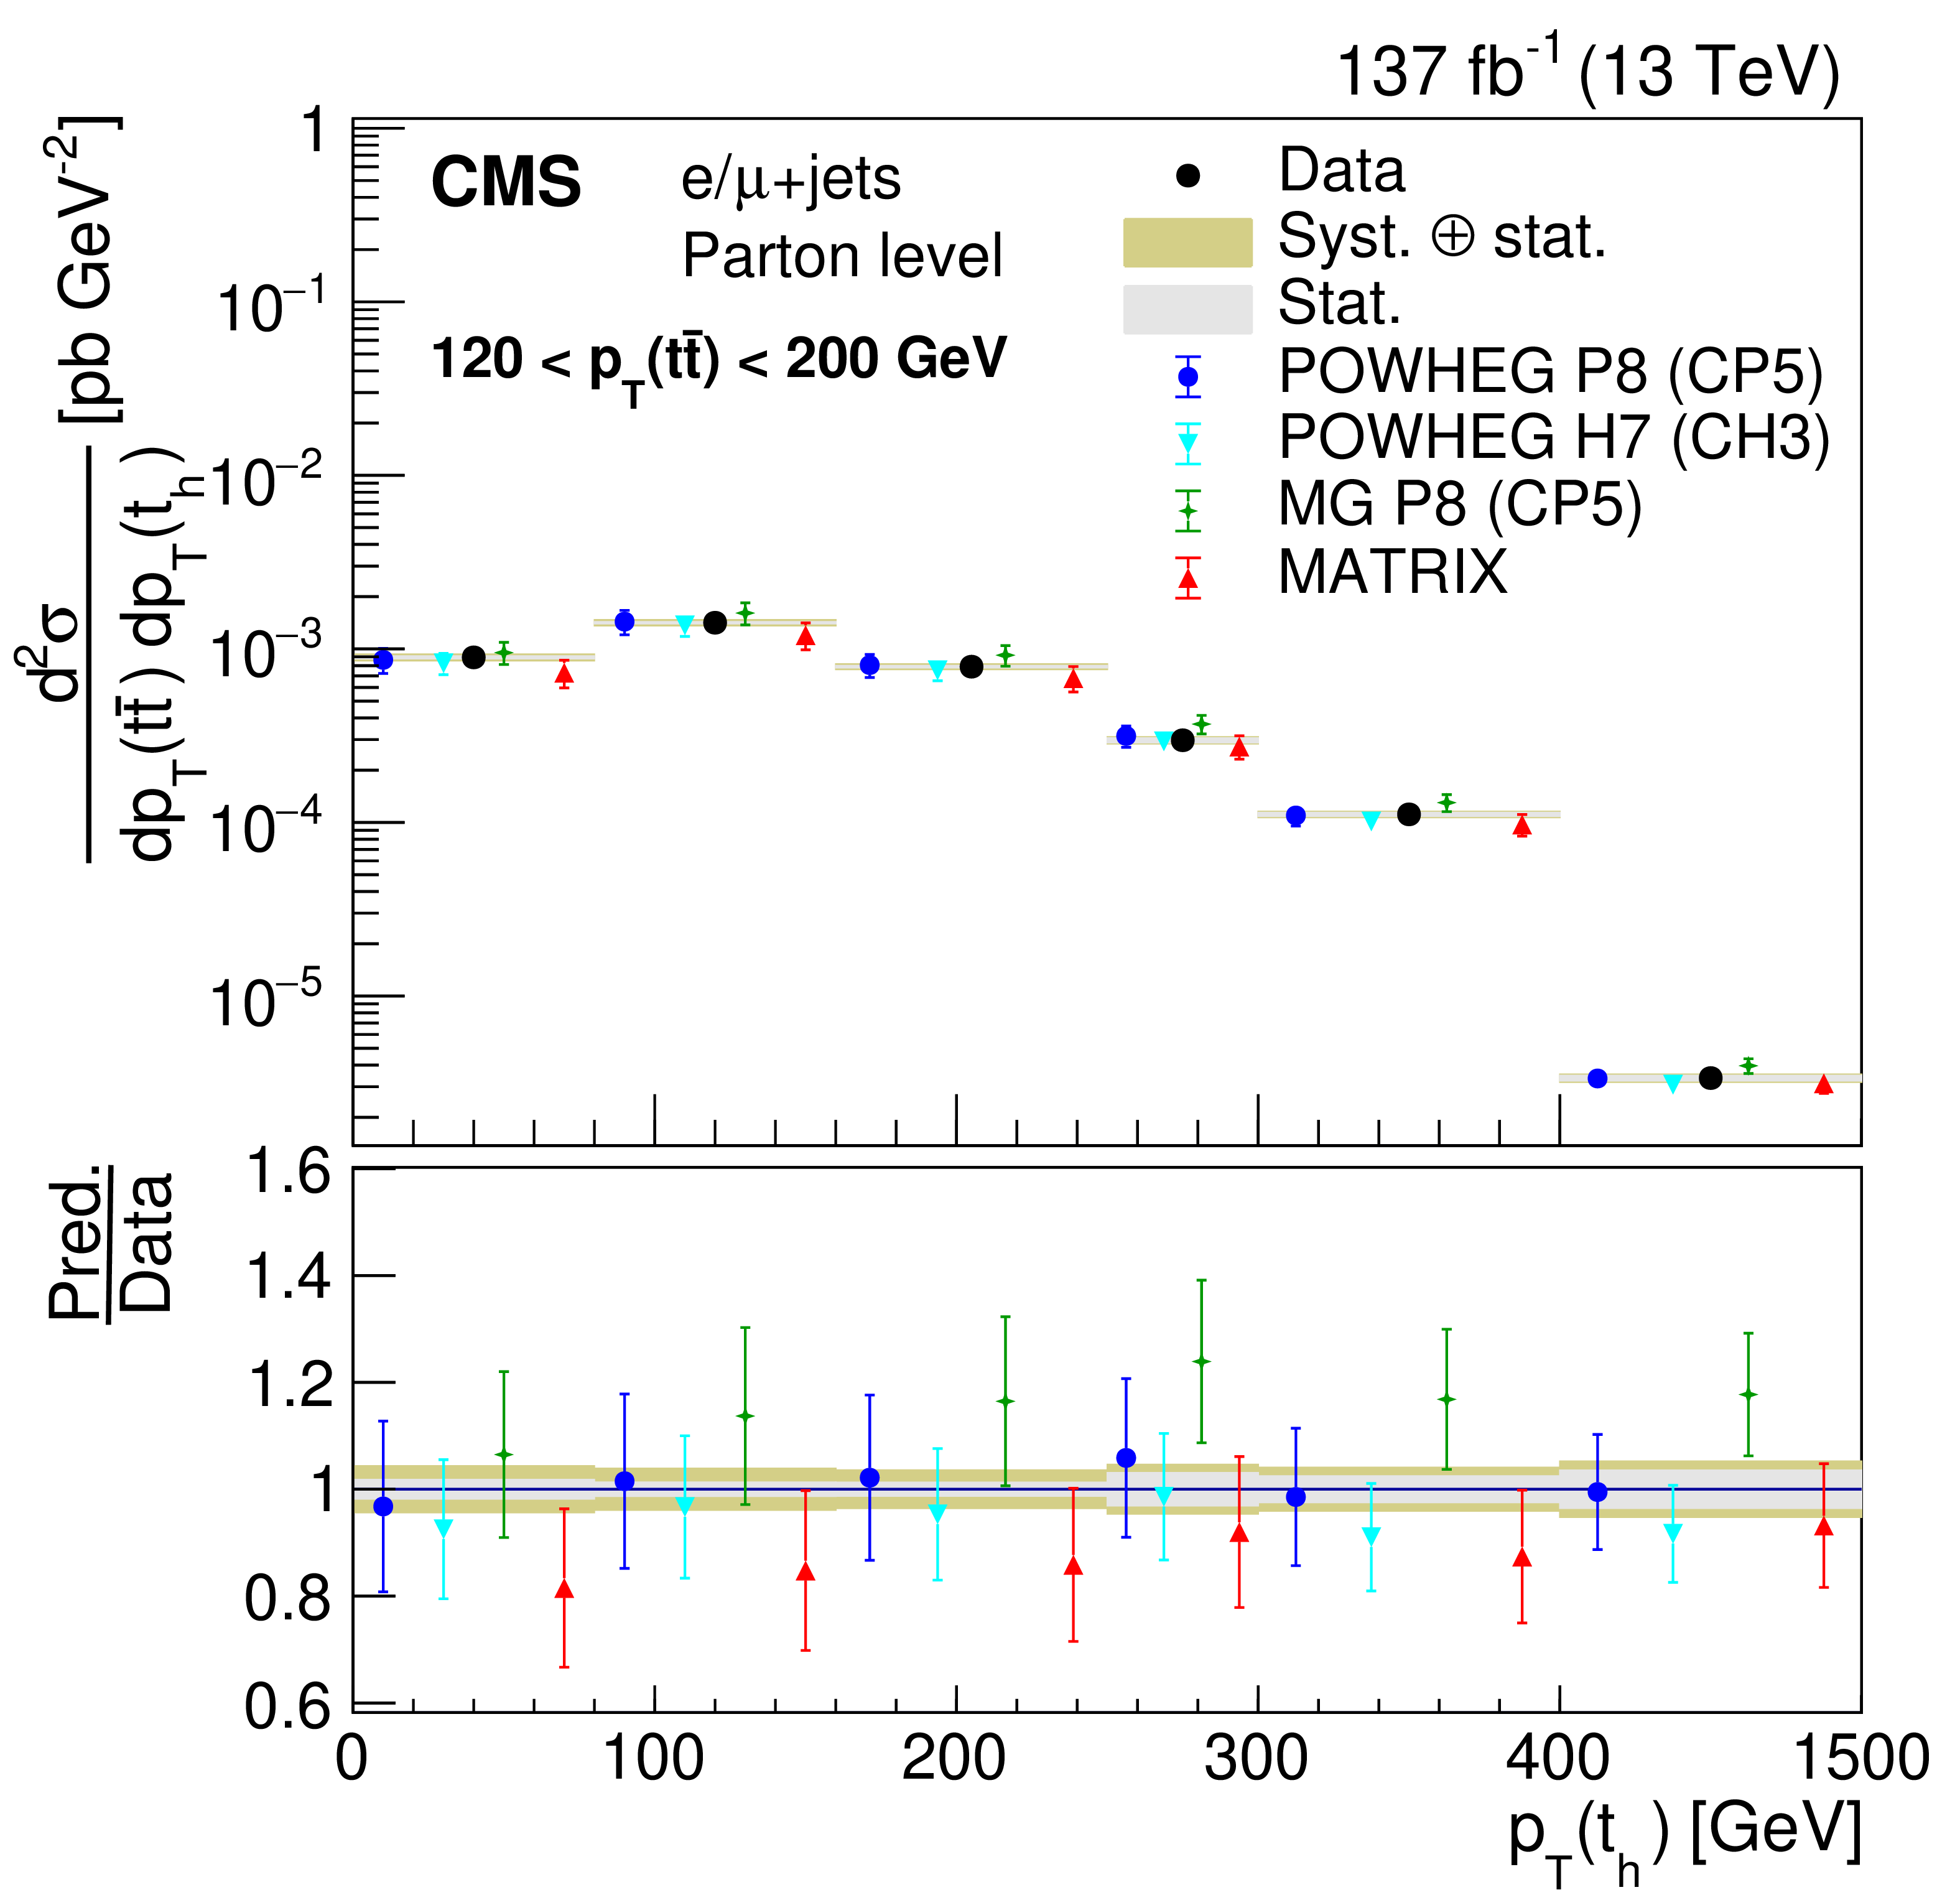
png pdf |
Figure 29-c:
Double-differential cross section at the parton level as a function of ${{p_{\mathrm {T}}} ({\mathrm{t} \mathrm{\bar{t}}})}$ vs. ${{p_{\mathrm {T}}} ({\mathrm{t} _\mathrm {h}})}$. The data are shown as points with gray (yellow) bands indicating the statistical (statistical and systematic) uncertainties. The cross sections are compared to the predictions of POWHEG combined with PYTHIA (P8) or HERWIG (H7), the multiparton simulation MG5_aMC@NLO (MG)+PYTHIA FxFx, and the NNLO QCD calculations obtained with Matrix. The ratios of the various predictions to the measured cross sections are shown in the lower panels. |
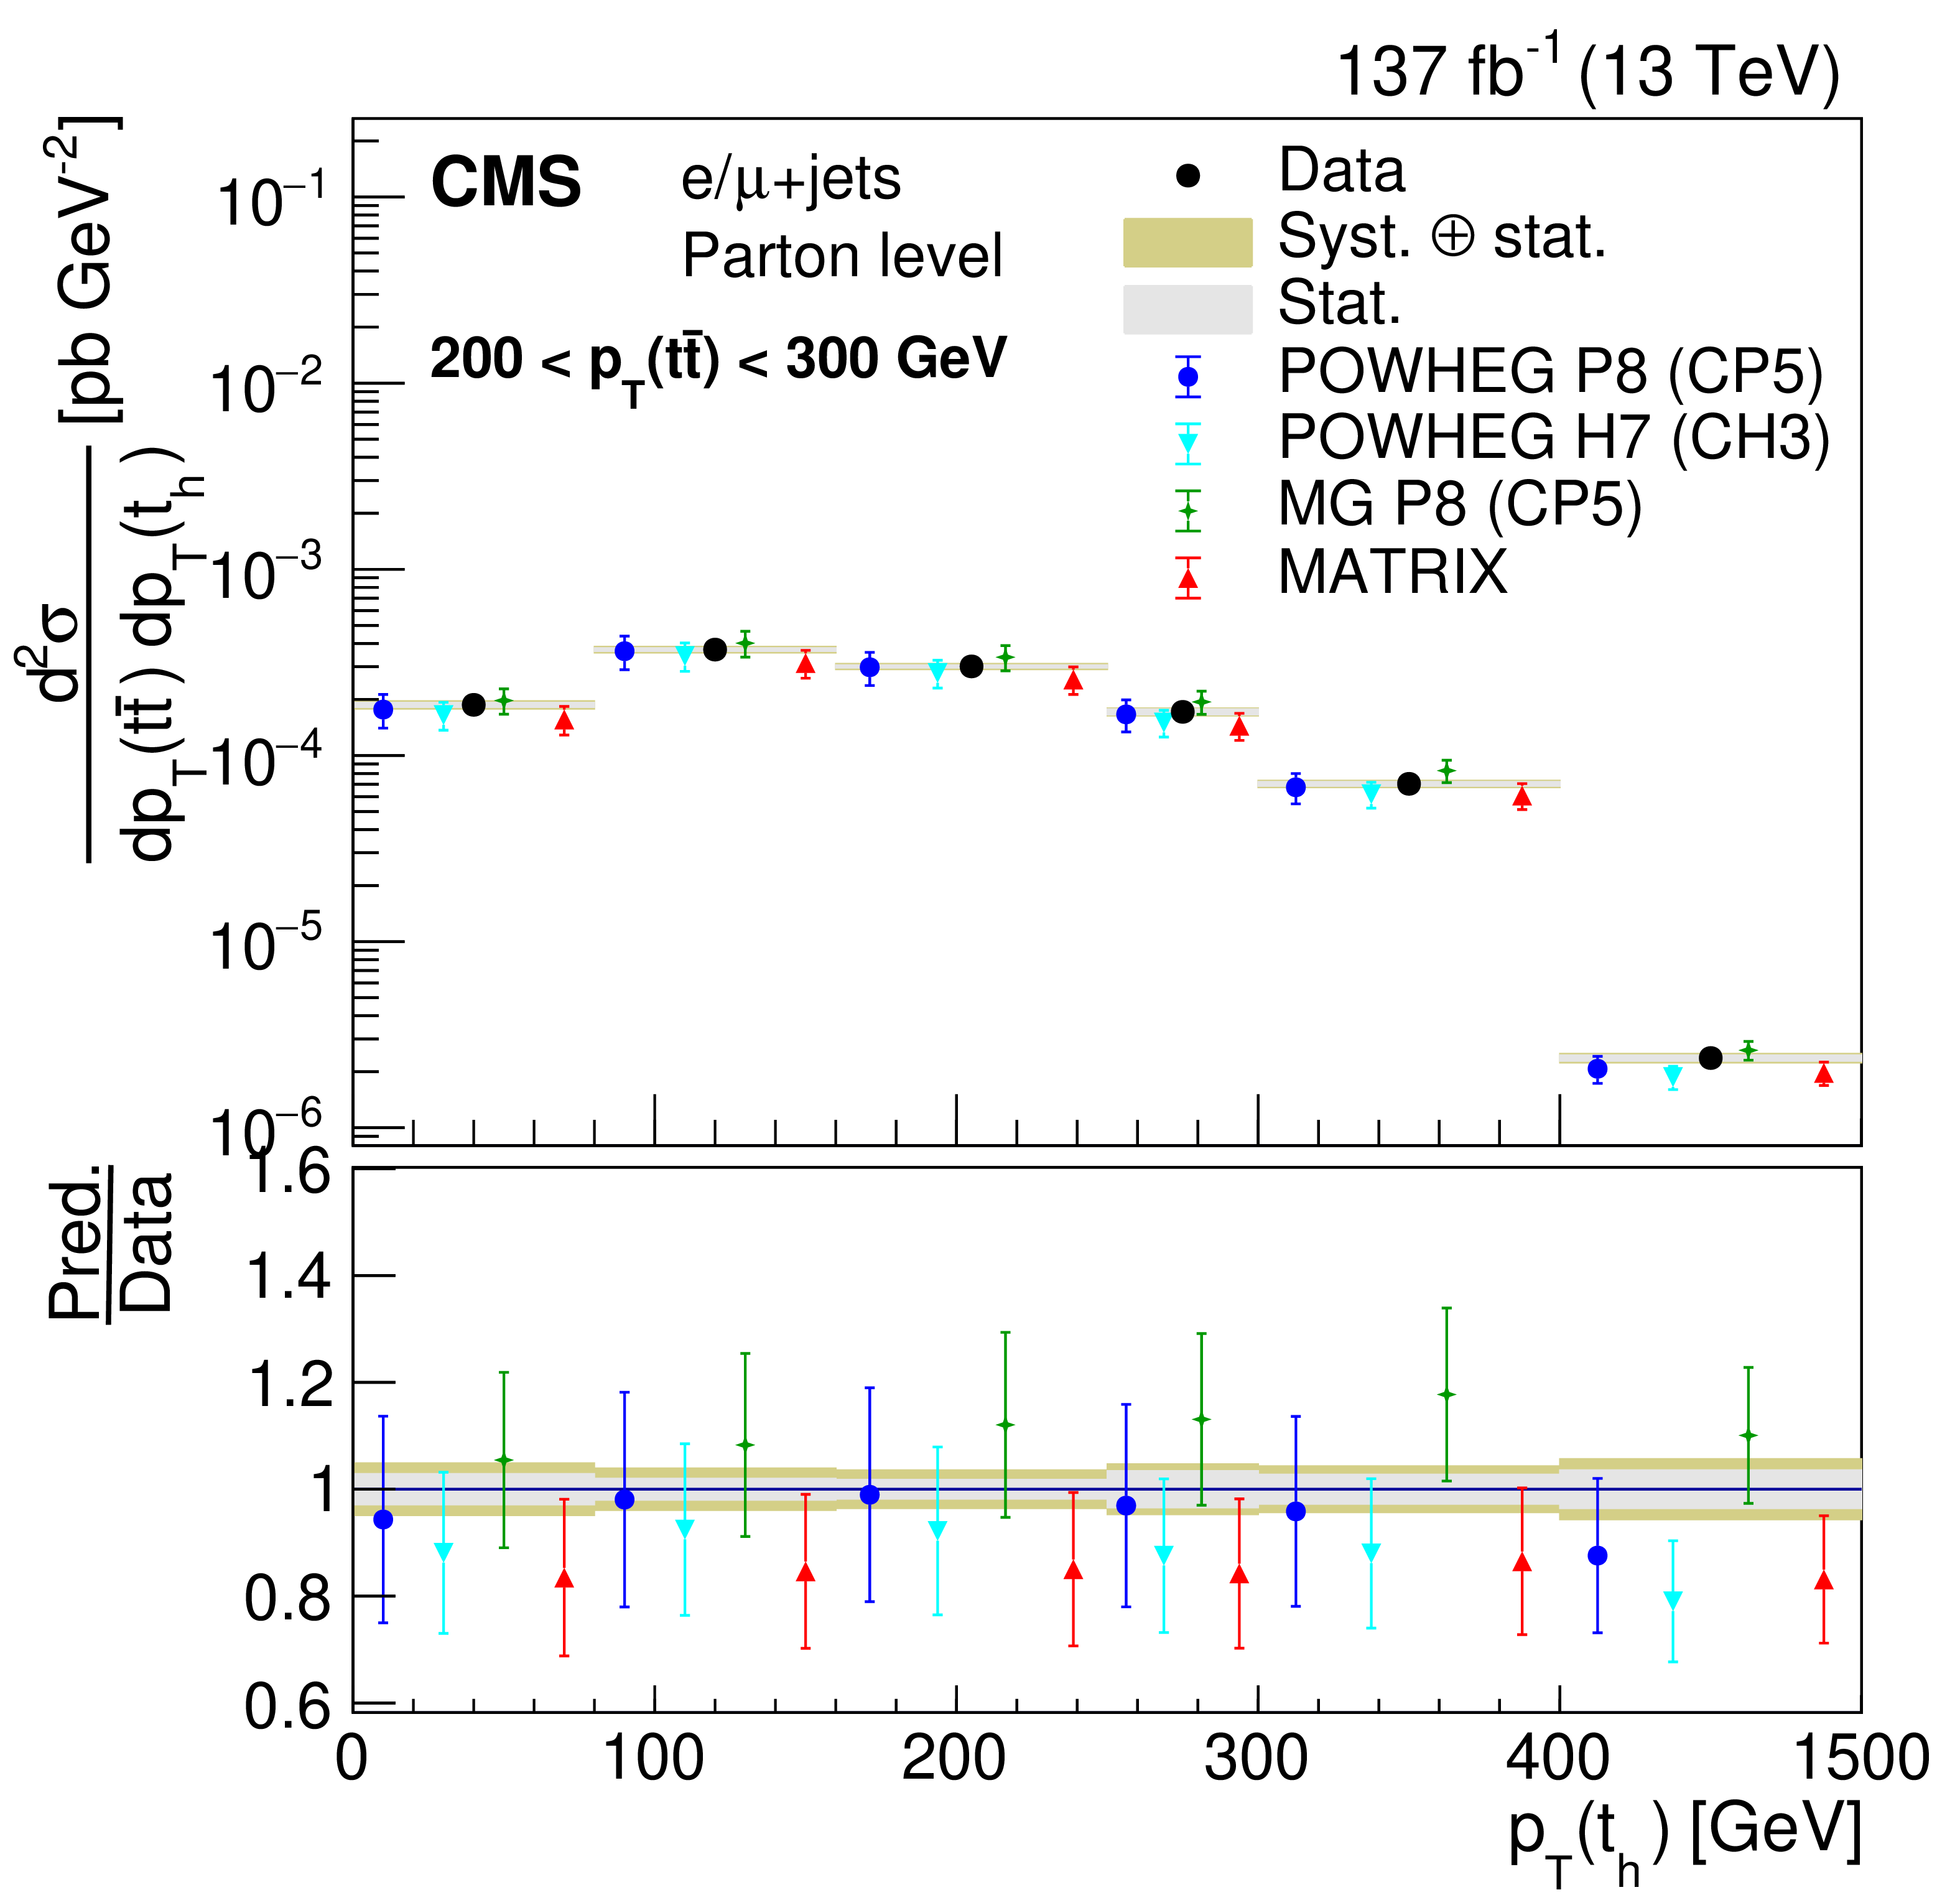
png pdf |
Figure 29-d:
Double-differential cross section at the parton level as a function of ${{p_{\mathrm {T}}} ({\mathrm{t} \mathrm{\bar{t}}})}$ vs. ${{p_{\mathrm {T}}} ({\mathrm{t} _\mathrm {h}})}$. The data are shown as points with gray (yellow) bands indicating the statistical (statistical and systematic) uncertainties. The cross sections are compared to the predictions of POWHEG combined with PYTHIA (P8) or HERWIG (H7), the multiparton simulation MG5_aMC@NLO (MG)+PYTHIA FxFx, and the NNLO QCD calculations obtained with Matrix. The ratios of the various predictions to the measured cross sections are shown in the lower panels. |
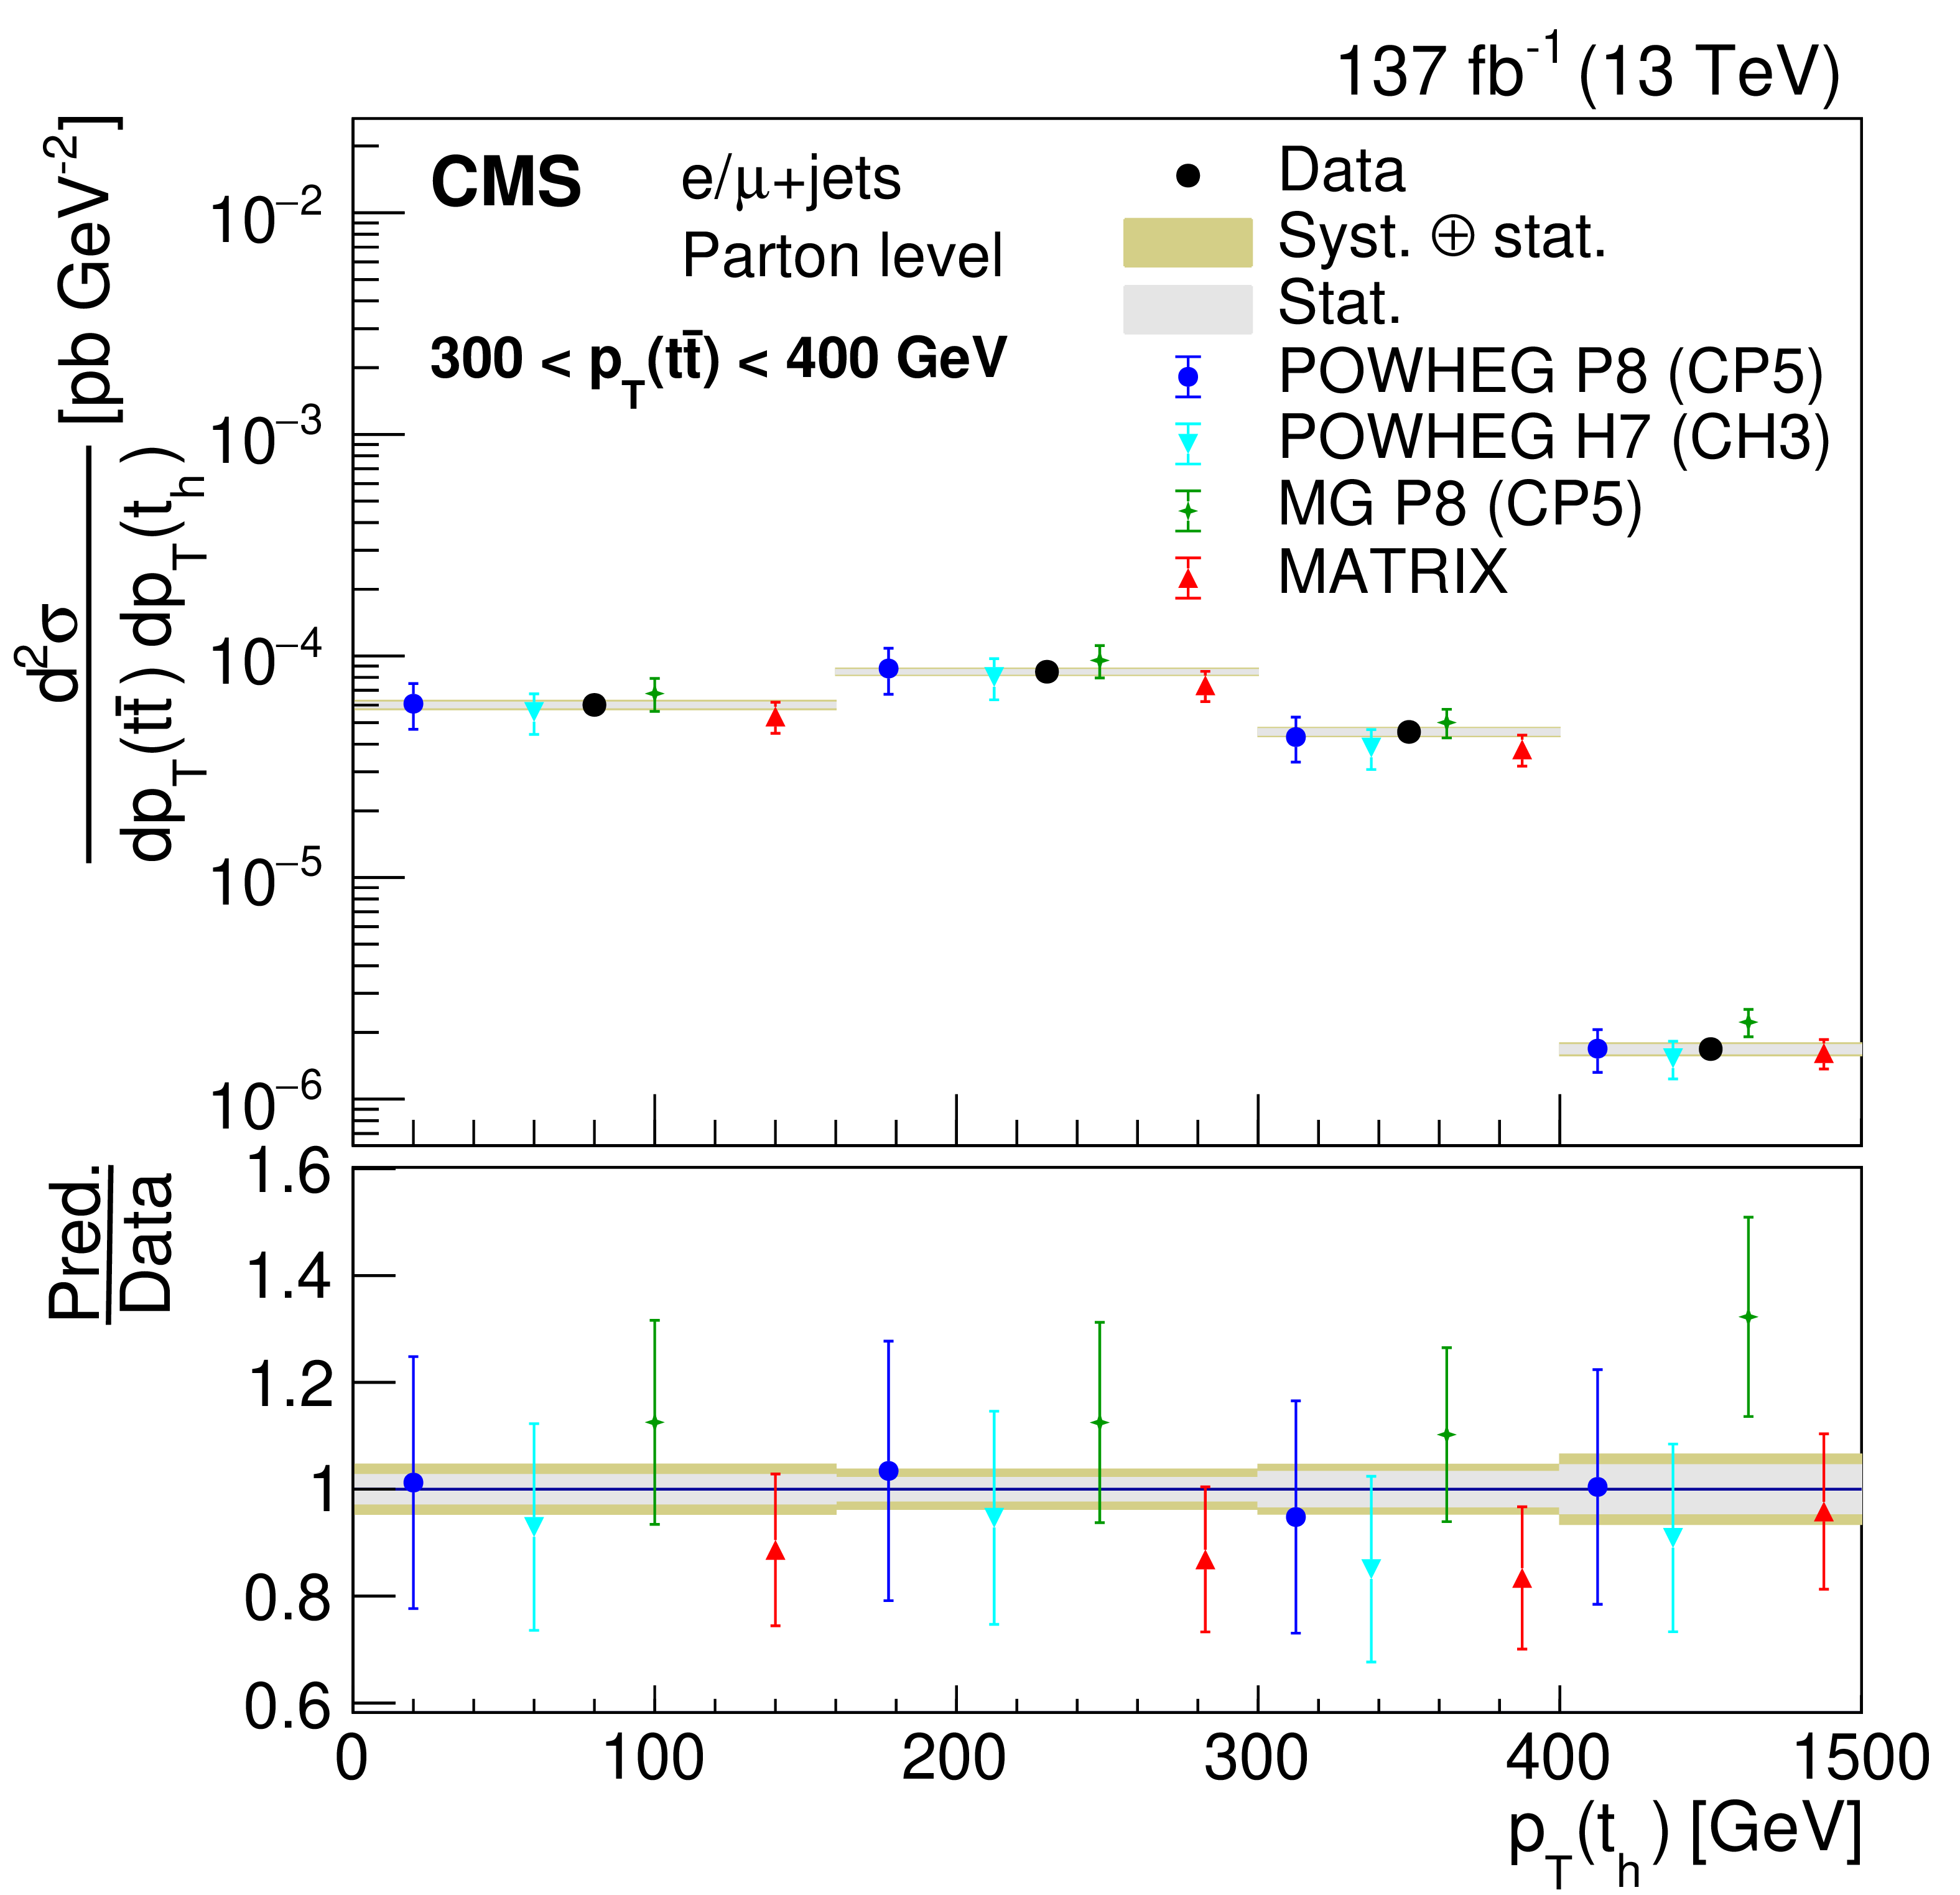
png pdf |
Figure 29-e:
Double-differential cross section at the parton level as a function of ${{p_{\mathrm {T}}} ({\mathrm{t} \mathrm{\bar{t}}})}$ vs. ${{p_{\mathrm {T}}} ({\mathrm{t} _\mathrm {h}})}$. The data are shown as points with gray (yellow) bands indicating the statistical (statistical and systematic) uncertainties. The cross sections are compared to the predictions of POWHEG combined with PYTHIA (P8) or HERWIG (H7), the multiparton simulation MG5_aMC@NLO (MG)+PYTHIA FxFx, and the NNLO QCD calculations obtained with Matrix. The ratios of the various predictions to the measured cross sections are shown in the lower panels. |
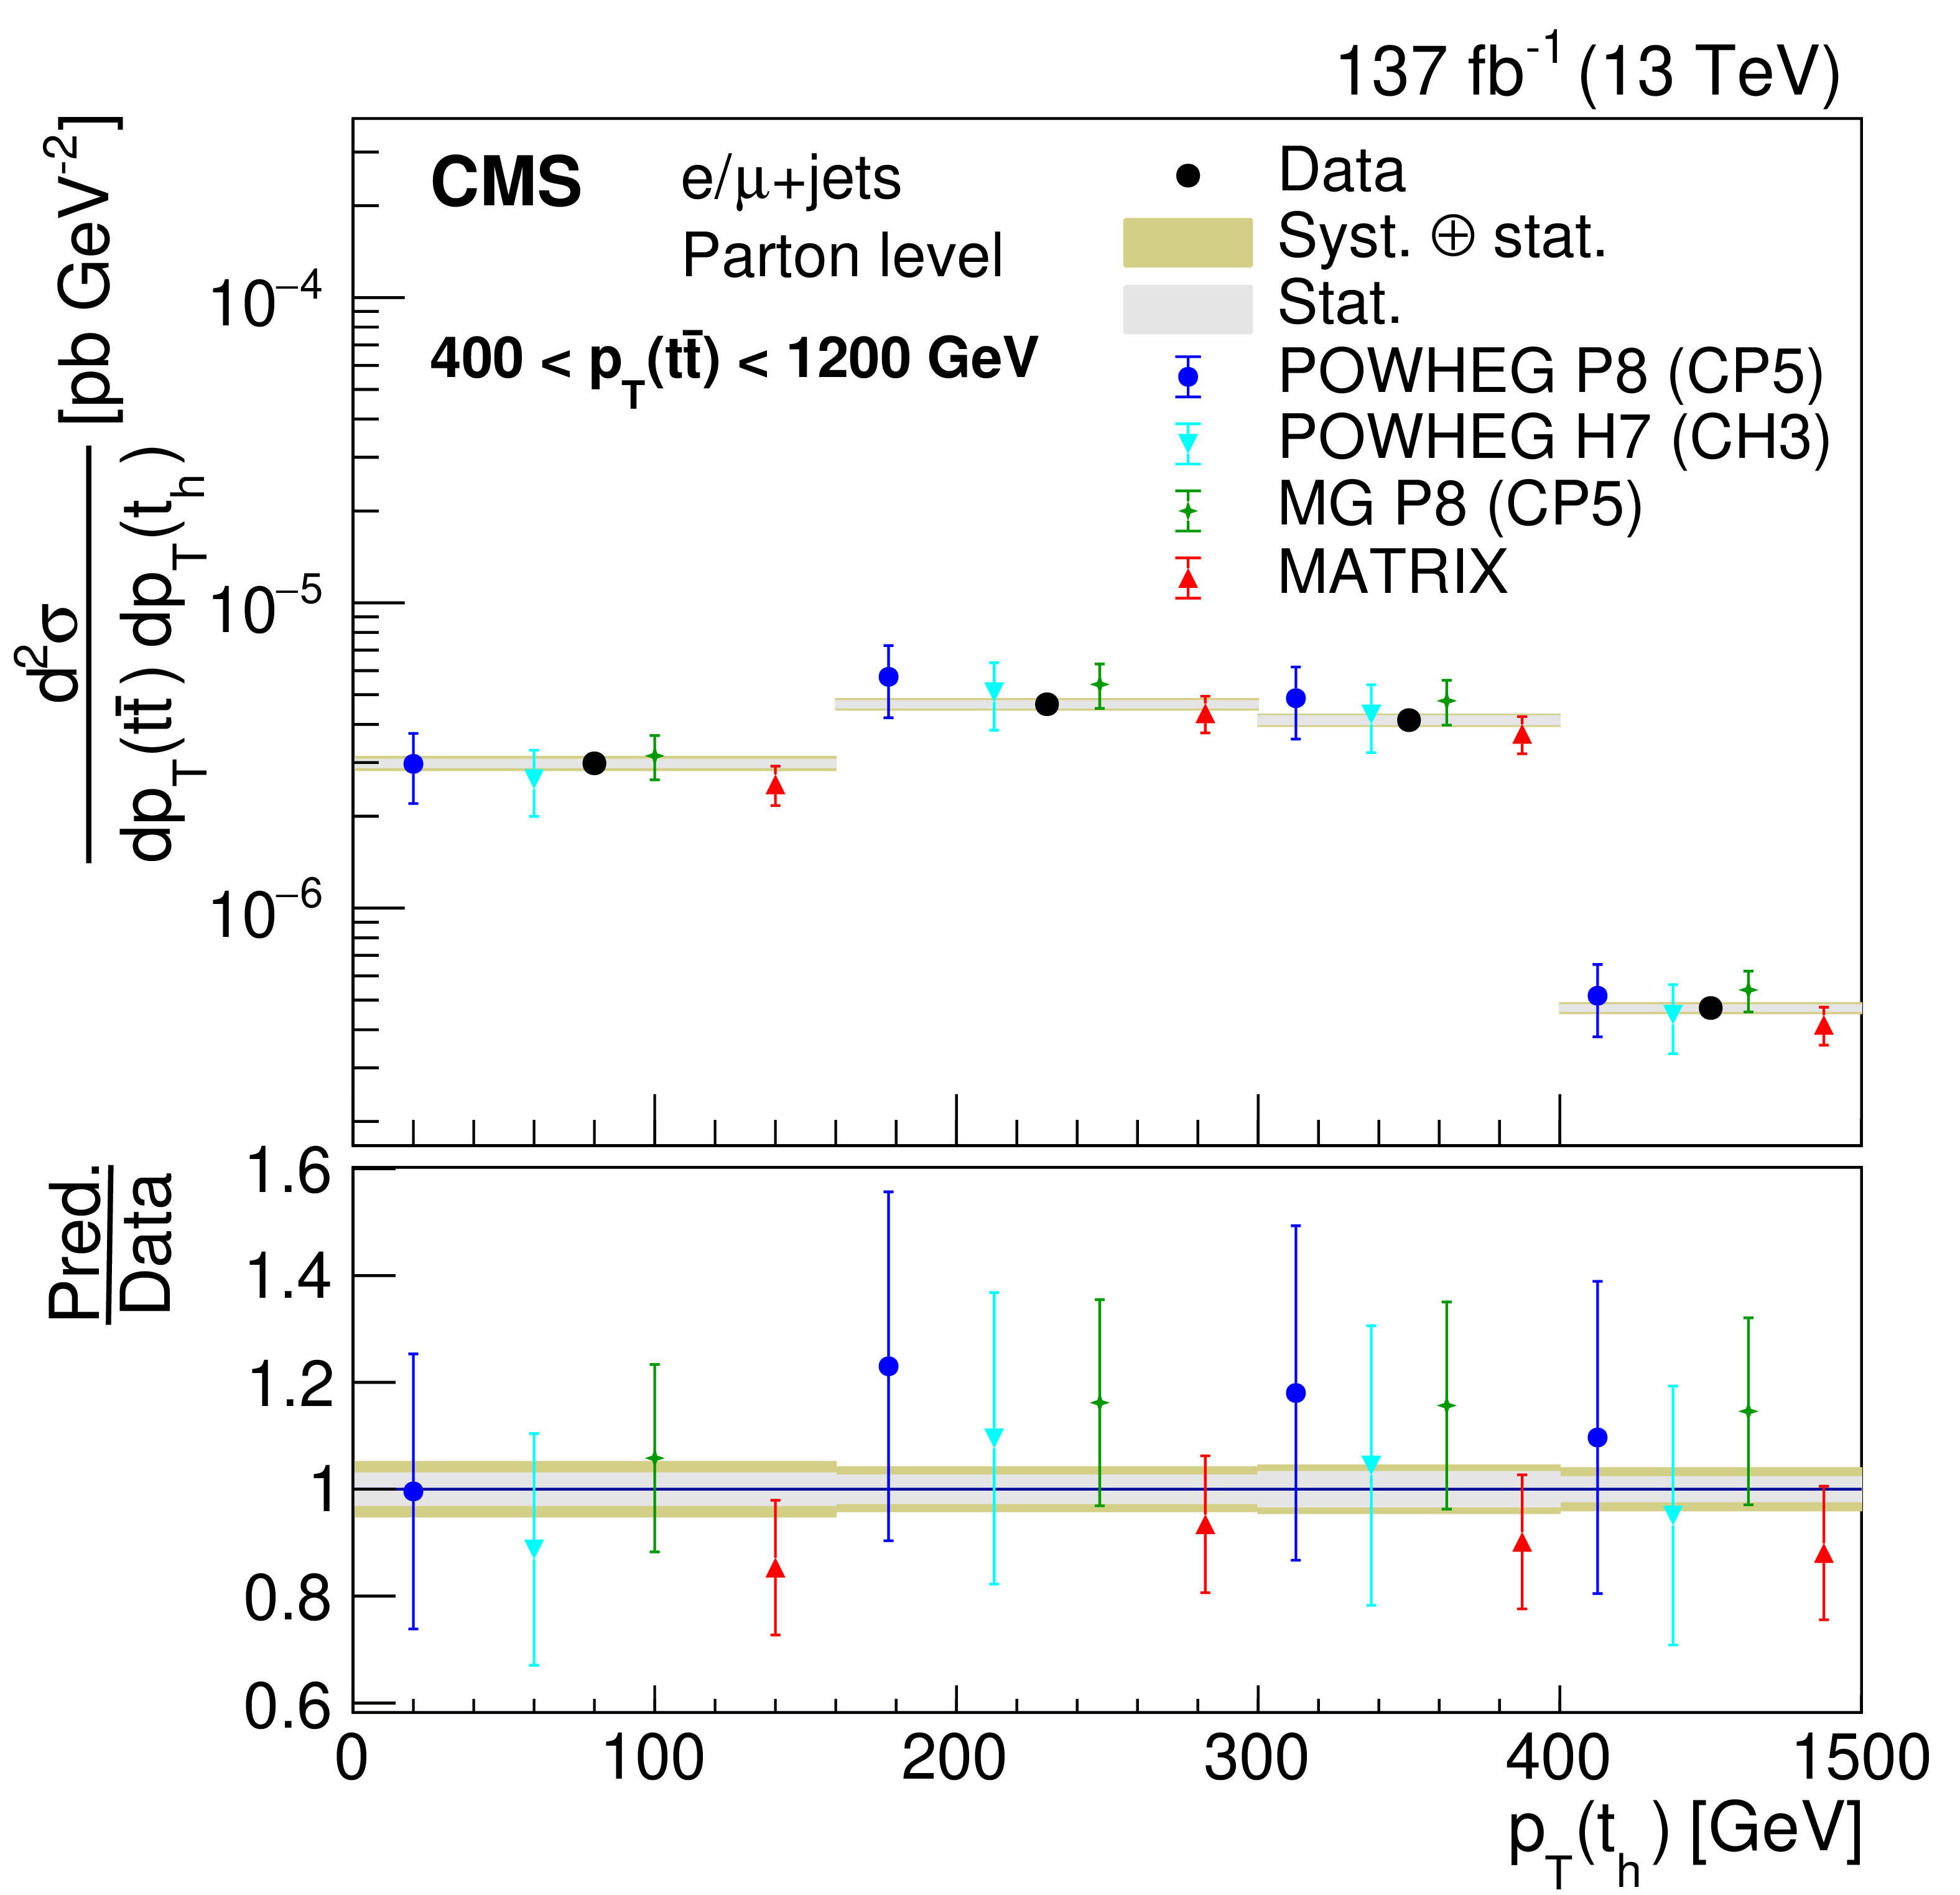
png pdf |
Figure 29-f:
Double-differential cross section at the parton level as a function of ${{p_{\mathrm {T}}} ({\mathrm{t} \mathrm{\bar{t}}})}$ vs. ${{p_{\mathrm {T}}} ({\mathrm{t} _\mathrm {h}})}$. The data are shown as points with gray (yellow) bands indicating the statistical (statistical and systematic) uncertainties. The cross sections are compared to the predictions of POWHEG combined with PYTHIA (P8) or HERWIG (H7), the multiparton simulation MG5_aMC@NLO (MG)+PYTHIA FxFx, and the NNLO QCD calculations obtained with Matrix. The ratios of the various predictions to the measured cross sections are shown in the lower panels. |
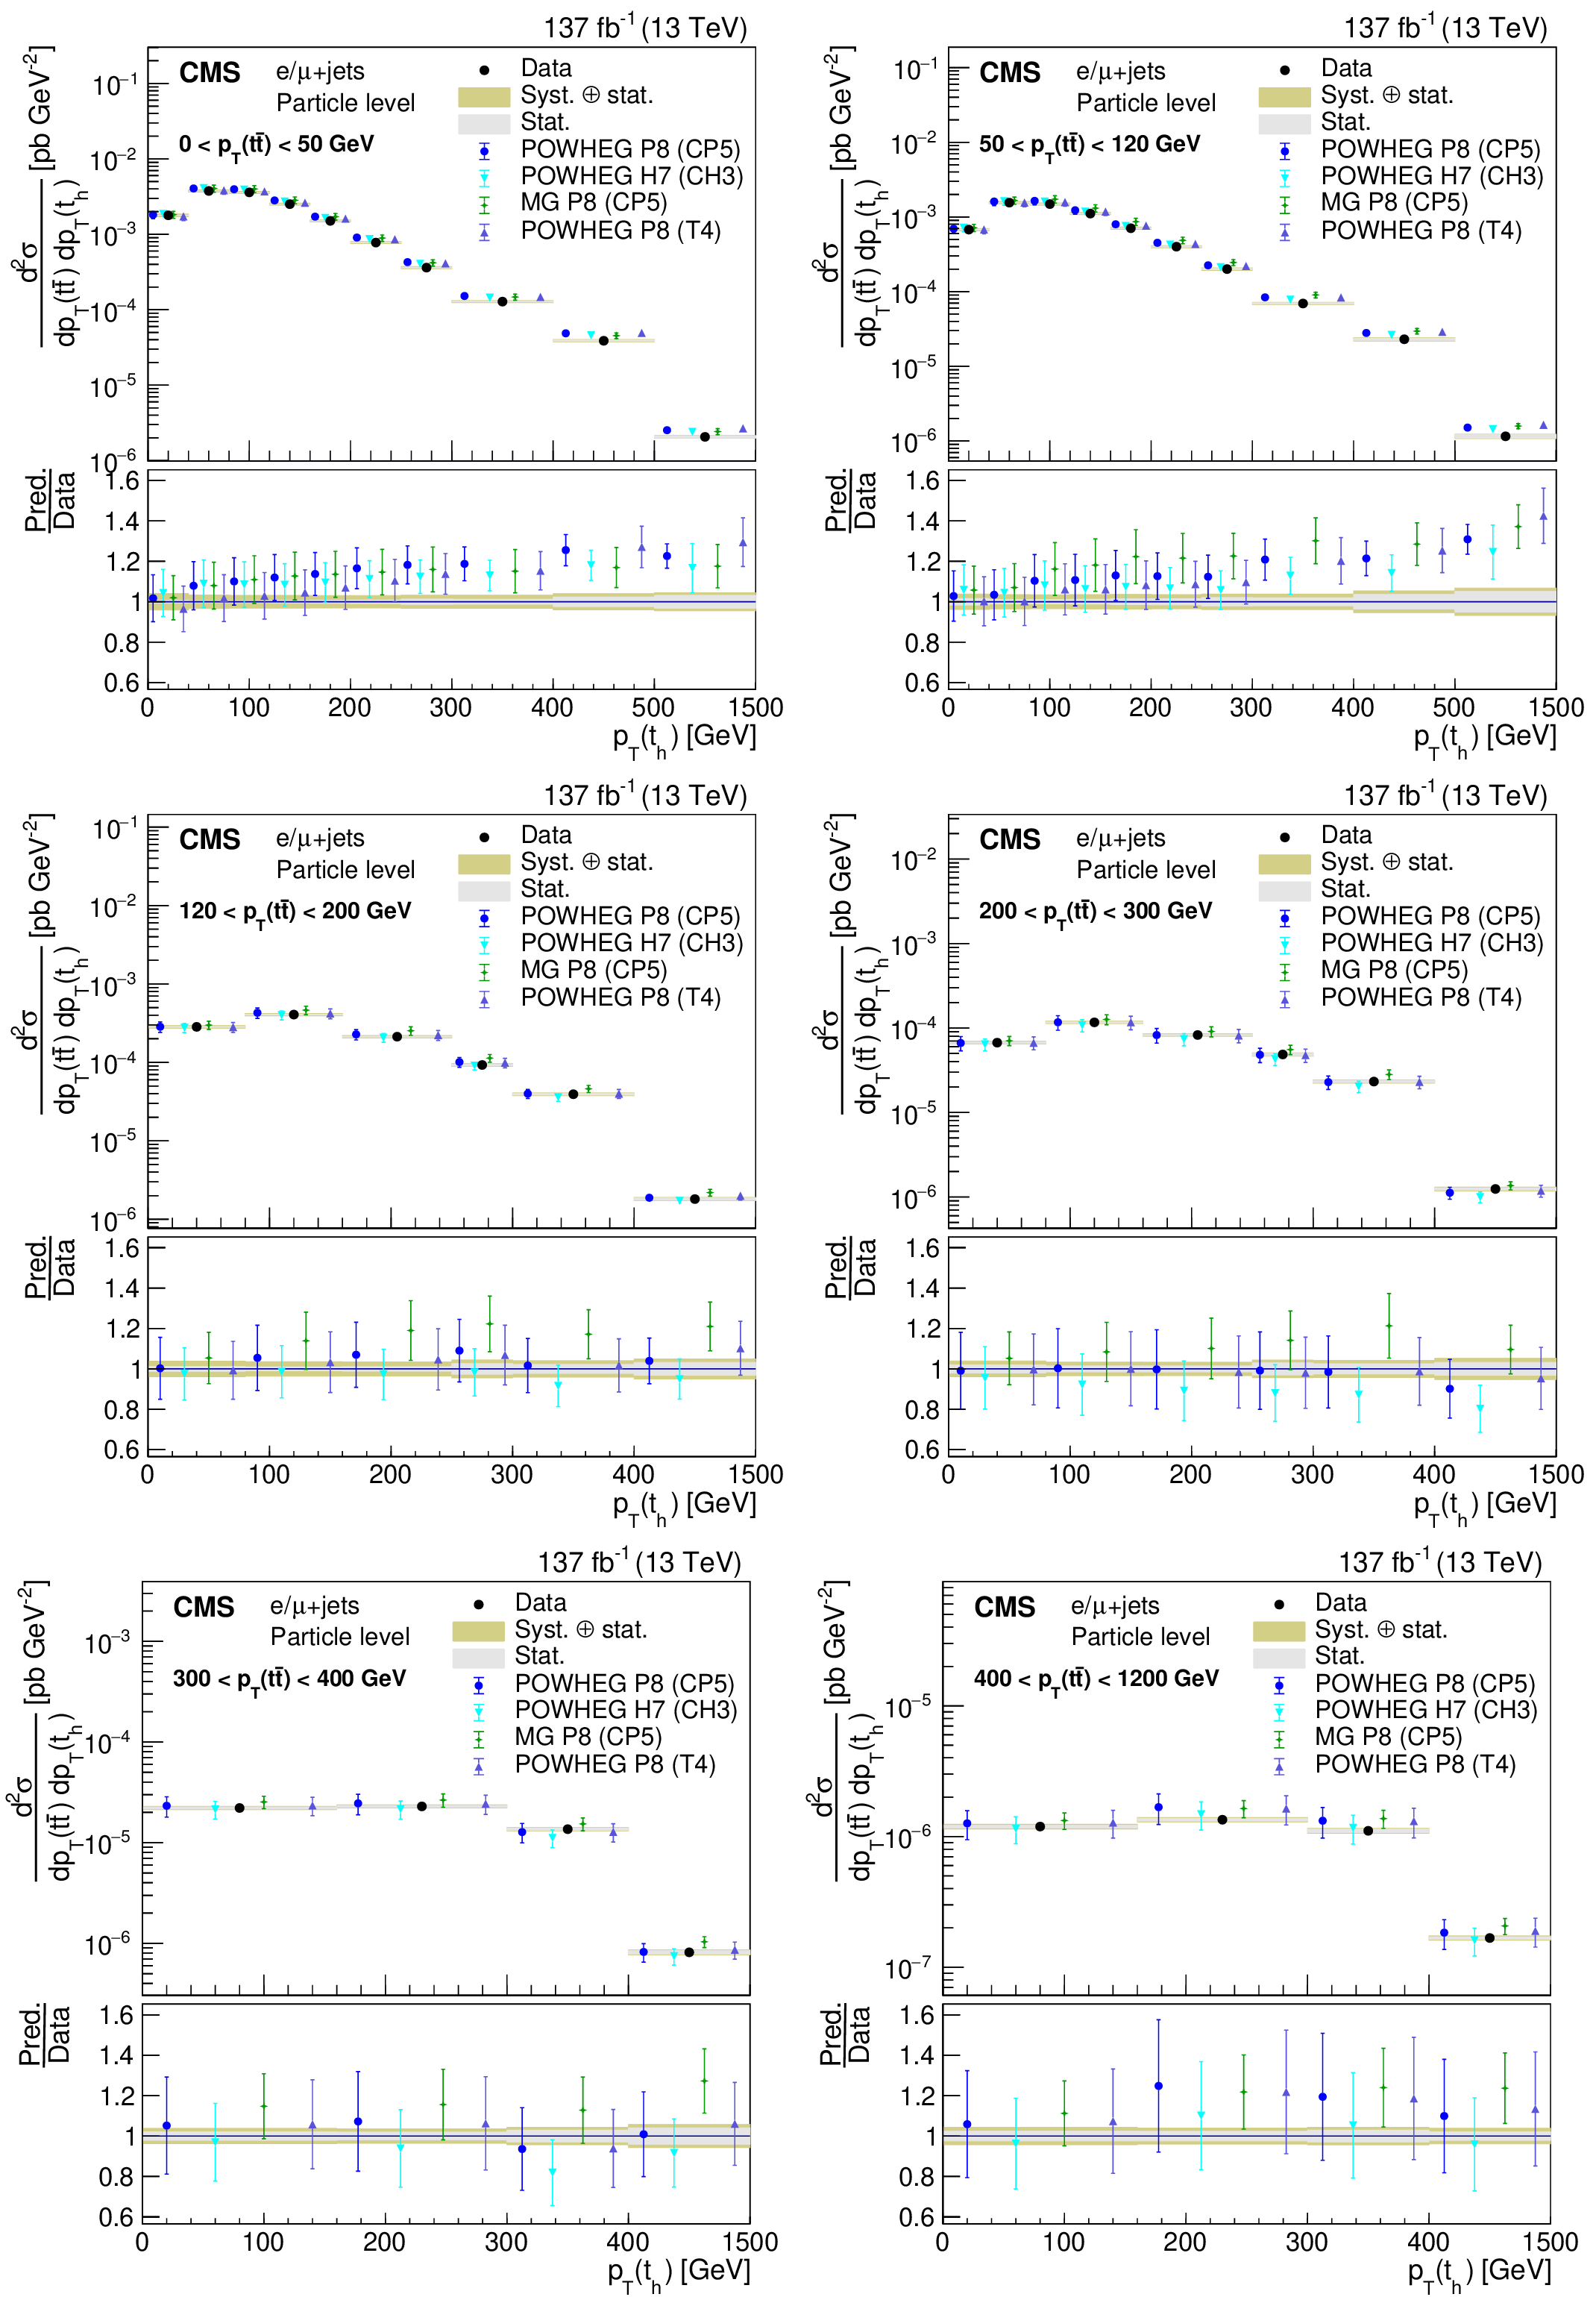
png pdf |
Figure 30:
Double-differential cross section at the particle level as a function of ${{p_{\mathrm {T}}} ({\mathrm{t} \mathrm{\bar{t}}})}$ vs. ${{p_{\mathrm {T}}} ({\mathrm{t} _\mathrm {h}})}$. The data are shown as points with gray (yellow) bands indicating the statistical (statistical and systematic) uncertainties. The cross sections are compared to the predictions of POWHEG+PYTHIA (P8) for the CP5 and CUETP8M2T4 (T4) tunes, POWHEG+HERWIG (H7), and the multiparton simulation MG5_aMC@NLO (MG)+PYTHIA. The ratios of the various predictions to the measured cross sections are shown in the lower panels. |
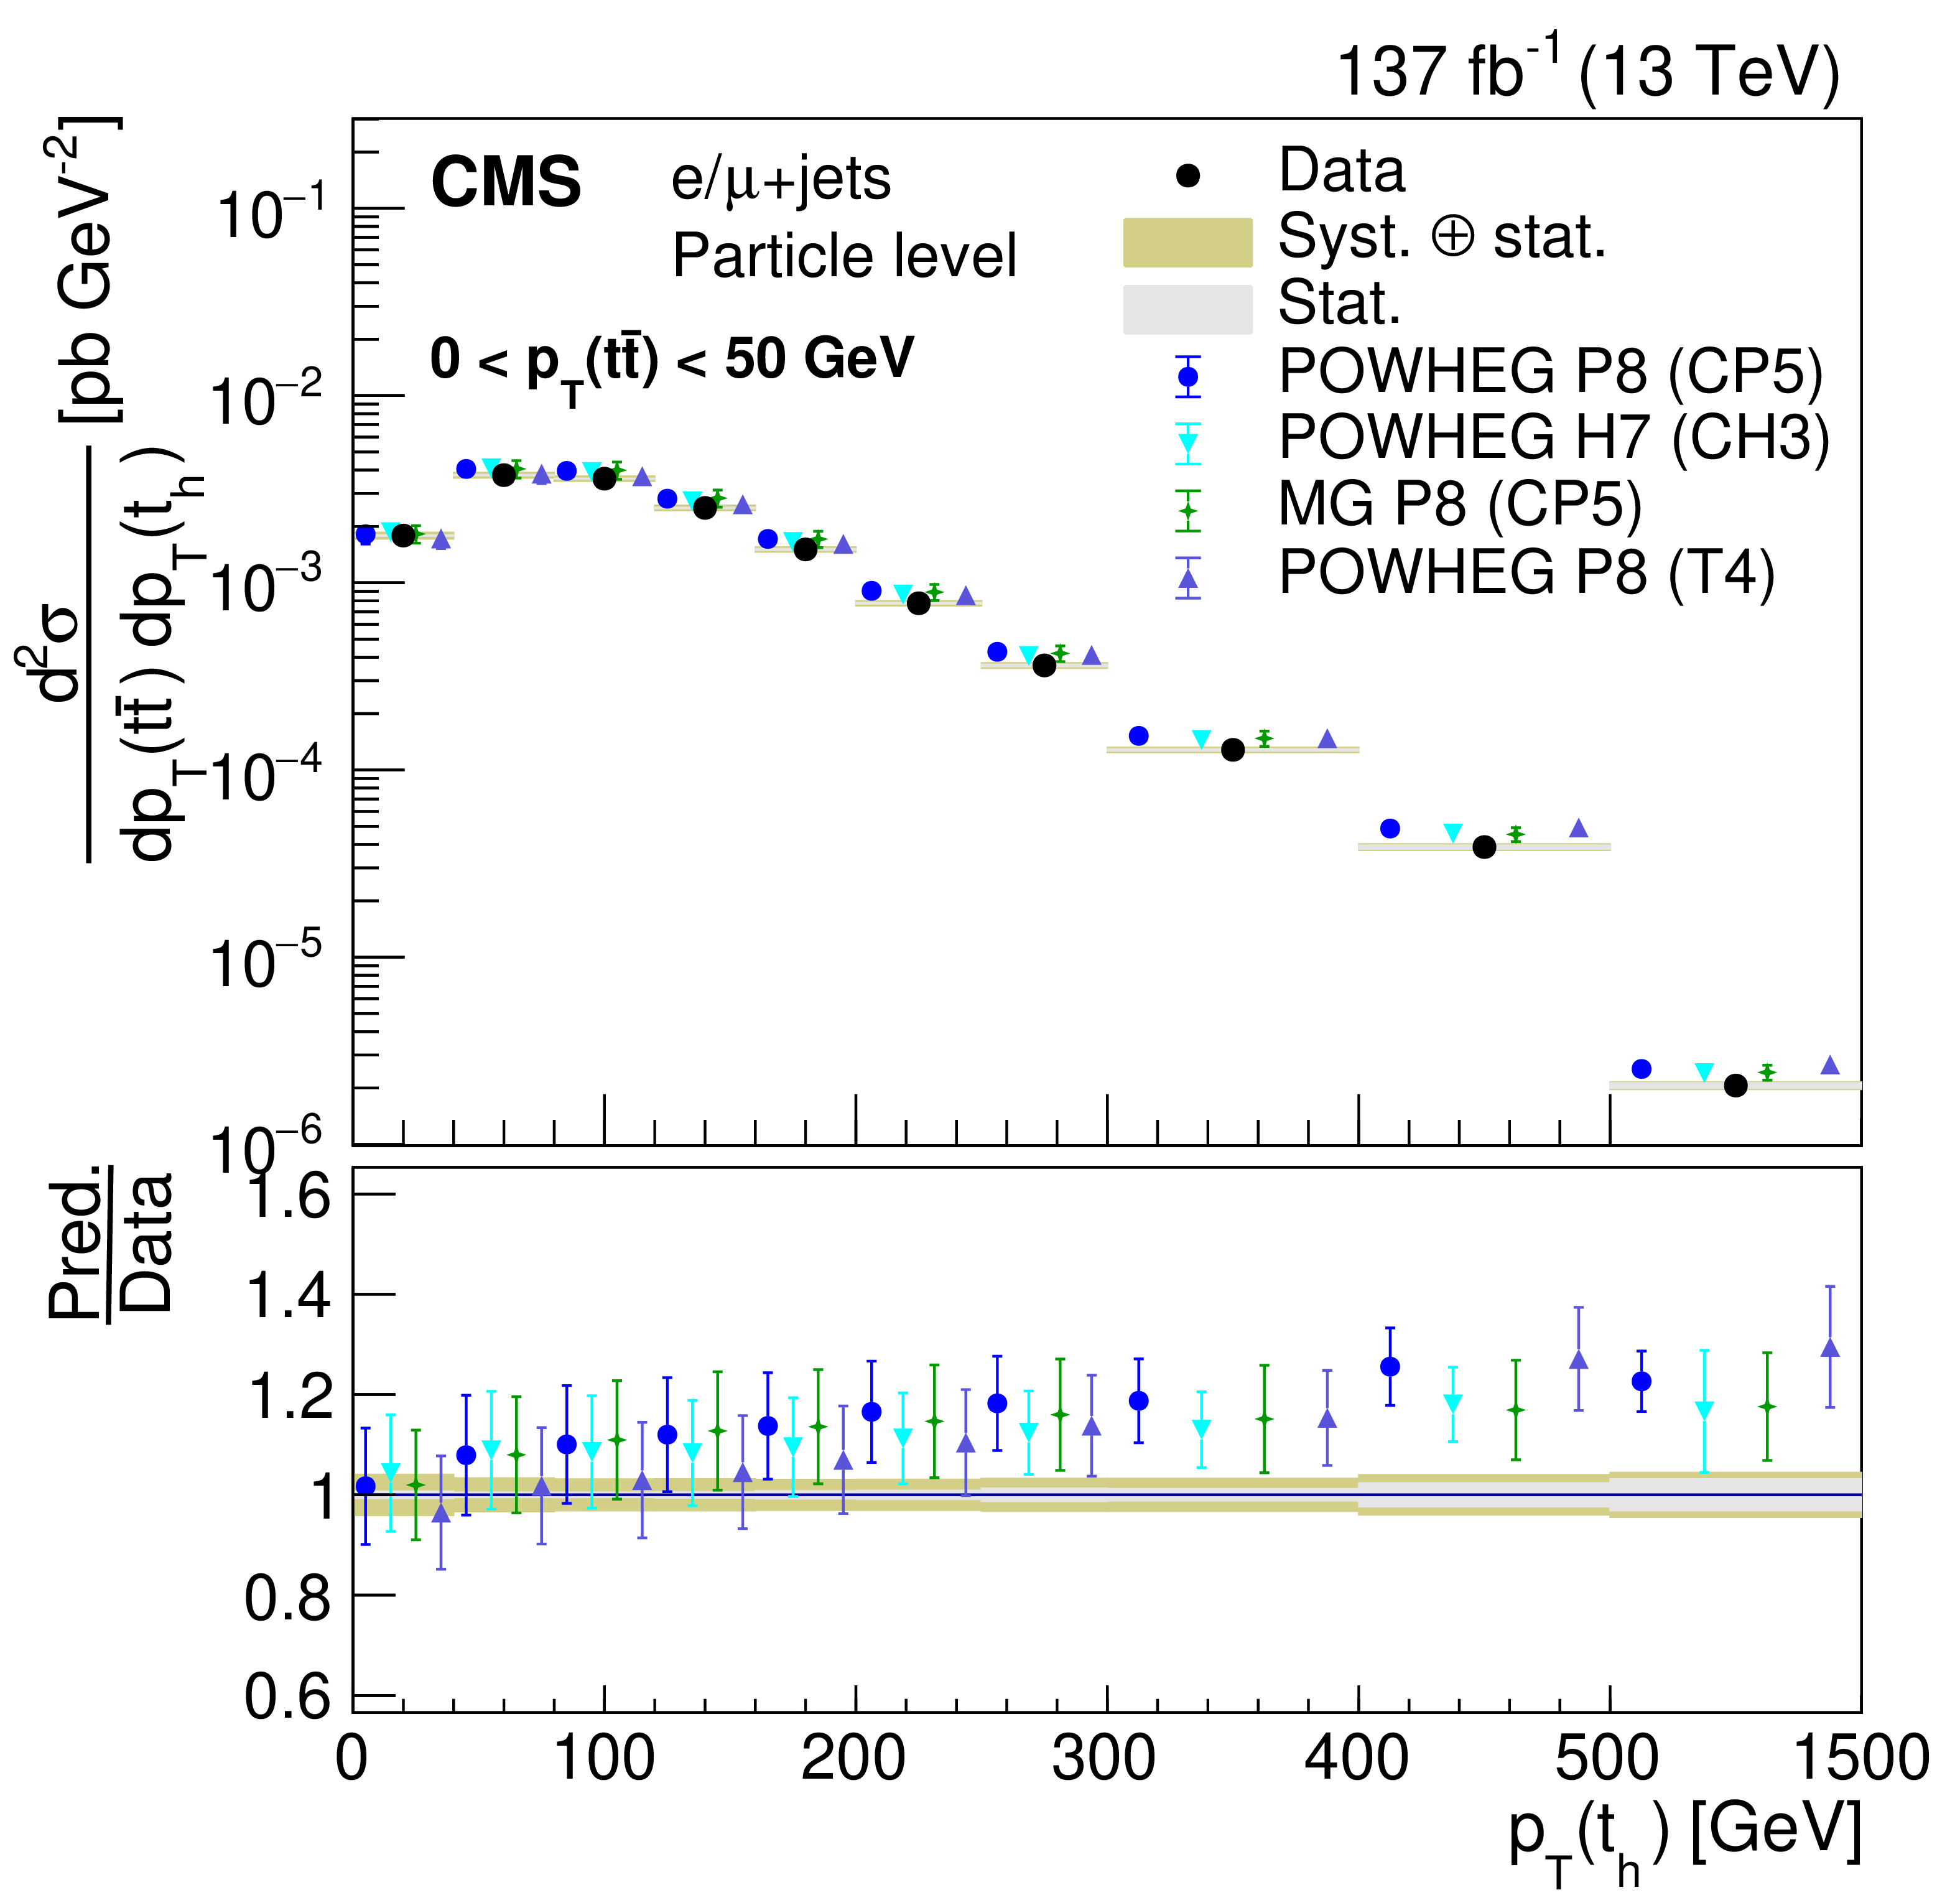
png pdf |
Figure 30-a:
Double-differential cross section at the particle level as a function of ${{p_{\mathrm {T}}} ({\mathrm{t} \mathrm{\bar{t}}})}$ vs. ${{p_{\mathrm {T}}} ({\mathrm{t} _\mathrm {h}})}$. The data are shown as points with gray (yellow) bands indicating the statistical (statistical and systematic) uncertainties. The cross sections are compared to the predictions of POWHEG+PYTHIA (P8) for the CP5 and CUETP8M2T4 (T4) tunes, POWHEG+HERWIG (H7), and the multiparton simulation MG5_aMC@NLO (MG)+PYTHIA. The ratios of the various predictions to the measured cross sections are shown in the lower panels. |
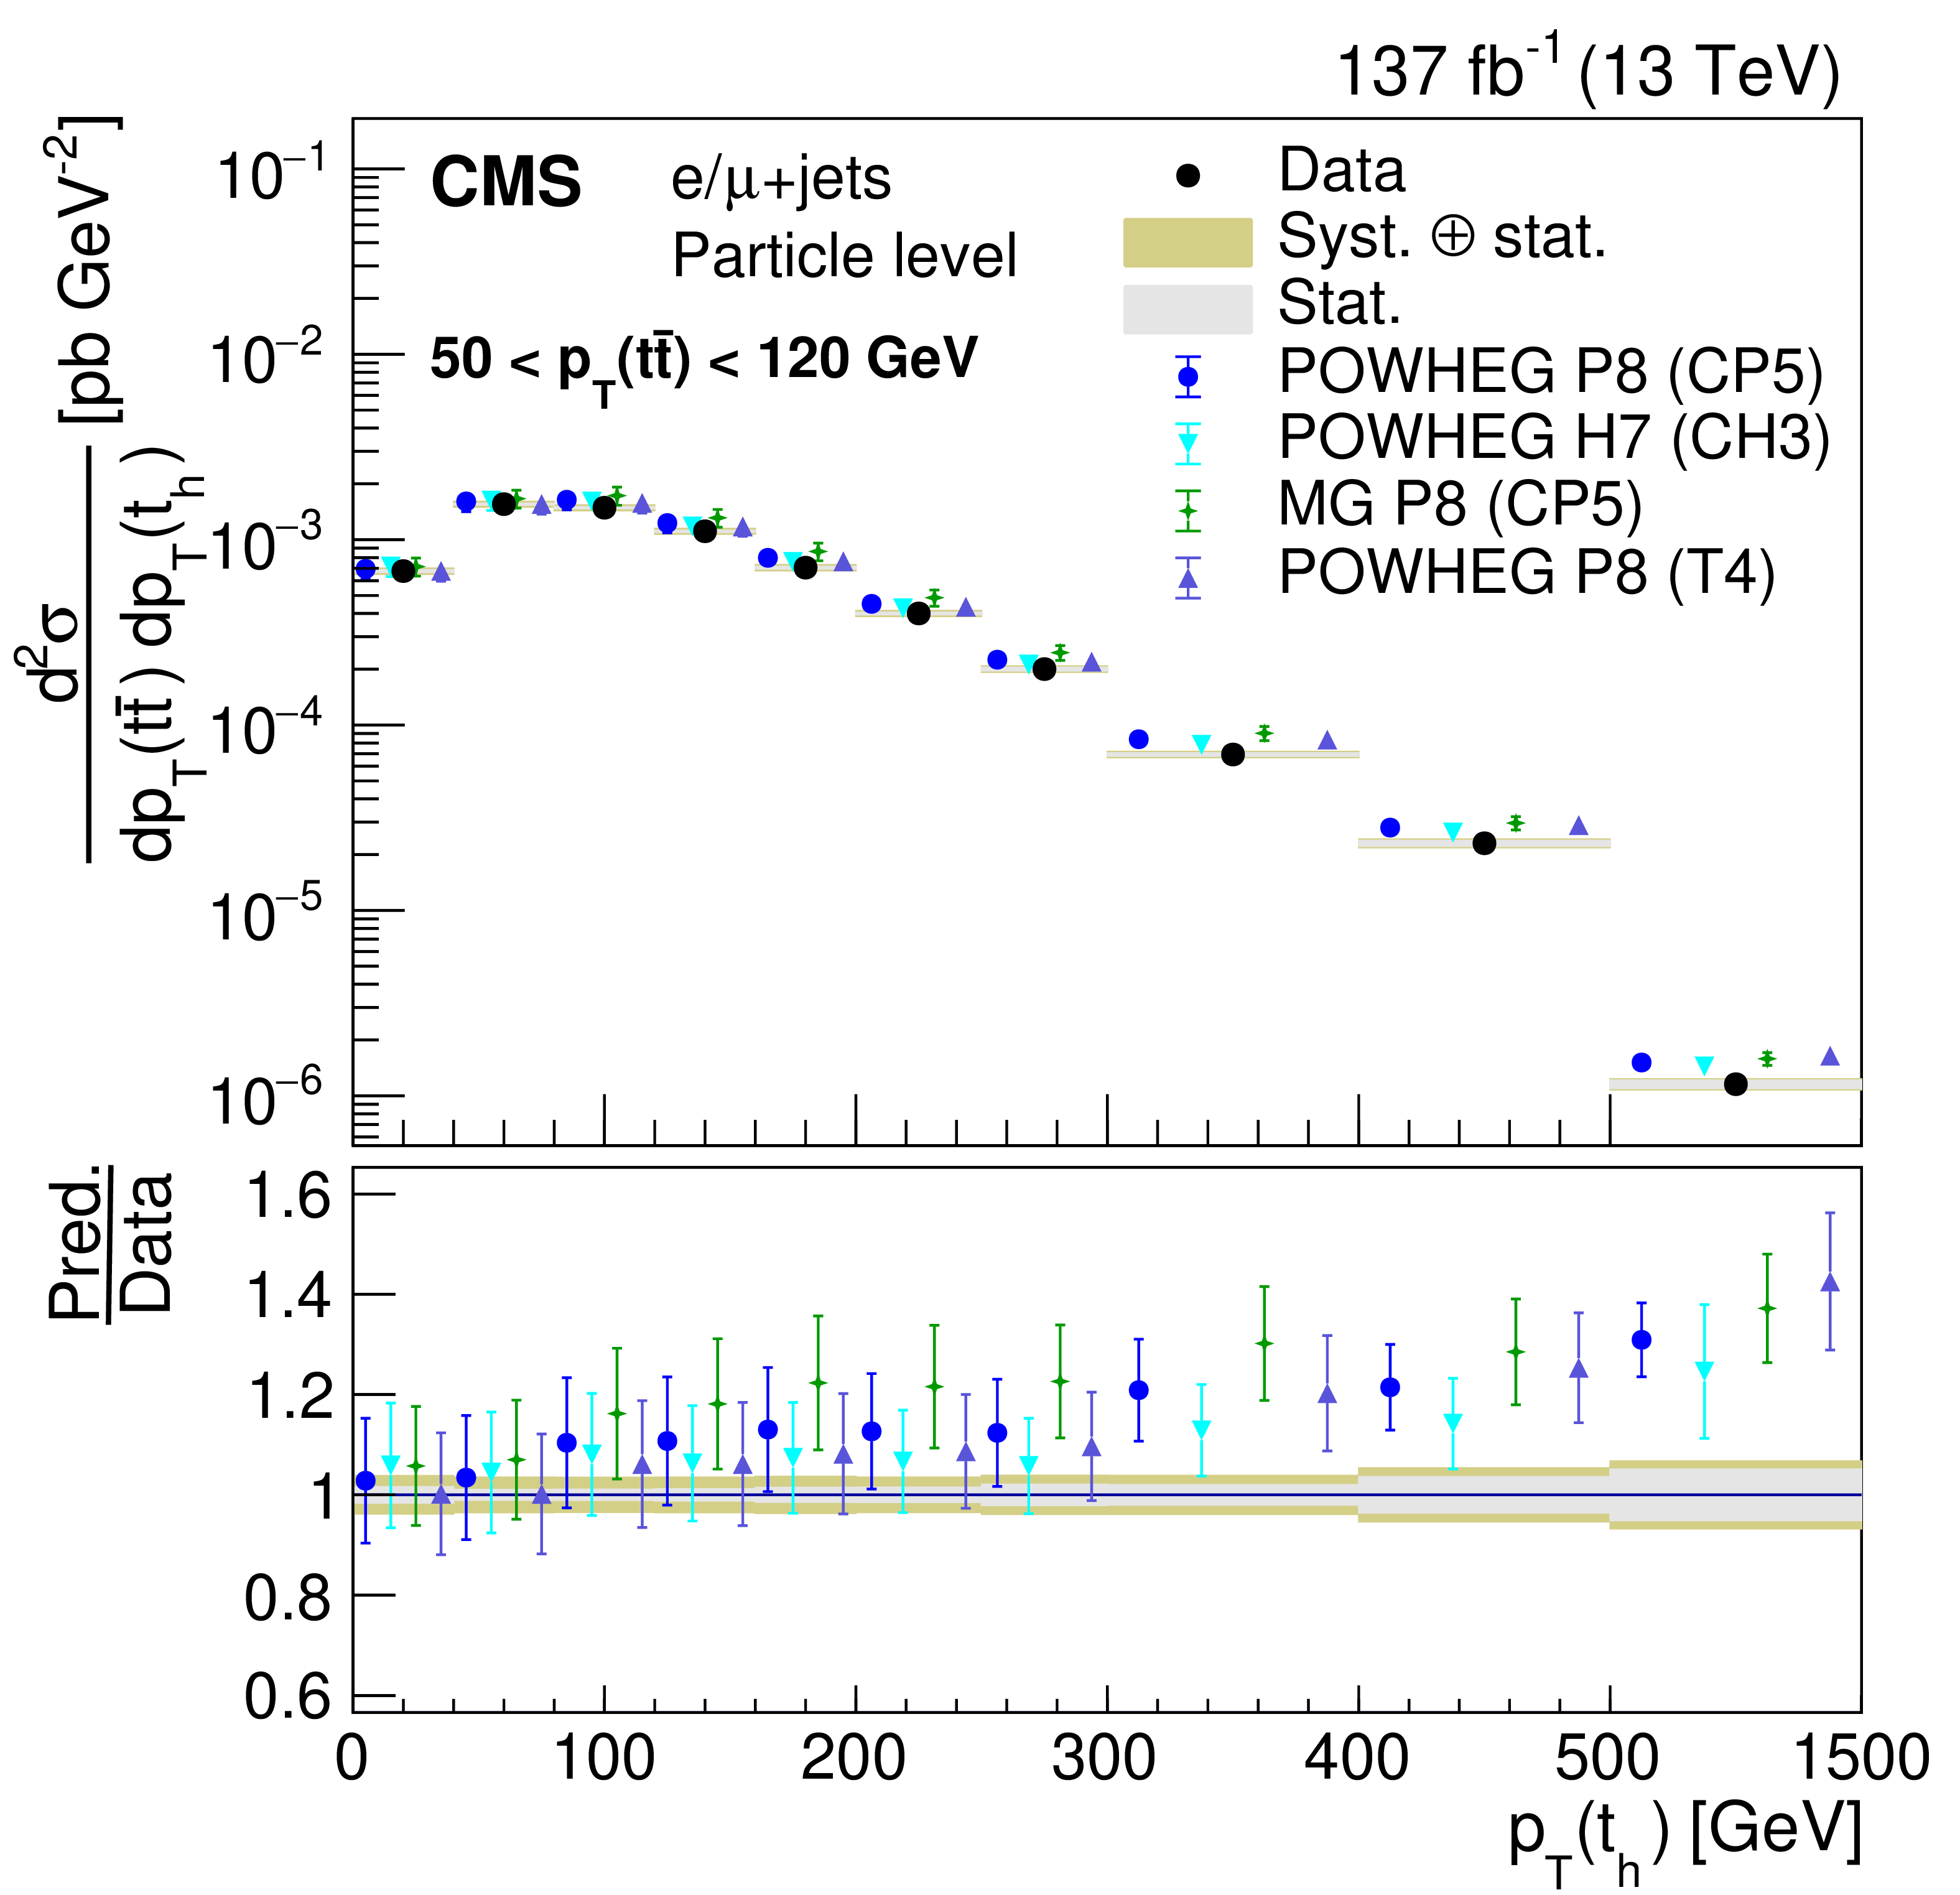
png pdf |
Figure 30-b:
Double-differential cross section at the particle level as a function of ${{p_{\mathrm {T}}} ({\mathrm{t} \mathrm{\bar{t}}})}$ vs. ${{p_{\mathrm {T}}} ({\mathrm{t} _\mathrm {h}})}$. The data are shown as points with gray (yellow) bands indicating the statistical (statistical and systematic) uncertainties. The cross sections are compared to the predictions of POWHEG+PYTHIA (P8) for the CP5 and CUETP8M2T4 (T4) tunes, POWHEG+HERWIG (H7), and the multiparton simulation MG5_aMC@NLO (MG)+PYTHIA. The ratios of the various predictions to the measured cross sections are shown in the lower panels. |
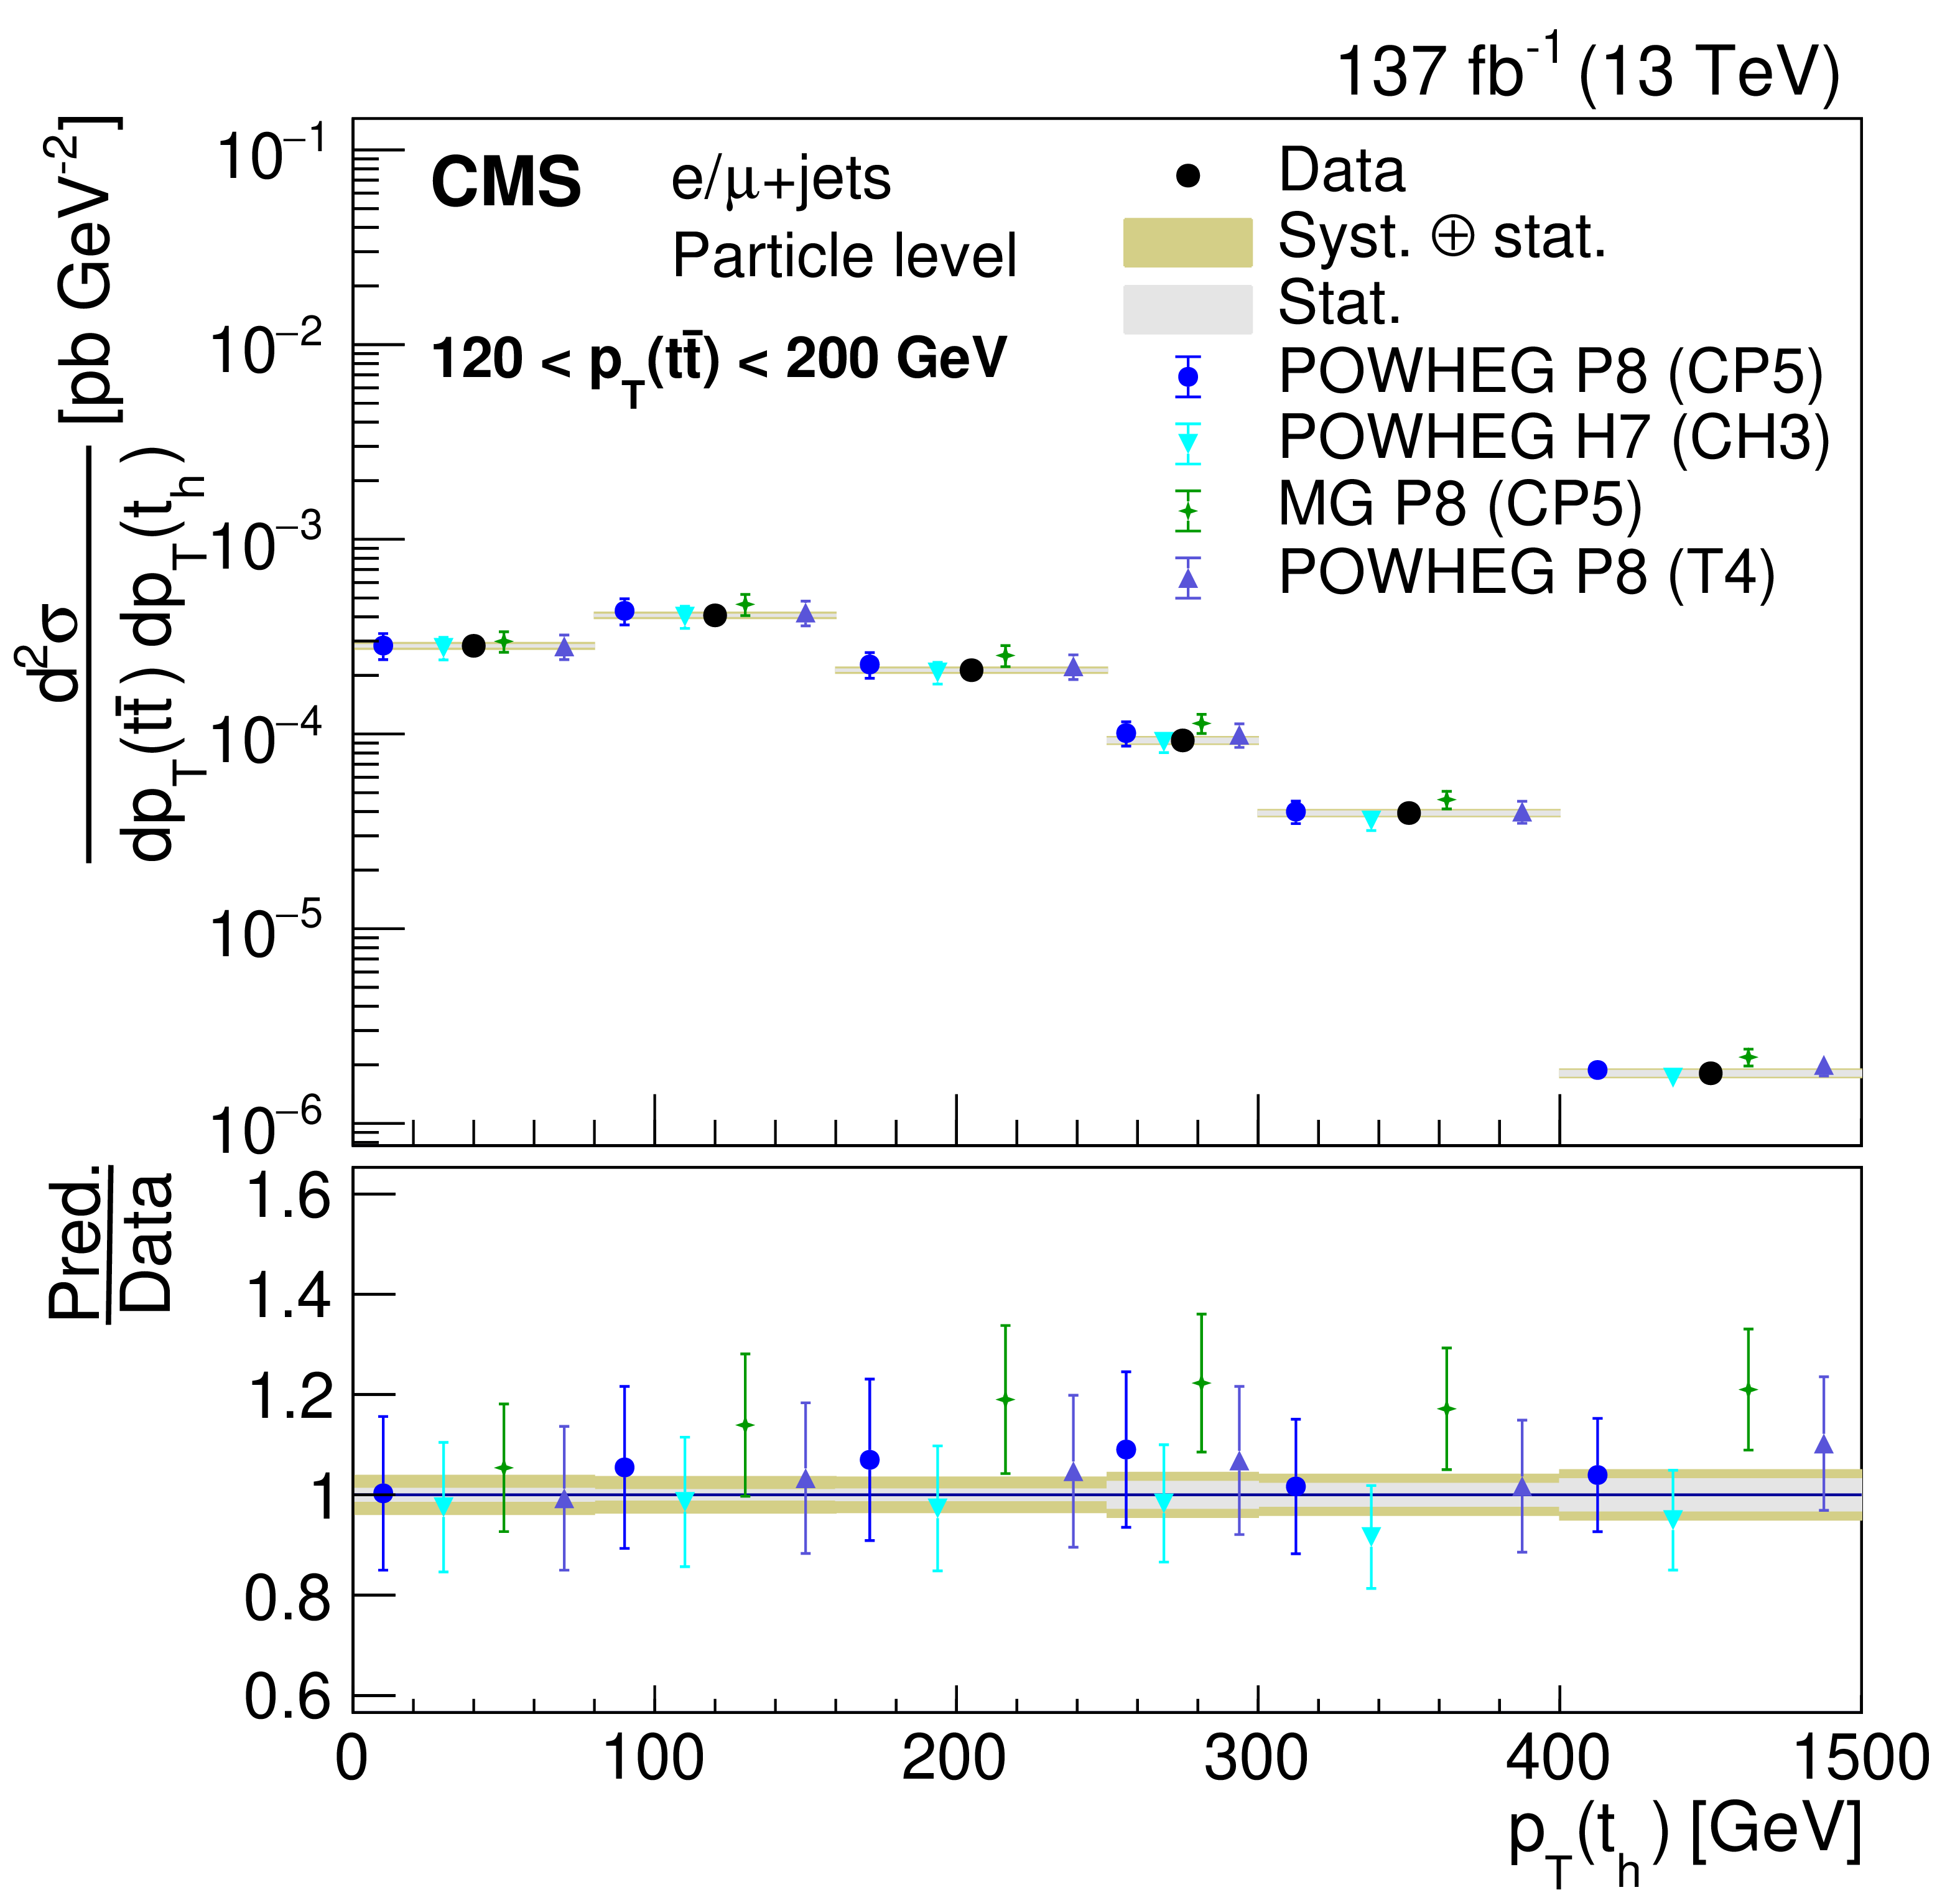
png pdf |
Figure 30-c:
Double-differential cross section at the particle level as a function of ${{p_{\mathrm {T}}} ({\mathrm{t} \mathrm{\bar{t}}})}$ vs. ${{p_{\mathrm {T}}} ({\mathrm{t} _\mathrm {h}})}$. The data are shown as points with gray (yellow) bands indicating the statistical (statistical and systematic) uncertainties. The cross sections are compared to the predictions of POWHEG+PYTHIA (P8) for the CP5 and CUETP8M2T4 (T4) tunes, POWHEG+HERWIG (H7), and the multiparton simulation MG5_aMC@NLO (MG)+PYTHIA. The ratios of the various predictions to the measured cross sections are shown in the lower panels. |
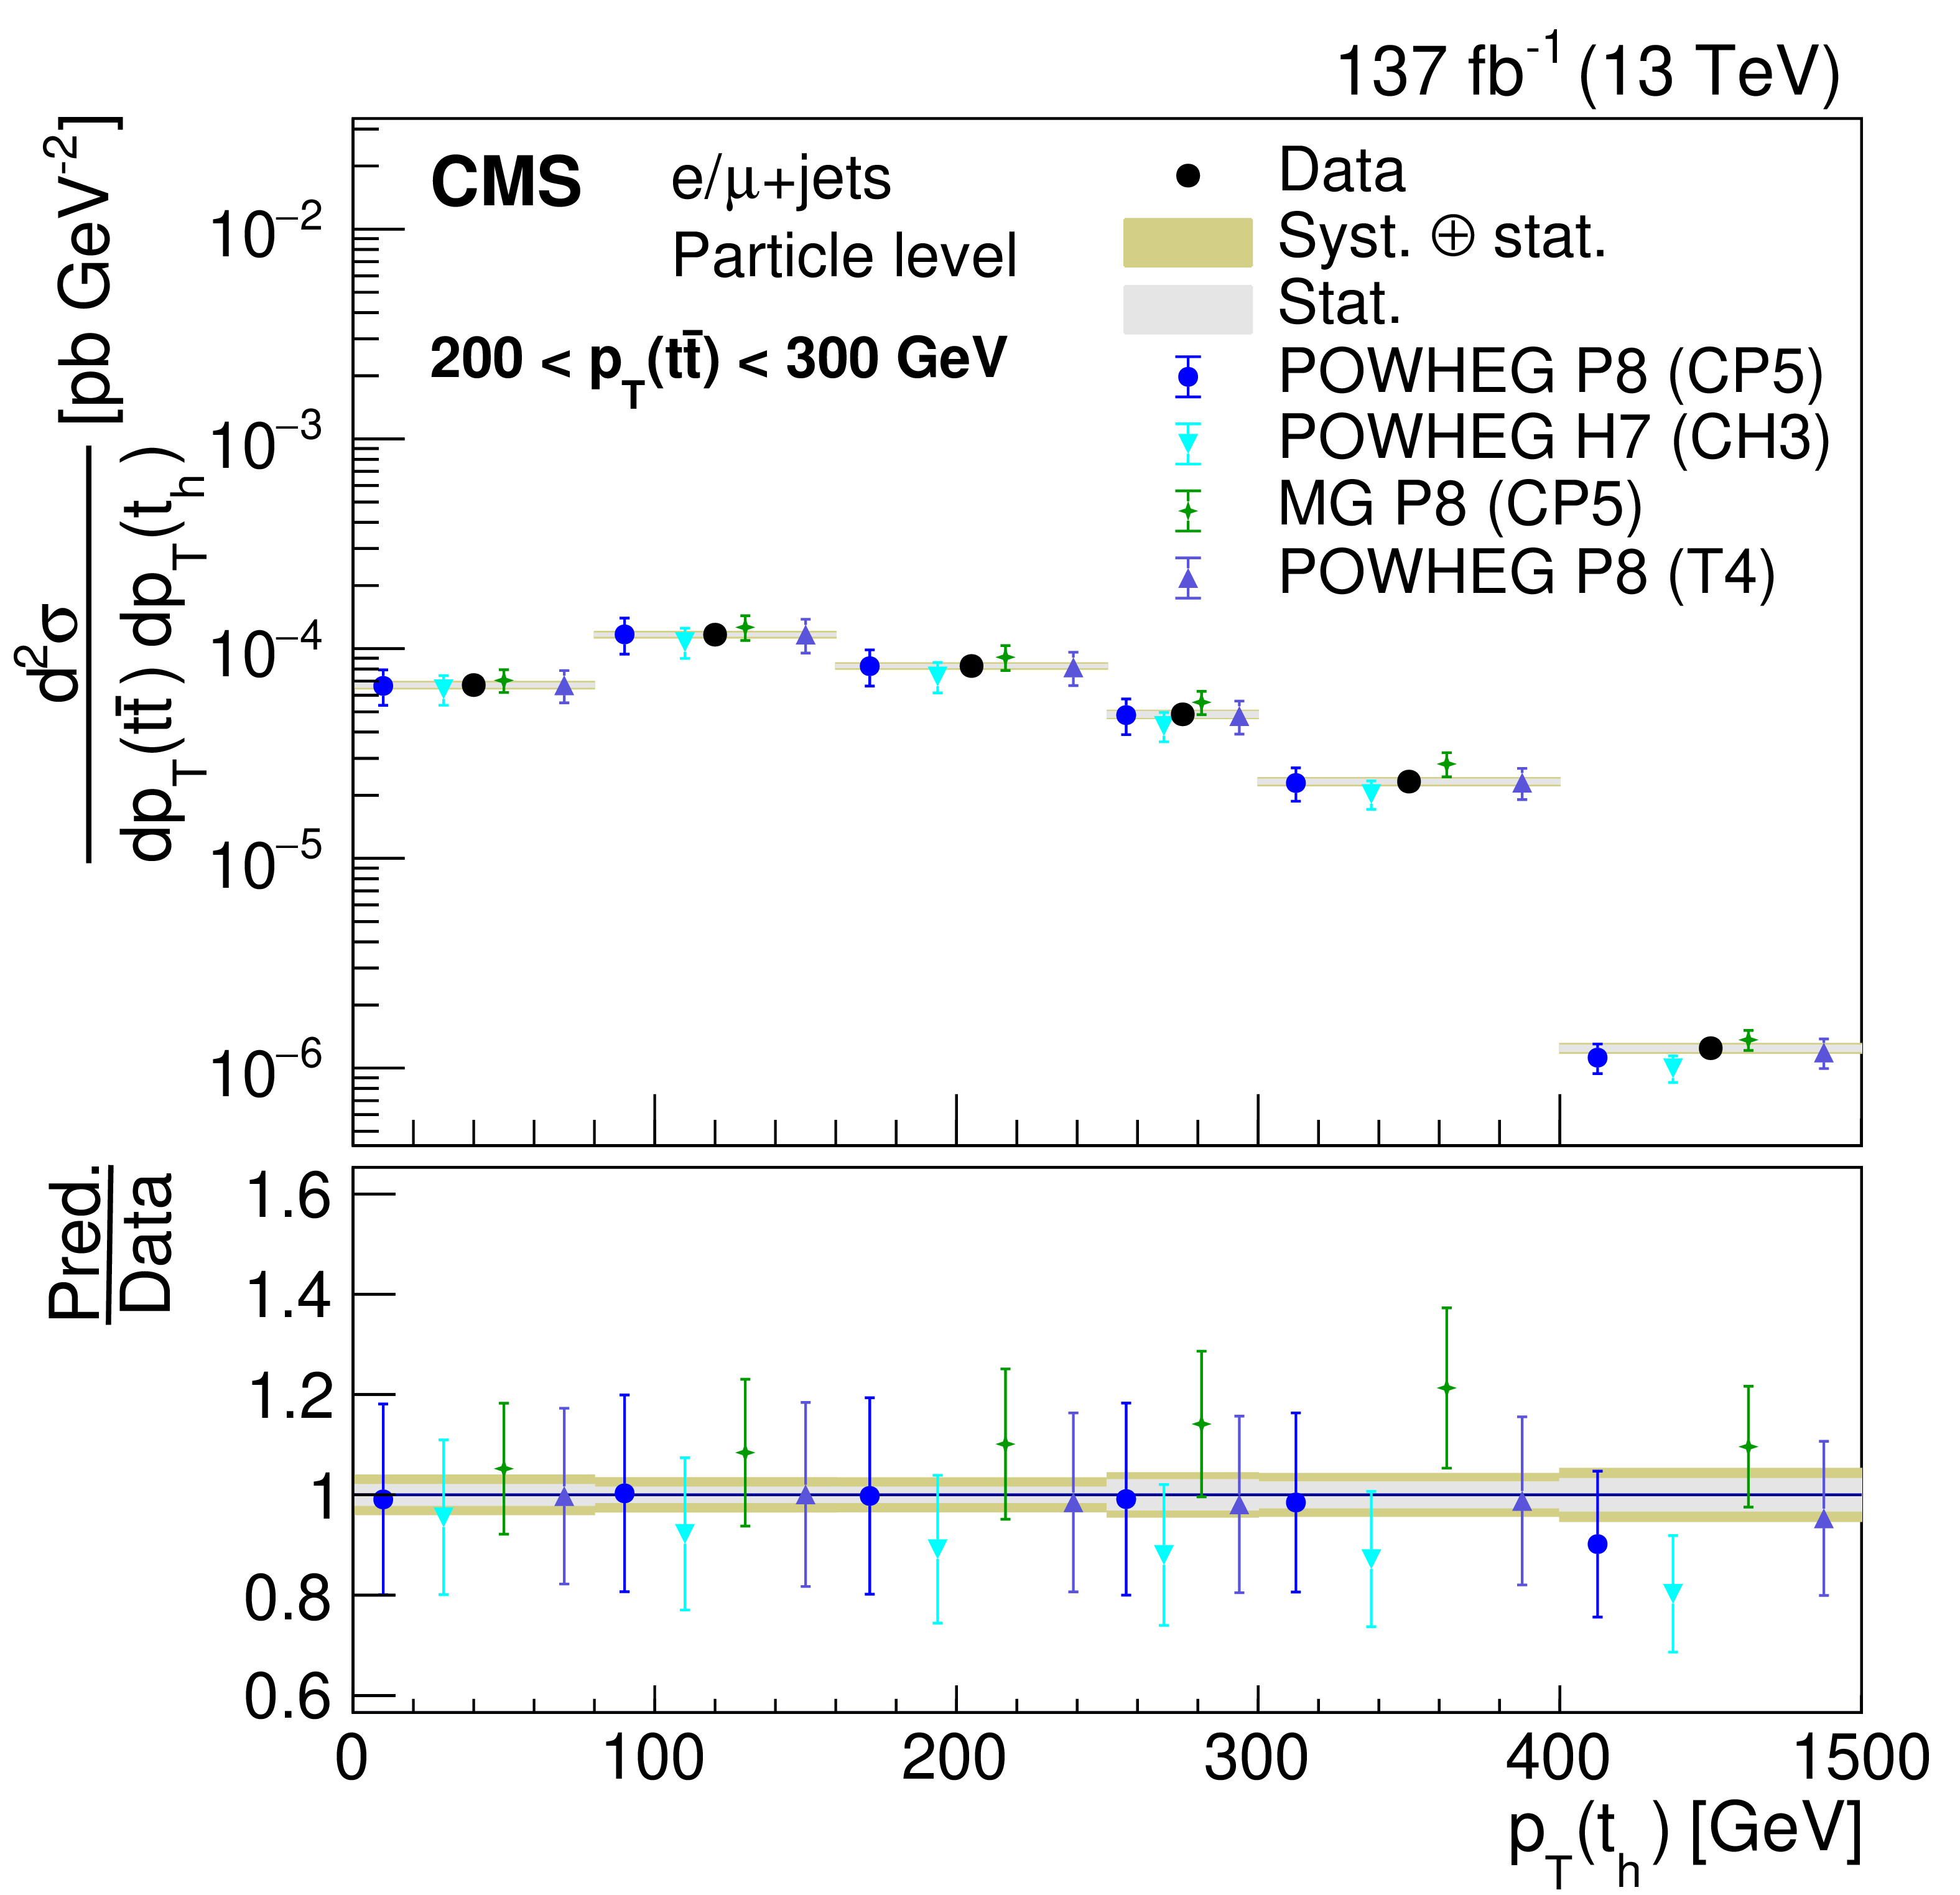
png pdf |
Figure 30-d:
Double-differential cross section at the particle level as a function of ${{p_{\mathrm {T}}} ({\mathrm{t} \mathrm{\bar{t}}})}$ vs. ${{p_{\mathrm {T}}} ({\mathrm{t} _\mathrm {h}})}$. The data are shown as points with gray (yellow) bands indicating the statistical (statistical and systematic) uncertainties. The cross sections are compared to the predictions of POWHEG+PYTHIA (P8) for the CP5 and CUETP8M2T4 (T4) tunes, POWHEG+HERWIG (H7), and the multiparton simulation MG5_aMC@NLO (MG)+PYTHIA. The ratios of the various predictions to the measured cross sections are shown in the lower panels. |
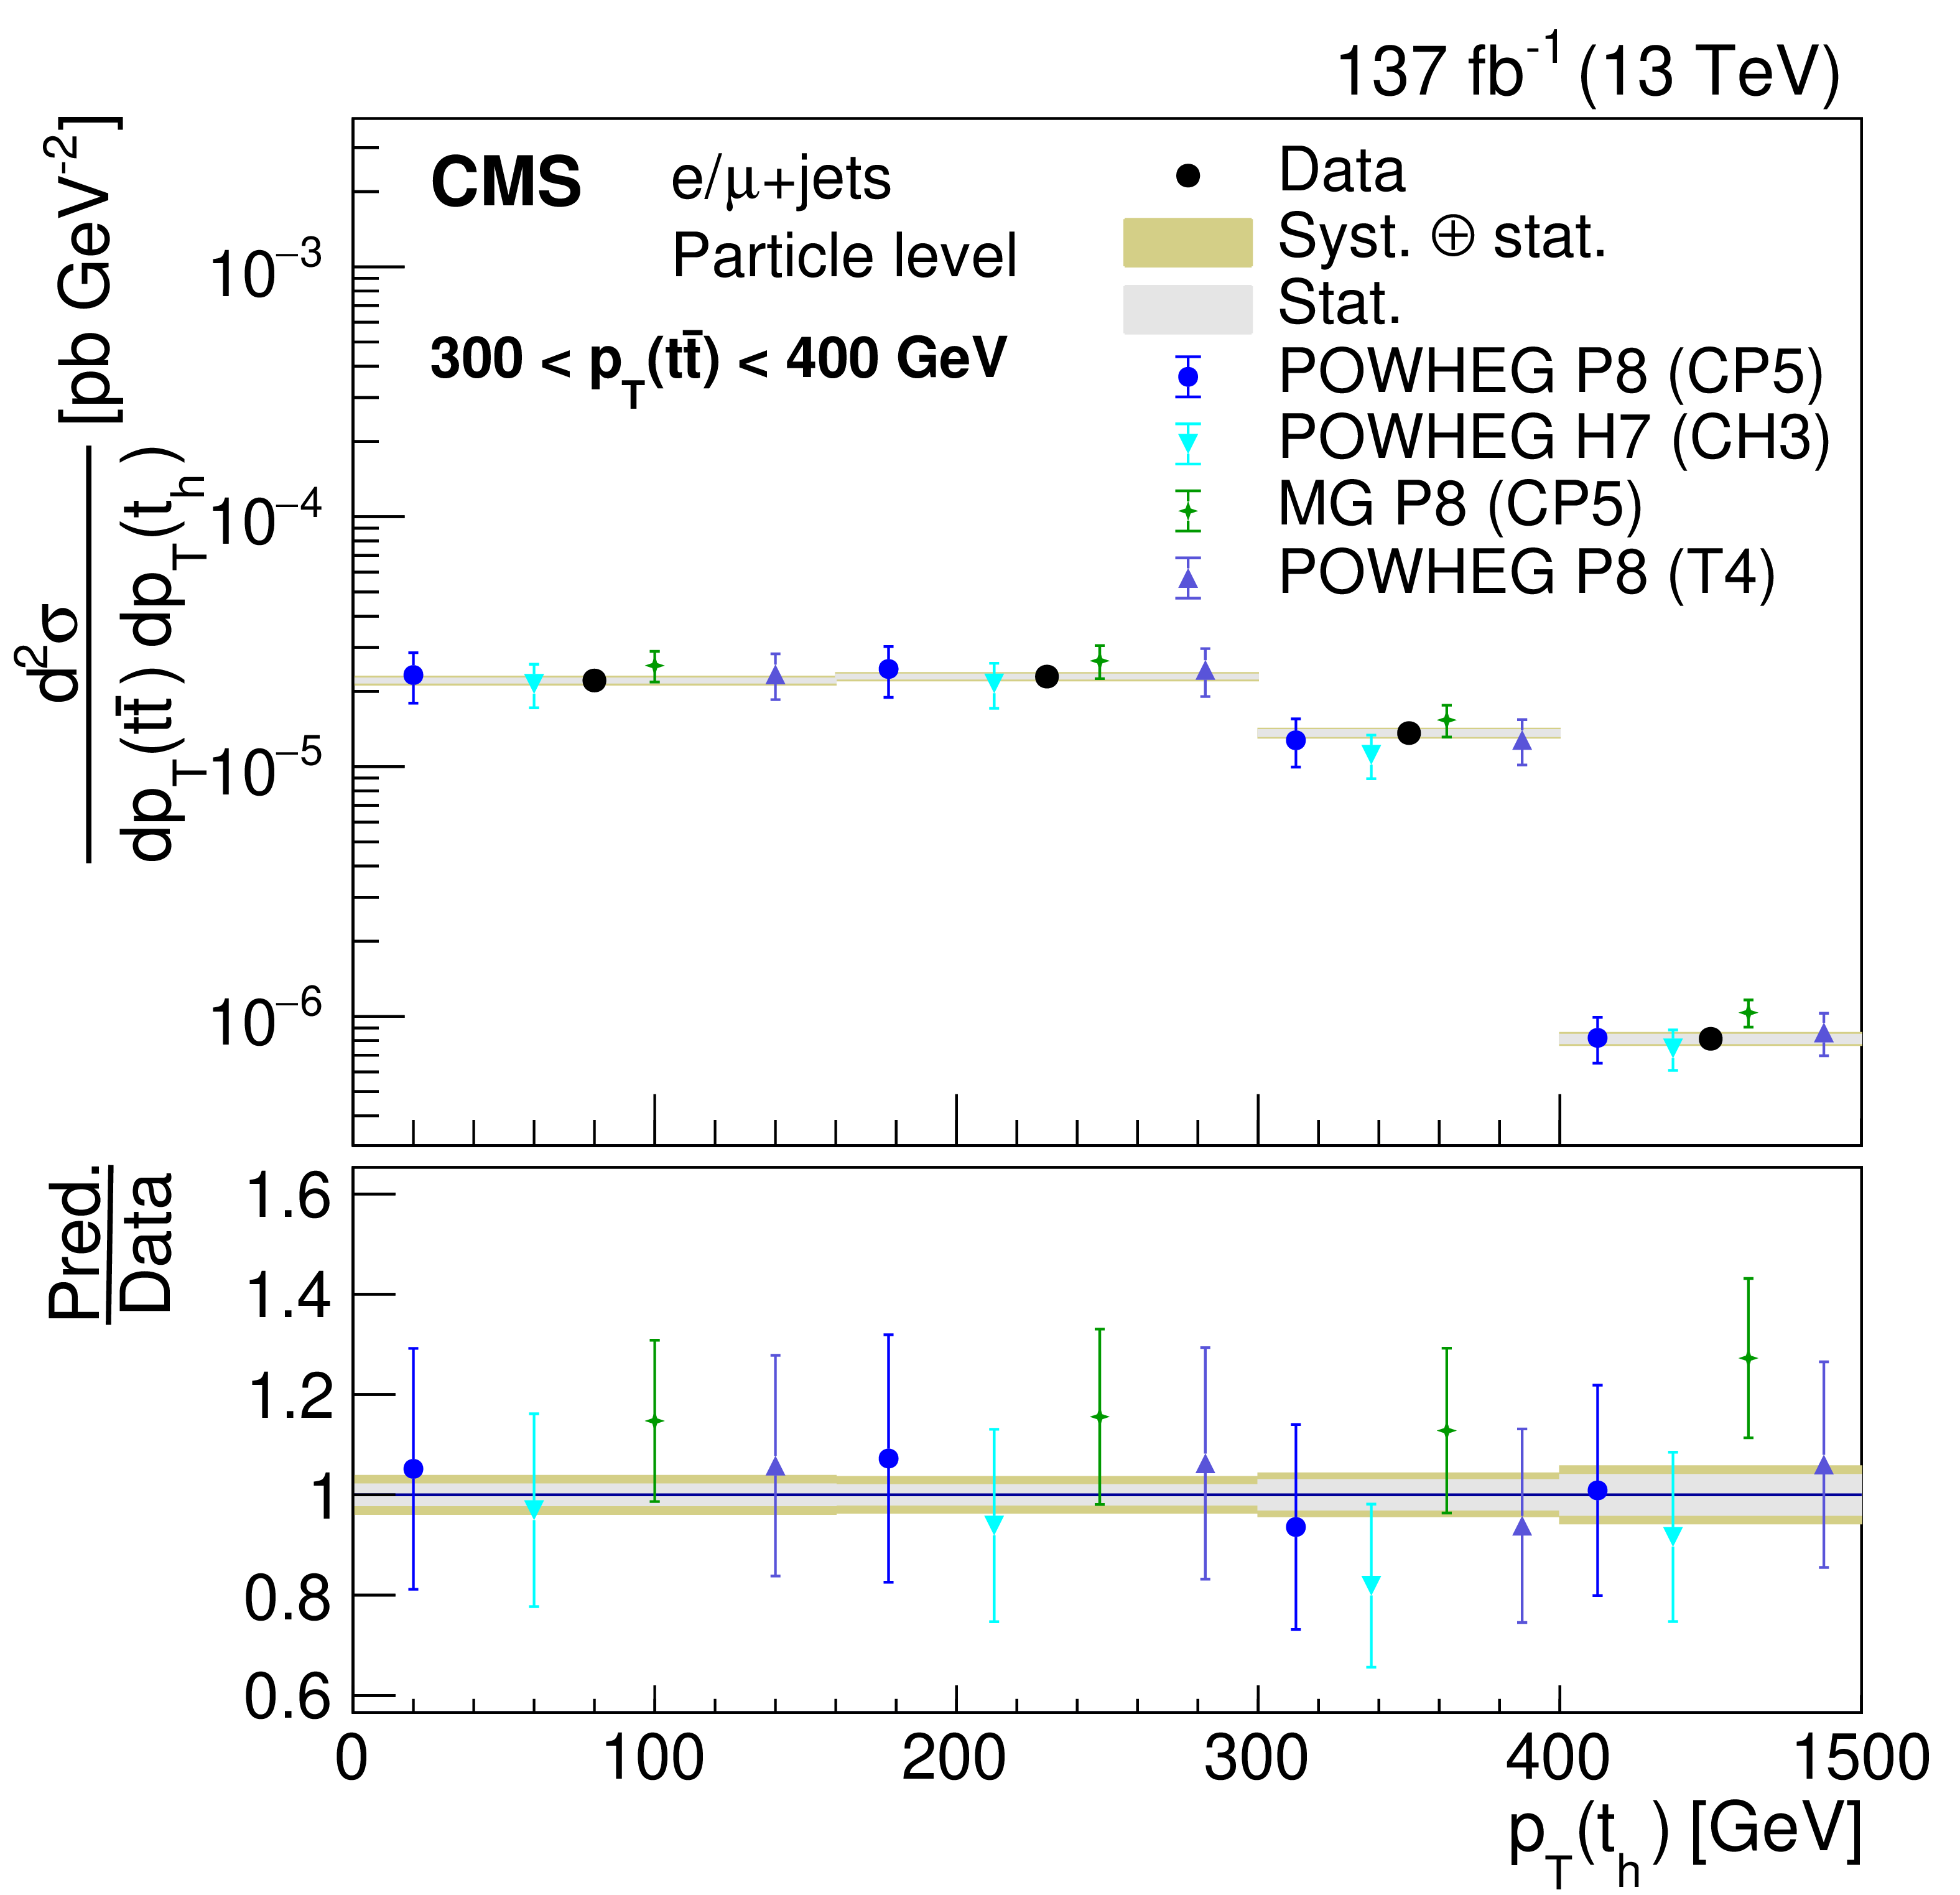
png pdf |
Figure 30-e:
Double-differential cross section at the particle level as a function of ${{p_{\mathrm {T}}} ({\mathrm{t} \mathrm{\bar{t}}})}$ vs. ${{p_{\mathrm {T}}} ({\mathrm{t} _\mathrm {h}})}$. The data are shown as points with gray (yellow) bands indicating the statistical (statistical and systematic) uncertainties. The cross sections are compared to the predictions of POWHEG+PYTHIA (P8) for the CP5 and CUETP8M2T4 (T4) tunes, POWHEG+HERWIG (H7), and the multiparton simulation MG5_aMC@NLO (MG)+PYTHIA. The ratios of the various predictions to the measured cross sections are shown in the lower panels. |
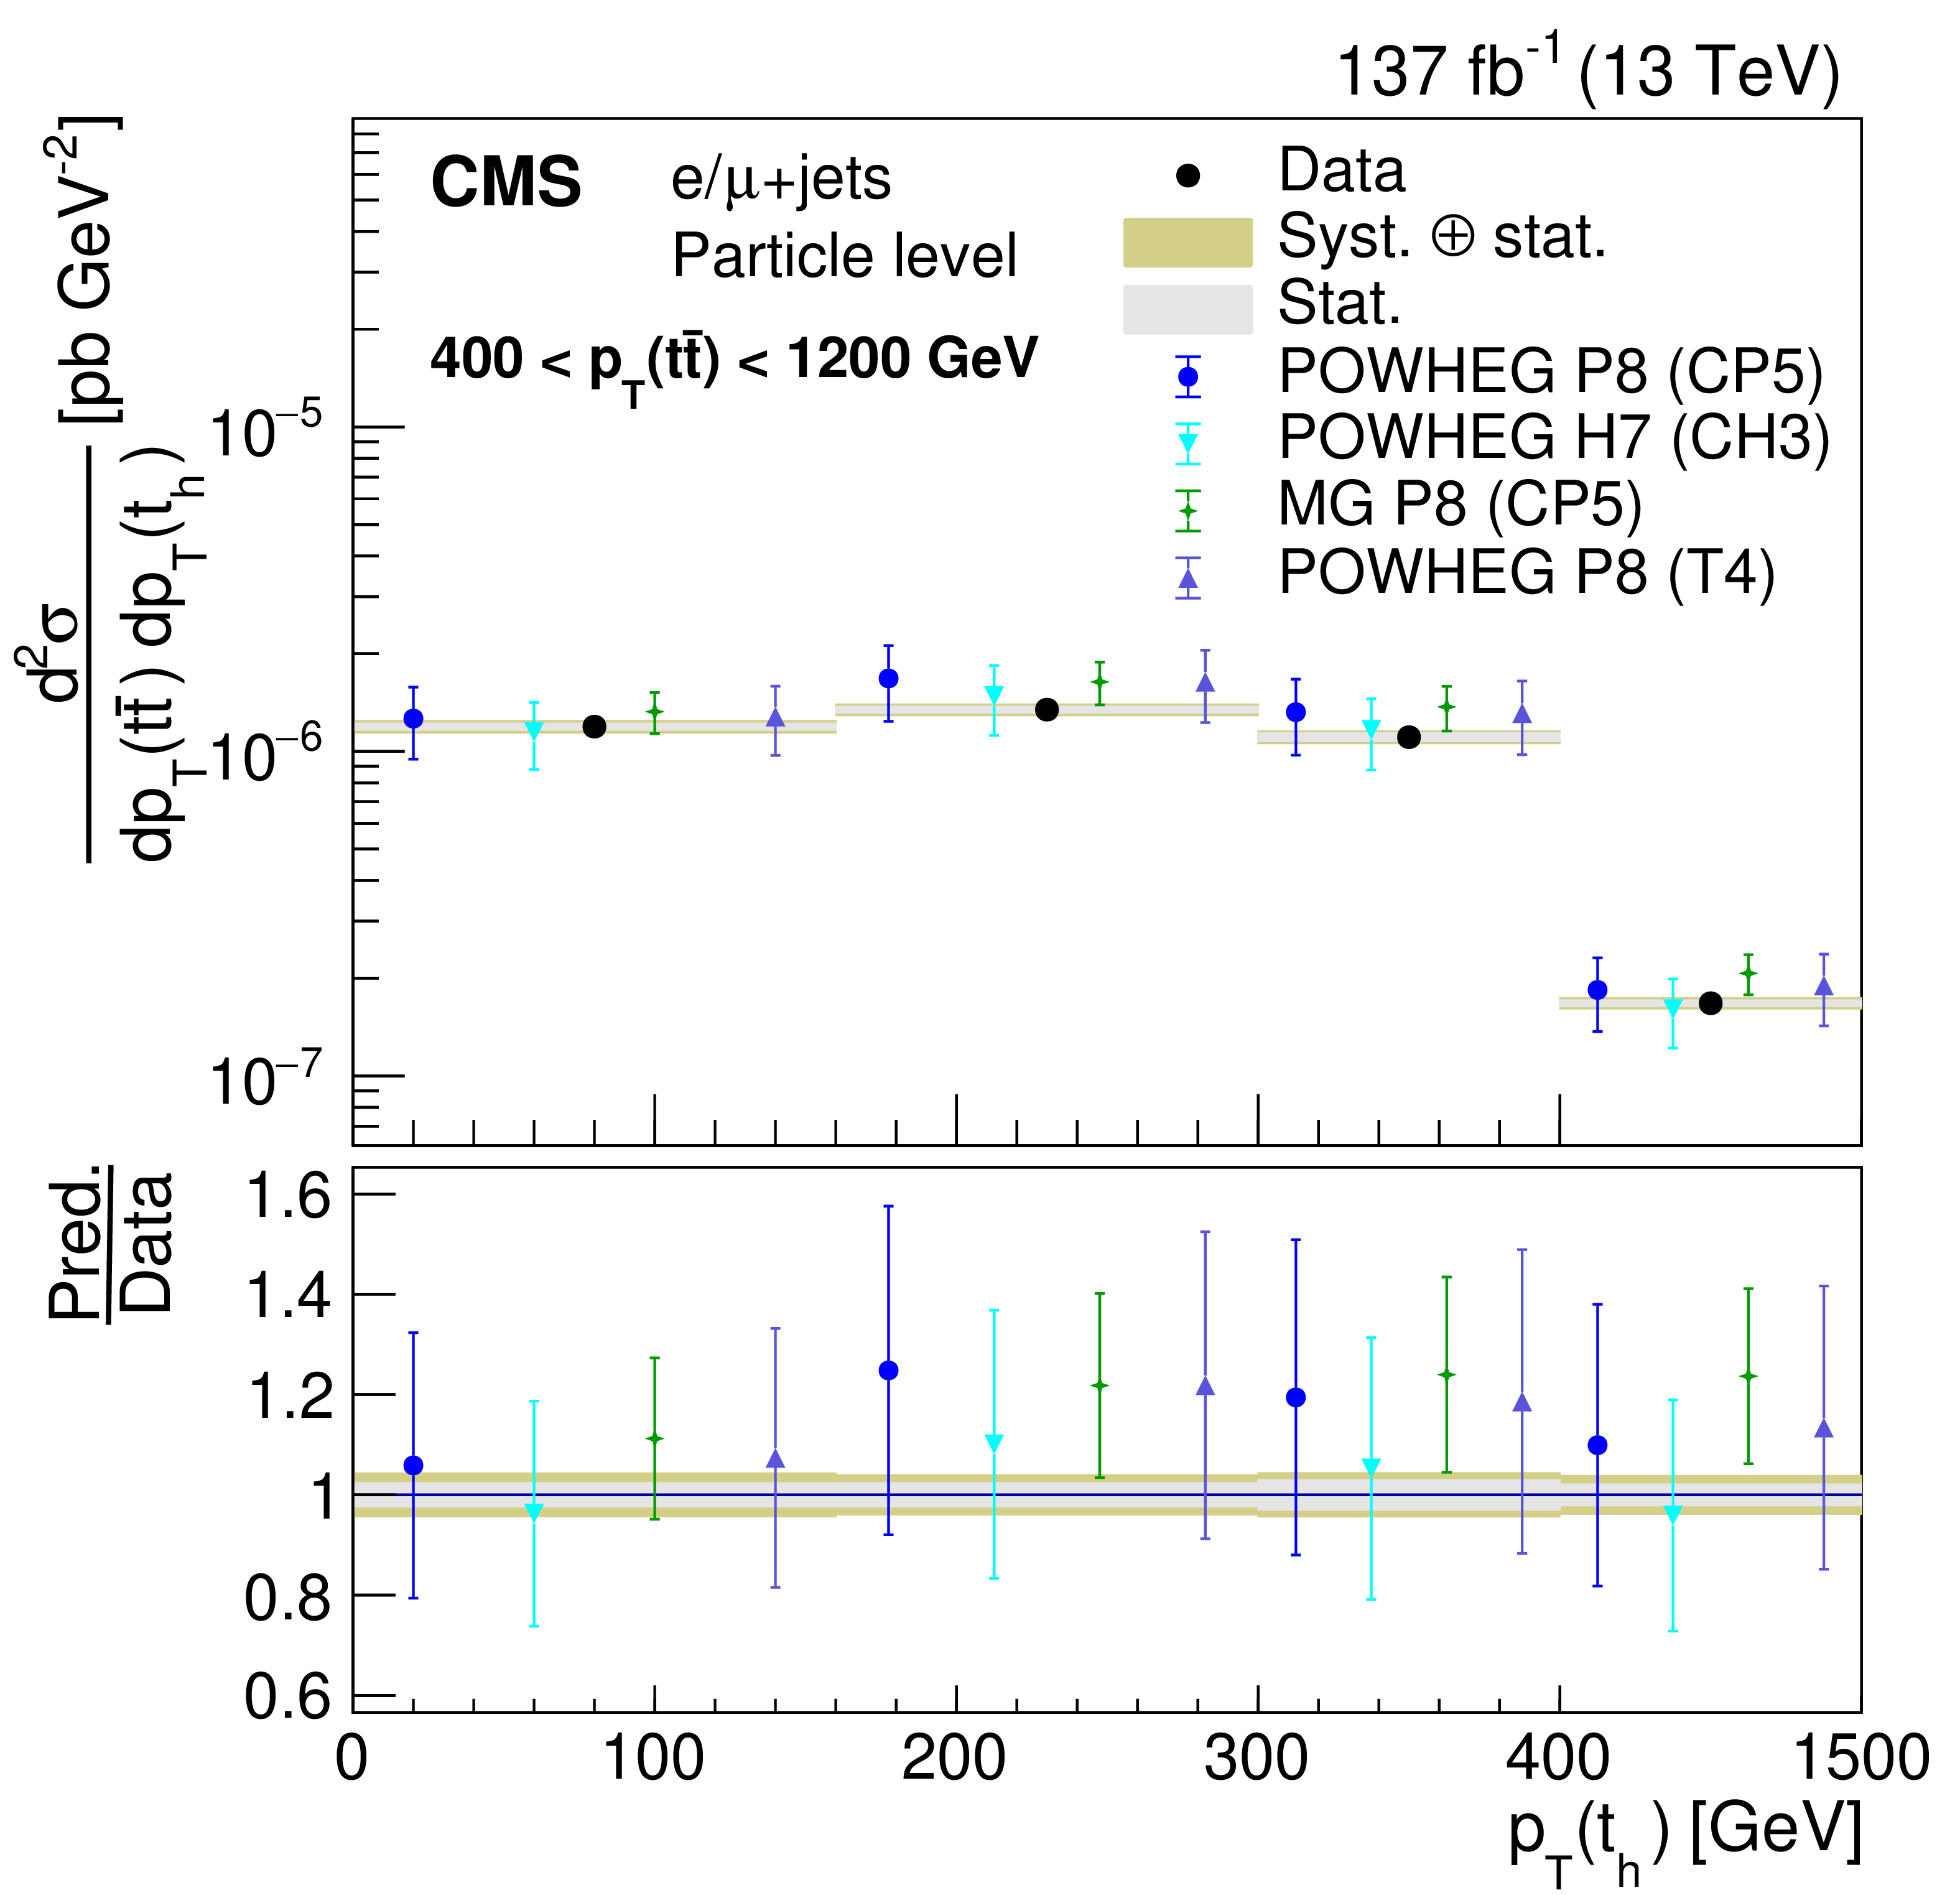
png pdf |
Figure 30-f:
Double-differential cross section at the particle level as a function of ${{p_{\mathrm {T}}} ({\mathrm{t} \mathrm{\bar{t}}})}$ vs. ${{p_{\mathrm {T}}} ({\mathrm{t} _\mathrm {h}})}$. The data are shown as points with gray (yellow) bands indicating the statistical (statistical and systematic) uncertainties. The cross sections are compared to the predictions of POWHEG+PYTHIA (P8) for the CP5 and CUETP8M2T4 (T4) tunes, POWHEG+HERWIG (H7), and the multiparton simulation MG5_aMC@NLO (MG)+PYTHIA. The ratios of the various predictions to the measured cross sections are shown in the lower panels. |
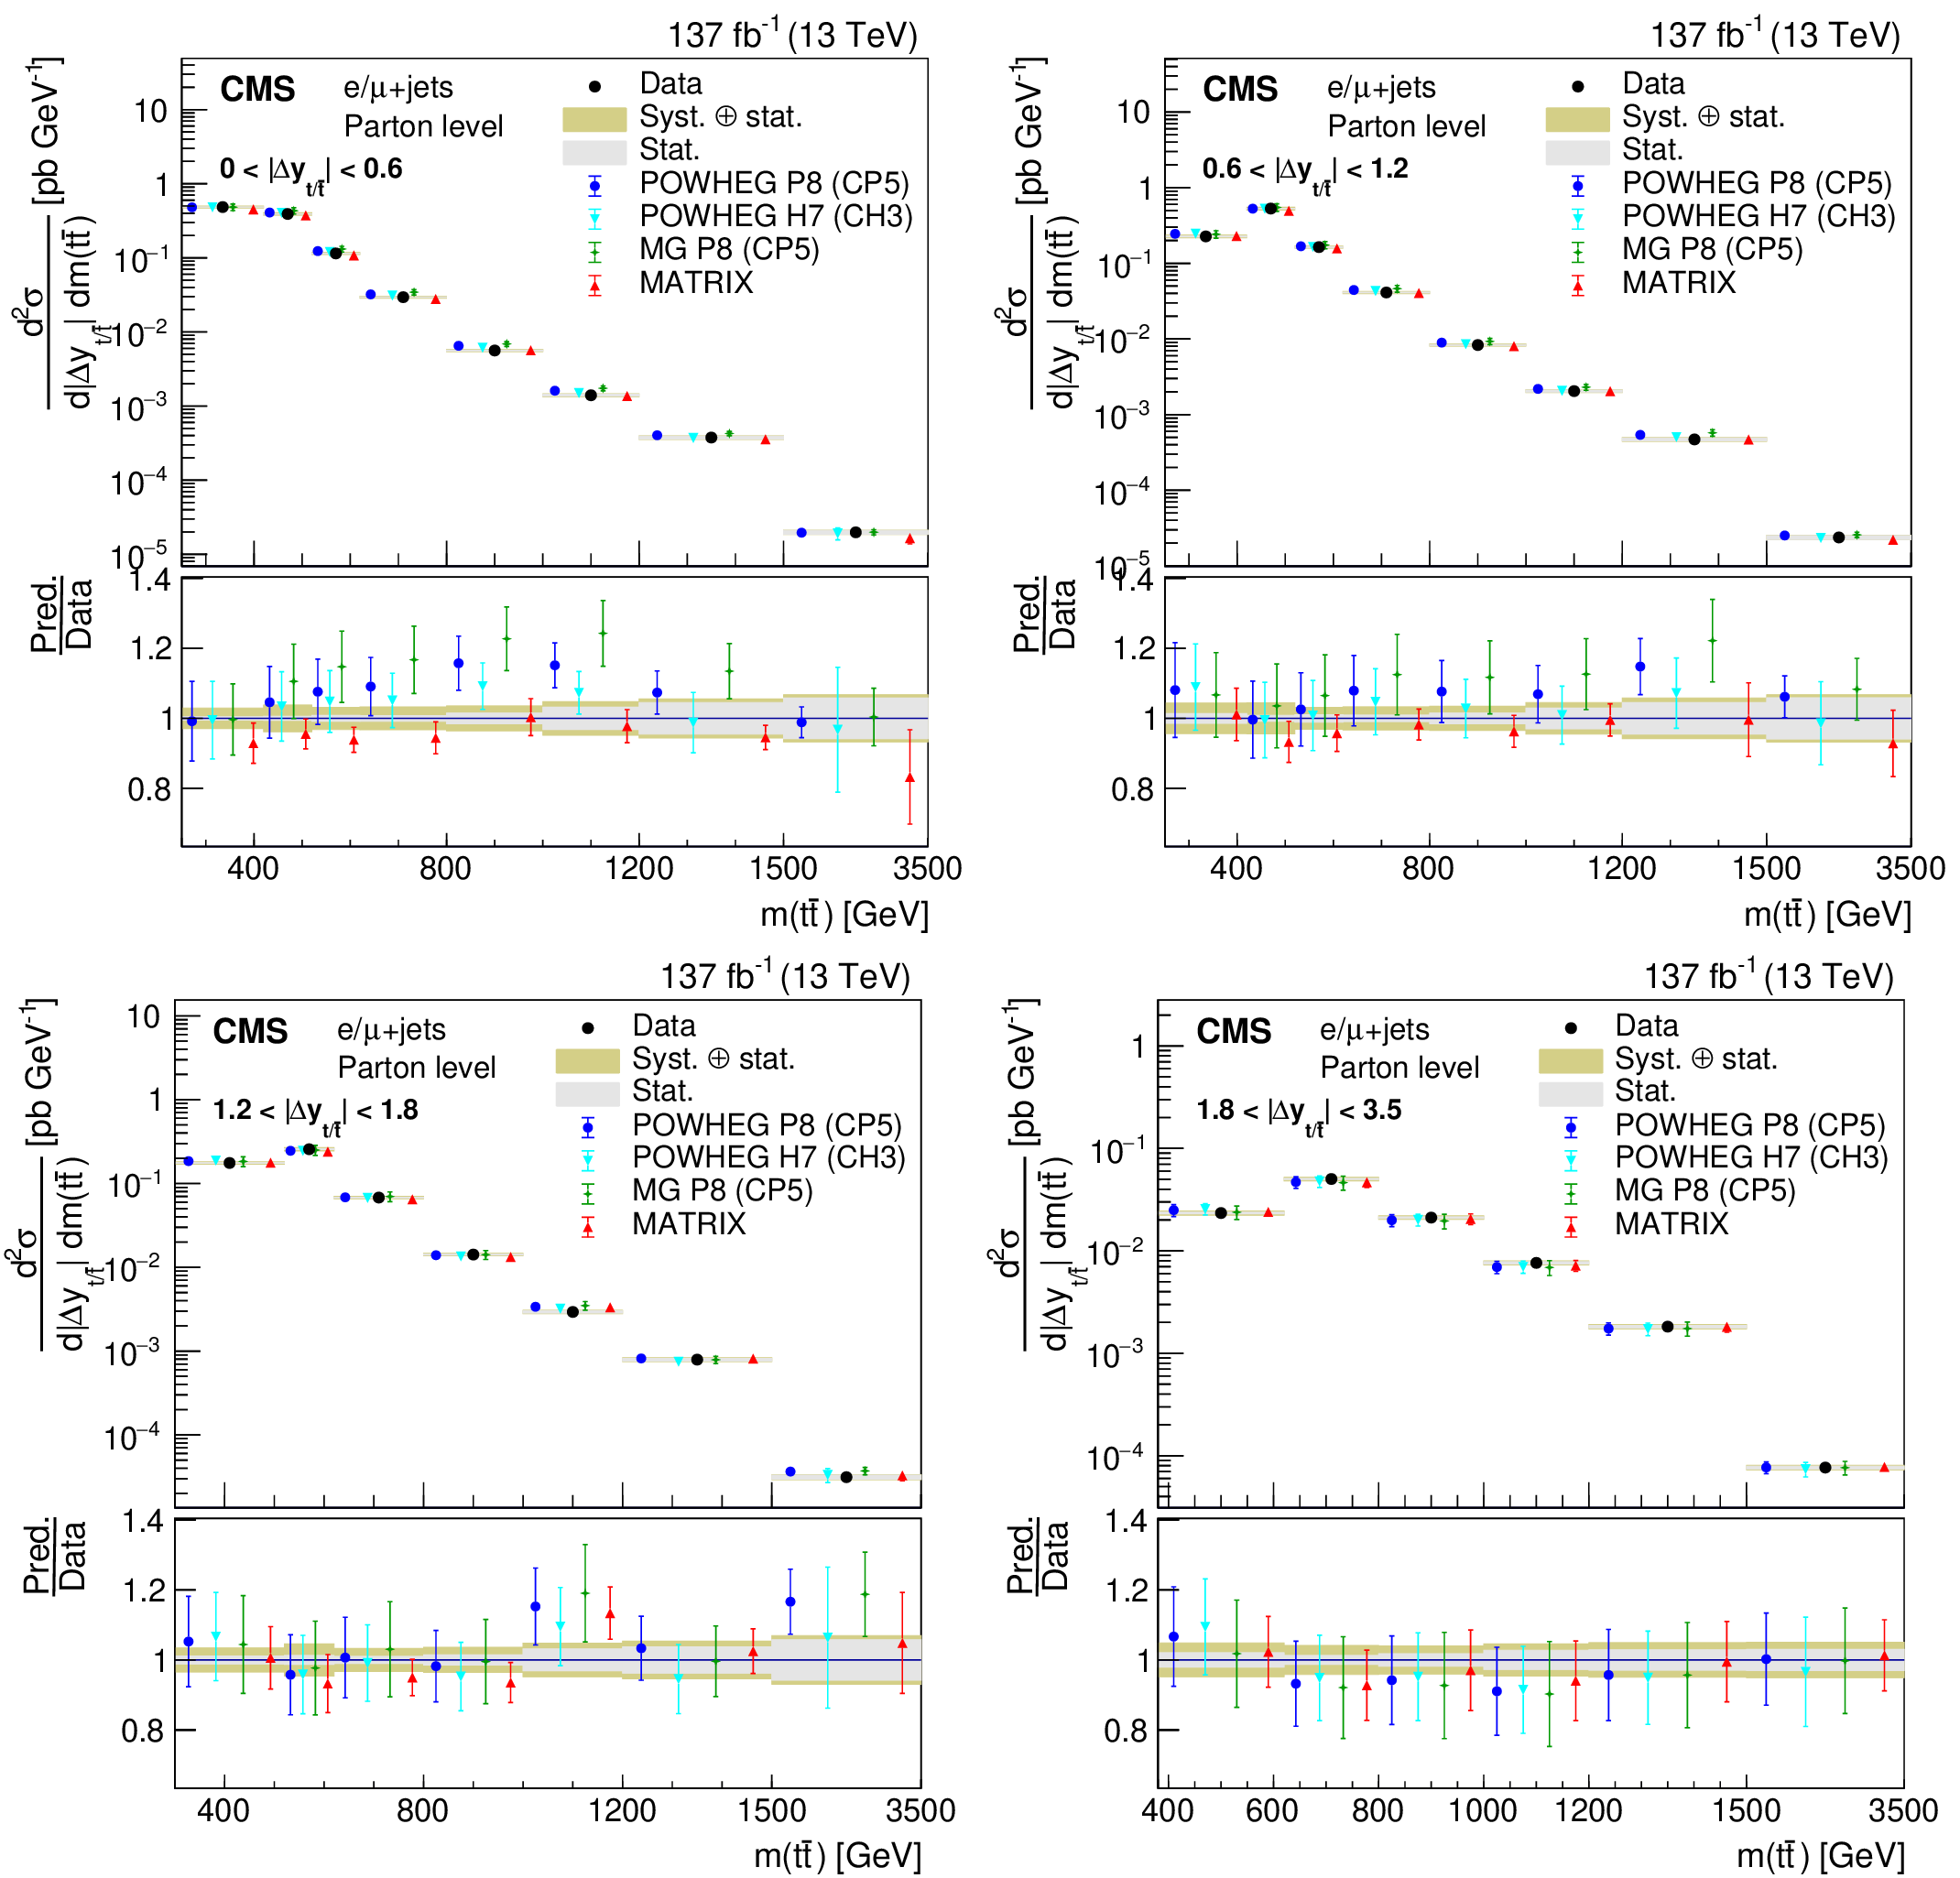
png pdf |
Figure 31:
Double-differential cross section at the parton level as a function of ${{| \Delta y_{\mathrm{t} /\mathrm{\bar{t}}} |}}$ vs. ${m({\mathrm{t} \mathrm{\bar{t}}})}$. The data are shown as points with gray (yellow) bands indicating the statistical (statistical and systematic) uncertainties. The cross sections are compared to the predictions of POWHEG combined with PYTHIA (P8) or HERWIG (H7), the multiparton simulation MG5_aMC@NLO (MG)+PYTHIA FxFx, and the NNLO QCD calculations obtained with Matrix. The ratios of the various predictions to the measured cross sections are shown in the lower panels. |
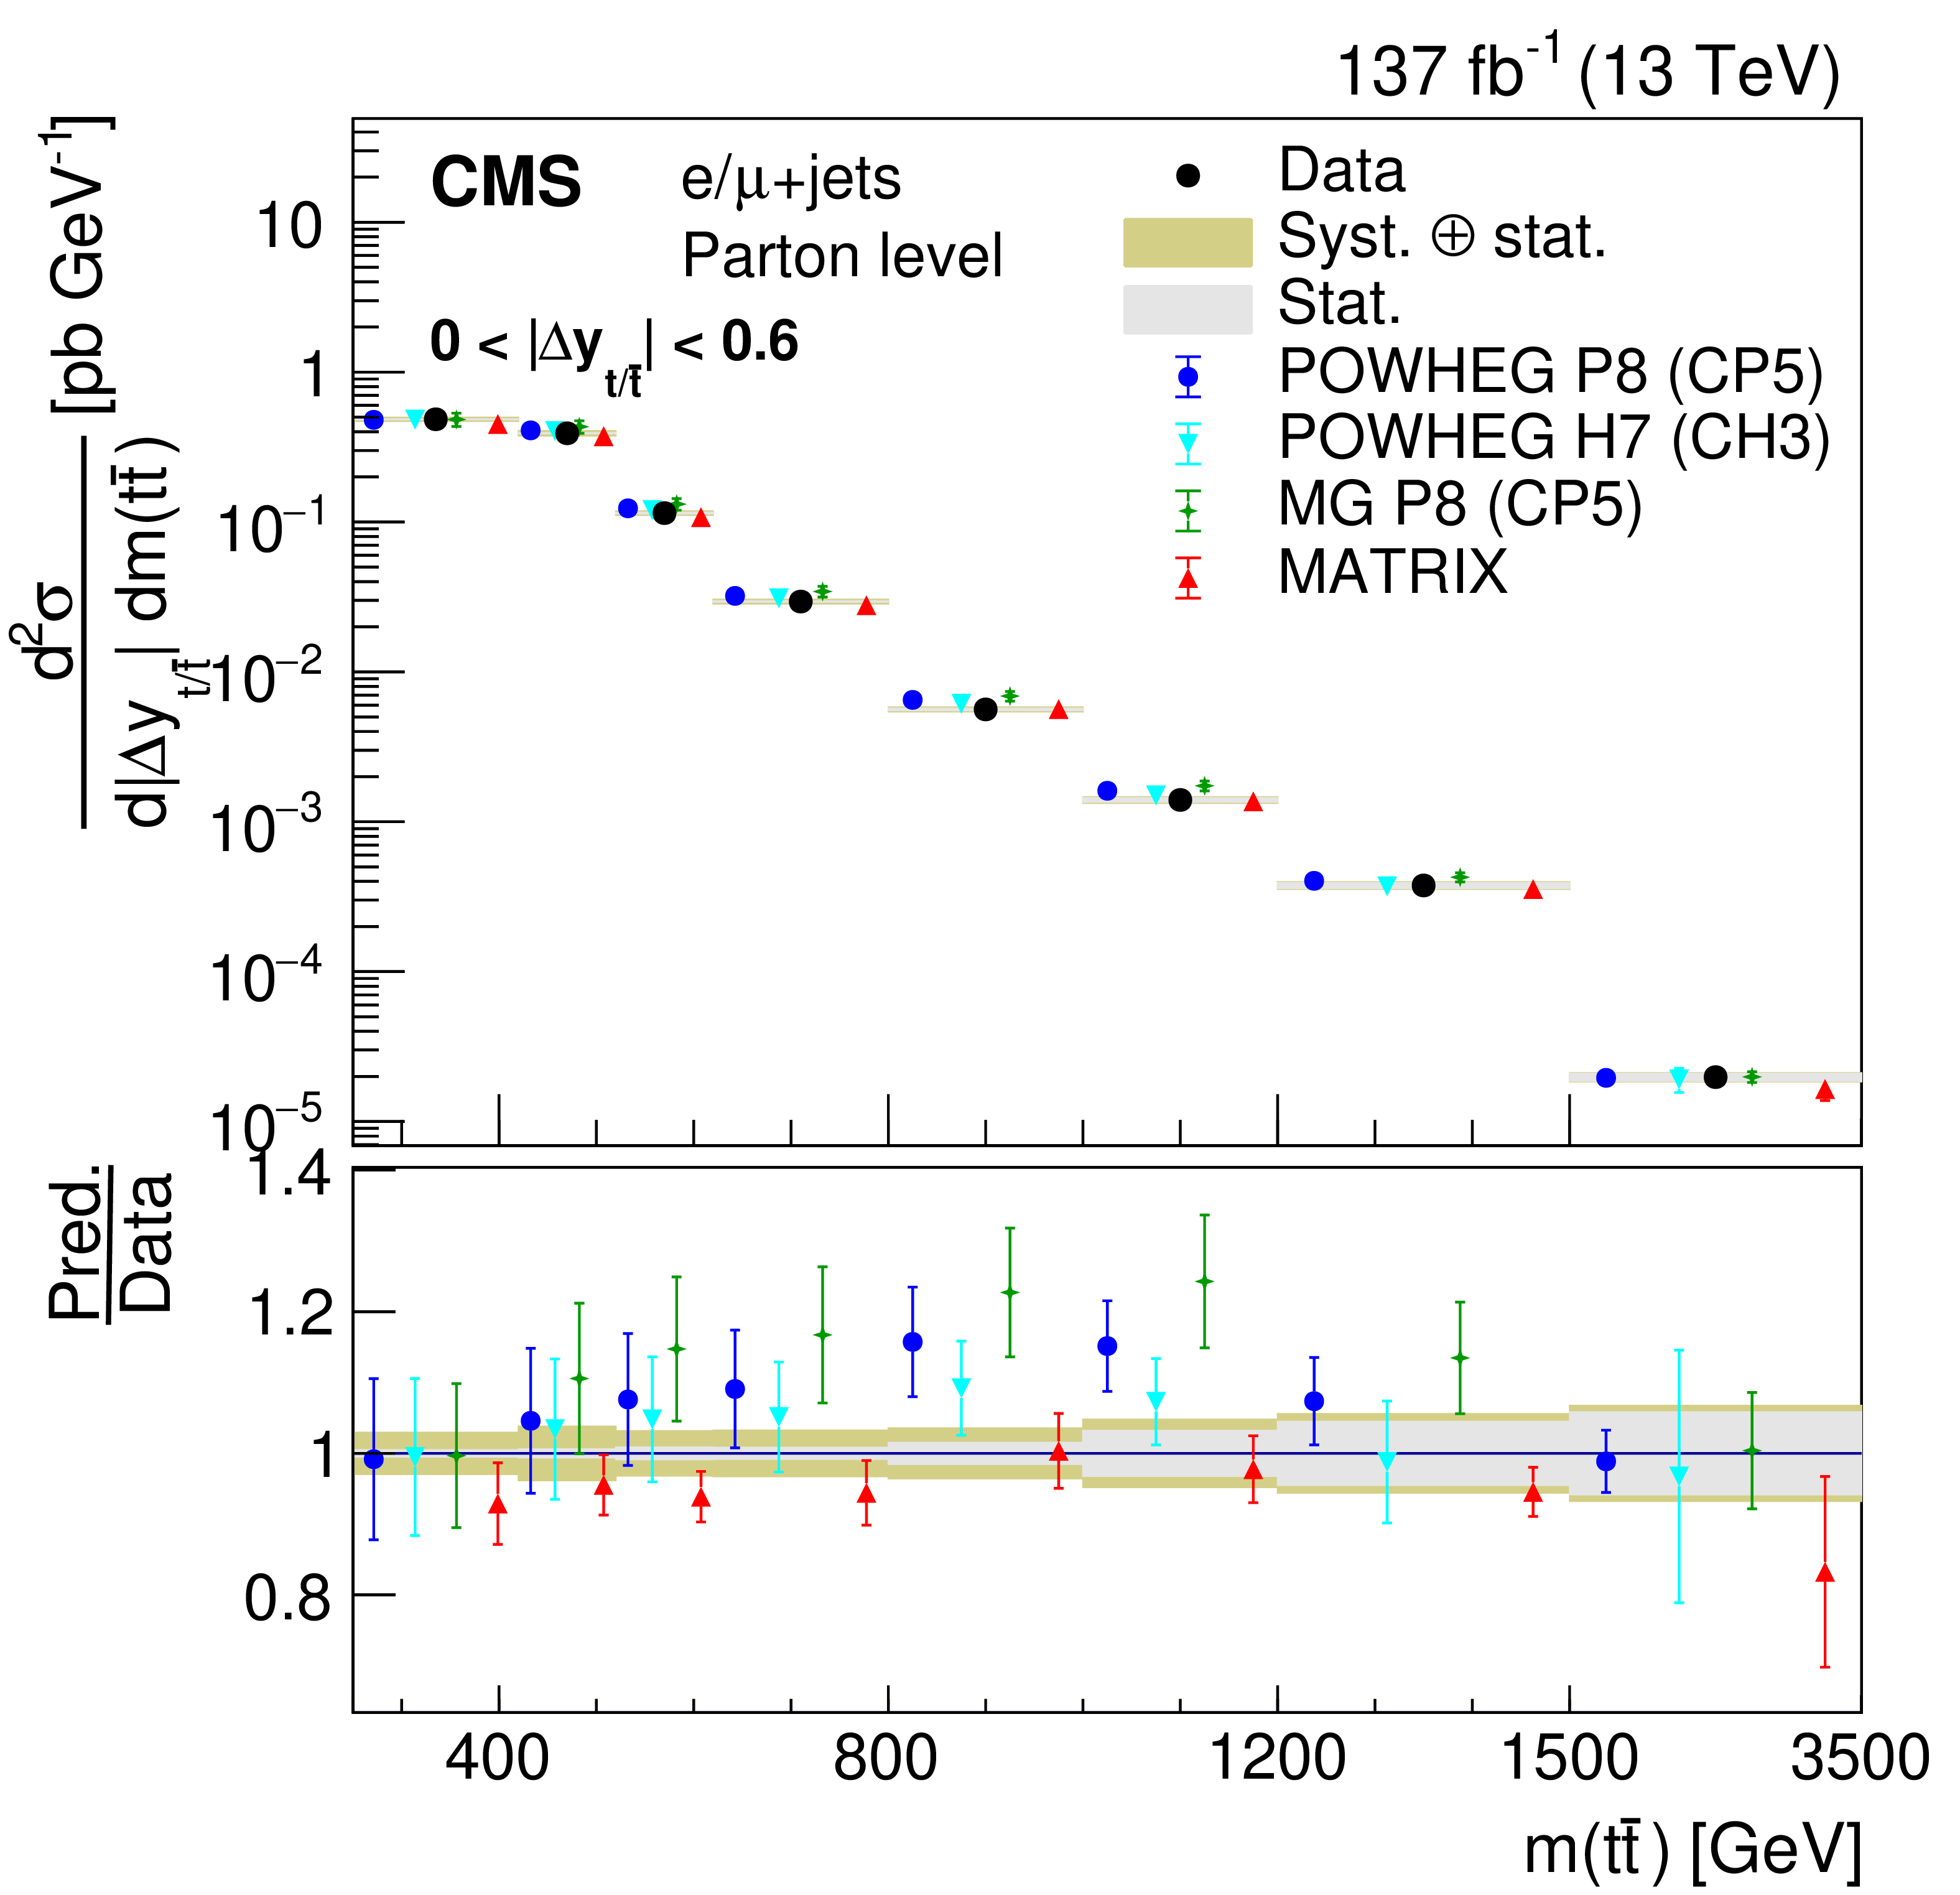
png pdf |
Figure 31-a:
Double-differential cross section at the parton level as a function of ${{| \Delta y_{\mathrm{t} /\mathrm{\bar{t}}} |}}$ vs. ${m({\mathrm{t} \mathrm{\bar{t}}})}$. The data are shown as points with gray (yellow) bands indicating the statistical (statistical and systematic) uncertainties. The cross sections are compared to the predictions of POWHEG combined with PYTHIA (P8) or HERWIG (H7), the multiparton simulation MG5_aMC@NLO (MG)+PYTHIA FxFx, and the NNLO QCD calculations obtained with Matrix. The ratios of the various predictions to the measured cross sections are shown in the lower panels. |
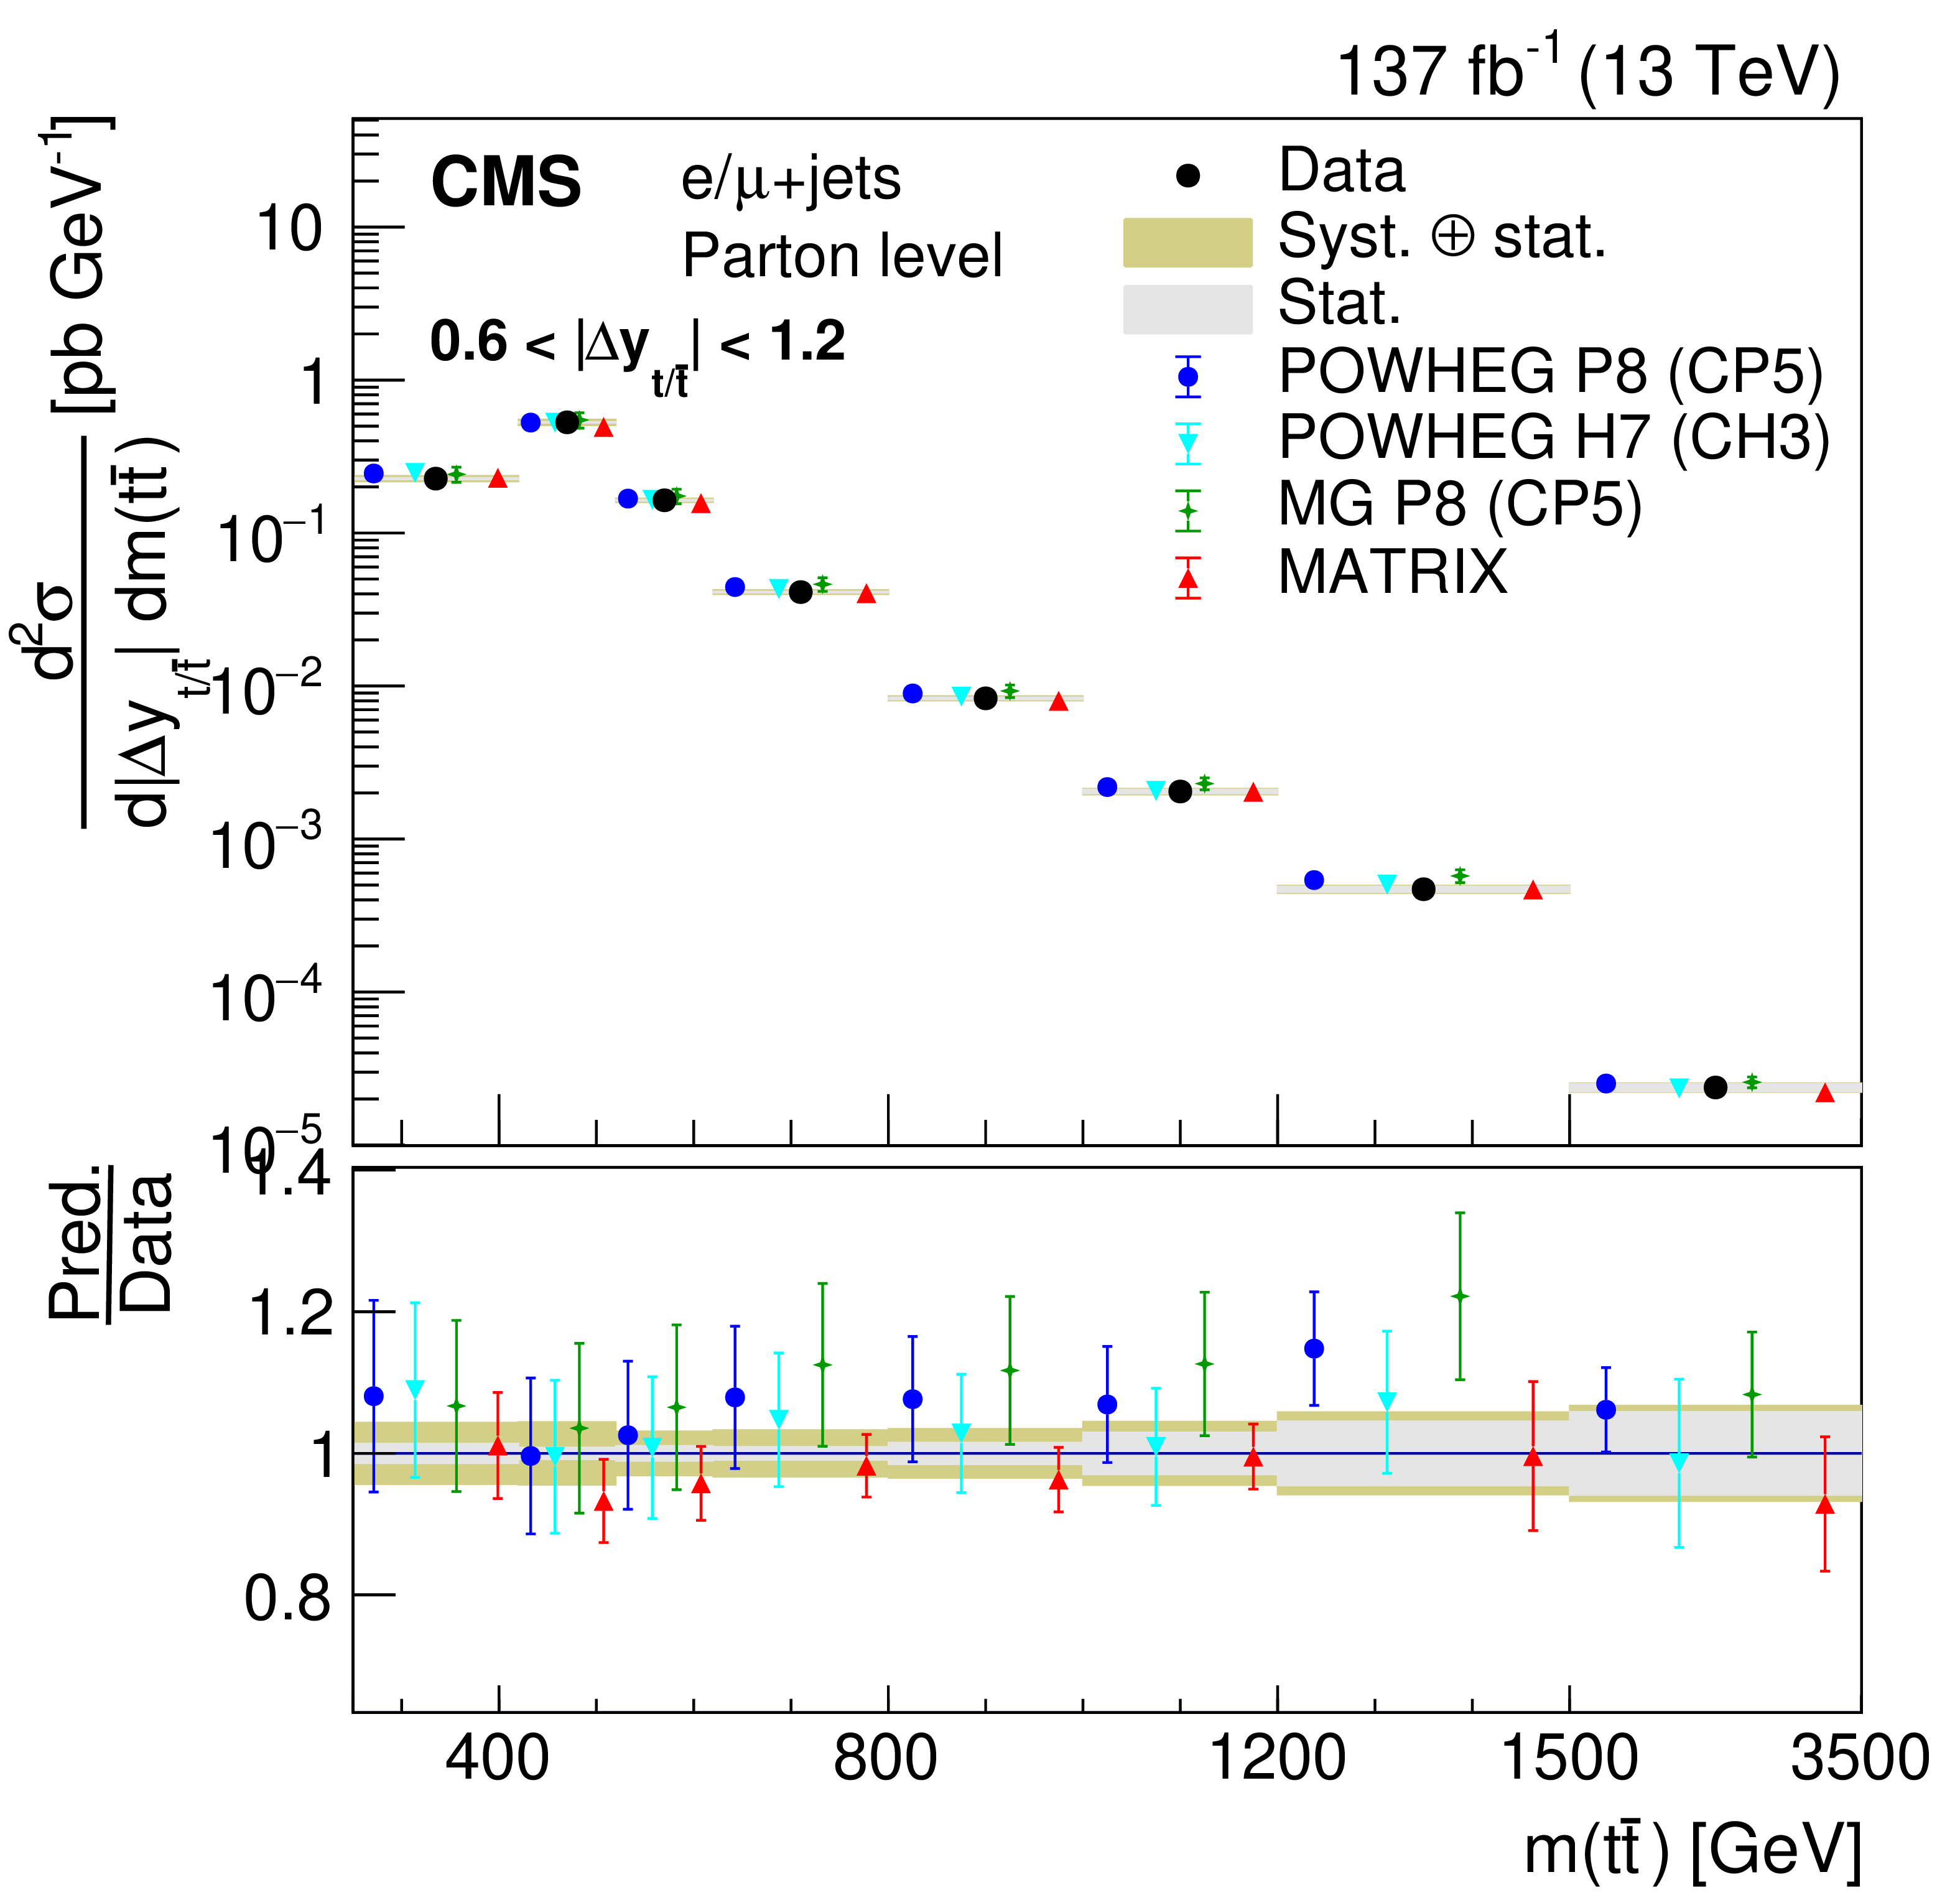
png pdf |
Figure 31-b:
Double-differential cross section at the parton level as a function of ${{| \Delta y_{\mathrm{t} /\mathrm{\bar{t}}} |}}$ vs. ${m({\mathrm{t} \mathrm{\bar{t}}})}$. The data are shown as points with gray (yellow) bands indicating the statistical (statistical and systematic) uncertainties. The cross sections are compared to the predictions of POWHEG combined with PYTHIA (P8) or HERWIG (H7), the multiparton simulation MG5_aMC@NLO (MG)+PYTHIA FxFx, and the NNLO QCD calculations obtained with Matrix. The ratios of the various predictions to the measured cross sections are shown in the lower panels. |

png pdf |
Figure 31-c:
Double-differential cross section at the parton level as a function of ${{| \Delta y_{\mathrm{t} /\mathrm{\bar{t}}} |}}$ vs. ${m({\mathrm{t} \mathrm{\bar{t}}})}$. The data are shown as points with gray (yellow) bands indicating the statistical (statistical and systematic) uncertainties. The cross sections are compared to the predictions of POWHEG combined with PYTHIA (P8) or HERWIG (H7), the multiparton simulation MG5_aMC@NLO (MG)+PYTHIA FxFx, and the NNLO QCD calculations obtained with Matrix. The ratios of the various predictions to the measured cross sections are shown in the lower panels. |
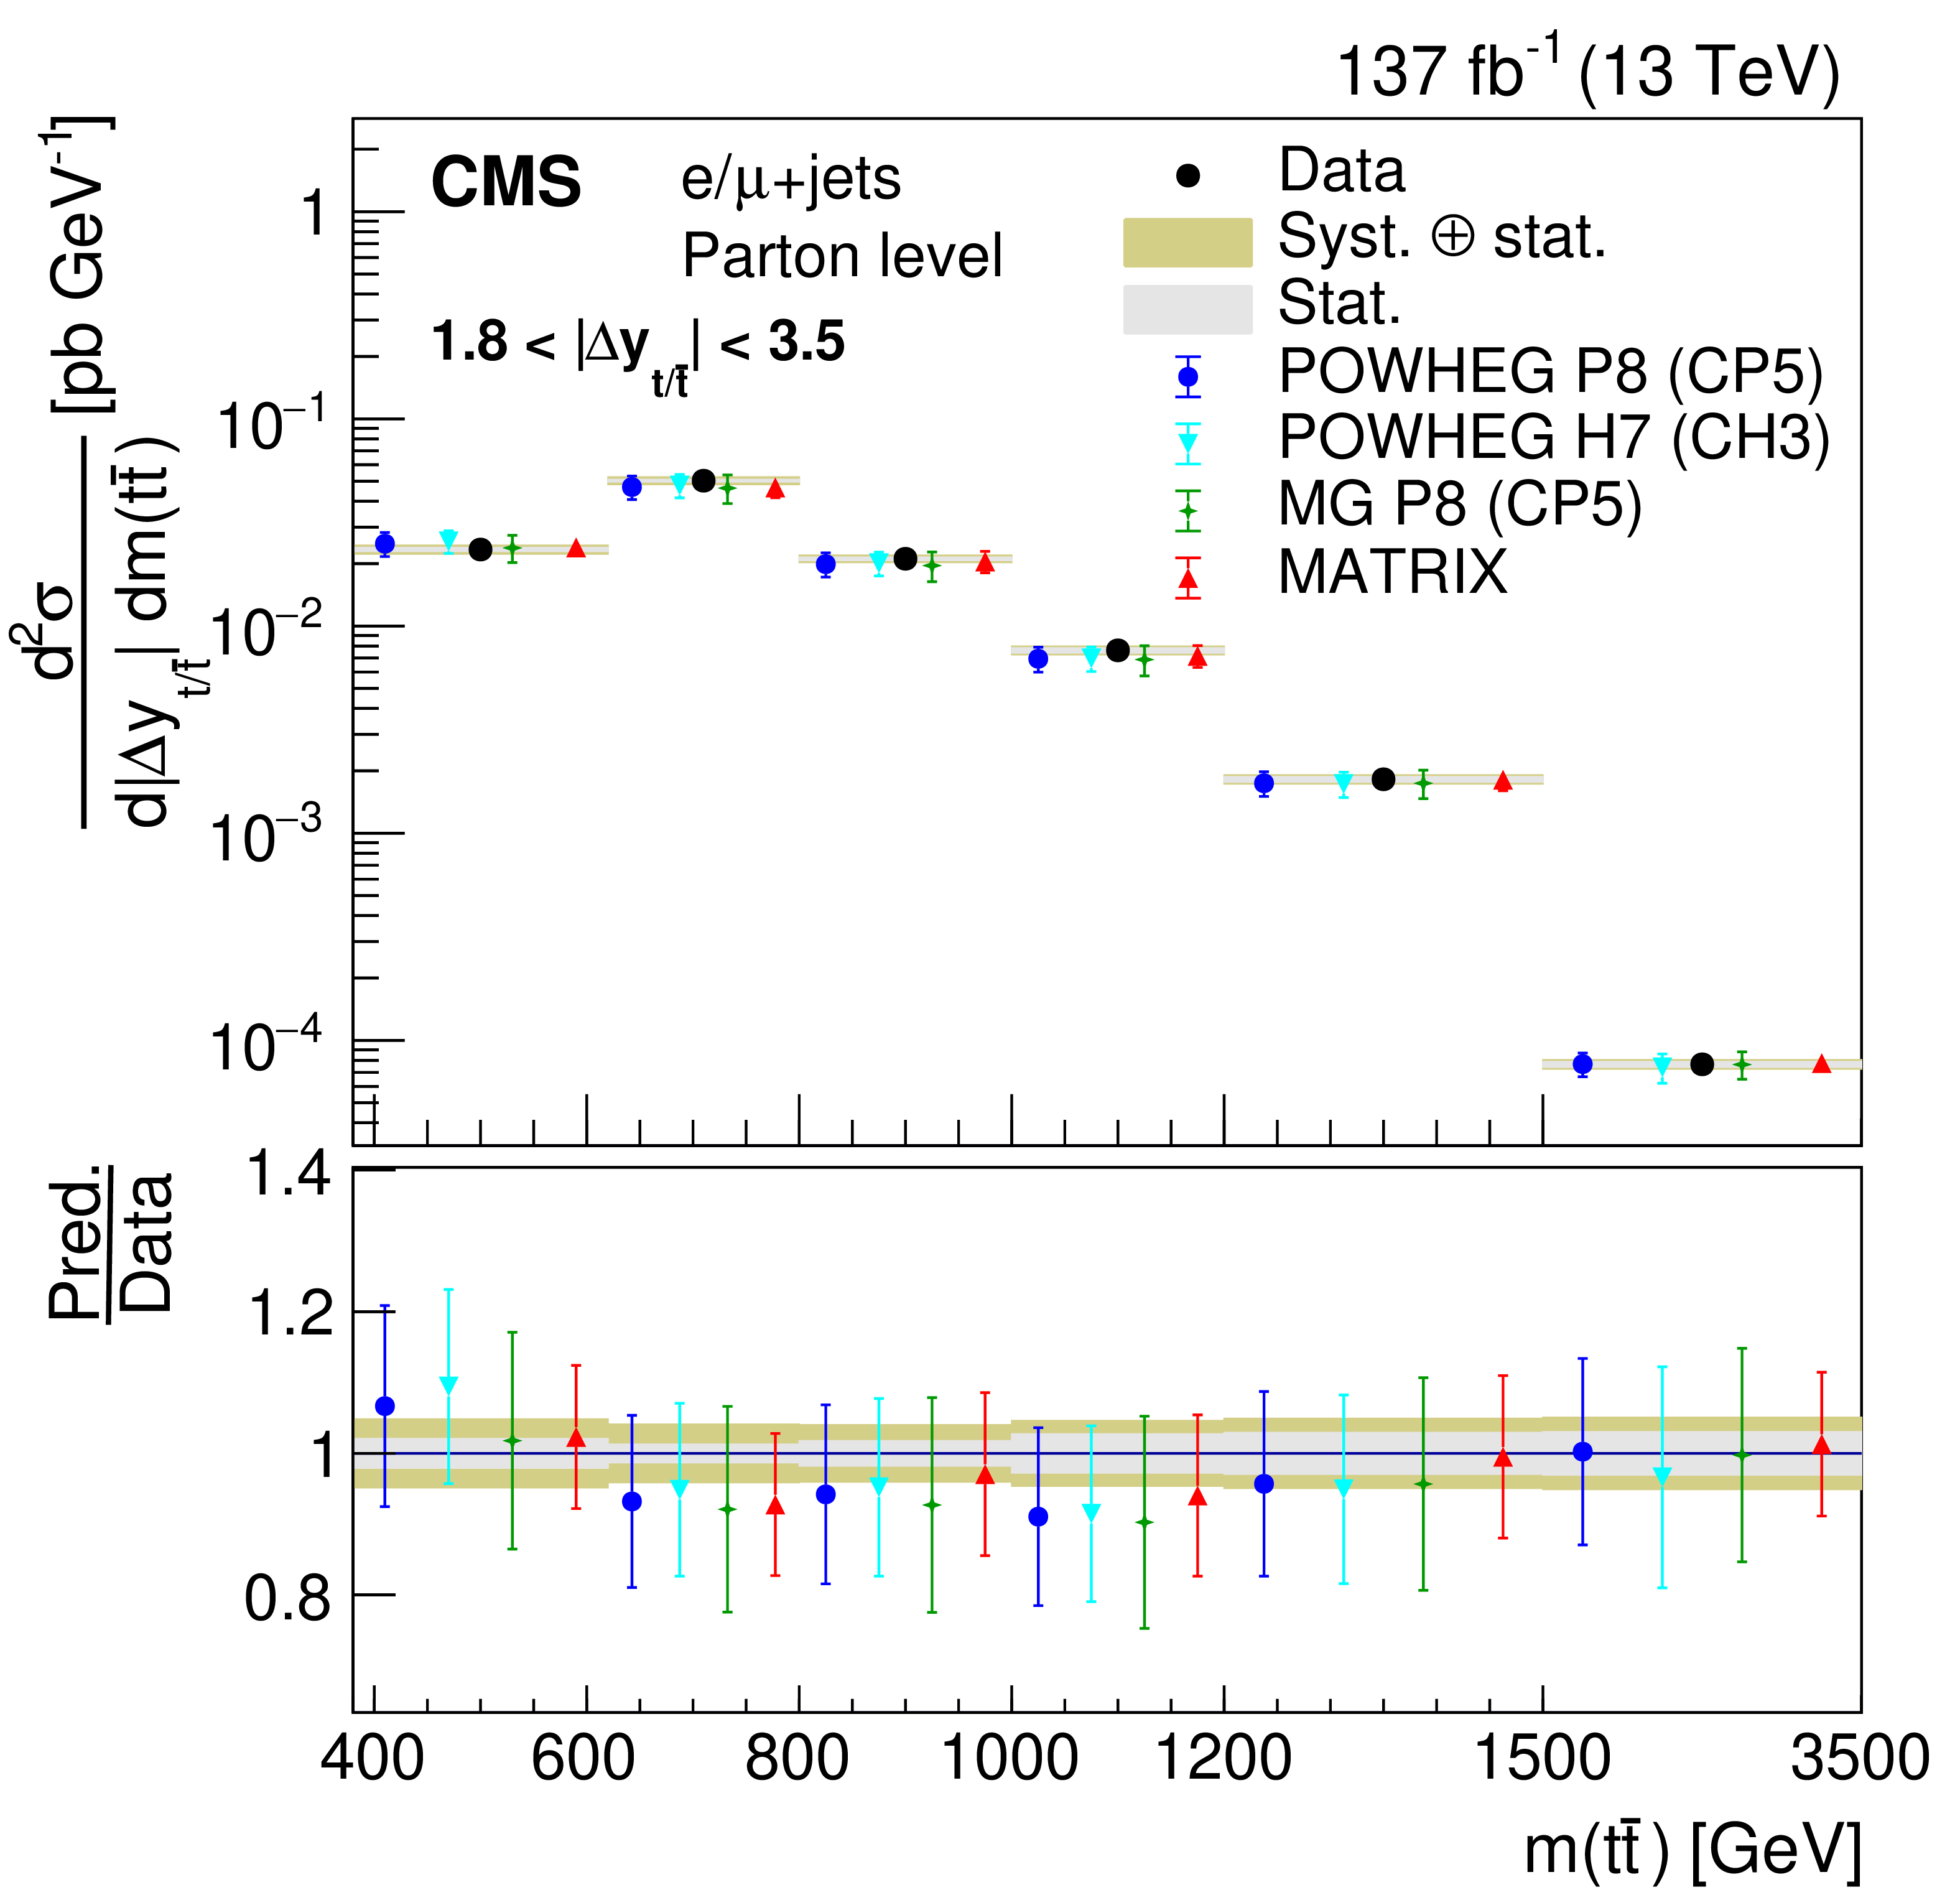
png pdf |
Figure 31-d:
Double-differential cross section at the parton level as a function of ${{| \Delta y_{\mathrm{t} /\mathrm{\bar{t}}} |}}$ vs. ${m({\mathrm{t} \mathrm{\bar{t}}})}$. The data are shown as points with gray (yellow) bands indicating the statistical (statistical and systematic) uncertainties. The cross sections are compared to the predictions of POWHEG combined with PYTHIA (P8) or HERWIG (H7), the multiparton simulation MG5_aMC@NLO (MG)+PYTHIA FxFx, and the NNLO QCD calculations obtained with Matrix. The ratios of the various predictions to the measured cross sections are shown in the lower panels. |
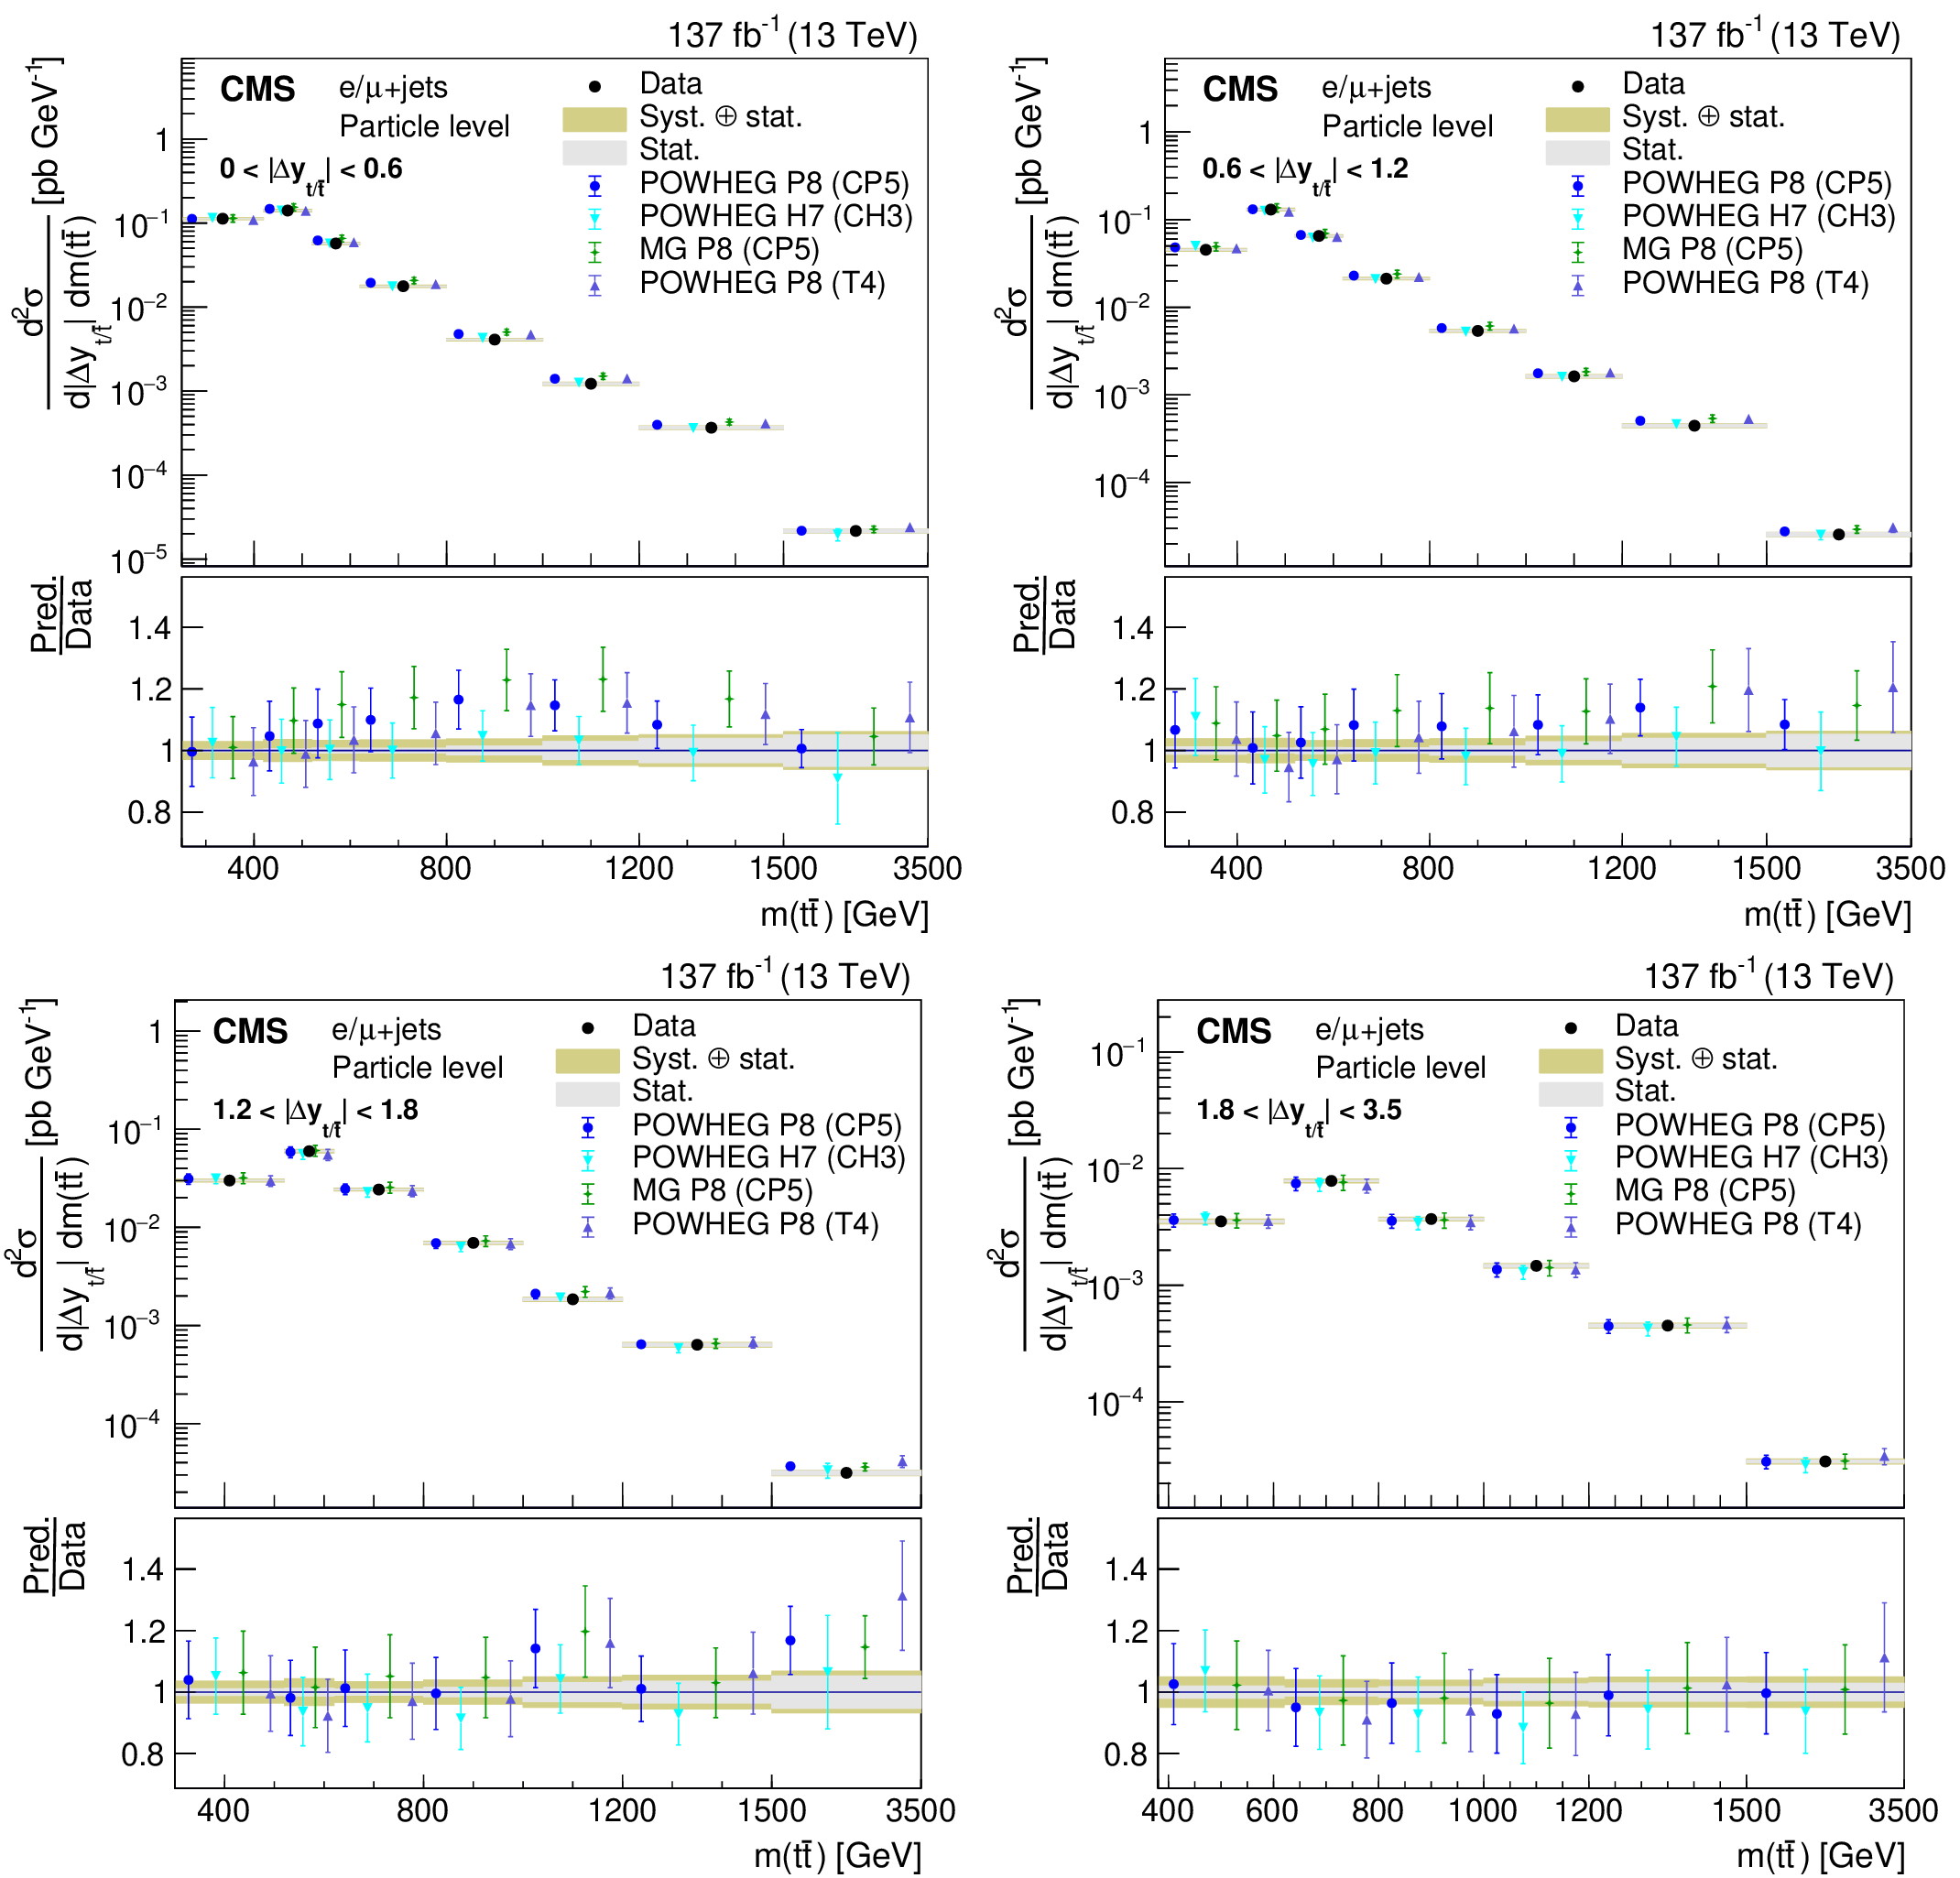
png pdf |
Figure 32:
Double-differential cross section at the particle level as a function of ${{| \Delta y_{\mathrm{t} /\mathrm{\bar{t}}} |}}$ vs. ${m({\mathrm{t} \mathrm{\bar{t}}})}$. The data are shown as points with gray (yellow) bands indicating the statistical (statistical and systematic) uncertainties. The cross sections are compared to the predictions of POWHEG+PYTHIA (P8) for the CP5 and CUETP8M2T4 (T4) tunes, POWHEG+HERWIG (H7), and the multiparton simulation MG5_aMC@NLO (MG)+PYTHIA. The ratios of the various predictions to the measured cross sections are shown in the lower panels. |
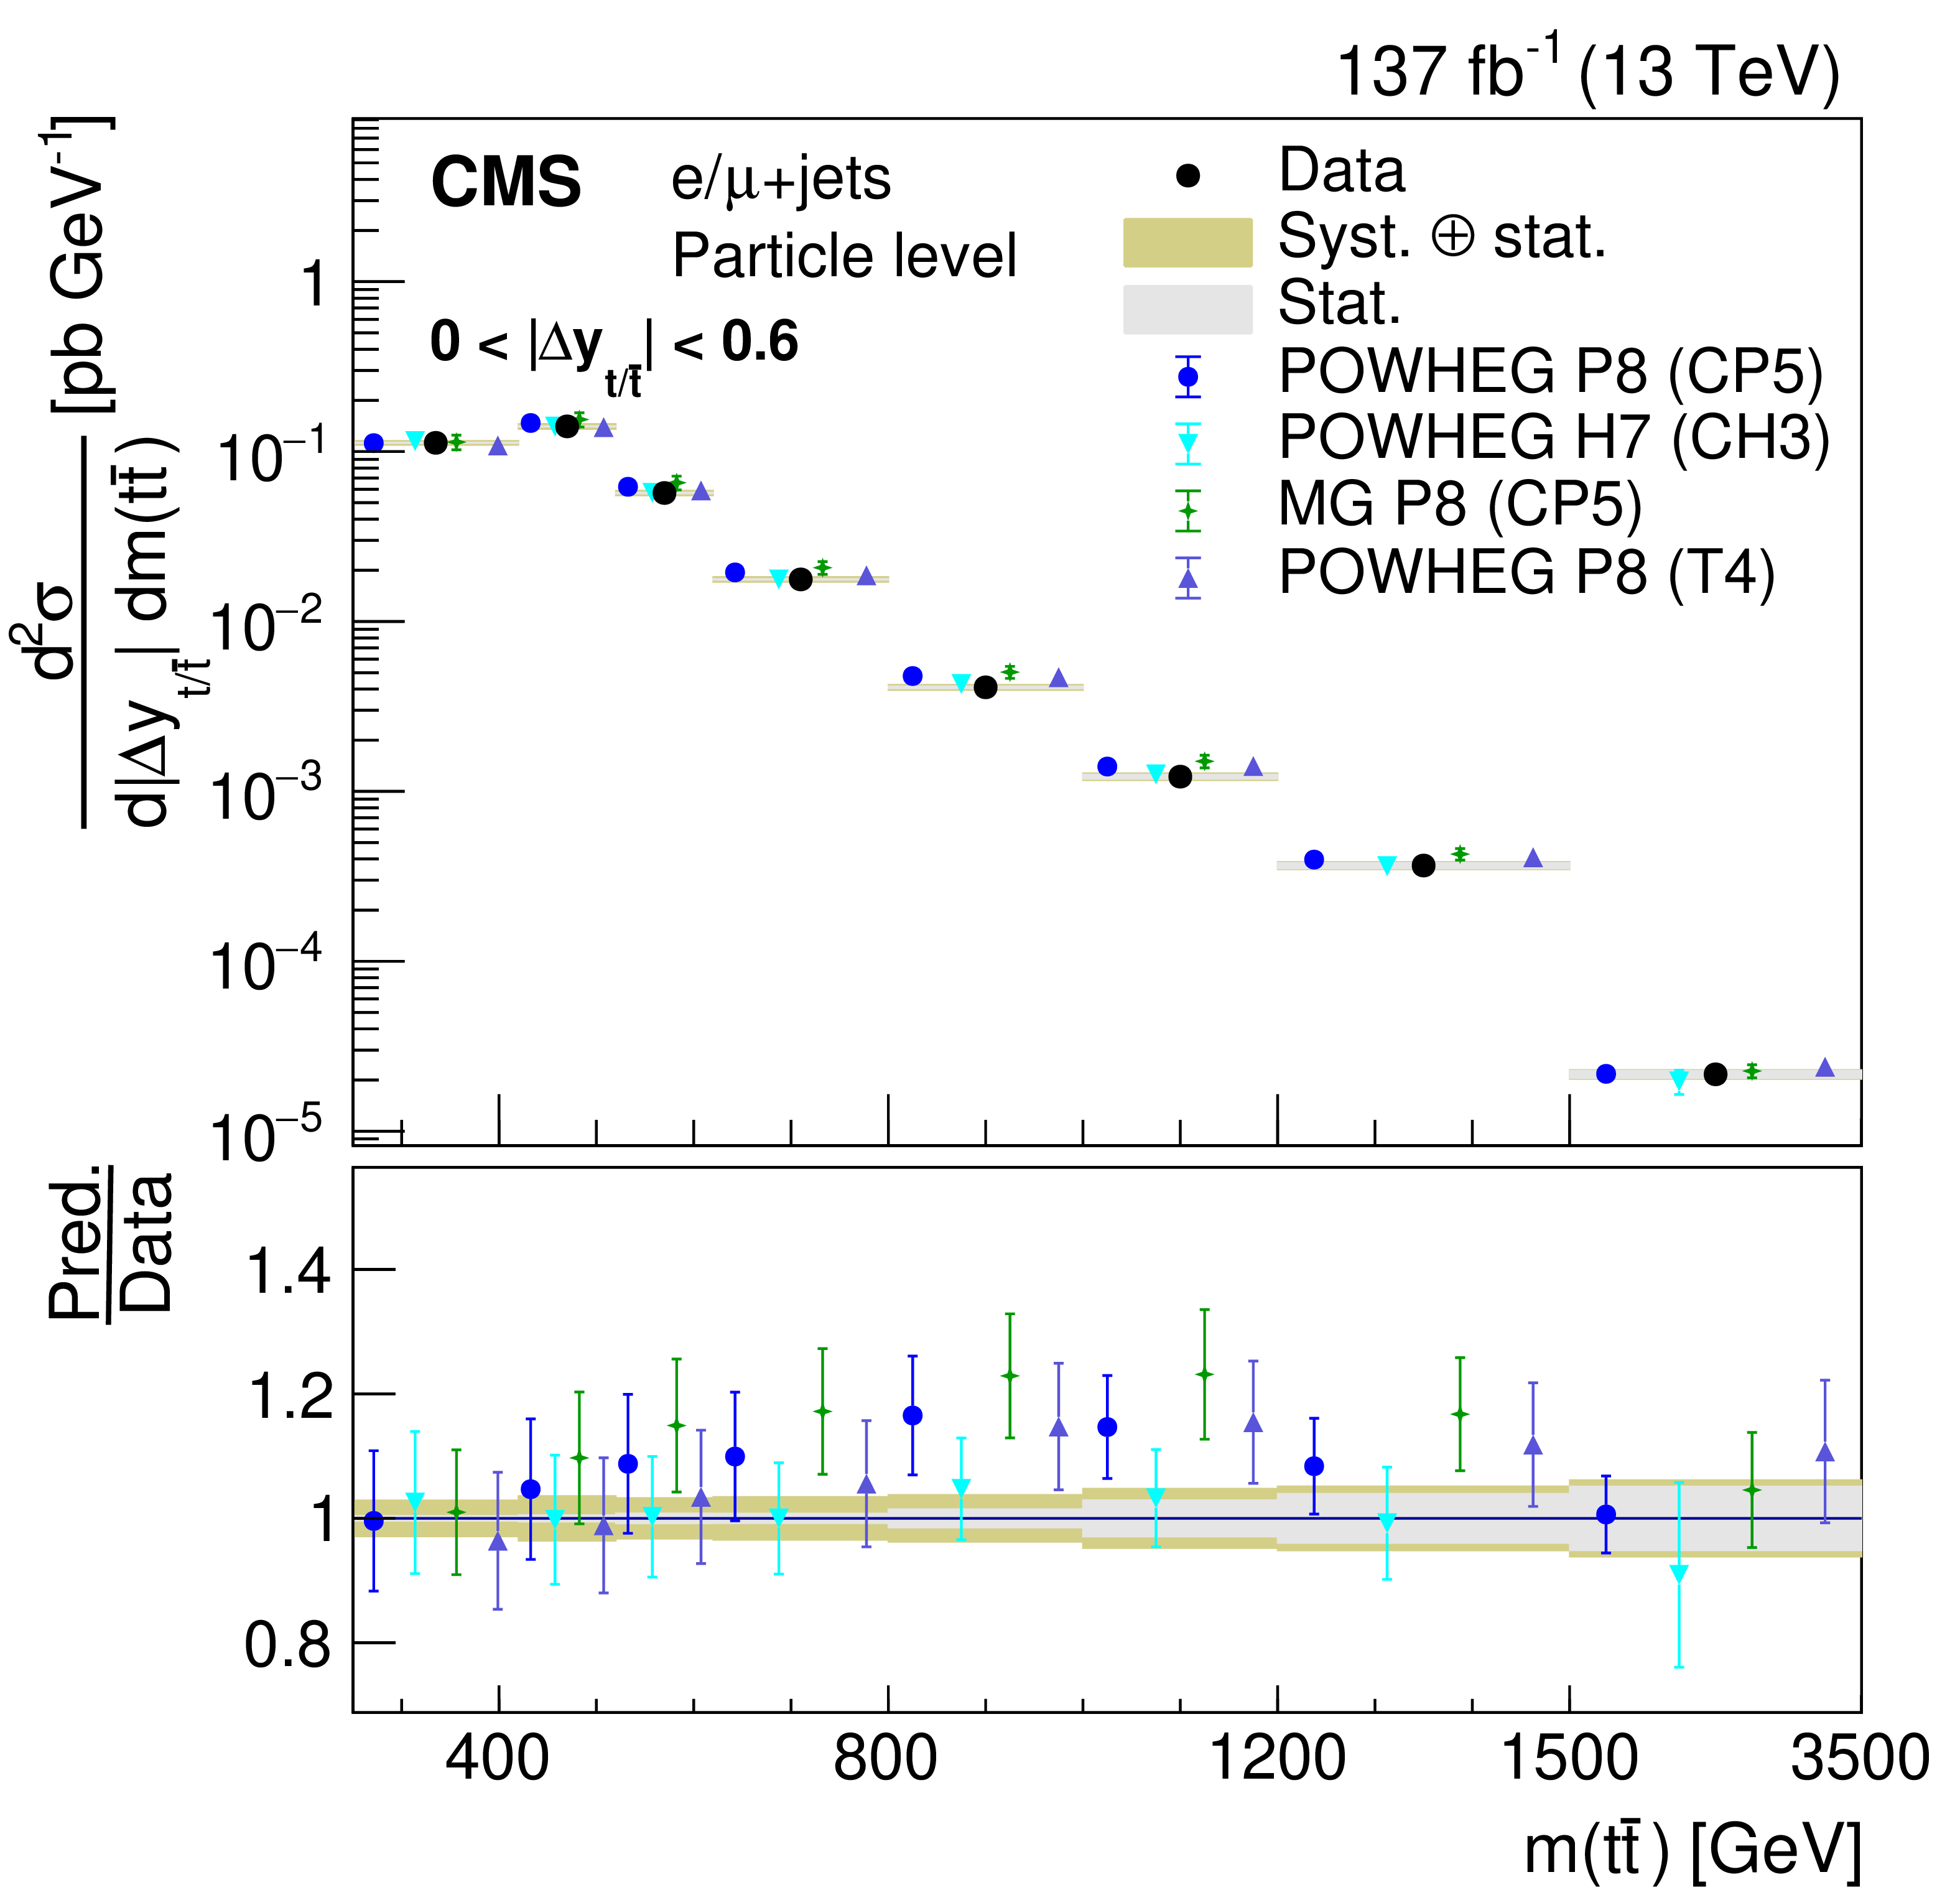
png pdf |
Figure 32-a:
Double-differential cross section at the particle level as a function of ${{| \Delta y_{\mathrm{t} /\mathrm{\bar{t}}} |}}$ vs. ${m({\mathrm{t} \mathrm{\bar{t}}})}$. The data are shown as points with gray (yellow) bands indicating the statistical (statistical and systematic) uncertainties. The cross sections are compared to the predictions of POWHEG+PYTHIA (P8) for the CP5 and CUETP8M2T4 (T4) tunes, POWHEG+HERWIG (H7), and the multiparton simulation MG5_aMC@NLO (MG)+PYTHIA. The ratios of the various predictions to the measured cross sections are shown in the lower panels. |
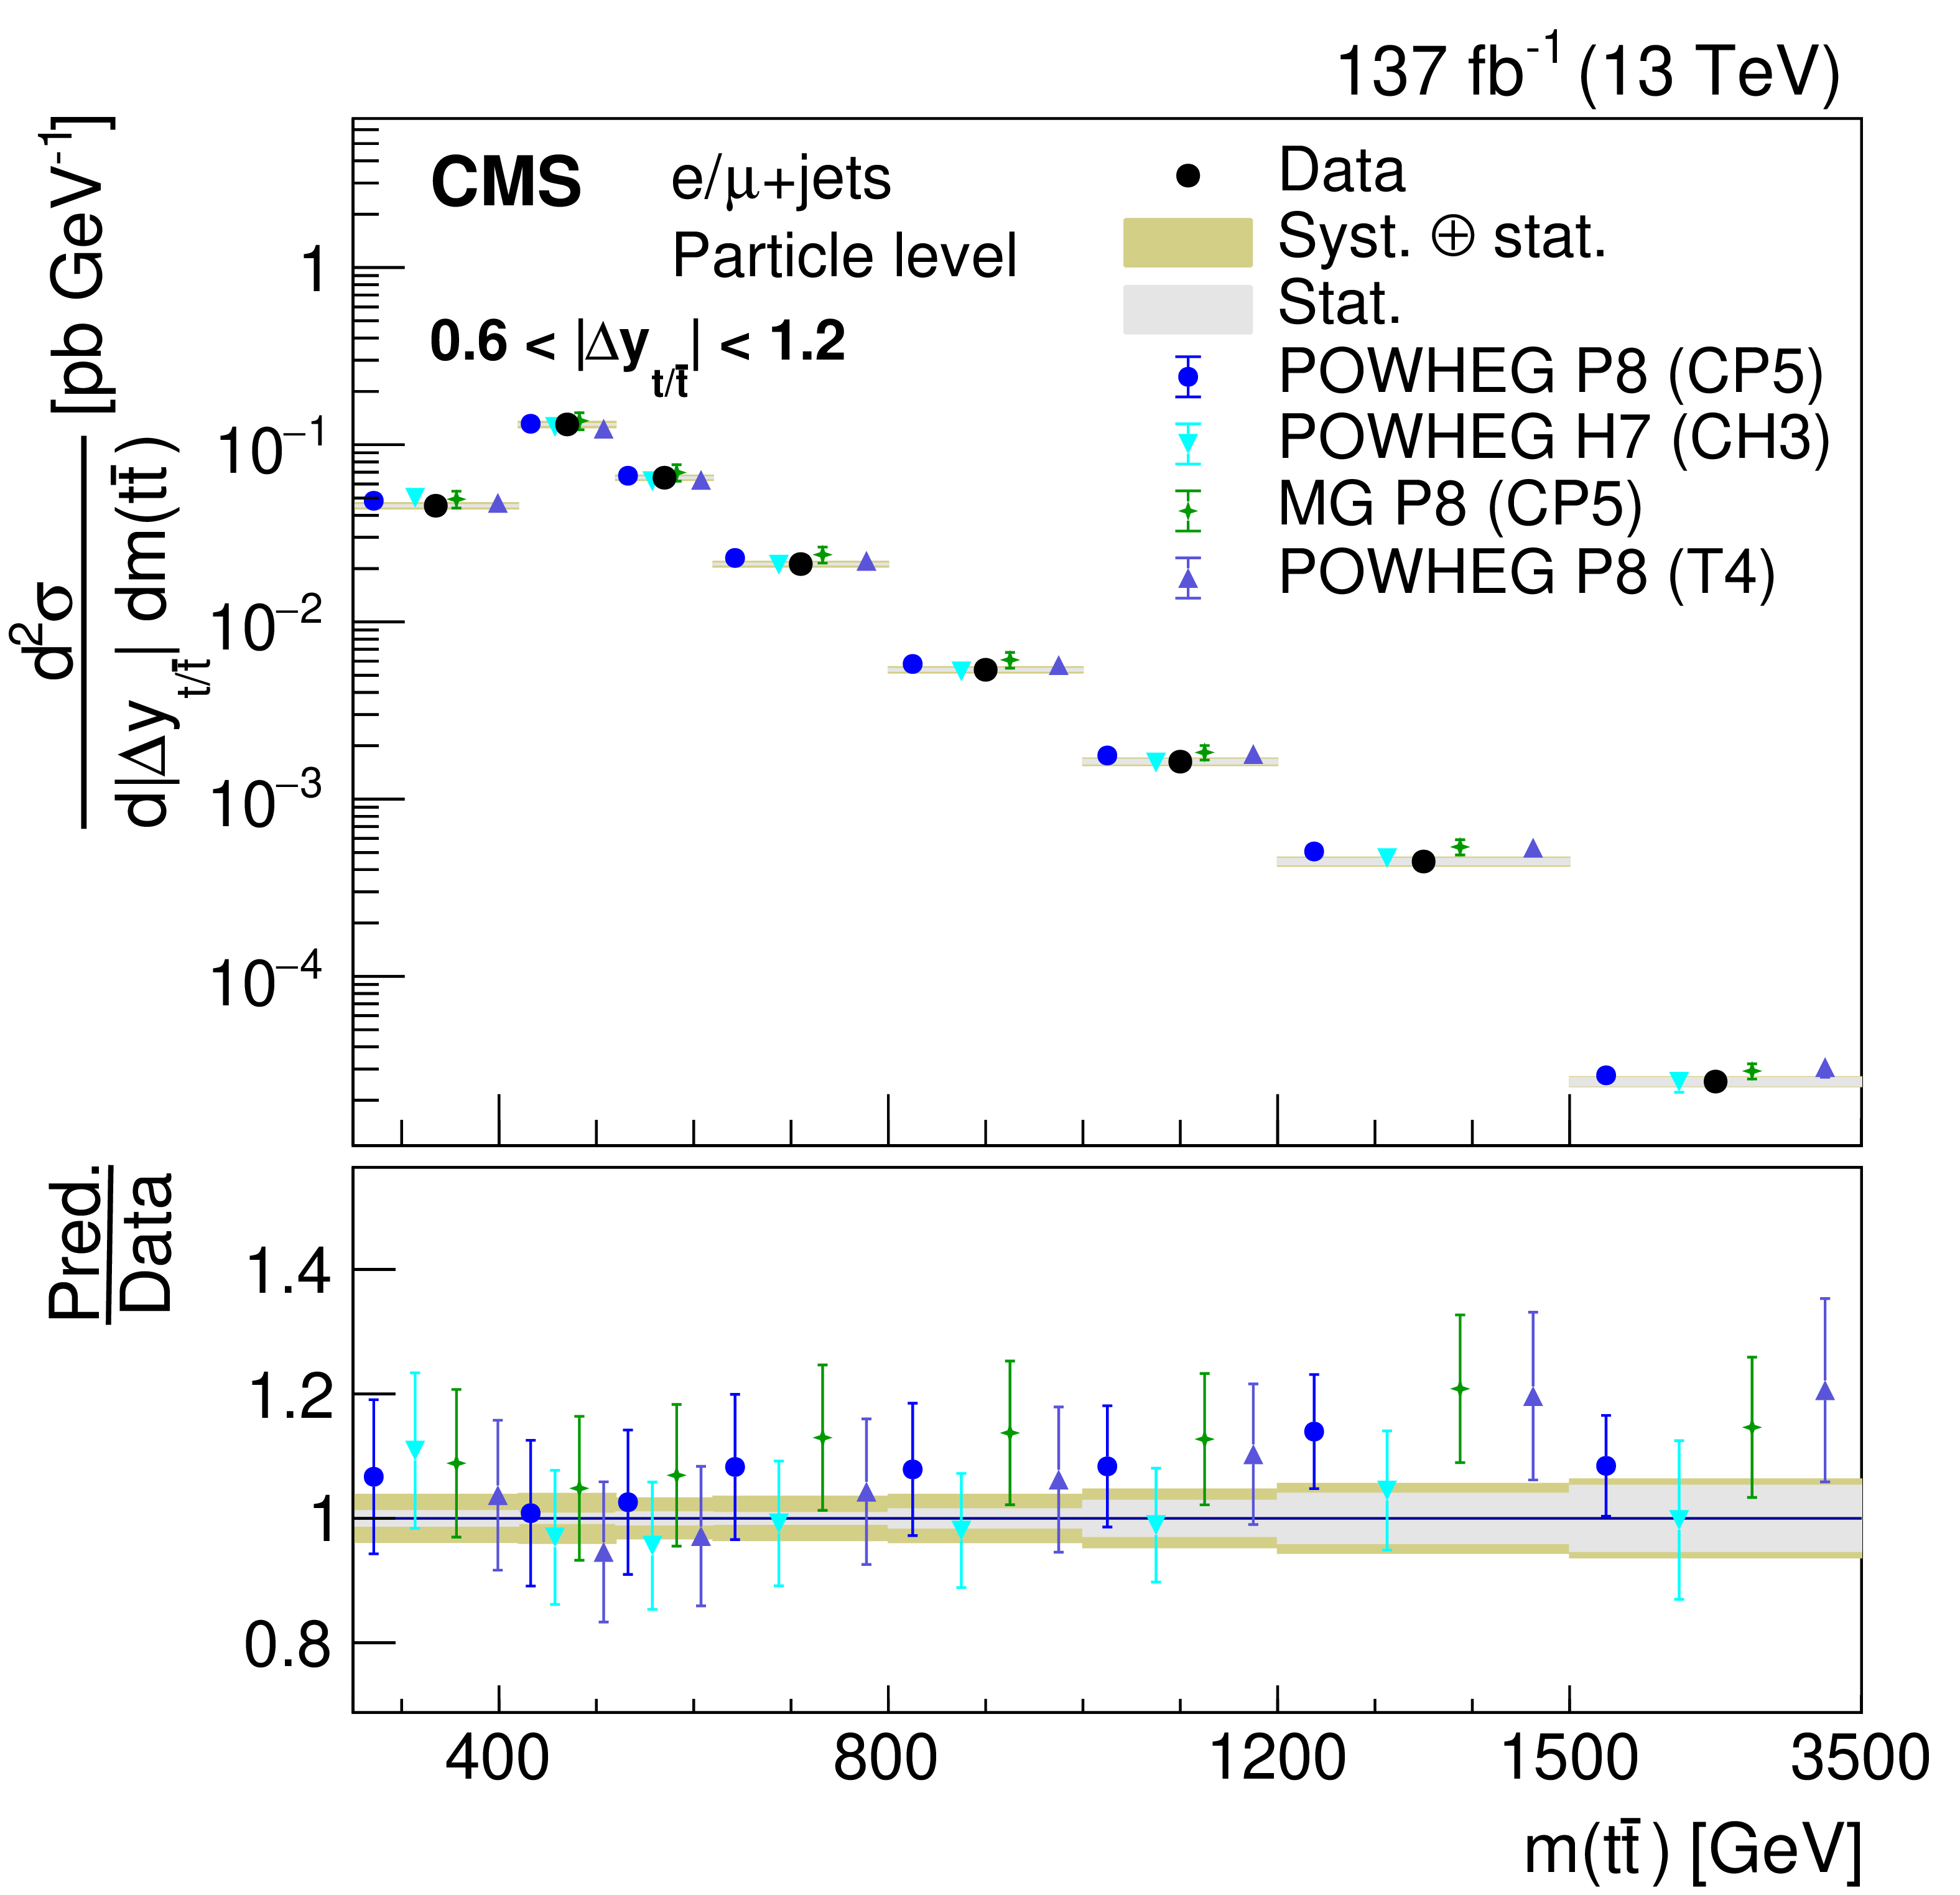
png pdf |
Figure 32-b:
Double-differential cross section at the particle level as a function of ${{| \Delta y_{\mathrm{t} /\mathrm{\bar{t}}} |}}$ vs. ${m({\mathrm{t} \mathrm{\bar{t}}})}$. The data are shown as points with gray (yellow) bands indicating the statistical (statistical and systematic) uncertainties. The cross sections are compared to the predictions of POWHEG+PYTHIA (P8) for the CP5 and CUETP8M2T4 (T4) tunes, POWHEG+HERWIG (H7), and the multiparton simulation MG5_aMC@NLO (MG)+PYTHIA. The ratios of the various predictions to the measured cross sections are shown in the lower panels. |
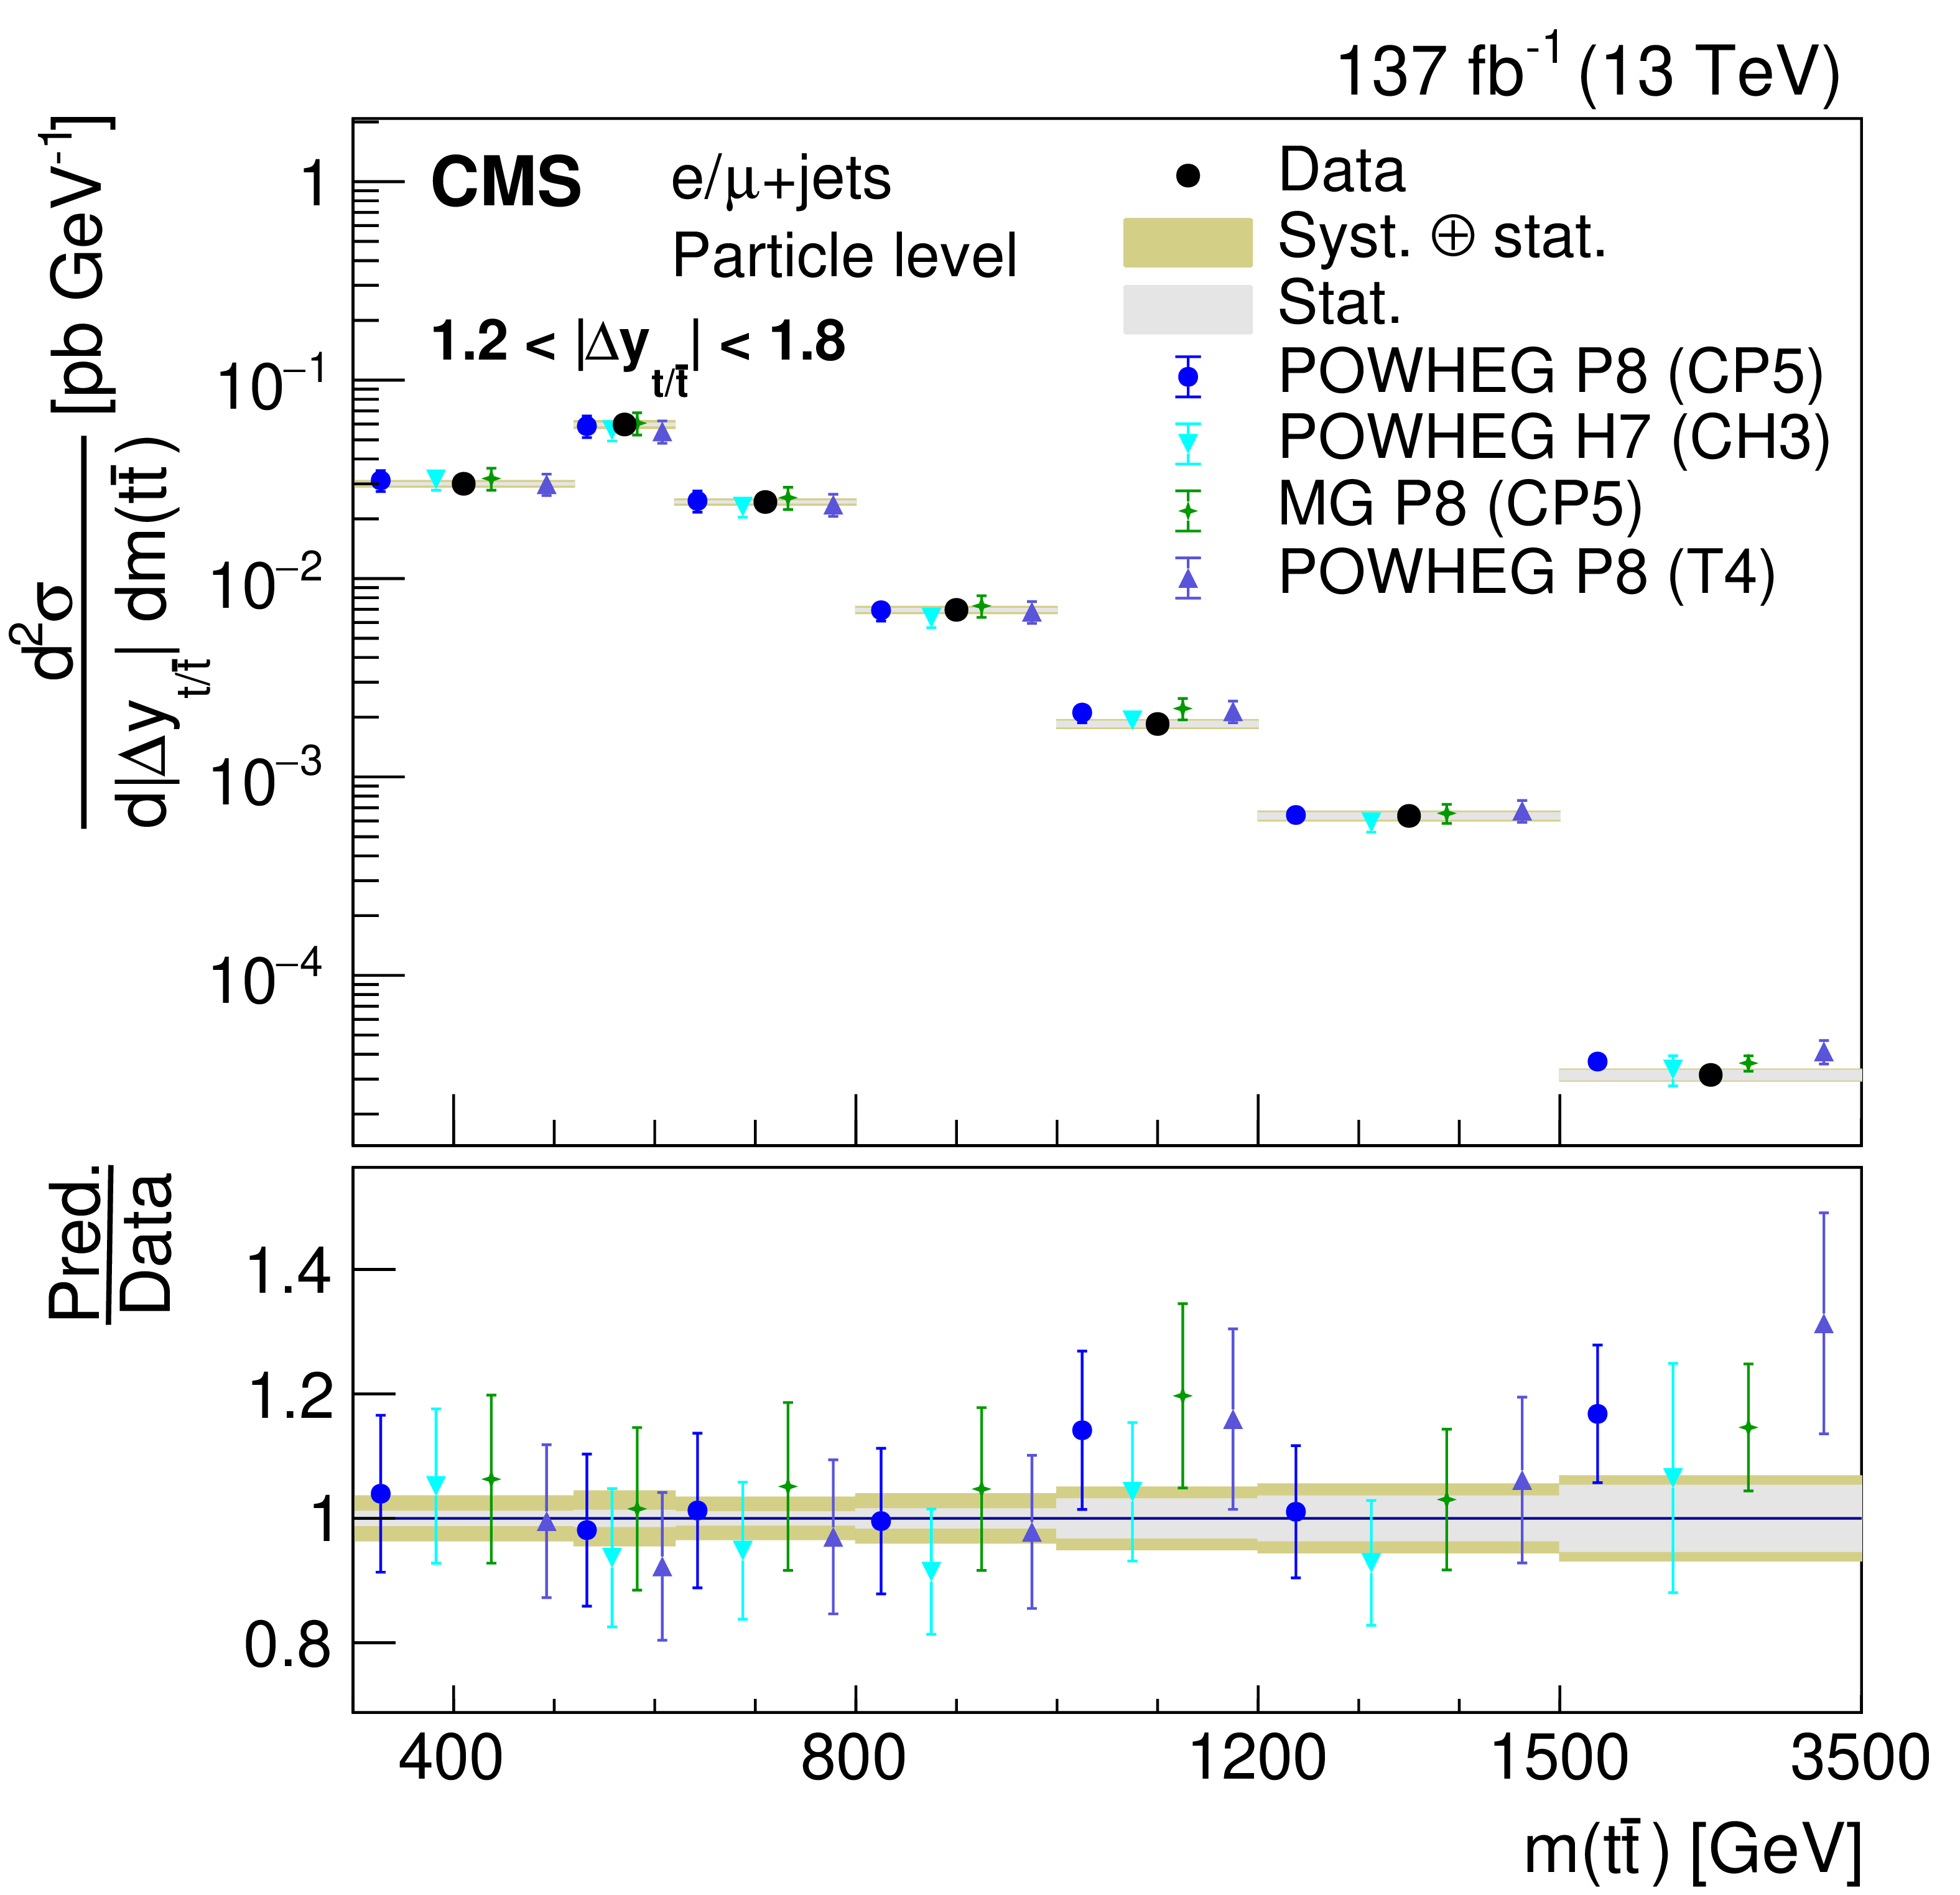
png pdf |
Figure 32-c:
Double-differential cross section at the particle level as a function of ${{| \Delta y_{\mathrm{t} /\mathrm{\bar{t}}} |}}$ vs. ${m({\mathrm{t} \mathrm{\bar{t}}})}$. The data are shown as points with gray (yellow) bands indicating the statistical (statistical and systematic) uncertainties. The cross sections are compared to the predictions of POWHEG+PYTHIA (P8) for the CP5 and CUETP8M2T4 (T4) tunes, POWHEG+HERWIG (H7), and the multiparton simulation MG5_aMC@NLO (MG)+PYTHIA. The ratios of the various predictions to the measured cross sections are shown in the lower panels. |
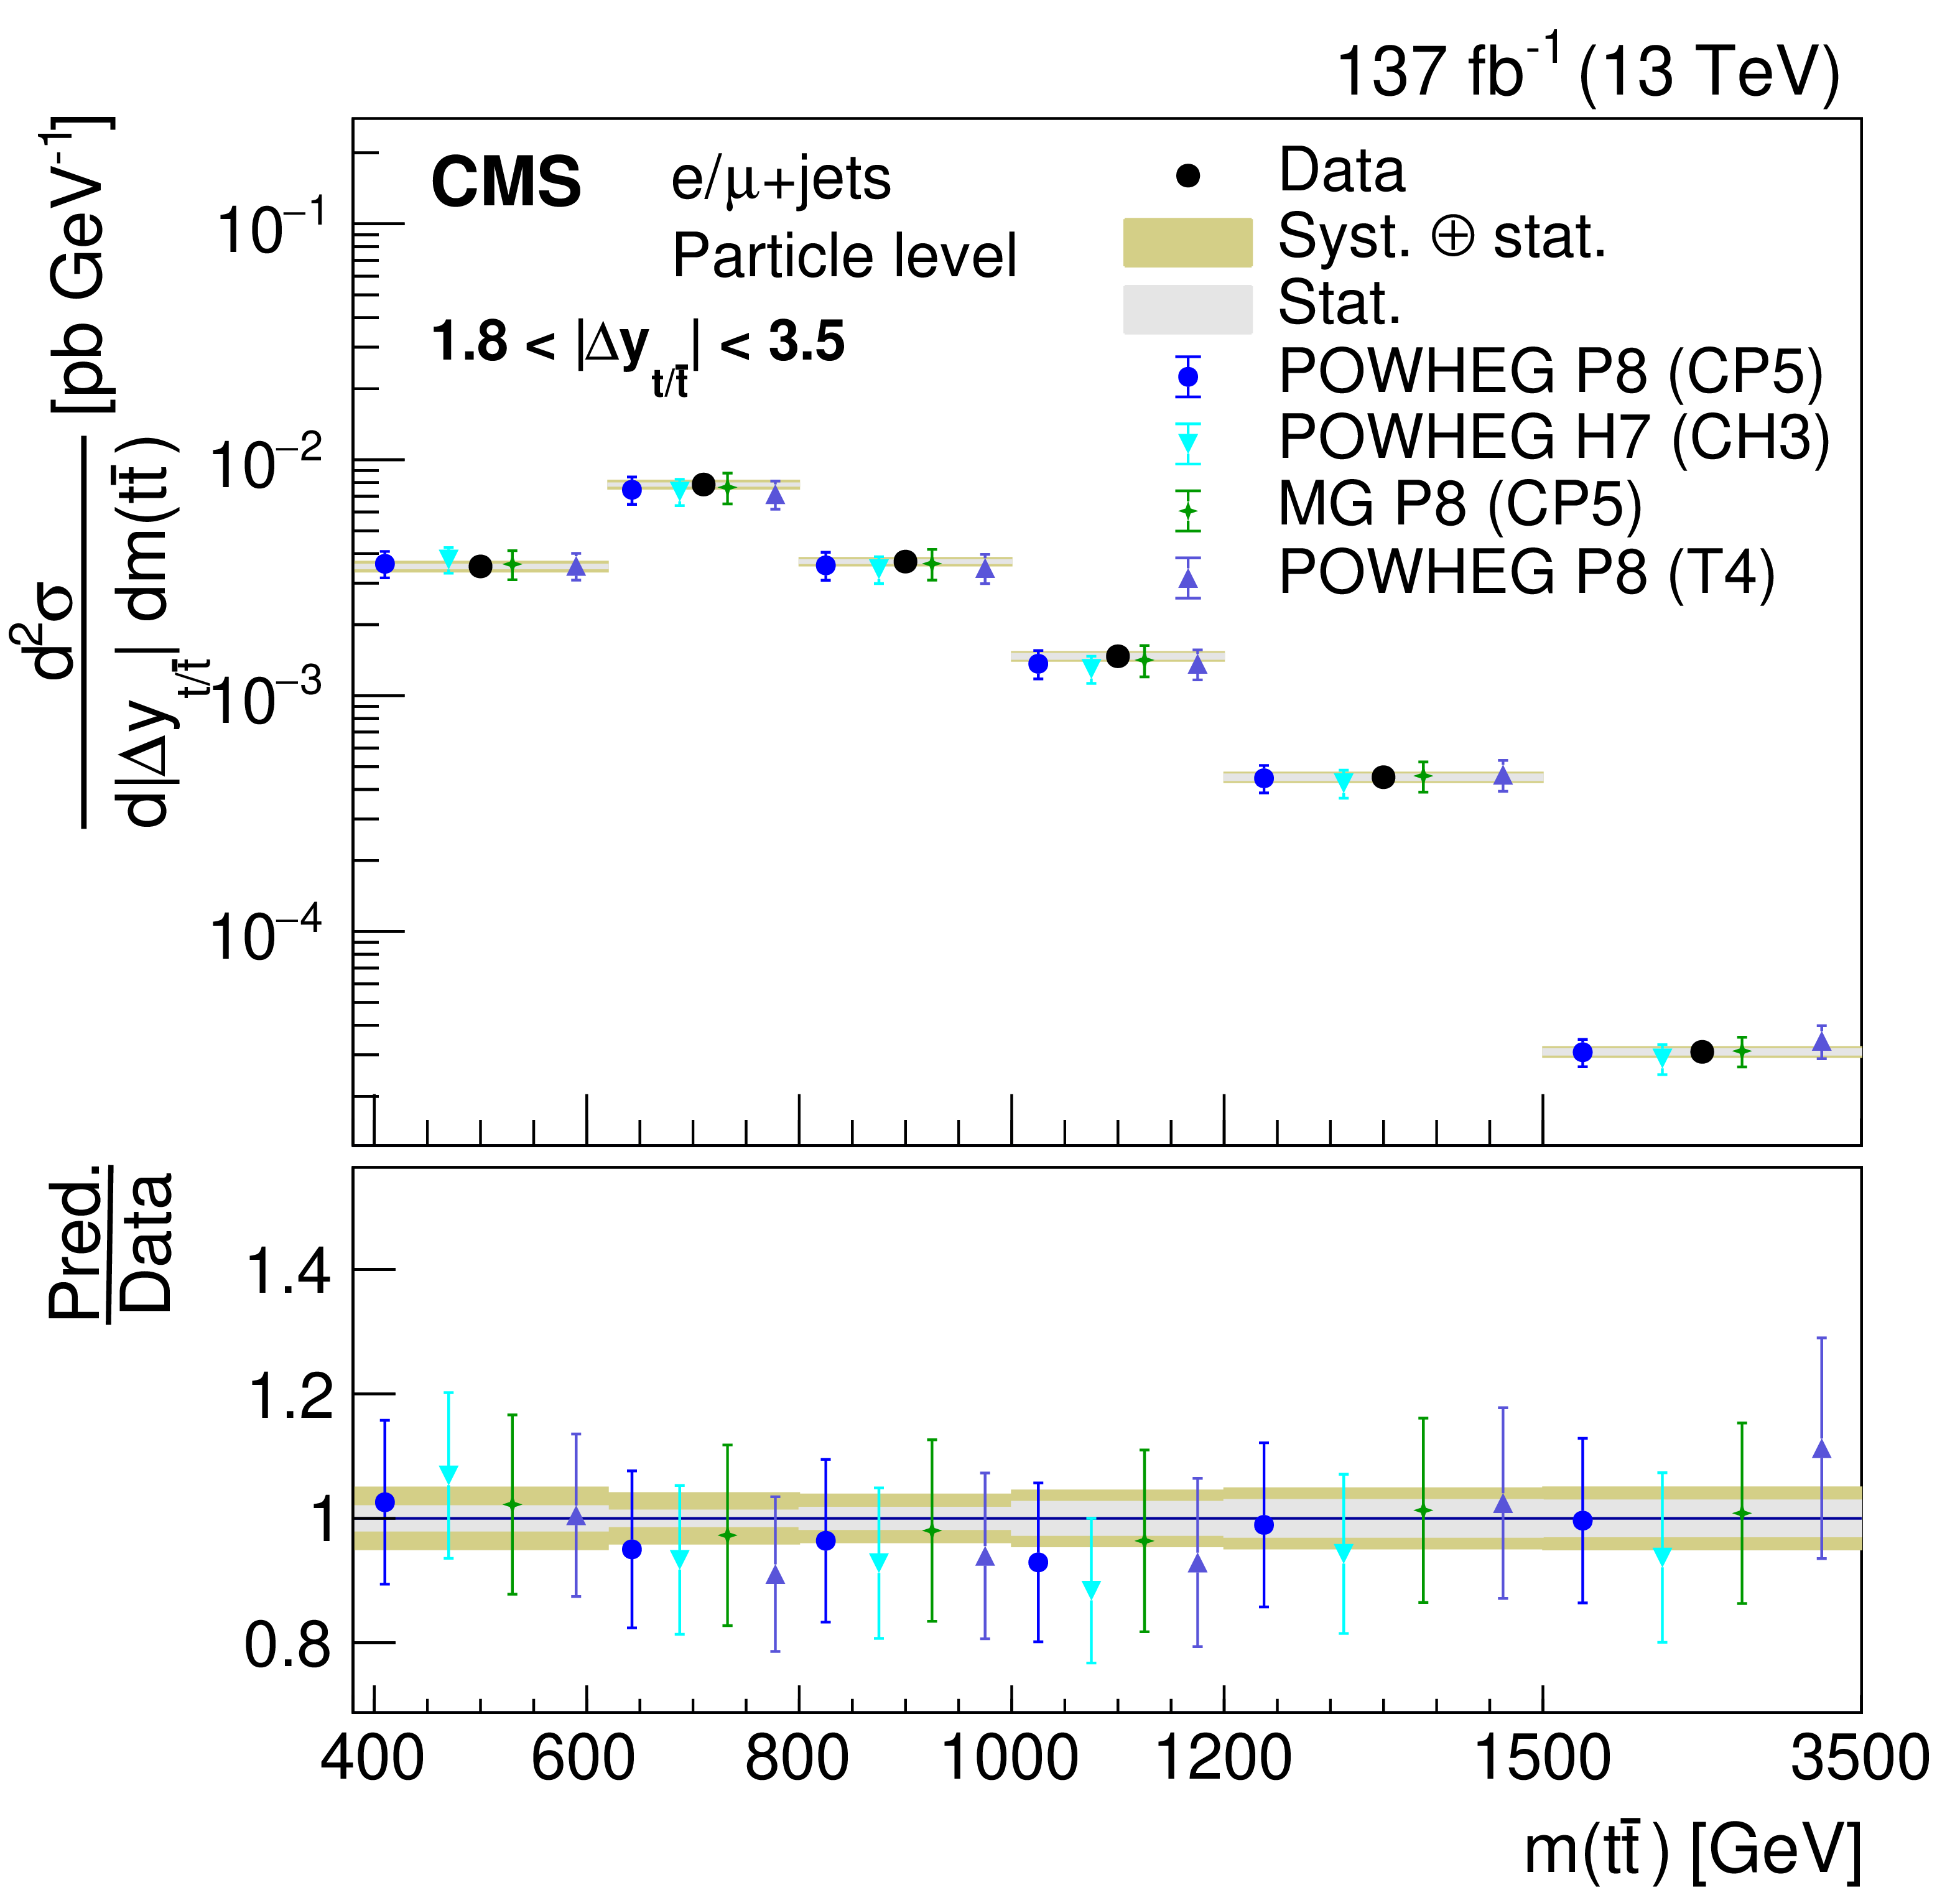
png pdf |
Figure 32-d:
Double-differential cross section at the particle level as a function of ${{| \Delta y_{\mathrm{t} /\mathrm{\bar{t}}} |}}$ vs. ${m({\mathrm{t} \mathrm{\bar{t}}})}$. The data are shown as points with gray (yellow) bands indicating the statistical (statistical and systematic) uncertainties. The cross sections are compared to the predictions of POWHEG+PYTHIA (P8) for the CP5 and CUETP8M2T4 (T4) tunes, POWHEG+HERWIG (H7), and the multiparton simulation MG5_aMC@NLO (MG)+PYTHIA. The ratios of the various predictions to the measured cross sections are shown in the lower panels. |
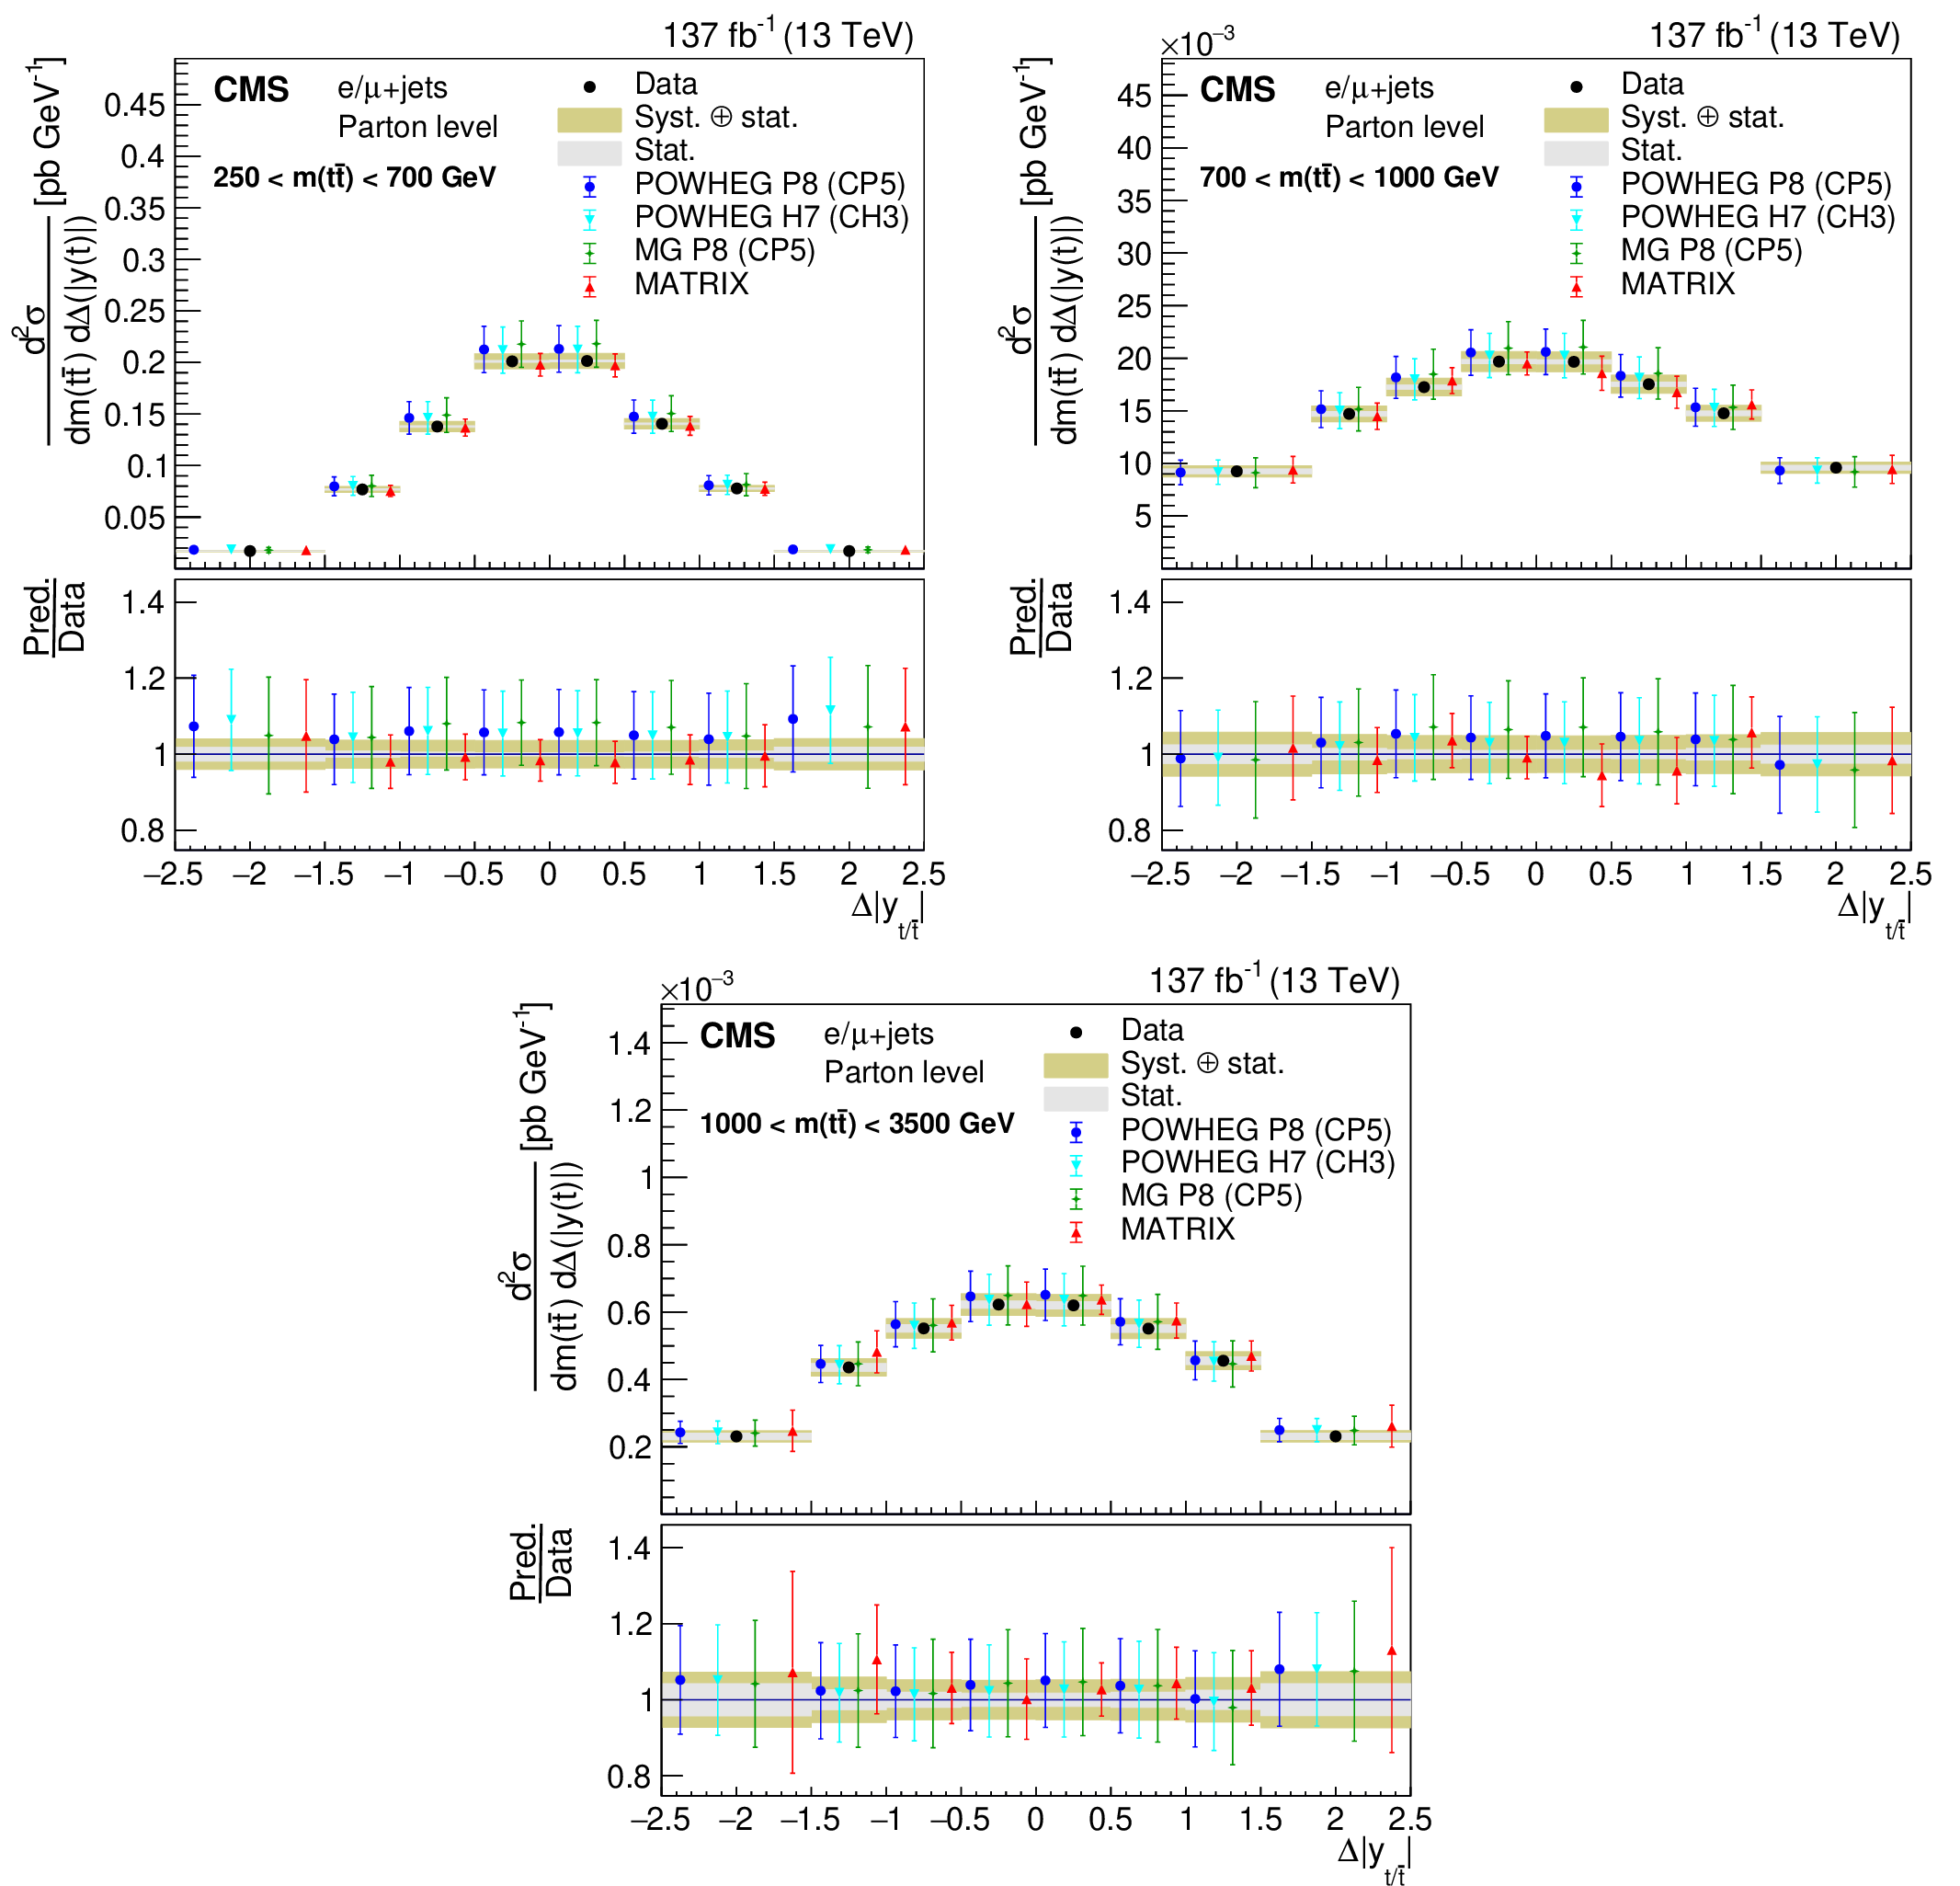
png pdf |
Figure 33:
Double-differential cross section at the parton level as a function of ${m({\mathrm{t} \mathrm{\bar{t}}})}$ vs. ${\Delta {| y_{\mathrm{t} /\mathrm{\bar{t}}} |}}$. The data are shown as points with gray (yellow) bands indicating the statistical (statistical and systematic) uncertainties. The cross sections are compared to the predictions of POWHEG combined with PYTHIA (P8) or HERWIG (H7), the multiparton simulation MG5_aMC@NLO (MG)+PYTHIA FxFx, and the NNLO QCD calculations obtained with Matrix. The ratios of the various predictions to the measured cross sections are shown in the lower panels. |
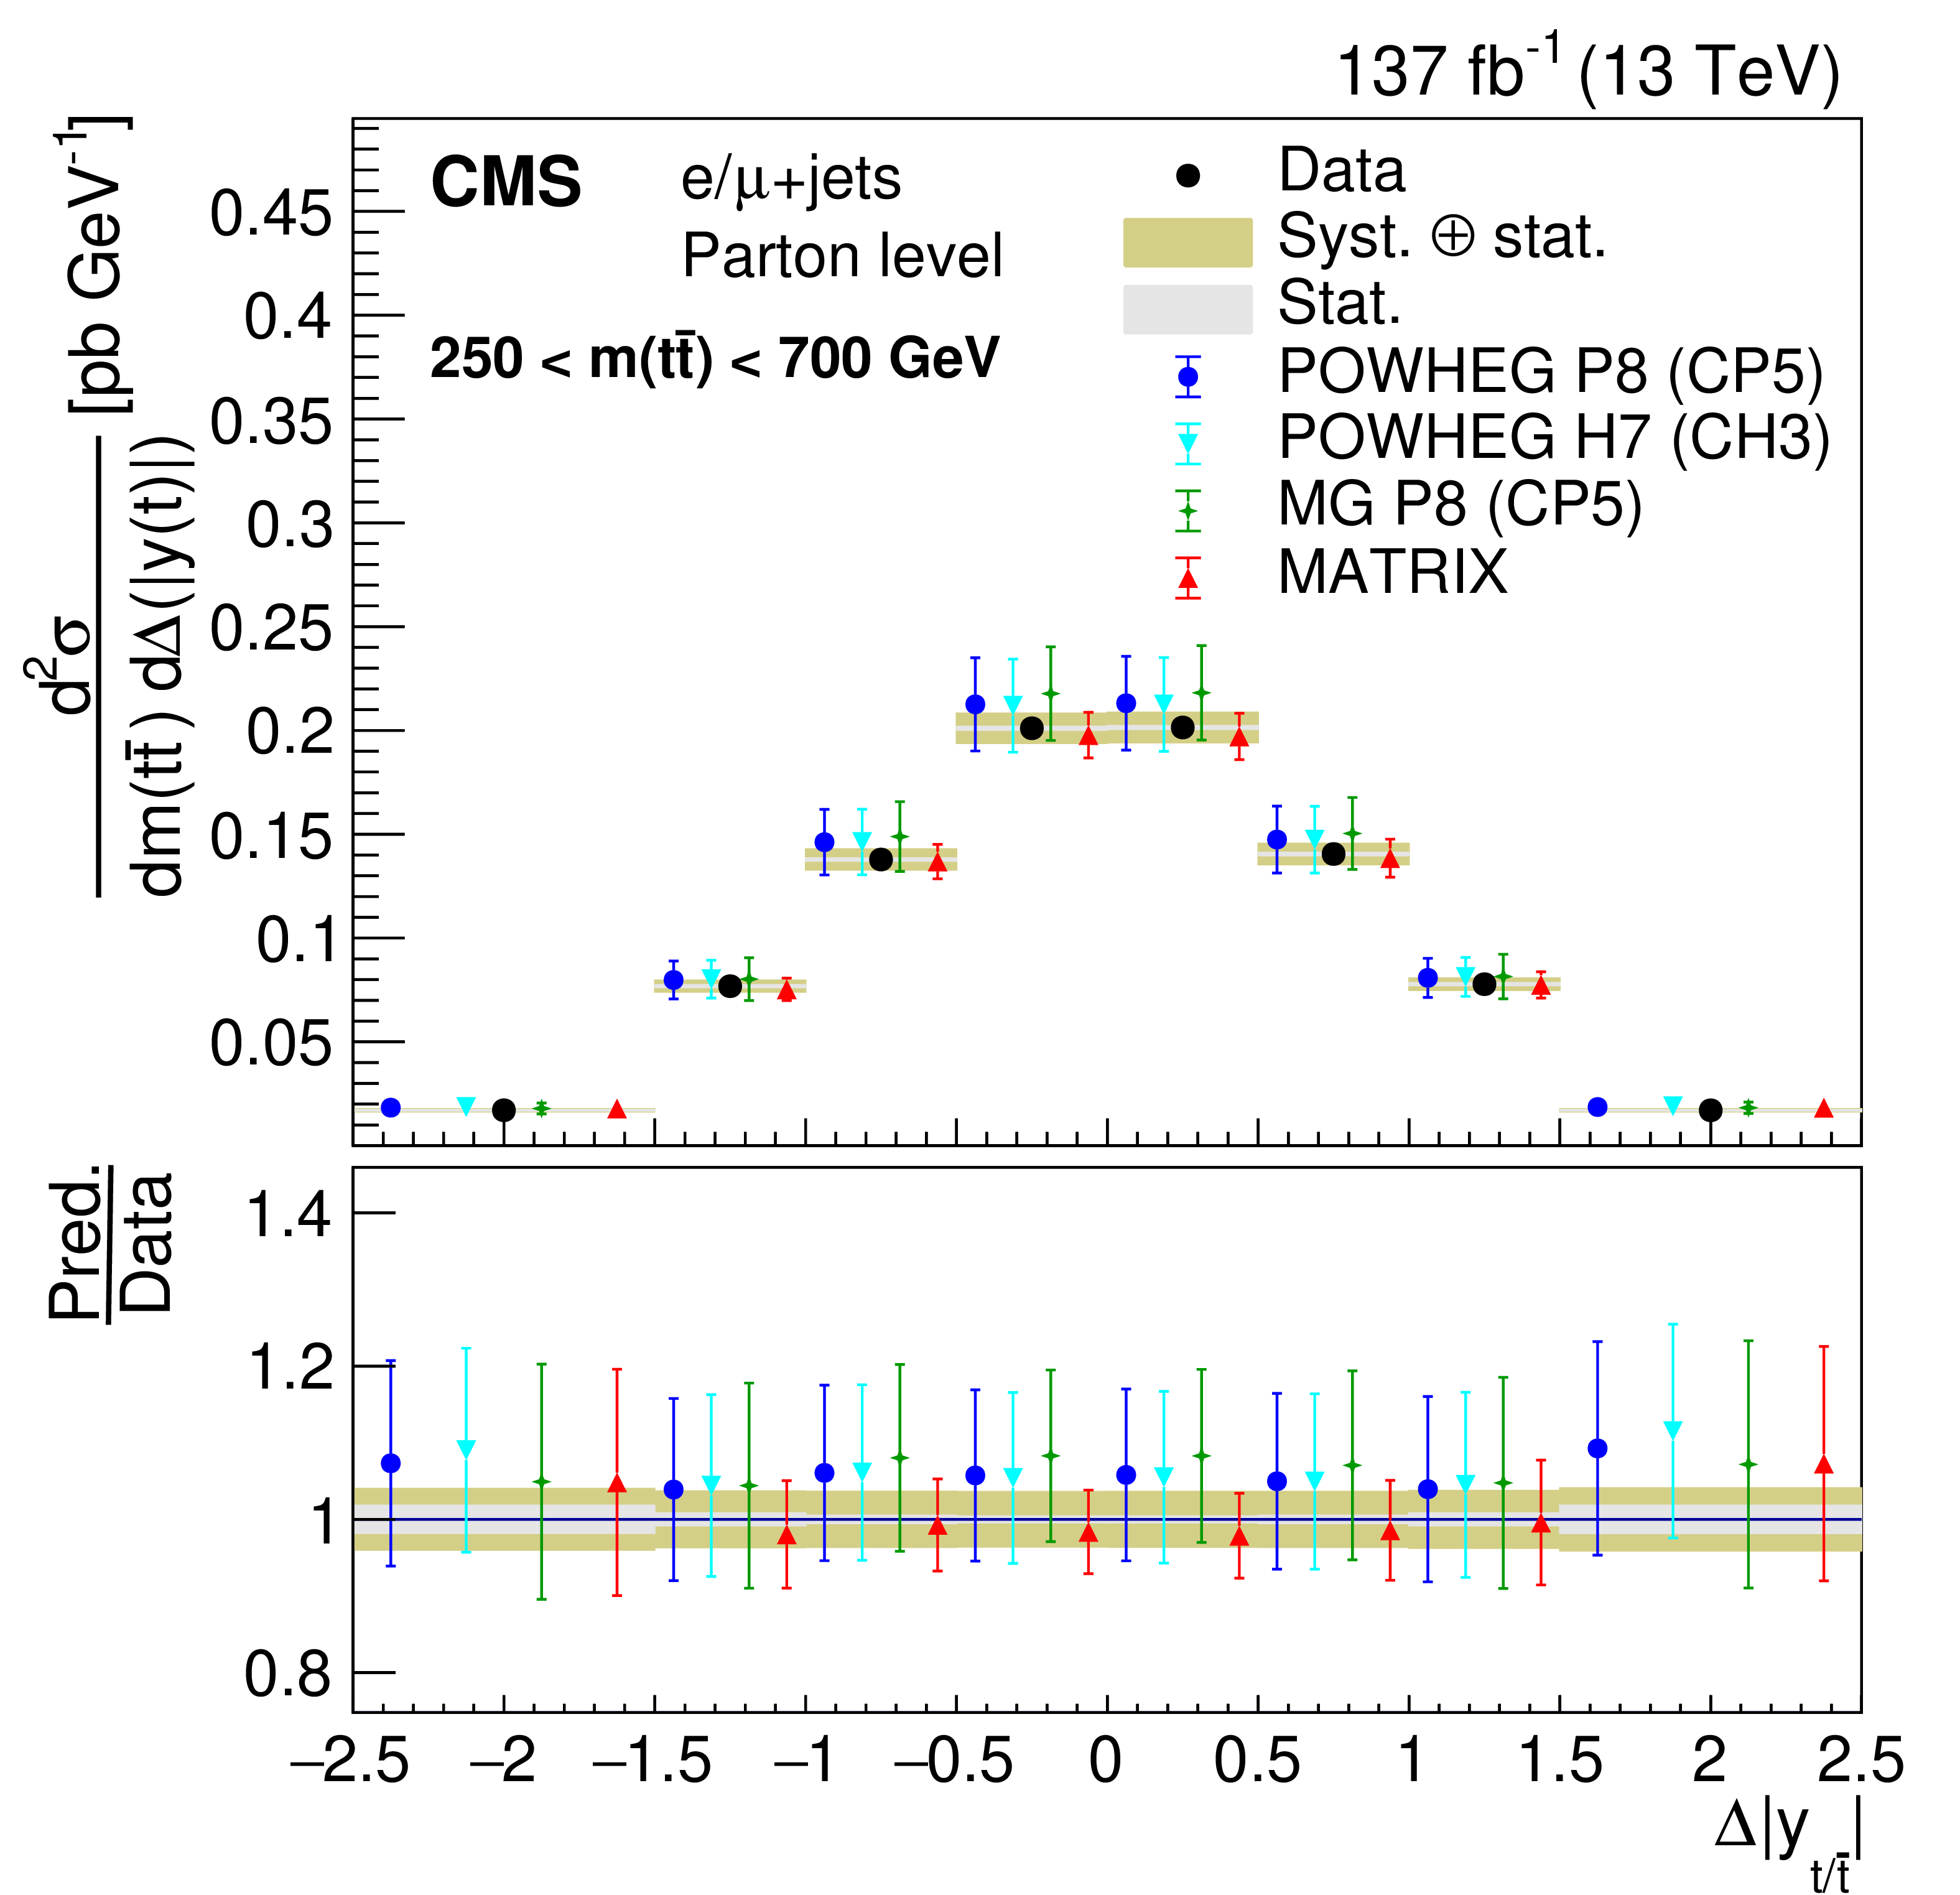
png pdf |
Figure 33-a:
Double-differential cross section at the parton level as a function of ${m({\mathrm{t} \mathrm{\bar{t}}})}$ vs. ${\Delta {| y_{\mathrm{t} /\mathrm{\bar{t}}} |}}$. The data are shown as points with gray (yellow) bands indicating the statistical (statistical and systematic) uncertainties. The cross sections are compared to the predictions of POWHEG combined with PYTHIA (P8) or HERWIG (H7), the multiparton simulation MG5_aMC@NLO (MG)+PYTHIA FxFx, and the NNLO QCD calculations obtained with Matrix. The ratios of the various predictions to the measured cross sections are shown in the lower panels. |

png pdf |
Figure 33-b:
Double-differential cross section at the parton level as a function of ${m({\mathrm{t} \mathrm{\bar{t}}})}$ vs. ${\Delta {| y_{\mathrm{t} /\mathrm{\bar{t}}} |}}$. The data are shown as points with gray (yellow) bands indicating the statistical (statistical and systematic) uncertainties. The cross sections are compared to the predictions of POWHEG combined with PYTHIA (P8) or HERWIG (H7), the multiparton simulation MG5_aMC@NLO (MG)+PYTHIA FxFx, and the NNLO QCD calculations obtained with Matrix. The ratios of the various predictions to the measured cross sections are shown in the lower panels. |

png pdf |
Figure 33-c:
Double-differential cross section at the parton level as a function of ${m({\mathrm{t} \mathrm{\bar{t}}})}$ vs. ${\Delta {| y_{\mathrm{t} /\mathrm{\bar{t}}} |}}$. The data are shown as points with gray (yellow) bands indicating the statistical (statistical and systematic) uncertainties. The cross sections are compared to the predictions of POWHEG combined with PYTHIA (P8) or HERWIG (H7), the multiparton simulation MG5_aMC@NLO (MG)+PYTHIA FxFx, and the NNLO QCD calculations obtained with Matrix. The ratios of the various predictions to the measured cross sections are shown in the lower panels. |

png pdf |
Figure 34:
Double-differential cross section at the particle level as a function of ${m({\mathrm{t} \mathrm{\bar{t}}})}$ vs. ${\Delta {| y_{\mathrm{t} /\mathrm{\bar{t}}} |}}$. The data are shown as points with gray (yellow) bands indicating the statistical (statistical and systematic) uncertainties. The cross sections are compared to the predictions of POWHEG+PYTHIA (P8) for the CP5 and CUETP8M2T4 (T4) tunes, POWHEG+HERWIG (H7), and the multiparton simulation MG5_aMC@NLO (MG)+PYTHIA. The ratios of the various predictions to the measured cross sections are shown in the lower panels. |
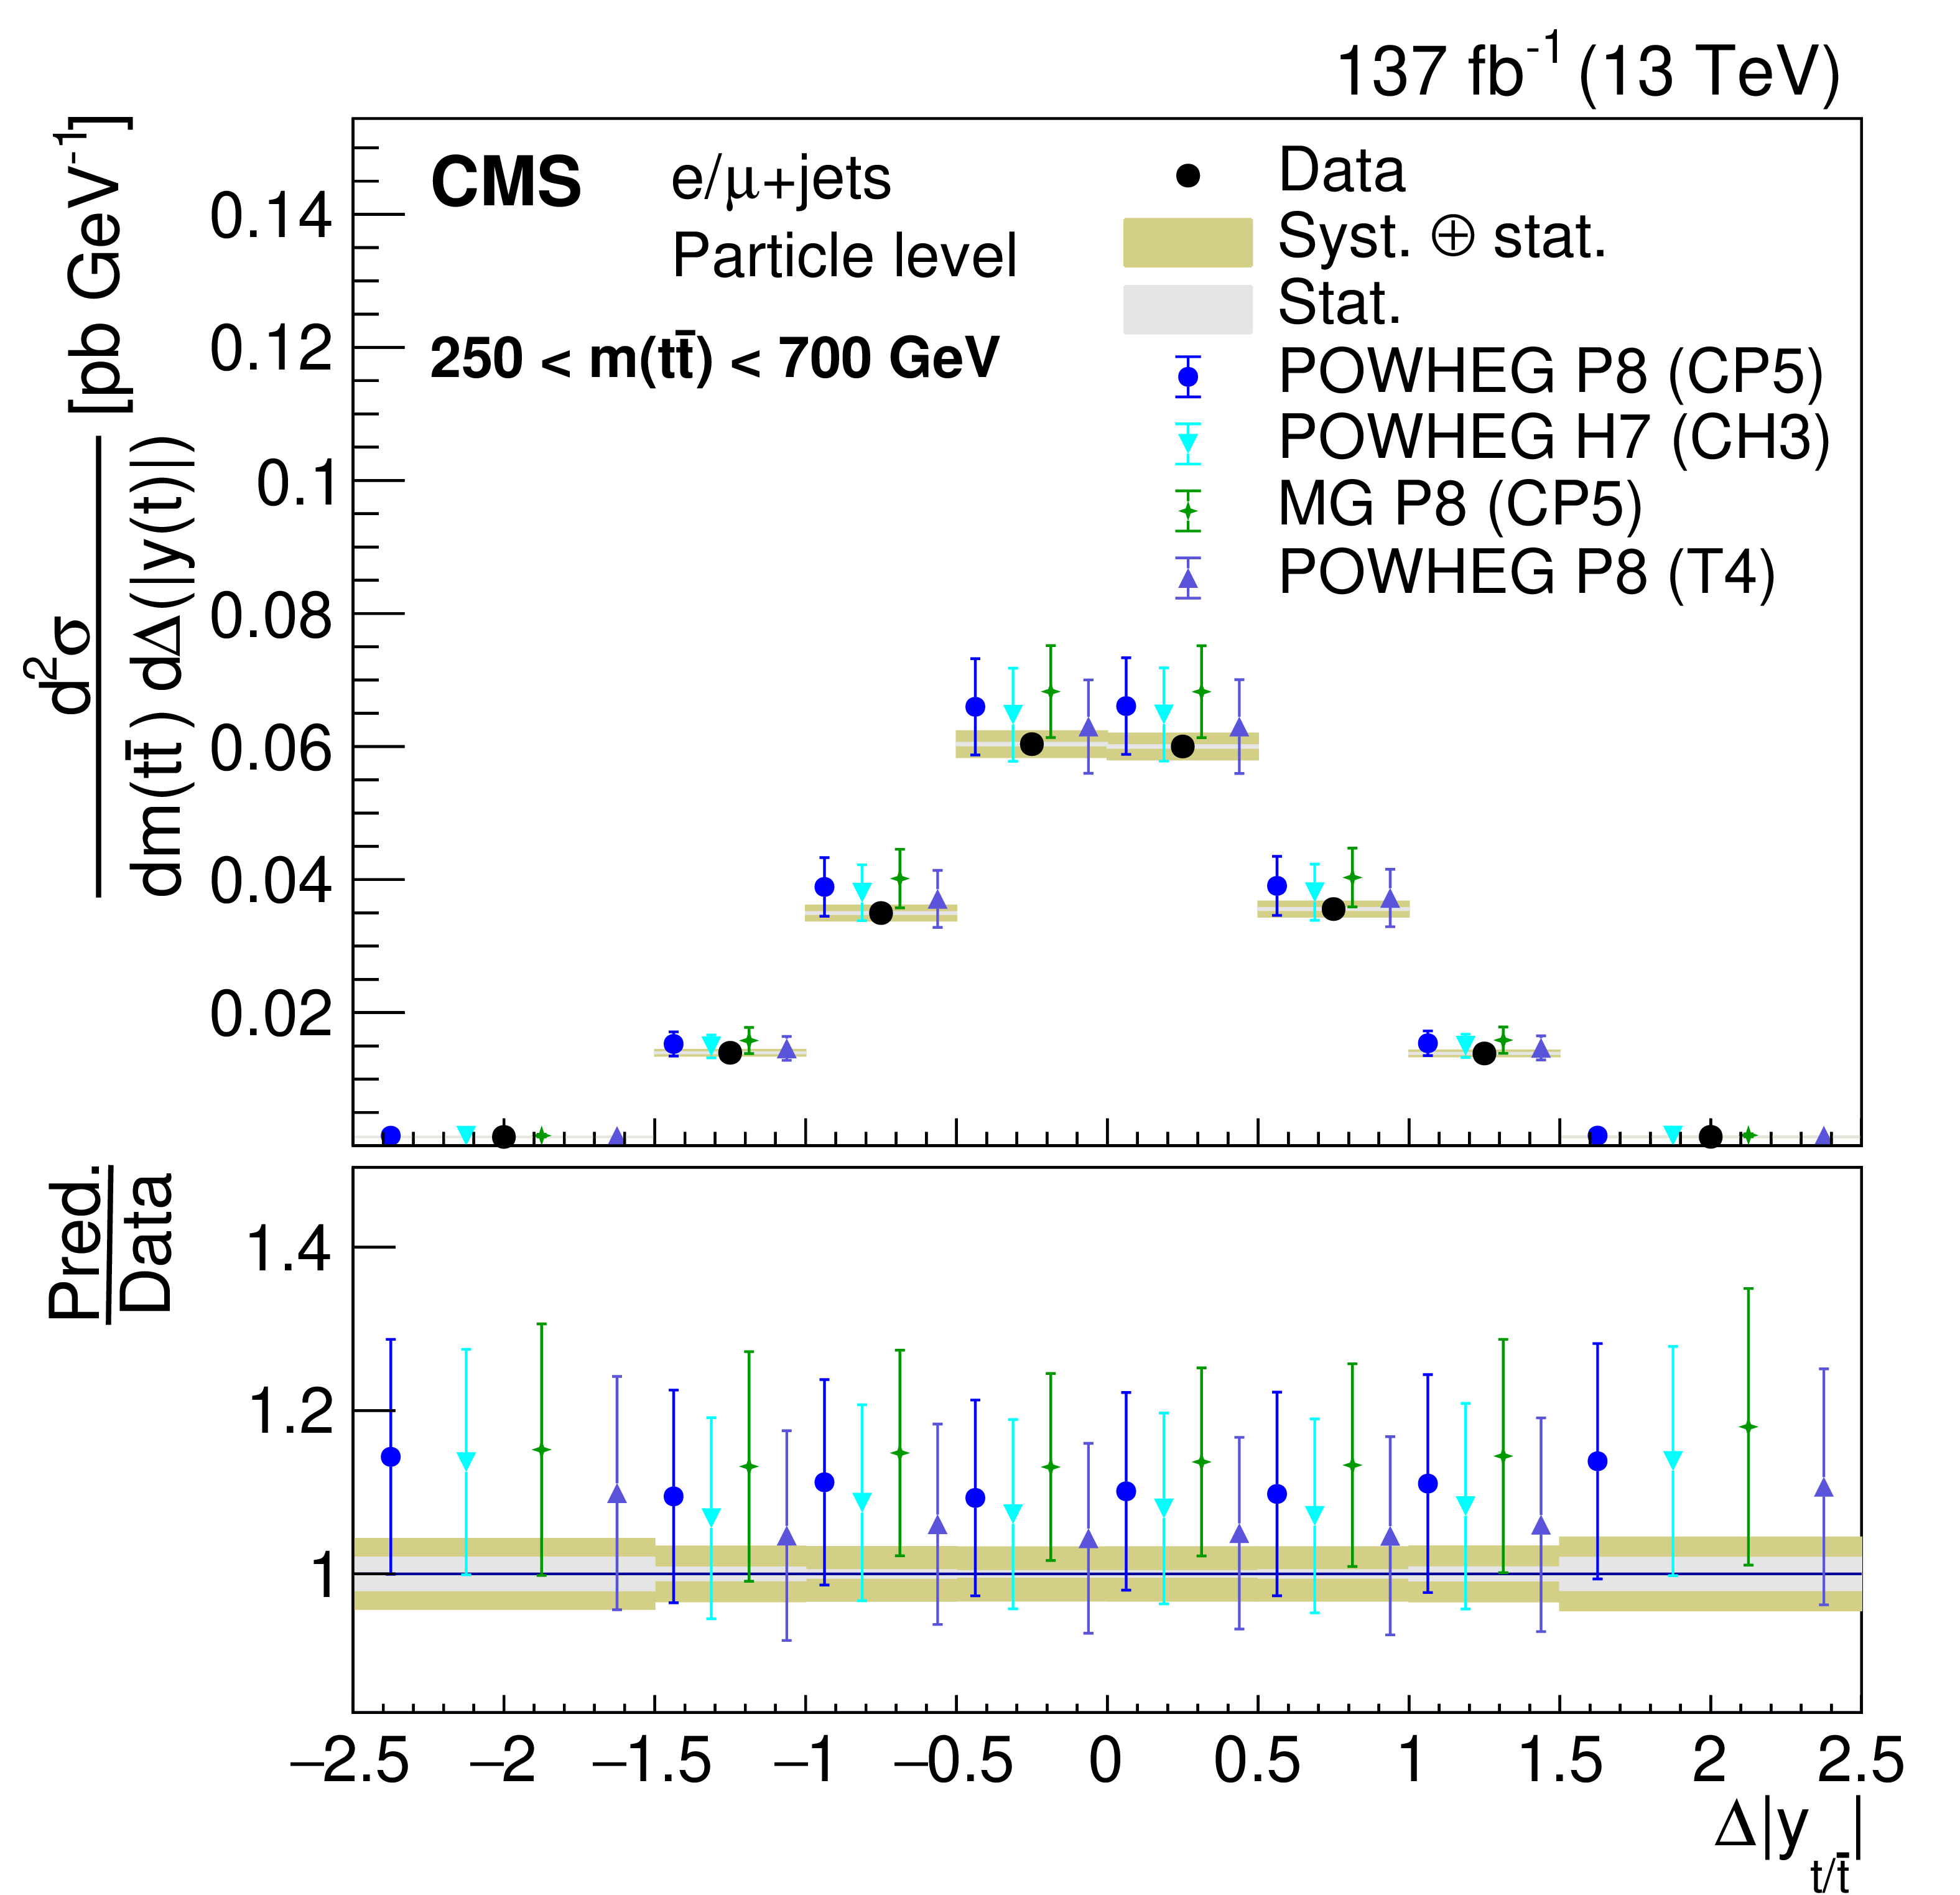
png pdf |
Figure 34-a:
Double-differential cross section at the particle level as a function of ${m({\mathrm{t} \mathrm{\bar{t}}})}$ vs. ${\Delta {| y_{\mathrm{t} /\mathrm{\bar{t}}} |}}$. The data are shown as points with gray (yellow) bands indicating the statistical (statistical and systematic) uncertainties. The cross sections are compared to the predictions of POWHEG+PYTHIA (P8) for the CP5 and CUETP8M2T4 (T4) tunes, POWHEG+HERWIG (H7), and the multiparton simulation MG5_aMC@NLO (MG)+PYTHIA. The ratios of the various predictions to the measured cross sections are shown in the lower panels. |
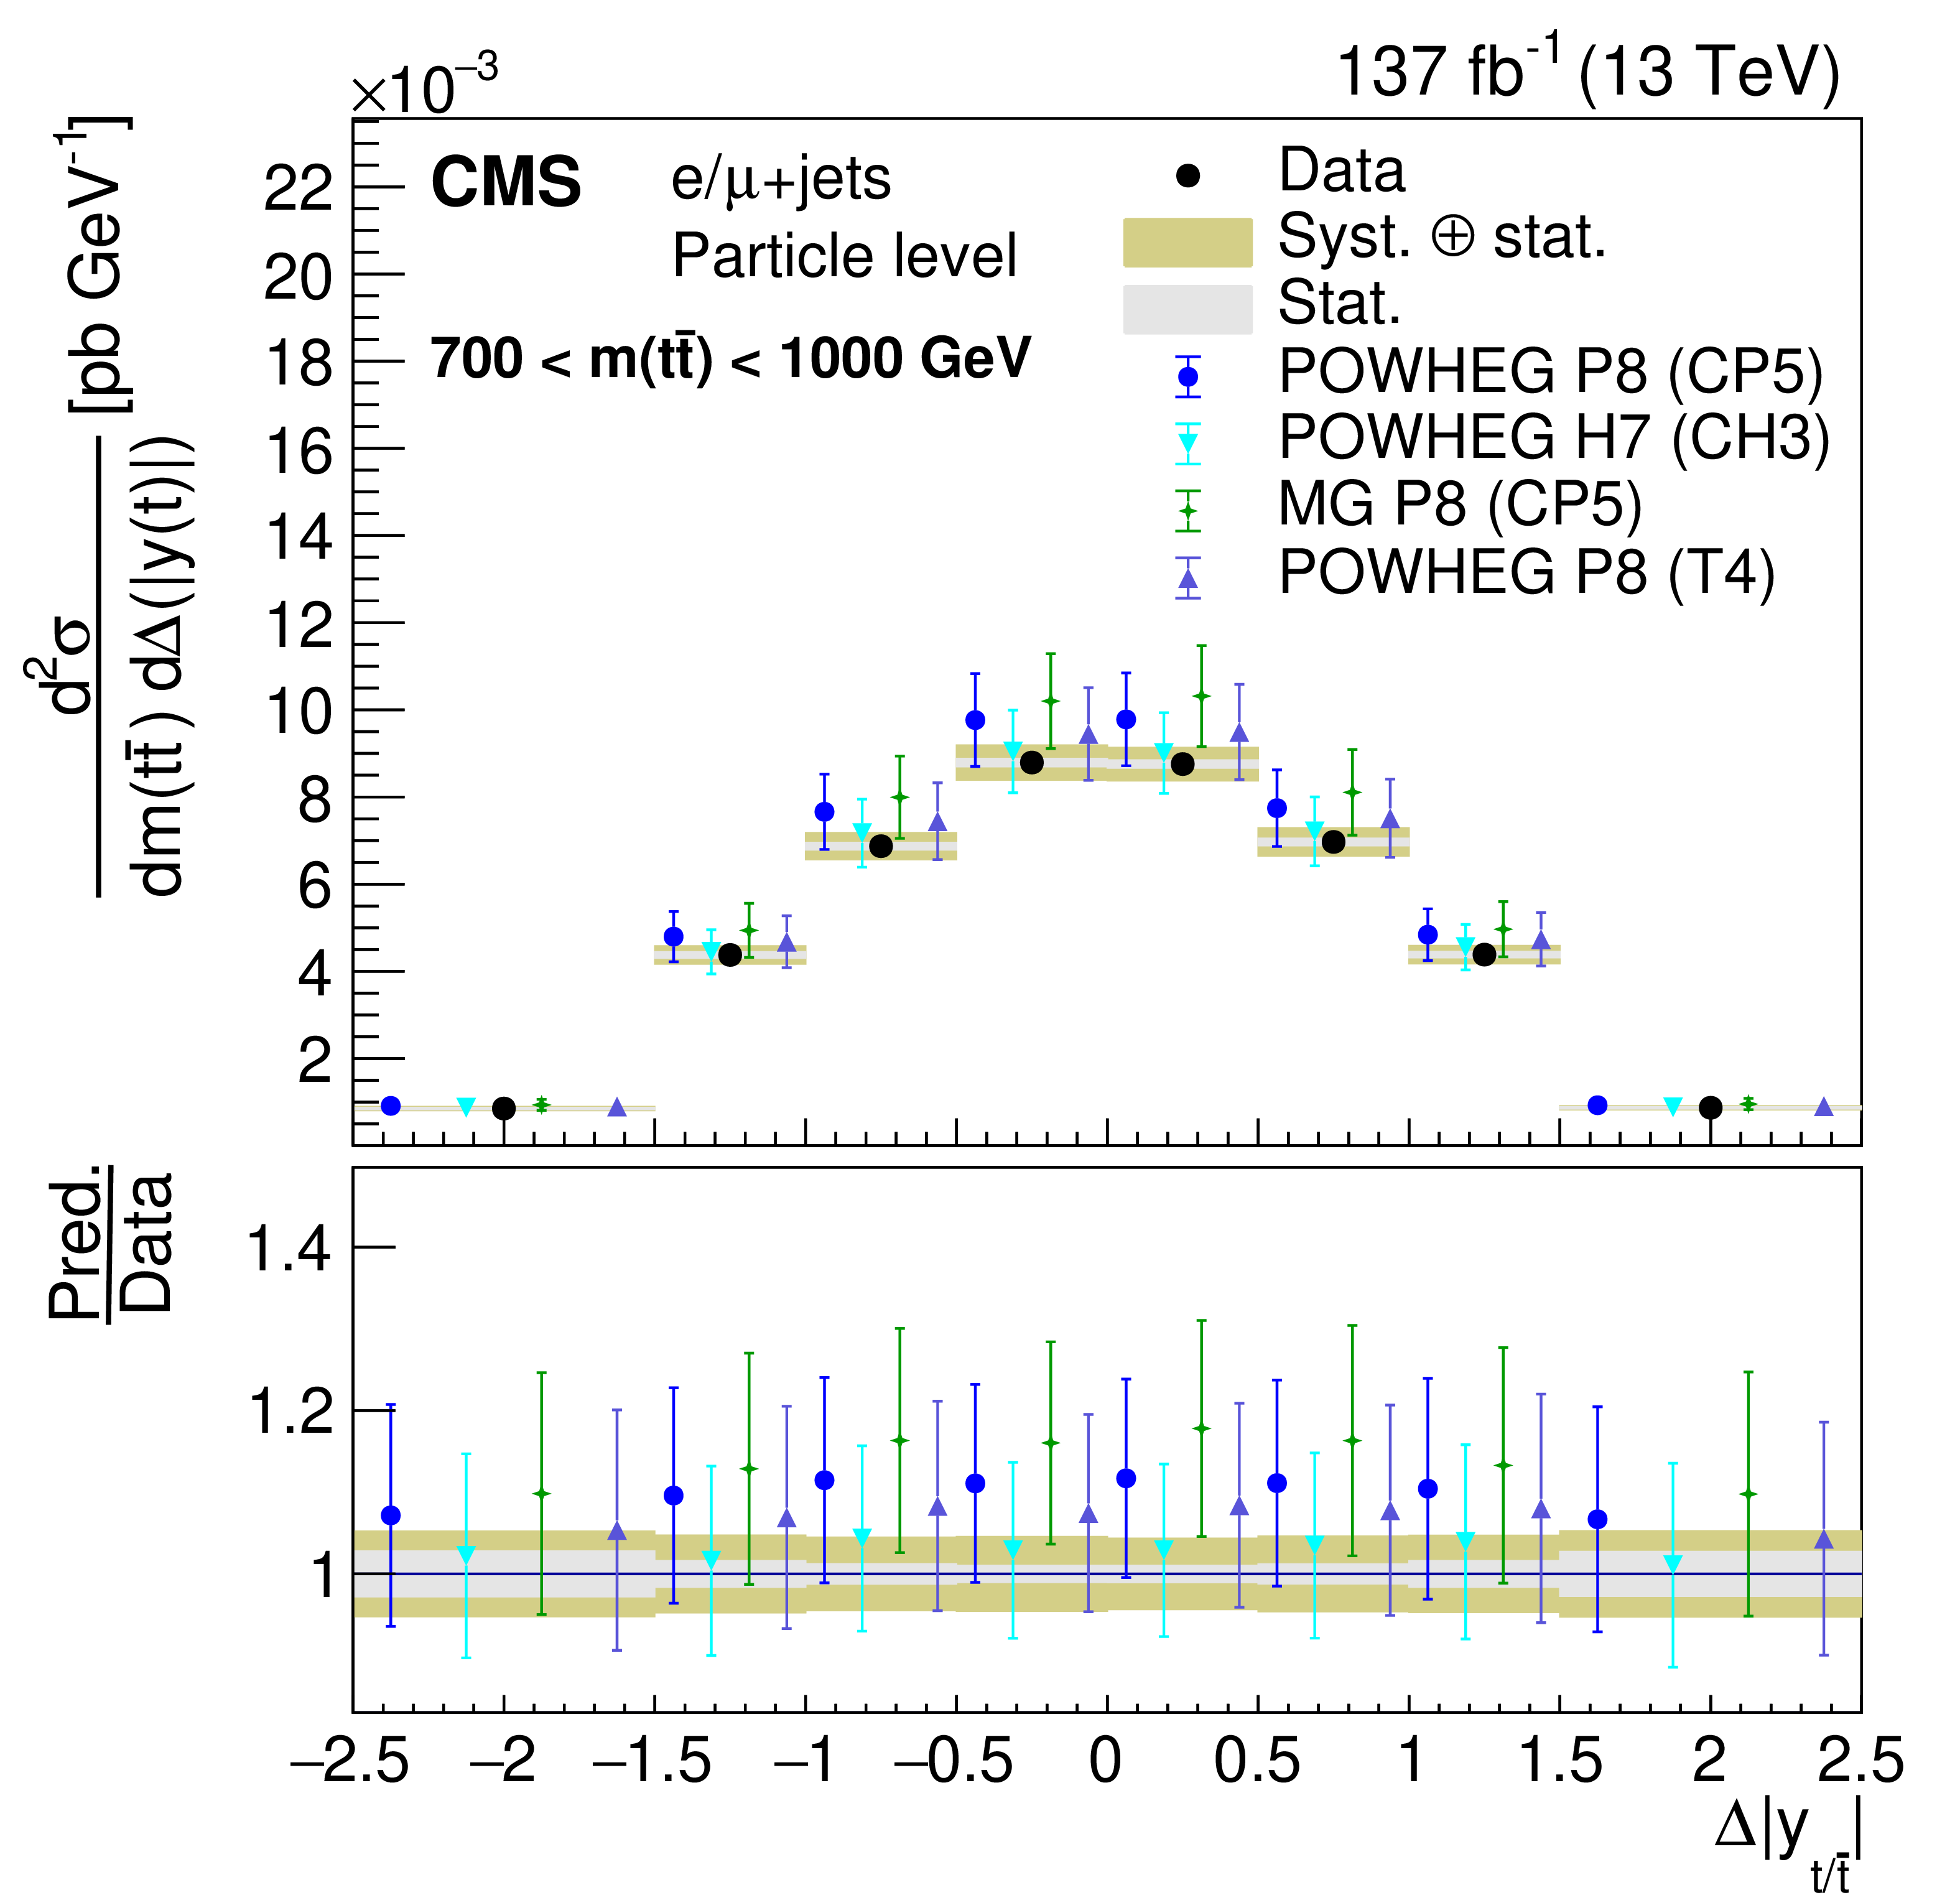
png pdf |
Figure 34-b:
Double-differential cross section at the particle level as a function of ${m({\mathrm{t} \mathrm{\bar{t}}})}$ vs. ${\Delta {| y_{\mathrm{t} /\mathrm{\bar{t}}} |}}$. The data are shown as points with gray (yellow) bands indicating the statistical (statistical and systematic) uncertainties. The cross sections are compared to the predictions of POWHEG+PYTHIA (P8) for the CP5 and CUETP8M2T4 (T4) tunes, POWHEG+HERWIG (H7), and the multiparton simulation MG5_aMC@NLO (MG)+PYTHIA. The ratios of the various predictions to the measured cross sections are shown in the lower panels. |
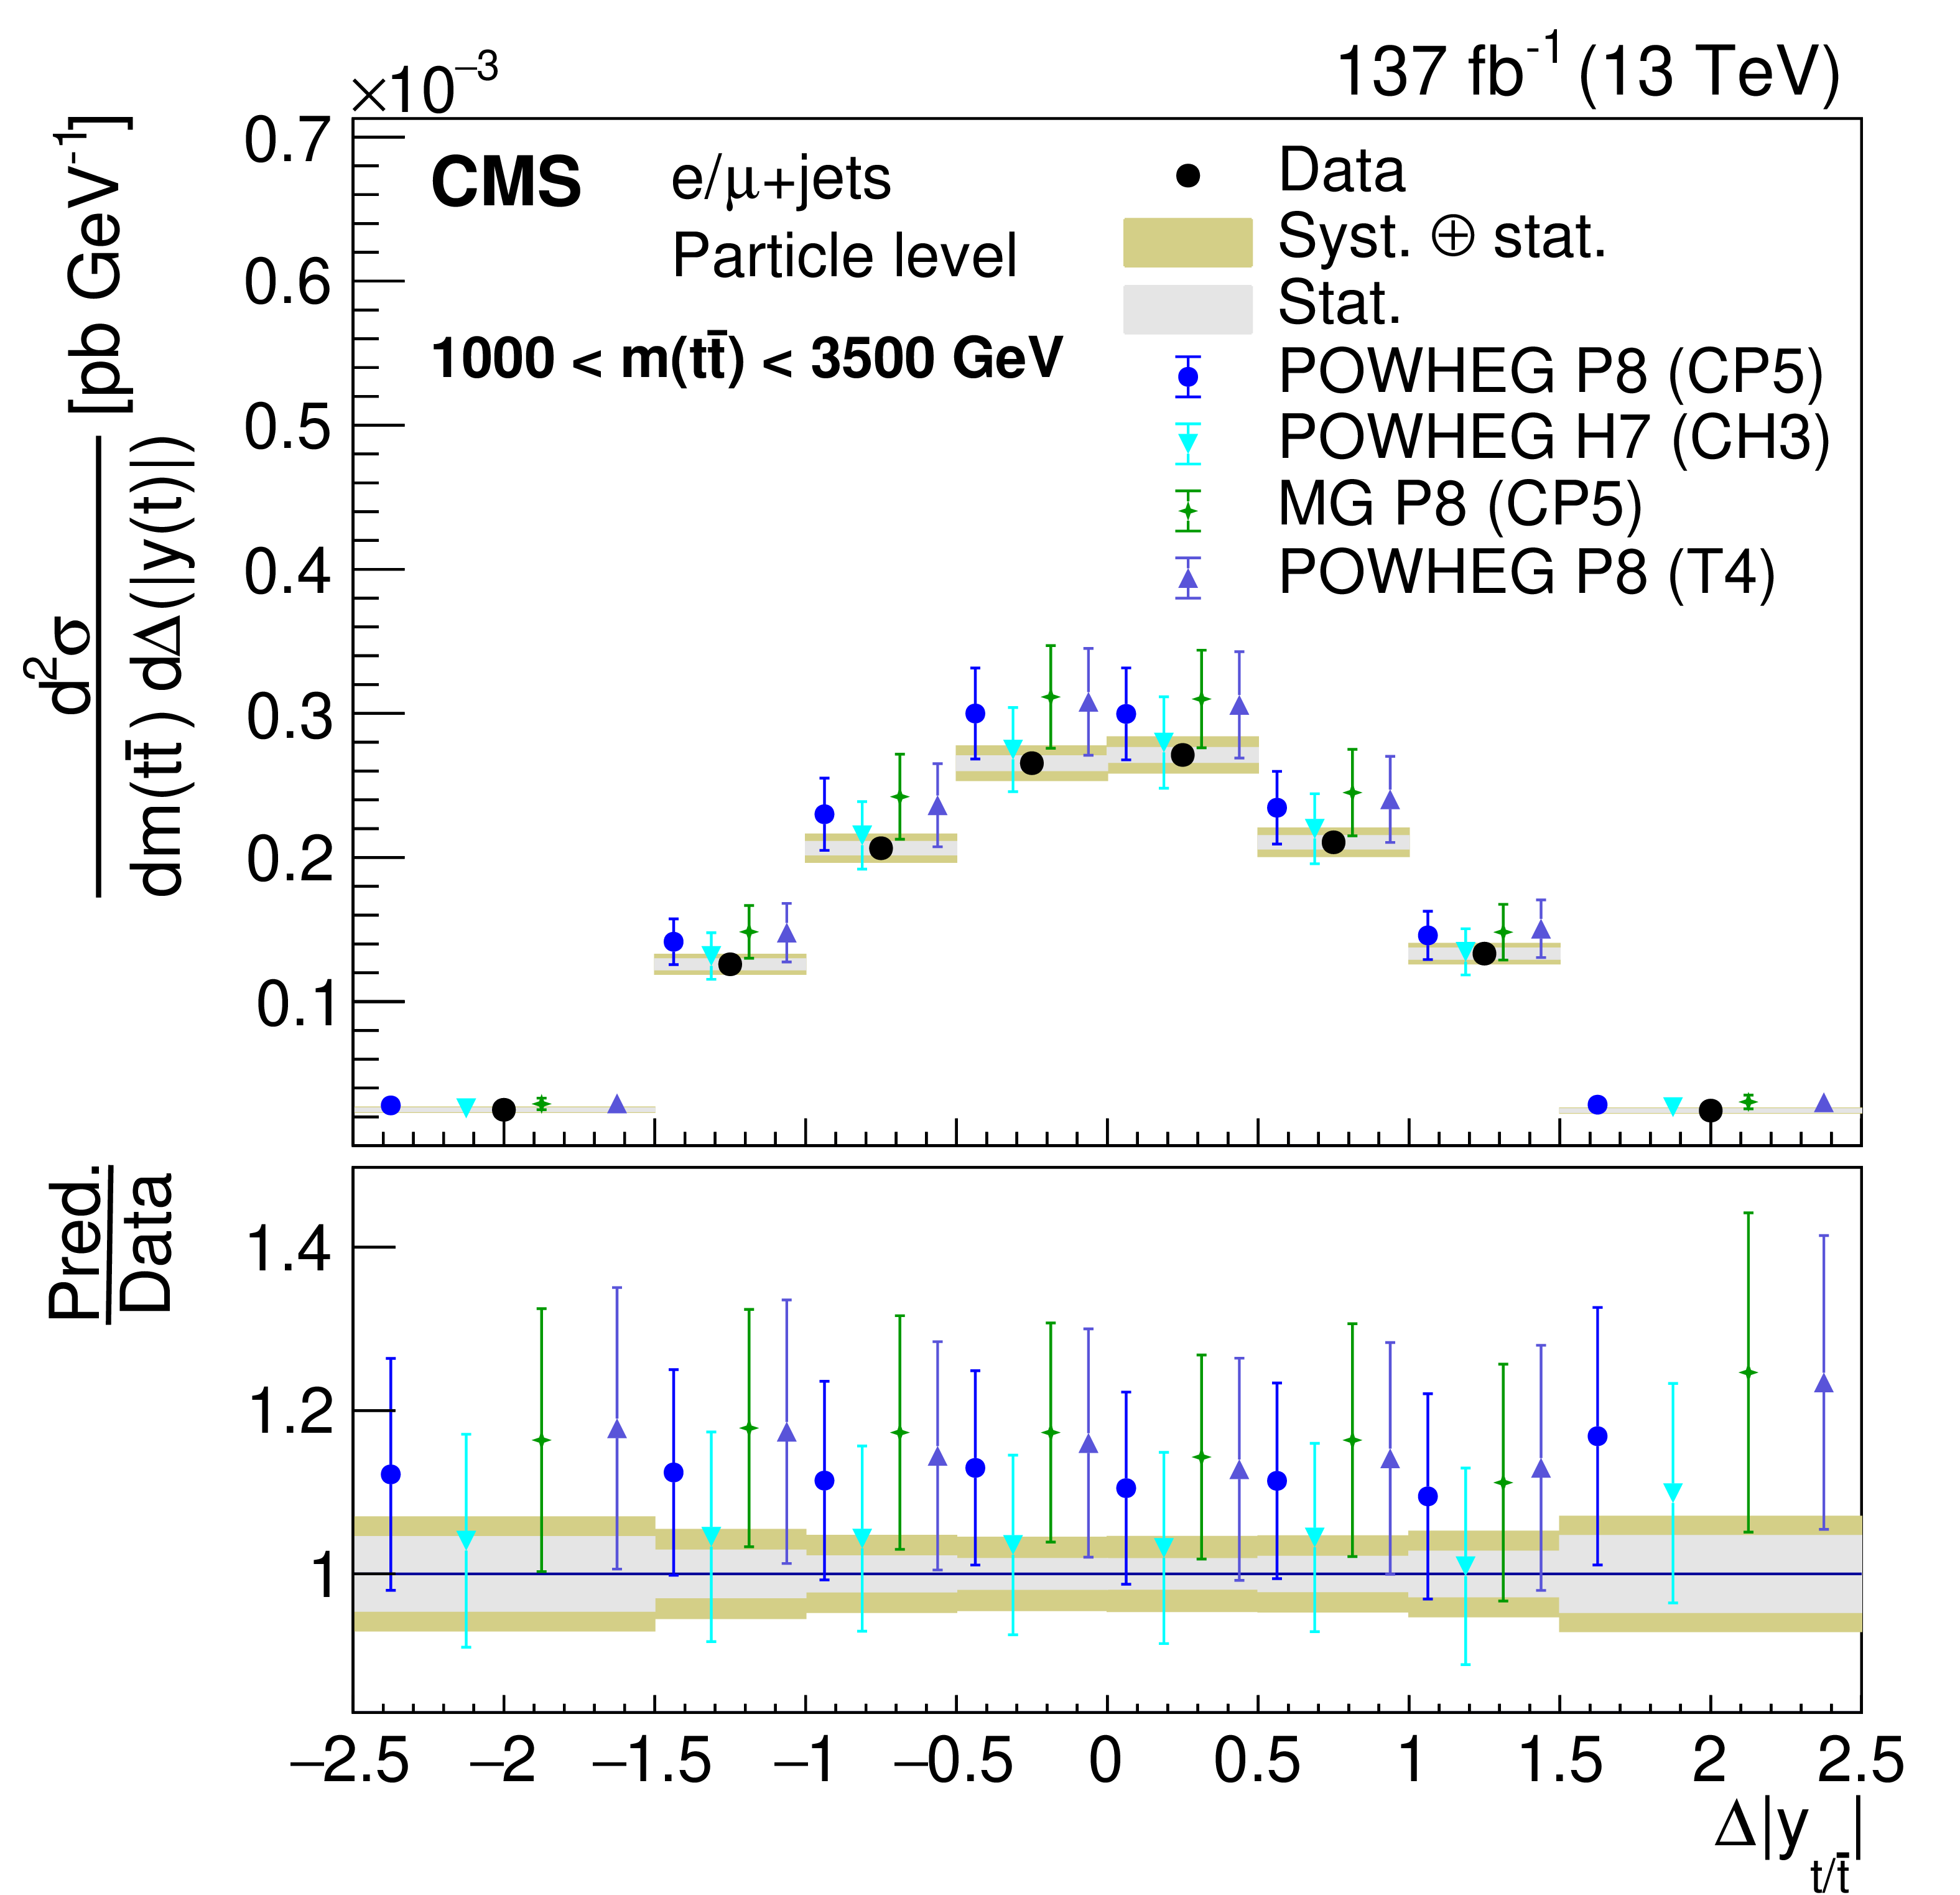
png pdf |
Figure 34-c:
Double-differential cross section at the particle level as a function of ${m({\mathrm{t} \mathrm{\bar{t}}})}$ vs. ${\Delta {| y_{\mathrm{t} /\mathrm{\bar{t}}} |}}$. The data are shown as points with gray (yellow) bands indicating the statistical (statistical and systematic) uncertainties. The cross sections are compared to the predictions of POWHEG+PYTHIA (P8) for the CP5 and CUETP8M2T4 (T4) tunes, POWHEG+HERWIG (H7), and the multiparton simulation MG5_aMC@NLO (MG)+PYTHIA. The ratios of the various predictions to the measured cross sections are shown in the lower panels. |
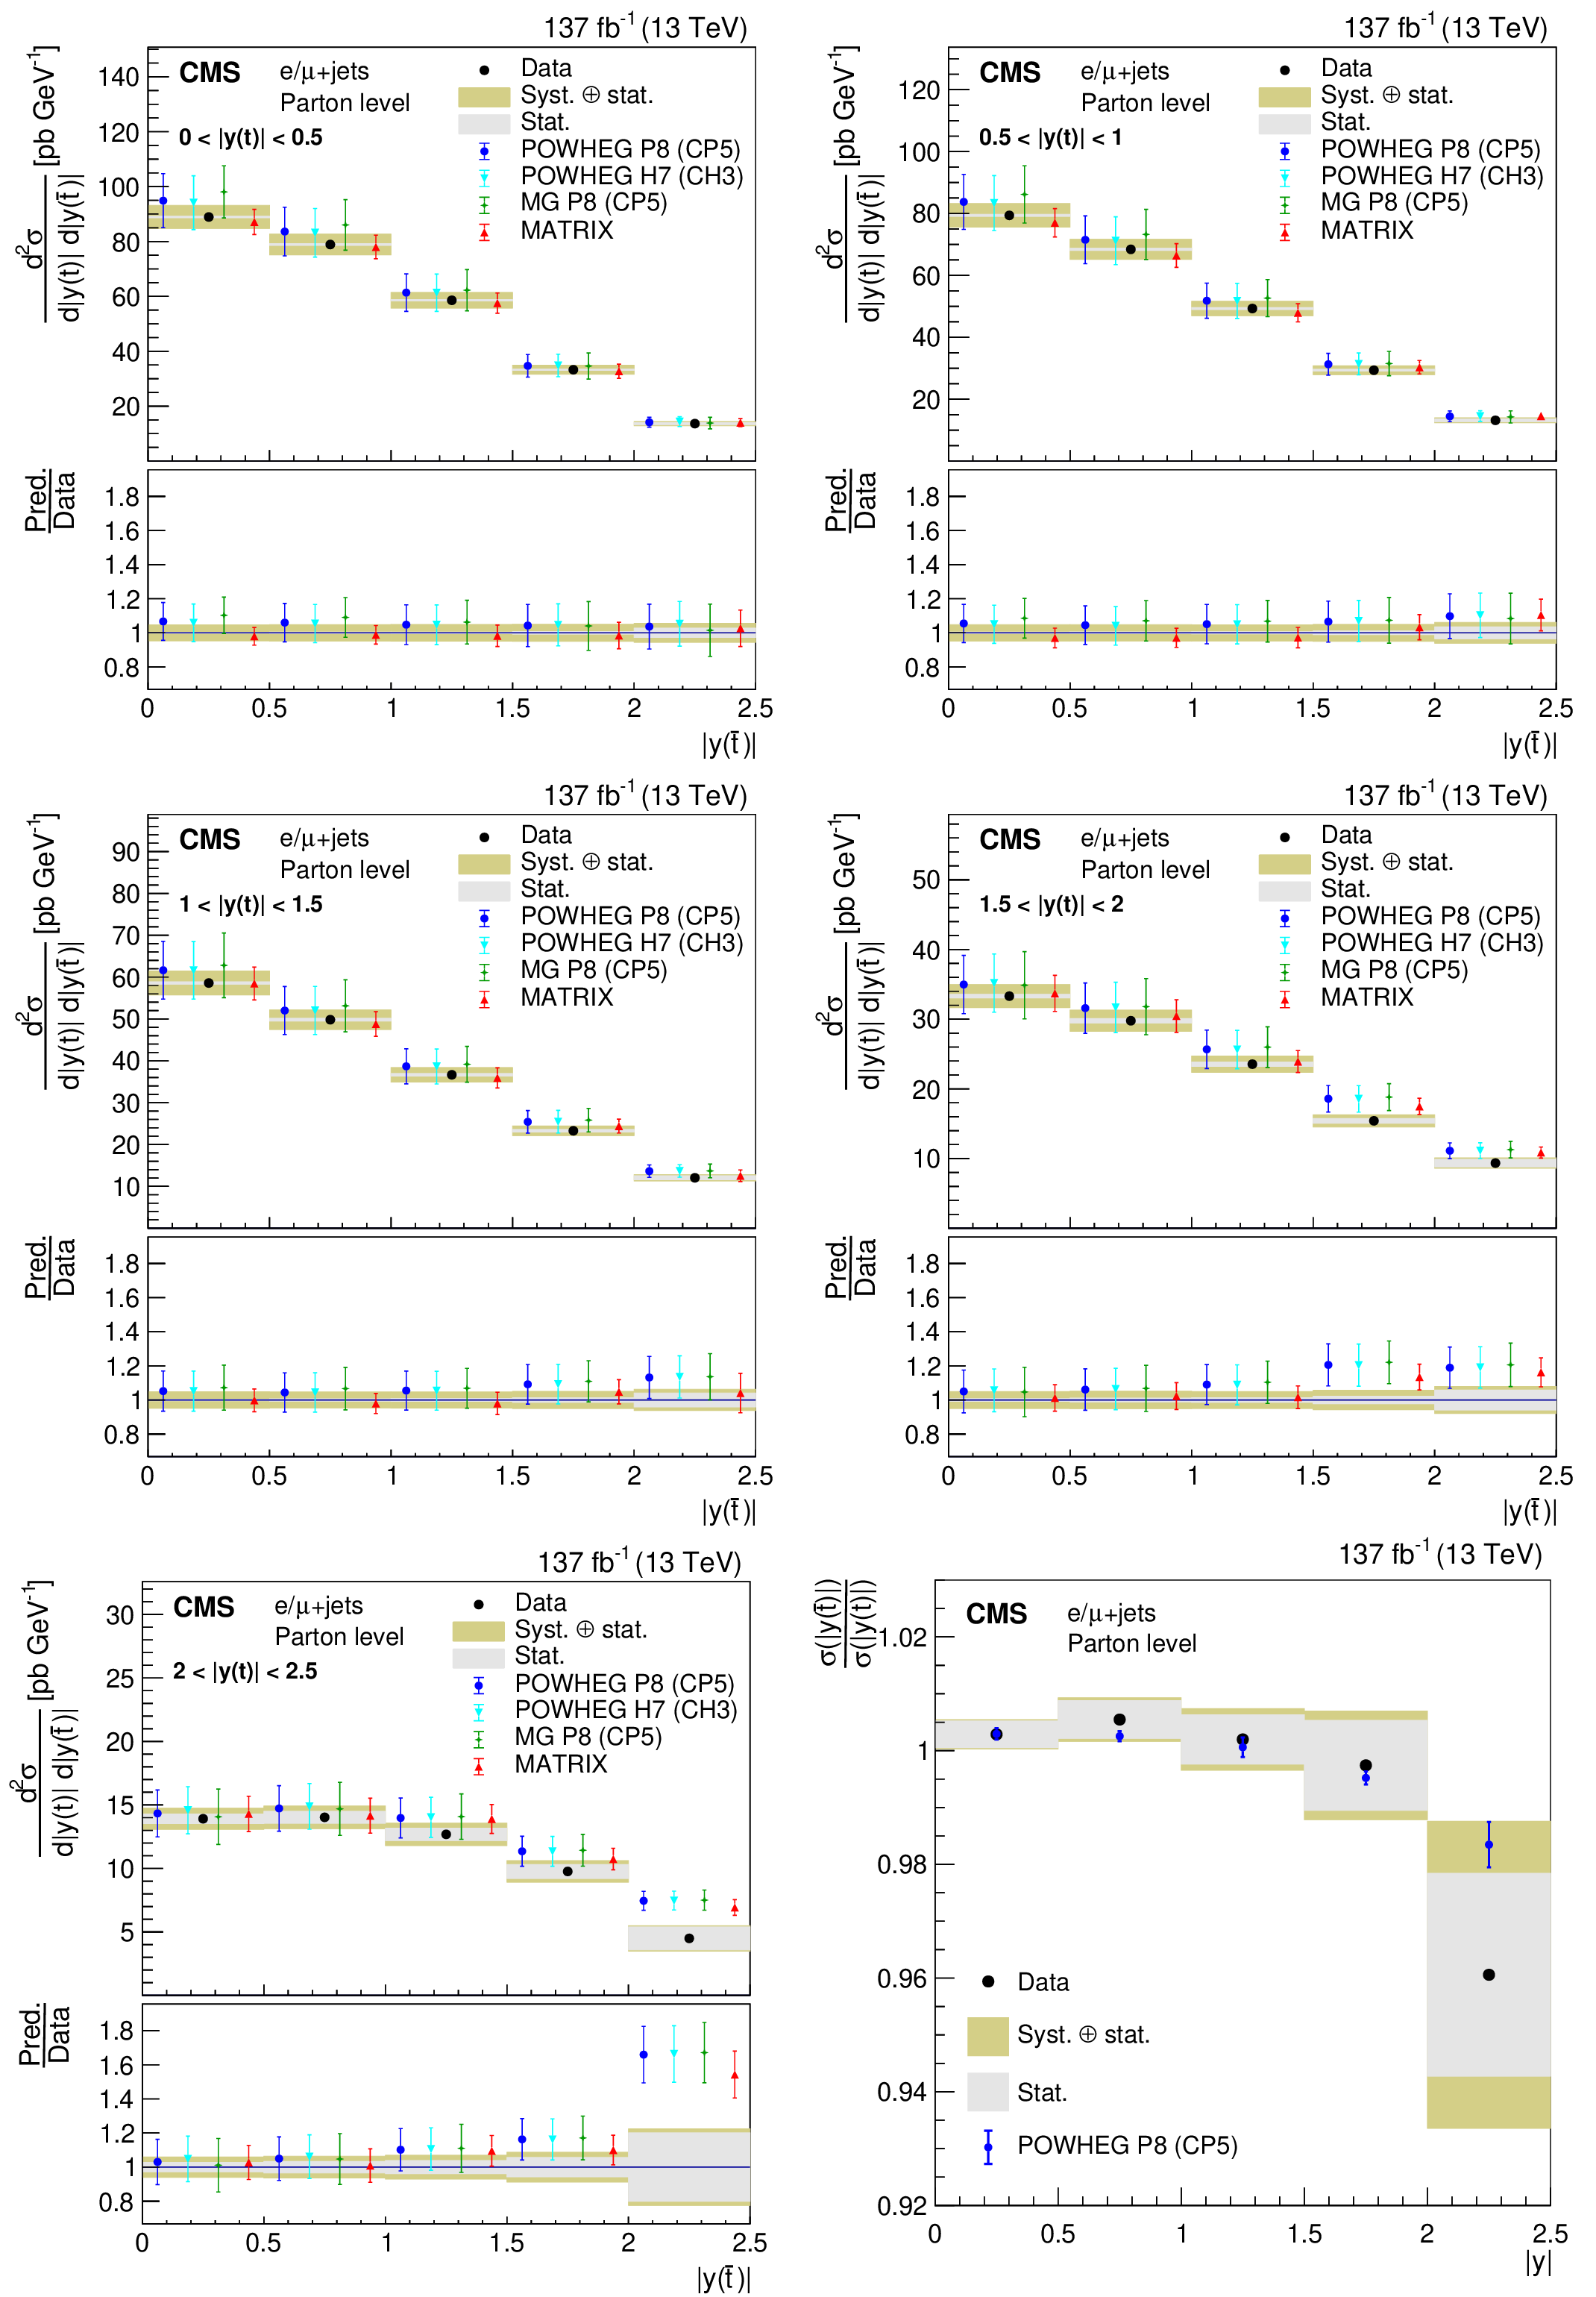
png pdf |
Figure 35:
Double-differential cross section at the parton level as a function of ${{| y(\mathrm{t}) |}}$ vs. ${{| y(\mathrm{\bar{t}}) |}}$. The data are shown as points with gray (yellow) bands indicating the statistical (statistical and systematic) uncertainties. The cross sections are compared to the predictions of POWHEG combined with PYTHIA (P8) or HERWIG (H7), the multiparton simulation MG5_aMC@NLO (MG)+PYTHIA FxFx, and the NNLO QCD calculations obtained with Matrix. The ratios of the various predictions to the measured cross sections are shown in the lower panels. Lower right: ratio of $ {| y(\mathrm{\bar{t}}) |} / {| y(\mathrm{t}) |}$. |
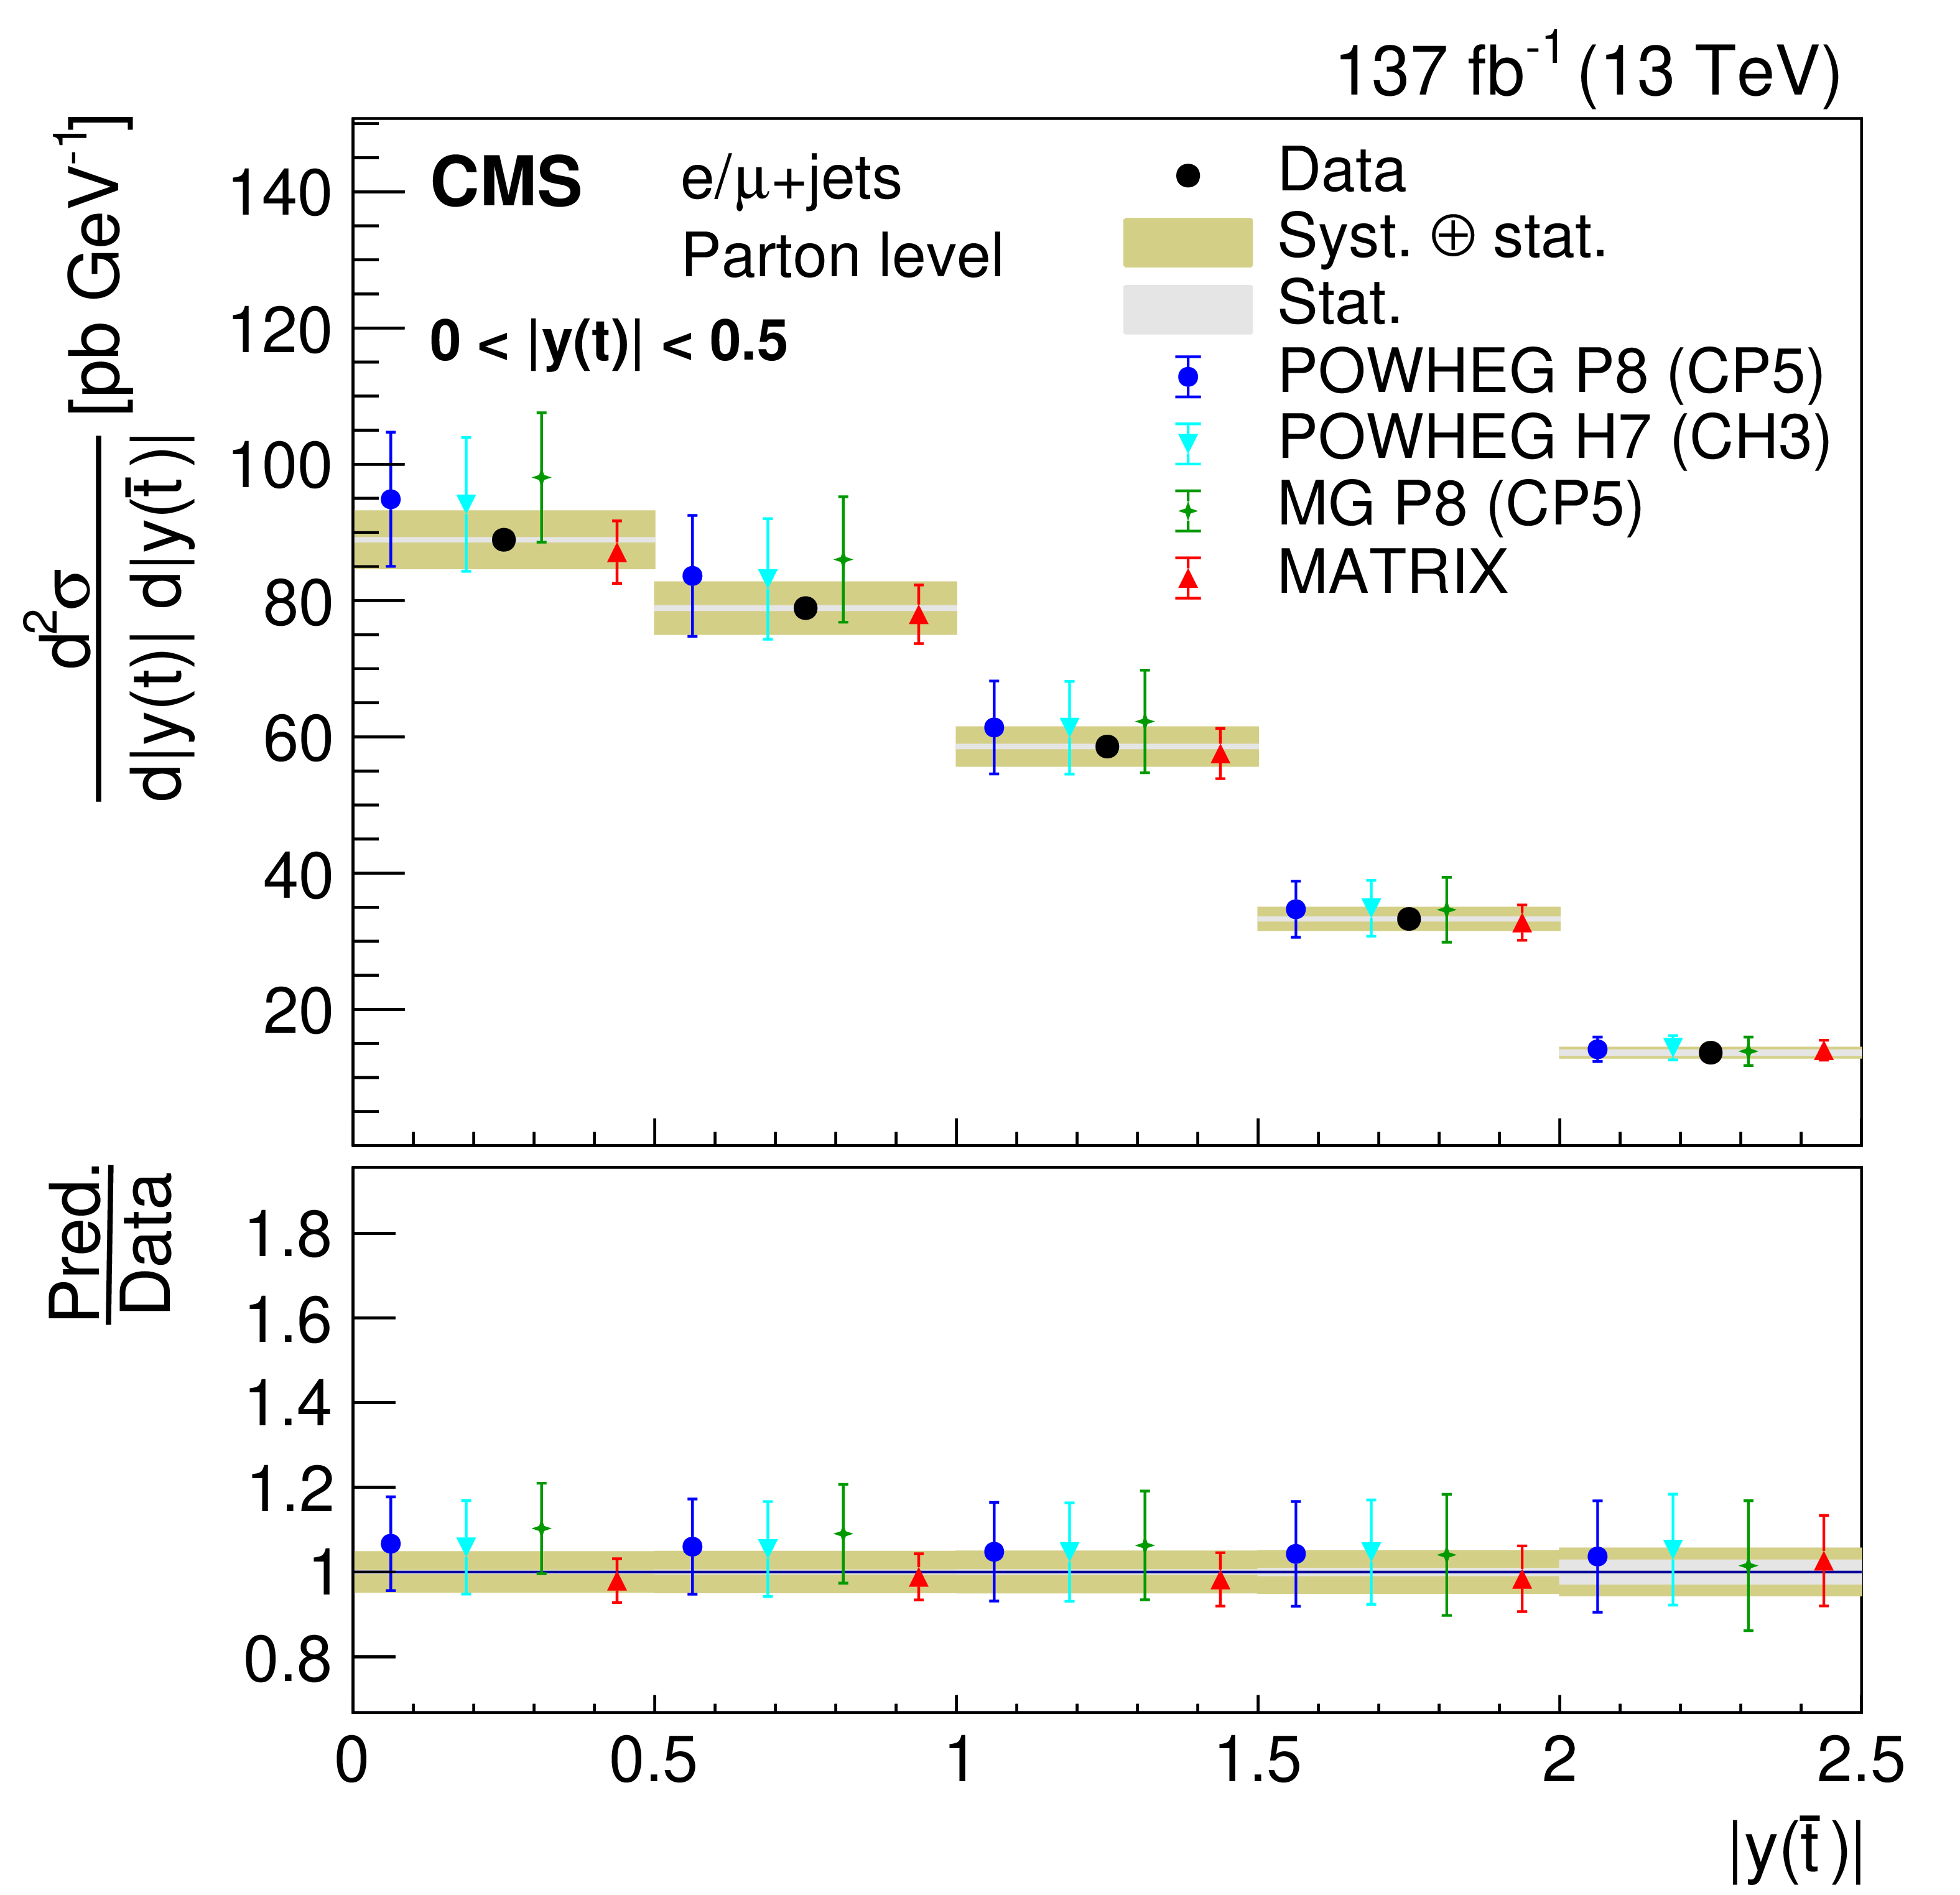
png pdf |
Figure 35-a:
Double-differential cross section at the parton level as a function of ${{| y(\mathrm{t}) |}}$ vs. ${{| y(\mathrm{\bar{t}}) |}}$. The data are shown as points with gray (yellow) bands indicating the statistical (statistical and systematic) uncertainties. The cross sections are compared to the predictions of POWHEG combined with PYTHIA (P8) or HERWIG (H7), the multiparton simulation MG5_aMC@NLO (MG)+PYTHIA FxFx, and the NNLO QCD calculations obtained with Matrix. The ratios of the various predictions to the measured cross sections are shown in the lower panels. Lower right: ratio of $ {| y(\mathrm{\bar{t}}) |} / {| y(\mathrm{t}) |}$. |
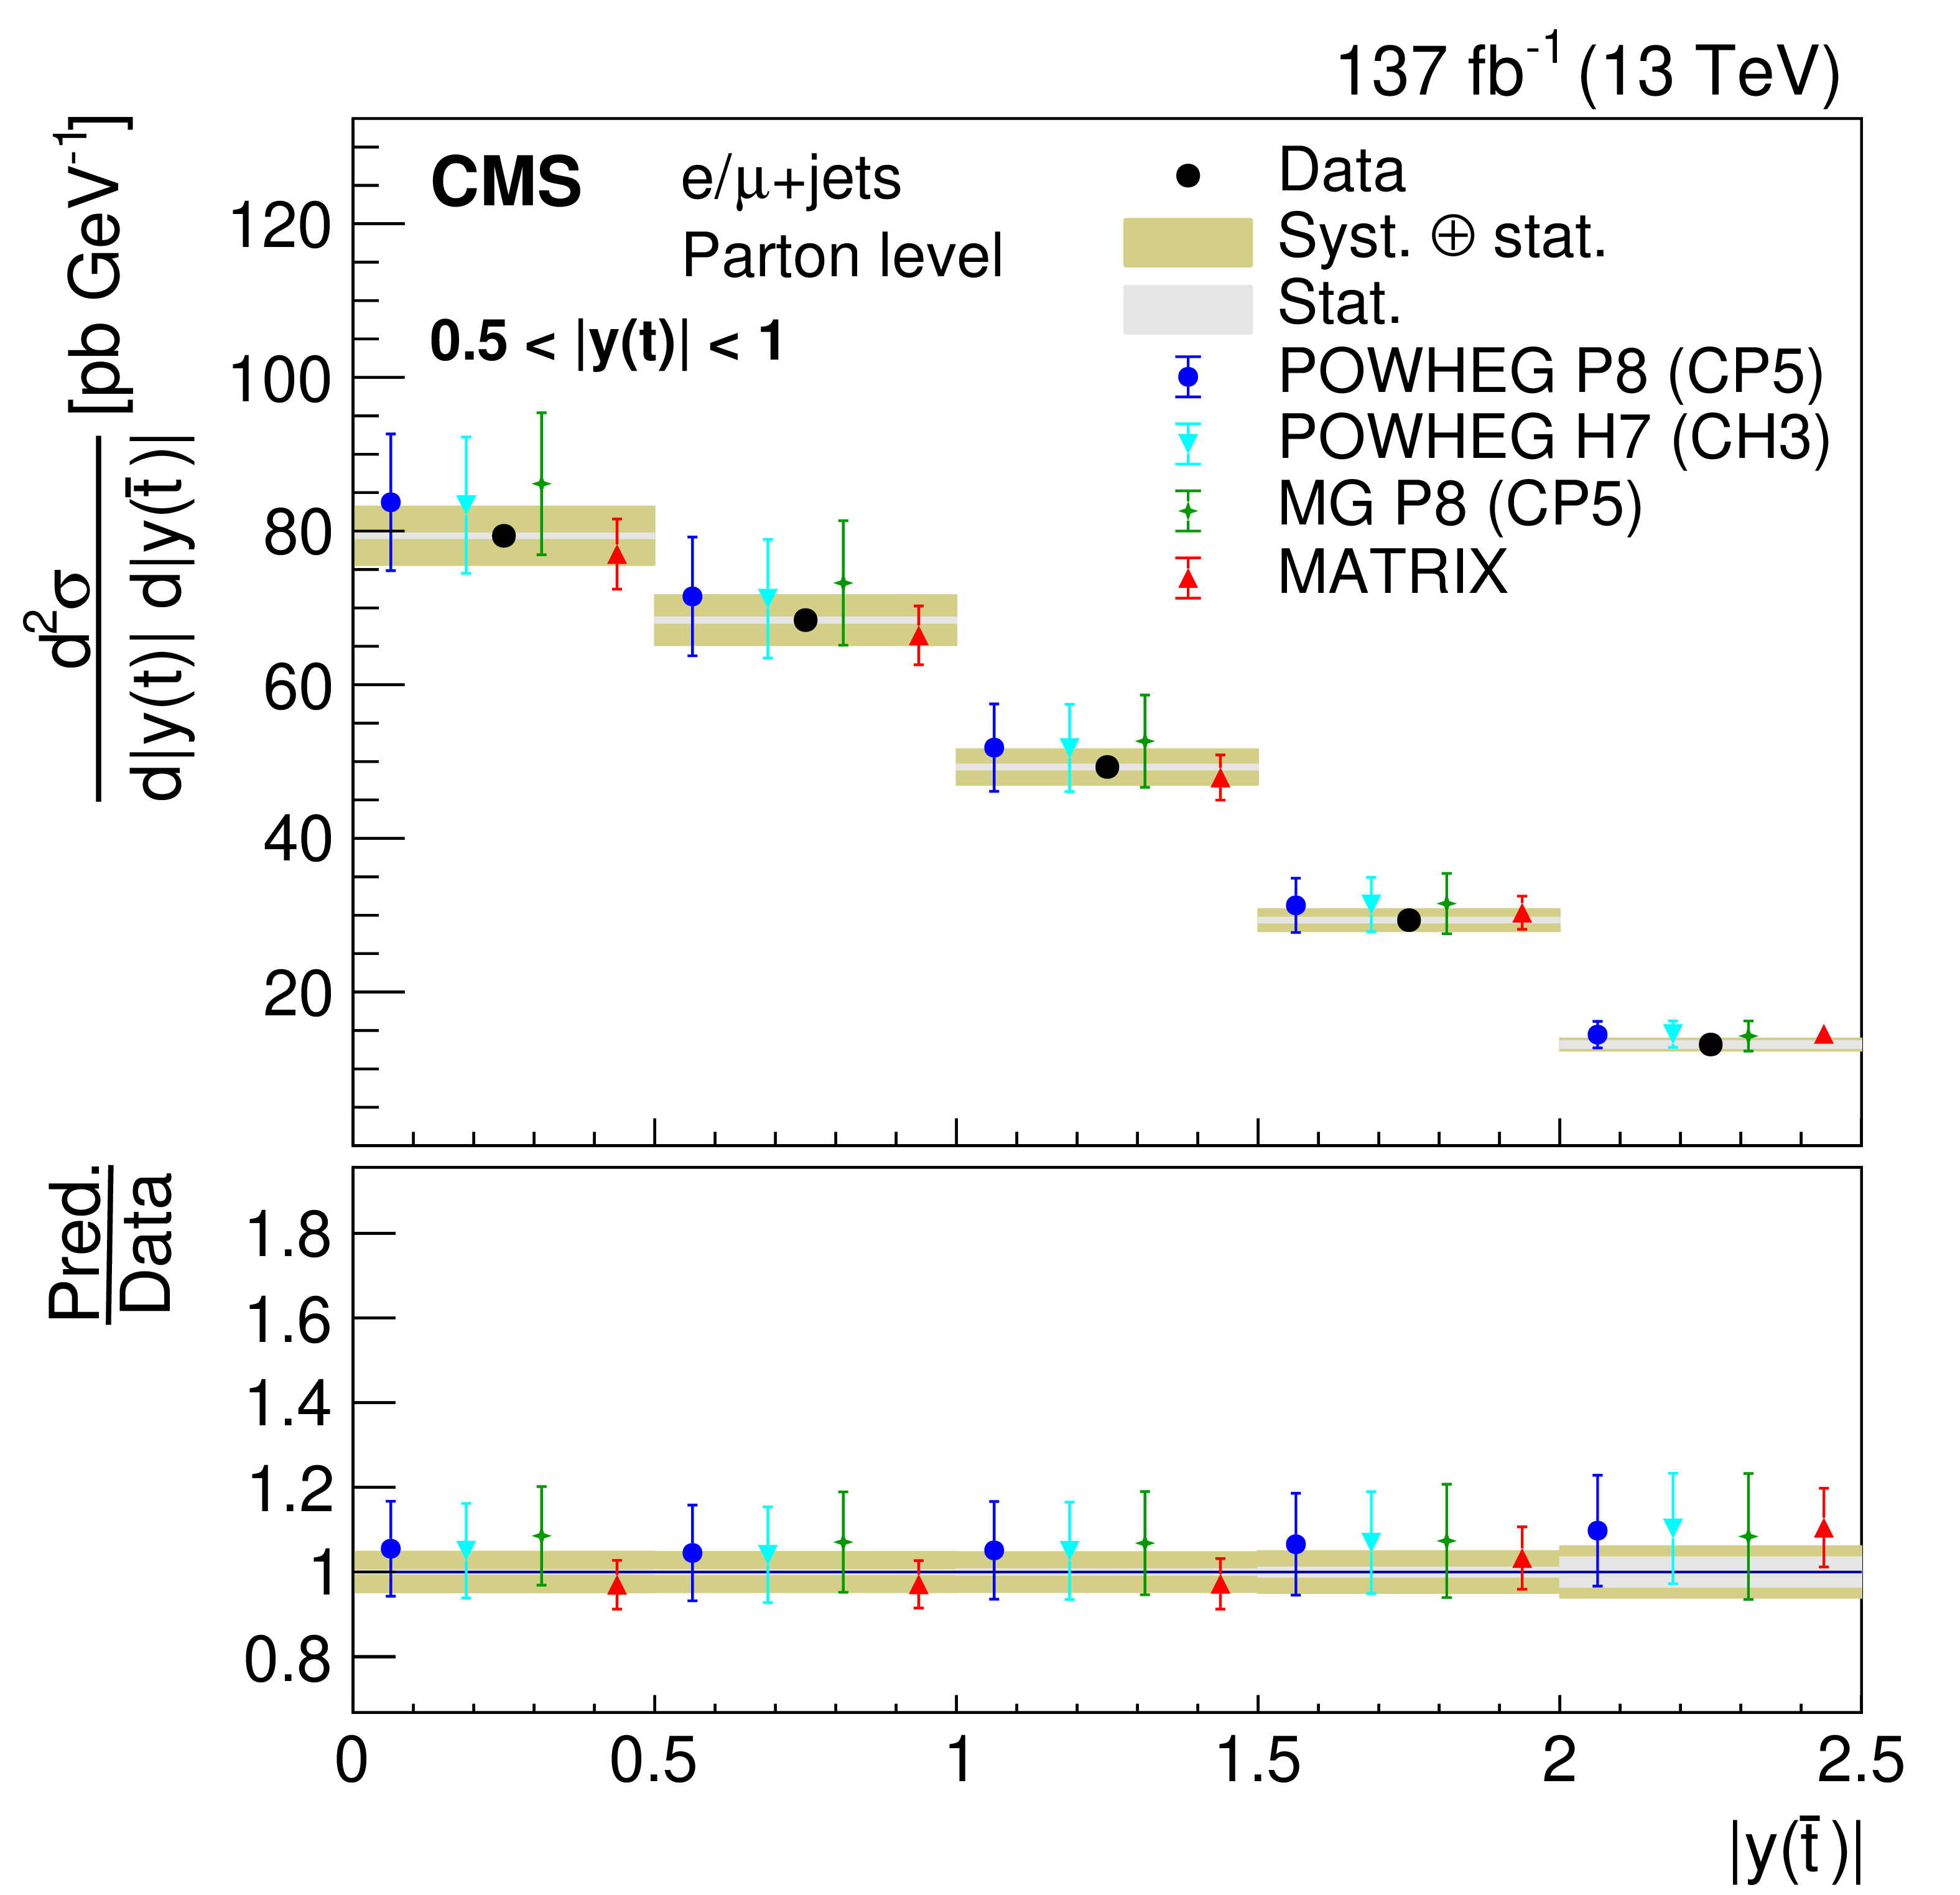
png pdf |
Figure 35-b:
Double-differential cross section at the parton level as a function of ${{| y(\mathrm{t}) |}}$ vs. ${{| y(\mathrm{\bar{t}}) |}}$. The data are shown as points with gray (yellow) bands indicating the statistical (statistical and systematic) uncertainties. The cross sections are compared to the predictions of POWHEG combined with PYTHIA (P8) or HERWIG (H7), the multiparton simulation MG5_aMC@NLO (MG)+PYTHIA FxFx, and the NNLO QCD calculations obtained with Matrix. The ratios of the various predictions to the measured cross sections are shown in the lower panels. Lower right: ratio of $ {| y(\mathrm{\bar{t}}) |} / {| y(\mathrm{t}) |}$. |
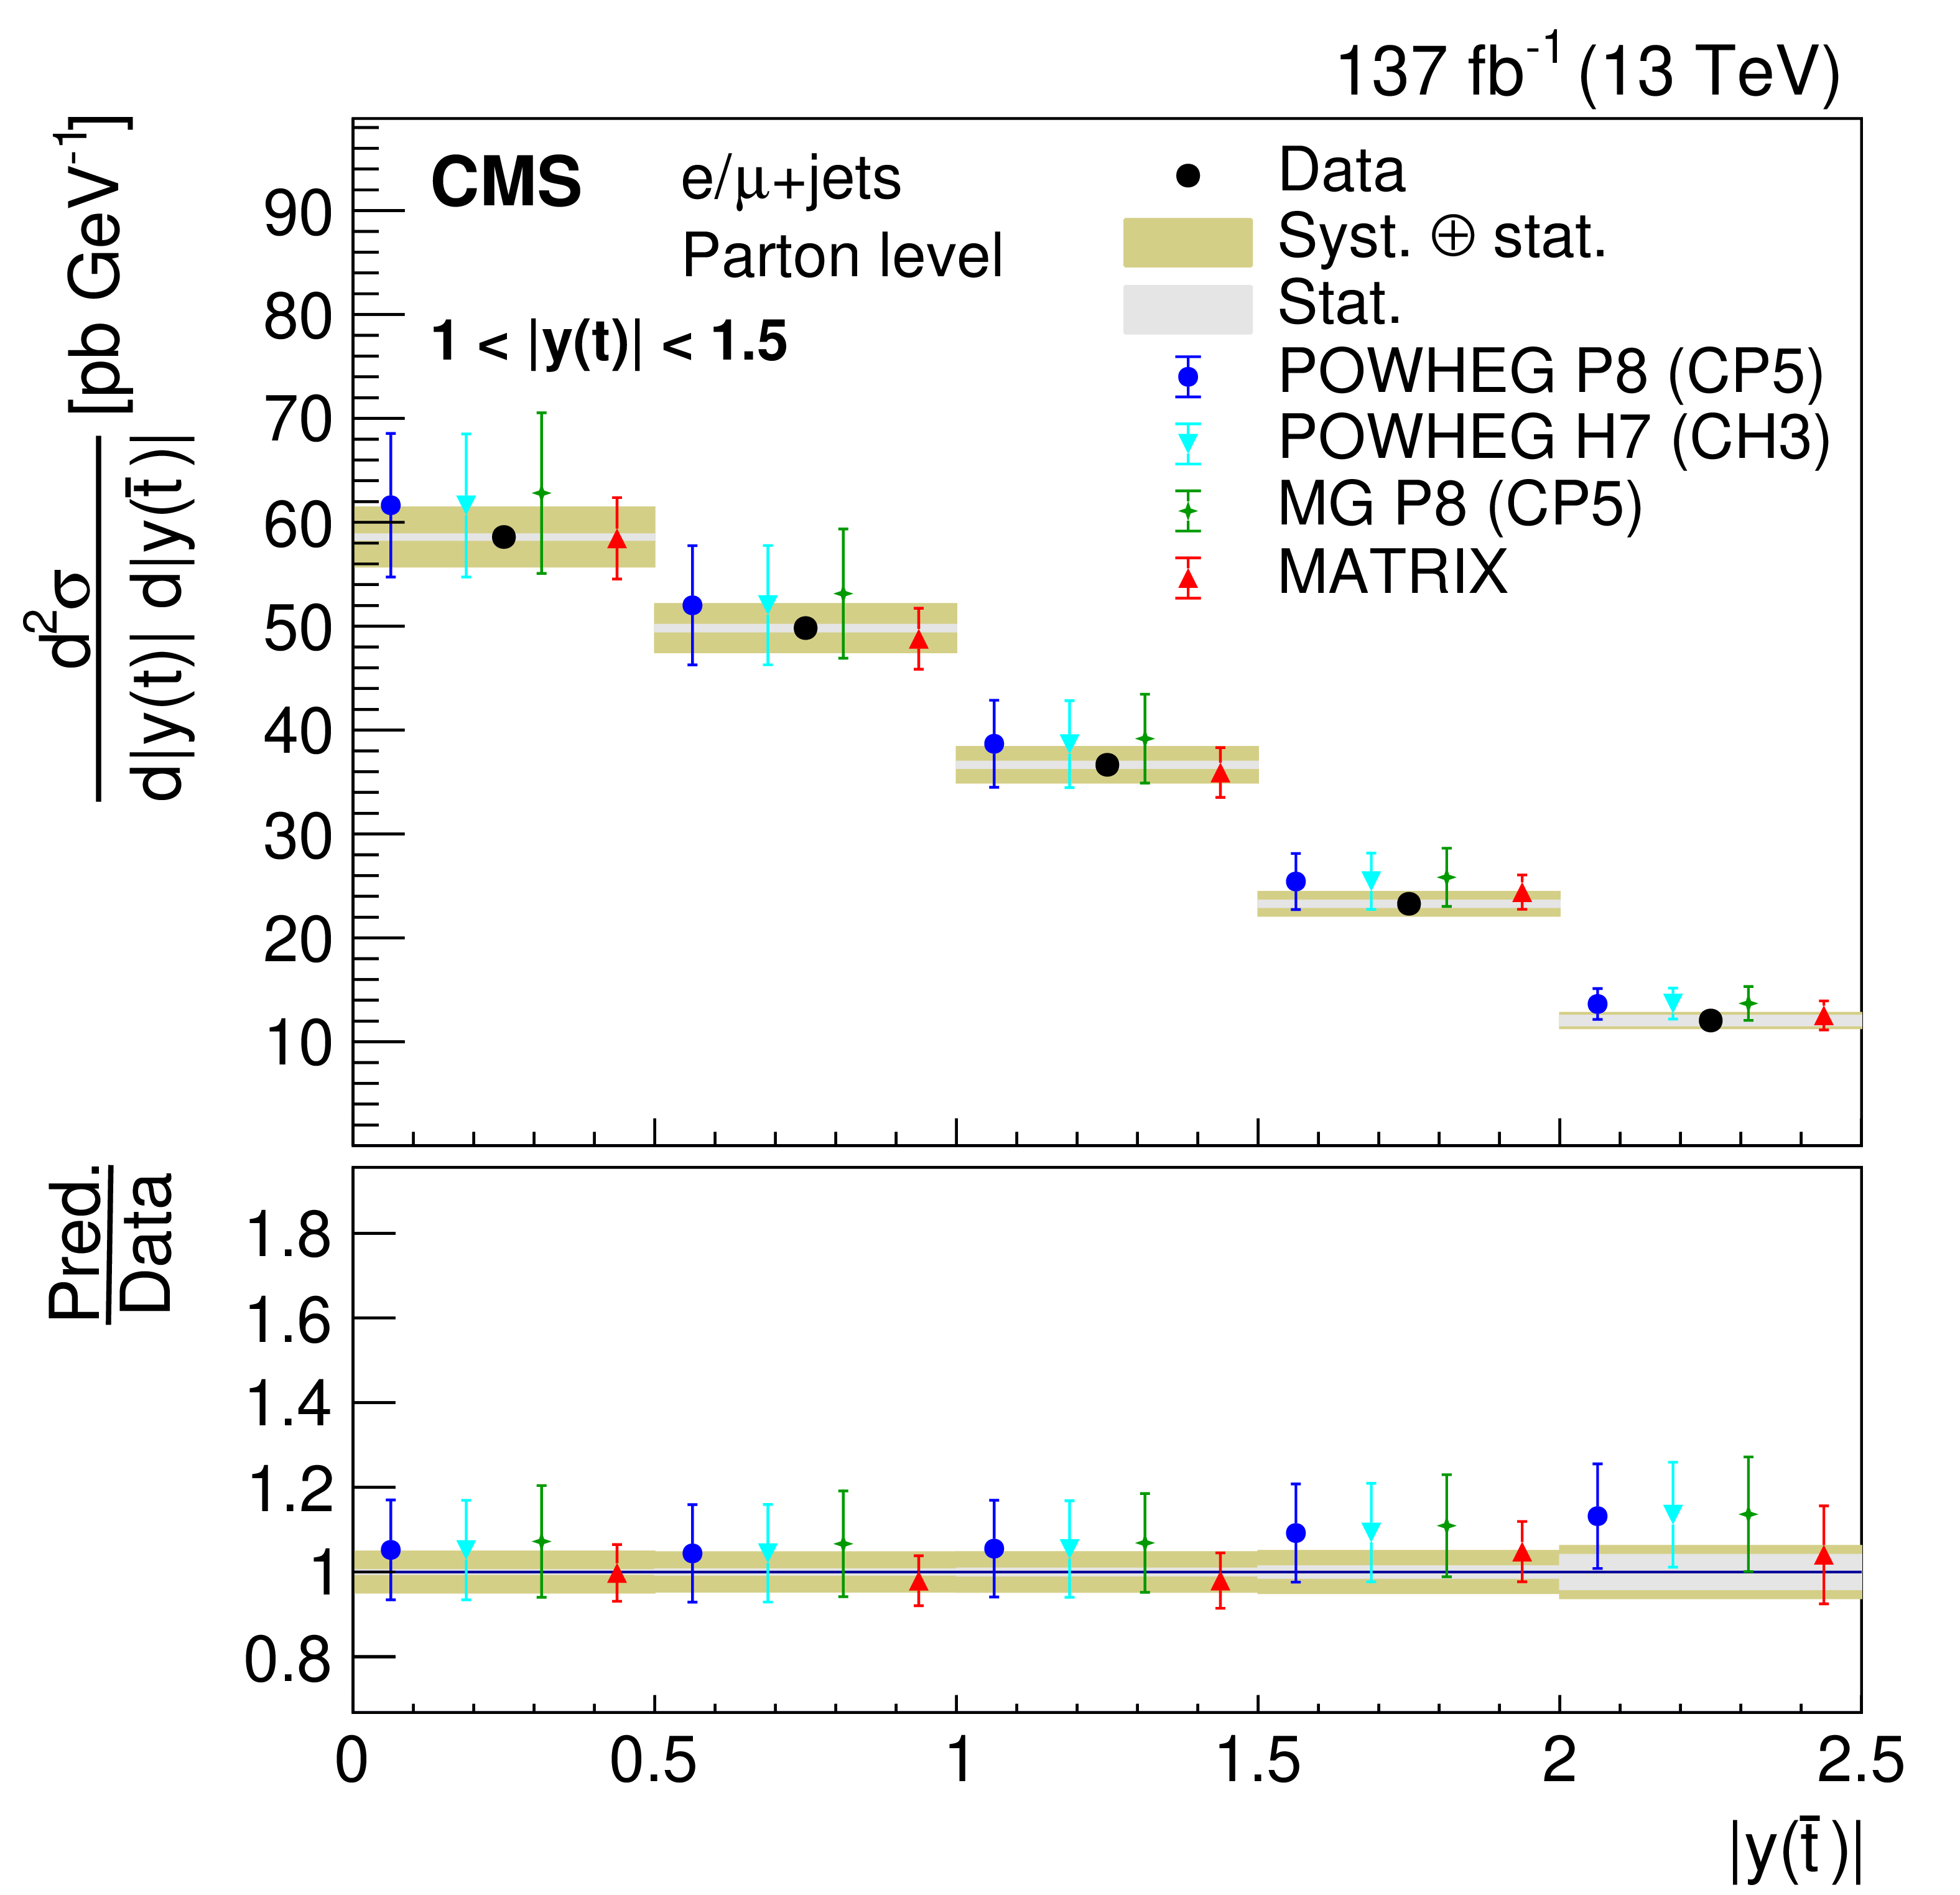
png pdf |
Figure 35-c:
Double-differential cross section at the parton level as a function of ${{| y(\mathrm{t}) |}}$ vs. ${{| y(\mathrm{\bar{t}}) |}}$. The data are shown as points with gray (yellow) bands indicating the statistical (statistical and systematic) uncertainties. The cross sections are compared to the predictions of POWHEG combined with PYTHIA (P8) or HERWIG (H7), the multiparton simulation MG5_aMC@NLO (MG)+PYTHIA FxFx, and the NNLO QCD calculations obtained with Matrix. The ratios of the various predictions to the measured cross sections are shown in the lower panels. Lower right: ratio of $ {| y(\mathrm{\bar{t}}) |} / {| y(\mathrm{t}) |}$. |

png pdf |
Figure 35-d:
Double-differential cross section at the parton level as a function of ${{| y(\mathrm{t}) |}}$ vs. ${{| y(\mathrm{\bar{t}}) |}}$. The data are shown as points with gray (yellow) bands indicating the statistical (statistical and systematic) uncertainties. The cross sections are compared to the predictions of POWHEG combined with PYTHIA (P8) or HERWIG (H7), the multiparton simulation MG5_aMC@NLO (MG)+PYTHIA FxFx, and the NNLO QCD calculations obtained with Matrix. The ratios of the various predictions to the measured cross sections are shown in the lower panels. Lower right: ratio of $ {| y(\mathrm{\bar{t}}) |} / {| y(\mathrm{t}) |}$. |

png pdf |
Figure 35-e:
Double-differential cross section at the parton level as a function of ${{| y(\mathrm{t}) |}}$ vs. ${{| y(\mathrm{\bar{t}}) |}}$. The data are shown as points with gray (yellow) bands indicating the statistical (statistical and systematic) uncertainties. The cross sections are compared to the predictions of POWHEG combined with PYTHIA (P8) or HERWIG (H7), the multiparton simulation MG5_aMC@NLO (MG)+PYTHIA FxFx, and the NNLO QCD calculations obtained with Matrix. The ratios of the various predictions to the measured cross sections are shown in the lower panels. Lower right: ratio of $ {| y(\mathrm{\bar{t}}) |} / {| y(\mathrm{t}) |}$. |
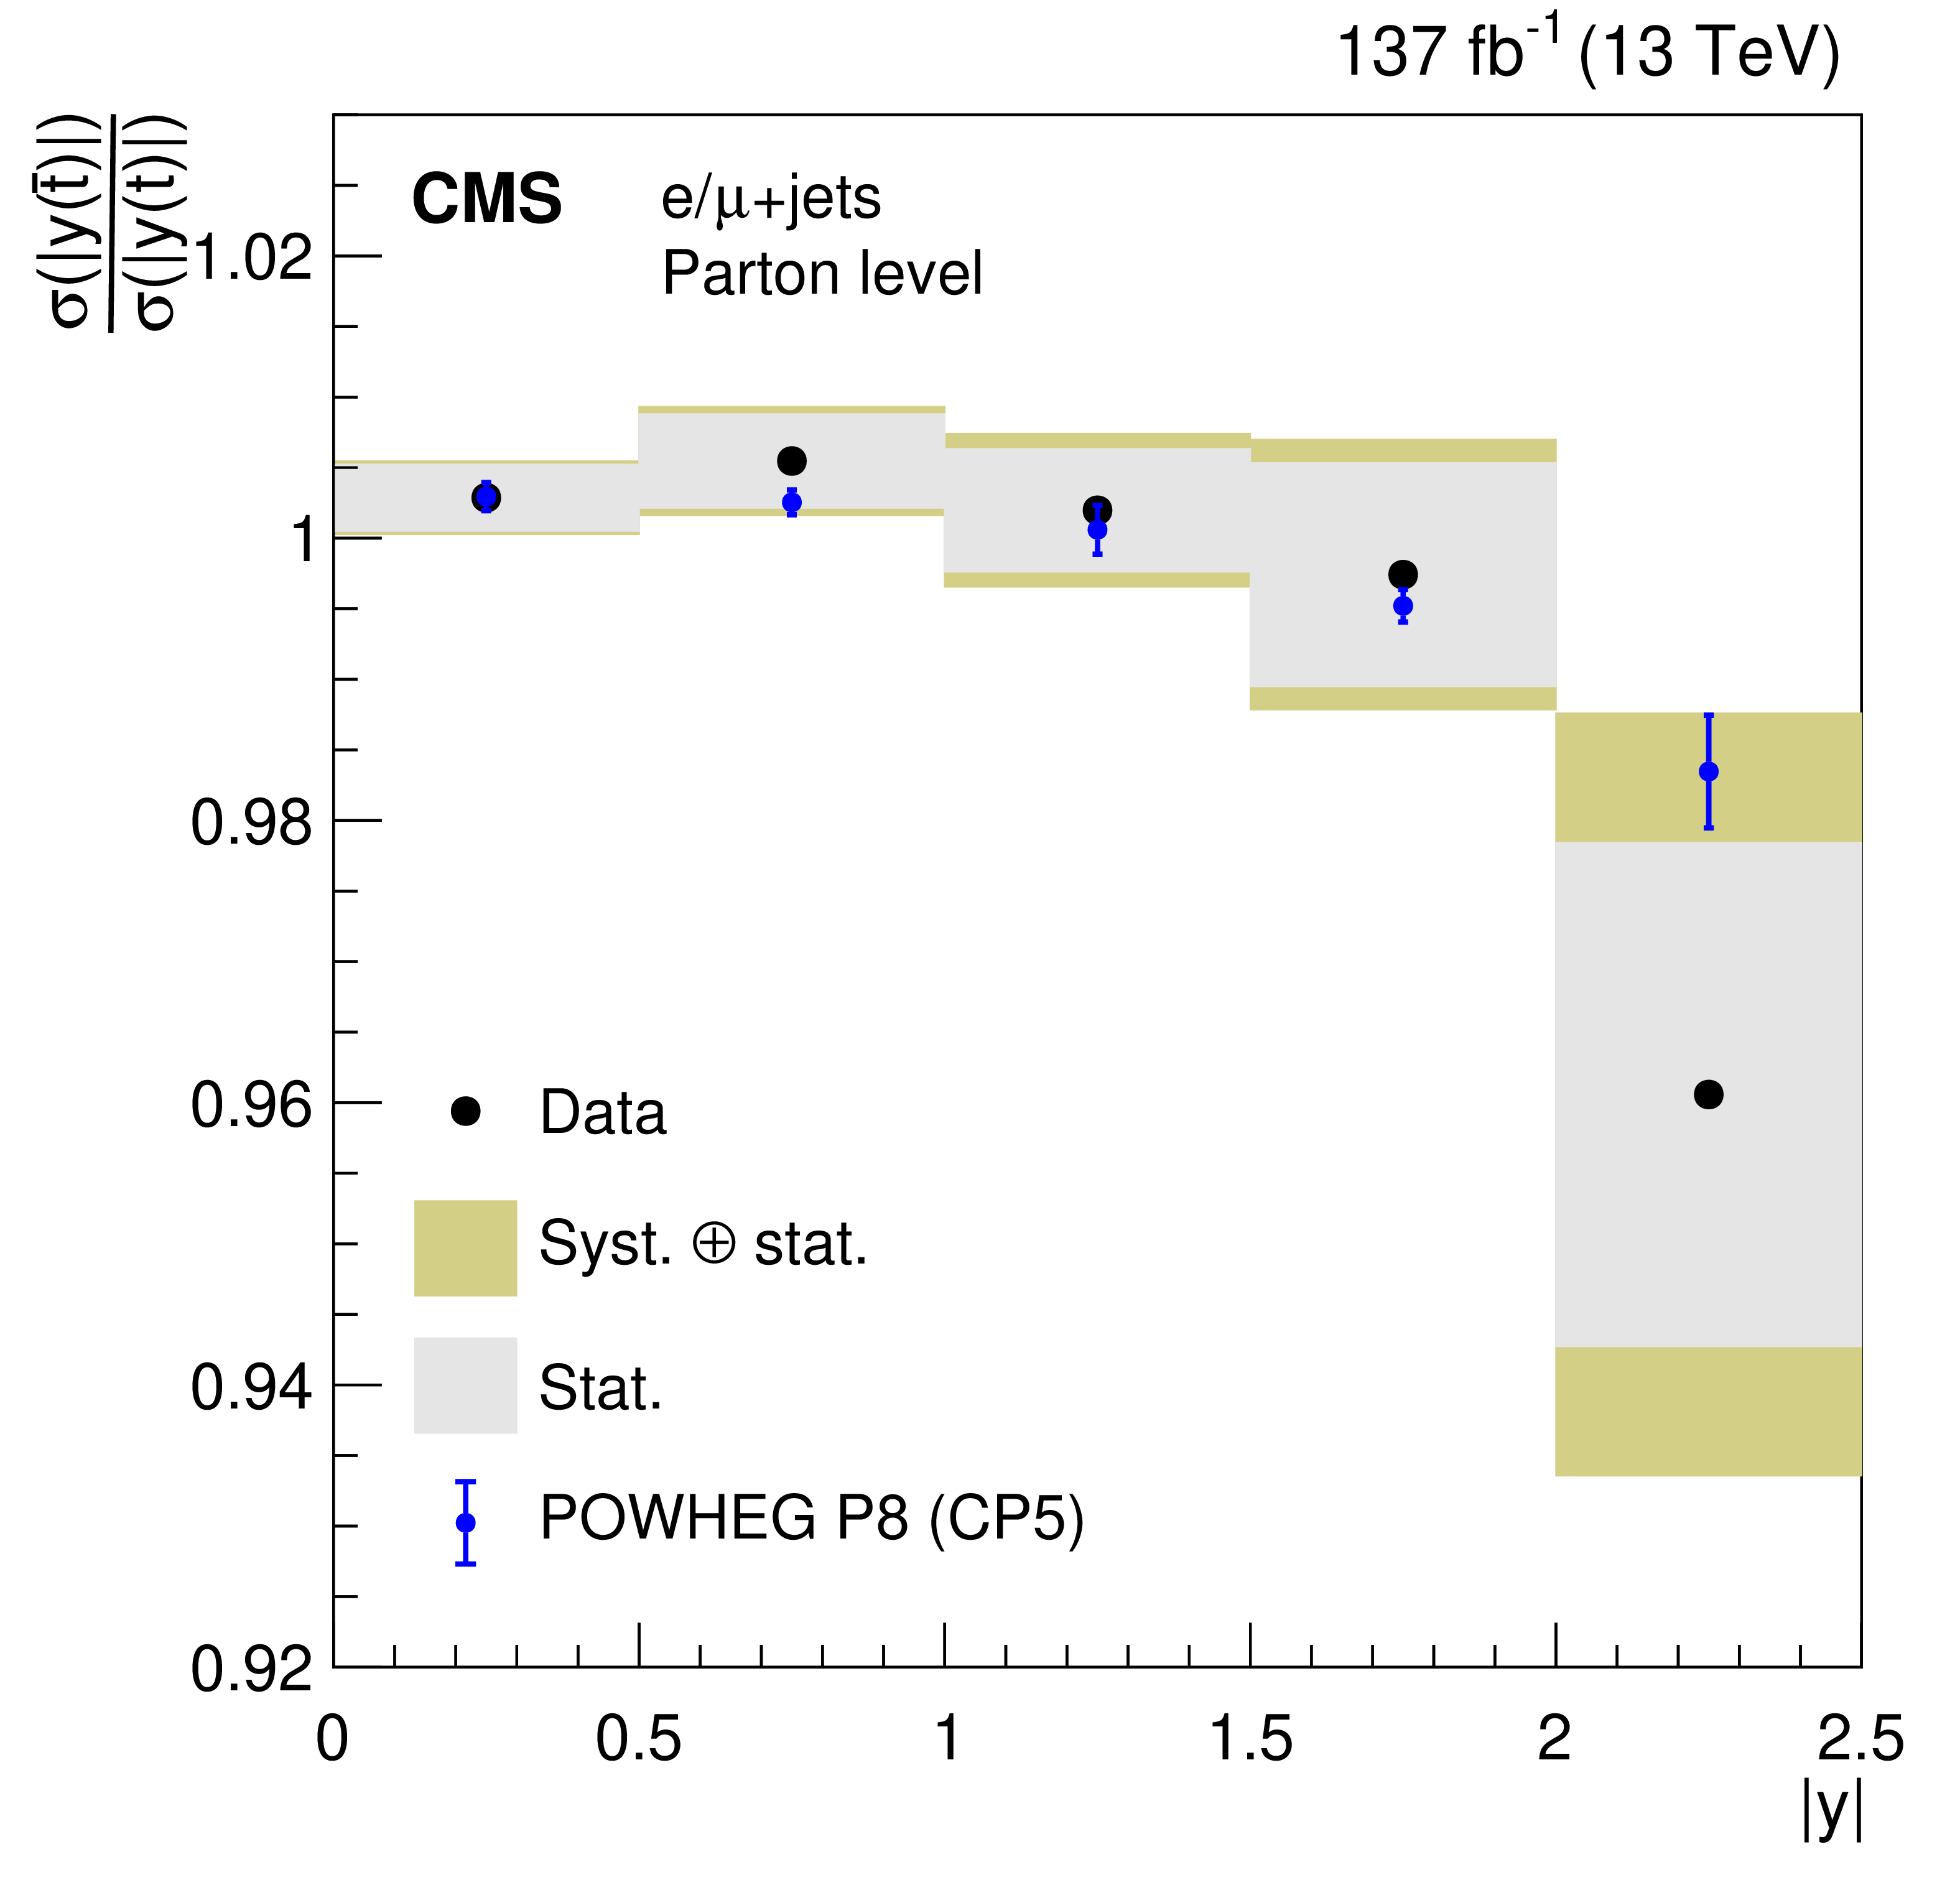
png pdf |
Figure 35-f:
Double-differential cross section at the parton level as a function of ${{| y(\mathrm{t}) |}}$ vs. ${{| y(\mathrm{\bar{t}}) |}}$. The data are shown as points with gray (yellow) bands indicating the statistical (statistical and systematic) uncertainties. The cross sections are compared to the predictions of POWHEG combined with PYTHIA (P8) or HERWIG (H7), the multiparton simulation MG5_aMC@NLO (MG)+PYTHIA FxFx, and the NNLO QCD calculations obtained with Matrix. The ratios of the various predictions to the measured cross sections are shown in the lower panels. Lower right: ratio of $ {| y(\mathrm{\bar{t}}) |} / {| y(\mathrm{t}) |}$. |
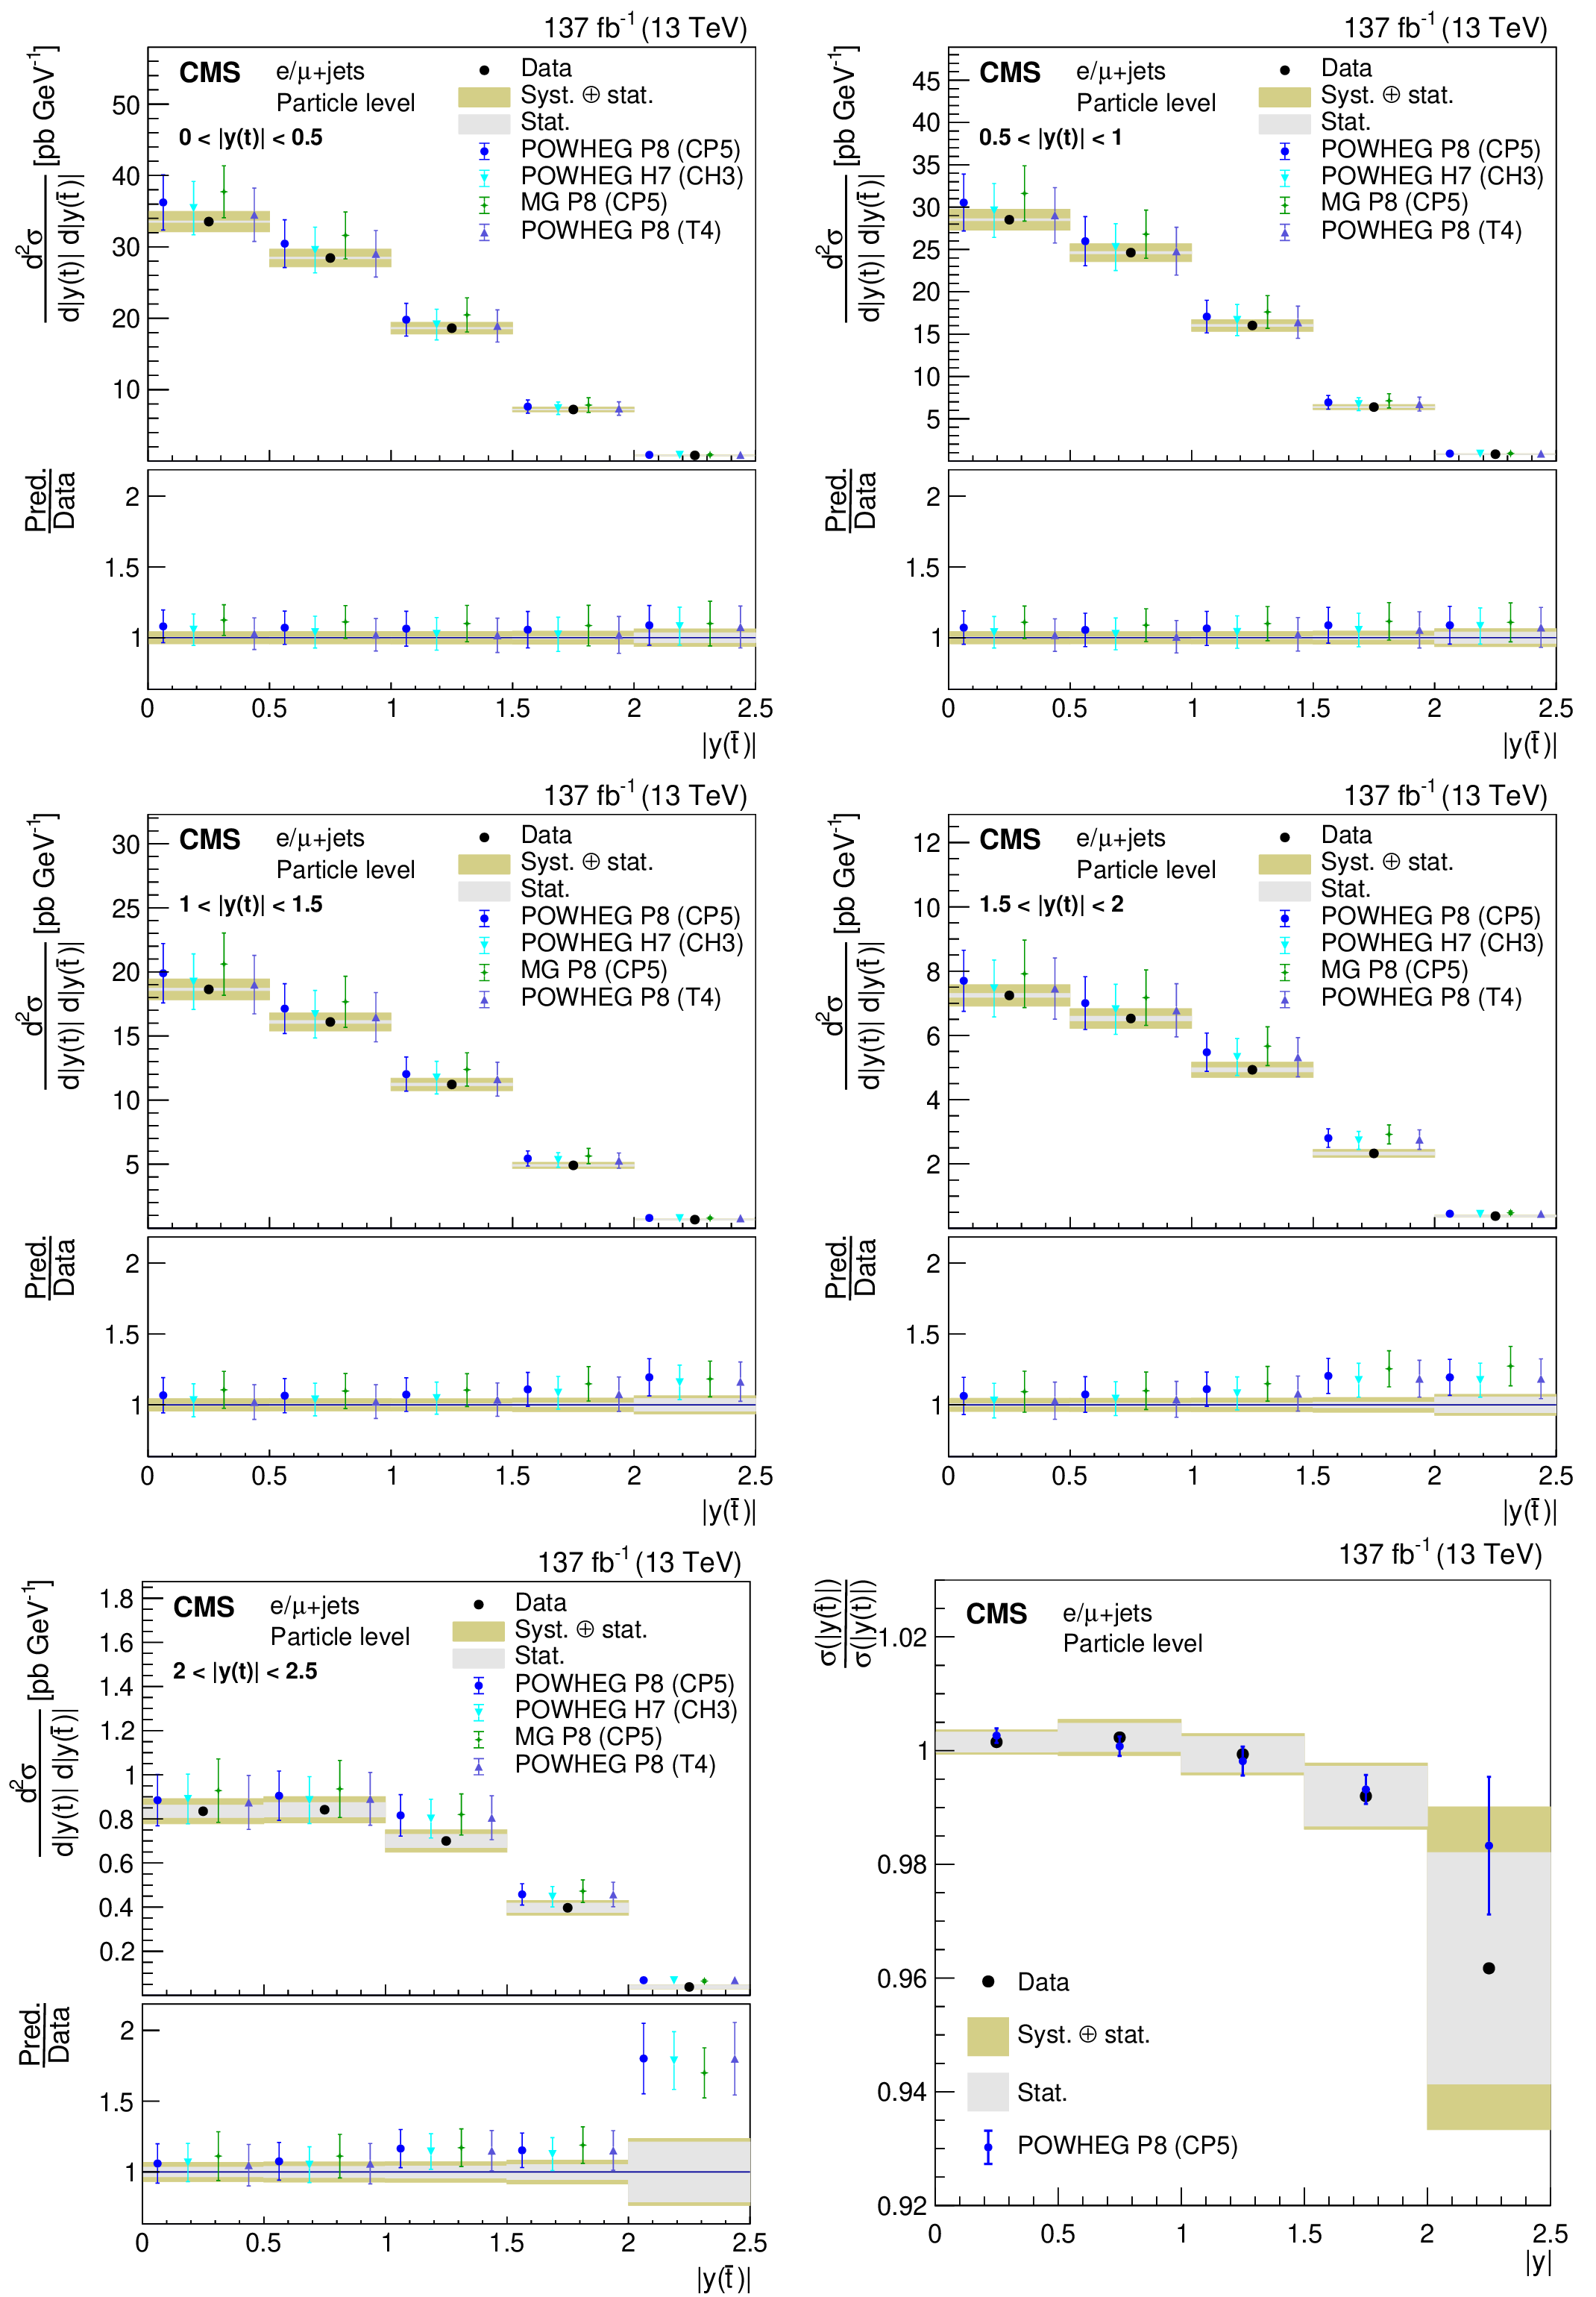
png pdf |
Figure 36:
Double-differential cross section at the particle level as a function of ${{| y(\mathrm{t}) |}}$ vs. ${{| y(\mathrm{\bar{t}}) |}}$. The data are shown as points with gray (yellow) bands indicating the statistical (statistical and systematic) uncertainties. The cross sections are compared to the predictions of POWHEG+PYTHIA (P8) for the CP5 and CUETP8M2T4 (T4) tunes, POWHEG+HERWIG (H7), and the multiparton simulation MG5_aMC@NLO (MG)+PYTHIA. The ratios of the various predictions to the measured cross sections are shown in the lower panels. Lower right: ratio of $ {| y(\mathrm{\bar{t}}) |} / {| y(\mathrm{t}) |}$ |
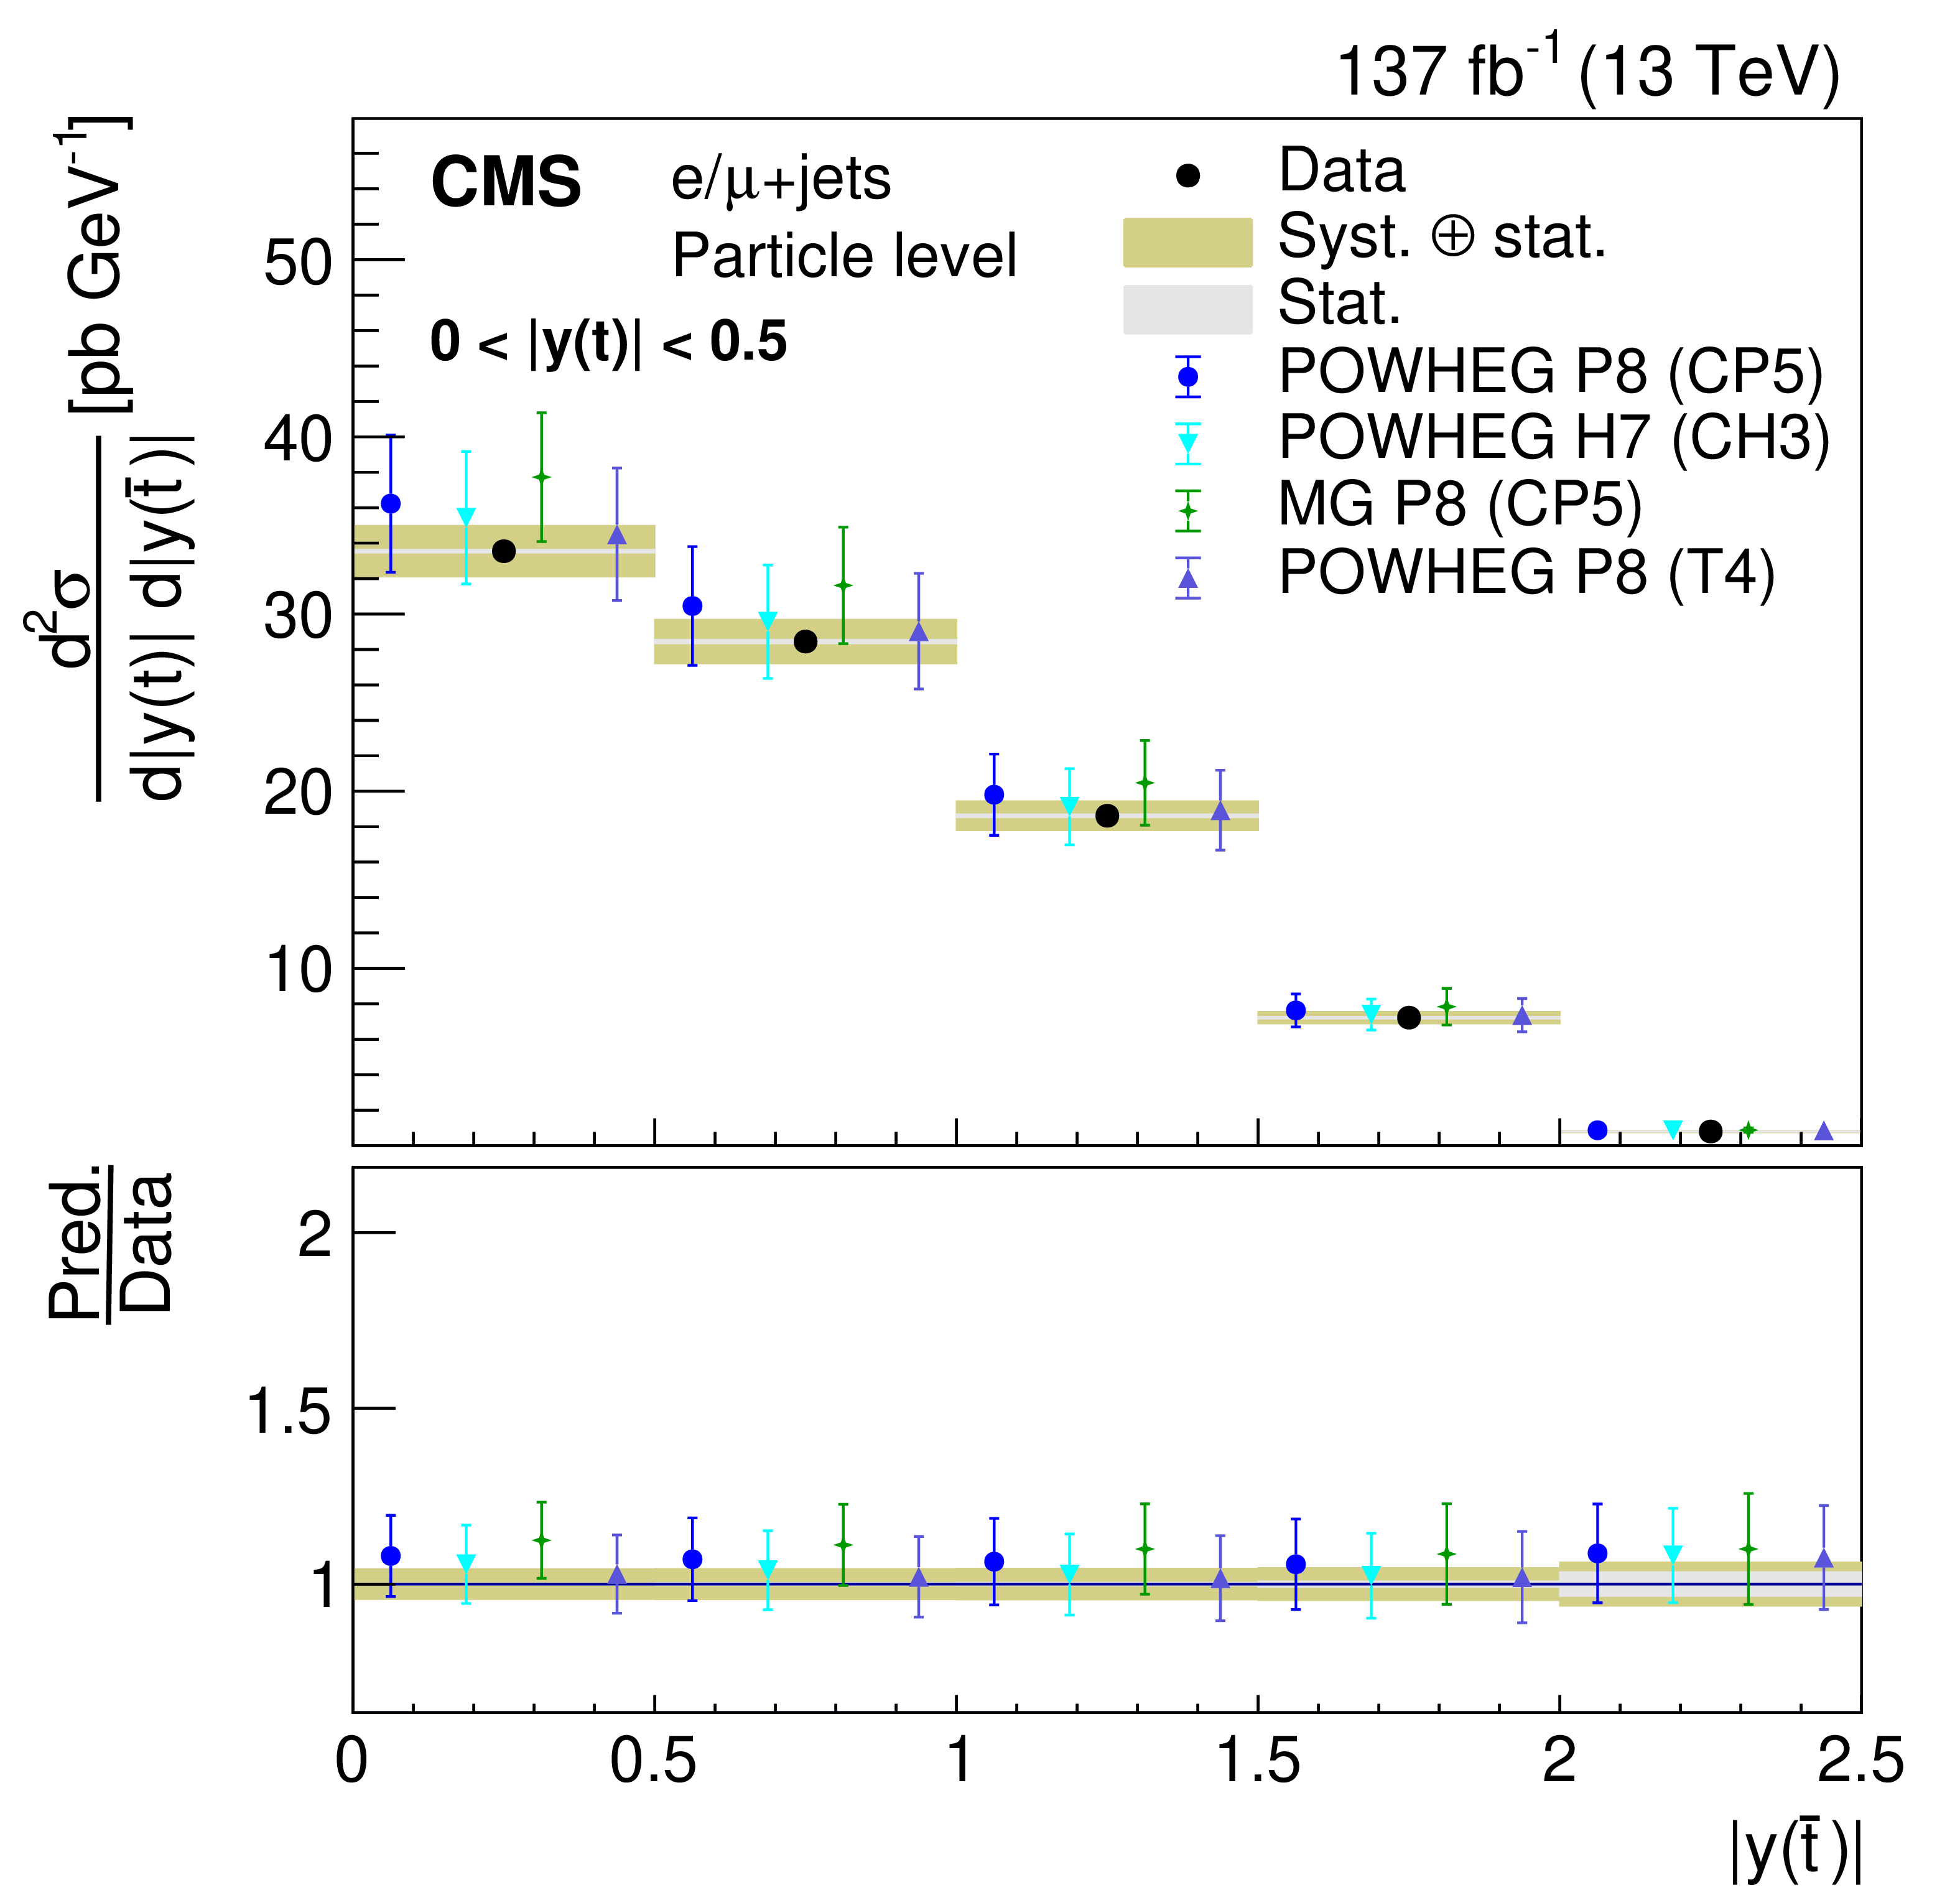
png pdf |
Figure 36-a:
Double-differential cross section at the particle level as a function of ${{| y(\mathrm{t}) |}}$ vs. ${{| y(\mathrm{\bar{t}}) |}}$. The data are shown as points with gray (yellow) bands indicating the statistical (statistical and systematic) uncertainties. The cross sections are compared to the predictions of POWHEG+PYTHIA (P8) for the CP5 and CUETP8M2T4 (T4) tunes, POWHEG+HERWIG (H7), and the multiparton simulation MG5_aMC@NLO (MG)+PYTHIA. The ratios of the various predictions to the measured cross sections are shown in the lower panels. Lower right: ratio of $ {| y(\mathrm{\bar{t}}) |} / {| y(\mathrm{t}) |}$ |
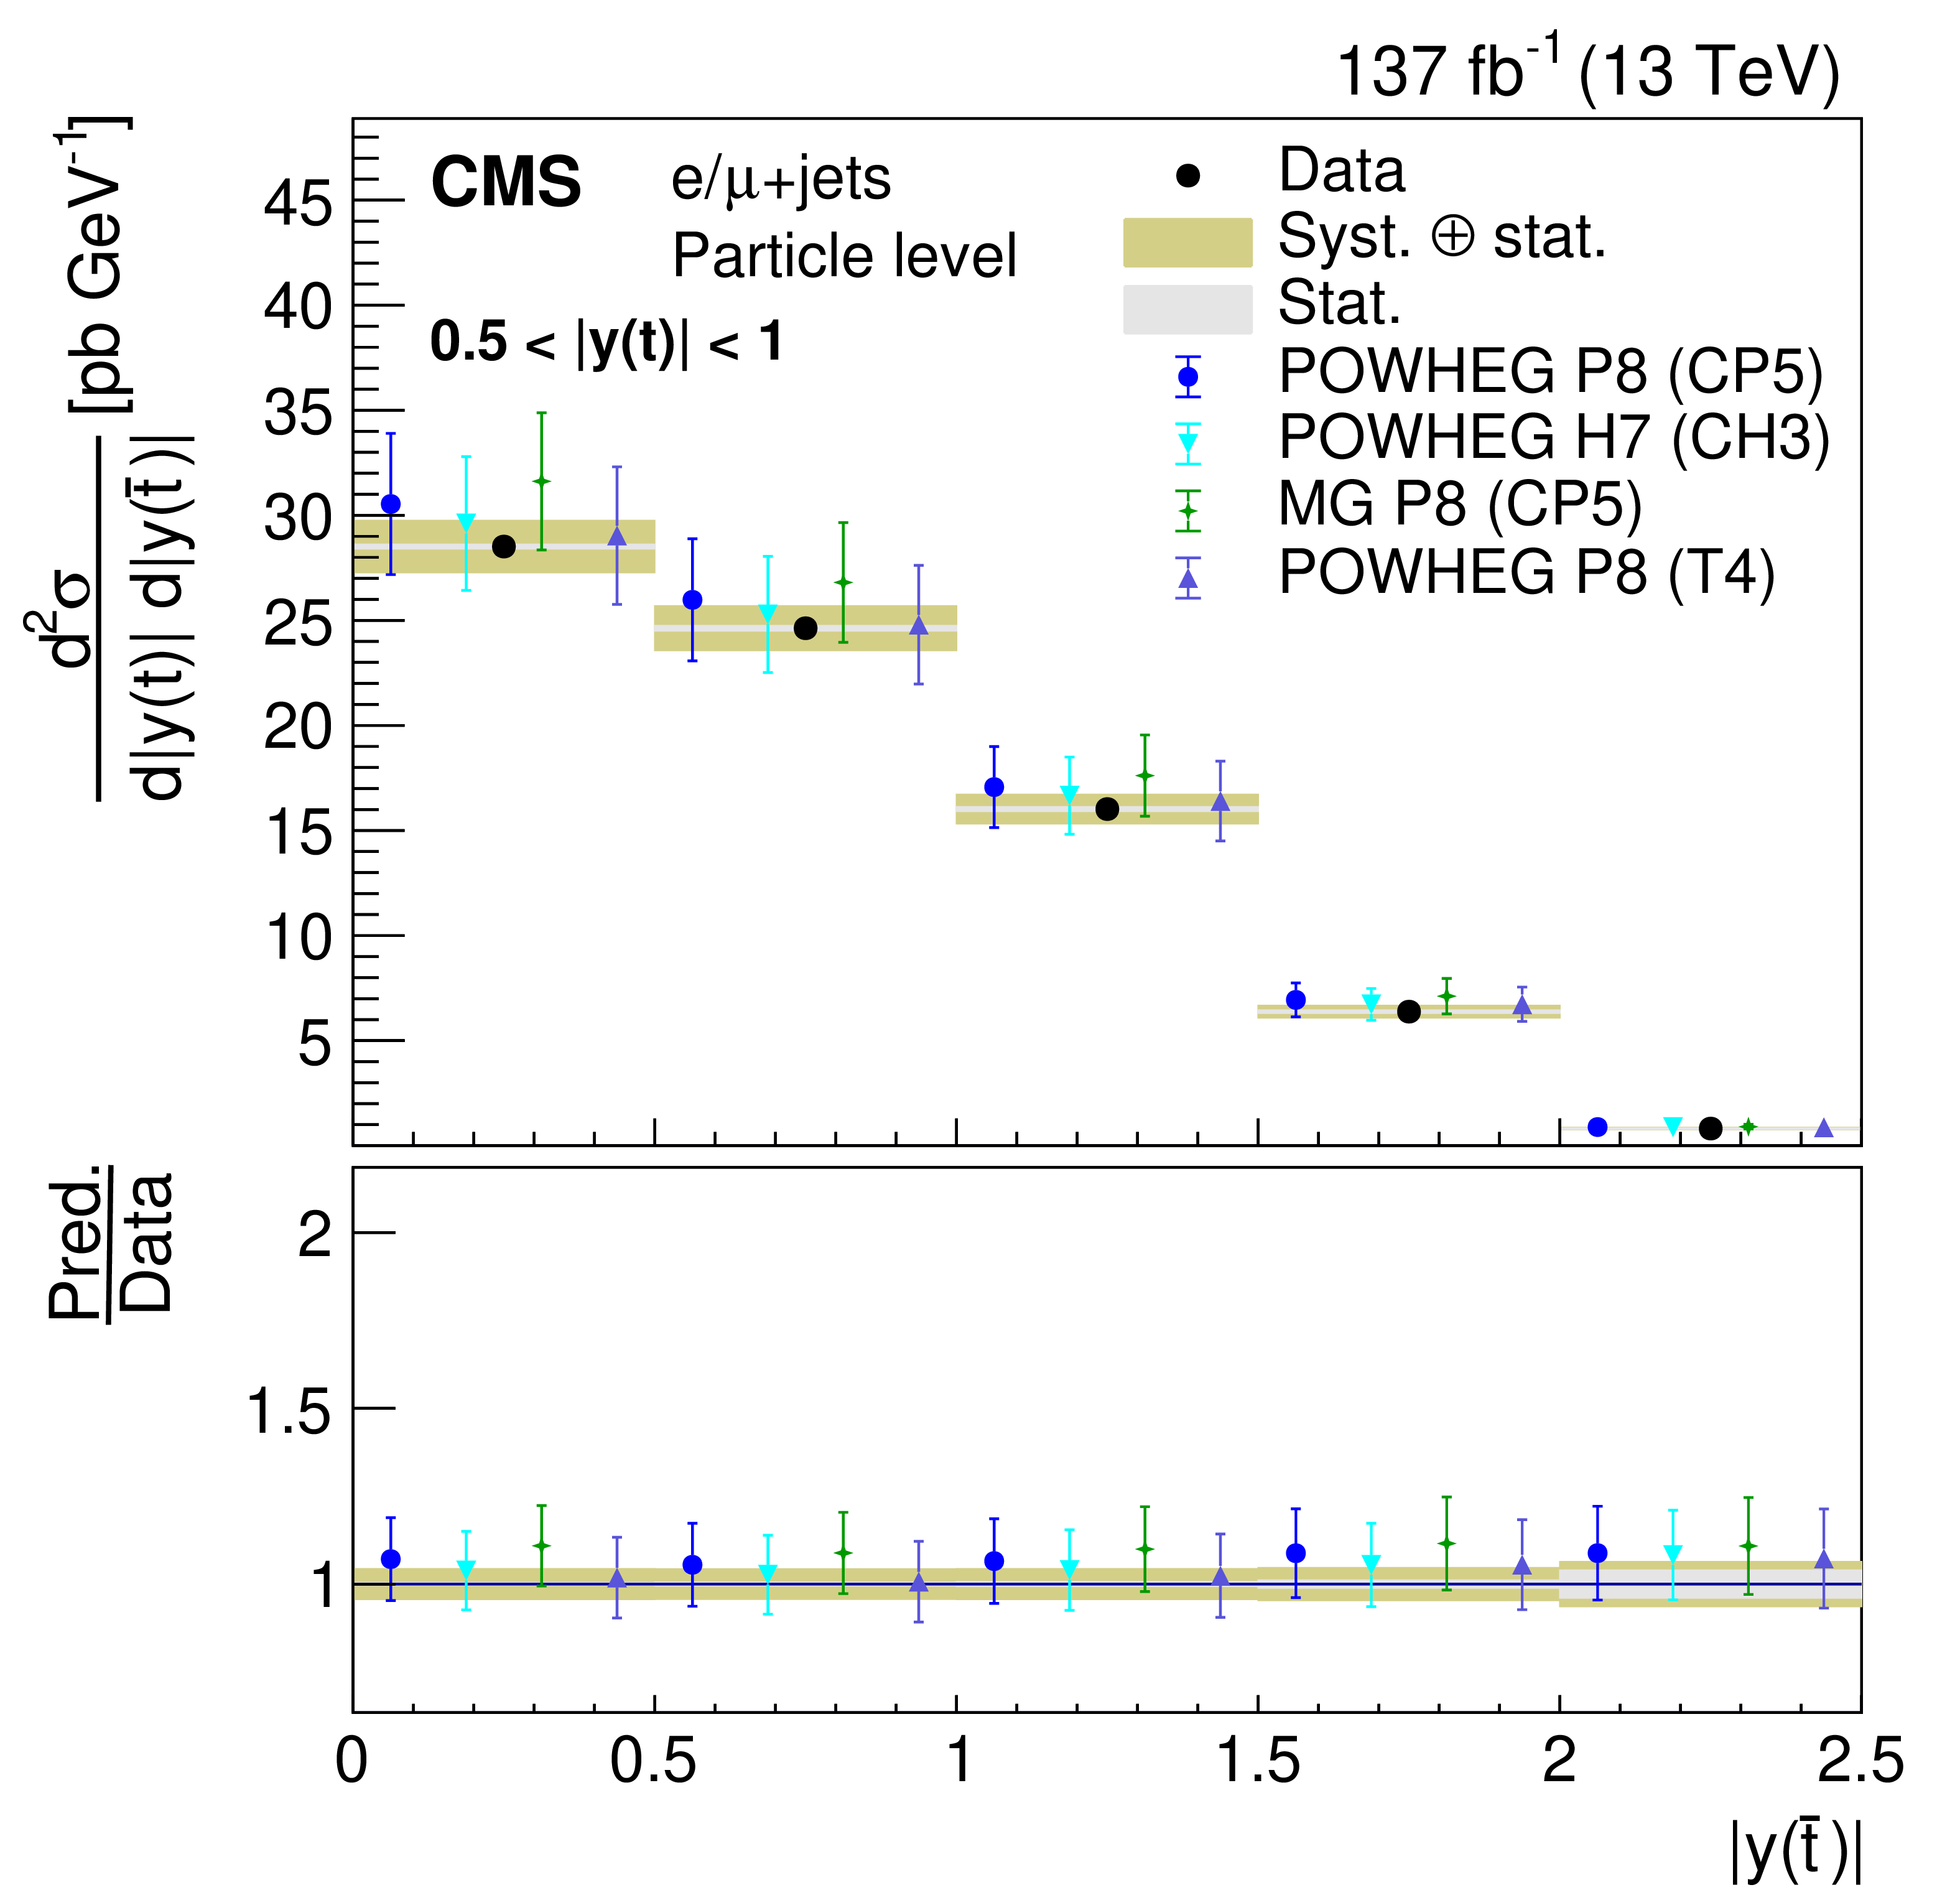
png pdf |
Figure 36-b:
Double-differential cross section at the particle level as a function of ${{| y(\mathrm{t}) |}}$ vs. ${{| y(\mathrm{\bar{t}}) |}}$. The data are shown as points with gray (yellow) bands indicating the statistical (statistical and systematic) uncertainties. The cross sections are compared to the predictions of POWHEG+PYTHIA (P8) for the CP5 and CUETP8M2T4 (T4) tunes, POWHEG+HERWIG (H7), and the multiparton simulation MG5_aMC@NLO (MG)+PYTHIA. The ratios of the various predictions to the measured cross sections are shown in the lower panels. Lower right: ratio of $ {| y(\mathrm{\bar{t}}) |} / {| y(\mathrm{t}) |}$ |
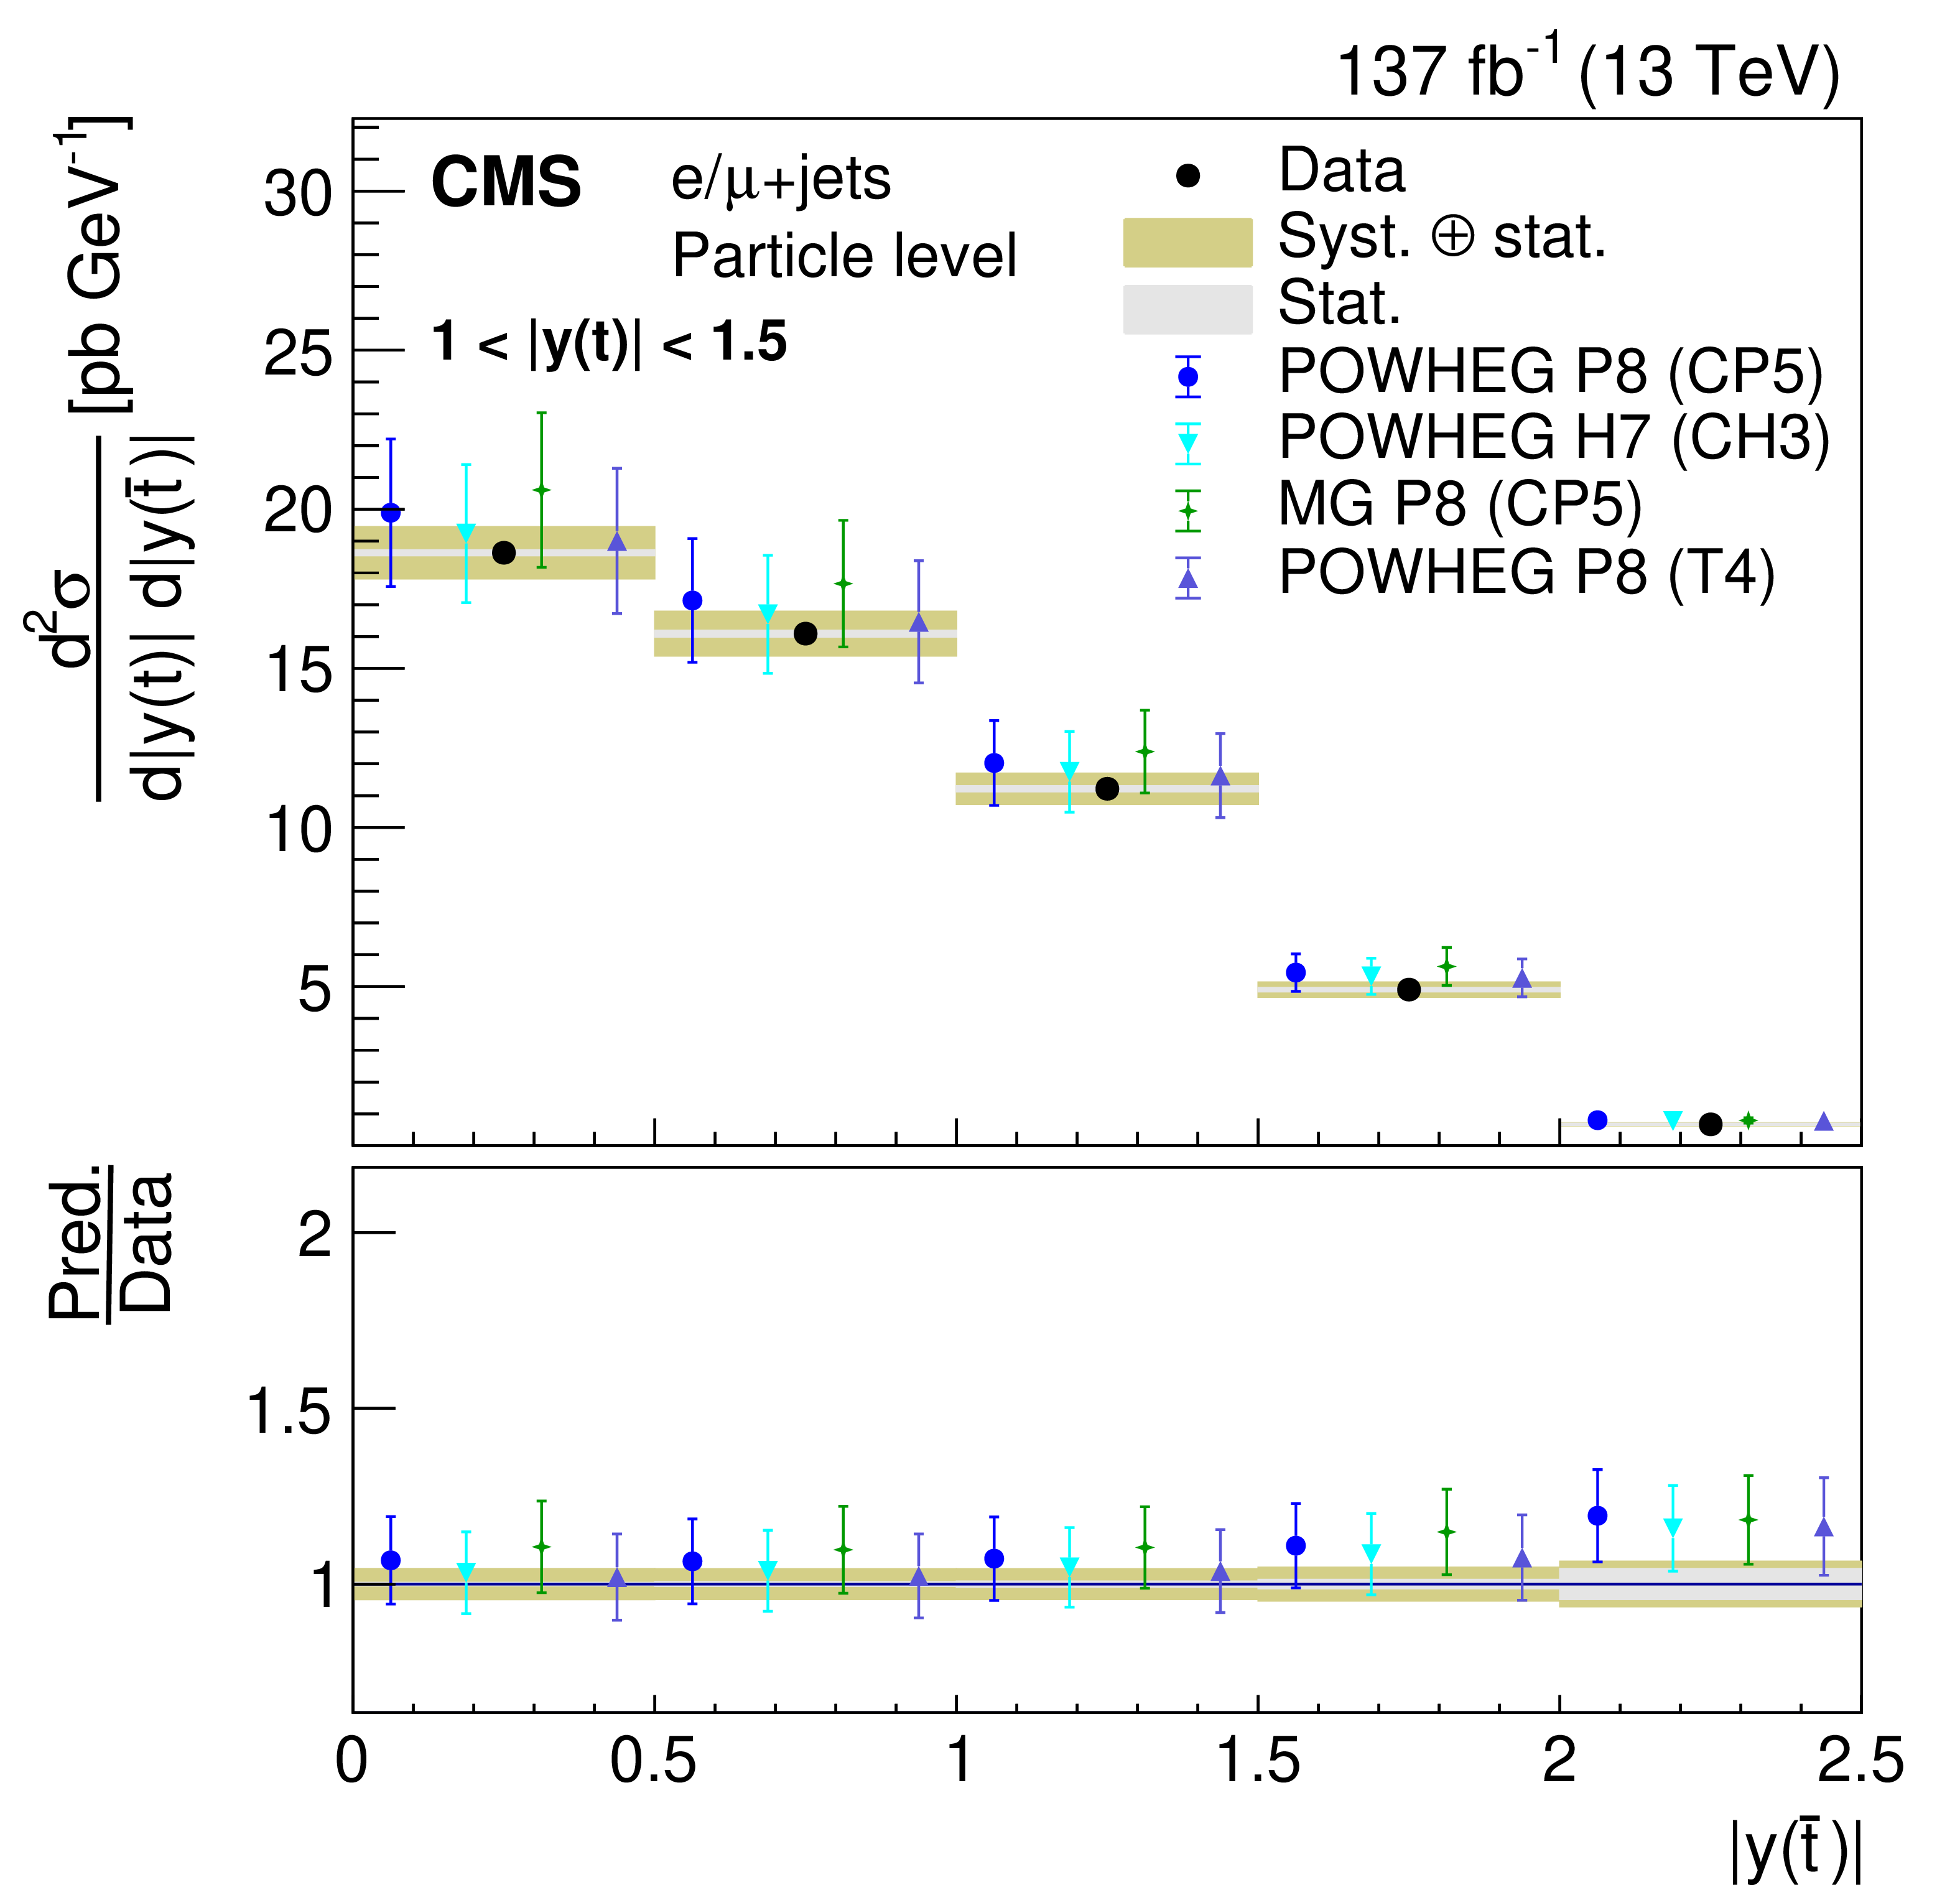
png pdf |
Figure 36-c:
Double-differential cross section at the particle level as a function of ${{| y(\mathrm{t}) |}}$ vs. ${{| y(\mathrm{\bar{t}}) |}}$. The data are shown as points with gray (yellow) bands indicating the statistical (statistical and systematic) uncertainties. The cross sections are compared to the predictions of POWHEG+PYTHIA (P8) for the CP5 and CUETP8M2T4 (T4) tunes, POWHEG+HERWIG (H7), and the multiparton simulation MG5_aMC@NLO (MG)+PYTHIA. The ratios of the various predictions to the measured cross sections are shown in the lower panels. Lower right: ratio of $ {| y(\mathrm{\bar{t}}) |} / {| y(\mathrm{t}) |}$ |
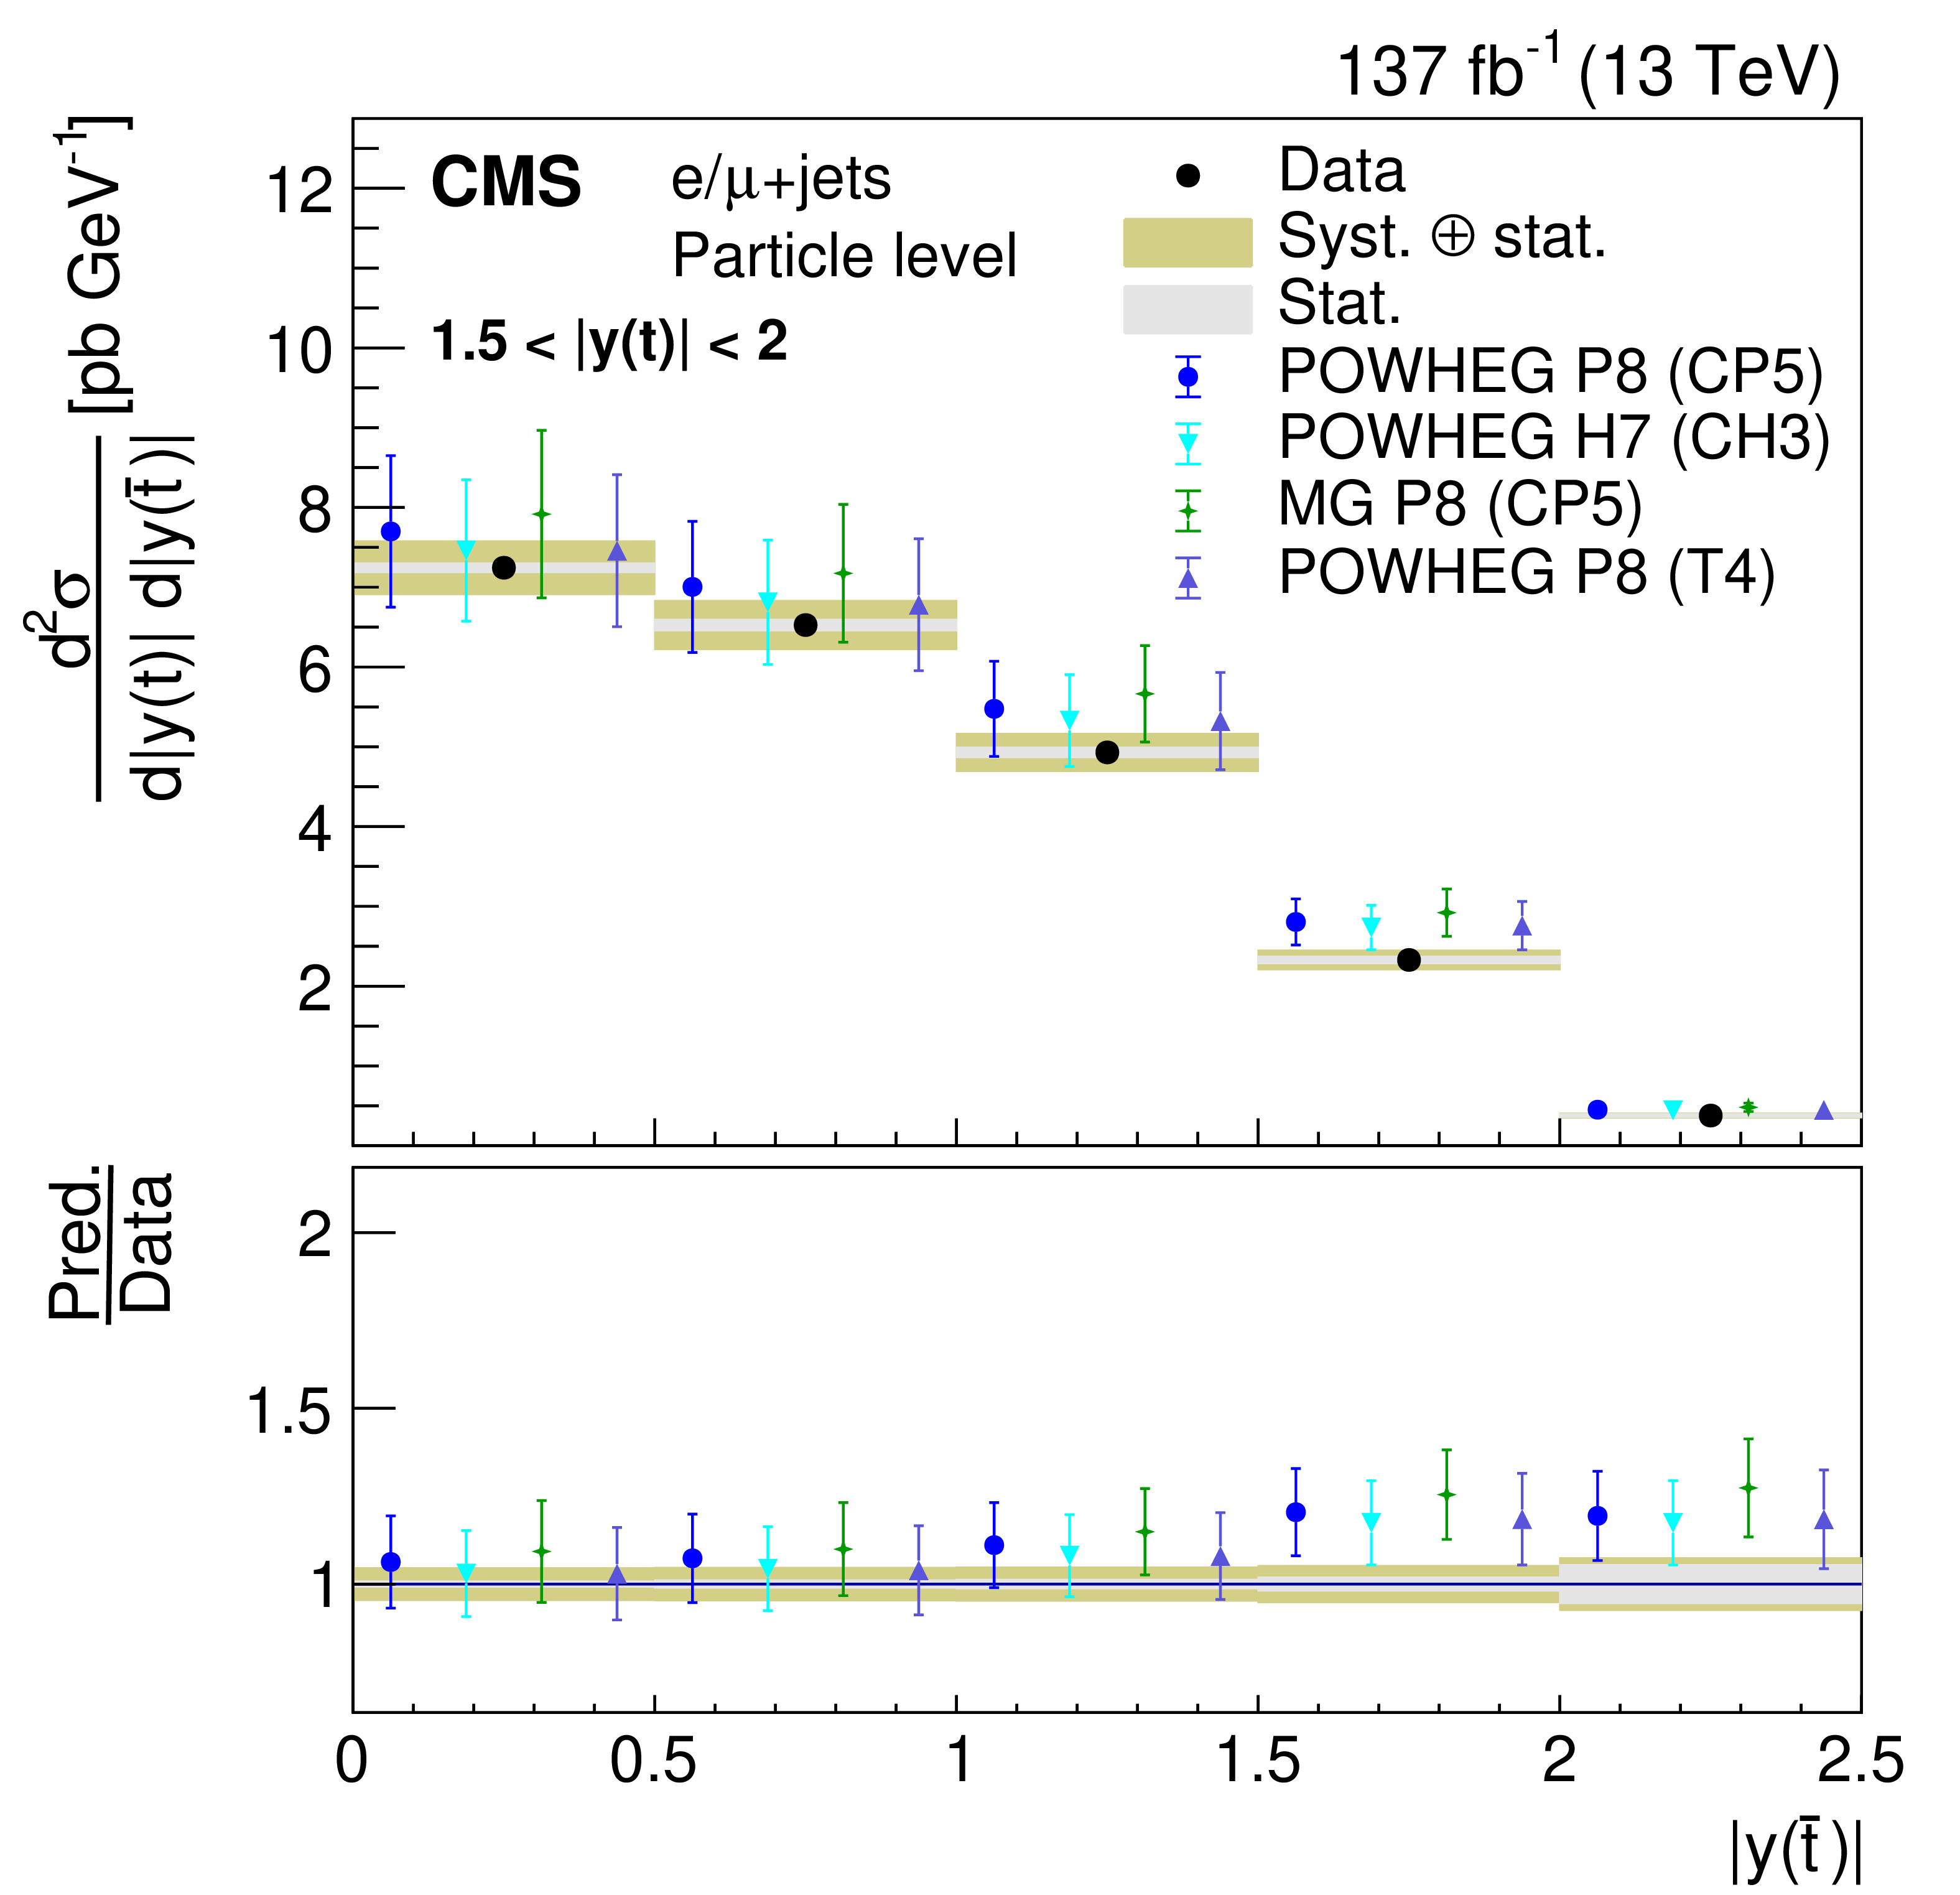
png pdf |
Figure 36-d:
Double-differential cross section at the particle level as a function of ${{| y(\mathrm{t}) |}}$ vs. ${{| y(\mathrm{\bar{t}}) |}}$. The data are shown as points with gray (yellow) bands indicating the statistical (statistical and systematic) uncertainties. The cross sections are compared to the predictions of POWHEG+PYTHIA (P8) for the CP5 and CUETP8M2T4 (T4) tunes, POWHEG+HERWIG (H7), and the multiparton simulation MG5_aMC@NLO (MG)+PYTHIA. The ratios of the various predictions to the measured cross sections are shown in the lower panels. Lower right: ratio of $ {| y(\mathrm{\bar{t}}) |} / {| y(\mathrm{t}) |}$ |
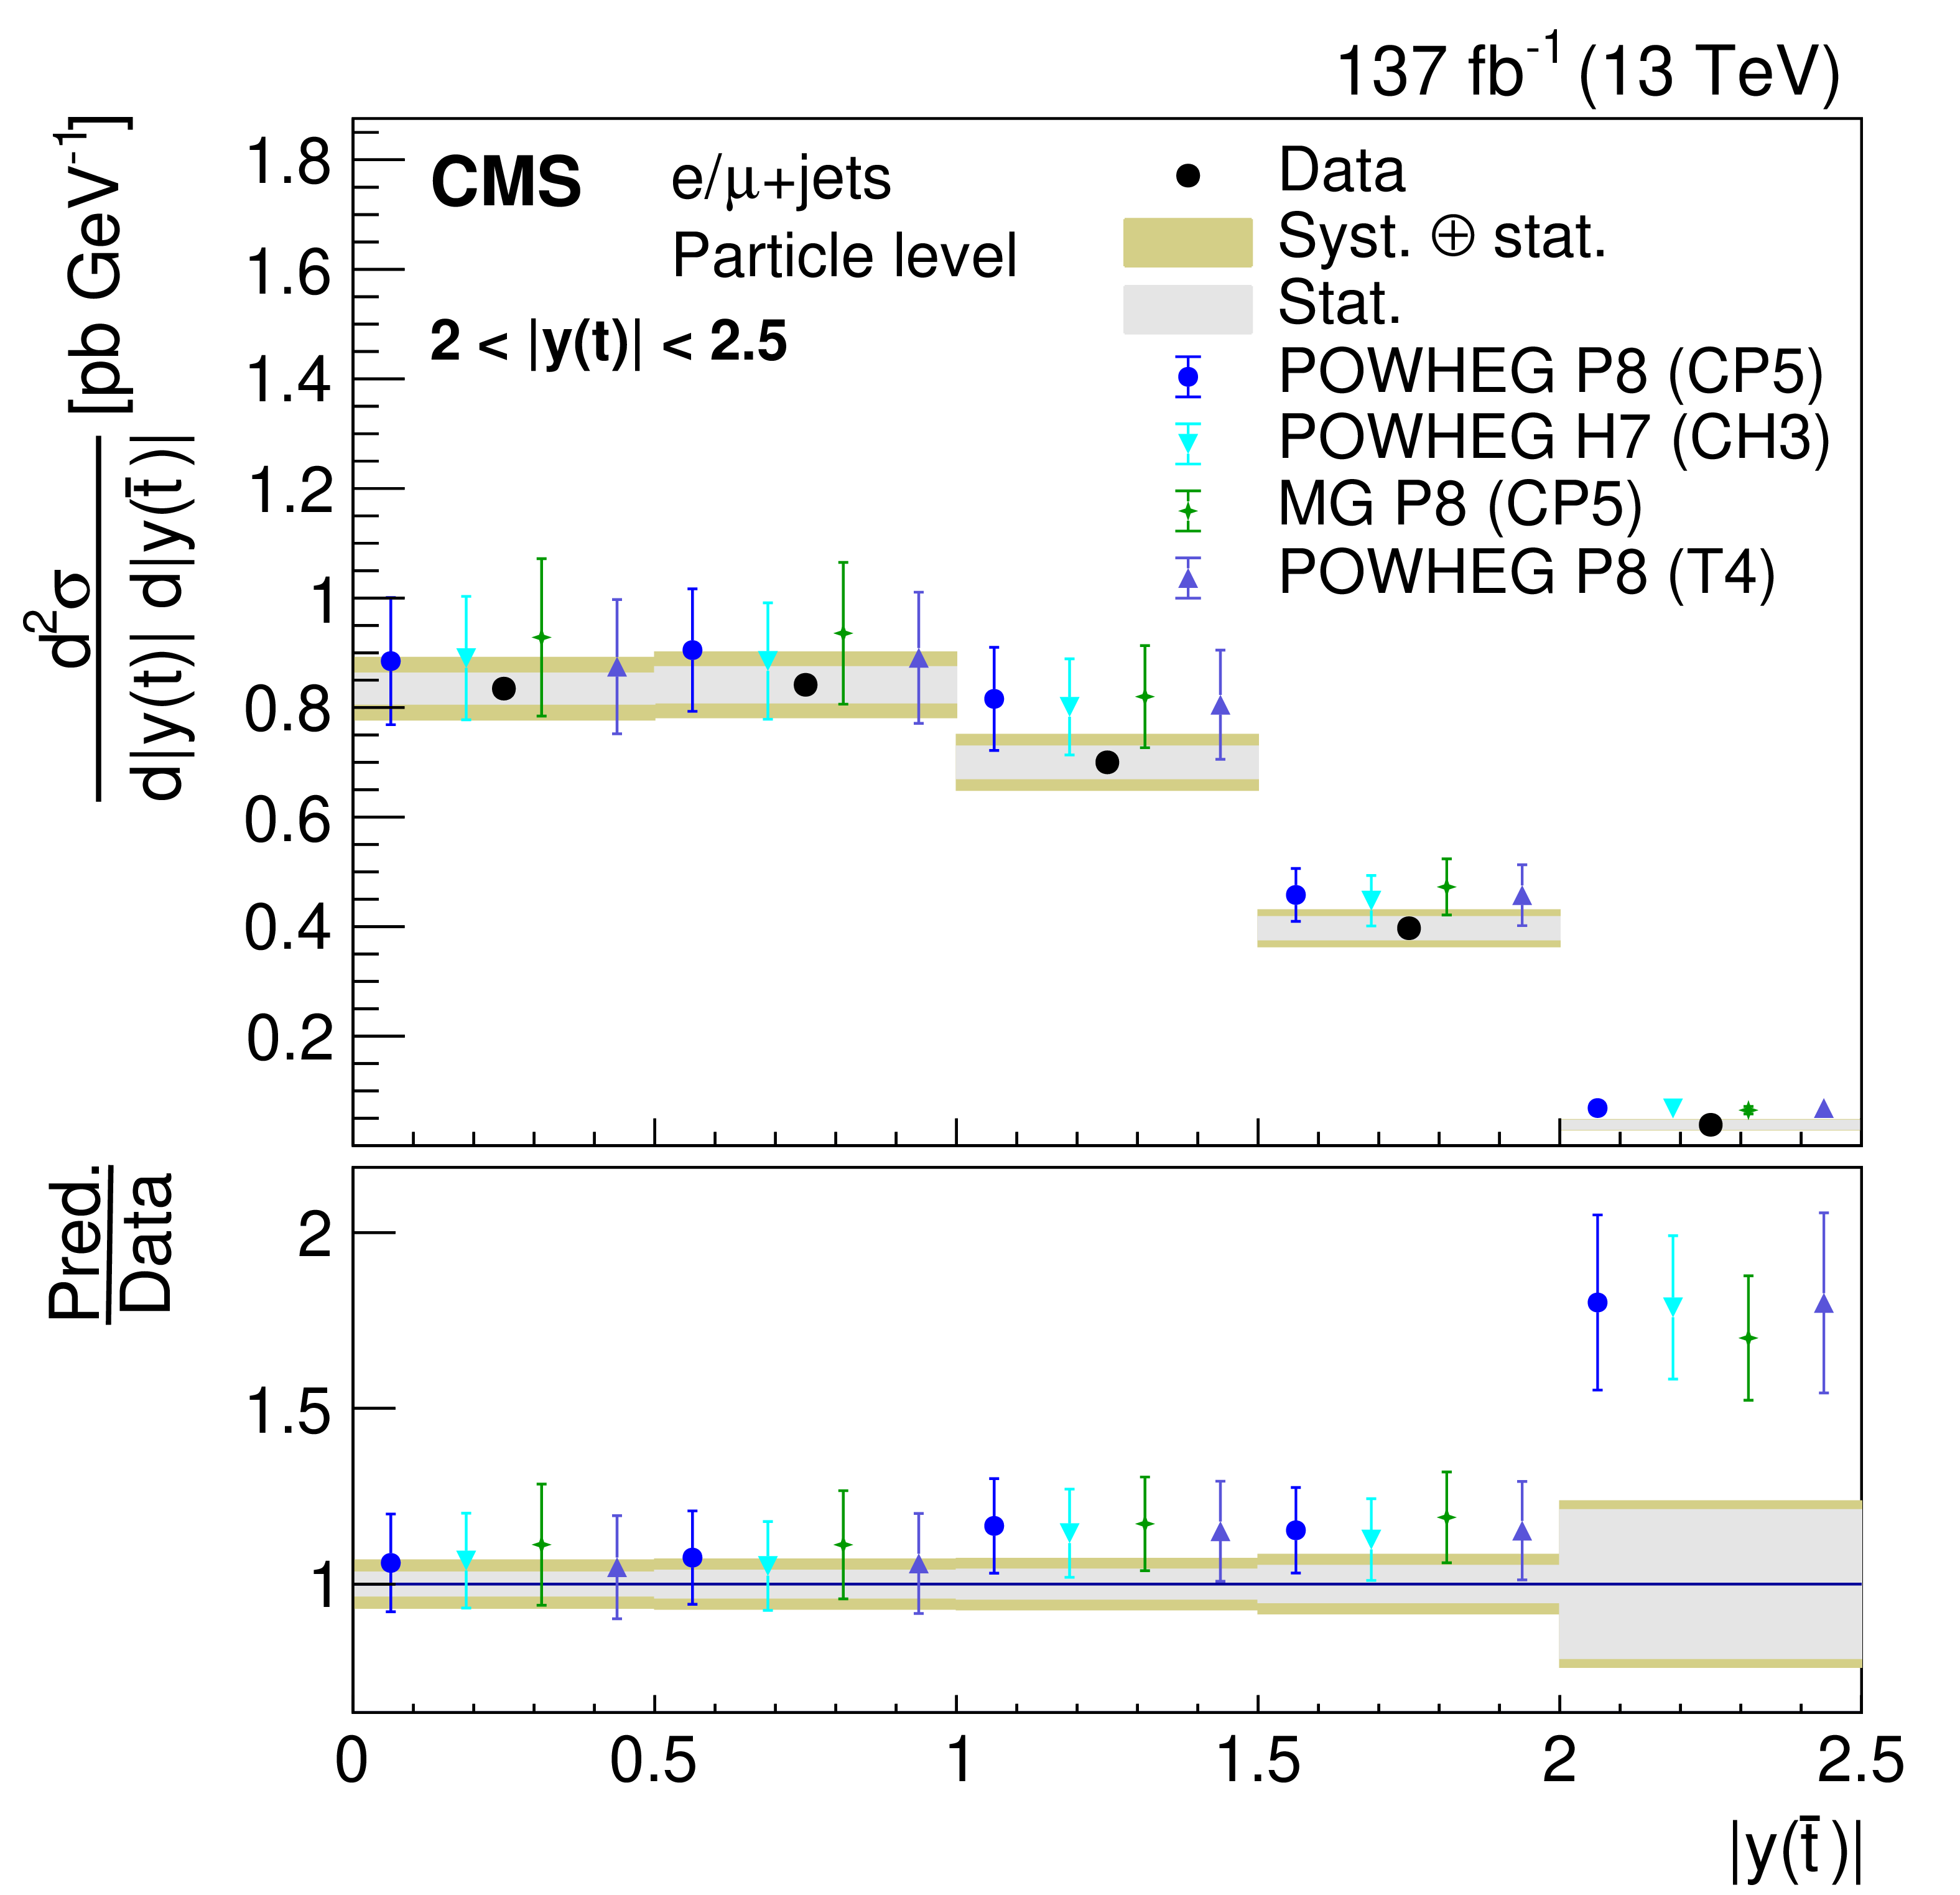
png pdf |
Figure 36-e:
Double-differential cross section at the particle level as a function of ${{| y(\mathrm{t}) |}}$ vs. ${{| y(\mathrm{\bar{t}}) |}}$. The data are shown as points with gray (yellow) bands indicating the statistical (statistical and systematic) uncertainties. The cross sections are compared to the predictions of POWHEG+PYTHIA (P8) for the CP5 and CUETP8M2T4 (T4) tunes, POWHEG+HERWIG (H7), and the multiparton simulation MG5_aMC@NLO (MG)+PYTHIA. The ratios of the various predictions to the measured cross sections are shown in the lower panels. Lower right: ratio of $ {| y(\mathrm{\bar{t}}) |} / {| y(\mathrm{t}) |}$ |
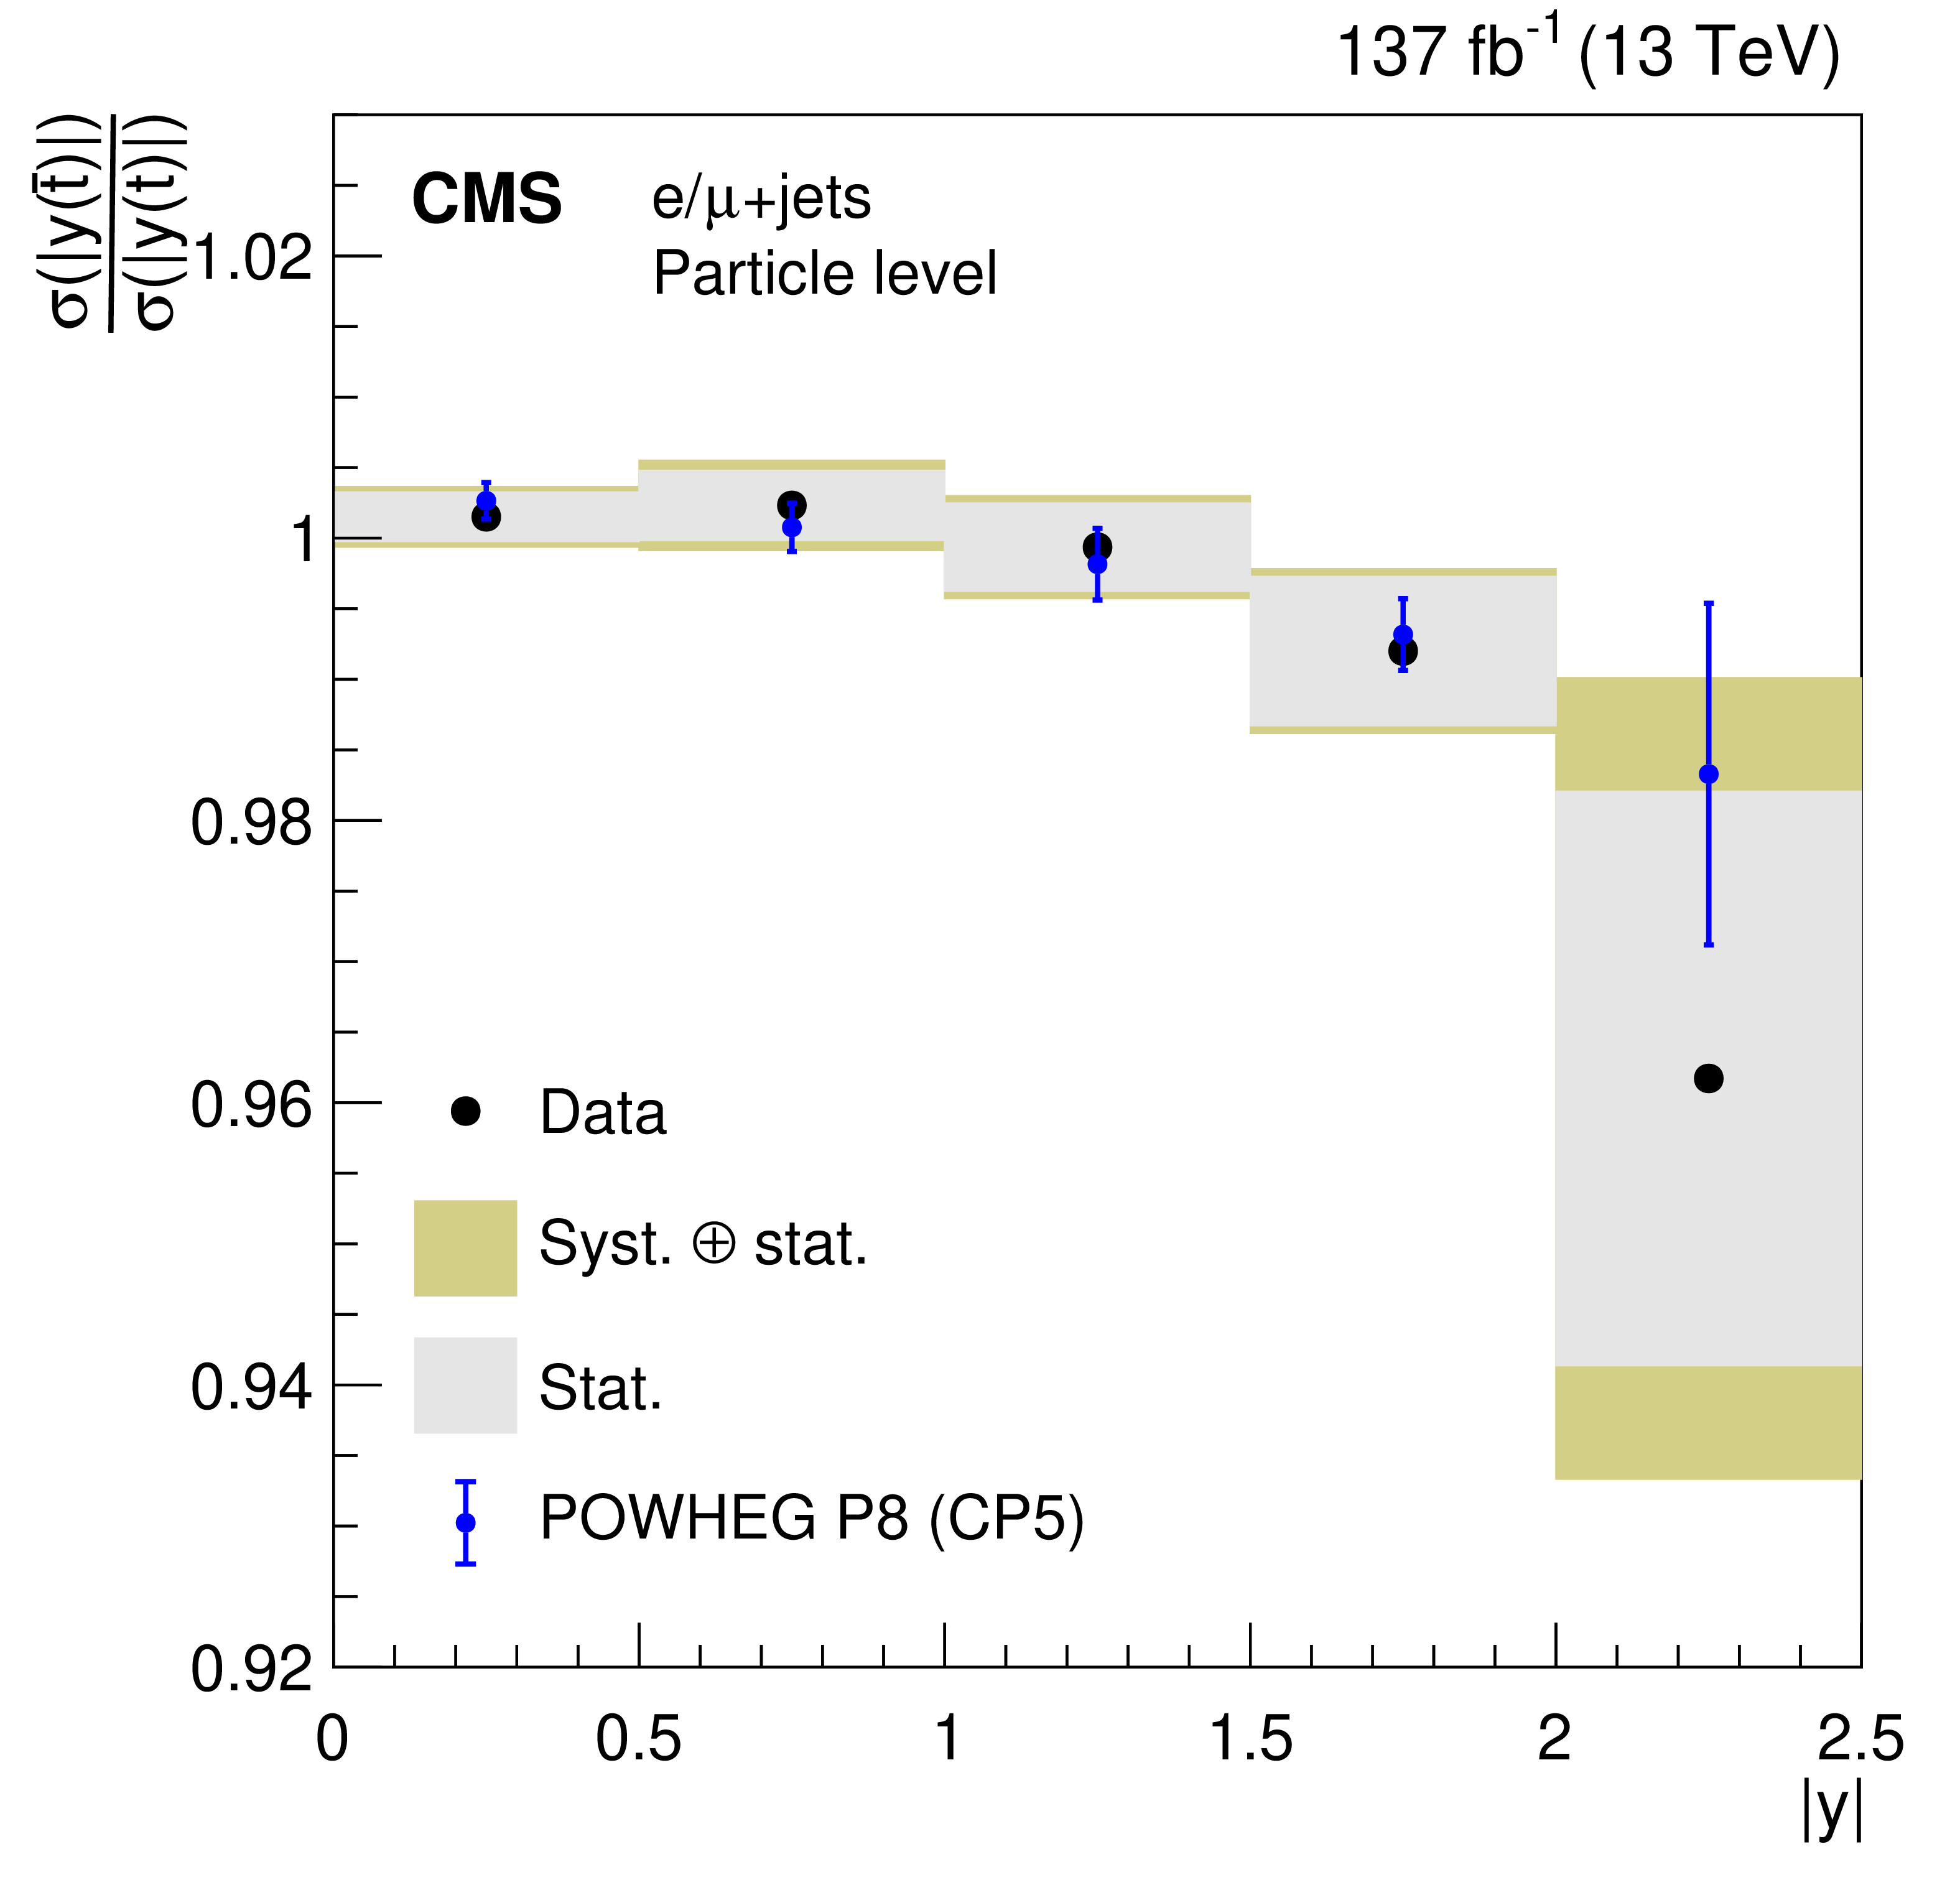
png pdf |
Figure 36-f:
Double-differential cross section at the particle level as a function of ${{| y(\mathrm{t}) |}}$ vs. ${{| y(\mathrm{\bar{t}}) |}}$. The data are shown as points with gray (yellow) bands indicating the statistical (statistical and systematic) uncertainties. The cross sections are compared to the predictions of POWHEG+PYTHIA (P8) for the CP5 and CUETP8M2T4 (T4) tunes, POWHEG+HERWIG (H7), and the multiparton simulation MG5_aMC@NLO (MG)+PYTHIA. The ratios of the various predictions to the measured cross sections are shown in the lower panels. Lower right: ratio of $ {| y(\mathrm{\bar{t}}) |} / {| y(\mathrm{t}) |}$ |
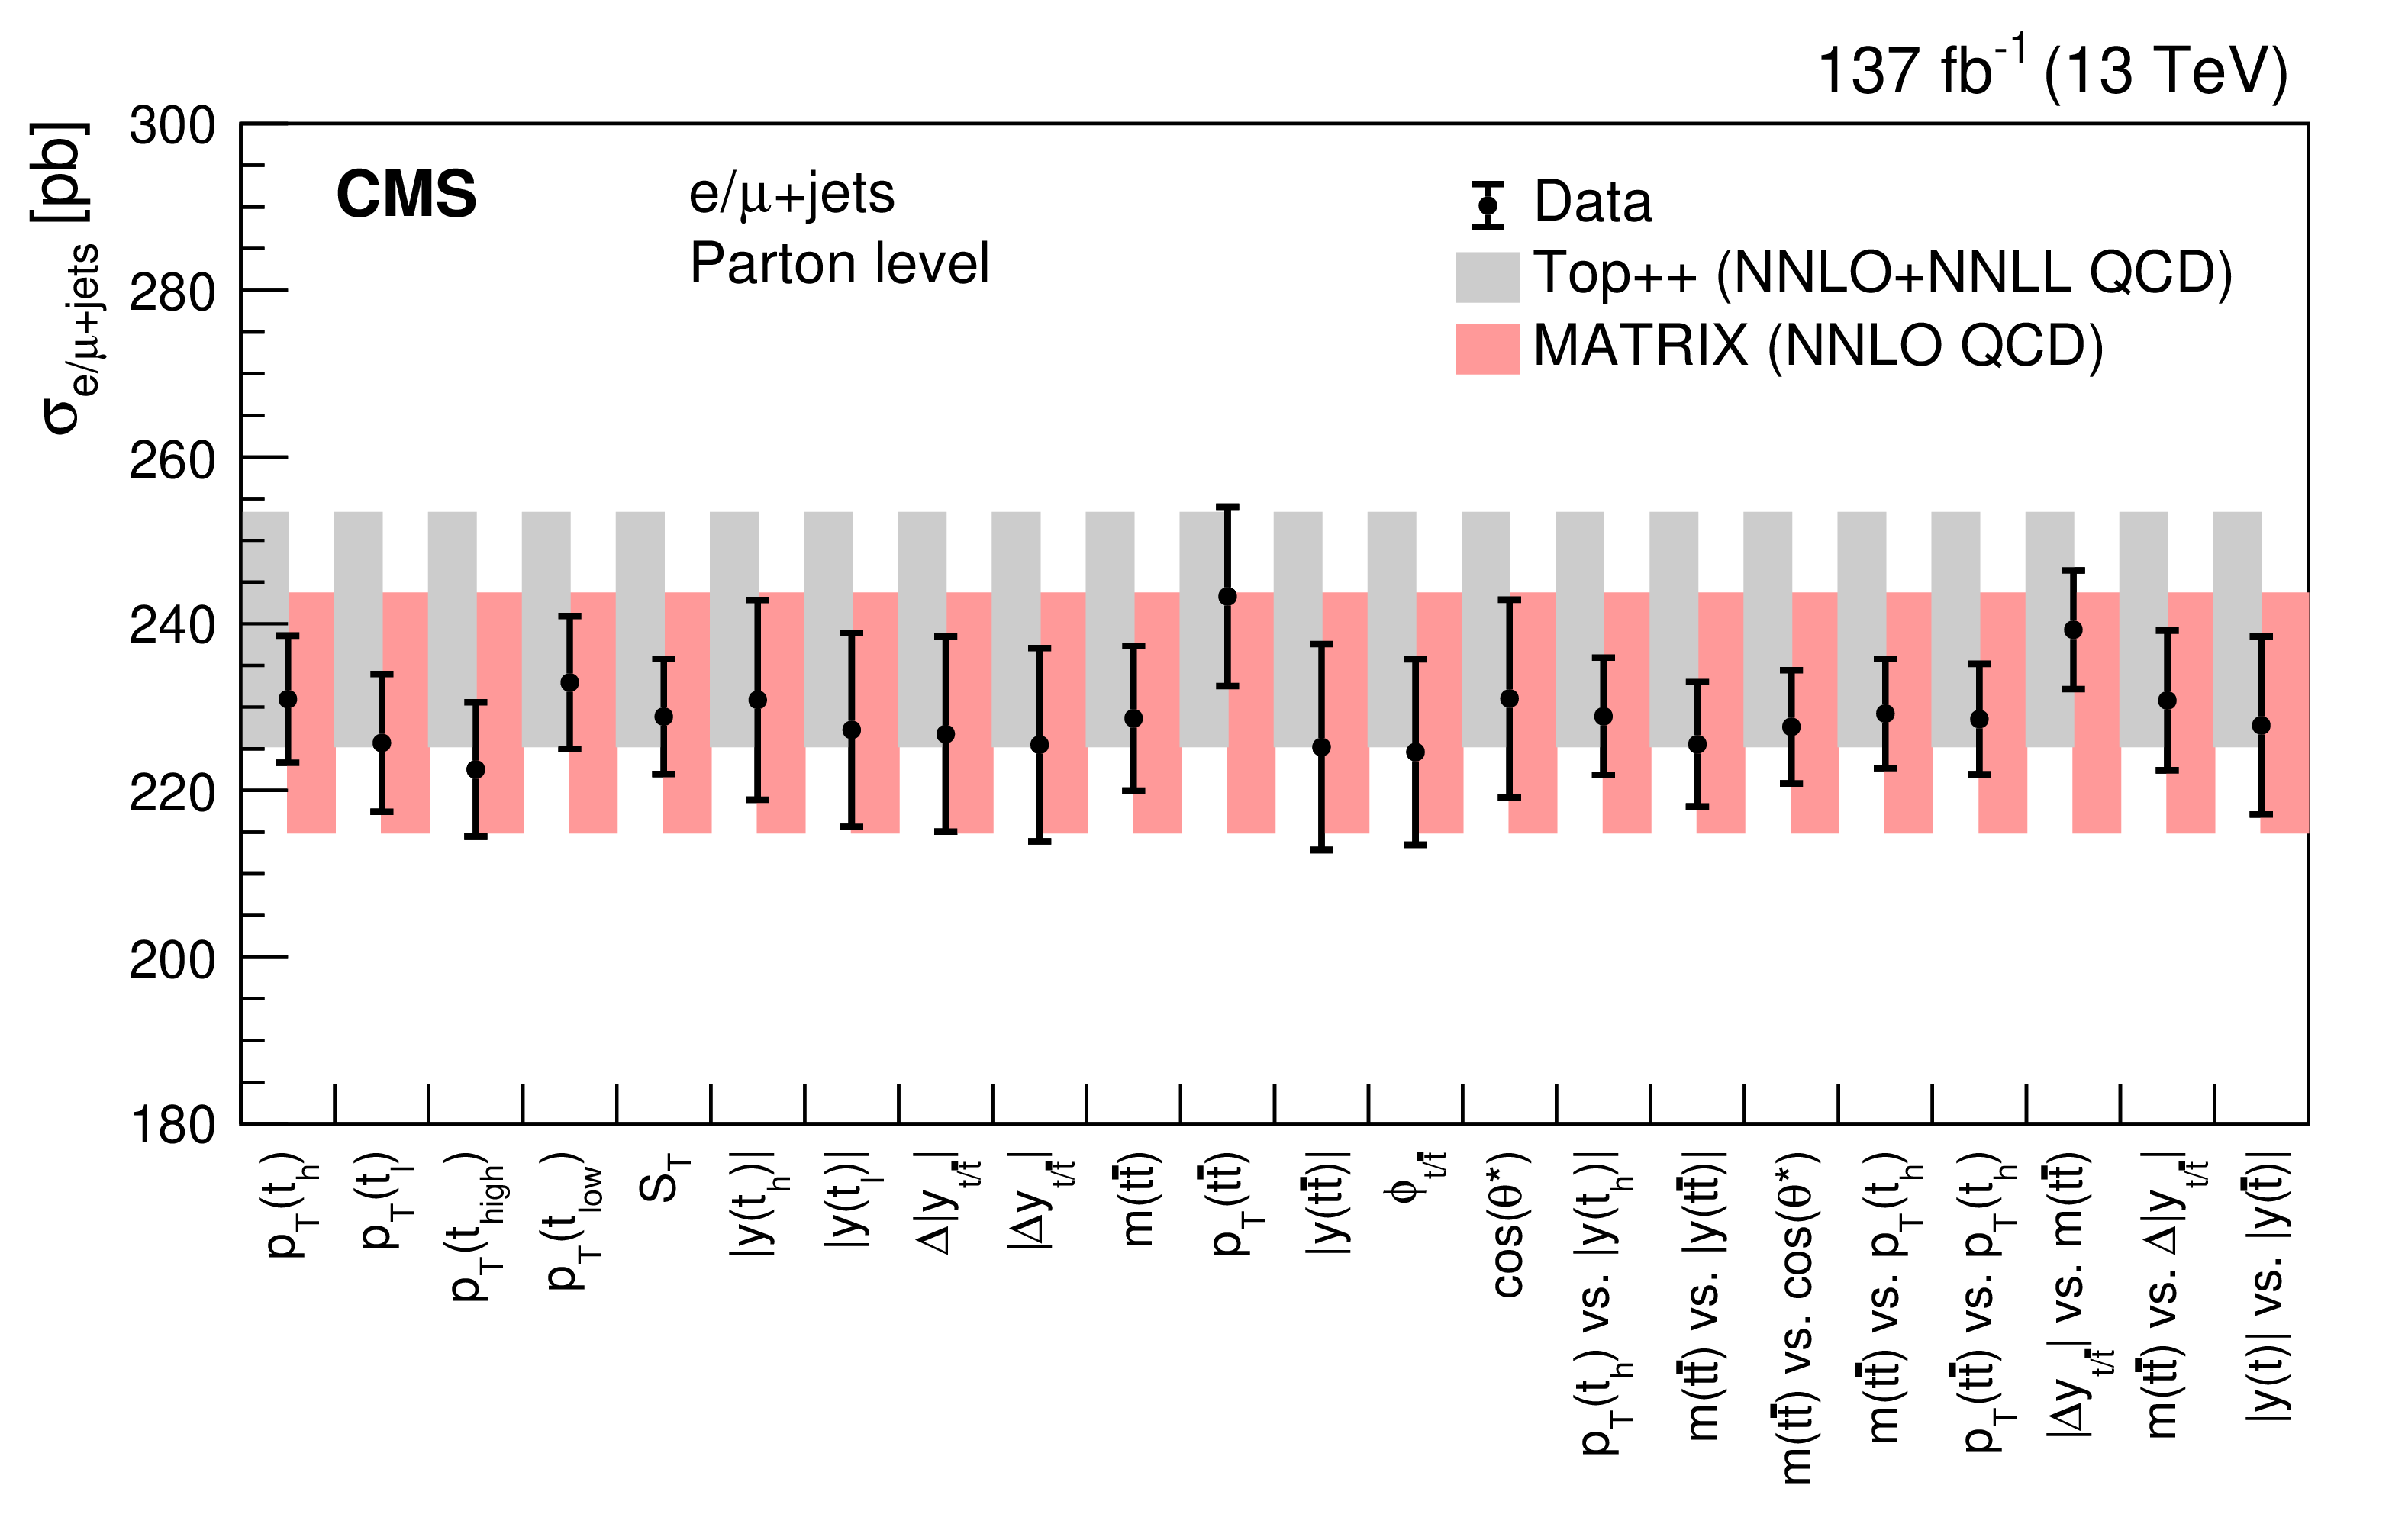
png pdf |
Figure 37:
Measurements of the ${\mathrm{t} \mathrm{\bar{t}}}$ production cross sections $\sigma _{{\mathrm{e} \text {/} \mu \text {+jets}}}$ with their total uncertainty obtained as the sum of the cross sections in all bins of a distribution as a function of the kinematic variable used in the determination. The results are compared to the Top++ and the Matrix predictions with their corresponding uncertainties. |
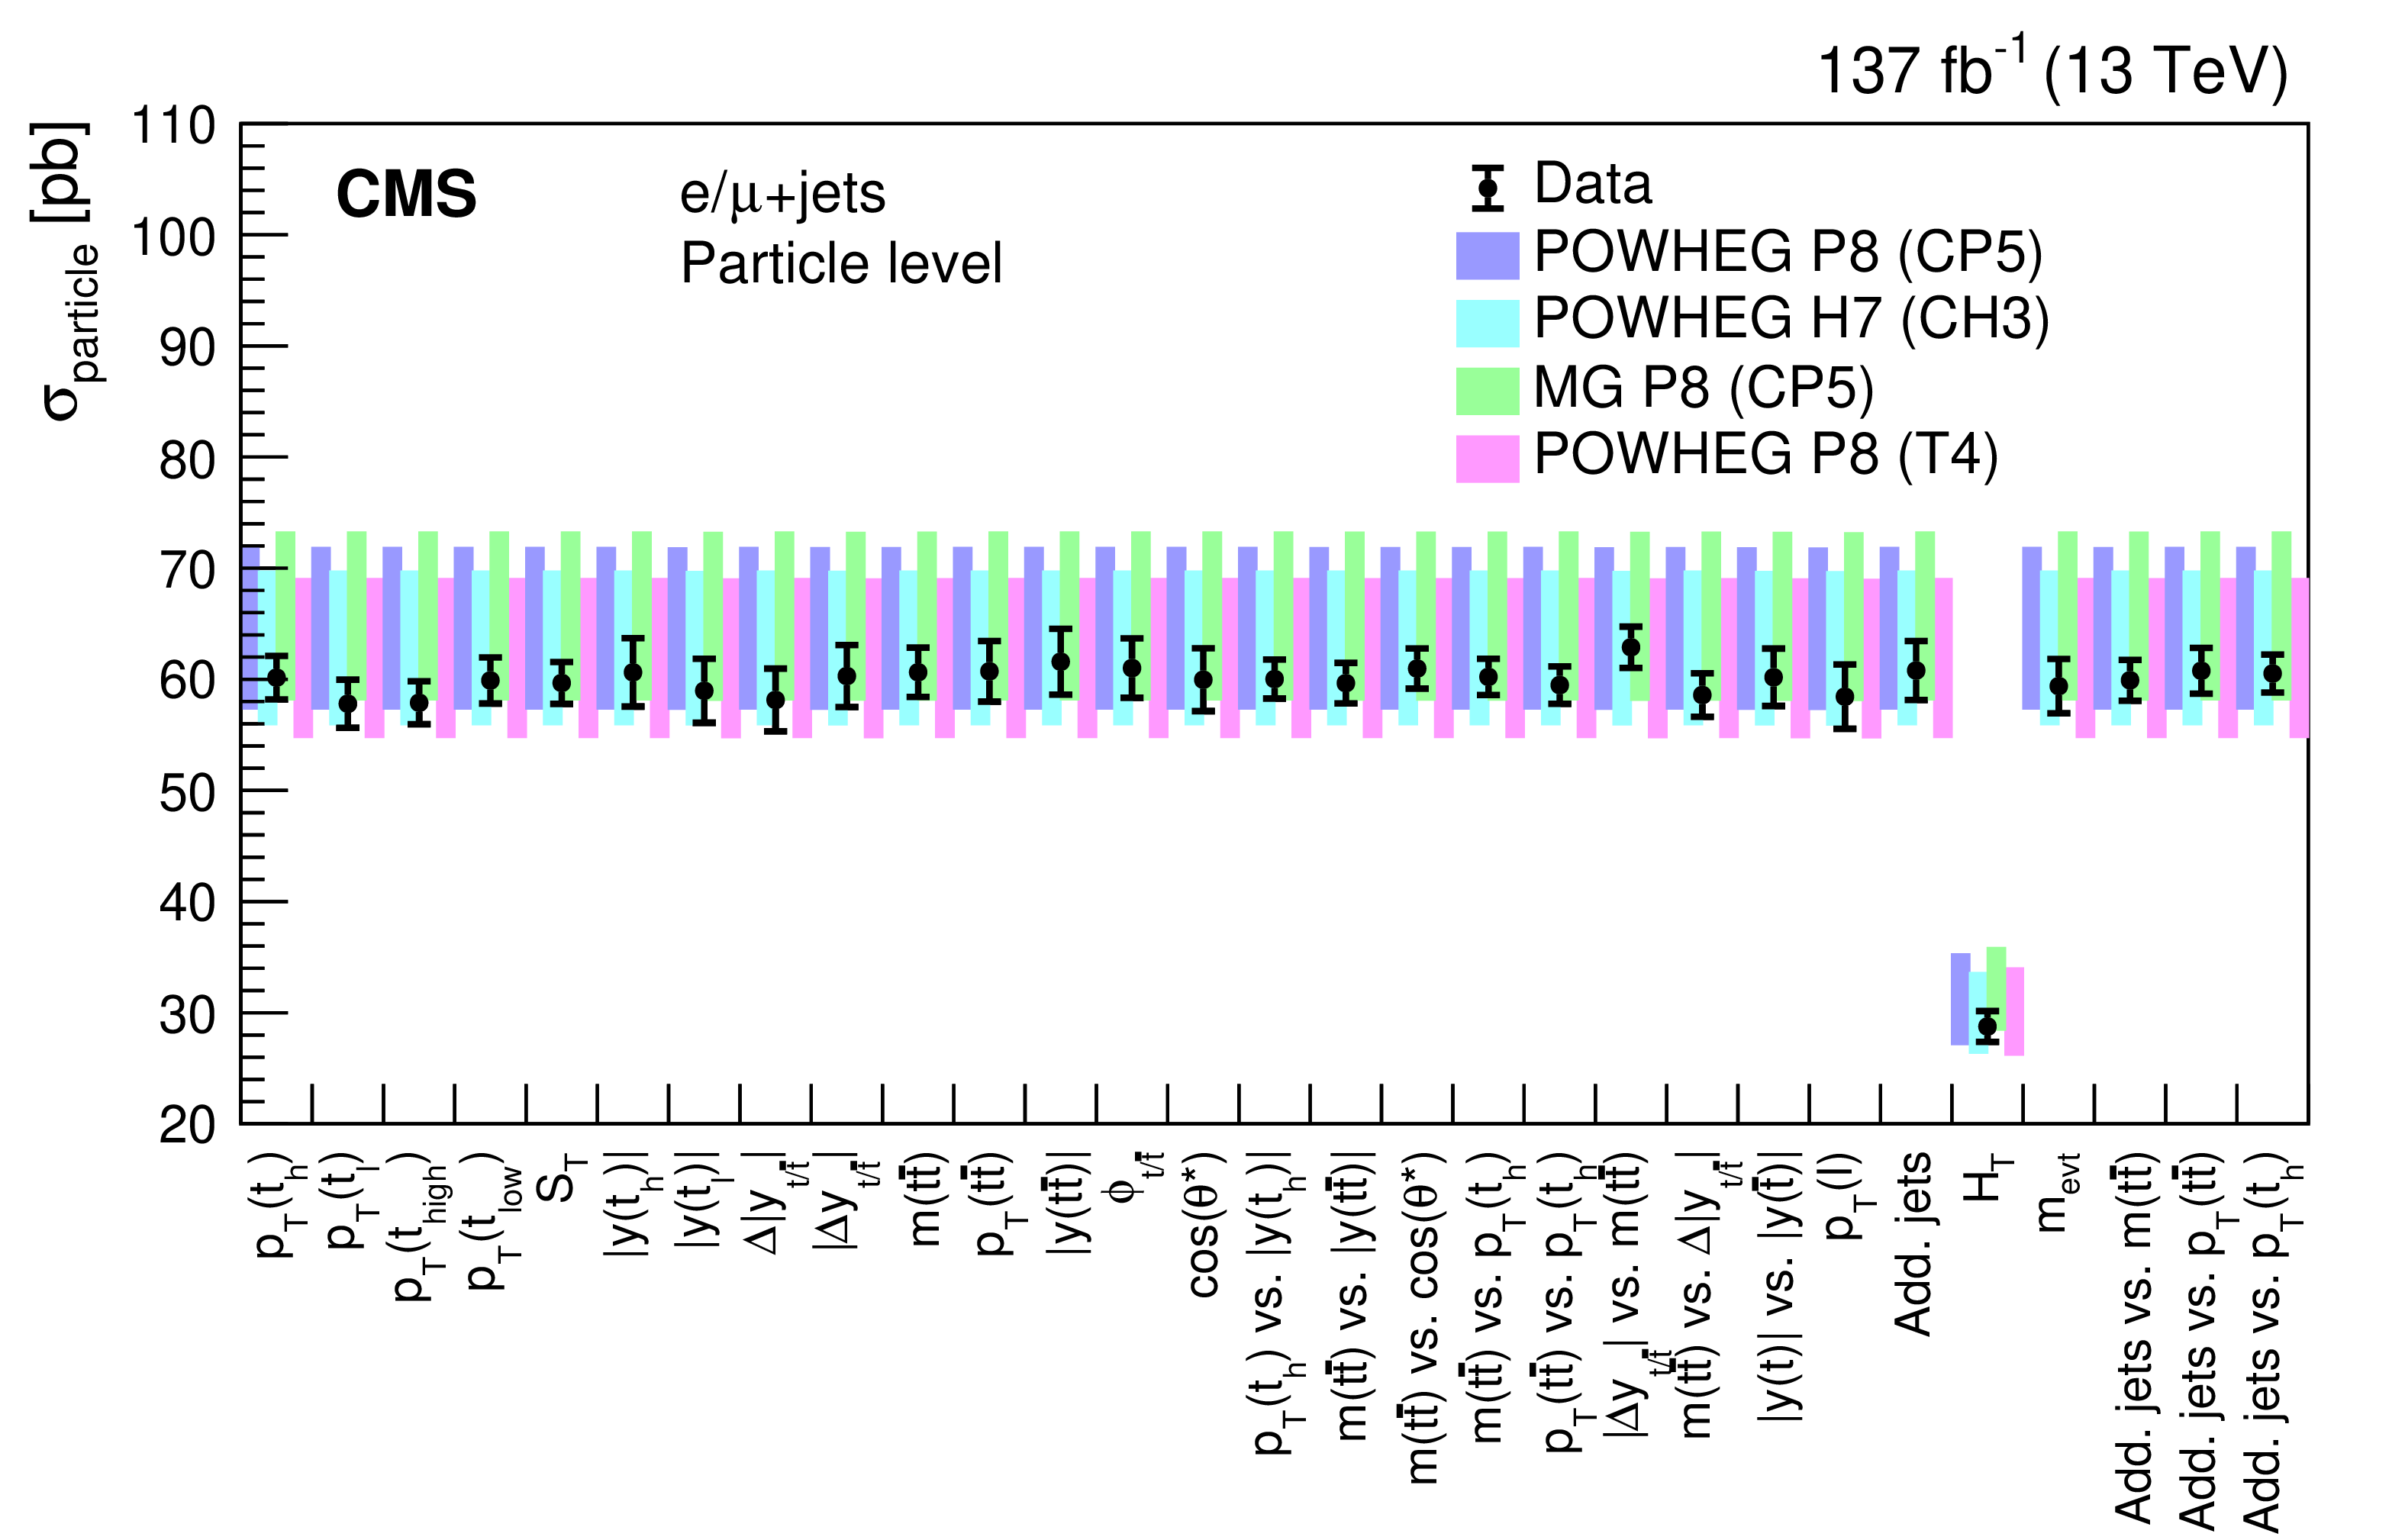
png pdf |
Figure 38:
Measurements of the ${\mathrm{t} \mathrm{\bar{t}}}$ production cross sections $\sigma _\mathrm {particle}$ at the particle level and their total uncertainties as a function of the kinematic variable used in the determination. The results are compared to the predictions of POWHEG+PYTHIA (P8) for the CP5 and CUETP8M2T4 (T4) tunes, POWHEG+HERWIG (H7), and the multiparton simulation MG5_aMC@NLO (MG)+PYTHIA. |
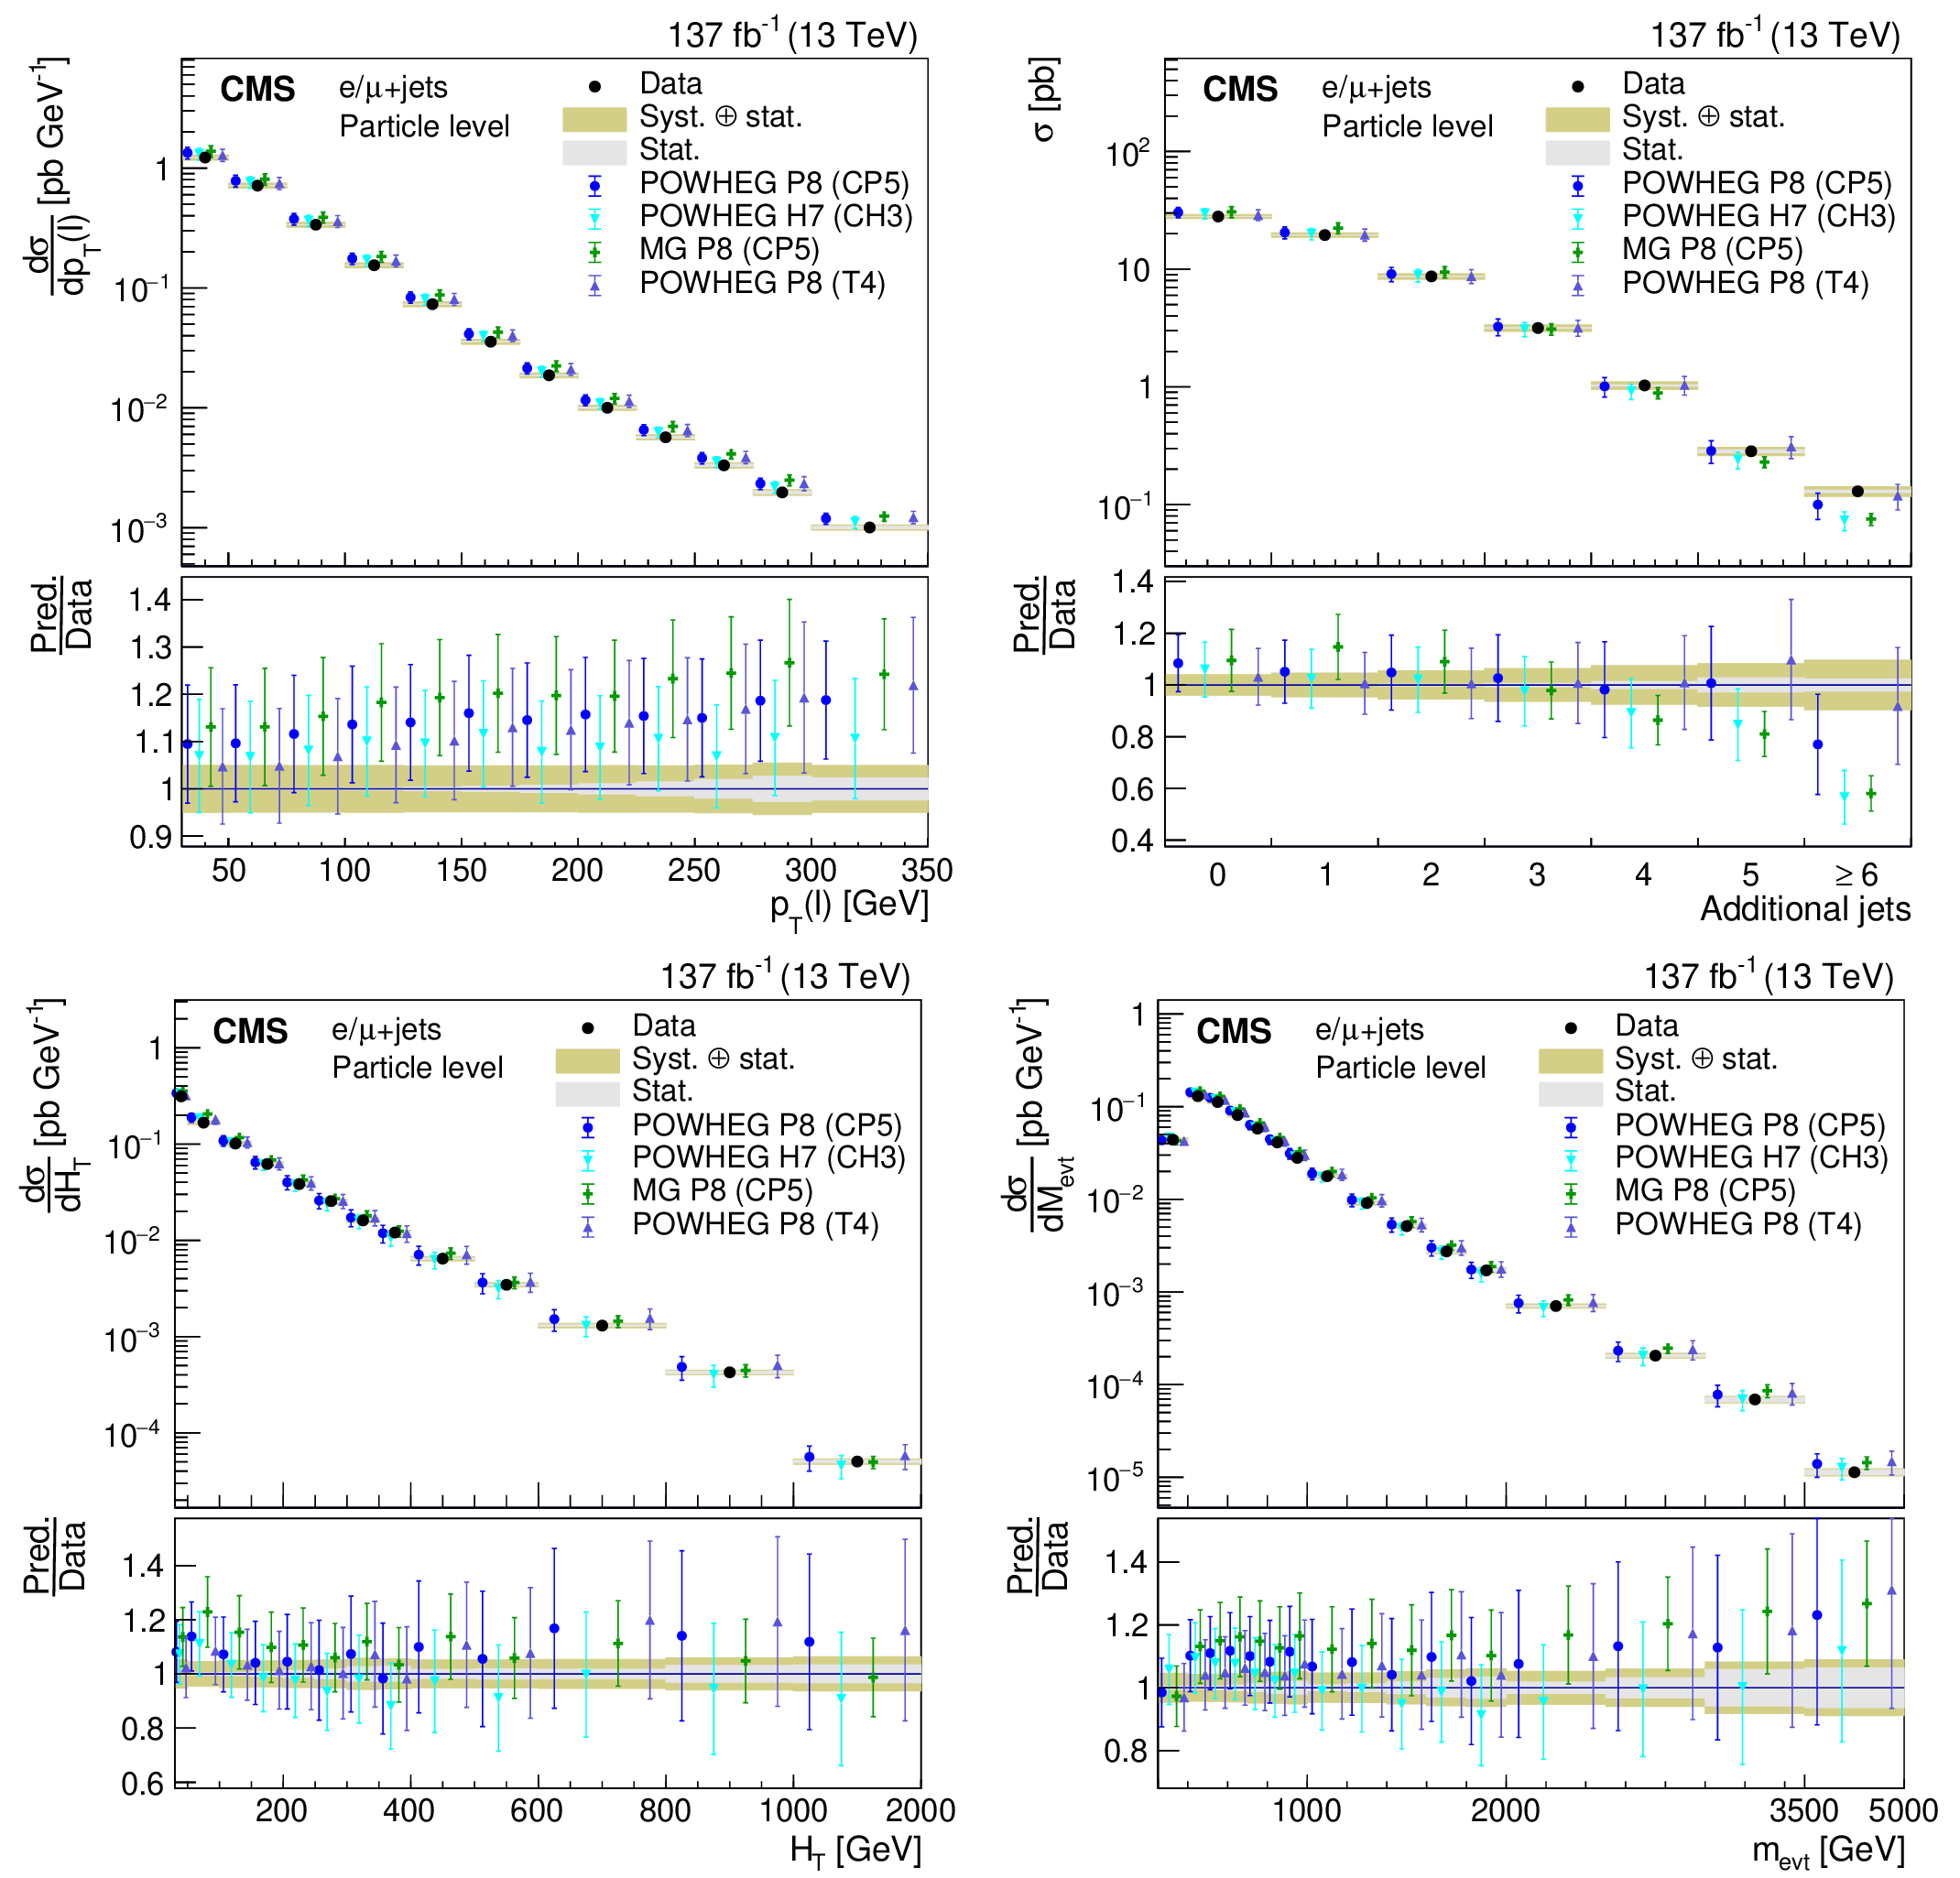
png pdf |
Figure 39:
Differential cross sections at the particle level as a function of ${{p_{\mathrm {T}}} (\ell)}$, jet multiplicity, ${H_{\mathrm {T}}}$, and ${m_\text {evt}}$. The data are shown as points with gray (yellow) bands indicating the statistical (statistical and systematic) uncertainties. The cross sections are compared to the predictions of POWHEG+PYTHIA (P8) for the CP5 and CUETP8M2T4 (T4) tunes, POWHEG+HERWIG (H7), and the multiparton simulation MG5_aMC@NLO (MG)+PYTHIA. The ratios of the various predictions to the measured cross sections are shown in the lower panels. |
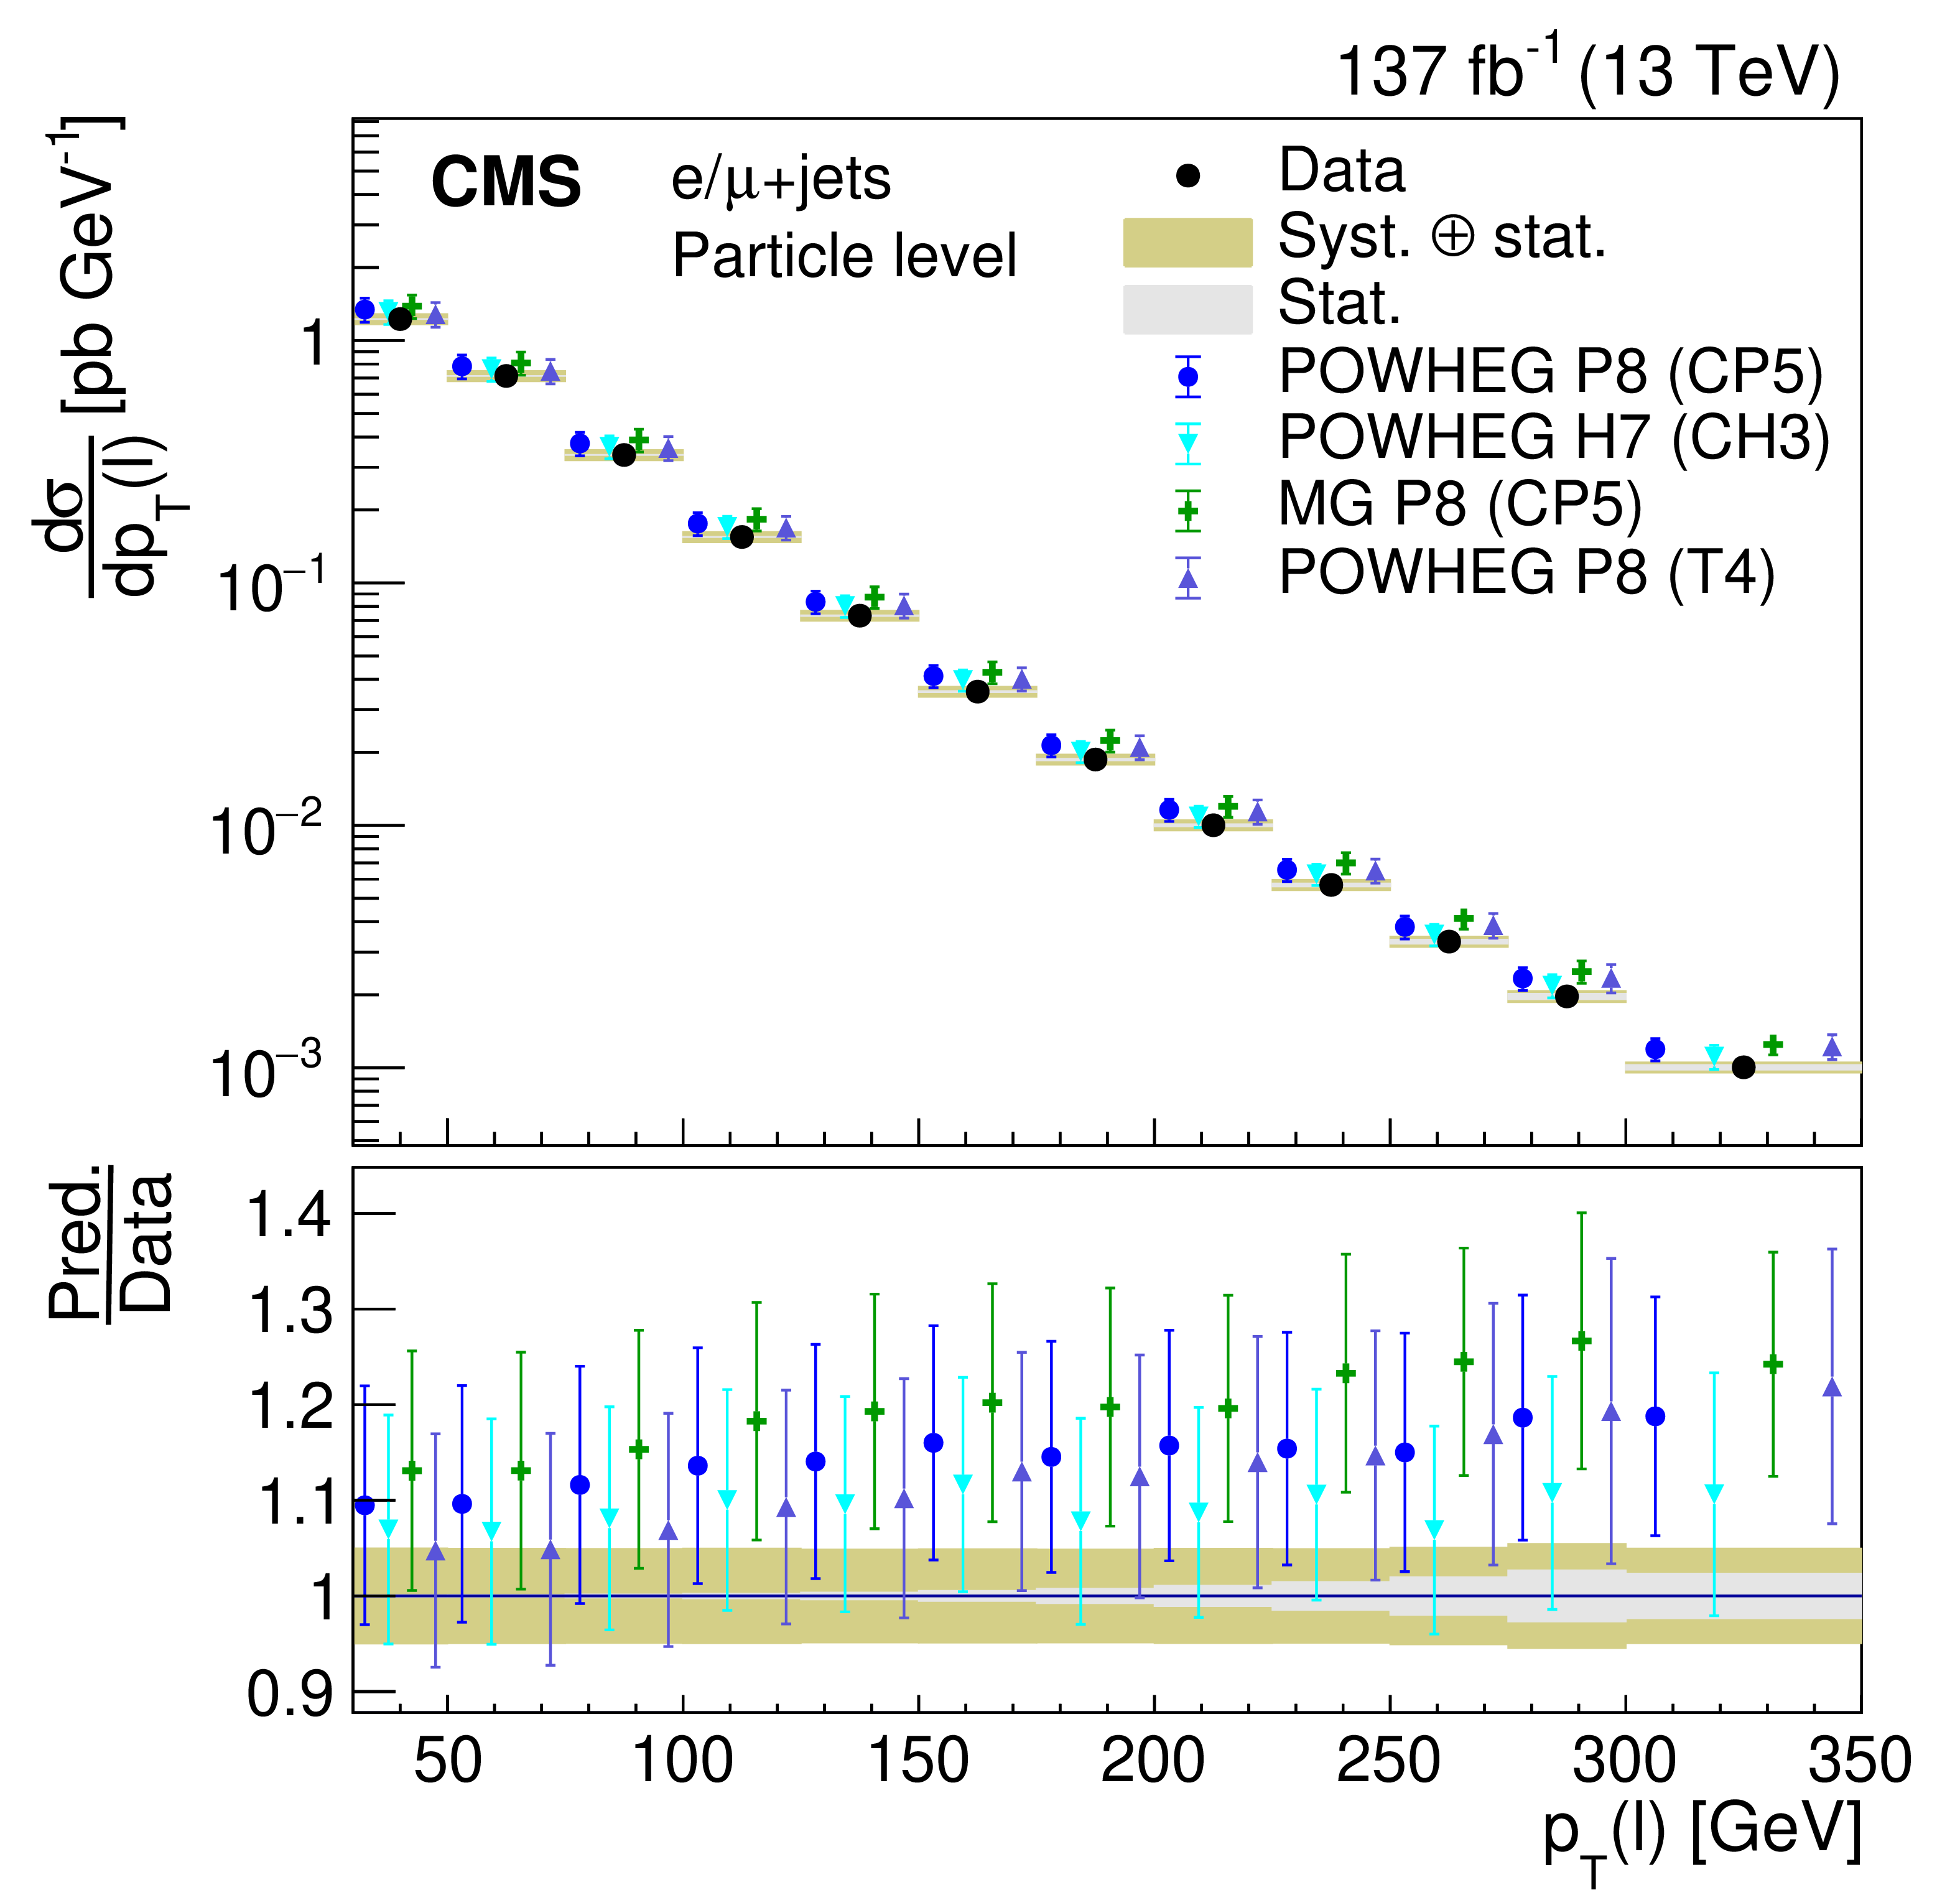
png pdf |
Figure 39-a:
Differential cross sections at the particle level as a function of ${{p_{\mathrm {T}}} (\ell)}$, jet multiplicity, ${H_{\mathrm {T}}}$, and ${m_\text {evt}}$. The data are shown as points with gray (yellow) bands indicating the statistical (statistical and systematic) uncertainties. The cross sections are compared to the predictions of POWHEG+PYTHIA (P8) for the CP5 and CUETP8M2T4 (T4) tunes, POWHEG+HERWIG (H7), and the multiparton simulation MG5_aMC@NLO (MG)+PYTHIA. The ratios of the various predictions to the measured cross sections are shown in the lower panels. |
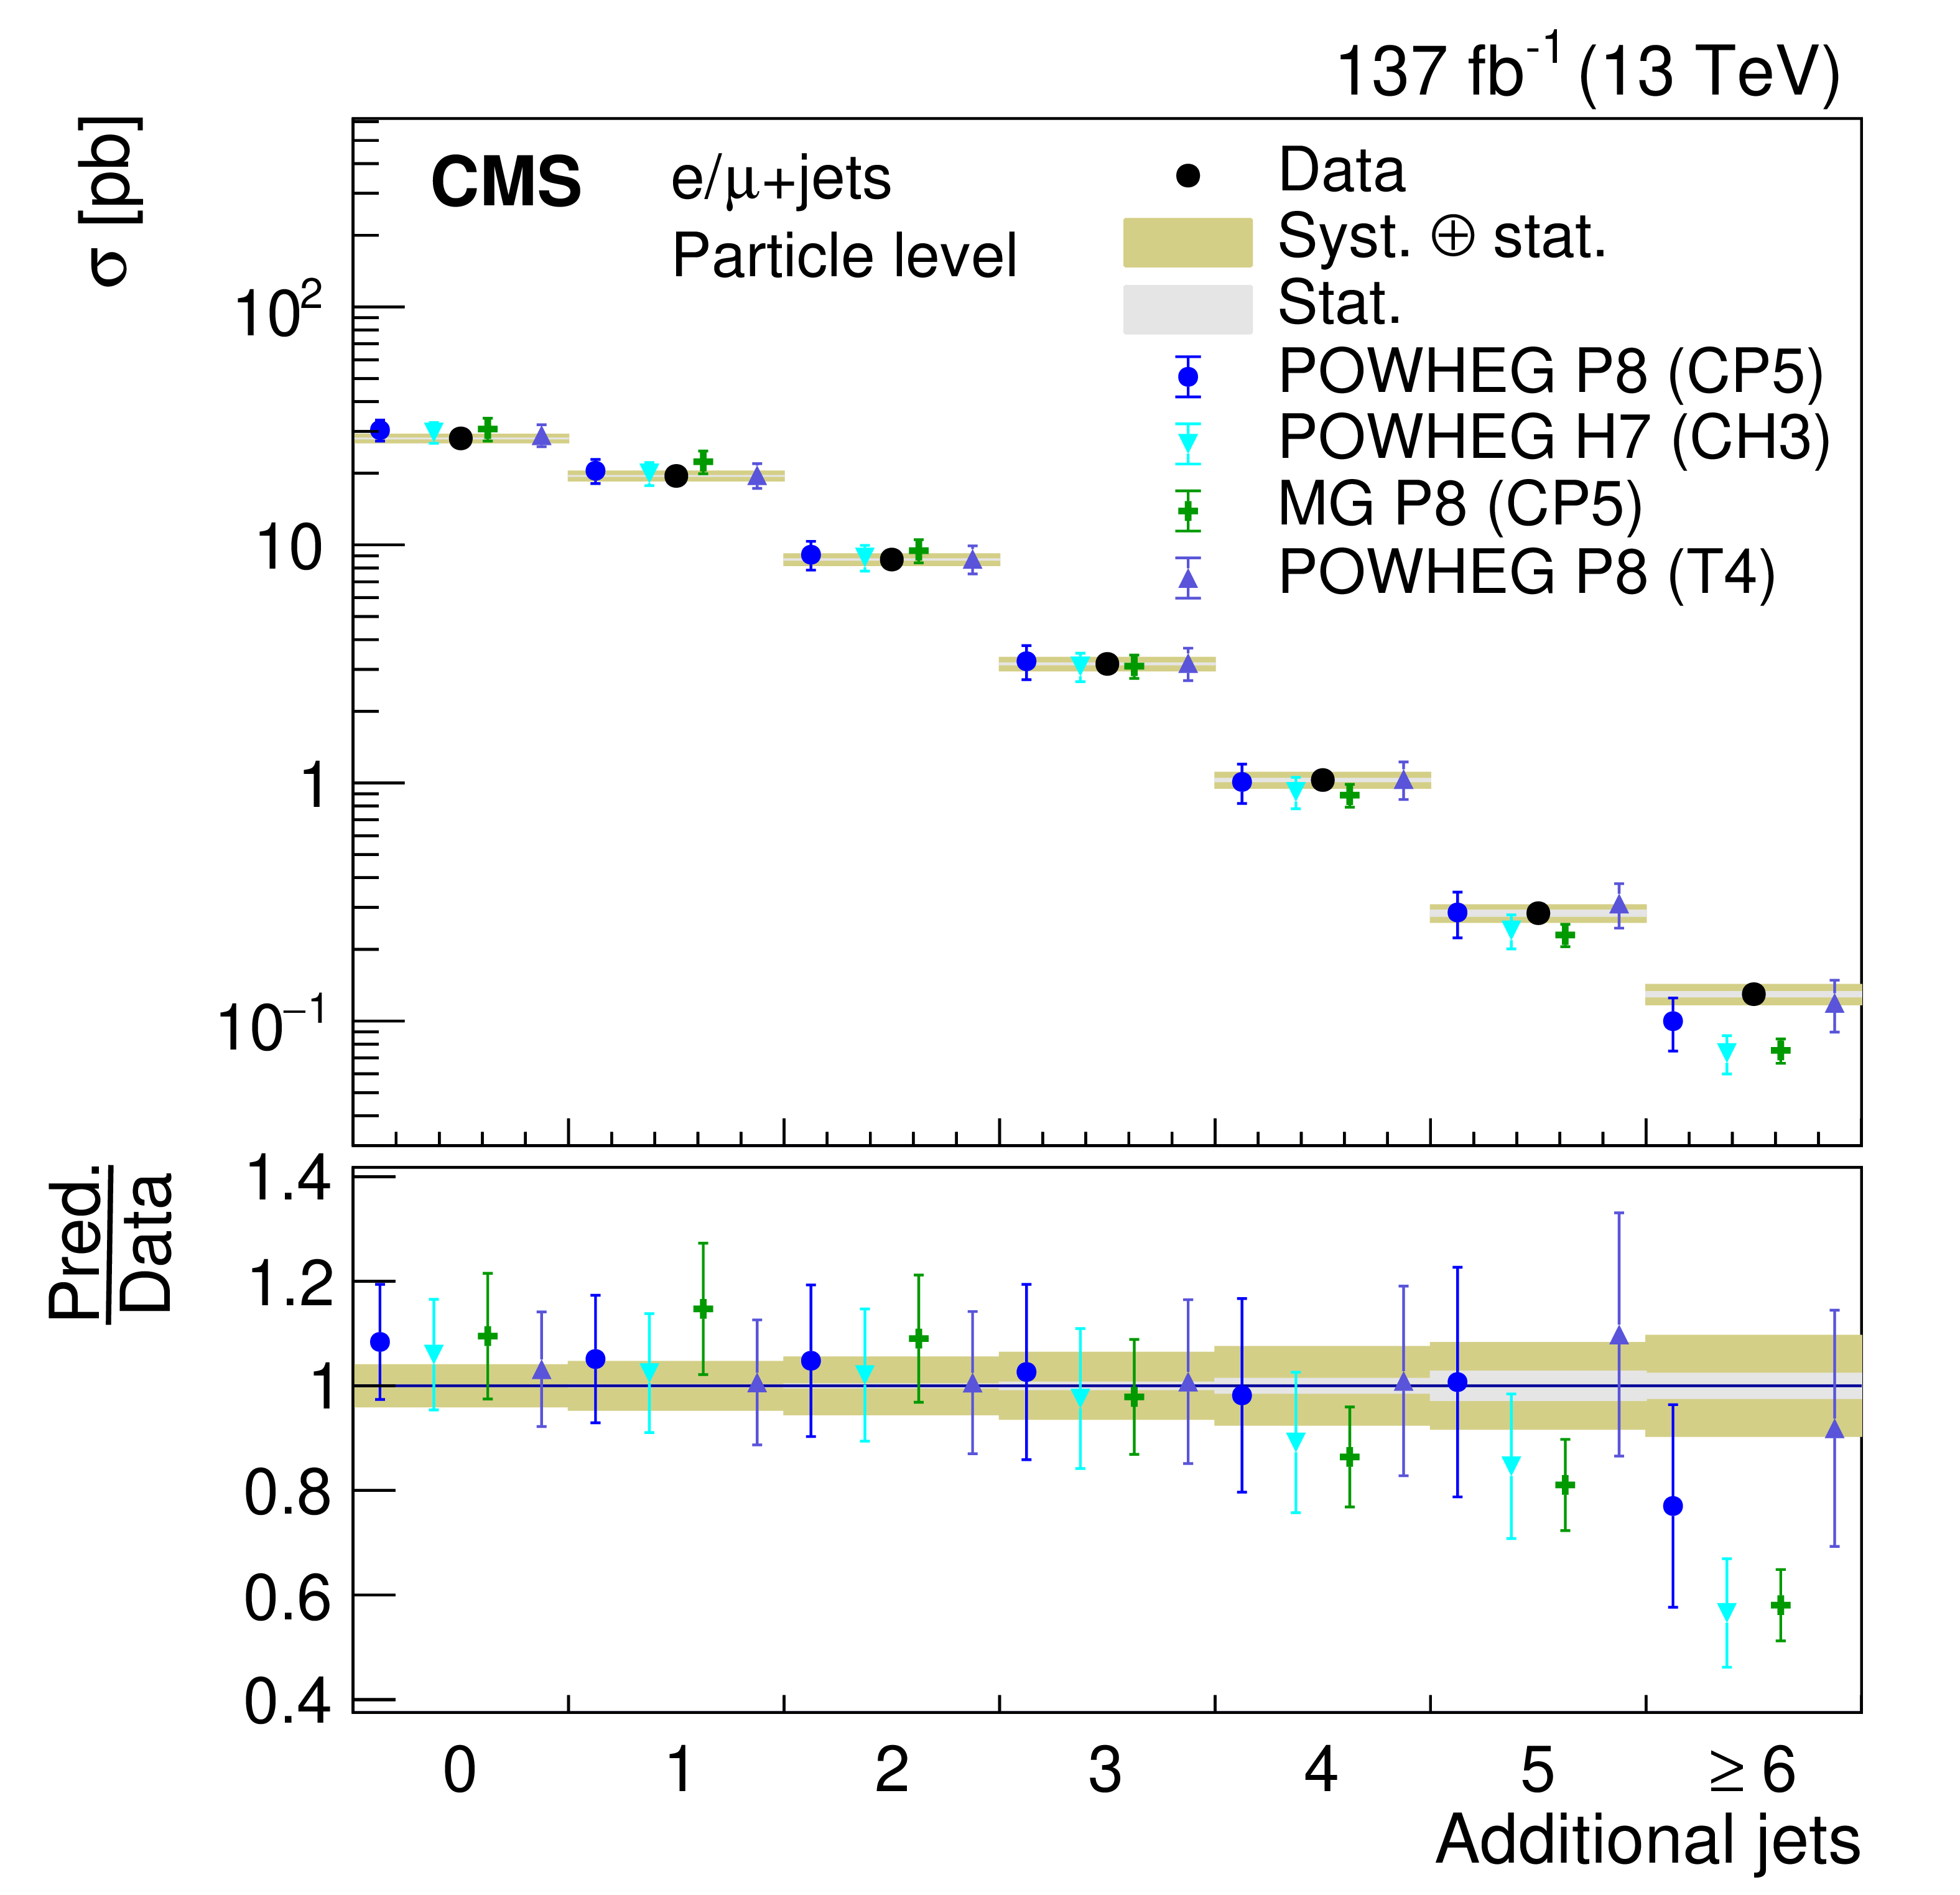
png pdf |
Figure 39-b:
Differential cross sections at the particle level as a function of ${{p_{\mathrm {T}}} (\ell)}$, jet multiplicity, ${H_{\mathrm {T}}}$, and ${m_\text {evt}}$. The data are shown as points with gray (yellow) bands indicating the statistical (statistical and systematic) uncertainties. The cross sections are compared to the predictions of POWHEG+PYTHIA (P8) for the CP5 and CUETP8M2T4 (T4) tunes, POWHEG+HERWIG (H7), and the multiparton simulation MG5_aMC@NLO (MG)+PYTHIA. The ratios of the various predictions to the measured cross sections are shown in the lower panels. |

png pdf |
Figure 39-c:
Differential cross sections at the particle level as a function of ${{p_{\mathrm {T}}} (\ell)}$, jet multiplicity, ${H_{\mathrm {T}}}$, and ${m_\text {evt}}$. The data are shown as points with gray (yellow) bands indicating the statistical (statistical and systematic) uncertainties. The cross sections are compared to the predictions of POWHEG+PYTHIA (P8) for the CP5 and CUETP8M2T4 (T4) tunes, POWHEG+HERWIG (H7), and the multiparton simulation MG5_aMC@NLO (MG)+PYTHIA. The ratios of the various predictions to the measured cross sections are shown in the lower panels. |
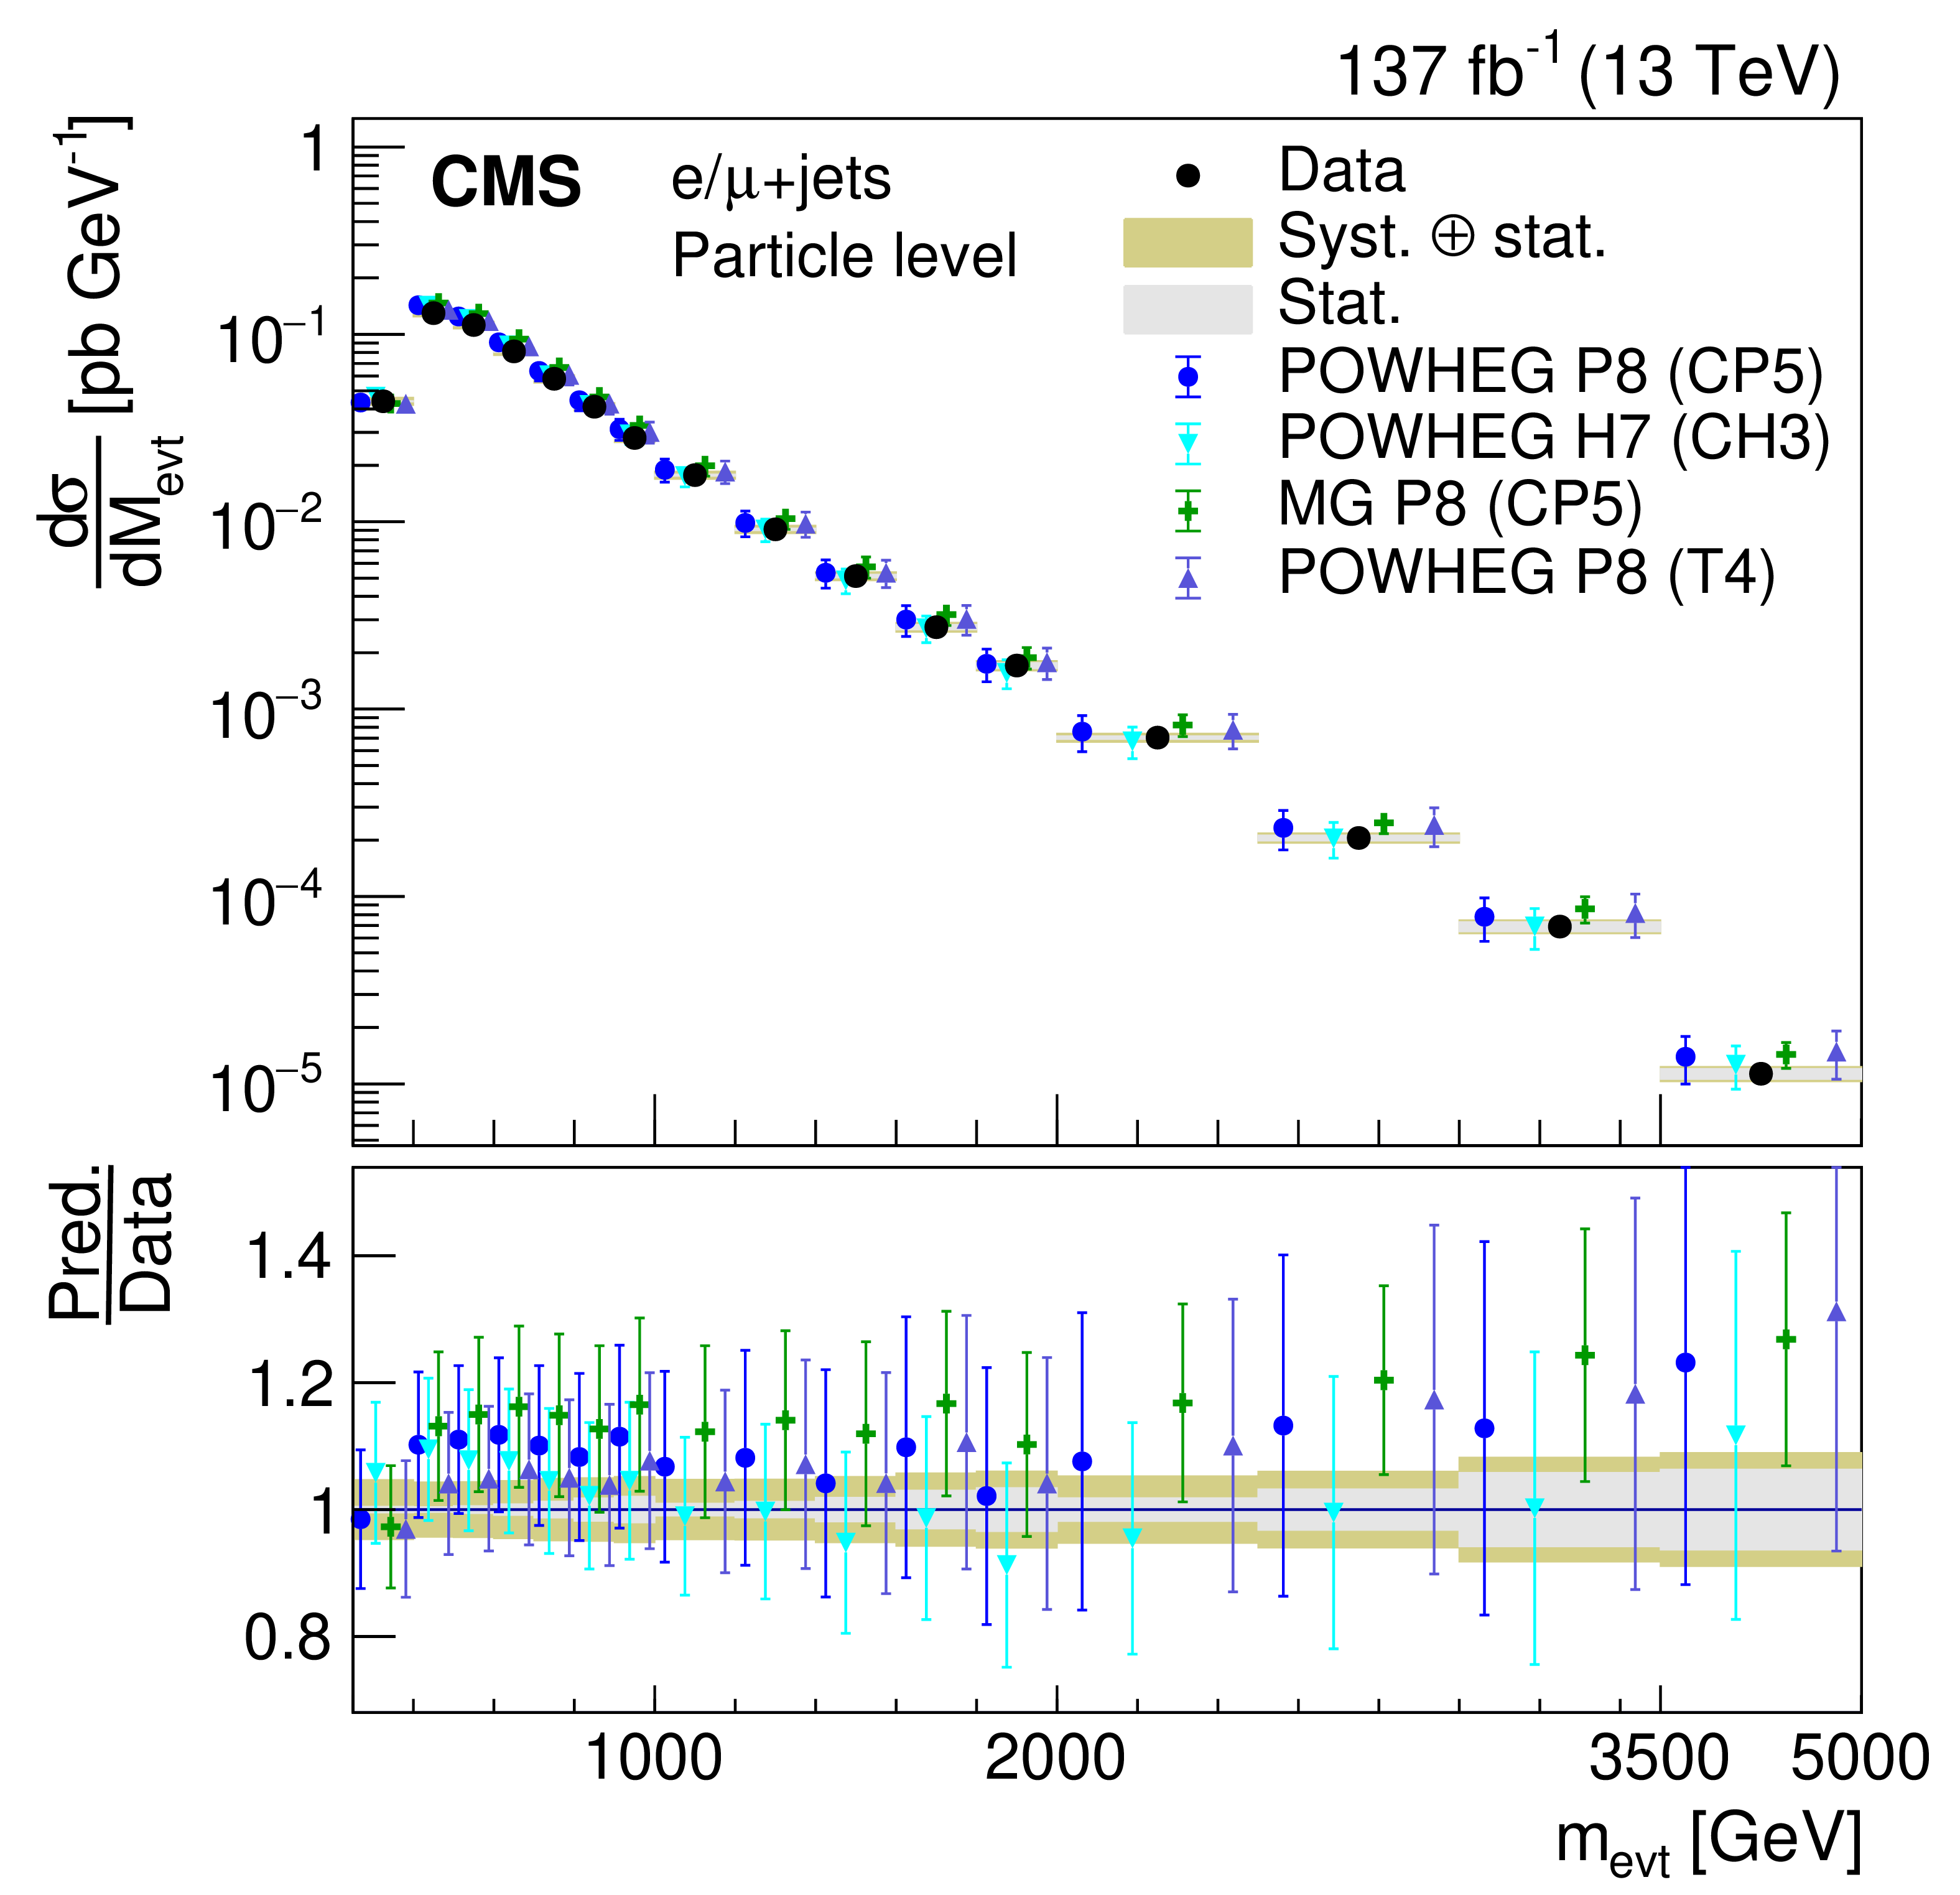
png pdf |
Figure 39-d:
Differential cross sections at the particle level as a function of ${{p_{\mathrm {T}}} (\ell)}$, jet multiplicity, ${H_{\mathrm {T}}}$, and ${m_\text {evt}}$. The data are shown as points with gray (yellow) bands indicating the statistical (statistical and systematic) uncertainties. The cross sections are compared to the predictions of POWHEG+PYTHIA (P8) for the CP5 and CUETP8M2T4 (T4) tunes, POWHEG+HERWIG (H7), and the multiparton simulation MG5_aMC@NLO (MG)+PYTHIA. The ratios of the various predictions to the measured cross sections are shown in the lower panels. |
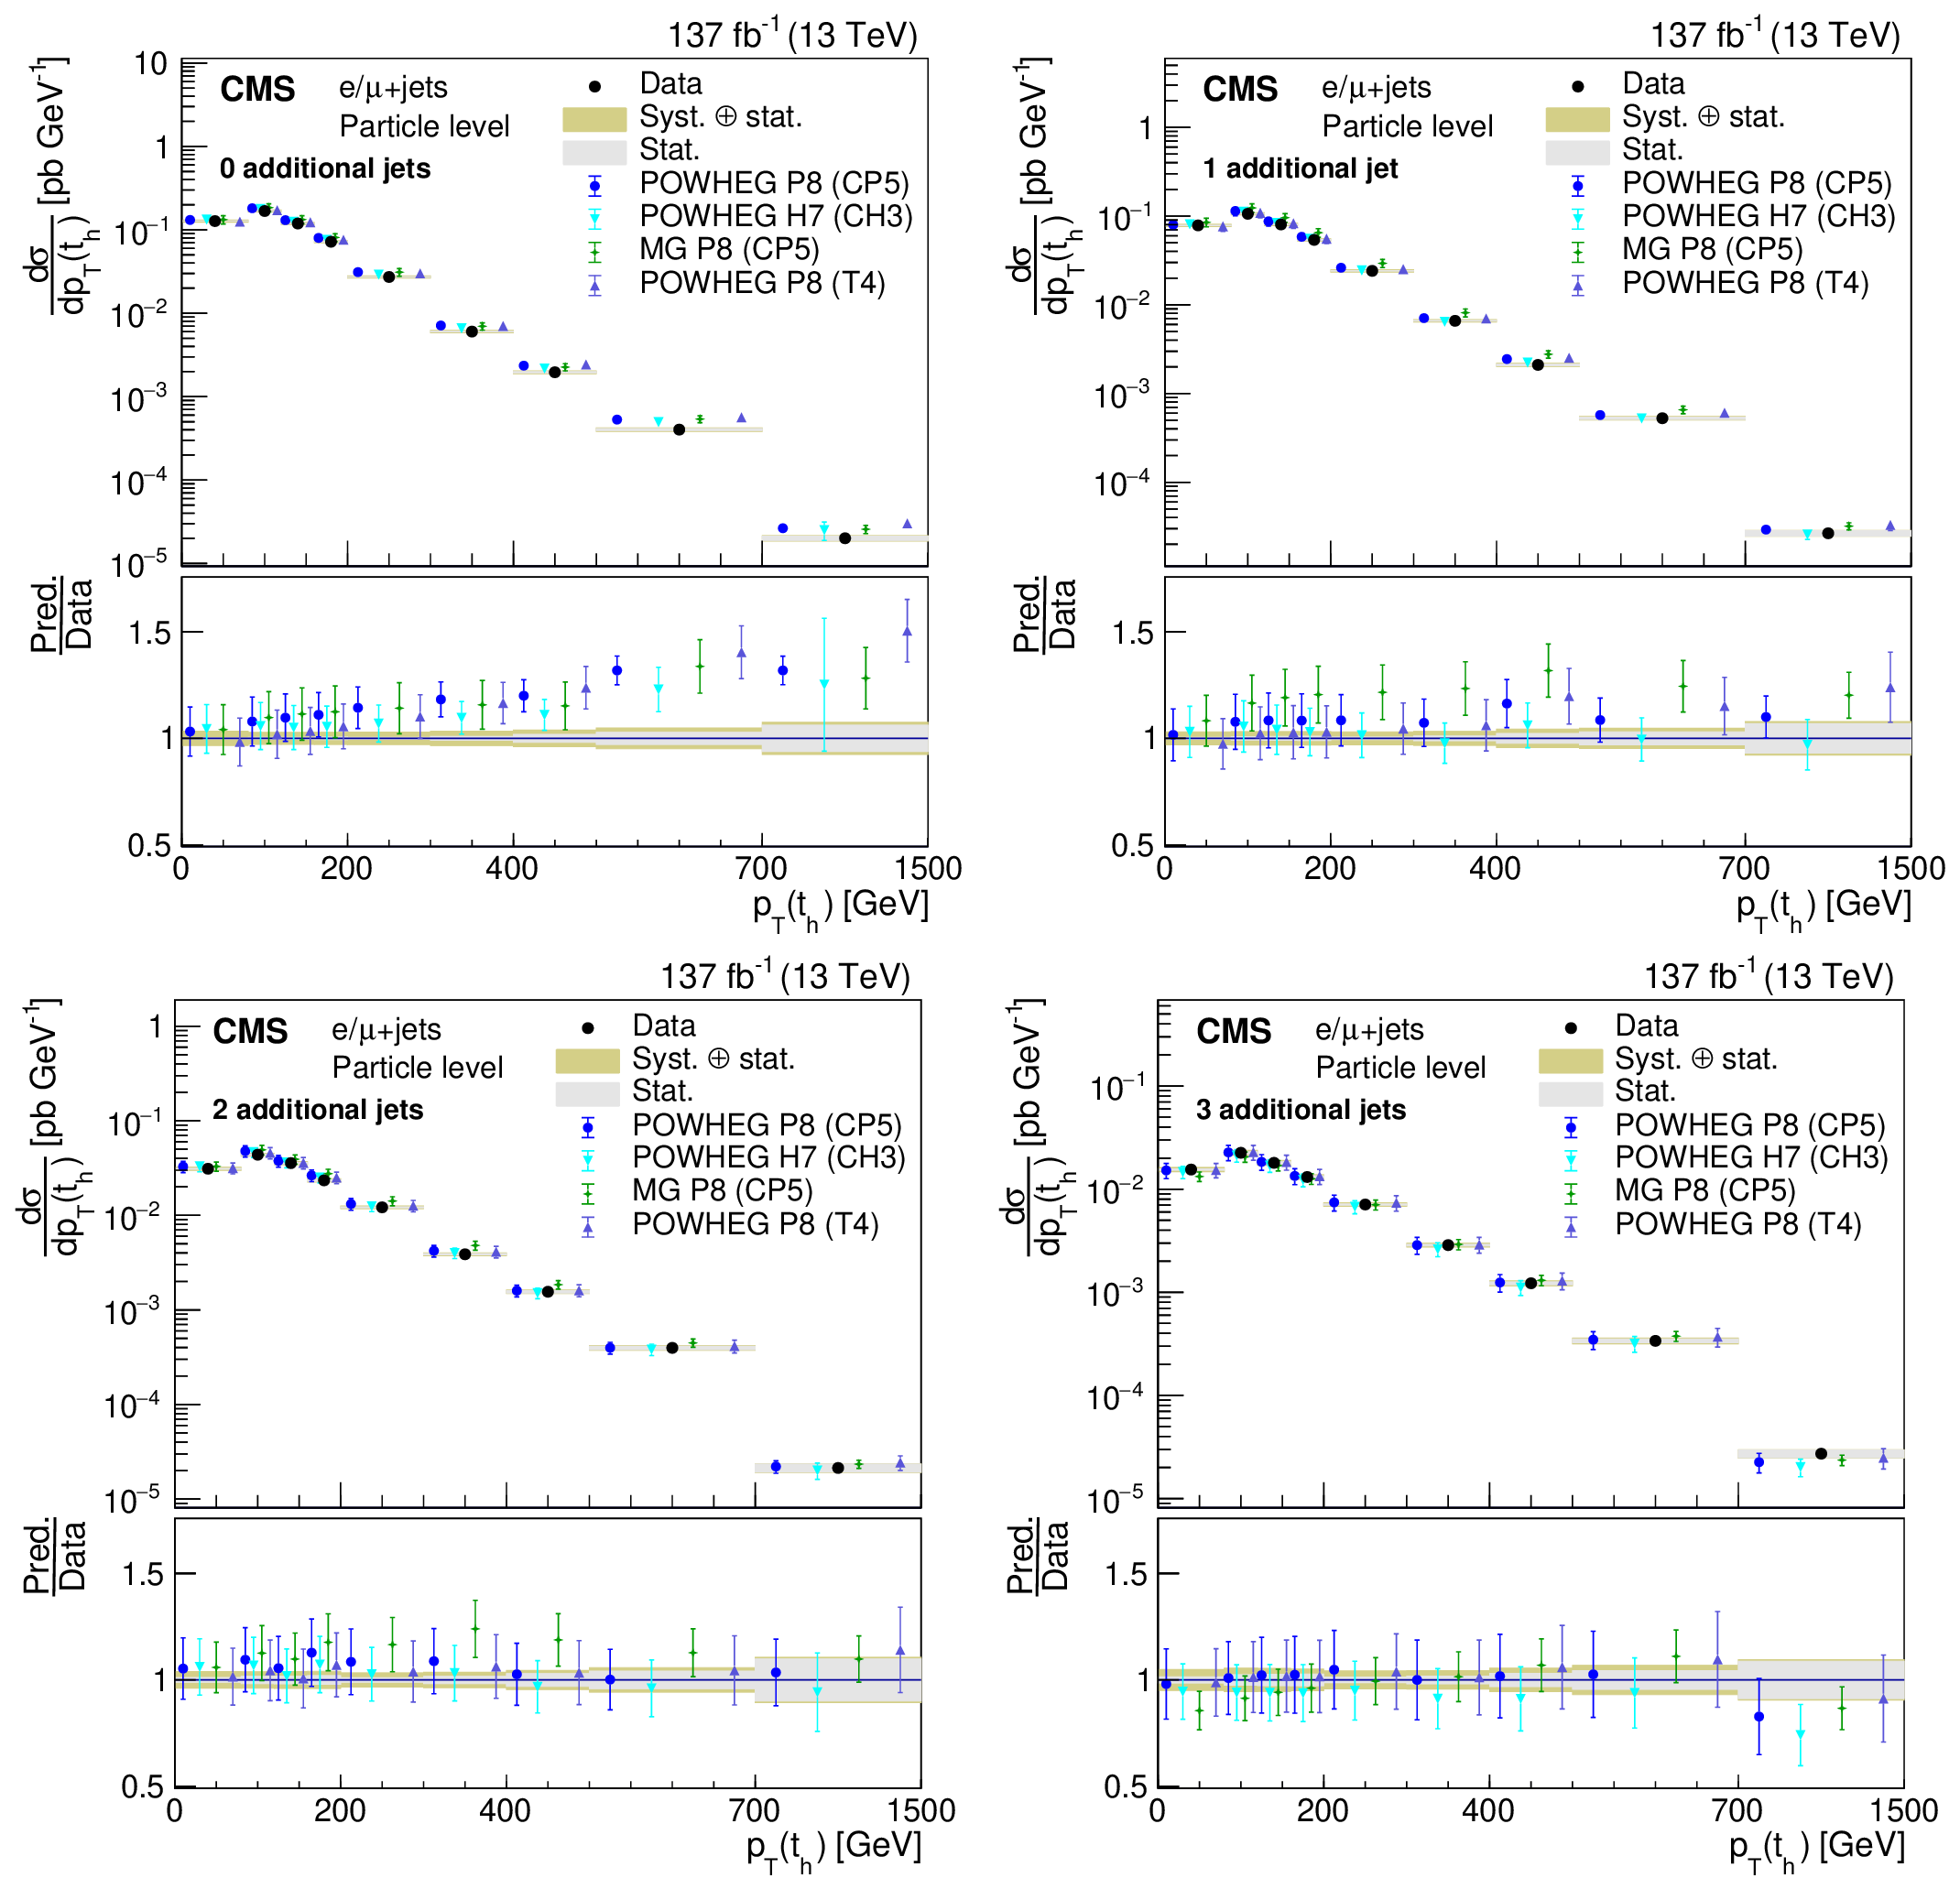
png pdf |
Figure 40:
Differential cross section at the particle level as a function of ${{p_{\mathrm {T}}} ({\mathrm{t} _\mathrm {h}})}$ in bins of jet multiplicity. The data are shown as points with gray (yellow) bands indicating the statistical (statistical and systematic) uncertainties. The cross sections are compared to the predictions of POWHEG+PYTHIA (P8) for the CP5 and CUETP8M2T4 (T4) tunes, POWHEG+HERWIG (H7), and the multiparton simulation MG5_aMC@NLO (MG)+PYTHIA. The ratios of the various predictions to the measured cross sections are shown in the lower panels. |
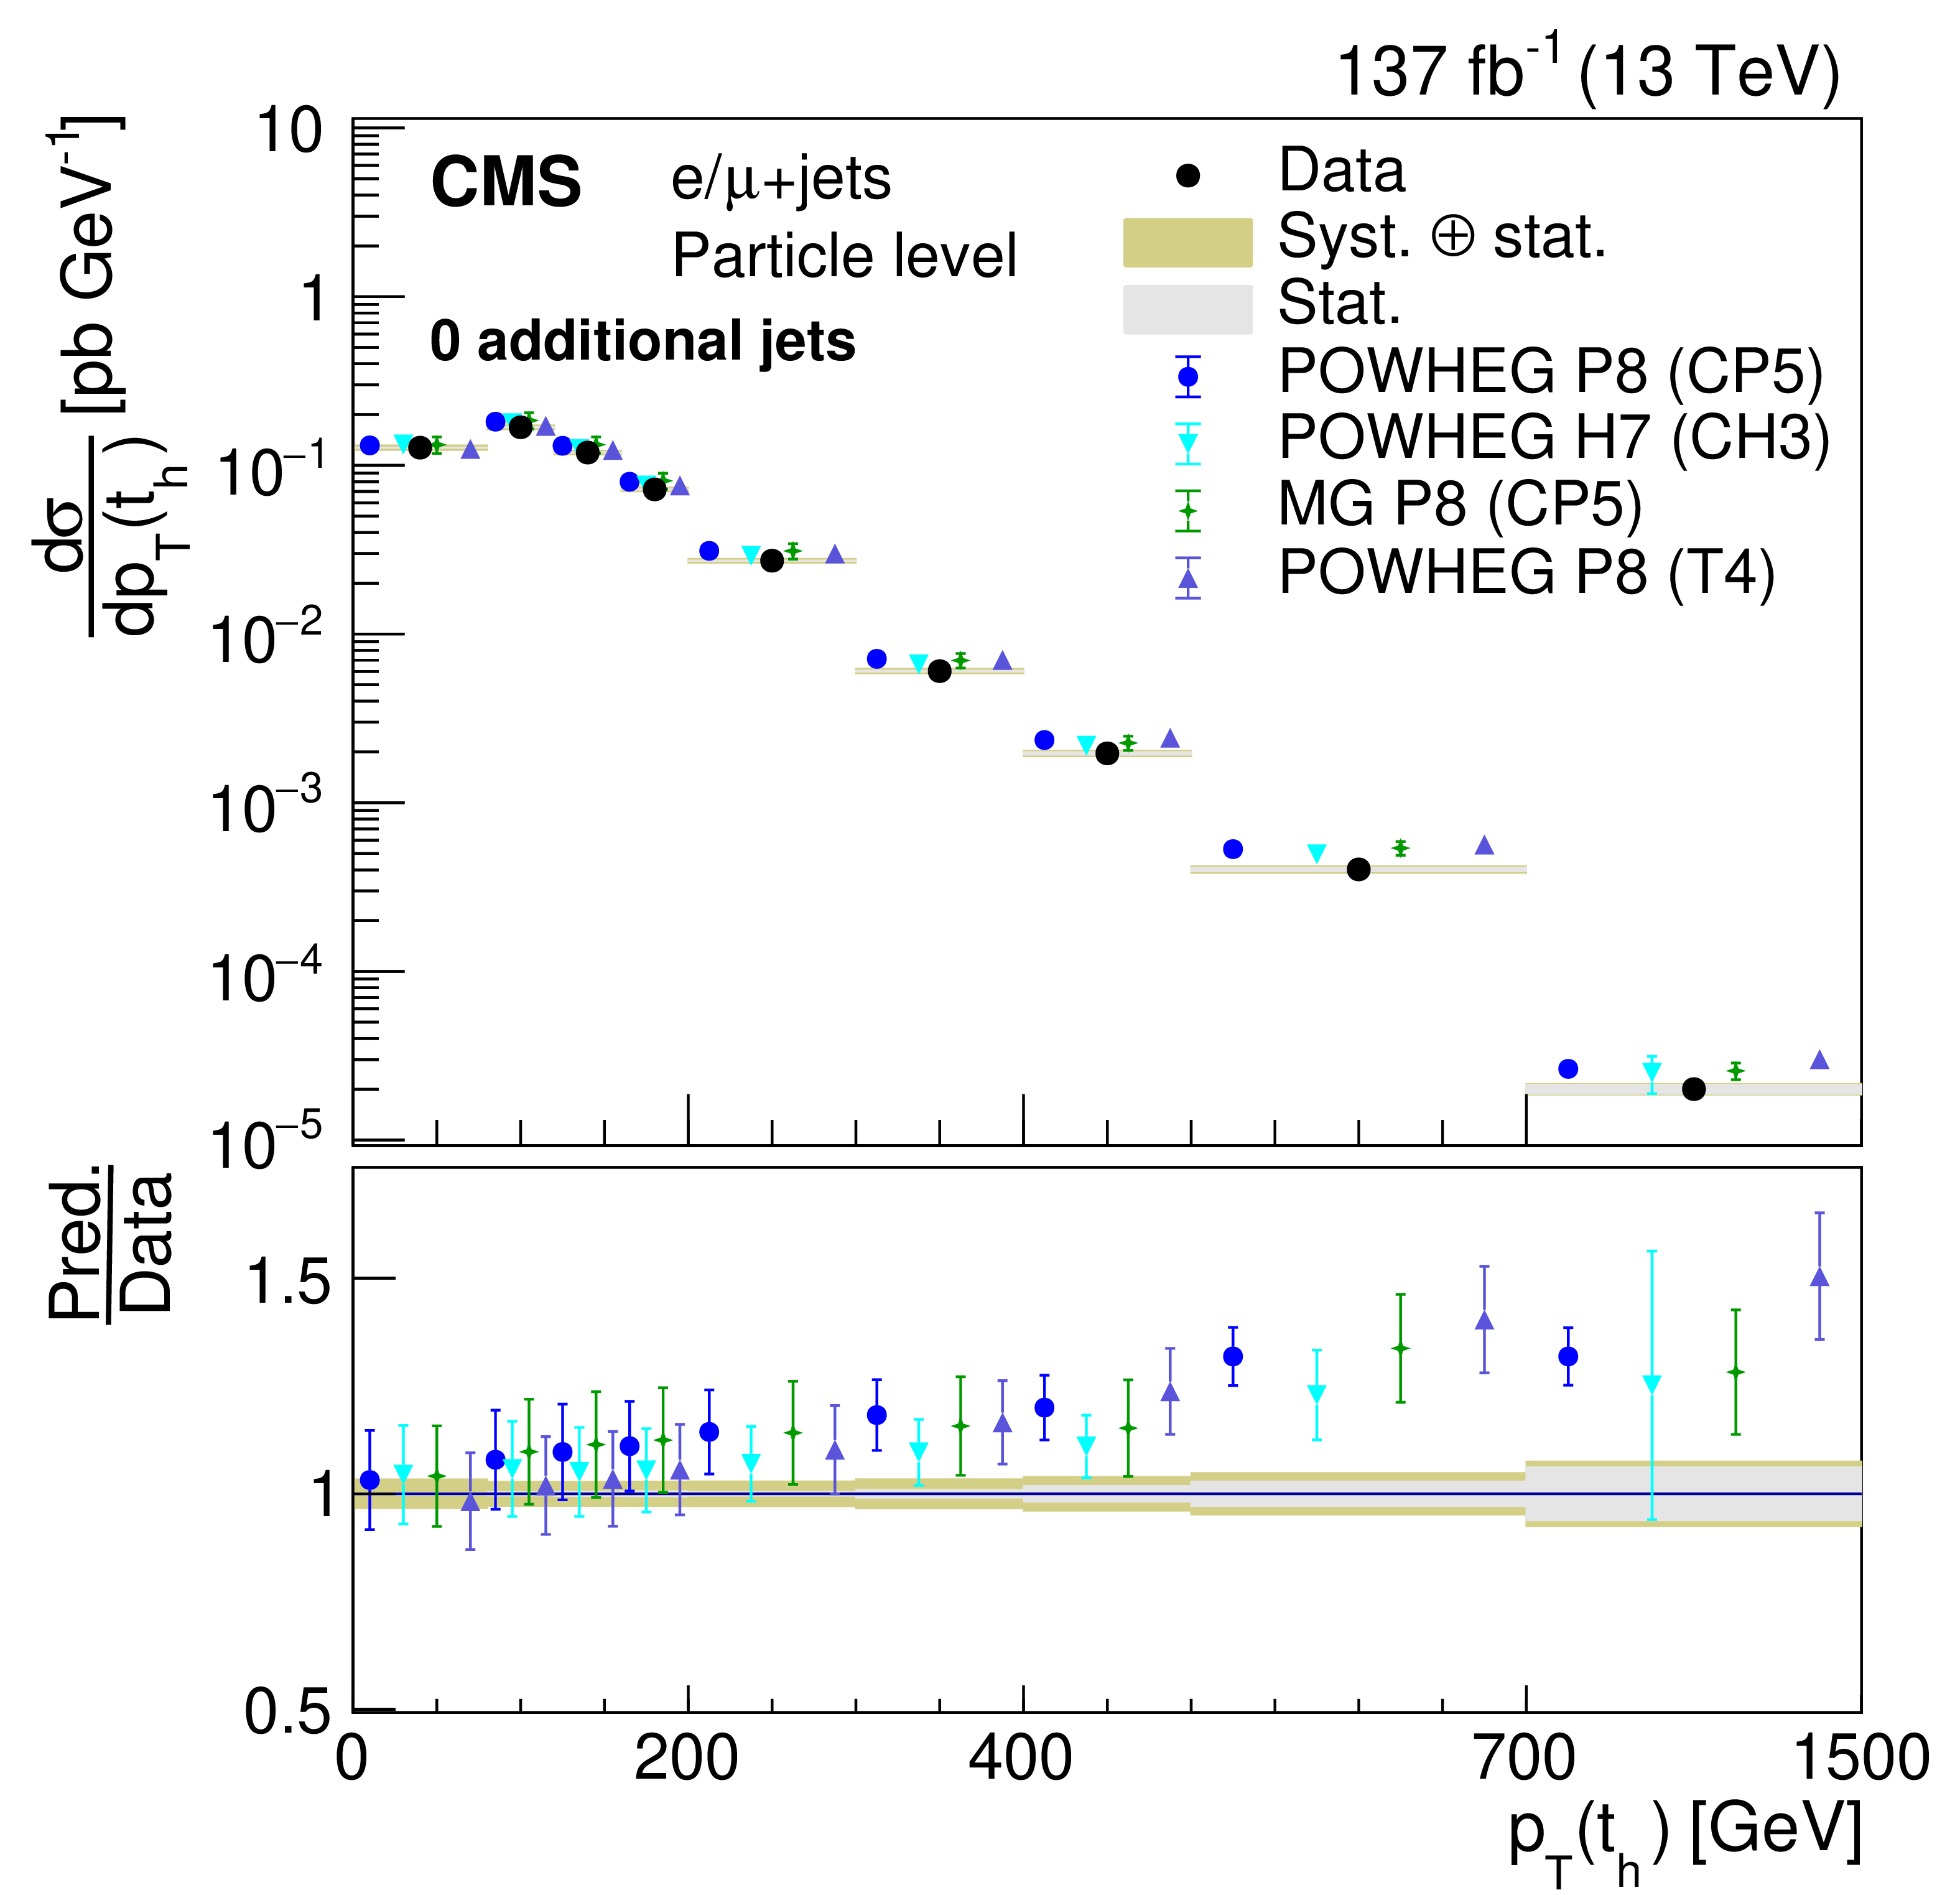
png pdf |
Figure 40-a:
Differential cross section at the particle level as a function of ${{p_{\mathrm {T}}} ({\mathrm{t} _\mathrm {h}})}$ in bins of jet multiplicity. The data are shown as points with gray (yellow) bands indicating the statistical (statistical and systematic) uncertainties. The cross sections are compared to the predictions of POWHEG+PYTHIA (P8) for the CP5 and CUETP8M2T4 (T4) tunes, POWHEG+HERWIG (H7), and the multiparton simulation MG5_aMC@NLO (MG)+PYTHIA. The ratios of the various predictions to the measured cross sections are shown in the lower panels. |
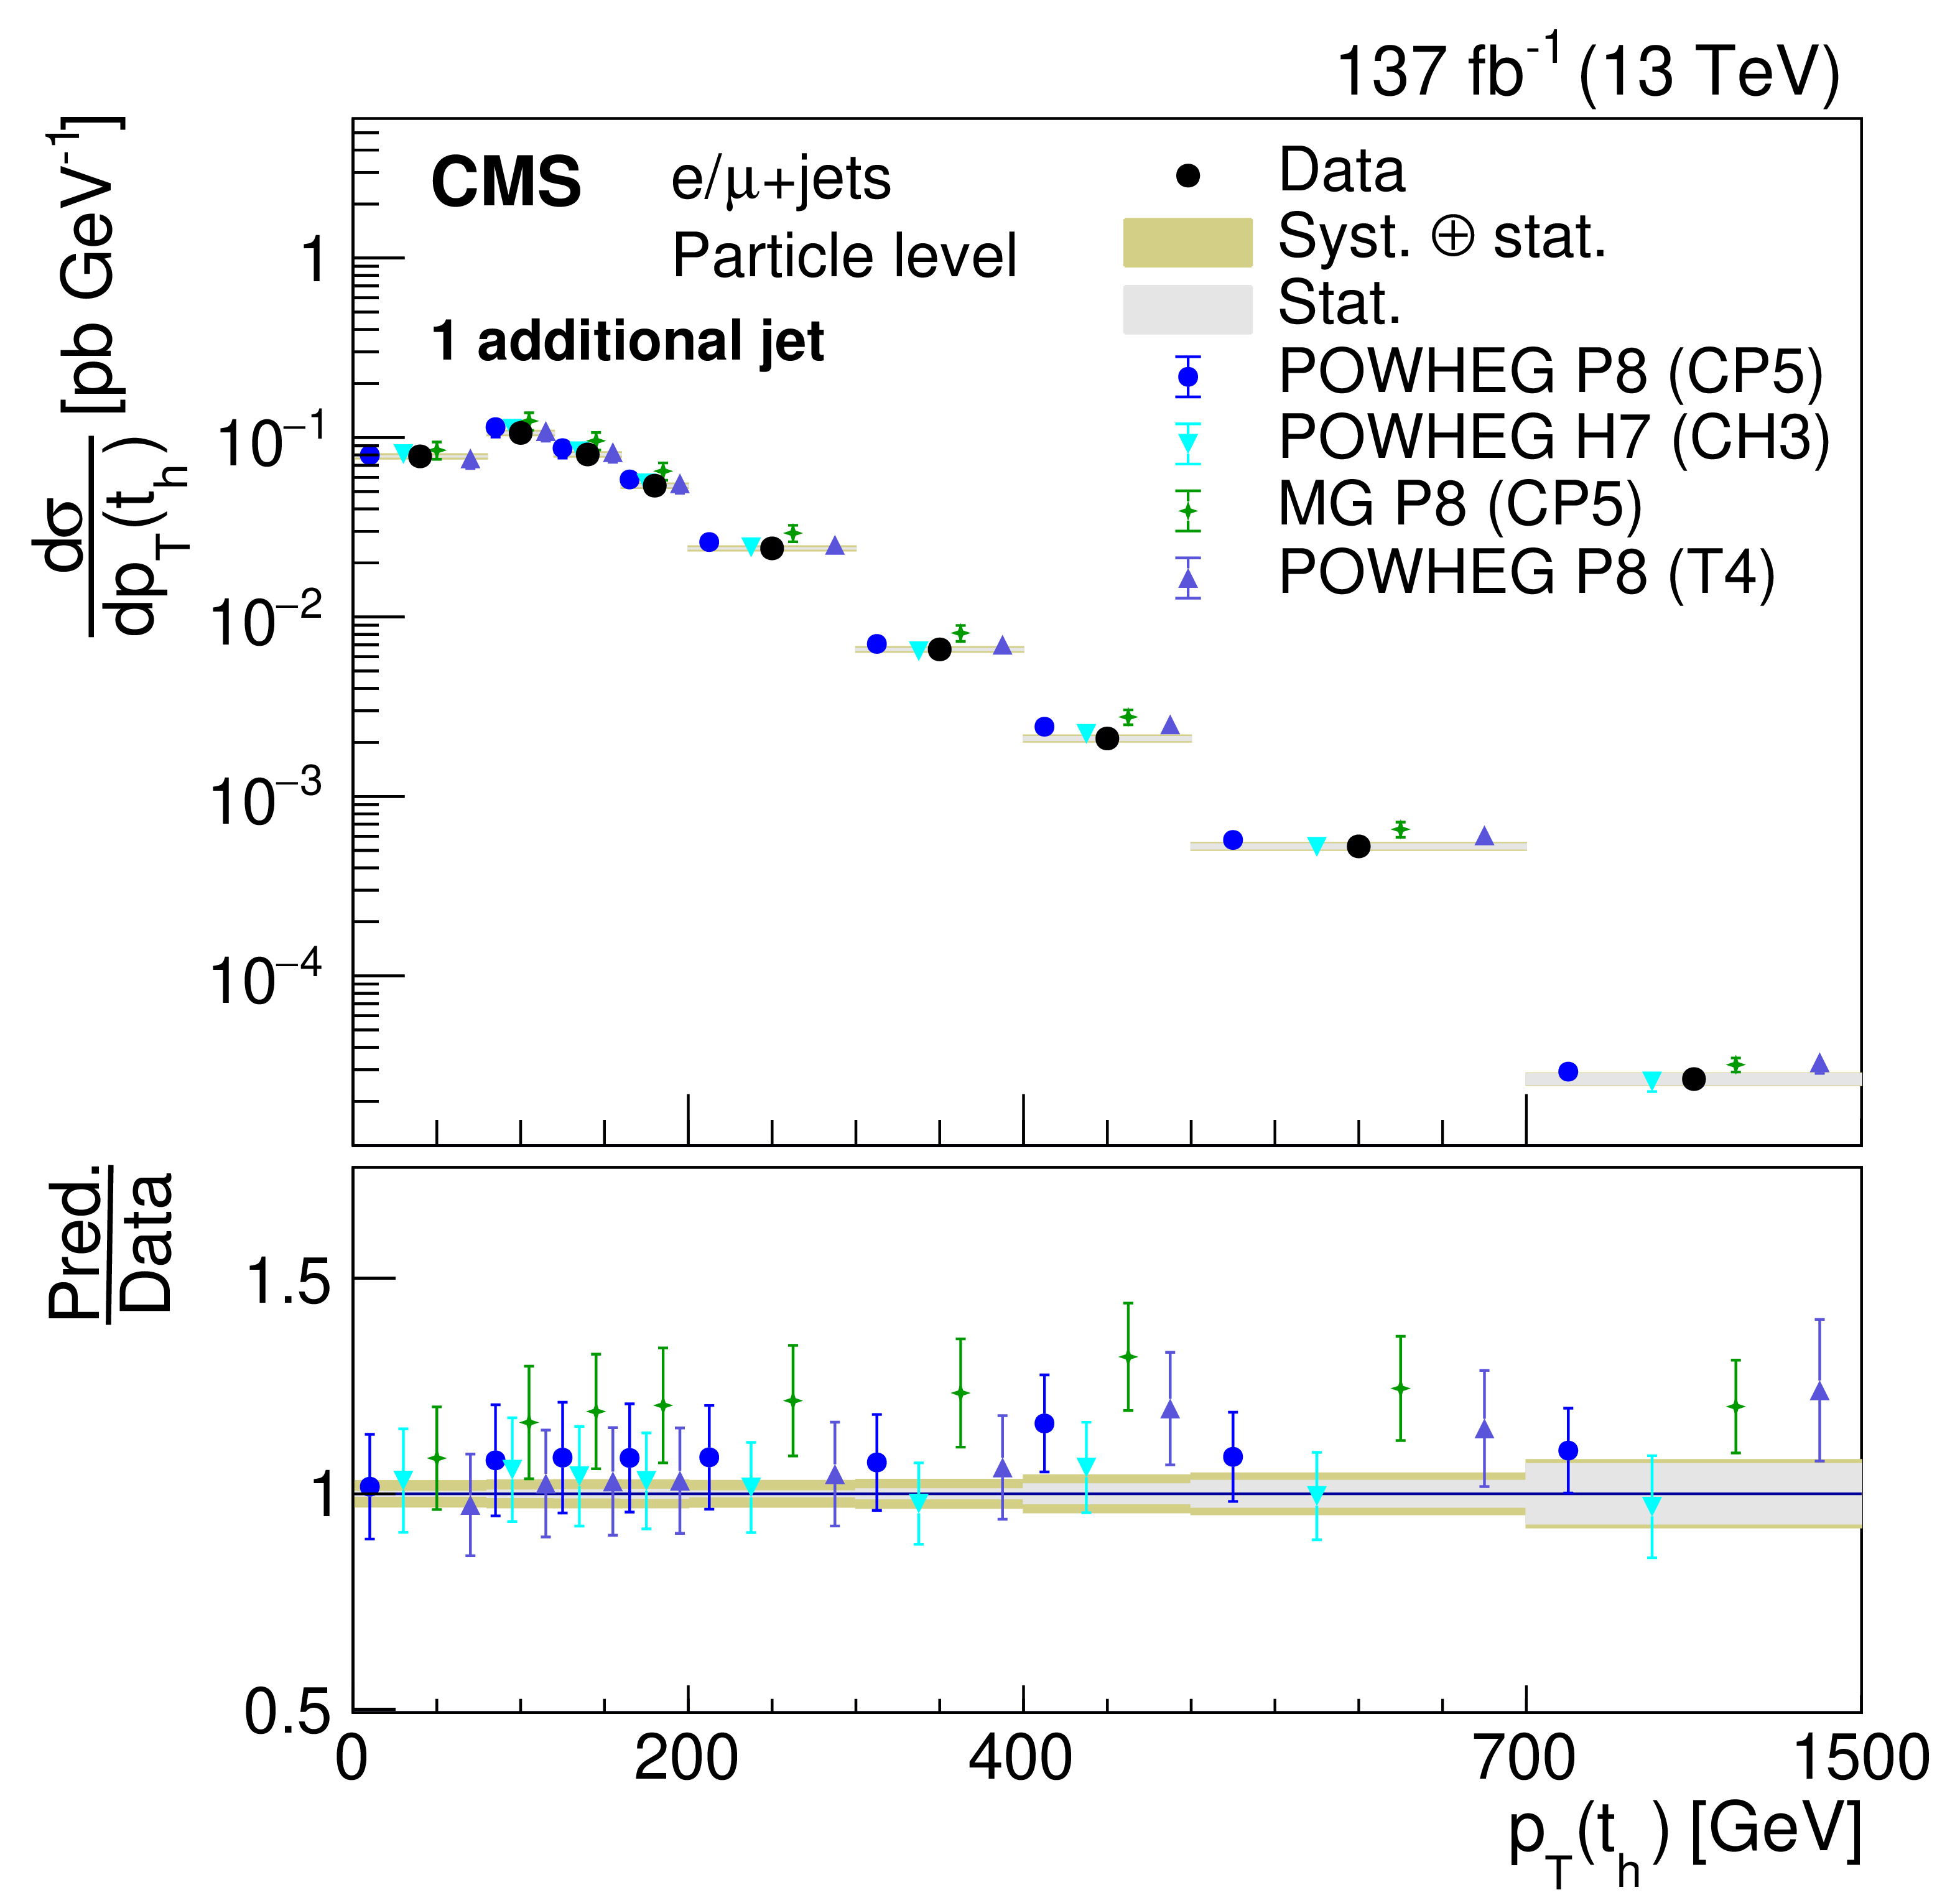
png pdf |
Figure 40-b:
Differential cross section at the particle level as a function of ${{p_{\mathrm {T}}} ({\mathrm{t} _\mathrm {h}})}$ in bins of jet multiplicity. The data are shown as points with gray (yellow) bands indicating the statistical (statistical and systematic) uncertainties. The cross sections are compared to the predictions of POWHEG+PYTHIA (P8) for the CP5 and CUETP8M2T4 (T4) tunes, POWHEG+HERWIG (H7), and the multiparton simulation MG5_aMC@NLO (MG)+PYTHIA. The ratios of the various predictions to the measured cross sections are shown in the lower panels. |
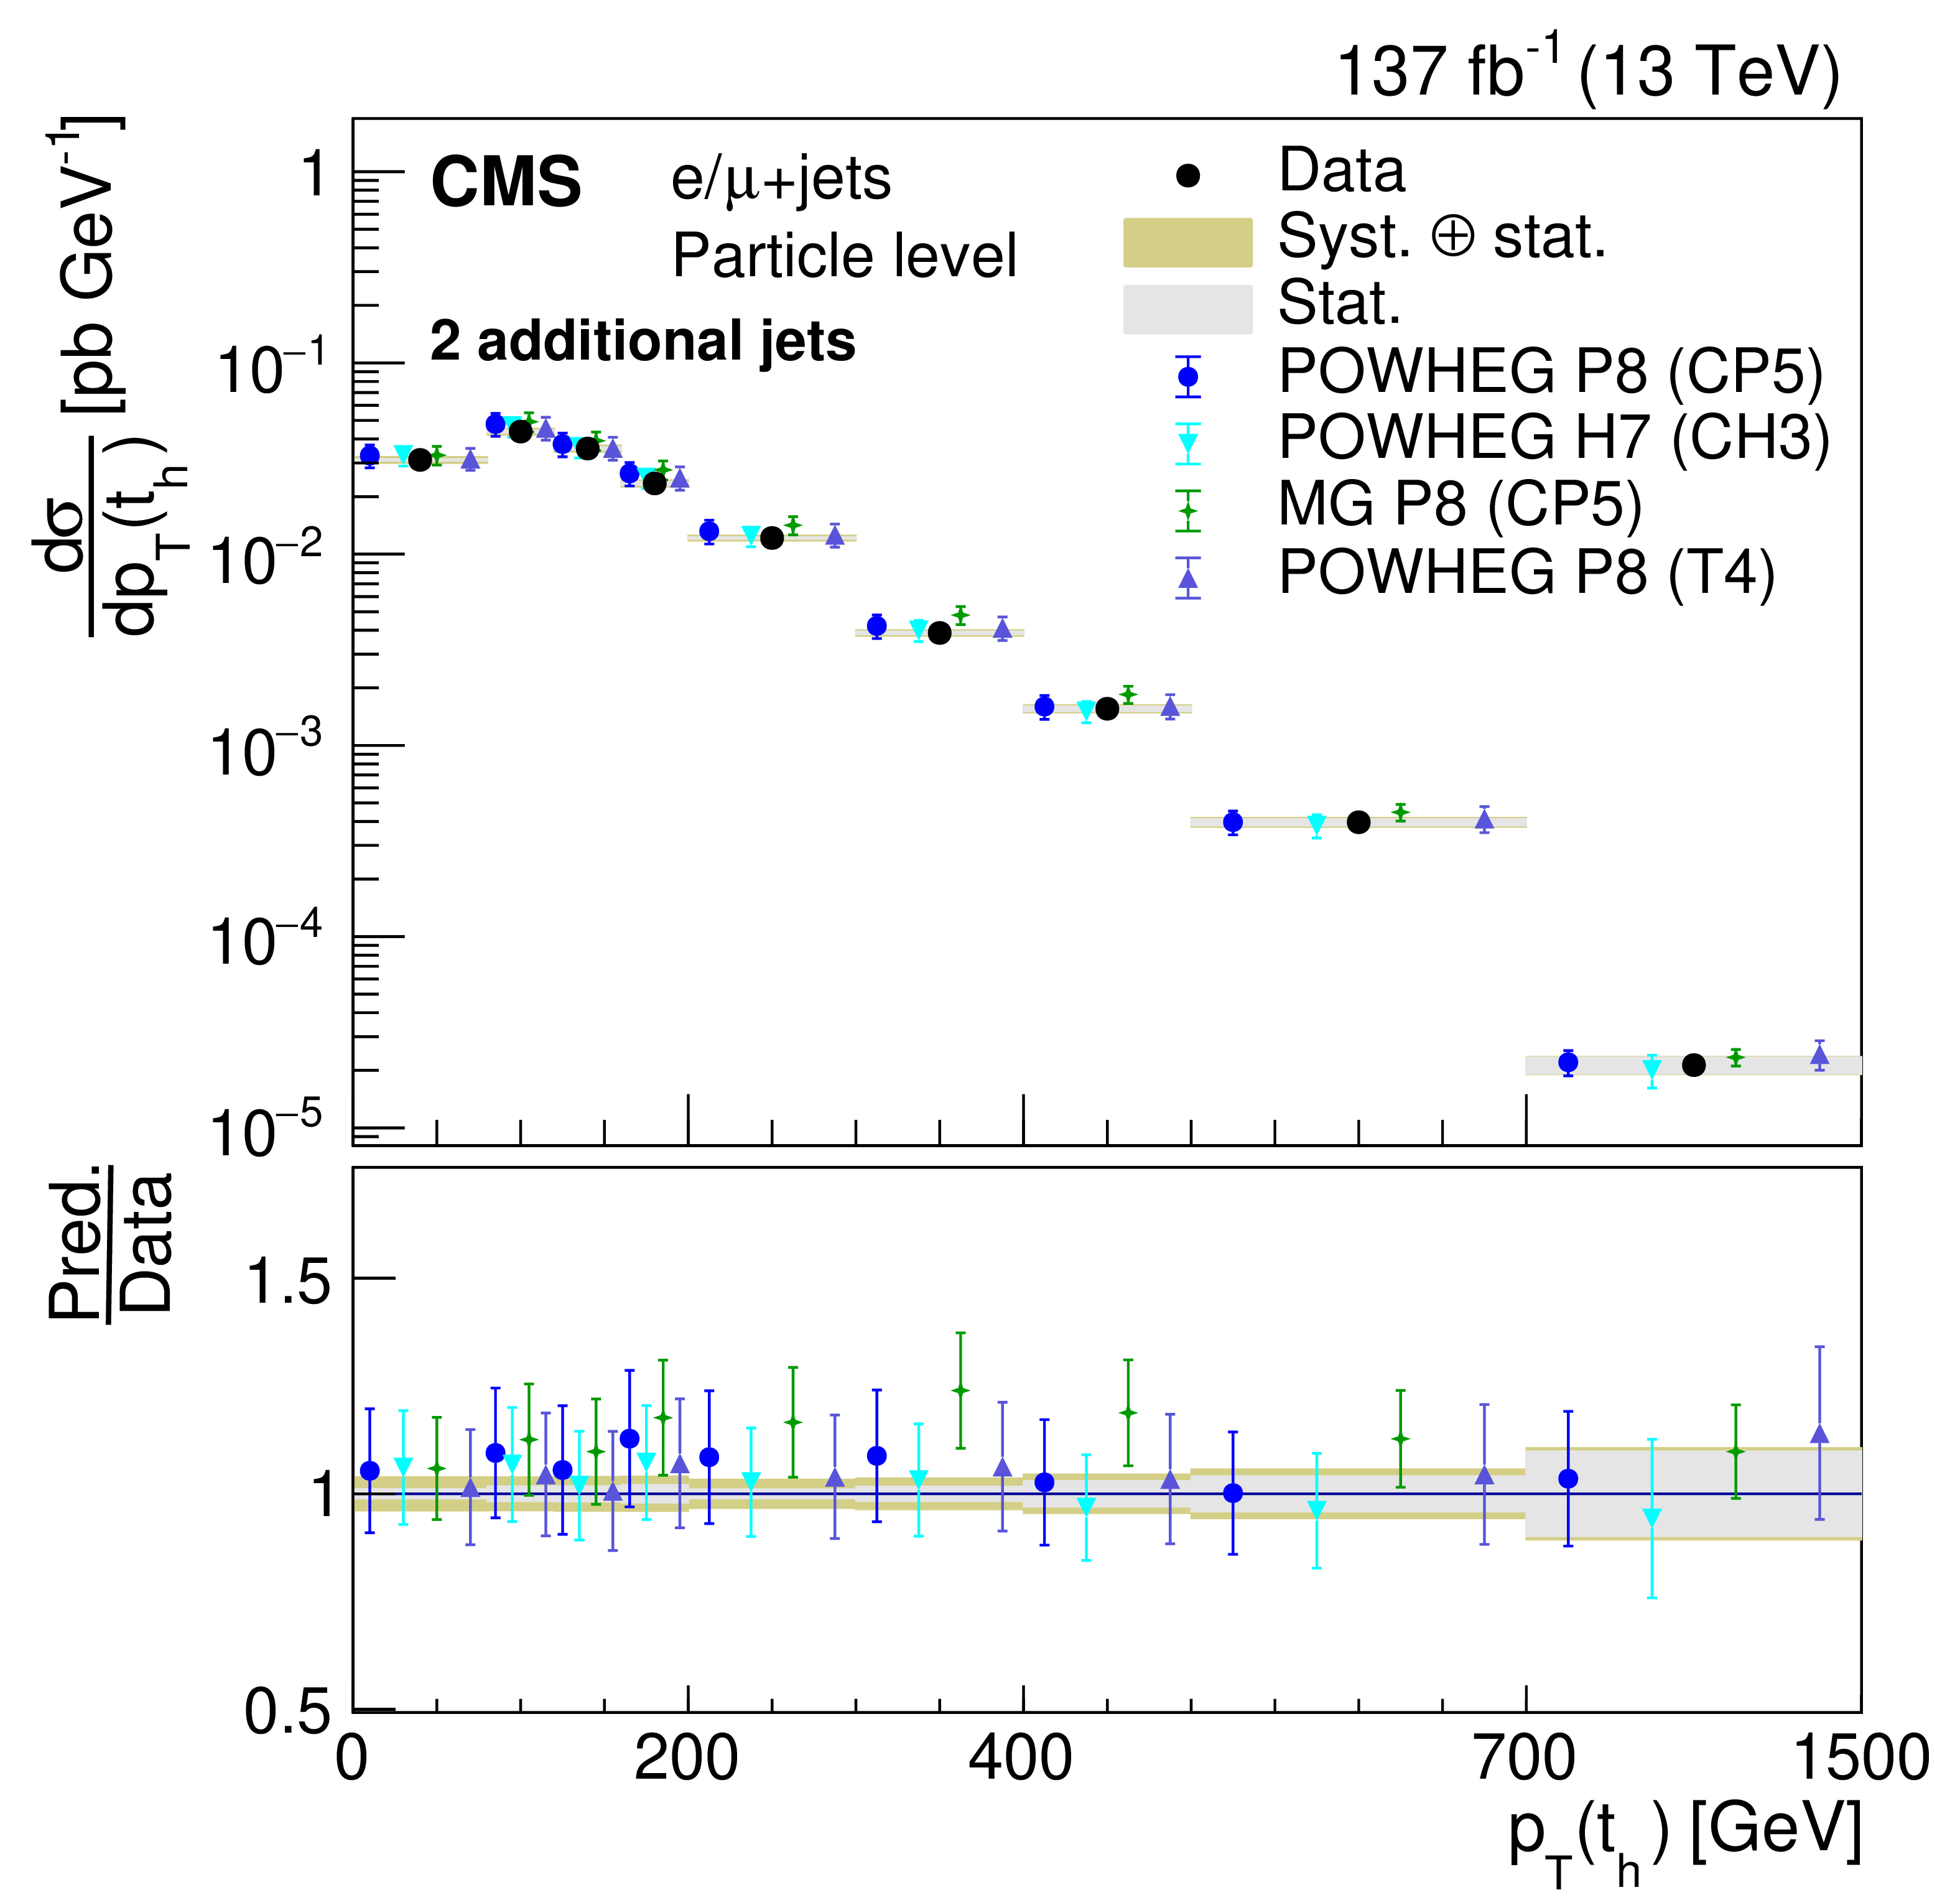
png pdf |
Figure 40-c:
Differential cross section at the particle level as a function of ${{p_{\mathrm {T}}} ({\mathrm{t} _\mathrm {h}})}$ in bins of jet multiplicity. The data are shown as points with gray (yellow) bands indicating the statistical (statistical and systematic) uncertainties. The cross sections are compared to the predictions of POWHEG+PYTHIA (P8) for the CP5 and CUETP8M2T4 (T4) tunes, POWHEG+HERWIG (H7), and the multiparton simulation MG5_aMC@NLO (MG)+PYTHIA. The ratios of the various predictions to the measured cross sections are shown in the lower panels. |
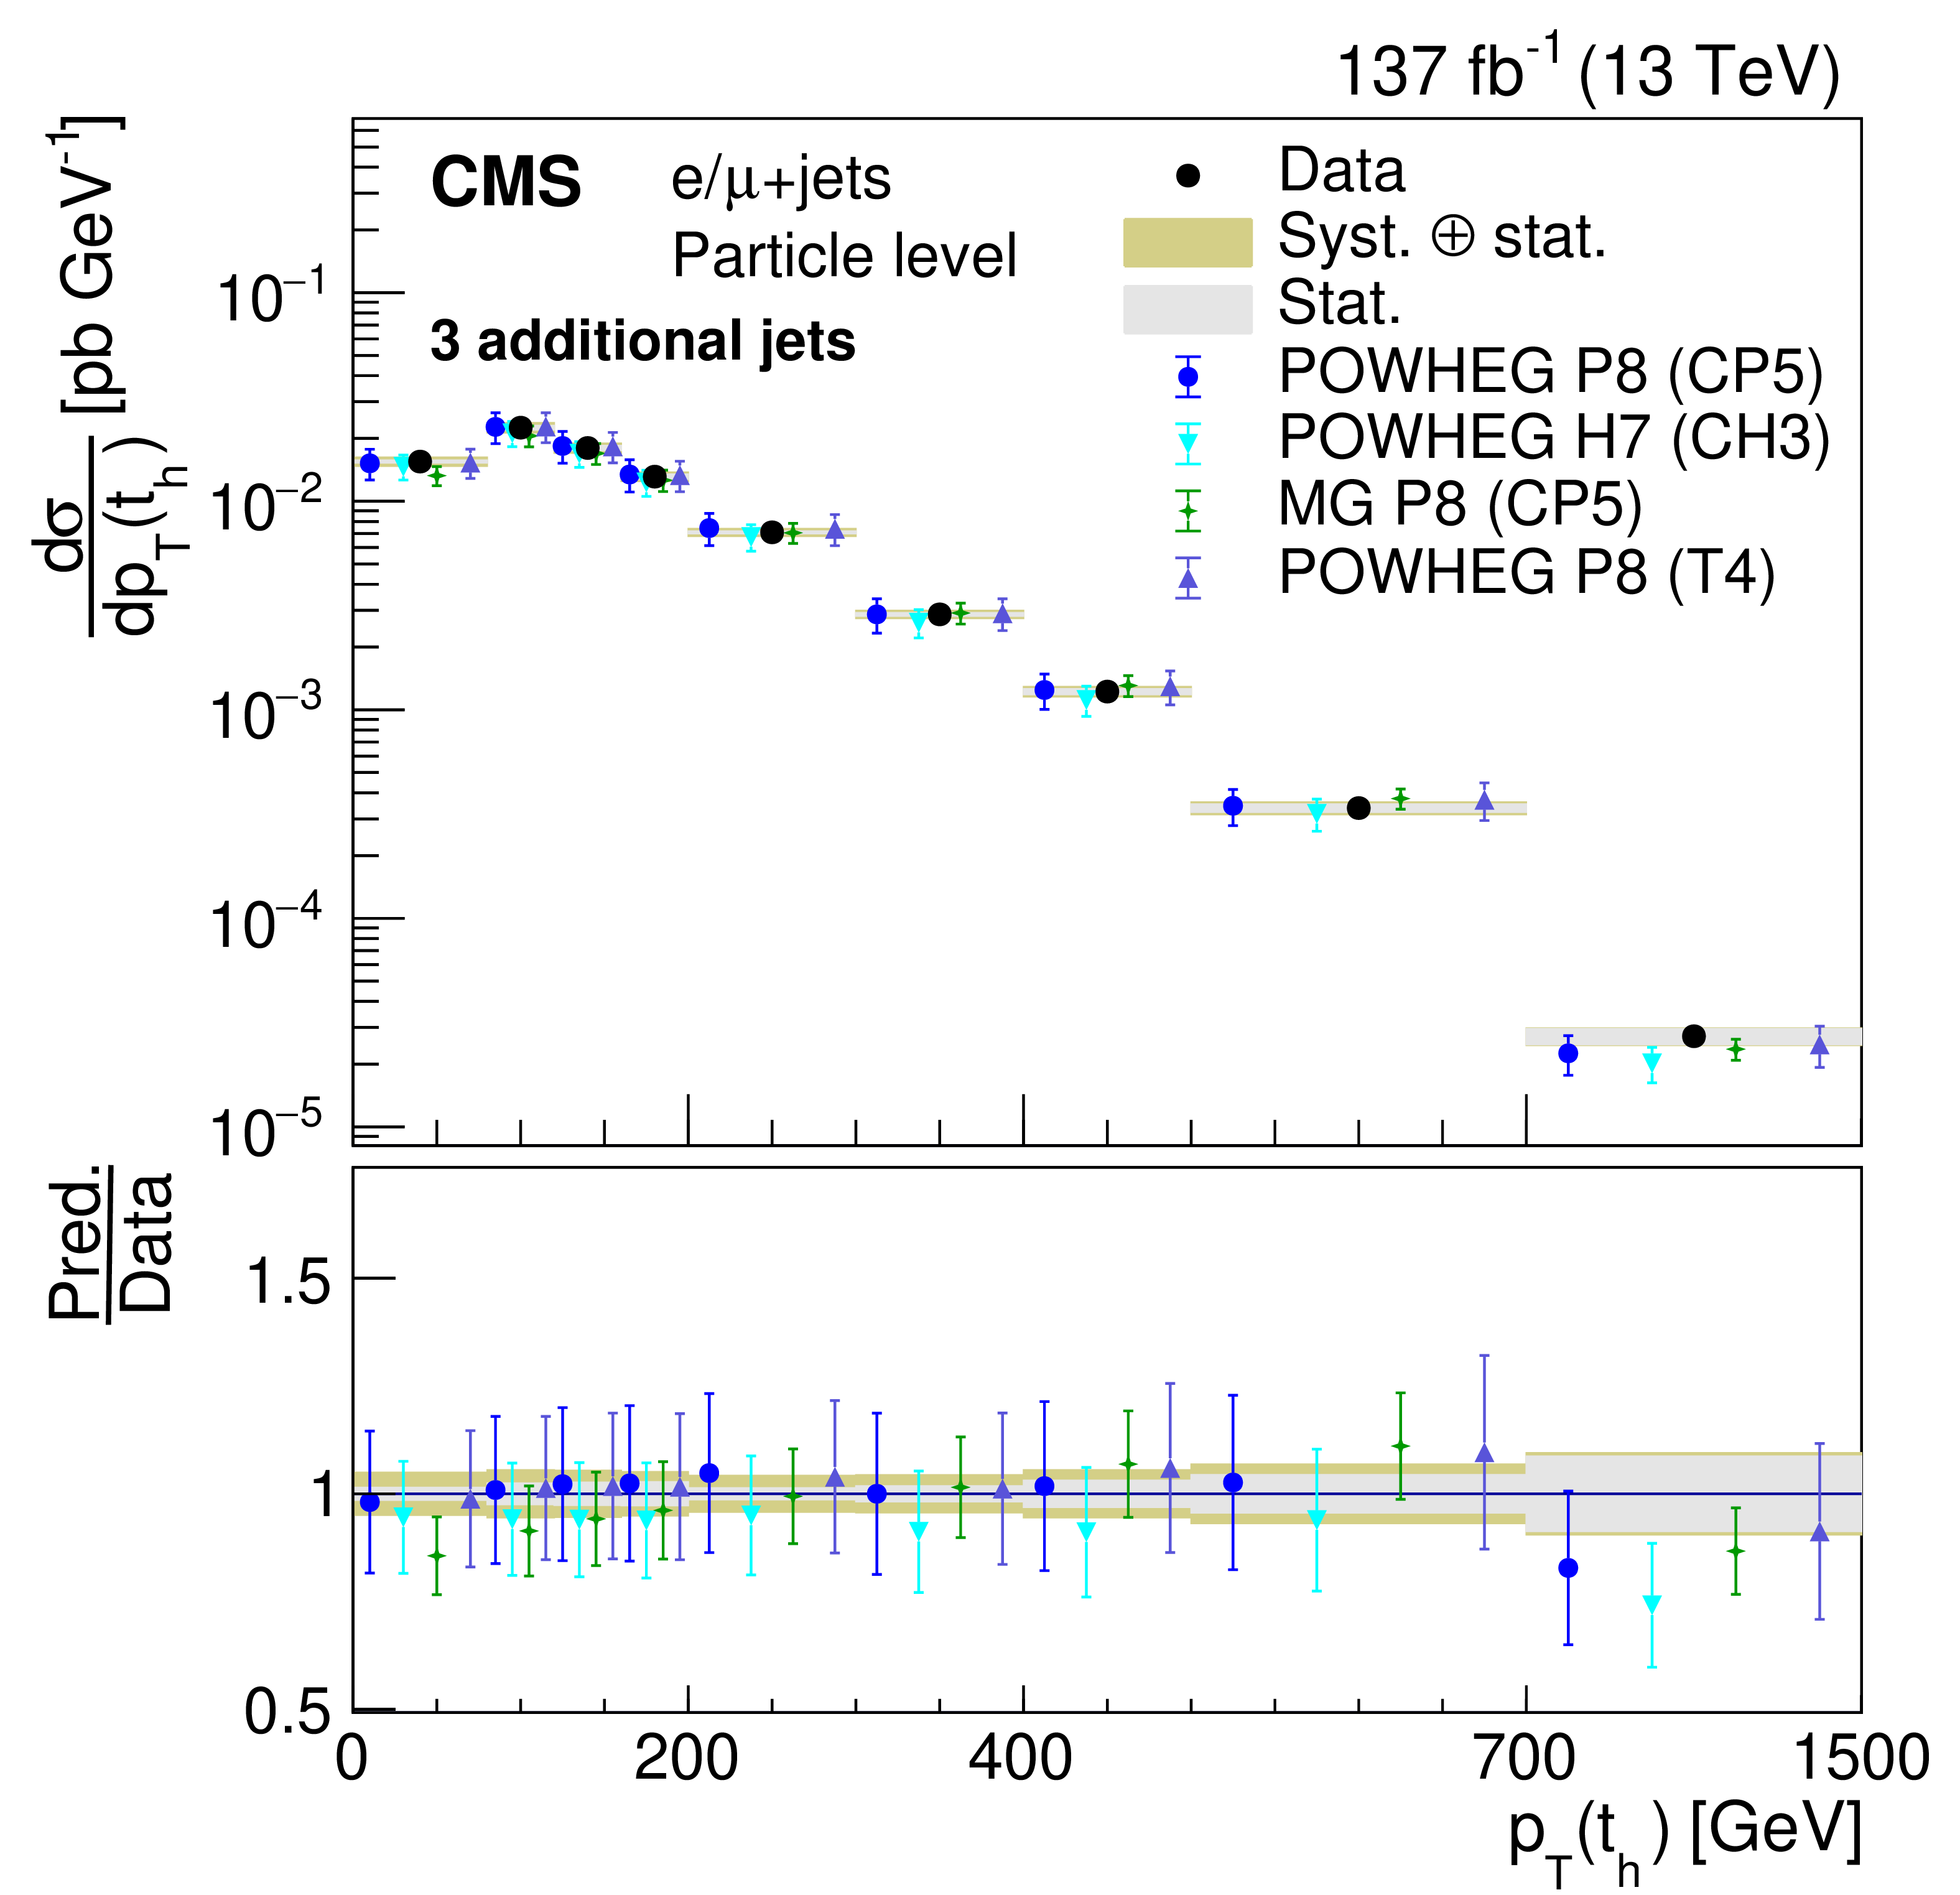
png pdf |
Figure 40-d:
Differential cross section at the particle level as a function of ${{p_{\mathrm {T}}} ({\mathrm{t} _\mathrm {h}})}$ in bins of jet multiplicity. The data are shown as points with gray (yellow) bands indicating the statistical (statistical and systematic) uncertainties. The cross sections are compared to the predictions of POWHEG+PYTHIA (P8) for the CP5 and CUETP8M2T4 (T4) tunes, POWHEG+HERWIG (H7), and the multiparton simulation MG5_aMC@NLO (MG)+PYTHIA. The ratios of the various predictions to the measured cross sections are shown in the lower panels. |

png pdf |
Figure 41:
Differential cross section at the particle level as a function of ${m({\mathrm{t} \mathrm{\bar{t}}})}$ in bins of jet multiplicity. The data are shown as points with gray (yellow) bands indicating the statistical (statistical and systematic) uncertainties. The cross sections are compared to the predictions of POWHEG+PYTHIA (P8) for the CP5 and CUETP8M2T4 (T4) tunes, POWHEG+HERWIG (H7), and the multiparton simulation MG5_aMC@NLO (MG)+PYTHIA. The ratios of the various predictions to the measured cross sections are shown in the lower panels. |
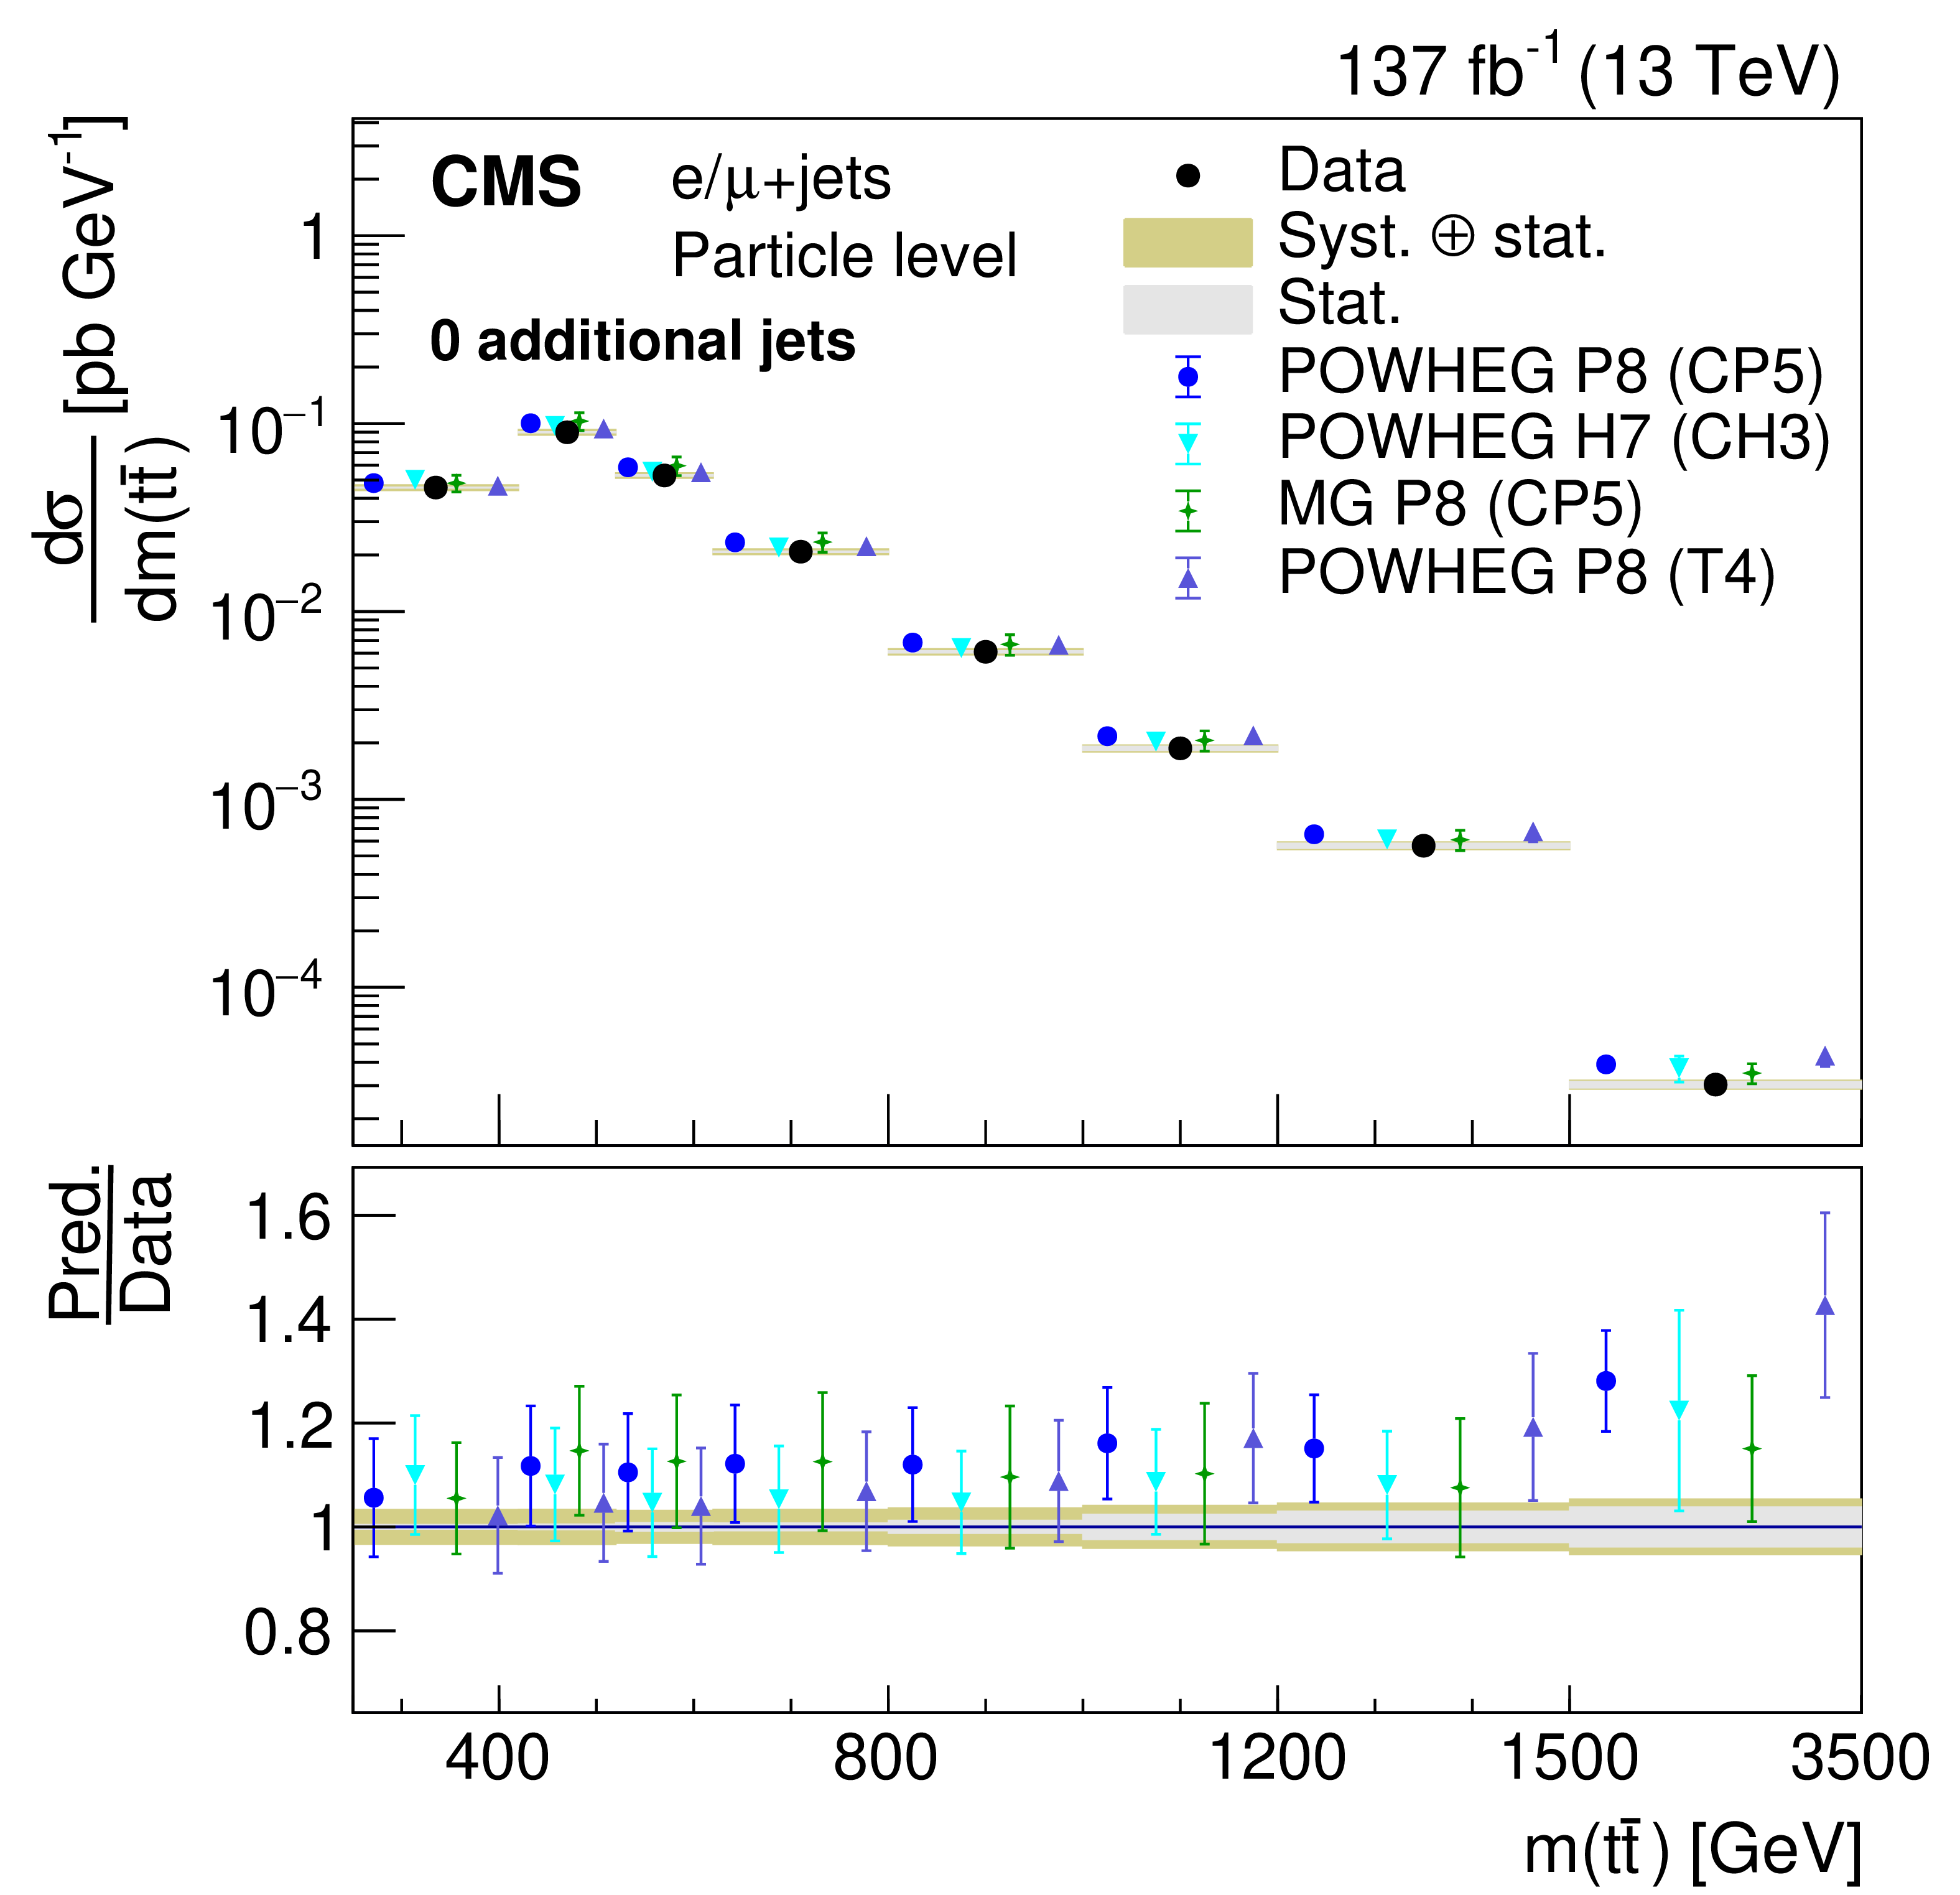
png pdf |
Figure 41-a:
Differential cross section at the particle level as a function of ${m({\mathrm{t} \mathrm{\bar{t}}})}$ in bins of jet multiplicity. The data are shown as points with gray (yellow) bands indicating the statistical (statistical and systematic) uncertainties. The cross sections are compared to the predictions of POWHEG+PYTHIA (P8) for the CP5 and CUETP8M2T4 (T4) tunes, POWHEG+HERWIG (H7), and the multiparton simulation MG5_aMC@NLO (MG)+PYTHIA. The ratios of the various predictions to the measured cross sections are shown in the lower panels. |

png pdf |
Figure 41-b:
Differential cross section at the particle level as a function of ${m({\mathrm{t} \mathrm{\bar{t}}})}$ in bins of jet multiplicity. The data are shown as points with gray (yellow) bands indicating the statistical (statistical and systematic) uncertainties. The cross sections are compared to the predictions of POWHEG+PYTHIA (P8) for the CP5 and CUETP8M2T4 (T4) tunes, POWHEG+HERWIG (H7), and the multiparton simulation MG5_aMC@NLO (MG)+PYTHIA. The ratios of the various predictions to the measured cross sections are shown in the lower panels. |
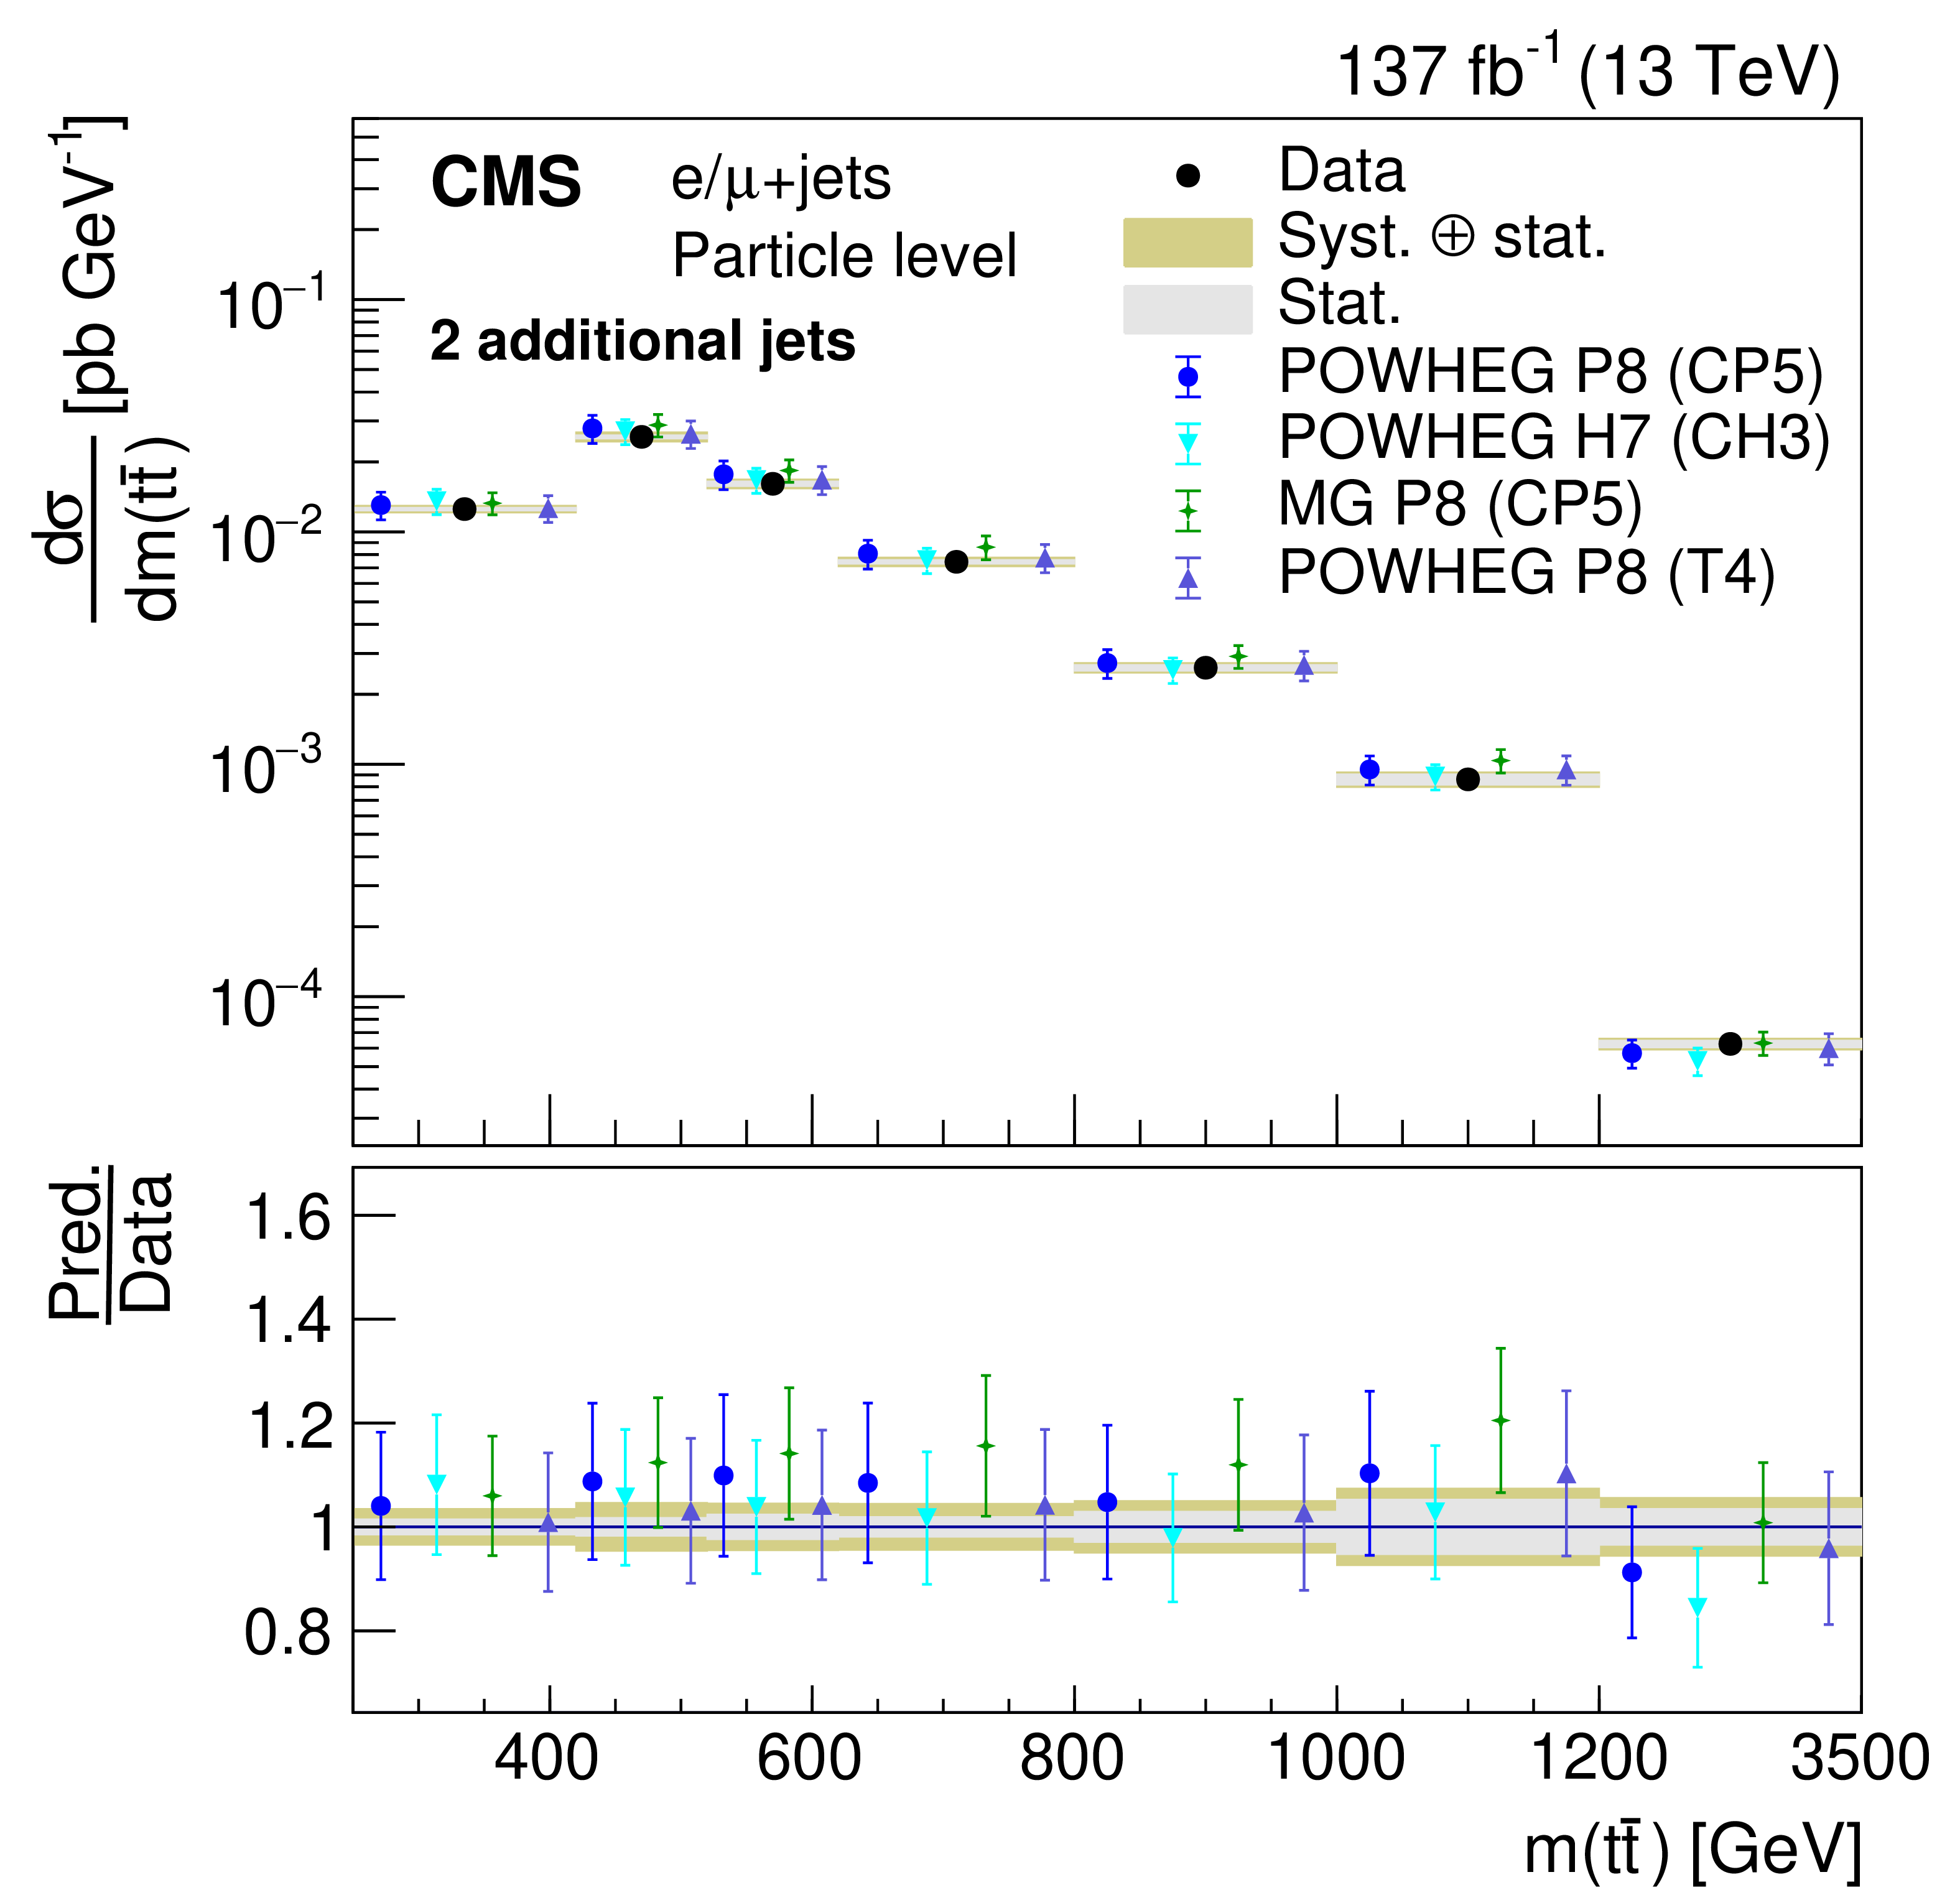
png pdf |
Figure 41-c:
Differential cross section at the particle level as a function of ${m({\mathrm{t} \mathrm{\bar{t}}})}$ in bins of jet multiplicity. The data are shown as points with gray (yellow) bands indicating the statistical (statistical and systematic) uncertainties. The cross sections are compared to the predictions of POWHEG+PYTHIA (P8) for the CP5 and CUETP8M2T4 (T4) tunes, POWHEG+HERWIG (H7), and the multiparton simulation MG5_aMC@NLO (MG)+PYTHIA. The ratios of the various predictions to the measured cross sections are shown in the lower panels. |
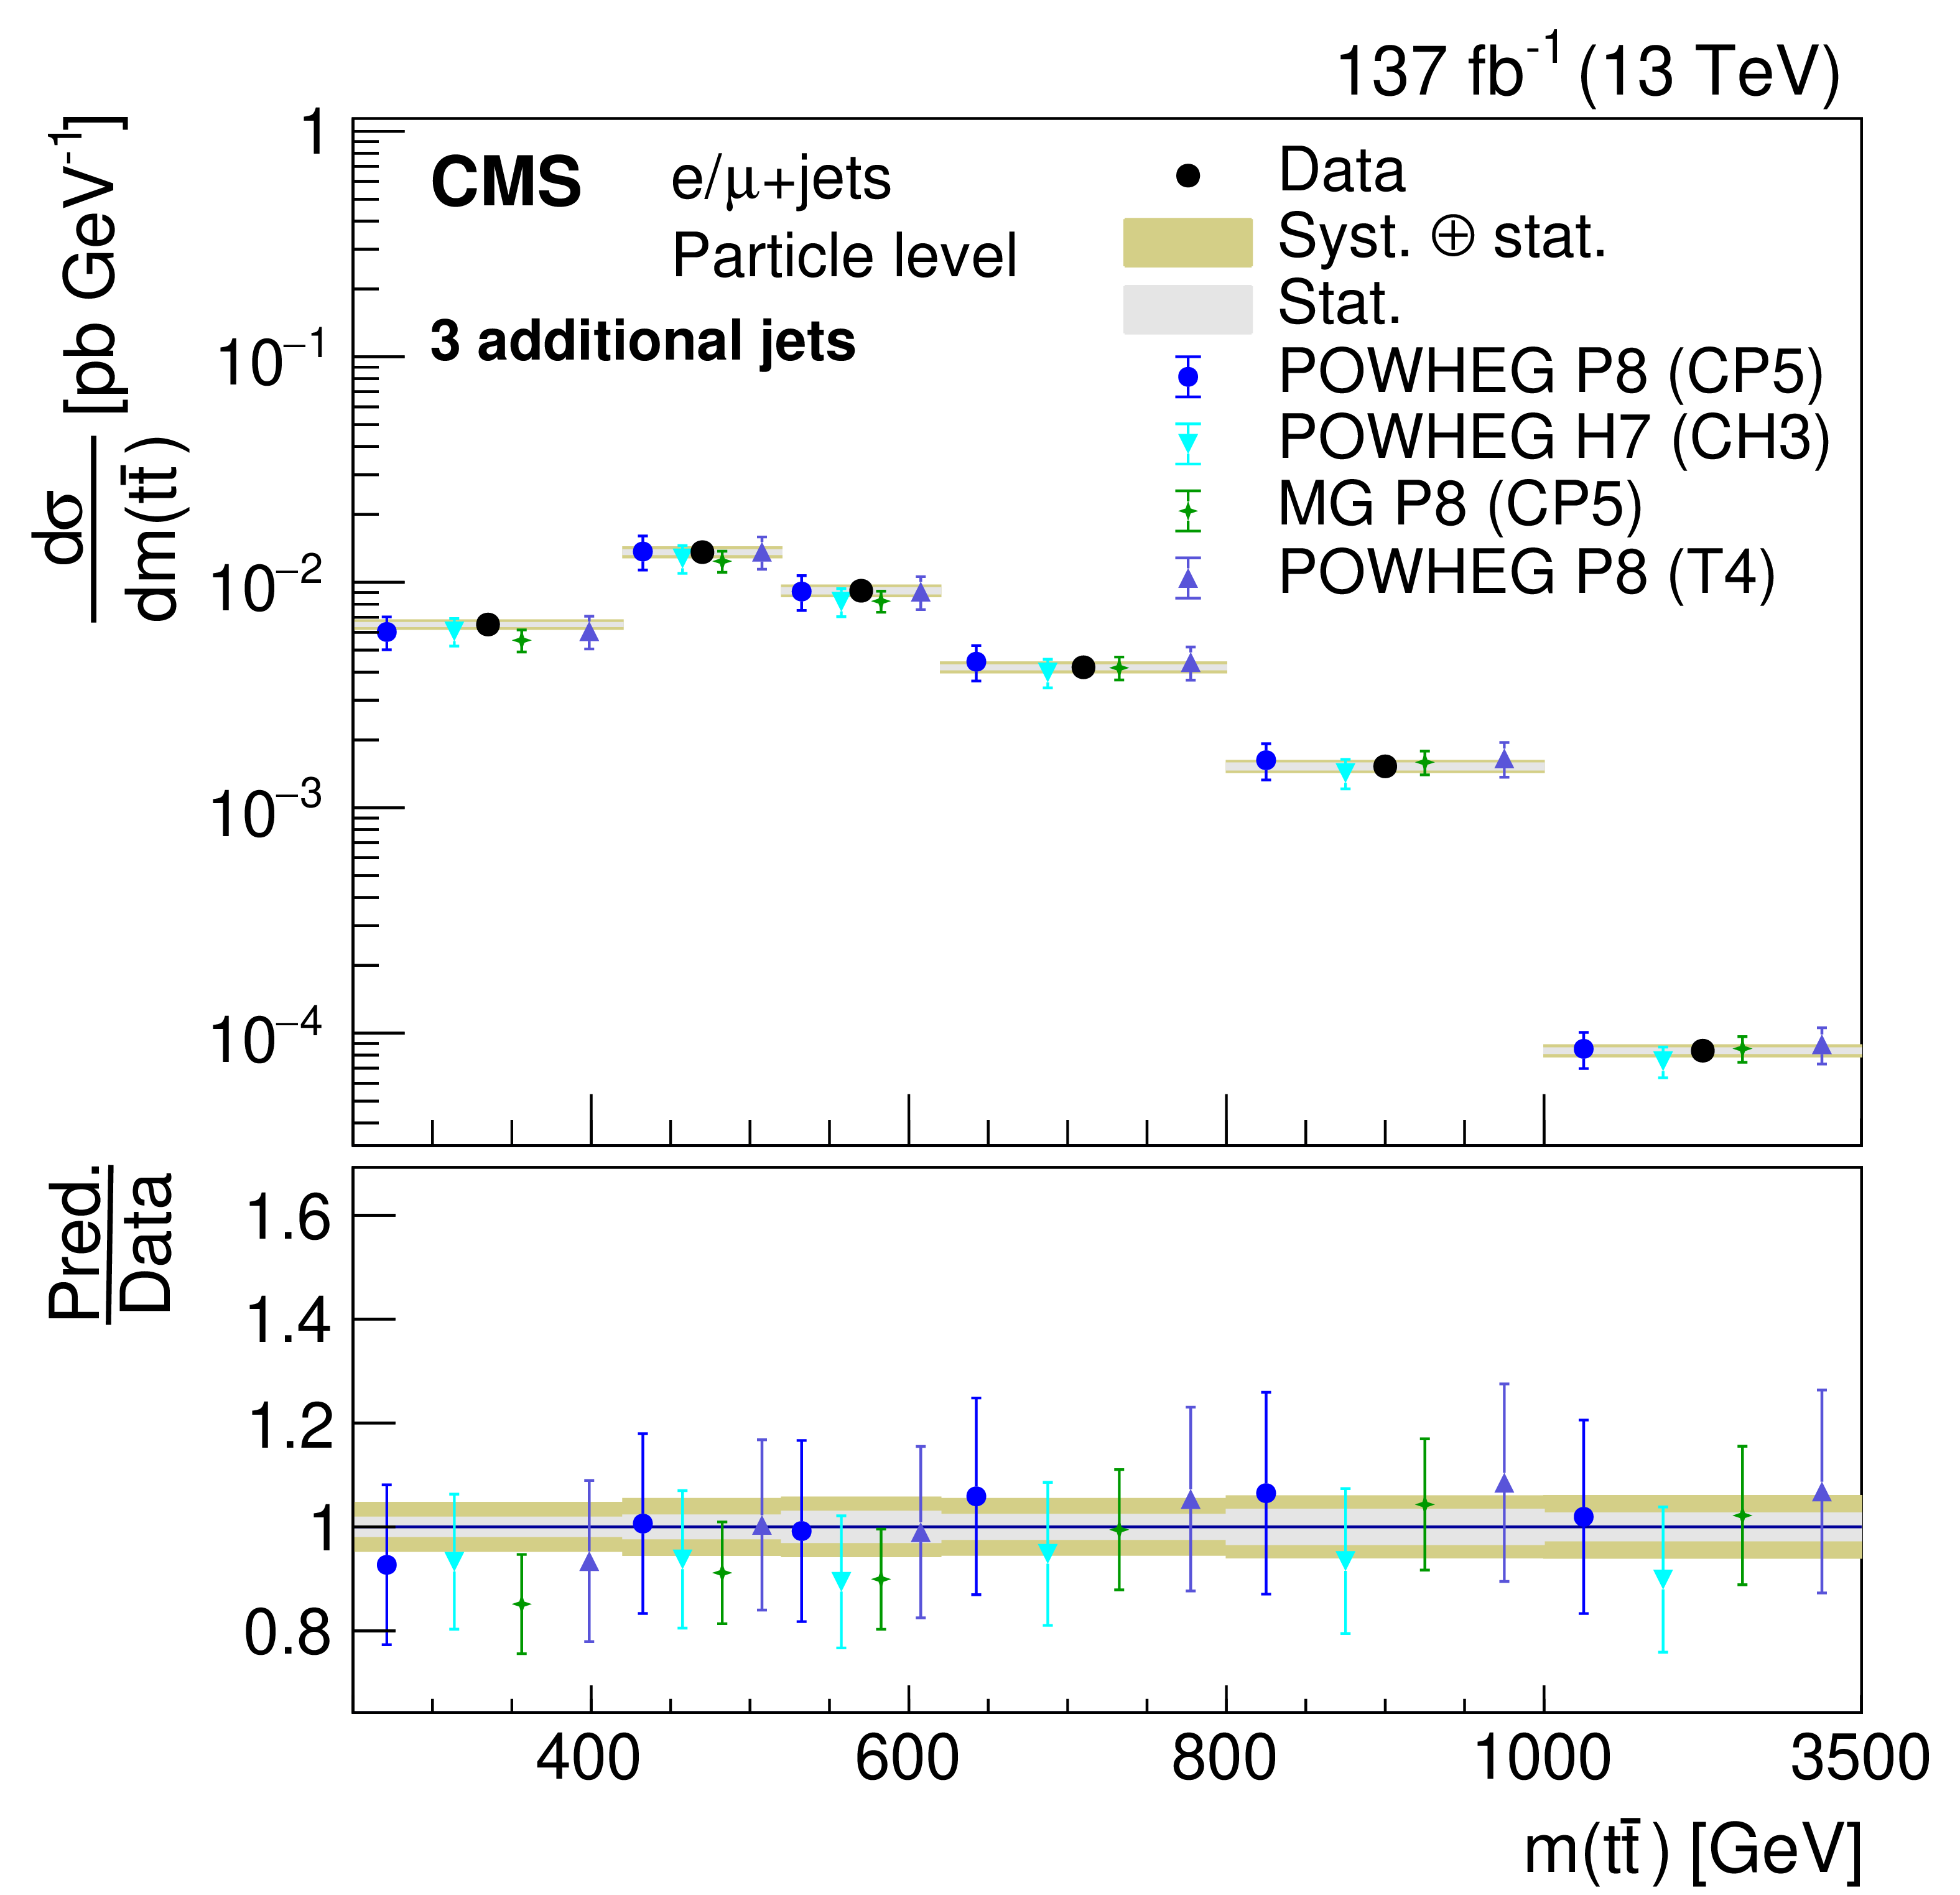
png pdf |
Figure 41-d:
Differential cross section at the particle level as a function of ${m({\mathrm{t} \mathrm{\bar{t}}})}$ in bins of jet multiplicity. The data are shown as points with gray (yellow) bands indicating the statistical (statistical and systematic) uncertainties. The cross sections are compared to the predictions of POWHEG+PYTHIA (P8) for the CP5 and CUETP8M2T4 (T4) tunes, POWHEG+HERWIG (H7), and the multiparton simulation MG5_aMC@NLO (MG)+PYTHIA. The ratios of the various predictions to the measured cross sections are shown in the lower panels. |
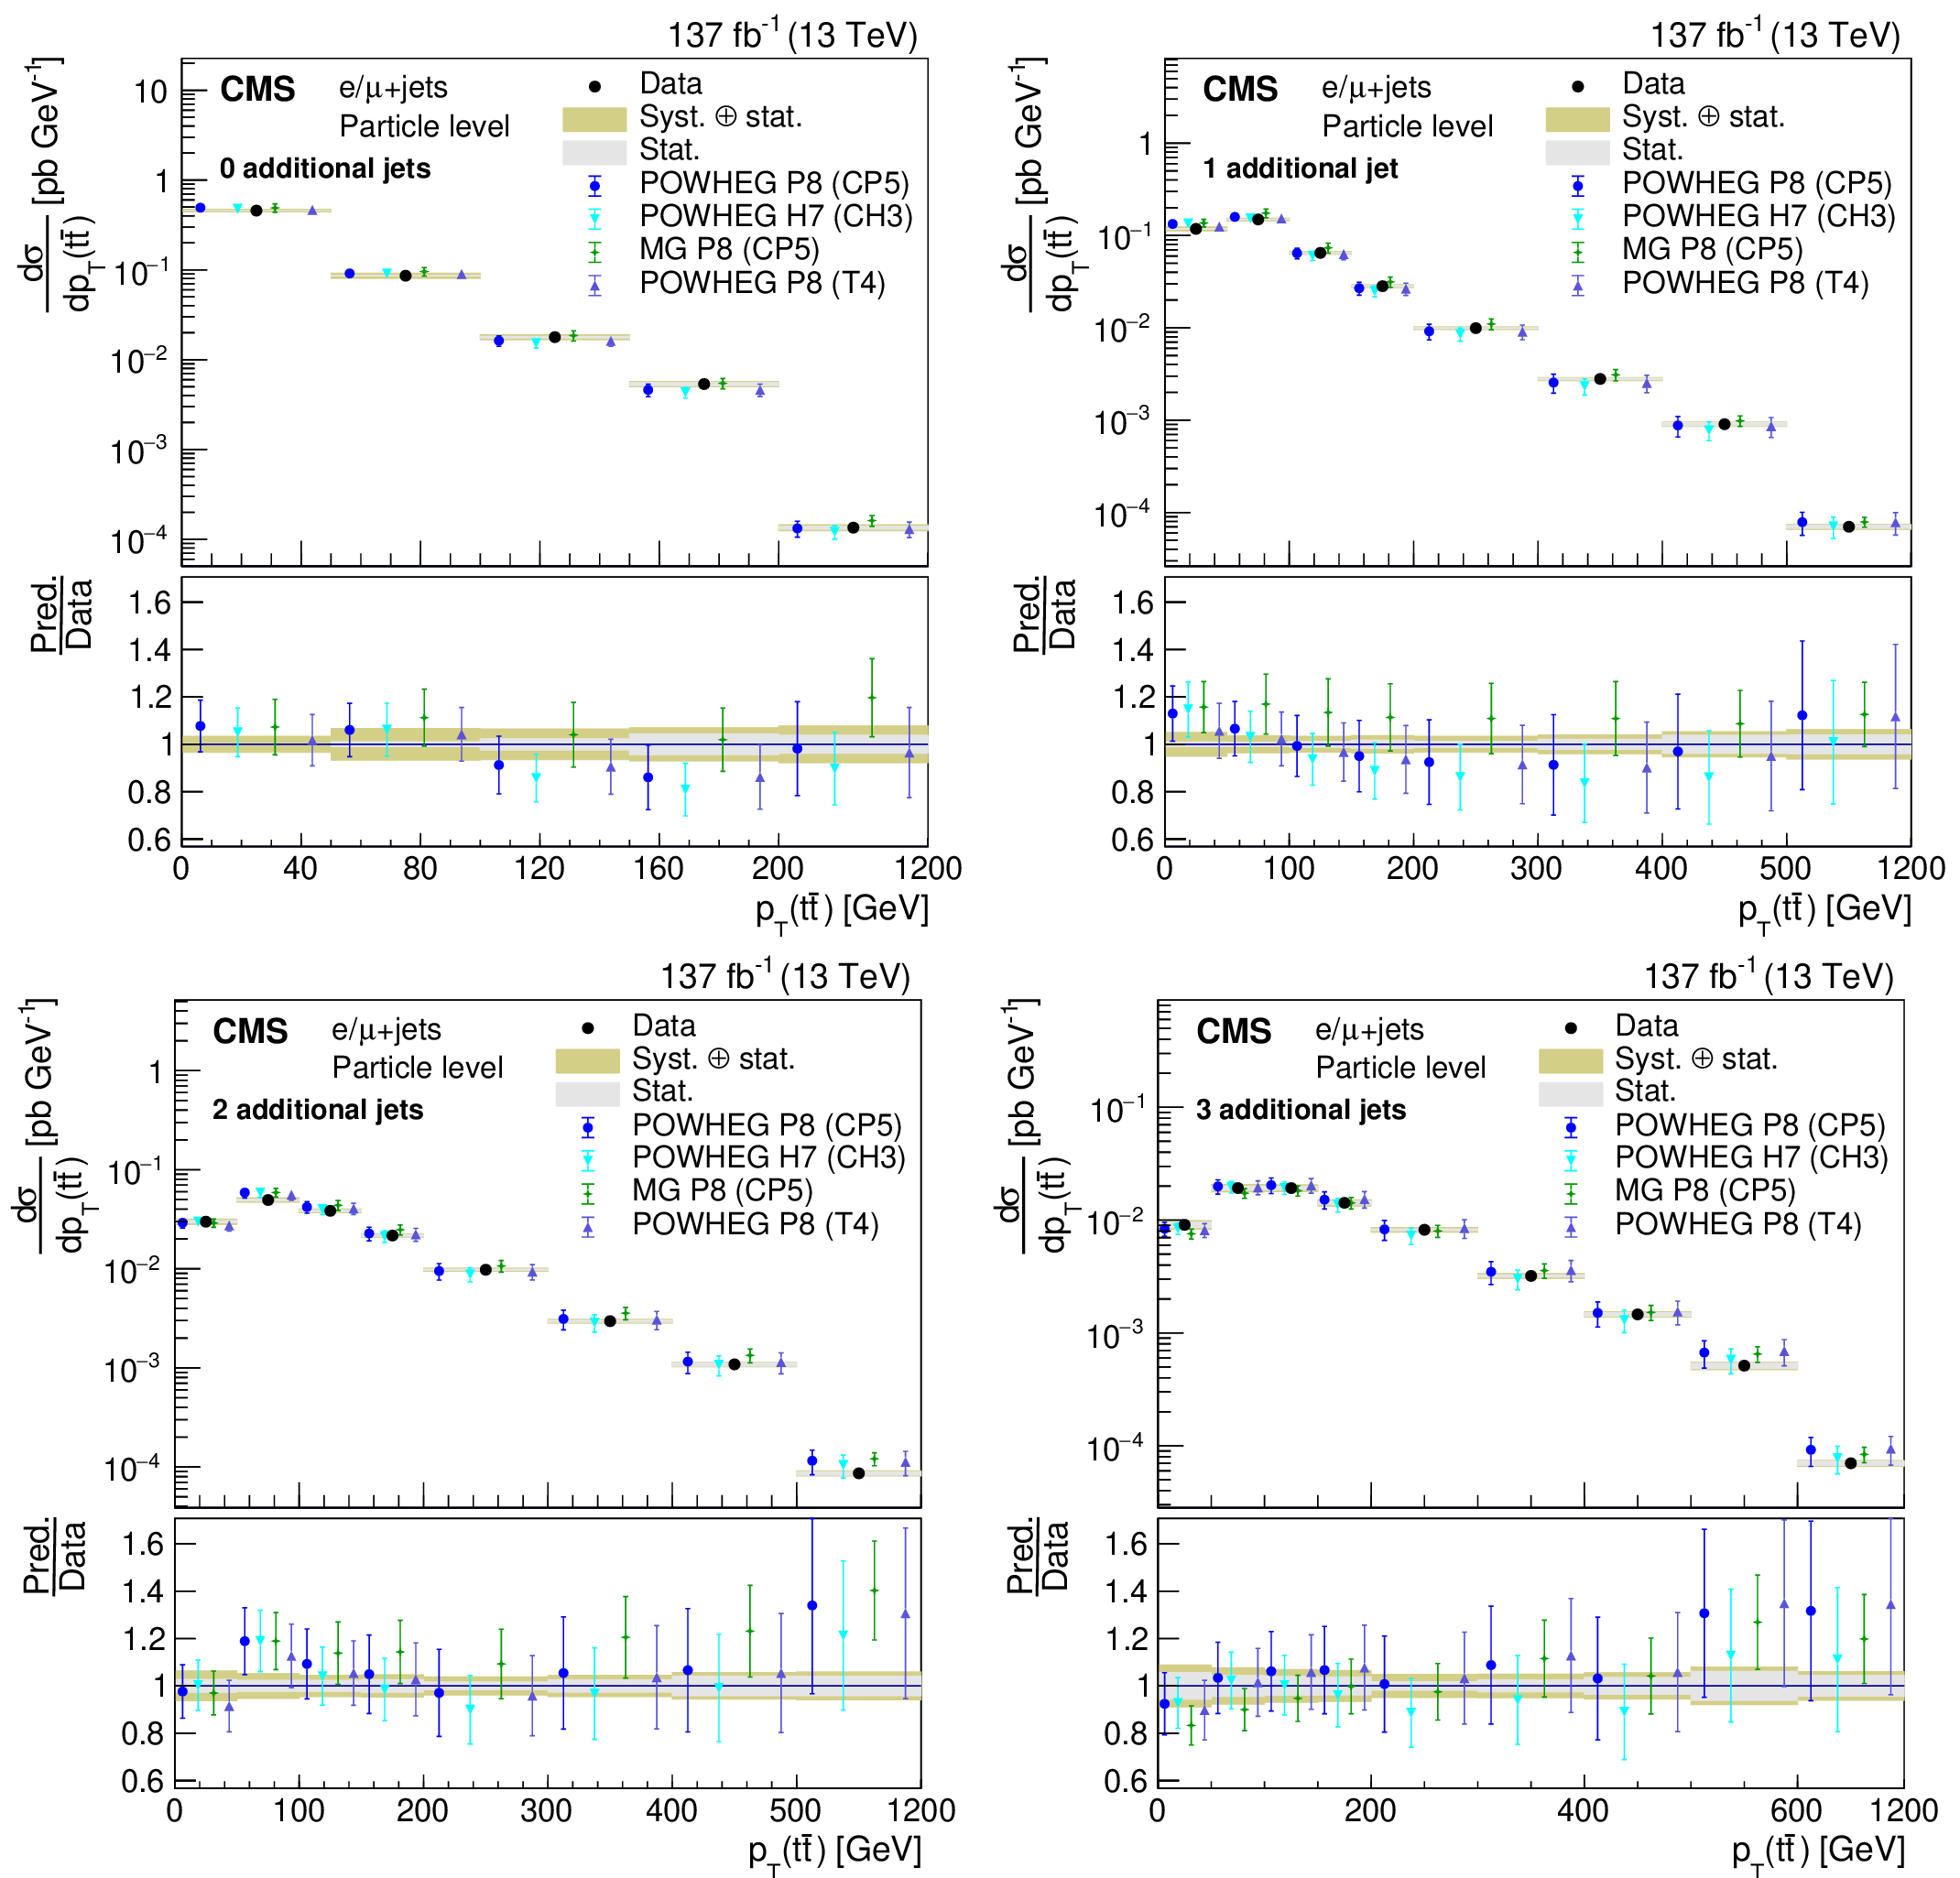
png pdf |
Figure 42:
Differential cross section at the particle level as a function of ${{p_{\mathrm {T}}} ({\mathrm{t} \mathrm{\bar{t}}})}$ in bins of jet multiplicity. The data are shown as points with gray (yellow) bands indicating the statistical (statistical and systematic) uncertainties. The cross sections are compared to the predictions of POWHEG+PYTHIA (P8) for the CP5 and CUETP8M2T4 (T4) tunes, POWHEG+HERWIG (H7), and the multiparton simulation MG5_aMC@NLO (MG)+PYTHIA. The ratios of the various predictions to the measured cross sections are shown in the lower panels. |
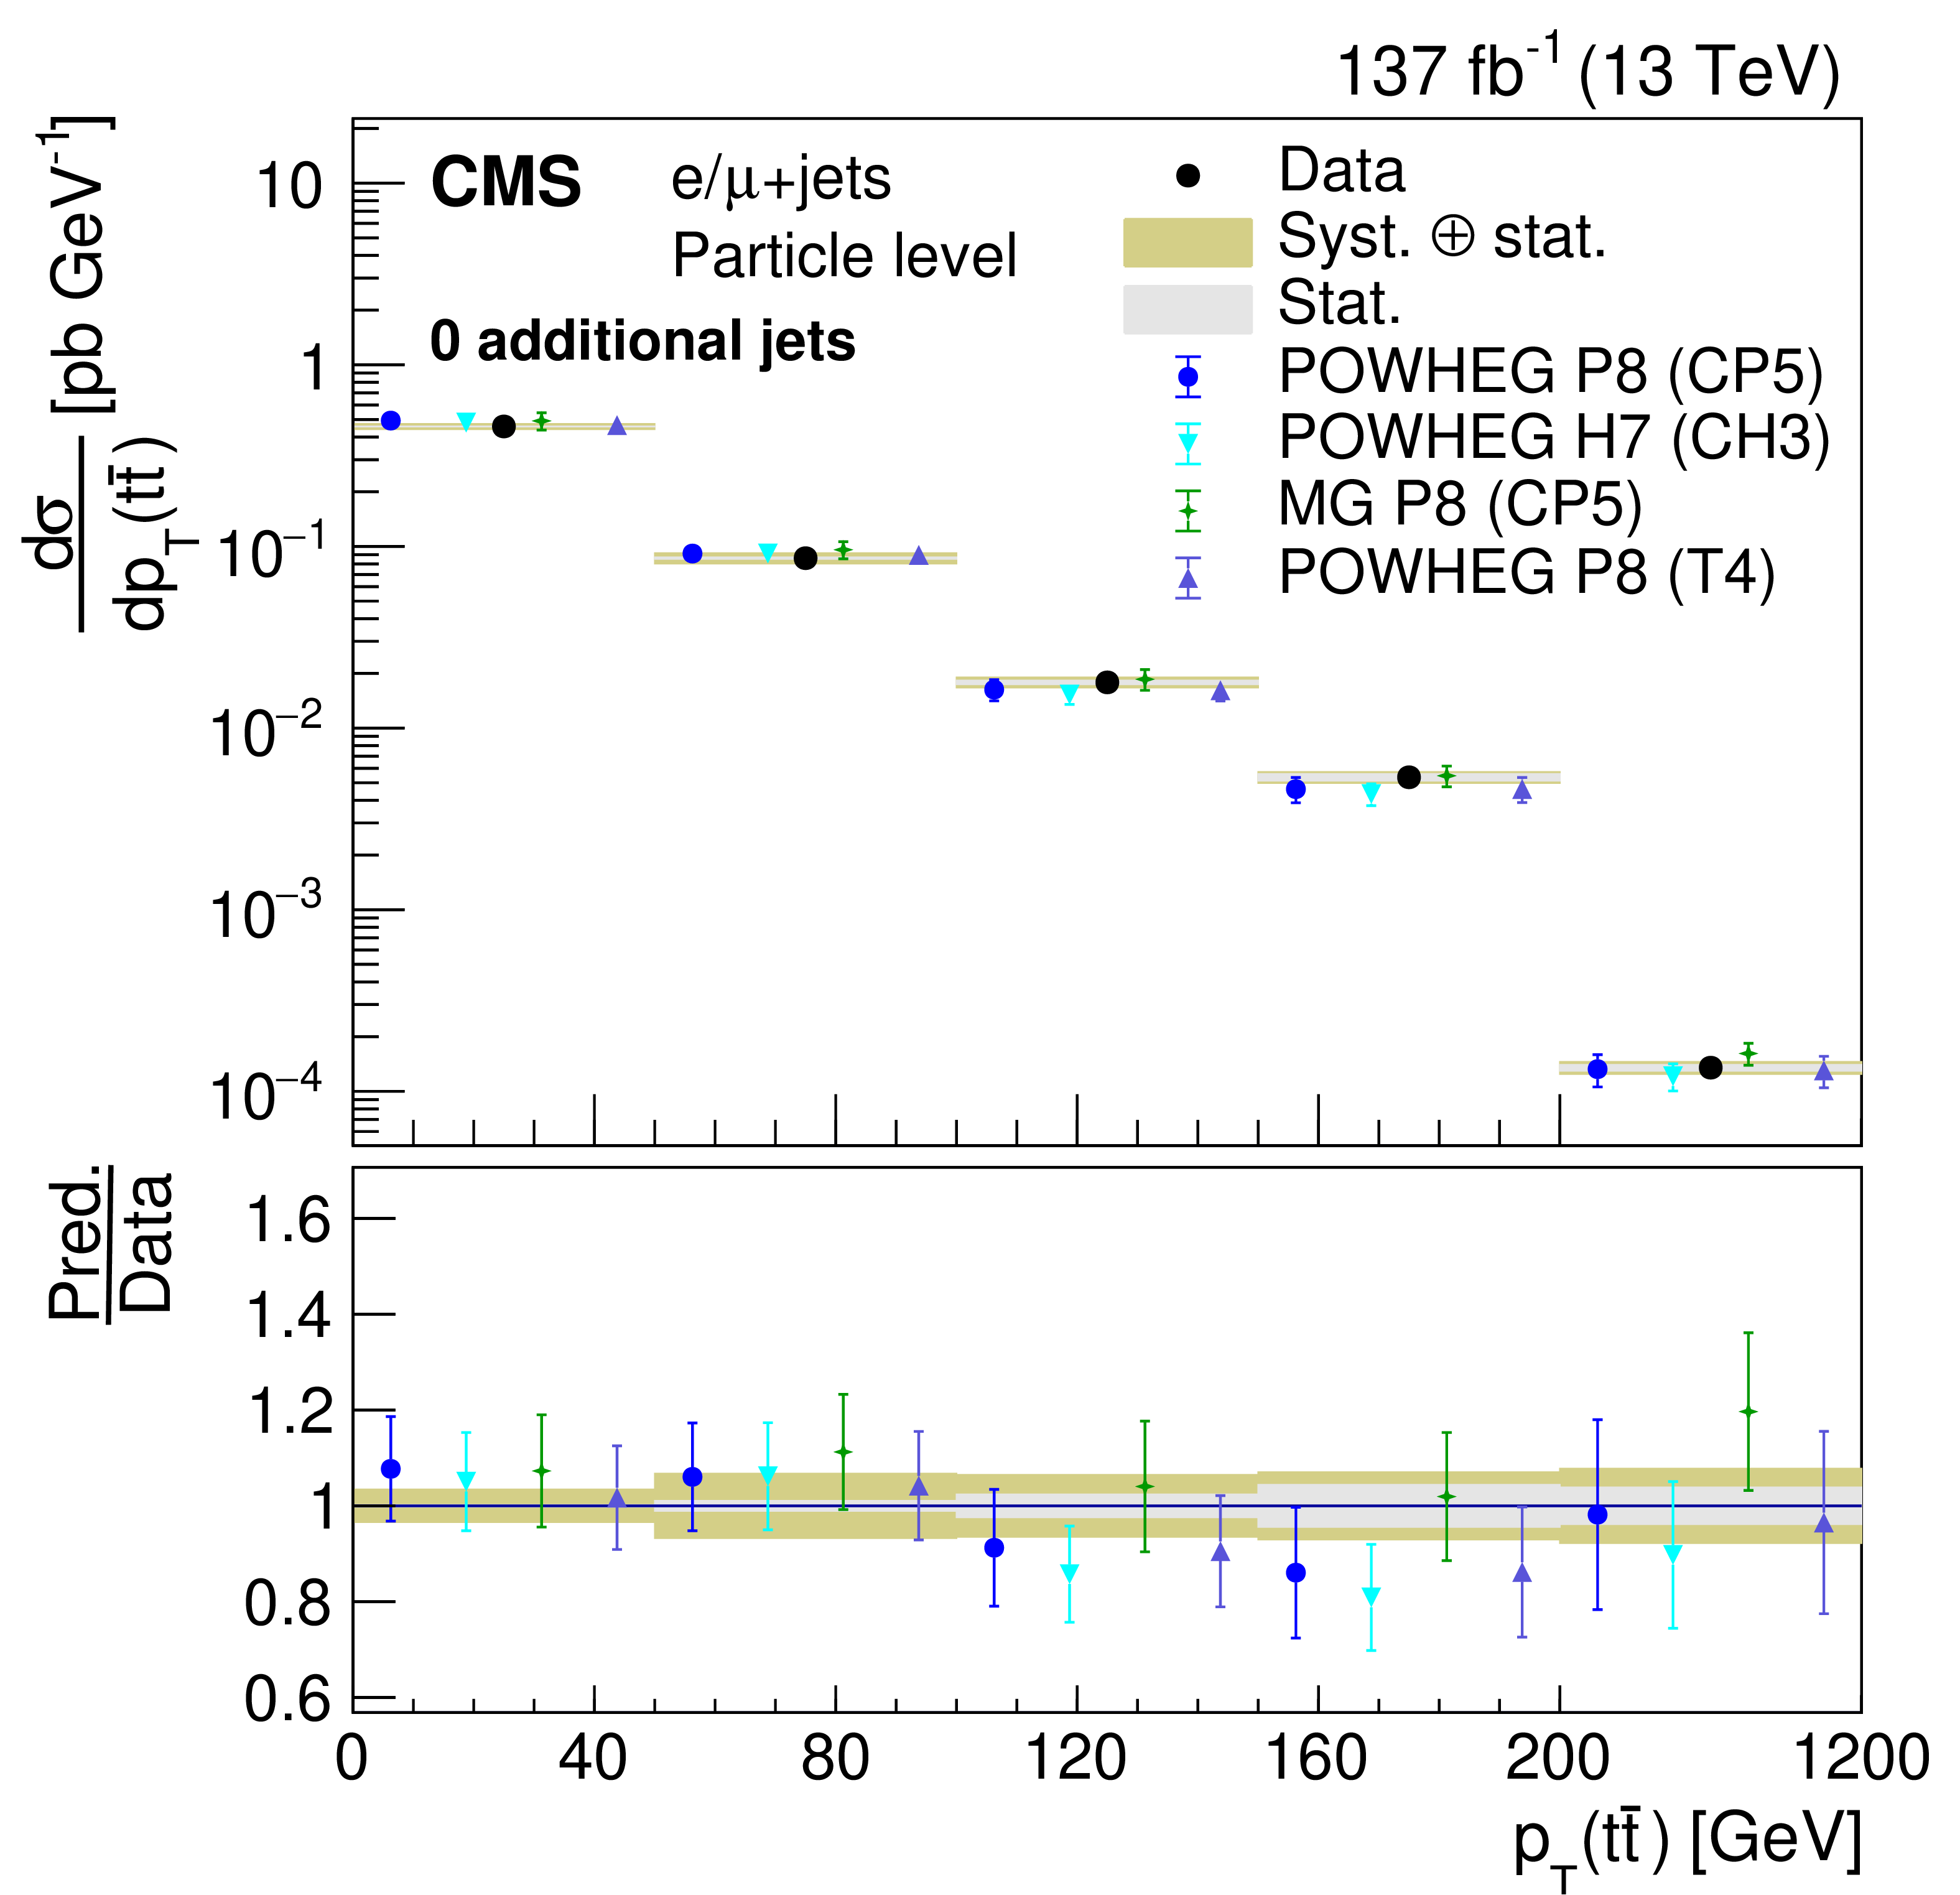
png pdf |
Figure 42-a:
Differential cross section at the particle level as a function of ${{p_{\mathrm {T}}} ({\mathrm{t} \mathrm{\bar{t}}})}$ in bins of jet multiplicity. The data are shown as points with gray (yellow) bands indicating the statistical (statistical and systematic) uncertainties. The cross sections are compared to the predictions of POWHEG+PYTHIA (P8) for the CP5 and CUETP8M2T4 (T4) tunes, POWHEG+HERWIG (H7), and the multiparton simulation MG5_aMC@NLO (MG)+PYTHIA. The ratios of the various predictions to the measured cross sections are shown in the lower panels. |
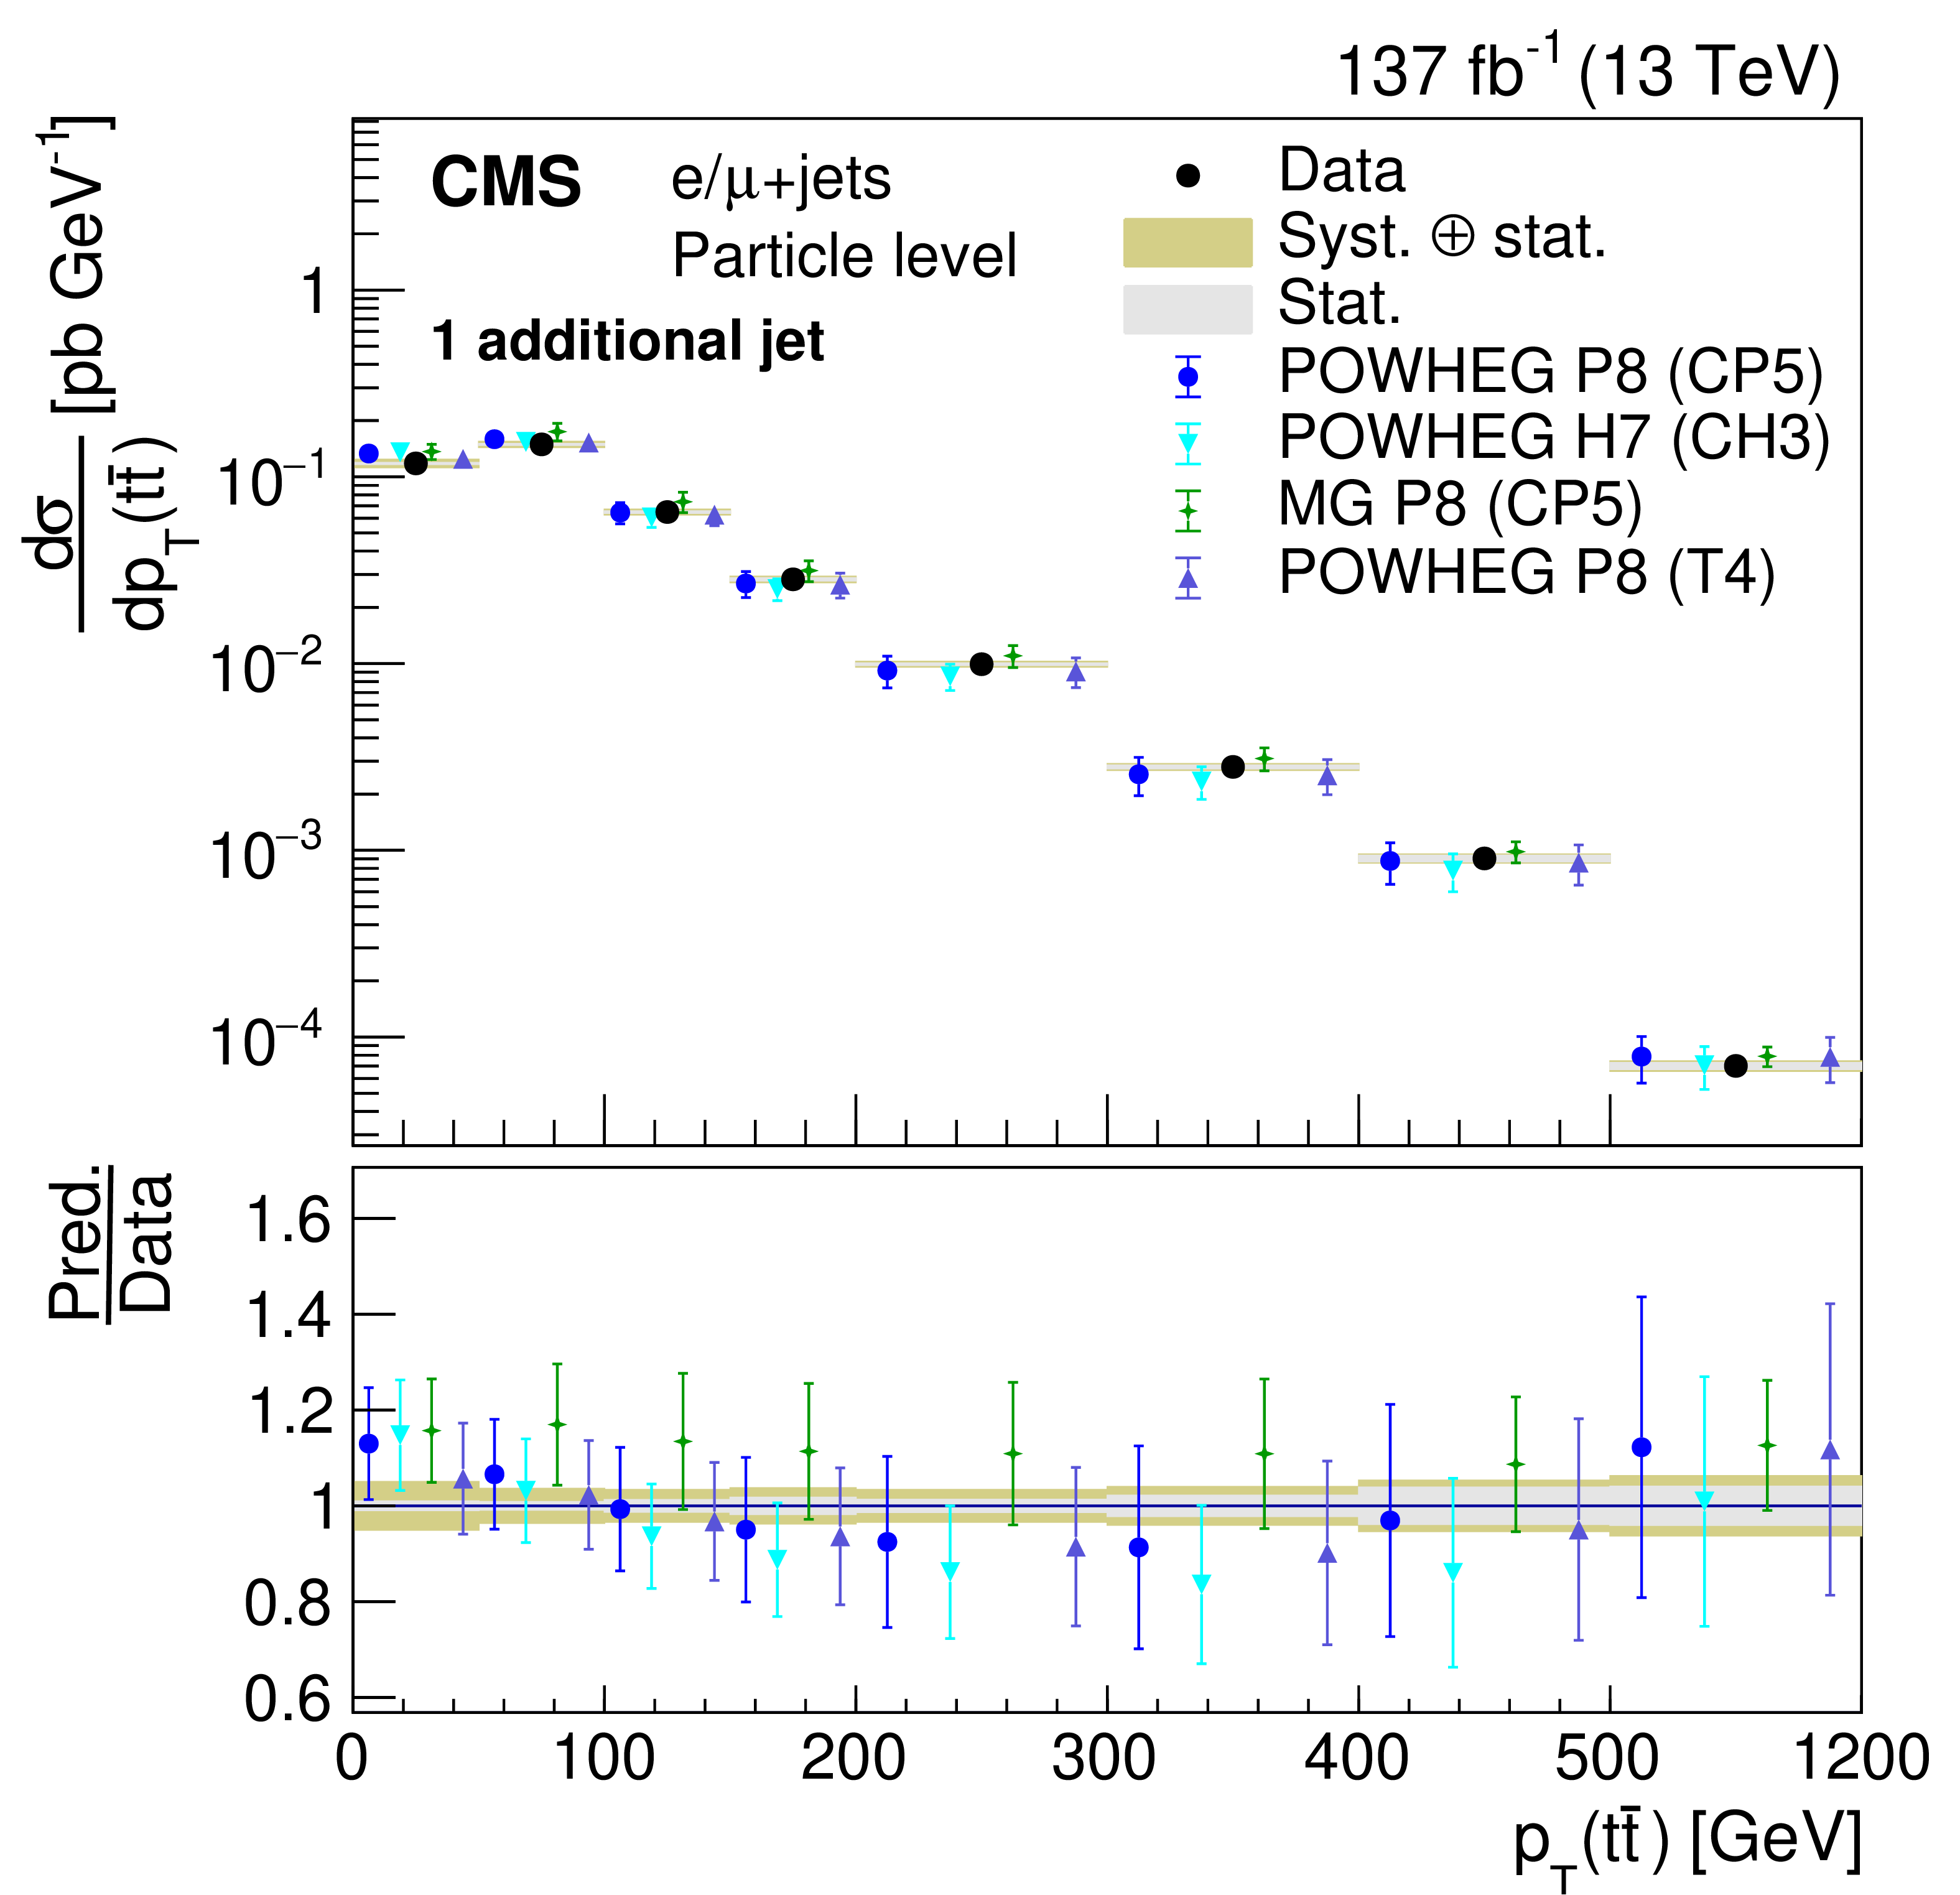
png pdf |
Figure 42-b:
Differential cross section at the particle level as a function of ${{p_{\mathrm {T}}} ({\mathrm{t} \mathrm{\bar{t}}})}$ in bins of jet multiplicity. The data are shown as points with gray (yellow) bands indicating the statistical (statistical and systematic) uncertainties. The cross sections are compared to the predictions of POWHEG+PYTHIA (P8) for the CP5 and CUETP8M2T4 (T4) tunes, POWHEG+HERWIG (H7), and the multiparton simulation MG5_aMC@NLO (MG)+PYTHIA. The ratios of the various predictions to the measured cross sections are shown in the lower panels. |
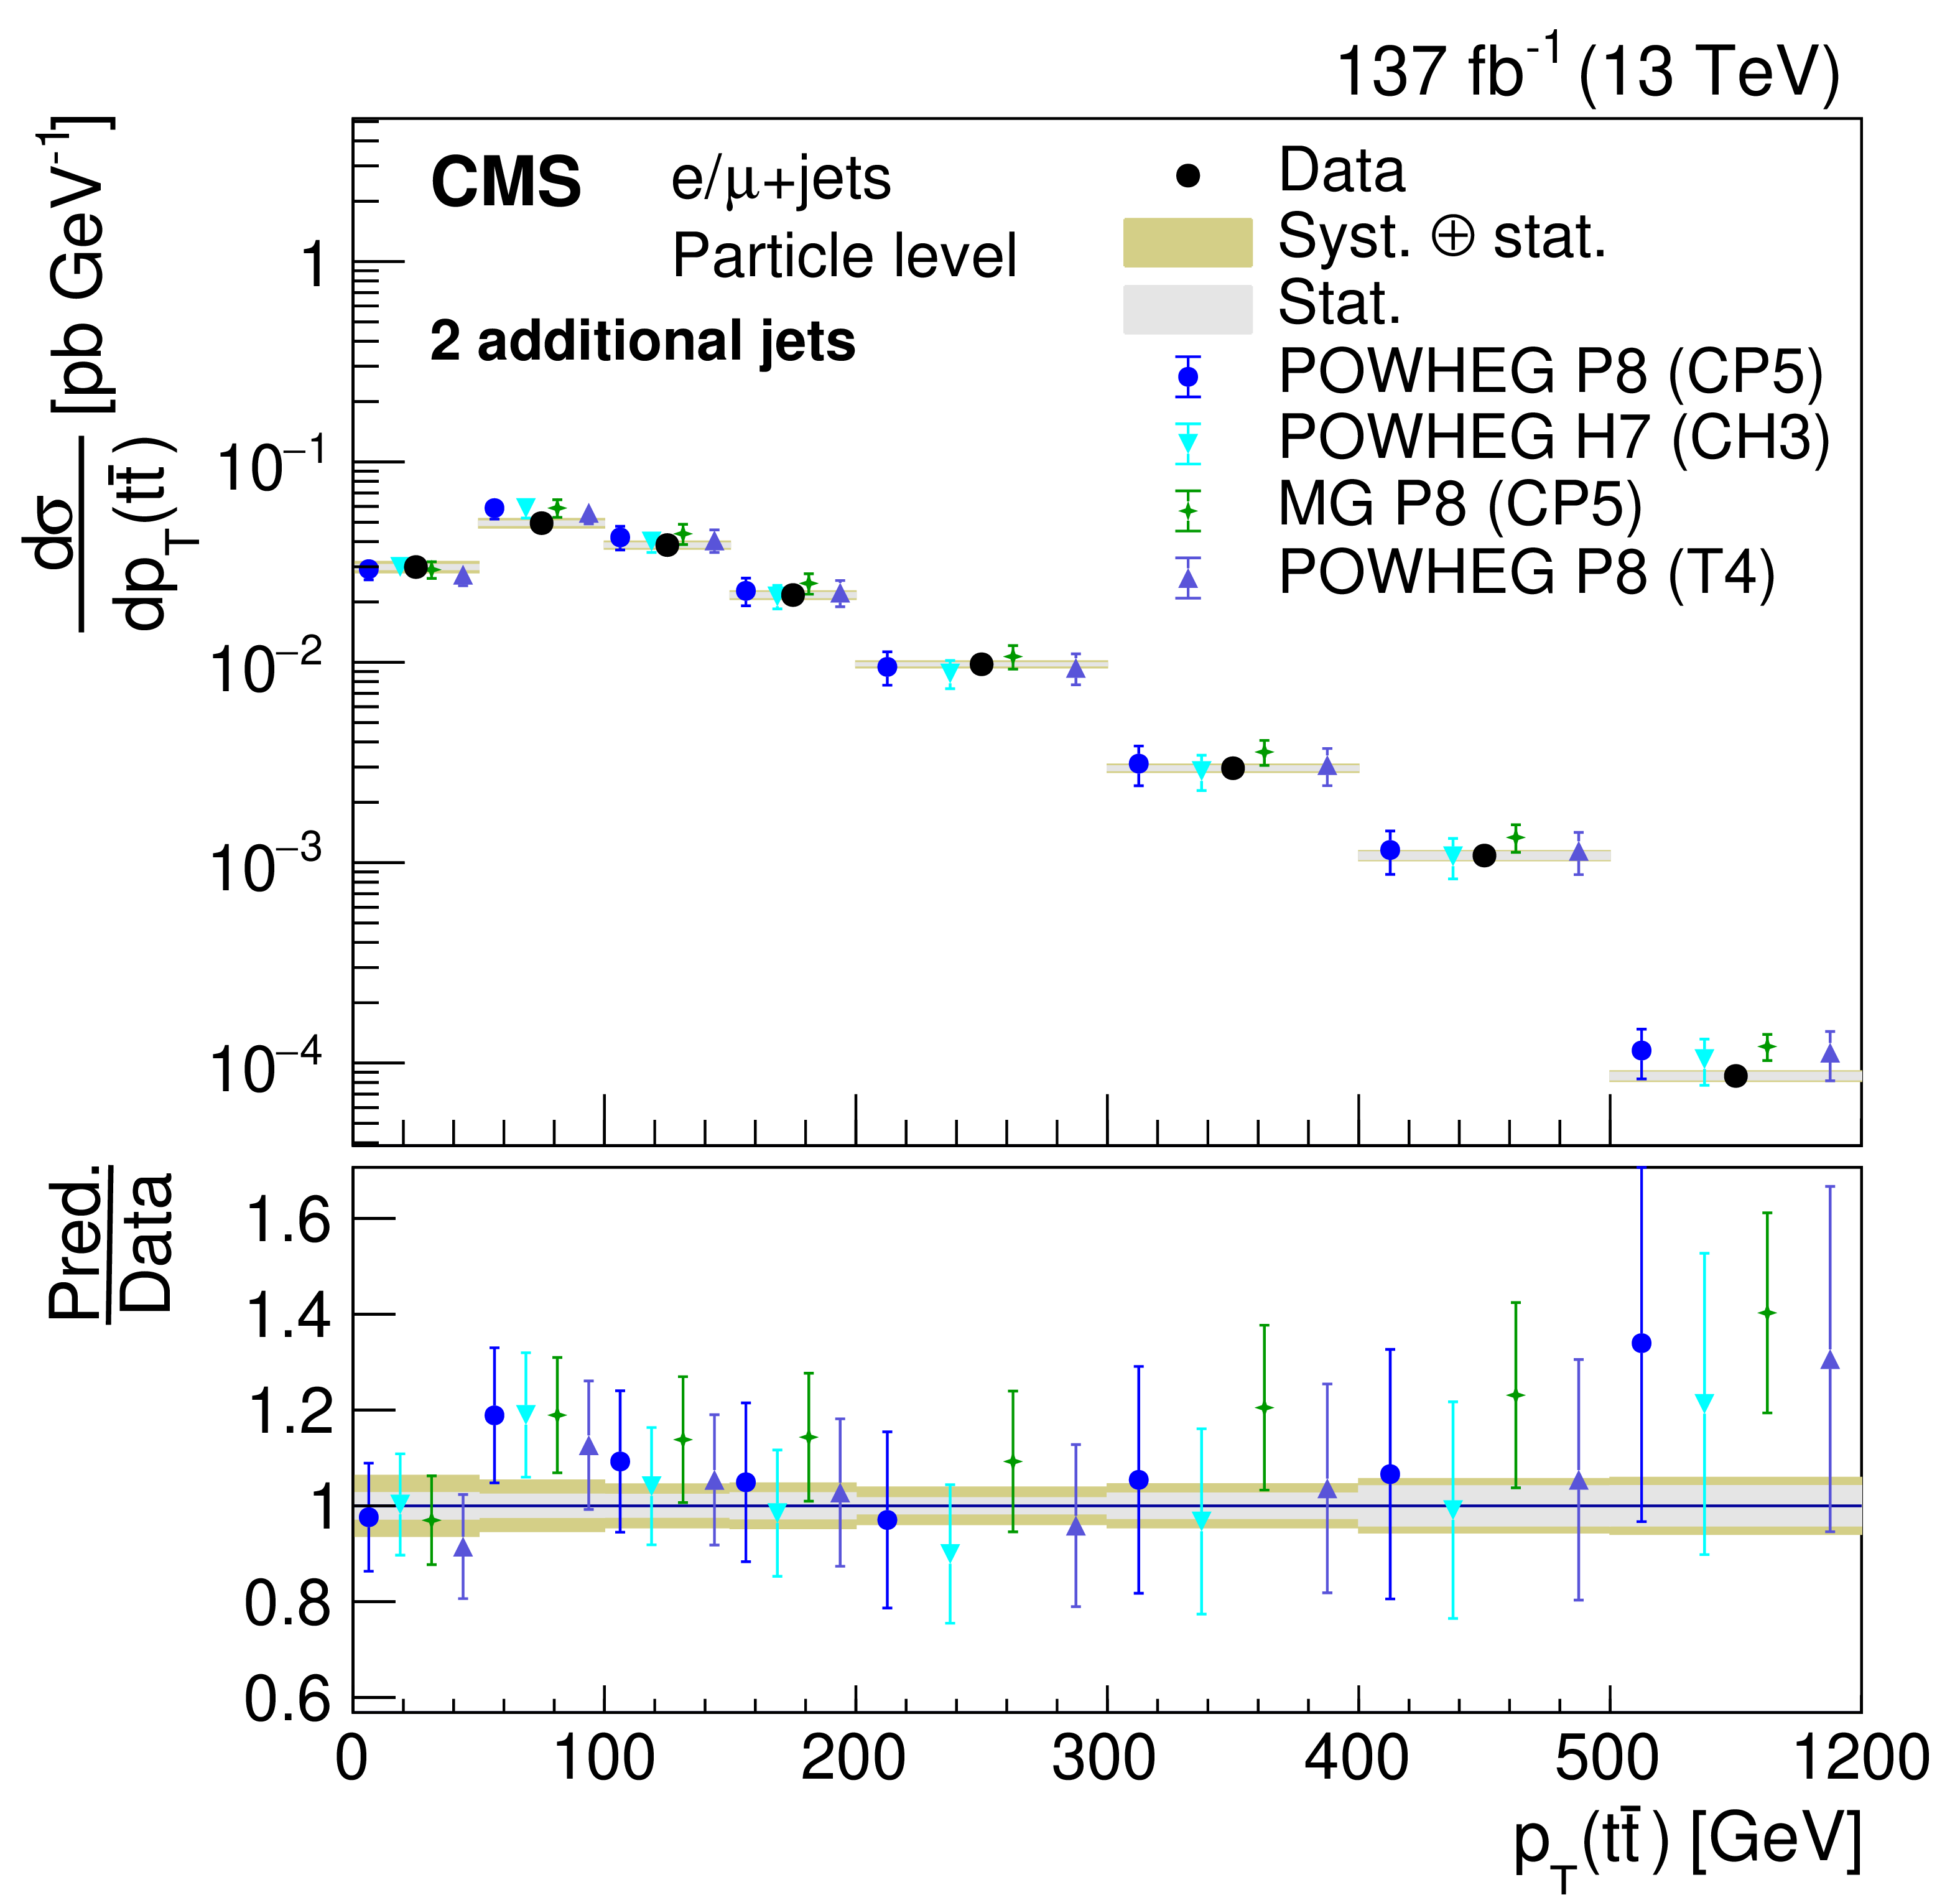
png pdf |
Figure 42-c:
Differential cross section at the particle level as a function of ${{p_{\mathrm {T}}} ({\mathrm{t} \mathrm{\bar{t}}})}$ in bins of jet multiplicity. The data are shown as points with gray (yellow) bands indicating the statistical (statistical and systematic) uncertainties. The cross sections are compared to the predictions of POWHEG+PYTHIA (P8) for the CP5 and CUETP8M2T4 (T4) tunes, POWHEG+HERWIG (H7), and the multiparton simulation MG5_aMC@NLO (MG)+PYTHIA. The ratios of the various predictions to the measured cross sections are shown in the lower panels. |

png pdf |
Figure 42-d:
Differential cross section at the particle level as a function of ${{p_{\mathrm {T}}} ({\mathrm{t} \mathrm{\bar{t}}})}$ in bins of jet multiplicity. The data are shown as points with gray (yellow) bands indicating the statistical (statistical and systematic) uncertainties. The cross sections are compared to the predictions of POWHEG+PYTHIA (P8) for the CP5 and CUETP8M2T4 (T4) tunes, POWHEG+HERWIG (H7), and the multiparton simulation MG5_aMC@NLO (MG)+PYTHIA. The ratios of the various predictions to the measured cross sections are shown in the lower panels. |
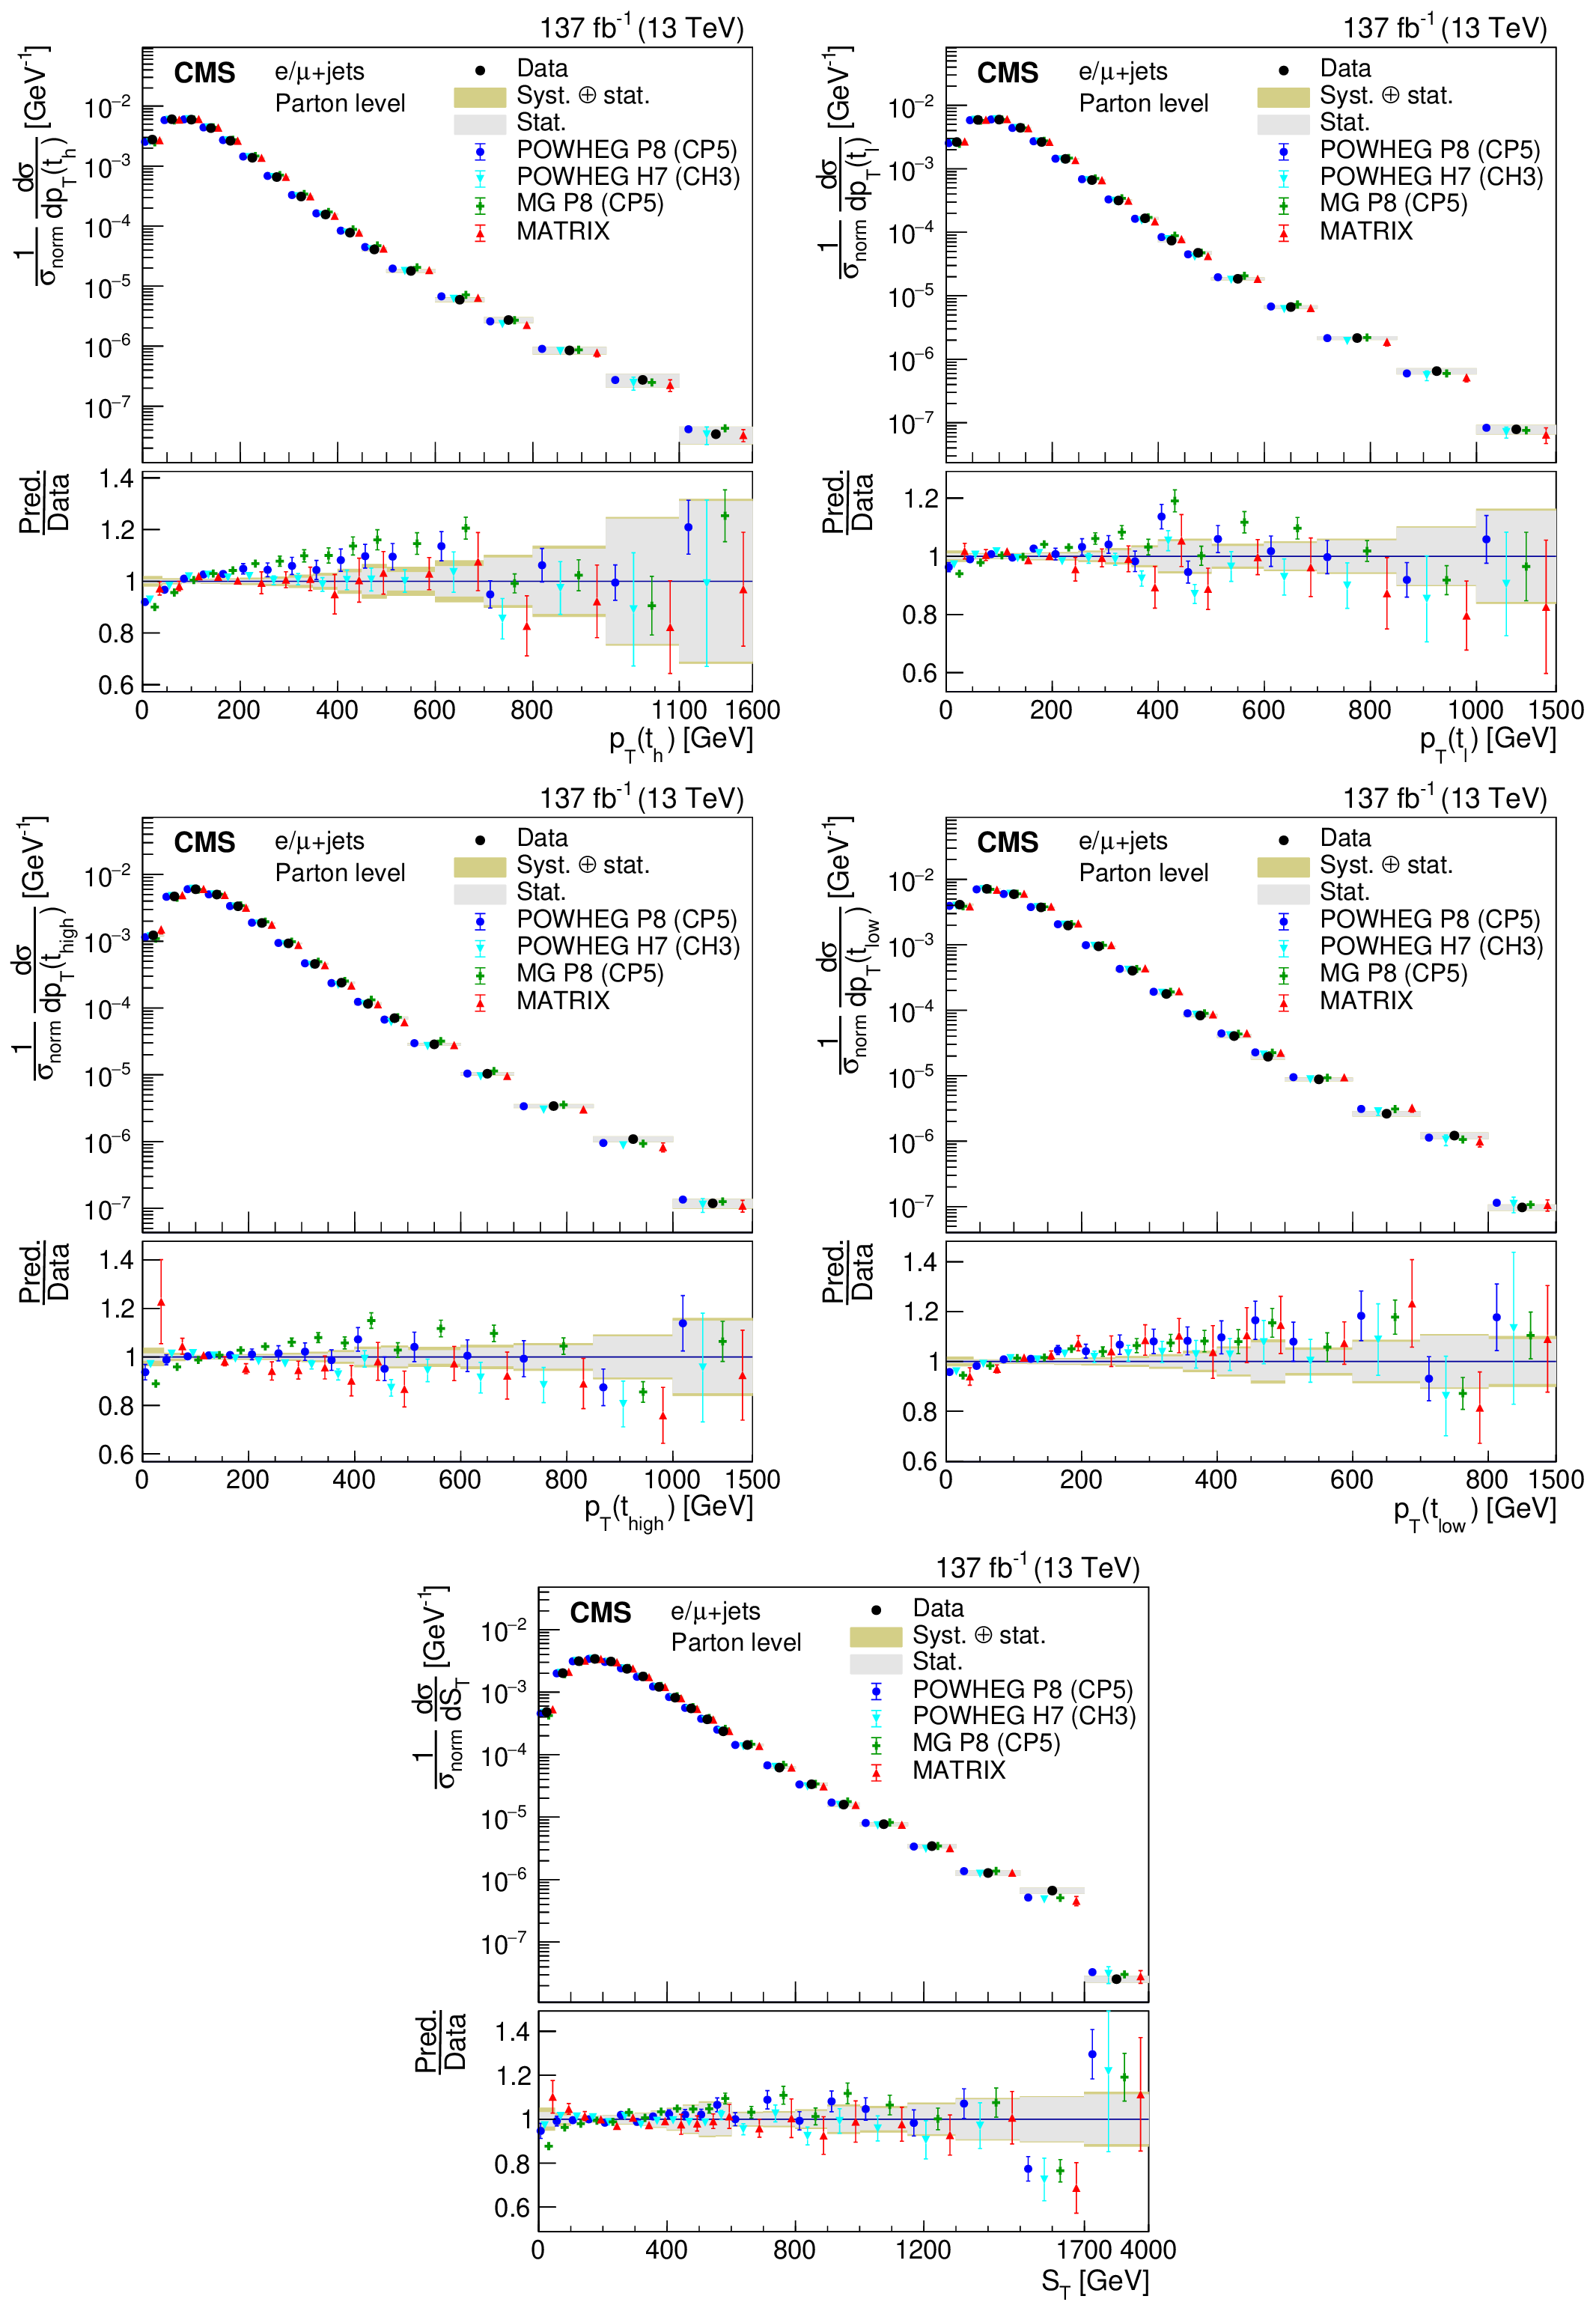
png pdf |
Figure A1:
Normalized differential cross sections at the parton level as a function of ${{p_{\mathrm {T}}} ({\mathrm{t} _\mathrm {h}})}$, ${{p_{\mathrm {T}}} ({\mathrm{t} _\ell})}$, ${{p_{\mathrm {T}}} ({\mathrm{t} _\text {high}})}$, ${{p_{\mathrm {T}}} ({\mathrm{t} _\text {low}})}$, and ${S_\mathrm {T}}$. The data are shown as points with gray (yellow) bands indicating the statistical (statistical and systematic) uncertainties. The cross sections are compared to the predictions of POWHEG combined with PYTHIA (P8) or HERWIG (H7), the multiparton simulation MG5_aMC@NLO (MG)+PYTHIA FxFx, and the NNLO QCD calculations obtained with Matrix. The ratios of the various predictions to the measured cross sections are shown in the lower panels. |

png pdf |
Figure A1-a:
Normalized differential cross sections at the parton level as a function of ${{p_{\mathrm {T}}} ({\mathrm{t} _\mathrm {h}})}$, ${{p_{\mathrm {T}}} ({\mathrm{t} _\ell})}$, ${{p_{\mathrm {T}}} ({\mathrm{t} _\text {high}})}$, ${{p_{\mathrm {T}}} ({\mathrm{t} _\text {low}})}$, and ${S_\mathrm {T}}$. The data are shown as points with gray (yellow) bands indicating the statistical (statistical and systematic) uncertainties. The cross sections are compared to the predictions of POWHEG combined with PYTHIA (P8) or HERWIG (H7), the multiparton simulation MG5_aMC@NLO (MG)+PYTHIA FxFx, and the NNLO QCD calculations obtained with Matrix. The ratios of the various predictions to the measured cross sections are shown in the lower panels. |
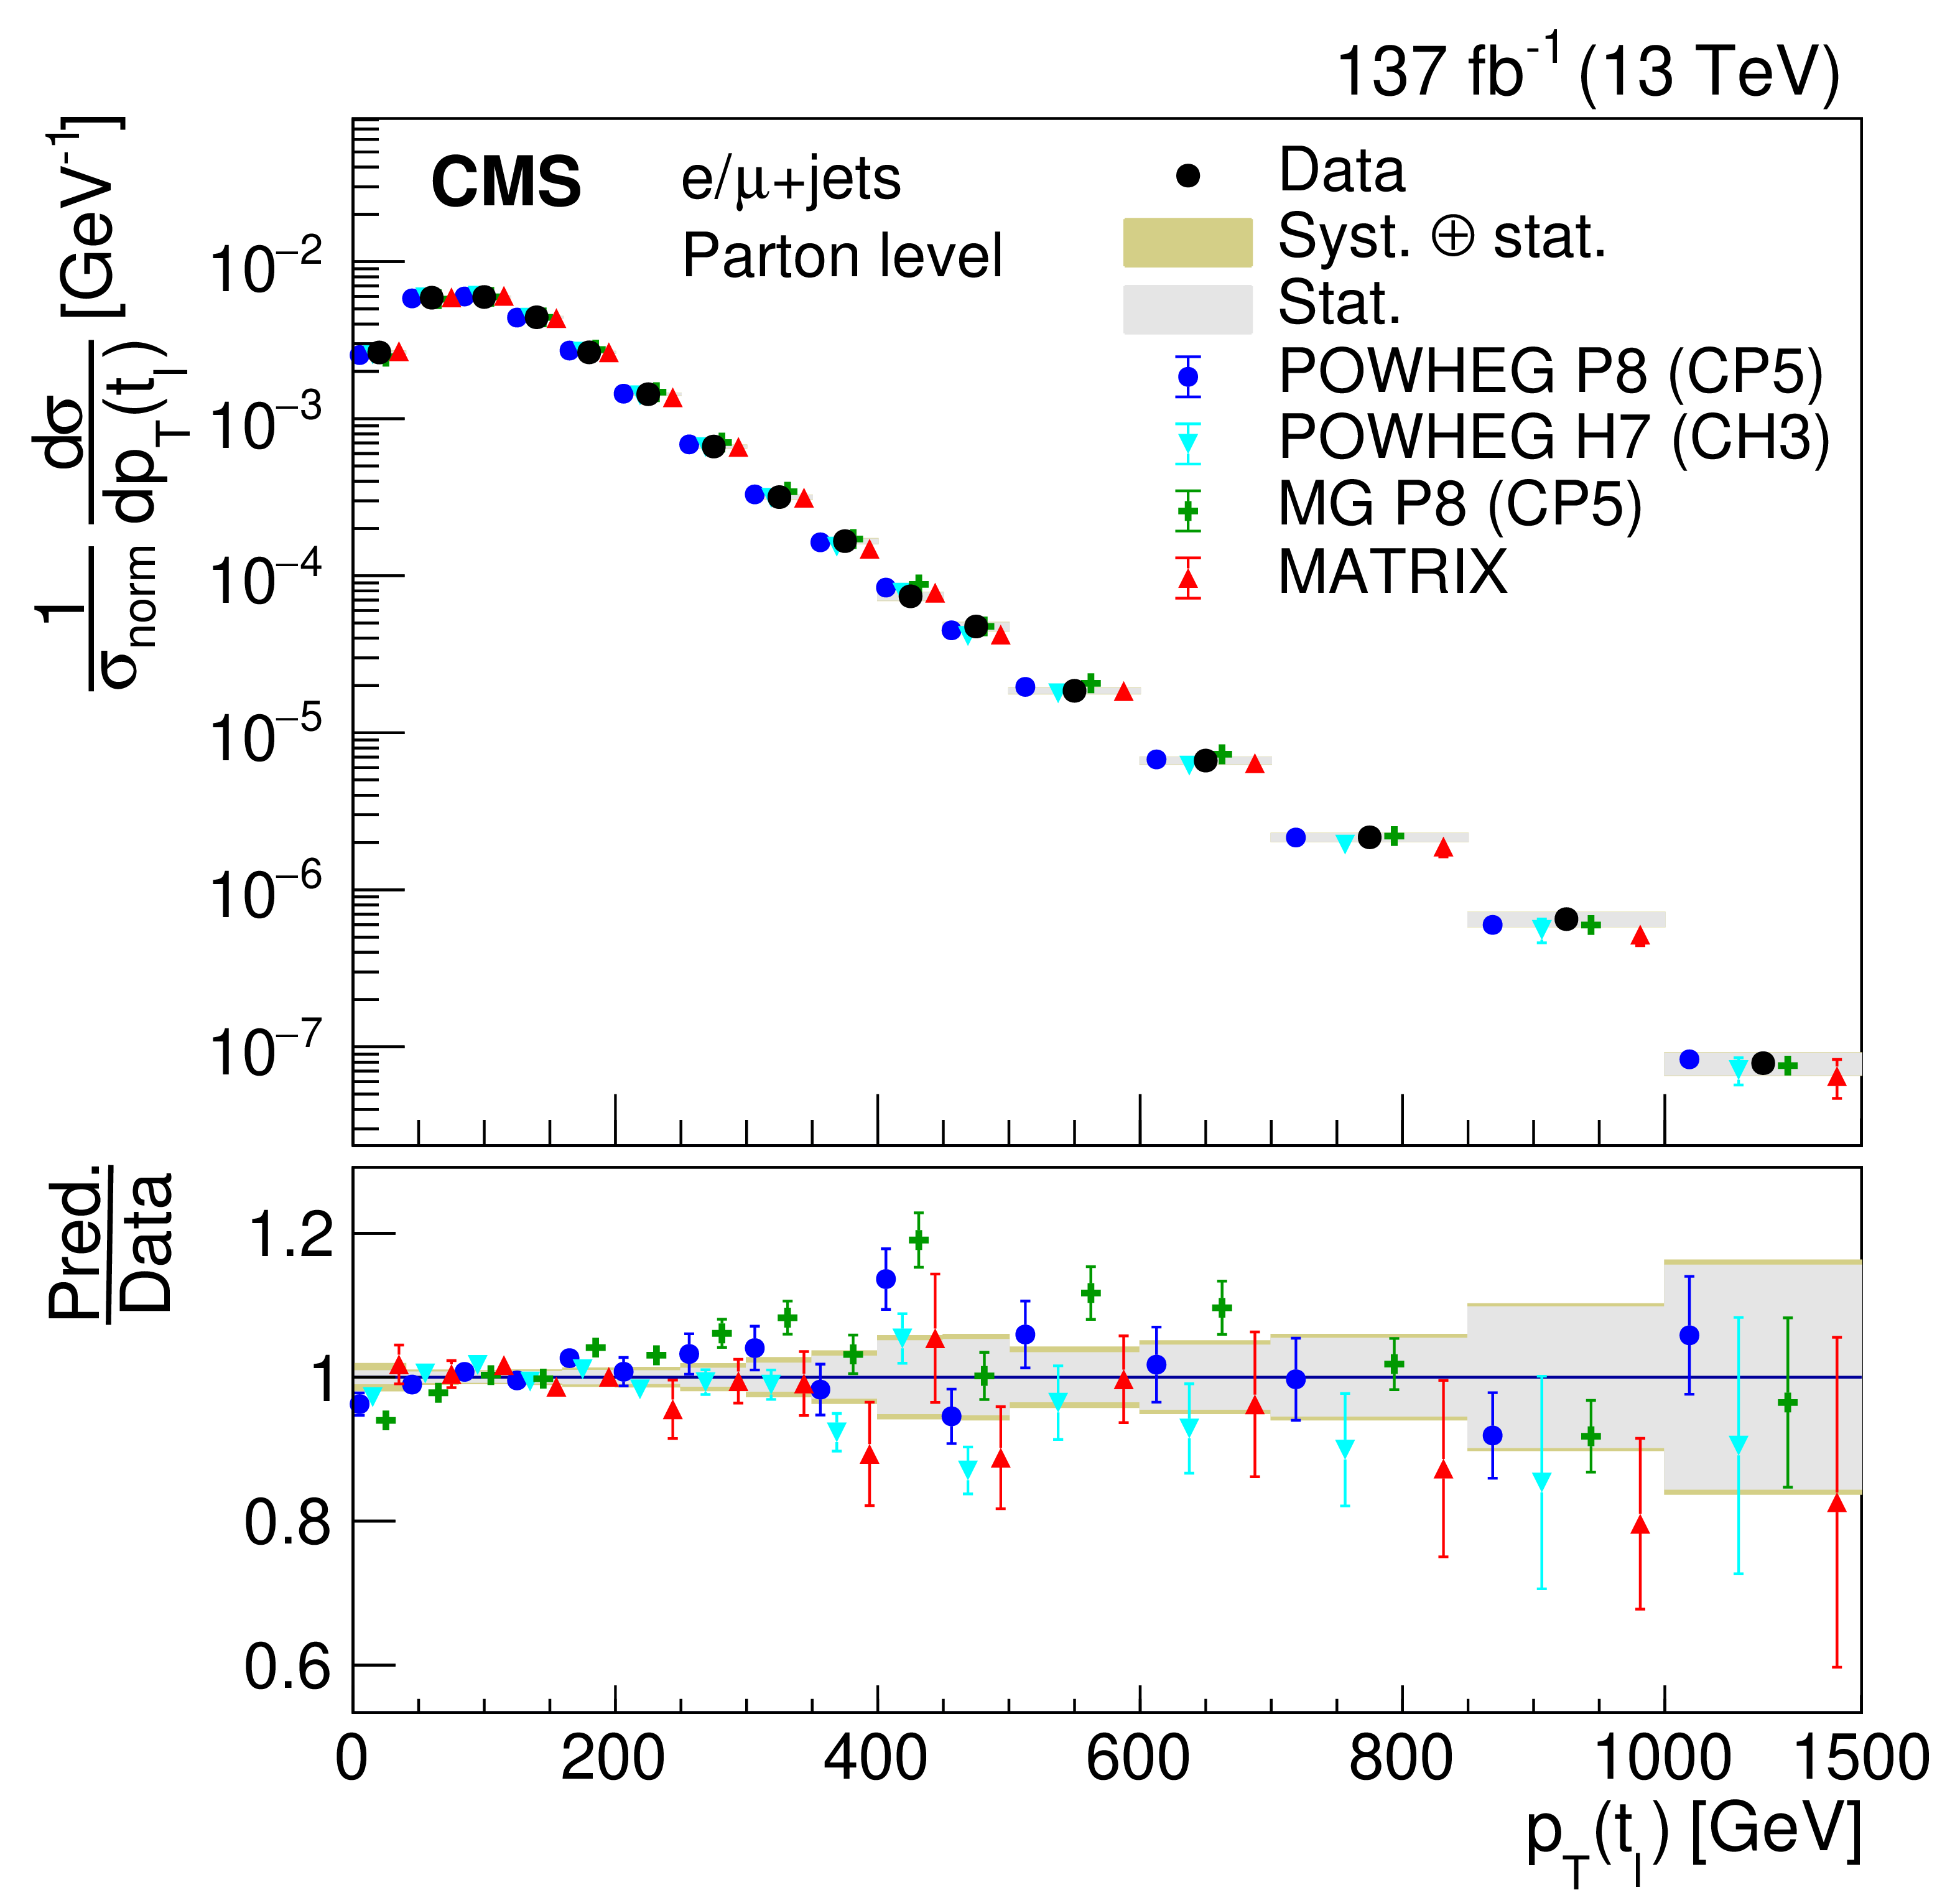
png pdf |
Figure A1-b:
Normalized differential cross sections at the parton level as a function of ${{p_{\mathrm {T}}} ({\mathrm{t} _\mathrm {h}})}$, ${{p_{\mathrm {T}}} ({\mathrm{t} _\ell})}$, ${{p_{\mathrm {T}}} ({\mathrm{t} _\text {high}})}$, ${{p_{\mathrm {T}}} ({\mathrm{t} _\text {low}})}$, and ${S_\mathrm {T}}$. The data are shown as points with gray (yellow) bands indicating the statistical (statistical and systematic) uncertainties. The cross sections are compared to the predictions of POWHEG combined with PYTHIA (P8) or HERWIG (H7), the multiparton simulation MG5_aMC@NLO (MG)+PYTHIA FxFx, and the NNLO QCD calculations obtained with Matrix. The ratios of the various predictions to the measured cross sections are shown in the lower panels. |

png pdf |
Figure A1-c:
Normalized differential cross sections at the parton level as a function of ${{p_{\mathrm {T}}} ({\mathrm{t} _\mathrm {h}})}$, ${{p_{\mathrm {T}}} ({\mathrm{t} _\ell})}$, ${{p_{\mathrm {T}}} ({\mathrm{t} _\text {high}})}$, ${{p_{\mathrm {T}}} ({\mathrm{t} _\text {low}})}$, and ${S_\mathrm {T}}$. The data are shown as points with gray (yellow) bands indicating the statistical (statistical and systematic) uncertainties. The cross sections are compared to the predictions of POWHEG combined with PYTHIA (P8) or HERWIG (H7), the multiparton simulation MG5_aMC@NLO (MG)+PYTHIA FxFx, and the NNLO QCD calculations obtained with Matrix. The ratios of the various predictions to the measured cross sections are shown in the lower panels. |
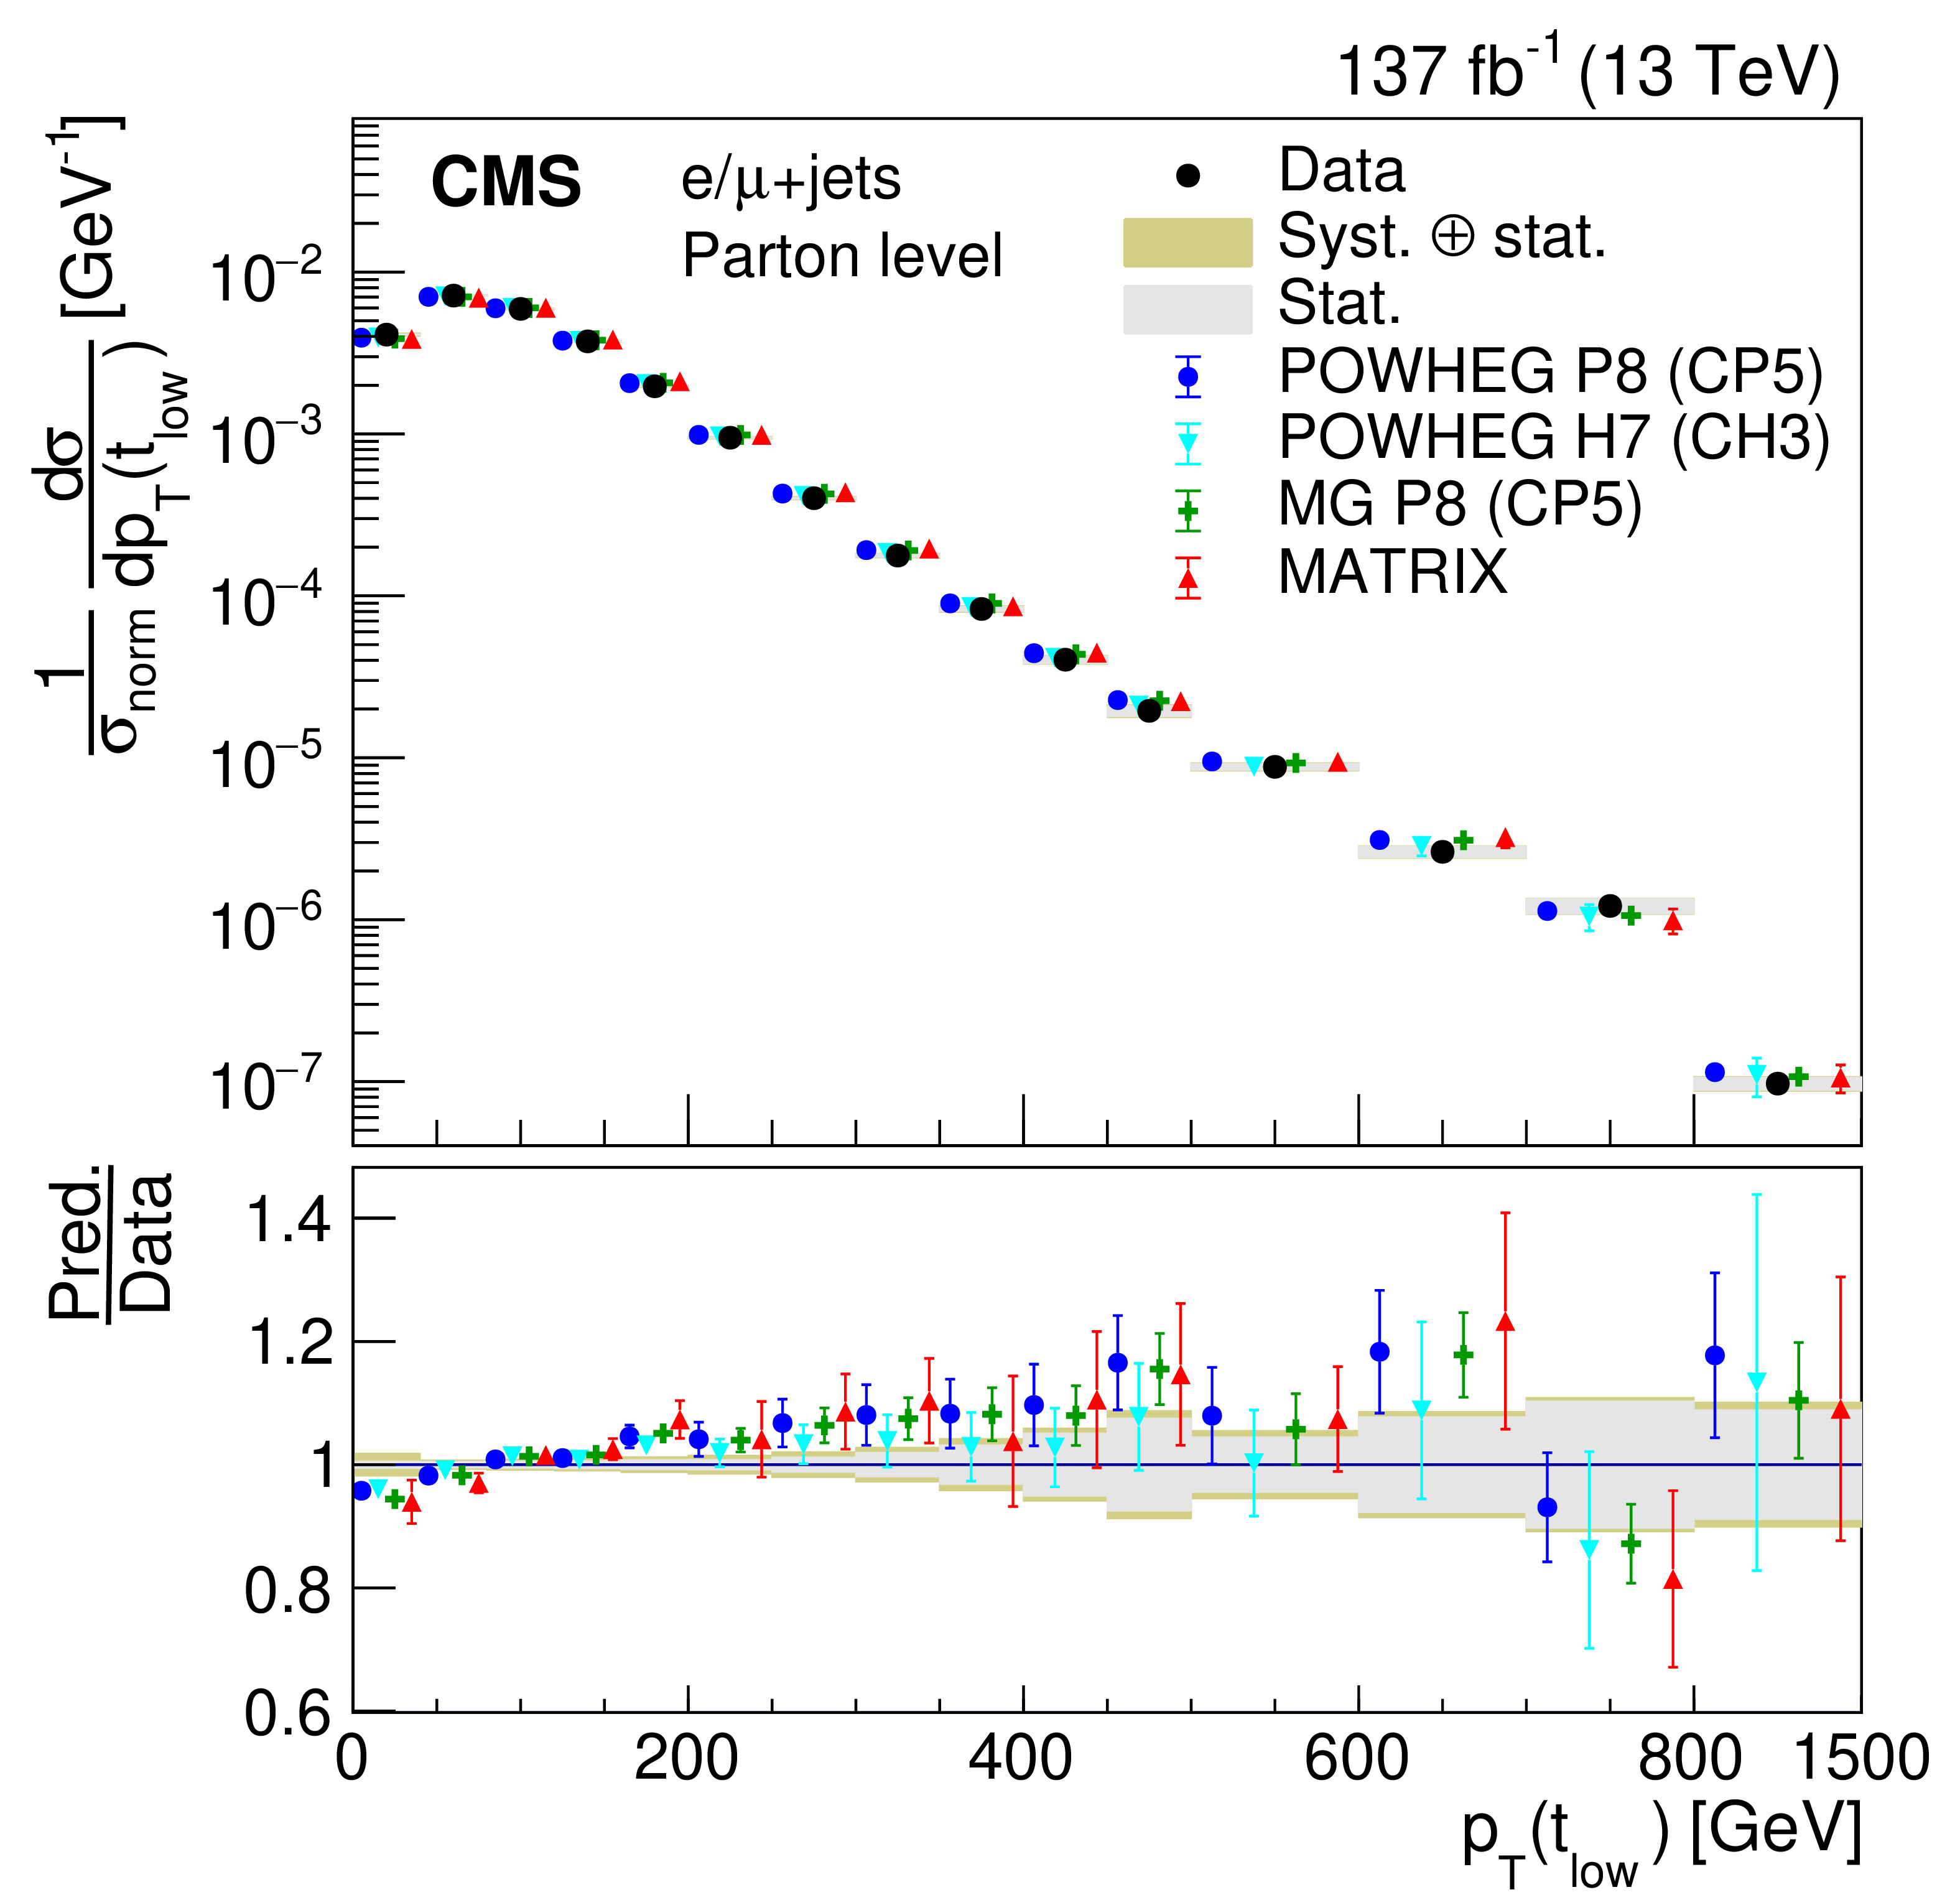
png pdf |
Figure A1-d:
Normalized differential cross sections at the parton level as a function of ${{p_{\mathrm {T}}} ({\mathrm{t} _\mathrm {h}})}$, ${{p_{\mathrm {T}}} ({\mathrm{t} _\ell})}$, ${{p_{\mathrm {T}}} ({\mathrm{t} _\text {high}})}$, ${{p_{\mathrm {T}}} ({\mathrm{t} _\text {low}})}$, and ${S_\mathrm {T}}$. The data are shown as points with gray (yellow) bands indicating the statistical (statistical and systematic) uncertainties. The cross sections are compared to the predictions of POWHEG combined with PYTHIA (P8) or HERWIG (H7), the multiparton simulation MG5_aMC@NLO (MG)+PYTHIA FxFx, and the NNLO QCD calculations obtained with Matrix. The ratios of the various predictions to the measured cross sections are shown in the lower panels. |

png pdf |
Figure A1-e:
Normalized differential cross sections at the parton level as a function of ${{p_{\mathrm {T}}} ({\mathrm{t} _\mathrm {h}})}$, ${{p_{\mathrm {T}}} ({\mathrm{t} _\ell})}$, ${{p_{\mathrm {T}}} ({\mathrm{t} _\text {high}})}$, ${{p_{\mathrm {T}}} ({\mathrm{t} _\text {low}})}$, and ${S_\mathrm {T}}$. The data are shown as points with gray (yellow) bands indicating the statistical (statistical and systematic) uncertainties. The cross sections are compared to the predictions of POWHEG combined with PYTHIA (P8) or HERWIG (H7), the multiparton simulation MG5_aMC@NLO (MG)+PYTHIA FxFx, and the NNLO QCD calculations obtained with Matrix. The ratios of the various predictions to the measured cross sections are shown in the lower panels. |
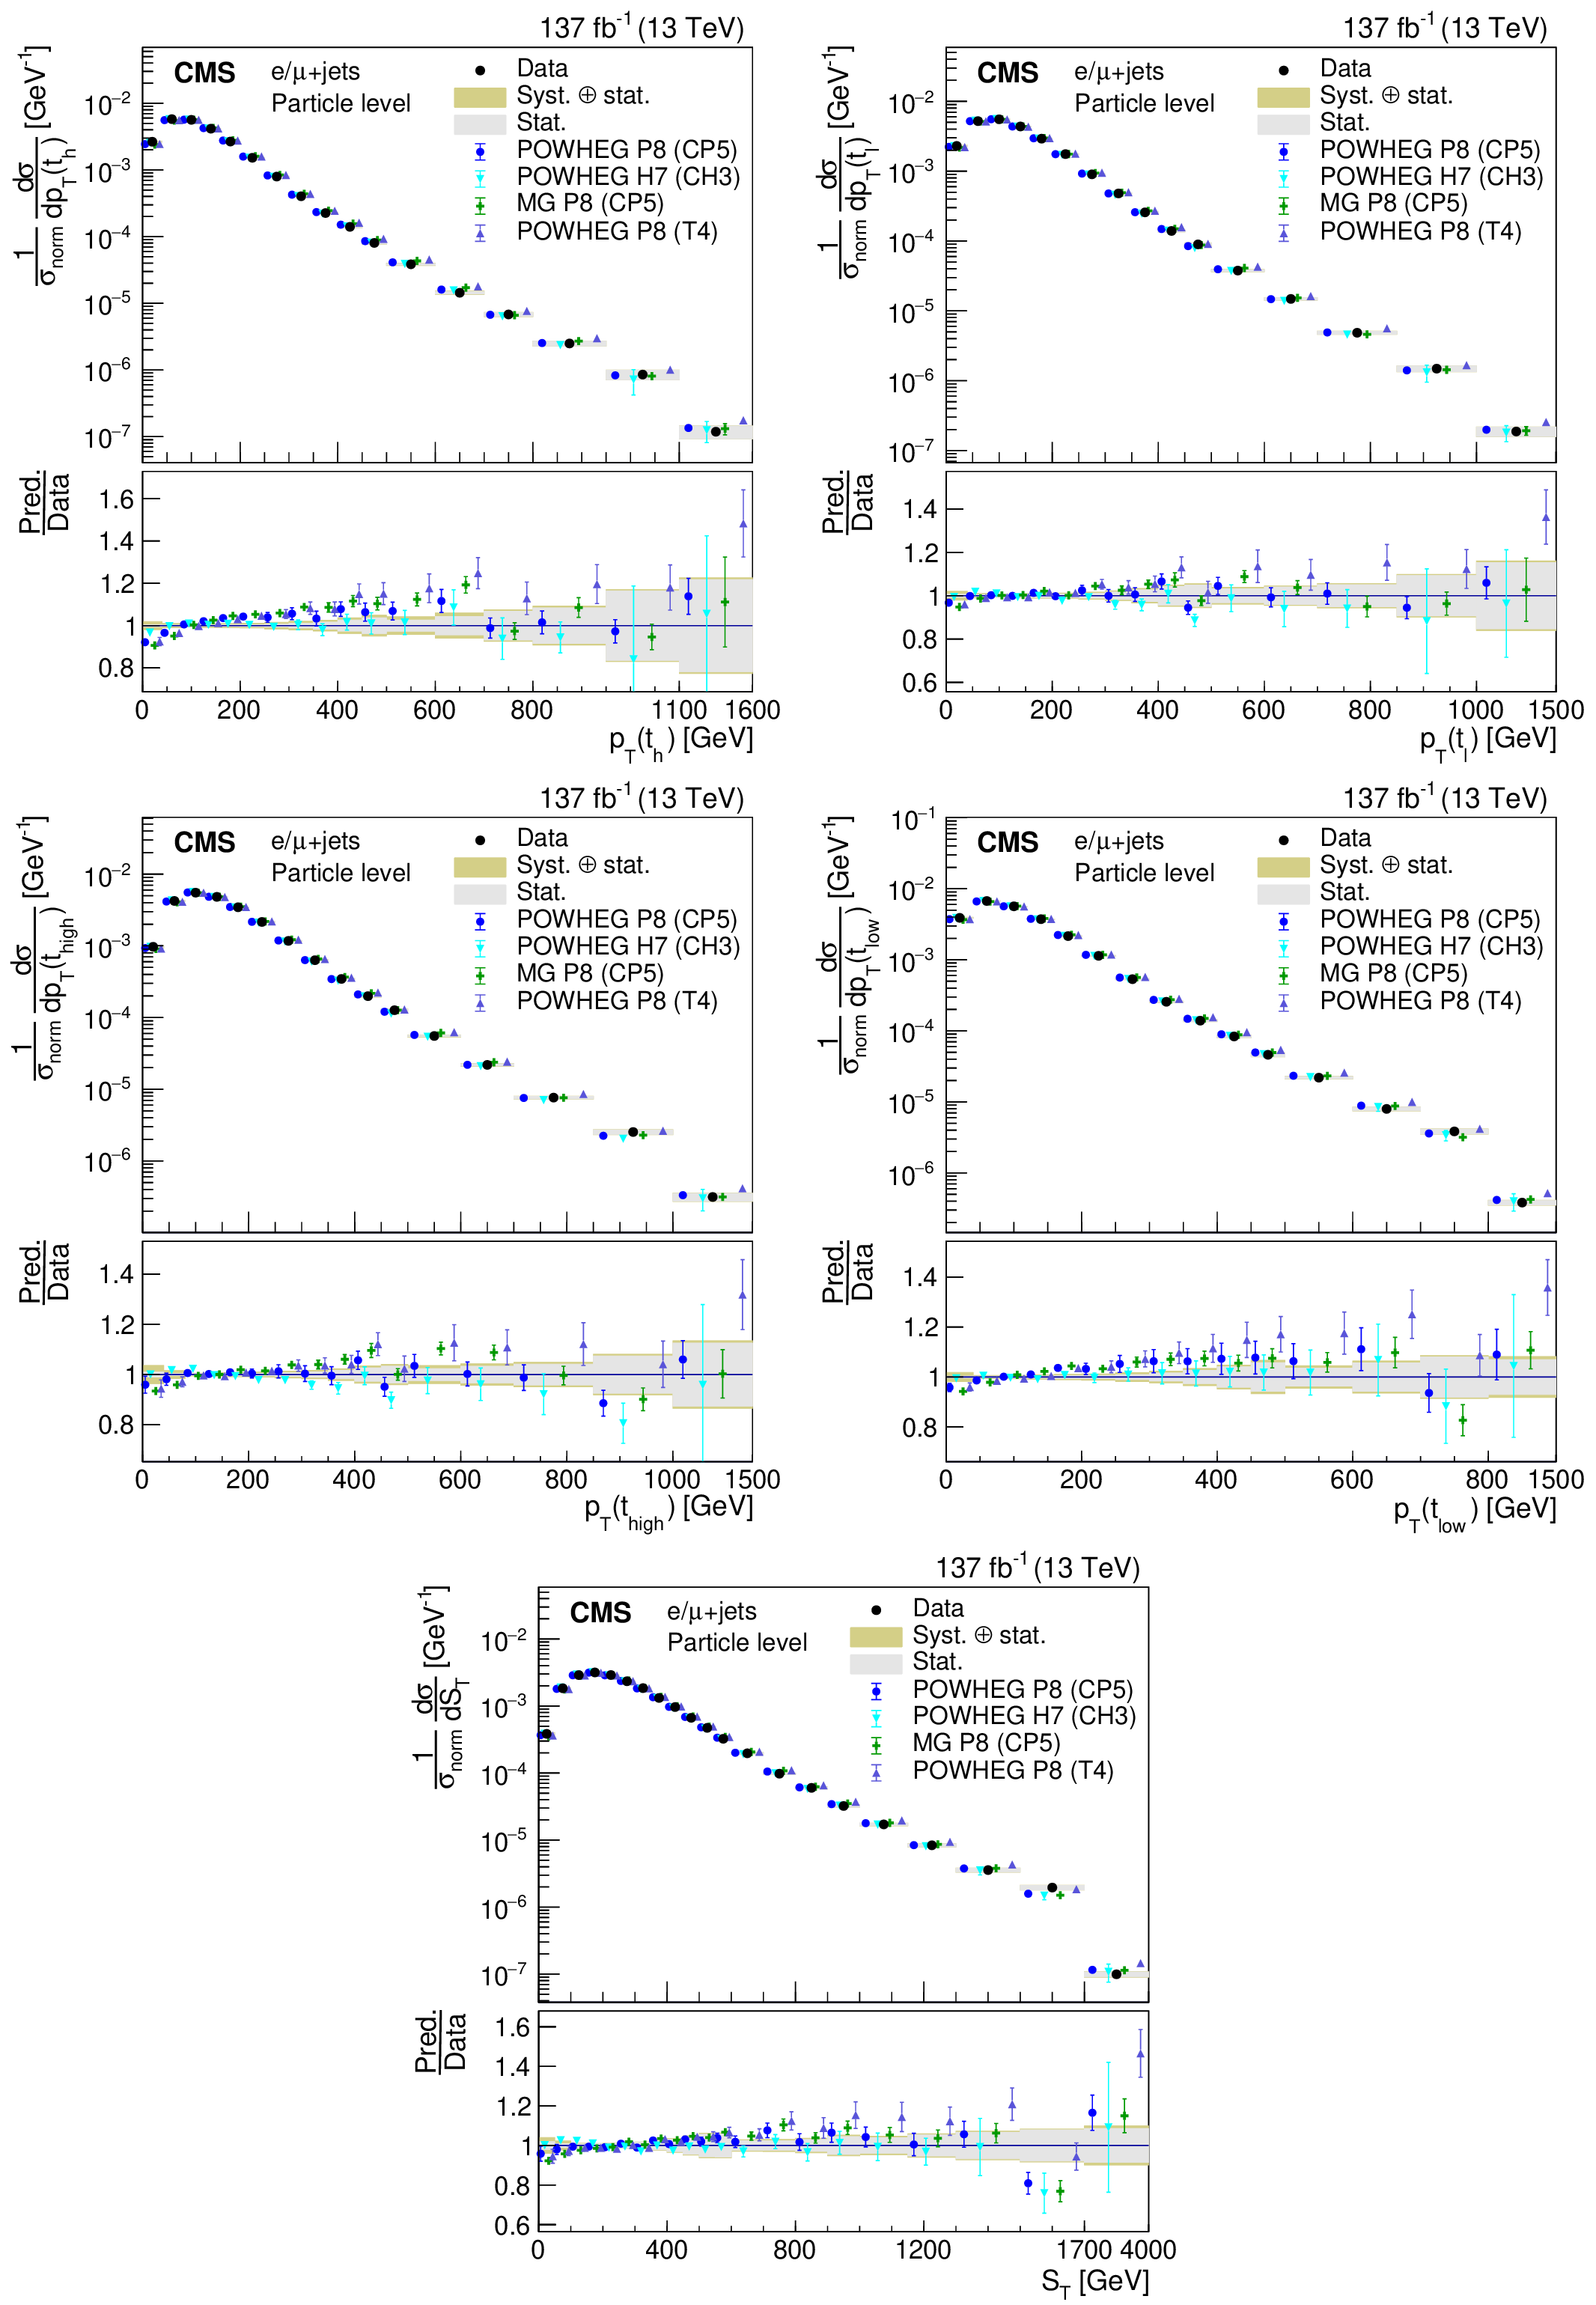
png pdf |
Figure A2:
Normalized differential cross sections at the particle level as a function of ${{p_{\mathrm {T}}} ({\mathrm{t} _\mathrm {h}})}$, ${{p_{\mathrm {T}}} ({\mathrm{t} _\ell})}$, ${{p_{\mathrm {T}}} ({\mathrm{t} _\text {high}})}$, ${{p_{\mathrm {T}}} ({\mathrm{t} _\text {low}})}$, and ${S_\mathrm {T}}$. The data are shown as points with gray (yellow) bands indicating the statistical (statistical and systematic) uncertainties. The cross sections are compared to the predictions of POWHEG+PYTHIA (P8) for the CP5 and CUETP8M2T4 (T4) tunes, POWHEG+HERWIG (H7), and the multiparton simulation MG5_aMC@NLO (MG)+PYTHIA. The ratios of the various predictions to the measured cross sections are shown in the lower panels. |
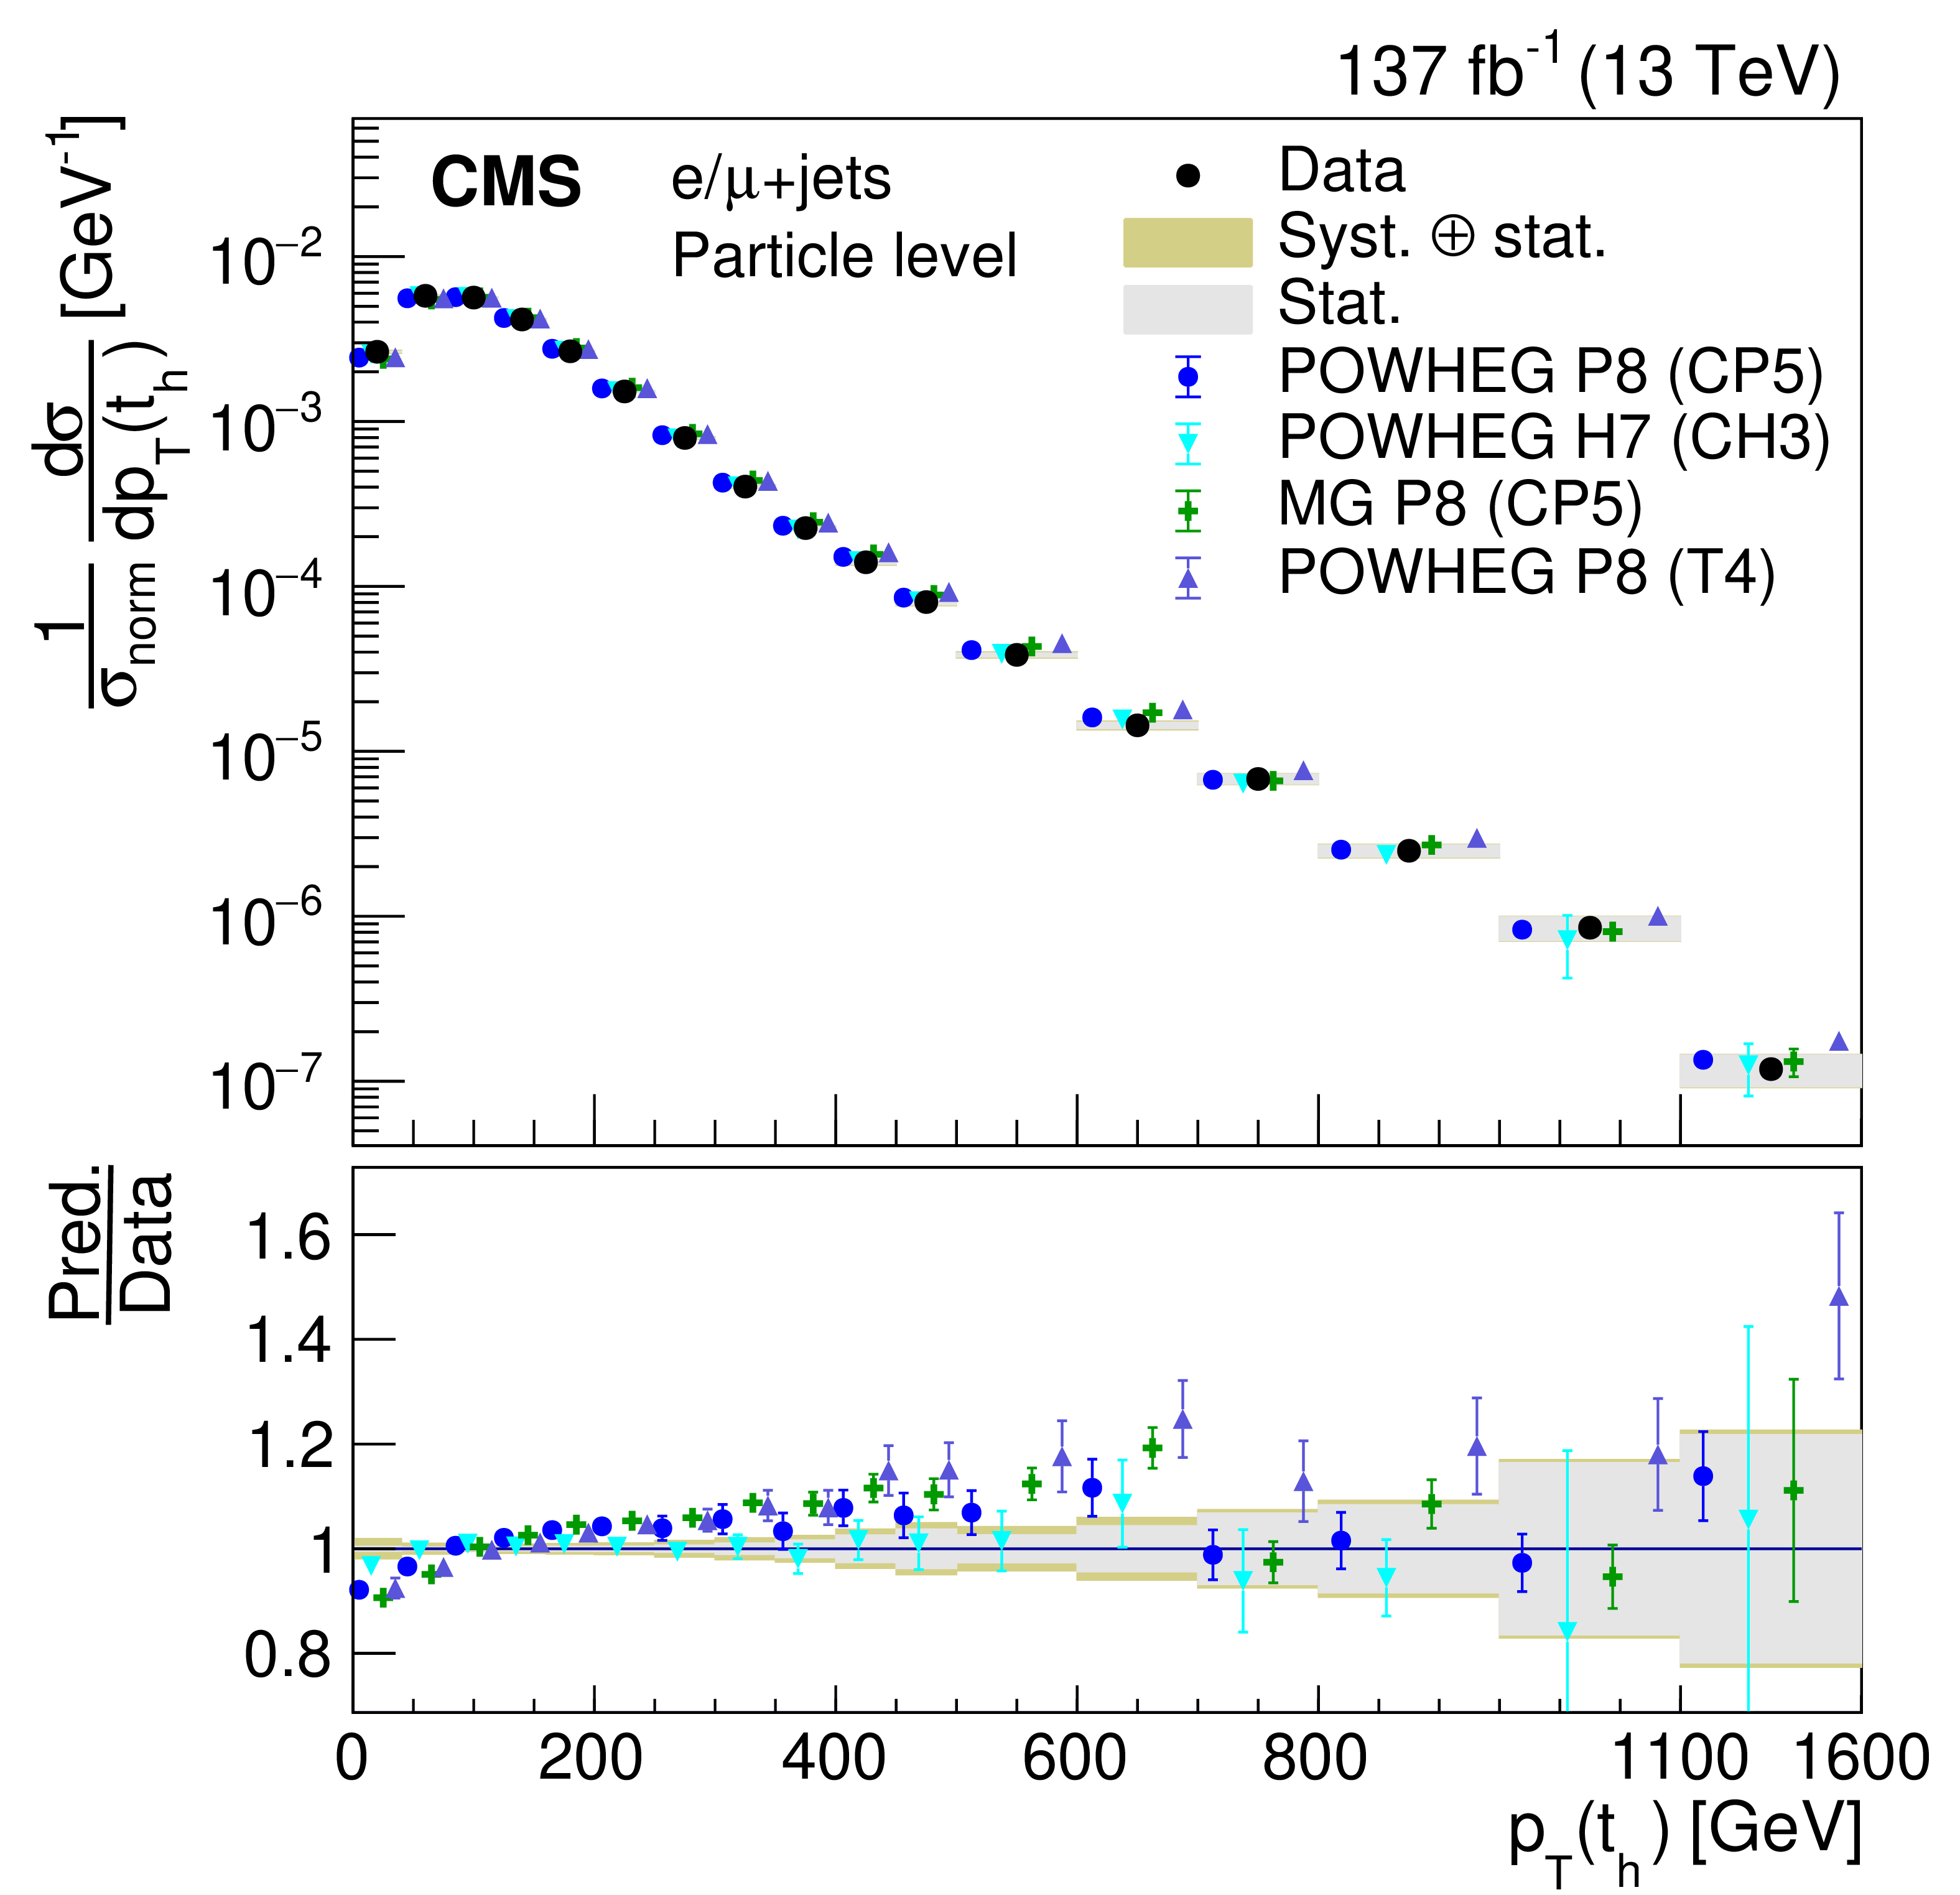
png pdf |
Figure A2-a:
Normalized differential cross sections at the particle level as a function of ${{p_{\mathrm {T}}} ({\mathrm{t} _\mathrm {h}})}$, ${{p_{\mathrm {T}}} ({\mathrm{t} _\ell})}$, ${{p_{\mathrm {T}}} ({\mathrm{t} _\text {high}})}$, ${{p_{\mathrm {T}}} ({\mathrm{t} _\text {low}})}$, and ${S_\mathrm {T}}$. The data are shown as points with gray (yellow) bands indicating the statistical (statistical and systematic) uncertainties. The cross sections are compared to the predictions of POWHEG+PYTHIA (P8) for the CP5 and CUETP8M2T4 (T4) tunes, POWHEG+HERWIG (H7), and the multiparton simulation MG5_aMC@NLO (MG)+PYTHIA. The ratios of the various predictions to the measured cross sections are shown in the lower panels. |
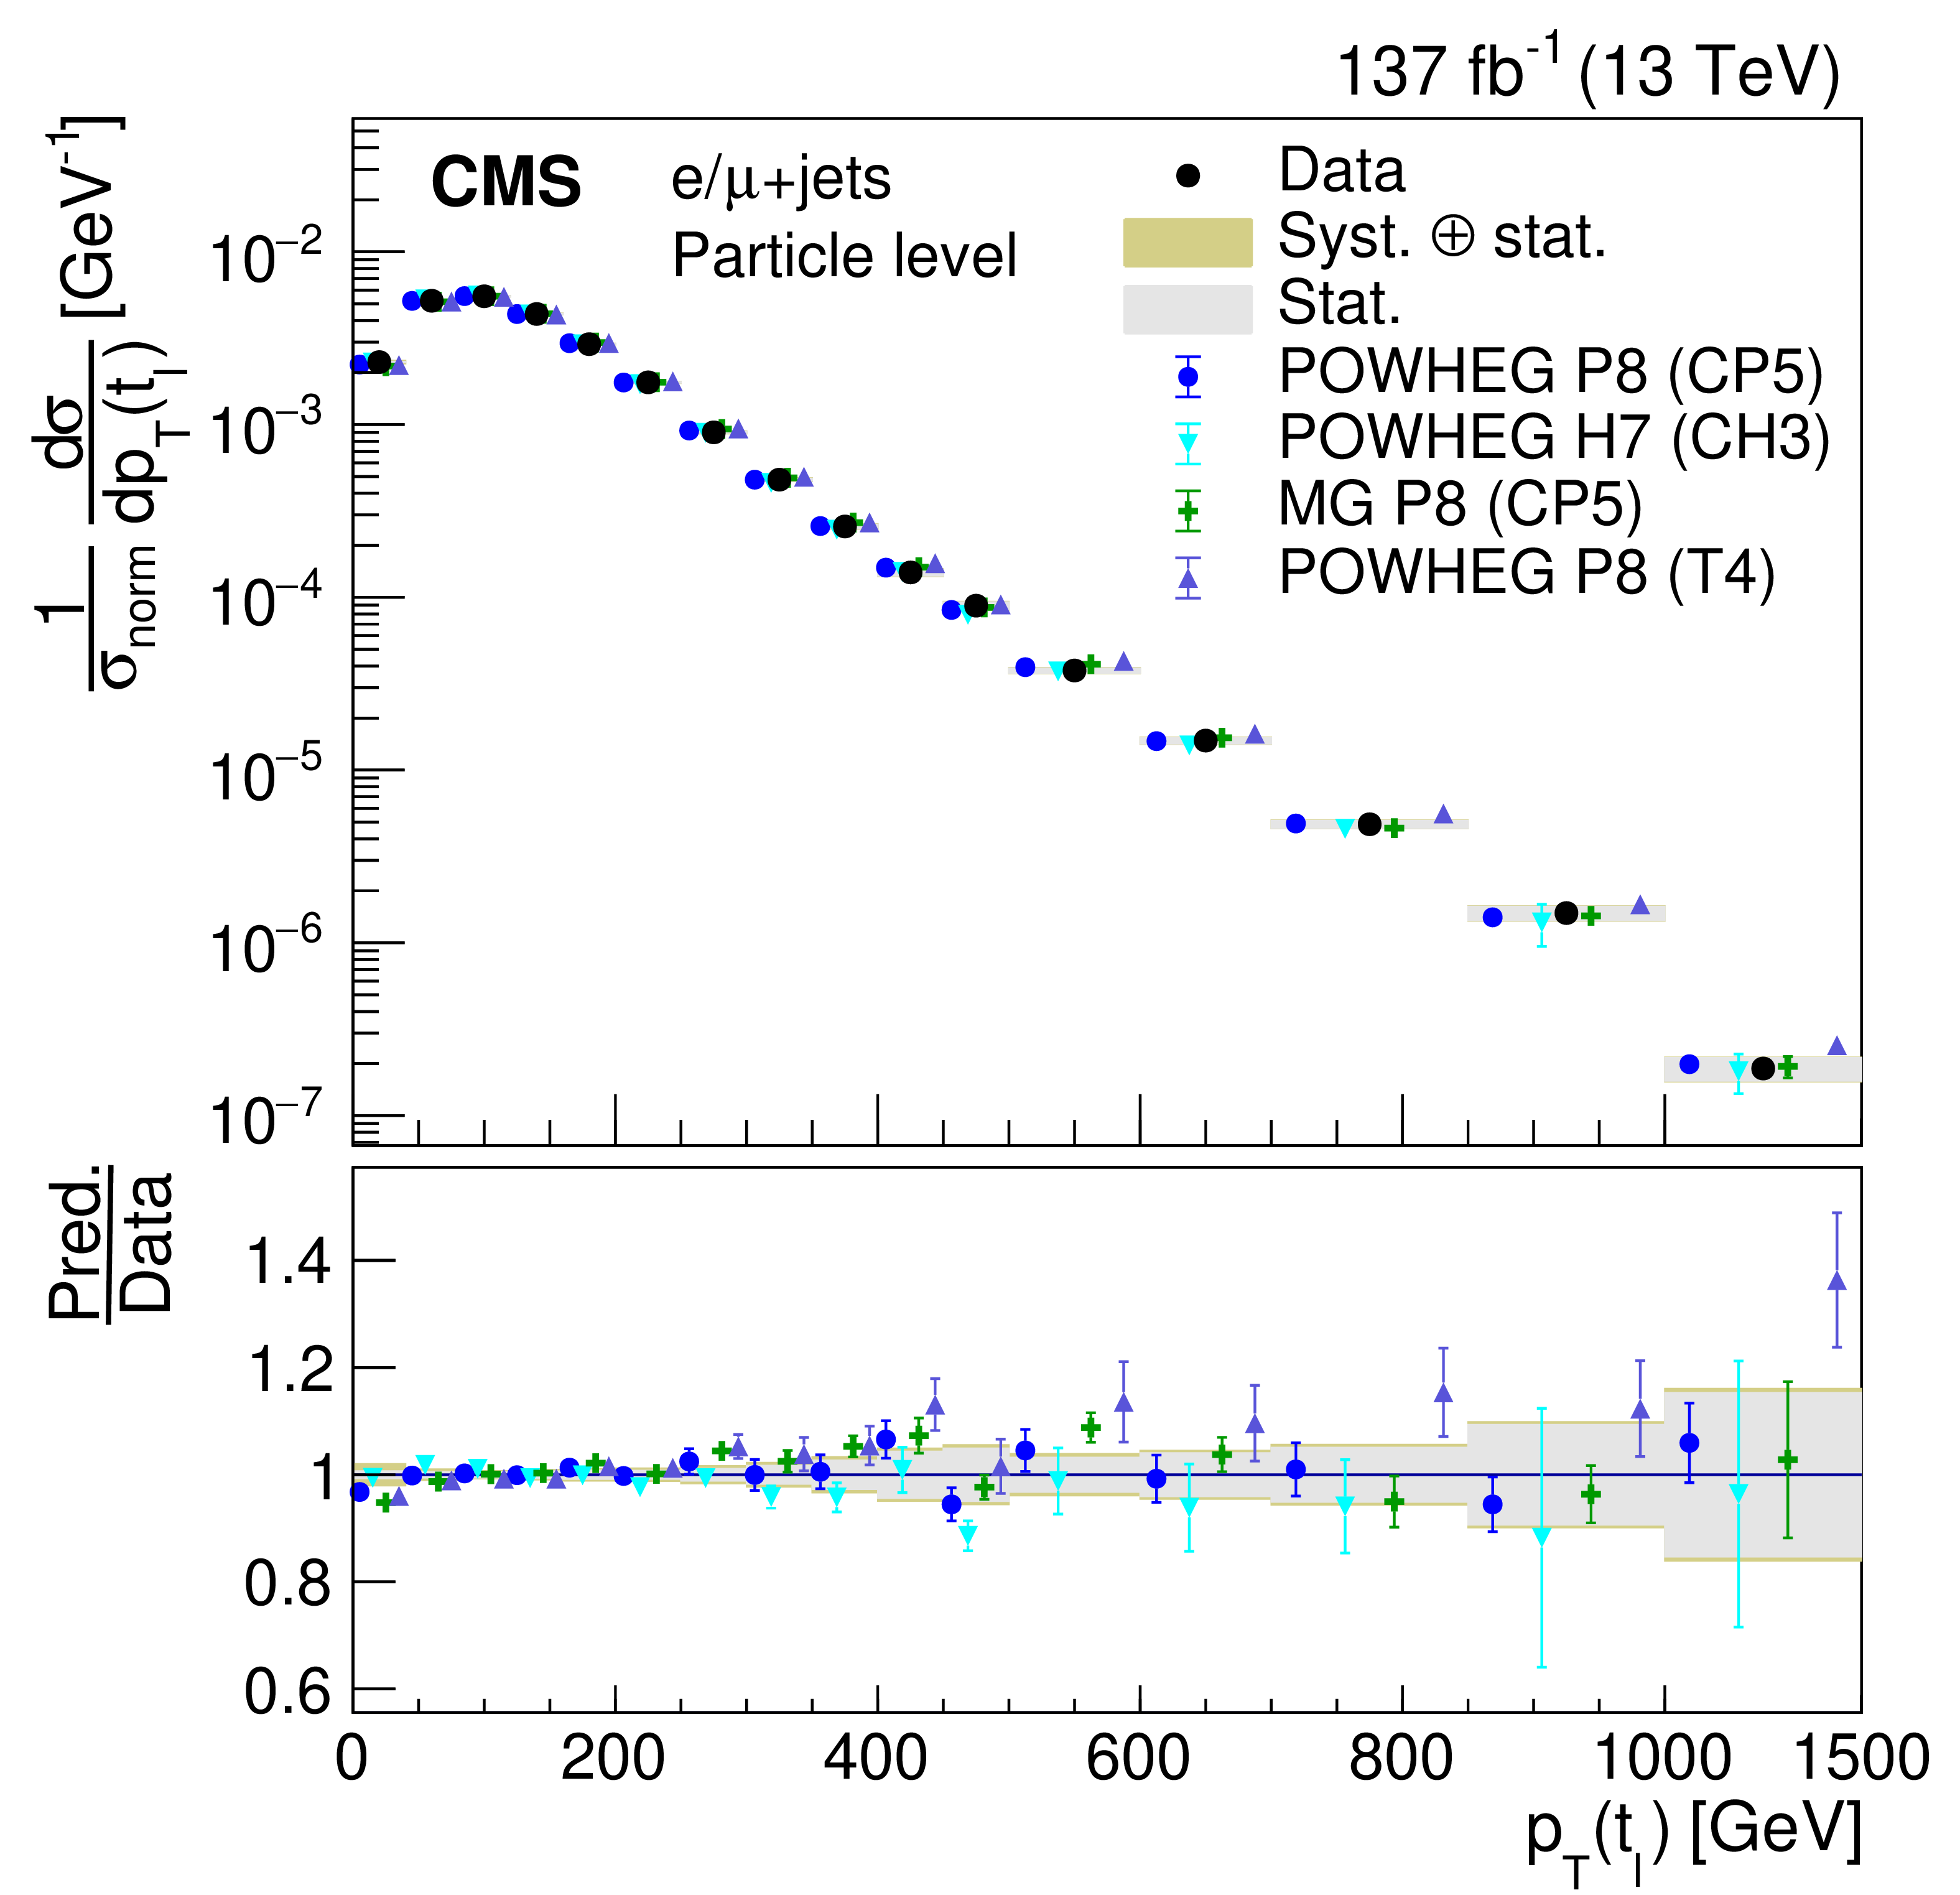
png pdf |
Figure A2-b:
Normalized differential cross sections at the particle level as a function of ${{p_{\mathrm {T}}} ({\mathrm{t} _\mathrm {h}})}$, ${{p_{\mathrm {T}}} ({\mathrm{t} _\ell})}$, ${{p_{\mathrm {T}}} ({\mathrm{t} _\text {high}})}$, ${{p_{\mathrm {T}}} ({\mathrm{t} _\text {low}})}$, and ${S_\mathrm {T}}$. The data are shown as points with gray (yellow) bands indicating the statistical (statistical and systematic) uncertainties. The cross sections are compared to the predictions of POWHEG+PYTHIA (P8) for the CP5 and CUETP8M2T4 (T4) tunes, POWHEG+HERWIG (H7), and the multiparton simulation MG5_aMC@NLO (MG)+PYTHIA. The ratios of the various predictions to the measured cross sections are shown in the lower panels. |
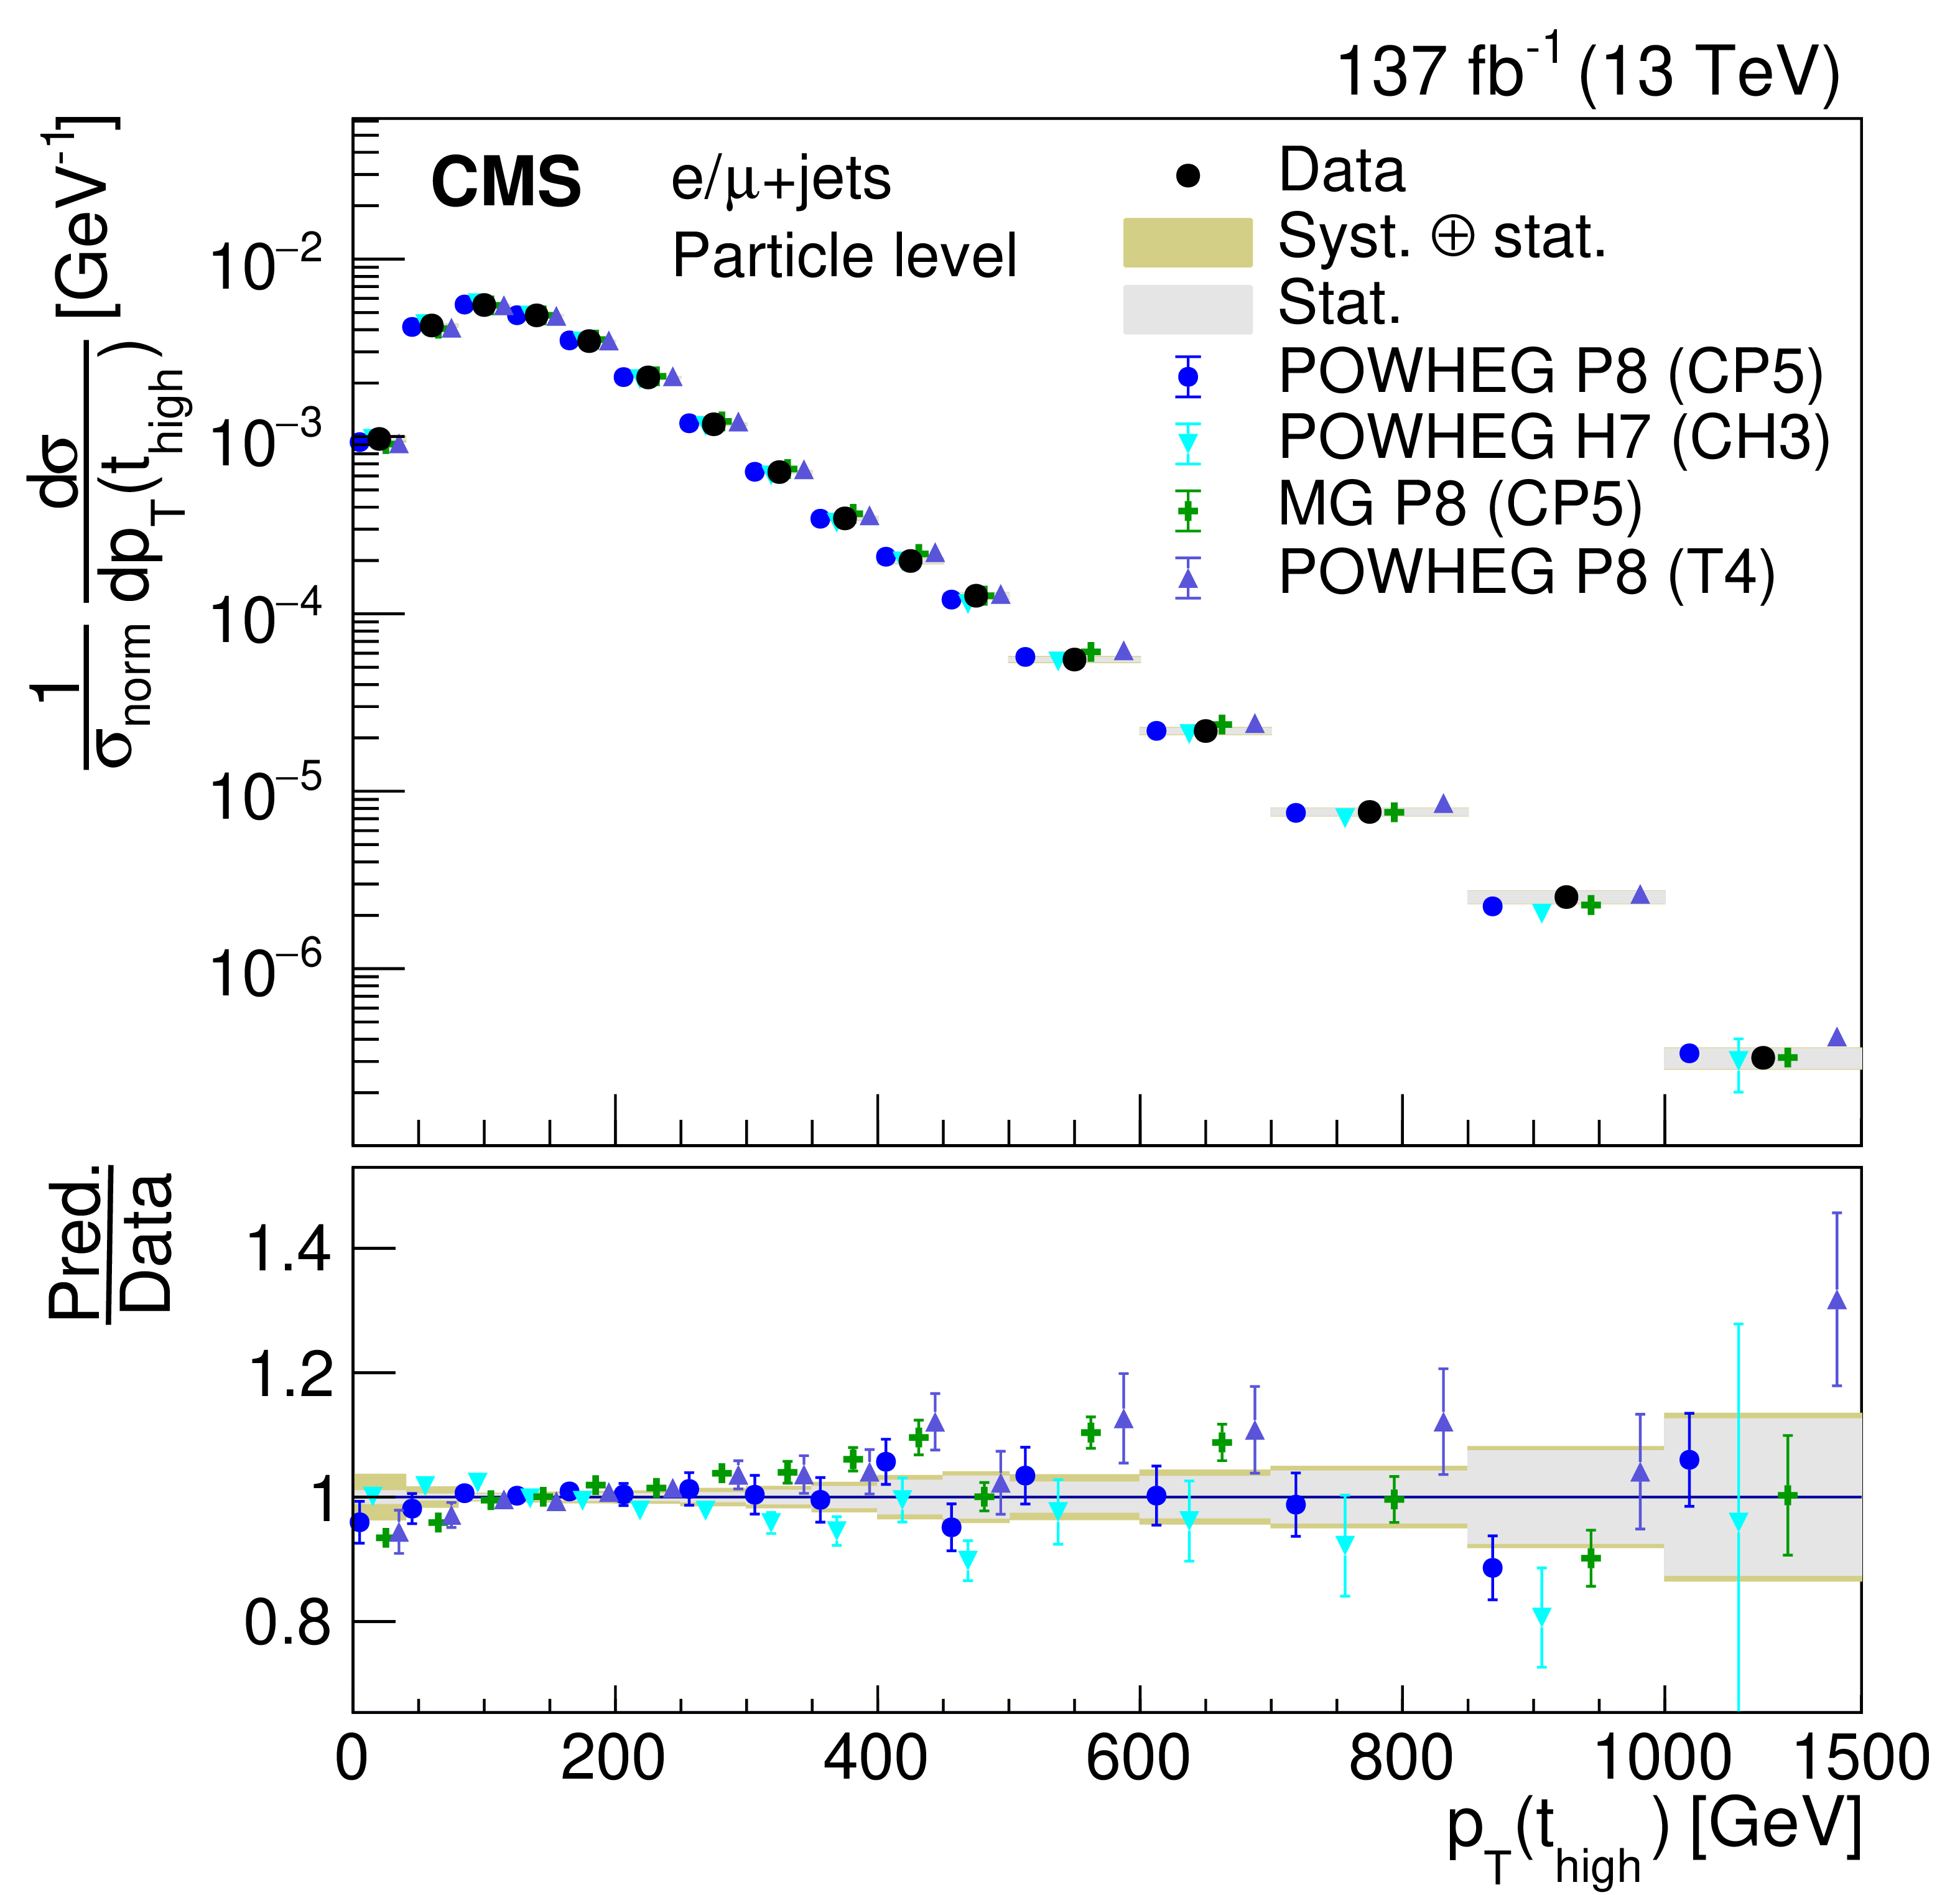
png pdf |
Figure A2-c:
Normalized differential cross sections at the particle level as a function of ${{p_{\mathrm {T}}} ({\mathrm{t} _\mathrm {h}})}$, ${{p_{\mathrm {T}}} ({\mathrm{t} _\ell})}$, ${{p_{\mathrm {T}}} ({\mathrm{t} _\text {high}})}$, ${{p_{\mathrm {T}}} ({\mathrm{t} _\text {low}})}$, and ${S_\mathrm {T}}$. The data are shown as points with gray (yellow) bands indicating the statistical (statistical and systematic) uncertainties. The cross sections are compared to the predictions of POWHEG+PYTHIA (P8) for the CP5 and CUETP8M2T4 (T4) tunes, POWHEG+HERWIG (H7), and the multiparton simulation MG5_aMC@NLO (MG)+PYTHIA. The ratios of the various predictions to the measured cross sections are shown in the lower panels. |

png pdf |
Figure A2-d:
Normalized differential cross sections at the particle level as a function of ${{p_{\mathrm {T}}} ({\mathrm{t} _\mathrm {h}})}$, ${{p_{\mathrm {T}}} ({\mathrm{t} _\ell})}$, ${{p_{\mathrm {T}}} ({\mathrm{t} _\text {high}})}$, ${{p_{\mathrm {T}}} ({\mathrm{t} _\text {low}})}$, and ${S_\mathrm {T}}$. The data are shown as points with gray (yellow) bands indicating the statistical (statistical and systematic) uncertainties. The cross sections are compared to the predictions of POWHEG+PYTHIA (P8) for the CP5 and CUETP8M2T4 (T4) tunes, POWHEG+HERWIG (H7), and the multiparton simulation MG5_aMC@NLO (MG)+PYTHIA. The ratios of the various predictions to the measured cross sections are shown in the lower panels. |

png pdf |
Figure A2-e:
Normalized differential cross sections at the particle level as a function of ${{p_{\mathrm {T}}} ({\mathrm{t} _\mathrm {h}})}$, ${{p_{\mathrm {T}}} ({\mathrm{t} _\ell})}$, ${{p_{\mathrm {T}}} ({\mathrm{t} _\text {high}})}$, ${{p_{\mathrm {T}}} ({\mathrm{t} _\text {low}})}$, and ${S_\mathrm {T}}$. The data are shown as points with gray (yellow) bands indicating the statistical (statistical and systematic) uncertainties. The cross sections are compared to the predictions of POWHEG+PYTHIA (P8) for the CP5 and CUETP8M2T4 (T4) tunes, POWHEG+HERWIG (H7), and the multiparton simulation MG5_aMC@NLO (MG)+PYTHIA. The ratios of the various predictions to the measured cross sections are shown in the lower panels. |
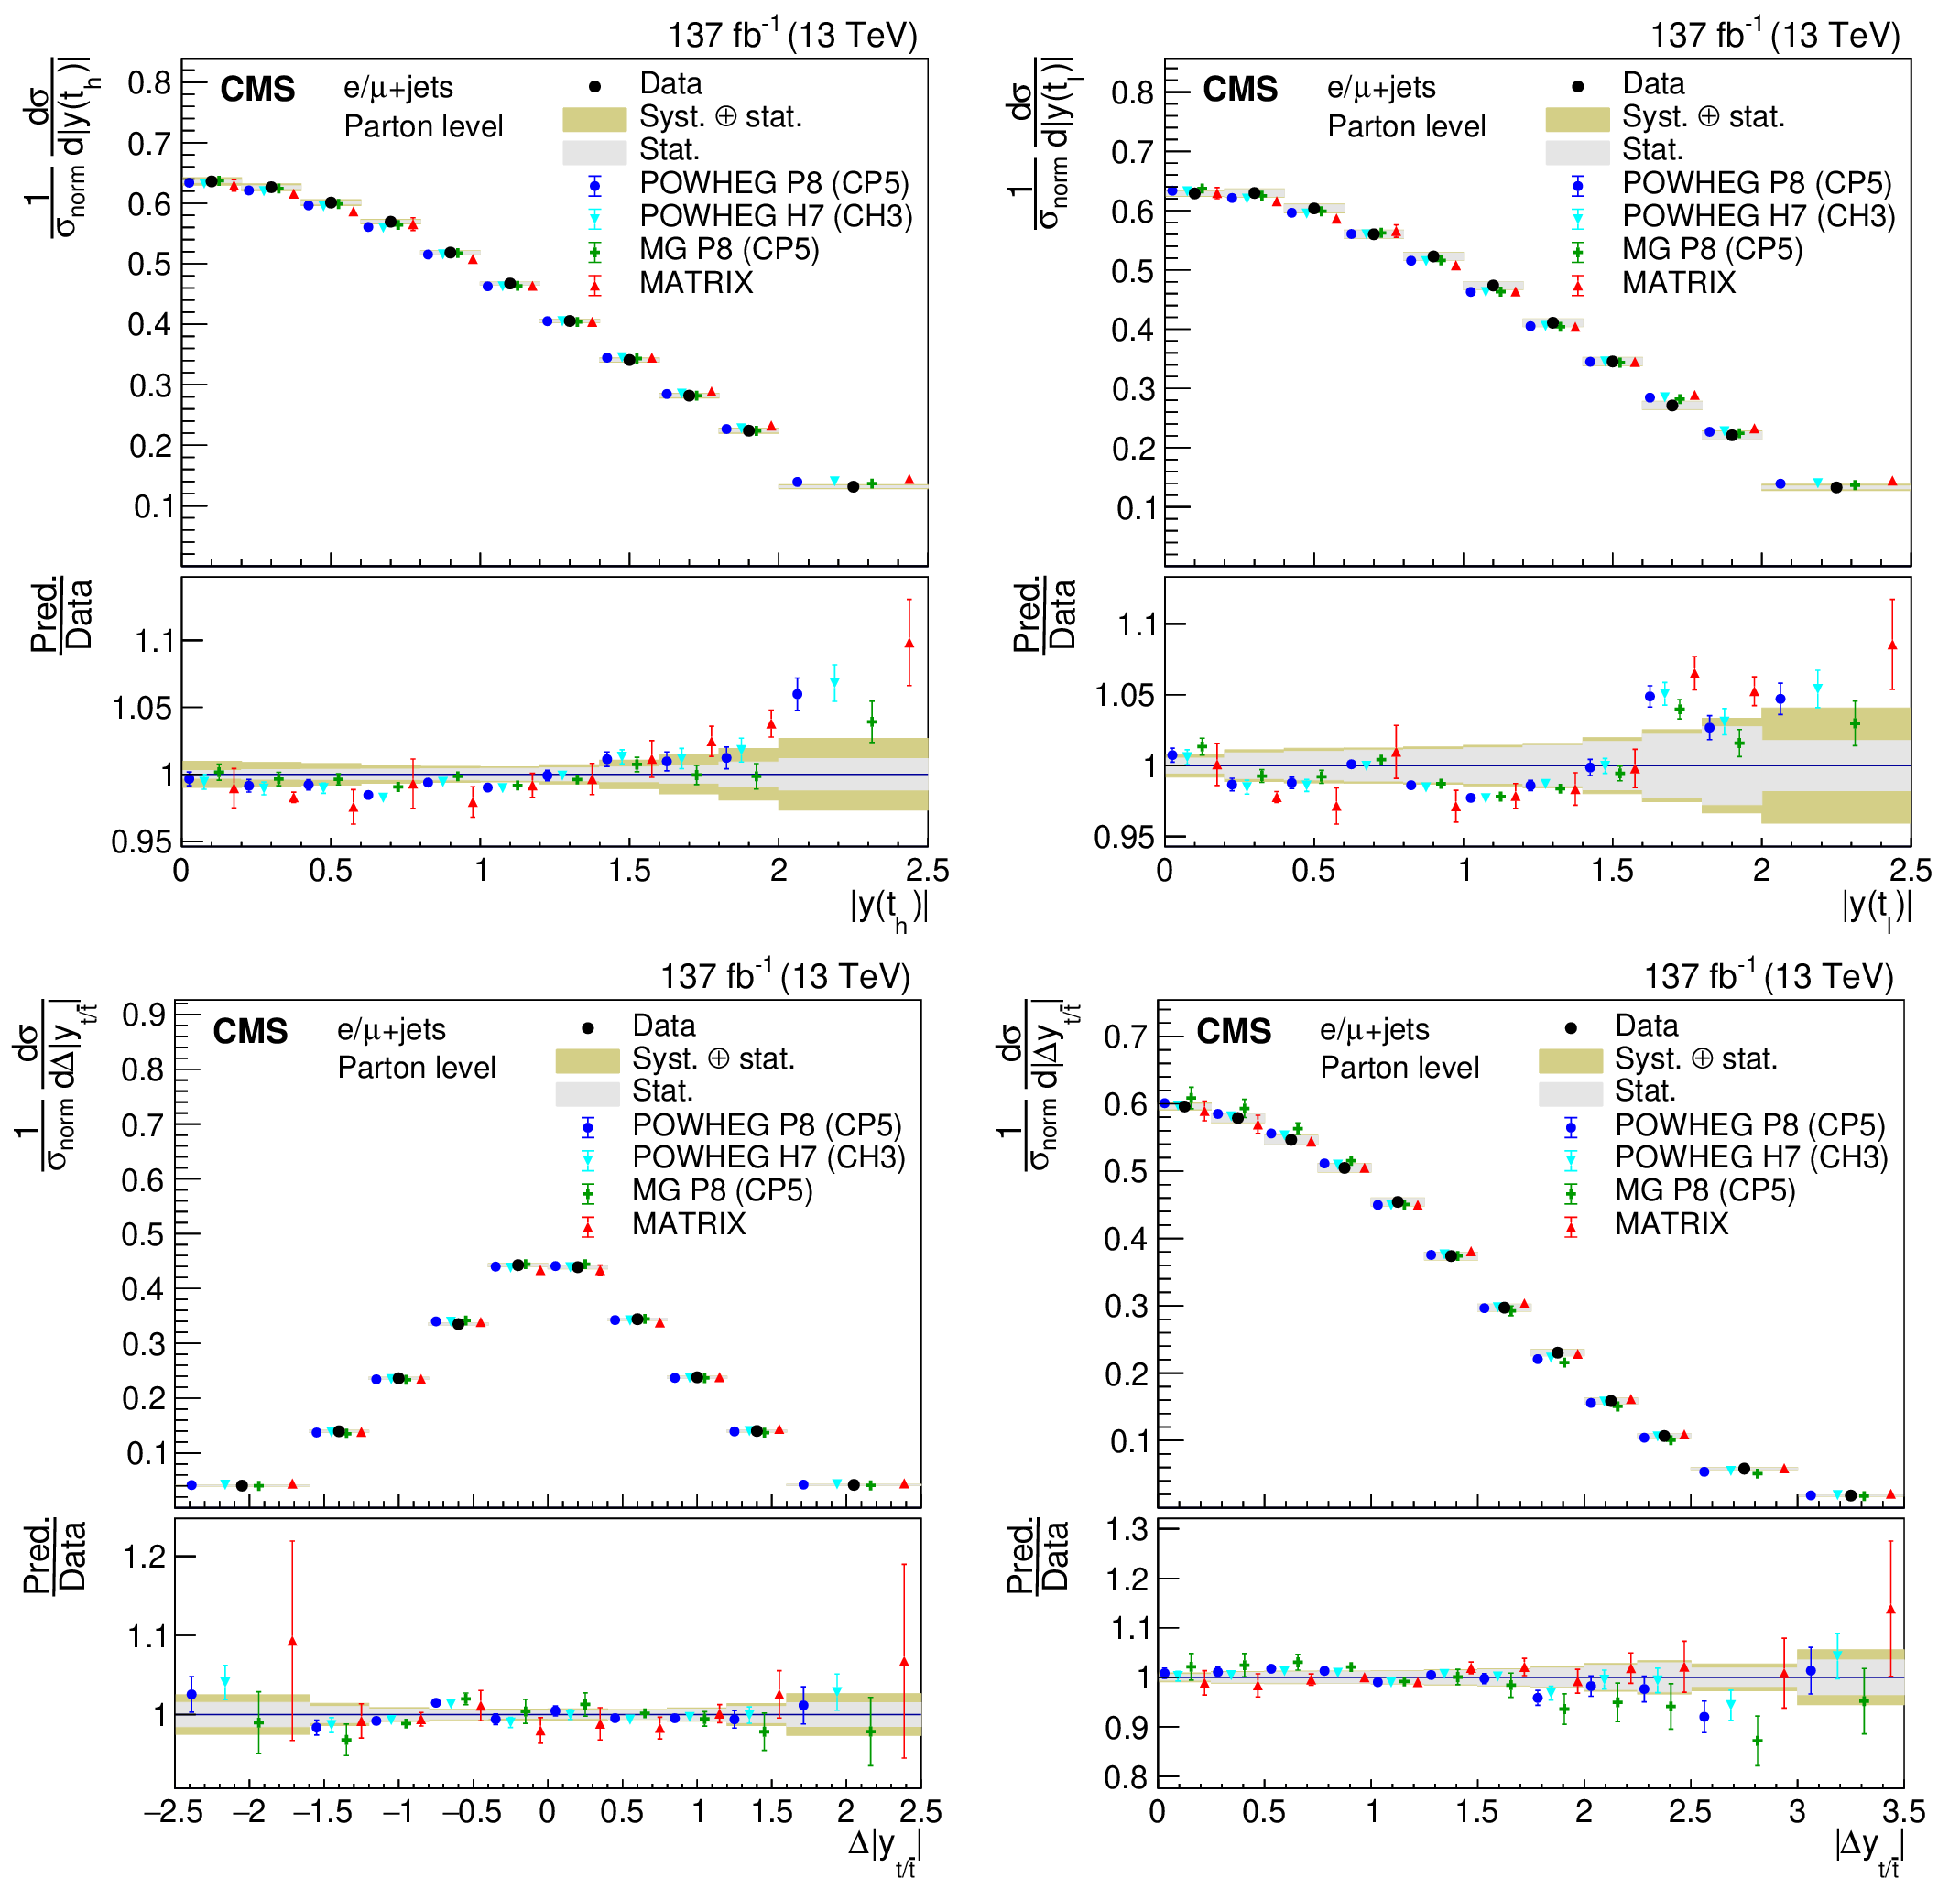
png pdf |
Figure A3:
Normalized differential cross sections at the parton level as a function of ${{| y({\mathrm{t} _\mathrm {h}}) |}}$, ${{| y({\mathrm{t} _\ell}) |}}$, and the differences ${\Delta {| y_{\mathrm{t} /\mathrm{\bar{t}}} |}}$ and ${{| \Delta y_{\mathrm{t} /\mathrm{\bar{t}}} |}}$. The data are shown as points with gray (yellow) bands indicating the statistical (statistical and systematic) uncertainties. The cross sections are compared to the predictions of POWHEG combined with PYTHIA (P8) or HERWIG (H7), the multiparton simulation MG5_aMC@NLO (MG)+PYTHIA FxFx, and the NNLO QCD calculations obtained with Matrix. The ratios of the various predictions to the measured cross sections are shown in the lower panels. |
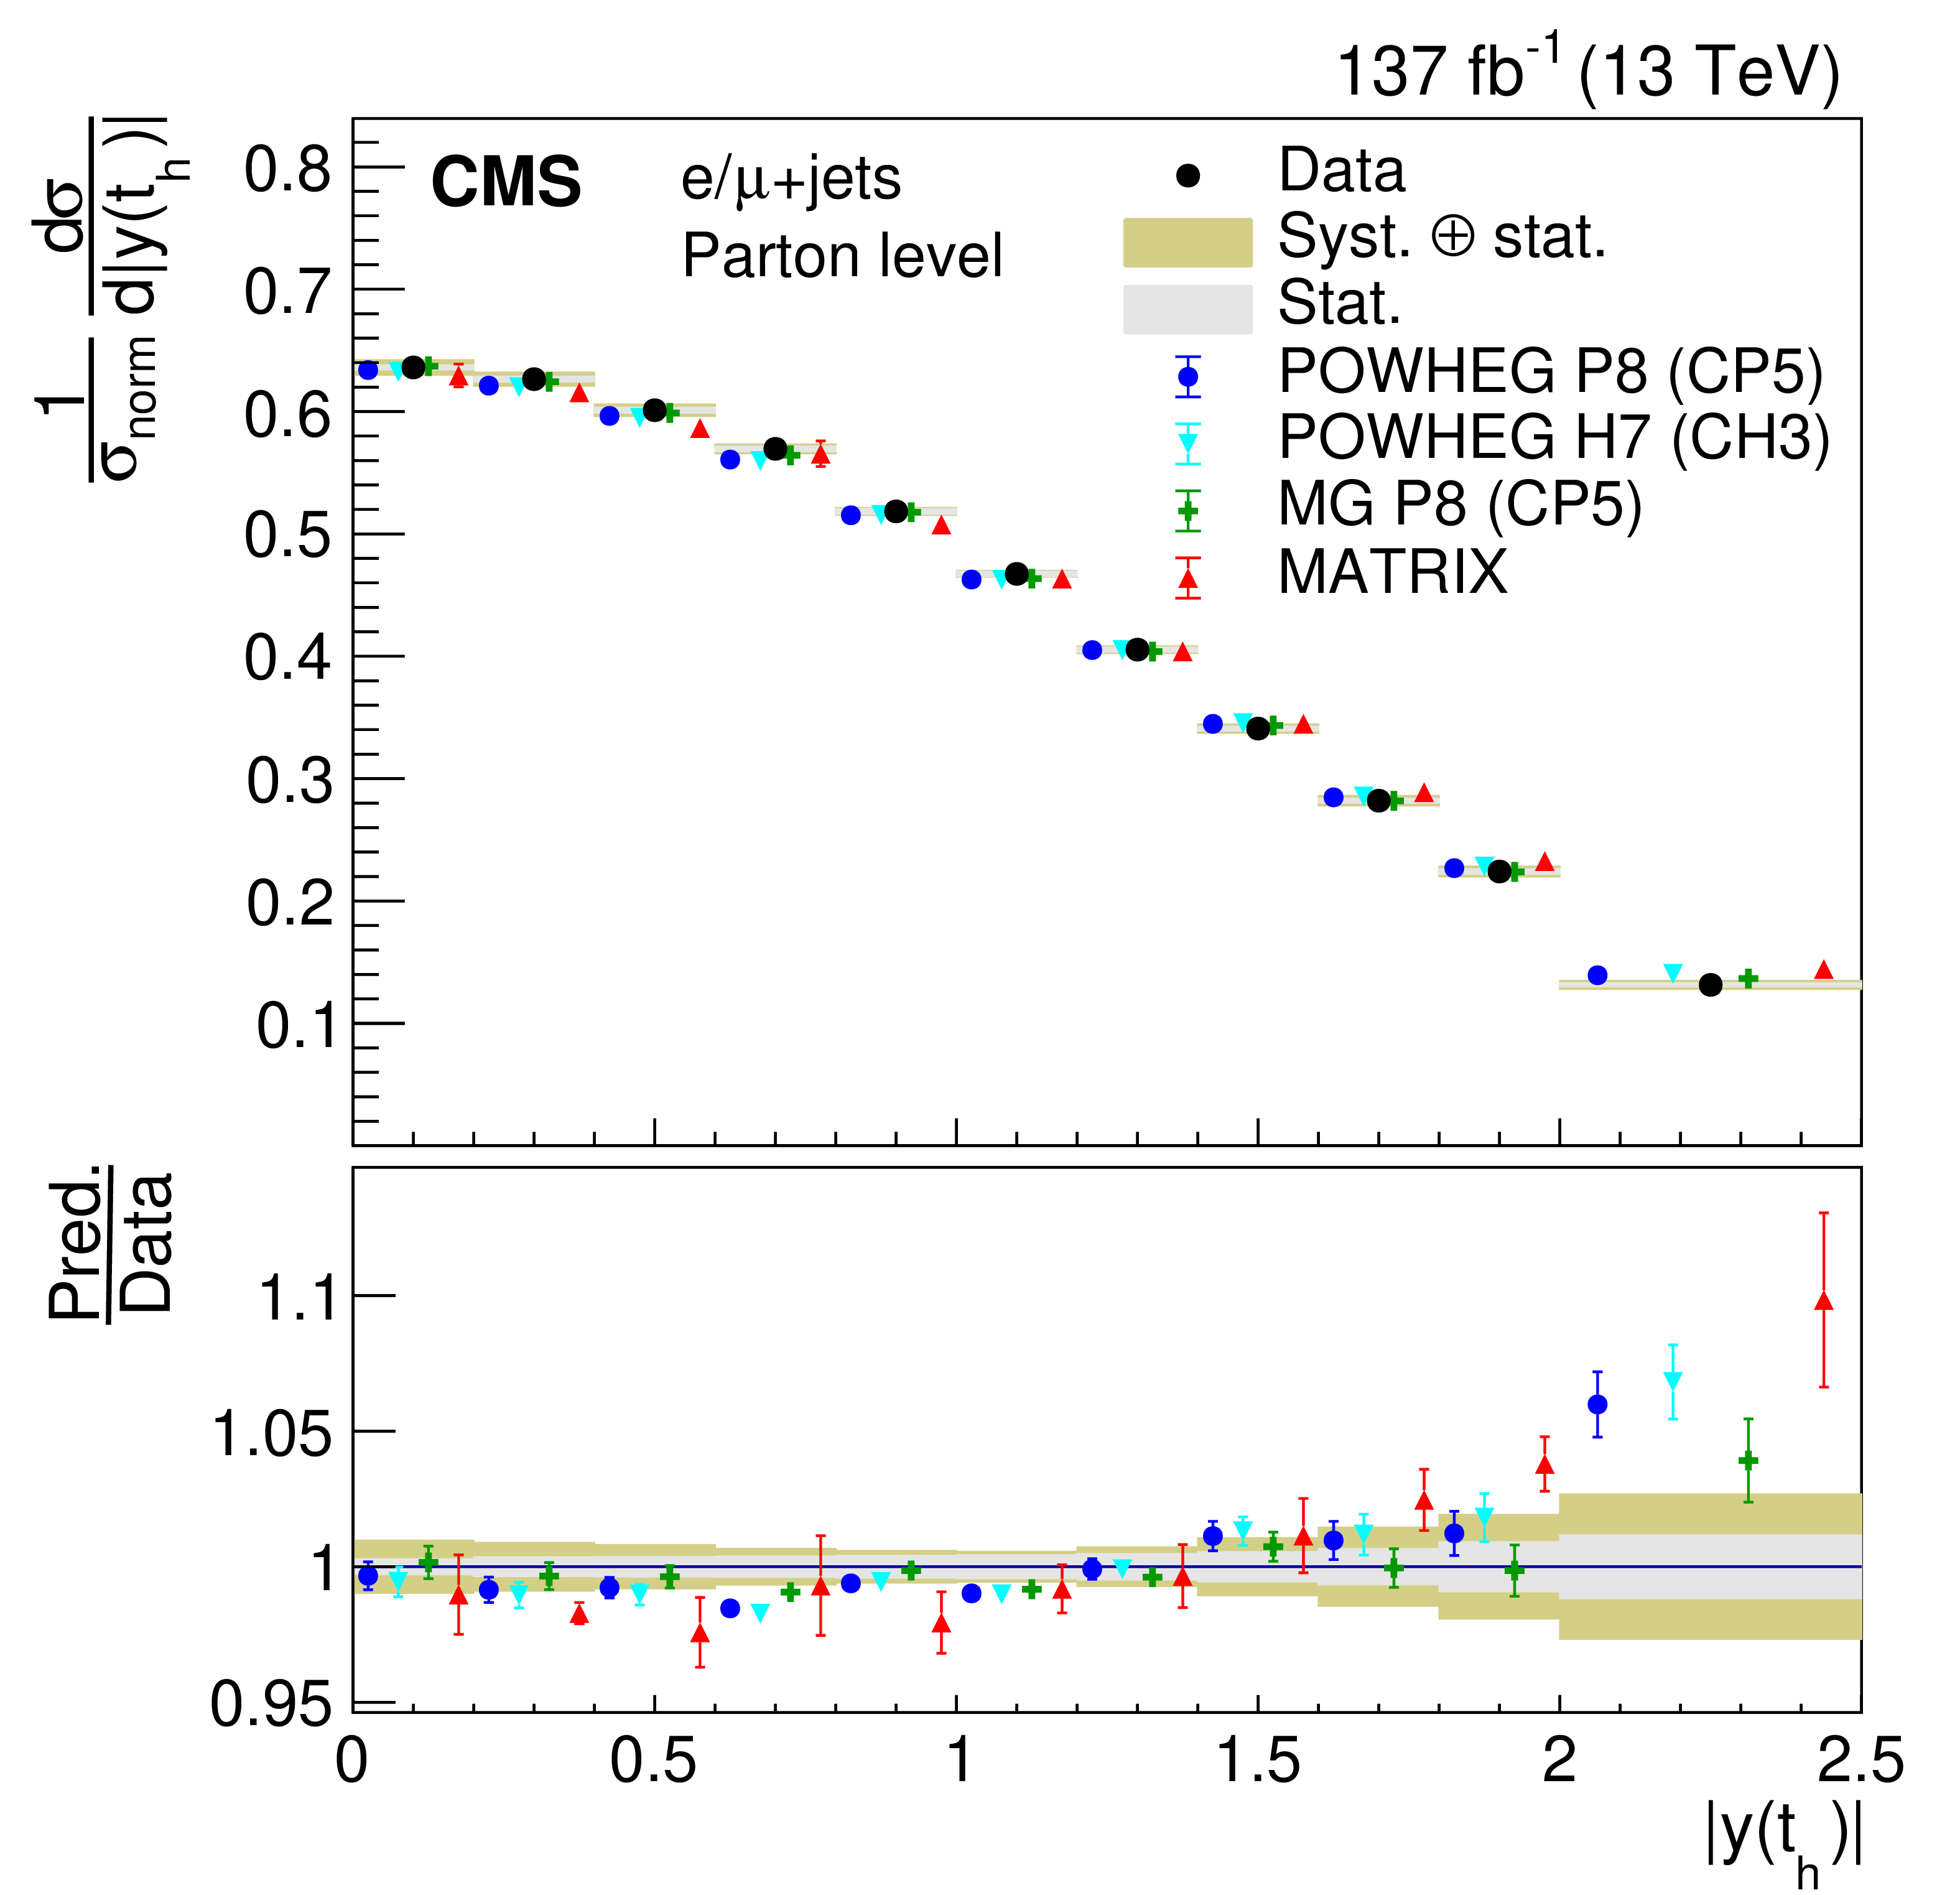
png pdf |
Figure A3-a:
Normalized differential cross sections at the parton level as a function of ${{| y({\mathrm{t} _\mathrm {h}}) |}}$, ${{| y({\mathrm{t} _\ell}) |}}$, and the differences ${\Delta {| y_{\mathrm{t} /\mathrm{\bar{t}}} |}}$ and ${{| \Delta y_{\mathrm{t} /\mathrm{\bar{t}}} |}}$. The data are shown as points with gray (yellow) bands indicating the statistical (statistical and systematic) uncertainties. The cross sections are compared to the predictions of POWHEG combined with PYTHIA (P8) or HERWIG (H7), the multiparton simulation MG5_aMC@NLO (MG)+PYTHIA FxFx, and the NNLO QCD calculations obtained with Matrix. The ratios of the various predictions to the measured cross sections are shown in the lower panels. |
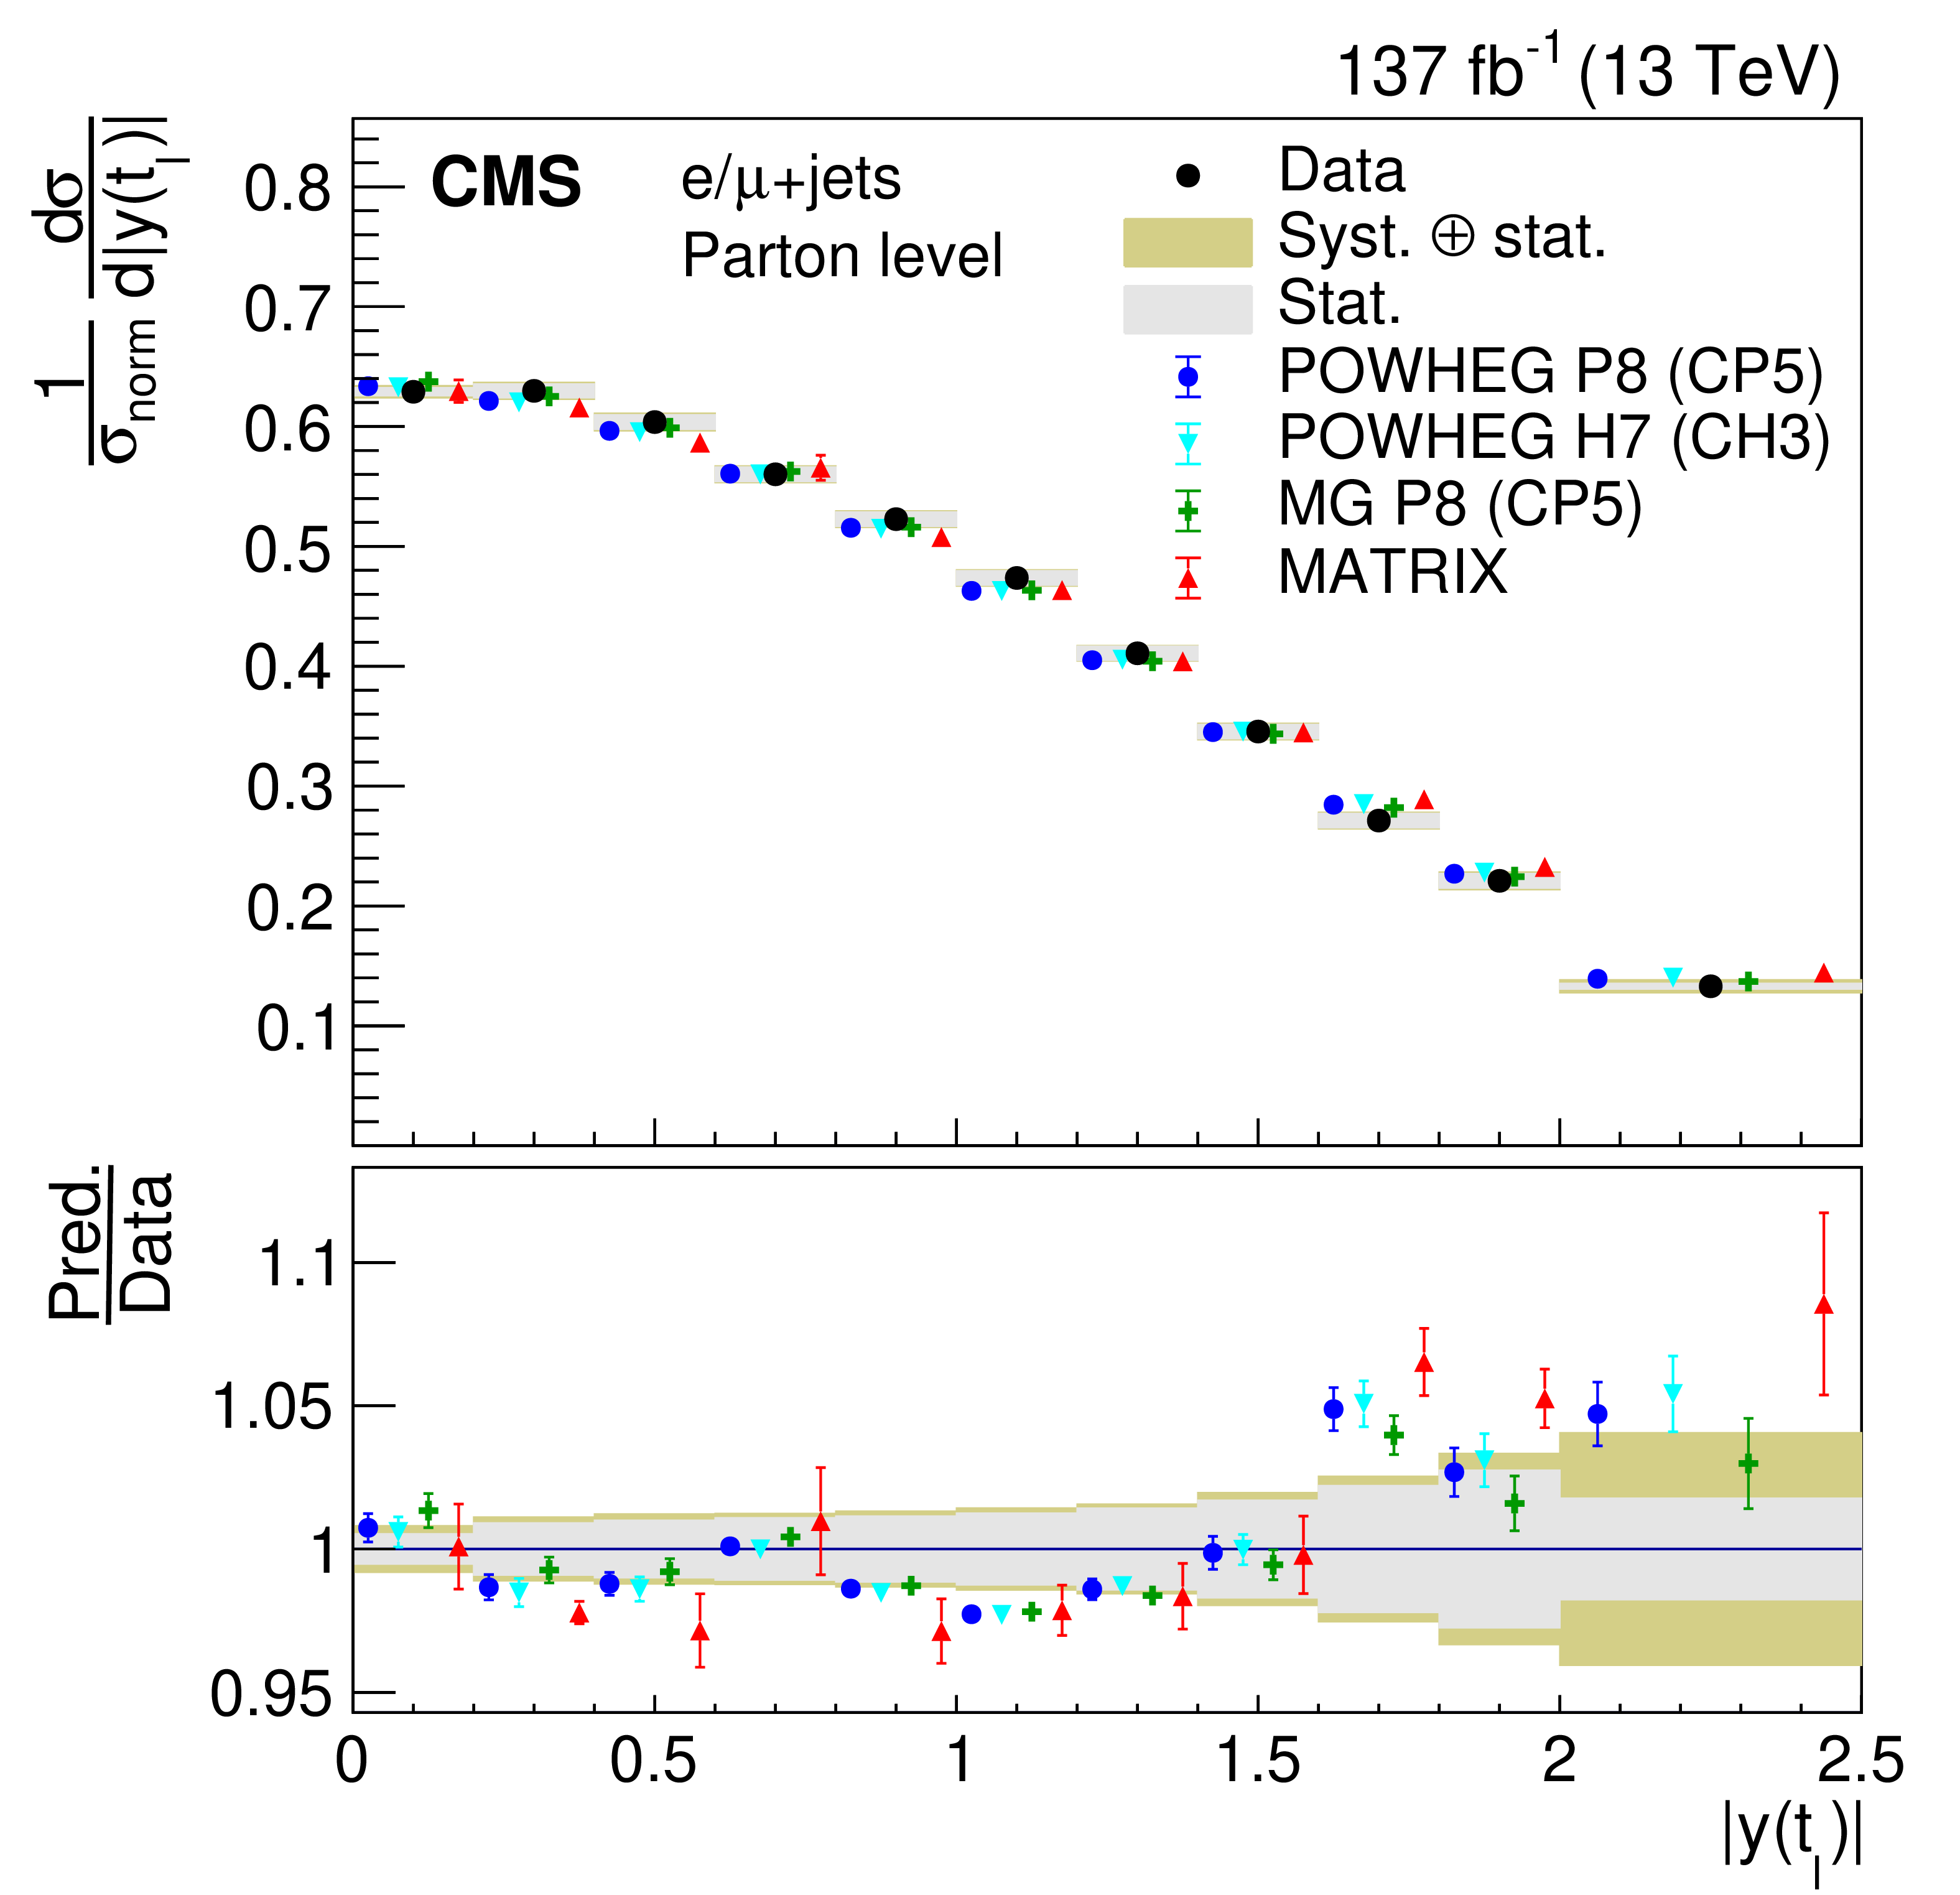
png pdf |
Figure A3-b:
Normalized differential cross sections at the parton level as a function of ${{| y({\mathrm{t} _\mathrm {h}}) |}}$, ${{| y({\mathrm{t} _\ell}) |}}$, and the differences ${\Delta {| y_{\mathrm{t} /\mathrm{\bar{t}}} |}}$ and ${{| \Delta y_{\mathrm{t} /\mathrm{\bar{t}}} |}}$. The data are shown as points with gray (yellow) bands indicating the statistical (statistical and systematic) uncertainties. The cross sections are compared to the predictions of POWHEG combined with PYTHIA (P8) or HERWIG (H7), the multiparton simulation MG5_aMC@NLO (MG)+PYTHIA FxFx, and the NNLO QCD calculations obtained with Matrix. The ratios of the various predictions to the measured cross sections are shown in the lower panels. |
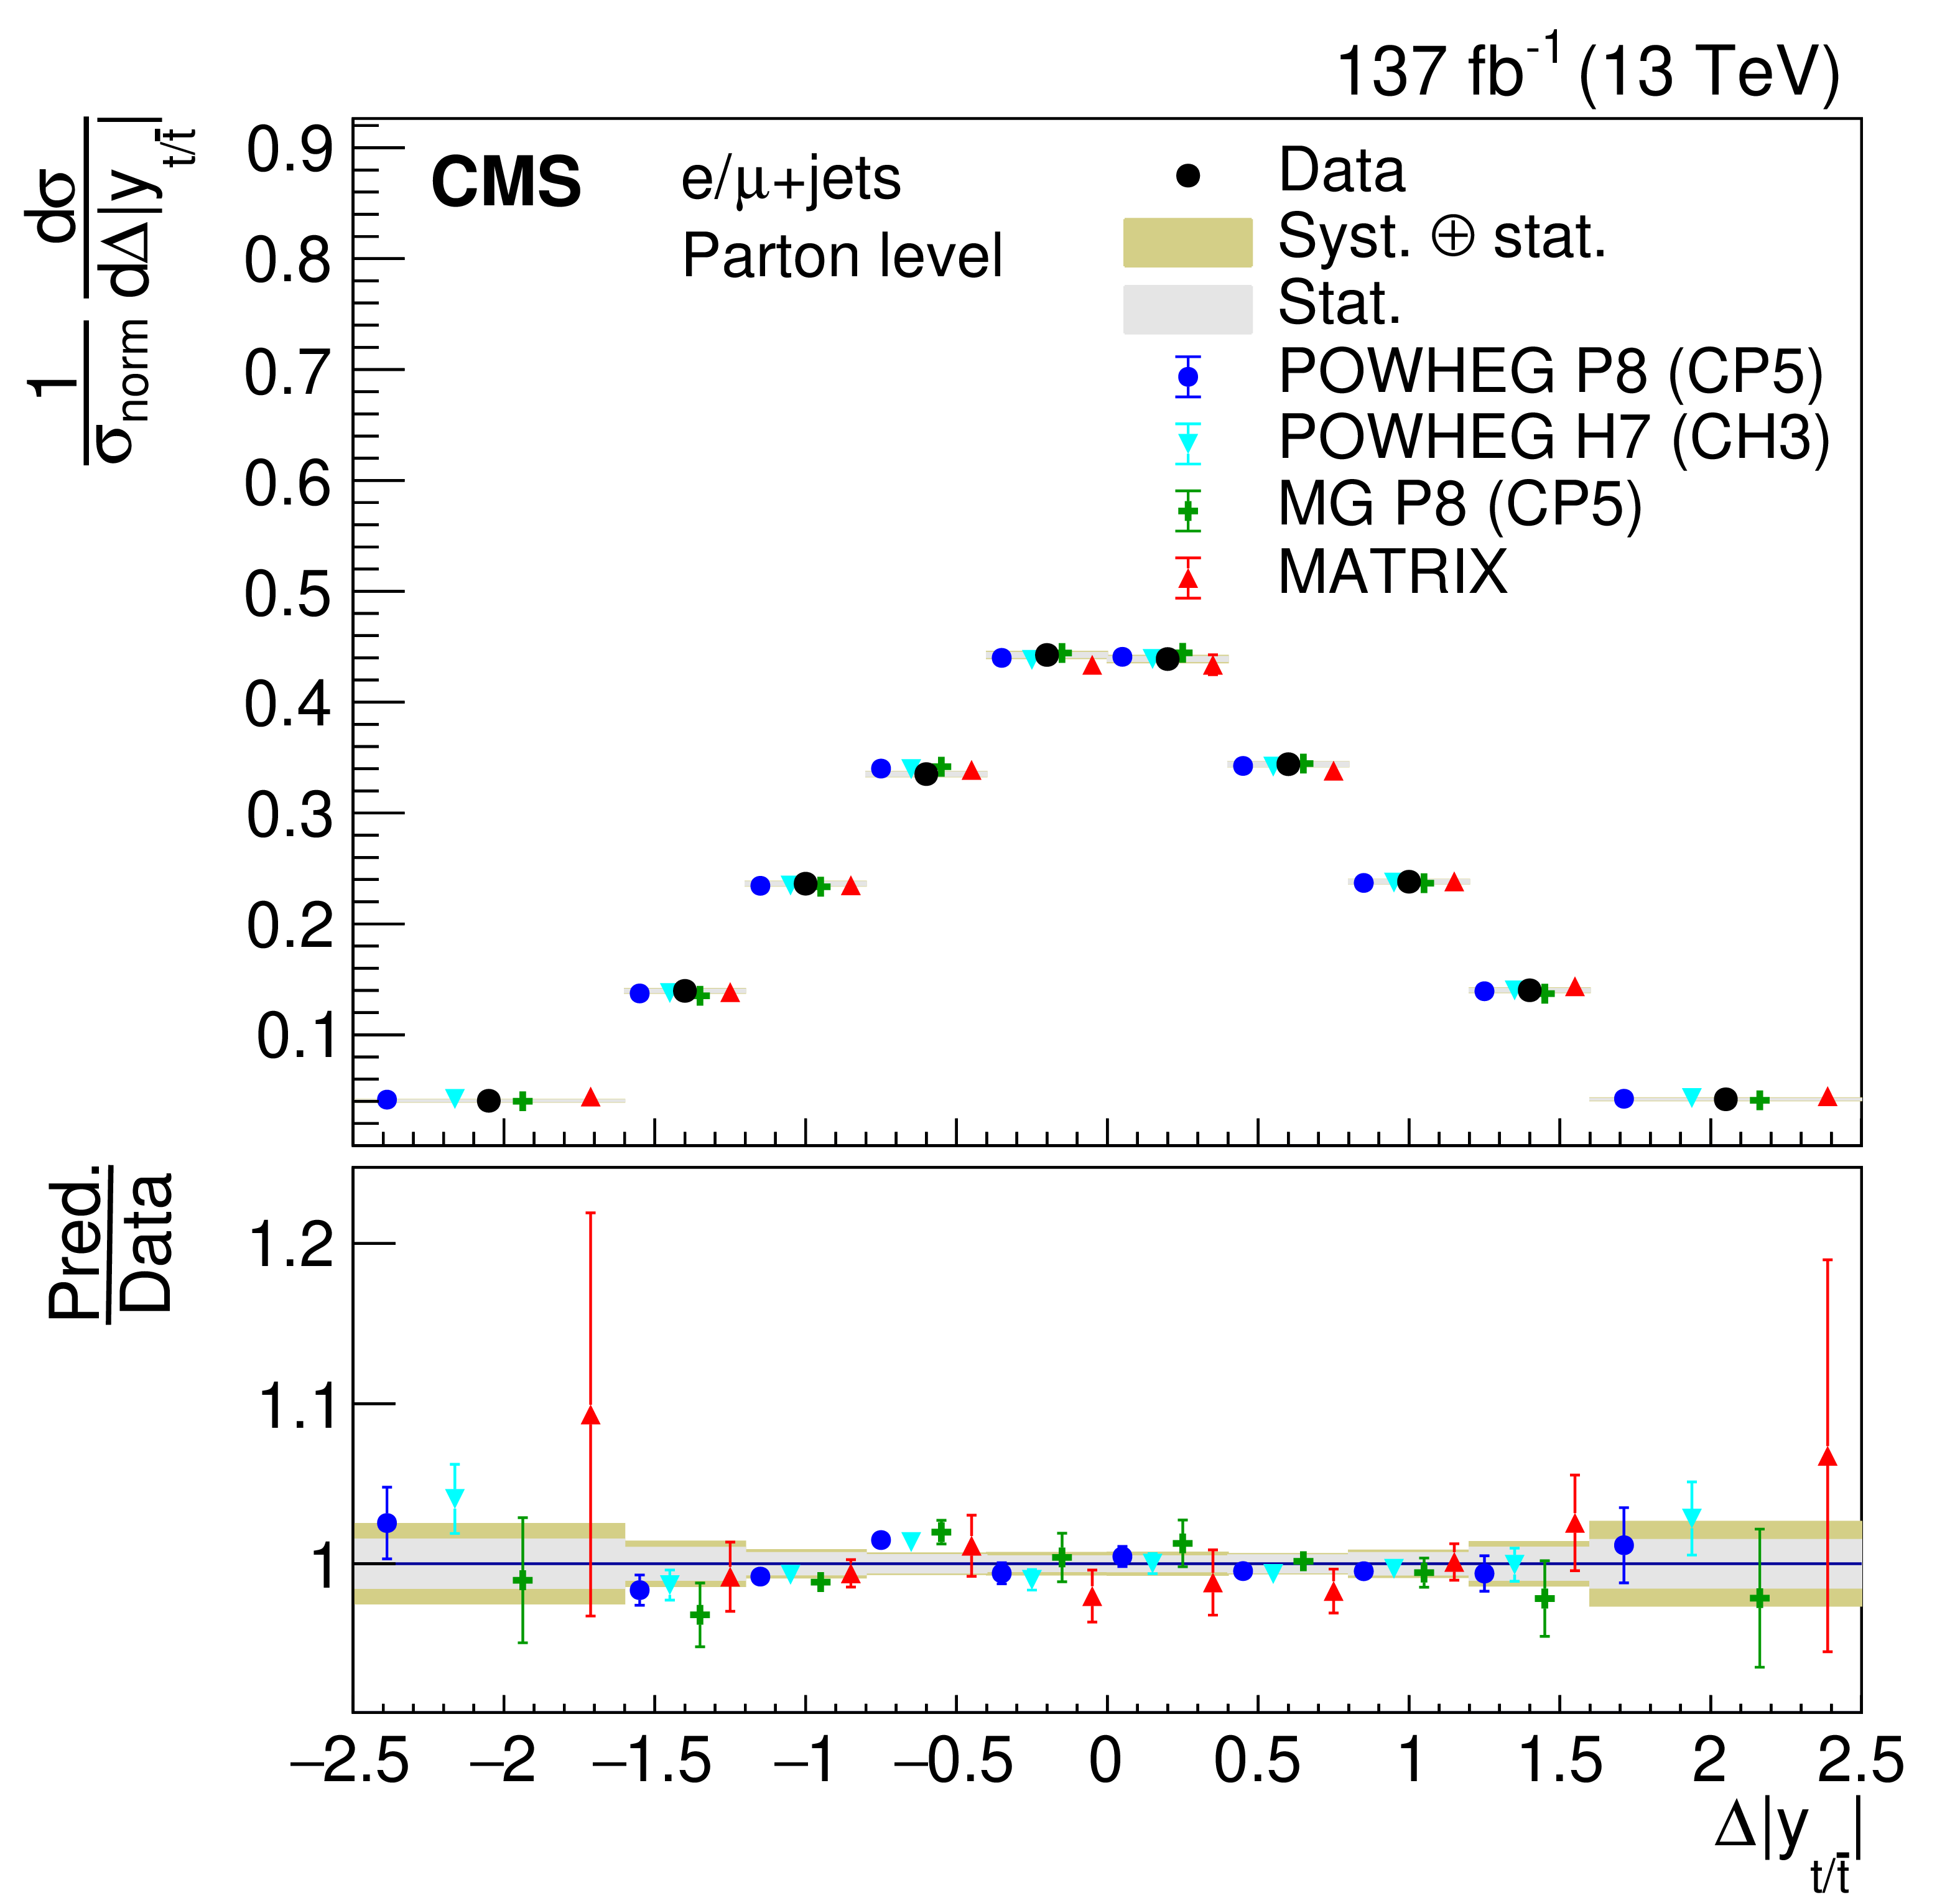
png pdf |
Figure A3-c:
Normalized differential cross sections at the parton level as a function of ${{| y({\mathrm{t} _\mathrm {h}}) |}}$, ${{| y({\mathrm{t} _\ell}) |}}$, and the differences ${\Delta {| y_{\mathrm{t} /\mathrm{\bar{t}}} |}}$ and ${{| \Delta y_{\mathrm{t} /\mathrm{\bar{t}}} |}}$. The data are shown as points with gray (yellow) bands indicating the statistical (statistical and systematic) uncertainties. The cross sections are compared to the predictions of POWHEG combined with PYTHIA (P8) or HERWIG (H7), the multiparton simulation MG5_aMC@NLO (MG)+PYTHIA FxFx, and the NNLO QCD calculations obtained with Matrix. The ratios of the various predictions to the measured cross sections are shown in the lower panels. |
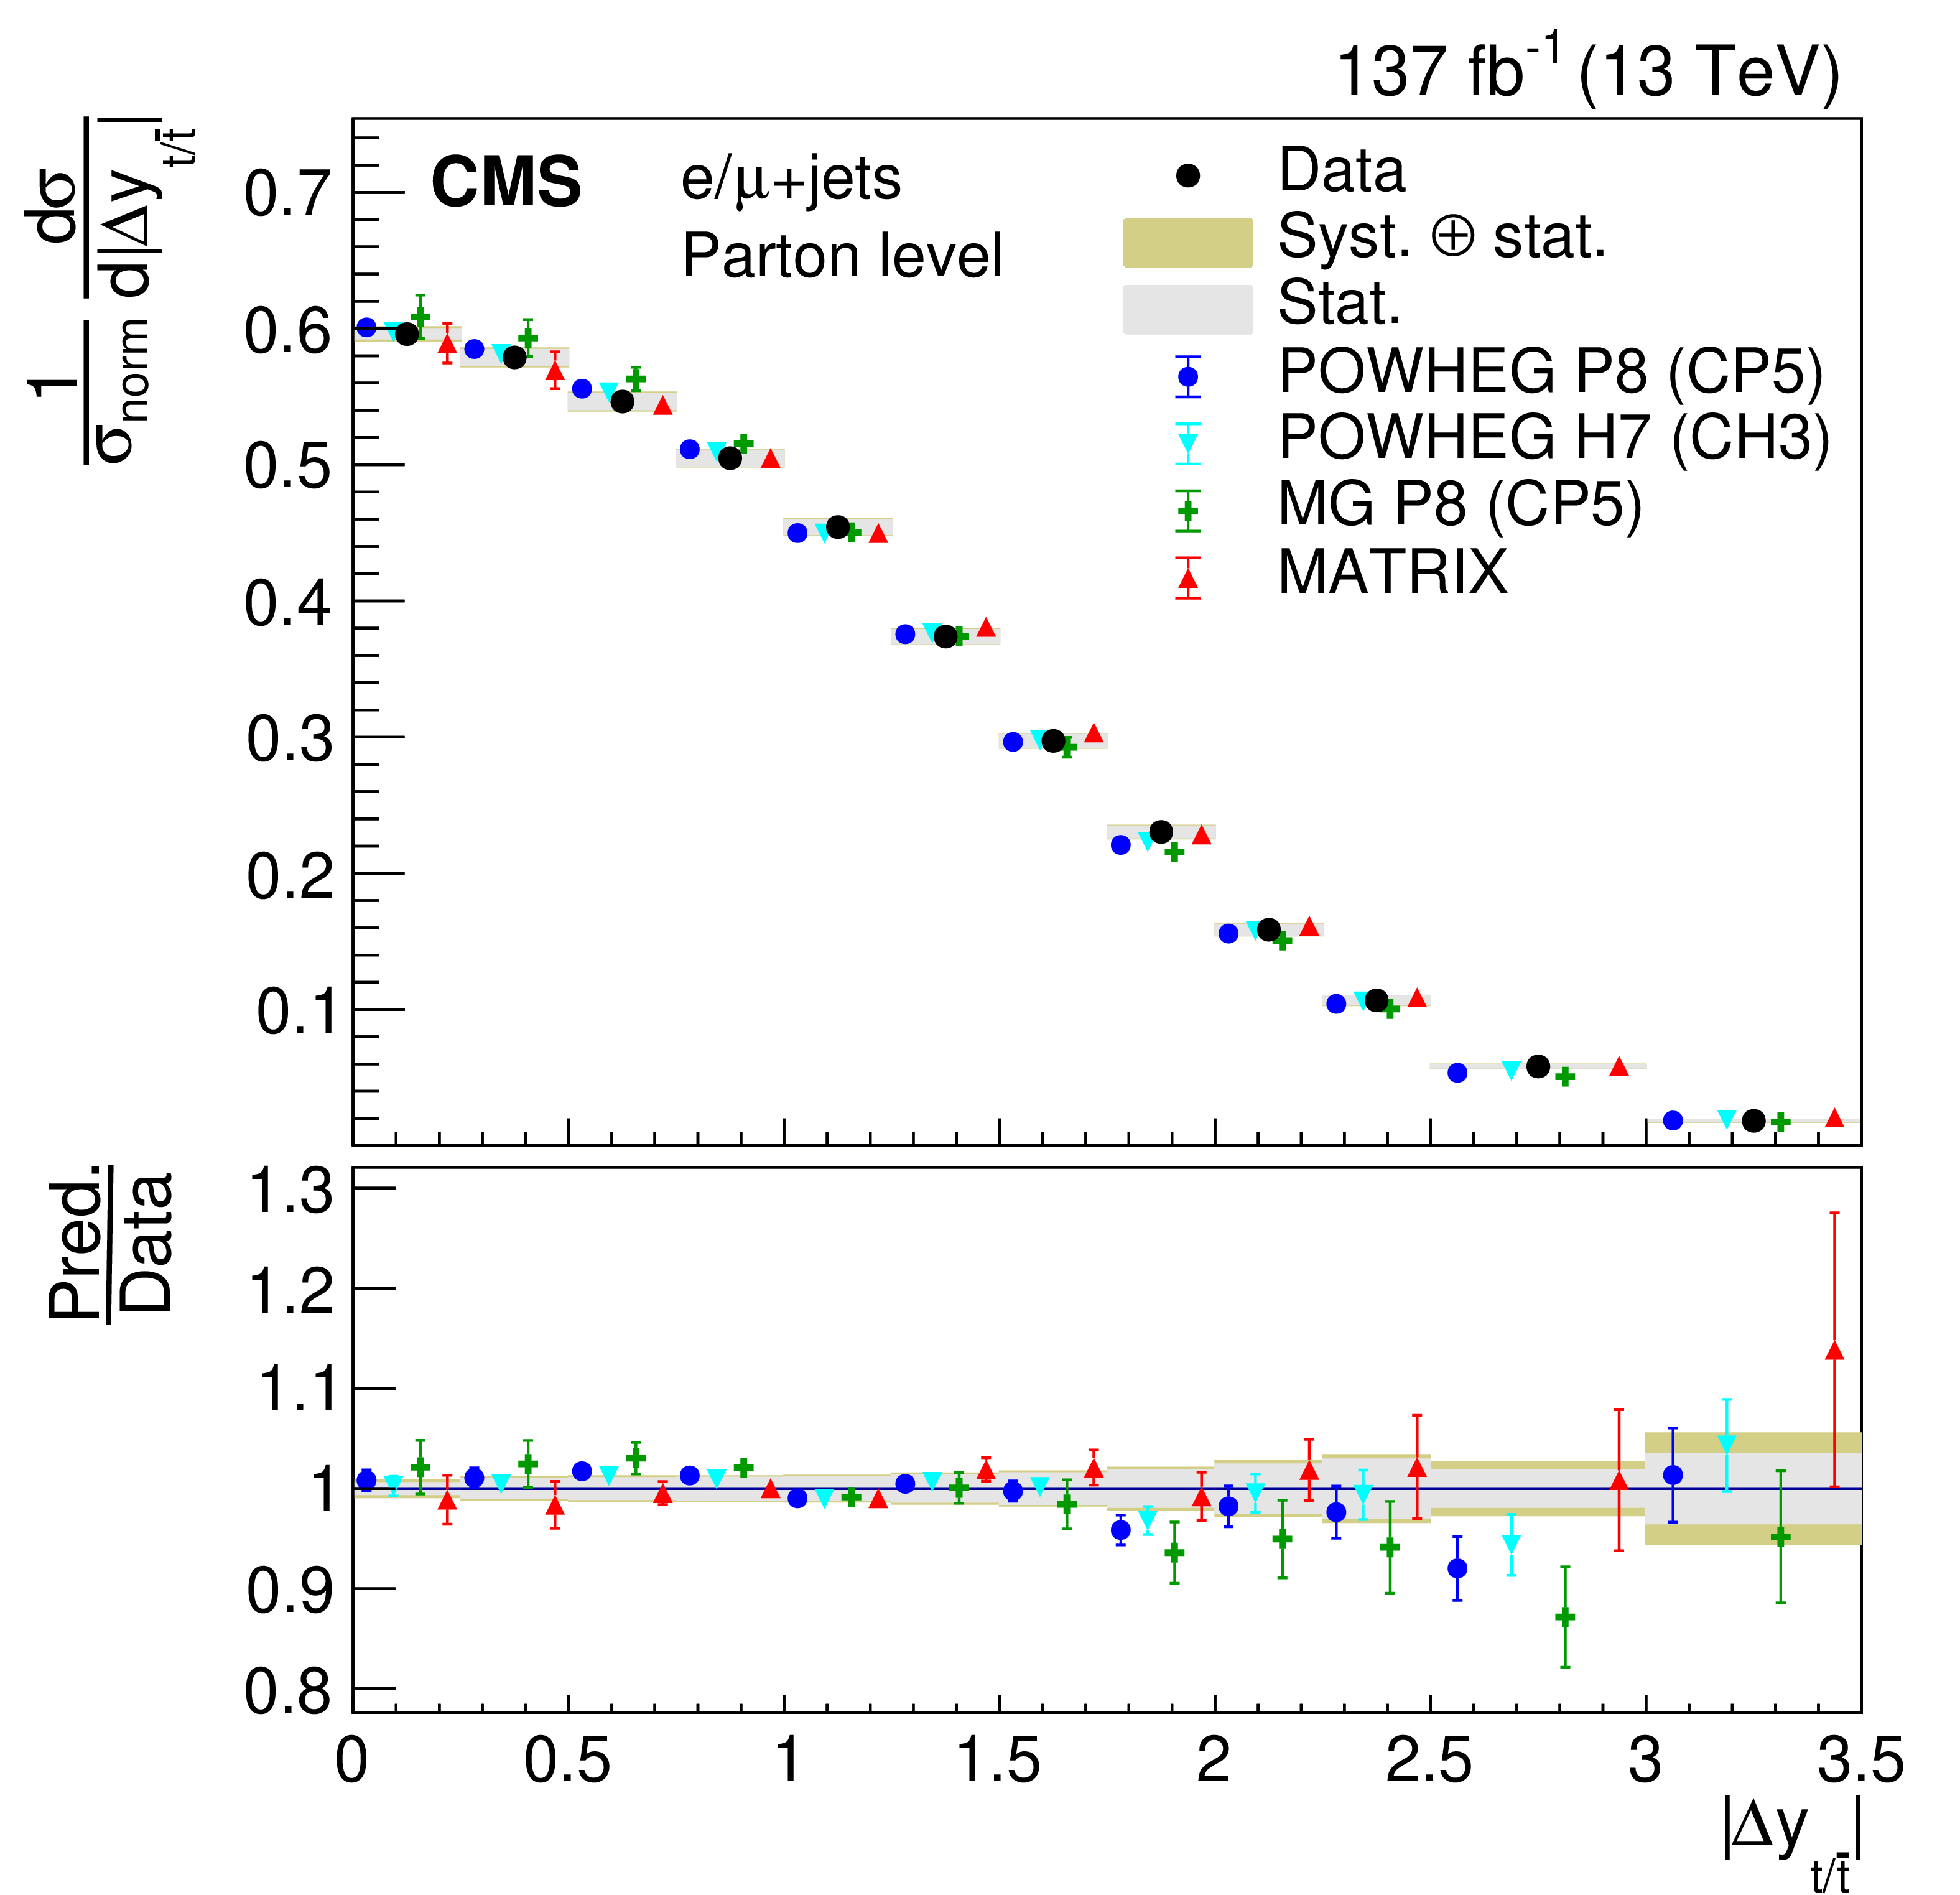
png pdf |
Figure A3-d:
Normalized differential cross sections at the parton level as a function of ${{| y({\mathrm{t} _\mathrm {h}}) |}}$, ${{| y({\mathrm{t} _\ell}) |}}$, and the differences ${\Delta {| y_{\mathrm{t} /\mathrm{\bar{t}}} |}}$ and ${{| \Delta y_{\mathrm{t} /\mathrm{\bar{t}}} |}}$. The data are shown as points with gray (yellow) bands indicating the statistical (statistical and systematic) uncertainties. The cross sections are compared to the predictions of POWHEG combined with PYTHIA (P8) or HERWIG (H7), the multiparton simulation MG5_aMC@NLO (MG)+PYTHIA FxFx, and the NNLO QCD calculations obtained with Matrix. The ratios of the various predictions to the measured cross sections are shown in the lower panels. |
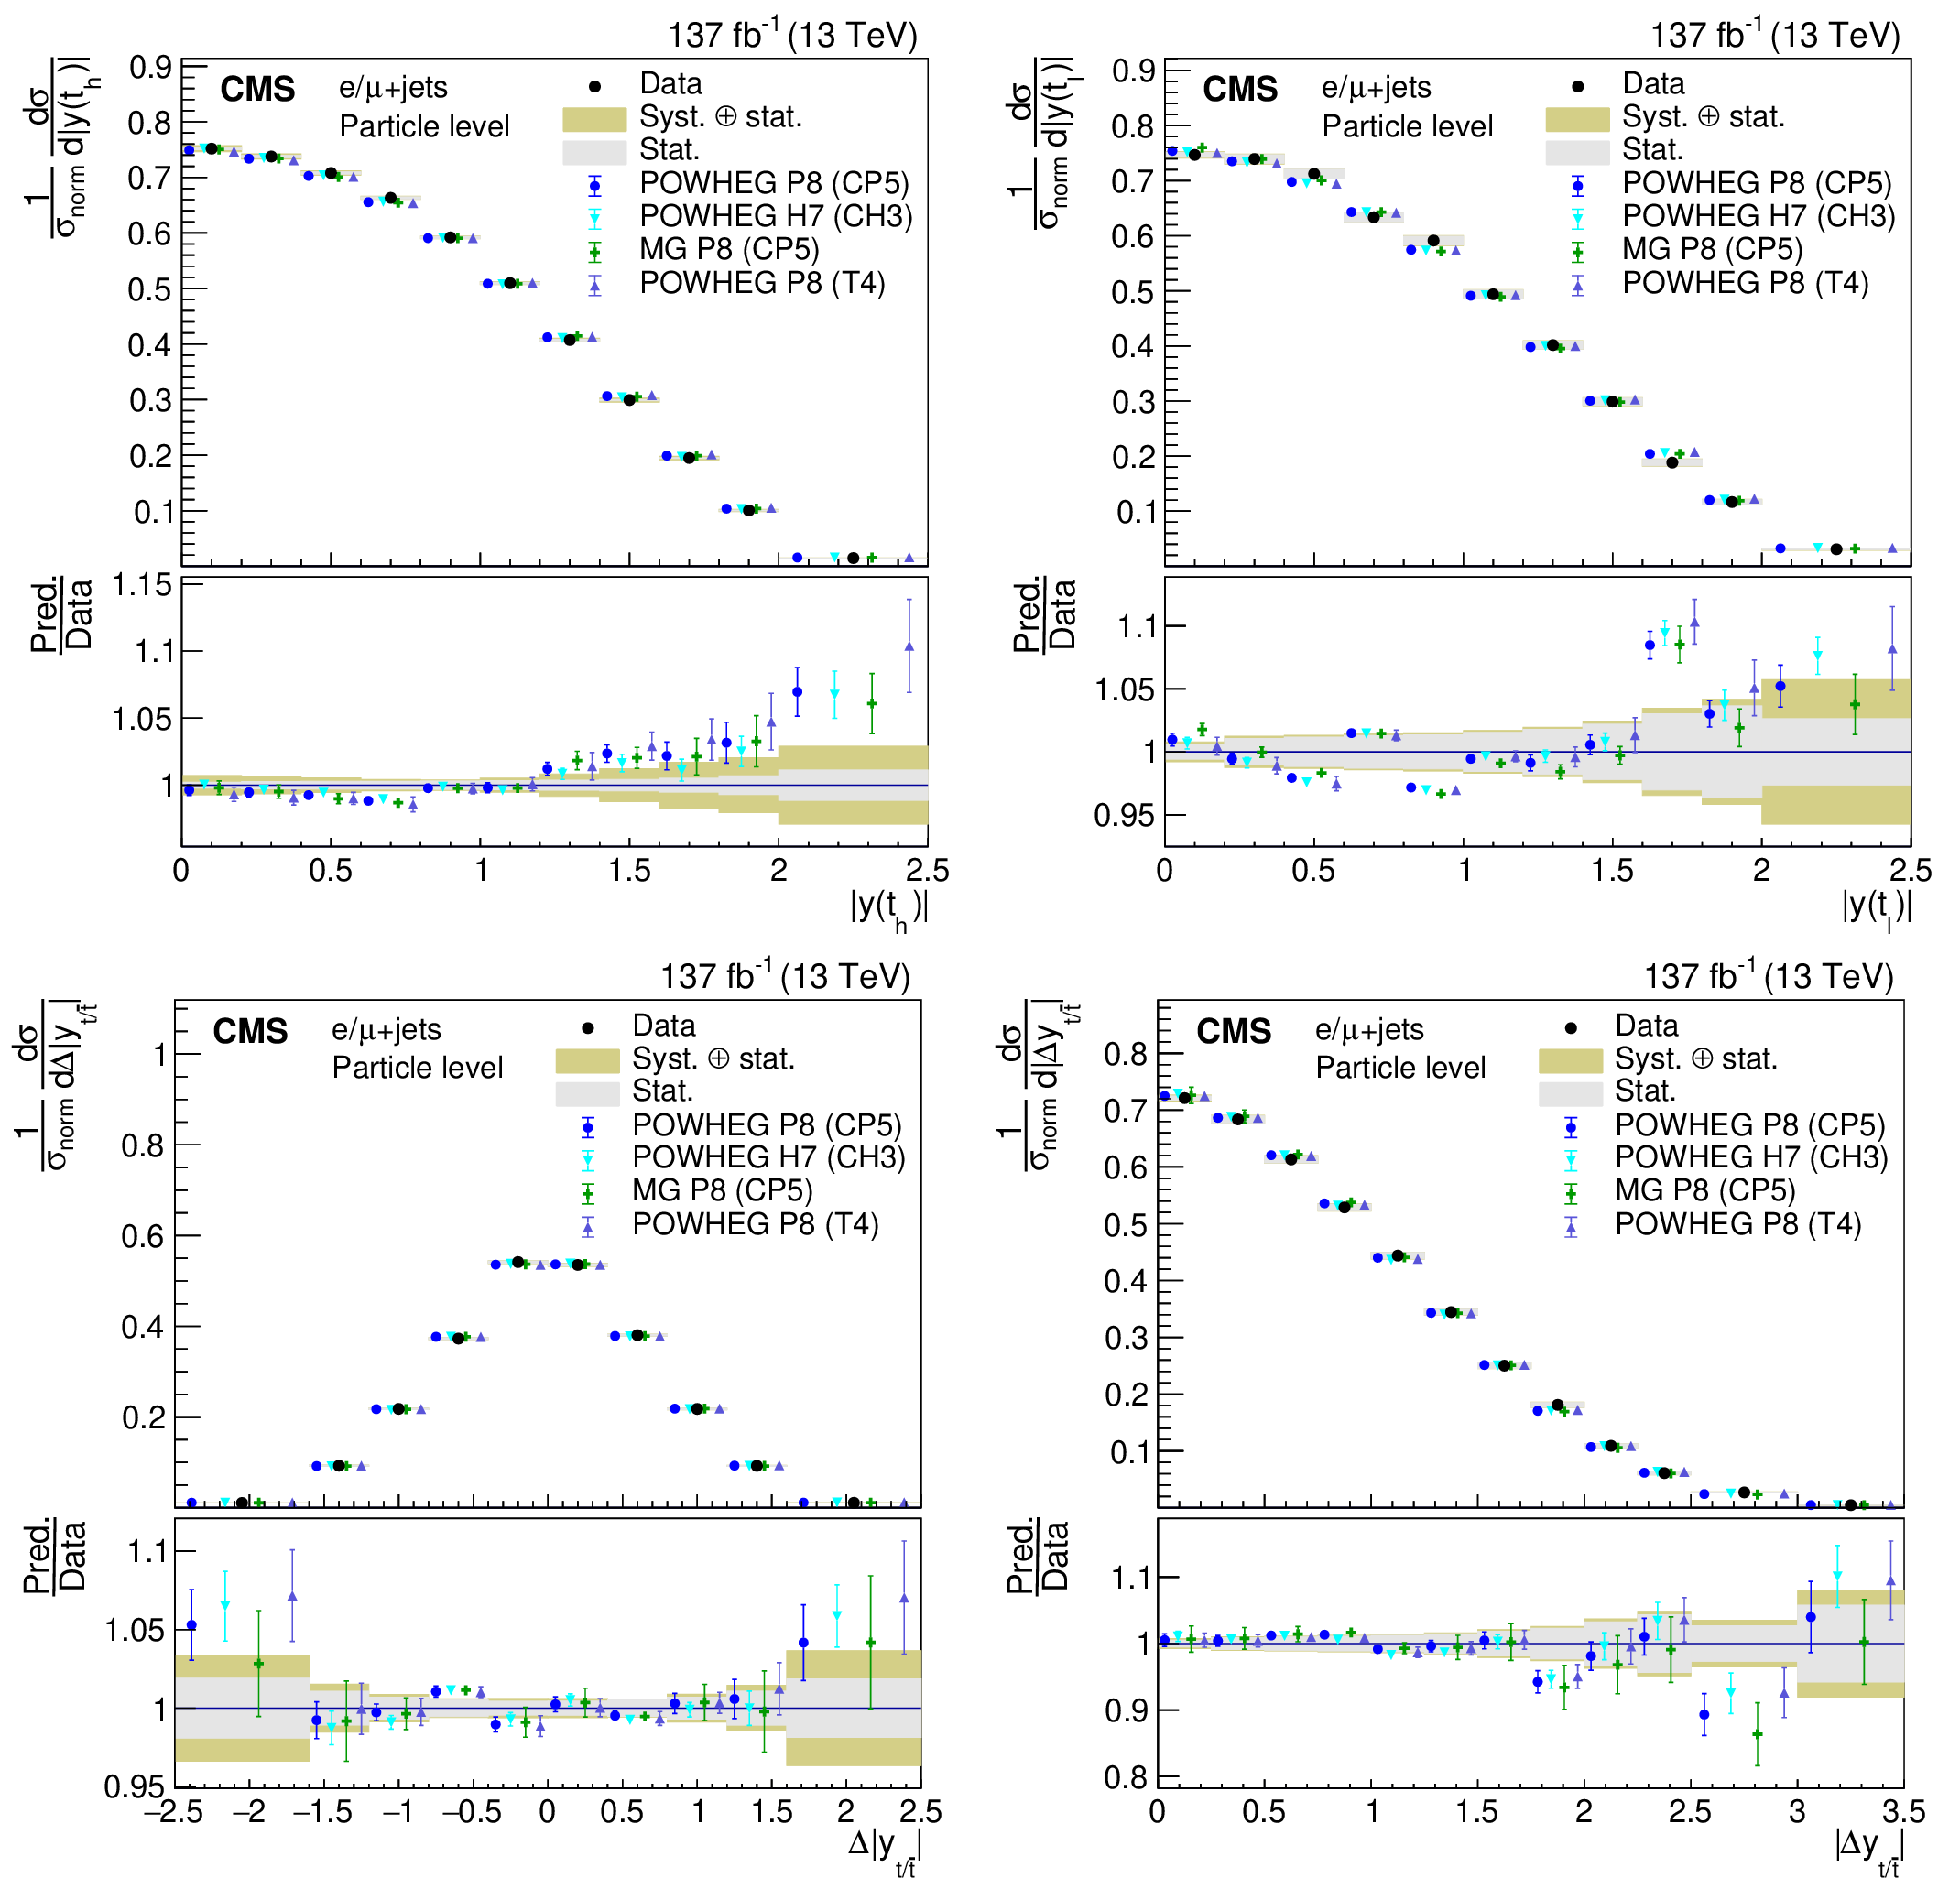
png pdf |
Figure A4:
Normalized differential cross sections at the particle level as a function of ${{| y({\mathrm{t} _\mathrm {h}}) |}}$, ${{| y({\mathrm{t} _\ell}) |}}$, and the differences ${\Delta {| y_{\mathrm{t} /\mathrm{\bar{t}}} |}}$ and ${{| \Delta y_{\mathrm{t} /\mathrm{\bar{t}}} |}}$. The data are shown as points with gray (yellow) bands indicating the statistical (statistical and systematic) uncertainties. The cross sections are compared to the predictions of POWHEG+PYTHIA (P8) for the CP5 and CUETP8M2T4 (T4) tunes, POWHEG+HERWIG (H7), and the multiparton simulation MG5_aMC@NLO (MG)+PYTHIA. The ratios of the various predictions to the measured cross sections are shown in the lower panels. |
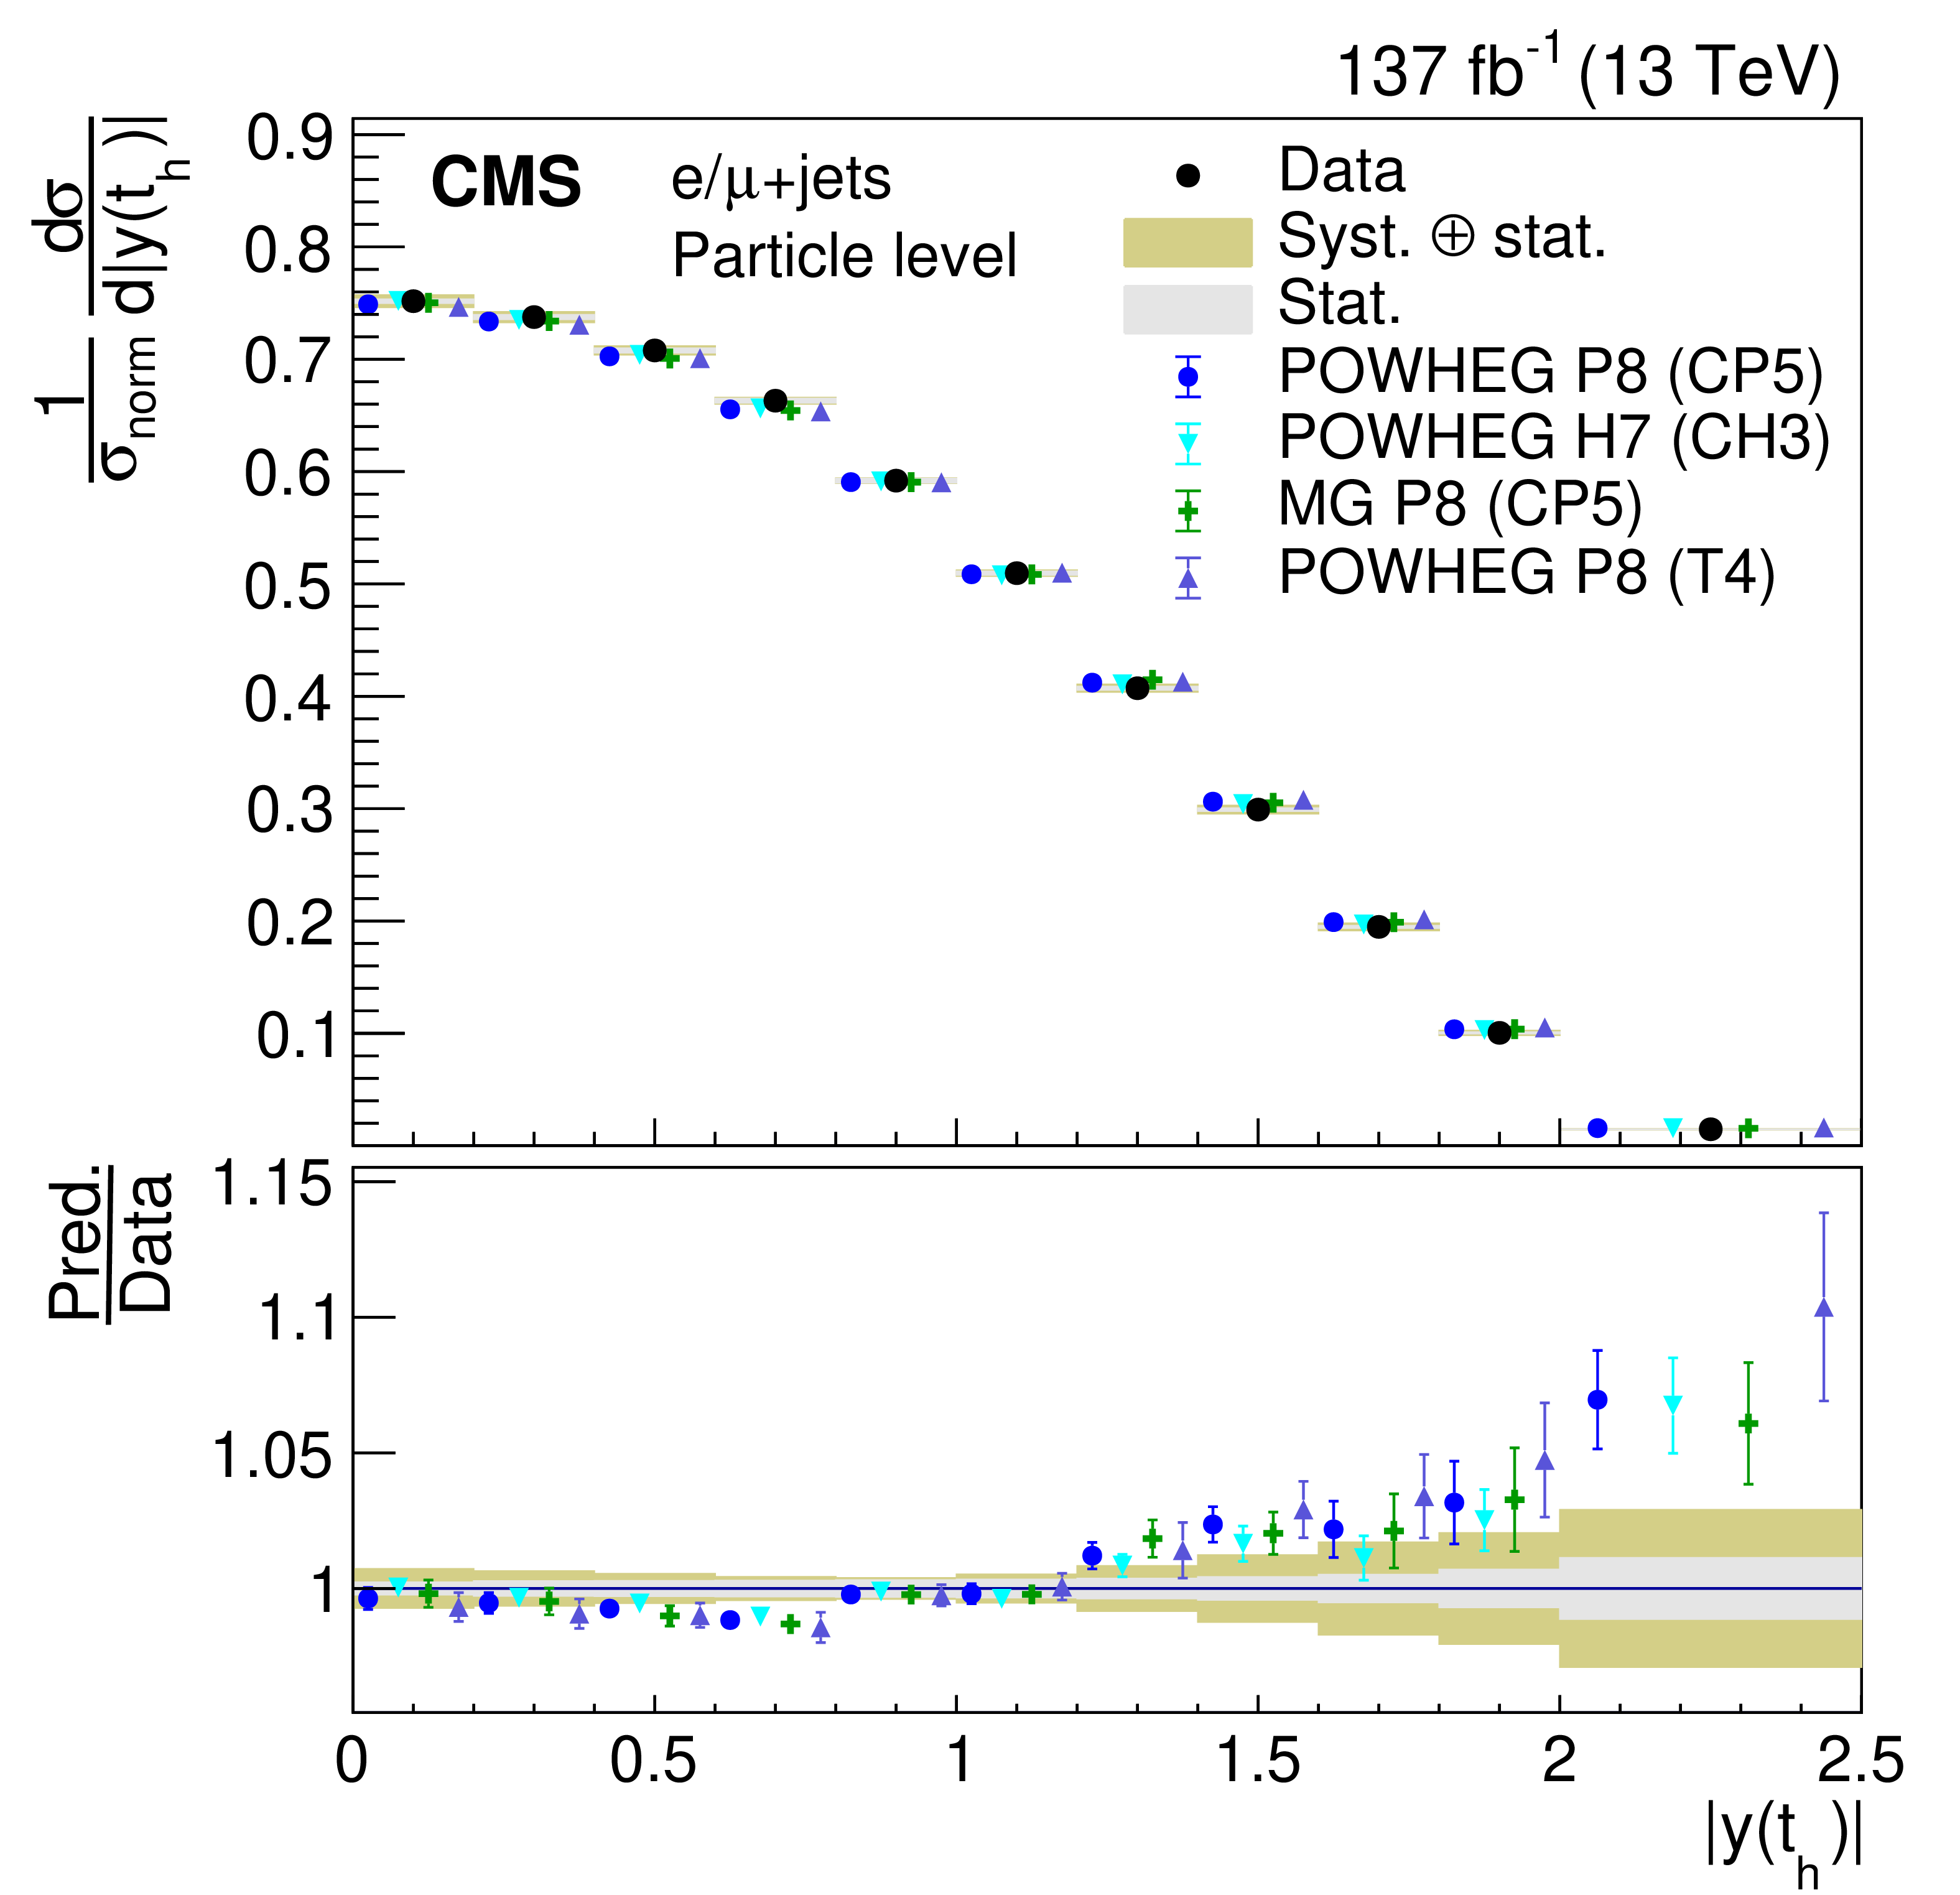
png pdf |
Figure A4-a:
Normalized differential cross sections at the particle level as a function of ${{| y({\mathrm{t} _\mathrm {h}}) |}}$, ${{| y({\mathrm{t} _\ell}) |}}$, and the differences ${\Delta {| y_{\mathrm{t} /\mathrm{\bar{t}}} |}}$ and ${{| \Delta y_{\mathrm{t} /\mathrm{\bar{t}}} |}}$. The data are shown as points with gray (yellow) bands indicating the statistical (statistical and systematic) uncertainties. The cross sections are compared to the predictions of POWHEG+PYTHIA (P8) for the CP5 and CUETP8M2T4 (T4) tunes, POWHEG+HERWIG (H7), and the multiparton simulation MG5_aMC@NLO (MG)+PYTHIA. The ratios of the various predictions to the measured cross sections are shown in the lower panels. |
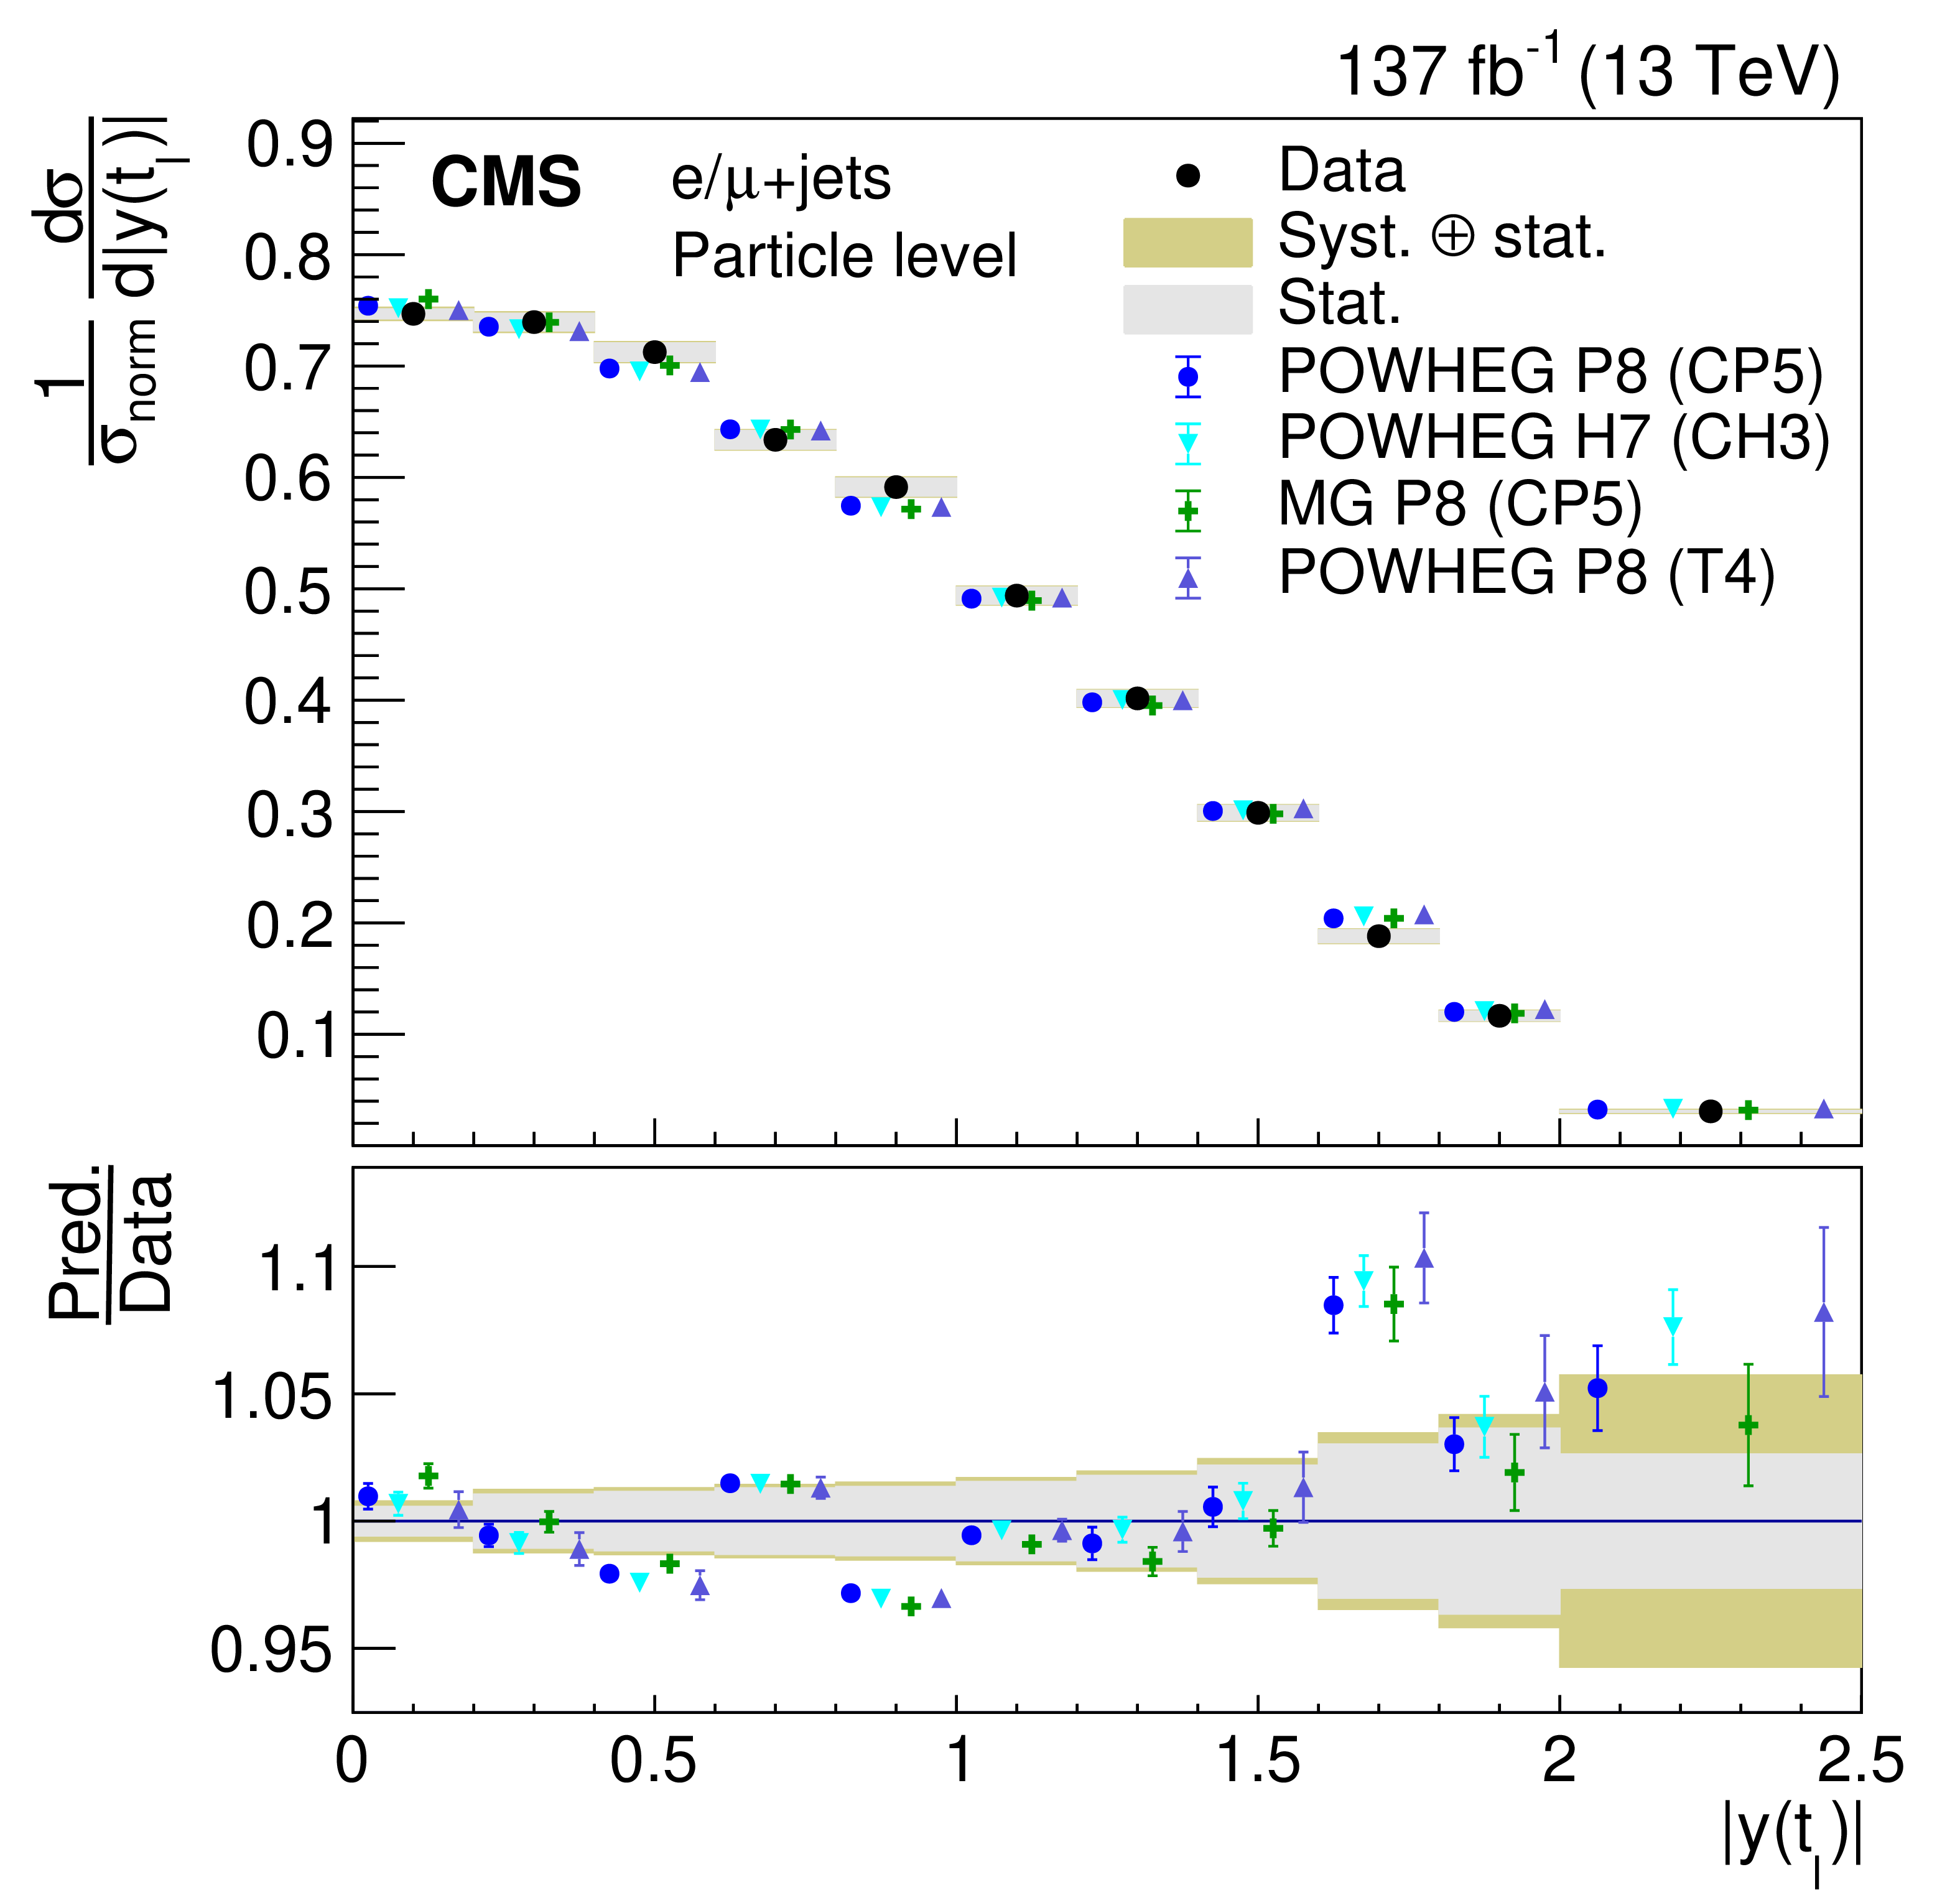
png pdf |
Figure A4-b:
Normalized differential cross sections at the particle level as a function of ${{| y({\mathrm{t} _\mathrm {h}}) |}}$, ${{| y({\mathrm{t} _\ell}) |}}$, and the differences ${\Delta {| y_{\mathrm{t} /\mathrm{\bar{t}}} |}}$ and ${{| \Delta y_{\mathrm{t} /\mathrm{\bar{t}}} |}}$. The data are shown as points with gray (yellow) bands indicating the statistical (statistical and systematic) uncertainties. The cross sections are compared to the predictions of POWHEG+PYTHIA (P8) for the CP5 and CUETP8M2T4 (T4) tunes, POWHEG+HERWIG (H7), and the multiparton simulation MG5_aMC@NLO (MG)+PYTHIA. The ratios of the various predictions to the measured cross sections are shown in the lower panels. |
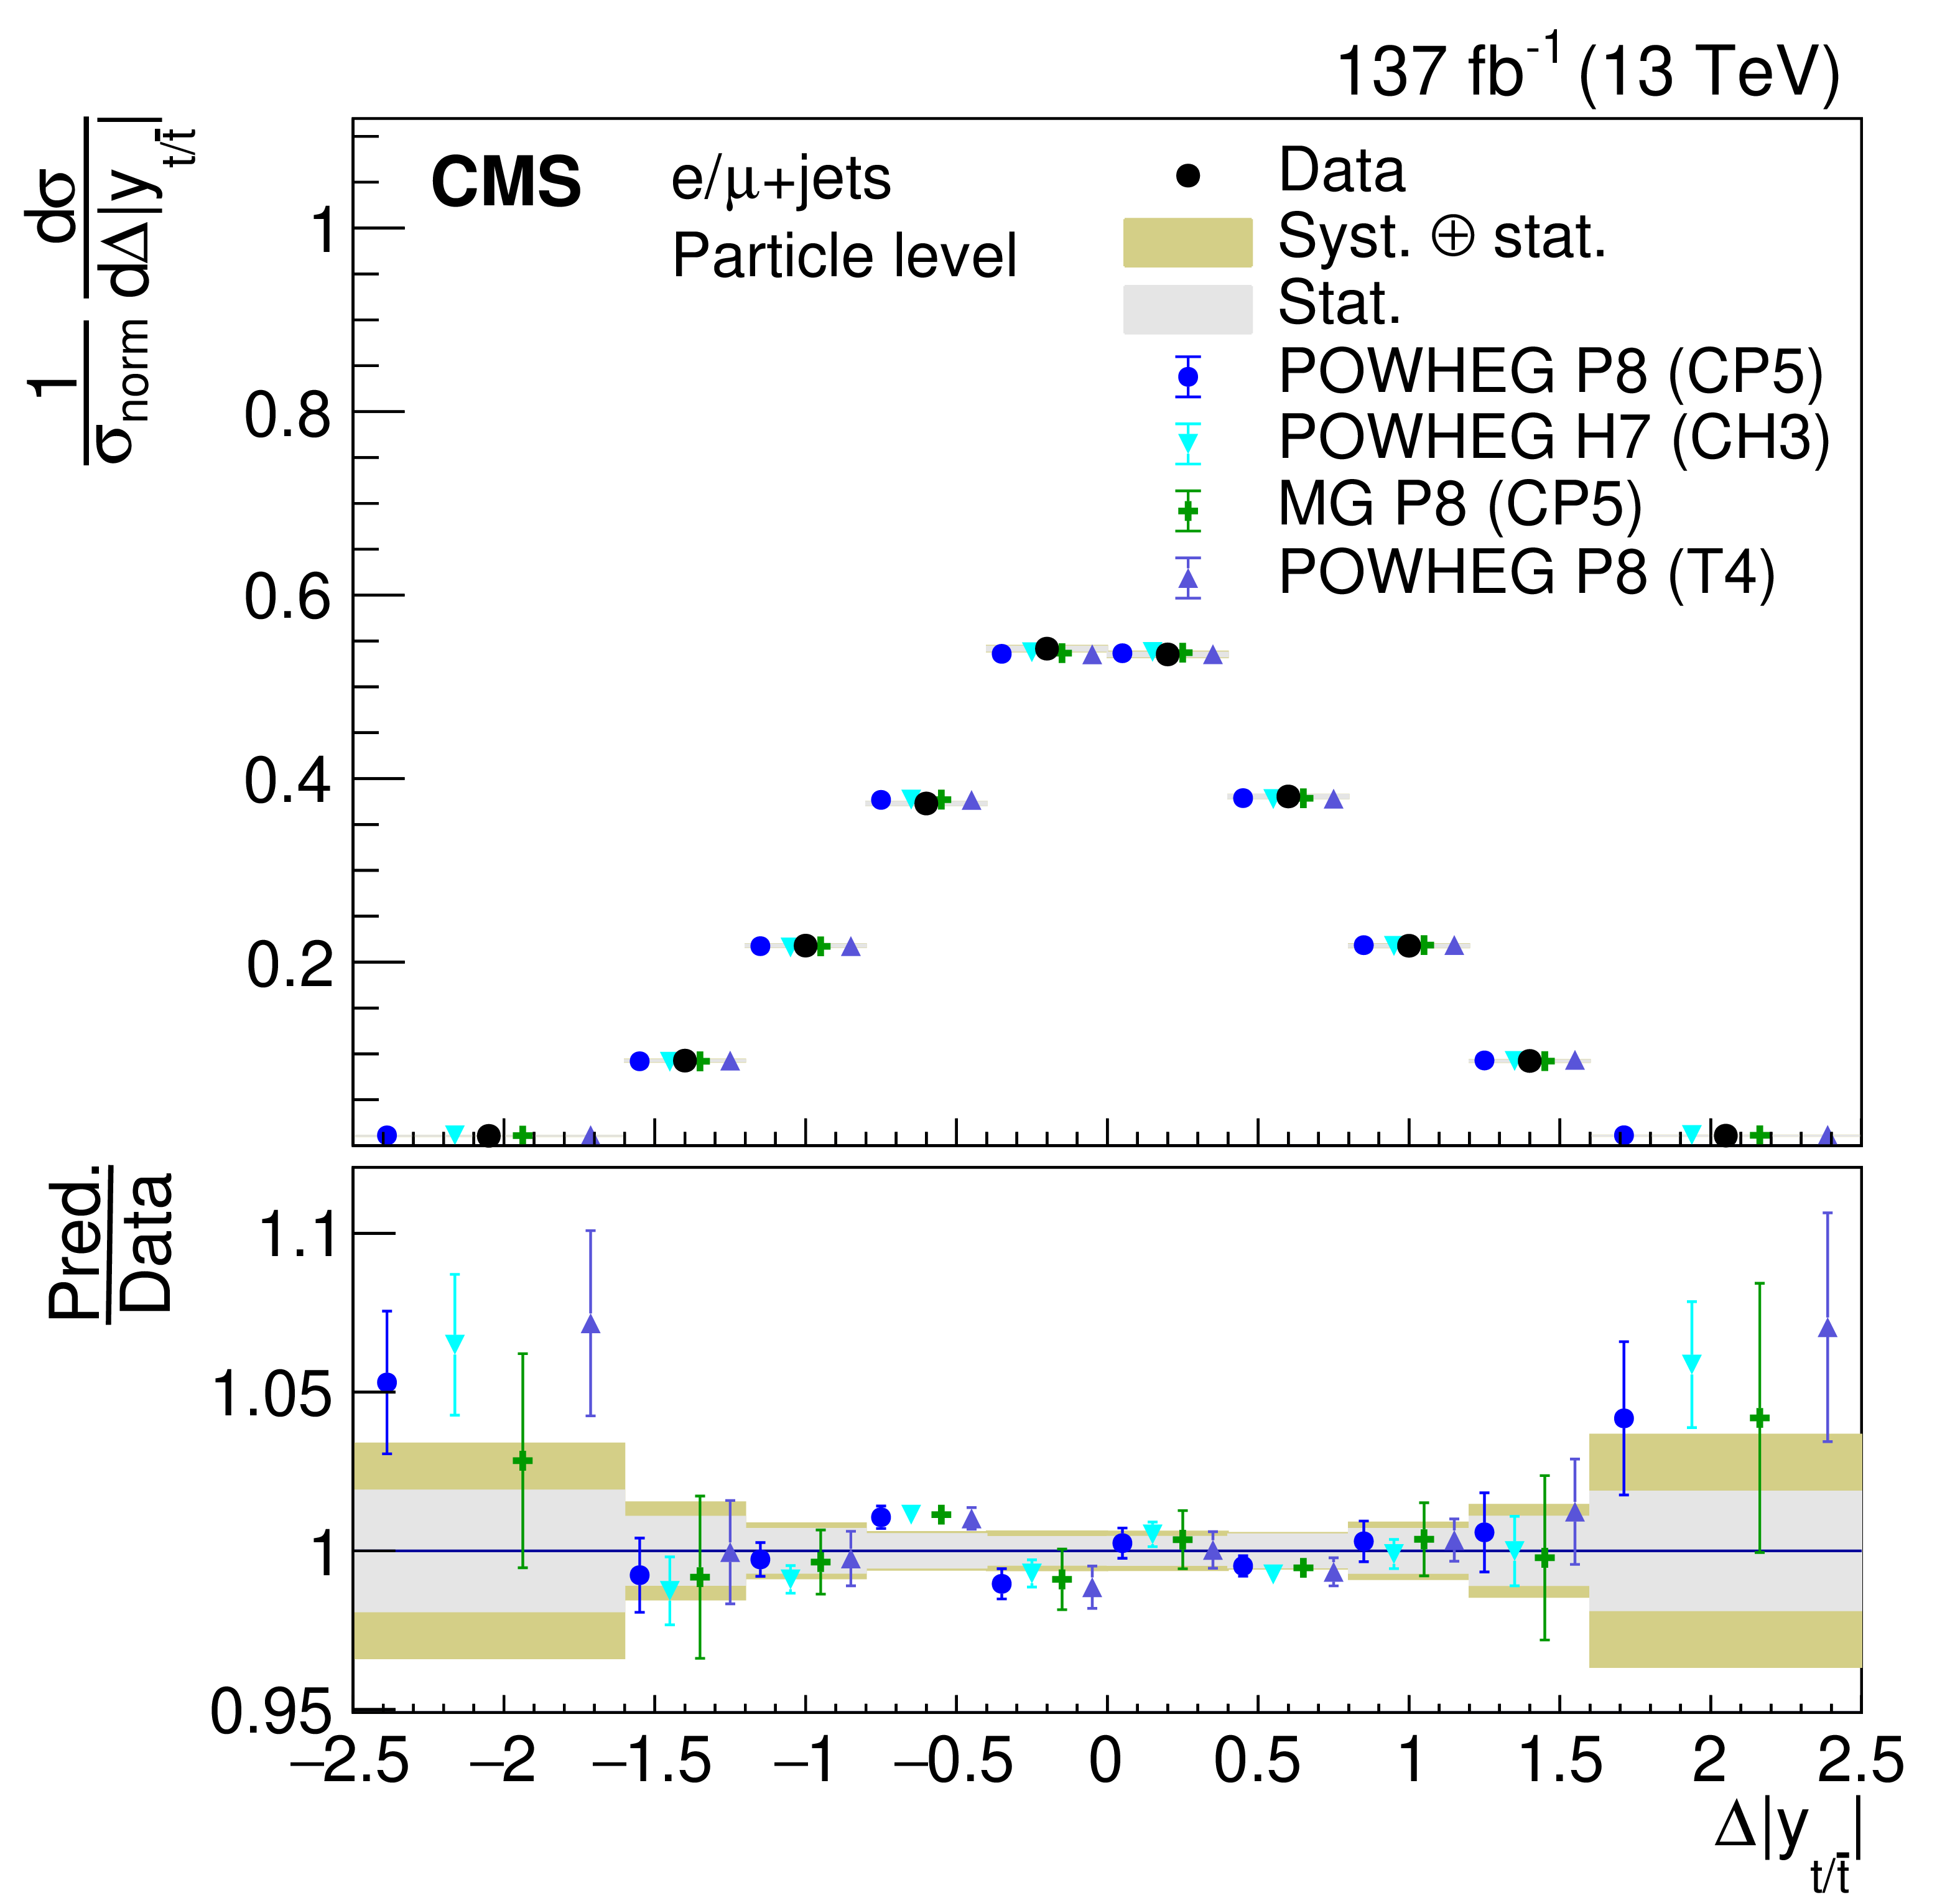
png pdf |
Figure A4-c:
Normalized differential cross sections at the particle level as a function of ${{| y({\mathrm{t} _\mathrm {h}}) |}}$, ${{| y({\mathrm{t} _\ell}) |}}$, and the differences ${\Delta {| y_{\mathrm{t} /\mathrm{\bar{t}}} |}}$ and ${{| \Delta y_{\mathrm{t} /\mathrm{\bar{t}}} |}}$. The data are shown as points with gray (yellow) bands indicating the statistical (statistical and systematic) uncertainties. The cross sections are compared to the predictions of POWHEG+PYTHIA (P8) for the CP5 and CUETP8M2T4 (T4) tunes, POWHEG+HERWIG (H7), and the multiparton simulation MG5_aMC@NLO (MG)+PYTHIA. The ratios of the various predictions to the measured cross sections are shown in the lower panels. |
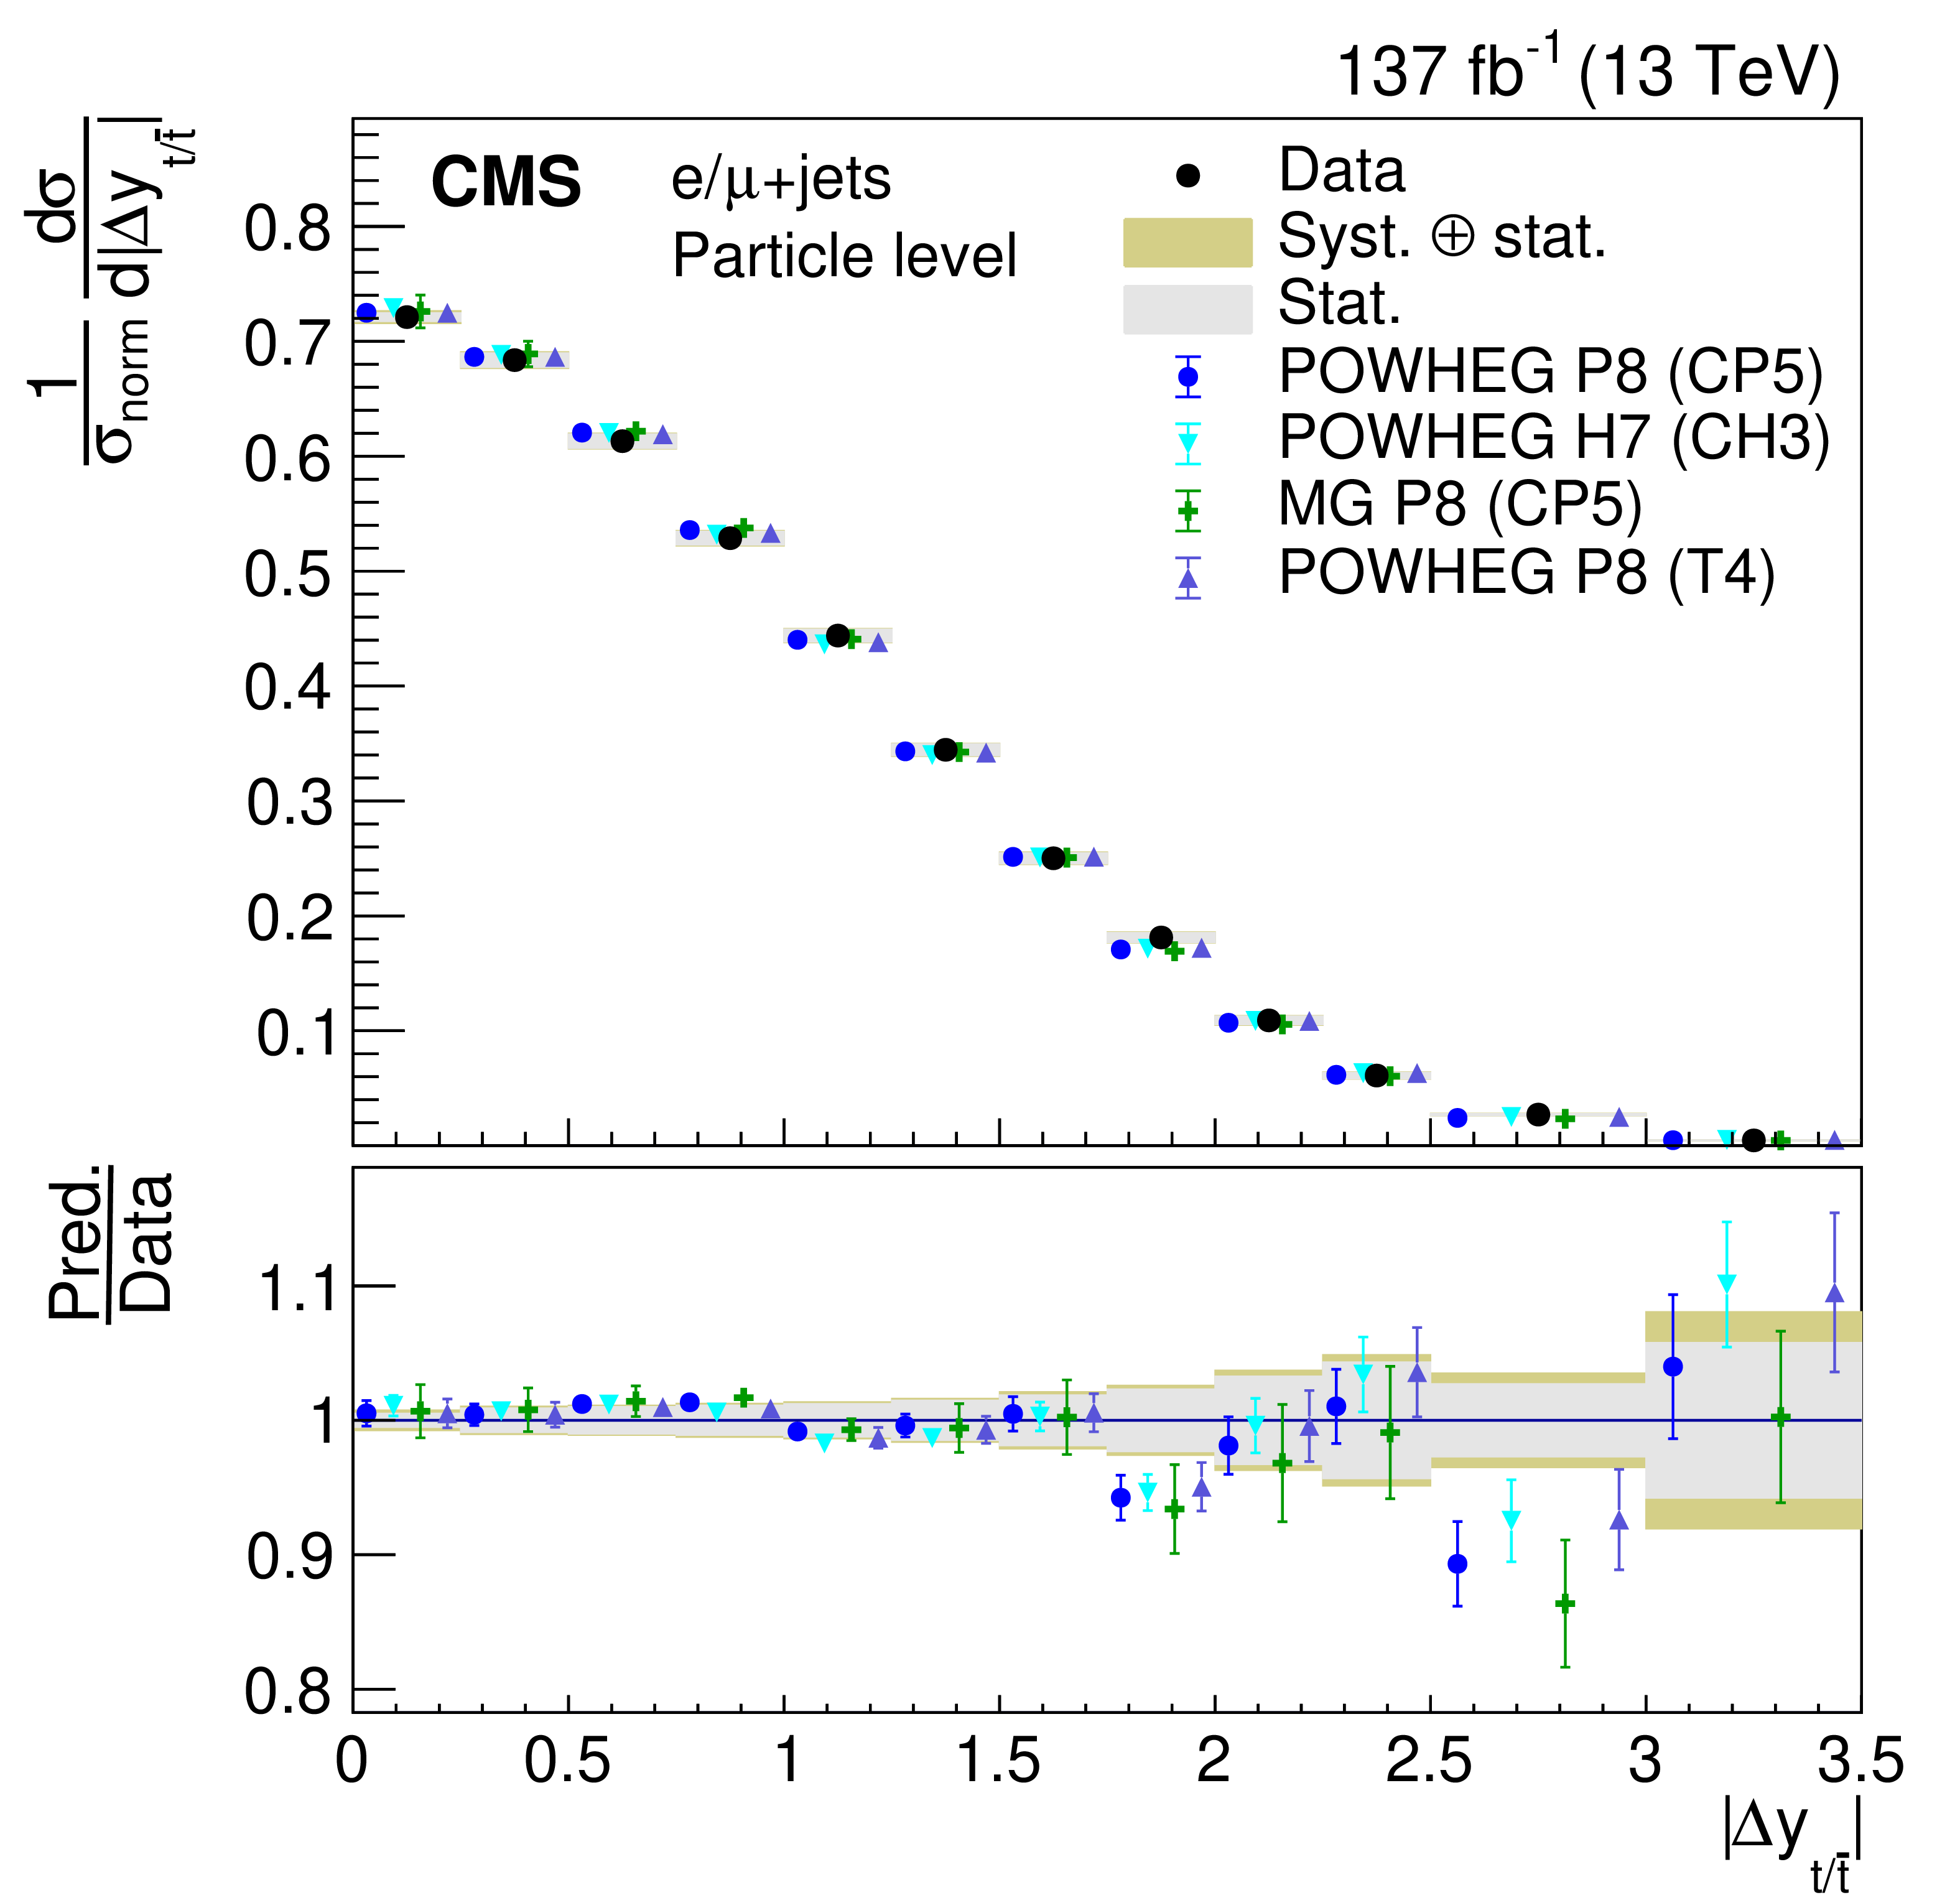
png pdf |
Figure A4-d:
Normalized differential cross sections at the particle level as a function of ${{| y({\mathrm{t} _\mathrm {h}}) |}}$, ${{| y({\mathrm{t} _\ell}) |}}$, and the differences ${\Delta {| y_{\mathrm{t} /\mathrm{\bar{t}}} |}}$ and ${{| \Delta y_{\mathrm{t} /\mathrm{\bar{t}}} |}}$. The data are shown as points with gray (yellow) bands indicating the statistical (statistical and systematic) uncertainties. The cross sections are compared to the predictions of POWHEG+PYTHIA (P8) for the CP5 and CUETP8M2T4 (T4) tunes, POWHEG+HERWIG (H7), and the multiparton simulation MG5_aMC@NLO (MG)+PYTHIA. The ratios of the various predictions to the measured cross sections are shown in the lower panels. |
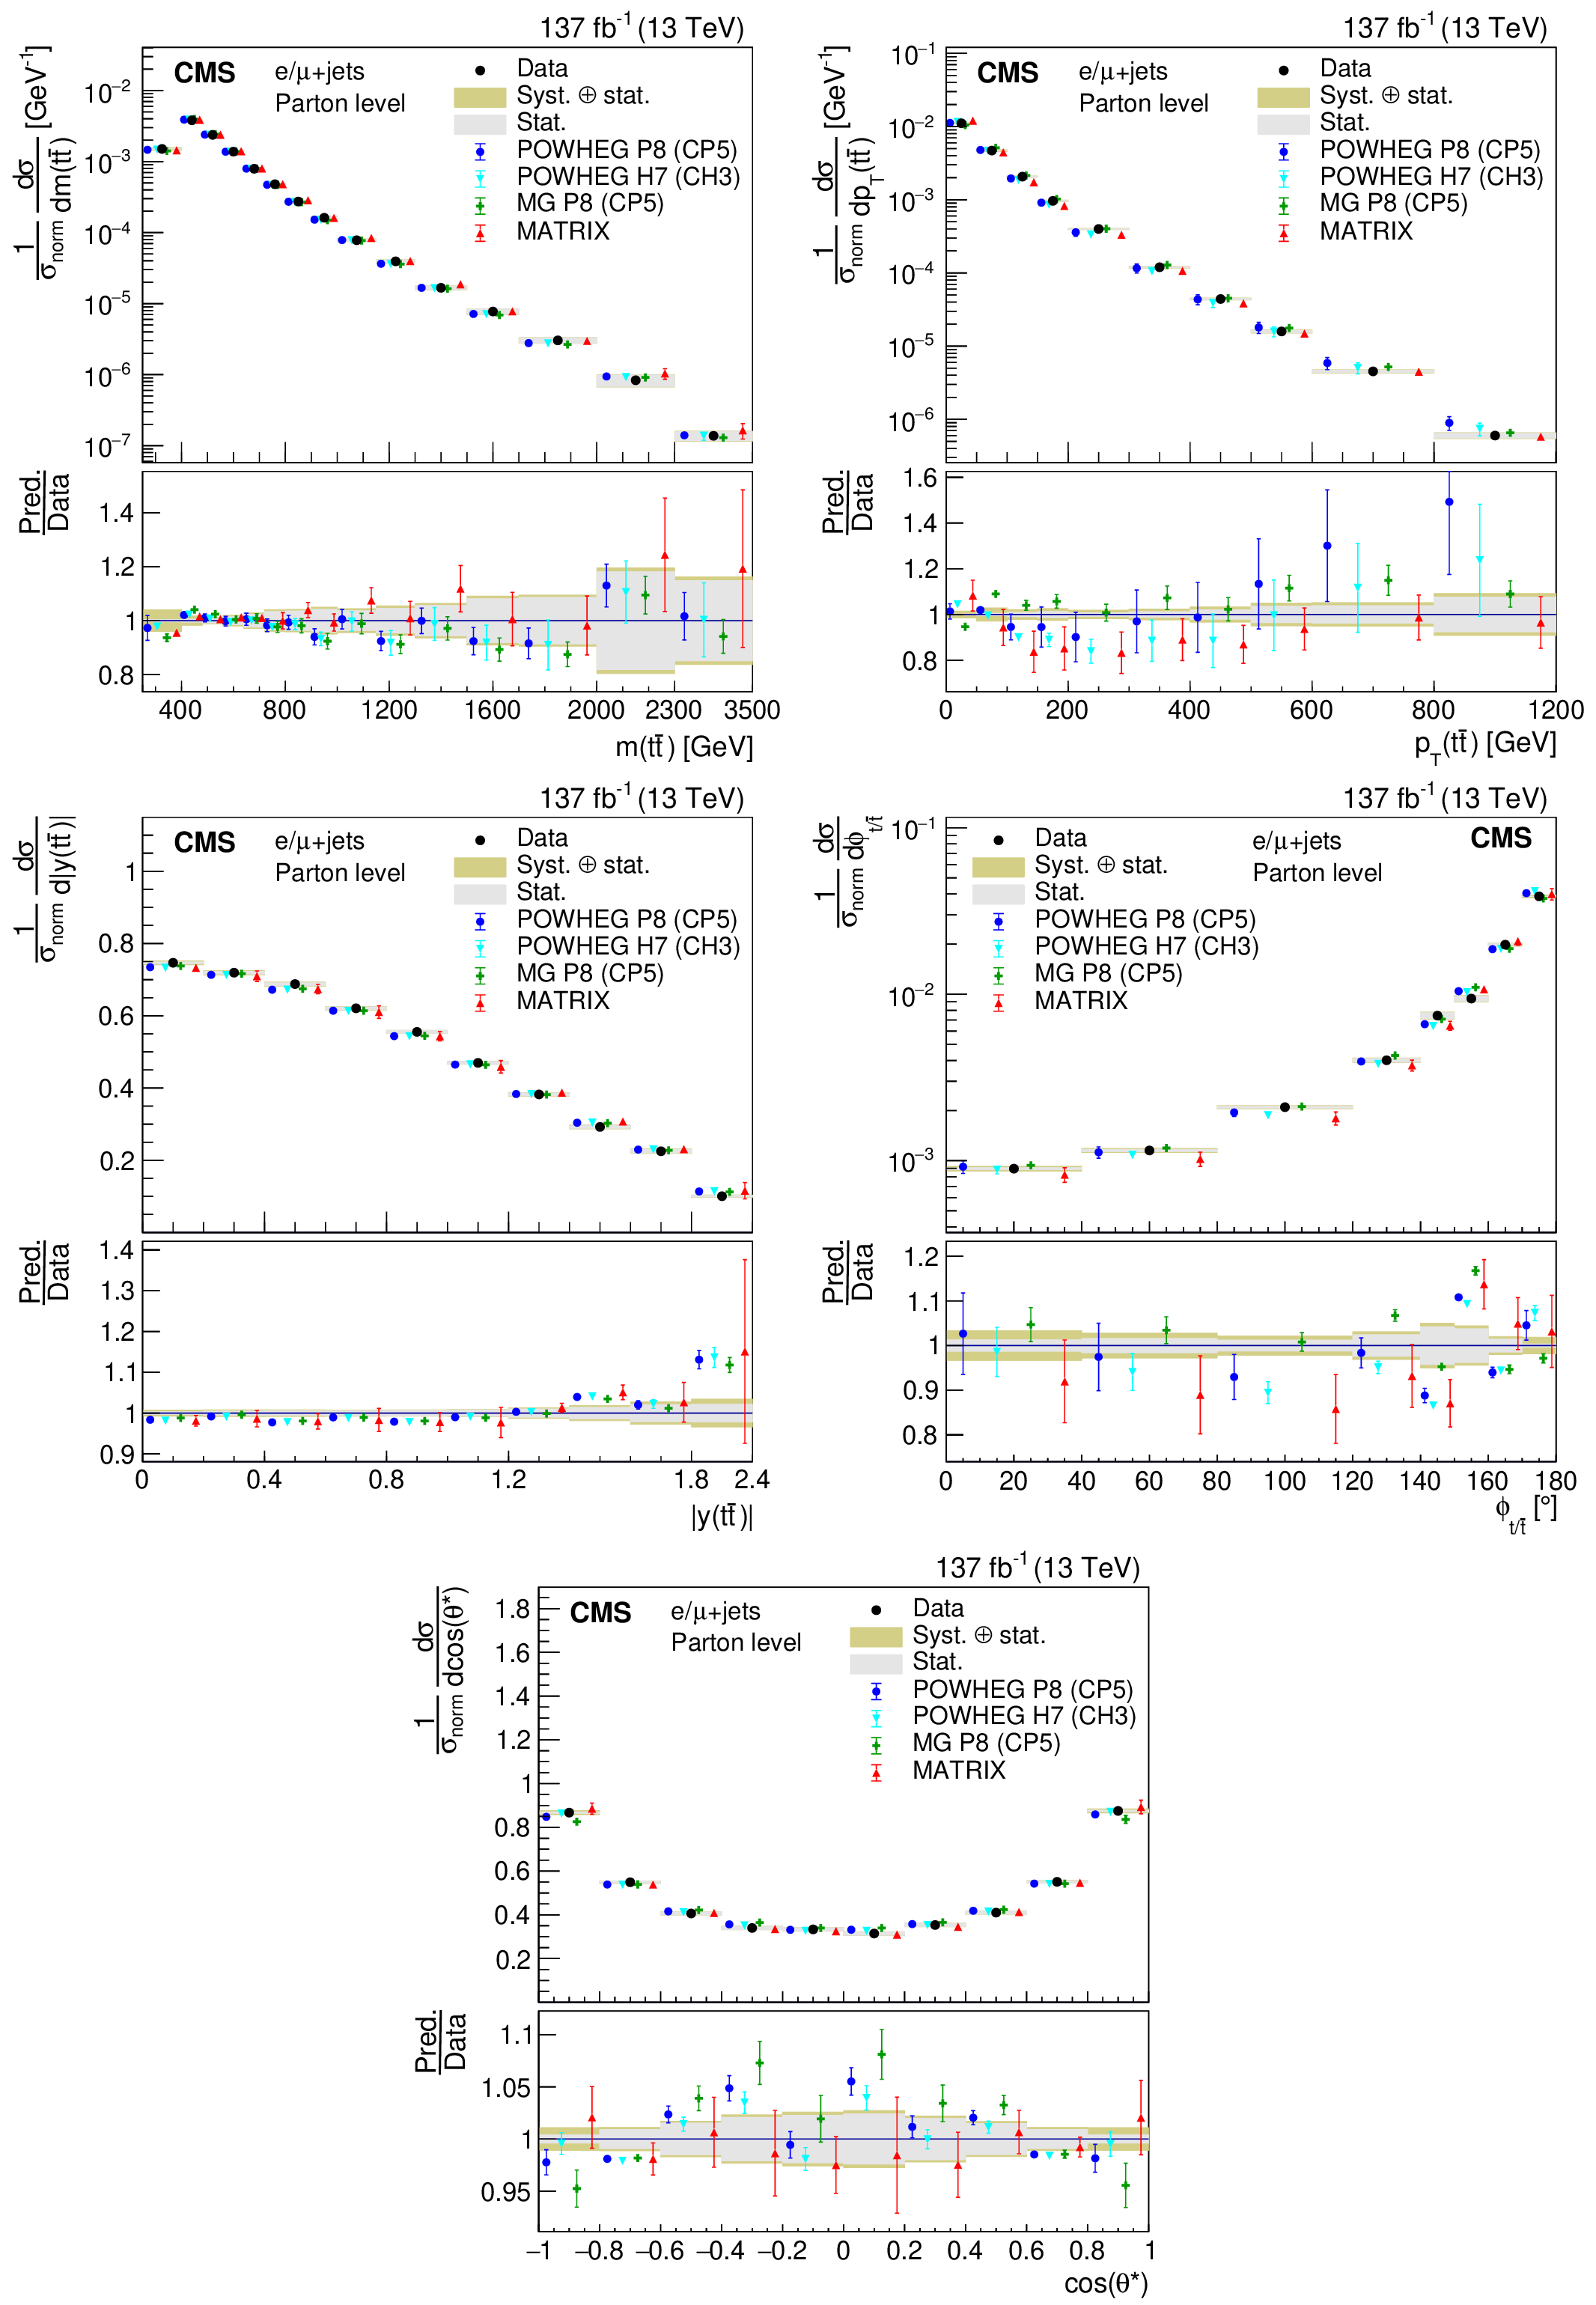
png pdf |
Figure A5:
Normalized differential cross sections at the parton level as a function of kinematic variables of the ${\mathrm{t} {}\mathrm{\bar{t}}}$ system. The data are shown as points with gray (yellow) bands indicating the statistical (statistical and systematic) uncertainties. The cross sections are compared to the predictions of POWHEG combined with PYTHIA (P8) or HERWIG (H7), the multiparton simulation MG5_aMC@NLO (MG)+PYTHIA FxFx, and the NNLO QCD calculations obtained with Matrix. The ratios of the various predictions to the measured cross sections are shown in the lower panels. |
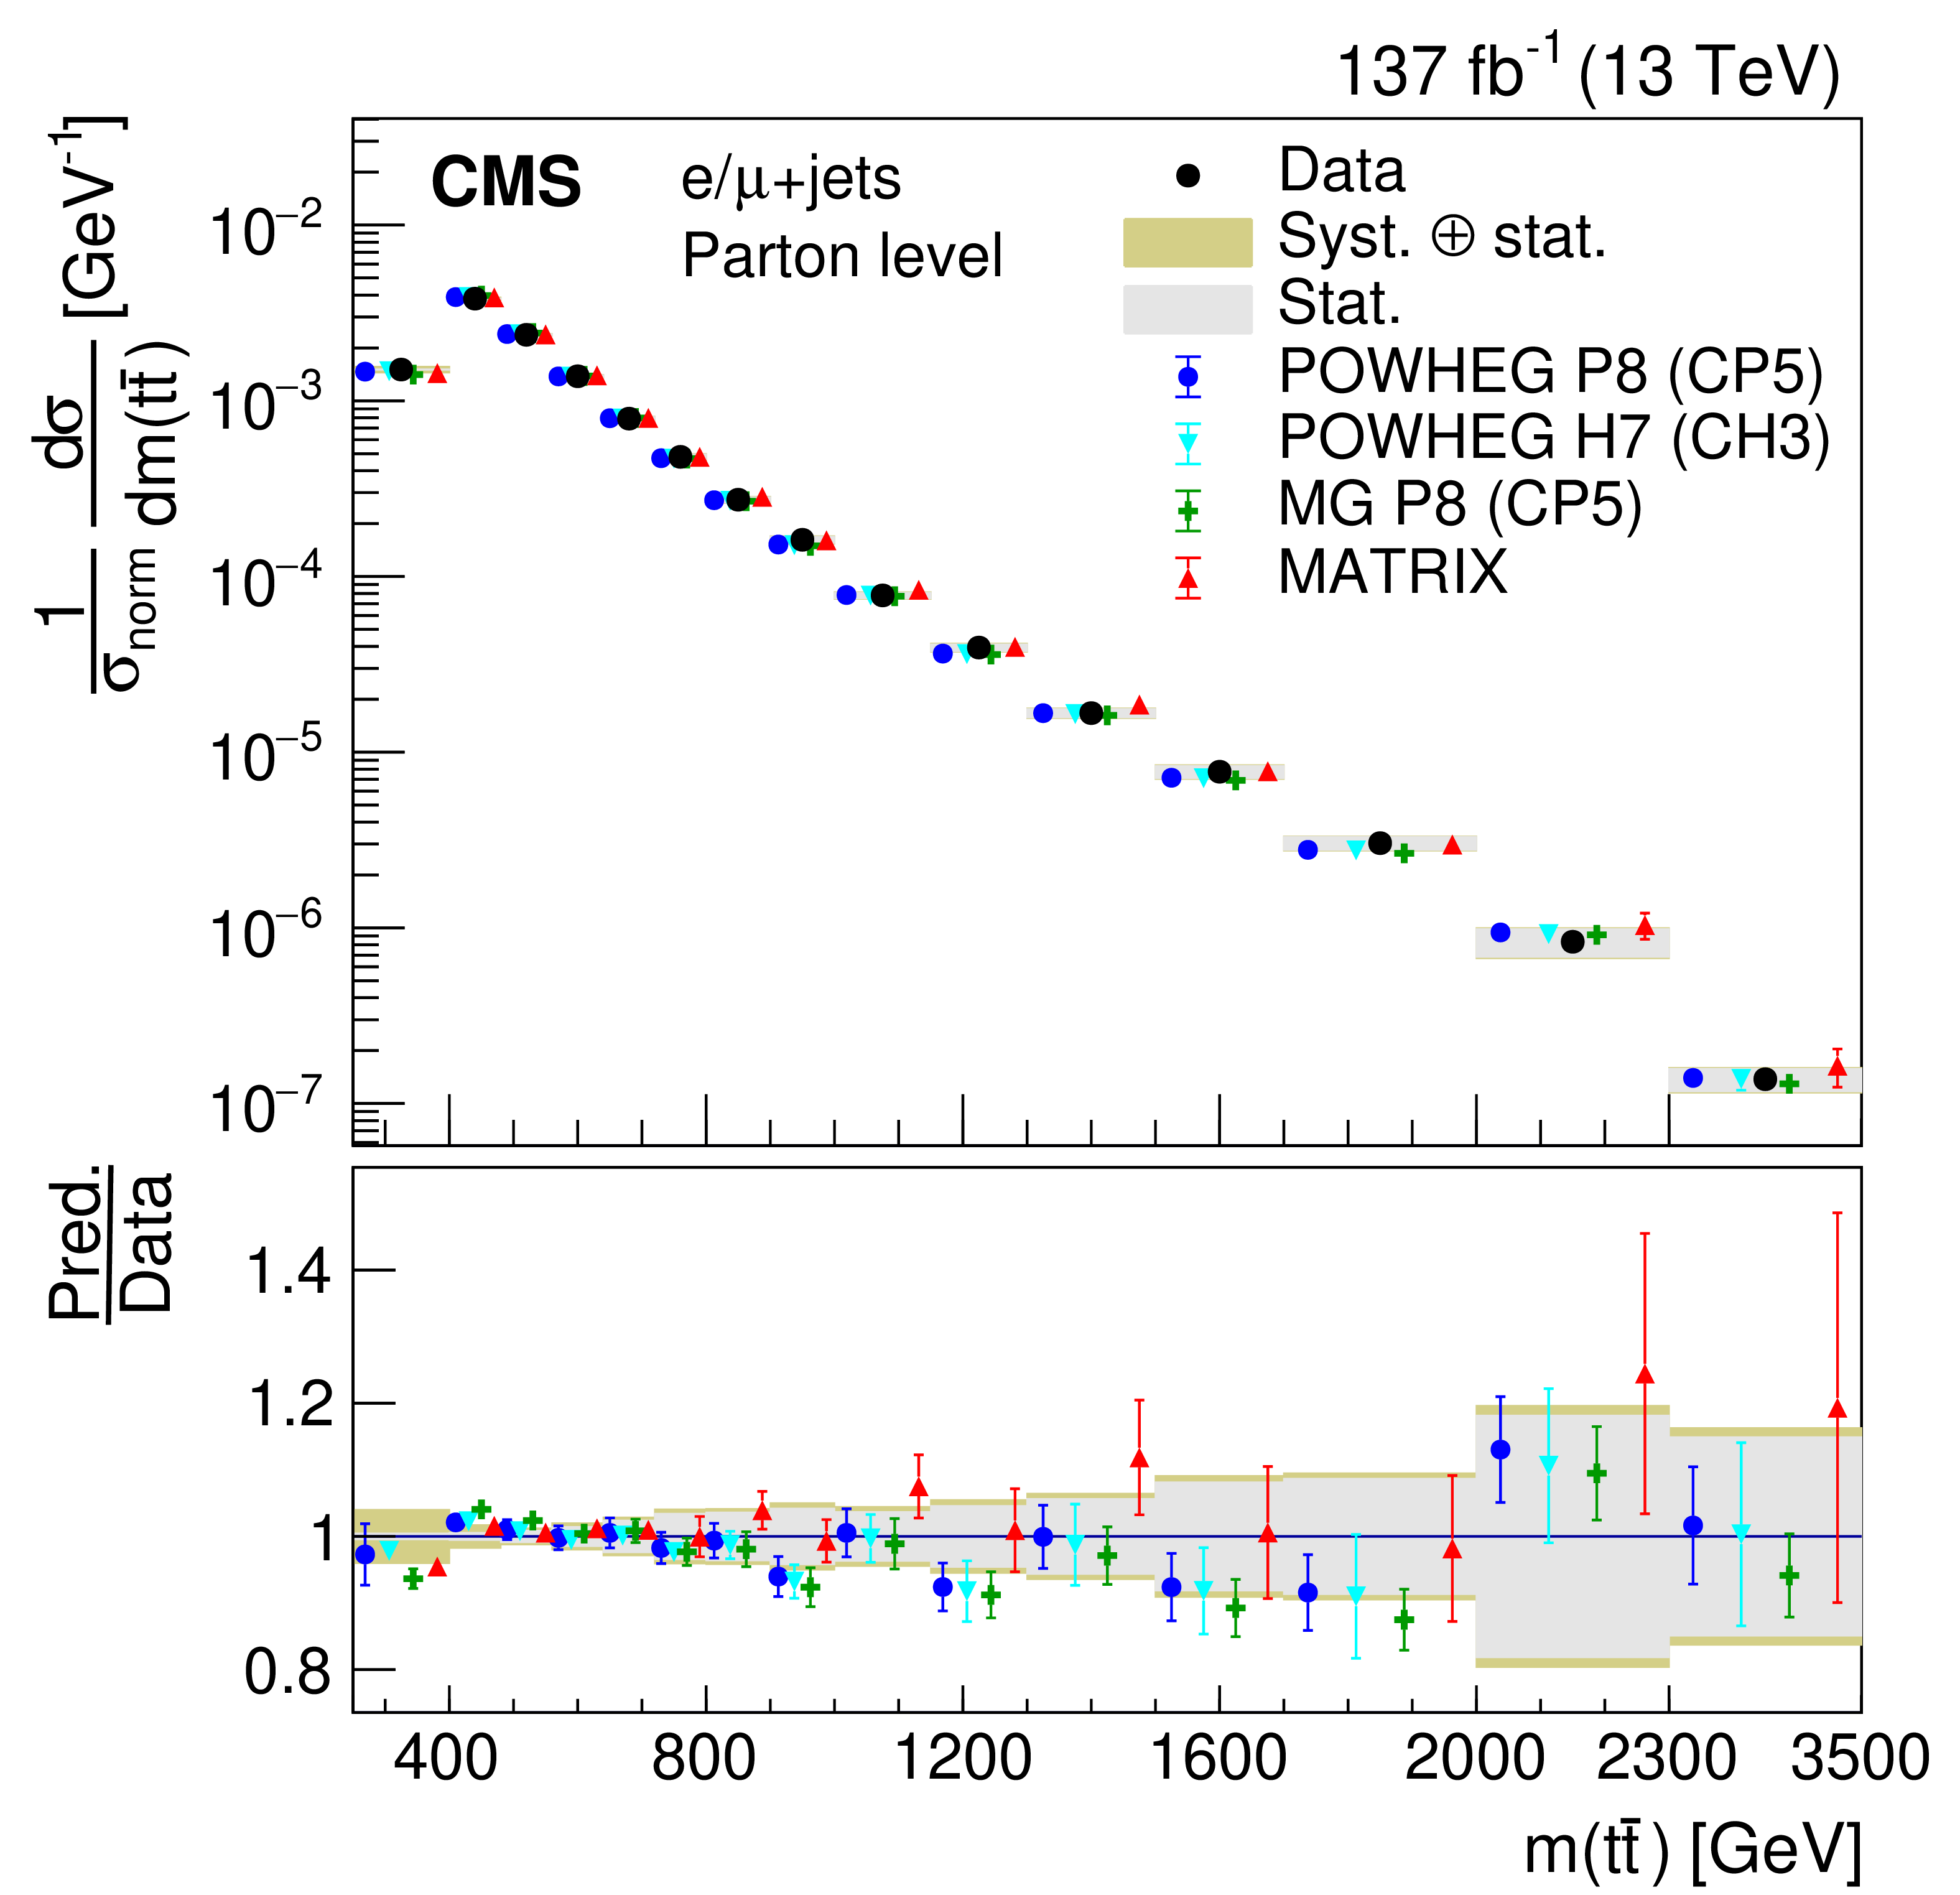
png pdf |
Figure A5-a:
Normalized differential cross sections at the parton level as a function of kinematic variables of the ${\mathrm{t} {}\mathrm{\bar{t}}}$ system. The data are shown as points with gray (yellow) bands indicating the statistical (statistical and systematic) uncertainties. The cross sections are compared to the predictions of POWHEG combined with PYTHIA (P8) or HERWIG (H7), the multiparton simulation MG5_aMC@NLO (MG)+PYTHIA FxFx, and the NNLO QCD calculations obtained with Matrix. The ratios of the various predictions to the measured cross sections are shown in the lower panels. |
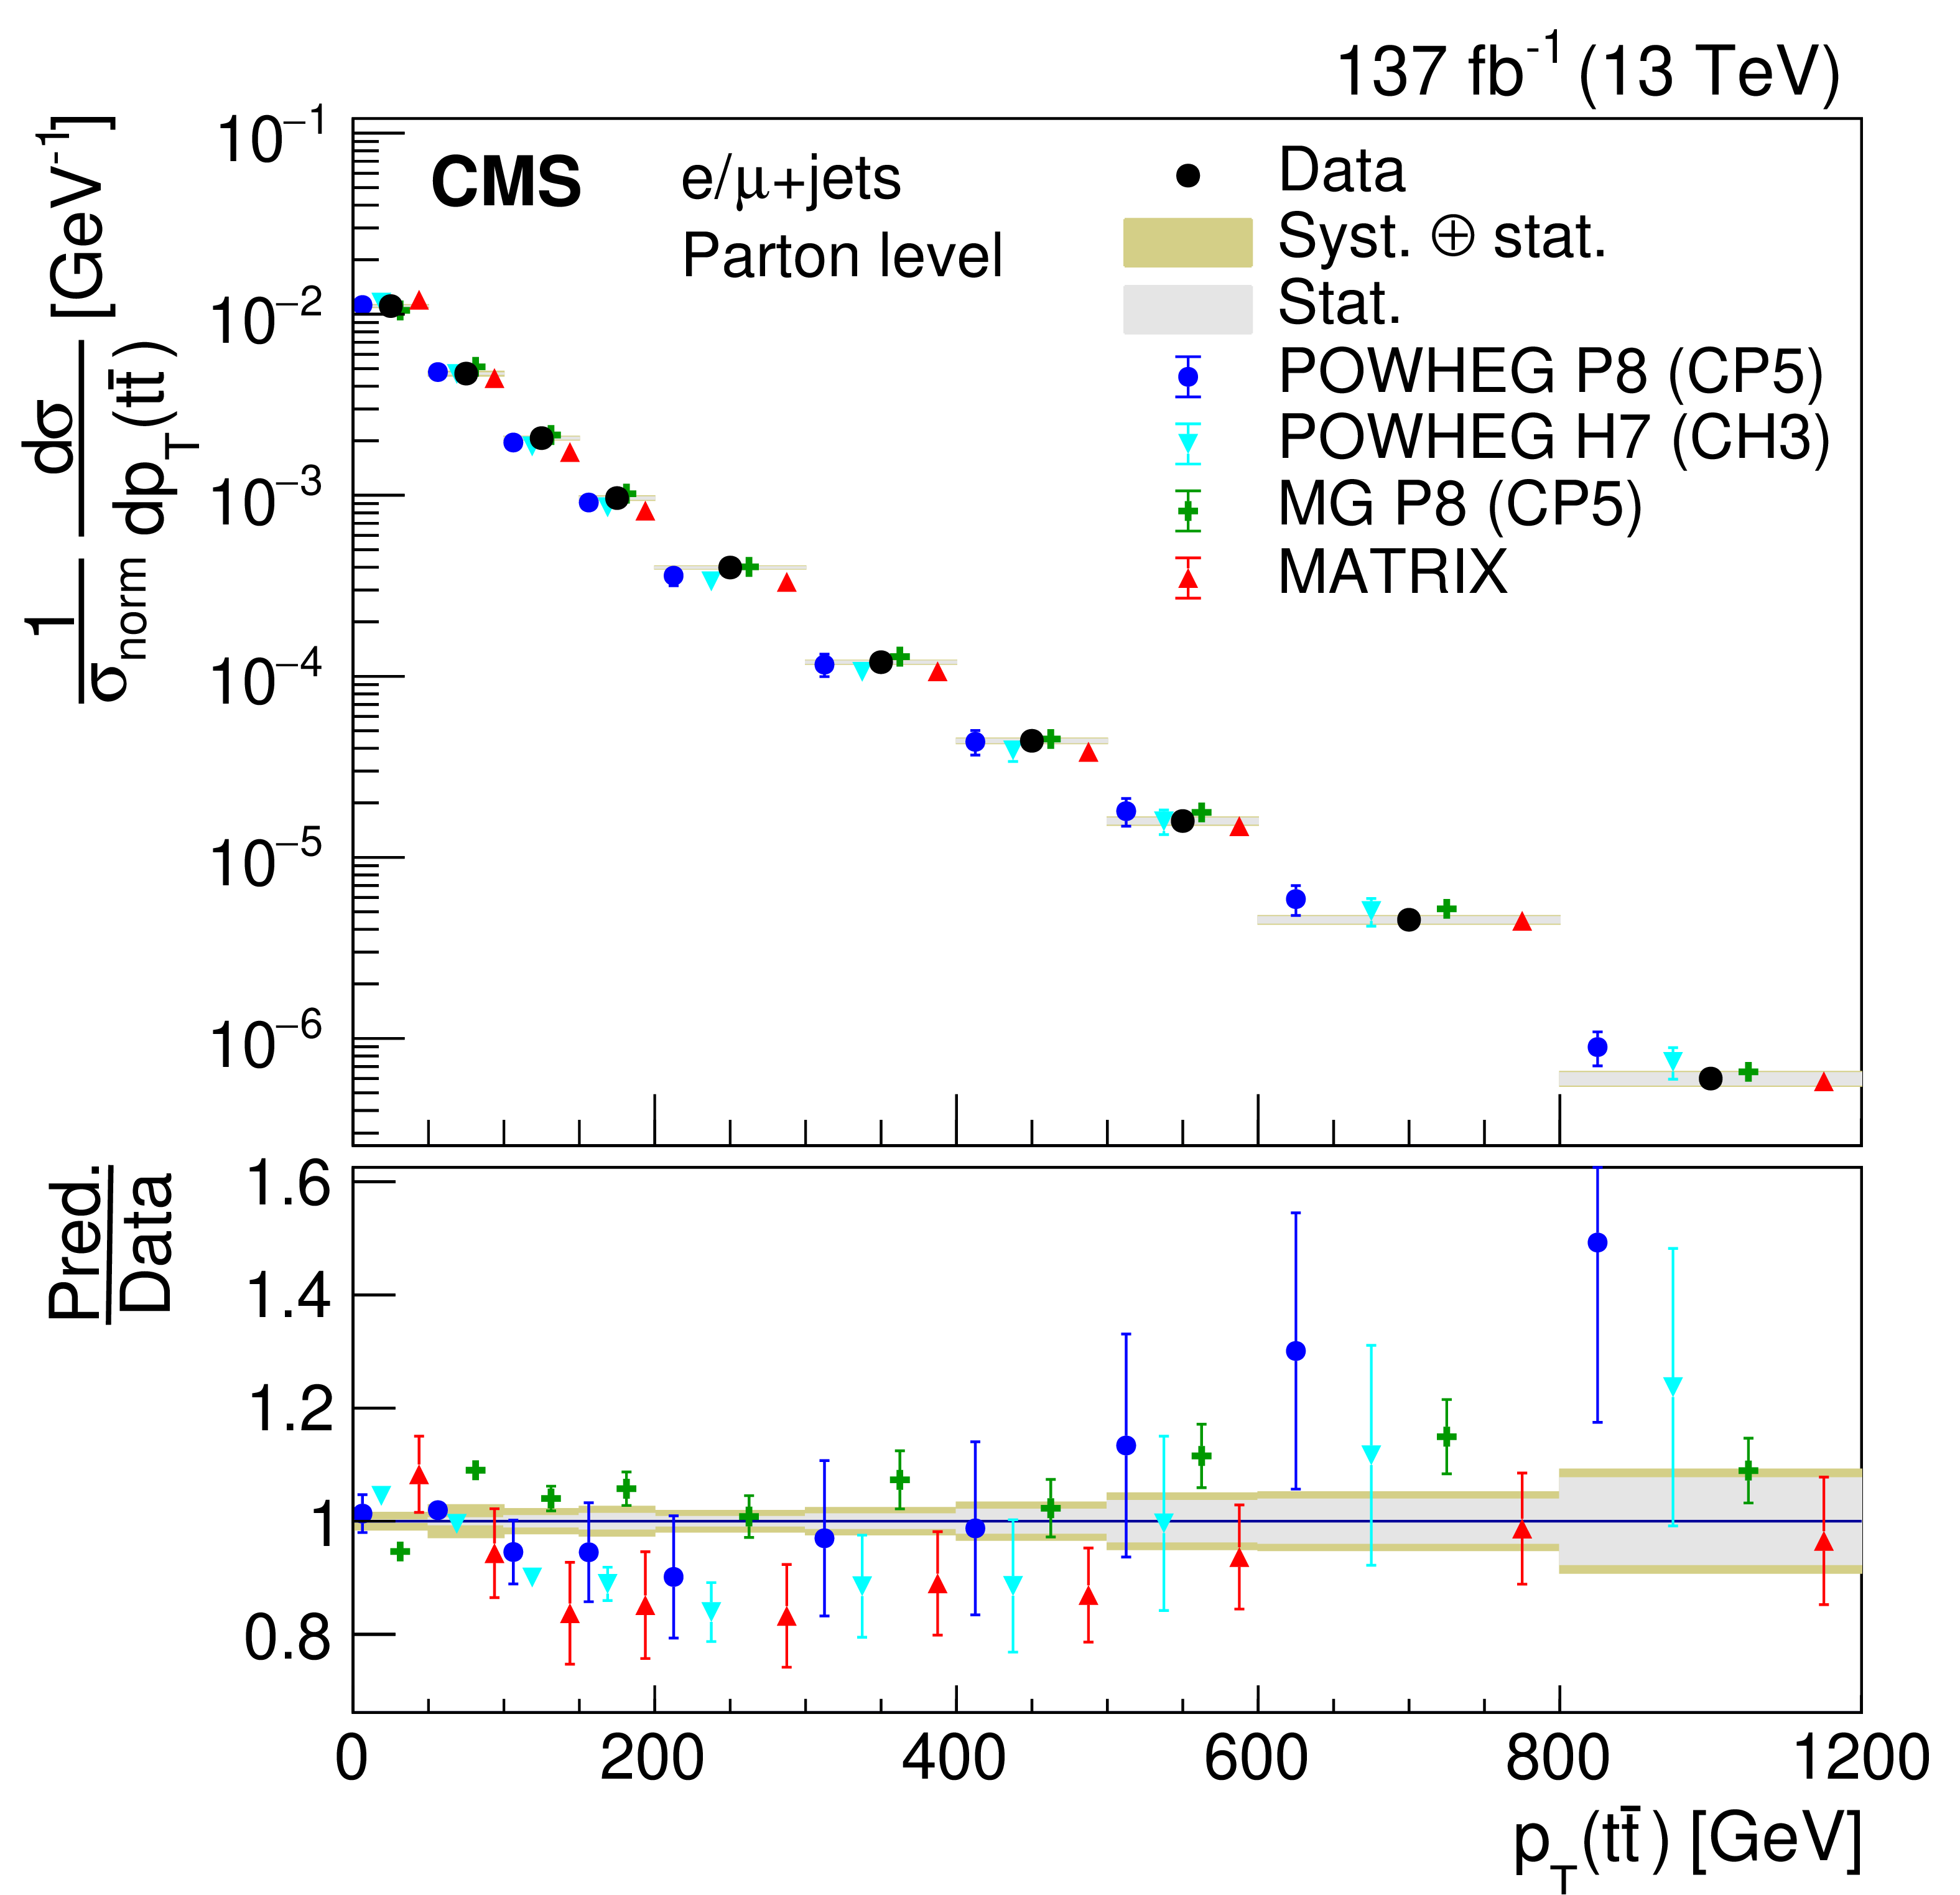
png pdf |
Figure A5-b:
Normalized differential cross sections at the parton level as a function of kinematic variables of the ${\mathrm{t} {}\mathrm{\bar{t}}}$ system. The data are shown as points with gray (yellow) bands indicating the statistical (statistical and systematic) uncertainties. The cross sections are compared to the predictions of POWHEG combined with PYTHIA (P8) or HERWIG (H7), the multiparton simulation MG5_aMC@NLO (MG)+PYTHIA FxFx, and the NNLO QCD calculations obtained with Matrix. The ratios of the various predictions to the measured cross sections are shown in the lower panels. |
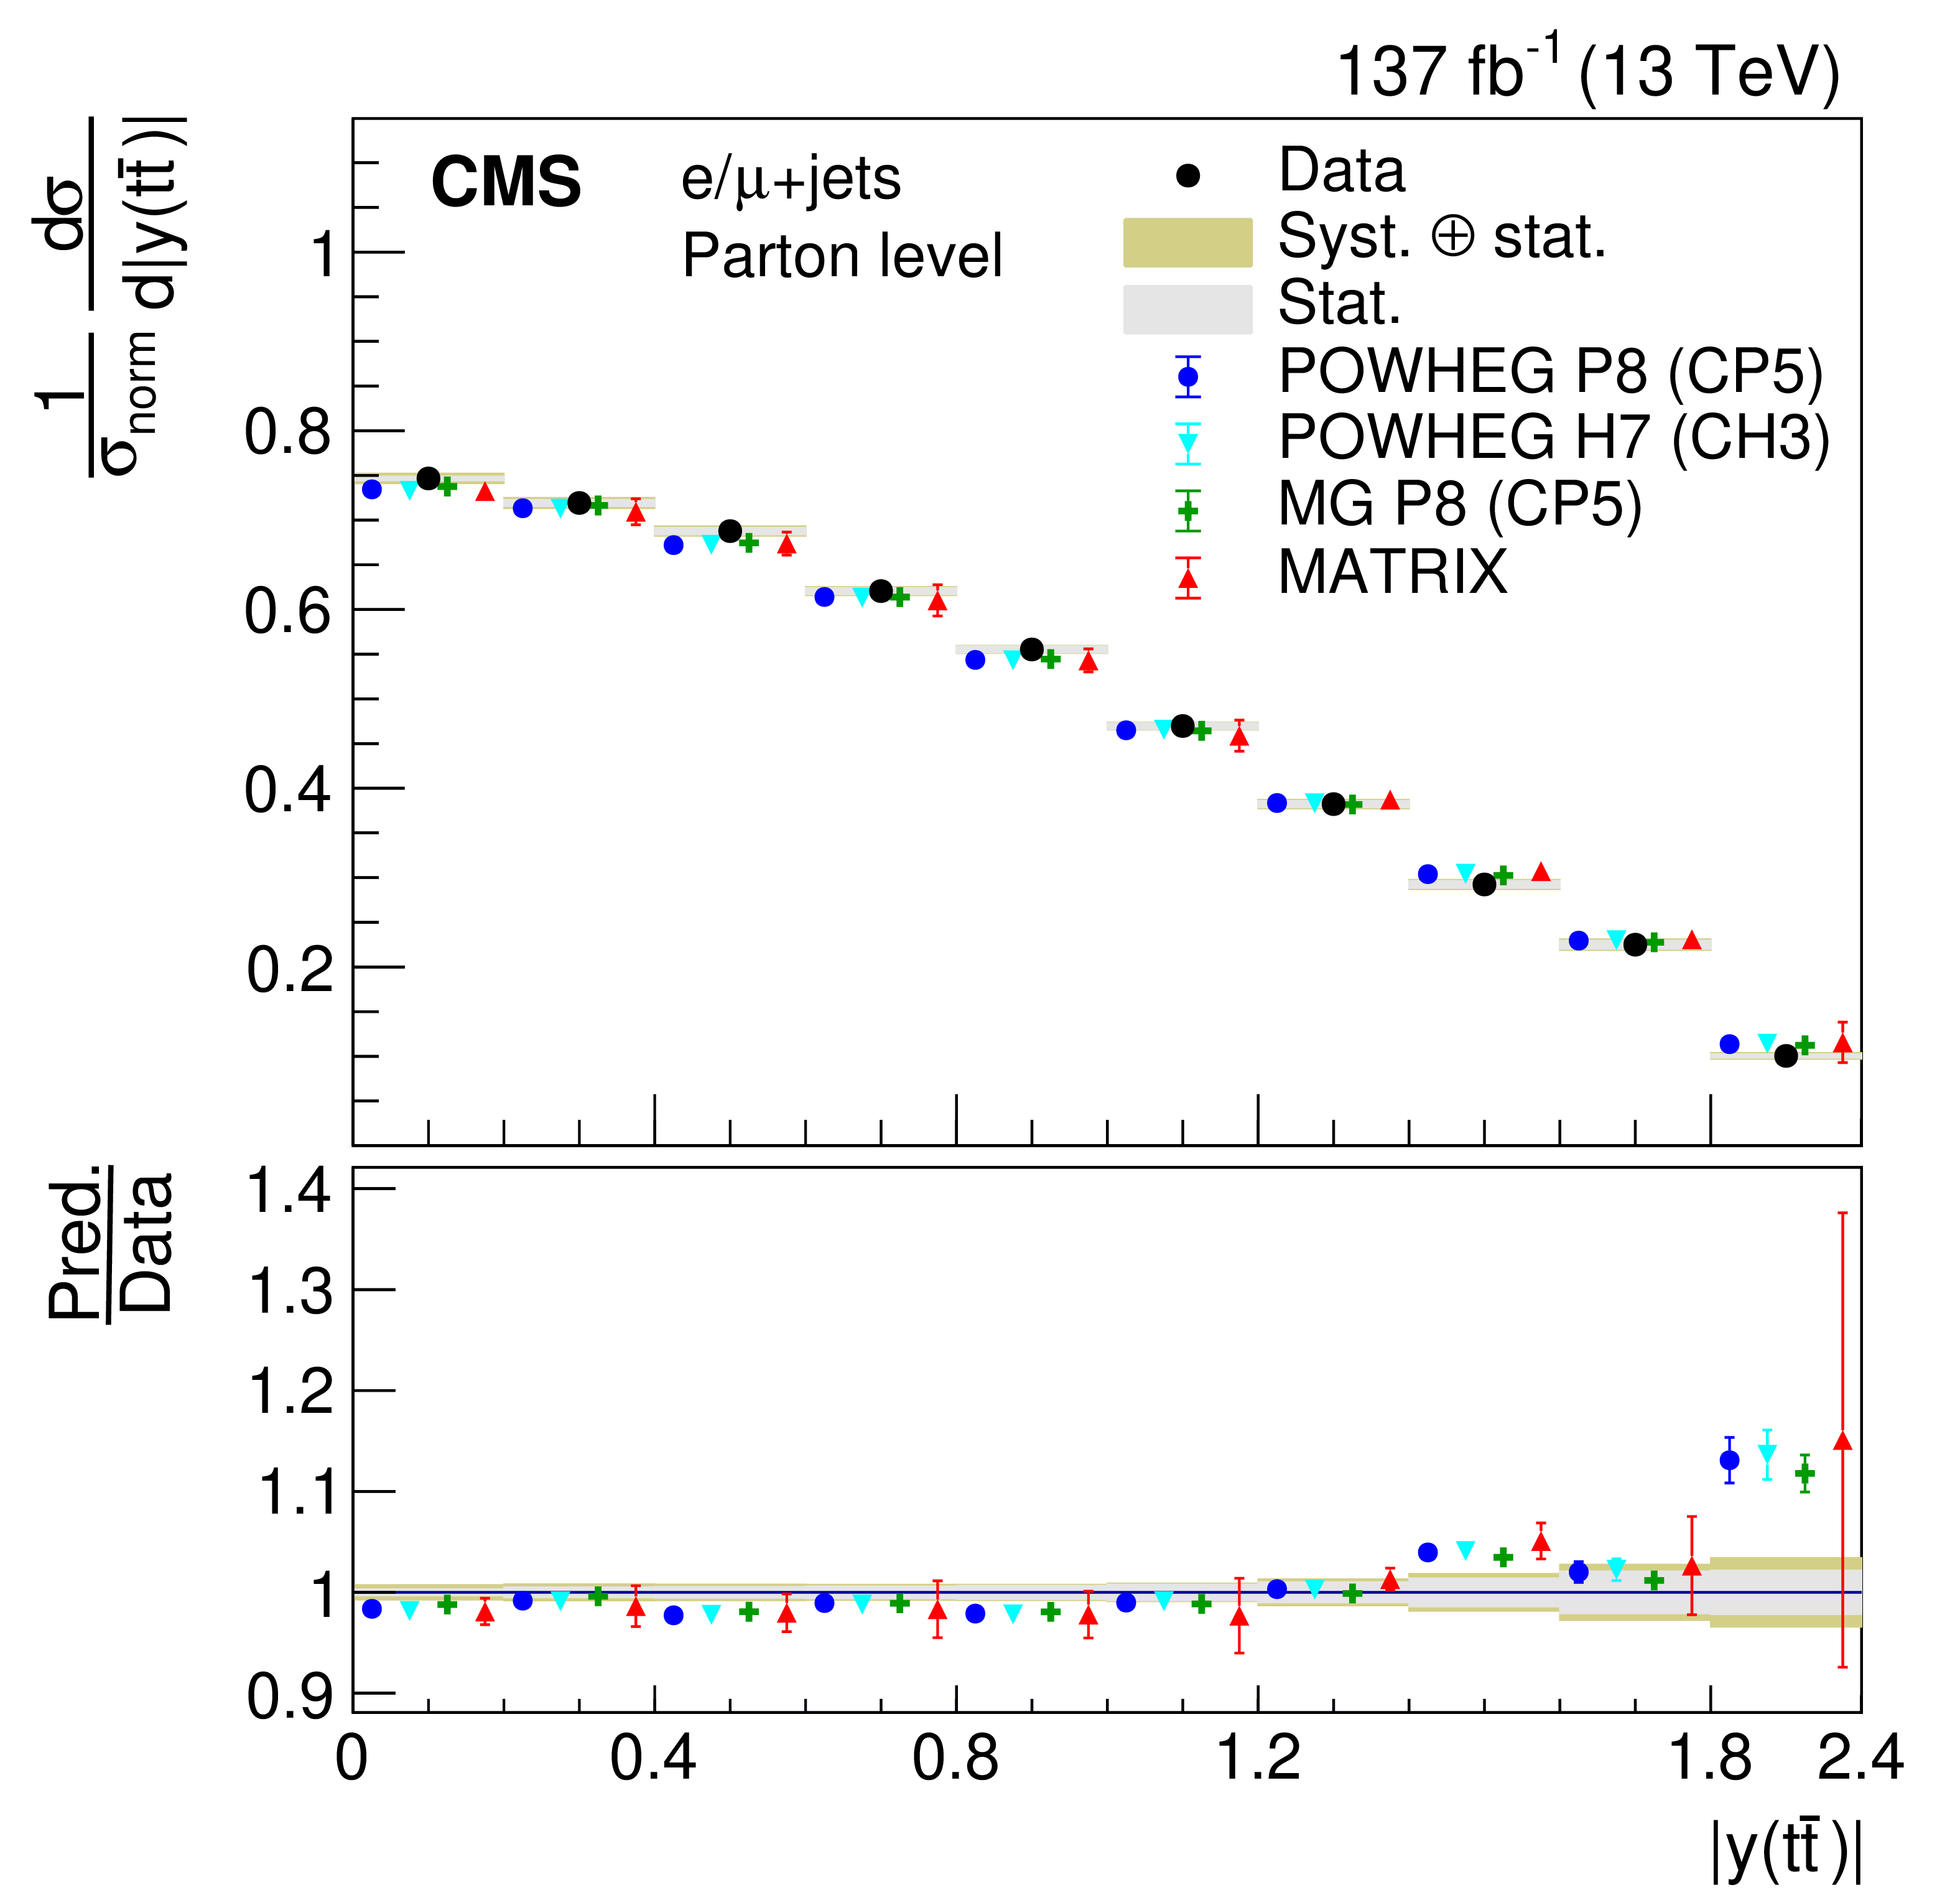
png pdf |
Figure A5-c:
Normalized differential cross sections at the parton level as a function of kinematic variables of the ${\mathrm{t} {}\mathrm{\bar{t}}}$ system. The data are shown as points with gray (yellow) bands indicating the statistical (statistical and systematic) uncertainties. The cross sections are compared to the predictions of POWHEG combined with PYTHIA (P8) or HERWIG (H7), the multiparton simulation MG5_aMC@NLO (MG)+PYTHIA FxFx, and the NNLO QCD calculations obtained with Matrix. The ratios of the various predictions to the measured cross sections are shown in the lower panels. |
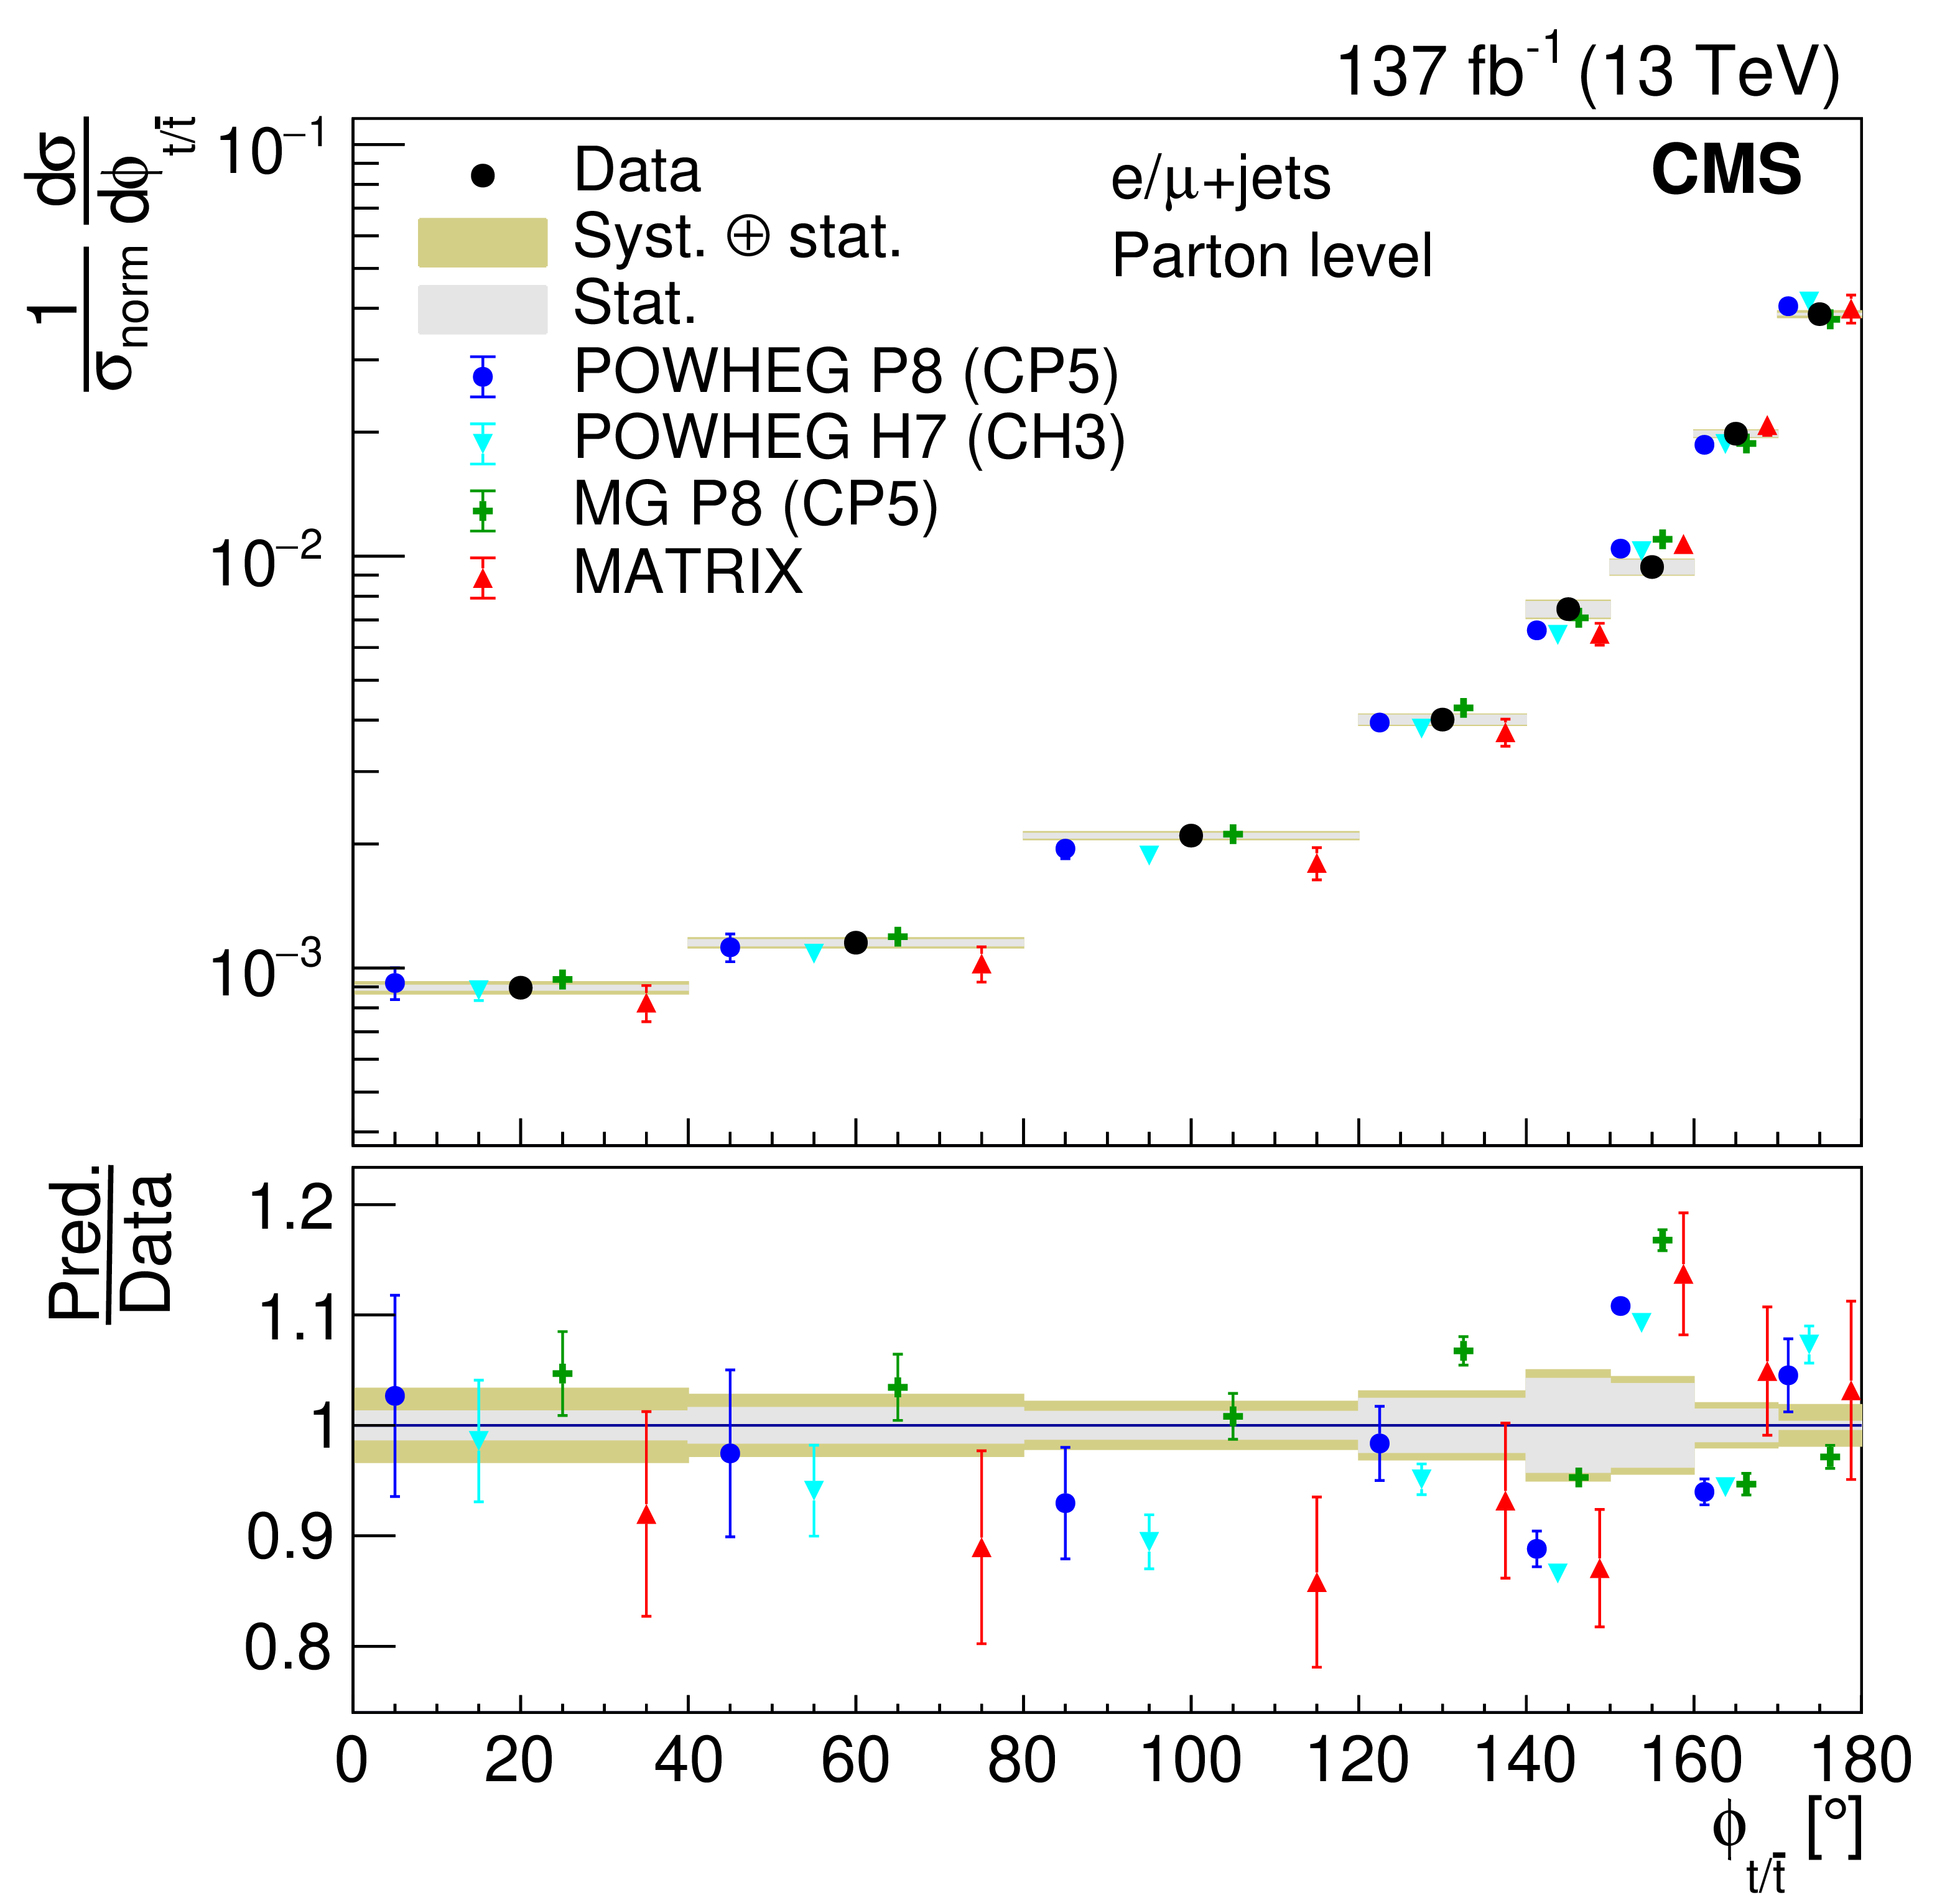
png pdf |
Figure A5-d:
Normalized differential cross sections at the parton level as a function of kinematic variables of the ${\mathrm{t} {}\mathrm{\bar{t}}}$ system. The data are shown as points with gray (yellow) bands indicating the statistical (statistical and systematic) uncertainties. The cross sections are compared to the predictions of POWHEG combined with PYTHIA (P8) or HERWIG (H7), the multiparton simulation MG5_aMC@NLO (MG)+PYTHIA FxFx, and the NNLO QCD calculations obtained with Matrix. The ratios of the various predictions to the measured cross sections are shown in the lower panels. |
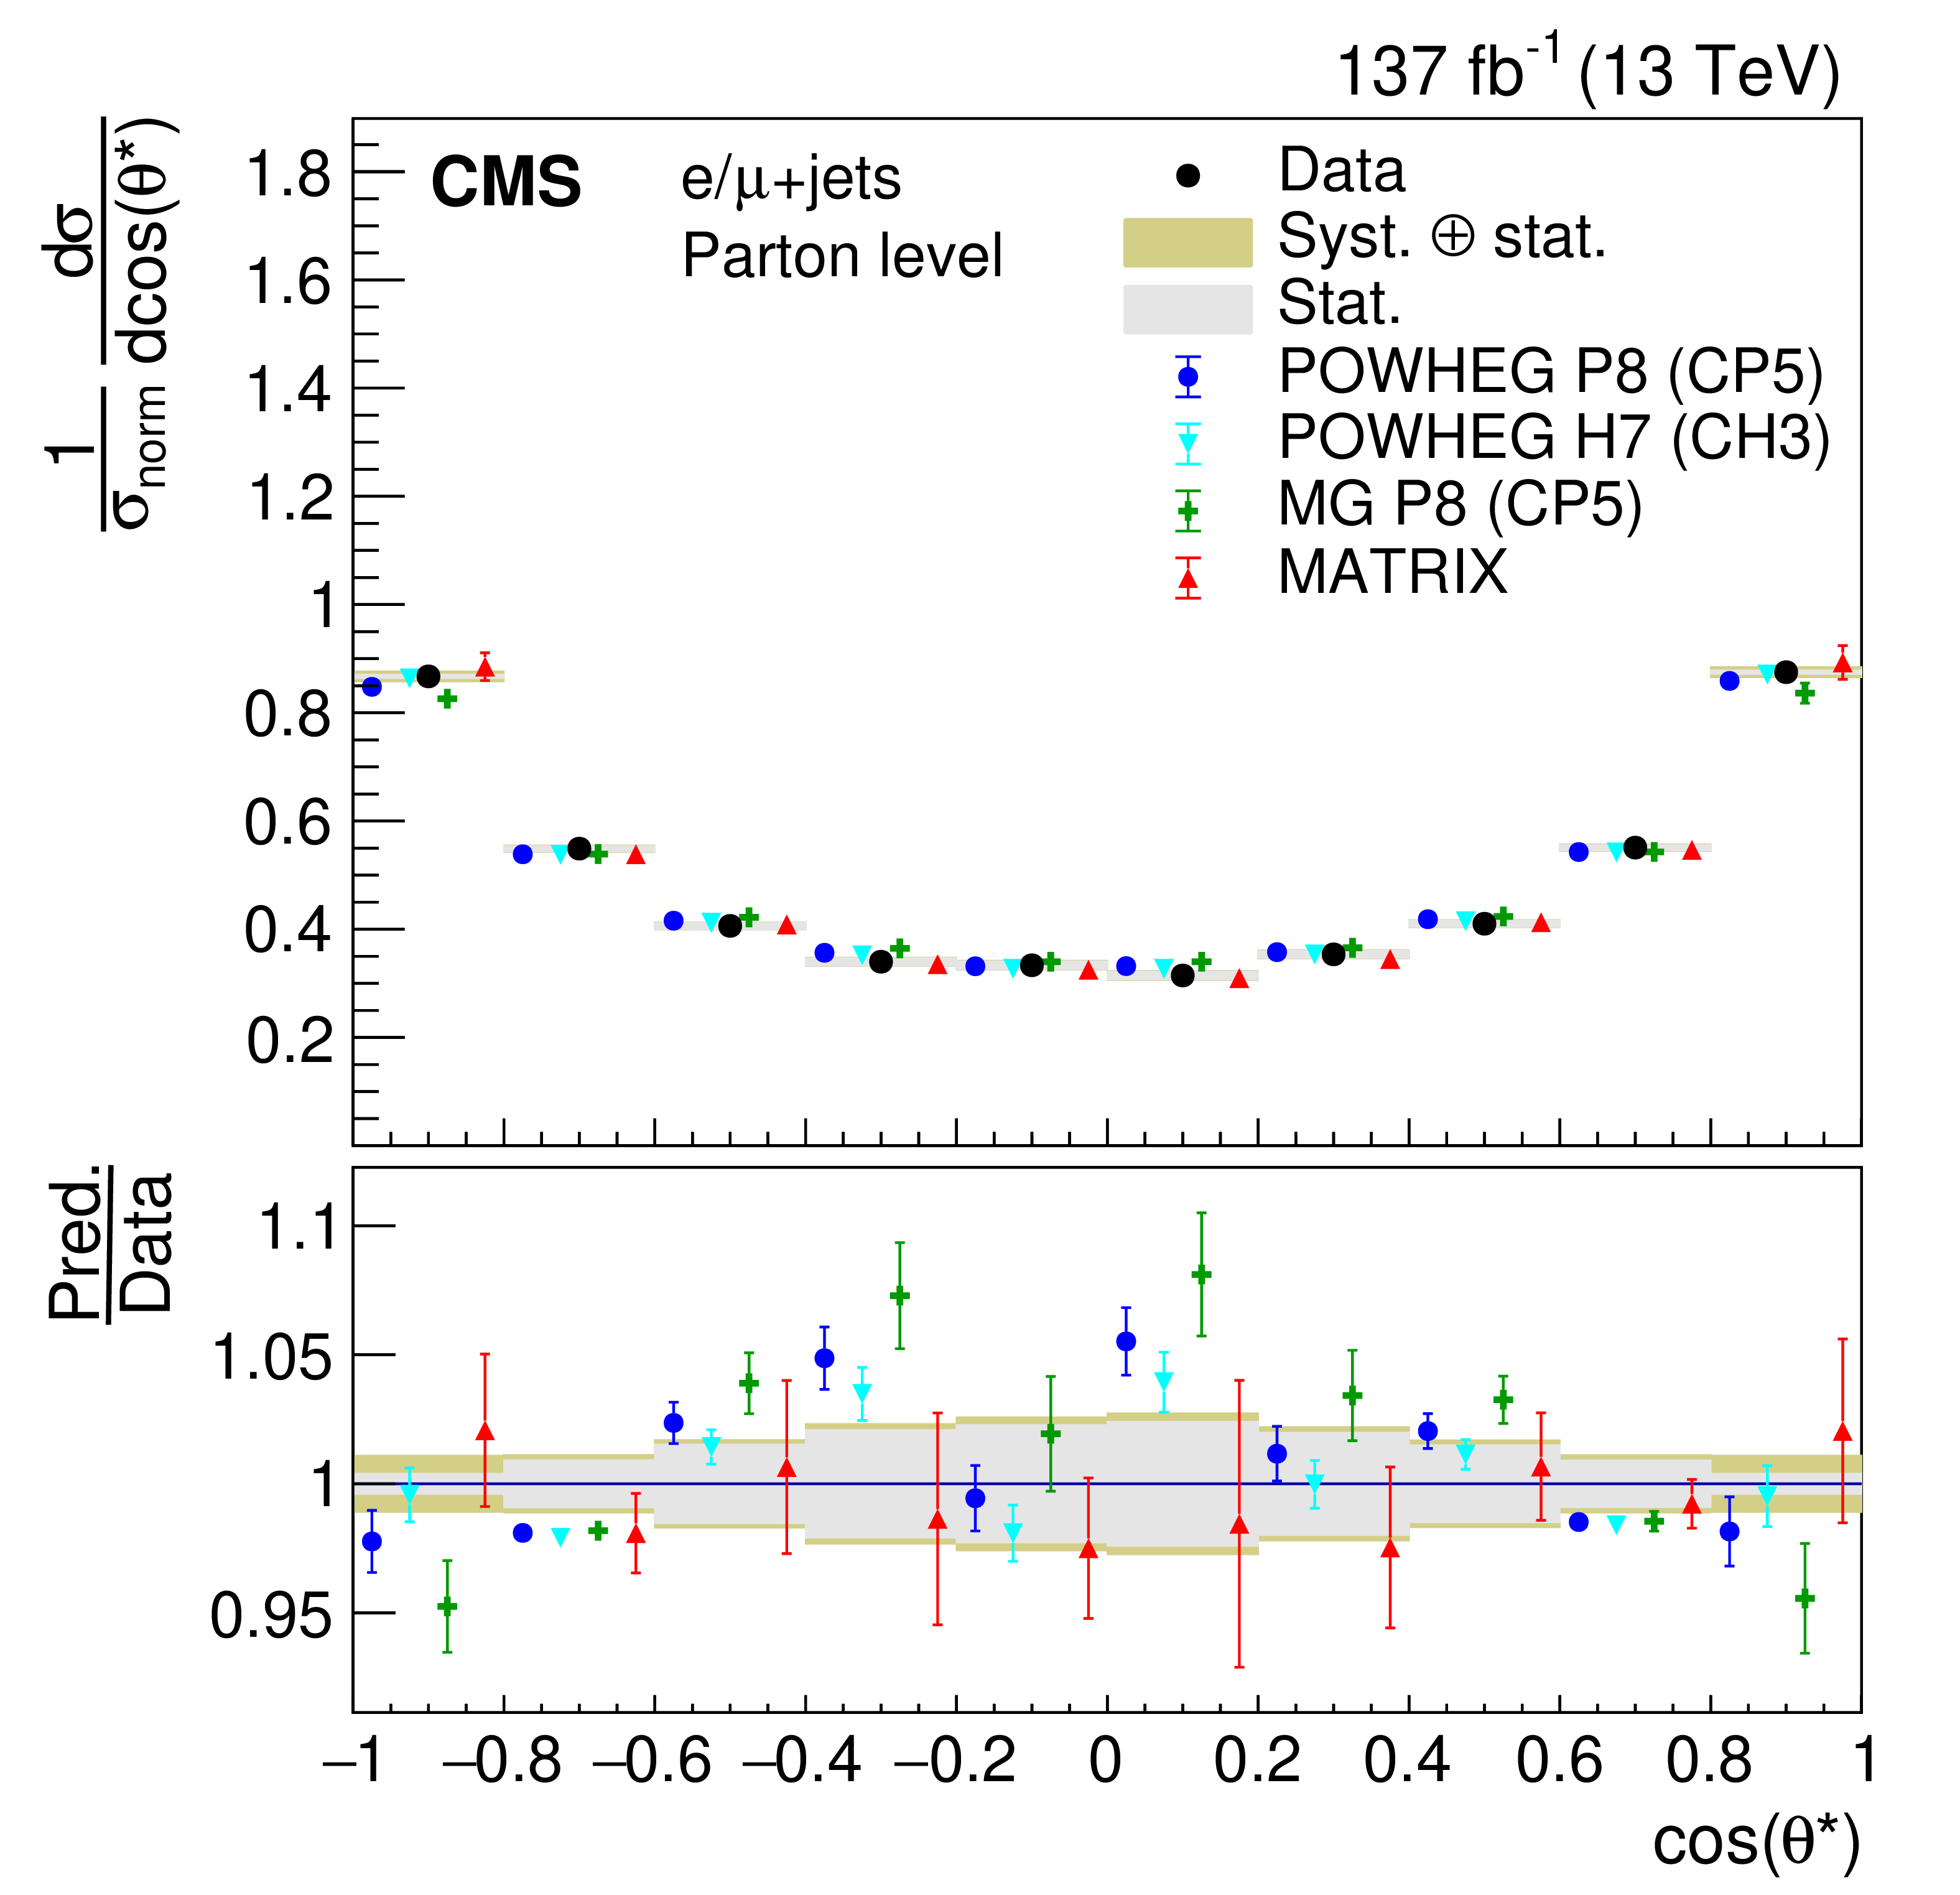
png pdf |
Figure A5-e:
Normalized differential cross sections at the parton level as a function of kinematic variables of the ${\mathrm{t} {}\mathrm{\bar{t}}}$ system. The data are shown as points with gray (yellow) bands indicating the statistical (statistical and systematic) uncertainties. The cross sections are compared to the predictions of POWHEG combined with PYTHIA (P8) or HERWIG (H7), the multiparton simulation MG5_aMC@NLO (MG)+PYTHIA FxFx, and the NNLO QCD calculations obtained with Matrix. The ratios of the various predictions to the measured cross sections are shown in the lower panels. |
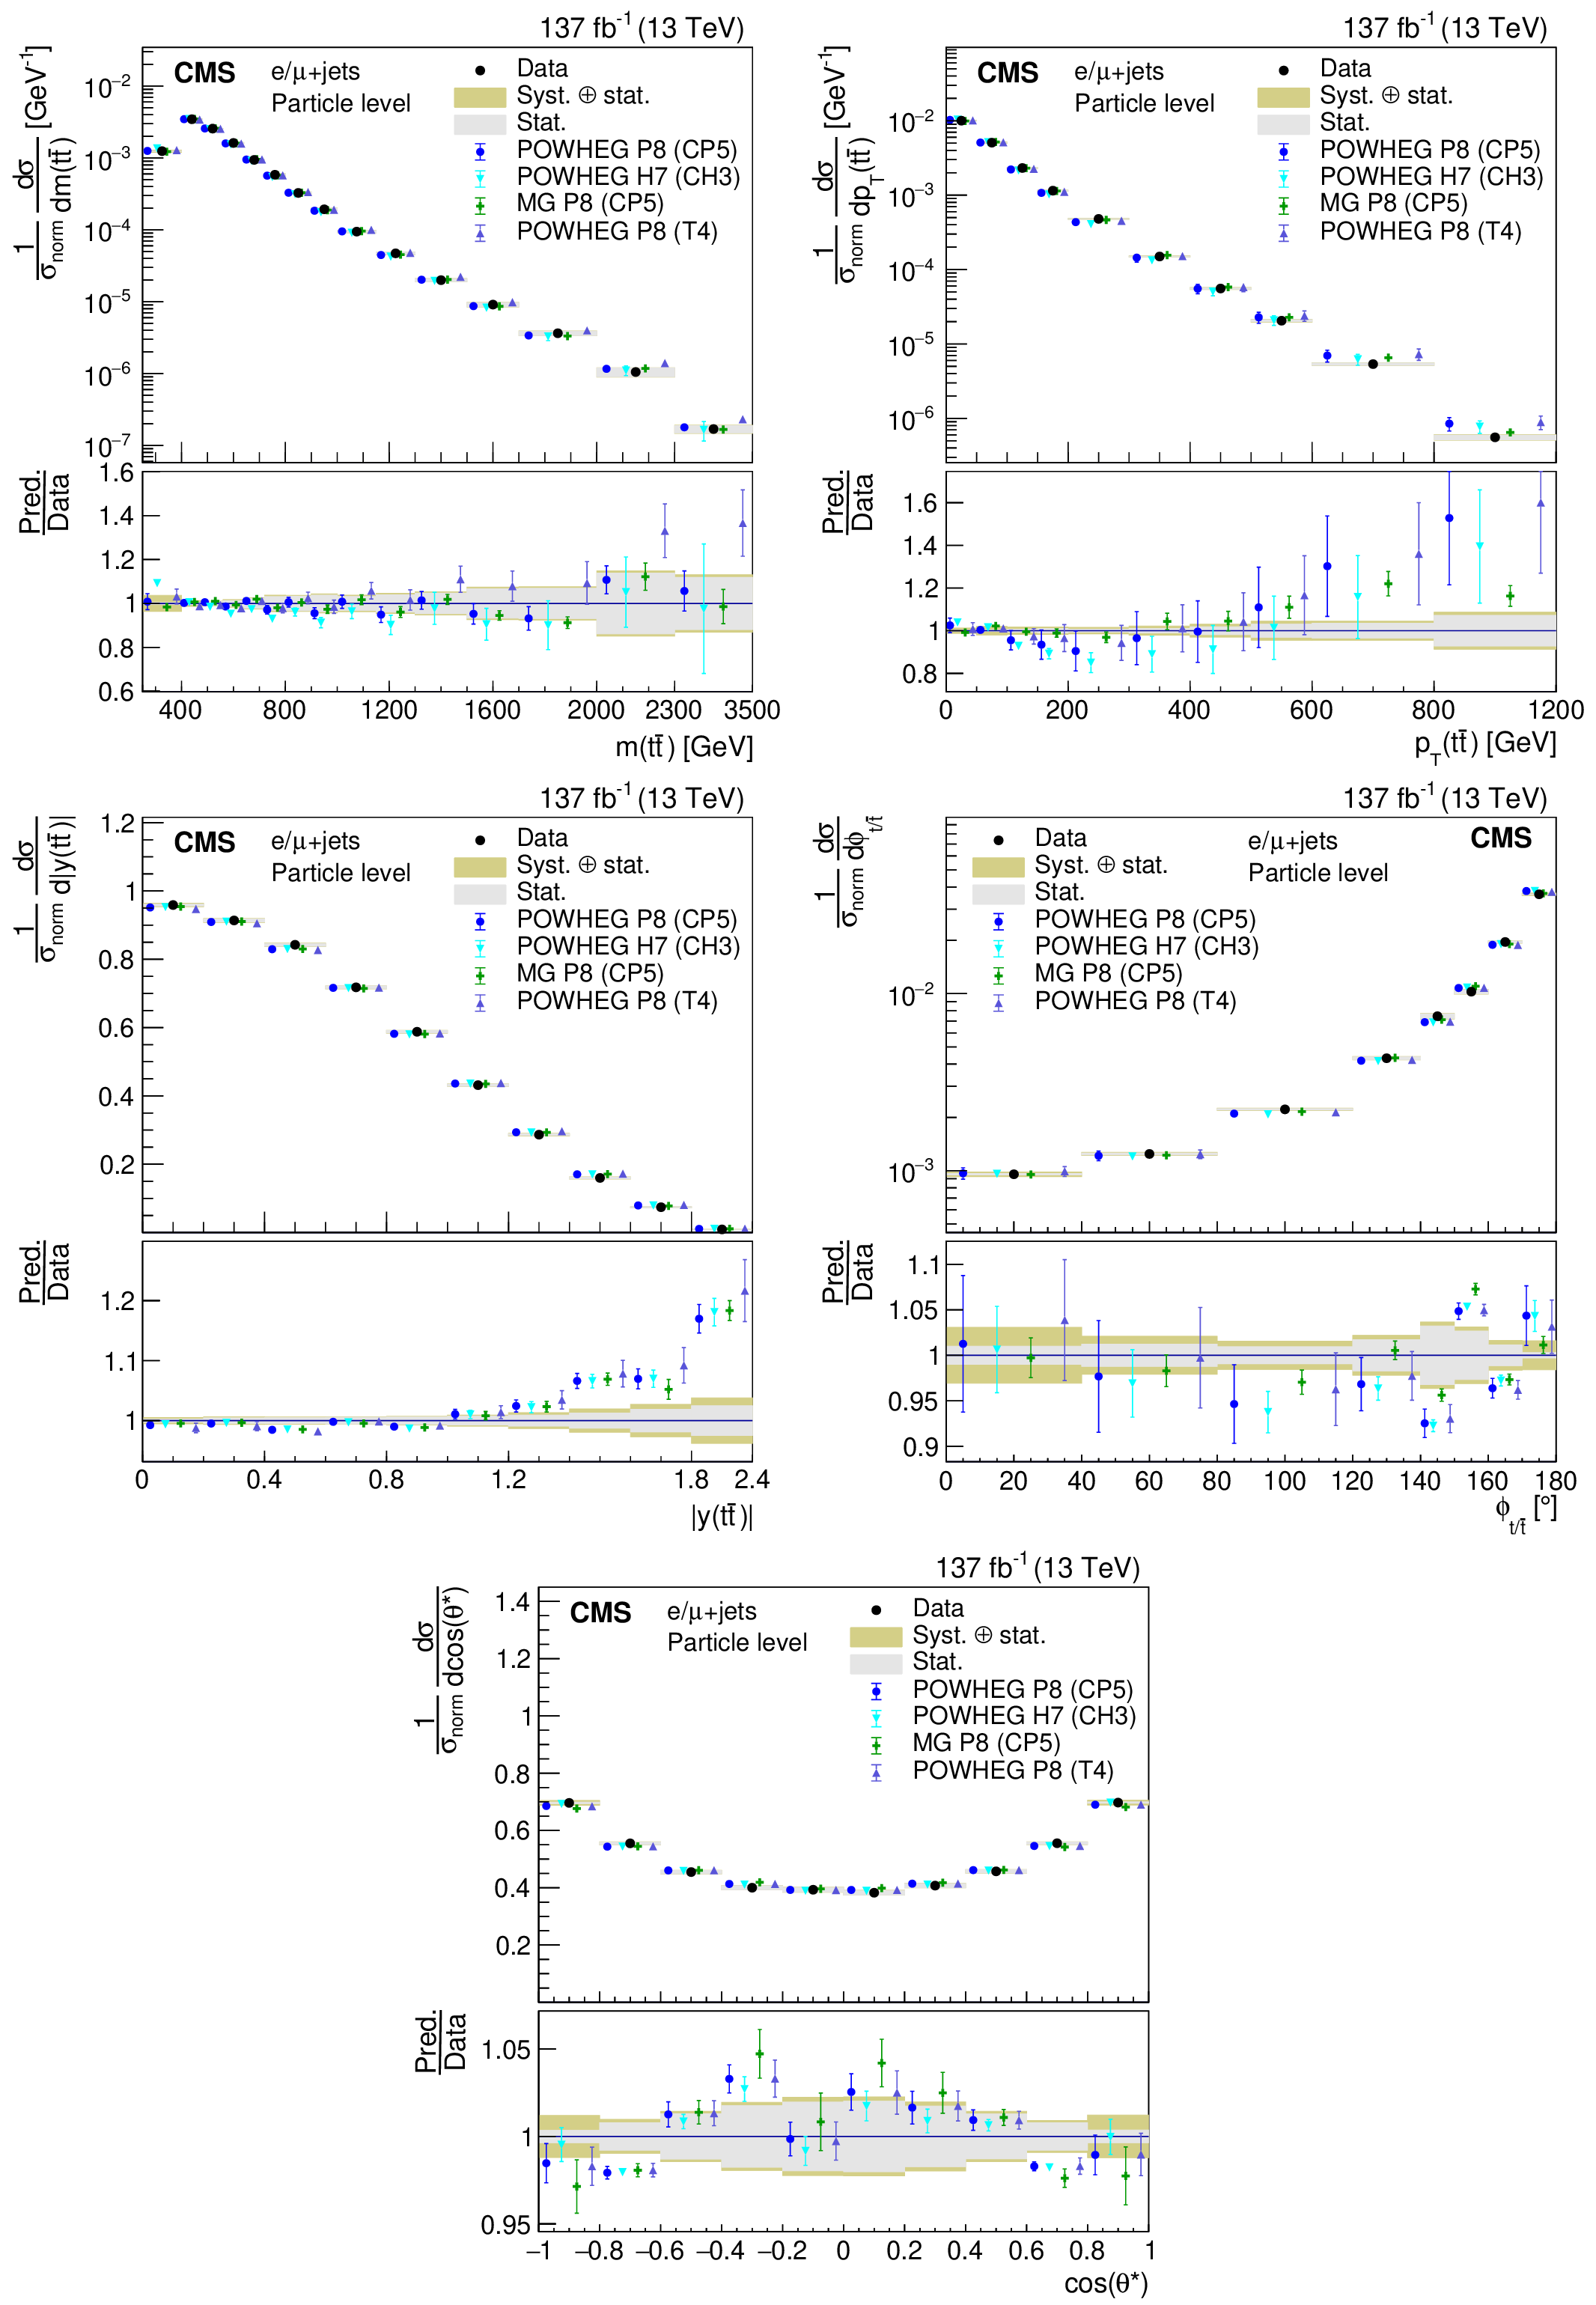
png pdf |
Figure A6:
Normalized differential cross sections at the particle level as a function of kinematic variables of the ${\mathrm{t} {}\mathrm{\bar{t}}}$ system. The data are shown as points with gray (yellow) bands indicating the statistical (statistical and systematic) uncertainties. The cross sections are compared to the predictions of POWHEG+PYTHIA (P8) for the CP5 and CUETP8M2T4 (T4) tunes, POWHEG+HERWIG (H7), and the multiparton simulation MG5_aMC@NLO (MG)+PYTHIA. The ratios of the various predictions to the measured cross sections are shown in the lower panels. |

png pdf |
Figure A6-a:
Normalized differential cross sections at the particle level as a function of kinematic variables of the ${\mathrm{t} {}\mathrm{\bar{t}}}$ system. The data are shown as points with gray (yellow) bands indicating the statistical (statistical and systematic) uncertainties. The cross sections are compared to the predictions of POWHEG+PYTHIA (P8) for the CP5 and CUETP8M2T4 (T4) tunes, POWHEG+HERWIG (H7), and the multiparton simulation MG5_aMC@NLO (MG)+PYTHIA. The ratios of the various predictions to the measured cross sections are shown in the lower panels. |
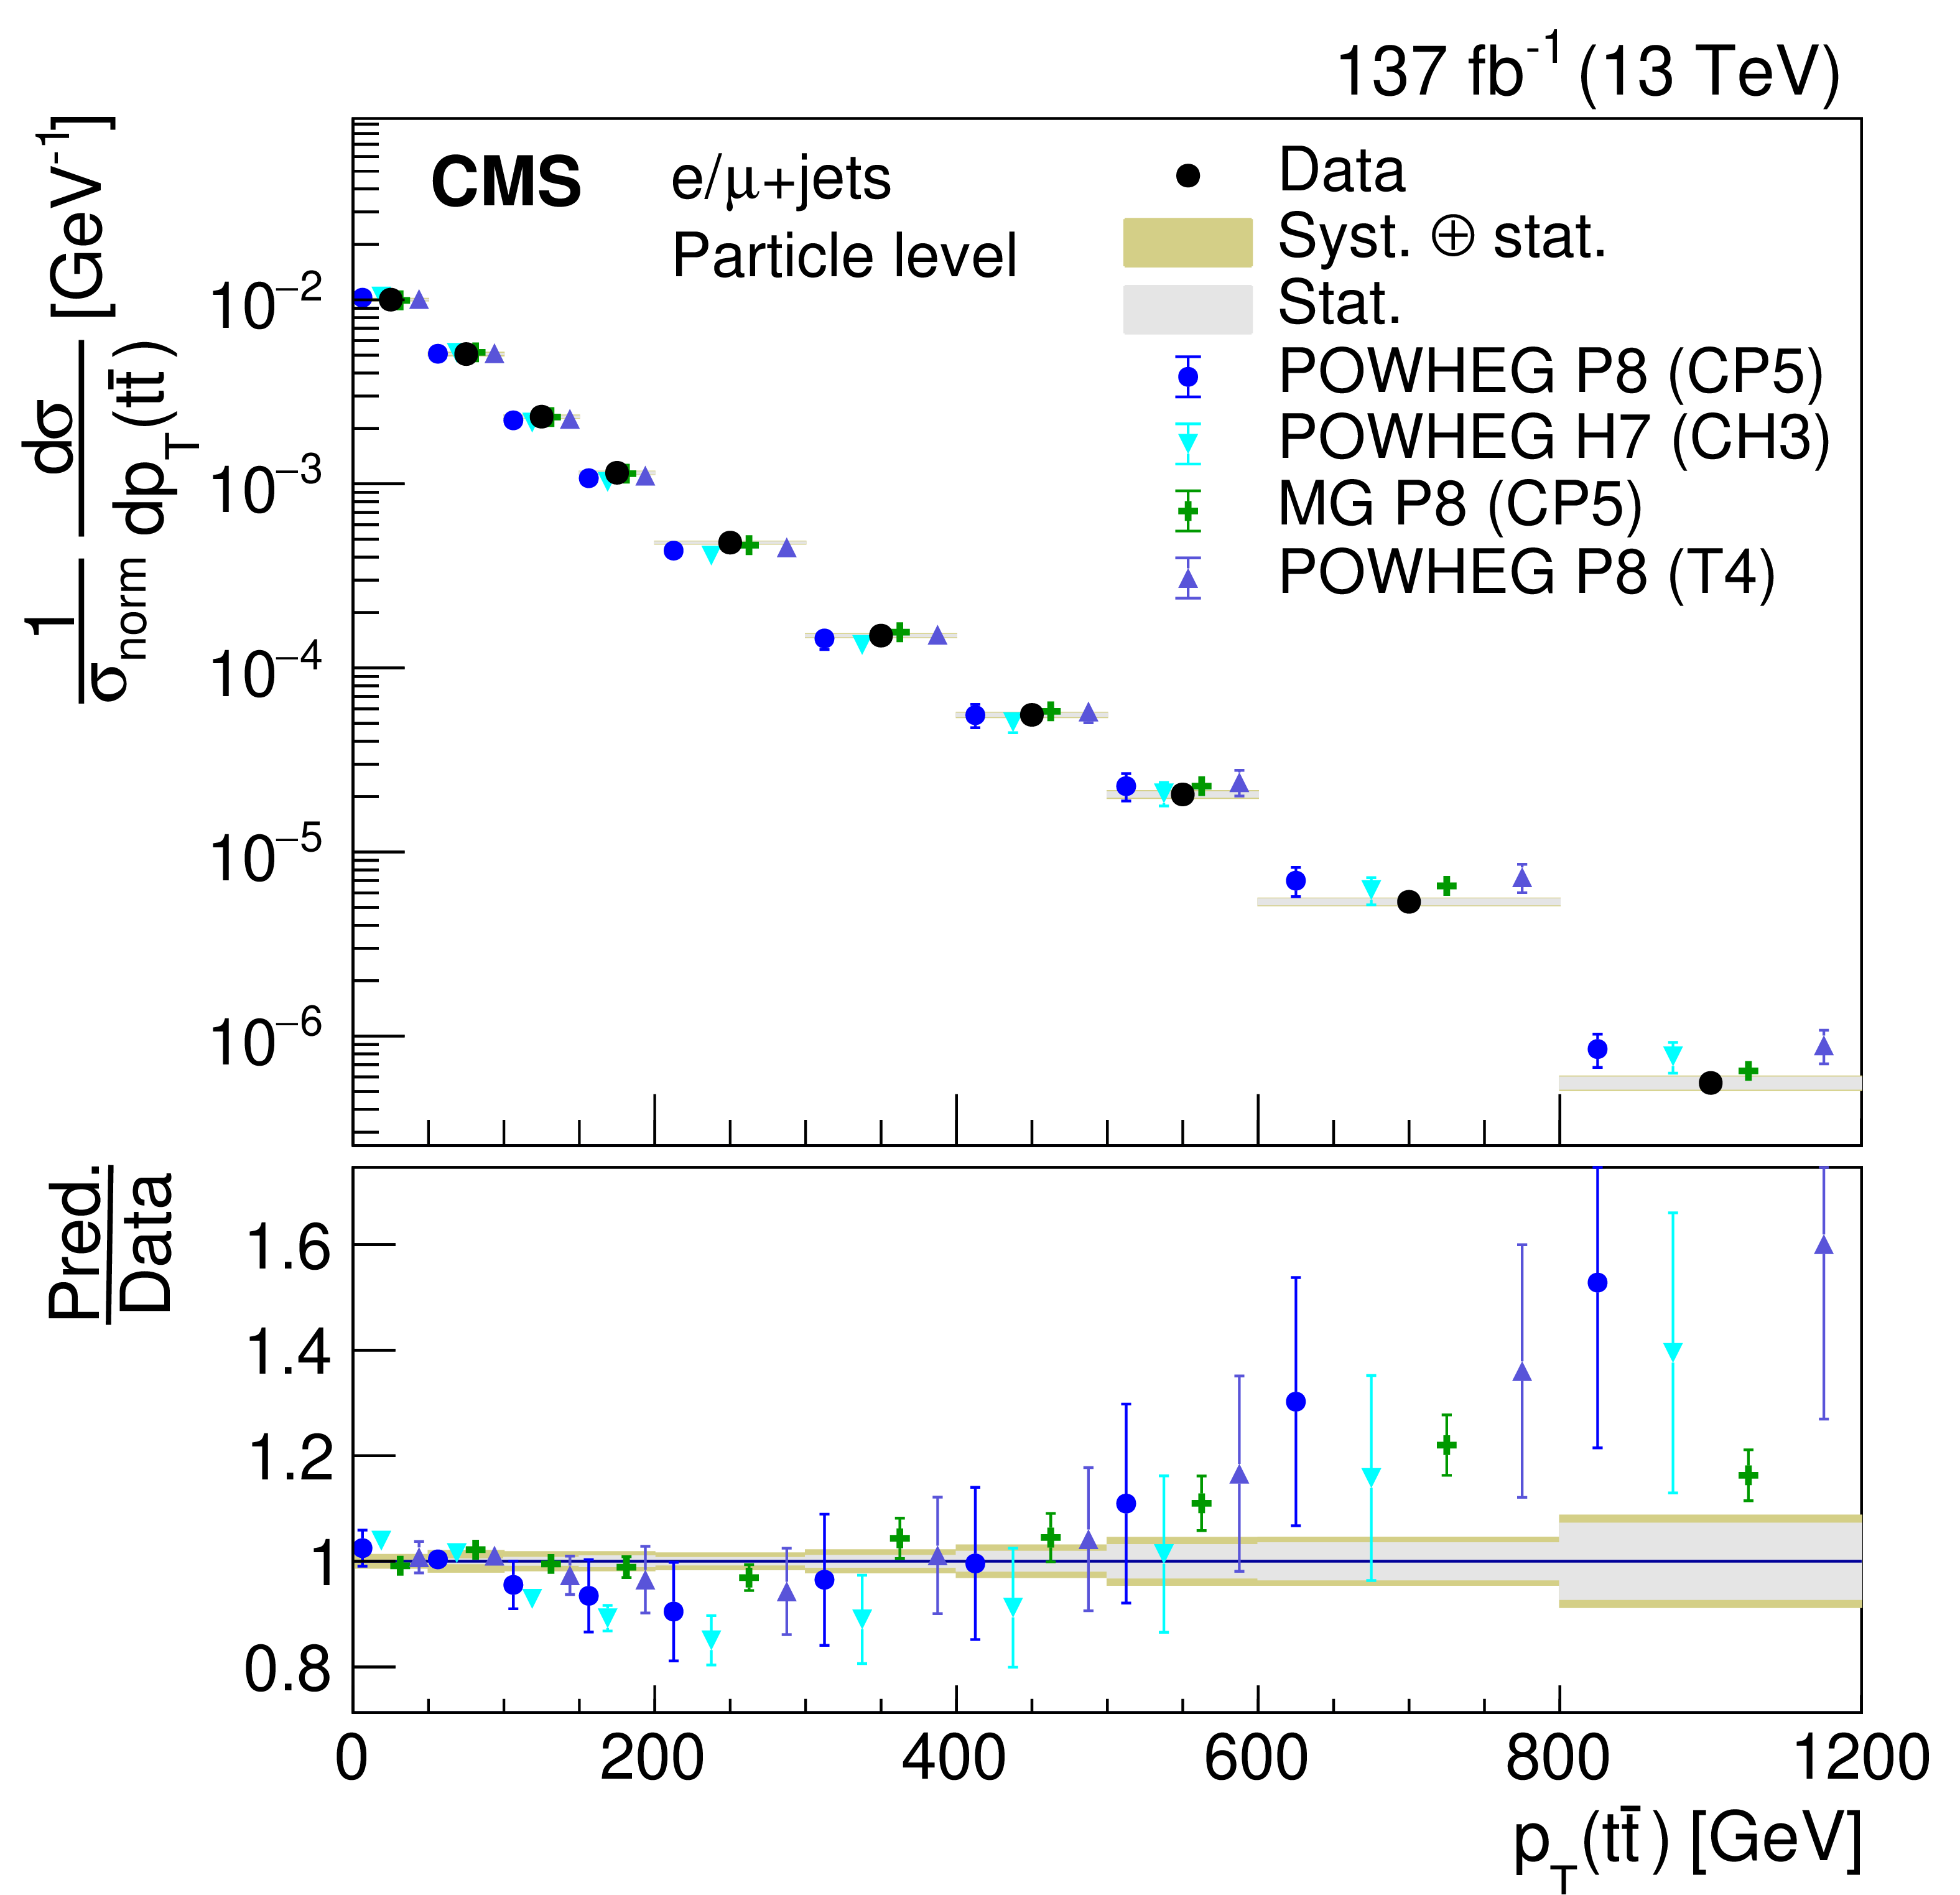
png pdf |
Figure A6-b:
Normalized differential cross sections at the particle level as a function of kinematic variables of the ${\mathrm{t} {}\mathrm{\bar{t}}}$ system. The data are shown as points with gray (yellow) bands indicating the statistical (statistical and systematic) uncertainties. The cross sections are compared to the predictions of POWHEG+PYTHIA (P8) for the CP5 and CUETP8M2T4 (T4) tunes, POWHEG+HERWIG (H7), and the multiparton simulation MG5_aMC@NLO (MG)+PYTHIA. The ratios of the various predictions to the measured cross sections are shown in the lower panels. |
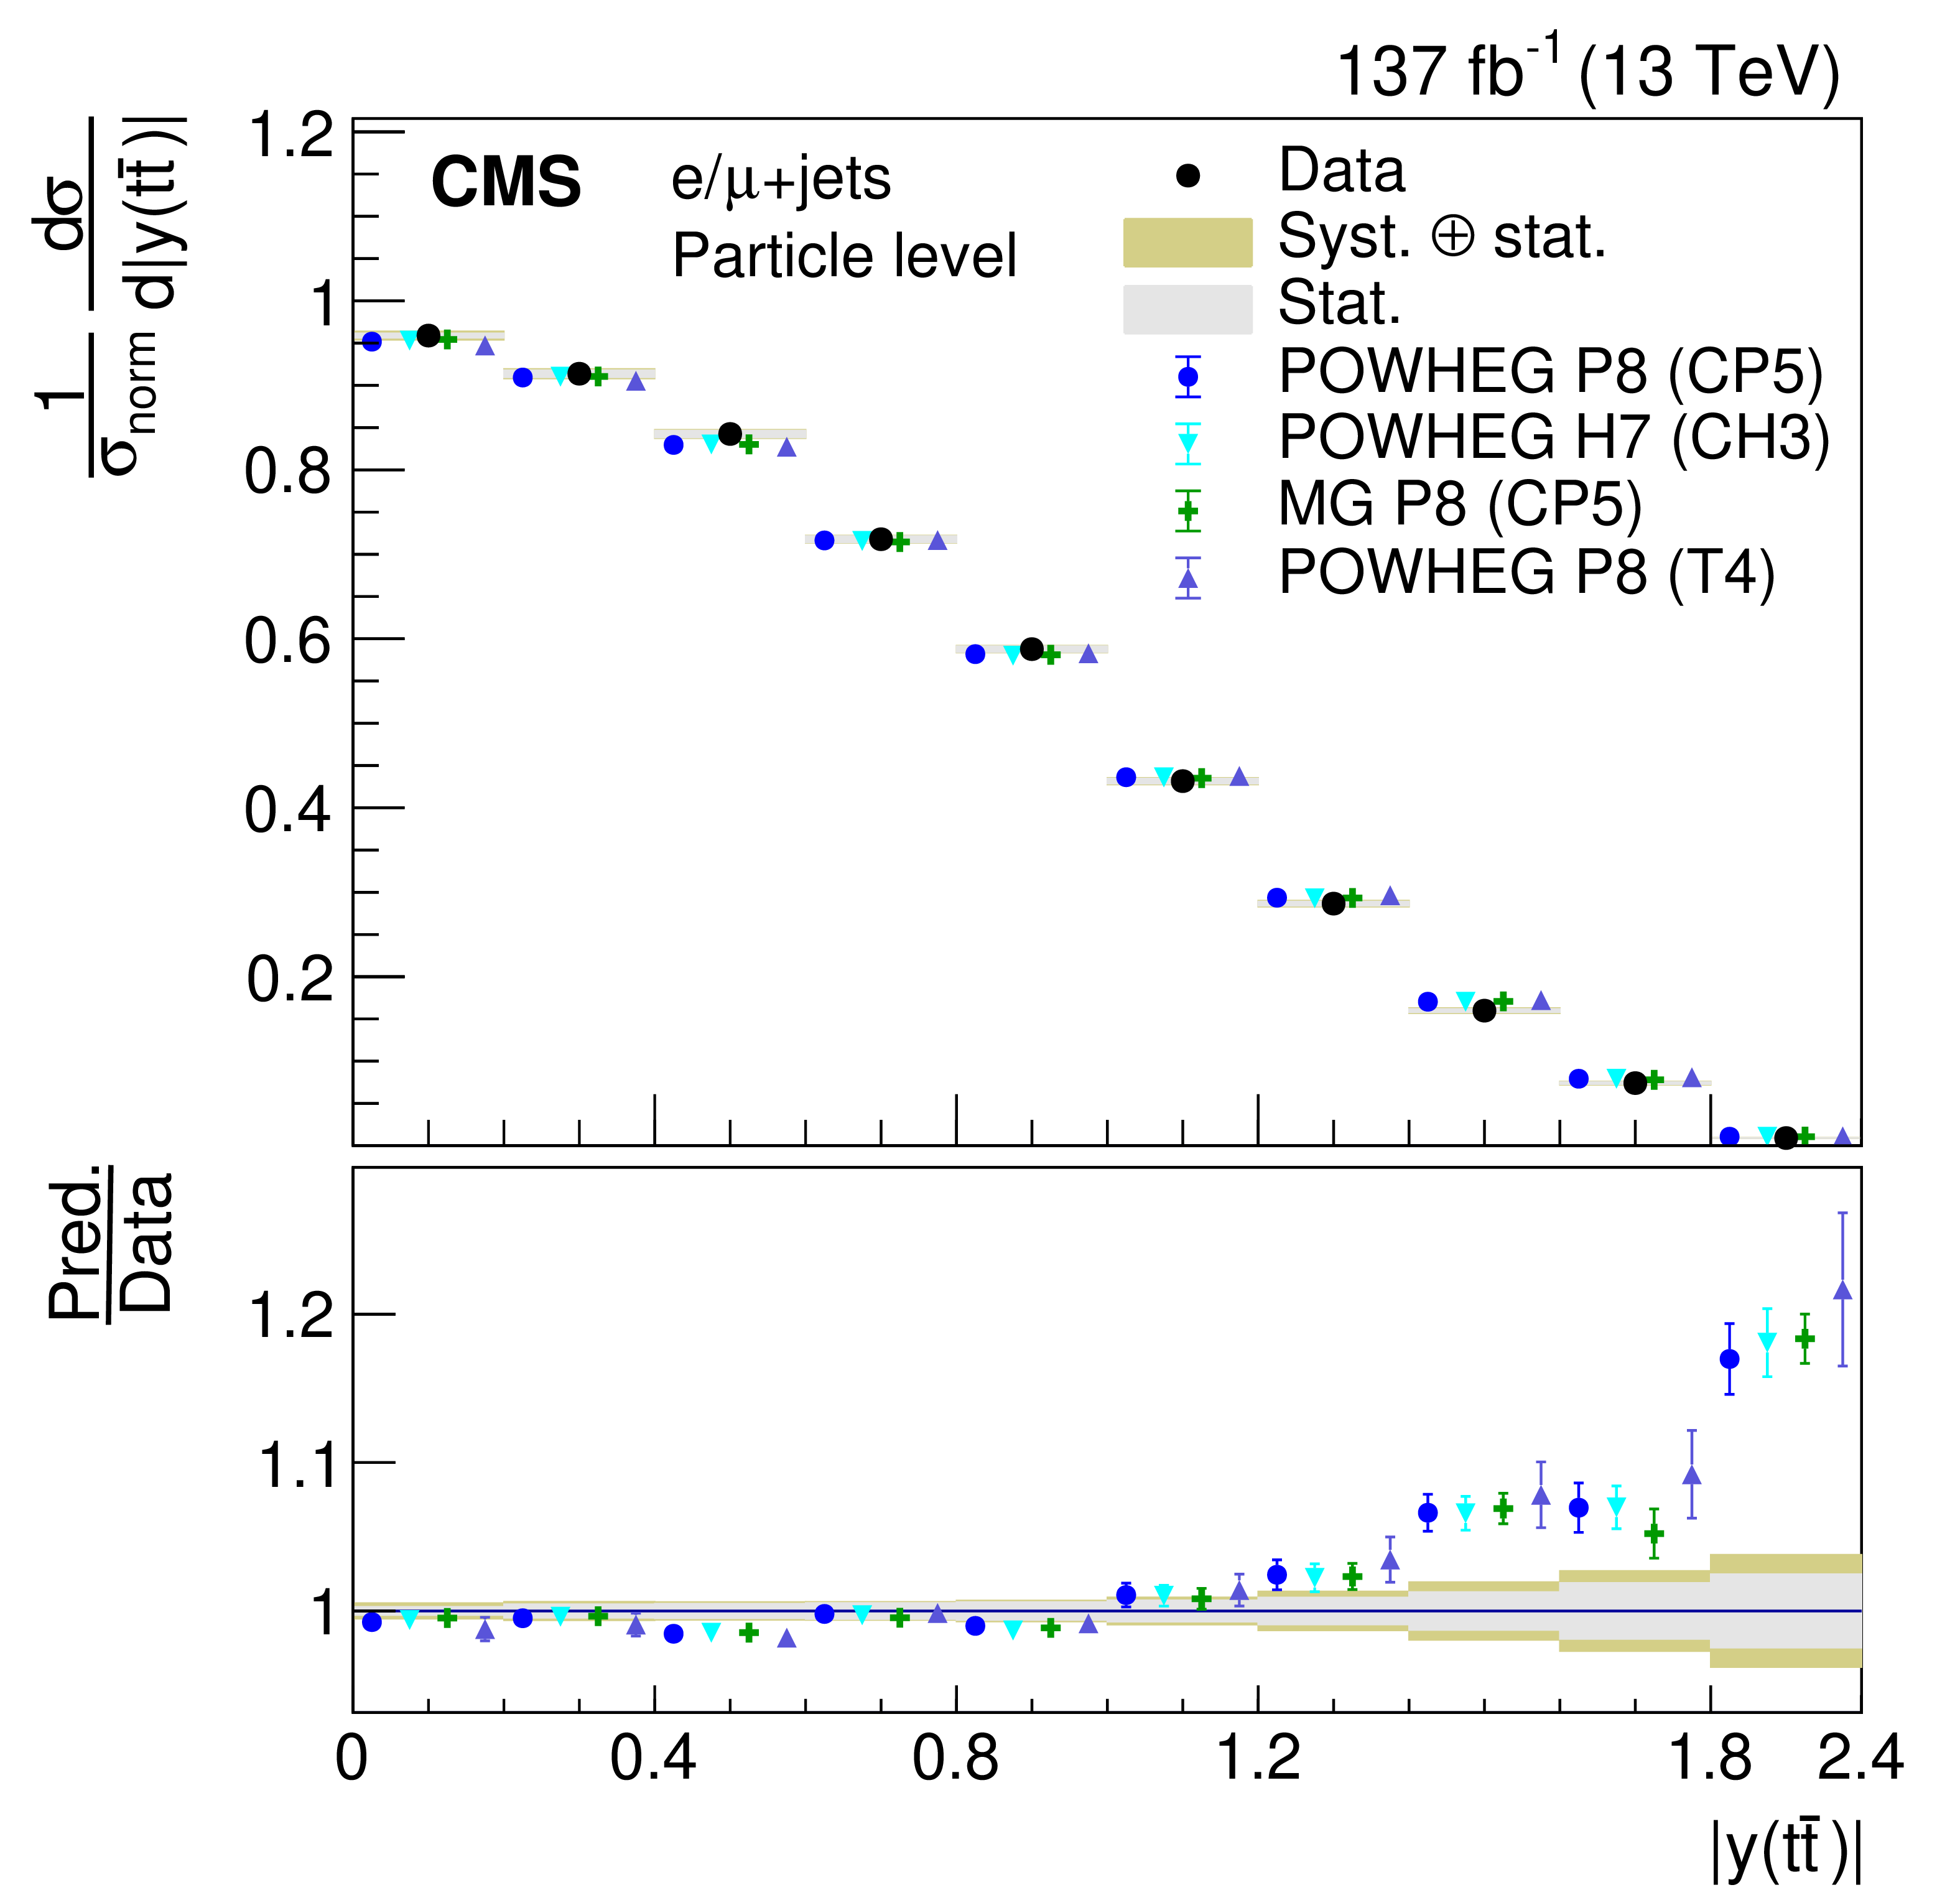
png pdf |
Figure A6-c:
Normalized differential cross sections at the particle level as a function of kinematic variables of the ${\mathrm{t} {}\mathrm{\bar{t}}}$ system. The data are shown as points with gray (yellow) bands indicating the statistical (statistical and systematic) uncertainties. The cross sections are compared to the predictions of POWHEG+PYTHIA (P8) for the CP5 and CUETP8M2T4 (T4) tunes, POWHEG+HERWIG (H7), and the multiparton simulation MG5_aMC@NLO (MG)+PYTHIA. The ratios of the various predictions to the measured cross sections are shown in the lower panels. |
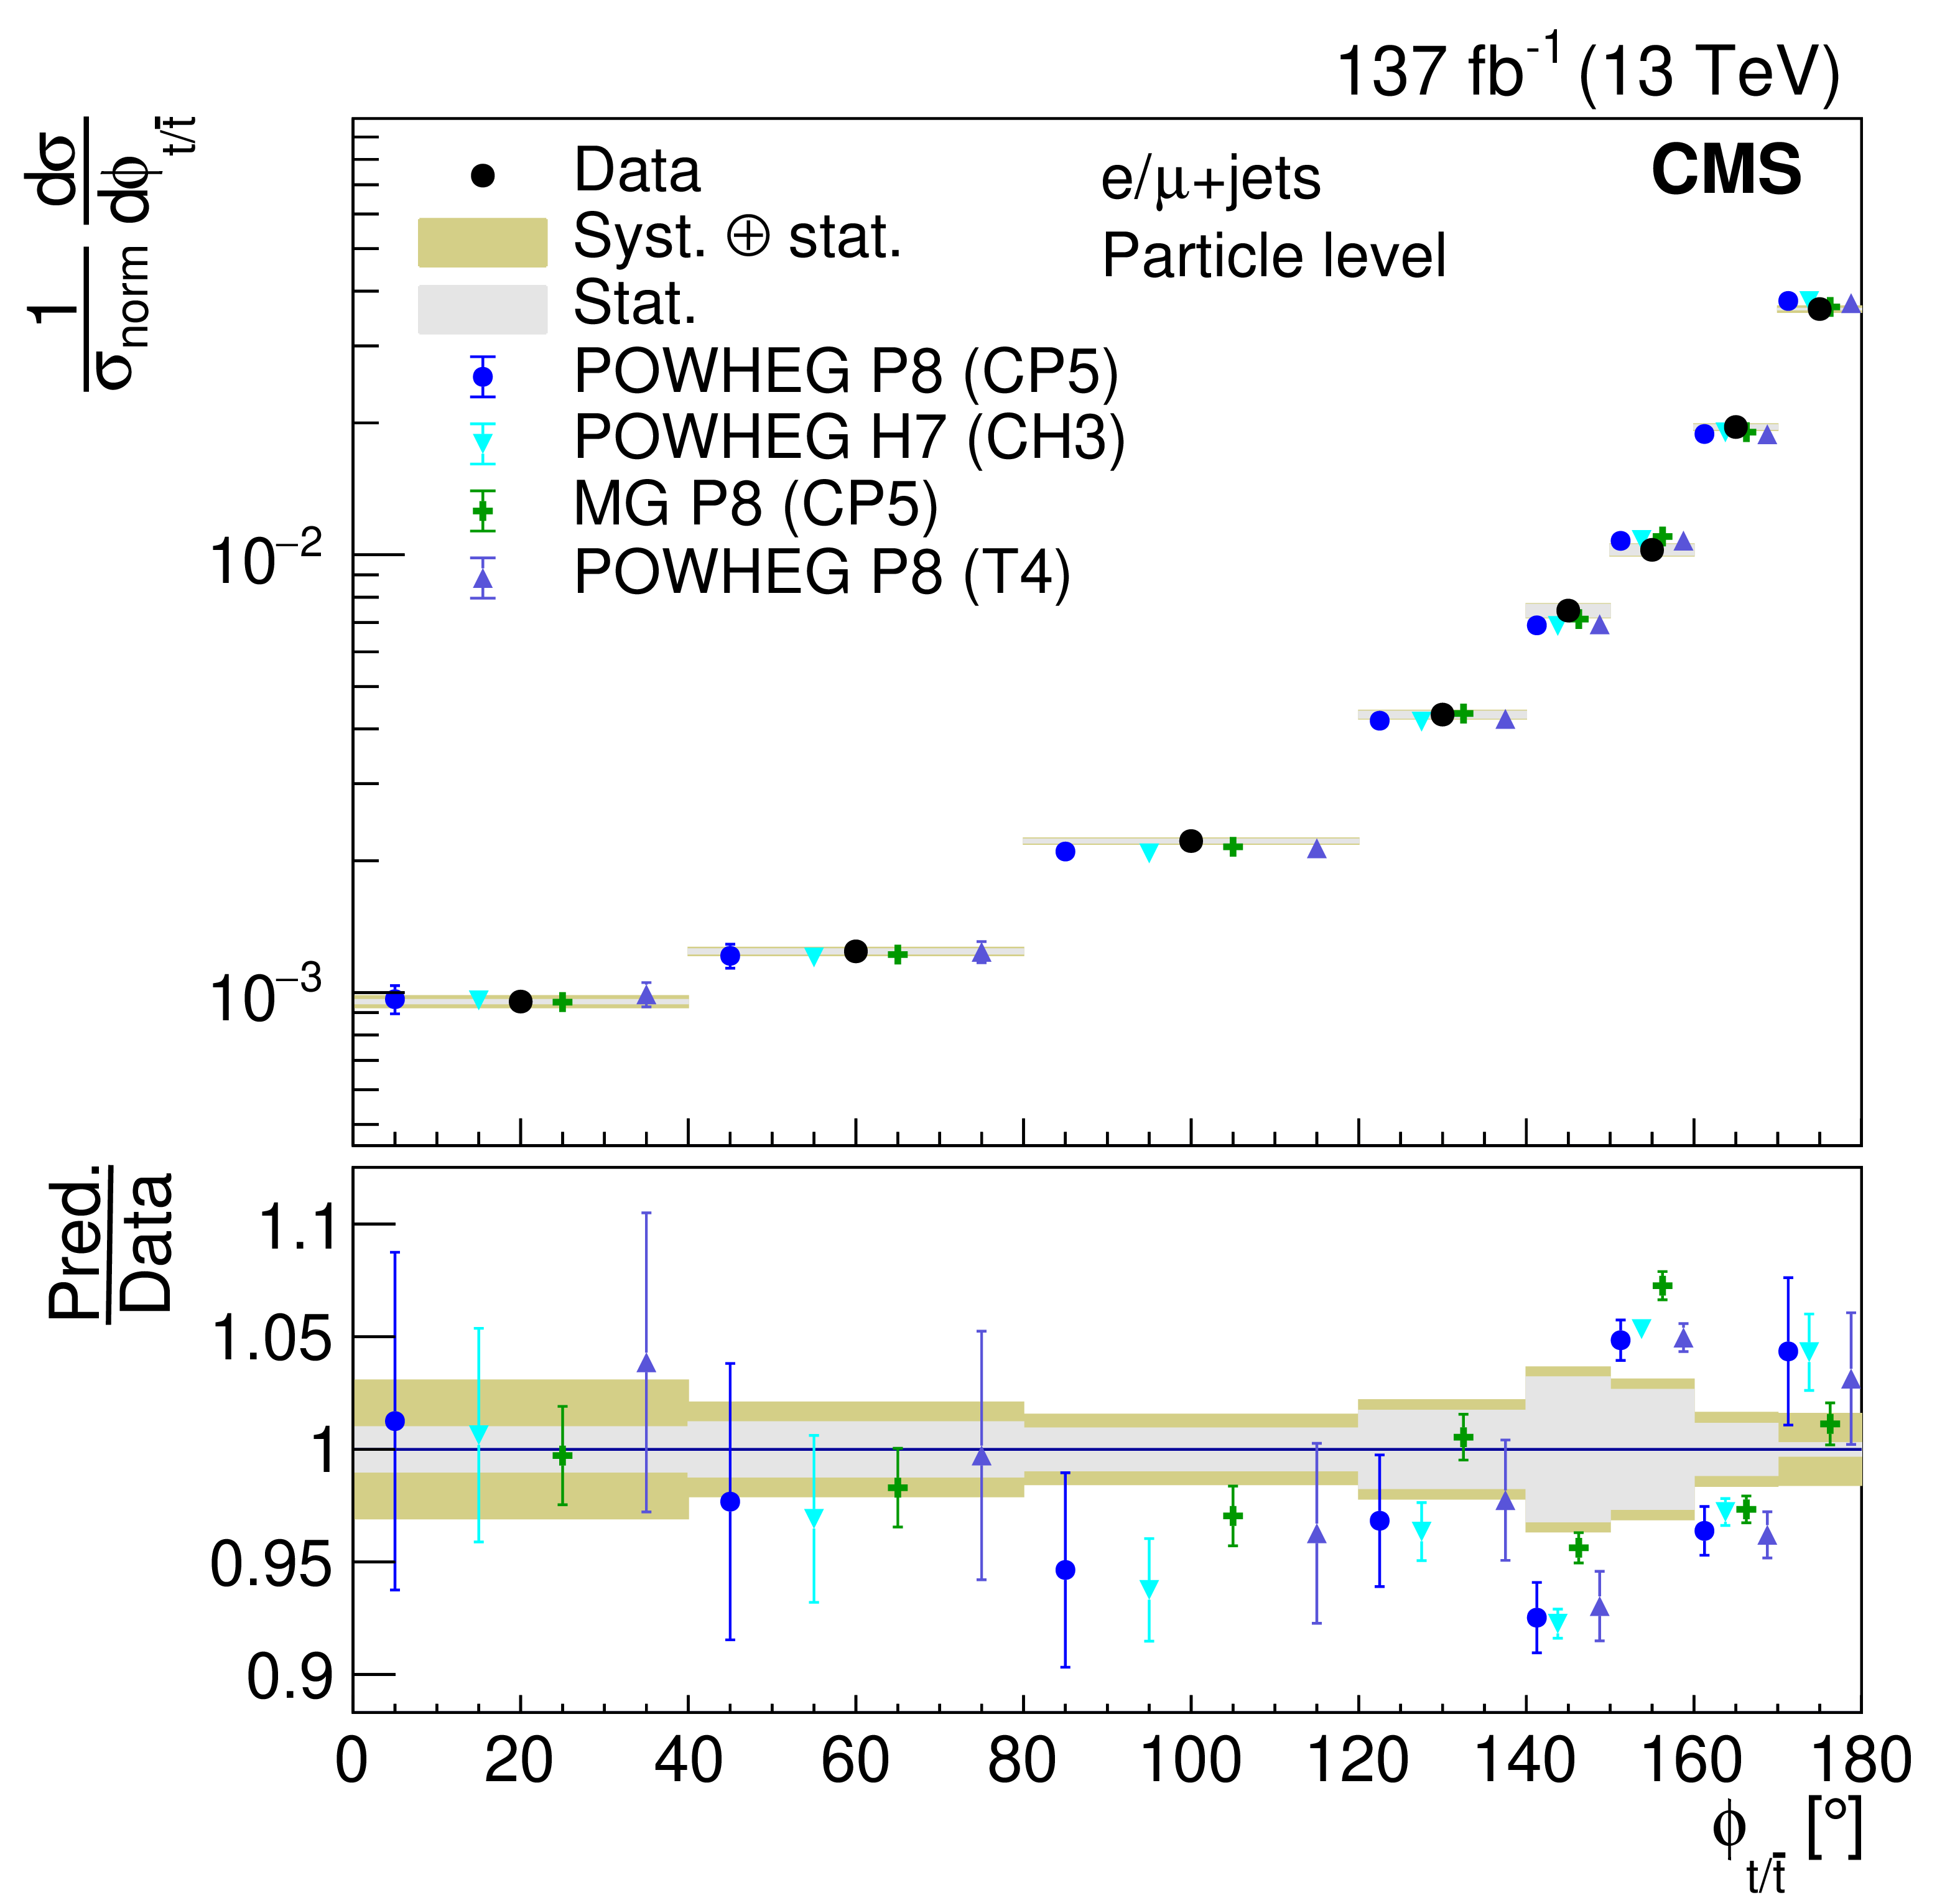
png pdf |
Figure A6-d:
Normalized differential cross sections at the particle level as a function of kinematic variables of the ${\mathrm{t} {}\mathrm{\bar{t}}}$ system. The data are shown as points with gray (yellow) bands indicating the statistical (statistical and systematic) uncertainties. The cross sections are compared to the predictions of POWHEG+PYTHIA (P8) for the CP5 and CUETP8M2T4 (T4) tunes, POWHEG+HERWIG (H7), and the multiparton simulation MG5_aMC@NLO (MG)+PYTHIA. The ratios of the various predictions to the measured cross sections are shown in the lower panels. |
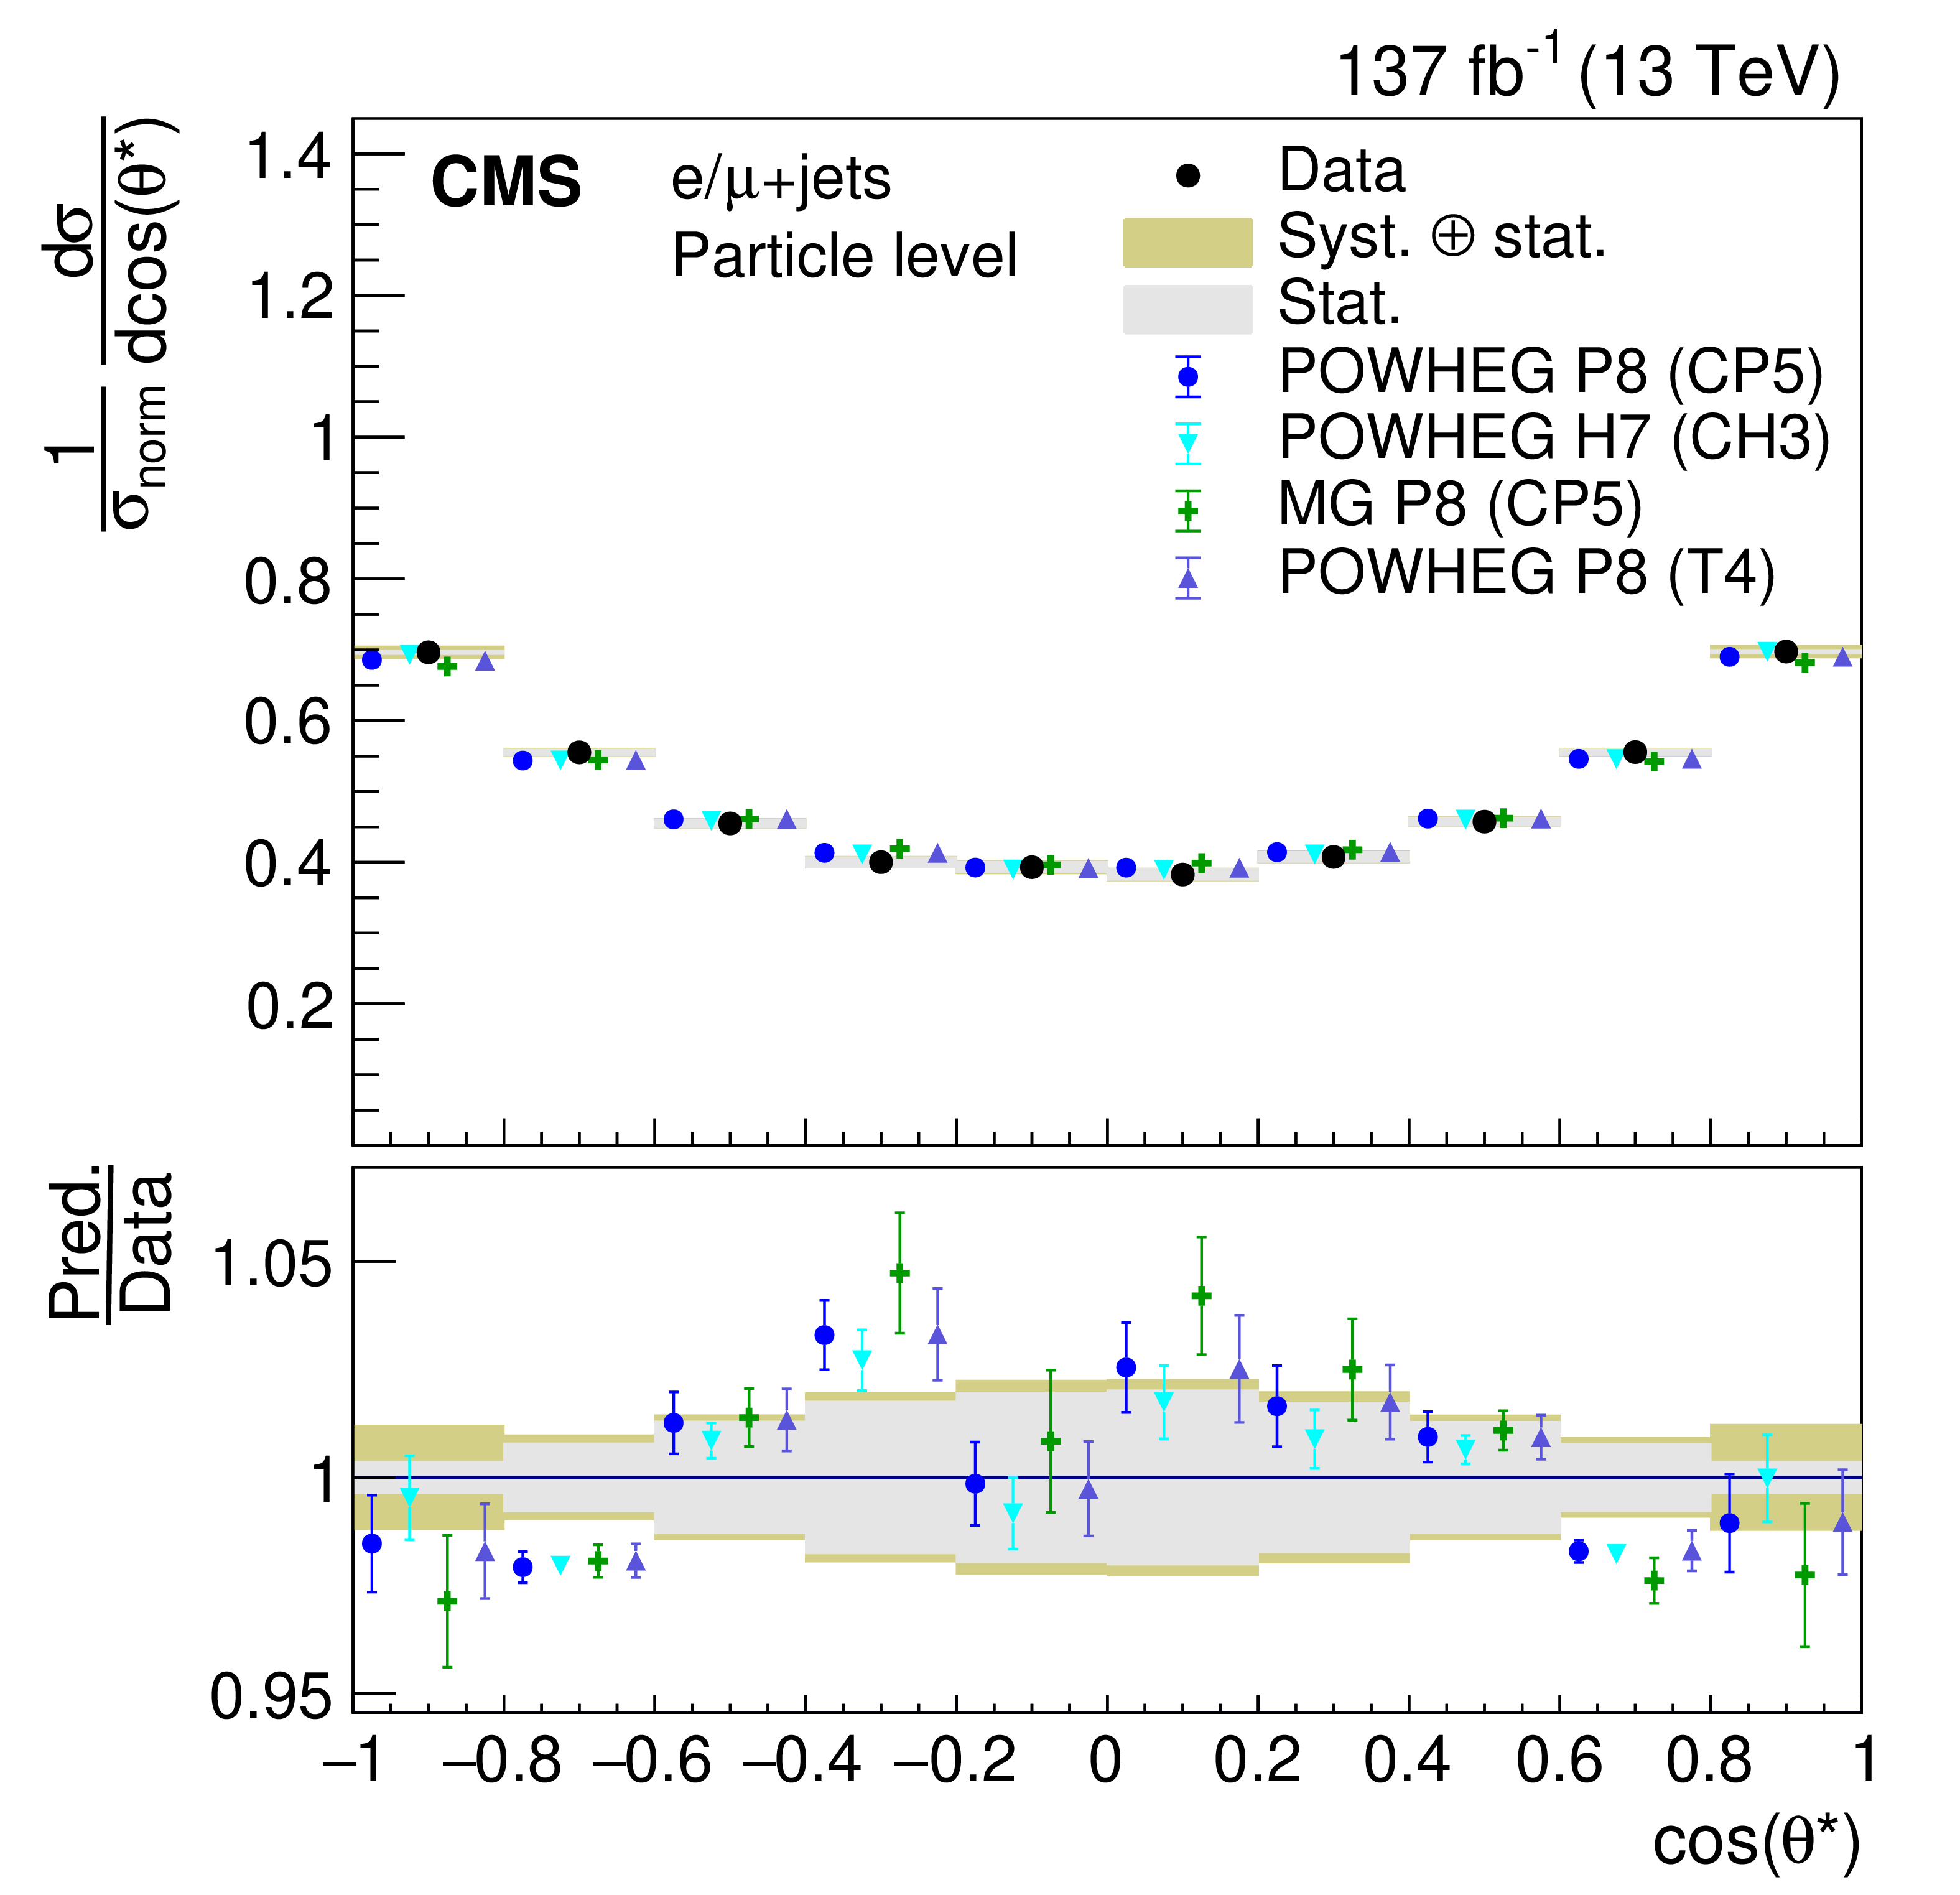
png pdf |
Figure A6-e:
Normalized differential cross sections at the particle level as a function of kinematic variables of the ${\mathrm{t} {}\mathrm{\bar{t}}}$ system. The data are shown as points with gray (yellow) bands indicating the statistical (statistical and systematic) uncertainties. The cross sections are compared to the predictions of POWHEG+PYTHIA (P8) for the CP5 and CUETP8M2T4 (T4) tunes, POWHEG+HERWIG (H7), and the multiparton simulation MG5_aMC@NLO (MG)+PYTHIA. The ratios of the various predictions to the measured cross sections are shown in the lower panels. |
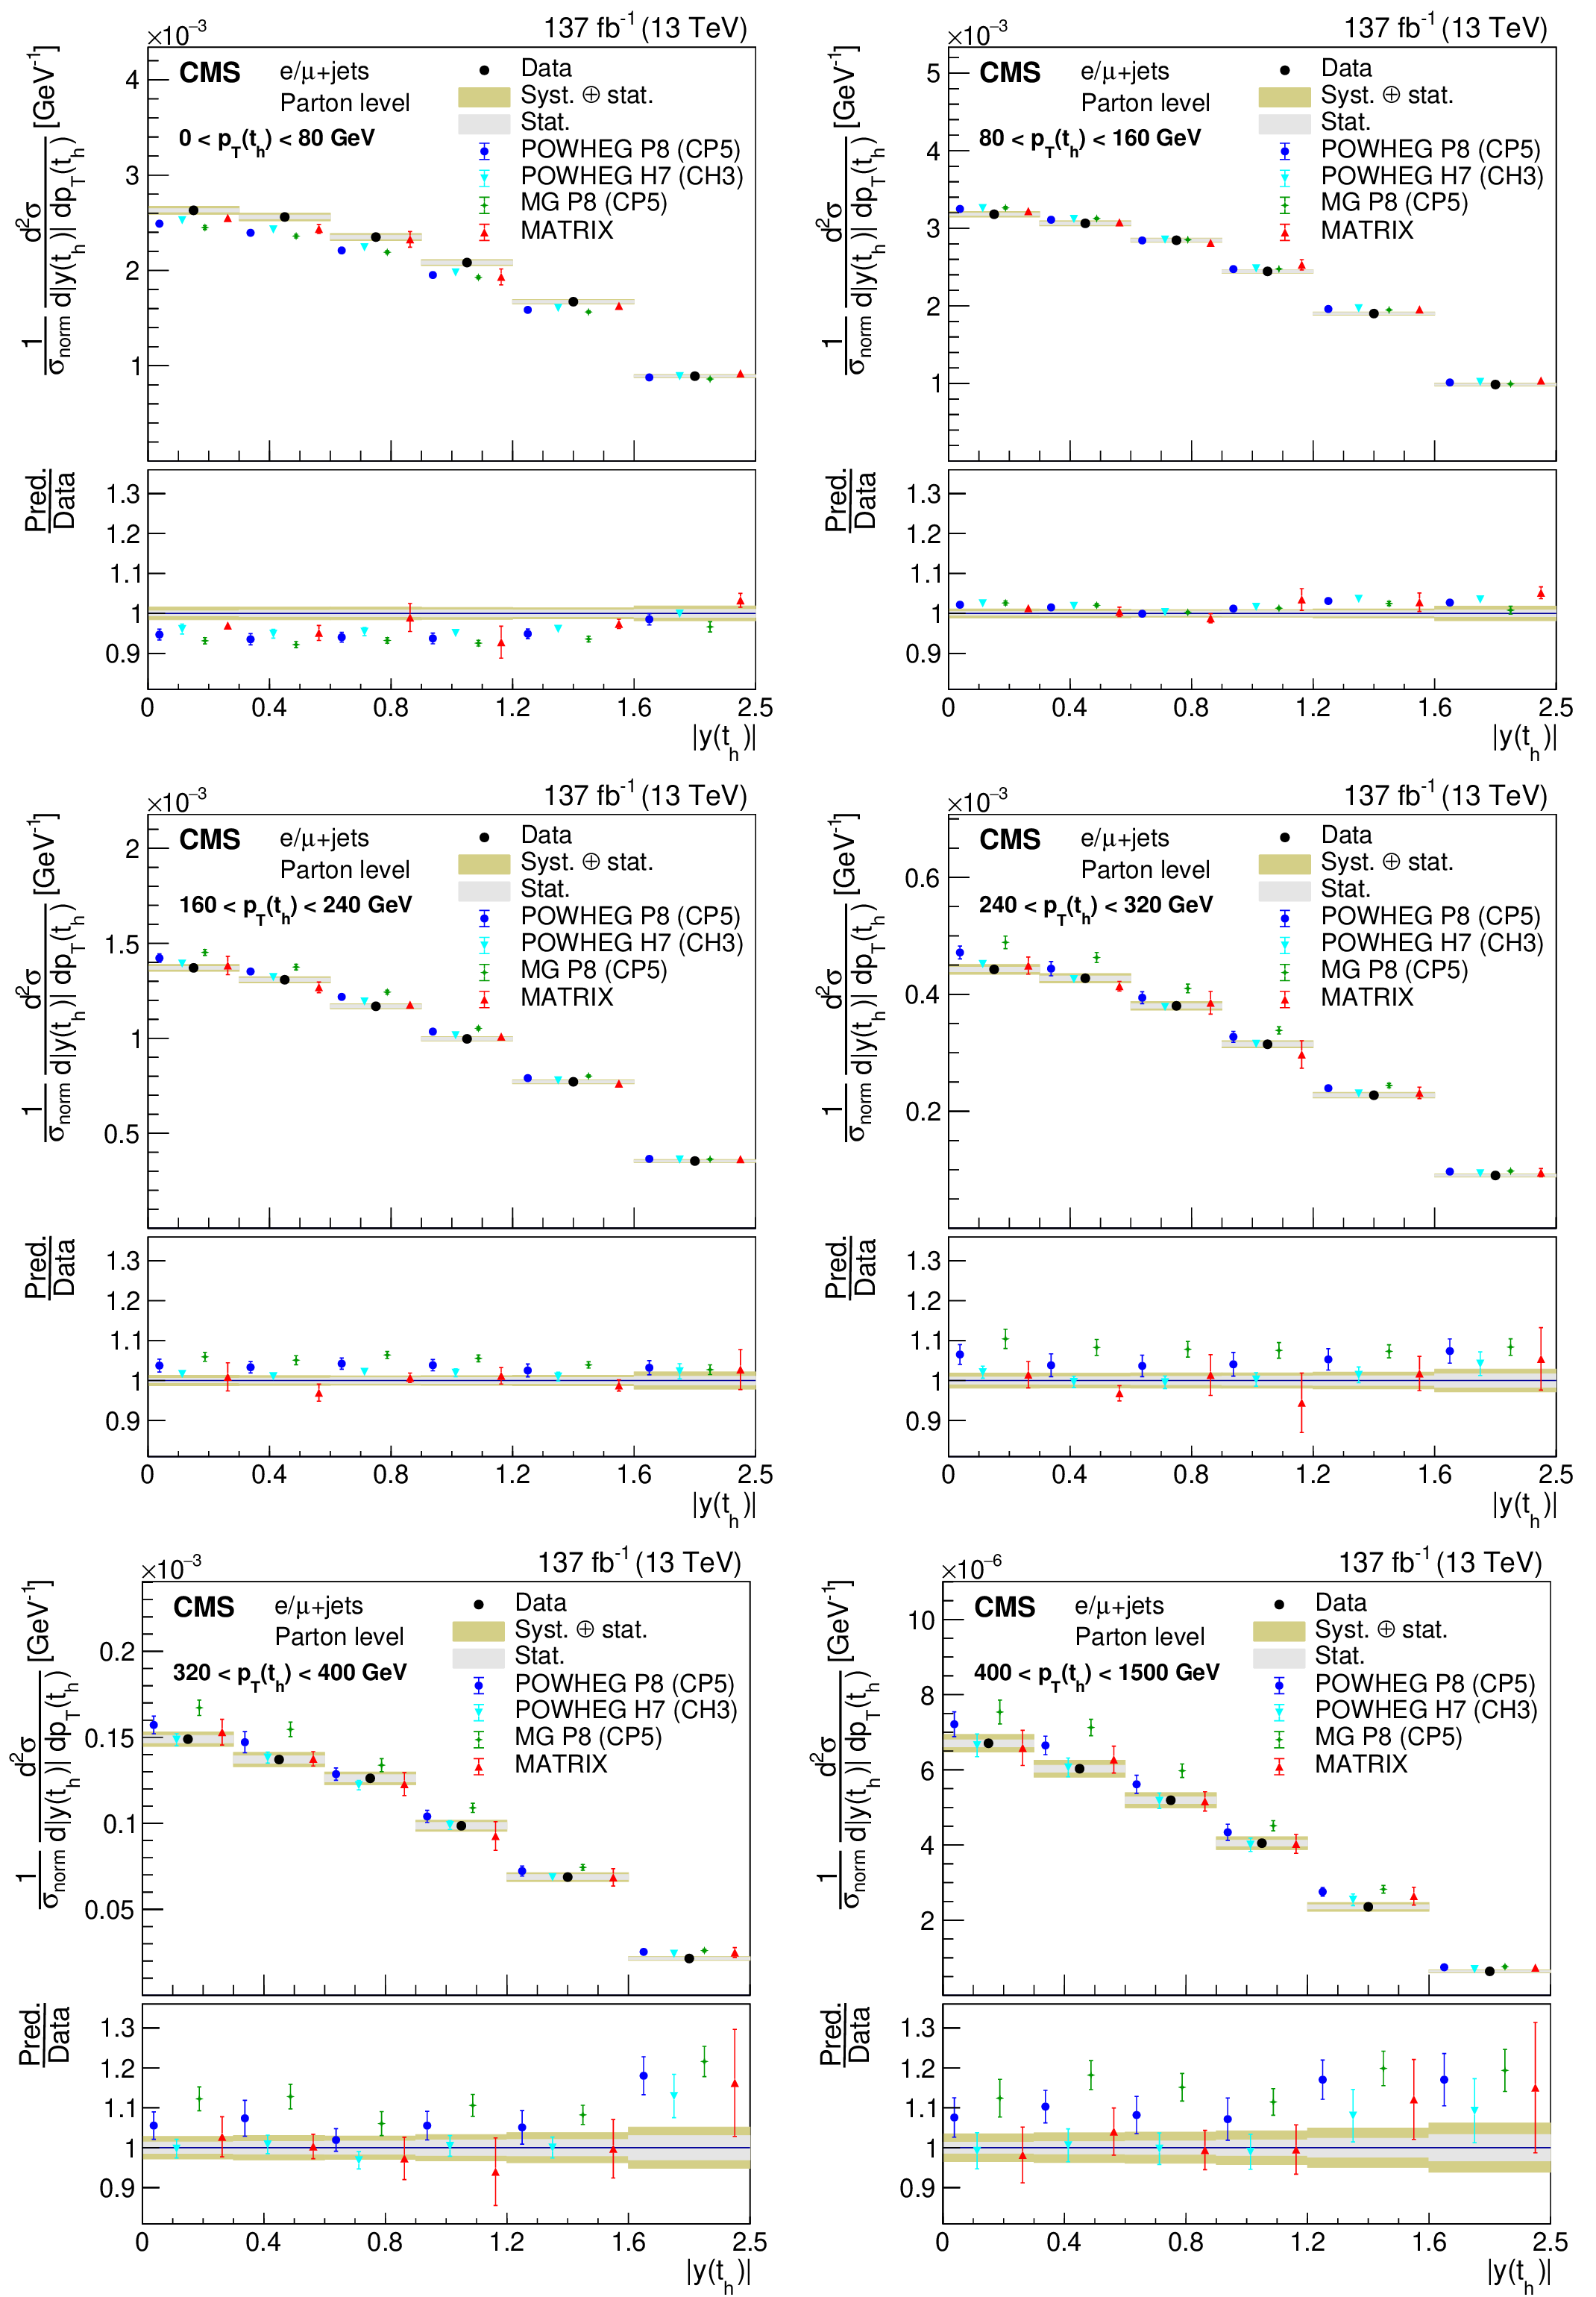
png pdf |
Figure A7:
Normalized double-differential cross section at the parton level as a function of ${{p_{\mathrm {T}}} ({\mathrm{t} _\mathrm {h}})}$ vs. ${{| y({\mathrm{t} _\mathrm {h}}) |}}$. The data are shown as points with gray (yellow) bands indicating the statistical (statistical and systematic) uncertainties. The cross sections are compared to the predictions of POWHEG combined with PYTHIA (P8) or HERWIG (H7), the multiparton simulation MG5_aMC@NLO (MG)+PYTHIA FxFx, and the NNLO QCD calculations obtained with Matrix. The ratios of the various predictions to the measured cross sections are shown in the lower panels. |
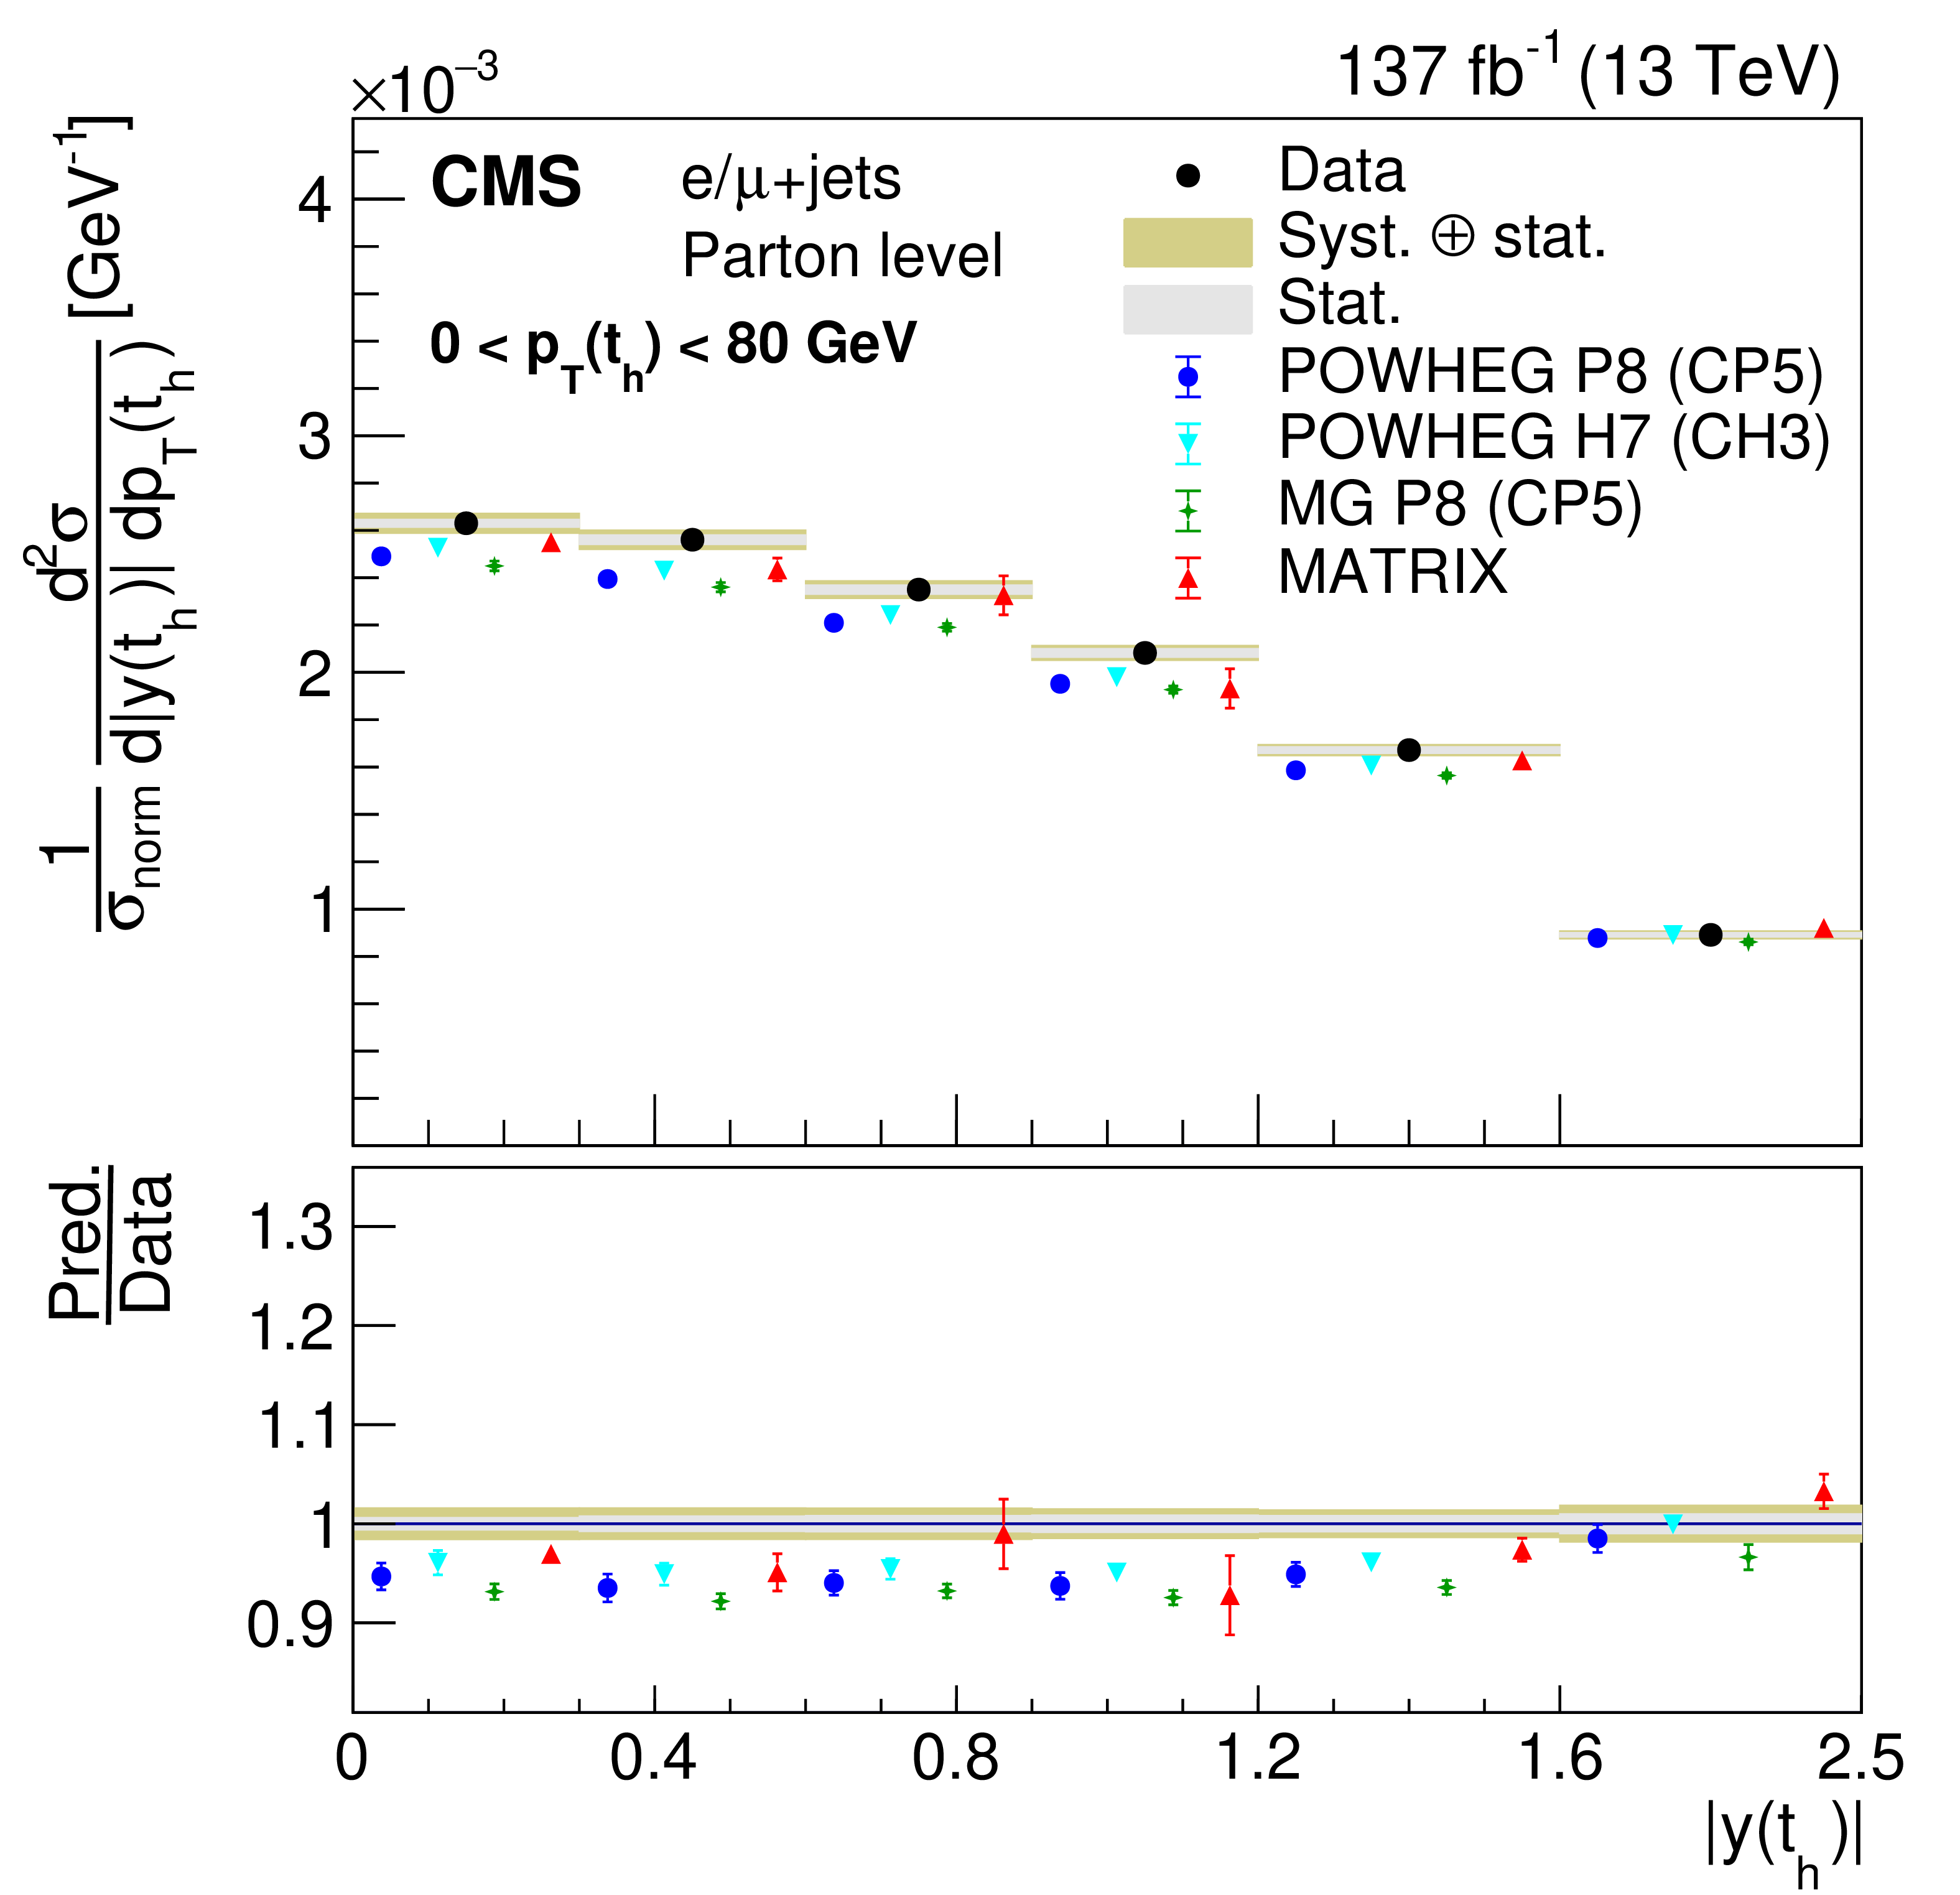
png pdf |
Figure A7-a:
Normalized double-differential cross section at the parton level as a function of ${{p_{\mathrm {T}}} ({\mathrm{t} _\mathrm {h}})}$ vs. ${{| y({\mathrm{t} _\mathrm {h}}) |}}$. The data are shown as points with gray (yellow) bands indicating the statistical (statistical and systematic) uncertainties. The cross sections are compared to the predictions of POWHEG combined with PYTHIA (P8) or HERWIG (H7), the multiparton simulation MG5_aMC@NLO (MG)+PYTHIA FxFx, and the NNLO QCD calculations obtained with Matrix. The ratios of the various predictions to the measured cross sections are shown in the lower panels. |
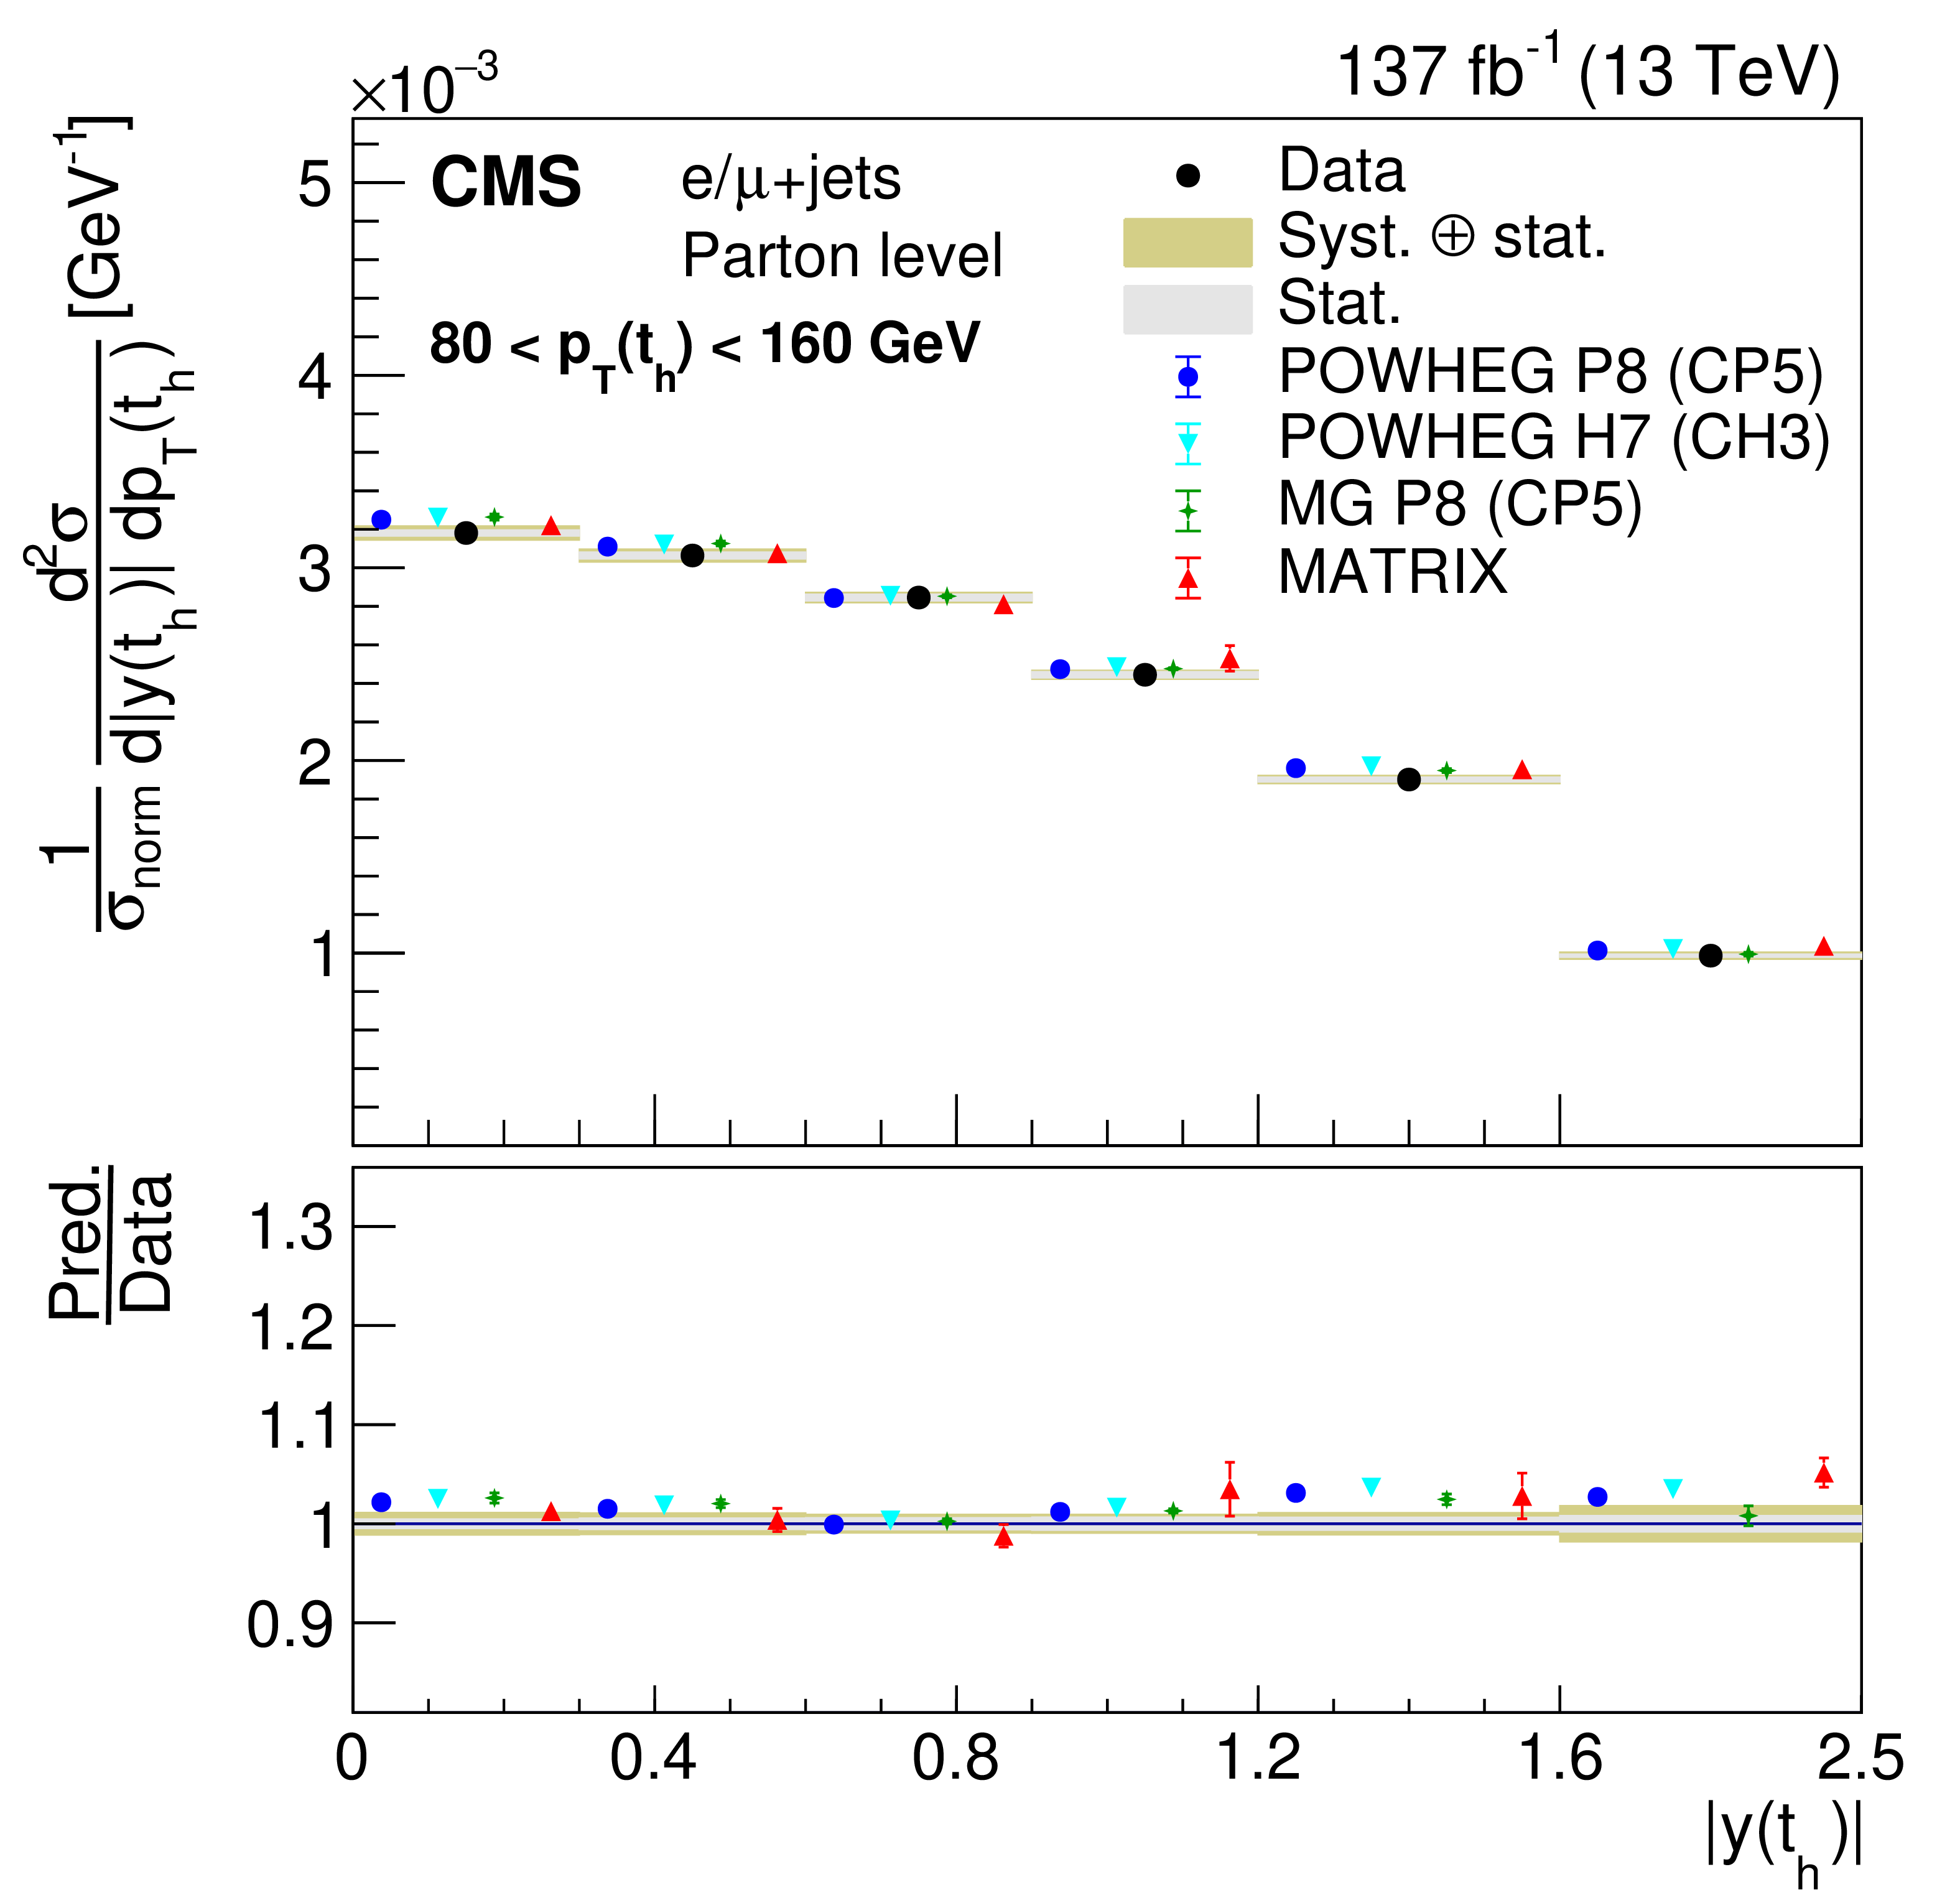
png pdf |
Figure A7-b:
Normalized double-differential cross section at the parton level as a function of ${{p_{\mathrm {T}}} ({\mathrm{t} _\mathrm {h}})}$ vs. ${{| y({\mathrm{t} _\mathrm {h}}) |}}$. The data are shown as points with gray (yellow) bands indicating the statistical (statistical and systematic) uncertainties. The cross sections are compared to the predictions of POWHEG combined with PYTHIA (P8) or HERWIG (H7), the multiparton simulation MG5_aMC@NLO (MG)+PYTHIA FxFx, and the NNLO QCD calculations obtained with Matrix. The ratios of the various predictions to the measured cross sections are shown in the lower panels. |
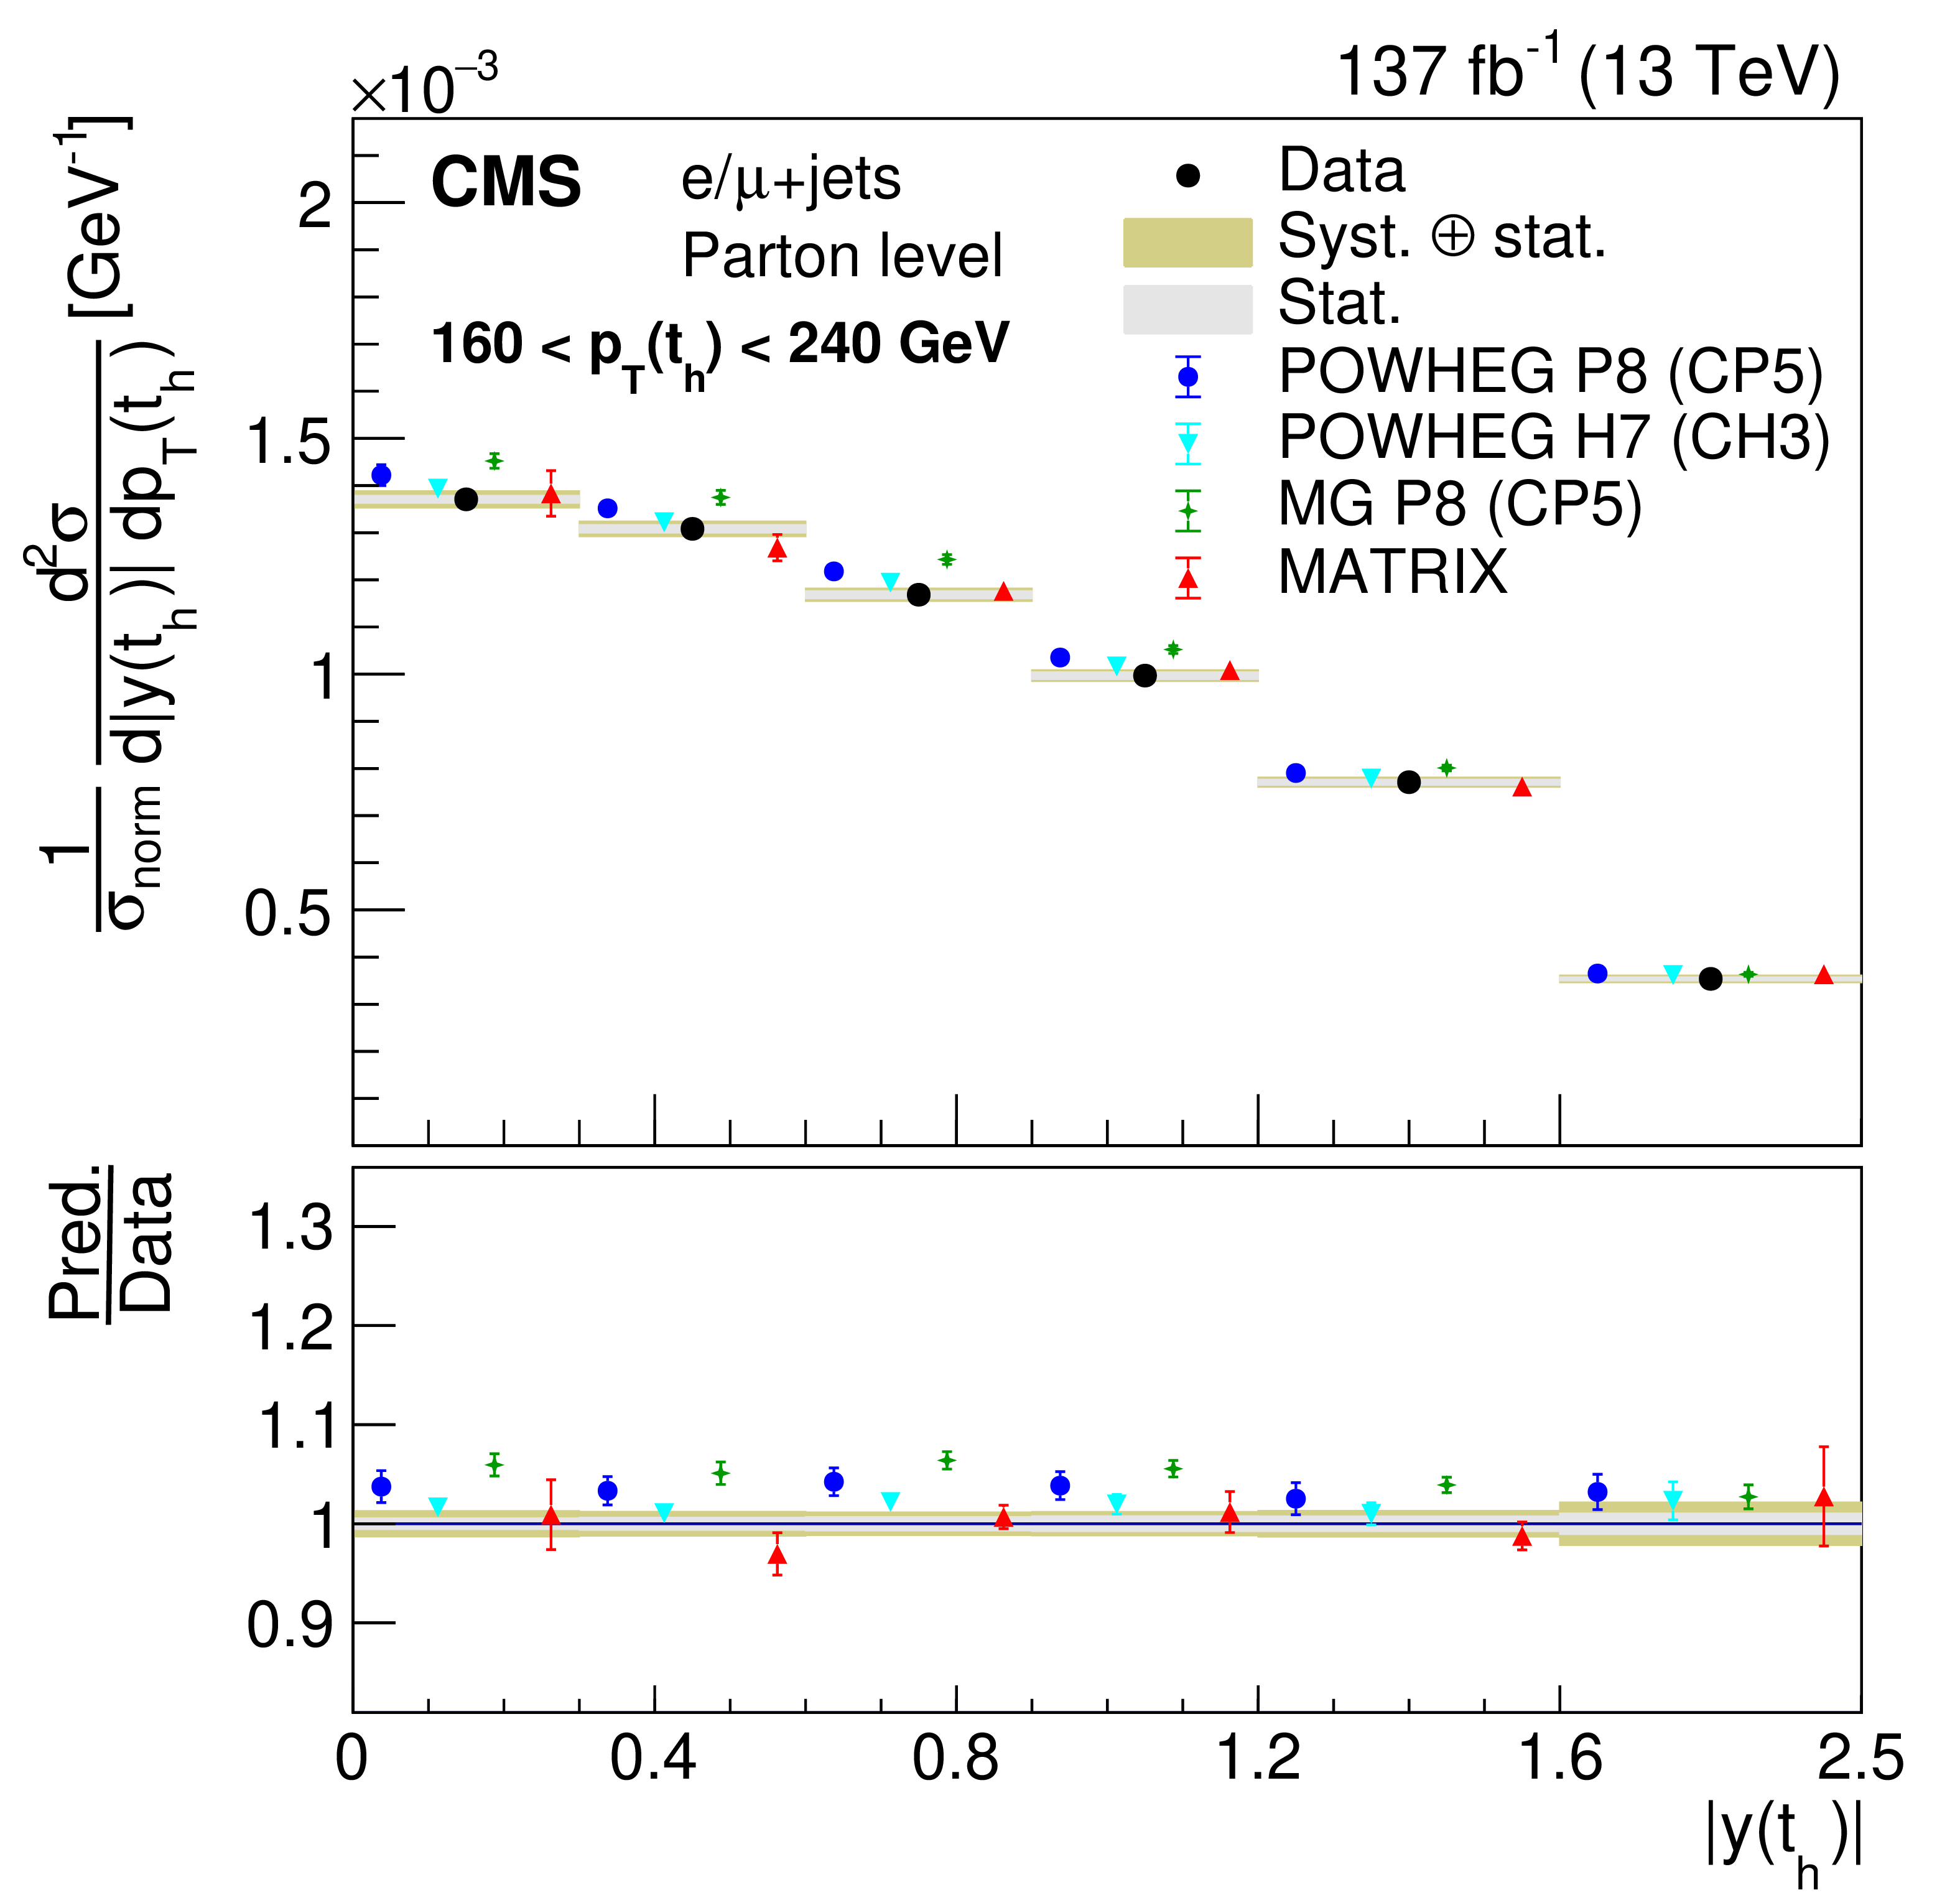
png pdf |
Figure A7-c:
Normalized double-differential cross section at the parton level as a function of ${{p_{\mathrm {T}}} ({\mathrm{t} _\mathrm {h}})}$ vs. ${{| y({\mathrm{t} _\mathrm {h}}) |}}$. The data are shown as points with gray (yellow) bands indicating the statistical (statistical and systematic) uncertainties. The cross sections are compared to the predictions of POWHEG combined with PYTHIA (P8) or HERWIG (H7), the multiparton simulation MG5_aMC@NLO (MG)+PYTHIA FxFx, and the NNLO QCD calculations obtained with Matrix. The ratios of the various predictions to the measured cross sections are shown in the lower panels. |

png pdf |
Figure A7-d:
Normalized double-differential cross section at the parton level as a function of ${{p_{\mathrm {T}}} ({\mathrm{t} _\mathrm {h}})}$ vs. ${{| y({\mathrm{t} _\mathrm {h}}) |}}$. The data are shown as points with gray (yellow) bands indicating the statistical (statistical and systematic) uncertainties. The cross sections are compared to the predictions of POWHEG combined with PYTHIA (P8) or HERWIG (H7), the multiparton simulation MG5_aMC@NLO (MG)+PYTHIA FxFx, and the NNLO QCD calculations obtained with Matrix. The ratios of the various predictions to the measured cross sections are shown in the lower panels. |

png pdf |
Figure A7-e:
Normalized double-differential cross section at the parton level as a function of ${{p_{\mathrm {T}}} ({\mathrm{t} _\mathrm {h}})}$ vs. ${{| y({\mathrm{t} _\mathrm {h}}) |}}$. The data are shown as points with gray (yellow) bands indicating the statistical (statistical and systematic) uncertainties. The cross sections are compared to the predictions of POWHEG combined with PYTHIA (P8) or HERWIG (H7), the multiparton simulation MG5_aMC@NLO (MG)+PYTHIA FxFx, and the NNLO QCD calculations obtained with Matrix. The ratios of the various predictions to the measured cross sections are shown in the lower panels. |
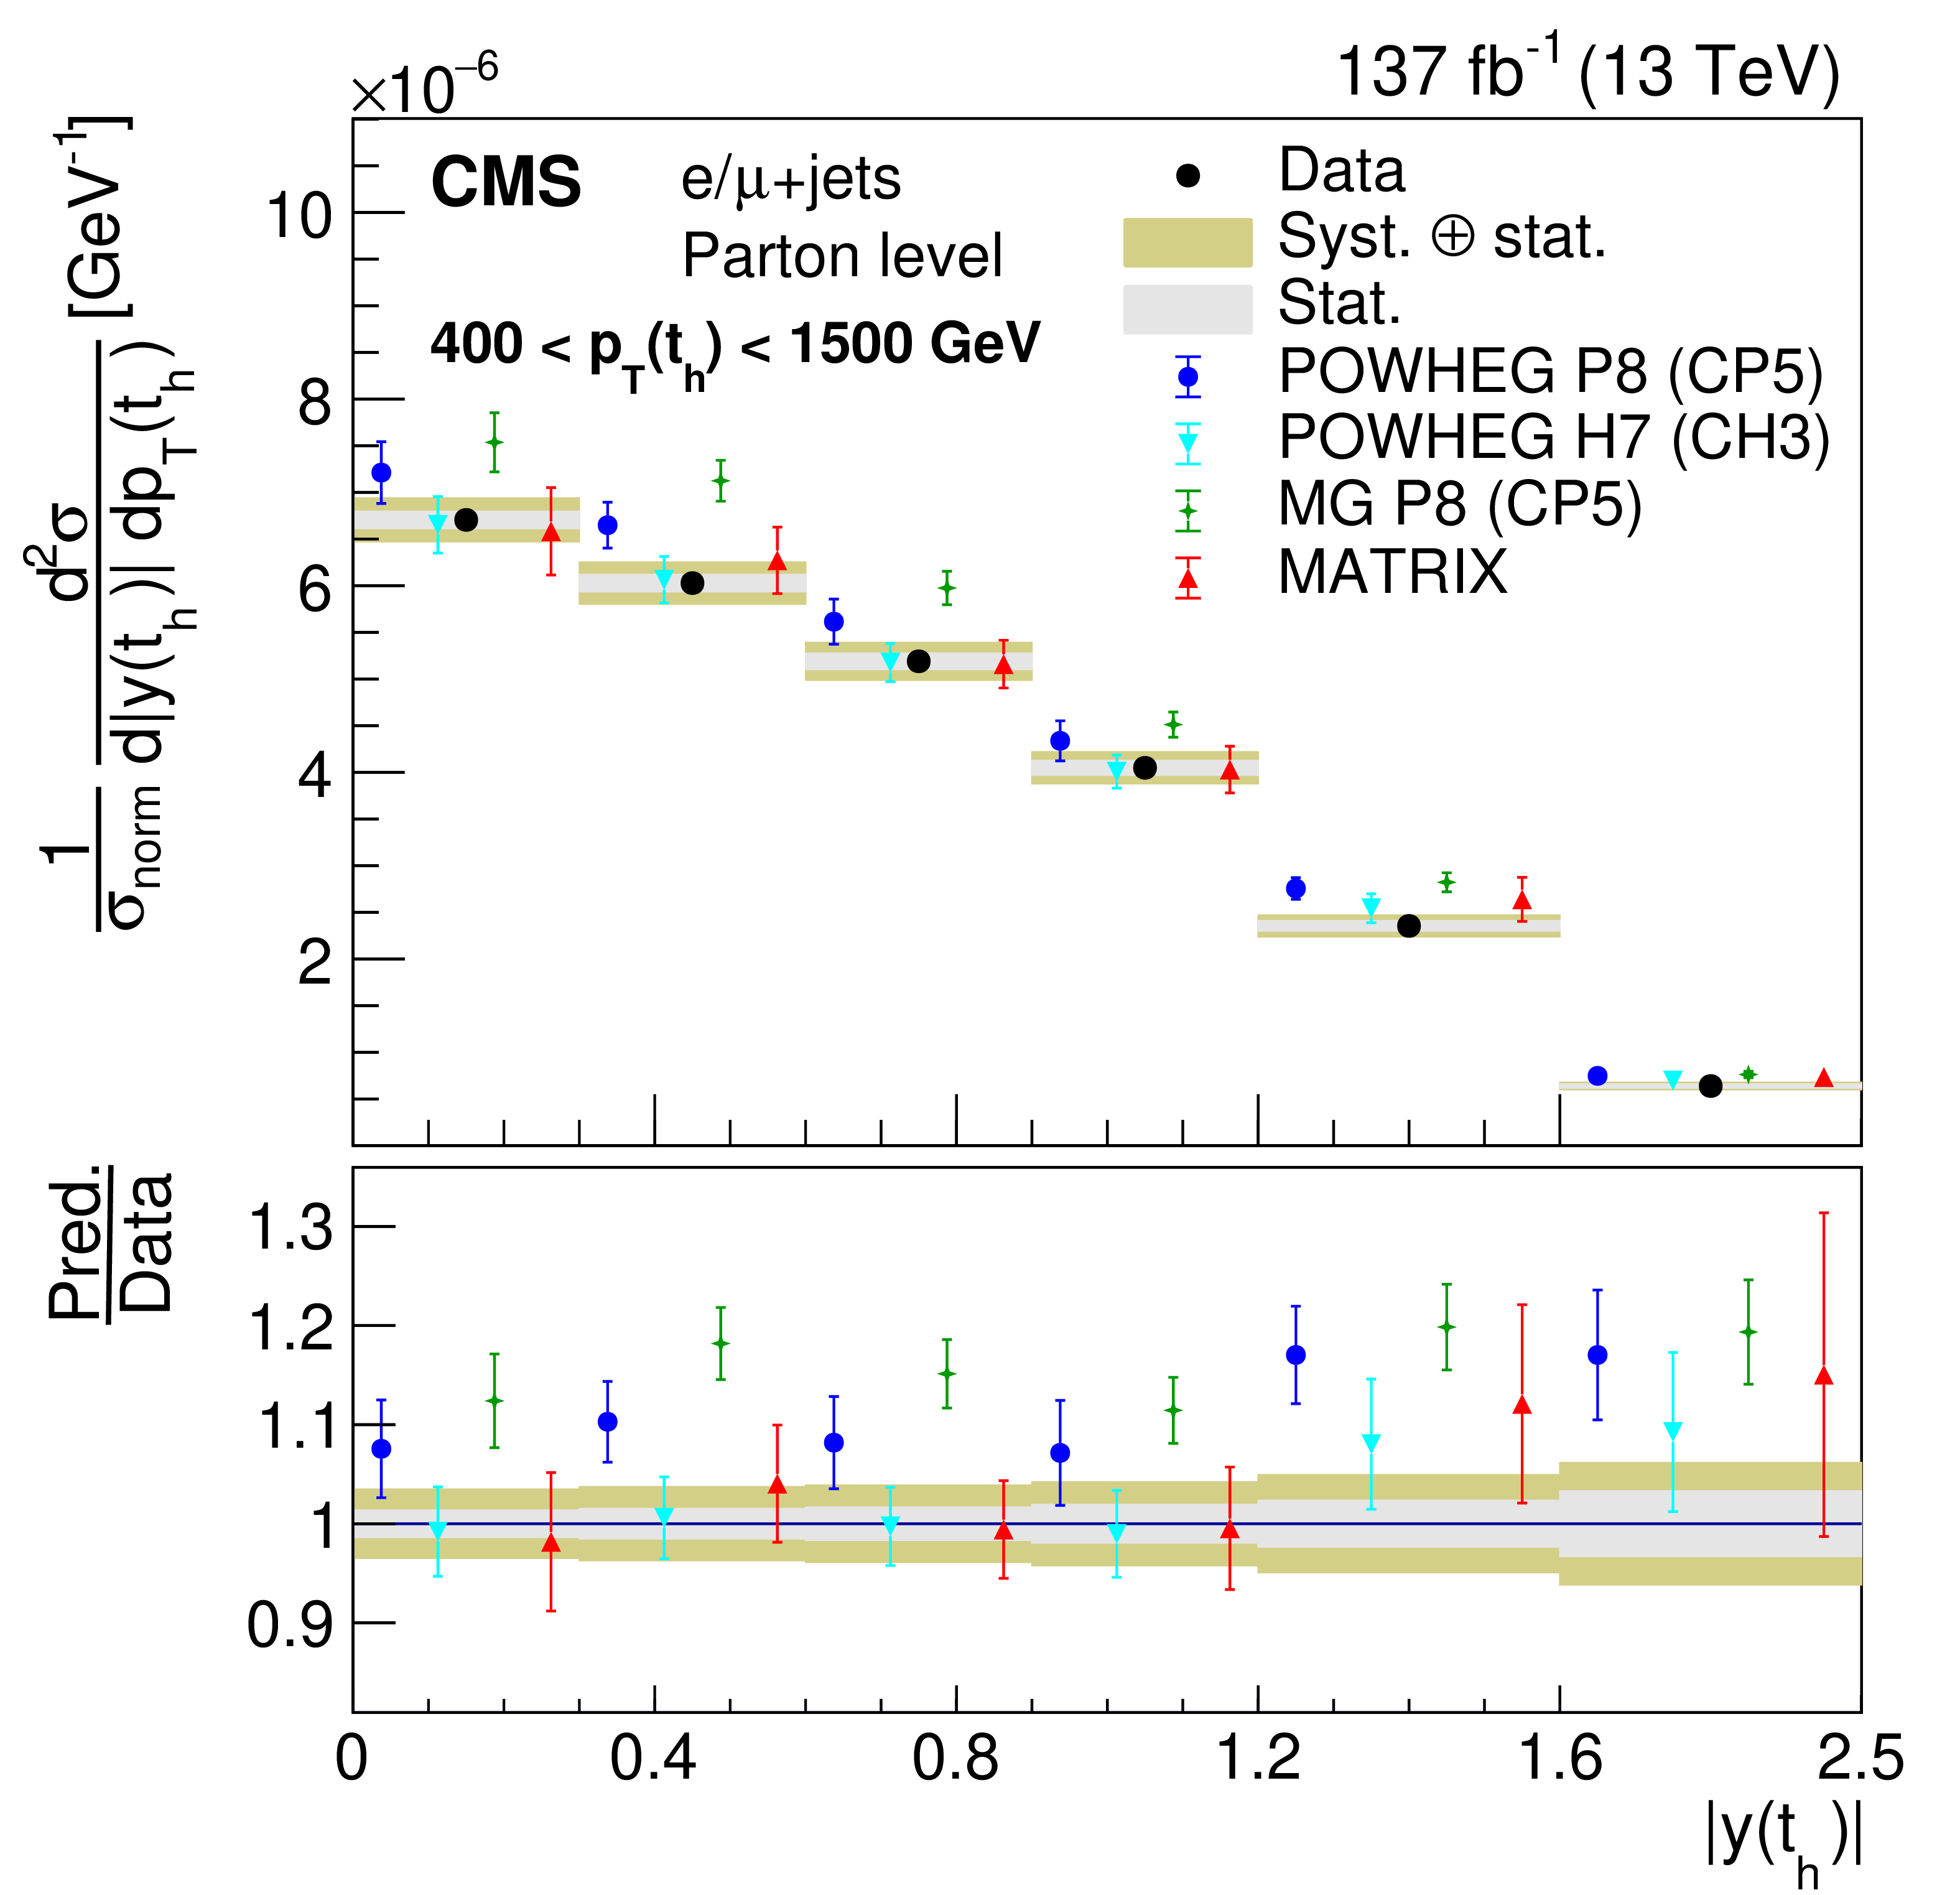
png pdf |
Figure A7-f:
Normalized double-differential cross section at the parton level as a function of ${{p_{\mathrm {T}}} ({\mathrm{t} _\mathrm {h}})}$ vs. ${{| y({\mathrm{t} _\mathrm {h}}) |}}$. The data are shown as points with gray (yellow) bands indicating the statistical (statistical and systematic) uncertainties. The cross sections are compared to the predictions of POWHEG combined with PYTHIA (P8) or HERWIG (H7), the multiparton simulation MG5_aMC@NLO (MG)+PYTHIA FxFx, and the NNLO QCD calculations obtained with Matrix. The ratios of the various predictions to the measured cross sections are shown in the lower panels. |
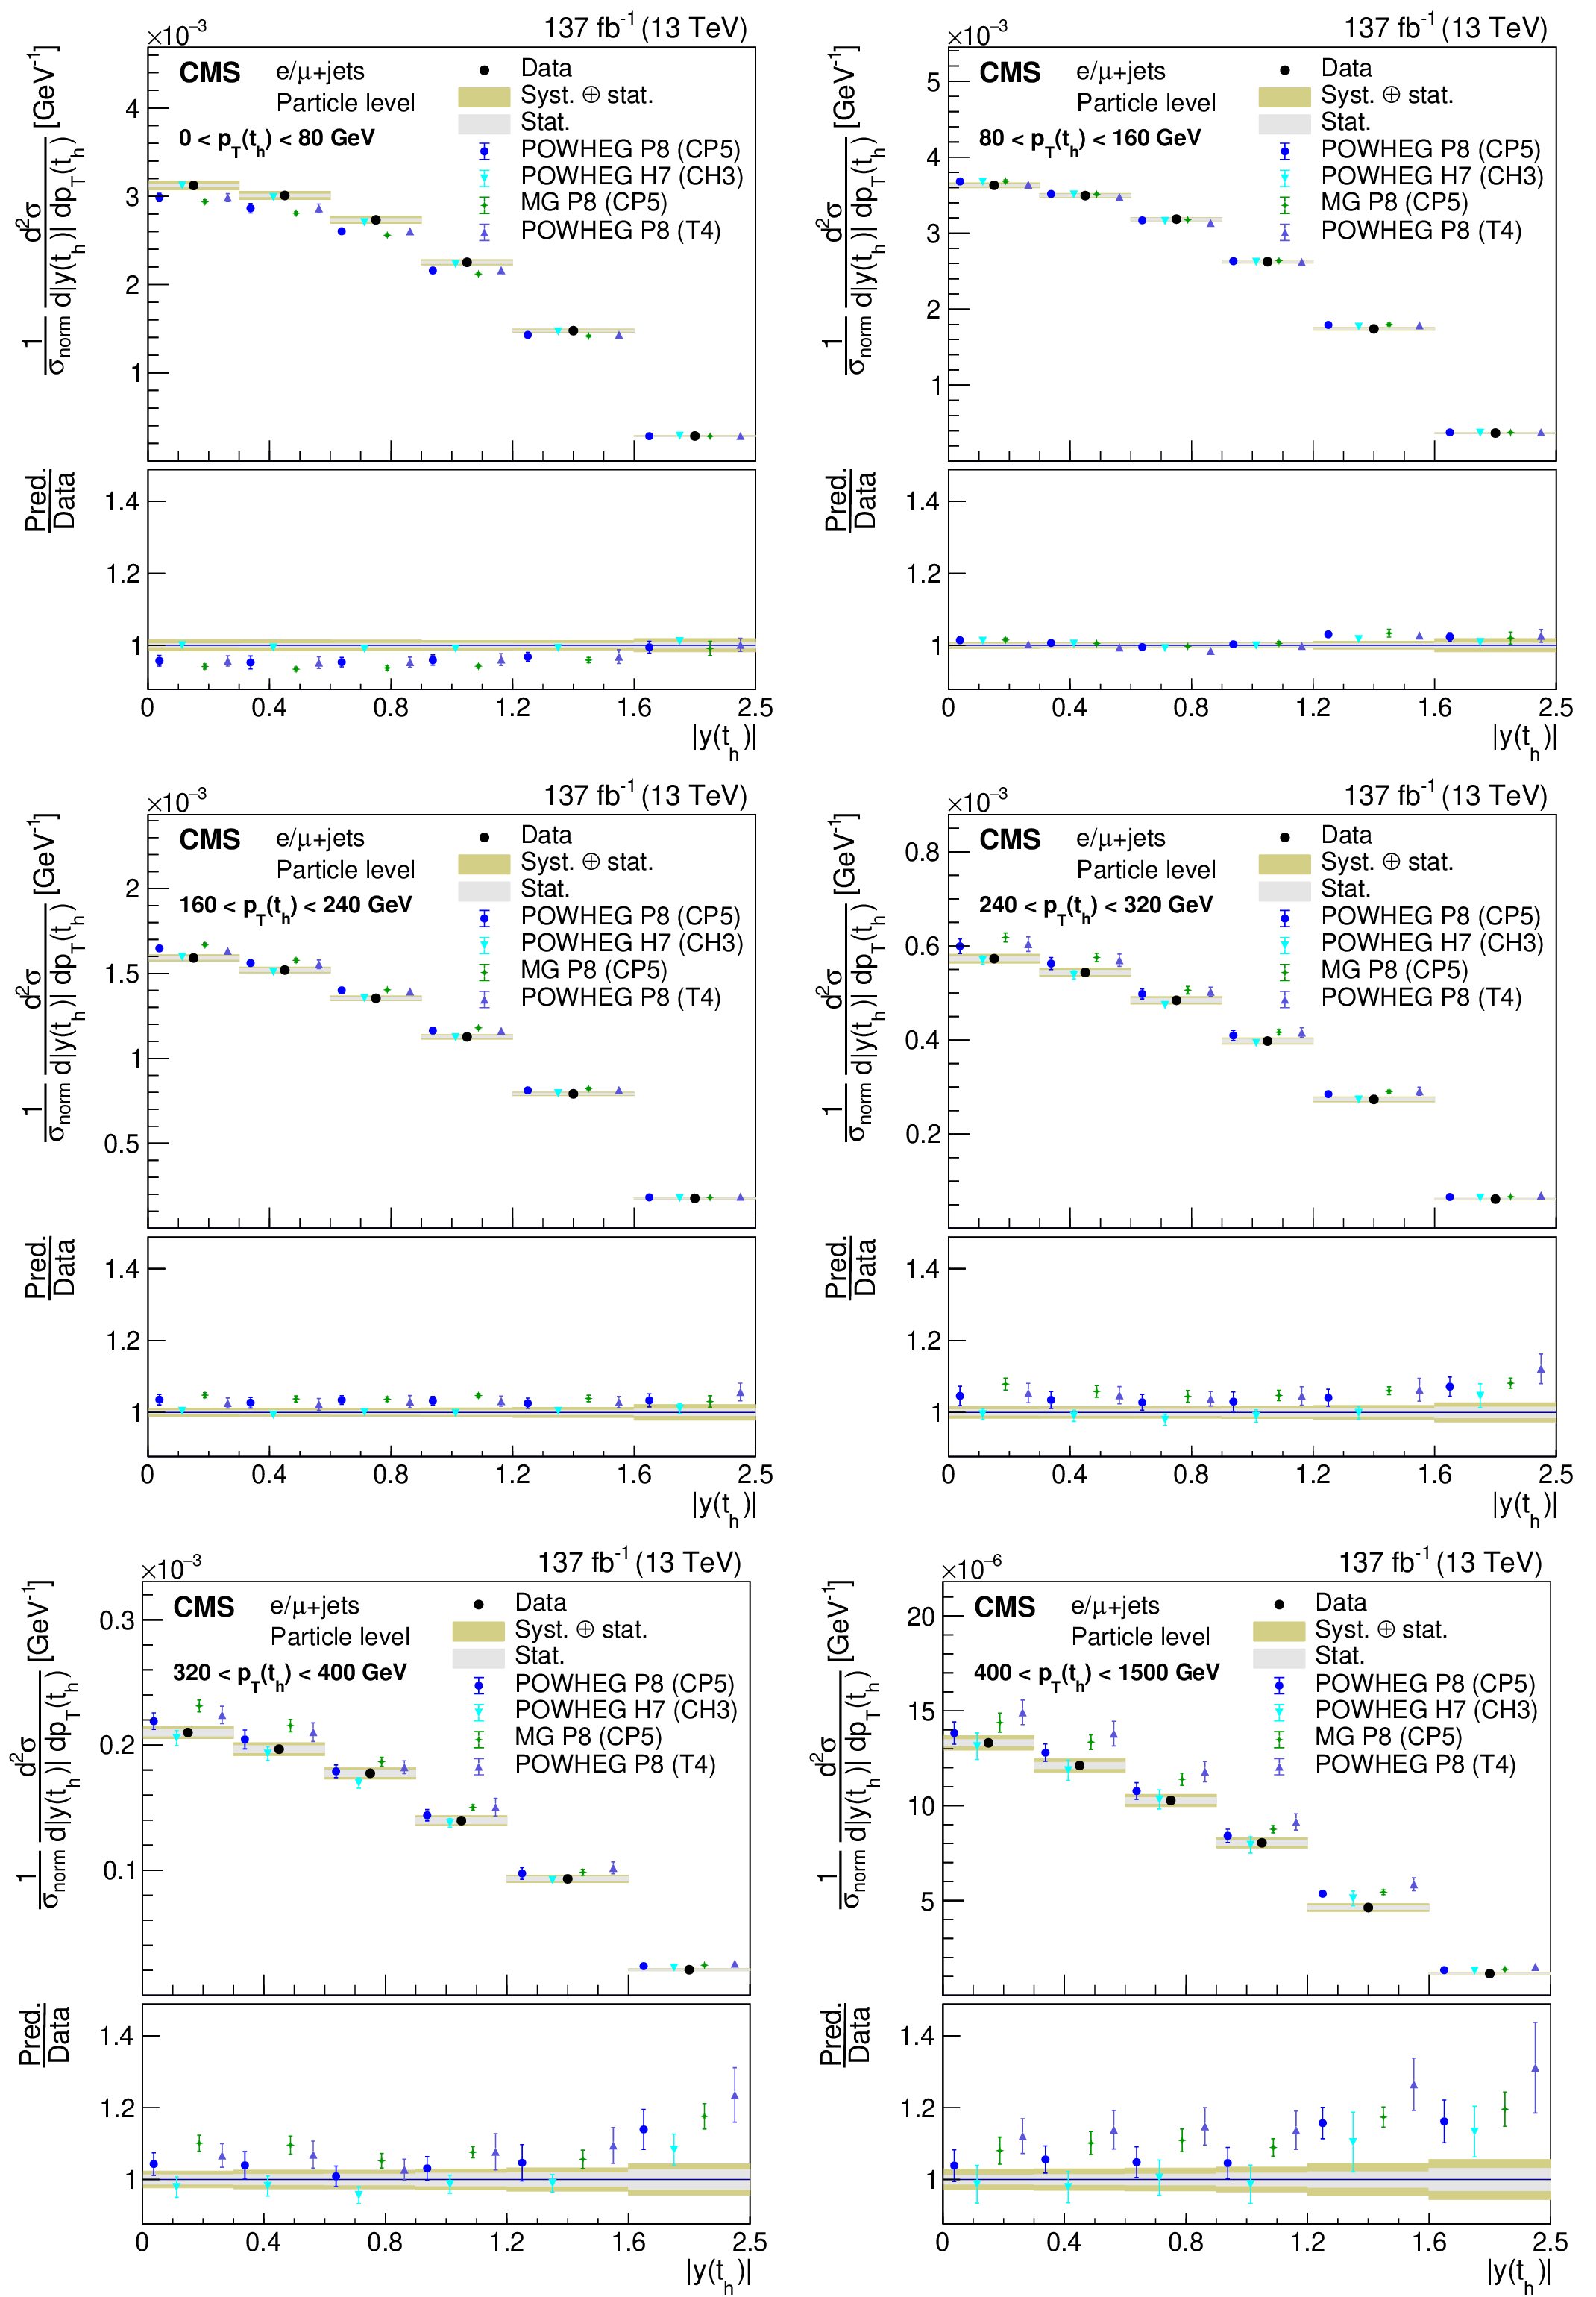
png pdf |
Figure A8:
Normalized double-differential cross section at the particle level as a function of ${{p_{\mathrm {T}}} ({\mathrm{t} _\mathrm {h}})}$ vs. ${{| y({\mathrm{t} _\mathrm {h}}) |}}$. The data are shown as points with gray (yellow) bands indicating the statistical (statistical and systematic) uncertainties. The cross sections are compared to the predictions of POWHEG+PYTHIA (P8) for the CP5 and CUETP8M2T4 (T4) tunes, POWHEG+HERWIG (H7), and the multiparton simulation MG5_aMC@NLO (MG)+PYTHIA. The ratios of the various predictions to the measured cross sections are shown in the lower panels. |
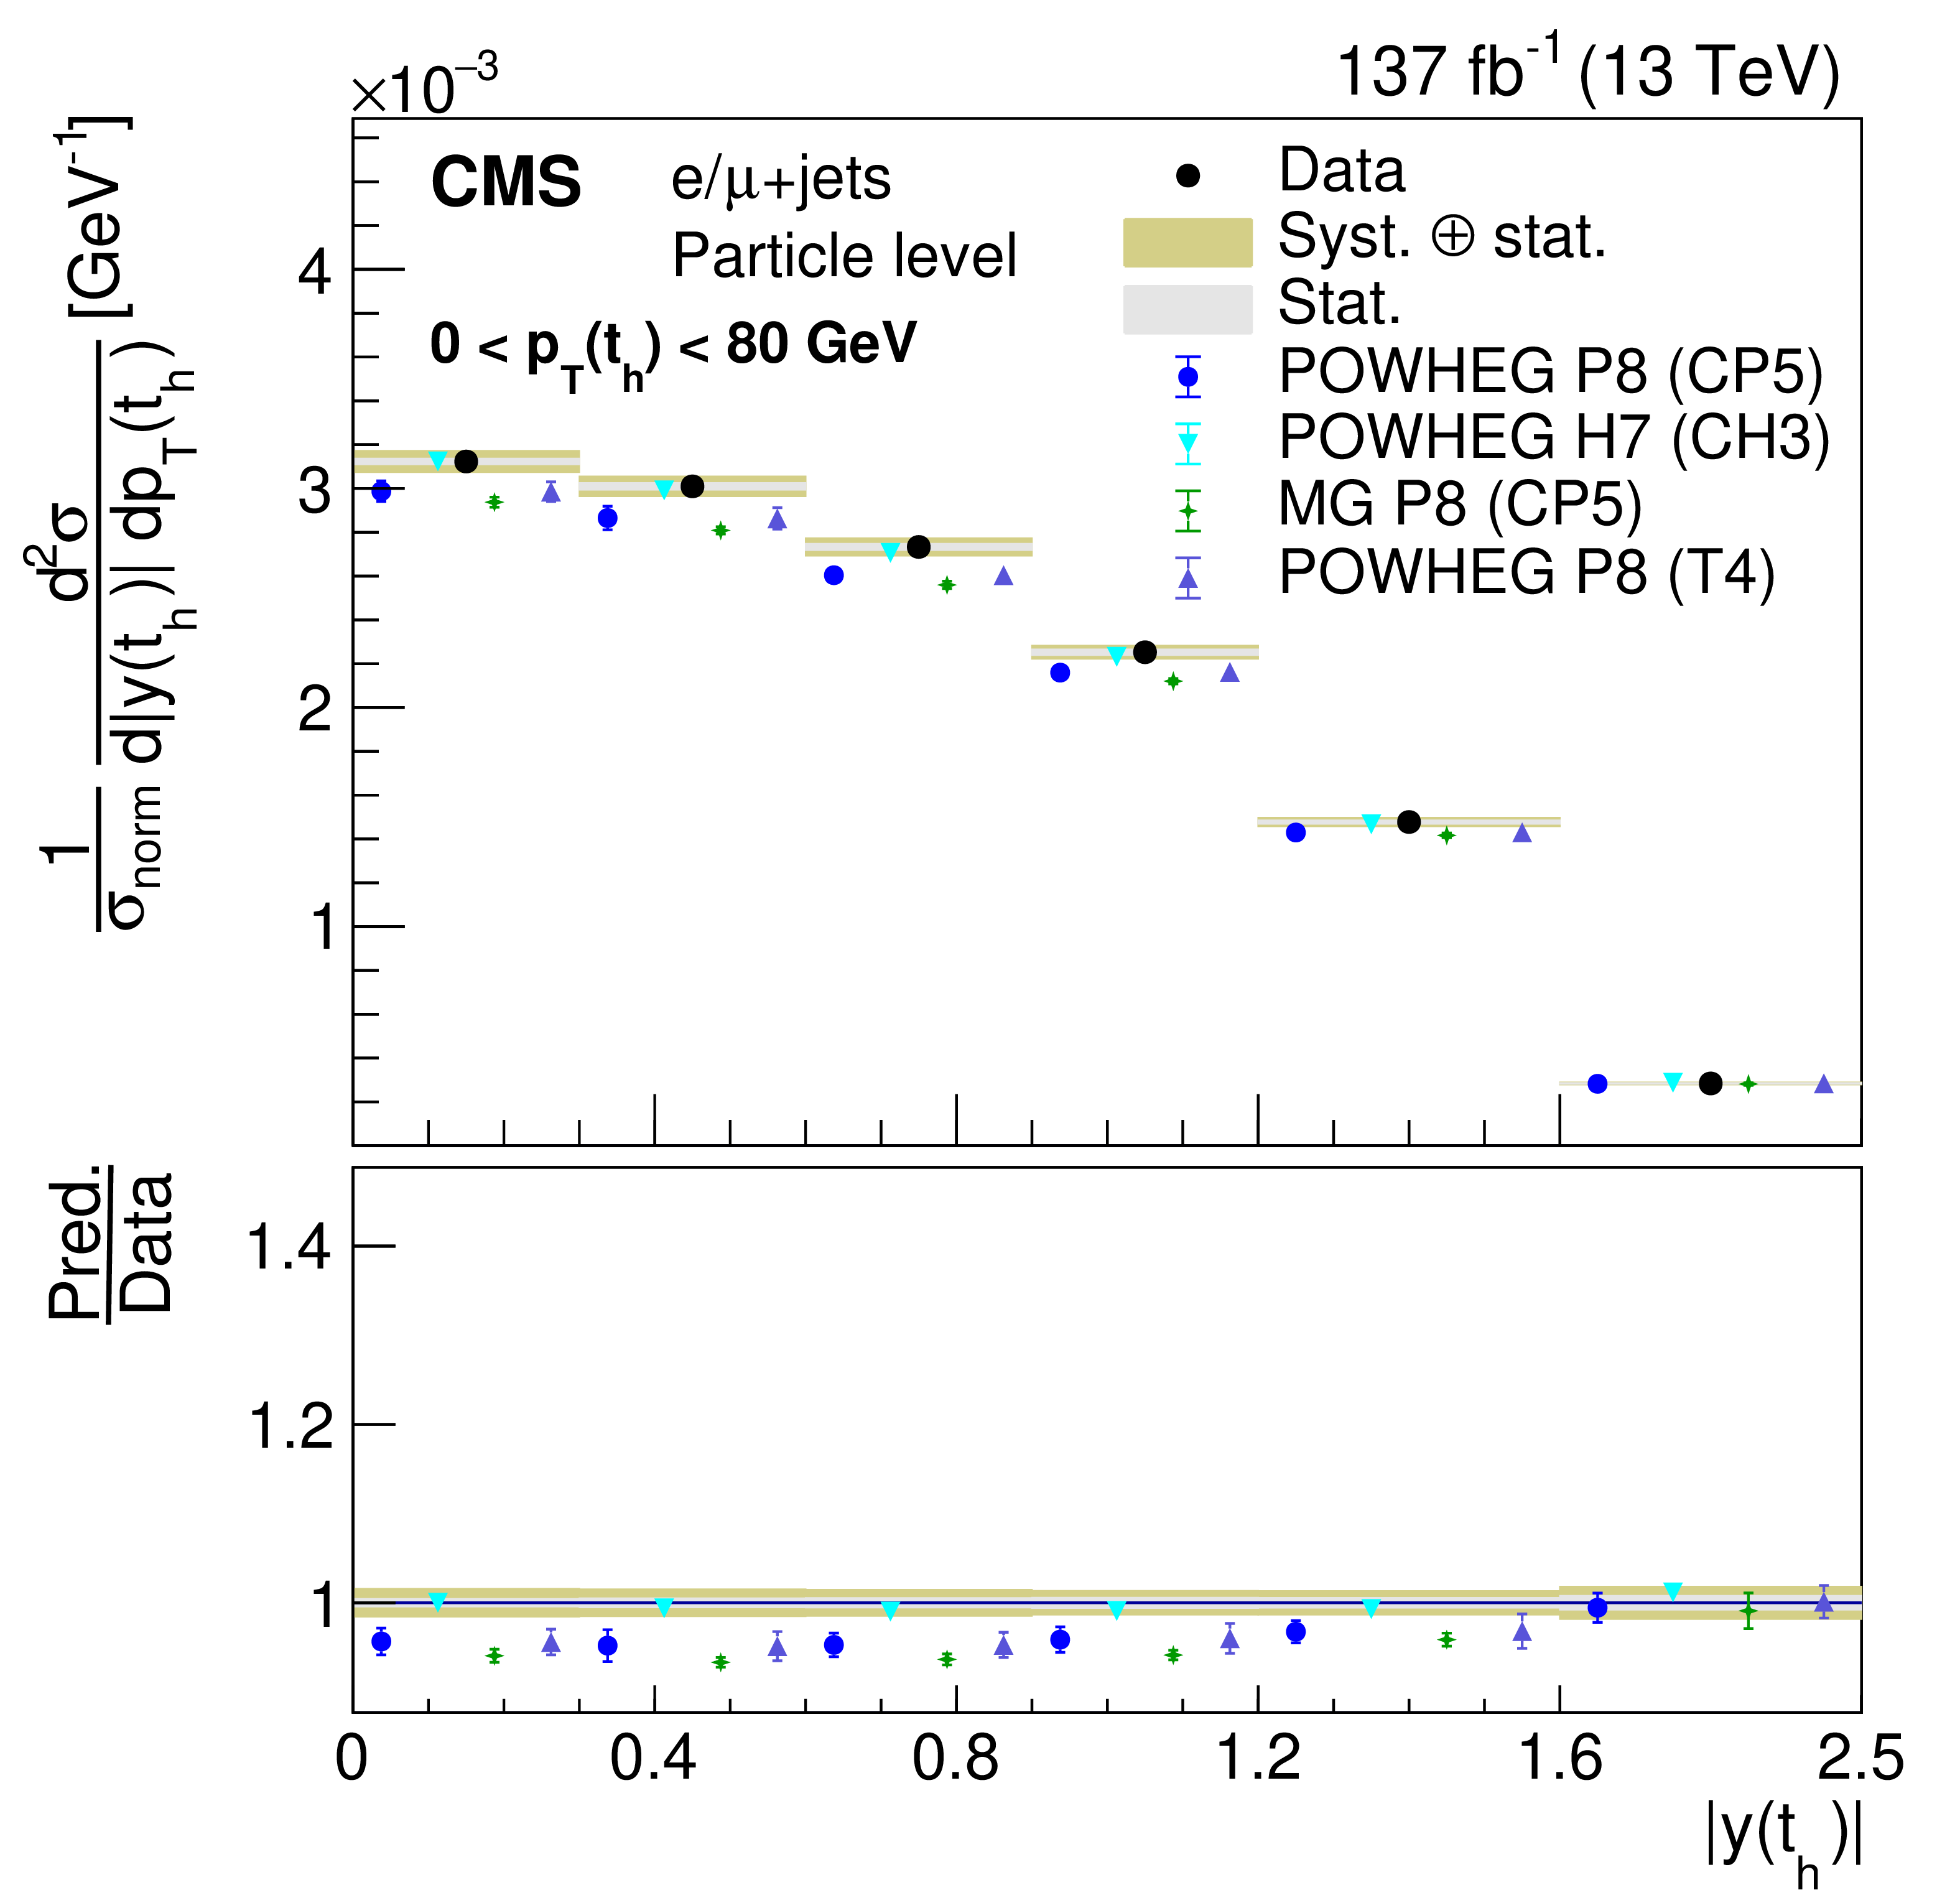
png pdf |
Figure A8-a:
Normalized double-differential cross section at the particle level as a function of ${{p_{\mathrm {T}}} ({\mathrm{t} _\mathrm {h}})}$ vs. ${{| y({\mathrm{t} _\mathrm {h}}) |}}$. The data are shown as points with gray (yellow) bands indicating the statistical (statistical and systematic) uncertainties. The cross sections are compared to the predictions of POWHEG+PYTHIA (P8) for the CP5 and CUETP8M2T4 (T4) tunes, POWHEG+HERWIG (H7), and the multiparton simulation MG5_aMC@NLO (MG)+PYTHIA. The ratios of the various predictions to the measured cross sections are shown in the lower panels. |

png pdf |
Figure A8-b:
Normalized double-differential cross section at the particle level as a function of ${{p_{\mathrm {T}}} ({\mathrm{t} _\mathrm {h}})}$ vs. ${{| y({\mathrm{t} _\mathrm {h}}) |}}$. The data are shown as points with gray (yellow) bands indicating the statistical (statistical and systematic) uncertainties. The cross sections are compared to the predictions of POWHEG+PYTHIA (P8) for the CP5 and CUETP8M2T4 (T4) tunes, POWHEG+HERWIG (H7), and the multiparton simulation MG5_aMC@NLO (MG)+PYTHIA. The ratios of the various predictions to the measured cross sections are shown in the lower panels. |
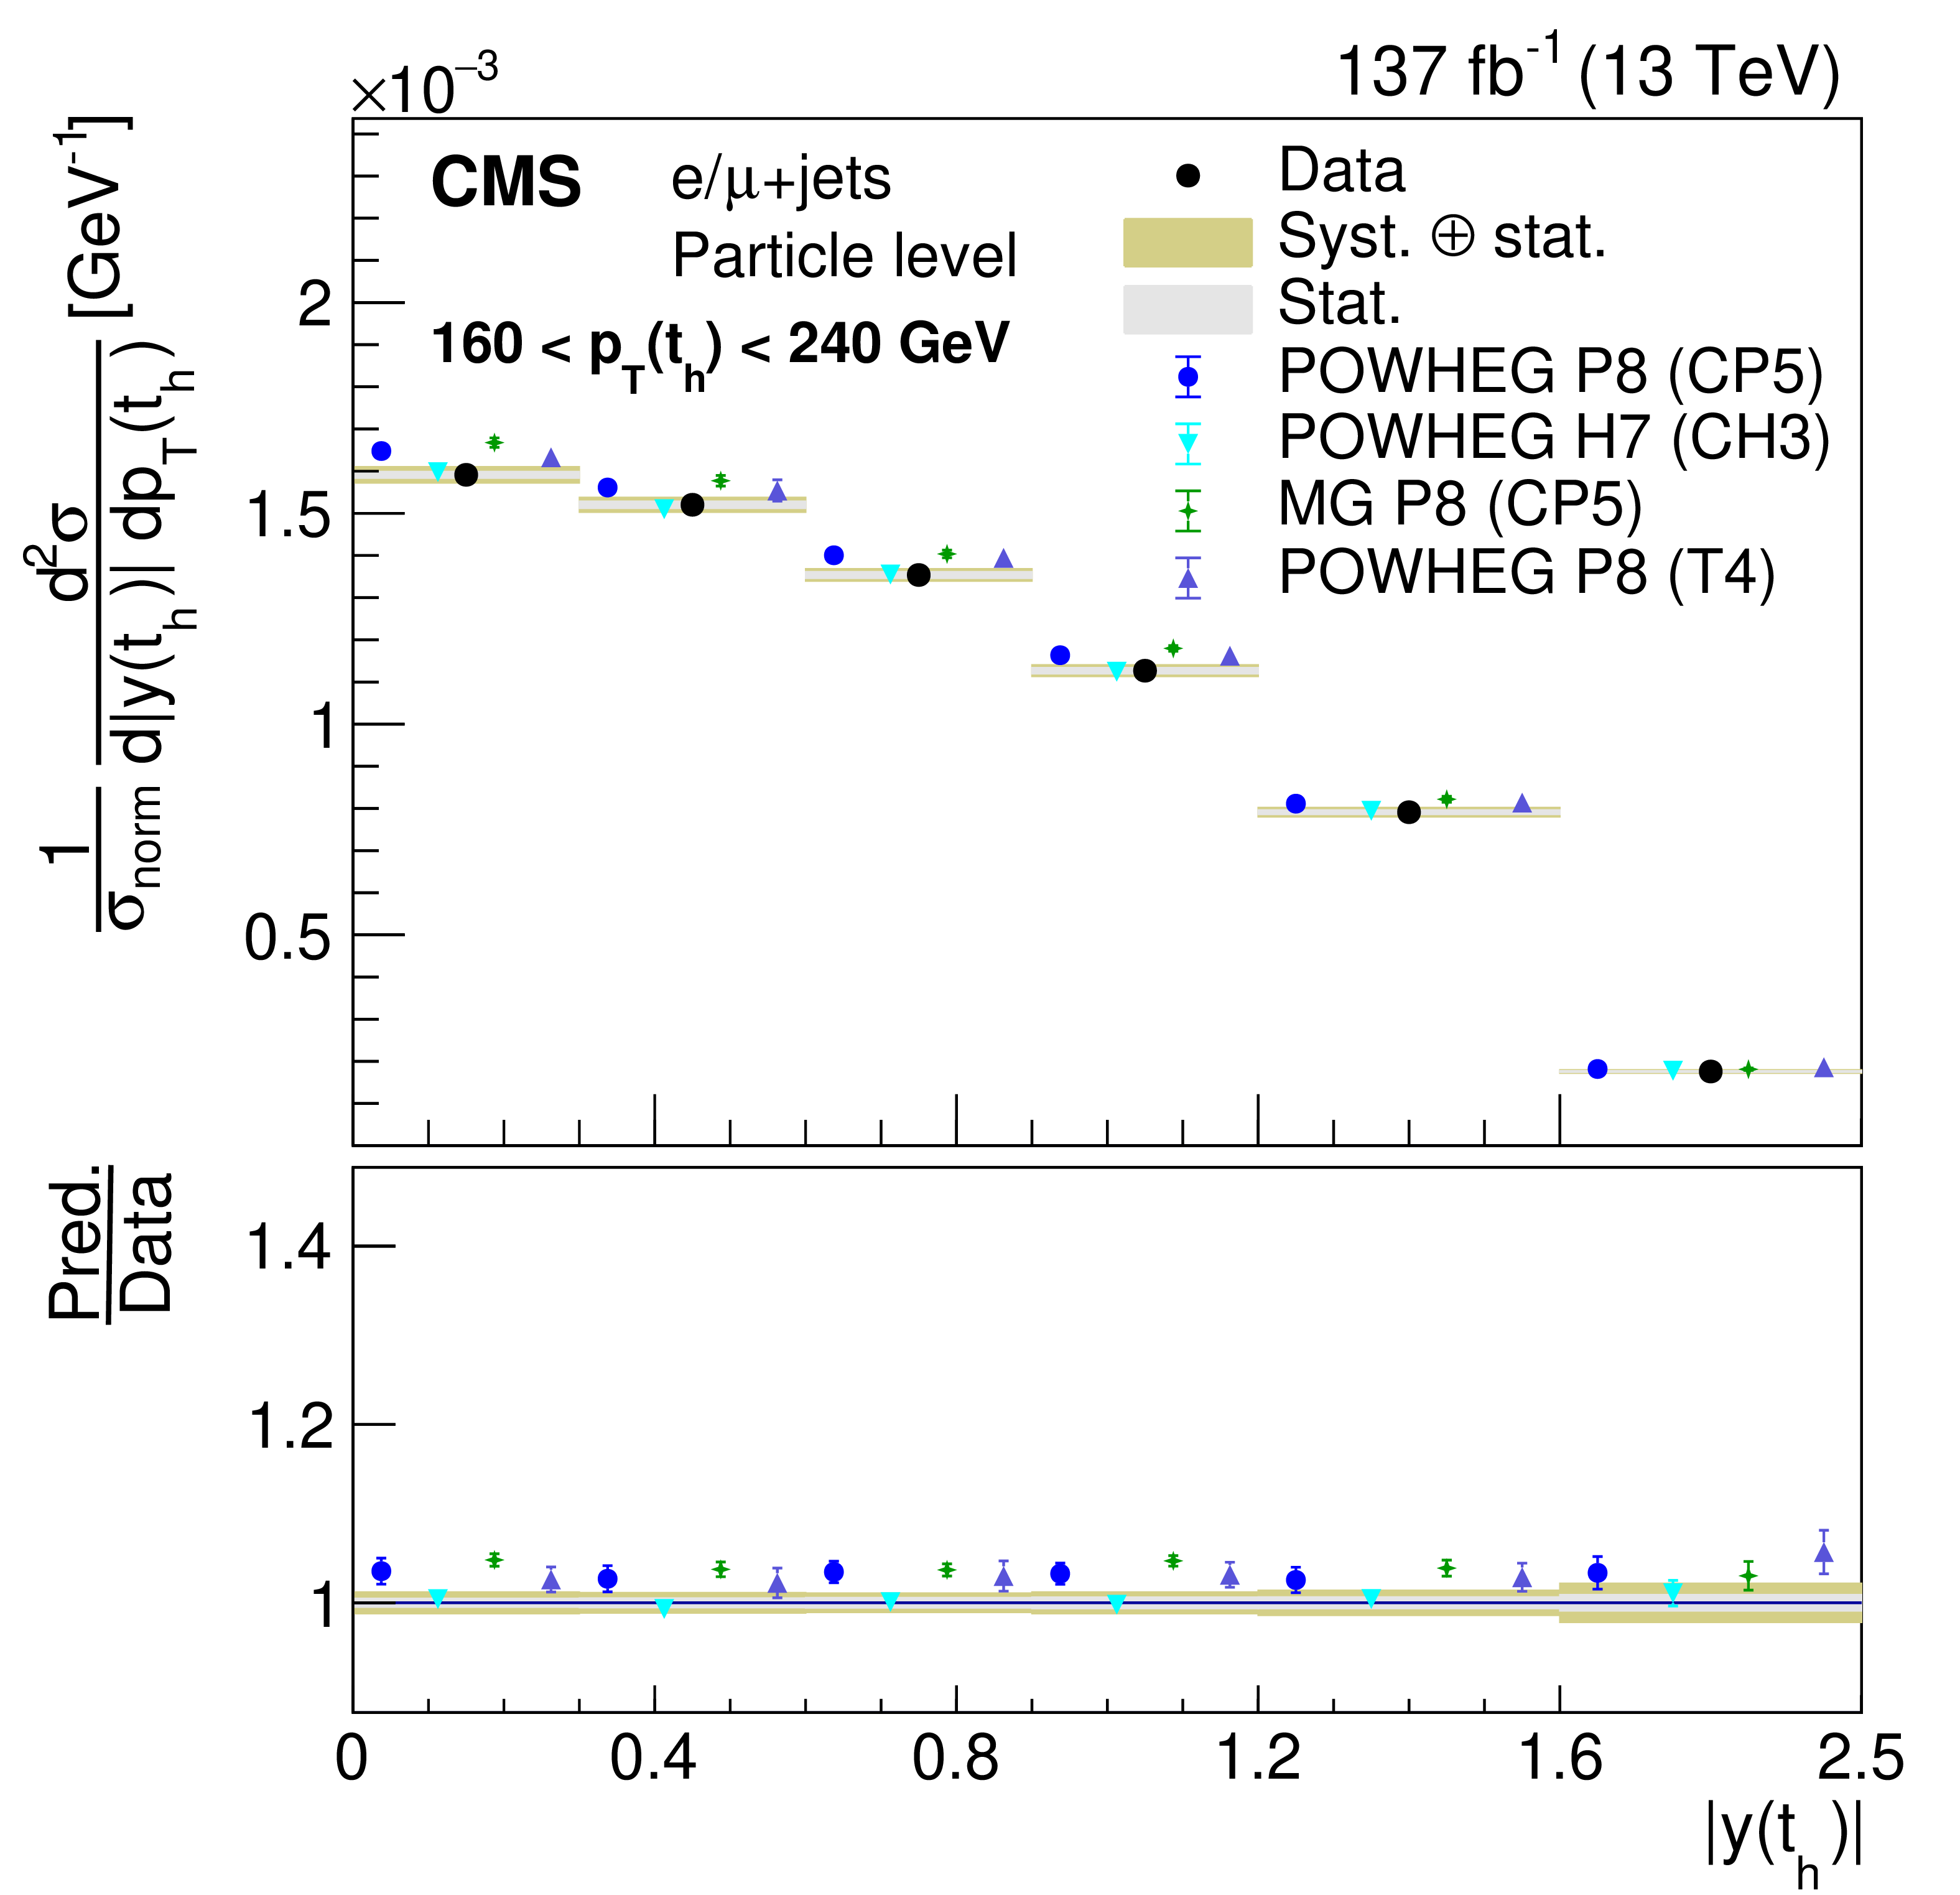
png pdf |
Figure A8-c:
Normalized double-differential cross section at the particle level as a function of ${{p_{\mathrm {T}}} ({\mathrm{t} _\mathrm {h}})}$ vs. ${{| y({\mathrm{t} _\mathrm {h}}) |}}$. The data are shown as points with gray (yellow) bands indicating the statistical (statistical and systematic) uncertainties. The cross sections are compared to the predictions of POWHEG+PYTHIA (P8) for the CP5 and CUETP8M2T4 (T4) tunes, POWHEG+HERWIG (H7), and the multiparton simulation MG5_aMC@NLO (MG)+PYTHIA. The ratios of the various predictions to the measured cross sections are shown in the lower panels. |

png pdf |
Figure A8-d:
Normalized double-differential cross section at the particle level as a function of ${{p_{\mathrm {T}}} ({\mathrm{t} _\mathrm {h}})}$ vs. ${{| y({\mathrm{t} _\mathrm {h}}) |}}$. The data are shown as points with gray (yellow) bands indicating the statistical (statistical and systematic) uncertainties. The cross sections are compared to the predictions of POWHEG+PYTHIA (P8) for the CP5 and CUETP8M2T4 (T4) tunes, POWHEG+HERWIG (H7), and the multiparton simulation MG5_aMC@NLO (MG)+PYTHIA. The ratios of the various predictions to the measured cross sections are shown in the lower panels. |

png pdf |
Figure A8-e:
Normalized double-differential cross section at the particle level as a function of ${{p_{\mathrm {T}}} ({\mathrm{t} _\mathrm {h}})}$ vs. ${{| y({\mathrm{t} _\mathrm {h}}) |}}$. The data are shown as points with gray (yellow) bands indicating the statistical (statistical and systematic) uncertainties. The cross sections are compared to the predictions of POWHEG+PYTHIA (P8) for the CP5 and CUETP8M2T4 (T4) tunes, POWHEG+HERWIG (H7), and the multiparton simulation MG5_aMC@NLO (MG)+PYTHIA. The ratios of the various predictions to the measured cross sections are shown in the lower panels. |

png pdf |
Figure A8-f:
Normalized double-differential cross section at the particle level as a function of ${{p_{\mathrm {T}}} ({\mathrm{t} _\mathrm {h}})}$ vs. ${{| y({\mathrm{t} _\mathrm {h}}) |}}$. The data are shown as points with gray (yellow) bands indicating the statistical (statistical and systematic) uncertainties. The cross sections are compared to the predictions of POWHEG+PYTHIA (P8) for the CP5 and CUETP8M2T4 (T4) tunes, POWHEG+HERWIG (H7), and the multiparton simulation MG5_aMC@NLO (MG)+PYTHIA. The ratios of the various predictions to the measured cross sections are shown in the lower panels. |
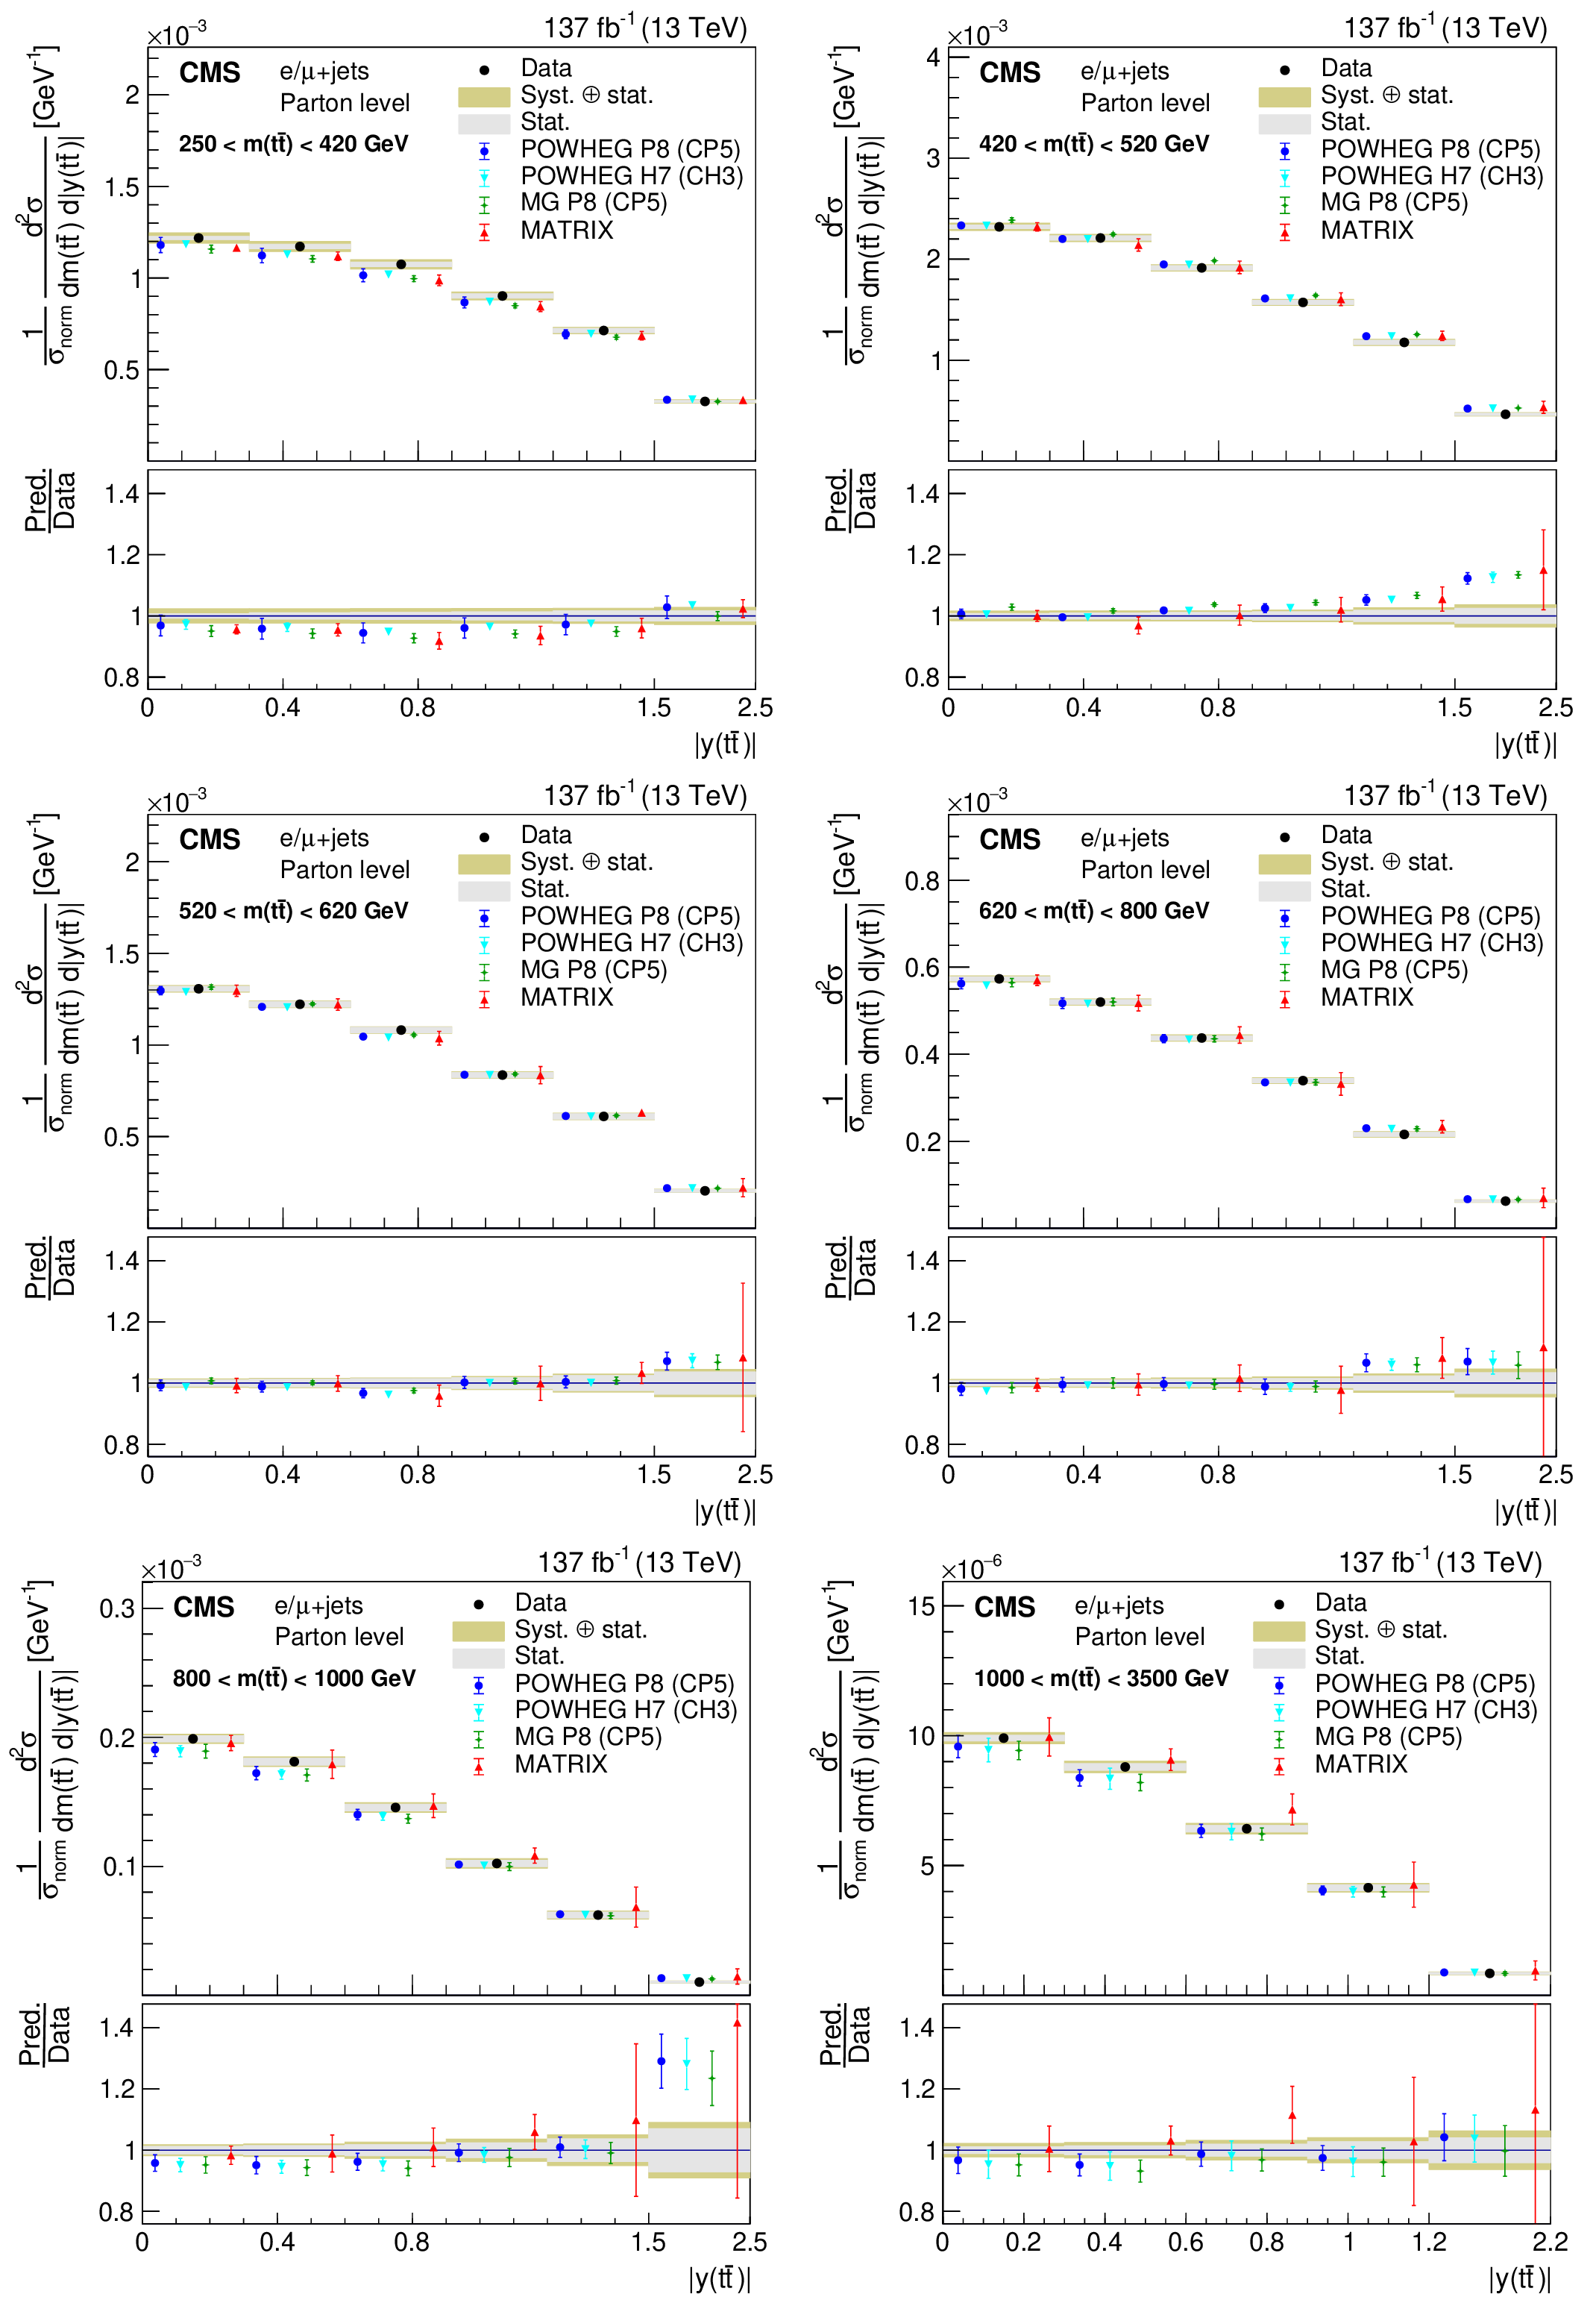
png pdf |
Figure A9:
Normalized double-differential cross section at the parton level as a function of ${m({\mathrm{t} {}\mathrm{\bar{t}}})}$ vs.$ {{| y({\mathrm{t} {}\mathrm{\bar{t}}}) |}}$. The data are shown as points with gray (yellow) bands indicating the statistical (statistical and systematic) uncertainties. The cross sections are compared to the predictions of POWHEG combined with PYTHIA (P8) or HERWIG (H7), the multiparton simulation MG5_aMC@NLO (MG)+PYTHIA FxFx, and the NNLO QCD calculations obtained with Matrix. The ratios of the various predictions to the measured cross sections are shown in the lower panels. |
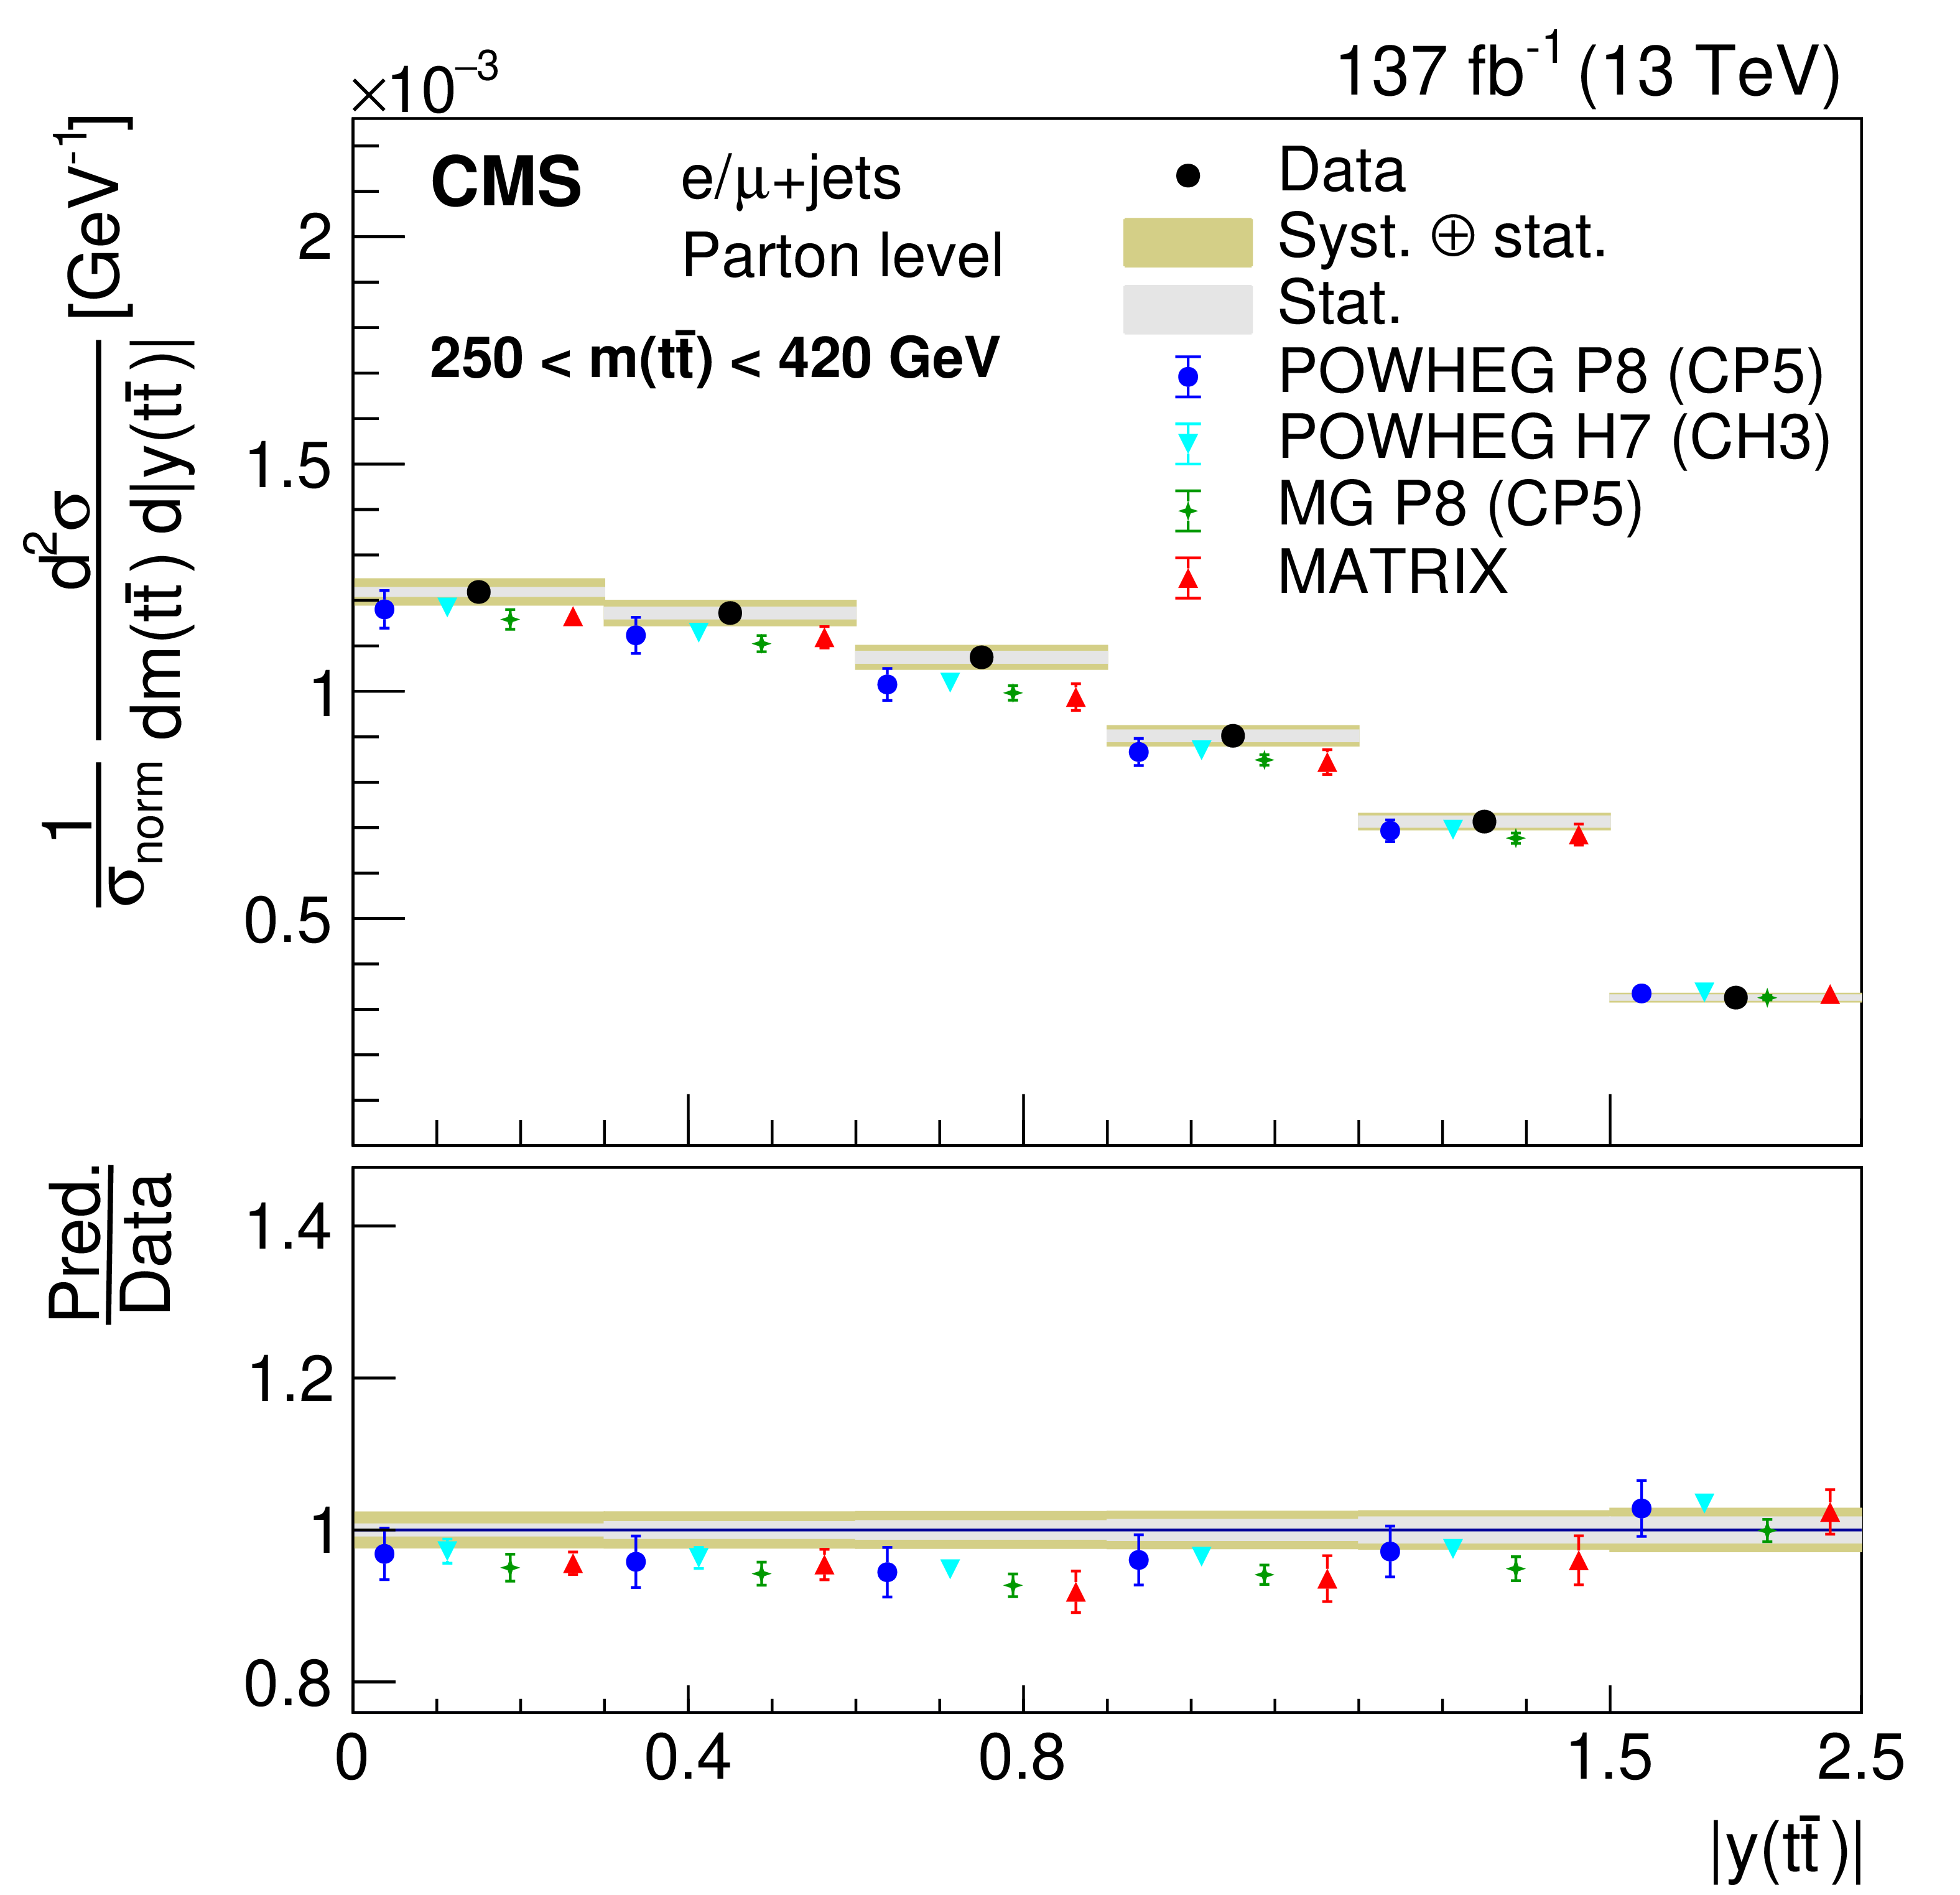
png pdf |
Figure A9-a:
Normalized double-differential cross section at the parton level as a function of ${m({\mathrm{t} {}\mathrm{\bar{t}}})}$ vs.$ {{| y({\mathrm{t} {}\mathrm{\bar{t}}}) |}}$. The data are shown as points with gray (yellow) bands indicating the statistical (statistical and systematic) uncertainties. The cross sections are compared to the predictions of POWHEG combined with PYTHIA (P8) or HERWIG (H7), the multiparton simulation MG5_aMC@NLO (MG)+PYTHIA FxFx, and the NNLO QCD calculations obtained with Matrix. The ratios of the various predictions to the measured cross sections are shown in the lower panels. |
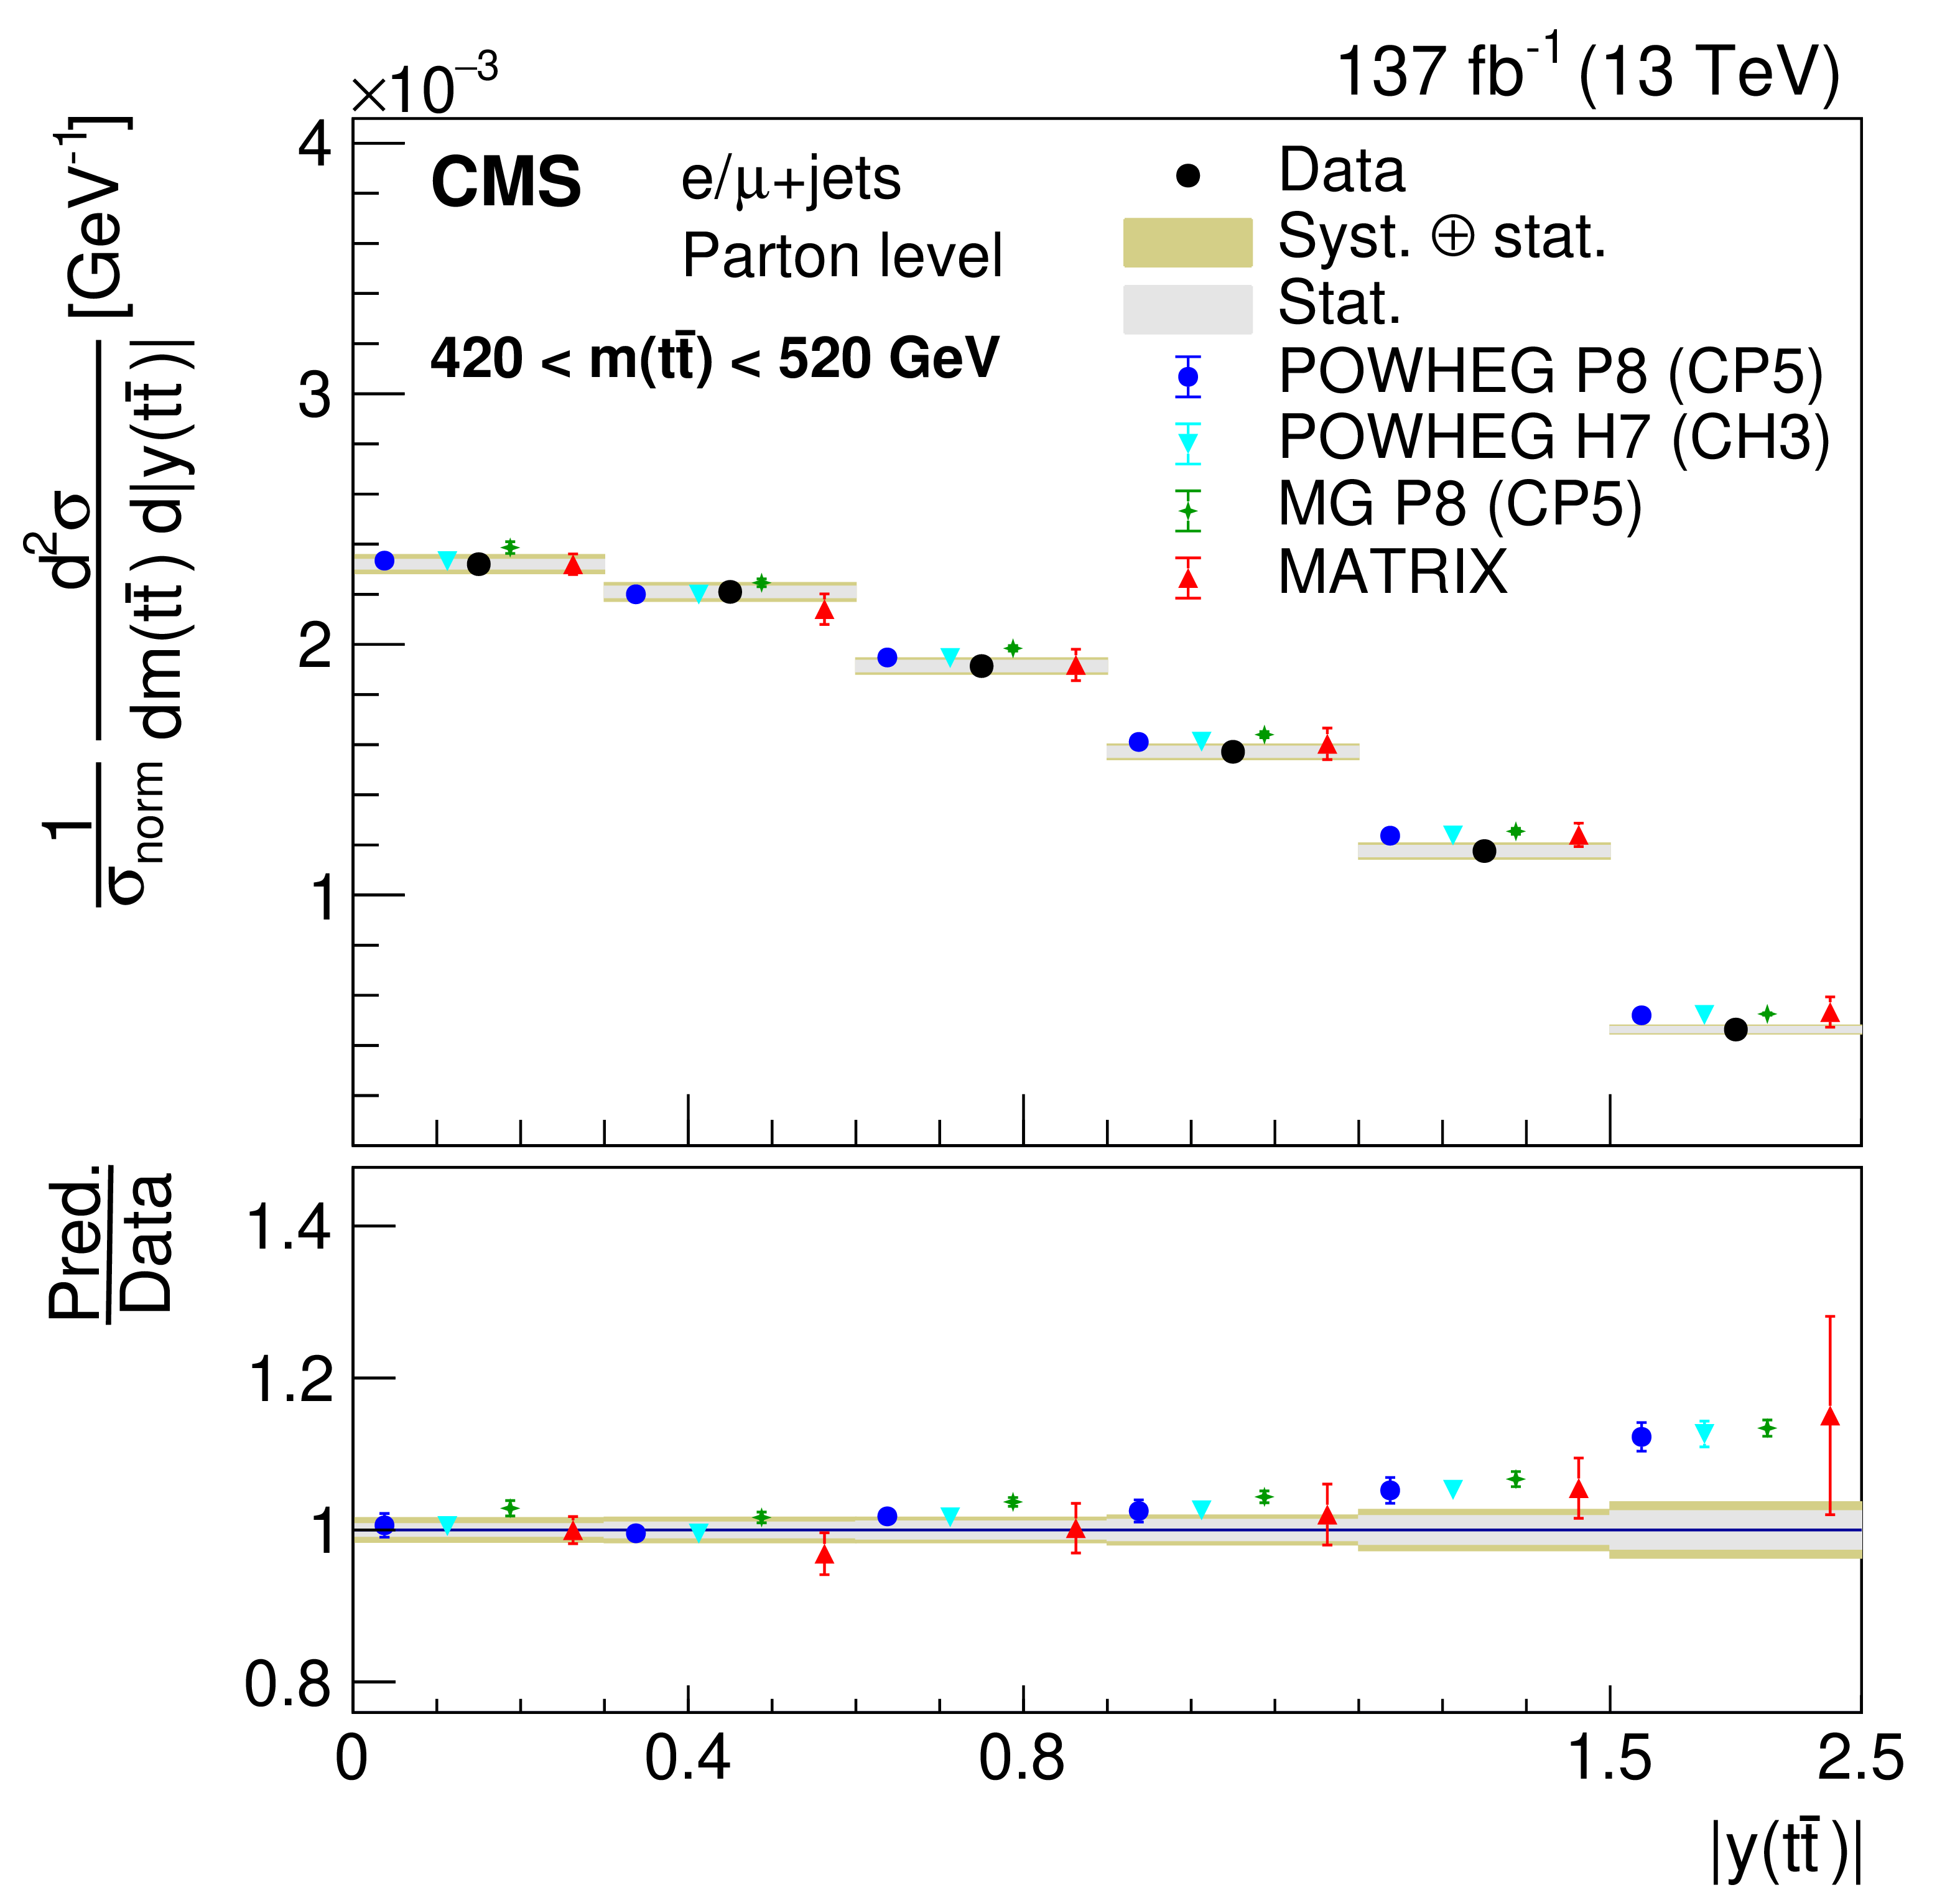
png pdf |
Figure A9-b:
Normalized double-differential cross section at the parton level as a function of ${m({\mathrm{t} {}\mathrm{\bar{t}}})}$ vs.$ {{| y({\mathrm{t} {}\mathrm{\bar{t}}}) |}}$. The data are shown as points with gray (yellow) bands indicating the statistical (statistical and systematic) uncertainties. The cross sections are compared to the predictions of POWHEG combined with PYTHIA (P8) or HERWIG (H7), the multiparton simulation MG5_aMC@NLO (MG)+PYTHIA FxFx, and the NNLO QCD calculations obtained with Matrix. The ratios of the various predictions to the measured cross sections are shown in the lower panels. |

png pdf |
Figure A9-c:
Normalized double-differential cross section at the parton level as a function of ${m({\mathrm{t} {}\mathrm{\bar{t}}})}$ vs.$ {{| y({\mathrm{t} {}\mathrm{\bar{t}}}) |}}$. The data are shown as points with gray (yellow) bands indicating the statistical (statistical and systematic) uncertainties. The cross sections are compared to the predictions of POWHEG combined with PYTHIA (P8) or HERWIG (H7), the multiparton simulation MG5_aMC@NLO (MG)+PYTHIA FxFx, and the NNLO QCD calculations obtained with Matrix. The ratios of the various predictions to the measured cross sections are shown in the lower panels. |

png pdf |
Figure A9-d:
Normalized double-differential cross section at the parton level as a function of ${m({\mathrm{t} {}\mathrm{\bar{t}}})}$ vs.$ {{| y({\mathrm{t} {}\mathrm{\bar{t}}}) |}}$. The data are shown as points with gray (yellow) bands indicating the statistical (statistical and systematic) uncertainties. The cross sections are compared to the predictions of POWHEG combined with PYTHIA (P8) or HERWIG (H7), the multiparton simulation MG5_aMC@NLO (MG)+PYTHIA FxFx, and the NNLO QCD calculations obtained with Matrix. The ratios of the various predictions to the measured cross sections are shown in the lower panels. |

png pdf |
Figure A9-e:
Normalized double-differential cross section at the parton level as a function of ${m({\mathrm{t} {}\mathrm{\bar{t}}})}$ vs.$ {{| y({\mathrm{t} {}\mathrm{\bar{t}}}) |}}$. The data are shown as points with gray (yellow) bands indicating the statistical (statistical and systematic) uncertainties. The cross sections are compared to the predictions of POWHEG combined with PYTHIA (P8) or HERWIG (H7), the multiparton simulation MG5_aMC@NLO (MG)+PYTHIA FxFx, and the NNLO QCD calculations obtained with Matrix. The ratios of the various predictions to the measured cross sections are shown in the lower panels. |
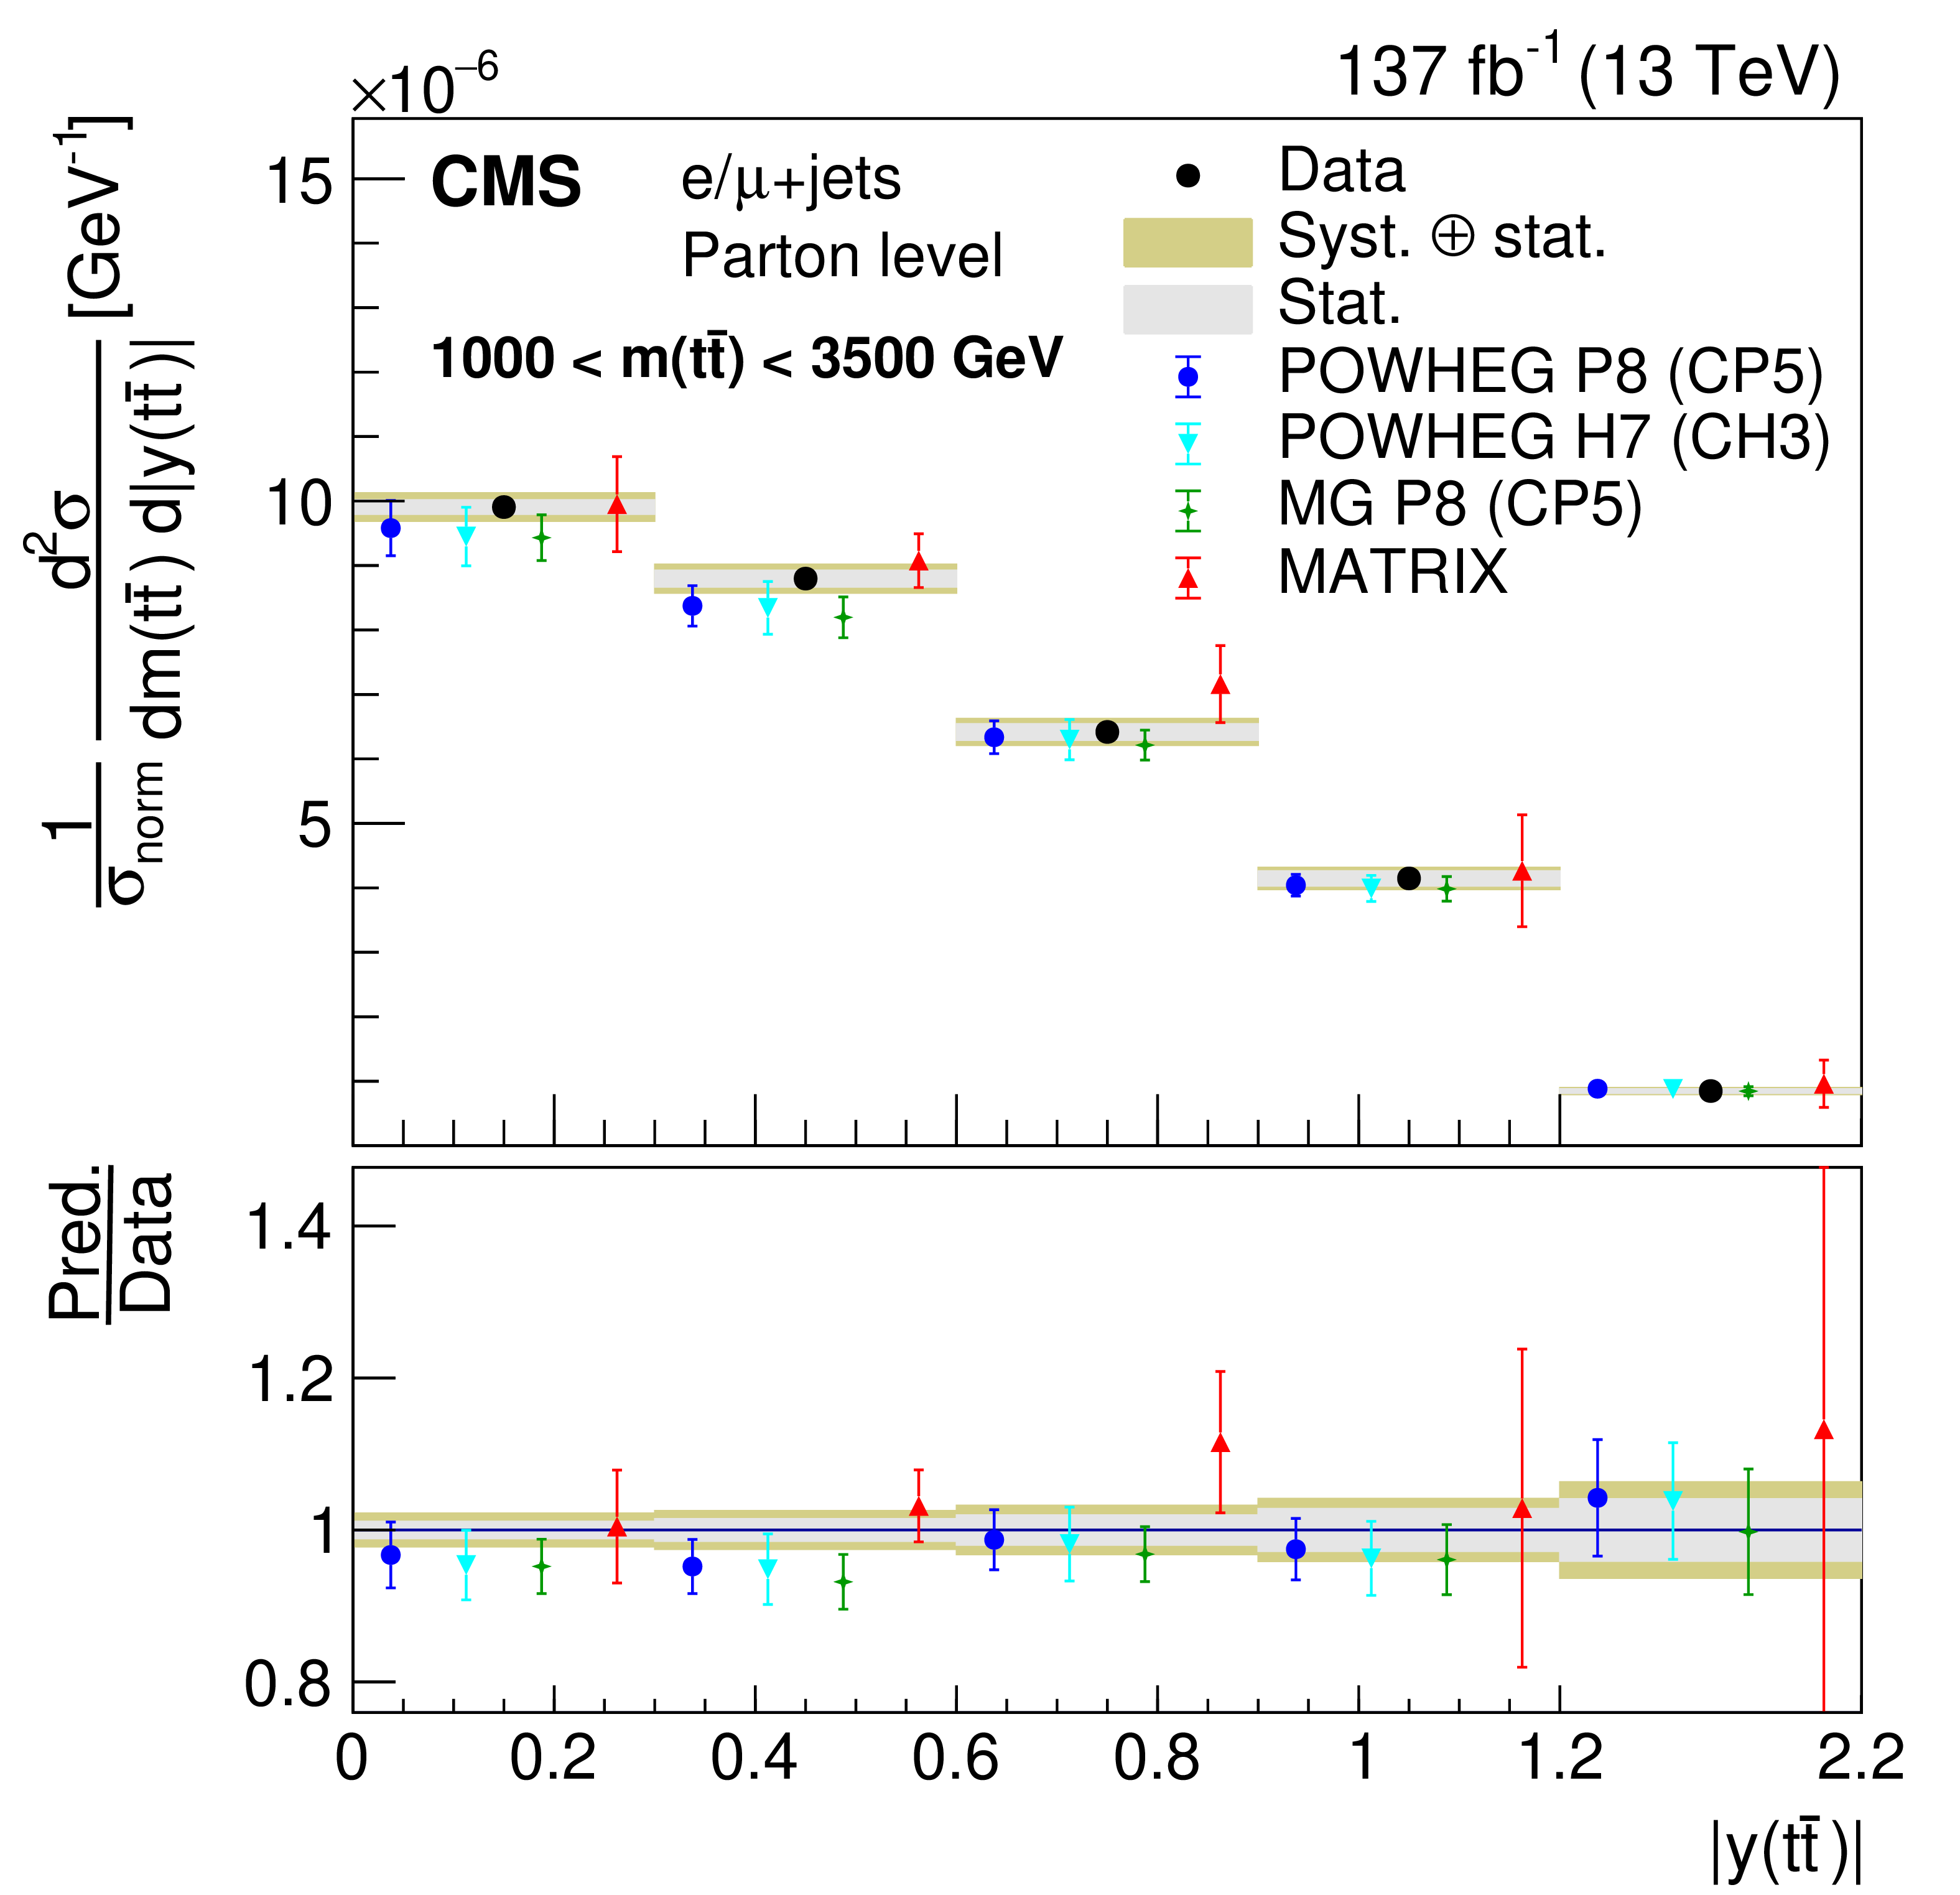
png pdf |
Figure A9-f:
Normalized double-differential cross section at the parton level as a function of ${m({\mathrm{t} {}\mathrm{\bar{t}}})}$ vs.$ {{| y({\mathrm{t} {}\mathrm{\bar{t}}}) |}}$. The data are shown as points with gray (yellow) bands indicating the statistical (statistical and systematic) uncertainties. The cross sections are compared to the predictions of POWHEG combined with PYTHIA (P8) or HERWIG (H7), the multiparton simulation MG5_aMC@NLO (MG)+PYTHIA FxFx, and the NNLO QCD calculations obtained with Matrix. The ratios of the various predictions to the measured cross sections are shown in the lower panels. |
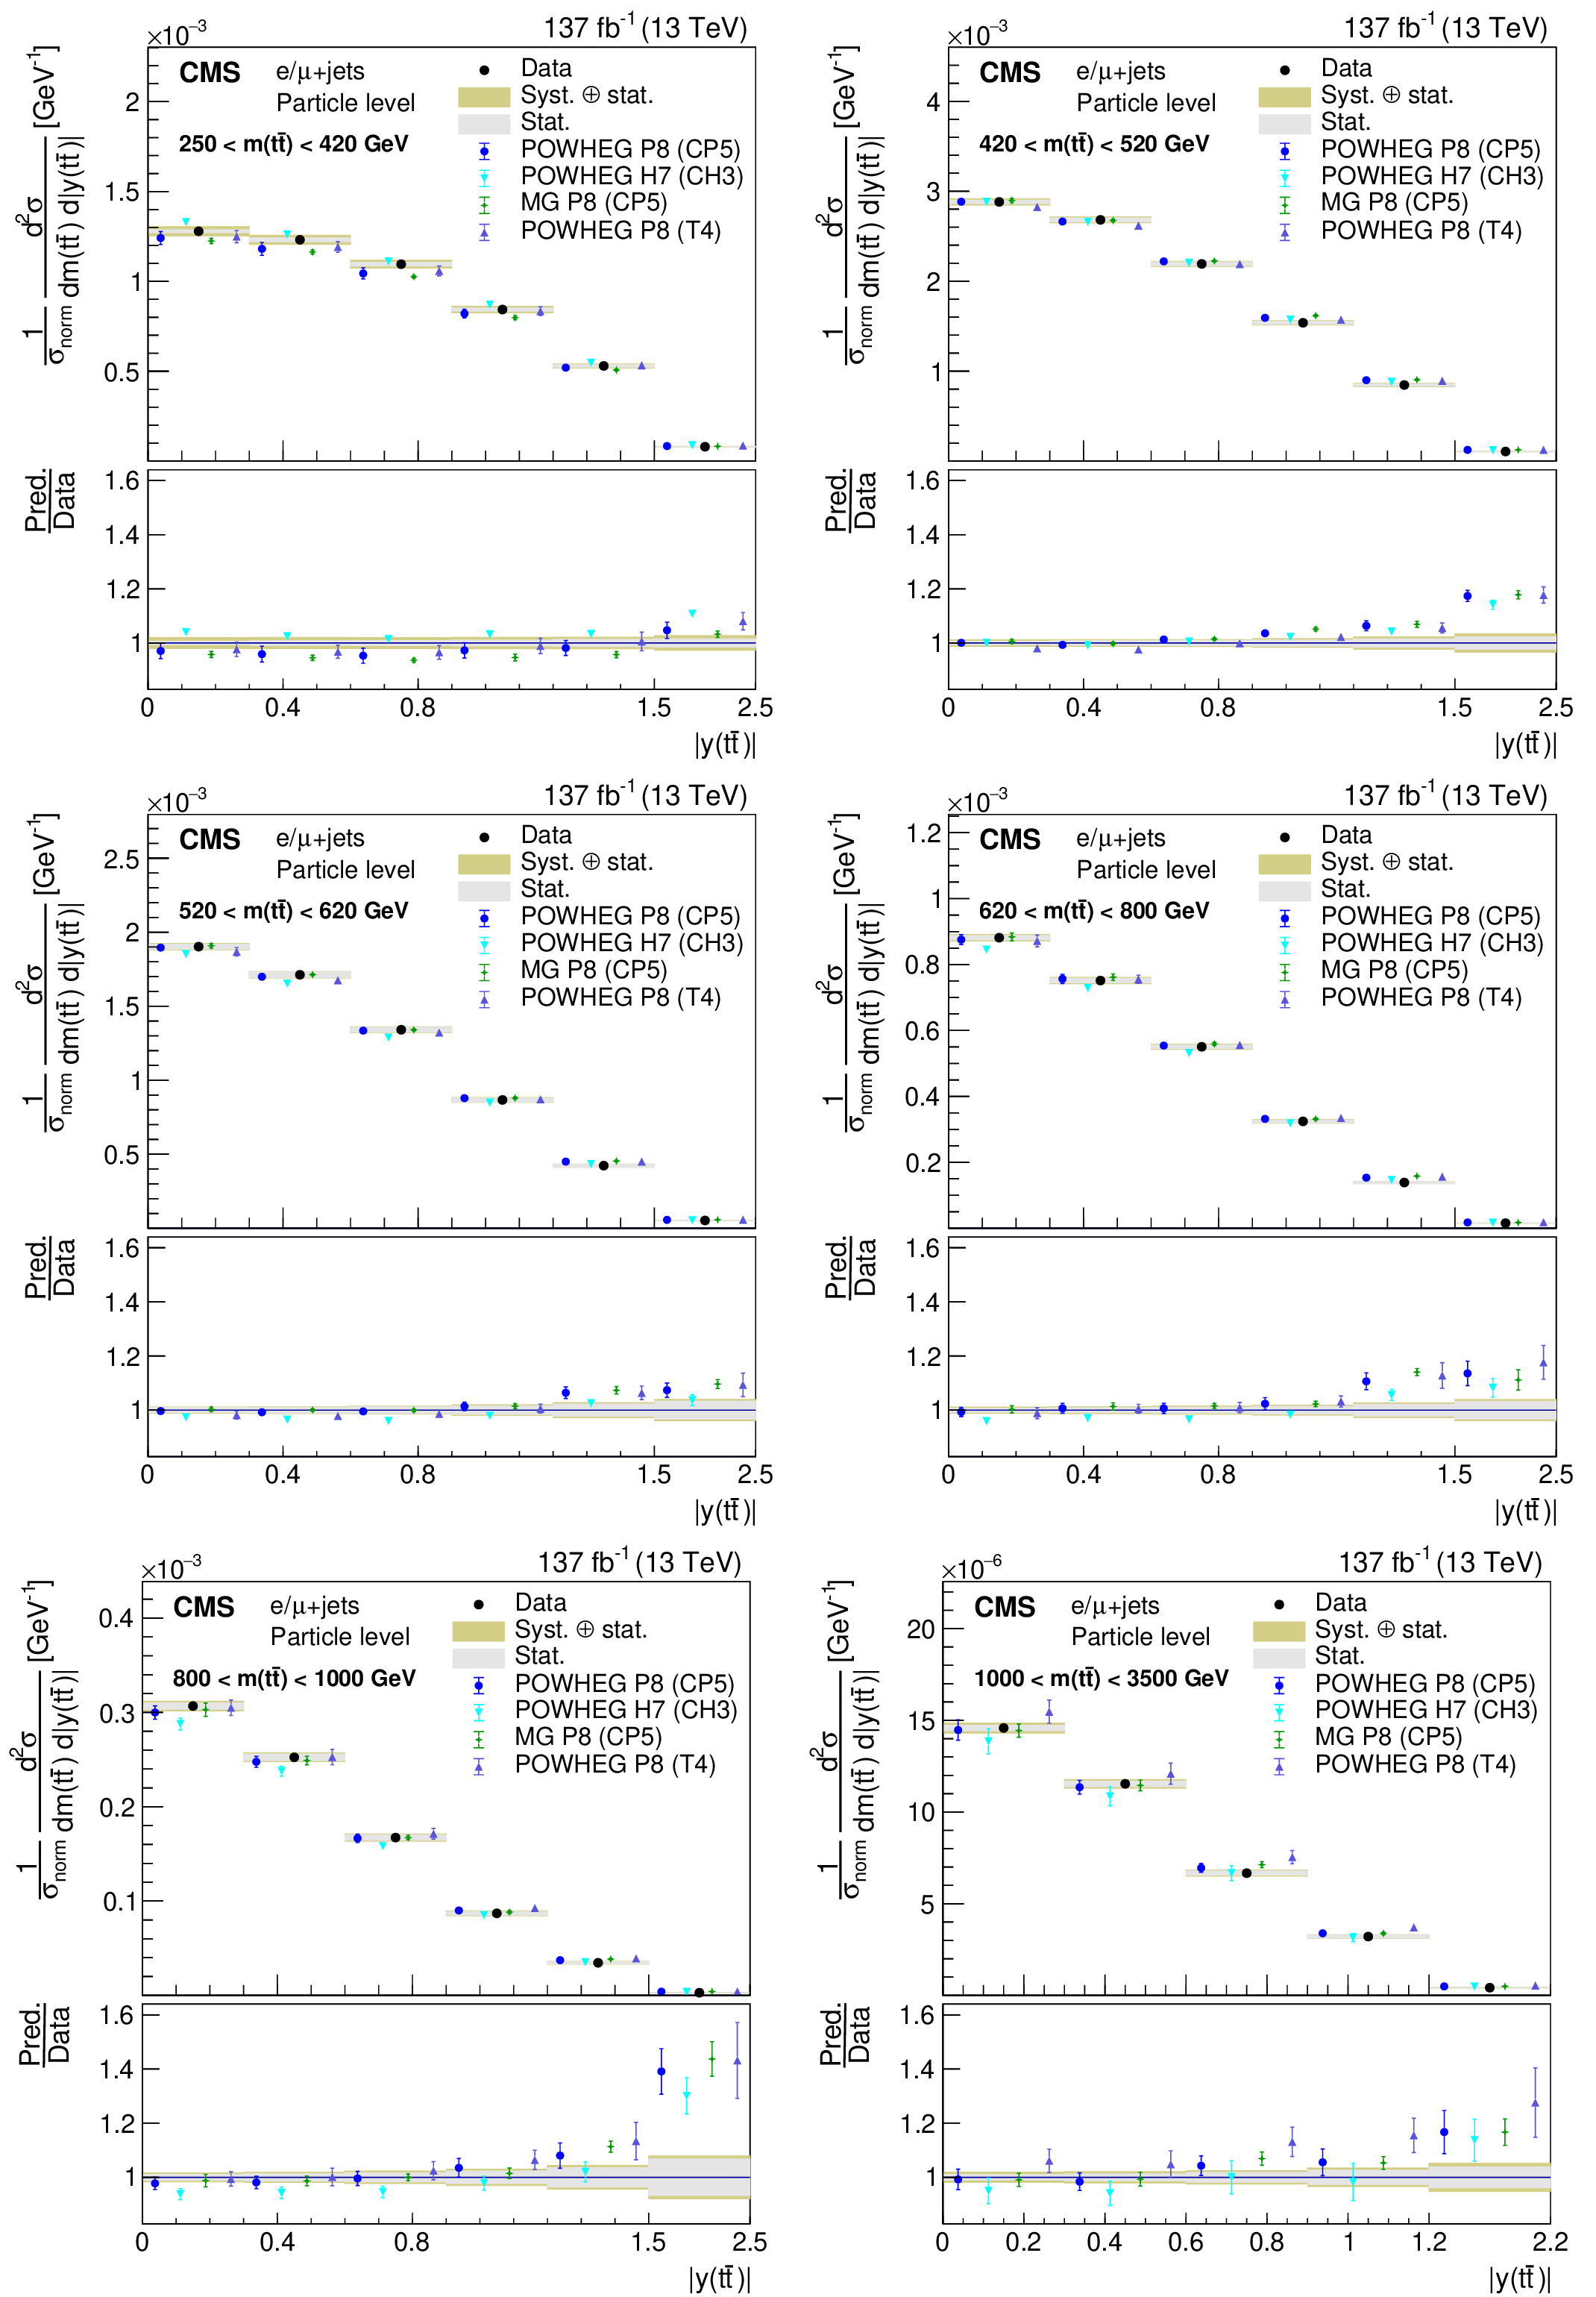
png pdf |
Figure A10:
Normalized double-differential cross section at the particle level as a function of ${m({\mathrm{t} {}\mathrm{\bar{t}}})}$ vs.$ {{| y({\mathrm{t} {}\mathrm{\bar{t}}}) |}}$. The data are shown as points with gray (yellow) bands indicating the statistical (statistical and systematic) uncertainties. The cross sections are compared to the predictions of POWHEG+PYTHIA (P8) for the CP5 and CUETP8M2T4 (T4) tunes, POWHEG+HERWIG (H7), and the multiparton simulation MG5_aMC@NLO (MG)+PYTHIA. The ratios of the various predictions to the measured cross sections are shown in the lower panels. |
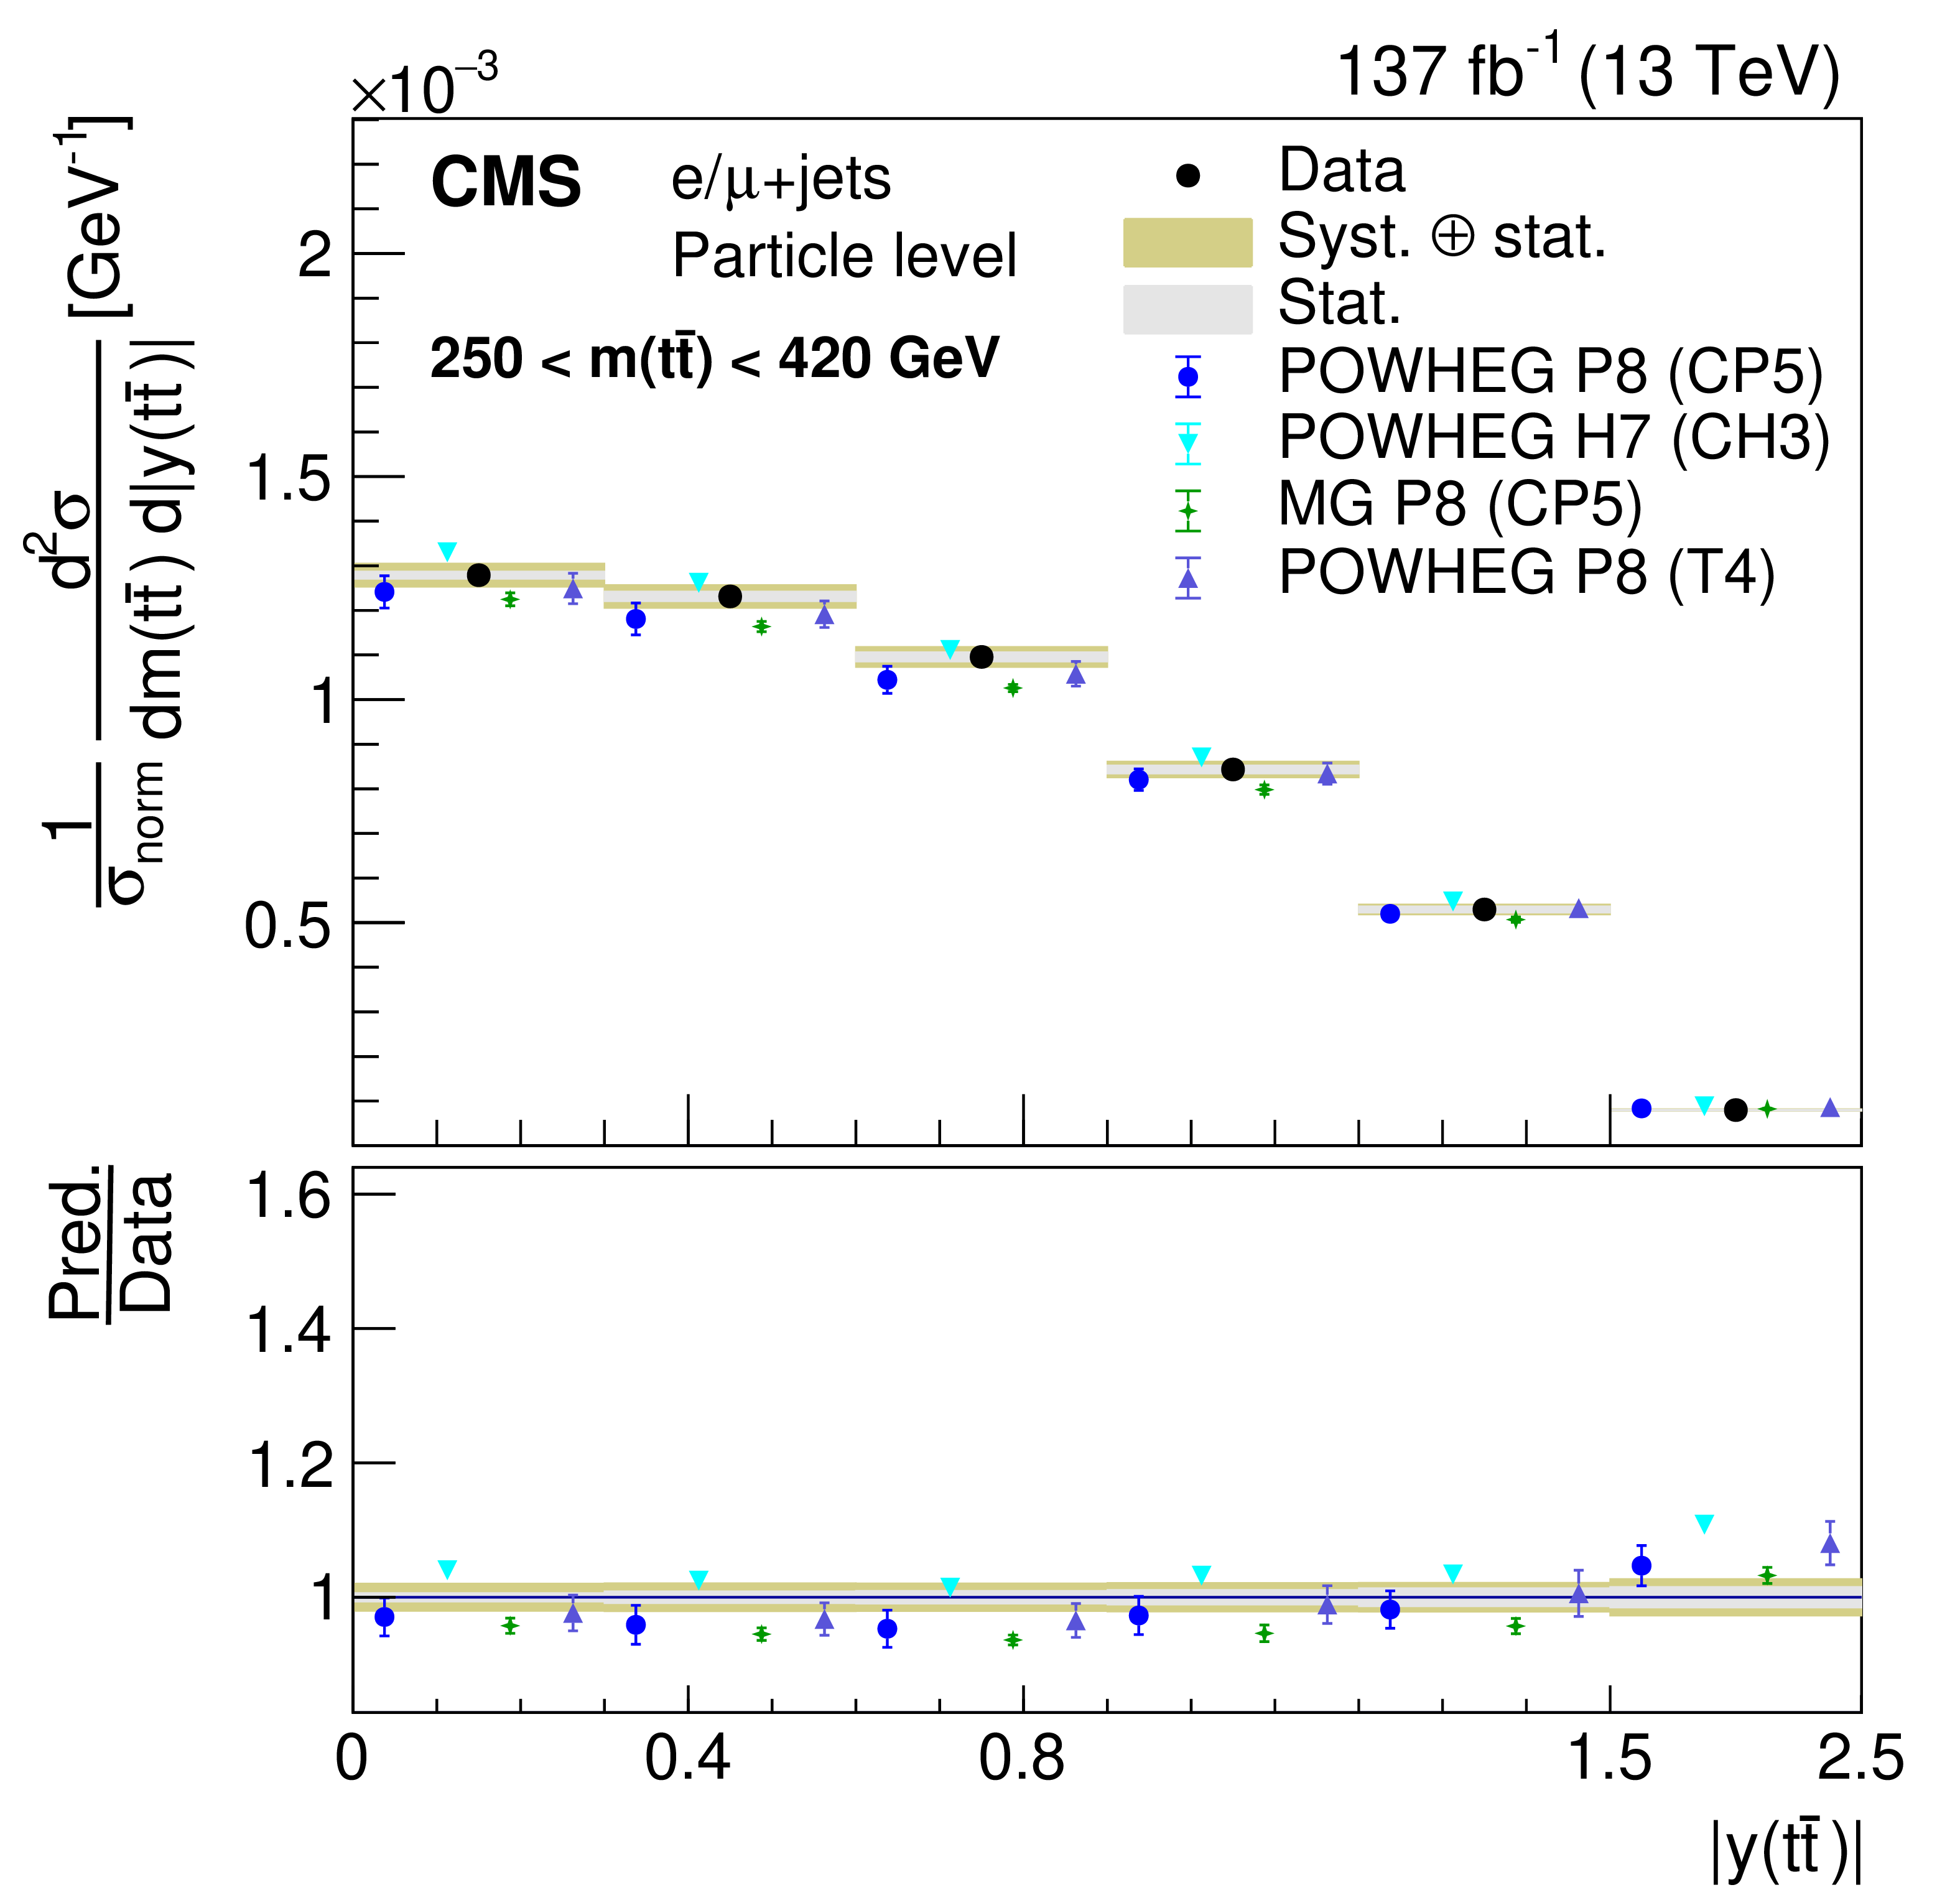
png pdf |
Figure A10-a:
Normalized double-differential cross section at the particle level as a function of ${m({\mathrm{t} {}\mathrm{\bar{t}}})}$ vs.$ {{| y({\mathrm{t} {}\mathrm{\bar{t}}}) |}}$. The data are shown as points with gray (yellow) bands indicating the statistical (statistical and systematic) uncertainties. The cross sections are compared to the predictions of POWHEG+PYTHIA (P8) for the CP5 and CUETP8M2T4 (T4) tunes, POWHEG+HERWIG (H7), and the multiparton simulation MG5_aMC@NLO (MG)+PYTHIA. The ratios of the various predictions to the measured cross sections are shown in the lower panels. |

png pdf |
Figure A10-b:
Normalized double-differential cross section at the particle level as a function of ${m({\mathrm{t} {}\mathrm{\bar{t}}})}$ vs.$ {{| y({\mathrm{t} {}\mathrm{\bar{t}}}) |}}$. The data are shown as points with gray (yellow) bands indicating the statistical (statistical and systematic) uncertainties. The cross sections are compared to the predictions of POWHEG+PYTHIA (P8) for the CP5 and CUETP8M2T4 (T4) tunes, POWHEG+HERWIG (H7), and the multiparton simulation MG5_aMC@NLO (MG)+PYTHIA. The ratios of the various predictions to the measured cross sections are shown in the lower panels. |
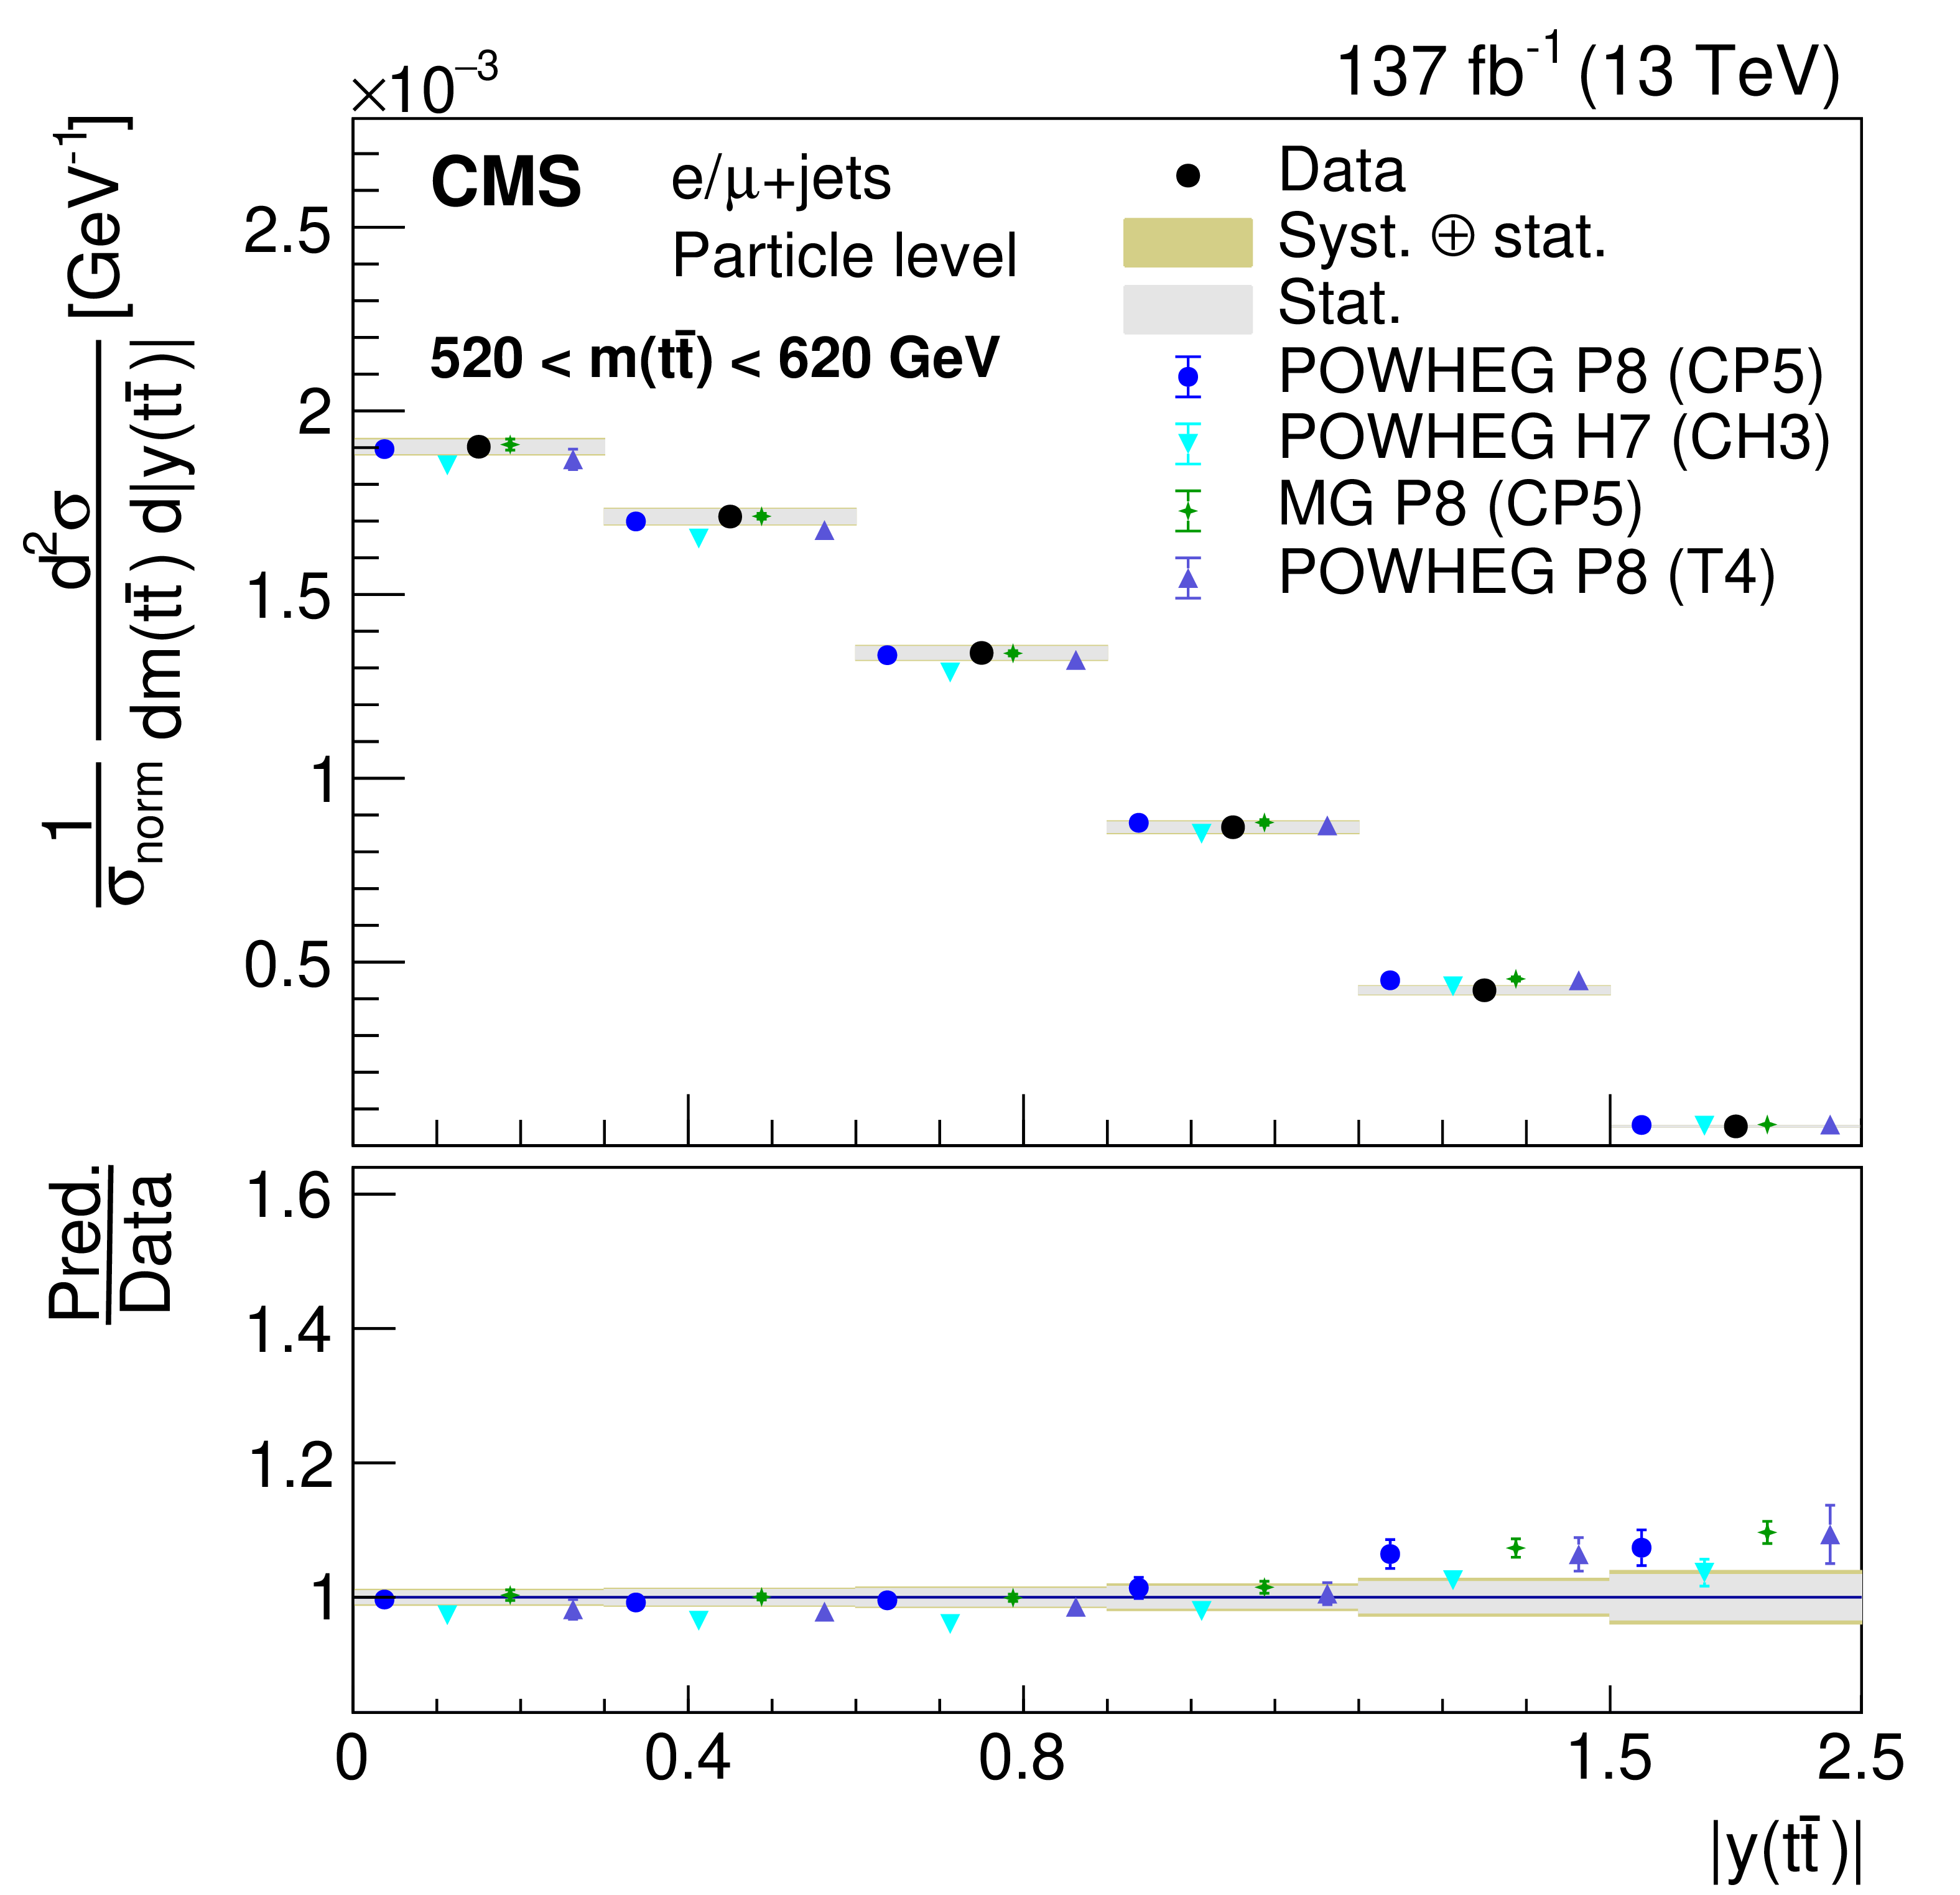
png pdf |
Figure A10-c:
Normalized double-differential cross section at the particle level as a function of ${m({\mathrm{t} {}\mathrm{\bar{t}}})}$ vs.$ {{| y({\mathrm{t} {}\mathrm{\bar{t}}}) |}}$. The data are shown as points with gray (yellow) bands indicating the statistical (statistical and systematic) uncertainties. The cross sections are compared to the predictions of POWHEG+PYTHIA (P8) for the CP5 and CUETP8M2T4 (T4) tunes, POWHEG+HERWIG (H7), and the multiparton simulation MG5_aMC@NLO (MG)+PYTHIA. The ratios of the various predictions to the measured cross sections are shown in the lower panels. |
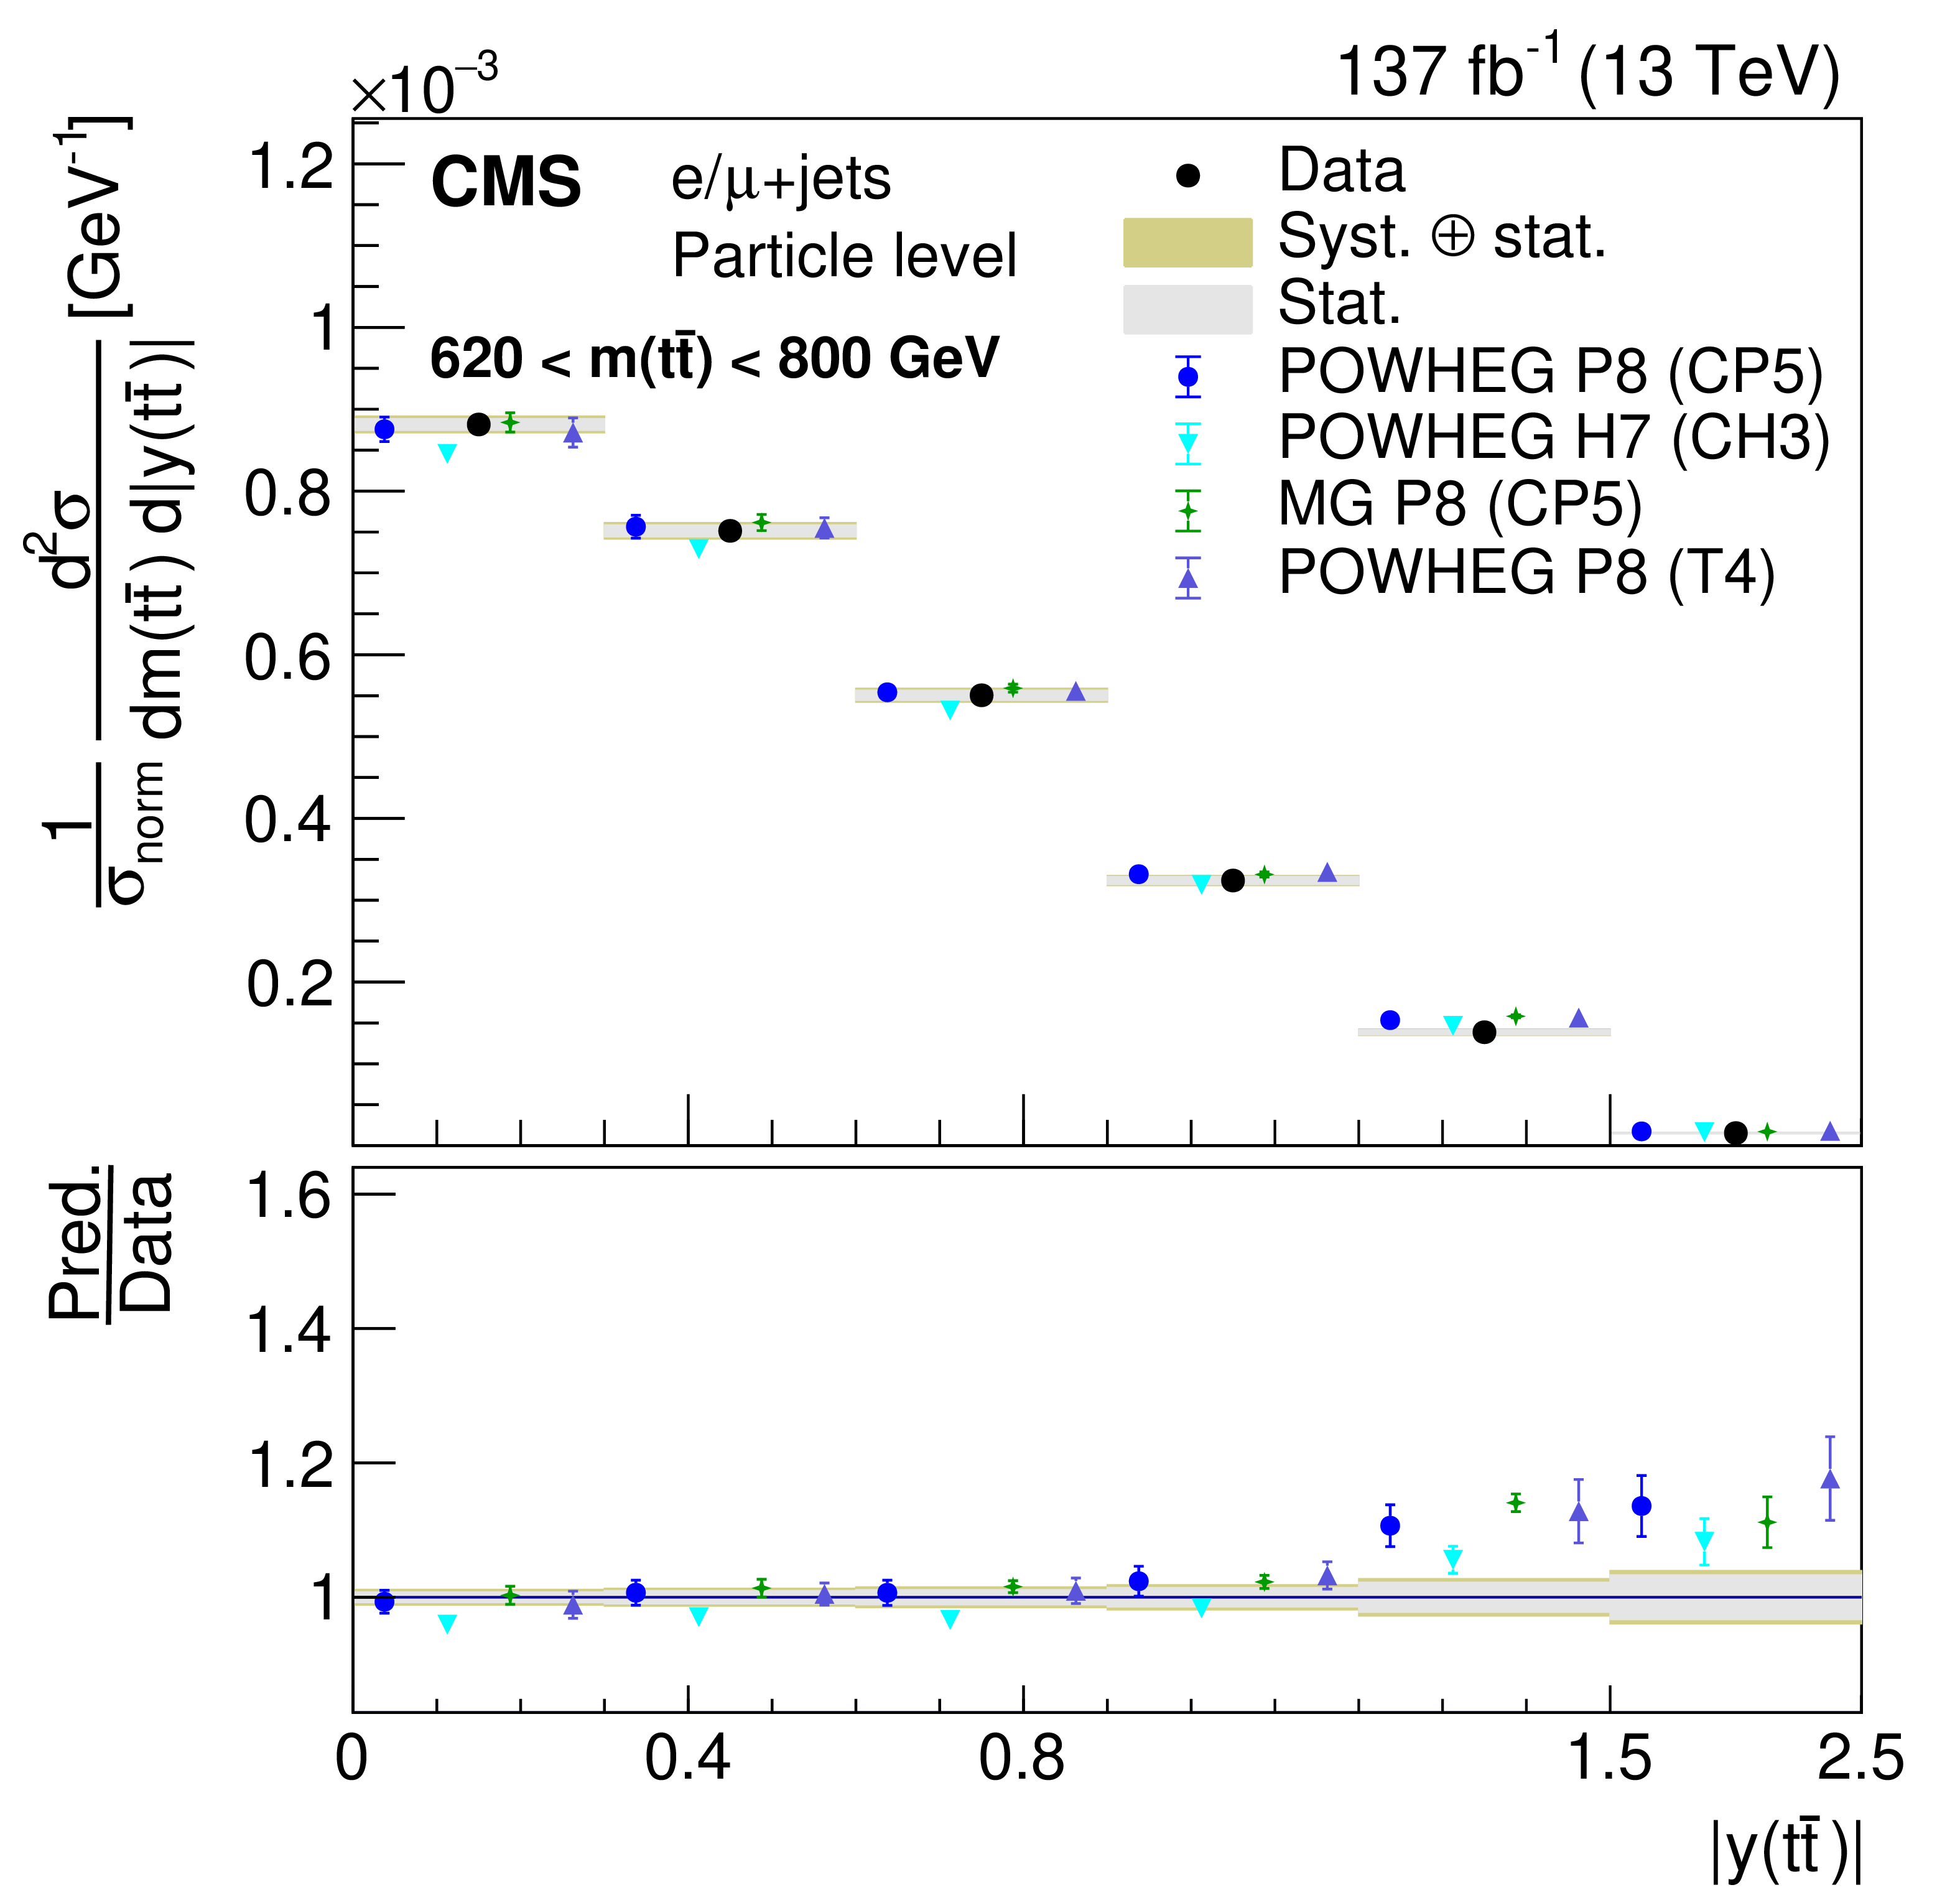
png pdf |
Figure A10-d:
Normalized double-differential cross section at the particle level as a function of ${m({\mathrm{t} {}\mathrm{\bar{t}}})}$ vs.$ {{| y({\mathrm{t} {}\mathrm{\bar{t}}}) |}}$. The data are shown as points with gray (yellow) bands indicating the statistical (statistical and systematic) uncertainties. The cross sections are compared to the predictions of POWHEG+PYTHIA (P8) for the CP5 and CUETP8M2T4 (T4) tunes, POWHEG+HERWIG (H7), and the multiparton simulation MG5_aMC@NLO (MG)+PYTHIA. The ratios of the various predictions to the measured cross sections are shown in the lower panels. |
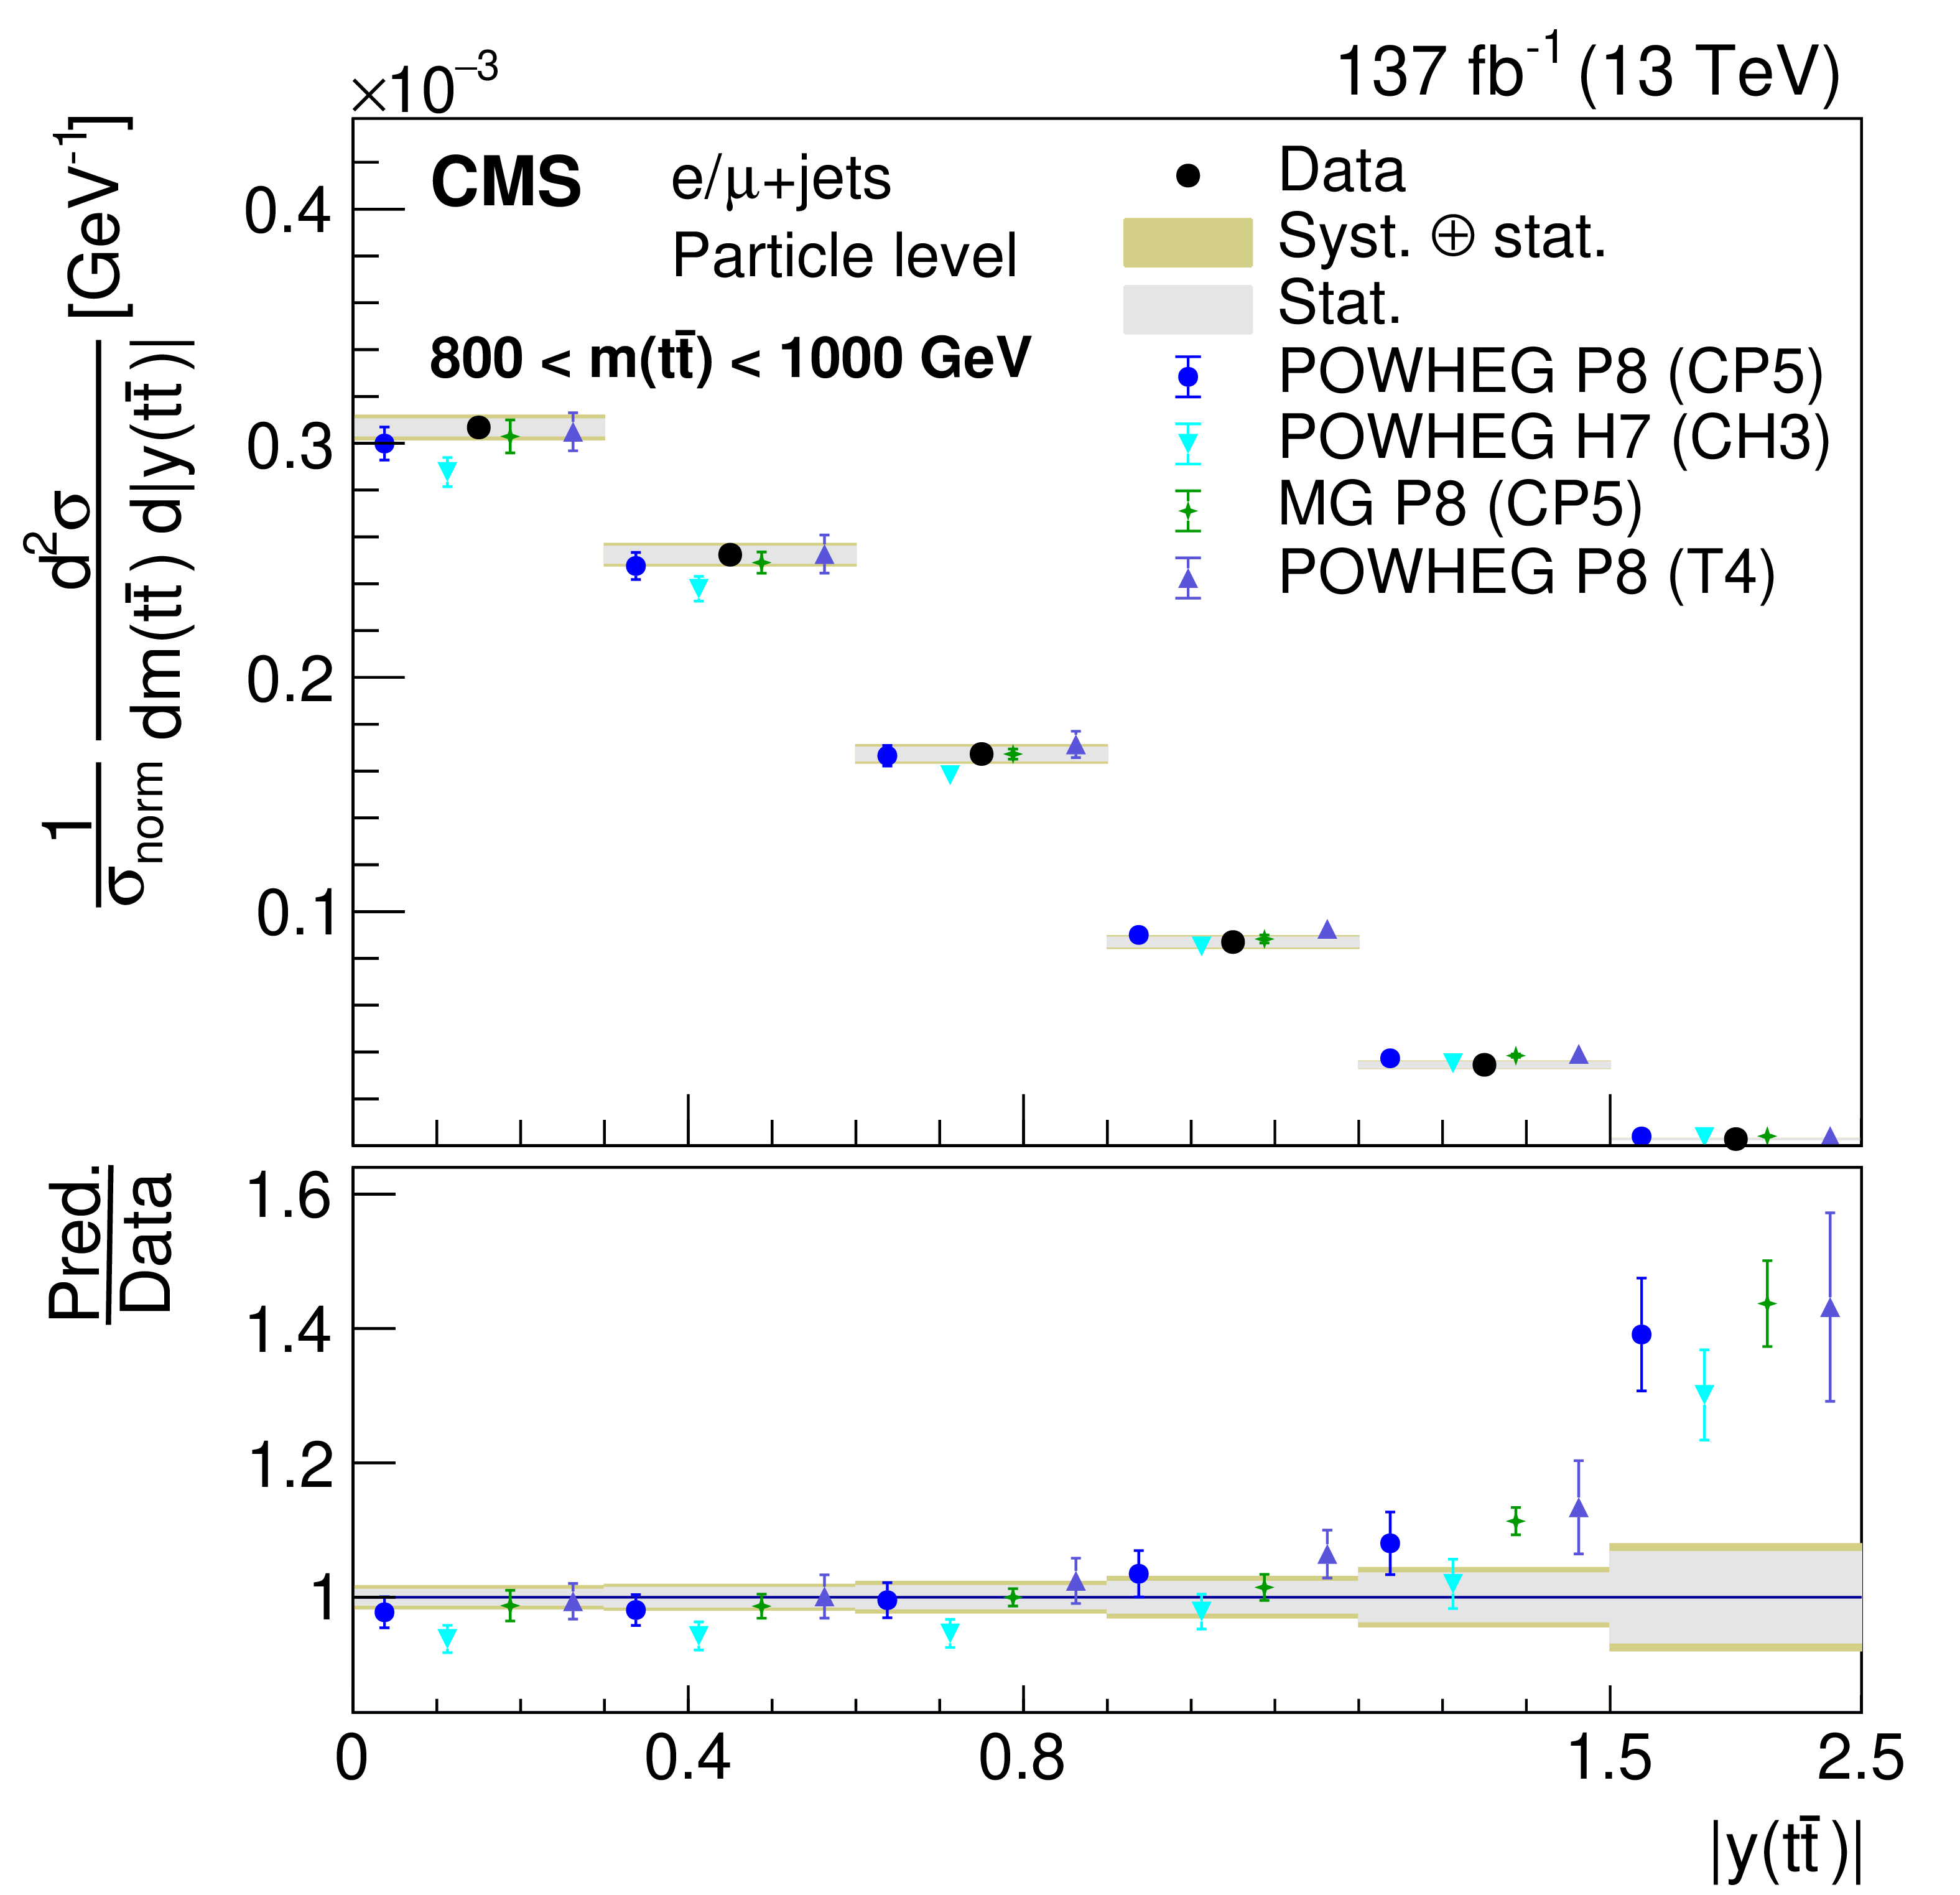
png pdf |
Figure A10-e:
Normalized double-differential cross section at the particle level as a function of ${m({\mathrm{t} {}\mathrm{\bar{t}}})}$ vs.$ {{| y({\mathrm{t} {}\mathrm{\bar{t}}}) |}}$. The data are shown as points with gray (yellow) bands indicating the statistical (statistical and systematic) uncertainties. The cross sections are compared to the predictions of POWHEG+PYTHIA (P8) for the CP5 and CUETP8M2T4 (T4) tunes, POWHEG+HERWIG (H7), and the multiparton simulation MG5_aMC@NLO (MG)+PYTHIA. The ratios of the various predictions to the measured cross sections are shown in the lower panels. |
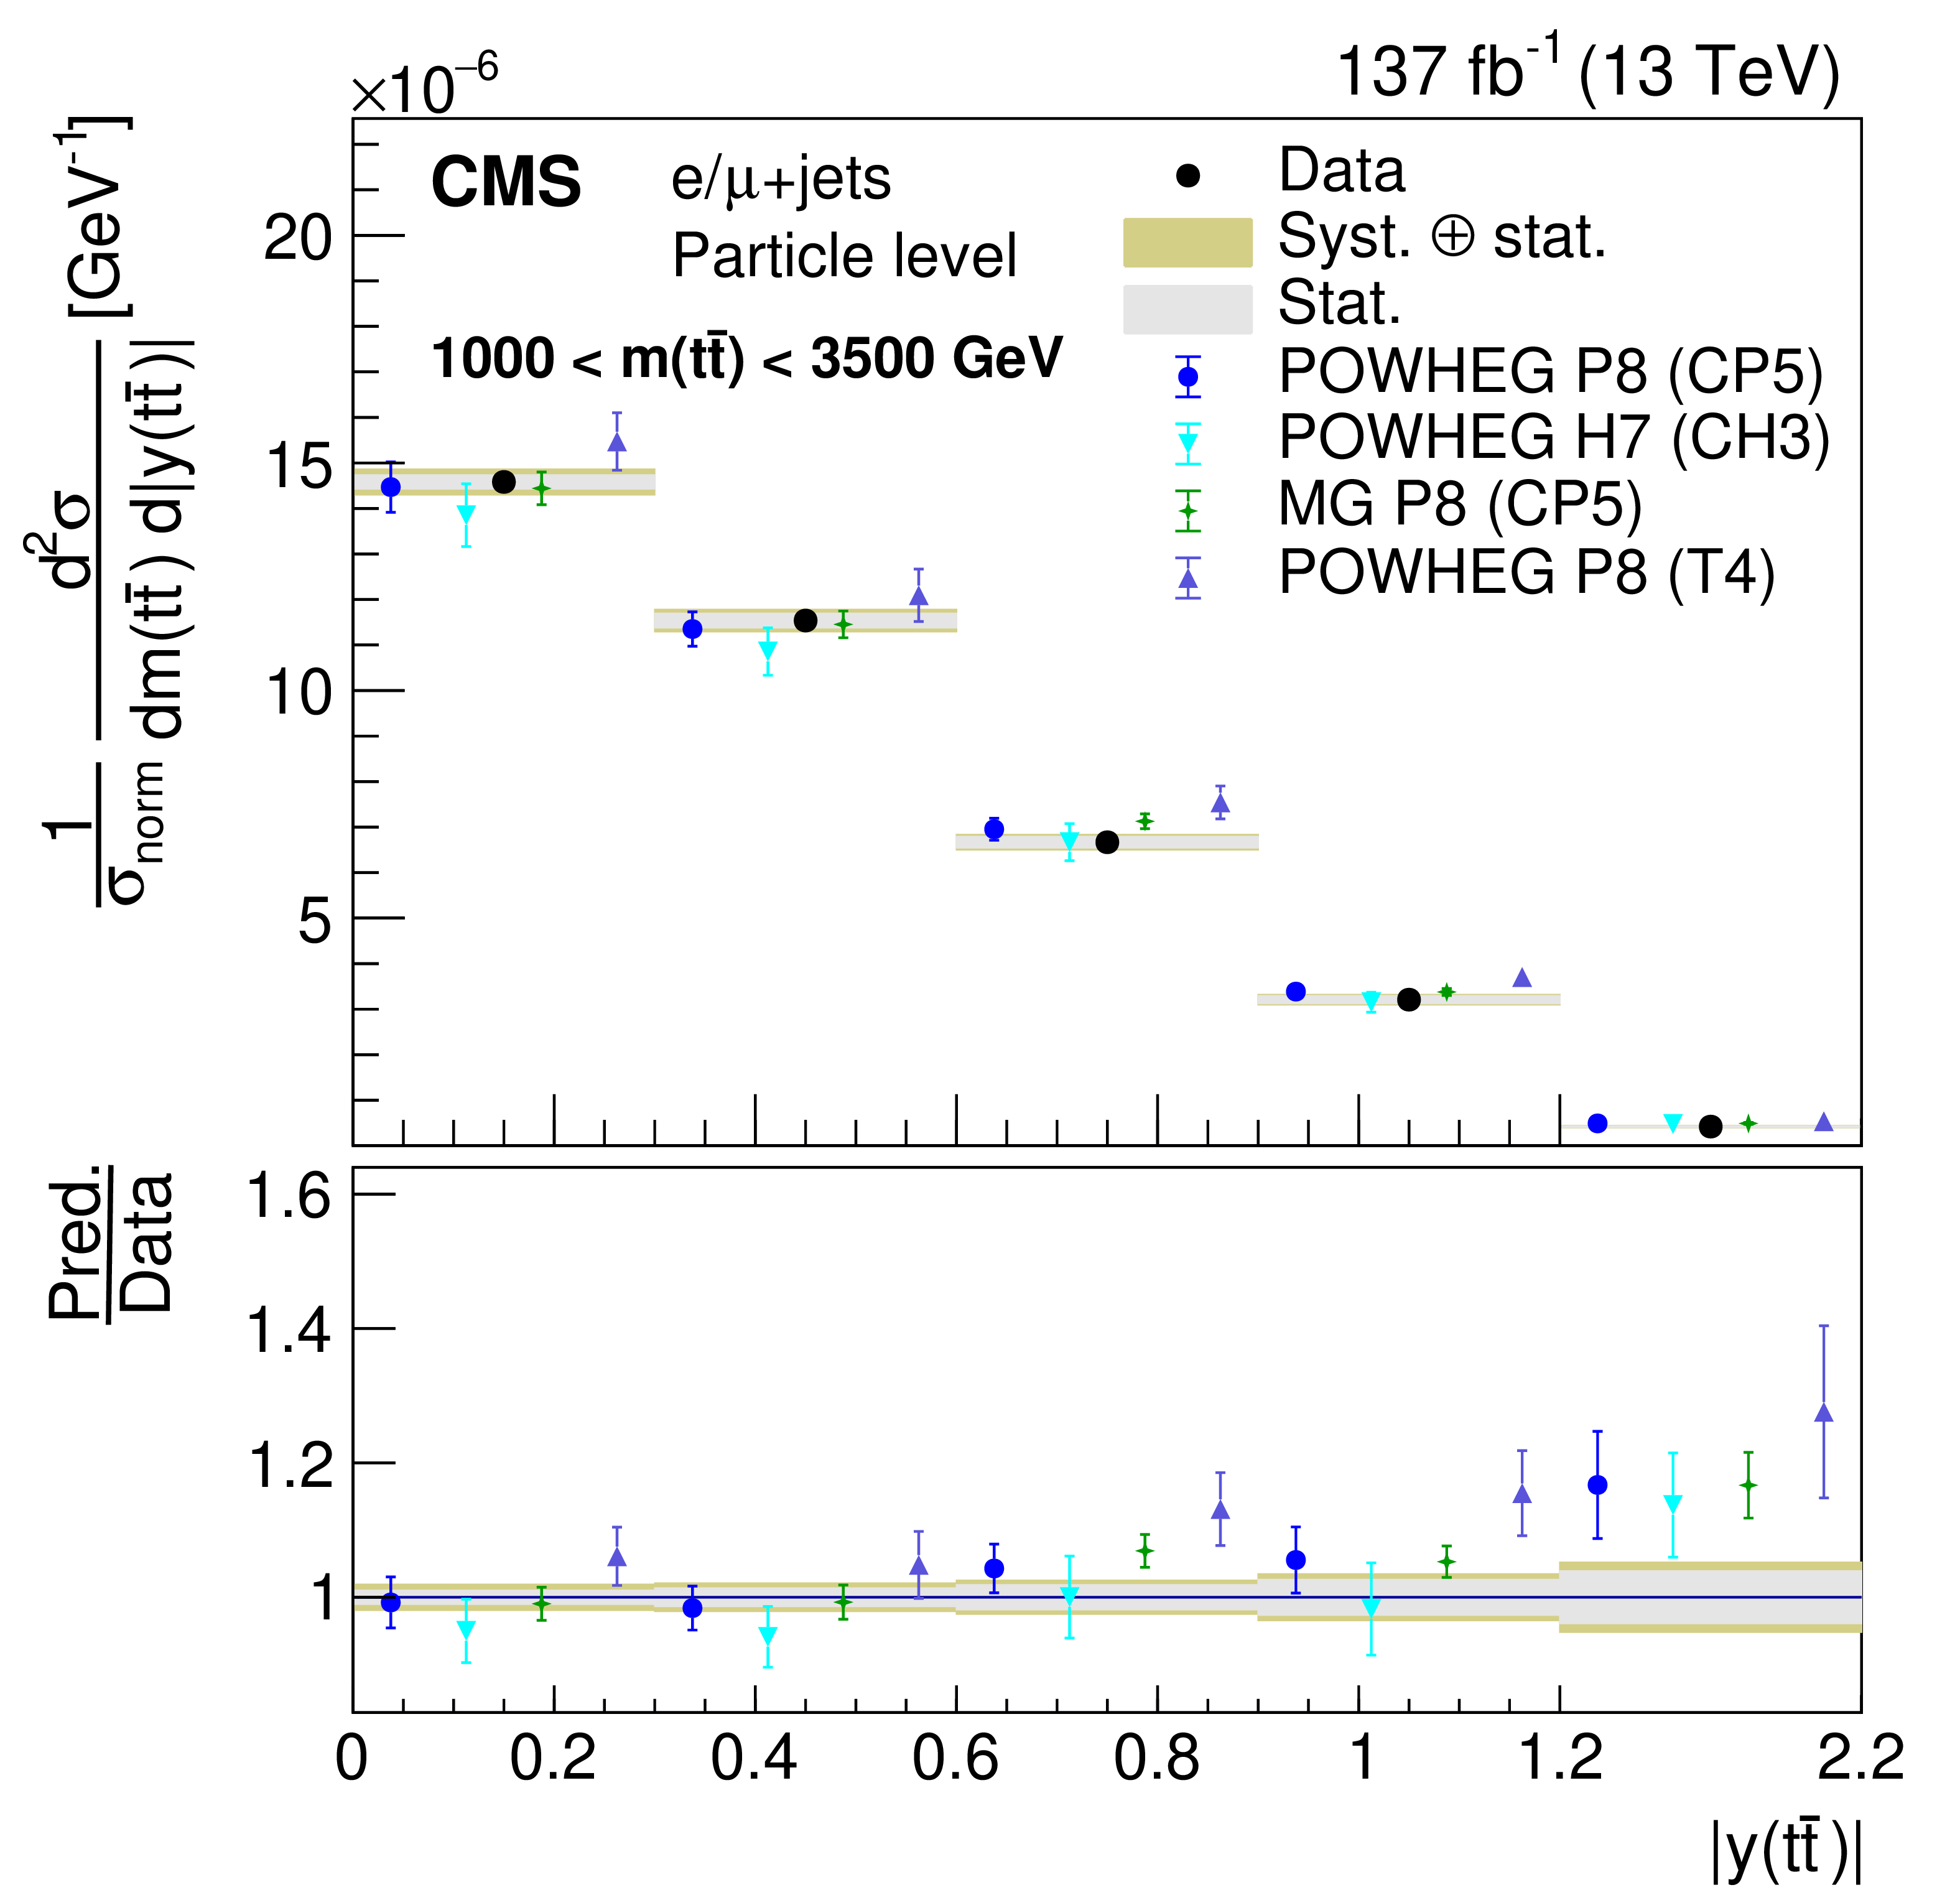
png pdf |
Figure A10-f:
Normalized double-differential cross section at the particle level as a function of ${m({\mathrm{t} {}\mathrm{\bar{t}}})}$ vs.$ {{| y({\mathrm{t} {}\mathrm{\bar{t}}}) |}}$. The data are shown as points with gray (yellow) bands indicating the statistical (statistical and systematic) uncertainties. The cross sections are compared to the predictions of POWHEG+PYTHIA (P8) for the CP5 and CUETP8M2T4 (T4) tunes, POWHEG+HERWIG (H7), and the multiparton simulation MG5_aMC@NLO (MG)+PYTHIA. The ratios of the various predictions to the measured cross sections are shown in the lower panels. |
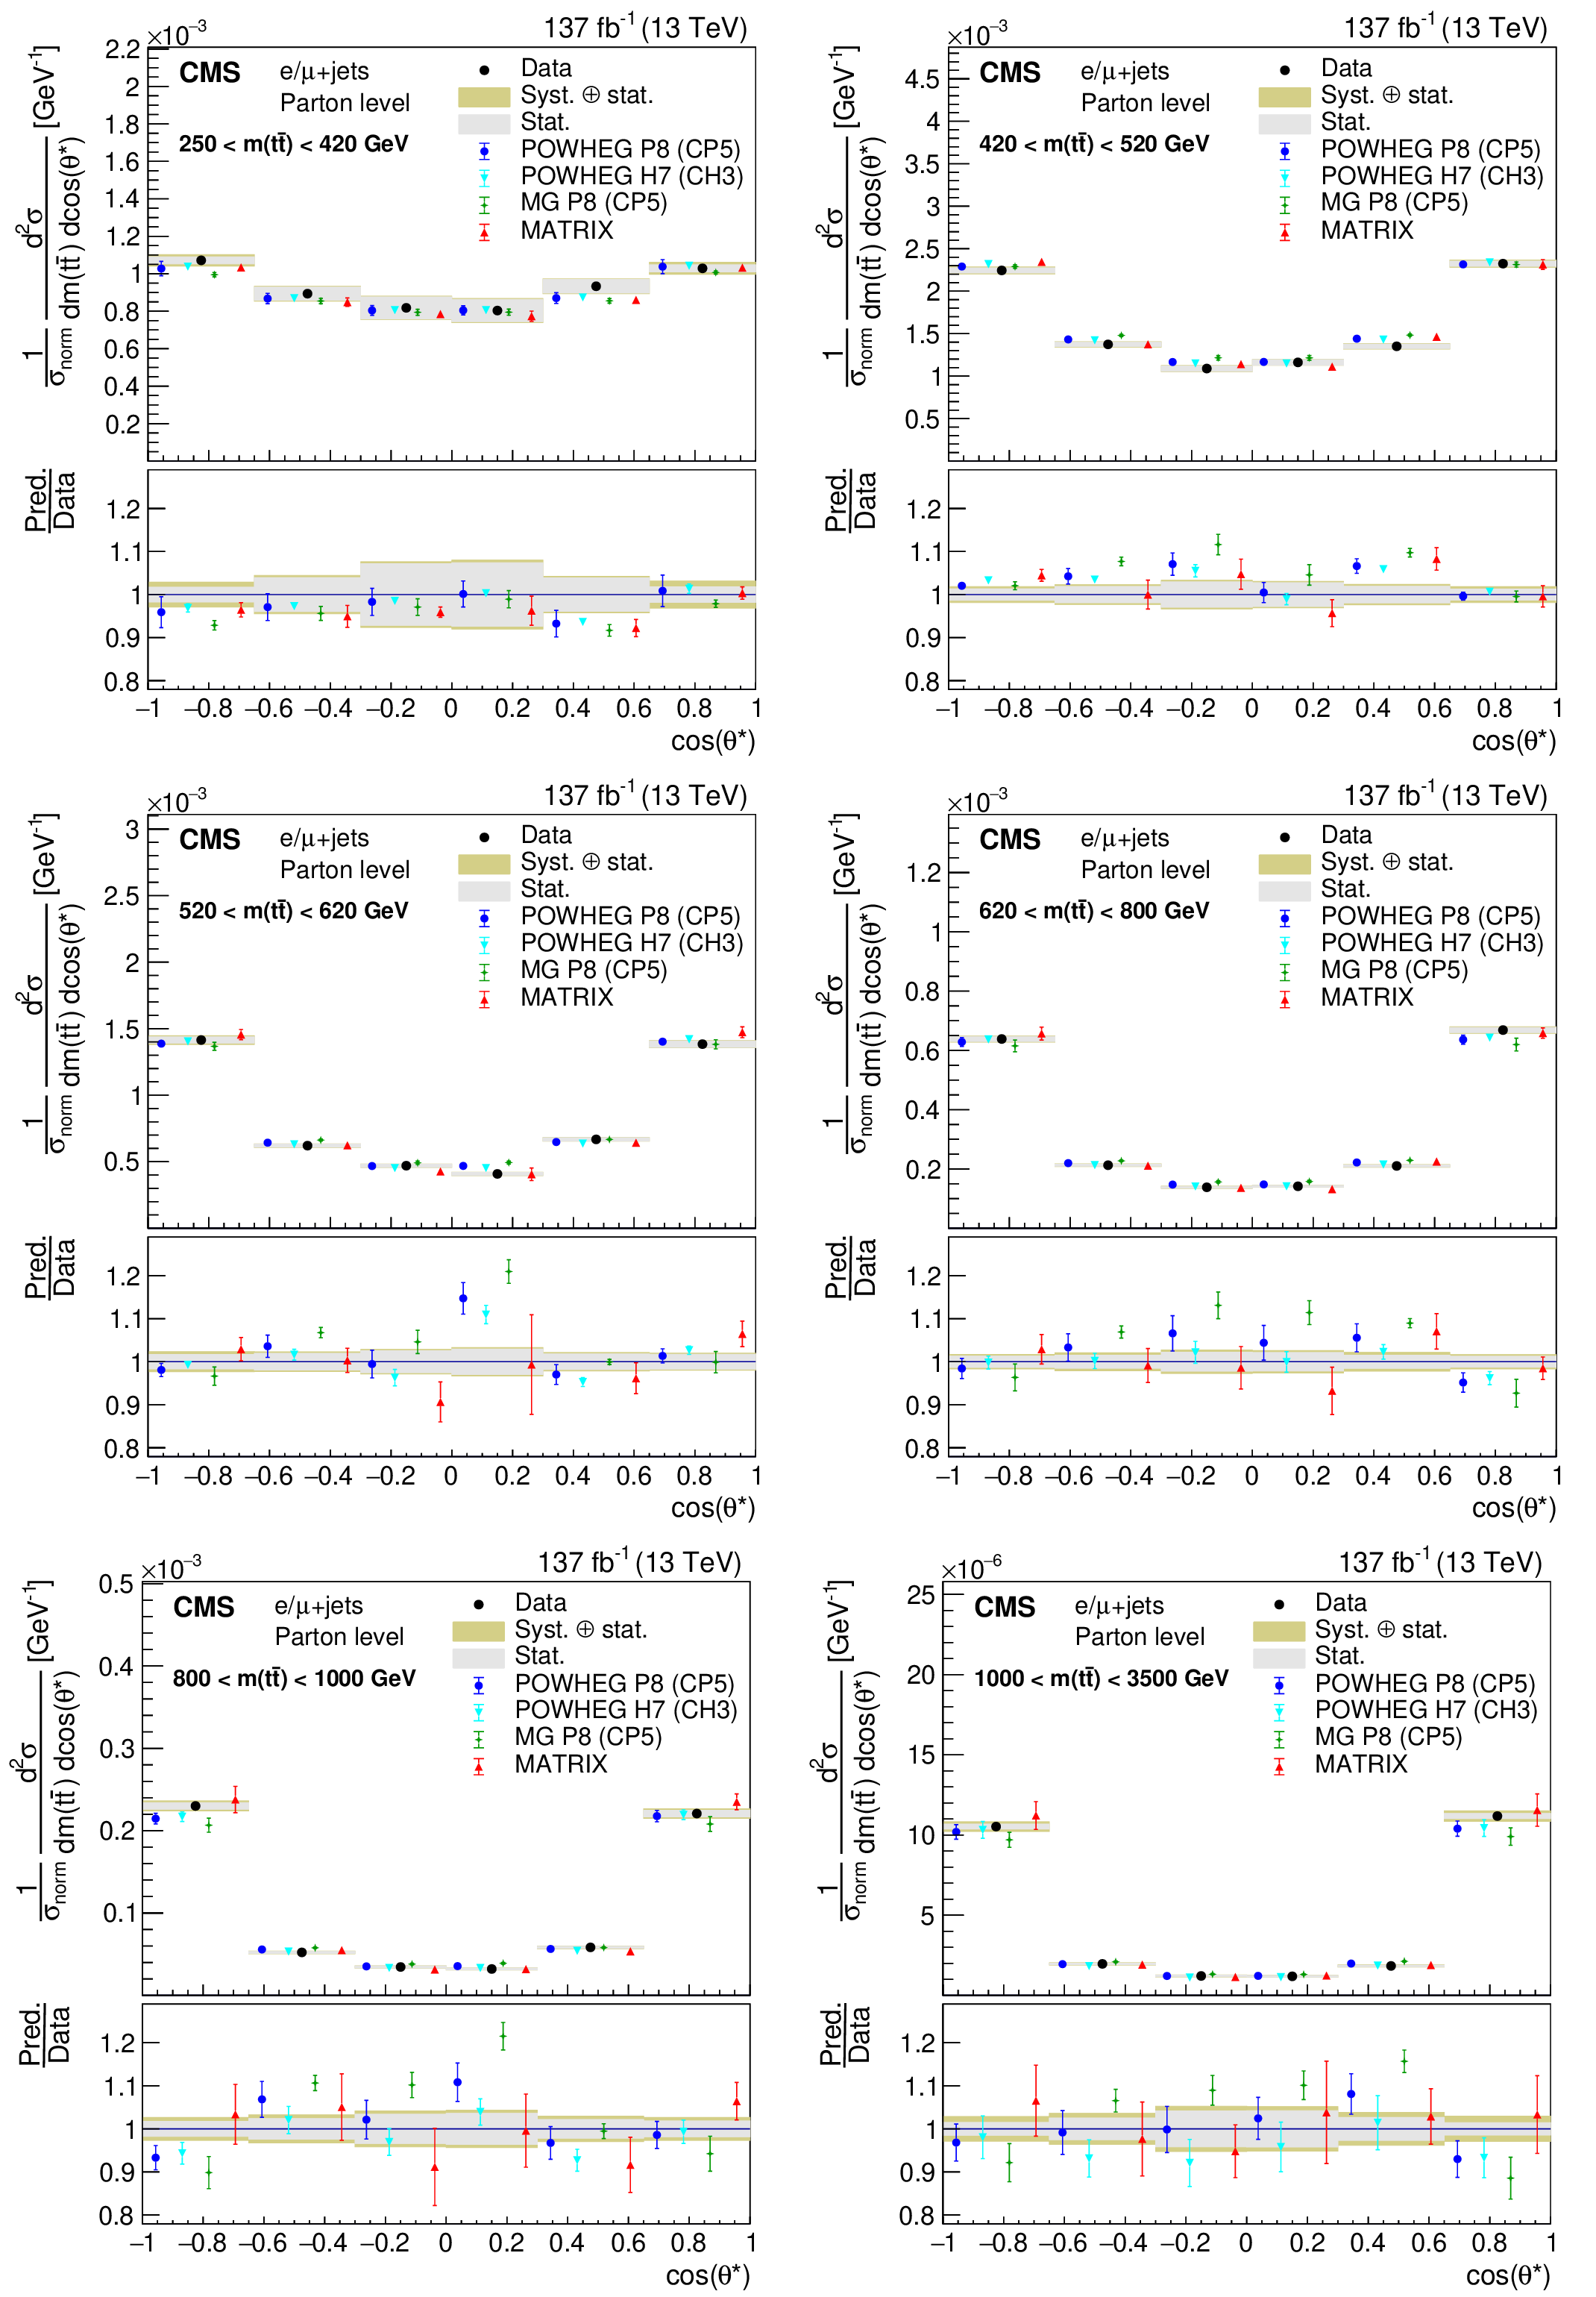
png pdf |
Figure A11:
Normalized double-differential cross section at the parton level as a function of ${m({\mathrm{t} {}\mathrm{\bar{t}}})}$ vs.$ {\cos(\theta ^*)}$. The data are shown as points with gray (yellow) bands indicating the statistical (statistical and systematic) uncertainties. The cross sections are compared to the predictions of POWHEG combined with PYTHIA (P8) or HERWIG (H7), the multiparton simulation MG5_aMC@NLO (MG)+PYTHIA FxFx, and the NNLO QCD calculations obtained with Matrix. The ratios of the various predictions to the measured cross sections are shown in the lower panels. |
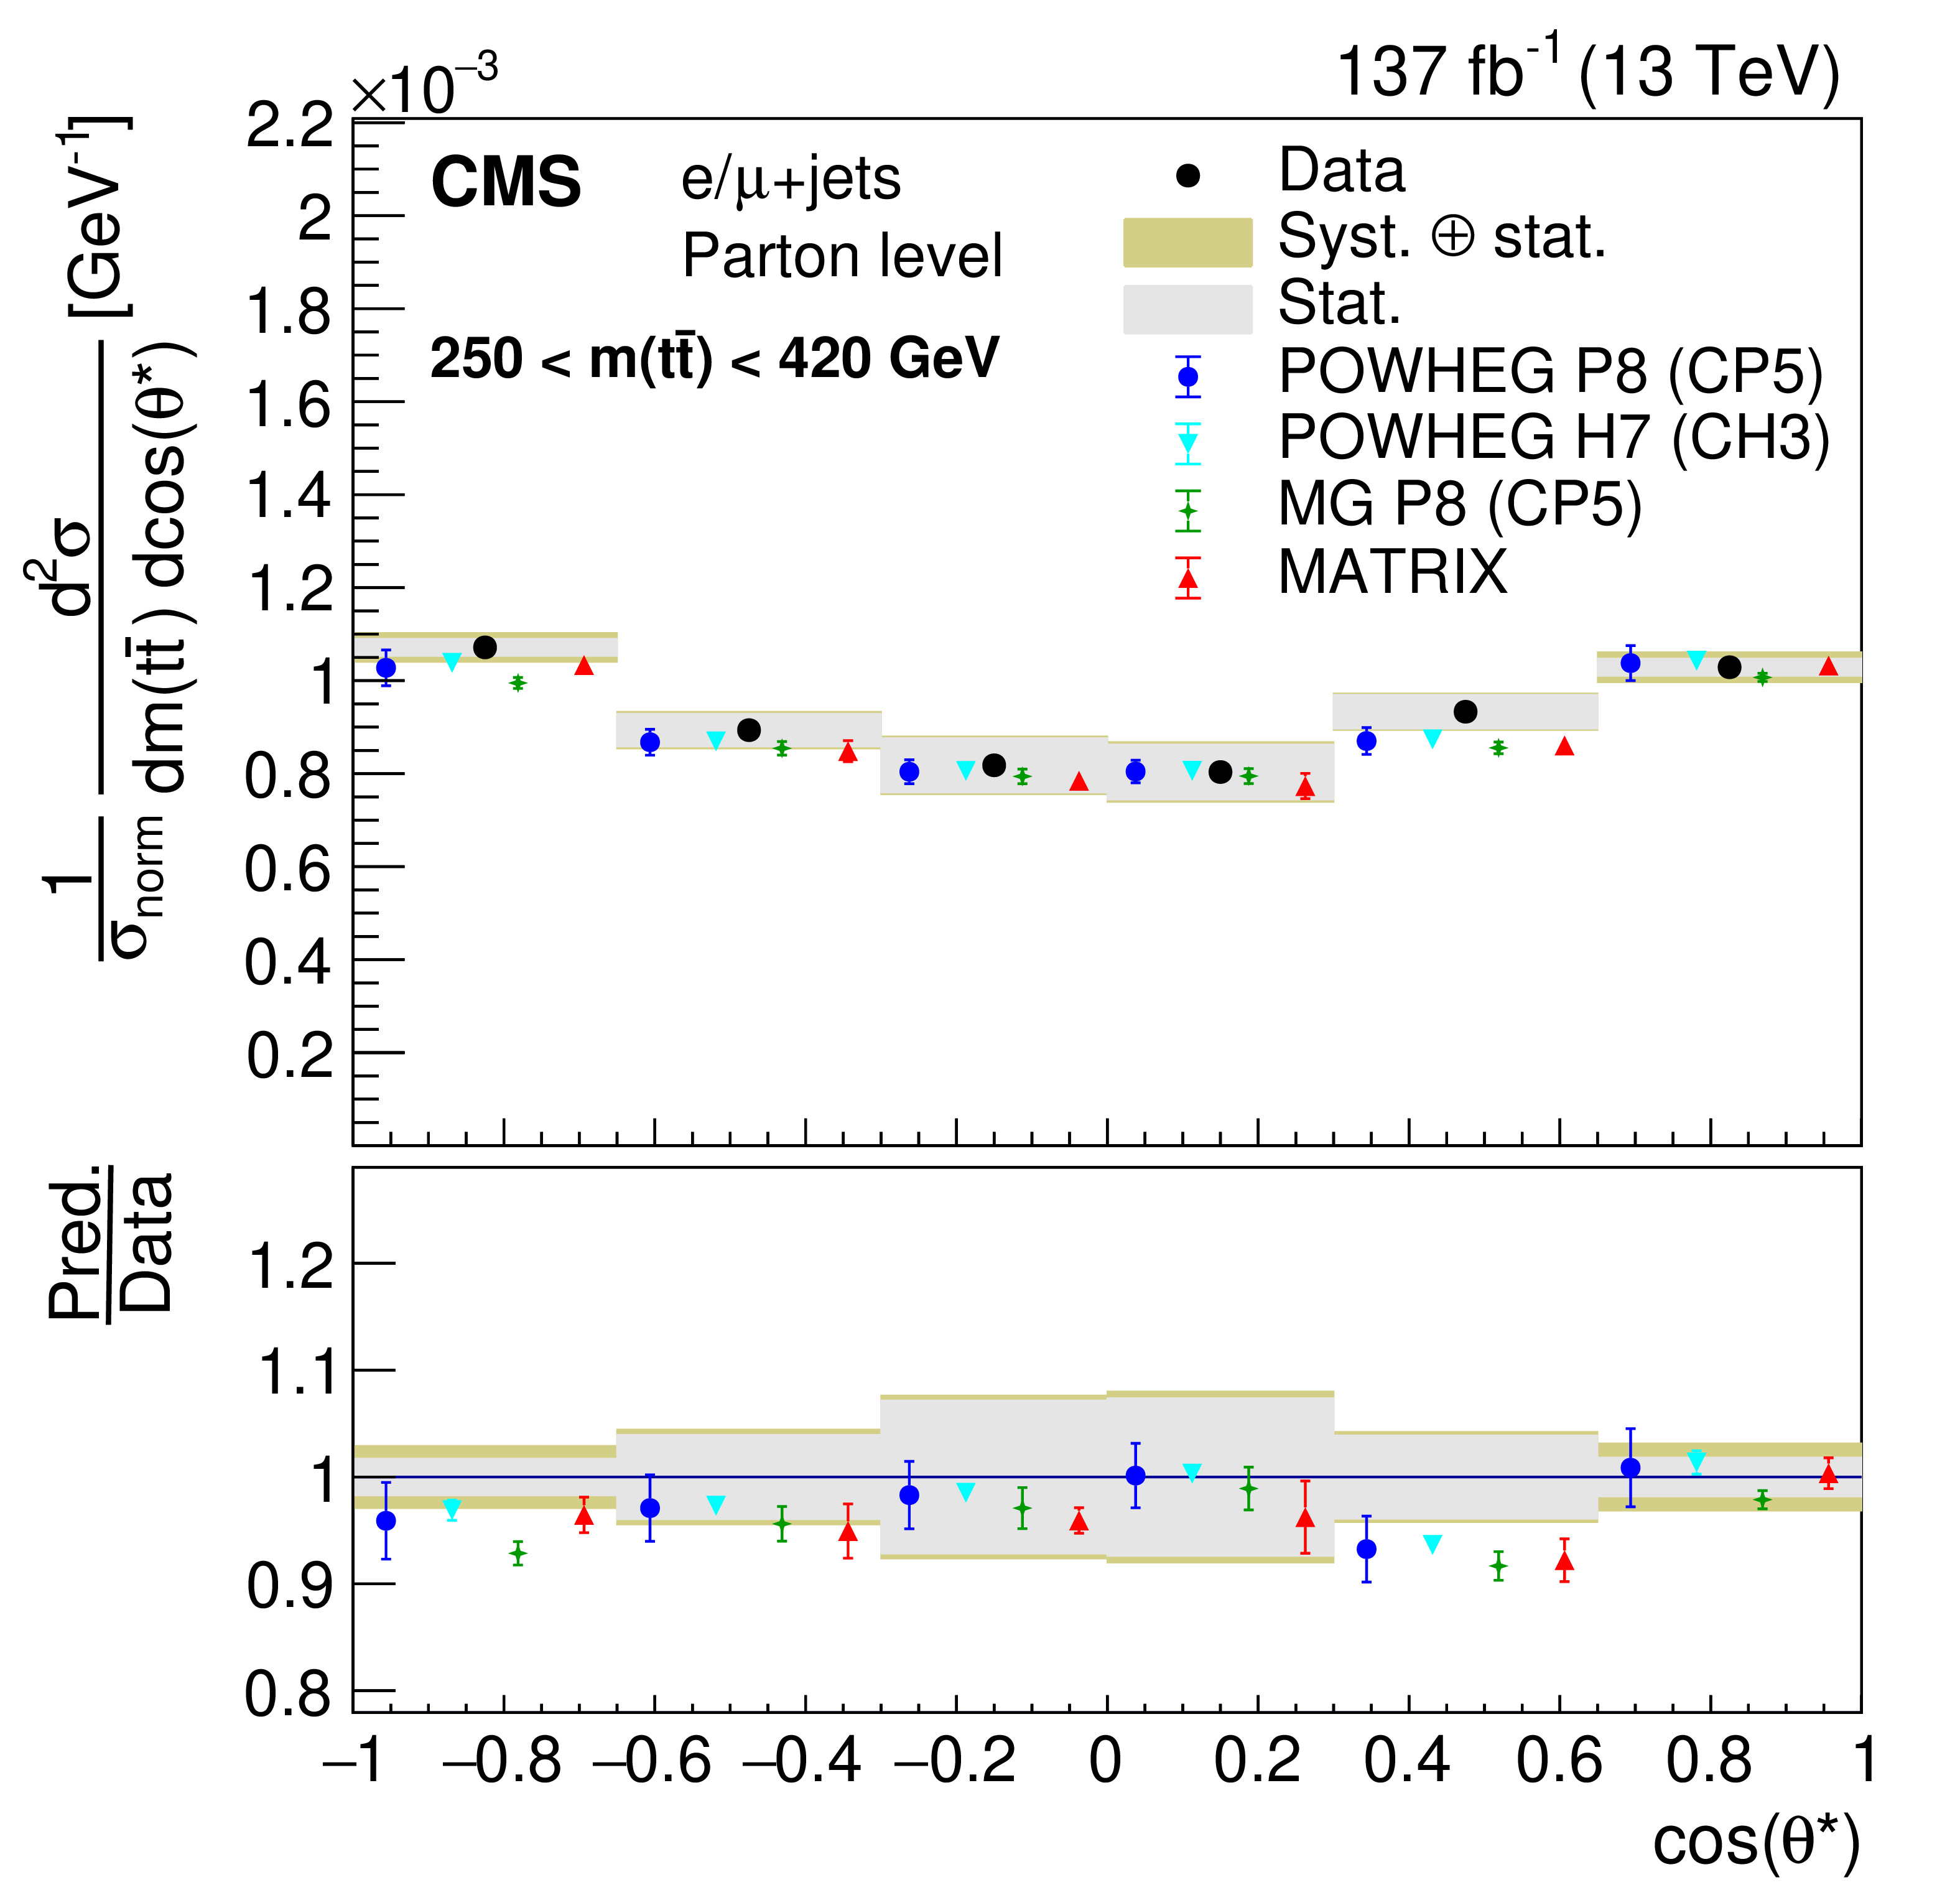
png pdf |
Figure A11-a:
Normalized double-differential cross section at the parton level as a function of ${m({\mathrm{t} {}\mathrm{\bar{t}}})}$ vs.$ {\cos(\theta ^*)}$. The data are shown as points with gray (yellow) bands indicating the statistical (statistical and systematic) uncertainties. The cross sections are compared to the predictions of POWHEG combined with PYTHIA (P8) or HERWIG (H7), the multiparton simulation MG5_aMC@NLO (MG)+PYTHIA FxFx, and the NNLO QCD calculations obtained with Matrix. The ratios of the various predictions to the measured cross sections are shown in the lower panels. |
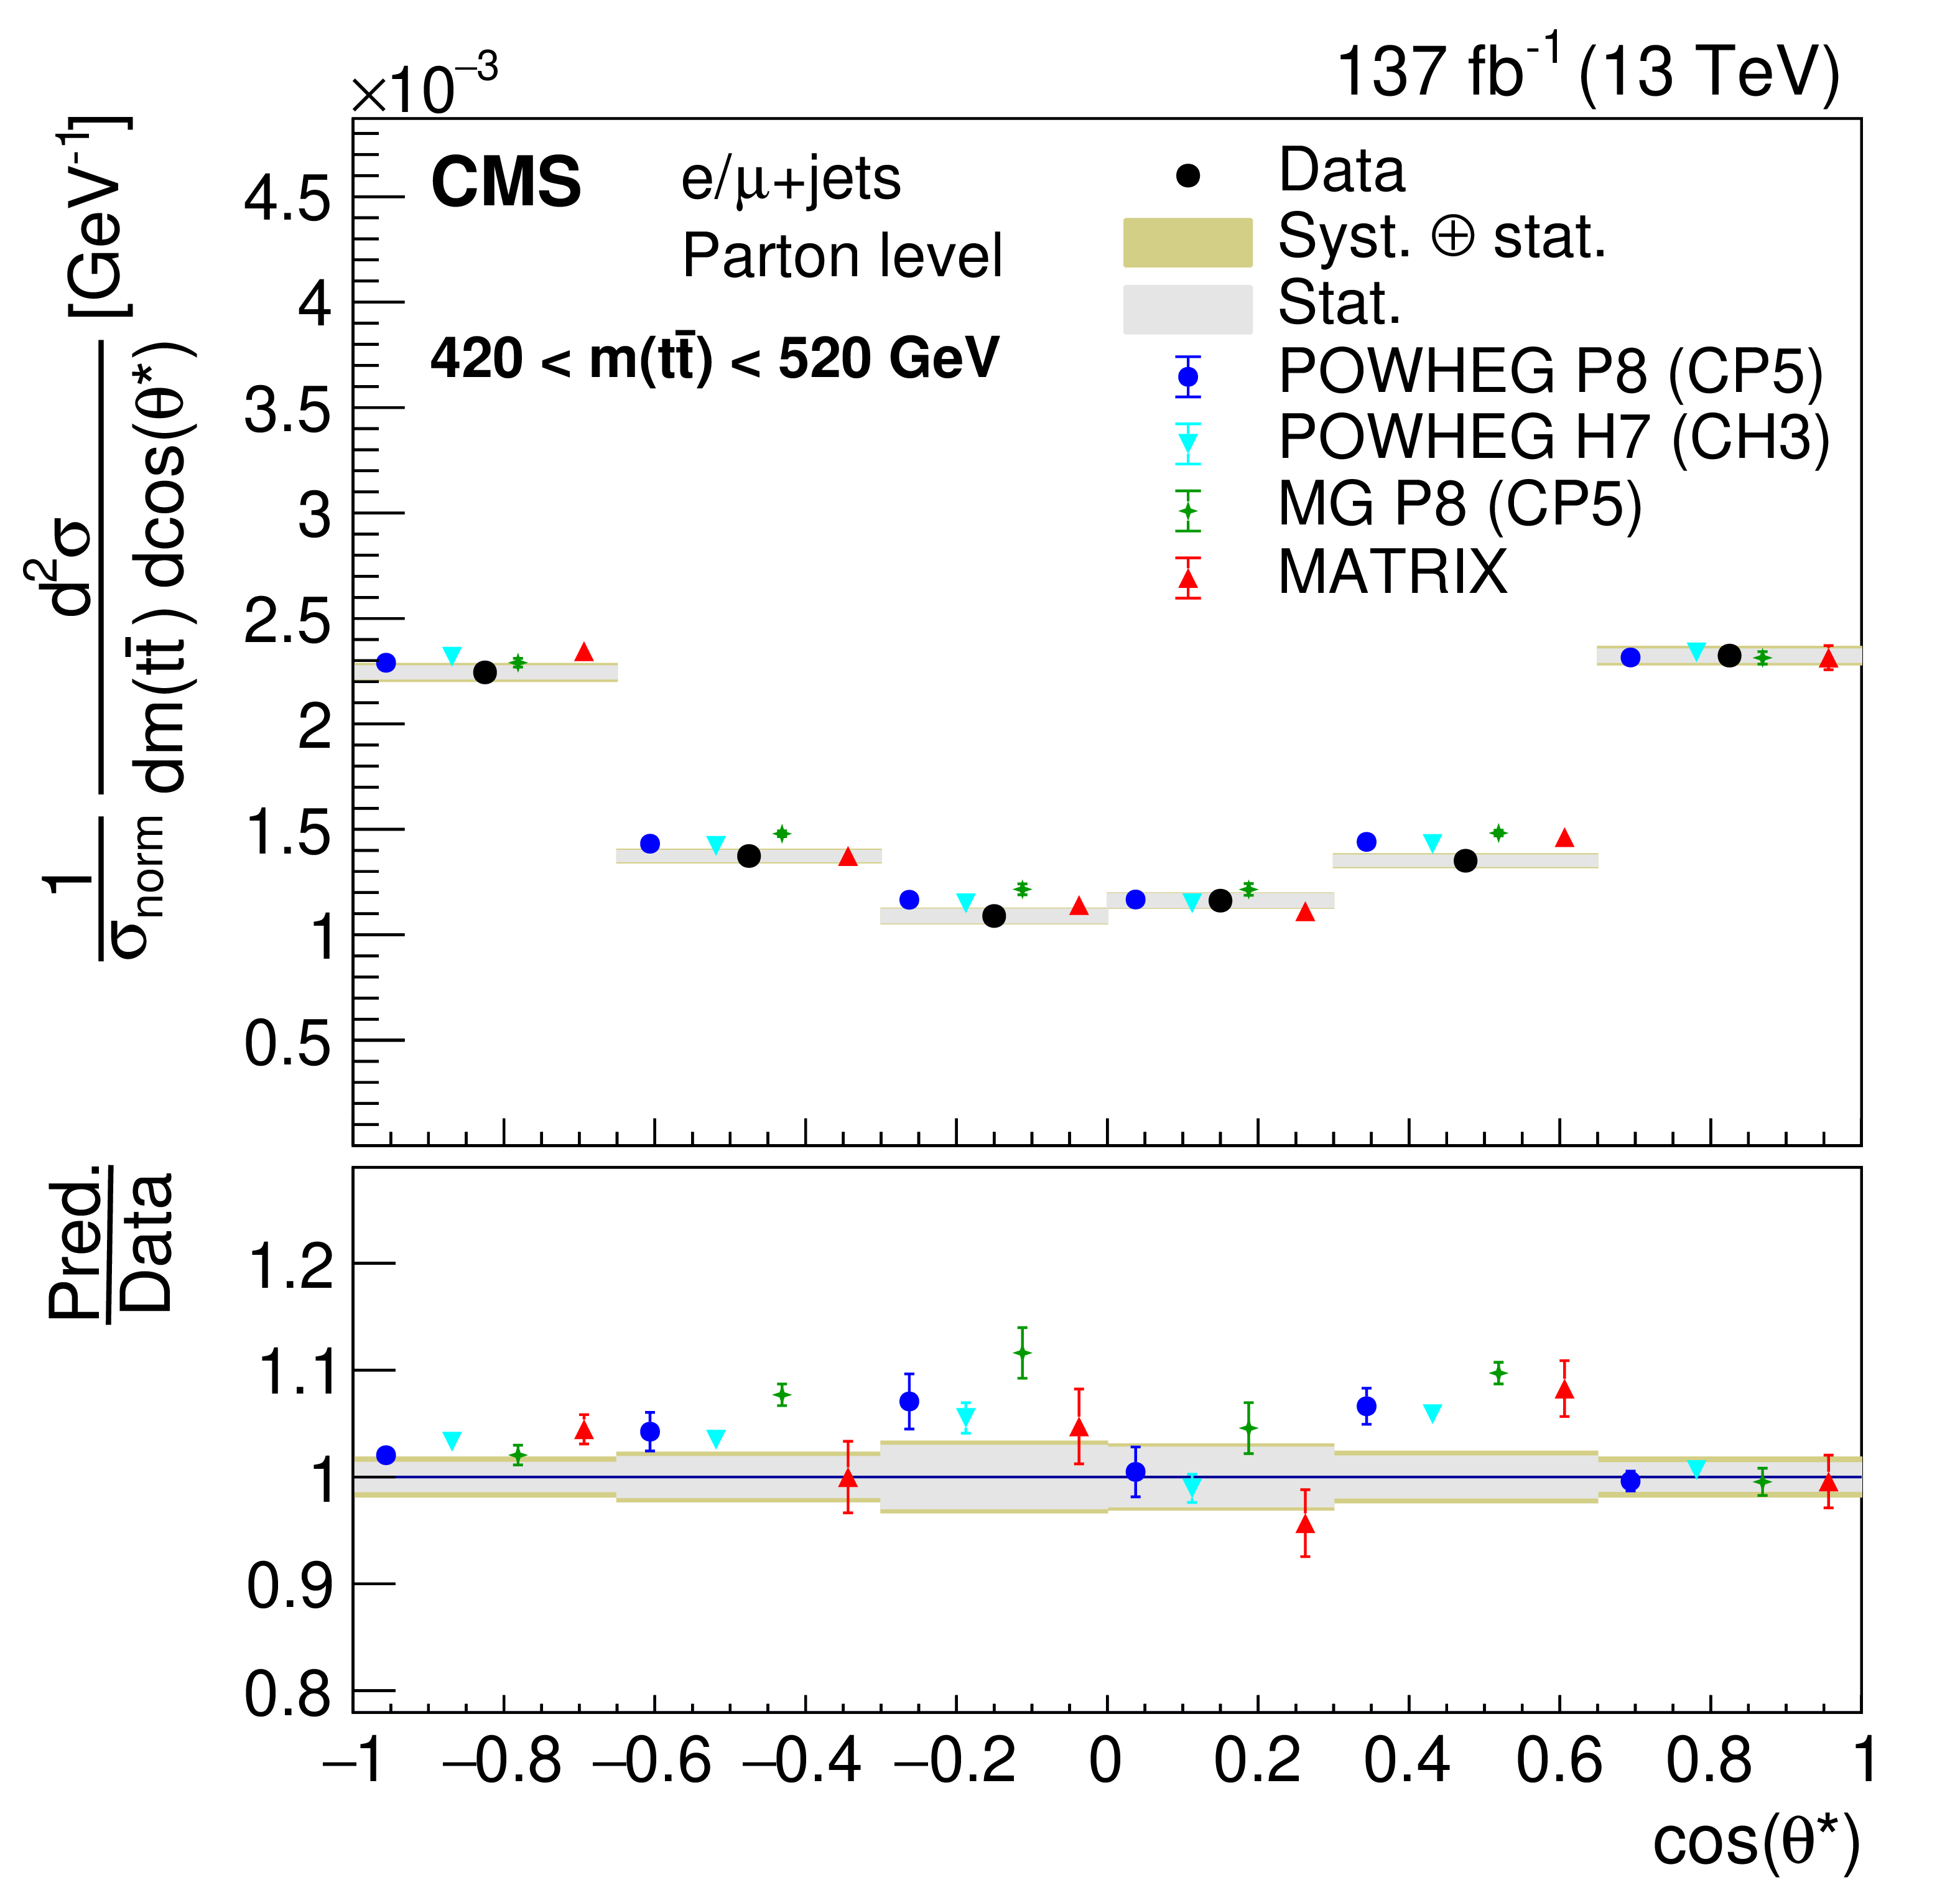
png pdf |
Figure A11-b:
Normalized double-differential cross section at the parton level as a function of ${m({\mathrm{t} {}\mathrm{\bar{t}}})}$ vs.$ {\cos(\theta ^*)}$. The data are shown as points with gray (yellow) bands indicating the statistical (statistical and systematic) uncertainties. The cross sections are compared to the predictions of POWHEG combined with PYTHIA (P8) or HERWIG (H7), the multiparton simulation MG5_aMC@NLO (MG)+PYTHIA FxFx, and the NNLO QCD calculations obtained with Matrix. The ratios of the various predictions to the measured cross sections are shown in the lower panels. |
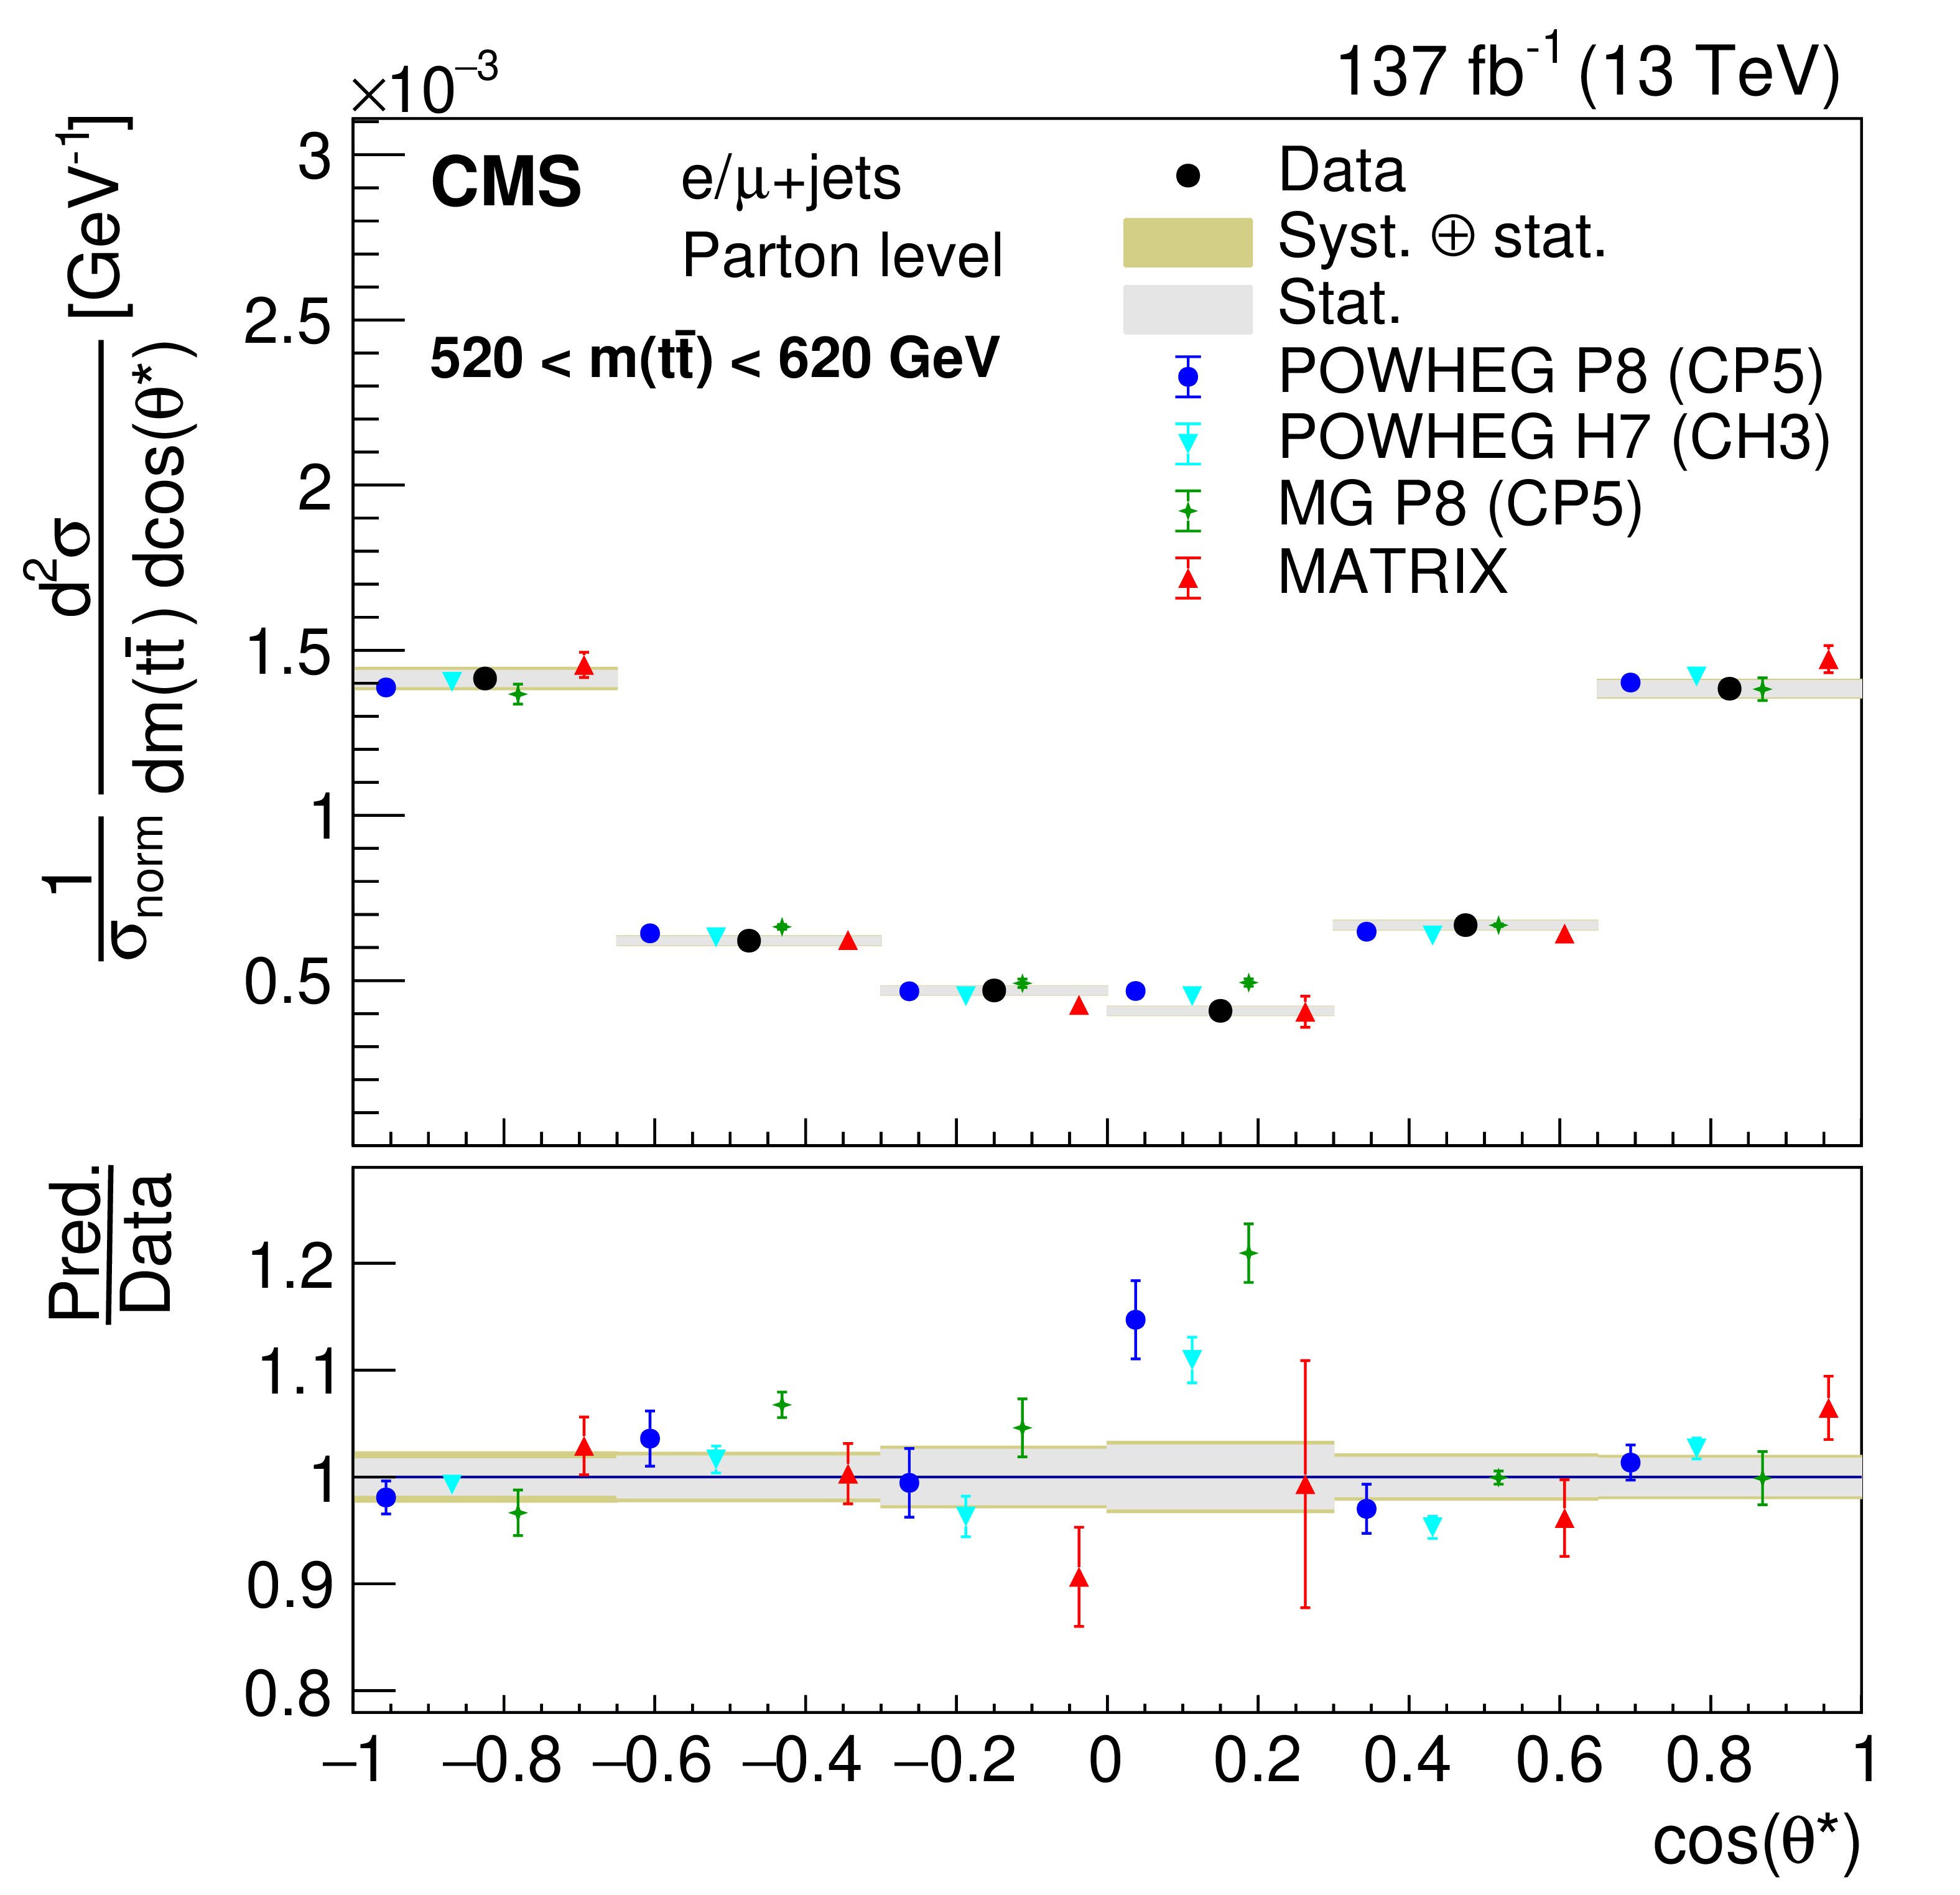
png pdf |
Figure A11-c:
Normalized double-differential cross section at the parton level as a function of ${m({\mathrm{t} {}\mathrm{\bar{t}}})}$ vs.$ {\cos(\theta ^*)}$. The data are shown as points with gray (yellow) bands indicating the statistical (statistical and systematic) uncertainties. The cross sections are compared to the predictions of POWHEG combined with PYTHIA (P8) or HERWIG (H7), the multiparton simulation MG5_aMC@NLO (MG)+PYTHIA FxFx, and the NNLO QCD calculations obtained with Matrix. The ratios of the various predictions to the measured cross sections are shown in the lower panels. |

png pdf |
Figure A11-d:
Normalized double-differential cross section at the parton level as a function of ${m({\mathrm{t} {}\mathrm{\bar{t}}})}$ vs.$ {\cos(\theta ^*)}$. The data are shown as points with gray (yellow) bands indicating the statistical (statistical and systematic) uncertainties. The cross sections are compared to the predictions of POWHEG combined with PYTHIA (P8) or HERWIG (H7), the multiparton simulation MG5_aMC@NLO (MG)+PYTHIA FxFx, and the NNLO QCD calculations obtained with Matrix. The ratios of the various predictions to the measured cross sections are shown in the lower panels. |

png pdf |
Figure A11-e:
Normalized double-differential cross section at the parton level as a function of ${m({\mathrm{t} {}\mathrm{\bar{t}}})}$ vs.$ {\cos(\theta ^*)}$. The data are shown as points with gray (yellow) bands indicating the statistical (statistical and systematic) uncertainties. The cross sections are compared to the predictions of POWHEG combined with PYTHIA (P8) or HERWIG (H7), the multiparton simulation MG5_aMC@NLO (MG)+PYTHIA FxFx, and the NNLO QCD calculations obtained with Matrix. The ratios of the various predictions to the measured cross sections are shown in the lower panels. |
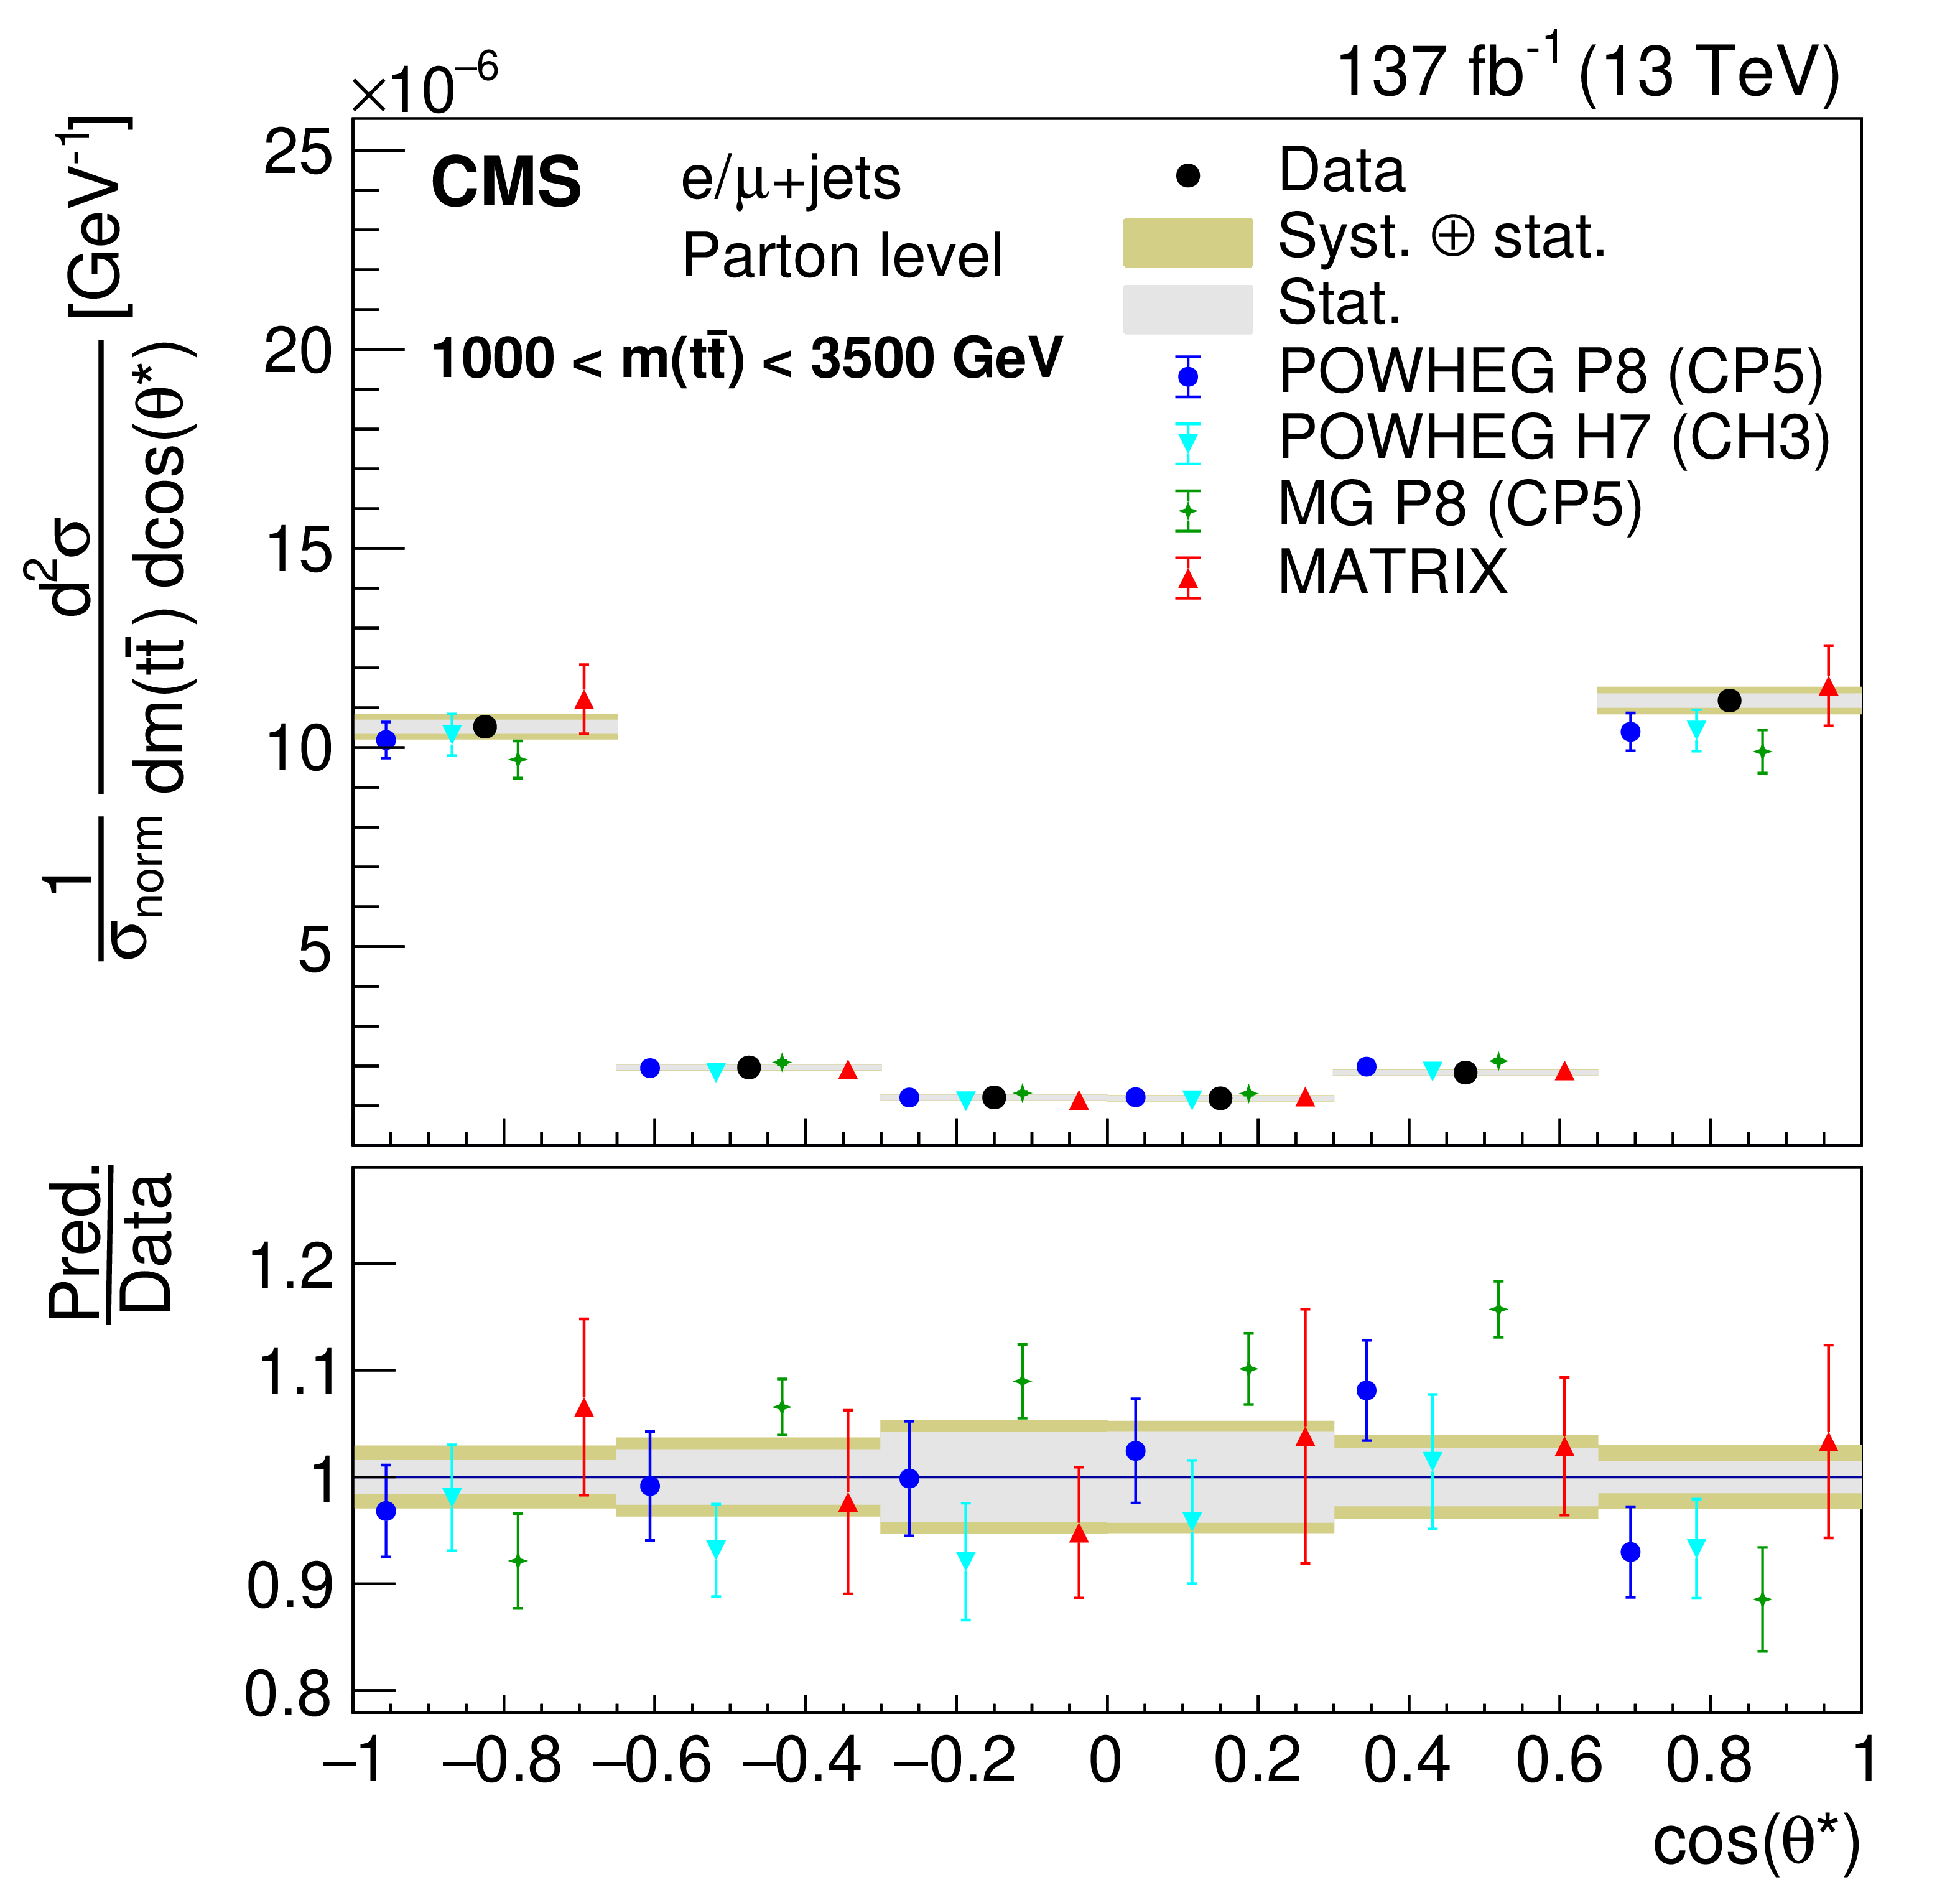
png pdf |
Figure A11-f:
Normalized double-differential cross section at the parton level as a function of ${m({\mathrm{t} {}\mathrm{\bar{t}}})}$ vs.$ {\cos(\theta ^*)}$. The data are shown as points with gray (yellow) bands indicating the statistical (statistical and systematic) uncertainties. The cross sections are compared to the predictions of POWHEG combined with PYTHIA (P8) or HERWIG (H7), the multiparton simulation MG5_aMC@NLO (MG)+PYTHIA FxFx, and the NNLO QCD calculations obtained with Matrix. The ratios of the various predictions to the measured cross sections are shown in the lower panels. |
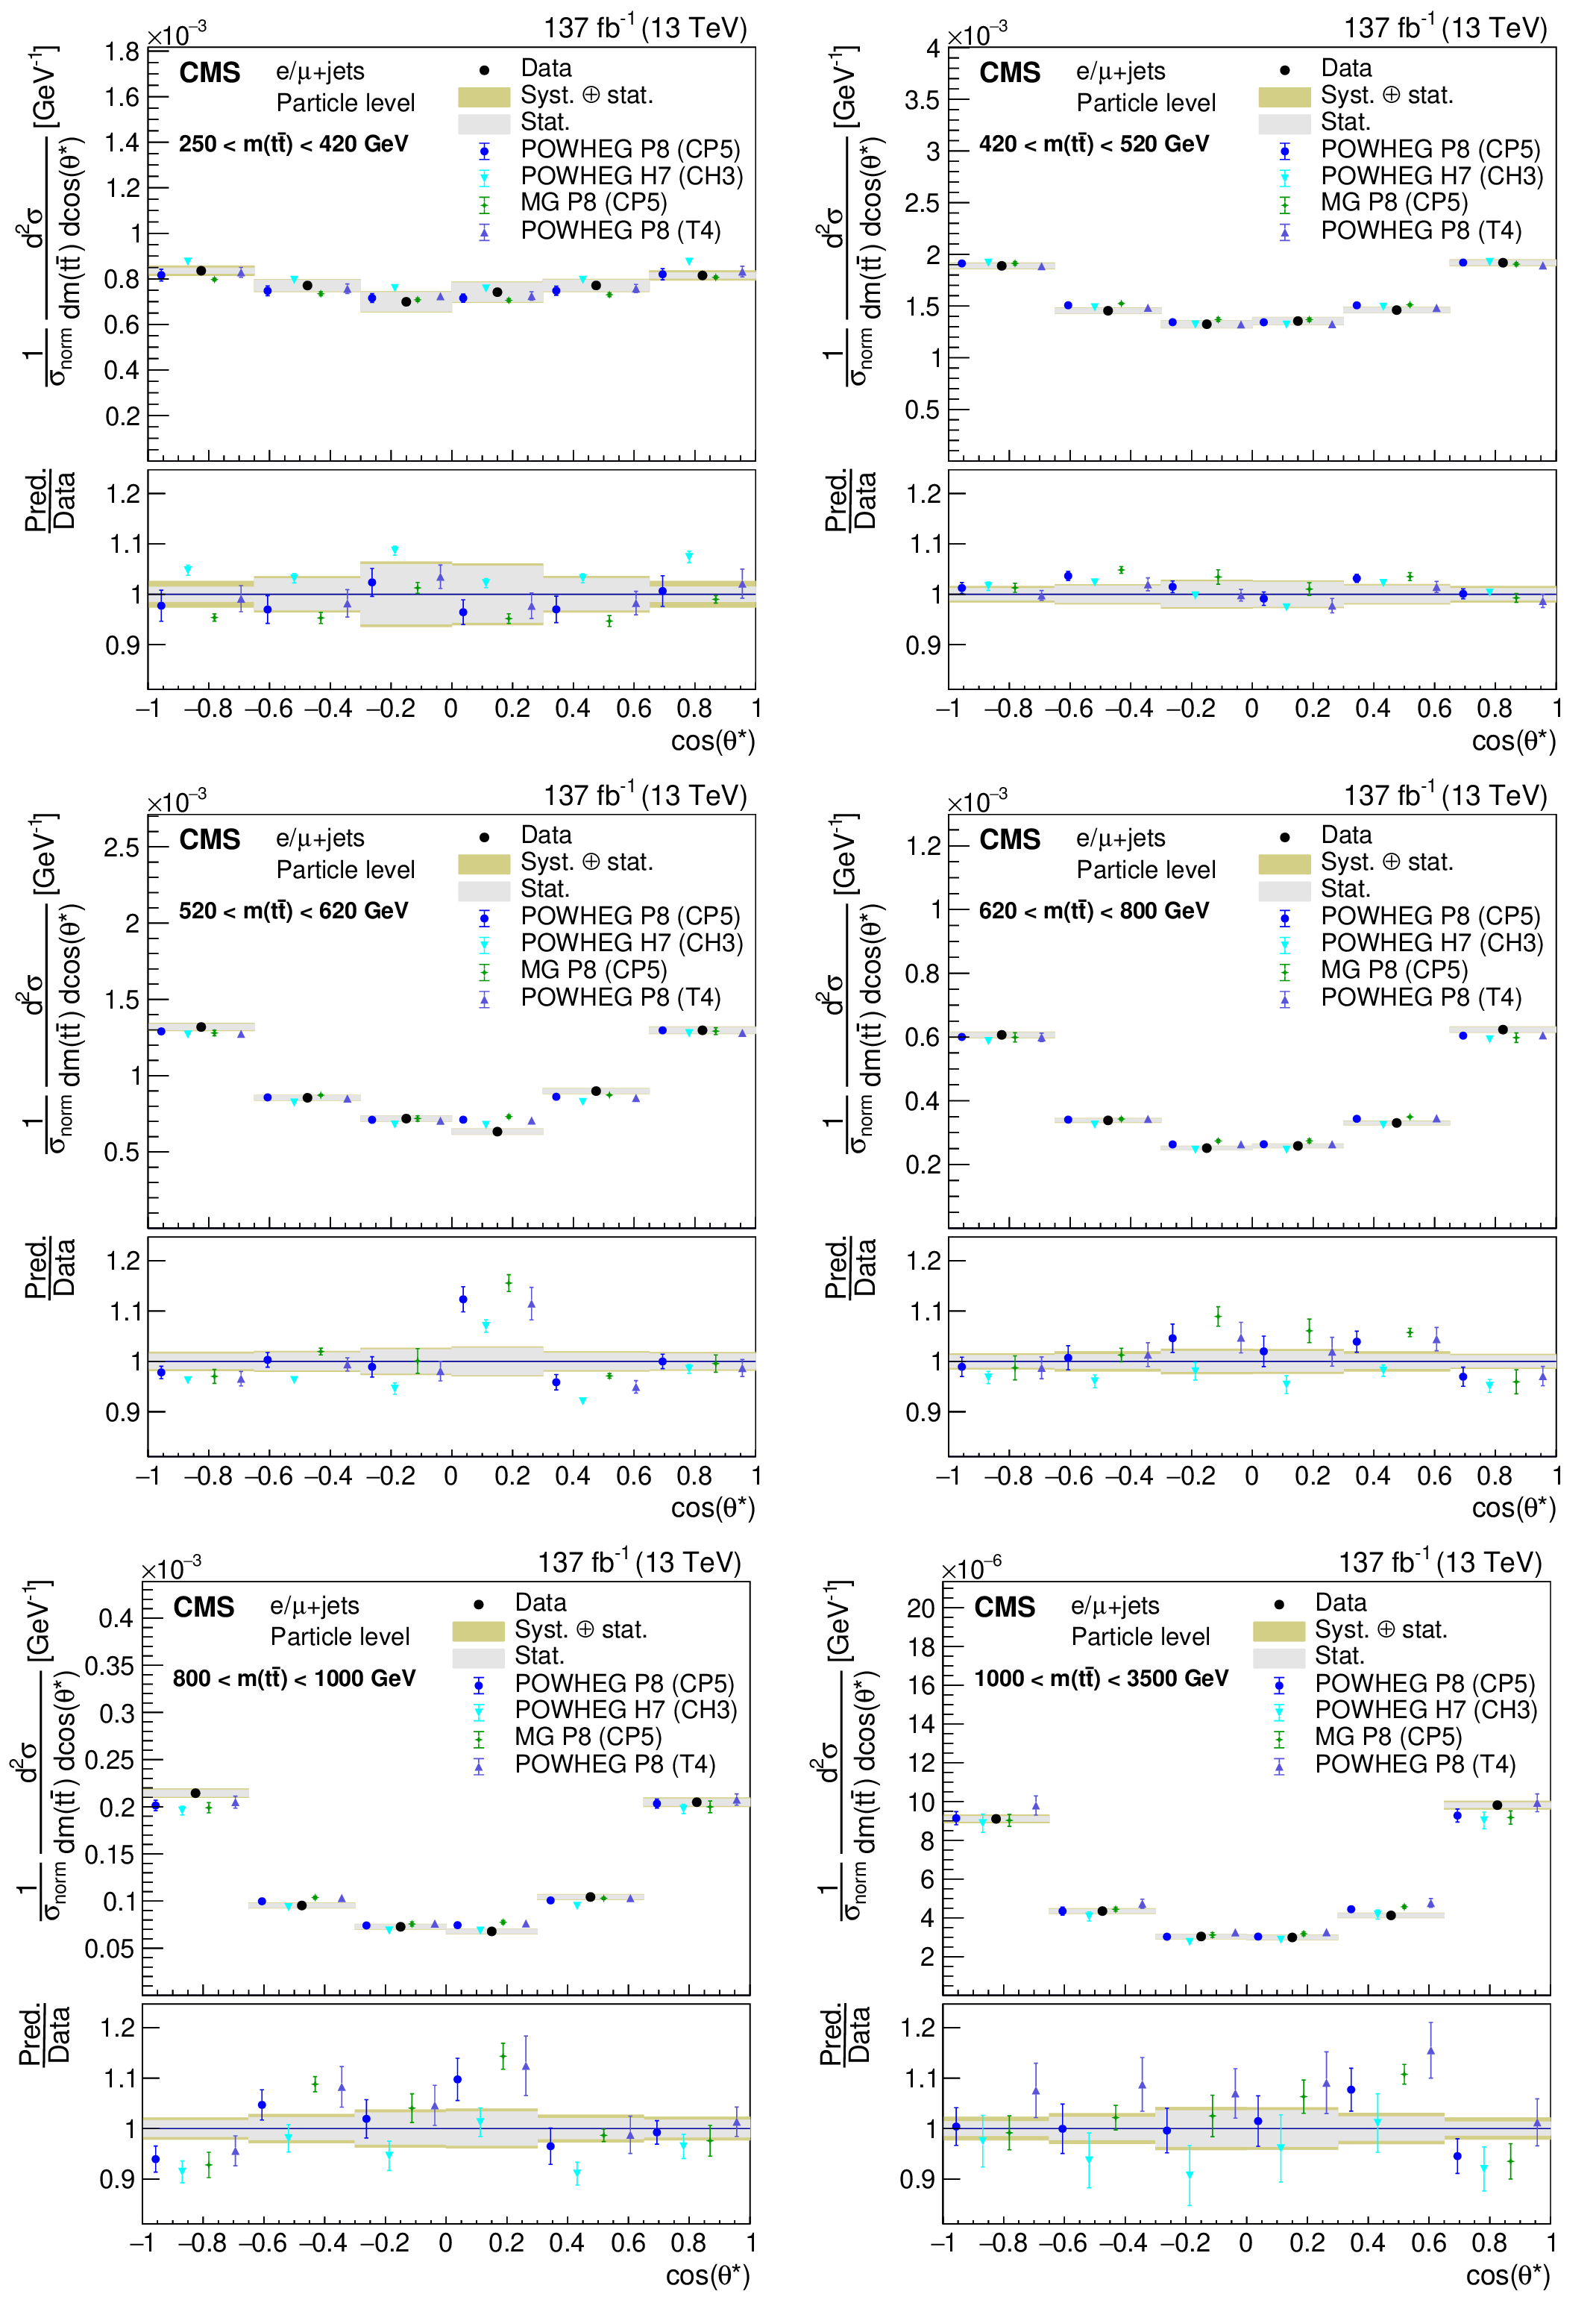
png pdf |
Figure A12:
Normalized double-differential cross section at the particle level as a function of ${m({\mathrm{t} {}\mathrm{\bar{t}}})}$ vs.$ {\cos(\theta ^*)}$. The data are shown as points with gray (yellow) bands indicating the statistical (statistical and systematic) uncertainties. The cross sections are compared to the predictions of POWHEG+PYTHIA (P8) for the CP5 and CUETP8M2T4 (T4) tunes, POWHEG+HERWIG (H7), and the multiparton simulation MG5_aMC@NLO (MG)+PYTHIA. The ratios of the various predictions to the measured cross sections are shown in the lower panels. |

png pdf |
Figure A12-a:
Normalized double-differential cross section at the particle level as a function of ${m({\mathrm{t} {}\mathrm{\bar{t}}})}$ vs.$ {\cos(\theta ^*)}$. The data are shown as points with gray (yellow) bands indicating the statistical (statistical and systematic) uncertainties. The cross sections are compared to the predictions of POWHEG+PYTHIA (P8) for the CP5 and CUETP8M2T4 (T4) tunes, POWHEG+HERWIG (H7), and the multiparton simulation MG5_aMC@NLO (MG)+PYTHIA. The ratios of the various predictions to the measured cross sections are shown in the lower panels. |
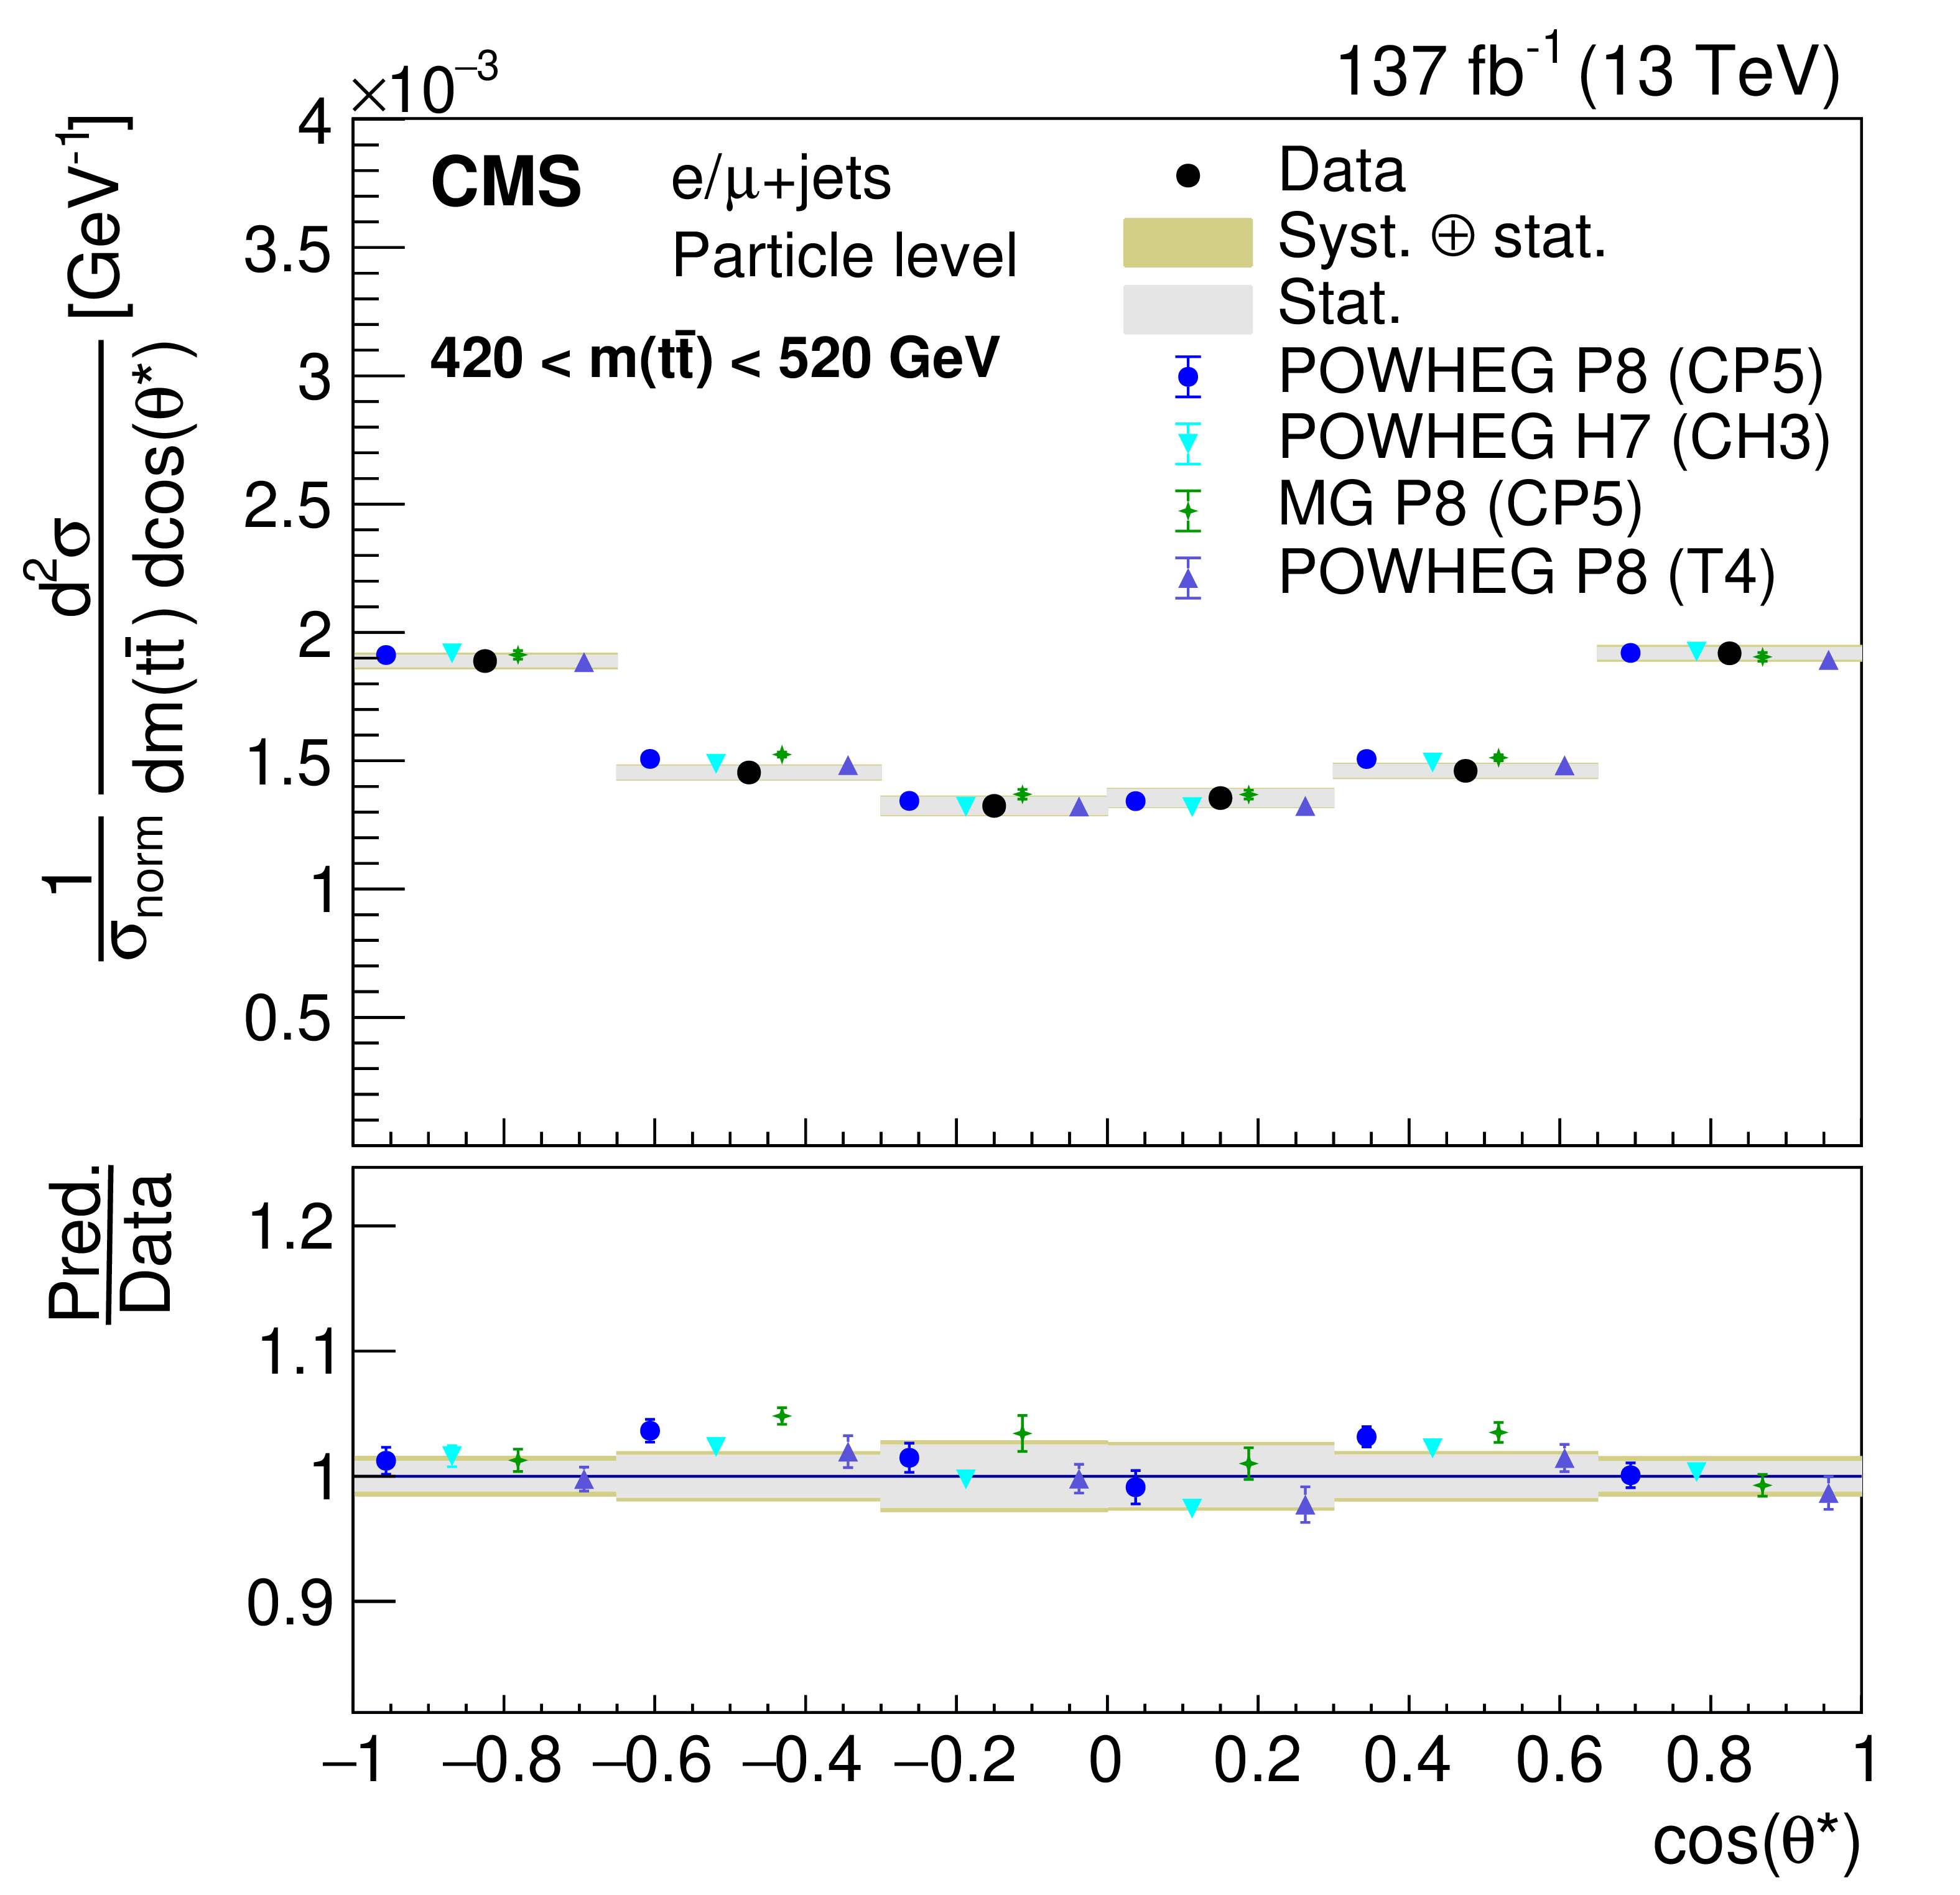
png pdf |
Figure A12-b:
Normalized double-differential cross section at the particle level as a function of ${m({\mathrm{t} {}\mathrm{\bar{t}}})}$ vs.$ {\cos(\theta ^*)}$. The data are shown as points with gray (yellow) bands indicating the statistical (statistical and systematic) uncertainties. The cross sections are compared to the predictions of POWHEG+PYTHIA (P8) for the CP5 and CUETP8M2T4 (T4) tunes, POWHEG+HERWIG (H7), and the multiparton simulation MG5_aMC@NLO (MG)+PYTHIA. The ratios of the various predictions to the measured cross sections are shown in the lower panels. |
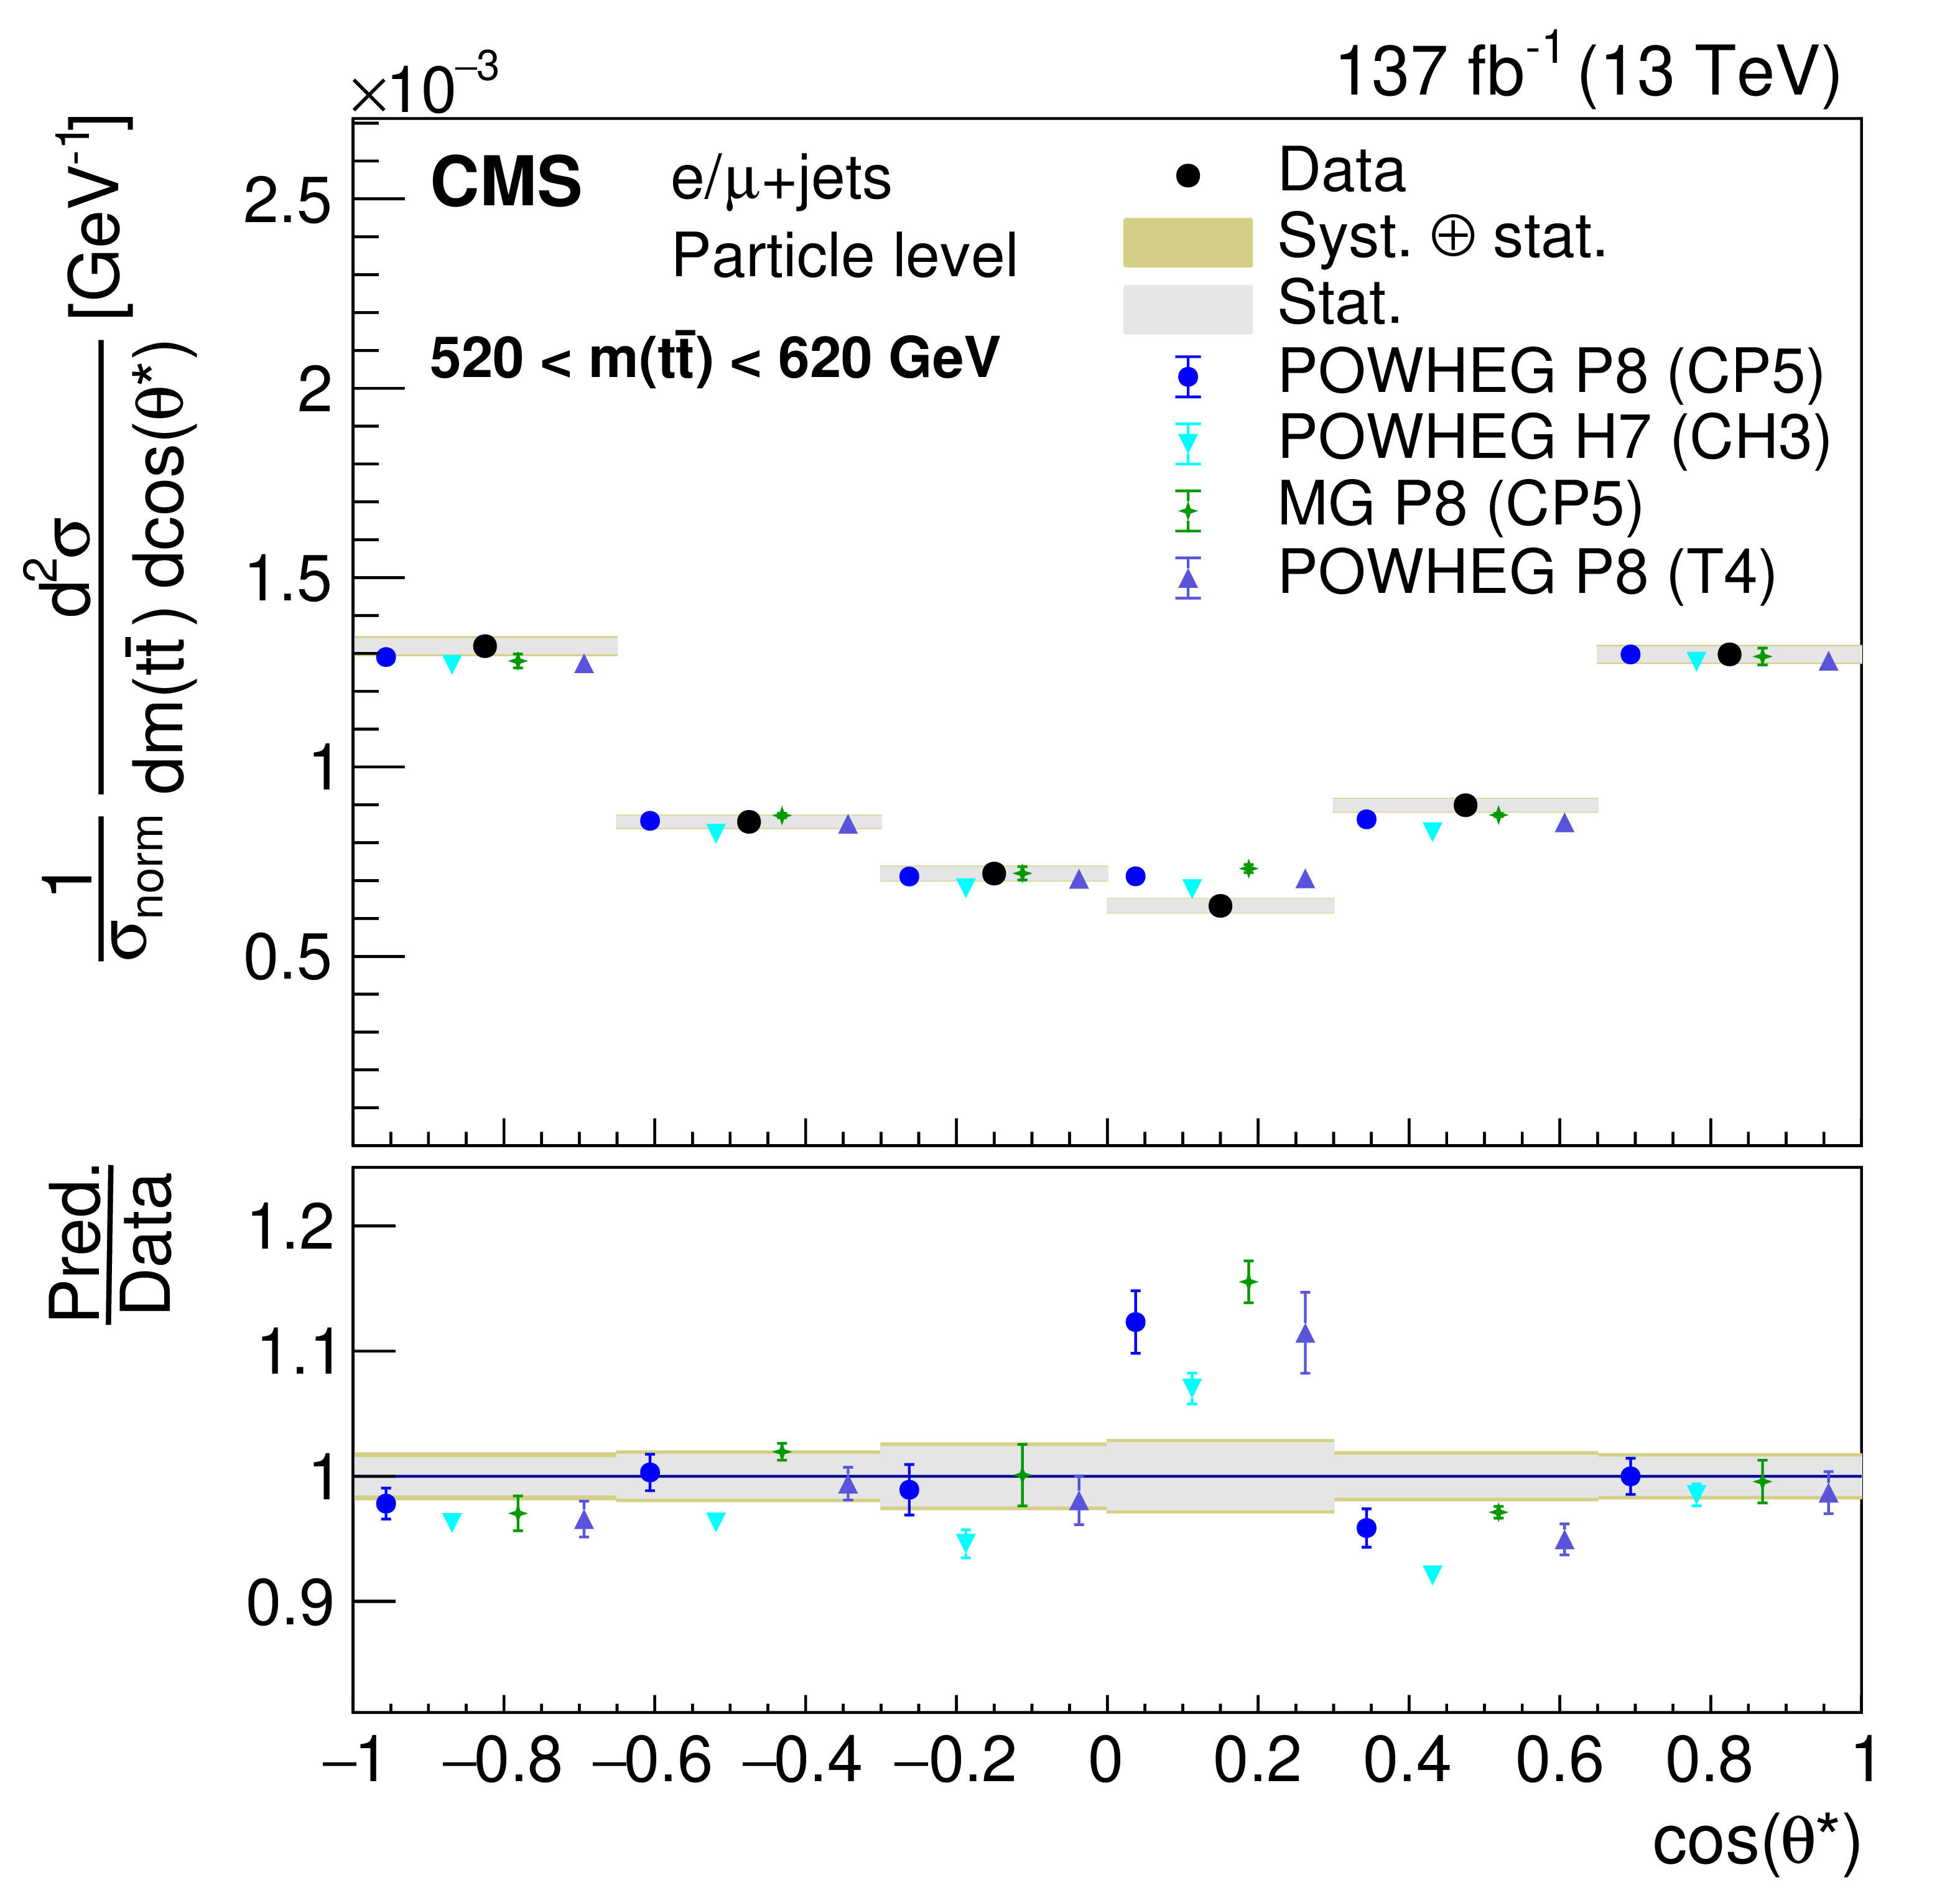
png pdf |
Figure A12-c:
Normalized double-differential cross section at the particle level as a function of ${m({\mathrm{t} {}\mathrm{\bar{t}}})}$ vs.$ {\cos(\theta ^*)}$. The data are shown as points with gray (yellow) bands indicating the statistical (statistical and systematic) uncertainties. The cross sections are compared to the predictions of POWHEG+PYTHIA (P8) for the CP5 and CUETP8M2T4 (T4) tunes, POWHEG+HERWIG (H7), and the multiparton simulation MG5_aMC@NLO (MG)+PYTHIA. The ratios of the various predictions to the measured cross sections are shown in the lower panels. |
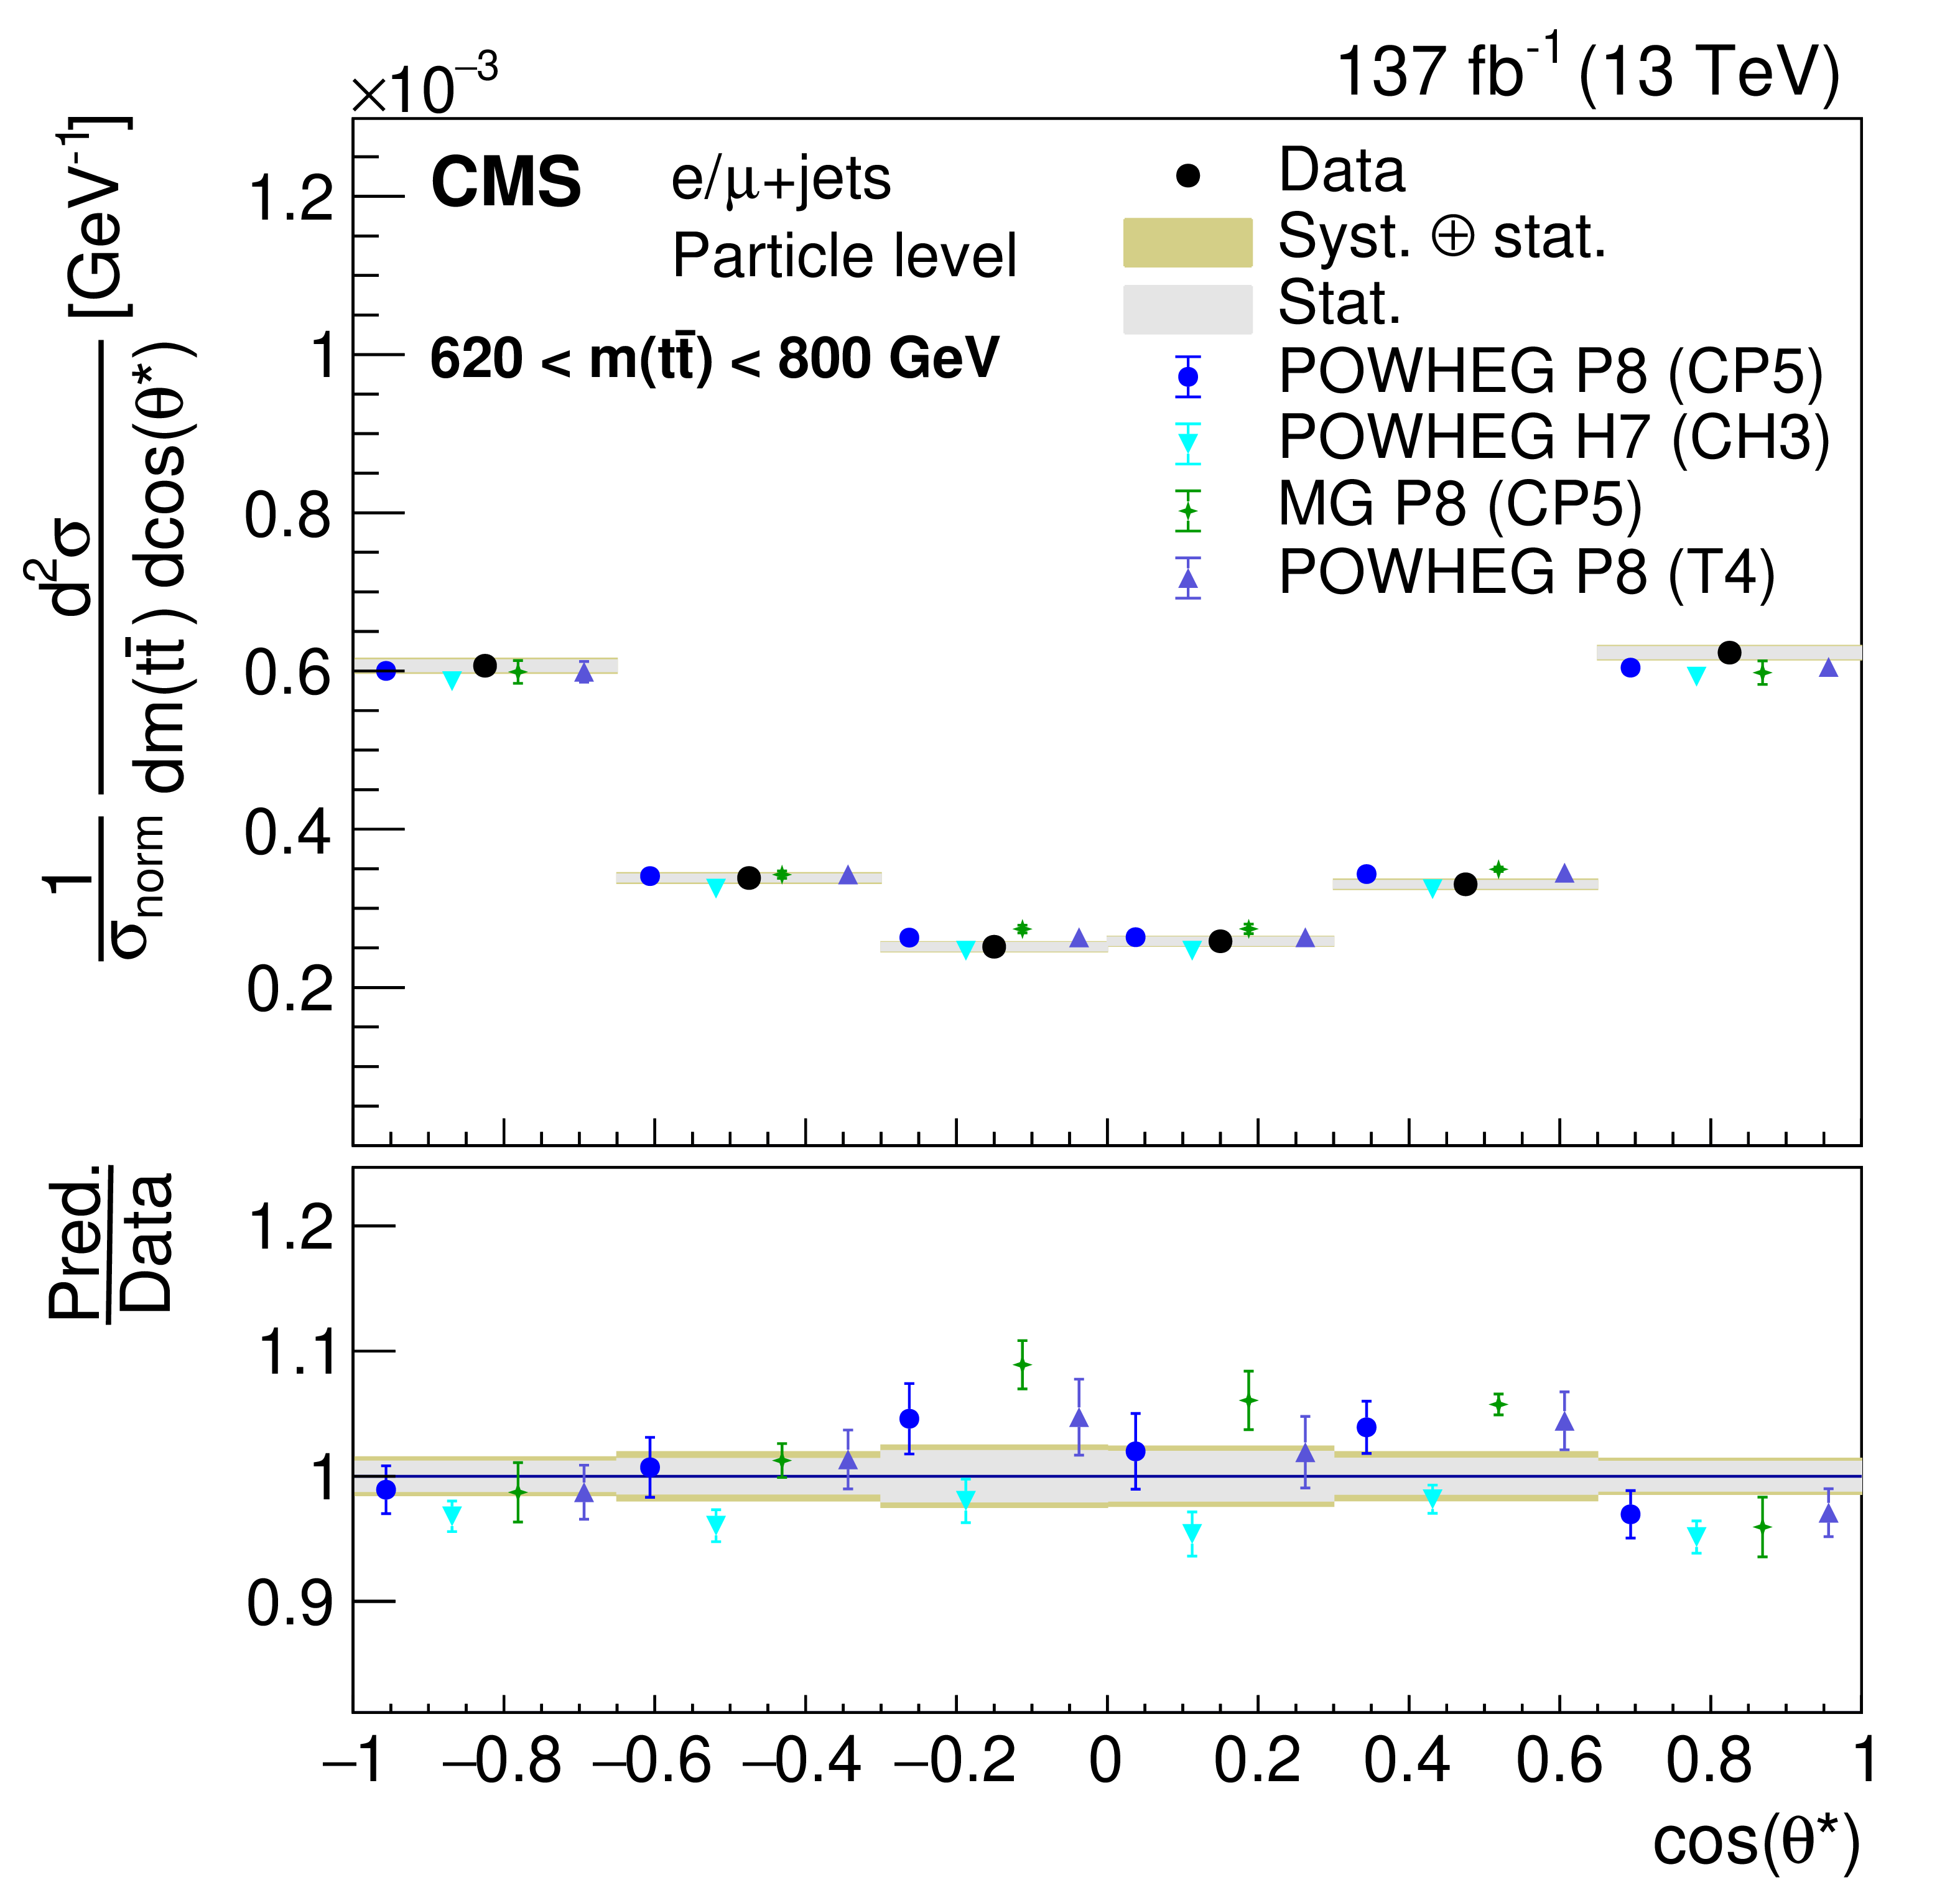
png pdf |
Figure A12-d:
Normalized double-differential cross section at the particle level as a function of ${m({\mathrm{t} {}\mathrm{\bar{t}}})}$ vs.$ {\cos(\theta ^*)}$. The data are shown as points with gray (yellow) bands indicating the statistical (statistical and systematic) uncertainties. The cross sections are compared to the predictions of POWHEG+PYTHIA (P8) for the CP5 and CUETP8M2T4 (T4) tunes, POWHEG+HERWIG (H7), and the multiparton simulation MG5_aMC@NLO (MG)+PYTHIA. The ratios of the various predictions to the measured cross sections are shown in the lower panels. |
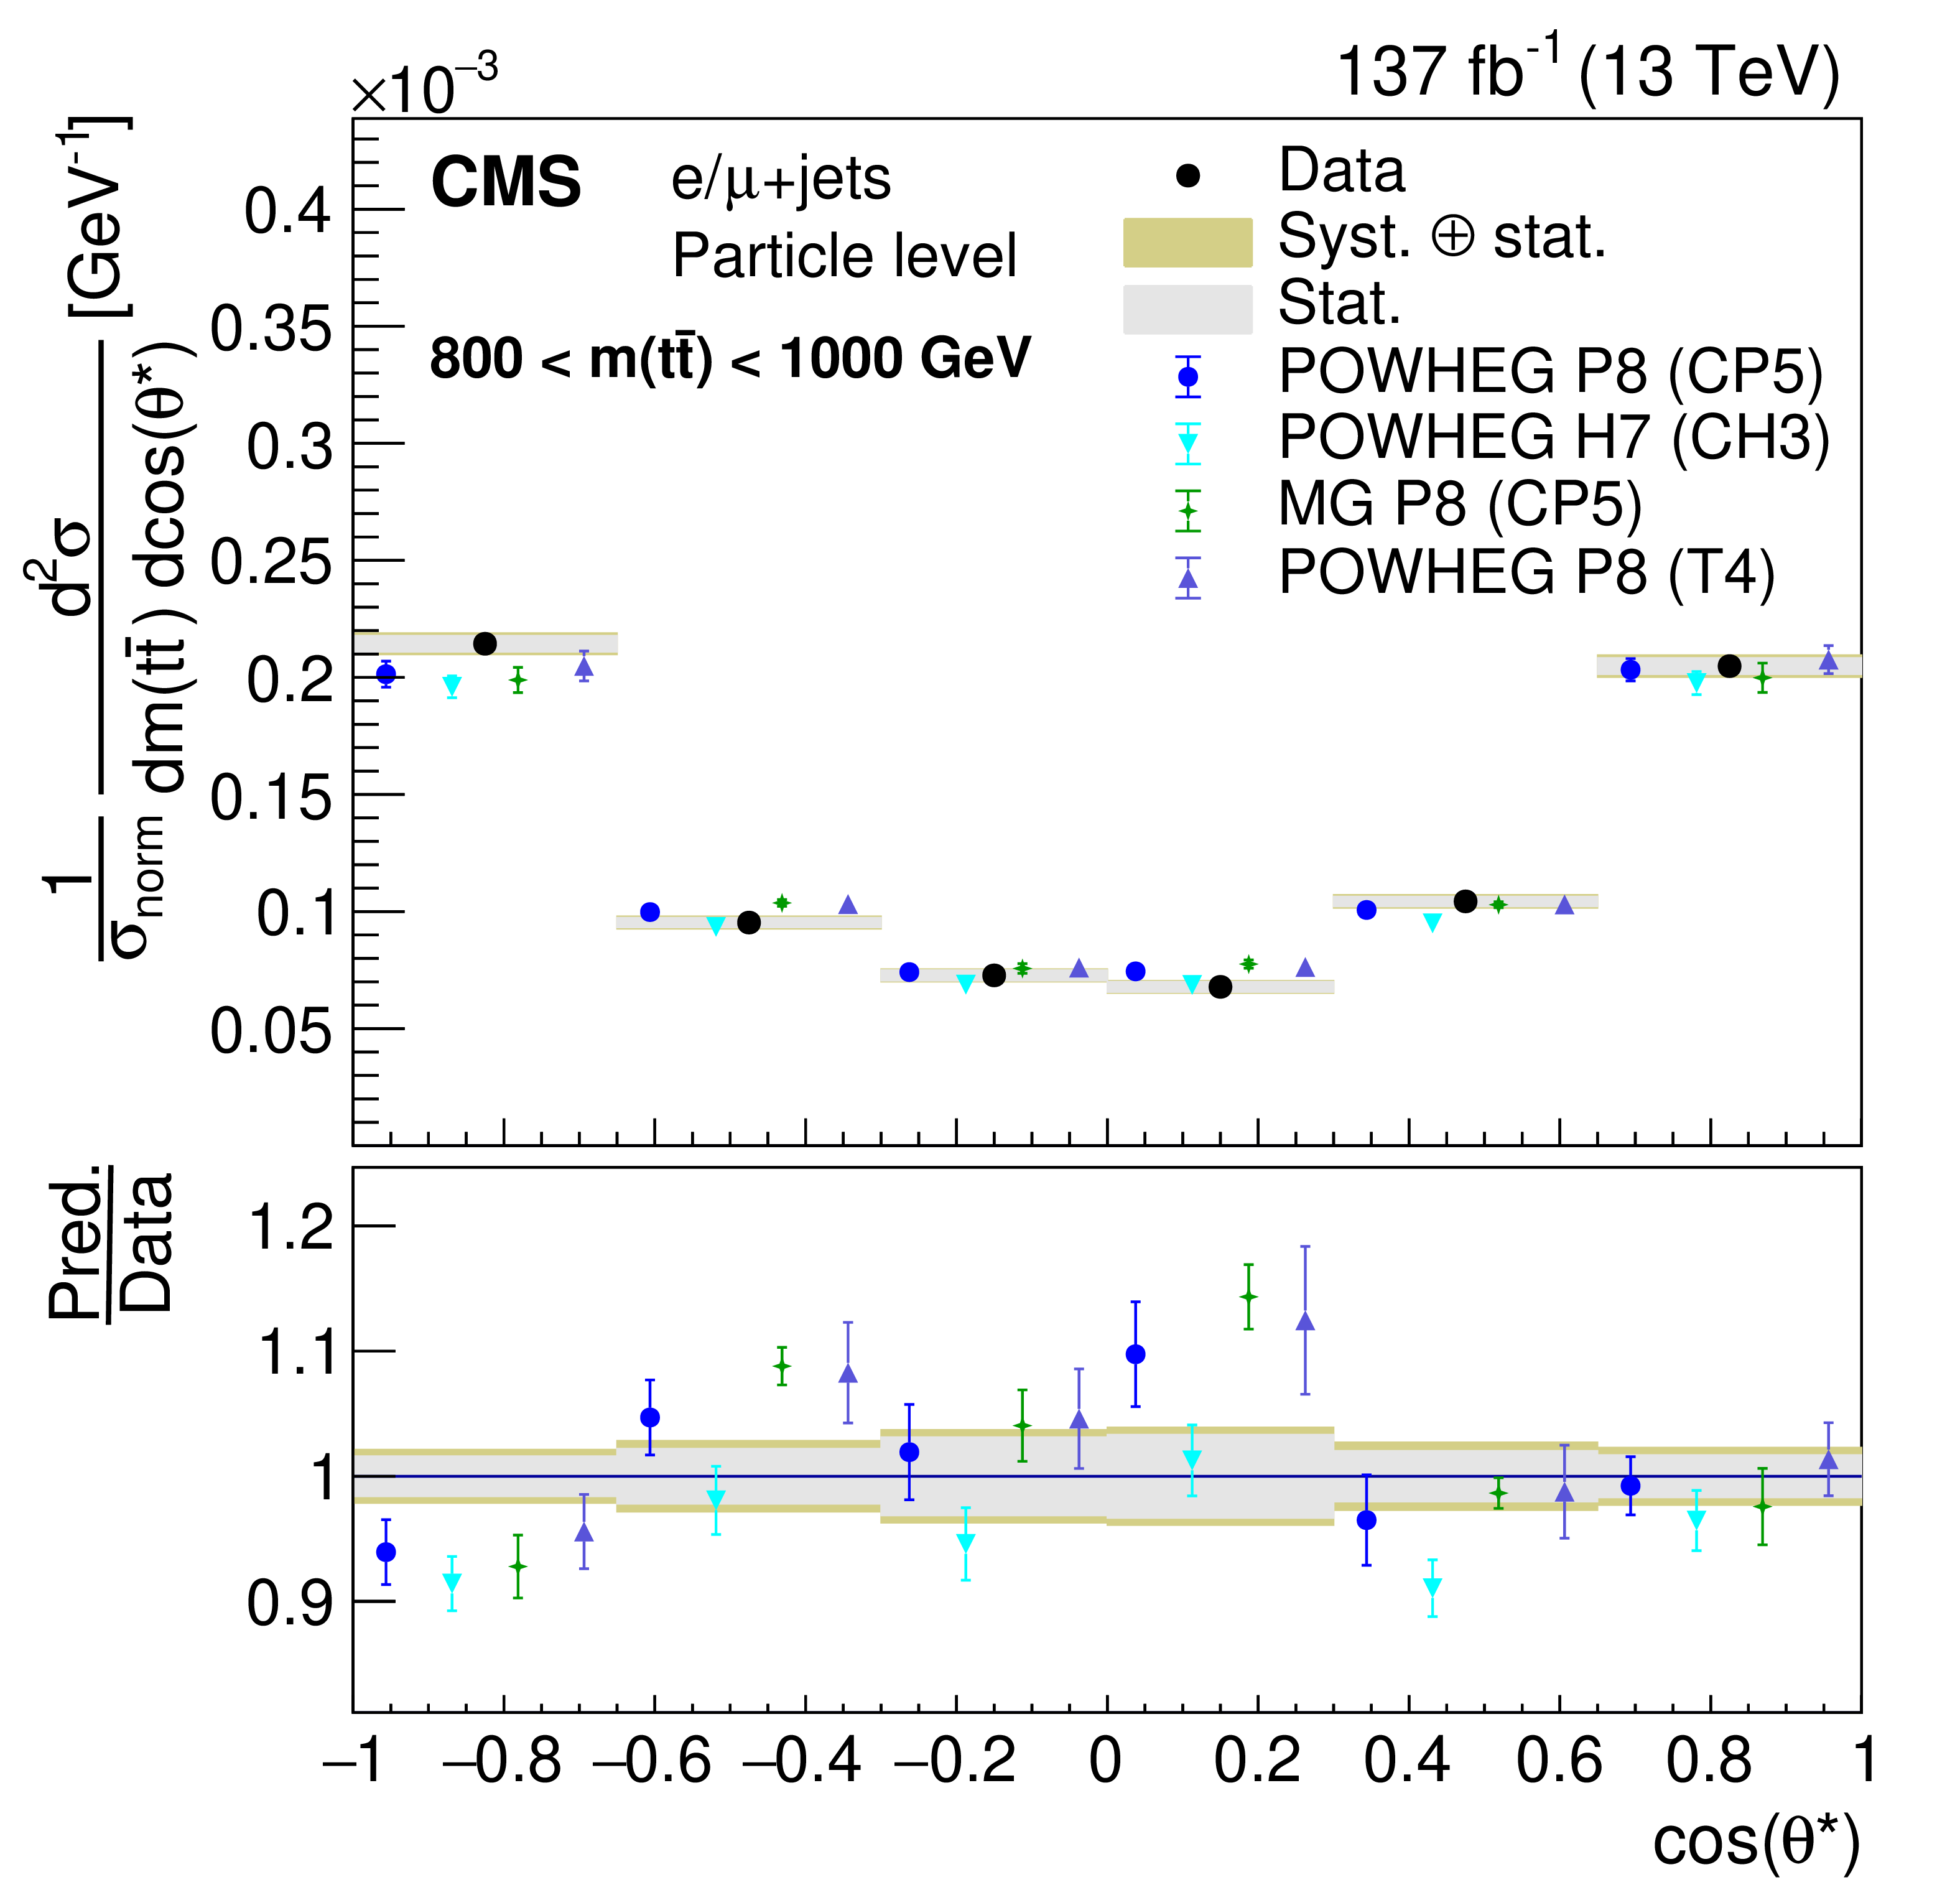
png pdf |
Figure A12-e:
Normalized double-differential cross section at the particle level as a function of ${m({\mathrm{t} {}\mathrm{\bar{t}}})}$ vs.$ {\cos(\theta ^*)}$. The data are shown as points with gray (yellow) bands indicating the statistical (statistical and systematic) uncertainties. The cross sections are compared to the predictions of POWHEG+PYTHIA (P8) for the CP5 and CUETP8M2T4 (T4) tunes, POWHEG+HERWIG (H7), and the multiparton simulation MG5_aMC@NLO (MG)+PYTHIA. The ratios of the various predictions to the measured cross sections are shown in the lower panels. |
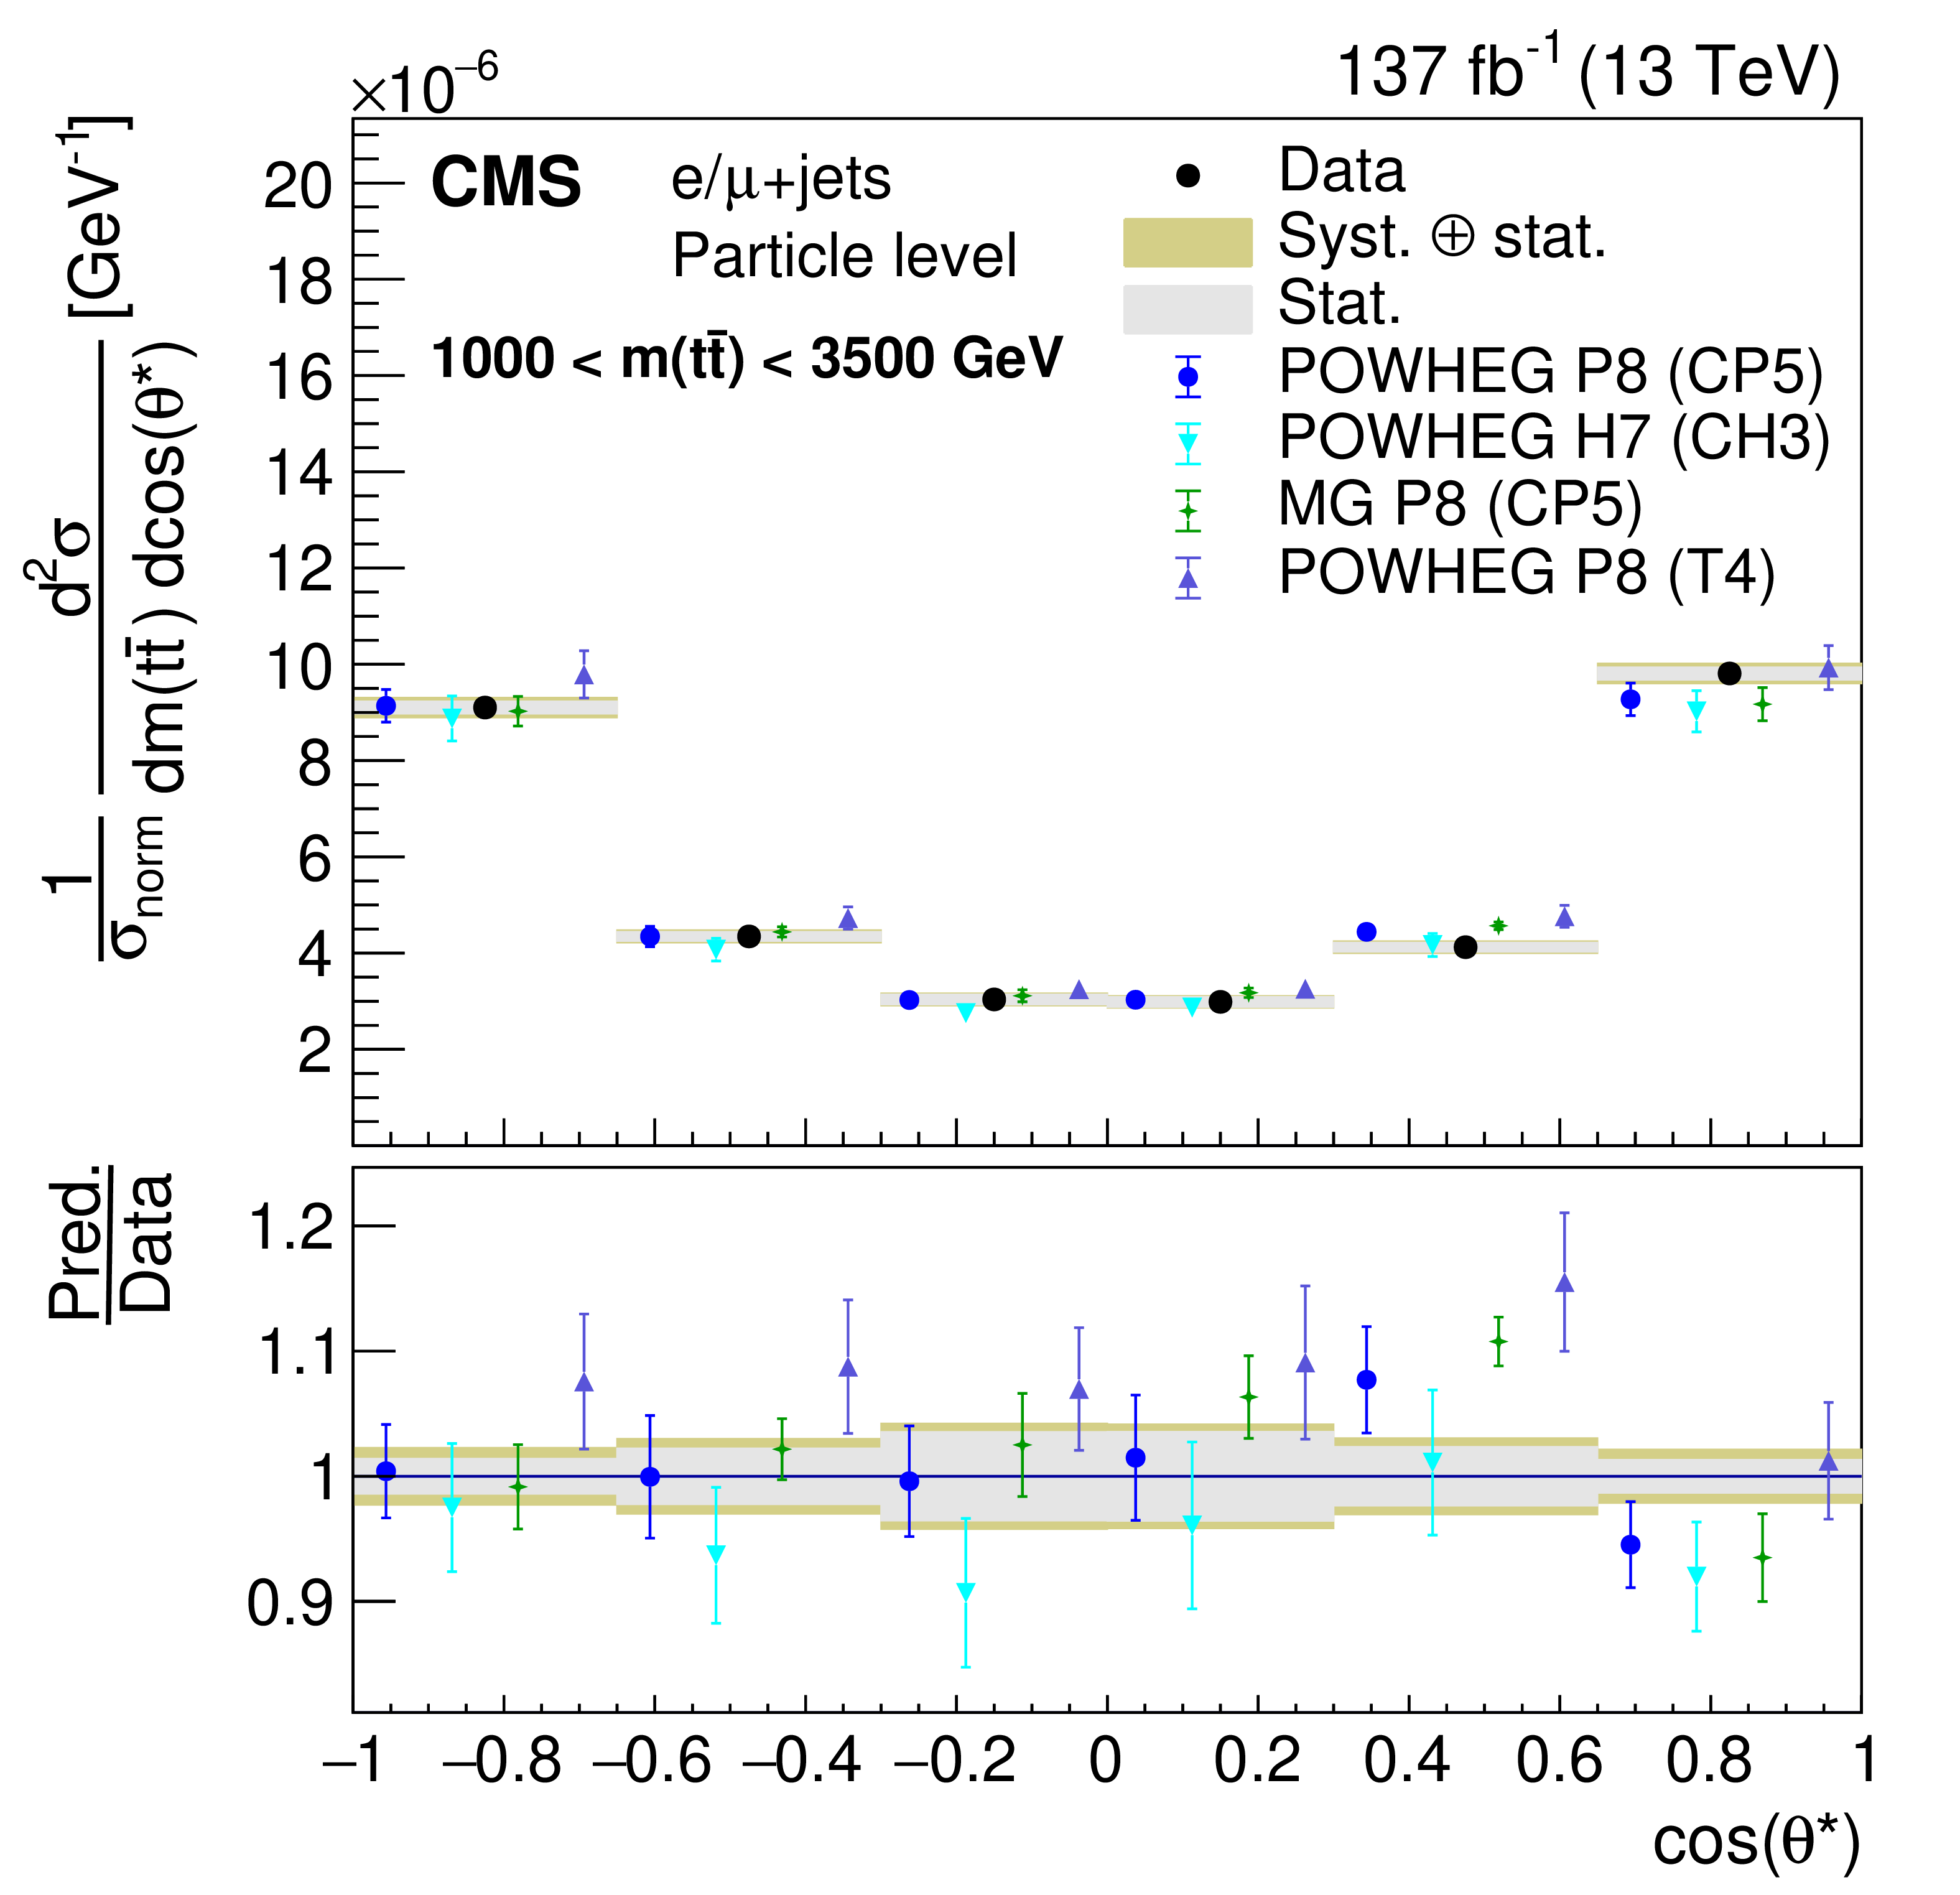
png pdf |
Figure A12-f:
Normalized double-differential cross section at the particle level as a function of ${m({\mathrm{t} {}\mathrm{\bar{t}}})}$ vs.$ {\cos(\theta ^*)}$. The data are shown as points with gray (yellow) bands indicating the statistical (statistical and systematic) uncertainties. The cross sections are compared to the predictions of POWHEG+PYTHIA (P8) for the CP5 and CUETP8M2T4 (T4) tunes, POWHEG+HERWIG (H7), and the multiparton simulation MG5_aMC@NLO (MG)+PYTHIA. The ratios of the various predictions to the measured cross sections are shown in the lower panels. |
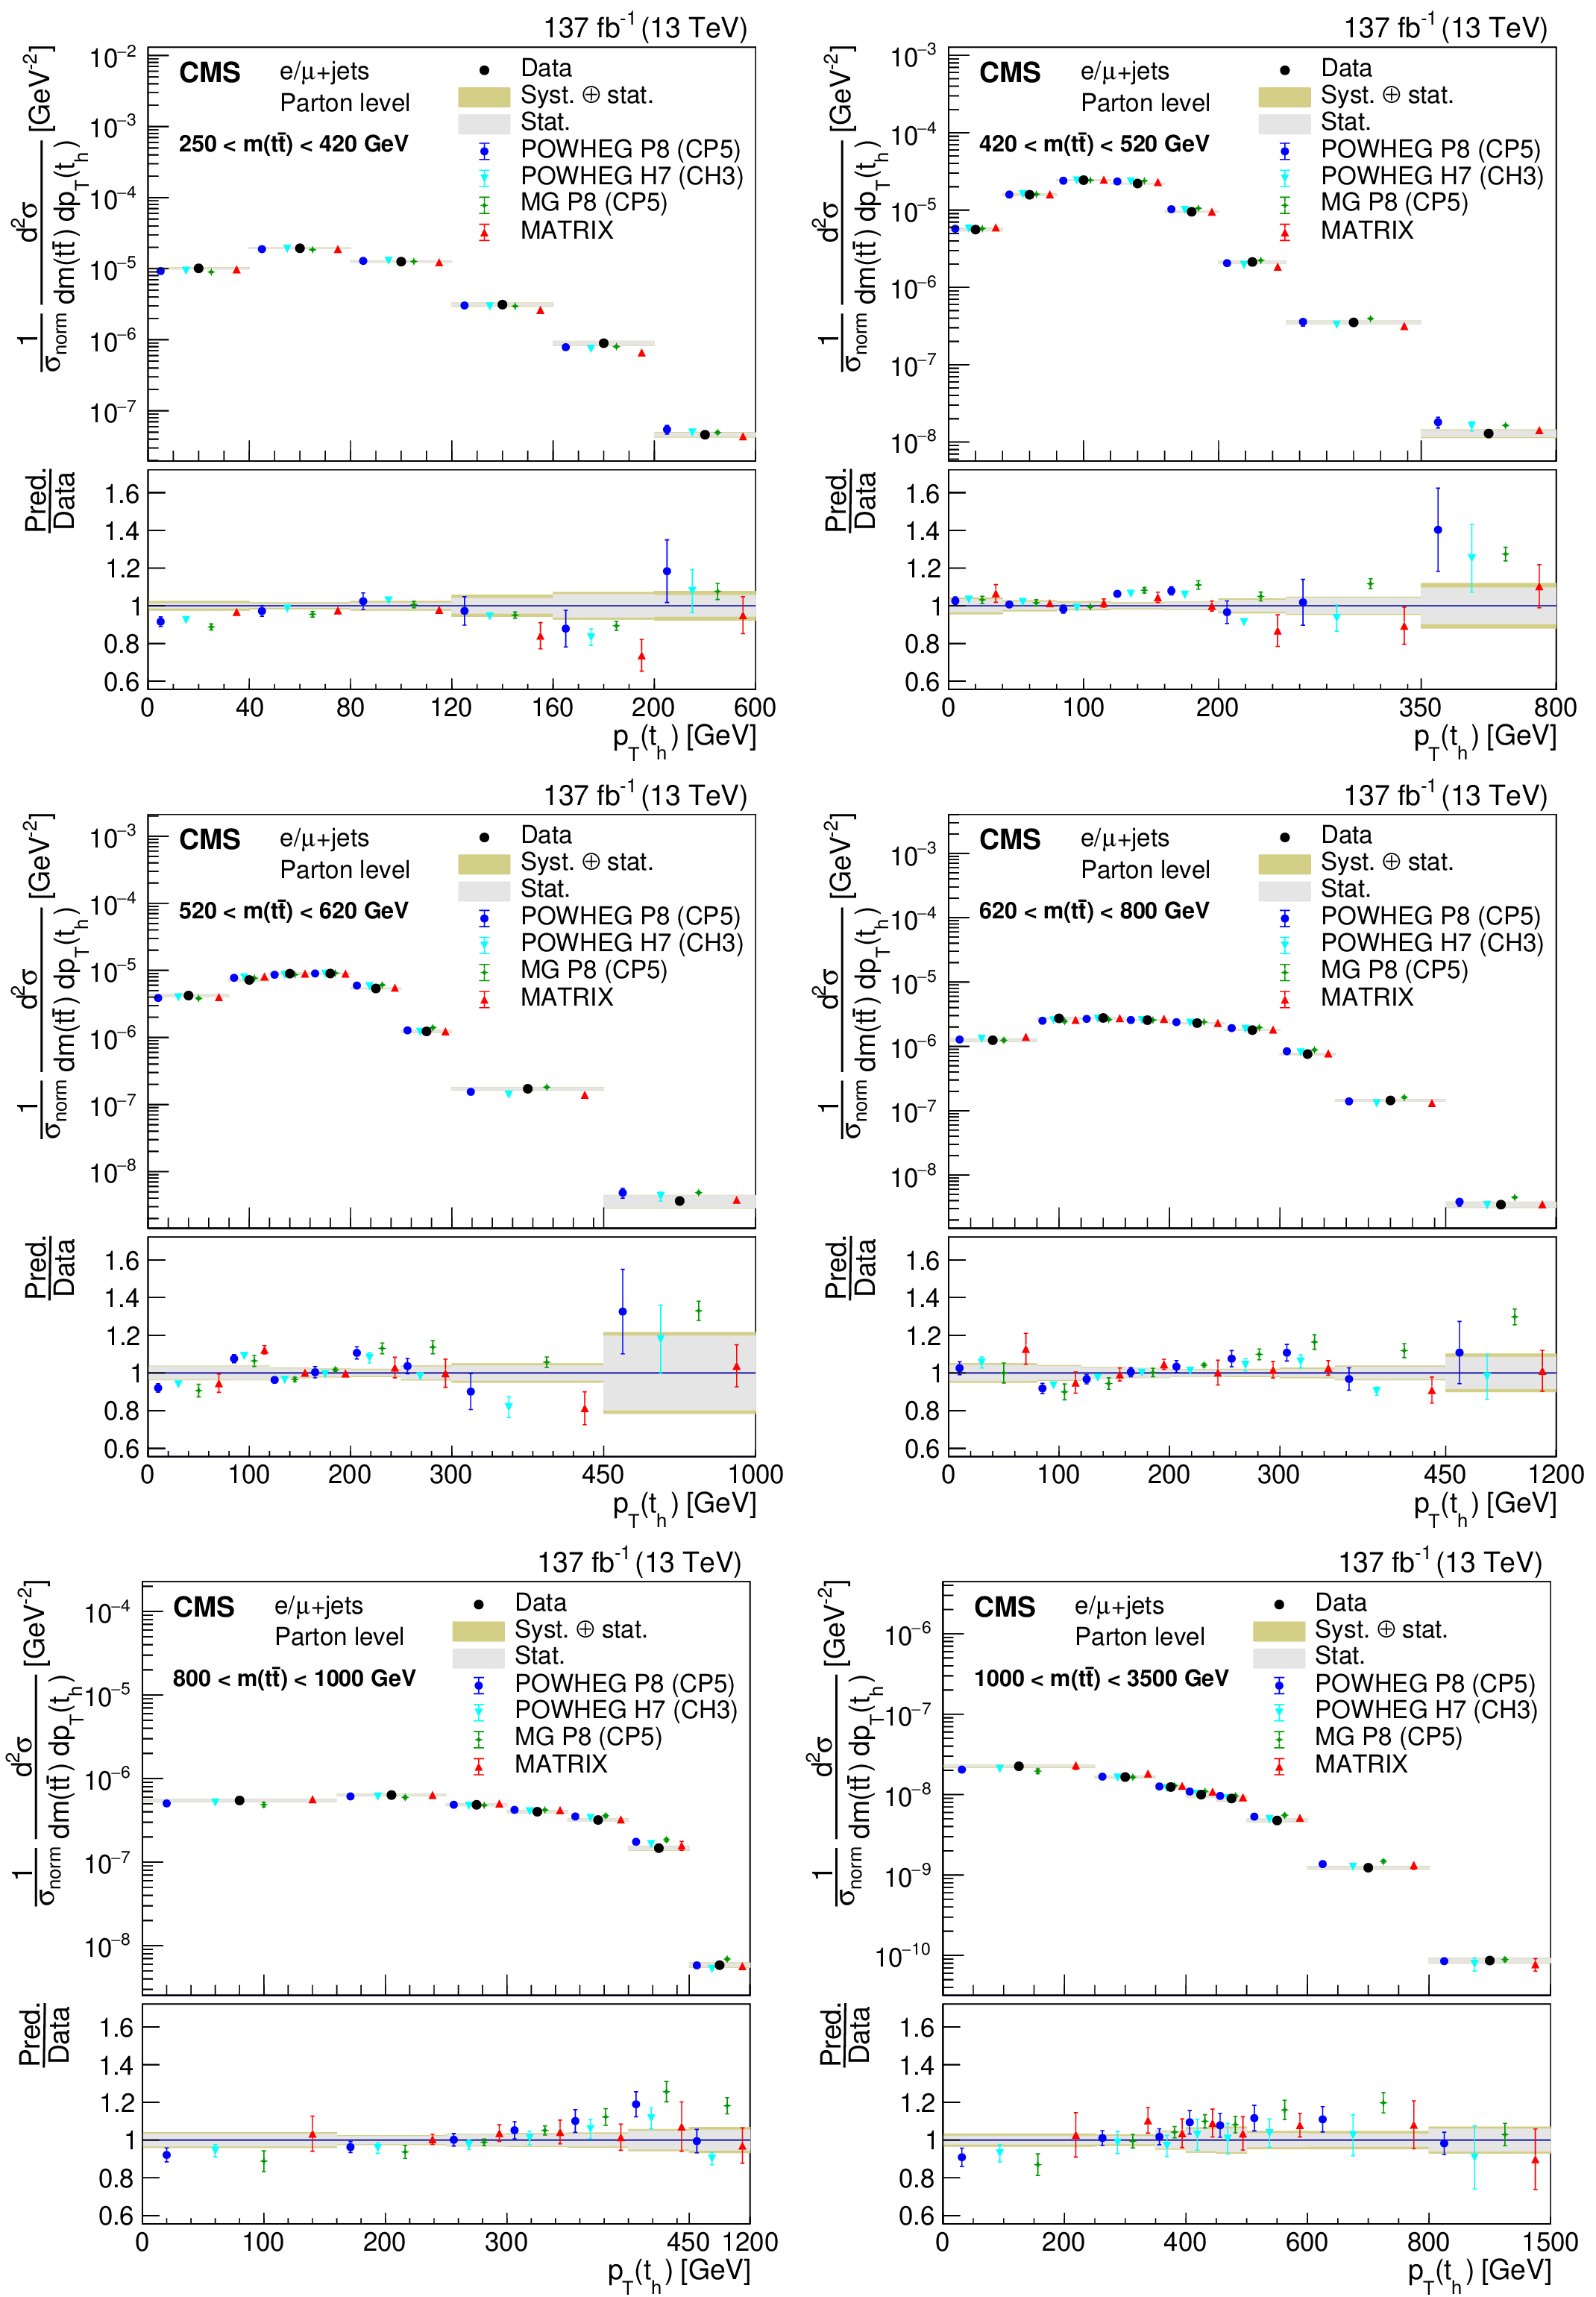
png pdf |
Figure A13:
Normalized double-differential cross section at the parton level as a function of ${m({\mathrm{t} {}\mathrm{\bar{t}}})}$ vs. ${{p_{\mathrm {T}}} ({\mathrm{t} _\mathrm {h}})}$. The data are shown as points with gray (yellow) bands indicating the statistical (statistical and systematic) uncertainties. The cross sections are compared to the predictions of POWHEG combined with PYTHIA (P8) or HERWIG (H7), the multiparton simulation MG5_aMC@NLO (MG)+PYTHIA FxFx, and the NNLO QCD calculations obtained with Matrix. The ratios of the various predictions to the measured cross sections are shown in the lower panels. |
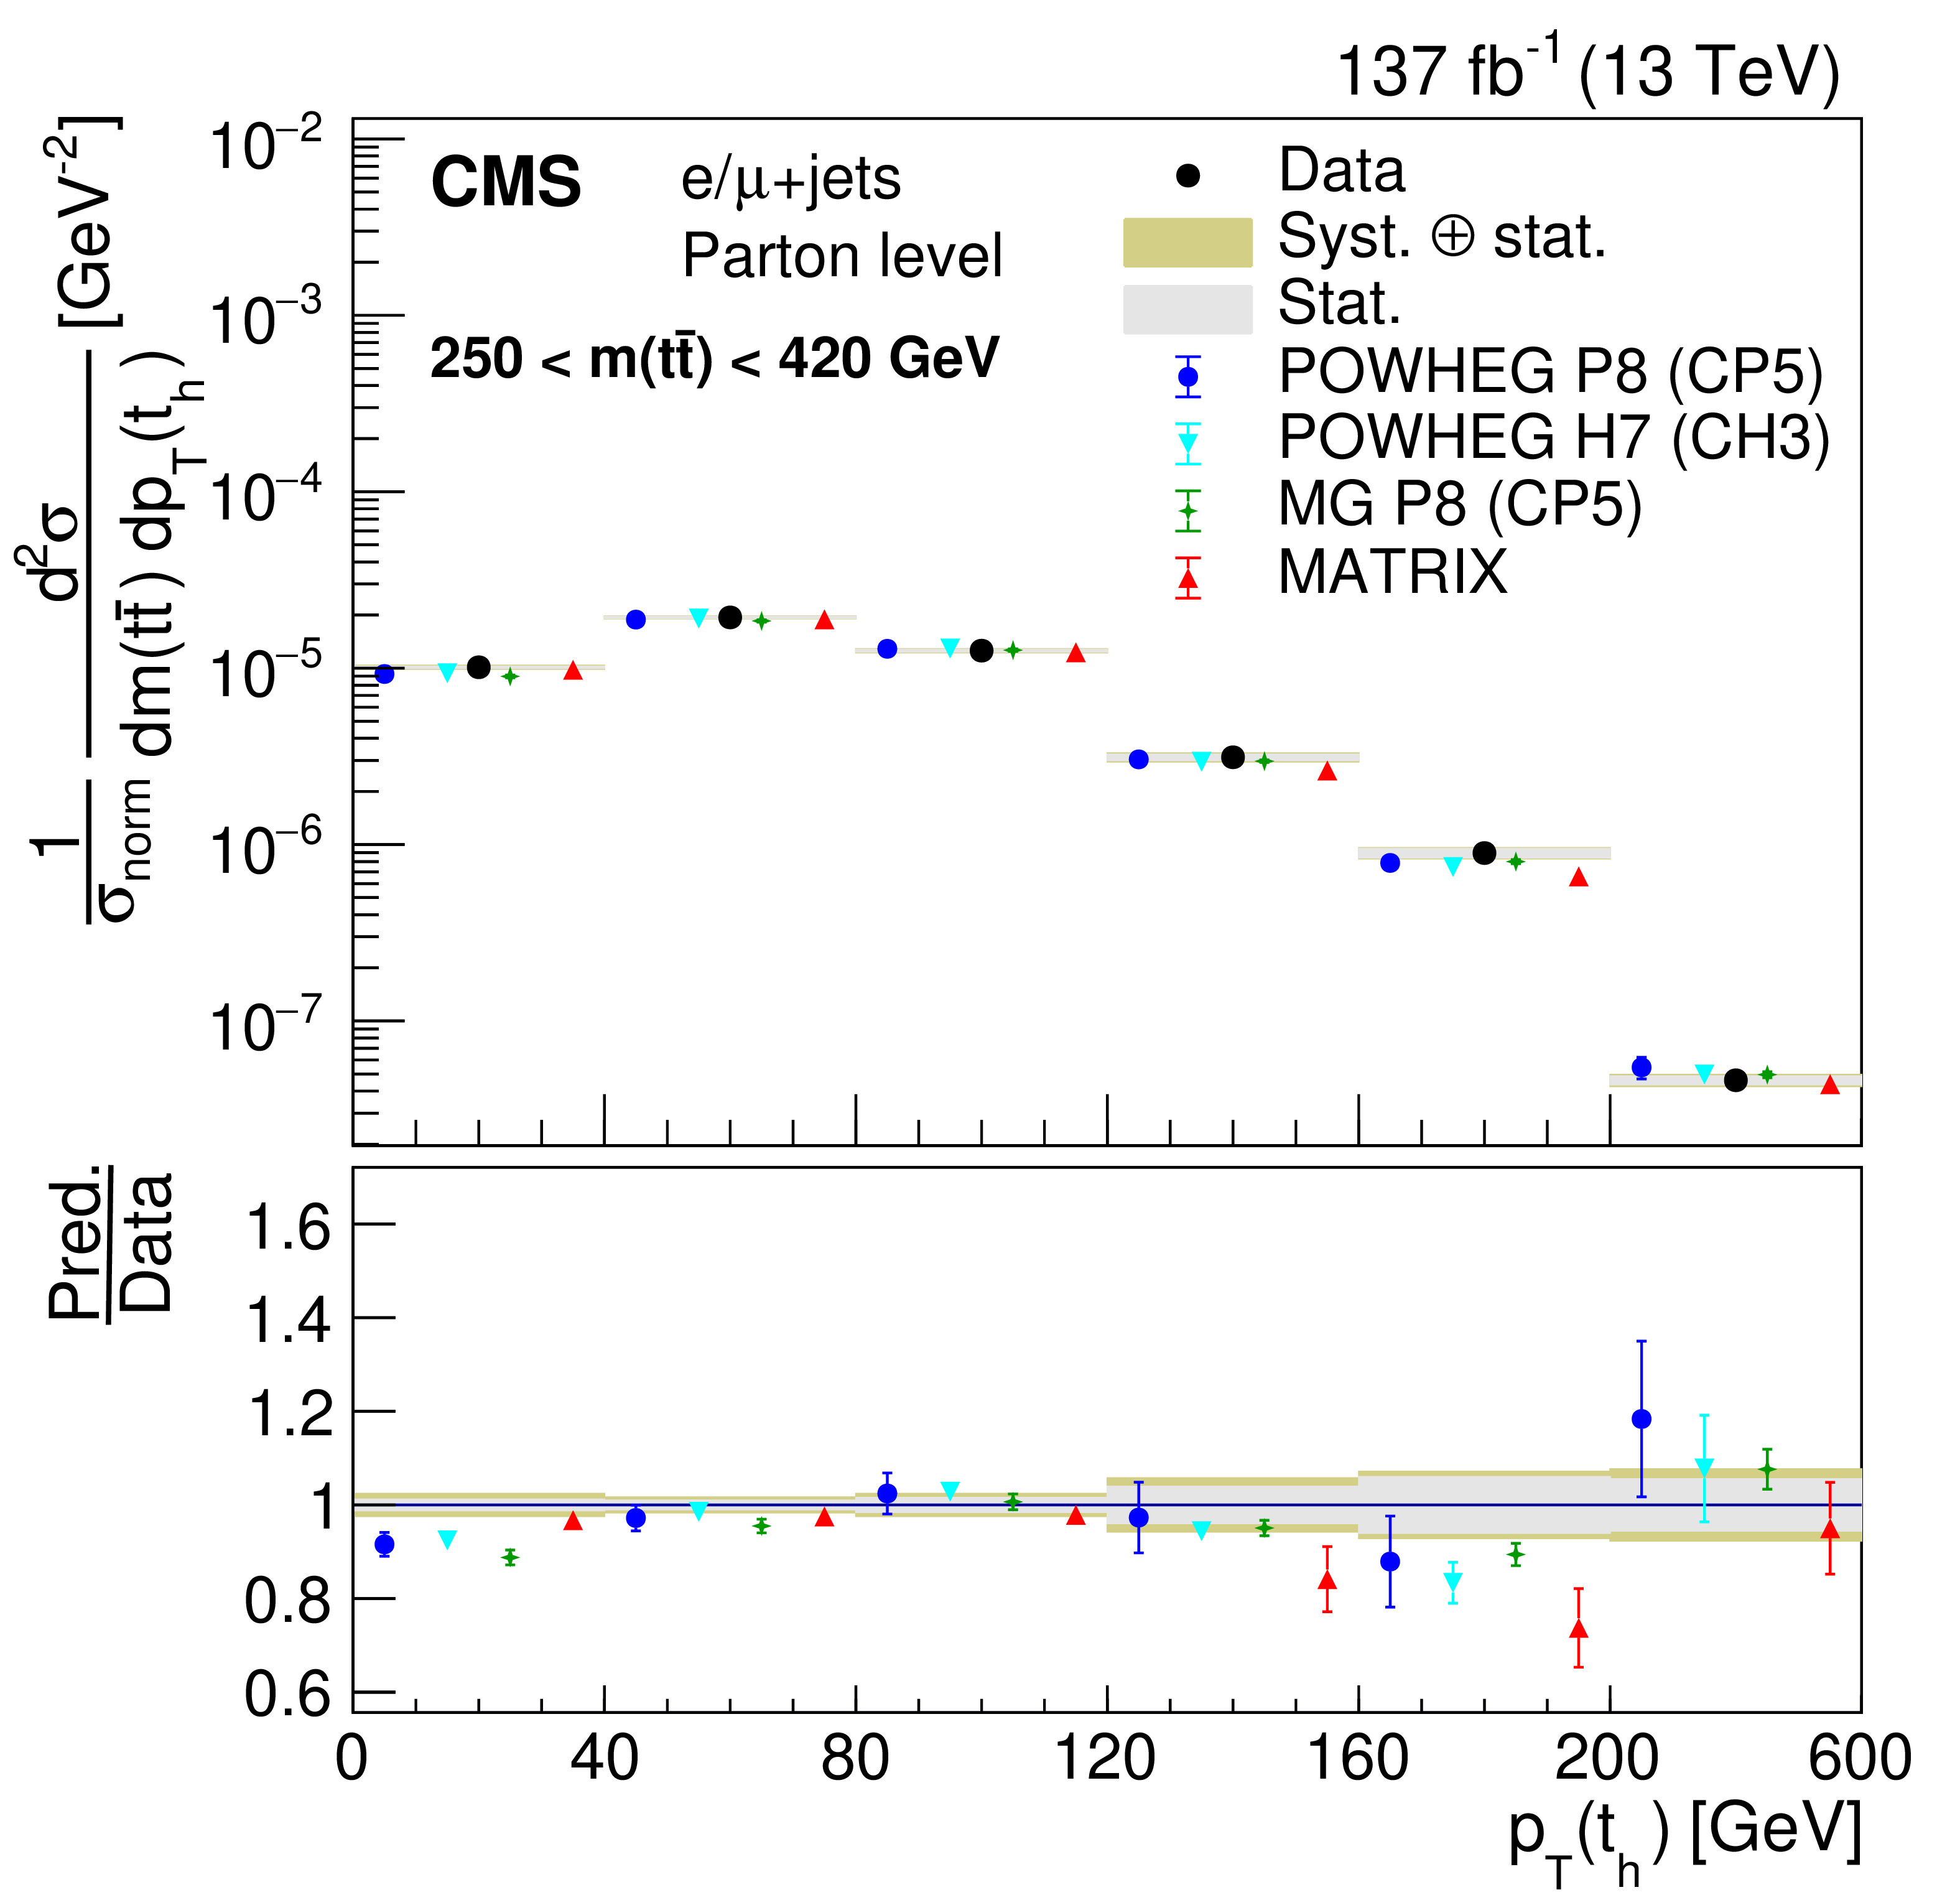
png pdf |
Figure A13-a:
Normalized double-differential cross section at the parton level as a function of ${m({\mathrm{t} {}\mathrm{\bar{t}}})}$ vs. ${{p_{\mathrm {T}}} ({\mathrm{t} _\mathrm {h}})}$. The data are shown as points with gray (yellow) bands indicating the statistical (statistical and systematic) uncertainties. The cross sections are compared to the predictions of POWHEG combined with PYTHIA (P8) or HERWIG (H7), the multiparton simulation MG5_aMC@NLO (MG)+PYTHIA FxFx, and the NNLO QCD calculations obtained with Matrix. The ratios of the various predictions to the measured cross sections are shown in the lower panels. |
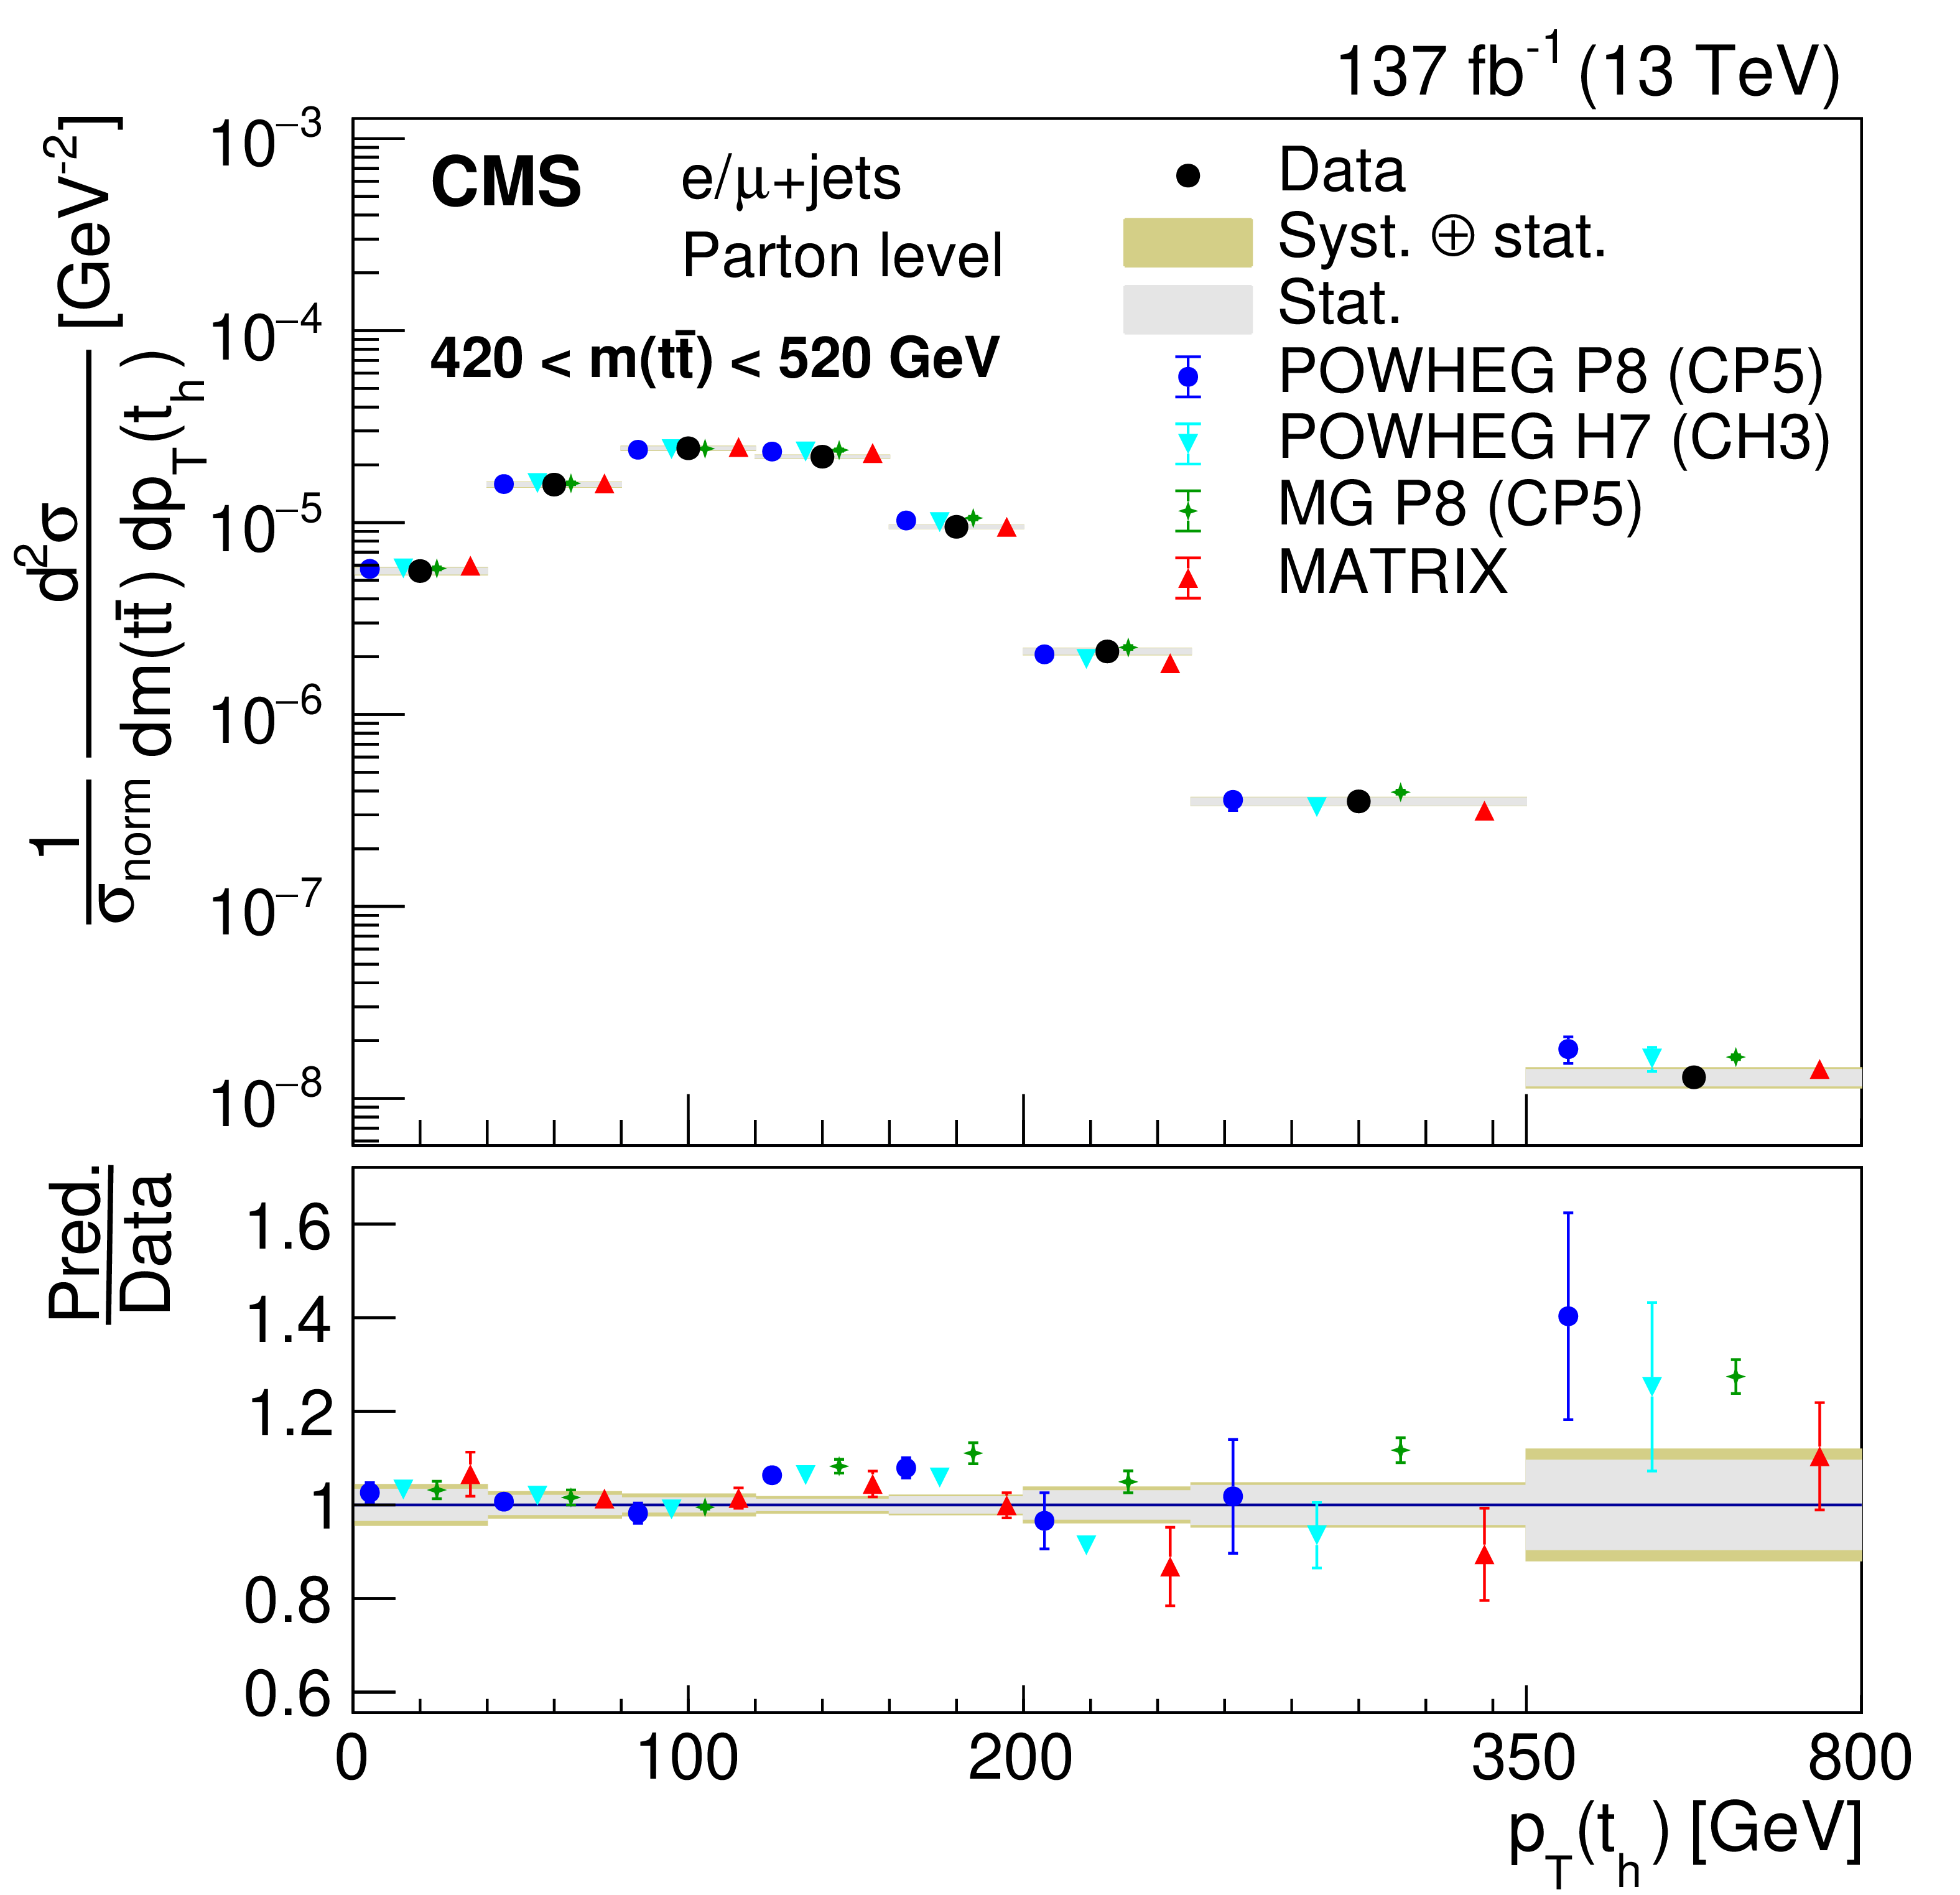
png pdf |
Figure A13-b:
Normalized double-differential cross section at the parton level as a function of ${m({\mathrm{t} {}\mathrm{\bar{t}}})}$ vs. ${{p_{\mathrm {T}}} ({\mathrm{t} _\mathrm {h}})}$. The data are shown as points with gray (yellow) bands indicating the statistical (statistical and systematic) uncertainties. The cross sections are compared to the predictions of POWHEG combined with PYTHIA (P8) or HERWIG (H7), the multiparton simulation MG5_aMC@NLO (MG)+PYTHIA FxFx, and the NNLO QCD calculations obtained with Matrix. The ratios of the various predictions to the measured cross sections are shown in the lower panels. |
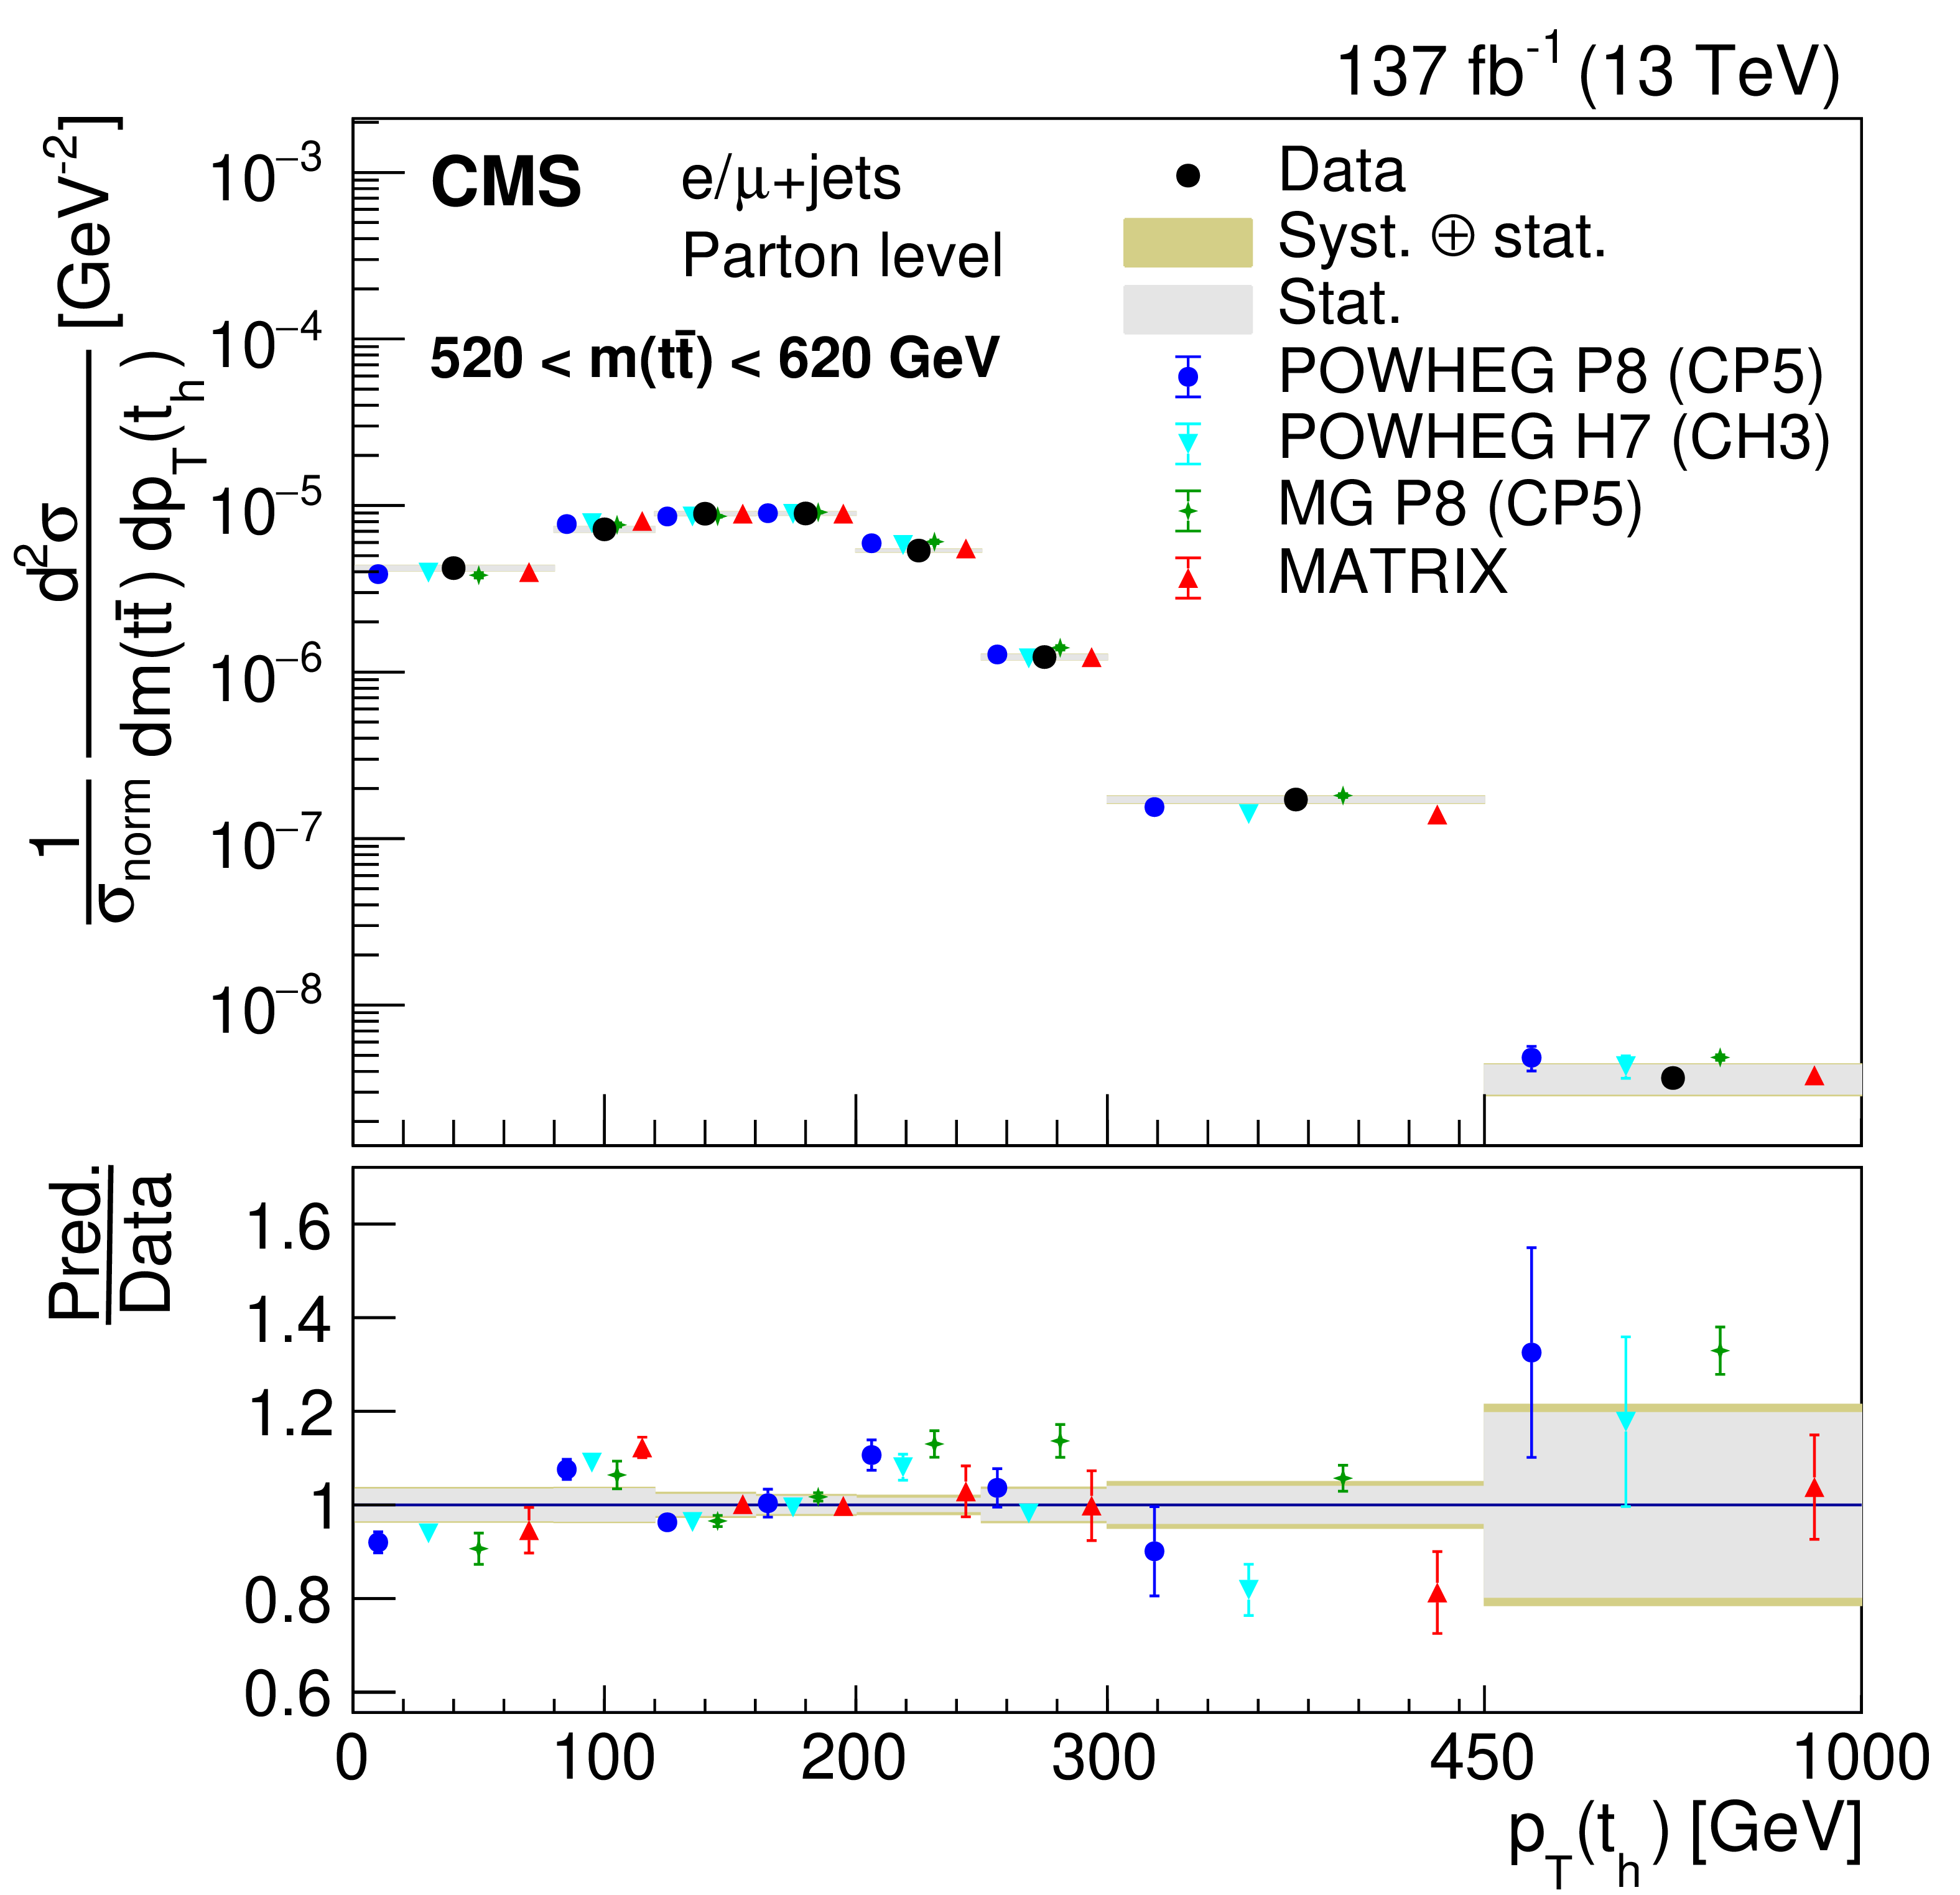
png pdf |
Figure A13-c:
Normalized double-differential cross section at the parton level as a function of ${m({\mathrm{t} {}\mathrm{\bar{t}}})}$ vs. ${{p_{\mathrm {T}}} ({\mathrm{t} _\mathrm {h}})}$. The data are shown as points with gray (yellow) bands indicating the statistical (statistical and systematic) uncertainties. The cross sections are compared to the predictions of POWHEG combined with PYTHIA (P8) or HERWIG (H7), the multiparton simulation MG5_aMC@NLO (MG)+PYTHIA FxFx, and the NNLO QCD calculations obtained with Matrix. The ratios of the various predictions to the measured cross sections are shown in the lower panels. |
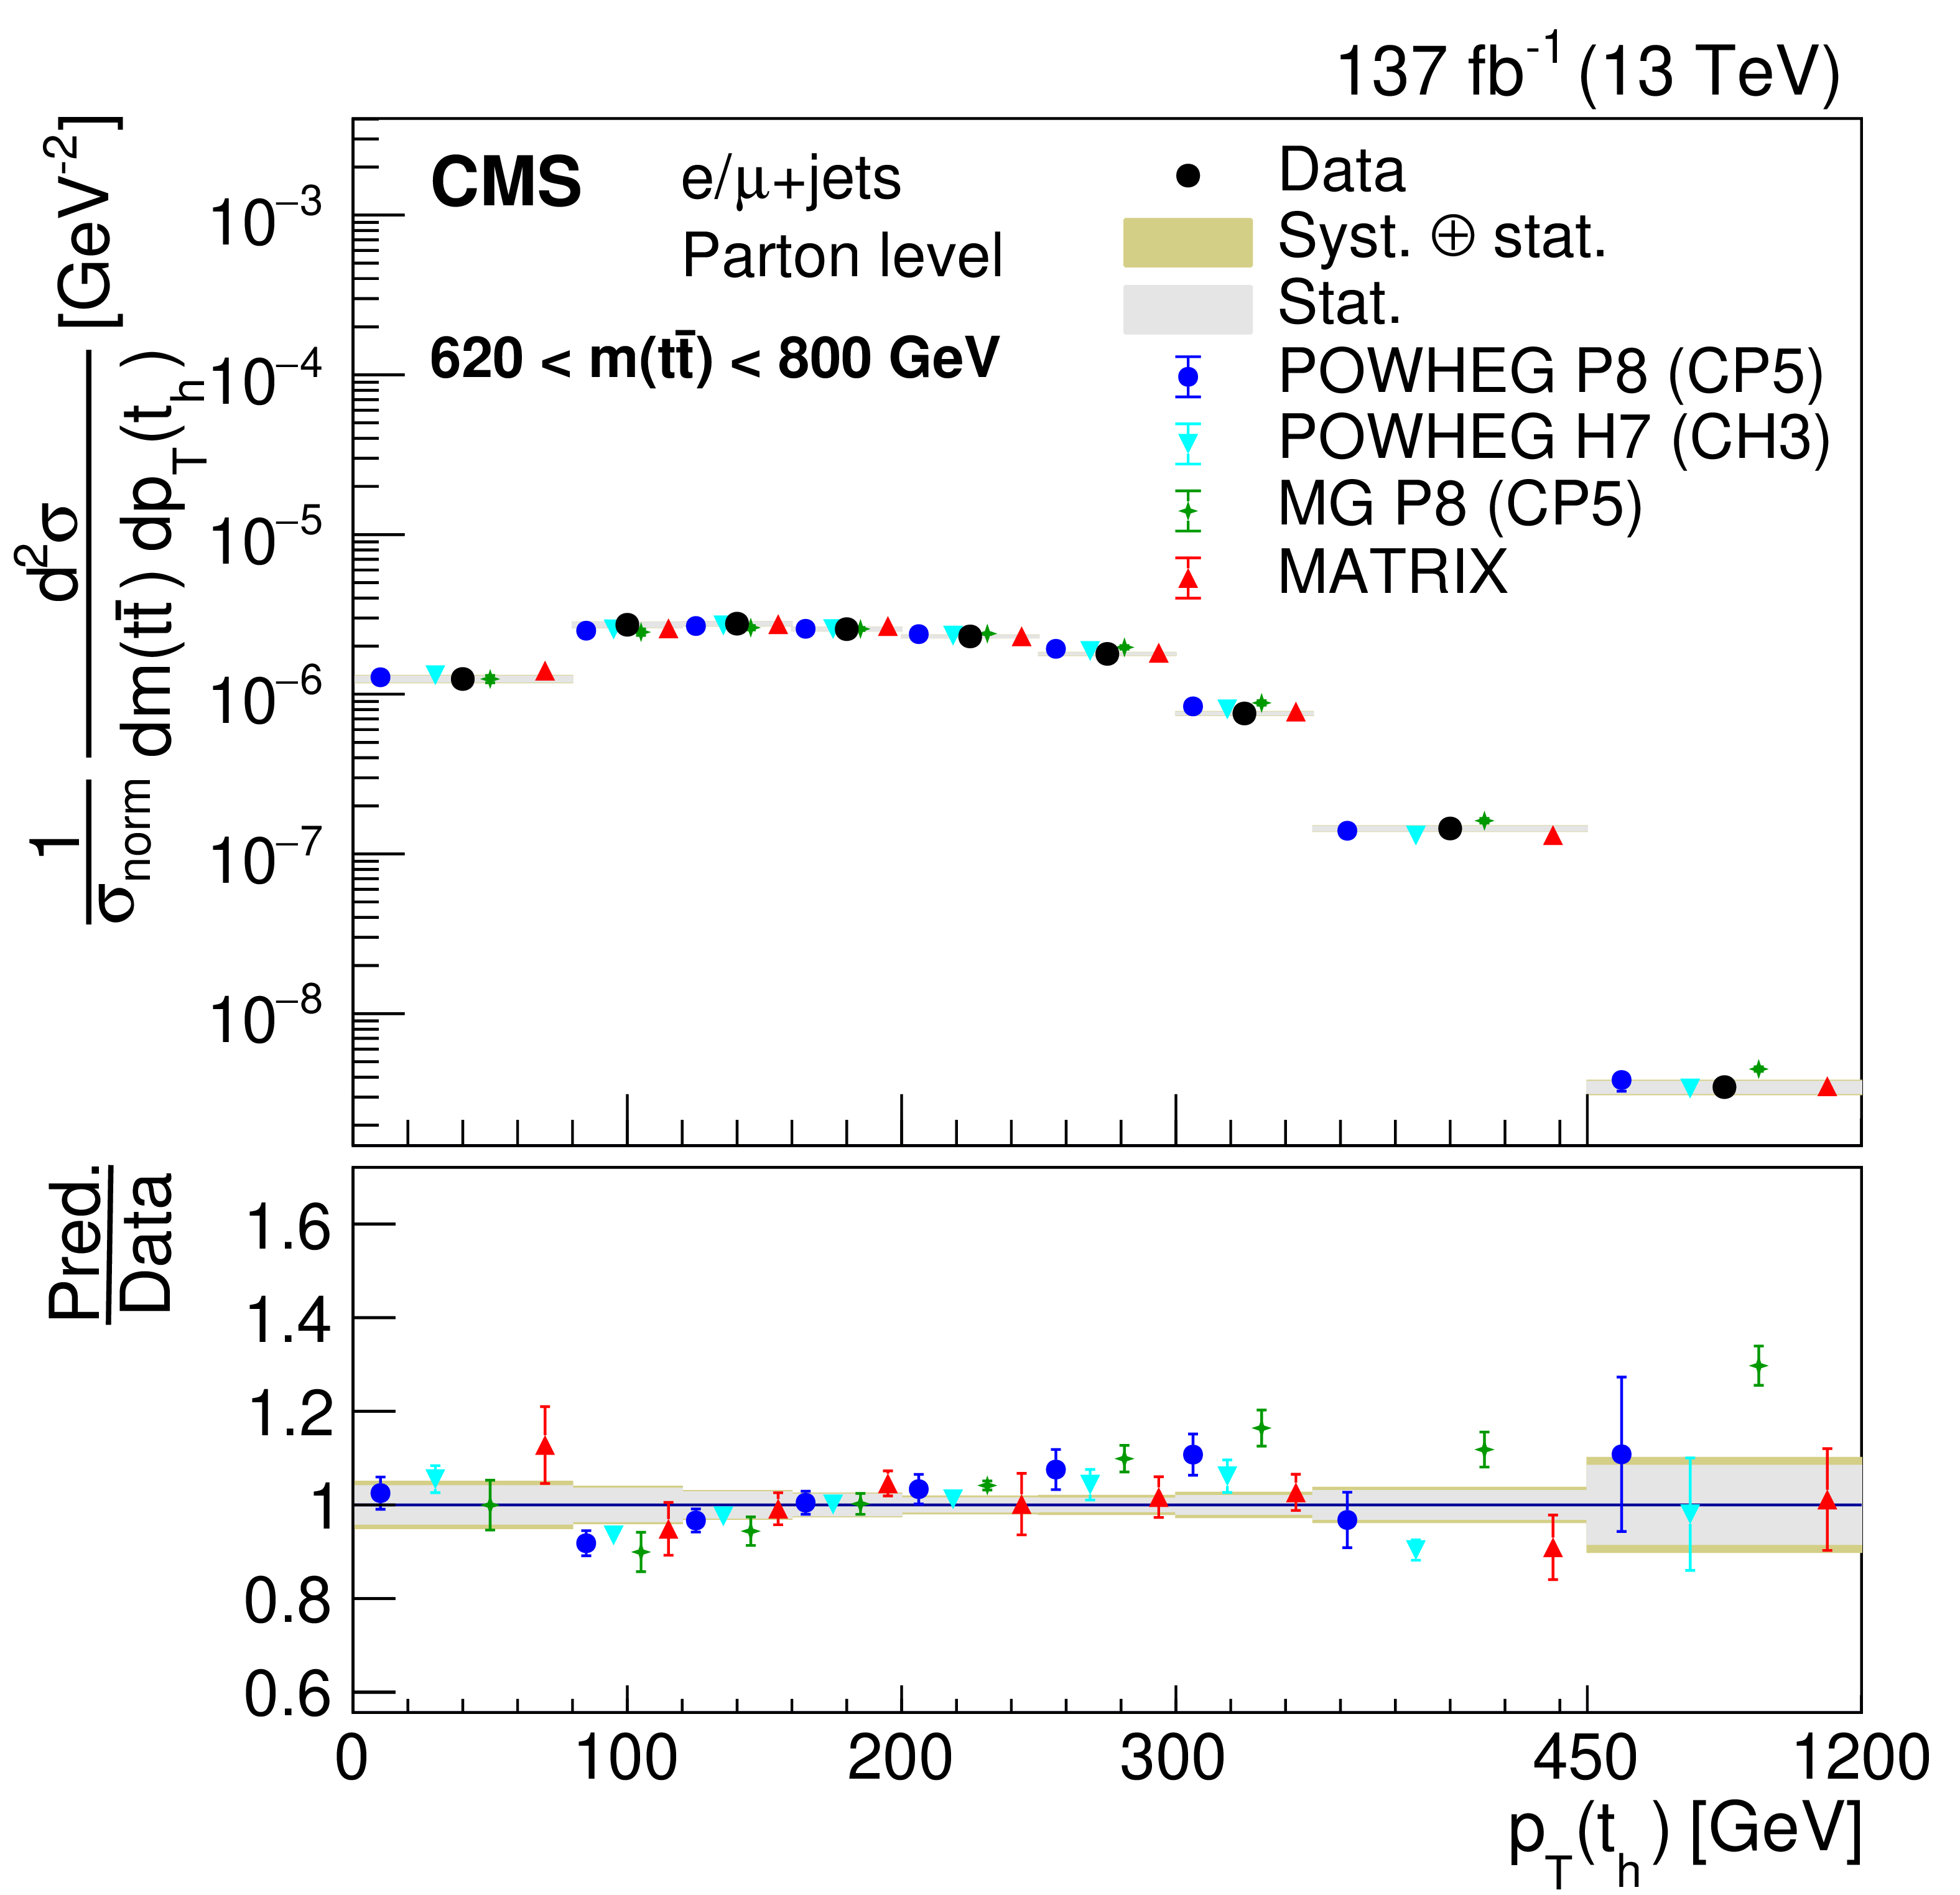
png pdf |
Figure A13-d:
Normalized double-differential cross section at the parton level as a function of ${m({\mathrm{t} {}\mathrm{\bar{t}}})}$ vs. ${{p_{\mathrm {T}}} ({\mathrm{t} _\mathrm {h}})}$. The data are shown as points with gray (yellow) bands indicating the statistical (statistical and systematic) uncertainties. The cross sections are compared to the predictions of POWHEG combined with PYTHIA (P8) or HERWIG (H7), the multiparton simulation MG5_aMC@NLO (MG)+PYTHIA FxFx, and the NNLO QCD calculations obtained with Matrix. The ratios of the various predictions to the measured cross sections are shown in the lower panels. |
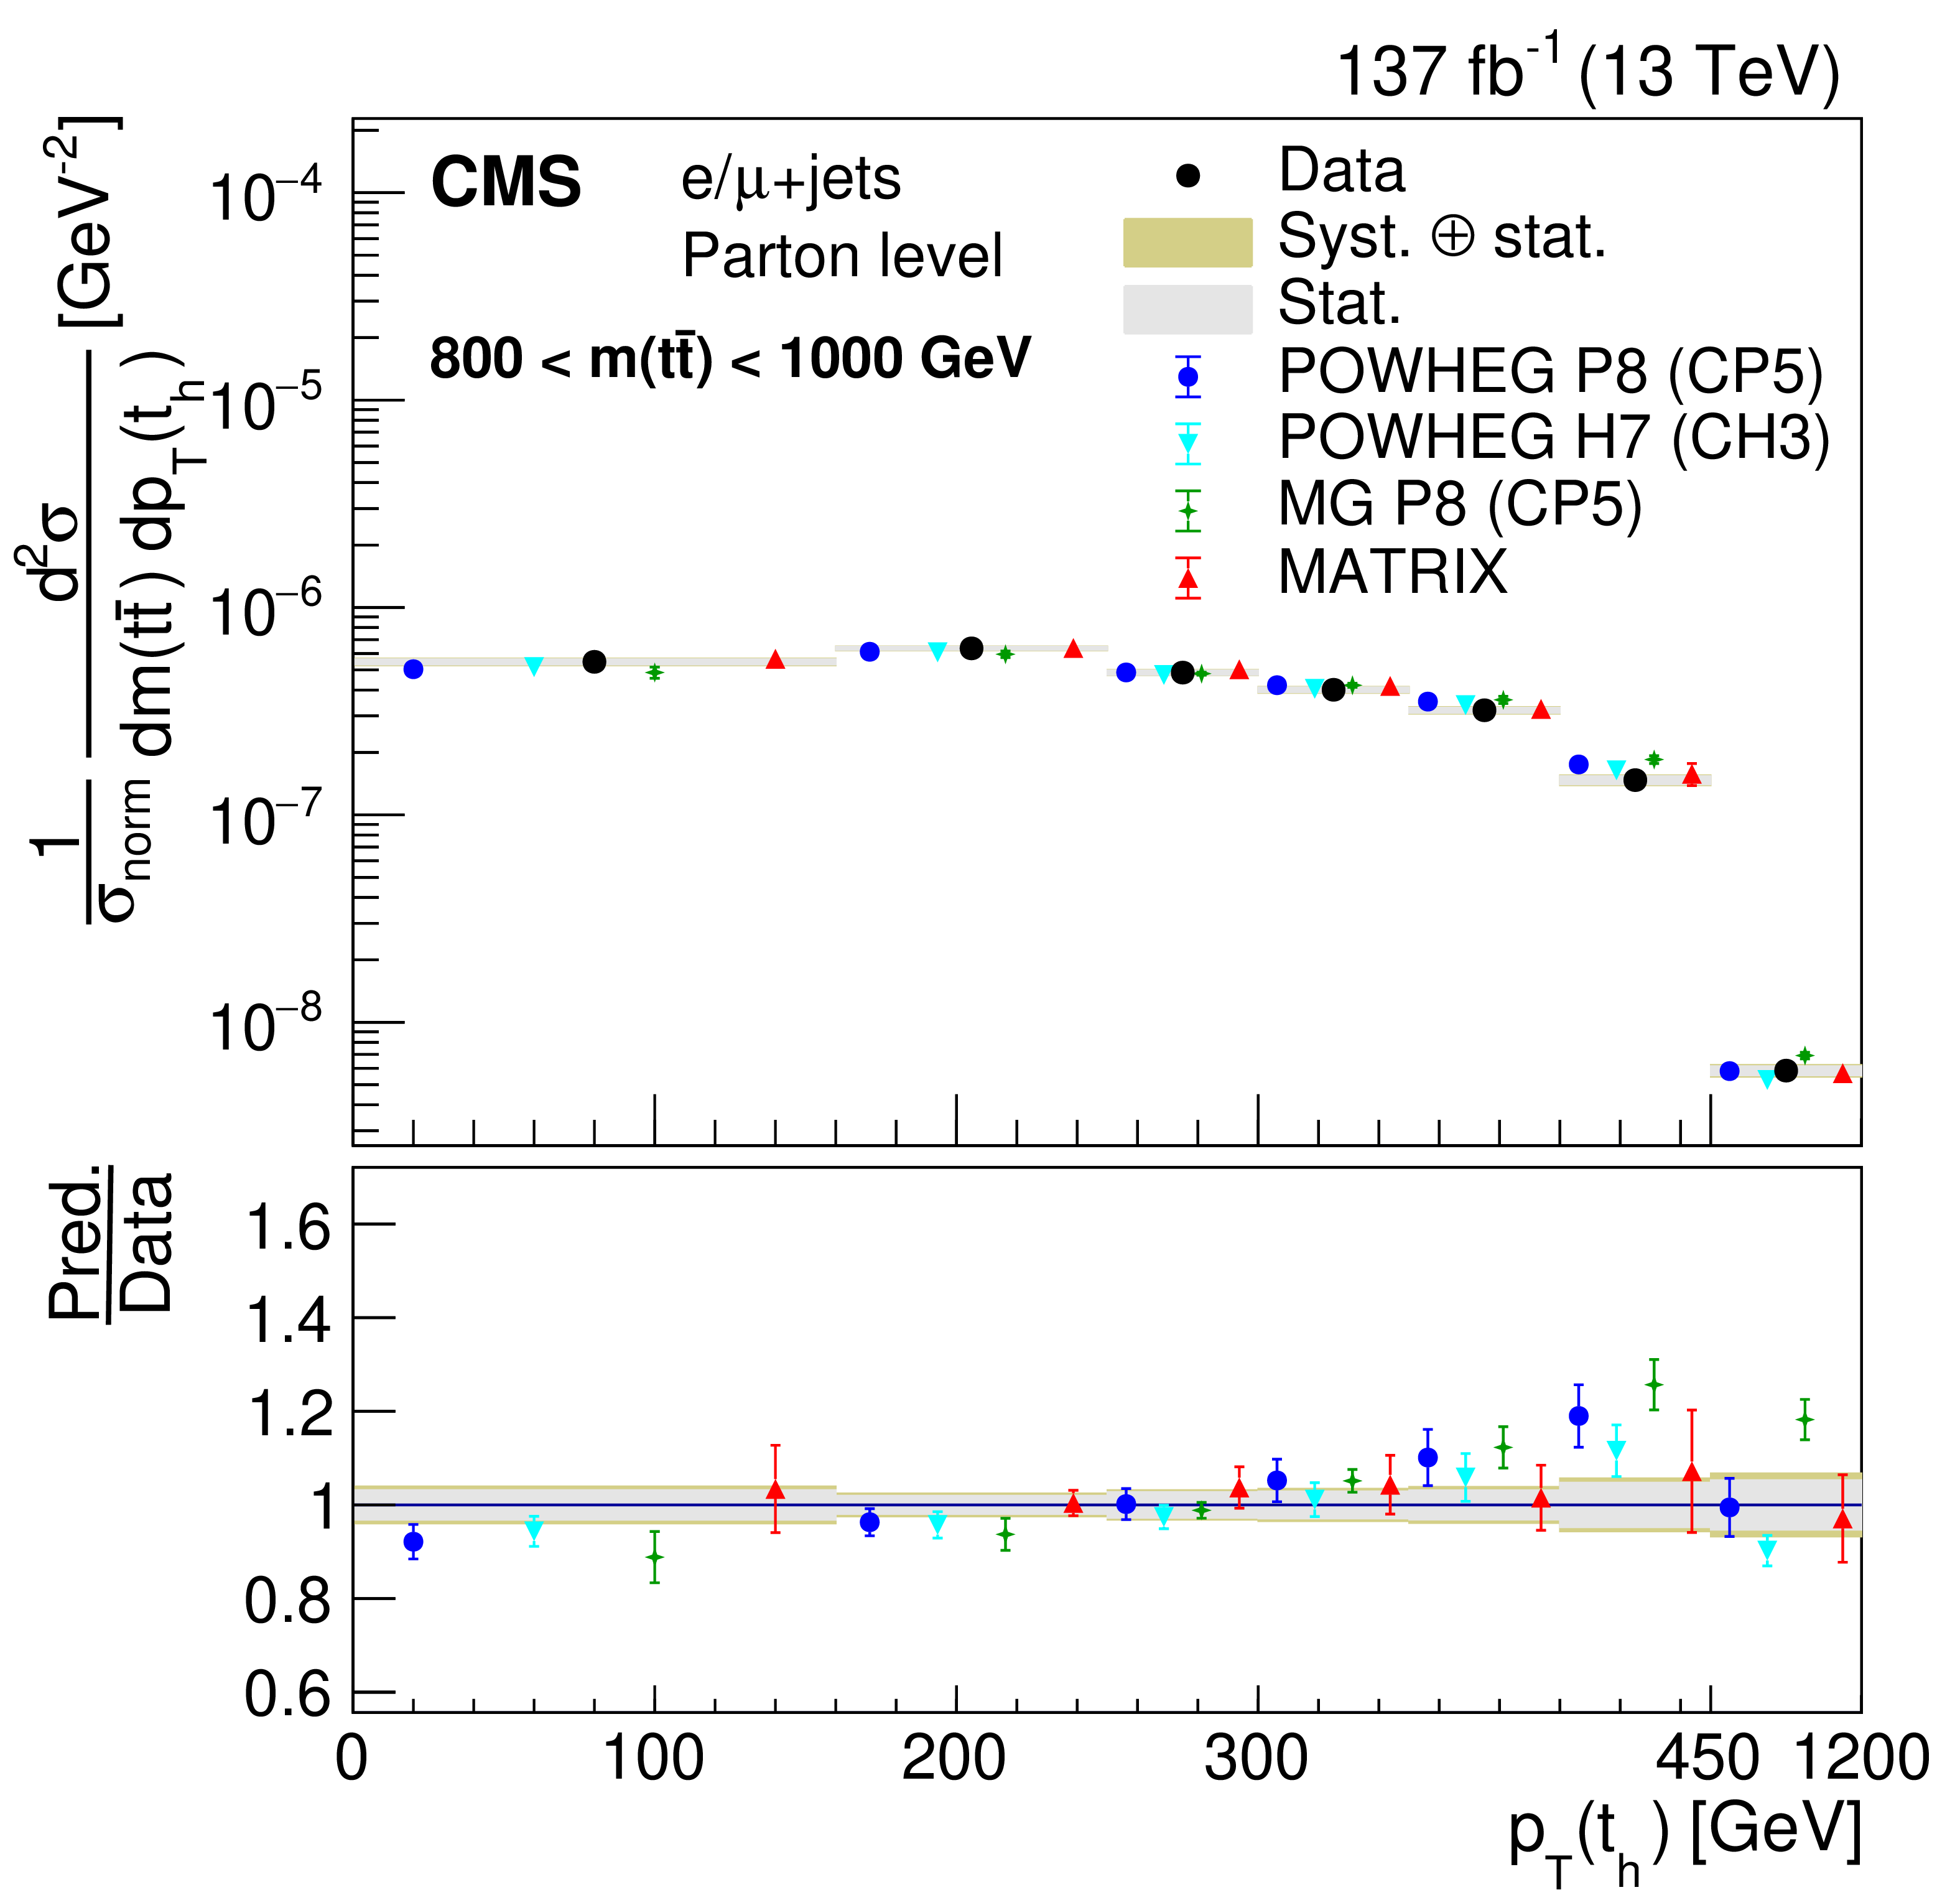
png pdf |
Figure A13-e:
Normalized double-differential cross section at the parton level as a function of ${m({\mathrm{t} {}\mathrm{\bar{t}}})}$ vs. ${{p_{\mathrm {T}}} ({\mathrm{t} _\mathrm {h}})}$. The data are shown as points with gray (yellow) bands indicating the statistical (statistical and systematic) uncertainties. The cross sections are compared to the predictions of POWHEG combined with PYTHIA (P8) or HERWIG (H7), the multiparton simulation MG5_aMC@NLO (MG)+PYTHIA FxFx, and the NNLO QCD calculations obtained with Matrix. The ratios of the various predictions to the measured cross sections are shown in the lower panels. |
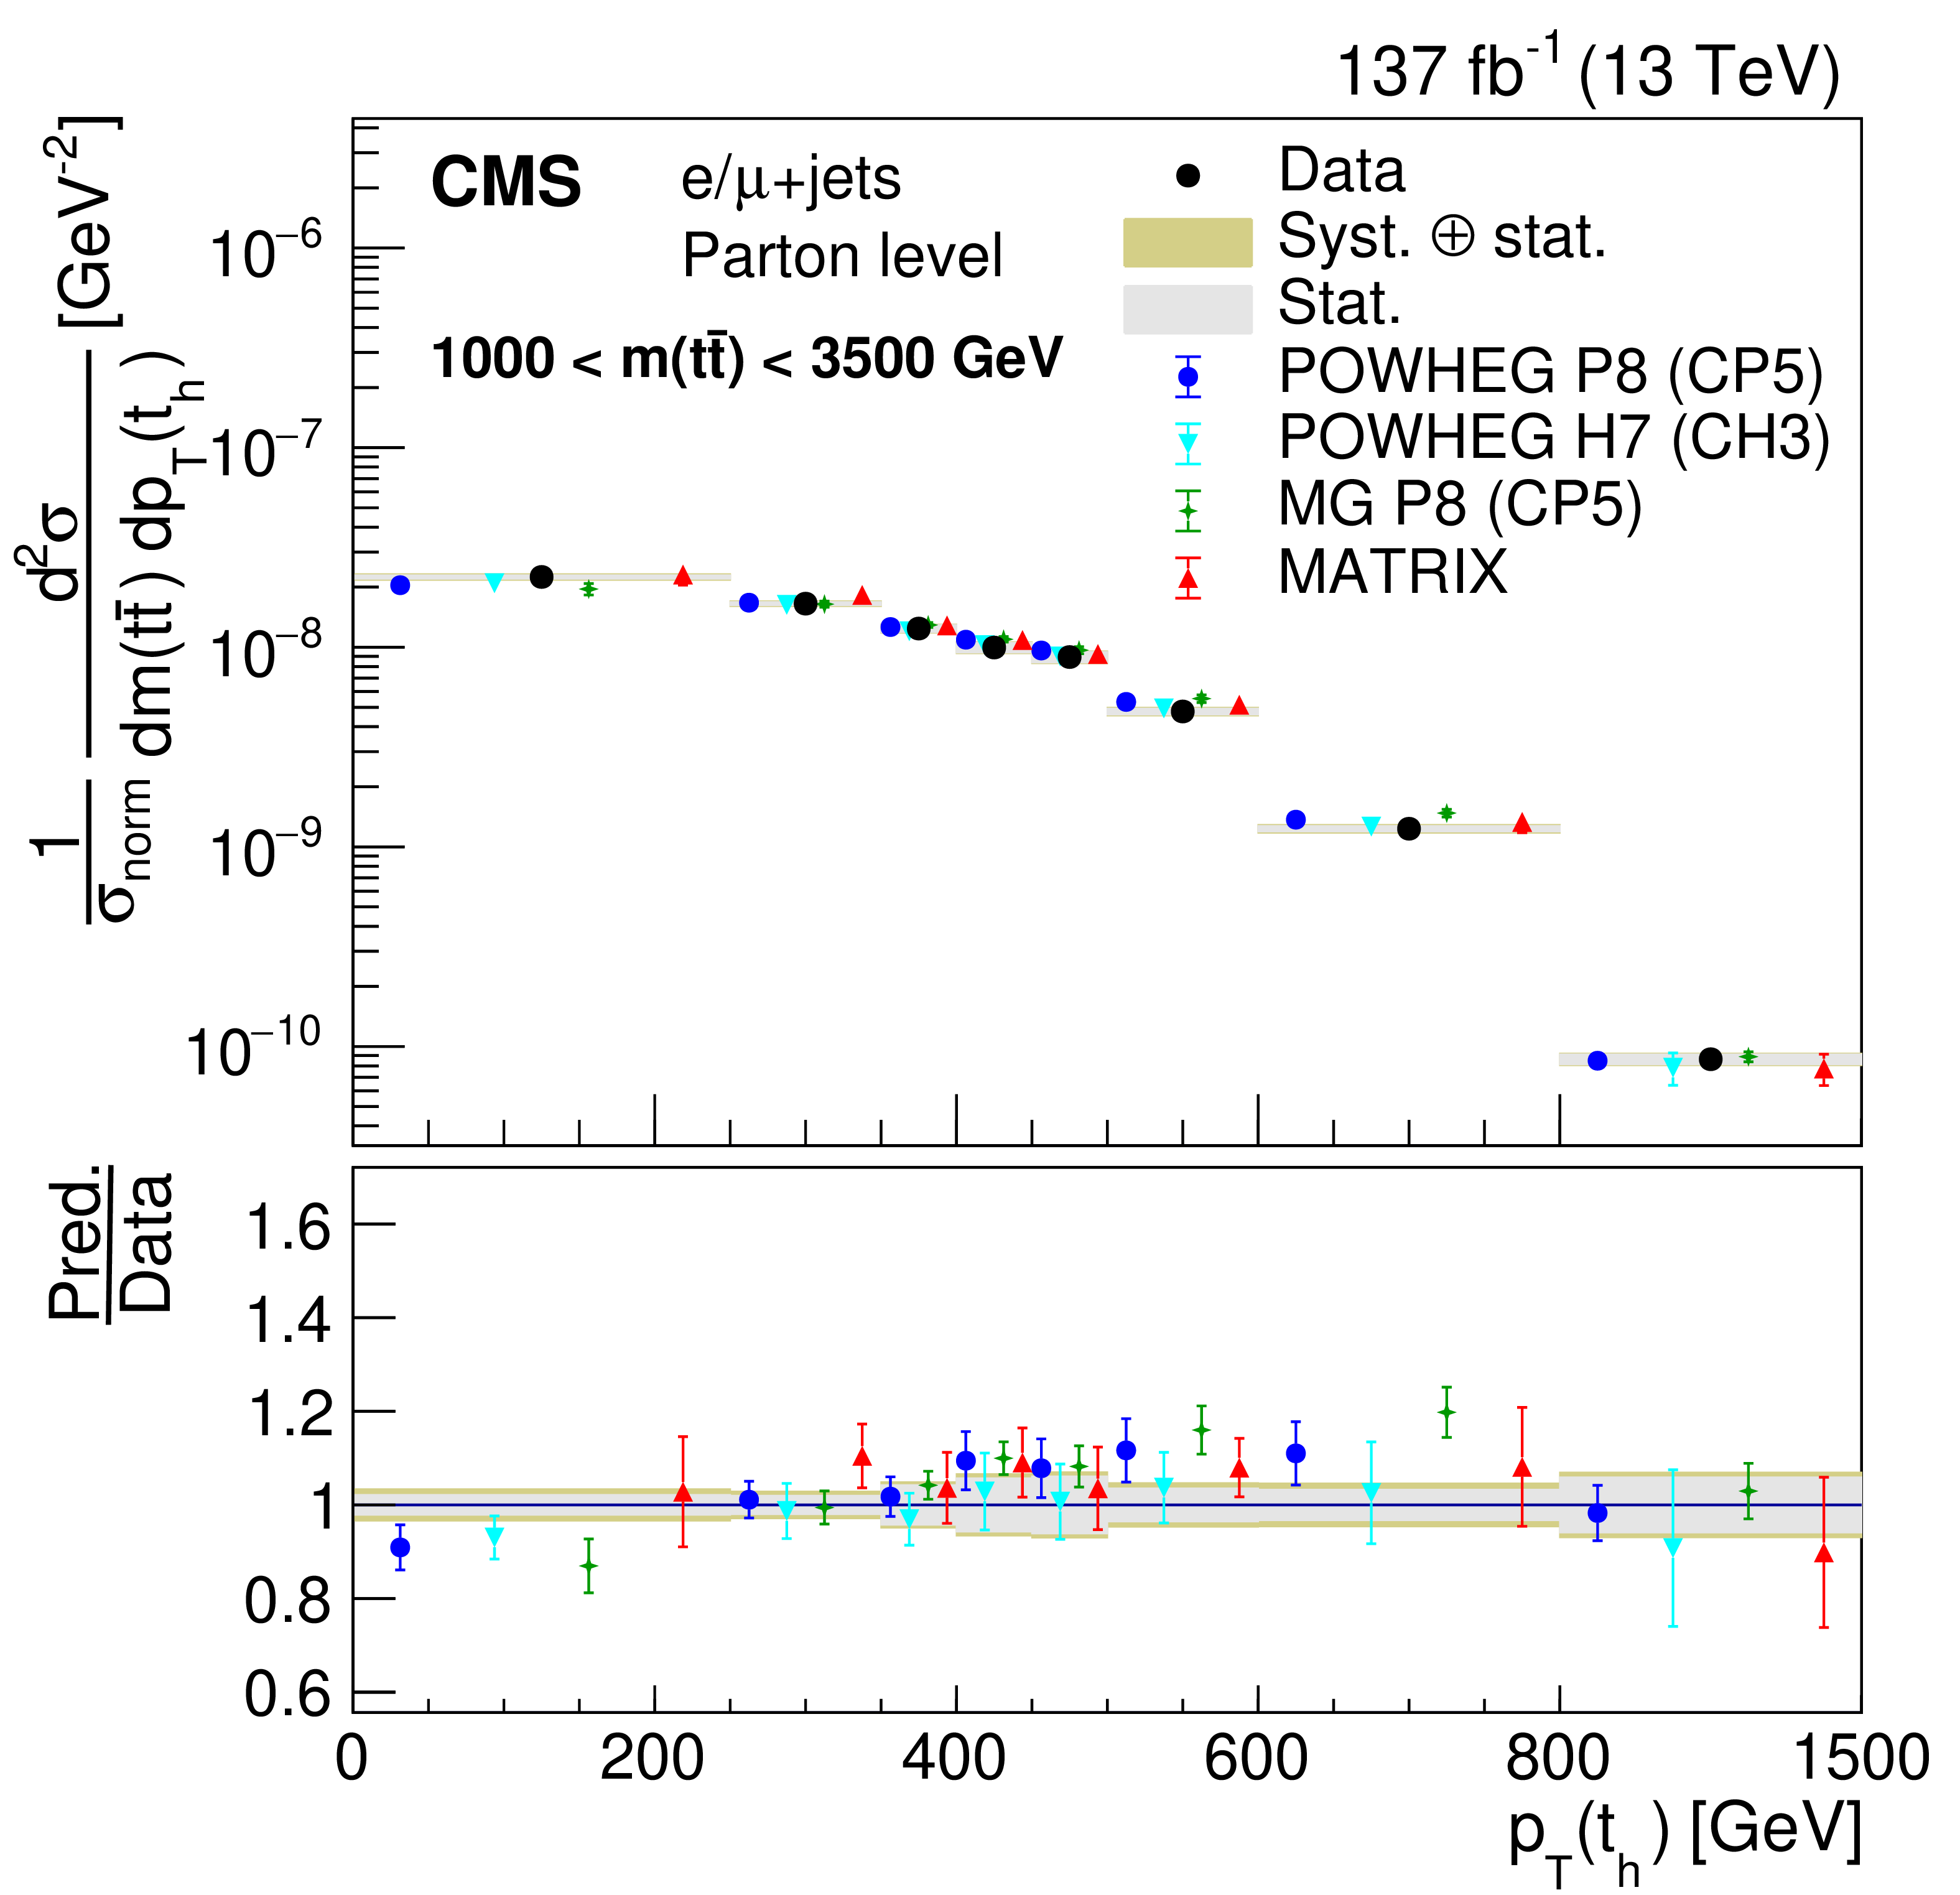
png pdf |
Figure A13-f:
Normalized double-differential cross section at the parton level as a function of ${m({\mathrm{t} {}\mathrm{\bar{t}}})}$ vs. ${{p_{\mathrm {T}}} ({\mathrm{t} _\mathrm {h}})}$. The data are shown as points with gray (yellow) bands indicating the statistical (statistical and systematic) uncertainties. The cross sections are compared to the predictions of POWHEG combined with PYTHIA (P8) or HERWIG (H7), the multiparton simulation MG5_aMC@NLO (MG)+PYTHIA FxFx, and the NNLO QCD calculations obtained with Matrix. The ratios of the various predictions to the measured cross sections are shown in the lower panels. |
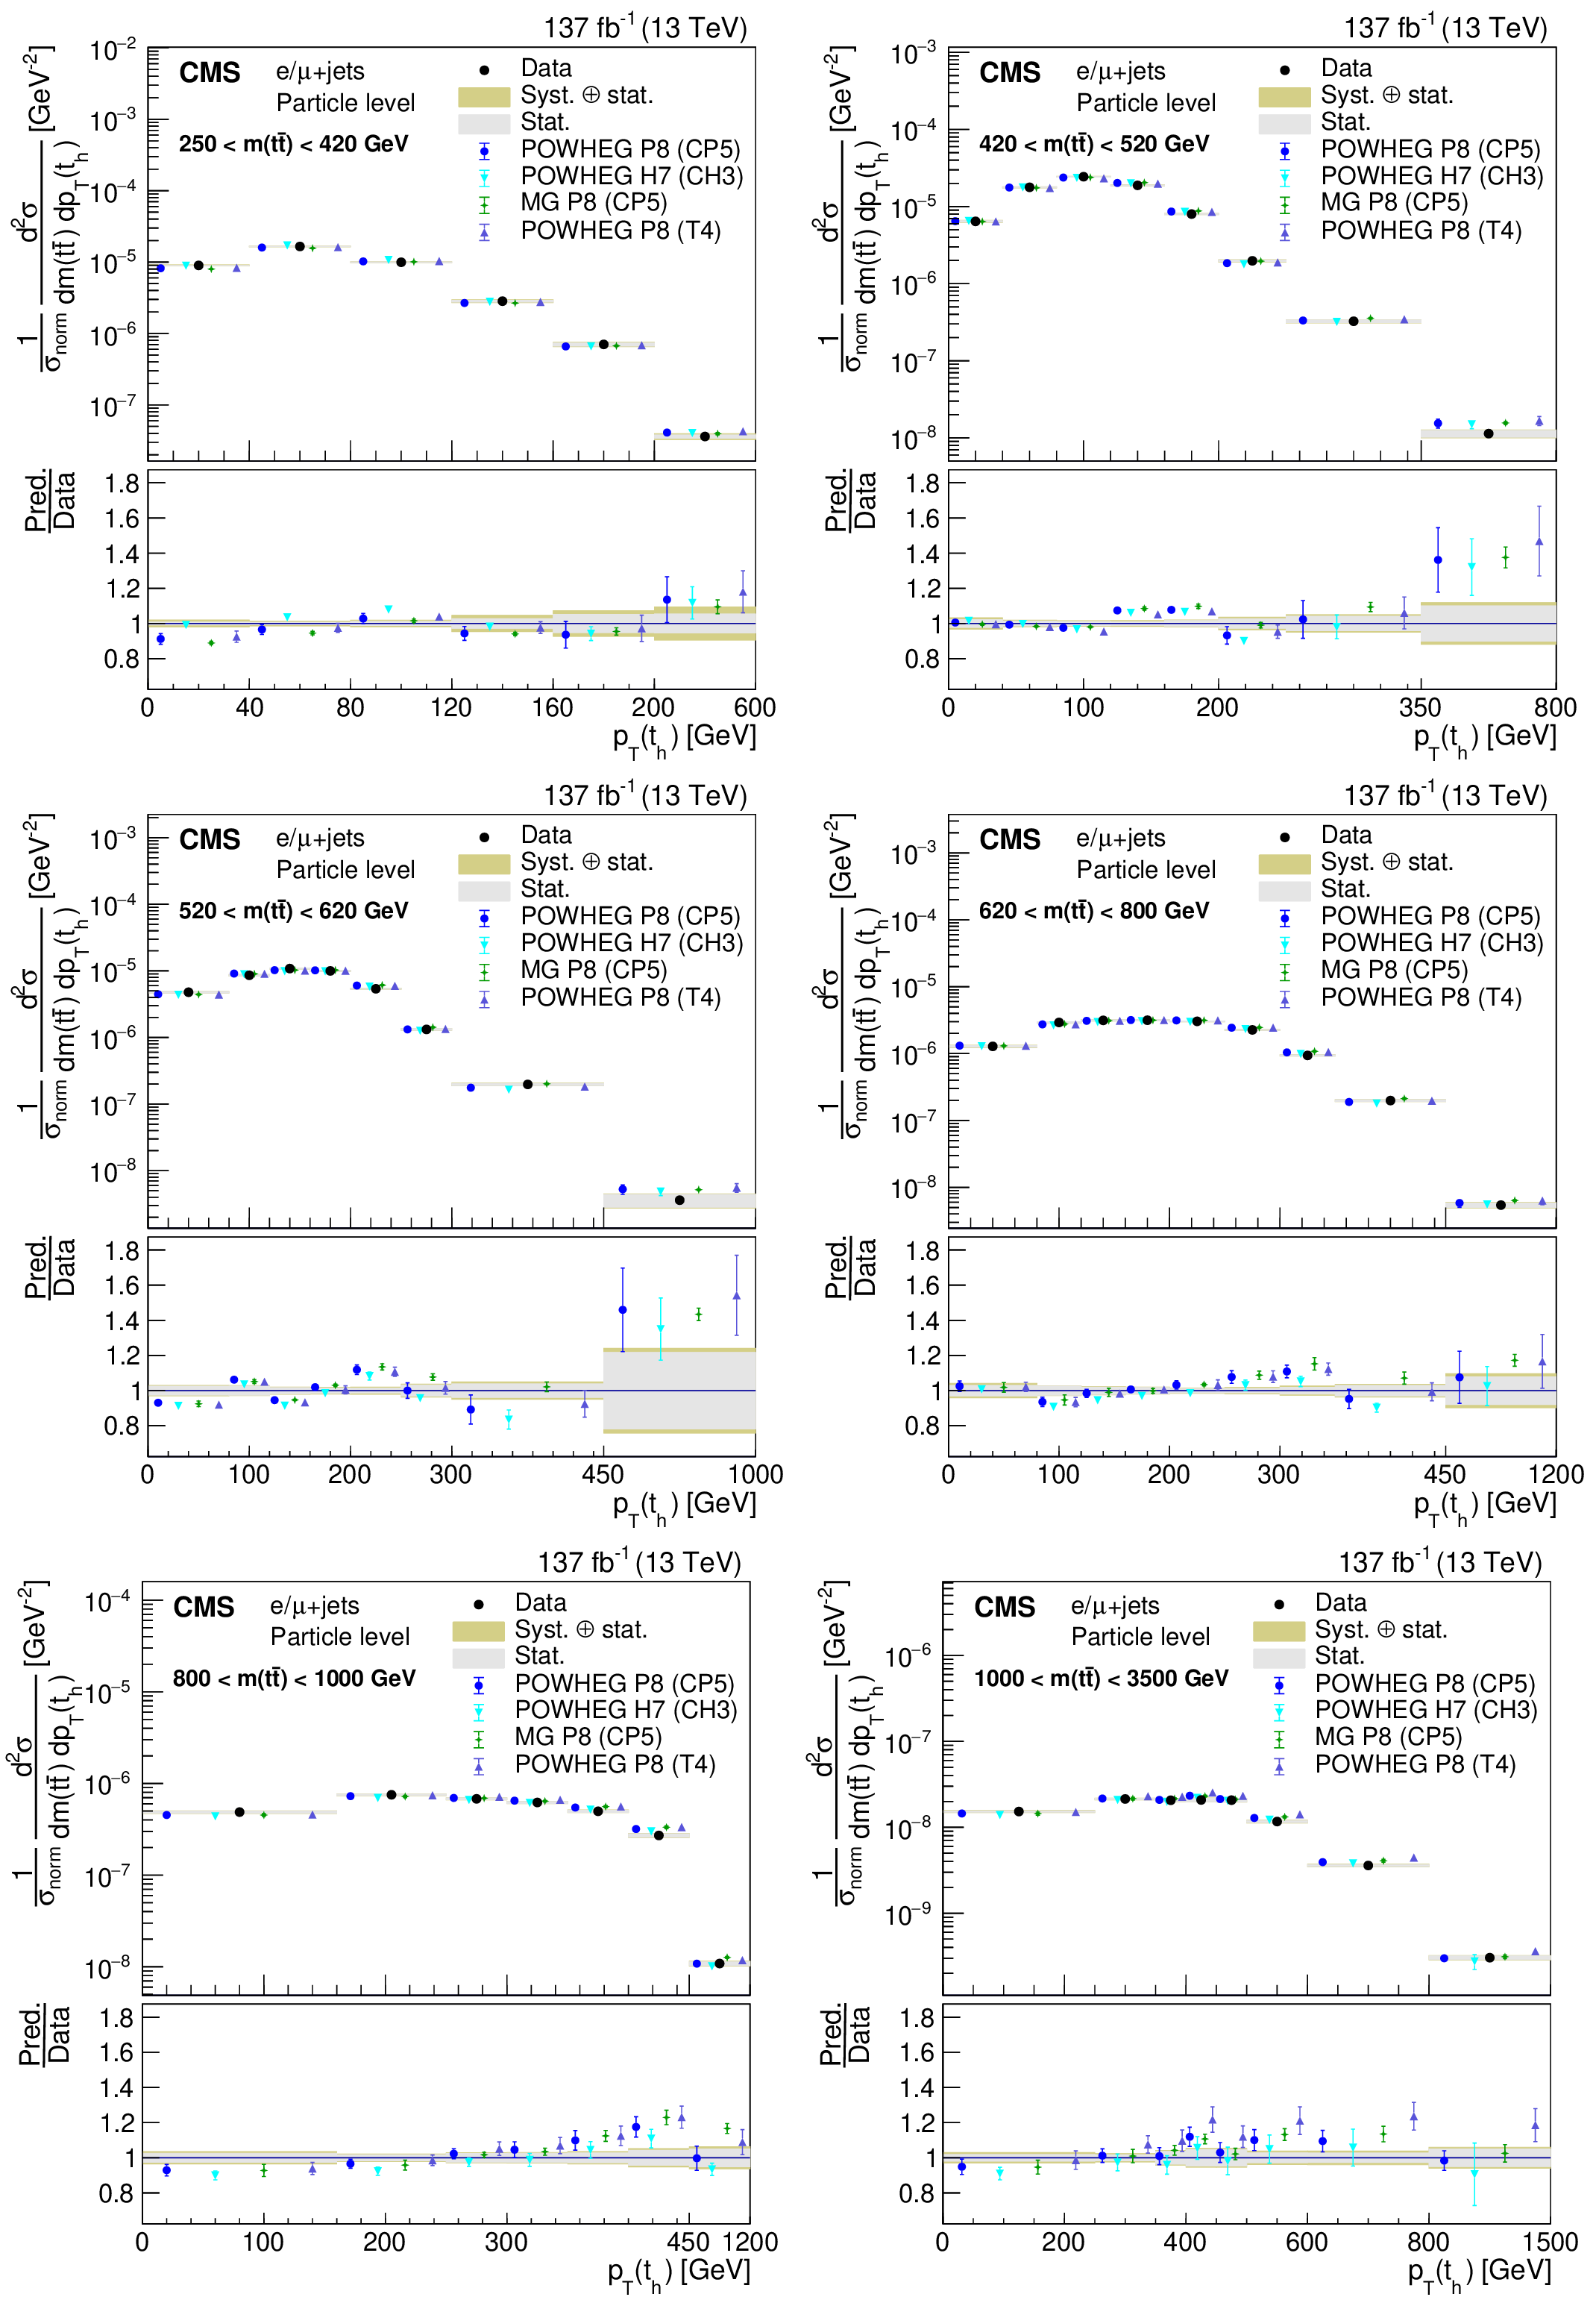
png pdf |
Figure A14:
Normalized double-differential cross section at the particle level as a function of ${m({\mathrm{t} {}\mathrm{\bar{t}}})}$ vs. ${{p_{\mathrm {T}}} ({\mathrm{t} _\mathrm {h}})}$. The data are shown as points with gray (yellow) bands indicating the statistical (statistical and systematic) uncertainties. The cross sections are compared to the predictions of POWHEG+PYTHIA (P8) for the CP5 and CUETP8M2T4 (T4) tunes, POWHEG+HERWIG (H7), and the multiparton simulation MG5_aMC@NLO (MG)+PYTHIA. The ratios of the various predictions to the measured cross sections are shown in the lower panels. |
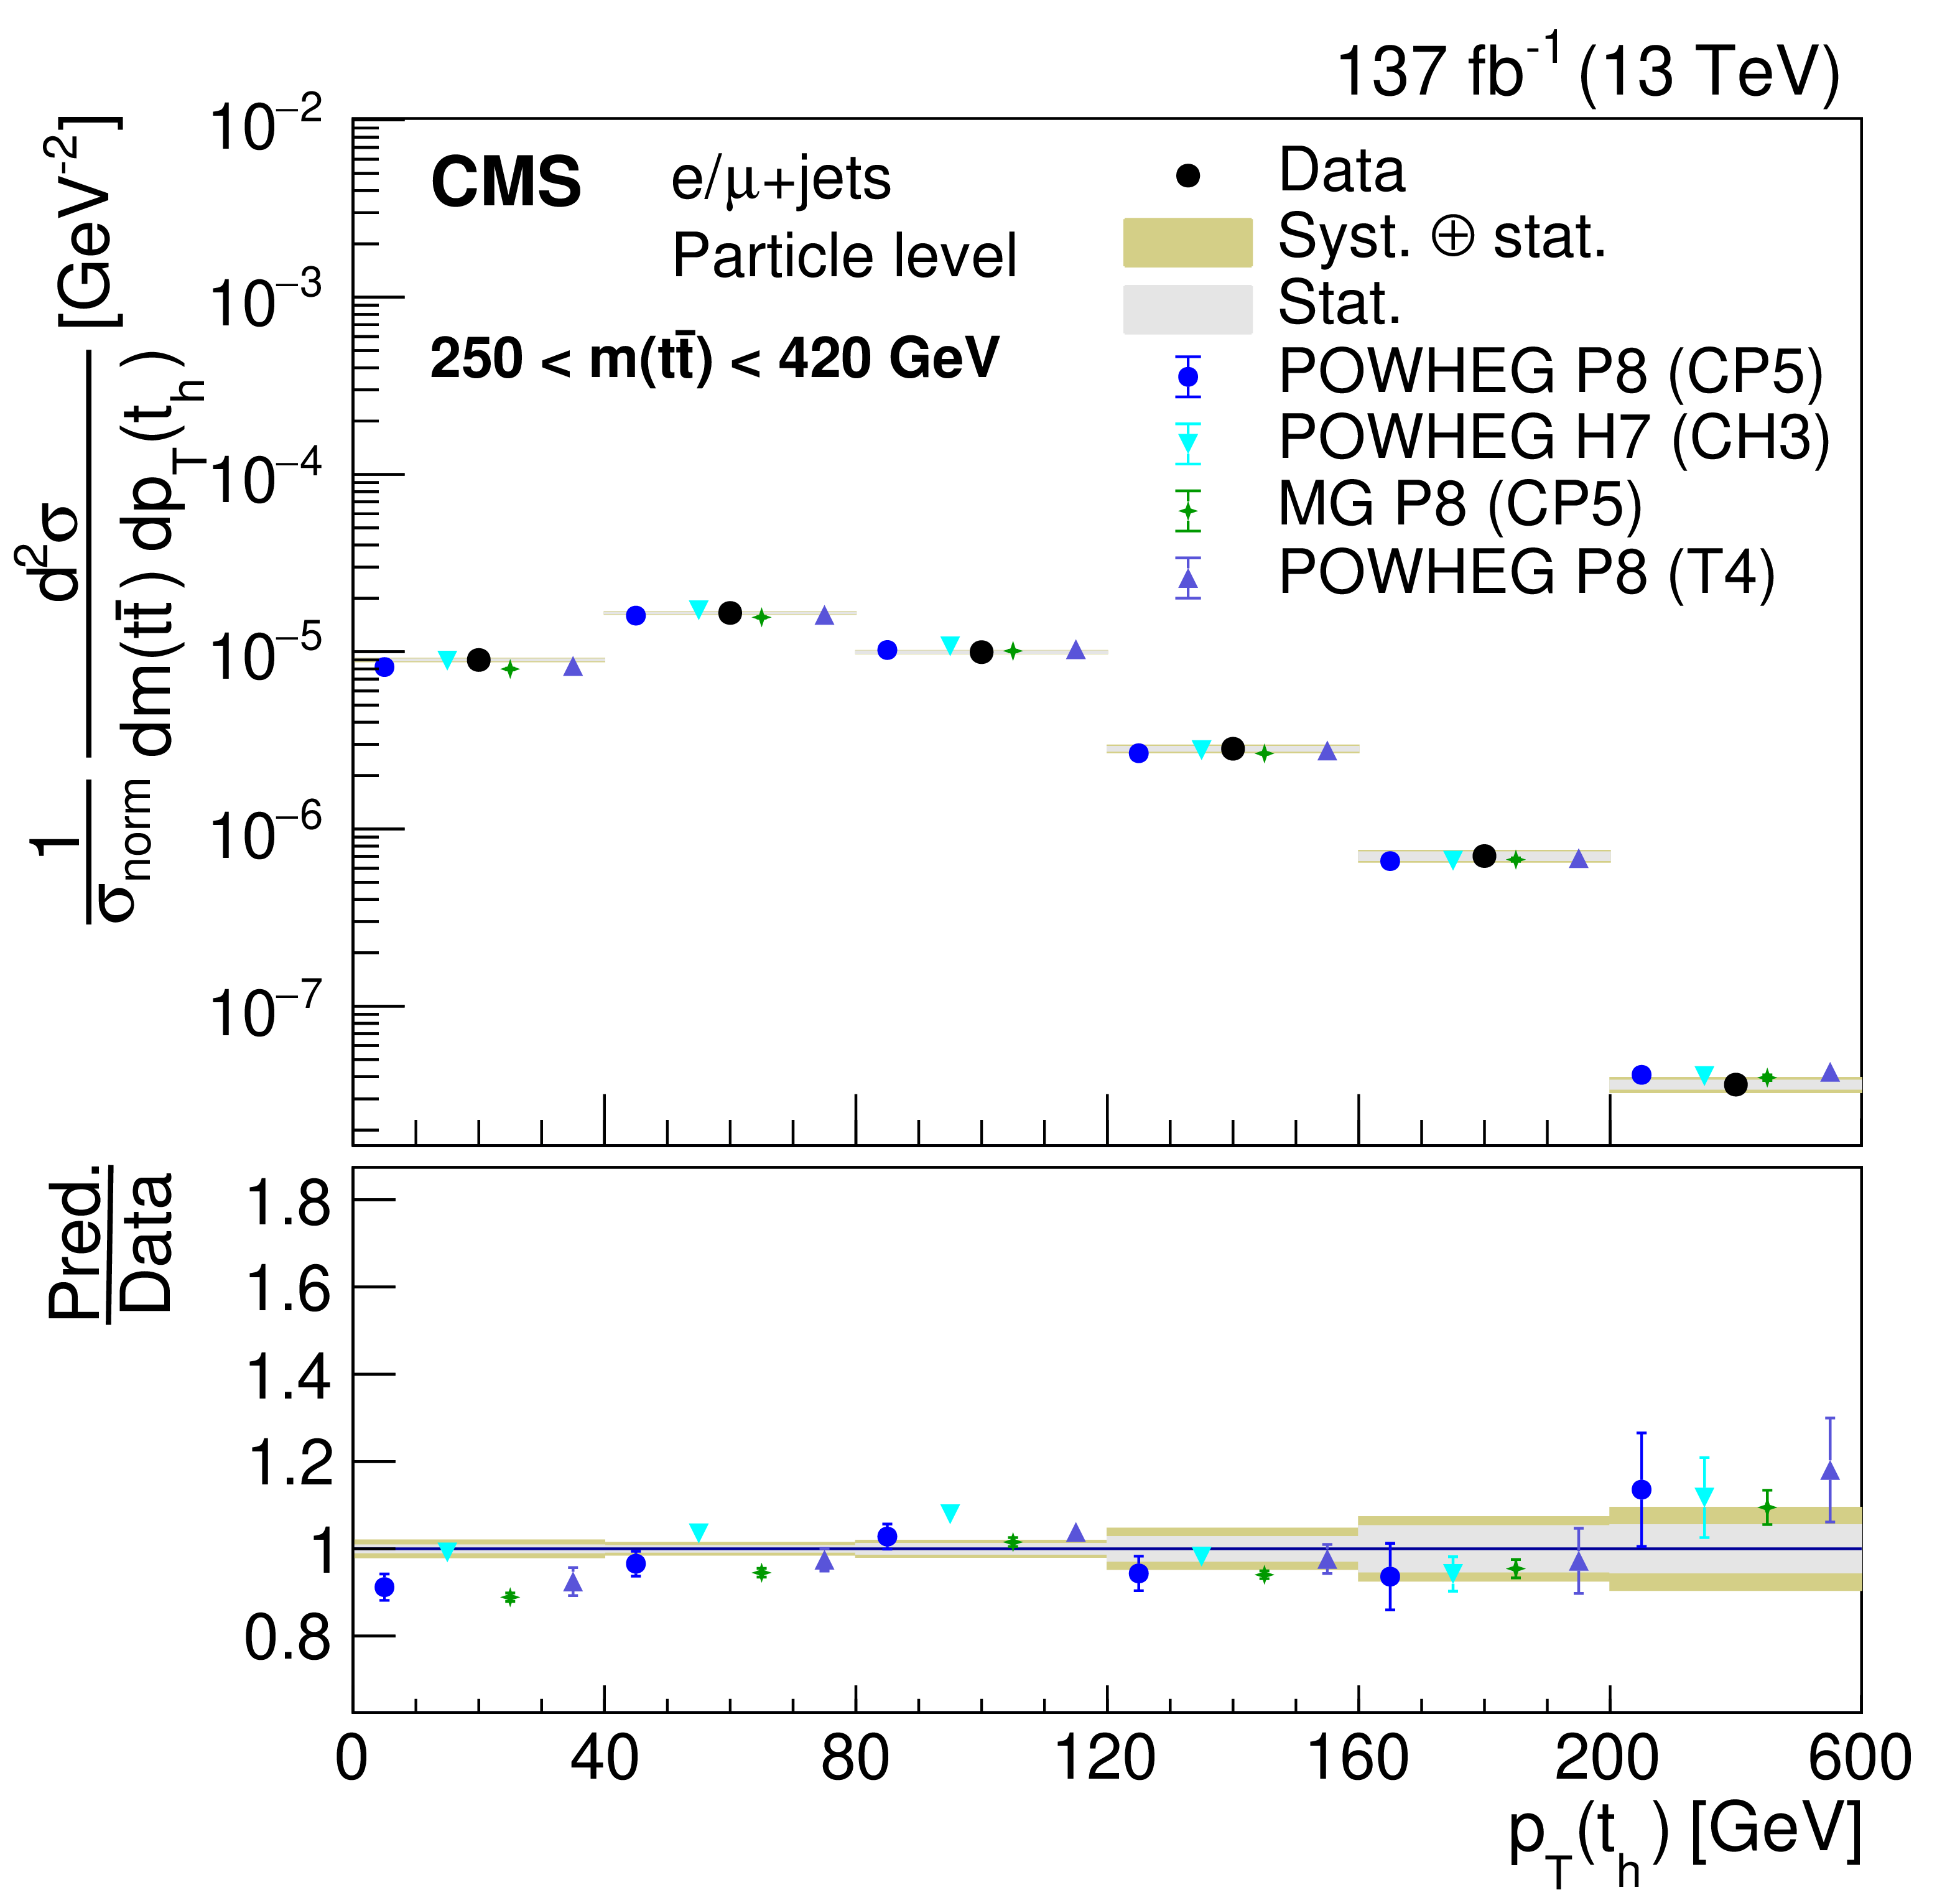
png pdf |
Figure A14-a:
Normalized double-differential cross section at the particle level as a function of ${m({\mathrm{t} {}\mathrm{\bar{t}}})}$ vs. ${{p_{\mathrm {T}}} ({\mathrm{t} _\mathrm {h}})}$. The data are shown as points with gray (yellow) bands indicating the statistical (statistical and systematic) uncertainties. The cross sections are compared to the predictions of POWHEG+PYTHIA (P8) for the CP5 and CUETP8M2T4 (T4) tunes, POWHEG+HERWIG (H7), and the multiparton simulation MG5_aMC@NLO (MG)+PYTHIA. The ratios of the various predictions to the measured cross sections are shown in the lower panels. |
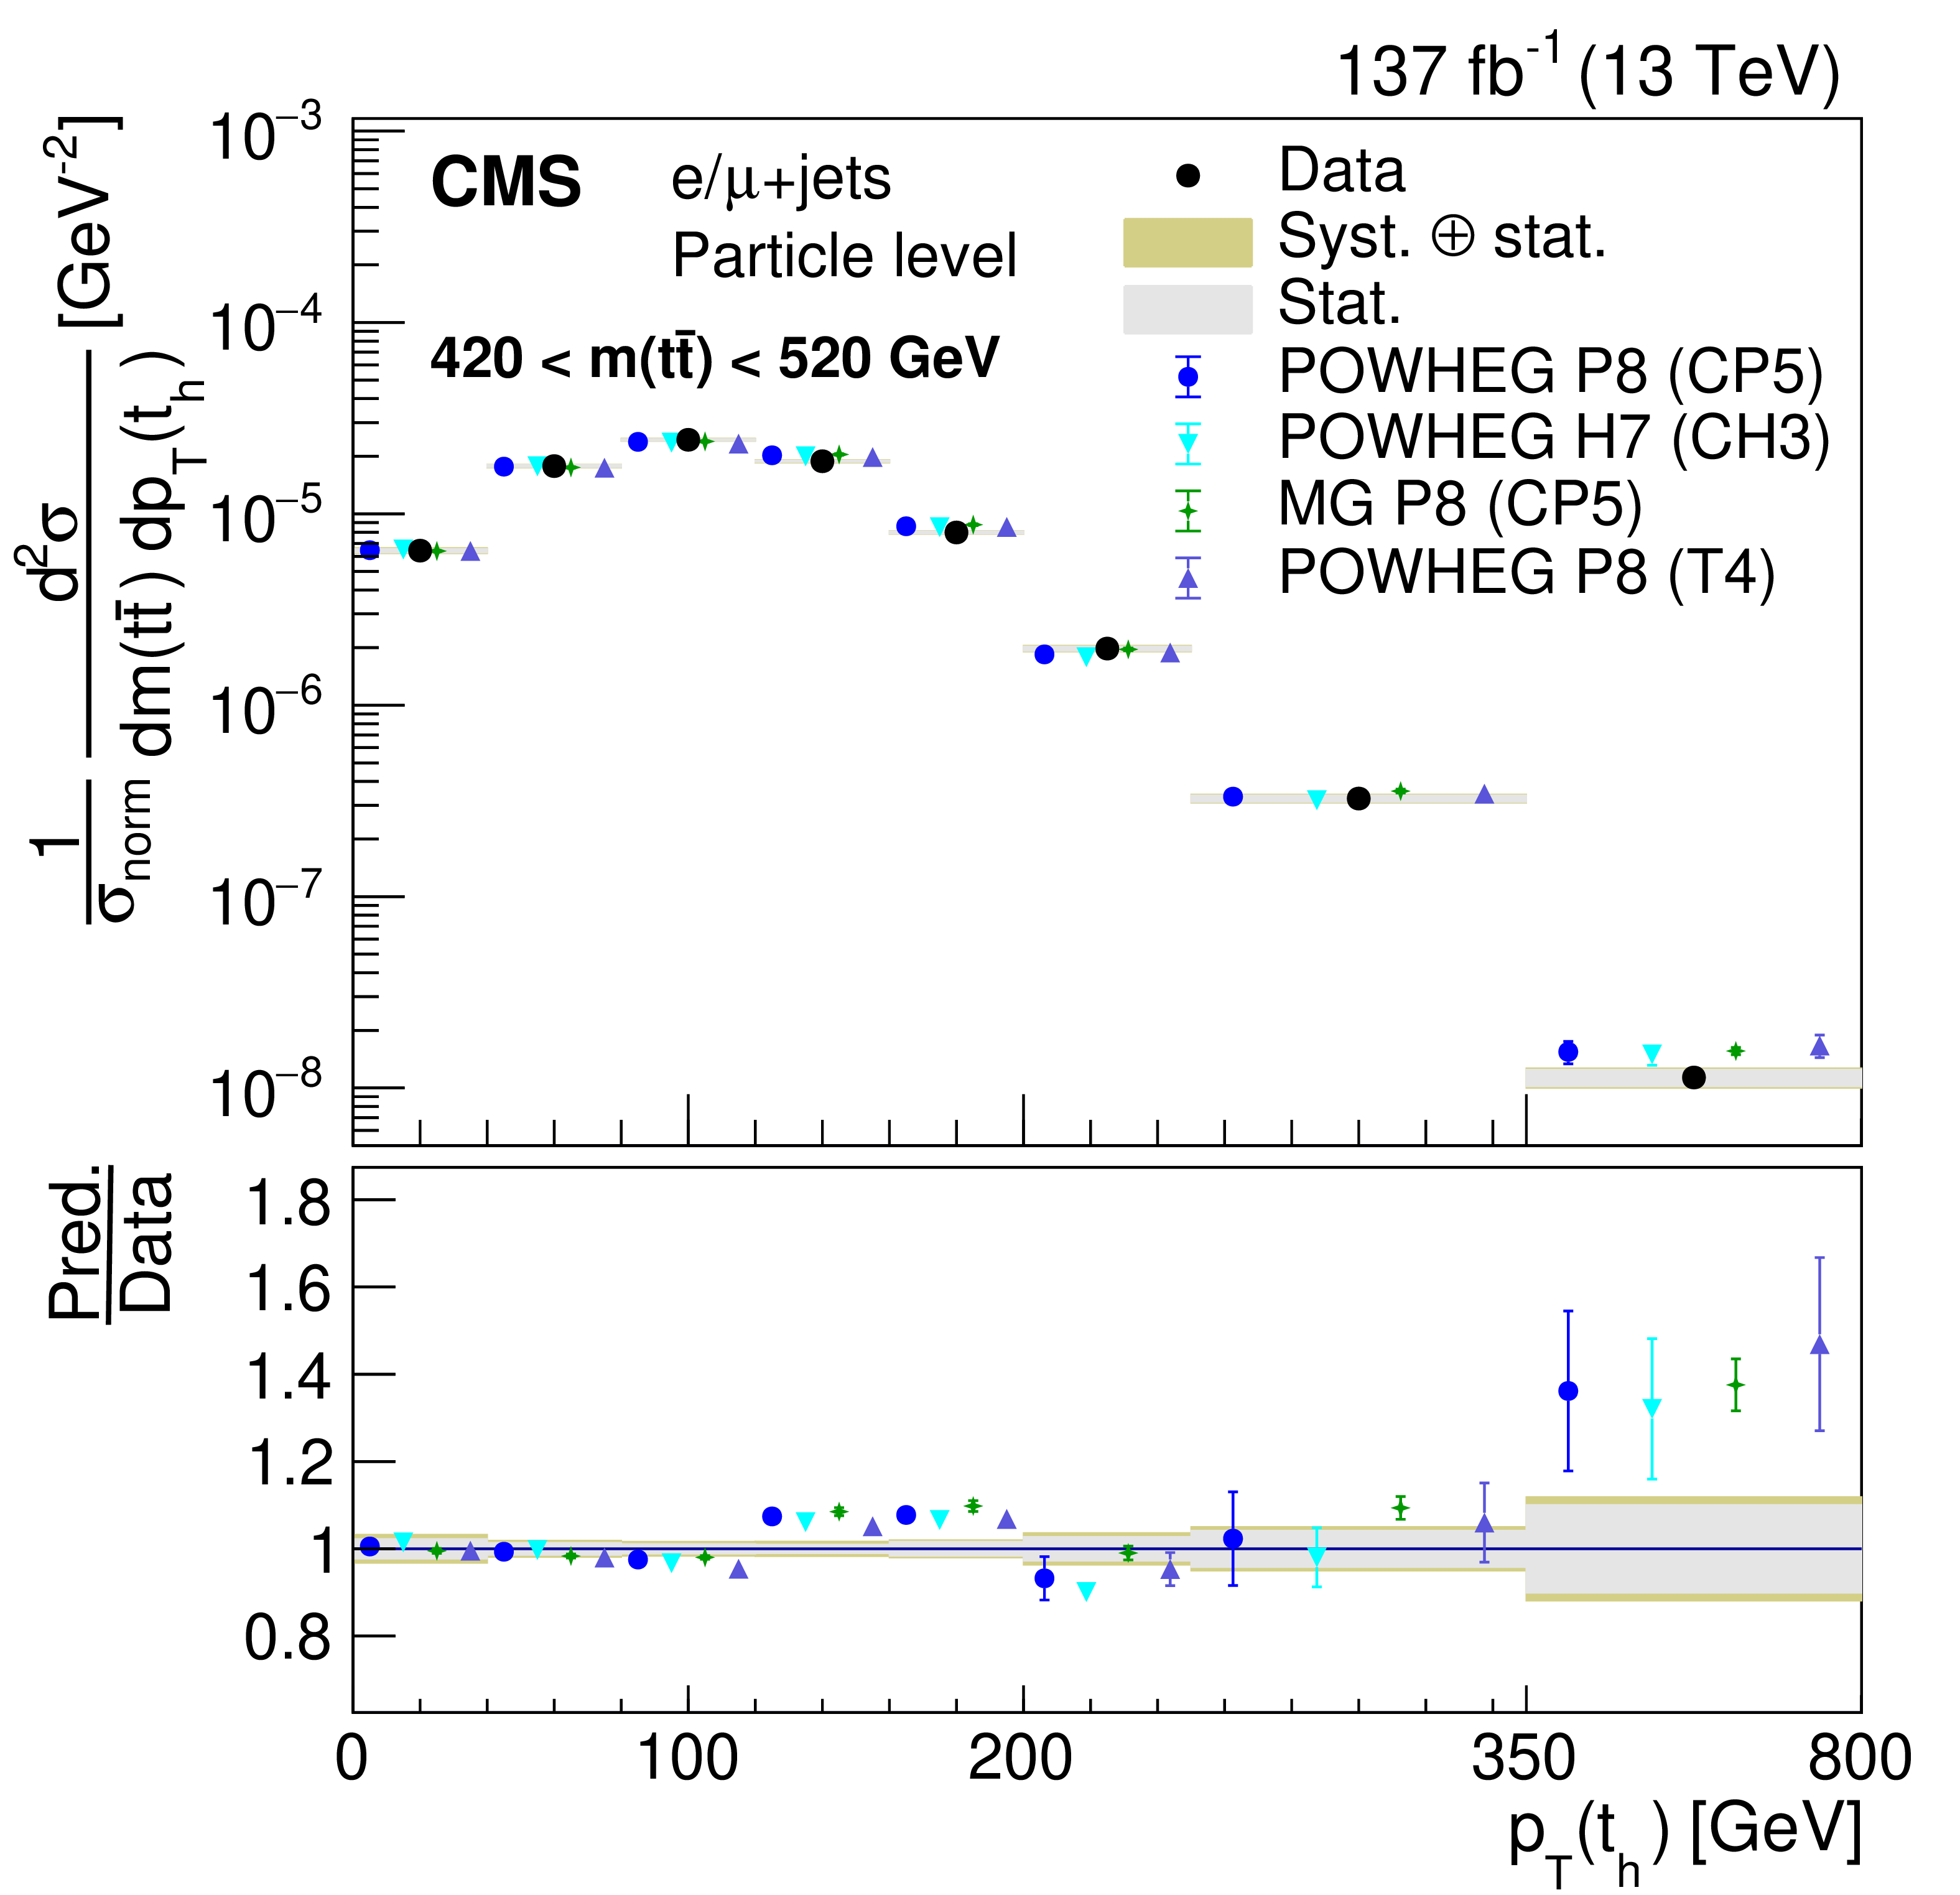
png pdf |
Figure A14-b:
Normalized double-differential cross section at the particle level as a function of ${m({\mathrm{t} {}\mathrm{\bar{t}}})}$ vs. ${{p_{\mathrm {T}}} ({\mathrm{t} _\mathrm {h}})}$. The data are shown as points with gray (yellow) bands indicating the statistical (statistical and systematic) uncertainties. The cross sections are compared to the predictions of POWHEG+PYTHIA (P8) for the CP5 and CUETP8M2T4 (T4) tunes, POWHEG+HERWIG (H7), and the multiparton simulation MG5_aMC@NLO (MG)+PYTHIA. The ratios of the various predictions to the measured cross sections are shown in the lower panels. |
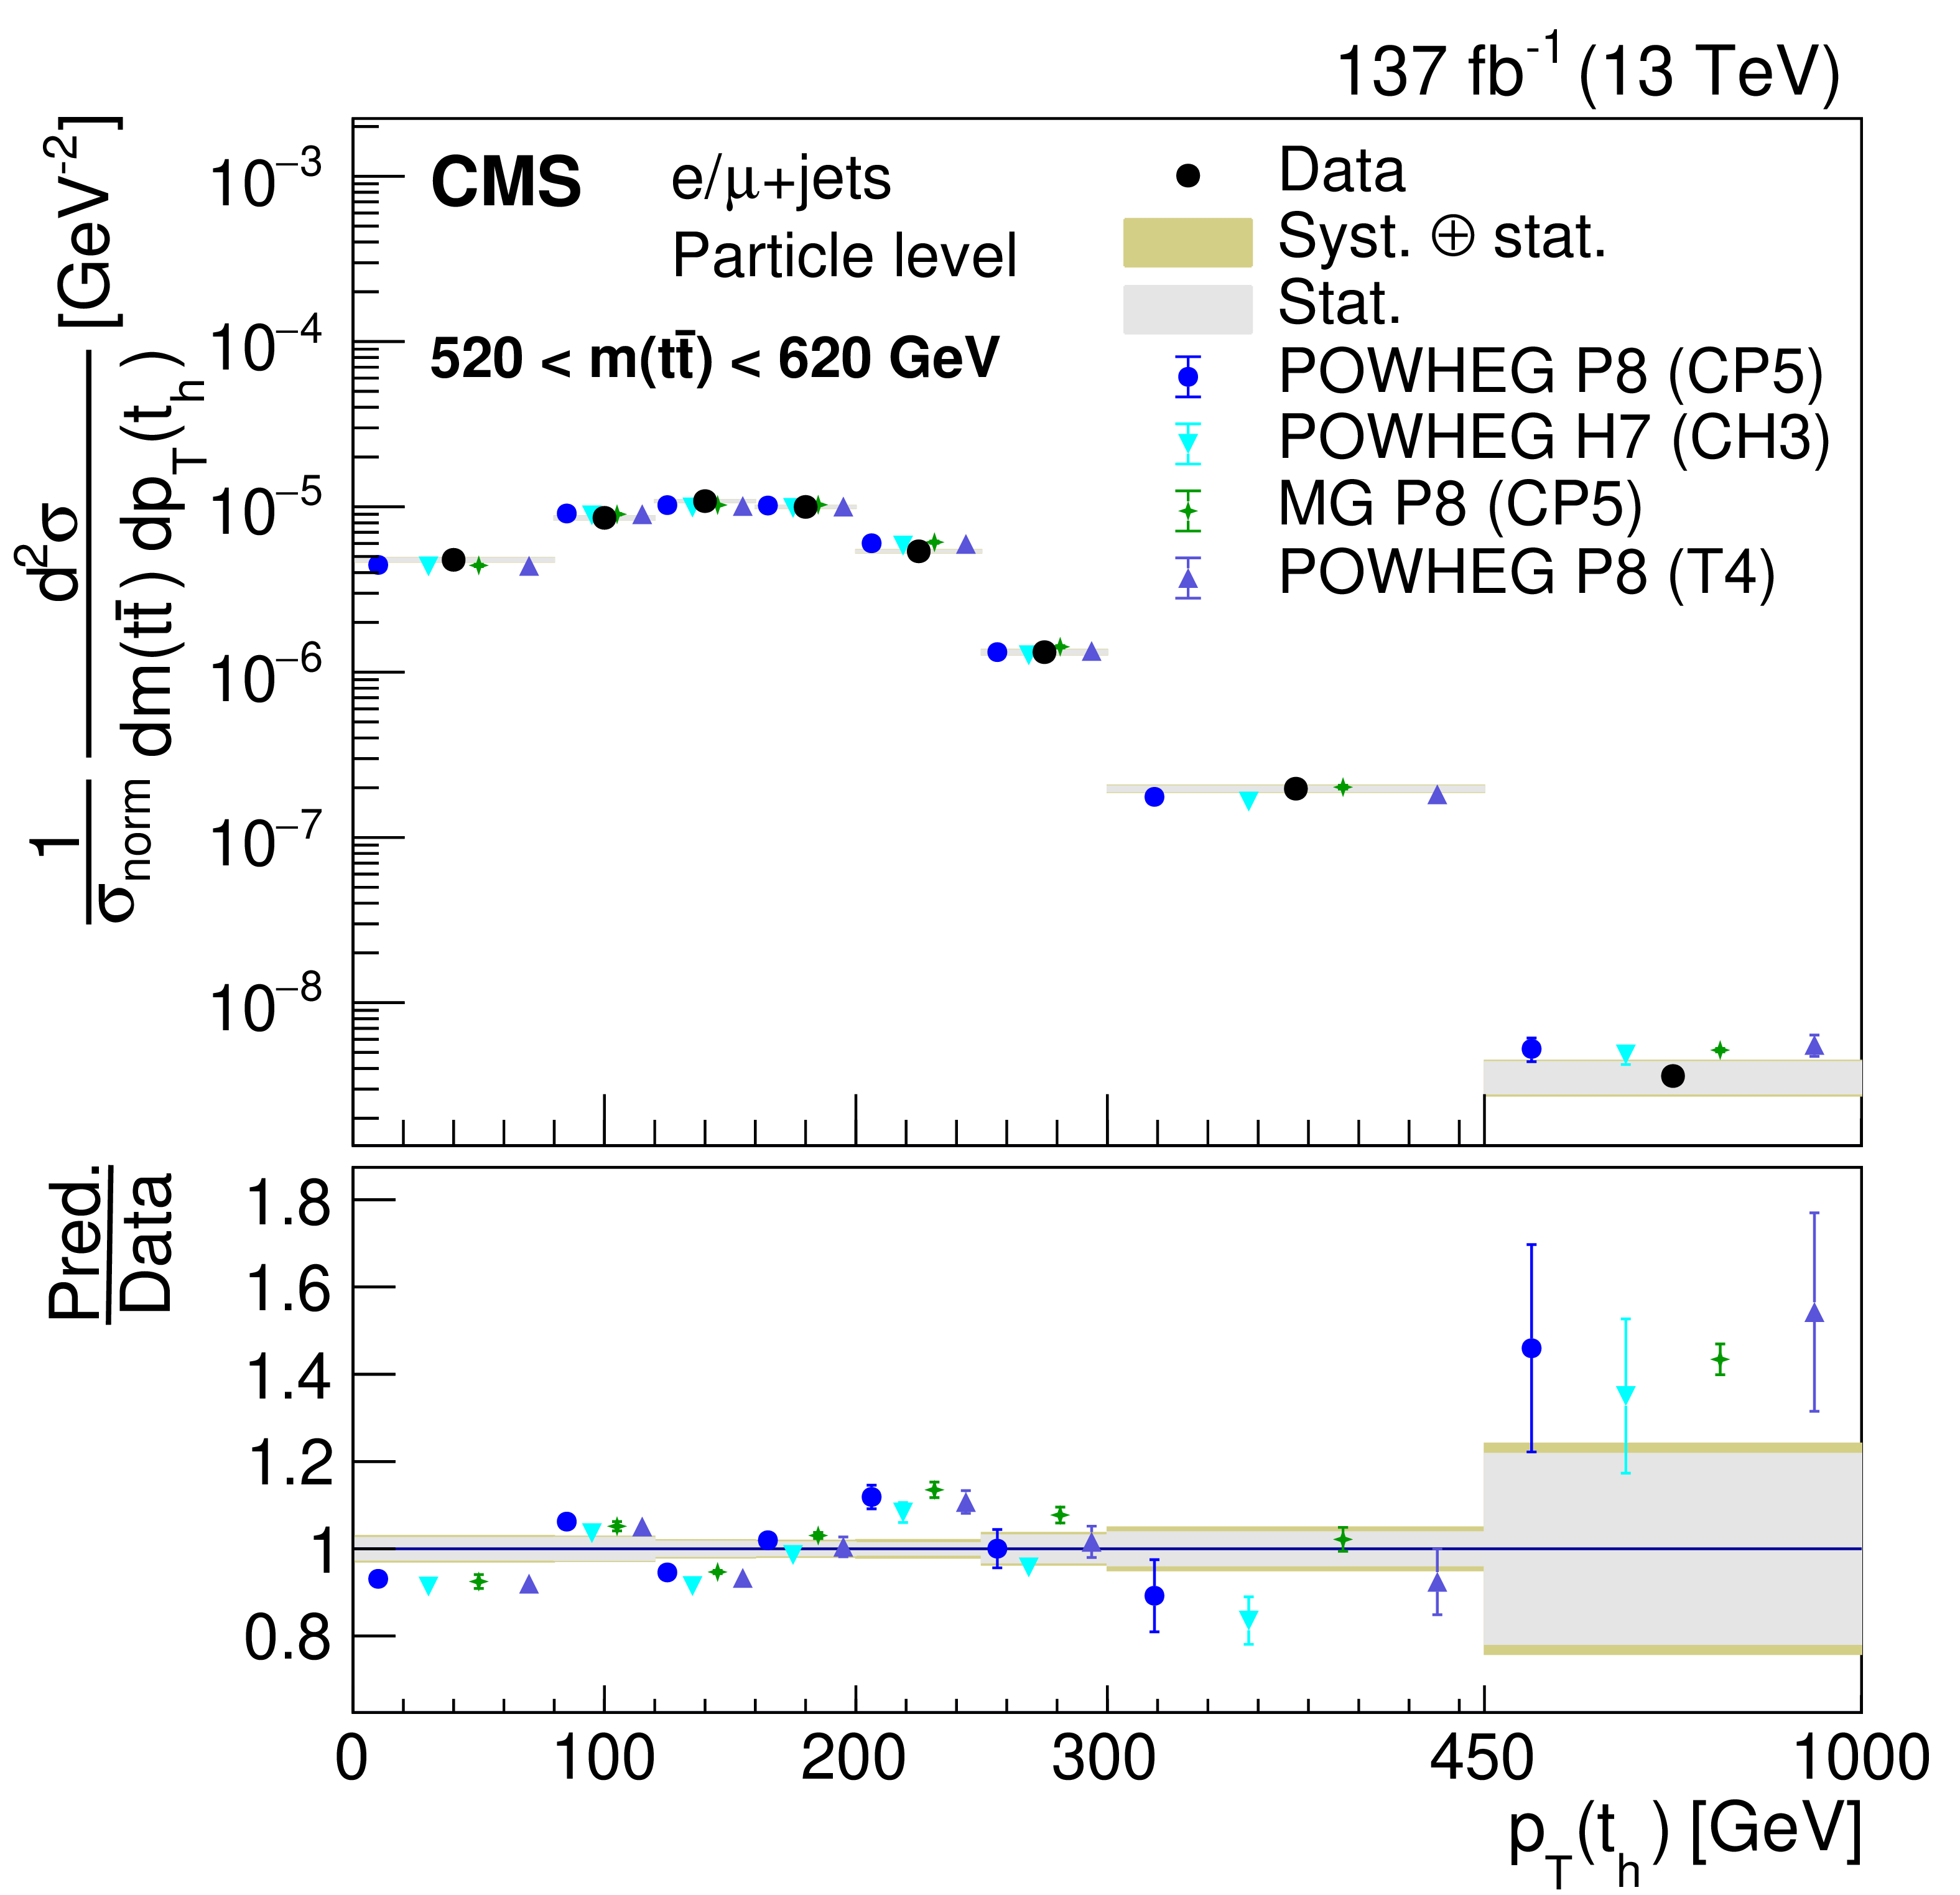
png pdf |
Figure A14-c:
Normalized double-differential cross section at the particle level as a function of ${m({\mathrm{t} {}\mathrm{\bar{t}}})}$ vs. ${{p_{\mathrm {T}}} ({\mathrm{t} _\mathrm {h}})}$. The data are shown as points with gray (yellow) bands indicating the statistical (statistical and systematic) uncertainties. The cross sections are compared to the predictions of POWHEG+PYTHIA (P8) for the CP5 and CUETP8M2T4 (T4) tunes, POWHEG+HERWIG (H7), and the multiparton simulation MG5_aMC@NLO (MG)+PYTHIA. The ratios of the various predictions to the measured cross sections are shown in the lower panels. |
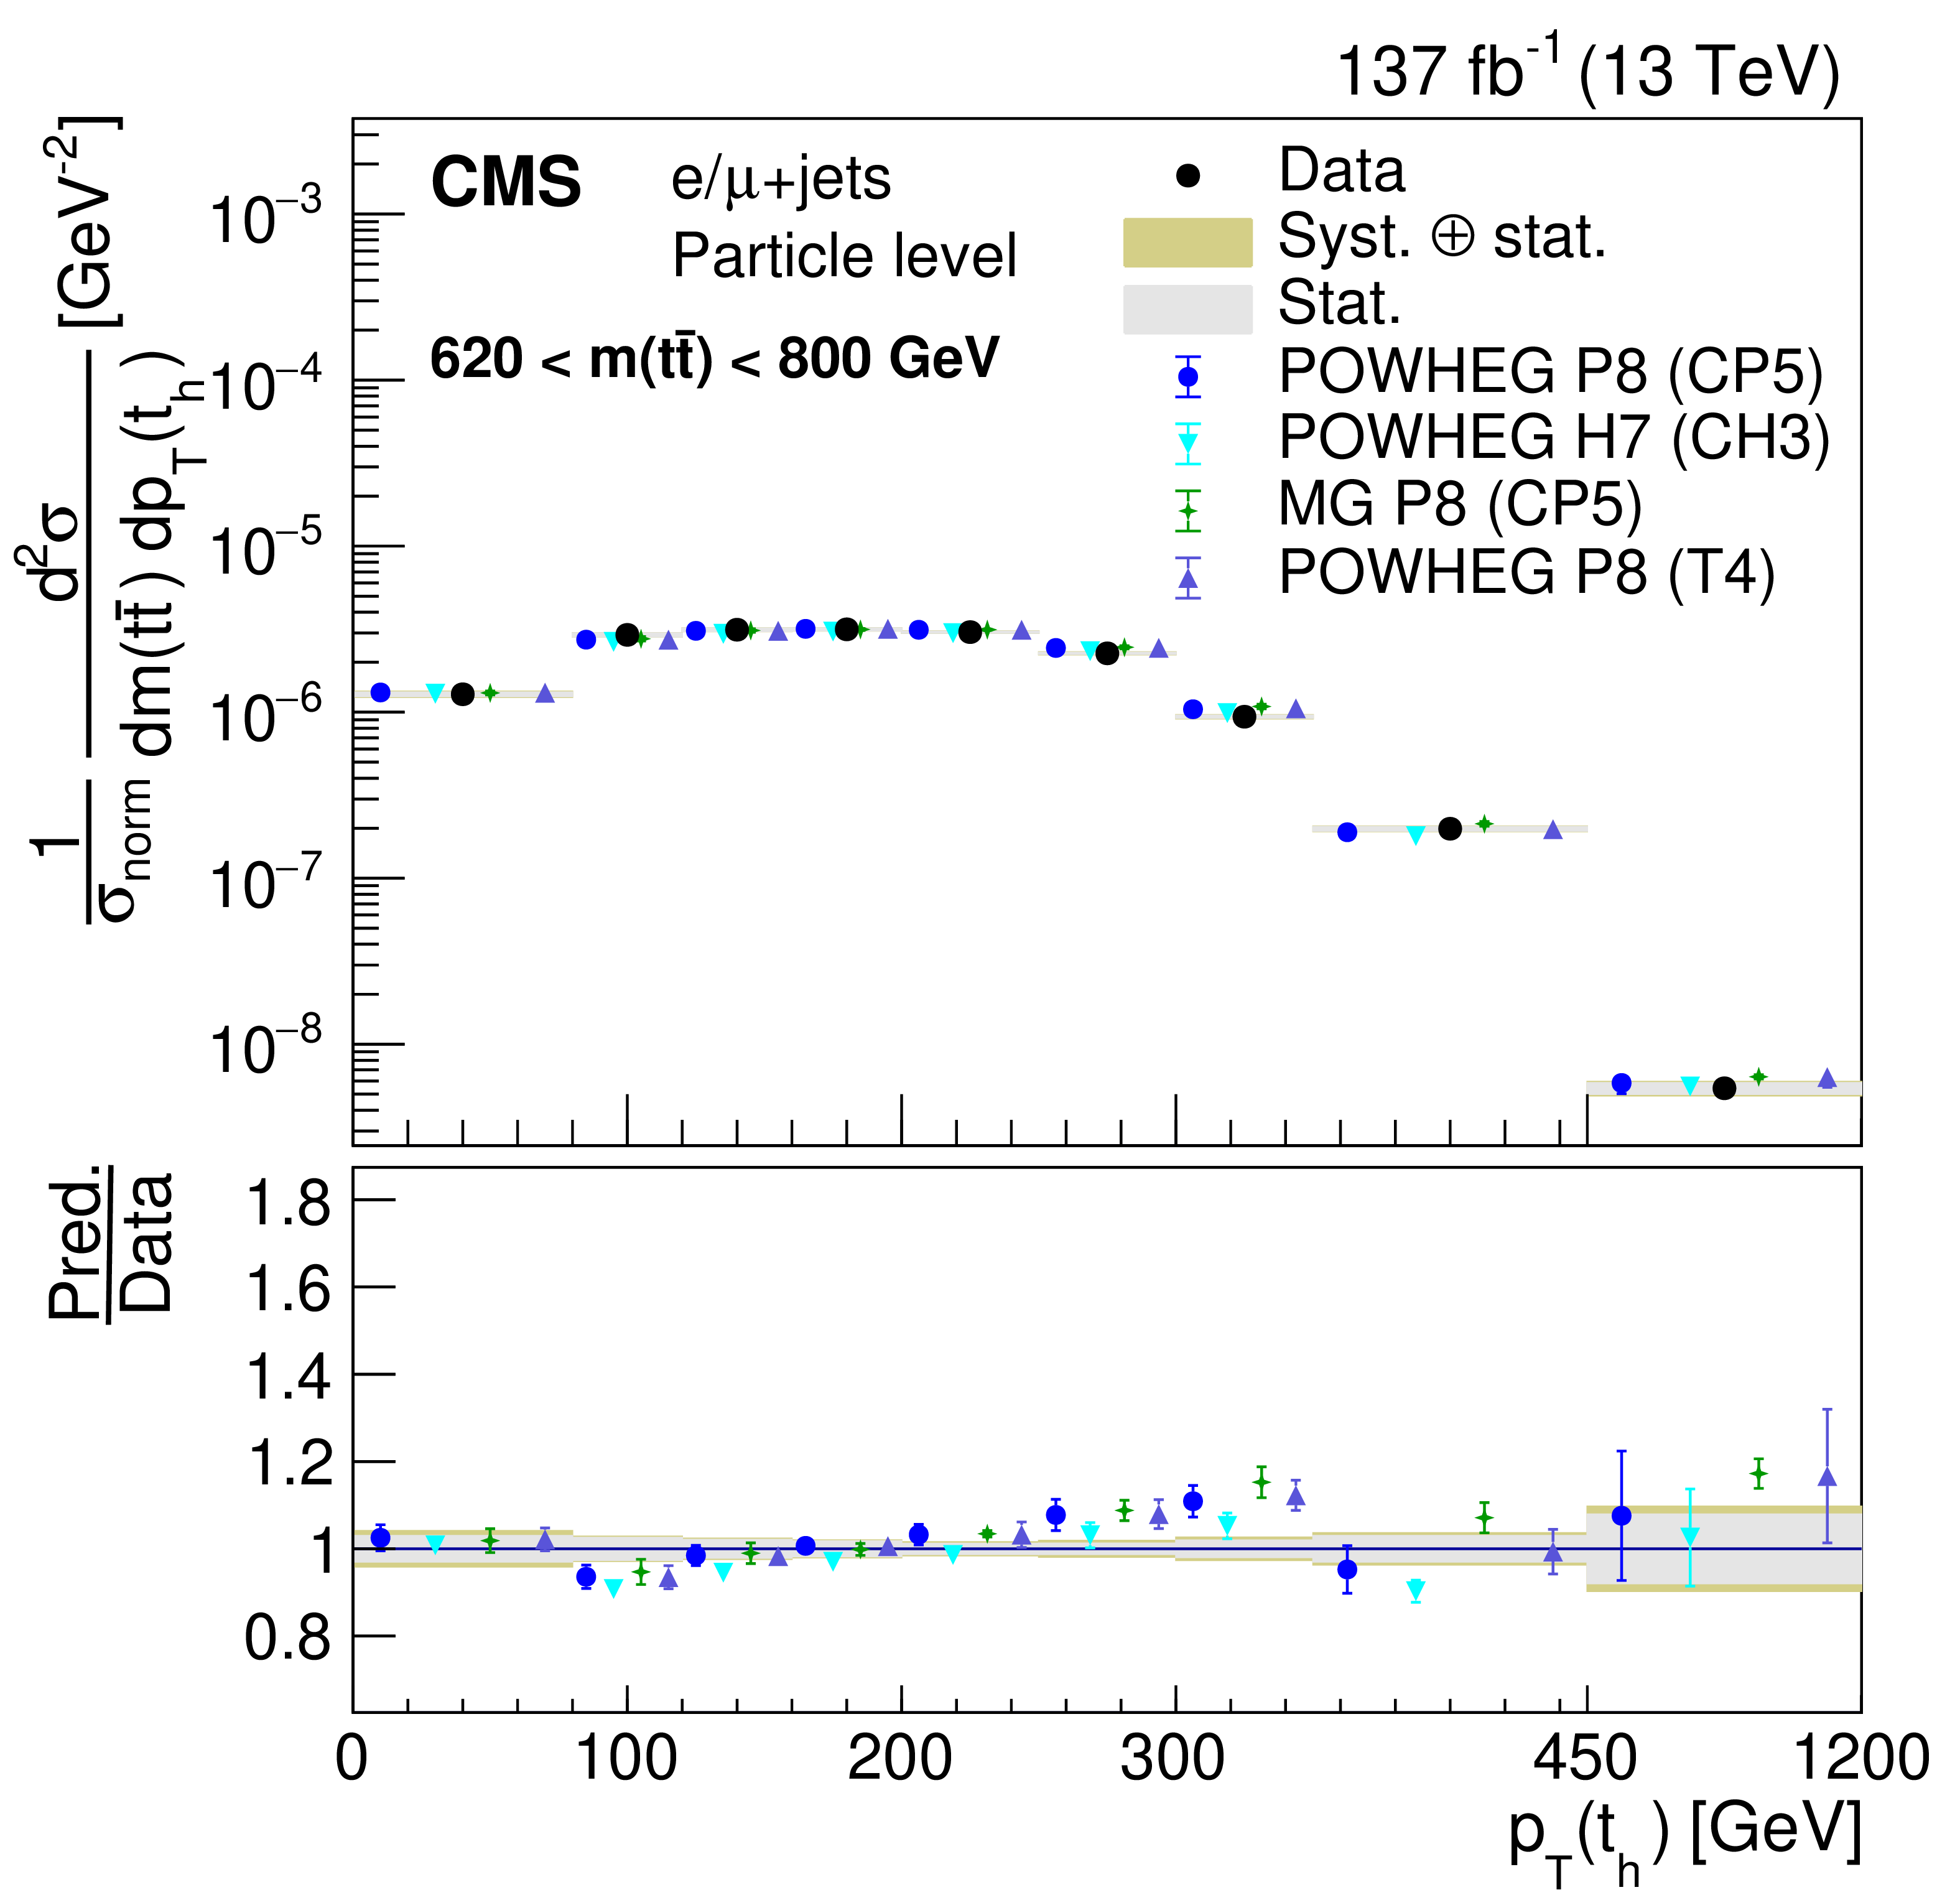
png pdf |
Figure A14-d:
Normalized double-differential cross section at the particle level as a function of ${m({\mathrm{t} {}\mathrm{\bar{t}}})}$ vs. ${{p_{\mathrm {T}}} ({\mathrm{t} _\mathrm {h}})}$. The data are shown as points with gray (yellow) bands indicating the statistical (statistical and systematic) uncertainties. The cross sections are compared to the predictions of POWHEG+PYTHIA (P8) for the CP5 and CUETP8M2T4 (T4) tunes, POWHEG+HERWIG (H7), and the multiparton simulation MG5_aMC@NLO (MG)+PYTHIA. The ratios of the various predictions to the measured cross sections are shown in the lower panels. |
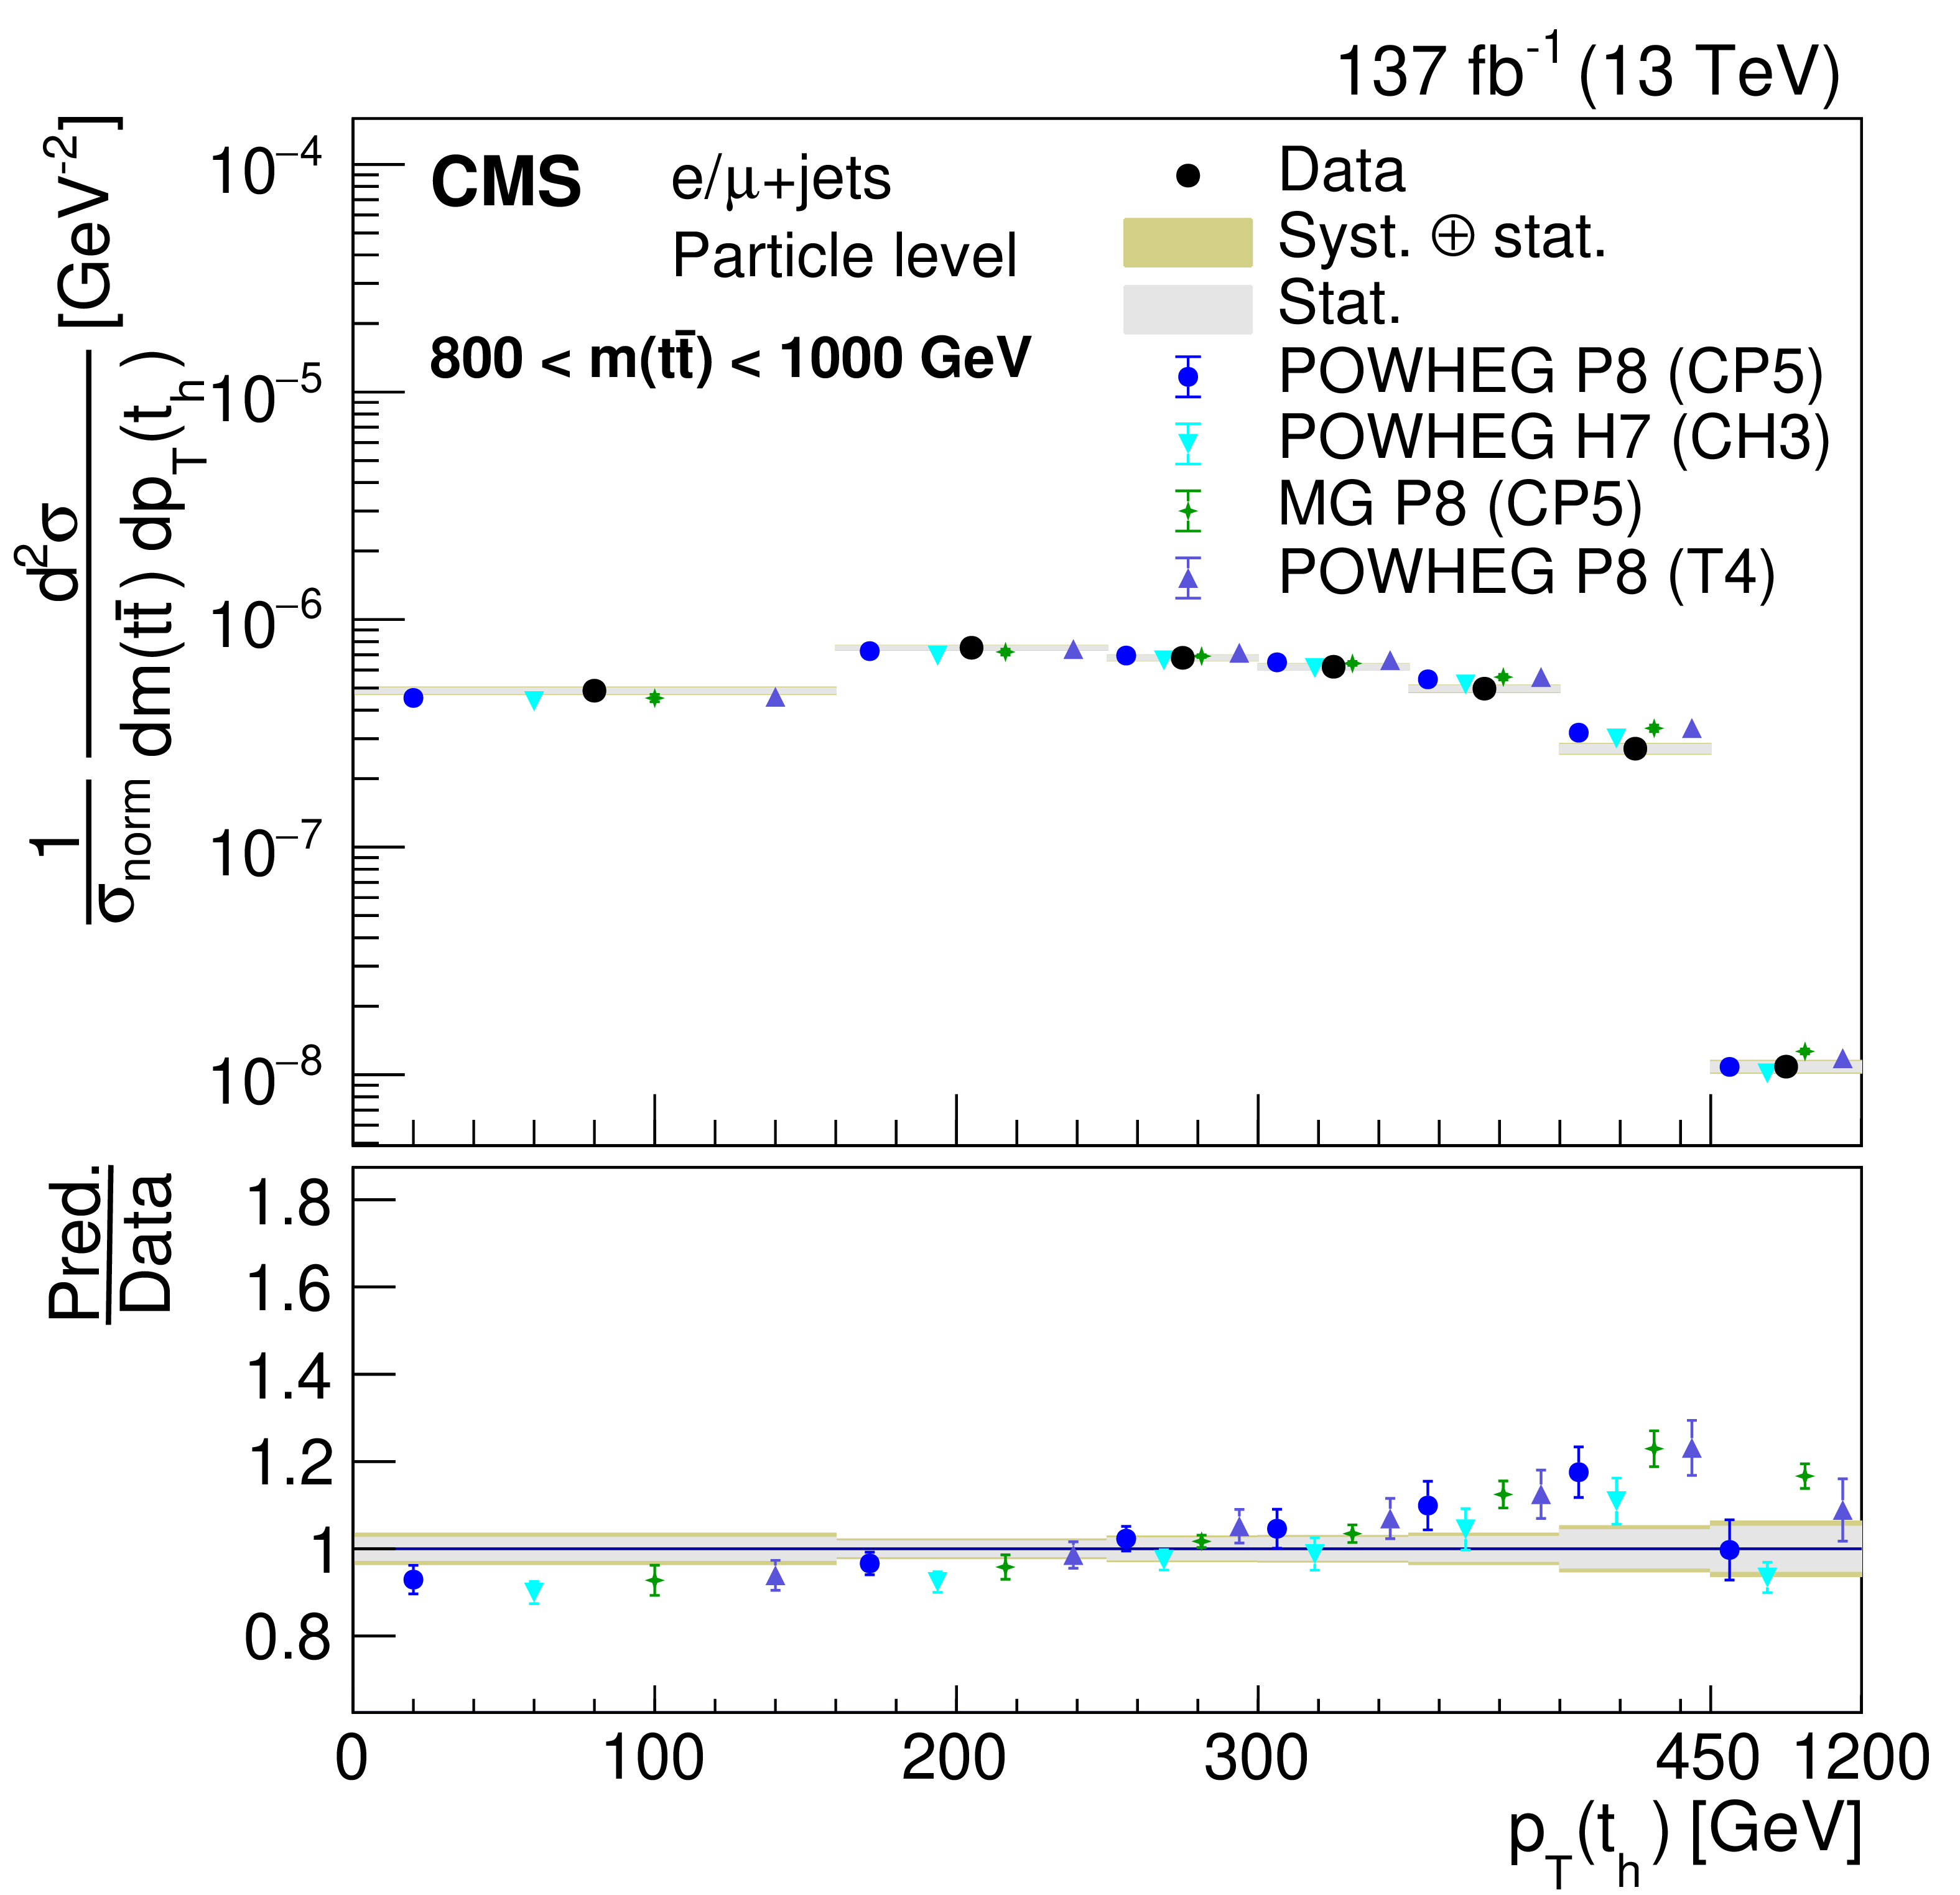
png pdf |
Figure A14-e:
Normalized double-differential cross section at the particle level as a function of ${m({\mathrm{t} {}\mathrm{\bar{t}}})}$ vs. ${{p_{\mathrm {T}}} ({\mathrm{t} _\mathrm {h}})}$. The data are shown as points with gray (yellow) bands indicating the statistical (statistical and systematic) uncertainties. The cross sections are compared to the predictions of POWHEG+PYTHIA (P8) for the CP5 and CUETP8M2T4 (T4) tunes, POWHEG+HERWIG (H7), and the multiparton simulation MG5_aMC@NLO (MG)+PYTHIA. The ratios of the various predictions to the measured cross sections are shown in the lower panels. |
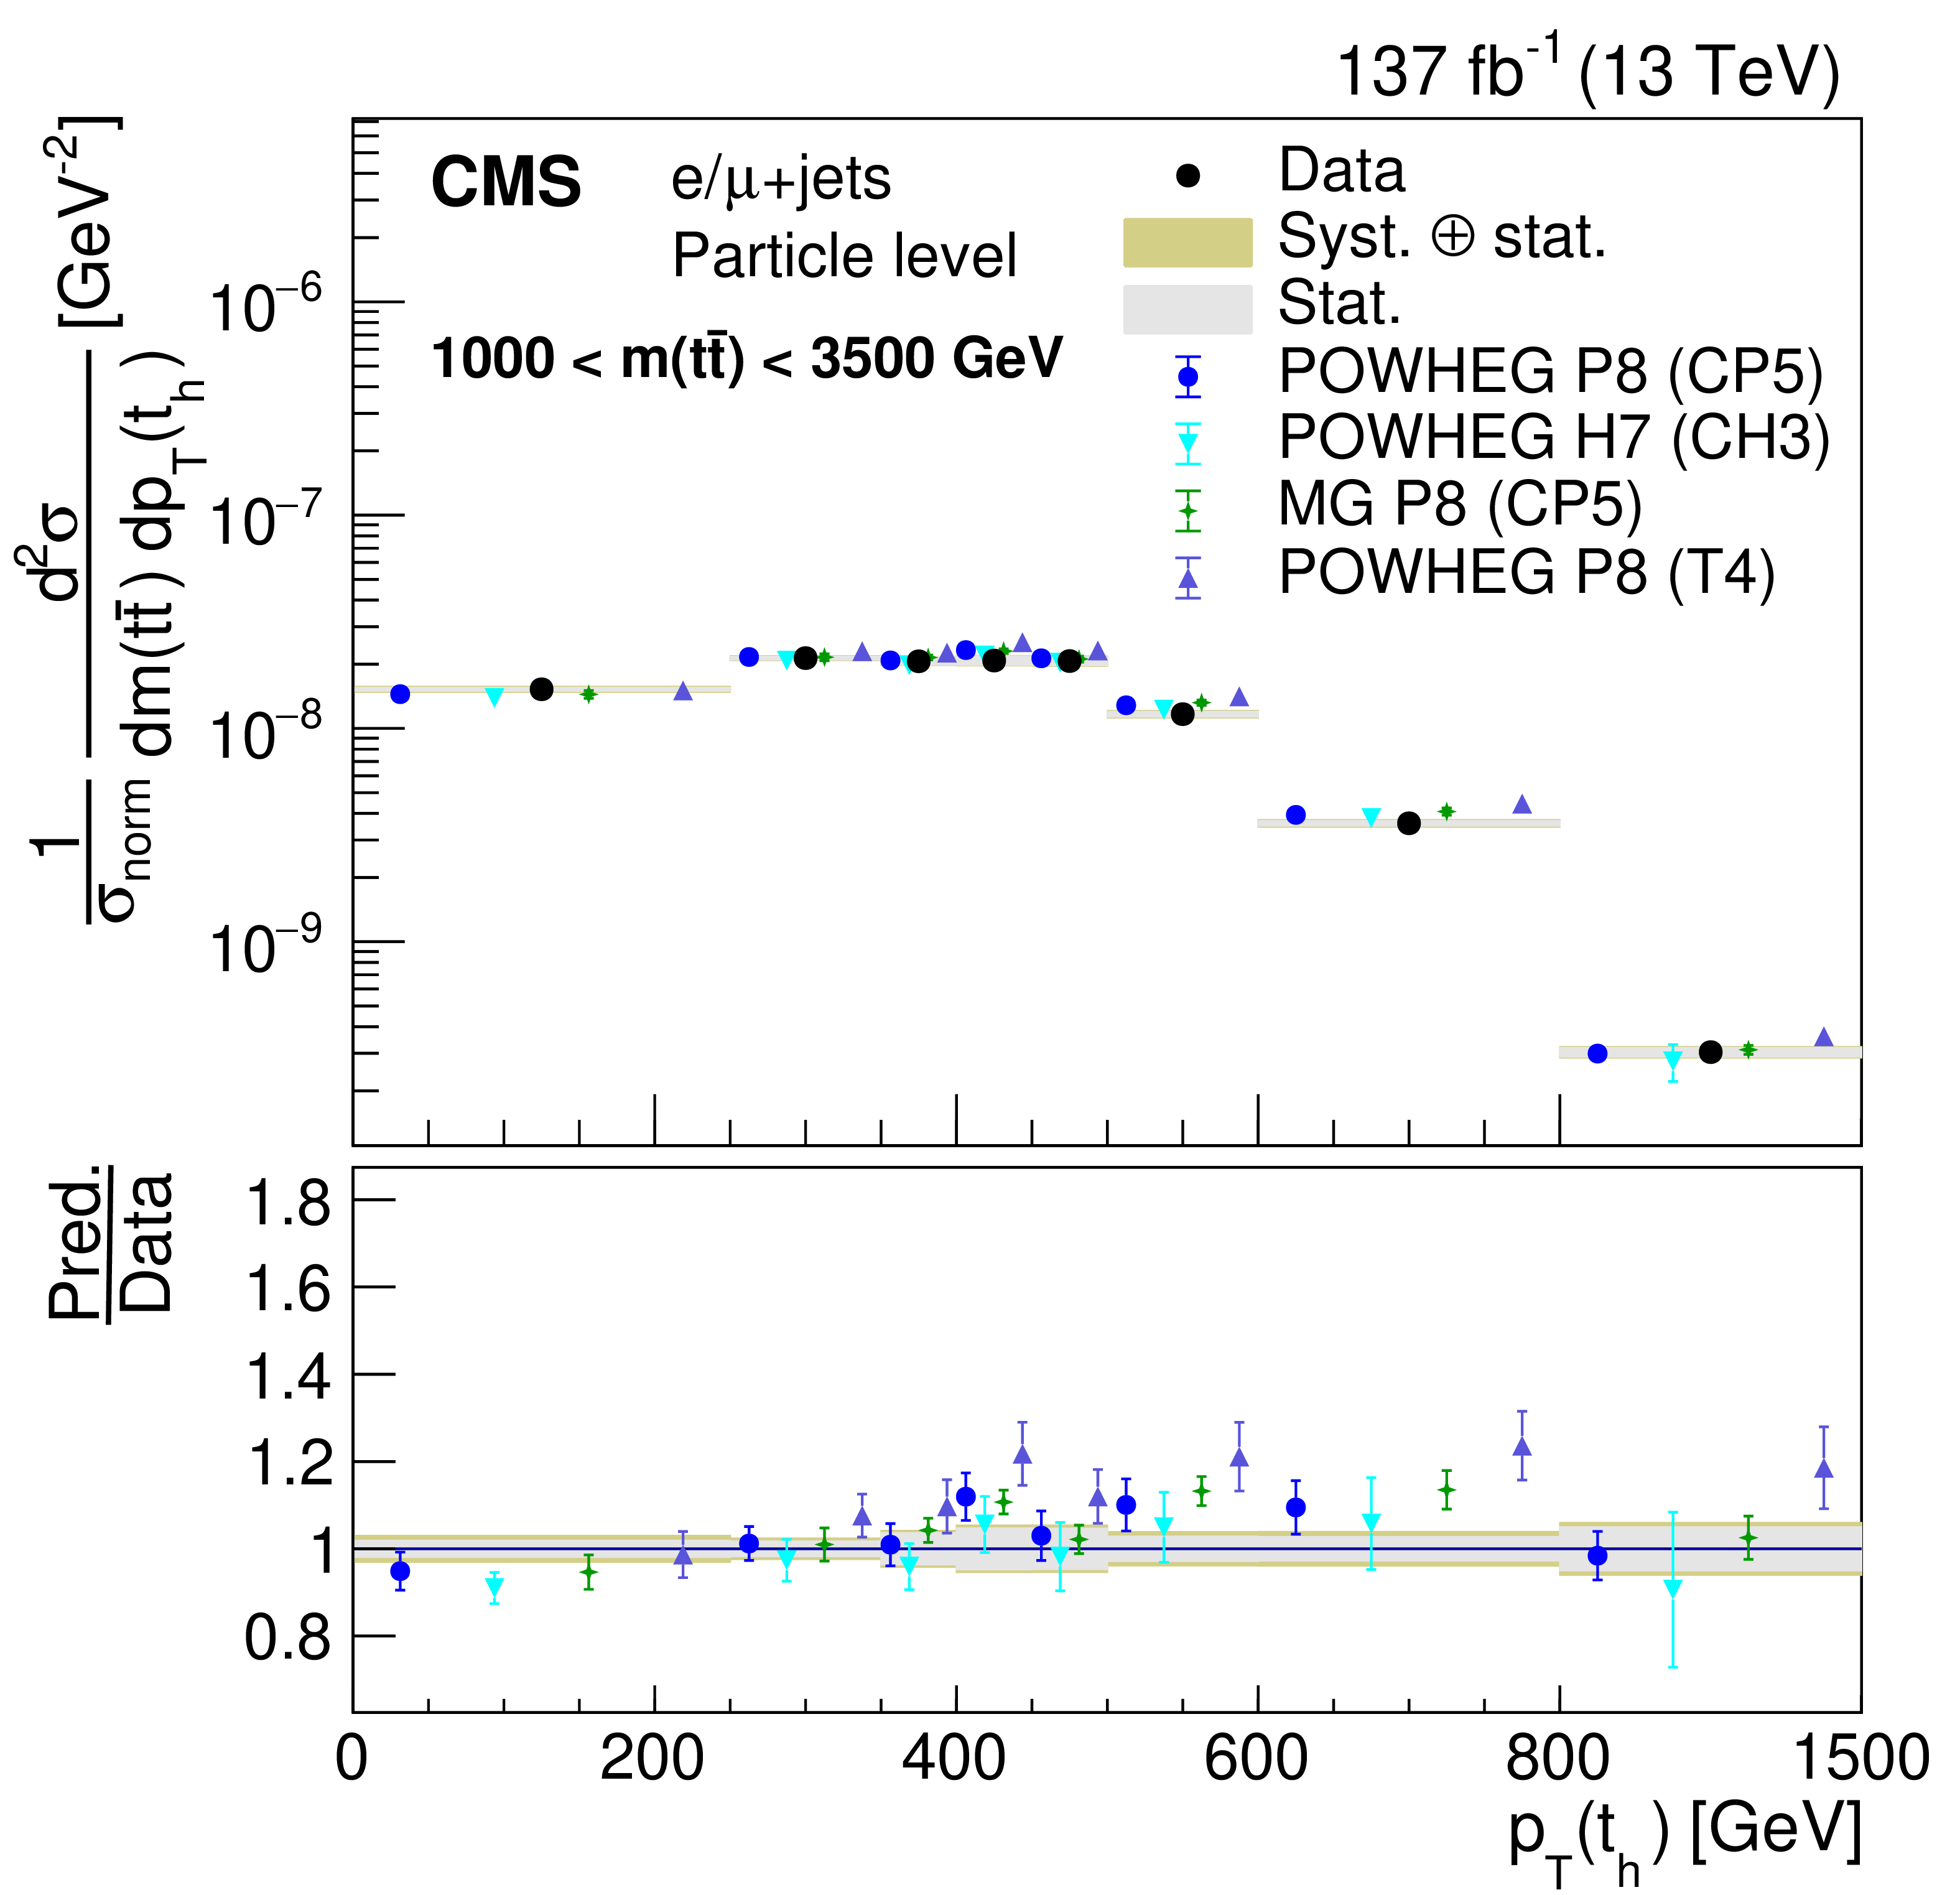
png pdf |
Figure A14-f:
Normalized double-differential cross section at the particle level as a function of ${m({\mathrm{t} {}\mathrm{\bar{t}}})}$ vs. ${{p_{\mathrm {T}}} ({\mathrm{t} _\mathrm {h}})}$. The data are shown as points with gray (yellow) bands indicating the statistical (statistical and systematic) uncertainties. The cross sections are compared to the predictions of POWHEG+PYTHIA (P8) for the CP5 and CUETP8M2T4 (T4) tunes, POWHEG+HERWIG (H7), and the multiparton simulation MG5_aMC@NLO (MG)+PYTHIA. The ratios of the various predictions to the measured cross sections are shown in the lower panels. |
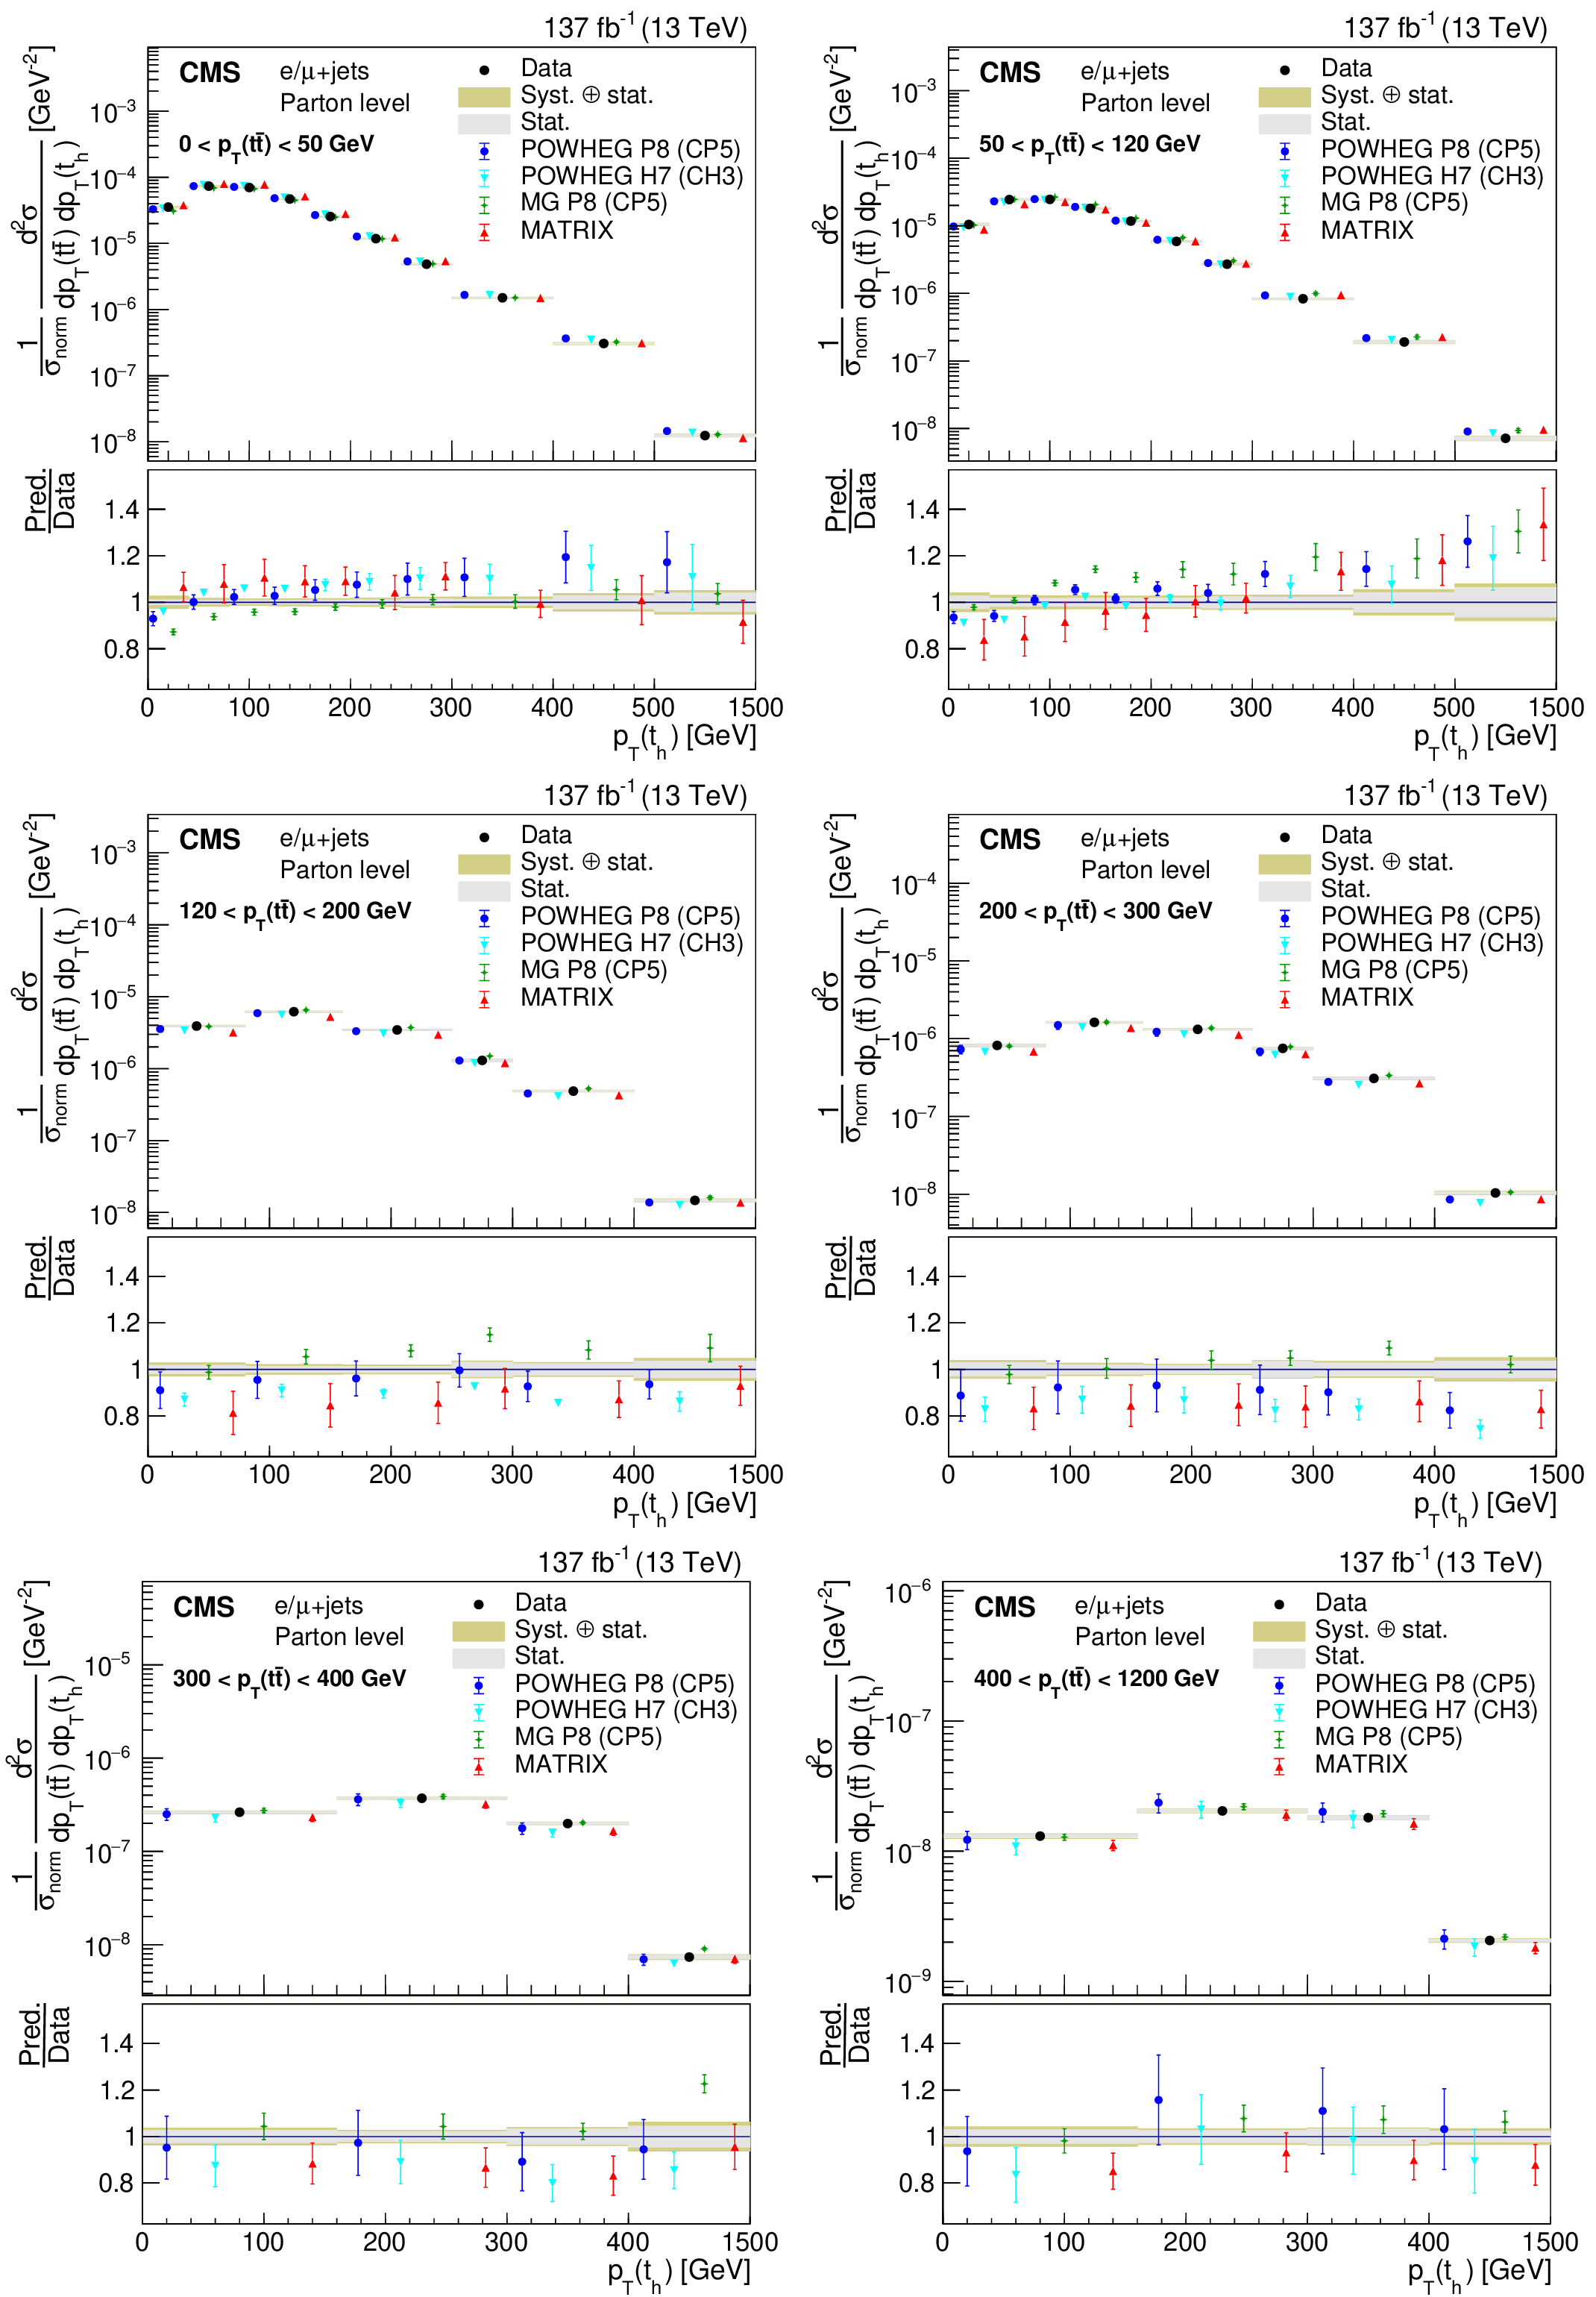
png pdf |
Figure A15:
Normalized double-differential cross section at the parton level as a function of ${{p_{\mathrm {T}}} ({\mathrm{t} {}\mathrm{\bar{t}}})}$ vs. ${{p_{\mathrm {T}}} ({\mathrm{t} _\mathrm {h}})}$. The data are shown as points with gray (yellow) bands indicating the statistical (statistical and systematic) uncertainties. The cross sections are compared to the predictions of POWHEG combined with PYTHIA (P8) or HERWIG (H7), the multiparton simulation MG5_aMC@NLO (MG)+PYTHIA FxFx, and the NNLO QCD calculations obtained with Matrix. The ratios of the various predictions to the measured cross sections are shown in the lower panels. |
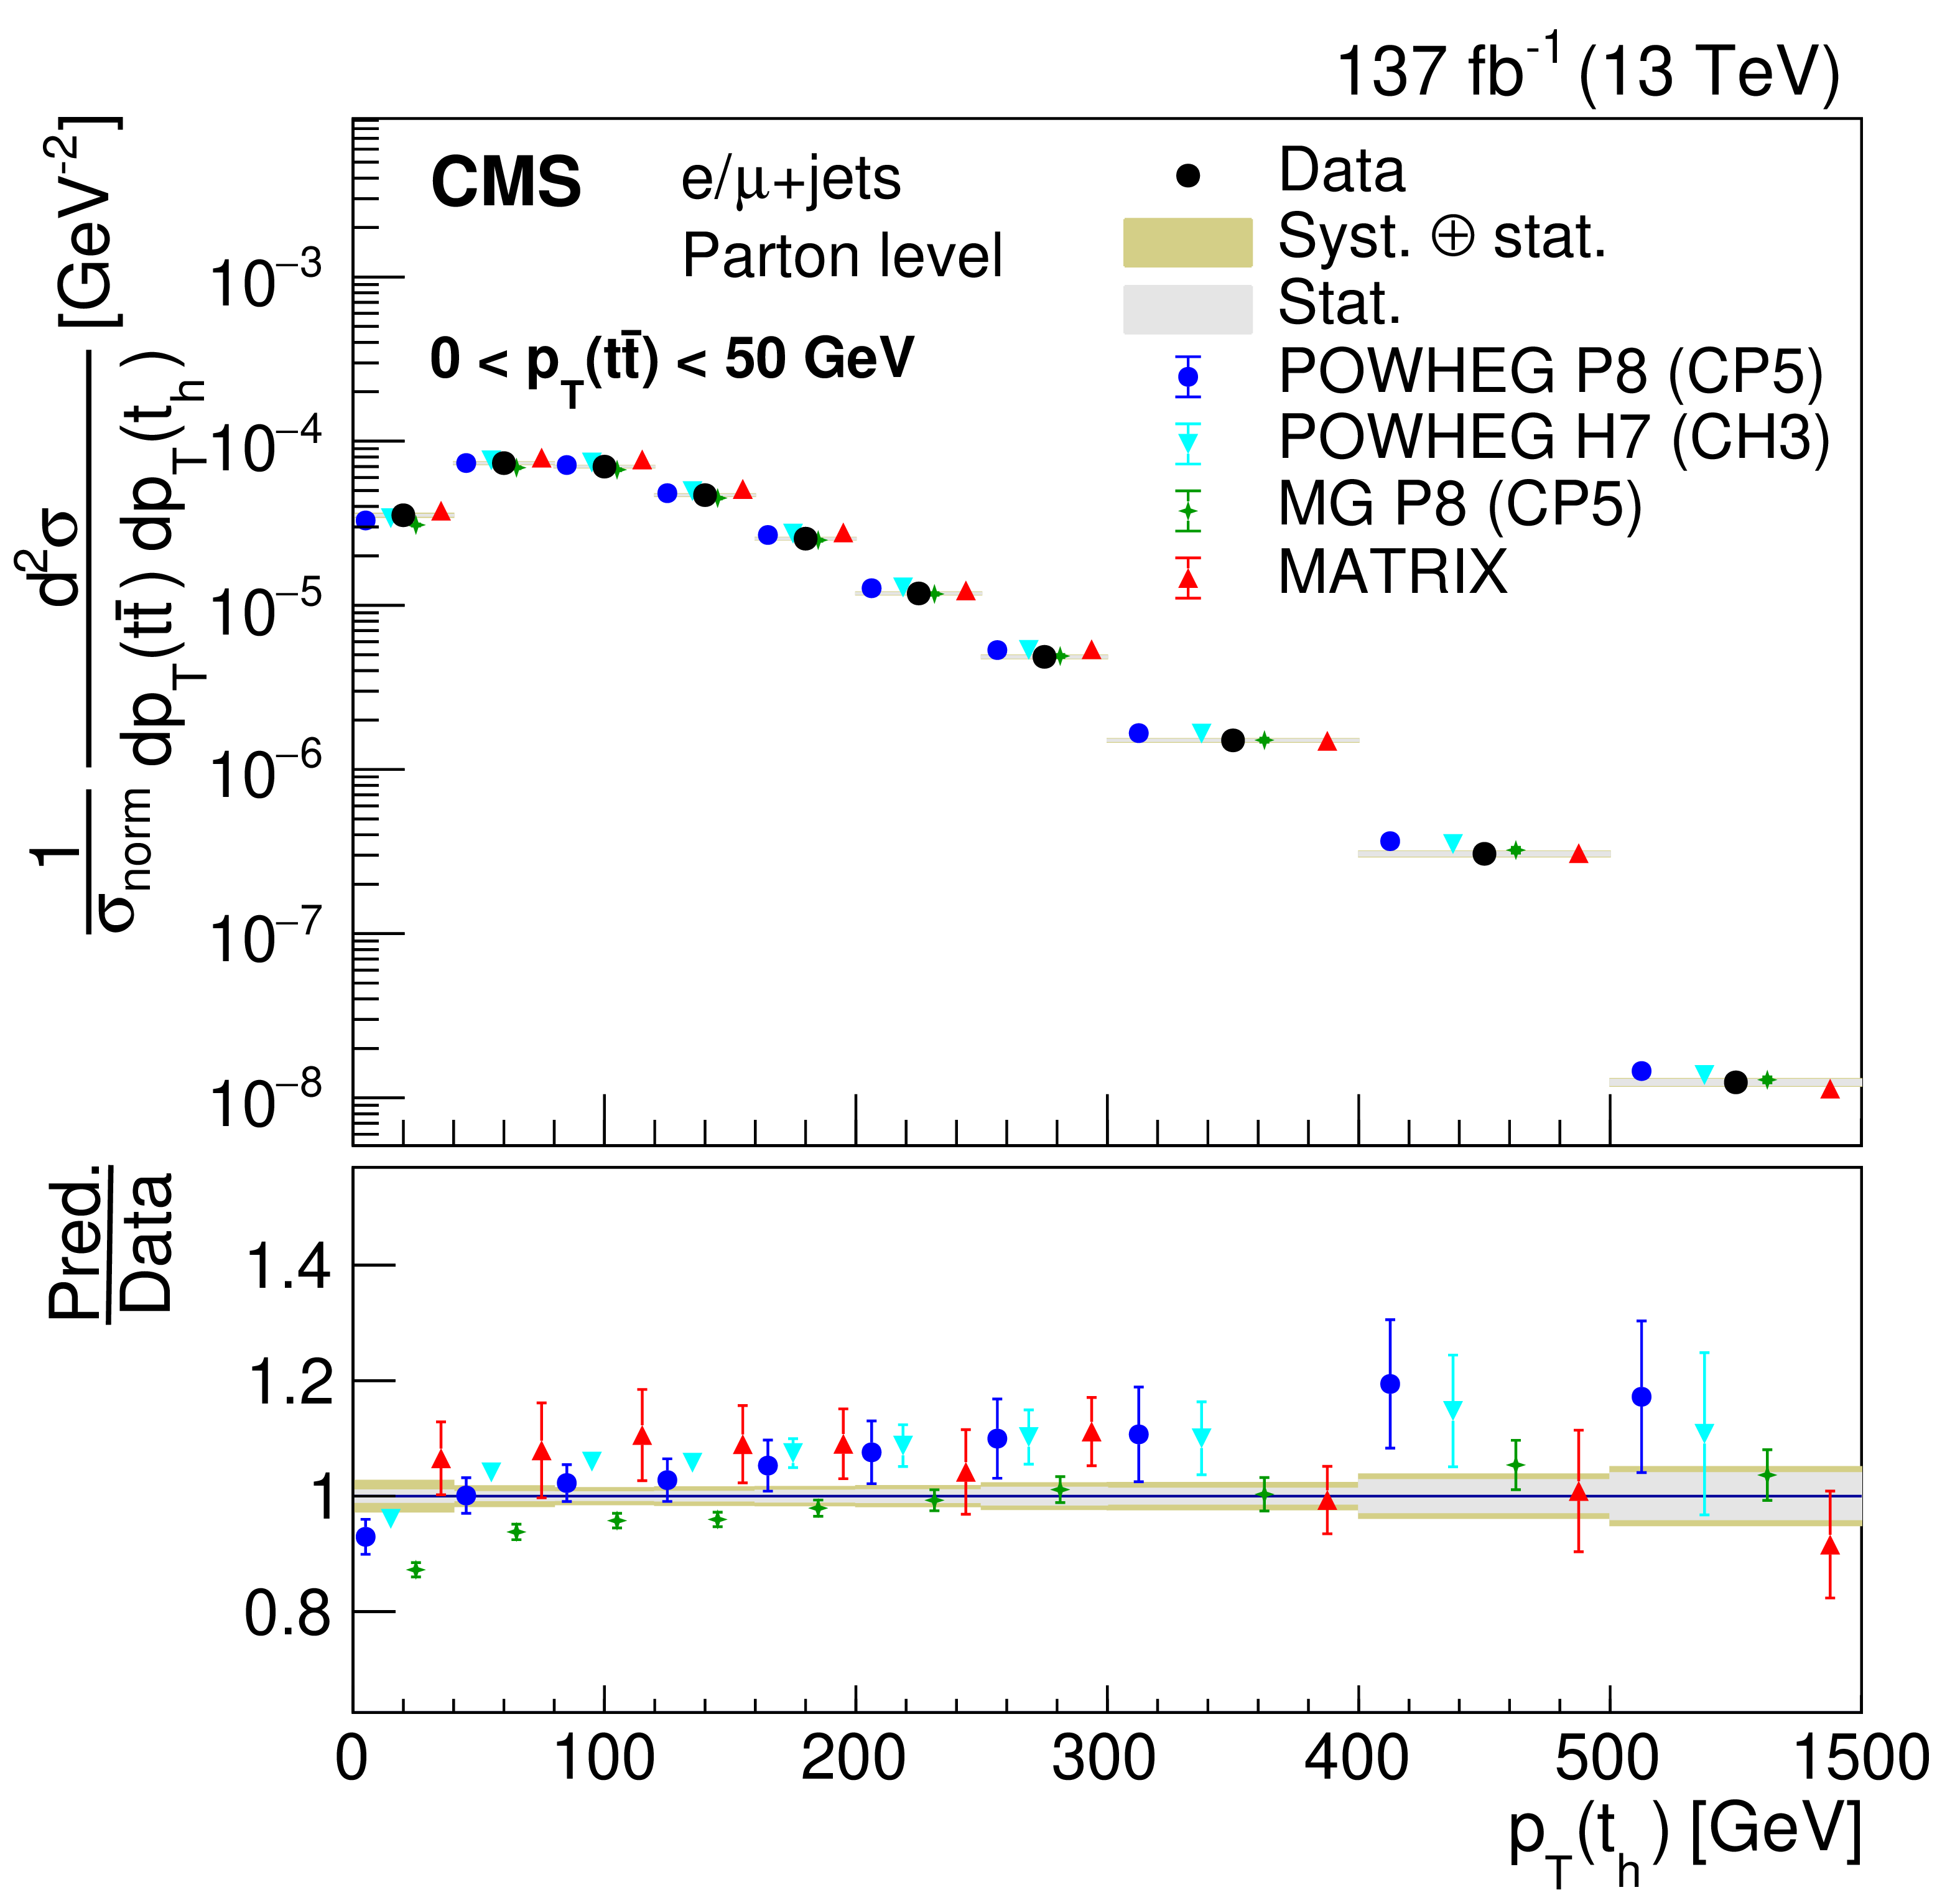
png pdf |
Figure A15-a:
Normalized double-differential cross section at the parton level as a function of ${{p_{\mathrm {T}}} ({\mathrm{t} {}\mathrm{\bar{t}}})}$ vs. ${{p_{\mathrm {T}}} ({\mathrm{t} _\mathrm {h}})}$. The data are shown as points with gray (yellow) bands indicating the statistical (statistical and systematic) uncertainties. The cross sections are compared to the predictions of POWHEG combined with PYTHIA (P8) or HERWIG (H7), the multiparton simulation MG5_aMC@NLO (MG)+PYTHIA FxFx, and the NNLO QCD calculations obtained with Matrix. The ratios of the various predictions to the measured cross sections are shown in the lower panels. |
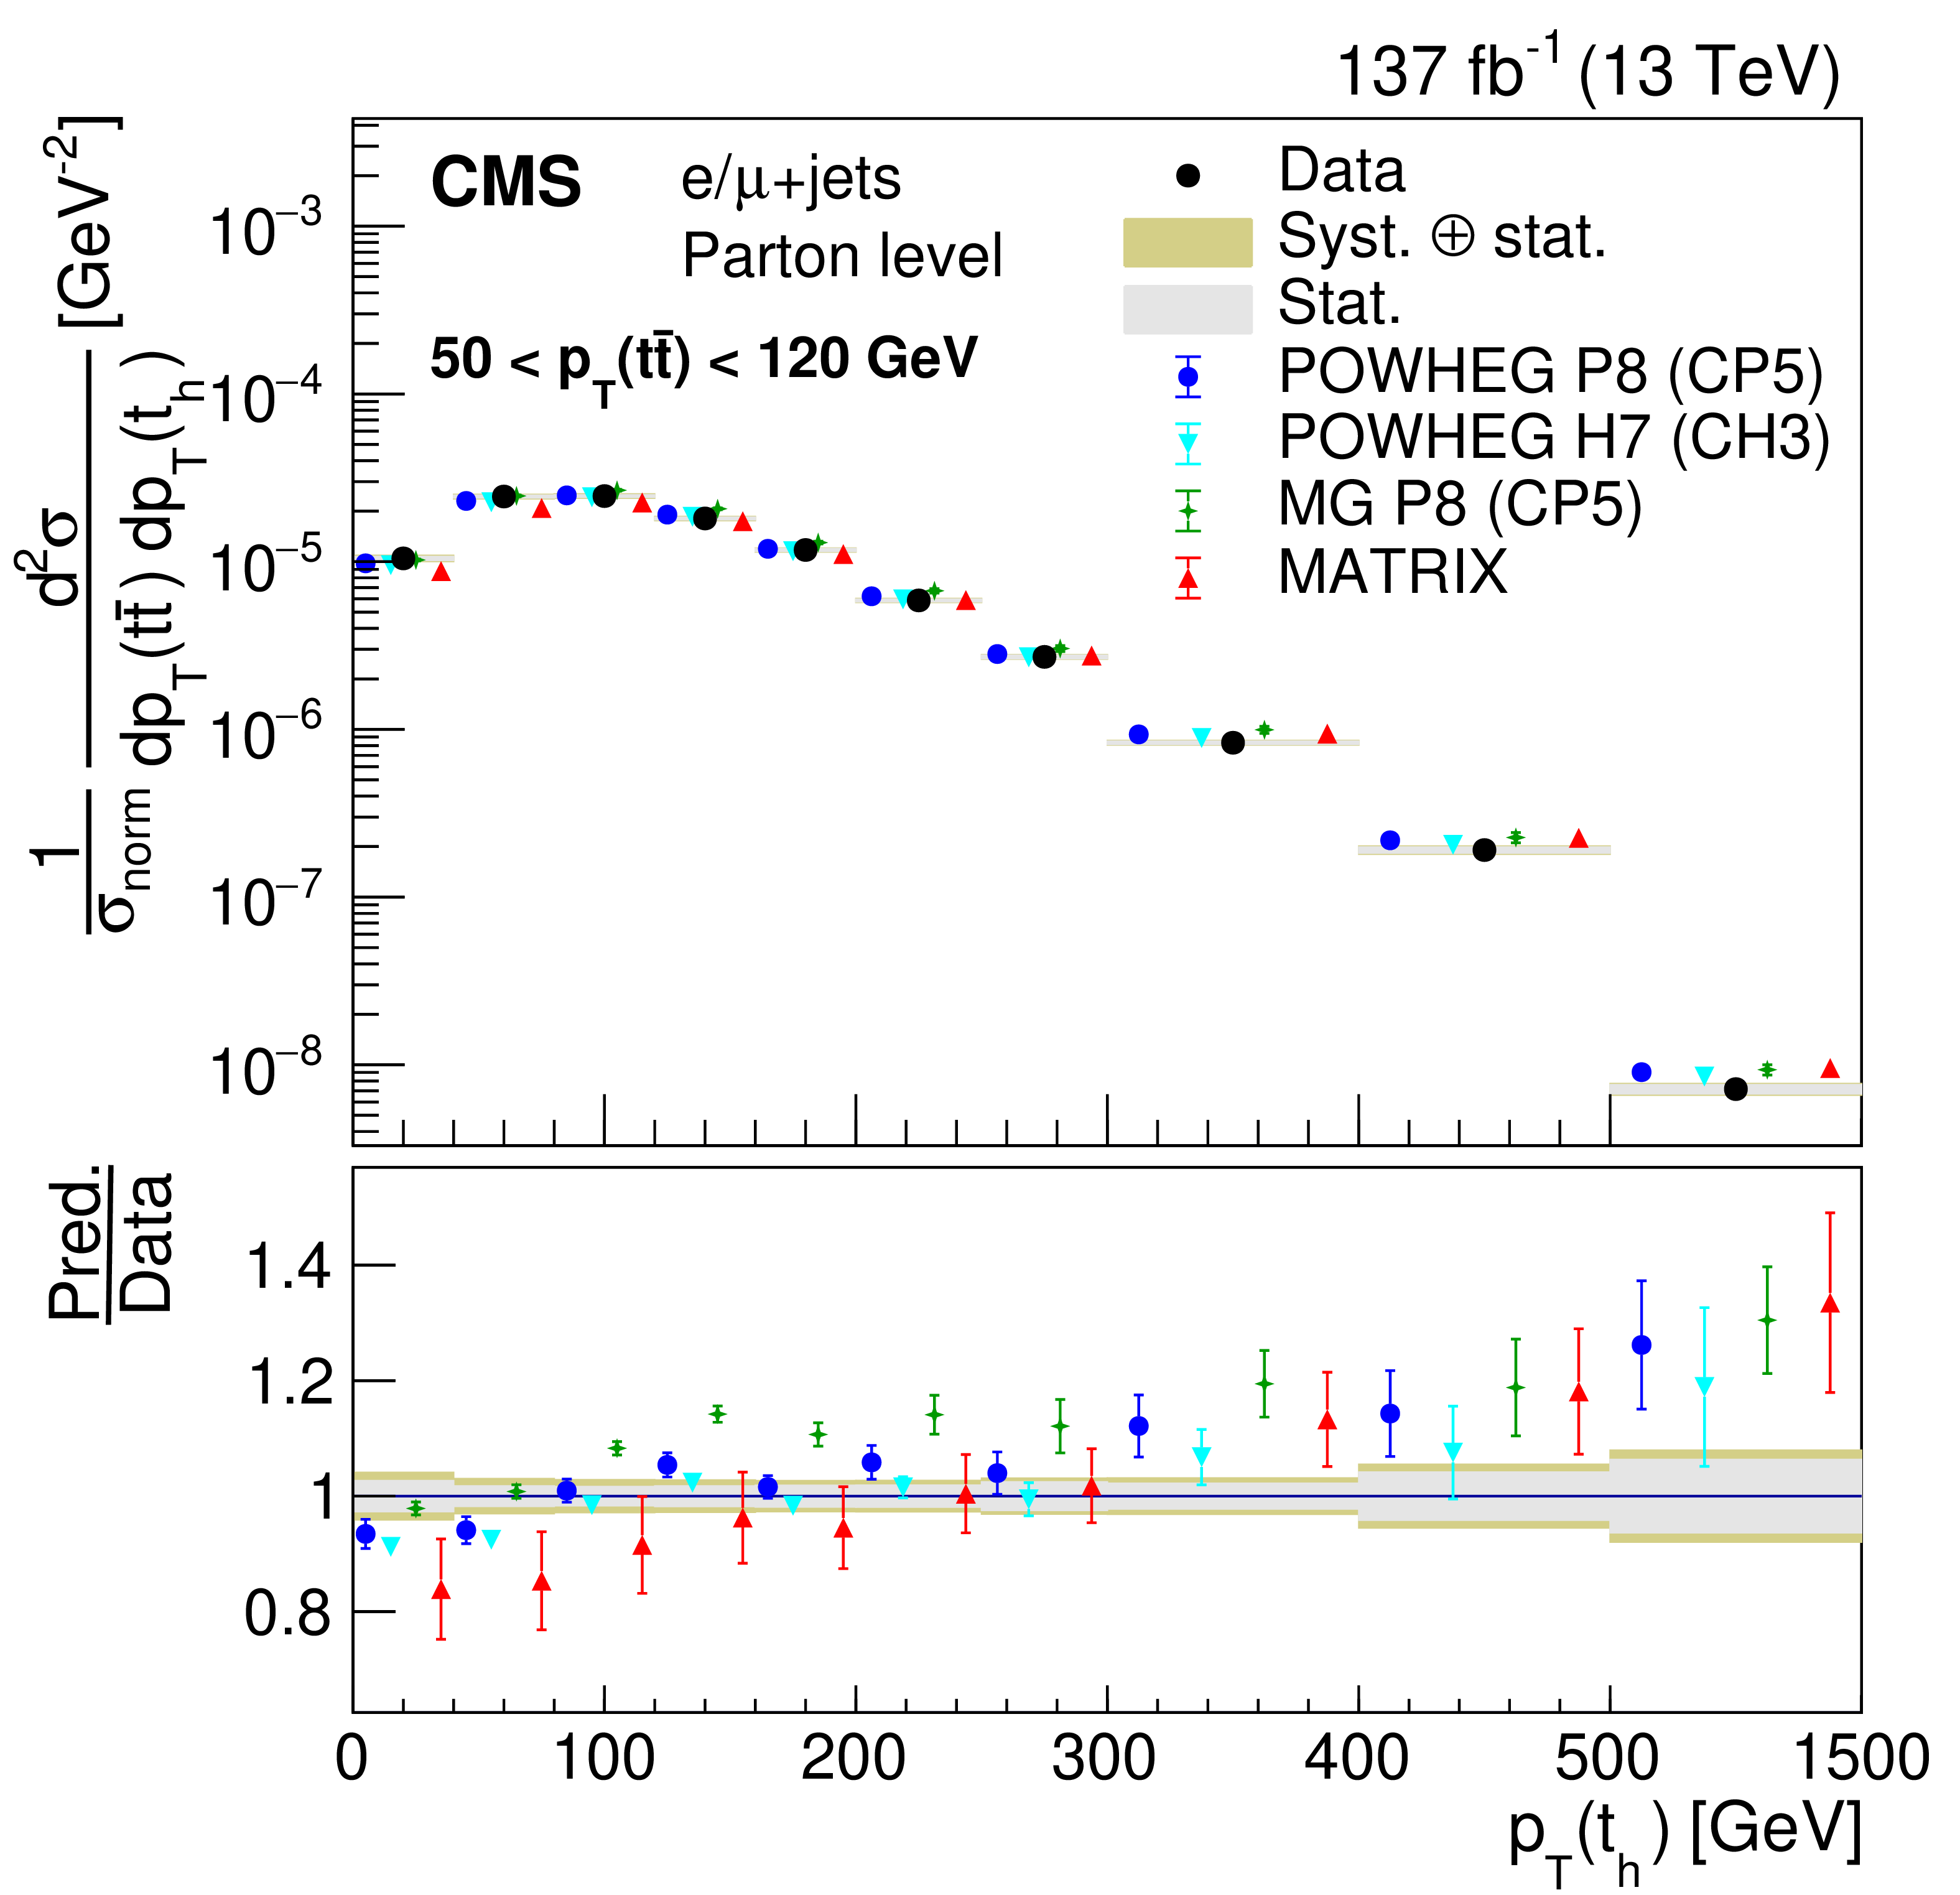
png pdf |
Figure A15-b:
Normalized double-differential cross section at the parton level as a function of ${{p_{\mathrm {T}}} ({\mathrm{t} {}\mathrm{\bar{t}}})}$ vs. ${{p_{\mathrm {T}}} ({\mathrm{t} _\mathrm {h}})}$. The data are shown as points with gray (yellow) bands indicating the statistical (statistical and systematic) uncertainties. The cross sections are compared to the predictions of POWHEG combined with PYTHIA (P8) or HERWIG (H7), the multiparton simulation MG5_aMC@NLO (MG)+PYTHIA FxFx, and the NNLO QCD calculations obtained with Matrix. The ratios of the various predictions to the measured cross sections are shown in the lower panels. |
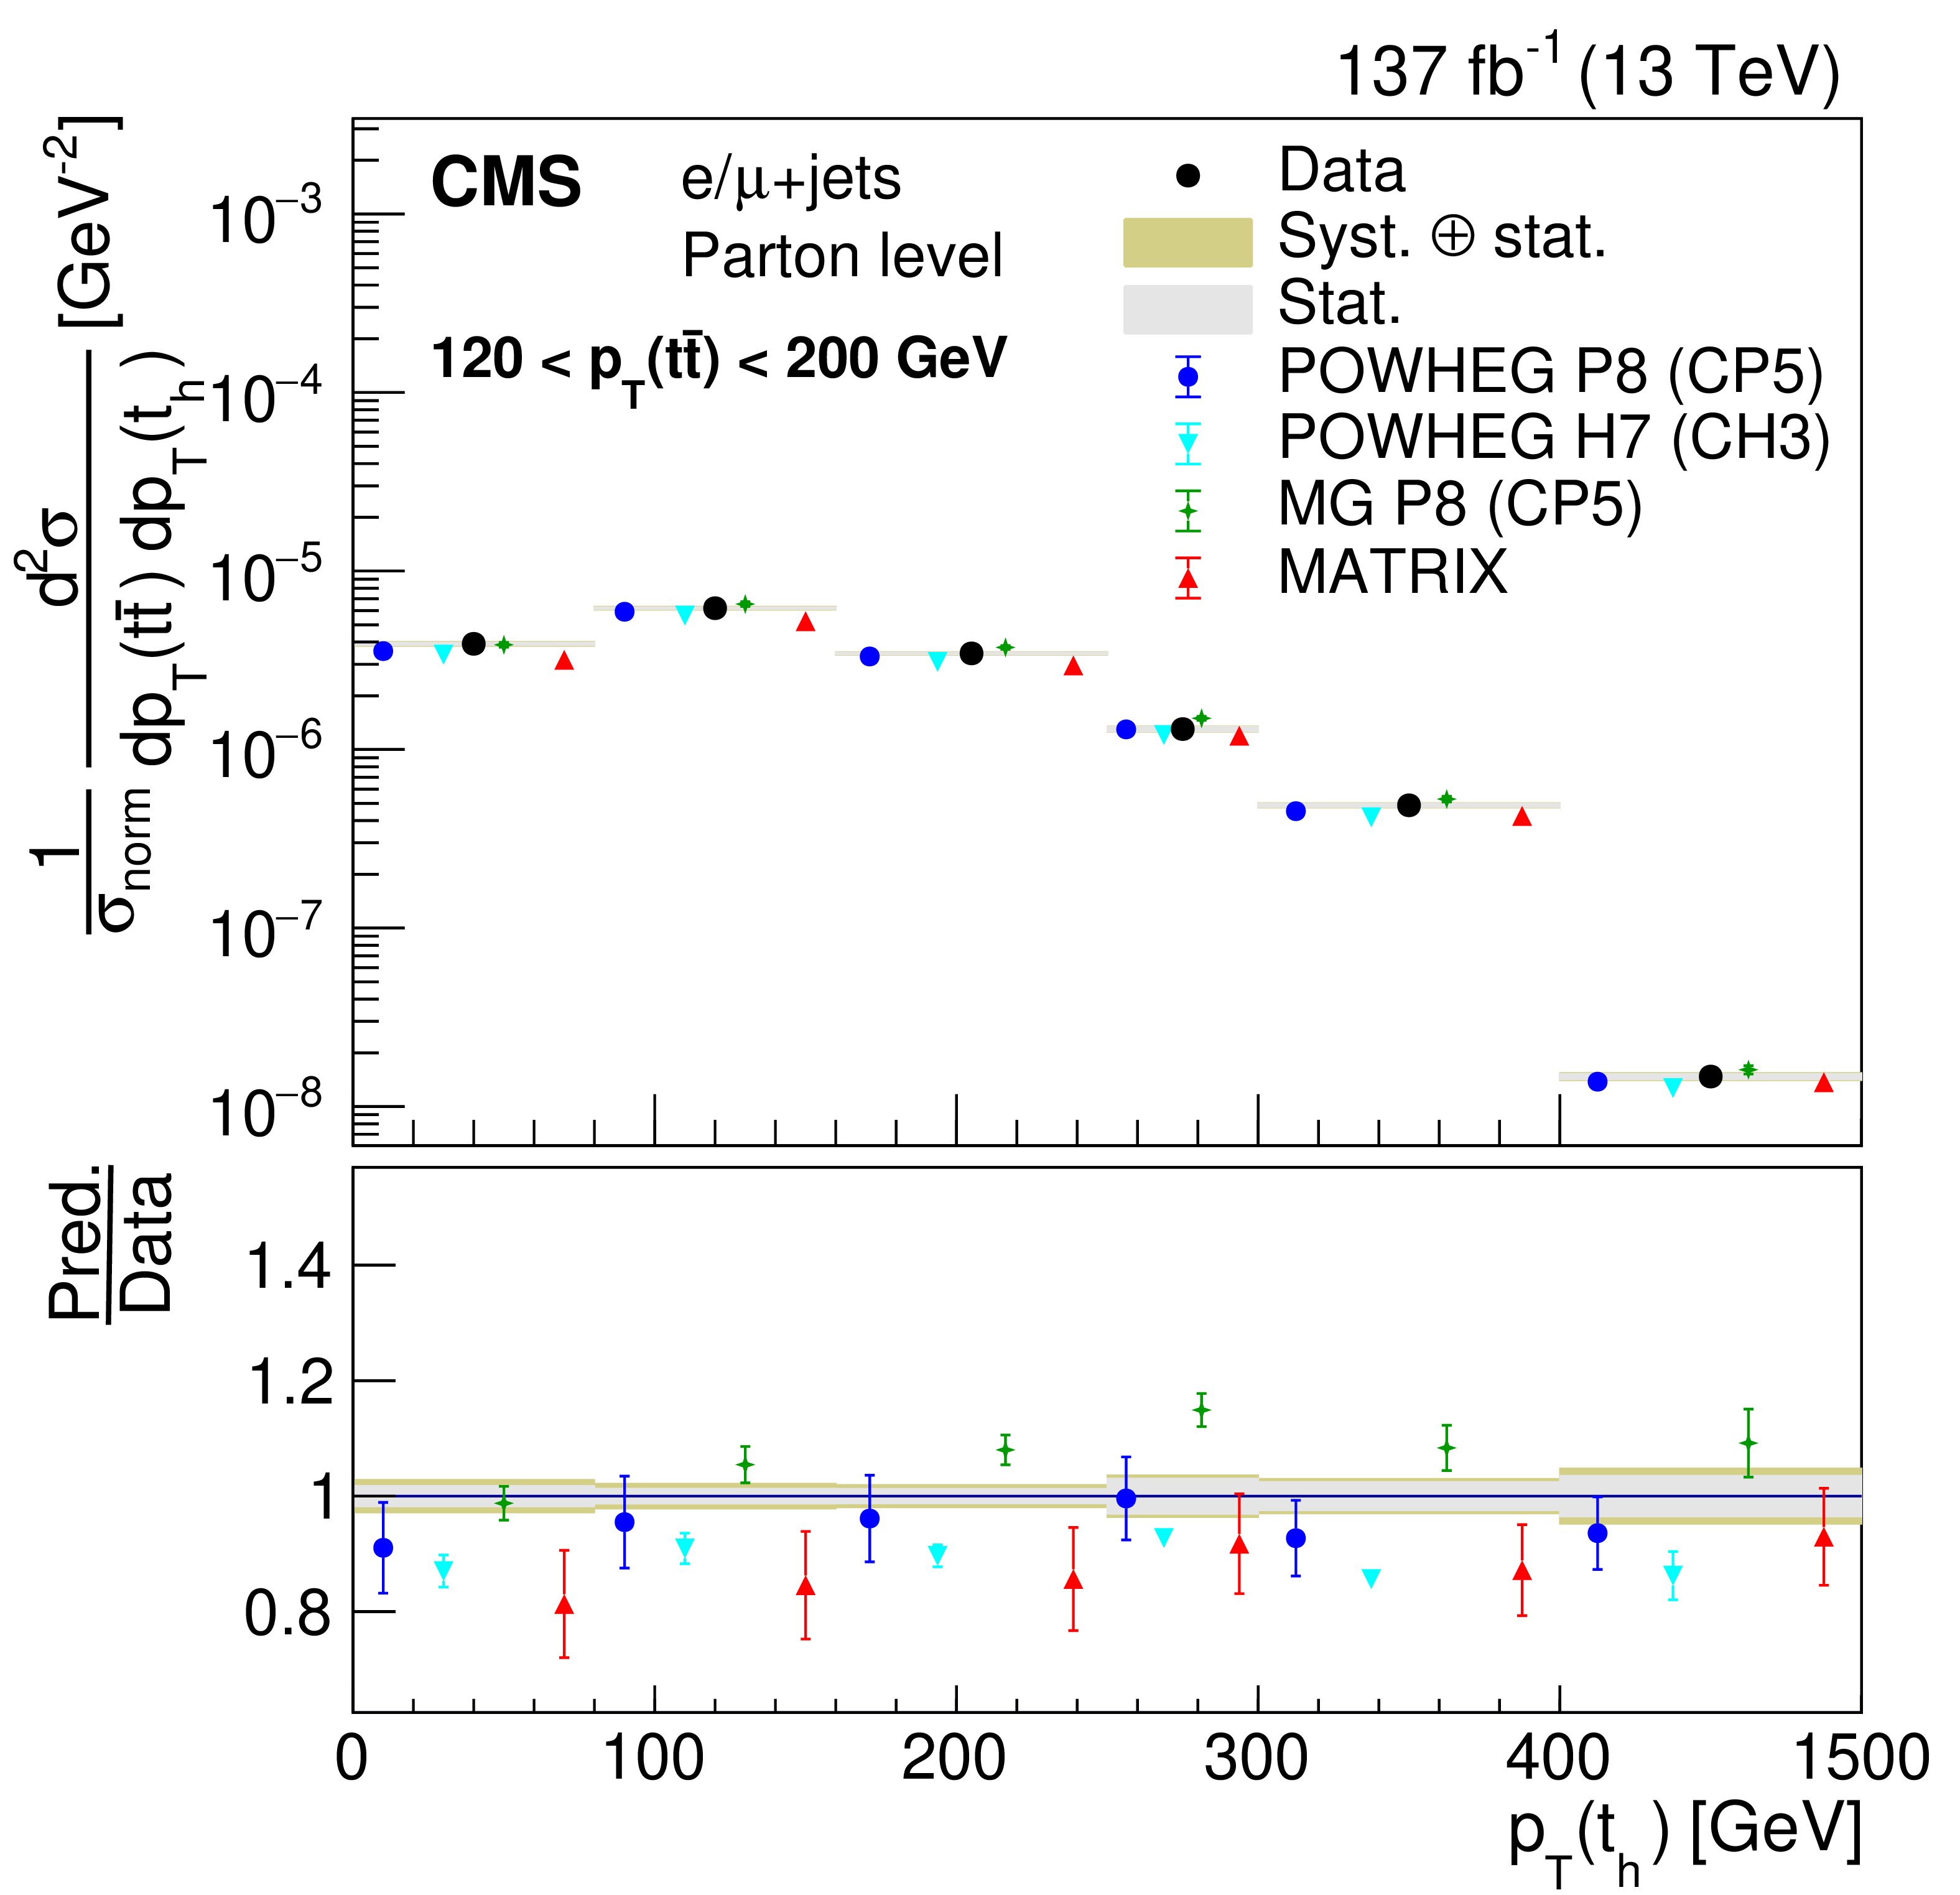
png pdf |
Figure A15-c:
Normalized double-differential cross section at the parton level as a function of ${{p_{\mathrm {T}}} ({\mathrm{t} {}\mathrm{\bar{t}}})}$ vs. ${{p_{\mathrm {T}}} ({\mathrm{t} _\mathrm {h}})}$. The data are shown as points with gray (yellow) bands indicating the statistical (statistical and systematic) uncertainties. The cross sections are compared to the predictions of POWHEG combined with PYTHIA (P8) or HERWIG (H7), the multiparton simulation MG5_aMC@NLO (MG)+PYTHIA FxFx, and the NNLO QCD calculations obtained with Matrix. The ratios of the various predictions to the measured cross sections are shown in the lower panels. |
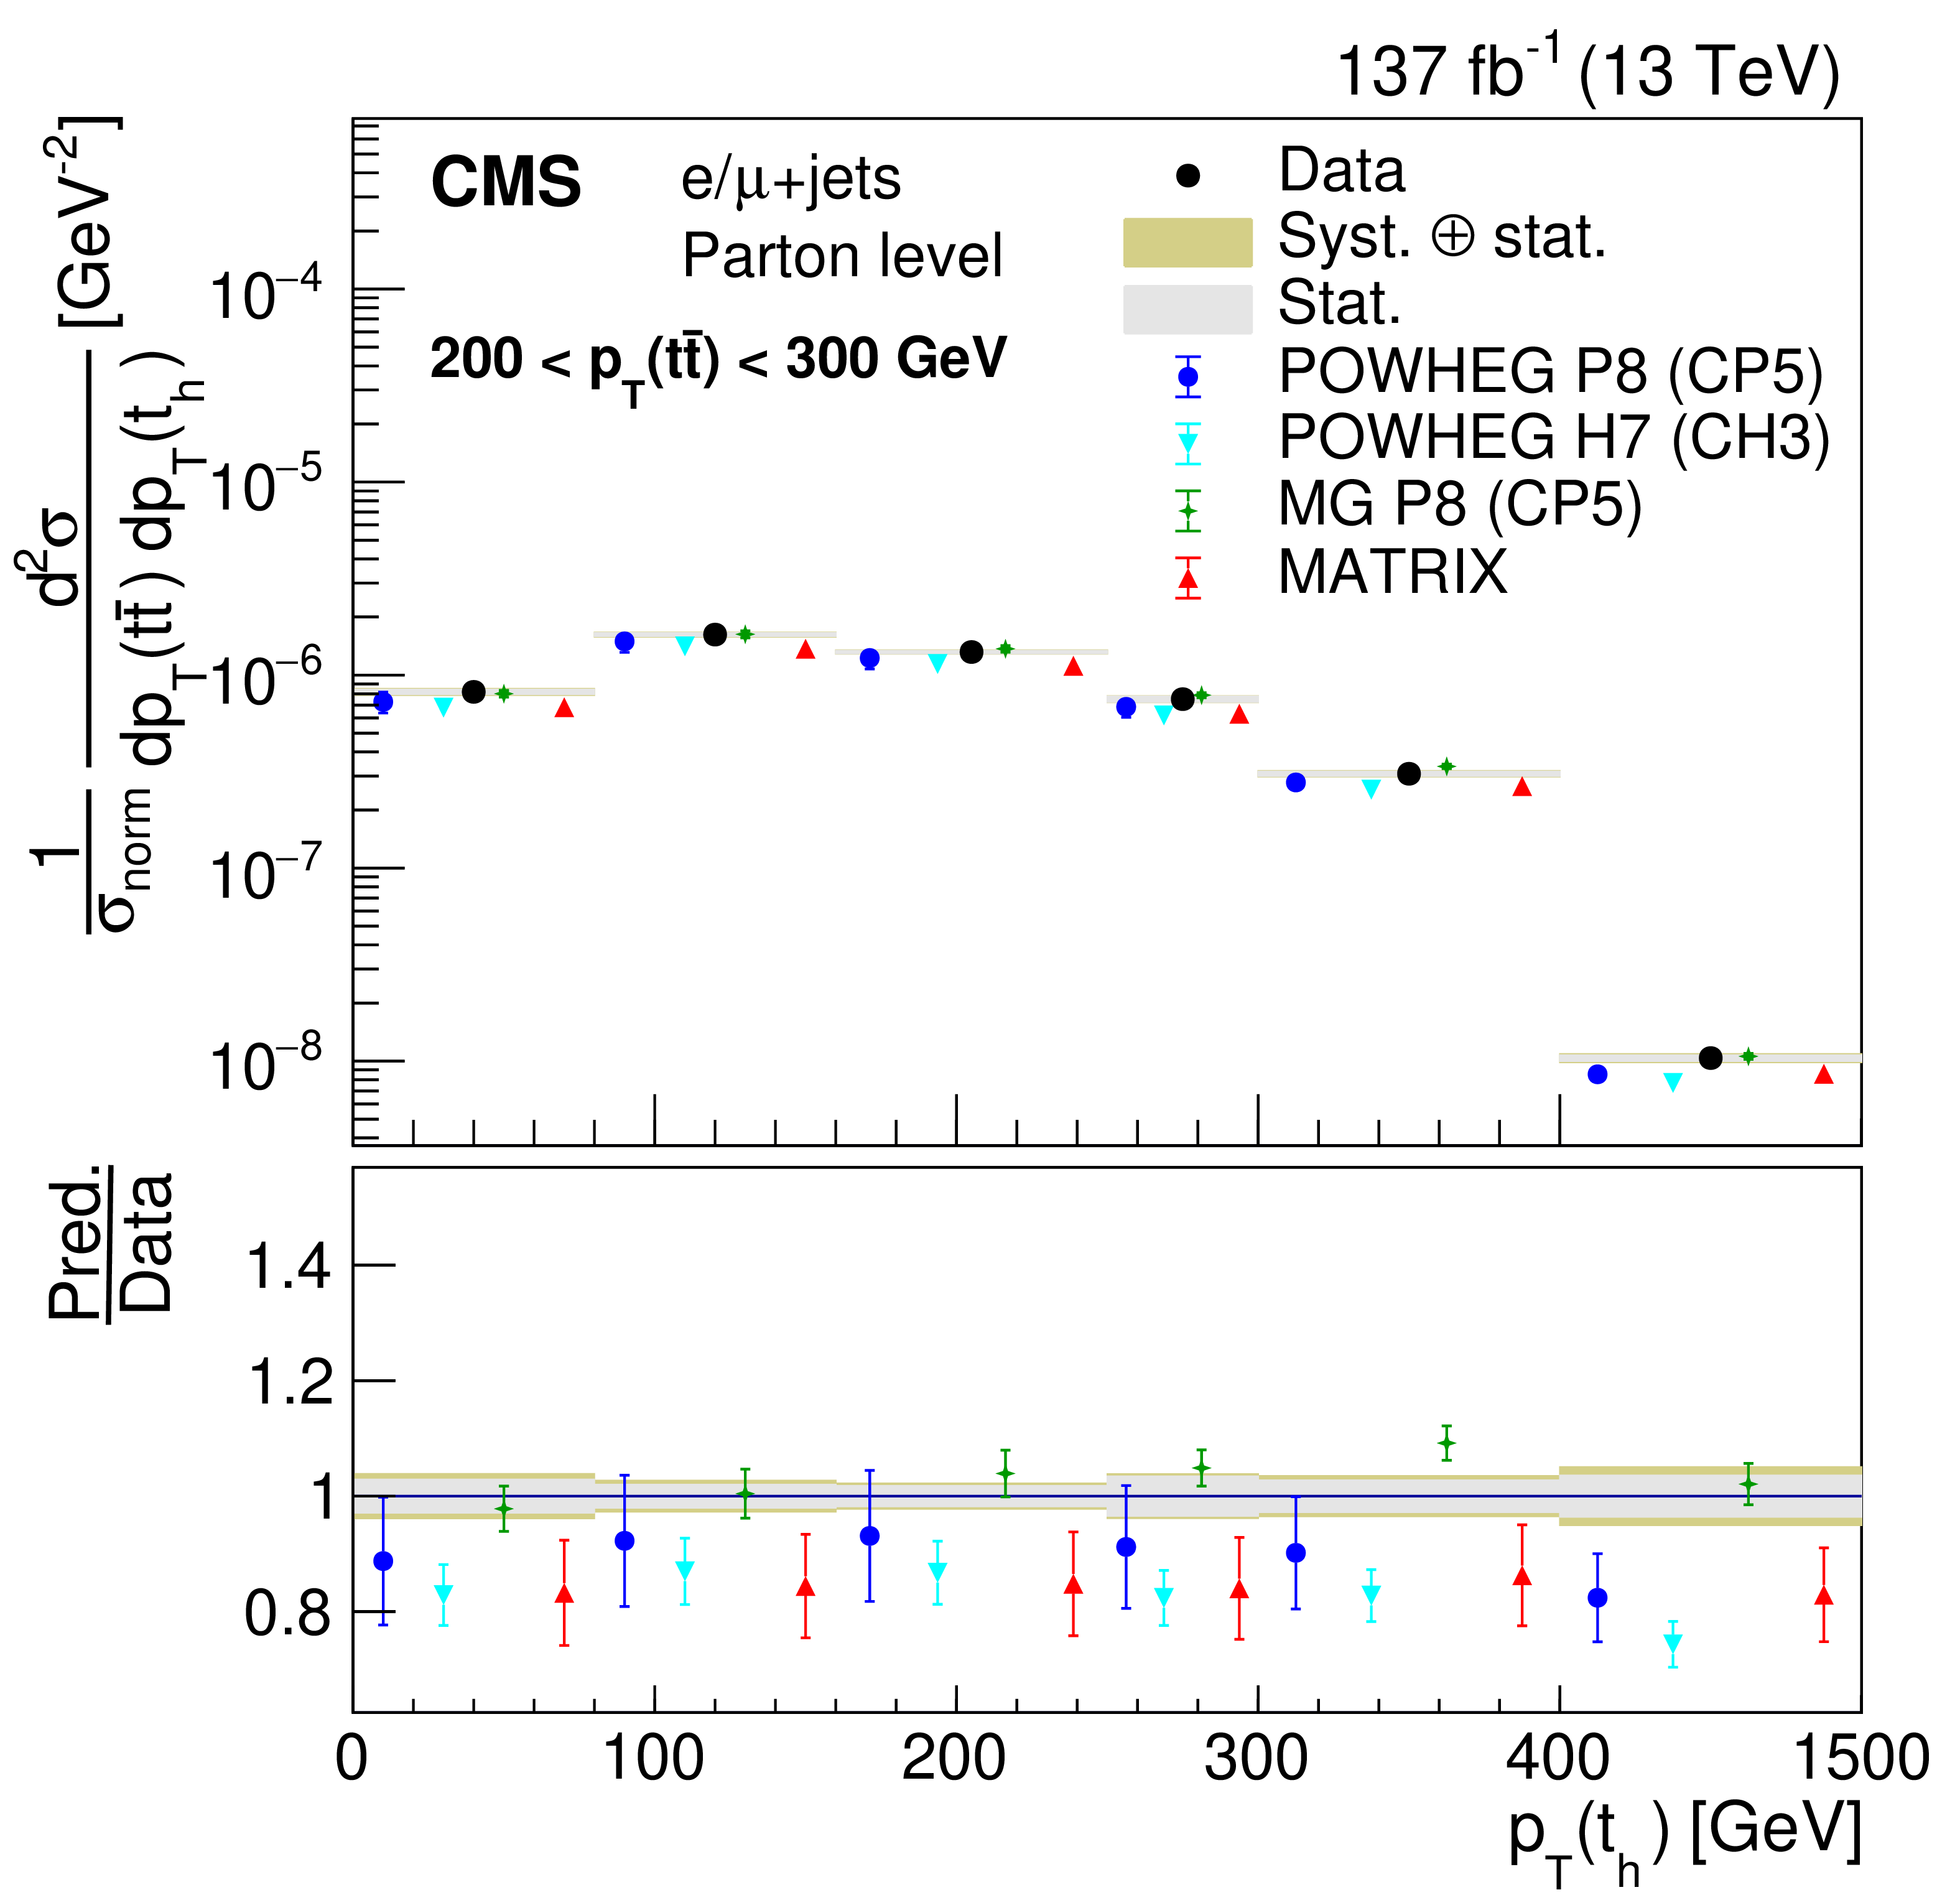
png pdf |
Figure A15-d:
Normalized double-differential cross section at the parton level as a function of ${{p_{\mathrm {T}}} ({\mathrm{t} {}\mathrm{\bar{t}}})}$ vs. ${{p_{\mathrm {T}}} ({\mathrm{t} _\mathrm {h}})}$. The data are shown as points with gray (yellow) bands indicating the statistical (statistical and systematic) uncertainties. The cross sections are compared to the predictions of POWHEG combined with PYTHIA (P8) or HERWIG (H7), the multiparton simulation MG5_aMC@NLO (MG)+PYTHIA FxFx, and the NNLO QCD calculations obtained with Matrix. The ratios of the various predictions to the measured cross sections are shown in the lower panels. |
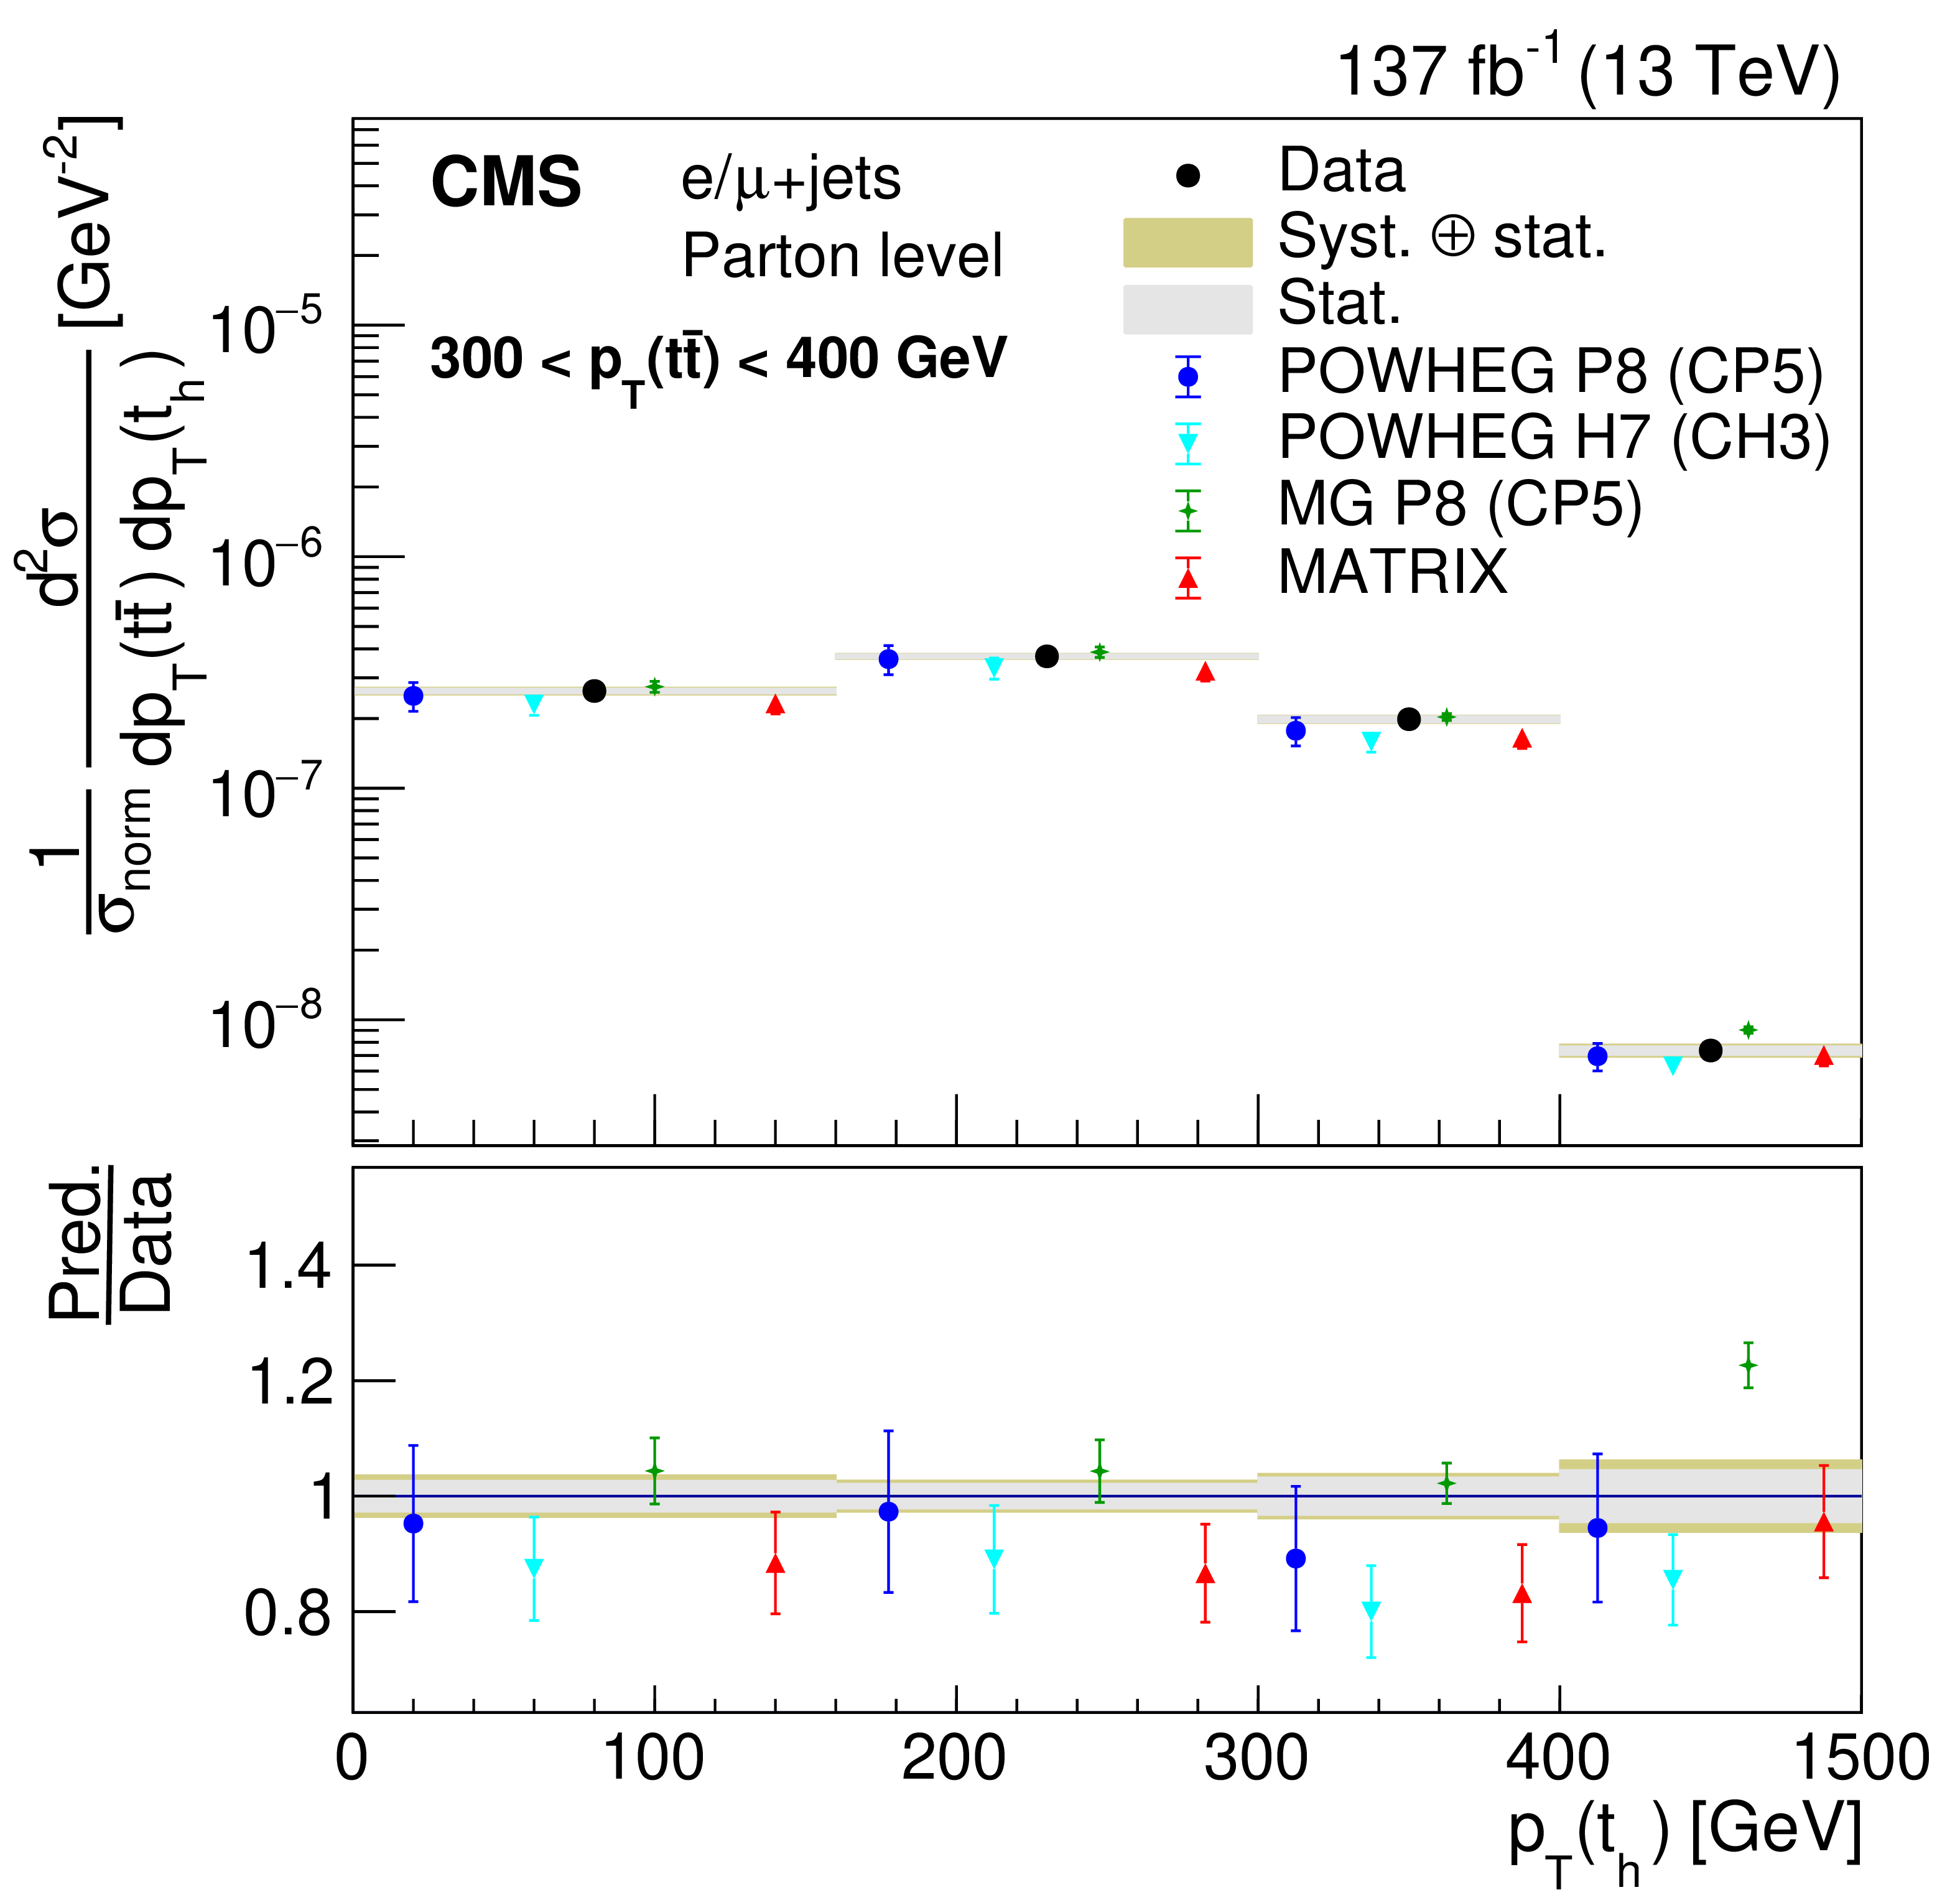
png pdf |
Figure A15-e:
Normalized double-differential cross section at the parton level as a function of ${{p_{\mathrm {T}}} ({\mathrm{t} {}\mathrm{\bar{t}}})}$ vs. ${{p_{\mathrm {T}}} ({\mathrm{t} _\mathrm {h}})}$. The data are shown as points with gray (yellow) bands indicating the statistical (statistical and systematic) uncertainties. The cross sections are compared to the predictions of POWHEG combined with PYTHIA (P8) or HERWIG (H7), the multiparton simulation MG5_aMC@NLO (MG)+PYTHIA FxFx, and the NNLO QCD calculations obtained with Matrix. The ratios of the various predictions to the measured cross sections are shown in the lower panels. |

png pdf |
Figure A15-f:
Normalized double-differential cross section at the parton level as a function of ${{p_{\mathrm {T}}} ({\mathrm{t} {}\mathrm{\bar{t}}})}$ vs. ${{p_{\mathrm {T}}} ({\mathrm{t} _\mathrm {h}})}$. The data are shown as points with gray (yellow) bands indicating the statistical (statistical and systematic) uncertainties. The cross sections are compared to the predictions of POWHEG combined with PYTHIA (P8) or HERWIG (H7), the multiparton simulation MG5_aMC@NLO (MG)+PYTHIA FxFx, and the NNLO QCD calculations obtained with Matrix. The ratios of the various predictions to the measured cross sections are shown in the lower panels. |
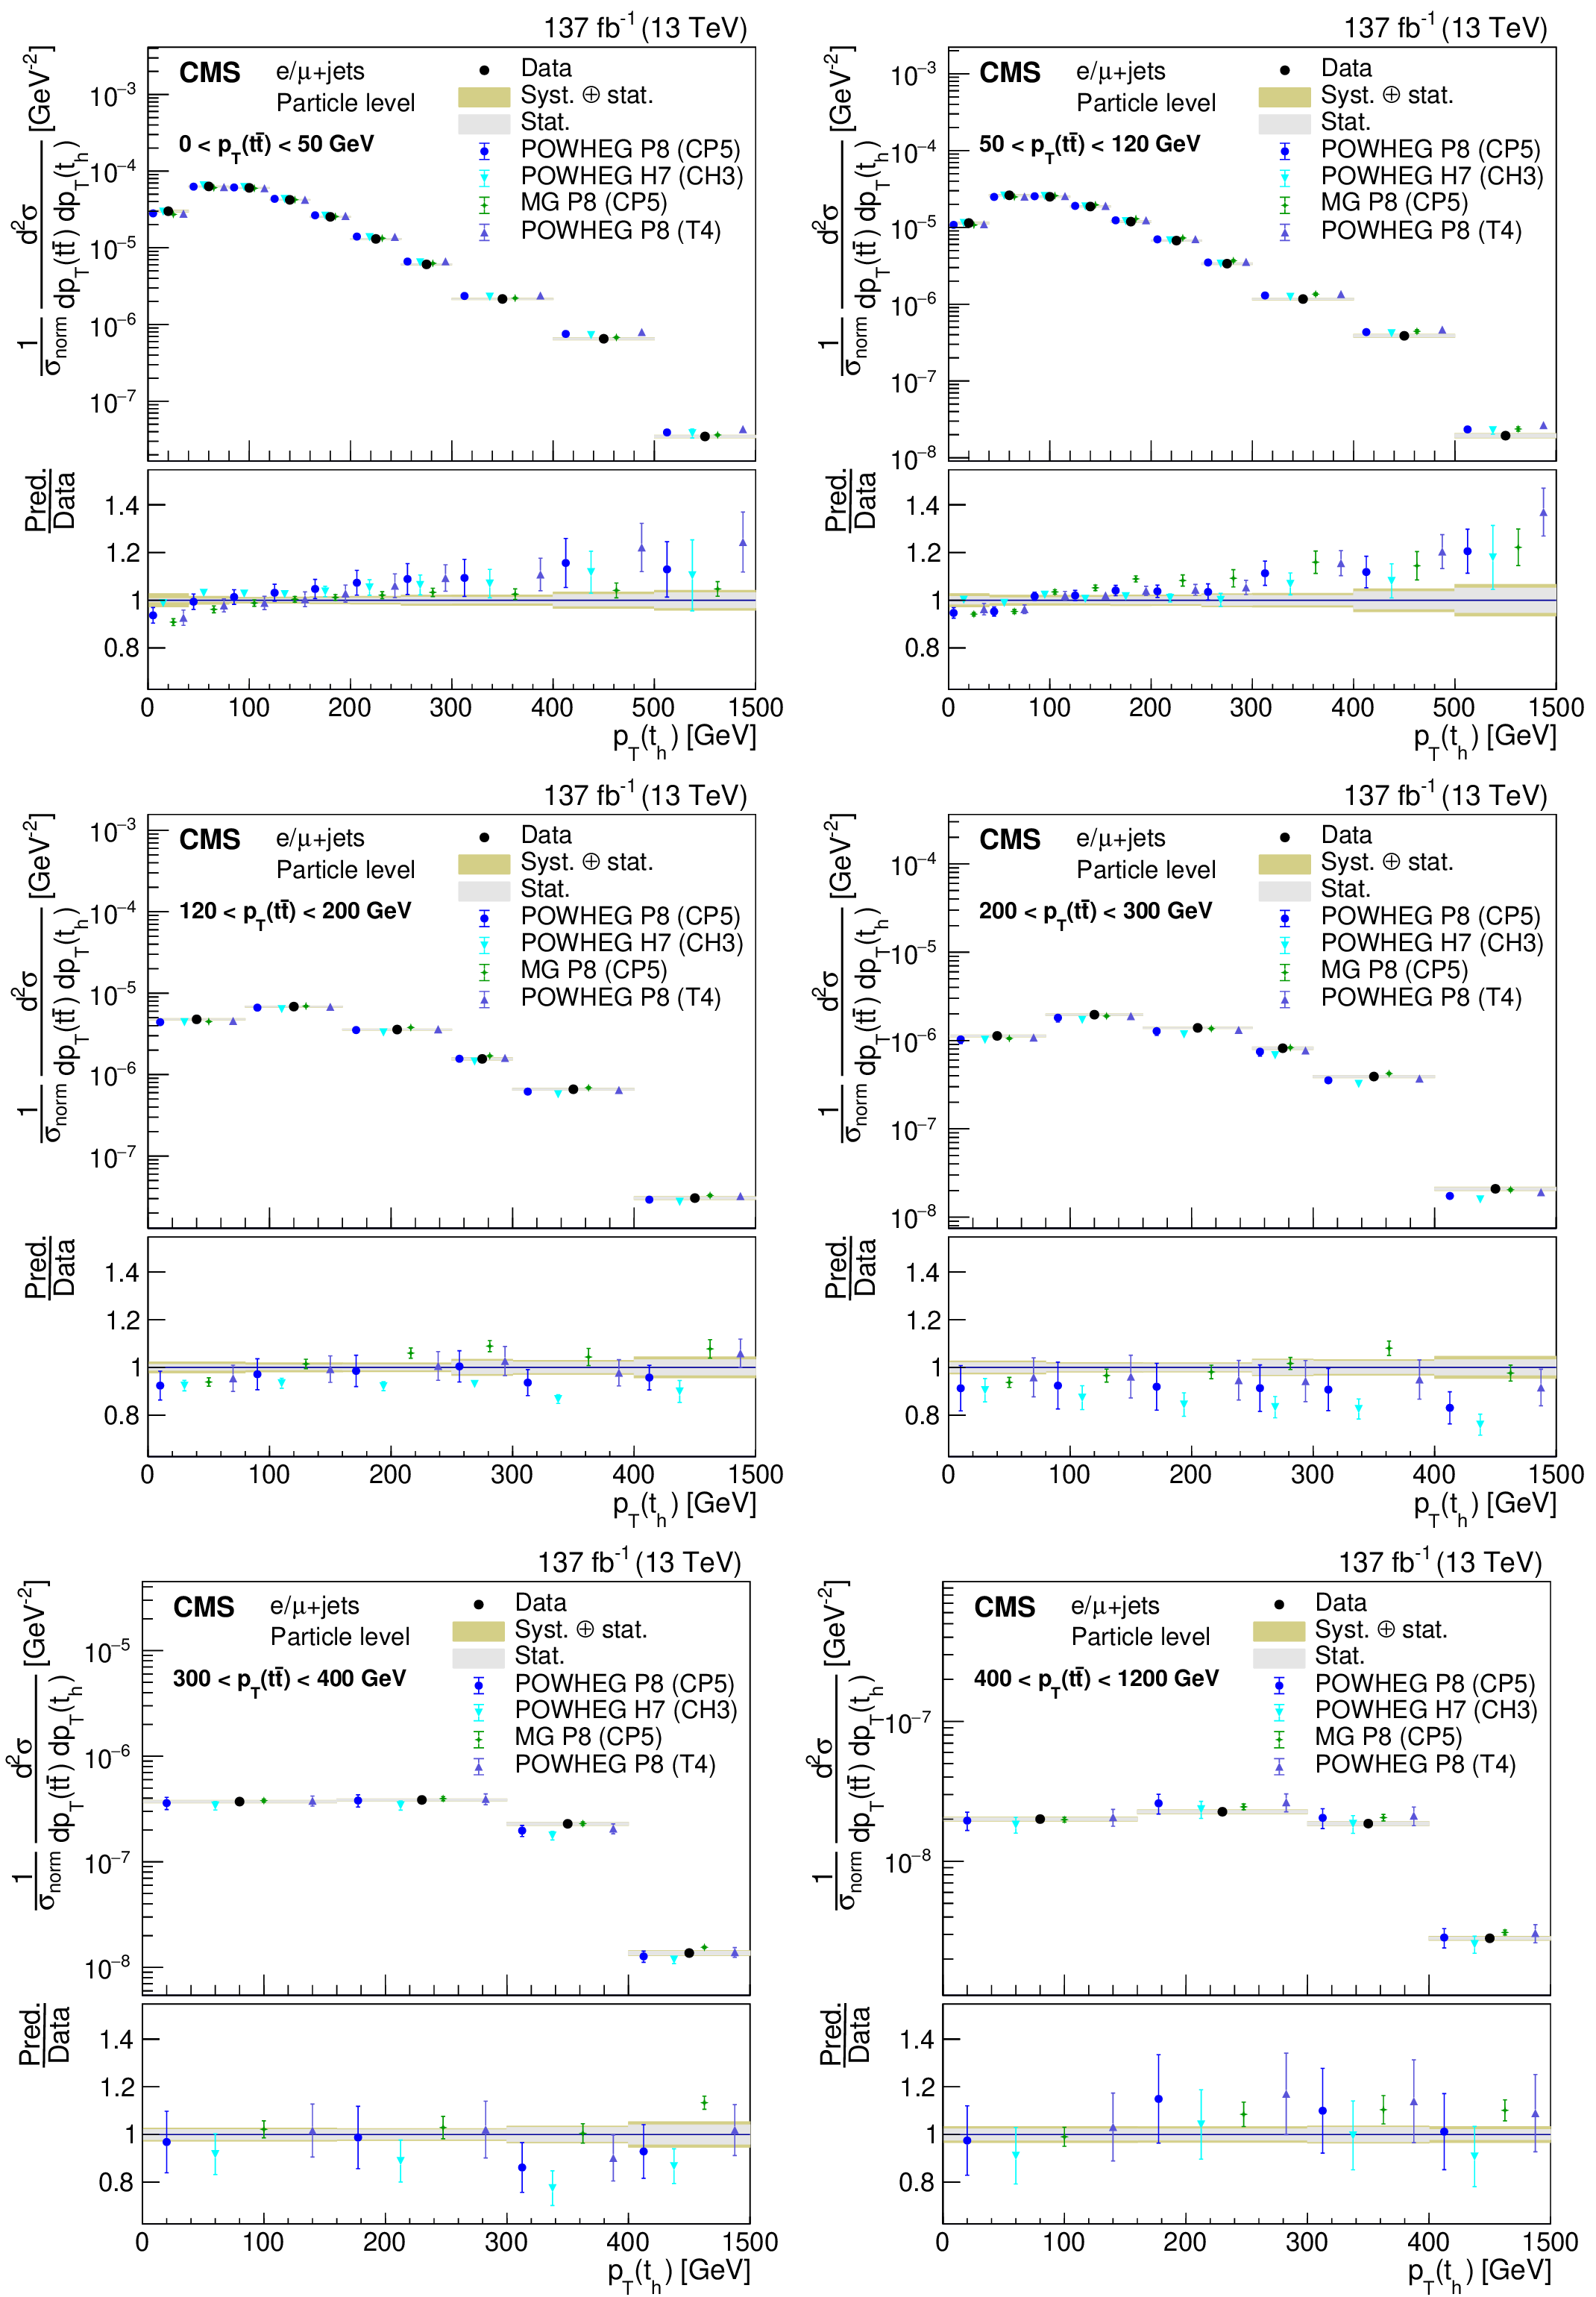
png pdf |
Figure A16:
Normalized double-differential cross section at the particle level as a function of ${{p_{\mathrm {T}}} ({\mathrm{t} {}\mathrm{\bar{t}}})}$ vs. ${{p_{\mathrm {T}}} ({\mathrm{t} _\mathrm {h}})}$. The data are shown as points with gray (yellow) bands indicating the statistical (statistical and systematic) uncertainties. The cross sections are compared to the predictions of POWHEG+PYTHIA (P8) for the CP5 and CUETP8M2T4 (T4) tunes, POWHEG+HERWIG (H7), and the multiparton simulation MG5_aMC@NLO (MG)+PYTHIA. The ratios of the various predictions to the measured cross sections are shown in the lower panels. |
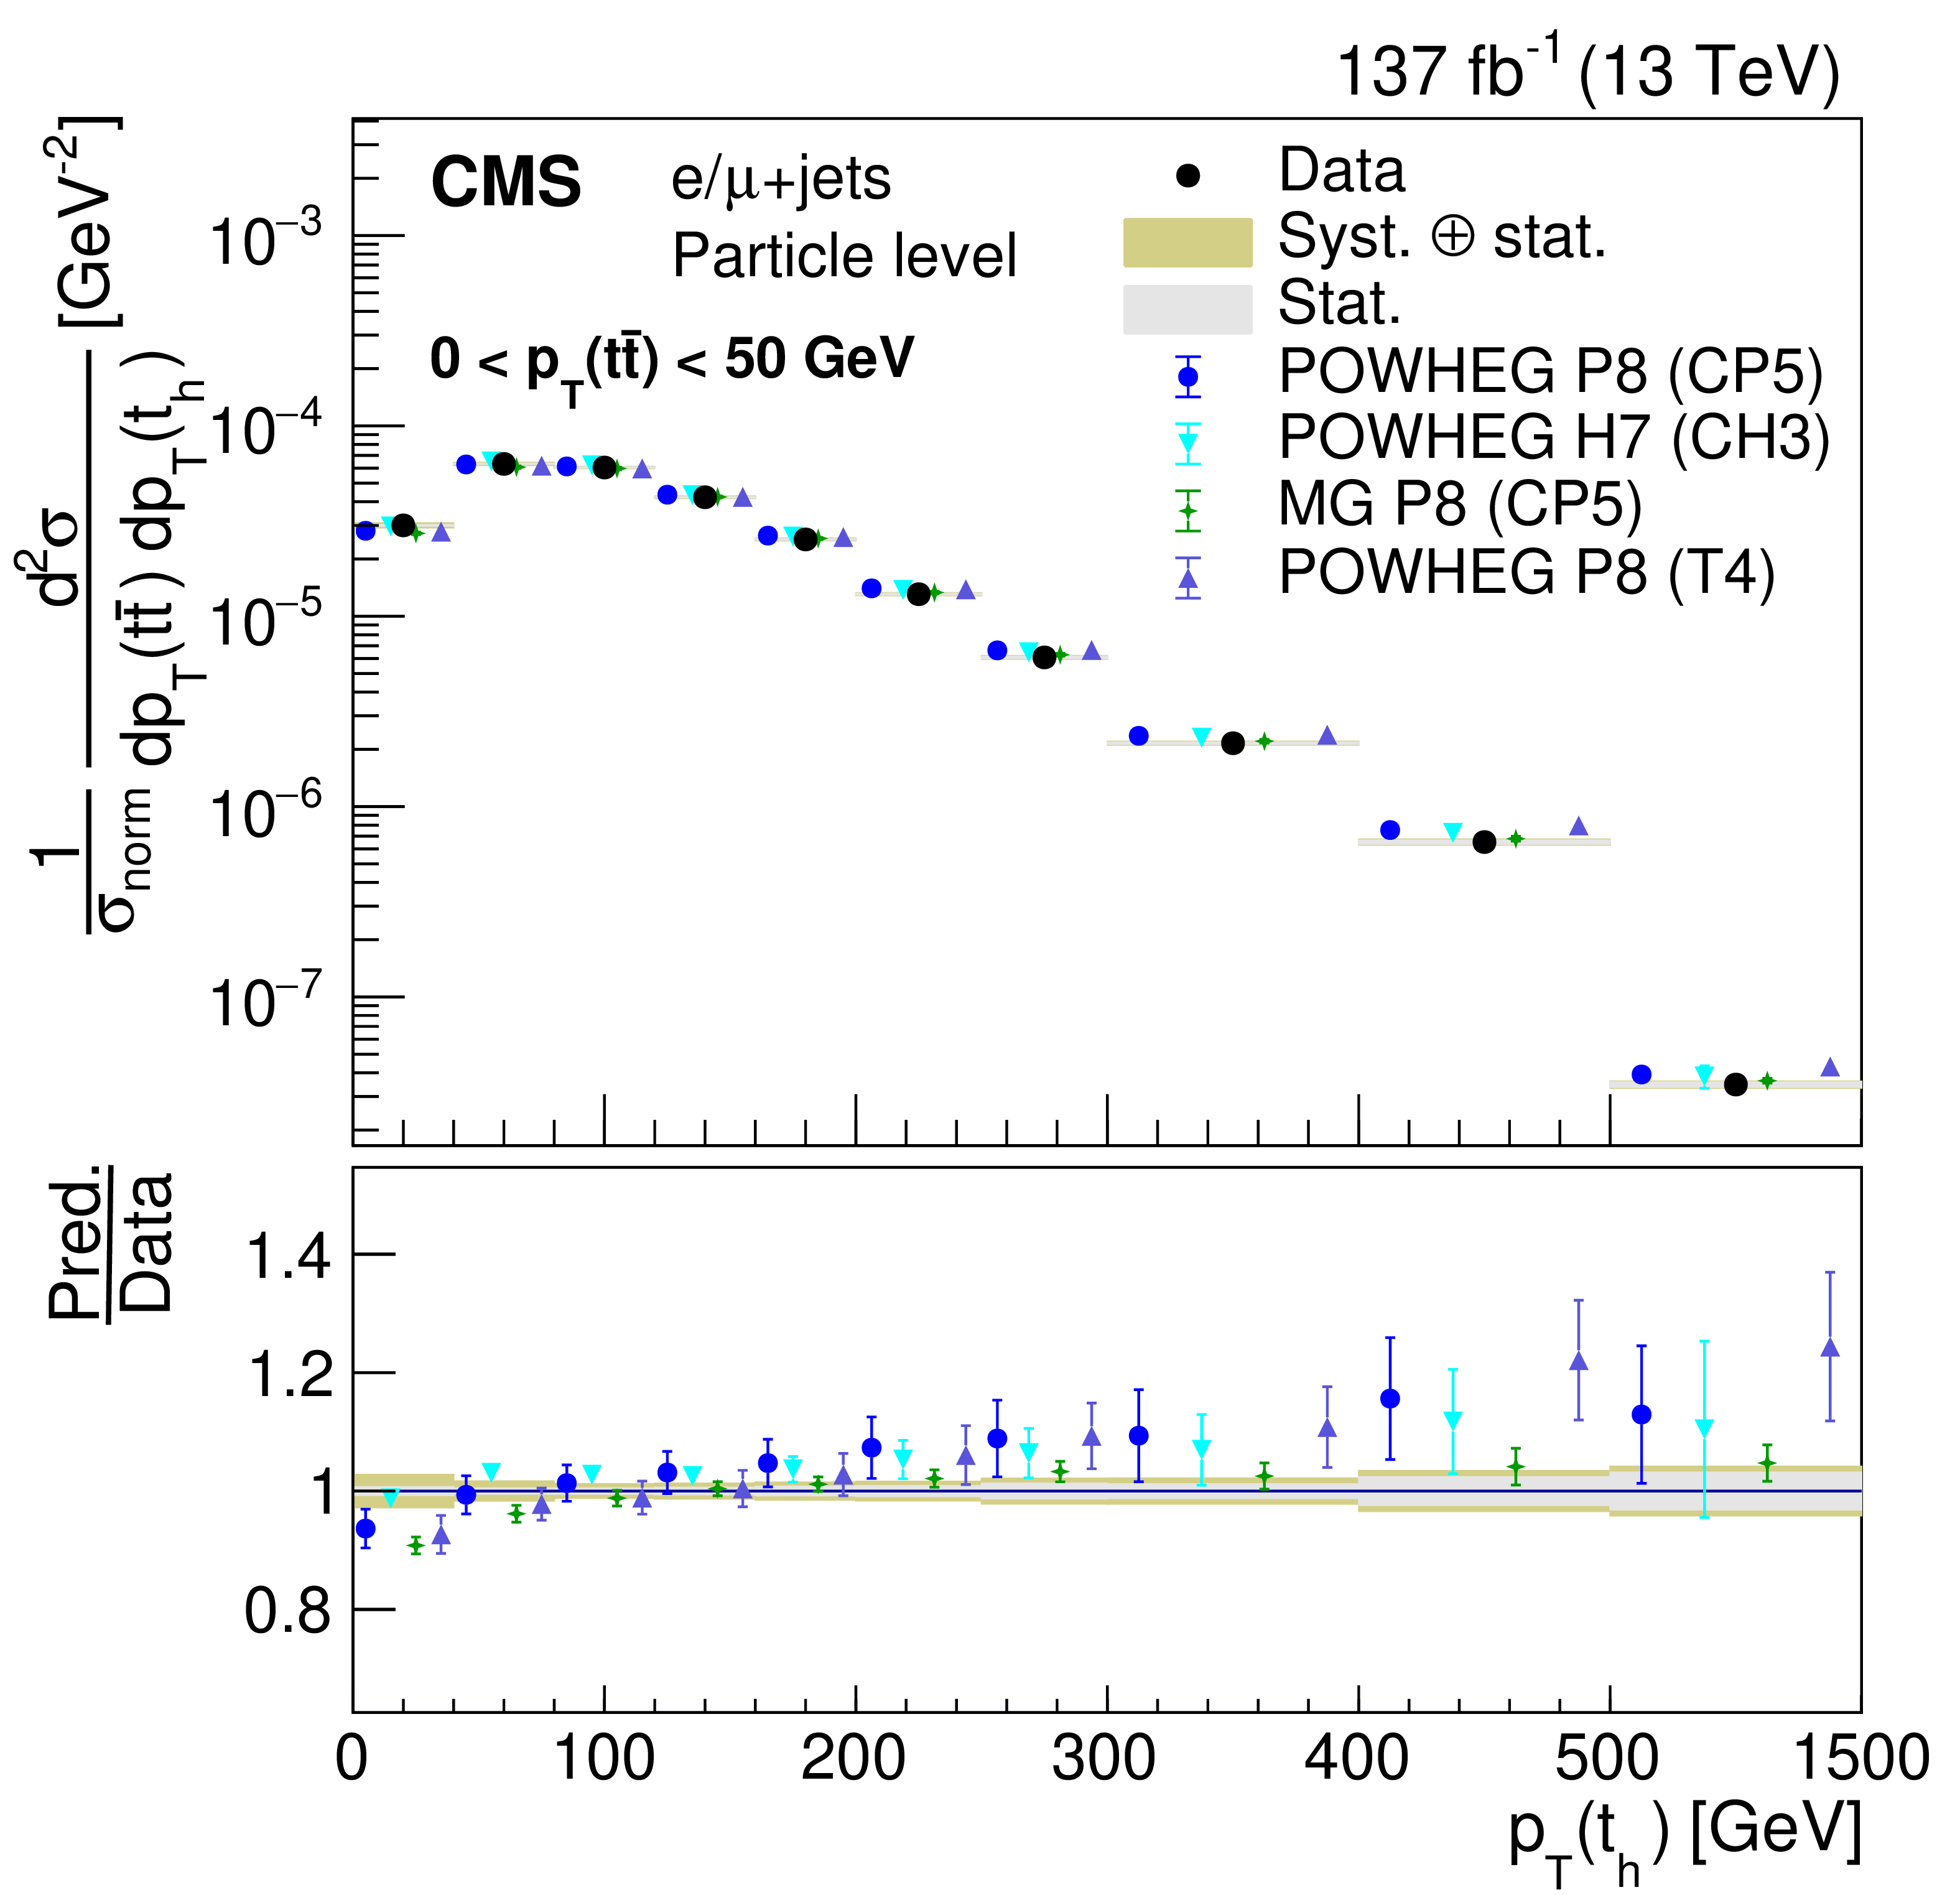
png pdf |
Figure A16-a:
Normalized double-differential cross section at the particle level as a function of ${{p_{\mathrm {T}}} ({\mathrm{t} {}\mathrm{\bar{t}}})}$ vs. ${{p_{\mathrm {T}}} ({\mathrm{t} _\mathrm {h}})}$. The data are shown as points with gray (yellow) bands indicating the statistical (statistical and systematic) uncertainties. The cross sections are compared to the predictions of POWHEG+PYTHIA (P8) for the CP5 and CUETP8M2T4 (T4) tunes, POWHEG+HERWIG (H7), and the multiparton simulation MG5_aMC@NLO (MG)+PYTHIA. The ratios of the various predictions to the measured cross sections are shown in the lower panels. |

png pdf |
Figure A16-b:
Normalized double-differential cross section at the particle level as a function of ${{p_{\mathrm {T}}} ({\mathrm{t} {}\mathrm{\bar{t}}})}$ vs. ${{p_{\mathrm {T}}} ({\mathrm{t} _\mathrm {h}})}$. The data are shown as points with gray (yellow) bands indicating the statistical (statistical and systematic) uncertainties. The cross sections are compared to the predictions of POWHEG+PYTHIA (P8) for the CP5 and CUETP8M2T4 (T4) tunes, POWHEG+HERWIG (H7), and the multiparton simulation MG5_aMC@NLO (MG)+PYTHIA. The ratios of the various predictions to the measured cross sections are shown in the lower panels. |
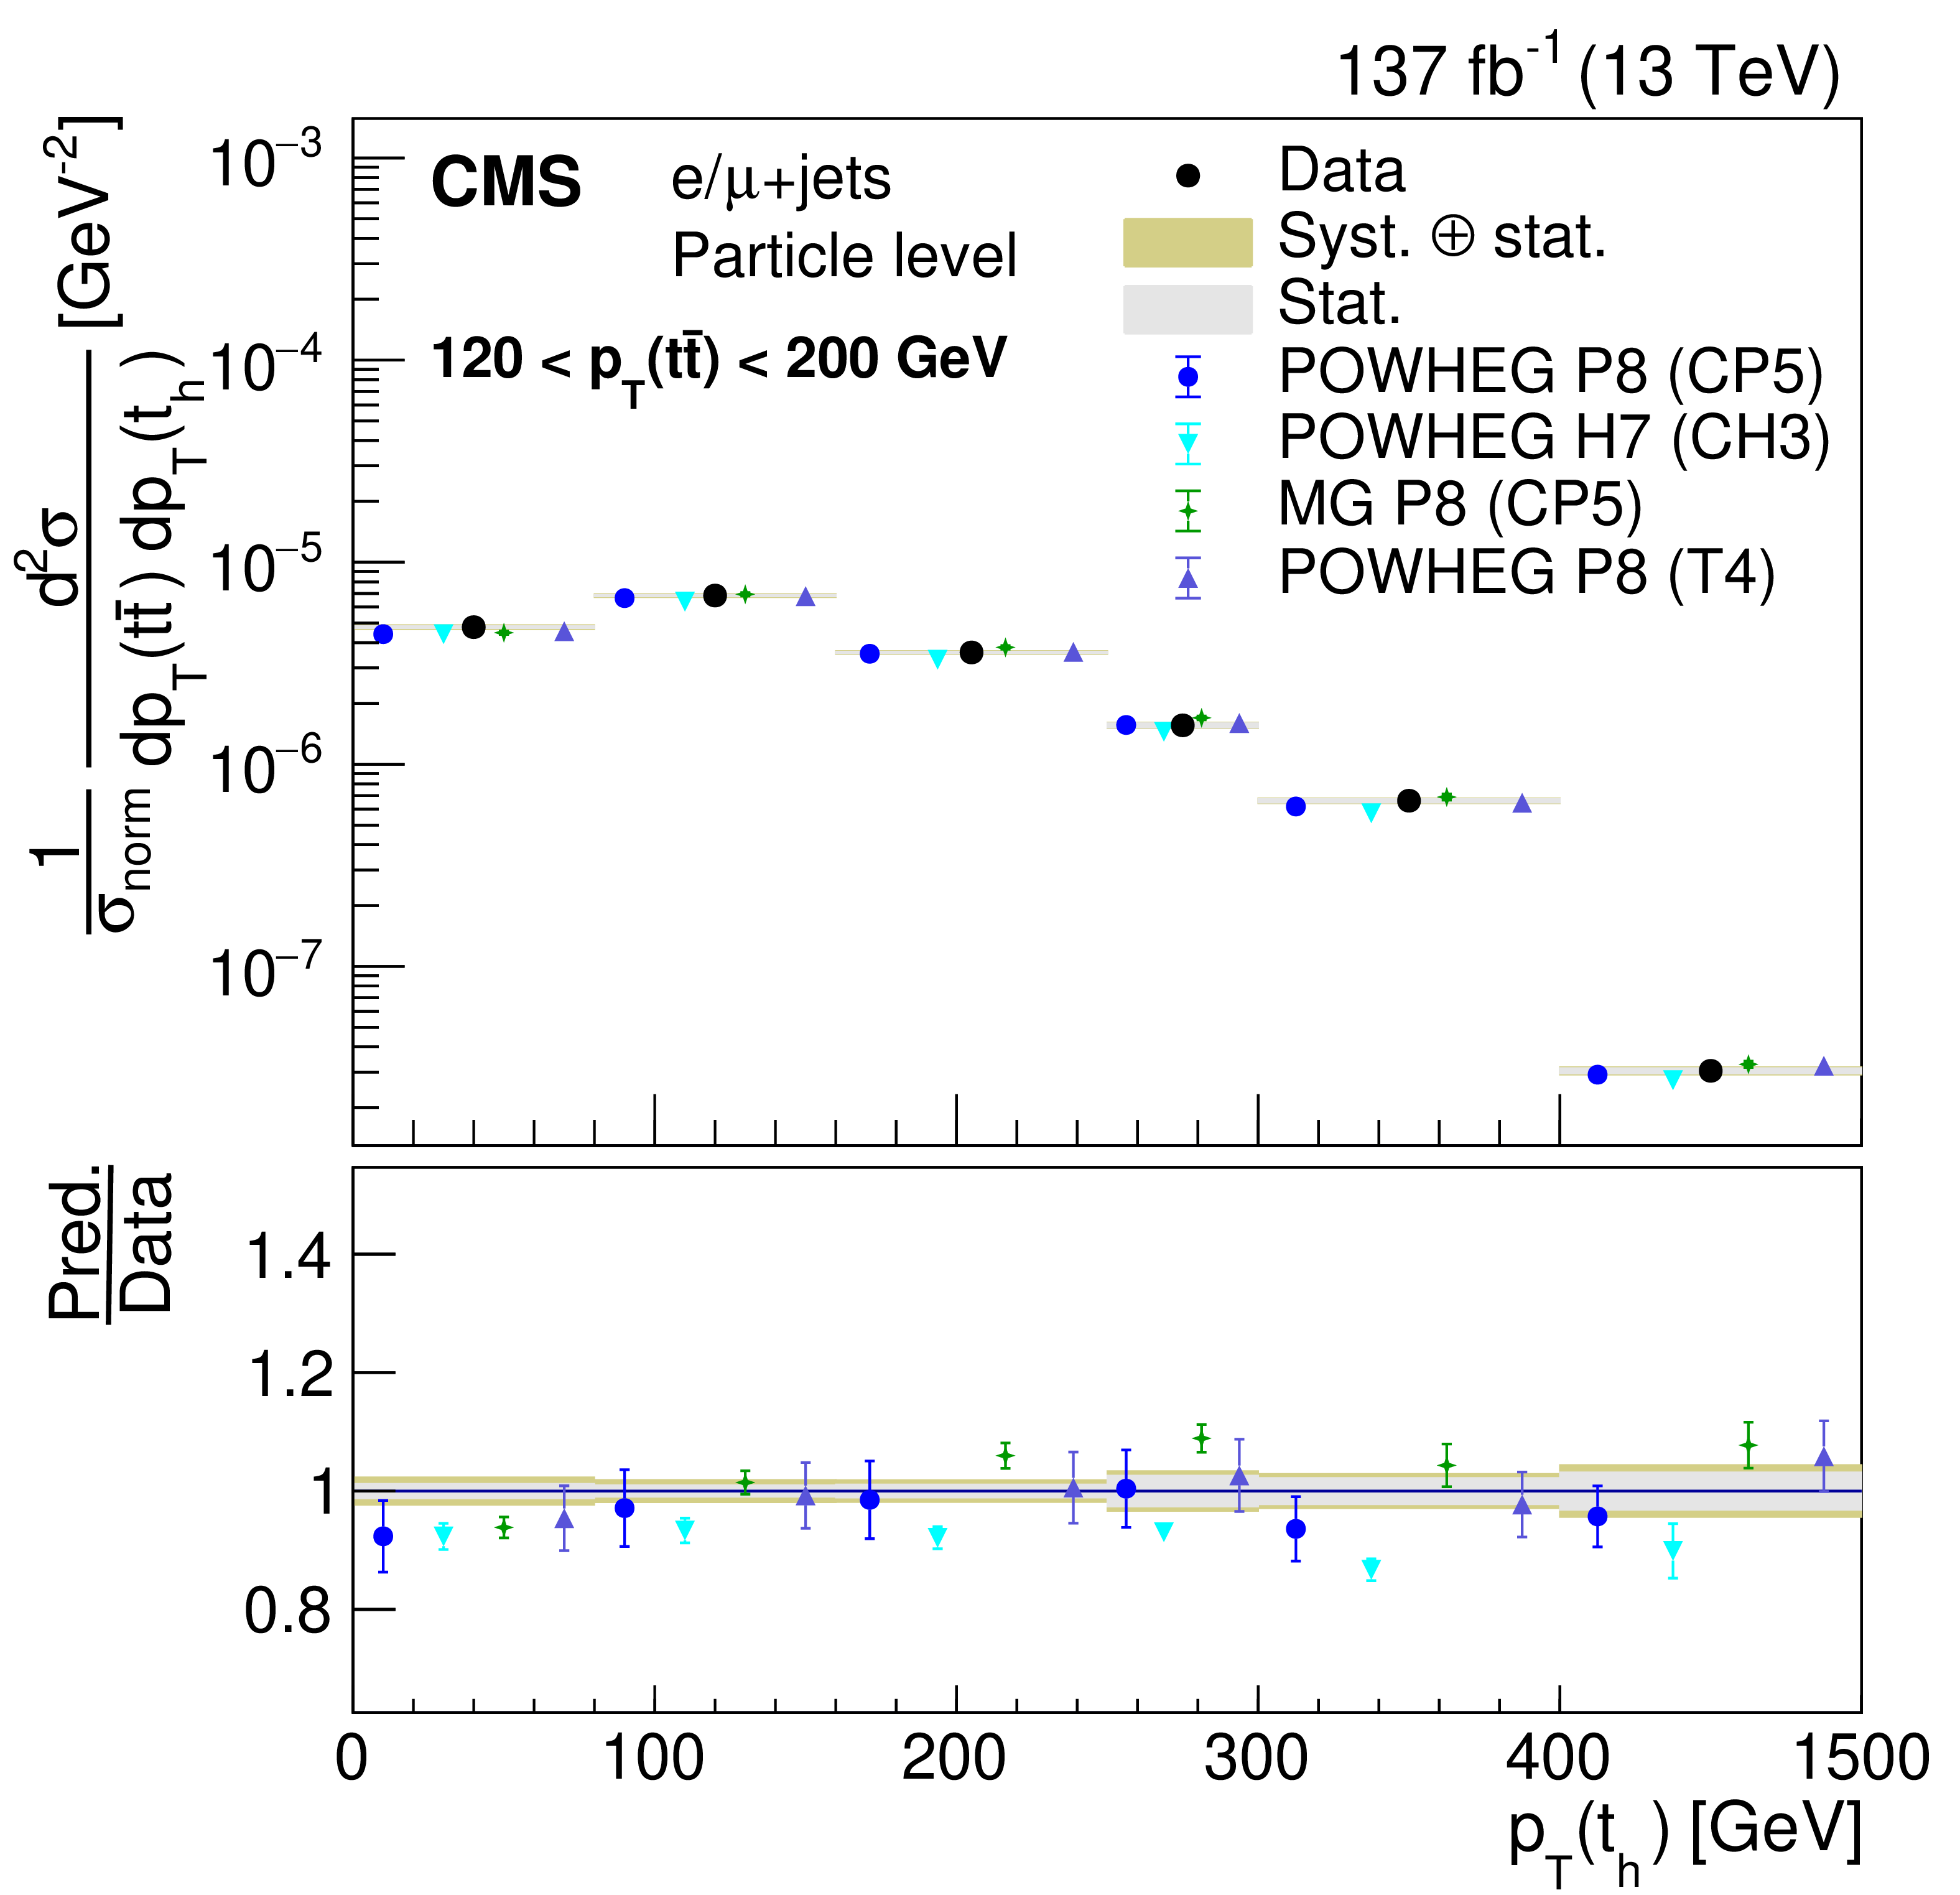
png pdf |
Figure A16-c:
Normalized double-differential cross section at the particle level as a function of ${{p_{\mathrm {T}}} ({\mathrm{t} {}\mathrm{\bar{t}}})}$ vs. ${{p_{\mathrm {T}}} ({\mathrm{t} _\mathrm {h}})}$. The data are shown as points with gray (yellow) bands indicating the statistical (statistical and systematic) uncertainties. The cross sections are compared to the predictions of POWHEG+PYTHIA (P8) for the CP5 and CUETP8M2T4 (T4) tunes, POWHEG+HERWIG (H7), and the multiparton simulation MG5_aMC@NLO (MG)+PYTHIA. The ratios of the various predictions to the measured cross sections are shown in the lower panels. |
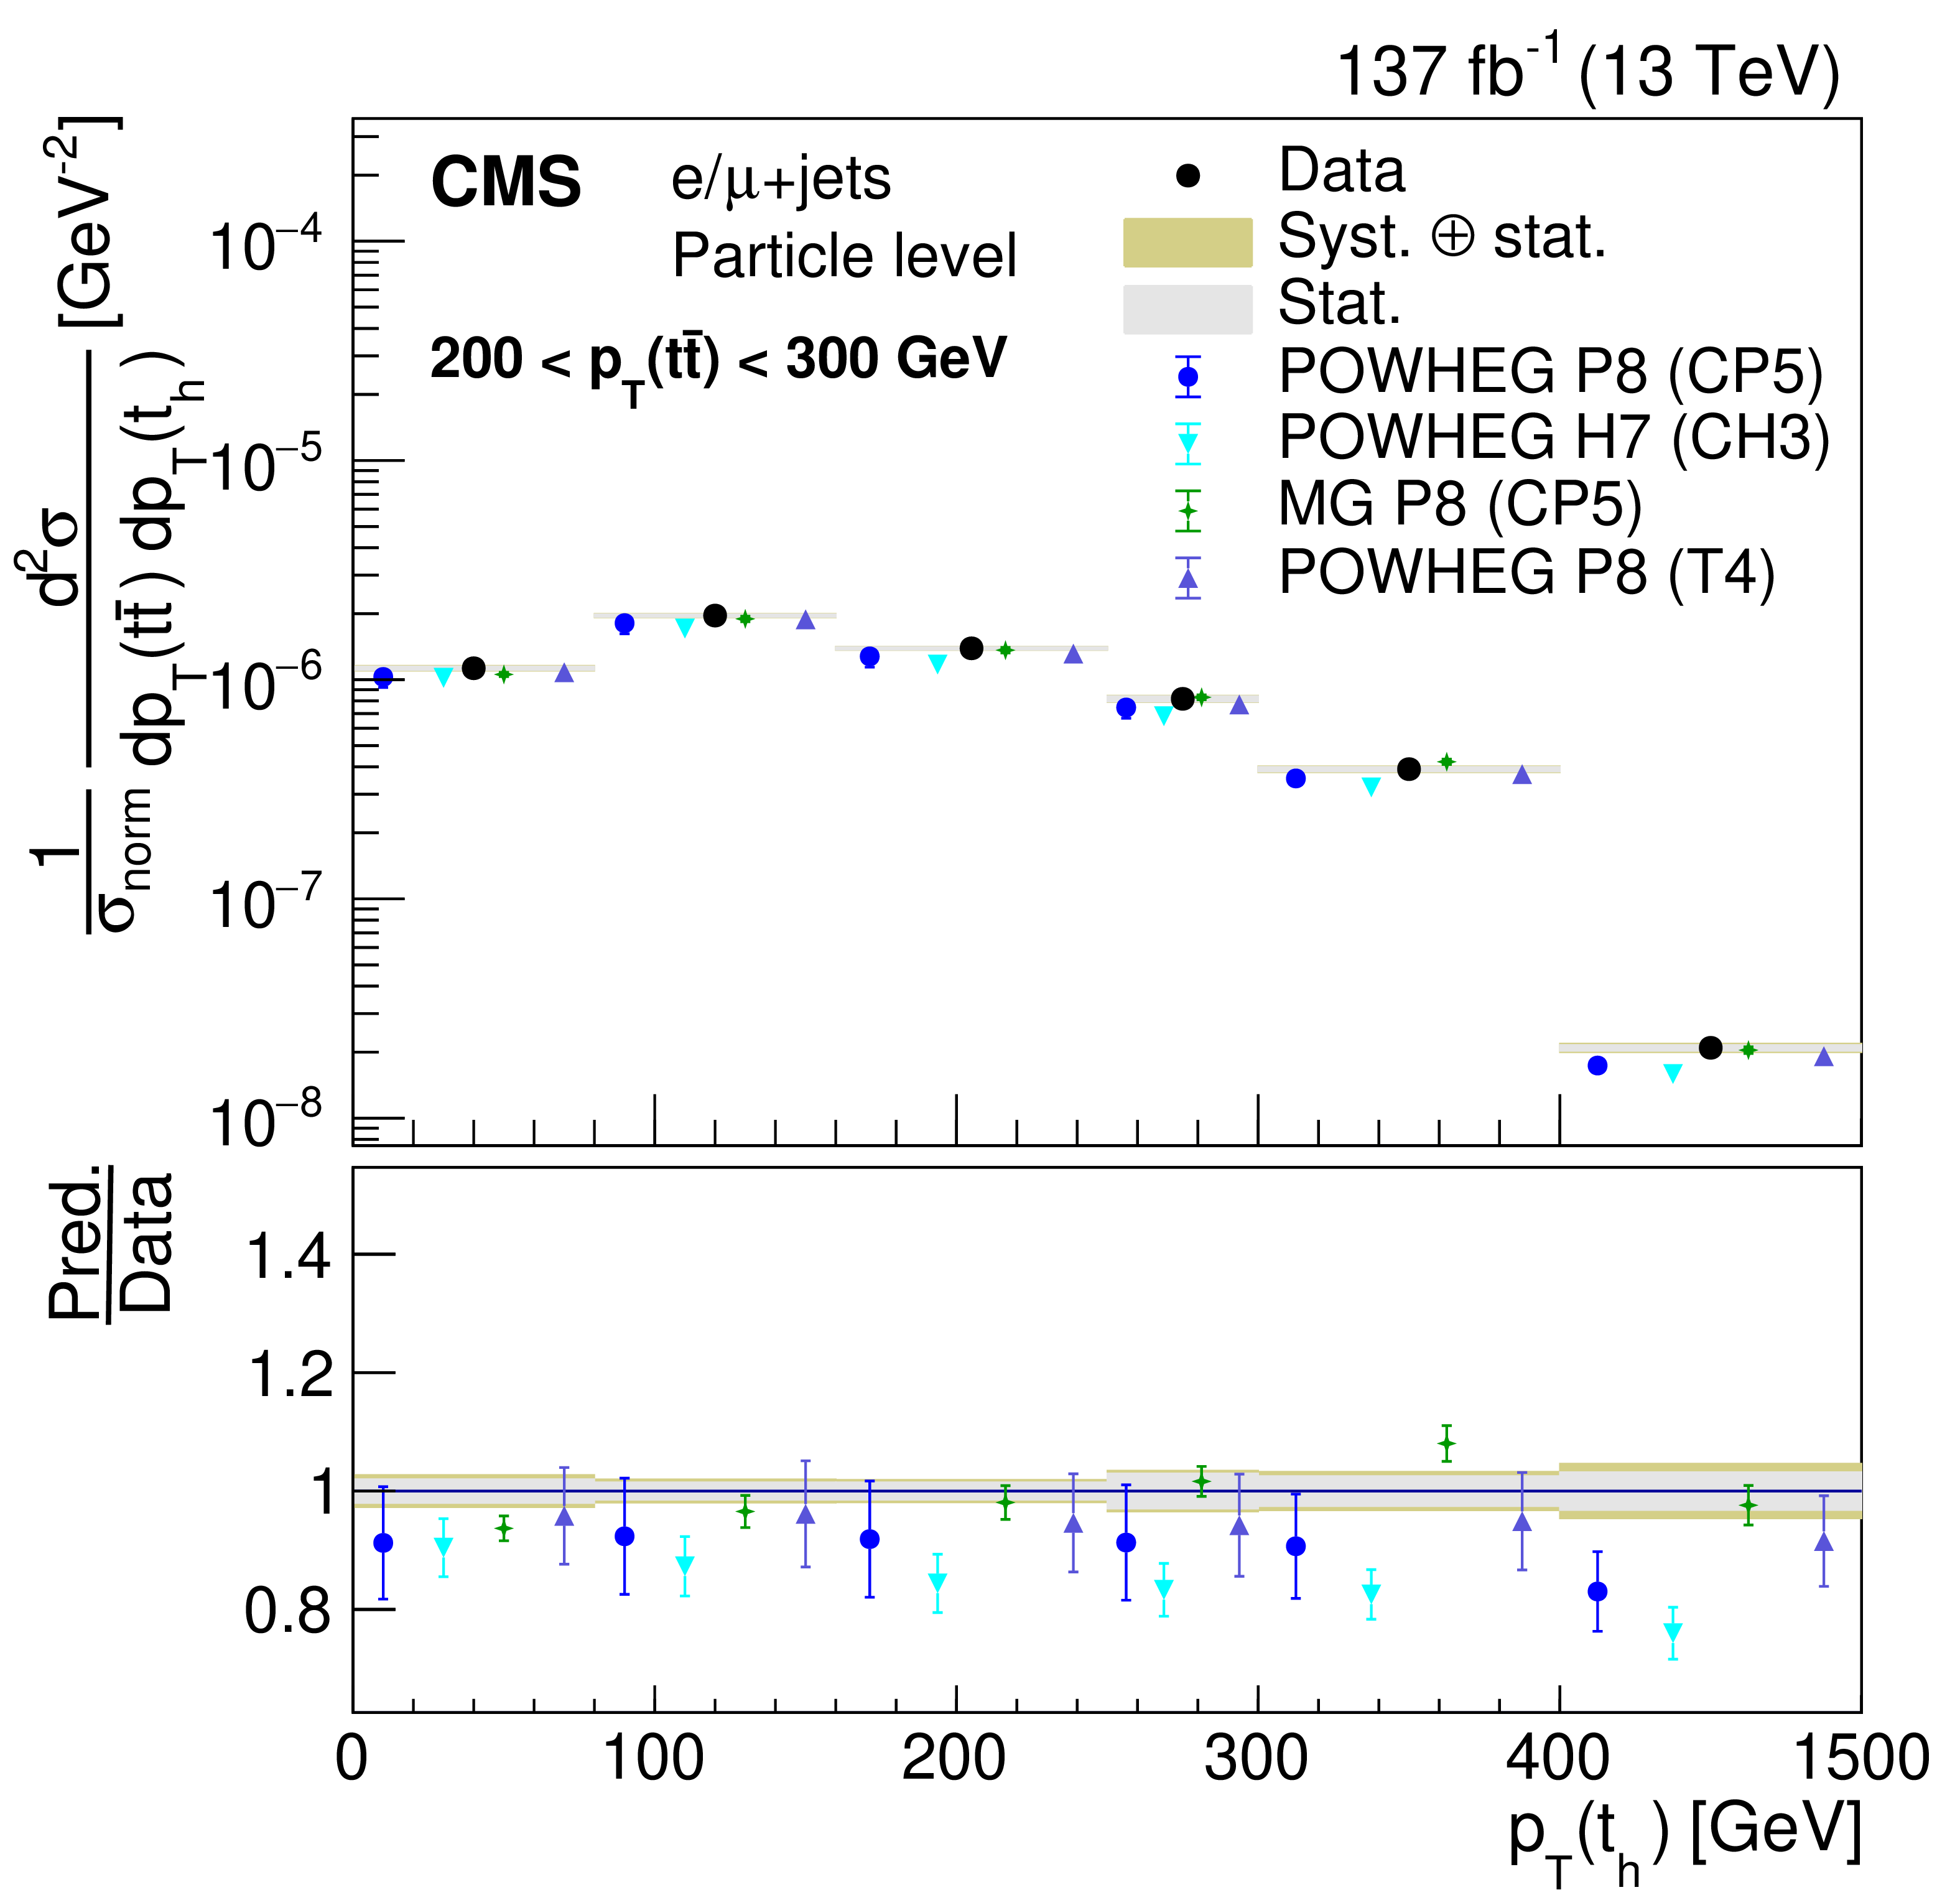
png pdf |
Figure A16-d:
Normalized double-differential cross section at the particle level as a function of ${{p_{\mathrm {T}}} ({\mathrm{t} {}\mathrm{\bar{t}}})}$ vs. ${{p_{\mathrm {T}}} ({\mathrm{t} _\mathrm {h}})}$. The data are shown as points with gray (yellow) bands indicating the statistical (statistical and systematic) uncertainties. The cross sections are compared to the predictions of POWHEG+PYTHIA (P8) for the CP5 and CUETP8M2T4 (T4) tunes, POWHEG+HERWIG (H7), and the multiparton simulation MG5_aMC@NLO (MG)+PYTHIA. The ratios of the various predictions to the measured cross sections are shown in the lower panels. |
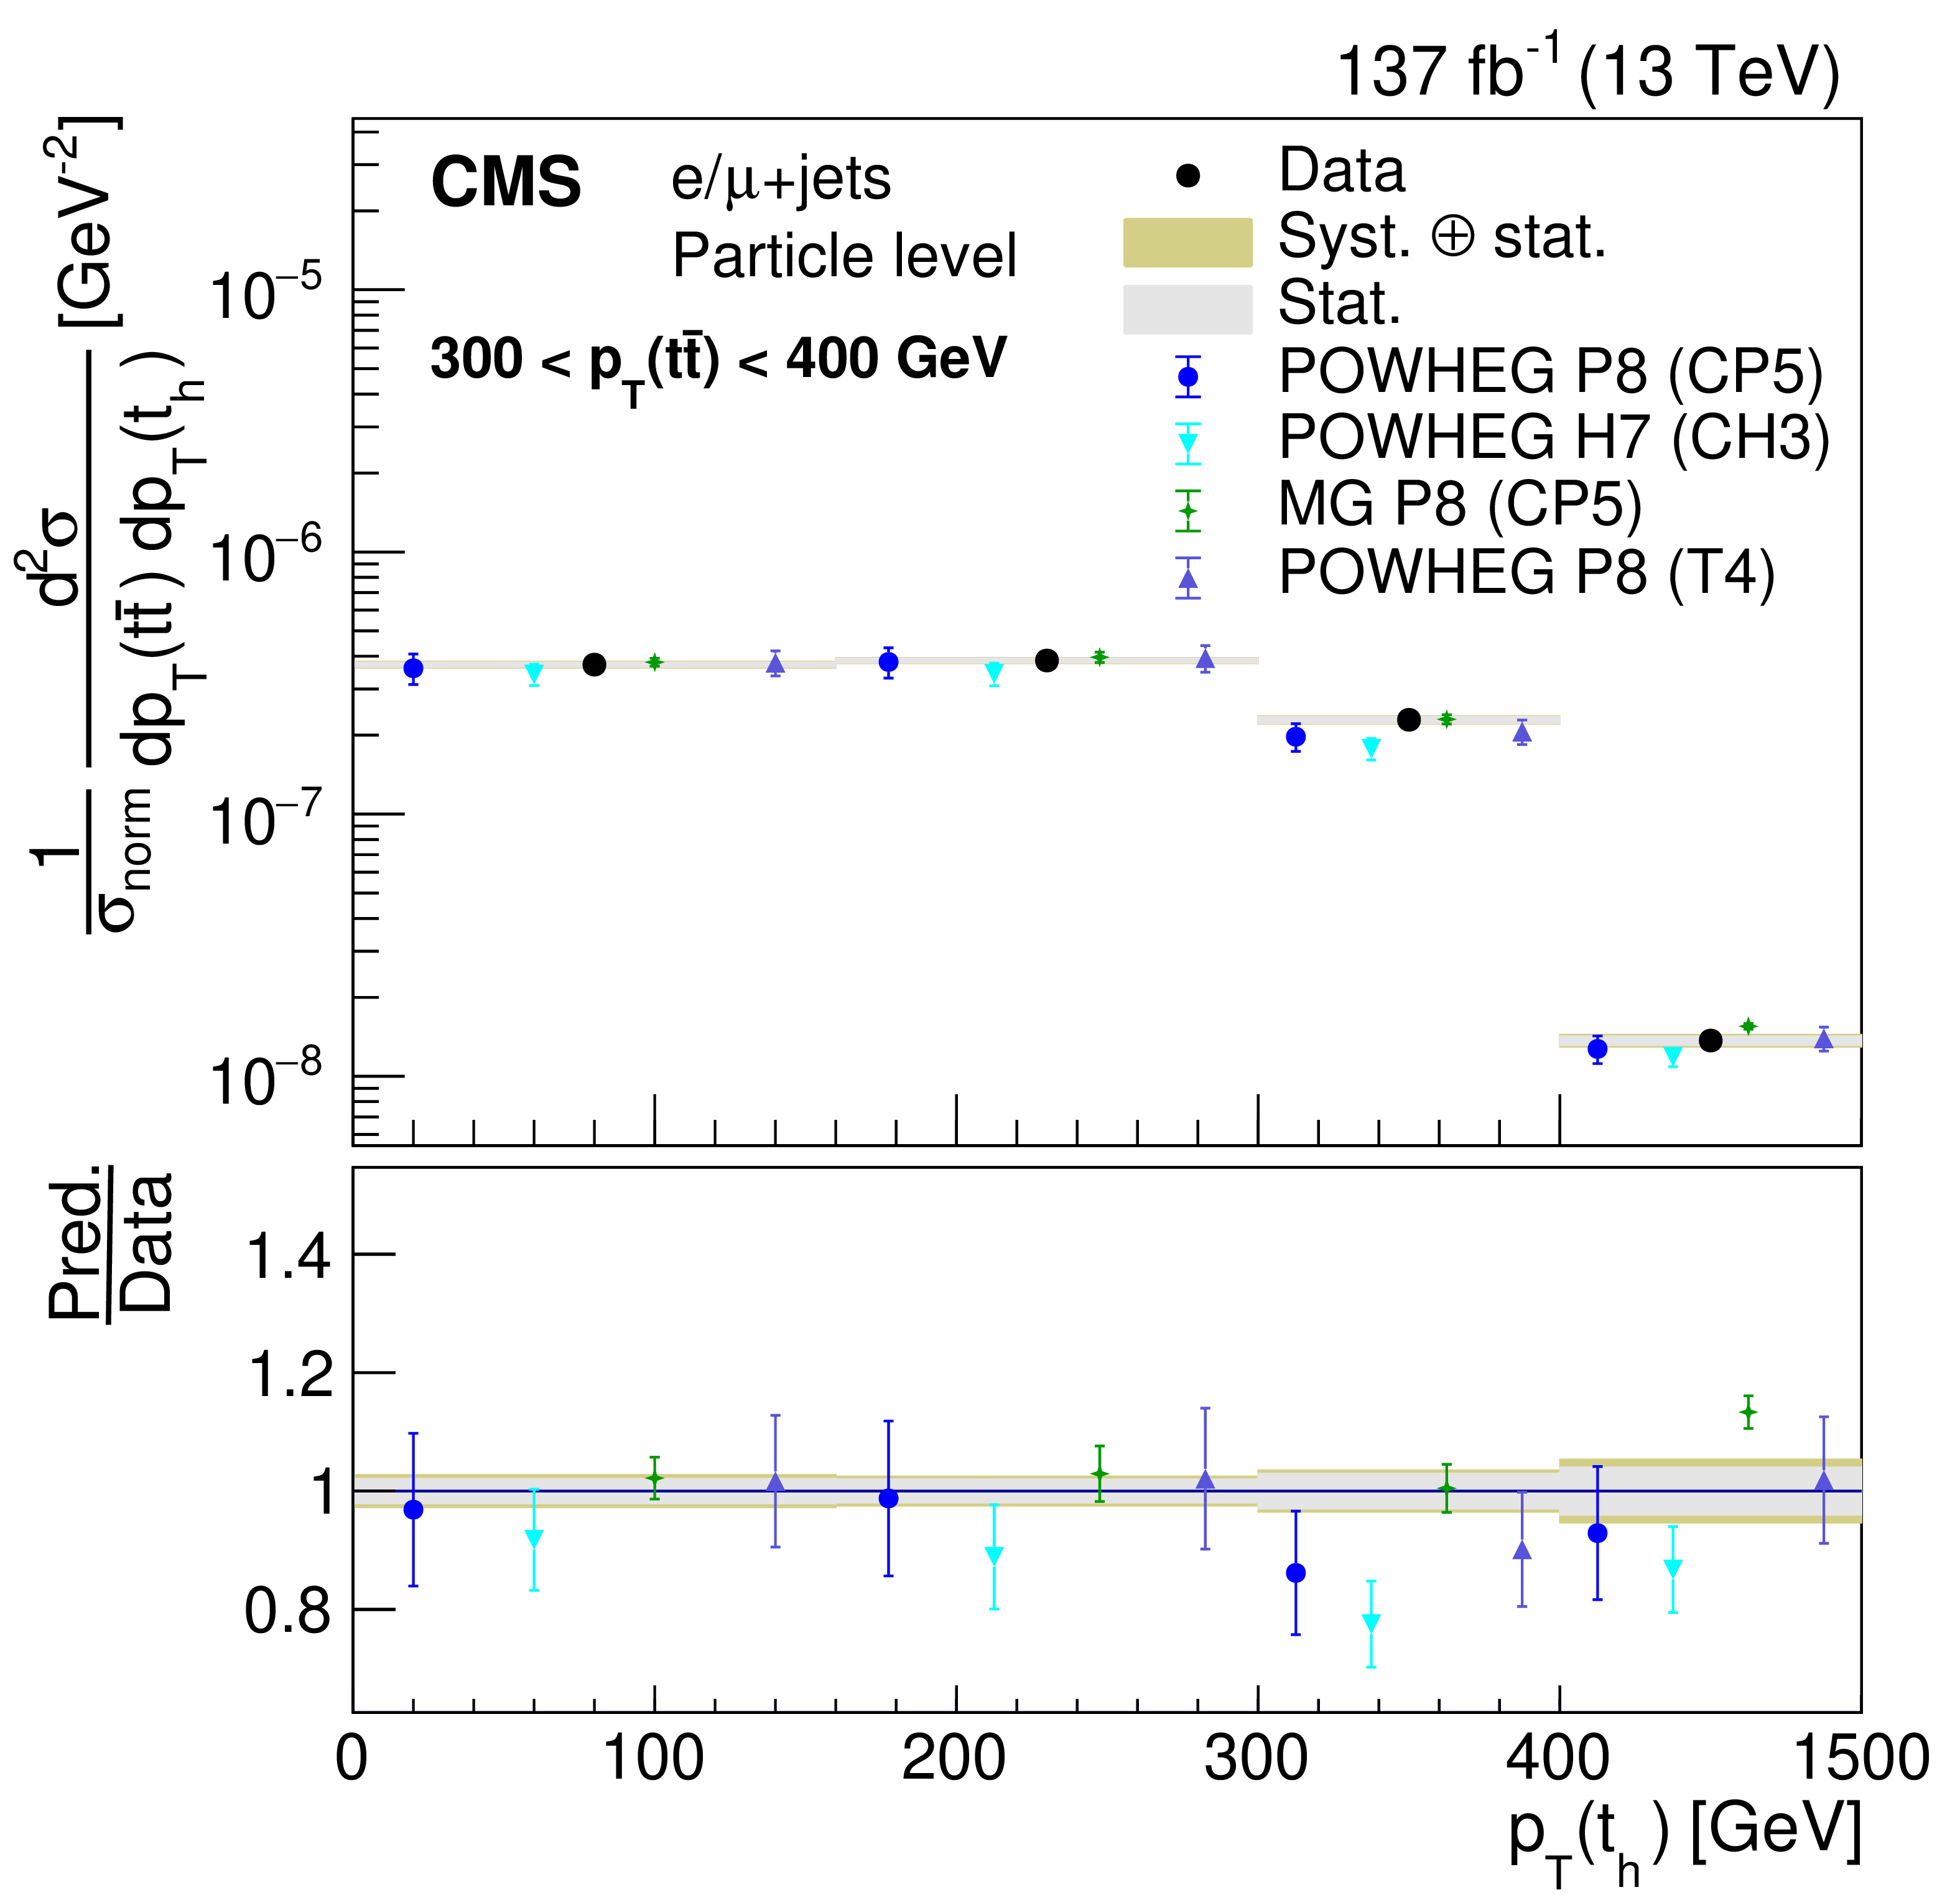
png pdf |
Figure A16-e:
Normalized double-differential cross section at the particle level as a function of ${{p_{\mathrm {T}}} ({\mathrm{t} {}\mathrm{\bar{t}}})}$ vs. ${{p_{\mathrm {T}}} ({\mathrm{t} _\mathrm {h}})}$. The data are shown as points with gray (yellow) bands indicating the statistical (statistical and systematic) uncertainties. The cross sections are compared to the predictions of POWHEG+PYTHIA (P8) for the CP5 and CUETP8M2T4 (T4) tunes, POWHEG+HERWIG (H7), and the multiparton simulation MG5_aMC@NLO (MG)+PYTHIA. The ratios of the various predictions to the measured cross sections are shown in the lower panels. |
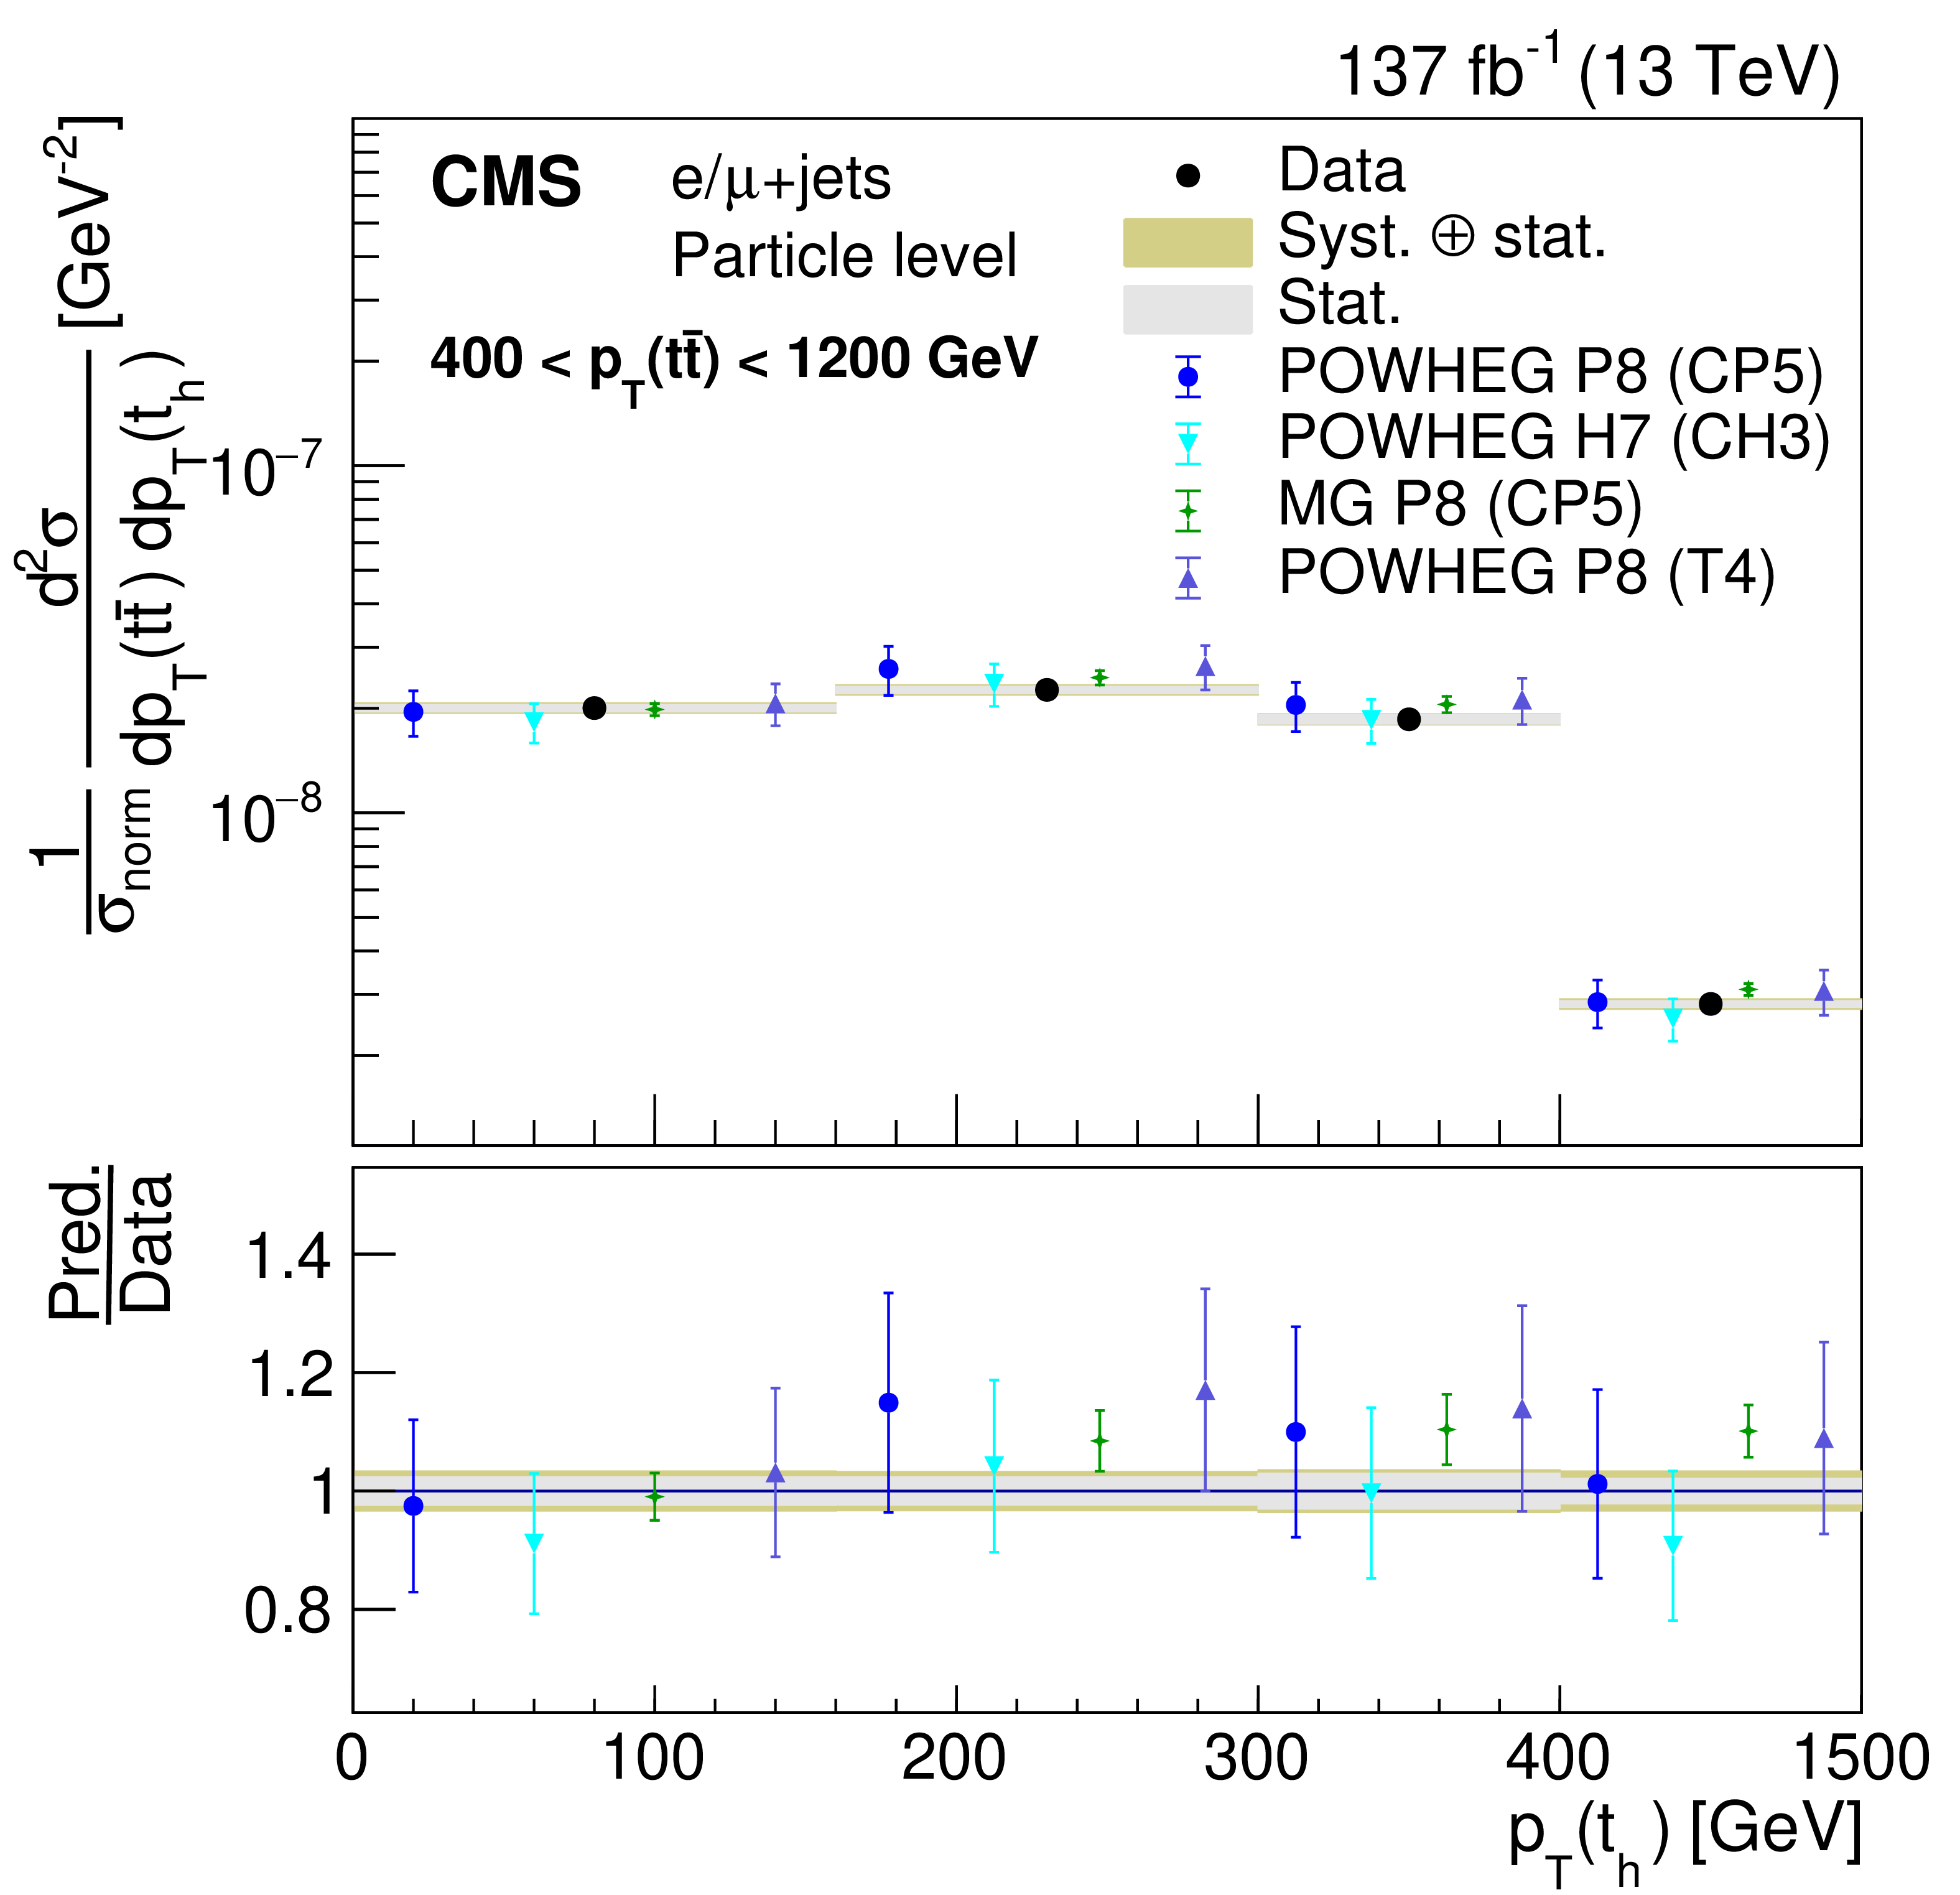
png pdf |
Figure A16-f:
Normalized double-differential cross section at the particle level as a function of ${{p_{\mathrm {T}}} ({\mathrm{t} {}\mathrm{\bar{t}}})}$ vs. ${{p_{\mathrm {T}}} ({\mathrm{t} _\mathrm {h}})}$. The data are shown as points with gray (yellow) bands indicating the statistical (statistical and systematic) uncertainties. The cross sections are compared to the predictions of POWHEG+PYTHIA (P8) for the CP5 and CUETP8M2T4 (T4) tunes, POWHEG+HERWIG (H7), and the multiparton simulation MG5_aMC@NLO (MG)+PYTHIA. The ratios of the various predictions to the measured cross sections are shown in the lower panels. |
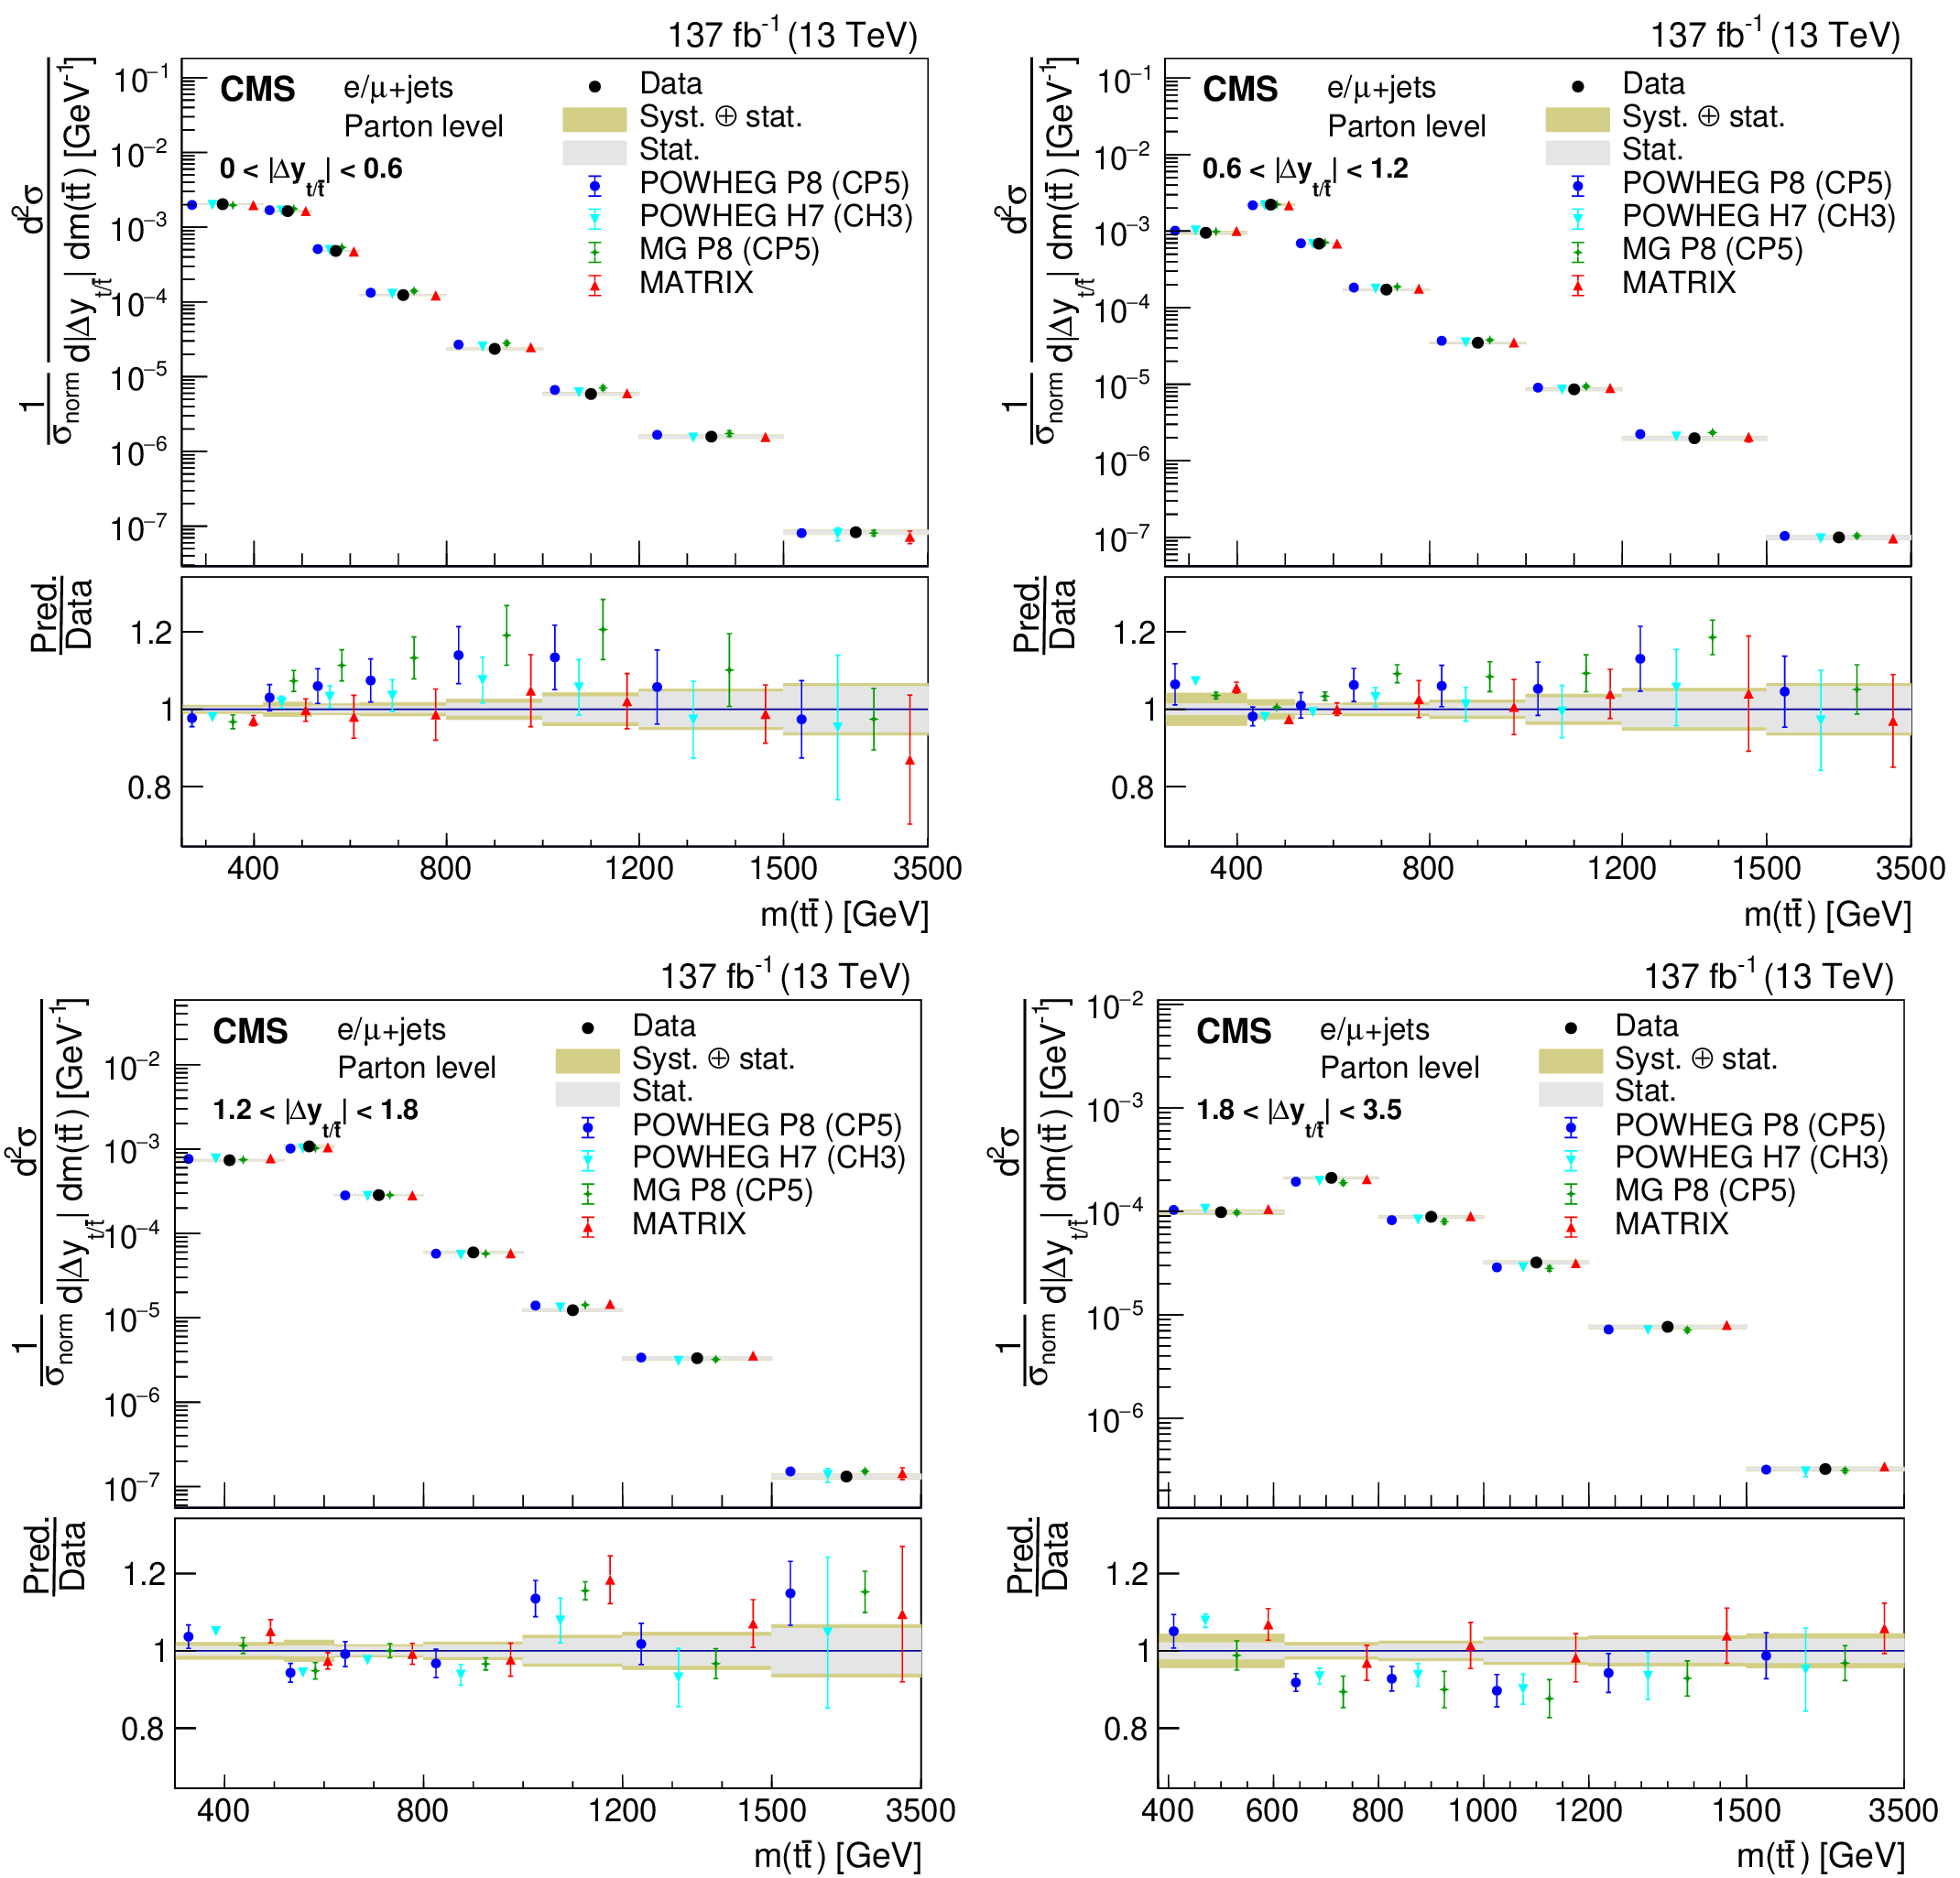
png pdf |
Figure A17:
Normalized double-differential cross section at the parton level as a function of ${{| \Delta y_{\mathrm{t} /\mathrm{\bar{t}}} |}}$ vs.$ {m({\mathrm{t} {}\mathrm{\bar{t}}})}$. The data are shown as points with gray (yellow) bands indicating the statistical (statistical and systematic) uncertainties. The cross sections are compared to the predictions of POWHEG combined with PYTHIA (P8) or HERWIG (H7), the multiparton simulation MG5_aMC@NLO (MG)+PYTHIA FxFx, and the NNLO QCD calculations obtained with Matrix. The ratios of the various predictions to the measured cross sections are shown in the lower panels. |
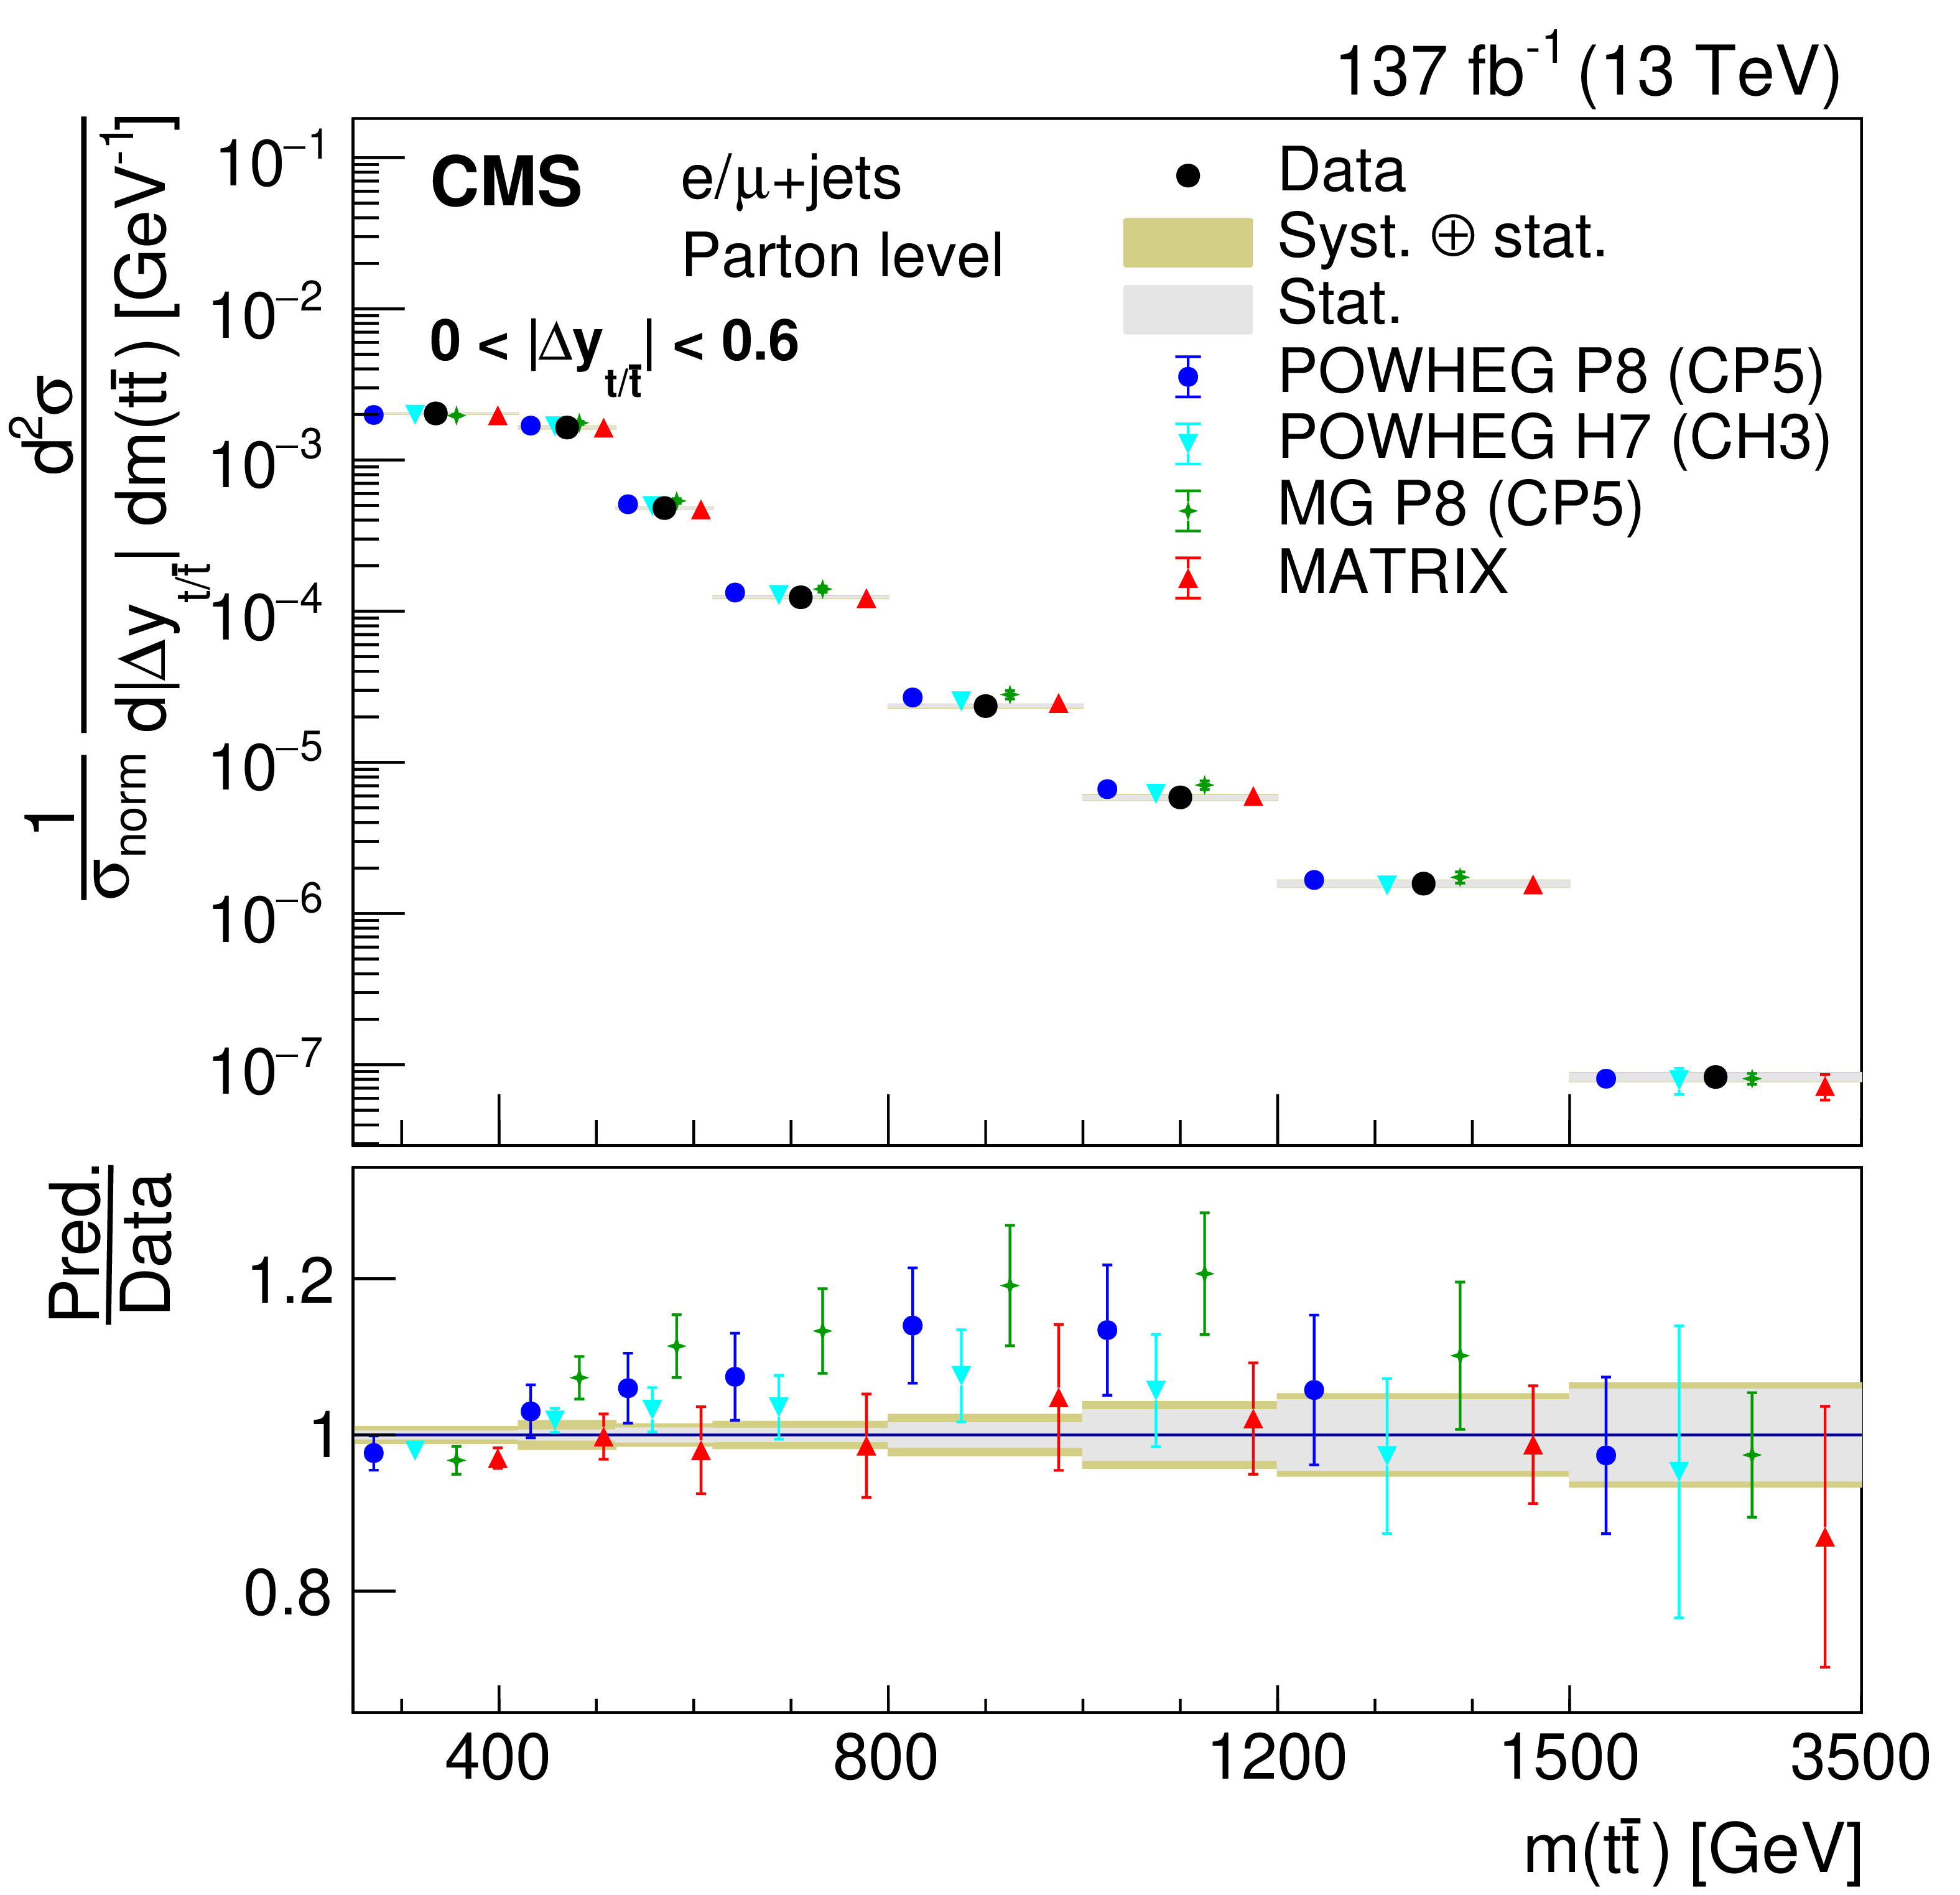
png pdf |
Figure A17-a:
Normalized double-differential cross section at the parton level as a function of ${{| \Delta y_{\mathrm{t} /\mathrm{\bar{t}}} |}}$ vs.$ {m({\mathrm{t} {}\mathrm{\bar{t}}})}$. The data are shown as points with gray (yellow) bands indicating the statistical (statistical and systematic) uncertainties. The cross sections are compared to the predictions of POWHEG combined with PYTHIA (P8) or HERWIG (H7), the multiparton simulation MG5_aMC@NLO (MG)+PYTHIA FxFx, and the NNLO QCD calculations obtained with Matrix. The ratios of the various predictions to the measured cross sections are shown in the lower panels. |

png pdf |
Figure A17-b:
Normalized double-differential cross section at the parton level as a function of ${{| \Delta y_{\mathrm{t} /\mathrm{\bar{t}}} |}}$ vs.$ {m({\mathrm{t} {}\mathrm{\bar{t}}})}$. The data are shown as points with gray (yellow) bands indicating the statistical (statistical and systematic) uncertainties. The cross sections are compared to the predictions of POWHEG combined with PYTHIA (P8) or HERWIG (H7), the multiparton simulation MG5_aMC@NLO (MG)+PYTHIA FxFx, and the NNLO QCD calculations obtained with Matrix. The ratios of the various predictions to the measured cross sections are shown in the lower panels. |
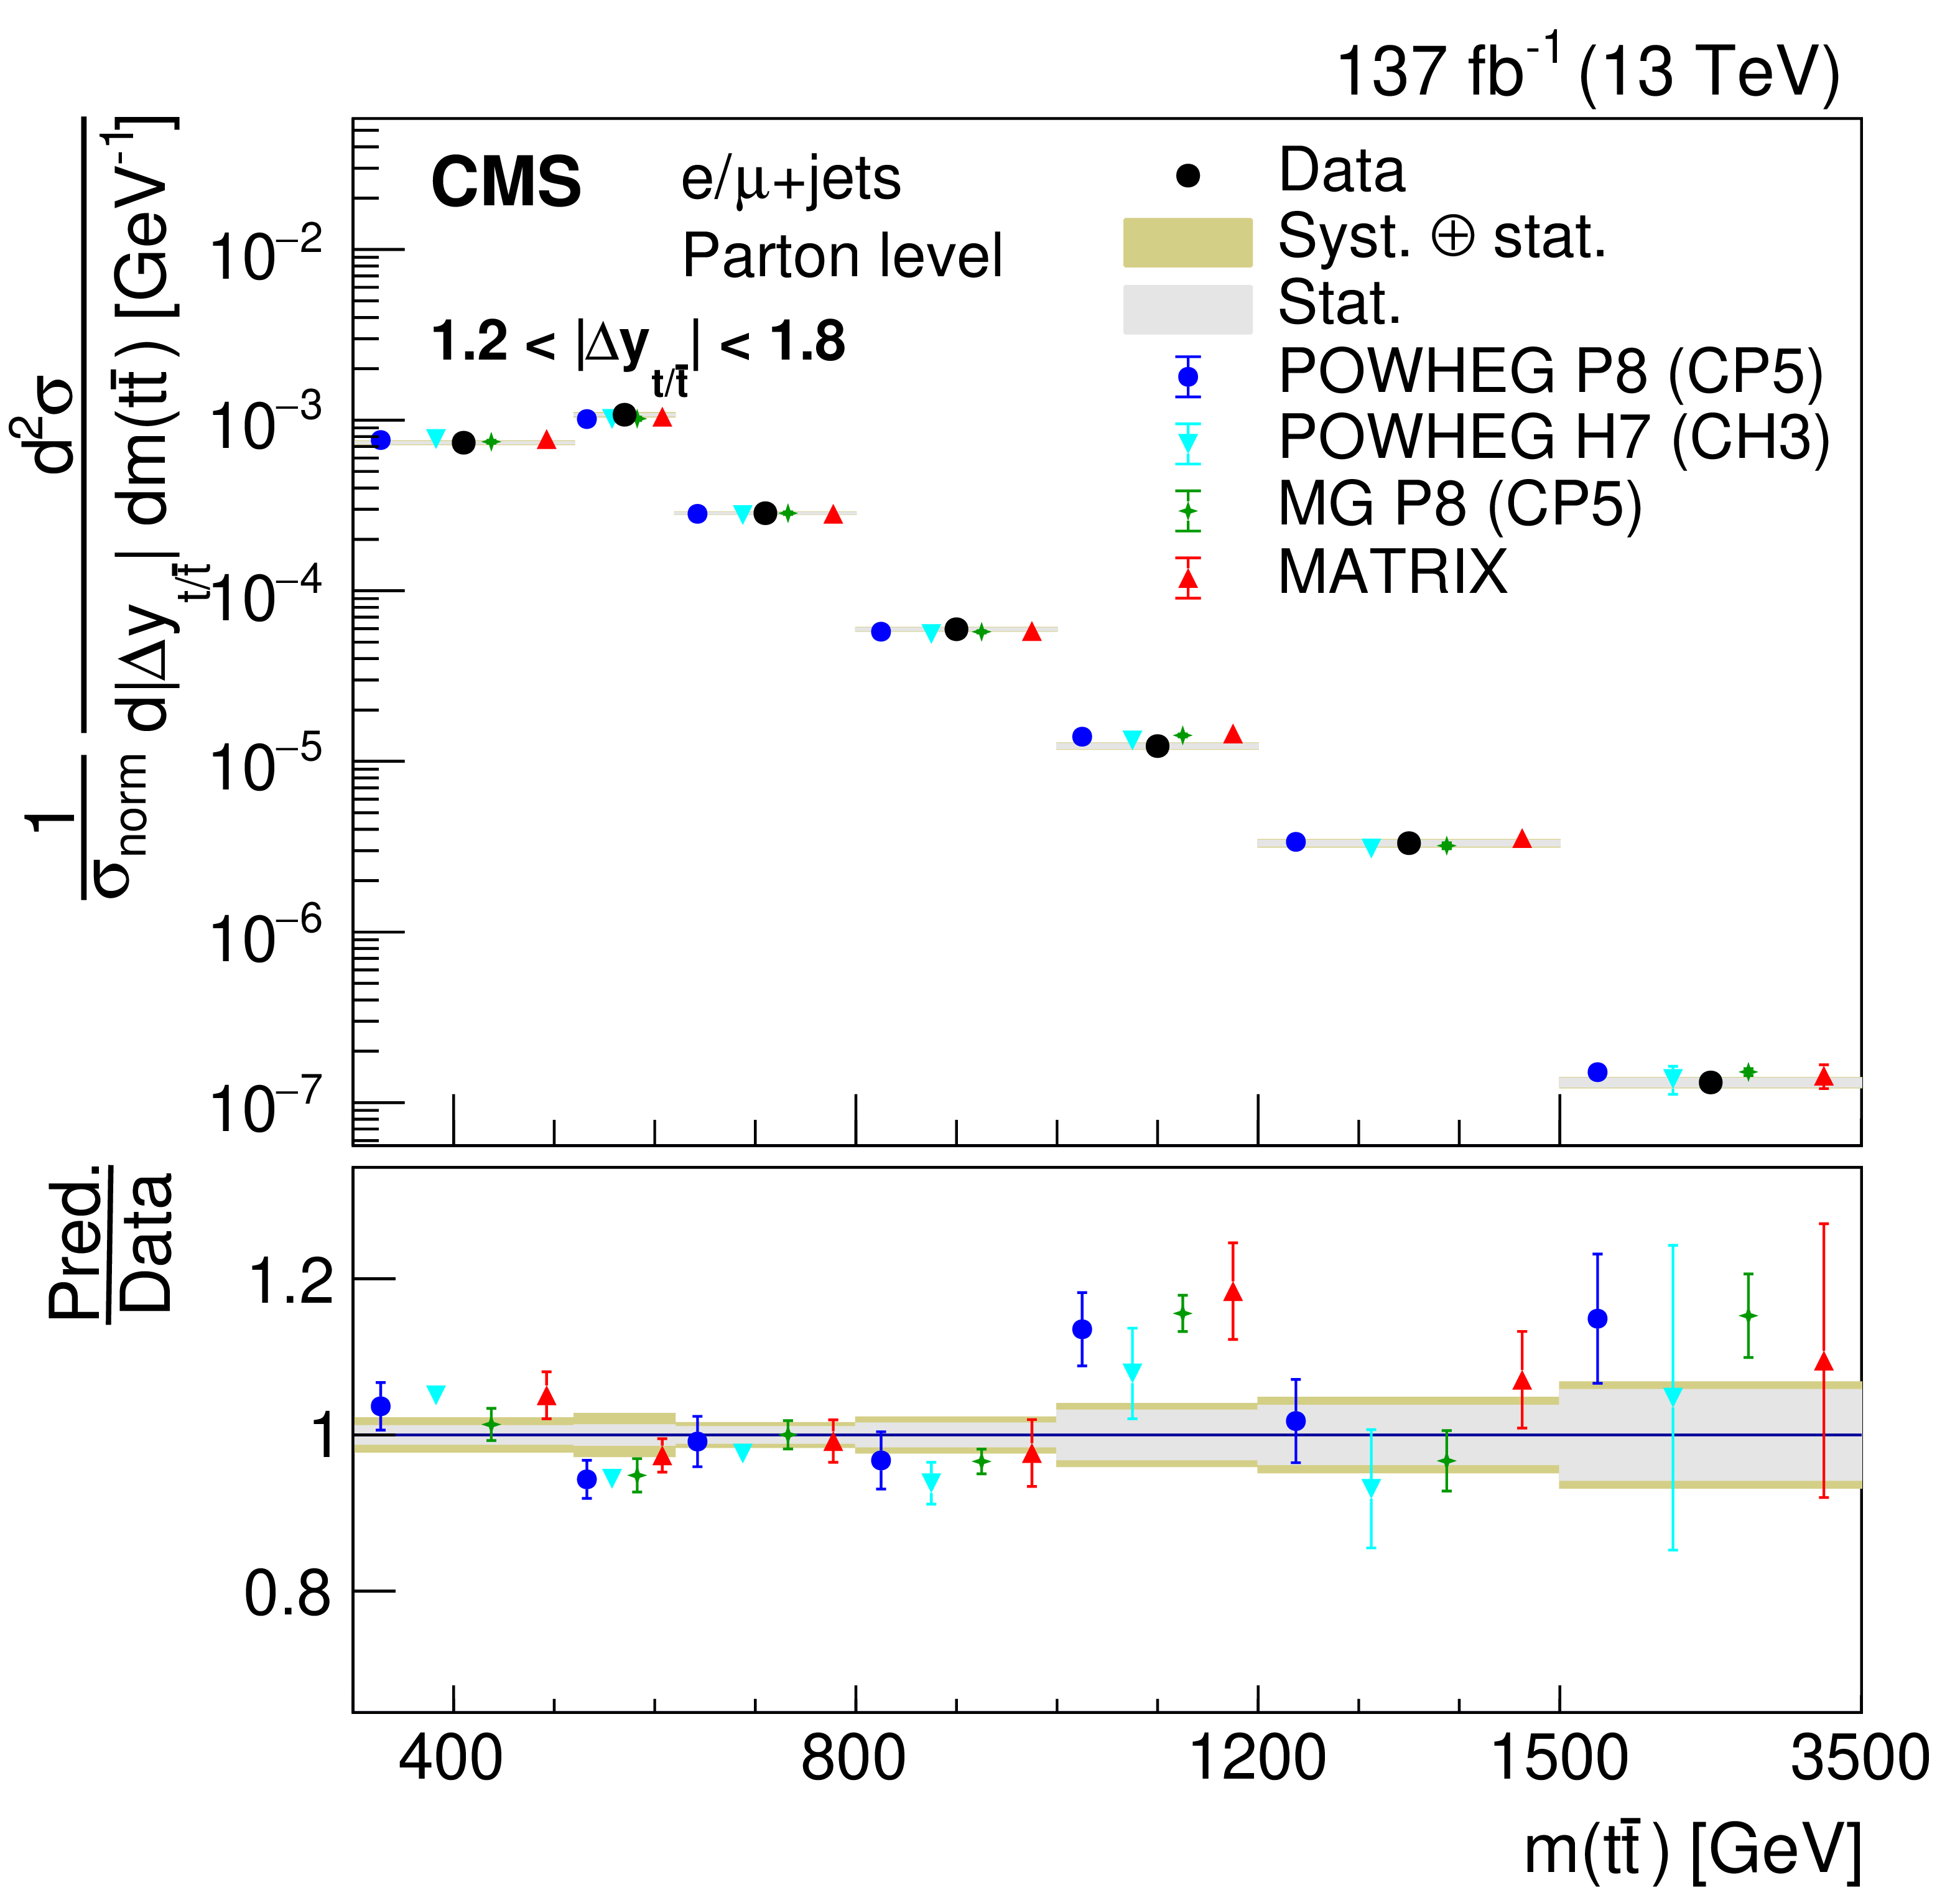
png pdf |
Figure A17-c:
Normalized double-differential cross section at the parton level as a function of ${{| \Delta y_{\mathrm{t} /\mathrm{\bar{t}}} |}}$ vs.$ {m({\mathrm{t} {}\mathrm{\bar{t}}})}$. The data are shown as points with gray (yellow) bands indicating the statistical (statistical and systematic) uncertainties. The cross sections are compared to the predictions of POWHEG combined with PYTHIA (P8) or HERWIG (H7), the multiparton simulation MG5_aMC@NLO (MG)+PYTHIA FxFx, and the NNLO QCD calculations obtained with Matrix. The ratios of the various predictions to the measured cross sections are shown in the lower panels. |
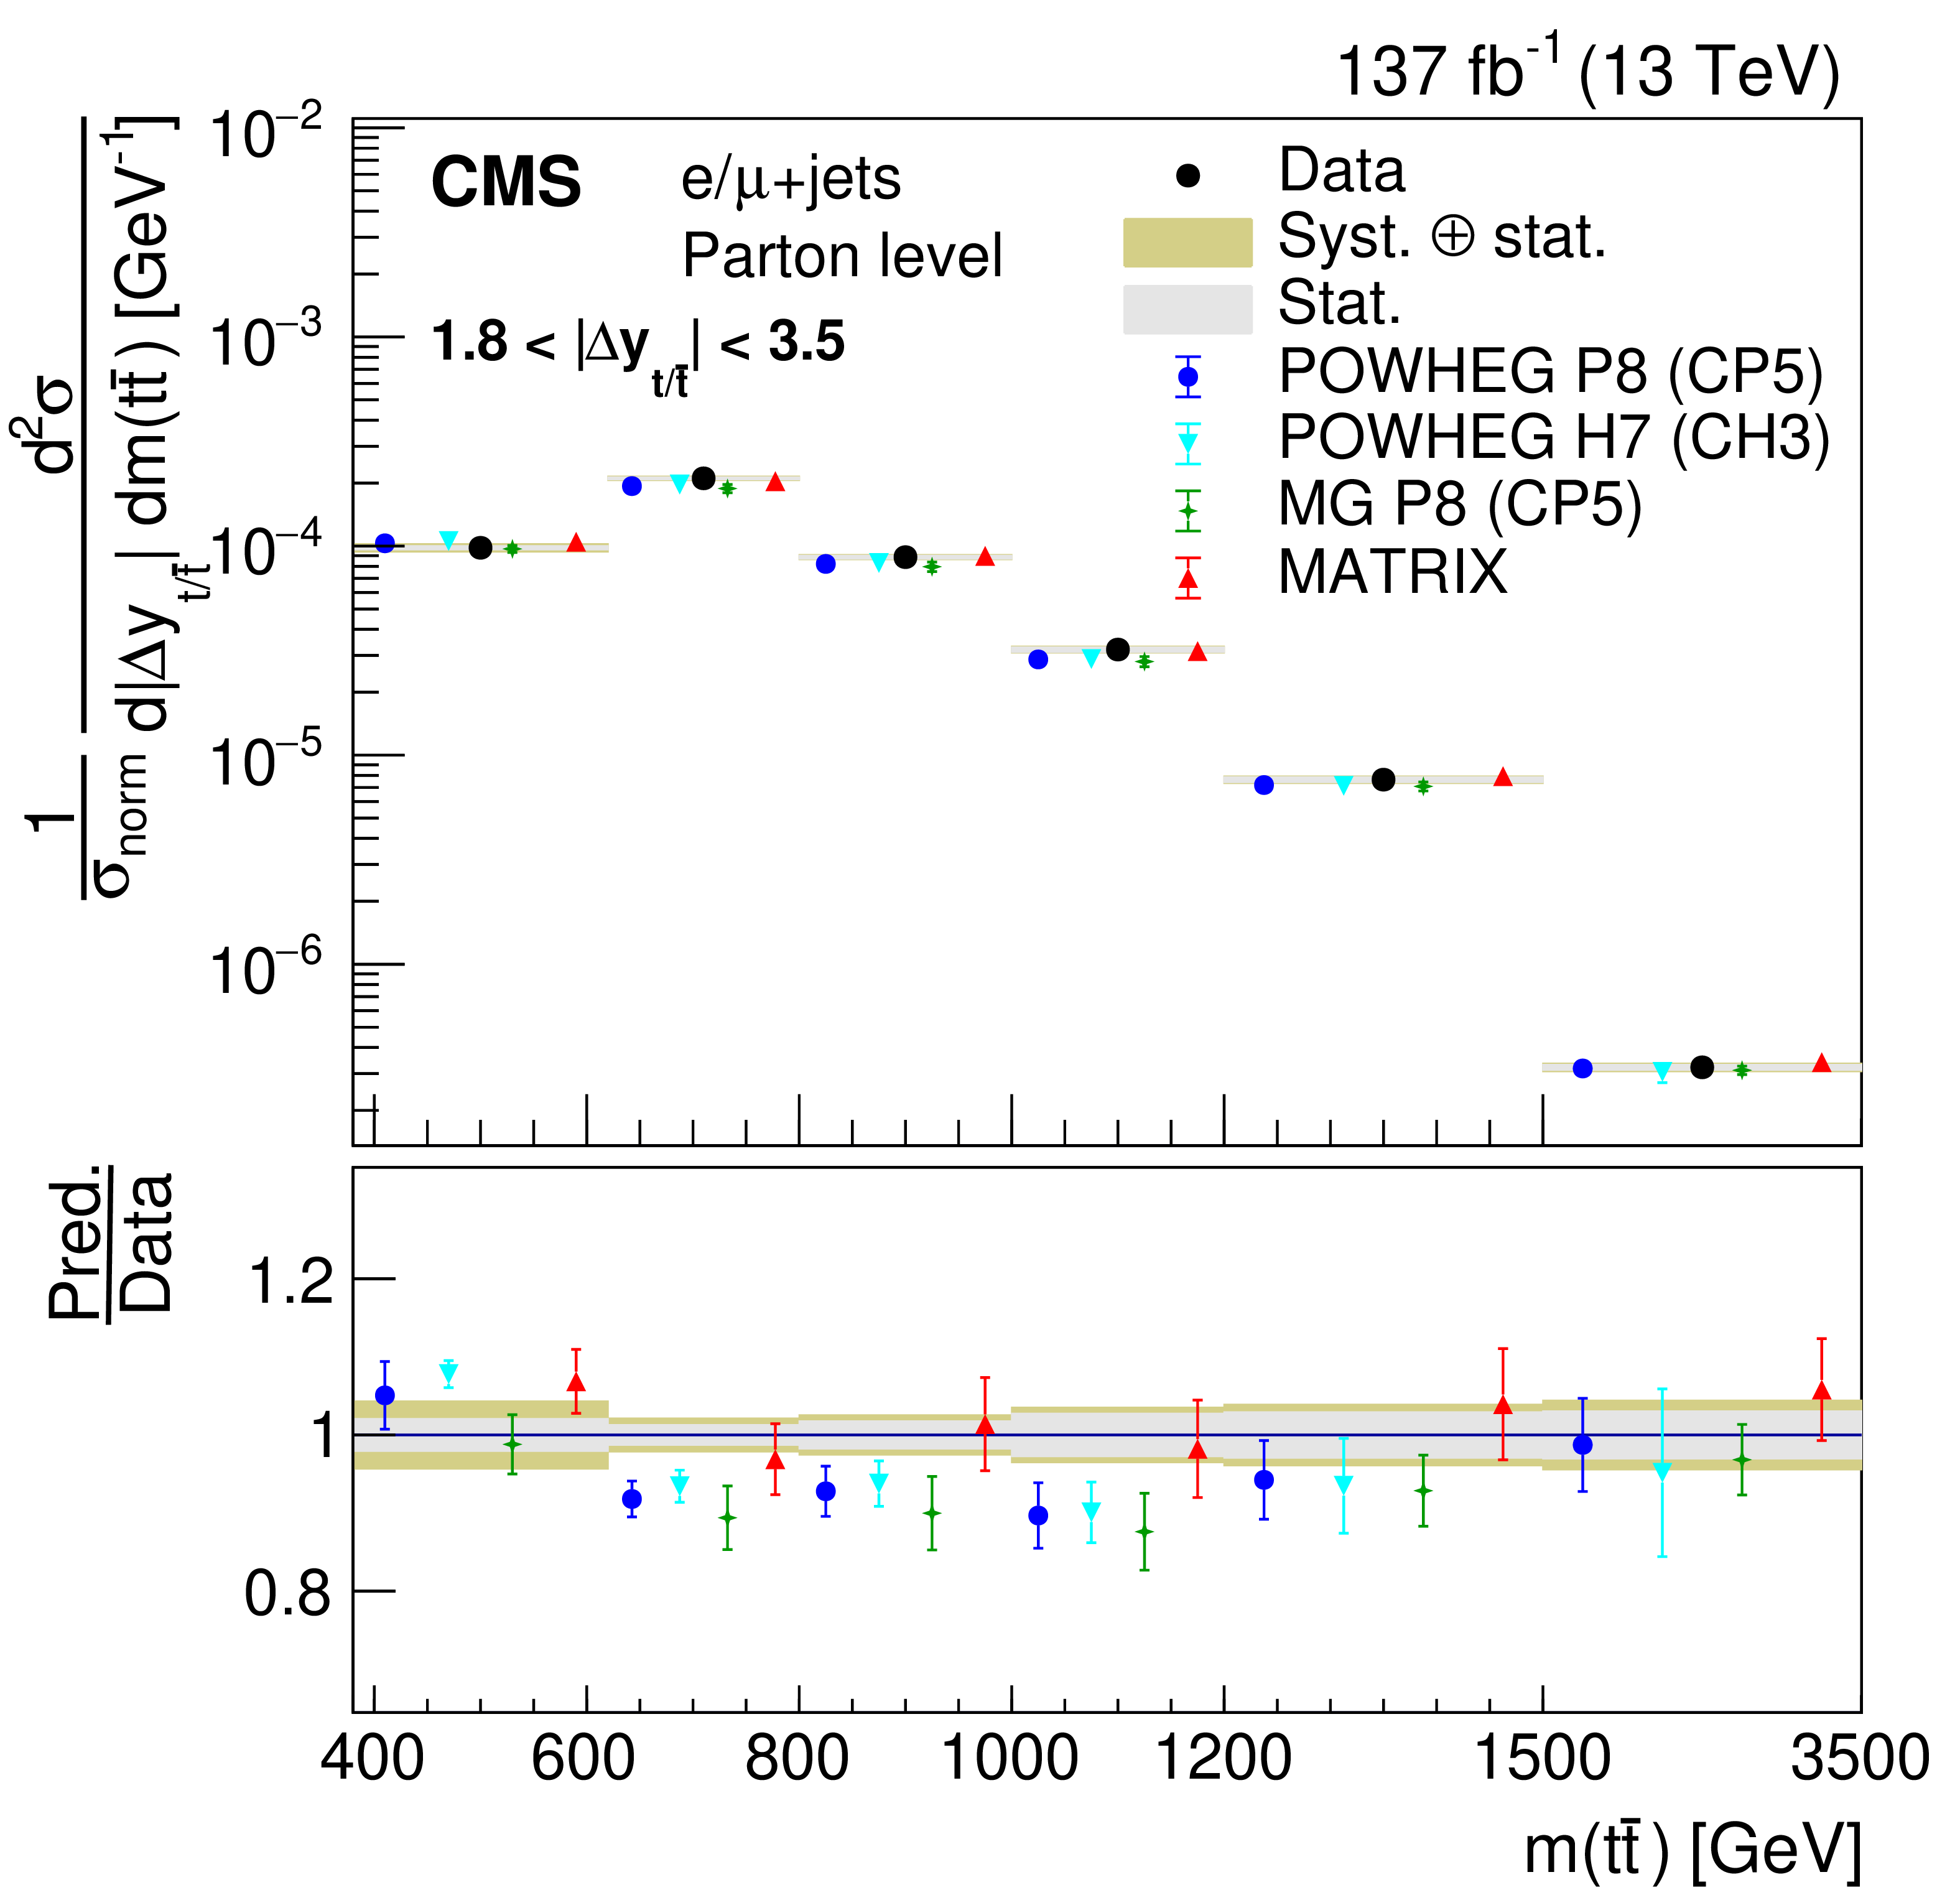
png pdf |
Figure A17-d:
Normalized double-differential cross section at the parton level as a function of ${{| \Delta y_{\mathrm{t} /\mathrm{\bar{t}}} |}}$ vs.$ {m({\mathrm{t} {}\mathrm{\bar{t}}})}$. The data are shown as points with gray (yellow) bands indicating the statistical (statistical and systematic) uncertainties. The cross sections are compared to the predictions of POWHEG combined with PYTHIA (P8) or HERWIG (H7), the multiparton simulation MG5_aMC@NLO (MG)+PYTHIA FxFx, and the NNLO QCD calculations obtained with Matrix. The ratios of the various predictions to the measured cross sections are shown in the lower panels. |

png pdf |
Figure A18:
Normalized double-differential cross section at the particle level as a function of ${{| \Delta y_{\mathrm{t} /\mathrm{\bar{t}}} |}}$ vs.$ {m({\mathrm{t} {}\mathrm{\bar{t}}})}$. The data are shown as points with gray (yellow) bands indicating the statistical (statistical and systematic) uncertainties. The cross sections are compared to the predictions of POWHEG+PYTHIA (P8) for the CP5 and CUETP8M2T4 (T4) tunes, POWHEG+HERWIG (H7), and the multiparton simulation MG5_aMC@NLO (MG)+PYTHIA. The ratios of the various predictions to the measured cross sections are shown in the lower panels. |

png pdf |
Figure A18-a:
Normalized double-differential cross section at the particle level as a function of ${{| \Delta y_{\mathrm{t} /\mathrm{\bar{t}}} |}}$ vs.$ {m({\mathrm{t} {}\mathrm{\bar{t}}})}$. The data are shown as points with gray (yellow) bands indicating the statistical (statistical and systematic) uncertainties. The cross sections are compared to the predictions of POWHEG+PYTHIA (P8) for the CP5 and CUETP8M2T4 (T4) tunes, POWHEG+HERWIG (H7), and the multiparton simulation MG5_aMC@NLO (MG)+PYTHIA. The ratios of the various predictions to the measured cross sections are shown in the lower panels. |

png pdf |
Figure A18-b:
Normalized double-differential cross section at the particle level as a function of ${{| \Delta y_{\mathrm{t} /\mathrm{\bar{t}}} |}}$ vs.$ {m({\mathrm{t} {}\mathrm{\bar{t}}})}$. The data are shown as points with gray (yellow) bands indicating the statistical (statistical and systematic) uncertainties. The cross sections are compared to the predictions of POWHEG+PYTHIA (P8) for the CP5 and CUETP8M2T4 (T4) tunes, POWHEG+HERWIG (H7), and the multiparton simulation MG5_aMC@NLO (MG)+PYTHIA. The ratios of the various predictions to the measured cross sections are shown in the lower panels. |
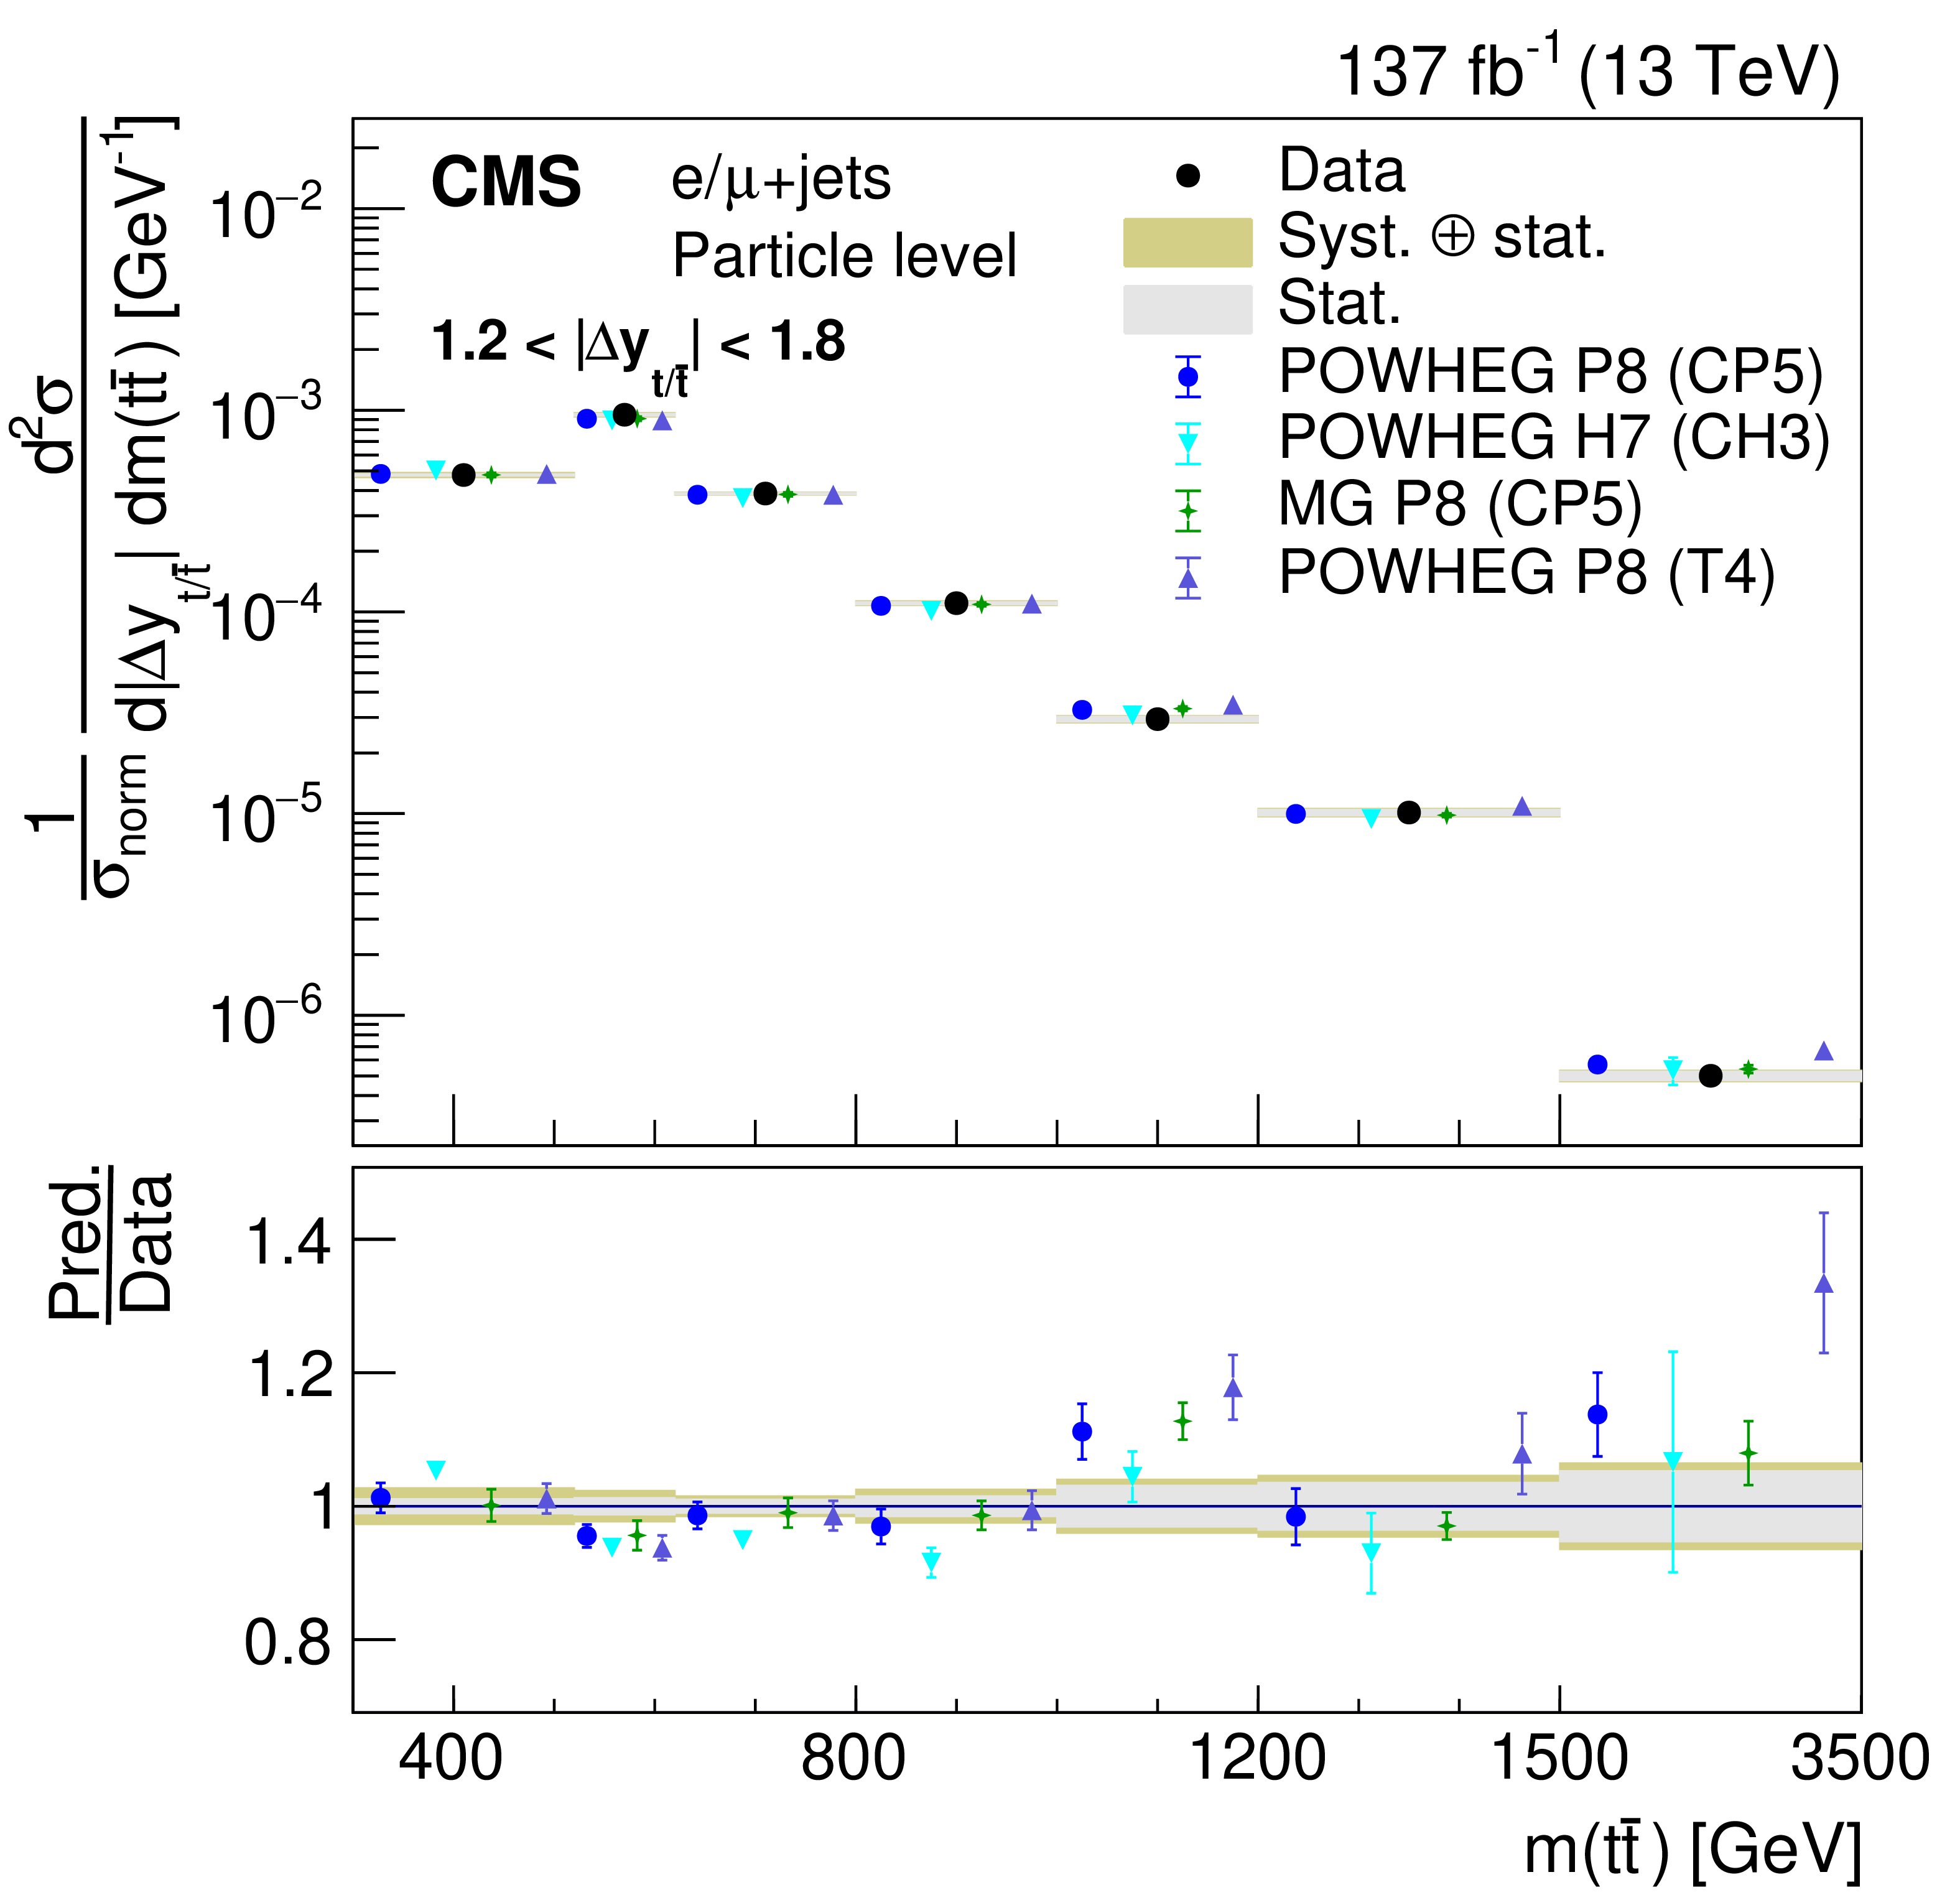
png pdf |
Figure A18-c:
Normalized double-differential cross section at the particle level as a function of ${{| \Delta y_{\mathrm{t} /\mathrm{\bar{t}}} |}}$ vs.$ {m({\mathrm{t} {}\mathrm{\bar{t}}})}$. The data are shown as points with gray (yellow) bands indicating the statistical (statistical and systematic) uncertainties. The cross sections are compared to the predictions of POWHEG+PYTHIA (P8) for the CP5 and CUETP8M2T4 (T4) tunes, POWHEG+HERWIG (H7), and the multiparton simulation MG5_aMC@NLO (MG)+PYTHIA. The ratios of the various predictions to the measured cross sections are shown in the lower panels. |
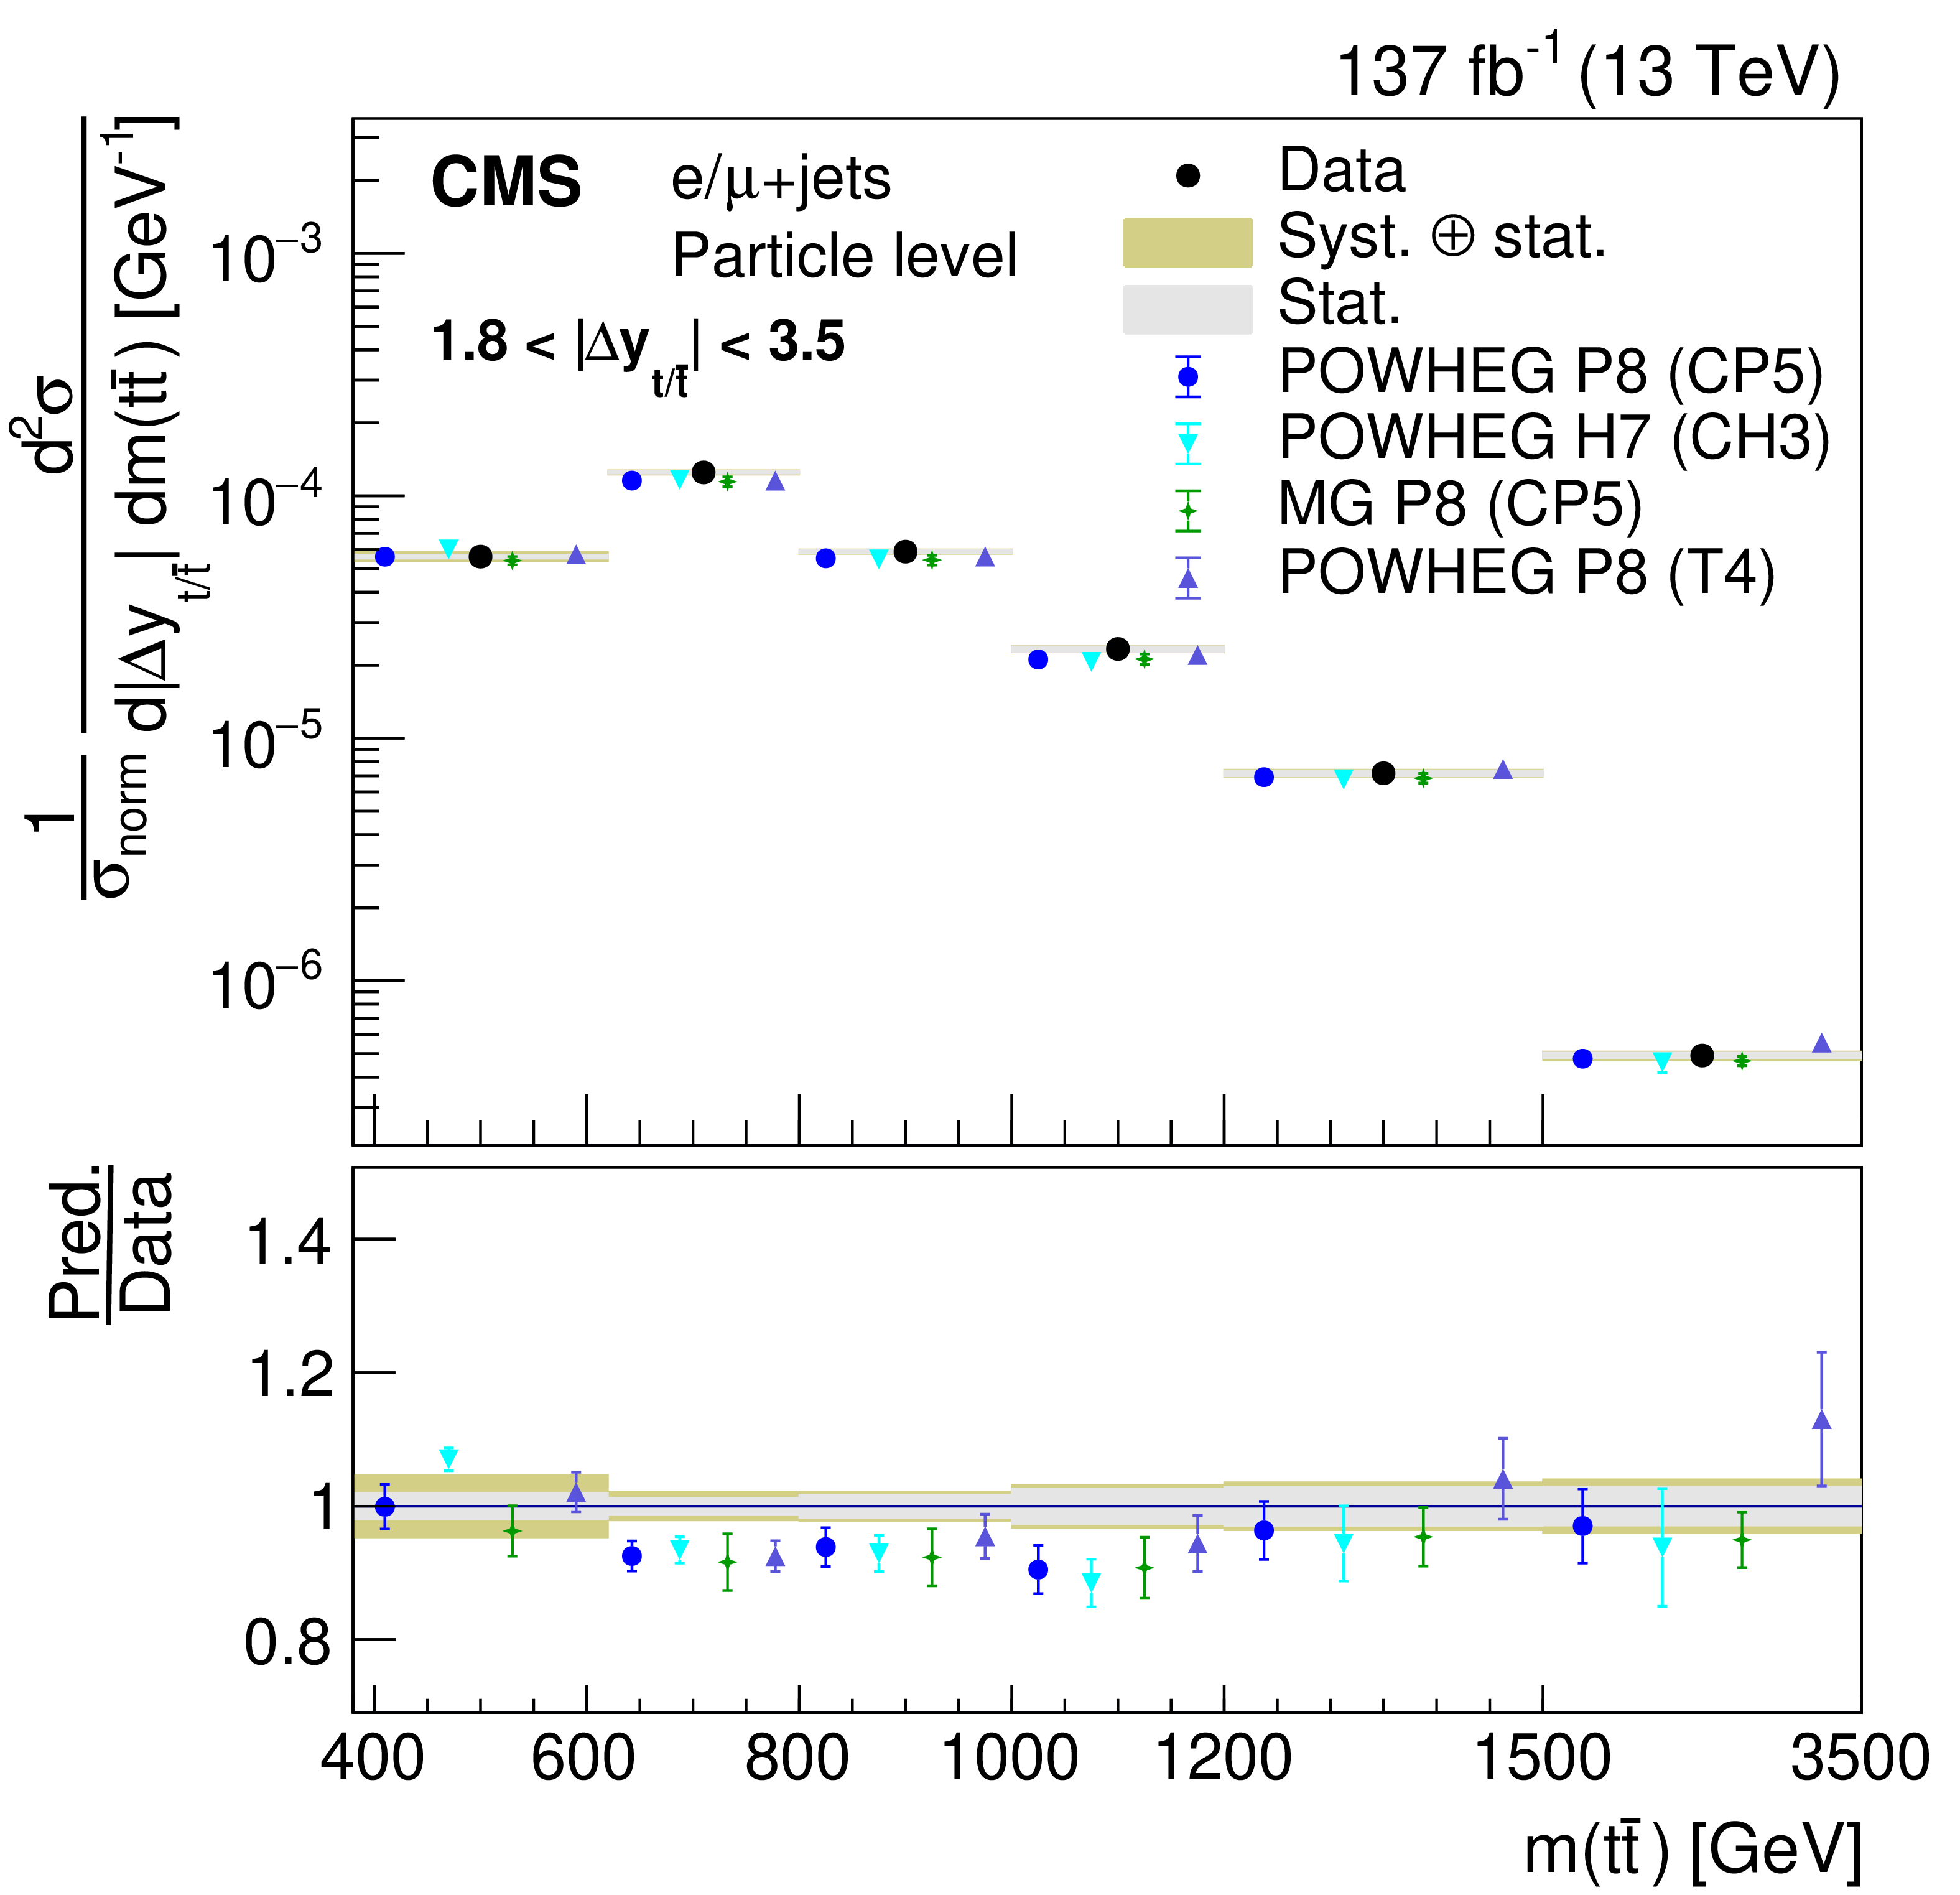
png pdf |
Figure A18-d:
Normalized double-differential cross section at the particle level as a function of ${{| \Delta y_{\mathrm{t} /\mathrm{\bar{t}}} |}}$ vs.$ {m({\mathrm{t} {}\mathrm{\bar{t}}})}$. The data are shown as points with gray (yellow) bands indicating the statistical (statistical and systematic) uncertainties. The cross sections are compared to the predictions of POWHEG+PYTHIA (P8) for the CP5 and CUETP8M2T4 (T4) tunes, POWHEG+HERWIG (H7), and the multiparton simulation MG5_aMC@NLO (MG)+PYTHIA. The ratios of the various predictions to the measured cross sections are shown in the lower panels. |
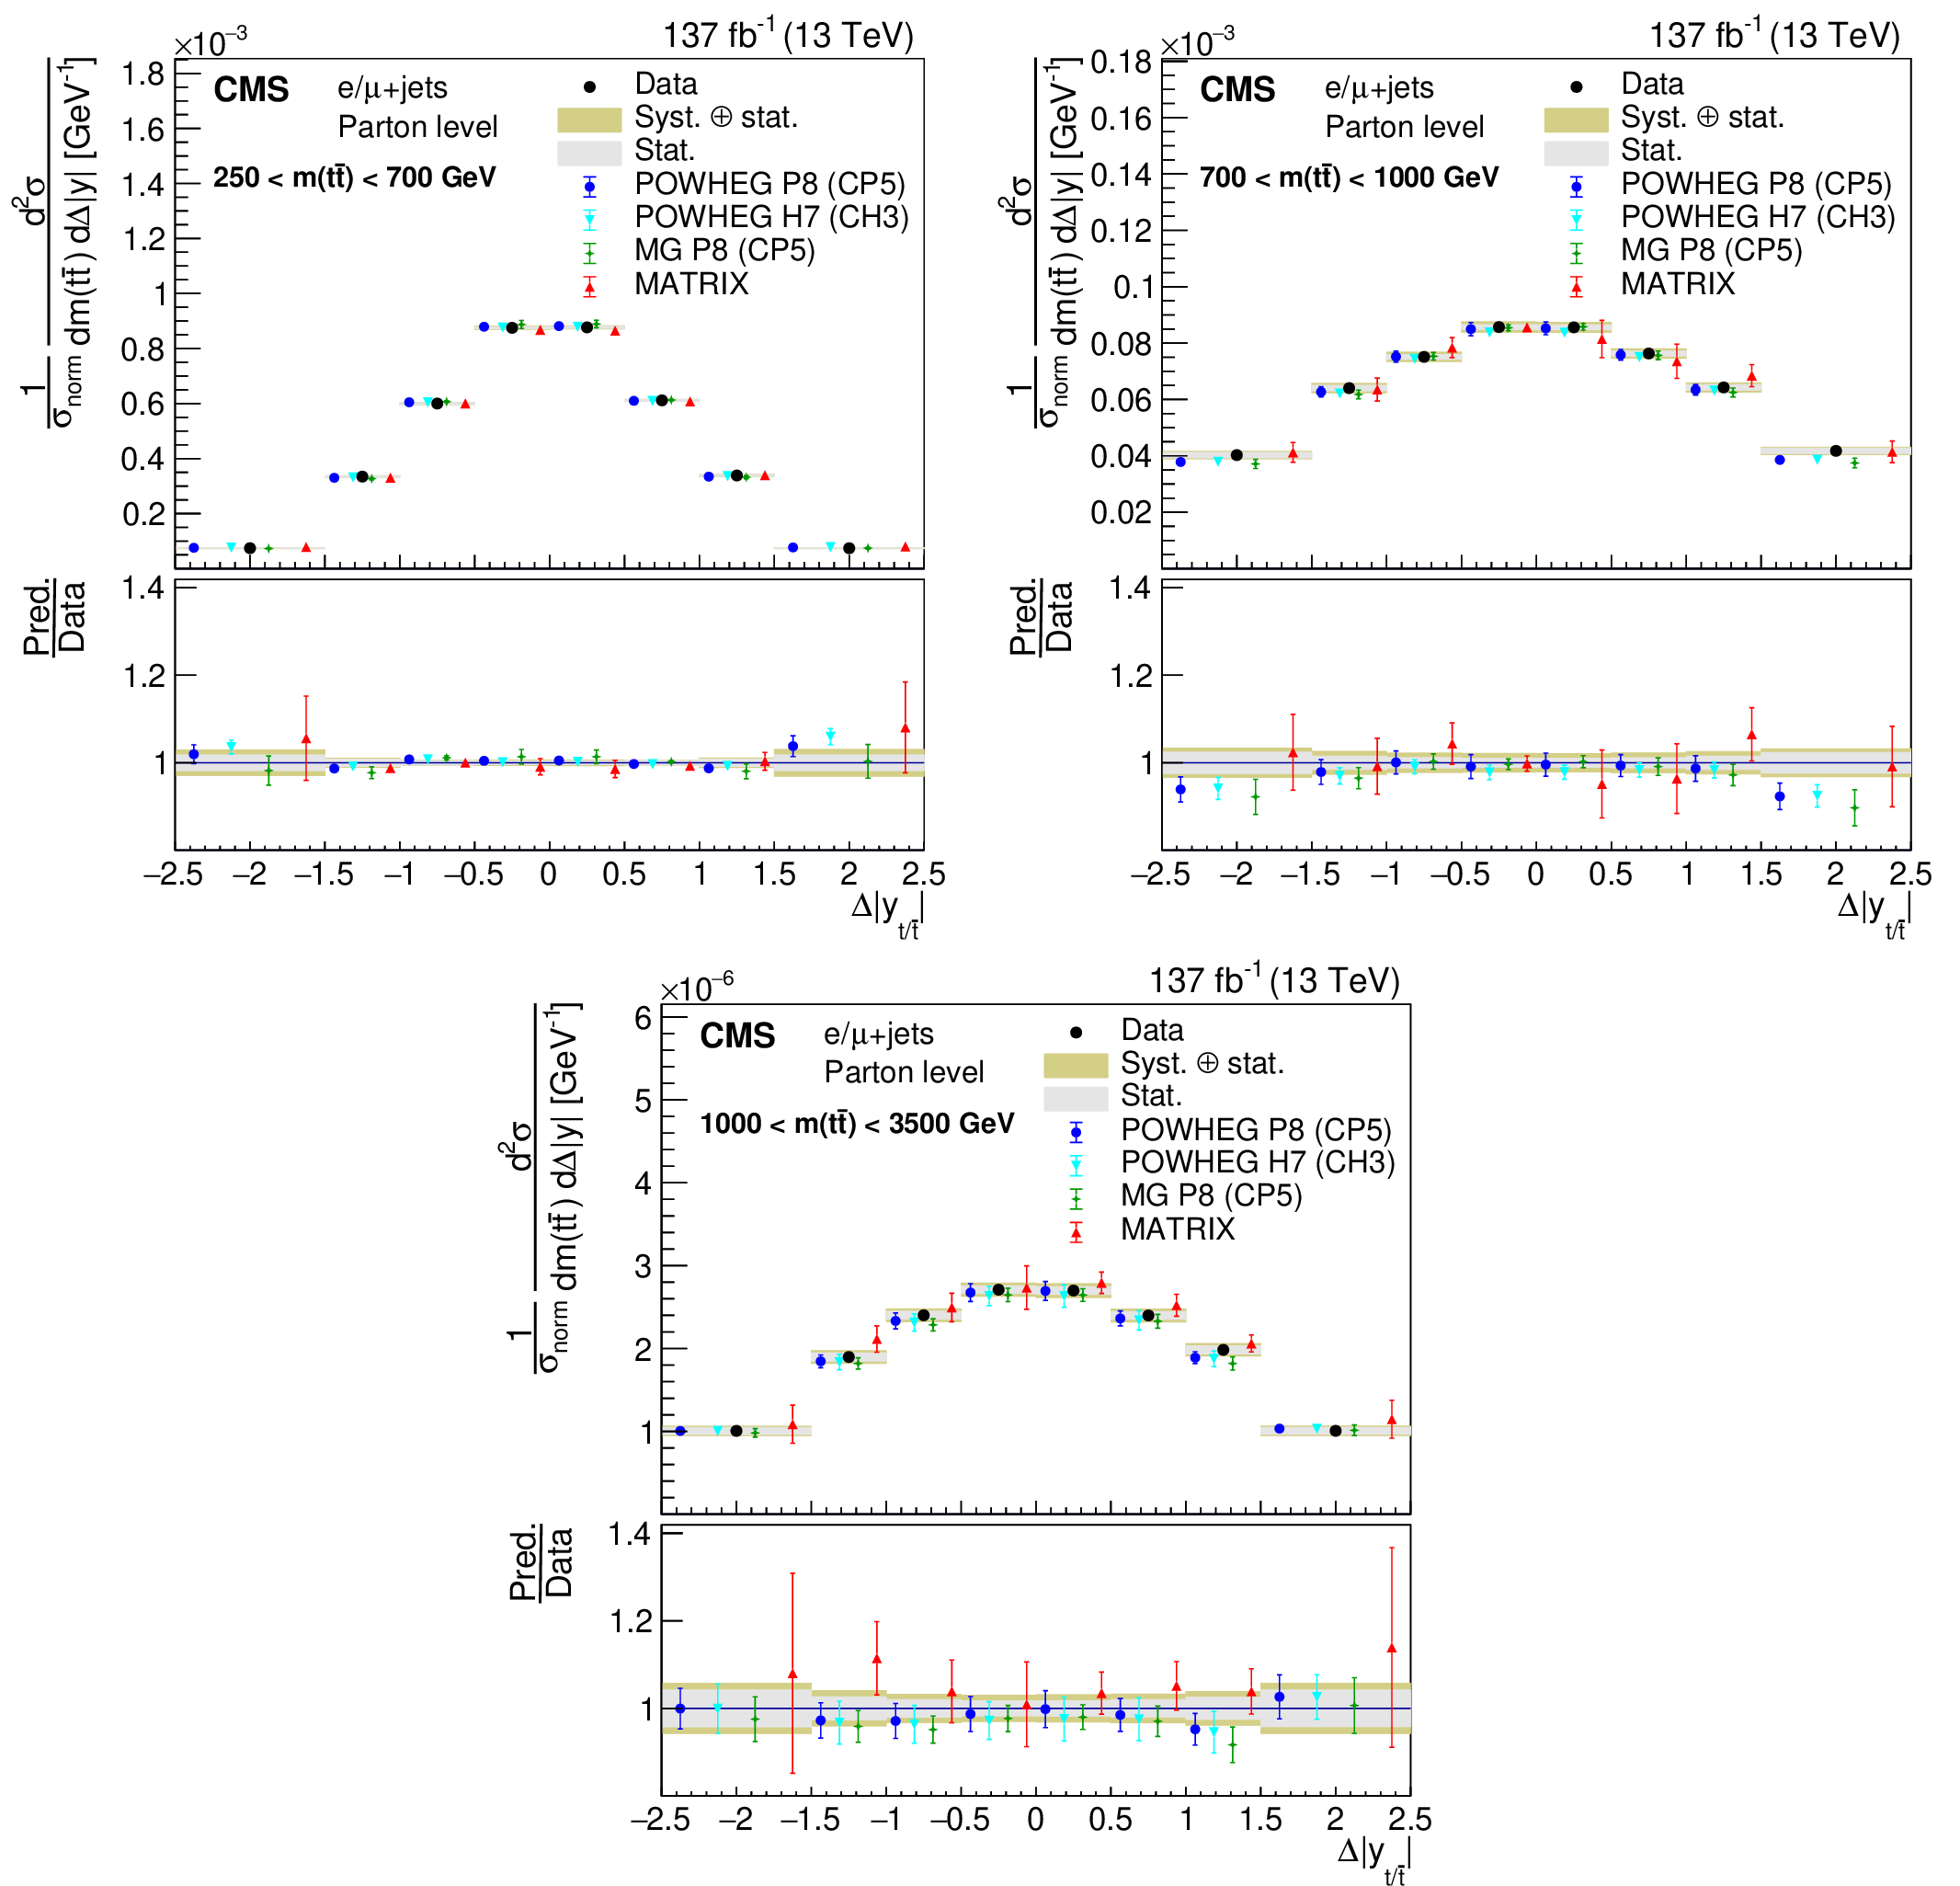
png pdf |
Figure A19:
Normalized double-differential cross section at the parton level as a function of ${m({\mathrm{t} {}\mathrm{\bar{t}}})}$ vs. ${\Delta {| y_{\mathrm{t} /\mathrm{\bar{t}}} |}}$. The data are shown as points with gray (yellow) bands indicating the statistical (statistical and systematic) uncertainties. The cross sections are compared to the predictions of POWHEG combined with PYTHIA (P8) or HERWIG (H7), the multiparton simulation MG5_aMC@NLO (MG)+PYTHIA FxFx, and the NNLO QCD calculations obtained with Matrix. The ratios of the various predictions to the measured cross sections are shown in the lower panels. |
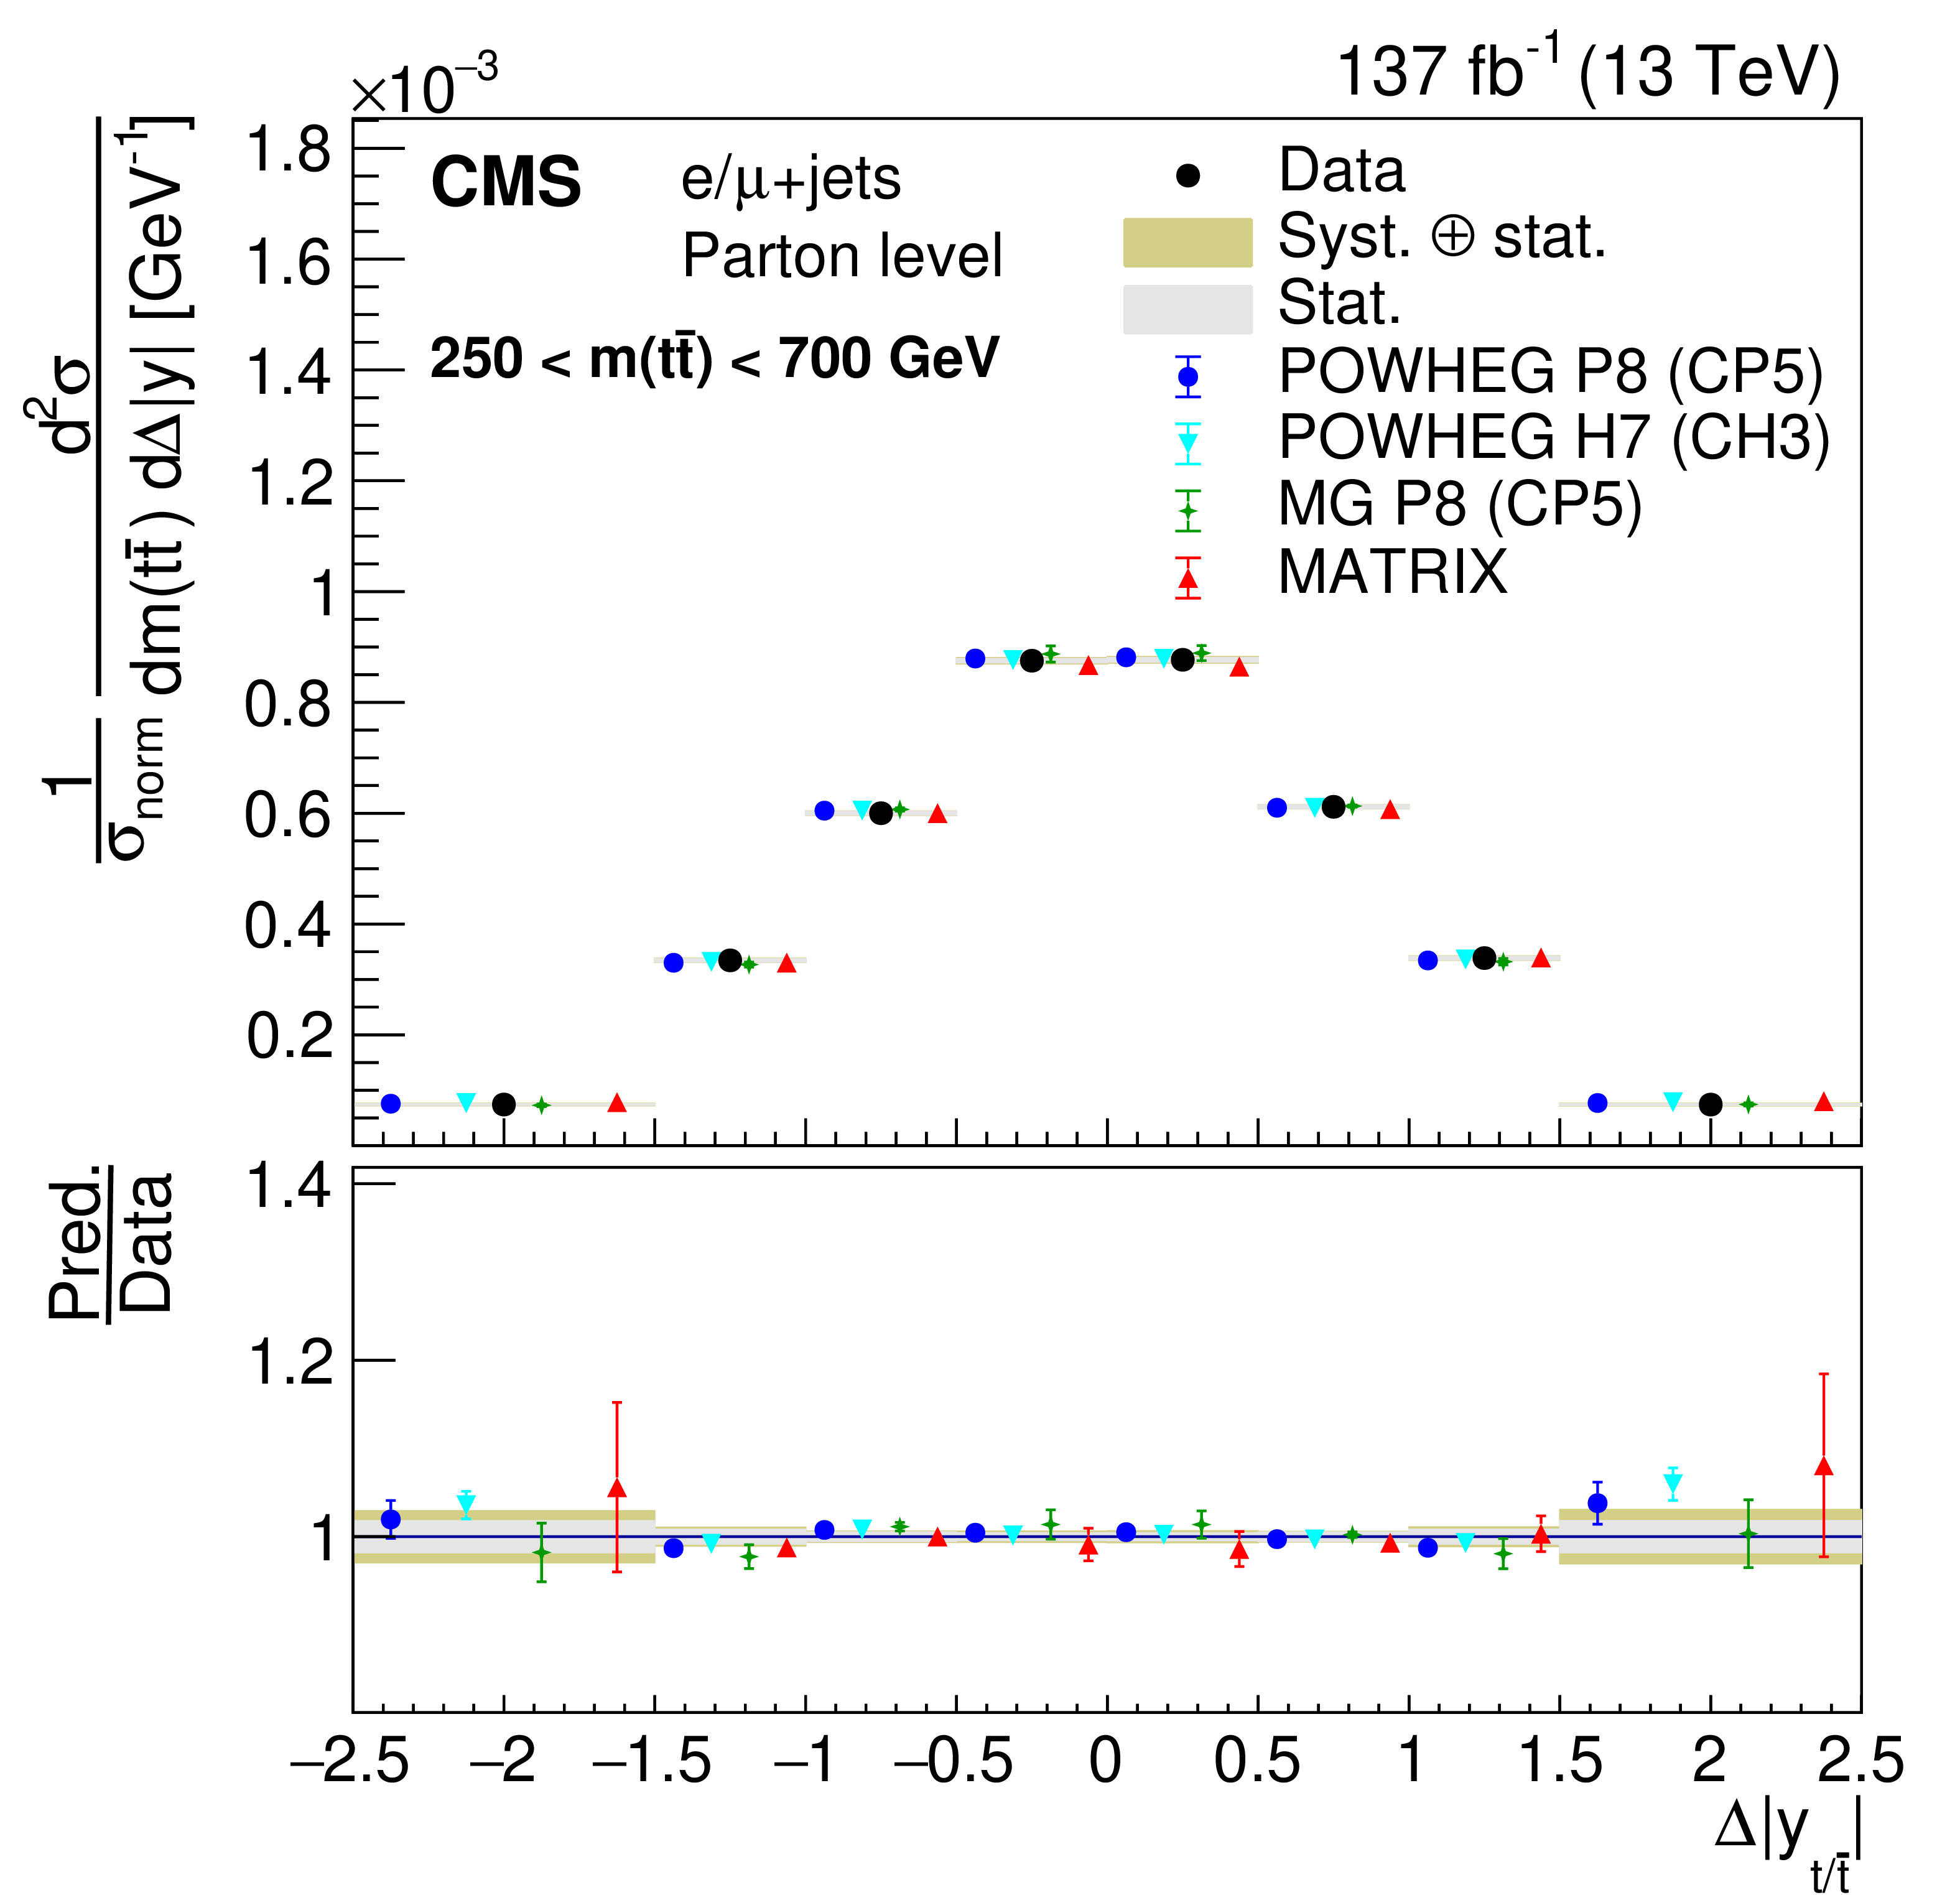
png pdf |
Figure A19-a:
Normalized double-differential cross section at the parton level as a function of ${m({\mathrm{t} {}\mathrm{\bar{t}}})}$ vs. ${\Delta {| y_{\mathrm{t} /\mathrm{\bar{t}}} |}}$. The data are shown as points with gray (yellow) bands indicating the statistical (statistical and systematic) uncertainties. The cross sections are compared to the predictions of POWHEG combined with PYTHIA (P8) or HERWIG (H7), the multiparton simulation MG5_aMC@NLO (MG)+PYTHIA FxFx, and the NNLO QCD calculations obtained with Matrix. The ratios of the various predictions to the measured cross sections are shown in the lower panels. |
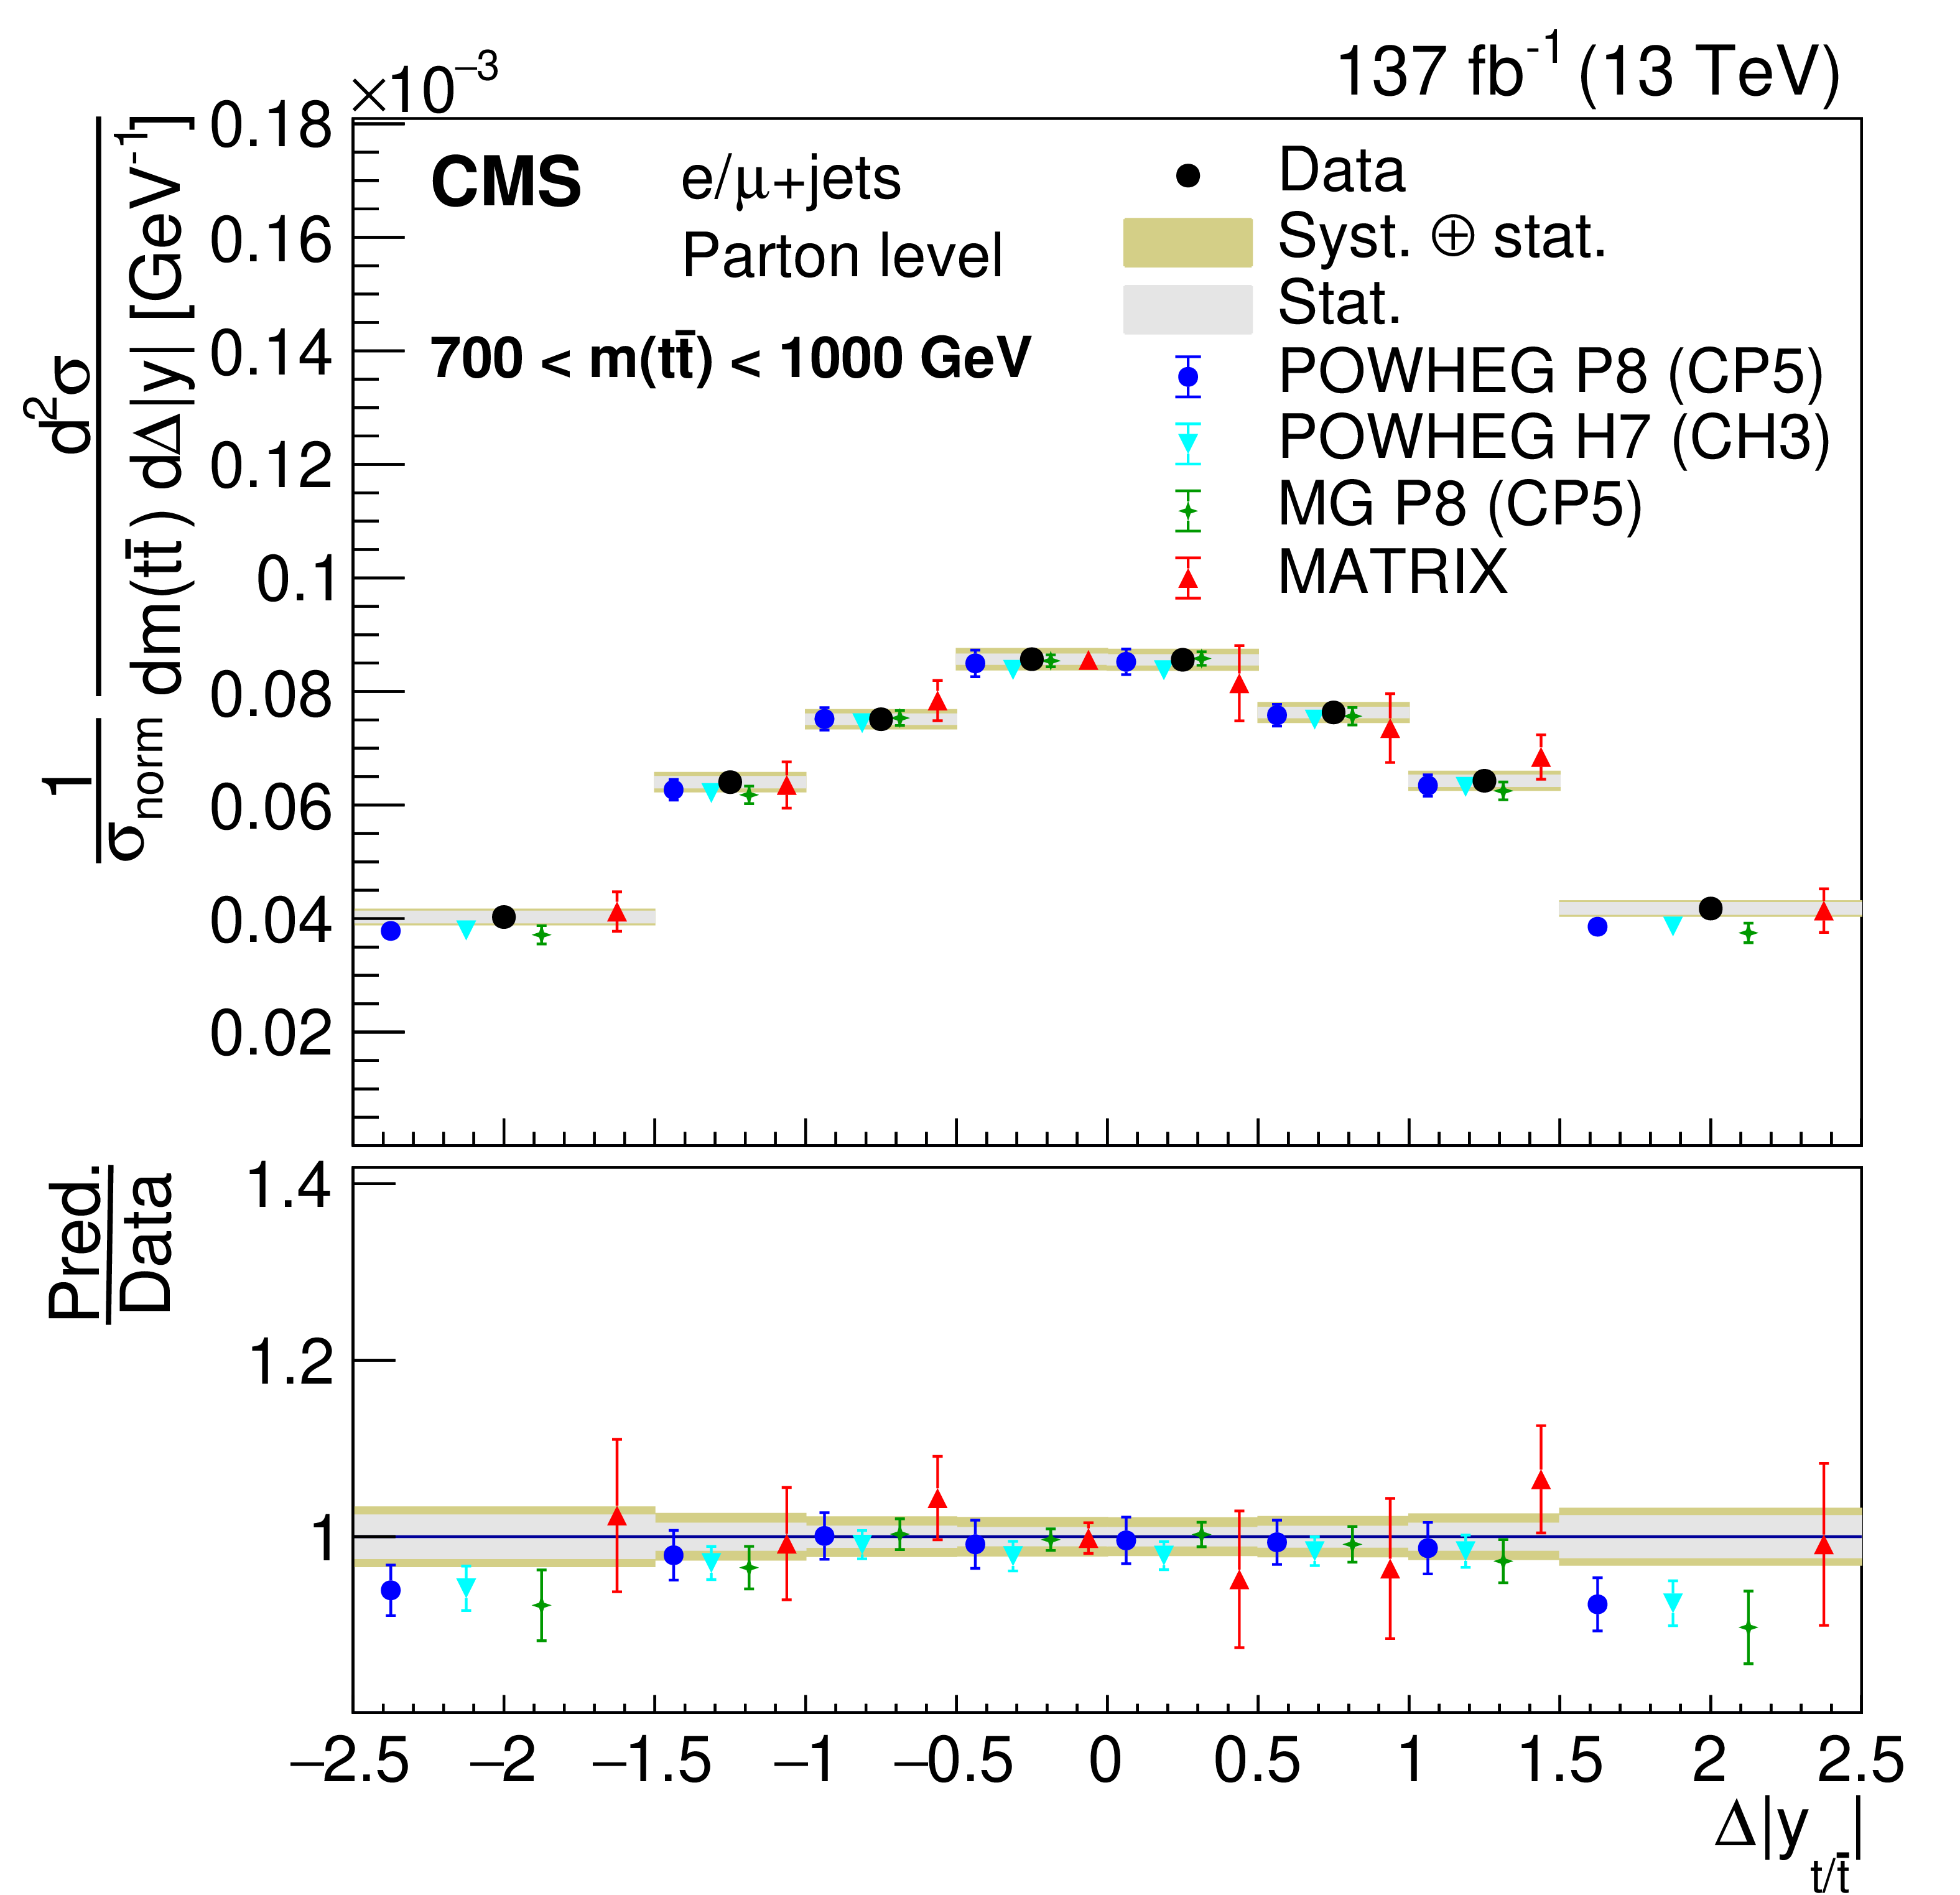
png pdf |
Figure A19-b:
Normalized double-differential cross section at the parton level as a function of ${m({\mathrm{t} {}\mathrm{\bar{t}}})}$ vs. ${\Delta {| y_{\mathrm{t} /\mathrm{\bar{t}}} |}}$. The data are shown as points with gray (yellow) bands indicating the statistical (statistical and systematic) uncertainties. The cross sections are compared to the predictions of POWHEG combined with PYTHIA (P8) or HERWIG (H7), the multiparton simulation MG5_aMC@NLO (MG)+PYTHIA FxFx, and the NNLO QCD calculations obtained with Matrix. The ratios of the various predictions to the measured cross sections are shown in the lower panels. |
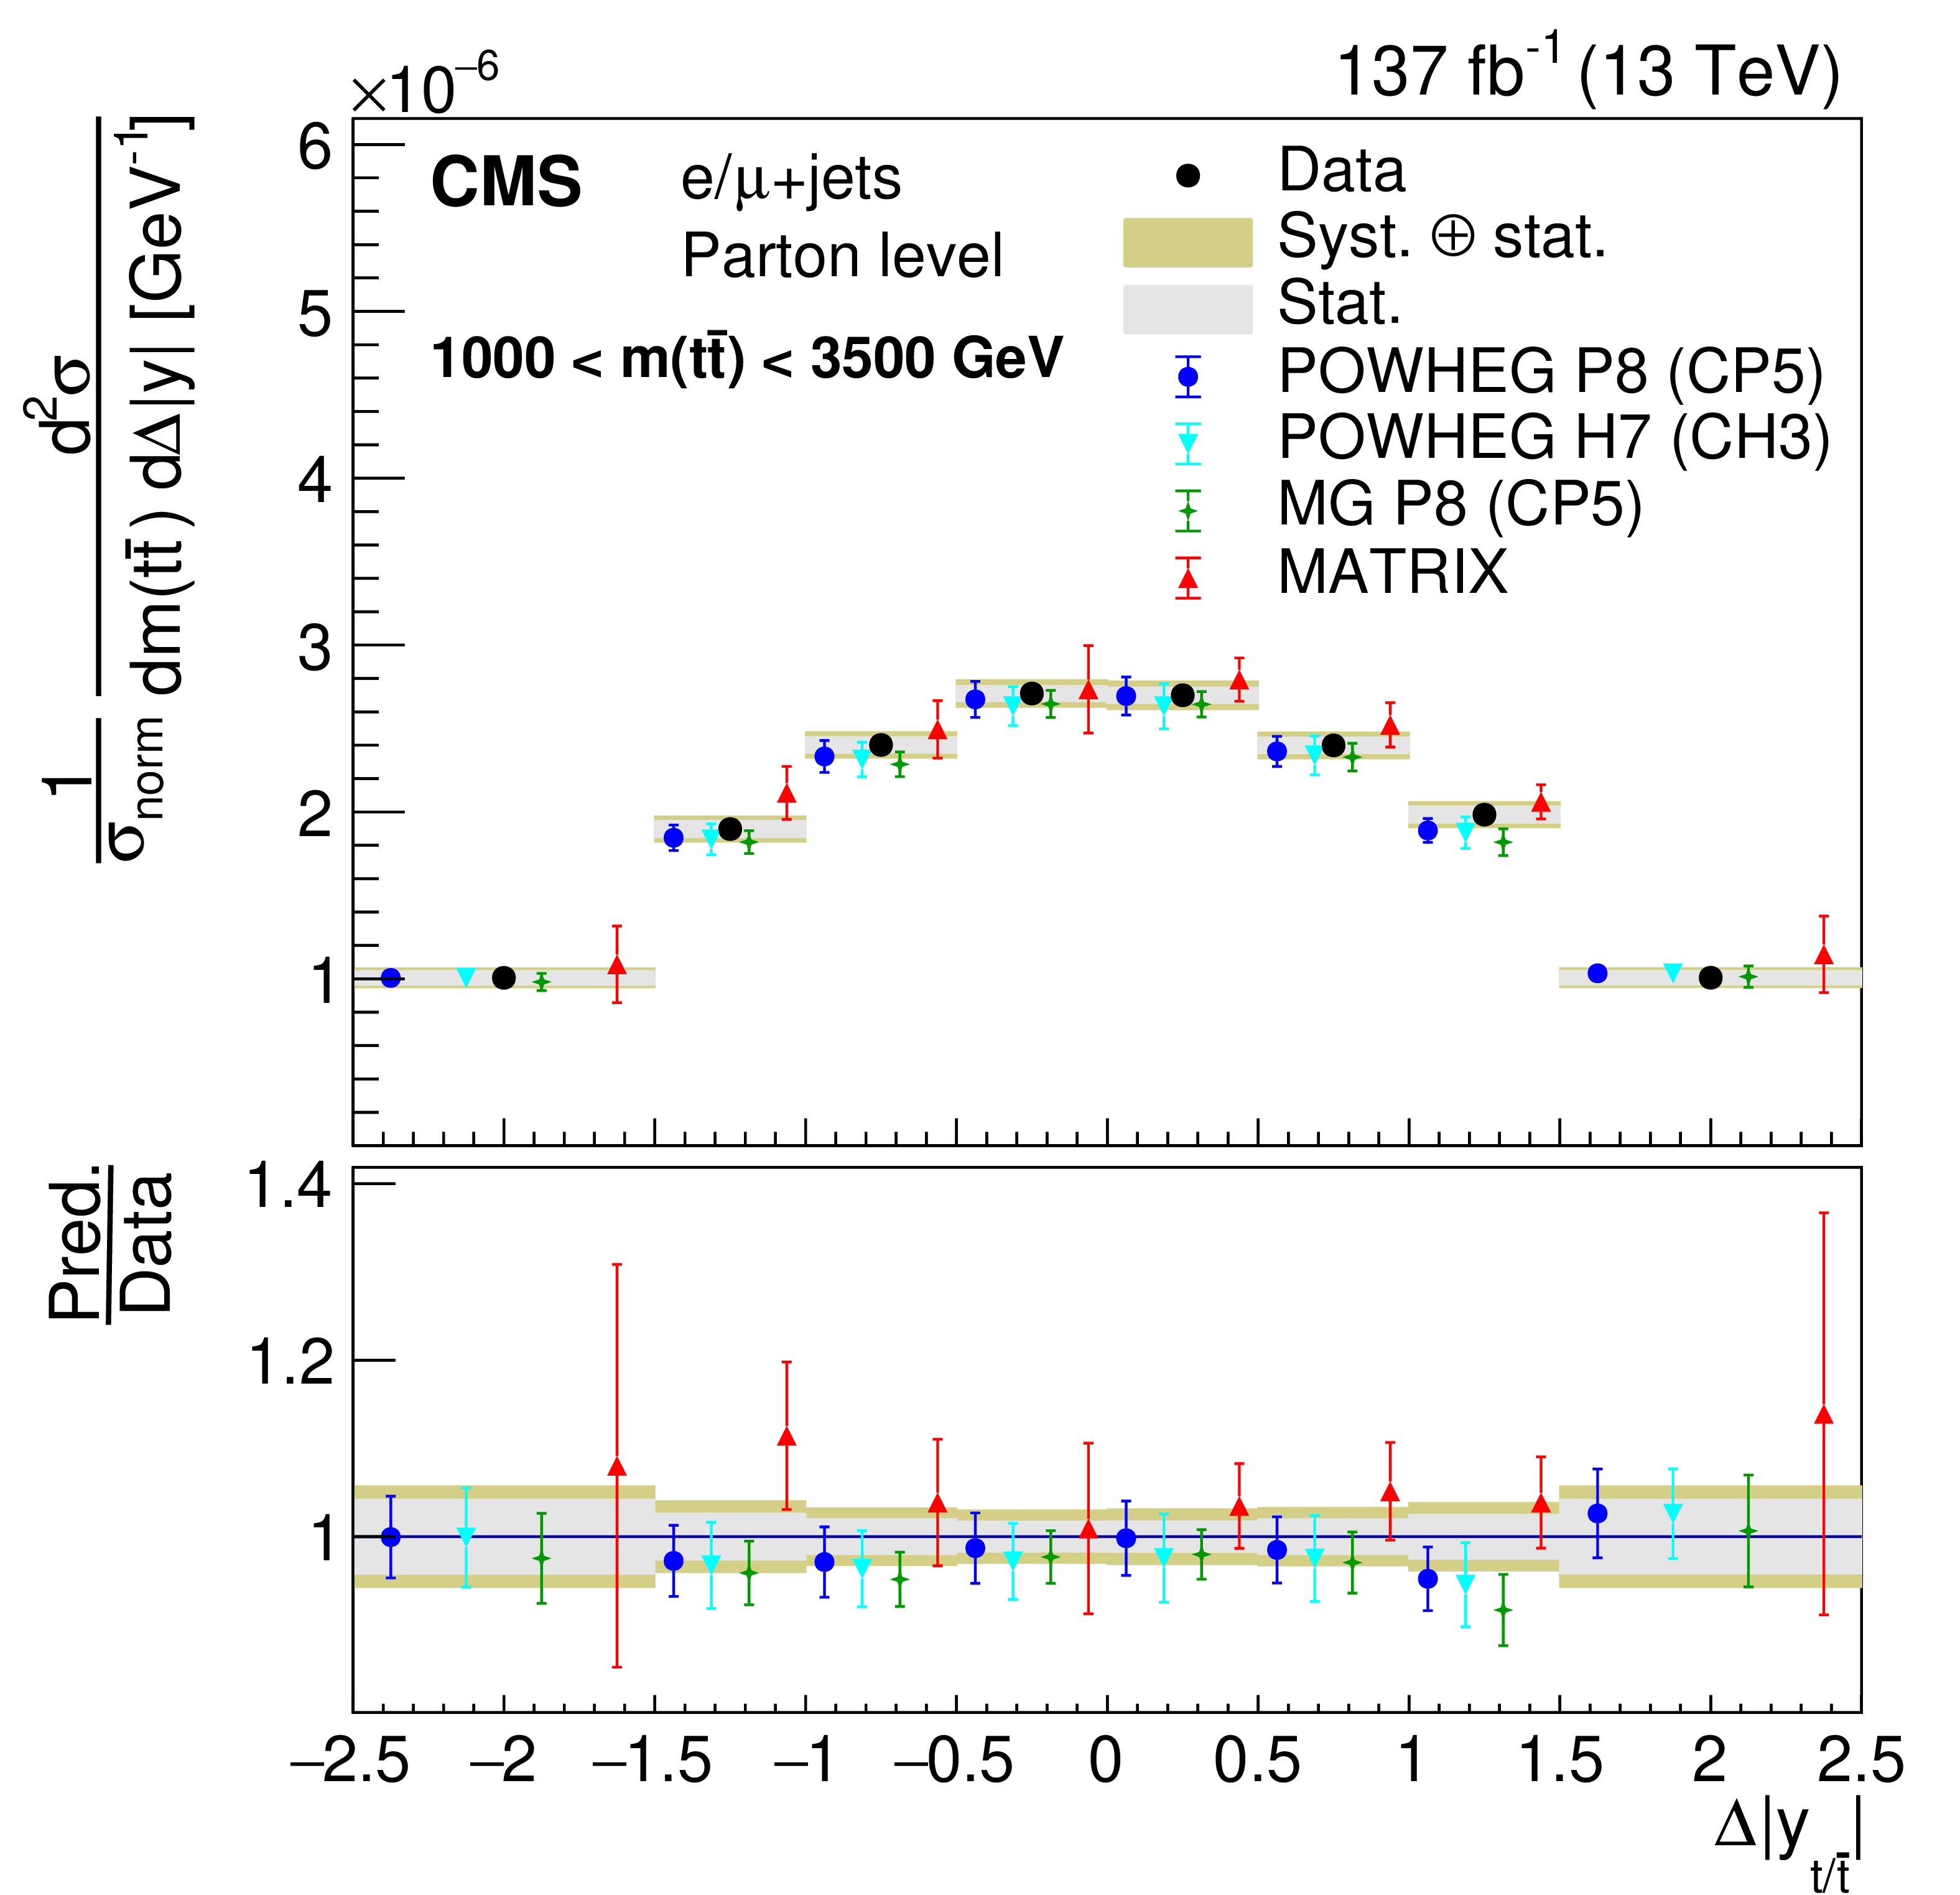
png pdf |
Figure A19-c:
Normalized double-differential cross section at the parton level as a function of ${m({\mathrm{t} {}\mathrm{\bar{t}}})}$ vs. ${\Delta {| y_{\mathrm{t} /\mathrm{\bar{t}}} |}}$. The data are shown as points with gray (yellow) bands indicating the statistical (statistical and systematic) uncertainties. The cross sections are compared to the predictions of POWHEG combined with PYTHIA (P8) or HERWIG (H7), the multiparton simulation MG5_aMC@NLO (MG)+PYTHIA FxFx, and the NNLO QCD calculations obtained with Matrix. The ratios of the various predictions to the measured cross sections are shown in the lower panels. |
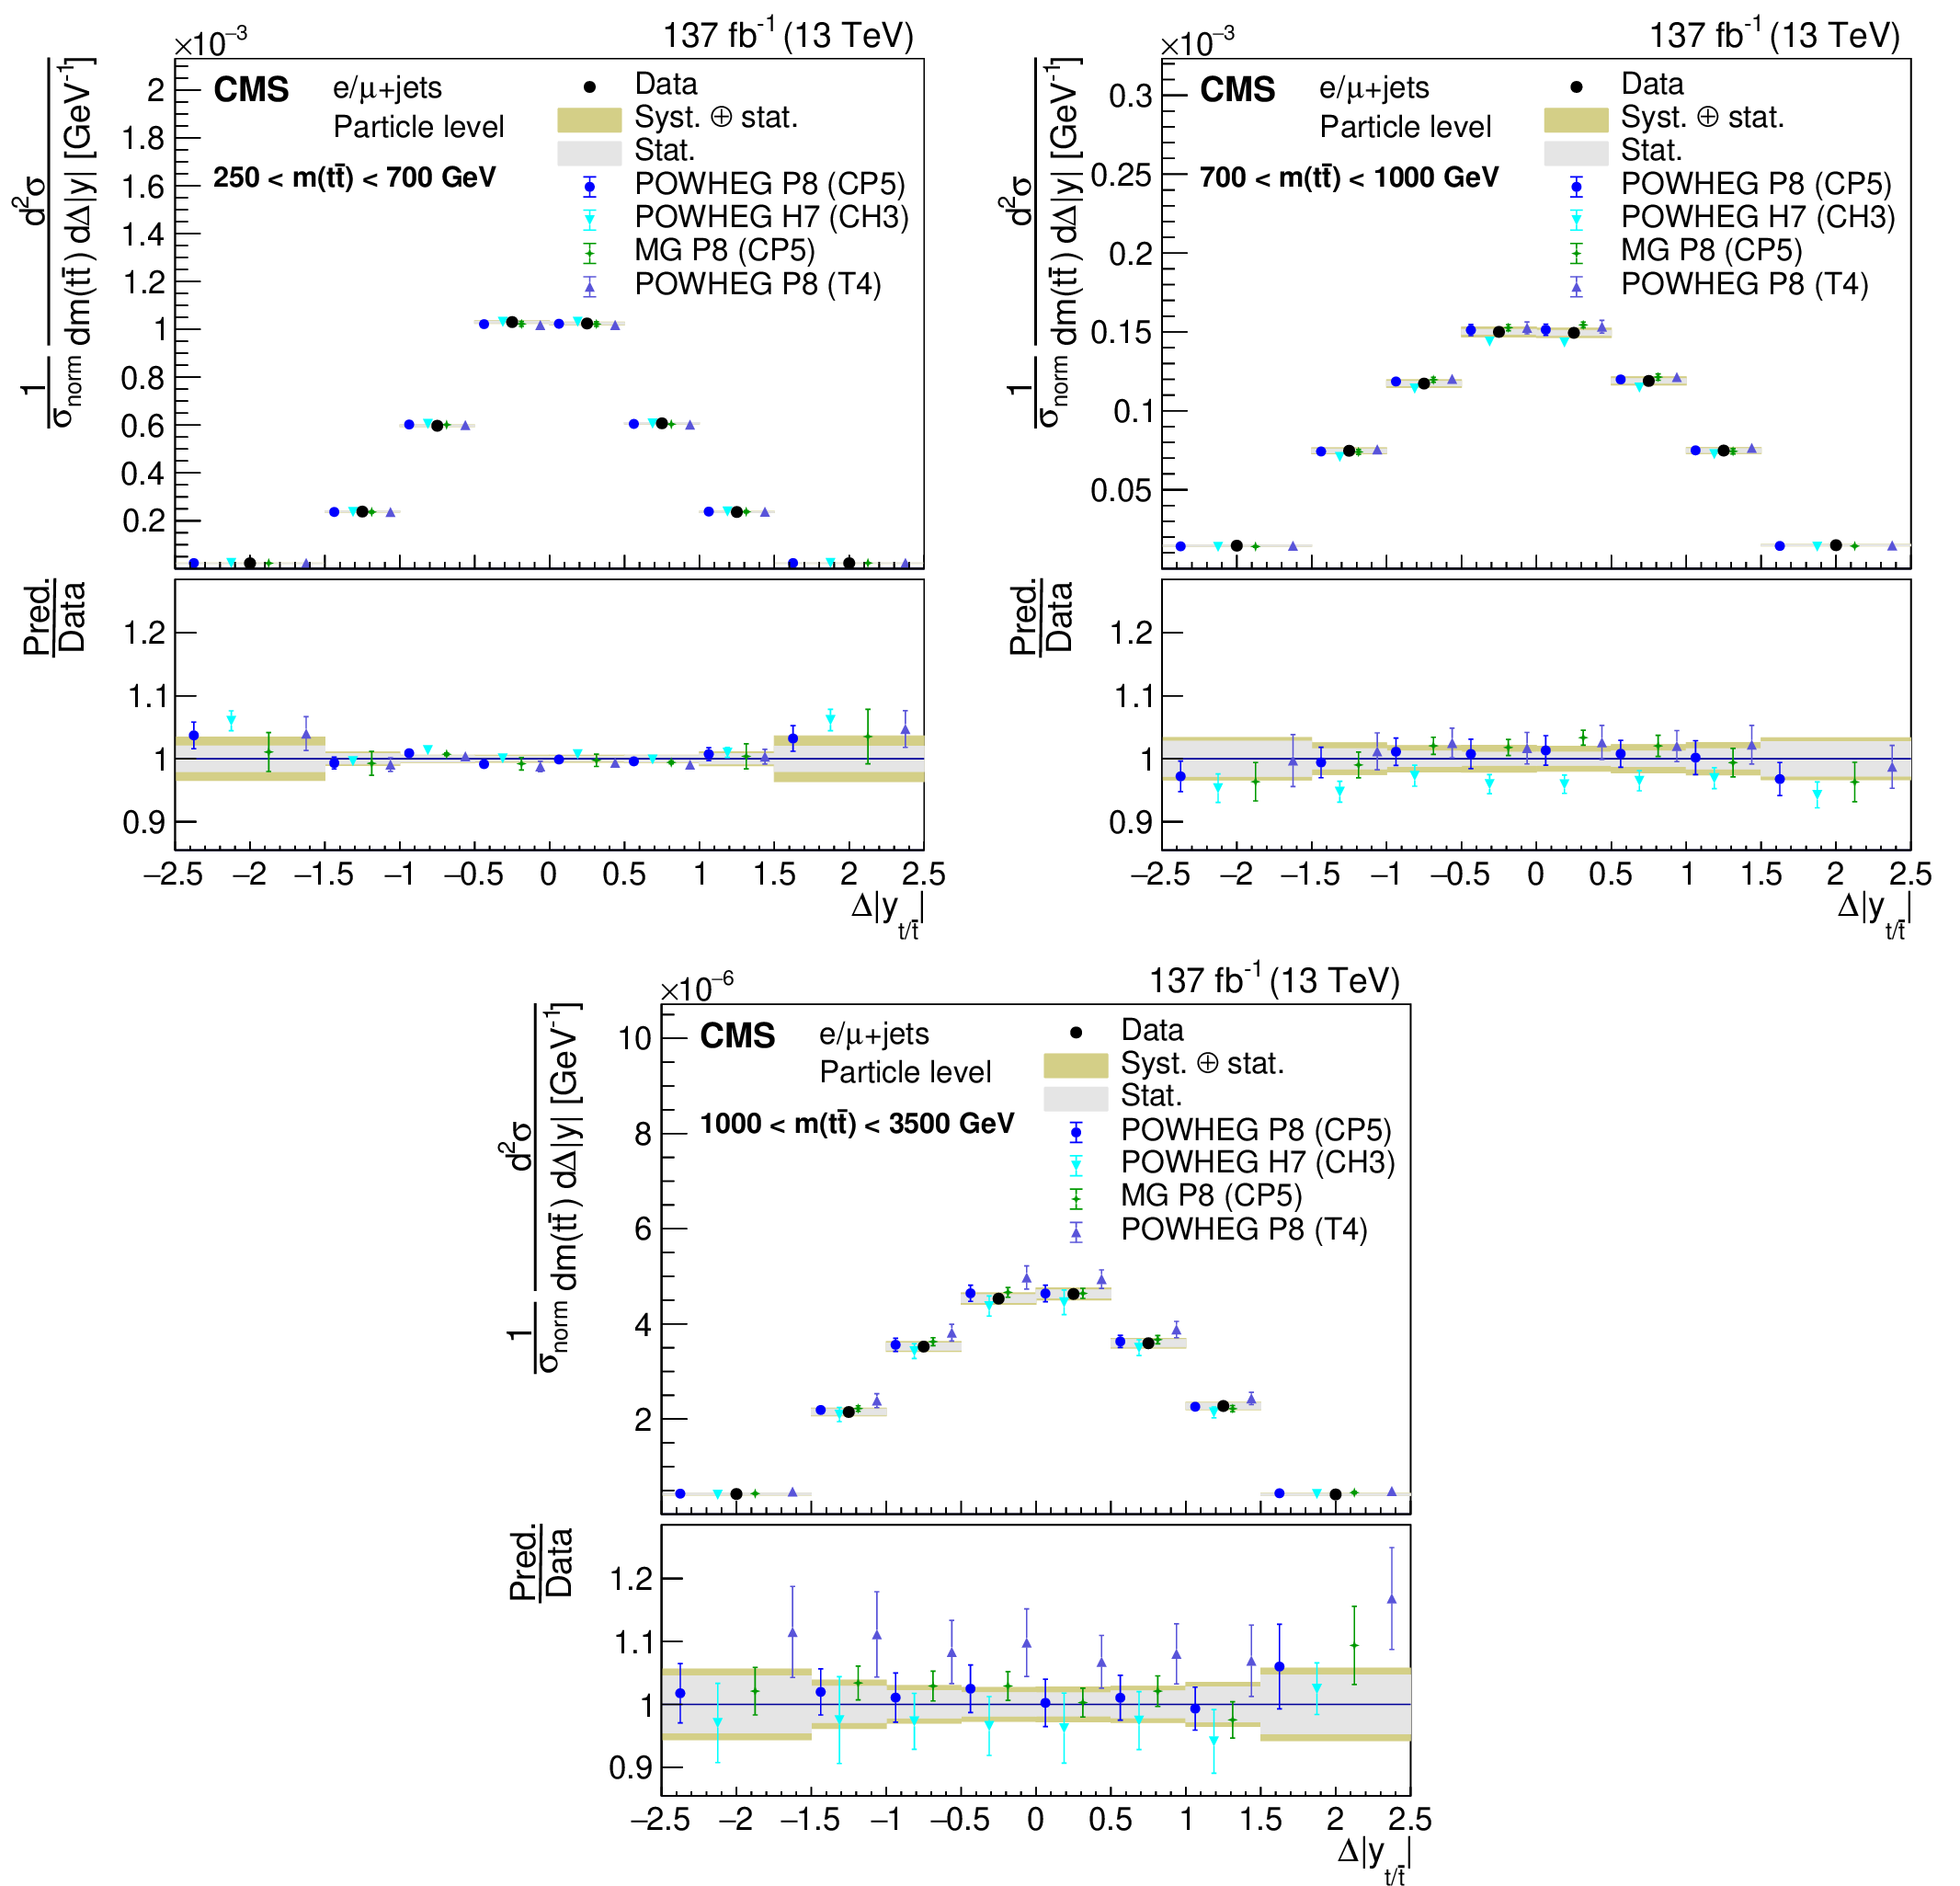
png pdf |
Figure A20:
Normalized double-differential cross section at the particle level as a function of ${m({\mathrm{t} {}\mathrm{\bar{t}}})}$ vs. ${\Delta {| y_{\mathrm{t} /\mathrm{\bar{t}}} |}}$. The data are shown as points with gray (yellow) bands indicating the statistical (statistical and systematic) uncertainties. The cross sections are compared to the predictions of POWHEG+PYTHIA (P8) for the CP5 and CUETP8M2T4 (T4) tunes, POWHEG+HERWIG (H7), and the multiparton simulation MG5_aMC@NLO (MG)+PYTHIA. The ratios of the various predictions to the measured cross sections are shown in the lower panels. |

png pdf |
Figure A20-a:
Normalized double-differential cross section at the particle level as a function of ${m({\mathrm{t} {}\mathrm{\bar{t}}})}$ vs. ${\Delta {| y_{\mathrm{t} /\mathrm{\bar{t}}} |}}$. The data are shown as points with gray (yellow) bands indicating the statistical (statistical and systematic) uncertainties. The cross sections are compared to the predictions of POWHEG+PYTHIA (P8) for the CP5 and CUETP8M2T4 (T4) tunes, POWHEG+HERWIG (H7), and the multiparton simulation MG5_aMC@NLO (MG)+PYTHIA. The ratios of the various predictions to the measured cross sections are shown in the lower panels. |
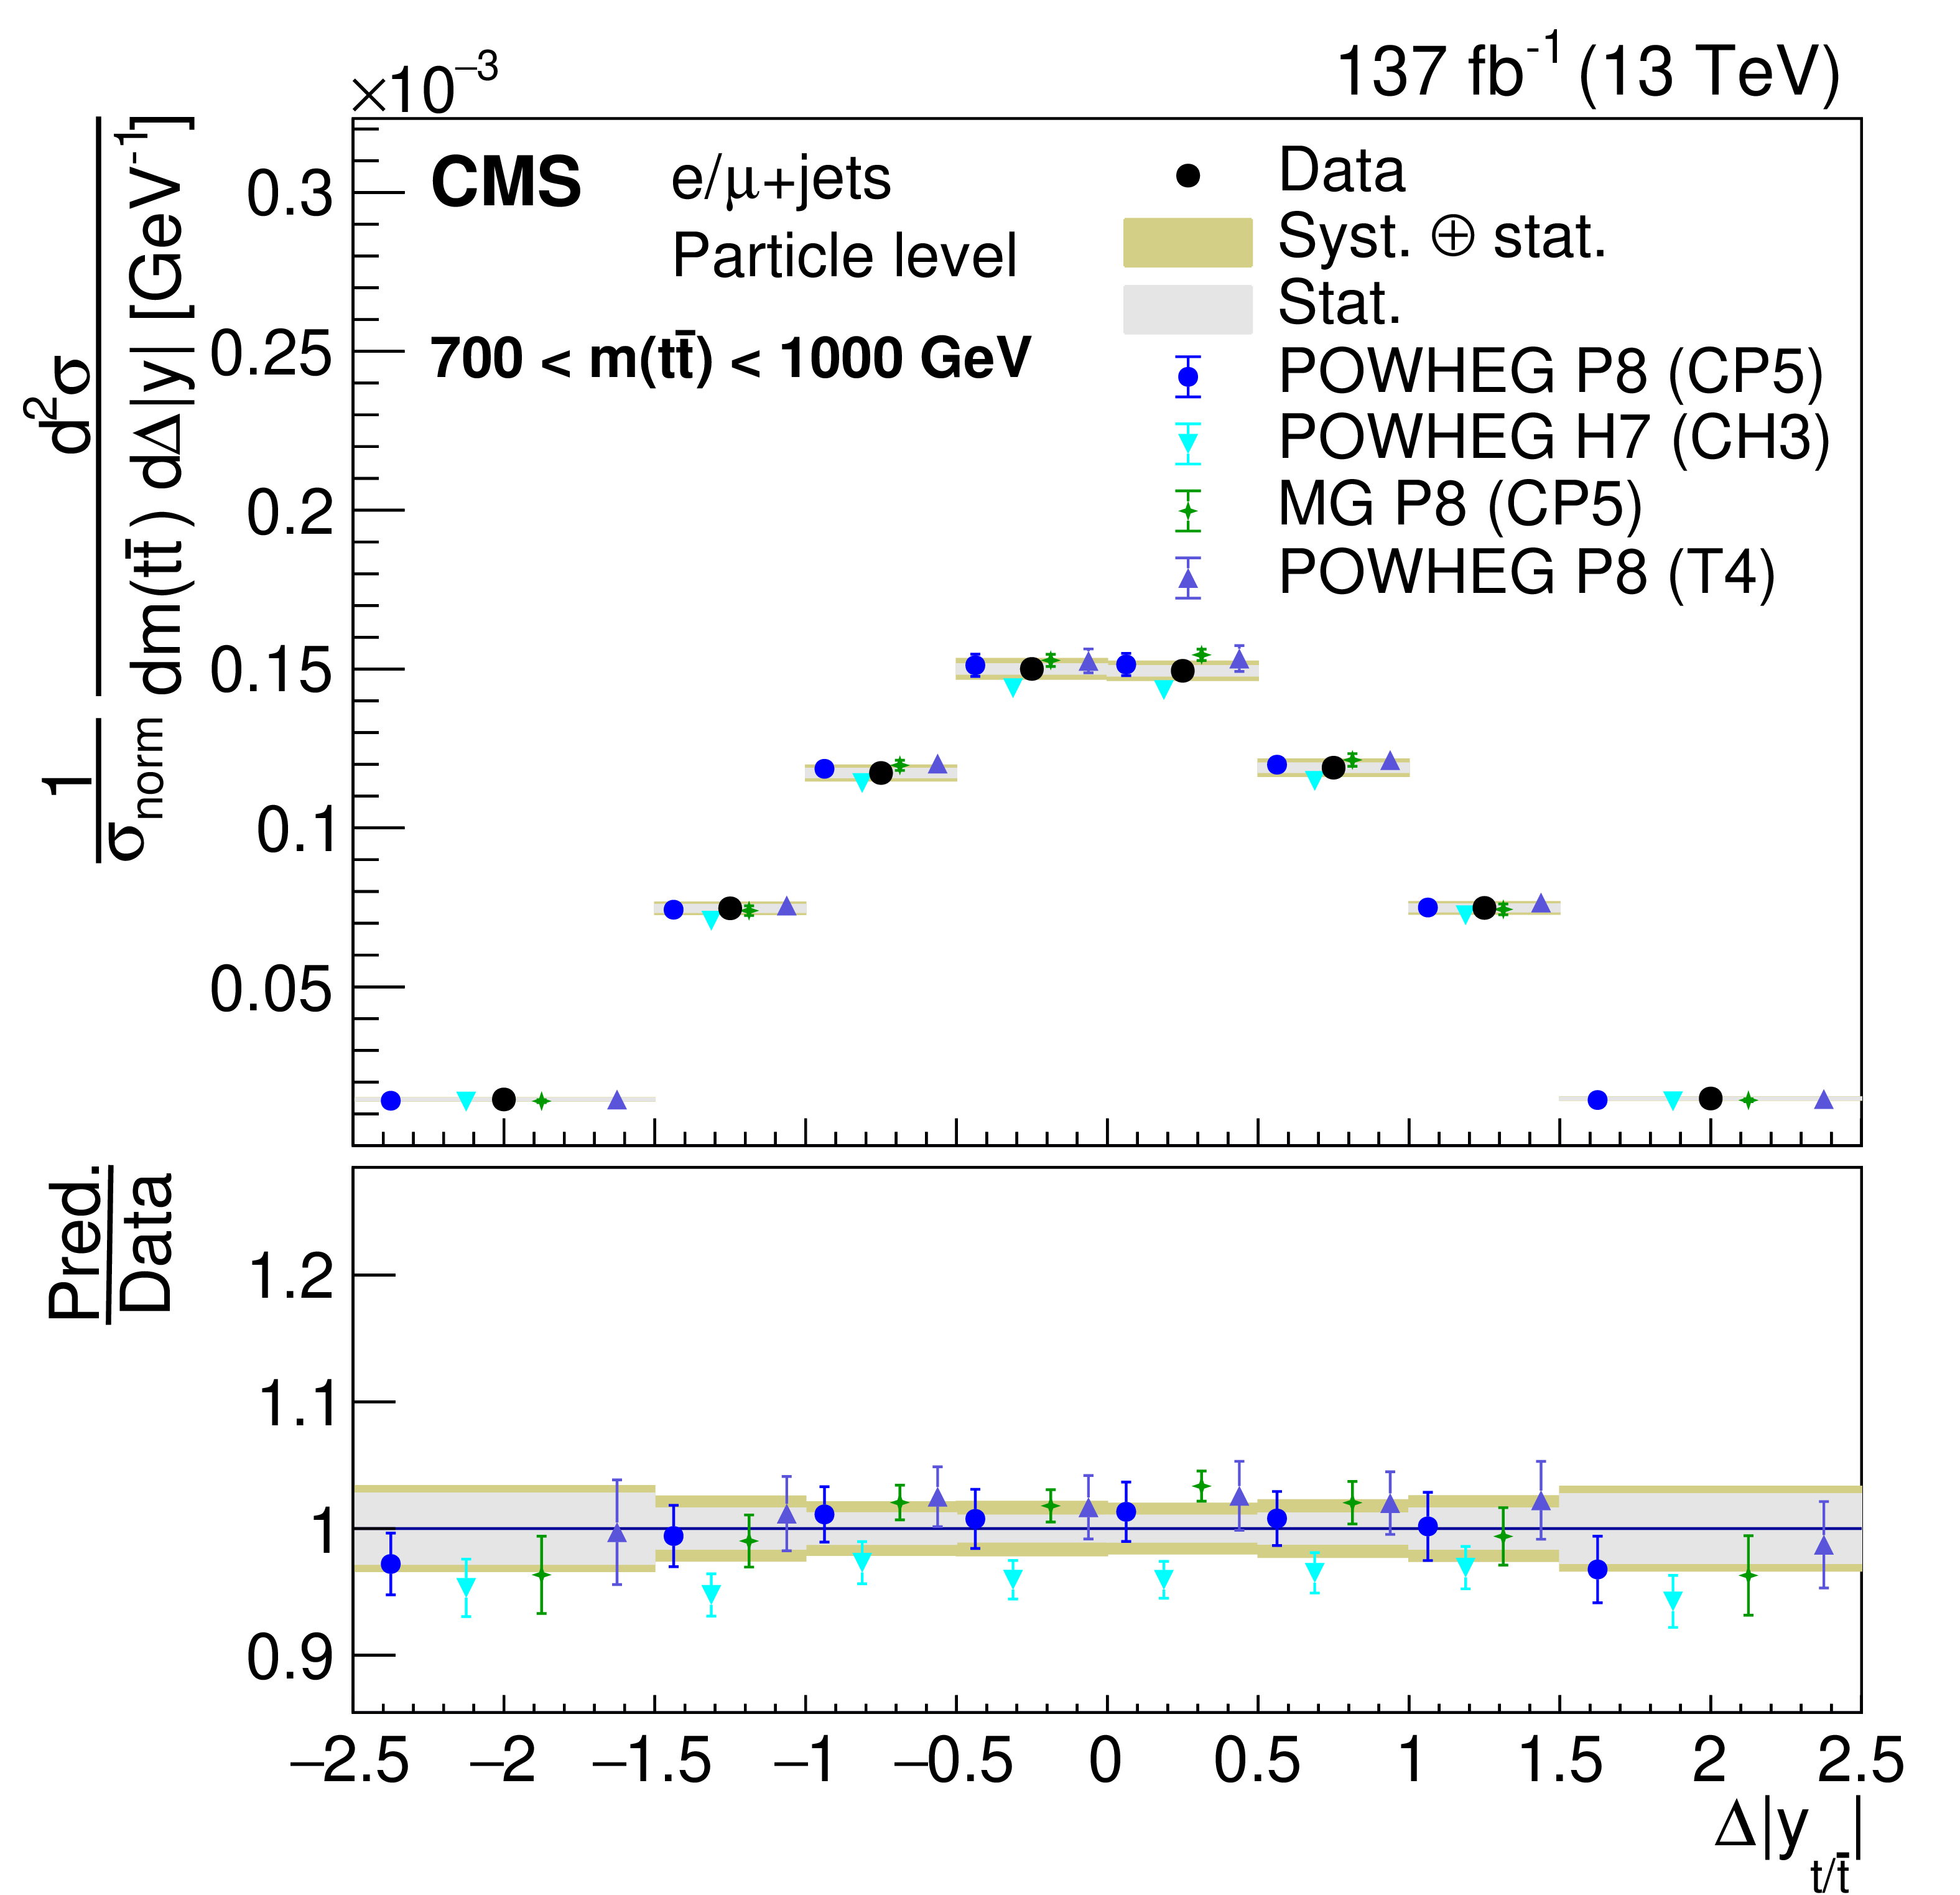
png pdf |
Figure A20-b:
Normalized double-differential cross section at the particle level as a function of ${m({\mathrm{t} {}\mathrm{\bar{t}}})}$ vs. ${\Delta {| y_{\mathrm{t} /\mathrm{\bar{t}}} |}}$. The data are shown as points with gray (yellow) bands indicating the statistical (statistical and systematic) uncertainties. The cross sections are compared to the predictions of POWHEG+PYTHIA (P8) for the CP5 and CUETP8M2T4 (T4) tunes, POWHEG+HERWIG (H7), and the multiparton simulation MG5_aMC@NLO (MG)+PYTHIA. The ratios of the various predictions to the measured cross sections are shown in the lower panels. |
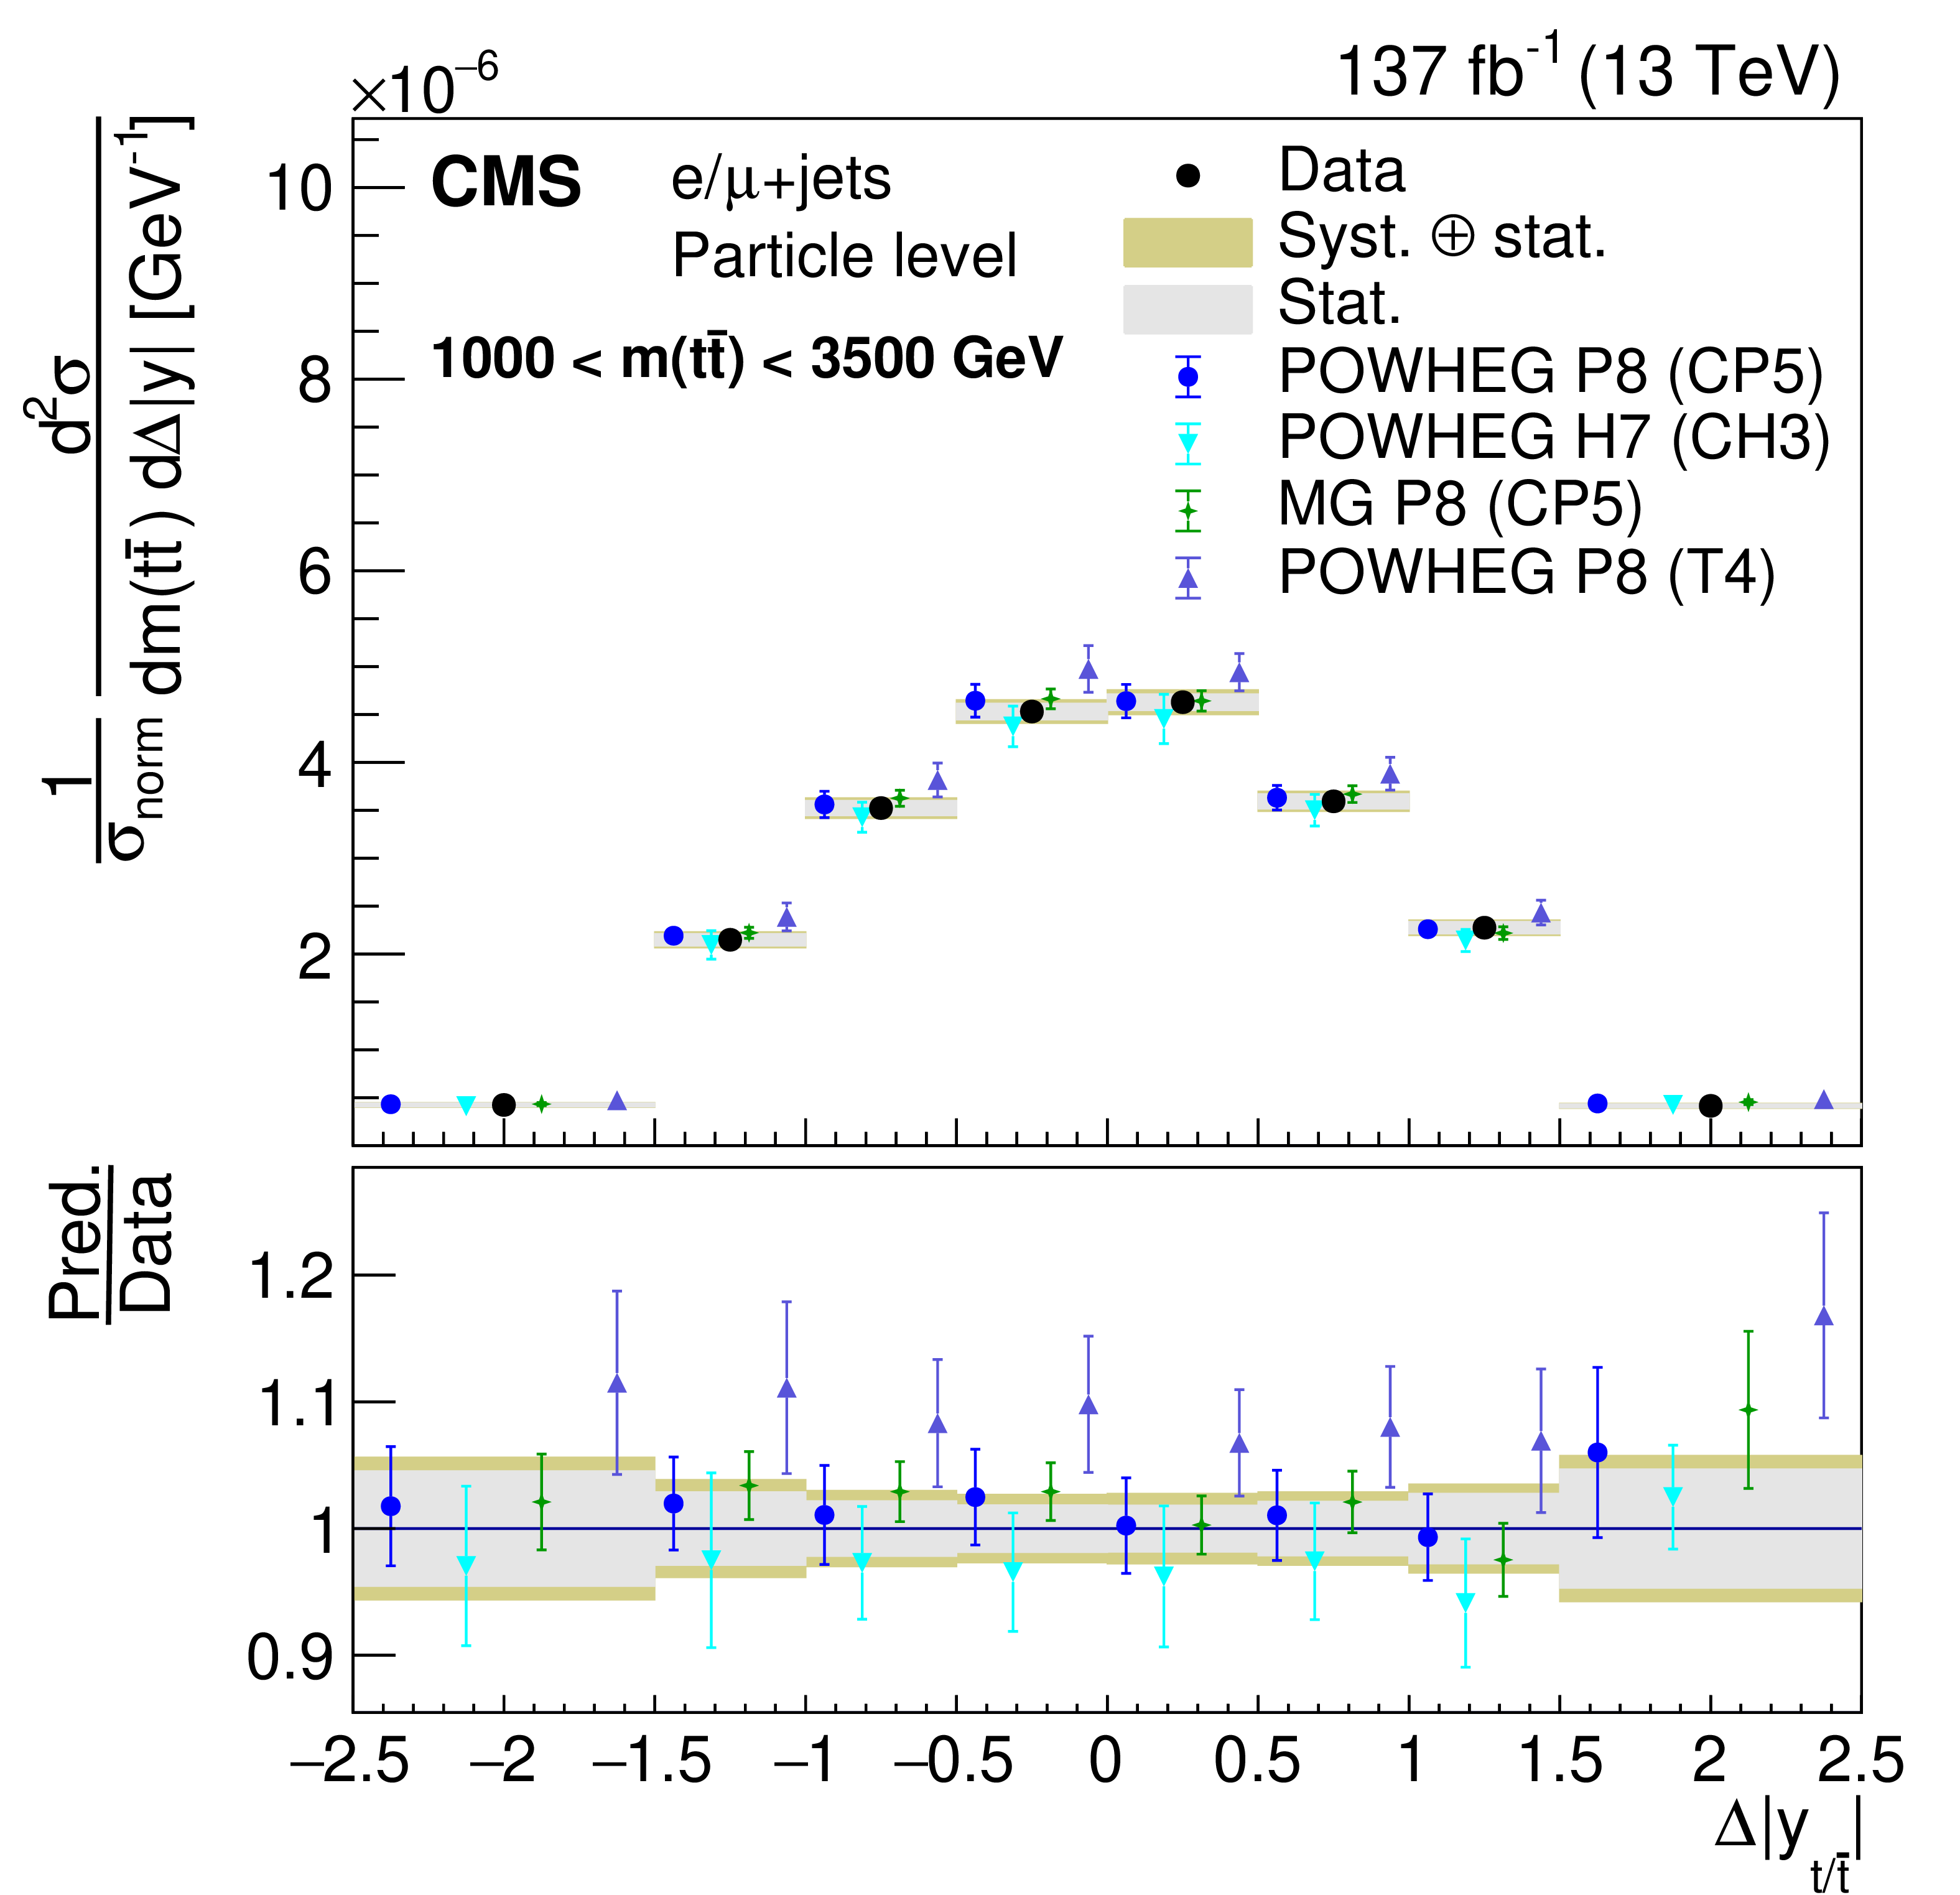
png pdf |
Figure A20-c:
Normalized double-differential cross section at the particle level as a function of ${m({\mathrm{t} {}\mathrm{\bar{t}}})}$ vs. ${\Delta {| y_{\mathrm{t} /\mathrm{\bar{t}}} |}}$. The data are shown as points with gray (yellow) bands indicating the statistical (statistical and systematic) uncertainties. The cross sections are compared to the predictions of POWHEG+PYTHIA (P8) for the CP5 and CUETP8M2T4 (T4) tunes, POWHEG+HERWIG (H7), and the multiparton simulation MG5_aMC@NLO (MG)+PYTHIA. The ratios of the various predictions to the measured cross sections are shown in the lower panels. |
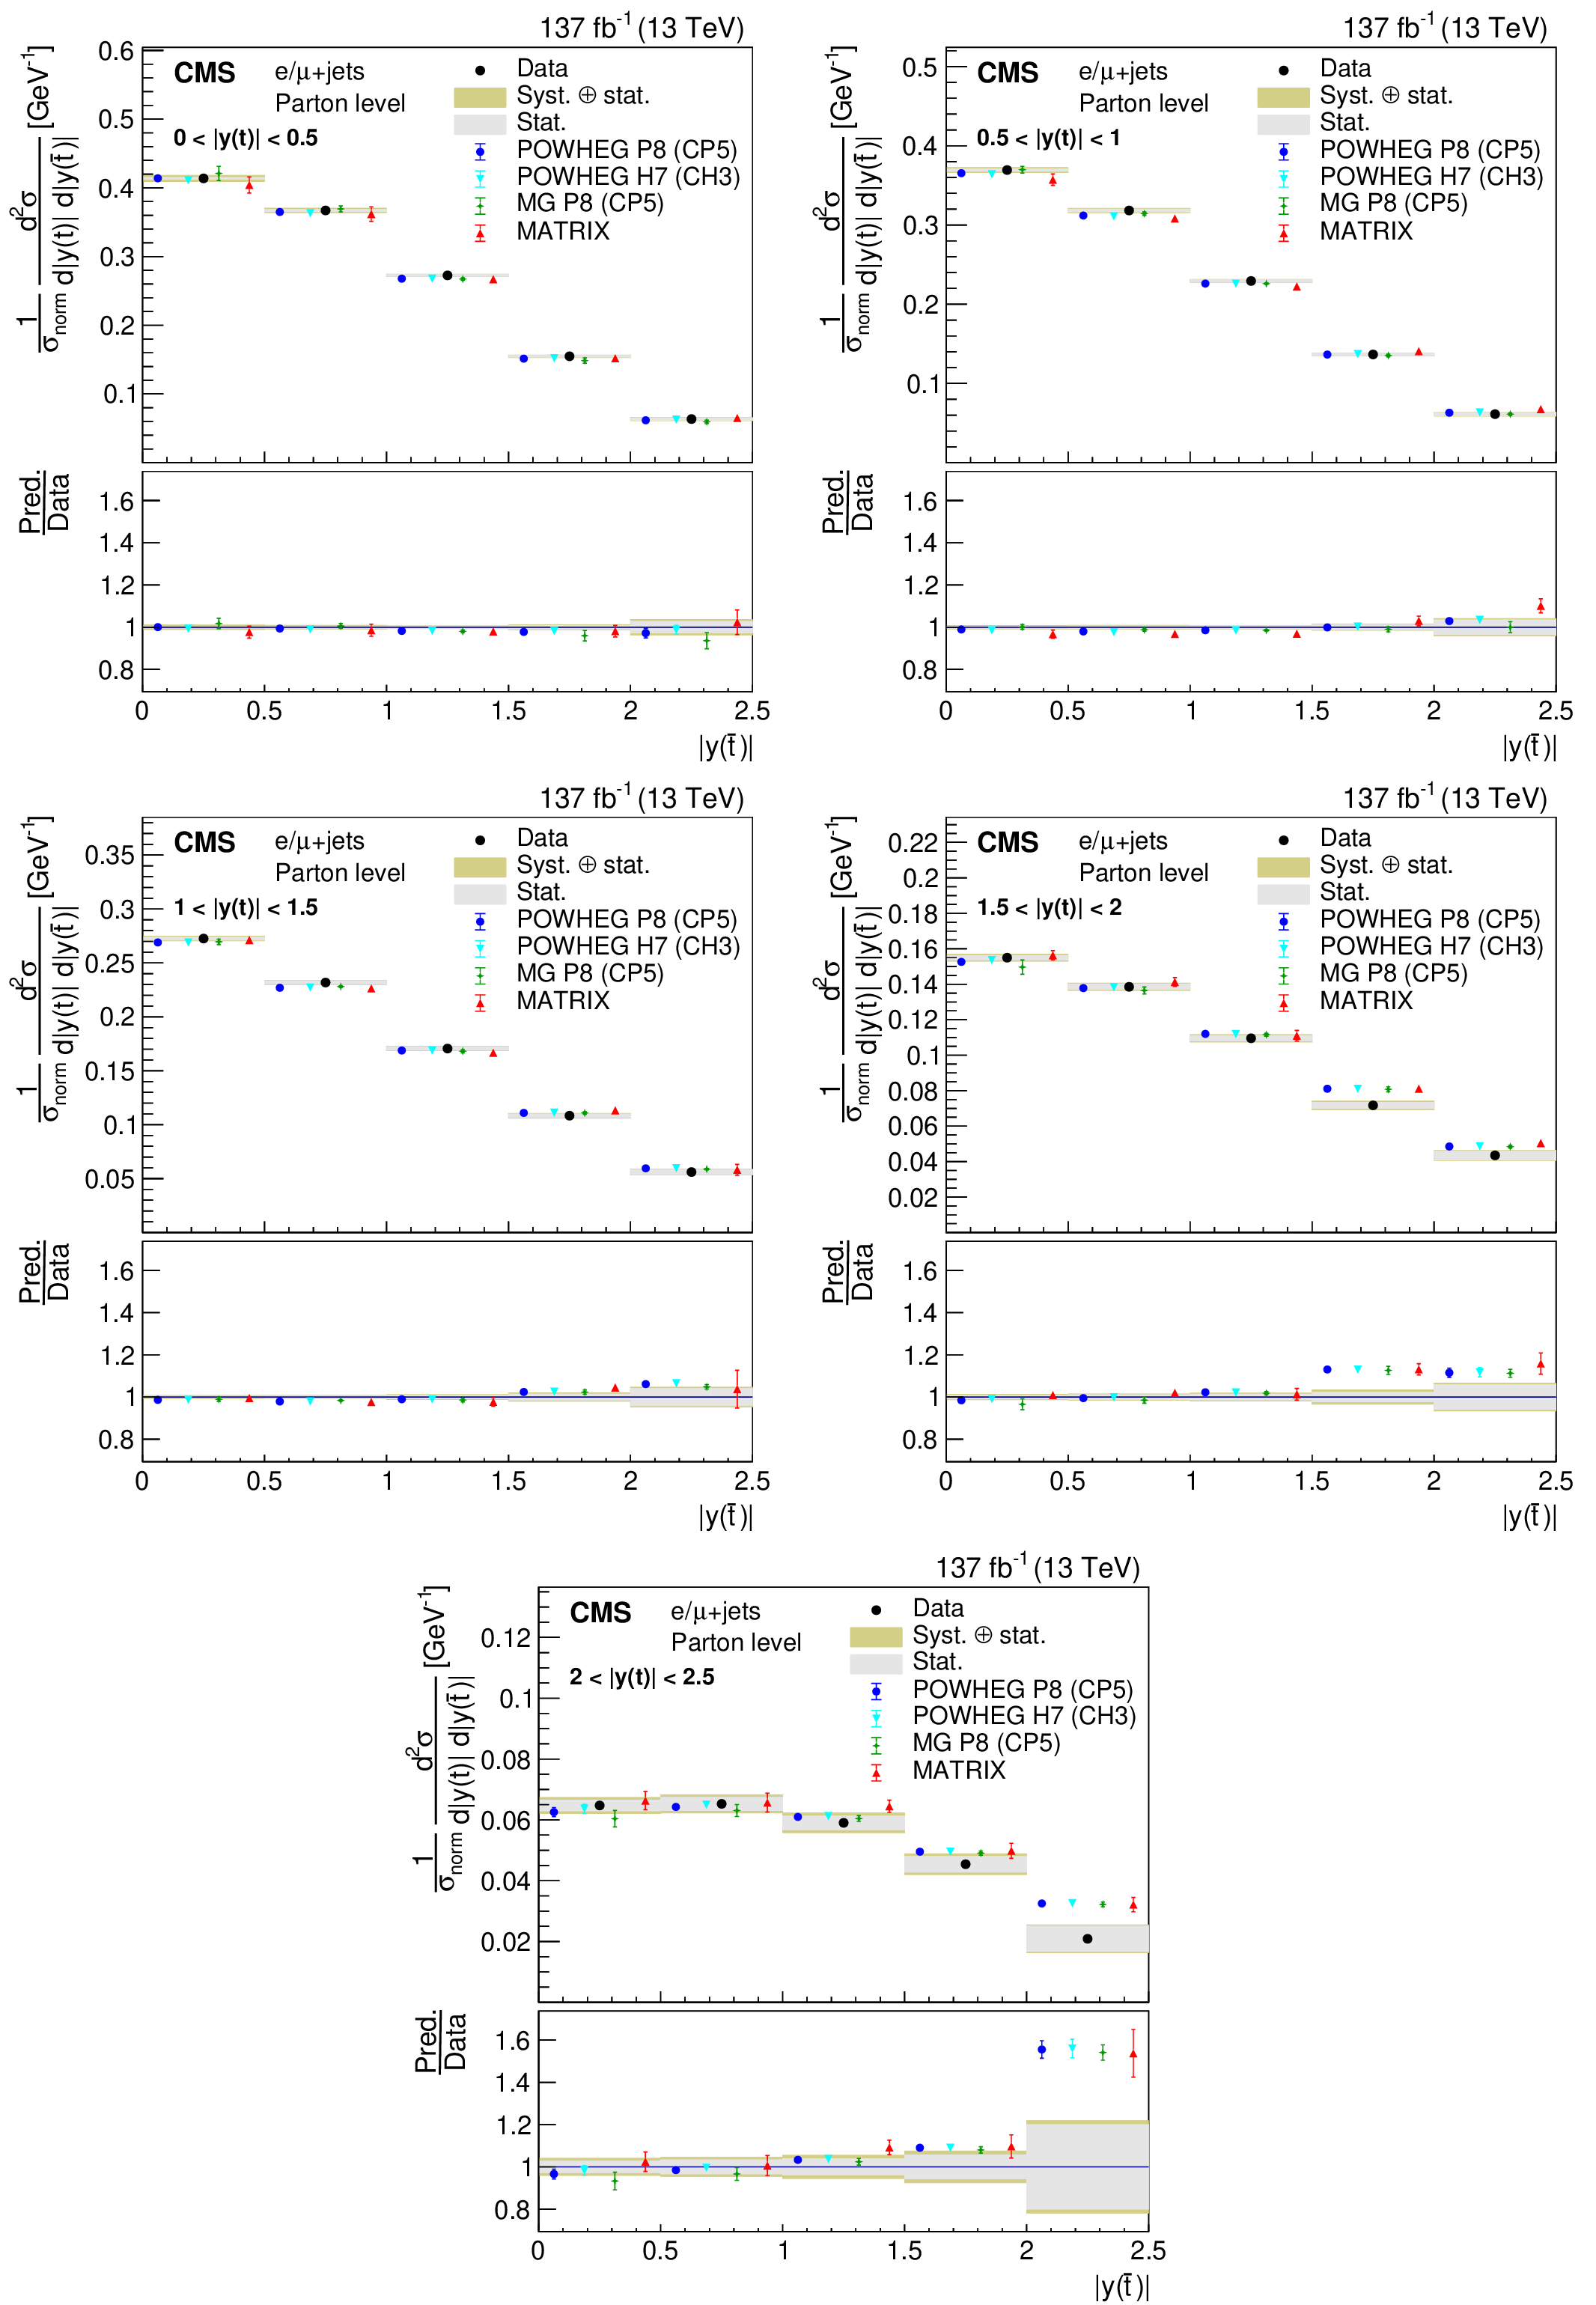
png pdf |
Figure A21:
Normalized double-differential cross section at the parton level as a function of ${{| y(\mathrm{t}) |}}$ vs.$ {{| y(\mathrm{\bar{t}}) |}}$. The data are shown as points with gray (yellow) bands indicating the statistical (statistical and systematic) uncertainties. The cross sections are compared to the predictions of POWHEG combined with PYTHIA (P8) or HERWIG (H7), the multiparton simulation MG5_aMC@NLO (MG)+PYTHIA FxFx, and the NNLO QCD calculations obtained with Matrix. The ratios of the various predictions to the measured cross sections are shown in the lower panels. |
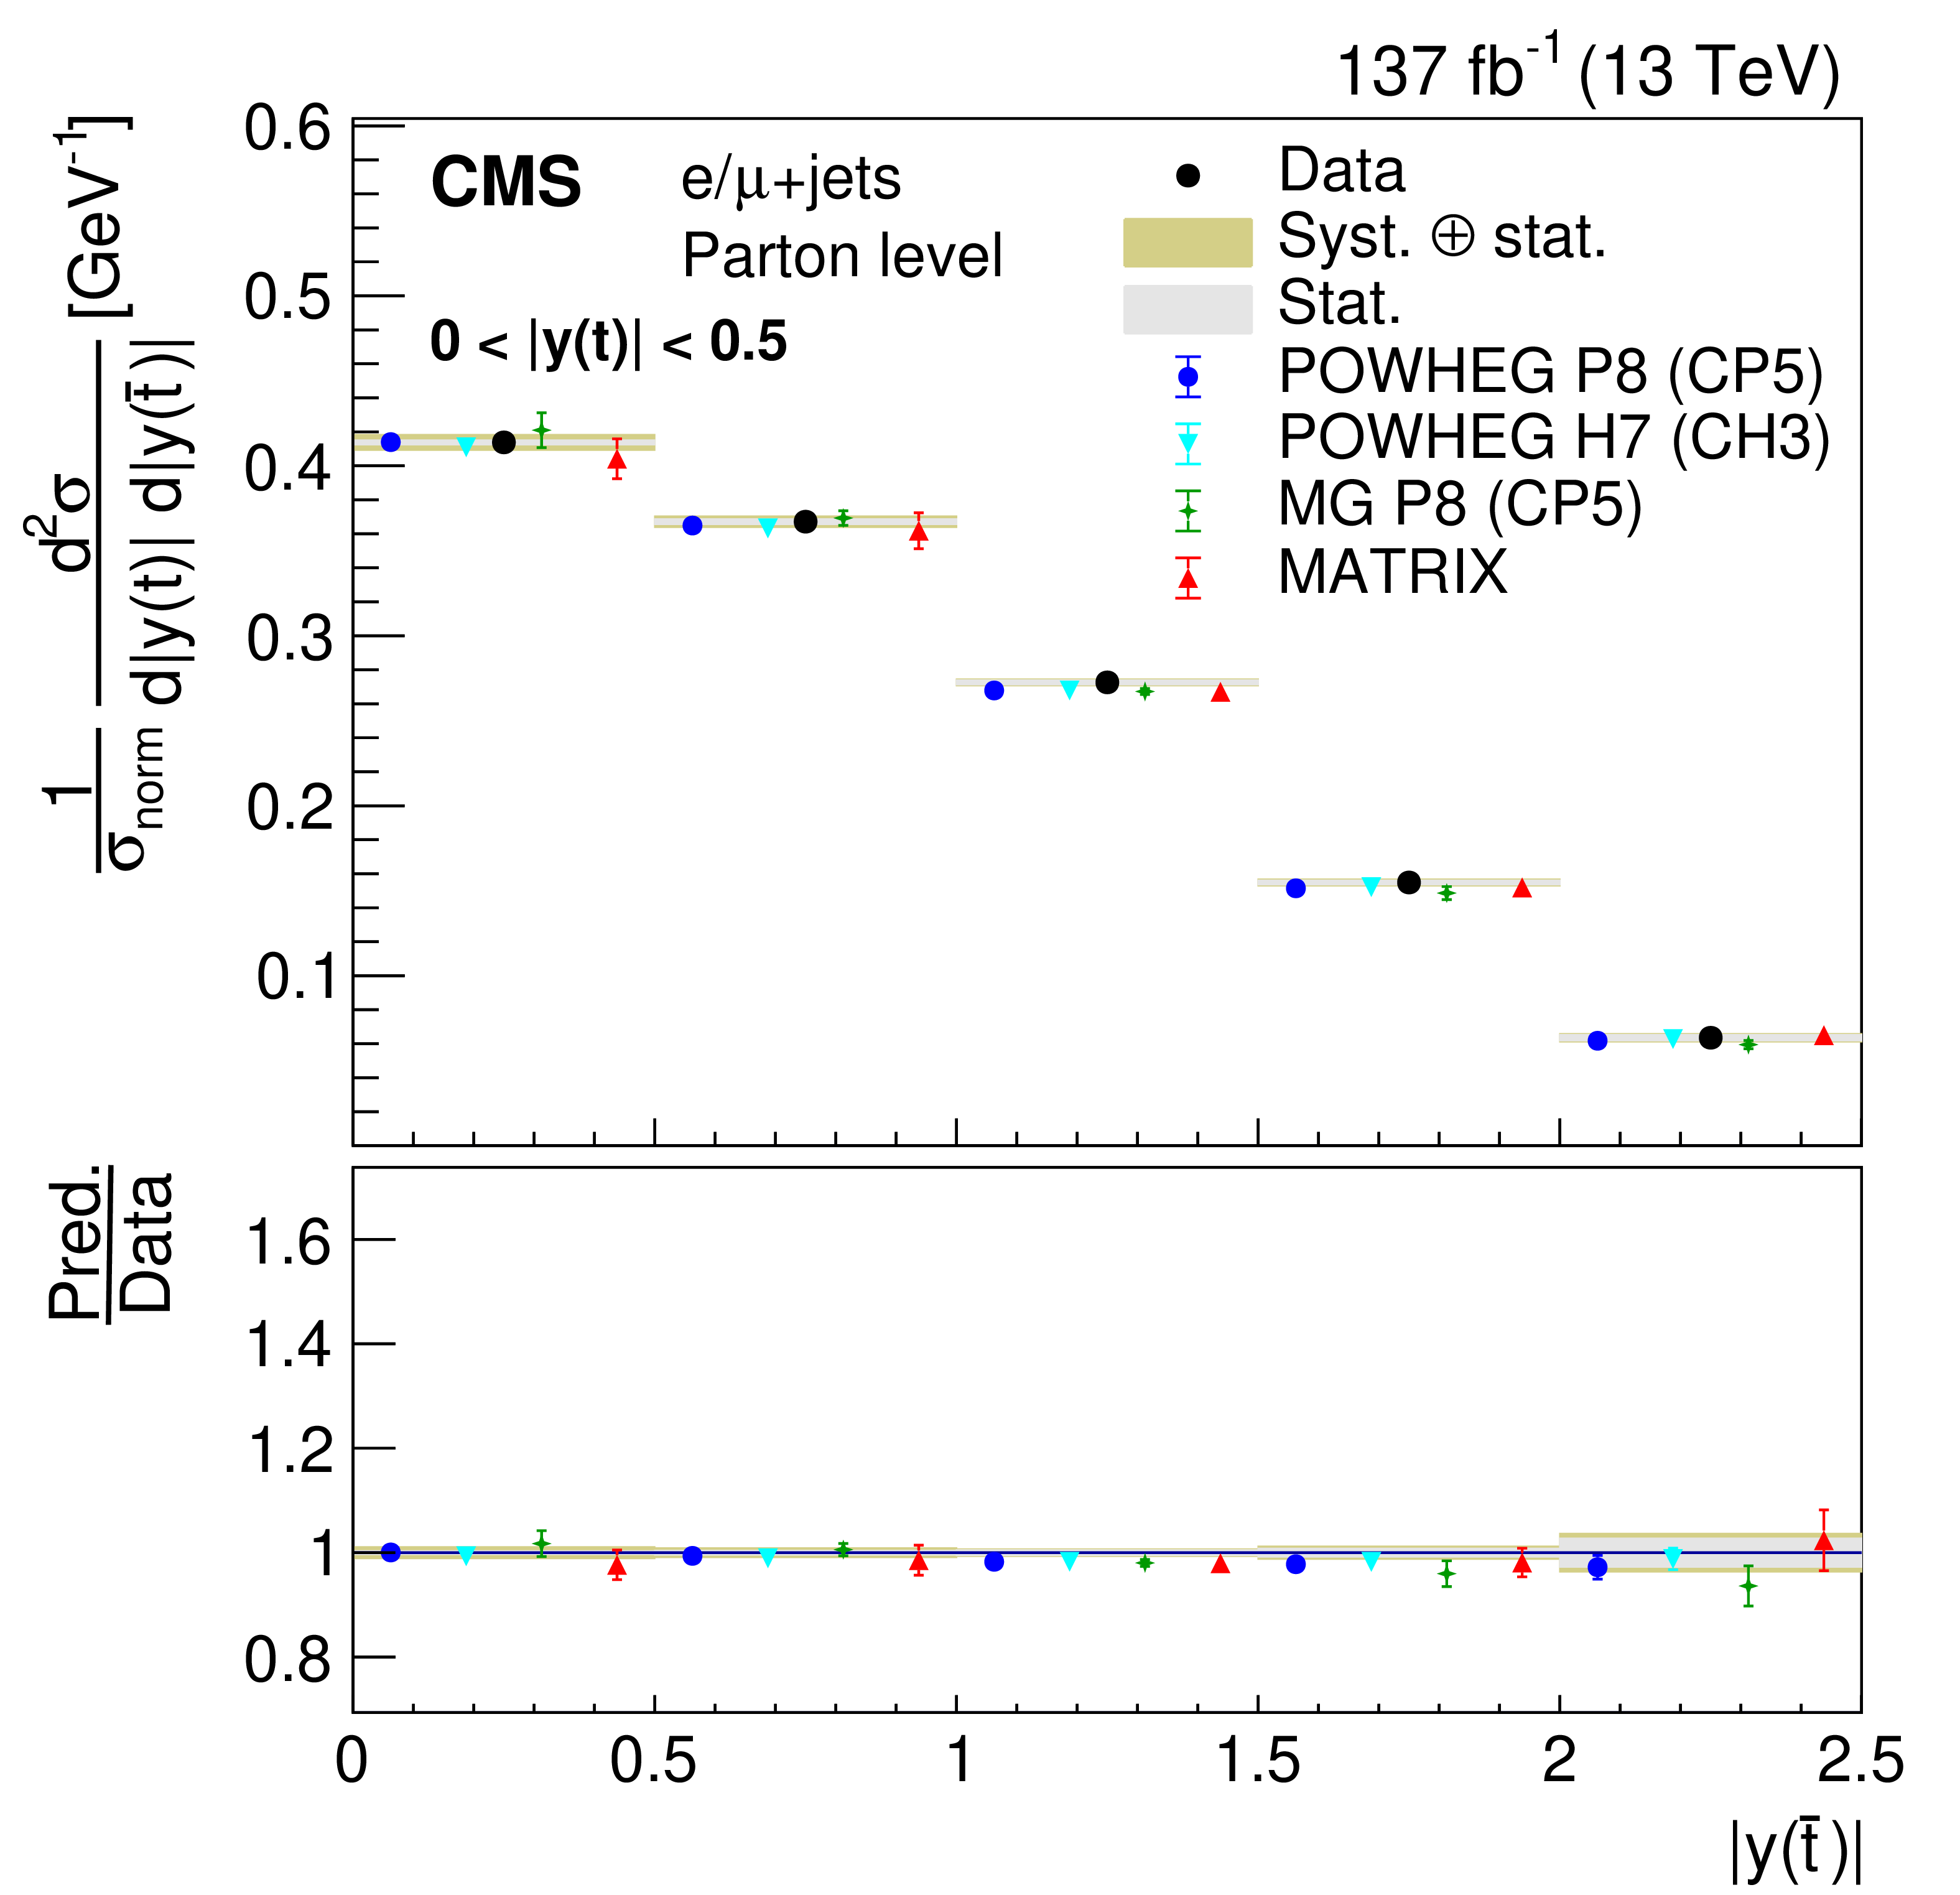
png pdf |
Figure A21-a:
Normalized double-differential cross section at the parton level as a function of ${{| y(\mathrm{t}) |}}$ vs.$ {{| y(\mathrm{\bar{t}}) |}}$. The data are shown as points with gray (yellow) bands indicating the statistical (statistical and systematic) uncertainties. The cross sections are compared to the predictions of POWHEG combined with PYTHIA (P8) or HERWIG (H7), the multiparton simulation MG5_aMC@NLO (MG)+PYTHIA FxFx, and the NNLO QCD calculations obtained with Matrix. The ratios of the various predictions to the measured cross sections are shown in the lower panels. |

png pdf |
Figure A21-b:
Normalized double-differential cross section at the parton level as a function of ${{| y(\mathrm{t}) |}}$ vs.$ {{| y(\mathrm{\bar{t}}) |}}$. The data are shown as points with gray (yellow) bands indicating the statistical (statistical and systematic) uncertainties. The cross sections are compared to the predictions of POWHEG combined with PYTHIA (P8) or HERWIG (H7), the multiparton simulation MG5_aMC@NLO (MG)+PYTHIA FxFx, and the NNLO QCD calculations obtained with Matrix. The ratios of the various predictions to the measured cross sections are shown in the lower panels. |
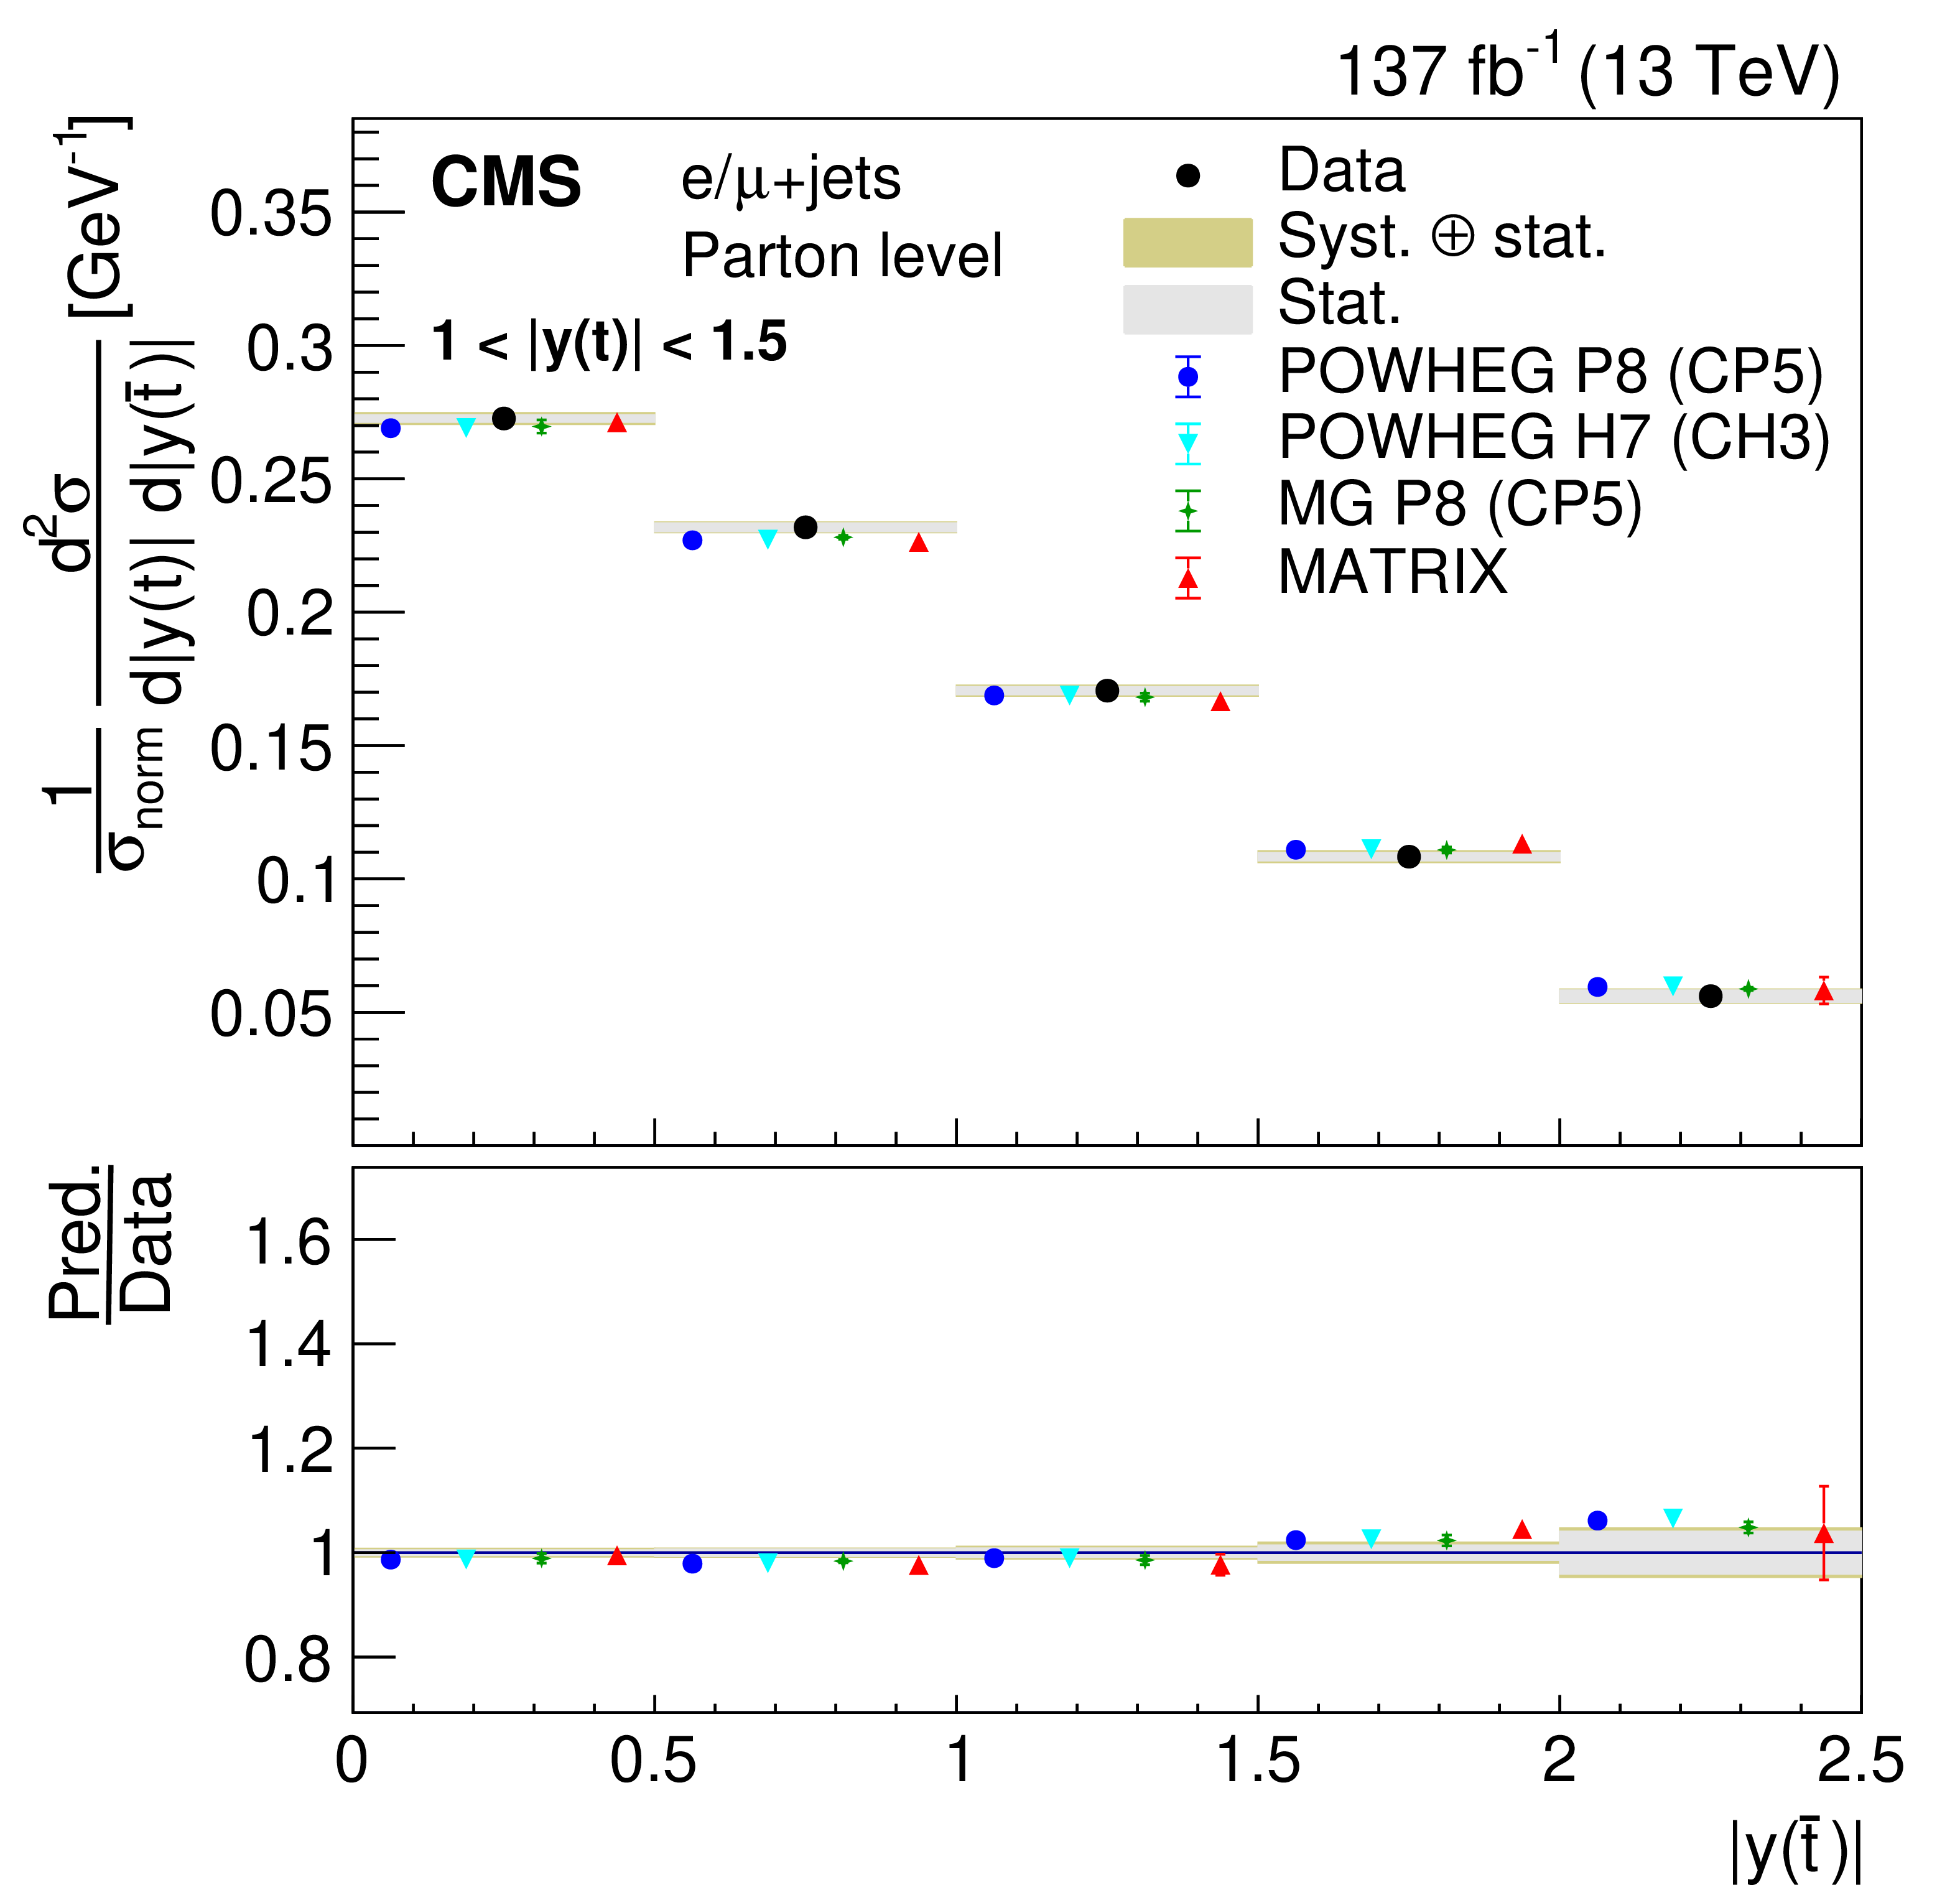
png pdf |
Figure A21-c:
Normalized double-differential cross section at the parton level as a function of ${{| y(\mathrm{t}) |}}$ vs.$ {{| y(\mathrm{\bar{t}}) |}}$. The data are shown as points with gray (yellow) bands indicating the statistical (statistical and systematic) uncertainties. The cross sections are compared to the predictions of POWHEG combined with PYTHIA (P8) or HERWIG (H7), the multiparton simulation MG5_aMC@NLO (MG)+PYTHIA FxFx, and the NNLO QCD calculations obtained with Matrix. The ratios of the various predictions to the measured cross sections are shown in the lower panels. |
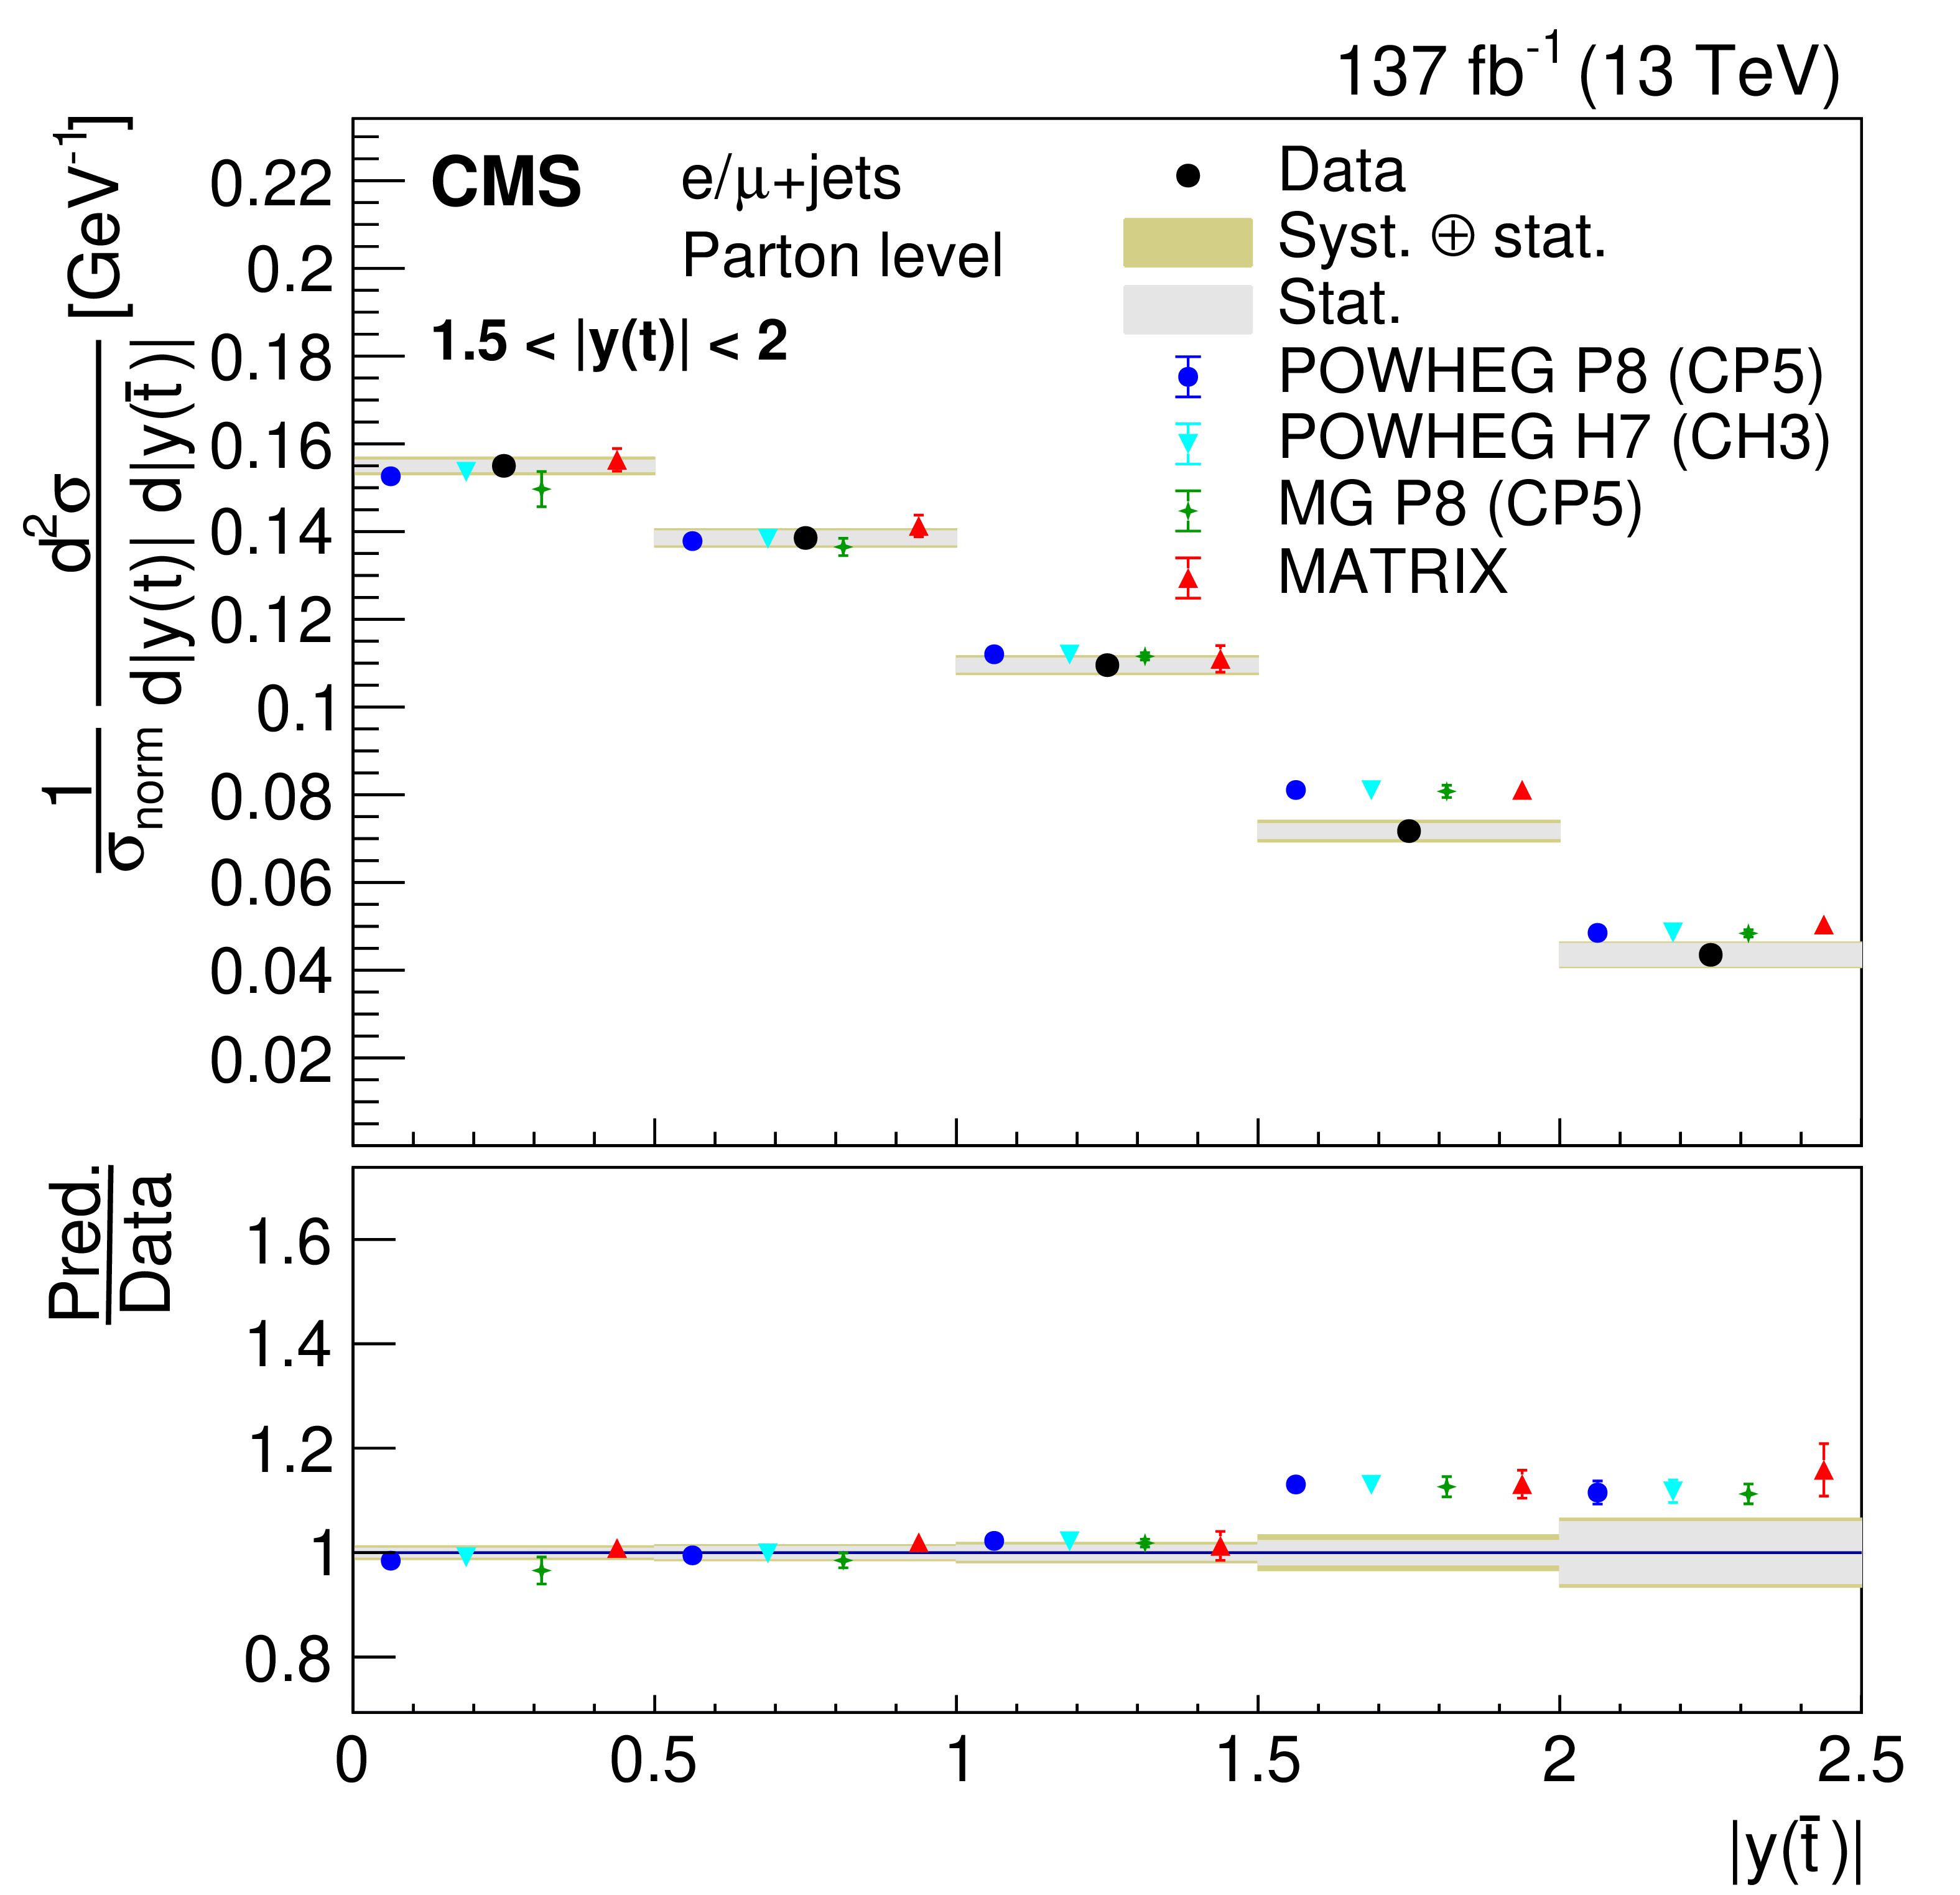
png pdf |
Figure A21-d:
Normalized double-differential cross section at the parton level as a function of ${{| y(\mathrm{t}) |}}$ vs.$ {{| y(\mathrm{\bar{t}}) |}}$. The data are shown as points with gray (yellow) bands indicating the statistical (statistical and systematic) uncertainties. The cross sections are compared to the predictions of POWHEG combined with PYTHIA (P8) or HERWIG (H7), the multiparton simulation MG5_aMC@NLO (MG)+PYTHIA FxFx, and the NNLO QCD calculations obtained with Matrix. The ratios of the various predictions to the measured cross sections are shown in the lower panels. |
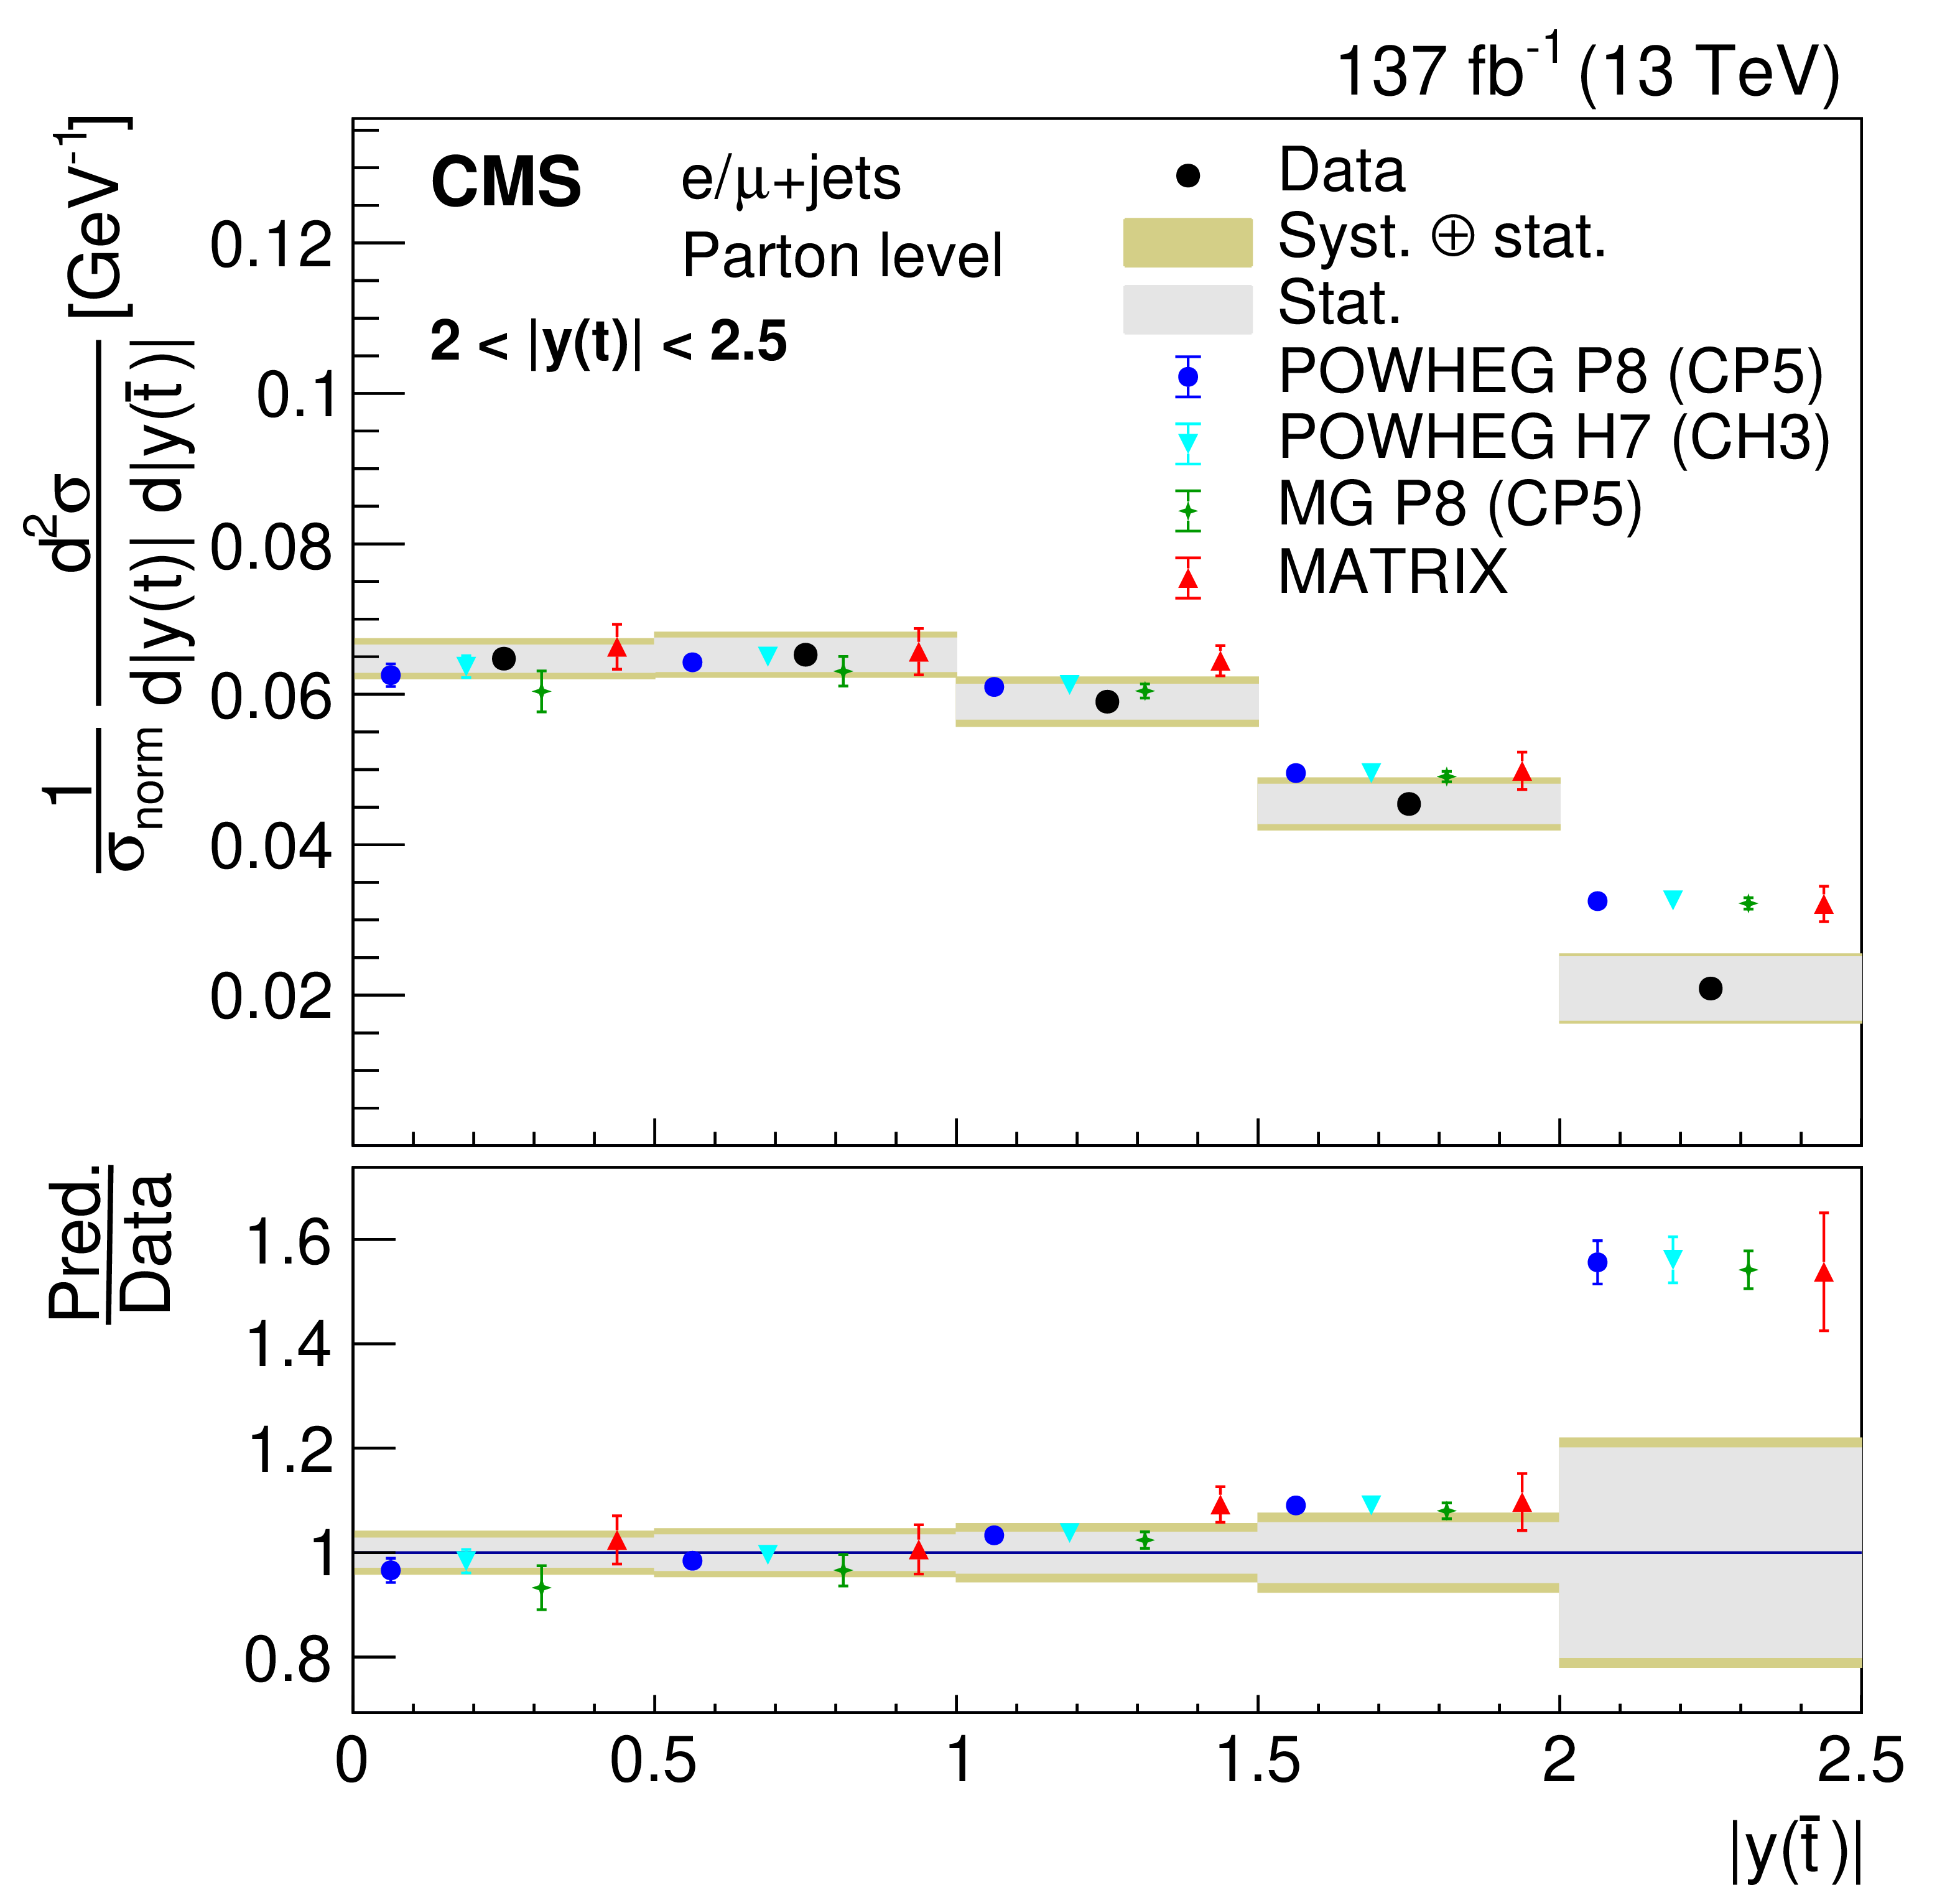
png pdf |
Figure A21-e:
Normalized double-differential cross section at the parton level as a function of ${{| y(\mathrm{t}) |}}$ vs.$ {{| y(\mathrm{\bar{t}}) |}}$. The data are shown as points with gray (yellow) bands indicating the statistical (statistical and systematic) uncertainties. The cross sections are compared to the predictions of POWHEG combined with PYTHIA (P8) or HERWIG (H7), the multiparton simulation MG5_aMC@NLO (MG)+PYTHIA FxFx, and the NNLO QCD calculations obtained with Matrix. The ratios of the various predictions to the measured cross sections are shown in the lower panels. |

png pdf |
Figure A22:
Normalized double-differential cross section at the particle level as a function of ${{| y(\mathrm{t}) |}}$ vs.$ {{| y(\mathrm{\bar{t}}) |}}$. The data are shown as points with gray (yellow) bands indicating the statistical (statistical and systematic) uncertainties. The cross sections are compared to the predictions of POWHEG+PYTHIA (P8) for the CP5 and CUETP8M2T4 (T4) tunes, POWHEG+HERWIG (H7), and the multiparton simulation MG5_aMC@NLO (MG)+PYTHIA. The ratios of the various predictions to the measured cross sections are shown in the lower panels. |
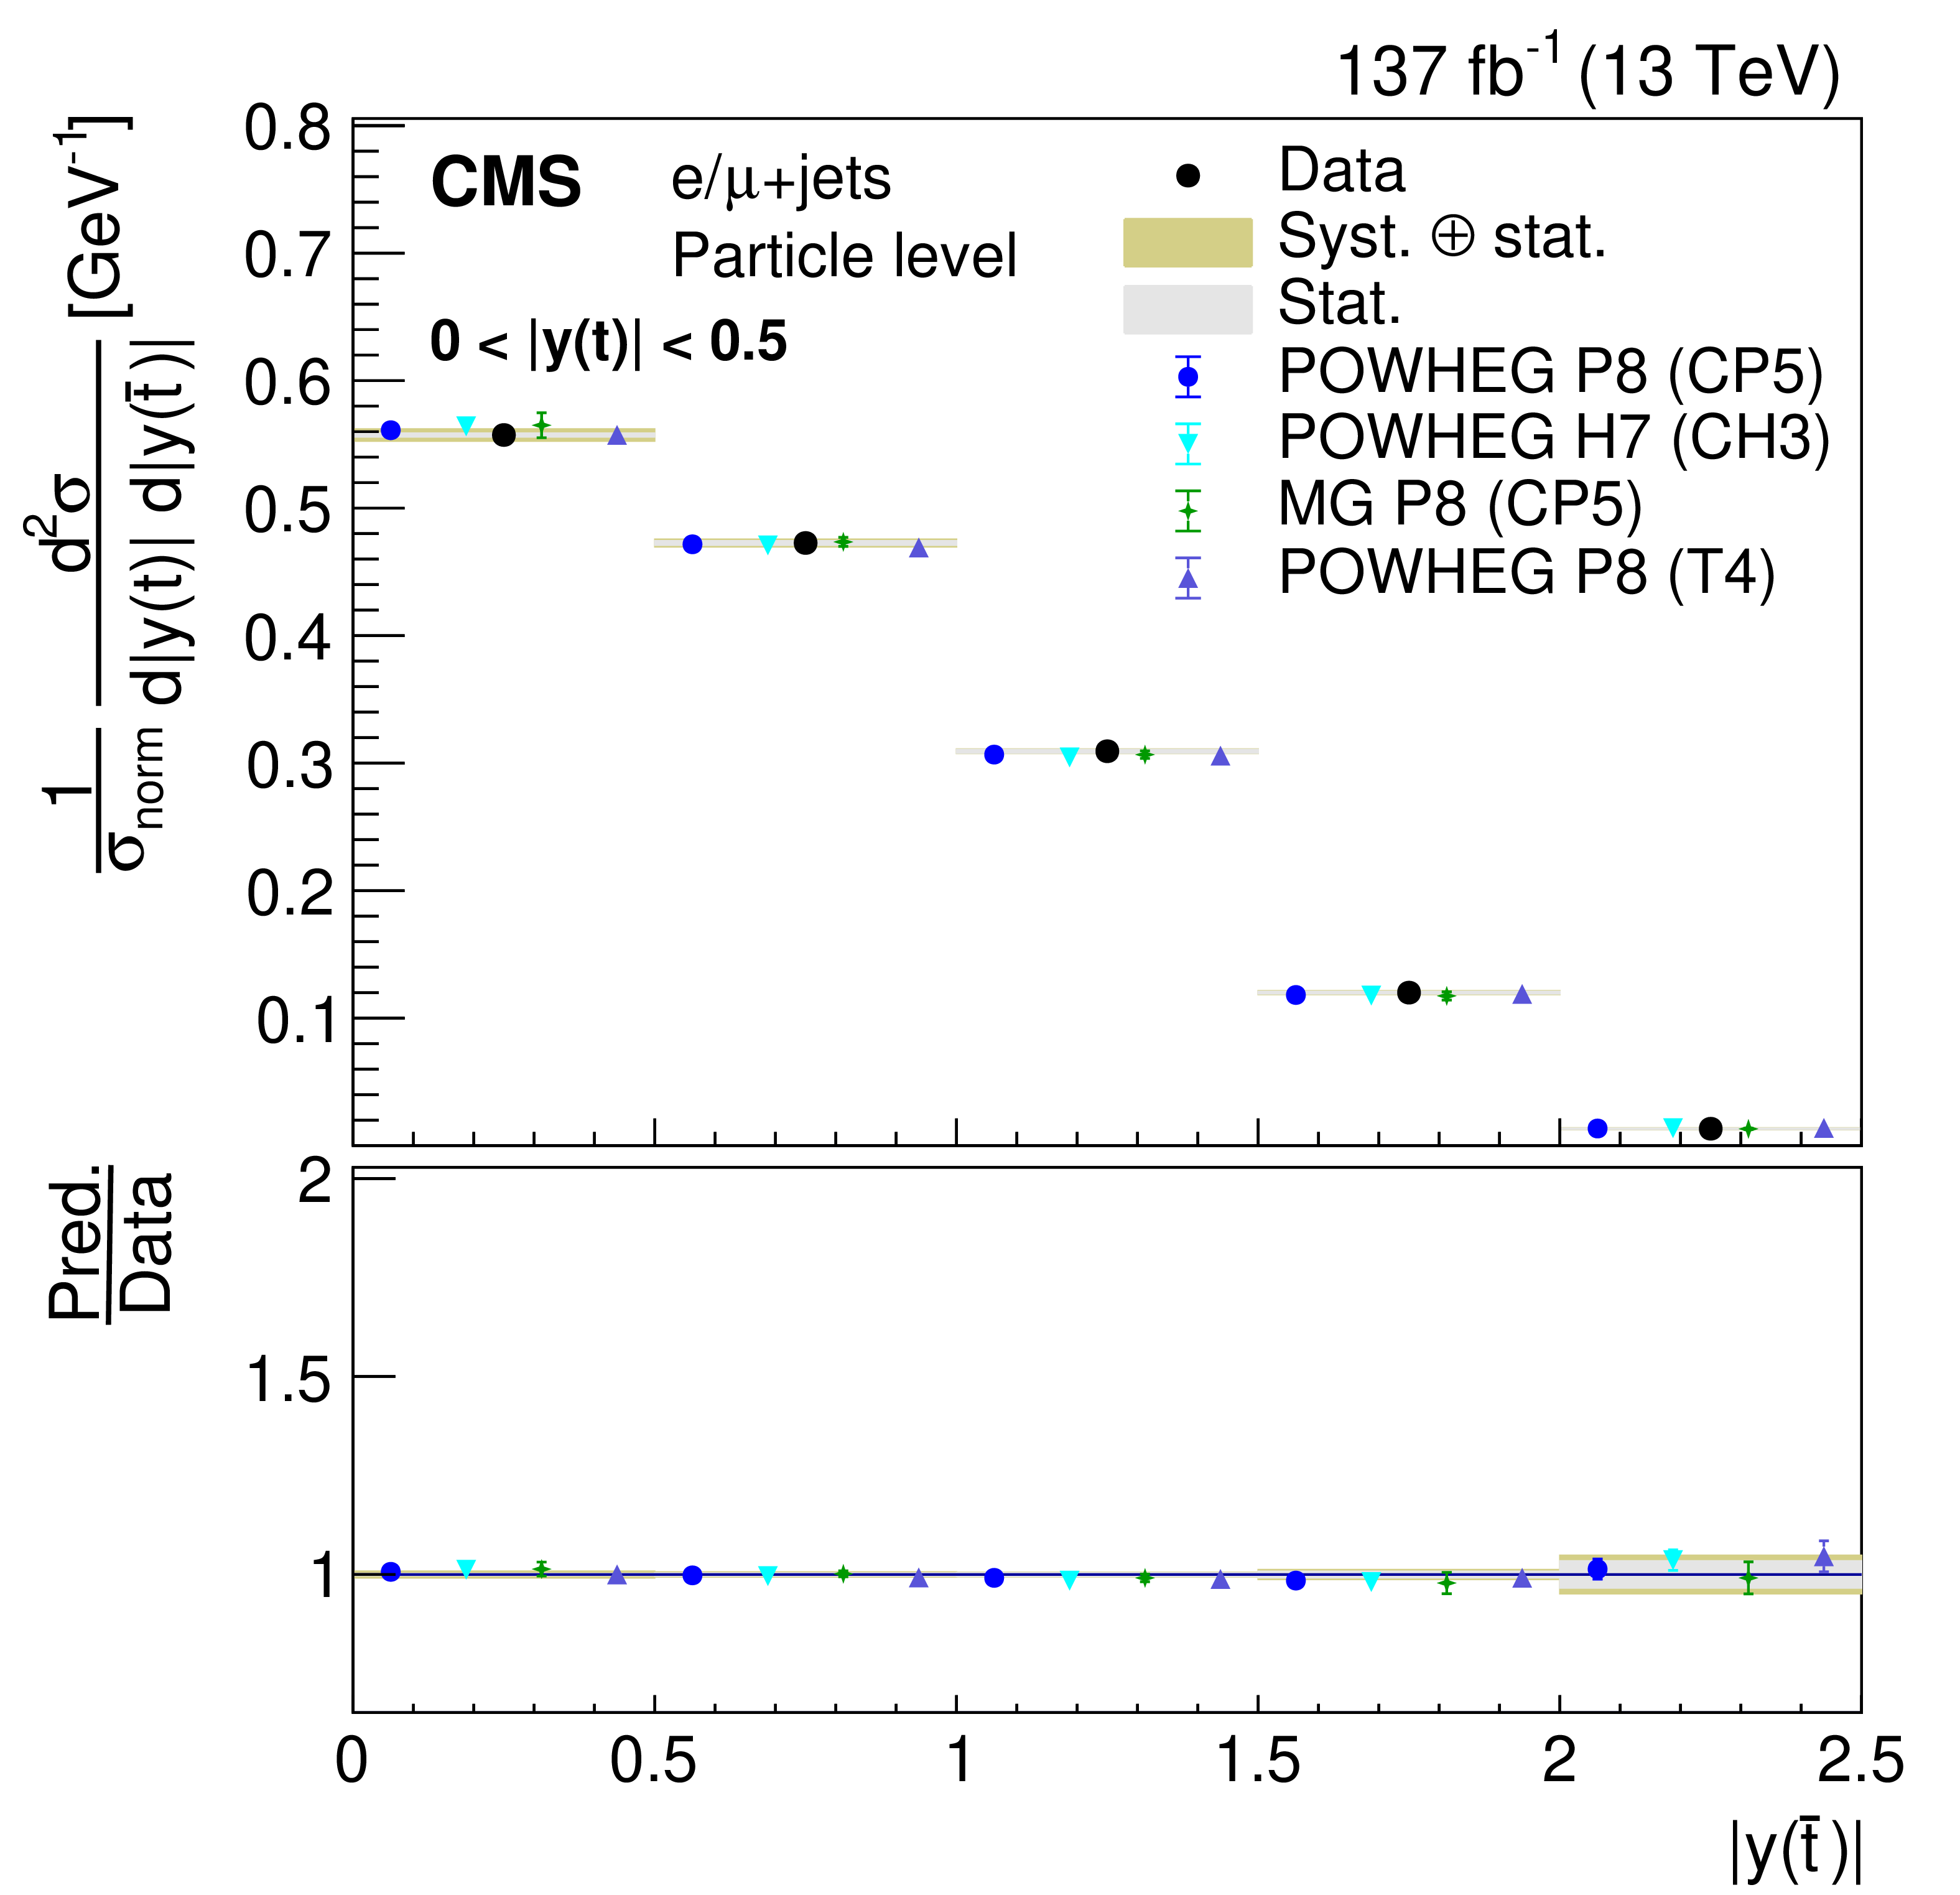
png pdf |
Figure A22-a:
Normalized double-differential cross section at the particle level as a function of ${{| y(\mathrm{t}) |}}$ vs.$ {{| y(\mathrm{\bar{t}}) |}}$. The data are shown as points with gray (yellow) bands indicating the statistical (statistical and systematic) uncertainties. The cross sections are compared to the predictions of POWHEG+PYTHIA (P8) for the CP5 and CUETP8M2T4 (T4) tunes, POWHEG+HERWIG (H7), and the multiparton simulation MG5_aMC@NLO (MG)+PYTHIA. The ratios of the various predictions to the measured cross sections are shown in the lower panels. |
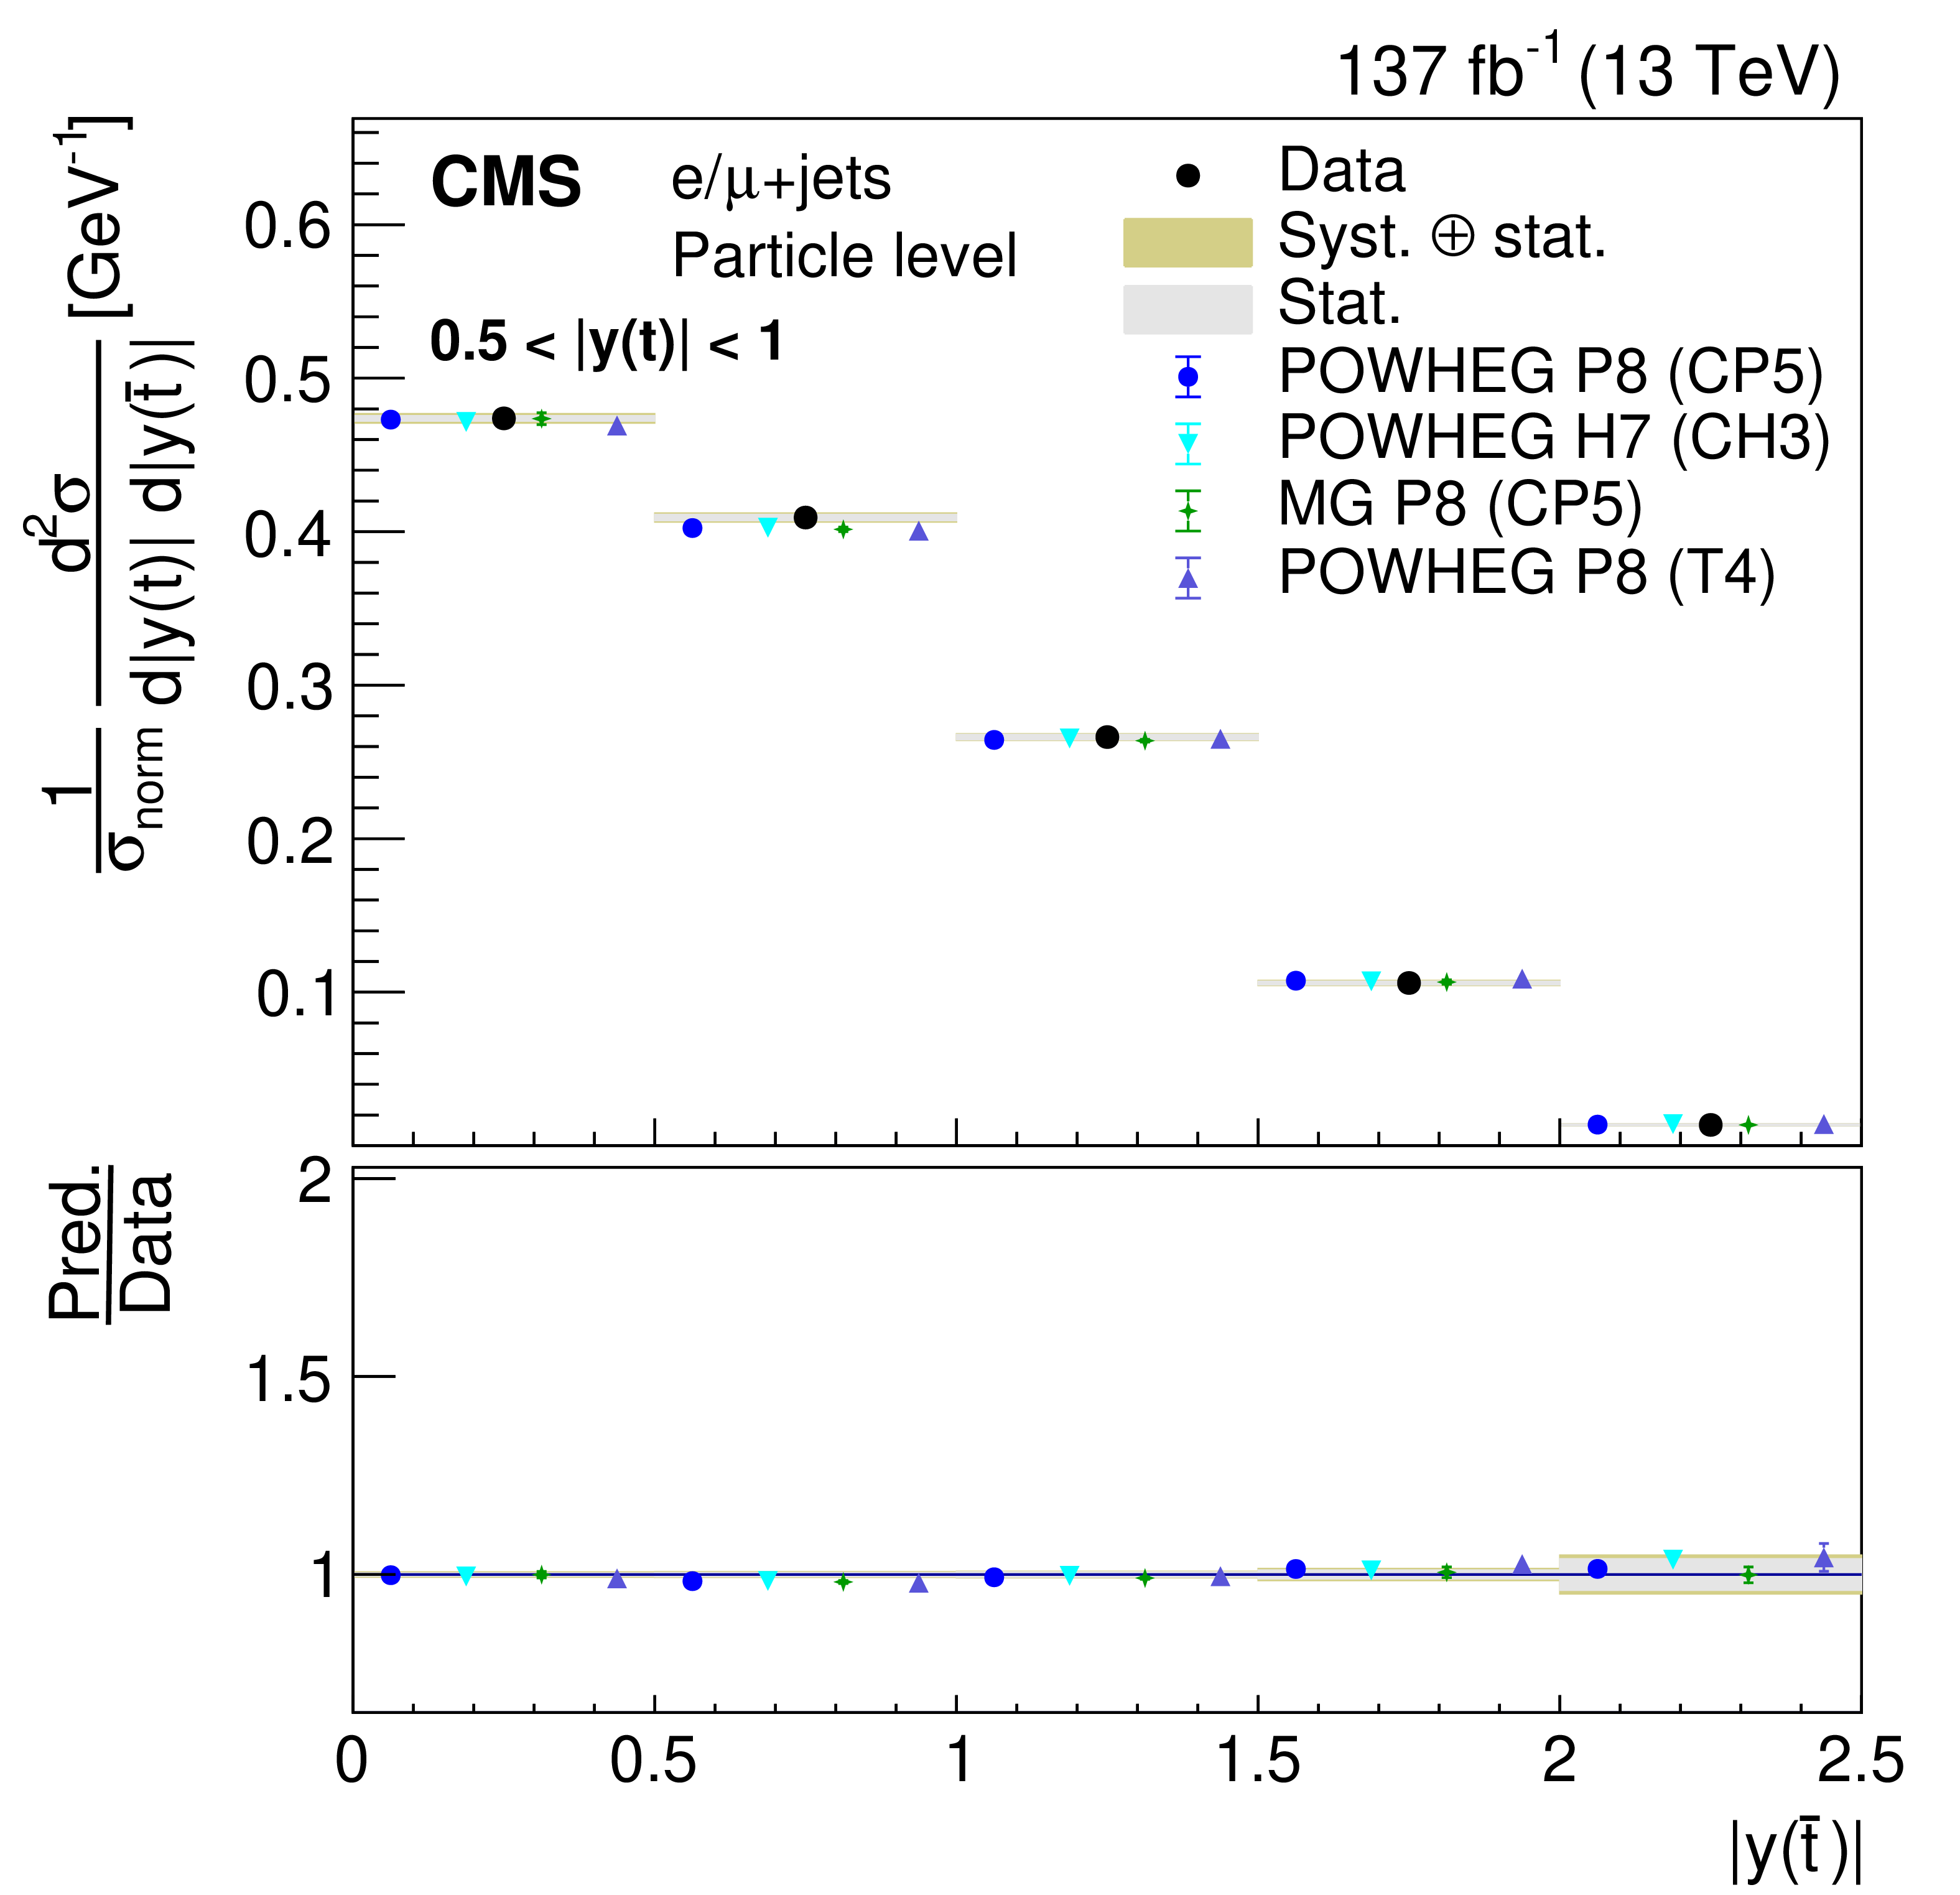
png pdf |
Figure A22-b:
Normalized double-differential cross section at the particle level as a function of ${{| y(\mathrm{t}) |}}$ vs.$ {{| y(\mathrm{\bar{t}}) |}}$. The data are shown as points with gray (yellow) bands indicating the statistical (statistical and systematic) uncertainties. The cross sections are compared to the predictions of POWHEG+PYTHIA (P8) for the CP5 and CUETP8M2T4 (T4) tunes, POWHEG+HERWIG (H7), and the multiparton simulation MG5_aMC@NLO (MG)+PYTHIA. The ratios of the various predictions to the measured cross sections are shown in the lower panels. |

png pdf |
Figure A22-c:
Normalized double-differential cross section at the particle level as a function of ${{| y(\mathrm{t}) |}}$ vs.$ {{| y(\mathrm{\bar{t}}) |}}$. The data are shown as points with gray (yellow) bands indicating the statistical (statistical and systematic) uncertainties. The cross sections are compared to the predictions of POWHEG+PYTHIA (P8) for the CP5 and CUETP8M2T4 (T4) tunes, POWHEG+HERWIG (H7), and the multiparton simulation MG5_aMC@NLO (MG)+PYTHIA. The ratios of the various predictions to the measured cross sections are shown in the lower panels. |
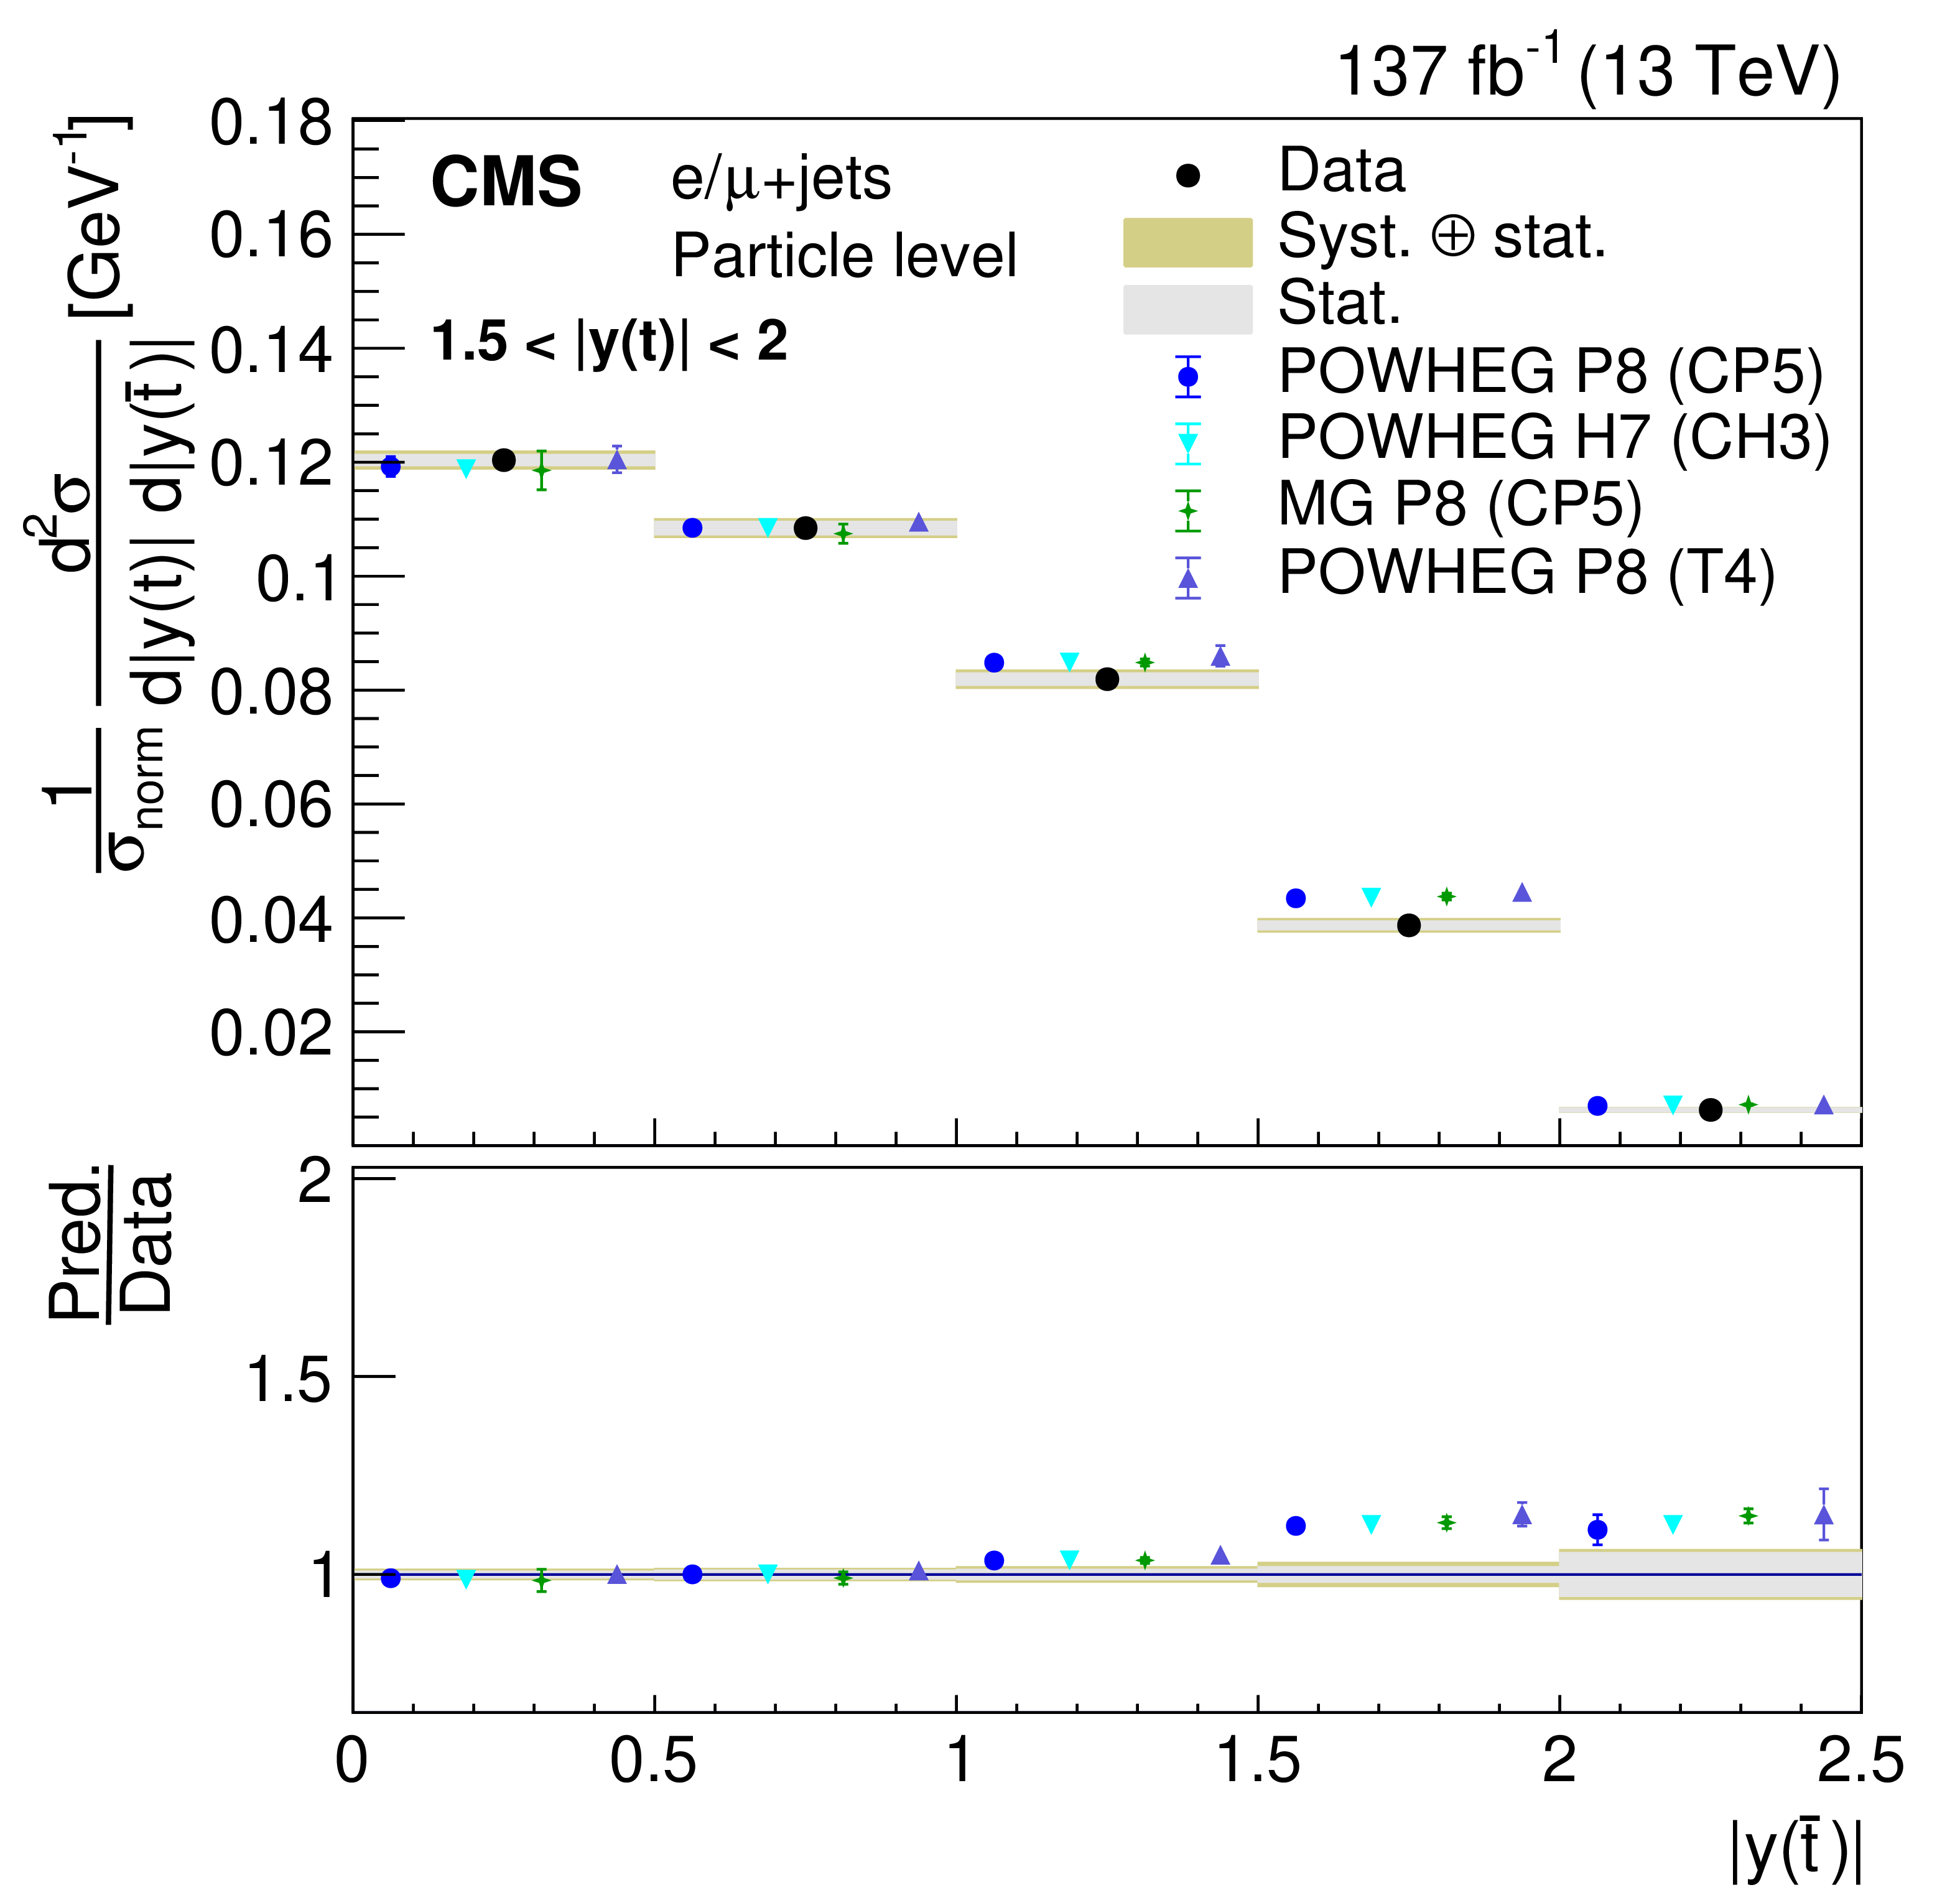
png pdf |
Figure A22-d:
Normalized double-differential cross section at the particle level as a function of ${{| y(\mathrm{t}) |}}$ vs.$ {{| y(\mathrm{\bar{t}}) |}}$. The data are shown as points with gray (yellow) bands indicating the statistical (statistical and systematic) uncertainties. The cross sections are compared to the predictions of POWHEG+PYTHIA (P8) for the CP5 and CUETP8M2T4 (T4) tunes, POWHEG+HERWIG (H7), and the multiparton simulation MG5_aMC@NLO (MG)+PYTHIA. The ratios of the various predictions to the measured cross sections are shown in the lower panels. |
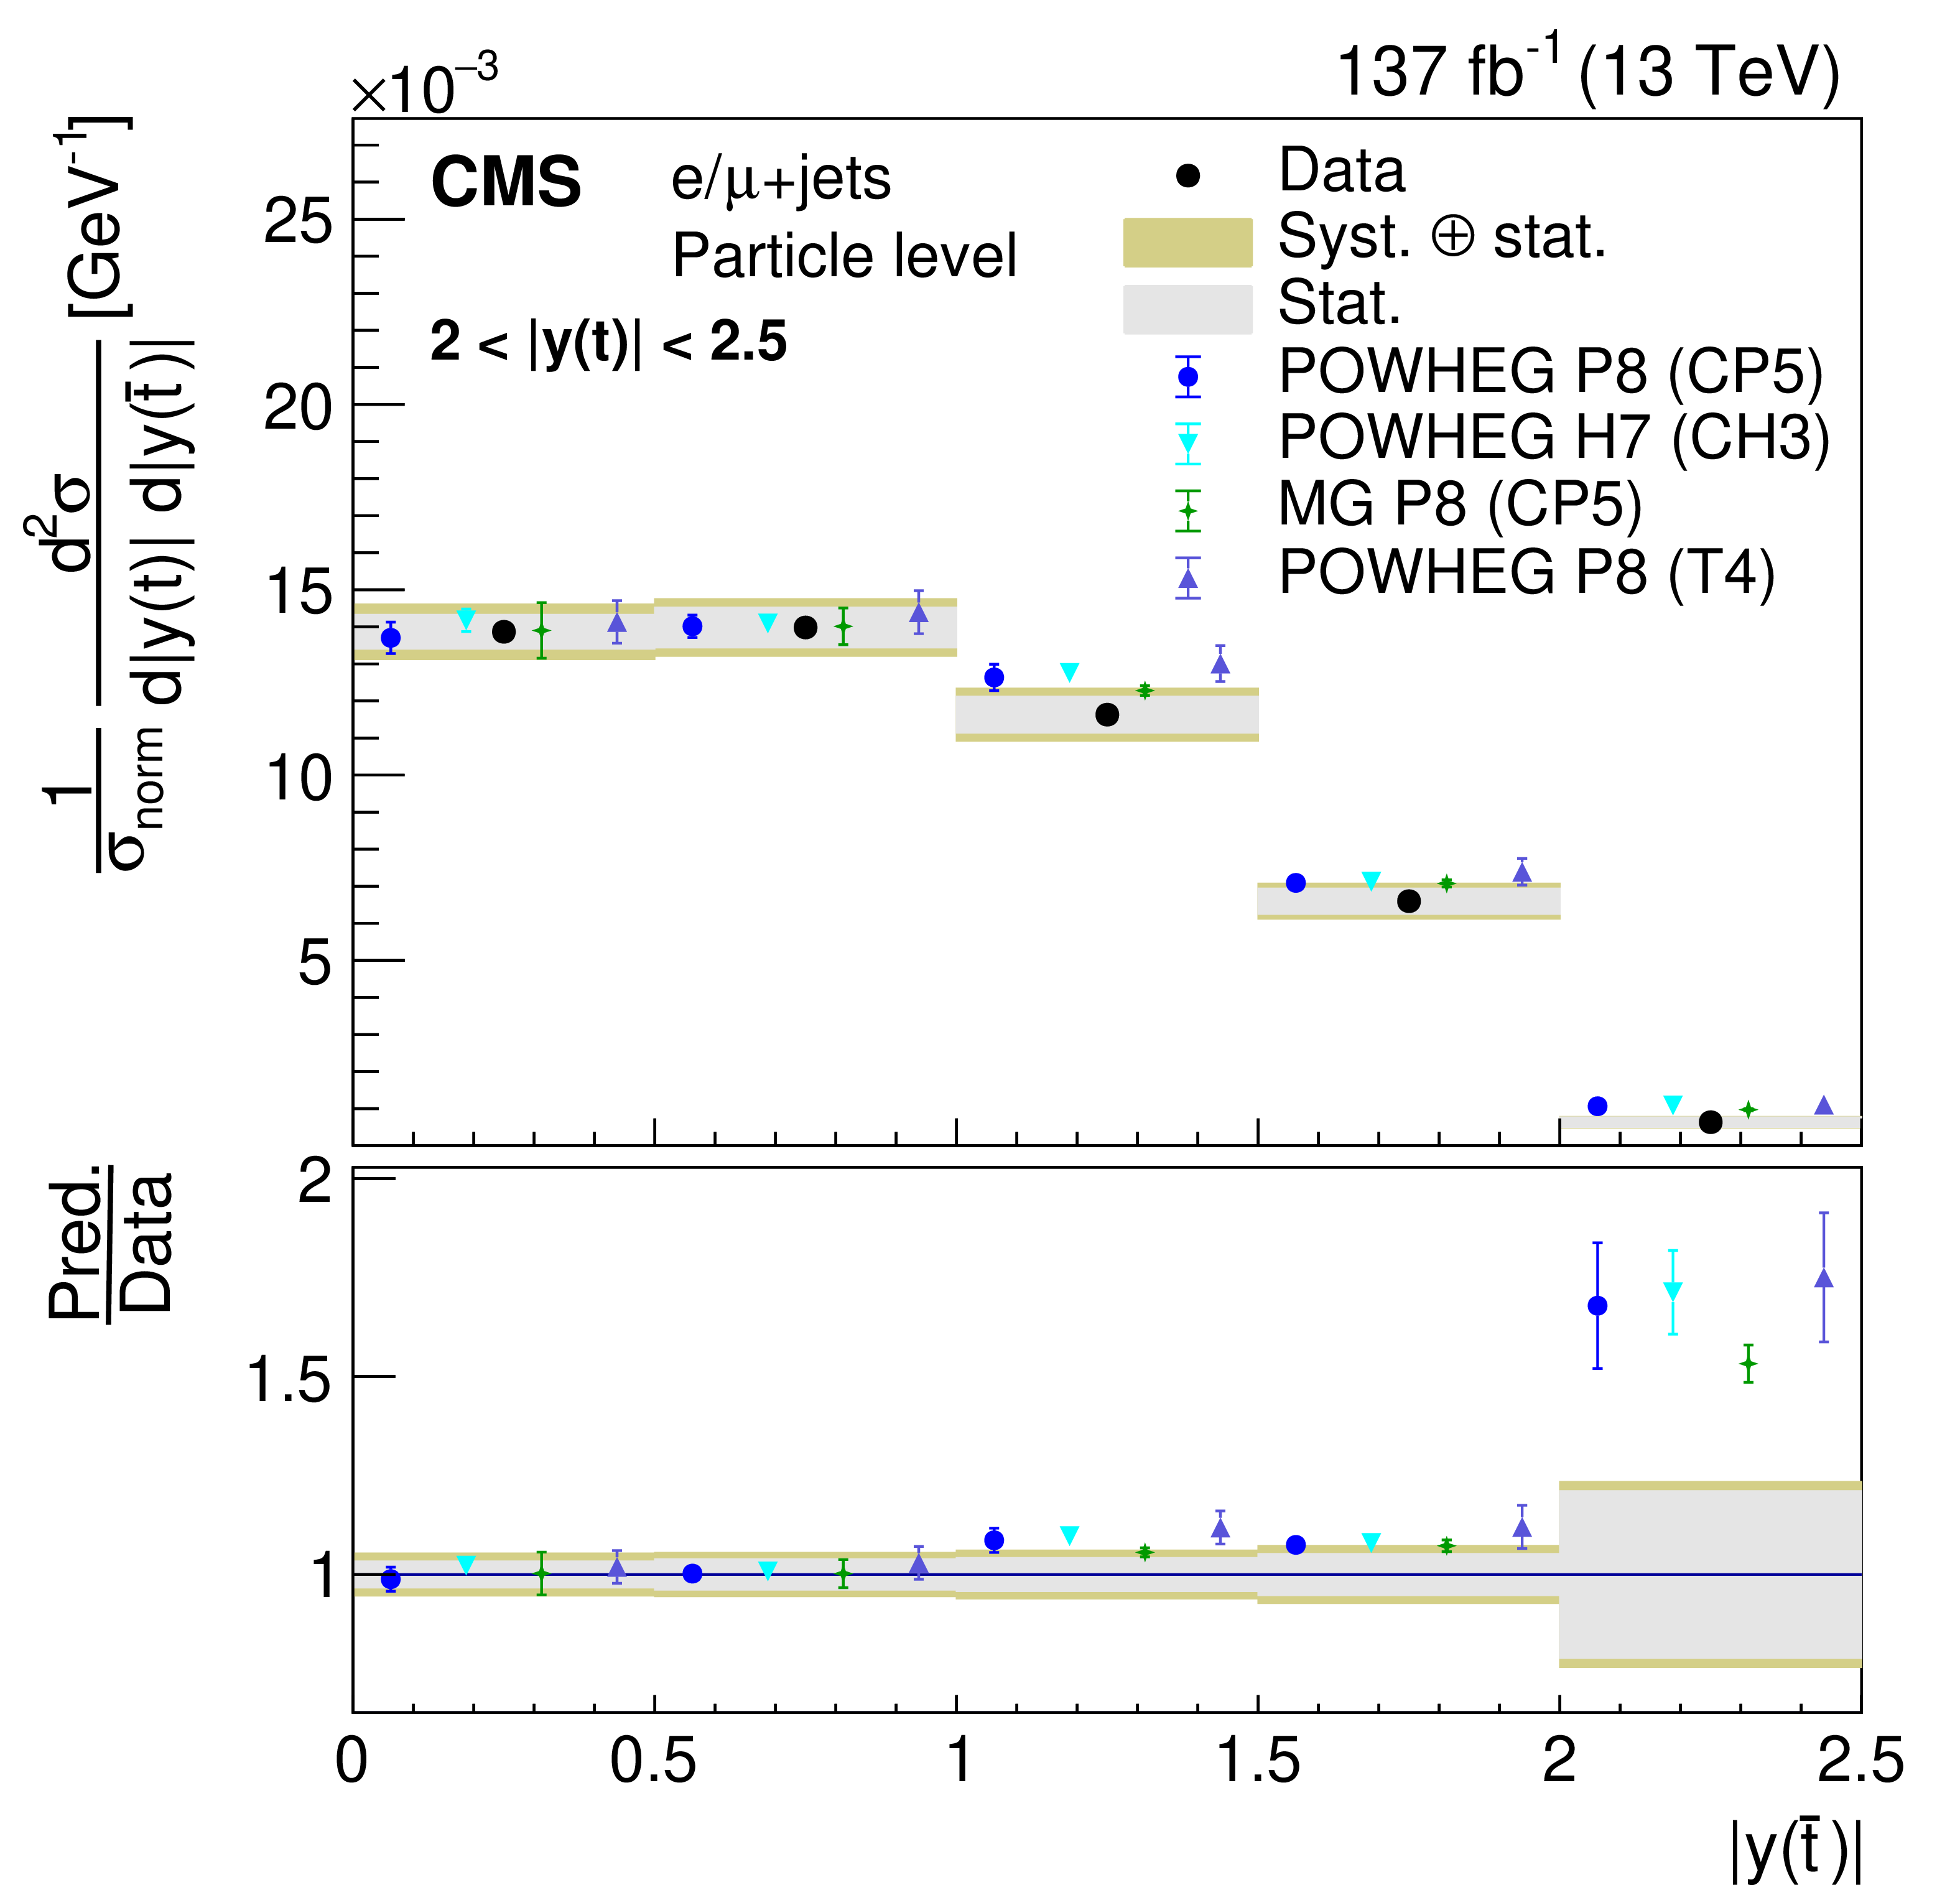
png pdf |
Figure A22-e:
Normalized double-differential cross section at the particle level as a function of ${{| y(\mathrm{t}) |}}$ vs.$ {{| y(\mathrm{\bar{t}}) |}}$. The data are shown as points with gray (yellow) bands indicating the statistical (statistical and systematic) uncertainties. The cross sections are compared to the predictions of POWHEG+PYTHIA (P8) for the CP5 and CUETP8M2T4 (T4) tunes, POWHEG+HERWIG (H7), and the multiparton simulation MG5_aMC@NLO (MG)+PYTHIA. The ratios of the various predictions to the measured cross sections are shown in the lower panels. |
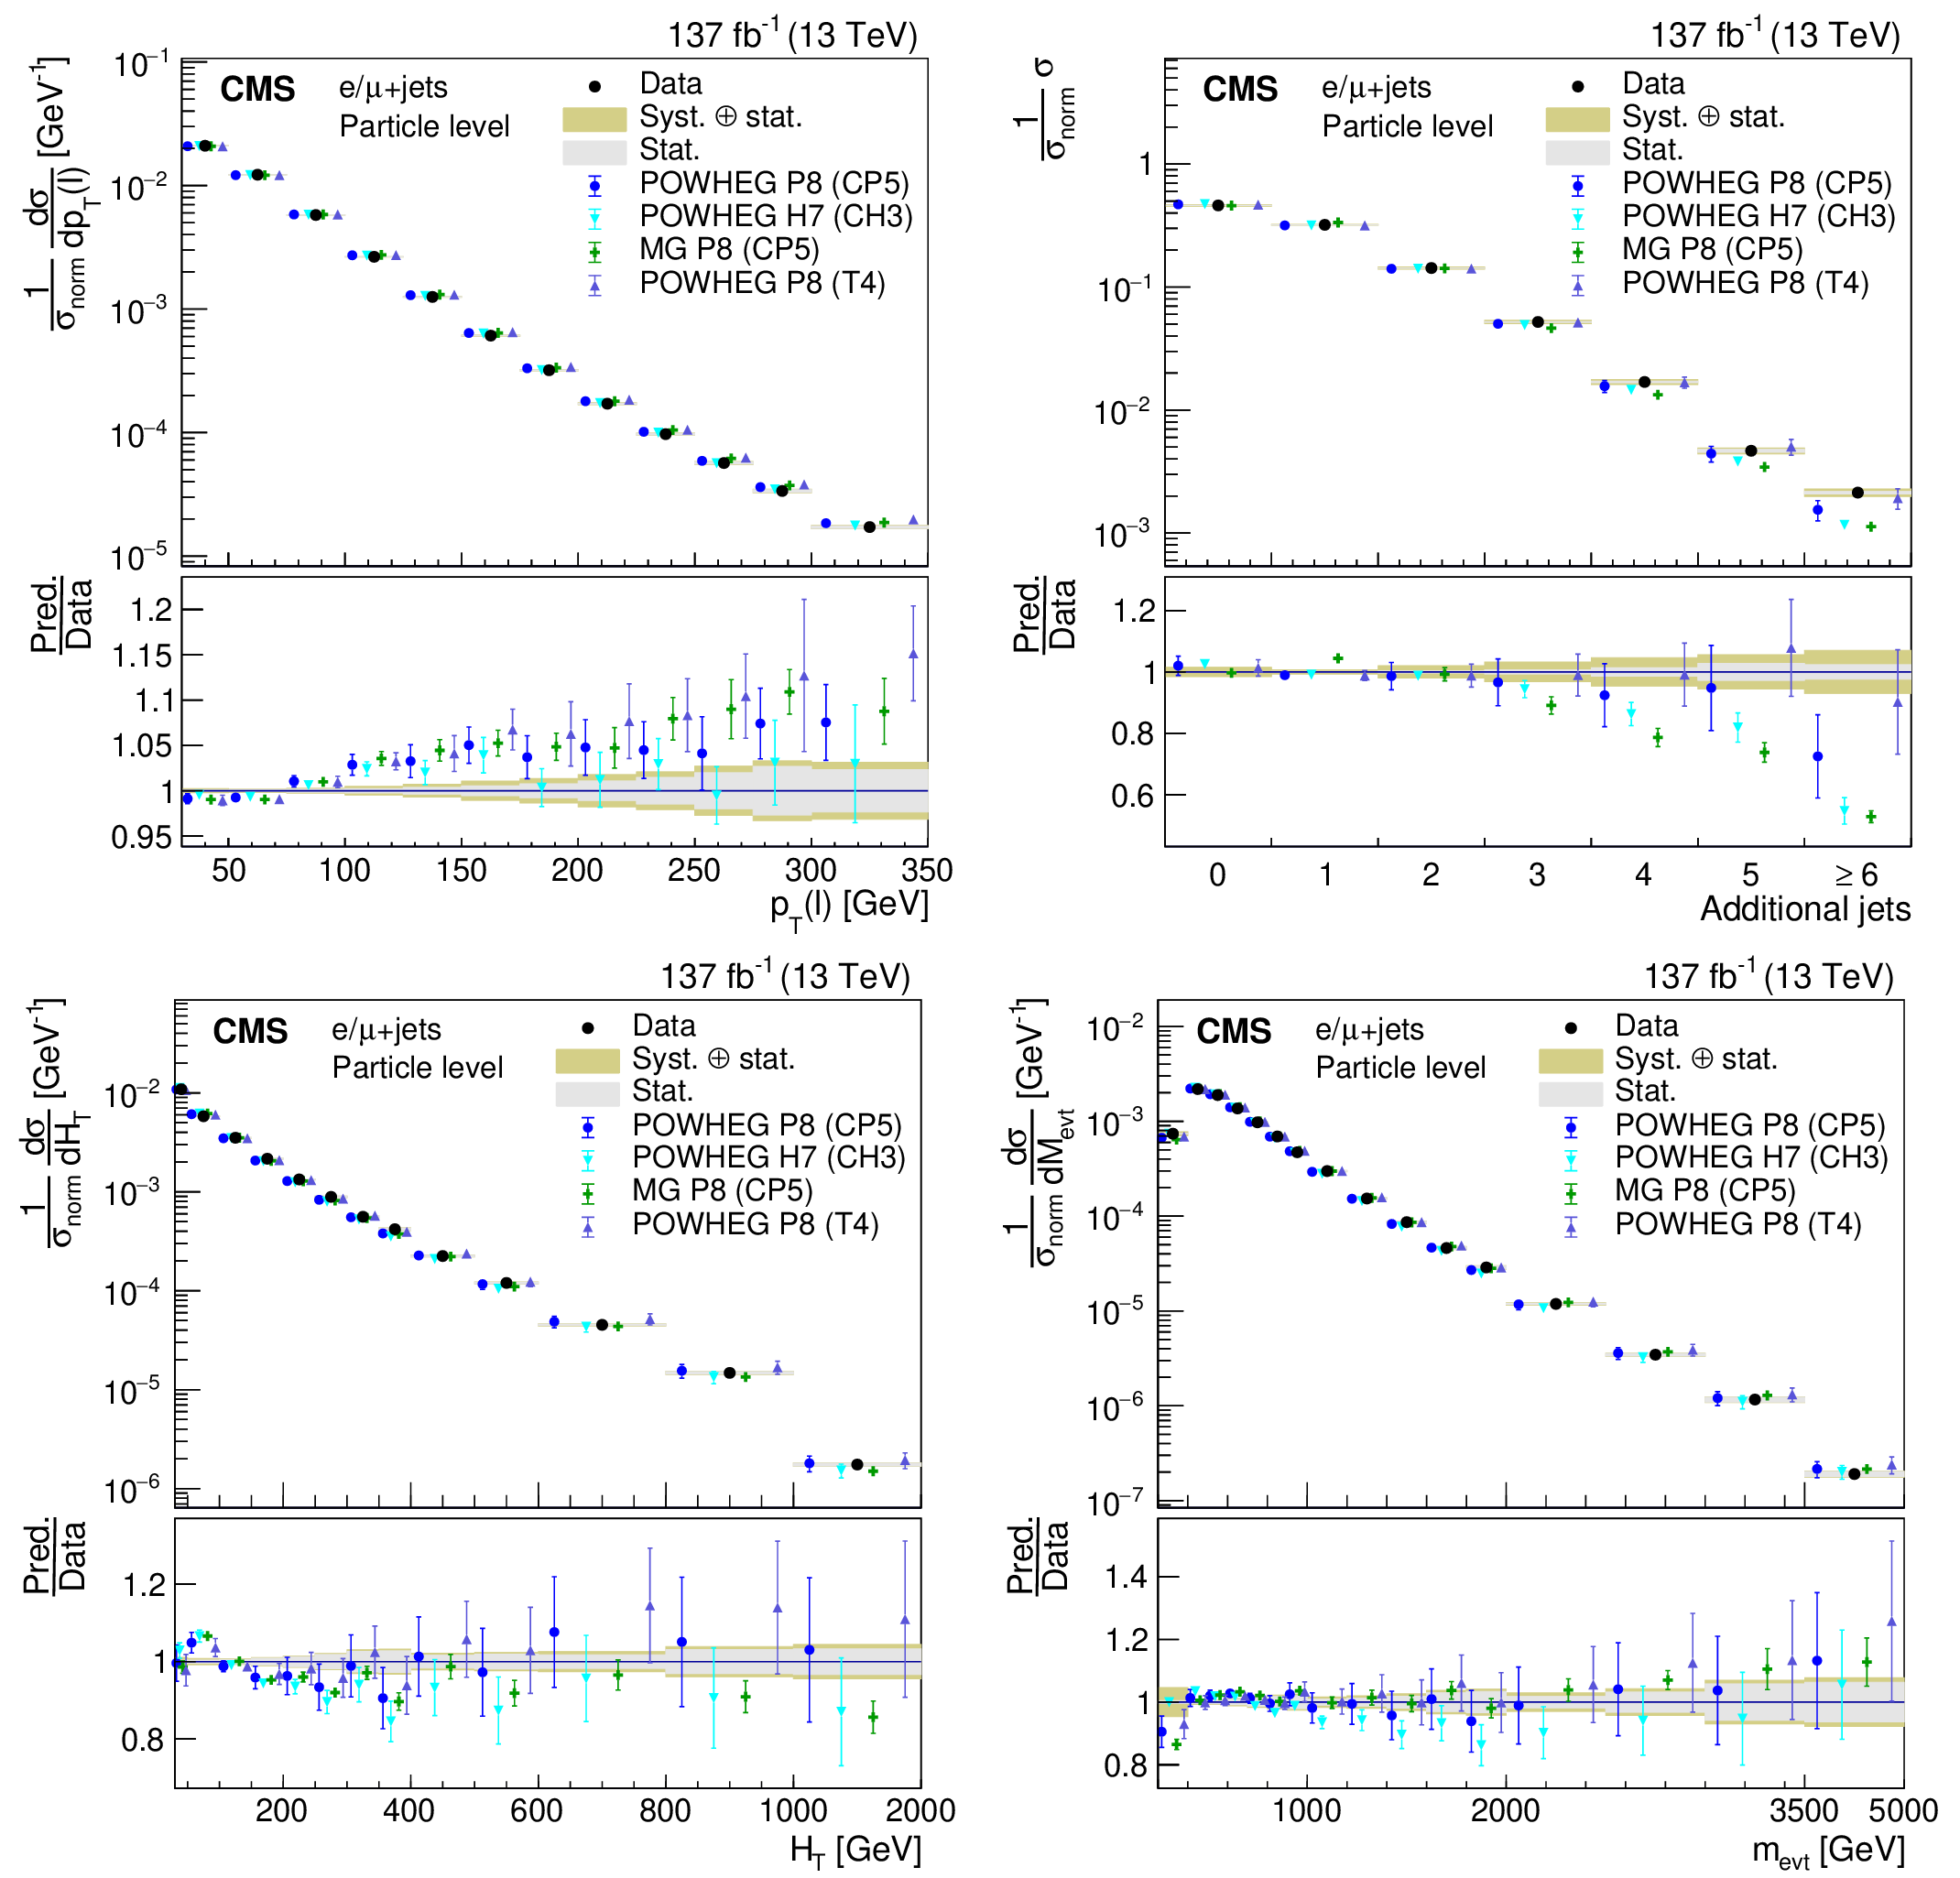
png pdf |
Figure A23:
Normalized differential cross sections at the particle level as a function of ${{p_{\mathrm {T}}} (\ell)}$, jet multiplicity, ${H_{\mathrm {T}}}$, and ${m_\text {evt}}$. The data are shown as points with gray (yellow) bands indicating the statistical (statistical and systematic) uncertainties. The cross sections are compared to the predictions of POWHEG+PYTHIA (P8) for the CP5 and CUETP8M2T4 (T4) tunes, POWHEG+HERWIG (H7), and the multiparton simulation MG5_aMC@NLO (MG)+PYTHIA. The ratios of the various predictions to the measured cross sections are shown in the lower panels. |
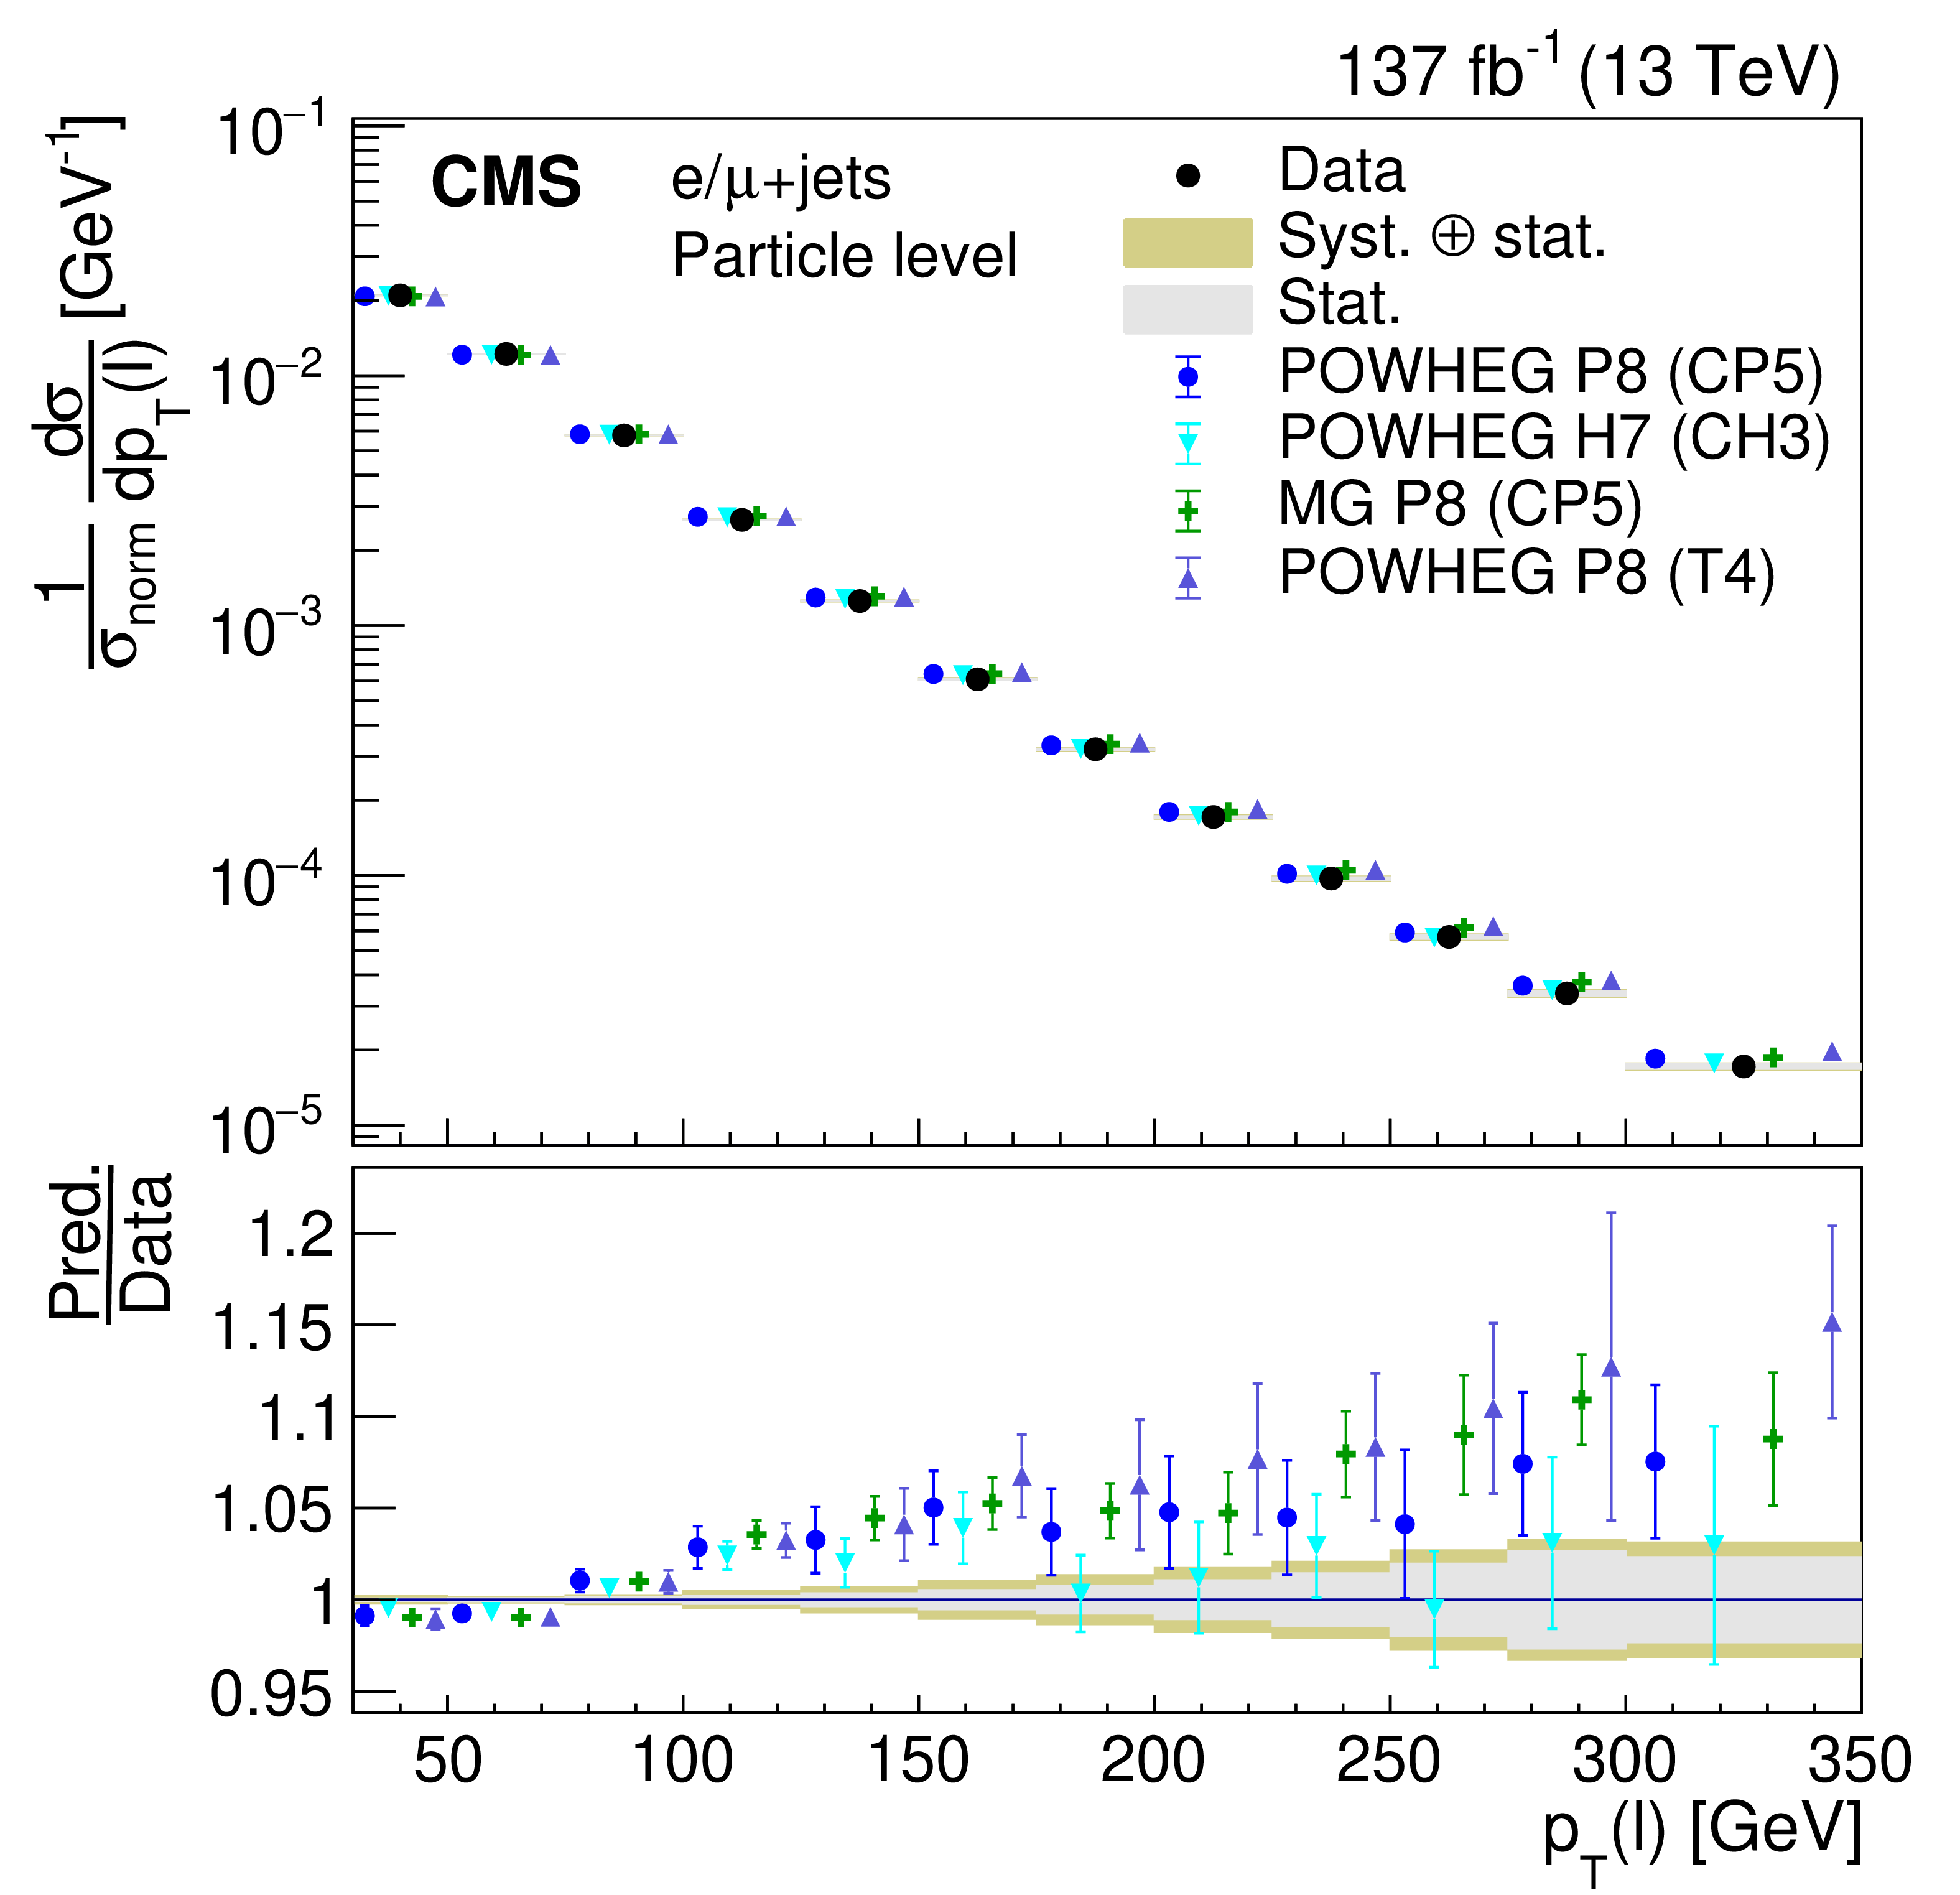
png pdf |
Figure A23-a:
Normalized differential cross sections at the particle level as a function of ${{p_{\mathrm {T}}} (\ell)}$, jet multiplicity, ${H_{\mathrm {T}}}$, and ${m_\text {evt}}$. The data are shown as points with gray (yellow) bands indicating the statistical (statistical and systematic) uncertainties. The cross sections are compared to the predictions of POWHEG+PYTHIA (P8) for the CP5 and CUETP8M2T4 (T4) tunes, POWHEG+HERWIG (H7), and the multiparton simulation MG5_aMC@NLO (MG)+PYTHIA. The ratios of the various predictions to the measured cross sections are shown in the lower panels. |
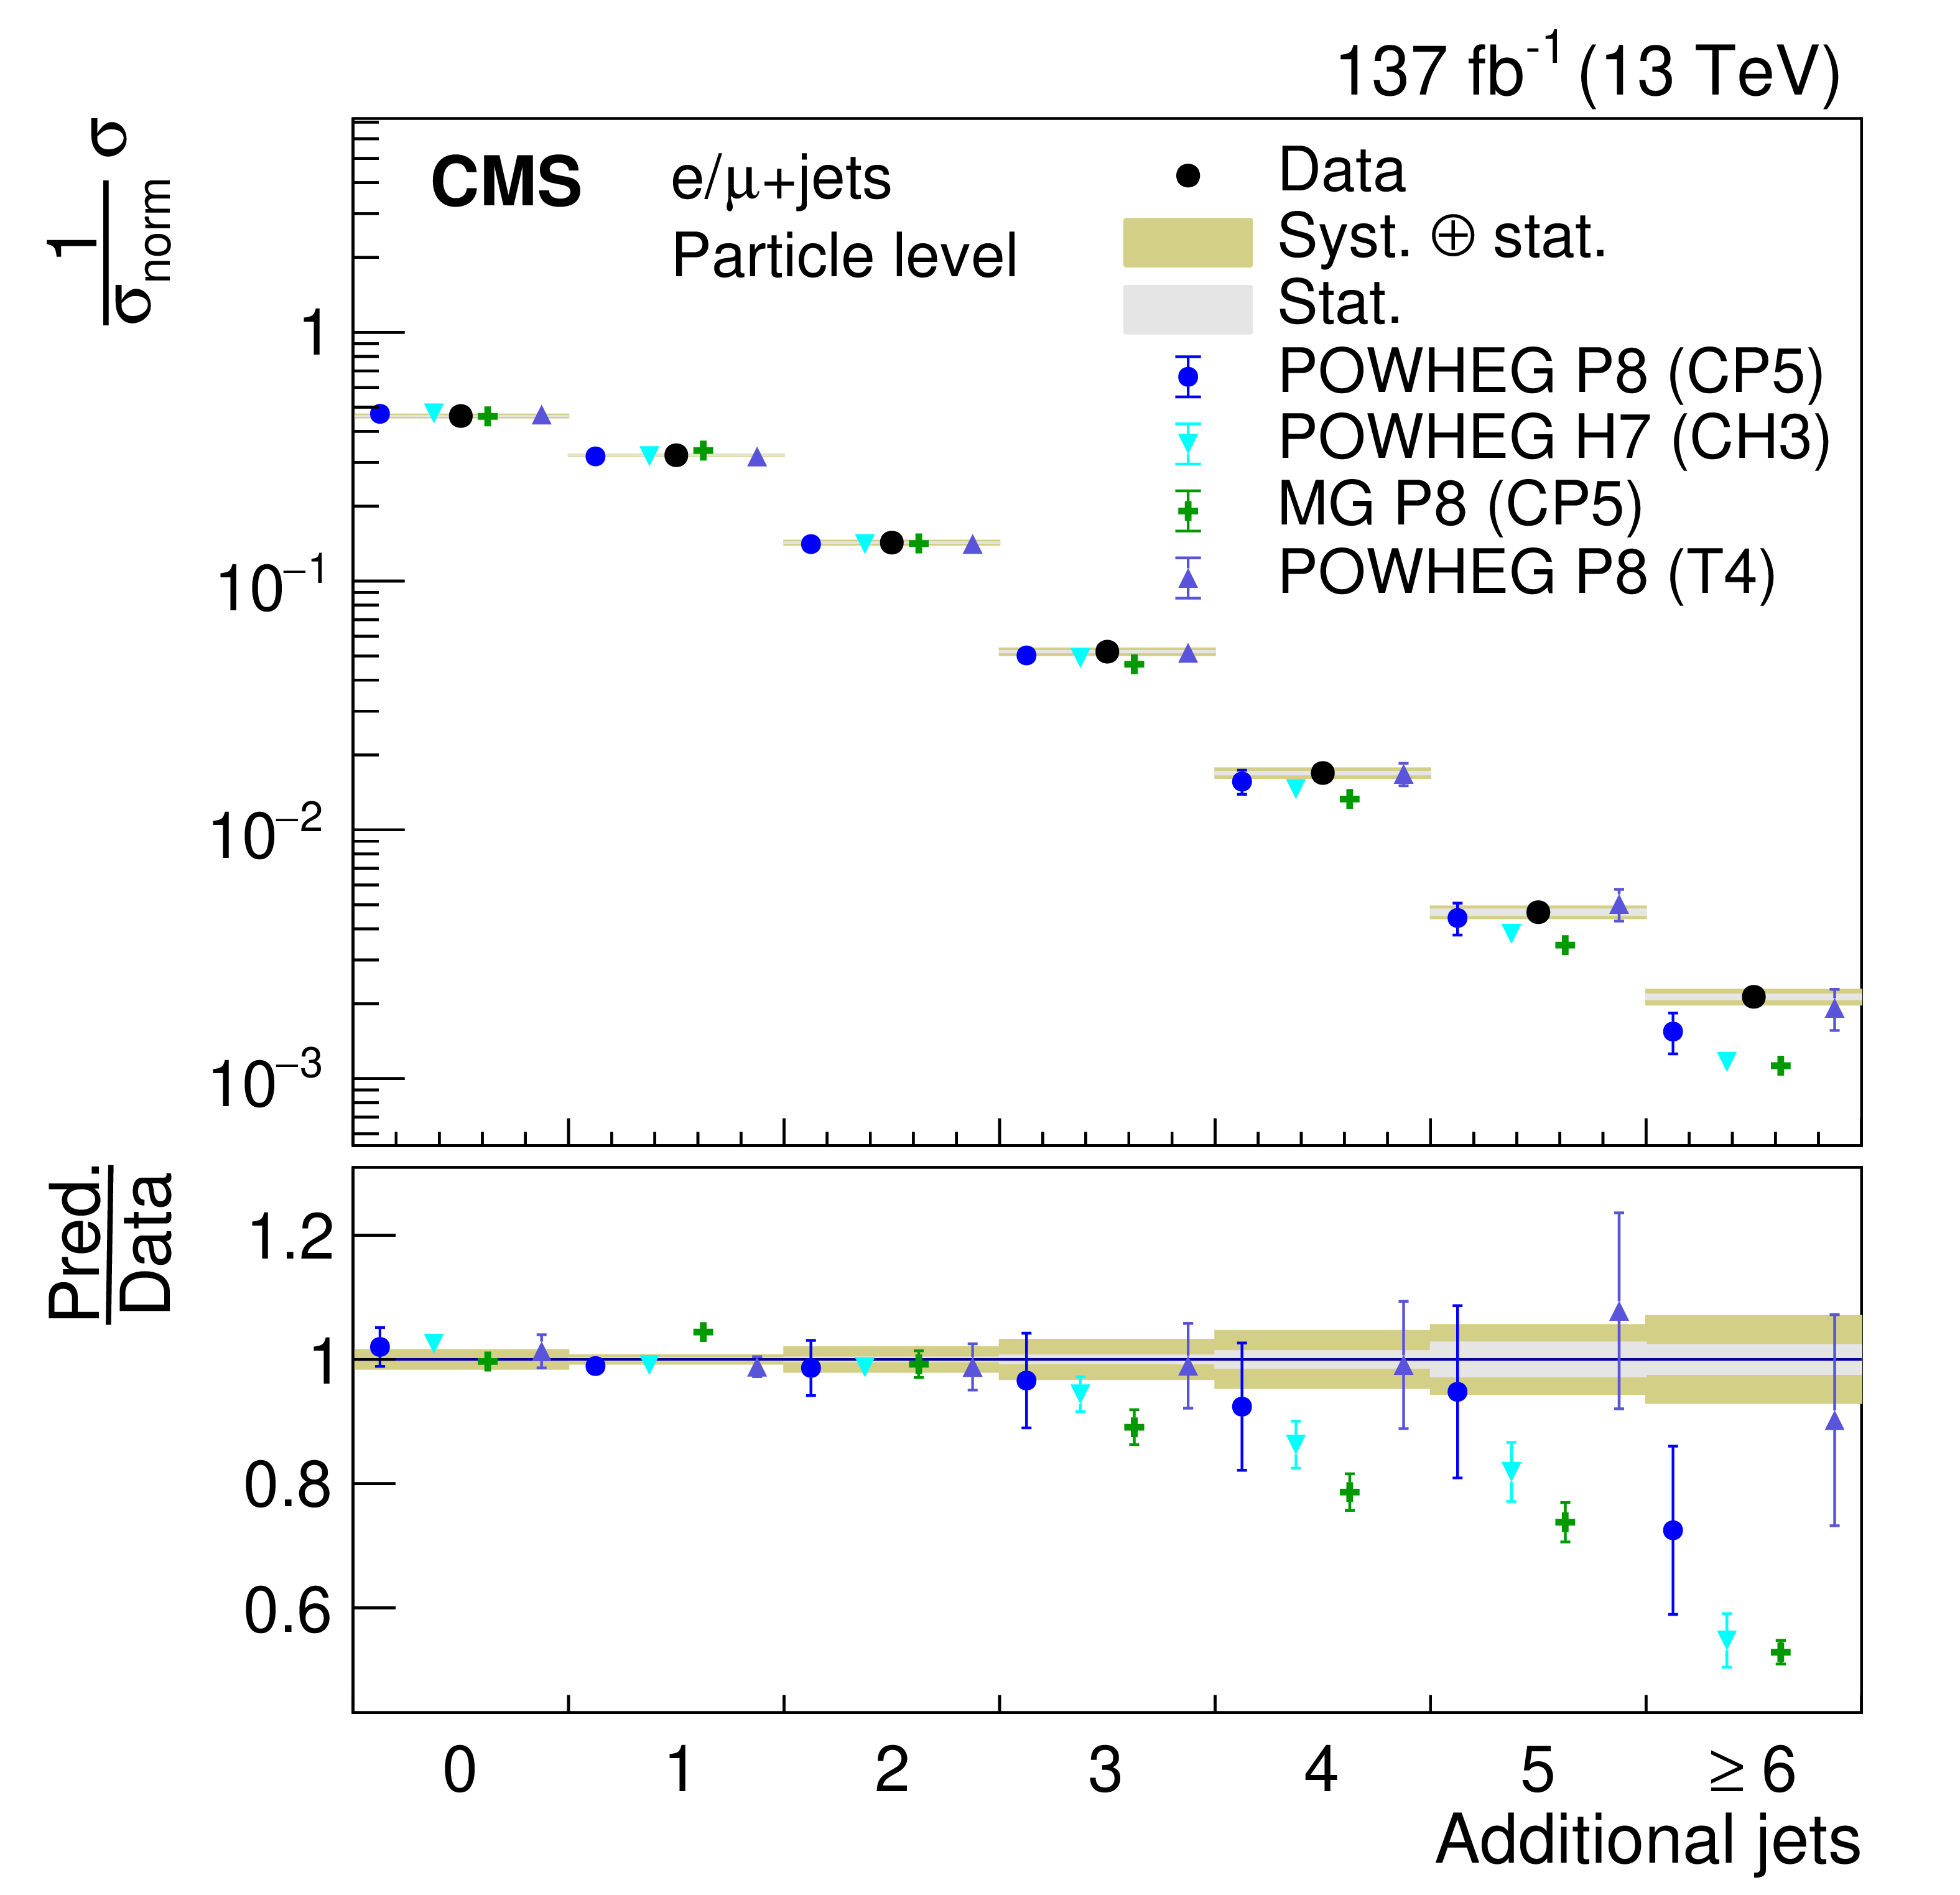
png pdf |
Figure A23-b:
Normalized differential cross sections at the particle level as a function of ${{p_{\mathrm {T}}} (\ell)}$, jet multiplicity, ${H_{\mathrm {T}}}$, and ${m_\text {evt}}$. The data are shown as points with gray (yellow) bands indicating the statistical (statistical and systematic) uncertainties. The cross sections are compared to the predictions of POWHEG+PYTHIA (P8) for the CP5 and CUETP8M2T4 (T4) tunes, POWHEG+HERWIG (H7), and the multiparton simulation MG5_aMC@NLO (MG)+PYTHIA. The ratios of the various predictions to the measured cross sections are shown in the lower panels. |
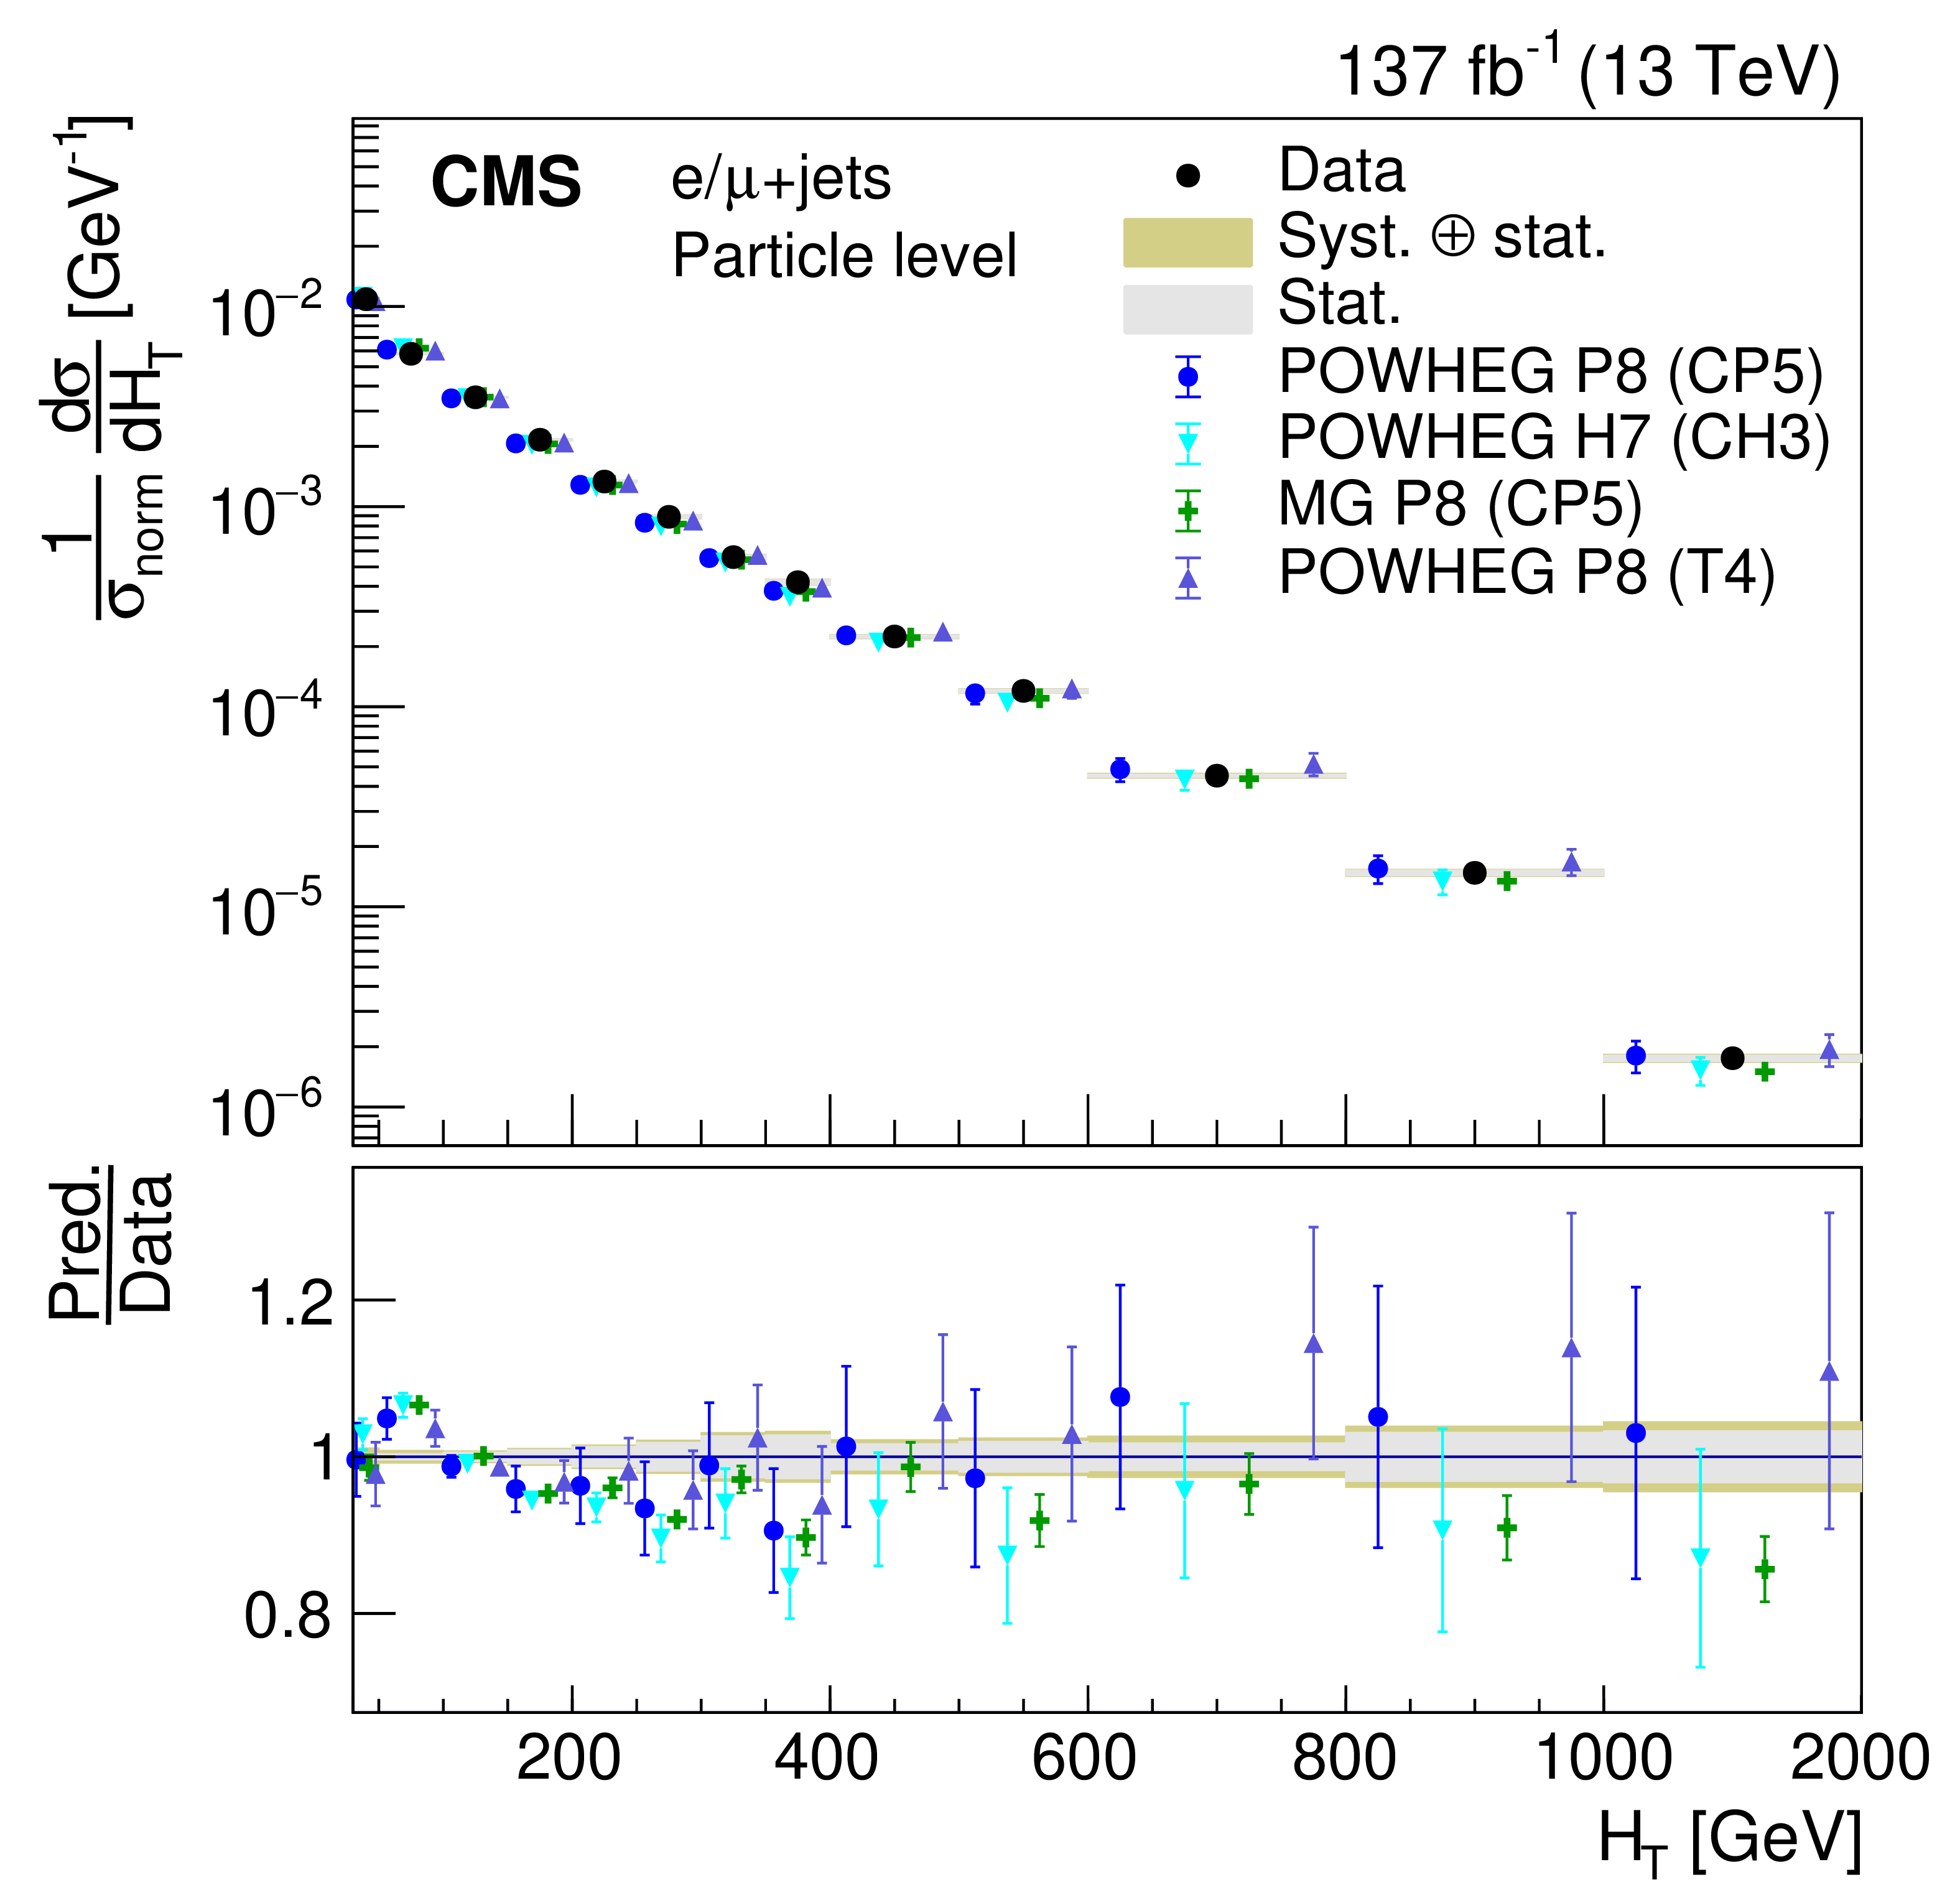
png pdf |
Figure A23-c:
Normalized differential cross sections at the particle level as a function of ${{p_{\mathrm {T}}} (\ell)}$, jet multiplicity, ${H_{\mathrm {T}}}$, and ${m_\text {evt}}$. The data are shown as points with gray (yellow) bands indicating the statistical (statistical and systematic) uncertainties. The cross sections are compared to the predictions of POWHEG+PYTHIA (P8) for the CP5 and CUETP8M2T4 (T4) tunes, POWHEG+HERWIG (H7), and the multiparton simulation MG5_aMC@NLO (MG)+PYTHIA. The ratios of the various predictions to the measured cross sections are shown in the lower panels. |
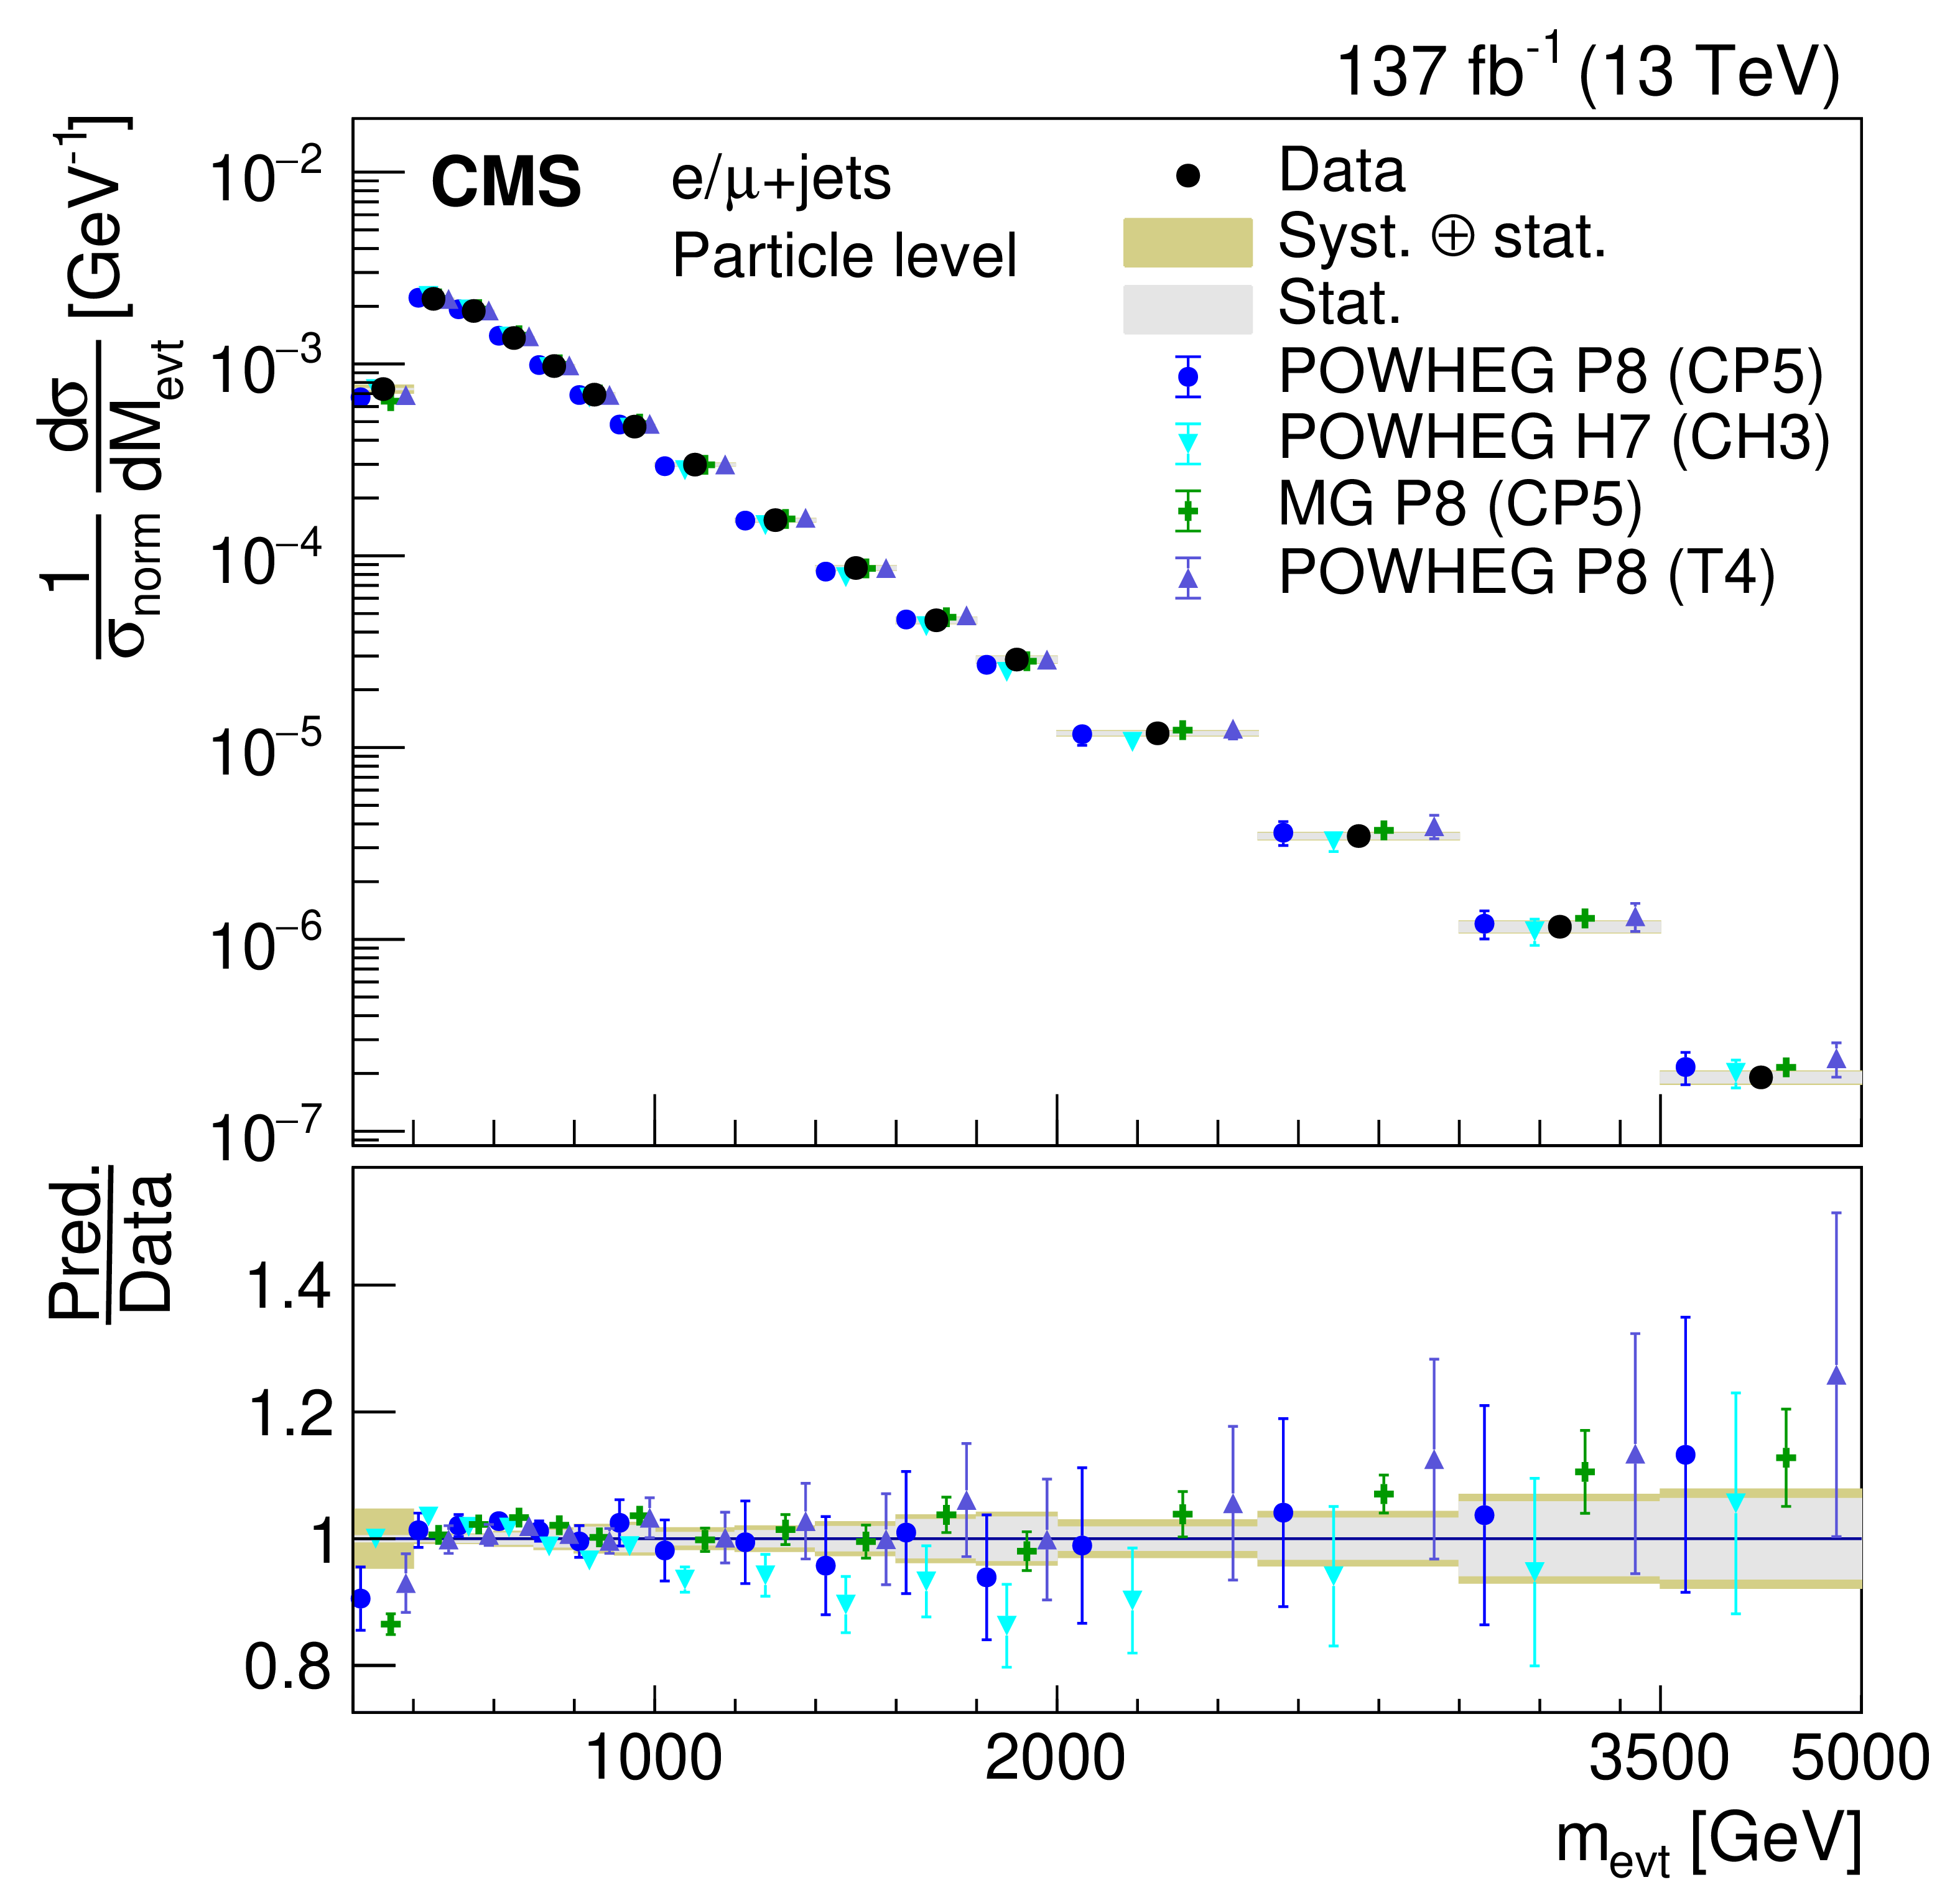
png pdf |
Figure A23-d:
Normalized differential cross sections at the particle level as a function of ${{p_{\mathrm {T}}} (\ell)}$, jet multiplicity, ${H_{\mathrm {T}}}$, and ${m_\text {evt}}$. The data are shown as points with gray (yellow) bands indicating the statistical (statistical and systematic) uncertainties. The cross sections are compared to the predictions of POWHEG+PYTHIA (P8) for the CP5 and CUETP8M2T4 (T4) tunes, POWHEG+HERWIG (H7), and the multiparton simulation MG5_aMC@NLO (MG)+PYTHIA. The ratios of the various predictions to the measured cross sections are shown in the lower panels. |

png pdf |
Figure A24:
Normalized differential cross section at the particle level as a function of ${{p_{\mathrm {T}}} ({\mathrm{t} _\mathrm {h}})}$ in bins of jet multiplicity. The data are shown as points with gray (yellow) bands indicating the statistical (statistical and systematic) uncertainties. The cross sections are compared to the predictions of POWHEG+PYTHIA (P8) for the CP5 and CUETP8M2T4 (T4) tunes, POWHEG+HERWIG (H7), and the multiparton simulation MG5_aMC@NLO (MG)+PYTHIA. The ratios of the various predictions to the measured cross sections are shown in the lower panels. |

png pdf |
Figure A24-a:
Normalized differential cross section at the particle level as a function of ${{p_{\mathrm {T}}} ({\mathrm{t} _\mathrm {h}})}$ in bins of jet multiplicity. The data are shown as points with gray (yellow) bands indicating the statistical (statistical and systematic) uncertainties. The cross sections are compared to the predictions of POWHEG+PYTHIA (P8) for the CP5 and CUETP8M2T4 (T4) tunes, POWHEG+HERWIG (H7), and the multiparton simulation MG5_aMC@NLO (MG)+PYTHIA. The ratios of the various predictions to the measured cross sections are shown in the lower panels. |
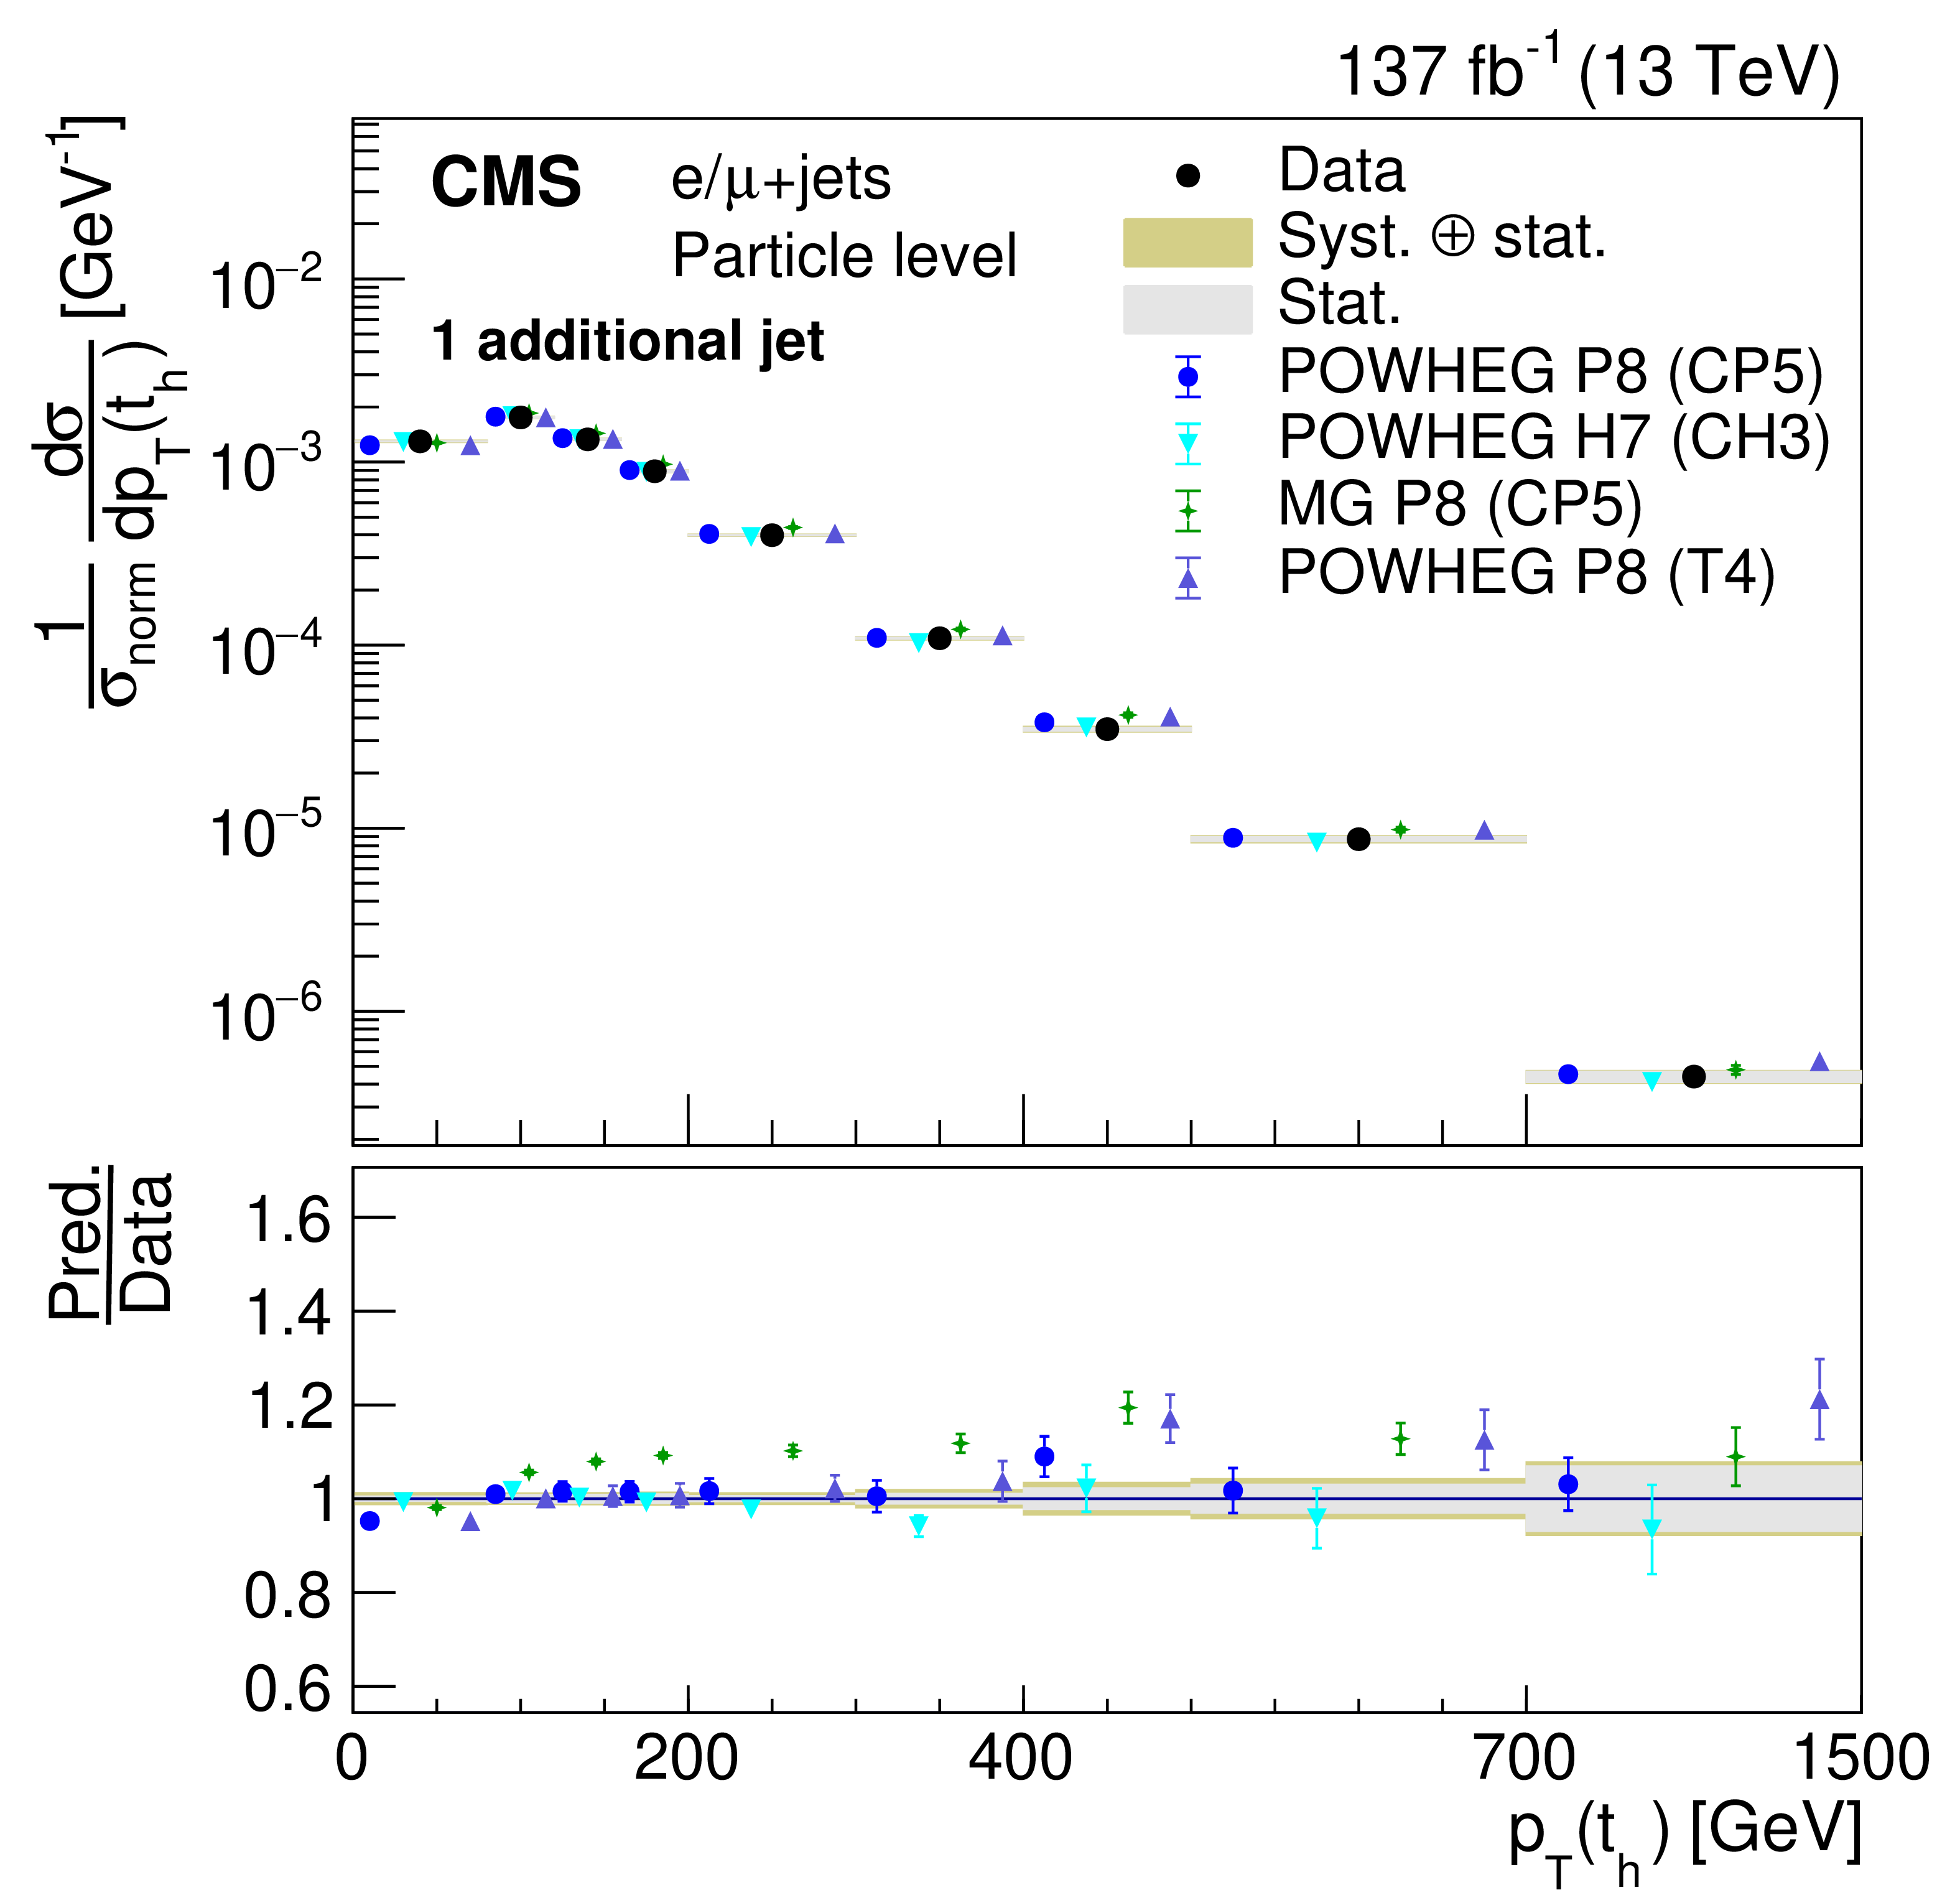
png pdf |
Figure A24-b:
Normalized differential cross section at the particle level as a function of ${{p_{\mathrm {T}}} ({\mathrm{t} _\mathrm {h}})}$ in bins of jet multiplicity. The data are shown as points with gray (yellow) bands indicating the statistical (statistical and systematic) uncertainties. The cross sections are compared to the predictions of POWHEG+PYTHIA (P8) for the CP5 and CUETP8M2T4 (T4) tunes, POWHEG+HERWIG (H7), and the multiparton simulation MG5_aMC@NLO (MG)+PYTHIA. The ratios of the various predictions to the measured cross sections are shown in the lower panels. |
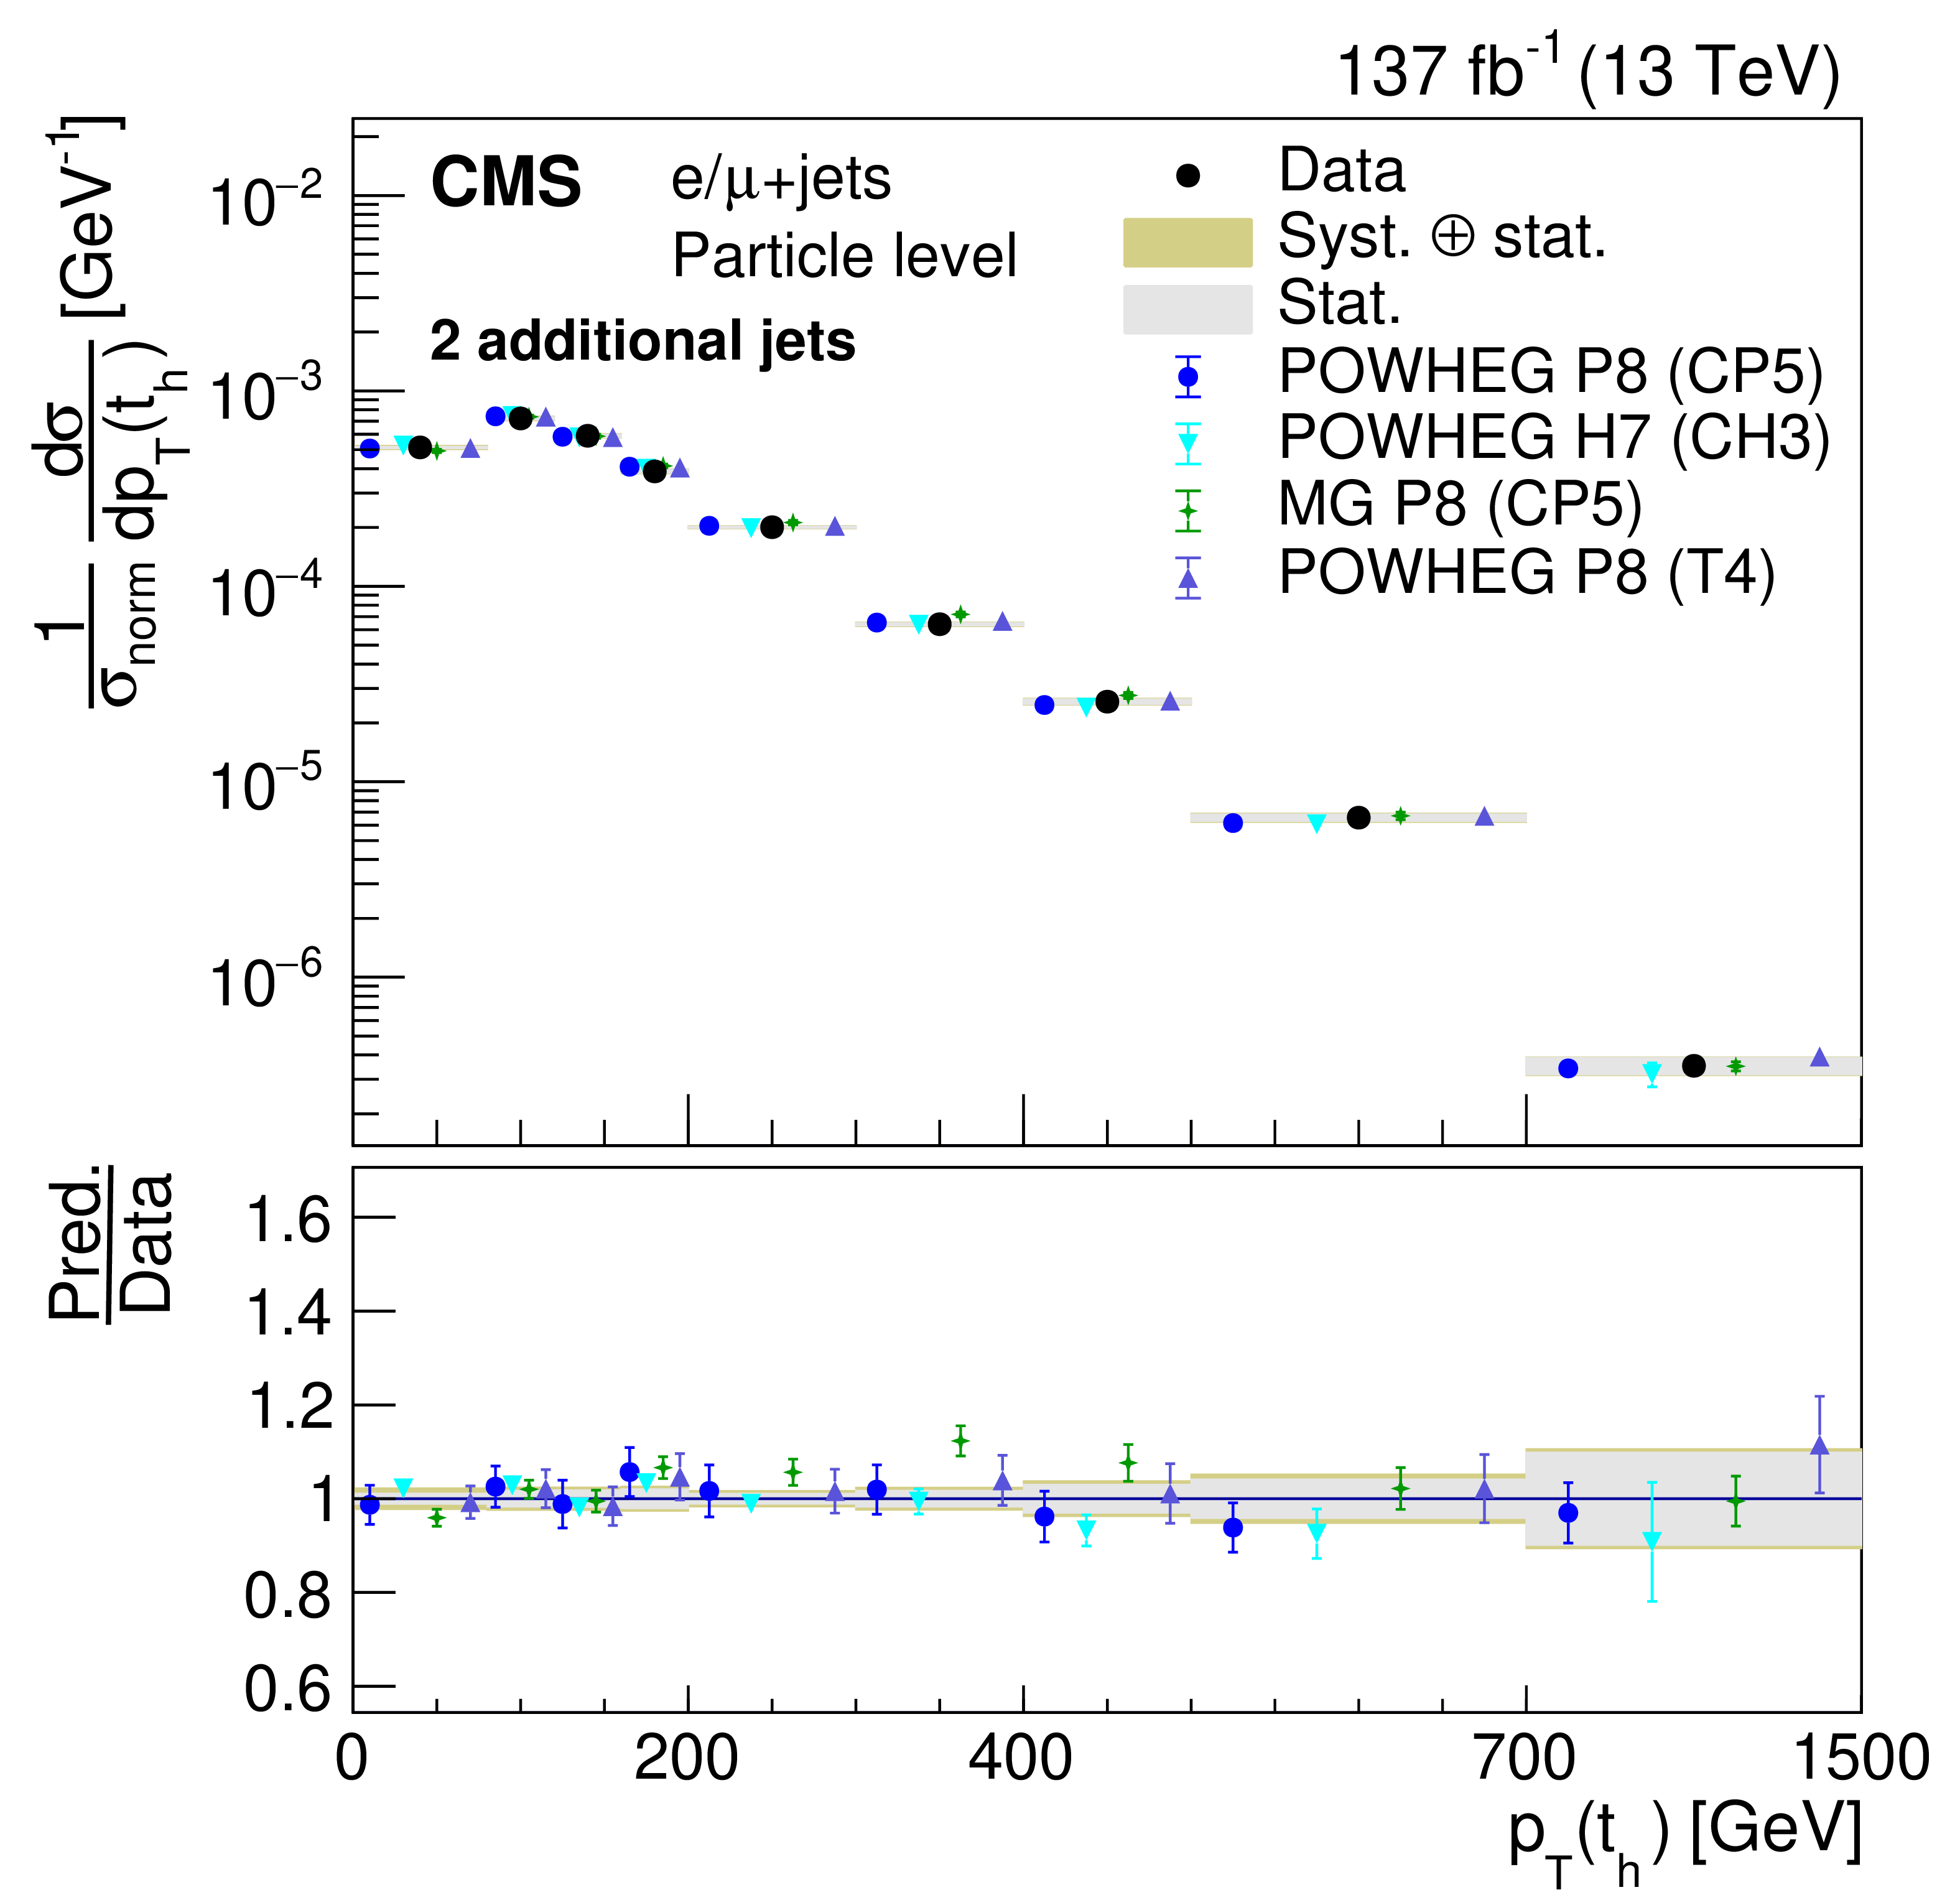
png pdf |
Figure A24-c:
Normalized differential cross section at the particle level as a function of ${{p_{\mathrm {T}}} ({\mathrm{t} _\mathrm {h}})}$ in bins of jet multiplicity. The data are shown as points with gray (yellow) bands indicating the statistical (statistical and systematic) uncertainties. The cross sections are compared to the predictions of POWHEG+PYTHIA (P8) for the CP5 and CUETP8M2T4 (T4) tunes, POWHEG+HERWIG (H7), and the multiparton simulation MG5_aMC@NLO (MG)+PYTHIA. The ratios of the various predictions to the measured cross sections are shown in the lower panels. |
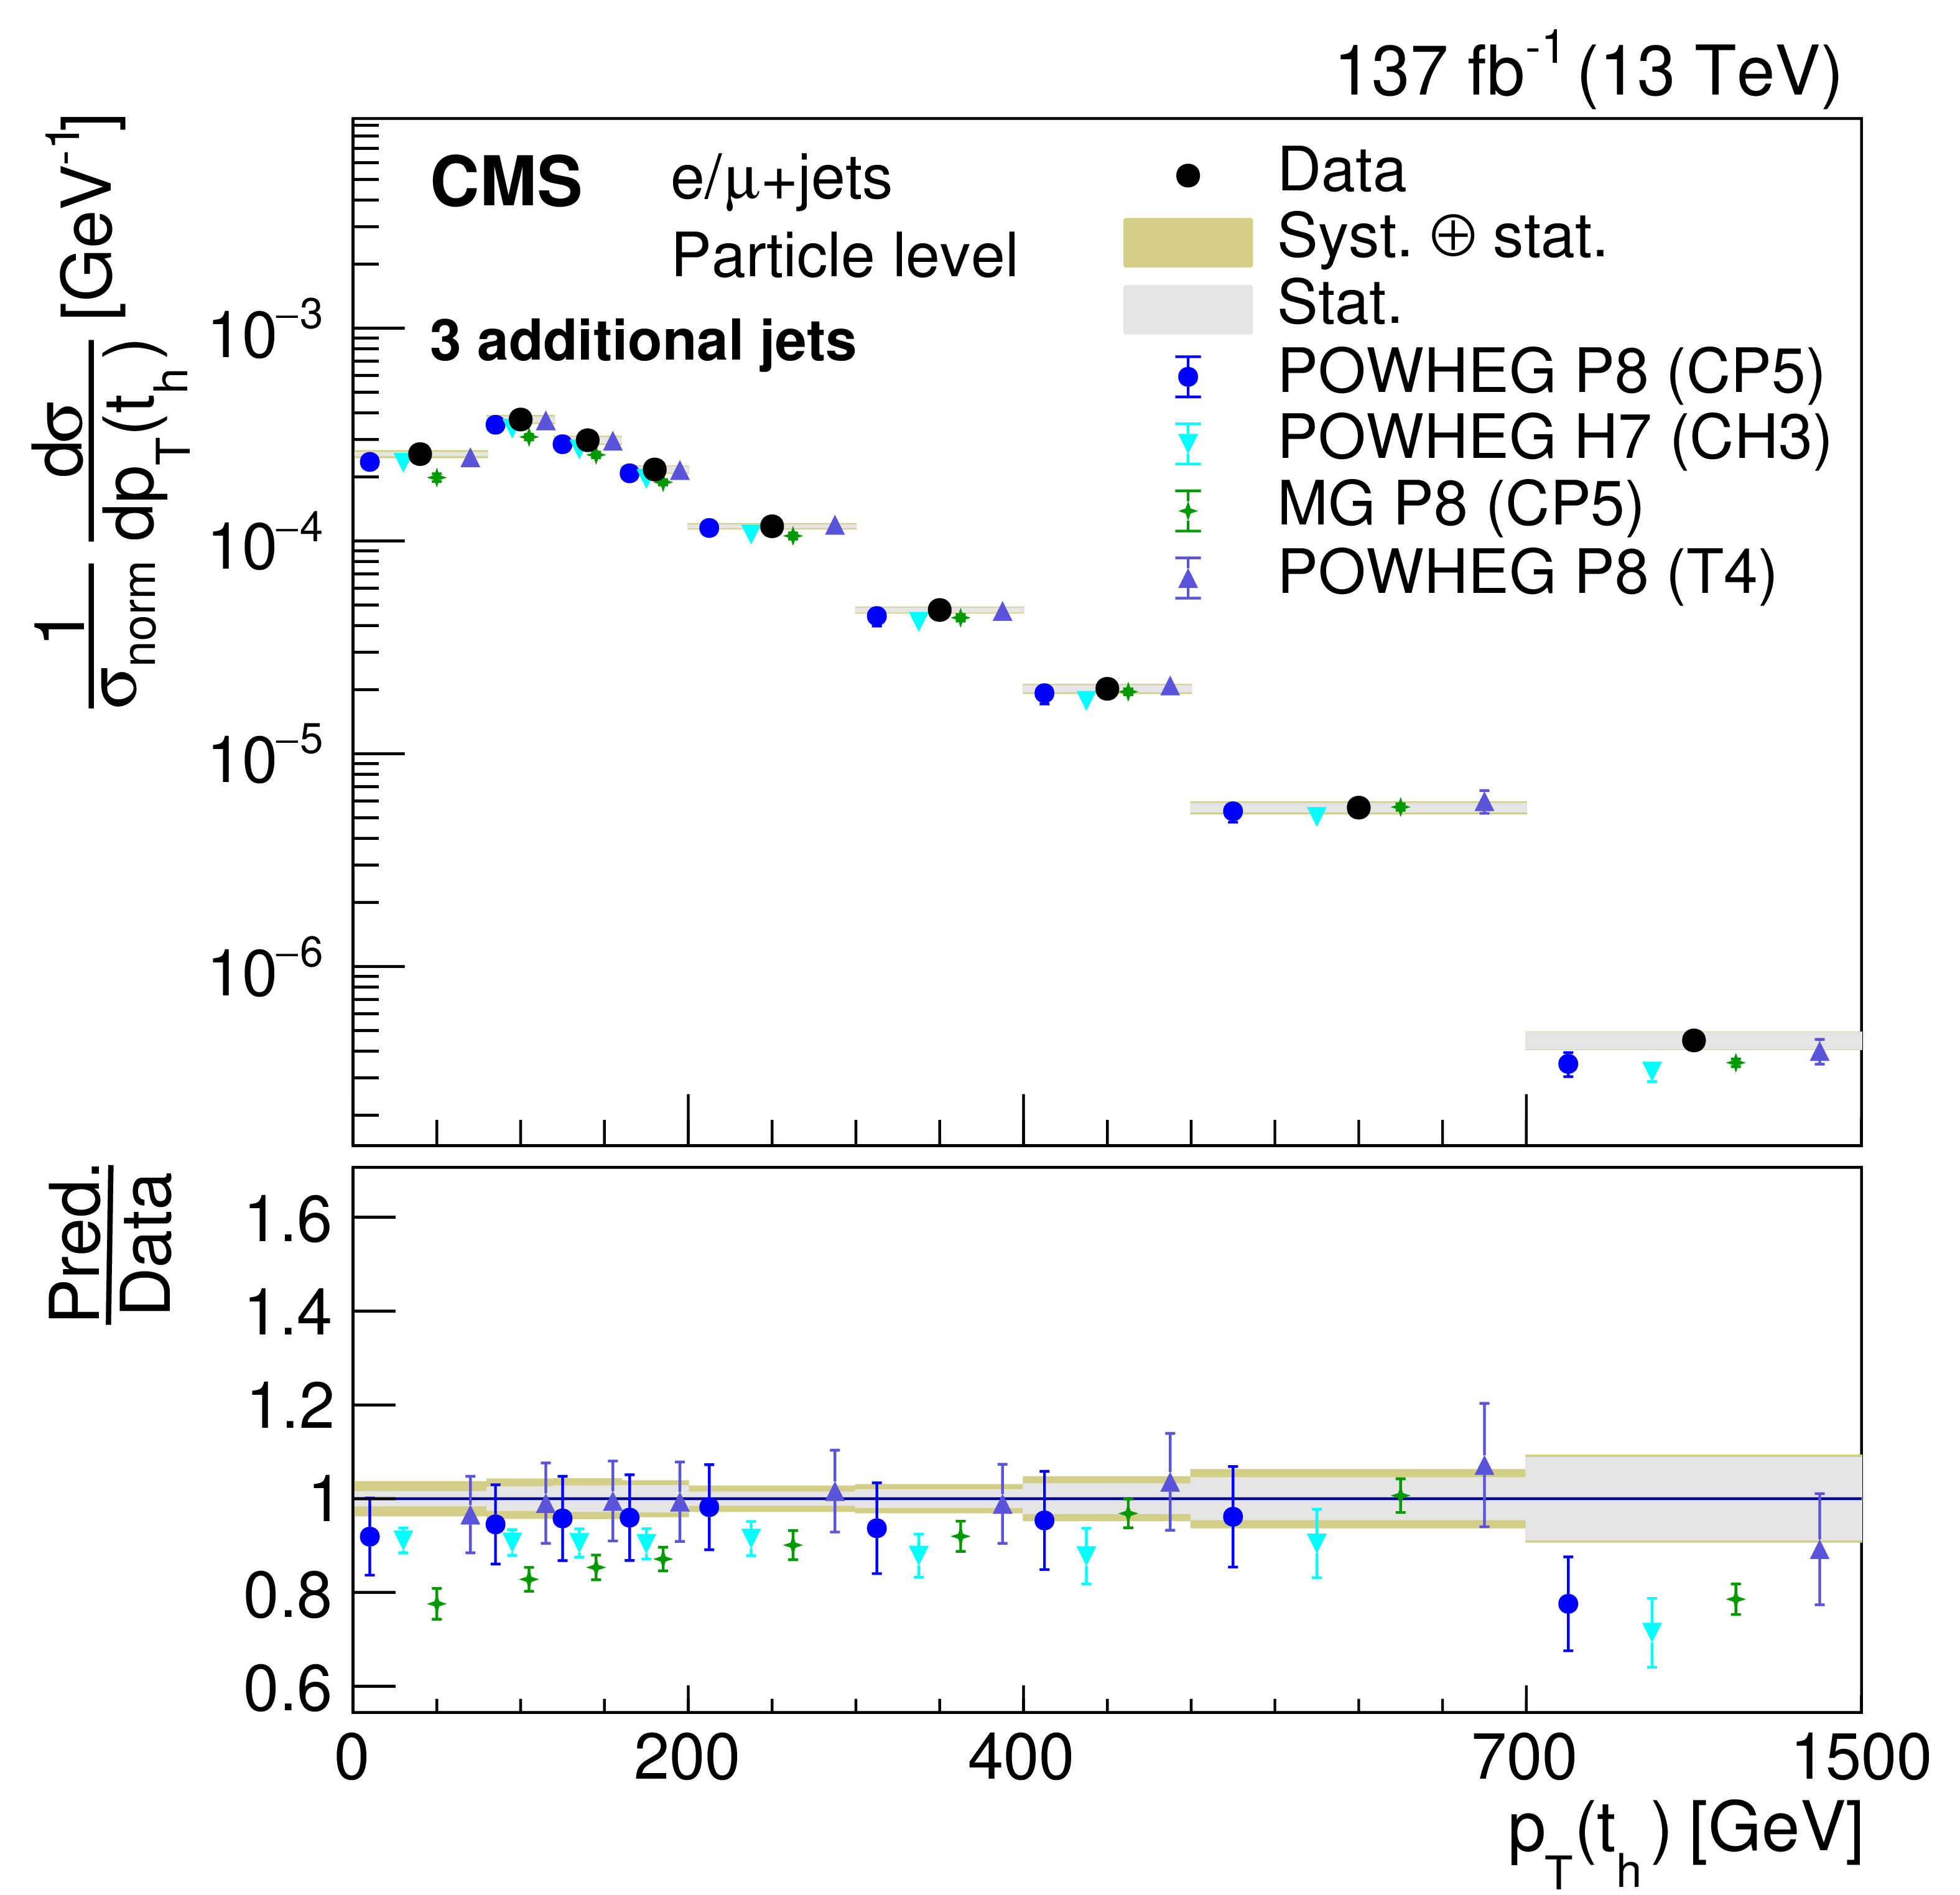
png pdf |
Figure A24-d:
Normalized differential cross section at the particle level as a function of ${{p_{\mathrm {T}}} ({\mathrm{t} _\mathrm {h}})}$ in bins of jet multiplicity. The data are shown as points with gray (yellow) bands indicating the statistical (statistical and systematic) uncertainties. The cross sections are compared to the predictions of POWHEG+PYTHIA (P8) for the CP5 and CUETP8M2T4 (T4) tunes, POWHEG+HERWIG (H7), and the multiparton simulation MG5_aMC@NLO (MG)+PYTHIA. The ratios of the various predictions to the measured cross sections are shown in the lower panels. |
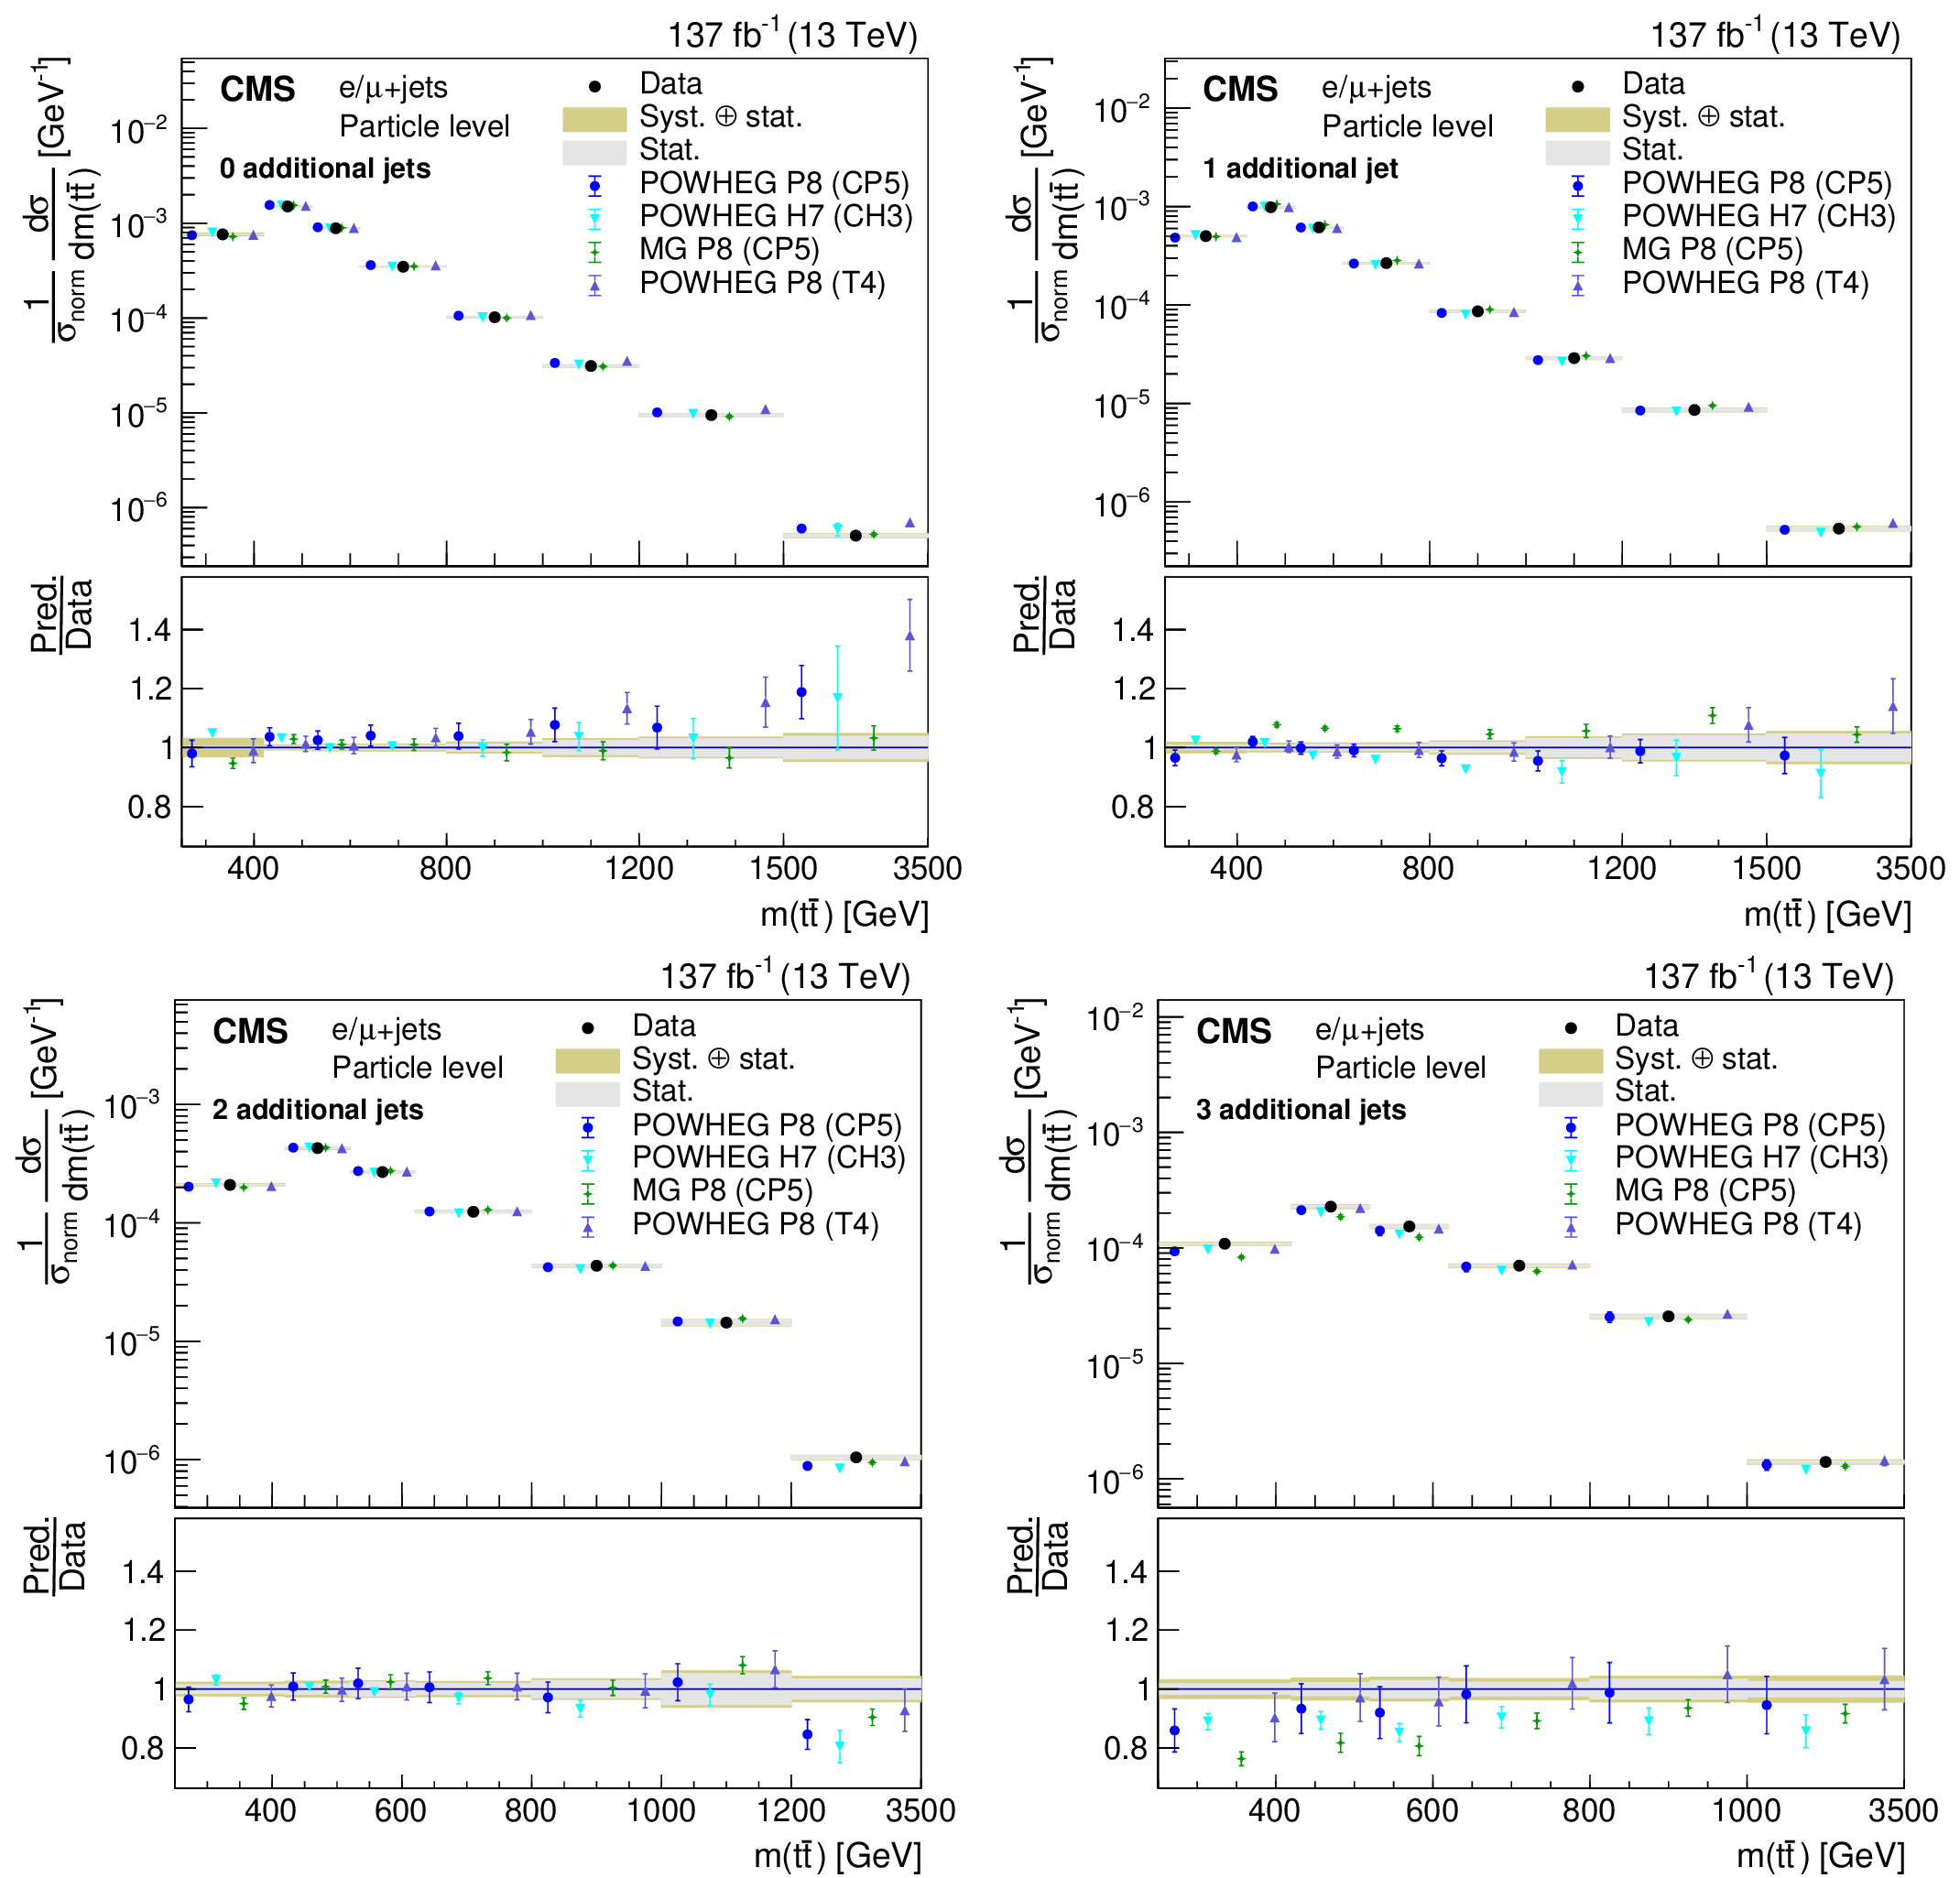
png pdf |
Figure A25:
Normalized differential cross section at the particle level as a function of ${m({\mathrm{t} {}\mathrm{\bar{t}}})}$ in bins of jet multiplicity. The data are shown as points with gray (yellow) bands indicating the statistical (statistical and systematic) uncertainties. The cross sections are compared to the predictions of POWHEG+PYTHIA (P8) for the CP5 and CUETP8M2T4 (T4) tunes, POWHEG+HERWIG (H7), and the multiparton simulation MG5_aMC@NLO (MG)+PYTHIA. The ratios of the various predictions to the measured cross sections are shown in the lower panels. |
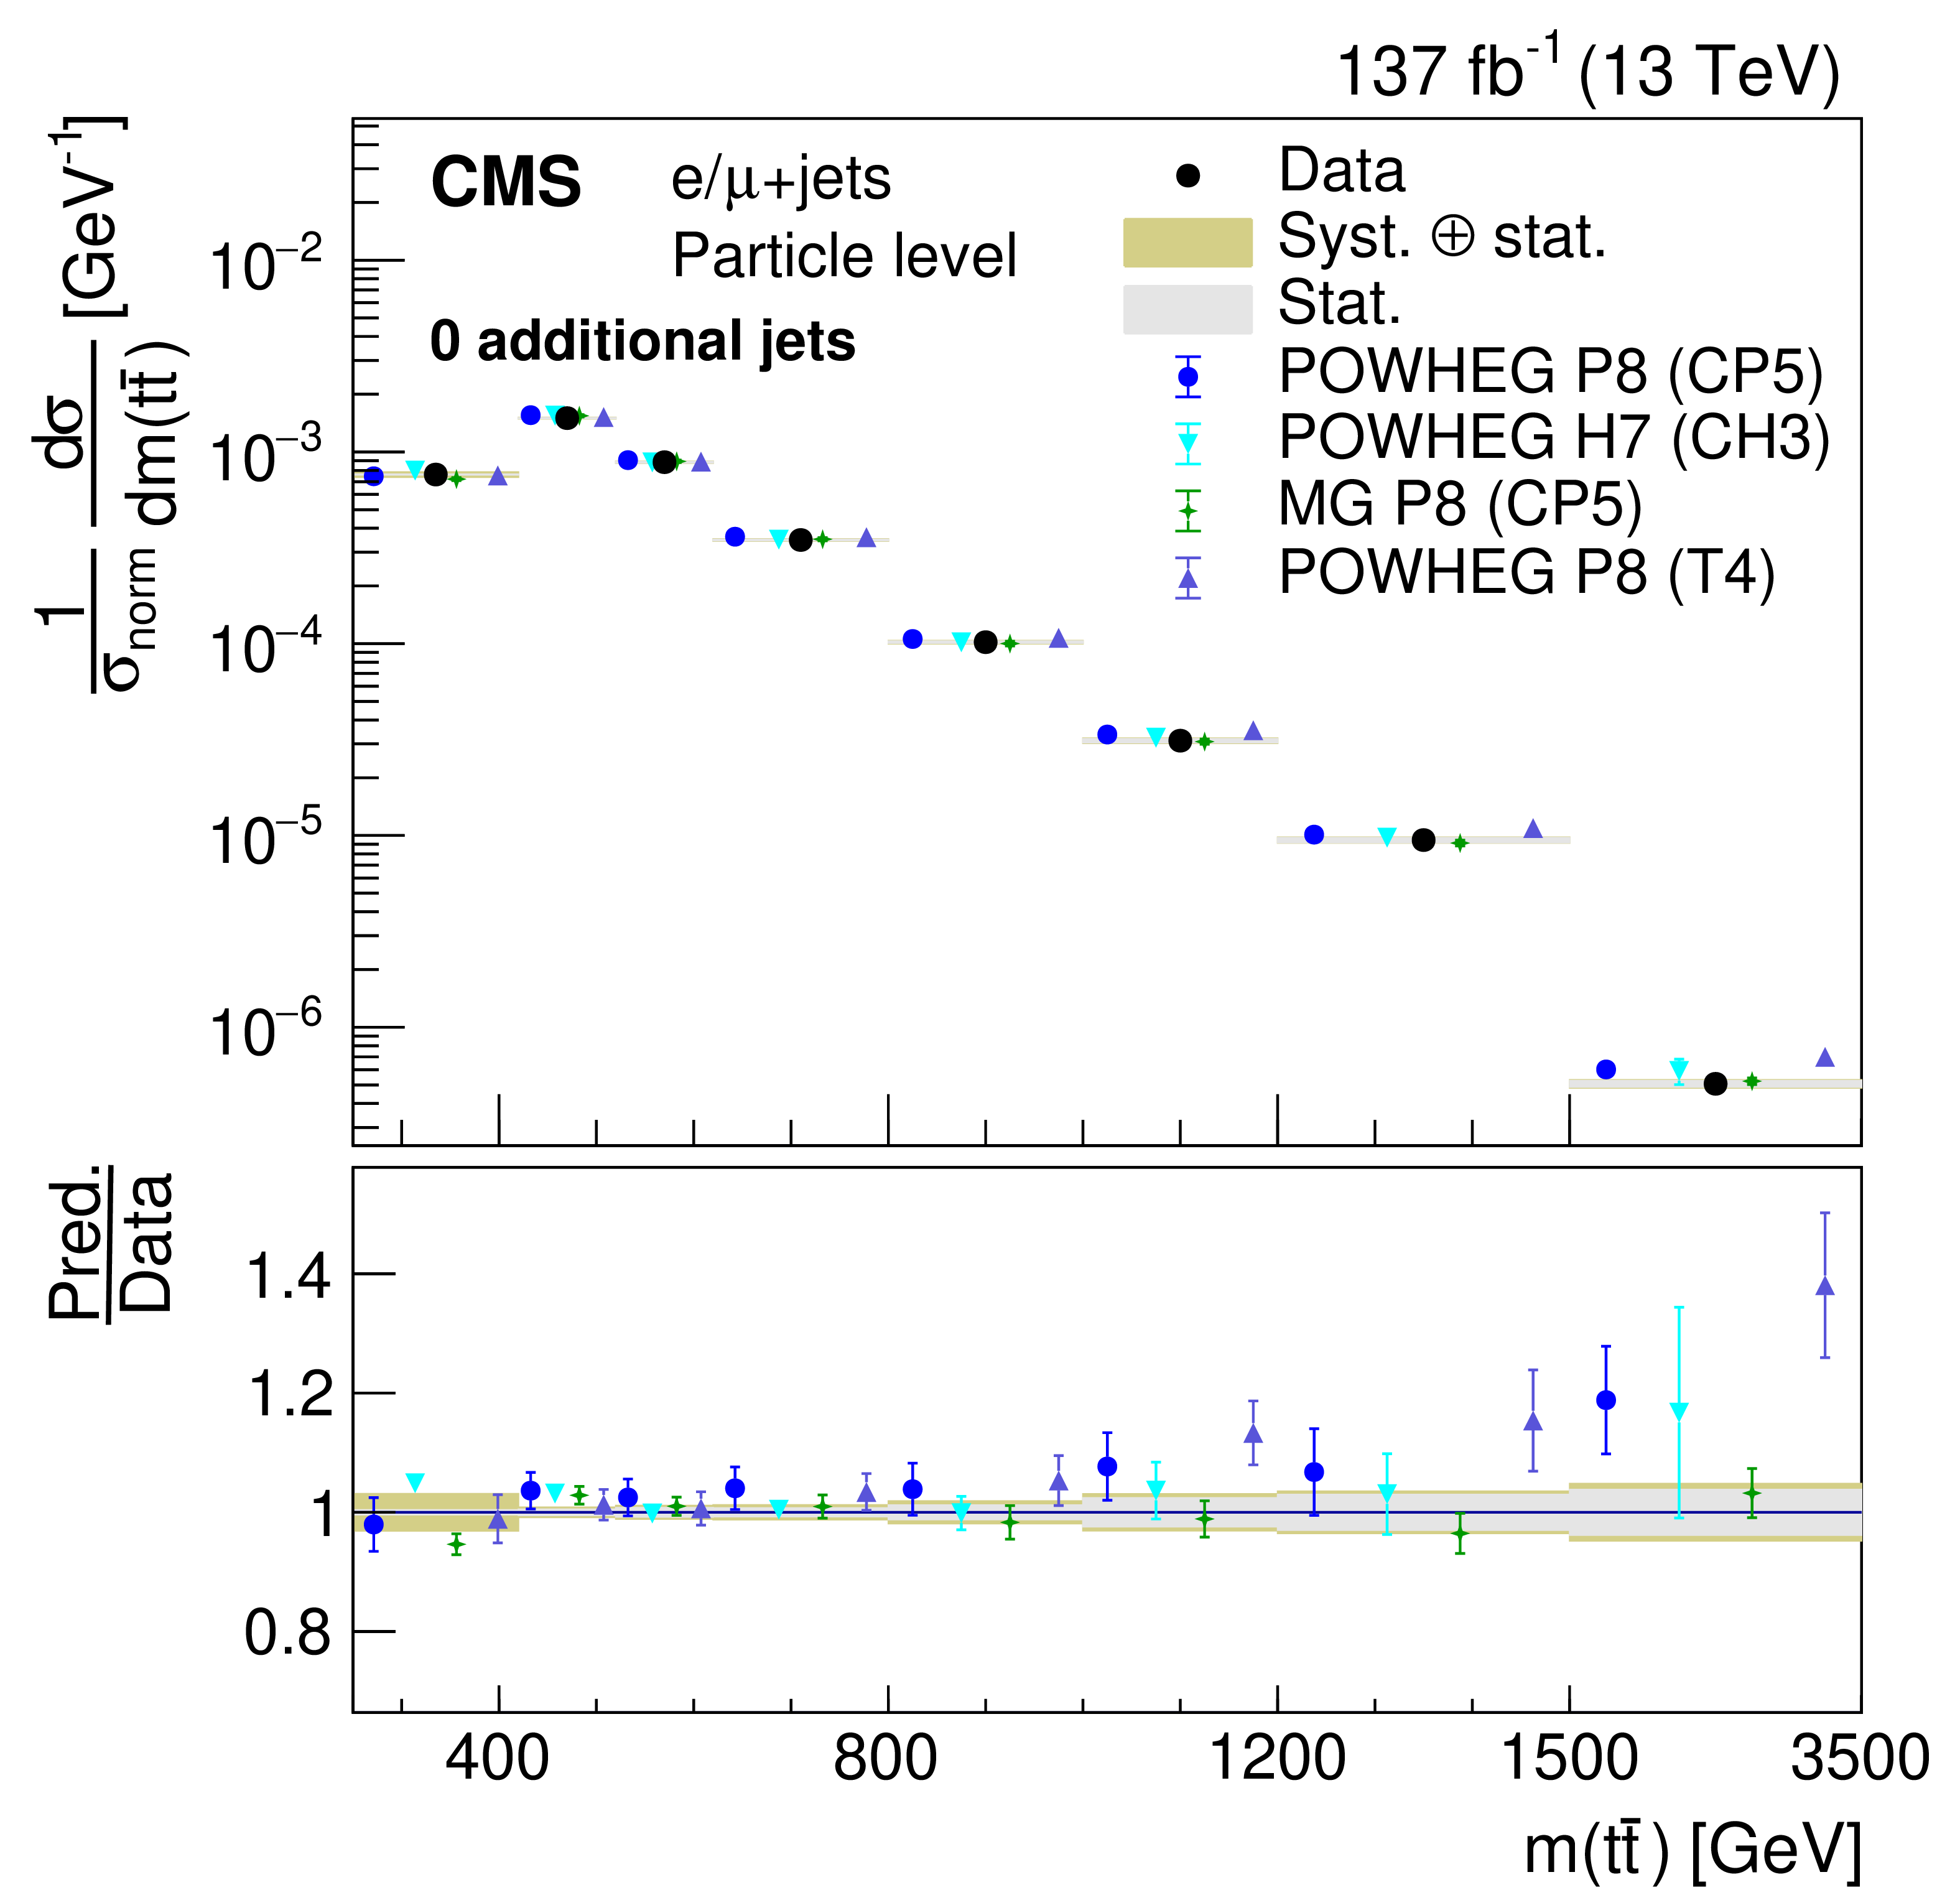
png pdf |
Figure A25-a:
Normalized differential cross section at the particle level as a function of ${m({\mathrm{t} {}\mathrm{\bar{t}}})}$ in bins of jet multiplicity. The data are shown as points with gray (yellow) bands indicating the statistical (statistical and systematic) uncertainties. The cross sections are compared to the predictions of POWHEG+PYTHIA (P8) for the CP5 and CUETP8M2T4 (T4) tunes, POWHEG+HERWIG (H7), and the multiparton simulation MG5_aMC@NLO (MG)+PYTHIA. The ratios of the various predictions to the measured cross sections are shown in the lower panels. |
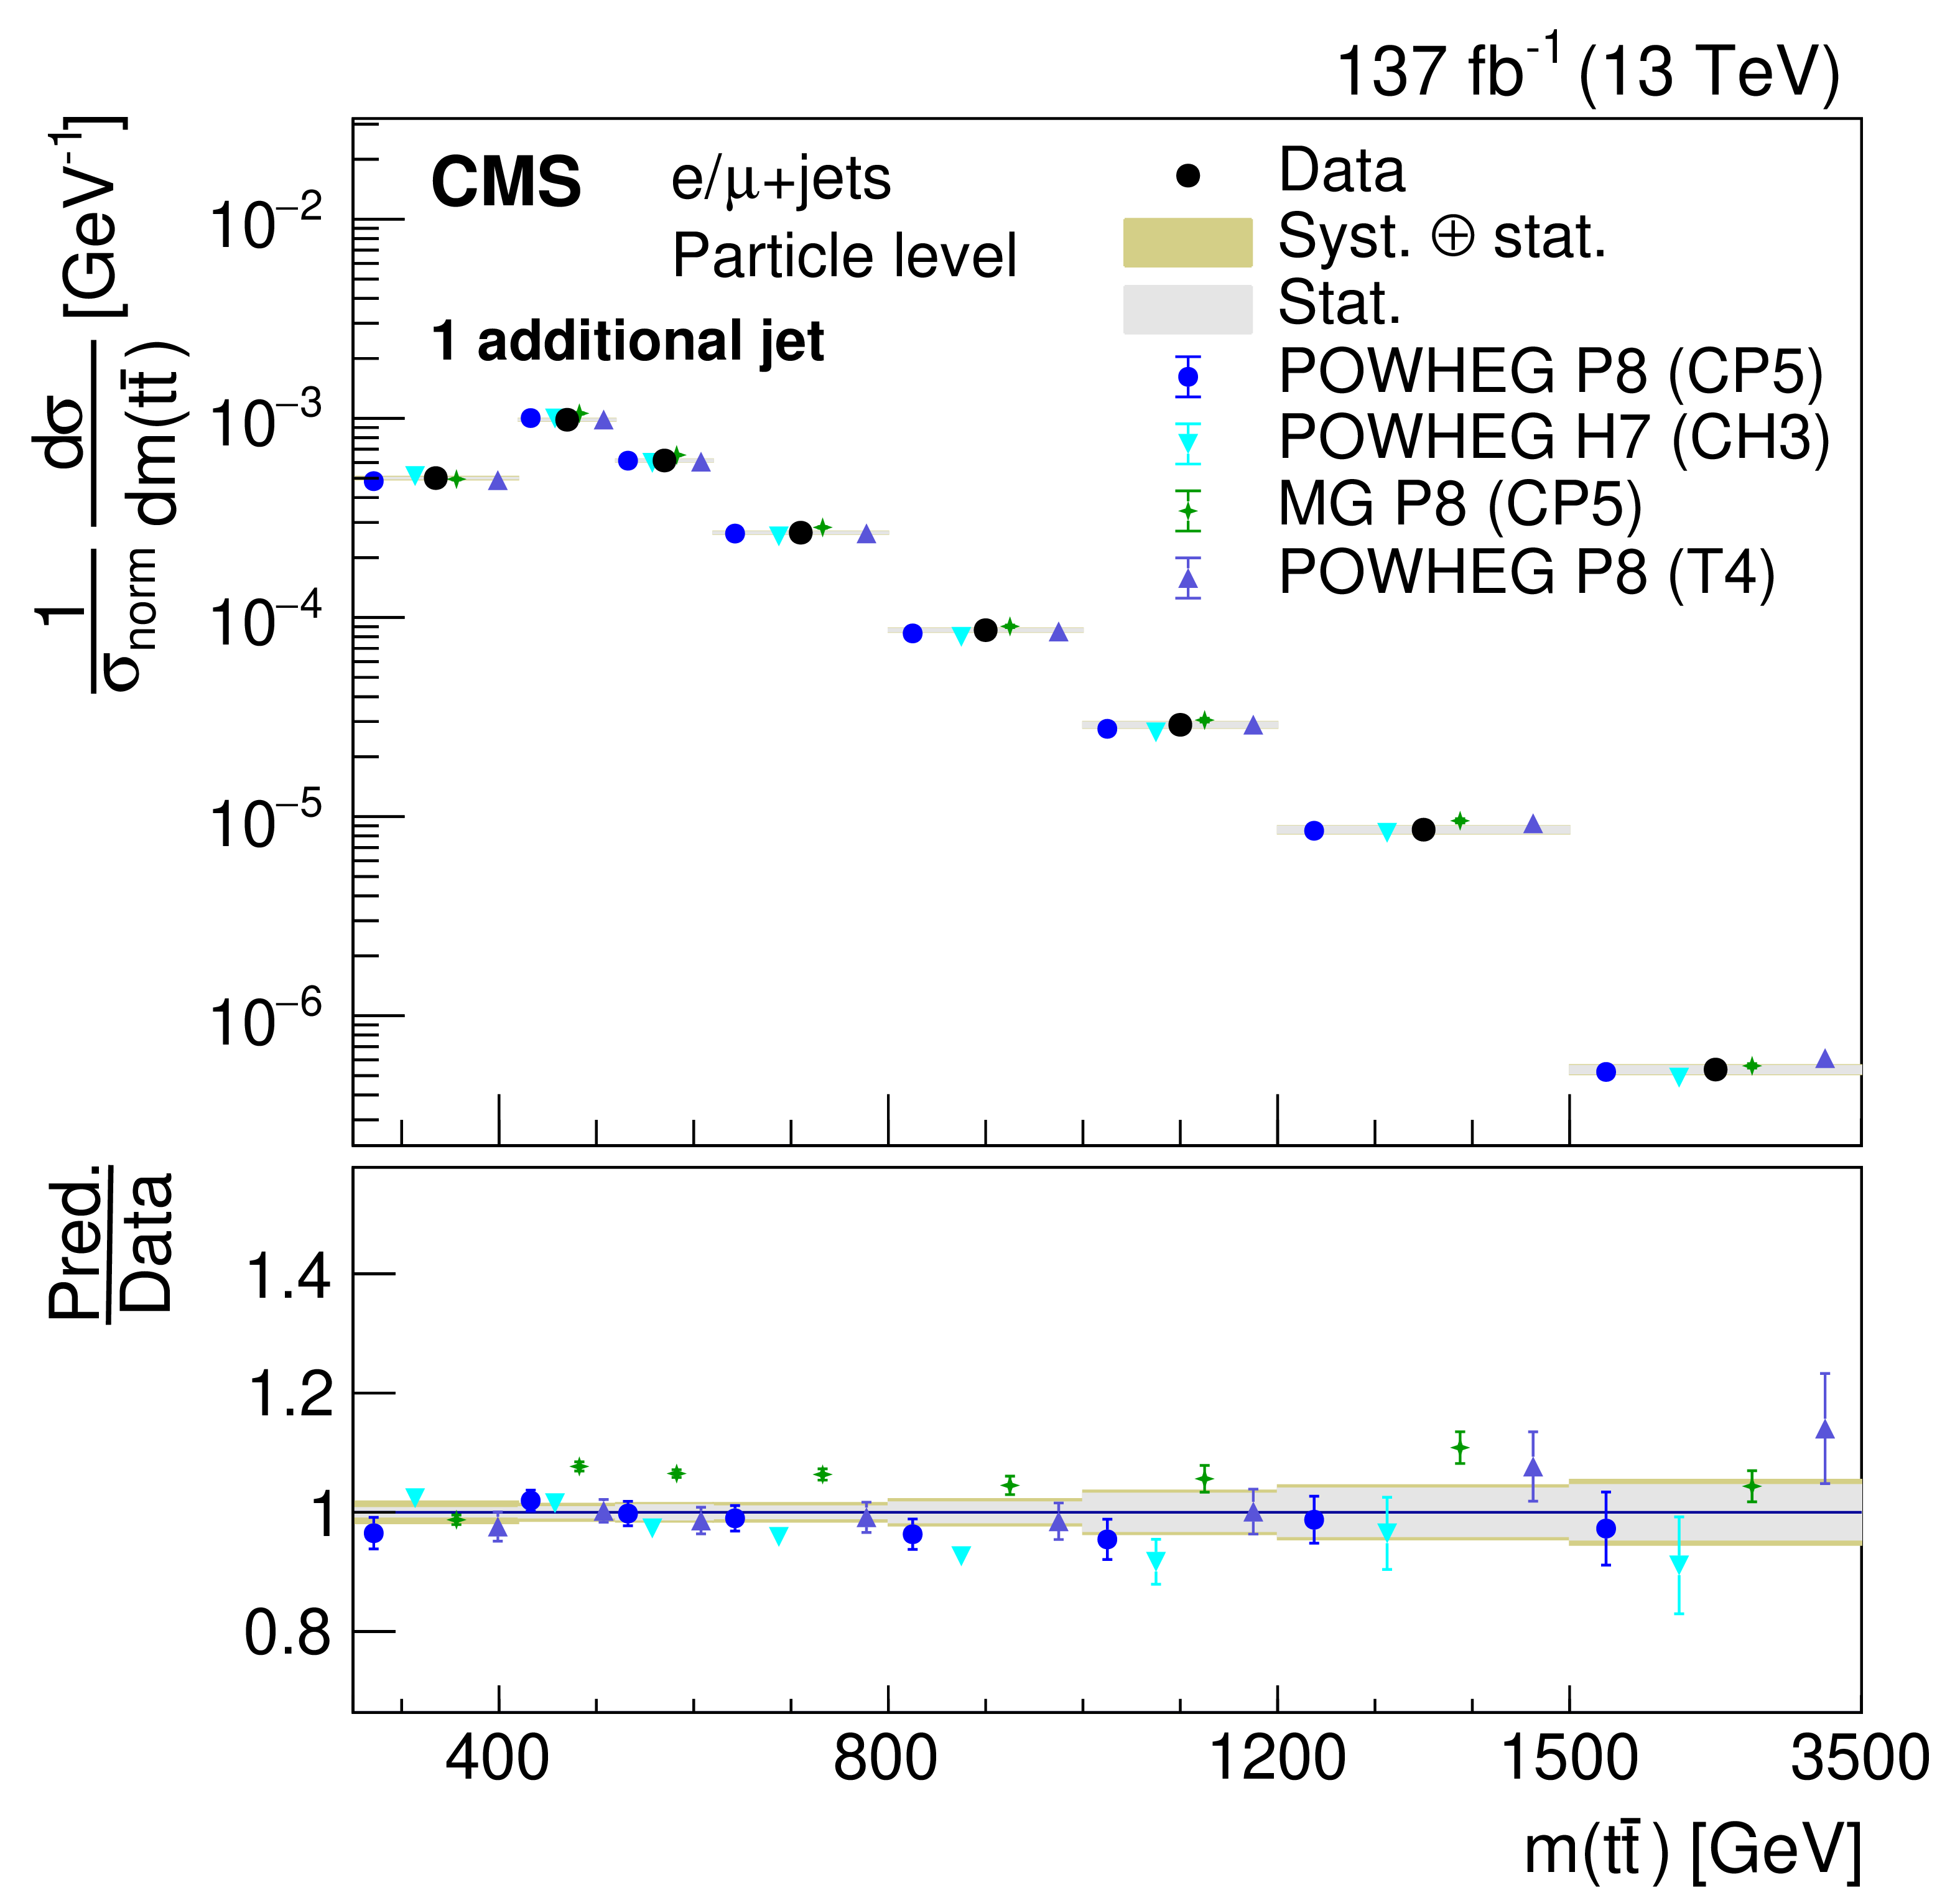
png pdf |
Figure A25-b:
Normalized differential cross section at the particle level as a function of ${m({\mathrm{t} {}\mathrm{\bar{t}}})}$ in bins of jet multiplicity. The data are shown as points with gray (yellow) bands indicating the statistical (statistical and systematic) uncertainties. The cross sections are compared to the predictions of POWHEG+PYTHIA (P8) for the CP5 and CUETP8M2T4 (T4) tunes, POWHEG+HERWIG (H7), and the multiparton simulation MG5_aMC@NLO (MG)+PYTHIA. The ratios of the various predictions to the measured cross sections are shown in the lower panels. |
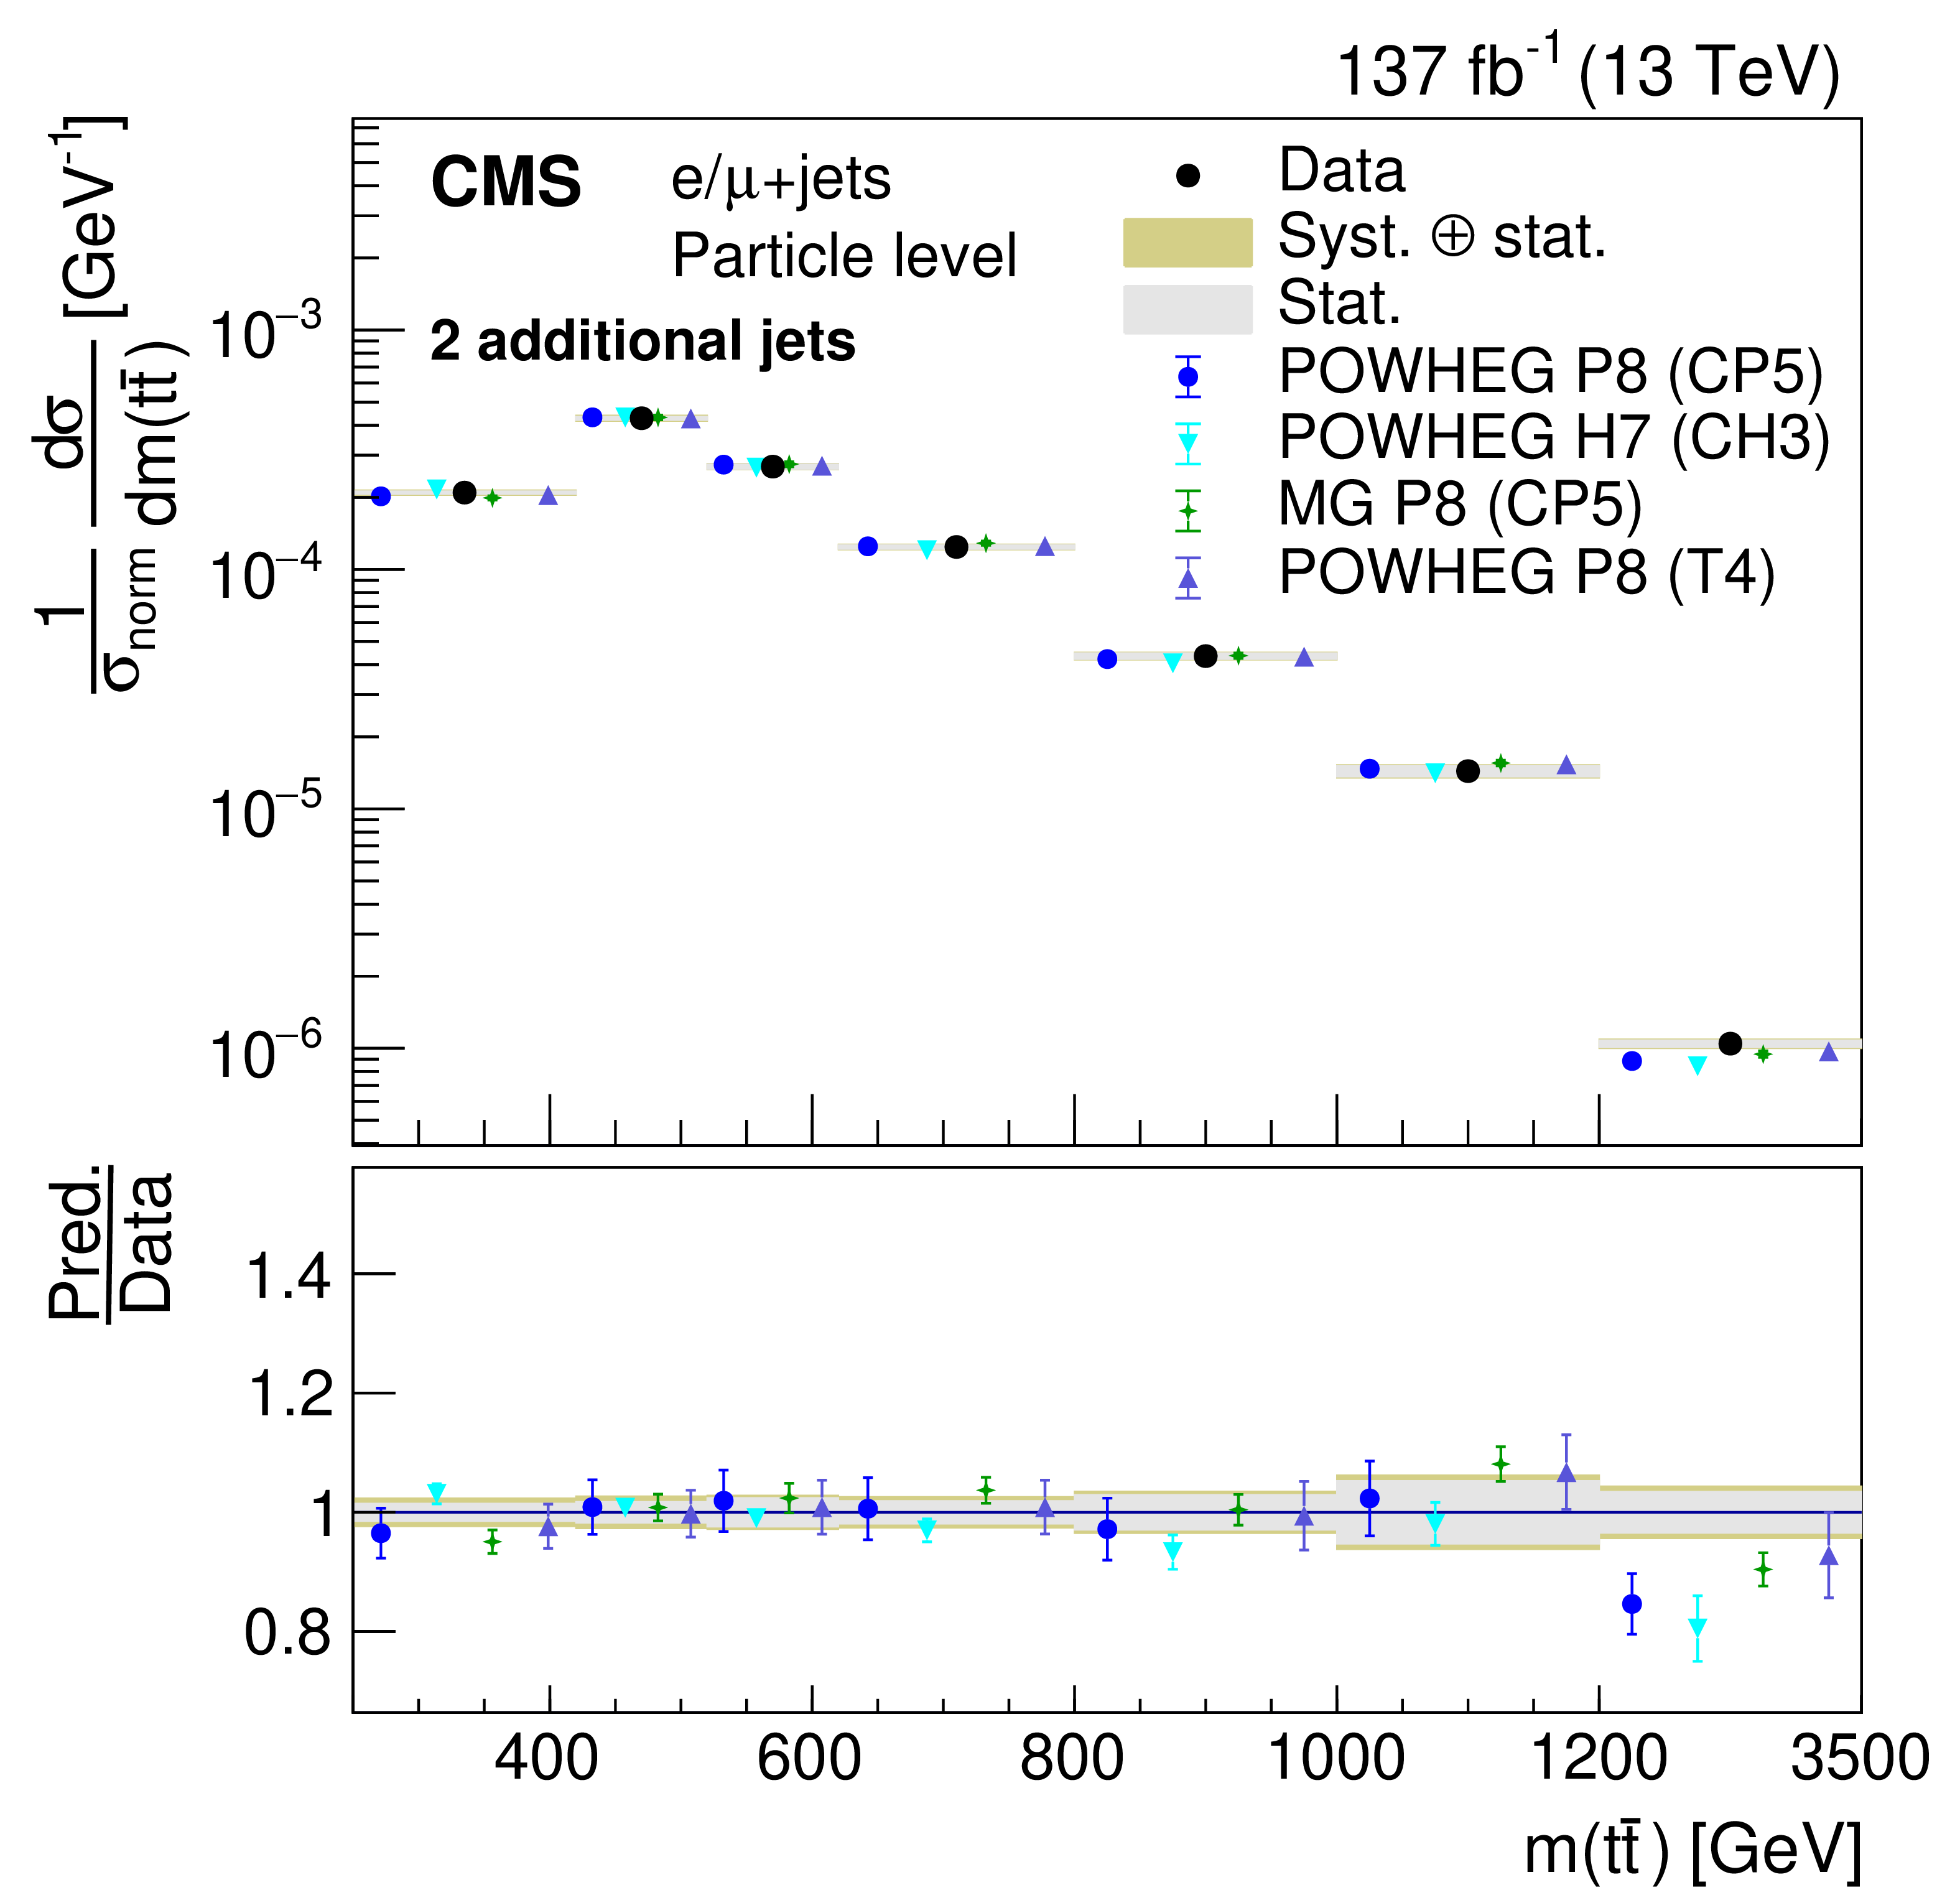
png pdf |
Figure A25-c:
Normalized differential cross section at the particle level as a function of ${m({\mathrm{t} {}\mathrm{\bar{t}}})}$ in bins of jet multiplicity. The data are shown as points with gray (yellow) bands indicating the statistical (statistical and systematic) uncertainties. The cross sections are compared to the predictions of POWHEG+PYTHIA (P8) for the CP5 and CUETP8M2T4 (T4) tunes, POWHEG+HERWIG (H7), and the multiparton simulation MG5_aMC@NLO (MG)+PYTHIA. The ratios of the various predictions to the measured cross sections are shown in the lower panels. |
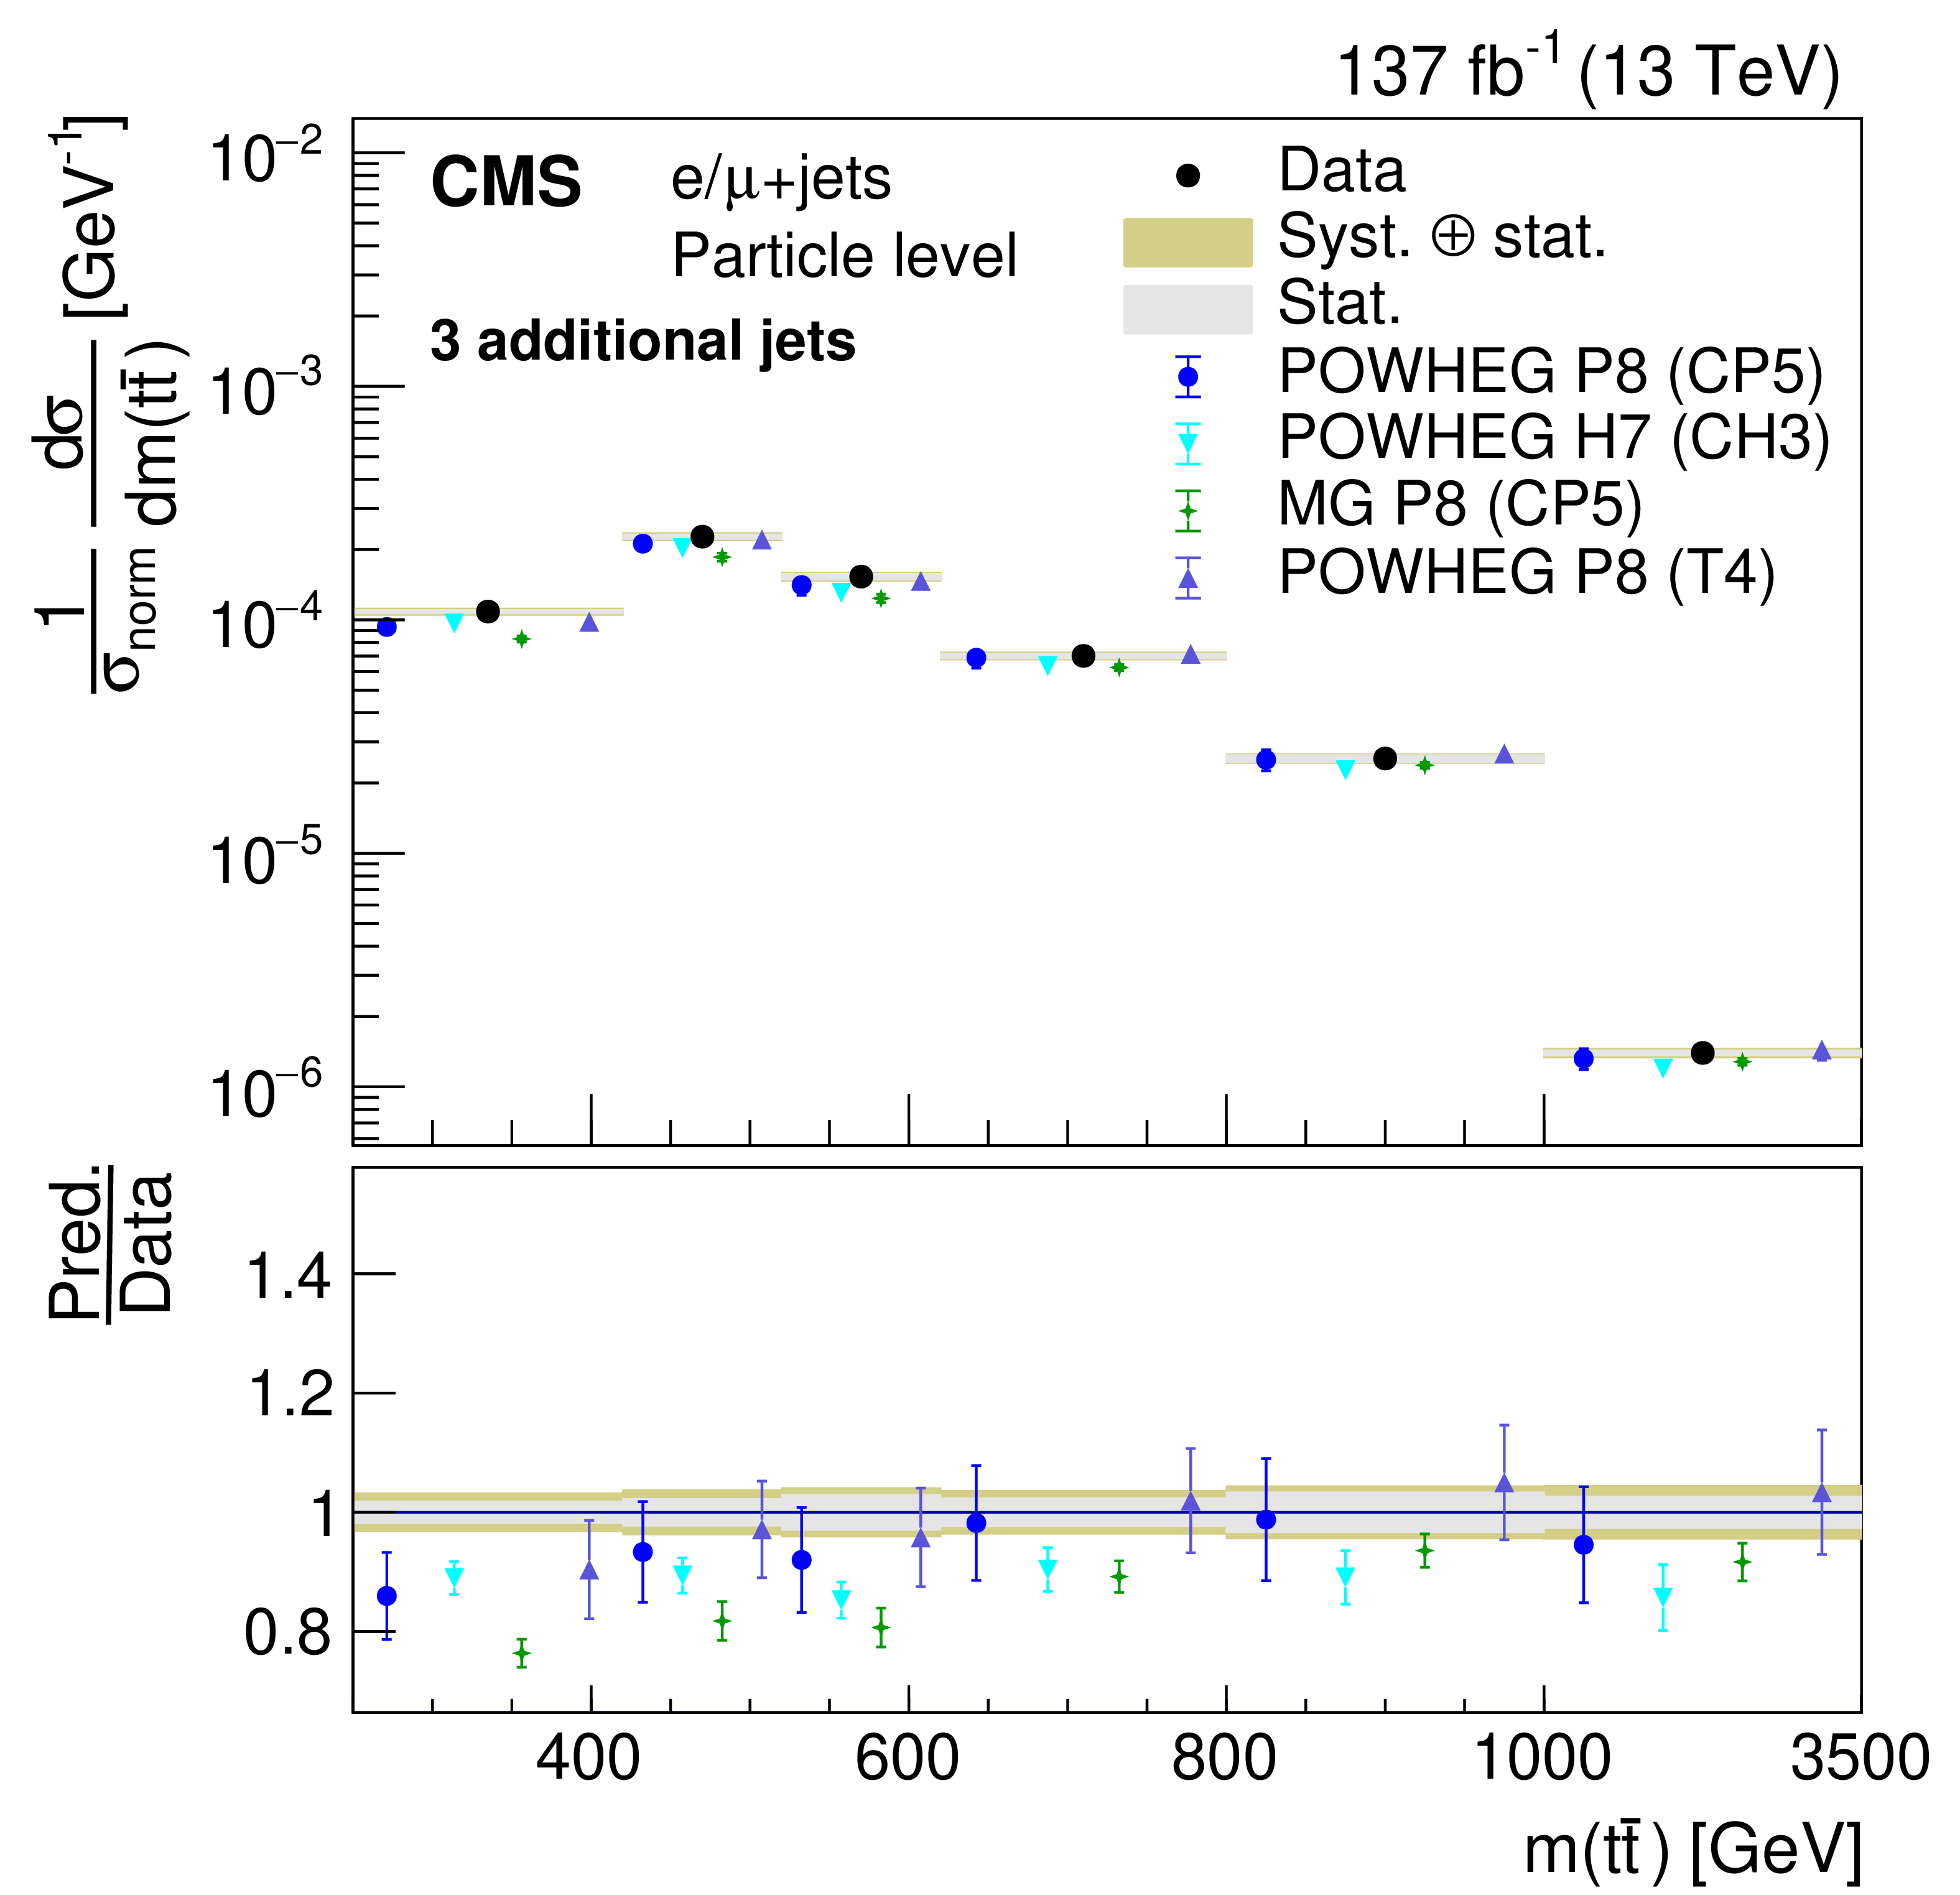
png pdf |
Figure A25-d:
Normalized differential cross section at the particle level as a function of ${m({\mathrm{t} {}\mathrm{\bar{t}}})}$ in bins of jet multiplicity. The data are shown as points with gray (yellow) bands indicating the statistical (statistical and systematic) uncertainties. The cross sections are compared to the predictions of POWHEG+PYTHIA (P8) for the CP5 and CUETP8M2T4 (T4) tunes, POWHEG+HERWIG (H7), and the multiparton simulation MG5_aMC@NLO (MG)+PYTHIA. The ratios of the various predictions to the measured cross sections are shown in the lower panels. |
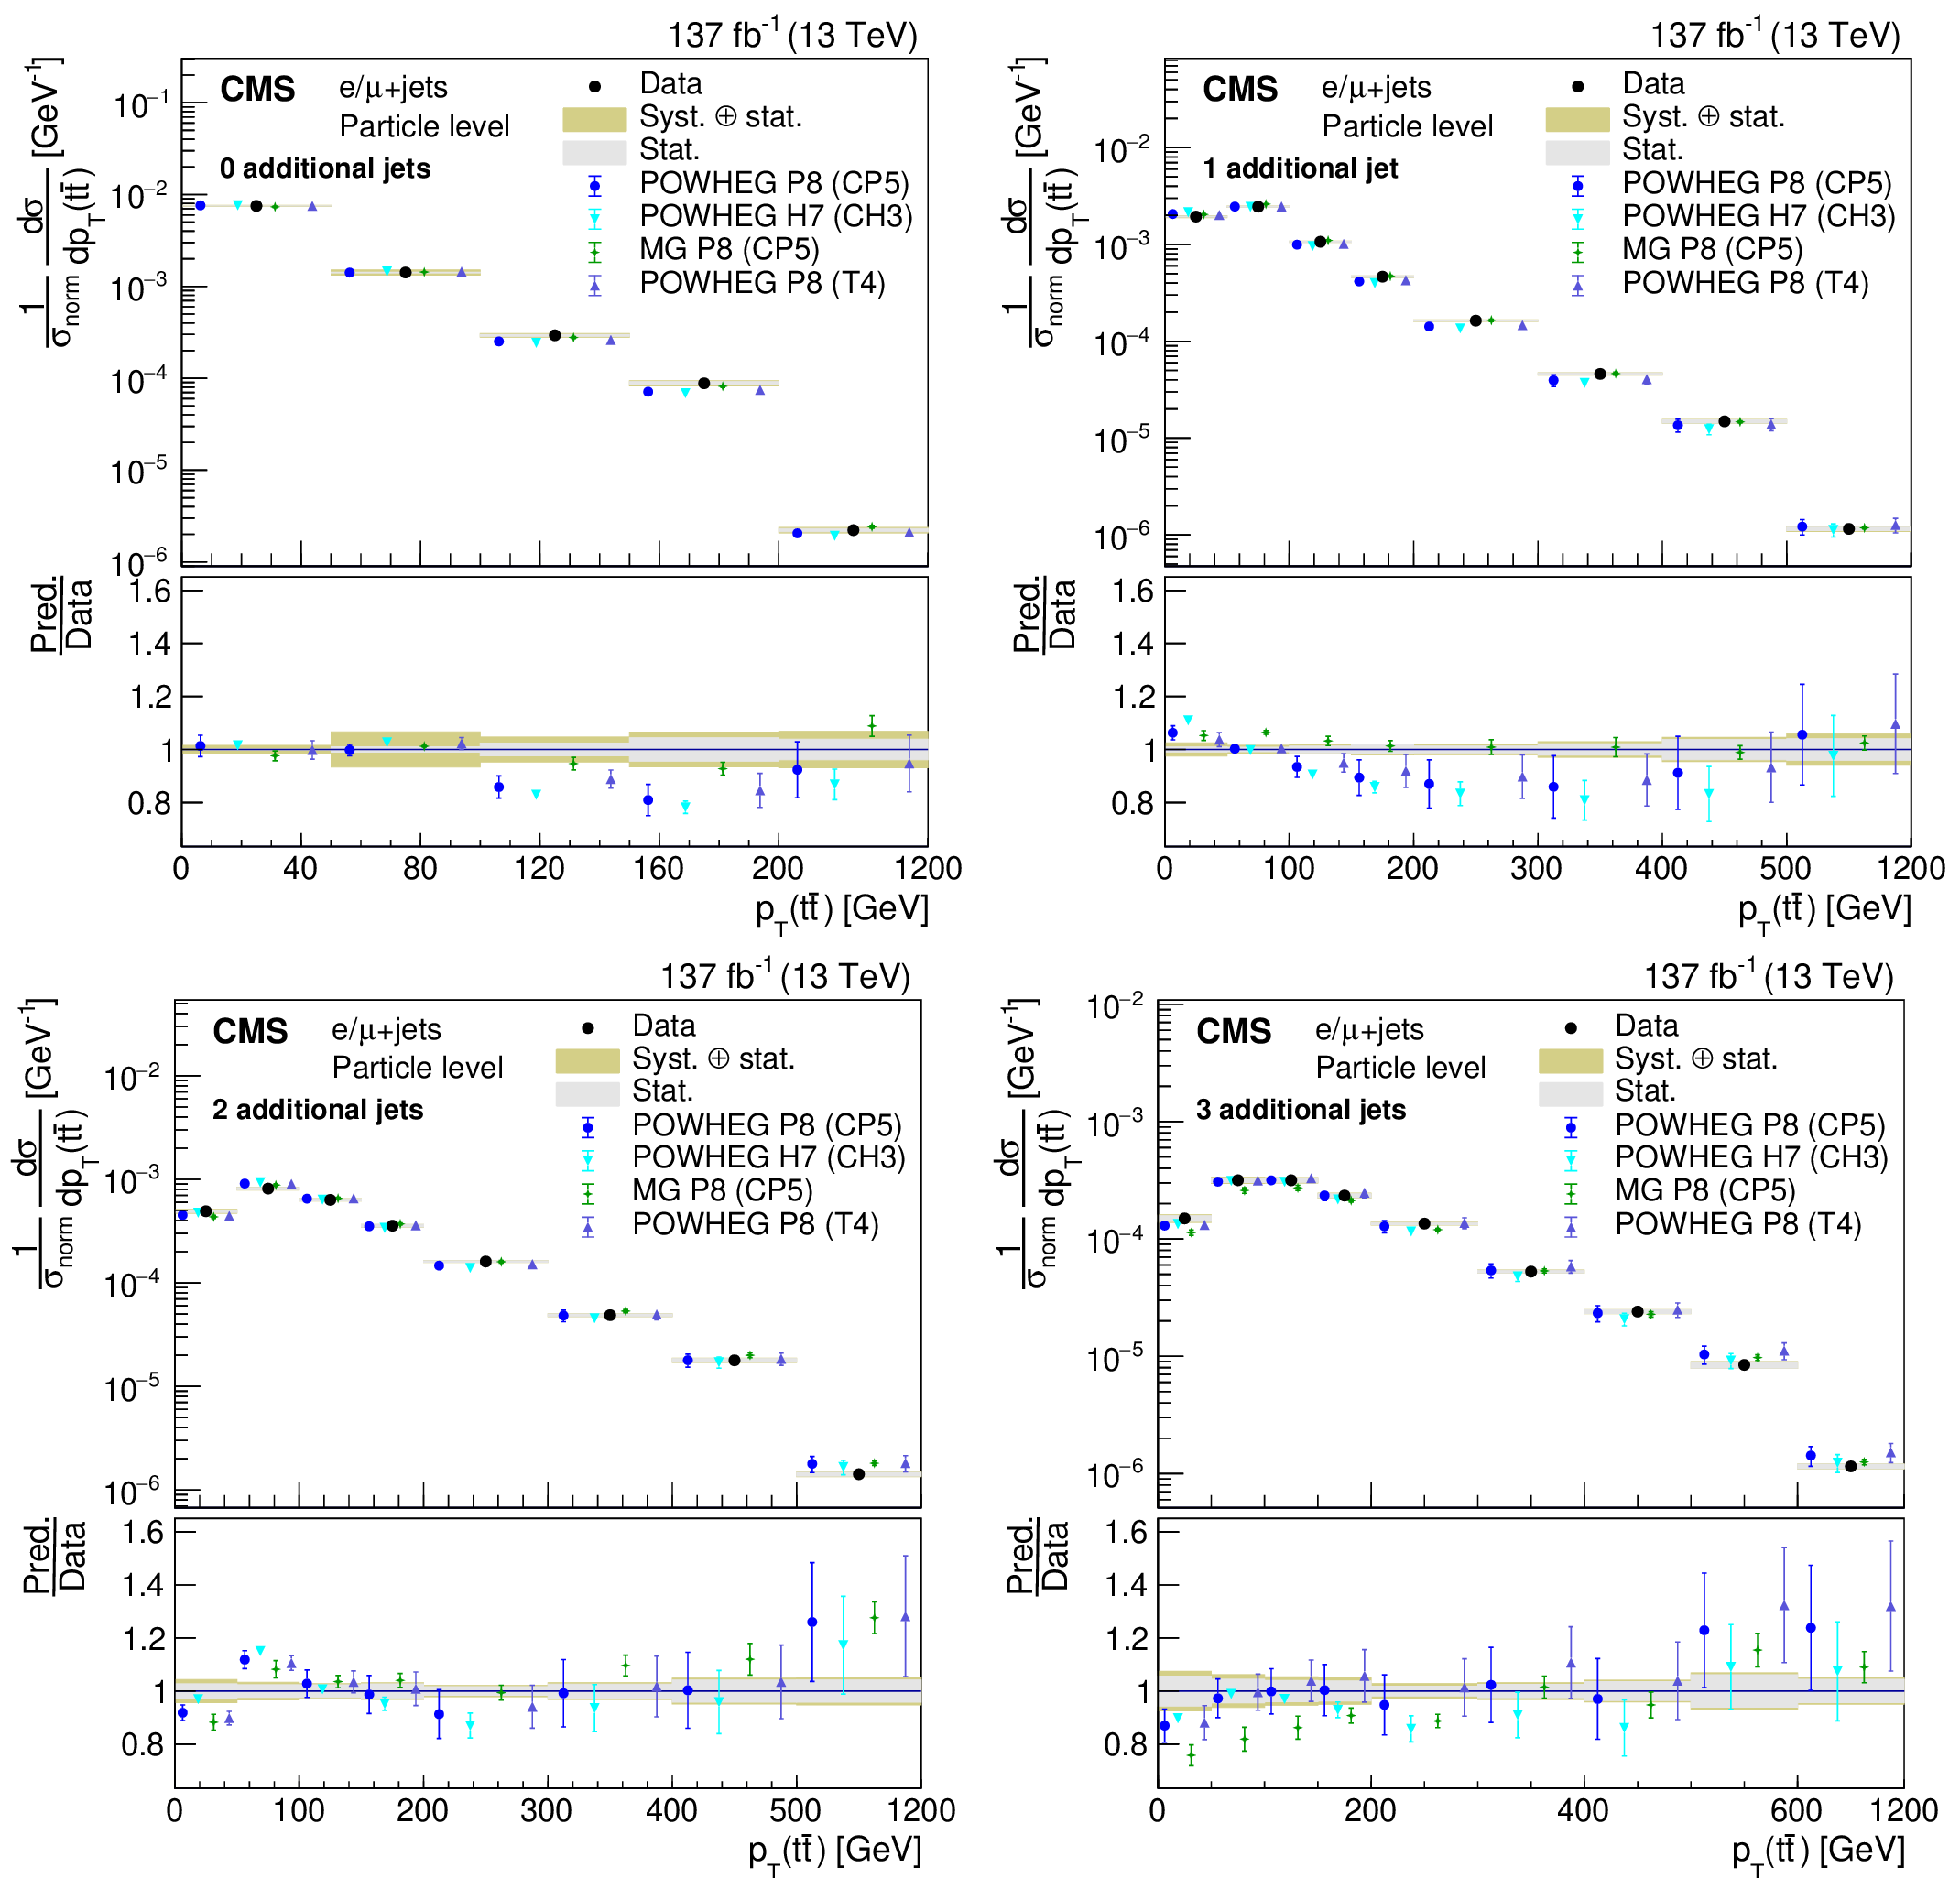
png pdf |
Figure A26:
Normalized differential cross section at the particle level as a function of ${{p_{\mathrm {T}}} ({\mathrm{t} {}\mathrm{\bar{t}}})}$ in bins of jet multiplicity. The data are shown as points with gray (yellow) bands indicating the statistical (statistical and systematic) uncertainties. The cross sections are compared to the predictions of POWHEG+PYTHIA (P8) for the CP5 and CUETP8M2T4 (T4) tunes, POWHEG+HERWIG (H7), and the multiparton simulation MG5_aMC@NLO (MG)+PYTHIA. The ratios of the various predictions to the measured cross sections are shown in the lower panels. |
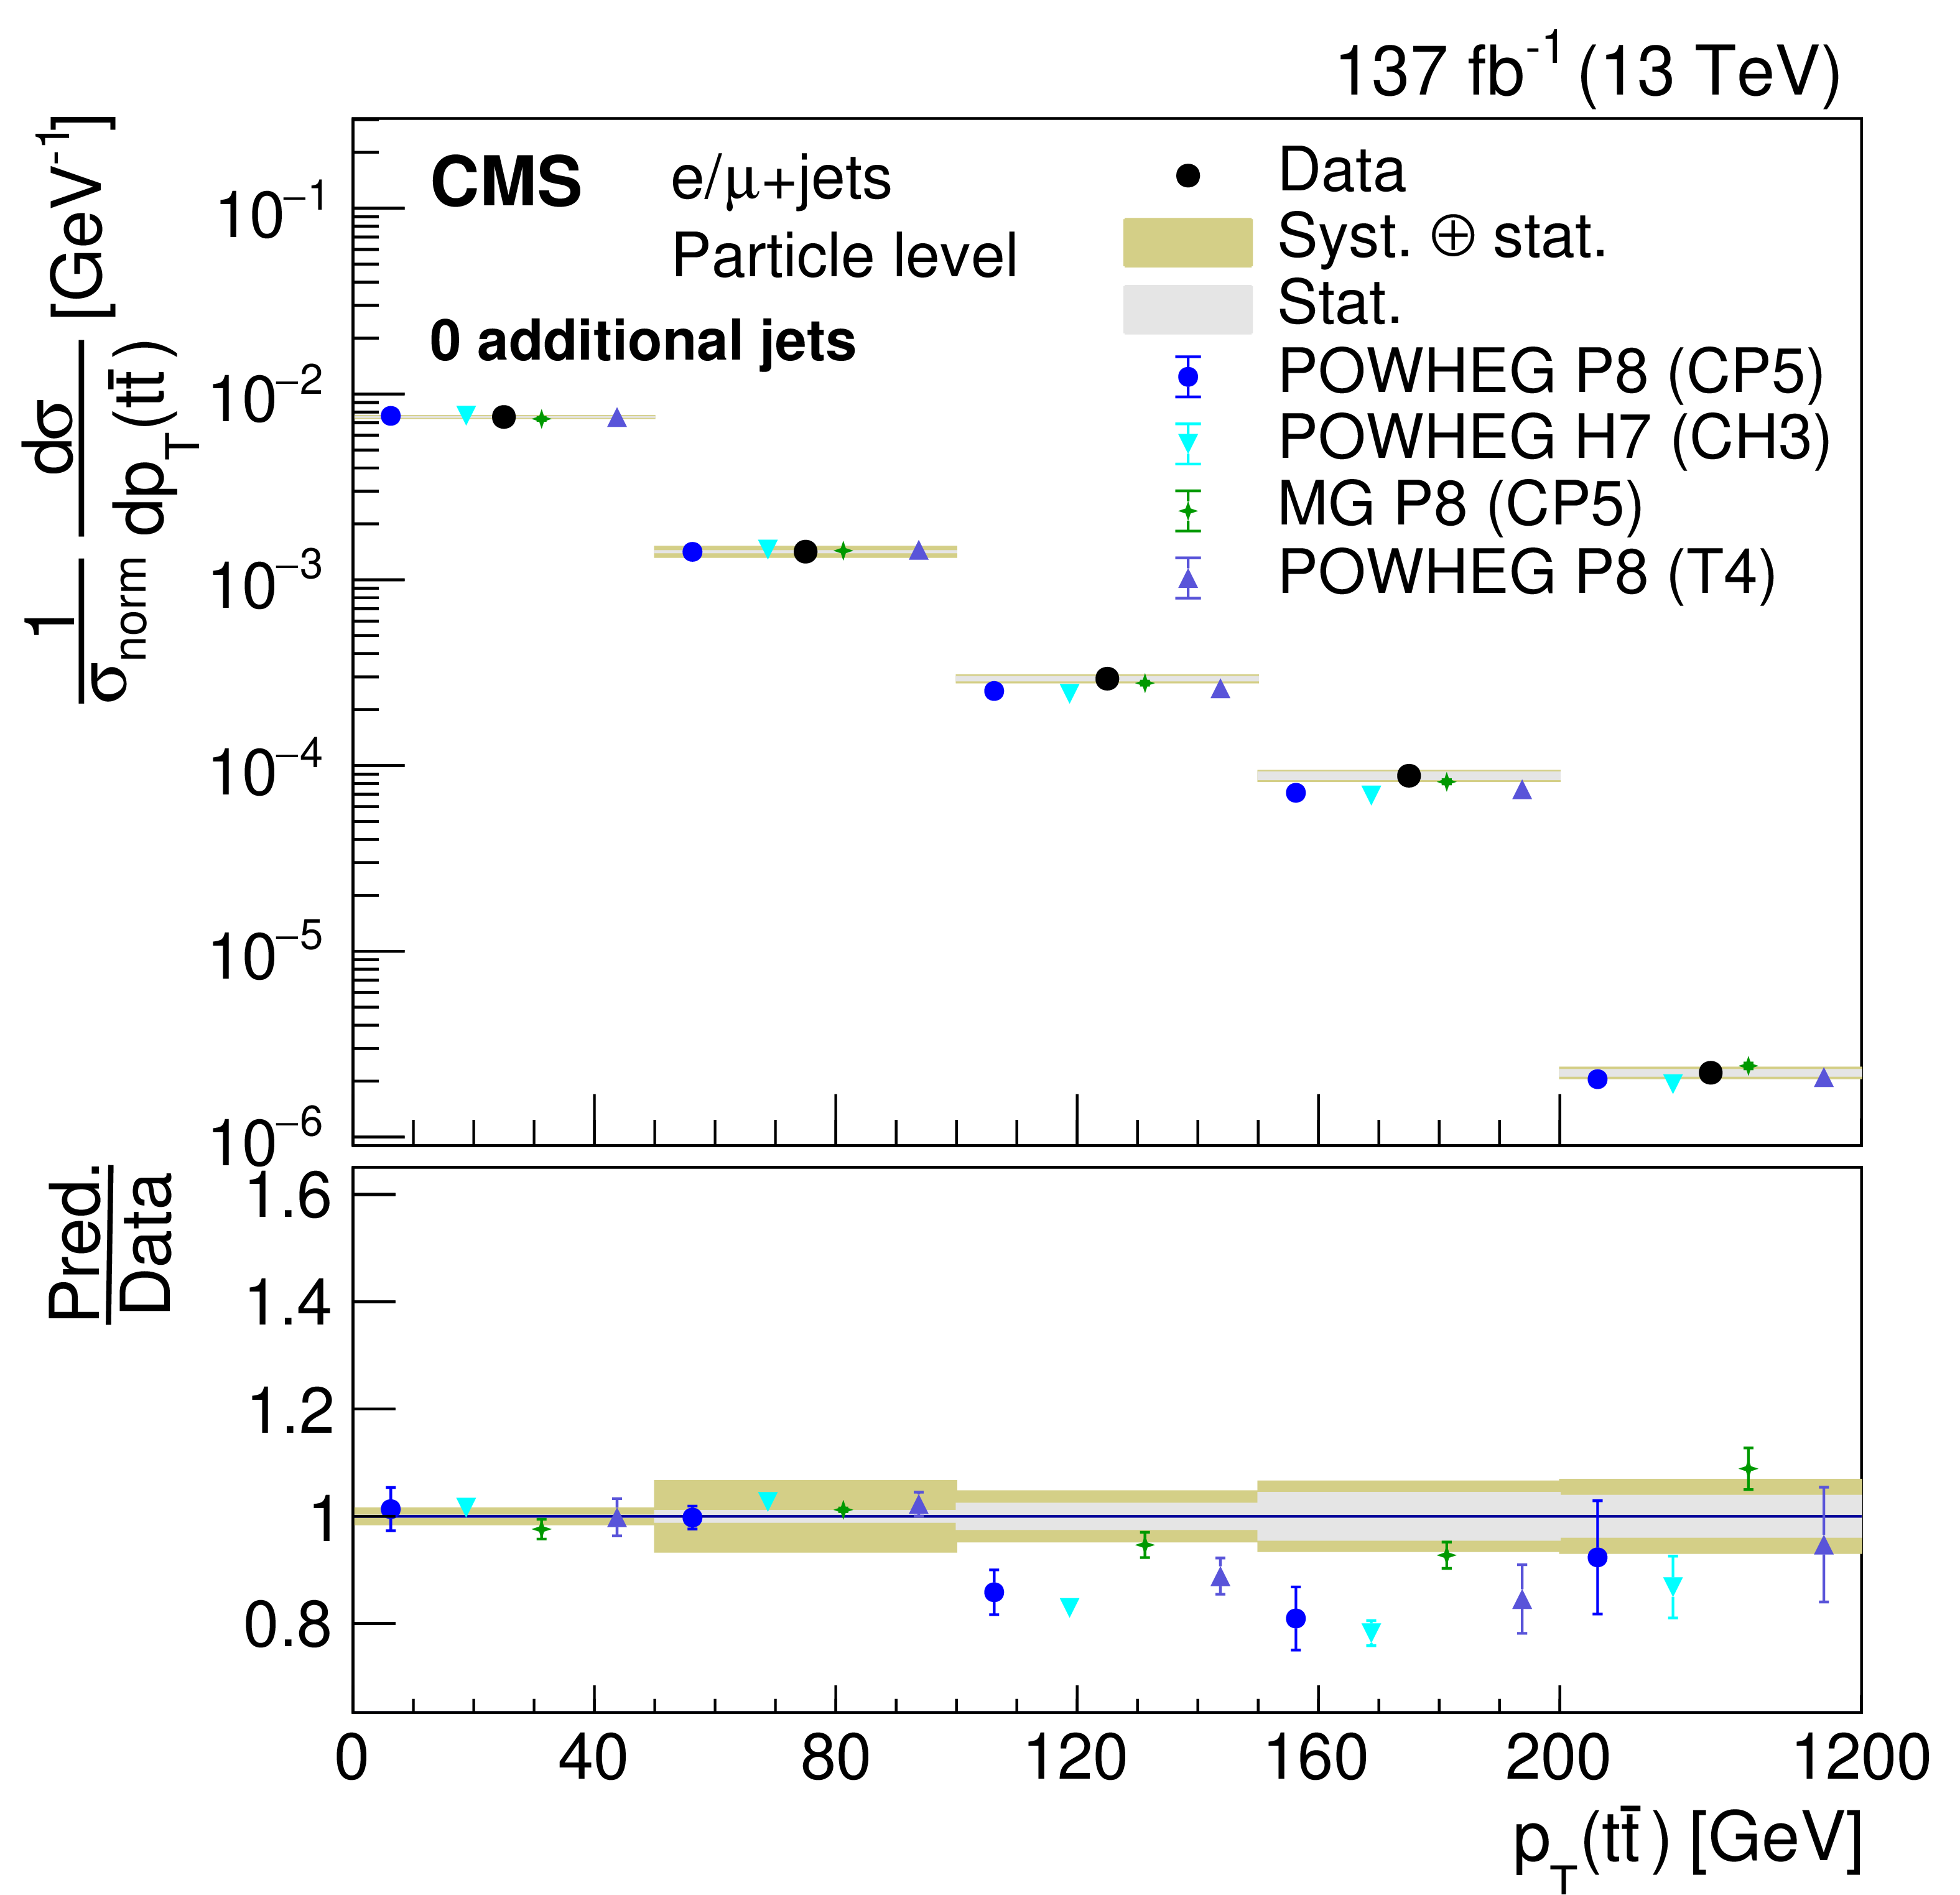
png pdf |
Figure A26-a:
Normalized differential cross section at the particle level as a function of ${{p_{\mathrm {T}}} ({\mathrm{t} {}\mathrm{\bar{t}}})}$ in bins of jet multiplicity. The data are shown as points with gray (yellow) bands indicating the statistical (statistical and systematic) uncertainties. The cross sections are compared to the predictions of POWHEG+PYTHIA (P8) for the CP5 and CUETP8M2T4 (T4) tunes, POWHEG+HERWIG (H7), and the multiparton simulation MG5_aMC@NLO (MG)+PYTHIA. The ratios of the various predictions to the measured cross sections are shown in the lower panels. |
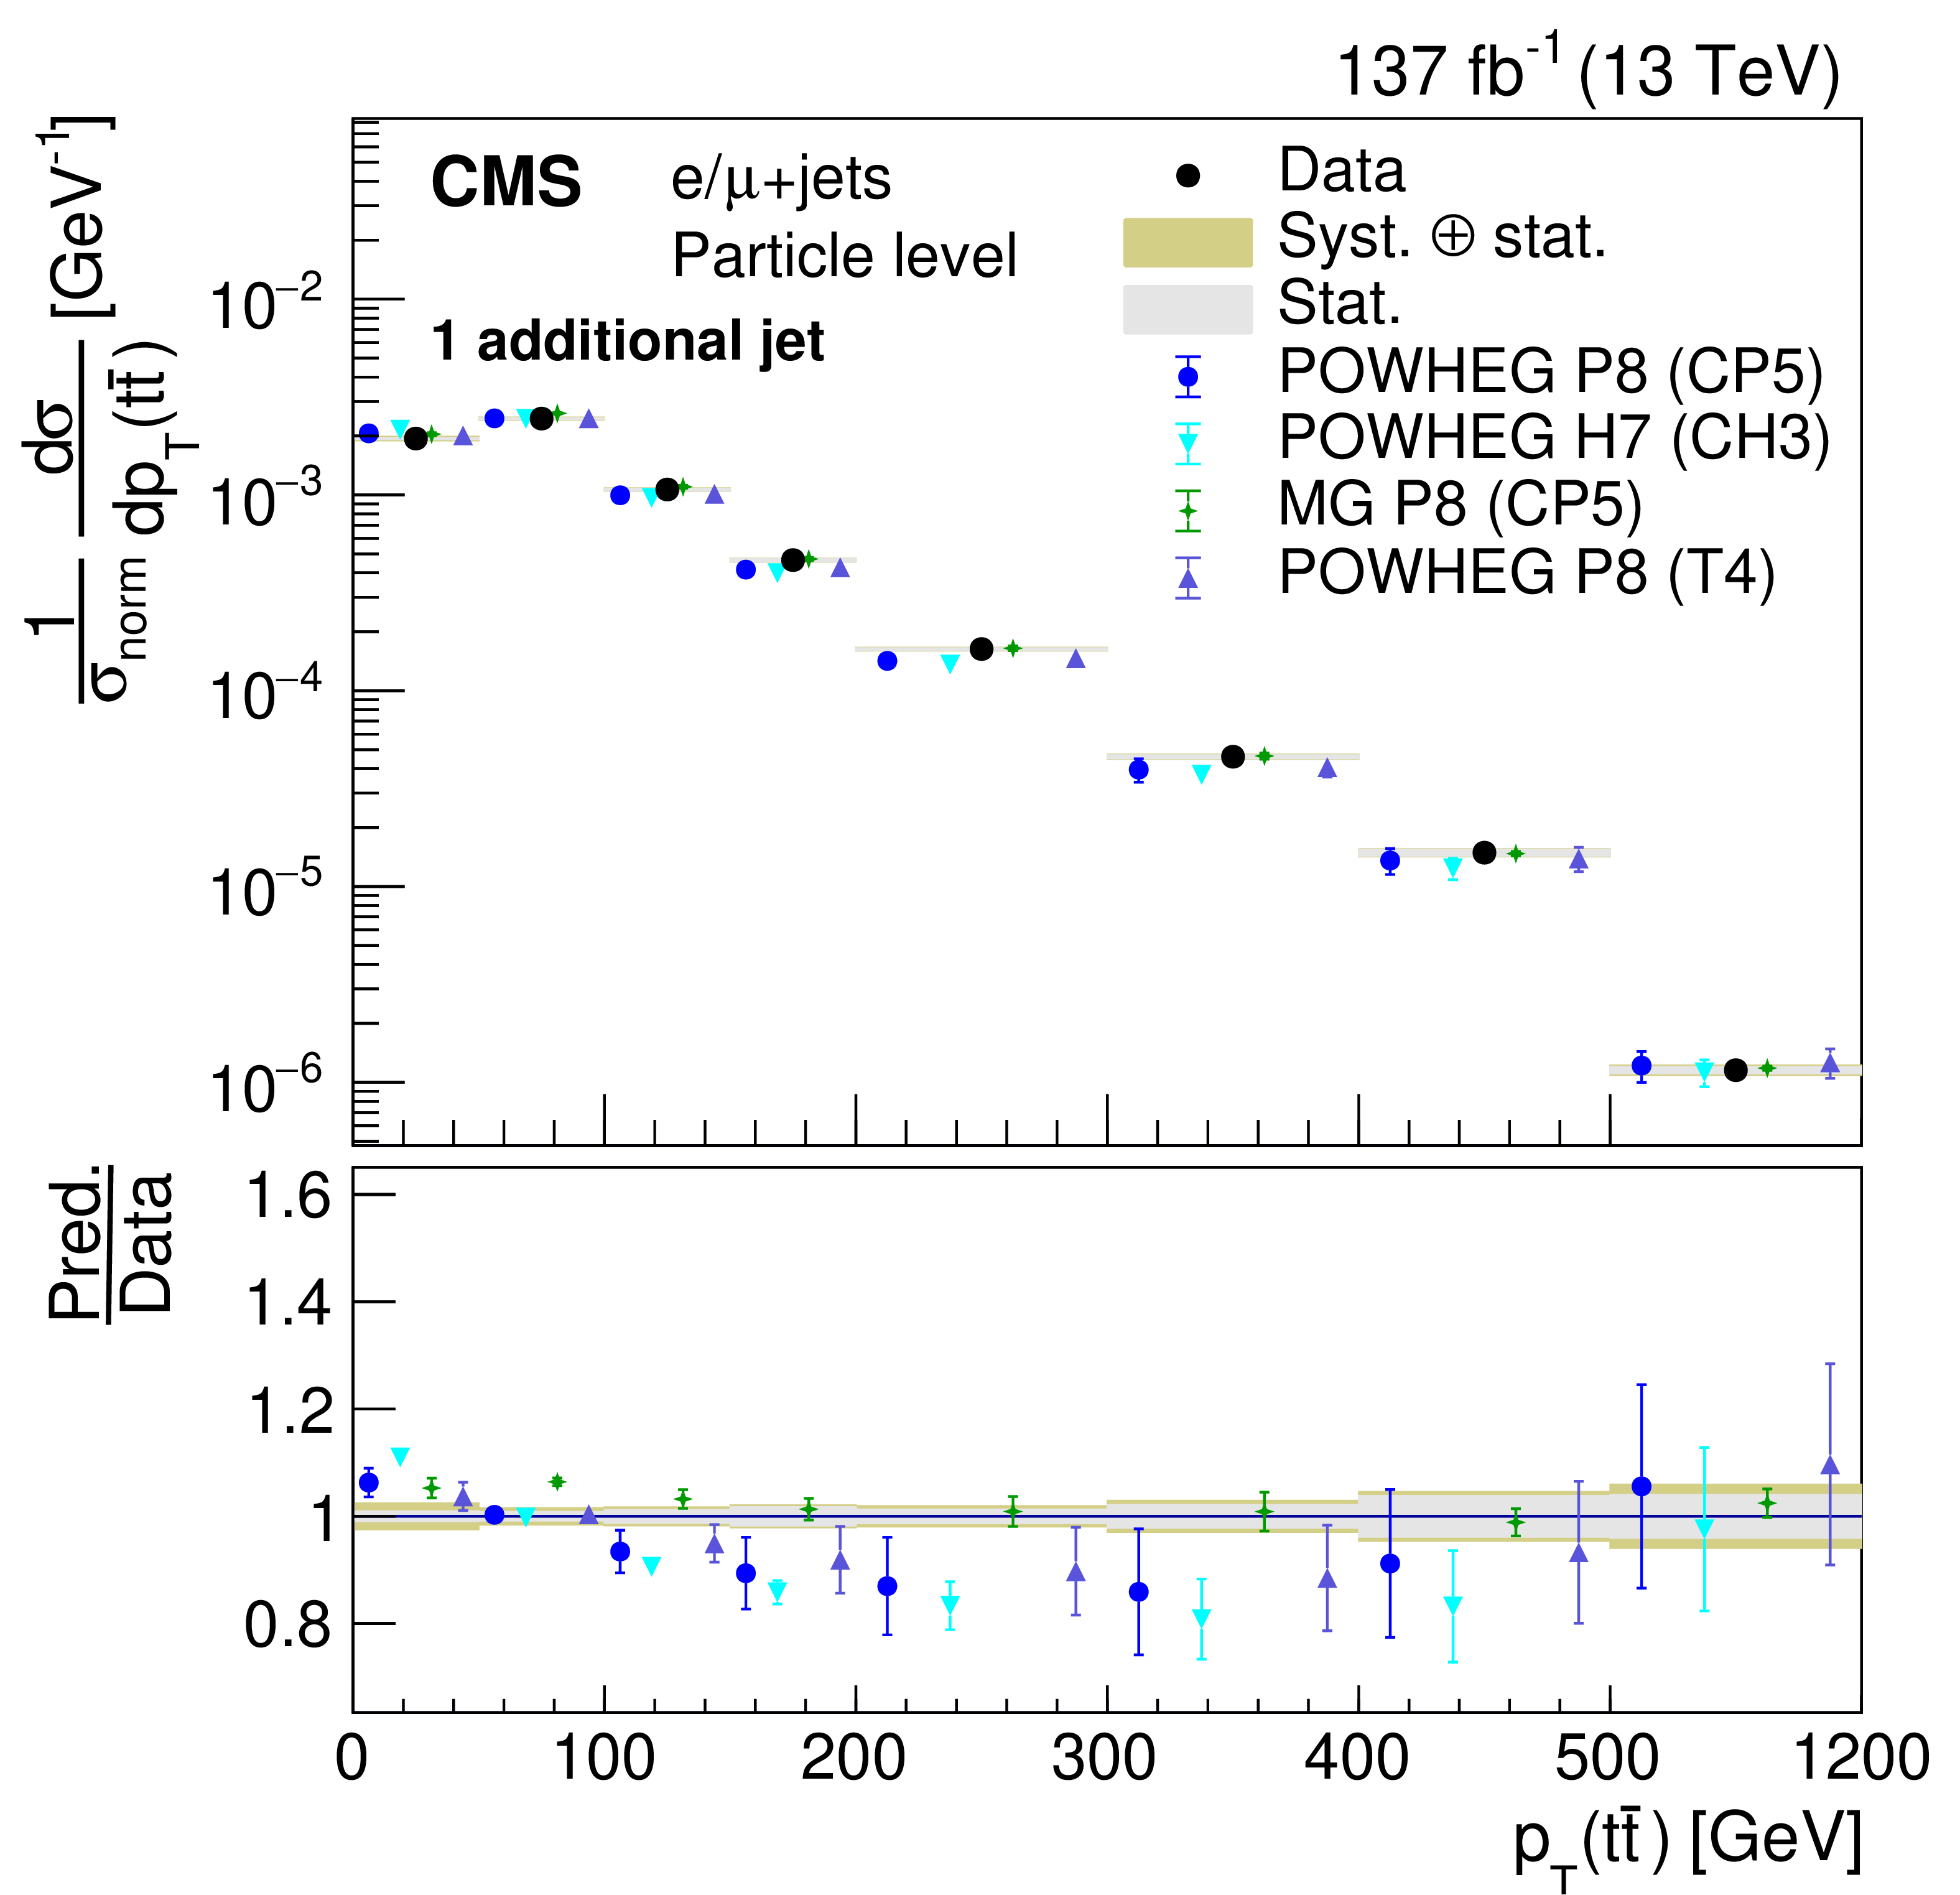
png pdf |
Figure A26-b:
Normalized differential cross section at the particle level as a function of ${{p_{\mathrm {T}}} ({\mathrm{t} {}\mathrm{\bar{t}}})}$ in bins of jet multiplicity. The data are shown as points with gray (yellow) bands indicating the statistical (statistical and systematic) uncertainties. The cross sections are compared to the predictions of POWHEG+PYTHIA (P8) for the CP5 and CUETP8M2T4 (T4) tunes, POWHEG+HERWIG (H7), and the multiparton simulation MG5_aMC@NLO (MG)+PYTHIA. The ratios of the various predictions to the measured cross sections are shown in the lower panels. |
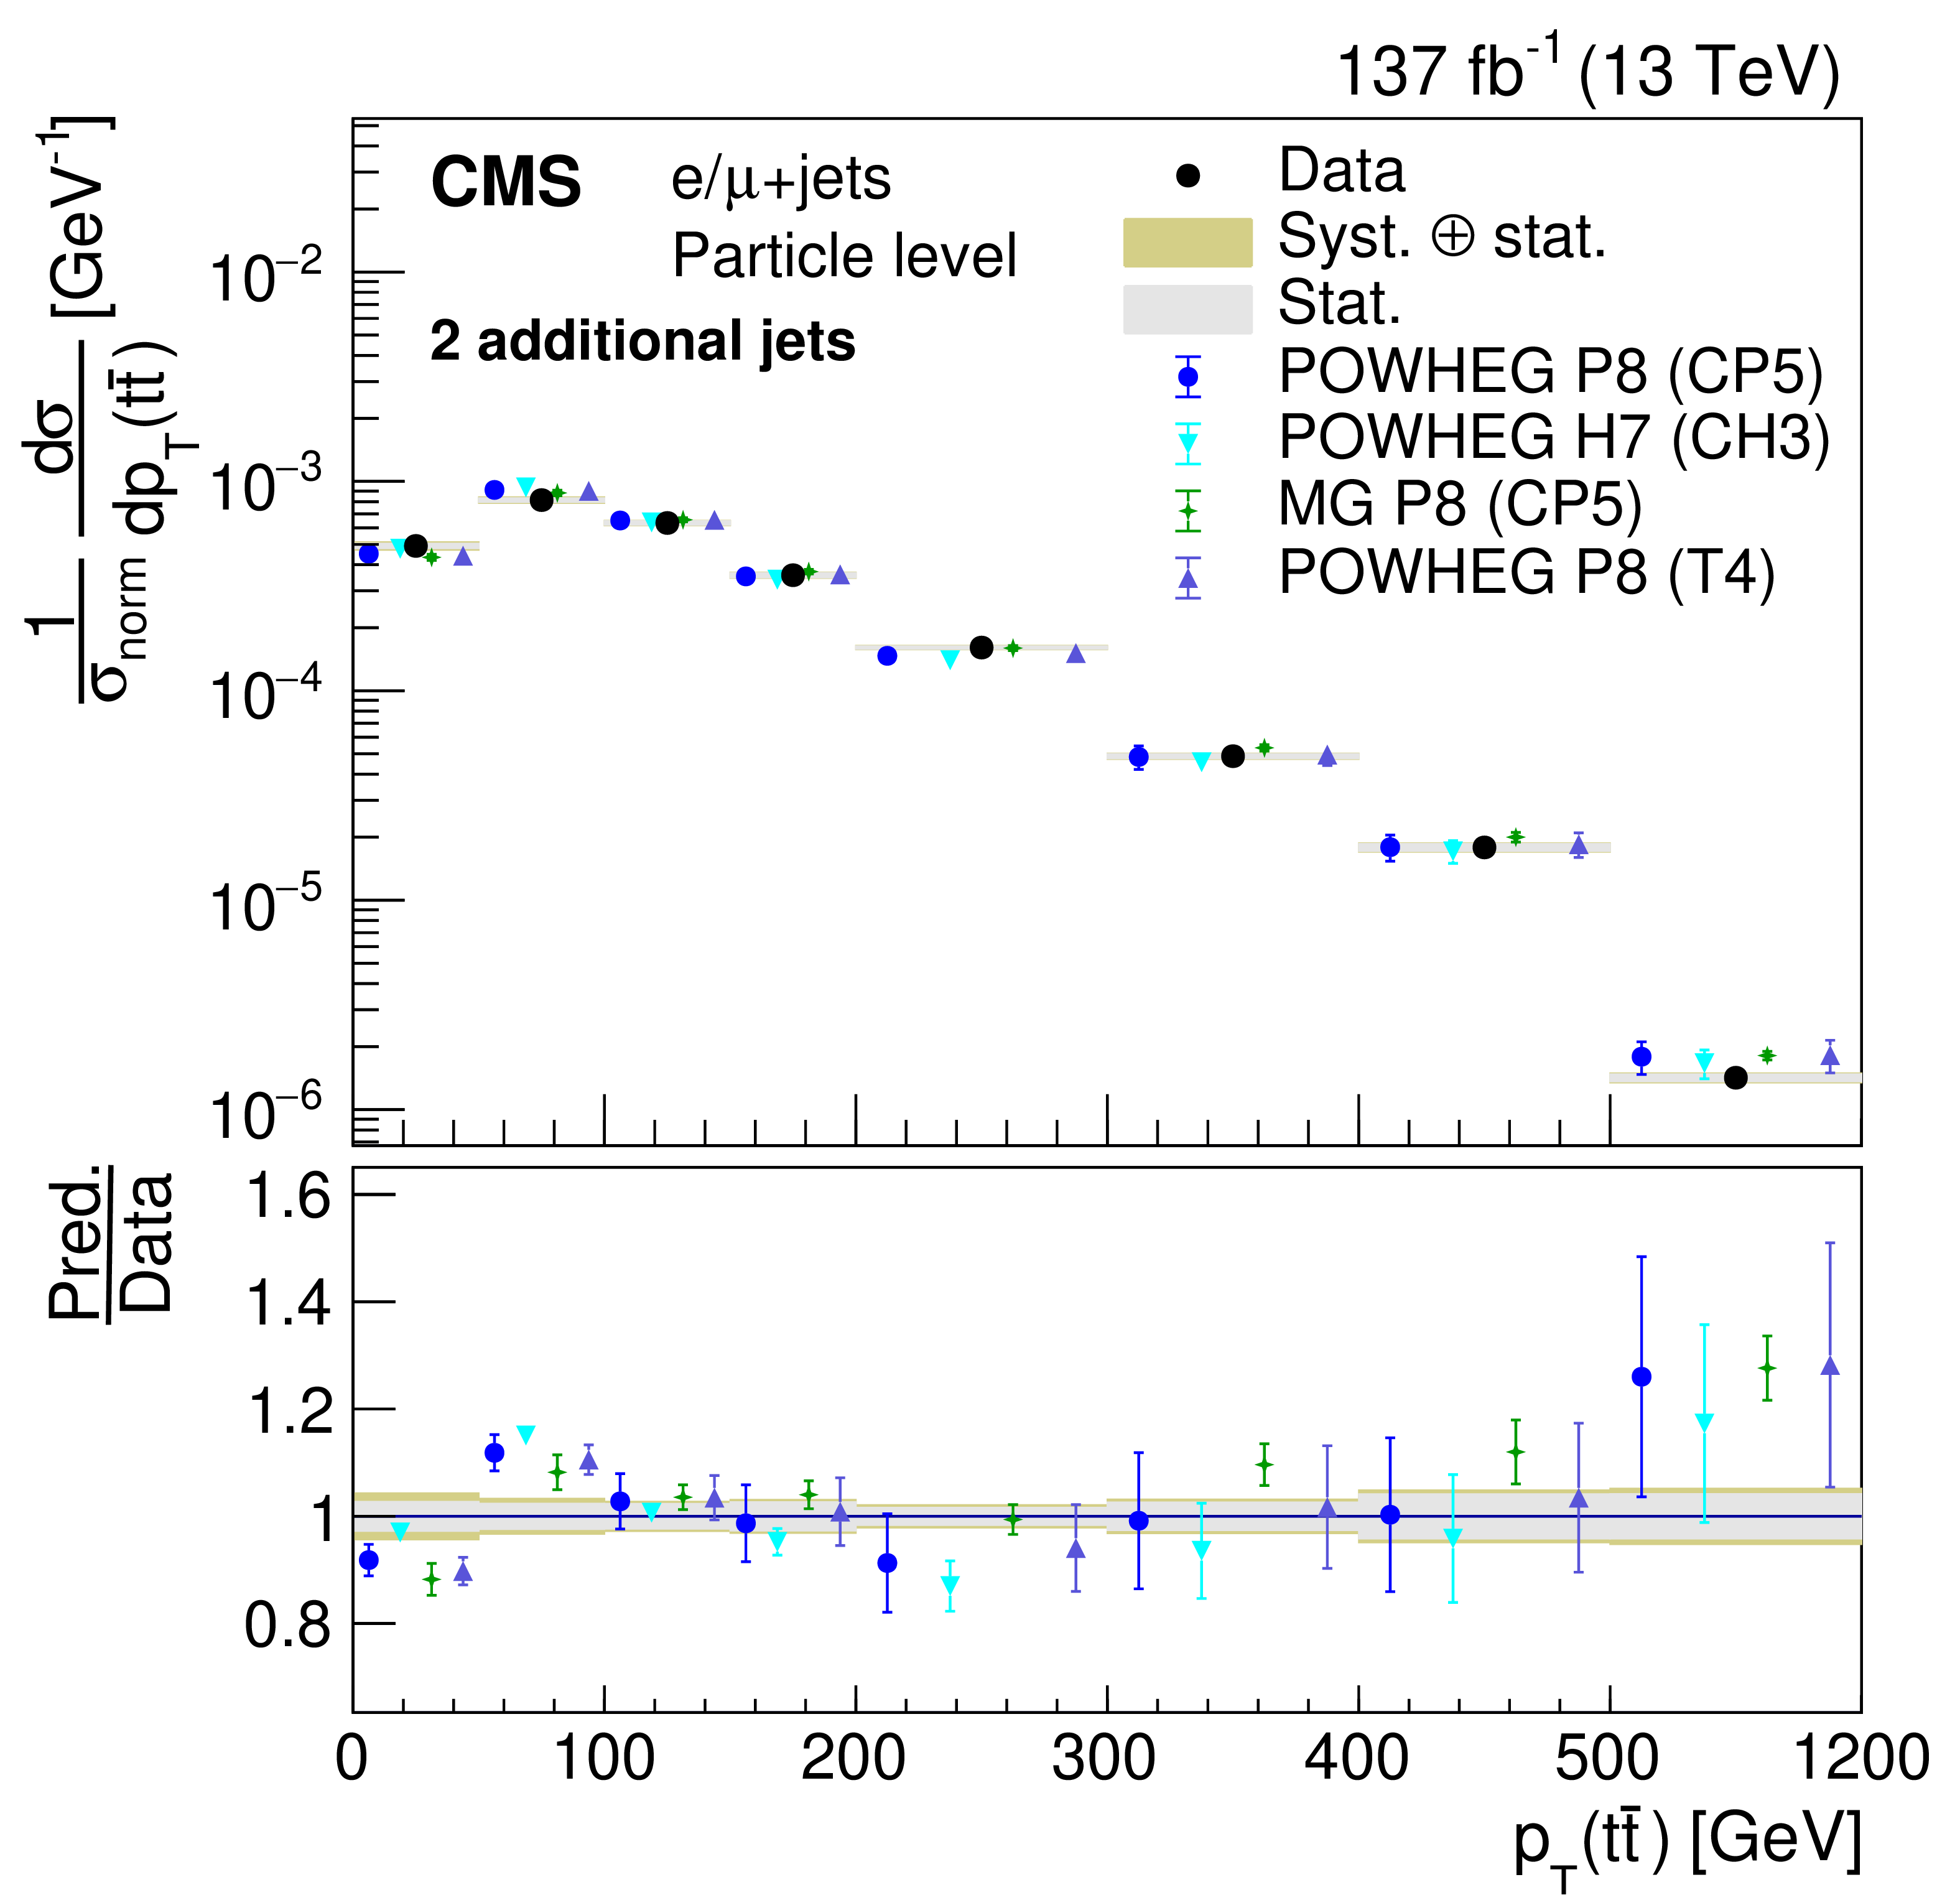
png pdf |
Figure A26-c:
Normalized differential cross section at the particle level as a function of ${{p_{\mathrm {T}}} ({\mathrm{t} {}\mathrm{\bar{t}}})}$ in bins of jet multiplicity. The data are shown as points with gray (yellow) bands indicating the statistical (statistical and systematic) uncertainties. The cross sections are compared to the predictions of POWHEG+PYTHIA (P8) for the CP5 and CUETP8M2T4 (T4) tunes, POWHEG+HERWIG (H7), and the multiparton simulation MG5_aMC@NLO (MG)+PYTHIA. The ratios of the various predictions to the measured cross sections are shown in the lower panels. |
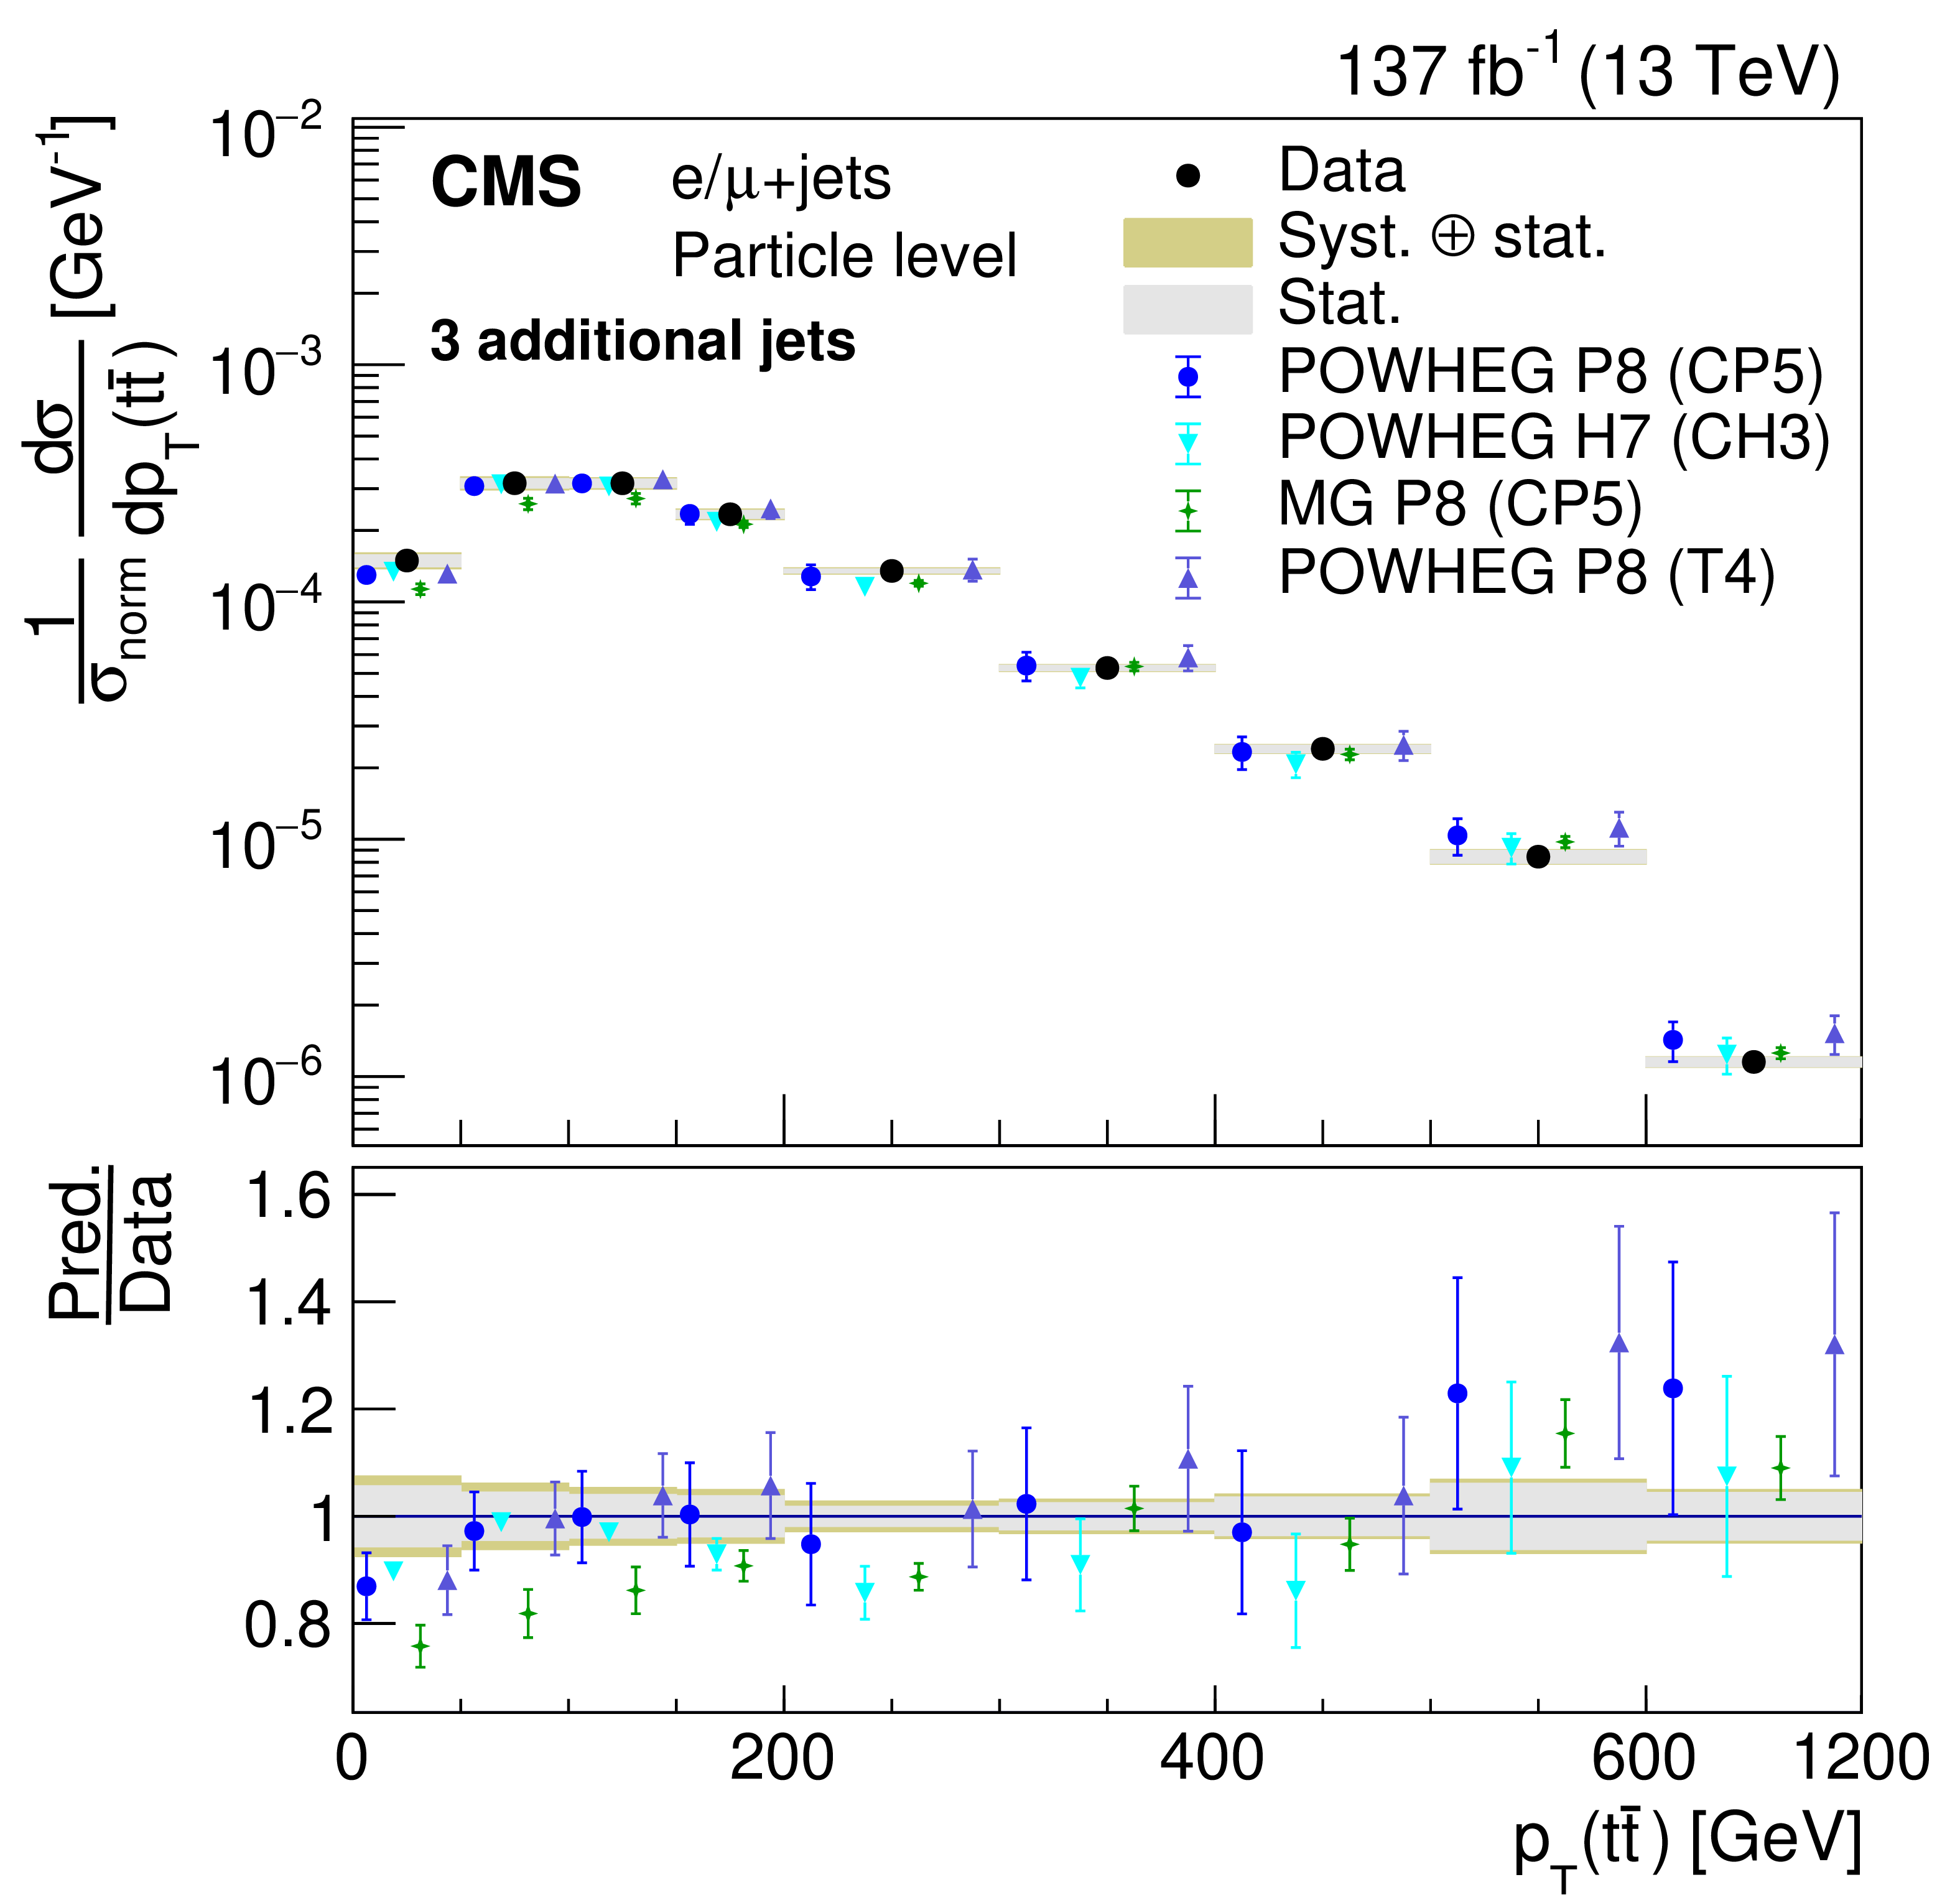
png pdf |
Figure A26-d:
Normalized differential cross section at the particle level as a function of ${{p_{\mathrm {T}}} ({\mathrm{t} {}\mathrm{\bar{t}}})}$ in bins of jet multiplicity. The data are shown as points with gray (yellow) bands indicating the statistical (statistical and systematic) uncertainties. The cross sections are compared to the predictions of POWHEG+PYTHIA (P8) for the CP5 and CUETP8M2T4 (T4) tunes, POWHEG+HERWIG (H7), and the multiparton simulation MG5_aMC@NLO (MG)+PYTHIA. The ratios of the various predictions to the measured cross sections are shown in the lower panels. |

png pdf |
Figure A27:
Results of $\chi ^2$ tests in $Z$-scores comparing the measured normalized cross sections at the parton (upper) and particle (lower) levels to the predictions of POWHEG+PYTHIA (P8) for the CP5 and CUETP8M2T4 (T4) tunes, POWHEG+HERWIG (H7), the multiparton simulation MG5_aMC@NLO (MG)+PYTHIA FxFx, and the NNLO QCD calculations obtained with Matrix. The $Z$-scores are truncated at an upper limit of six. The uncertainties in the measurements and the predictions are taken into account for the calculation of the $\chi ^2$. |
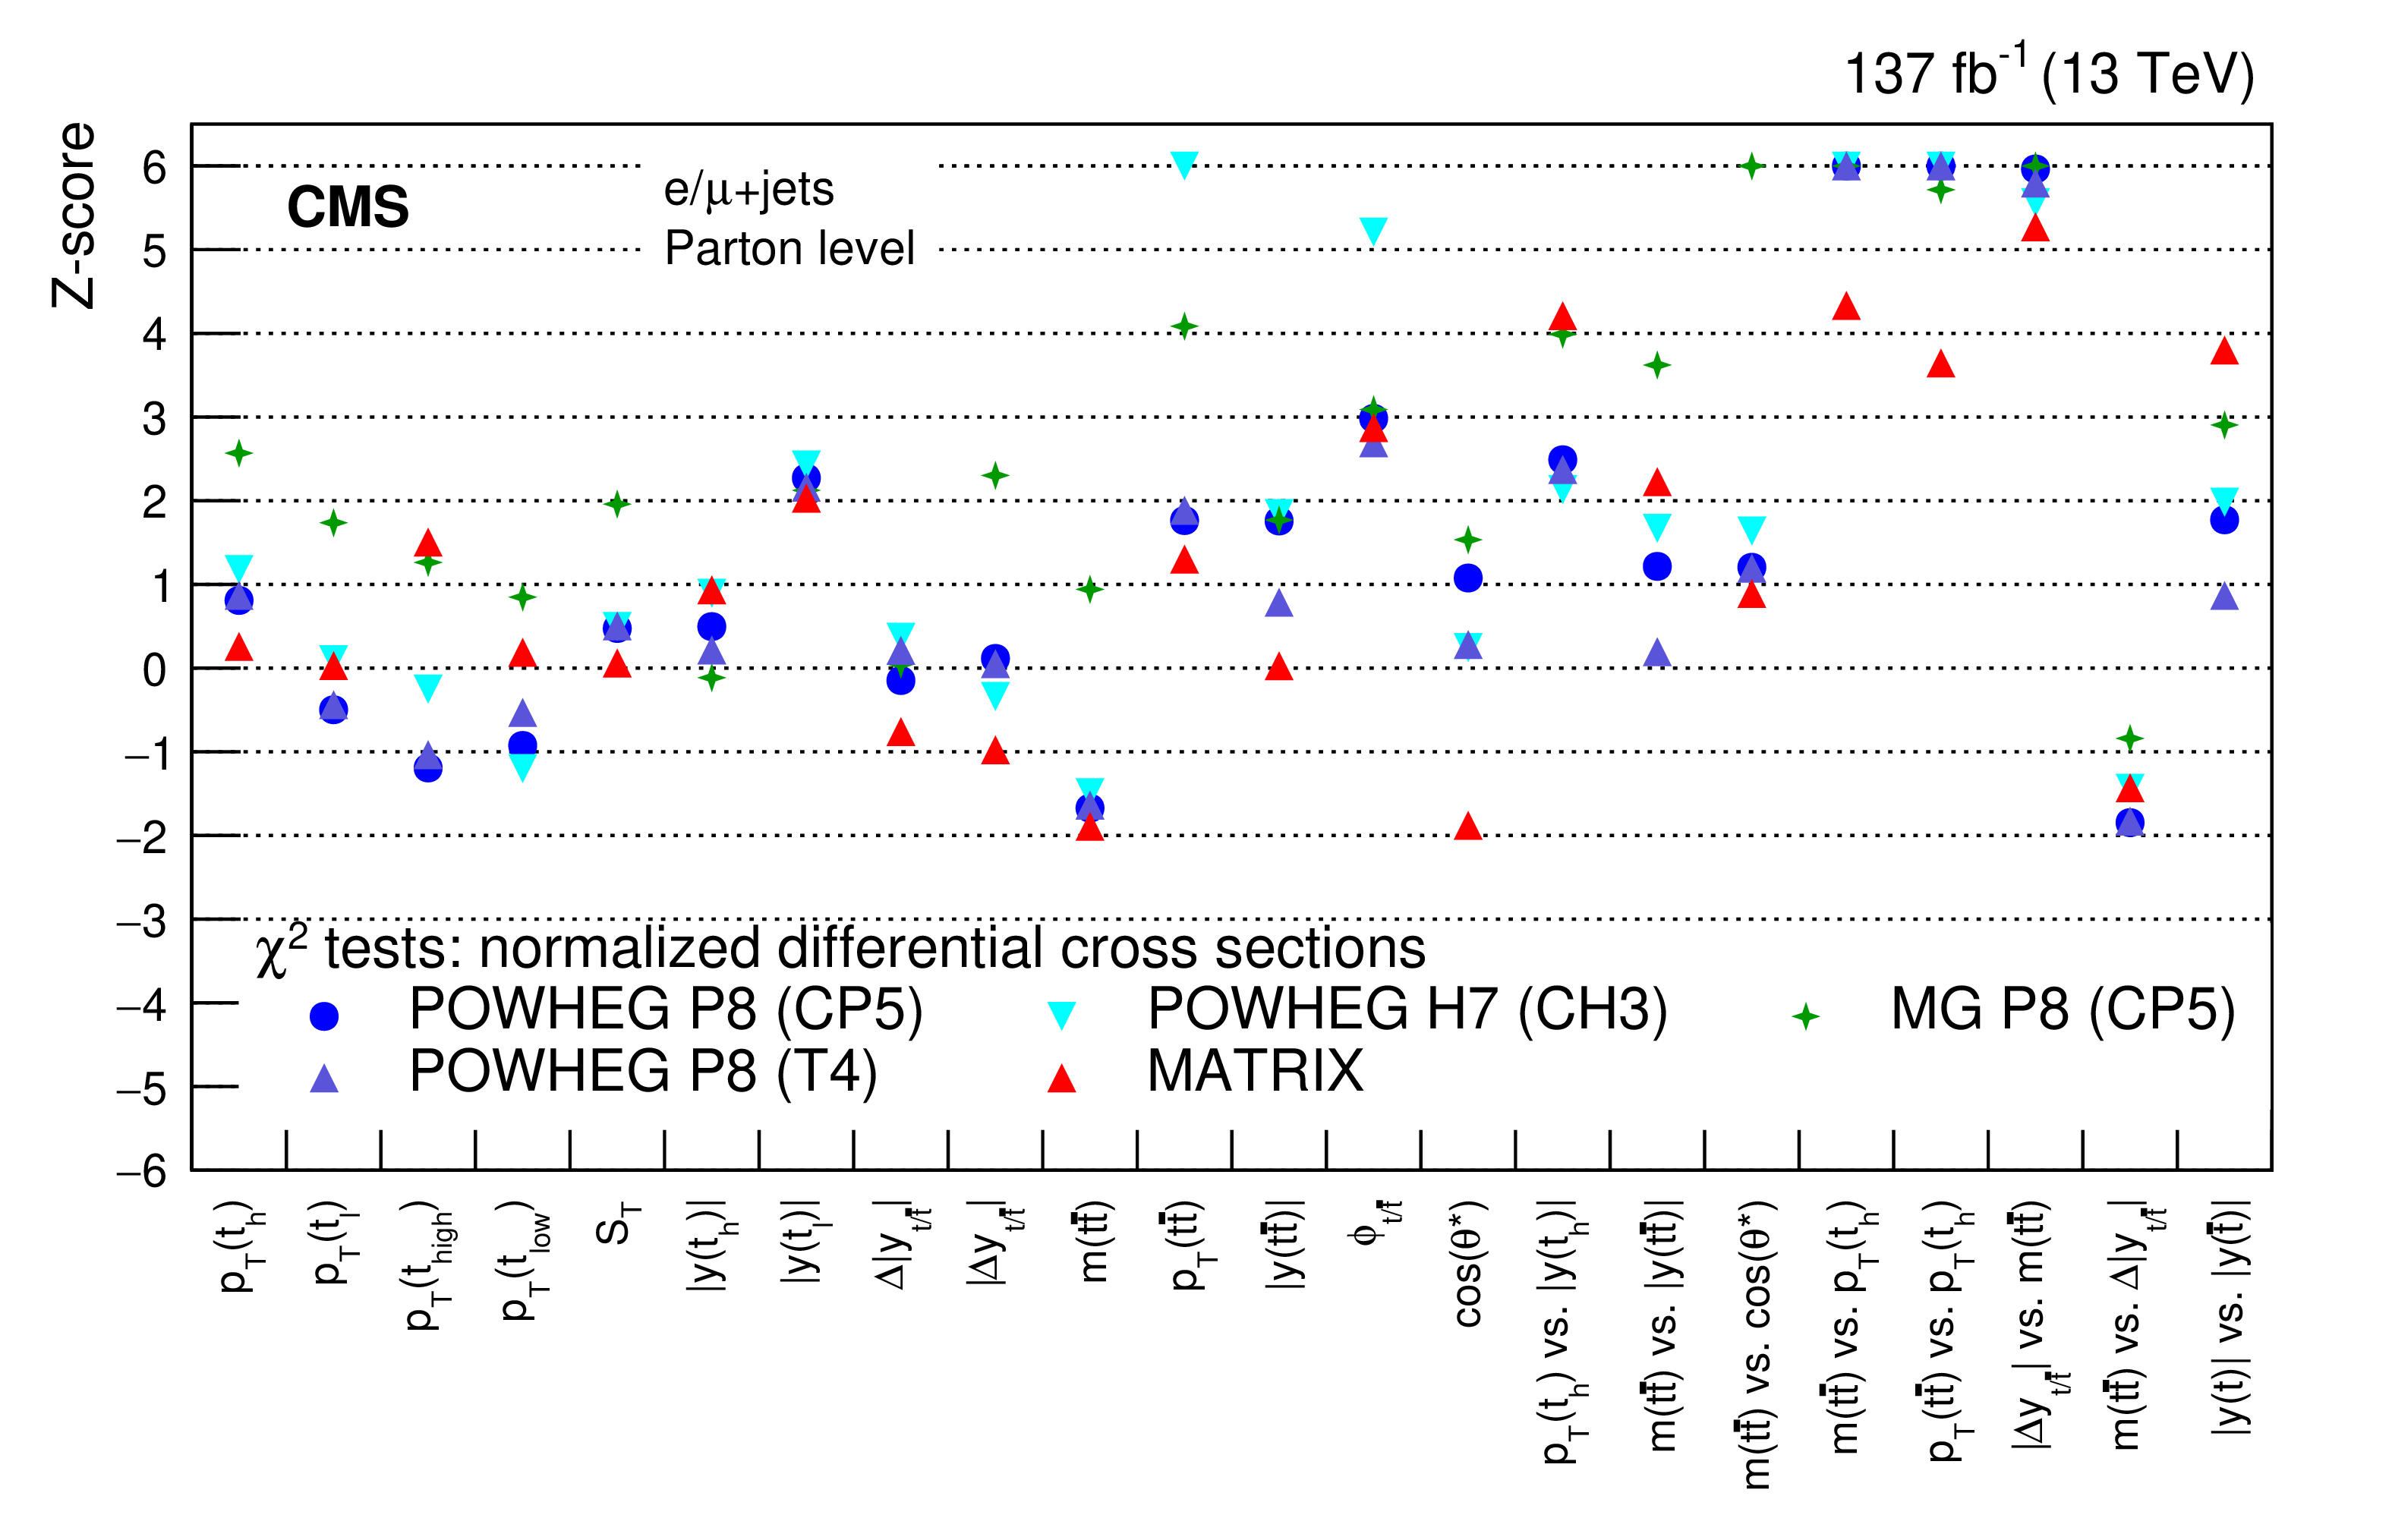
png pdf |
Figure A27-a:
Results of $\chi ^2$ tests in $Z$-scores comparing the measured normalized cross sections at the parton (upper) and particle (lower) levels to the predictions of POWHEG+PYTHIA (P8) for the CP5 and CUETP8M2T4 (T4) tunes, POWHEG+HERWIG (H7), the multiparton simulation MG5_aMC@NLO (MG)+PYTHIA FxFx, and the NNLO QCD calculations obtained with Matrix. The $Z$-scores are truncated at an upper limit of six. The uncertainties in the measurements and the predictions are taken into account for the calculation of the $\chi ^2$. |
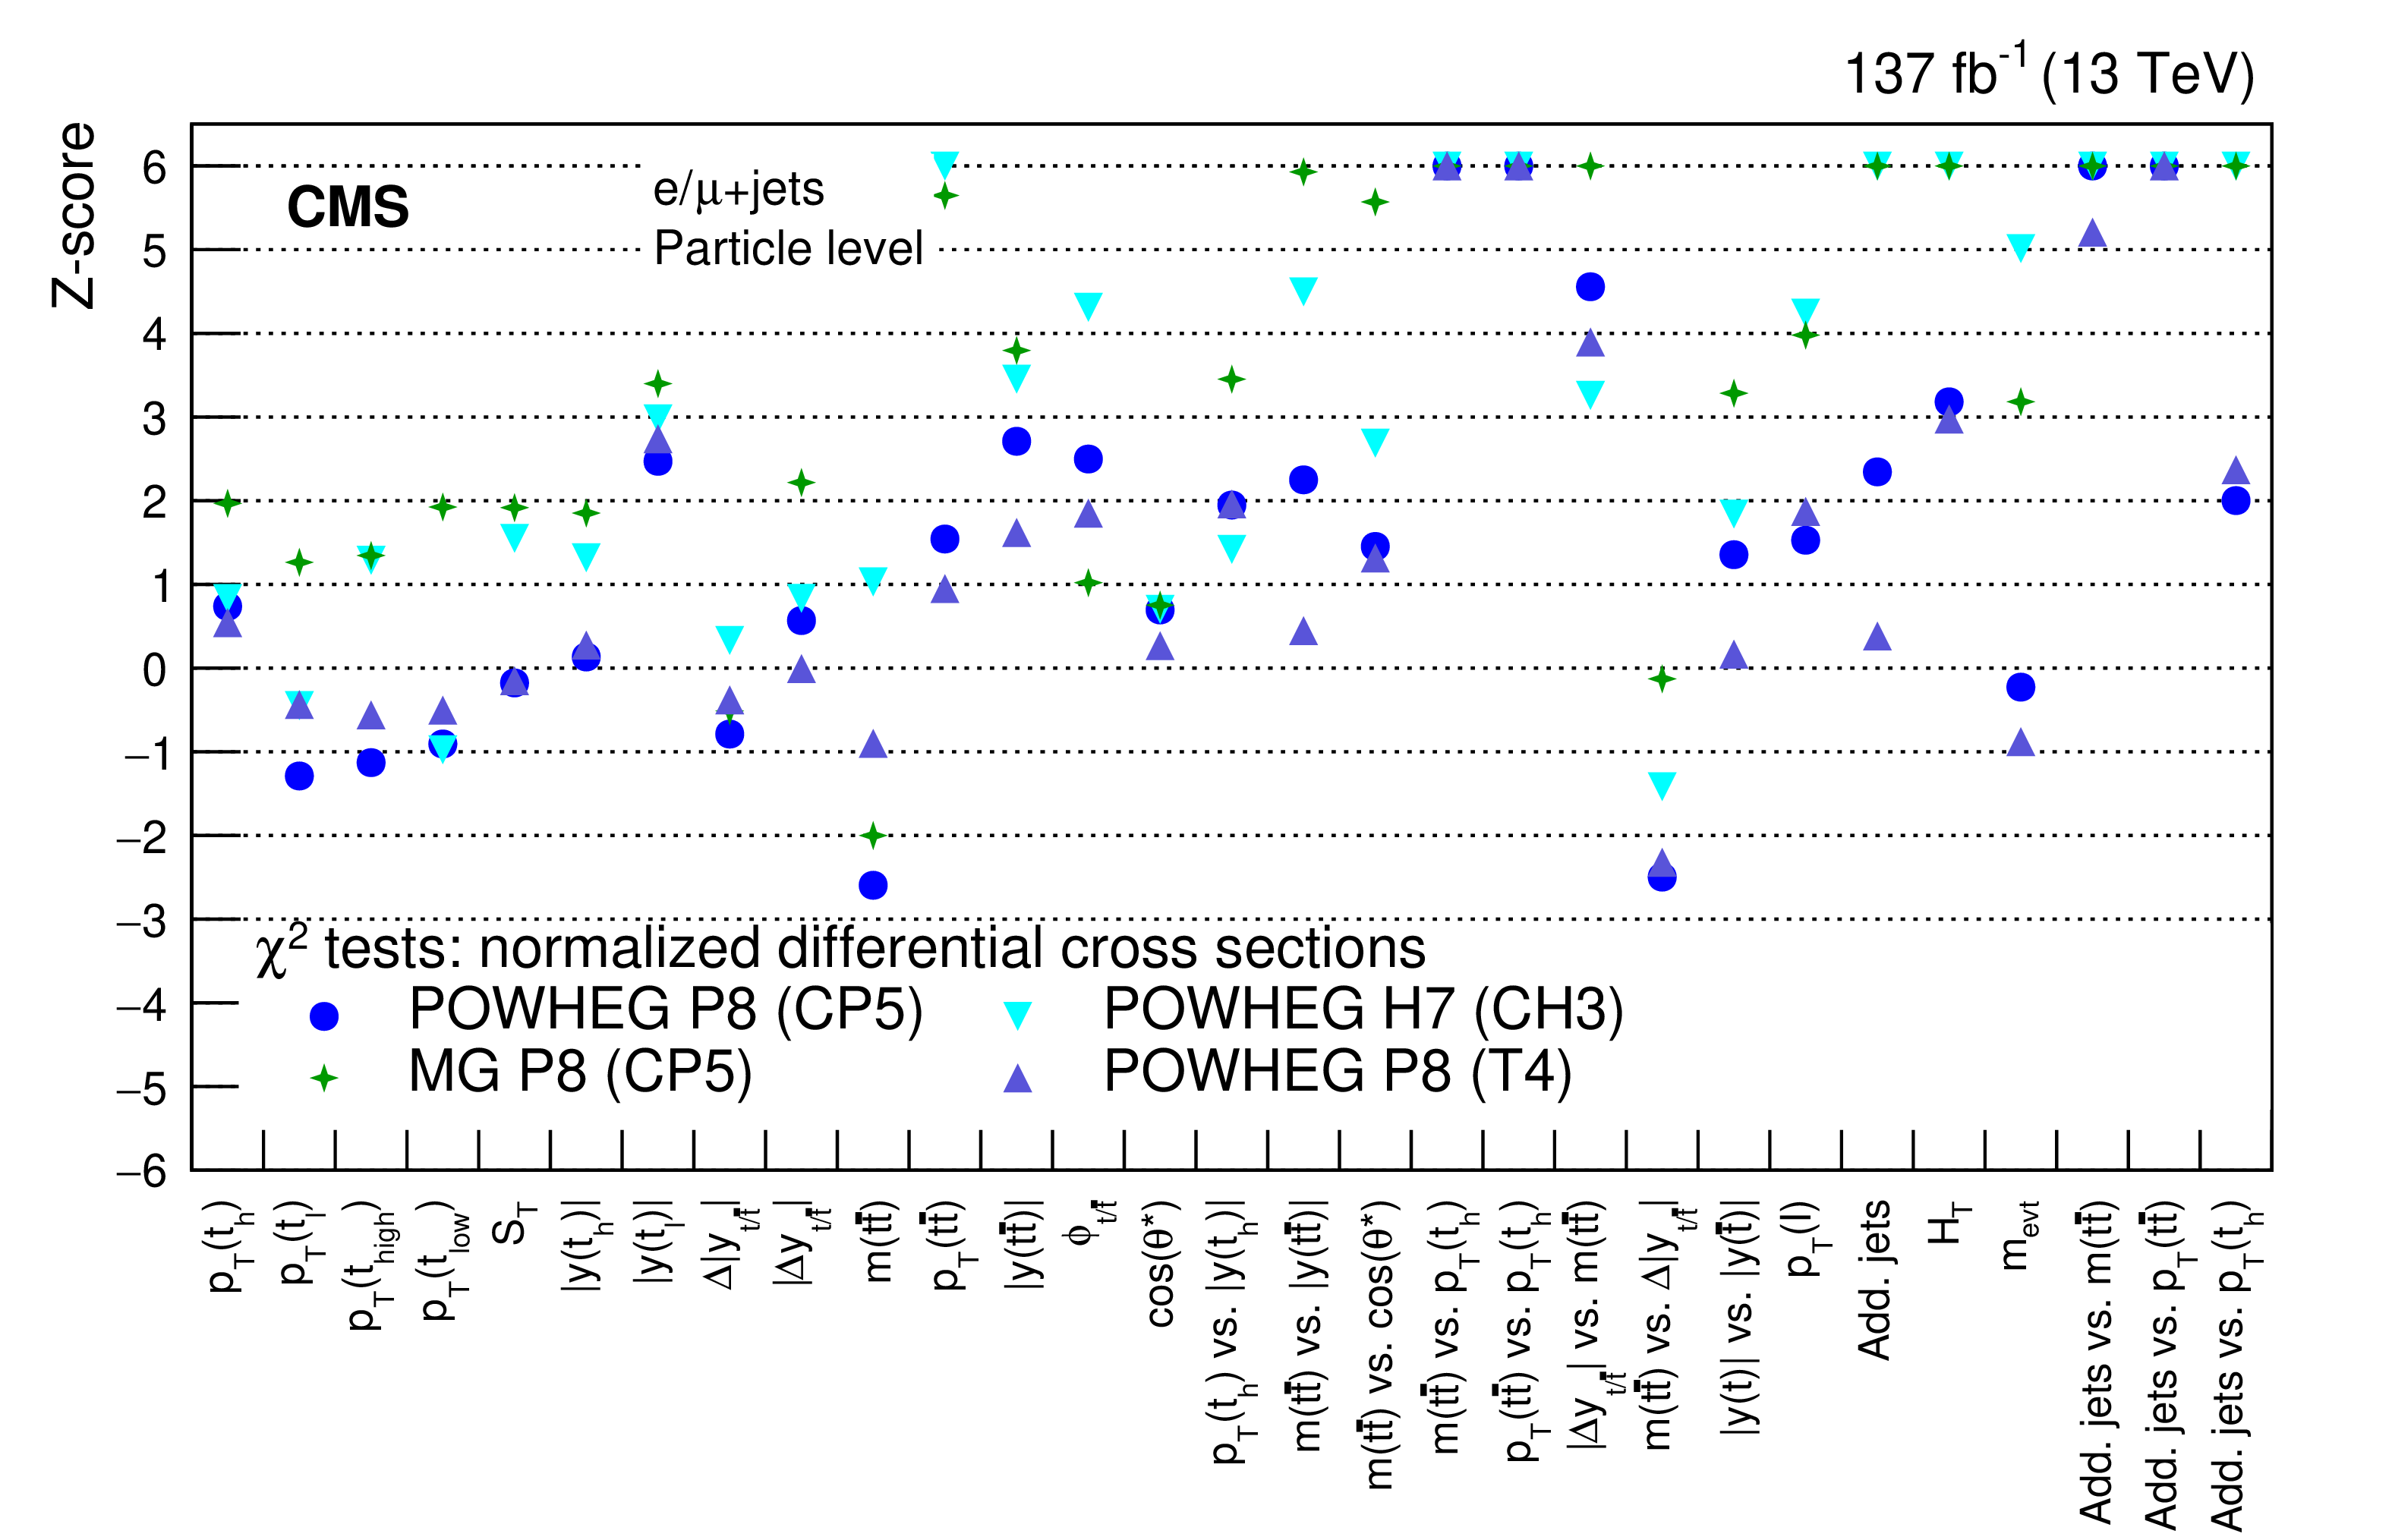
png pdf |
Figure A27-b:
Results of $\chi ^2$ tests in $Z$-scores comparing the measured normalized cross sections at the parton (upper) and particle (lower) levels to the predictions of POWHEG+PYTHIA (P8) for the CP5 and CUETP8M2T4 (T4) tunes, POWHEG+HERWIG (H7), the multiparton simulation MG5_aMC@NLO (MG)+PYTHIA FxFx, and the NNLO QCD calculations obtained with Matrix. The $Z$-scores are truncated at an upper limit of six. The uncertainties in the measurements and the predictions are taken into account for the calculation of the $\chi ^2$. |
| Tables | |
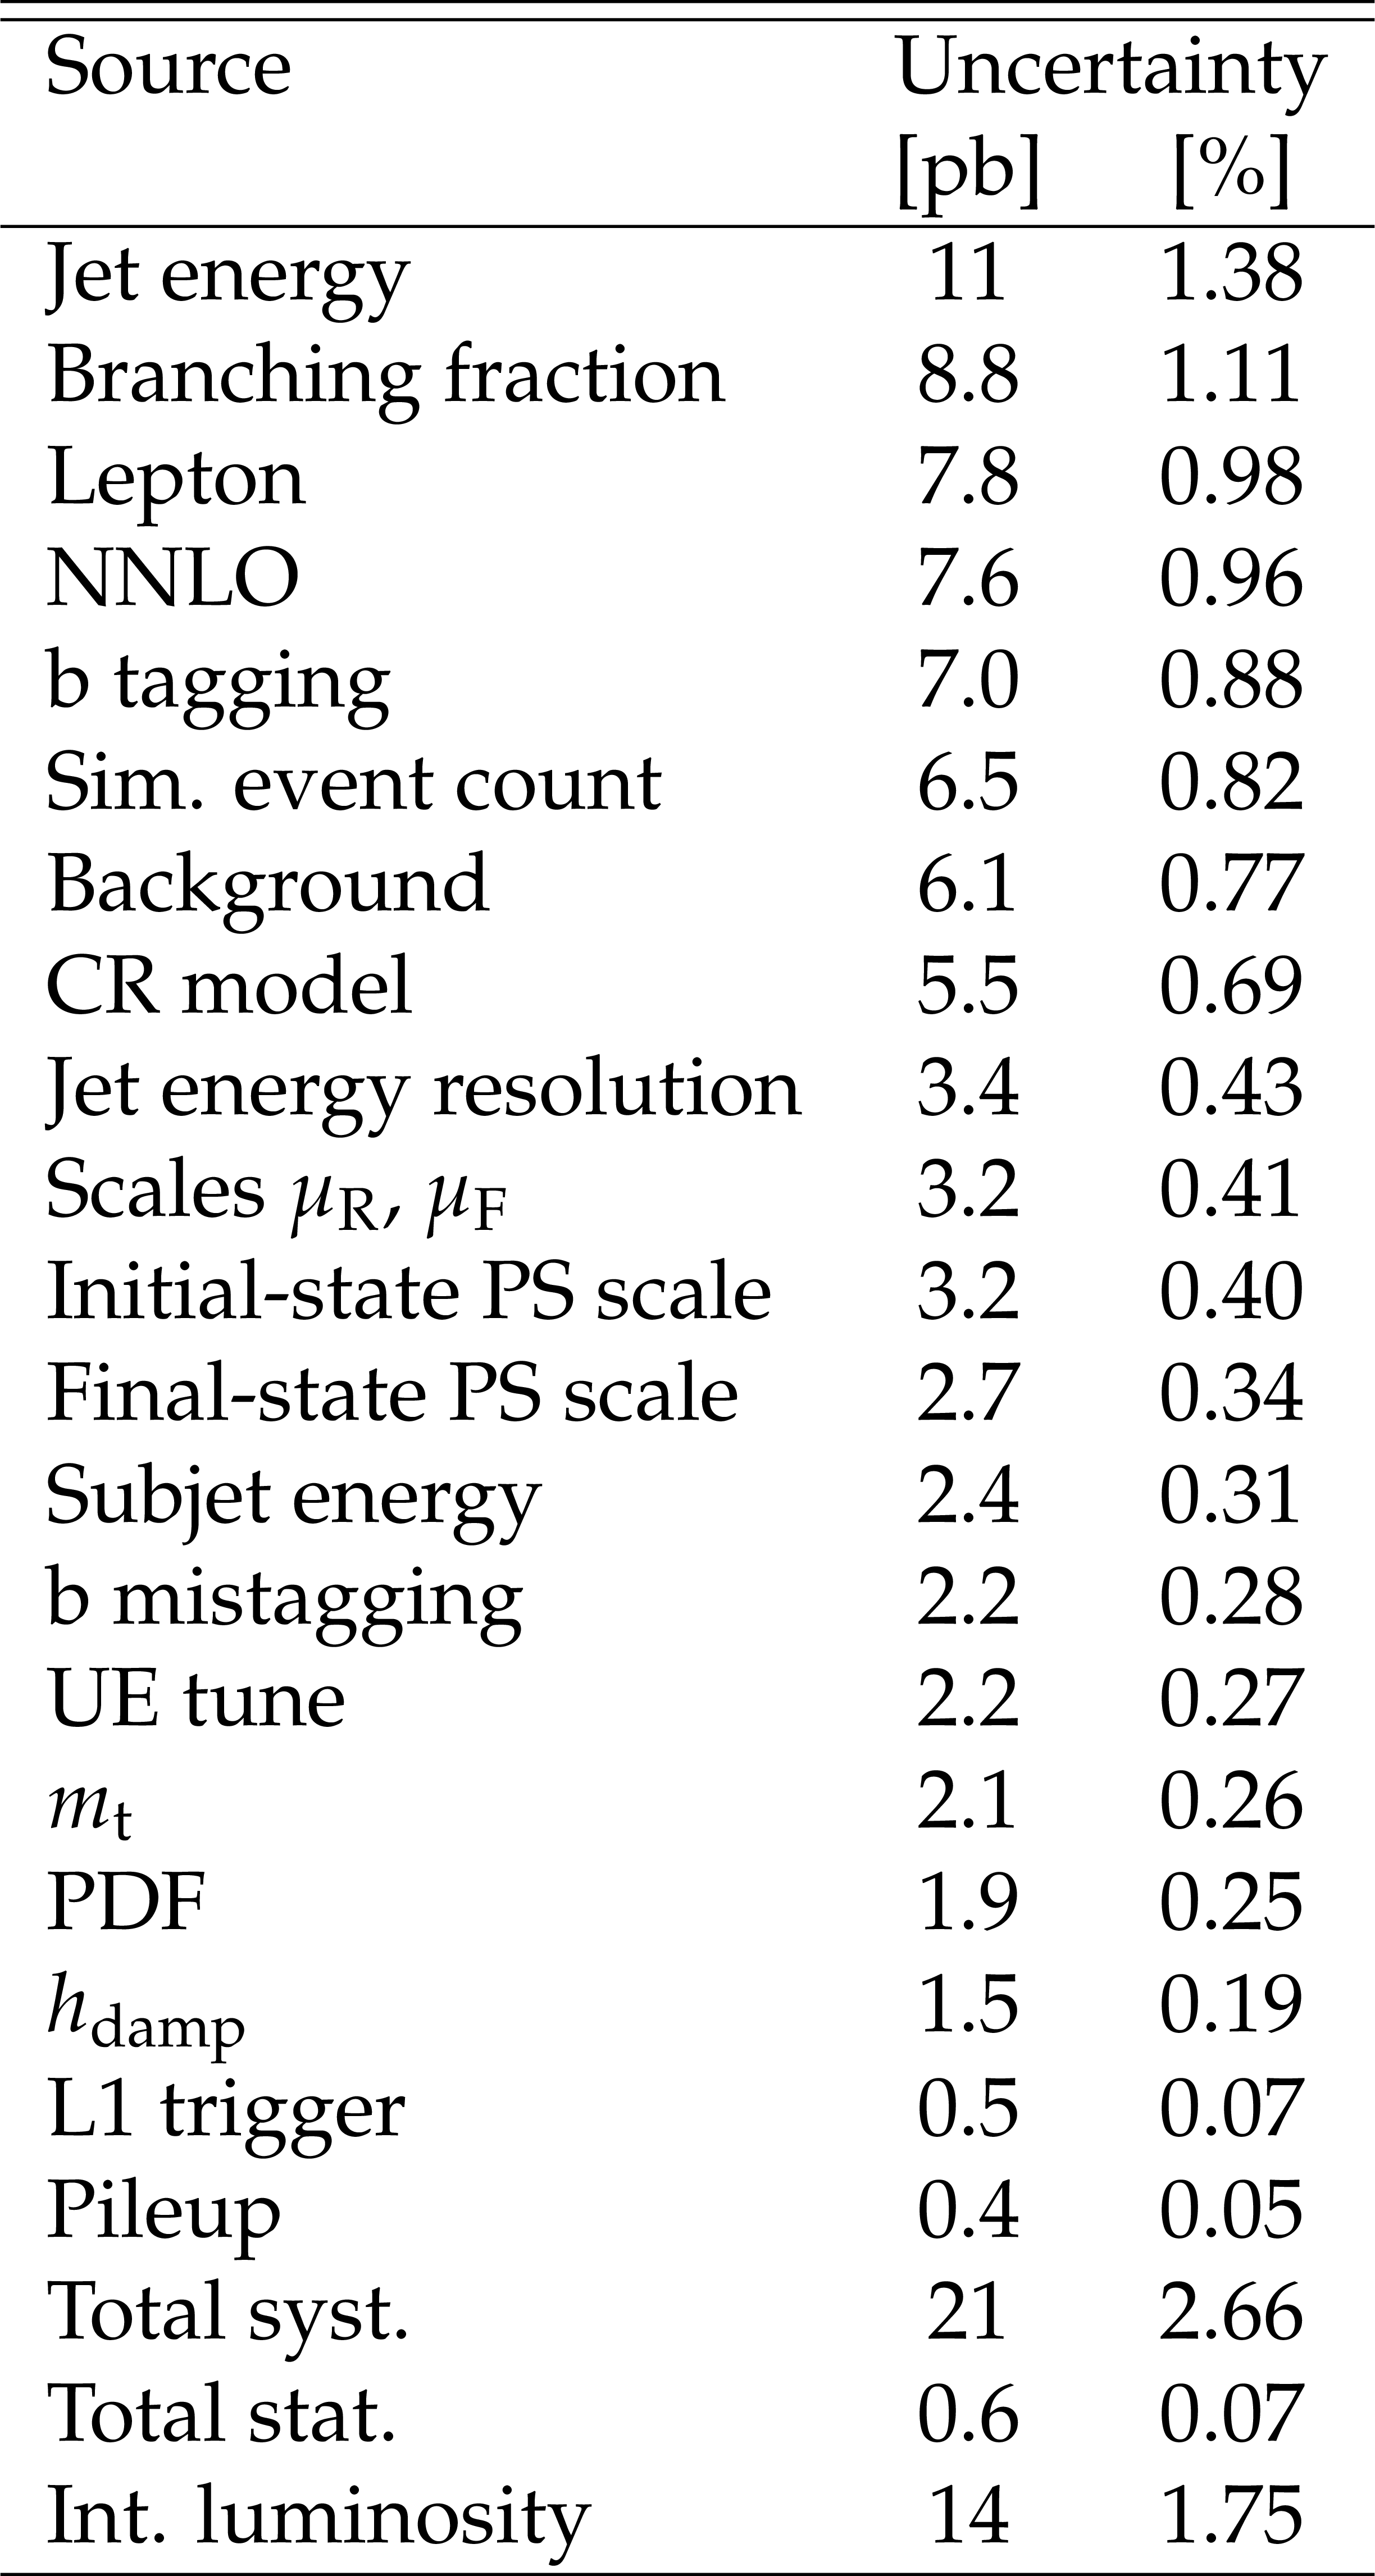
png pdf |
Table 1:
The sources of systematic uncertainty and their absolute and relative values in the measurement of $\sigma _{\mathrm{t} \mathrm{\bar{t}}} $. |
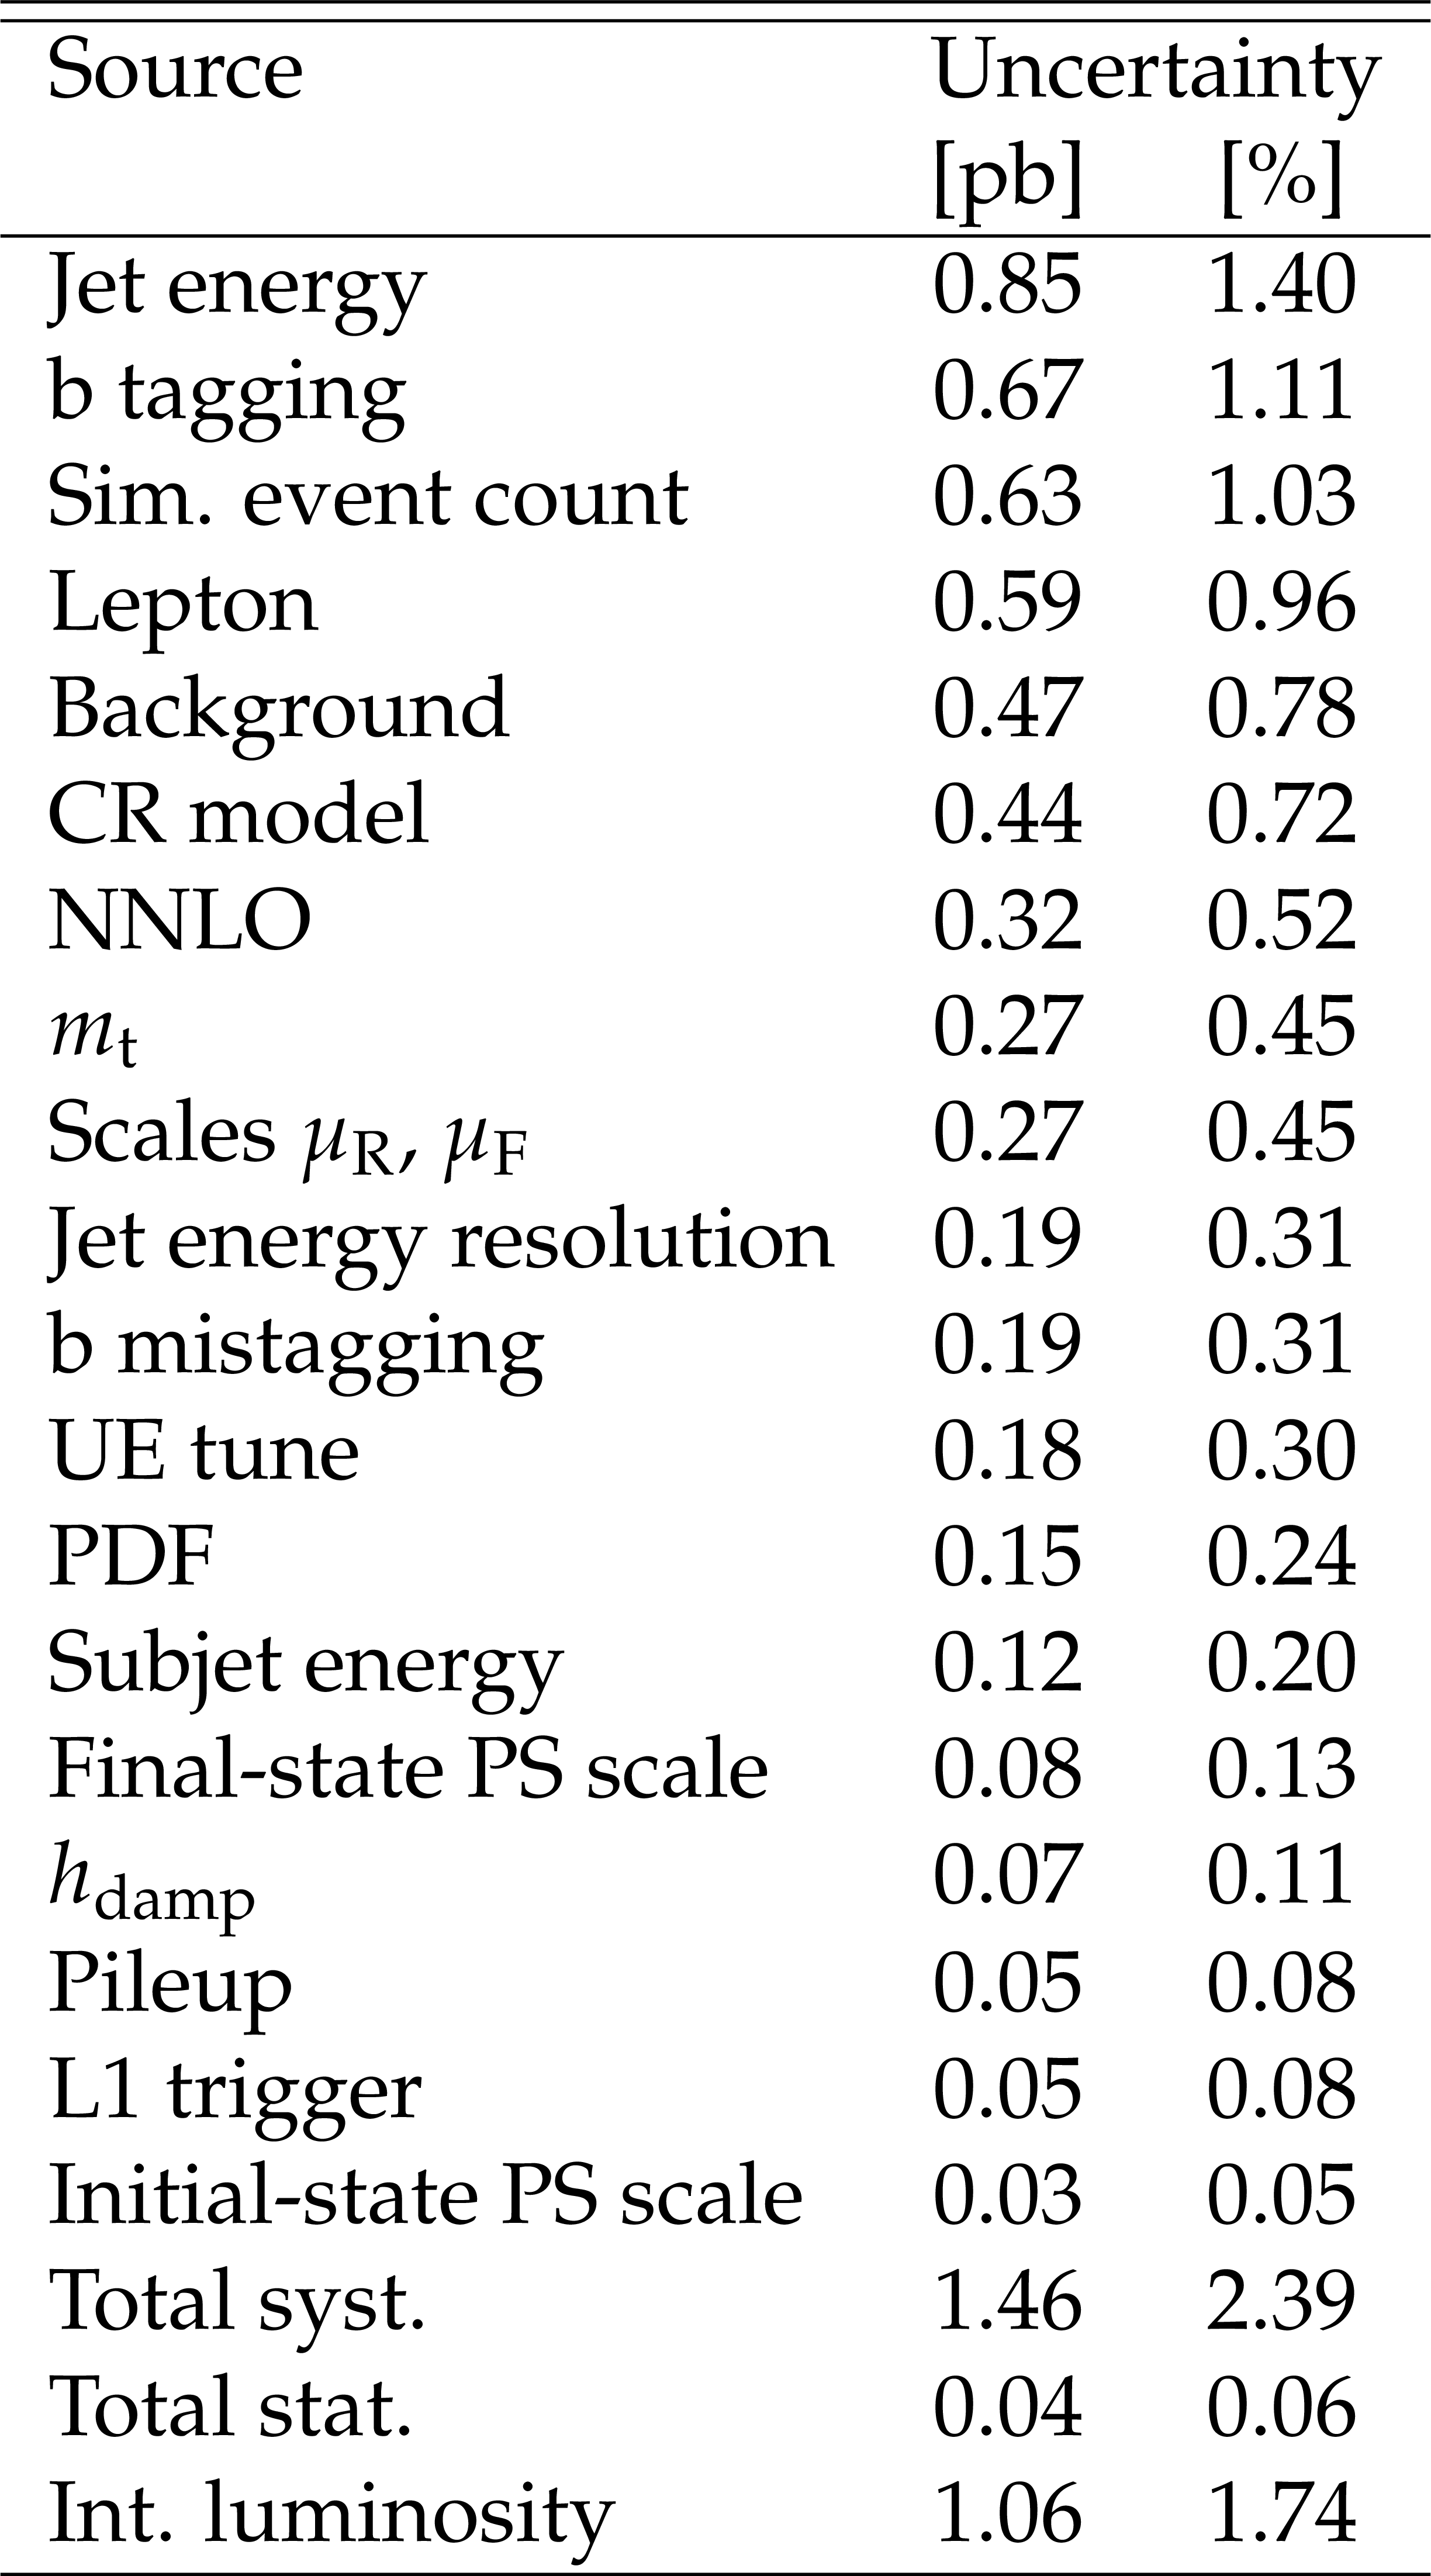
png pdf |
Table 2:
The sources of systematic uncertainty and their absolute and relative values in the measurement of $\sigma _\mathrm {particle}$. |
| Summary |
|
Measurements of differential and double-differential top quark pair ($\mathrm{t\bar{t}}$) production cross sections have been presented as a function of many kinematic properties of the top quarks and the $\mathrm{t\bar{t}}$ system at the parton and particle levels, where the latter reduces extrapolations based on theoretical assumptions. In addition, the number of additional jets and kinematic variables in bins of jet multiplicities have been measured at the particle level. The data correspond to an integrated luminosity of 137 fb$^{-1}$ recorded by the CMS experiment at the LHC in proton-proton collisions at $\sqrt{s} = $ 13 TeV. The $\mathrm{t\bar{t}}$ cross sections are measured in the lepton+jets channels with a single electron or muon and jets in the final state. For the first time the full spectra of differential cross sections are determined using a combination of resolved and boosted $\mathrm{t\bar{t}}$ topologies, in which the $\mathrm{t\bar{t}}$ decay products can be either identified as separated jets and isolated leptons or as collimated and overlapping jets, respectively. The combination of multiple reconstruction categories provides constraints on the systematic uncertainties and results in a significantly improved precision with respect to previous measurements. For a top quark transverse momentum ${p_{\mathrm{T}}} < $ 500 GeV the uncertainty is reduced by about 50% compared with the previous CMS measurement [17]. The dominant sources of systematic uncertainties are the jet energy scale, integrated luminosity, and $\mathrm{t\bar{t}}$ modeling. Most differential distributions are found to be compatible with the standard model predictions of the event generators POWHEG+PYTHIA, POWHEG+HERWIG, and MG5_aMC@NLO+PYTHIA. In addition, the parton-level cross sections are compared to the next-to-next-to-leading-order quantum chromodynamics calculations obtained with Matrix that comes with a significantly reduced theoretical uncertainty. A softer top quark ${p_{\mathrm{T}}}$ spectrum is observed compared to most of the next-to-leading-order predictions. Deviations between the predictions and data are observed when the top quark ${p_{\mathrm{T}}}$ is measured in bins of the $\mathrm{t\bar{t}}$ invariant mass and ${p_{\mathrm{T}}}$. The POWHEG+HERWIG and MG5_aMC@NLO+PYTHIA simulations do not give a good description of the observed jet multiplicities and related observables such as the scalar ${p_{\mathrm{T}}}$ sum of additional jets. The total $\mathrm{t\bar{t}}$ production cross section is measured to be |
| References | ||||
| 1 | CMS Collaboration | Measurement of $ \mathrm{t\bar{t}} $ normalised multi-differential cross sections in pp collisions at $ \sqrt{s} = $ 13 TeV and simultaneous determination of the strong coupling strength, top quark pole mass, and parton distribution functions | EPJC 80 (2020) 658 | CMS-TOP-18-004 1904.05237 |
| 2 | CMS Collaboration | Measurement of the top quark Yukawa coupling from $ \mathrm{t\bar{t}} $ kinematic distributions in the lepton+jets final state in proton-proton collisions at $ \sqrt{s} = $ 13 TeV | PRD 100 (2019) 072007 | CMS-TOP-17-004 1907.01590 |
| 3 | CMS Collaboration | Measurement of the top quark Yukawa coupling from $ \mathrm{t\bar{t}} $ kinematic distributions in the dilepton final state in proton-proton collisions at $ \sqrt{s}= $ 13 TeV | PRD 102 (2020) 092013 | CMS-TOP-19-008 2009.07123 |
| 4 | CMS Collaboration | Measurement of differential top-quark pair production cross sections in pp collisions at $ \sqrt{s}= $ 7 TeV | EPJC 73 (2013) 2339 | CMS-TOP-11-013 1211.2220 |
| 5 | ATLAS Collaboration | Differential top-antitop cross-section measurements as a function of observables constructed from final-state particles using pp collisions at $ \sqrt{s}= $ 7 TeV in the ATLAS detector | JHEP 06 (2015) 100 | 1502.05923 |
| 6 | CMS Collaboration | Measurement of the differential cross section for top quark pair production in pp collisions at $ \sqrt{s} = $ 8 TeV | EPJC 75 (2015) 542 | CMS-TOP-12-028 1505.04480 |
| 7 | ATLAS Collaboration | Measurements of top-quark pair differential cross-sections in the lepton+jets channel in pp collisions at $ \sqrt{s}= $ 8 TeV using the ATLAS detector | EPJC 76 (2016) 538 | 1511.04716 |
| 8 | ATLAS Collaboration | Measurement of the differential cross-section of highly boosted top quarks as a function of their transverse momentum in $ \sqrt{s} = $ 8 TeV proton-proton collisions using the ATLAS detector | PRD 93 (2016) 032009 | 1510.03818 |
| 9 | CMS Collaboration | Measurement of the $ \mathrm{t\bar{t}} $ production cross section in the all-jets final state in pp collisions at $ \sqrt{s}= $ 8 TeV | EPJC 76 (2016) 128 | CMS-TOP-14-018 1509.06076 |
| 10 | CMS Collaboration | Measurement of the integrated and differential $ \mathrm{t \bar{t}} $ production cross sections for high-$ p_{\mathrm{T}} $ top quarks in pp collisions at $ \sqrt{s} = $ 8 TeV | PRD 94 (2016) 072002 | CMS-TOP-14-012 1605.00116 |
| 11 | ATLAS Collaboration | Measurement of top quark pair differential cross-sections in the dilepton channel in pp collisions at $ \sqrt{s} = $ 7 and 8 TeV with ATLAS | PRD 94 (2016) 092003 | 1607.07281 |
| 12 | CMS Collaboration | Measurement of double-differential cross sections for top quark pair production in pp collisions at $ \sqrt{s} = $ 8 TeV and impact on parton distribution functions | EPJC 77 (2017) 459 | CMS-TOP-14-013 1703.01630 |
| 13 | ATLAS Collaboration | Measurement of jet activity produced in top-quark events with an electron, a muon and two b-tagged jets in the final state in pp collisions at $ \sqrt{s}= $ 13 TeV with the ATLAS detector | EPJC 77 (2017) 220 | 1610.09978 |
| 14 | ATLAS Collaboration | Measurements of top-quark pair differential cross-sections in the e$ \mu $ channel in pp collisions at $ \sqrt{s} = $ 13 TeV using the ATLAS detector | EPJC 77 (2017) 292 | 1612.05220 |
| 15 | CMS Collaboration | Measurement of normalized differential $ \mathrm{t \bar{t}} $ cross sections in the dilepton channel from pp collisions at $ \sqrt{s} = 13 TeV. $ | JHEP 04 (2018) 60 | CMS-TOP-16-007 1708.07638 |
| 16 | CMS Collaboration | Measurement of differential cross sections for top quark pair production using the lepton+jets final state in proton-proton collisions at 13 TeV | PRD 95 (2017) 092001 | CMS-TOP-16-008 1610.04191 |
| 17 | CMS Collaboration | Measurement of differential cross sections for the production of top quark pairs and of additional jets in lepton+jets events from pp collisions at 13 TeV | PRD 97 (2018) 112003 | CMS-TOP-17-002 1803.08856 |
| 18 | ATLAS Collaboration | Measurements of $ \mathrm{t\bar{t}} $ differential cross-sections of highly boosted top quarks decaying to all-hadronic final states in pp collisions at $ \sqrt{s}= $ 13 TeV using the ATLAS detector | PRD 98 (2018) 012003 | 1801.02052 |
| 19 | ATLAS Collaboration | Measurements of top-quark pair differential and double-differential cross-sections in the $ \ell $+jets channel with pp collisions at $ \sqrt{s}= $ 13 TeV using the ATLAS detector | EPJC 79 (2019) 1028 | 1908.07305 |
| 20 | ATLAS Collaboration | Measurement of the $ \mathrm{t\bar{t}} $ production cross-section and lepton differential distributions in $ \mathrm{e}\mu $ dilepton events from pp collisions at $ \sqrt{s}= $ 13 TeV with the ATLAS detector | EPJC 80 (2020) 528 | 1910.08819 |
| 21 | CMS Collaboration | HEPData record for this analysis | link | |
| 22 | P. Nason | A new method for combining NLO QCD with shower Monte Carlo algorithms | JHEP 11 (2004) 40 | hep-ph/0409146 |
| 23 | S. Frixione, P. Nason, and C. Oleari | Matching NLO QCD computations with parton shower simulations: the POWHEG method | JHEP 11 (2007) 70 | 0709.2092 |
| 24 | S. Alioli, P. Nason, C. Oleari, and E. Re | A general framework for implementing NLO calculations in shower Monte Carlo programs: the POWHEG BOX | JHEP 06 (2010) 043 | 1002.2581 |
| 25 | S. Frixione, P. Nason, and G. Ridolfi | A positive-weight next-to-leading-order Monte Carlo for heavy flavour hadroproduction | JHEP 09 (2007) 126 | 0707.3088 |
| 26 | T. Sjostrand et al. | An Introduction to PYTHIA 8.2 | CPC 191 (2015) 159 | 1410.3012 |
| 27 | P. Skands, S. Carrazza, and J. Rojo | Tuning PYTHIA 8.1: the Monash 2013 tune | EPJC 74 (2014) 3024 | 1404.5630 |
| 28 | CMS Collaboration | Event generator tunes obtained from underlying event and multiparton scattering measurements | EPJC 76 (2016) 155 | CMS-GEN-14-001 1512.00815 |
| 29 | CMS Collaboration | Investigations of the impact of the parton shower tuning in PYTHIA 8 in the modelling of $ \mathrm{t\overline{t}} $ at $ \sqrt{s}= $ 8 and 13 TeV | CMS-PAS-TOP-16-021 | CMS-PAS-TOP-16-021 |
| 30 | CMS Collaboration | Extraction and validation of a new set of CMS Pythia8 tunes from underlying-event measurements | EPJC 80 (2020) 4 | CMS-GEN-17-001 1903.12179 |
| 31 | NNPDF Collaboration | Parton distributions for the LHC Run II | JHEP 04 (2015) 040 | 1410.8849 |
| 32 | NNPDF Collaboration | Parton distributions from high-precision collider data | EPJC 77 (2017) 663 | 1706.00428 |
| 33 | GEANT4 Collaboration | GEANT4--a simulation toolkit | NIMA 506 (2003) 250 | |
| 34 | M. Bahr et al. | HERWIG++ physics and manual | EPJC 58 (2008) 639 | 0803.0883 |
| 35 | CMS Collaboration | Development and validation of HERWIG 7 tunes from CMS underlying-event measurements | EPJC 81 (2021) 312 | CMS-GEN-19-001 2011.03422 |
| 36 | J. Alwall et al. | The automated computation of tree-level and next-to-leading order differential cross sections, and their matching to parton shower simulations | JHEP 07 (2014) 079 | 1405.0301 |
| 37 | R. Frederix and S. Frixione | Merging meets matching in MC@NLO | JHEP 12 (2012) 061 | 1209.6215 |
| 38 | M. Czakon and A. Mitov | Top++: A program for the calculation of the top-pair cross-section at hadron colliders | CPC 185 (2014) 2930 | 1112.5675 |
| 39 | A. D. Martin, W. J. Stirling, R. S. Thorne, and G. Watt | Parton distributions for the LHC | EPJC 63 (2009) 189 | 0901.0002 |
| 40 | J. Gao et al. | CT10 next-to-next-to-leading order global analysis of QCD | PRD 89 (2014) 033009 | 1302.6246 |
| 41 | R. D. Ball et al. | Parton distributions with LHC data | NPB 867 (2013) 244 | 1207.1303 |
| 42 | S. Catani et al. | Top-quark pair hadroproduction at next-to-next-to-leading order in QCD | PRD 99 (2019) 051501 | 1901.04005 |
| 43 | S. Catani et al. | Top-quark pair production at the LHC: Fully differential QCD predictions at NNLO | JHEP 07 (2019) 100 | 1906.06535 |
| 44 | E. Re | Single-top Wt-channel production matched with parton showers using the POWHEG method | EPJC 71 (2011) 1547 | 1009.2450 |
| 45 | C. D. White, S. Frixione, E. Laenen, and F. Maltoni | Isolating Wt production at the LHC | JHEP 11 (2009) 074 | 0908.0631 |
| 46 | Y. Li and F. Petriello | Combining QCD and electroweak corrections to dilepton production in FEWZ | PRD 86 (2012) 094034 | 1208.5967 |
| 47 | P. Kant et al. | HatHor for single top-quark production: Updated predictions and uncertainty estimates for single top-quark production in hadronic collisions | CPC 191 (2015) 74 | 1406.4403 |
| 48 | N. Kidonakis | NNLL threshold resummation for top-pair and single-top production | Phys. Part. Nucl. 45 (2014) 714 | 1210.7813 |
| 49 | T. Sjostrand, S. Mrenna, and P. Skands | A brief introduction to PYTHIA 8.1 | CPC 178 (2008) 852 | 0710.3820 |
| 50 | Particle Data Group, P. A. Zyla et al. | Review of particle physics | Prog. Theor. Exp. Phys. 2020 (2020) 083C01 | |
| 51 | CMS Collaboration | Object definitions for top quark analyses at the particle level | CDS | |
| 52 | M. Cacciari, G. P. Salam, and G. Soyez | The anti-$ k_\mathrm{T} $ jet clustering algorithm | JHEP 04 (2008) 063 | 0802.1189 |
| 53 | M. Cacciari, G. P. Salam, and G. Soyez | FastJet user manual | EPJC 72 (2012) 1896 | 1111.6097 |
| 54 | M. Cacciari, G. P. Salam, and G. Soyez | The catchment area of jets | JHEP 04 (2008) 005 | 0802.1188 |
| 55 | CMS Collaboration | The CMS experiment at the CERN LHC | JINST 3 (2008) S08004 | CMS-00-001 |
| 56 | CMS Collaboration | Performance of the CMS Level-1 trigger in proton-proton collisions at $ \sqrt{s} = $ 13 TeV | JINST 15 (2020) P10017 | CMS-TRG-17-001 2006.10165 |
| 57 | CMS Collaboration | The CMS trigger system | JINST 12 (2017) P01020 | CMS-TRG-12-001 1609.02366 |
| 58 | CMS Collaboration | Particle-flow reconstruction and global event description with the CMS detector | JINST 12 (2017) P10003 | CMS-PRF-14-001 1706.04965 |
| 59 | CMS Collaboration | Electron and photon reconstruction and identification with the CMS experiment at the CERN LHC | JINST 16 (2021) P05014 | CMS-EGM-17-001 2012.06888 |
| 60 | CMS Collaboration | Performance of the CMS muon detector and muon reconstruction with proton-proton collisions at $ \sqrt{s} = $ 13 TeV | JINST 13 (2018) P06015 | CMS-MUO-16-001 1804.04528 |
| 61 | CMS Collaboration | Measurements of inclusive $ \mathrm{W} $ and $ \mathrm{Z} $ cross sections in pp collisions at $ \sqrt{s}= $ 7 TeV | JHEP 01 (2011) 080 | CMS-EWK-10-002 1012.2466 |
| 62 | CMS Collaboration | Jet energy scale and resolution in the CMS experiment in pp collisions at 8 TeV | JINST 12 (2017) P02014 | CMS-JME-13-004 1607.03663 |
| 63 | CMS Collaboration | Identification of heavy-flavour jets with the CMS detector in pp collisions at 13 TeV | JINST 13 (2018) P05011 | CMS-BTV-16-002 1712.07158 |
| 64 | D. Bertolini, P. Harris, M. Low, and N. Tran | Pileup per particle identification | JHEP 10 (2014) 59 | 1407.6013 |
| 65 | D. Kingma and J. Ba | Adam: a method for stochastic optimization | in Proceedings of the 3rd Int. Conf. on Learning Representations, ICLR 2015 2015 | 1412.6980 |
| 66 | I. W. Stewart, F. J. Tackmann, and W. J. Waalewijn | $ N $-jettiness: an inclusive event shape to veto jets | PRL 105 (2010) 092002 | 1004.2489 |
| 67 | J. D. Bjorken and S. J. Brodsky | Statistical model for electron-positron annihilation into hadrons | PRD 1 (1970) 1416 | |
| 68 | W. S. Cleveland | Robust locally weighted regression and smoothing scatterplots | J. Am. Stat. Assoc. 74 (1979) 829 | |
| 69 | CMS Collaboration | Precision luminosity measurement in proton-proton collisions at $ \sqrt{s} = $ 13 TeV in 2015 and 2016 at CMS | 2021. Submitted to EPJC | CMS-LUM-17-003 2104.01927 |
| 70 | CMS Collaboration | CMS Luminosity measurement for the 2017 data-taking period | CMS-PAS-LUM-17-004 | CMS-PAS-LUM-17-004 |
| 71 | CMS Collaboration | CMS Luminosity measurement for the 2018 data-taking period | CMS-PAS-LUM-18-002 | CMS-PAS-LUM-18-002 |
| 72 | ATLAS Collaboration | Measurement of the inelastic proton-proton cross section at $ \sqrt{s} = $ 13 TeV with the ATLAS detector at the LHC | PRL 117 (2016) 182002 | 1606.02625 |
| 73 | S. Dulat et al. | New parton distribution functions from a global analysis of quantum chromodynamics | PRD 93 (2016) 033006 | 1506.07443 |
| 74 | H1 and ZEUS Collaborations | Combination of measurements of inclusive deep inelastic e$ ^\pm $p scattering cross sections and QCD analysis of HERA data | EPJC 12 (2015) 580 | 1506.06042 |
| 75 | L. A. Harland-Lang, A. D. Martin, P. Motylinski, and R. S. Thorne | Parton distributions in the LHC era: MMHT 2014 PDFs | EPJC 75 (2015) 204 | 1412.3989 |
|
|
Compact Muon Solenoid LHC, CERN |
|

|

|

|

|

|