

Compact Muon Solenoid
LHC, CERN
| CMS-TOP-18-002 ; CERN-EP-2020-011 | ||
| Measurement of the cross section for $\mathrm{t\bar{t}}$ production with additional jets and b jets in pp collisions at $\sqrt{s} = $ 13 TeV | ||
| CMS Collaboration | ||
| 14 March 2020 | ||
| JHEP 07 (2020) 125 | ||
| Abstract: Measurements of the cross section for the production of top quark pairs in association with a pair of jets from bottom quarks (${\sigma_{{\mathrm{t\bar{t}}\mathrm{b\bar{b}}} }} $) and in association with a pair of jets from quarks of any flavor or gluons (${\sigma_{{\mathrm{t\bar{t}} \mathrm{jj}} }} $) and their ratio are presented. The data were collected in proton-proton collisions at a center-of-mass energy of 13 TeV by the CMS experiment at the LHC in 2016 and correspond to an integrated luminosity of 35.9 fb$^{-1}$. The measurements are performed in a fiducial phase space, separately in the dilepton and lepton+jets channels, where lepton corresponds to either an electron or a muon. The results for the dilepton and lepton+jets channels, respectively, are ${\sigma_{{\mathrm{t\bar{t}} \mathrm{jj}} }} = $ 2.36 $\pm$ 0.02 (stat) $\pm$ 0.20 (syst) pb and 31.0 $\pm$ 0.2 (stat) $\pm$ 2.9 (syst) pb, and for the cross section ratio 0.017 $\pm$ 0.001 (stat) $\pm$ 0.001 (syst) and 0.020 $\pm$ 0.001 (stat) $\pm$ 0.001 (syst). The values of ${\sigma_{{\mathrm{t\bar{t}}\mathrm{b\bar{b}}} }} $ are determined from the product of the ${\sigma_{{\mathrm{t\bar{t}} \mathrm{jj}} }} $ and the cross section ratio, obtaining, respectively, 0.040 $\pm$ 0.002 (stat) $\pm$ 0.005 (syst) pb and 0.62 $\pm$ 0.03 (stat) $\pm$ 0.07 (syst) pb. These measurements are the most precise to date and are consistent, within the uncertainties, with the standard model expectations obtained at next-to-leading order in quantum chromodynamics. | ||
| Links: e-print arXiv:2003.06467 [hep-ex] (PDF) ; CDS record ; inSPIRE record ; CADI line (restricted) ; | ||
| Figures | |

png pdf |
Figure 1:
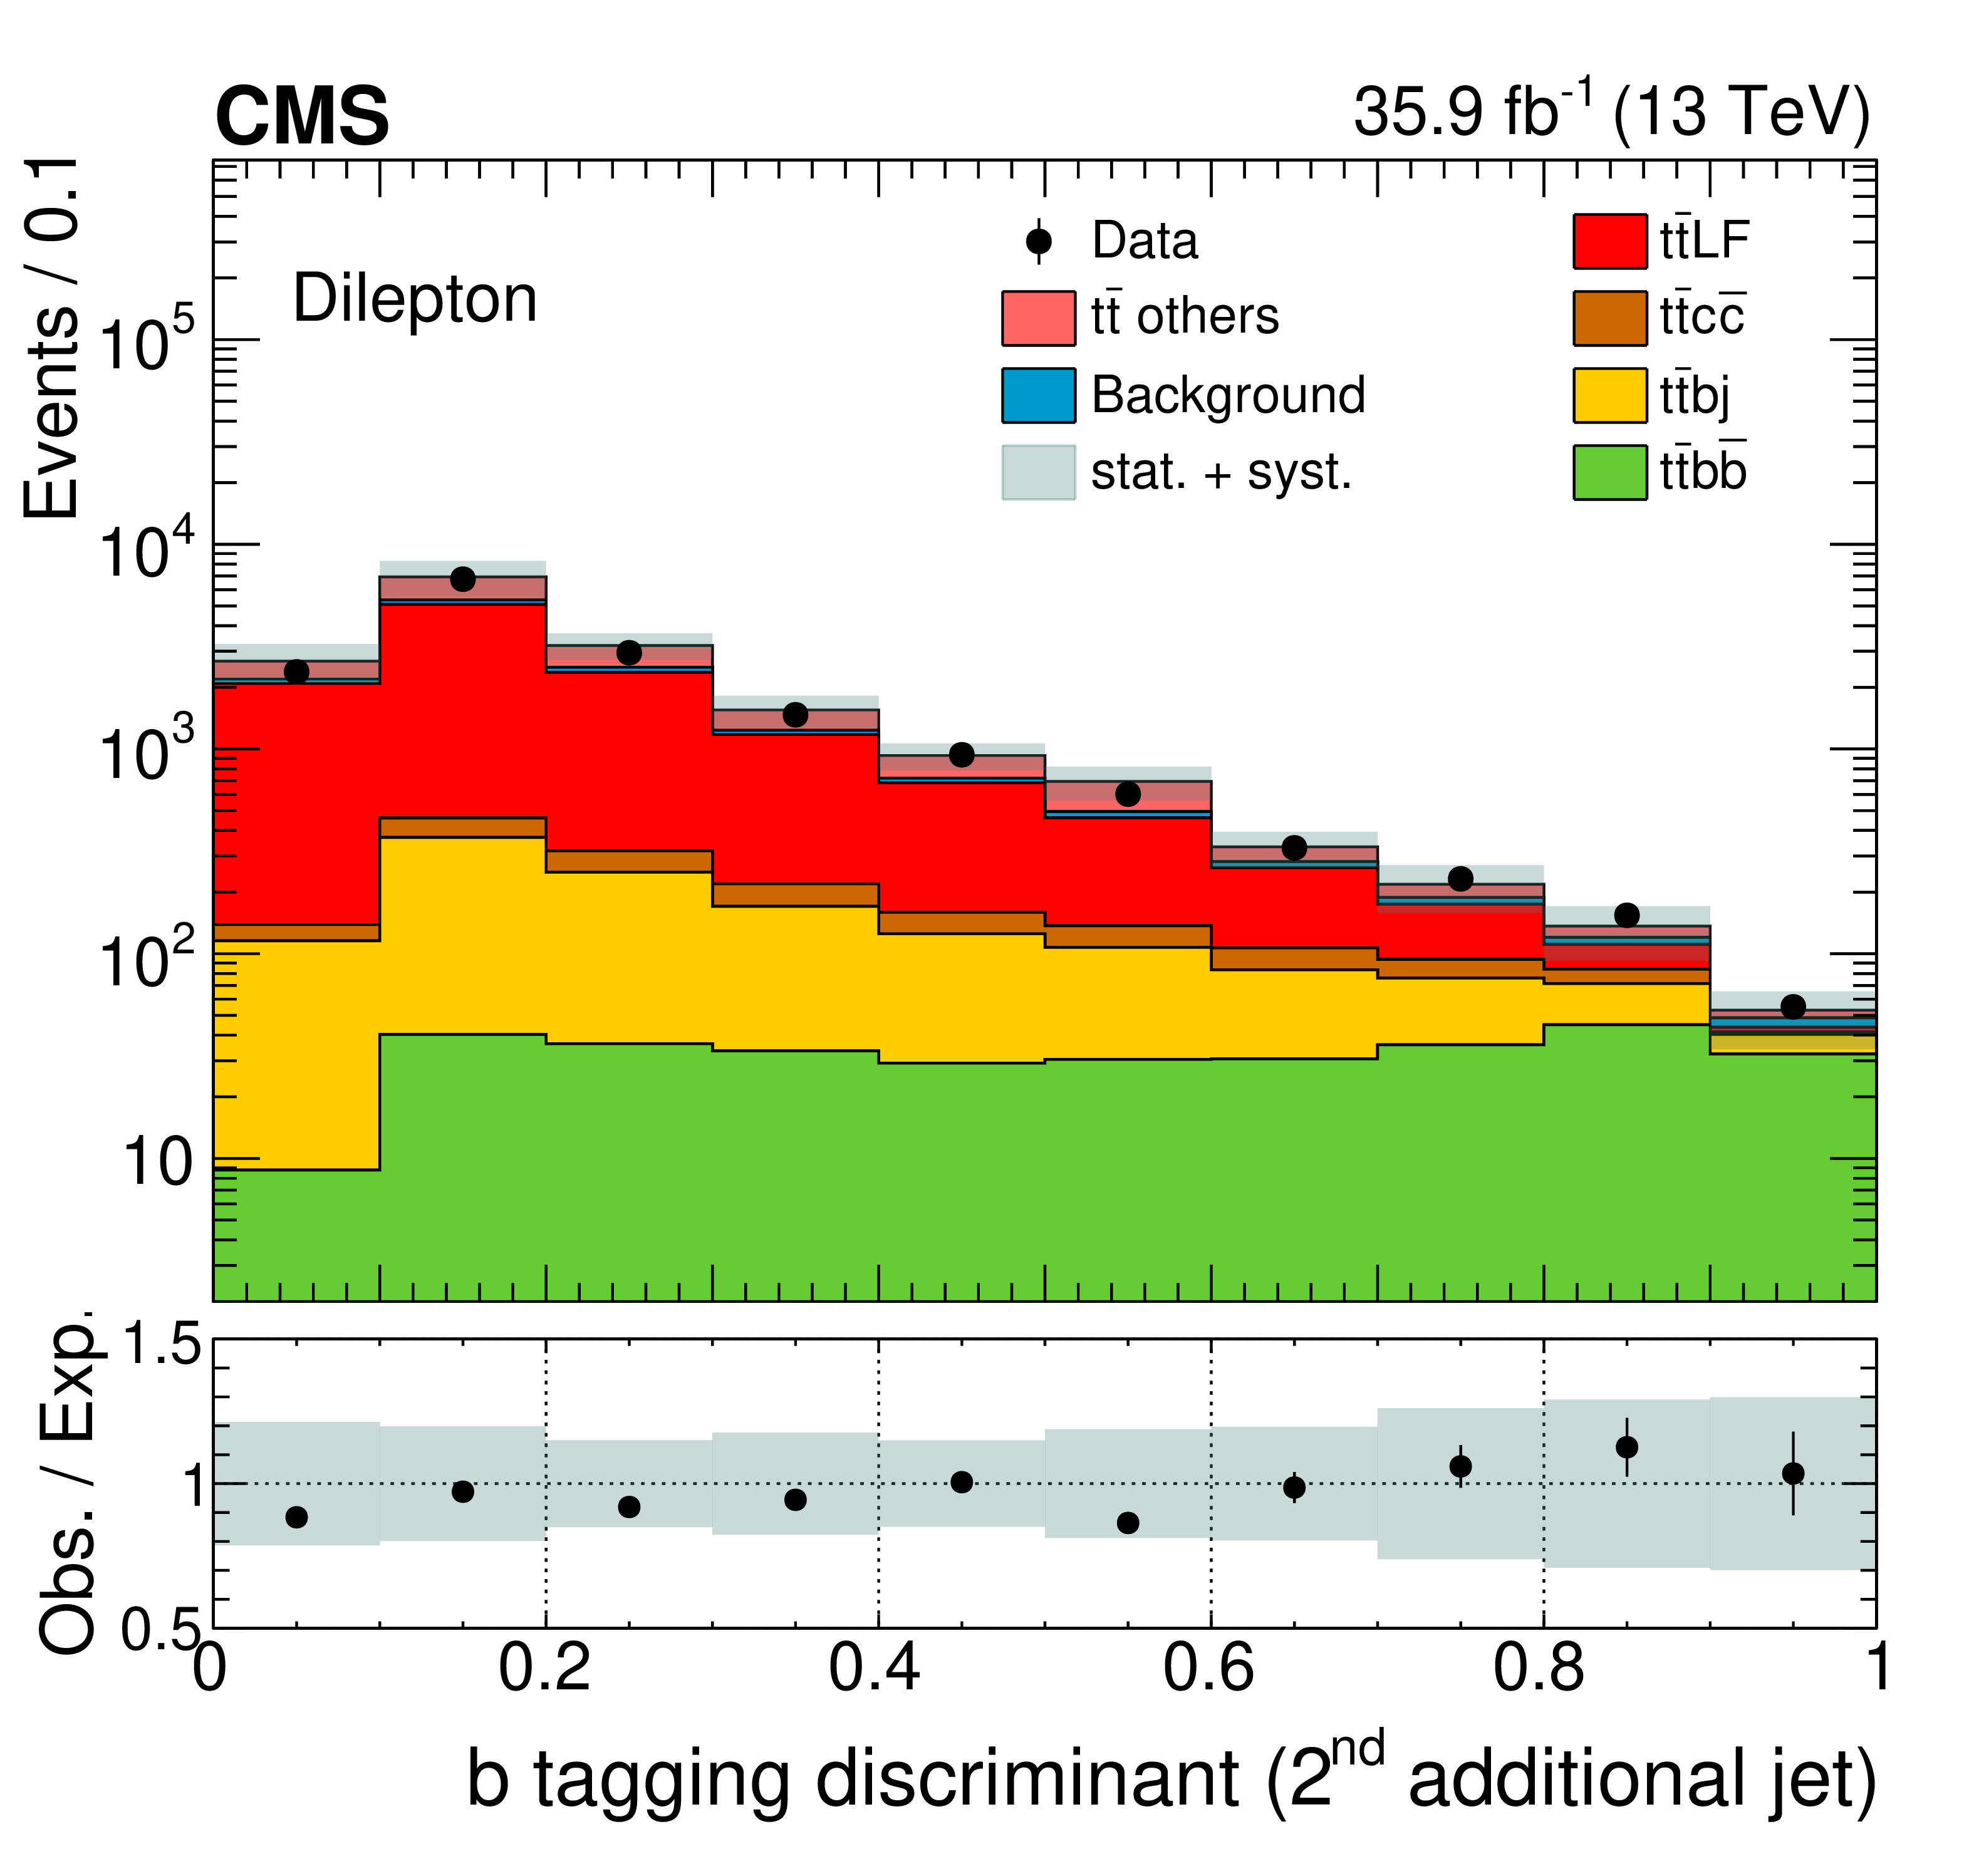
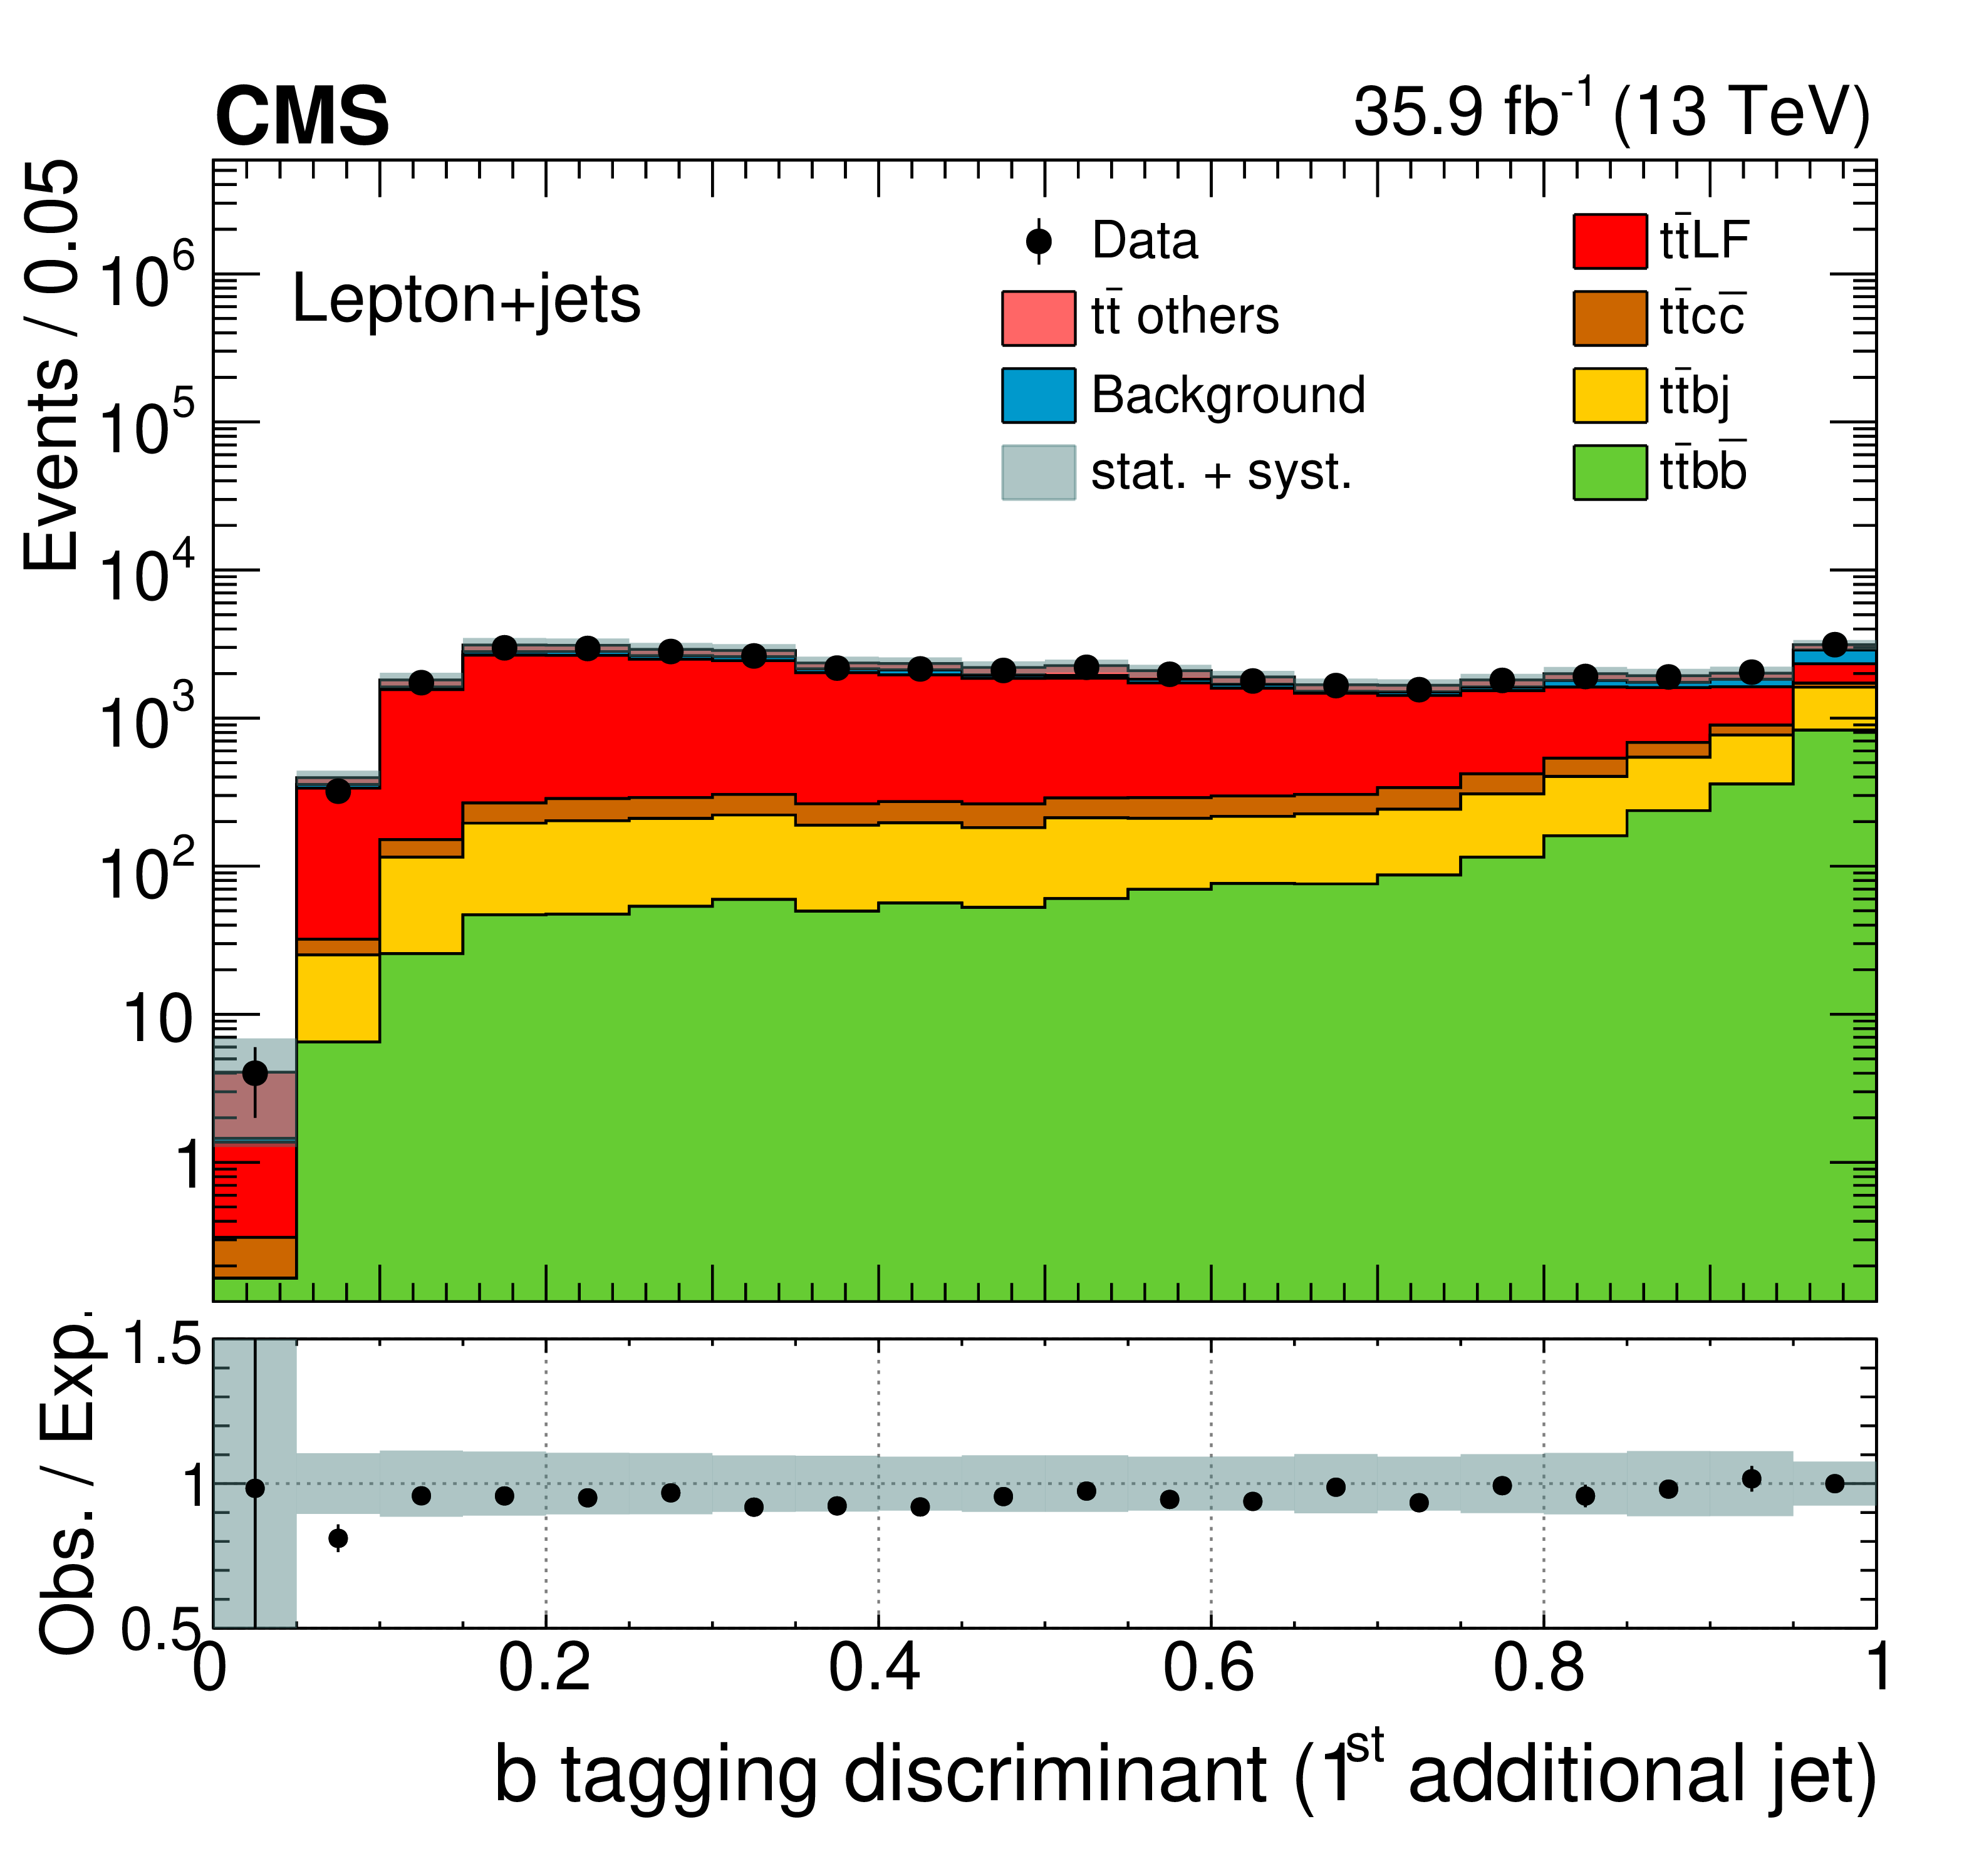
The b tagging discriminant distribution from data (points) for the first (left) and second (right) additional jet for the dilepton (upper) and lepton+jets (lower) channels in decreasing order of the b tagging discriminant value after event selection, and the predicted distributions for the signal and background from simulation (shaded histograms). The contributions of single top quark, ${\mathrm{t} \mathrm{\bar{t}} {\mathrm{V}}}$, $ {\mathrm{t} \mathrm{\bar{t}} \mathrm{H}} $, and the non-top quark processes are merged in the background (blue) entry. The $ {\mathrm{t} \mathrm{\bar{t}} \mathrm{b} \mathrm{\bar{b}}} $ process is located in the bottom part of the stack due to its low contribution in comparison with the other entries. The lower panels display the ratio of the data to the expectations. The grey bands display the combination of the statistical and systematic uncertainties. |

png pdf |
Figure 1-a:
The b tagging discriminant distribution from data (points) for the first additional jet for the dilepton channel in decreasing order of the b tagging discriminant value after event selection, and the predicted distributions for the signal and background from simulation (shaded histograms). The contributions of single top quark, ${\mathrm{t} \mathrm{\bar{t}} {\mathrm{V}}}$, $ {\mathrm{t} \mathrm{\bar{t}} \mathrm{H}} $, and the non-top quark processes are merged in the background (blue) entry. The $ {\mathrm{t} \mathrm{\bar{t}} \mathrm{b} \mathrm{\bar{b}}} $ process is located in the bottom part of the stack due to its low contribution in comparison with the other entries. The lower panel displays the ratio of the data to the expectations. The grey bands display the combination of the statistical and systematic uncertainties. |
png pdf |
Figure 1-b:
The b tagging discriminant distribution from data (points) for the second additional jet for the dilepton channel in decreasing order of the b tagging discriminant value after event selection, and the predicted distributions for the signal and background from simulation (shaded histograms). The contributions of single top quark, ${\mathrm{t} \mathrm{\bar{t}} {\mathrm{V}}}$, $ {\mathrm{t} \mathrm{\bar{t}} \mathrm{H}} $, and the non-top quark processes are merged in the background (blue) entry. The $ {\mathrm{t} \mathrm{\bar{t}} \mathrm{b} \mathrm{\bar{b}}} $ process is located in the bottom part of the stack due to its low contribution in comparison with the other entries. The lower panel displays the ratio of the data to the expectations. The grey bands display the combination of the statistical and systematic uncertainties. |
png pdf |
Figure 1-c:
The b tagging discriminant distribution from data (points) for the first additional jet for the lepton+jets channel in decreasing order of the b tagging discriminant value after event selection, and the predicted distributions for the signal and background from simulation (shaded histograms). The contributions of single top quark, ${\mathrm{t} \mathrm{\bar{t}} {\mathrm{V}}}$, $ {\mathrm{t} \mathrm{\bar{t}} \mathrm{H}} $, and the non-top quark processes are merged in the background (blue) entry. The $ {\mathrm{t} \mathrm{\bar{t}} \mathrm{b} \mathrm{\bar{b}}} $ process is located in the bottom part of the stack due to its low contribution in comparison with the other entries. The lower panel displays the ratio of the data to the expectations. The grey bands display the combination of the statistical and systematic uncertainties. |

png pdf |
Figure 1-d:
The b tagging discriminant distribution from data (points) for the second additional jet for the lepton+jets channel in decreasing order of the b tagging discriminant value after event selection, and the predicted distributions for the signal and background from simulation (shaded histograms). The contributions of single top quark, ${\mathrm{t} \mathrm{\bar{t}} {\mathrm{V}}}$, $ {\mathrm{t} \mathrm{\bar{t}} \mathrm{H}} $, and the non-top quark processes are merged in the background (blue) entry. The $ {\mathrm{t} \mathrm{\bar{t}} \mathrm{b} \mathrm{\bar{b}}} $ process is located in the bottom part of the stack due to its low contribution in comparison with the other entries. The lower panel displays the ratio of the data to the expectations. The grey bands display the combination of the statistical and systematic uncertainties. |
png pdf |
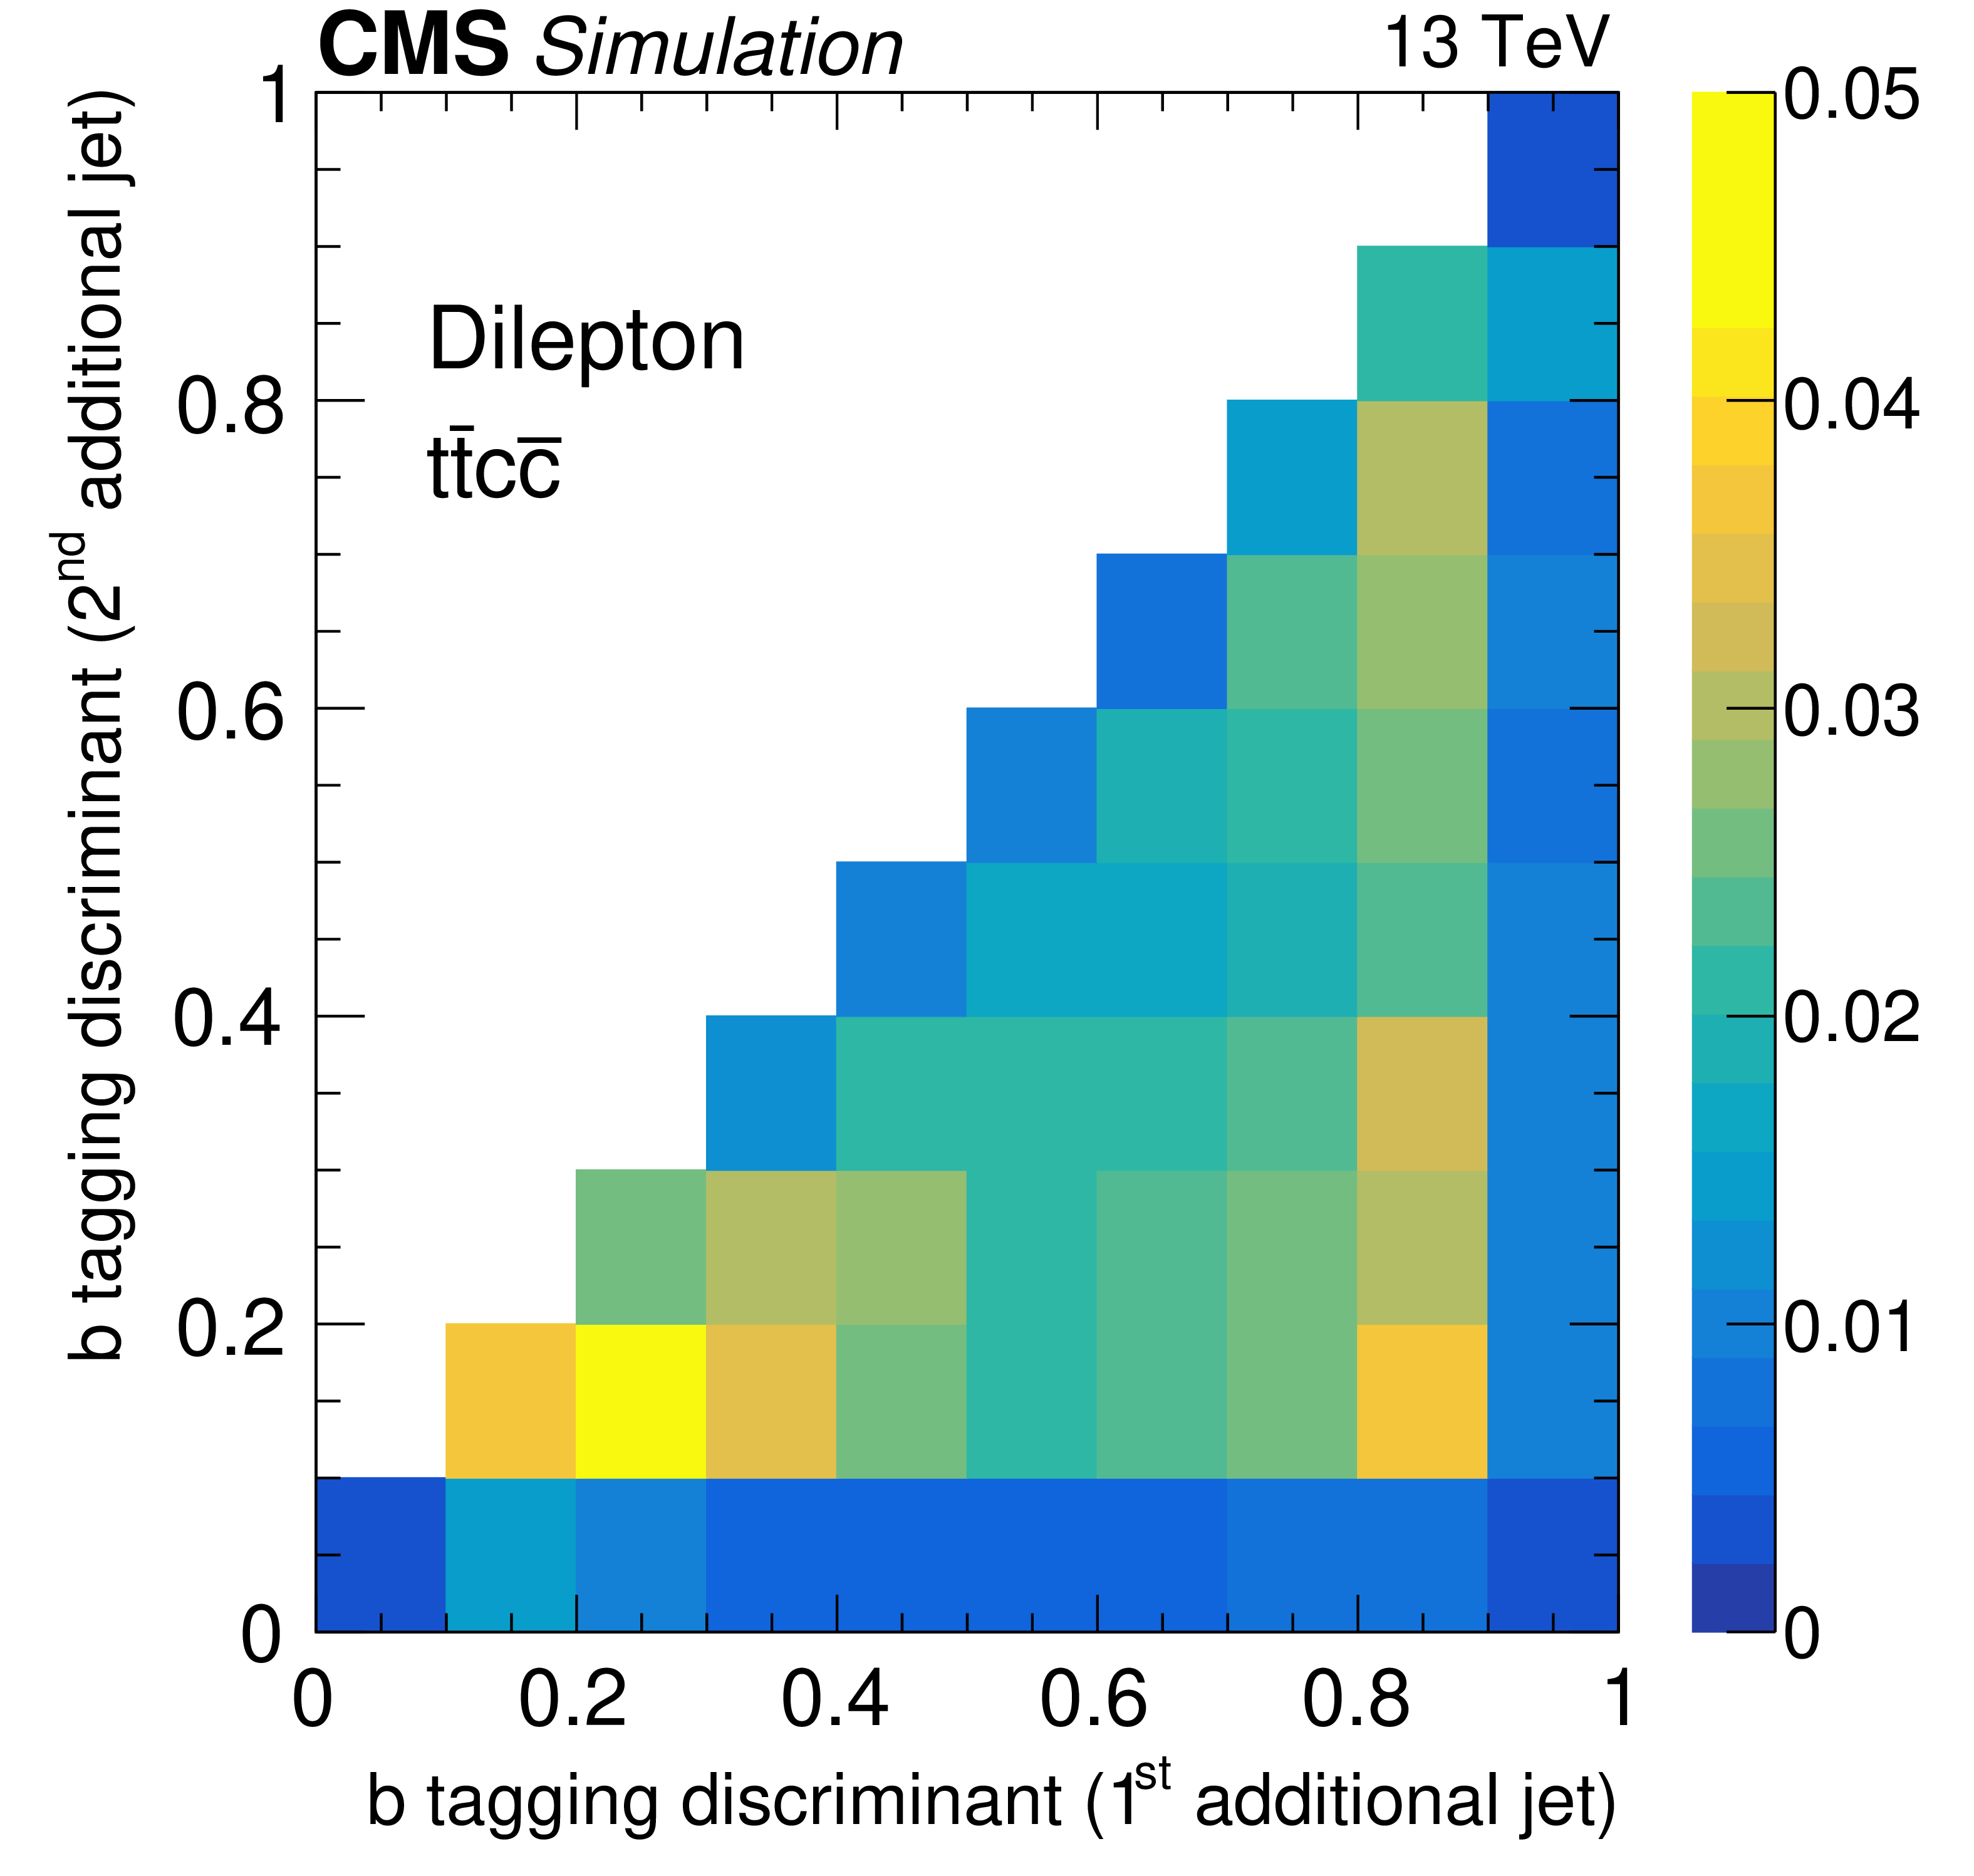
Figure 2:
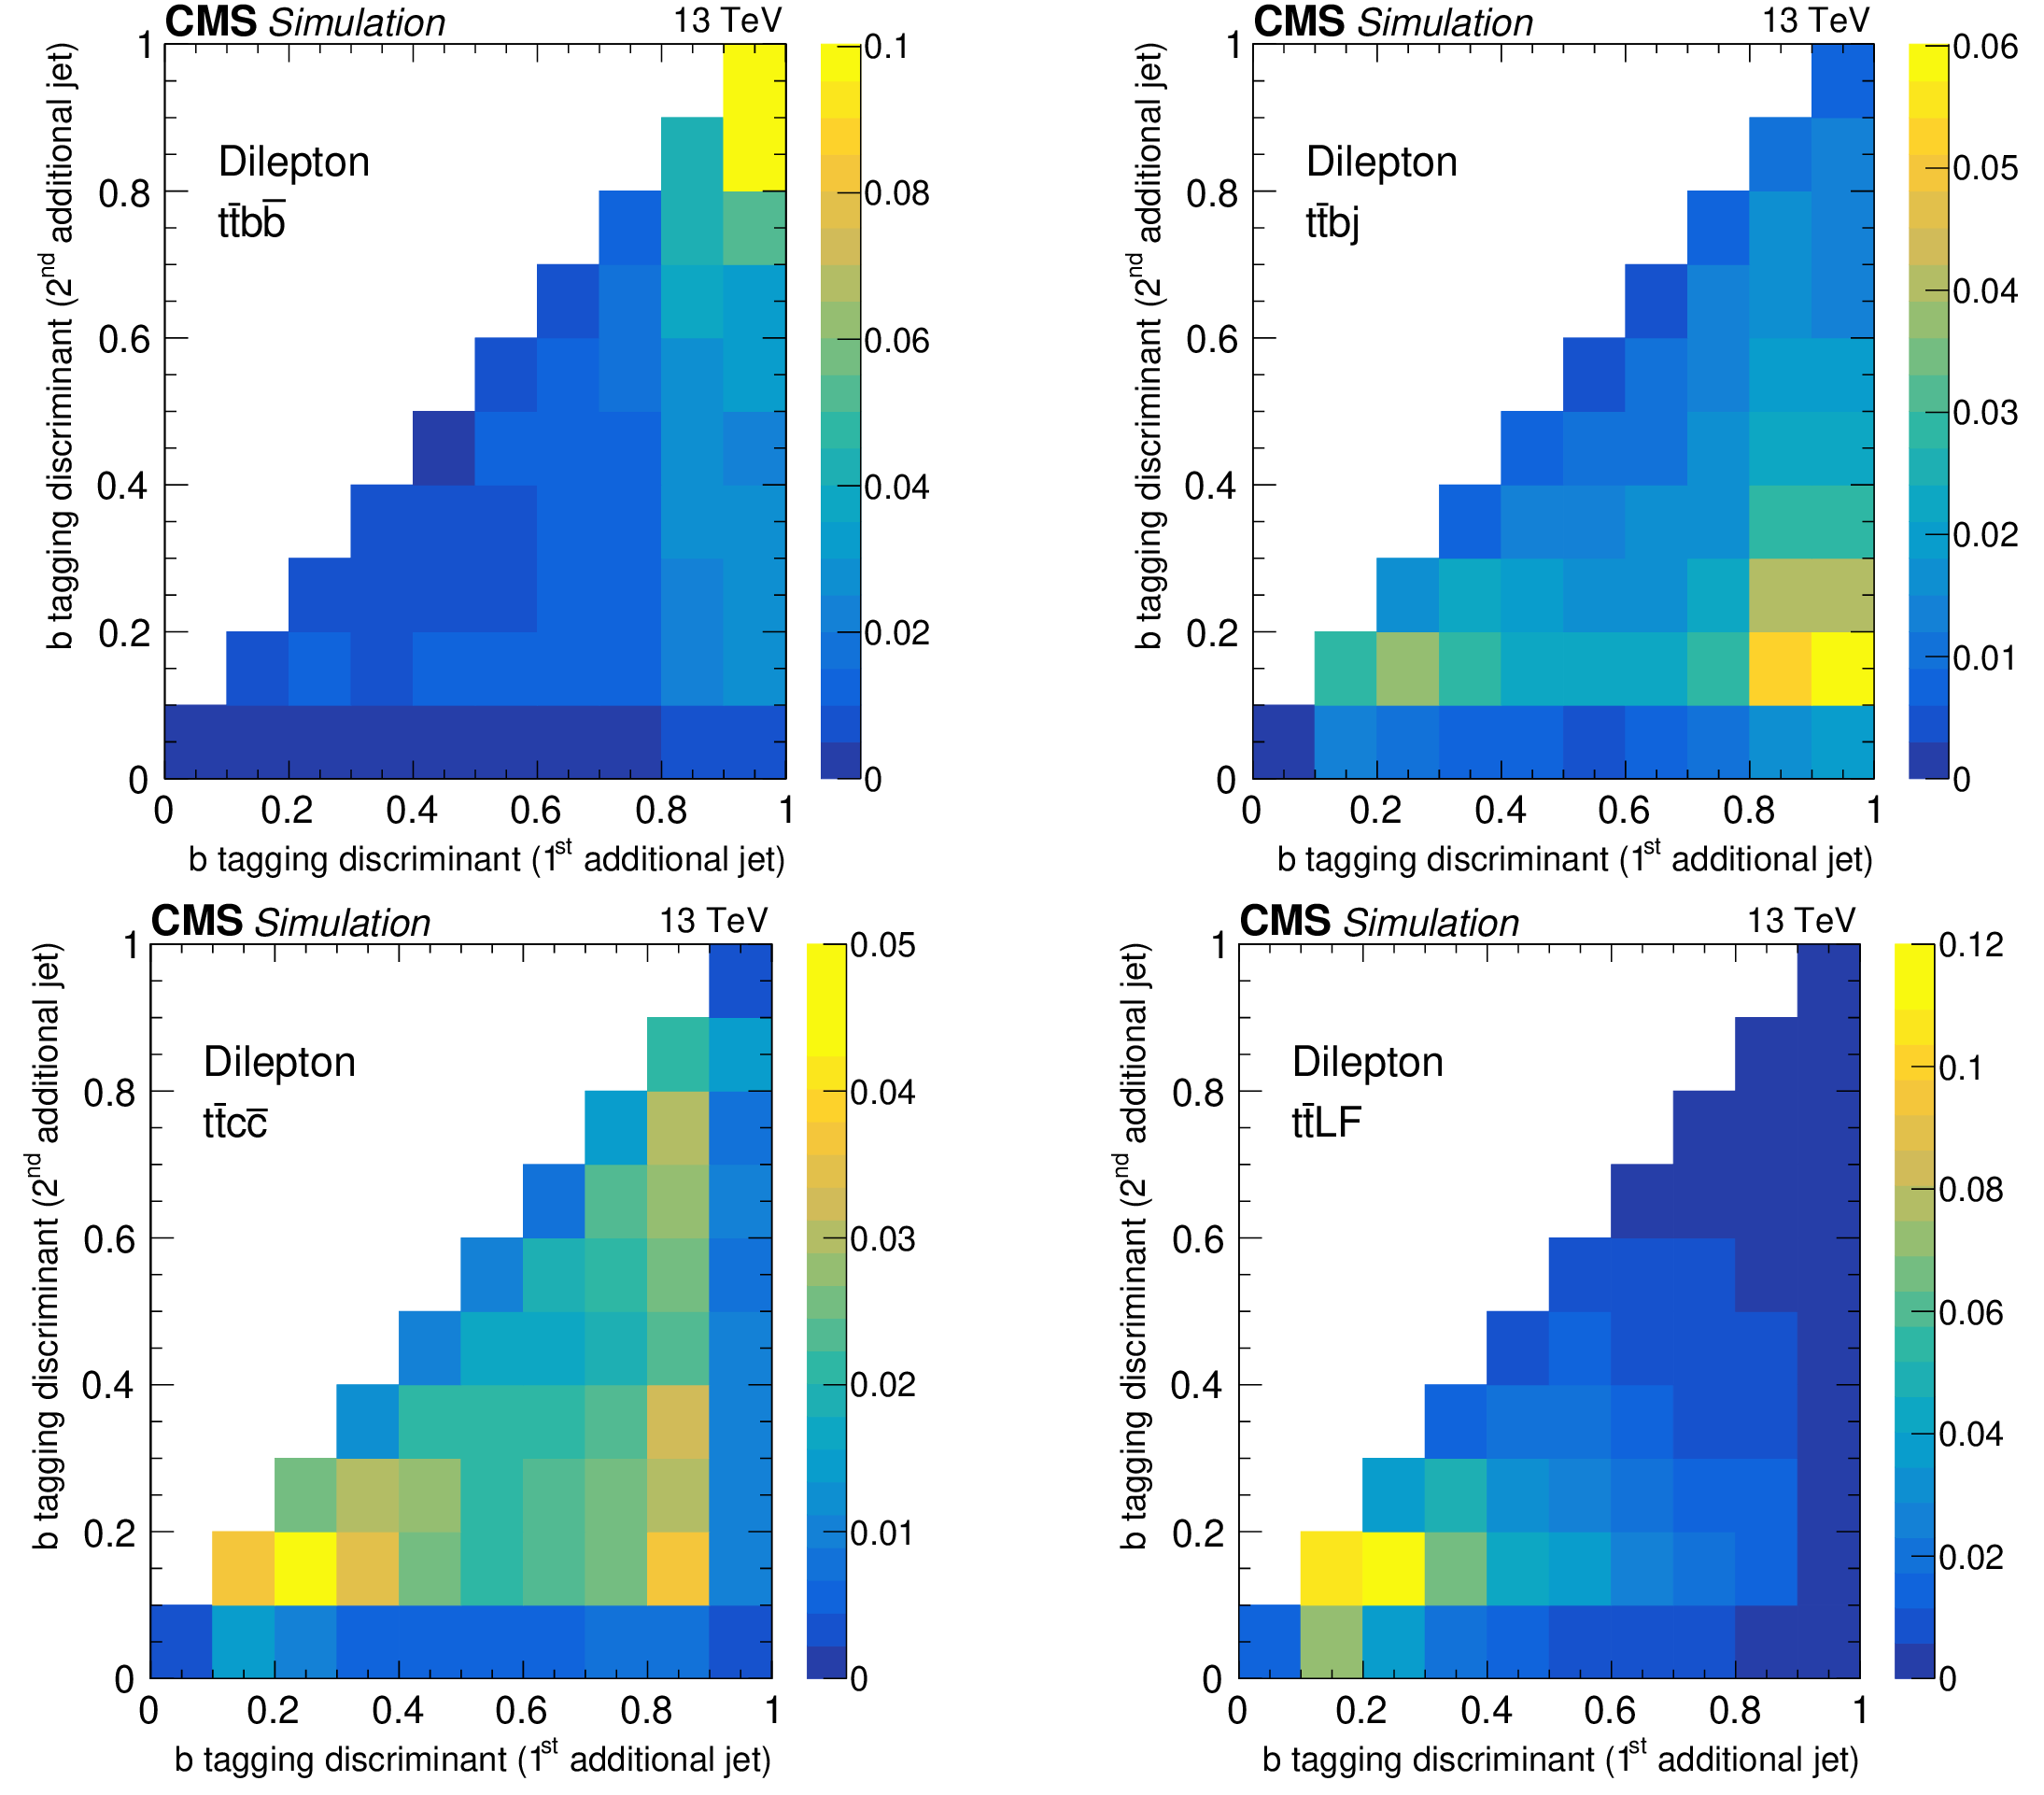
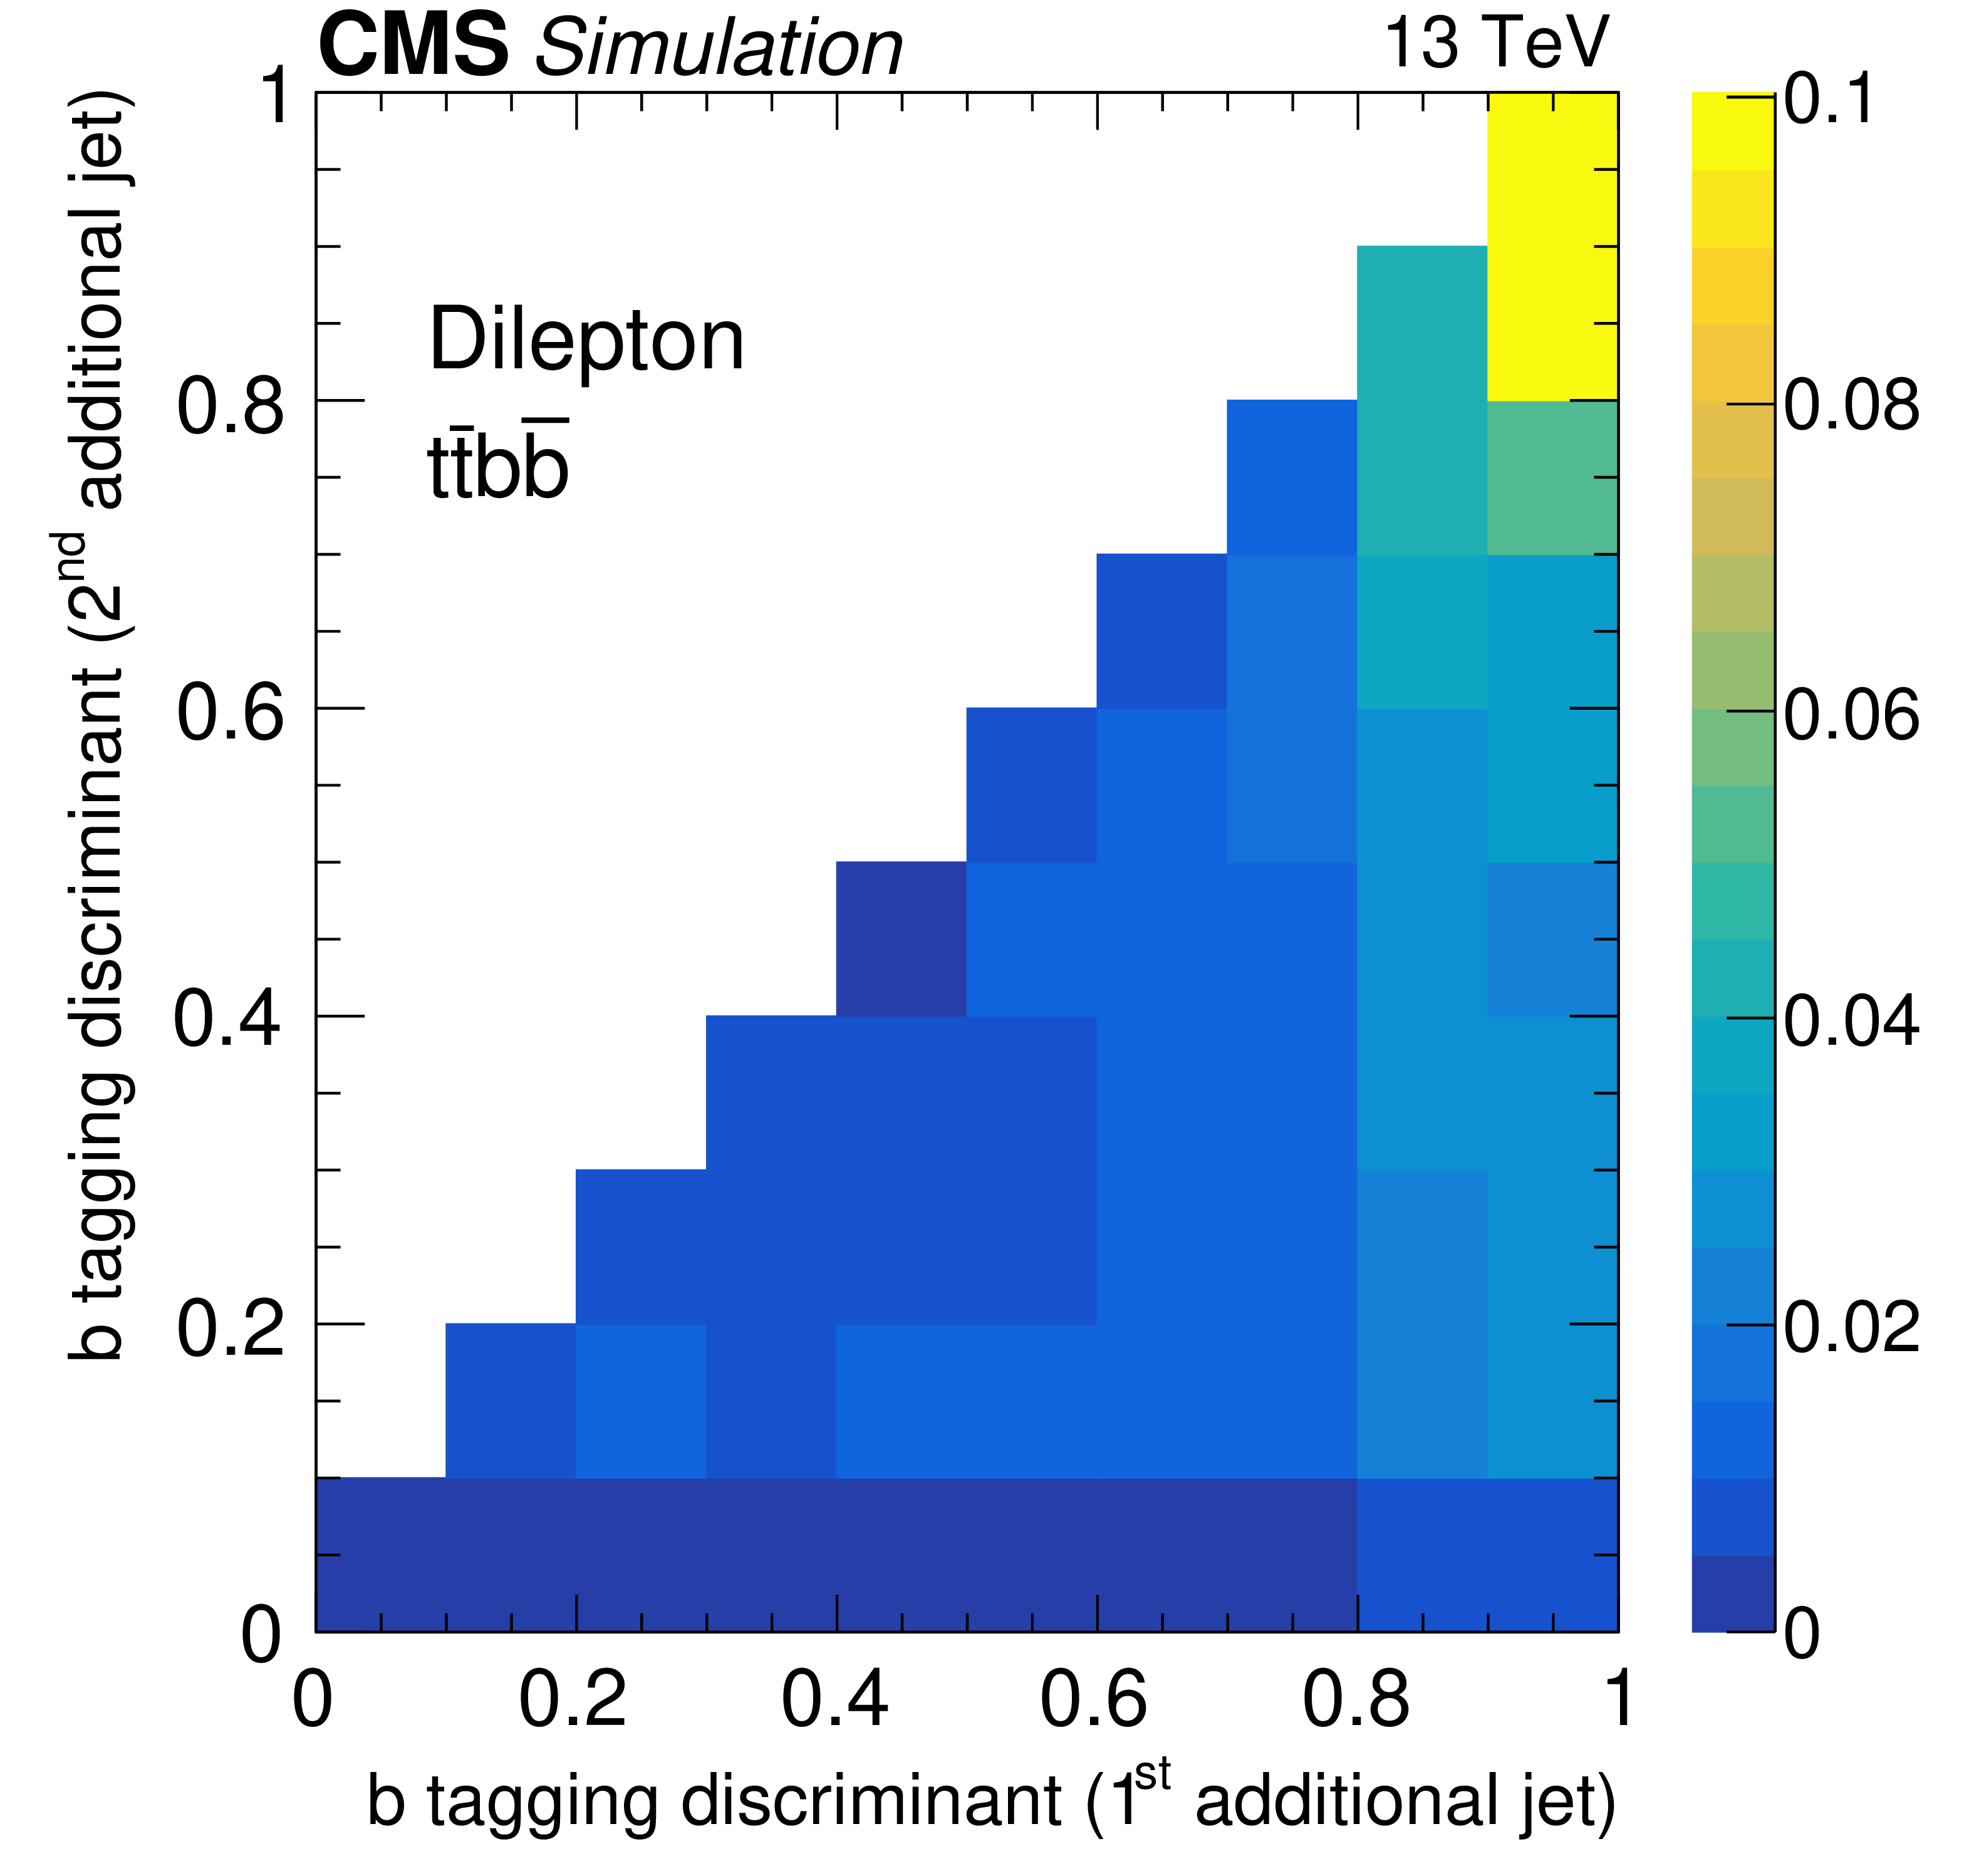
Two-dimensional distributions of the b tagging discriminant for the first and second additional jets in the dilepton channel shown separately for different flavors of the additional jets: $ {\mathrm{t} \mathrm{\bar{t}} \mathrm{b} \mathrm{\bar{b}}} $ (upper left), $ {\mathrm{t} \mathrm{\bar{t}} \mathrm{b} \mathrm {j}} $ (upper right), $ {\mathrm{t} \mathrm{\bar{t}} \mathrm{c} \mathrm{\bar{c}}} $ (lower left) and $ {\mathrm{t} \mathrm{\bar{t}} \mathrm {LF}} $ (lower right). The number of entries is normalized to unity. The histograms are obtained from the POWHEG MC simulation. |
png pdf |
Figure 2-a:
Two-dimensional distributions of the b tagging discriminant for the first and second additional jets in the dilepton channel shown for $ {\mathrm{t} \mathrm{\bar{t}} \mathrm{b} \mathrm{\bar{b}}} $. The number of entries is normalized to unity. The histograms are obtained from the POWHEG MC simulation. |

png pdf |
Figure 2-b:
Two-dimensional distributions of the b tagging discriminant for the first and second additional jets in the dilepton channel shown for $ {\mathrm{t} \mathrm{\bar{t}} \mathrm{b} \mathrm {j}} $. The number of entries is normalized to unity. The histograms are obtained from the POWHEG MC simulation. |
png pdf |
Figure 2-c:
Two-dimensional distributions of the b tagging discriminant for the first and second additional jets in the dilepton channel shown for $ {\mathrm{t} \mathrm{\bar{t}} \mathrm{c} \mathrm{\bar{c}}} $. The number of entries is normalized to unity. The histograms are obtained from the POWHEG MC simulation. |

png pdf |
Figure 2-d:
Two-dimensional distributions of the b tagging discriminant for the first and second additional jets in the dilepton channel shown for $ {\mathrm{t} \mathrm{\bar{t}} \mathrm {LF}} $. The number of entries is normalized to unity. The histograms are obtained from the POWHEG MC simulation. |
png pdf |
Figure 3:
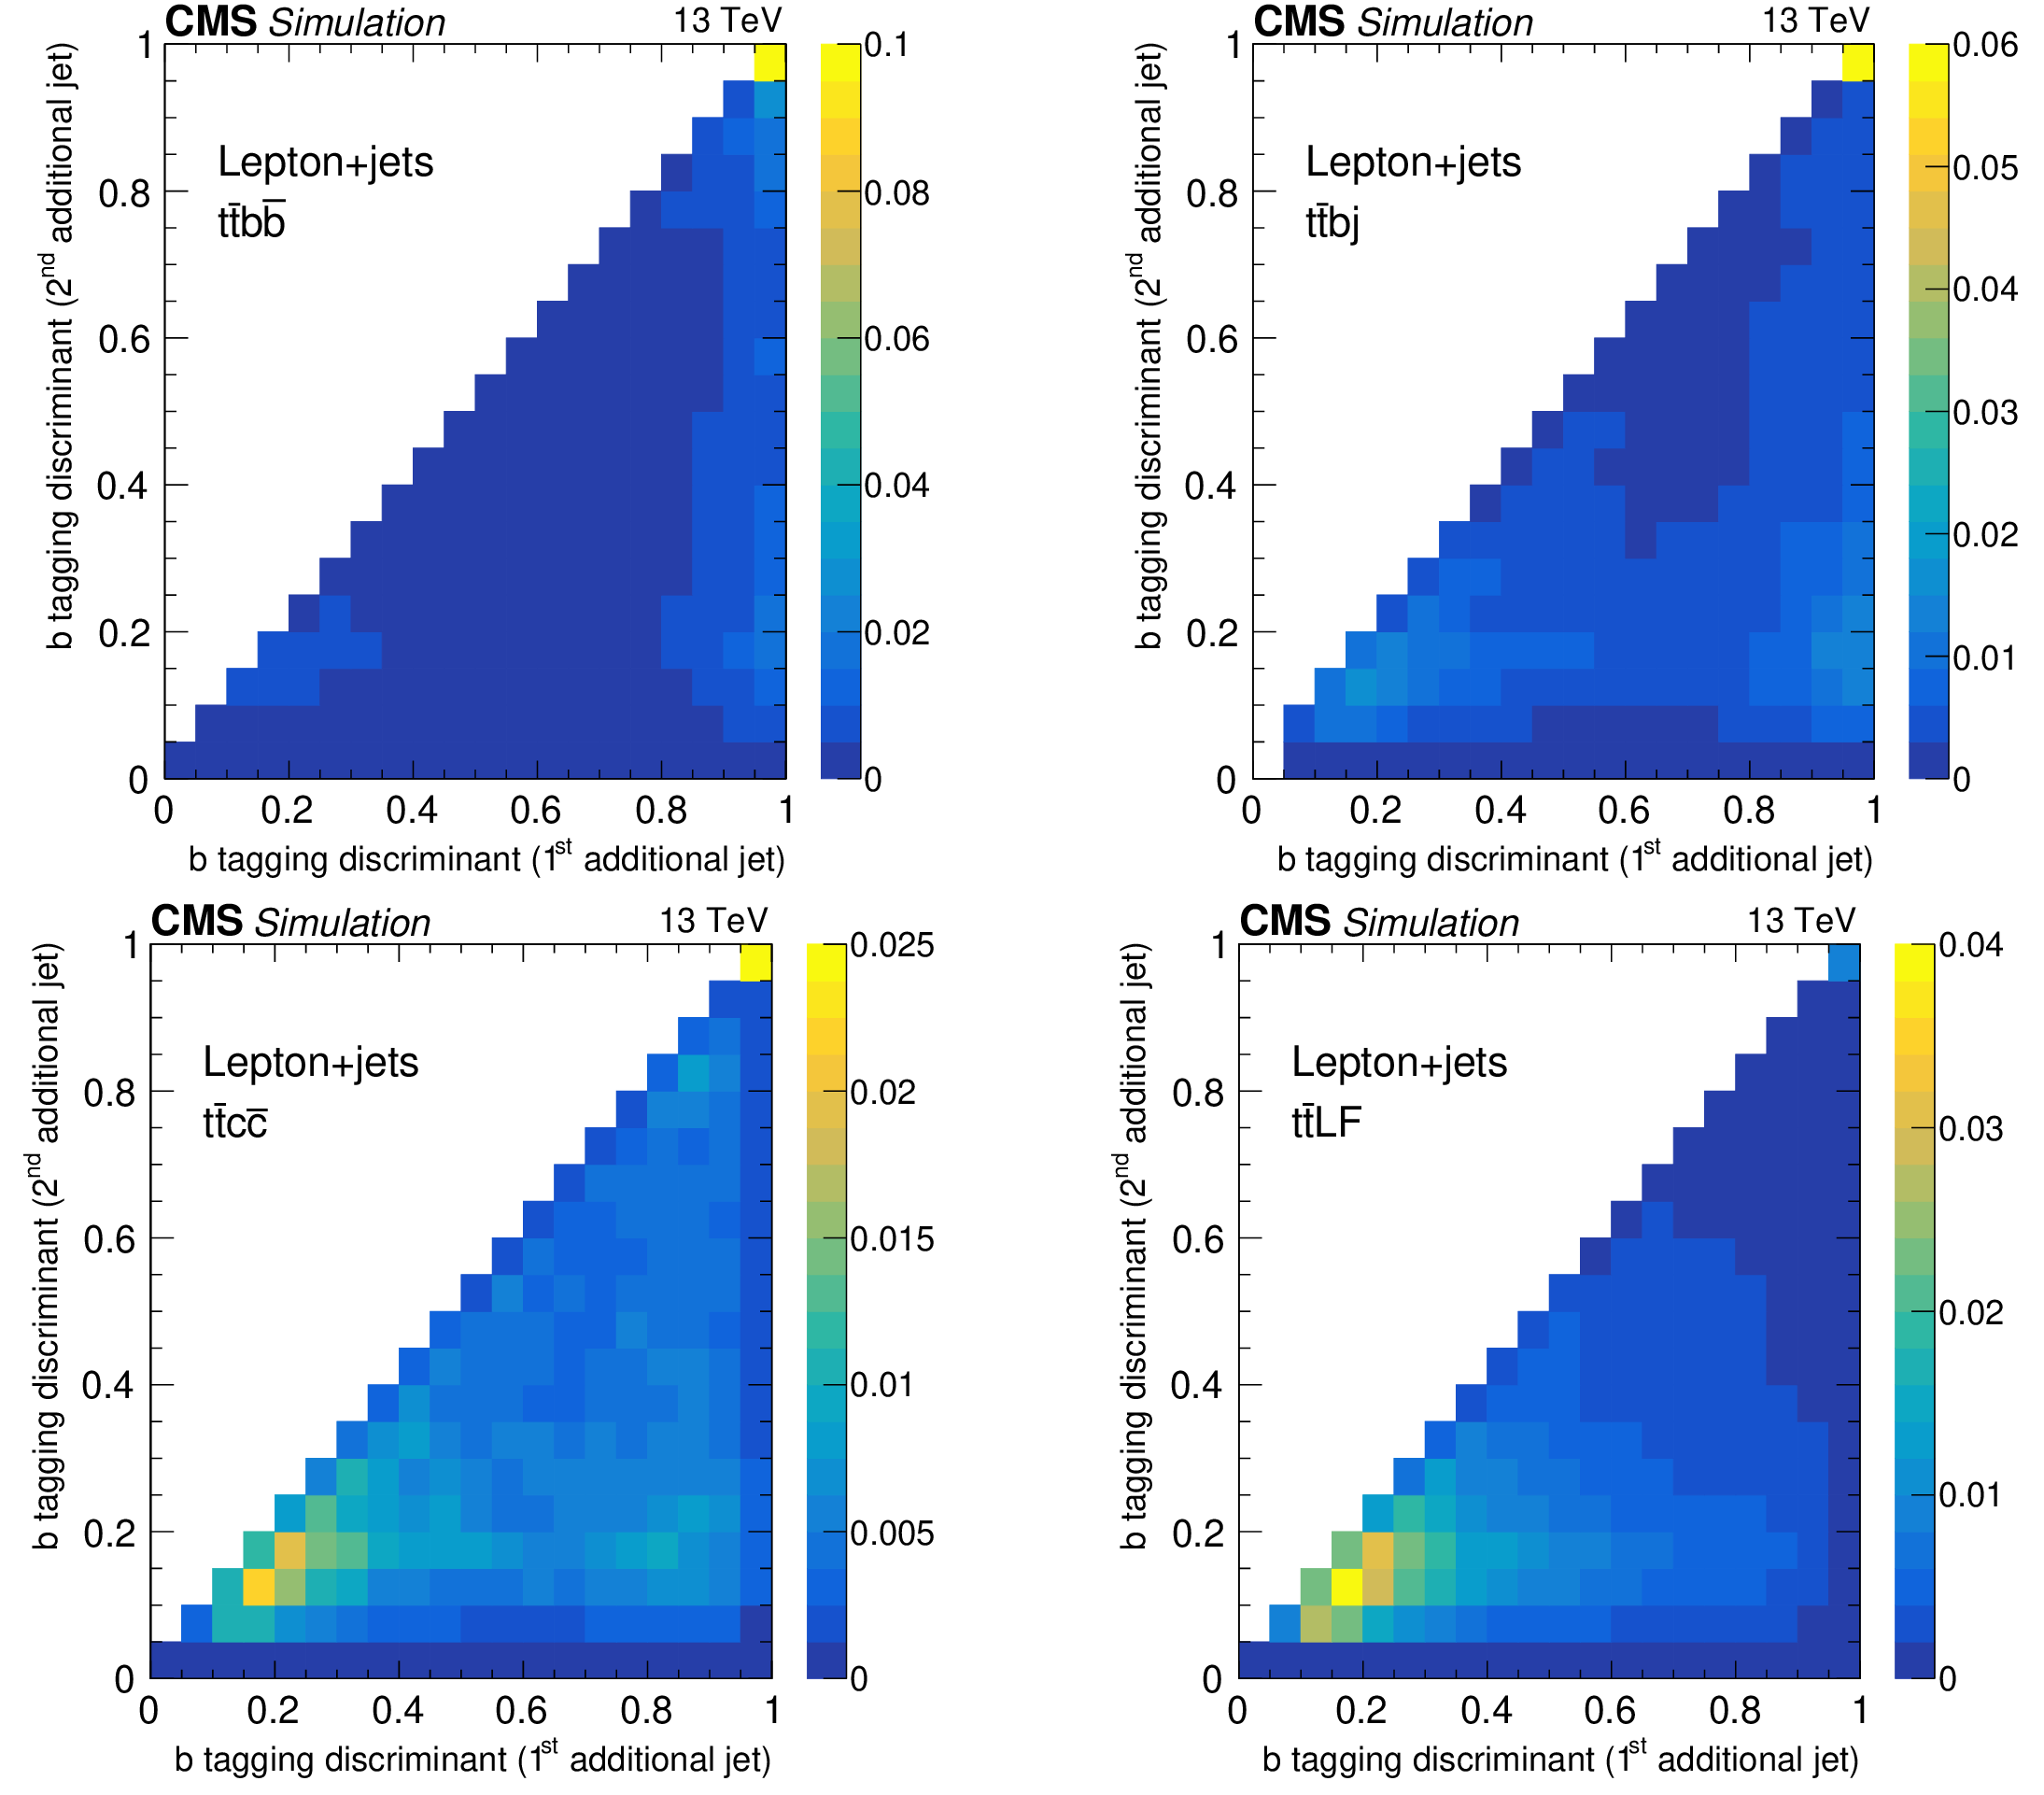
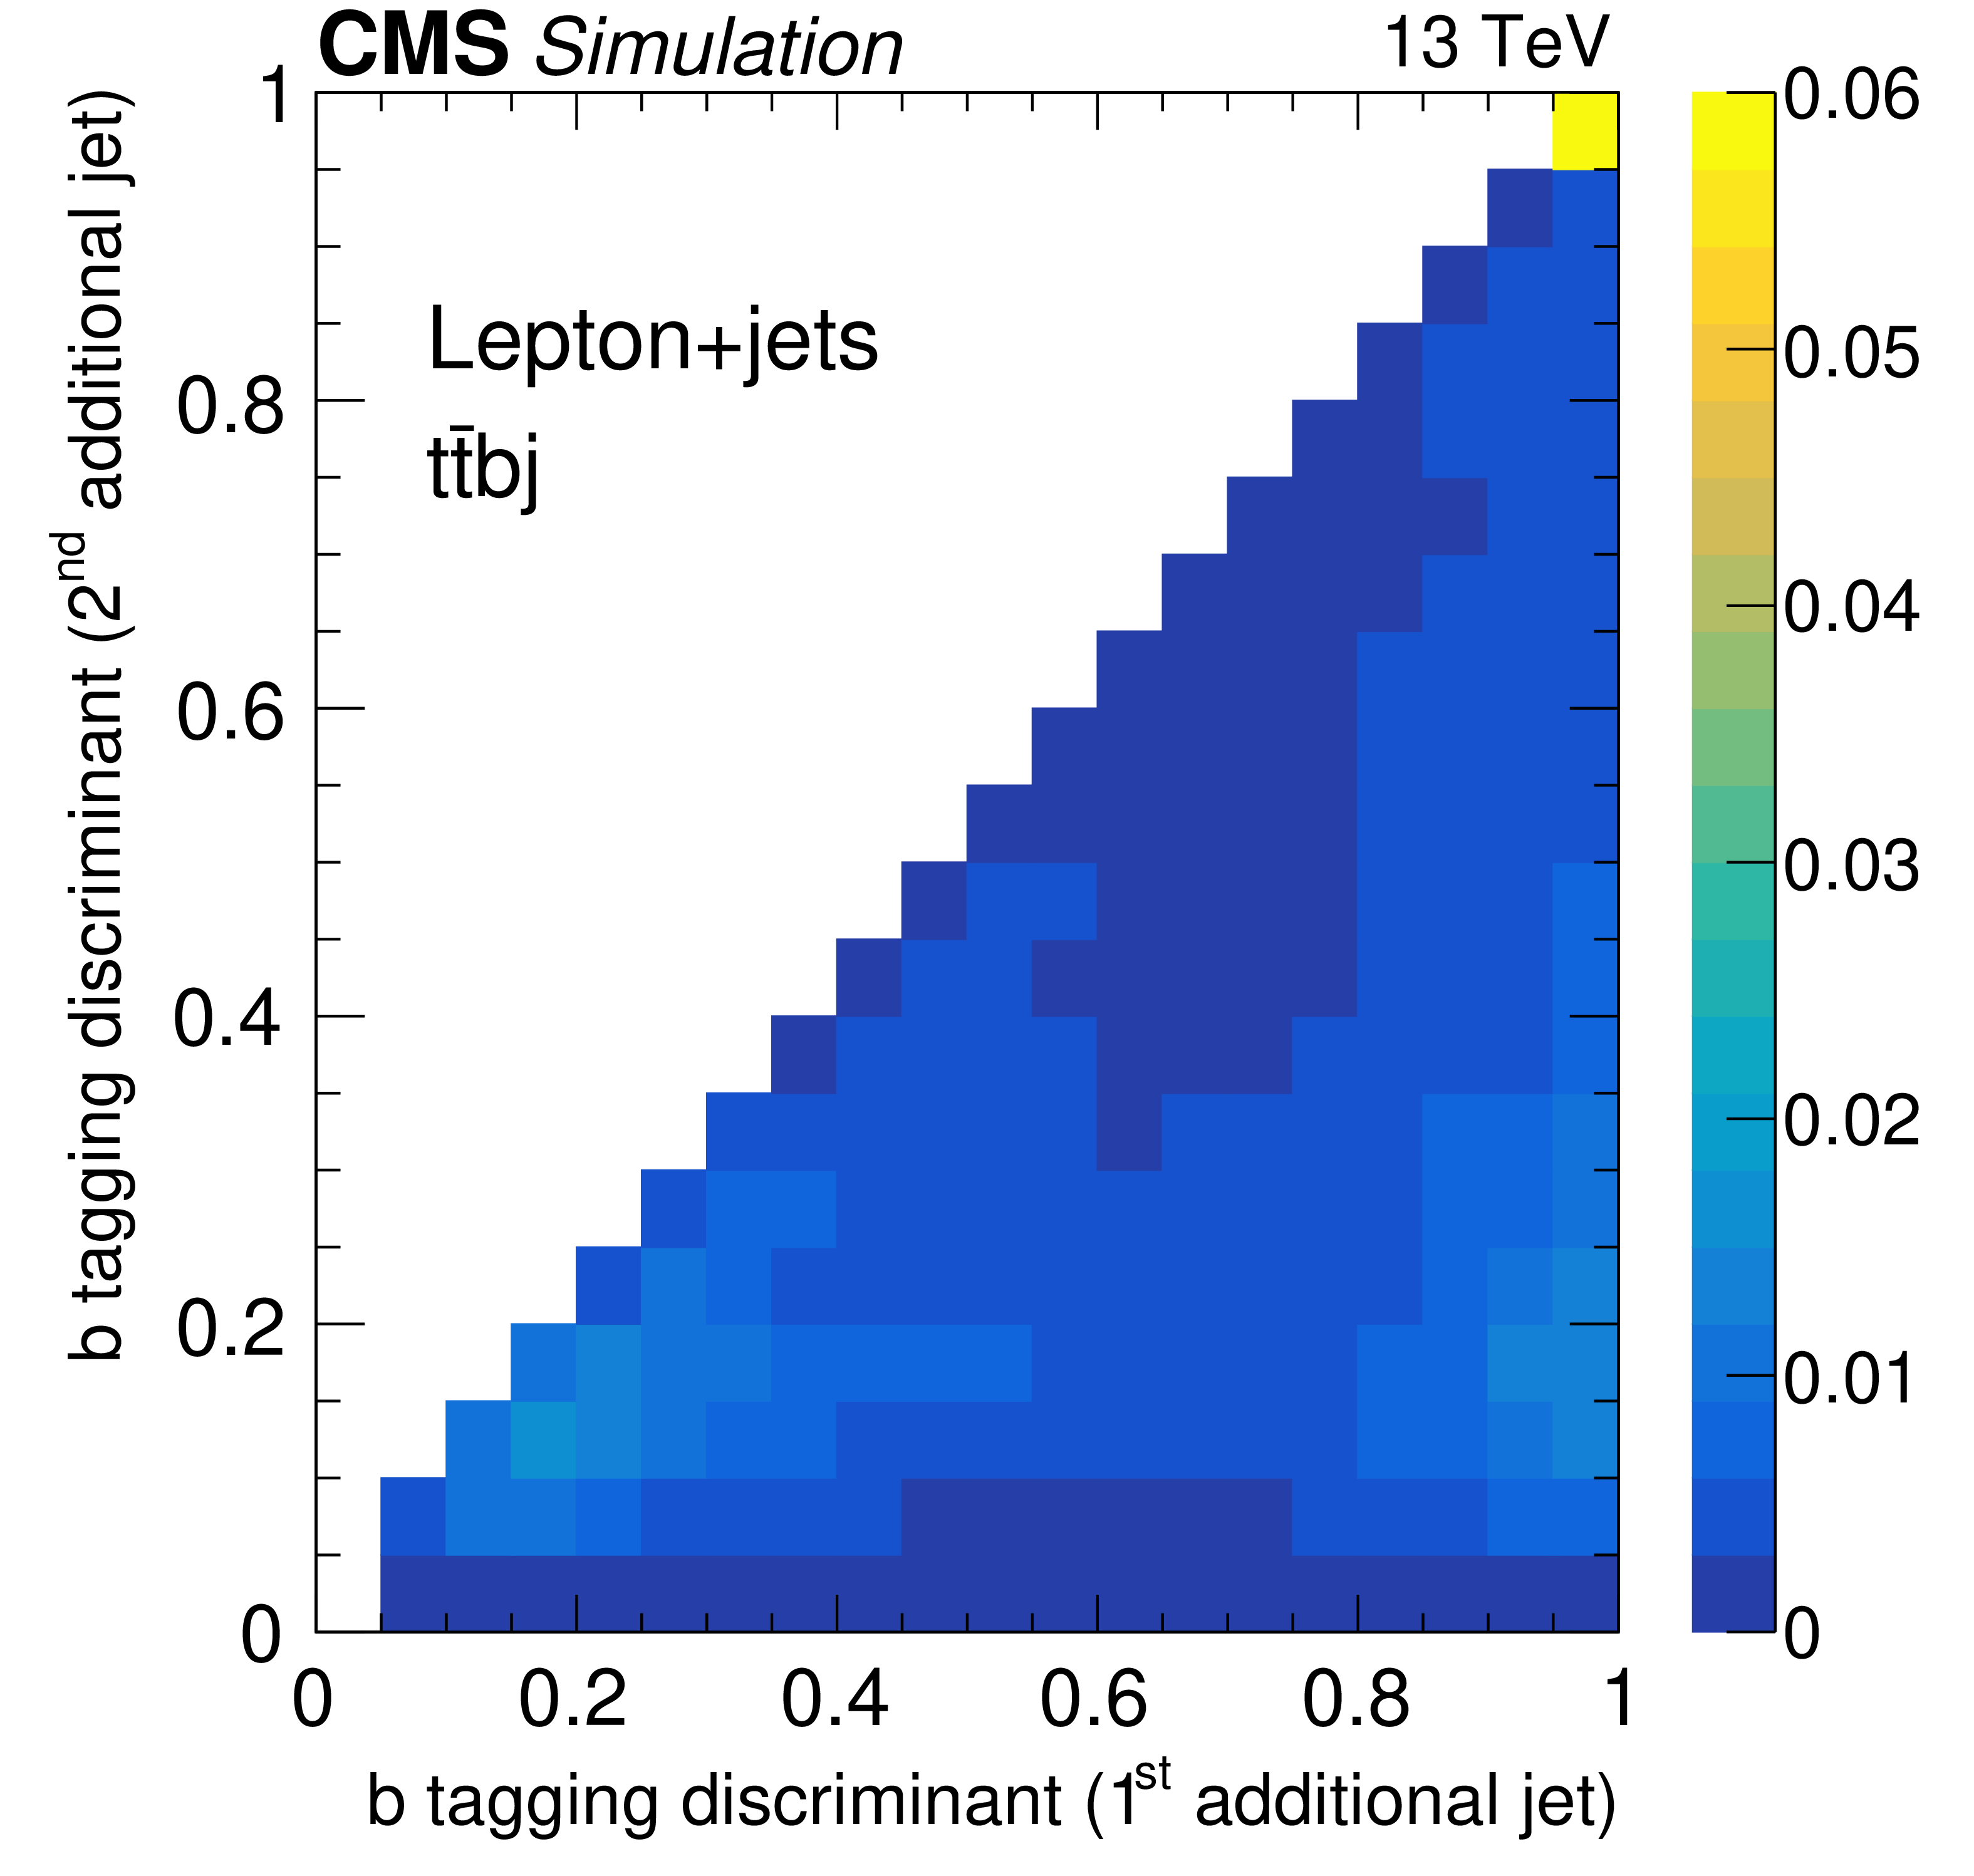
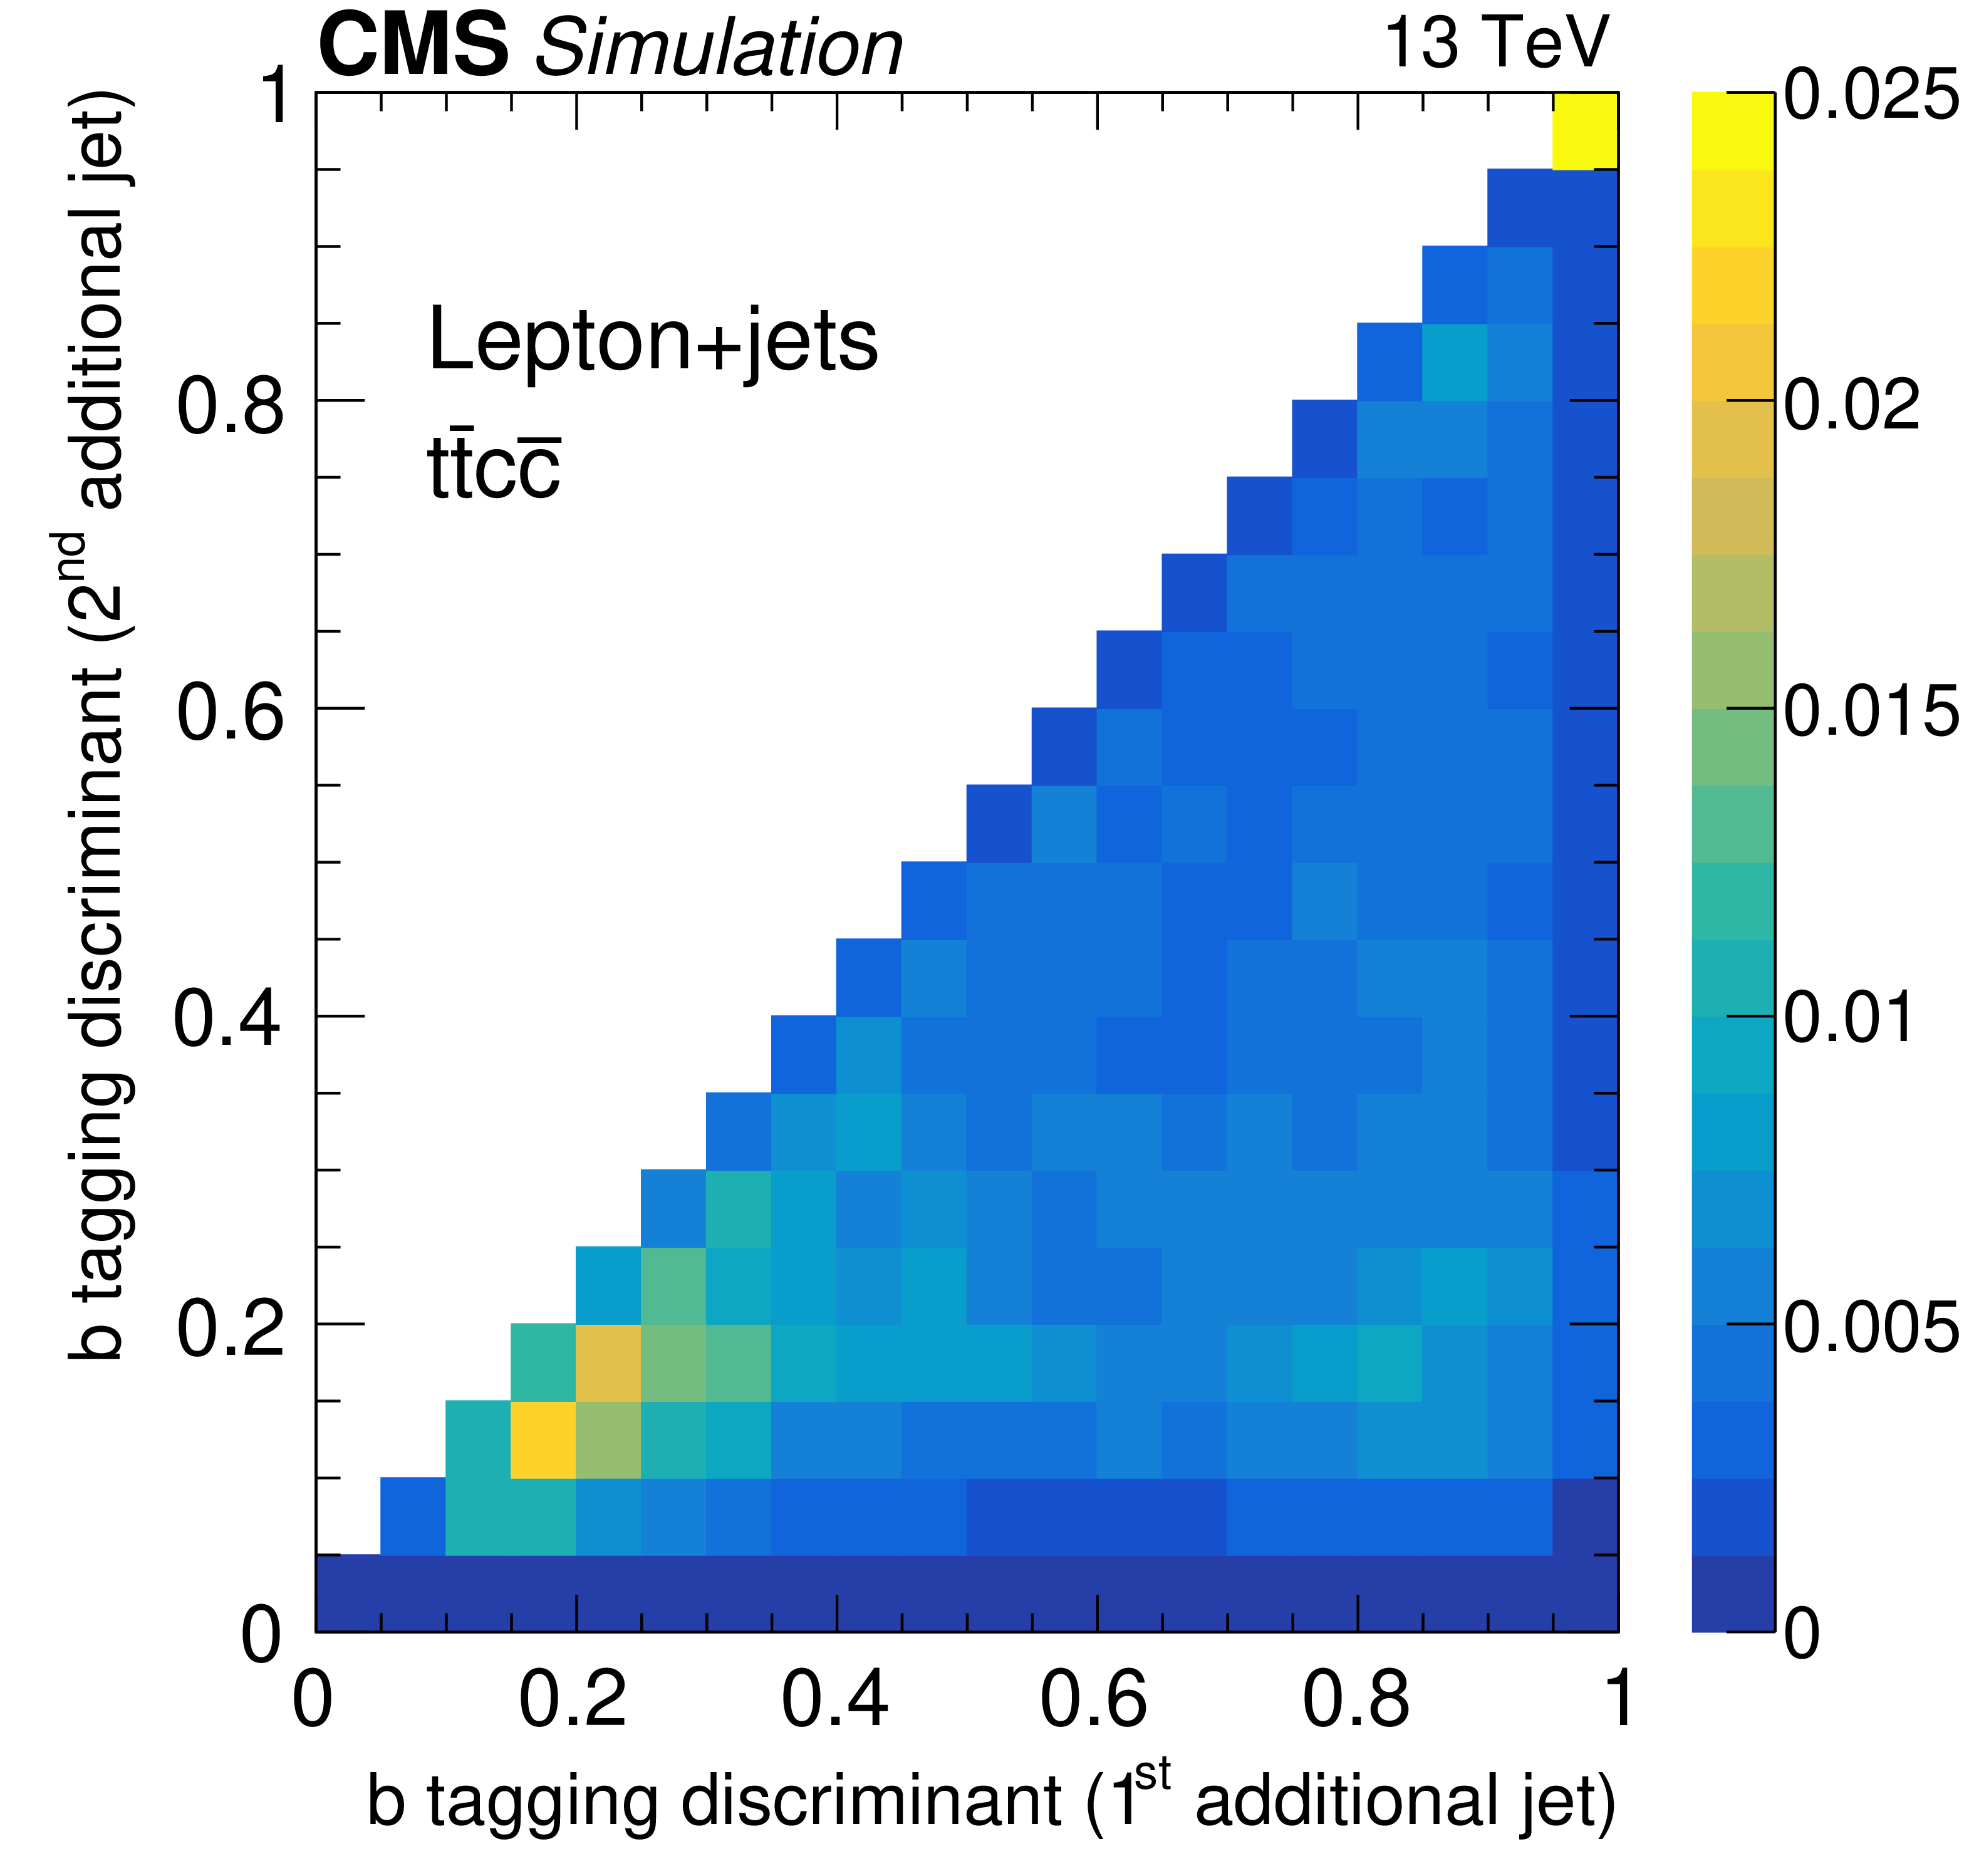
Two-dimensional distributions of the b tagging discriminant for the first and second additional jets in the lepton+jets channel shown separately for different flavors of the additional jets: $ {\mathrm{t} \mathrm{\bar{t}} \mathrm{b} \mathrm{\bar{b}}} $ (upper left), $ {\mathrm{t} \mathrm{\bar{t}} \mathrm{b} \mathrm {j}} $ (upper right), $ {\mathrm{t} \mathrm{\bar{t}} \mathrm{c} \mathrm{\bar{c}}} $ (lower left) and $ {\mathrm{t} \mathrm{\bar{t}} \mathrm {LF}} $ (lower right). The number of entries is normalized to unity. The histograms are obtained from the POWHEG MC simulation. |

png pdf |
Figure 3-a:
Two-dimensional distributions of the b tagging discriminant for the first and second additional jets in the lepton+jets channel shown for $ {\mathrm{t} \mathrm{\bar{t}} \mathrm{b} \mathrm{\bar{b}}} $. The number of entries is normalized to unity. The histograms are obtained from the POWHEG MC simulation. |
png pdf |
Figure 3-b:
Two-dimensional dist$ {\mathrm{t} \mathrm{\bar{t}} \mathrm{b} \mathrm{\bar{b}}} $. he number of entries is normalized to unity. The histograms are obtained from the POWHEG MC simulation. |
png pdf |
Figure 3-c:
Two-dimensional distributions of the b tagging discriminant for the first and second additional jets in the lepton+jets channel shown for $ {\mathrm{t} \mathrm{\bar{t}} \mathrm{c} \mathrm{\bar{c}}} $. The number of entries is normalized to unity. The histograms are obtained from the POWHEG MC simulation. |

png pdf |
Figure 3-d:
Two-dimensional distributions of the b tagging discriminant for the first and second additional jets in the lepton+jets channel shown for $ {\mathrm{t} \mathrm{\bar{t}} \mathrm {LF}} $. The number of entries is normalized to unity. The histograms are obtained from the POWHEG MC simulation. |
png pdf |
Figure 4:
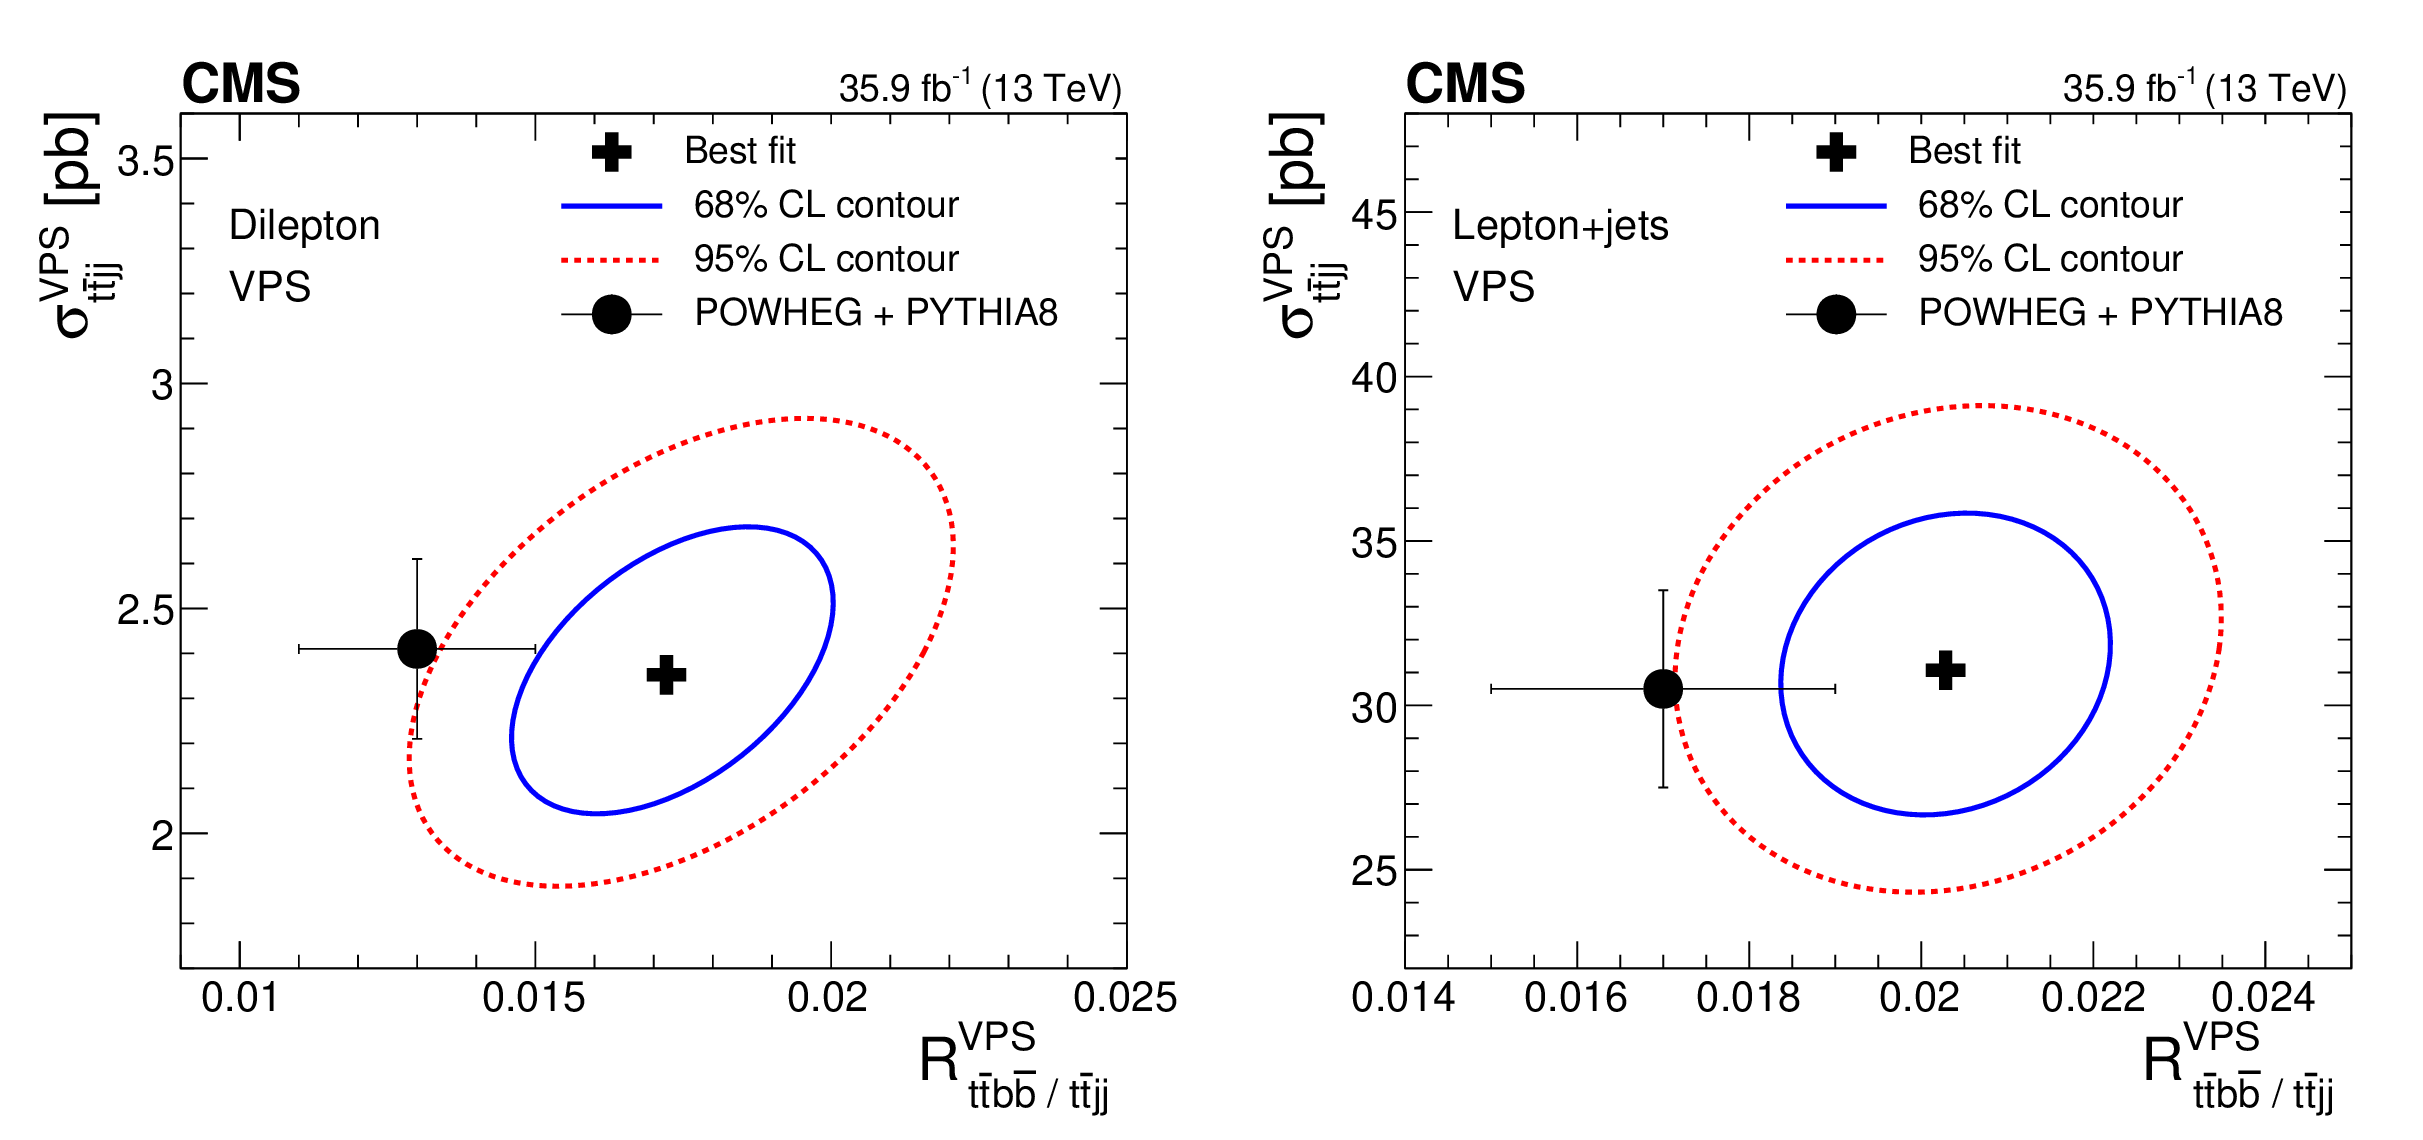
Results of the simultaneous fit for ${R_{{\mathrm{t} \mathrm{\bar{t}} \mathrm{b} \mathrm{\bar{b}}} / {\mathrm{t} \mathrm{\bar{t}} \mathrm {jj}}}} and {\sigma _{{\mathrm{t} \mathrm{\bar{t}} \mathrm {jj}}}}$ (denoted by the cross) in the visible phase space, along with its 68 and 95% CL contours, are shown for the (left) dilepton and (right) lepton+jets channels. The solid circle shows the prediction by POWHEG + PYTHIA 8. The uncertainties in the MC prediction are a combination of statistical, $\mu _\mathrm {F}/\mu _\mathrm {R}$ scale, and PDF components; they are assumed to be uncorrelated between $ {R_{{\mathrm{t} \mathrm{\bar{t}} \mathrm{b} \mathrm{\bar{b}}} / {\mathrm{t} \mathrm{\bar{t}} \mathrm {jj}}}} $ and $ {\sigma _{{\mathrm{t} \mathrm{\bar{t}} \mathrm {jj}}}} $. |
png pdf |
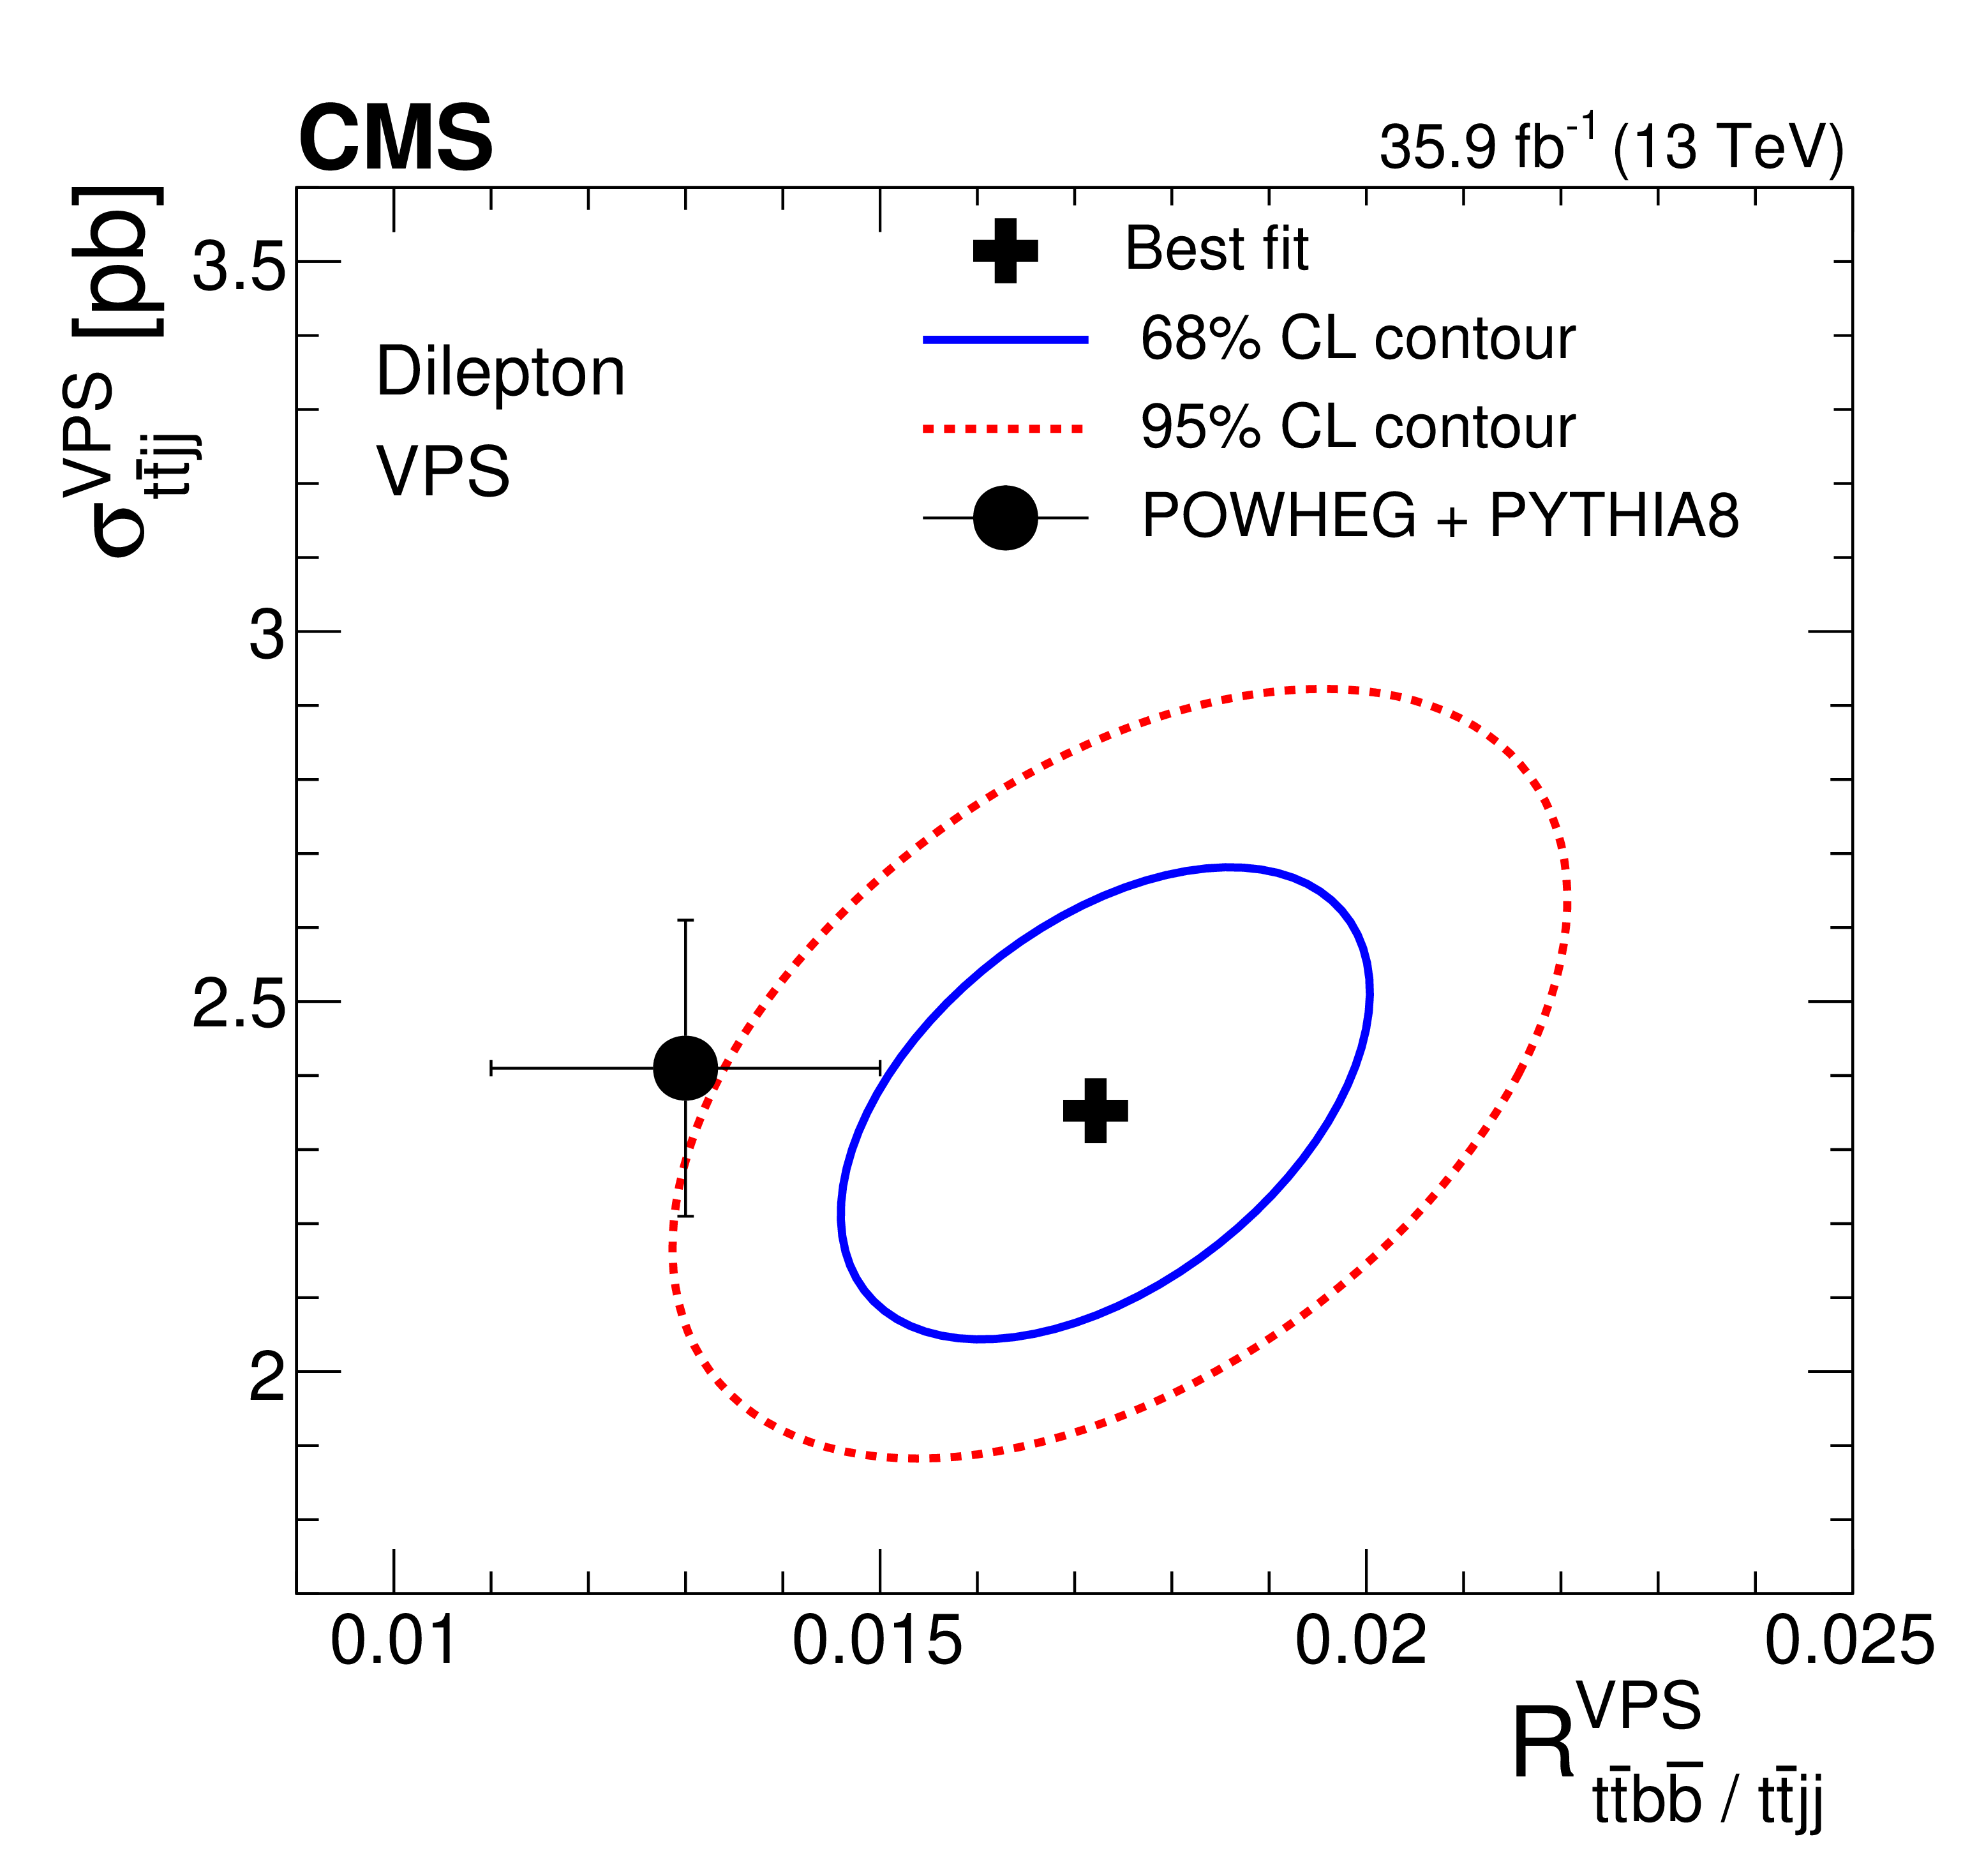
Figure 4-a:
Results of the simultaneous fit for ${R_{{\mathrm{t} \mathrm{\bar{t}} \mathrm{b} \mathrm{\bar{b}}} / {\mathrm{t} \mathrm{\bar{t}} \mathrm {jj}}}} and {\sigma _{{\mathrm{t} \mathrm{\bar{t}} \mathrm {jj}}}}$ (denoted by the cross) in the visible phase space, along with its 68 and 95% CL contours, are shown for the dilepton channel. The solid circle shows the prediction by POWHEG + PYTHIA 8. The uncertainties in the MC prediction are a combination of statistical, $\mu _\mathrm {F}/\mu _\mathrm {R}$ scale, and PDF components; they are assumed to be uncorrelated between $ {R_{{\mathrm{t} \mathrm{\bar{t}} \mathrm{b} \mathrm{\bar{b}}} / {\mathrm{t} \mathrm{\bar{t}} \mathrm {jj}}}} $ and $ {\sigma _{{\mathrm{t} \mathrm{\bar{t}} \mathrm {jj}}}} $. |

png pdf |
Figure 4-b:
Results of the simultaneous fit for ${R_{{\mathrm{t} \mathrm{\bar{t}} \mathrm{b} \mathrm{\bar{b}}} / {\mathrm{t} \mathrm{\bar{t}} \mathrm {jj}}}} and {\sigma _{{\mathrm{t} \mathrm{\bar{t}} \mathrm {jj}}}}$ (denoted by the cross) in the visible phase space, along with its 68 and 95% CL contours, are shown for the lepton+jets channel. The solid circle shows the prediction by POWHEG + PYTHIA 8. The uncertainties in the MC prediction are a combination of statistical, $\mu _\mathrm {F}/\mu _\mathrm {R}$ scale, and PDF components; they are assumed to be uncorrelated between $ {R_{{\mathrm{t} \mathrm{\bar{t}} \mathrm{b} \mathrm{\bar{b}}} / {\mathrm{t} \mathrm{\bar{t}} \mathrm {jj}}}} $ and $ {\sigma _{{\mathrm{t} \mathrm{\bar{t}} \mathrm {jj}}}} $. |

png pdf |
Figure 5:
Measured values (vertical lines) of the $ {\mathrm{t} \mathrm{\bar{t}} \mathrm{b} \mathrm{\bar{b}}} $ and $ {\mathrm{t} \mathrm{\bar{t}} \mathrm {jj}} $ cross sections and their ratio, along with their statistical and total uncertainties (dark and light bands) in the dilepton (upper) and lepton+jets (lower) channels in the FPS. Also shown are the theoretical predictions obtained from POWHEG and MG_aMC@NLO (5FS) interfaced with PYTHIA 8, and POWHEG interfaced with HERWIG++. The theoretical predictions for the $ {\mathrm{t} \mathrm{\bar{t}} \mathrm {jj}} $ and $ {\mathrm{t} \mathrm{\bar{t}} \mathrm{b} \mathrm{\bar{b}}} $ cross sections are normalized to $\sigma _{{\mathrm{t} \mathrm{\bar{t}}}}^{\text{NNLO}} = $ 832 pb. The previous measurement performed by the CMS Collaboration [18] is also shown with a rhombus marker in the lower plot. The uncertainties in the MC predictions are a combination of the statistical, $\mu _F/\mu _R$ scale, and PDF components. |
png pdf |
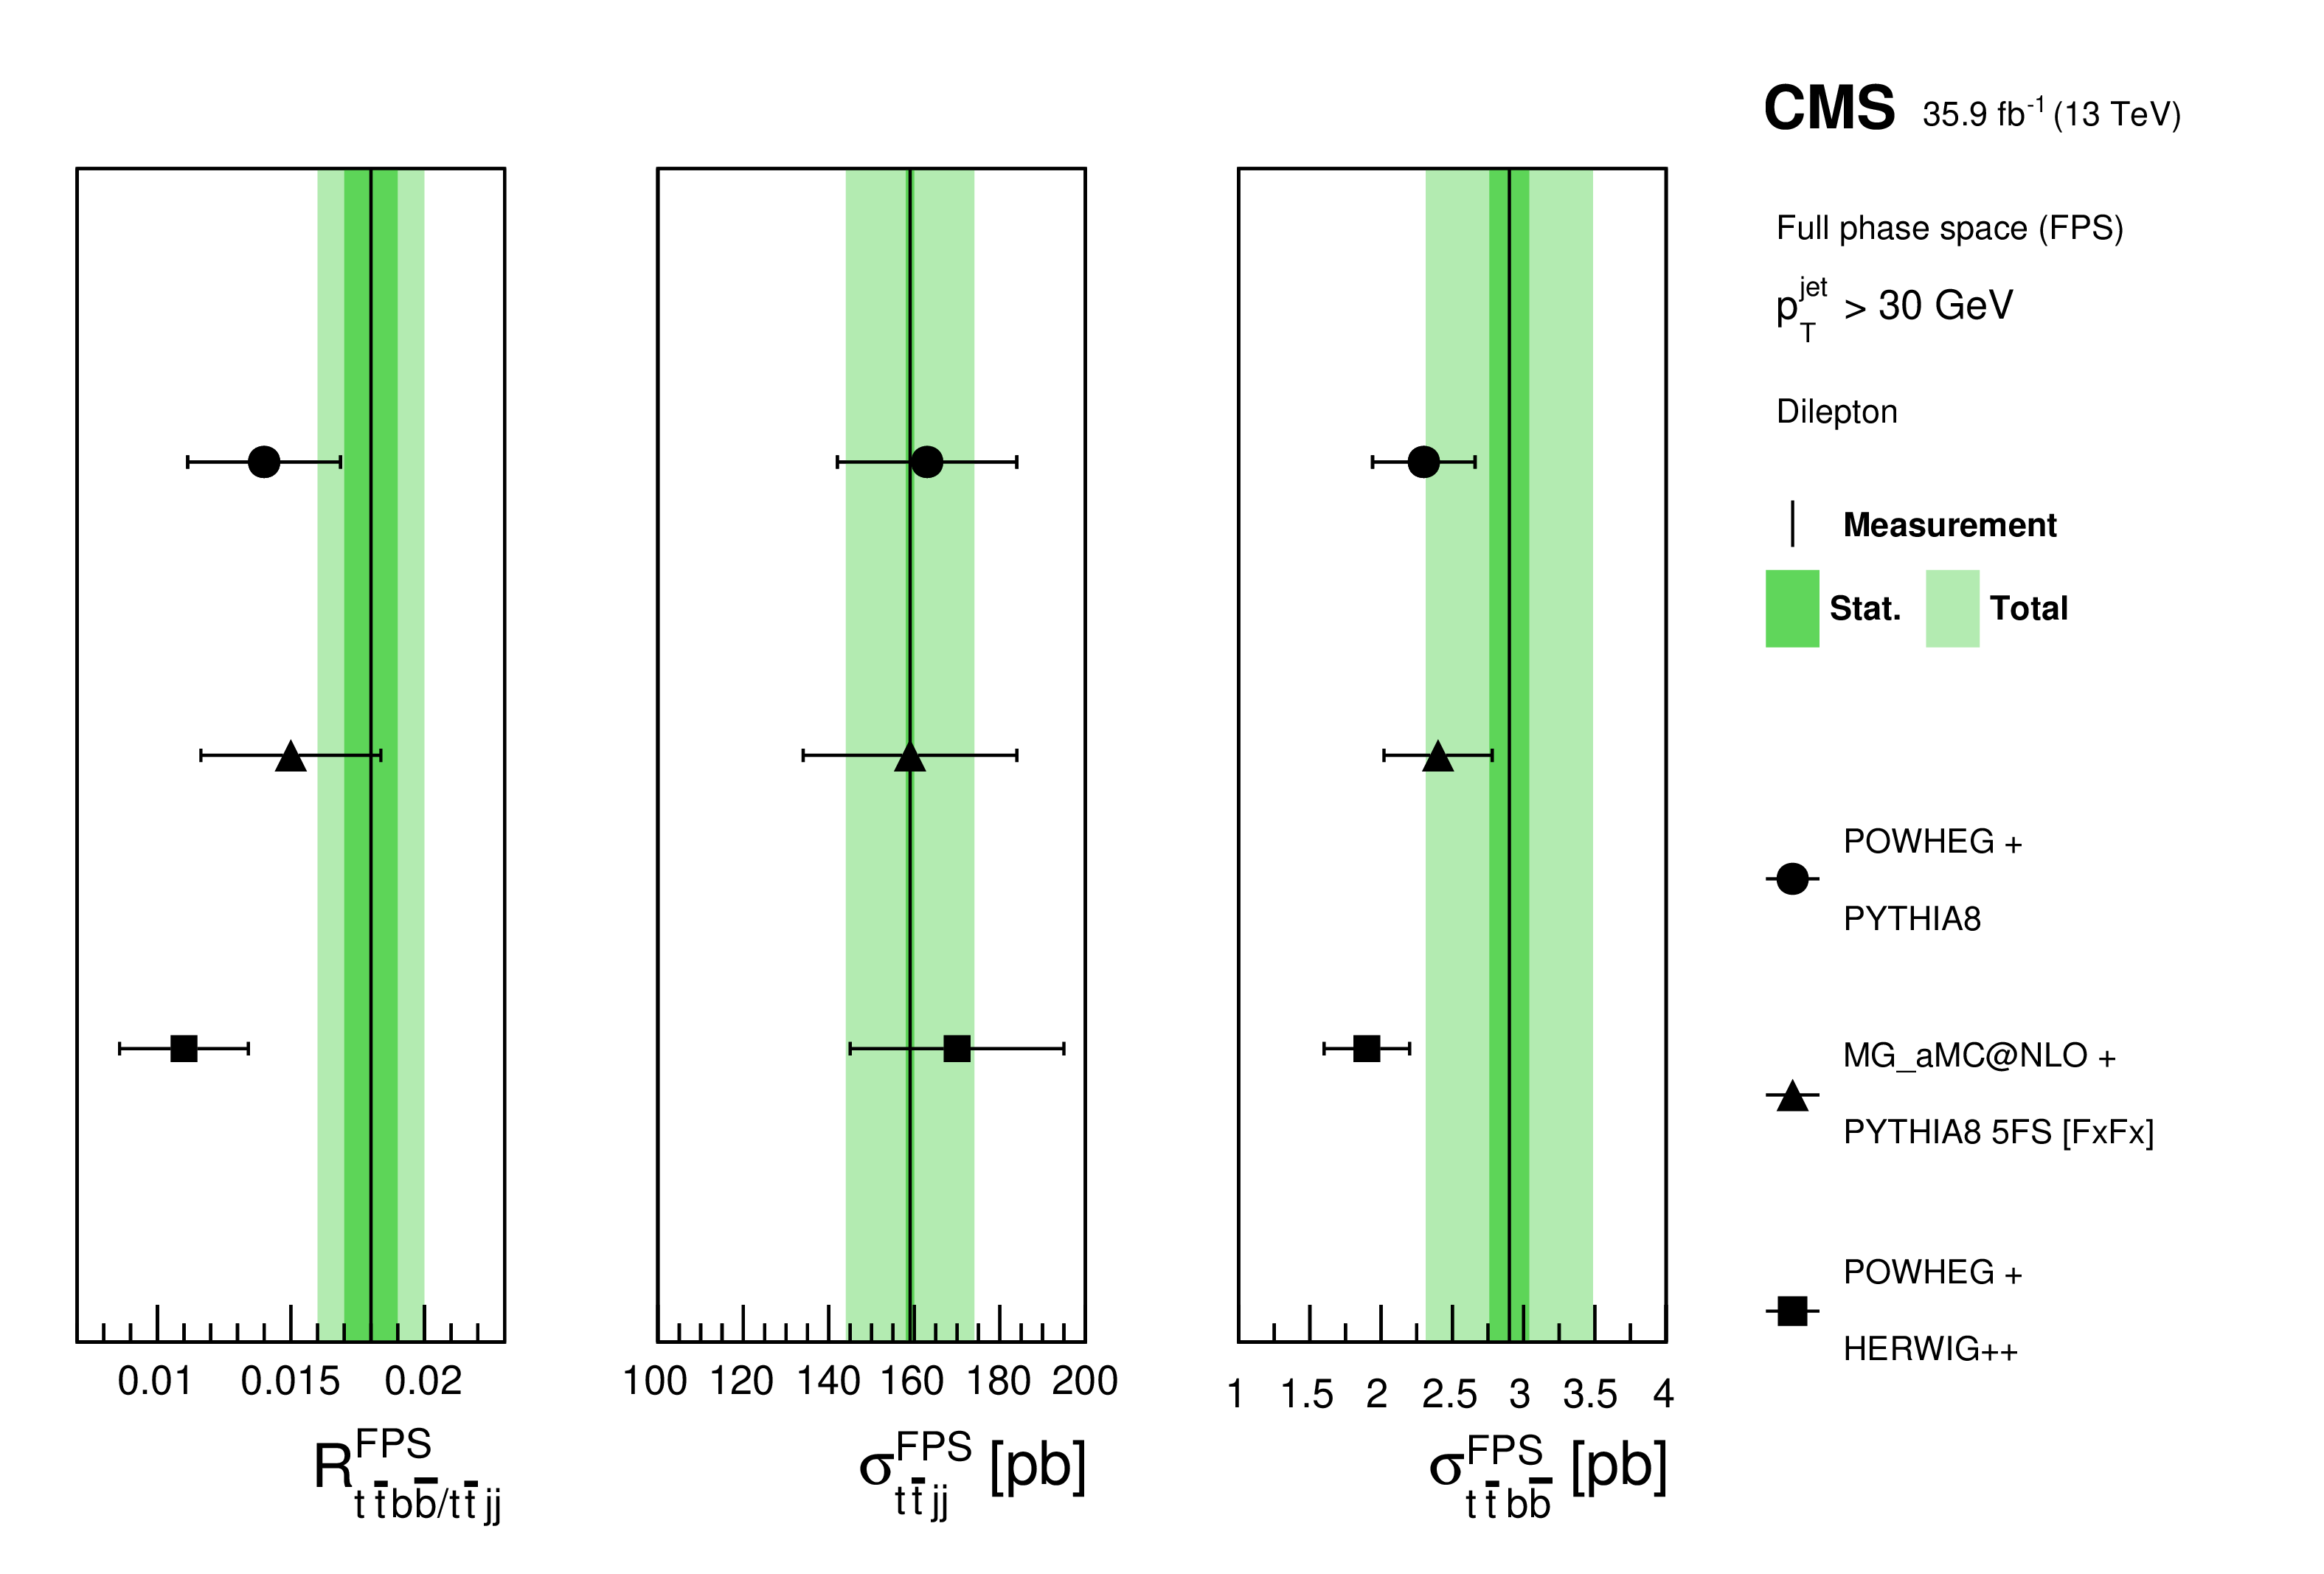
Figure 5-a:
Measured values (vertical lines) of the $ {\mathrm{t} \mathrm{\bar{t}} \mathrm{b} \mathrm{\bar{b}}} $ and $ {\mathrm{t} \mathrm{\bar{t}} \mathrm {jj}} $ cross sections and their ratio, along with their statistical and total uncertainties (dark and light bands) in the dilepton lepton+jets channel in the FPS. Also shown are the theoretical predictions obtained from POWHEG and MG_aMC@NLO (5FS) interfaced with PYTHIA 8, and POWHEG interfaced with HERWIG++. The theoretical predictions for the $ {\mathrm{t} \mathrm{\bar{t}} \mathrm {jj}} $ and $ {\mathrm{t} \mathrm{\bar{t}} \mathrm{b} \mathrm{\bar{b}}} $ cross sections are normalized to $\sigma _{{\mathrm{t} \mathrm{\bar{t}}}}^{\text{NNLO}} = $ 832 pb. The uncertainties in the MC predictions are a combination of the statistical, $\mu _F/\mu _R$ scale, and PDF components. |
png pdf |
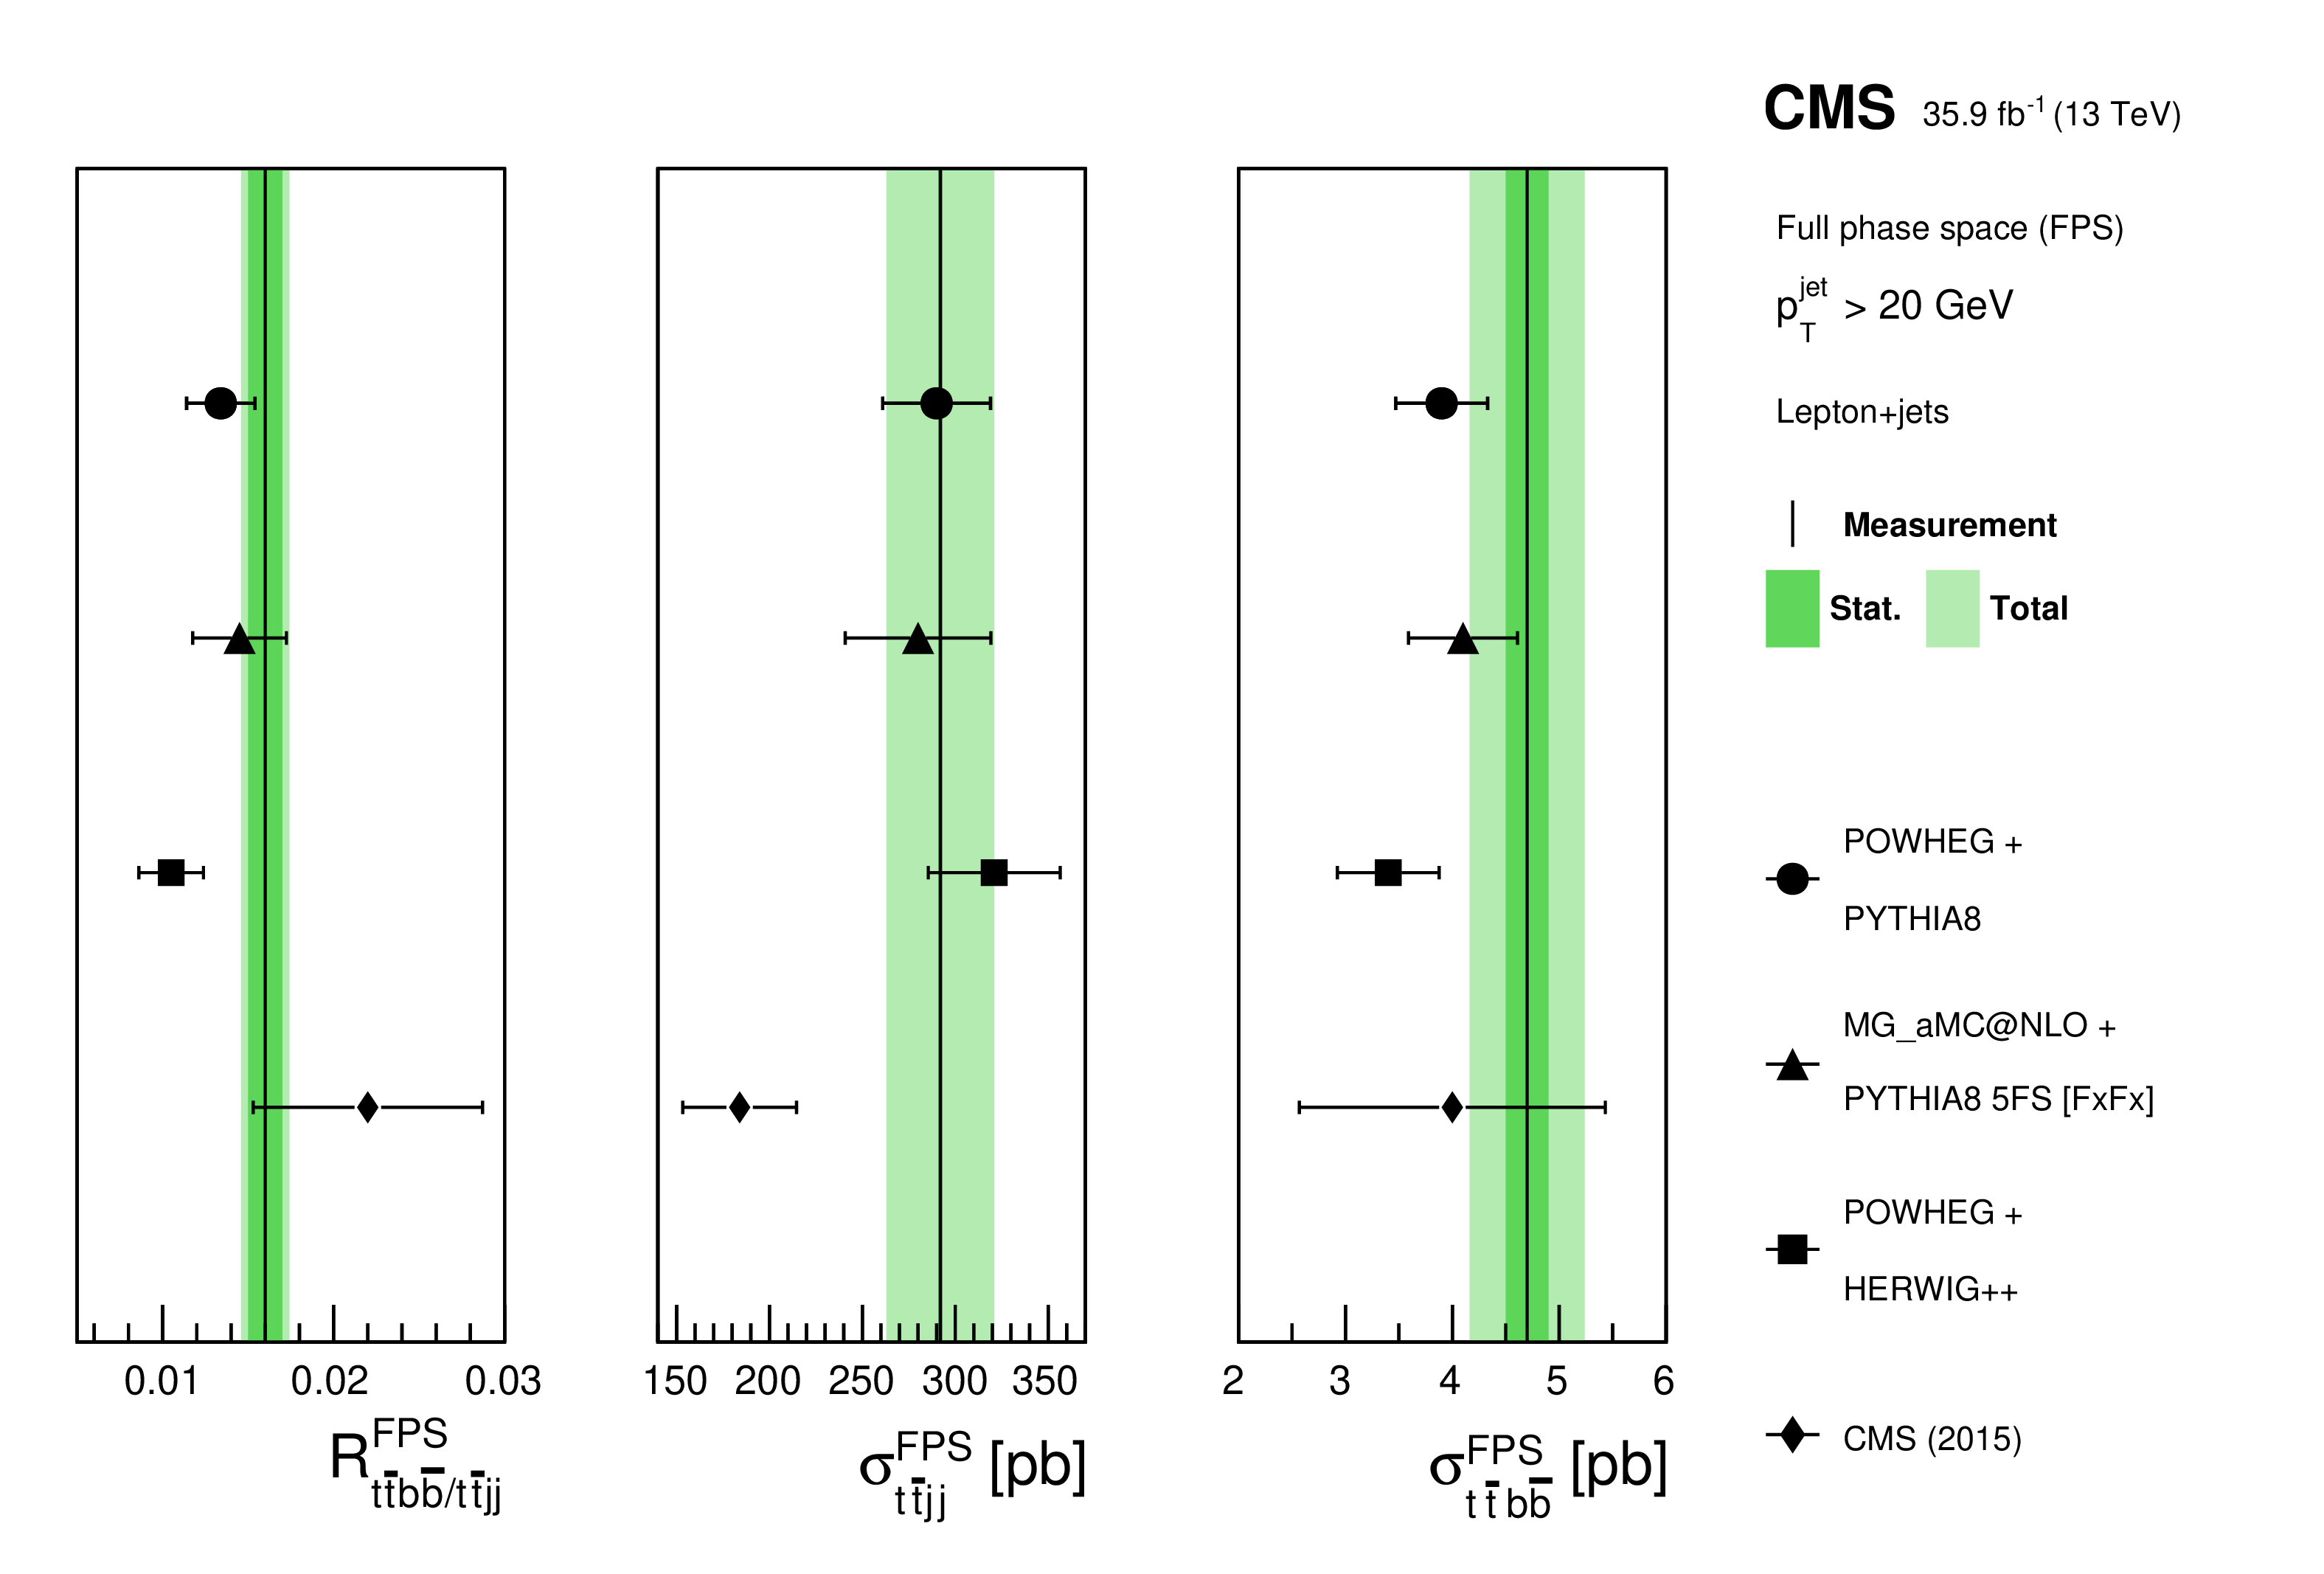
Figure 5-b:
Measured values (vertical lines) of the $ {\mathrm{t} \mathrm{\bar{t}} \mathrm{b} \mathrm{\bar{b}}} $ and $ {\mathrm{t} \mathrm{\bar{t}} \mathrm {jj}} $ cross sections and their ratio, along with their statistical and total uncertainties (dark and light bands) in the dilepton lepton+jets channel in the FPS. Also shown are the theoretical predictions obtained from POWHEG and MG_aMC@NLO (5FS) interfaced with PYTHIA 8, and POWHEG interfaced with HERWIG++. The theoretical predictions for the $ {\mathrm{t} \mathrm{\bar{t}} \mathrm {jj}} $ and $ {\mathrm{t} \mathrm{\bar{t}} \mathrm{b} \mathrm{\bar{b}}} $ cross sections are normalized to $\sigma _{{\mathrm{t} \mathrm{\bar{t}}}}^{\text{NNLO}} = $ 832 pb. The previous measurement performed by the CMS Collaboration [18] is also shown with a rhombus marker. The uncertainties in the MC predictions are a combination of the statistical, $\mu _F/\mu _R$ scale, and PDF components. |
| Tables | |

png pdf |
Table 1:
Summary of the requirements for a simulated event to be in the fiducial (VPS) and full (FPS) phase space regions for the $ {\mathrm{t} \mathrm{\bar{t}} \mathrm{b} \mathrm{\bar{b}}} $ and $ {\mathrm{t} \mathrm{\bar{t}} \mathrm {jj}} $ categories in the dilepton and lepton+jets channels. Details of the particle-level definitions are described in the text. The symbol $\ell $ denotes a lepton (e or $\mu$). |

png pdf |
Table 2:
Expected and observed numbers of events in the dilepton and lepton+jets channels after applying the event selection. The results are given for the different ${\mathrm{t} \mathrm{\bar{t}}} $(+jets) categories, the individual sources of background (from MC simulation), normalized to an integrated luminosity of 35.9 fb$^{-1}$, and the observed number from data. The uncertainties quoted for each MC contribution include all the systematic uncertainties described in Section 7. |

png pdf |
Table 3:
Summary of the individual contributions to the systematic uncertainty in the $ {R_{{\mathrm{t} \mathrm{\bar{t}} \mathrm{b} \mathrm{\bar{b}}} / {\mathrm{t} \mathrm{\bar{t}} \mathrm {jj}}}} $ and $ {\sigma _{{\mathrm{t} \mathrm{\bar{t}} \mathrm {jj}}}} $ measurements for the VPS. The uncertainties are given as relative uncertainties. Some sources include a linear (lin.) or quadratic (quad.) dependency on the fluctuations in data and simulation. |

png pdf |
Table 4:
The measured cross sections $ {\sigma _{{\mathrm{t} \mathrm{\bar{t}} \mathrm{b} \mathrm{\bar{b}}}}} $ and $ {\sigma _{{\mathrm{t} \mathrm{\bar{t}} \mathrm {jj}}}} $, and their ratio, for the VPS and FPS, with the results in the latter corrected for the acceptance and branching fractions. In both the VPS and FPS definitions, the dilepton and lepton+jets channels require particle-level jets with $ {p_{\mathrm {T}}} > $ 30 GeV and 20 GeV, respectively. The predictions from several MC simulations are also shown. The uncertainties in the measurements are split into their statistical (first) and systematic (second) components, while the uncertainties in the MC predictions are a combination of the statistical, $\mu _\mathrm {F}/\mu _\mathrm {R}$ scale, and PDF components. |
| Summary |
|
Measurements of the ${\mathrm{t\bar{t}}\mathrm{b\bar{b}}} $ and ${\mathrm{t\bar{t}} \mathrm{jj}} $ cross sections and their ratio are performed independently in the dilepton and lepton+jets final states using a data sample of proton-proton collisions collected at $\sqrt{s} = $ 13 TeV by the CMS experiment at the LHC in 2016, and corresponding to an integrated luminosity of 35.9 fb$^{-1}$. Leptons and particle-level jets must be in the experimentally accessible kinematic region. The inclusive ${\mathrm{t\bar{t}} \mathrm{jj}} $ cross section and the ${\mathrm{t\bar{t}}\mathrm{b\bar{b}}} $ to ${\mathrm{t\bar{t}} \mathrm{jj}} $ cross section ratio in the fiducial phase space are measured by means of a binned maximum likelihood fit to the b tagging discriminant distribution of the additional jets, from which the inclusive ${\mathrm{t\bar{t}}\mathrm{b\bar{b}}} $ cross section measurement is inferred. The cross section ratio and the inclusive ${\mathrm{t\bar{t}} \mathrm{jj}} $ cross section in the fiducial phase space are extrapolated to the full phase space after correcting for the detector acceptance. The measured inclusive cross sections in the fiducial phase space for the dilepton and lepton+jets channels, respectively, are ${\sigma_{{\mathrm{t\bar{t}}\mathrm{b\bar{b}}} }} =$ 0.040 $\pm$ 0.002 (stat) $\pm$ 0.005 (syst) pb and 0.62 $\pm$ 0.03 (stat) $\pm$ 0.07 (syst) pb, performed by multiplying ${\sigma_{{\mathrm{t\bar{t}} \mathrm{jj}} }} $ with the ratio of ${\sigma_{{\mathrm{t\bar{t}}\mathrm{b\bar{b}}} }} $ to ${\sigma_{{\mathrm{t\bar{t}} \mathrm{jj}} }} $, where ${\sigma_{{\mathrm{t\bar{t}} \mathrm{jj}} }} = $ 2.36 $\pm$ 0.02 (stat) $\pm$ 0.20 (syst) pb and 31.0 $\pm$ 0.2 (stat) $\pm$ 2.9 (syst) pb and the ratios are 0.017 $\pm$ 0.001 (stat) $\pm$ 0.001 (syst) and 0.020 $\pm$ 0.001 (stat) $\pm$ 0.001 (syst). The treatment of the systematic uncertainties as nuisance parameters in the fit leads to an improvement in the precision compared to previous measurements. The inclusive ${\mathrm{t\bar{t}}\mathrm{b\bar{b}}} $ cross sections and the cross section ratios for both decay channels measured in the full phase space have values higher than, but consistent with, the predictions from several different Monte Carlo generators. A measured ${\mathrm{t\bar{t}}\mathrm{b\bar{b}}} $ cross section higher than Monte Carlo predictions is also reported in a recent measurement performed by the CMS Collaboration in the fully hadronic final state [19]. |
| References | ||||
| 1 | G. Bevilacqua and M. Worek | On the ratio of $ \mathrm{t\overline{t} b\overline{b}} $ and $ \mathrm{t\overline{t} jj} $ cross sections at the CERN Large Hadron Collider | JHEP 07 (2014) 135 | 1403.2046 |
| 2 | G. Bevilacqua, M. Czakon, C. G. Papadopoulos, and M. Worek | Hadronic top-quark pair production in association with two jets at next-to-leading order QCD | PRD 84 (2011) 114017 | 1108.2851 |
| 3 | T. Je\uzo, J. M. Lindert, N. Moretti, and S. Pozzorini | New NLOPS predictions for $ \mathrm{t}\overline{\mathrm{t}} $ + b-jet production at the LHC | EPJC 78 (2018) 502 | 1802.00426 |
| 4 | A. Bredenstein, A. Denner, S. Dittmaier, and S. Pozzorini | NLO QCD corrections to $ \mathrm{t\overline{t} b\overline{b}} $ production at the LHC: 1. Quark-antiquark annihilation | JHEP 08 (2008) 108 | 0807.1248 |
| 5 | CMS Collaboration | Measurements of properties of the Higgs boson decaying to a W boson pair in pp collisions at $ \sqrt{s}= $ 13 TeV | PLB 791 (2019) 96 | CMS-HIG-16-042 1806.05246 |
| 6 | CMS Collaboration | Measurements of Higgs boson properties in the diphoton decay channel in proton-proton collisions at $ \sqrt{s}= $ 13 TeV | JHEP 11 (2018) 185 | CMS-HIG-16-040 1804.02716 |
| 7 | CMS Collaboration | Measurements of properties of the Higgs boson decaying into the four-lepton final state in pp collisions at $ \sqrt{s}= $ 13 TeV | JHEP 11 (2017) 47 | CMS-HIG-16-041 1706.09936 |
| 8 | ATLAS Collaboration | Measurement of the Higgs boson mass in the H $ \to $ ZZ$ ^{*}\to4\ell $ and H $ \to\gamma\gamma $ channels with $ \sqrt{s}= $ 13 TeV pp collisions using the ATLAS detector | PLB 784 (2018) 345 | 1806.00242 |
| 9 | ATLAS Collaboration | Measurements of Higgs boson properties in the diphoton decay channel with 36 fb$^{-1}$ of pp collision data at $ \sqrt{s}=$ 13 TeV with the ATLAS detector | PRD 98 (2018) 052005 | 1802.04146 |
| 10 | CMS Collaboration | Observation of $ \mathrm{t\bar{t}H} $ production | PRL 120 (2018) 231801 | CMS-HIG-17-035 1804.02610 |
| 11 | ATLAS Collaboration | Observation of Higgs boson production in association with a top quark pair at the LHC with the ATLAS detector | PLB 784 (2018) 173 | 1806.00425 |
| 12 | CMS Collaboration | Search for $ \mathrm{t}\overline{\mathrm{t}}\mathrm{H} $ production in the $ \mathrm{H}\to \mathrm{b}\overline{\mathrm{b}} $ decay channel with leptonic $ \mathrm{t}\overline{\mathrm{t}} $ decays in proton-proton collisions at $ \sqrt{s}= $ 13 TeV | JHEP 03 (2019) 026 | CMS-HIG-17-026 1804.03682 |
| 13 | ATLAS Collaboration | Search for the standard model Higgs boson produced in association with top quarks and decaying into a $ \mathrm{b}\overline{\mathrm{b}} $ pair in pp collisions at $ \sqrt{s}=$ 13 TeV with the ATLAS detector | PRD 97 (2018) 072016 | 1712.08895 |
| 14 | ATLAS Collaboration | Measurements of fiducial cross-sections for $ \mathrm{t\bar{t}} $ production with one or two additional b-jets in pp collisions at $ \sqrt{s}= $ 8 TeV using the ATLAS detector | EPJC 76 (2016) 11 | 1508.06868 |
| 15 | ATLAS Collaboration | Measurements of inclusive and differential fiducial cross-sections of $ \mathrm{t}\overline{\mathrm{t}} $ production with additional heavy-flavour jets in proton-proton collisions at $ \sqrt{s} = $ 13 TeV with the ATLAS detector | JHEP 04 (2019) 046 | 1811.12113 |
| 16 | CMS Collaboration | Measurement of the cross section ratio $ \sigma_\mathrm{t \bar{t} b \bar{b}} / \sigma_\mathrm{t \bar{t} jj} $ in pp collisions at $ \sqrt{s}= $ 8 TeV | PLB 746 (2015) 132 | CMS-TOP-13-010 1411.5621 |
| 17 | CMS Collaboration | Measurement of $ \mathrm{t}\overline{\mathrm{t}} $ production with additional jet activity, including b quark jets, in the dilepton decay channel using pp collisions at $ \sqrt{s} = $ 8 TeV | EPJC 76 (2016) 379 | CMS-TOP-12-041 1510.03072 |
| 18 | CMS Collaboration | Measurements of $ \mathrm{t}\overline{\mathrm{t}} $ cross sections in association with b jets and inclusive jets and their ratio using dilepton final states in pp collisions at $ \sqrt{s}= $ 13 TeV | PLB 776 (2018) 355 | CMS-TOP-16-010 1705.10141 |
| 19 | CMS Collaboration | Measurement of the $ \mathrm{t}\overline{\mathrm{t}}\mathrm{b}\overline{\mathrm{b}} $ production cross section in the all-jet final state in pp collisions at $ \sqrt{s}= $ 13 TeV | PLB 803 (2020) 135285 | CMS-TOP-18-011 1909.05306 |
| 20 | CMS Collaboration | Performance of electron reconstruction and selection with the CMS detector in proton-proton collisions at $ \sqrt{s} = $ 8 TeV | JINST 10 (2015) P06005 | CMS-EGM-13-001 1502.02701 |
| 21 | CMS Collaboration | Performance of the CMS muon detector and muon reconstruction with proton-proton collisions at $ \sqrt{s}= $ 13 TeV | JINST 13 (2018) P06015 | CMS-MUO-16-001 1804.04528 |
| 22 | CMS Collaboration | Particle-flow reconstruction and global event description with the CMS detector | JINST 12 (2017) P10003 | CMS-PRF-14-001 1706.04965 |
| 23 | M. Cacciari, G. P. Salam, and G. Soyez | The anti-$ {k_{\mathrm{T}}} $ jet clustering algorithm | JHEP 04 (2008) 063 | 0802.1189 |
| 24 | M. Cacciari, G. P. Salam, and G. Soyez | FastJet user manual | EPJC 72 (2012) 1896 | 1111.6097 |
| 25 | CMS Collaboration | Performance of missing transverse momentum reconstruction in proton-proton collisions at $ \sqrt{s} = $ 13 TeV using the CMS detector | JINST 14 (2019) P07004 | CMS-JME-17-001 1903.06078 |
| 26 | CMS Collaboration | The CMS trigger system | JINST 12 (2017) P01020 | CMS-TRG-12-001 1609.02366 |
| 27 | P. Nason | A new method for combining NLO QCD with shower Monte Carlo algorithms | JHEP 11 (2004) 040 | hep-ph/0409146 |
| 28 | S. Frixione, P. Nason, and C. Oleari | Matching NLO QCD computations with parton shower simulations: the POWHEG method | JHEP 11 (2007) 070 | 0709.2092 |
| 29 | S. Alioli, P. Nason, C. Oleari, and E. Re | A general framework for implementing NLO calculations in shower Monte Carlo programs: the POWHEG BOX | JHEP 06 (2010) 043 | 1002.2581 |
| 30 | J. M. Campbell, R. K. Ellis, P. Nason, and E. Re | Top-pair production and decay at NLO matched with parton showers | JHEP 04 (2015) 114 | 1412.1828 |
| 31 | T. Sjostrand et al. | An introduction to PYTHIA 8.2 | CPC 191 (2015) 159 | 1410.3012 |
| 32 | CMS Collaboration | Investigations of the impact of the parton shower tuning in PYTHIA8 in the modelling of $ \mathrm{t\overline{t}} $ at $ \sqrt{s}= $ 8 and 13 TeV | CMS-PAS-TOP-16-021 | CMS-PAS-TOP-16-021 |
| 33 | M. Bahr et al. | Herwig++ physics and manual | EPJC 58 (2008) 639 | 0803.0883 |
| 34 | M. H. Seymour and A. Siodmok | Constraining MPI models using $ \sigma_{\rm eff} $ and recent Tevatron and LHC underlying event data | JHEP 10 (2013) 113 | 1307.5015 |
| 35 | S. Dulat et al. | New parton distribution functions from a global analysis of quantum chromodynamics | PRD 93 (2016) 033006 | 1506.07443 |
| 36 | S. Frixione et al. | Single-top hadroproduction in association with a W boson | JHEP 07 (2008) 029 | 0805.3067 |
| 37 | E. Re | Single-top W$ t $-channel production matched with parton showers using the POWHEG method | EPJC 71 (2011) 1547 | 1009.2450 |
| 38 | P. Artoisenet, R. Frederix, O. Mattelaer, and R. Rietkerk | Automatic spin-entangled decays of heavy resonances in Monte Carlo simulations | JHEP 03 (2013) 015 | 1212.3460 |
| 39 | R. Frederix and S. Frixione | Merging meets matching in MC@NLO | JHEP 12 (2012) 061 | 1209.6215 |
| 40 | M. Czakon and A. Mitov | Top++: a program for the calculation of the top-pair cross-section at hadron colliders | CPC 185 (2014) 2930 | 1112.5675 |
| 41 | M. Cacciari et al. | Top-pair production at hadron colliders with next-to-next-to-leading logarithmic soft-gluon resummation | PLB 710 (2012) 612 | 1111.5869 |
| 42 | P. Barnreuther, M. Czakon, and A. Mitov | Percent level precision physics at the Tevatron: First genuine NNLO QCD corrections to pp $ \rightarrow \mathrm{t}\overline{\mathrm{t}} $ + X | PRL 109 (2012) 132001 | 1204.5201 |
| 43 | M. Czakon and A. Mitov | NNLO corrections to top-pair production at hadron colliders: the all-fermionic scattering channels | JHEP 12 (2012) 054 | 1207.0236 |
| 44 | M. Czakon and A. Mitov | NNLO corrections to top pair production at hadron colliders: the quark-gluon reaction | JHEP 01 (2013) 080 | 1210.6832 |
| 45 | M. Beneke, P. Falgari, S. Klein, and C. Schwinn | Hadronic top-quark pair production with NNLL threshold resummation | NPB 855 (2012) 695 | 1109.1536 |
| 46 | M. Czakon, P. Fiedler, and A. Mitov | Total top-quark pair-production cross section at hadron colliders through $ \mathcal{O}({{\alpha}}_{S}^{4}) $ | PRL 110 (2013) 252004 | {1303.6254} |
| 47 | N. Kidonakis | NNLL threshold resummation for top-pair and single-top production | Phys. Part. Nucl. 45 (2014) 714 | 1210.7813 |
| 48 | Alwall, J. and Hoche, S. and Krauss, F. and others | Comparative study of various algorithms for the merging of parton showers and matrix elements in hadronic collisions | EPJC 53 (2008) 473 | 0706.2569 |
| 49 | Y. Li and F. Petriello | Combining QCD and electroweak corrections to dilepton production in FEWZ | PRD 86 (2012) 094034 | 1208.5967 |
| 50 | ATLAS, CDF, CMS, and D\O Collaborations | First combination of Tevatron and LHC measurements of the top-quark mass | CMS-PAS-TOP-13-014, D0-NOTE-6416, FERMILAB-TM-2582- | 1403.4427 |
| 51 | T. Gehrmann et al. | W$ ^{+} $W$ ^{-} $ production at hadron colliders in next to next to leading order QCD | PRL 113 (2014) 212001 | 1408.5243 |
| 52 | J. M. Campbell and R. K. Ellis | MCFM for the Tevatron and the LHC | NPPS 205--206 (2010) 10 | 1007.3492 |
| 53 | GEANT4 Collaboration | GEANT4--a simulation toolkit | NIMA 506 (2003) 250 | |
| 54 | M. Cacciari, G. P. Salam, and G. Soyez | The catchment area of jets | JHEP 04 (2008) 005 | 0802.1188 |
| 55 | CMS Collaboration | Jet energy scale and resolution in the CMS experiment in pp collisions at 8 TeV | JINST 12 (2017) P02014 | CMS-JME-13-004 1607.03663 |
| 56 | CMS Collaboration | Identification of heavy-flavour jets with the CMS detector in pp collisions at 13 TeV | JINST 13 (2018) P05011 | CMS-BTV-16-002 1712.07158 |
| 57 | Particle Data Group, M. Tanabashi et al. | Review of particle physics | PRD 98 (2018) 030001 | |
| 58 | D\O Collaboration | Direct measurement of the top quark mass by the D$ \O $ Collaboration | PRD 58 (1998) 052001 | ep-ex/9801025 |
| 59 | P. Skands, S. Carrazza, and J. Rojo | Tuning PYTHIA 8.1: the Monash 2013 tune | EPJC 74 (2014) 3024 | 1404.5630 |
| 60 | CMS Collaboration | Measurement of differential cross sections for the production of top quark pairs and of additional jets in lepton+jets events from pp collisions at $ \sqrt{s}=$ 13 TeV | PRD 97 (2018) 112003 | CMS-TOP-17-002 1803.08856 |
| 61 | NNPDF Collaboration | Parton distributions for the LHC Run II | JHEP 04 (2015) 040 | 1410.8849 |
| 62 | Butterworth, Jon and others | PDF4LHC recommendations for LHC Run II | JPG 43 (2016) 023001 | 1510.03865 |
| 63 | J. R. Christiansen and P. Z. Skands | String formation beyond leading colour | JHEP 08 (2015) 003 | 1505.01681 |
| 64 | S. Argyropoulos and T. Sjostrand | Effects of color reconnection on $ \mathrm{t}\overline{\mathrm{t}} $ final states at the LHC | JHEP 11 (2014) 043 | 1407.6653 |
| 65 | CMS Collaboration | CMS luminosity measurements for the 2016 data taking period | CMS-PAS-LUM-17-001 | CMS-PAS-LUM-17-001 |
|
|
Compact Muon Solenoid LHC, CERN |
|

|

|

|

|

|