

Compact Muon Solenoid
LHC, CERN
| CMS-TOP-20-005 ; CERN-EP-2022-051 | ||
| Search for CP violation using $\mathrm{t\bar{t}}$ events in the lepton+jets channel in pp collisions at $\sqrt{s}=$ 13 TeV | ||
| CMS Collaboration | ||
| 4 May 2022 | ||
| JHEP 06 (2023) 081 | ||
| Abstract: Results are presented on a search for CP violation in the production and decay of top quark-antiquark pairs in the lepton+jets channel. The search is based on data from proton-proton collisions at $\sqrt{s}=$ 13 TeV, collected with the CMS detector, corresponding to an integrated luminosity of 138 fb$^{-1}$. Possible CP violation effects are evaluated by measuring uncorrected asymmetries in observables constructed from linearly independent four-momentum vectors of the final-state particles. The dimensionless chromoelectric dipole moment of the top quark obtained from the observed asymmetries is measured to be 0.04 $\pm$ 0.10 (stat) $\pm$ 0.07 (syst), and the asymmetries exhibit no evidence for CP-violating effects, consistent with expectations from the standard model. | ||
| Links: e-print arXiv:2205.02314 [hep-ex] (PDF) ; CDS record ; inSPIRE record ; HepData record ; CADI line (restricted) ; | ||
| Figures | |
png pdf |
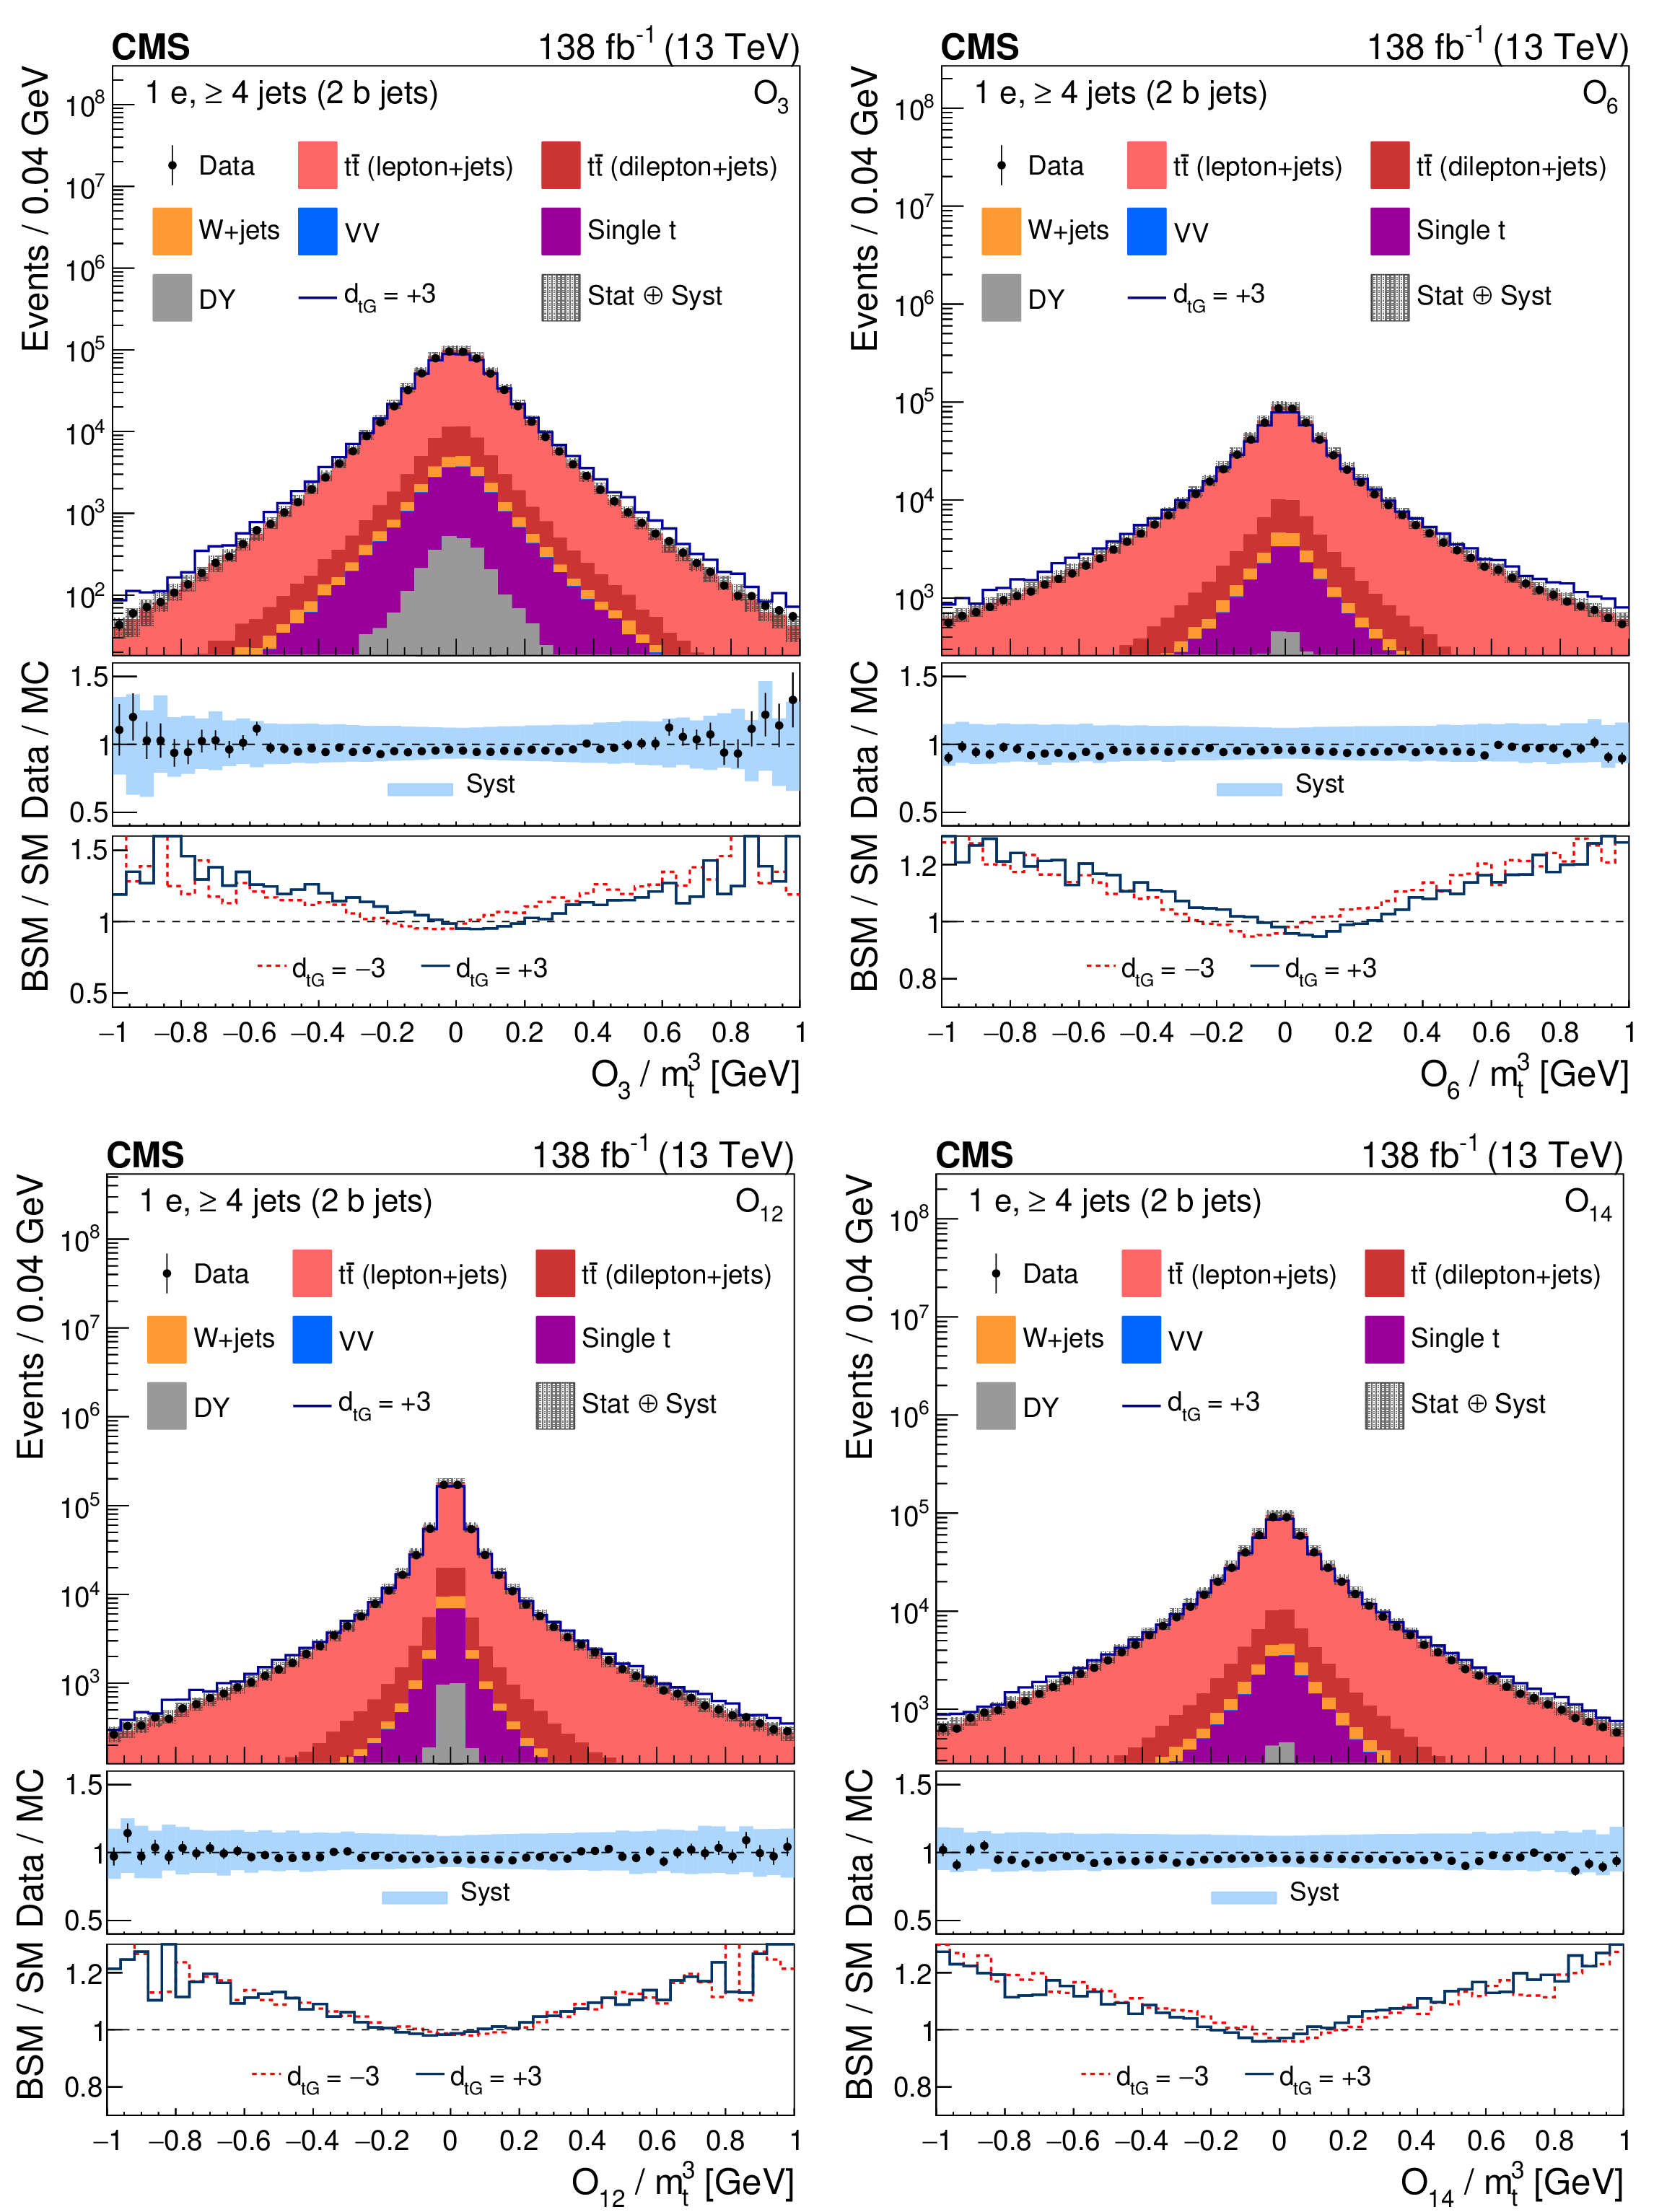
Figure 1:
Distributions of the CP observables ${O_3}$ (upper left), ${O_6}$ (upper right), ${O_{12}}$ (lower left), and ${O_{14}}$ (lower right), normalized with respect to ${m_{\mathrm{t}}^3}$, from data (points) and from the various sources in simulation (colored histograms) for electron events in the signal region. The solid-blue line shows the CEDM simulated signal normalized to the data with the CP-odd parameter $ {d_{\mathrm{t} \mathrm {G}}} = +$3. The vertical bars on the data points indicate the statistical uncertainties in the data, and the hatched bands show the quadrature sum of the statistical and systematic uncertainties in the simulation. The lower two panels display the ratio of the data to the sum of the MC predictions and the ratio of the CEDM to the SM predictions for $ {d_{\mathrm{t} \mathrm {G}}} = +$3 (red lines) and $-$3 (dark-blue lines). |

png pdf |
Figure 1-a:
Distribution of the CP observable ${O_3}$, normalized with respect to ${m_{\mathrm{t}}^3}$, from data (points) and from the various sources in simulation (colored histograms) for electron events in the signal region. The solid-blue line shows the CEDM simulated signal normalized to the data with the CP-odd parameter $ {d_{\mathrm{t} \mathrm {G}}} = +$3. The vertical bars on the data points indicate the statistical uncertainties in the data, and the hatched bands show the quadrature sum of the statistical and systematic uncertainties in the simulation. The lower two panels display the ratio of the data to the sum of the MC predictions and the ratio of the CEDM to the SM predictions for $ {d_{\mathrm{t} \mathrm {G}}} = +$3 (red lines) and $-$3 (dark-blue lines). |
png pdf |
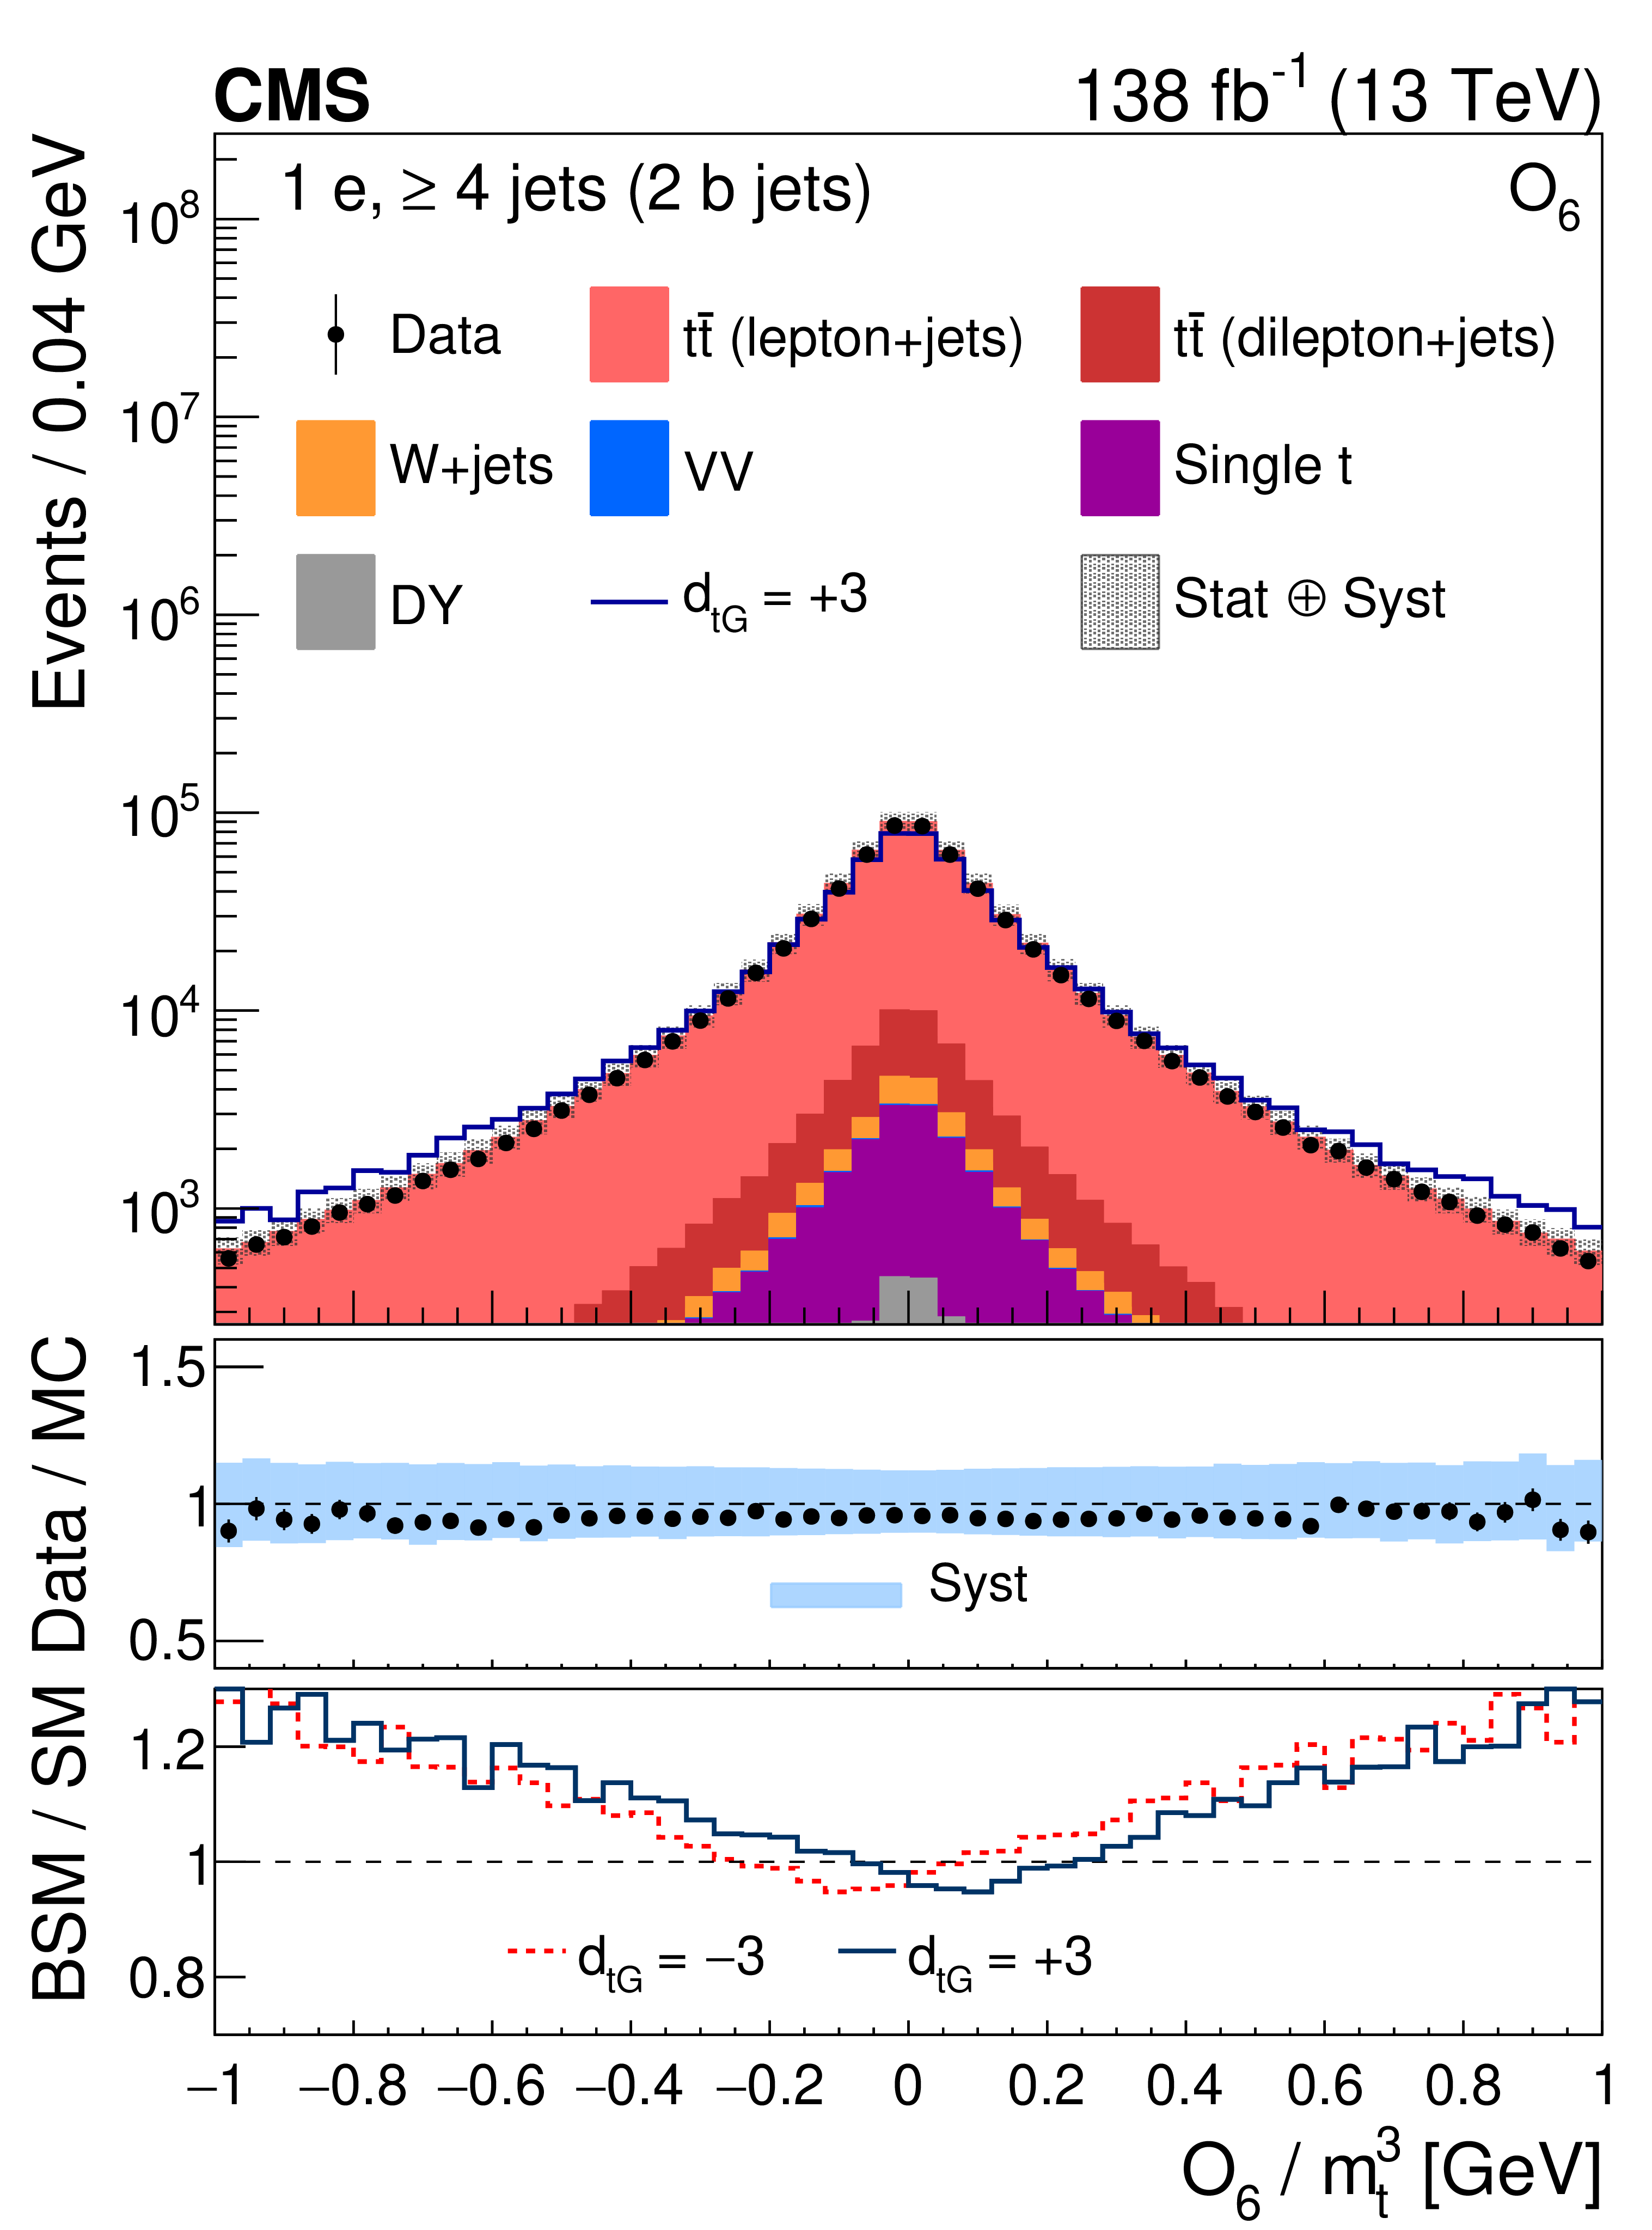
Figure 1-b:
Distribution of the CP observable ${O_6}$, normalized with respect to ${m_{\mathrm{t}}^3}$, from data (points) and from the various sources in simulation (colored histograms) for electron events in the signal region. The solid-blue line shows the CEDM simulated signal normalized to the data with the CP-odd parameter $ {d_{\mathrm{t} \mathrm {G}}} = +$3. The vertical bars on the data points indicate the statistical uncertainties in the data, and the hatched bands show the quadrature sum of the statistical and systematic uncertainties in the simulation. The lower two panels display the ratio of the data to the sum of the MC predictions and the ratio of the CEDM to the SM predictions for $ {d_{\mathrm{t} \mathrm {G}}} = +$3 (red lines) and $-$3 (dark-blue lines). |
png pdf |
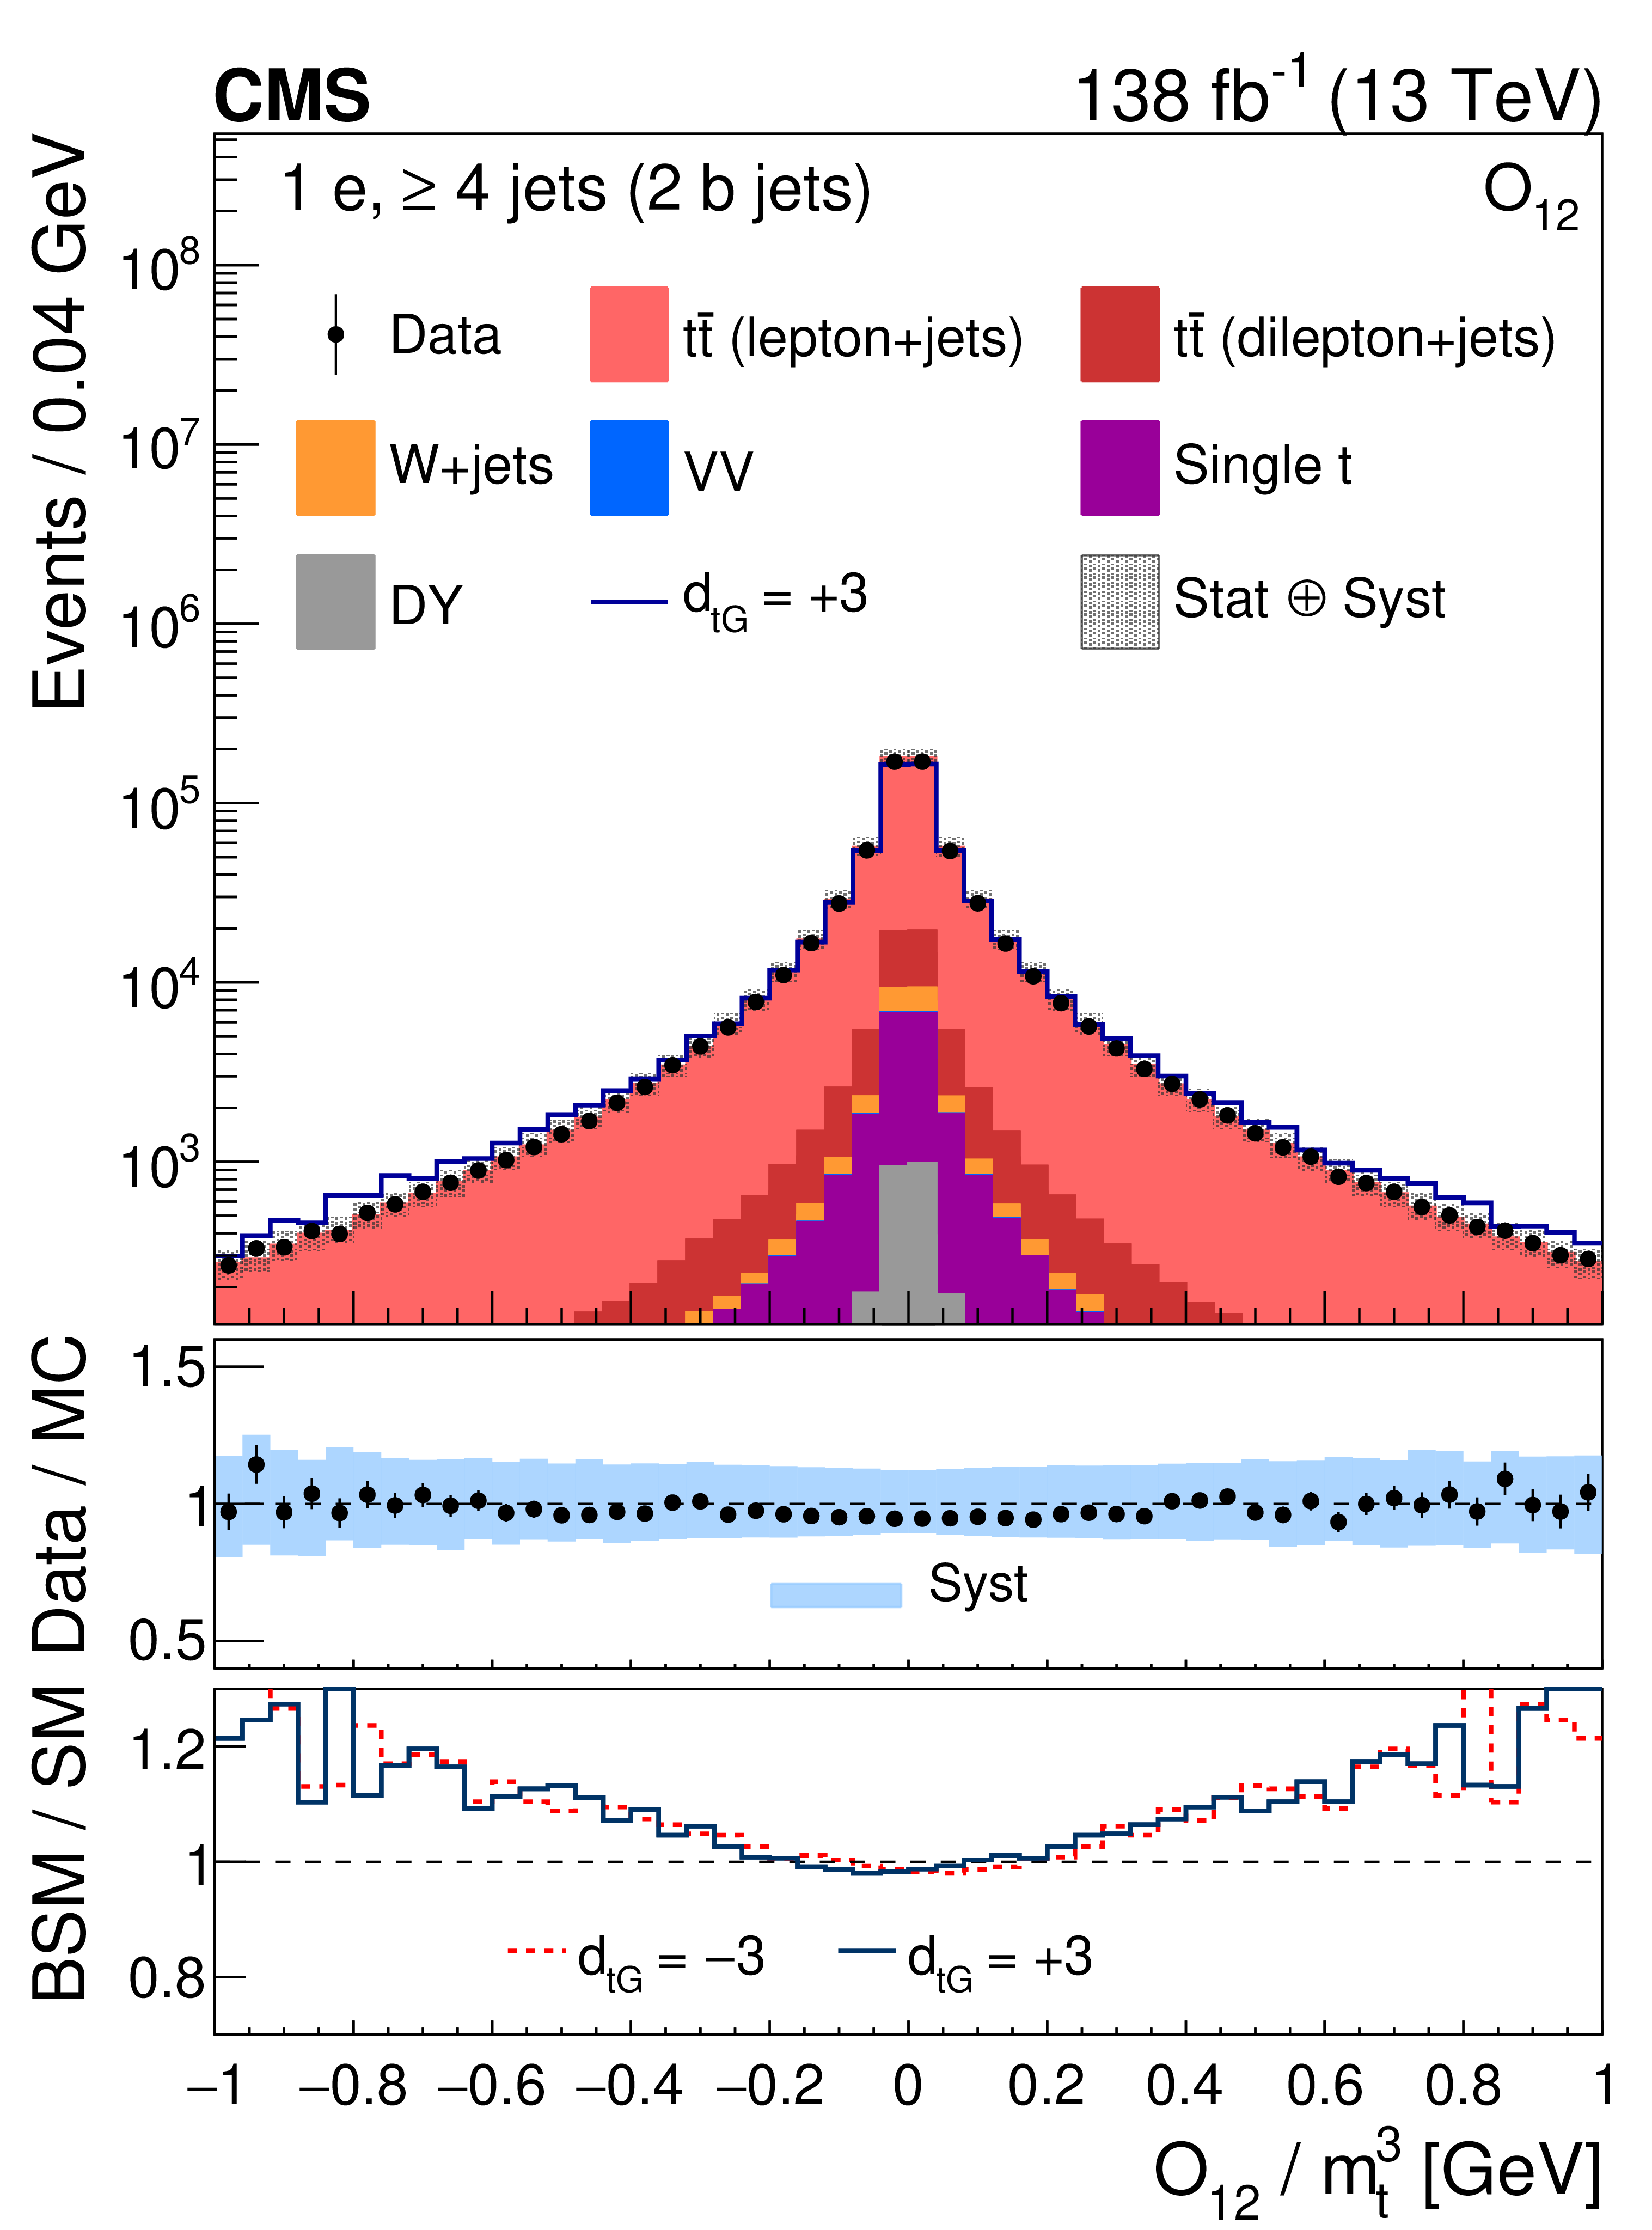
Figure 1-c:
Distribution of the CP observable ${O_{12}}$, normalized with respect to ${m_{\mathrm{t}}^3}$, from data (points) and from the various sources in simulation (colored histograms) for electron events in the signal region. The solid-blue line shows the CEDM simulated signal normalized to the data with the CP-odd parameter $ {d_{\mathrm{t} \mathrm {G}}} = +$3. The vertical bars on the data points indicate the statistical uncertainties in the data, and the hatched bands show the quadrature sum of the statistical and systematic uncertainties in the simulation. The lower two panels display the ratio of the data to the sum of the MC predictions and the ratio of the CEDM to the SM predictions for $ {d_{\mathrm{t} \mathrm {G}}} = +$3 (red lines) and $-$3 (dark-blue lines). |
png pdf |
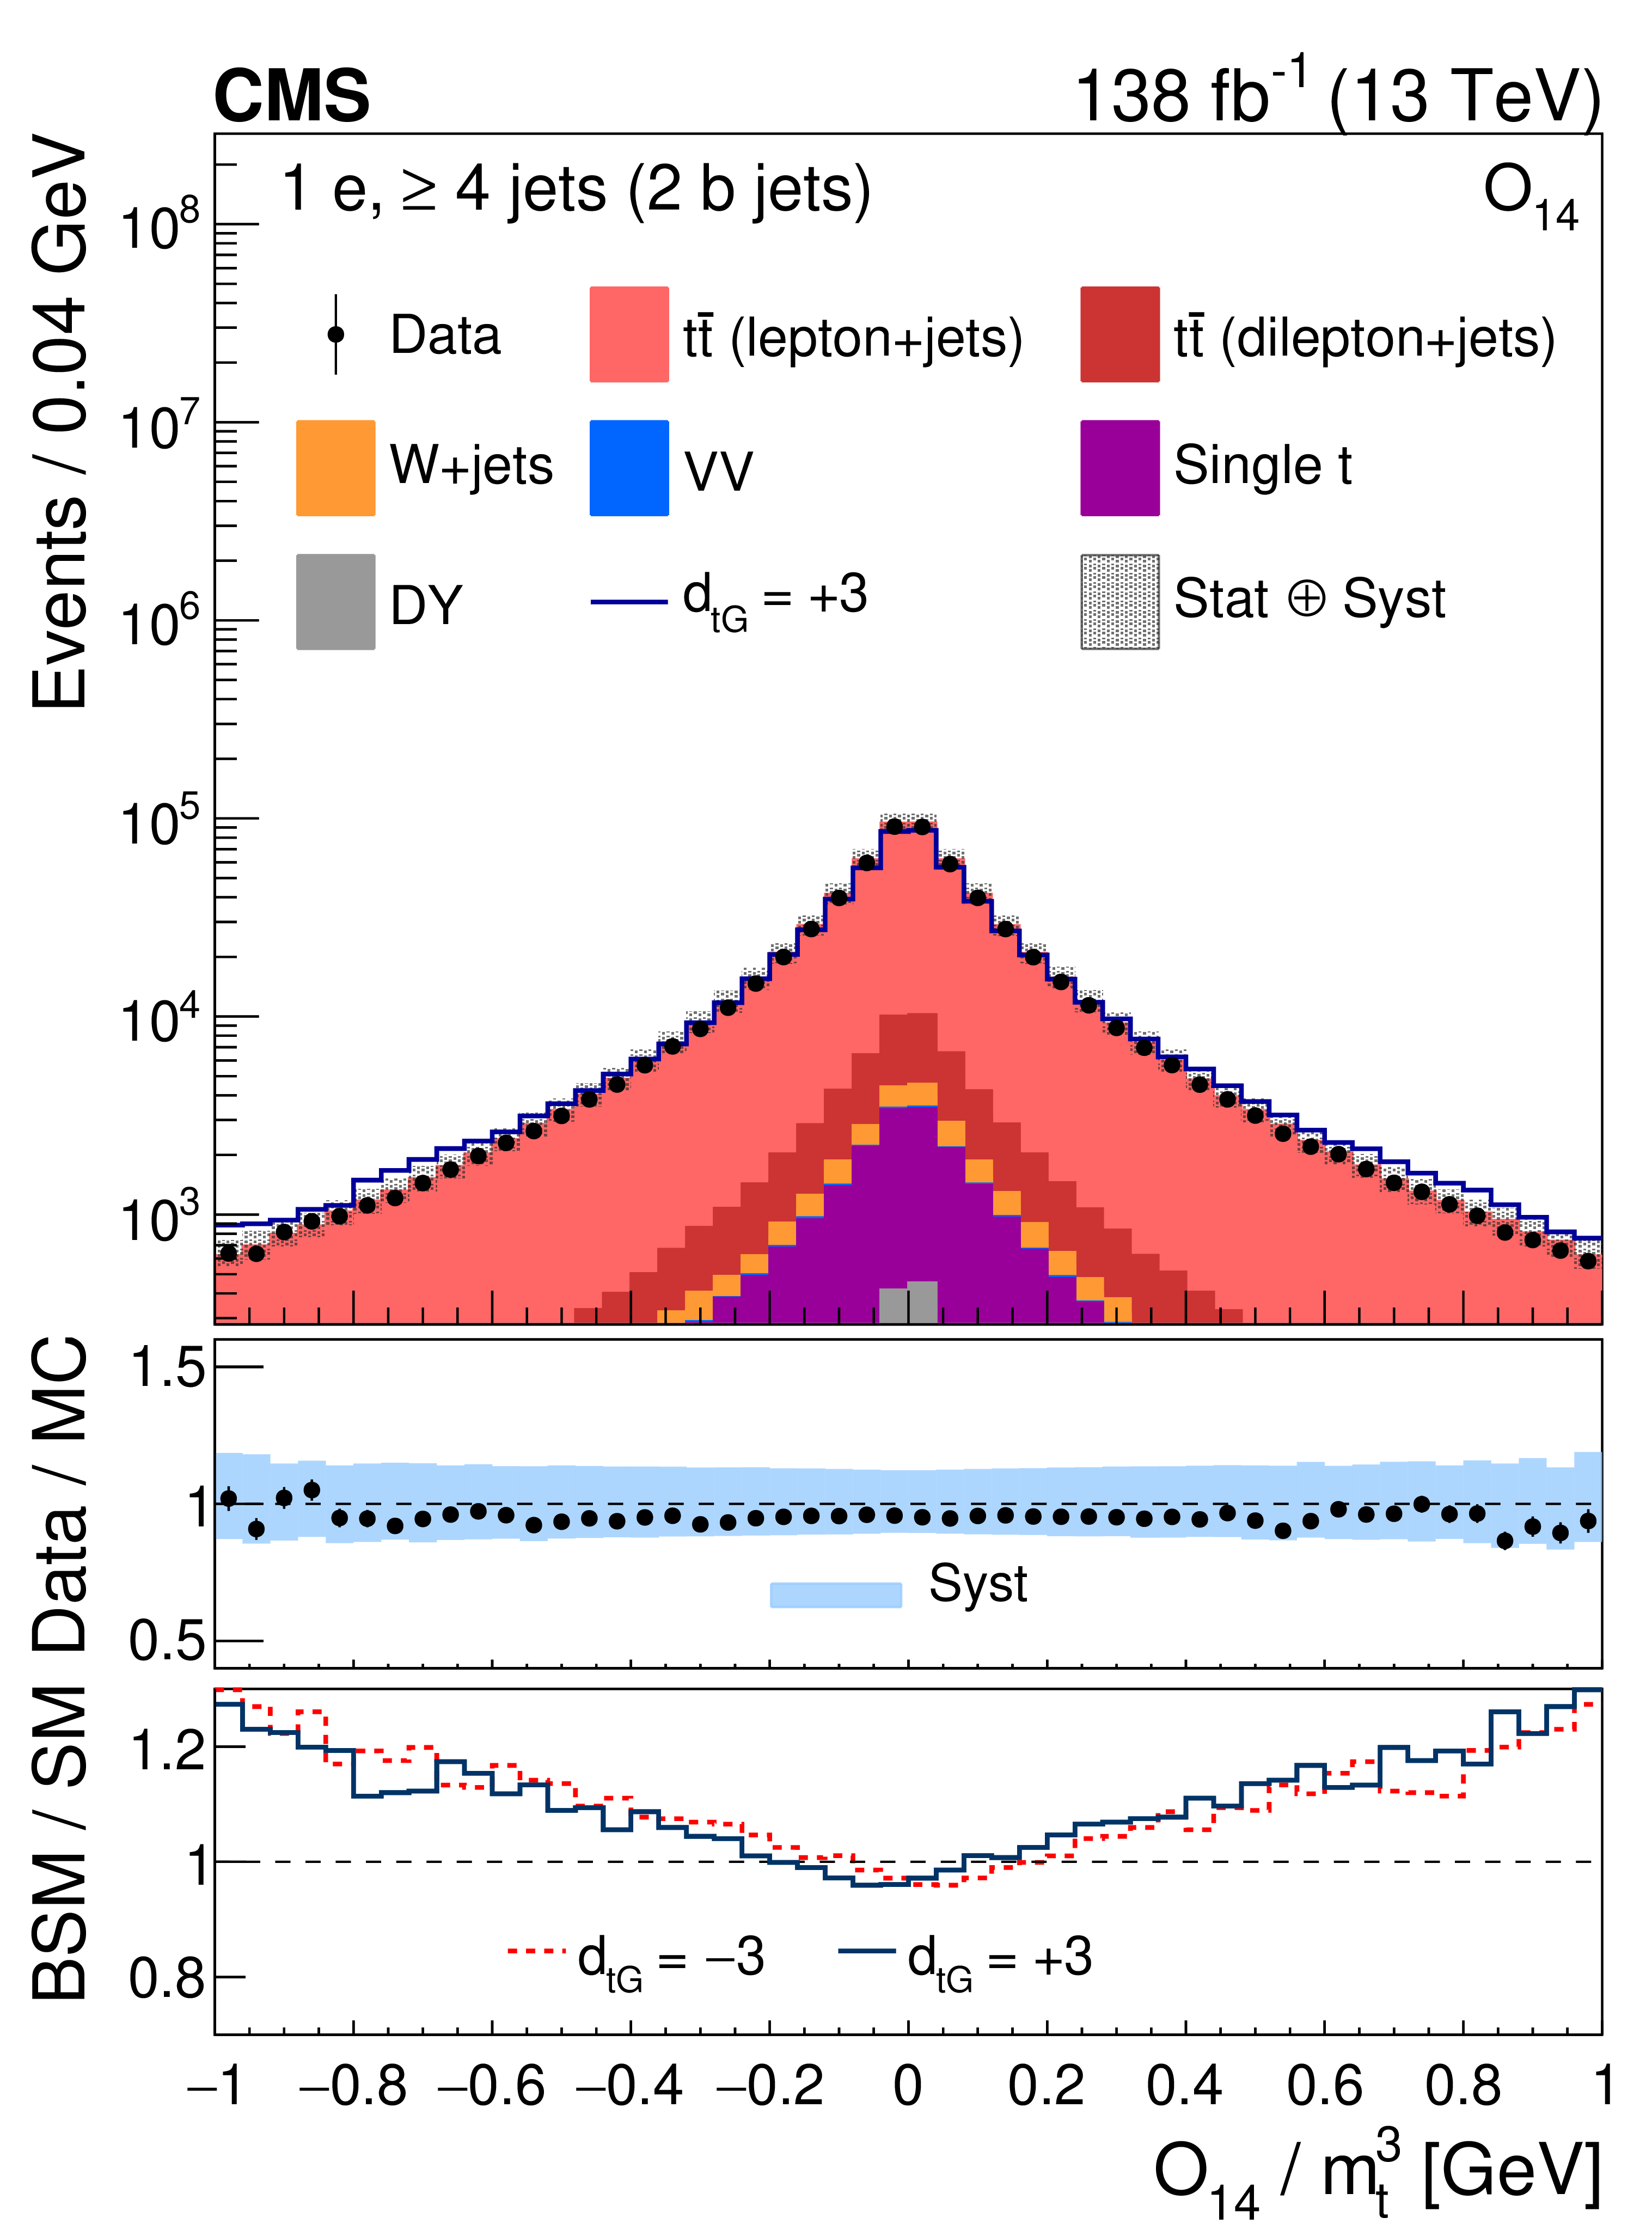
Figure 1-d:
Distribution of the CP observable ${O_{14}}$, normalized with respect to ${m_{\mathrm{t}}^3}$, from data (points) and from the various sources in simulation (colored histograms) for electron events in the signal region. The solid-blue line shows the CEDM simulated signal normalized to the data with the CP-odd parameter $ {d_{\mathrm{t} \mathrm {G}}} = +$3. The vertical bars on the data points indicate the statistical uncertainties in the data, and the hatched bands show the quadrature sum of the statistical and systematic uncertainties in the simulation. The lower two panels display the ratio of the data to the sum of the MC predictions and the ratio of the CEDM to the SM predictions for $ {d_{\mathrm{t} \mathrm {G}}} = +$3 (red lines) and $-$3 (dark-blue lines). |
png pdf |
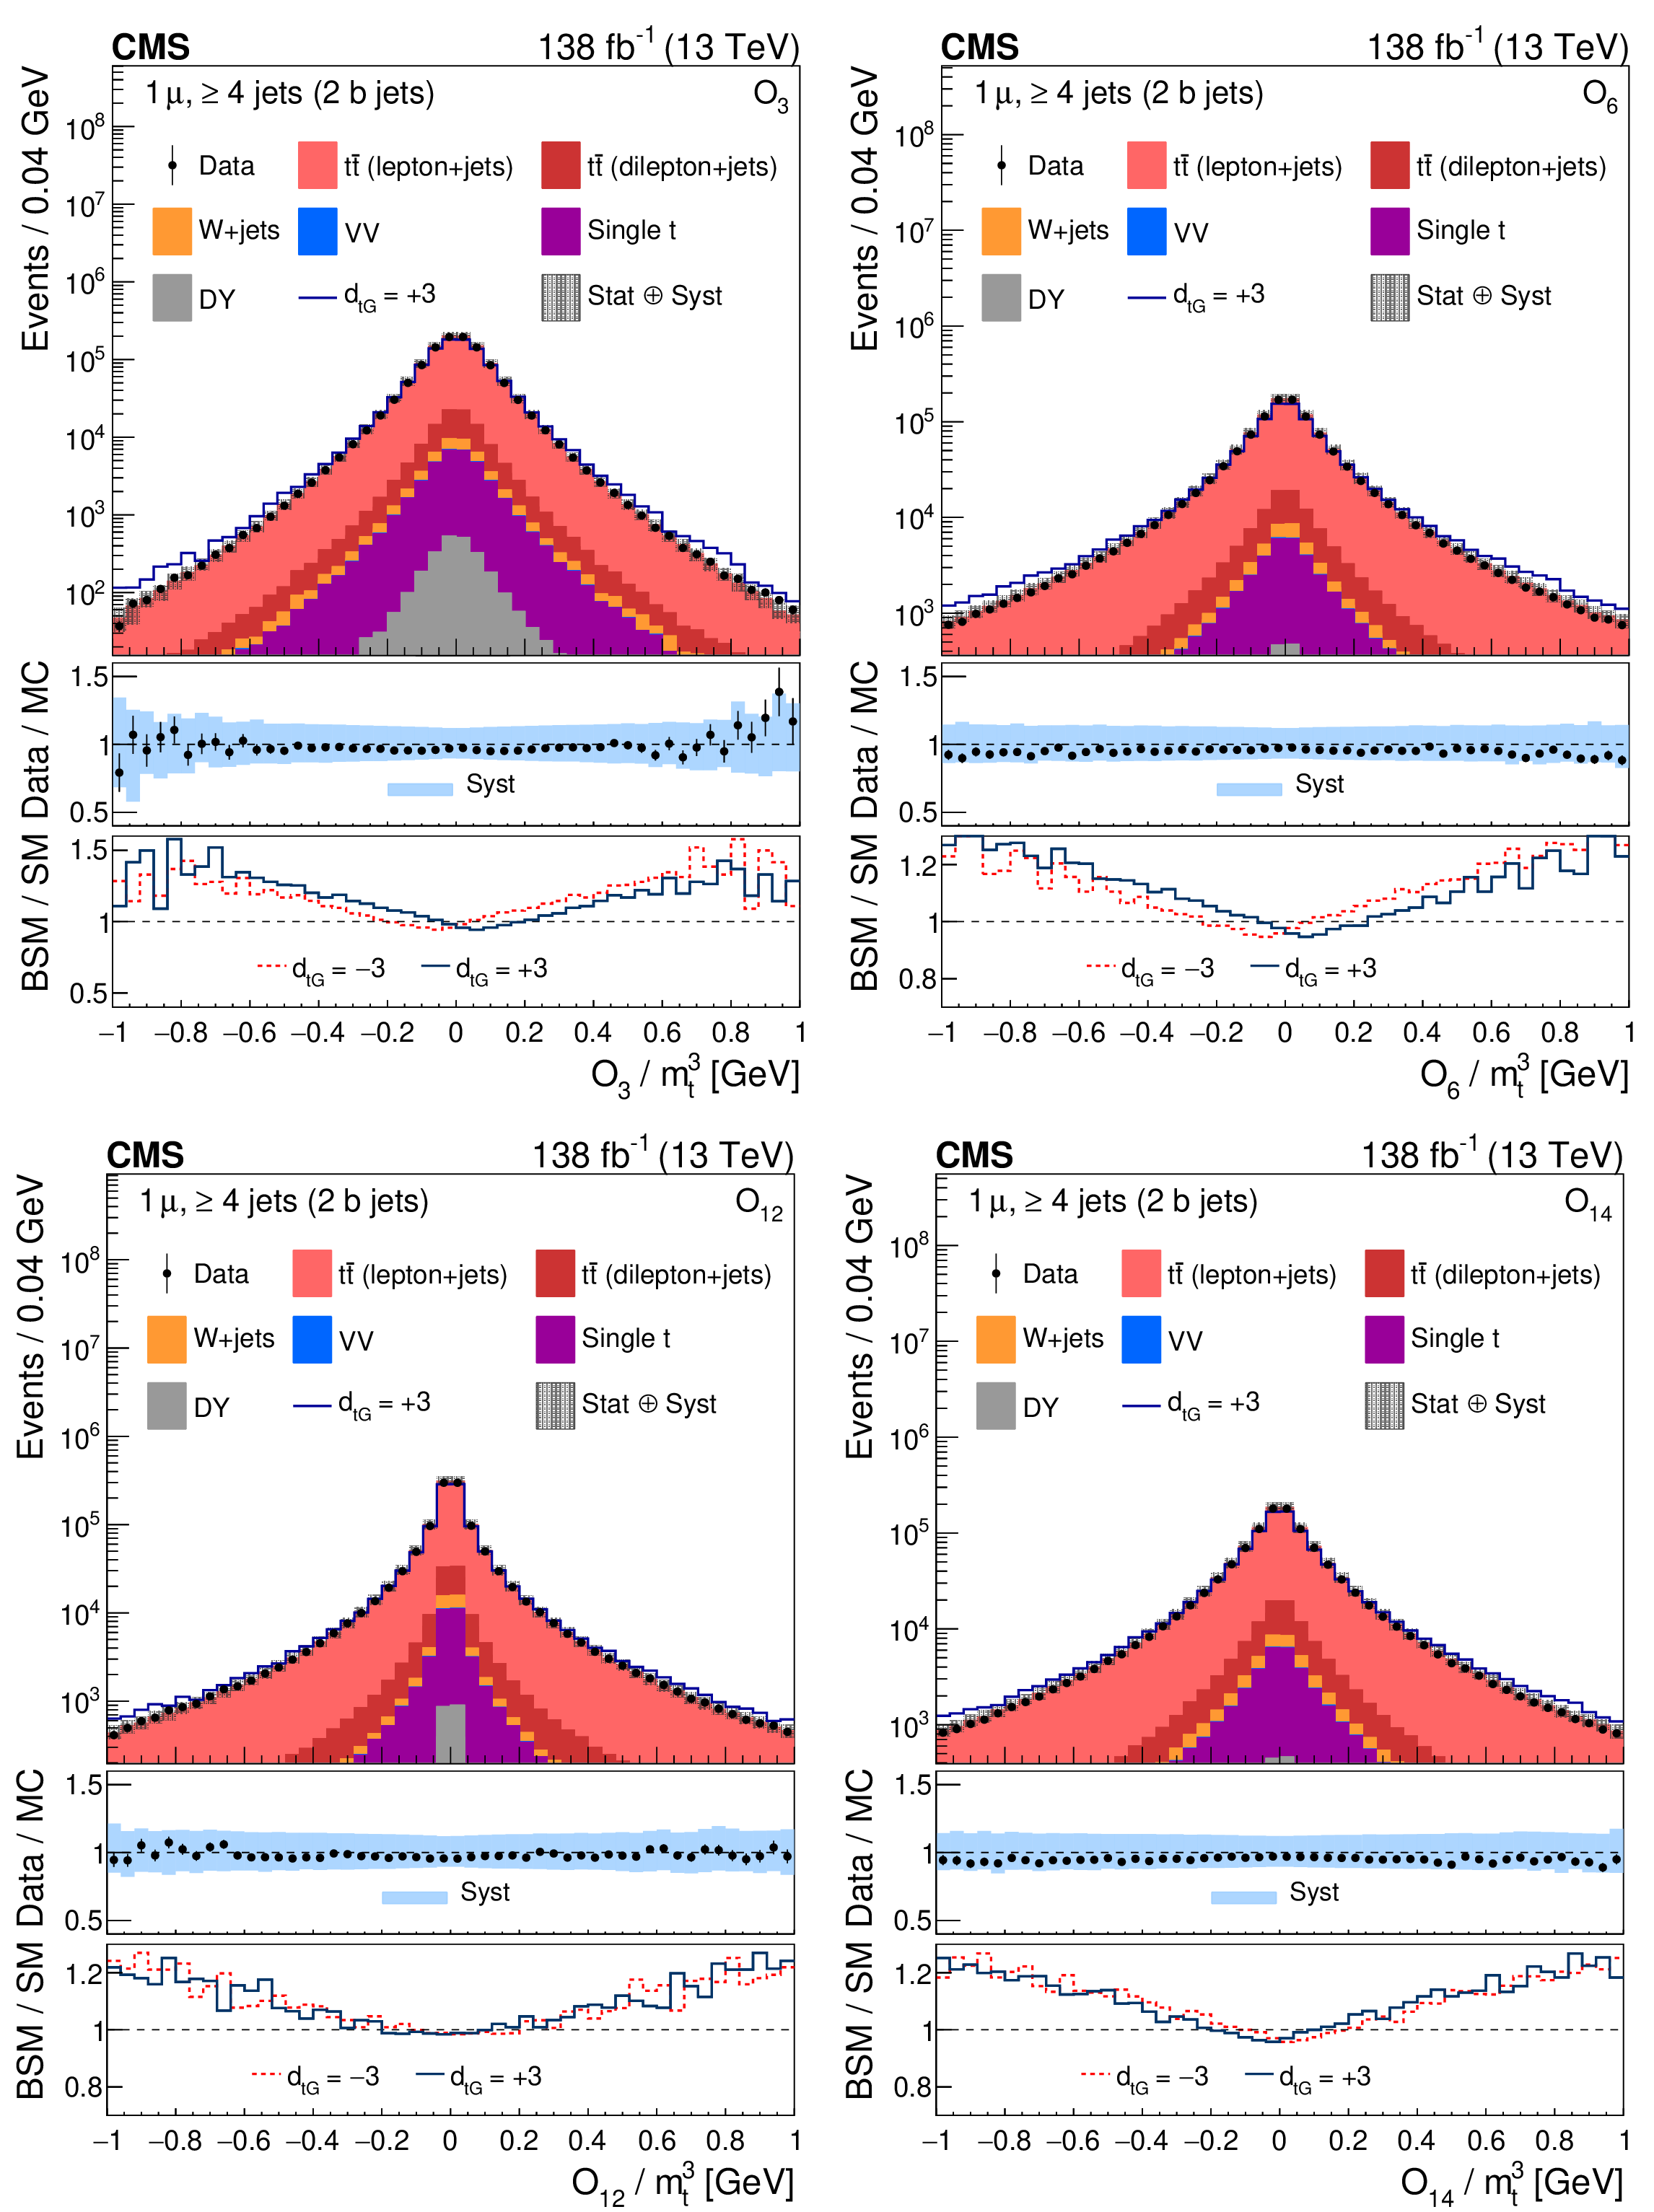
Figure 2:
Distributions of the CP observables ${O_3}$ (upper left), ${O_6}$ (upper right), ${O_{12}}$ (lower left), and ${O_{14}}$ (lower right), normalized with respect to ${m_{\mathrm{t}}^3}$, from data (points) and from the various sources in simulation (colored histograms) for muon events in the signal region. The solid-blue line shows the CEDM simulated signal normalized to the data with the CP-odd parameter $ {d_{\mathrm{t} \mathrm {G}}} = +$3. The vertical bars on the data points indicate the statistical uncertainties in the data, and the hatched bands show the quadrature sum of the statistical and systematic uncertainties in the simulation. The lower two panels display the ratio of the data to the sum of the MC predictions and the ratio of the CEDM to the SM predictions for $ {d_{\mathrm{t} \mathrm {G}}} = +$3 (red lines) and $-$3 (dark-blue lines). |

png pdf |
Figure 2-a:
Distribution of the CP observable ${O_3}$, normalized with respect to ${m_{\mathrm{t}}^3}$, from data (points) and from the various sources in simulation (colored histograms) for muon events in the signal region. The solid-blue line shows the CEDM simulated signal normalized to the data with the CP-odd parameter $ {d_{\mathrm{t} \mathrm {G}}} = +$3. The vertical bars on the data points indicate the statistical uncertainties in the data, and the hatched bands show the quadrature sum of the statistical and systematic uncertainties in the simulation. The lower two panels display the ratio of the data to the sum of the MC predictions and the ratio of the CEDM to the SM predictions for $ {d_{\mathrm{t} \mathrm {G}}} = +$3 (red lines) and $-$3 (dark-blue lines). |
png pdf |
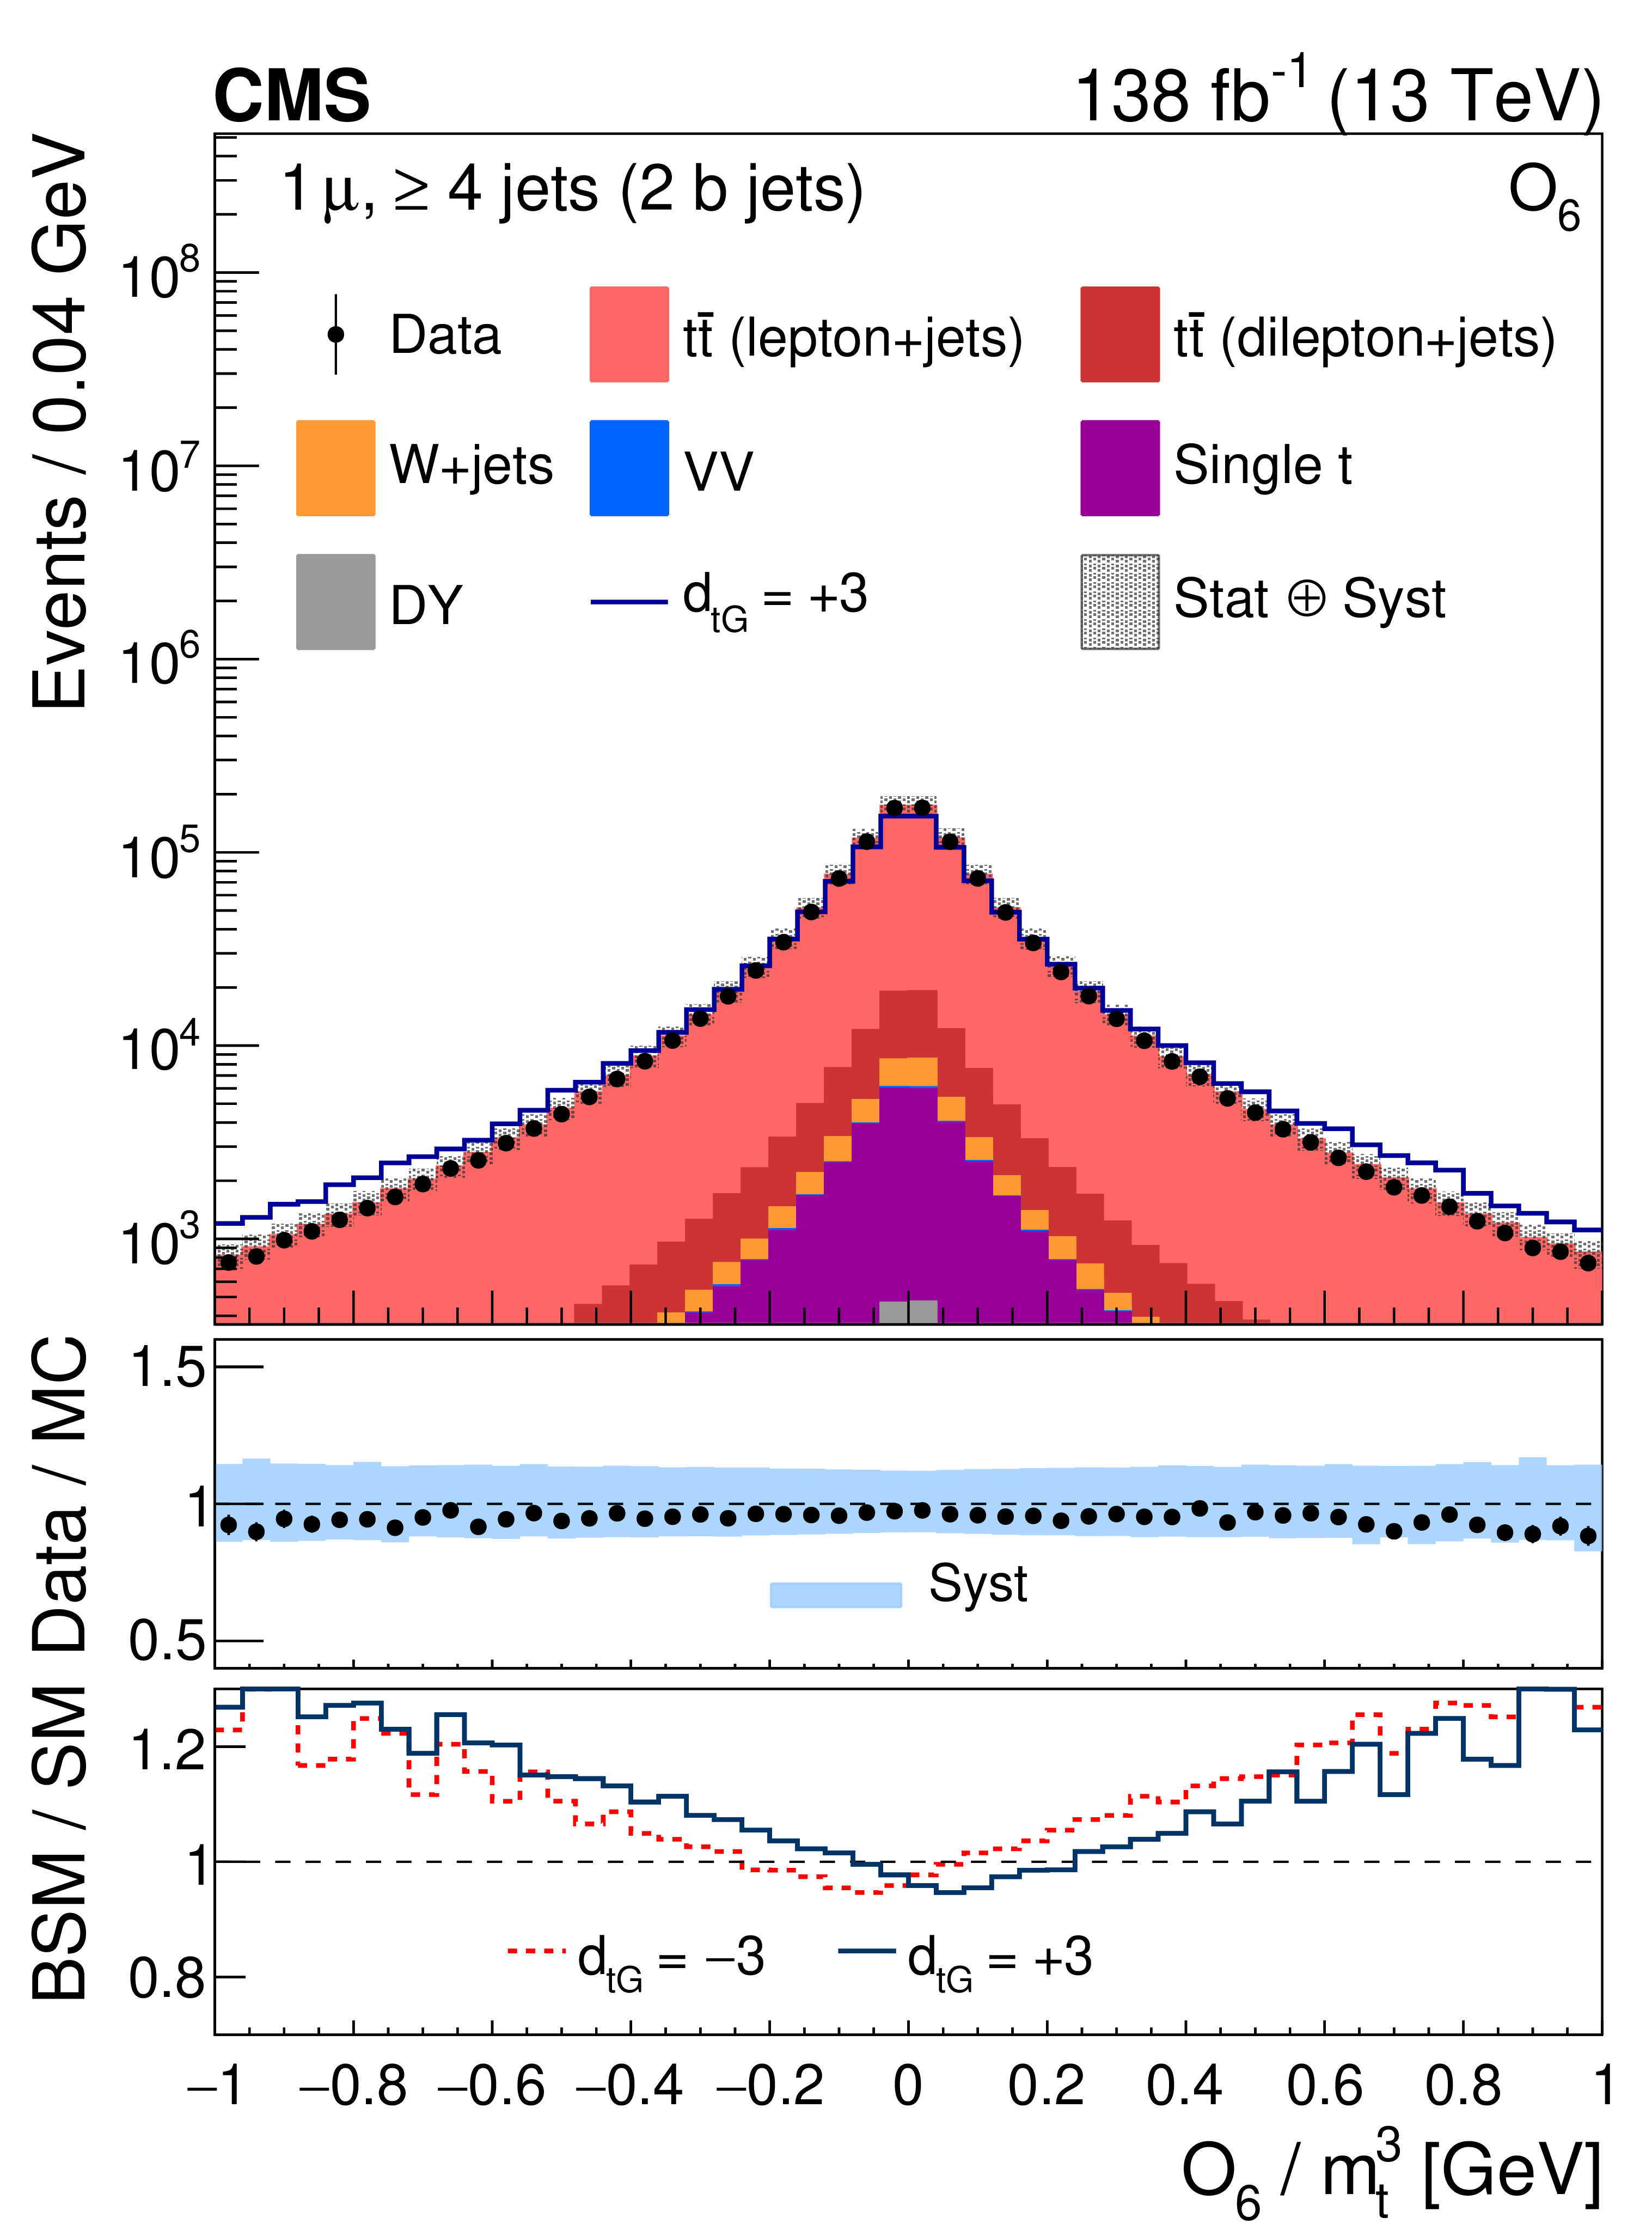
Figure 2-b:
Distribution of the CP observable ${O_6}$, normalized with respect to ${m_{\mathrm{t}}^3}$, from data (points) and from the various sources in simulation (colored histograms) for muon events in the signal region. The solid-blue line shows the CEDM simulated signal normalized to the data with the CP-odd parameter $ {d_{\mathrm{t} \mathrm {G}}} = +$3. The vertical bars on the data points indicate the statistical uncertainties in the data, and the hatched bands show the quadrature sum of the statistical and systematic uncertainties in the simulation. The lower two panels display the ratio of the data to the sum of the MC predictions and the ratio of the CEDM to the SM predictions for $ {d_{\mathrm{t} \mathrm {G}}} = +$3 (red lines) and $-$3 (dark-blue lines). |
png pdf |
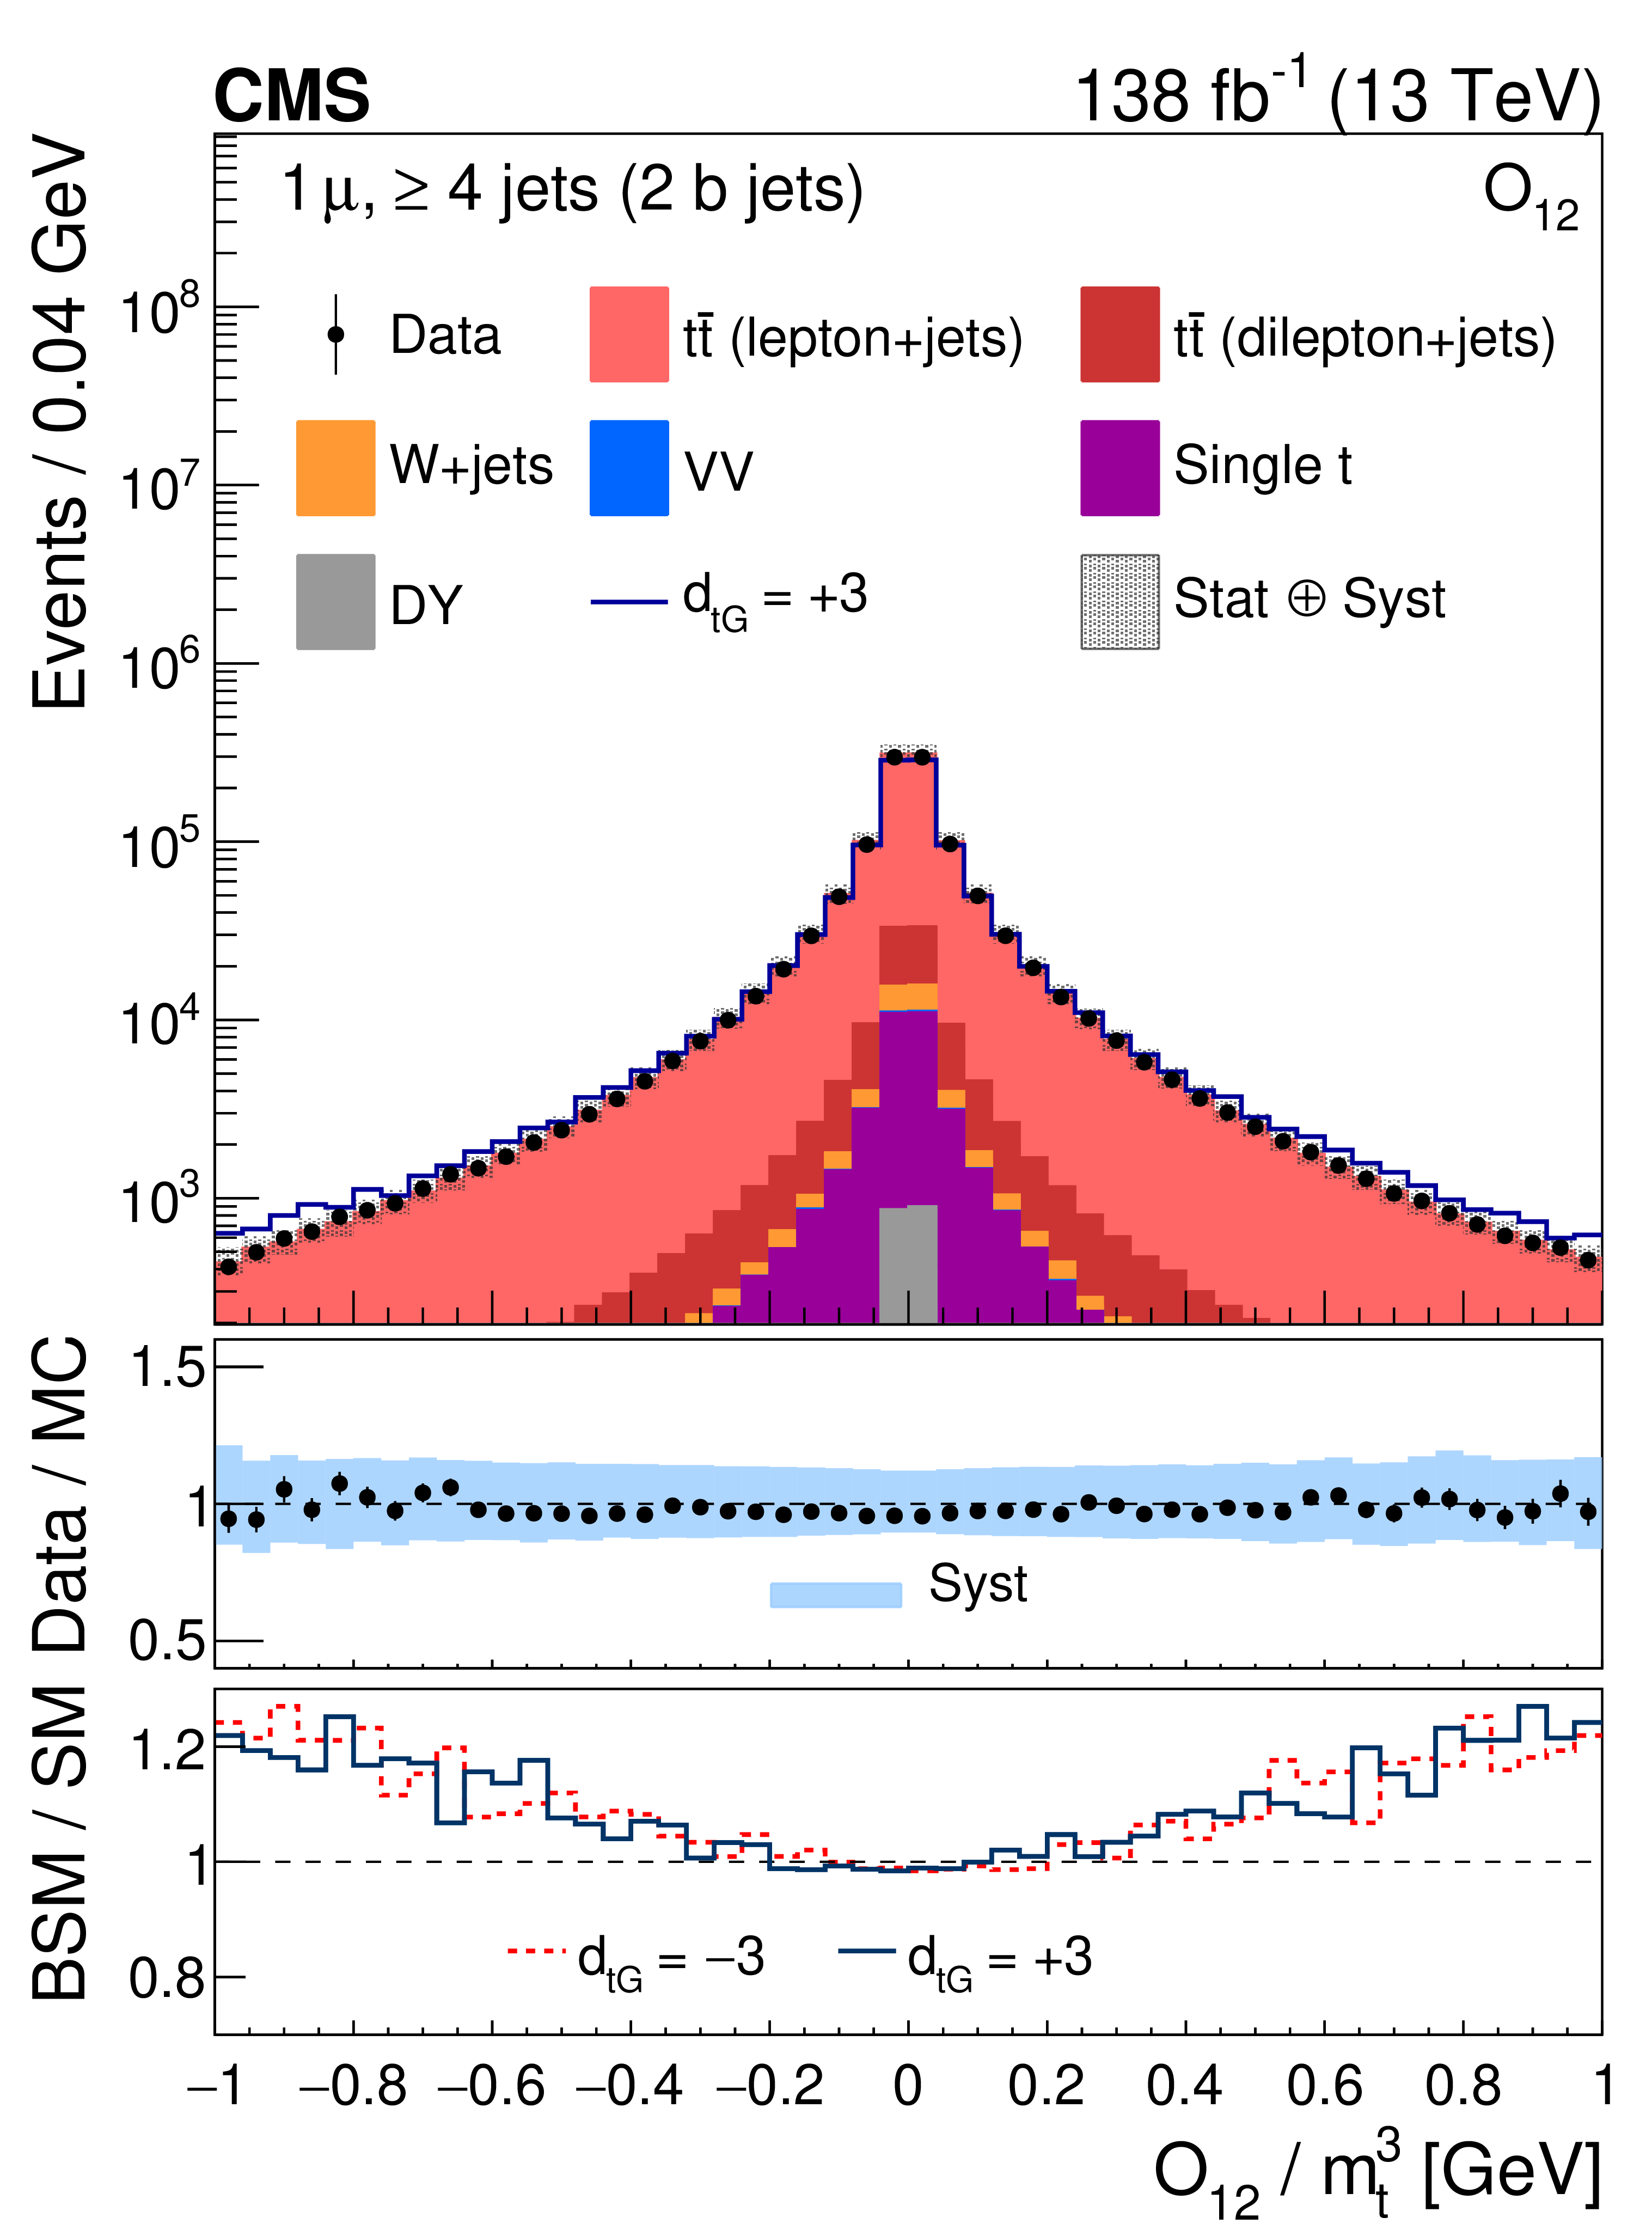
Figure 2-c:
Distribution of the CP observable ${O_{12}}$, normalized with respect to ${m_{\mathrm{t}}^3}$, from data (points) and from the various sources in simulation (colored histograms) for muon events in the signal region. The solid-blue line shows the CEDM simulated signal normalized to the data with the CP-odd parameter $ {d_{\mathrm{t} \mathrm {G}}} = +$3. The vertical bars on the data points indicate the statistical uncertainties in the data, and the hatched bands show the quadrature sum of the statistical and systematic uncertainties in the simulation. The lower two panels display the ratio of the data to the sum of the MC predictions and the ratio of the CEDM to the SM predictions for $ {d_{\mathrm{t} \mathrm {G}}} = +$3 (red lines) and $-$3 (dark-blue lines). |
png pdf |
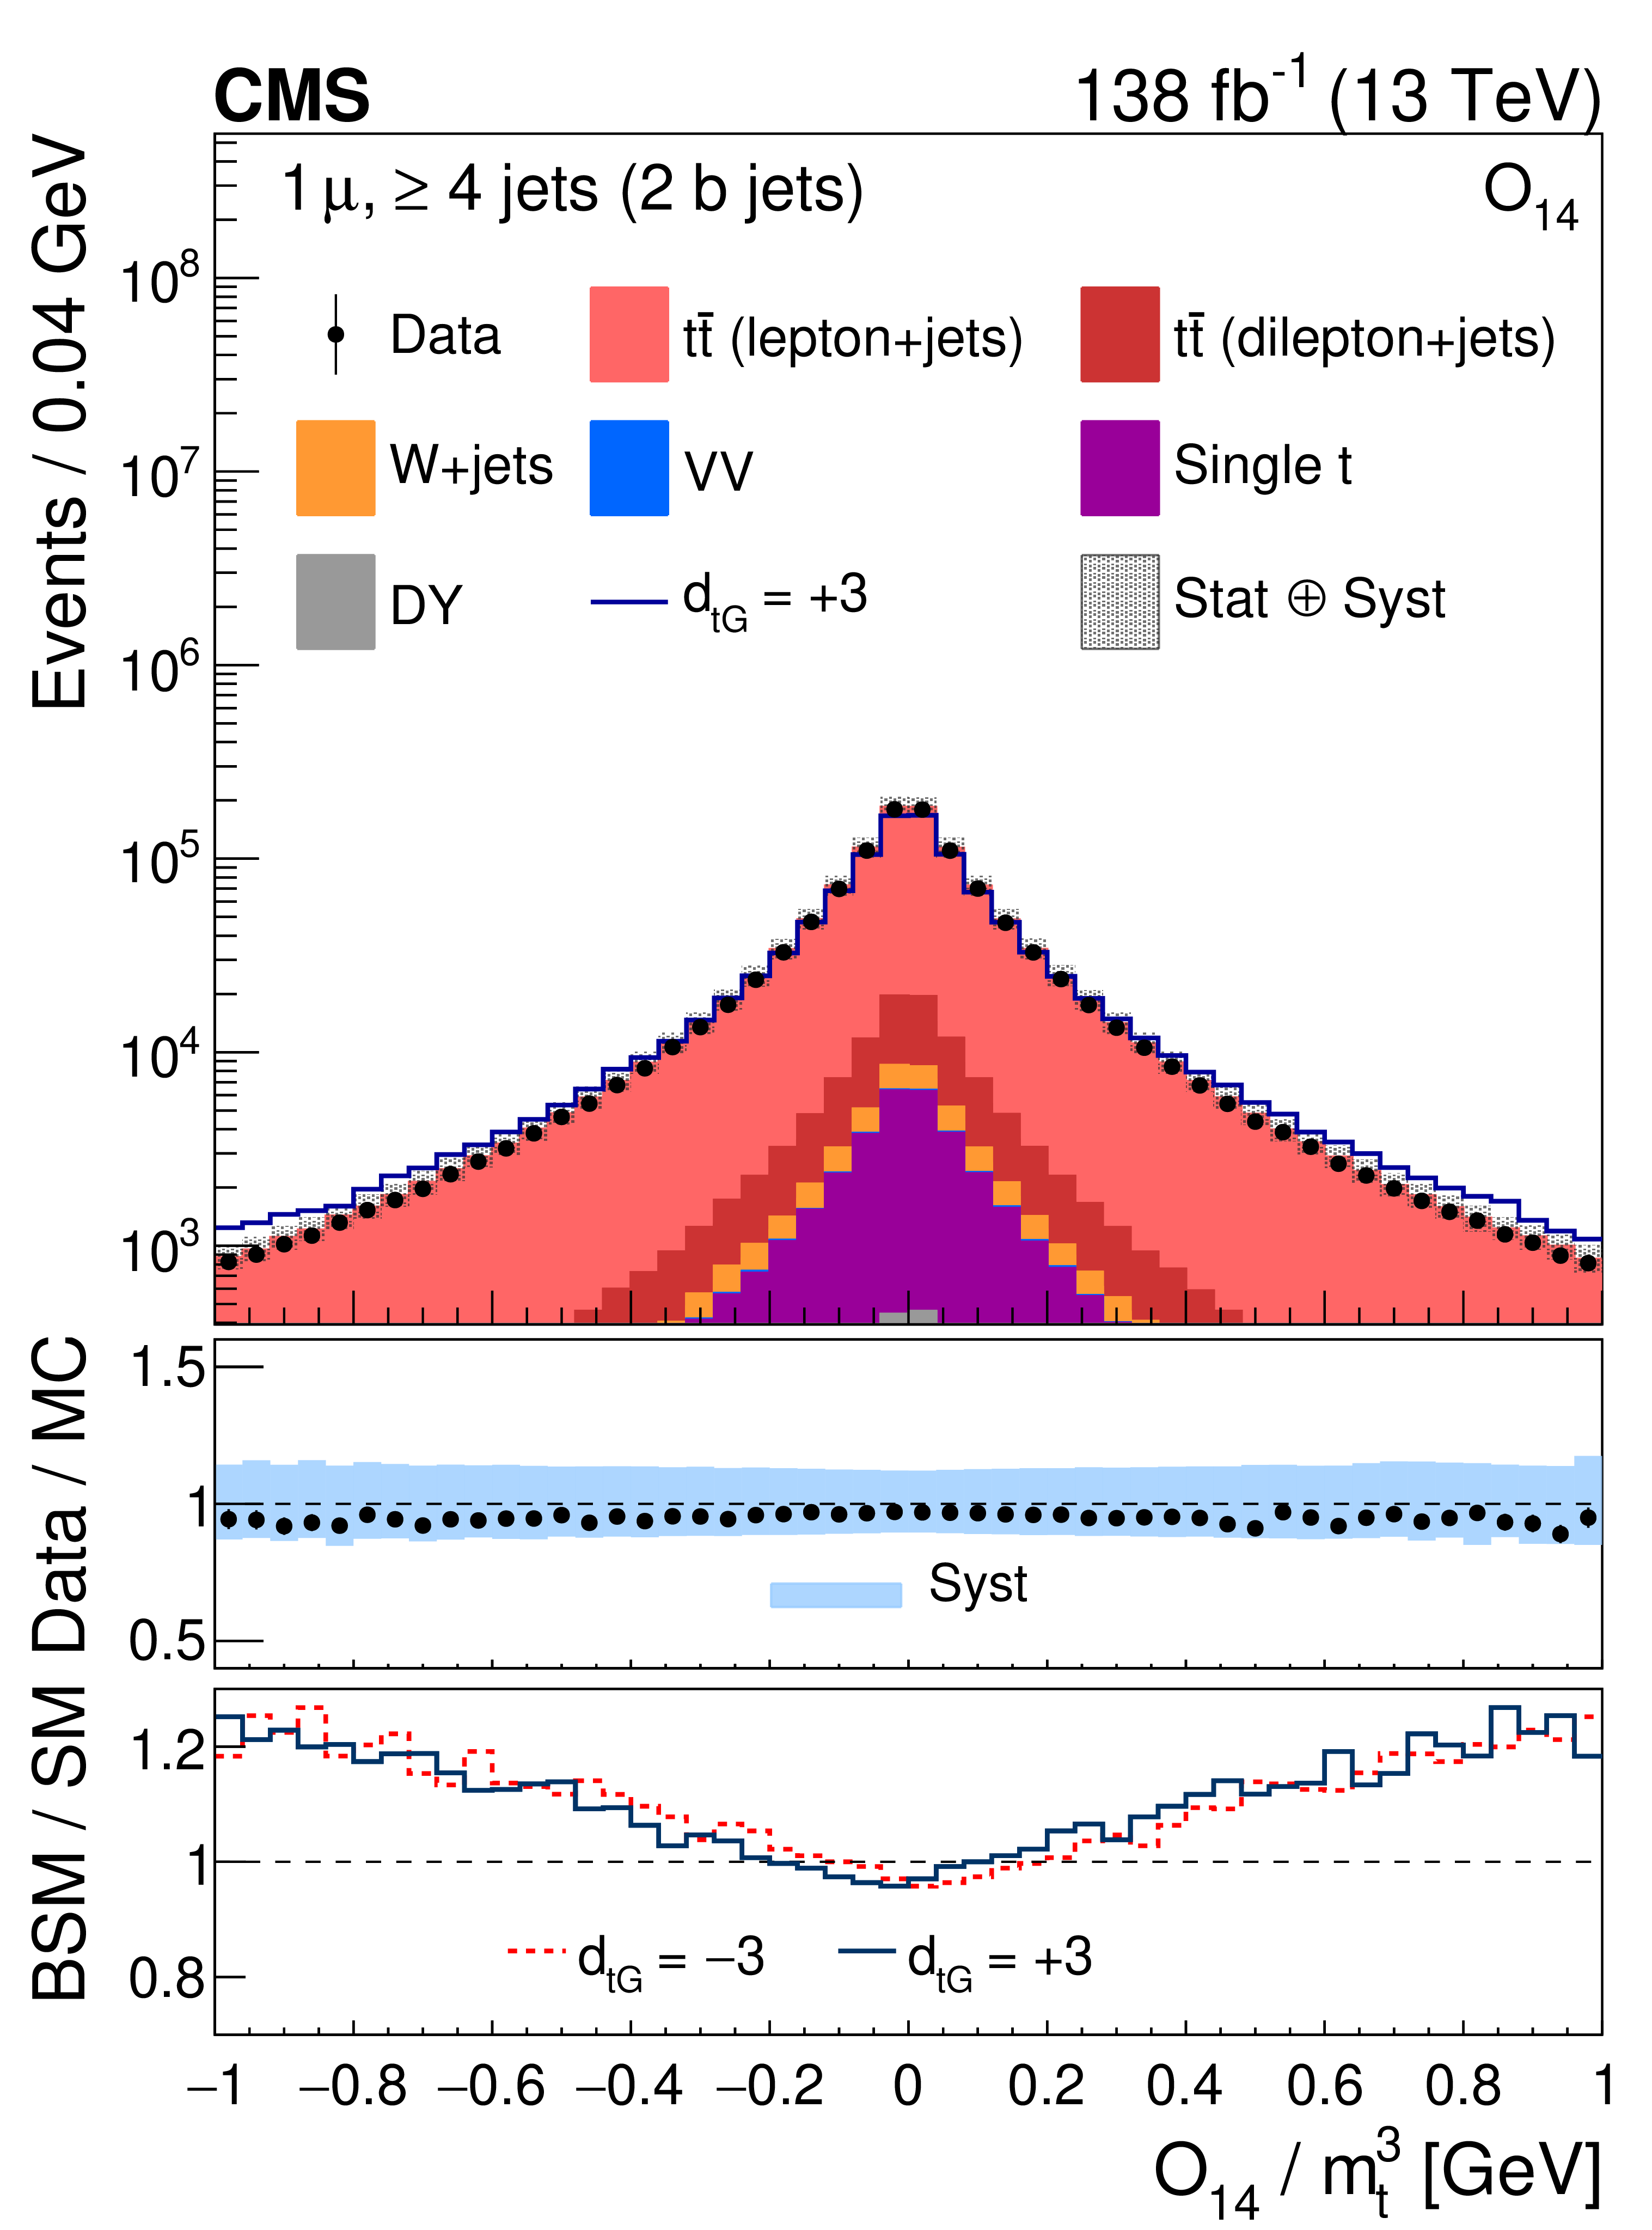
Figure 2-d:
Distribution of the CP observable ${O_{14}}$, normalized with respect to ${m_{\mathrm{t}}^3}$, from data (points) and from the various sources in simulation (colored histograms) for muon events in the signal region. The solid-blue line shows the CEDM simulated signal normalized to the data with the CP-odd parameter $ {d_{\mathrm{t} \mathrm {G}}} = +$3. The vertical bars on the data points indicate the statistical uncertainties in the data, and the hatched bands show the quadrature sum of the statistical and systematic uncertainties in the simulation. The lower two panels display the ratio of the data to the sum of the MC predictions and the ratio of the CEDM to the SM predictions for $ {d_{\mathrm{t} \mathrm {G}}} = +$3 (red lines) and $-$3 (dark-blue lines). |

png pdf |
Figure 3:
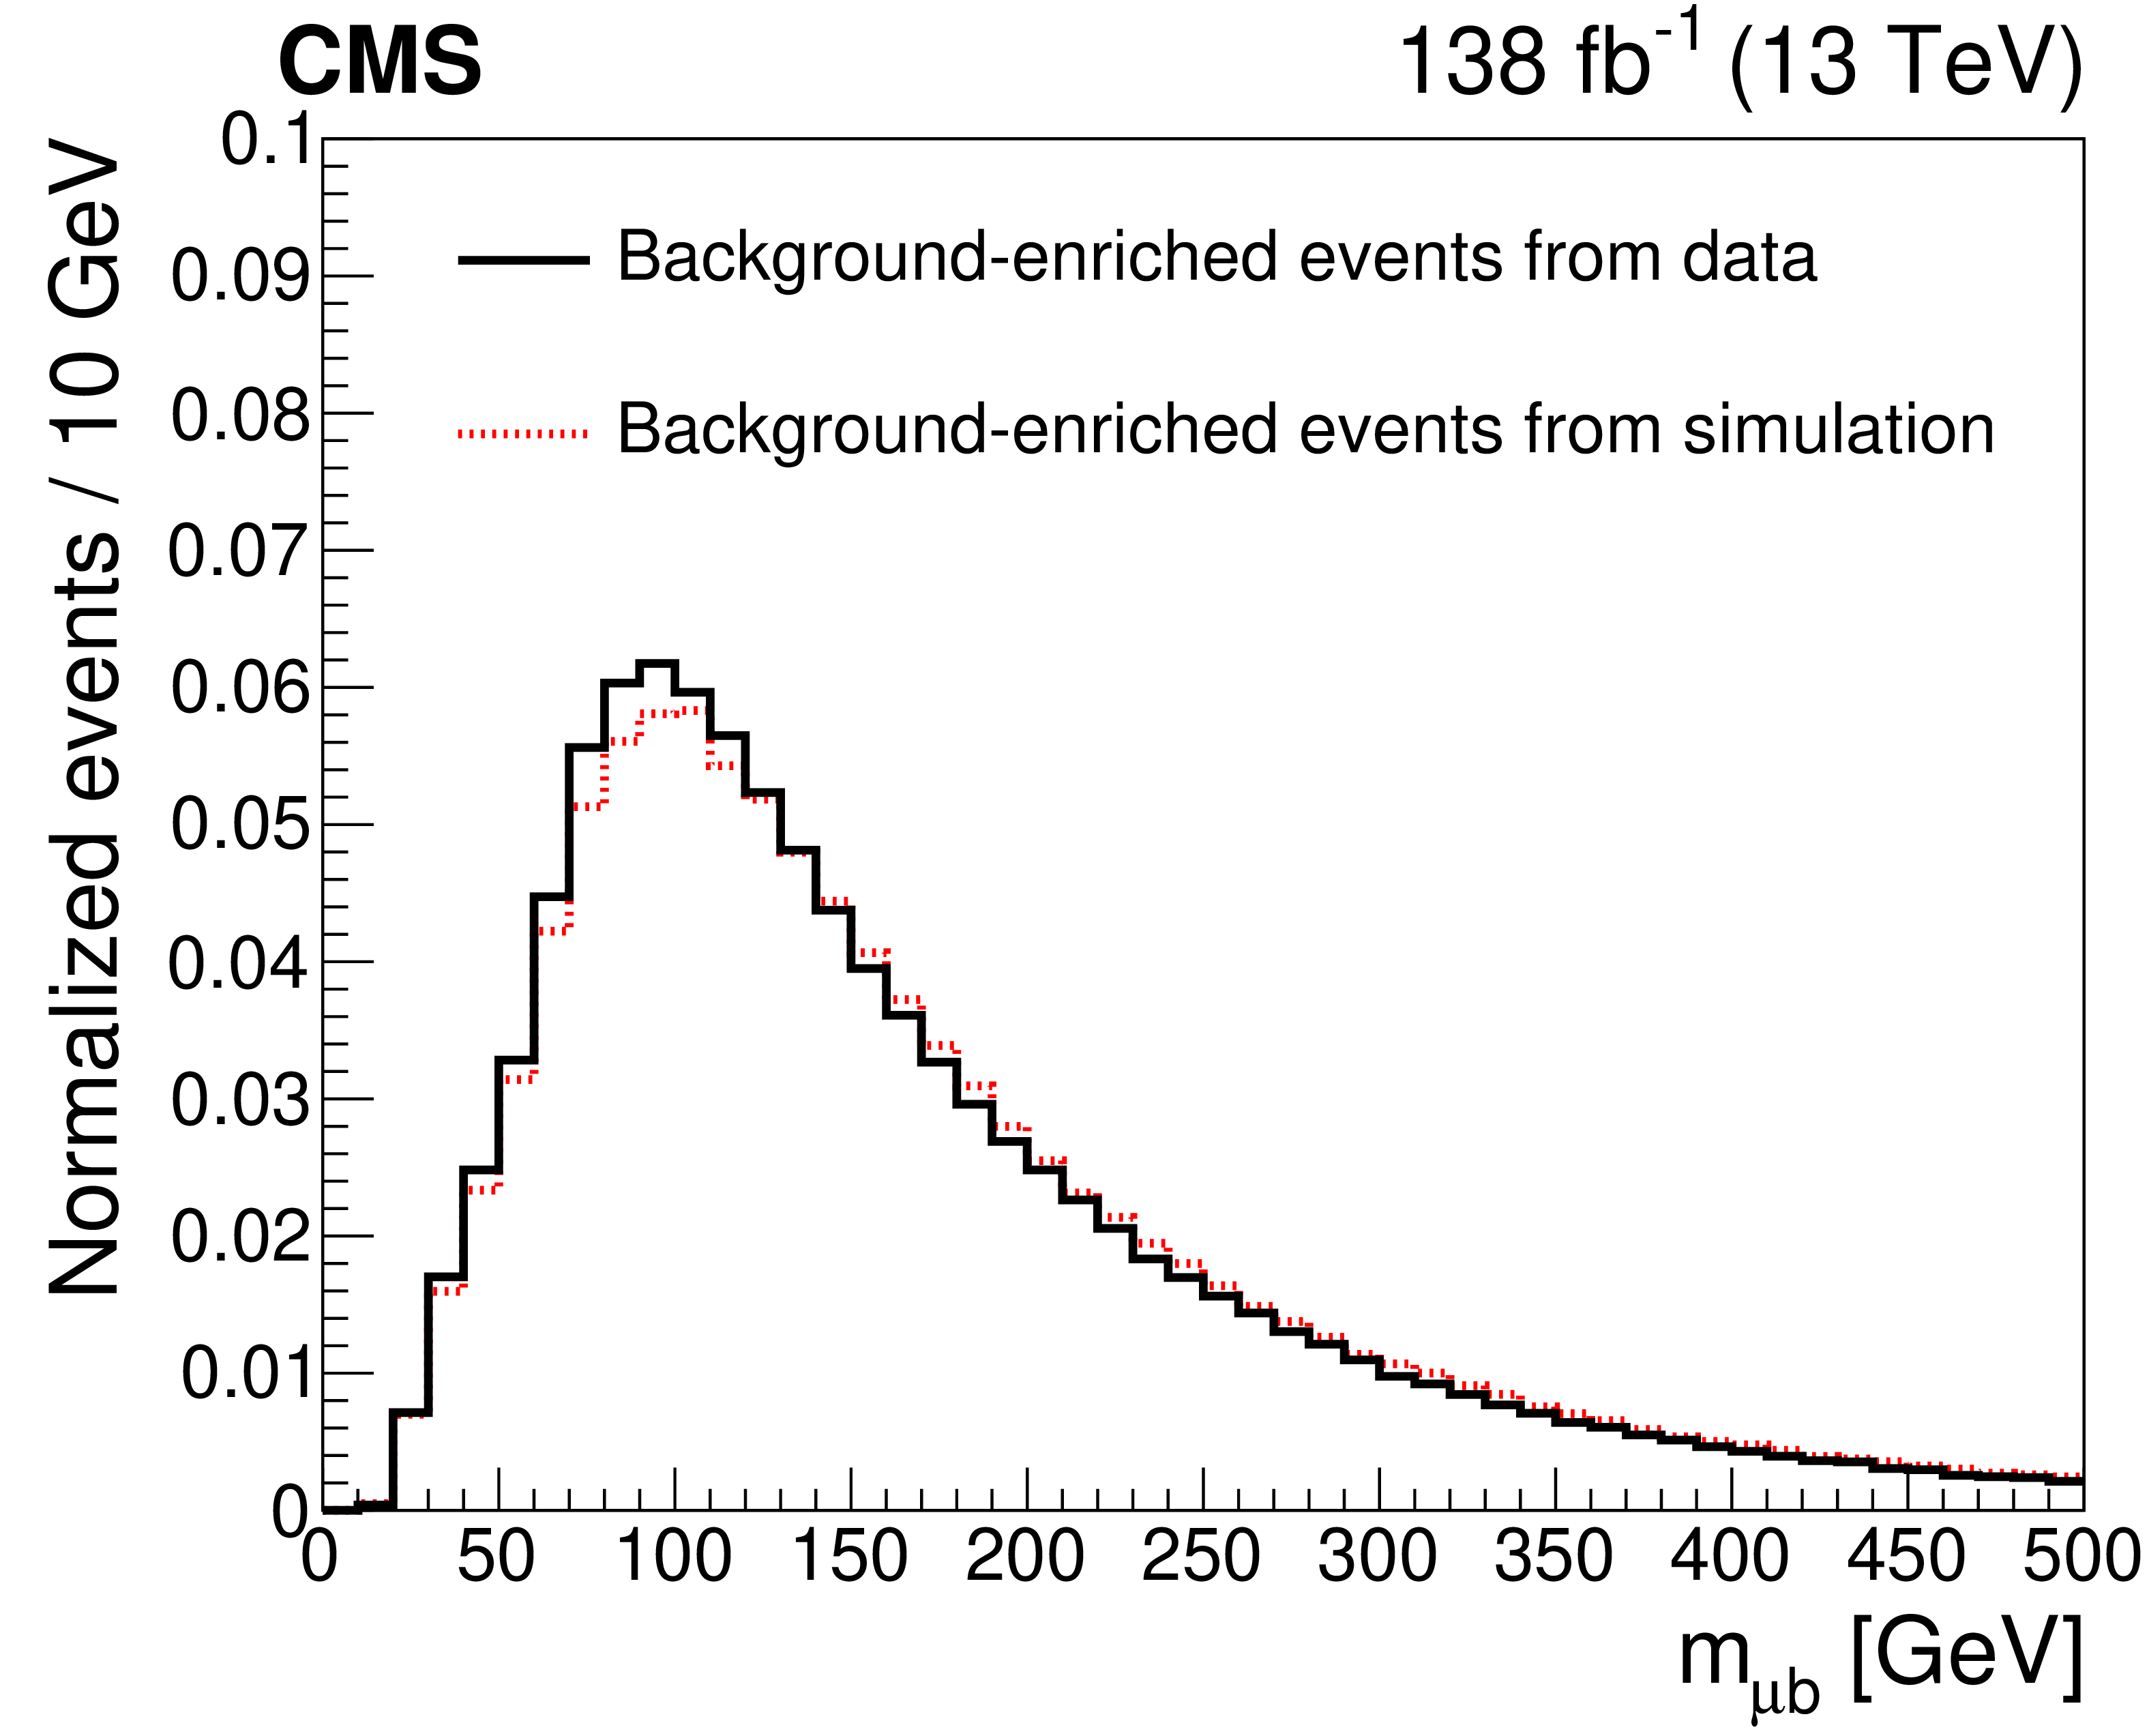
The normalized ${m_{\ell \mathrm{b}}}$ distributions for the electron (left) and muon (right) channels. The upper two plots compare the background-enriched distributions from data (solid line) to the MC predictions (dotted-red line). The lower two plots give the background-enriched distributions from data (solid line) and the MC predictions for the distributions from the background in the signal events. |

png pdf |
Figure 3-a:
The normalized ${m_{\ell \mathrm{b}}}$ distribution for the electron channel. The plot compares the background-enriched distributions from data (solid line) to the MC predictions (dotted-red line). |
png pdf |
Figure 3-b:
The normalized ${m_{\ell \mathrm{b}}}$ distribution for the muon channel. The plot compares the background-enriched distributions from data (solid line) to the MC predictions (dotted-red line). |
png pdf |
Figure 3-c:
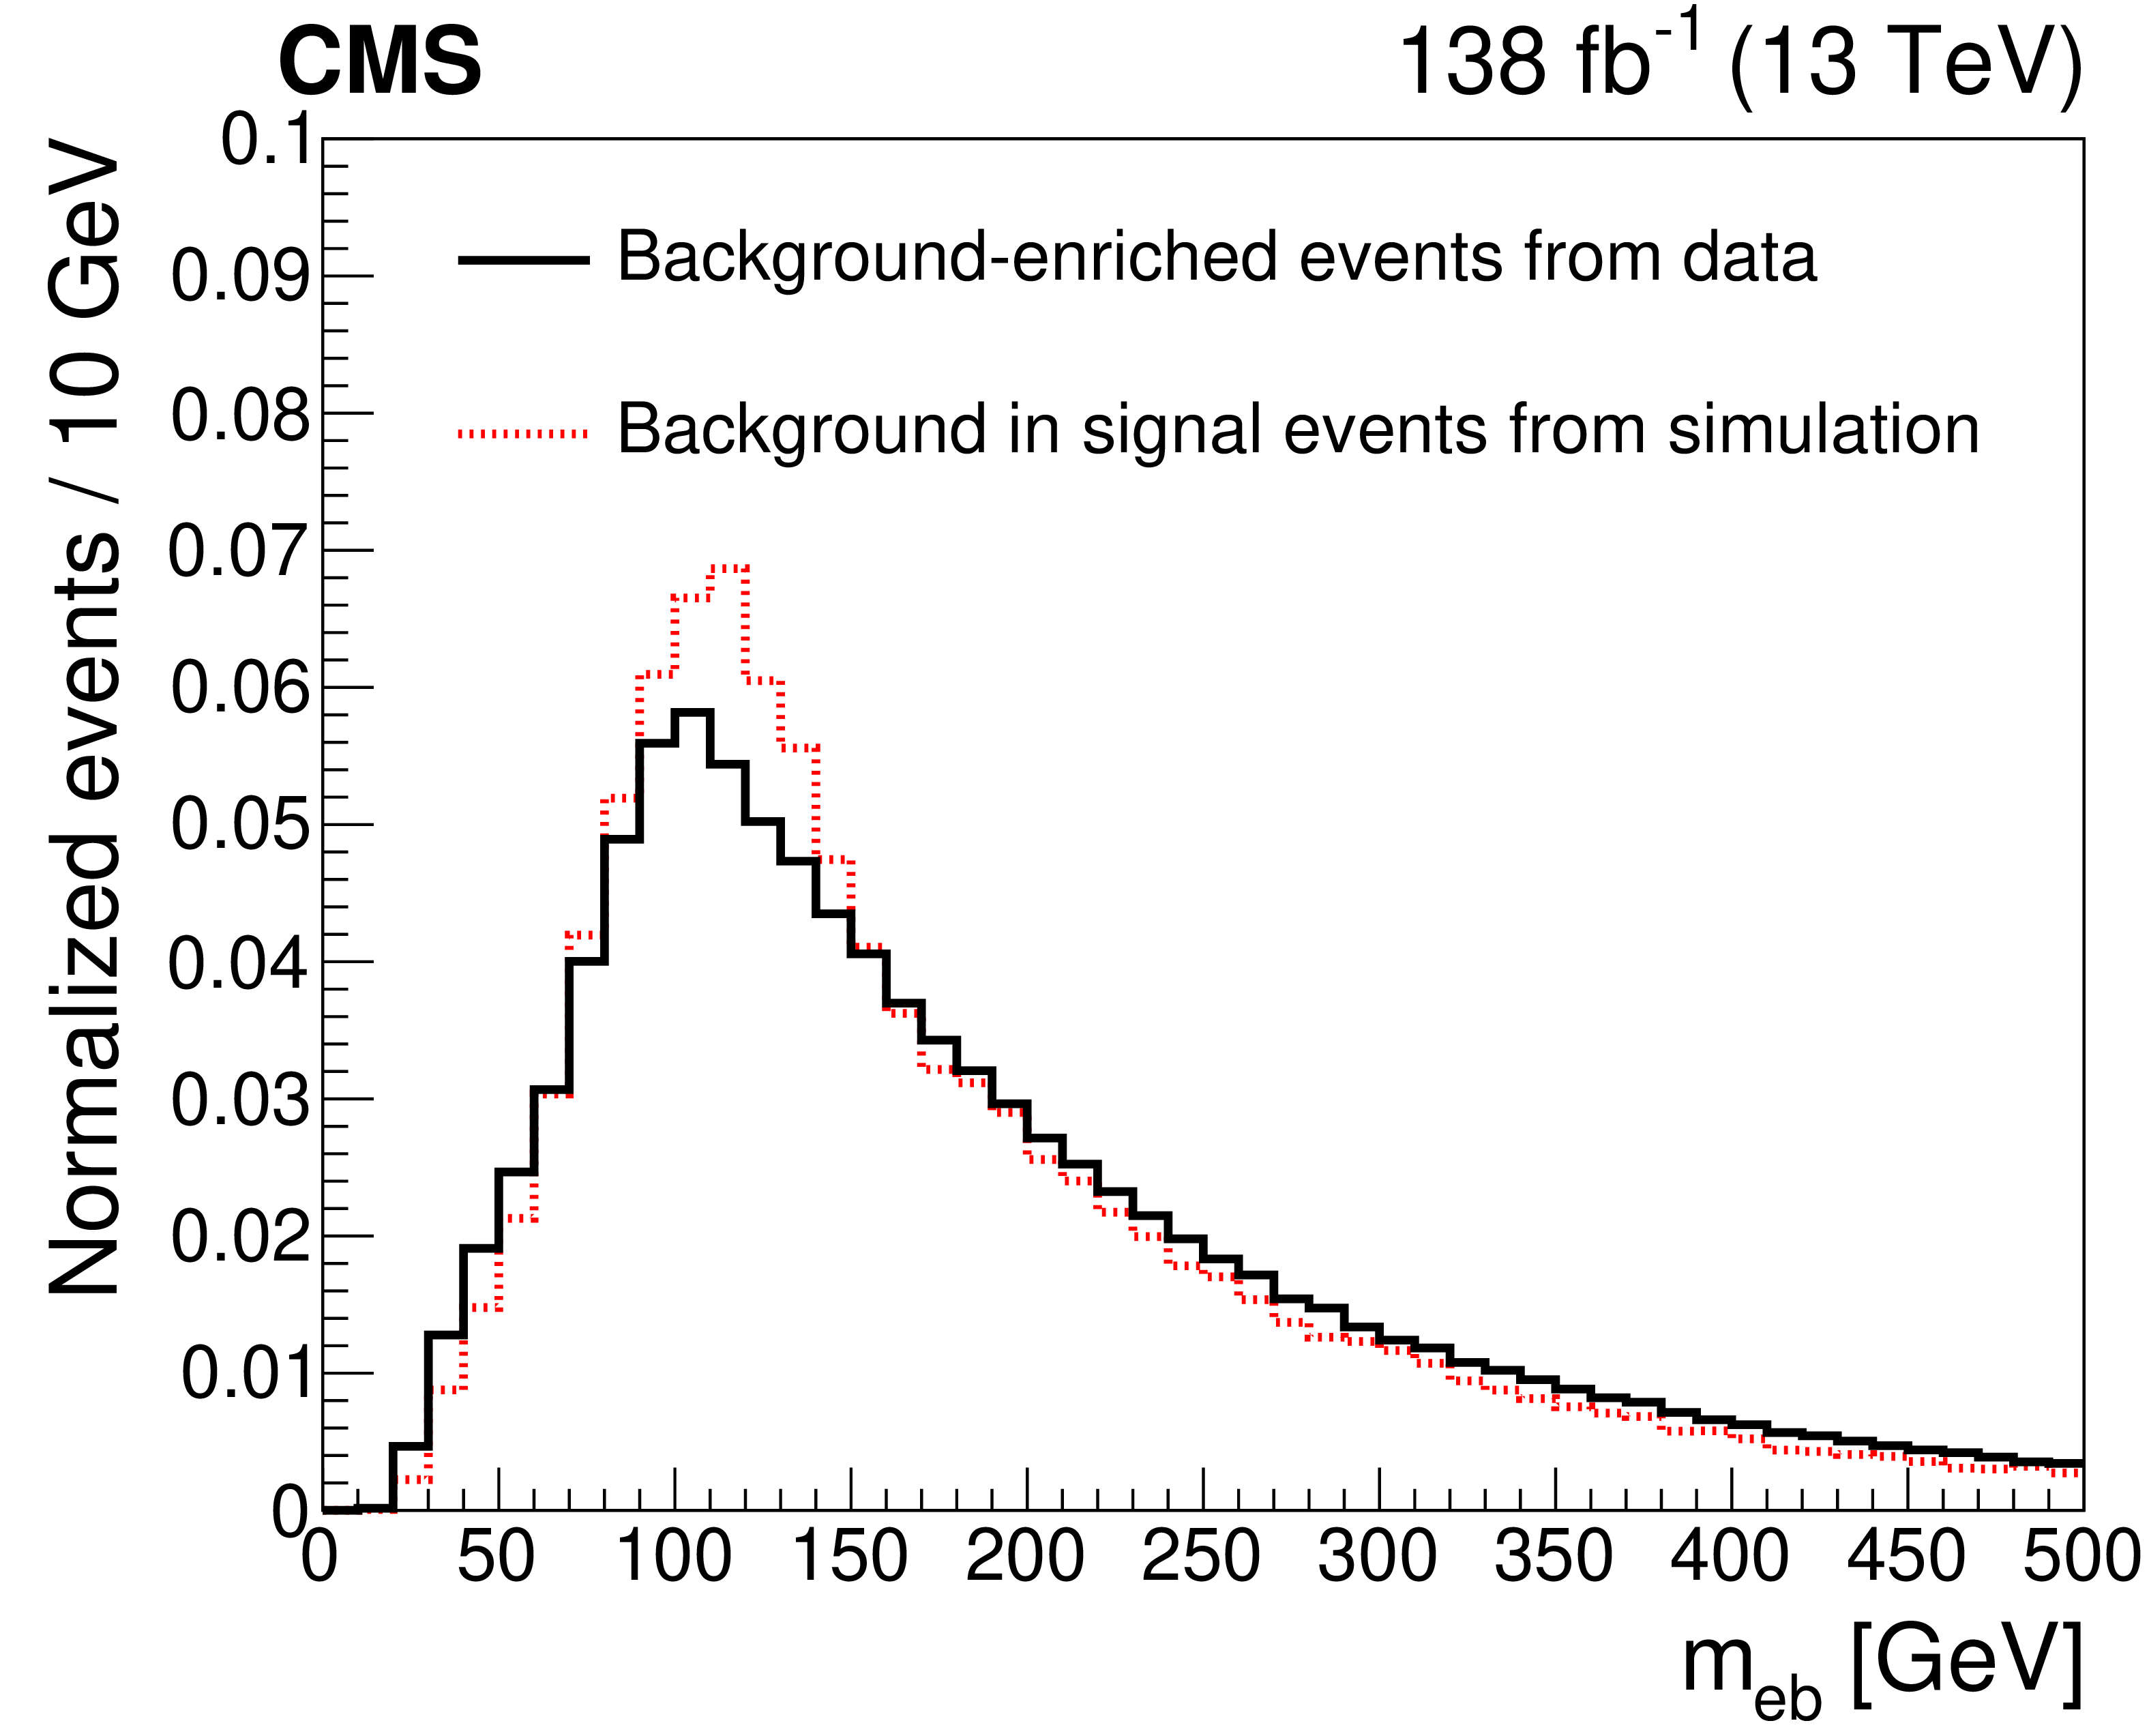
The normalized ${m_{\ell \mathrm{b}}}$ distribution for the electron channel. The plot gives the background-enriched distributions from data (solid line) and the MC predictions for the distributions from the background in the signal events. |
png pdf |
Figure 3-d:
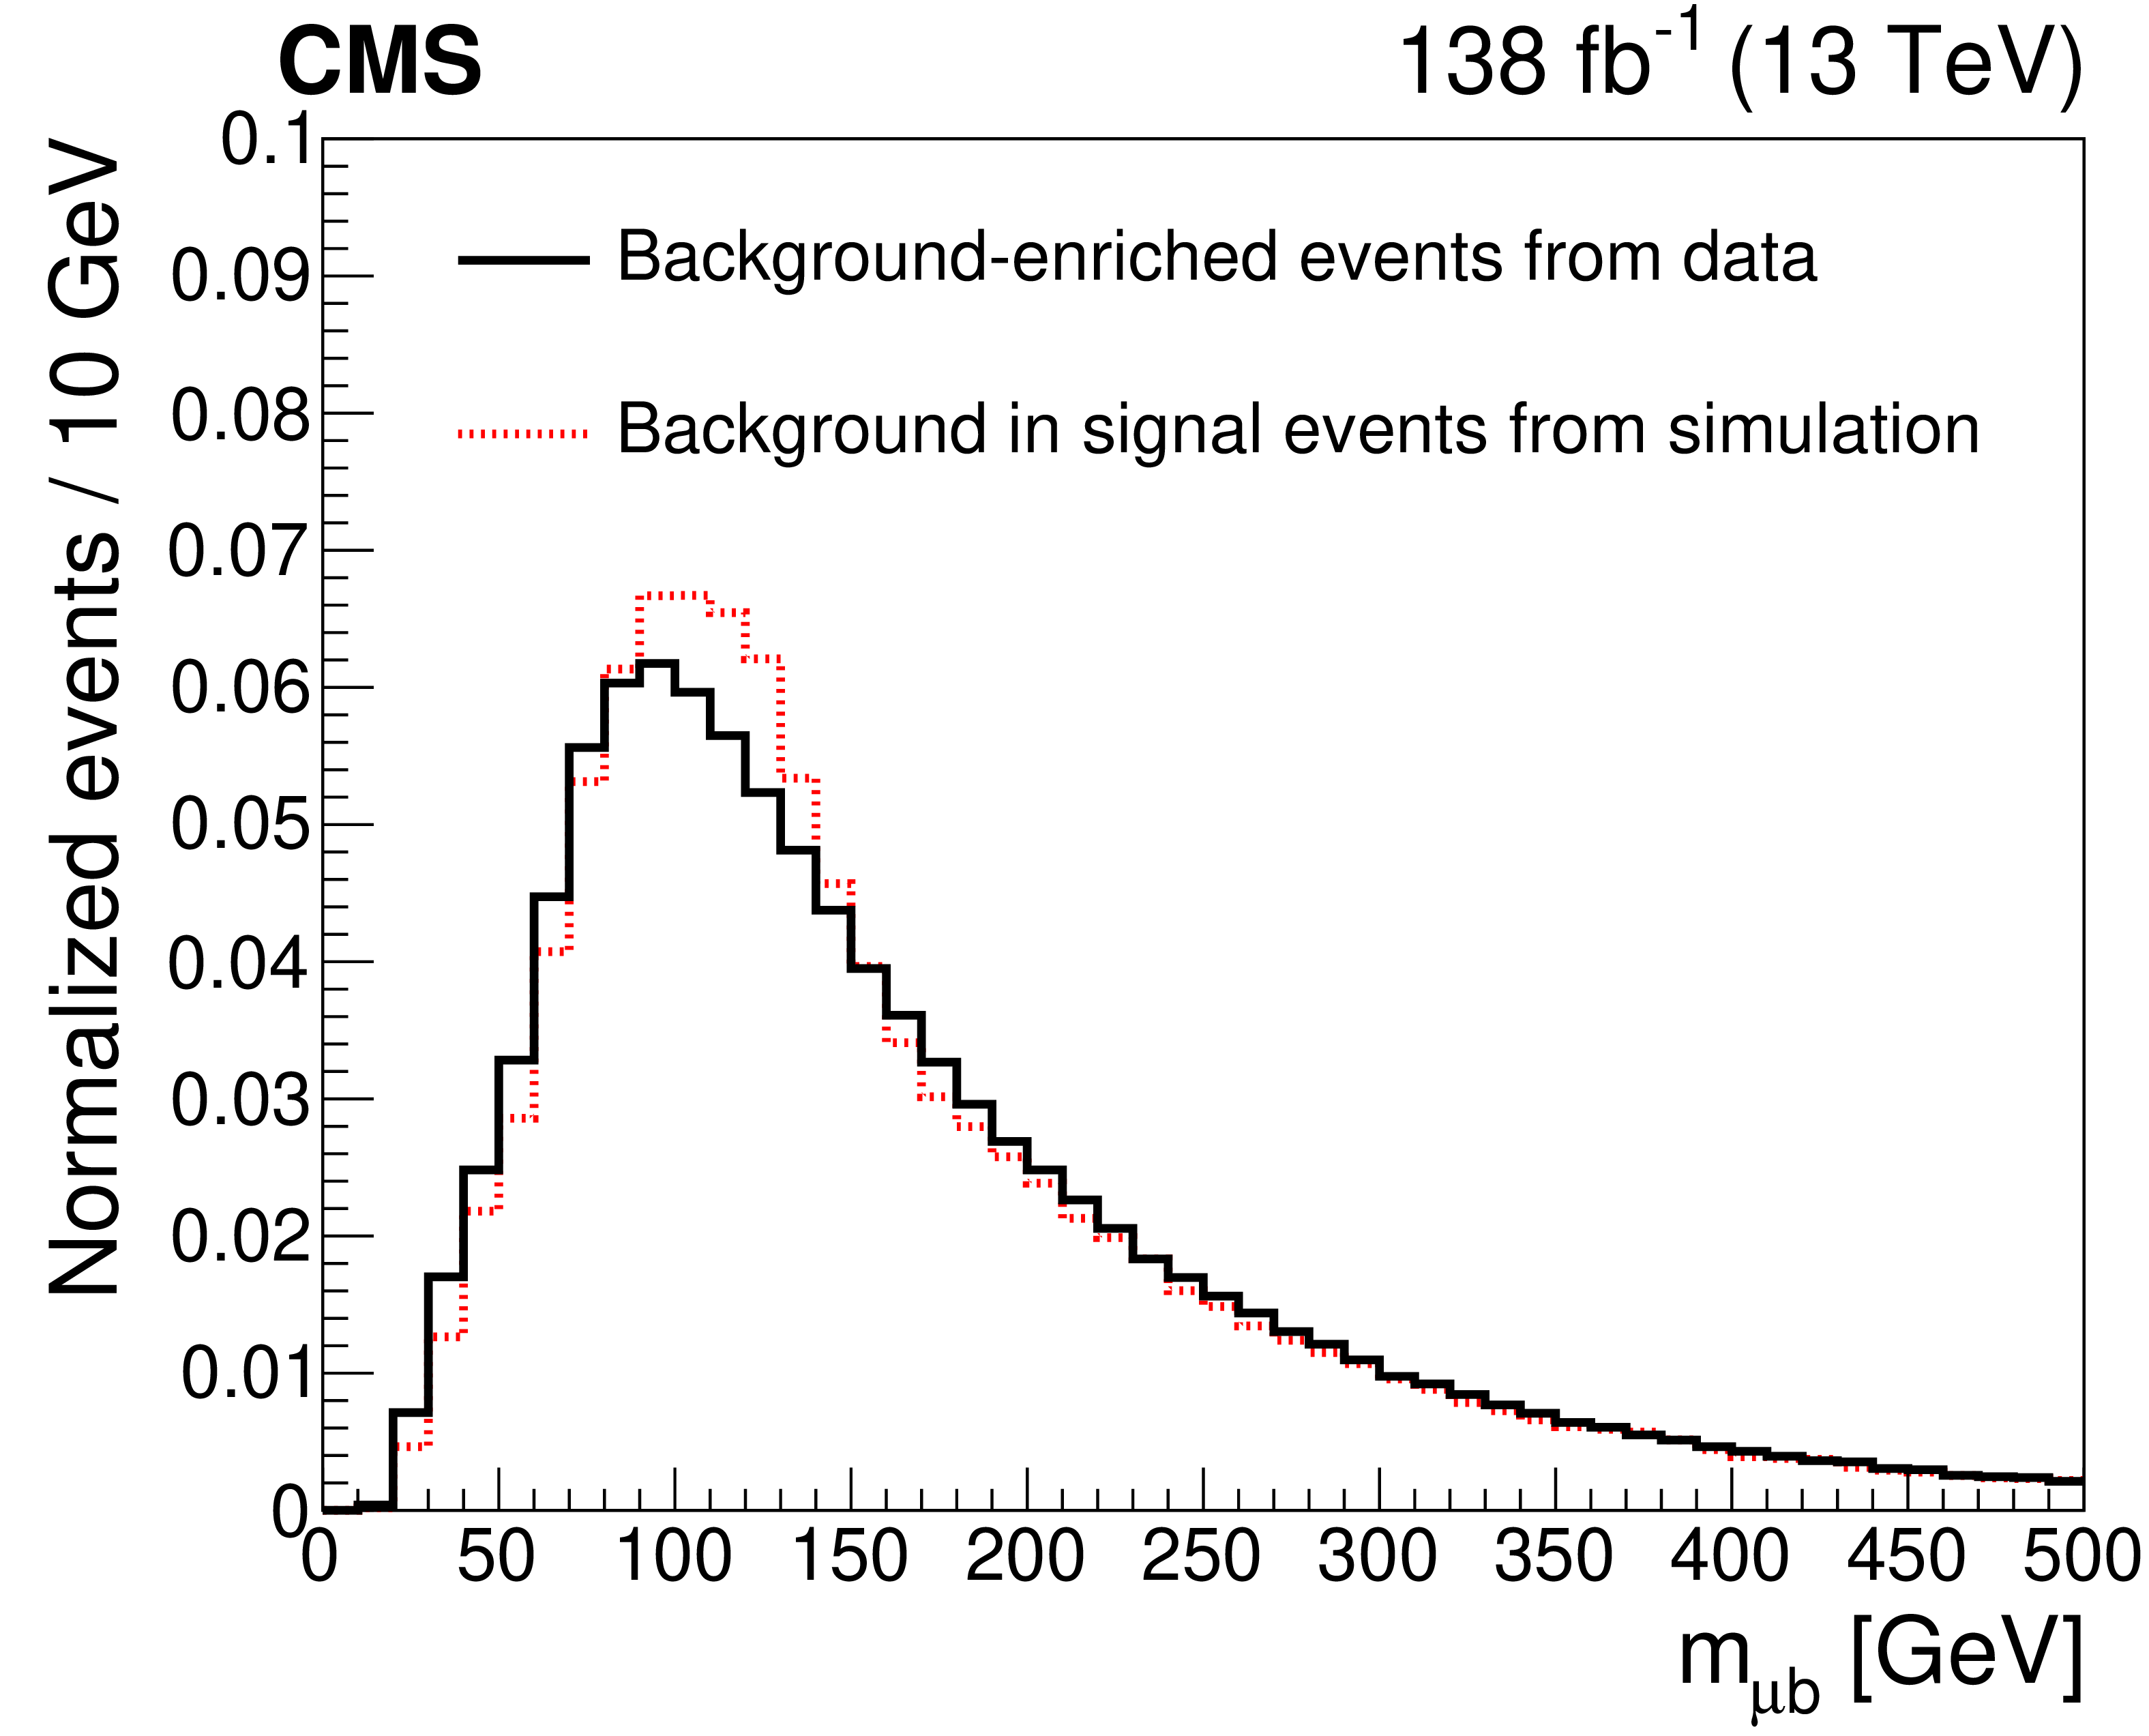
The normalized ${m_{\ell \mathrm{b}}}$ distribution for the muon channel. The plot gives the background-enriched distributions from data (solid line) and the MC predictions for the distributions from the background in the signal events. |

png pdf |
Figure 4:
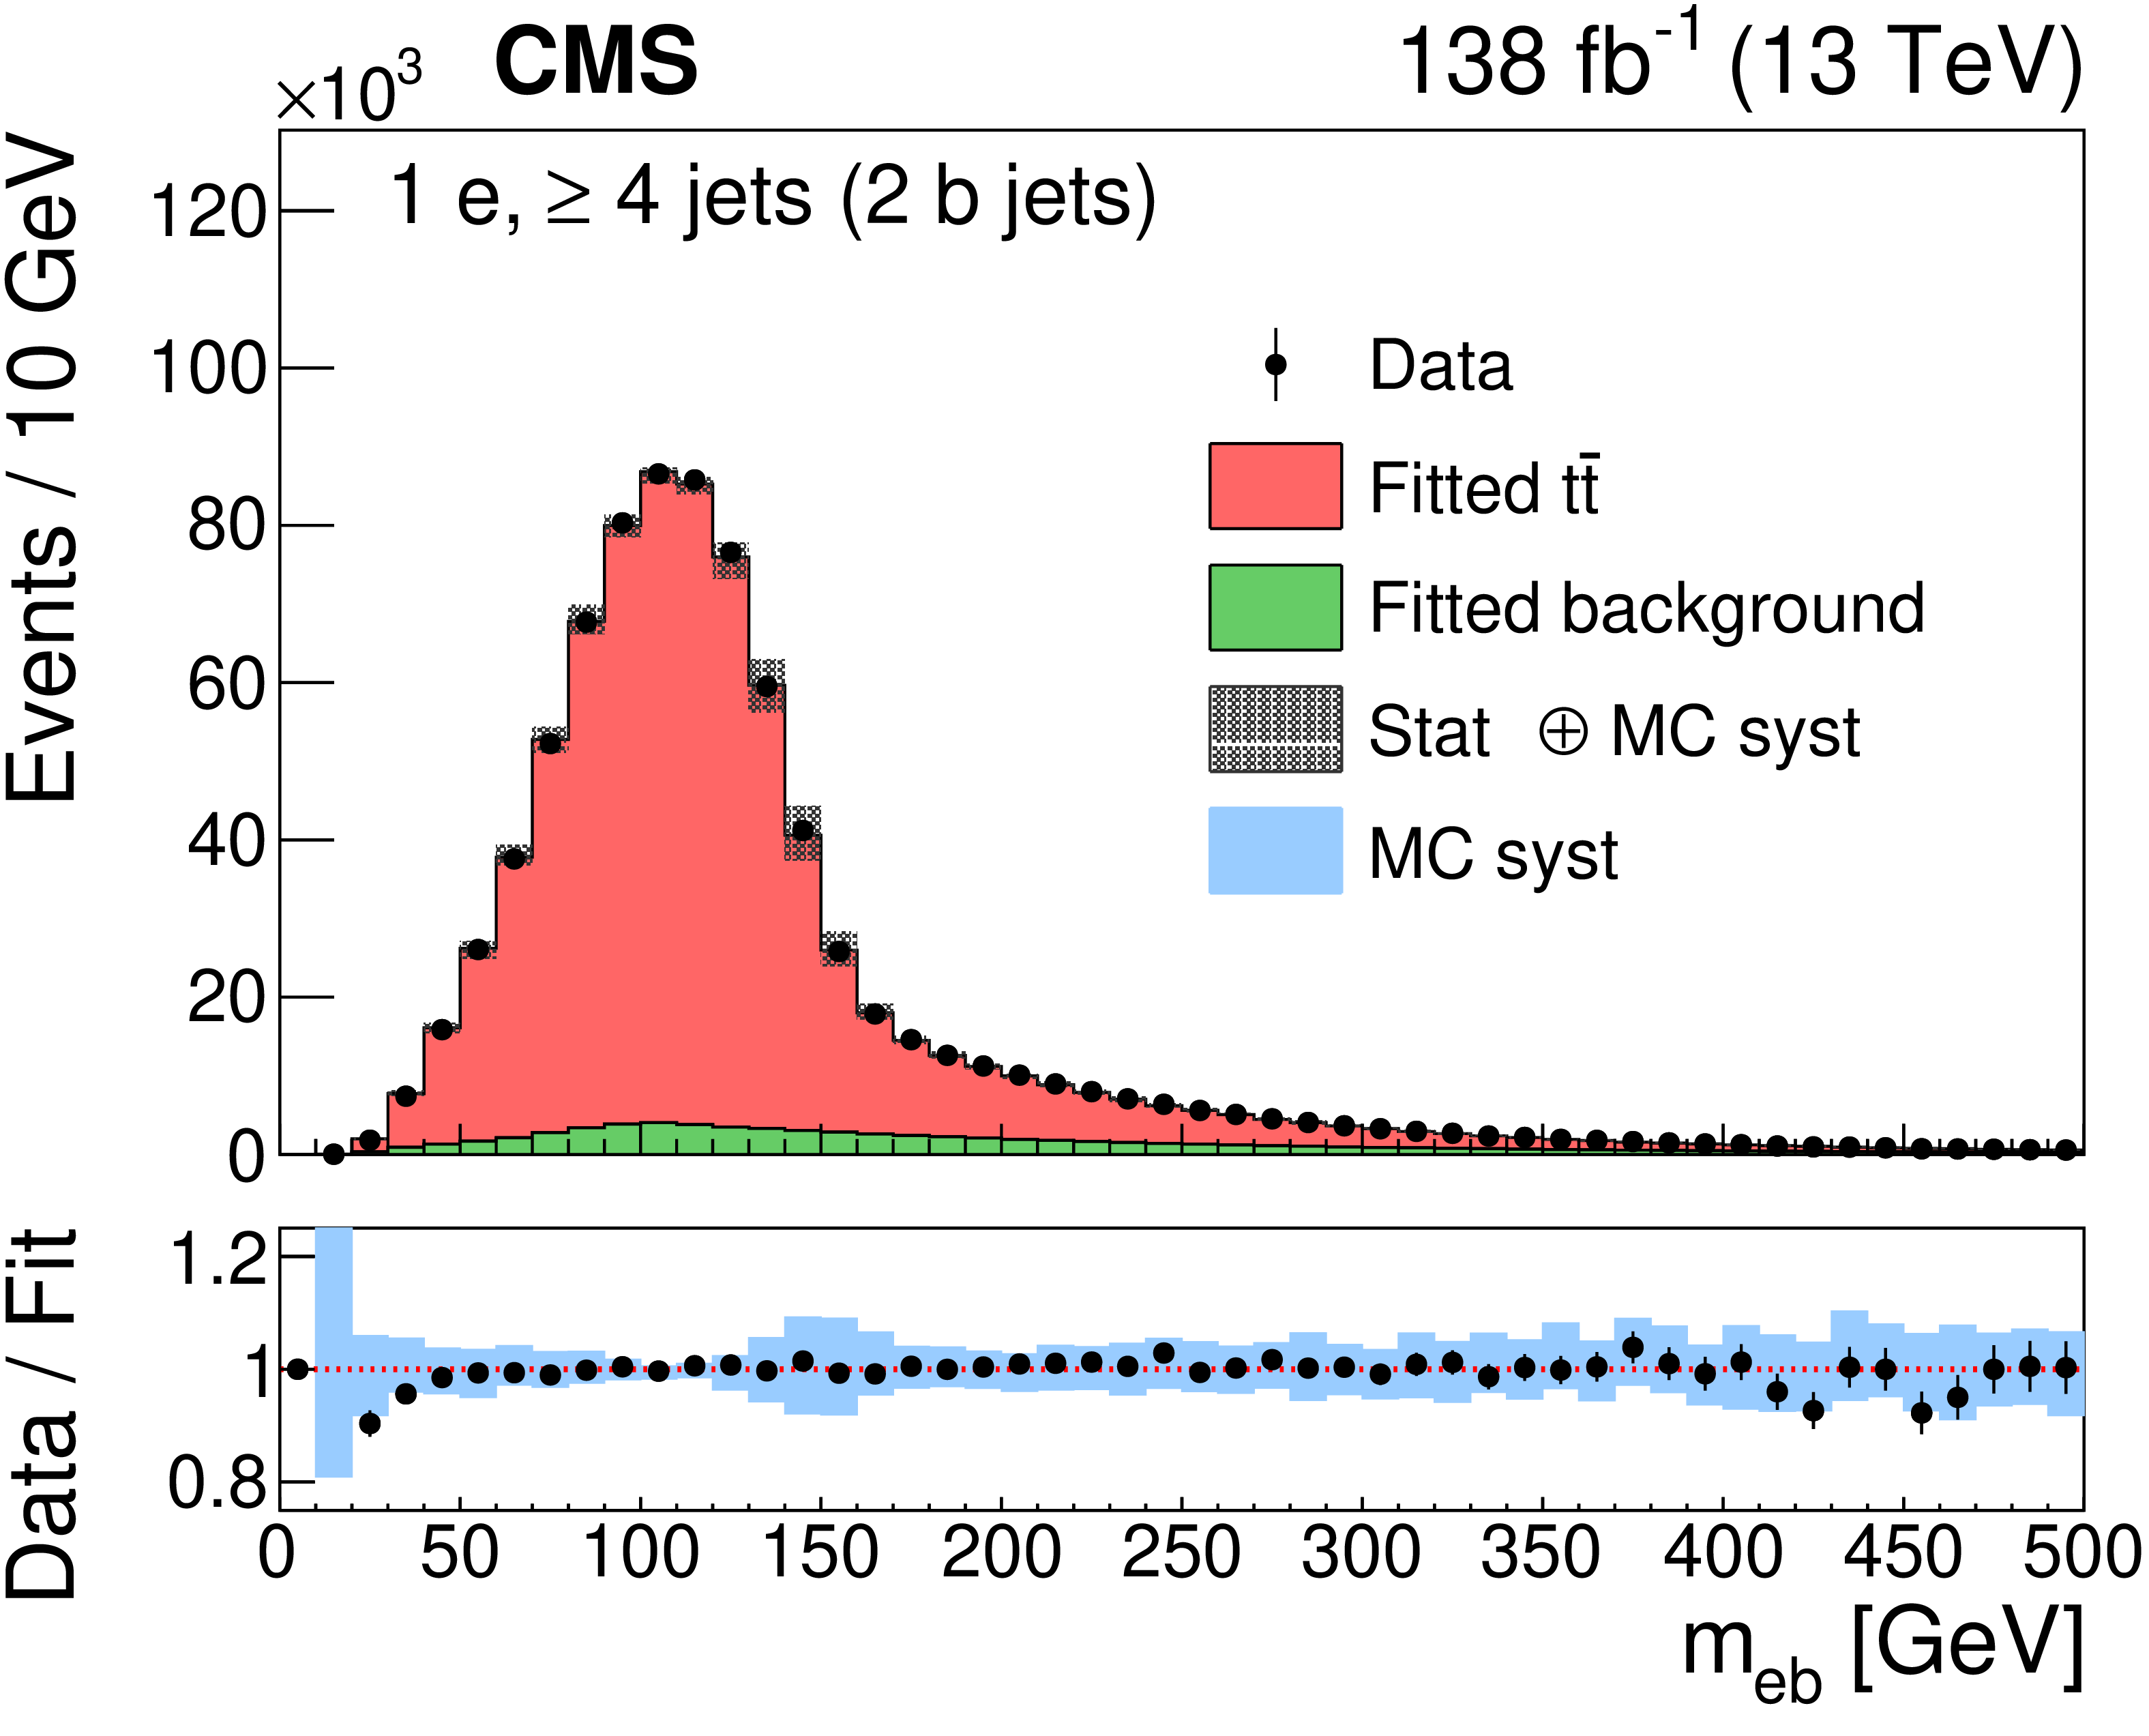
The ${m_{\ell \mathrm{b}}}$ invariant mass distributions in the electron (left) and muon (right) channels from data (points). The results of the fit to the $ \mathrm{t\bar{t}} $ and background templates are shown by the red and green histograms, respectively. The vertical bars on the data points in the upper panels indicate the statistical uncertainties in the data and the hatched bands show the combined statistical and systematic uncertainties in the simulation. The lower panels give the ratio of the data to the sum of the fitted MC predictions. The blue bands represent the systematic uncertainties in the expected yield in the simulation for all sources of systematic uncertainty (Section 6). |
png pdf |
Figure 4-a:
The ${m_{\ell \mathrm{b}}}$ invariant mass distributions in the electron channel from data (points). The results of the fit to the $ \mathrm{t\bar{t}} $ and background templates are shown by the red and green histograms, respectively. The vertical bars on the data points in the upper panel indicate the statistical uncertainties in the data and the hatched bands show the combined statistical and systematic uncertainties in the simulation. The lower panel gives the ratio of the data to the sum of the fitted MC predictions. The blue band represents the systematic uncertainties in the expected yield in the simulation for all sources of systematic uncertainty (Section 6). |

png pdf |
Figure 4-b:
The ${m_{\ell \mathrm{b}}}$ invariant mass distributions in the muon channel from data (points). The results of the fit to the $ \mathrm{t\bar{t}} $ and background templates are shown by the red and green histograms, respectively. The vertical bars on the data points in the upper panel indicate the statistical uncertainties in the data and the hatched bands show the combined statistical and systematic uncertainties in the simulation. The lower panel gives the ratio of the data to the sum of the fitted MC predictions. The blue band represents the systematic uncertainties in the expected yield in the simulation for all sources of systematic uncertainty (Section 6). |

png pdf |
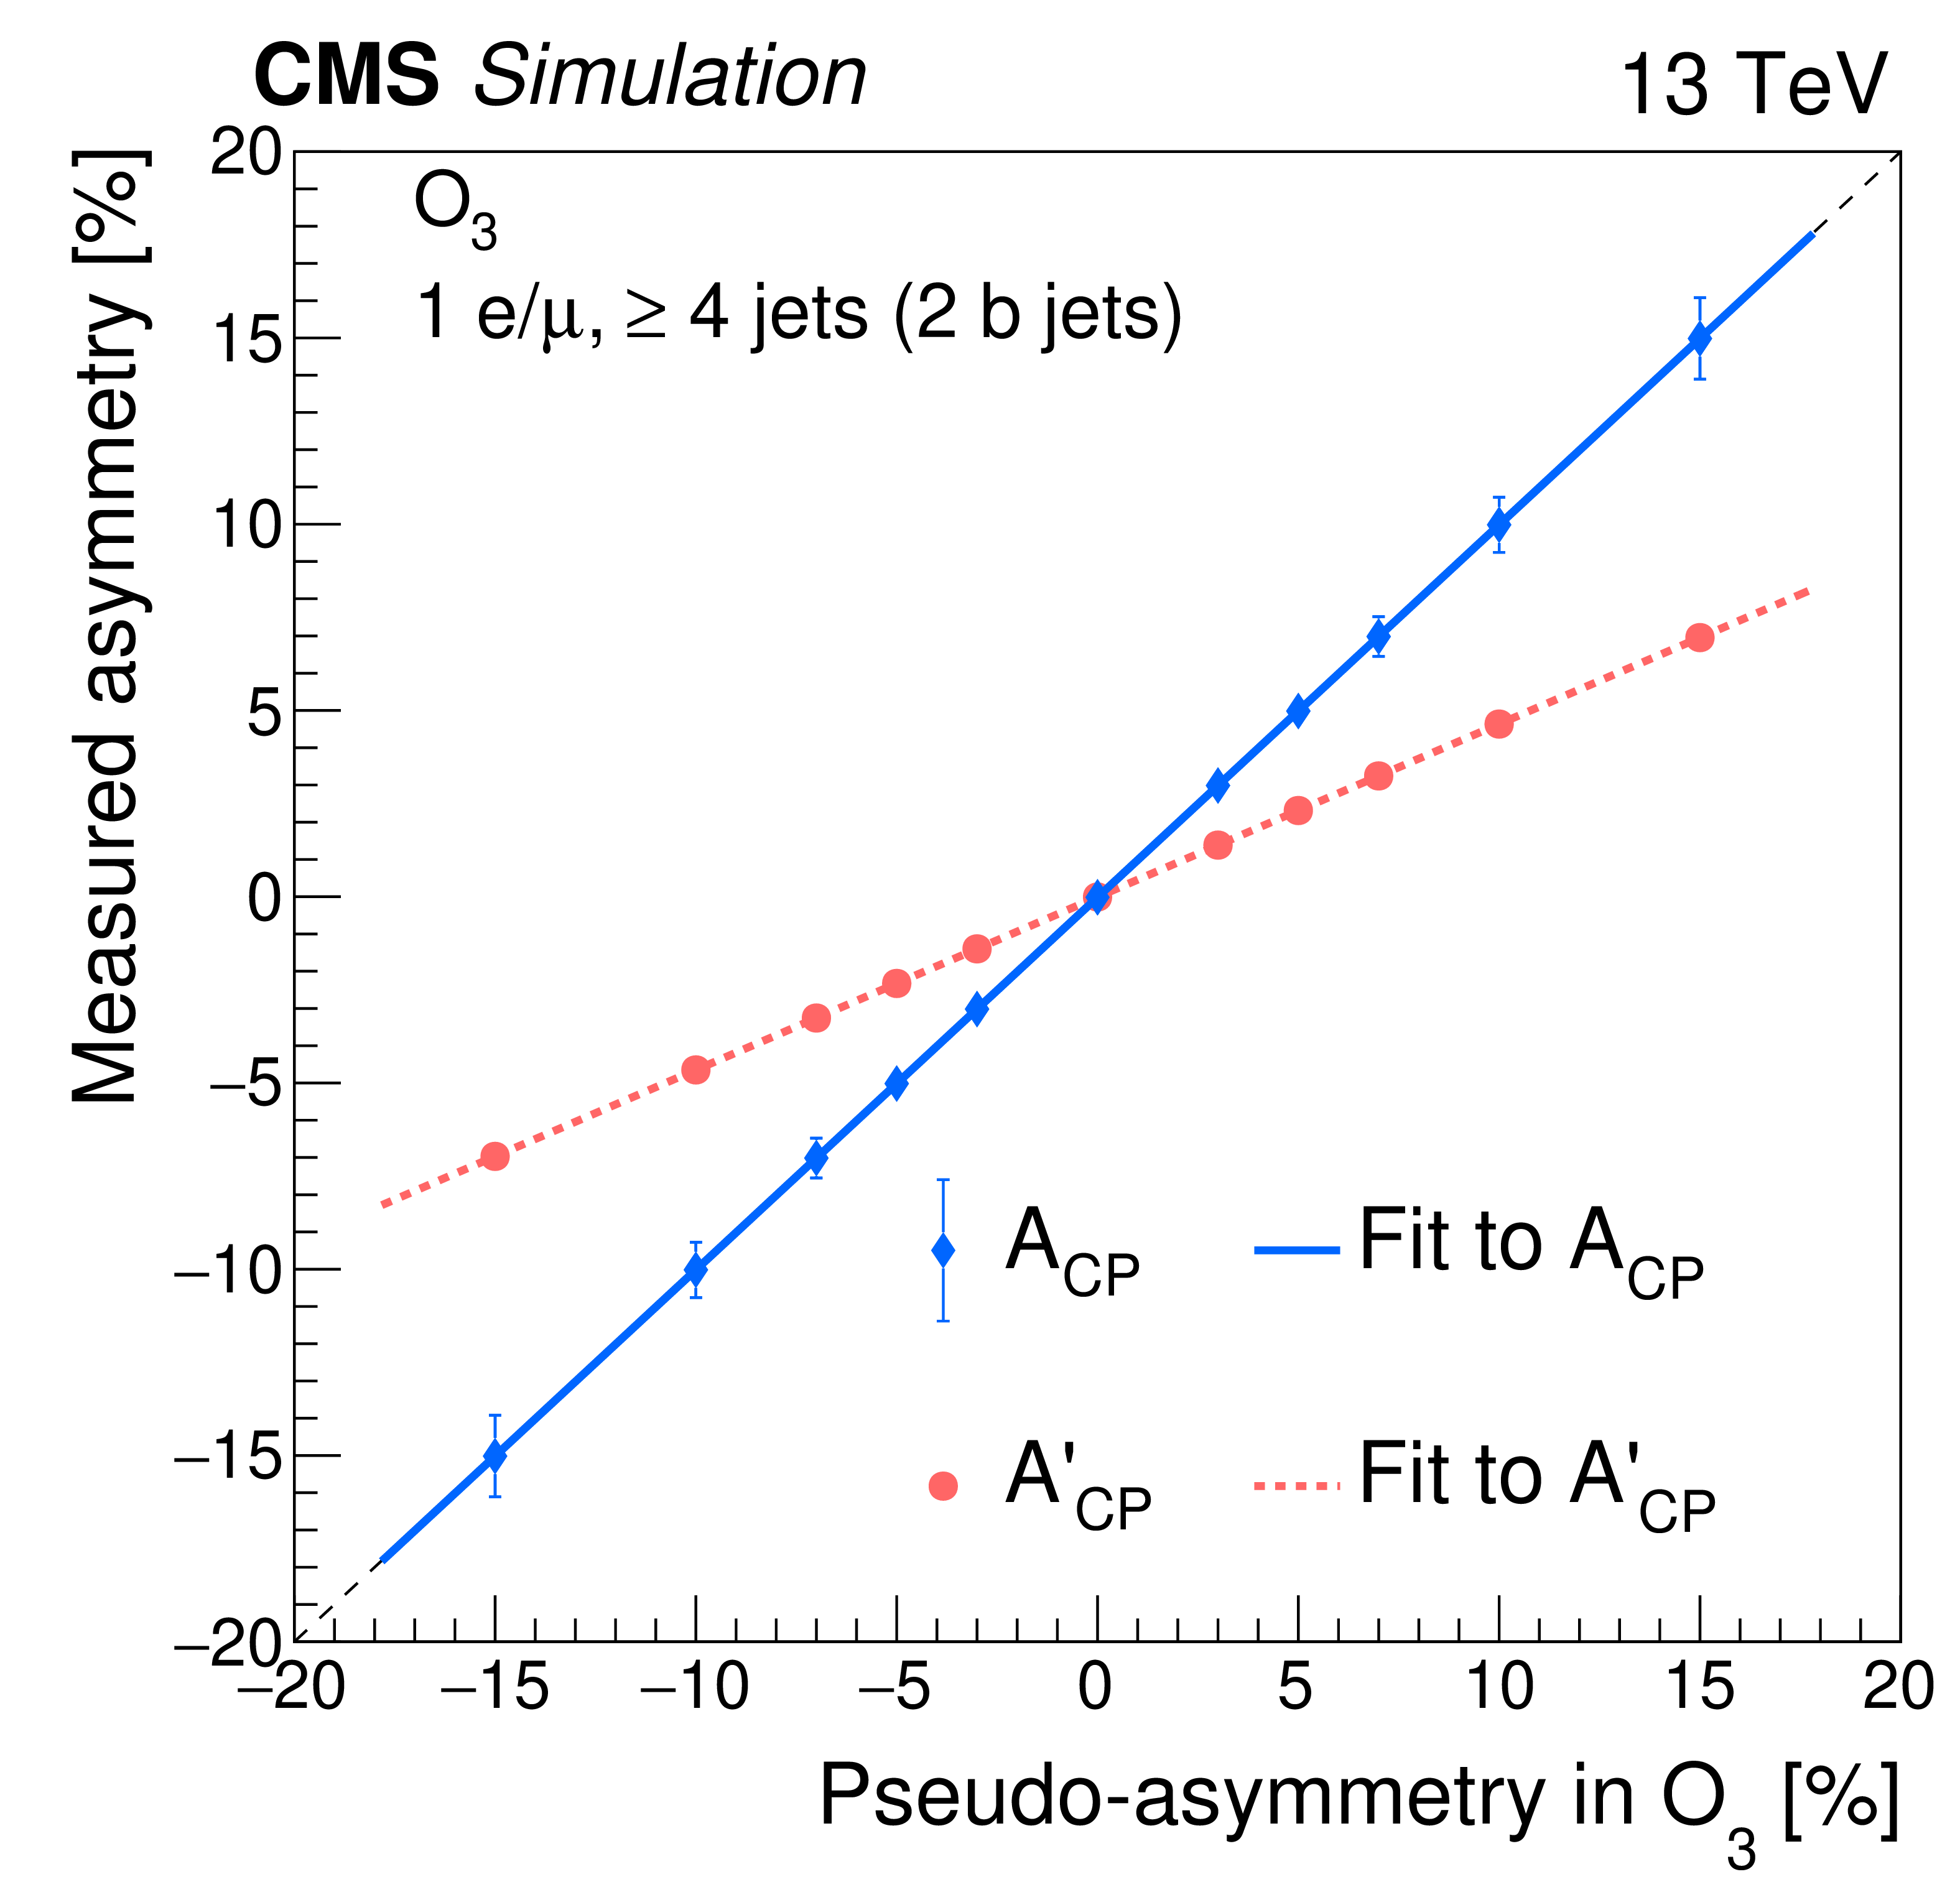
Figure 5:
The measured CP-violating asymmetries in simulation as a function of the generator-level pseudo-asymmetry for the CP observables ${O_3}$ (upper left), ${O_6}$ (upper right), ${O_{12}}$ (lower left), and ${O_{14}}$ (lower right). The red circles and blue diamonds give the ${A'_\text {CP}}$ and ${A_\text {CP}}$ values, respectively, with the red-dotted and blue-solid lines showing the results of linear fits to those corresponding values. The ${A_\text {CP}}$ value is obtained by dividing the ${A'_\text {CP}}$ value by the dilution factor determined from simulation for that CP observable. The statistical uncertainties in the ${A'_\text {CP}}$ values are smaller than the markers. |
png pdf |
Figure 5-a:
The measured CP-violating asymmetry in simulation as a function of the generator-level pseudo-asymmetry for the CP observable ${O_3}$. The red circles and blue diamonds give the ${A'_\text {CP}}$ and ${A_\text {CP}}$ values, respectively, with the red-dotted and blue-solid lines showing the results of linear fits to those corresponding values. The ${A_\text {CP}}$ value is obtained by dividing the ${A'_\text {CP}}$ value by the dilution factor determined from simulation for that CP observable. The statistical uncertainties in the ${A'_\text {CP}}$ values are smaller than the markers. |

png pdf |
Figure 5-b:
The measured CP-violating asymmetry in simulation as a function of the generator-level pseudo-asymmetry for the CP observable ${O_6}$. The red circles and blue diamonds give the ${A'_\text {CP}}$ and ${A_\text {CP}}$ values, respectively, with the red-dotted and blue-solid lines showing the results of linear fits to those corresponding values. The ${A_\text {CP}}$ value is obtained by dividing the ${A'_\text {CP}}$ value by the dilution factor determined from simulation for that CP observable. The statistical uncertainties in the ${A'_\text {CP}}$ values are smaller than the markers. |

png pdf |
Figure 5-c:
The measured CP-violating asymmetry in simulation as a function of the generator-level pseudo-asymmetry for the CP observable ${O_{12}}$. The red circles and blue diamonds give the ${A'_\text {CP}}$ and ${A_\text {CP}}$ values, respectively, with the red-dotted and blue-solid lines showing the results of linear fits to those corresponding values. The ${A_\text {CP}}$ value is obtained by dividing the ${A'_\text {CP}}$ value by the dilution factor determined from simulation for that CP observable. The statistical uncertainties in the ${A'_\text {CP}}$ values are smaller than the markers. |

png pdf |
Figure 5-d:
The measured CP-violating asymmetry in simulation as a function of the generator-level pseudo-asymmetry for the CP observable ${O_{14}}$. The red circles and blue diamonds give the ${A'_\text {CP}}$ and ${A_\text {CP}}$ values, respectively, with the red-dotted and blue-solid lines showing the results of linear fits to those corresponding values. The ${A_\text {CP}}$ value is obtained by dividing the ${A'_\text {CP}}$ value by the dilution factor determined from simulation for that CP observable. The statistical uncertainties in the ${A'_\text {CP}}$ values are smaller than the markers. |
png pdf |
Figure 6:
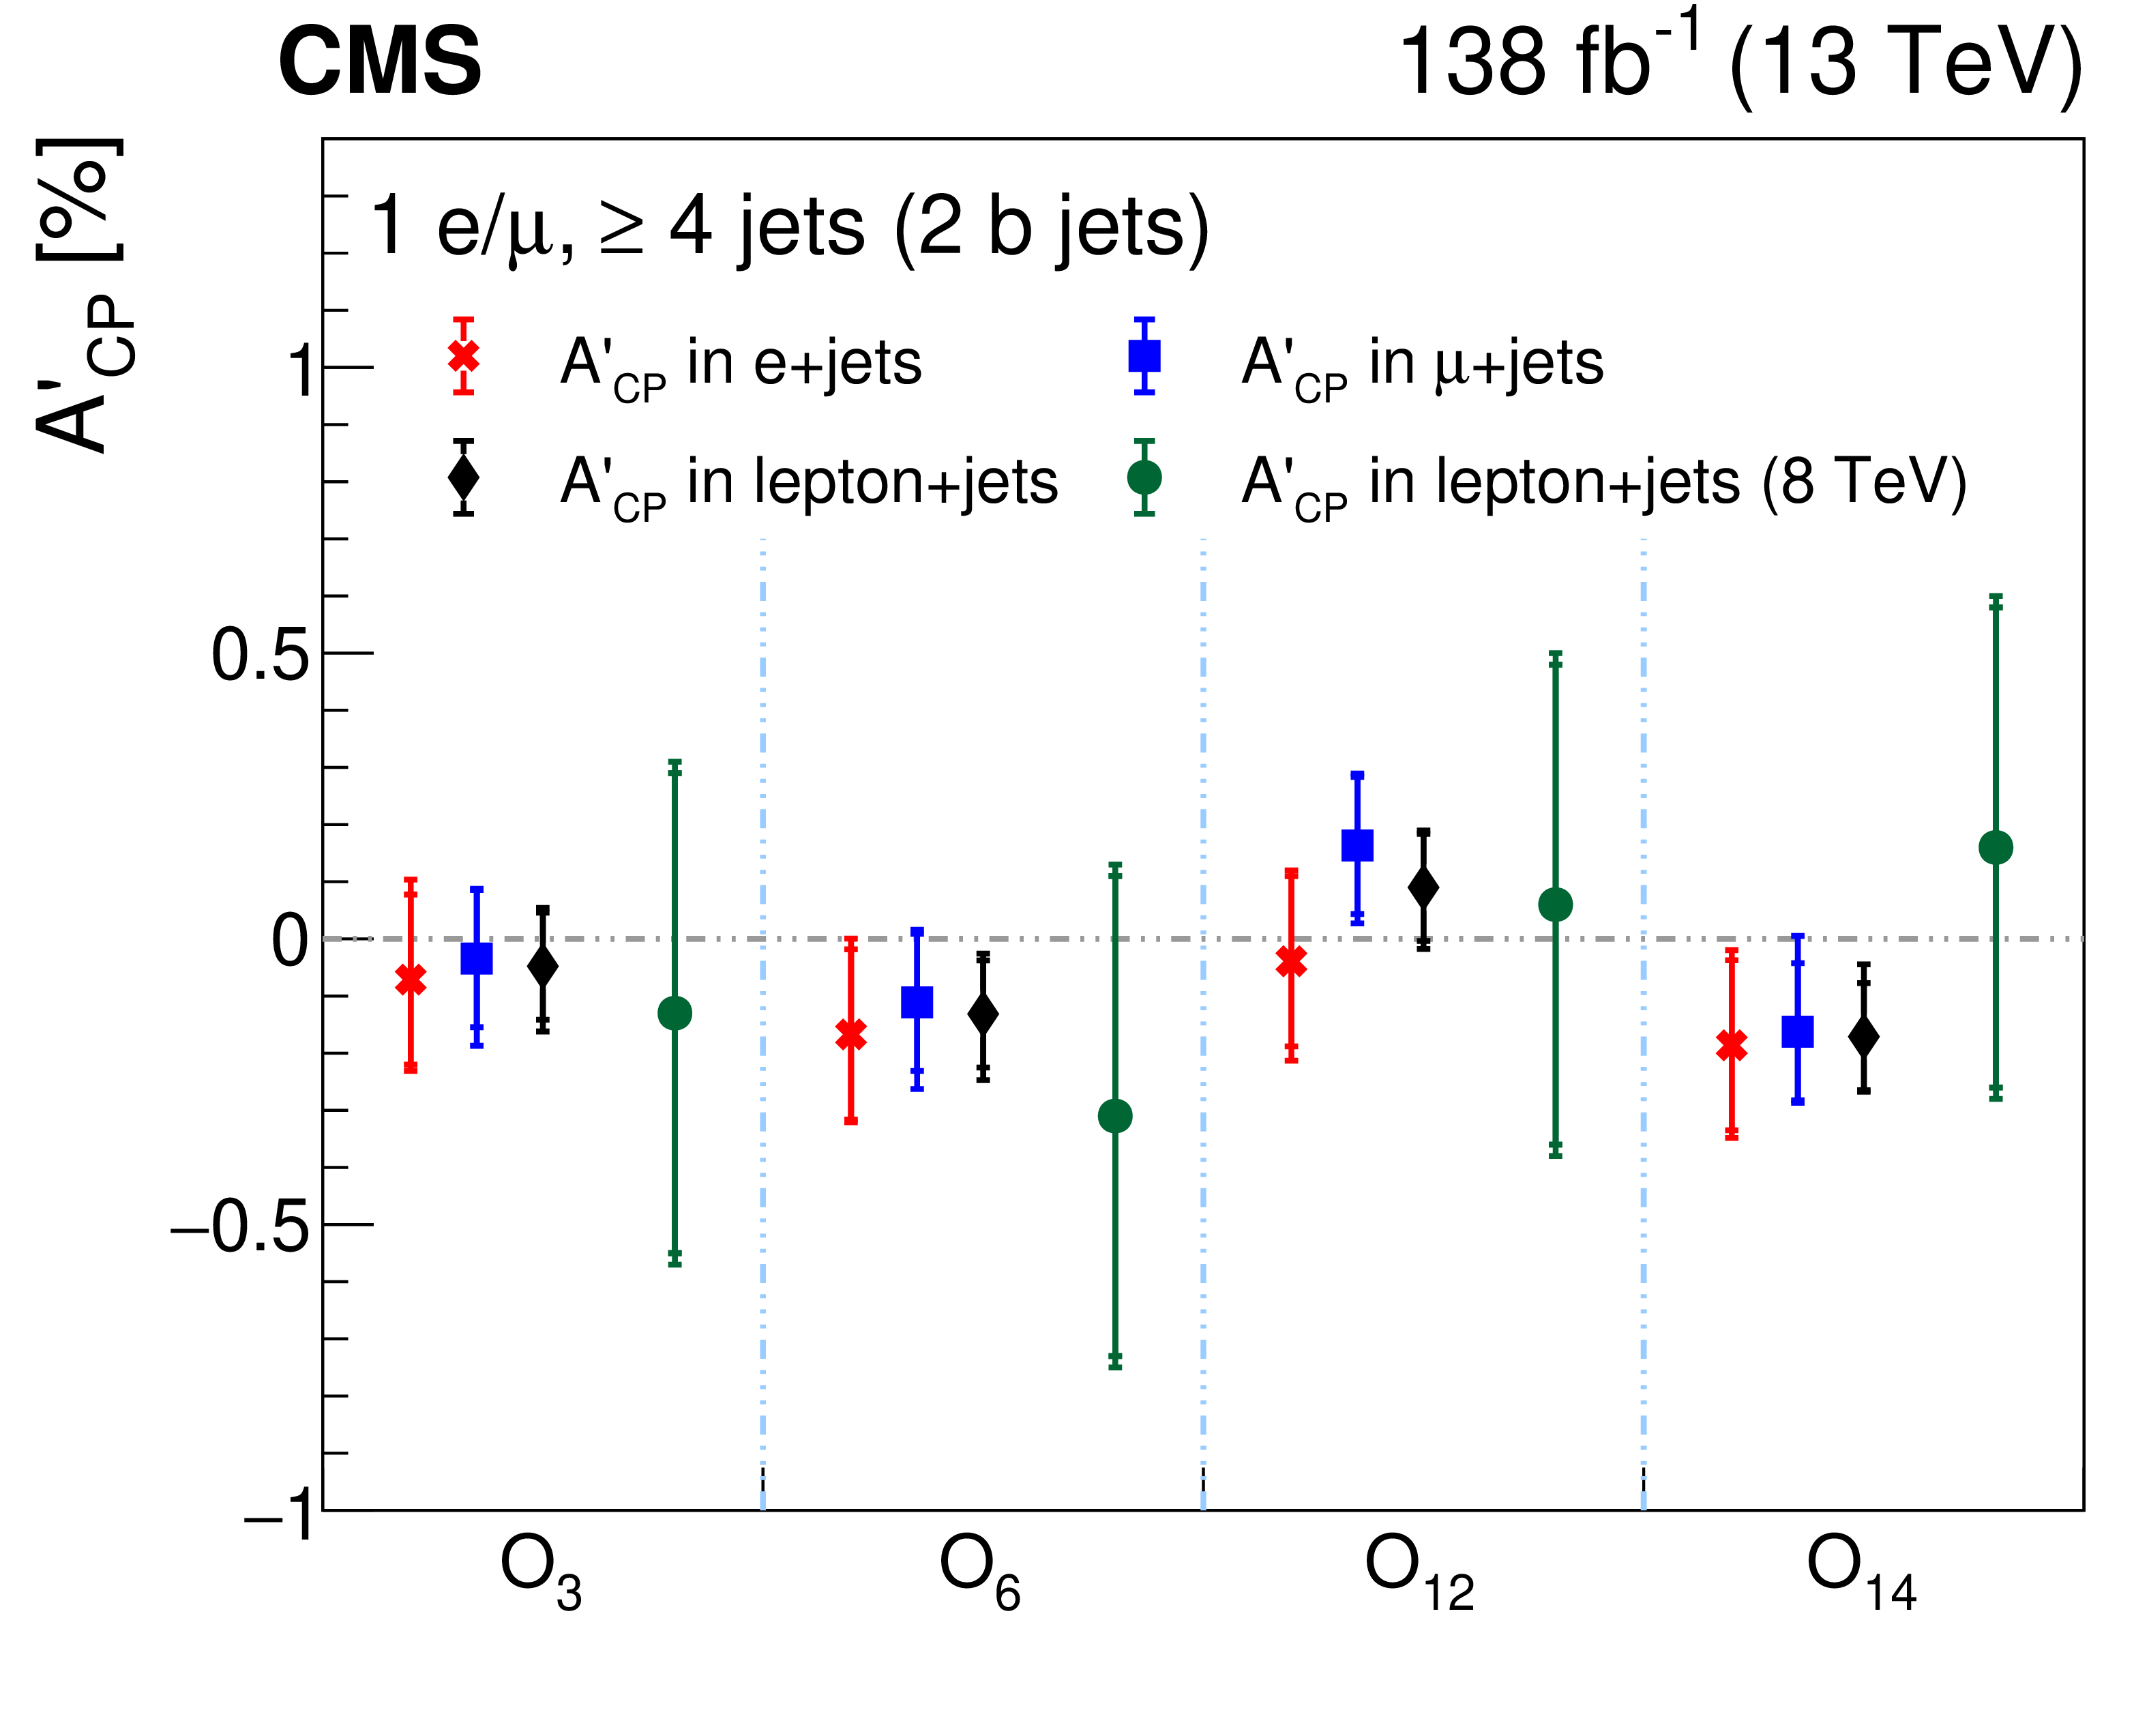
The measured effective asymmetries ${A'_\text {CP}}$ for each CP observable from the electron, muon, and combined lepton+jets channels. The results from the previous CMS measurement at $\sqrt {s}=$ 8 TeV [12] are shown by the green circles. The inner vertical bars on the symbols represent the statistical uncertainty, and the outer bars the statistical and systematic uncertainties added in quadrature. |
png pdf |
Figure 7:
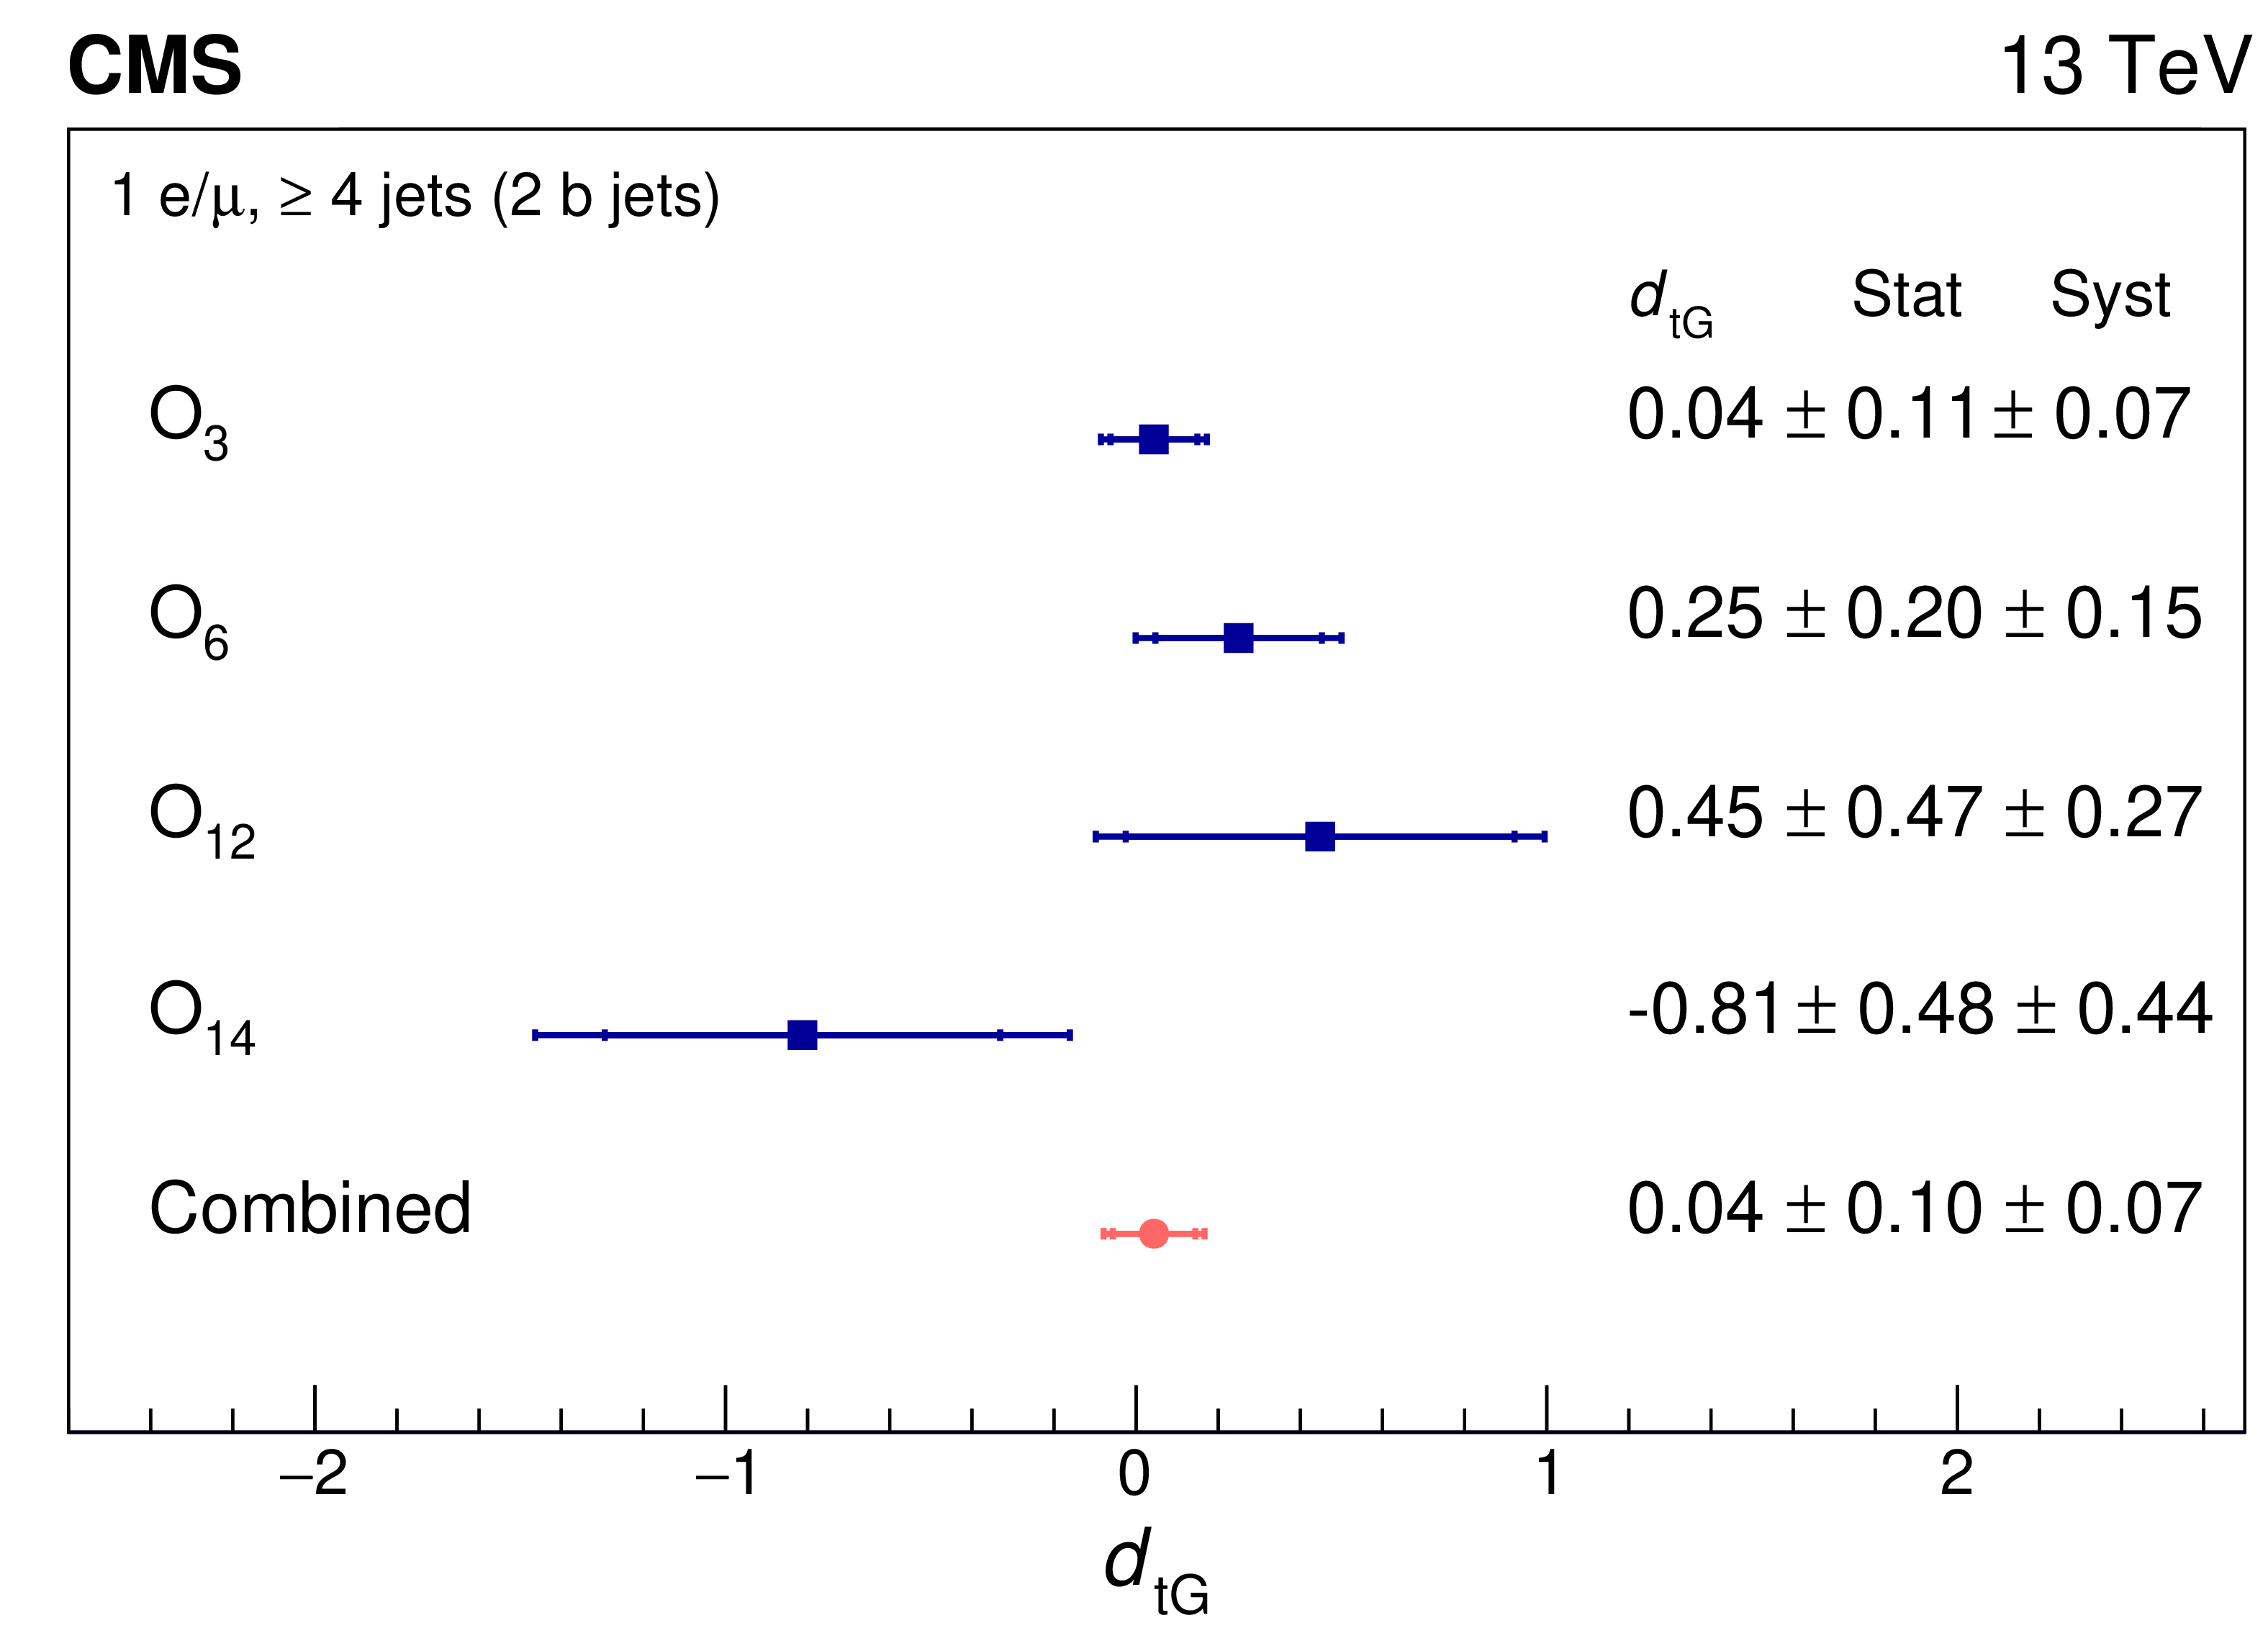
The measured dimensionless CEDM ${d_{\mathrm{t} \mathrm {G}}}$ for each CP observable (blue squares) in the lepton+jets channel and the combined result (red point). The inner horizontal bars on the points represent the statistical uncertainty and the outer bar the combined statistical and systematic uncertainties added in quadrature. |
| Tables | |

png pdf |
Table 1:
The predicted $ \mathrm{t\bar{t}} $ signal and background contributions to the signal events from simulation for the electron and muon channels. |

png pdf |
Table 2:
The fitted number of $ \mathrm{t\bar{t}} $ signal and $ \mathrm{t\bar{t}} $ background events (fitted $ \mathrm{t\bar{t}} $) and other background events (fitted background) in the electron and muon channels, along with the $ \mathrm{t\bar{t}} $ purities. Although the fit is performed for $ {m_{\ell \mathrm{b}}} < $ 500 GeV, the event yields are given for $ {m_{\ell \mathrm{b}}} < $ 150 GeV. The uncertainties shown are statistical only. |
png pdf |
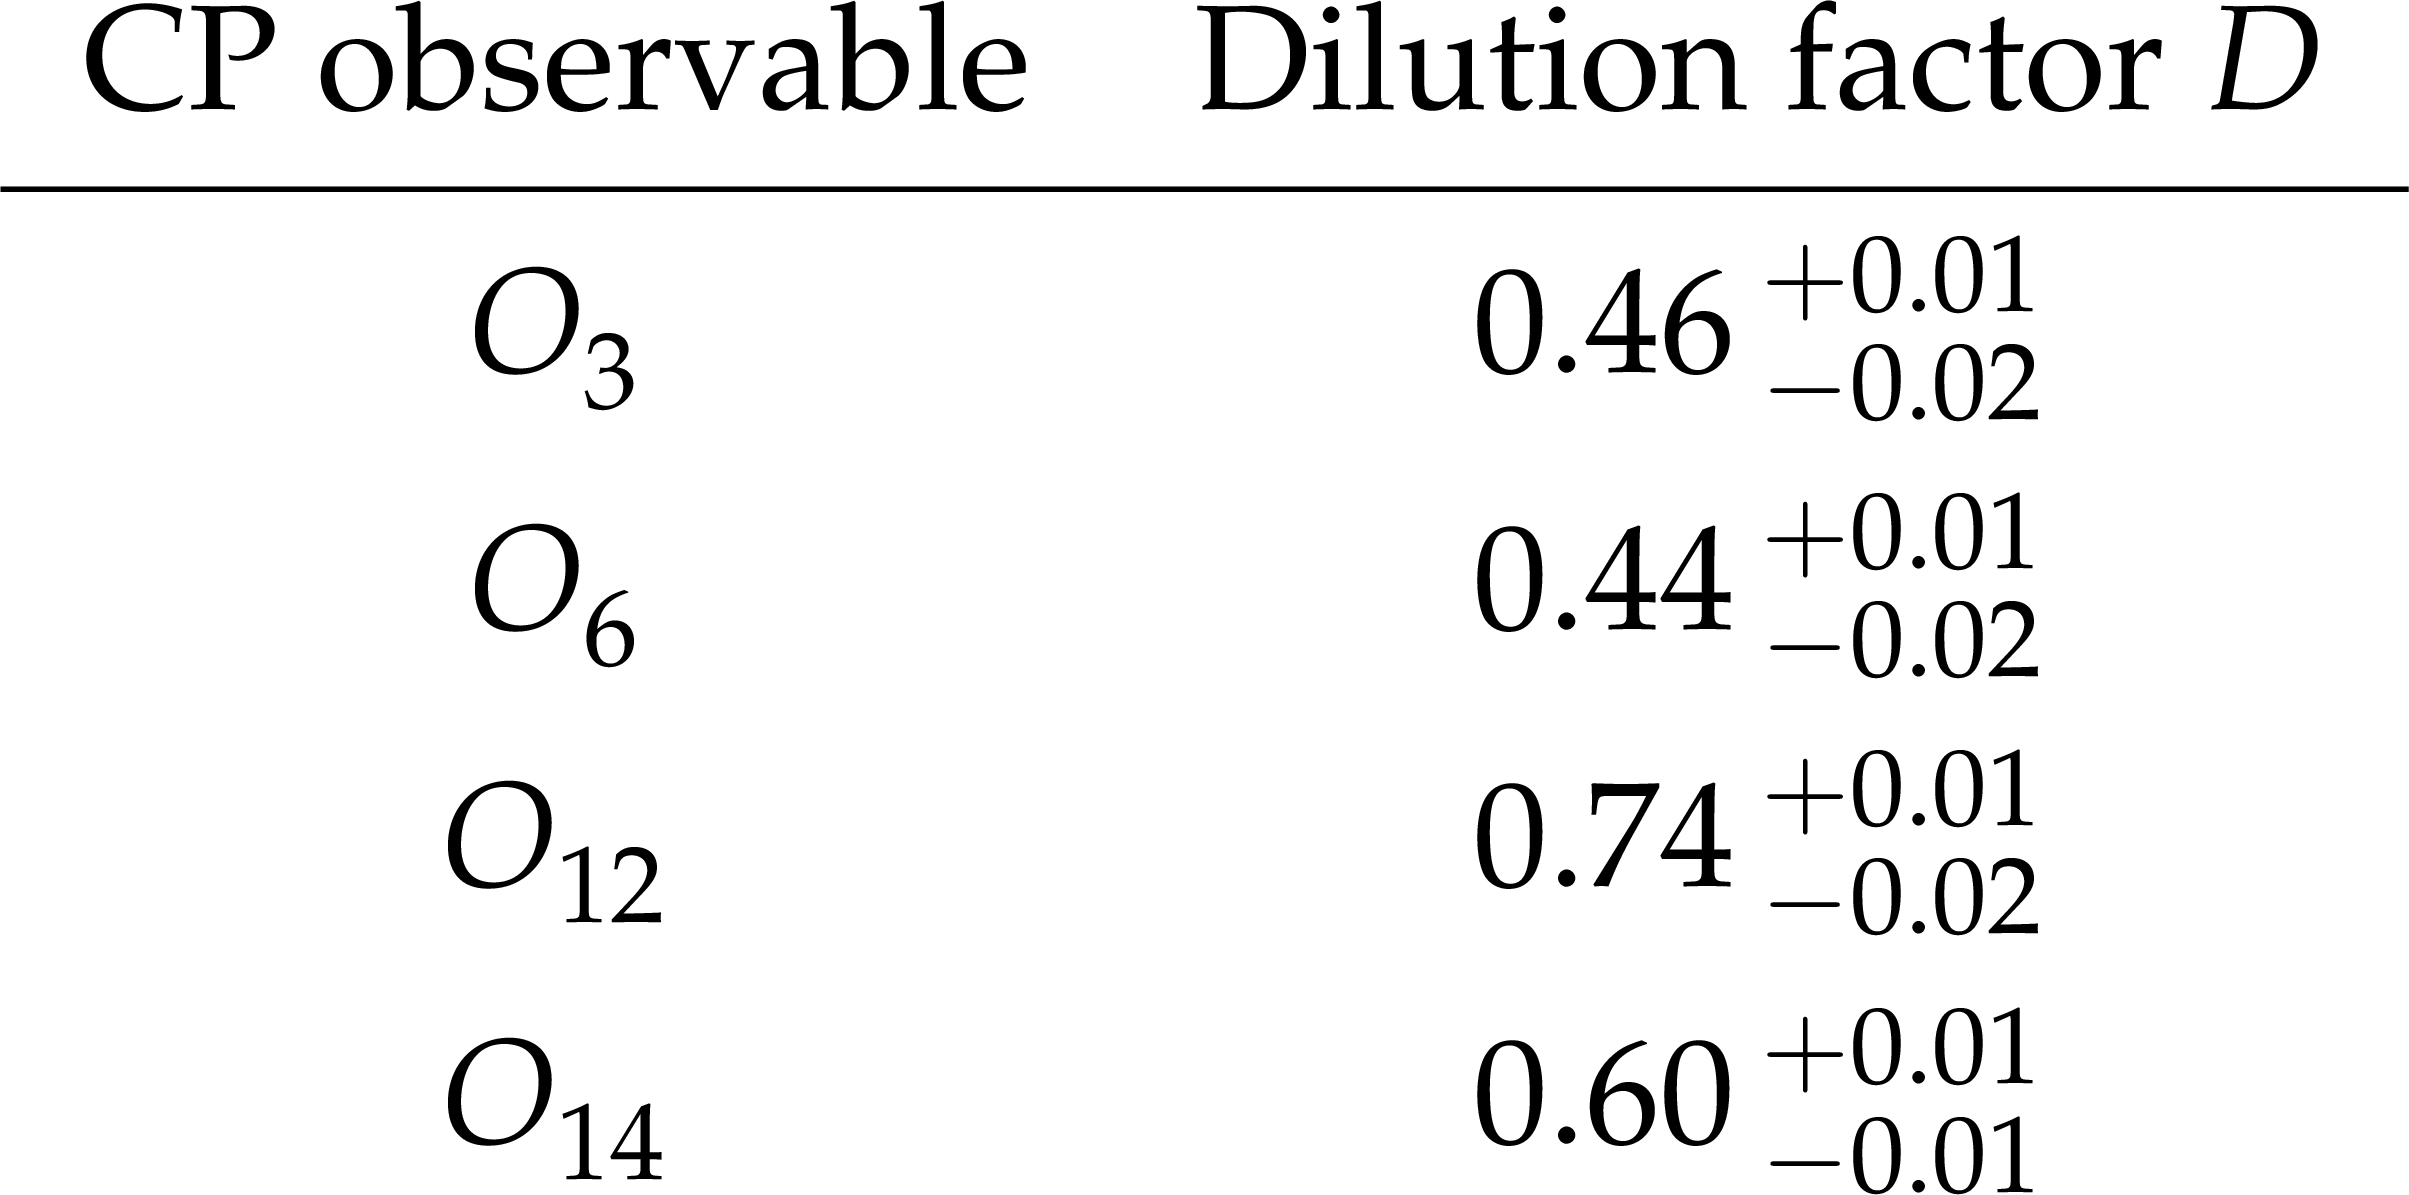
Table 3:
The dilution factor {D} determined from simulation and its systematic uncertainty for each CP observable. The statistical uncertainty is negligible compared to the systematic uncertainty. |

png pdf |
Table 4:
The ${A'_\text {CP}}$ values and their statistical uncertainties in percent for each CP observable from the electron and muon event-mixing samples and their combination, used to search for detector or reconstruction bias. |

png pdf |
Table 5:
The sources and values of the systematic uncertainties in ${A'_\text {CP}}$ for each of the CP observables in percent, averaged over the two lepton-flavor channels. The experimental sources are listed first and then the theoretical ones. |

png pdf |
Table 6:
The measured effective asymmetries ${A'_\text {CP}}$ in percent for each of the CP observables for the electron, muon, and combined data samples. The first uncertainty is statistical and the second is systematic. The statistical uncertainties are the same for each lepton type because the numbers of signal events are the same. |

png pdf |
Table 7:
The measured ${A_\text {CP}}$ and corresponding ${d_{\mathrm{t} \mathrm {G}}}$ values for each of the CP observables using the SM simulation predictions for the dilution factor {D} in the combined lepton+jets channel. The first uncertainty is statistical and the second is systematic. |
| Summary |
| The results of a search have been presented for the combined charge conjugate and parity (CP) violation effects in top quark-antiquark events performed in the electron+jets and muon+jets final states. The top quark and antiquark are each assumed to decay into a bottom quark and a W boson, with one W boson decaying hadronically and the other leptonically into an electron or muon and accompanying neutrino. This study uses data collected by the CMS experiment at the LHC from proton-proton collisions at $\sqrt{s}=$ 13 TeV, corresponding to an integrated luminosity of 138 fb$^{-1}$. The CP-violating asymmetries are obtained with four different triple-product T-odd observables, where T is the time-reversal operator, constructed using linearly independent four-momentum vectors associated with the final-state particles. The uncorrected asymmetries are computed using the fitted signal. There are no statistically significant indications of CP violation, with all the CP asymmetries being consistent with the standard model expectations. The resulting combined measurement of the dimensionless chromoelectric dipole moment gives $d_{\mathrm{tG}} =$ 0.04 $\pm$ 0.10 (stat) $\pm$ 0.07 (syst) and exhibits no evidence for CP-violating effects, consistent with expectations from the standard model. These results are compatible with a previous study performed by CMS in data from pp collisions at $\sqrt{s}=$ 8 TeV [12] with uncertainties improved by roughly a factor of 3. |
| References | ||||
| 1 | M. Kobayashi and T. Maskawa | CP violation in the renormalizable theory of weak interaction | Progress of Theoretical Physics 49 (1973) 652 | |
| 2 | A. Höcker and Z. Ligeti | CP violation and the CKM matrix | Ann. Rev. Nucl. Part. Sci. 56 (2006) 501 | hep-ph/0605217 |
| 3 | NA48 Collaboration | A new measurement of direct CP violation in two pion decays of the neutral kaon | PLB 465 (1999) 335 | hep-ex/9909022 |
| 4 | BaBar and Belle Collaborations | The physics of the $ {\mathrm{B}} $ factories | EPJC 74 (2014) 3026 | 1406.6311 |
| 5 | LHCb Collaboration | CP violation in charm at LHCb | Nuovo Cim. C 42 (2020) 250 | |
| 6 | Particle Data Group, P. A. Zyla et al. | Review of particle physics | Prog. Theor. Exp. Phys. 2020 (2020) 083C01 | |
| 7 | S. L. Glashow, J. Iliopoulos, and L. Maiani | Weak interactions with lepton-hadron symmetry | PRD 2 (1970) 1285 | |
| 8 | D. Atwood, S. Bar-Shalom, G. Eilam, and A. Soni | CP violation in top physics | Phys. Rept. 347 (2001) 1 | hep-ph/0006032 |
| 9 | S. K. Gupta, A. S. Mete, and G. Valencia | CP-violating anomalous top-quark couplings at the LHC | PRD 80 (2009) 034013 | 0905.1074 |
| 10 | A. Hayreter and G. Valencia | T-odd correlations from top-quark CEDM in lepton plus jets top-pair events | PRD 93 (2016) 014020 | 1511.01464 |
| 11 | S. K. Gupta and G. Valencia | CP-odd correlations using jet momenta from $ \mathrm{t} \overline{\mathrm{t}} $ events at the Tevatron | PRD 81 (2010) 034013 | 0912.0707 |
| 12 | G. Valencia | CP violation in top-quark physics | Nuovo Cim. C 033 (2010) 263 | 1007.4765 |
| 13 | CMS Collaboration | Search for CP violation in $ \mathrm{t} \overline{\mathrm{t}} $ production and decay in proton-proton collisions at $ \sqrt{s}= $ 8 TeV | JHEP 03 (2017) 101 | CMS-TOP-16-001 1611.08931 |
| 14 | CMS Collaboration | HEPData record for this analysis | link | |
| 15 | CMS Collaboration | The CMS trigger system | JINST 12 (2017) P01020 | CMS-TRG-12-001 1609.02366 |
| 16 | CMS Collaboration | Commissioning of the CMS high-level trigger with cosmic rays | JINST 5 (2010) T03005 | CMS-CFT-09-020 0911.4889 |
| 17 | CMS Collaboration | The CMS experiment at the CERN LHC | JINST 3 (2008) S08004 | |
| 18 | CMS Collaboration | Precision luminosity measurement in proton-proton collisions at $ \sqrt{s}= $ 13 TeV in 2015 and 2016 at CMS | EPJC 81 (2021) 800 | CMS-LUM-17-003 2104.01927 |
| 19 | CMS Collaboration | CMS luminosity measurement for the 2017 data-taking period at $ \sqrt{s}= $ 13 TeV | CMS Physics Analysis Summary, 2018 link |
CMS-PAS-LUM-17-004 |
| 20 | CMS Collaboration | CMS luminosity measurement for the 2018 data-taking period at $ \sqrt{s}= $ 13 TeV | CMS Physics Analysis Summary, 2019 link |
CMS-PAS-LUM-18-002 |
| 21 | P. Nason | A new method for combining NLO QCD with shower Monte Carlo algorithms | JHEP 11 (2004) 040 | hep-ph/0409146 |
| 22 | S. Frixione, P. Nason, and C. Oleari | Matching NLO QCD computations with parton shower simulations: the POWHEG method | JHEP 11 (2007) 070 | 0709.2092 |
| 23 | S. Alioli, P. Nason, C. Oleari, and E. Re | A general framework for implementing NLO calculations in shower Monte Carlo programs: the POWHEG \textscbox | JHEP 06 (2010) 043 | 1002.2581 |
| 24 | J. M. Campbell, R. K. Ellis, P. Nason, and E. Re | Top-pair production and decay at NLO matched with parton showers | JHEP 04 (2015) 114 | 1412.1828 |
| 25 | T. Sjöstrand et al. | An introduction to PYTHIA 8.2 | Comput. Phys. Commun. 191 (2015) 159 | 1410.3012 |
| 26 | CMS Collaboration | Extraction and validation of a new set of CMS PYTHIA8 tunes from underlying-event measurements | EPJC 80 (2020) 4 | CMS-GEN-17-001 1903.12179 |
| 27 | NNPDF Collaboration | Parton distributions from high-precision collider data | EPJC 77 (2017) 663 | 1706.00428 |
| 28 | J. Alwall et al. | The automated computation of tree-level and next-to-leading order differential cross sections, and their matching to parton shower simulations | JHEP 07 (2014) 079 | 1405.0301 |
| 29 | R. Frederix and S. Frixione | Merging meets matching in MC@NLO | JHEP 12 (2012) 061 | 1209.6215 |
| 30 | CMS Collaboration | Event generator tunes obtained from underlying event and multiparton scattering measurements | EPJC 76 (2016) 155 | CMS-GEN-14-001 1512.00815 |
| 31 | J. Alwall et al. | Comparative study of various algorithms for the merging of parton showers and matrix elements in hadronic collisions | EPJC 53 (2008) 473 | 0706.2569 |
| 32 | GEANT4 Collaboration | GEANT 4---a simulation toolkit | NIM A 506 (2003) 250 | |
| 33 | CMS Collaboration | Measurement of the inelastic proton-proton cross section at $ \sqrt{s}= $ 13 TeV | JHEP 07 (2018) 161 | CMS-FSQ-15-005 1802.02613 |
| 34 | CMS Collaboration | Particle-flow reconstruction and global event description with the CMS detector | JINST 12 (2017) P10003 | CMS-PRF-14-001 1706.04965 |
| 35 | CMS Collaboration | Performance of electron reconstruction and selection with the CMS detector in proton-proton collisions at $ \sqrt{s}= $ 8 TeV | JINST 10 (2015) P06005 | CMS-EGM-13-001 1502.02701 |
| 36 | CMS Collaboration | Electron and photon reconstruction and identification with the CMS experiment at the CERN LHC | JINST 16 (2021) P05014 | CMS-EGM-17-001 2012.06888 |
| 37 | CMS Collaboration | Performance of the CMS muon detector and muon reconstruction with proton-proton collisions at $ \sqrt{s}= $ 13 TeV | JINST 13 (2018) P06015 | CMS-MUO-16-001 1804.04528 |
| 38 | M. Cacciari, G. P. Salam, and G. Soyez | FASTJET user manual | EPJC 72 (2012) 1896 | 1111.6097 |
| 39 | M. Cacciari, G. P. Salam, and G. Soyez | The anti-$ k_{\mathrm{T}} $ jet clustering algorithm | JHEP 04 (2008) 063 | 0802.1189 |
| 40 | CMS Collaboration | Identification of heavy-flavour jets with the CMS detector in pp collisions at 13 TeV | JINST 13 (2018) P05011 | CMS-BTV-16-002 1712.07158 |
| 41 | CMS Collaboration | Measurements of the $ \mathrm{t} \overline{\mathrm{t}} $ production cross section in lepton+jets final states in pp collisions at 8 TeV and ratio of 8 to 7 TeV cross sections | EPJC 77 (2017) 15 | CMS-TOP-12-006 1602.09024 |
| 42 | CMS Collaboration | Identification of b-quark jets with the CMS experiment | JINST 8 (2013) P04013 | CMS-BTV-12-001 1211.4462 |
| 43 | CMS Collaboration | Jet energy scale and resolution in the CMS experiment in pp collisions at 8 TeV | JINST 12 (2017) P02014 | CMS-JME-13-004 1607.03663 |
| 44 | A. Buckley et al. | LHAPDF6: parton density access in the LHC precision era | EPJC 75 (2015) 132 | 1412.7420 |
| 45 | J. R. Christiansen and P. Z. Skands | String formation beyond leading colour | JHEP 08 (2015) 003 | 1505.01681 |
| 46 | S. Argyropoulos and T. Sjöstrand | Effects of color reconnection on $ \mathrm{t} \overline{\mathrm{t}} $ final states at the LHC | JHEP 11 (2014) 043 | 1407.6653 |
| 47 | CMS Collaboration | Measurement of differential cross sections for top quark pair production using the lepton+jets final state in proton-proton collisions at 13 TeV | PRD 95 (2017) 092001 | CMS-TOP-16-008 1610.04191 |
| 48 | ATLAS Collaboration | Measurements of top-quark pair differential and double-differential cross-sections in the leptonn+jets channel with $ pp $ collisions at 13 TeV using the ATLAS detector | EPJC 79 (2019) 1028 | 1908.07305 |
| 49 | N. Kidonakis | NNLL threshold resummation for top-pair and single-top production | Phys. Part. Nucl. 45 (2014) 714 | 1210.7813 |
| 50 | M. Czakon, D. Heymes, and A. Mitov | High-precision differential predictions for top-quark pairs at the LHC | PRL 116 (2016) 082003 | 1511.00549 |
| 51 | M. Czakon et al. | Top-pair production at the LHC through NNLO QCD and NLO EW | JHEP 10 (2017) 186 | 1705.04105 |
| 52 | S. Catani et al. | Top-quark pair production at the LHC: fully differential QCD predictions at NNLO | JHEP 07 (2019) 100 | 1906.06535 |
| 53 | L. Lyons, D. Gibaut, and P. Clifford | How to combine correlated estimates of a single physical quantity | NIM A 270 (1988) 110 | |
| 54 | CMS Collaboration | Measurement of the top quark polarization and $ \mathrm{t} \overline{\mathrm{t}} $ spin correlations using dilepton final states in proton-proton collisions at $ \sqrt{s}= $ 13 TeV | PRD 100 (2019) 072002 | CMS-TOP-18-006 1907.03729 |
| 55 | W. Bernreuther and Z.-G. Si | Top quark spin correlations and polarization at the LHC: standard model predictions and effects of anomalous top chromo moments | PLB 725 (2013) 115 | 1305.2066 |
| 56 | W. Bernreuther, D. Heisler, and Z.-G. Si | A set of top quark spin correlation and polarization observables for the LHC: standard model predictions and new physics contributions | JHEP 12 (2015) 026 | 1508.05271 |
|
|
Compact Muon Solenoid LHC, CERN |
|

|

|

|

|

|