

Compact Muon Solenoid
LHC, CERN
| CMS-EXO-18-010 ; CERN-EP-2018-311 | ||
| Search for dark matter produced in association with a single top quark or a top quark pair in proton-proton collisions at $\sqrt{s} = $ 13 TeV | ||
| CMS Collaboration | ||
| 6 January 2019 | ||
| JHEP 03 (2019) 141 | ||
| Abstract: A search for dark matter produced in association with top quarks in proton-proton collisions at a center-of-mass energy of 13 TeV is presented. The data set used corresponds to an integrated luminosity of 35.9 fb$^{-1}$ recorded with the CMS detector at the LHC. Whereas previous searches for neutral scalar or pseudoscalar mediators considered dark matter production in association with a top quark pair only, this analysis also includes production modes with a single top quark. The results are derived from the combination of multiple selection categories that are defined to target either the single top quark or the top quark pair signature. No significant deviations with respect to the standard model predictions are observed. The results are interpreted in the context of a simplified model in which a scalar or pseudoscalar mediator particle couples to a top quark and subsequently decays into dark matter particles. Scalar and pseudoscalar mediator particles with masses below 290 and 300 GeV, respectively, are excluded at 95% confidence level, assuming a dark matter particle mass of 1 GeV and mediator couplings to fermions and dark matter particles equal to unity. | ||
| Links: e-print arXiv:1901.01553 [hep-ex] (PDF) ; CDS record ; inSPIRE record ; HepData record ; CADI line (restricted) ; | ||
| Figures | |
png pdf |
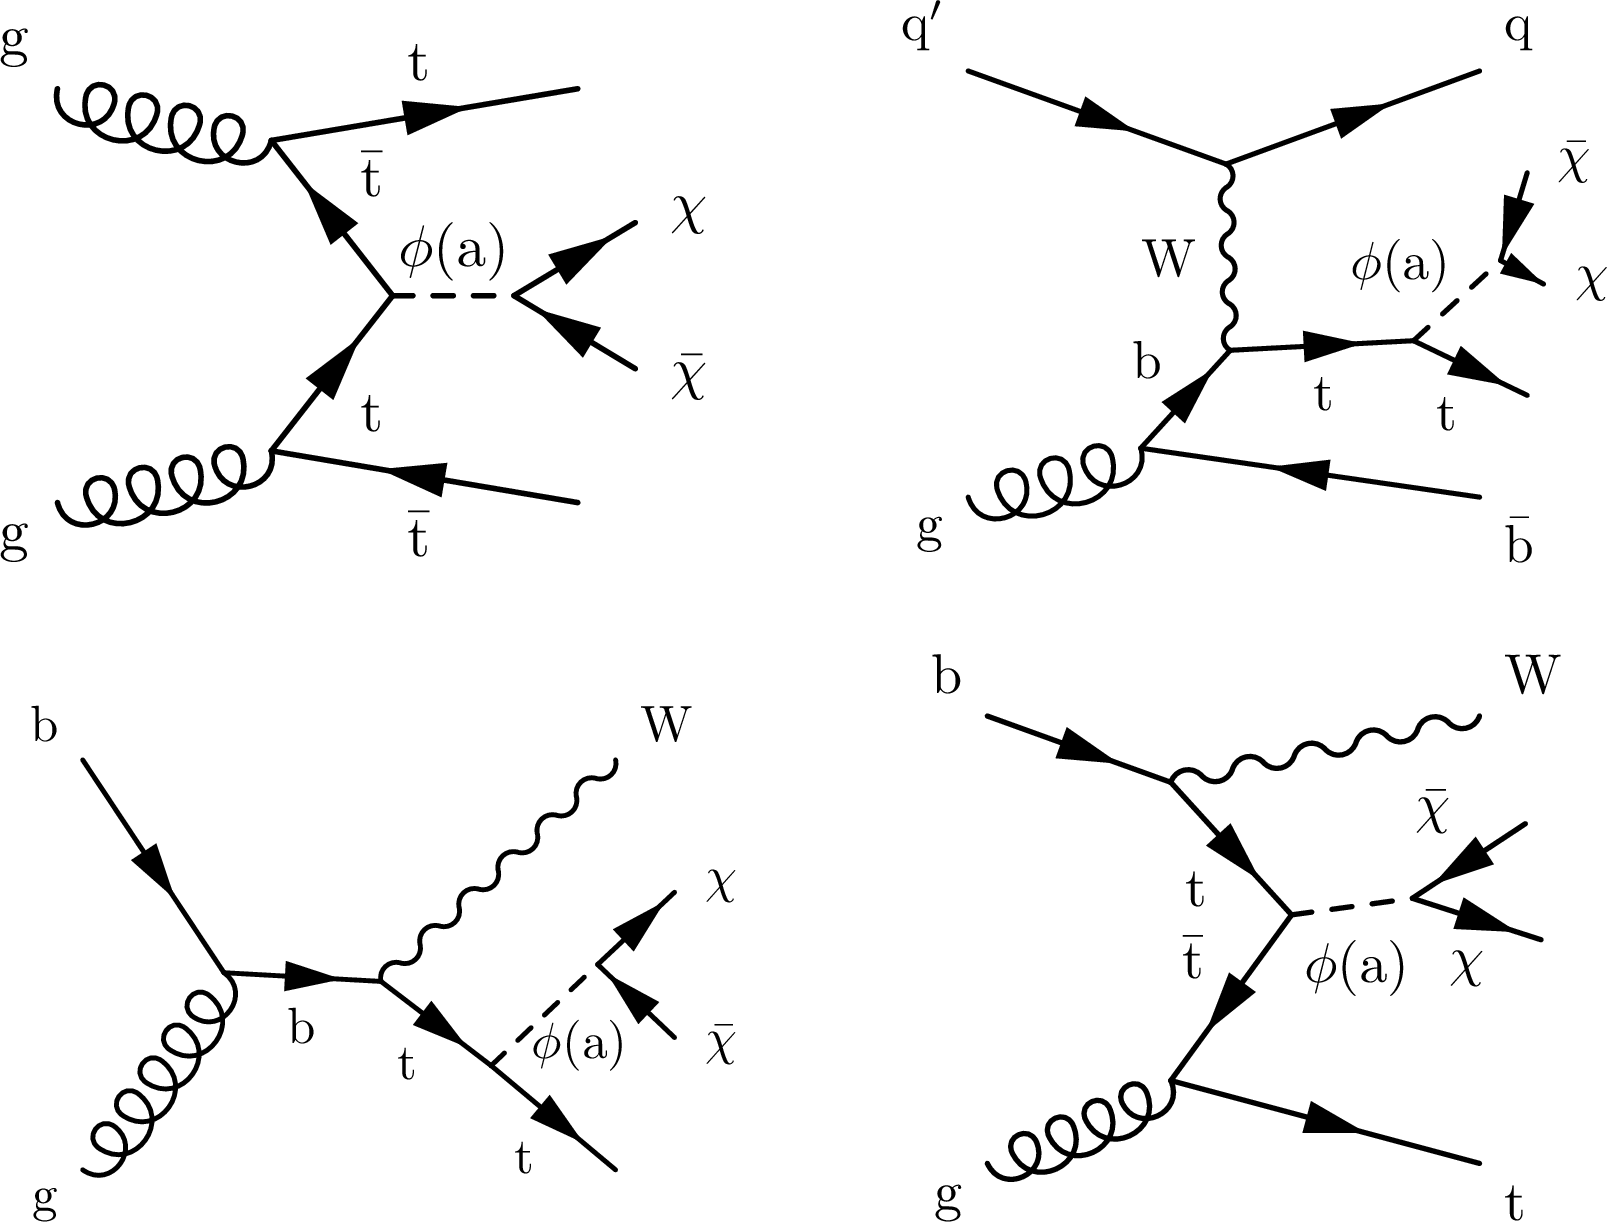
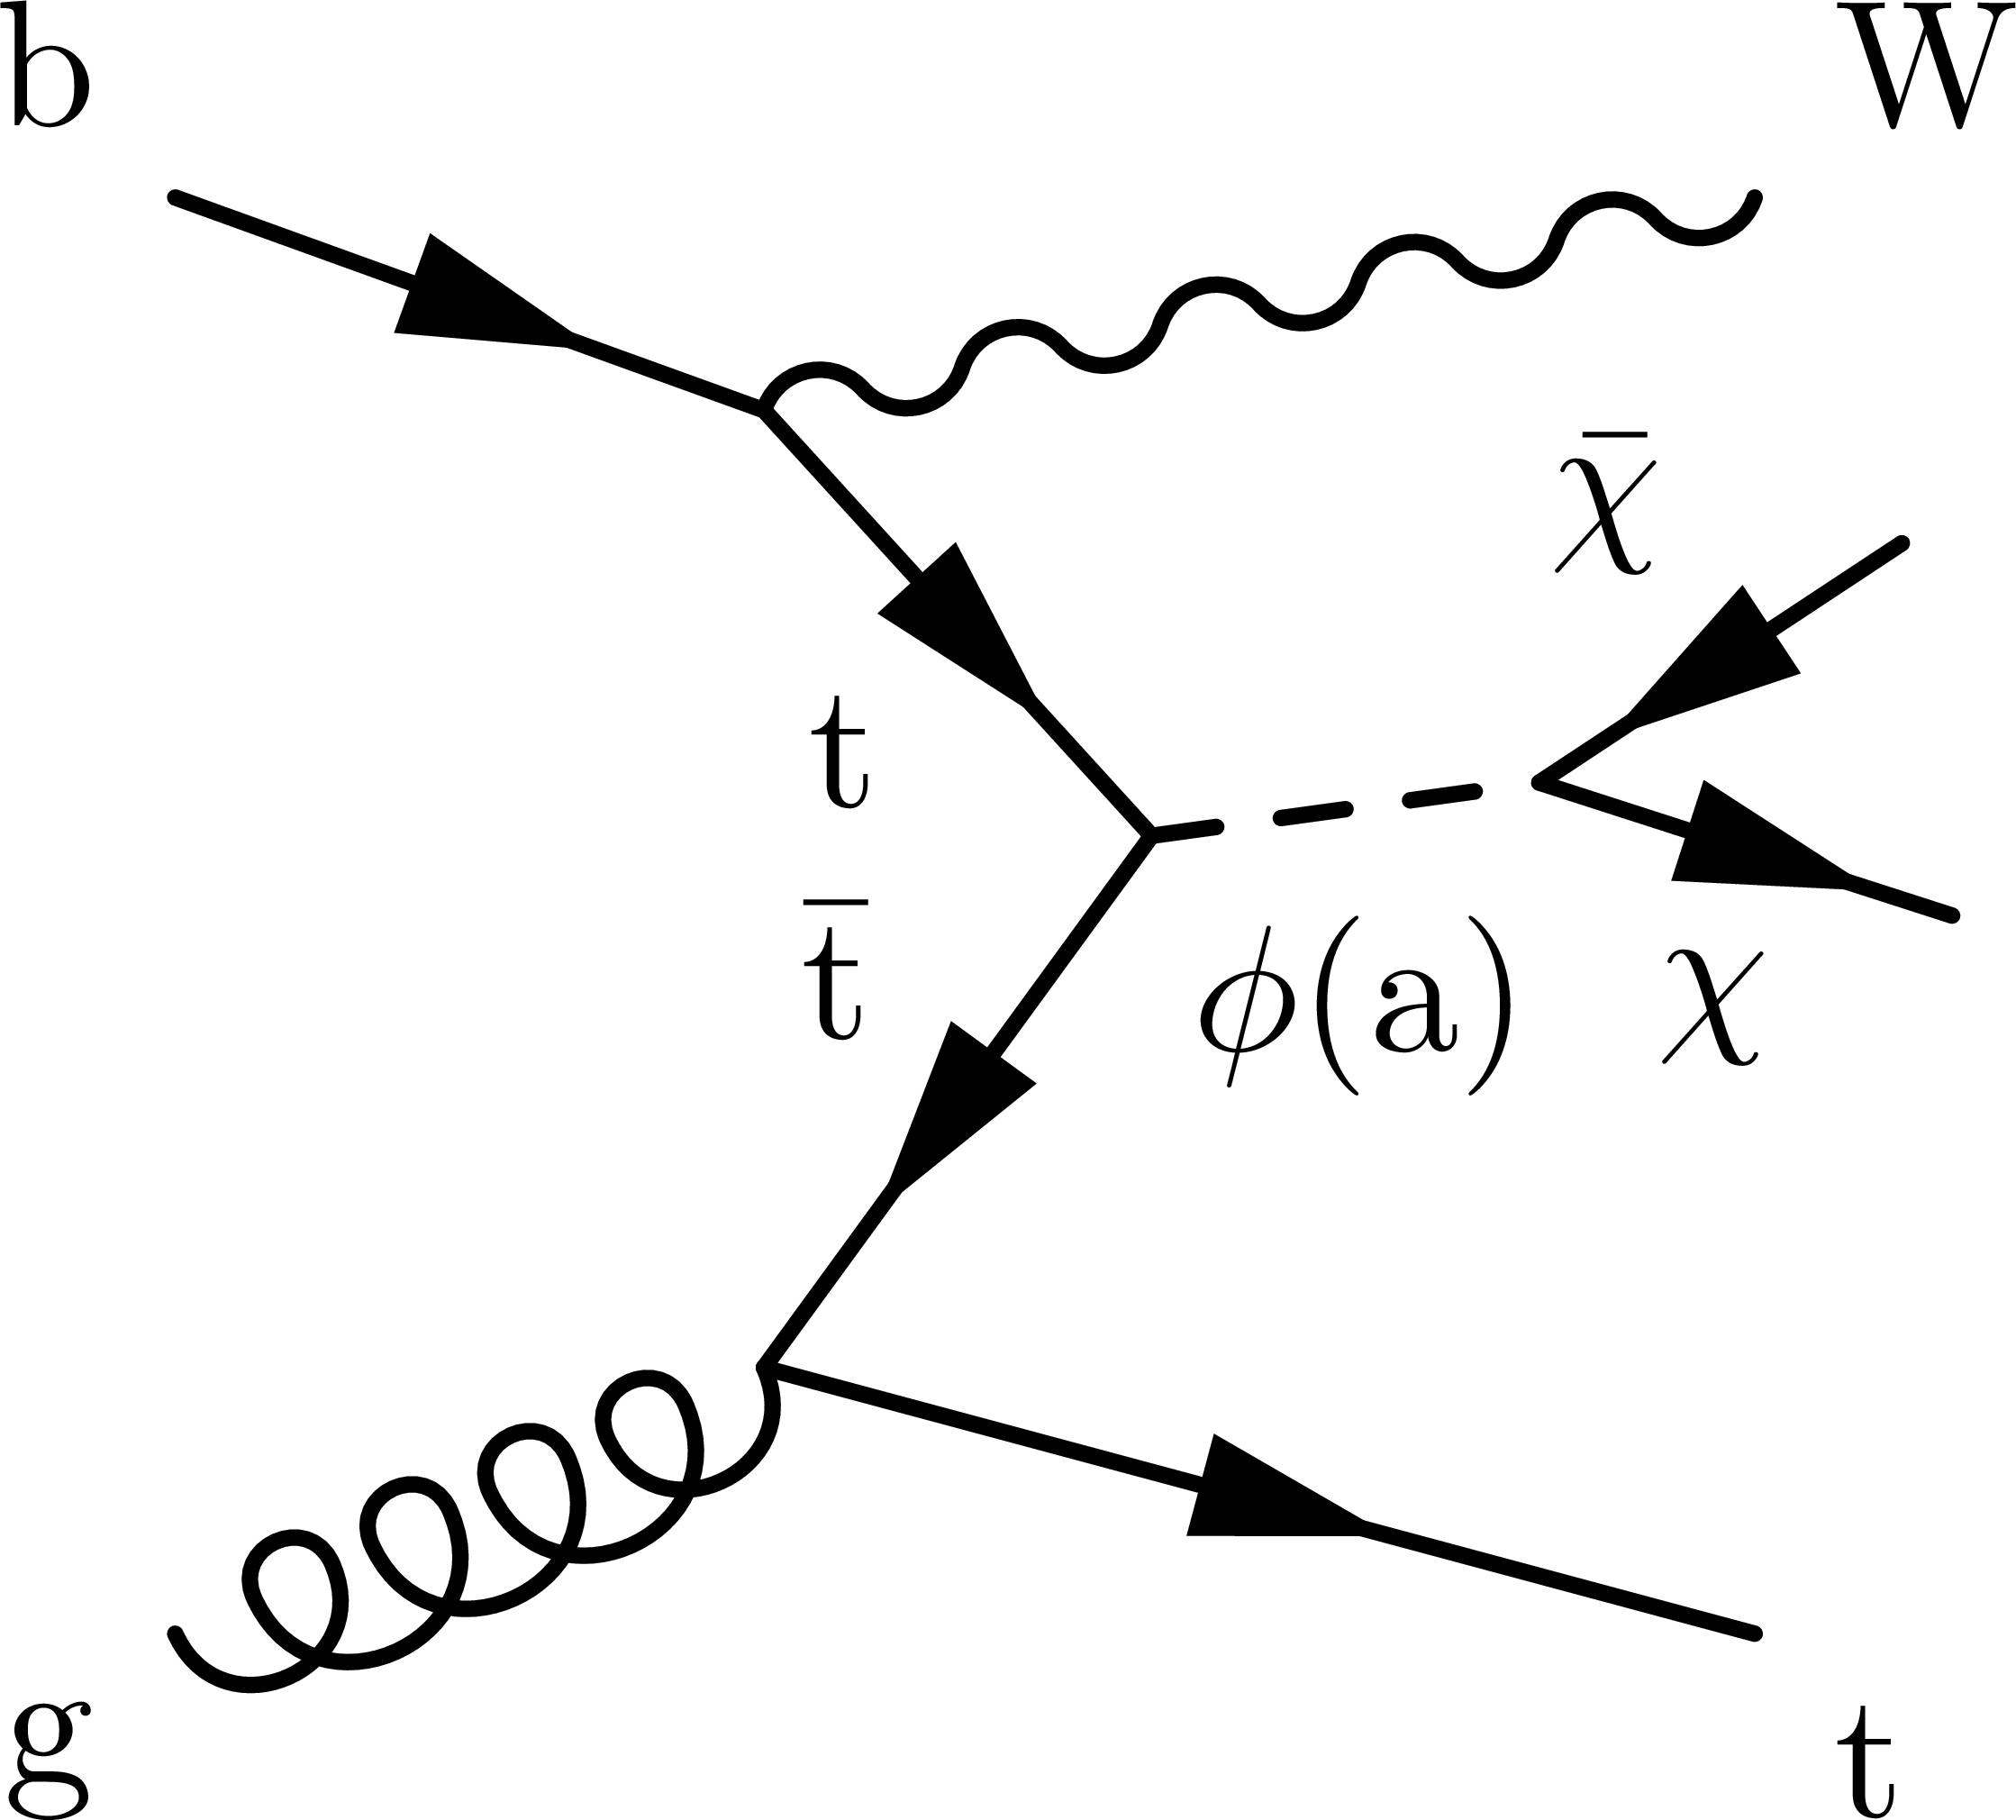
Figure 1:
Principal production diagrams for the associated production at the LHC of dark matter with a top quark pair (upper left) or a single top quark with associated $t$ channel W boson production (upper right) or with associated tW production (lower left and right). |
png pdf |
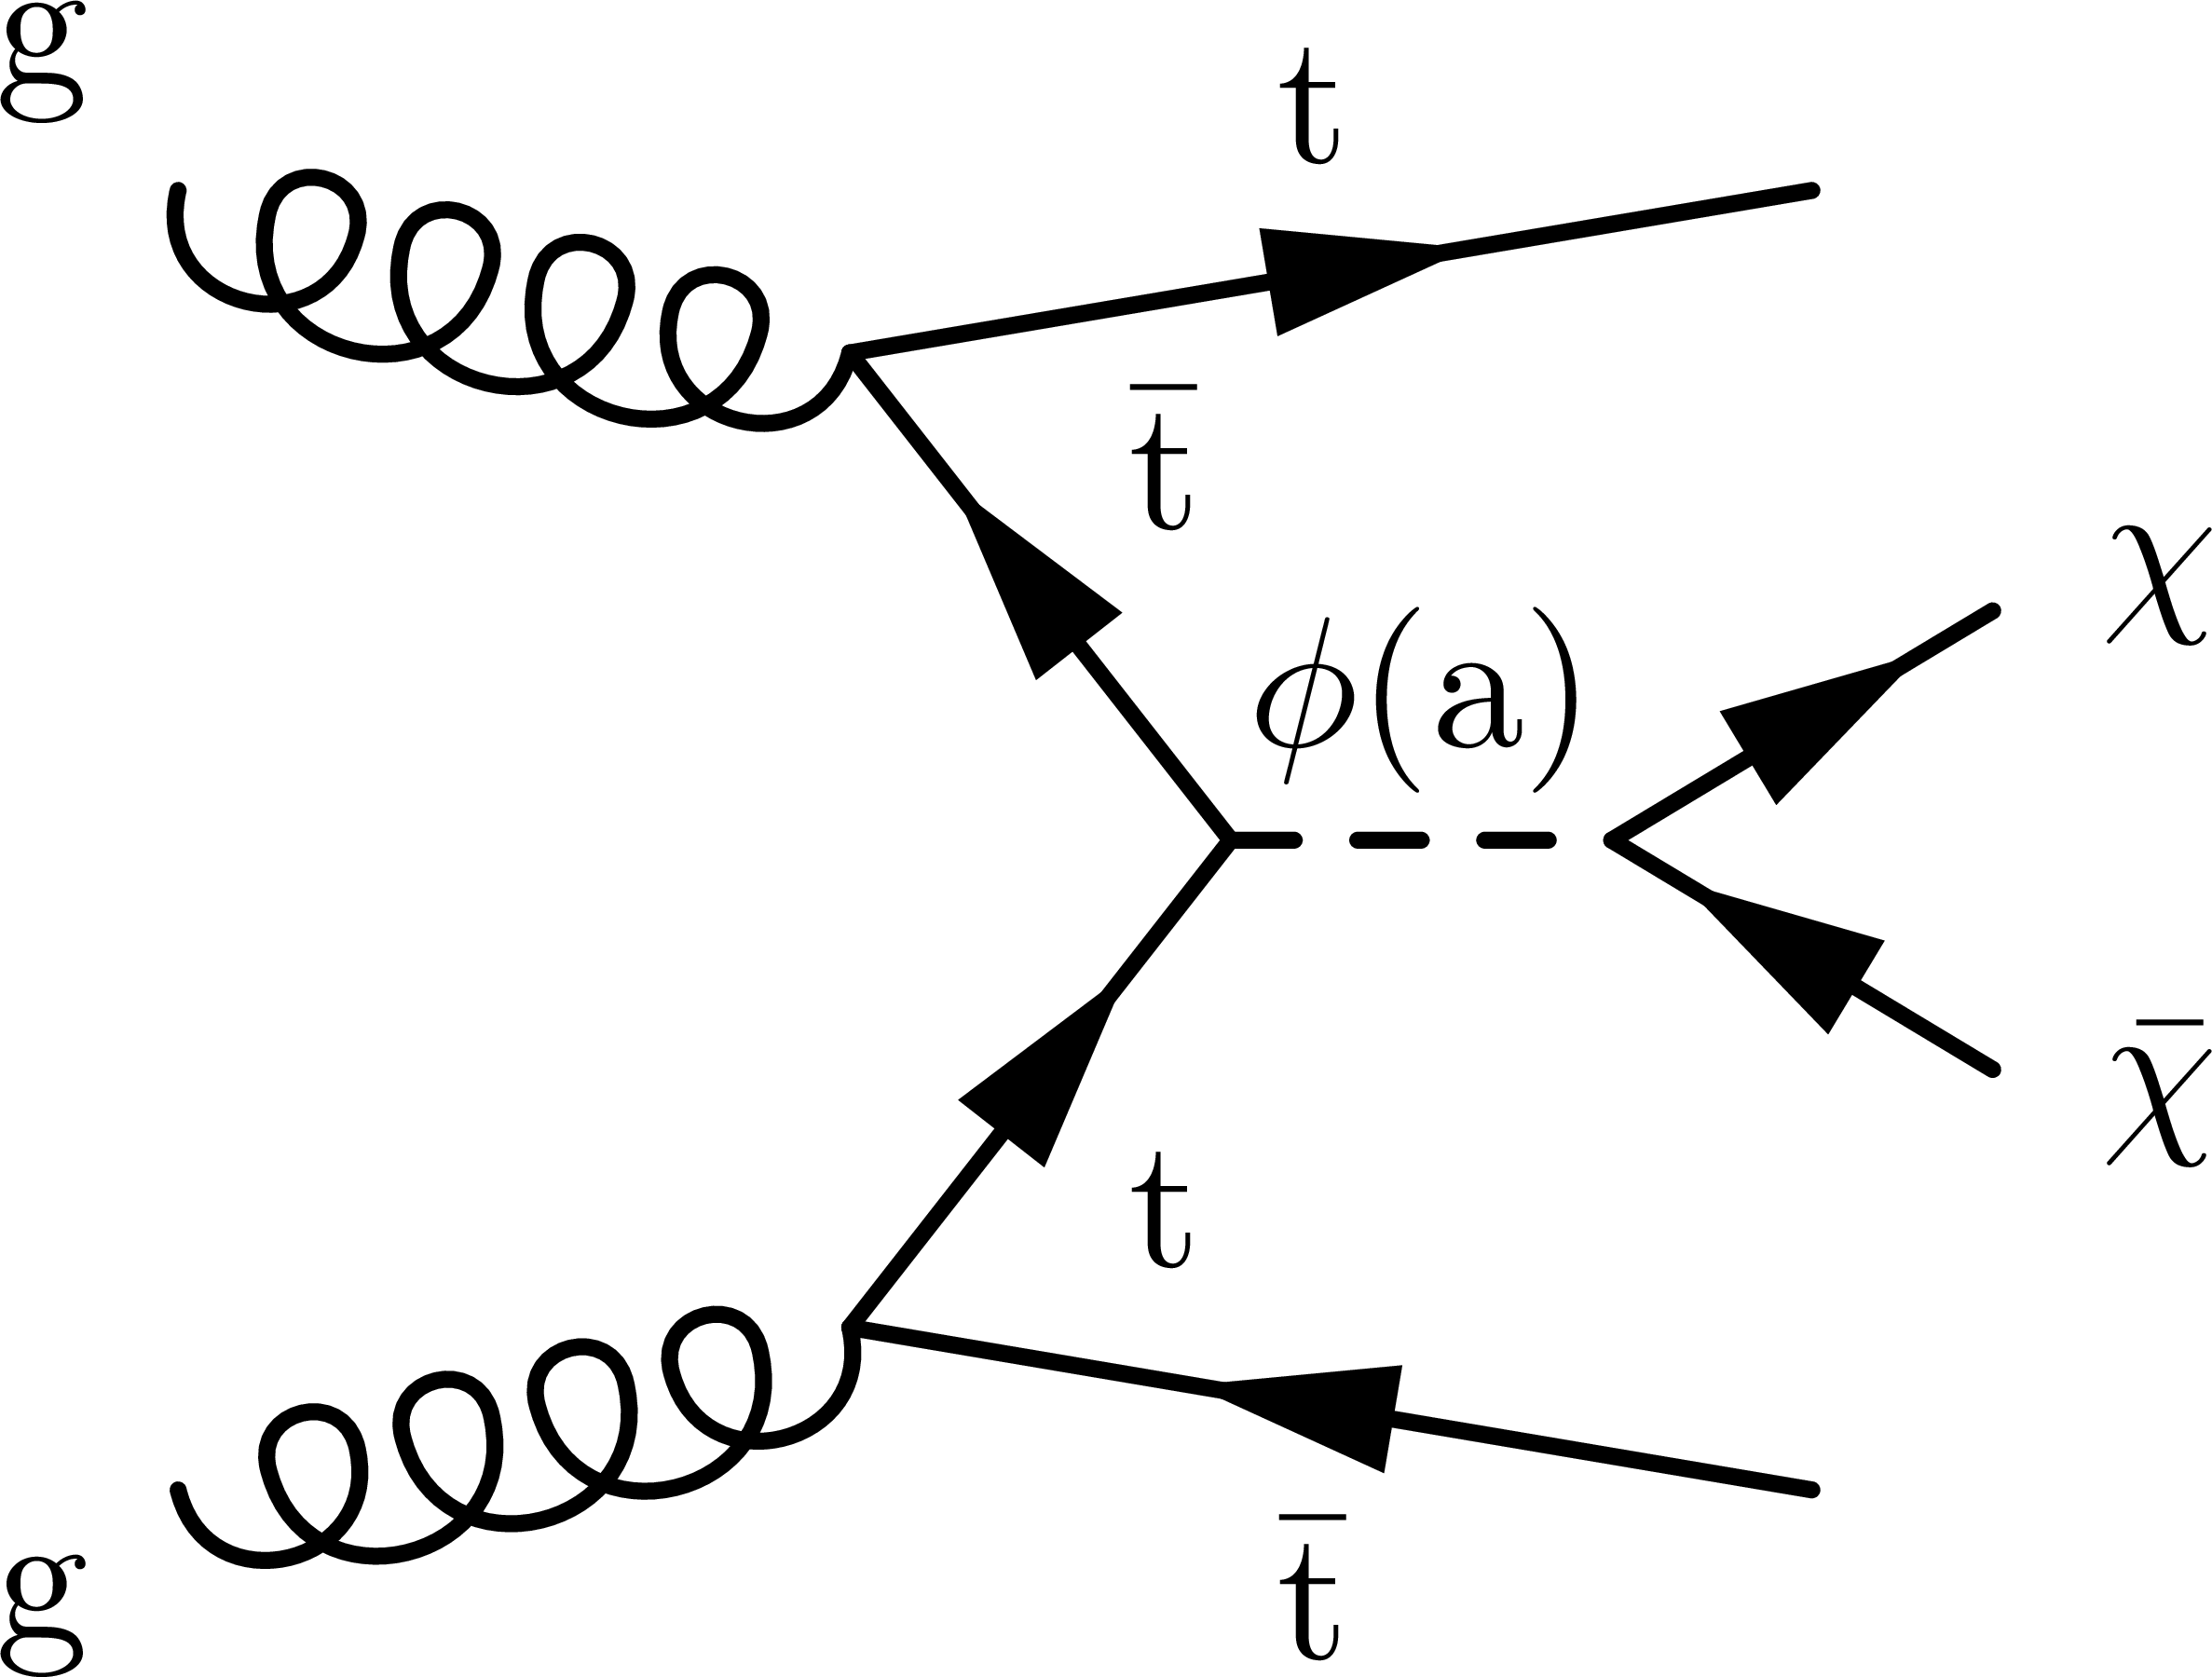
Figure 1-a:
Production diagram for the associated production at the LHC of dark matter with a top quark pair. |
png pdf |
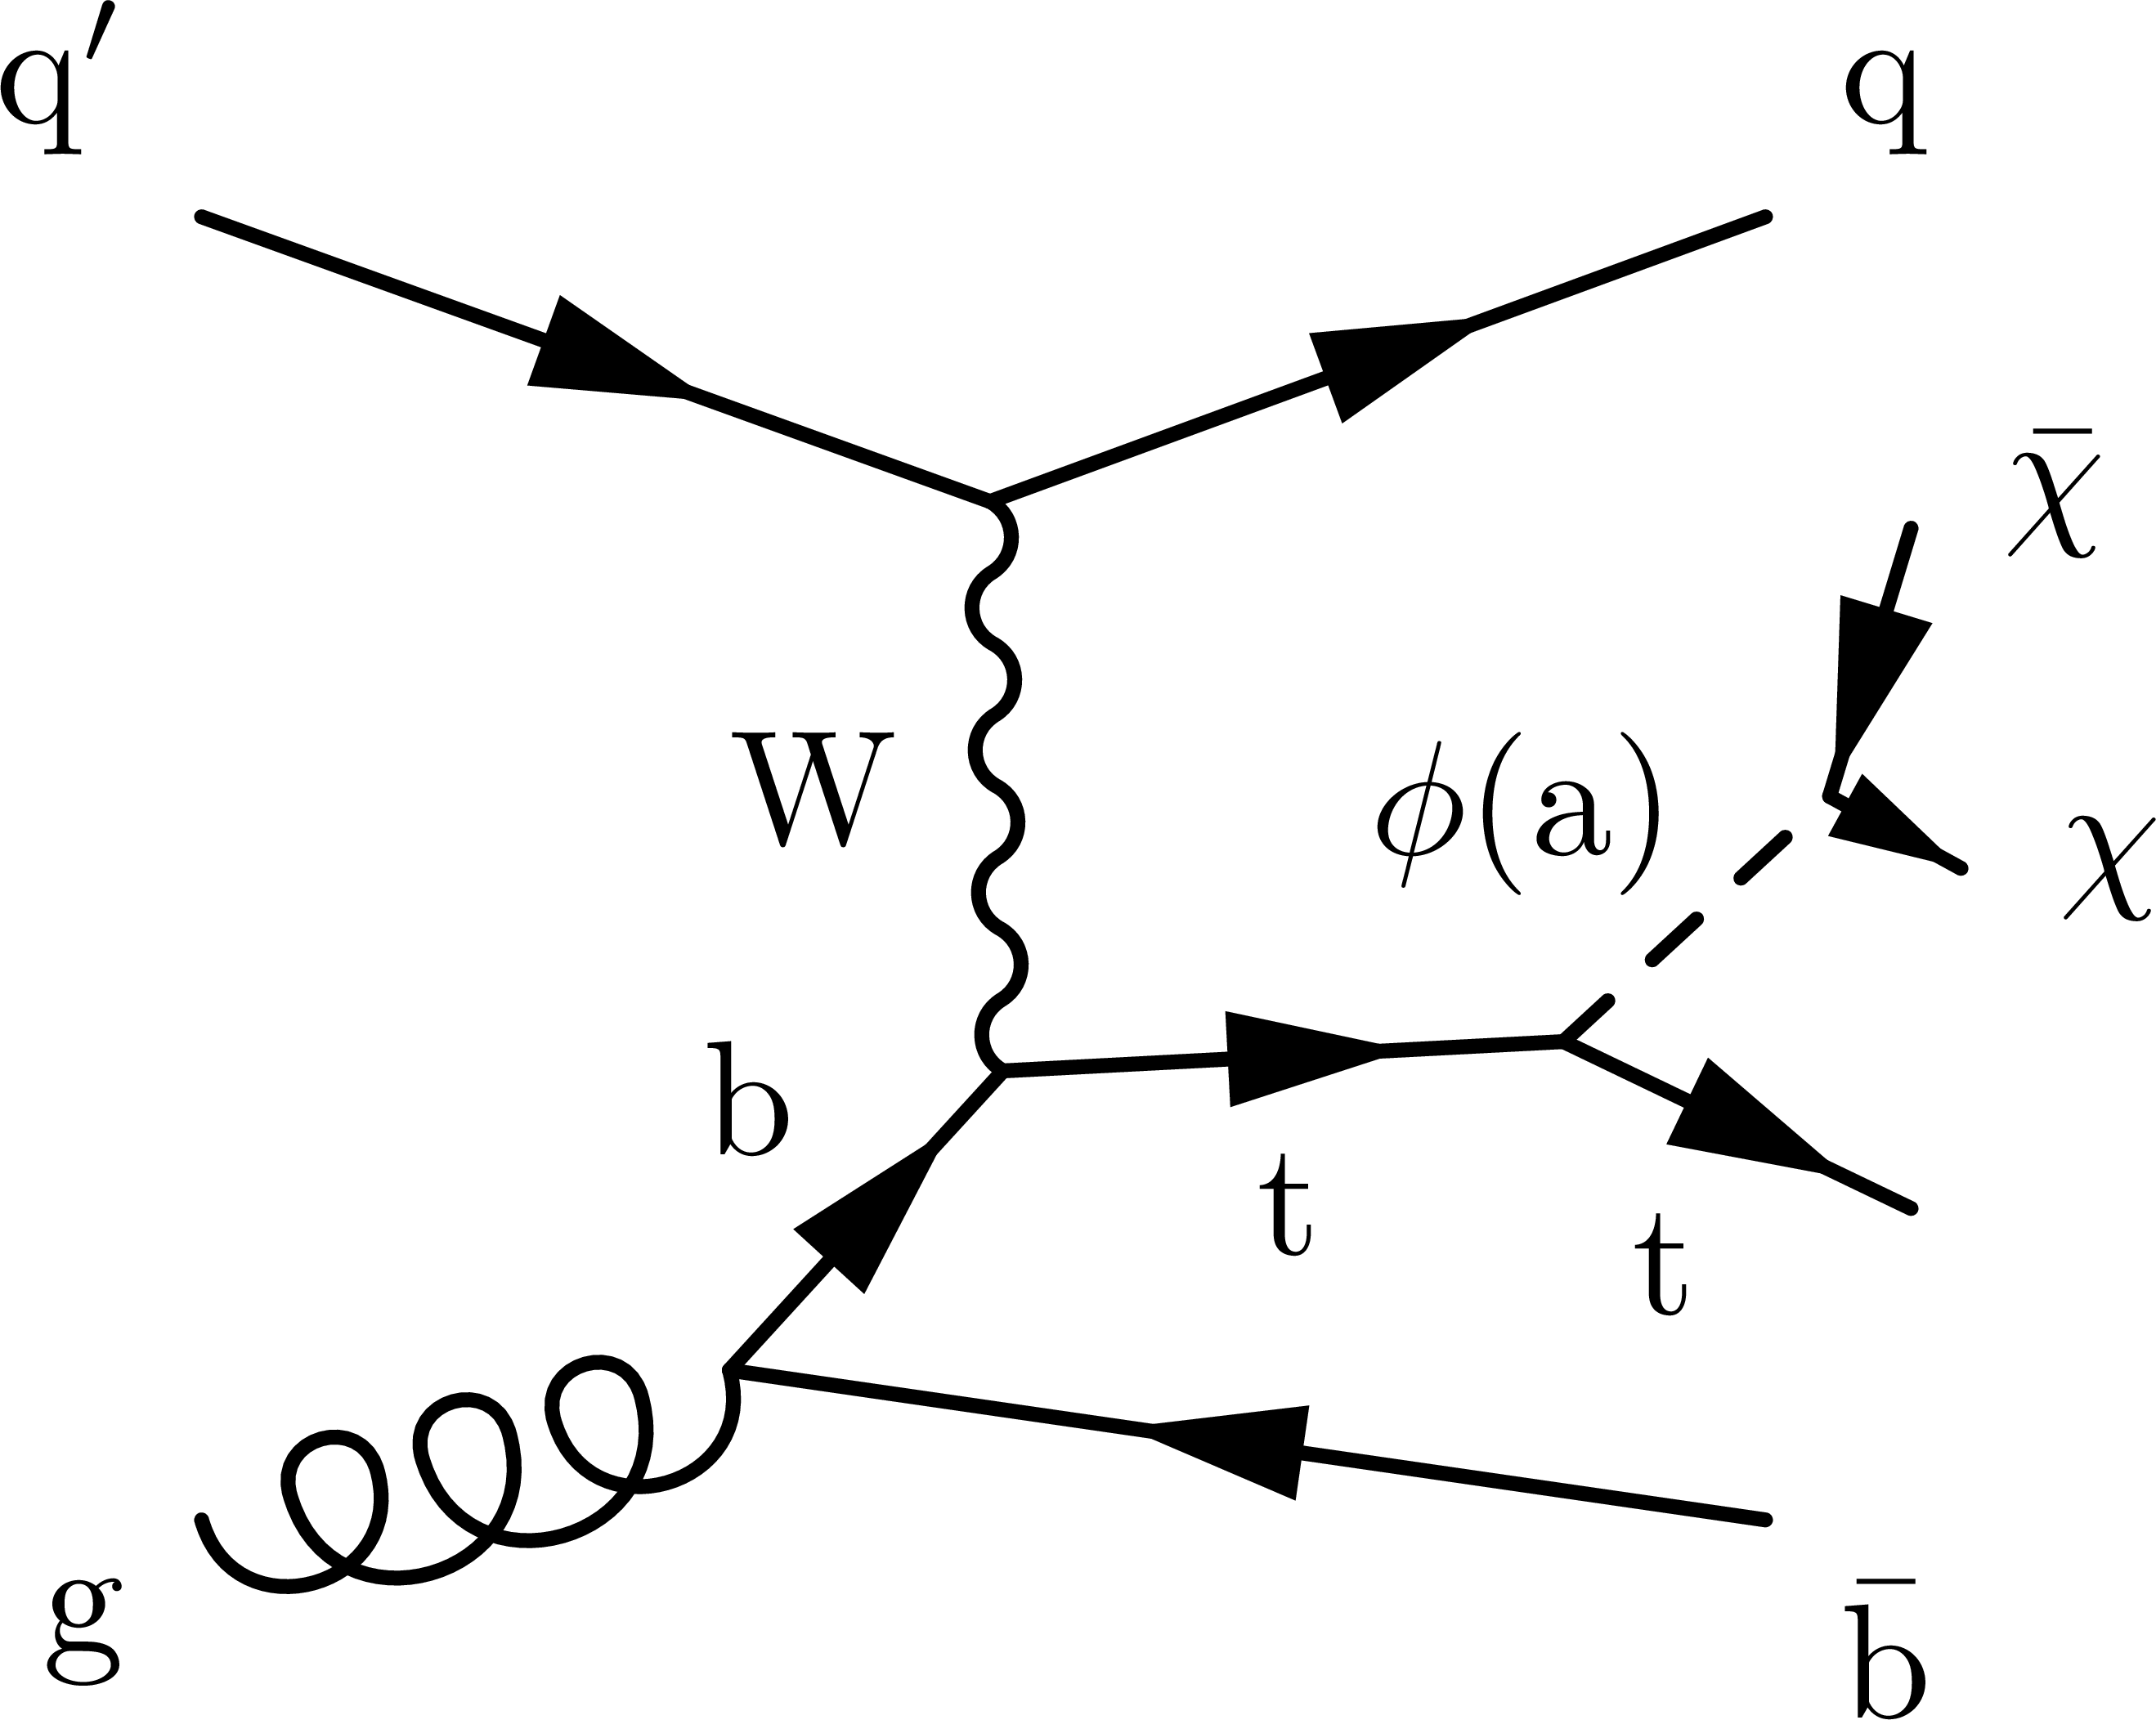
Figure 1-b:
Production diagram for the associated production at the LHC of dark matter with a single top quark with associated $t$ channel W boson production. |
png pdf |
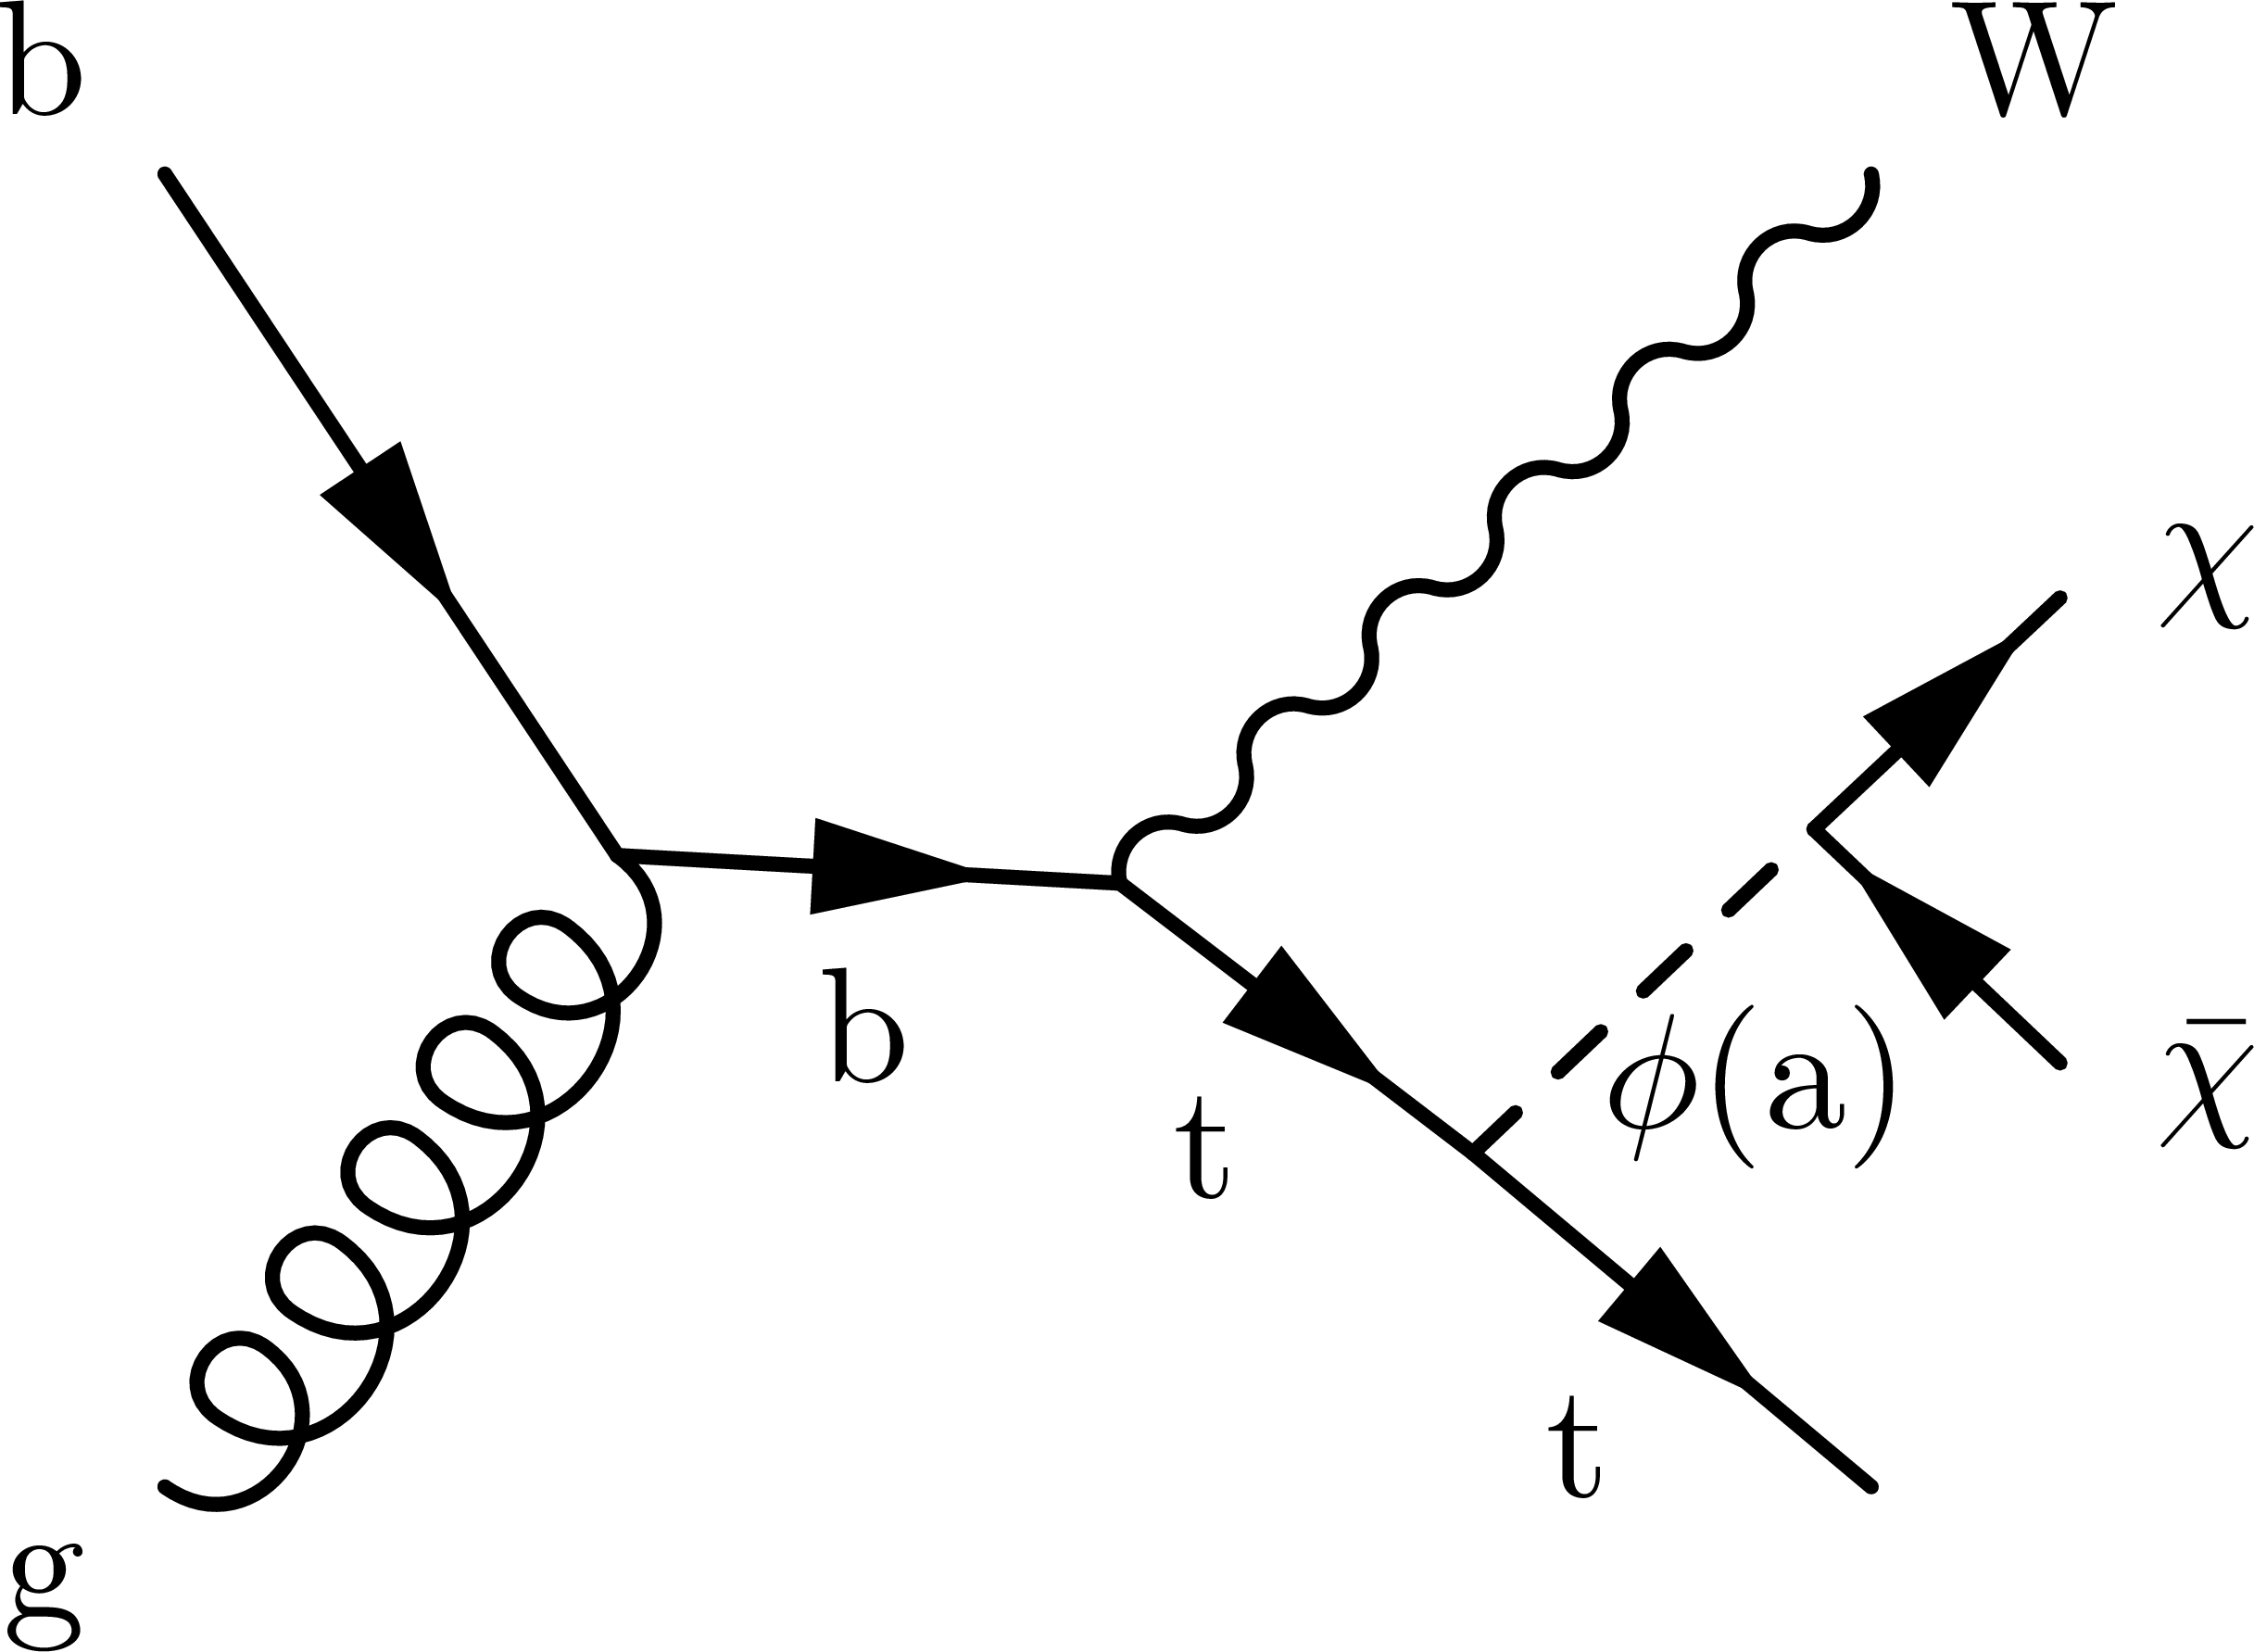
Figure 1-c:
Production diagram for the associated production at the LHC of dark matter with associated tW production. |
png pdf |
Figure 1-d:
Production diagram for the associated production at the LHC of dark matter with associated tW production. |
png pdf |
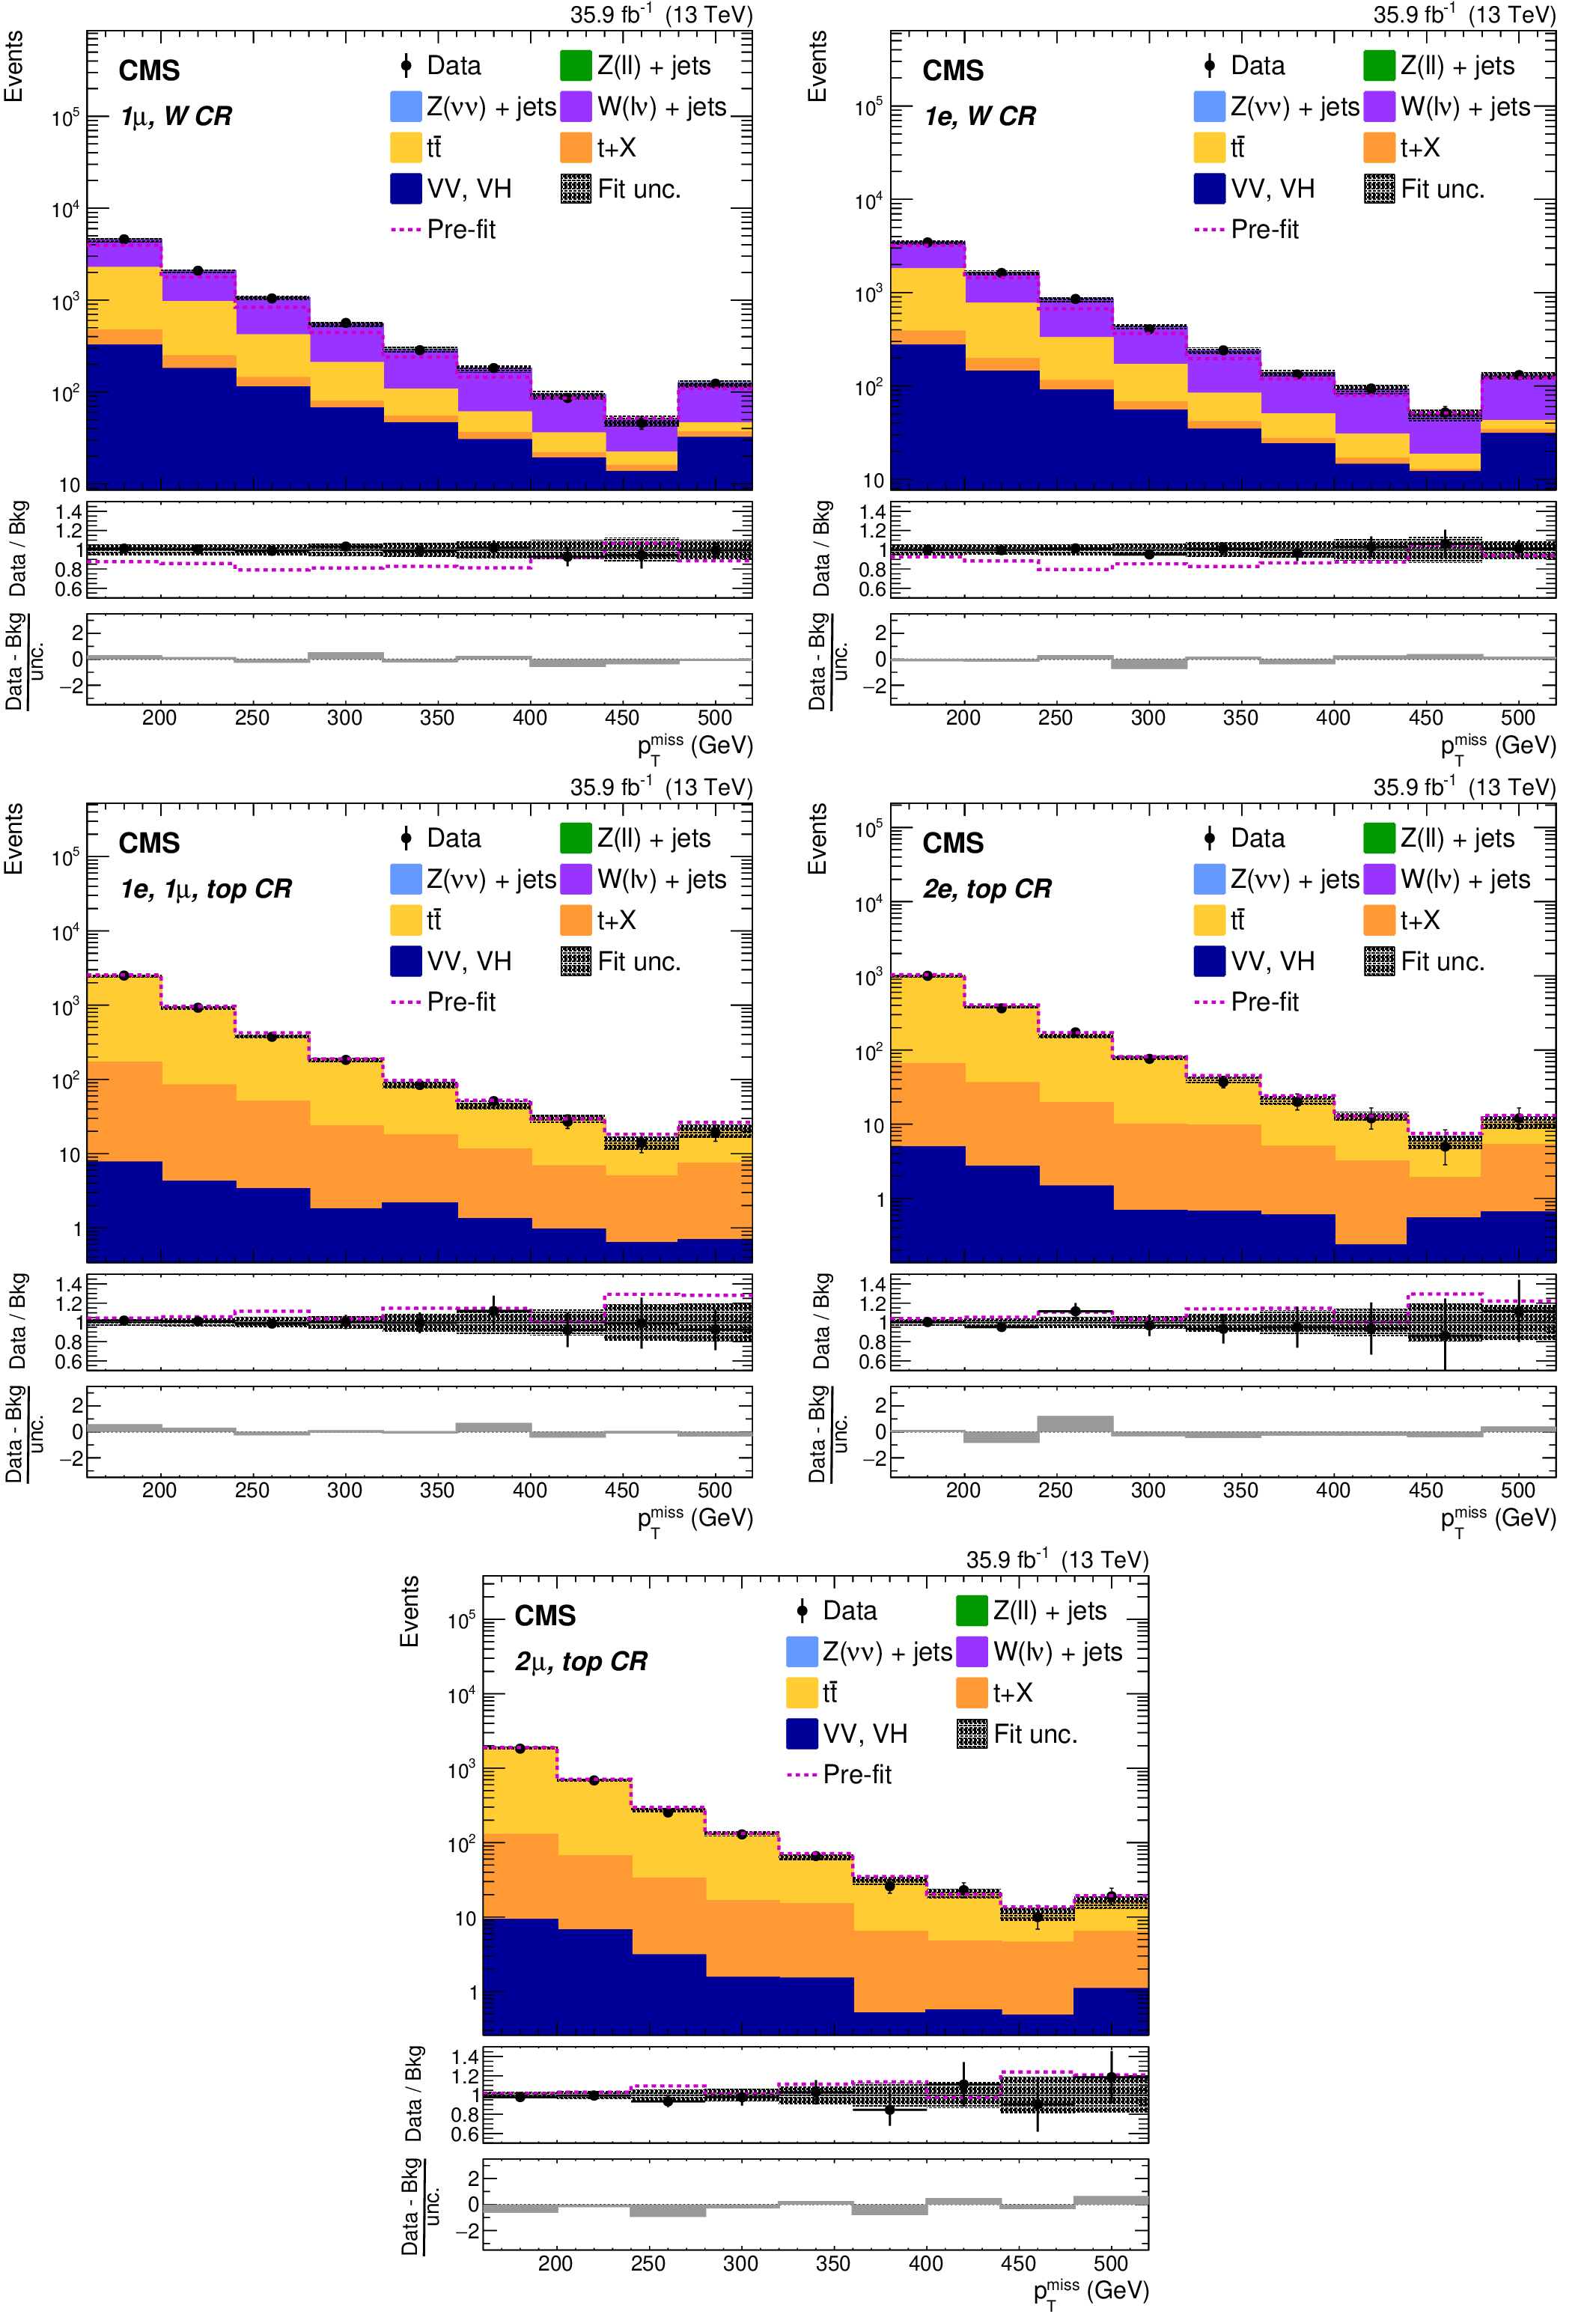
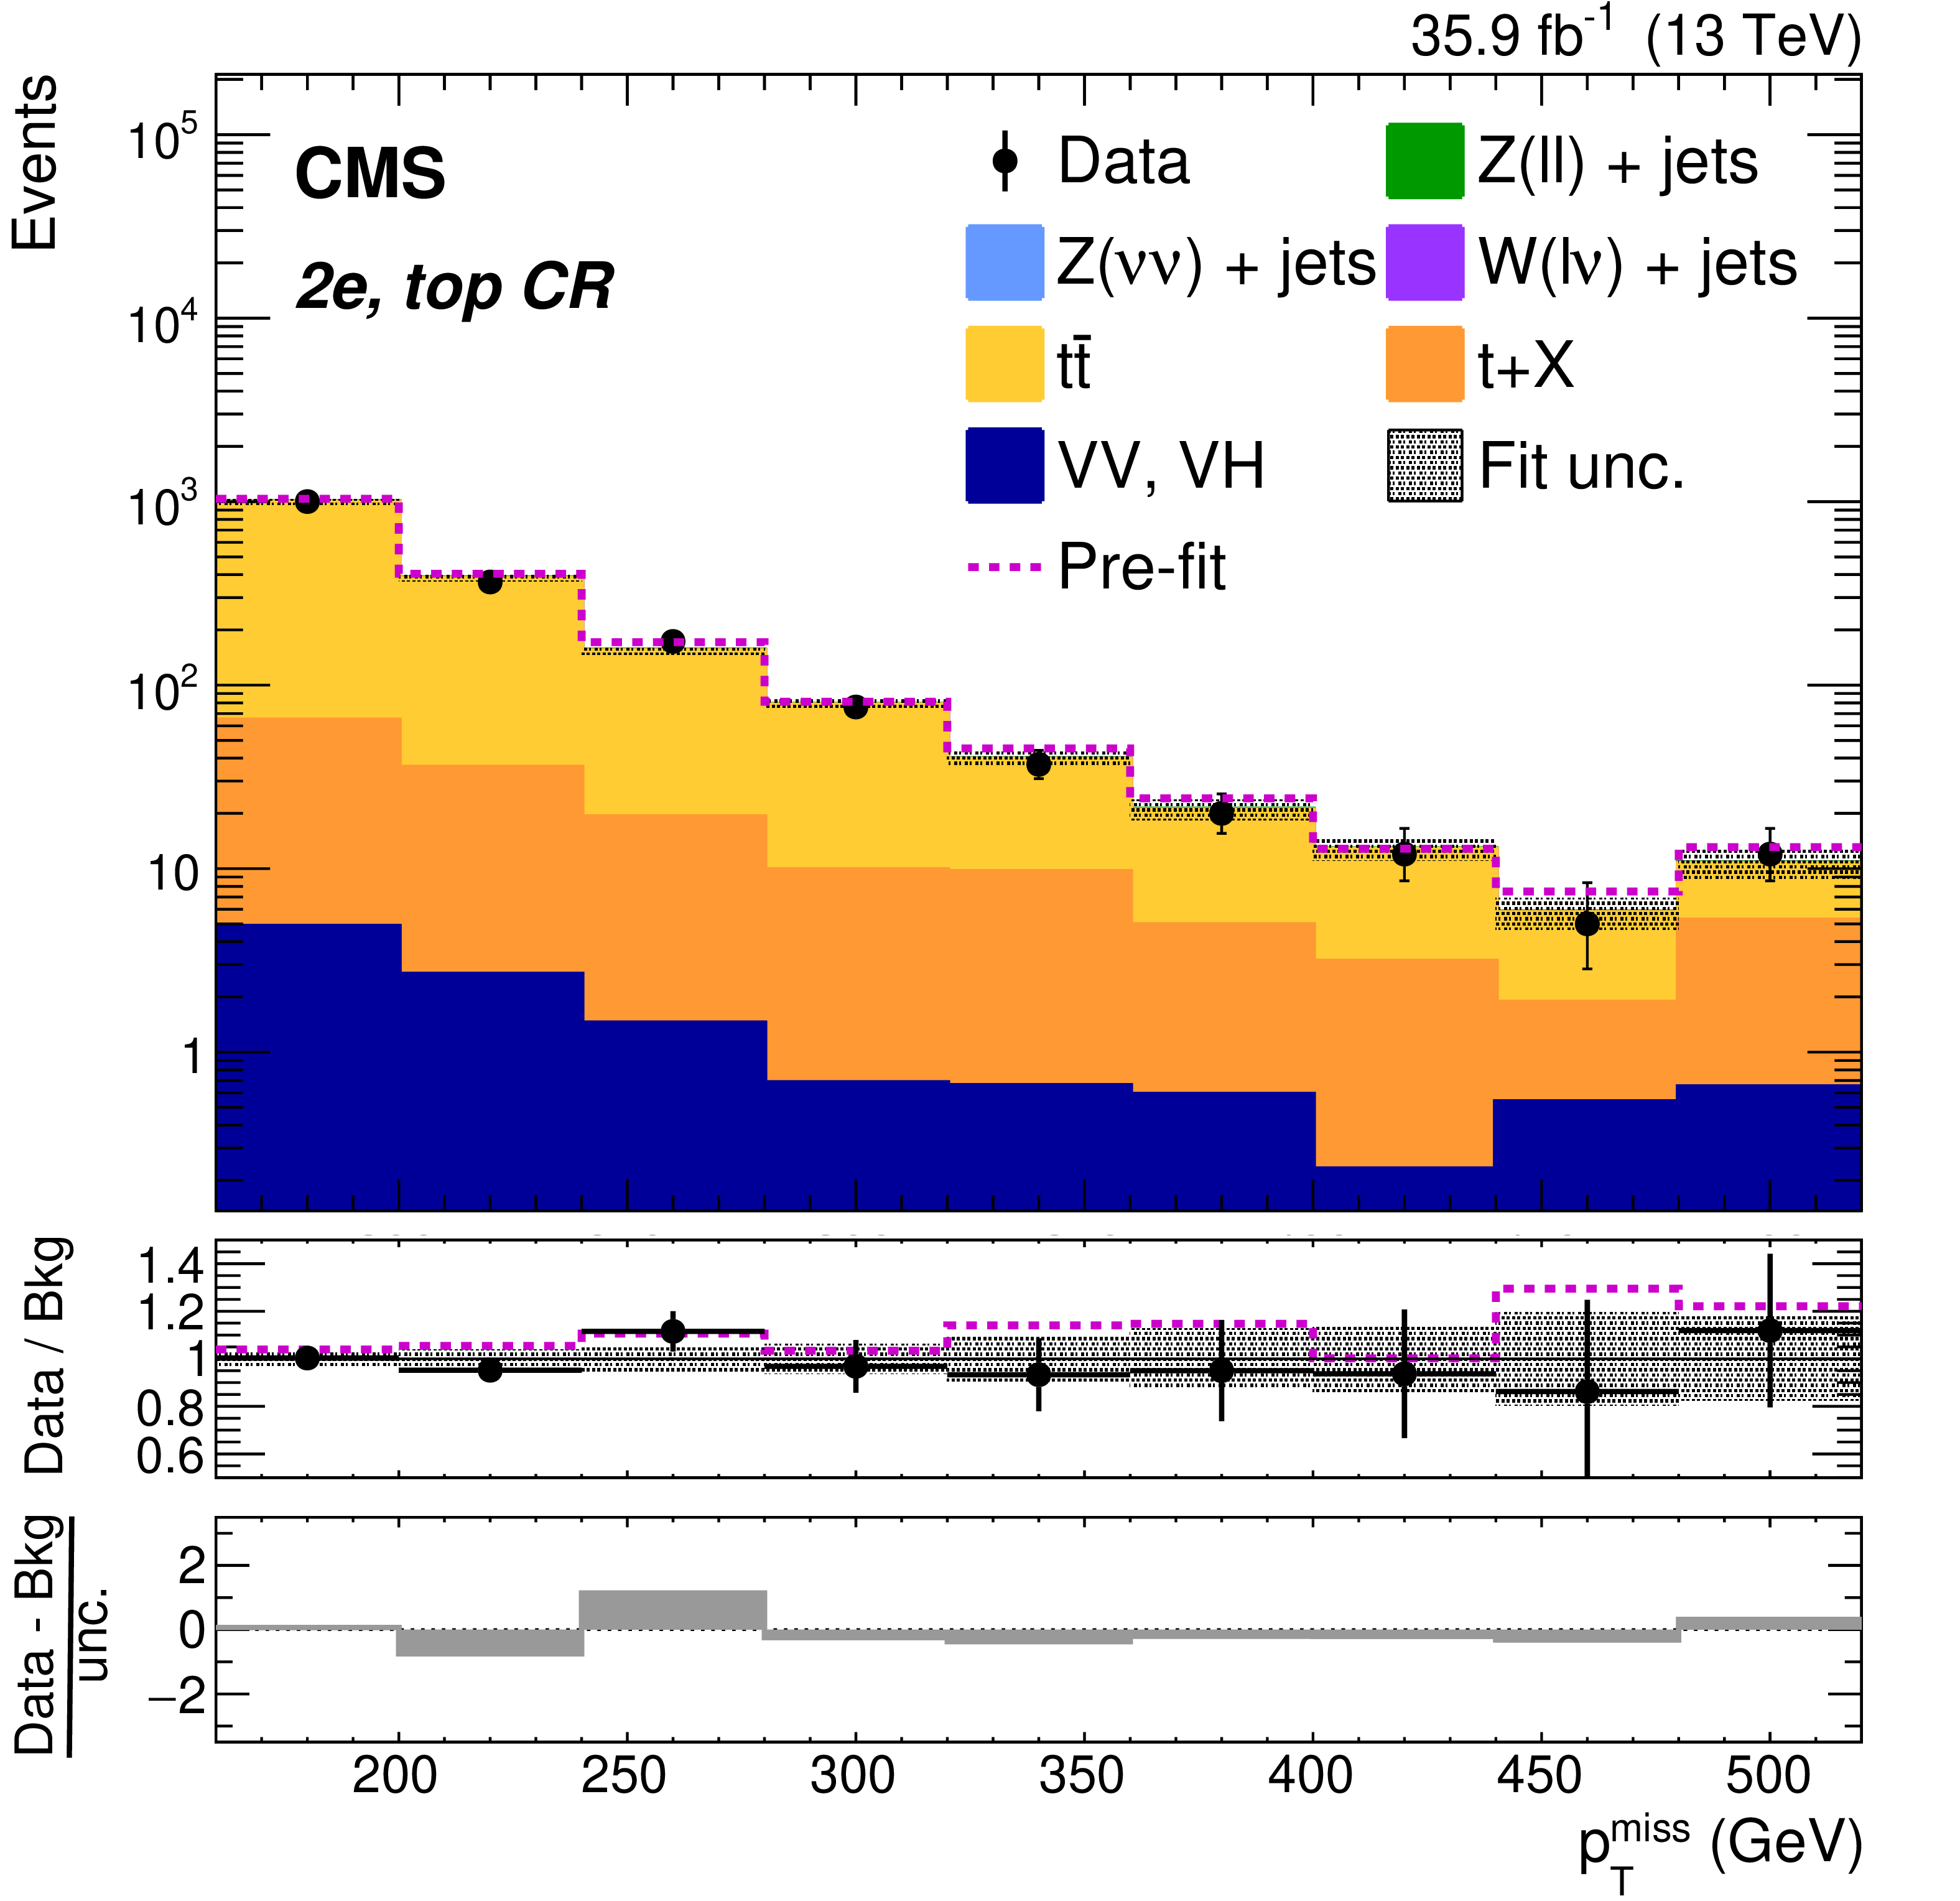
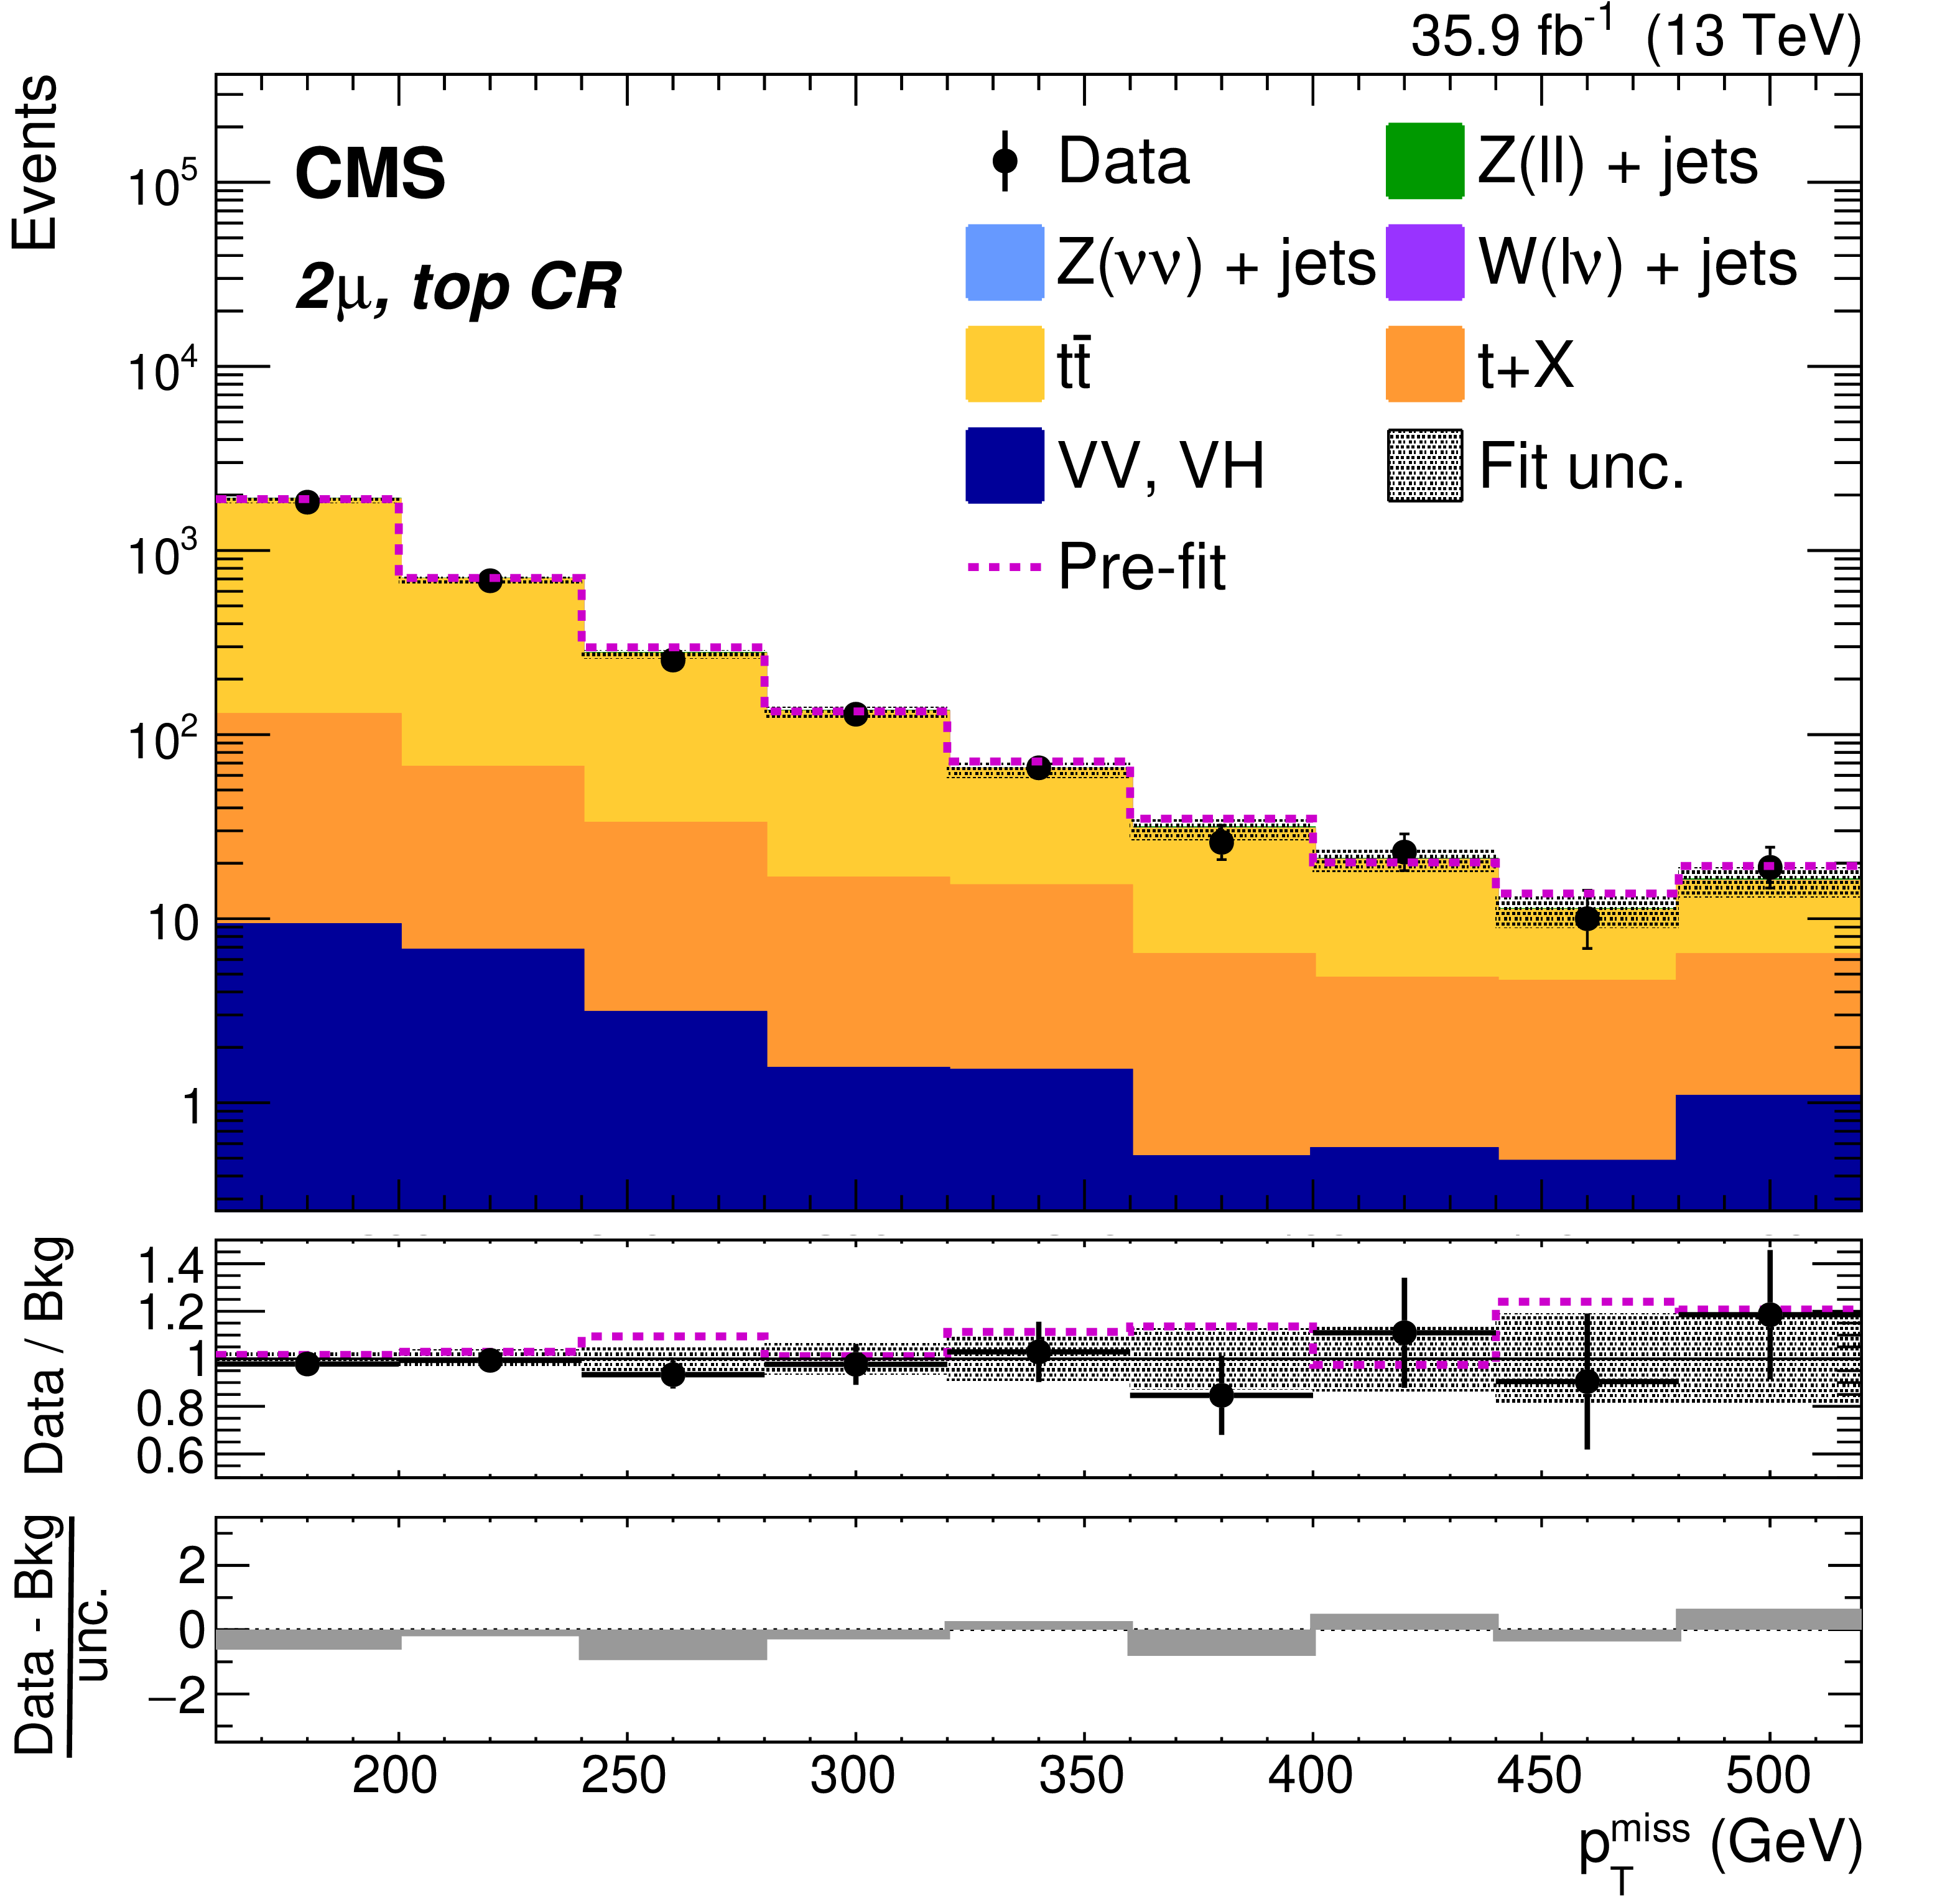
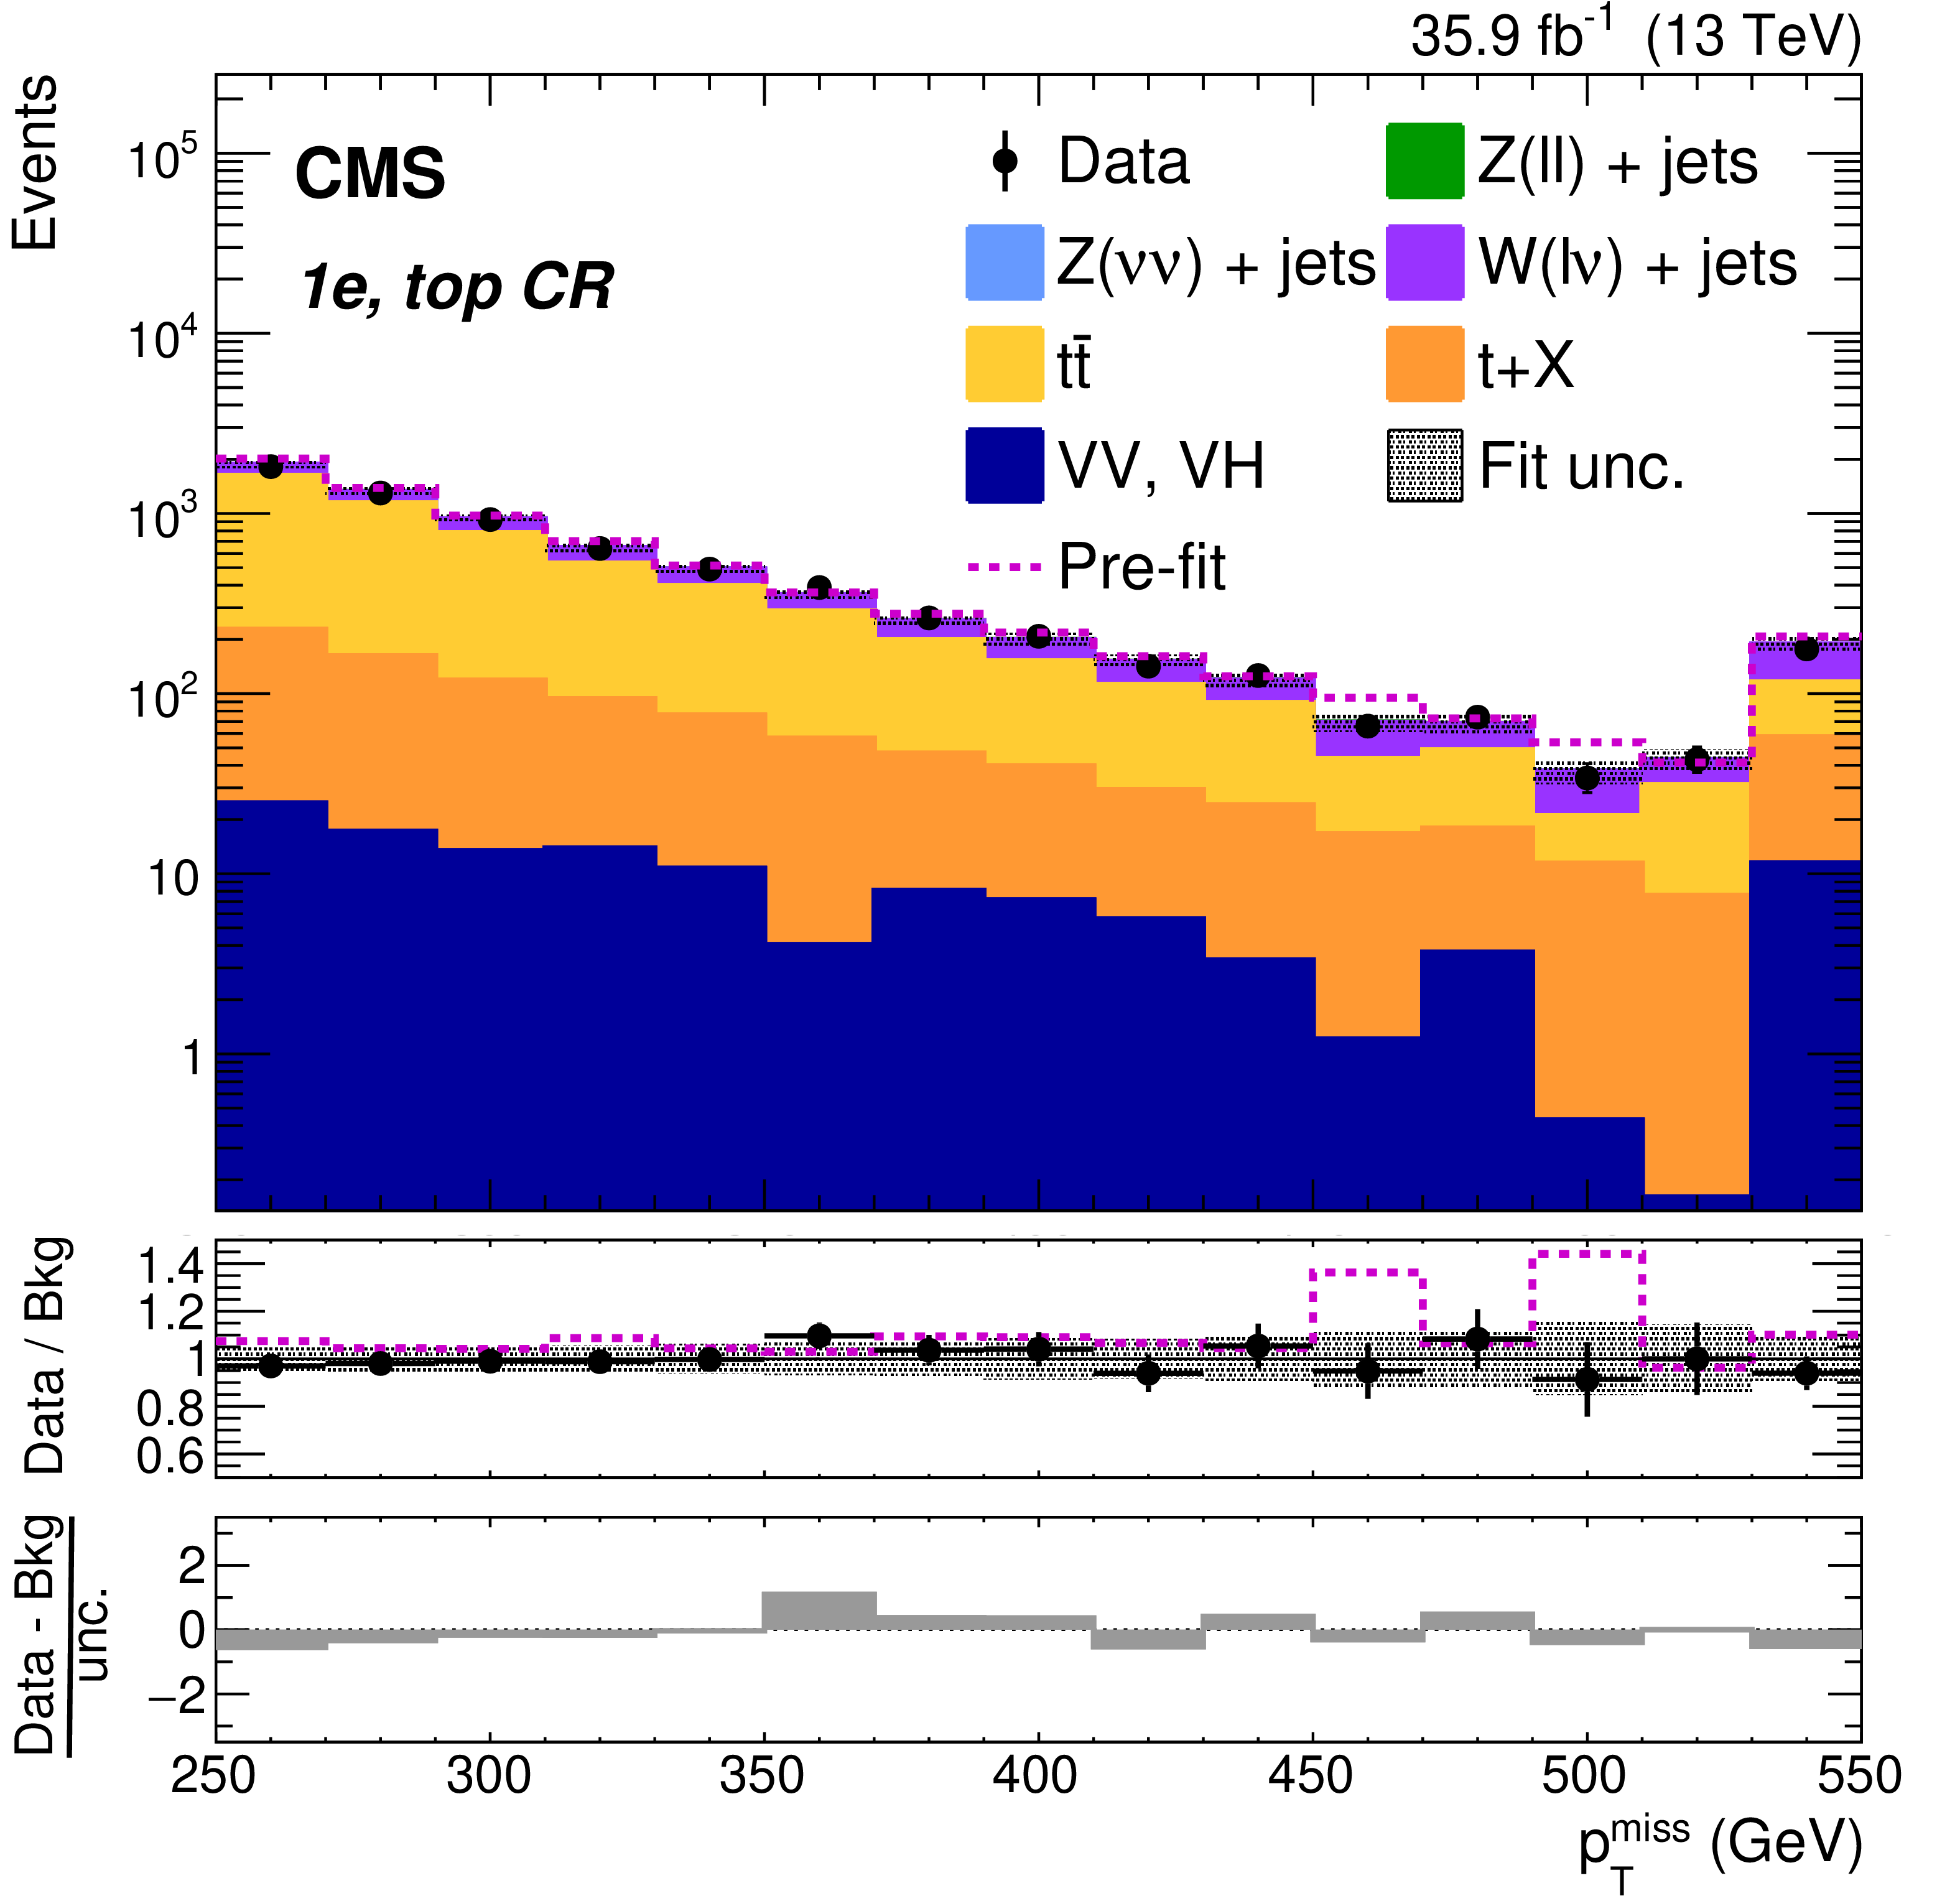
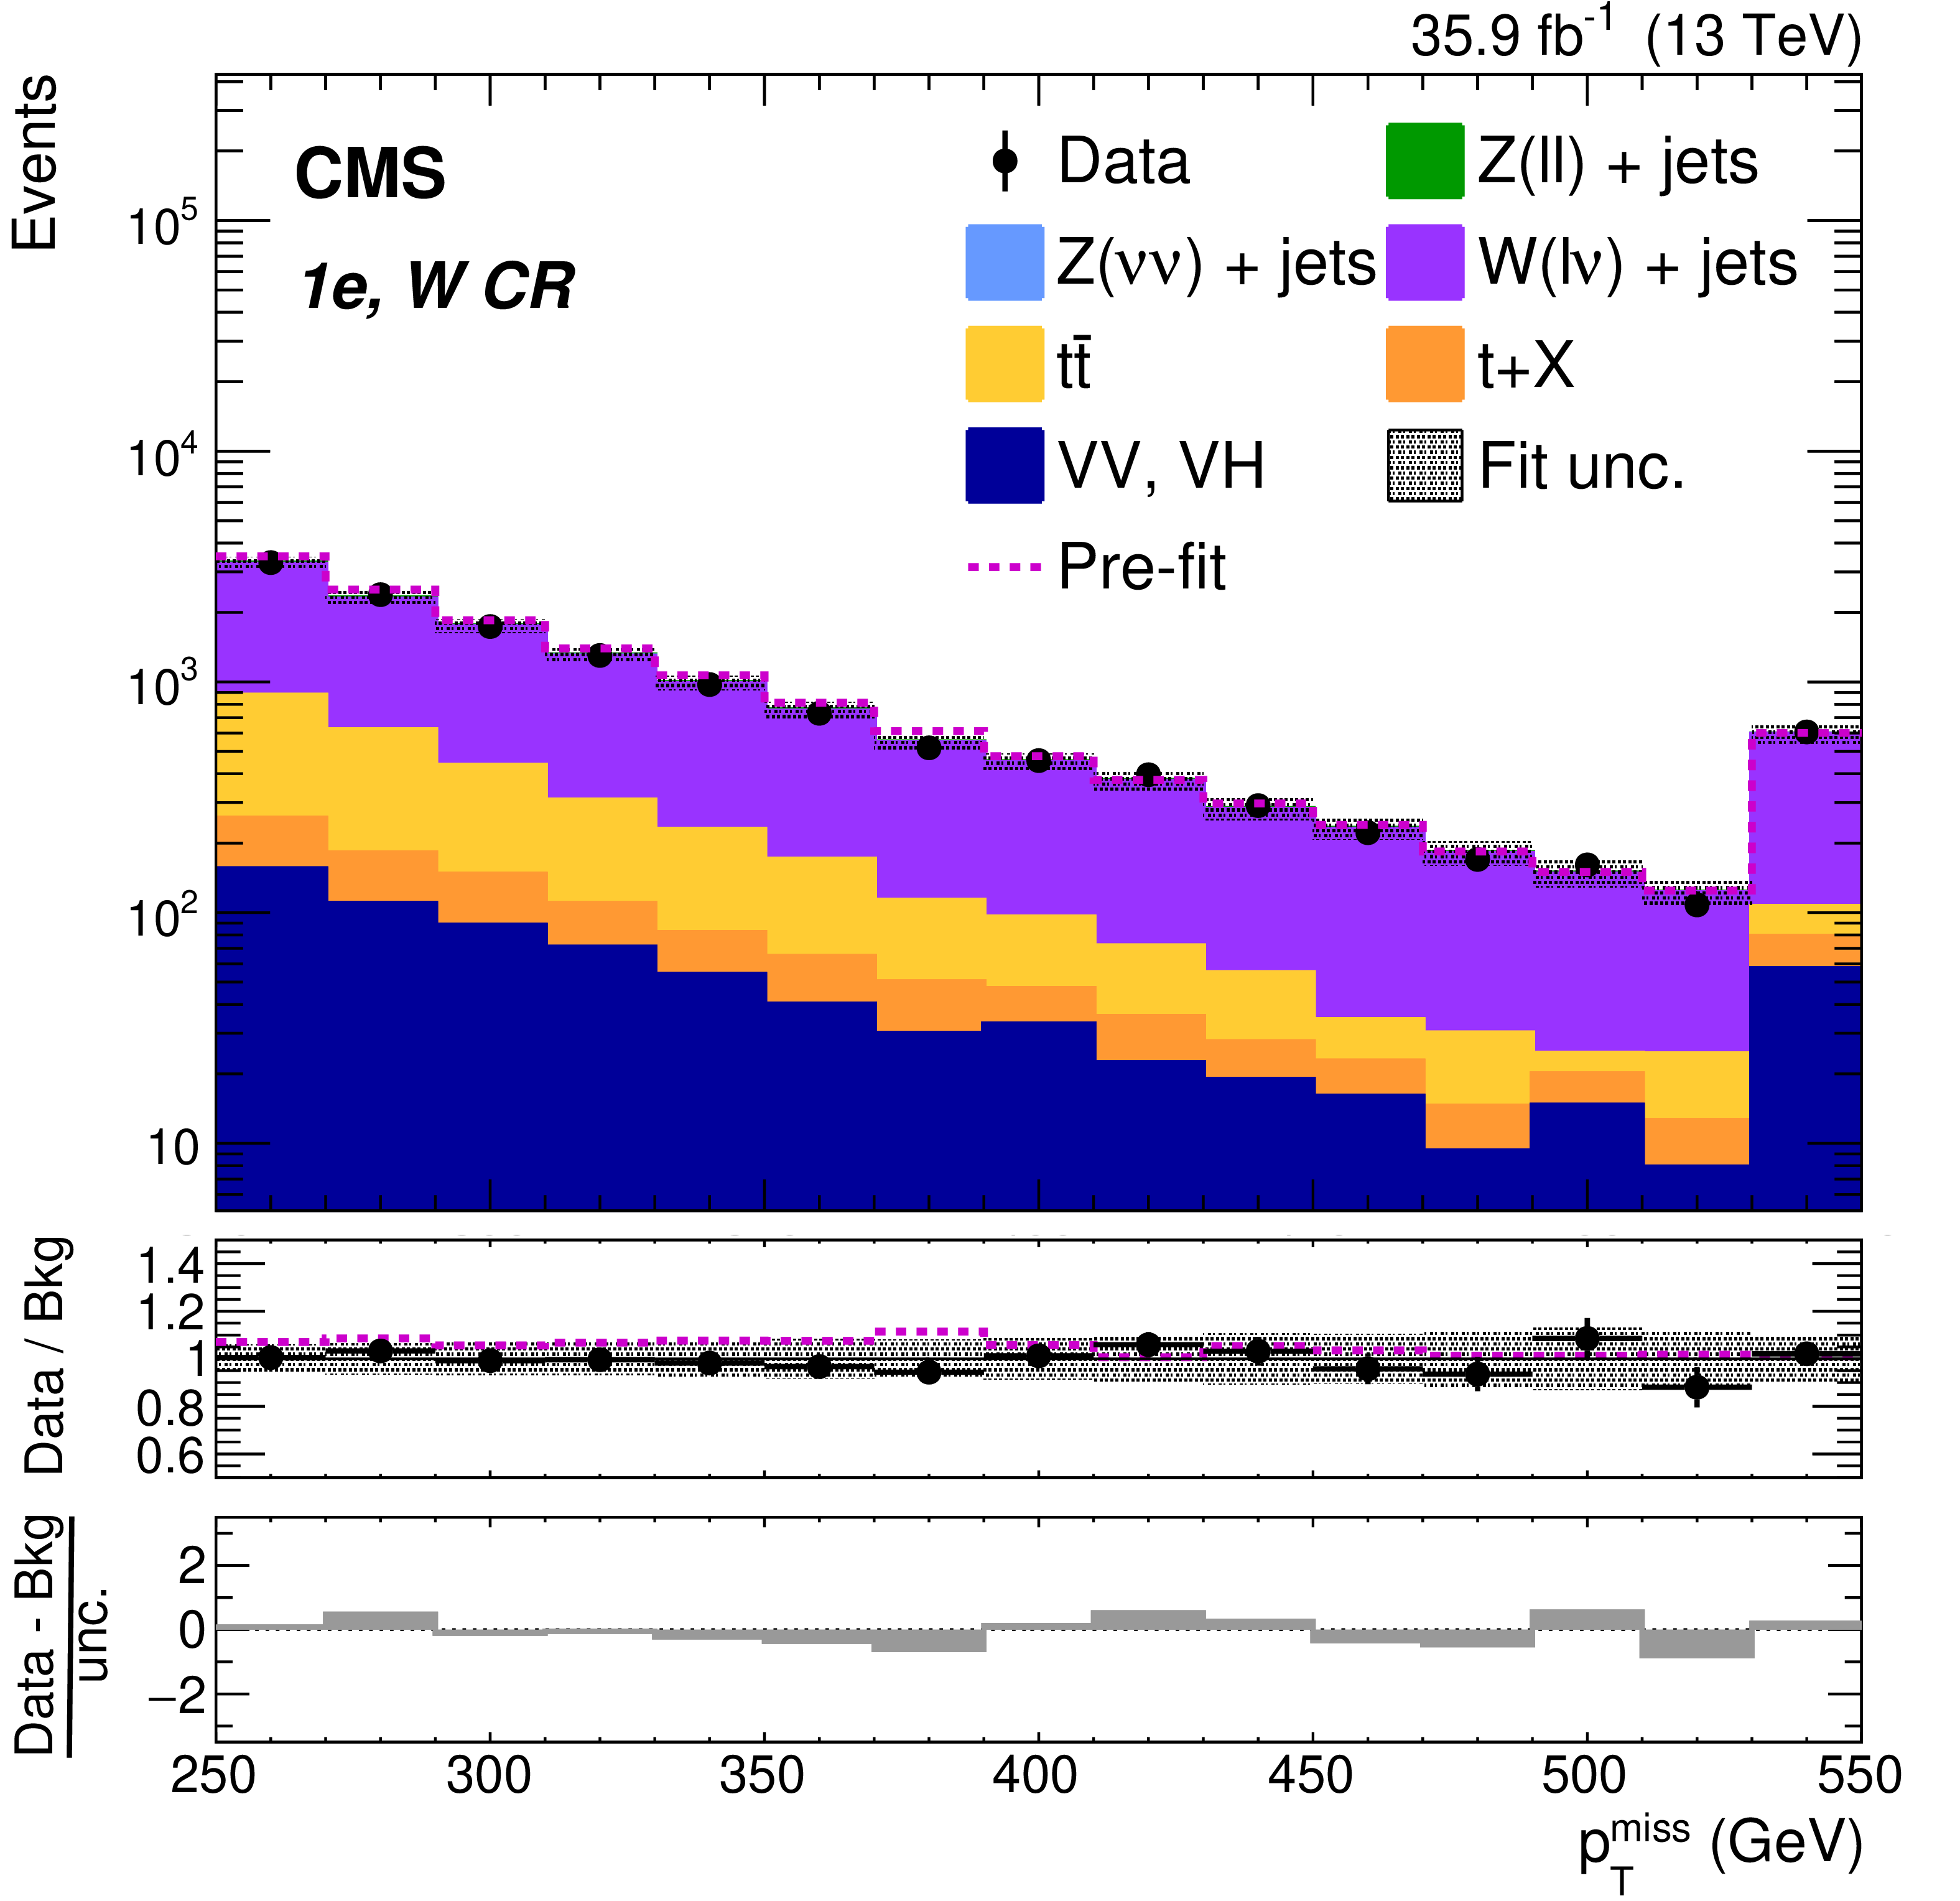
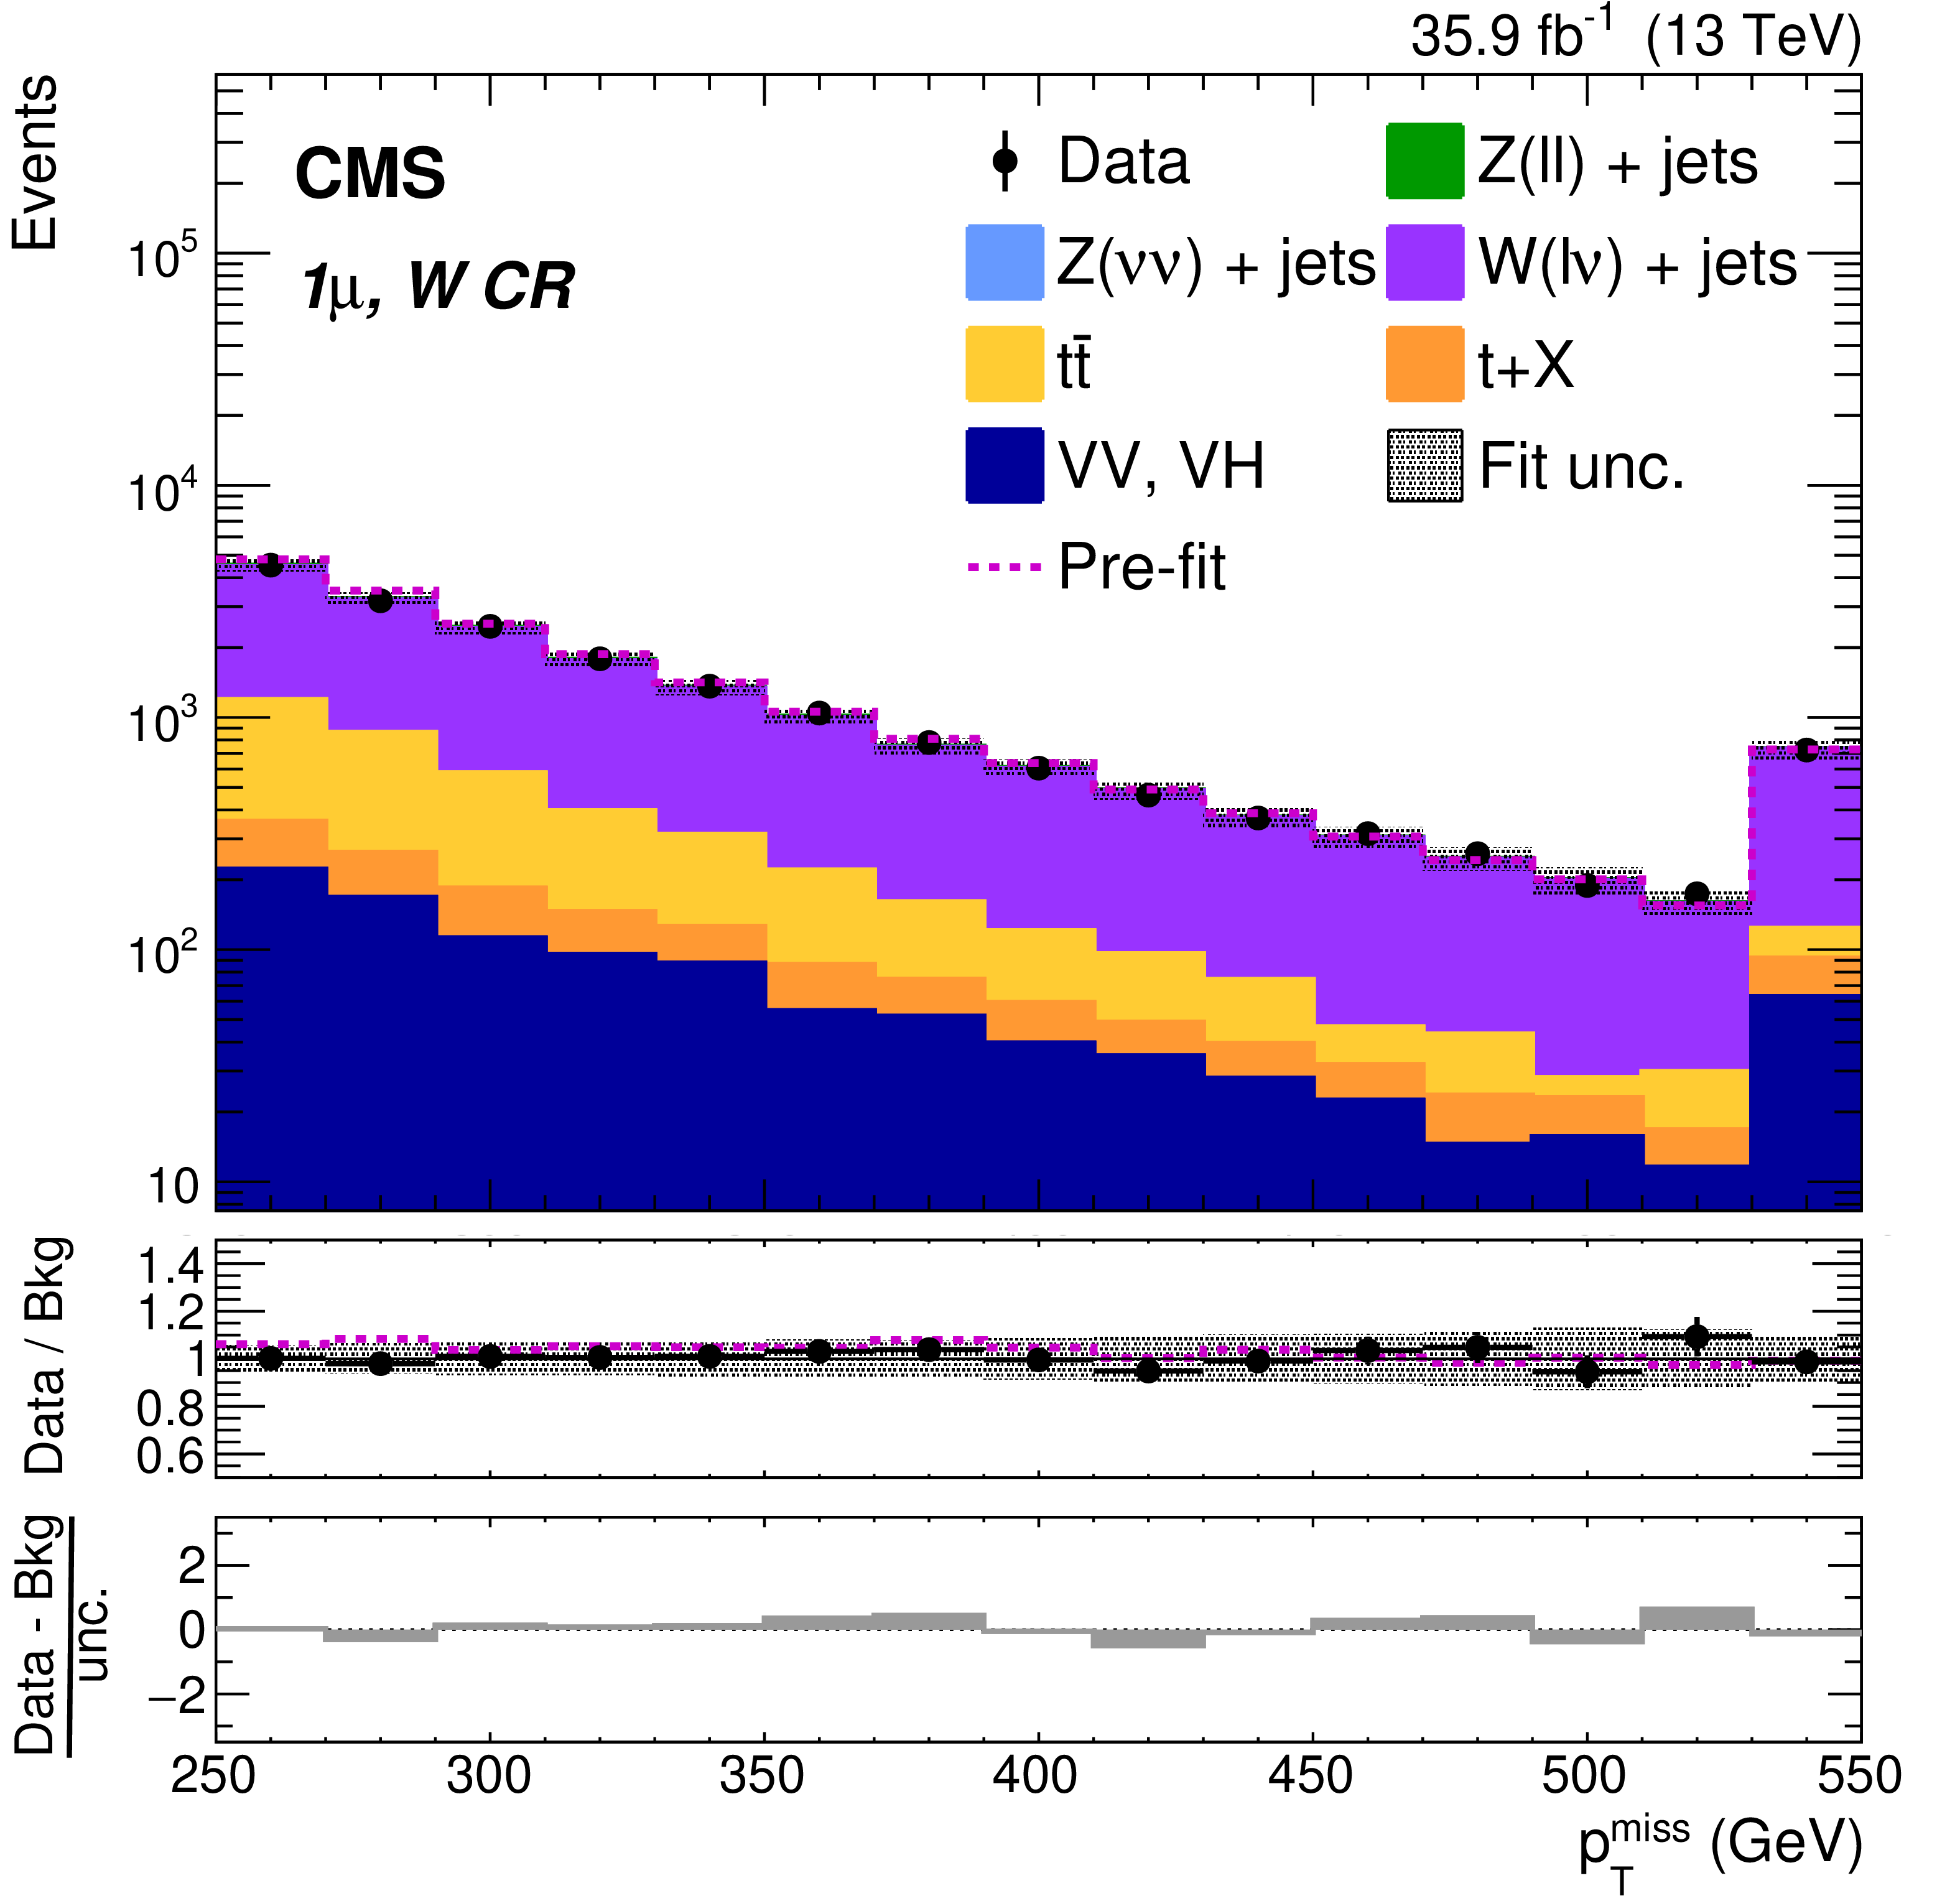
Figure 2:
Background-only post-fit ${{p_{\mathrm {T}}} ^\text {miss}}$ distributions for the CRs of the SL selection. The total theory signal (${{{\mathrm {t}}}/\overline {{{\mathrm {t}}}}}$+DM and ${{{\mathrm {t}\overline {\mathrm {t}}}}}$+DM summed together) is negligible and therefore is not shown. The last bin contains overflow events. The dashed magenta lines show the total pre-fit background expectation in the upper panels, and the ratio of pre-fit total background to post-fit total background in the middle panels. The lower panels show the difference between observed and post-fit total background divided by the full statistical and systematic uncertainties. |
png pdf |
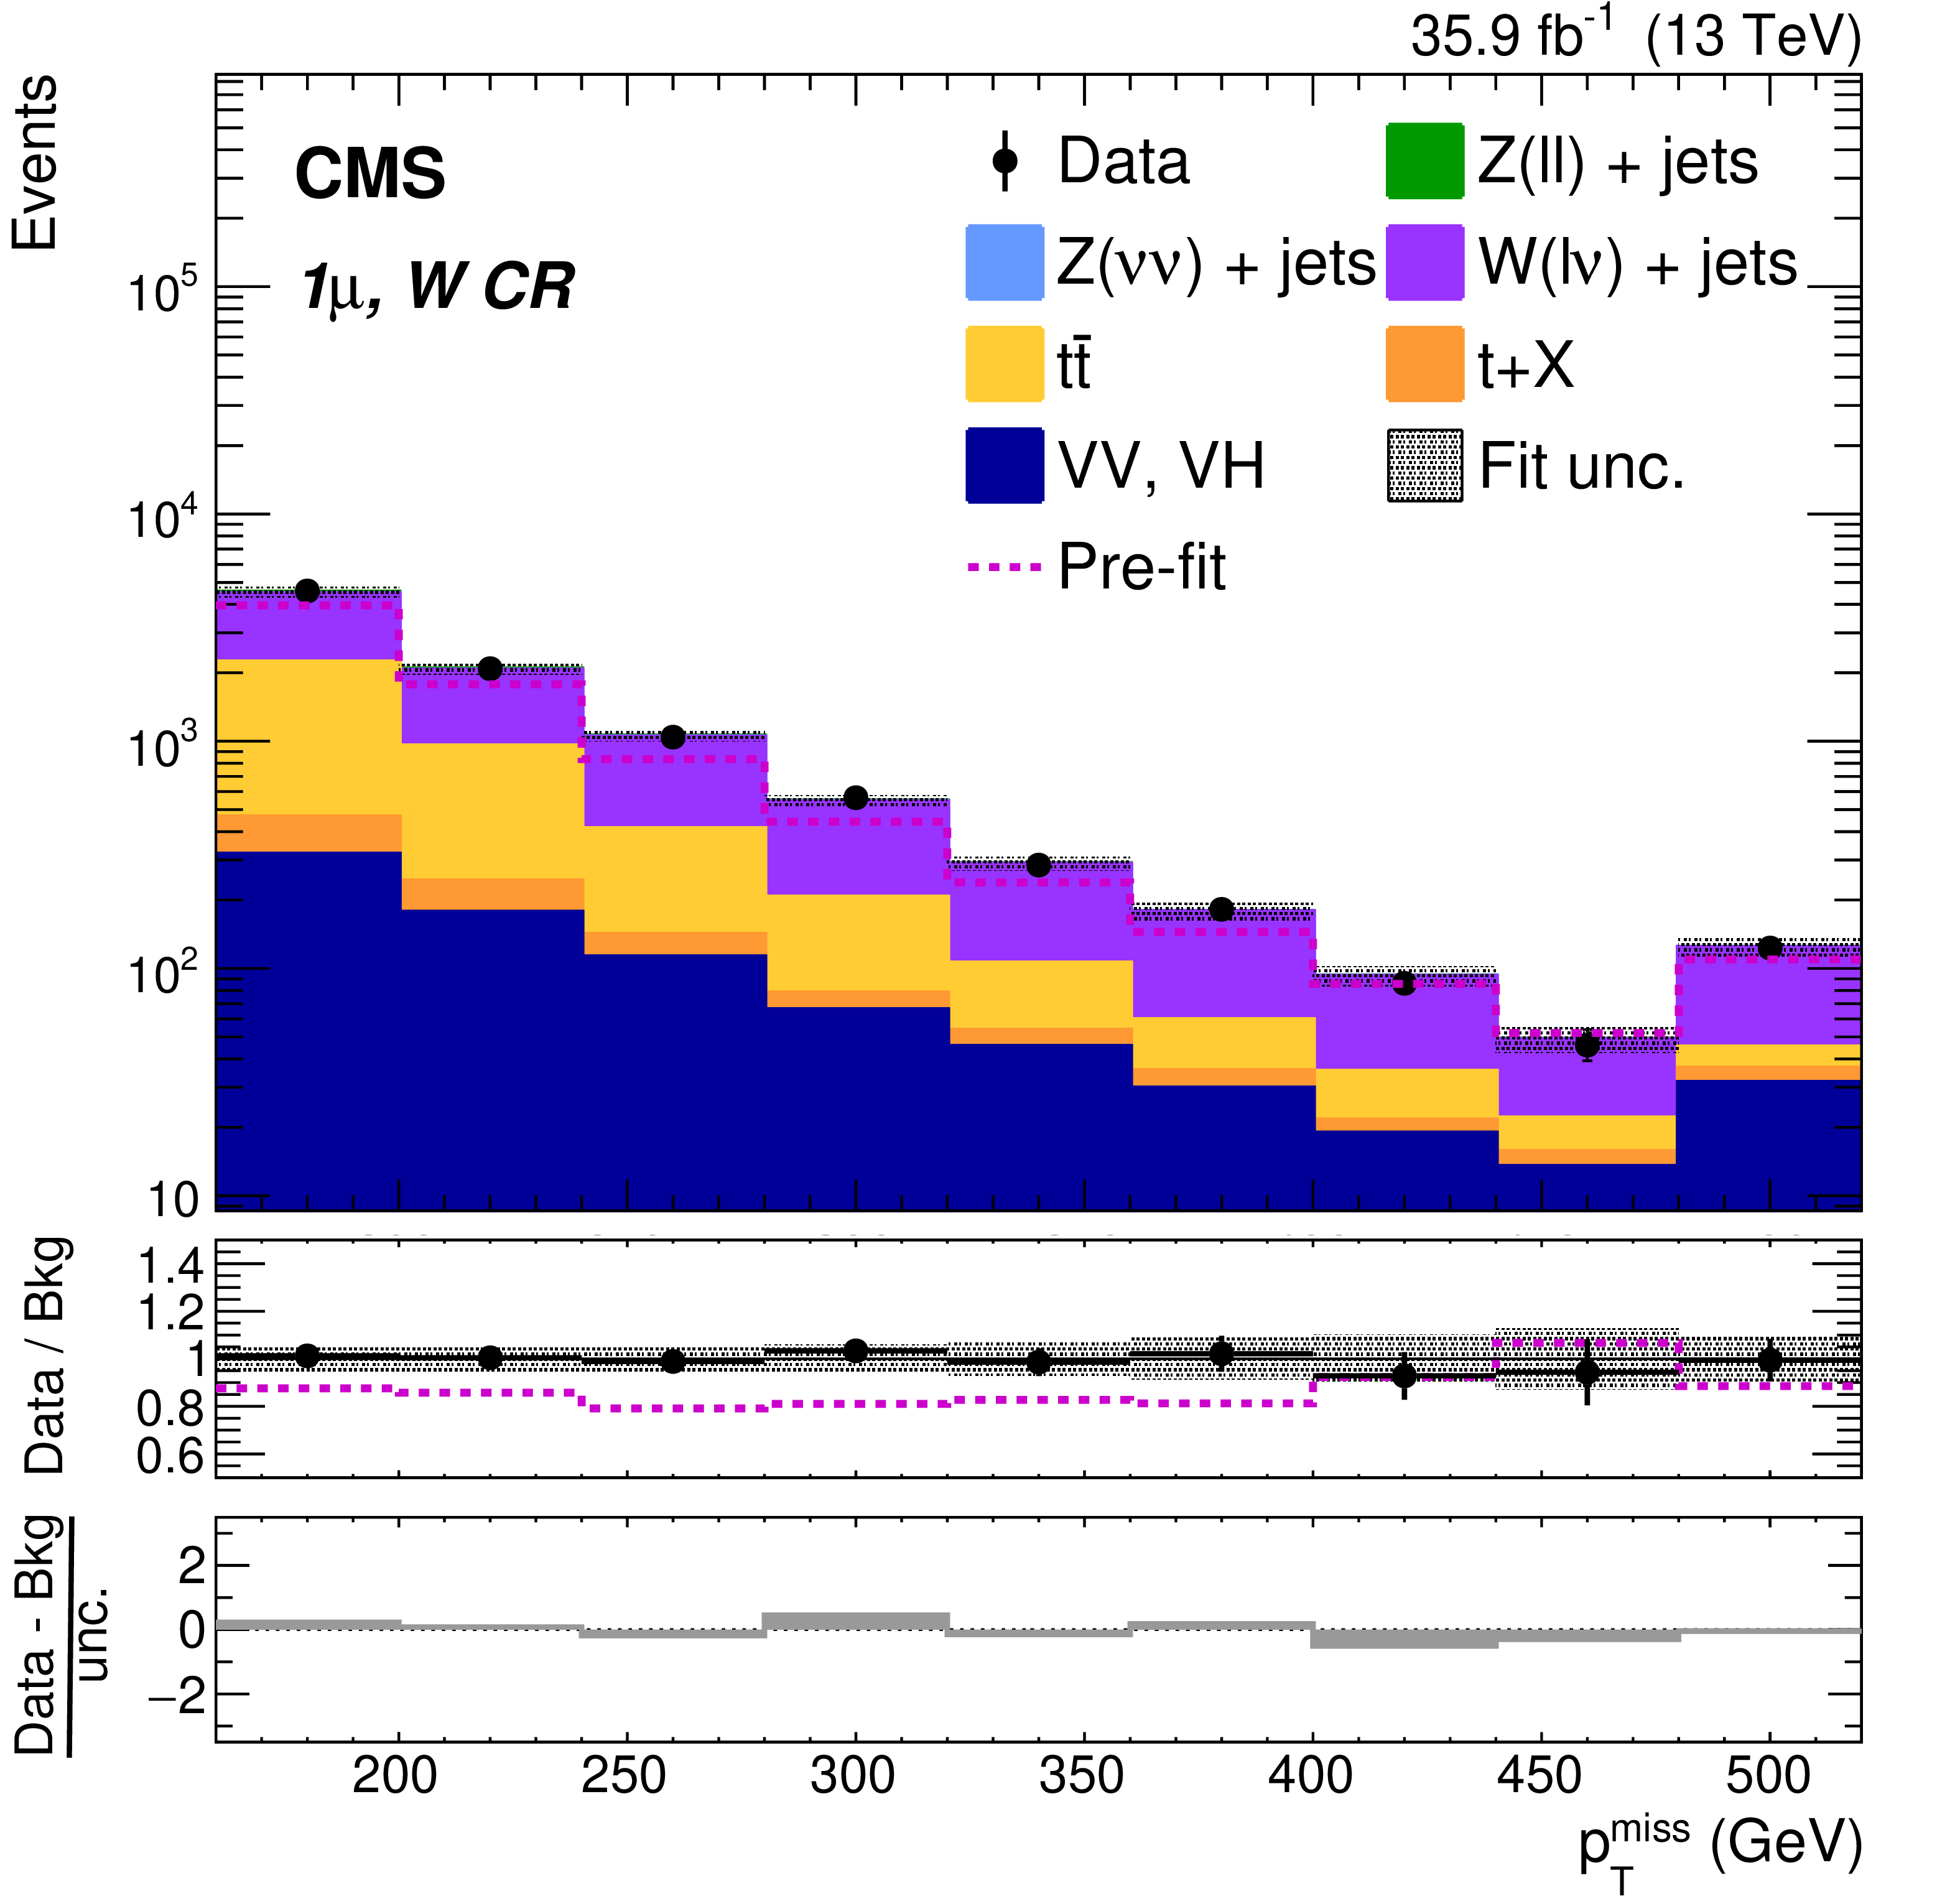
Figure 2-a:
Background-only post-fit ${{p_{\mathrm {T}}} ^\text {miss}}$ distribution for the 1$\mu$, W CR of the SL selection. The total theory signal (${{{\mathrm {t}}}/\overline {{{\mathrm {t}}}}}$+DM and ${{{\mathrm {t}\overline {\mathrm {t}}}}}$+DM summed together) is negligible and therefore is not shown. The last bin contains overflow events. The dashed magenta lines show the total pre-fit background expectation in the upper panel, and the ratio of pre-fit total background to post-fit total background in the middle panel. The lower panel shows the difference between observed and post-fit total background divided by the full statistical and systematic uncertainties. |

png pdf |
Figure 2-b:
Background-only post-fit ${{p_{\mathrm {T}}} ^\text {miss}}$ distribution for the 1e, W CR of the SL selection. The total theory signal (${{{\mathrm {t}}}/\overline {{{\mathrm {t}}}}}$+DM and ${{{\mathrm {t}\overline {\mathrm {t}}}}}$+DM summed together) is negligible and therefore is not shown. The last bin contains overflow events. The dashed magenta lines show the total pre-fit background expectation in the upper panel, and the ratio of pre-fit total background to post-fit total background in the middle panel. The lower panel shows the difference between observed and post-fit total background divided by the full statistical and systematic uncertainties. |
png pdf |
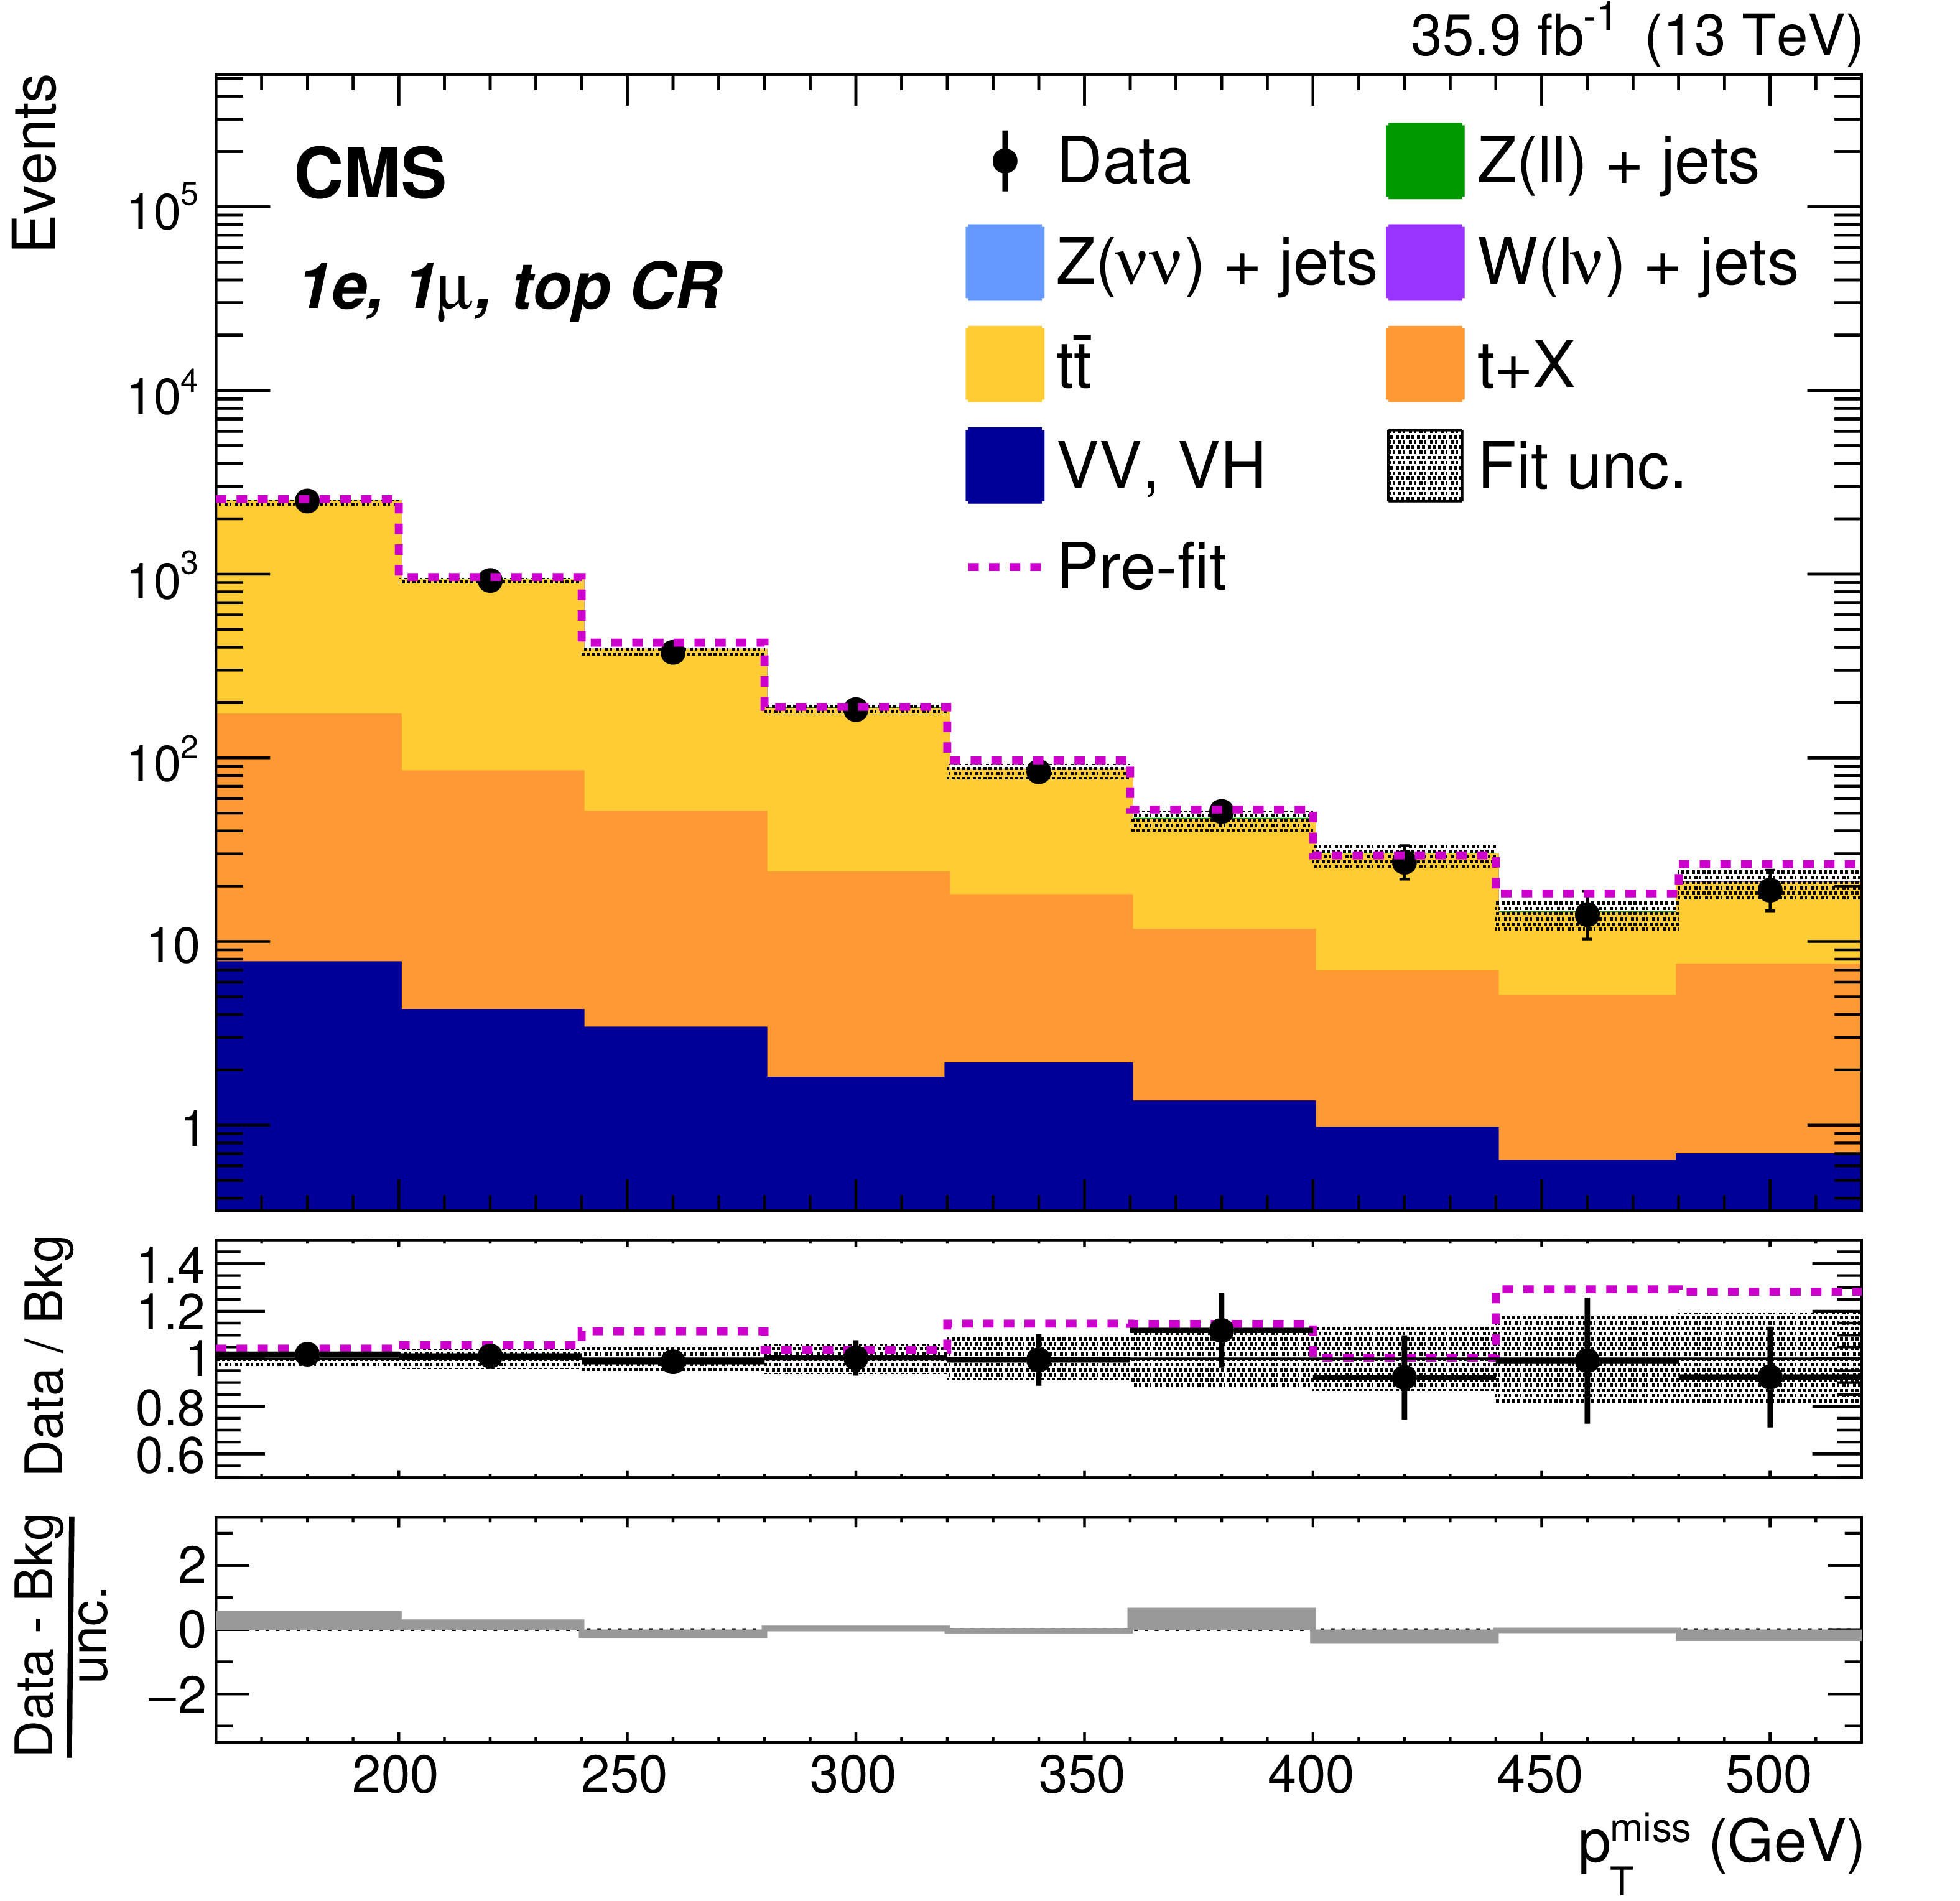
Figure 2-c:
Background-only post-fit ${{p_{\mathrm {T}}} ^\text {miss}}$ distribution for the 1e, 1$\mu$, top CR of the SL selection. The total theory signal (${{{\mathrm {t}}}/\overline {{{\mathrm {t}}}}}$+DM and ${{{\mathrm {t}\overline {\mathrm {t}}}}}$+DM summed together) is negligible and therefore is not shown. The last bin contains overflow events. The dashed magenta lines show the total pre-fit background expectation in the upper panel, and the ratio of pre-fit total background to post-fit total background in the middle panel. The lower panel shows the difference between observed and post-fit total background divided by the full statistical and systematic uncertainties. |
png pdf |
Figure 2-d:
Background-only post-fit ${{p_{\mathrm {T}}} ^\text {miss}}$ distribution for the 2e, top CR of the SL selection. The total theory signal (${{{\mathrm {t}}}/\overline {{{\mathrm {t}}}}}$+DM and ${{{\mathrm {t}\overline {\mathrm {t}}}}}$+DM summed together) is negligible and therefore is not shown. The last bin contains overflow events. The dashed magenta lines show the total pre-fit background expectation in the upper panel, and the ratio of pre-fit total background to post-fit total background in the middle panel. The lower panel shows the difference between observed and post-fit total background divided by the full statistical and systematic uncertainties. |
png pdf |
Figure 2-e:
Background-only post-fit ${{p_{\mathrm {T}}} ^\text {miss}}$ distribution for the 2$\mu$, top CR of the SL selection. The total theory signal (${{{\mathrm {t}}}/\overline {{{\mathrm {t}}}}}$+DM and ${{{\mathrm {t}\overline {\mathrm {t}}}}}$+DM summed together) is negligible and therefore is not shown. The last bin contains overflow events. The dashed magenta lines show the total pre-fit background expectation in the upper panel, and the ratio of pre-fit total background to post-fit total background in the middle panel. The lower panel shows the difference between observed and post-fit total background divided by the full statistical and systematic uncertainties. |
png pdf |
Figure 3:
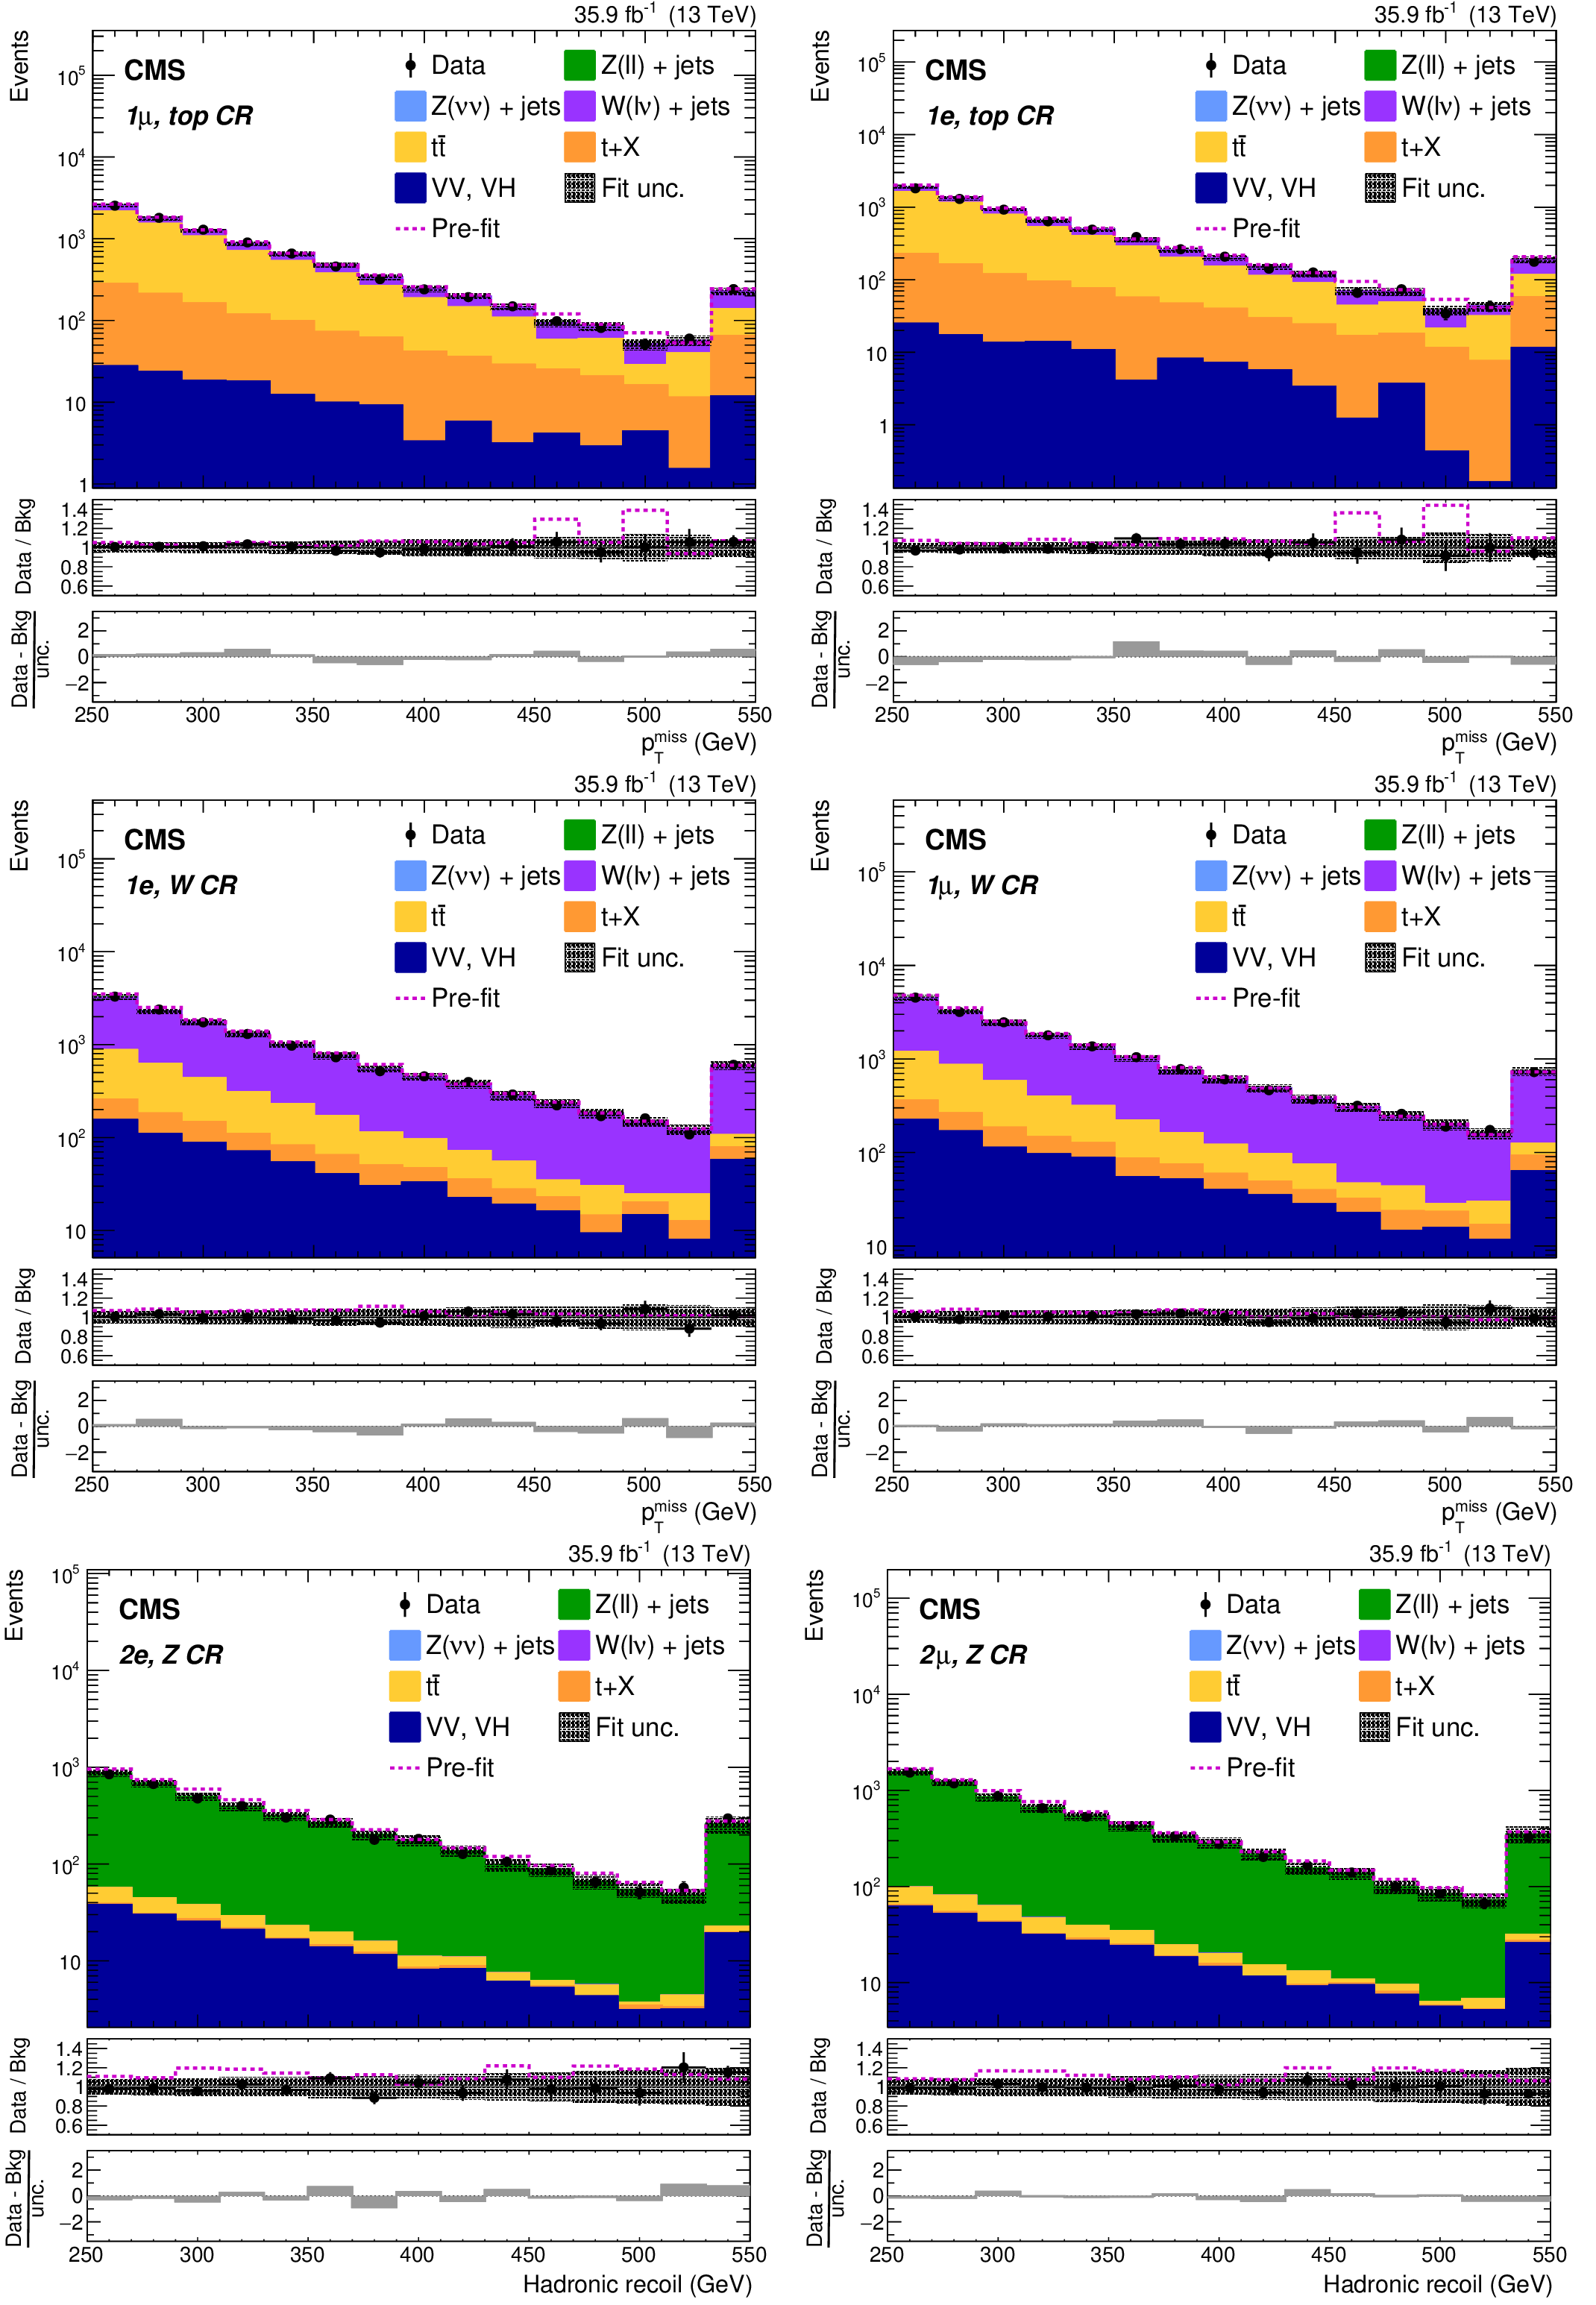
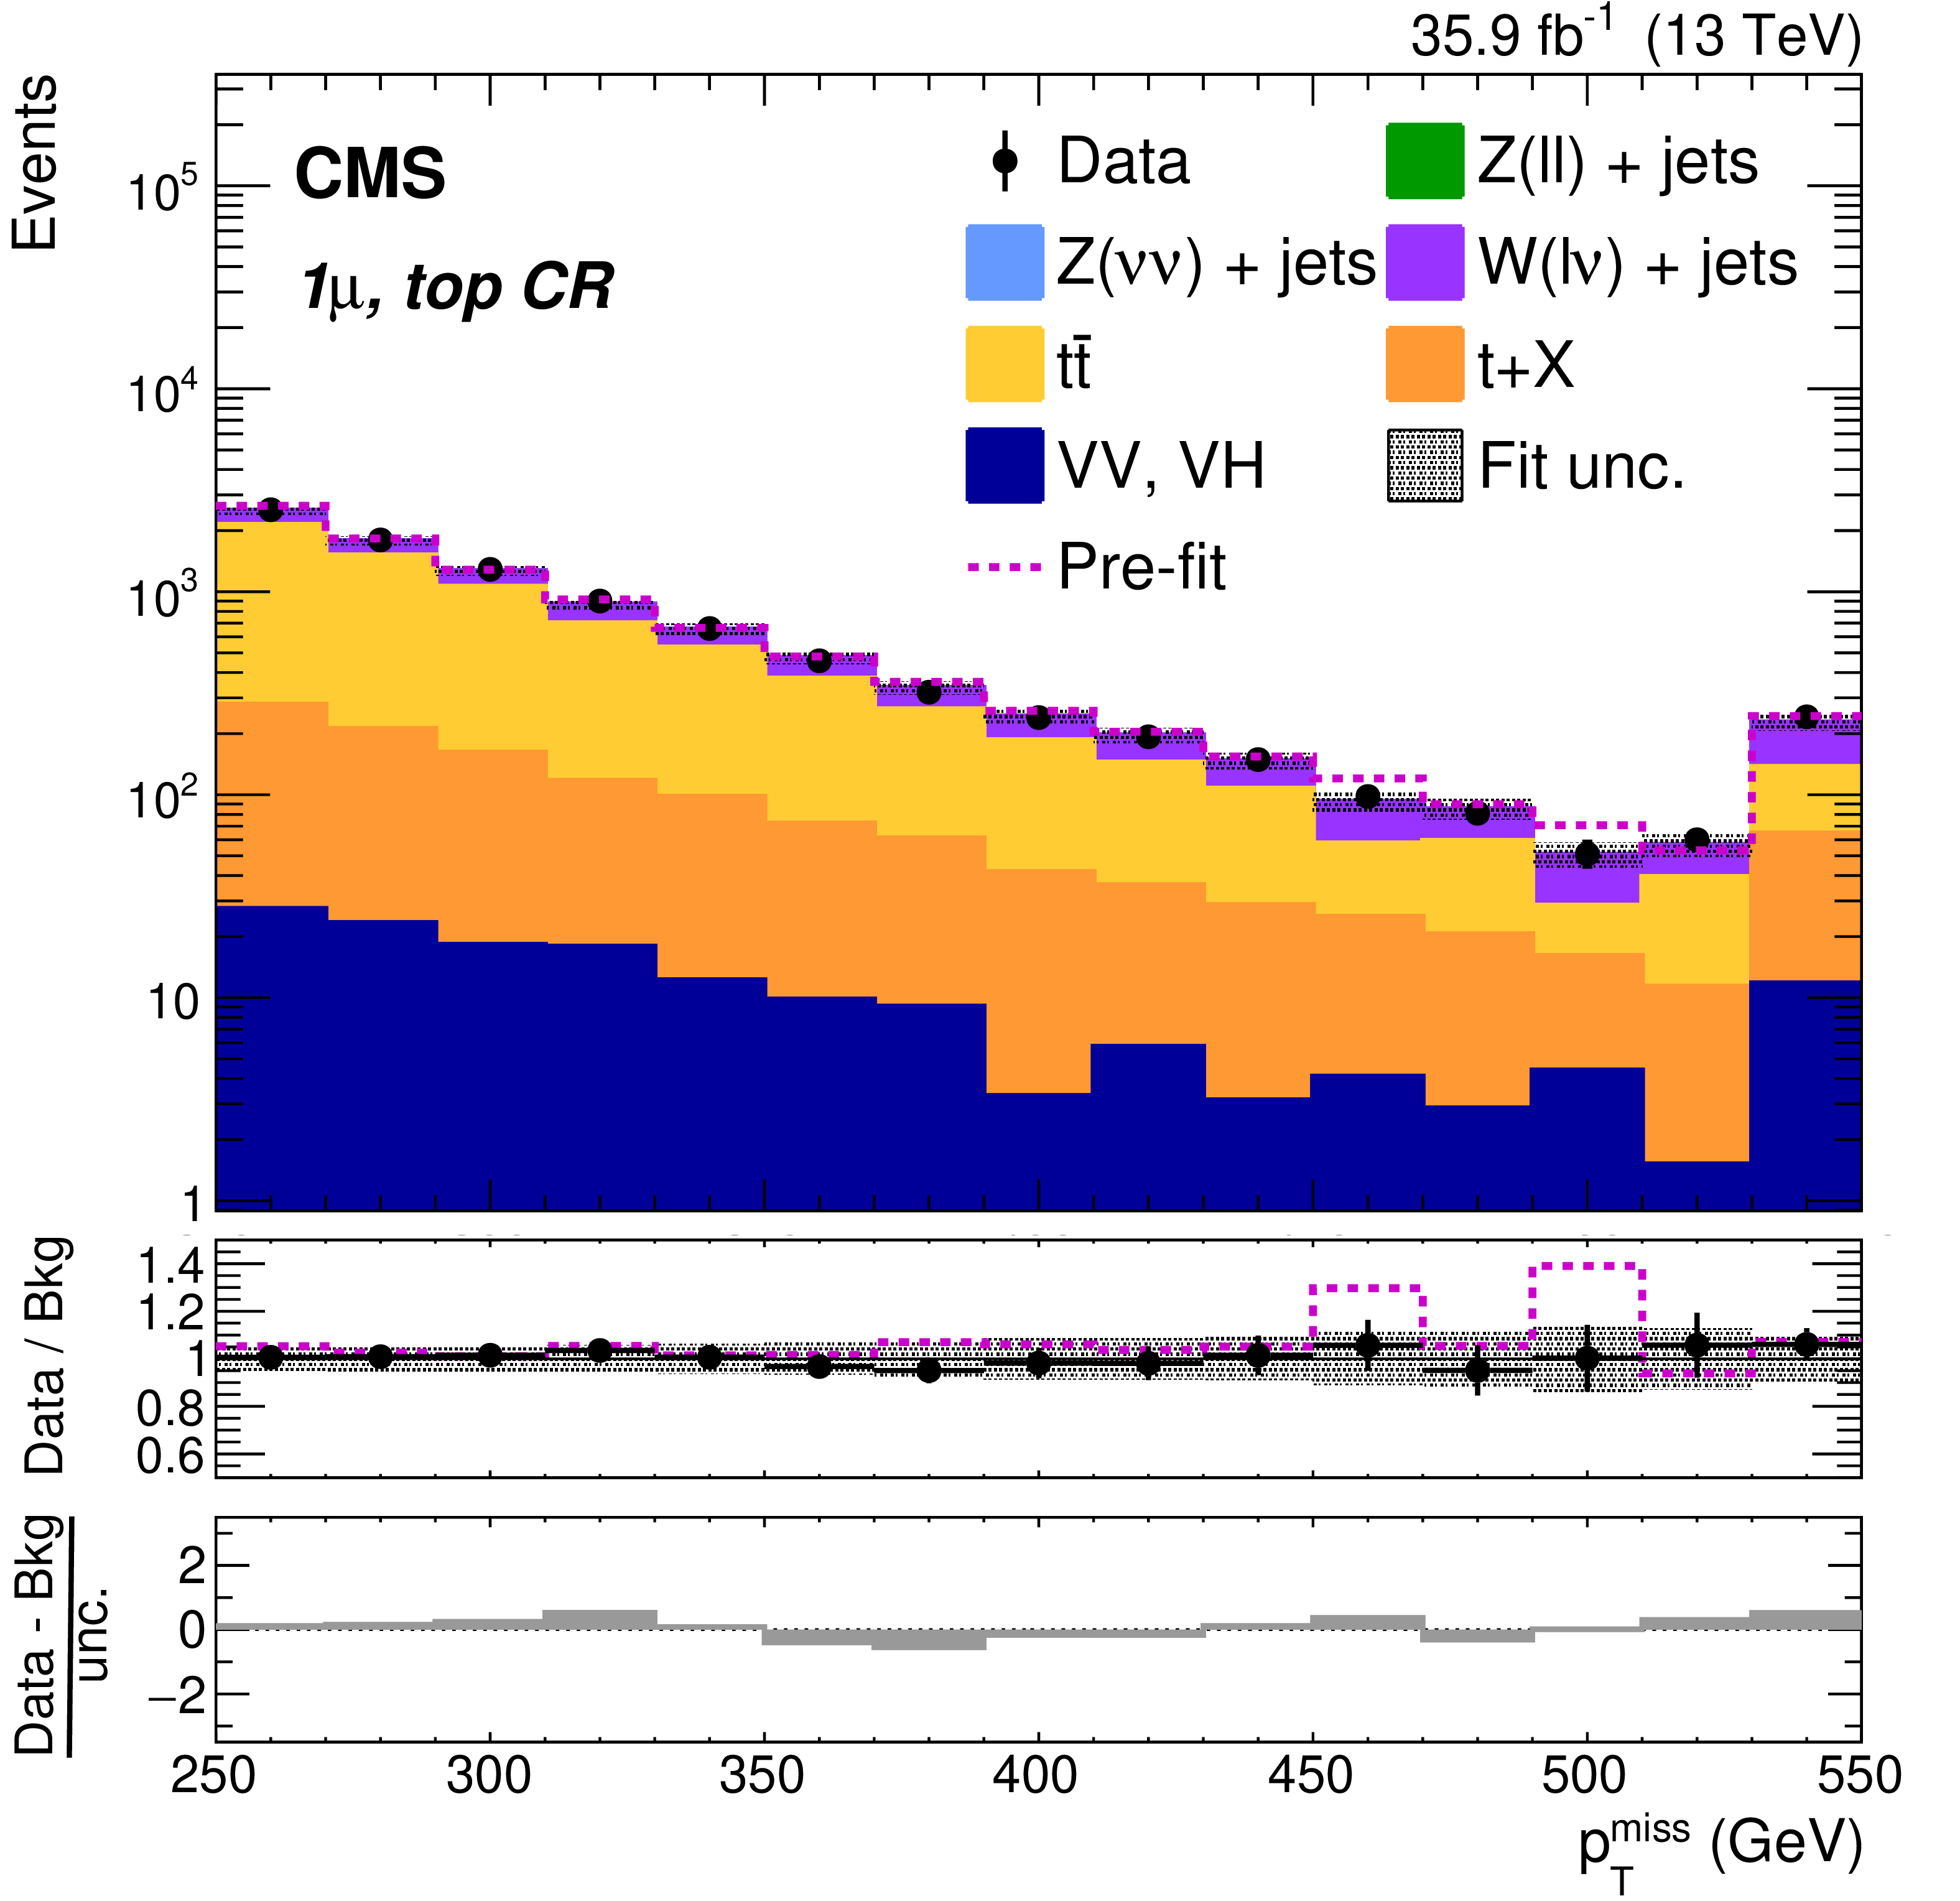
Background-only post-fit ${{p_{\mathrm {T}}} ^\text {miss}}$ distributions for the CRs of the AH selection. The total theory signal (${{{\mathrm {t}}}/\overline {{{\mathrm {t}}}}}$+DM and ${{{\mathrm {t}\overline {\mathrm {t}}}}}$+DM summed together) is negligible and therefore is not shown. The last bin contains overflow events. The dashed magenta lines show the total pre-fit background expectation in the upper panels, and the ratio of pre-fit total background to post-fit total background in the middle panels. The lower panels show the difference between observed and post-fit total background divided by the full statistical and systematic uncertainties. |
png pdf |
Figure 3-a:
Background-only post-fit ${{p_{\mathrm {T}}} ^\text {miss}}$ distribution for the 1$\mu$, top CR of the AH selection. The total theory signal (${{{\mathrm {t}}}/\overline {{{\mathrm {t}}}}}$+DM and ${{{\mathrm {t}\overline {\mathrm {t}}}}}$+DM summed together) is negligible and therefore is not shown. The last bin contains overflow events. The dashed magenta lines show the total pre-fit background expectation in the upper panel, and the ratio of pre-fit total background to post-fit total background in the middle panel. The lower panel shows the difference between observed and post-fit total background divided by the full statistical and systematic uncertainties. |
png pdf |
Figure 3-b:
Background-only post-fit ${{p_{\mathrm {T}}} ^\text {miss}}$ distribution for the 1e, top CR of the AH selection. The total theory signal (${{{\mathrm {t}}}/\overline {{{\mathrm {t}}}}}$+DM and ${{{\mathrm {t}\overline {\mathrm {t}}}}}$+DM summed together) is negligible and therefore is not shown. The last bin contains overflow events. The dashed magenta lines show the total pre-fit background expectation in the upper panel, and the ratio of pre-fit total background to post-fit total background in the middle panel. The lower panel shows the difference between observed and post-fit total background divided by the full statistical and systematic uncertainties. |
png pdf |
Figure 3-c:
Background-only post-fit ${{p_{\mathrm {T}}} ^\text {miss}}$ distribution for the 1e, W CR of the AH selection. The total theory signal (${{{\mathrm {t}}}/\overline {{{\mathrm {t}}}}}$+DM and ${{{\mathrm {t}\overline {\mathrm {t}}}}}$+DM summed together) is negligible and therefore is not shown. The last bin contains overflow events. The dashed magenta lines show the total pre-fit background expectation in the upper panel, and the ratio of pre-fit total background to post-fit total background in the middle panel. The lower panel shows the difference between observed and post-fit total background divided by the full statistical and systematic uncertainties. |
png pdf |
Figure 3-d:
Background-only post-fit ${{p_{\mathrm {T}}} ^\text {miss}}$ distribution for the 1$\mu$, W CR of the AH selection. The total theory signal (${{{\mathrm {t}}}/\overline {{{\mathrm {t}}}}}$+DM and ${{{\mathrm {t}\overline {\mathrm {t}}}}}$+DM summed together) is negligible and therefore is not shown. The last bin contains overflow events. The dashed magenta lines show the total pre-fit background expectation in the upper panel, and the ratio of pre-fit total background to post-fit total background in the middle panel. The lower panel shows the difference between observed and post-fit total background divided by the full statistical and systematic uncertainties. |
png pdf |
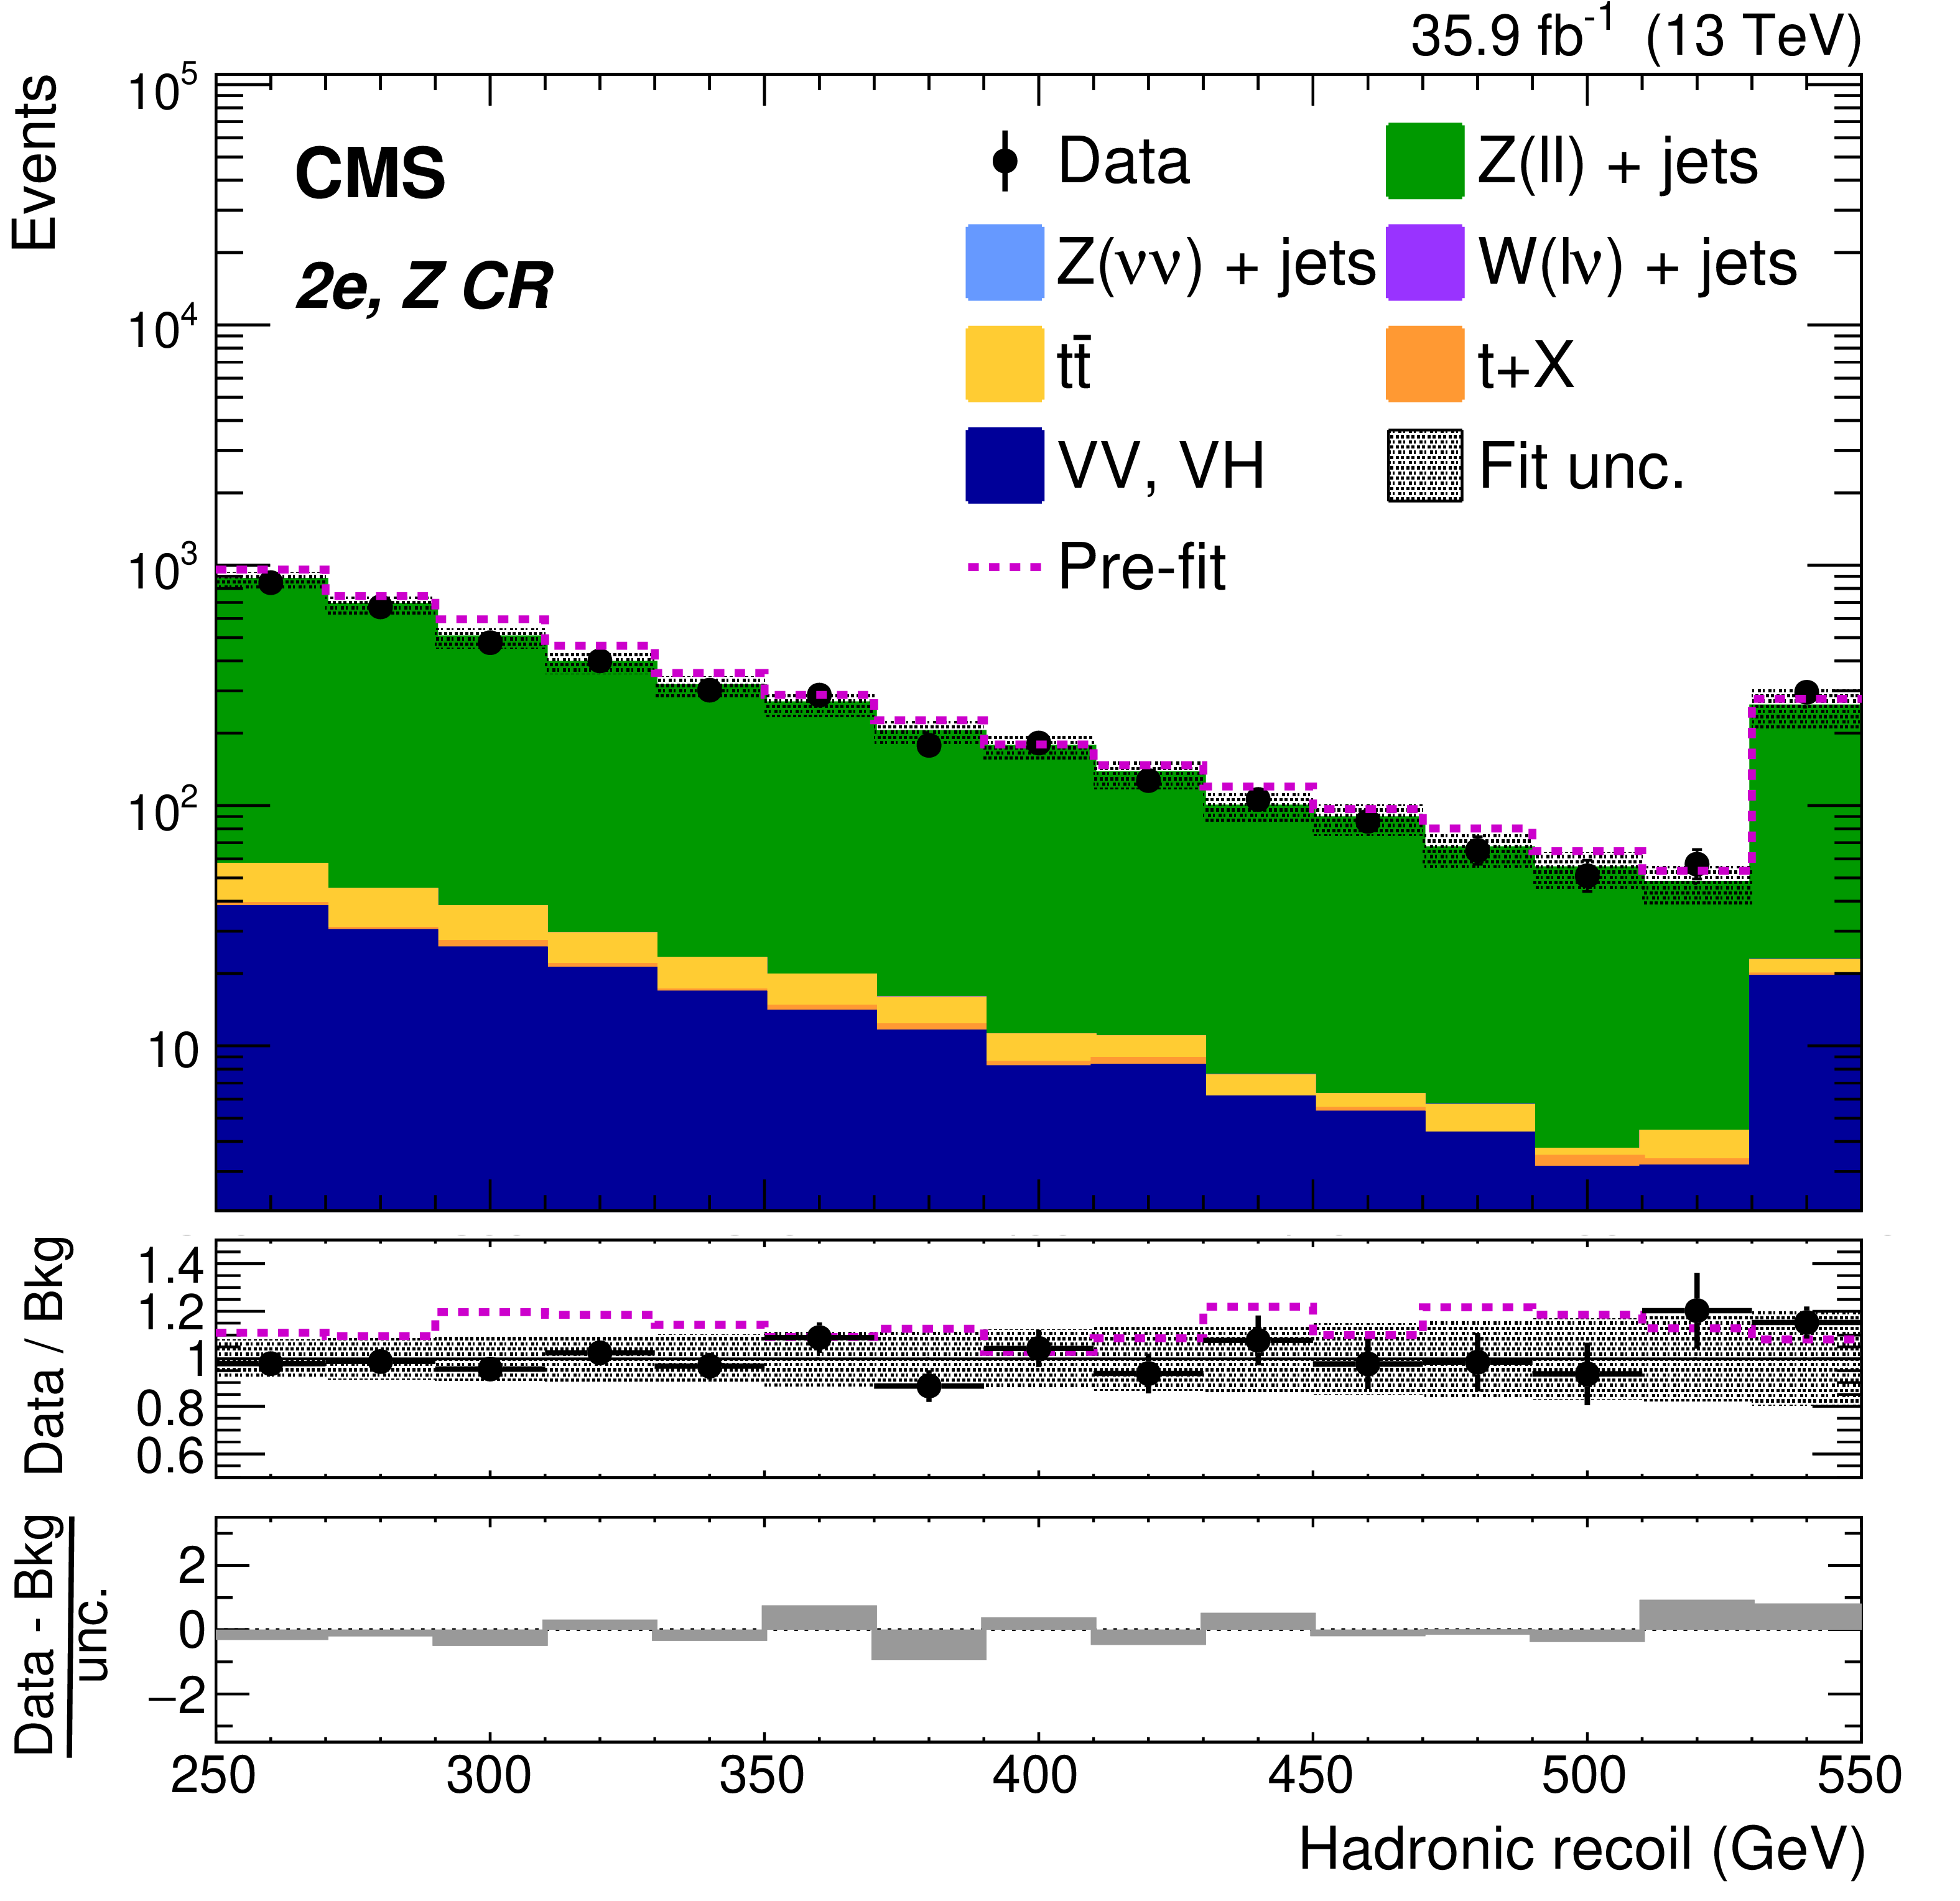
Figure 3-e:
Background-only post-fit ${{p_{\mathrm {T}}} ^\text {miss}}$ distribution for the 2e, Z CR of the AH selection. The total theory signal (${{{\mathrm {t}}}/\overline {{{\mathrm {t}}}}}$+DM and ${{{\mathrm {t}\overline {\mathrm {t}}}}}$+DM summed together) is negligible and therefore is not shown. The last bin contains overflow events. The dashed magenta lines show the total pre-fit background expectation in the upper panel, and the ratio of pre-fit total background to post-fit total background in the middle panel. The lower panel shows the difference between observed and post-fit total background divided by the full statistical and systematic uncertainties. |

png pdf |
Figure 3-f:
Background-only post-fit ${{p_{\mathrm {T}}} ^\text {miss}}$ distribution for the 2$\mu$, Z CR of the AH selection. The total theory signal (${{{\mathrm {t}}}/\overline {{{\mathrm {t}}}}}$+DM and ${{{\mathrm {t}\overline {\mathrm {t}}}}}$+DM summed together) is negligible and therefore is not shown. The last bin contains overflow events. The dashed magenta lines show the total pre-fit background expectation in the upper panel, and the ratio of pre-fit total background to post-fit total background in the middle panel. The lower panel shows the difference between observed and post-fit total background divided by the full statistical and systematic uncertainties. |

png pdf |
Figure 4:
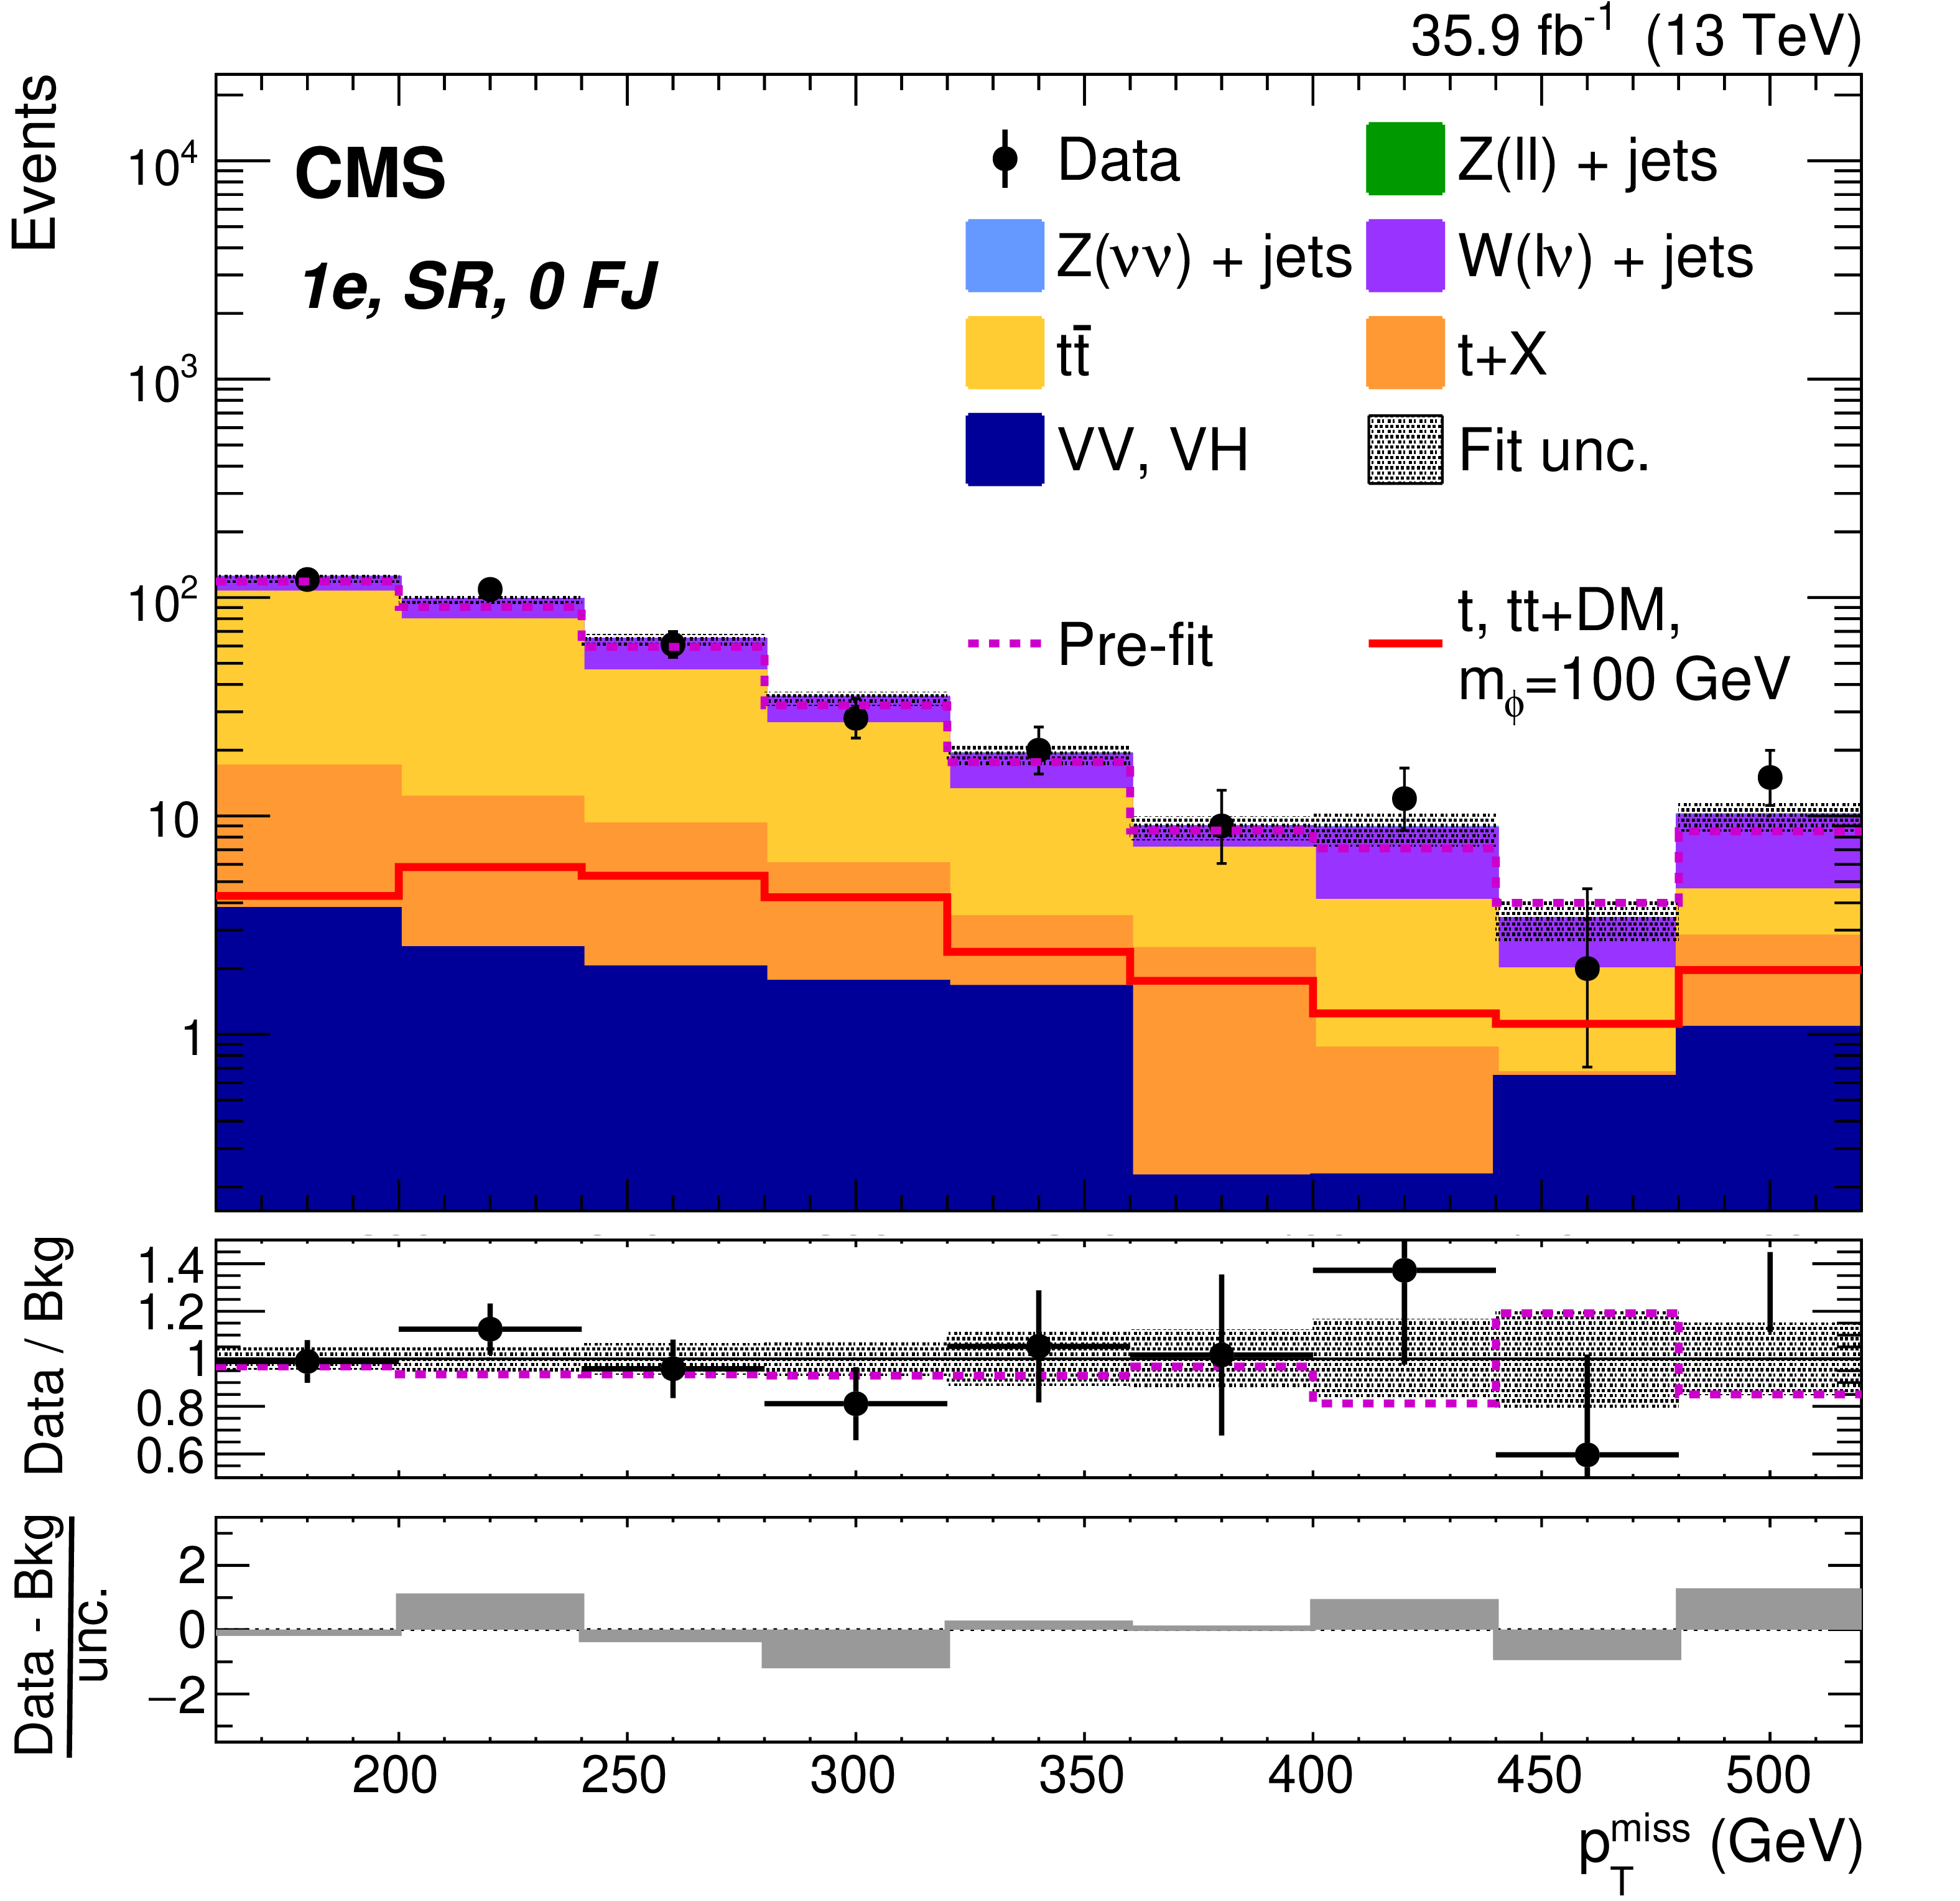
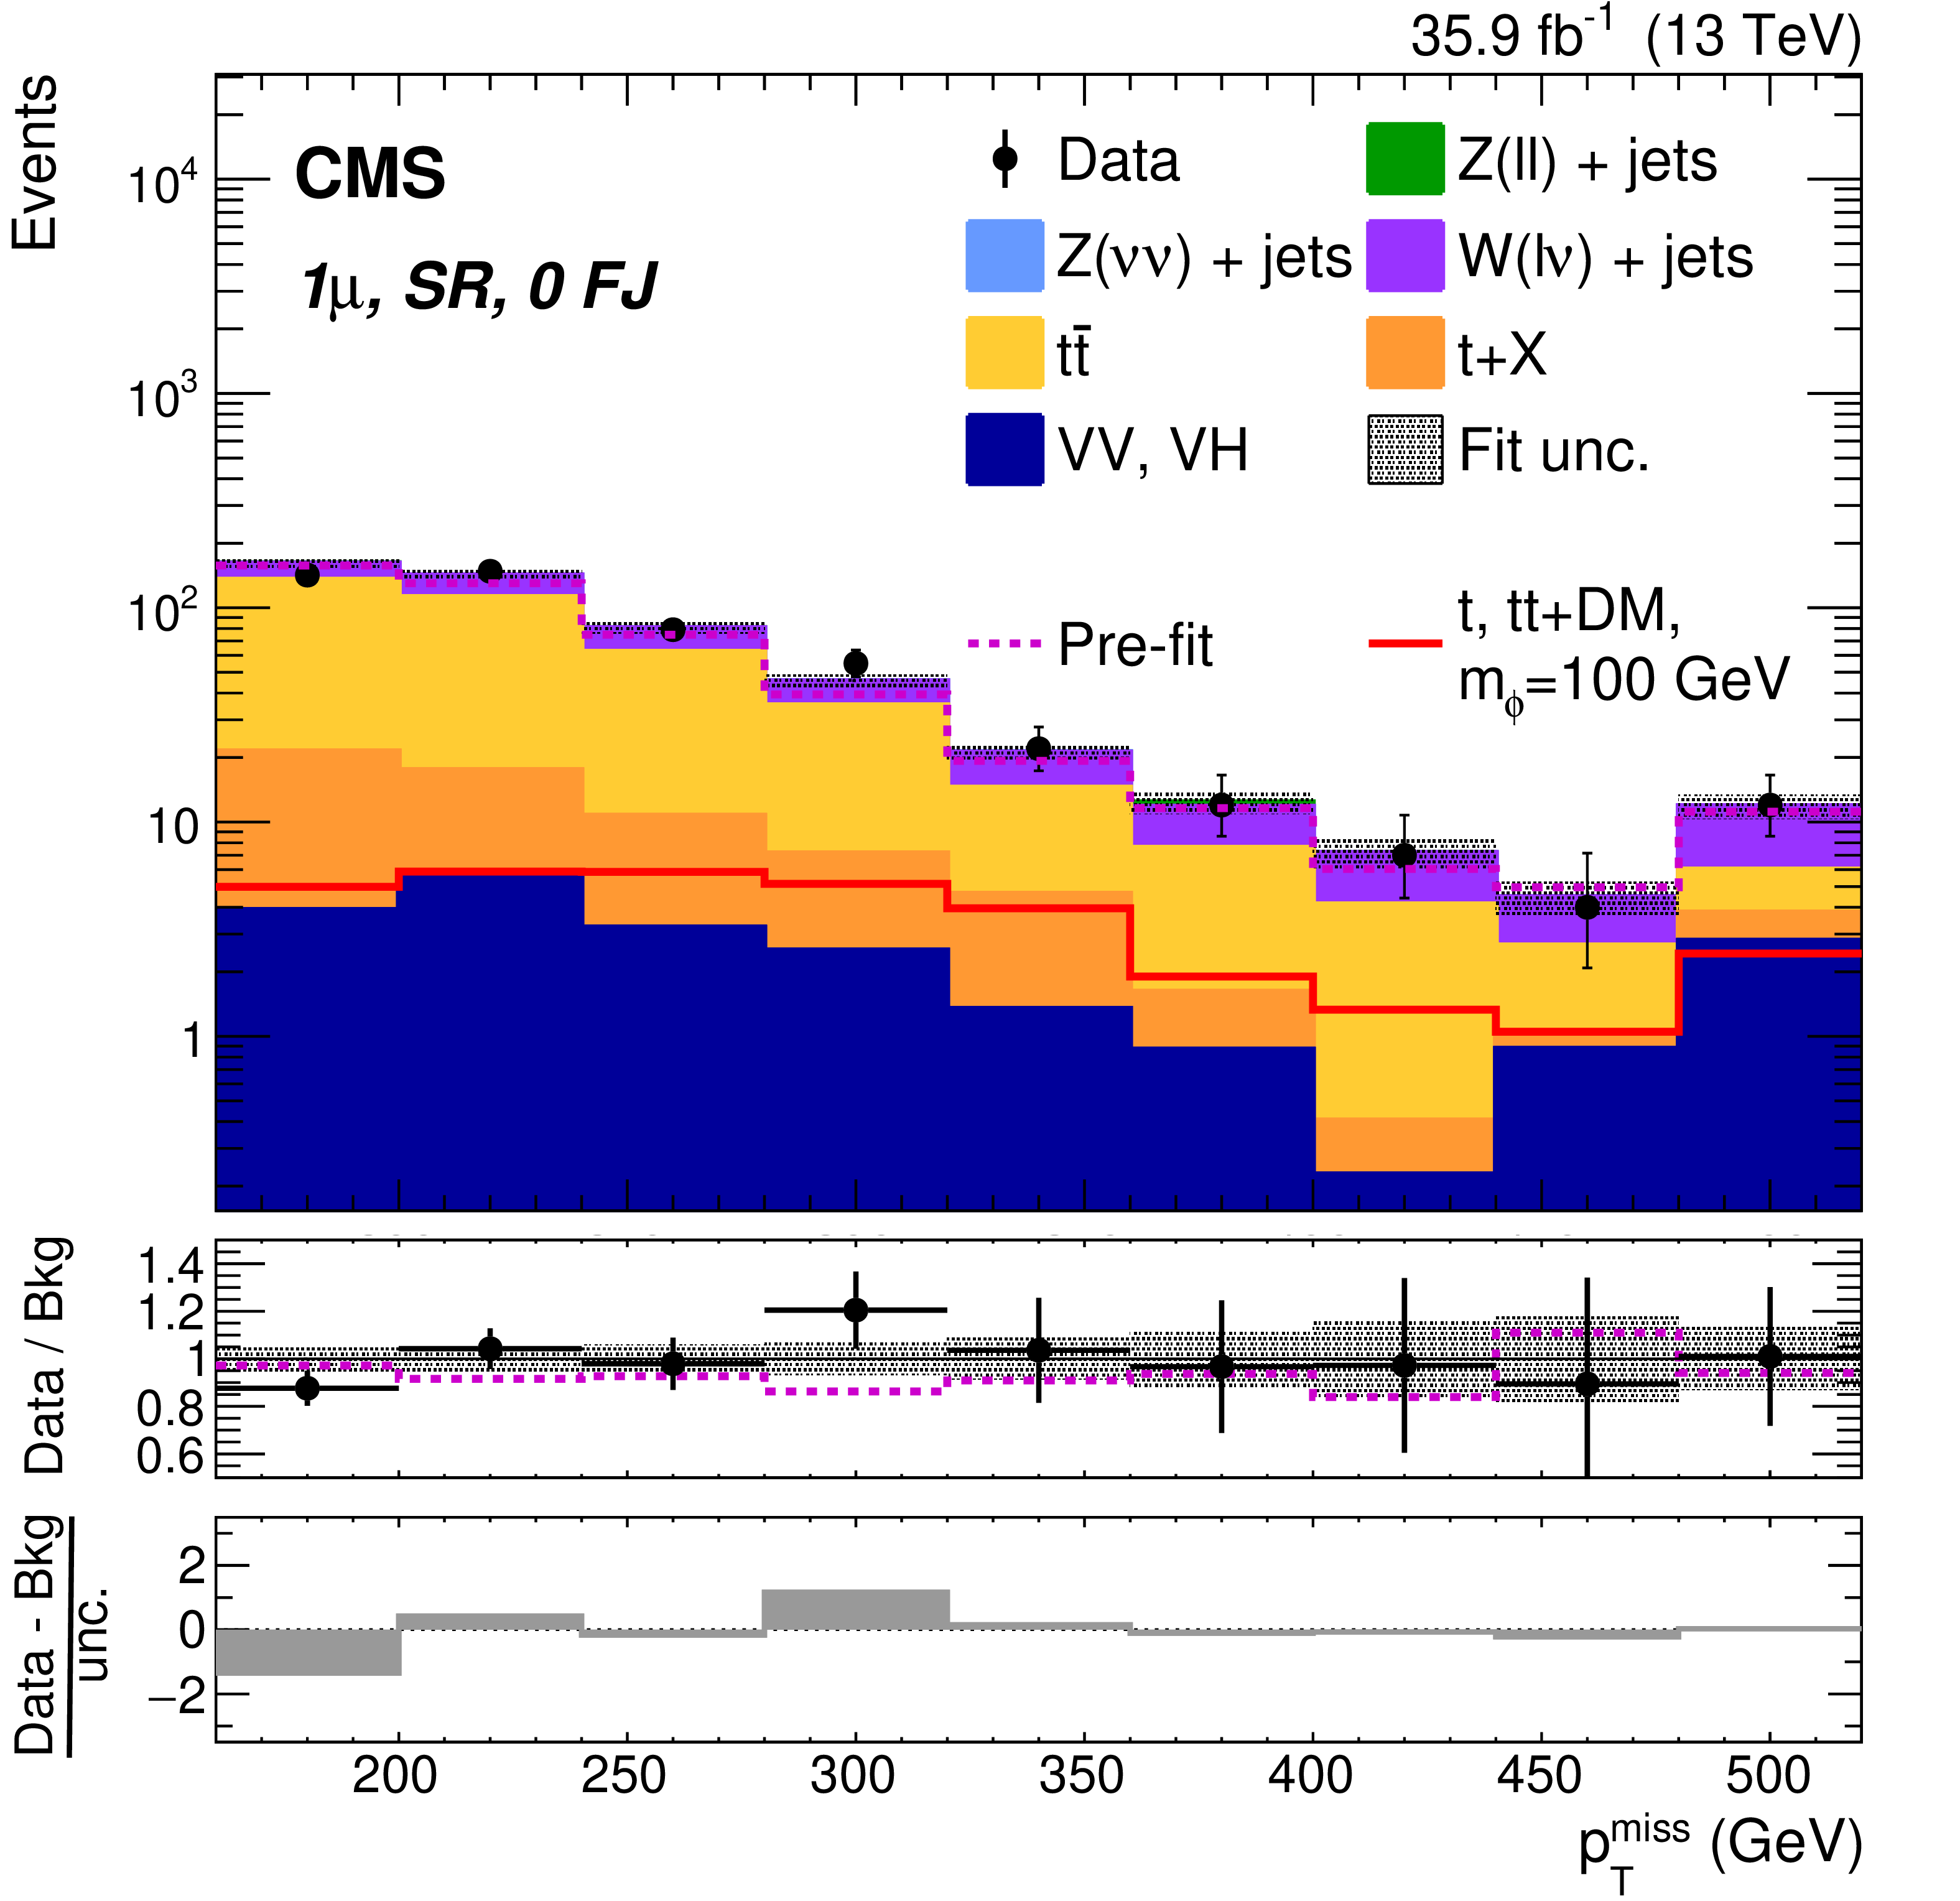
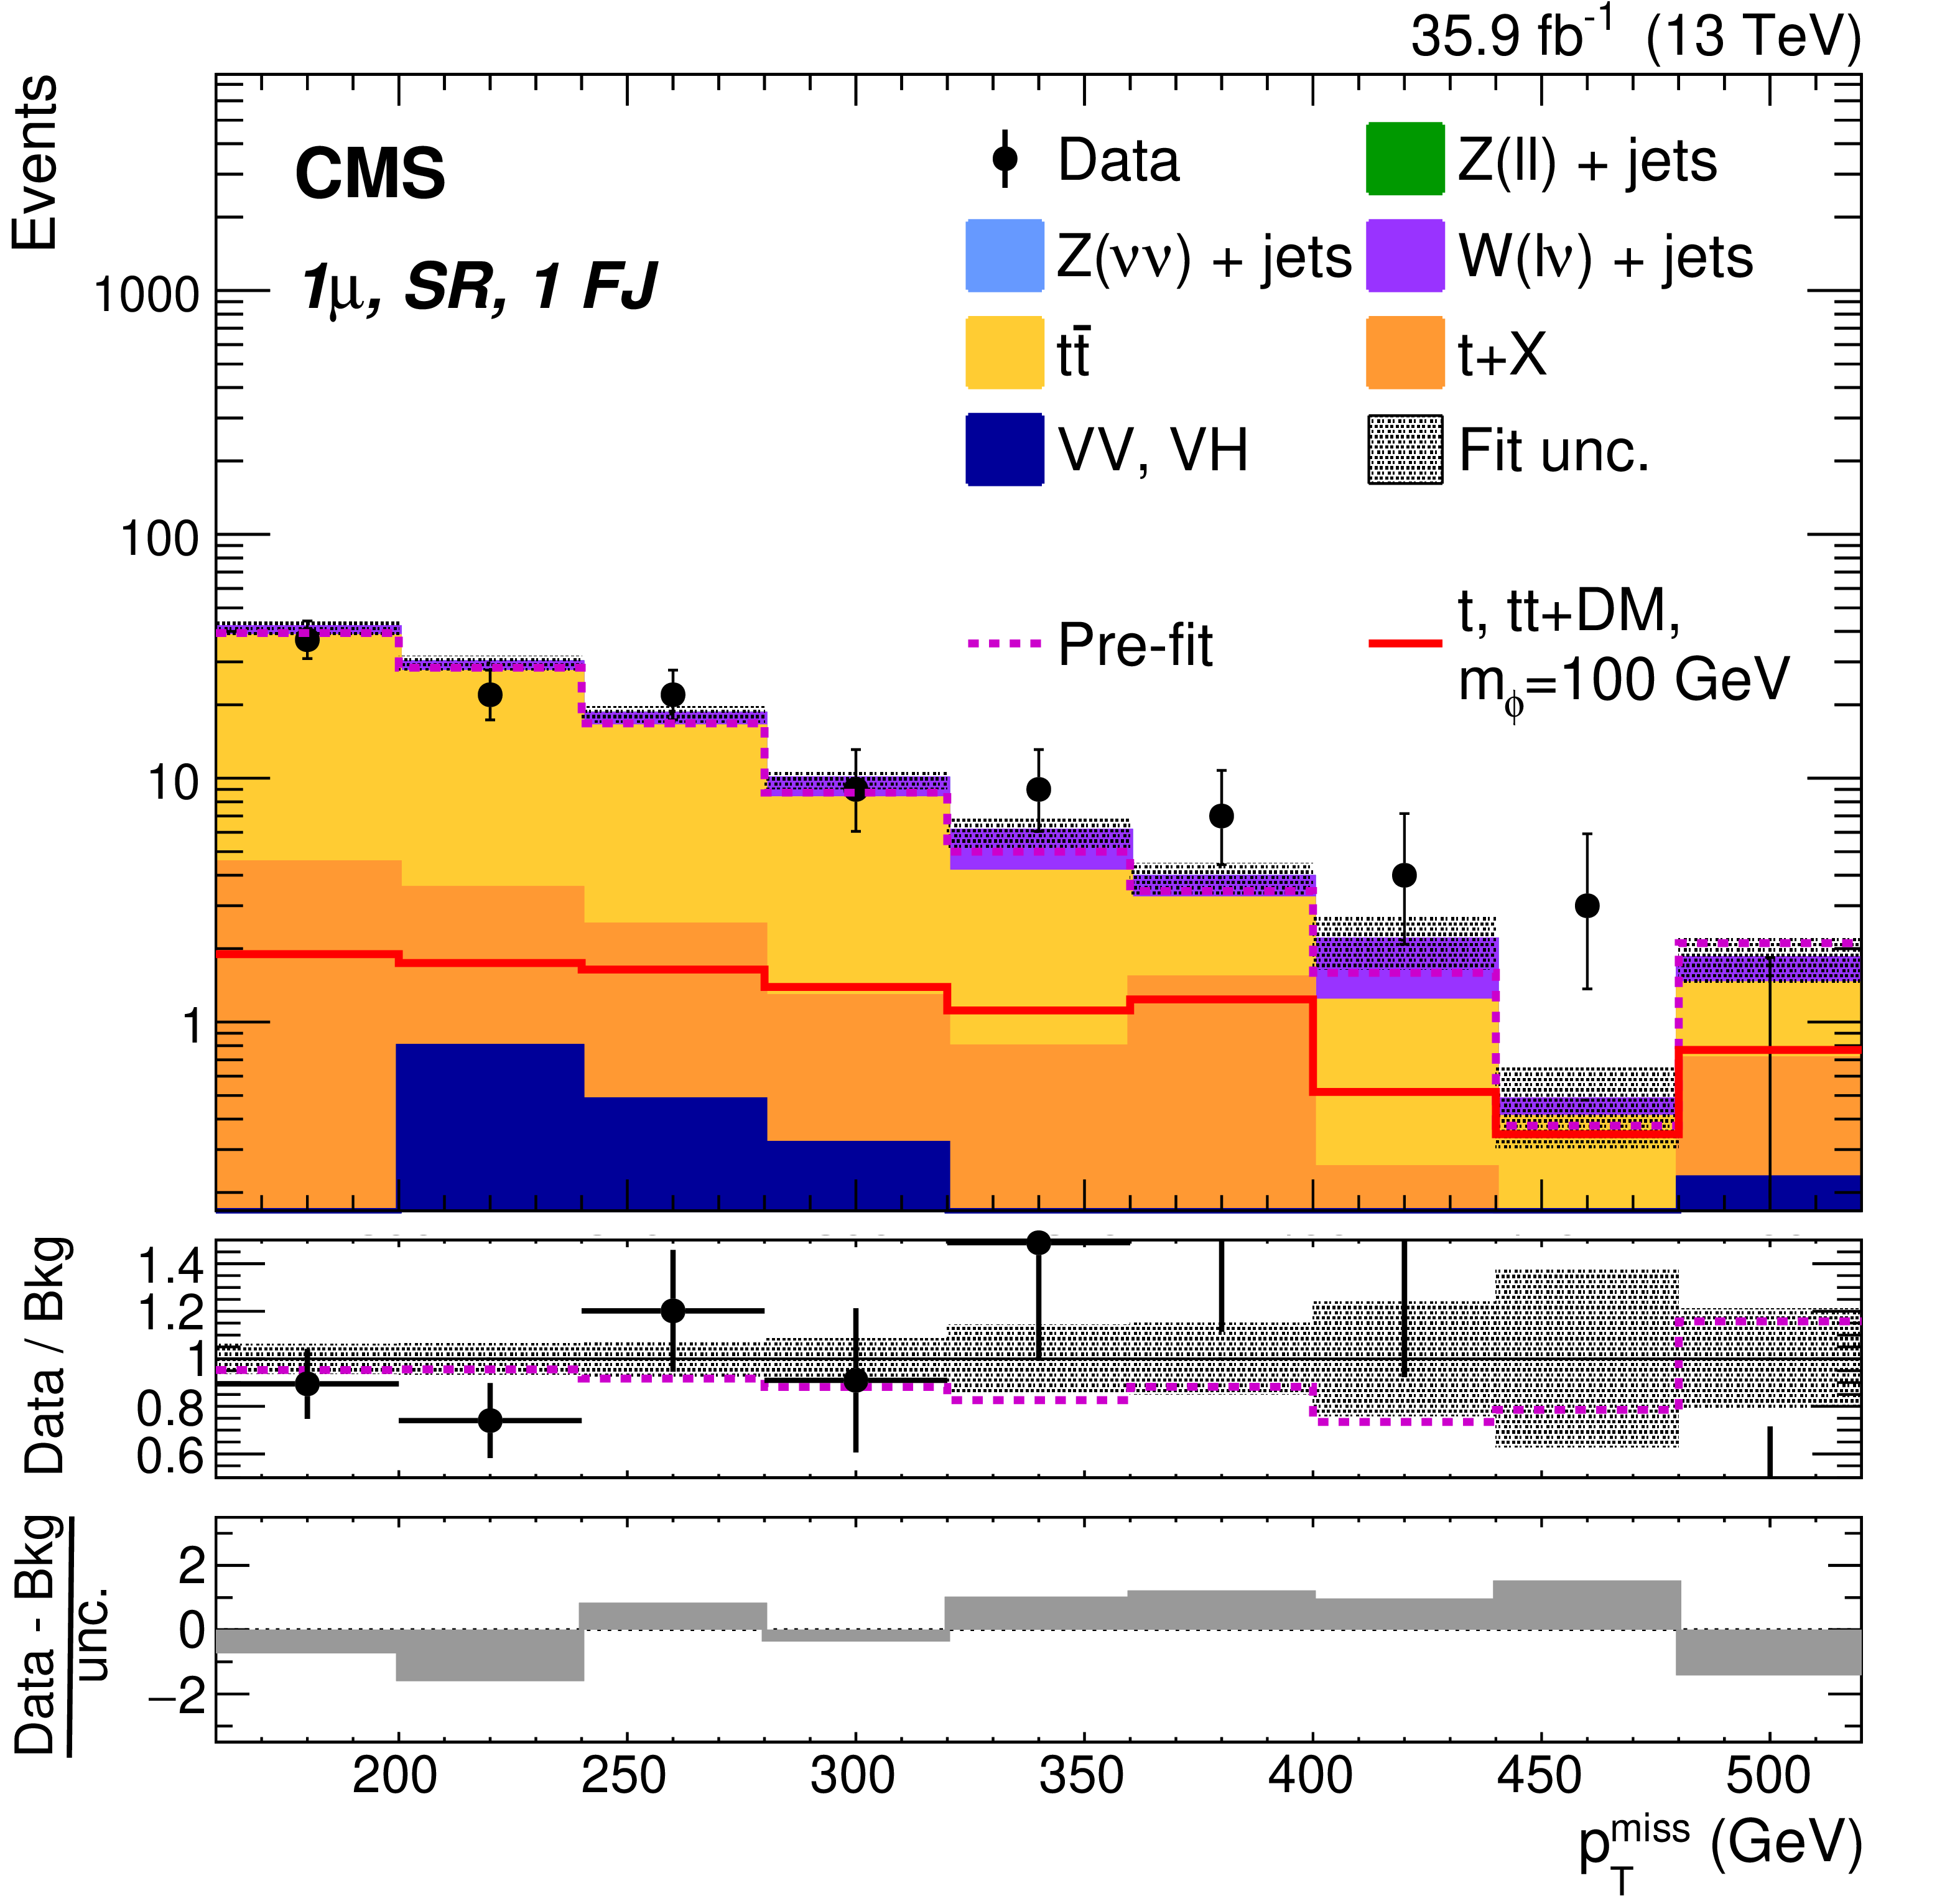
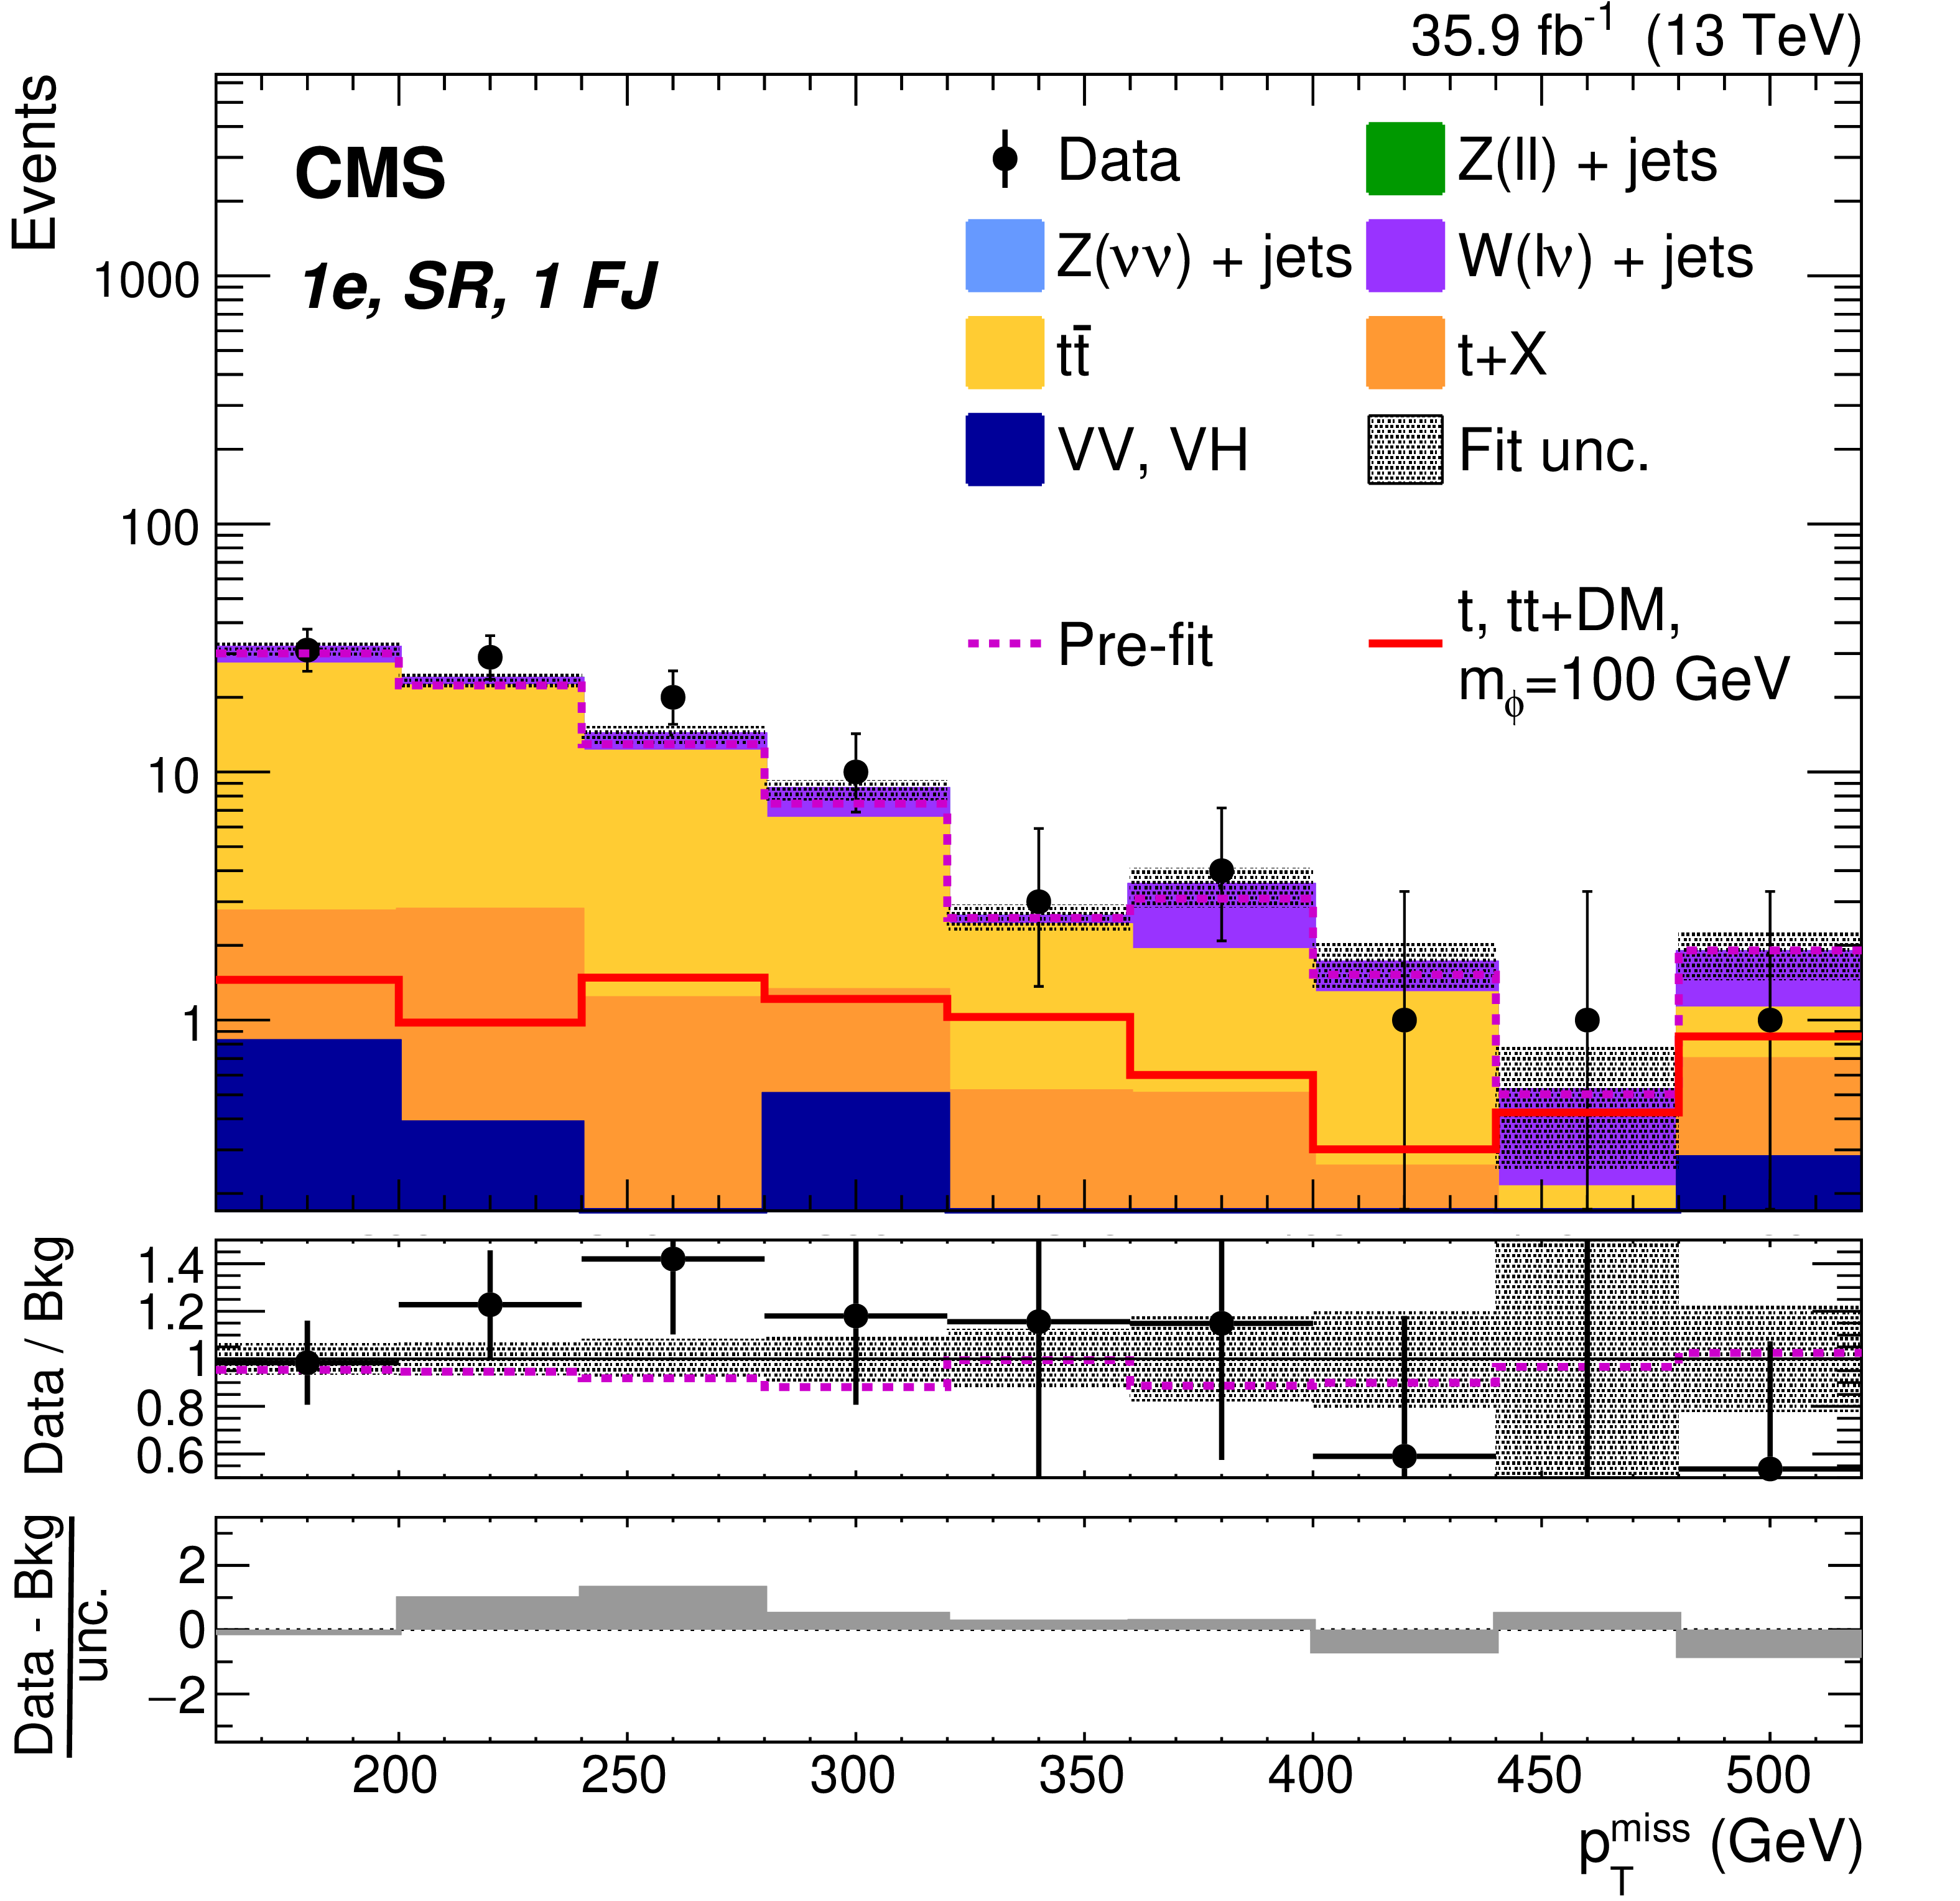
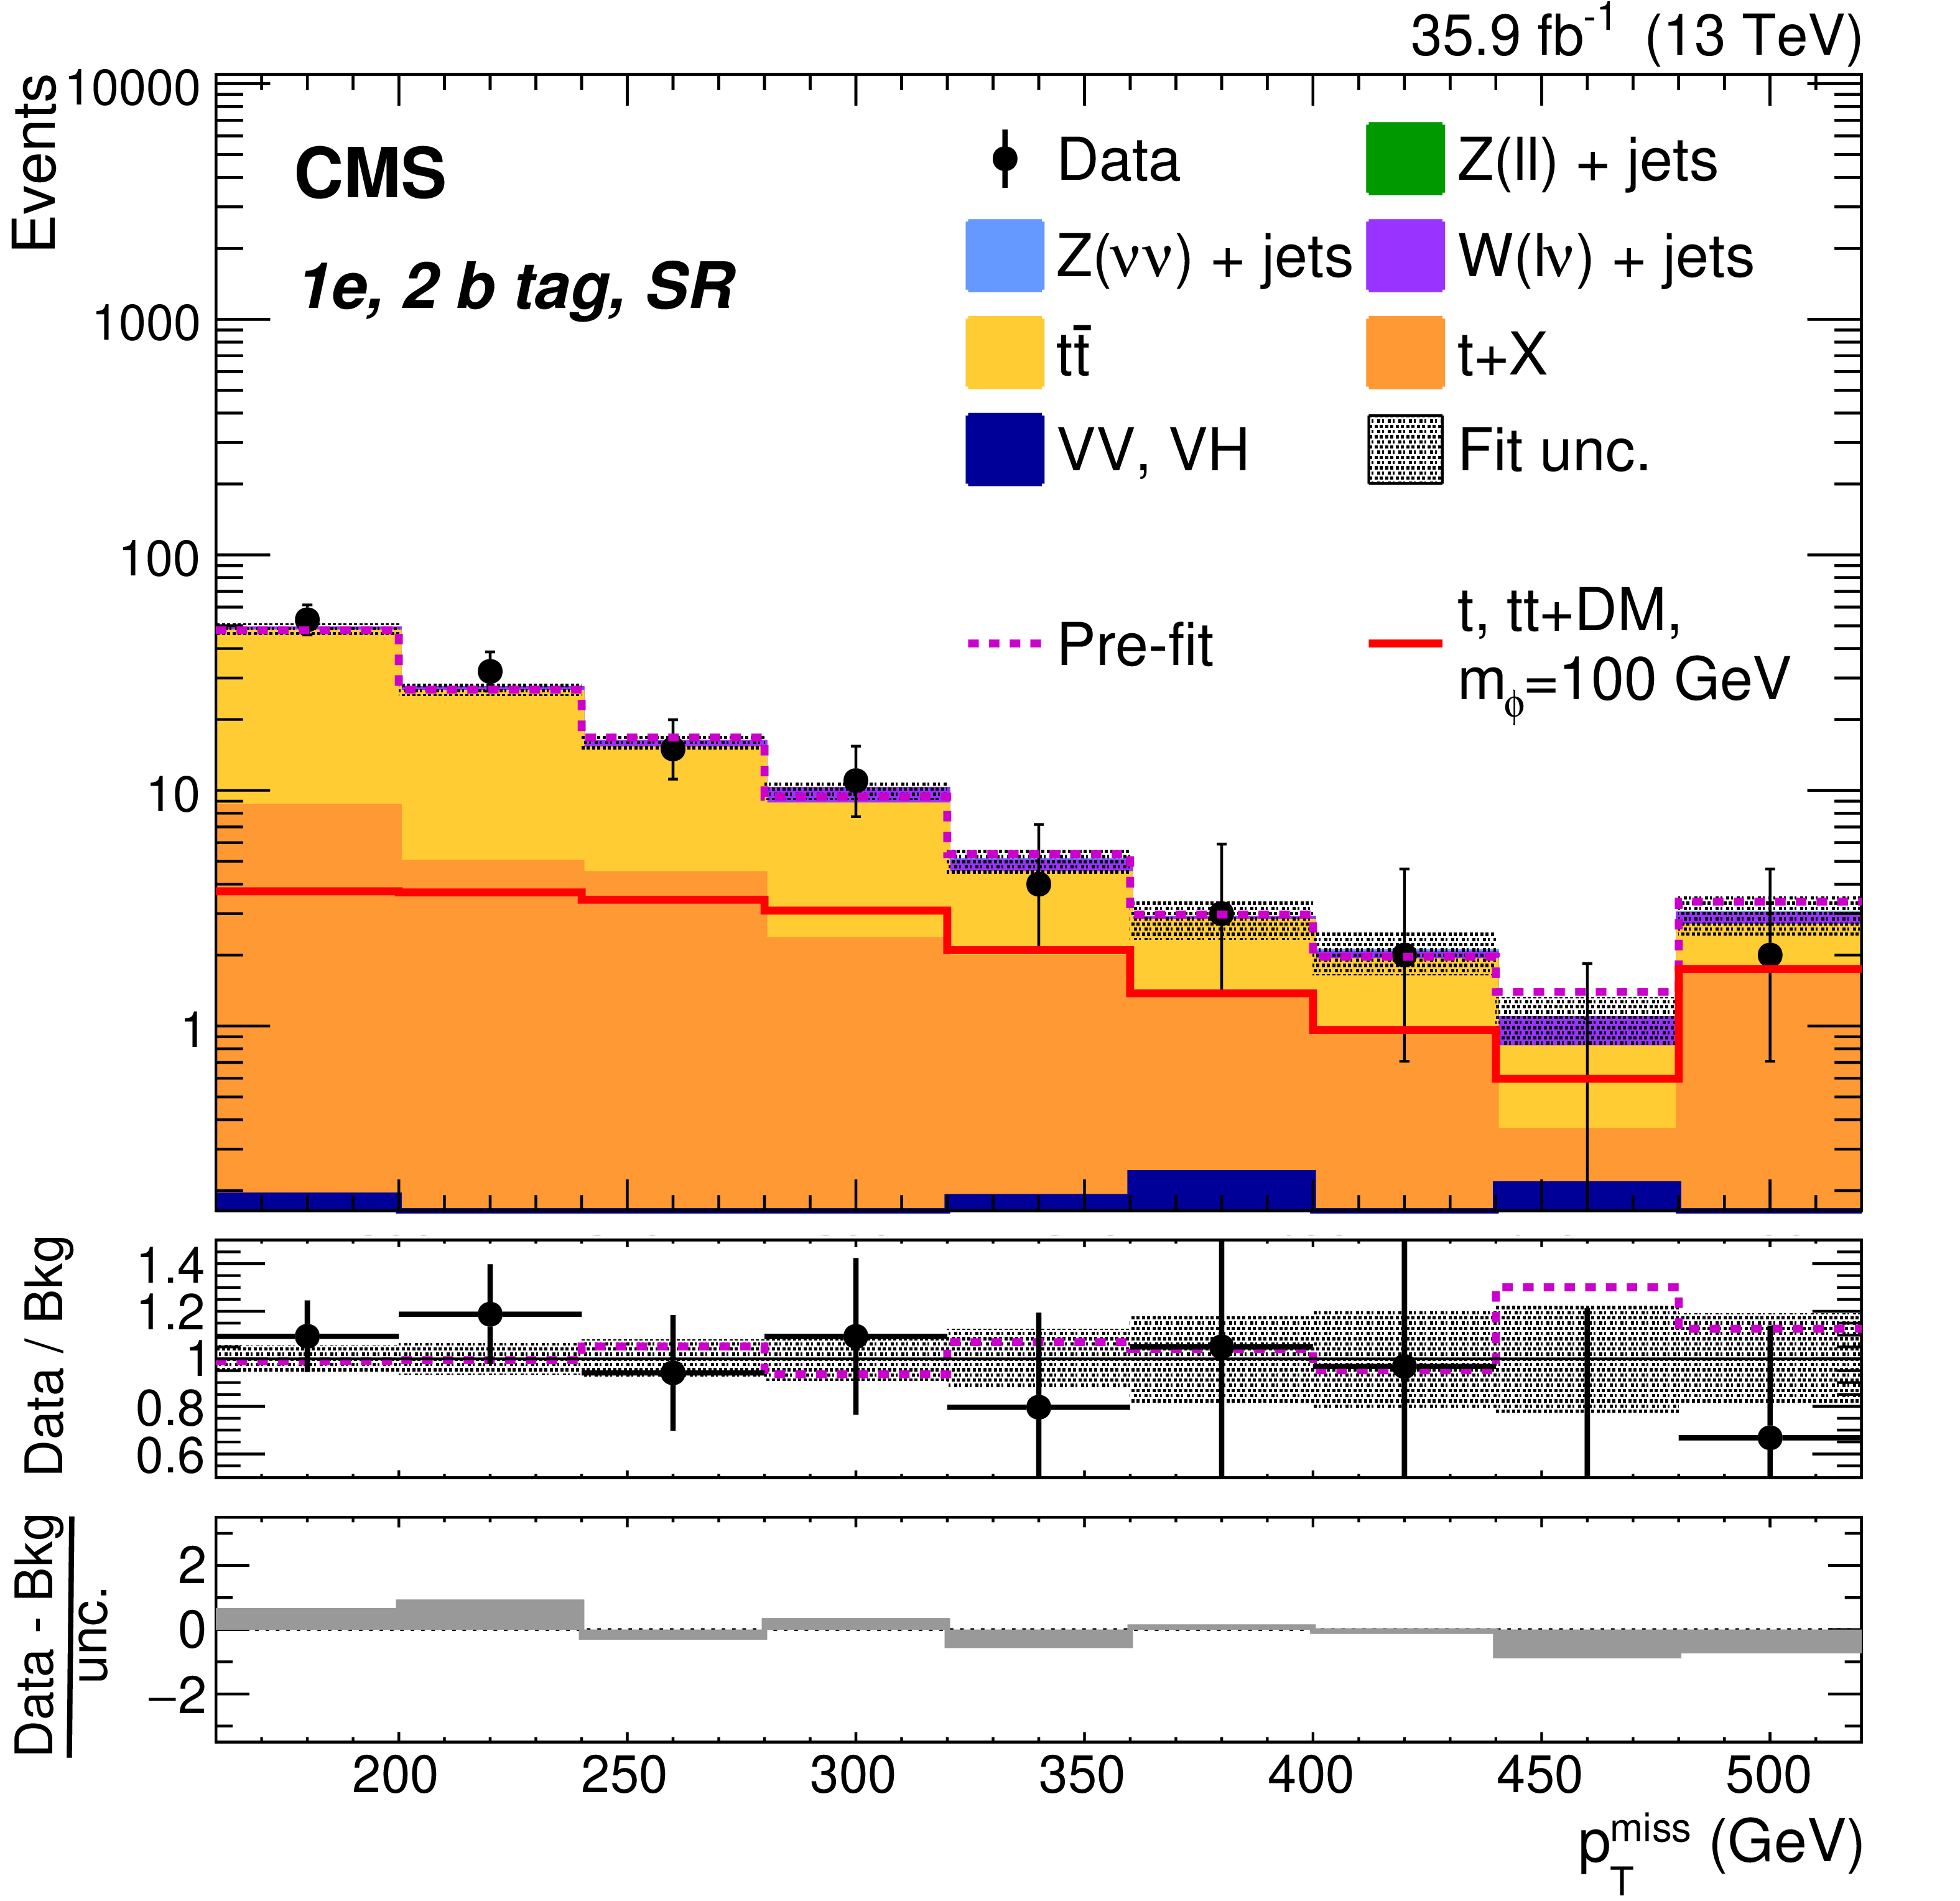
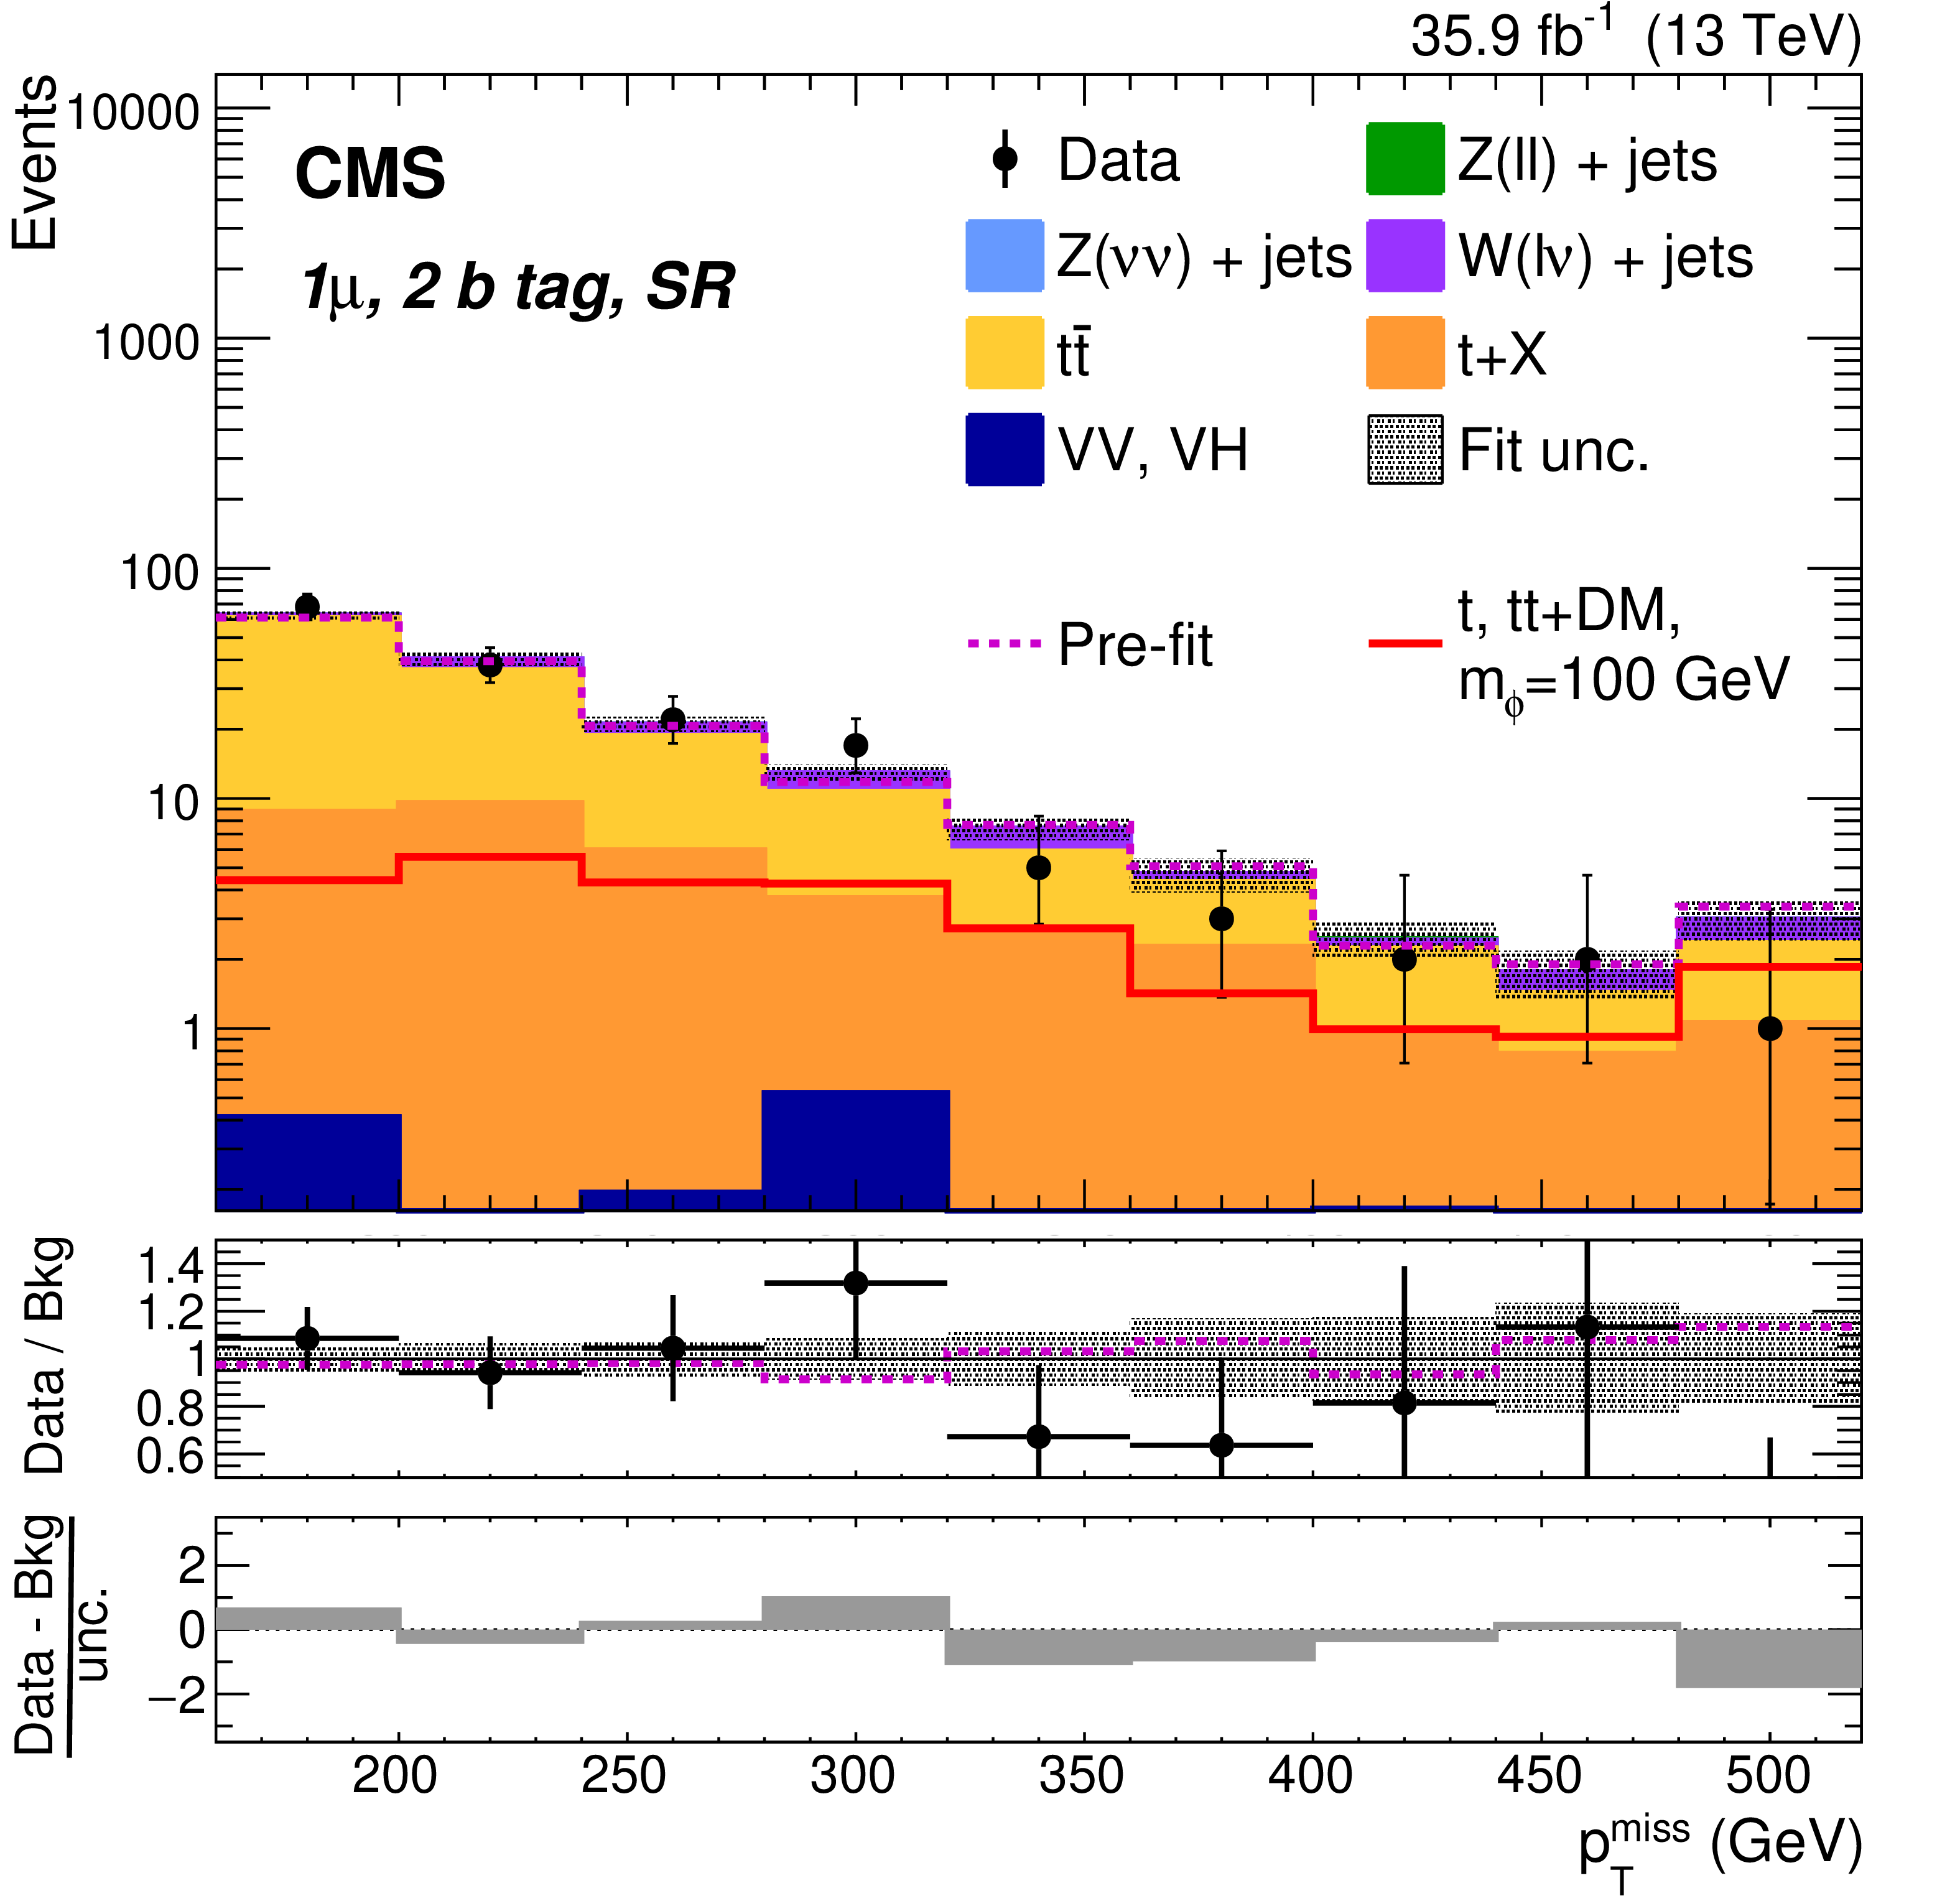
Background-only post-fit ${{p_{\mathrm {T}}} ^\text {miss}}$ distributions for the SRs of the SL selection. The total theory signal (${{{\mathrm {t}}}/\overline {{{\mathrm {t}}}}}$+DM and ${{{\mathrm {t}\overline {\mathrm {t}}}}}$+DM summed together) is presented by the red solid lines for a scalar mediator mass of 100 GeV. The last bin contains overflow events. The dashed magenta lines show the total pre-fit background expectation in the upper panels, and the ratio of pre-fit total background to post-fit total background in the middle panels. The lower panels show the difference between observed and post-fit total background divided by the full statistical and systematic uncertainties. |
png pdf |
Figure 4-a:
Background-only post-fit ${{p_{\mathrm {T}}} ^\text {miss}}$ distribution for the 1e, 0FJ SR of the SL selection. The total theory signal (${{{\mathrm {t}}}/\overline {{{\mathrm {t}}}}}$+DM and ${{{\mathrm {t}\overline {\mathrm {t}}}}}$+DM summed together) is presented by the red solid lines for a scalar mediator mass of 100 GeV. The last bin contains overflow events. The dashed magenta lines show the total pre-fit background expectation in the upper panel, and the ratio of pre-fit total background to post-fit total background in the middle panel. The lower panel shows the difference between observed and post-fit total background divided by the full statistical and systematic uncertainties. |
png pdf |
Figure 4-b:
Background-only post-fit ${{p_{\mathrm {T}}} ^\text {miss}}$ distribution for the 1$\mu$, 0FJ SR of the SL selection. The total theory signal (${{{\mathrm {t}}}/\overline {{{\mathrm {t}}}}}$+DM and ${{{\mathrm {t}\overline {\mathrm {t}}}}}$+DM summed together) is presented by the red solid lines for a scalar mediator mass of 100 GeV. The last bin contains overflow events. The dashed magenta lines show the total pre-fit background expectation in the upper panel, and the ratio of pre-fit total background to post-fit total background in the middle panel. The lower panel shows the difference between observed and post-fit total background divided by the full statistical and systematic uncertainties. |
png pdf |
Figure 4-c:
Background-only post-fit ${{p_{\mathrm {T}}} ^\text {miss}}$ distribution for the 1$\mu$, 1FJ SR of the SL selection. The total theory signal (${{{\mathrm {t}}}/\overline {{{\mathrm {t}}}}}$+DM and ${{{\mathrm {t}\overline {\mathrm {t}}}}}$+DM summed together) is presented by the red solid lines for a scalar mediator mass of 100 GeV. The last bin contains overflow events. The dashed magenta lines show the total pre-fit background expectation in the upper panel, and the ratio of pre-fit total background to post-fit total background in the middle panel. The lower panel shows the difference between observed and post-fit total background divided by the full statistical and systematic uncertainties. |
png pdf |
Figure 4-d:
Background-only post-fit ${{p_{\mathrm {T}}} ^\text {miss}}$ distribution for the 1e, 1FJ SR of the SL selection. The total theory signal (${{{\mathrm {t}}}/\overline {{{\mathrm {t}}}}}$+DM and ${{{\mathrm {t}\overline {\mathrm {t}}}}}$+DM summed together) is presented by the red solid lines for a scalar mediator mass of 100 GeV. The last bin contains overflow events. The dashed magenta lines show the total pre-fit background expectation in the upper panel, and the ratio of pre-fit total background to post-fit total background in the middle panel. The lower panel shows the difference between observed and post-fit total background divided by the full statistical and systematic uncertainties. |
png pdf |
Figure 4-e:
Background-only post-fit ${{p_{\mathrm {T}}} ^\text {miss}}$ distribution for the 1e, 2 b tag SR of the SL selection. The total theory signal (${{{\mathrm {t}}}/\overline {{{\mathrm {t}}}}}$+DM and ${{{\mathrm {t}\overline {\mathrm {t}}}}}$+DM summed together) is presented by the red solid lines for a scalar mediator mass of 100 GeV. The last bin contains overflow events. The dashed magenta lines show the total pre-fit background expectation in the upper panel, and the ratio of pre-fit total background to post-fit total background in the middle panel. The lower panel shows the difference between observed and post-fit total background divided by the full statistical and systematic uncertainties. |
png pdf |
Figure 4-f:
Background-only post-fit ${{p_{\mathrm {T}}} ^\text {miss}}$ distribution for the 1$\mu$, 2 b tag SR of the SL selection. The total theory signal (${{{\mathrm {t}}}/\overline {{{\mathrm {t}}}}}$+DM and ${{{\mathrm {t}\overline {\mathrm {t}}}}}$+DM summed together) is presented by the red solid lines for a scalar mediator mass of 100 GeV. The last bin contains overflow events. The dashed magenta lines show the total pre-fit background expectation in the upper panel, and the ratio of pre-fit total background to post-fit total background in the middle panel. The lower panel shows the difference between observed and post-fit total background divided by the full statistical and systematic uncertainties. |
png pdf |
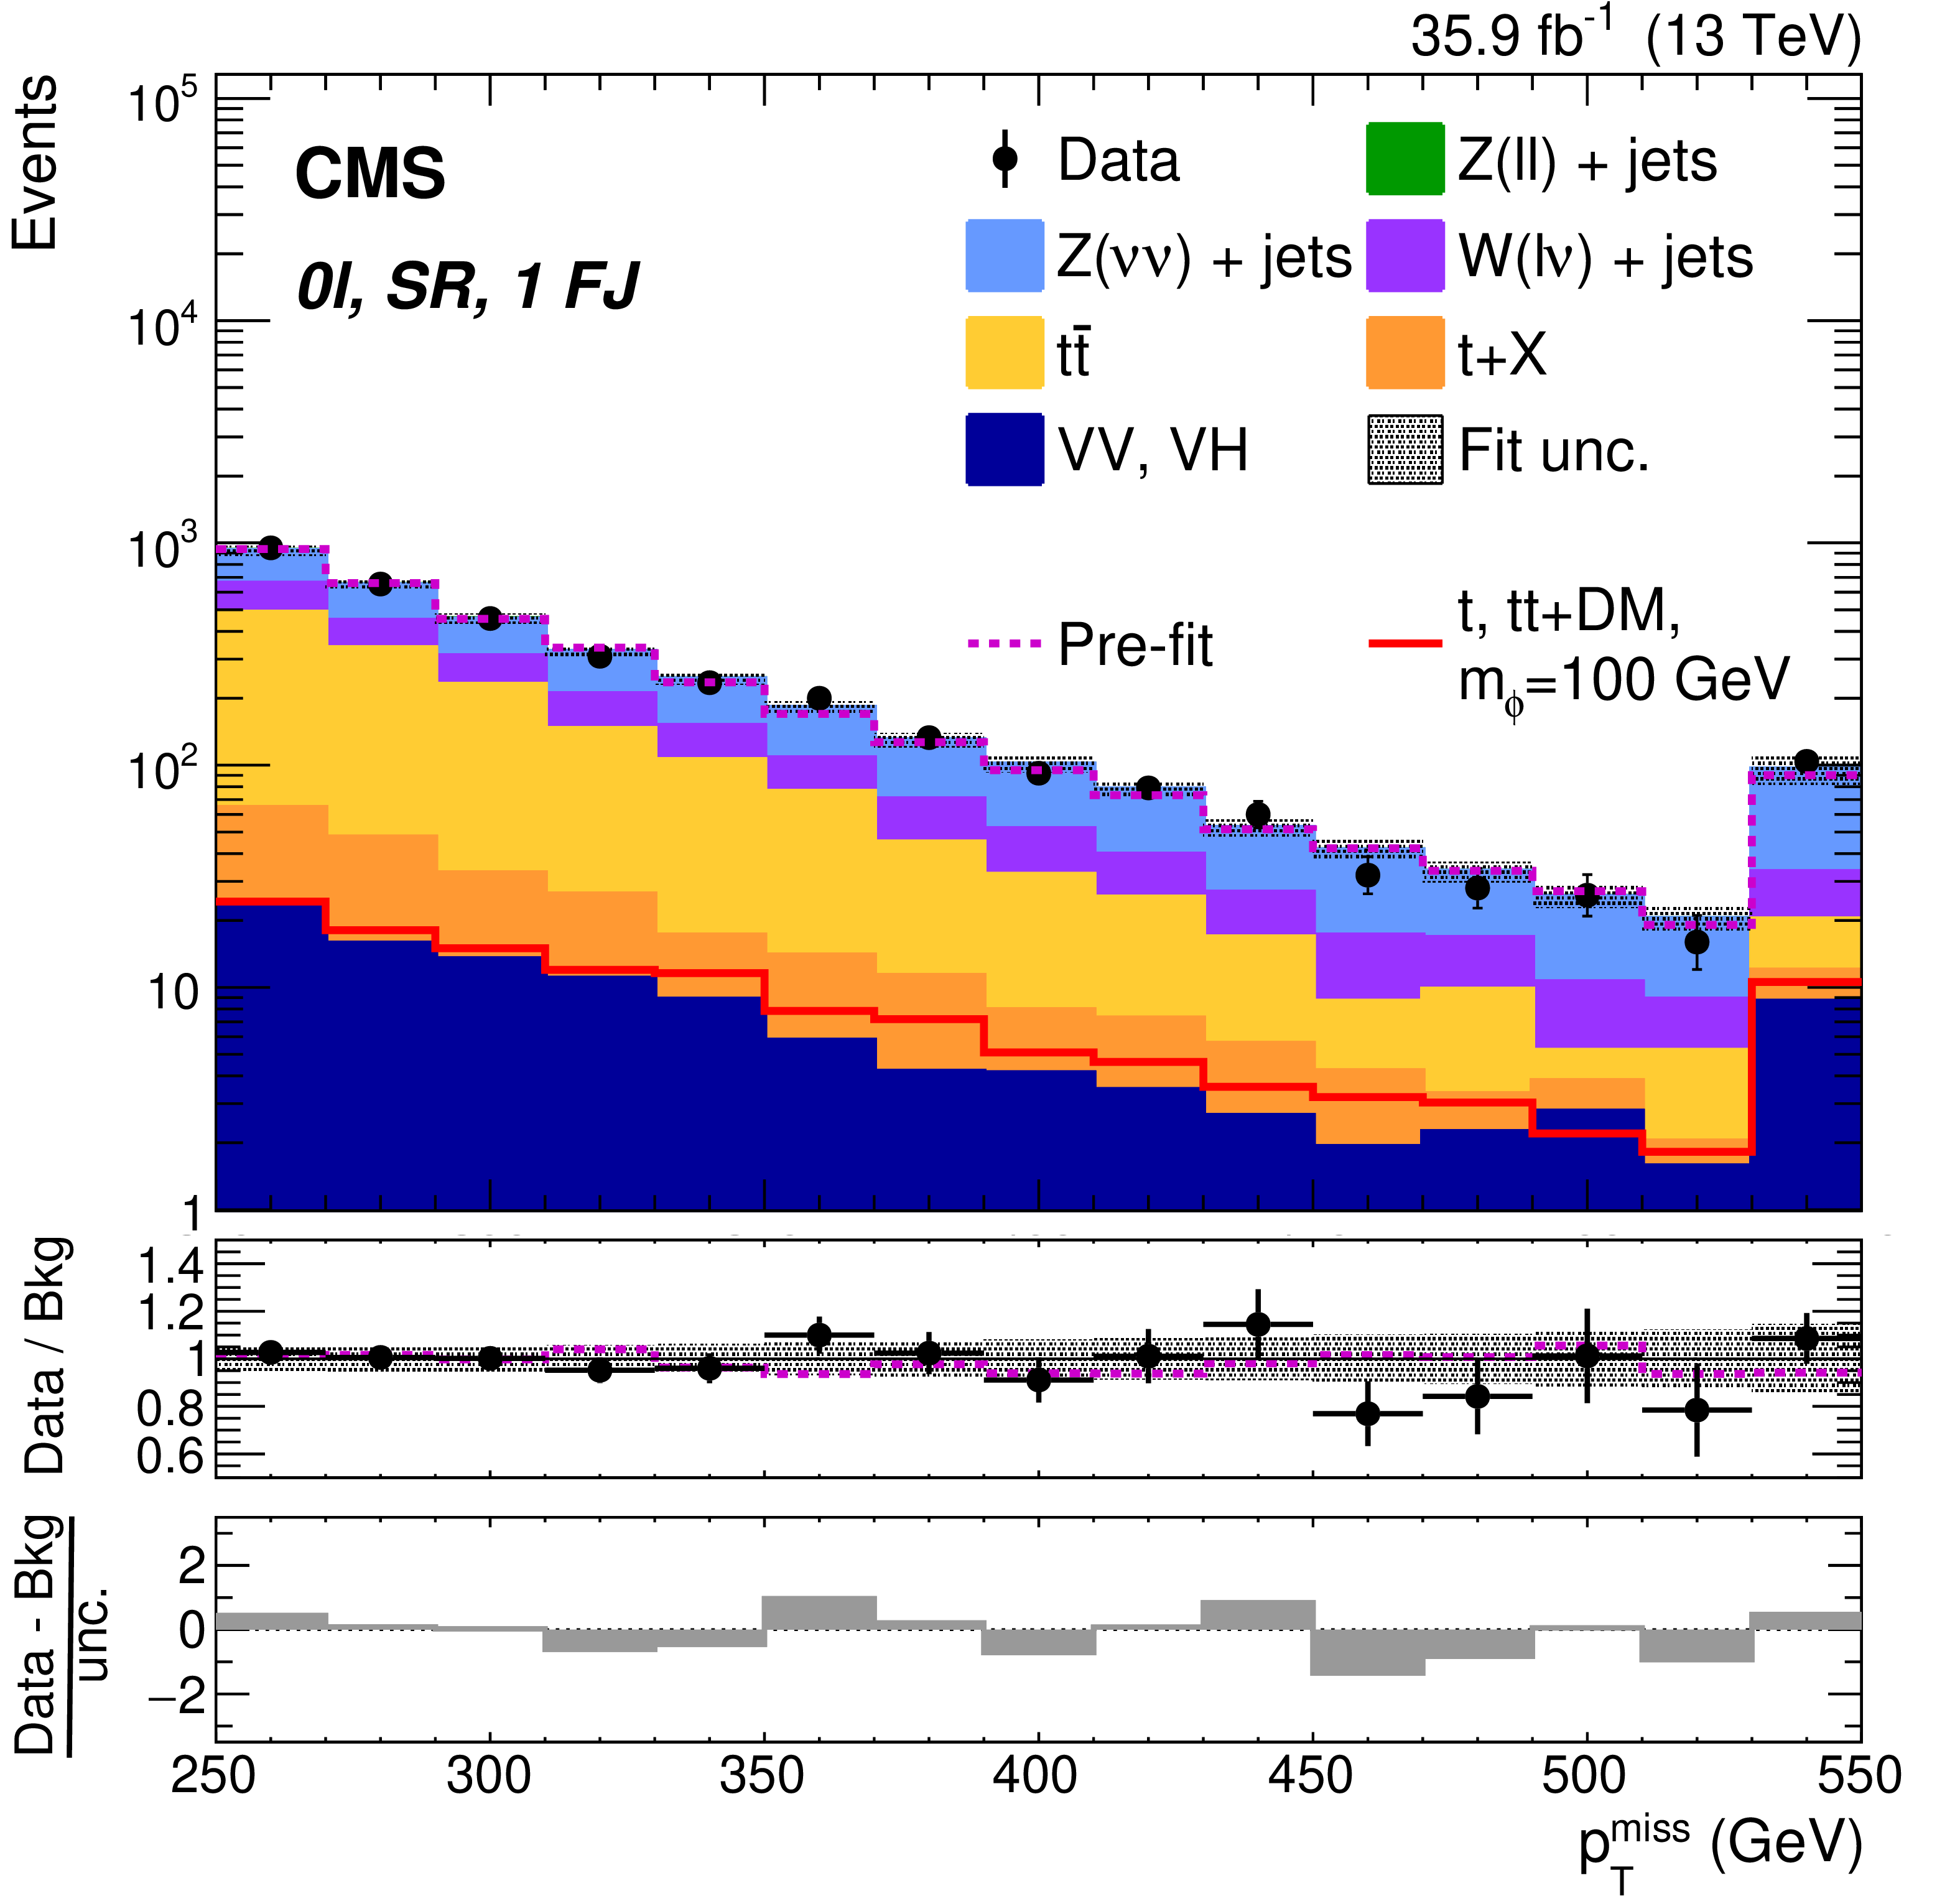
Figure 5:
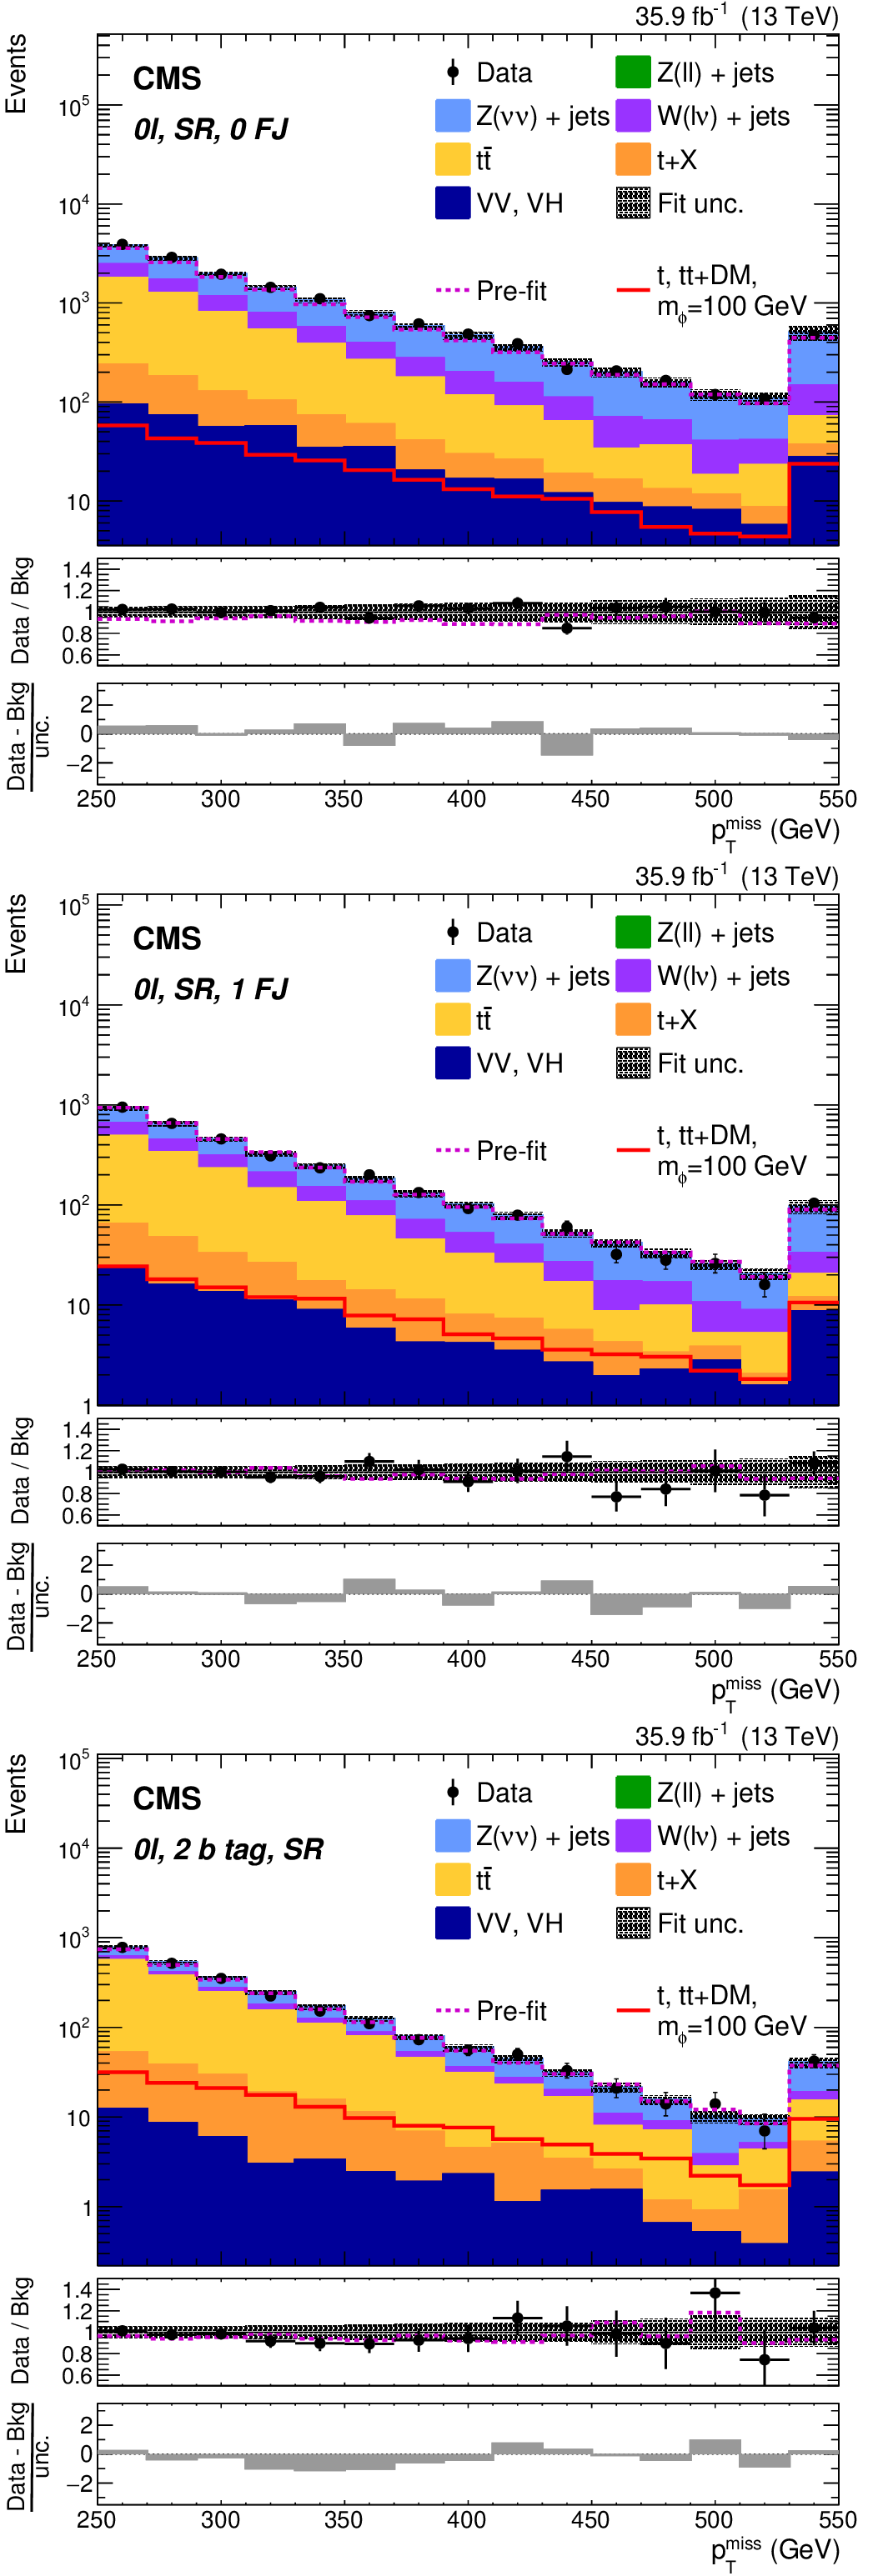
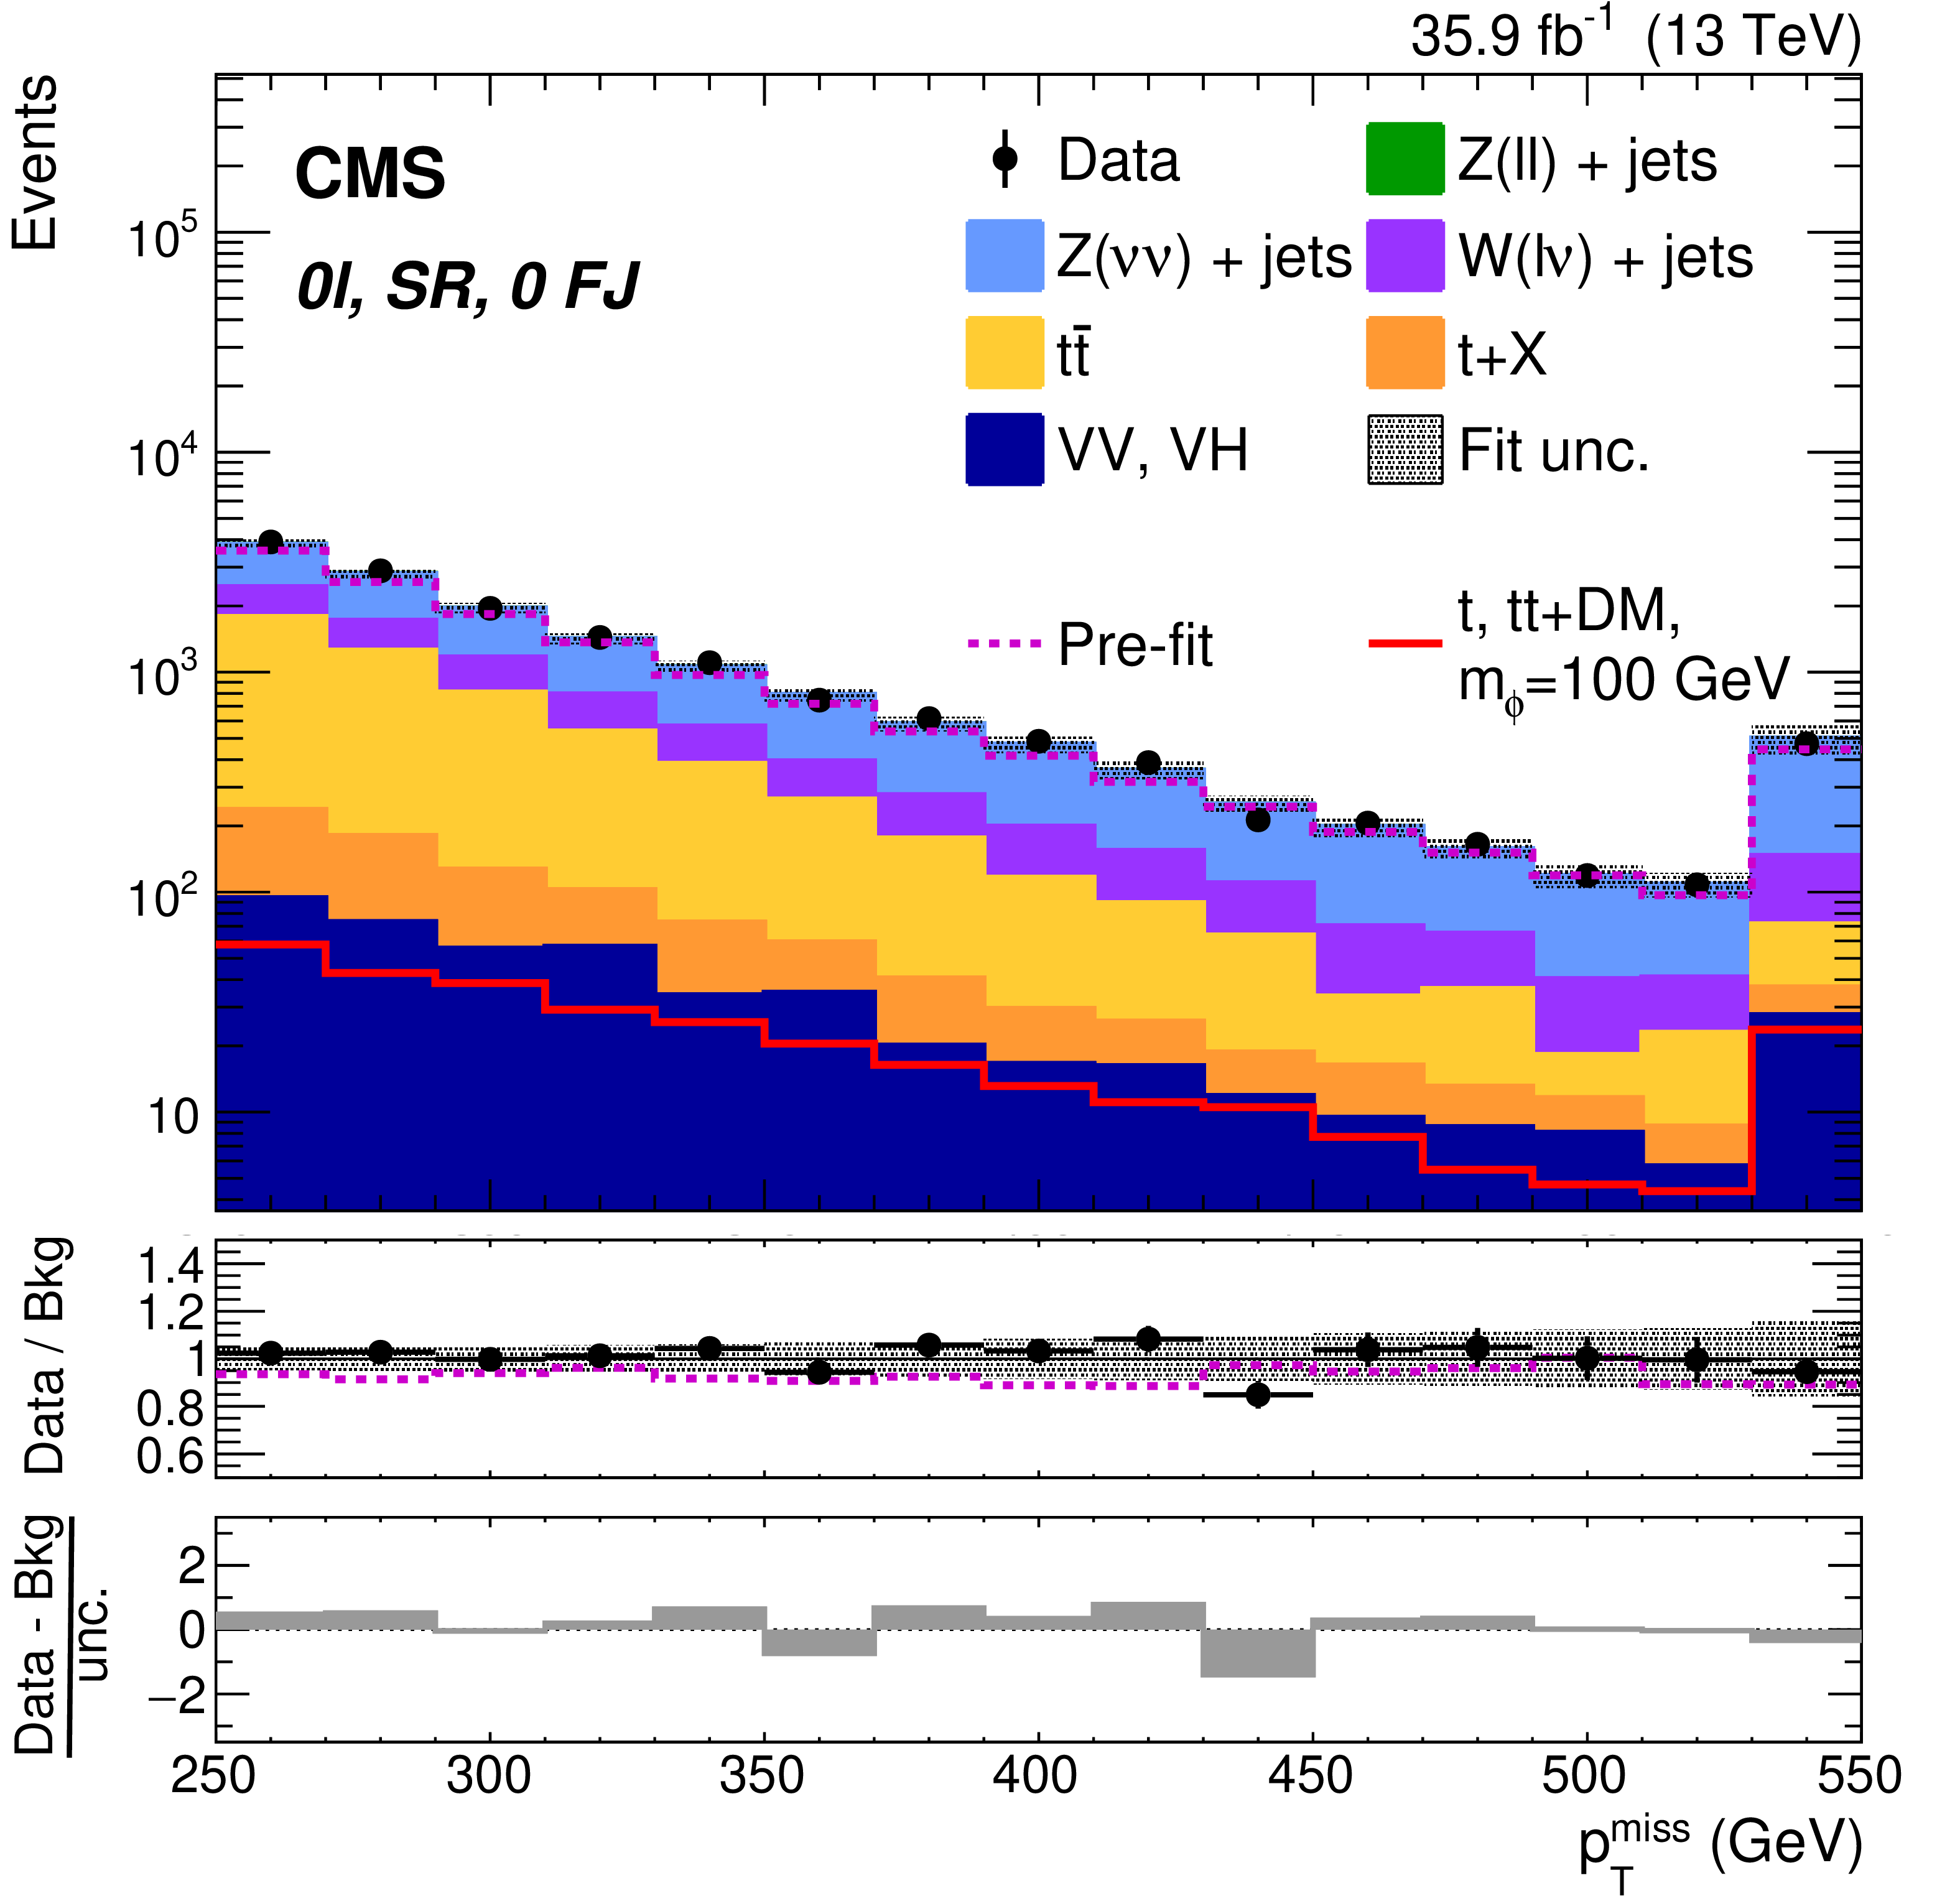
Background-only post-fit ${{p_{\mathrm {T}}} ^\text {miss}}$ distributions for the SRs of the AH selection. The total theory signal (${{{\mathrm {t}}}/\overline {{{\mathrm {t}}}}}$+DM and ${{{\mathrm {t}\overline {\mathrm {t}}}}}$+DM summed together) is presented by the red solid lines for a scalar mediator mass of 100 GeV. The last bin contains overflow events. The dashed magenta lines show the total pre-fit background expectation in the upper panels, and the ratio of pre-fit total background to post-fit total background in the middle panels. The lower panels show the difference between observed and post-fit total background divided by the full statistical and systematic uncertainties. |
png pdf |
Figure 5-a:
Background-only post-fit ${{p_{\mathrm {T}}} ^\text {miss}}$ distribution for the 0$\ell$, 0FJ SR of the AH selection. The total theory signal (${{{\mathrm {t}}}/\overline {{{\mathrm {t}}}}}$+DM and ${{{\mathrm {t}\overline {\mathrm {t}}}}}$+DM summed together) is presented by the red solid lines for a scalar mediator mass of 100 GeV. The last bin contains overflow events. The dashed magenta lines show the total pre-fit background expectation in the upper panel, and the ratio of pre-fit total background to post-fit total background in the middle panel. The lower panel shows the difference between observed and post-fit total background divided by the full statistical and systematic uncertainties. |
png pdf |
Figure 5-b:
Background-only post-fit ${{p_{\mathrm {T}}} ^\text {miss}}$ distribution for the 0$\ell$, 1FJ SR of the AH selection. The total theory signal (${{{\mathrm {t}}}/\overline {{{\mathrm {t}}}}}$+DM and ${{{\mathrm {t}\overline {\mathrm {t}}}}}$+DM summed together) is presented by the red solid lines for a scalar mediator mass of 100 GeV. The last bin contains overflow events. The dashed magenta lines show the total pre-fit background expectation in the upper panel, and the ratio of pre-fit total background to post-fit total background in the middle panel. The lower panel shows the difference between observed and post-fit total background divided by the full statistical and systematic uncertainties. |
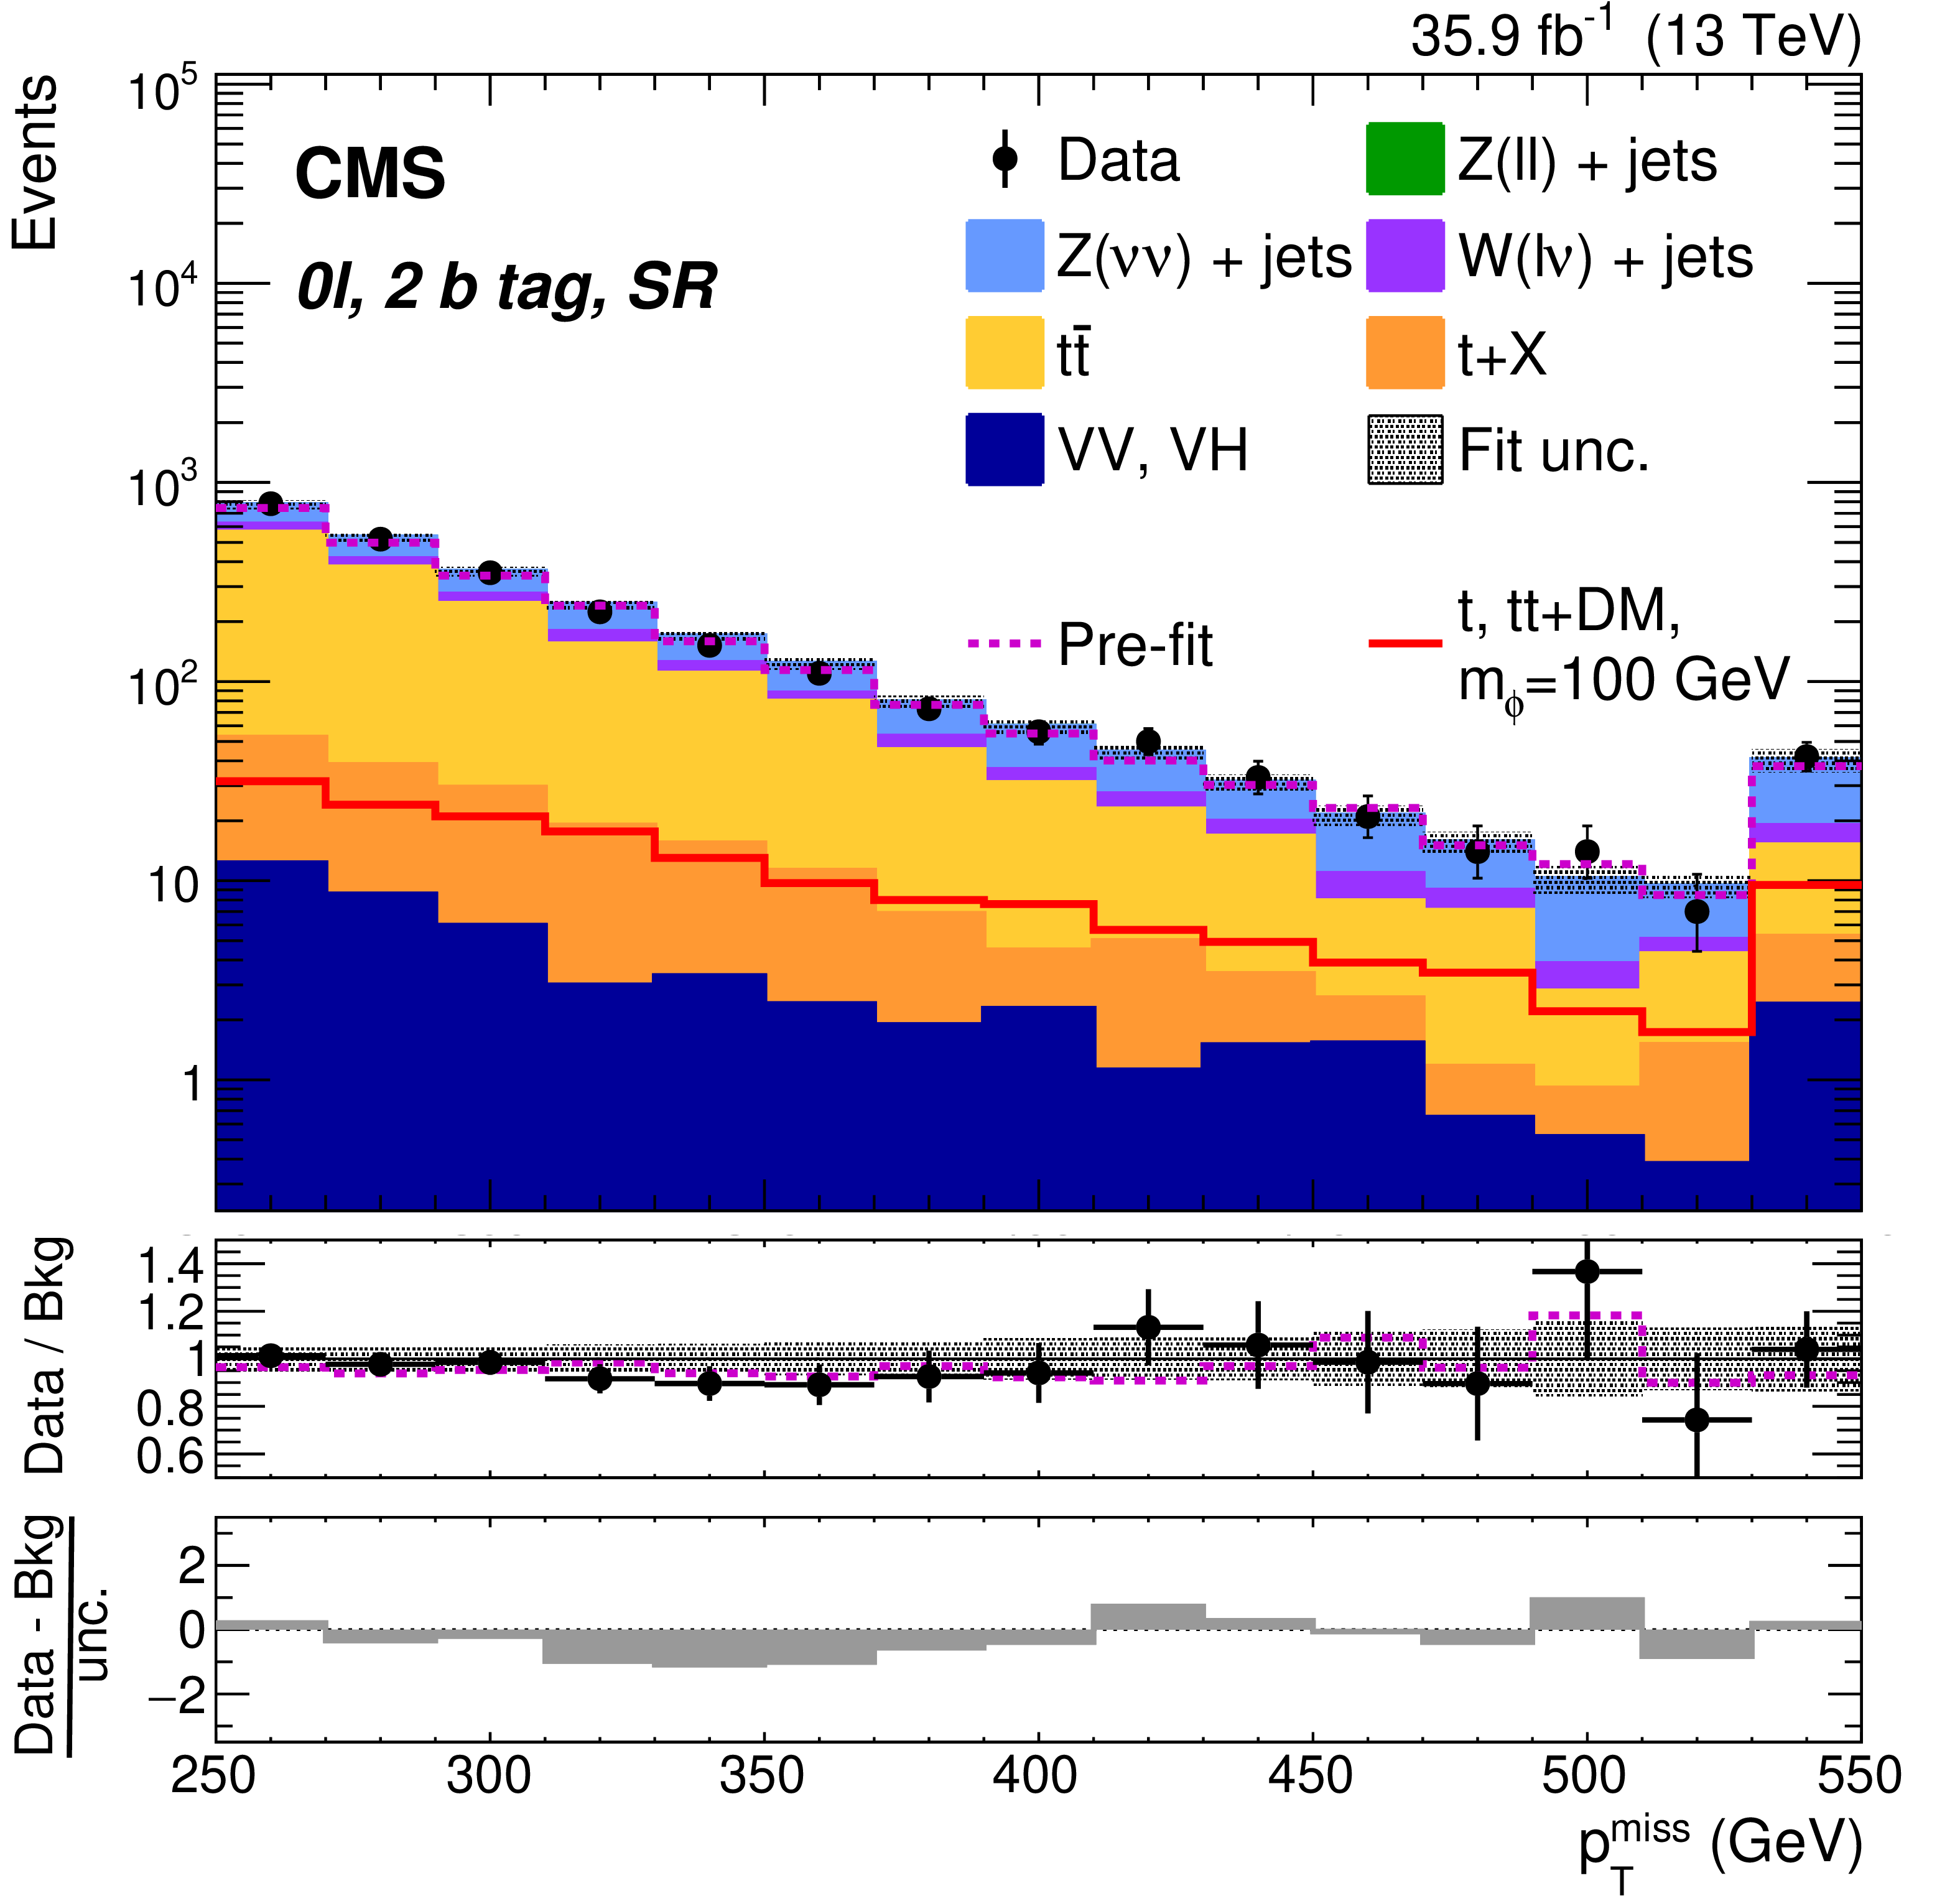
png pdf |
Figure 5-c:
Background-only post-fit ${{p_{\mathrm {T}}} ^\text {miss}}$ distribution for the 0$\ell$, 2 b tag SR of the AH selection. The total theory signal (${{{\mathrm {t}}}/\overline {{{\mathrm {t}}}}}$+DM and ${{{\mathrm {t}\overline {\mathrm {t}}}}}$+DM summed together) is presented by the red solid lines for a scalar mediator mass of 100 GeV. The last bin contains overflow events. The dashed magenta lines show the total pre-fit background expectation in the upper panel, and the ratio of pre-fit total background to post-fit total background in the middle panel. The lower panel shows the difference between observed and post-fit total background divided by the full statistical and systematic uncertainties. |

png pdf |
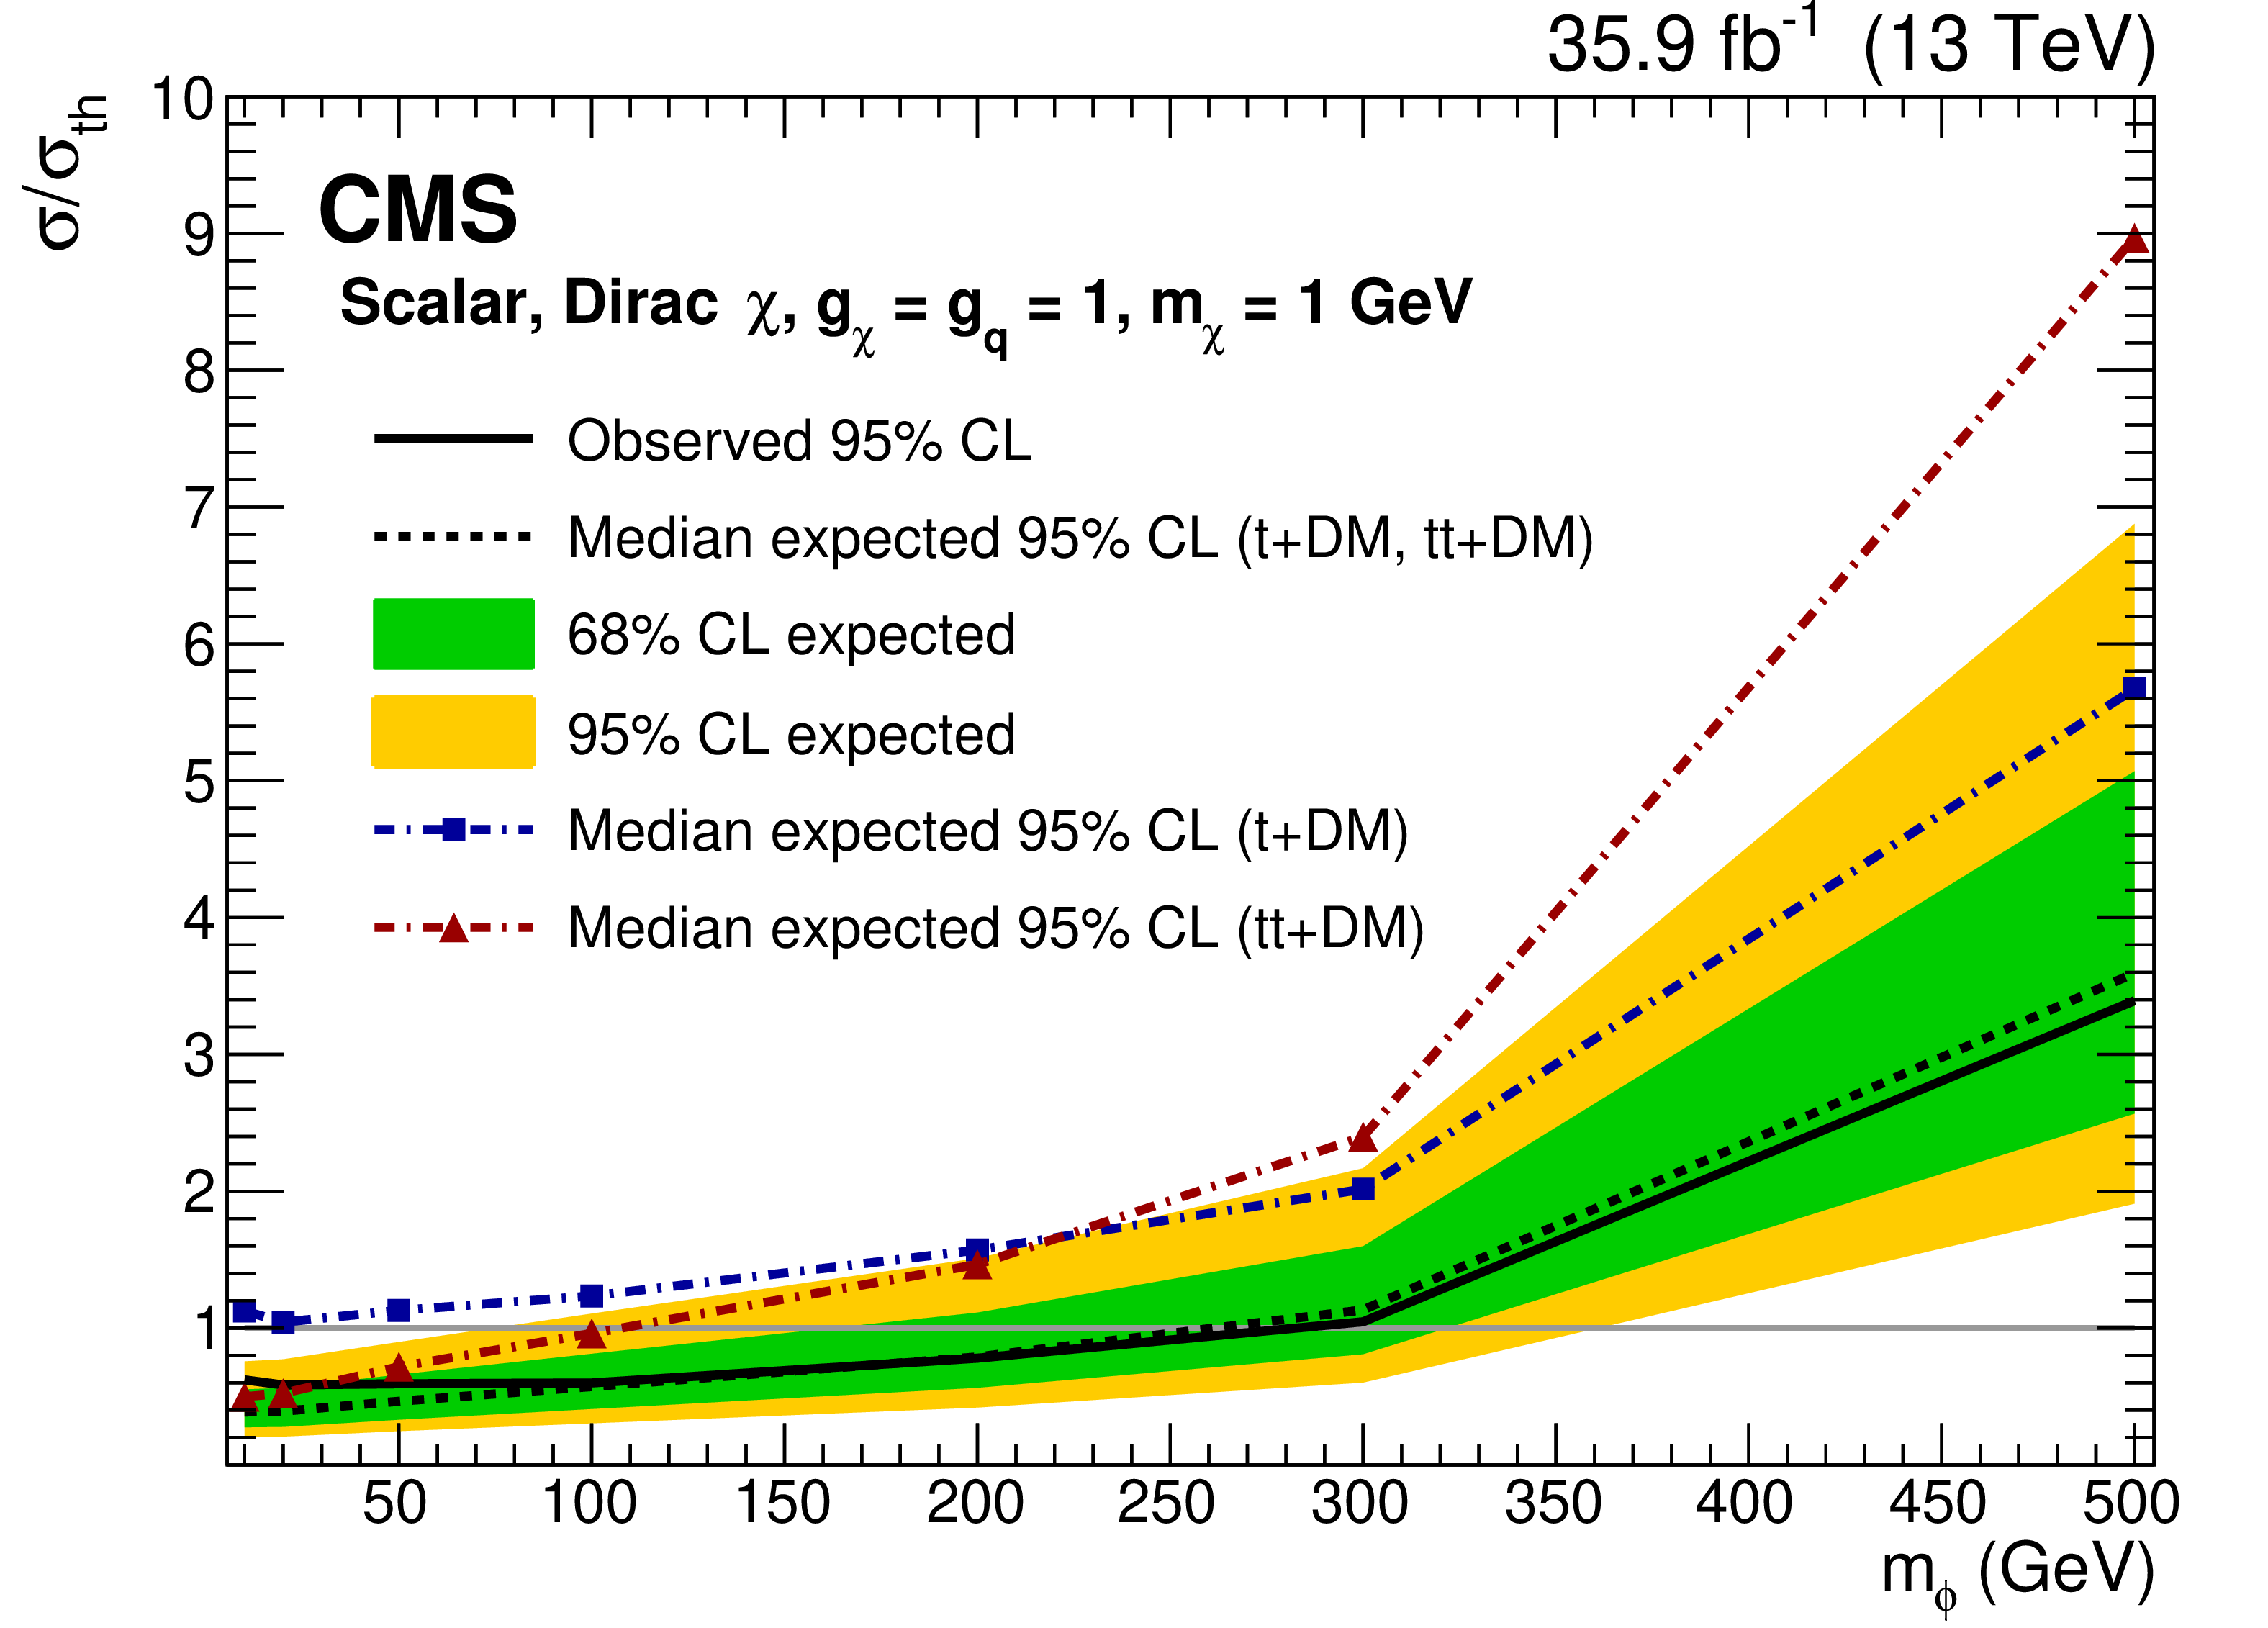
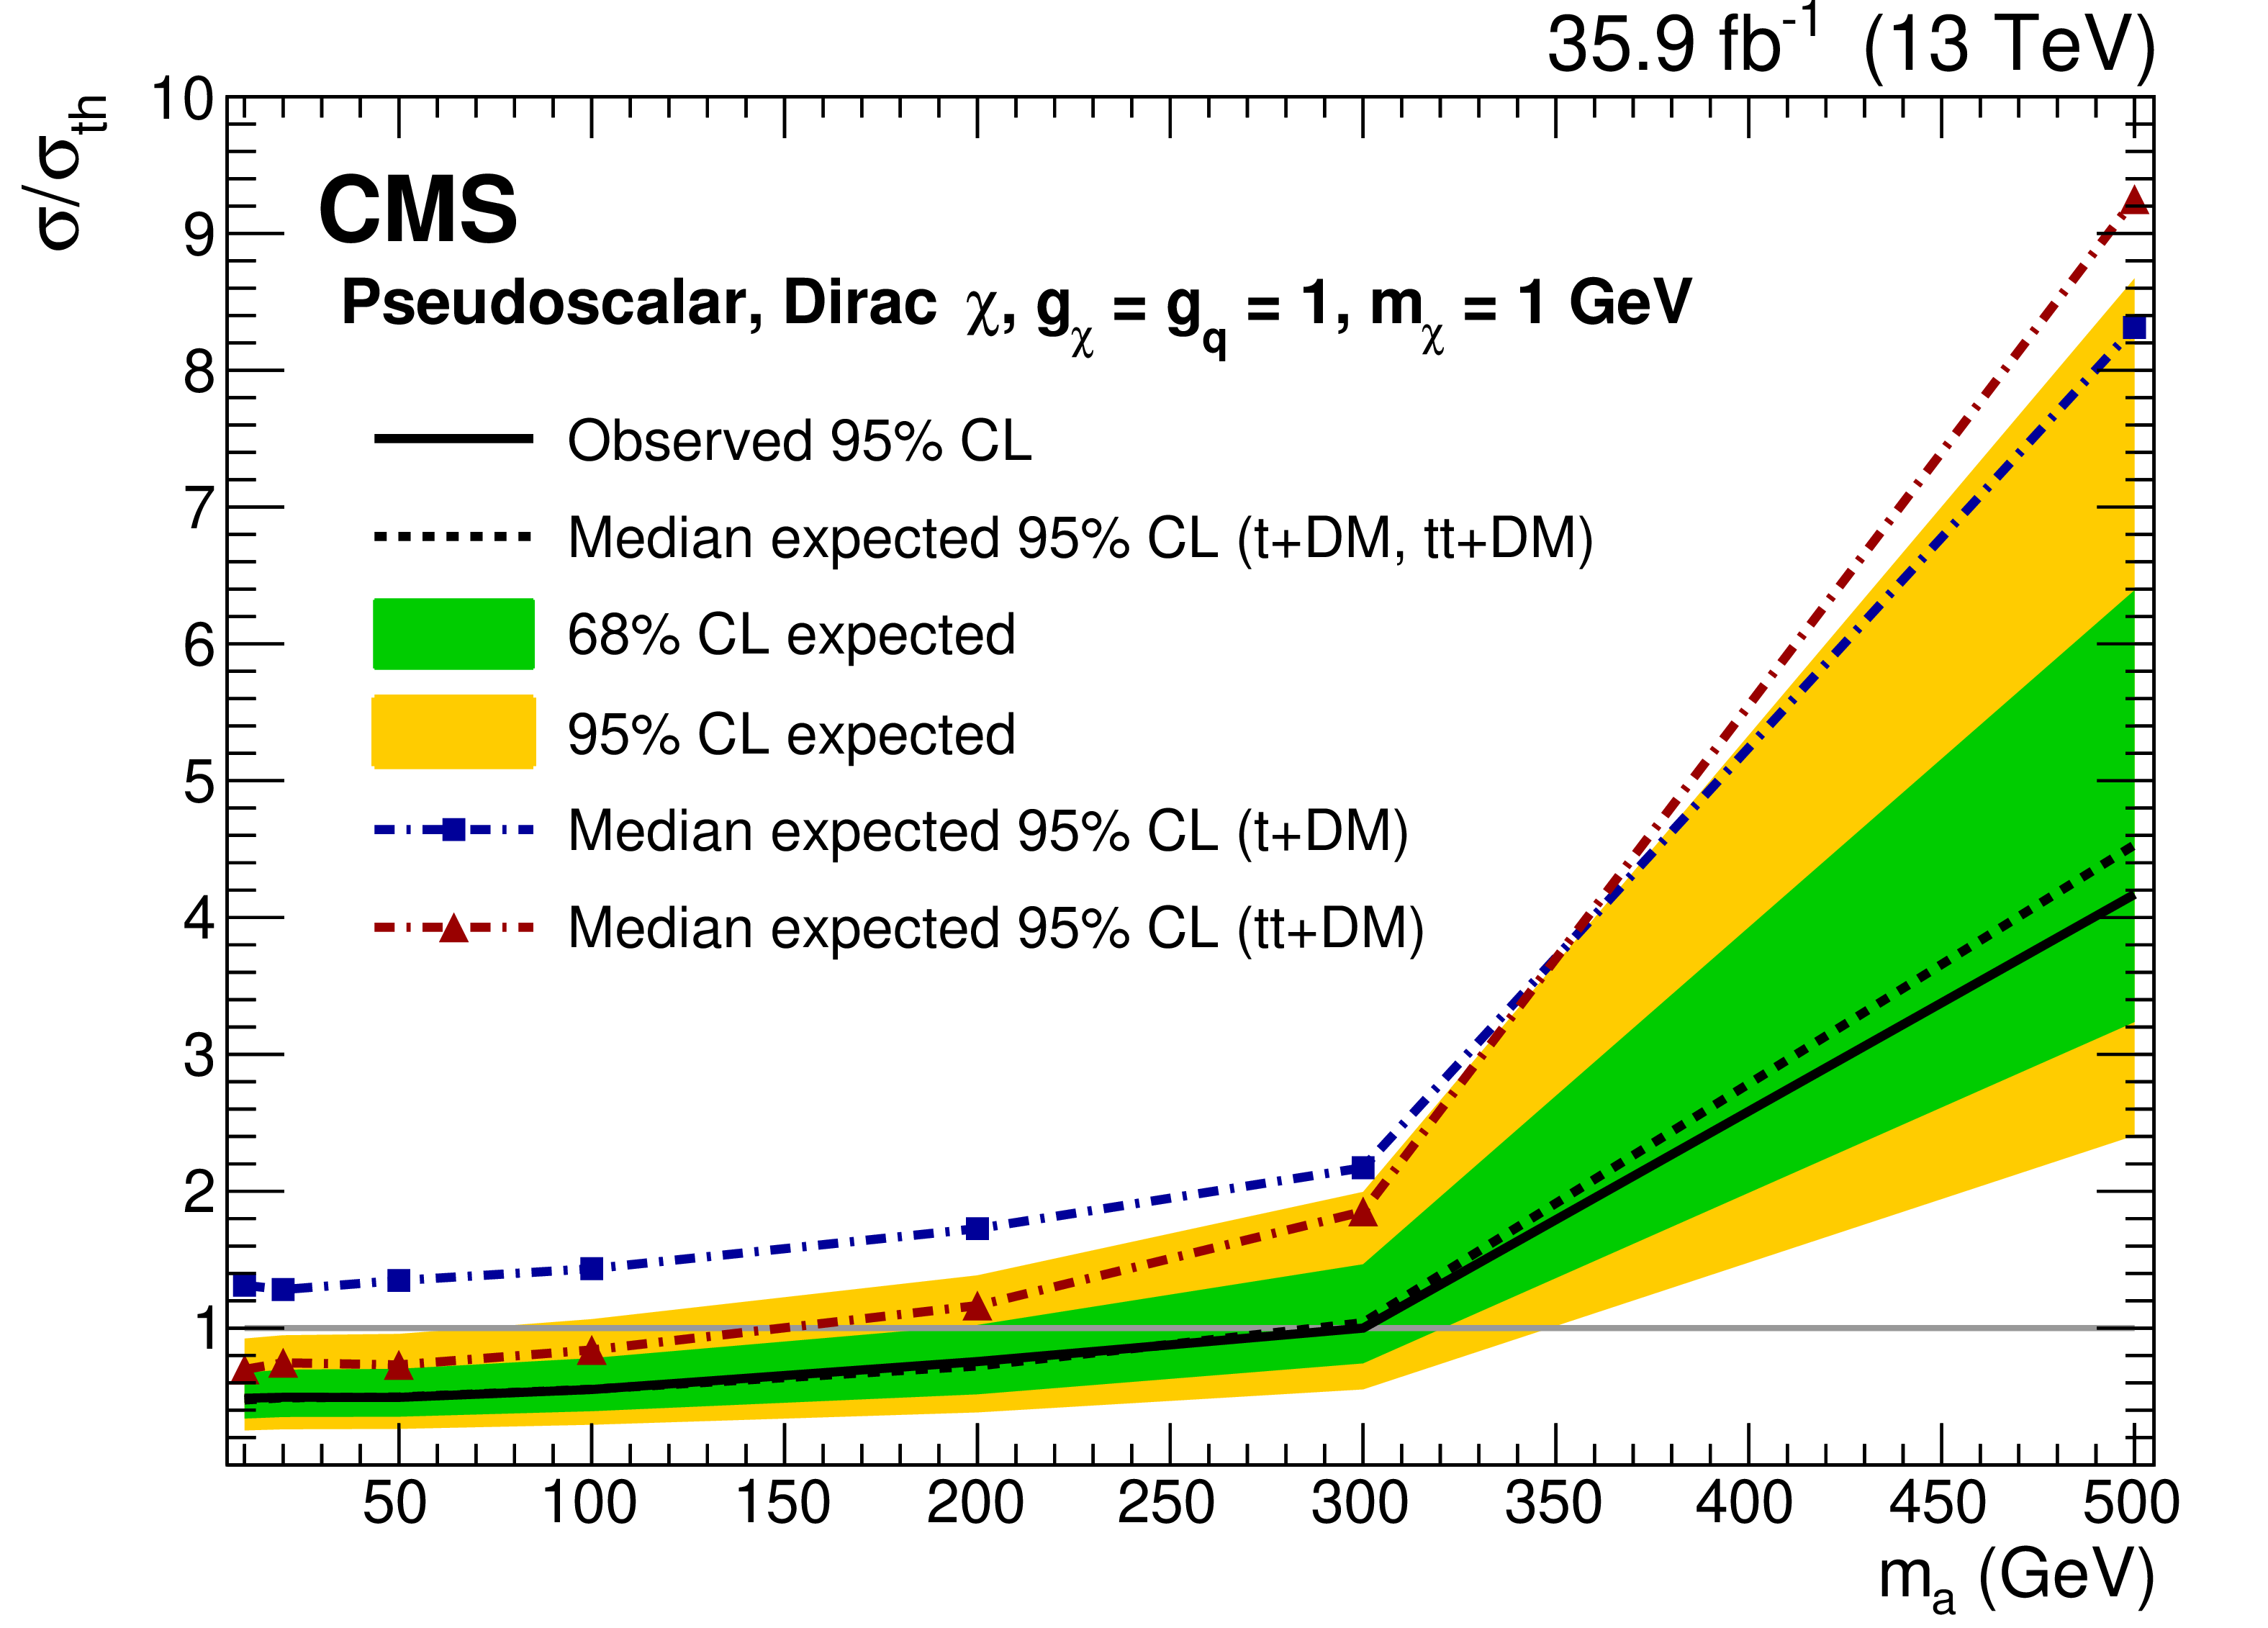
Figure 6:
The expected and observed 95% CL limits on the DM production cross sections, relative to the theory predictions, shown for the scalar (left) and pseudoscalar (right) models. The expected limit for the ${{{\mathrm {t}}}/\overline {{{\mathrm {t}}}}}$+DM signal alone is depicted by the blue dash-dotted line, while the ${{{\mathrm {t}\overline {\mathrm {t}}}}}$+DM limit alone is given by the red dash-dotted line. The observed limit on the sum of both signals is shown by the black solid line, while the expected value is shown by the black dashed line with the 68 and 95% CL uncertainty bands in green and yellow, respectively. The solid horizontal line corresponds to $\sigma/\sigma_{th}=$ 1. |
png pdf |
Figure 6-a:
The expected and observed 95% CL limits on the DM production cross sections, relative to the theory predictions, shown for the scalar model. The expected limit for the ${{{\mathrm {t}}}/\overline {{{\mathrm {t}}}}}$+DM signal alone is depicted by the blue dash-dotted line, while the ${{{\mathrm {t}\overline {\mathrm {t}}}}}$+DM limit alone is given by the red dash-dotted line. The observed limit on the sum of both signals is shown by the black solid line, while the expected value is shown by the black dashed line with the 68 and 95% CL uncertainty bands in green and yellow, respectively. The solid horizontal line corresponds to $\sigma/\sigma_{th}=$ 1. |
png pdf |
Figure 6-b:
The expected and observed 95% CL limits on the DM production cross sections, relative to the theory predictions, shown for the pseudoscalar model. The expected limit for the ${{{\mathrm {t}}}/\overline {{{\mathrm {t}}}}}$+DM signal alone is depicted by the blue dash-dotted line, while the ${{{\mathrm {t}\overline {\mathrm {t}}}}}$+DM limit alone is given by the red dash-dotted line. The observed limit on the sum of both signals is shown by the black solid line, while the expected value is shown by the black dashed line with the 68 and 95% CL uncertainty bands in green and yellow, respectively. The solid horizontal line corresponds to $\sigma/\sigma_{th}=$ 1. |
| Tables | |
png pdf |
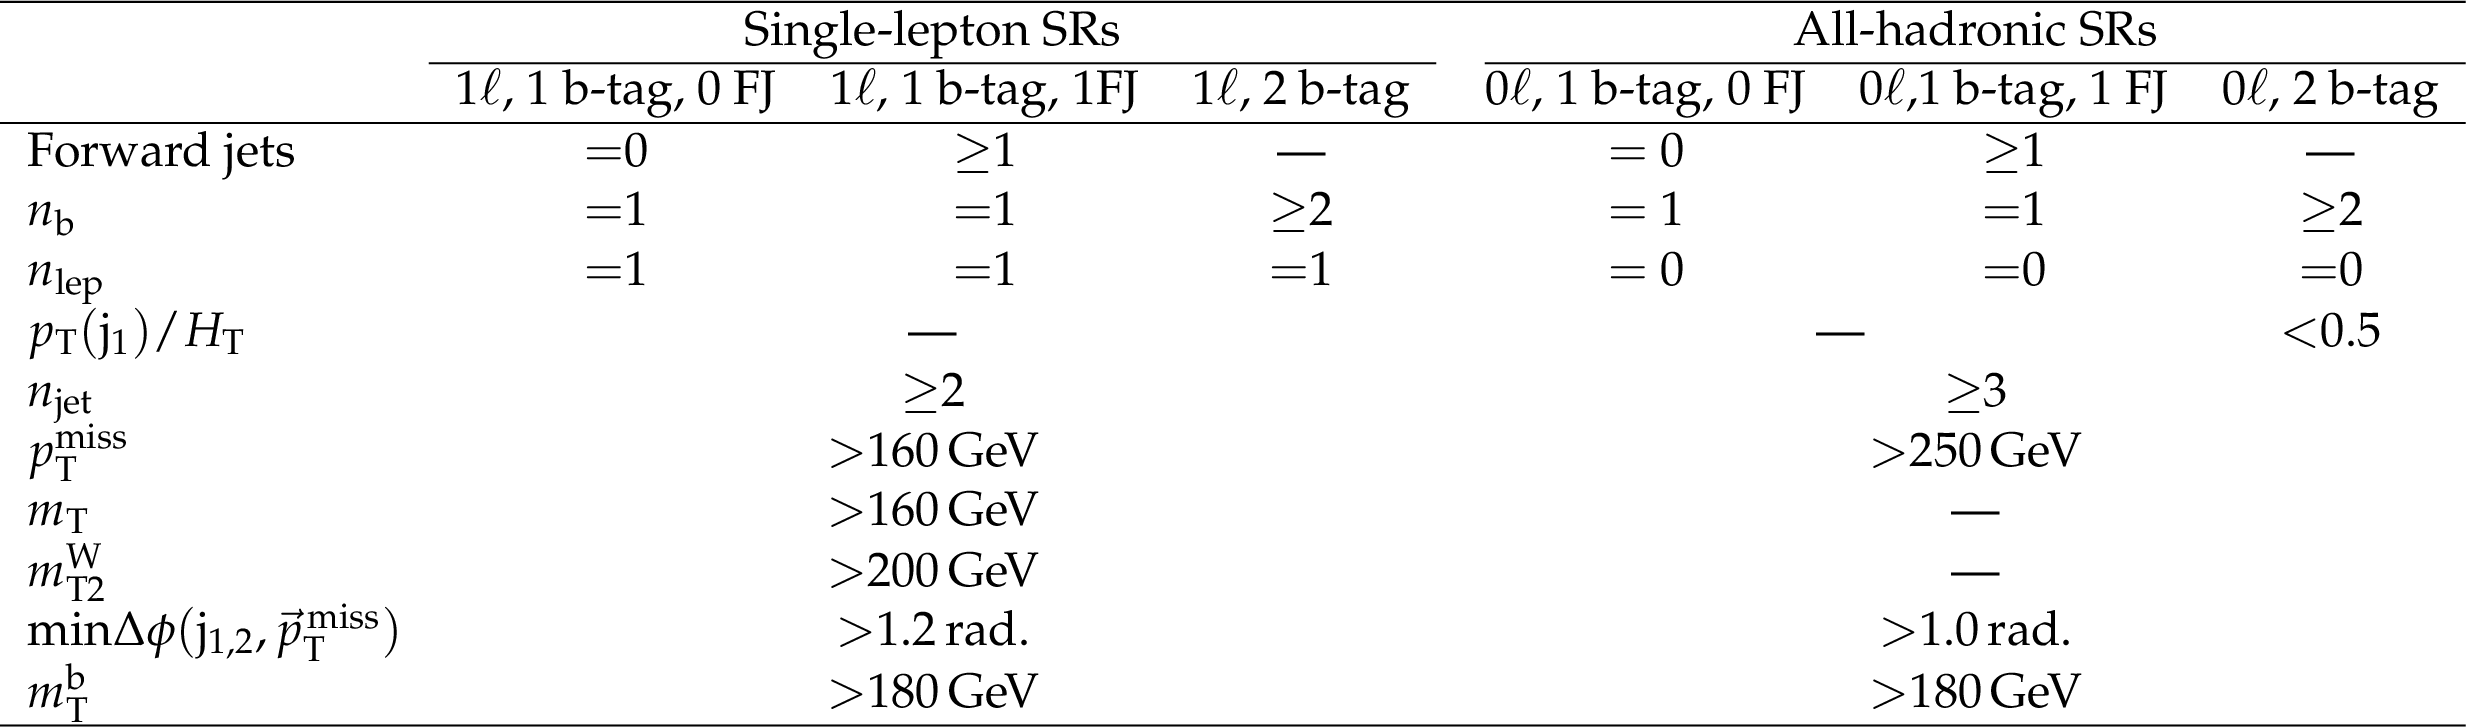
Table 1:
Final event selections for the SL and AH SRs. Electrons and muons are kept separate for the SL channel. |
png pdf |
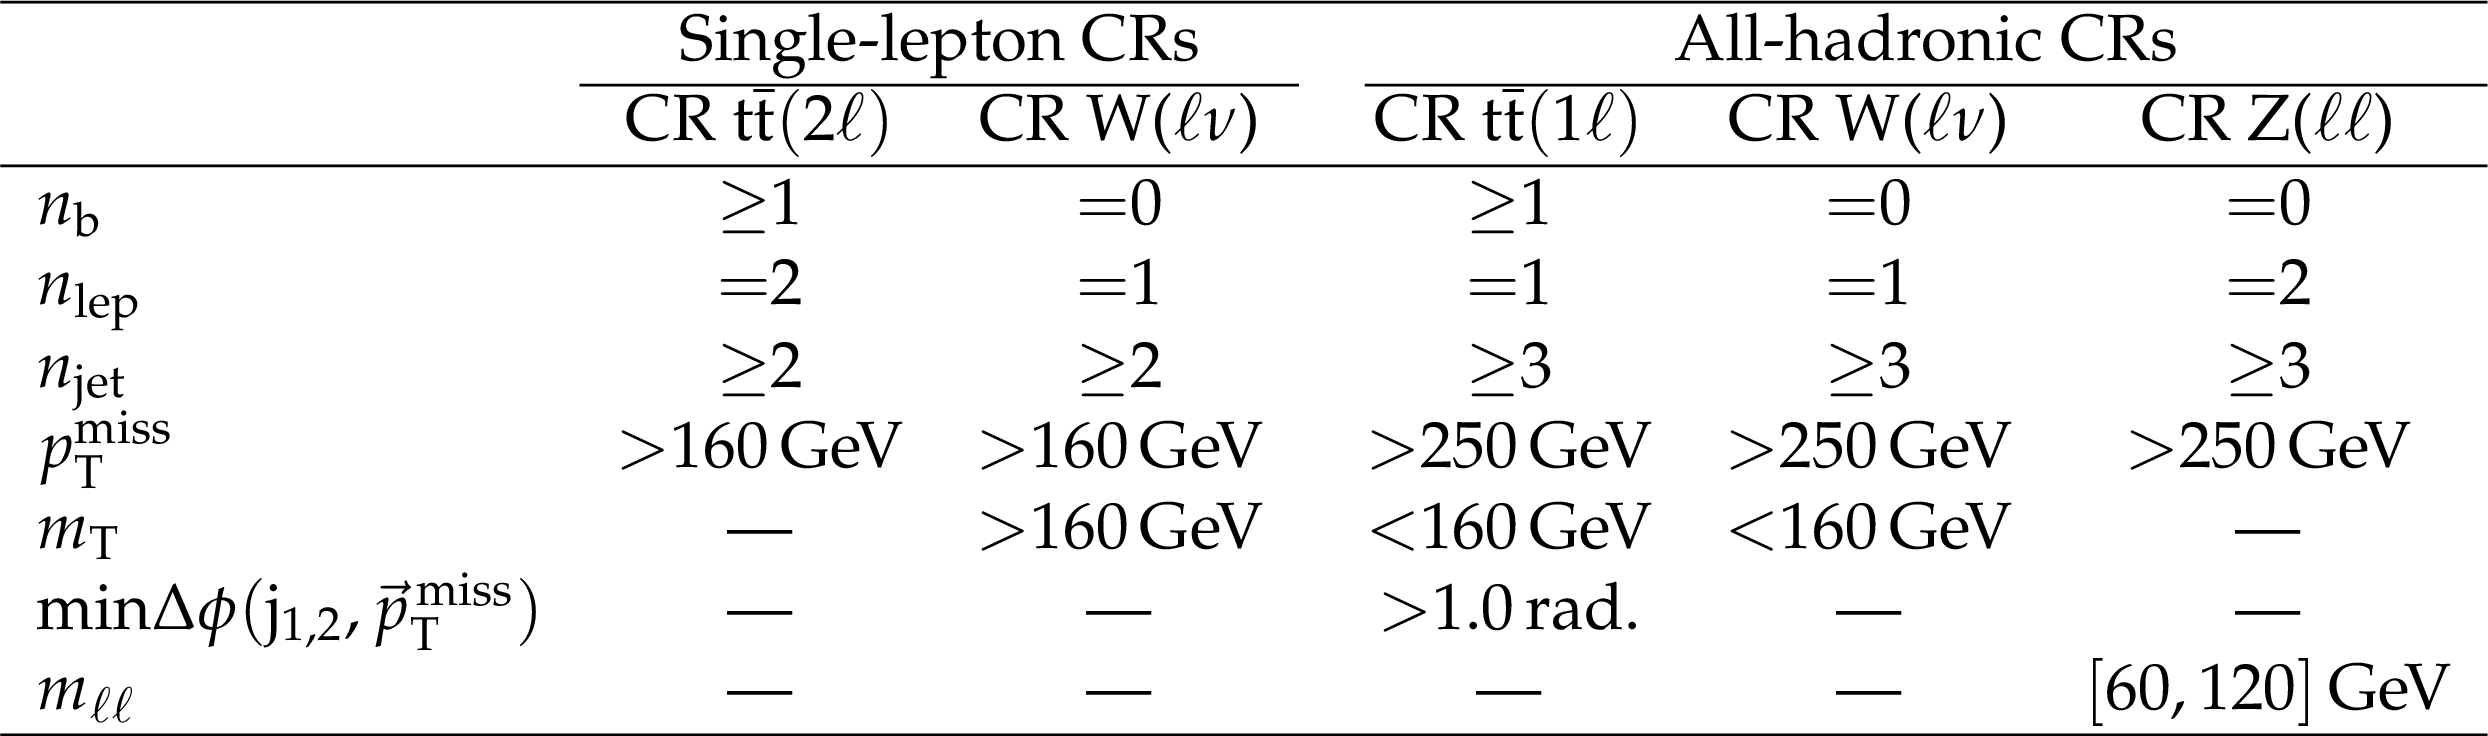
Table 2:
Control regions defined for the main backgrounds of the SL SRs (first two columns, ${{{\mathrm {t}\overline {\mathrm {t}}}} (2\ell)}$ and W+jets) and the AH SRs (last 3 columns, ${{{\mathrm {t}\overline {\mathrm {t}}}} (1\ell)}$, W+jets, and ${{{\mathrm {Z}}} \to \ell \ell}$). Some selections applied in the SRs are removed in the corresponding CRs to increase the available statistics and are therefore not listed. The ${{p_{\mathrm {T}}} ^\text {miss}}$ selection for the ${{{\mathrm {Z}}} \to \ell \ell}$ CR refers to the hadronic recoil. |
png pdf |
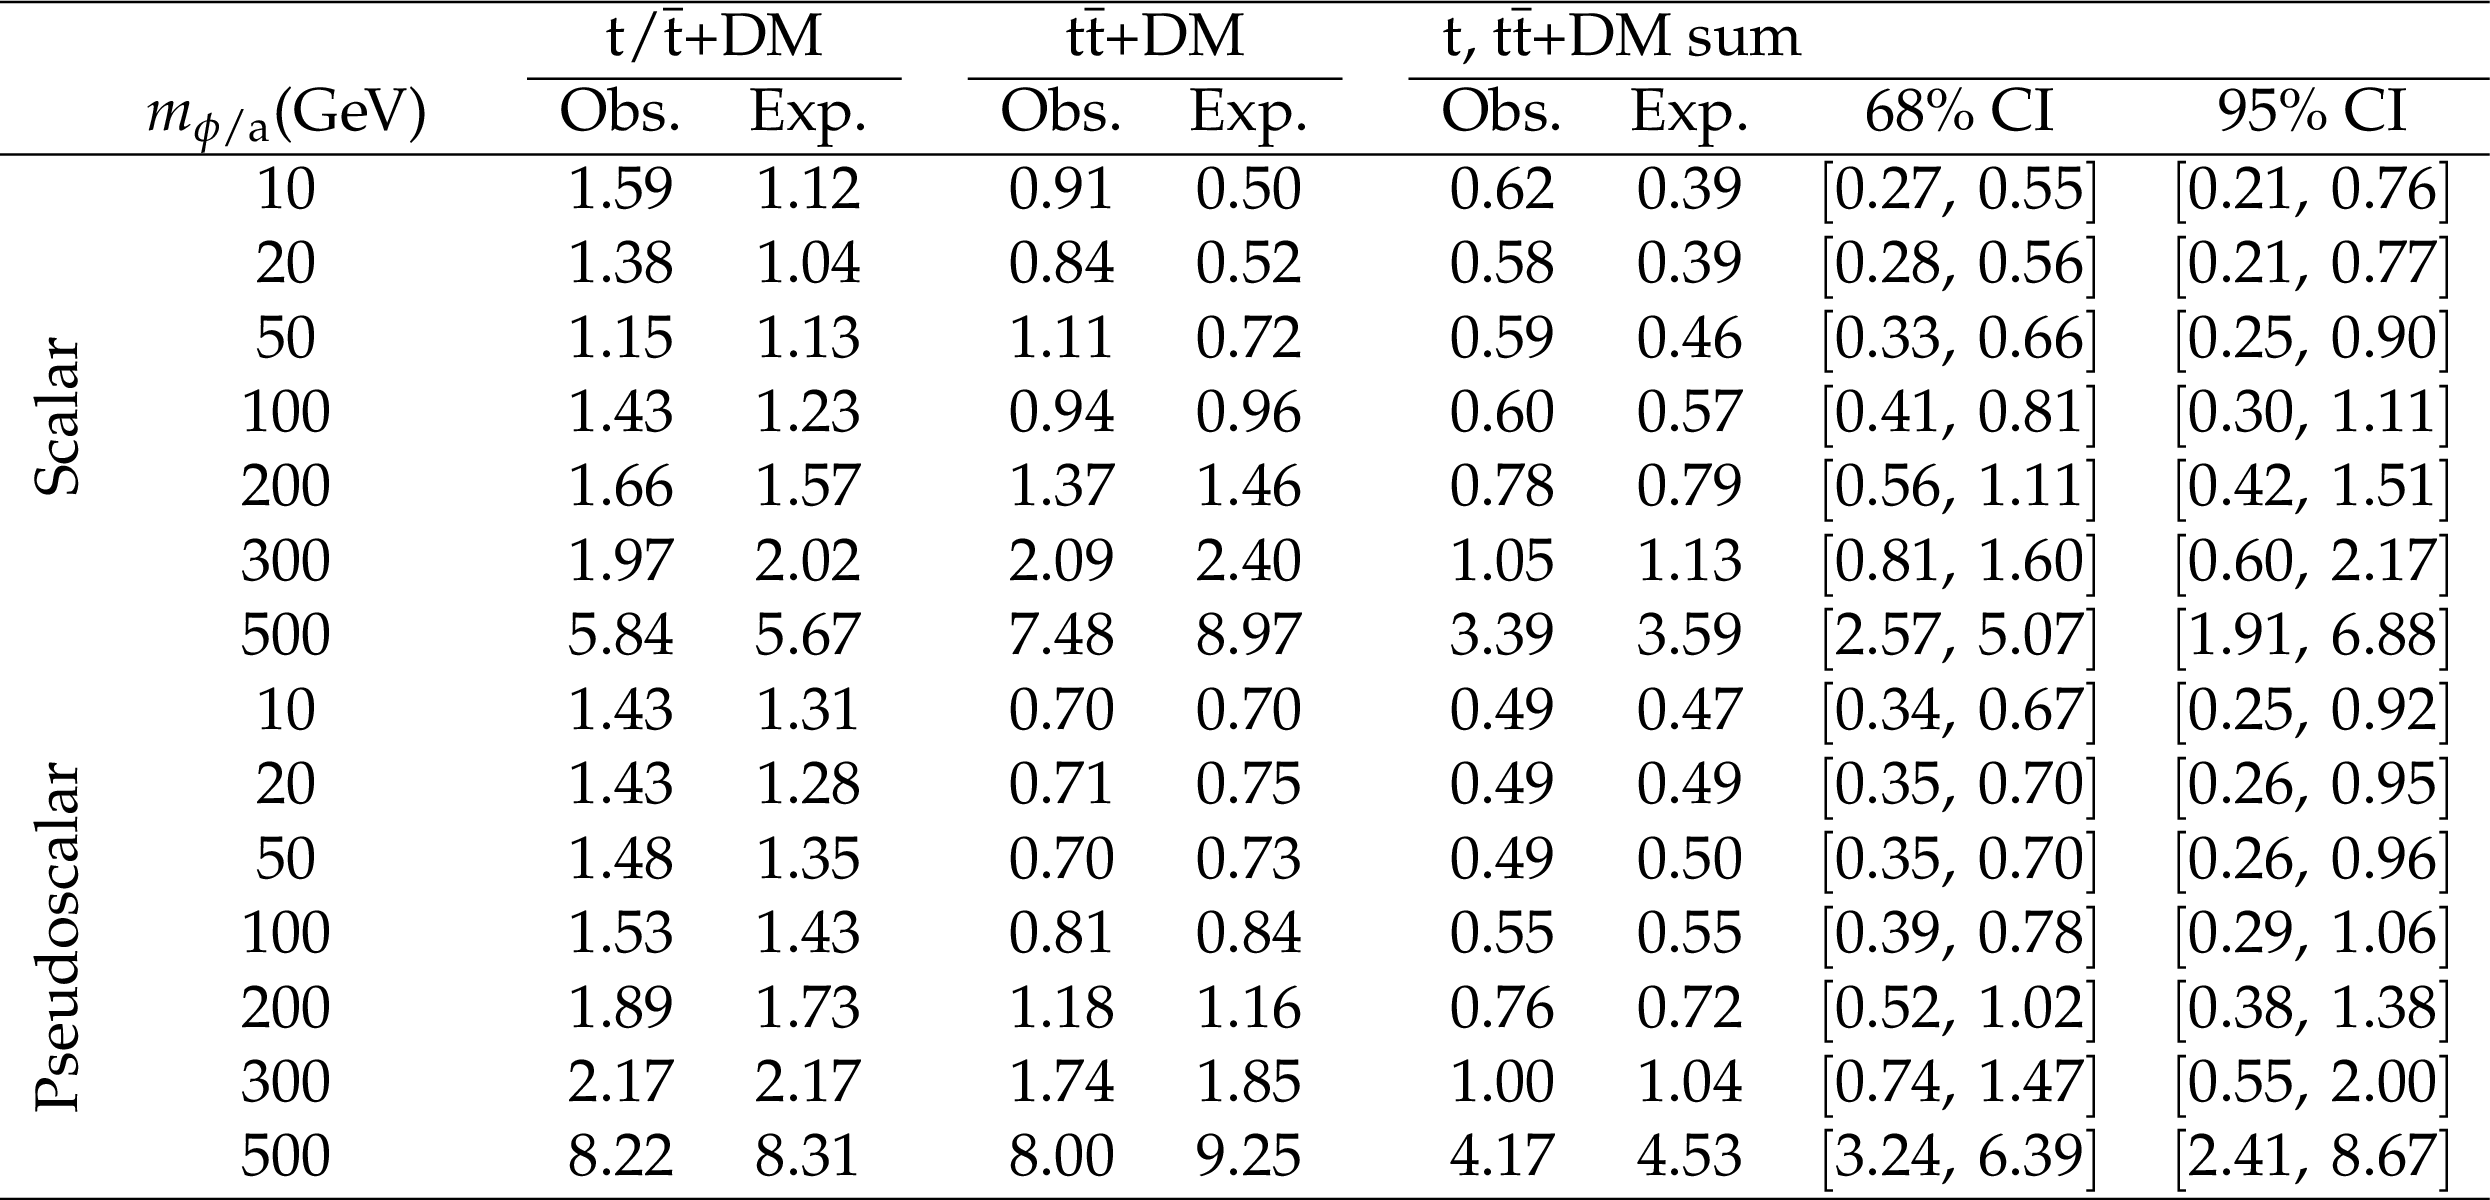
Table 3:
Upper limits at 95% CL on the cross section ratio with respect to the expected DM signal for different scalar ($\phi $) or pseudoscalar (a) mediator masses, $ {{m}_{\chi}} = $ 1 GeV, and $g_{\chi}=g_{{\mathrm {q}}}=$ 1 for the combination of SL and AH signal regions. The median expected value and its 68 and 95% confidence intervals (CIs) are given. |
| Summary |
| The first search at the LHC for dark matter (DM) produced in association with a single top quark or a top quark pair in interactions mediated by a neutral scalar or pseudoscalar particle in proton-proton collisions at a center-of-mass energy of 13 TeV has been presented. The data correspond to an integrated luminosity of 35.9 fb$^{-1}$ recorded by the CMS experiment in 2016. No significant deviations with respect to standard model predictions are observed and the results are interpreted in the context of a simplified model in which a scalar or pseudoscalar mediator particle couples to the top quark and subsequently decays into two DM particles.Scalar and pseudoscalar mediator masses below 290 and 300 GeV are excluded at 95% confidence level assuming a DM particle mass of 1 GeV and mediator couplings to fermions and DM particles equal to unity. |
| References | ||||
| 1 | G. Bertone, D. Hooper, and J. Silk | Particle dark matter: evidence, candidates and constraints | PR 405 (2005) 279 | hep-ph/0404175 |
| 2 | Y. G. Kim, K. Y. Lee, C. B. Park, and S. Shin | Secluded singlet fermionic dark matter driven by the Fermi gamma-ray excess | PRD 93 (2016) 075023 | 1601.05089 |
| 3 | A. Berlin, S. Gori, T. Lin, and L.-T. Wang | Pseudoscalar portal dark matter | PRD 92 (2015) 015005 | 1502.06000 |
| 4 | Y. G. Kim, K. Y. Lee, and S. Shin | Singlet fermionic dark matter | JHEP 05 (2008) 100 | 0803.2932 |
| 5 | L. Lopez-Honorez, T. Schwetz, and J. Zupan | Higgs portal, fermionic dark matter, and a Standard Model like Higgs at 125 GeV | PLB 716 (2012) 179 | 1203.2064 |
| 6 | G. D'Ambrosio, G. F. Giudice, G. Isidori, and A. Strumia | Minimal flavor violation: an effective field theory approach | NPB 645 (2002) 155 | hep-ph/0207036 |
| 7 | G. Isidori and D. M. Straub | Minimal flavour violation and beyond | EPJC 72 (2012) 2103 | 1202.0464 |
| 8 | T. Lin, E. W. Kolb, and L.-T. Wang | Probing dark matter couplings to top and bottom quarks at the LHC | PRD 88 (2013) 063510 | 1303.6638 |
| 9 | M. R. Buckley, D. Feld, and D. Gon\ifmmode \mbox\cc\else \cc\fialves | Scalar simplified models for dark matter | PRD 91 (2015) 015017 | 1410.6497 |
| 10 | U. Haisch and E. Re | Simplified dark matter top-quark interactions at the LHC | JHEP 06 (2015) 078 | 1503.00691 |
| 11 | U. Haisch, F. Kahlhoefer, and J. Unwin | The impact of heavy-quark loops on LHC dark matter searches | JHEP 07 (2013) 125 | 1208.4605 |
| 12 | CMS Collaboration | Search for the production of dark matter in association with top-quark pairs in the single-lepton final state in proton-proton collisions at $ \sqrt{s} = $ 8 TeV | JHEP 06 (2015) 121 | CMS-B2G-14-004 1504.03198 |
| 13 | ATLAS Collaboration | Search for dark matter in events with heavy quarks and missing transverse momentum in pp collisions with the ATLAS detector | EPJC 75 (2015) 92 | 1410.4031 |
| 14 | CMS Collaboration | Search for dark matter produced in association with heavy-flavor quark pairs in proton-proton collisions at $ \sqrt{s}= $ 13 TeV | EPJC 77 (2017) 845 | CMS-EXO-16-005 1706.02581 |
| 15 | ATLAS Collaboration | Search for dark matter produced in association with bottom or top quarks in $ \sqrt{s}= $ 13 TeV pp collisions with the ATLAS detector | EPJC 78 (2018) 18 | 1710.11412 |
| 16 | CMS Collaboration | Search for dark matter particles produced in association with a top quark pair at $ \sqrt{s} = $ 13 TeV | CMS-EXO-16-049 1807.06522 |
|
| 17 | D. Pinna, A. Zucchetta, M. R. Buckley, and F. Canelli | Single top quarks and dark matter | PRD 96 (2017) 035031 | 1701.05195 |
| 18 | U. Haisch, P. Pani, and G. Polesello | Determining the CP nature of spin-0 mediators in associated production of dark matter and $ \mathrm{t\overline{t}} $ pairs | JHEP 02 (2017) 131 | 1611.09841 |
| 19 | CDF Collaboration | Search for a dark matter candidate produced in association with a single top quark in $ \mathrm{p\overline{p}} $ collisions at $ \sqrt{s}= $ 1.96 TeV | PRL 108 (2012) 201802 | 1202.5653 |
| 20 | ATLAS Collaboration | Search for invisible particles produced in association with single-top-quarks in proton-proton collisions at $ \sqrt{s}= $ 8 TeV with the ATLAS detector | EPJC 75 (2015) 79 | 1410.5404 |
| 21 | CMS Collaboration | Search for monotop signatures in proton-proton collisions at $ \sqrt{s}= $ 8 TeV | PRL 114 (2015) 101801 | CMS-B2G-12-022 1410.1149 |
| 22 | CMS Collaboration | Search for dark matter in events with energetic, hadronically decaying top quarks and missing transverse momentum at $ \sqrt{s}= $ 13 TeV | JHEP 06 (2018) 027 | CMS-EXO-16-051 1801.08427 |
| 23 | CMS Collaboration | The CMS experiment at the CERN LHC | JINST 3 (2008) S08004 | CMS-00-001 |
| 24 | CMS Collaboration | The CMS trigger system | JINST 12 (2017) P01020 | CMS-TRG-12-001 1609.02366 |
| 25 | CMS Collaboration | Particle-flow reconstruction and global event description with the CMS detector | JINST 12 (2017) P10003 | CMS-PRF-14-001 1706.04965 |
| 26 | M. Cacciari, G. P. Salam, and G. Soyez | The anti-$ {k_{\mathrm{T}}} $ jet clustering algorithm | JHEP 04 (2008) 063 | 0802.1189 |
| 27 | M. Cacciari, G. P. Salam, and G. Soyez | FastJet user manual | EPJC 72 (2012) 1896 | 1111.6097 |
| 28 | M. Cacciari, G. P. Salam, and G. Soyez | The catchment area of jets | JHEP 04 (2008) 005 | 0802.1188 |
| 29 | CMS Collaboration | Jet algorithms performance in 13 TeV data | CMS-PAS-JME-16-003 | CMS-PAS-JME-16-003 |
| 30 | CMS Collaboration | Identification of heavy-flavour jets with the CMS detector in pp collisions at 13 TeV | JINST 13 (2018) P05011 | CMS-BTV-16-002 1712.07158 |
| 31 | P. Nason | A new method for combining NLO QCD with shower Monte Carlo algorithms | JHEP 11 (2004) 040 | hep-ph/0409146 |
| 32 | S. Frixione, P. Nason, and C. Oleari | Matching NLO QCD computations with parton shower simulations: the $ POWHEG $ method | JHEP 11 (2007) 070 | 0709.2092 |
| 33 | S. Alioli, P. Nason, C. Oleari, and E. Re | A general framework for implementing NLO calculations in shower Monte Carlo programs: the $ POWHEG $ box | JHEP 06 (2010) 043 | 1002.2581 |
| 34 | CMS Collaboration | Measurement of differential cross sections for top quark pair production using the lepton+jets final state in proton-proton collisions at 13 TeV | PRD 95 (2017) 092001 | CMS-TOP-16-008 1610.04191 |
| 35 | J. Alwall et al. | The automated computation of tree-level and next-to-leading order differential cross sections, and their matching to parton shower simulations | JHEP 07 (2014) 079 | 1405.0301 |
| 36 | M. L. Mangano, M. Moretti, F. Piccinini, and M. Treccani | Matching matrix elements and shower evolution for top-quark production in hadronic collisions | JHEP 01 (2007) 013 | hep-ph/0611129 |
| 37 | A. Denner, S. Dittmaier, T. Kasprzik, and A. Muck | Electroweak corrections to W+jet hadroproduction including leptonic W-boson decays | JHEP 08 (2009) 075 | 0906.1656 |
| 38 | A. Denner, S. Dittmaier, T. Kasprzik, and A. Muck | Electroweak corrections to dilepton+jet production at hadron colliders | JHEP 06 (2011) 069 | 1103.0914 |
| 39 | A. Denner, S. Dittmaier, T. Kasprzik, and A. Maeck | Electroweak corrections to monojet production at the LHC | EPJC 73 (2013) 2297 | 1211.5078 |
| 40 | J. H. Kuhn, A. Kulesza, S. Pozzorini, and M. Schulze | Electroweak corrections to hadronic photon production at large transverse momenta | JHEP 03 (2006) 059 | hep-ph/0508253 |
| 41 | S. Kallweit et al. | NLO electroweak automation and precise predictions for W+multijet production at the LHC | JHEP 04 (2015) 012 | 1412.5157 |
| 42 | S. Kallweit et al. | NLO QCD+EW predictions for V+jets including off-shell vector-boson decays and multijet merging | JHEP 04 (2016) 021 | 1511.08692 |
| 43 | R. Frederix and S. Frixione | Merging meets matching in MC@NLO | JHEP 12 (2012) 061 | 1209.6215 |
| 44 | D. Abercrombie et al. | Dark matter benchmark models for early LHC Run-2 searches: report of the ATLAS/CMS Dark Matter Forum | 1507.00966 | |
| 45 | G. Busoni et al. | Recommendations on presenting LHC searches for missing transverse energy signals using simplified $ s $-channel models of dark matter | 1603.04156 | |
| 46 | A. Albert et al. | Towards the next generation of simplified dark matter models | Phys. Dark Univ. 16 (2017) 49 | 1607.06680 |
| 47 | NNPDF Collaboration | Parton distributions for the LHC Run II | JHEP 04 (2015) 040 | 1410.8849 |
| 48 | T. Sjostrand, S. Mrenna, and P. Z. Skands | A brief introduction to $ PYTHIA $ 8.1 | CPC 178 (2008) 852 | 0710.3820 |
| 49 | CMS Collaboration | Event generator tunes obtained from underlying event and multiparton scattering measurements | EPJC 76 (2016) 155 | CMS-GEN-14-001 1512.00815 |
| 50 | CMS Collaboration | Investigations of the impact of the parton shower tuning in $ PYTHIA $ 8 in the modelling of $ \mathrm{t\overline{t}} $ at $ \sqrt{s}= $ 8 and 13 TeV | CMS-PAS-TOP-16-021 | CMS-PAS-TOP-16-021 |
| 51 | GEANT4 Collaboration | GEANT4--a simulation toolkit | NIMA 506 (2003) 250 | |
| 52 | CMS Collaboration | Performance of CMS muon reconstruction in pp collision events at $ \sqrt{s} = $ 7 TeV | JINST 7 (2012) P10002 | CMS-MUO-10-004 1206.4071 |
| 53 | CMS Collaboration | Performance of electron reconstruction and selection with the CMS detector in proton-proton collisions at $ \sqrt{s} = $ 8 TeV | JINST 10 (2015) P06005 | CMS-EGM-13-001 1502.02701 |
| 54 | Y. Bai, H.-C. Cheng, J. Gallicchio, and J. Gu | Stop the top background of the stop search | JHEP 07 (2012) 110 | 1203.4813 |
| 55 | CMS Collaboration | Measurement of the inelastic proton-proton cross section at $ \sqrt{s}= $ 13 TeV | JHEP 07 (2018) 161 | CMS-FSQ-15-005 1802.02613 |
| 56 | CMS Collaboration | CMS luminosity measurements for the 2016 data taking period | CMS-PAS-LUM-17-001 | CMS-PAS-LUM-17-001 |
| 57 | CMS Collaboration | Jet energy scale and resolution in the CMS experiment in pp collisions at 8 TeV | JINST 12 (2017) P02014 | CMS-JME-13-004 1607.03663 |
| 58 | J. Butterworth et al. | PDF4LHC recommendations for LHC Run II | JPG 43 (2016) 023001 | 1510.03865 |
| 59 | CMS Collaboration | Measurements of differential cross sections for associated production of a W boson and jets in proton-proton collisions at $ \sqrt{s} = $ 8 TeV | PRD 95 (2017) 052002 | CMS-SMP-14-023 1610.04222 |
| 60 | CMS Collaboration | Measurement of the production cross section of a W boson in association with two b jets in pp collisions at $ \sqrt{s} = $ 8 TeV | EPJC 77 (2017) 92 | CMS-SMP-14-020 1608.07561 |
| 61 | CMS Collaboration | Measurements of jet multiplicity and differential production cross sections of $ \text{Z} $+$ \textrm{jets} $ events in proton-proton collisions at $ \sqrt{s} = $ 7 TeV | PRD 91 (2015) 052008 | CMS-SMP-12-017 1408.3104 |
| 62 | CMS Collaboration | Measurements of the associated production of a Z boson and b jets in pp collisions at $ {\sqrt{s}} = $ 8 TeV | EPJC 77 (2017) 751 | CMS-SMP-14-010 1611.06507 |
| 63 | R. J. Barlow and C. Beeston | Fitting using finite Monte Carlo samples | CPC 77 (1993) 219 | |
| 64 | L. Moneta et al. | The RooStats project | in 13th International Workshop on Advanced Computing and Analysis Techniques in Physics Research (ACAT2010) SISSA, 2010 PoS(ACAT2010)057 | 1009.1003 |
| 65 | T. Junk | Confidence level computation for combining searches with small statistics | Nucl. Inst. Meth. A 434 (1999) 435 | hep-ex/9902226 |
| 66 | A. L. Read | Presentation of search results: the CL$ _{s} $ technique | JPG 28 (2002) 2693 | |
| 67 | G. Cowan, K. Cranmer, E. Gross, and O. Vitells | Asymptotic formulae for likelihood-based tests of new physics | EPJC 71 (2011) 1554 | 1007.1727 |
|
|
Compact Muon Solenoid LHC, CERN |
|

|

|

|

|

|