

Compact Muon Solenoid
LHC, CERN
| CMS-EXO-19-008 ; CERN-EP-2020-171 | ||
| MUSiC: a model unspecific search for new physics in proton-proton collisions at $\sqrt{s} = $ 13 TeV | ||
| CMS Collaboration | ||
| 6 October 2020 | ||
| Eur. Phys. J. C 81 (2021) 629 | ||
| Abstract: Results of the Model Unspecific Search in CMS (MUSiC), using proton-proton collision data recorded at the LHC at a centre-of-mass energy of 13 TeV, corresponding to an integrated luminosity of 35.9 fb$^{-1}$, are presented. The MUSiC analysis searches for anomalies that could be signatures of physics beyond the standard model. The analysis is based on the comparison of observed data with the standard model prediction, as determined from simulation, in several hundred final states and multiple kinematic distributions. Events containing at least one electron or muon are classified based on their final state topology, and an automated search algorithm surveys the observed data for deviations from the prediction. The sensitivity of the search is validated using multiple methods. No significant deviations from the predictions have been observed. For a wide range of final state topologies, agreement is found between the data and the standard model simulation. This analysis complements dedicated search analyses by significantly expanding the range of final states covered using a model independent approach with the largest data set to date to probe phase space regions beyond the reach of previous general searches. | ||
| Links: e-print arXiv:2010.02984 [hep-ex] (PDF) ; CDS record ; inSPIRE record ; CADI line (restricted) ; | ||
| Figures & Tables | Summary | Additional Figures | References | CMS Publications |
|---|
| Figures | |

png pdf |
Figure 1:
Illustrative example of classification of a single event (red square) containing one electron, two muons, and one jet. This event will contribute to precisely one exclusive (green), and several inclusive (blue) and jet-inclusive (orange) event classes. |
png pdf |
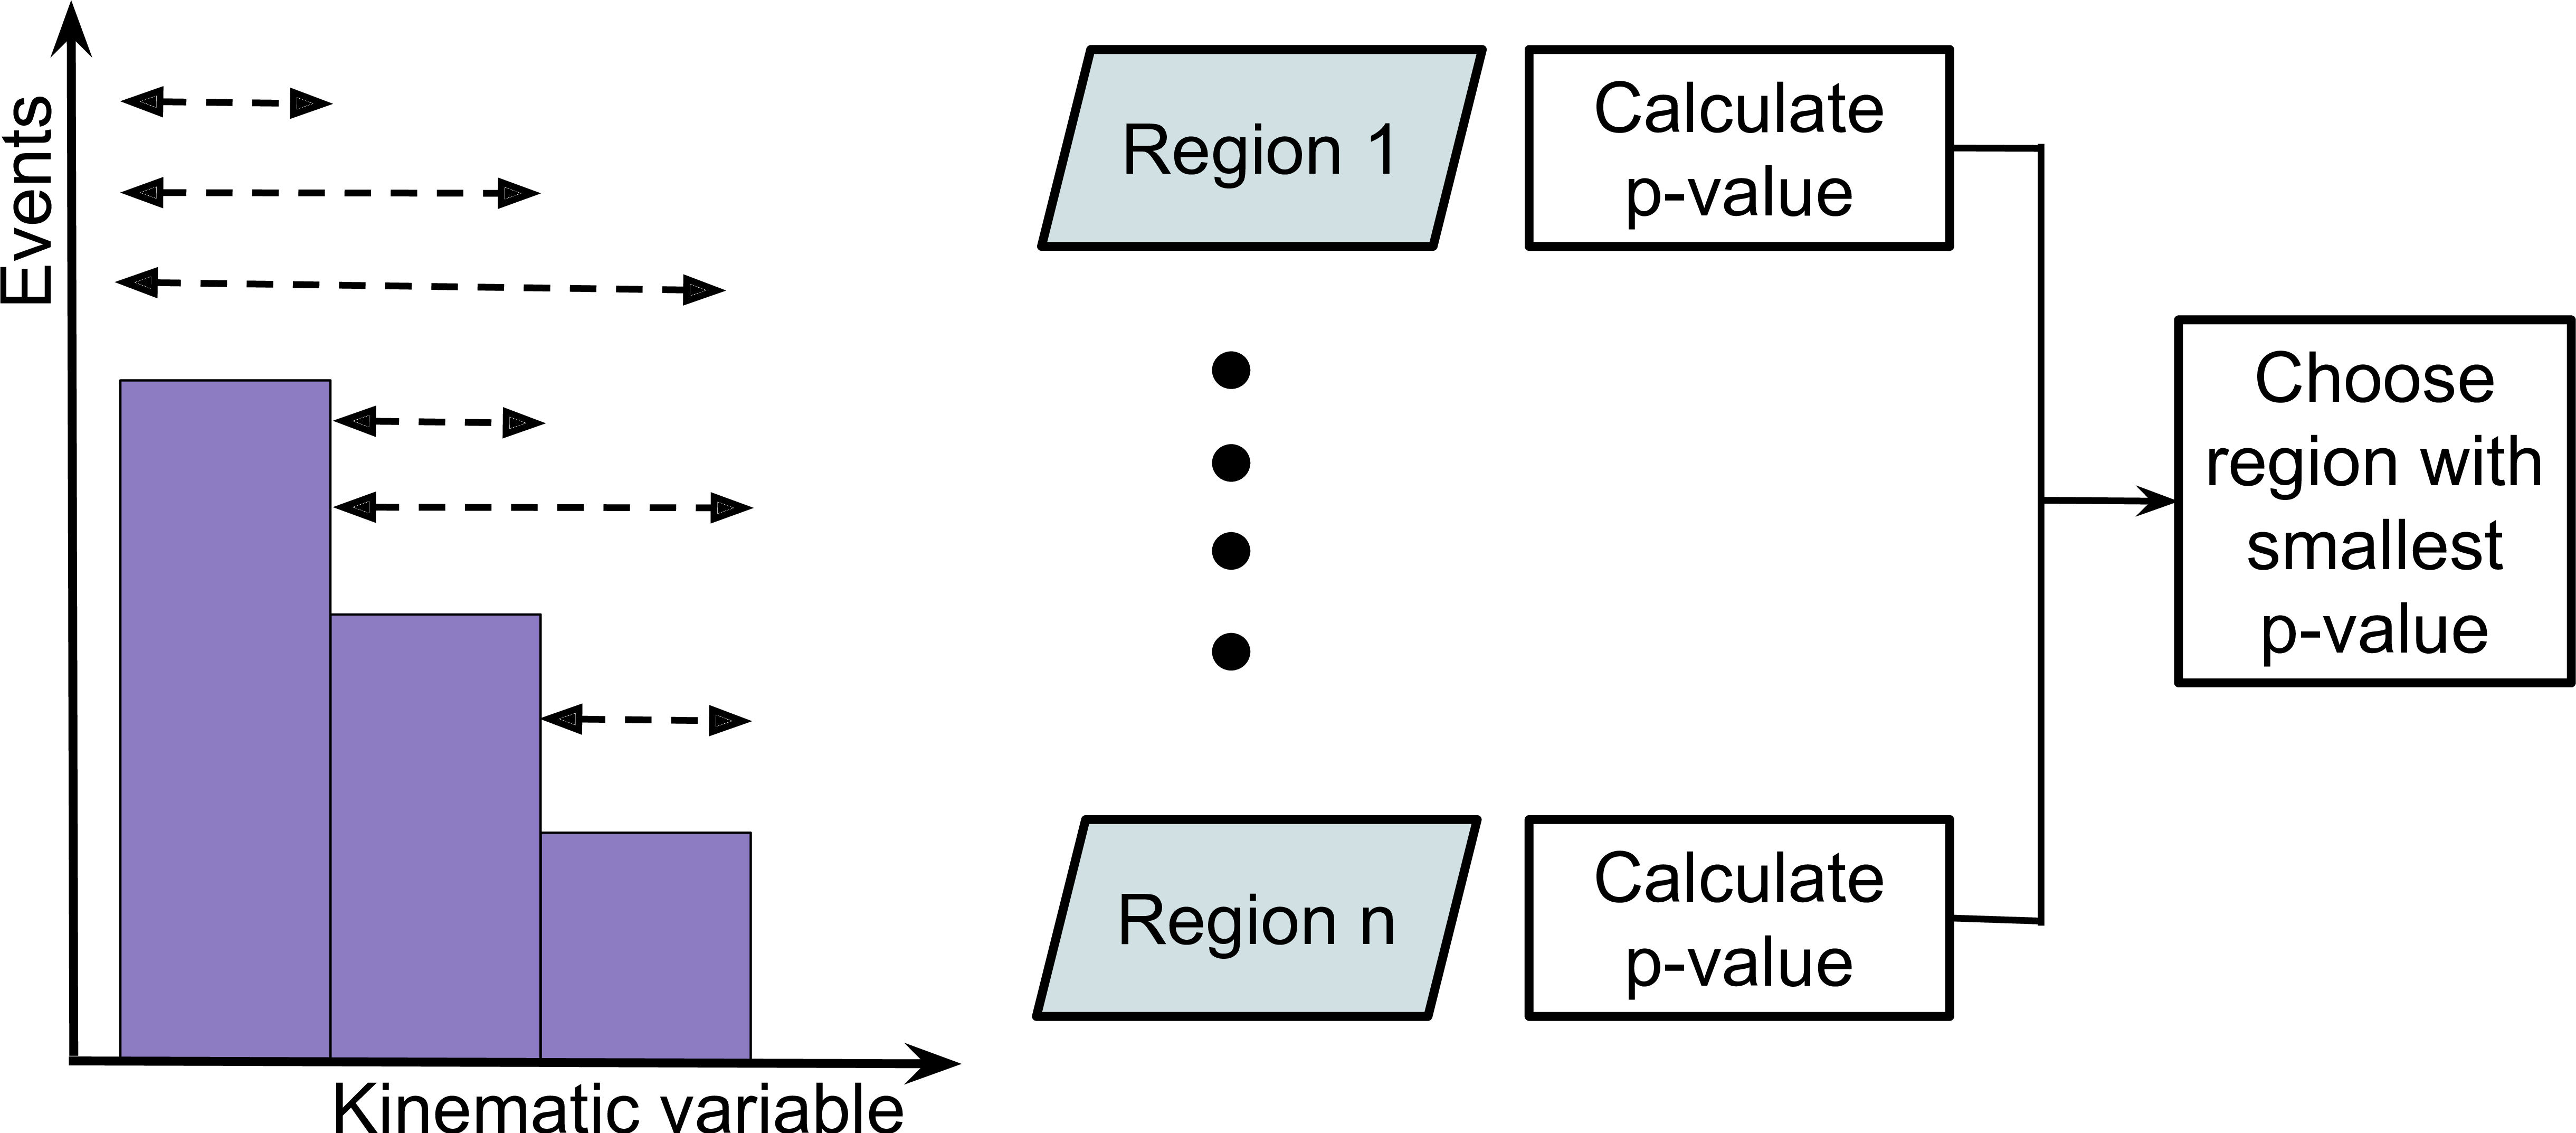
Figure 2:
Illustration for the calculation of $p$-value in different regions and the selection of the RoI as the region with the smallest $p$-value. |
png pdf |
Figure 3:
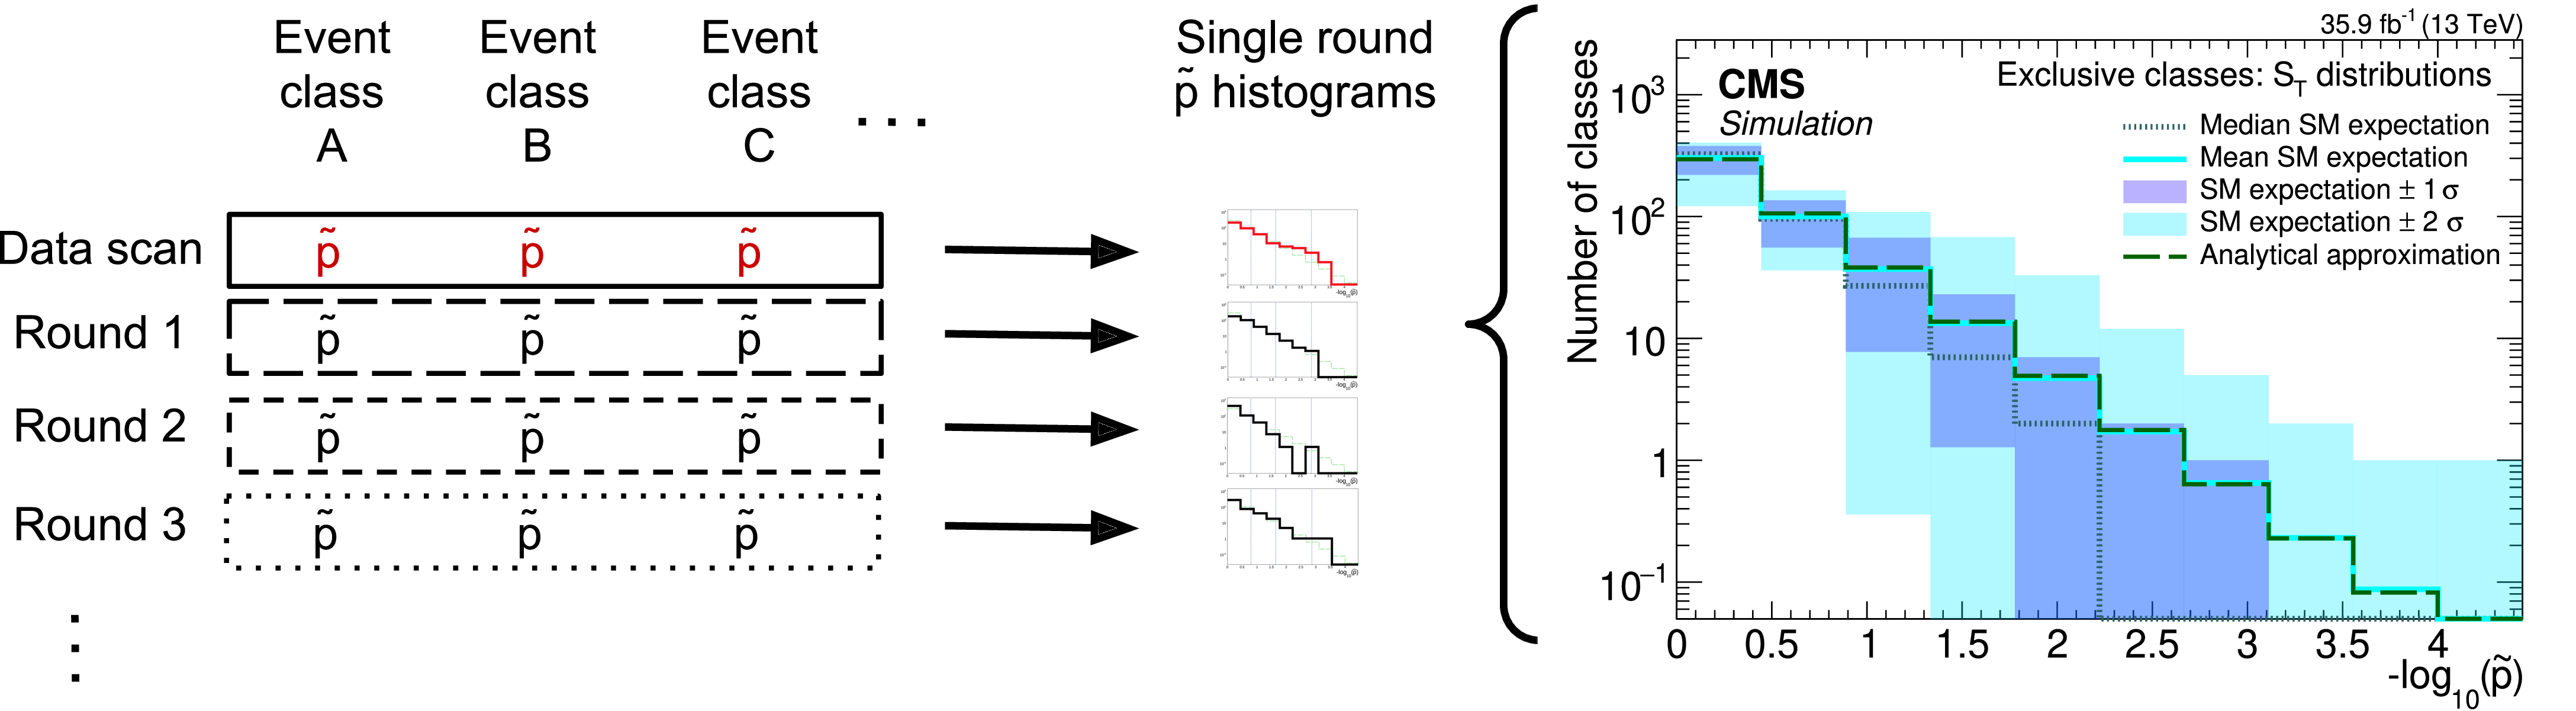
Illustrative example of a $\tilde{p}$-value distribution for different event classes (final states) based on a RoI scan of an ${S_{\mathrm {T}}}$ distribution. Histograms of the number of event classes corresponding to a bin in $-\log_{10}({\tilde{p}})$ for the different pseudo-experiment rounds (shown on the left) are used to create the global overview plot for a scan of each particular kinematic distribution for each event class type (shown on the right for an ${S_{\mathrm {T}}}$ distribution scan in exclusive event classes, without showing the observed deviations from data here). The mean and the median distributions of $\tilde{p}$-values obtained from the different pseudo-experiments are shown as solid cyan and dotted grey lines. The distribution estimated from the analytic calculation is shown as a green dashed line. The 68% ($ \pm $1$ \sigma $) and 95% ($ \pm $2$ \sigma $) uncertainty bands are displayed as dark and light blue areas, respectively. |
png pdf |
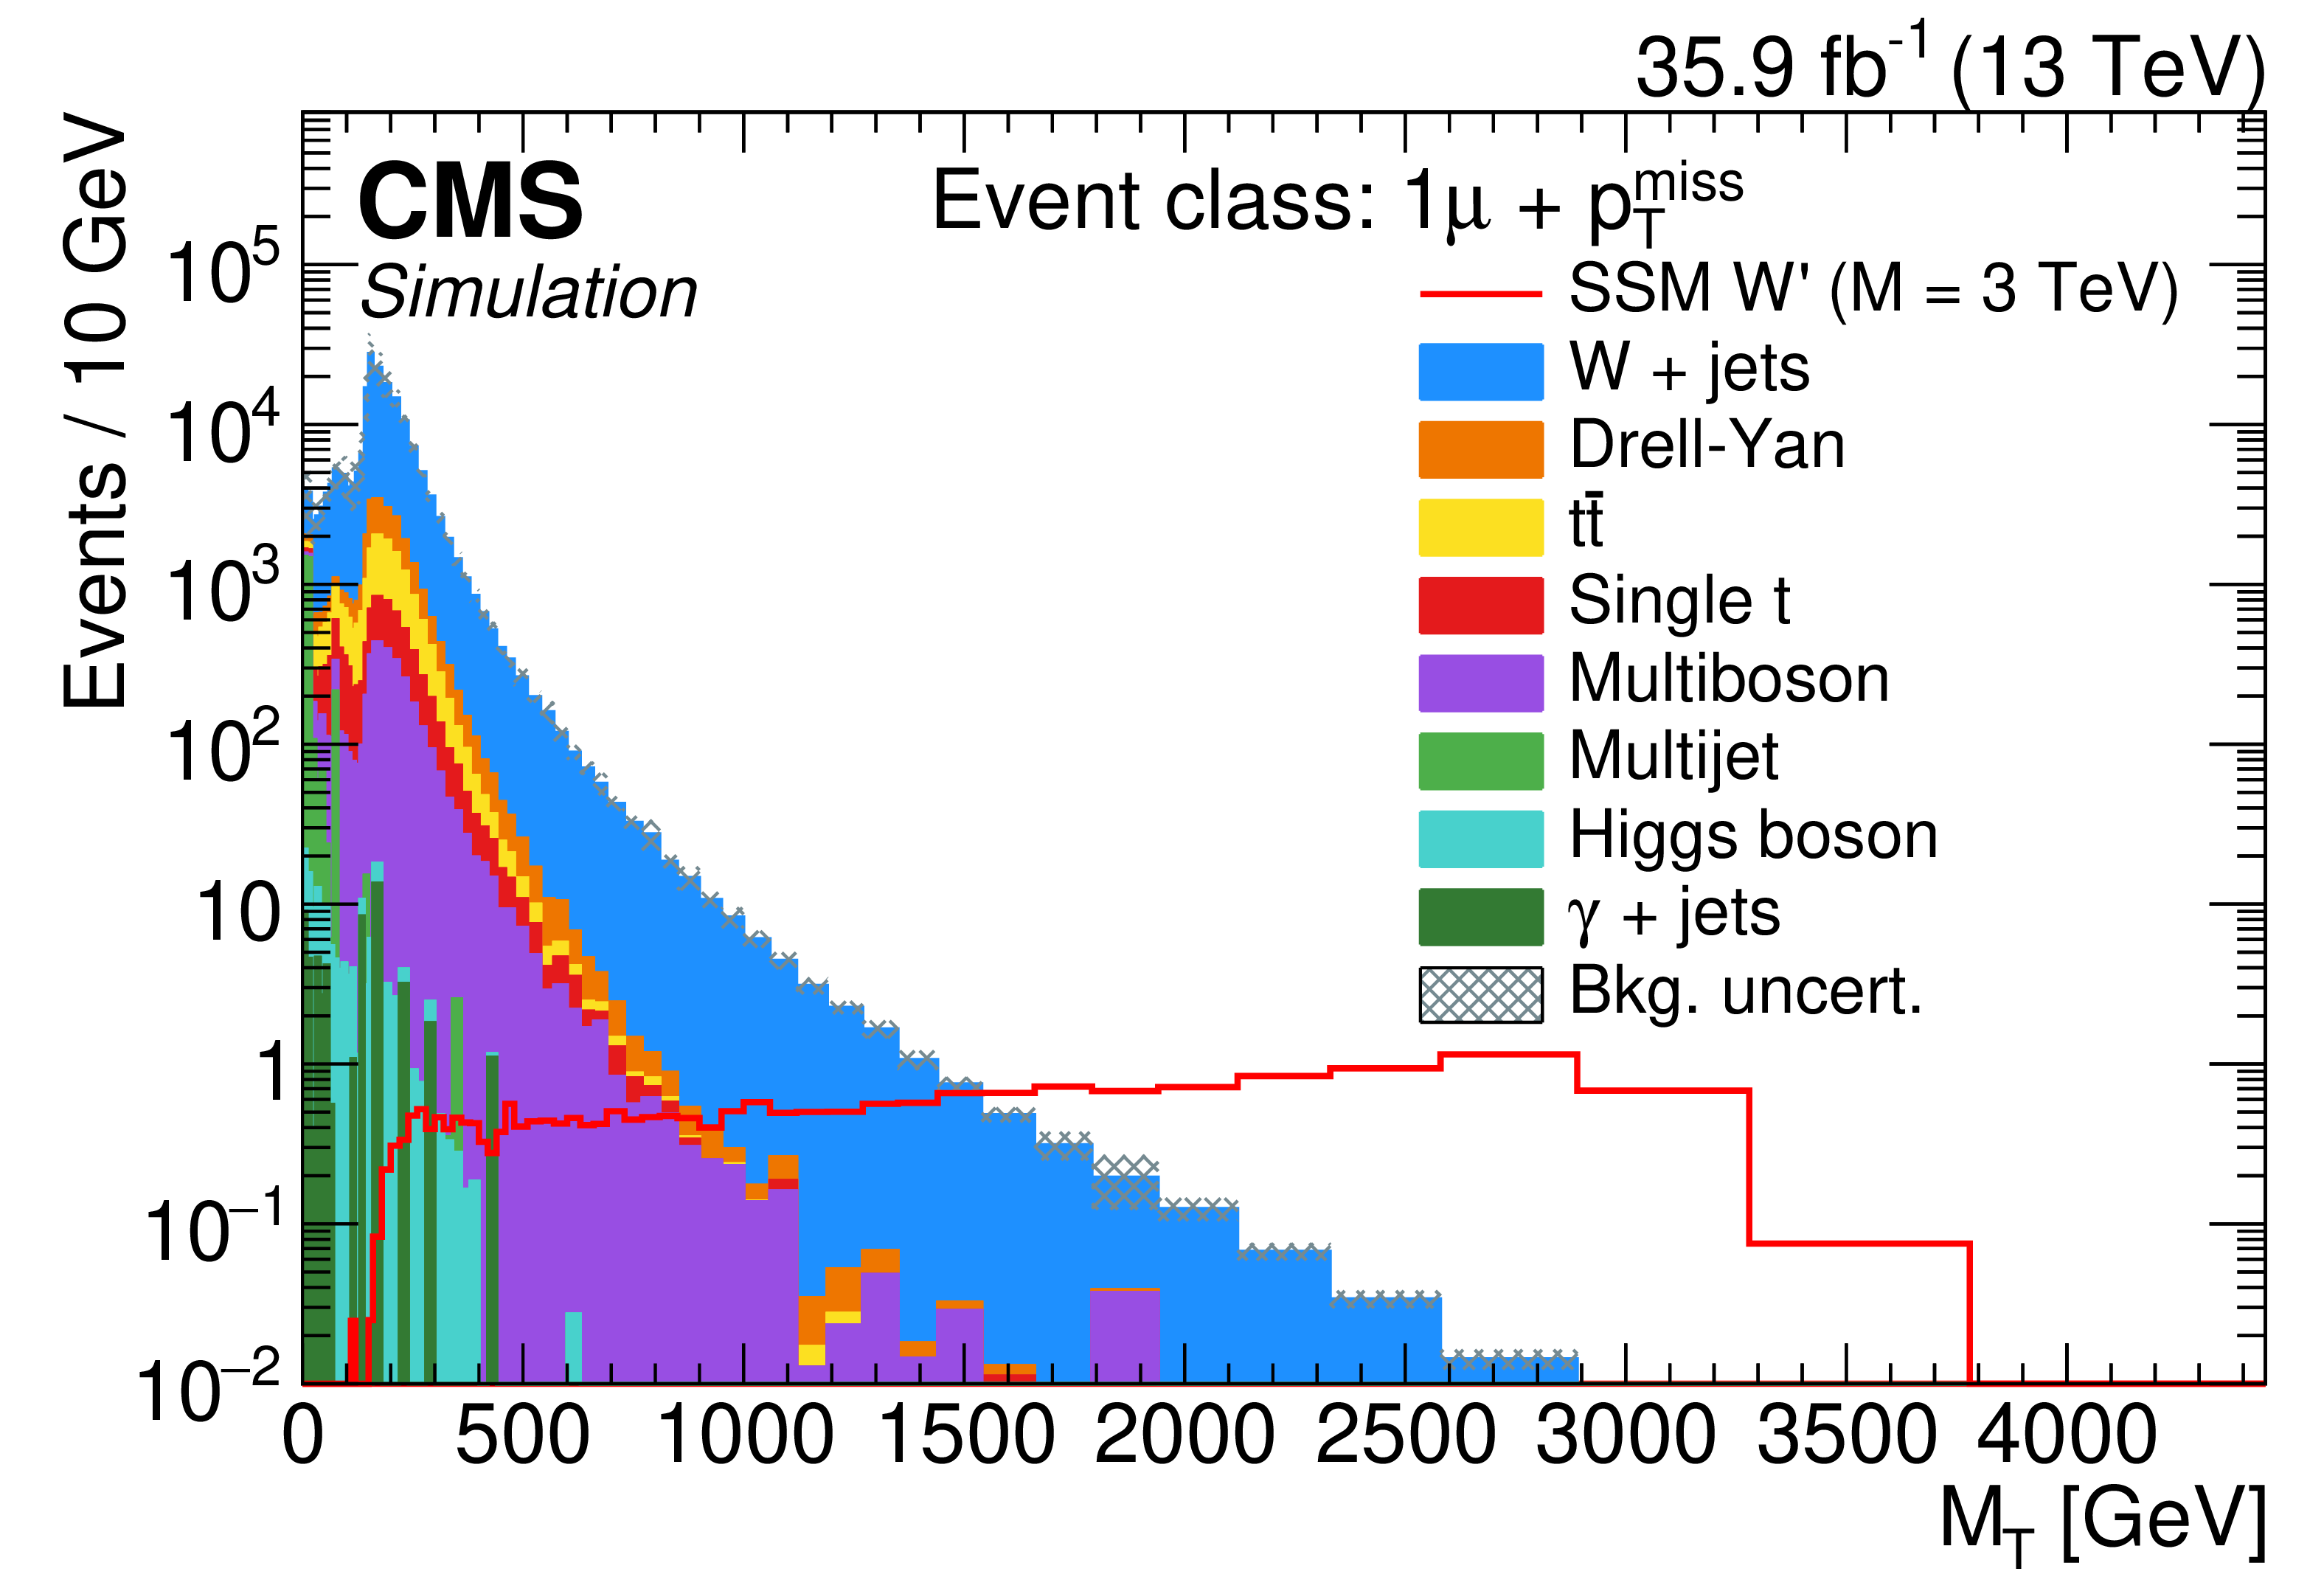
Figure 4:
Distribution of the transverse mass for the 1$\mu$+${{p_{\mathrm {T}}} ^\text {miss}} $ exclusive class with a hypothetical SSM W' boson (with mass of 3 TeV) along with the SM simulation. |
png pdf |
Figure 5:
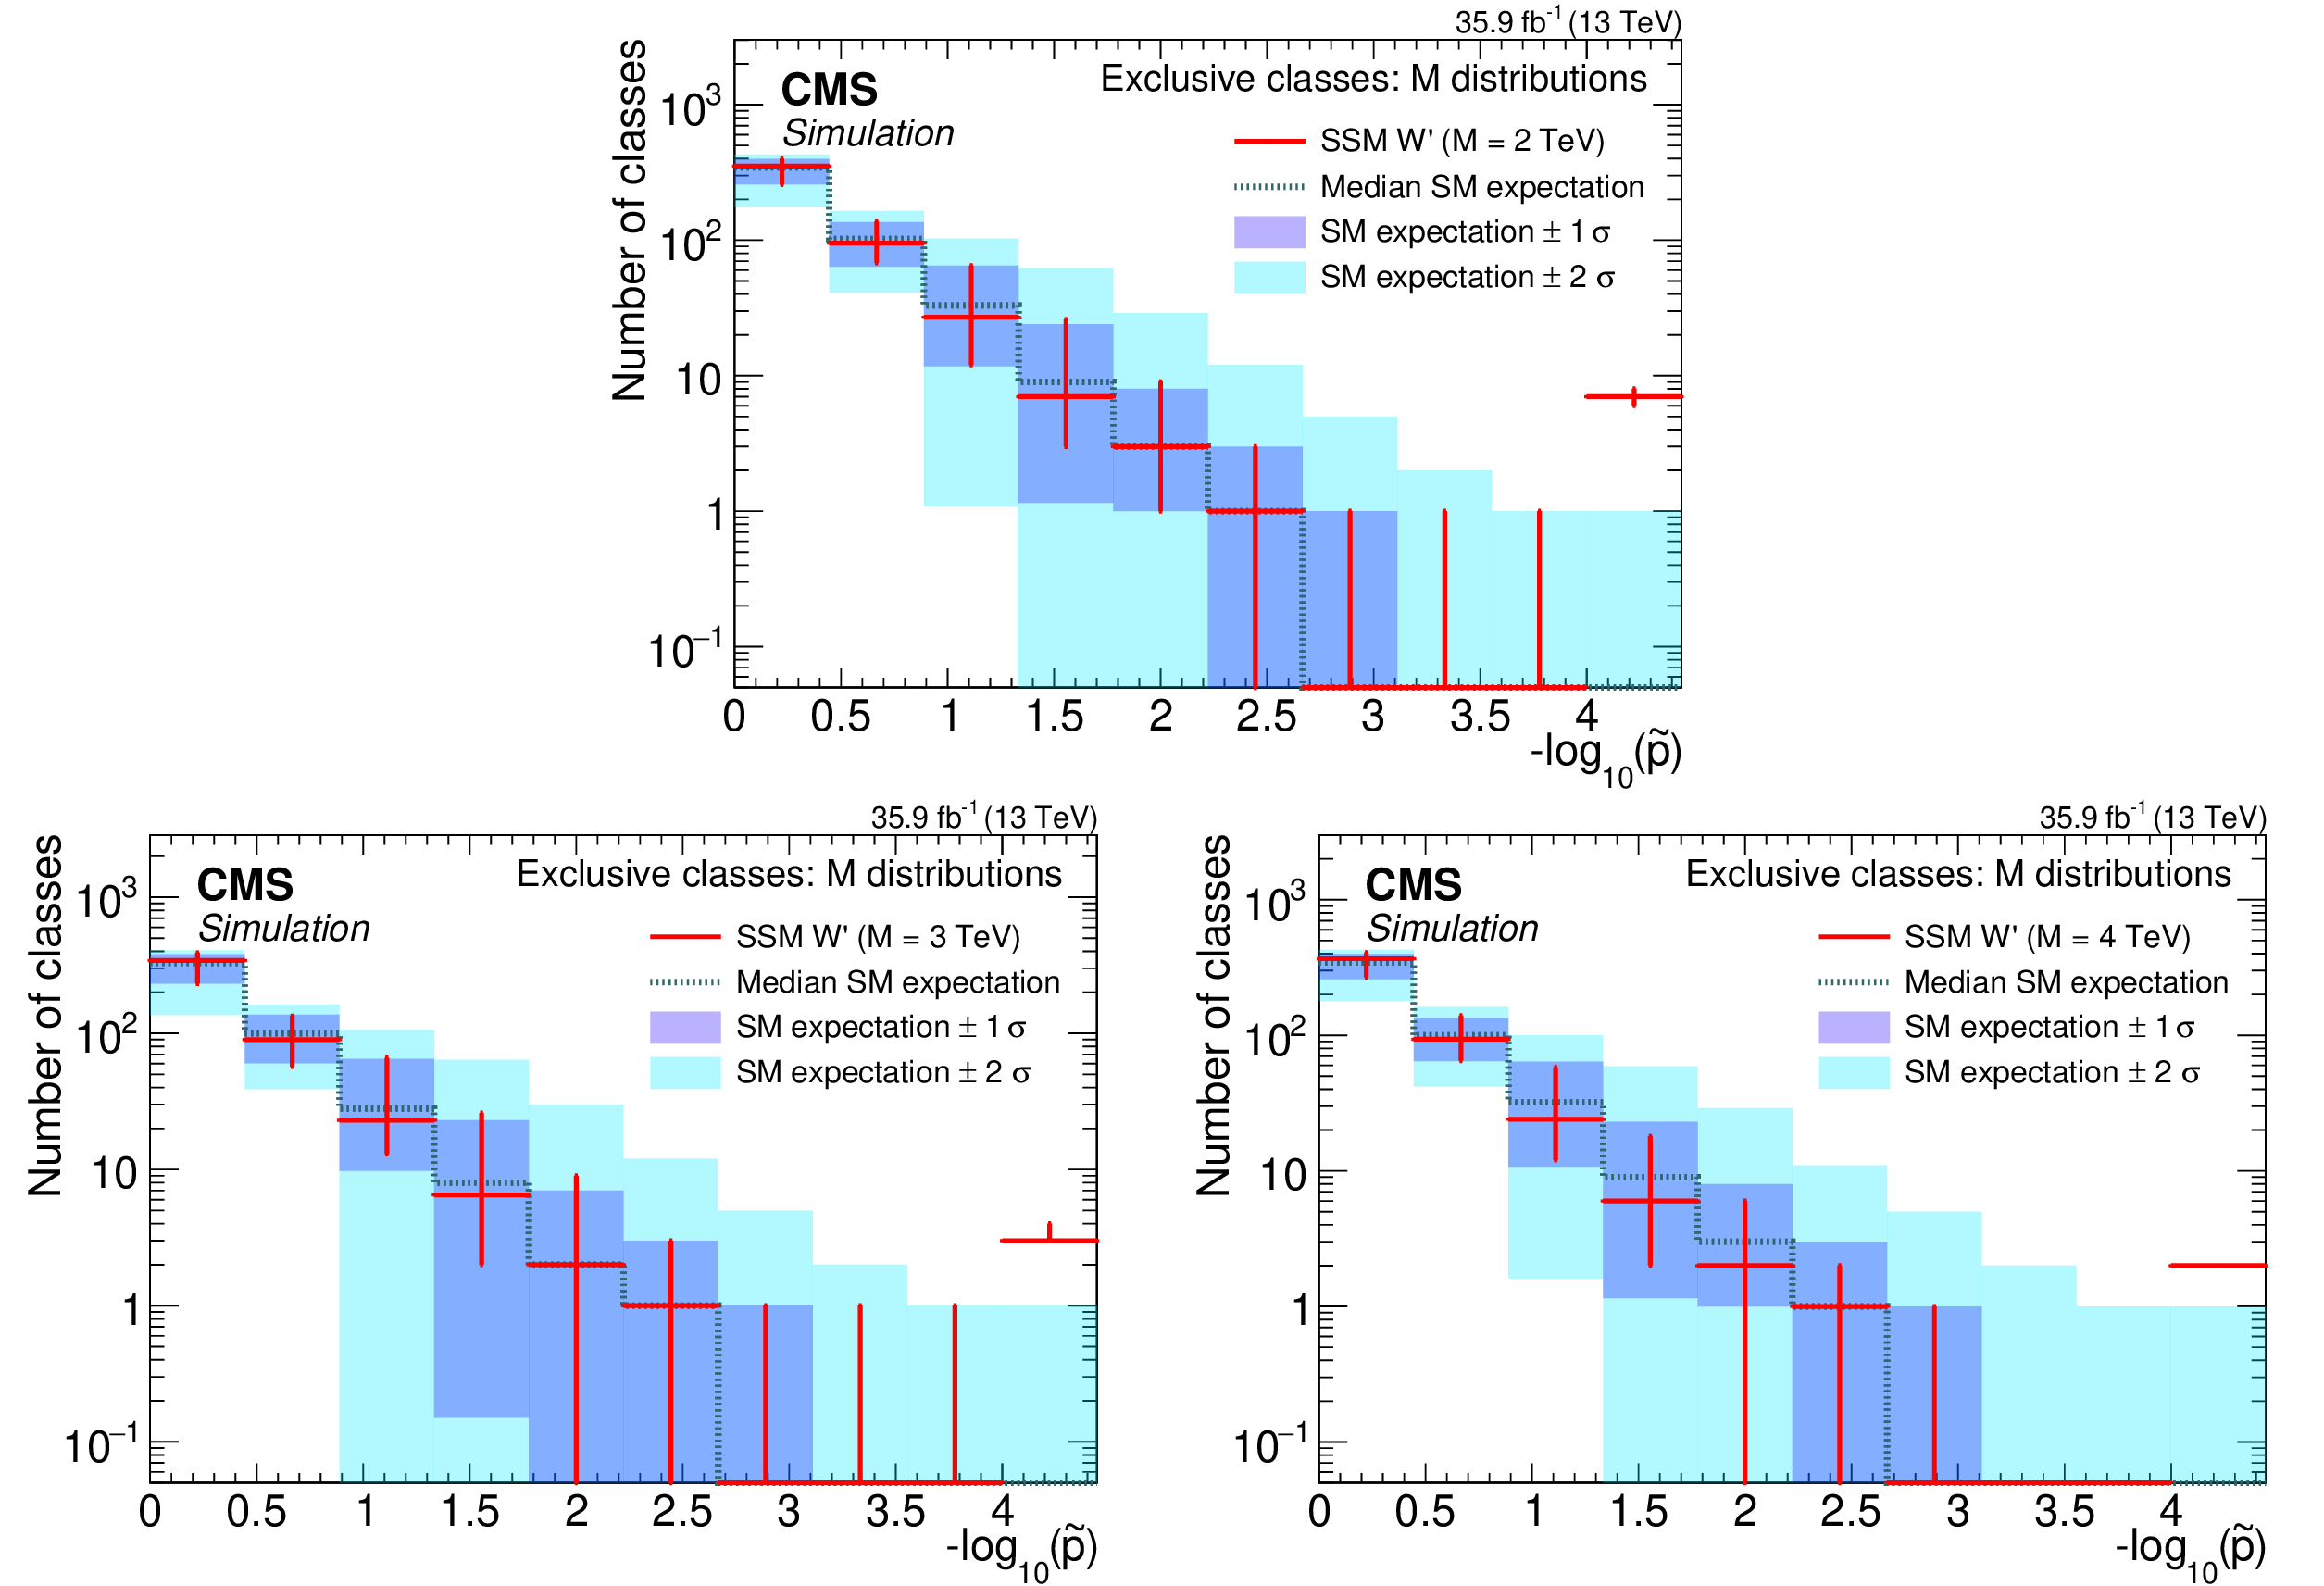
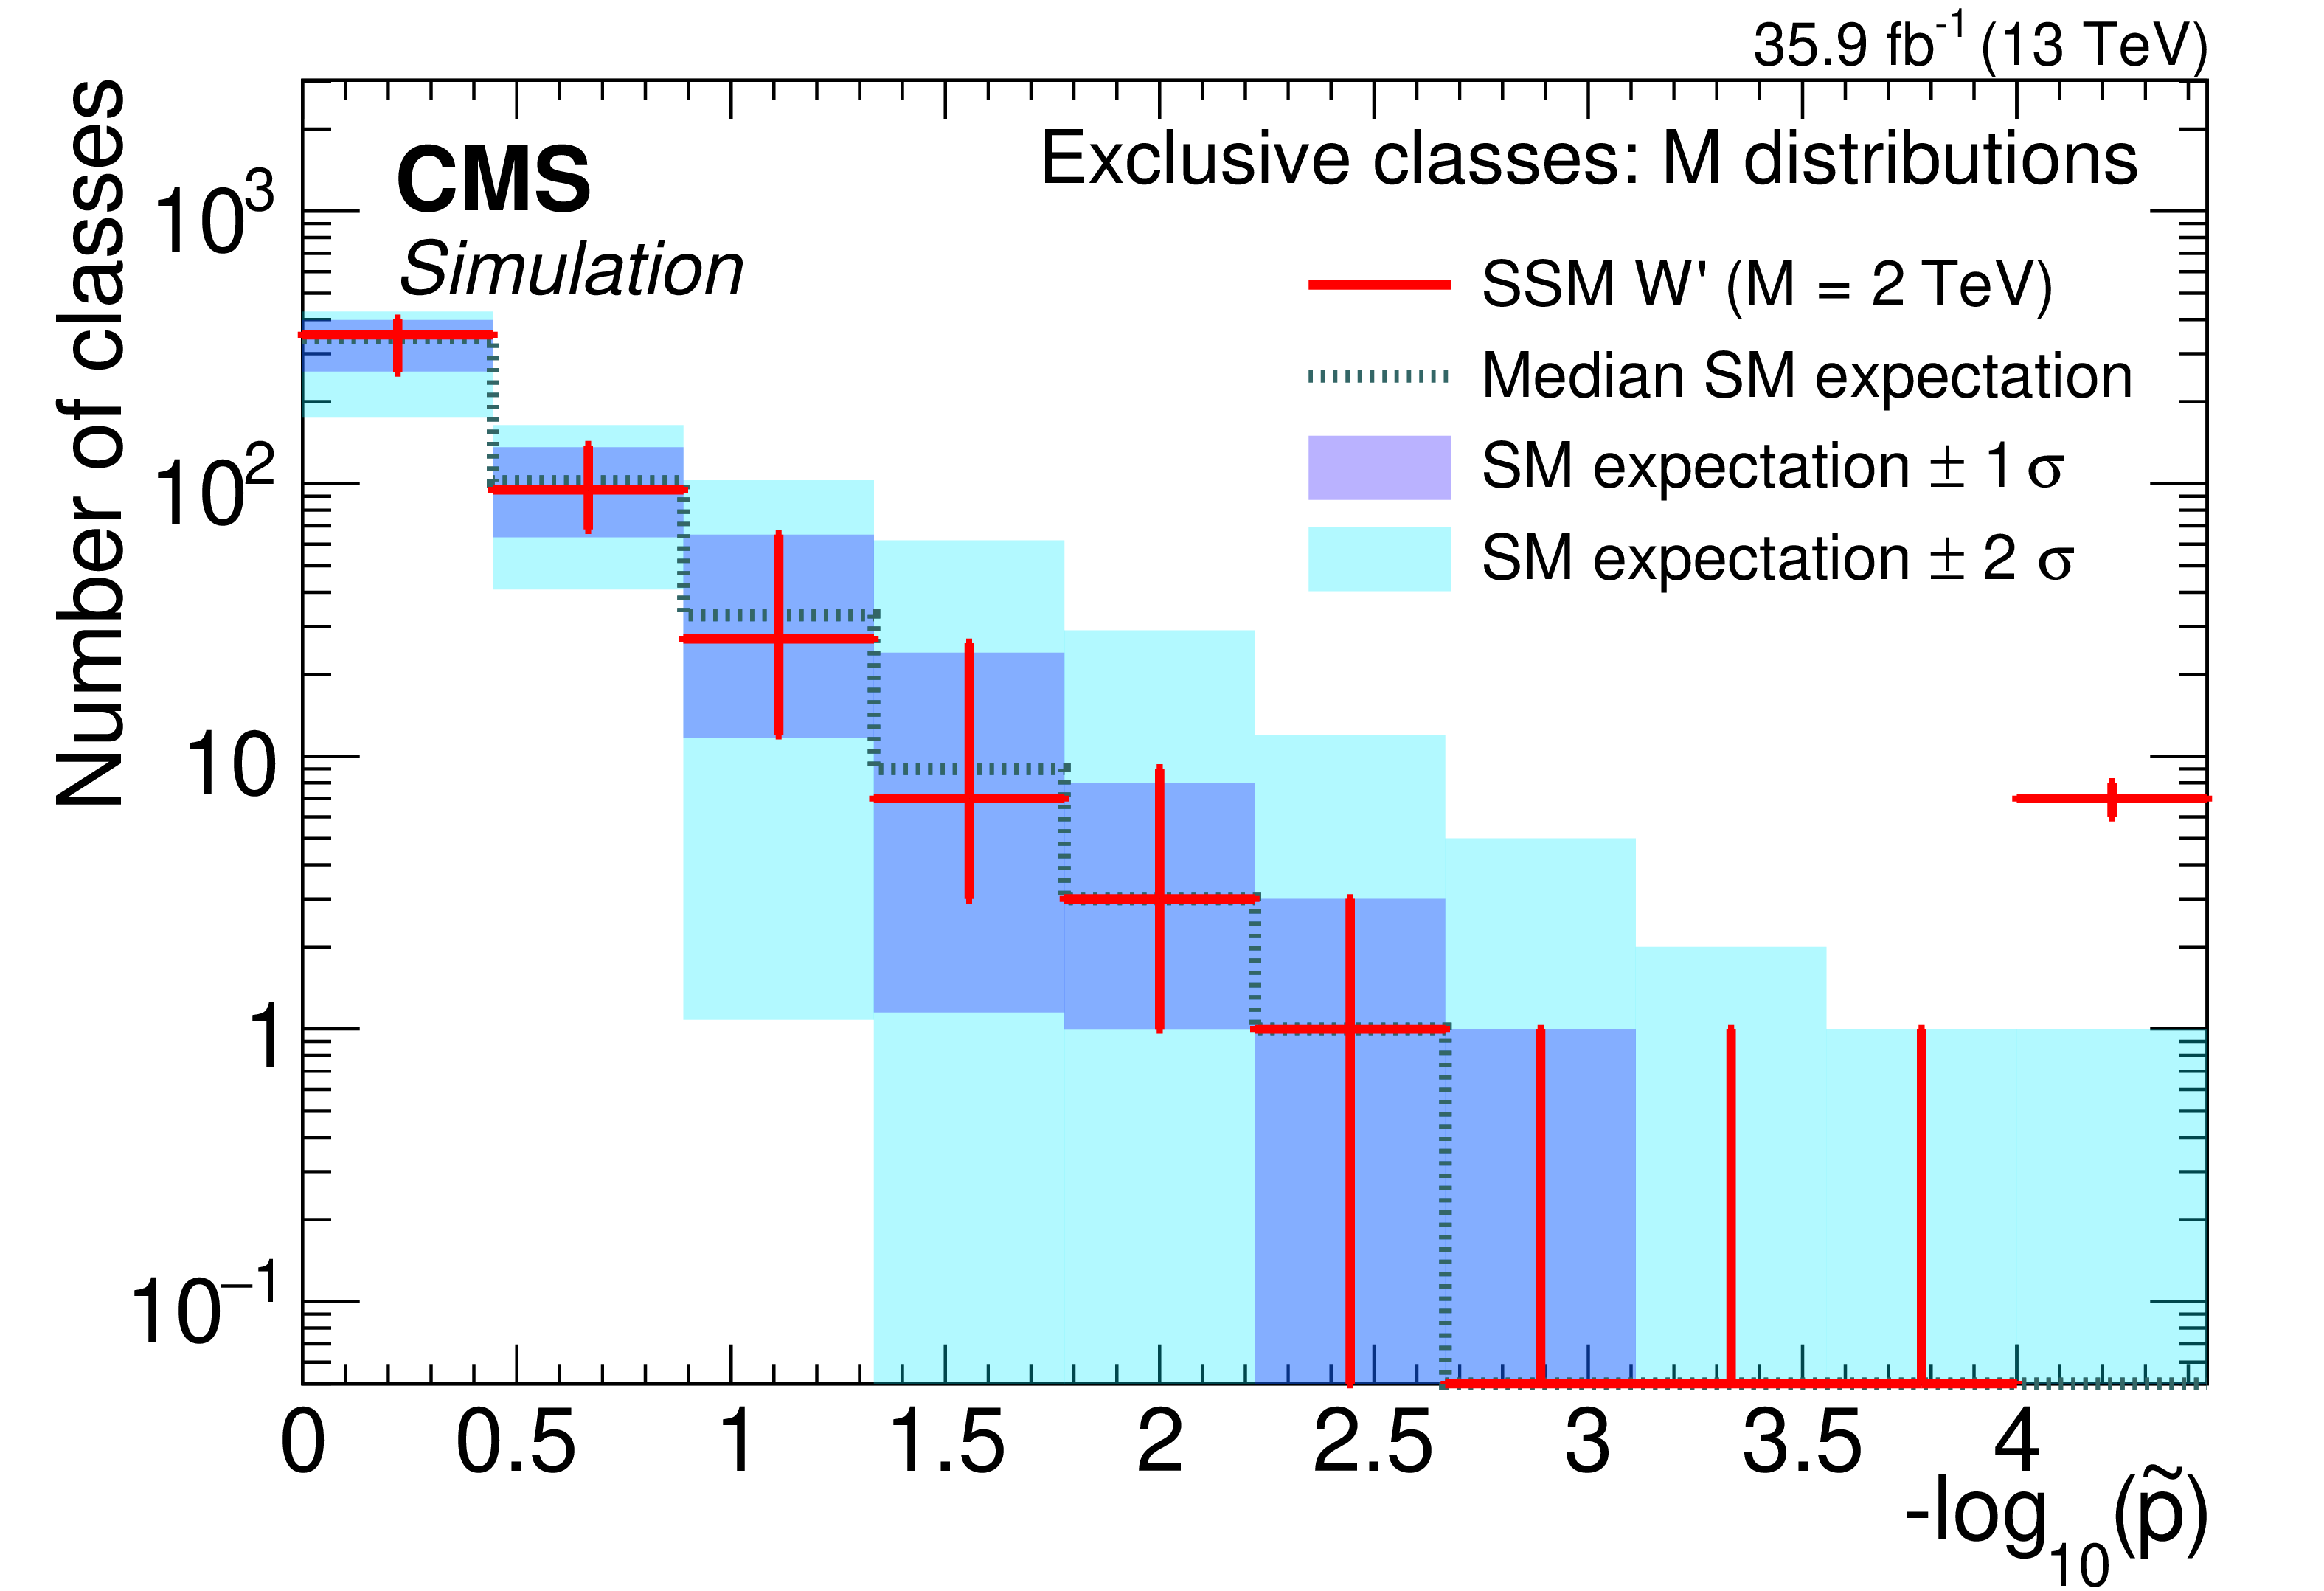
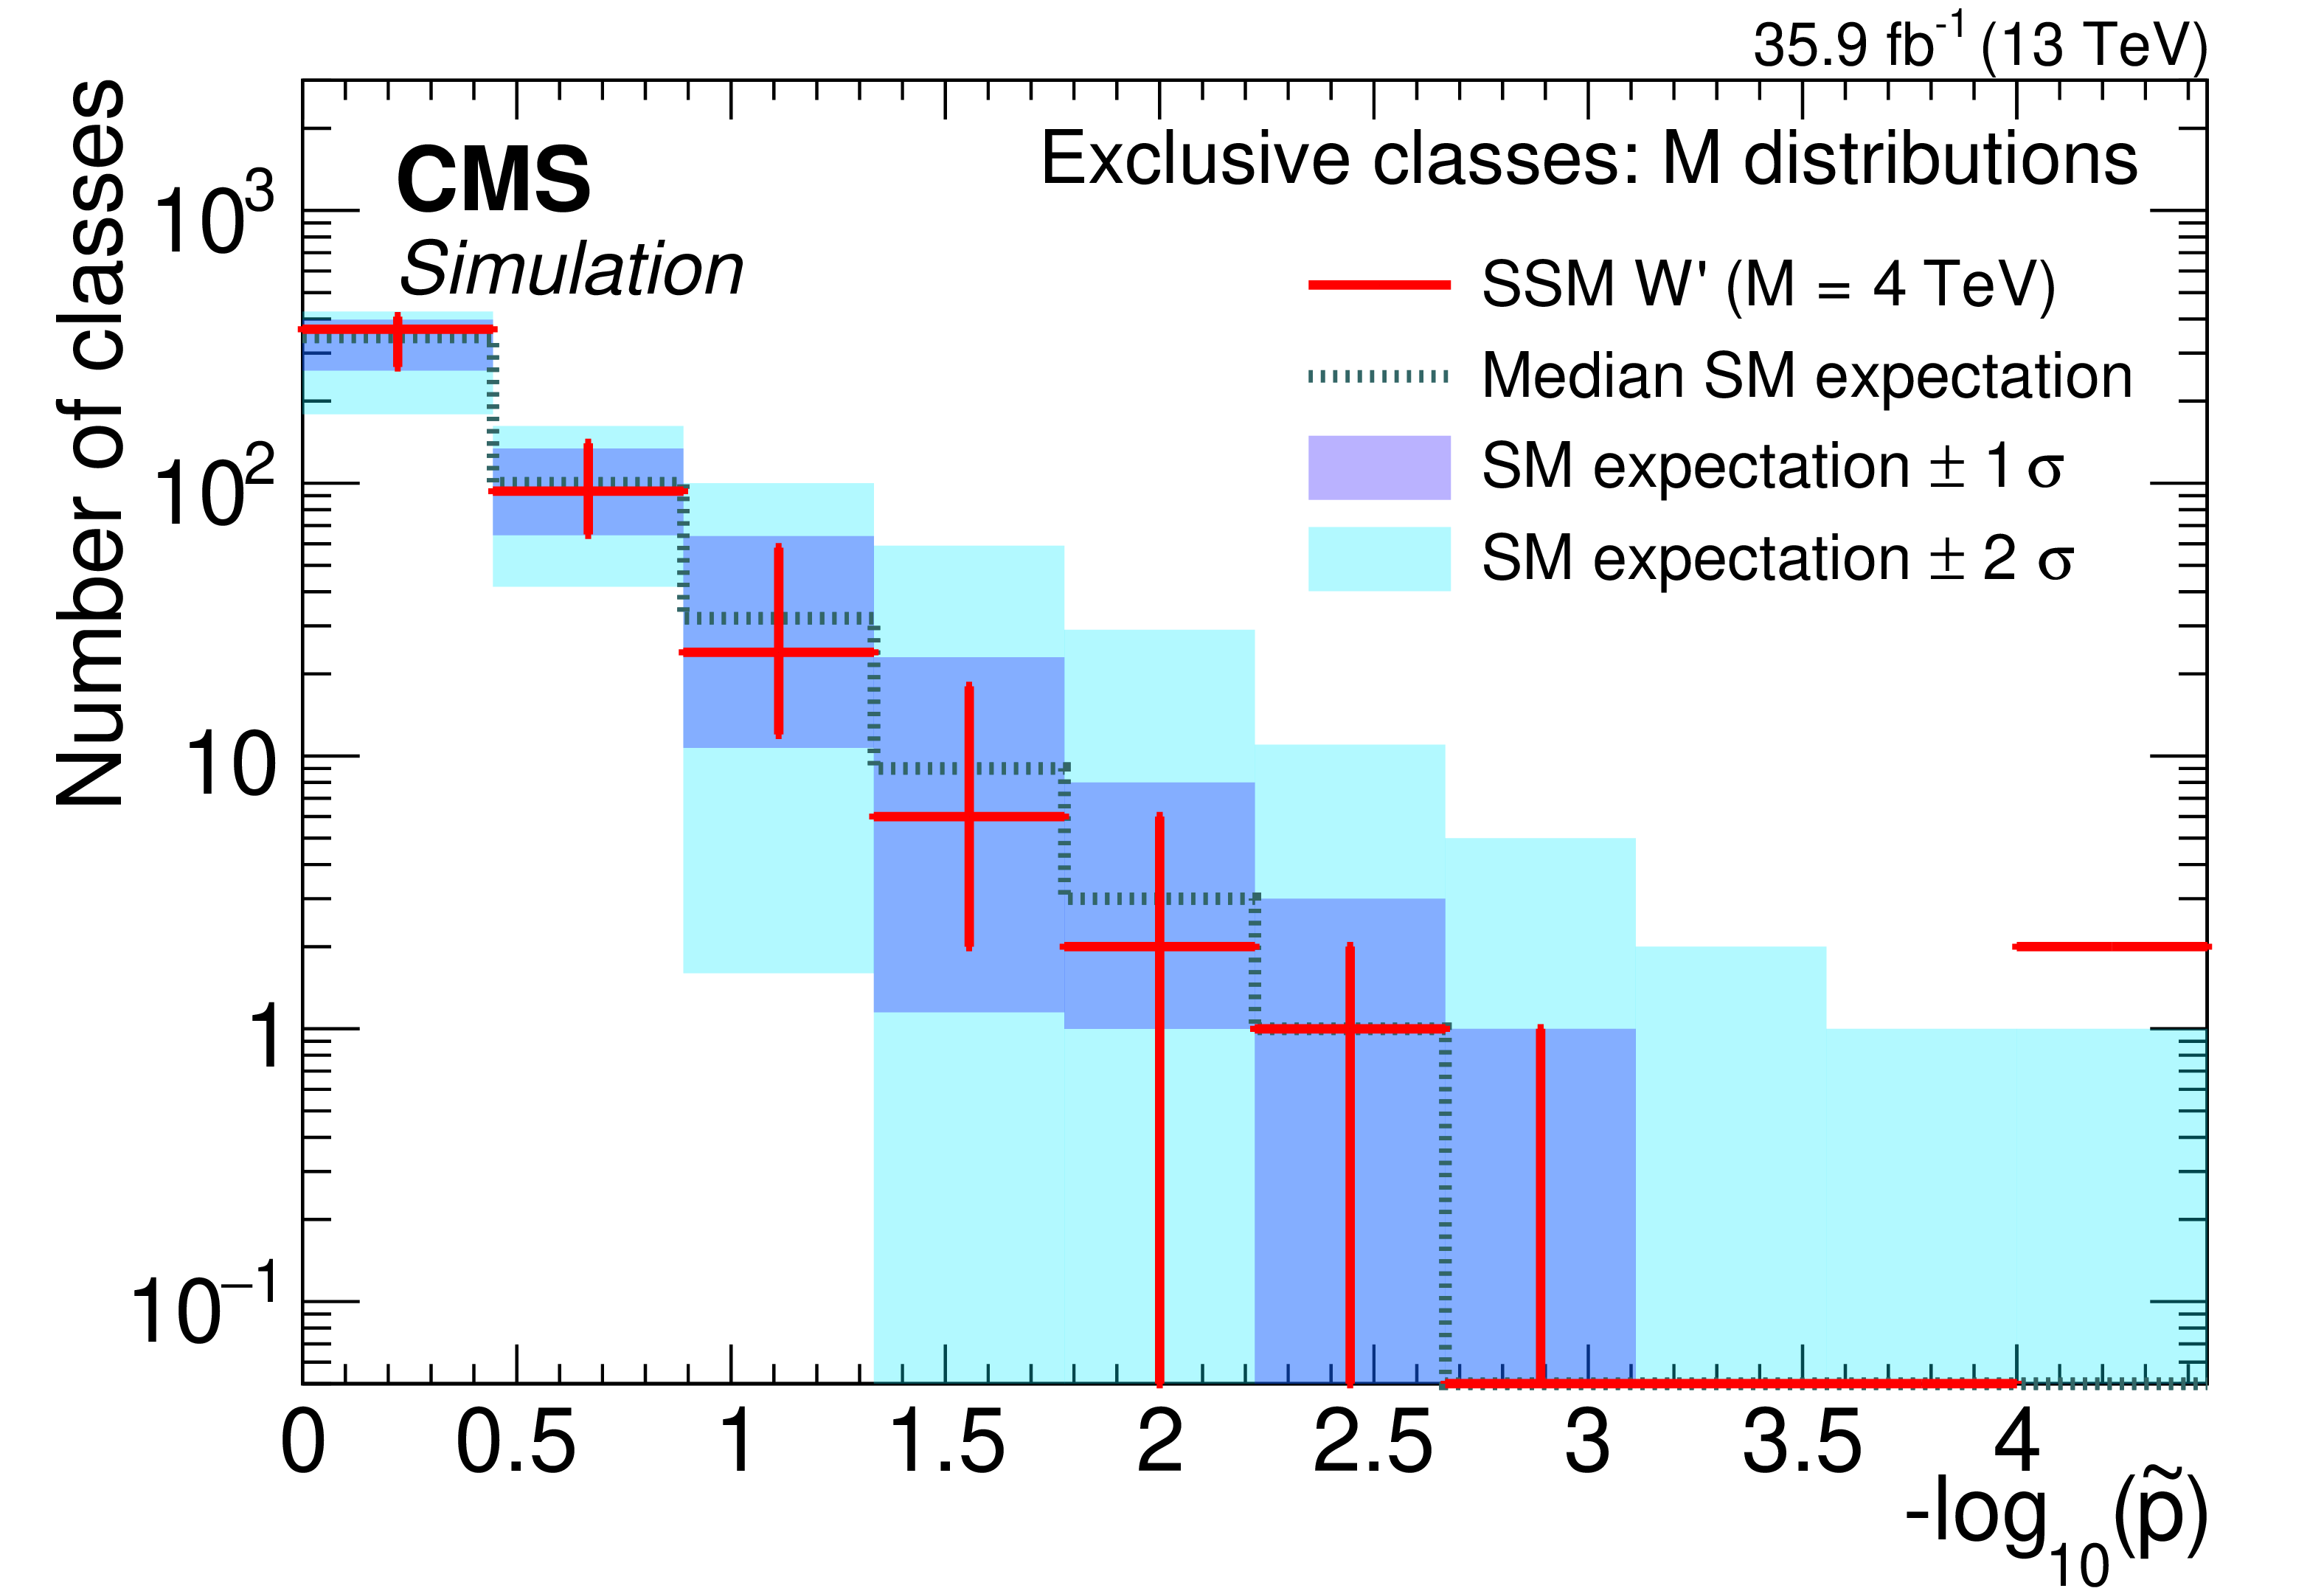
Distribution of $\tilde{p}$-values for the RoI scan in exclusive classes for the invariant mass (transverse mass for classes with ${{p_{\mathrm {T}}} ^\text {miss}}$) with assumed values for the mass of the SSM W' boson of 2 (upper), 3 ()lower left), and 4 TeV (lower right). The uncertainty in the distribution of $\tilde{p}$-values for the signal is obtained from the variations in the pseudo-data performed with the W' signal simulation. |
png pdf |
Figure 5-a:
Distribution of $\tilde{p}$-values for the RoI scan in exclusive classes for the invariant mass (transverse mass for classes with ${{p_{\mathrm {T}}} ^\text {miss}}$) with assumed values for the mass of the SSM W' boson of 2 (upper), 3 ()lower left), and 4 TeV (lower right). The uncertainty in the distribution of $\tilde{p}$-values for the signal is obtained from the variations in the pseudo-data performed with the W' signal simulation. |

png pdf |
Figure 5-b:
Distribution of $\tilde{p}$-values for the RoI scan in exclusive classes for the invariant mass (transverse mass for classes with ${{p_{\mathrm {T}}} ^\text {miss}}$) with assumed values for the mass of the SSM W' boson of 2 (upper), 3 ()lower left), and 4 TeV (lower right). The uncertainty in the distribution of $\tilde{p}$-values for the signal is obtained from the variations in the pseudo-data performed with the W' signal simulation. |
png pdf |
Figure 5-c:
Distribution of $\tilde{p}$-values for the RoI scan in exclusive classes for the invariant mass (transverse mass for classes with ${{p_{\mathrm {T}}} ^\text {miss}}$) with assumed values for the mass of the SSM W' boson of 2 (upper), 3 ()lower left), and 4 TeV (lower right). The uncertainty in the distribution of $\tilde{p}$-values for the signal is obtained from the variations in the pseudo-data performed with the W' signal simulation. |
png pdf |
Figure 6:
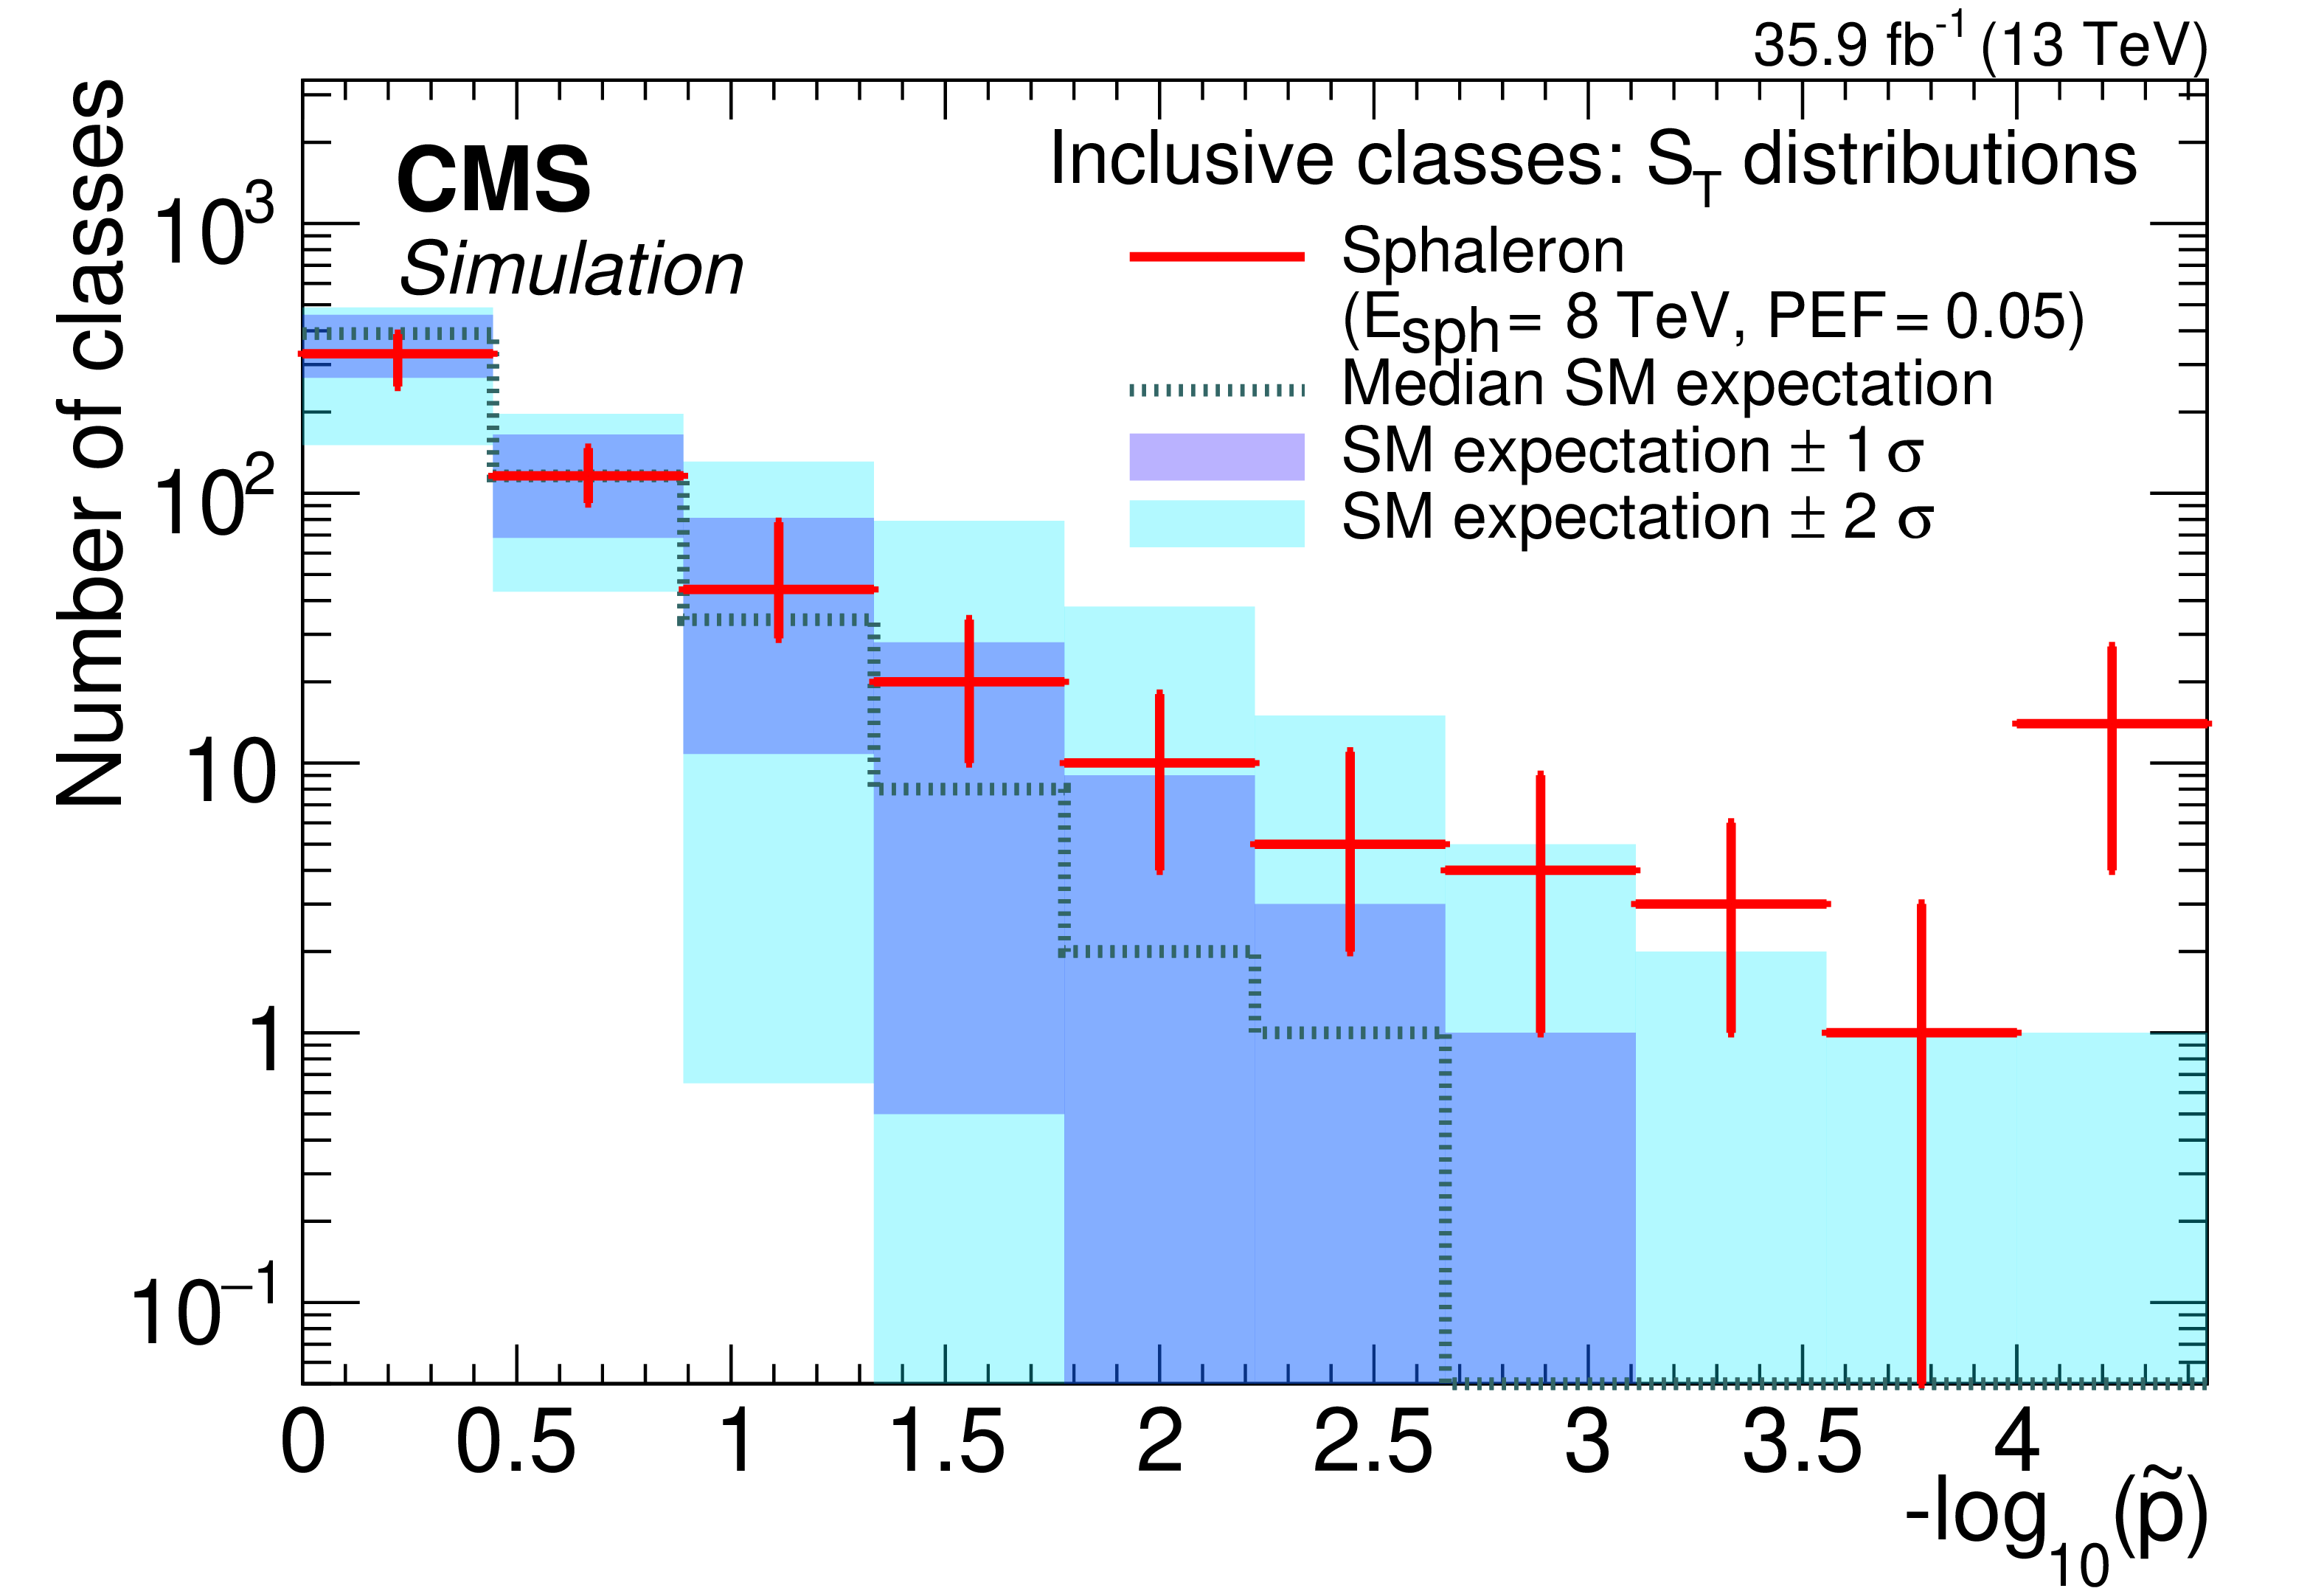
Distribution of $\tilde{p}$-values for the RoI scan in inclusive classes for the ${S_{\mathrm {T}}}$ distributions for a sphaleron signal with $E_{\text {sph}} = $ 8 TeV and PEF = 0.05. The uncertainty in the distribution of $\tilde{p}$-values for the signal is obtained from the variations in the pseudo-data performed with the sphaleron signal simulation. |
png pdf |
Figure 7:
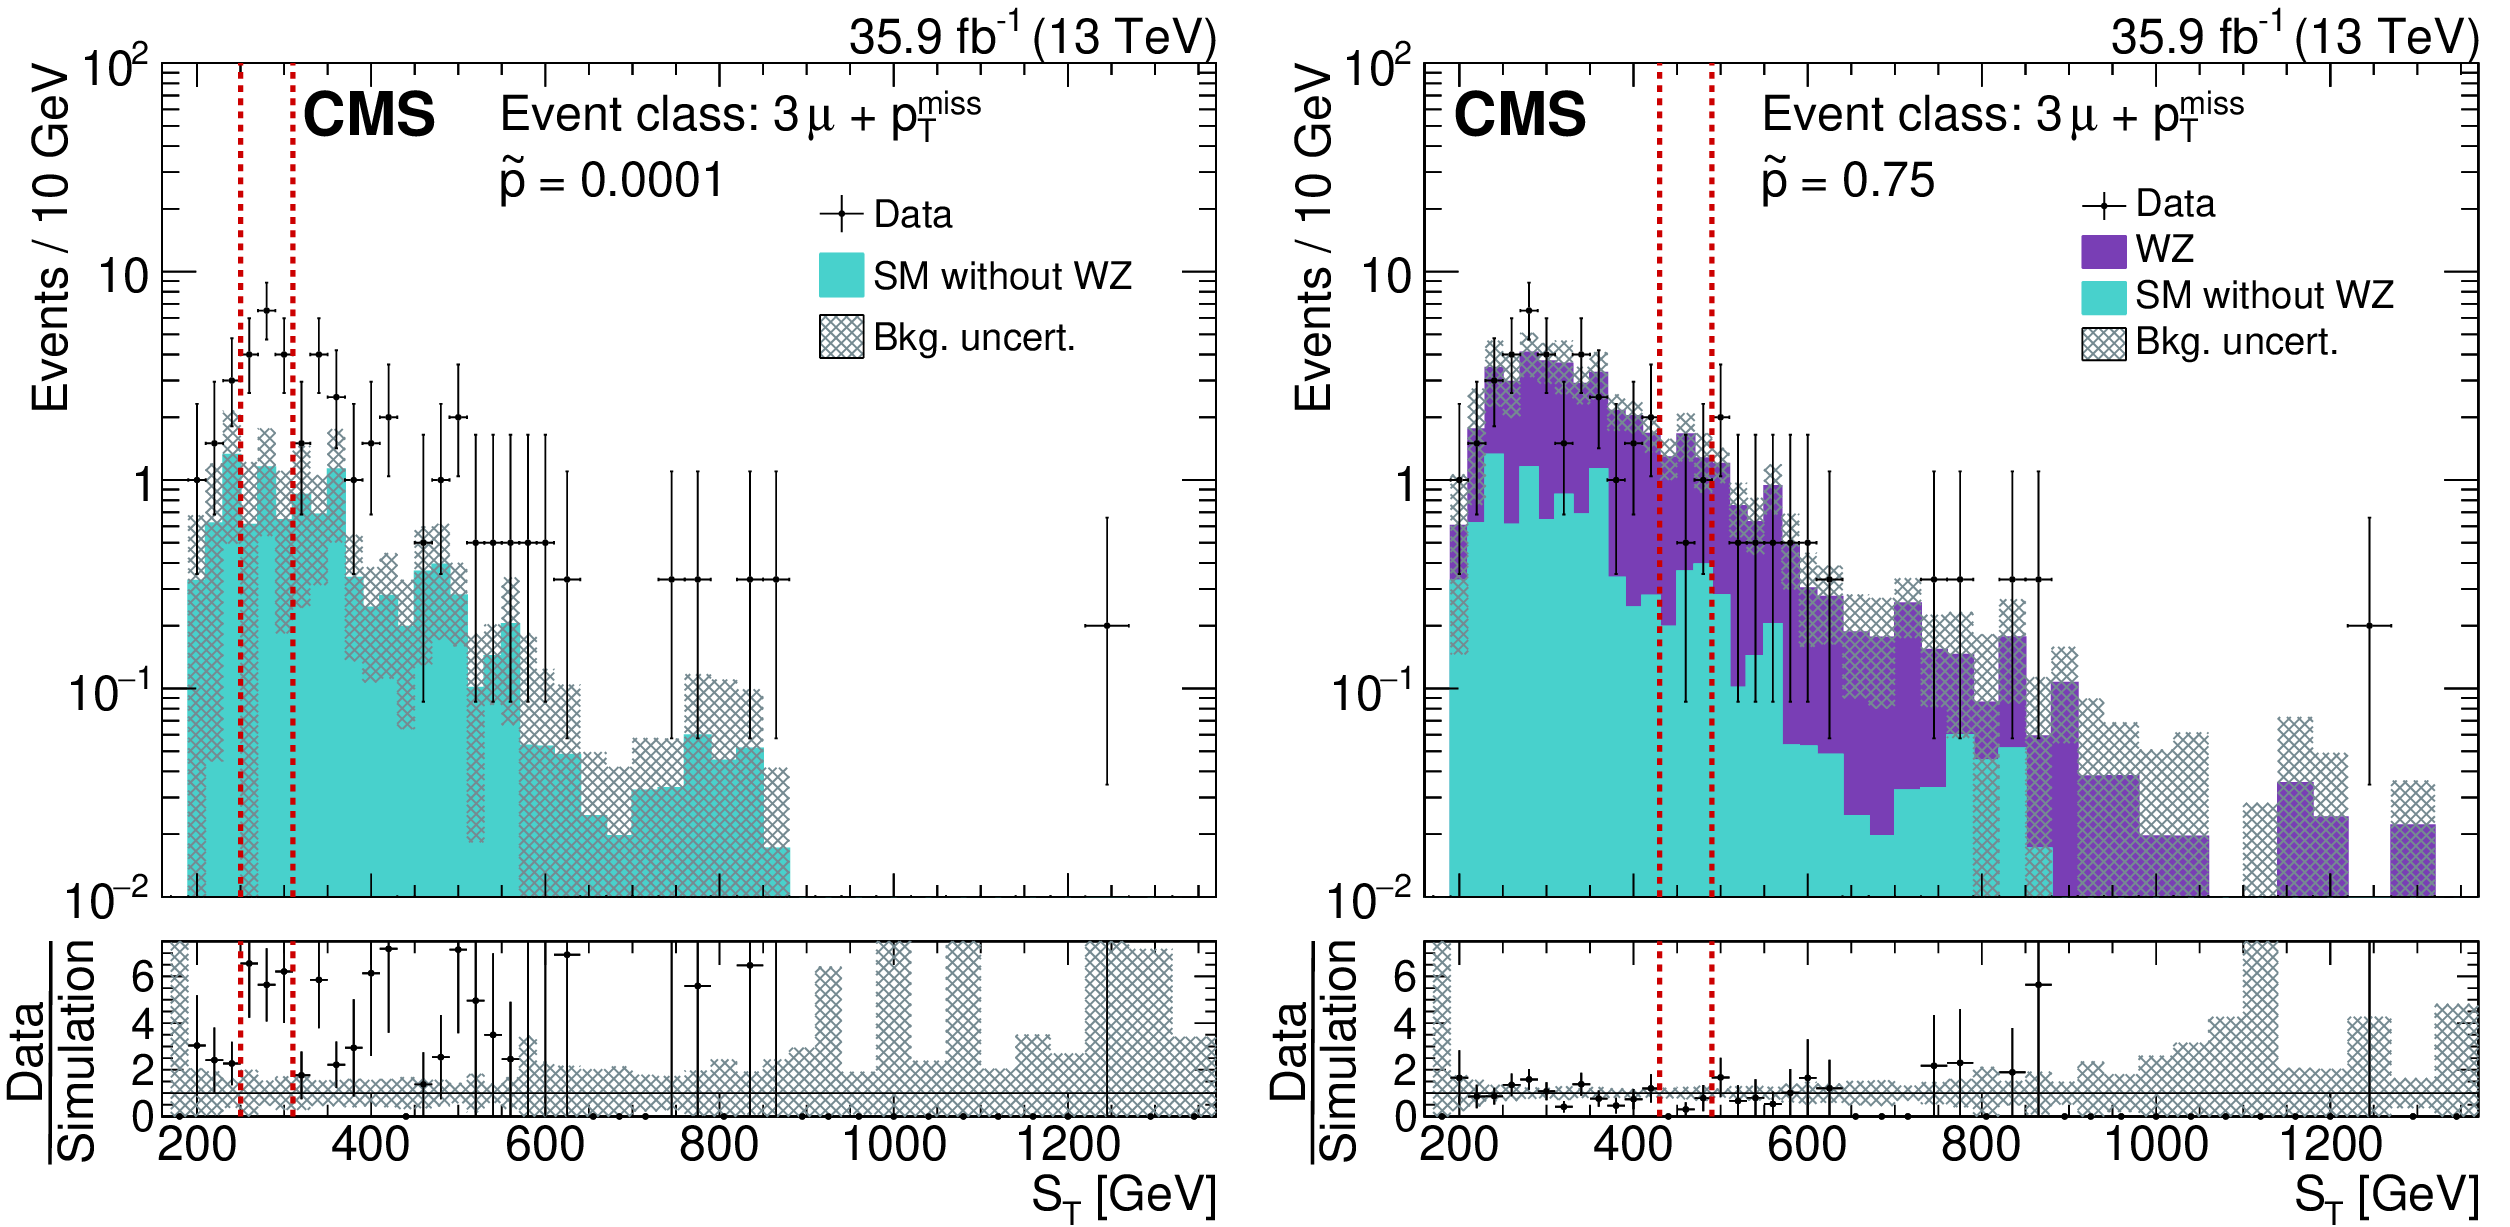
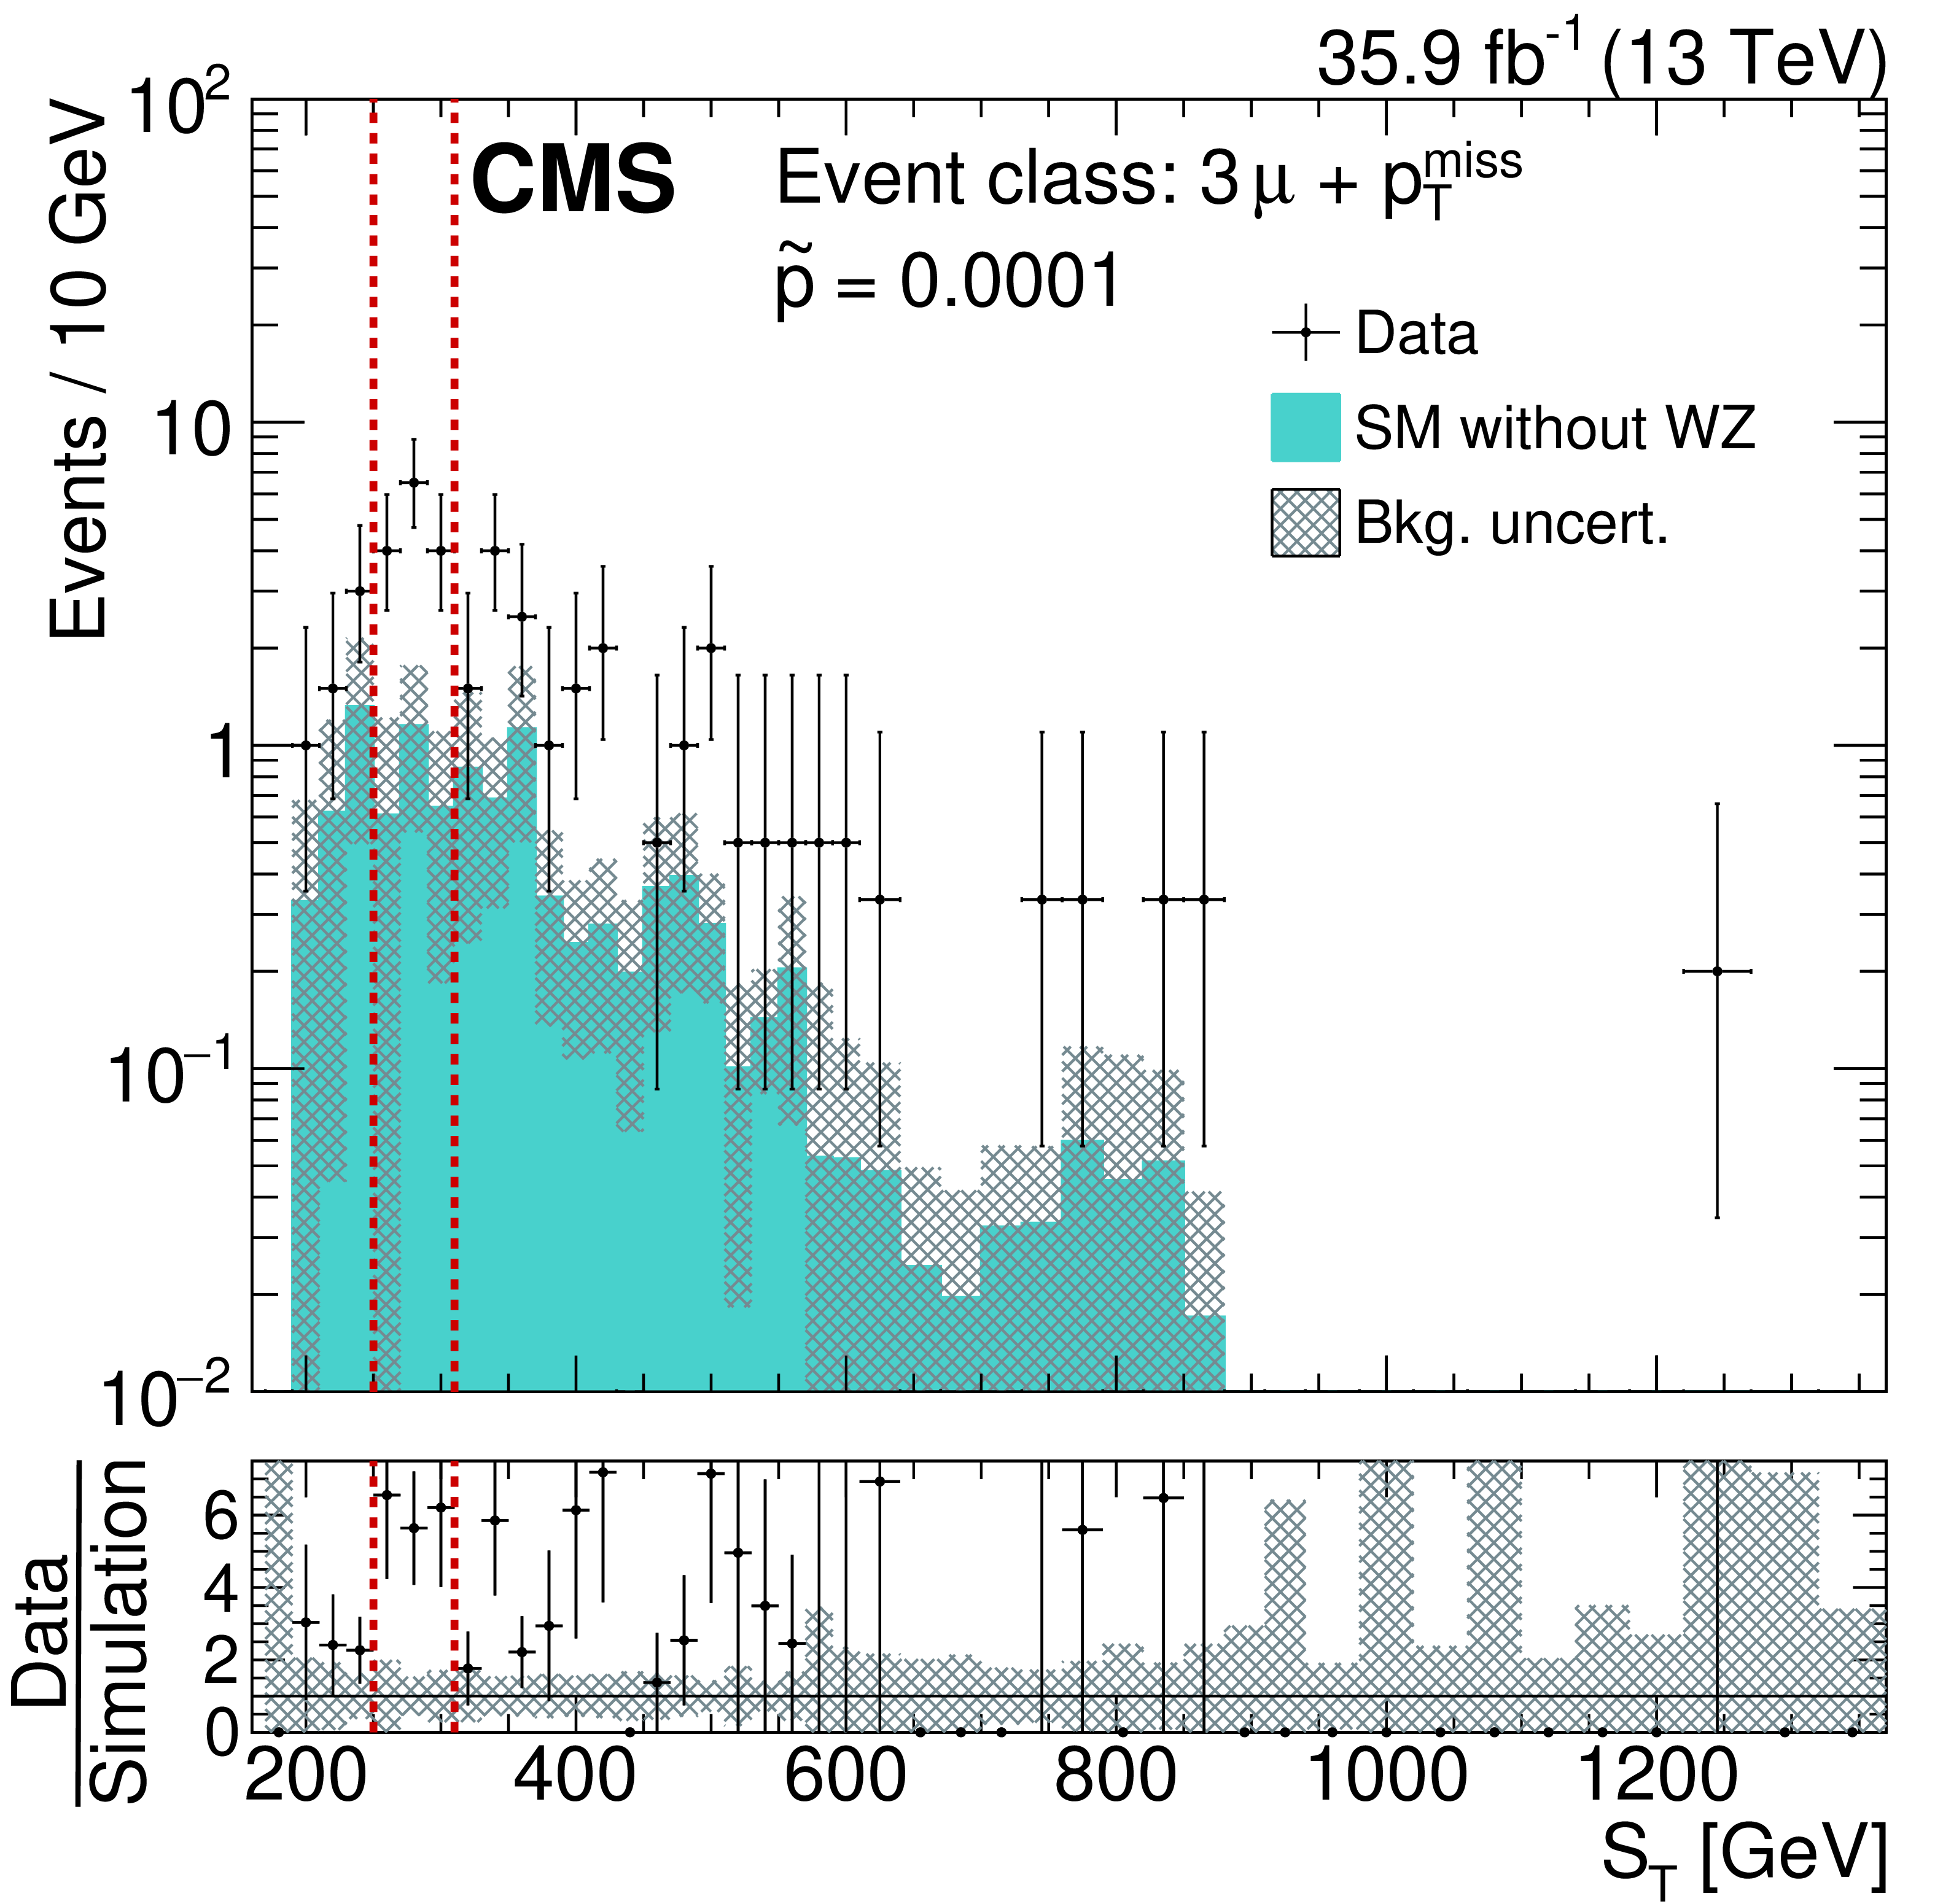
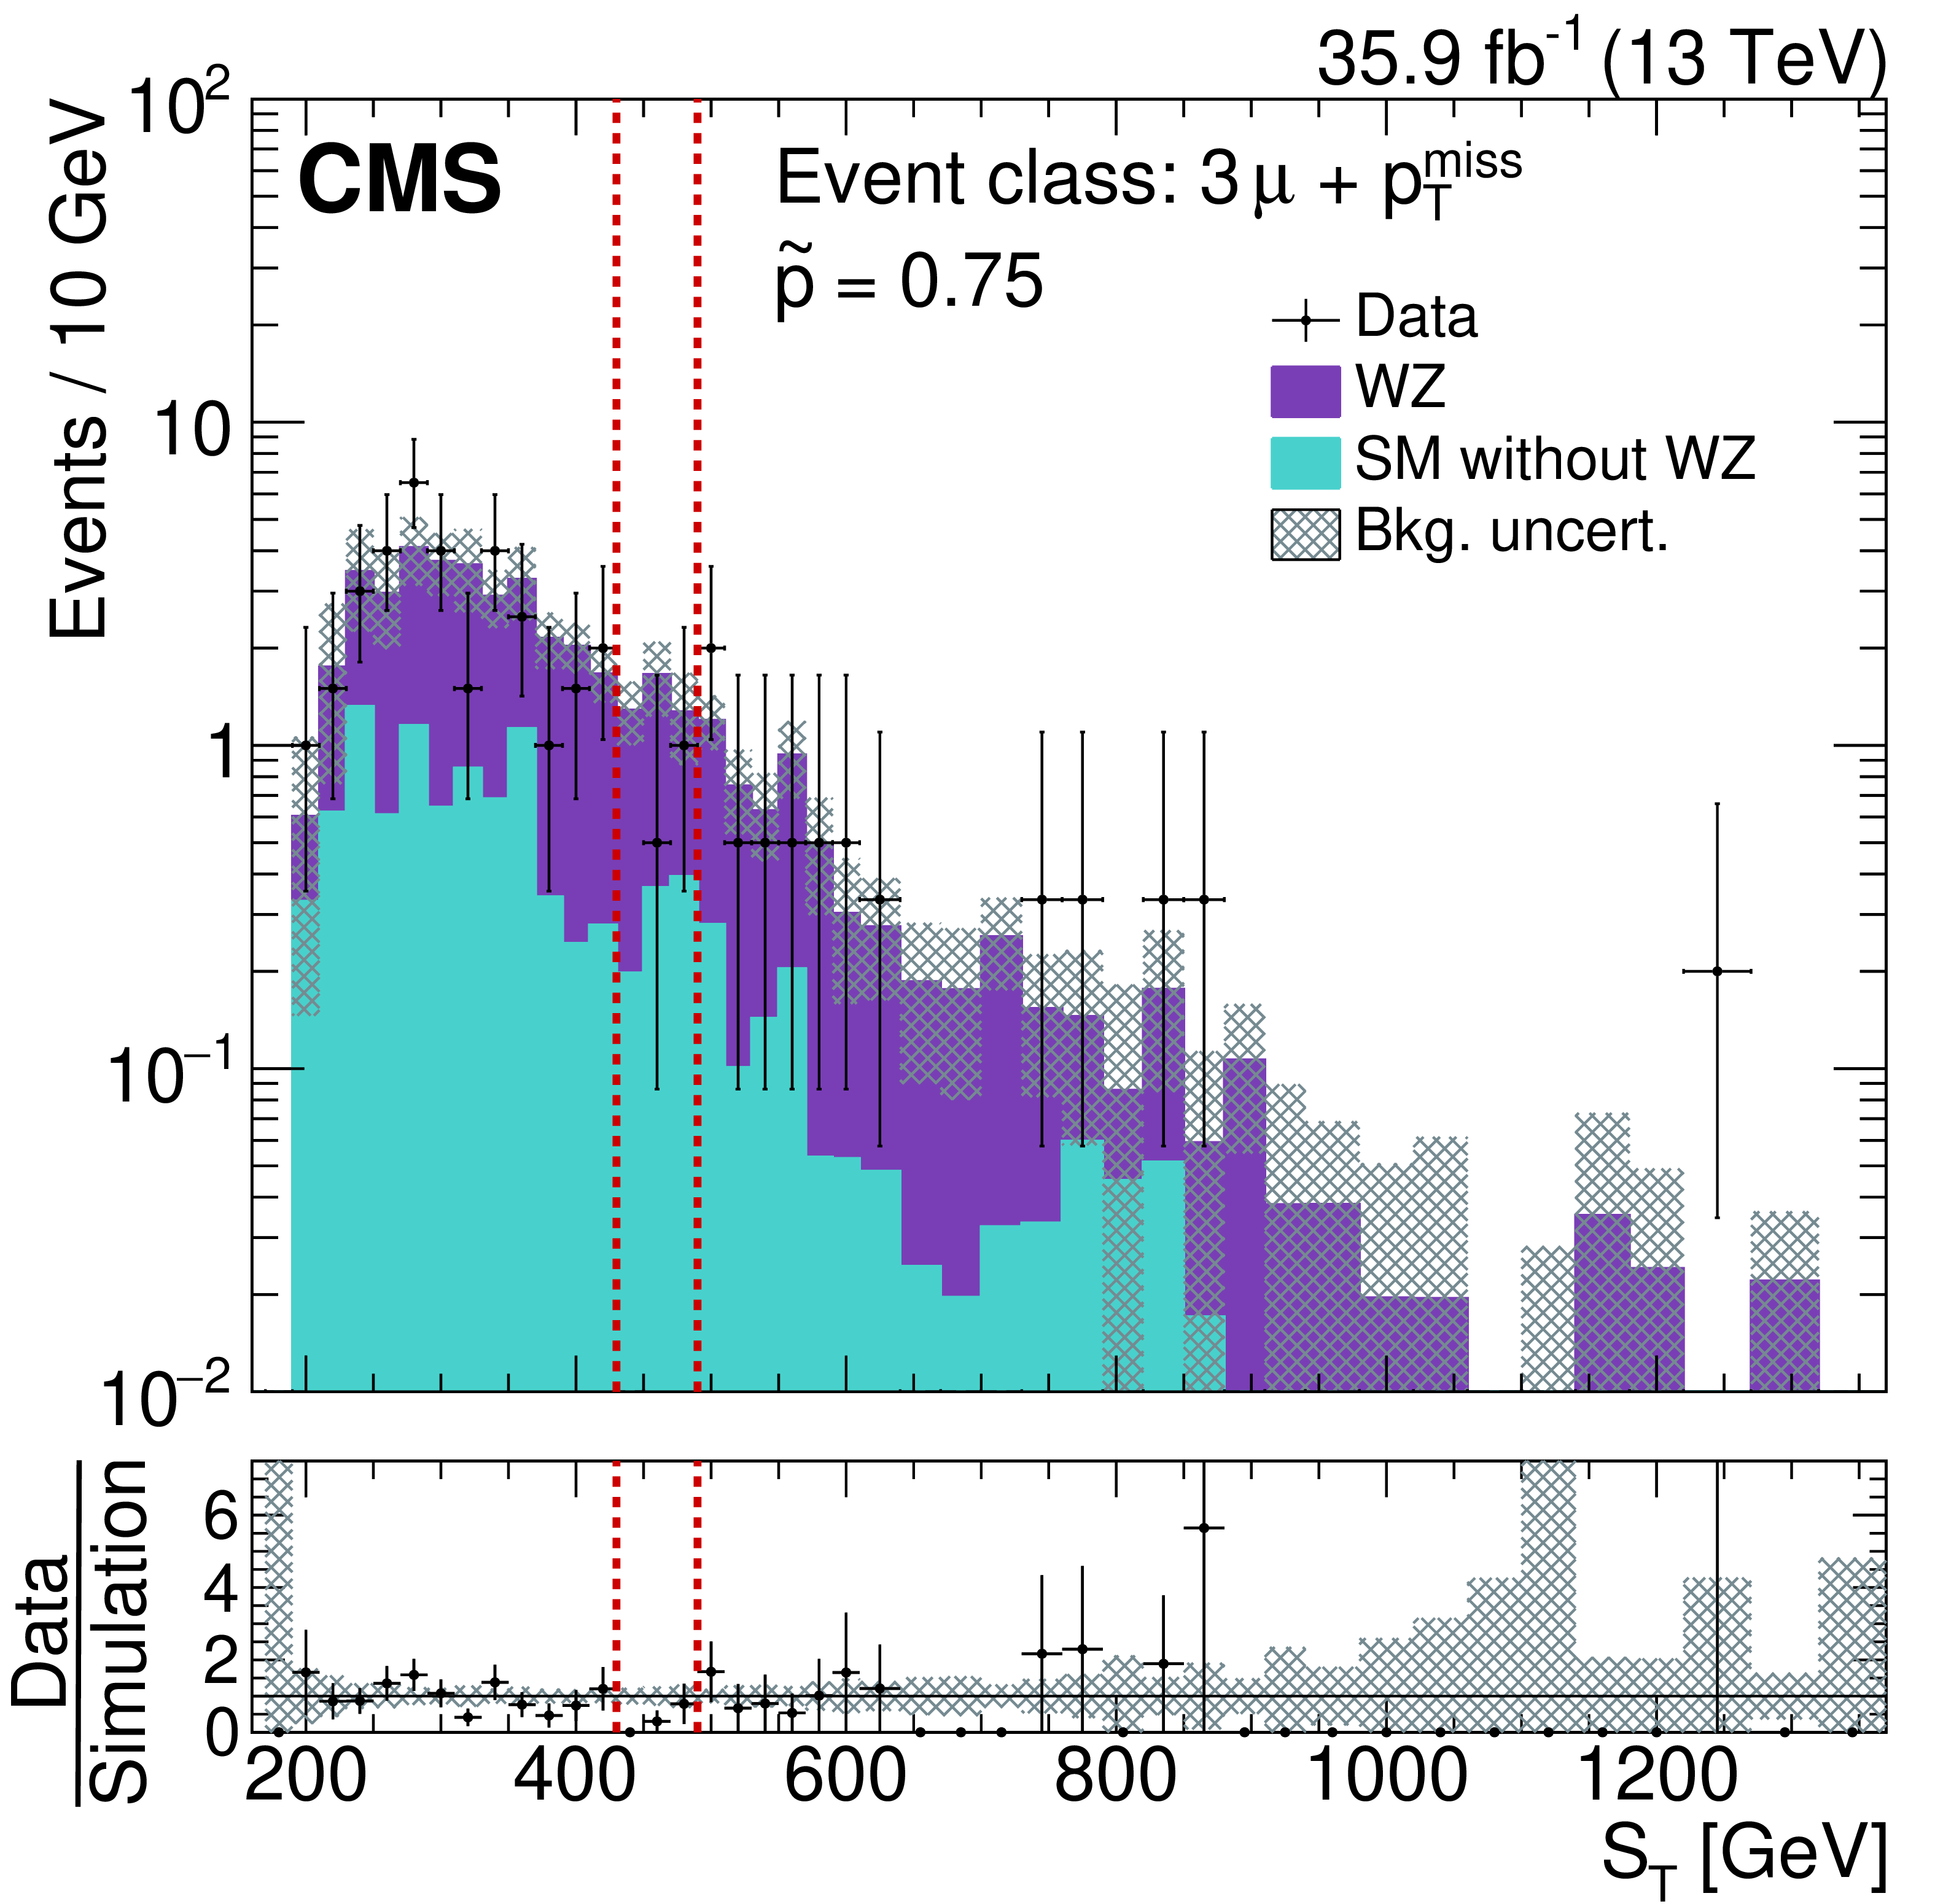
Distributions of ${S_{\mathrm {T}}}$ for the 3$\mu$+${{p_{\mathrm {T}}} ^\text {miss}} $ exclusive class without (left) and with (right) $\mathrm{W} \mathrm{Z} $ production as part of the SM simulation. The data events are shown in black and the simulations of the SM processes are shown as coloured histograms. The region enclosed within the red dashed lines is the region of interest. |
png pdf |
Figure 7-a:
Distributions of ${S_{\mathrm {T}}}$ for the 3$\mu$+${{p_{\mathrm {T}}} ^\text {miss}} $ exclusive class without (left) and with (right) $\mathrm{W} \mathrm{Z} $ production as part of the SM simulation. The data events are shown in black and the simulations of the SM processes are shown as coloured histograms. The region enclosed within the red dashed lines is the region of interest. |
png pdf |
Figure 7-b:
Distributions of ${S_{\mathrm {T}}}$ for the 3$\mu$+${{p_{\mathrm {T}}} ^\text {miss}} $ exclusive class without (left) and with (right) $\mathrm{W} \mathrm{Z} $ production as part of the SM simulation. The data events are shown in black and the simulations of the SM processes are shown as coloured histograms. The region enclosed within the red dashed lines is the region of interest. |

png pdf |
Figure 8:
Data and SM predictions for the most significant exclusive event classes, where the significance of an event class is calculated in a single aggregated bin. Measured data are shown as black markers, contributions from SM processes are represented by coloured histograms, and the shaded region represents the uncertainty in the SM background. The values above the plot indicate the observed $p$-value for each event class. |

png pdf |
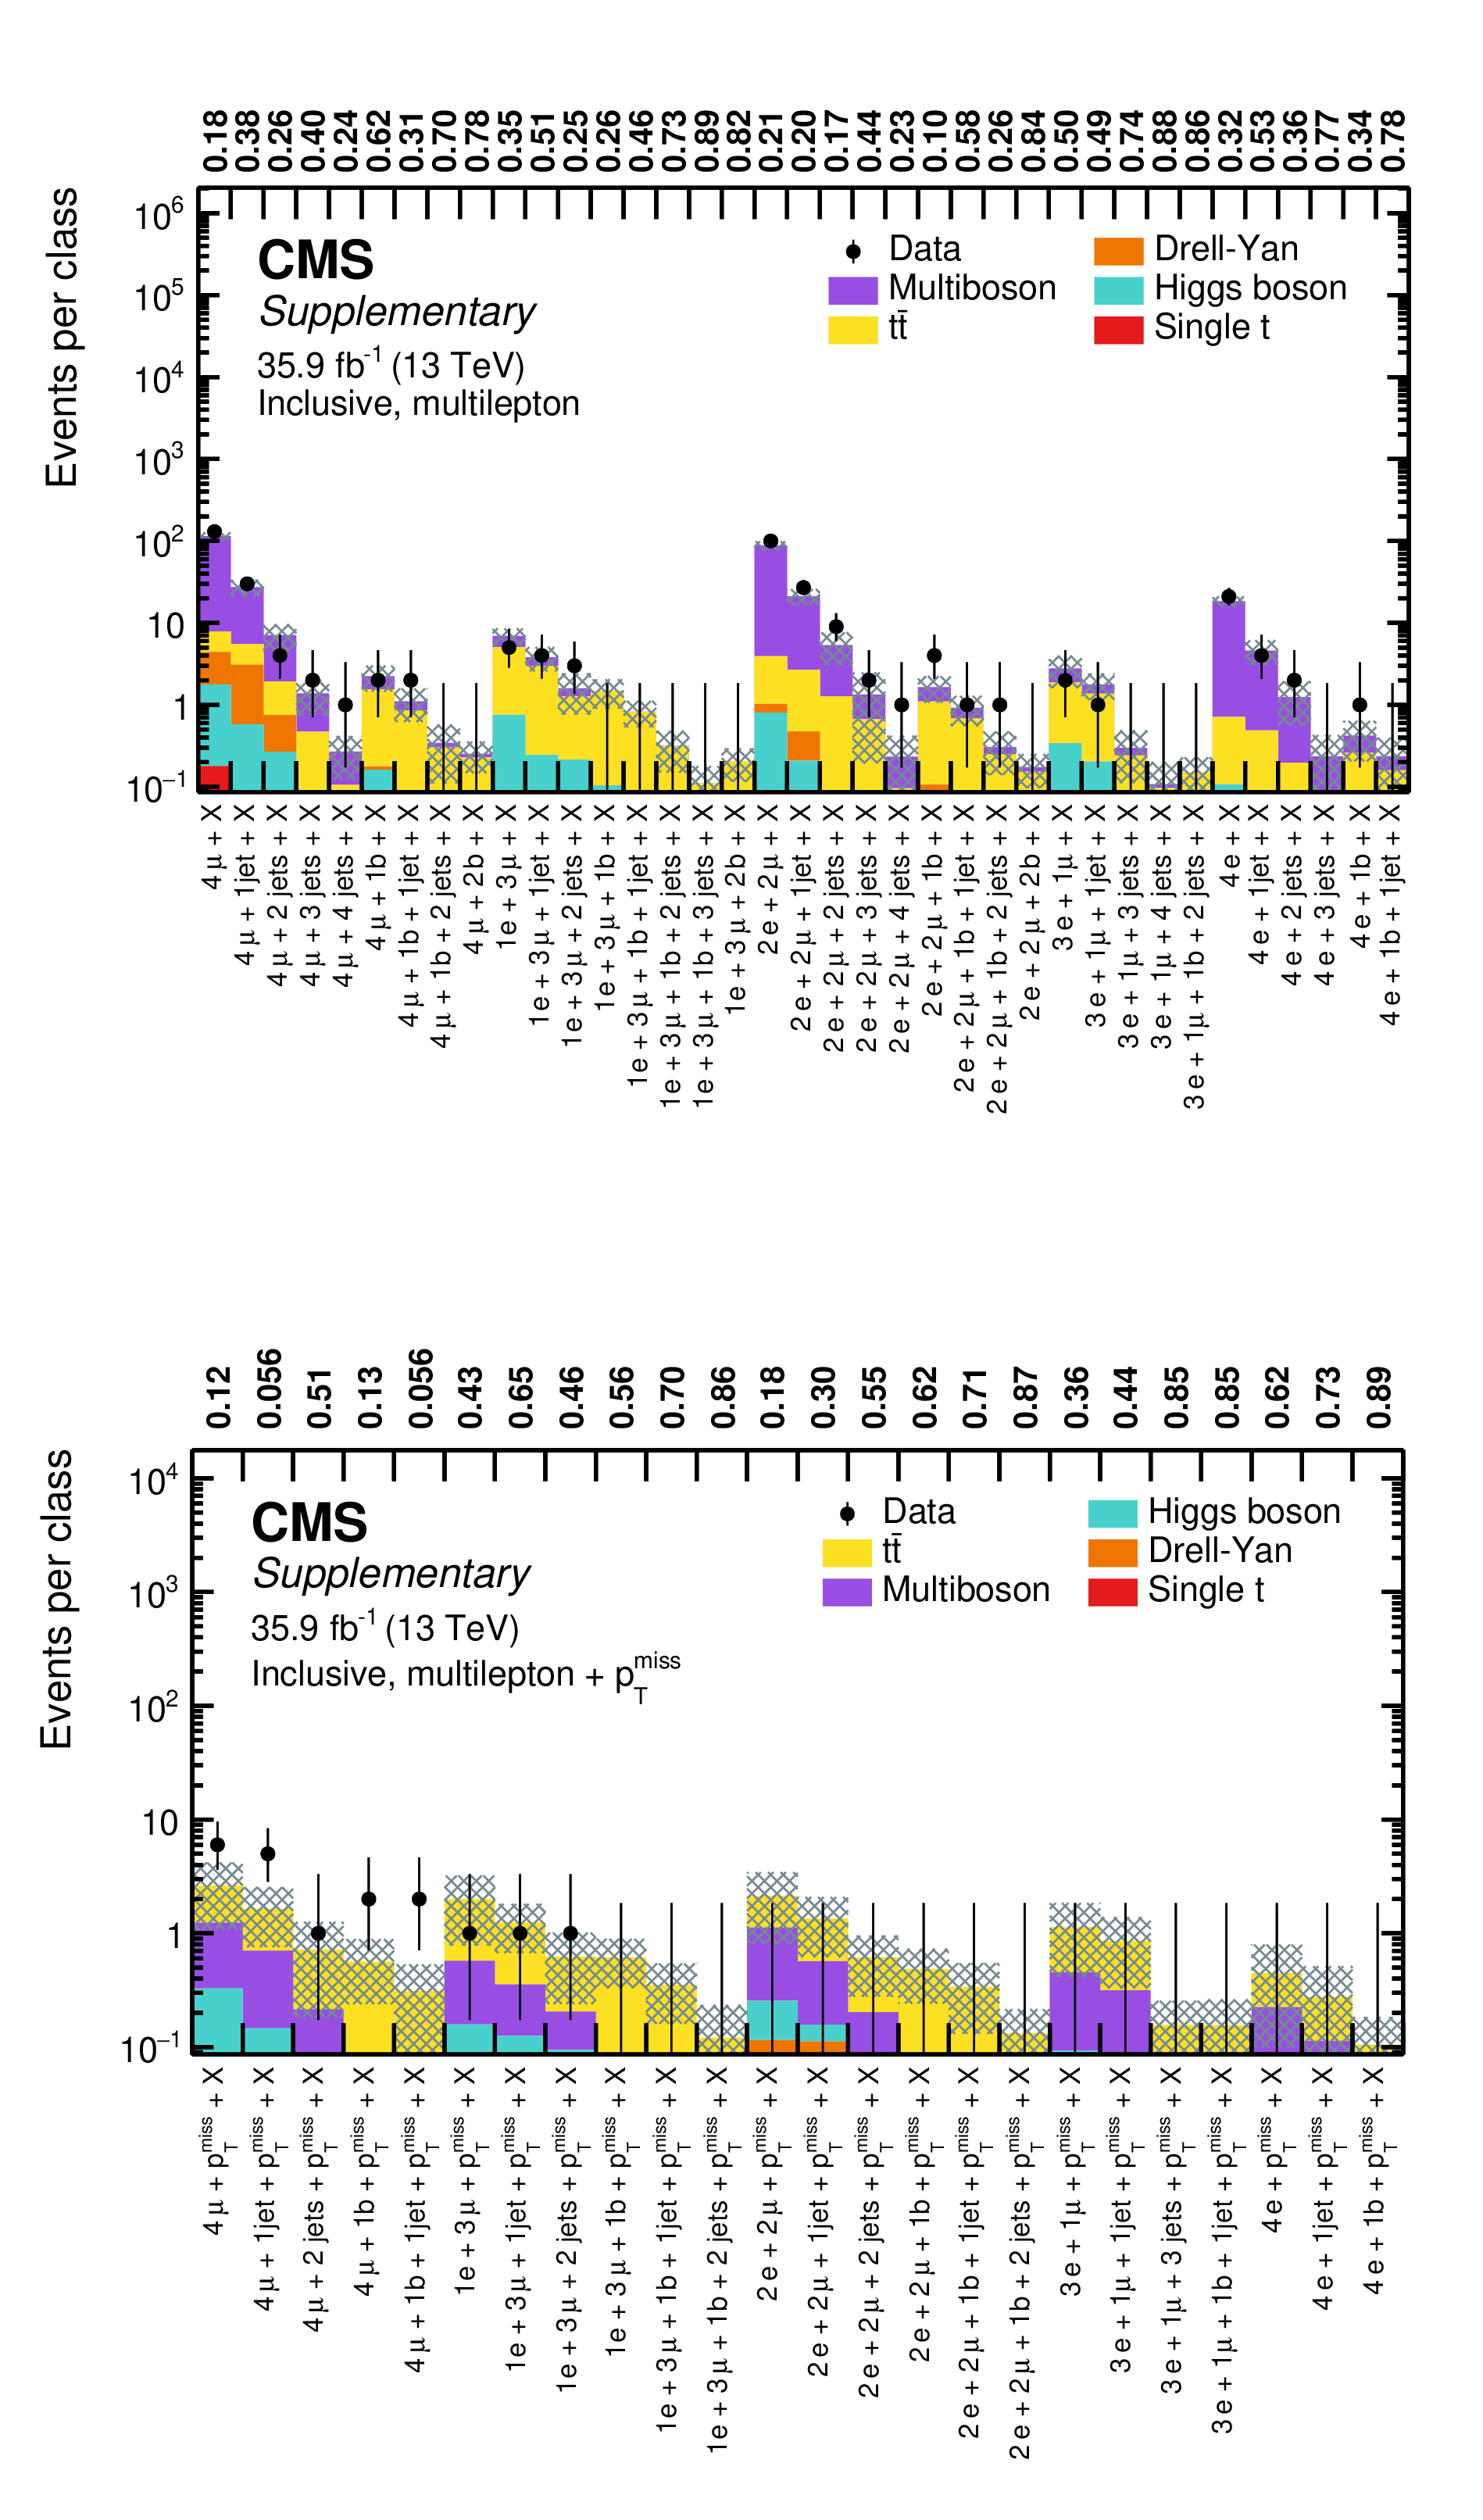
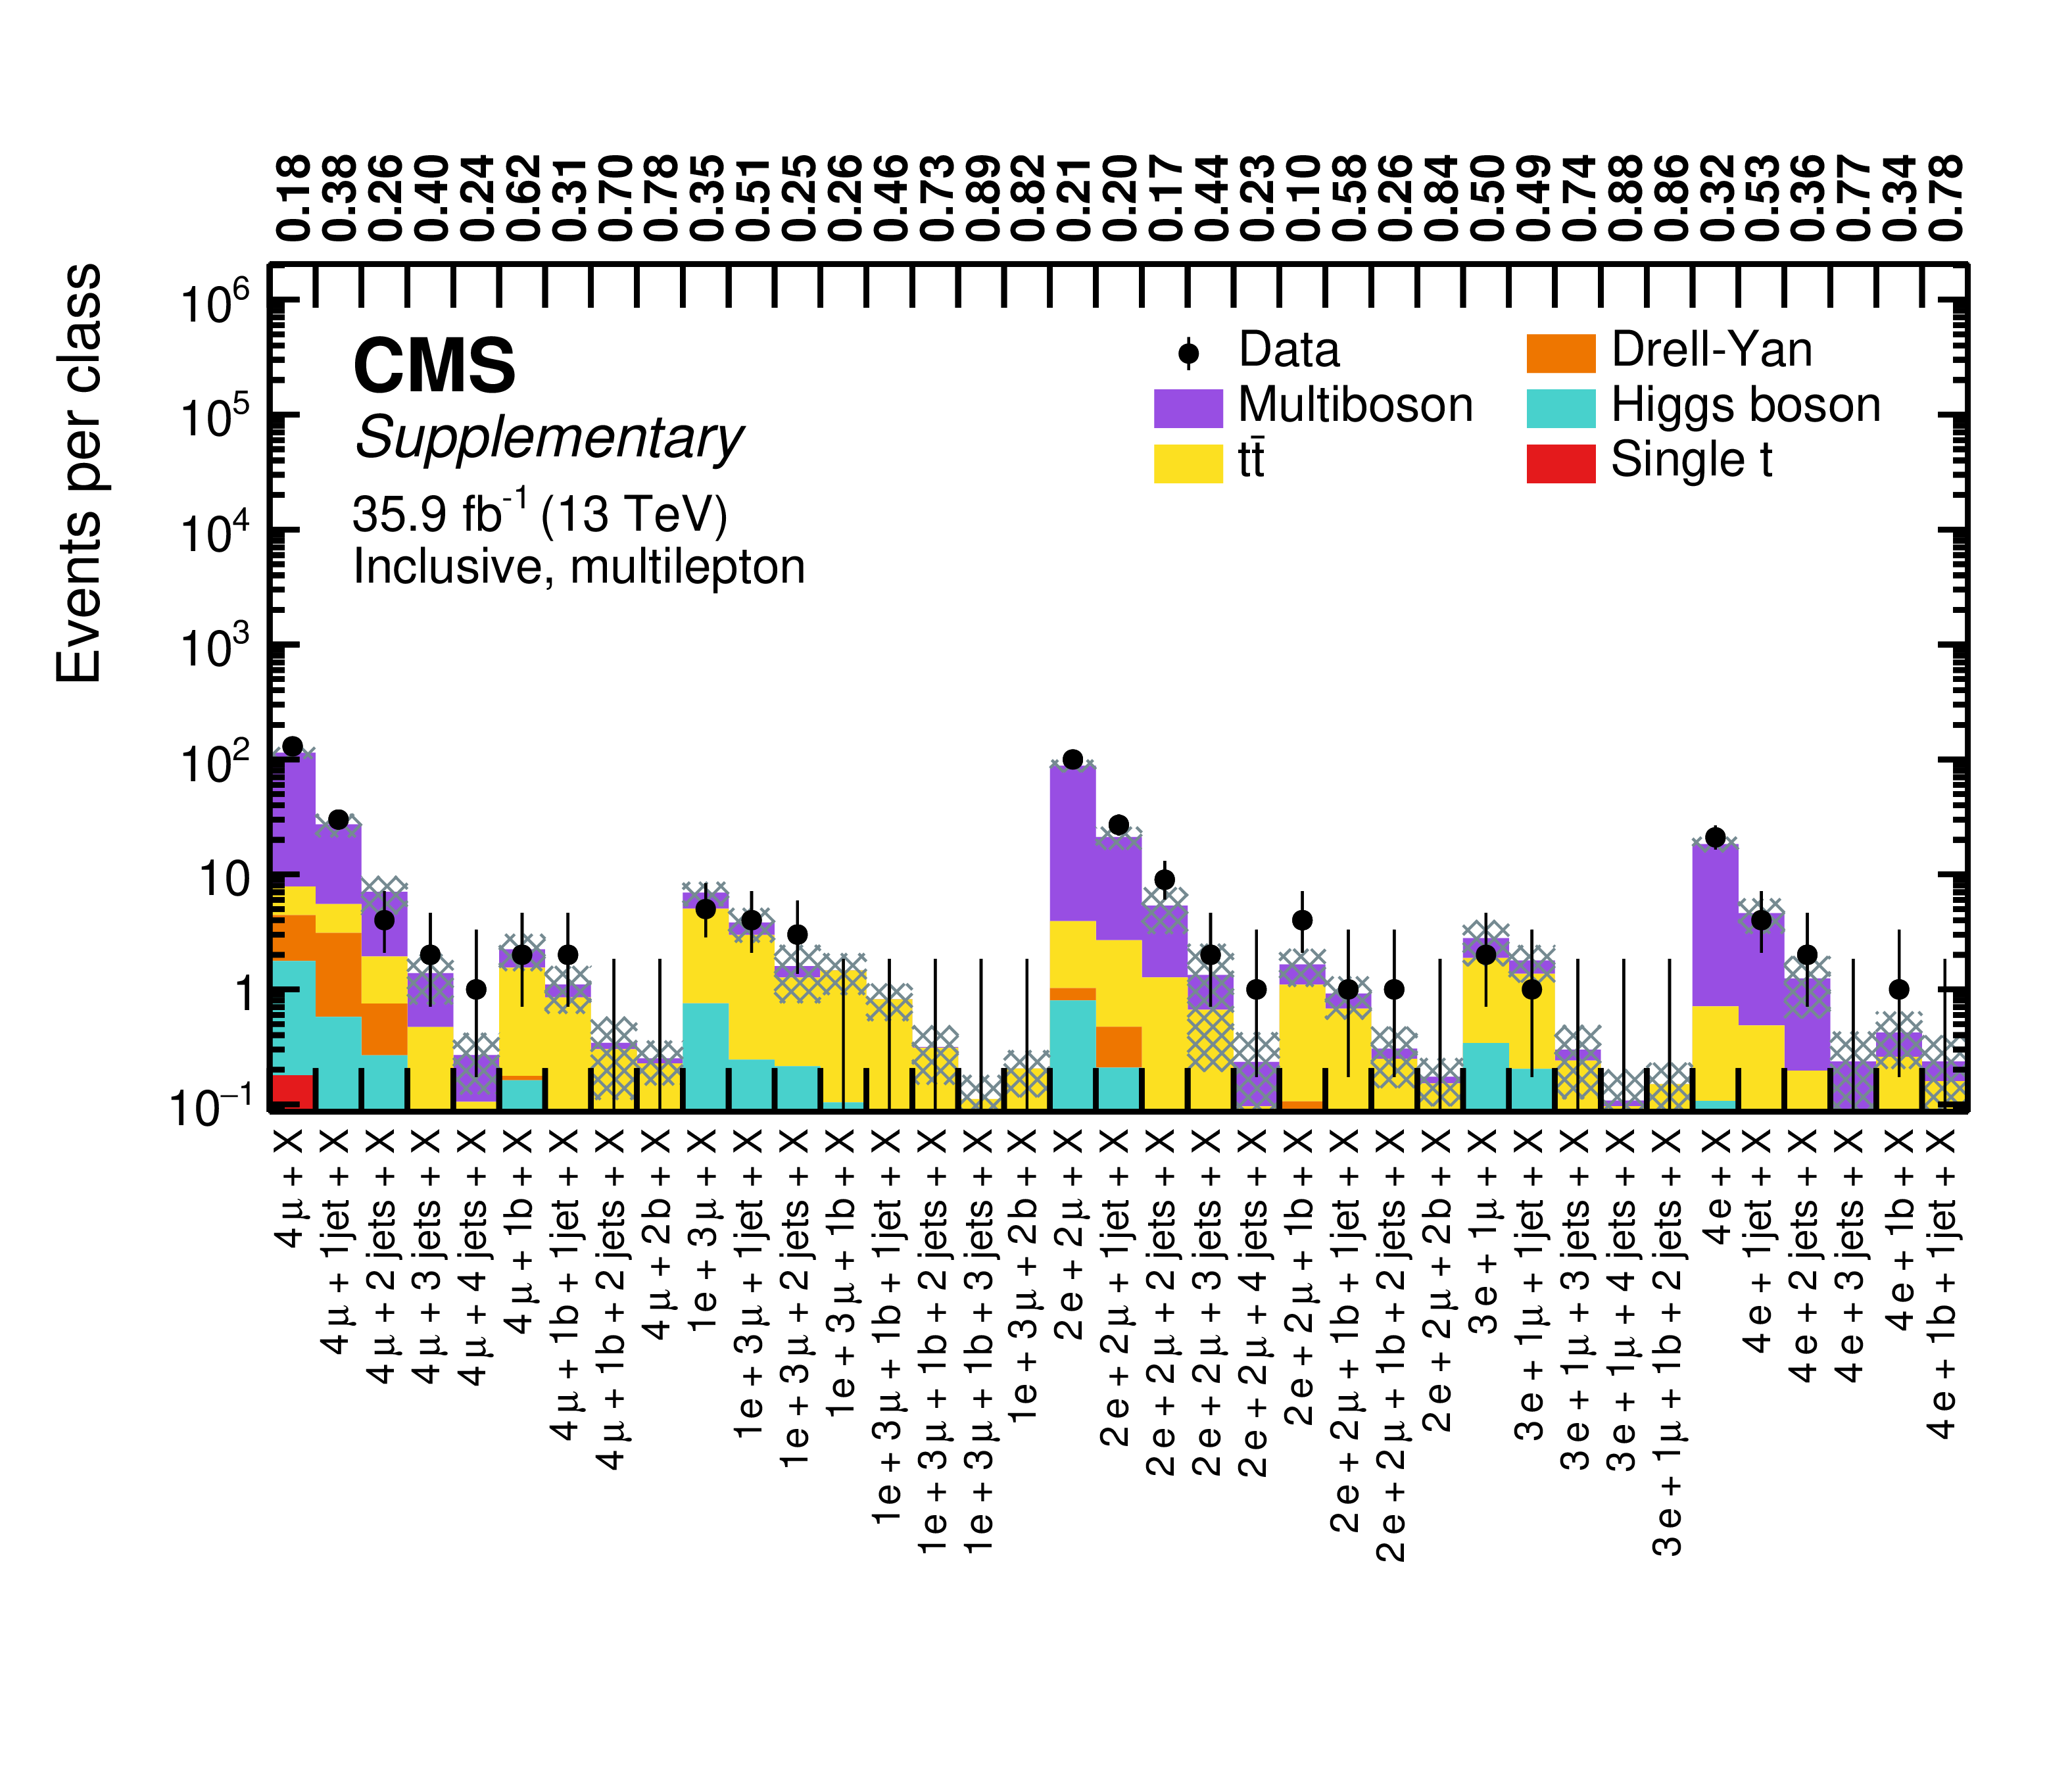
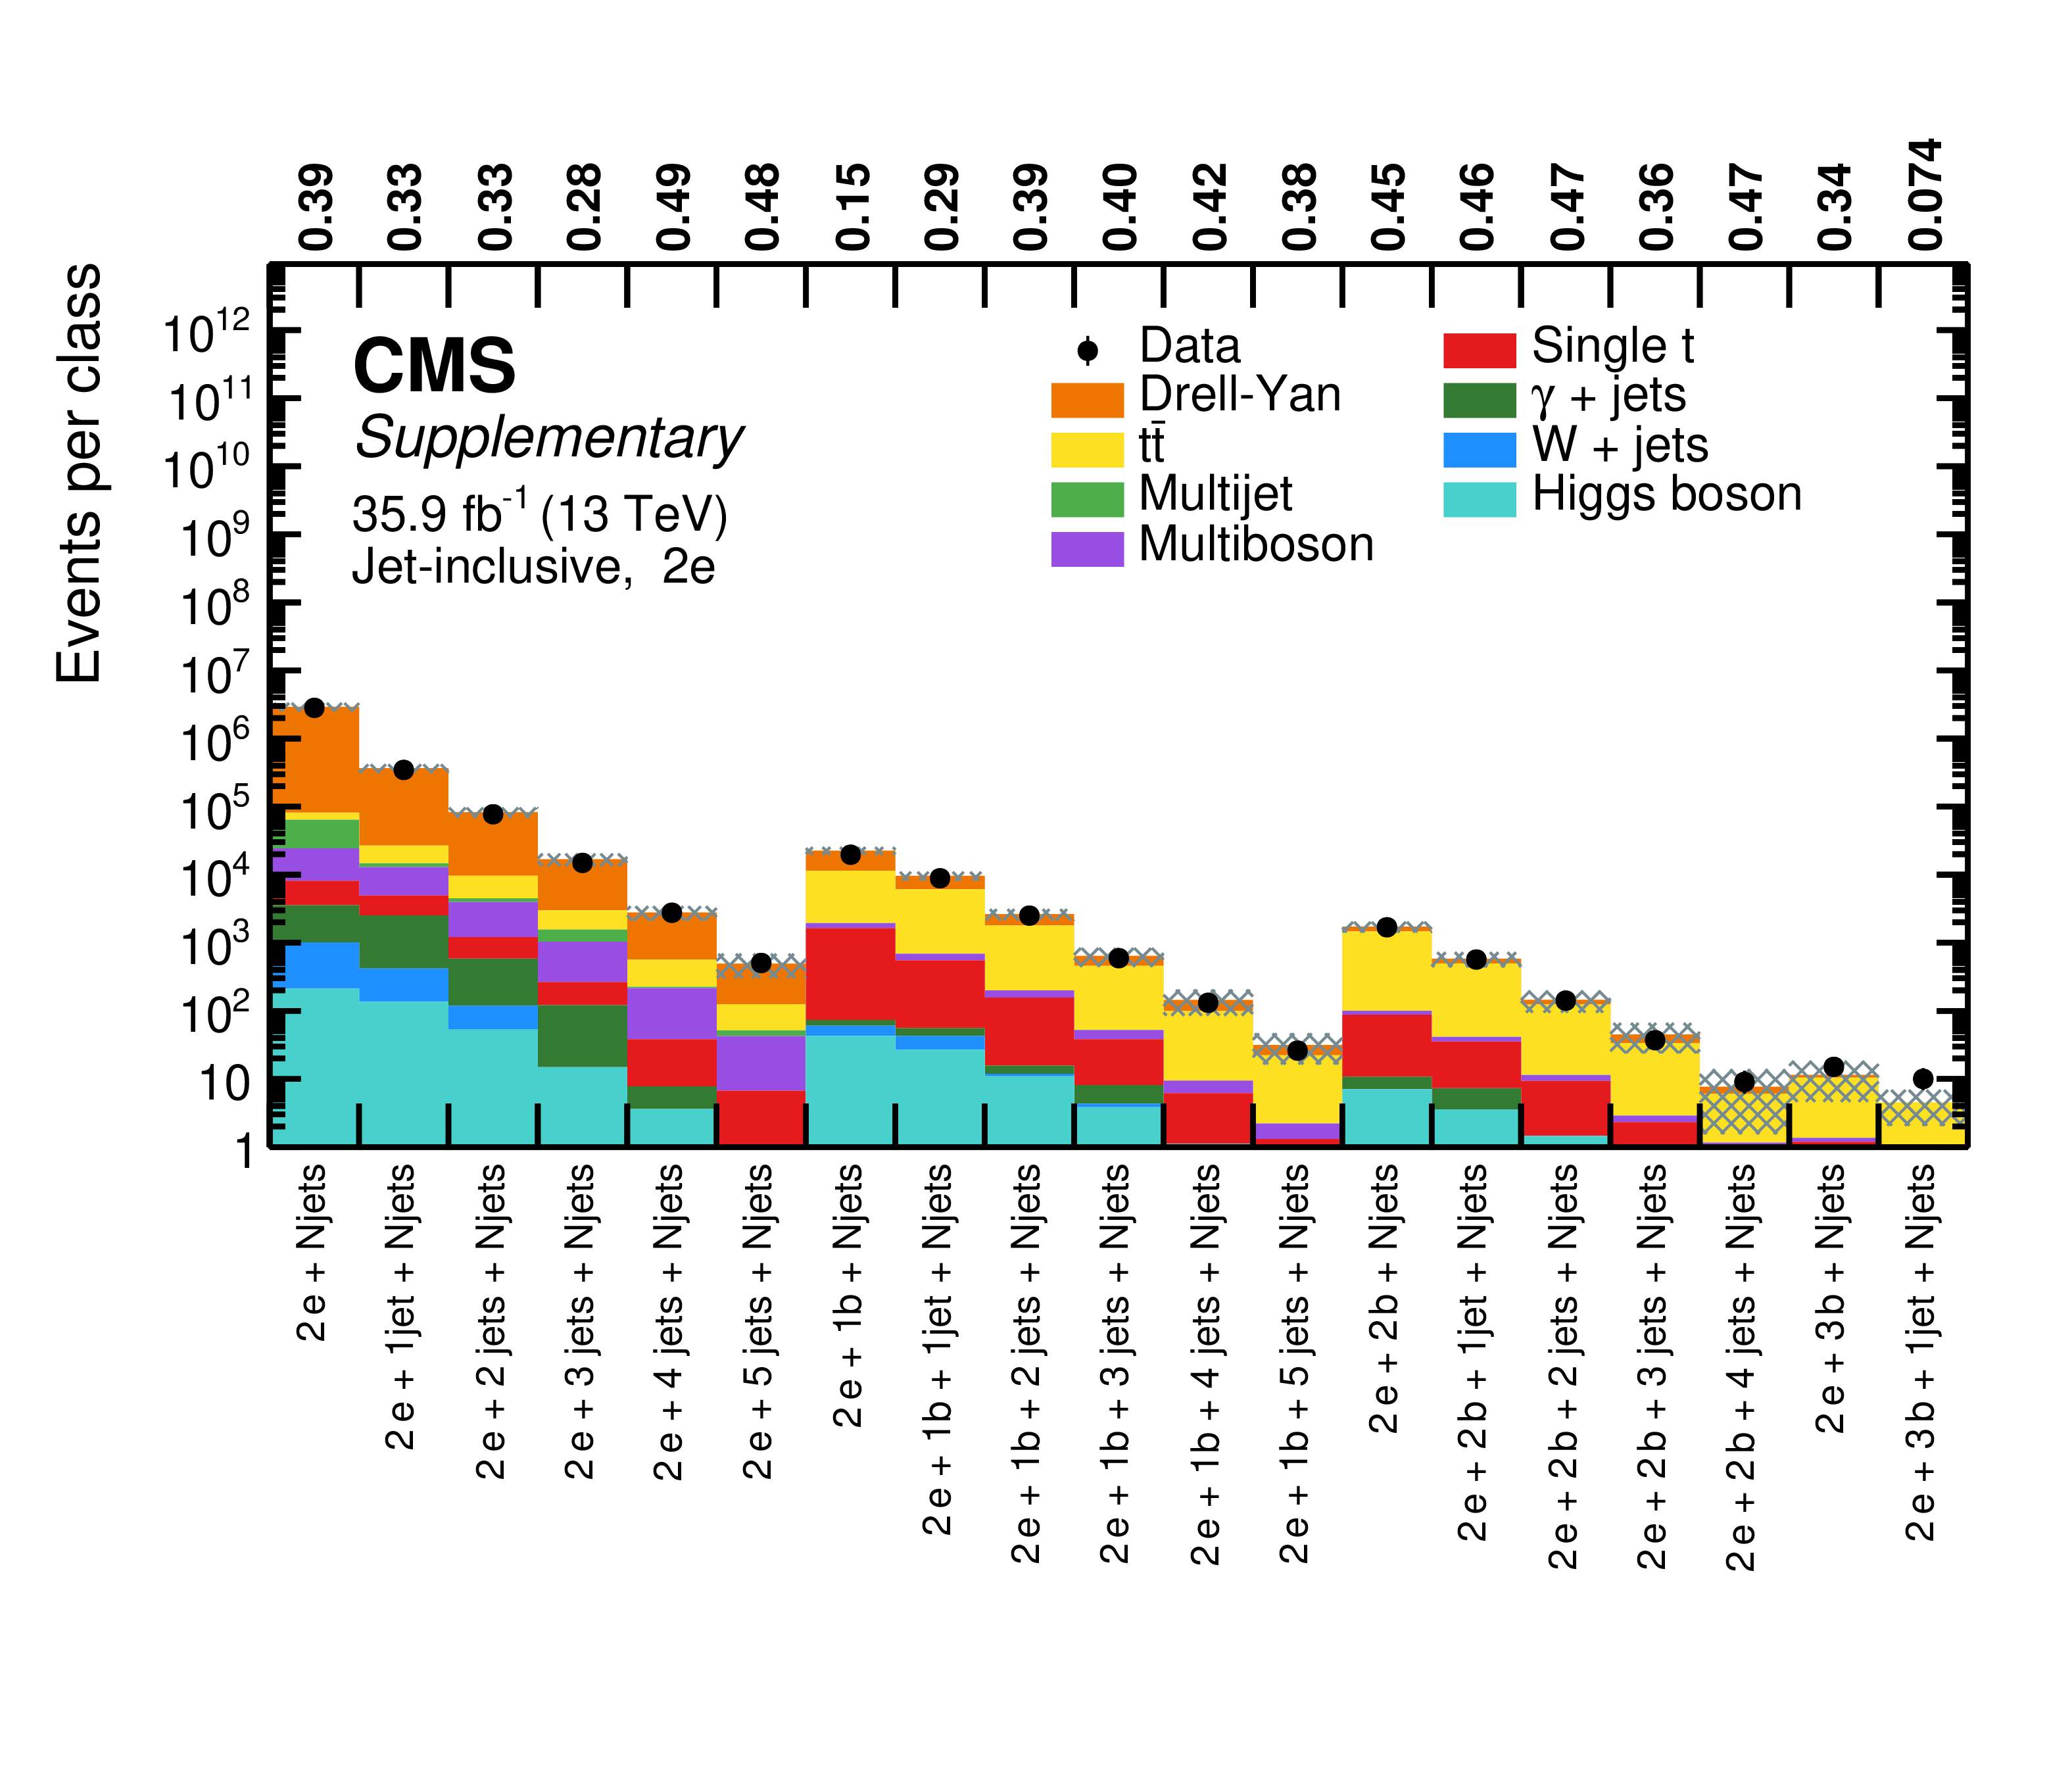
Figure 9:
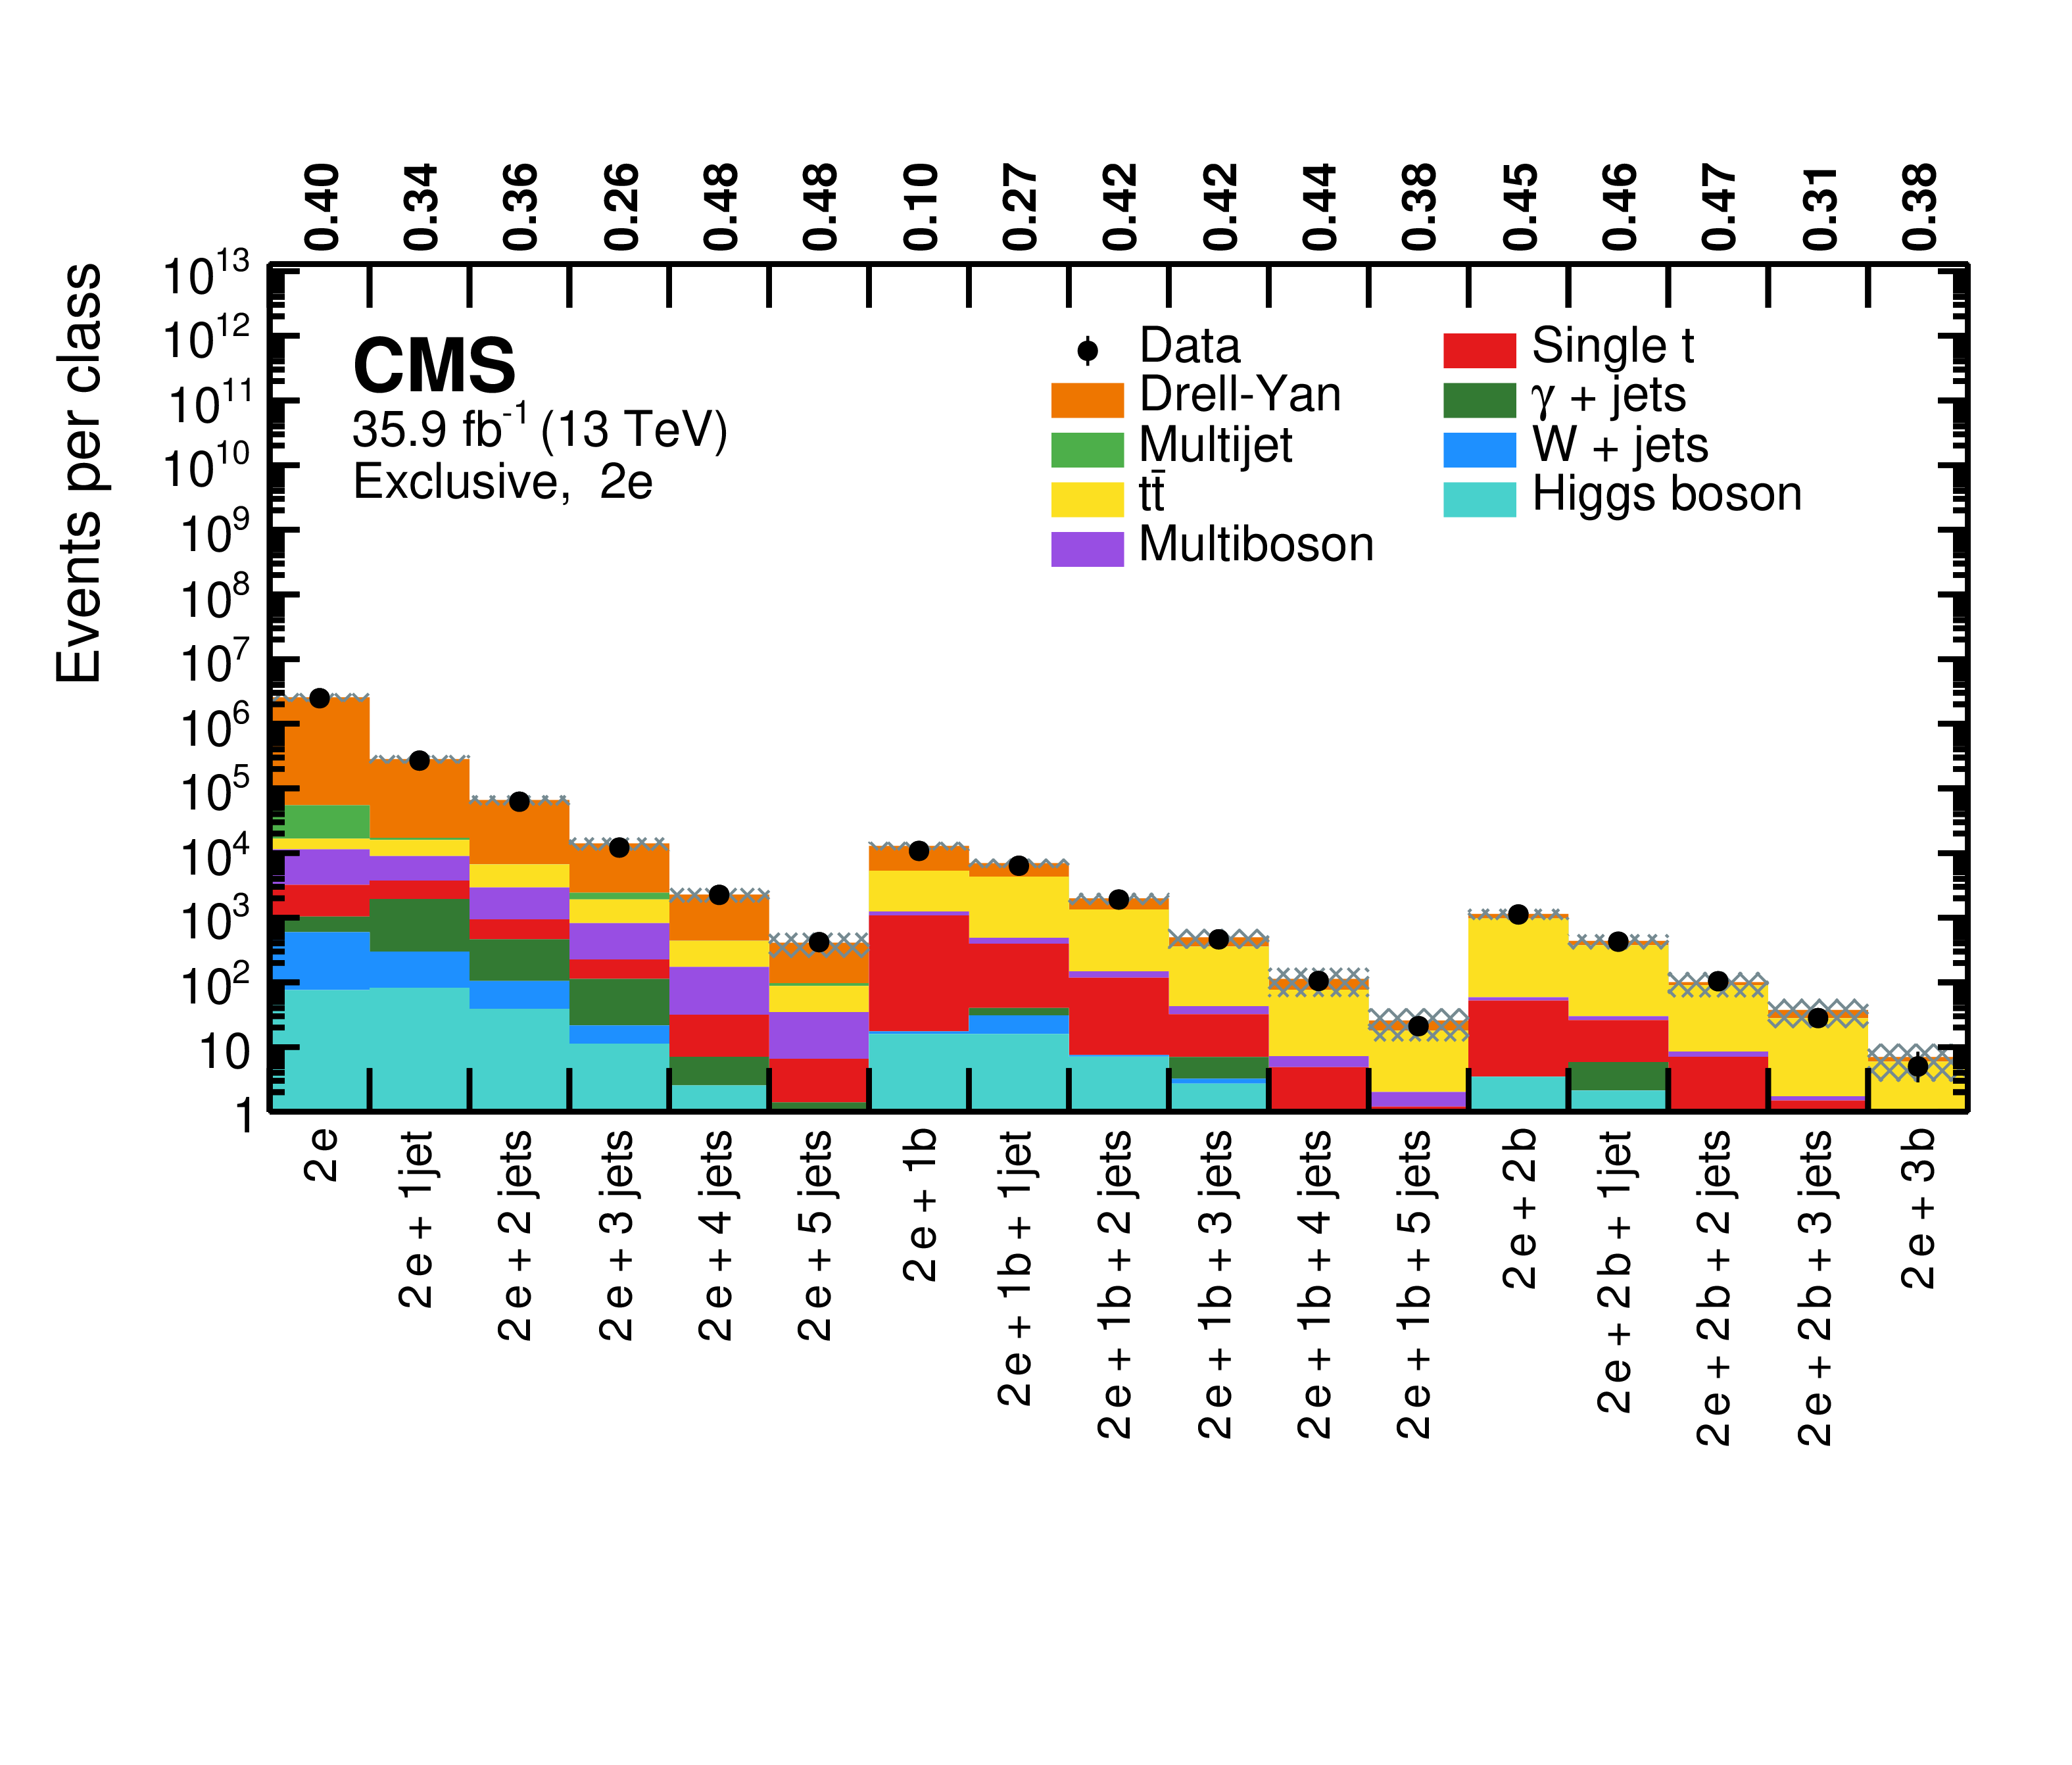
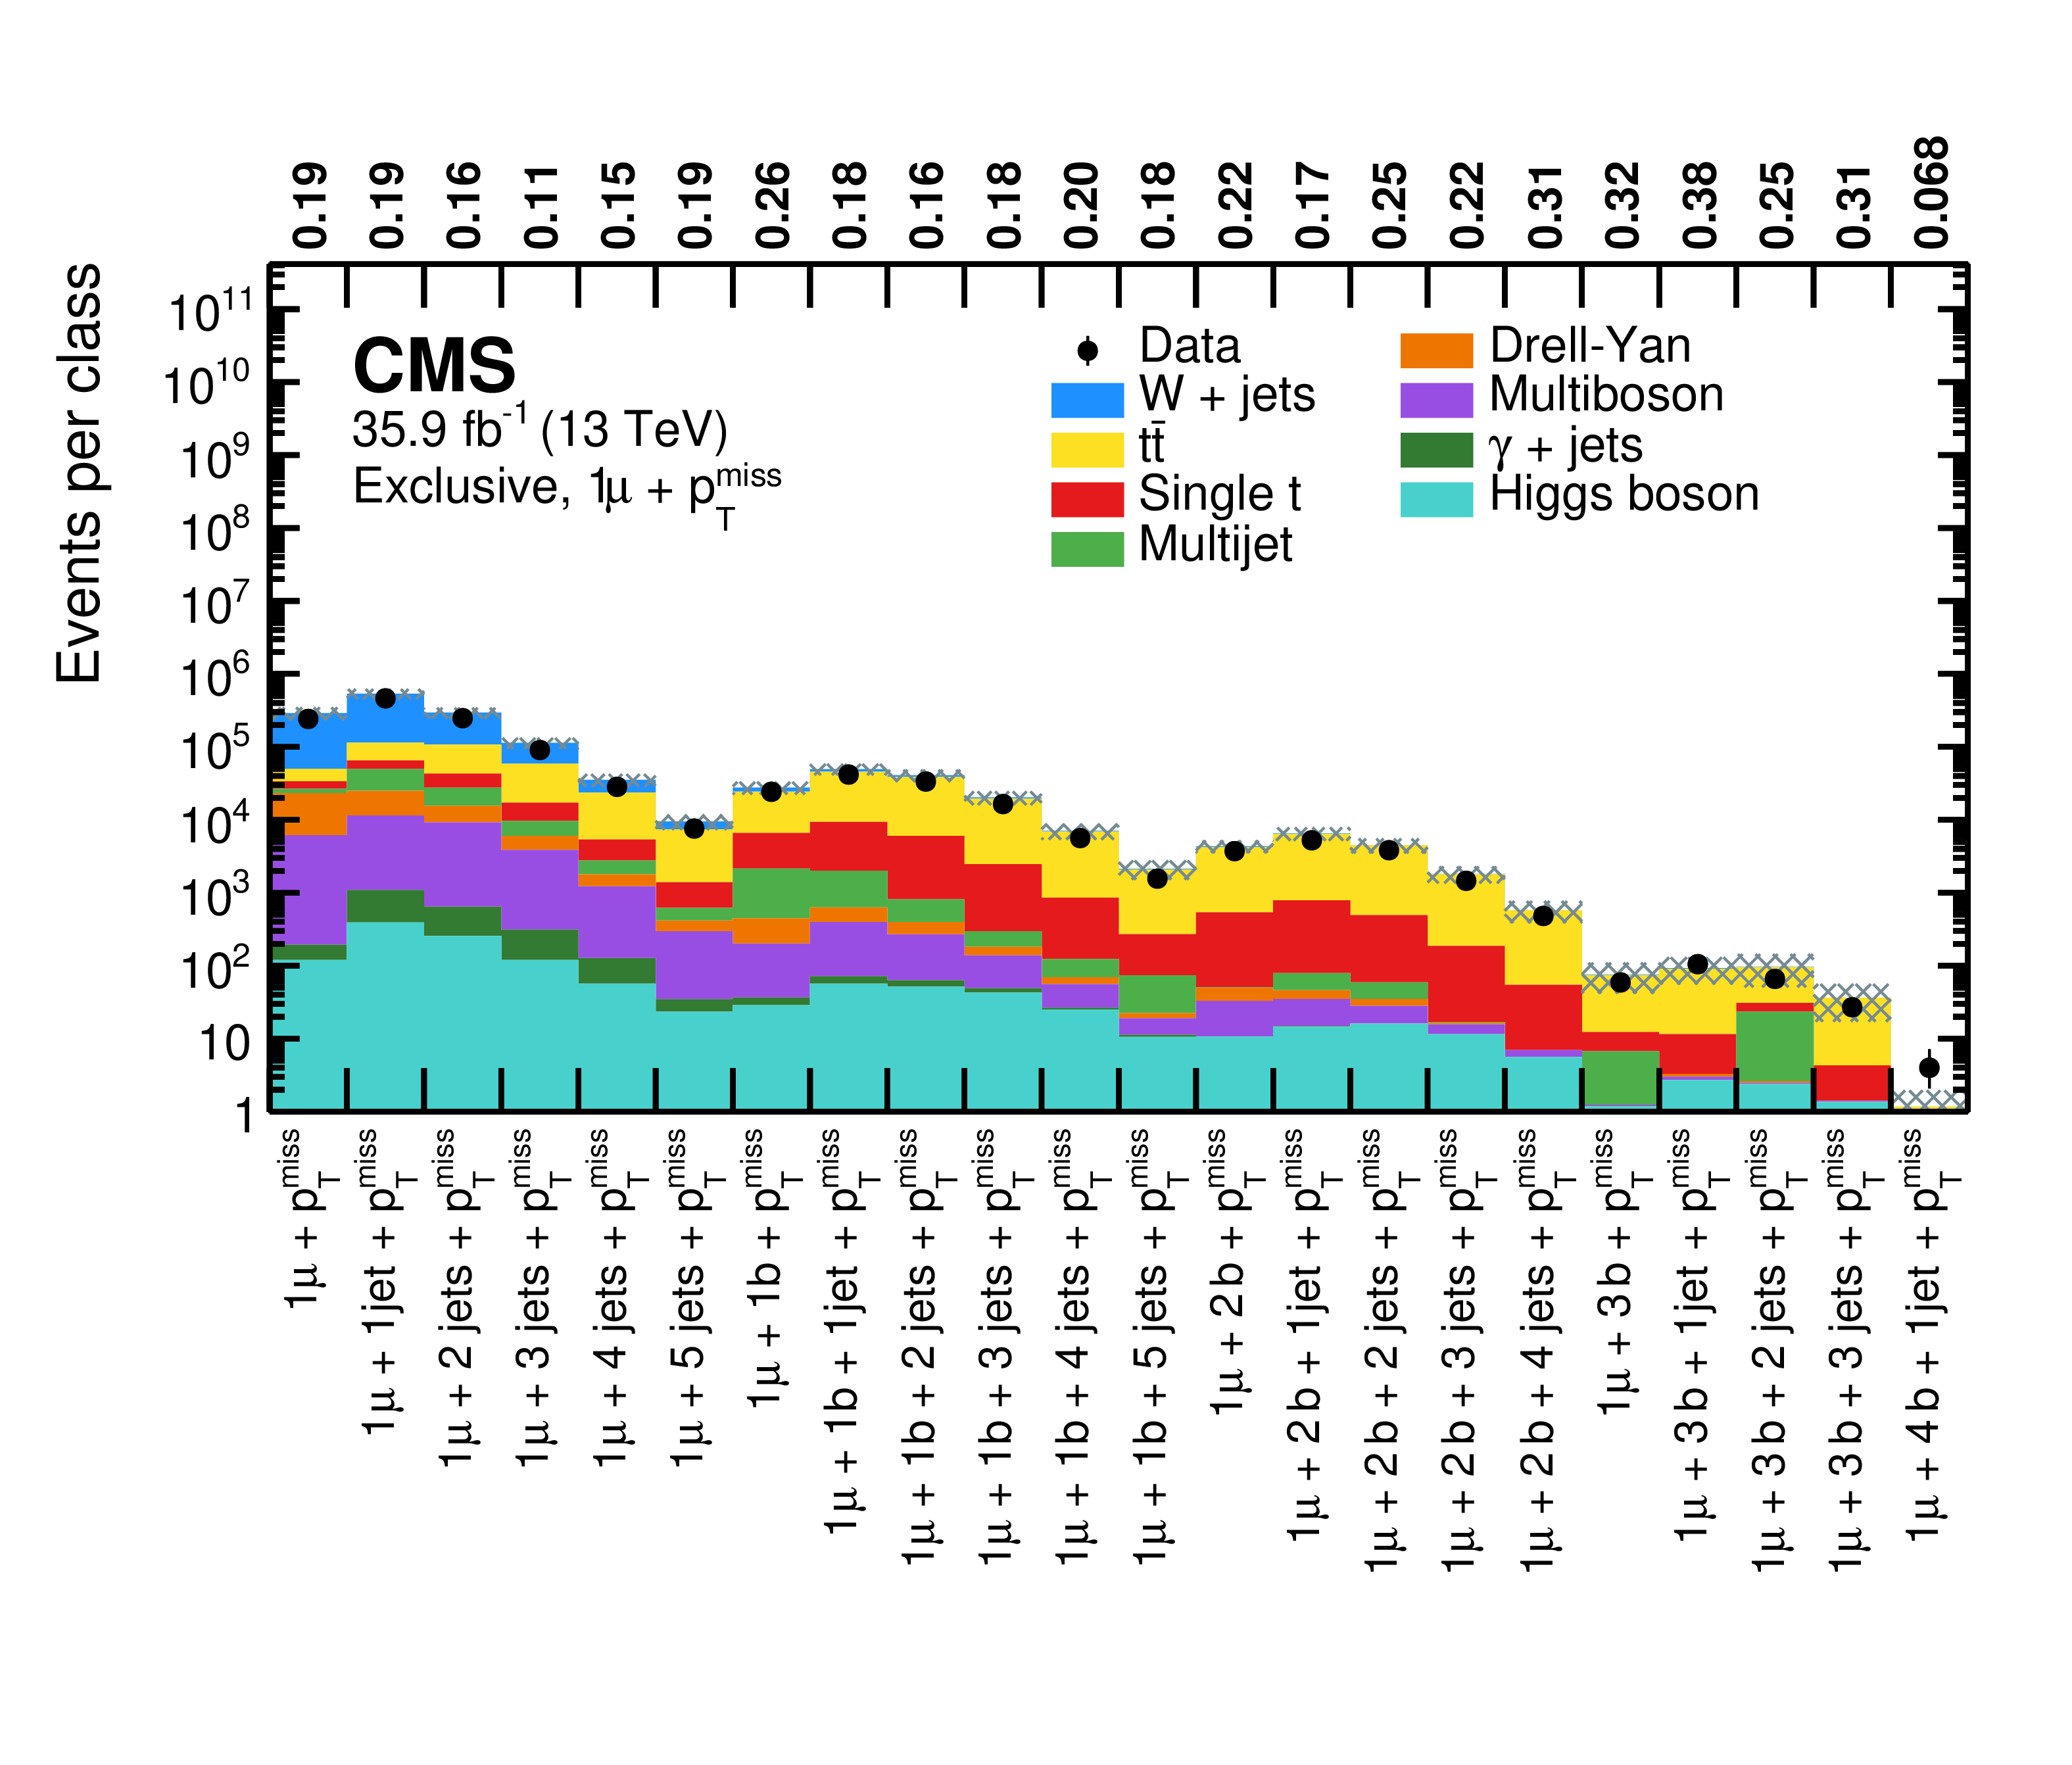
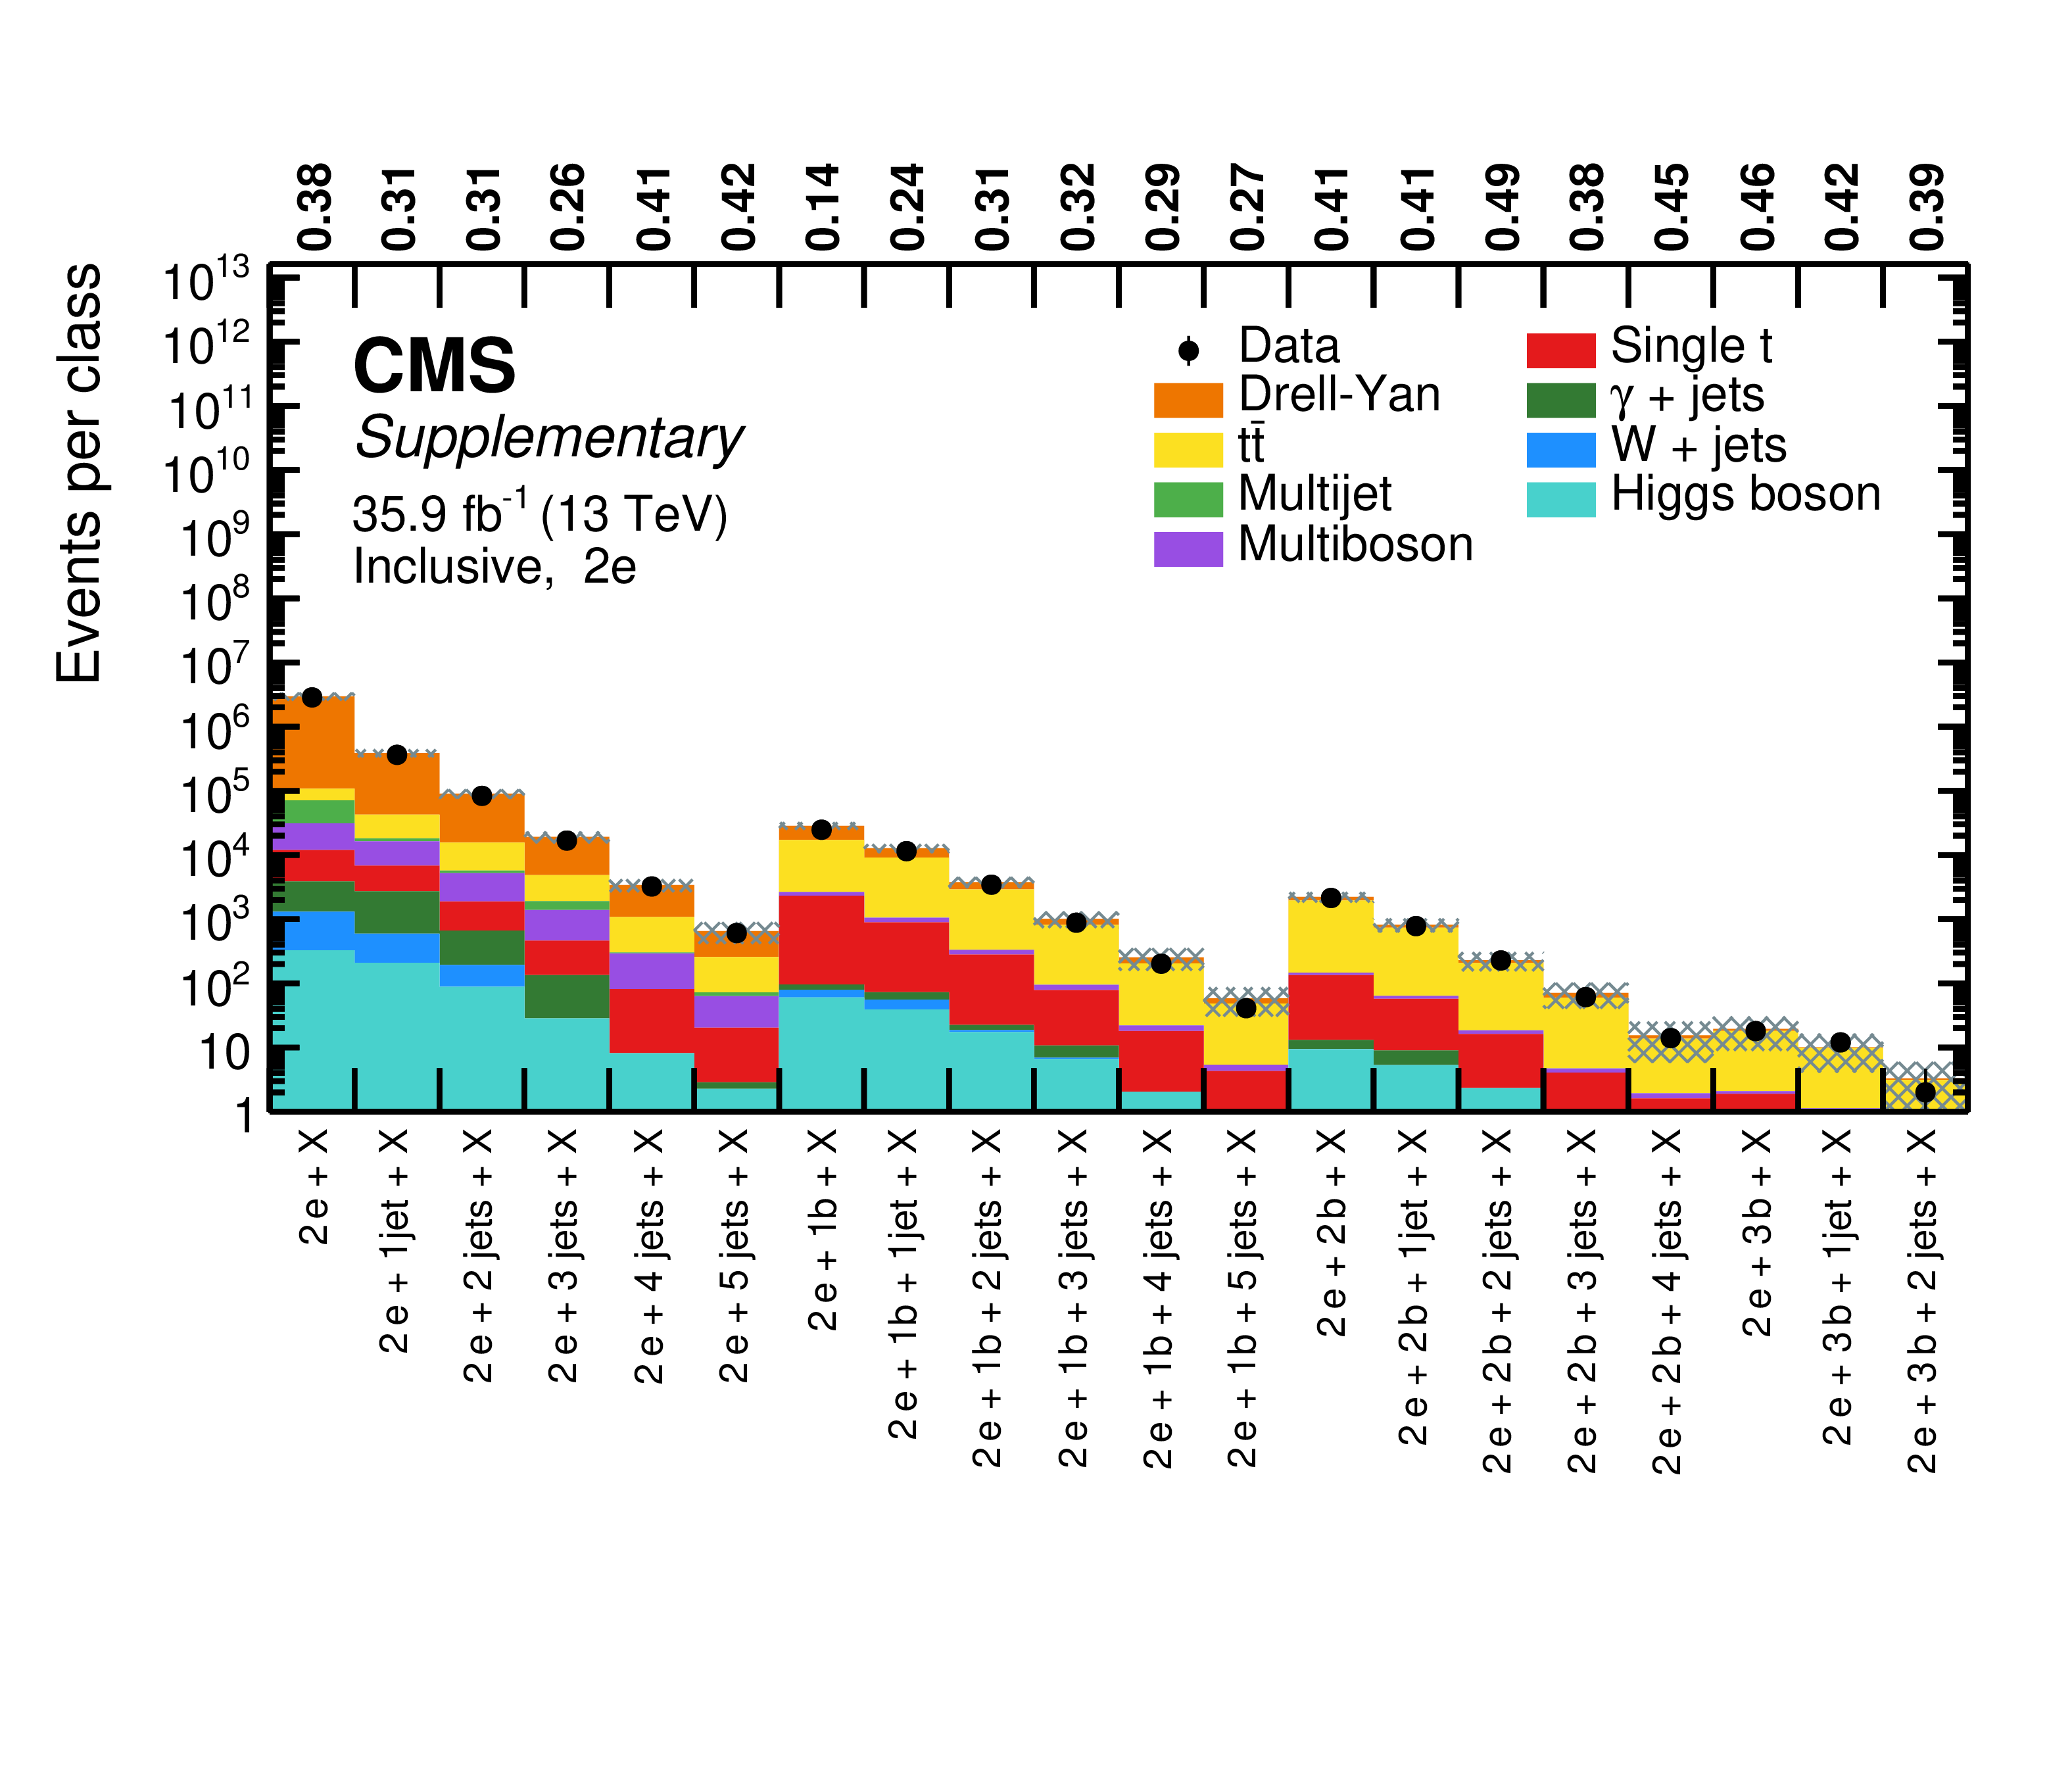
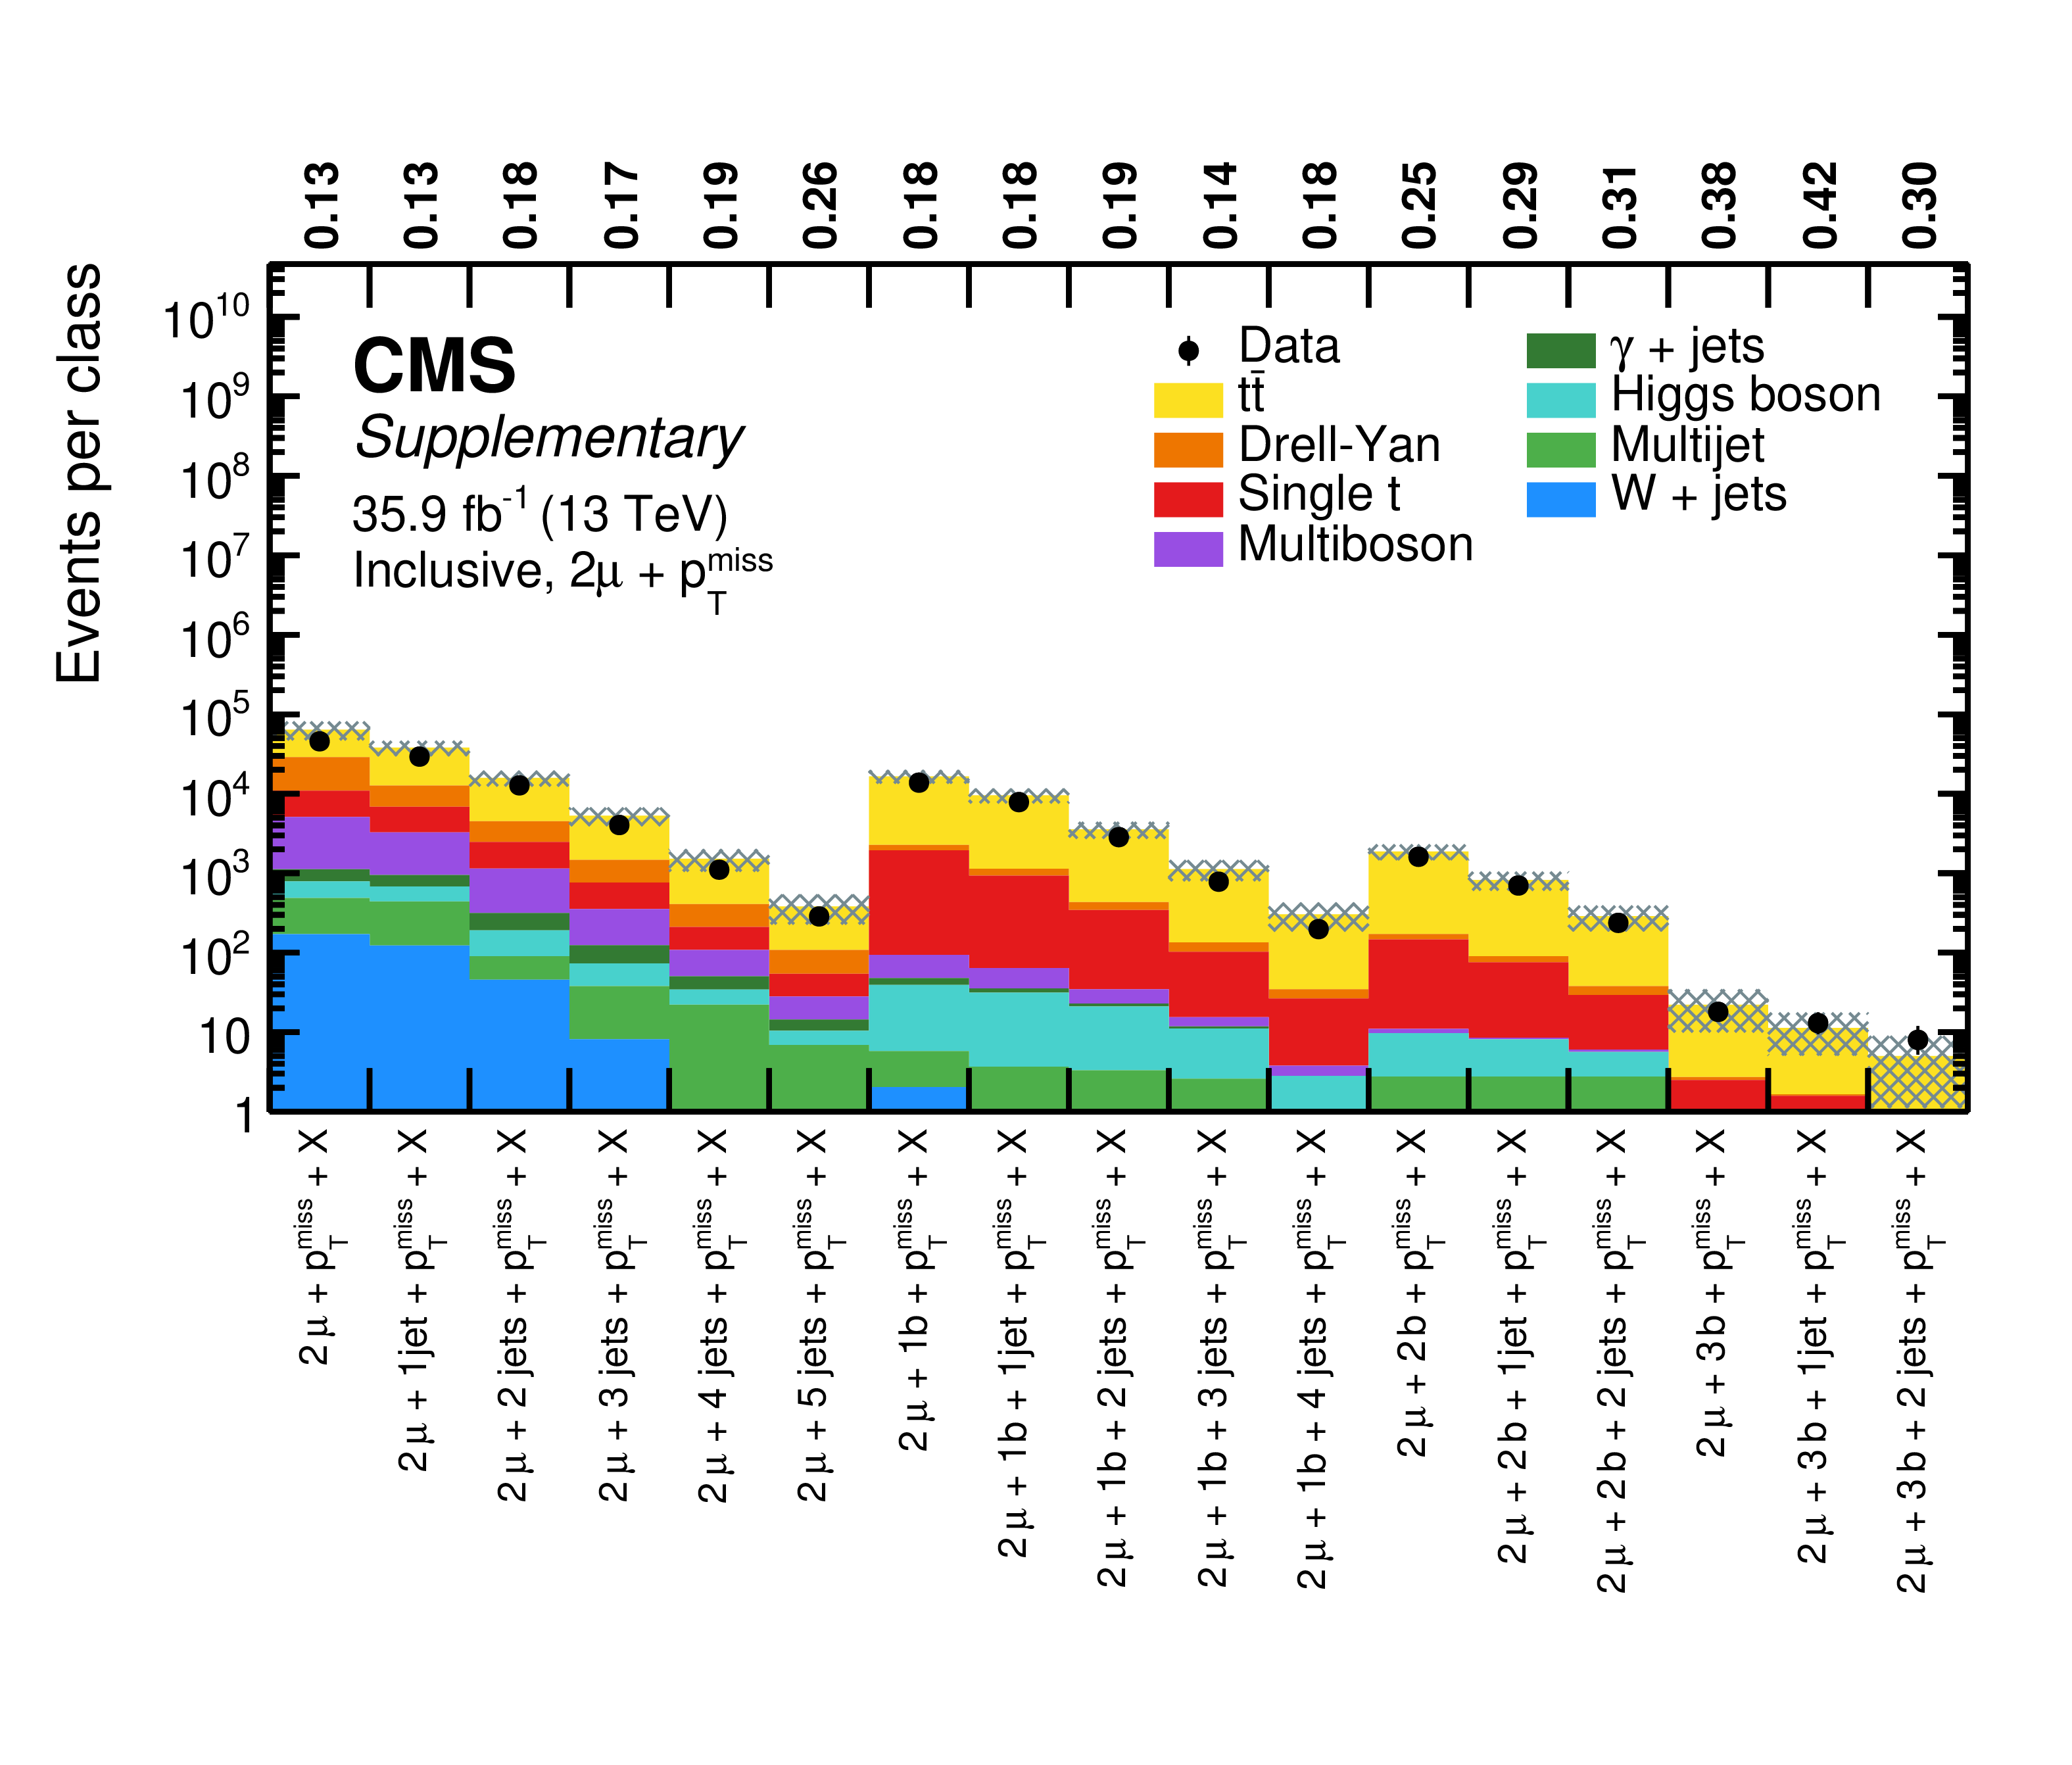
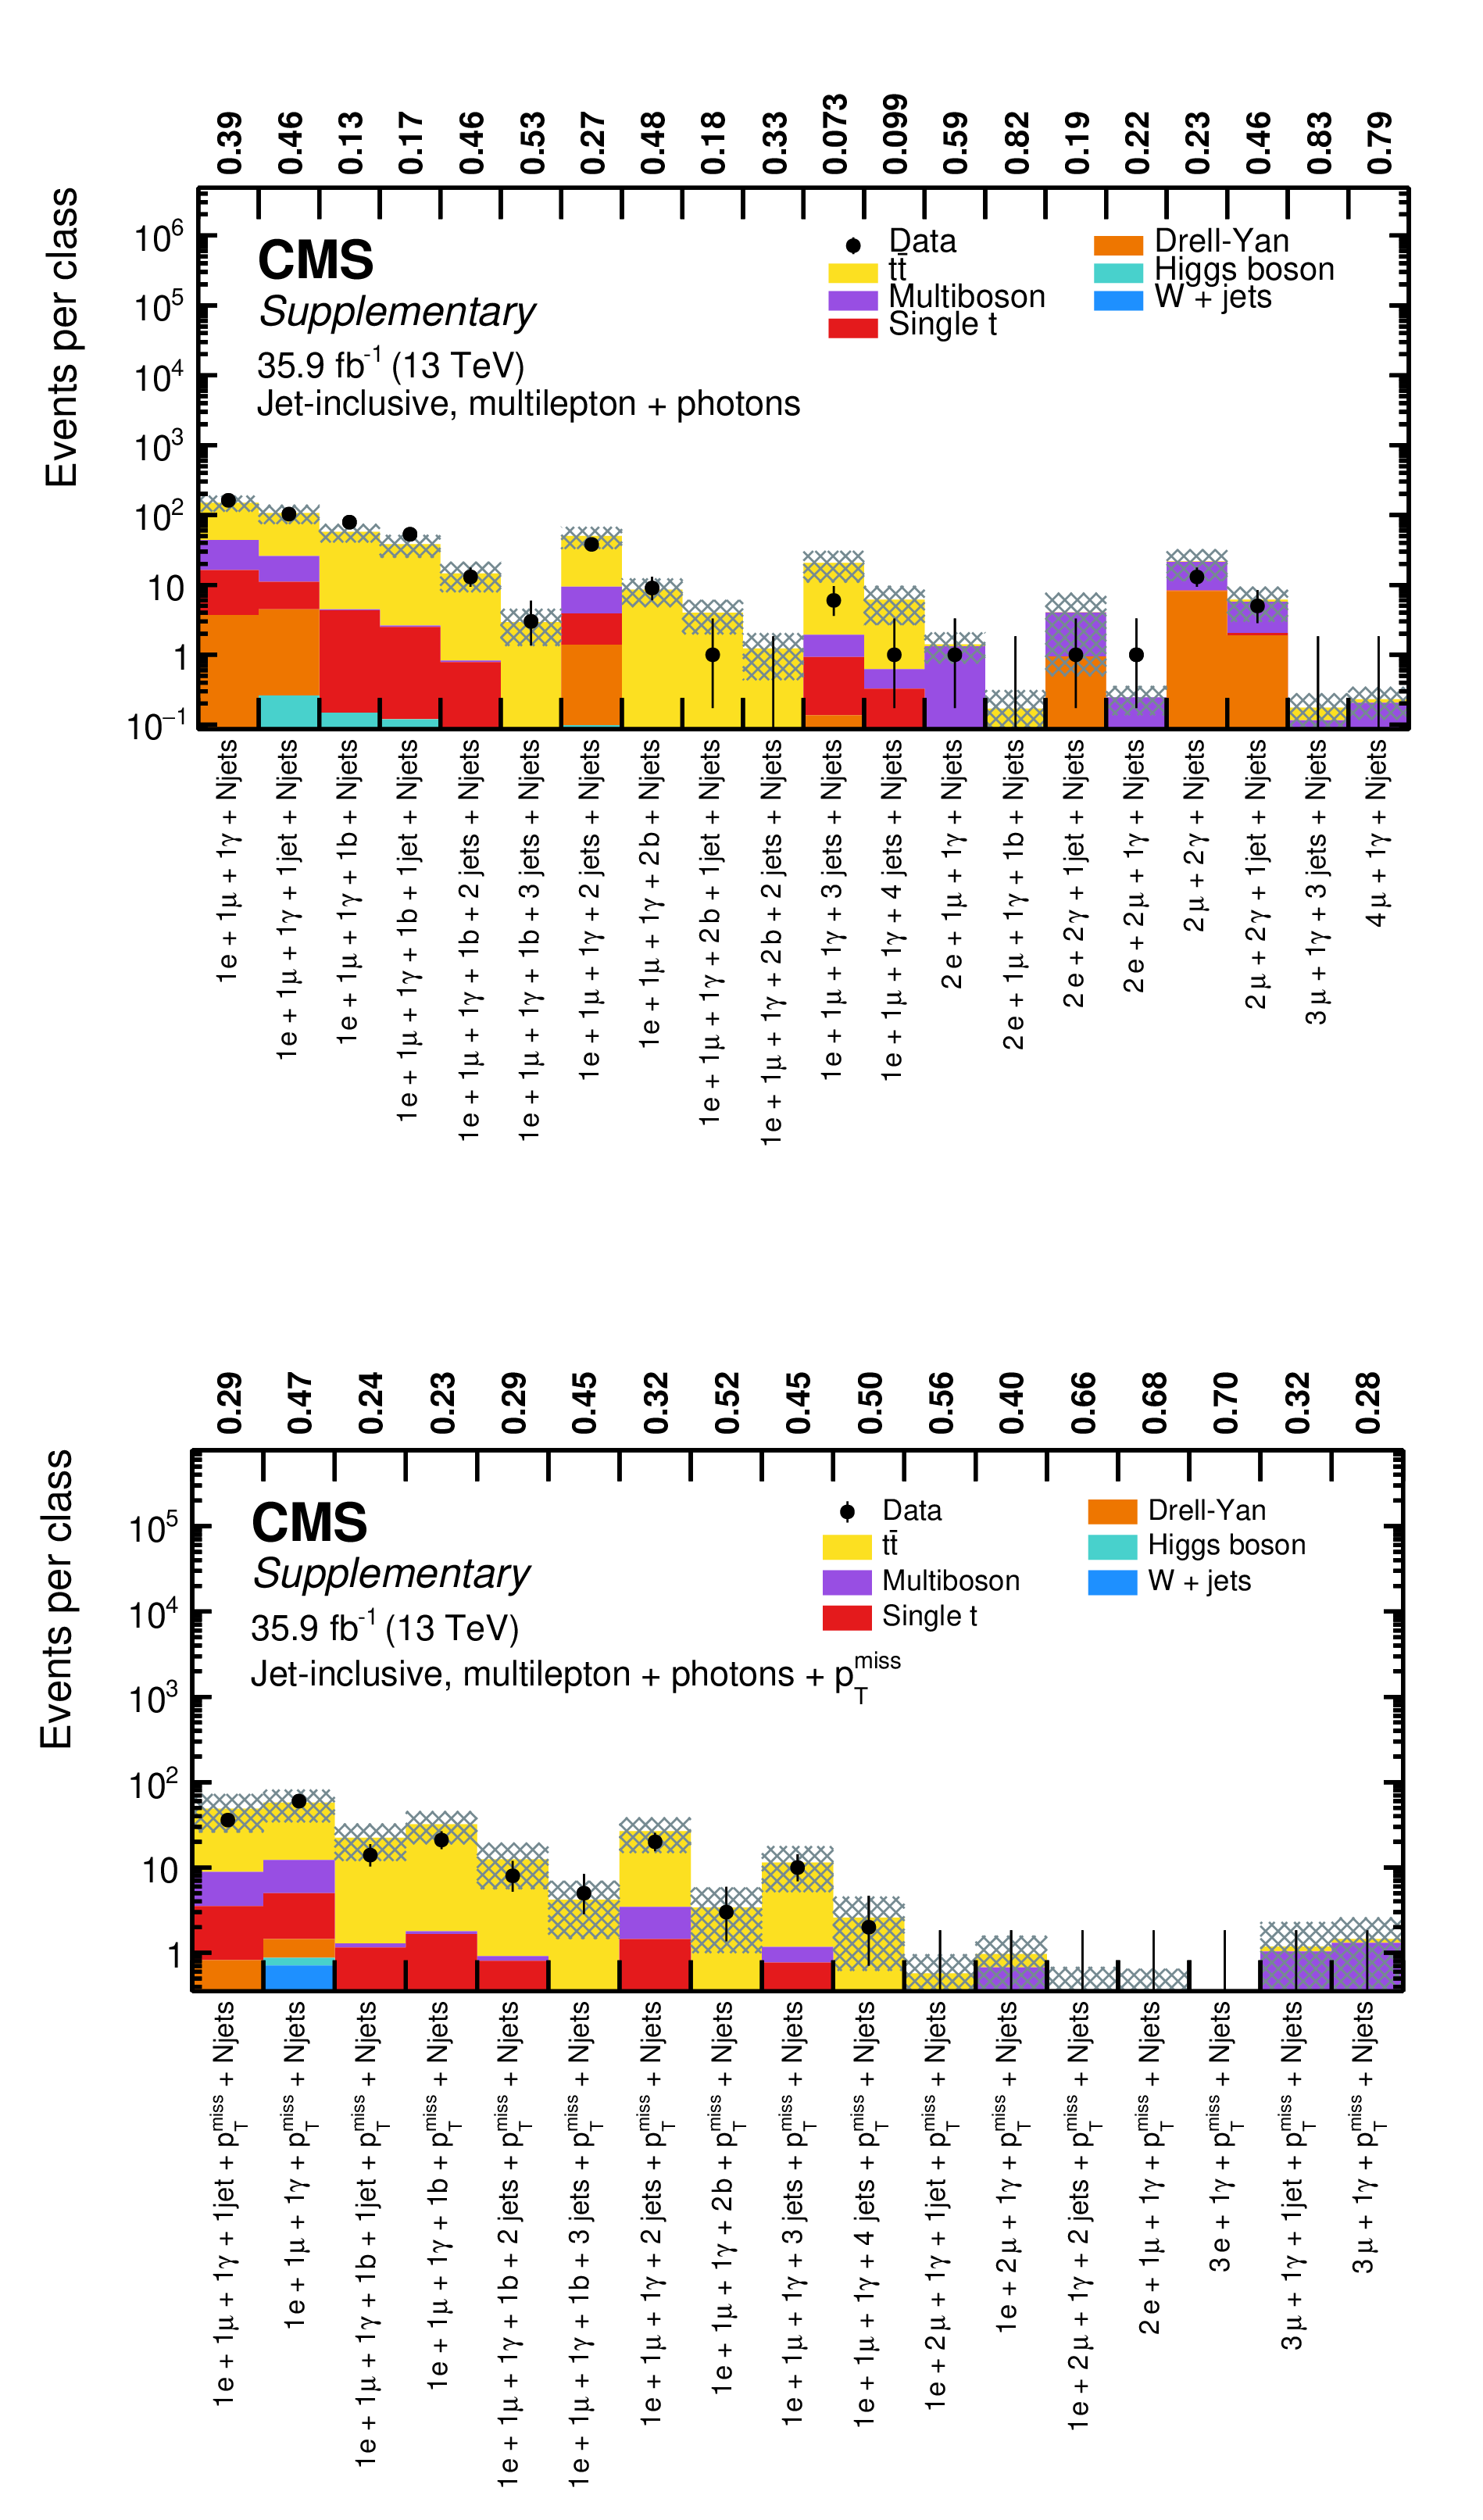
Overview of total event yields for event classes corresponding to the double-electron (upper) and for the single-muon + ${{p_{\mathrm {T}}} ^\text {miss}}$ object groups (lower). Measured data are shown as black markers, contributions from SM processes are represented by coloured histograms, and the shaded region represents the uncertainty in the SM background. The numbers above each plot indicate the observed $p$-value for the agreement of data and simulation for the corresponding event class. |
png pdf |
Figure 9-a:
Overview of total event yields for event classes corresponding to the double-electron (upper) and for the single-muon + ${{p_{\mathrm {T}}} ^\text {miss}}$ object groups (lower). Measured data are shown as black markers, contributions from SM processes are represented by coloured histograms, and the shaded region represents the uncertainty in the SM background. The numbers above each plot indicate the observed $p$-value for the agreement of data and simulation for the corresponding event class. |
png pdf |
Figure 9-b:
Overview of total event yields for event classes corresponding to the double-electron (upper) and for the single-muon + ${{p_{\mathrm {T}}} ^\text {miss}}$ object groups (lower). Measured data are shown as black markers, contributions from SM processes are represented by coloured histograms, and the shaded region represents the uncertainty in the SM background. The numbers above each plot indicate the observed $p$-value for the agreement of data and simulation for the corresponding event class. |
png pdf |
Figure 10:
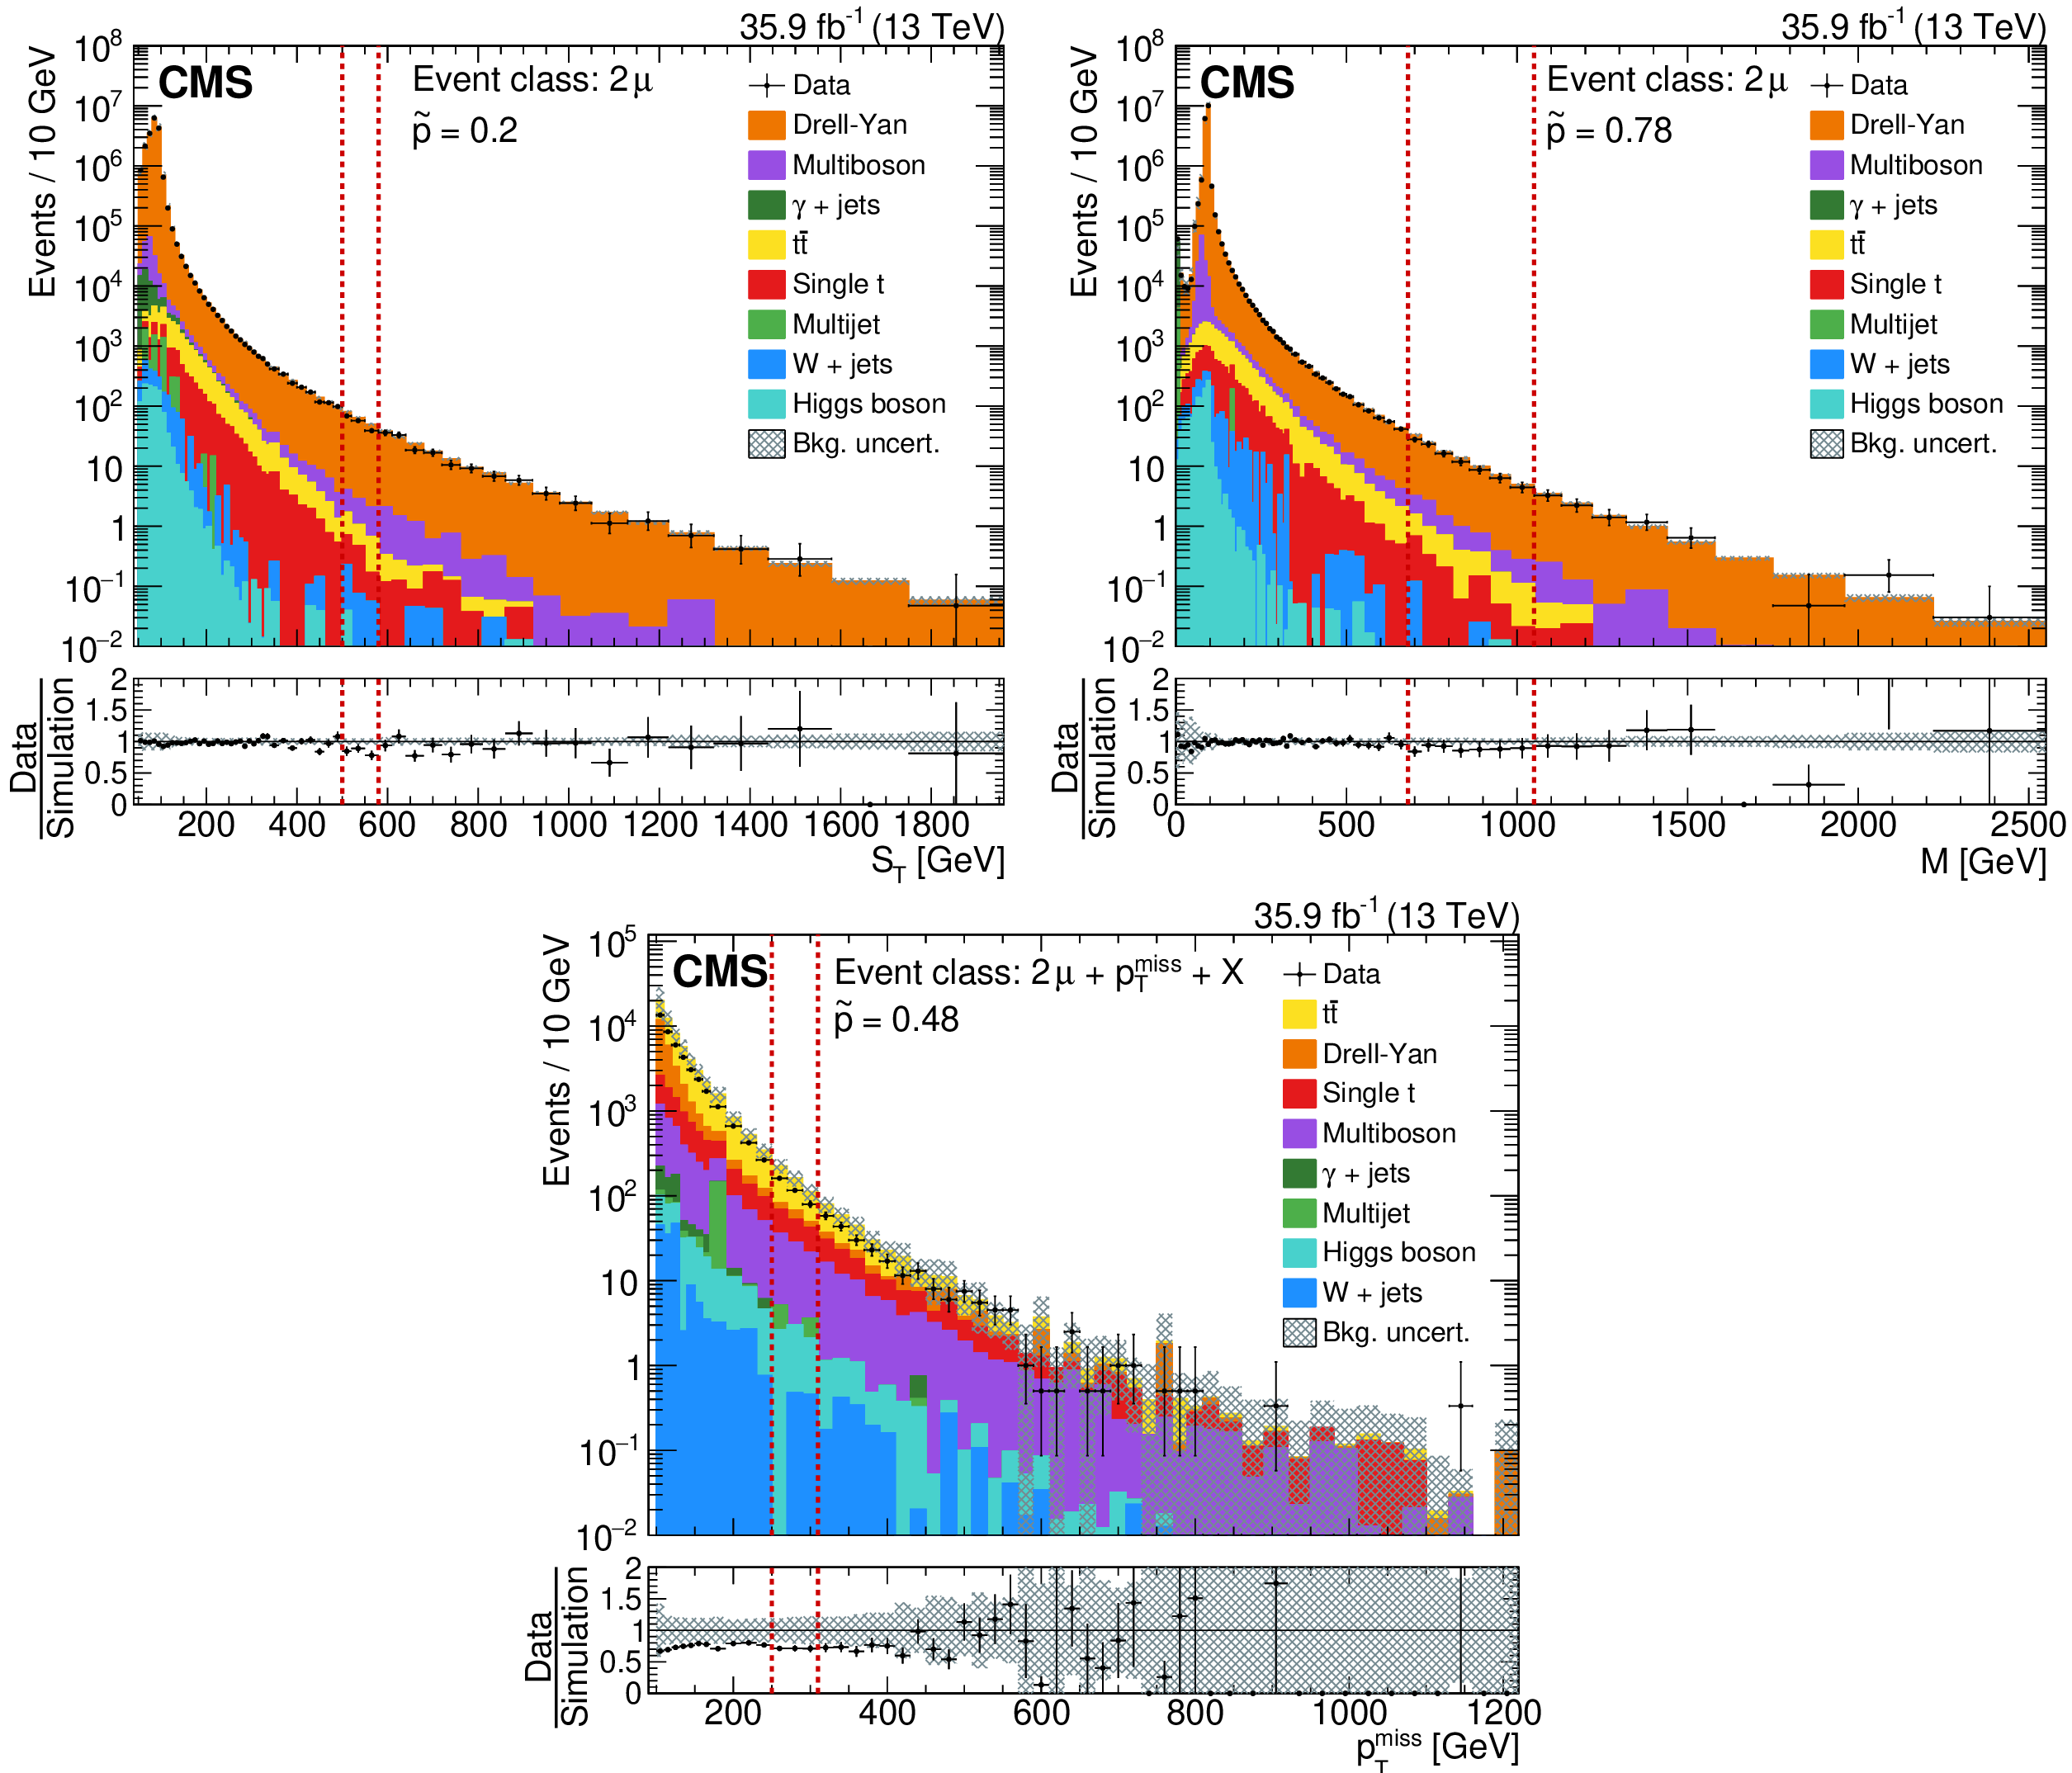
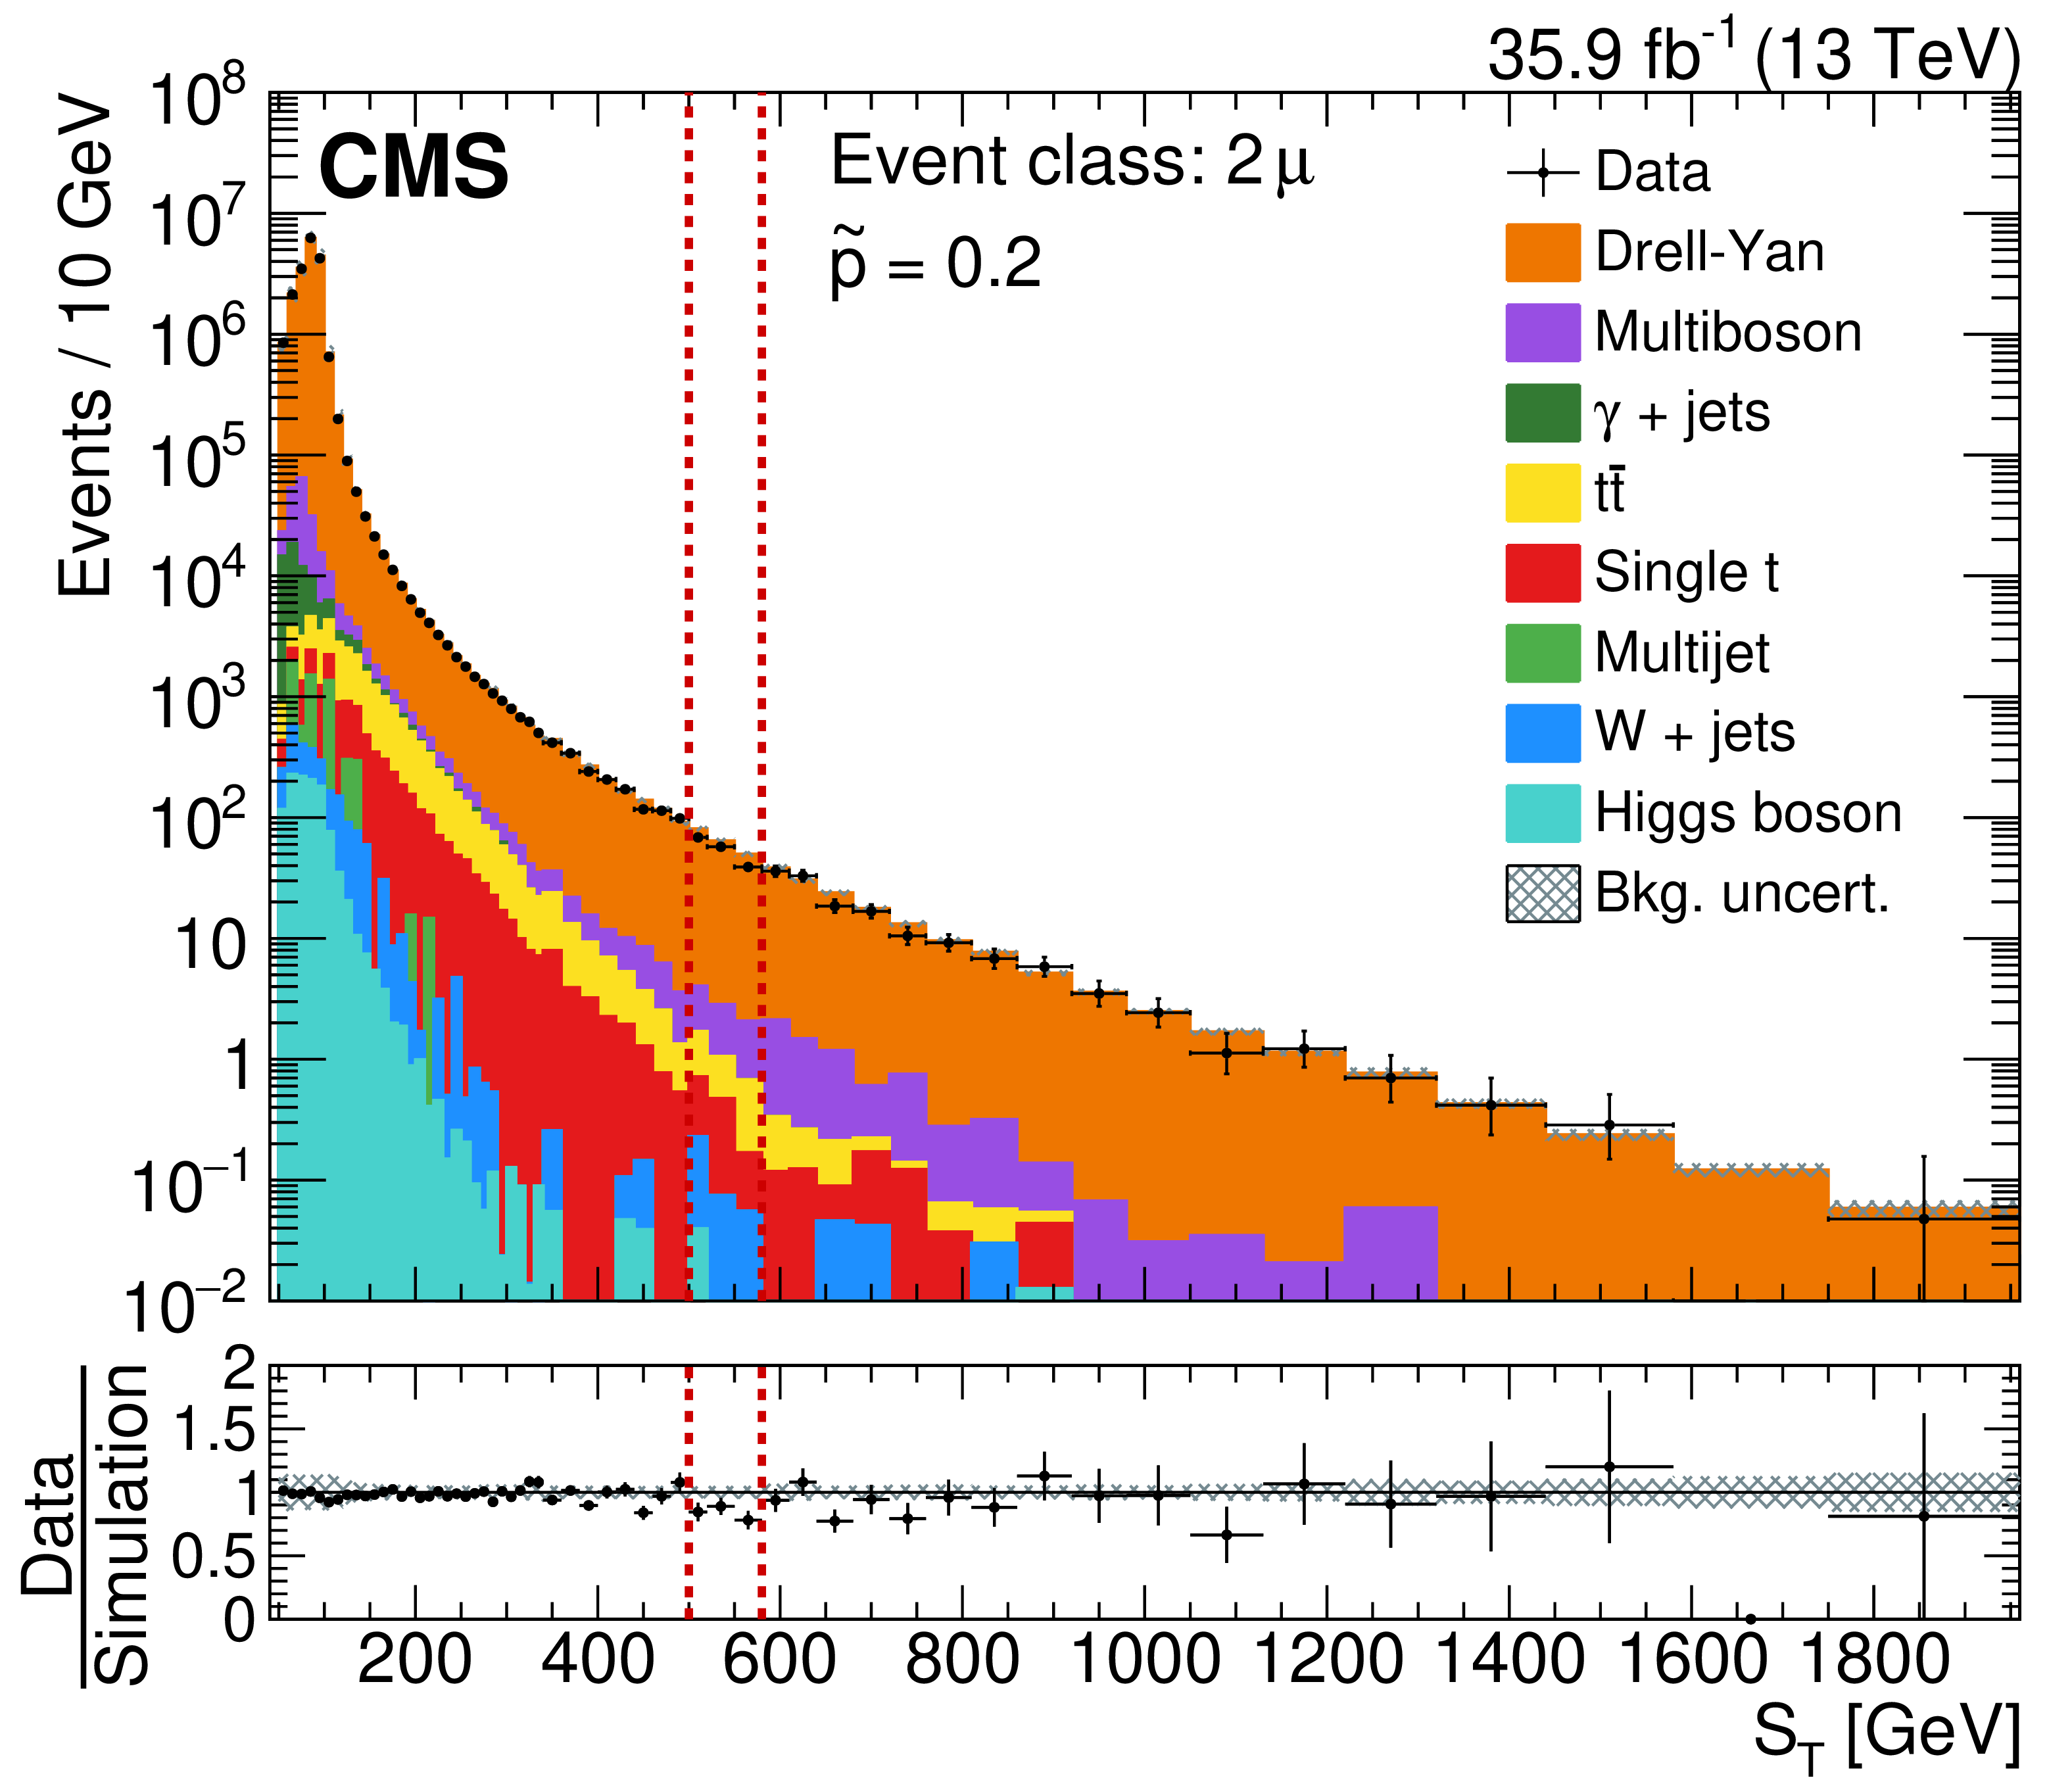
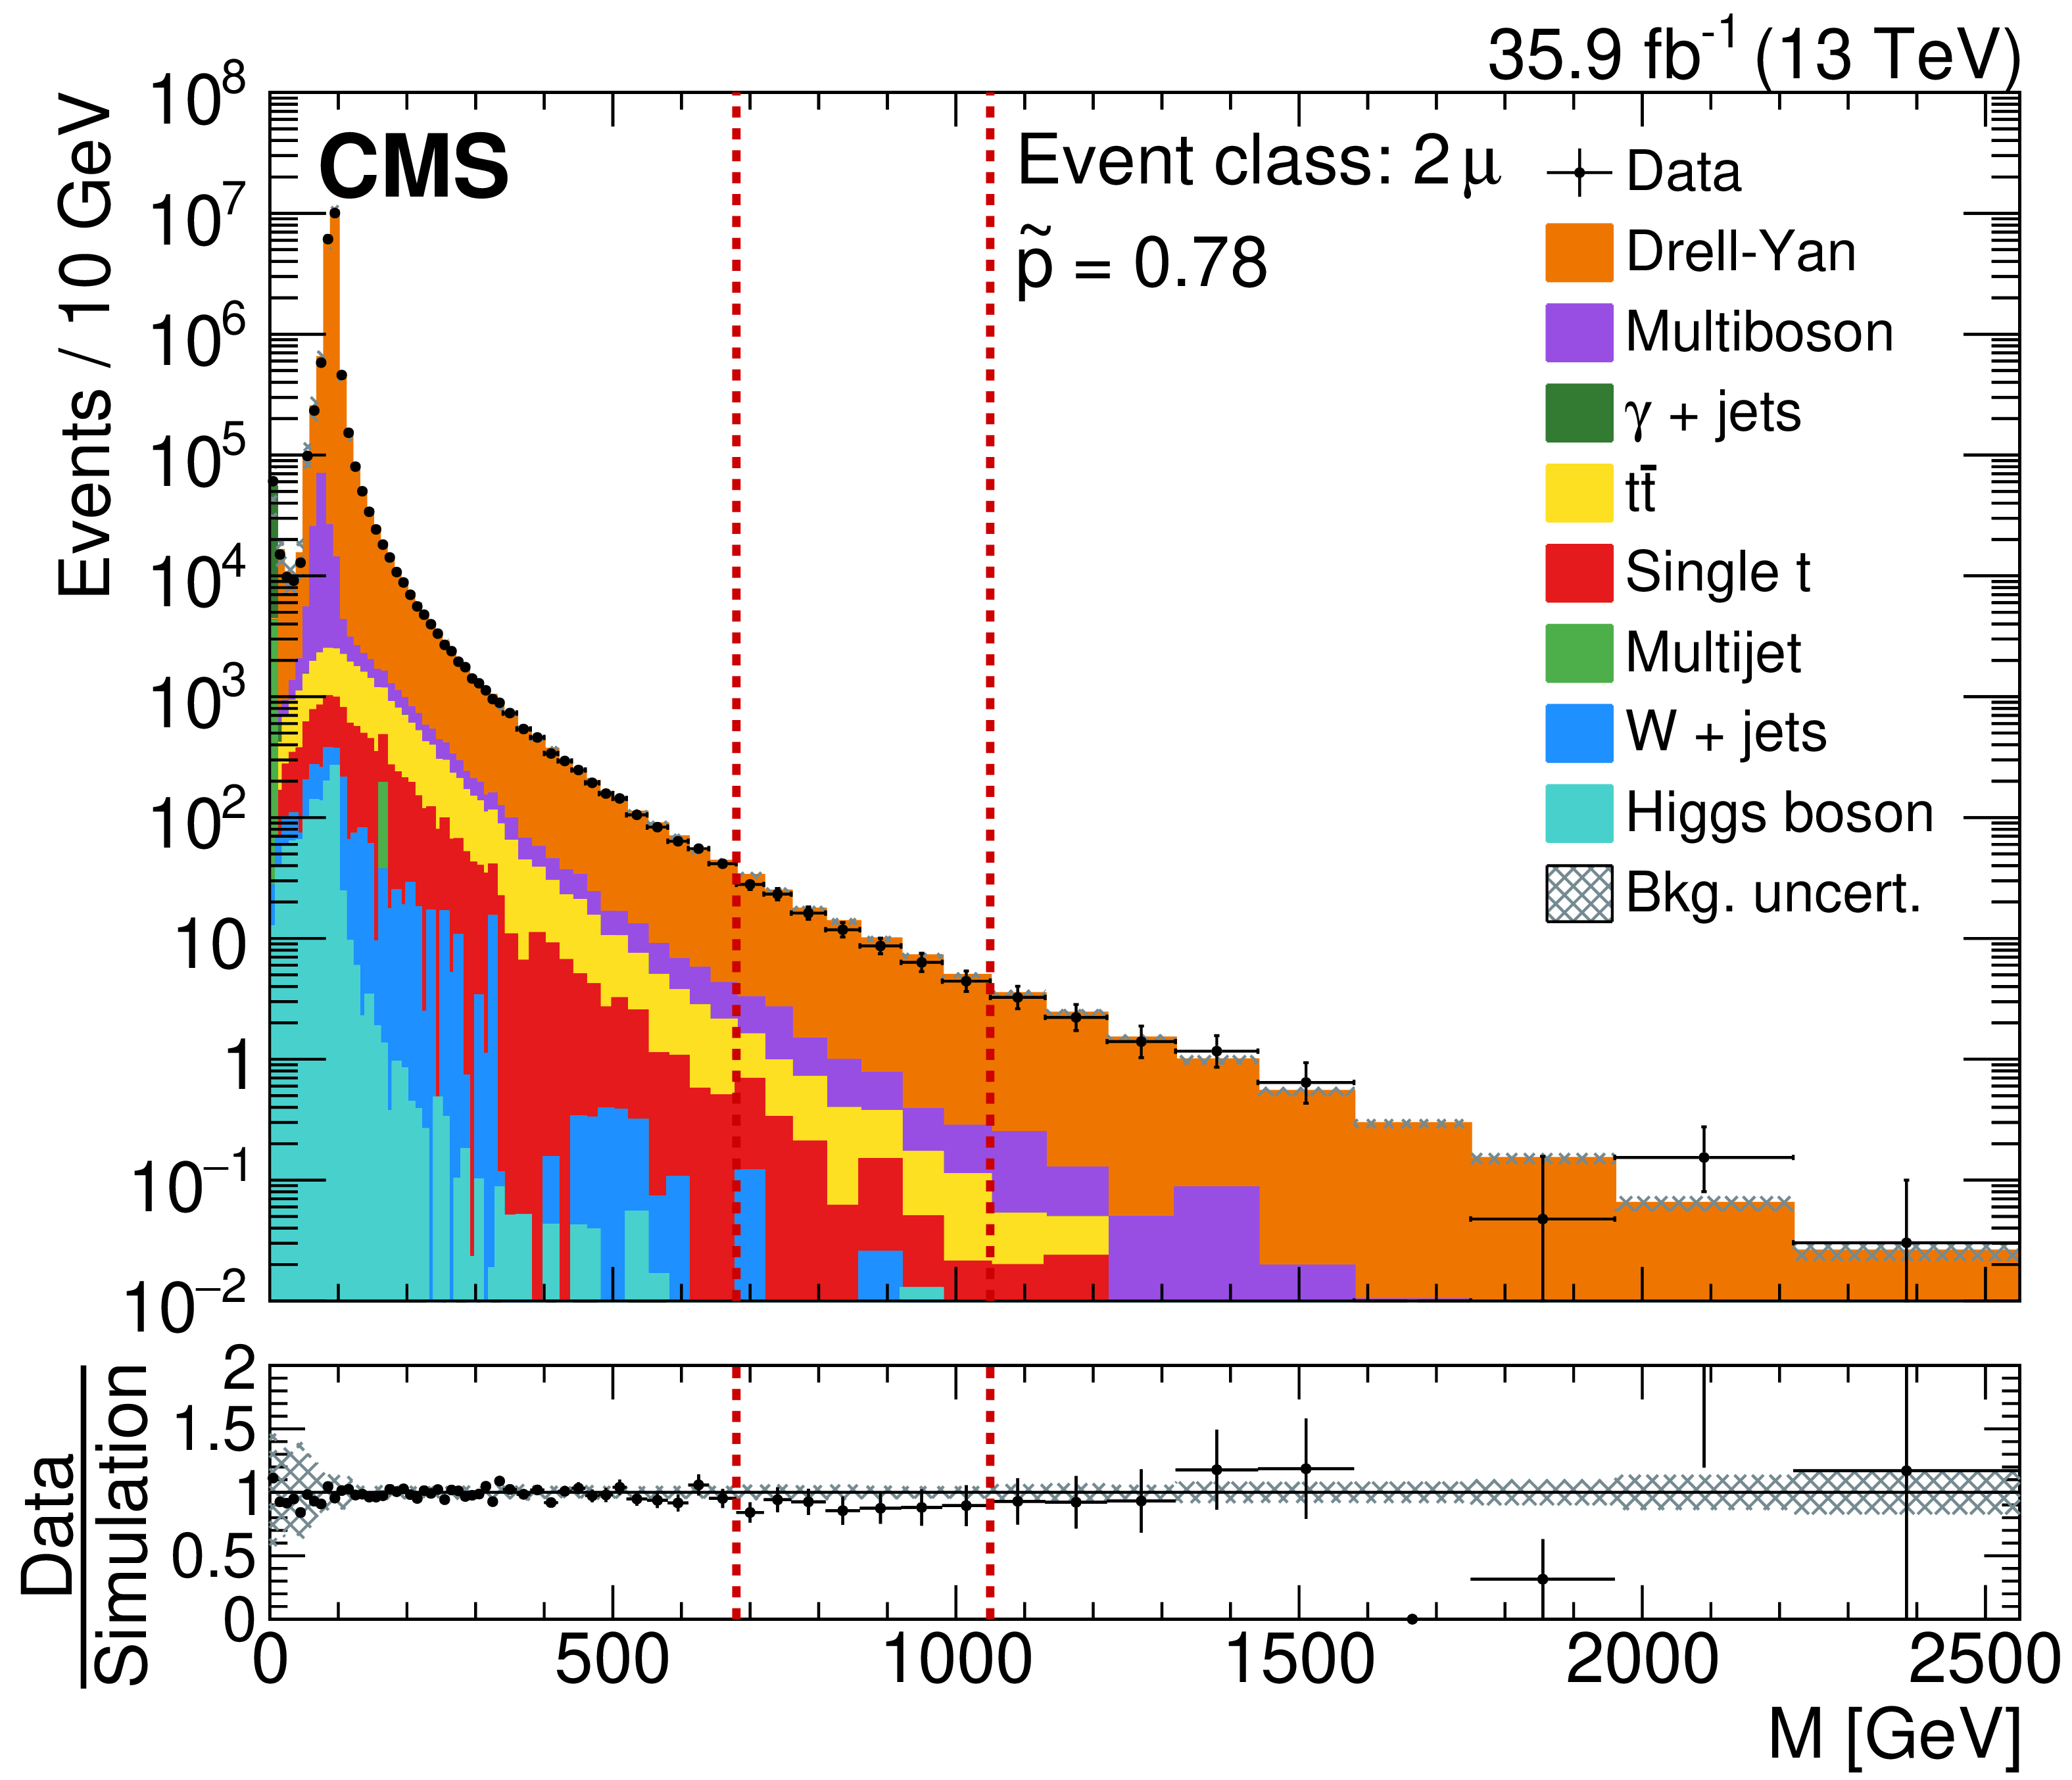
Example ${S_{\mathrm {T}}}$ (upper left) and $M$ (upper right) distributions for the 2$\mu$ exclusive event class, and the ${{p_{\mathrm {T}}} ^\text {miss}}$ distribution for the 2$\mu$+${{p_{\mathrm {T}}} ^\text {miss}} $+X inclusive event class (lower). Measured data are shown as black markers, contributions from SM processes are represented by coloured histograms, and the region enclosed by red dashed lines in each figure corresponds to the region of interest determined by the RoI algorithm described in Section 5. |
png pdf |
Figure 10-a:
Example ${S_{\mathrm {T}}}$ (upper left) and $M$ (upper right) distributions for the 2$\mu$ exclusive event class, and the ${{p_{\mathrm {T}}} ^\text {miss}}$ distribution for the 2$\mu$+${{p_{\mathrm {T}}} ^\text {miss}} $+X inclusive event class (lower). Measured data are shown as black markers, contributions from SM processes are represented by coloured histograms, and the region enclosed by red dashed lines in each figure corresponds to the region of interest determined by the RoI algorithm described in Section 5. |
png pdf |
Figure 10-b:
Example ${S_{\mathrm {T}}}$ (upper left) and $M$ (upper right) distributions for the 2$\mu$ exclusive event class, and the ${{p_{\mathrm {T}}} ^\text {miss}}$ distribution for the 2$\mu$+${{p_{\mathrm {T}}} ^\text {miss}} $+X inclusive event class (lower). Measured data are shown as black markers, contributions from SM processes are represented by coloured histograms, and the region enclosed by red dashed lines in each figure corresponds to the region of interest determined by the RoI algorithm described in Section 5. |

png pdf |
Figure 10-c:
Example ${S_{\mathrm {T}}}$ (upper left) and $M$ (upper right) distributions for the 2$\mu$ exclusive event class, and the ${{p_{\mathrm {T}}} ^\text {miss}}$ distribution for the 2$\mu$+${{p_{\mathrm {T}}} ^\text {miss}} $+X inclusive event class (lower). Measured data are shown as black markers, contributions from SM processes are represented by coloured histograms, and the region enclosed by red dashed lines in each figure corresponds to the region of interest determined by the RoI algorithm described in Section 5. |
png pdf |
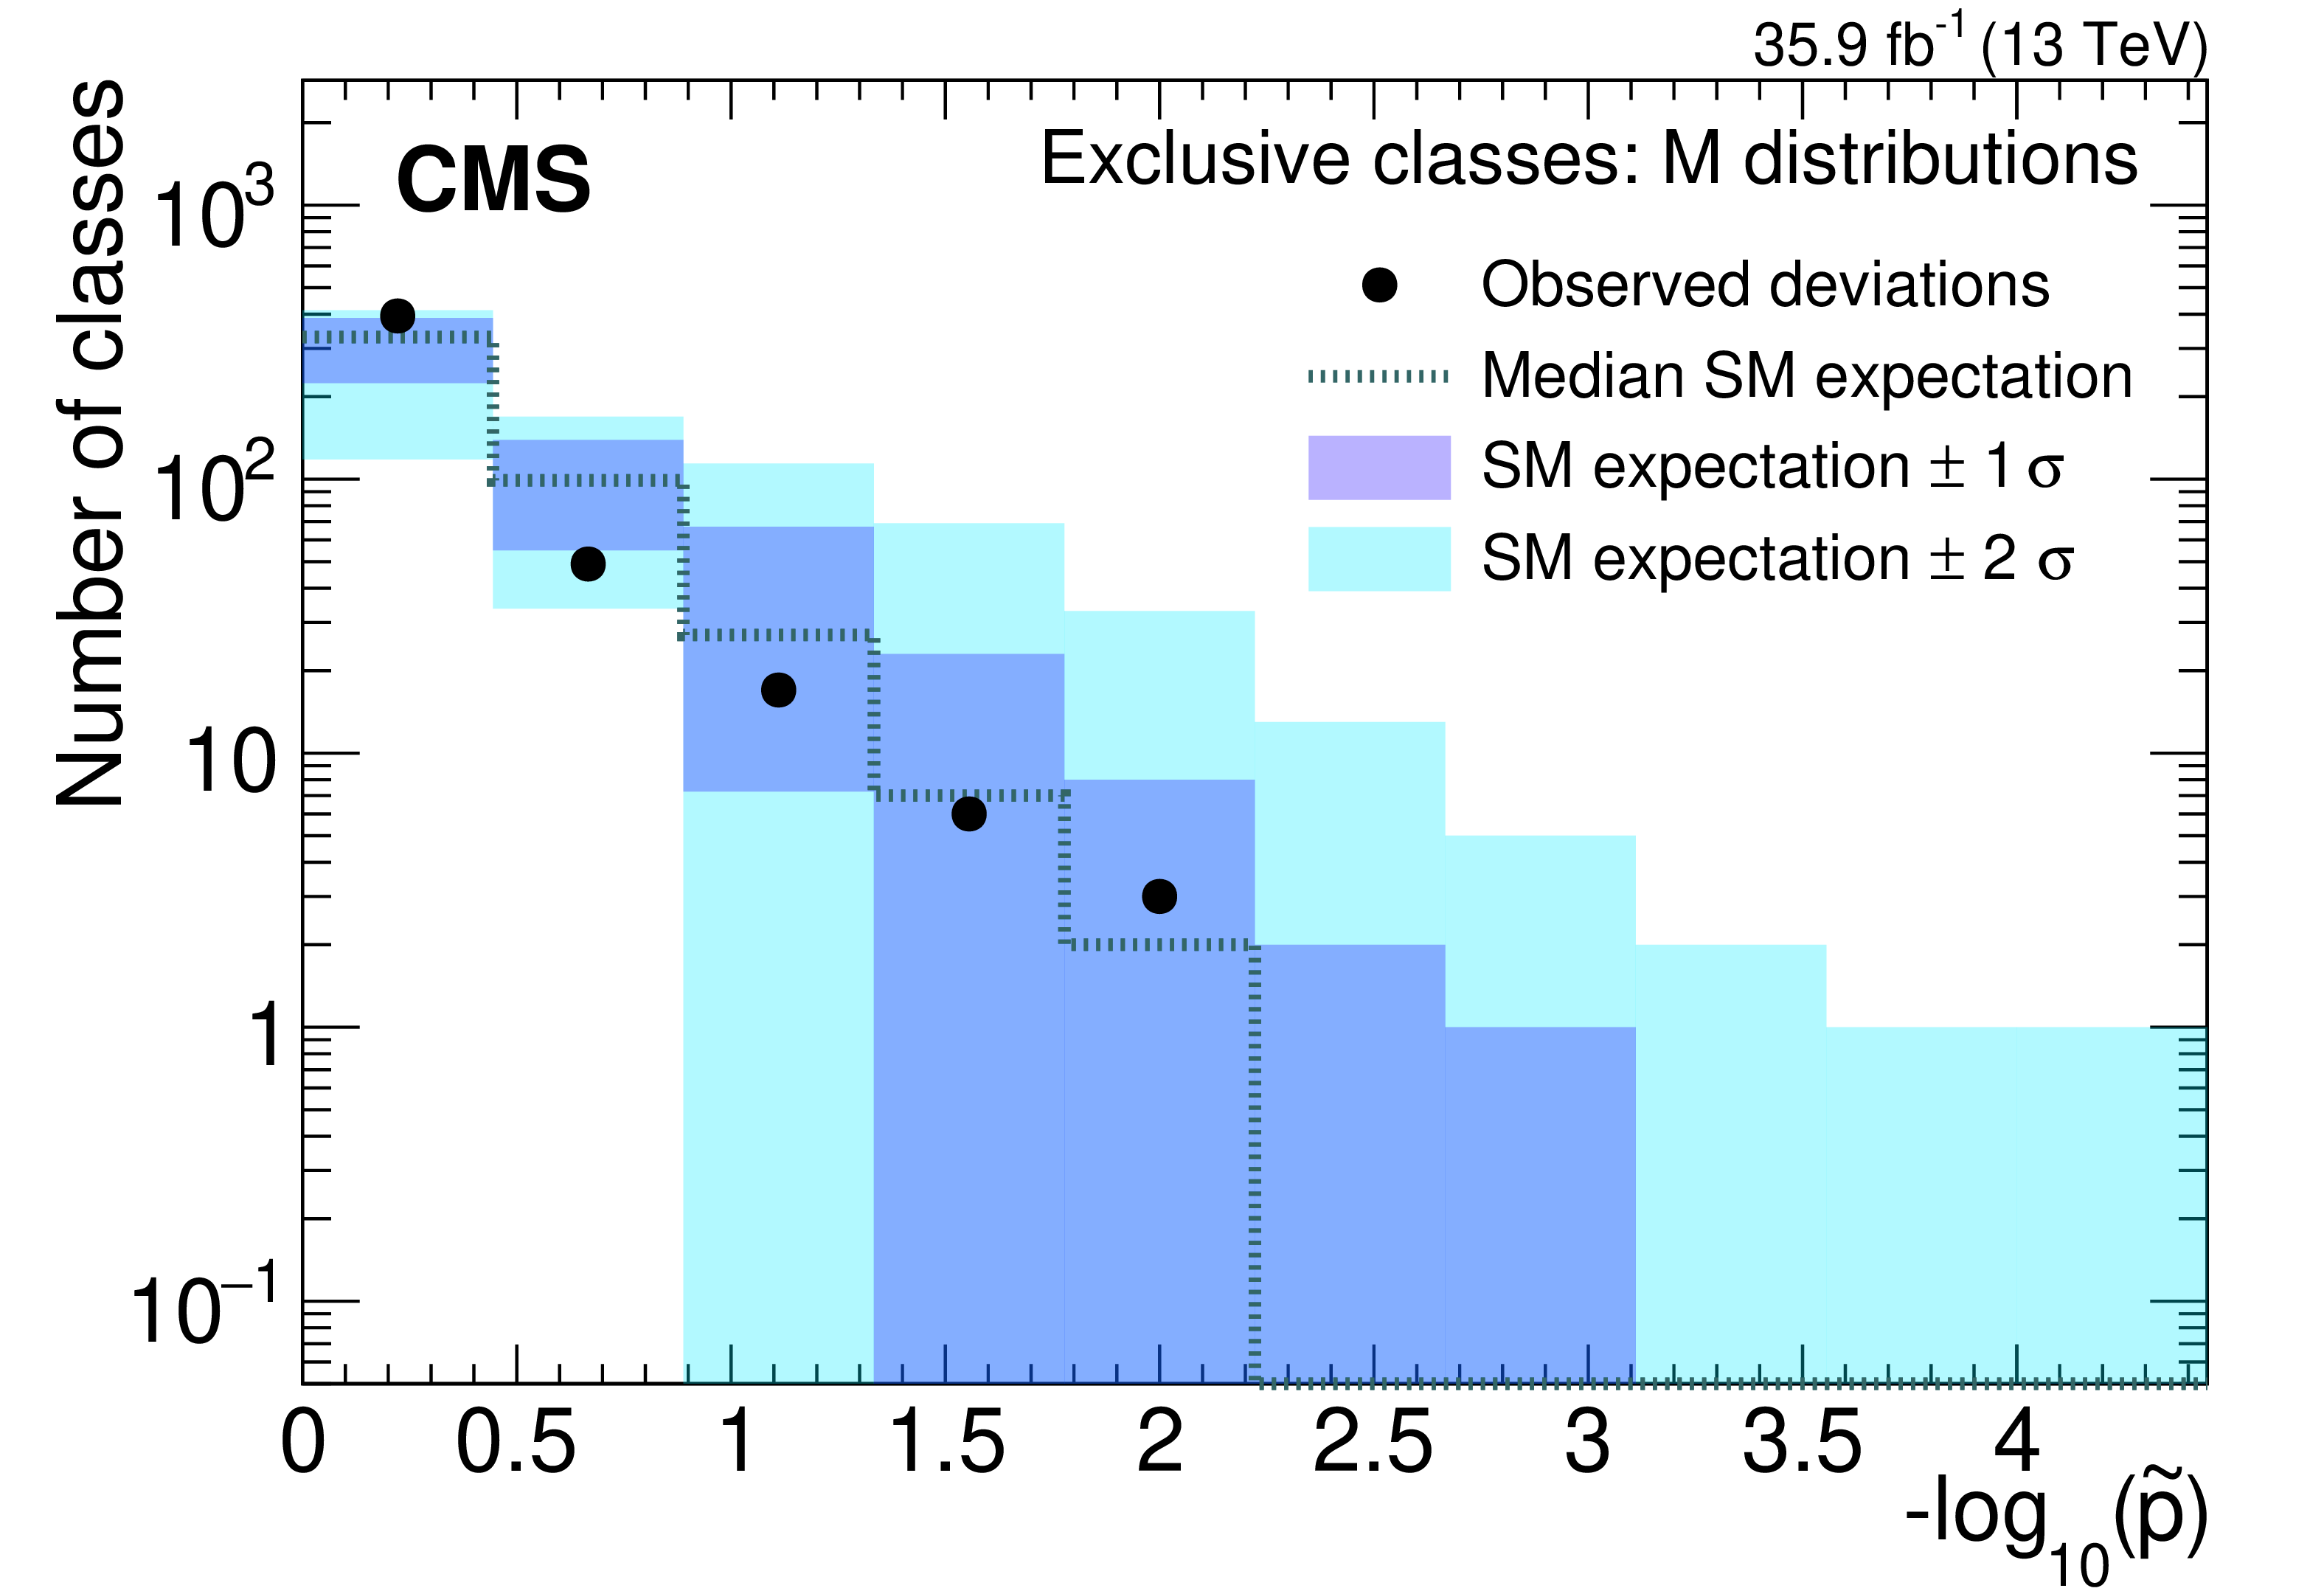
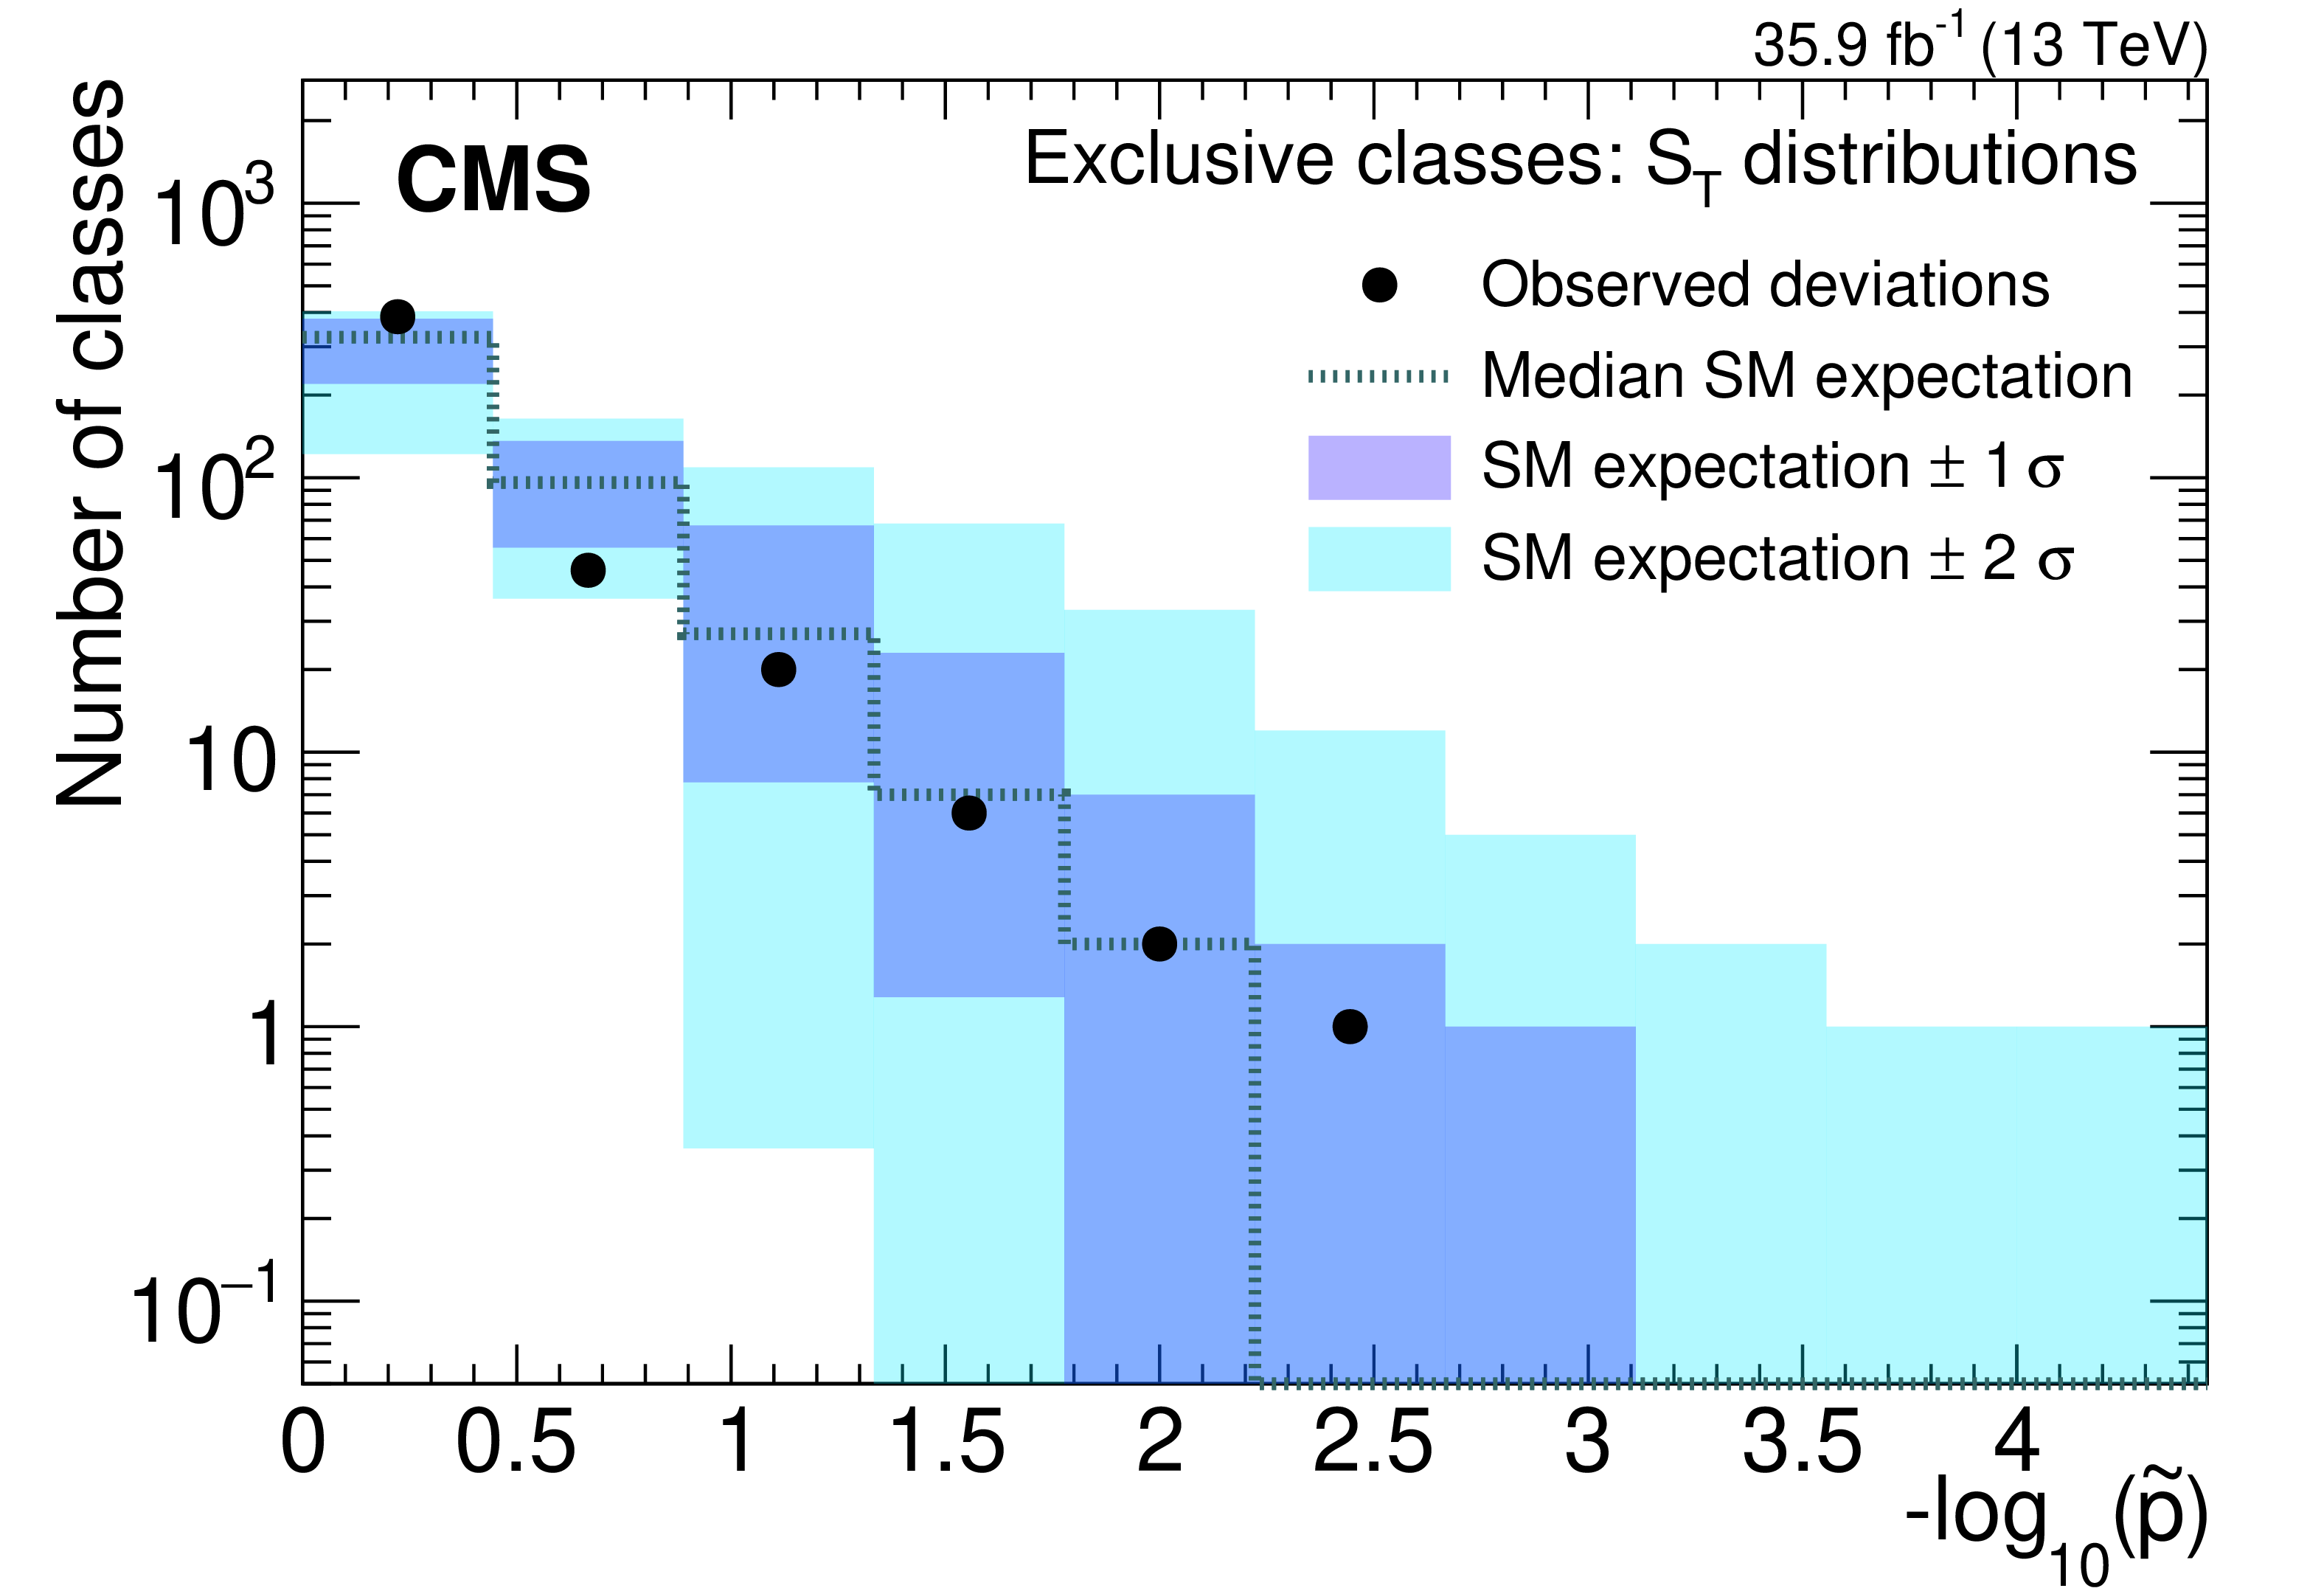
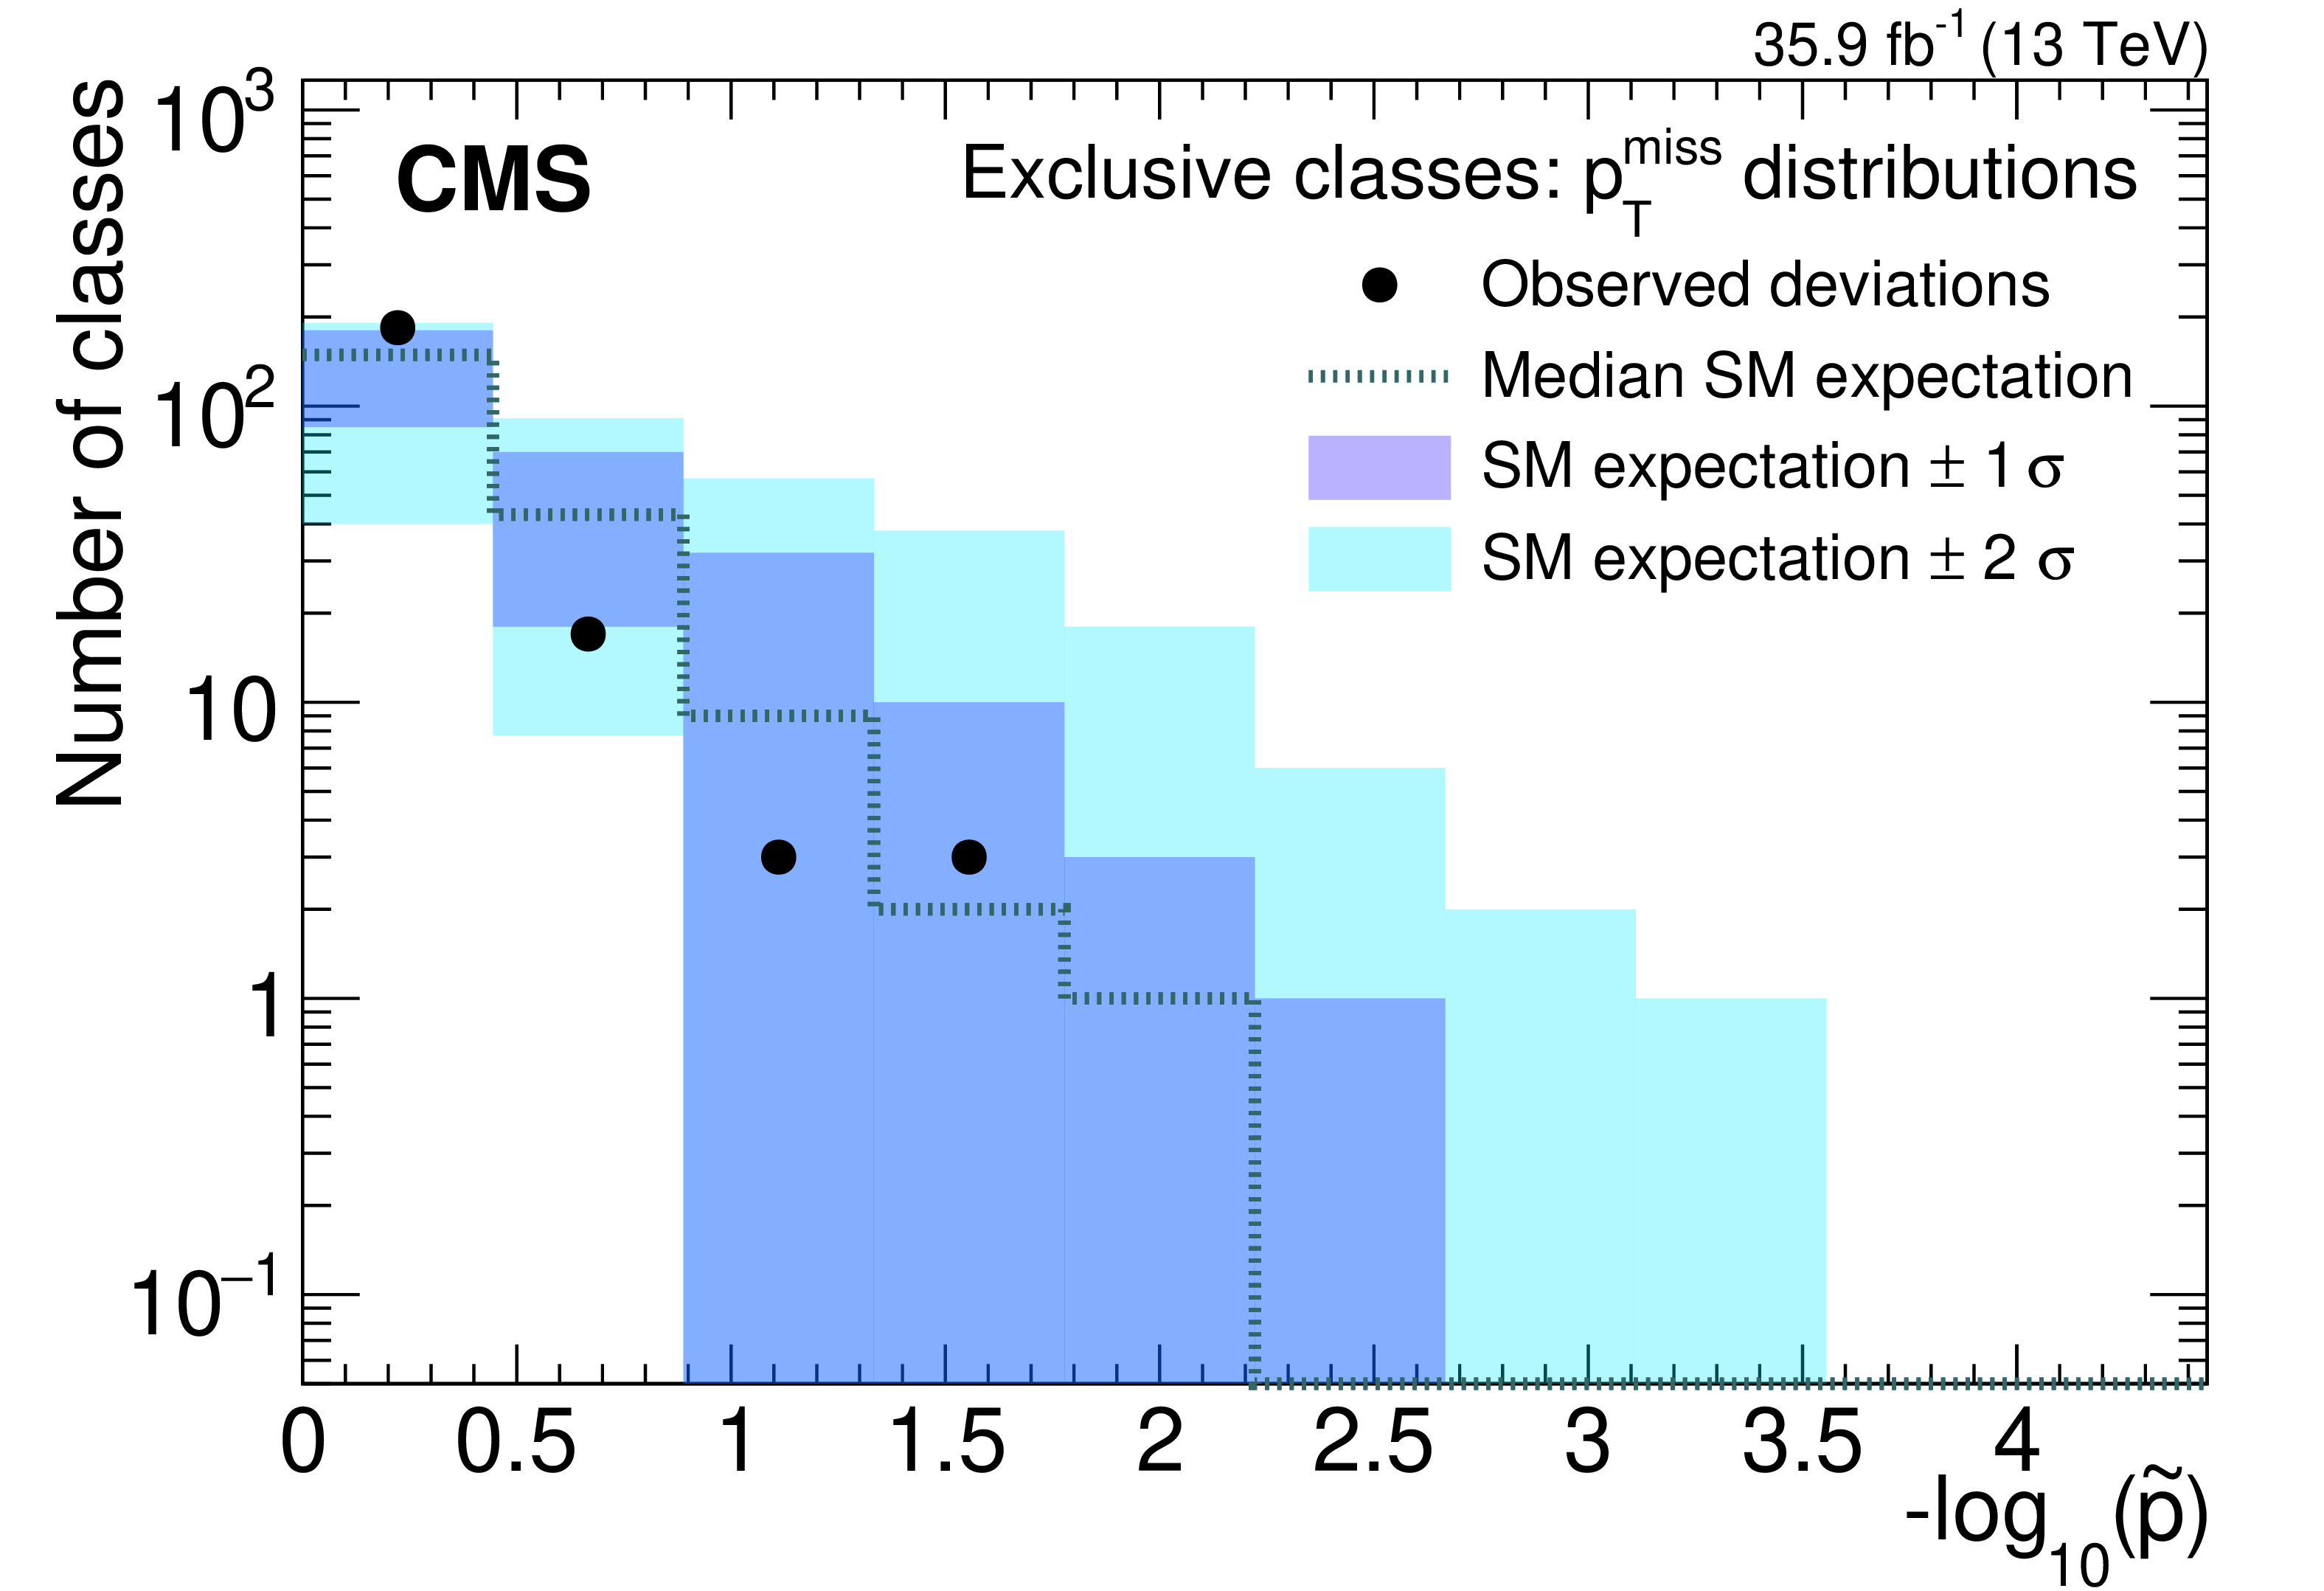
Figure 11:
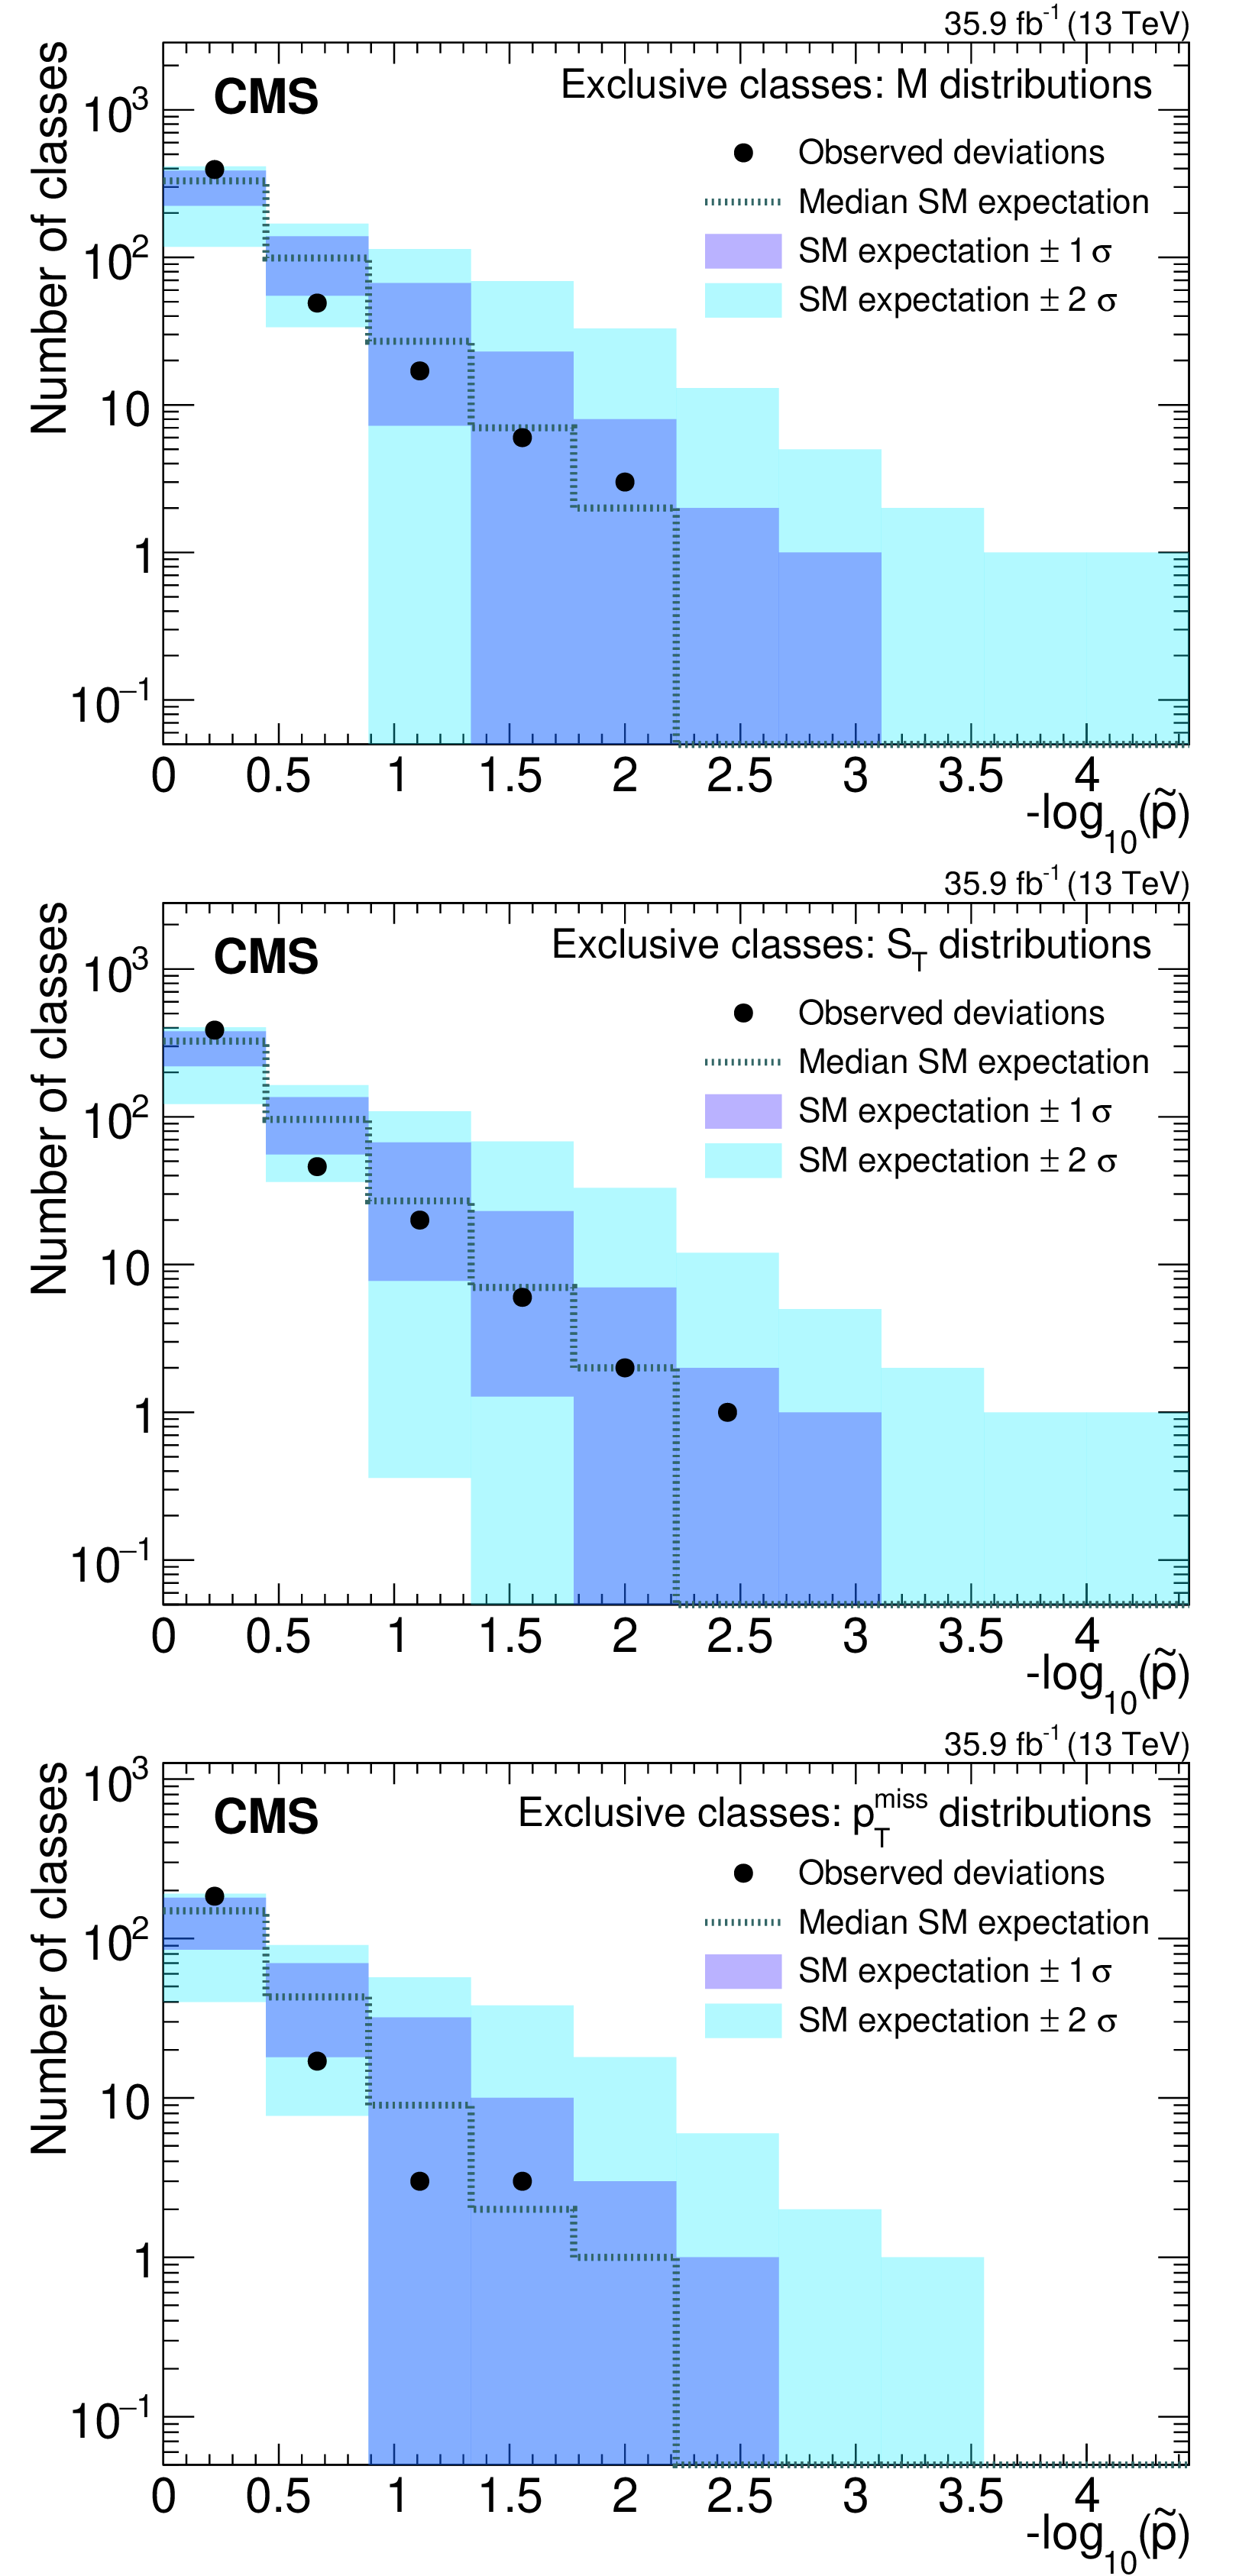
Distribution of $\tilde{p}$-values for the RoI scan in exclusive classes for the $M$ (upper), ${S_{\mathrm {T}}}$ (middle), and ${{p_{\mathrm {T}}} ^\text {miss}}$ (lower) distributions. |
png pdf |
Figure 11-a:
Distribution of $\tilde{p}$-values for the RoI scan in exclusive classes for the $M$ (upper), ${S_{\mathrm {T}}}$ (middle), and ${{p_{\mathrm {T}}} ^\text {miss}}$ (lower) distributions. |
png pdf |
Figure 11-b:
Distribution of $\tilde{p}$-values for the RoI scan in exclusive classes for the $M$ (upper), ${S_{\mathrm {T}}}$ (middle), and ${{p_{\mathrm {T}}} ^\text {miss}}$ (lower) distributions. |
png pdf |
Figure 11-c:
Distribution of $\tilde{p}$-values for the RoI scan in exclusive classes for the $M$ (upper), ${S_{\mathrm {T}}}$ (middle), and ${{p_{\mathrm {T}}} ^\text {miss}}$ (lower) distributions. |
png pdf |
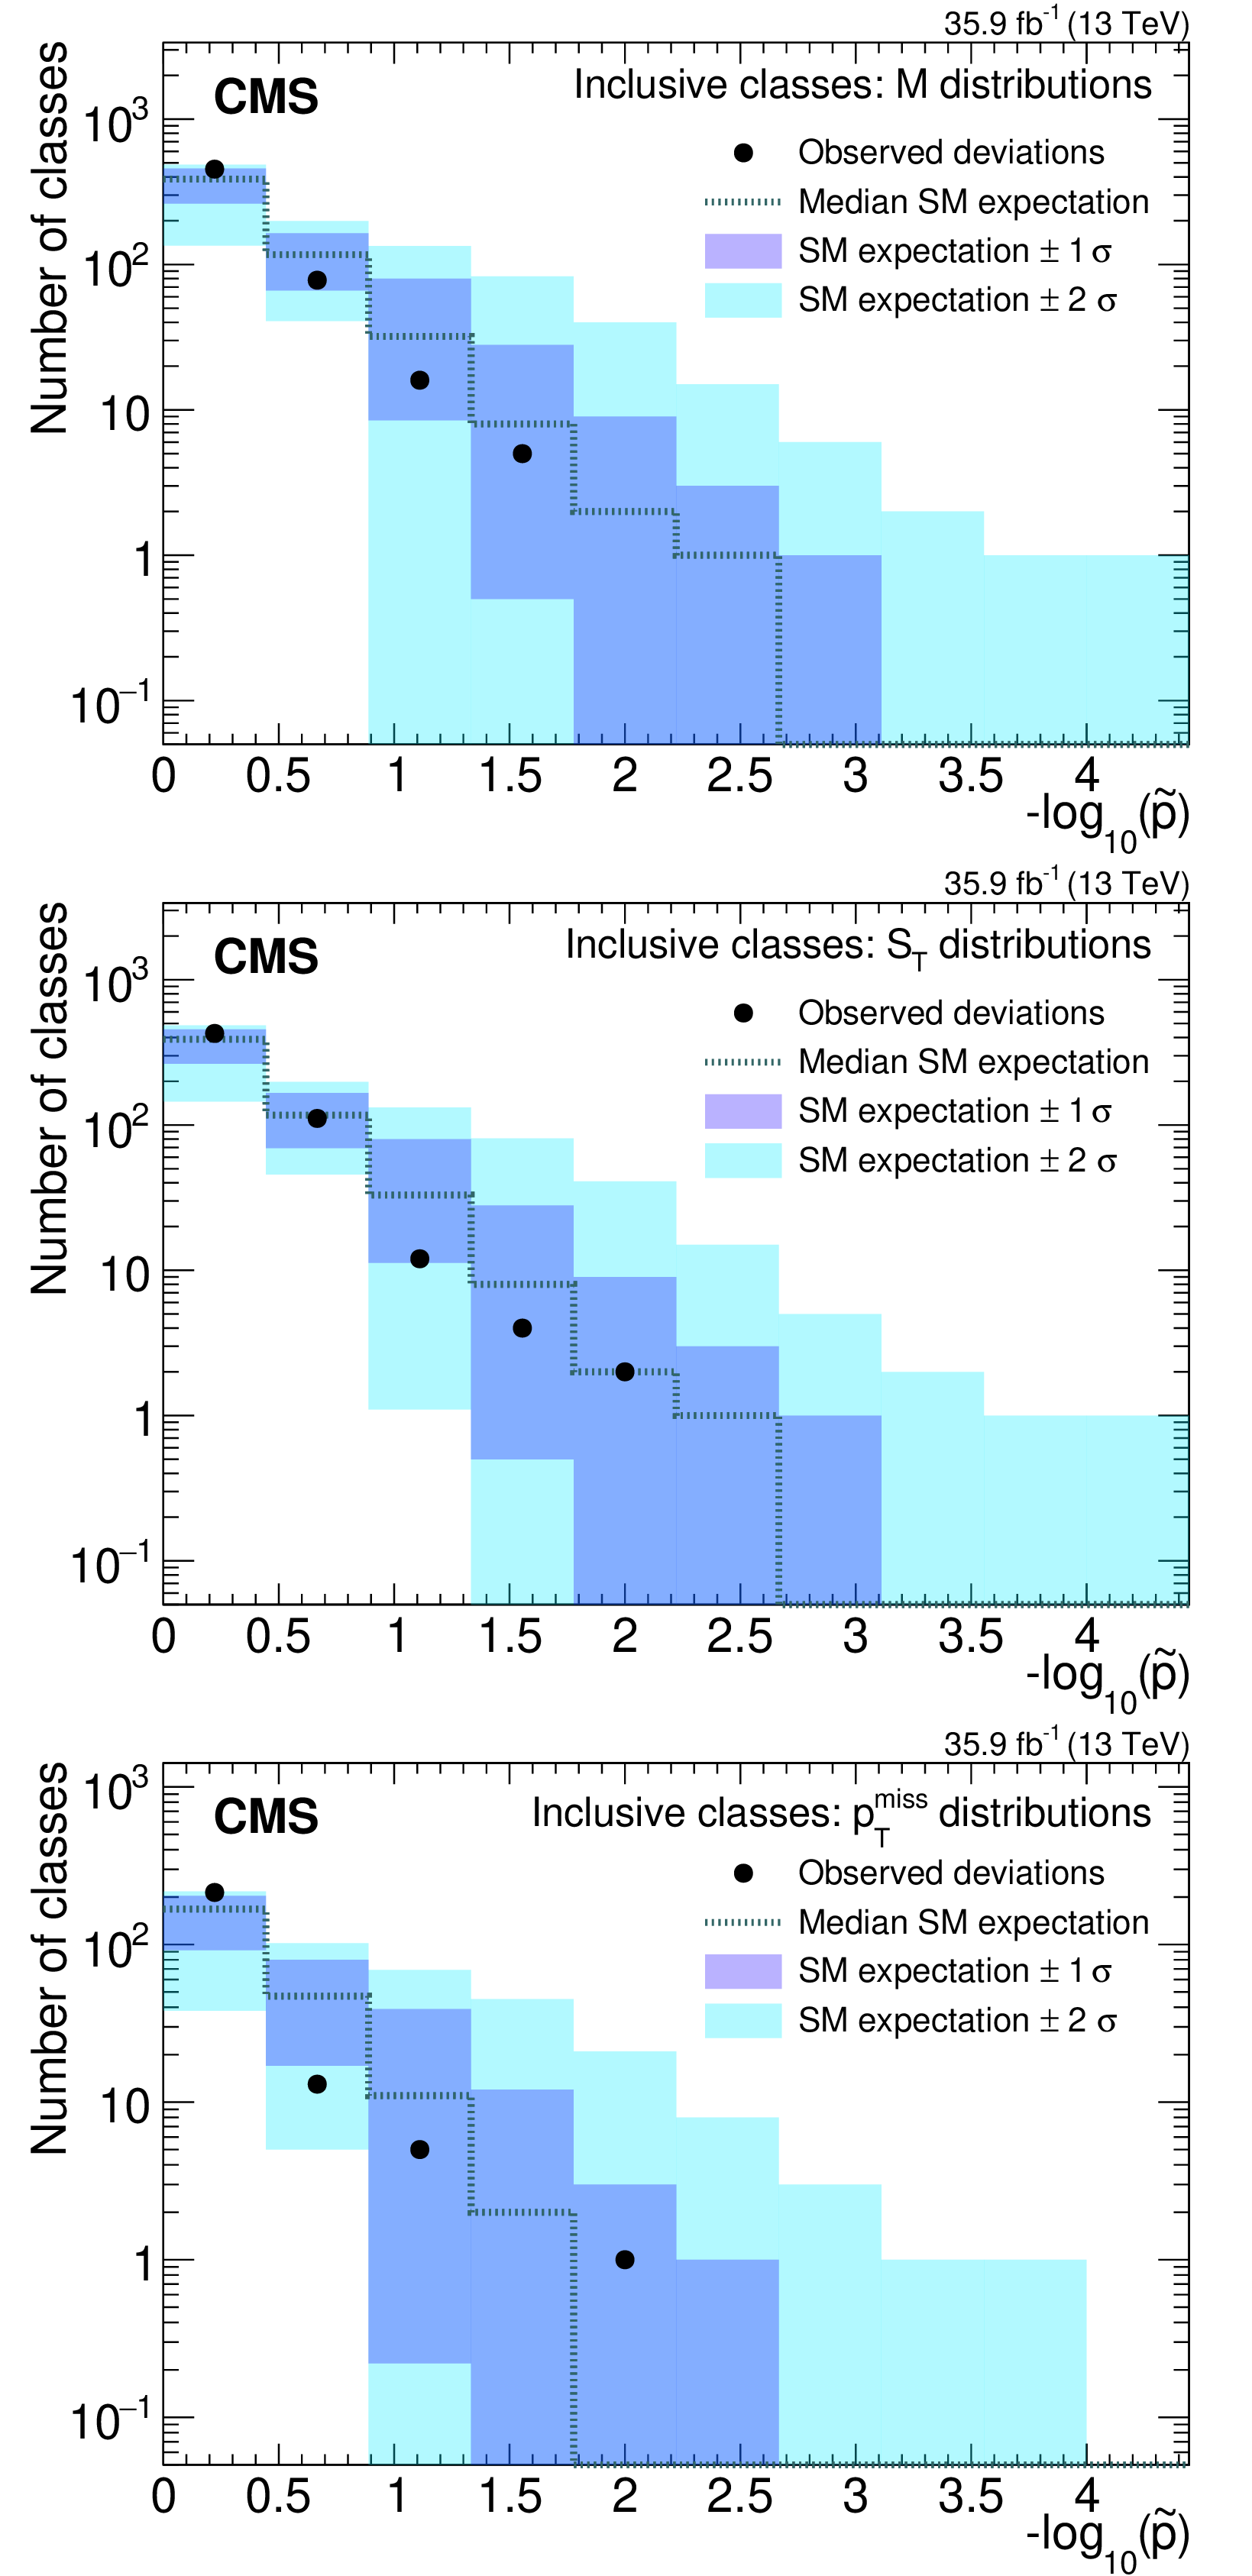
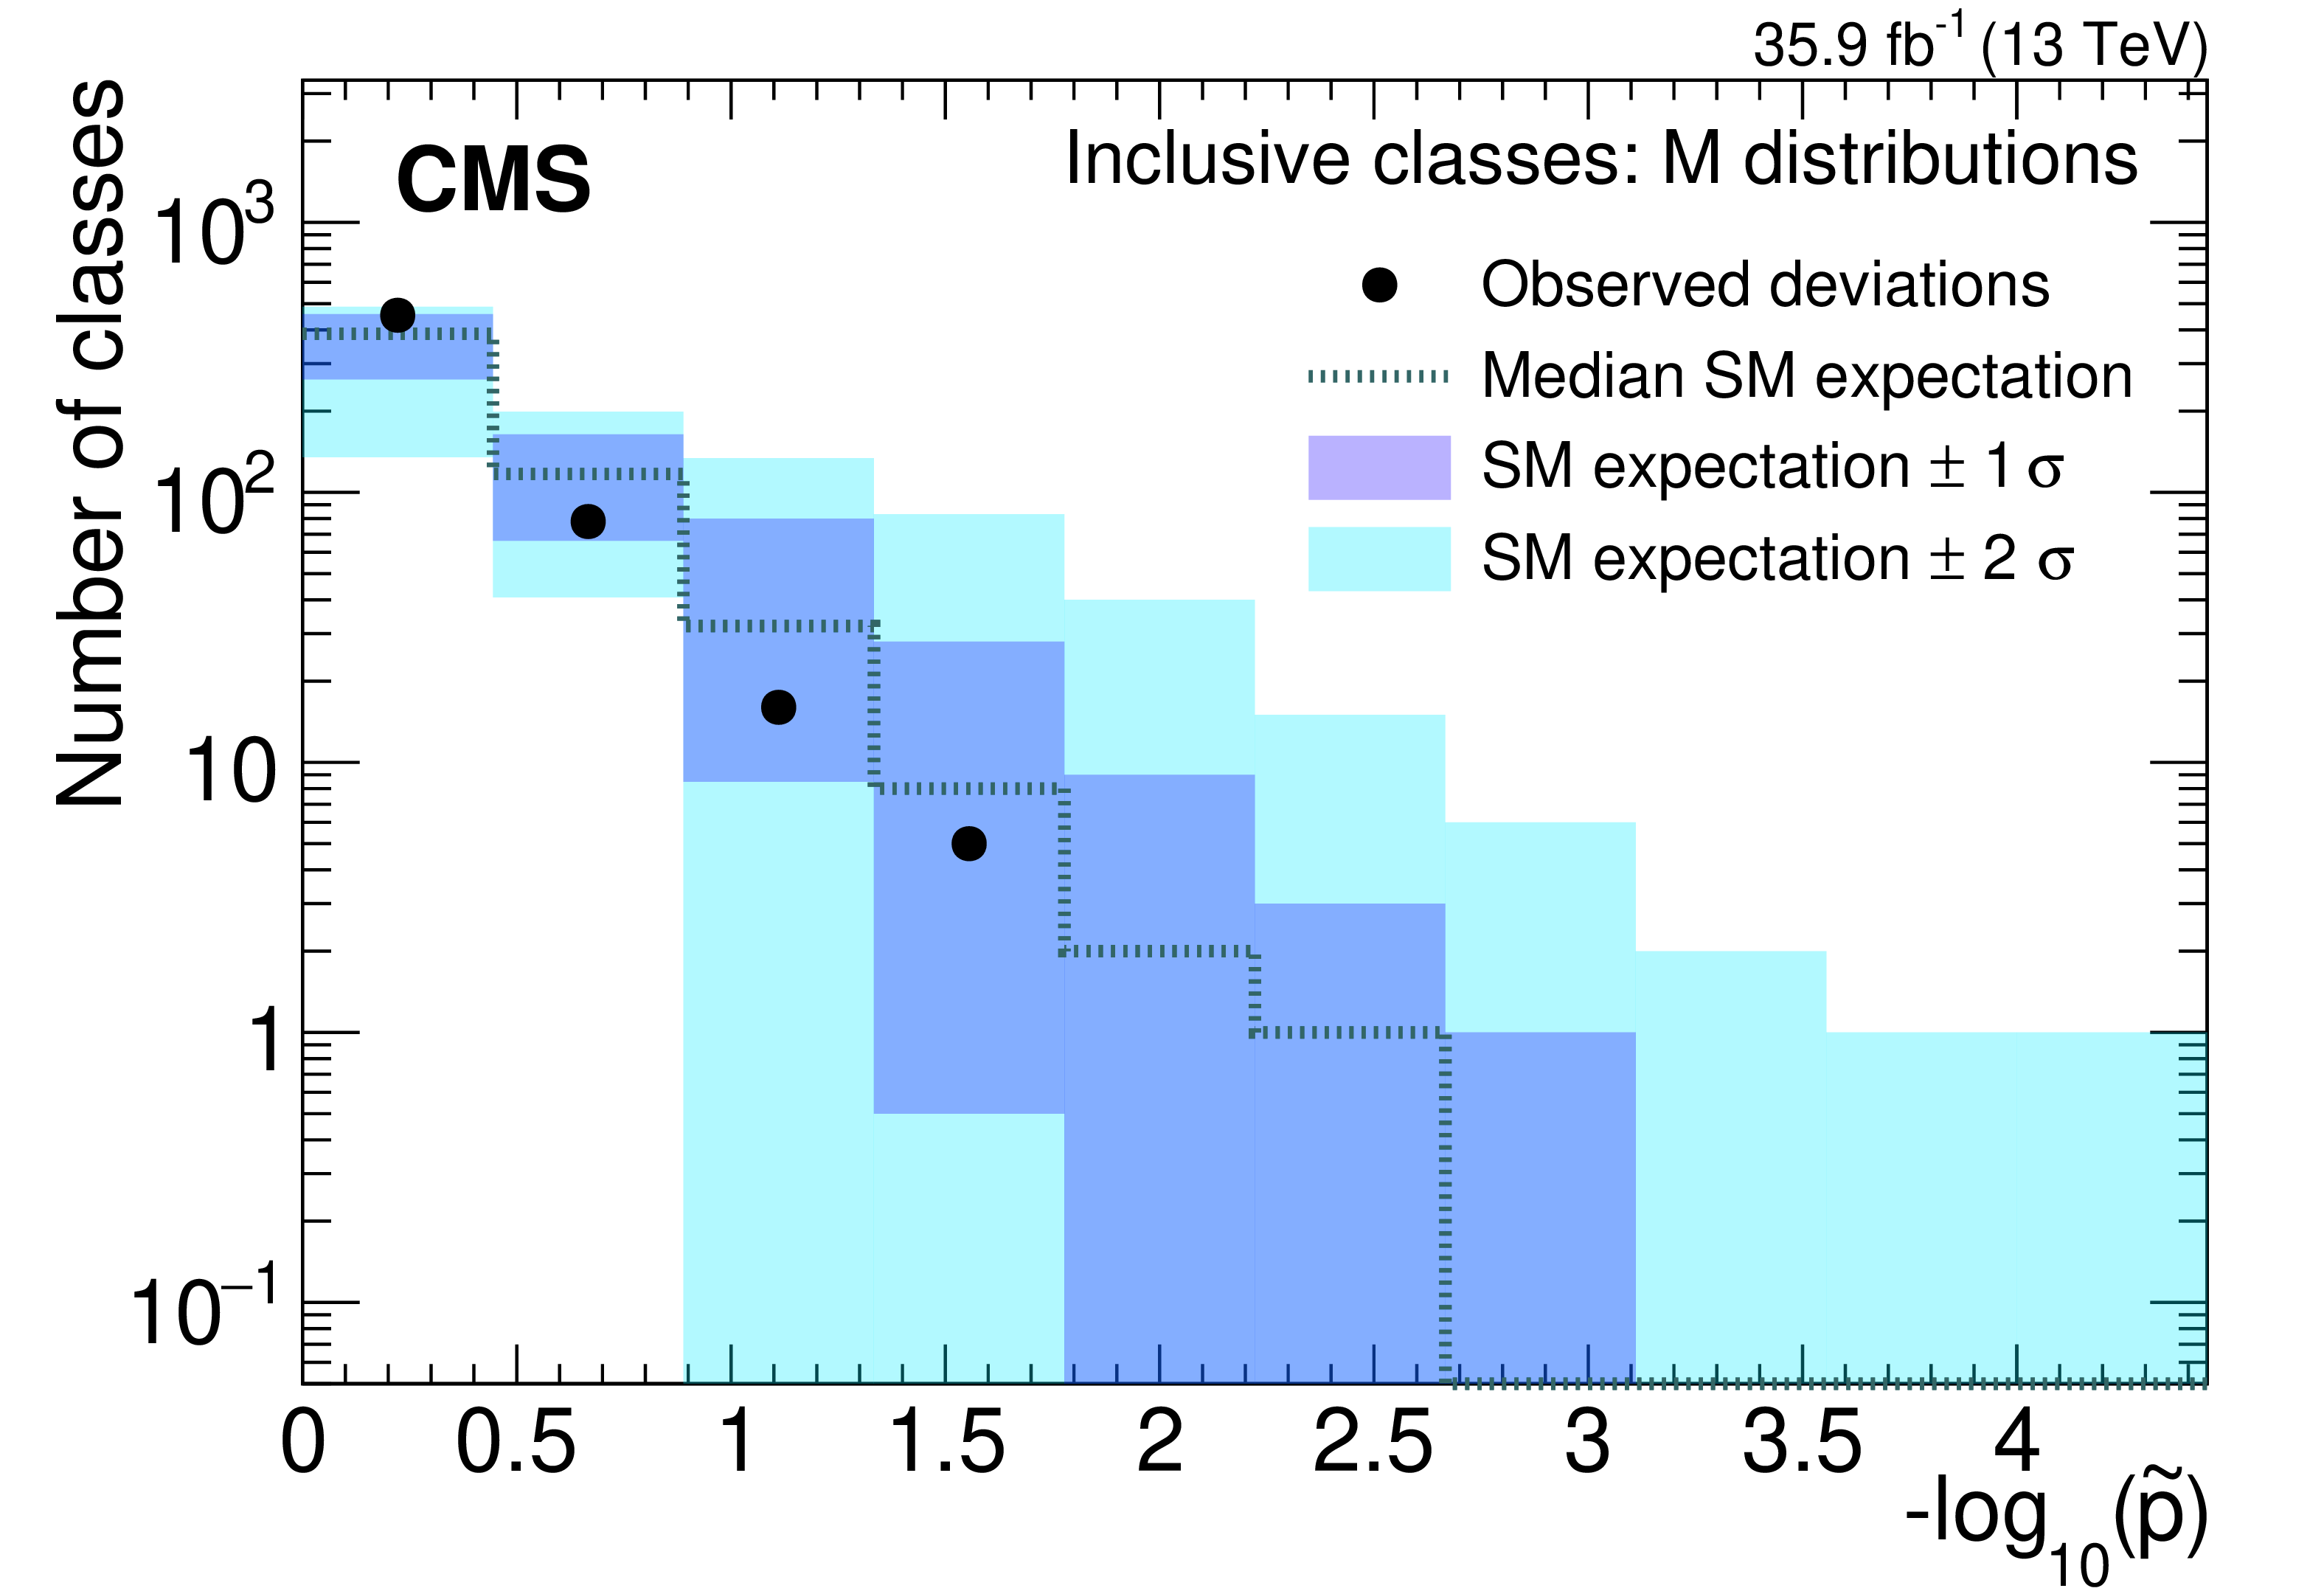
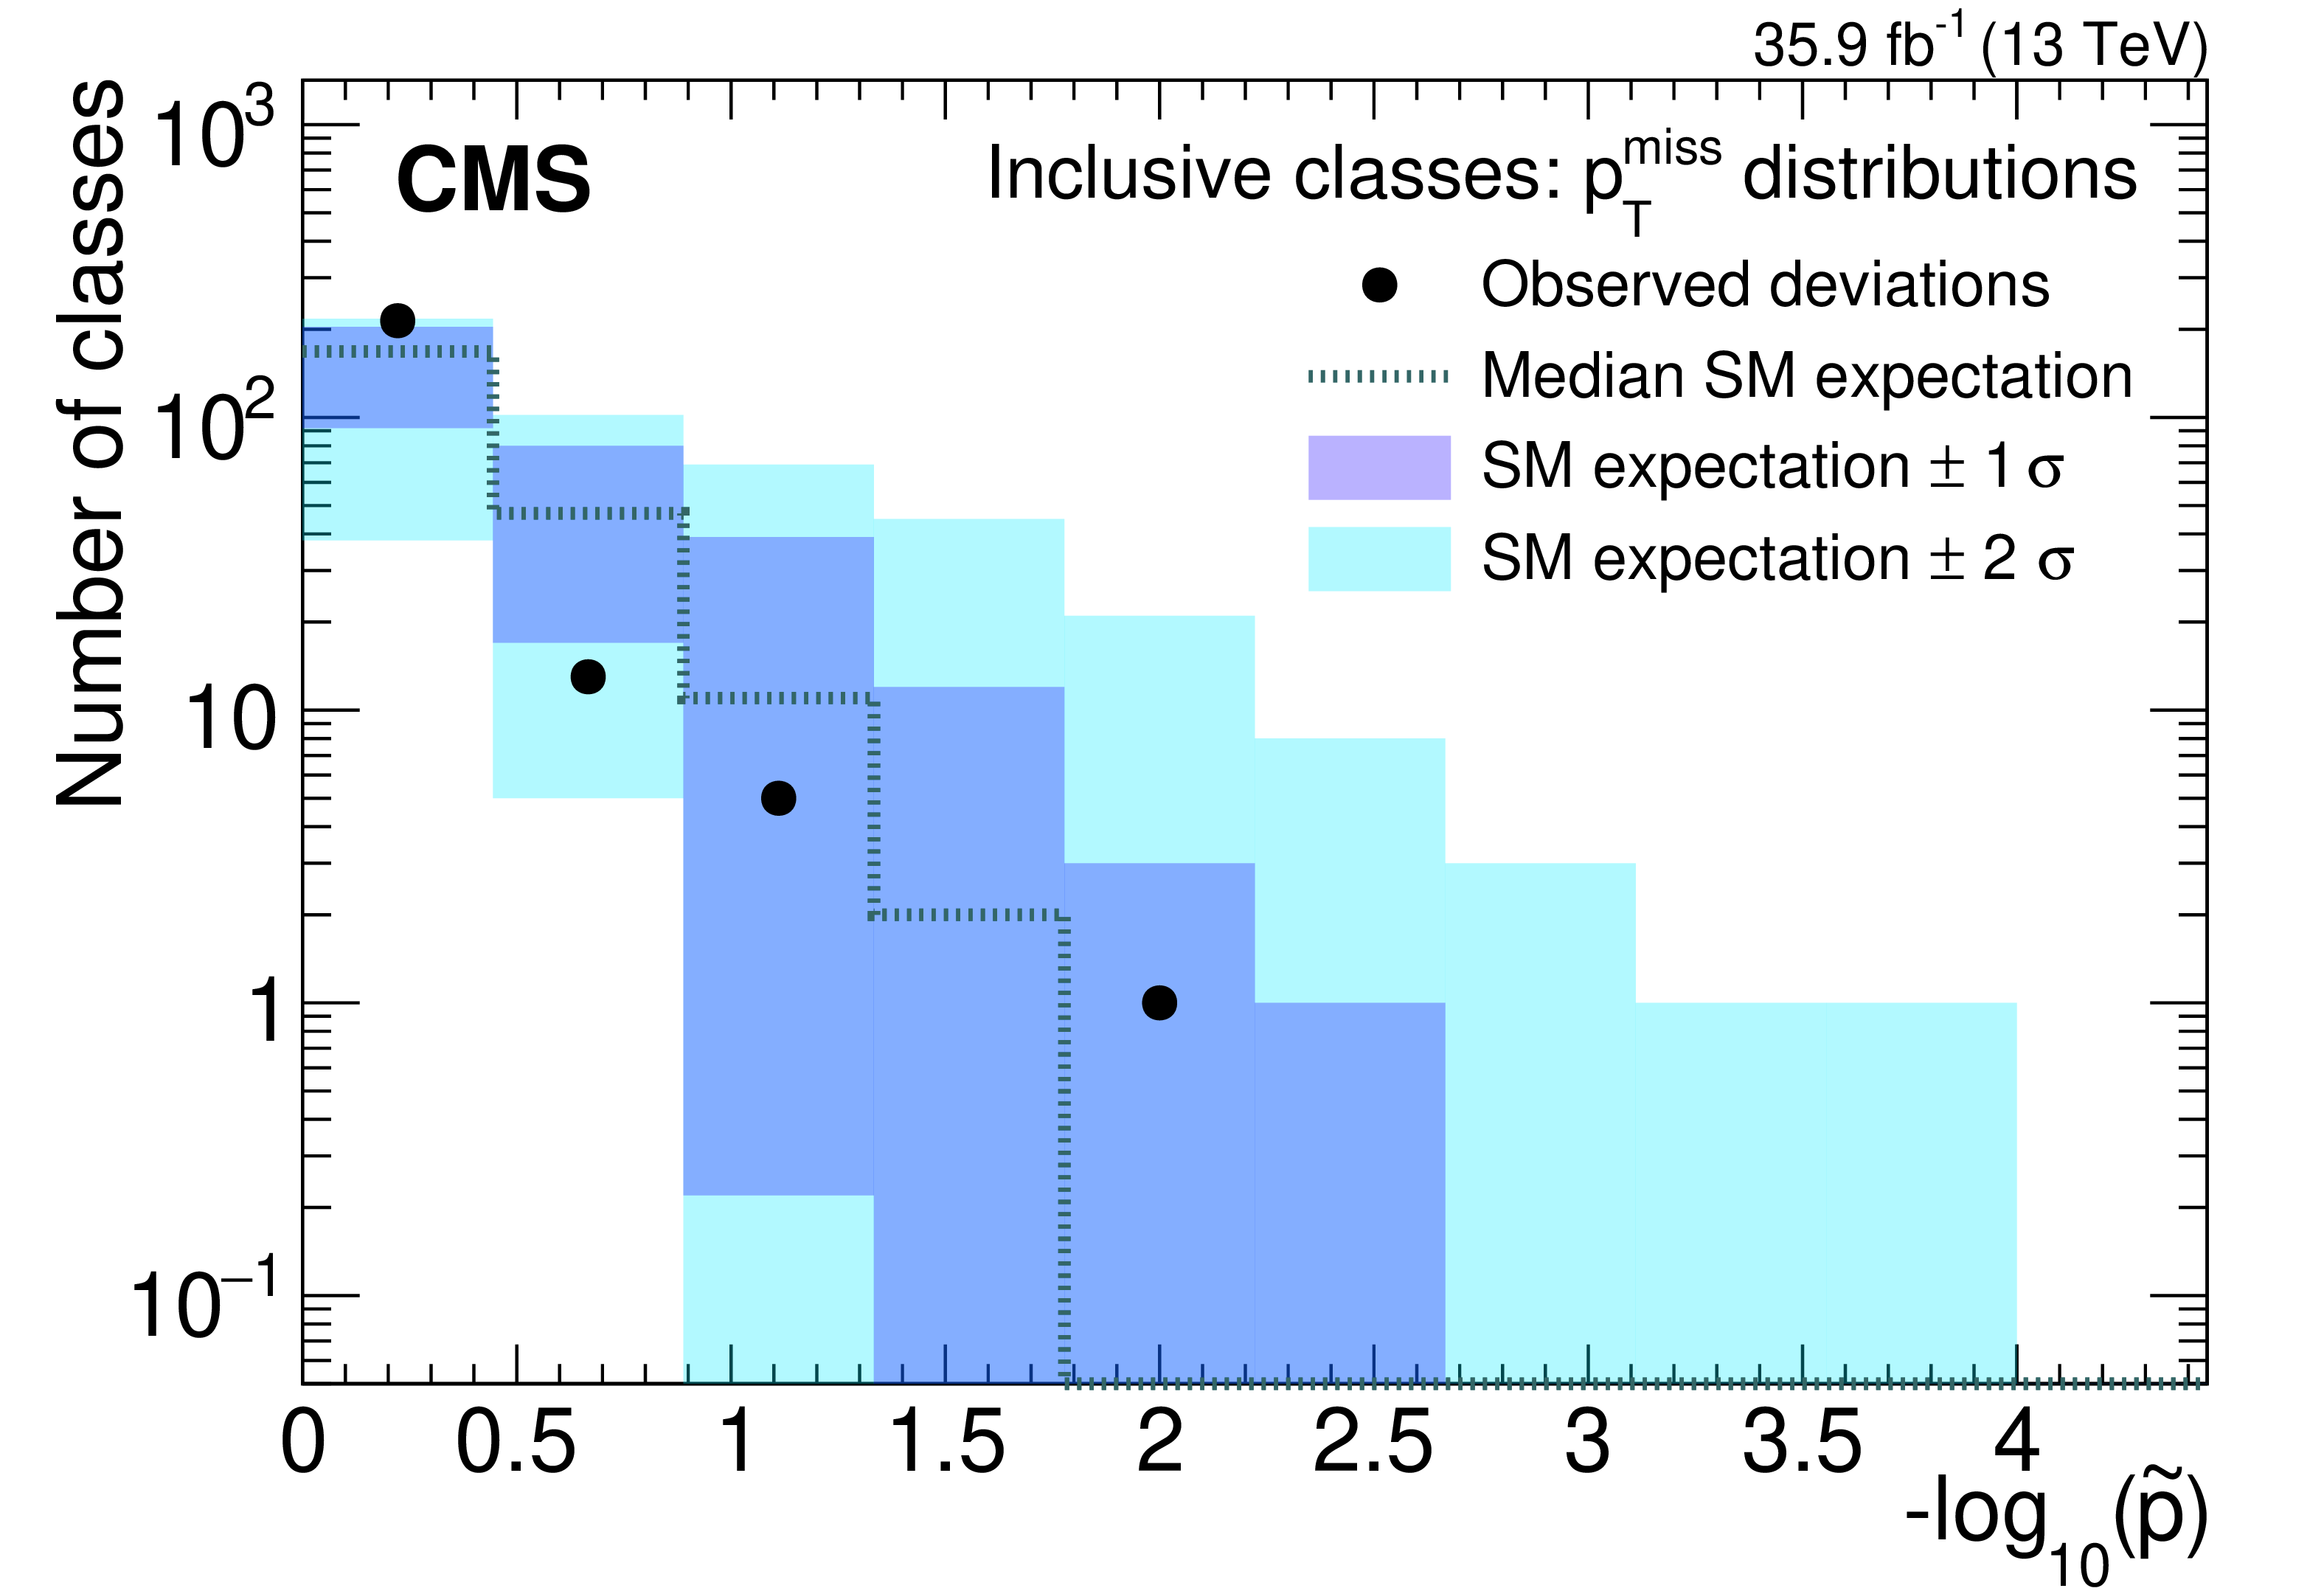
Figure 12:
Distribution of $\tilde{p}$-values for the RoI scan in inclusive classes for the $M$ (upper), ${S_{\mathrm {T}}}$ (middle), and ${{p_{\mathrm {T}}} ^\text {miss}}$ (lower) distributions. |
png pdf |
Figure 12-a:
Distribution of $\tilde{p}$-values for the RoI scan in inclusive classes for the $M$ (upper), ${S_{\mathrm {T}}}$ (middle), and ${{p_{\mathrm {T}}} ^\text {miss}}$ (lower) distributions. |

png pdf |
Figure 12-b:
Distribution of $\tilde{p}$-values for the RoI scan in inclusive classes for the $M$ (upper), ${S_{\mathrm {T}}}$ (middle), and ${{p_{\mathrm {T}}} ^\text {miss}}$ (lower) distributions. |
png pdf |
Figure 12-c:
Distribution of $\tilde{p}$-values for the RoI scan in inclusive classes for the $M$ (upper), ${S_{\mathrm {T}}}$ (middle), and ${{p_{\mathrm {T}}} ^\text {miss}}$ (lower) distributions. |
png pdf |
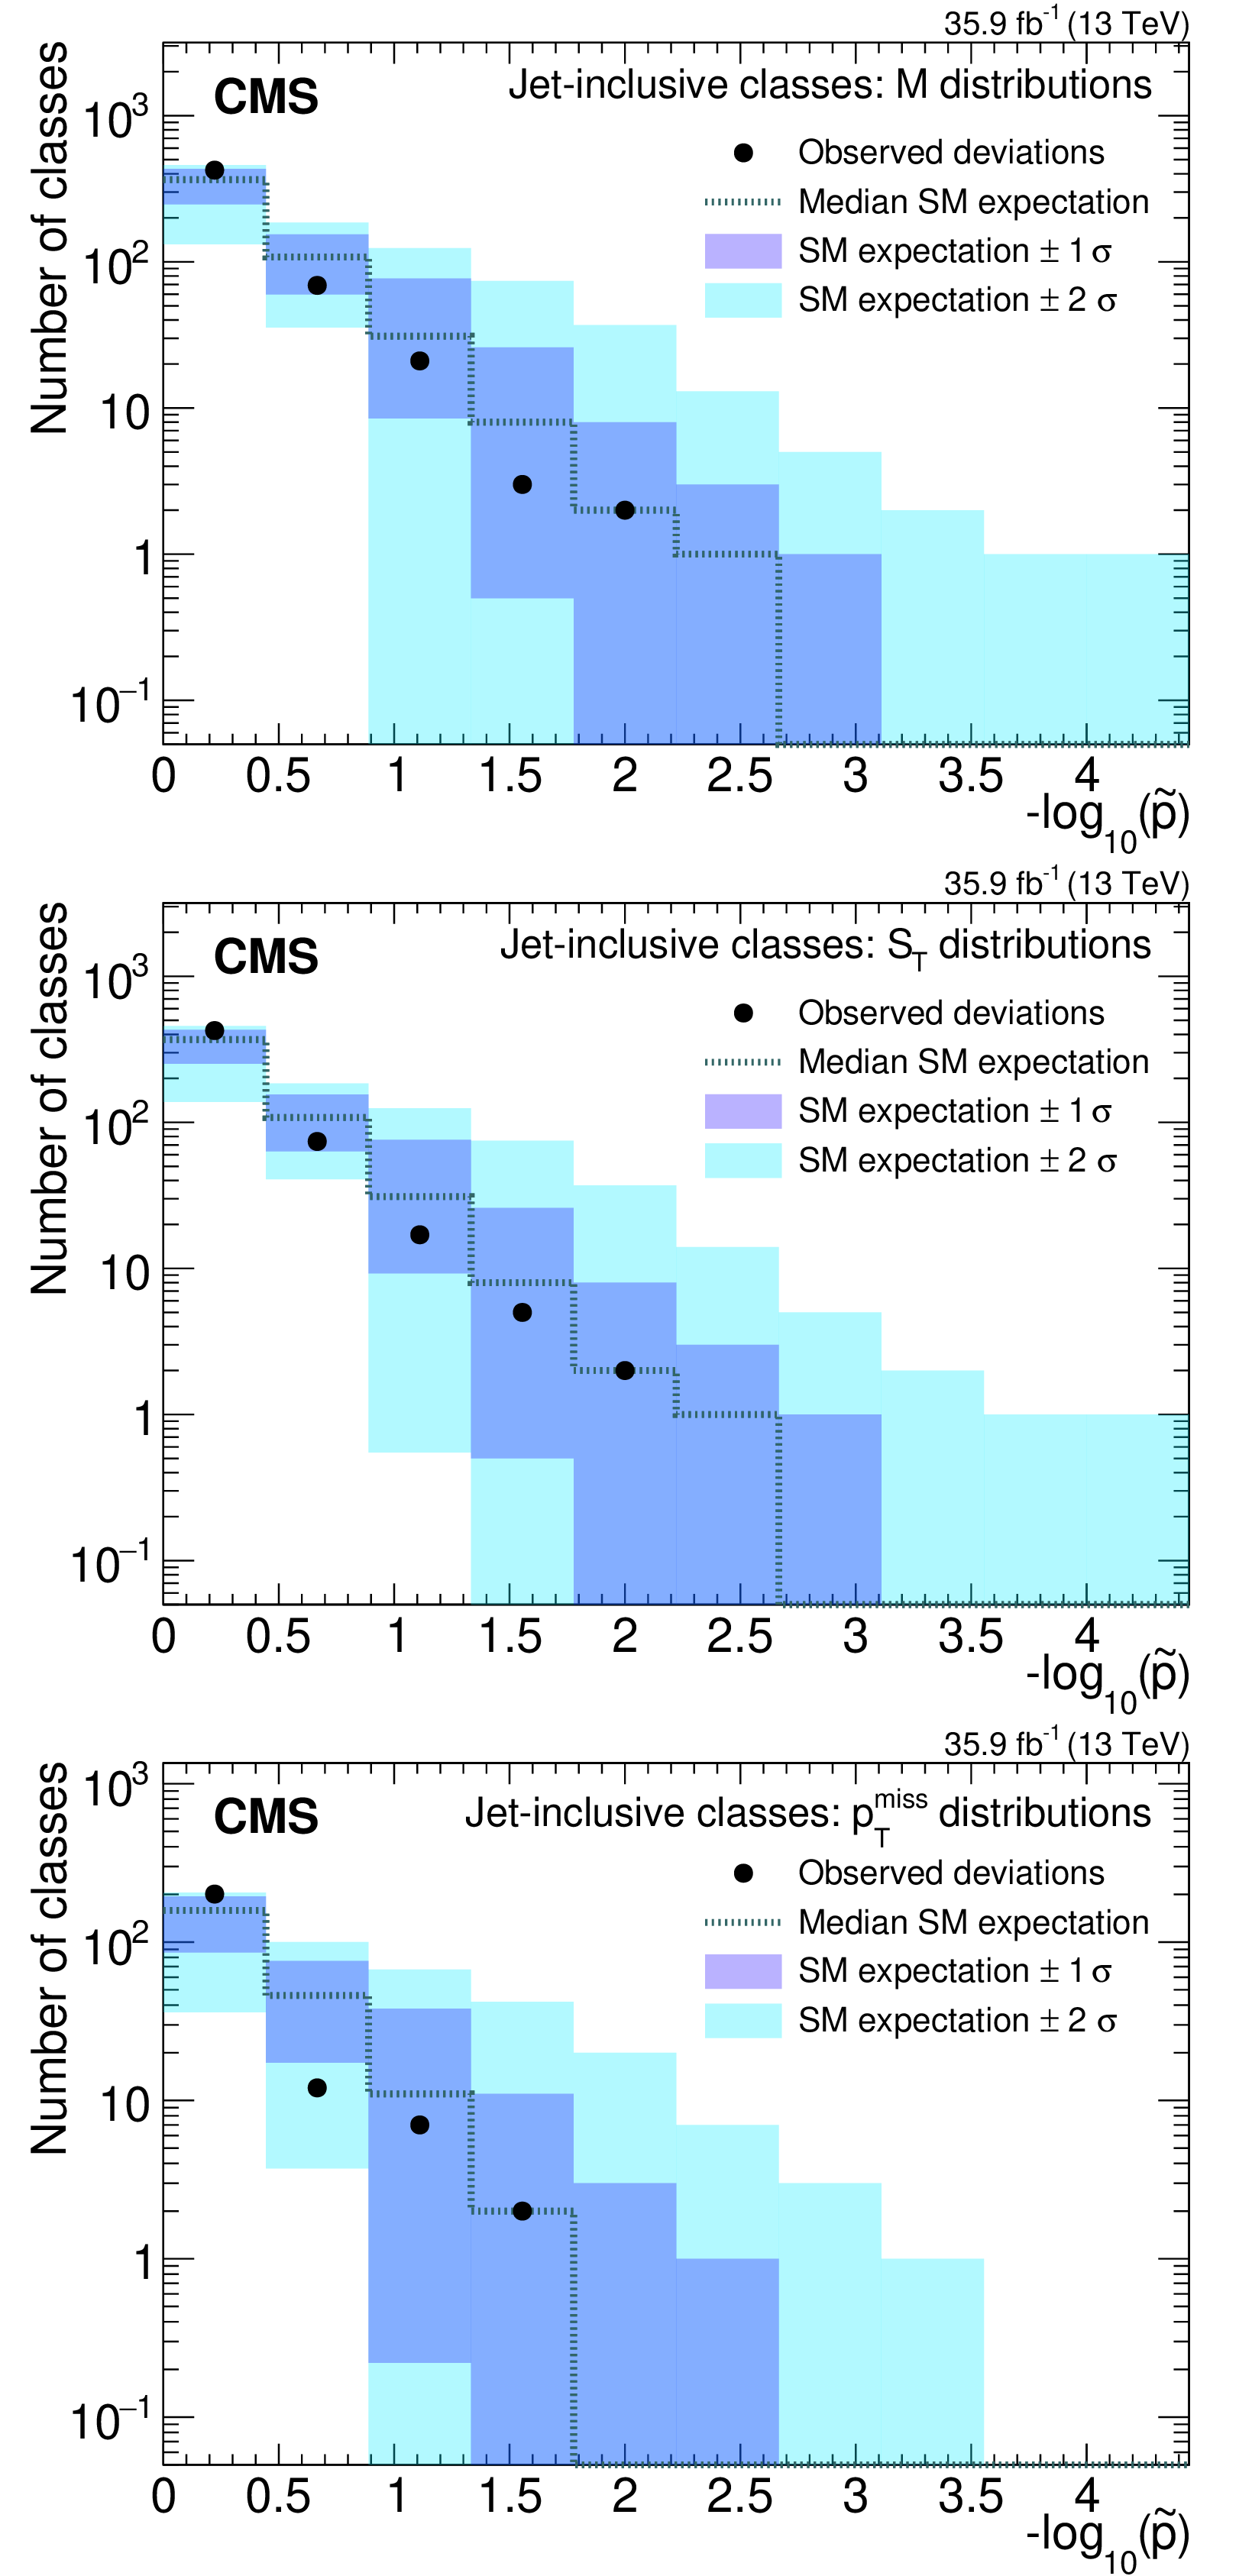
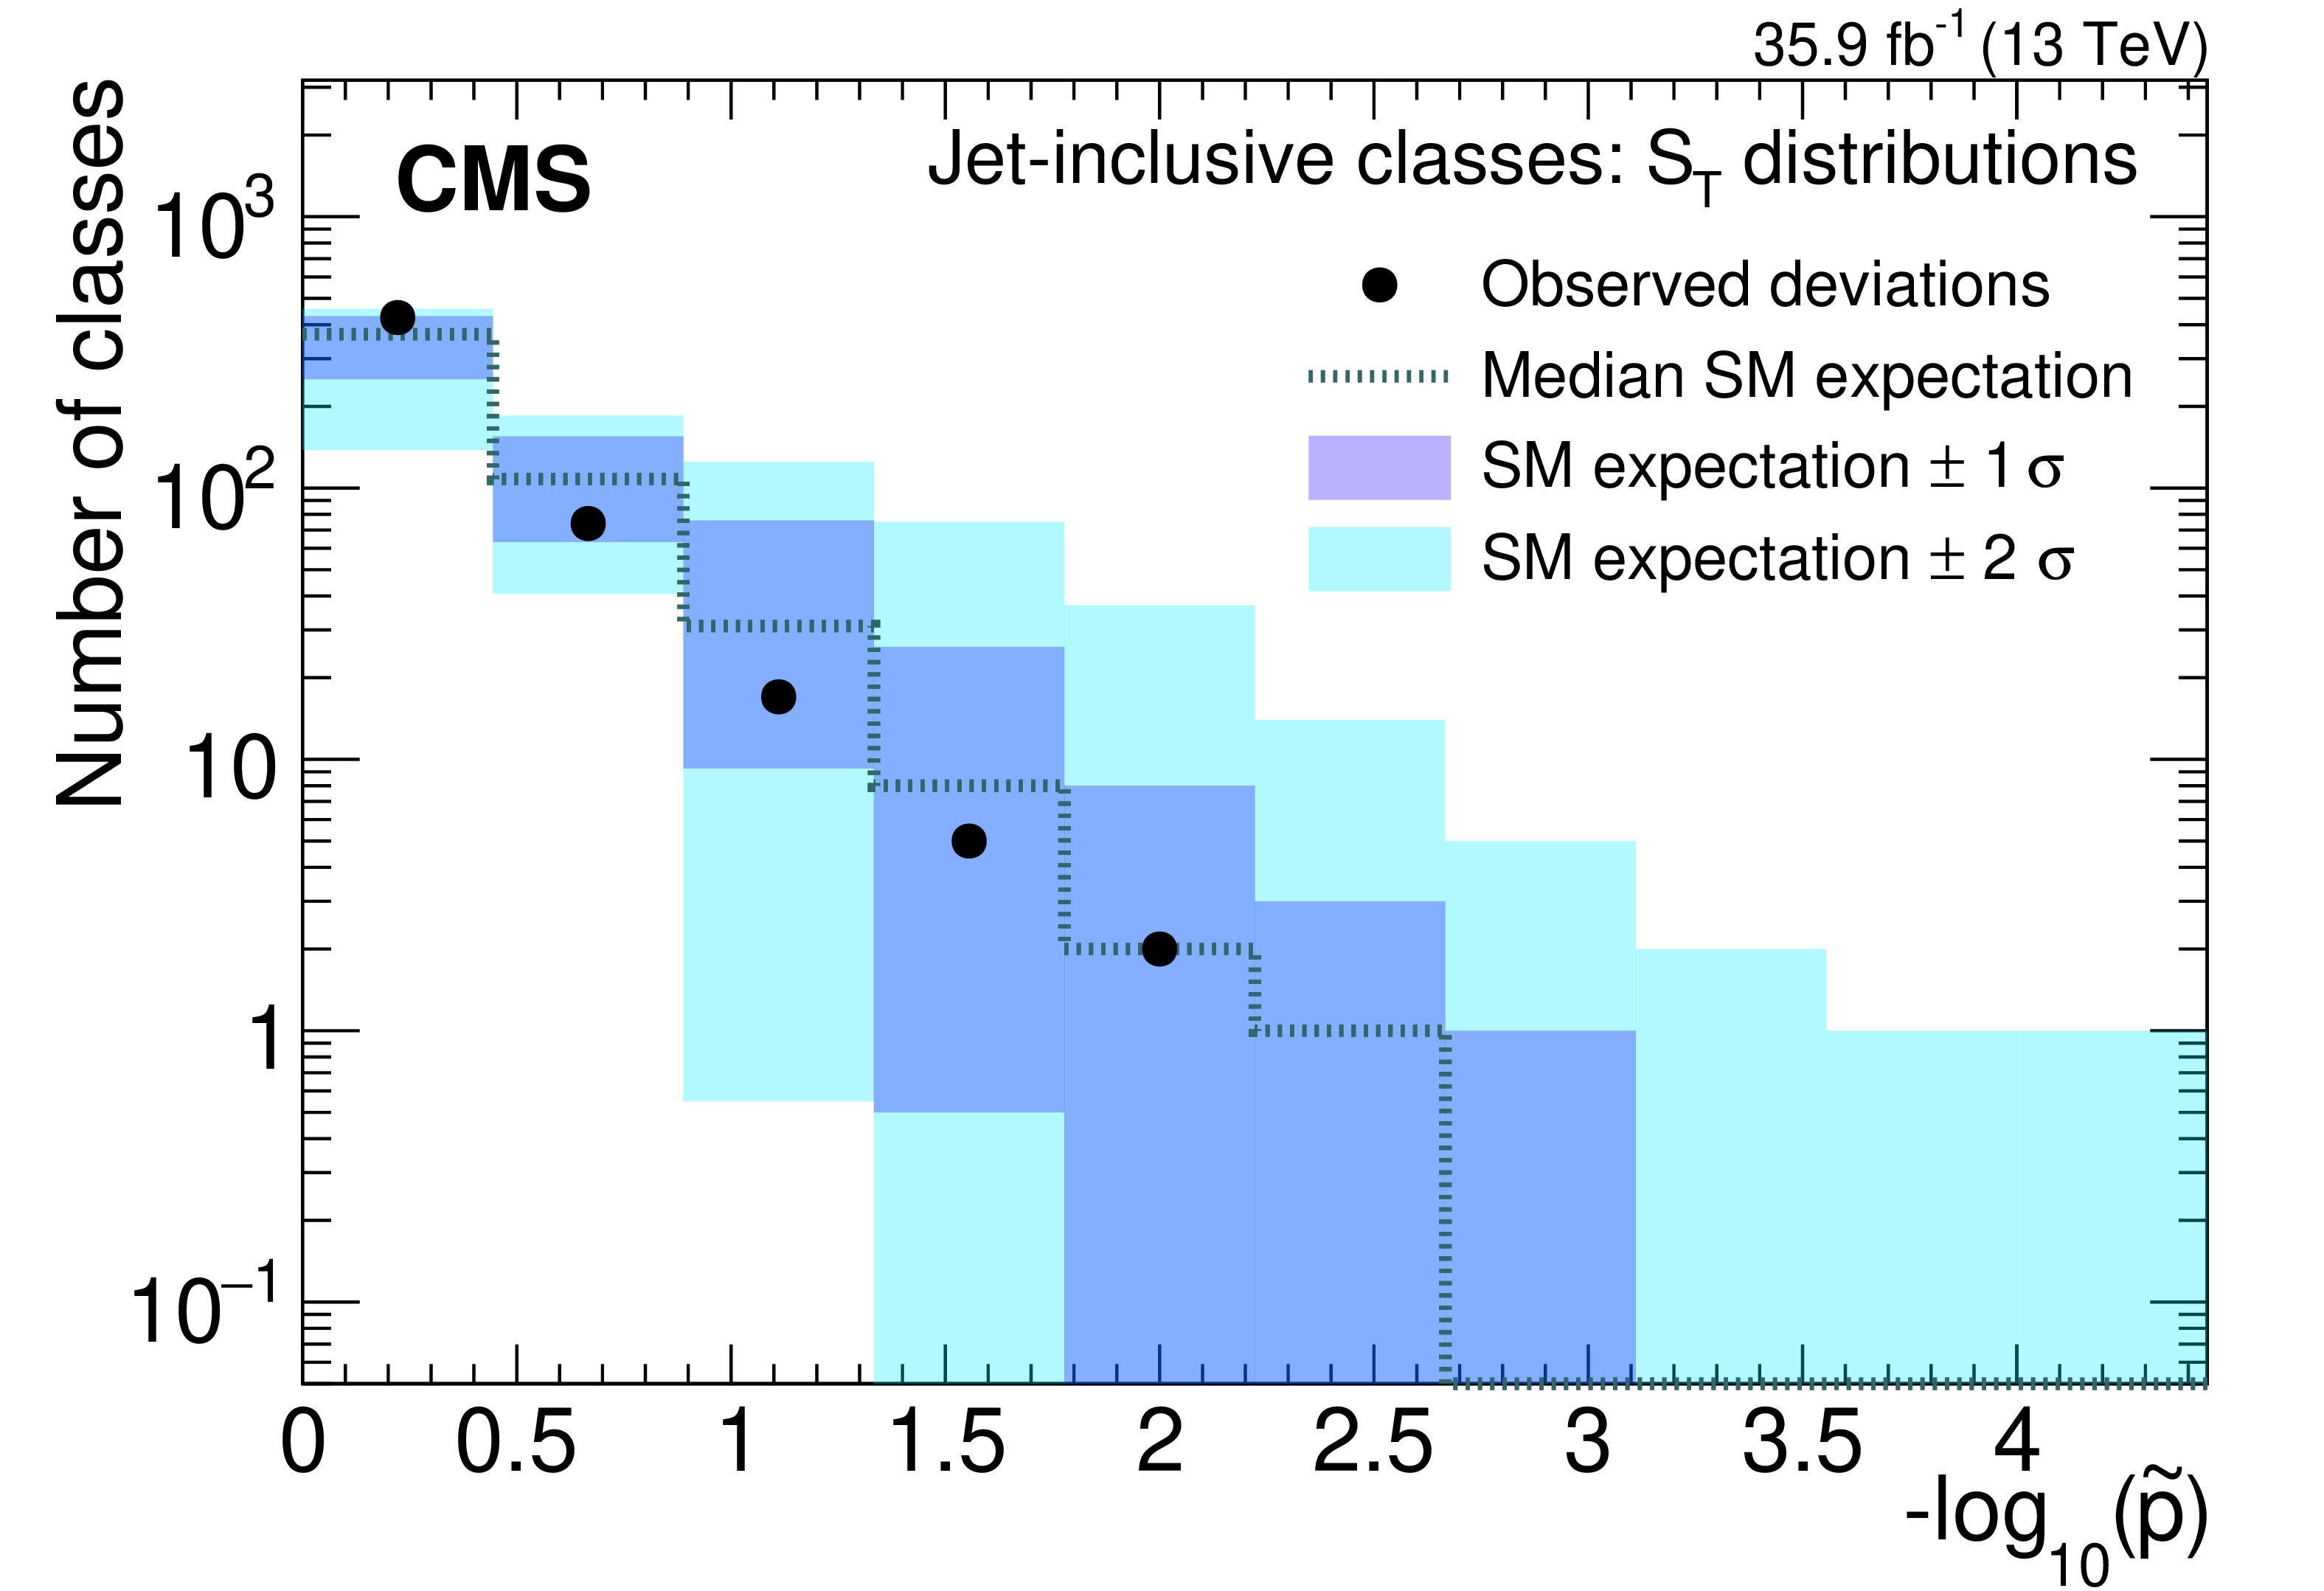
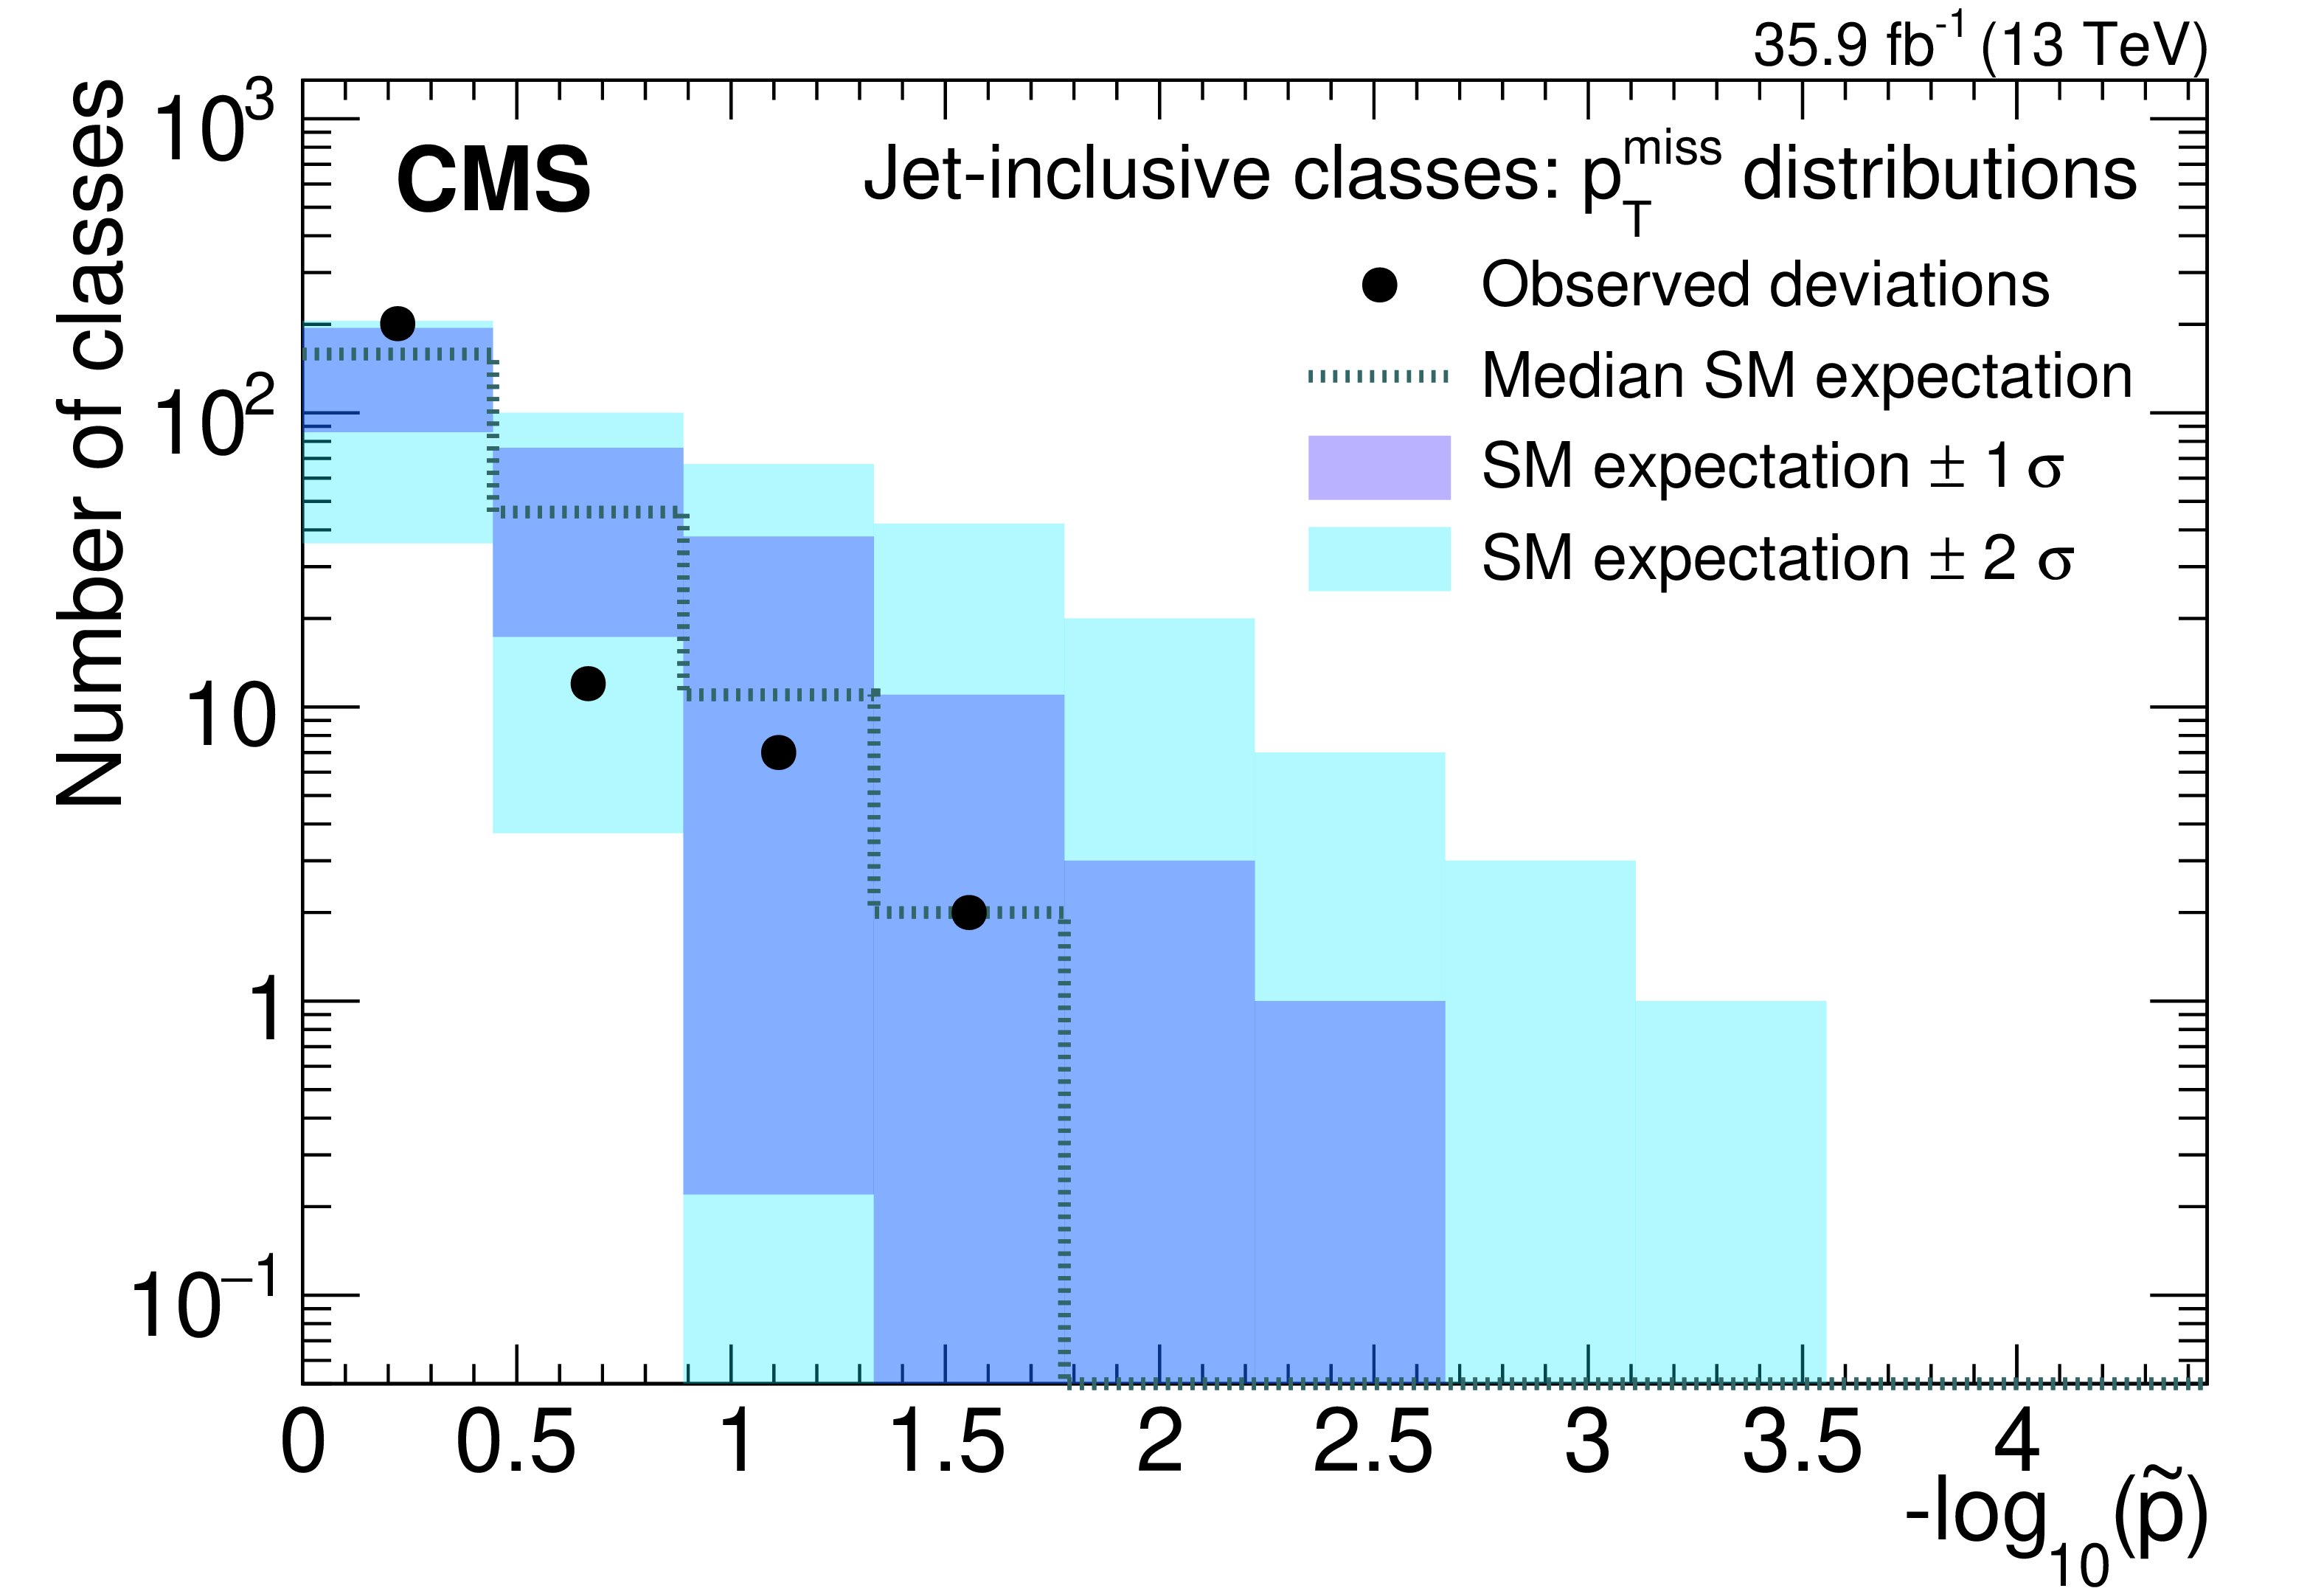
Figure 13:
Distribution of $\tilde{p}$-values for the RoI scan in jet-inclusive classes for the $M$ (upper), ${S_{\mathrm {T}}}$ (middle), and ${{p_{\mathrm {T}}} ^\text {miss}}$ (lower) distributions. |

png pdf |
Figure 13-a:
Distribution of $\tilde{p}$-values for the RoI scan in jet-inclusive classes for the $M$ (upper), ${S_{\mathrm {T}}}$ (middle), and ${{p_{\mathrm {T}}} ^\text {miss}}$ (lower) distributions. |
png pdf |
Figure 13-b:
Distribution of $\tilde{p}$-values for the RoI scan in jet-inclusive classes for the $M$ (upper), ${S_{\mathrm {T}}}$ (middle), and ${{p_{\mathrm {T}}} ^\text {miss}}$ (lower) distributions. |
png pdf |
Figure 13-c:
Distribution of $\tilde{p}$-values for the RoI scan in jet-inclusive classes for the $M$ (upper), ${S_{\mathrm {T}}}$ (middle), and ${{p_{\mathrm {T}}} ^\text {miss}}$ (lower) distributions. |
| Tables | |
png pdf |
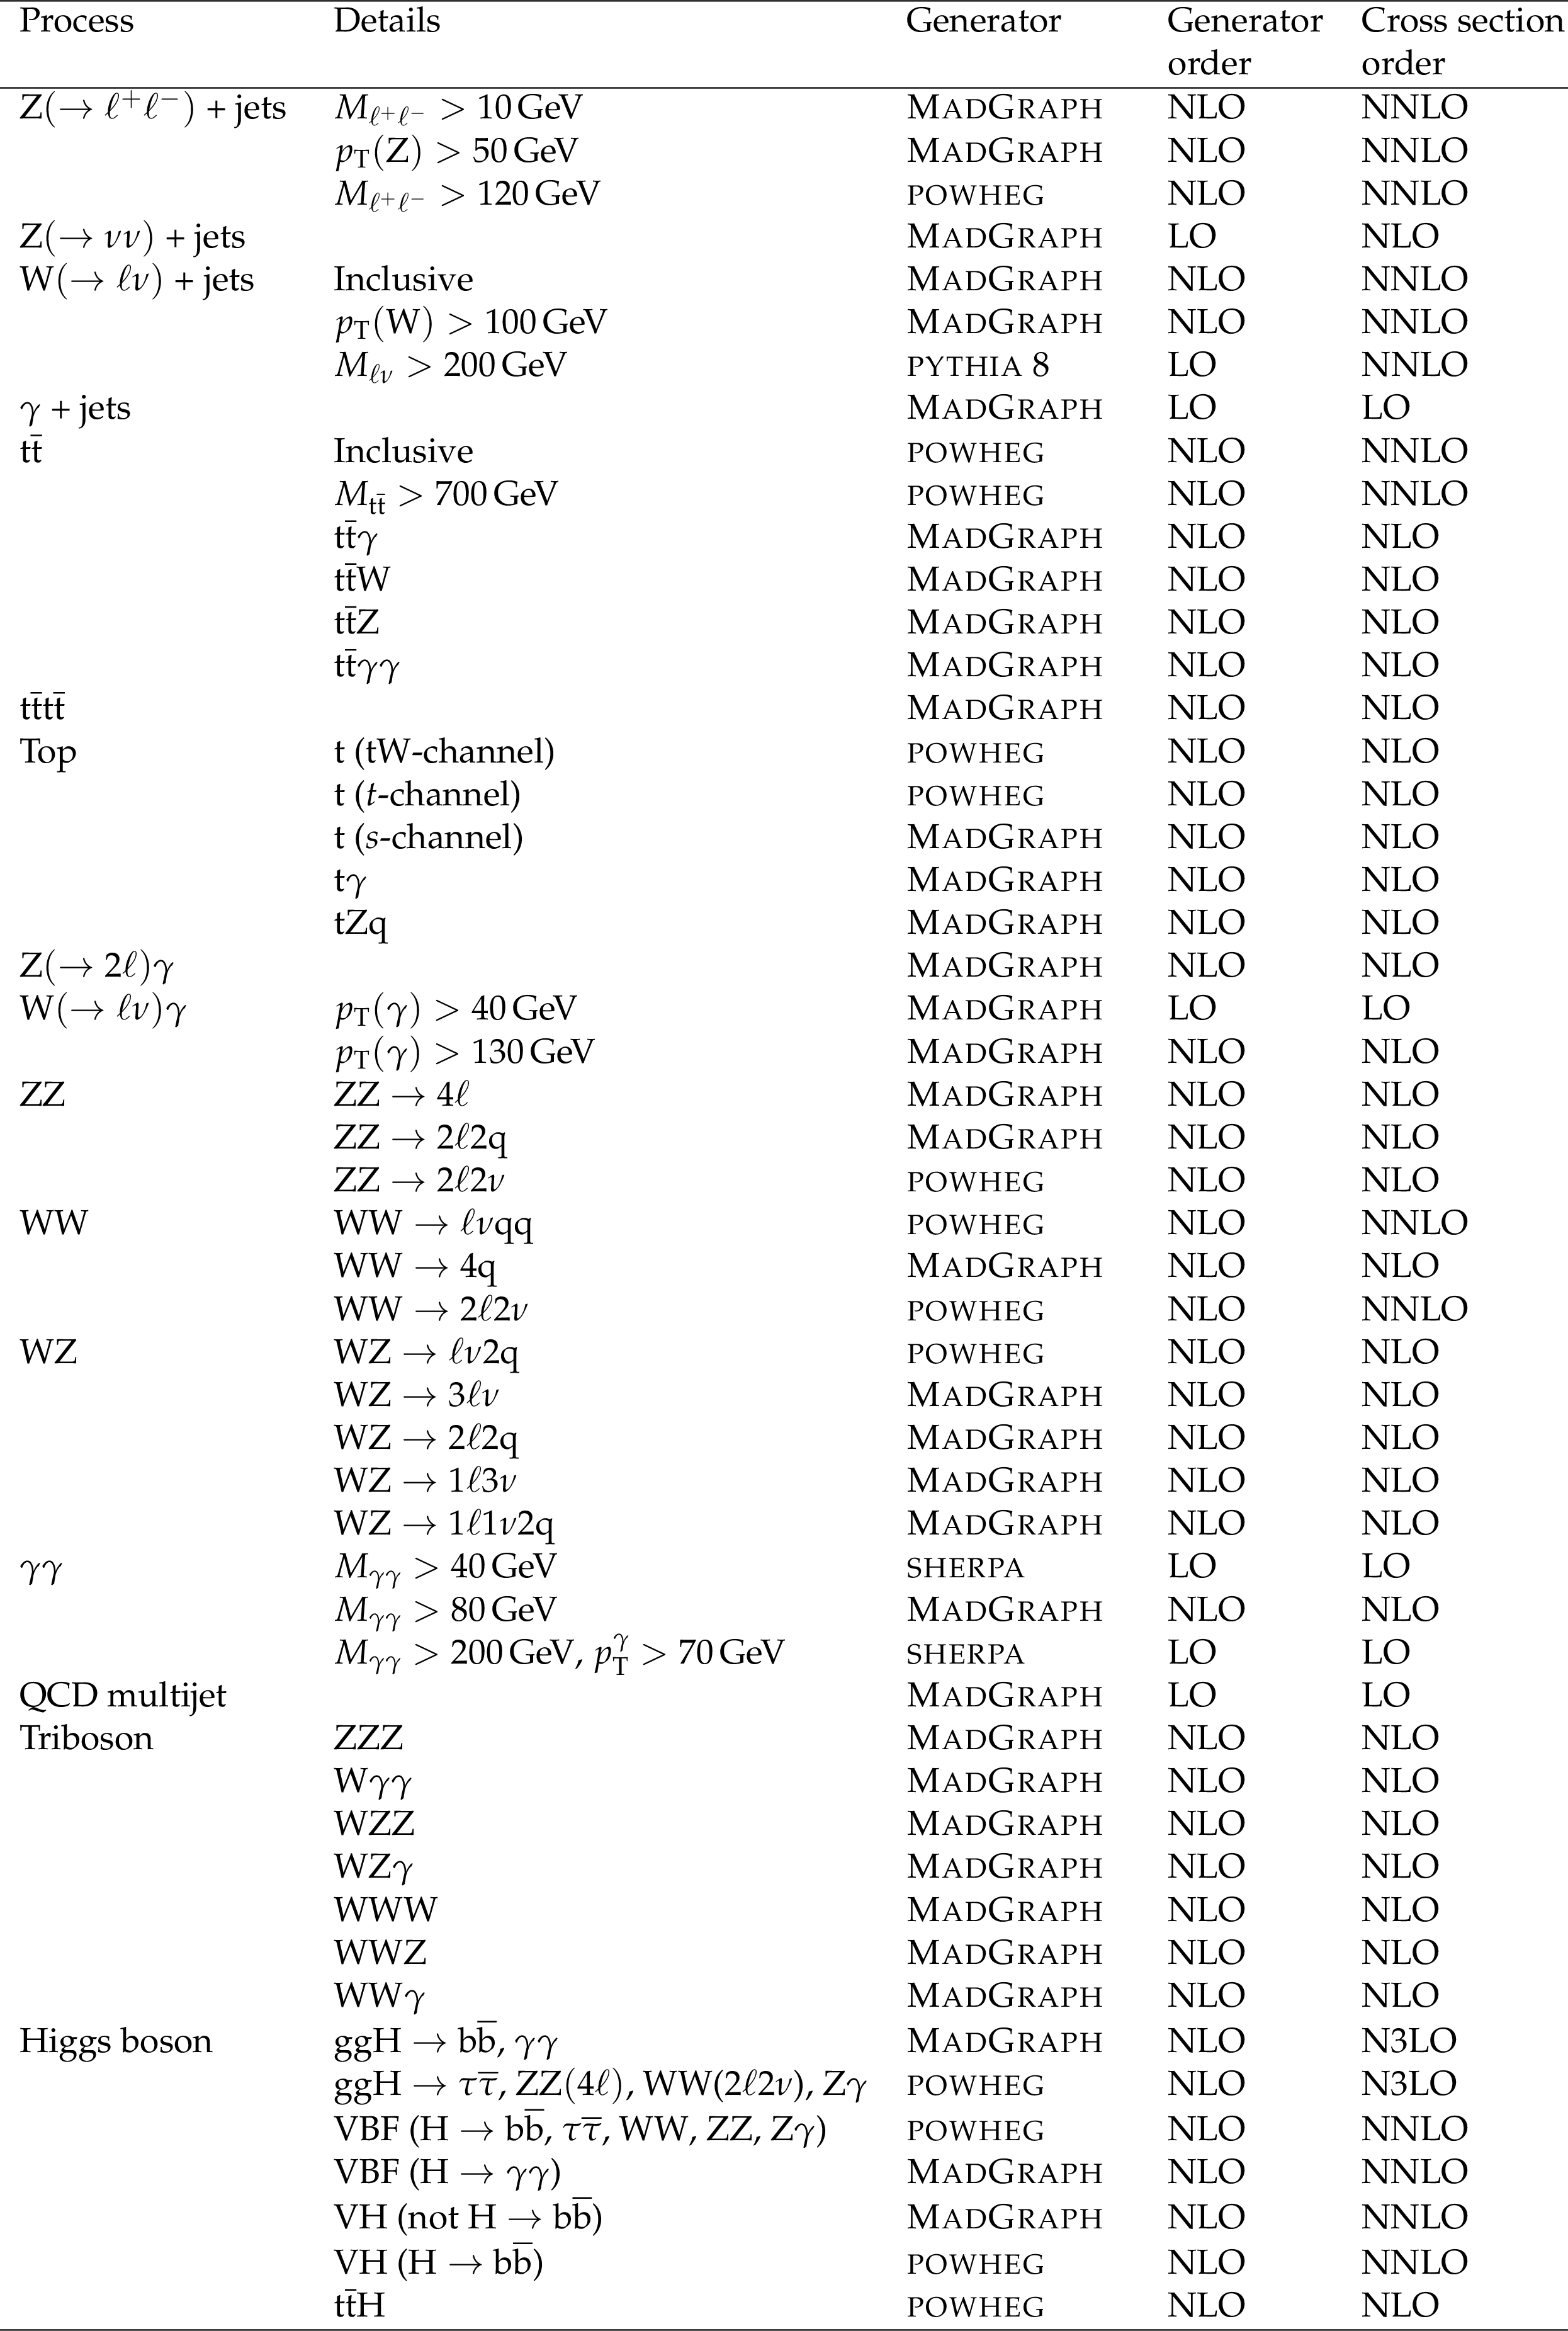
Table 1:
Summary of standard model simulated samples. The generator described in the table corresponds to the matrix element generator. |
png pdf |
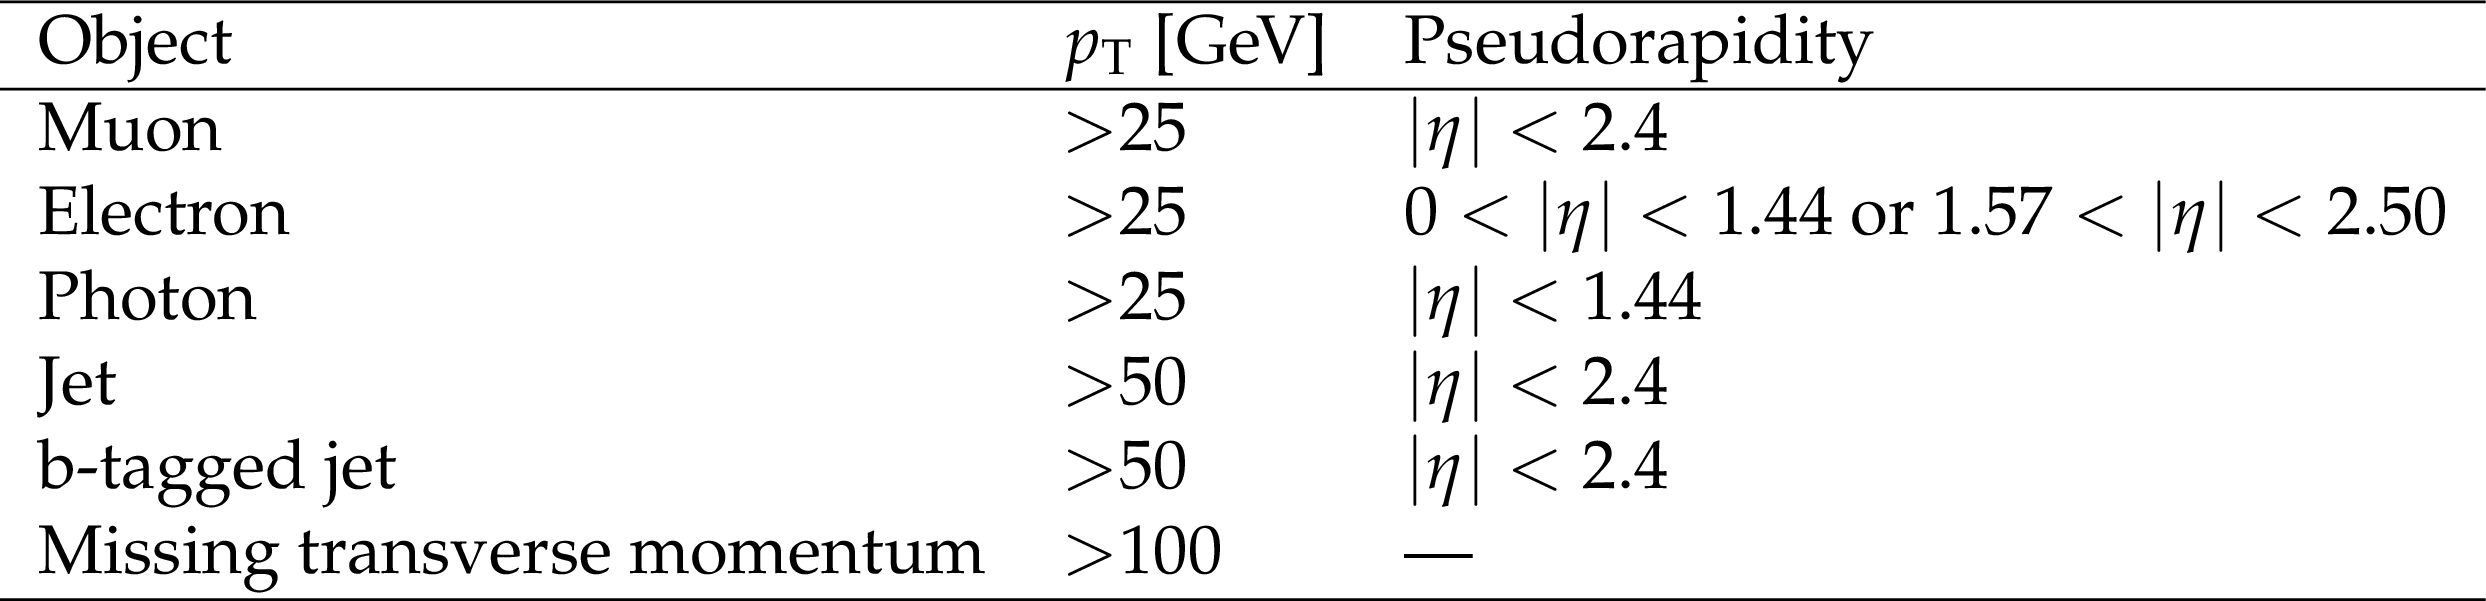
Table 2:
Summary of object selection criteria discussed in Section 4. |
png pdf |
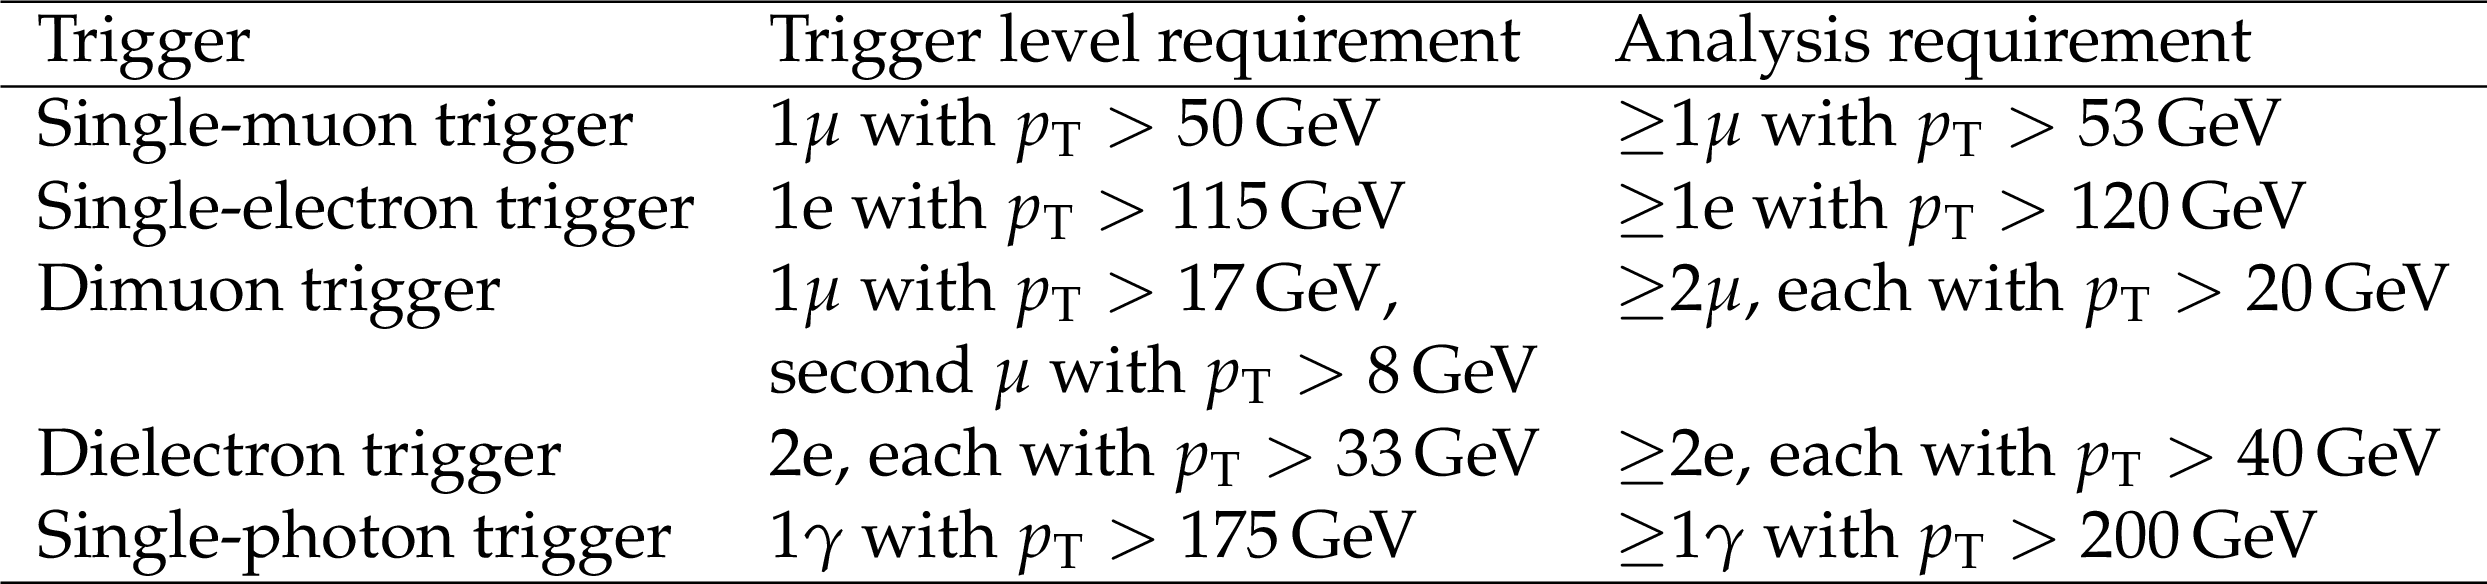
Table 3:
Summary of online and offline criteria. |

png pdf |
Table 4:
Summary of systematic uncertainties in the analysis. |
png pdf |
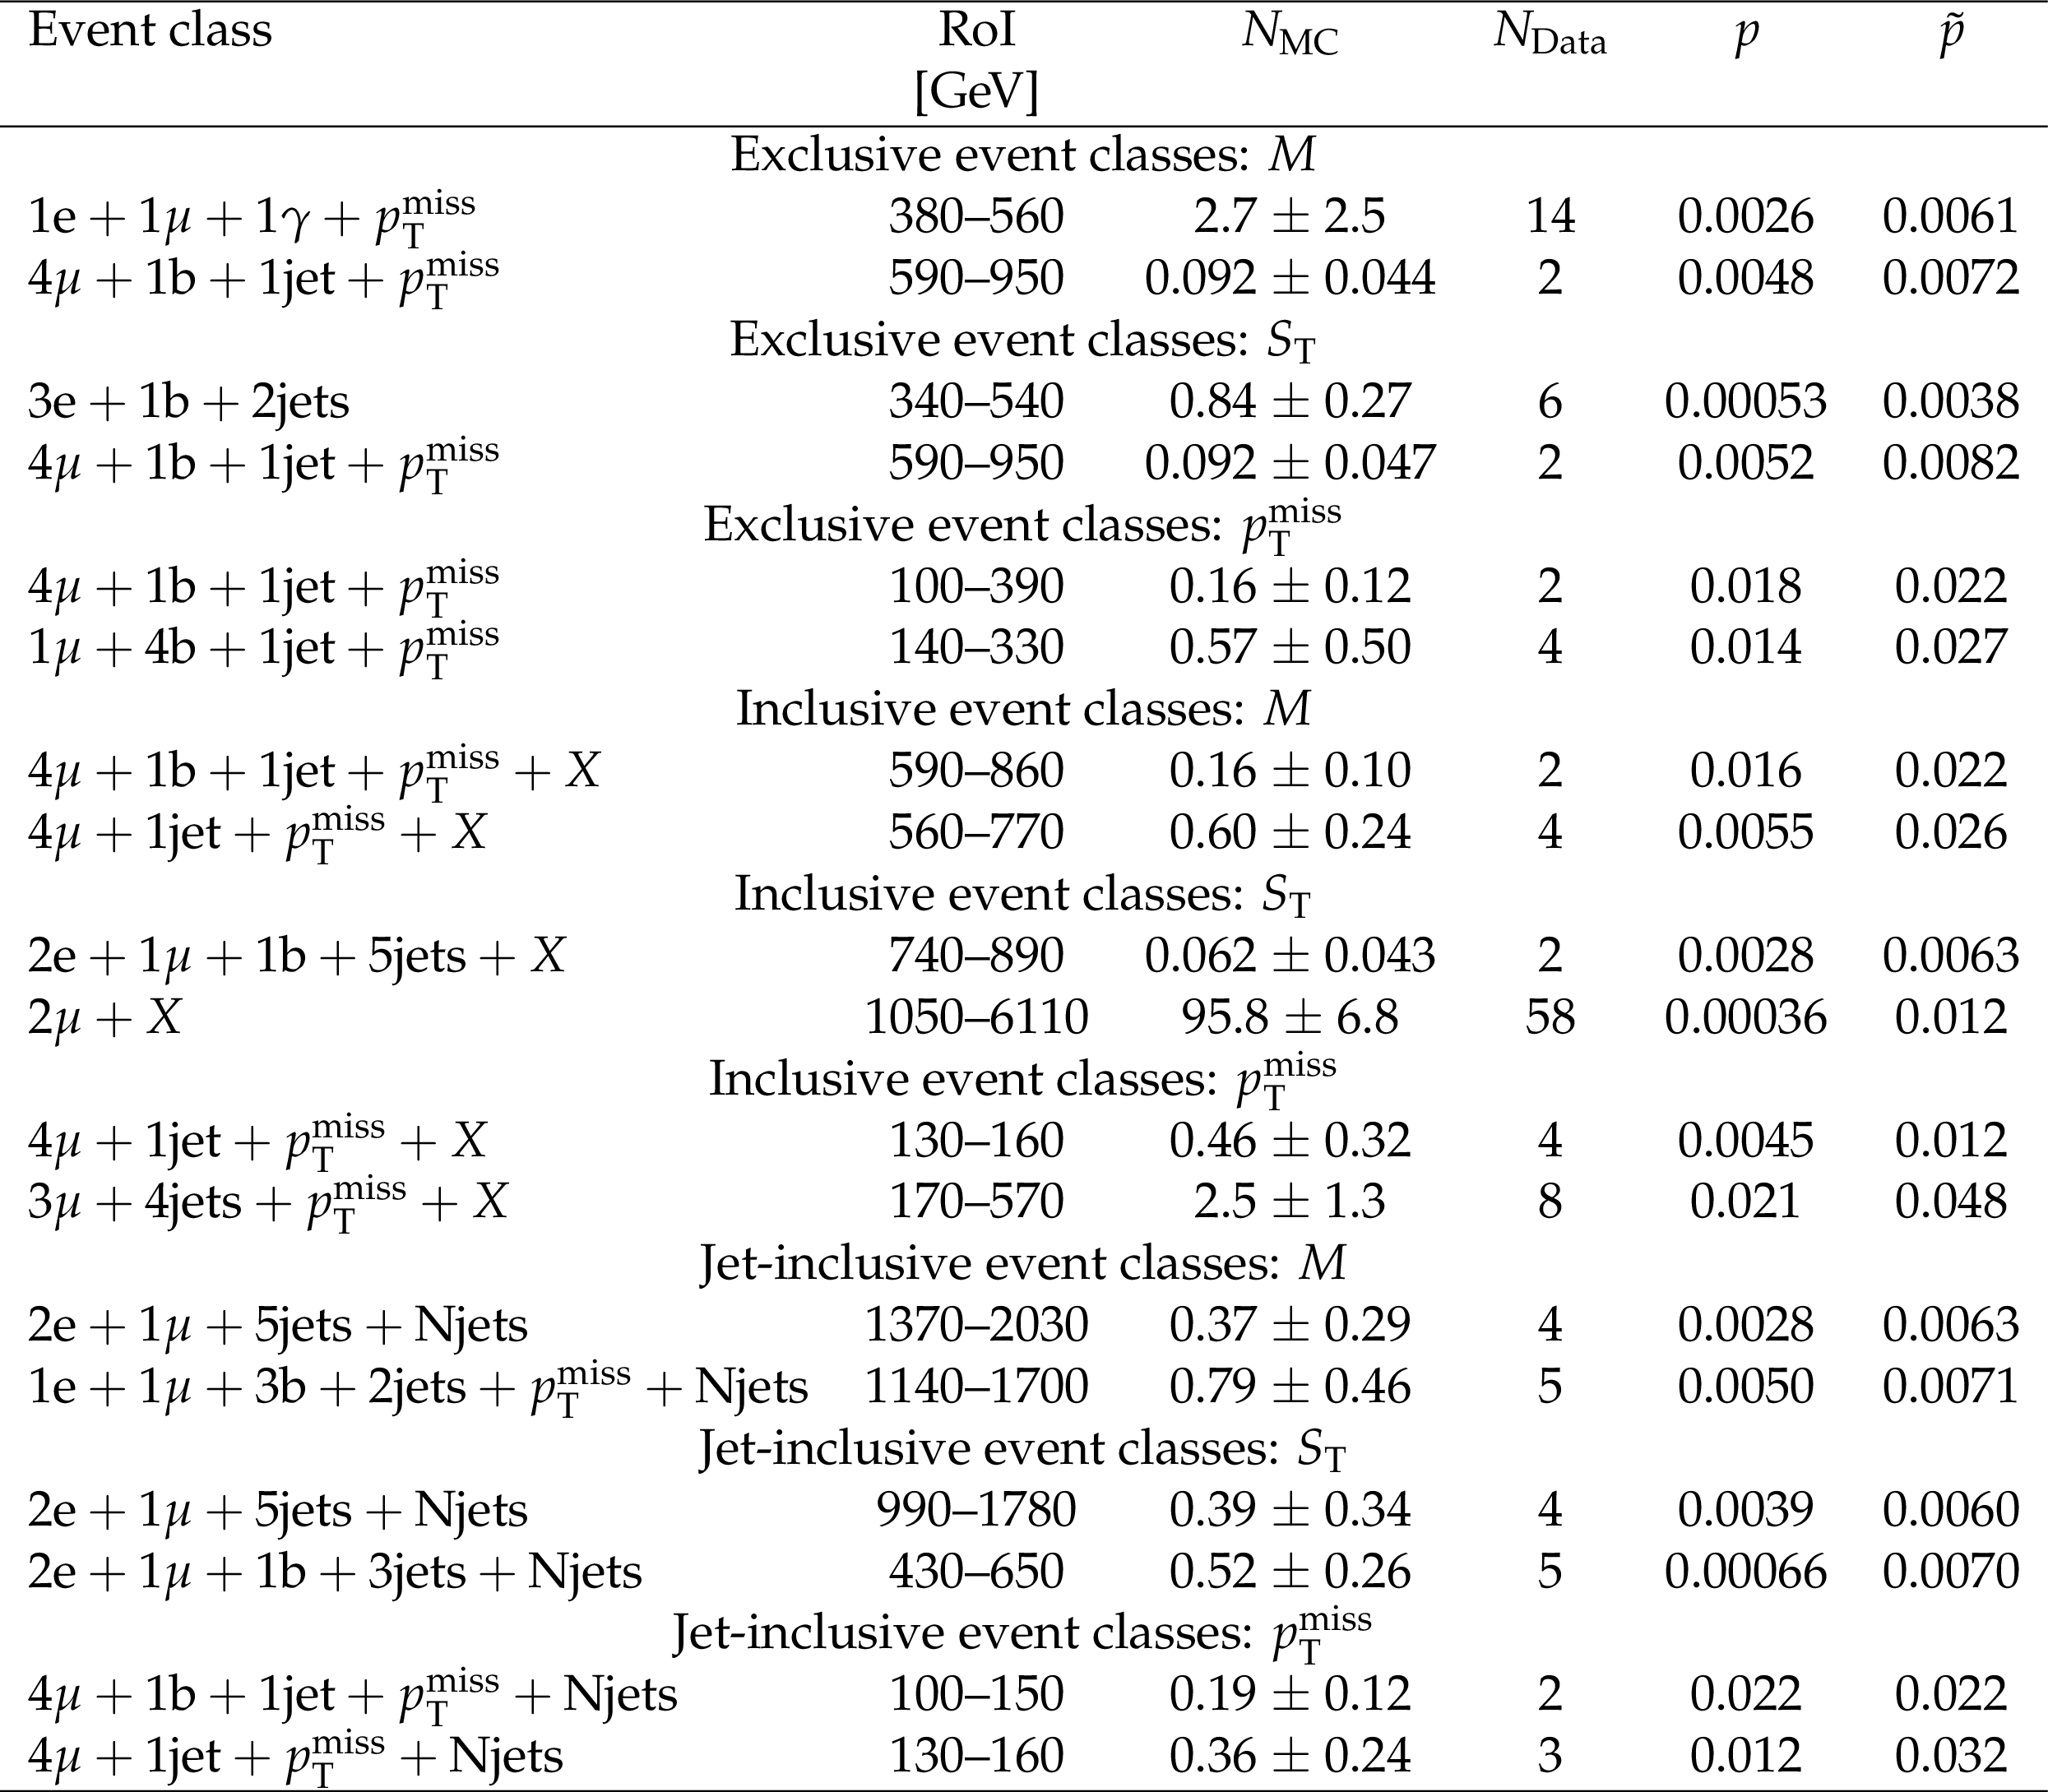
Table 5:
Overview of the two most significant event classes in each RoI scan. Details of the RoI, the expectation from the SM simulation, and the number of data events within the RoI are shown along with the $p$- and $\tilde{p}$-values. |
| Summary |
|
The Model Unspecific Search in CMS (MUSiC) analysis has been presented. The analysis is based on data recorded by the CMS detector at the LHC during proton-proton collisions at a centre-of-mass energy of 13 TeV in 2016 and corresponding to an integrated luminosity of 35.9 fb$^{-1}$ . The MUSiC analysis searches for anomalies and possible hints of physics beyond the standard model in the data using a model-independent approach, relying solely on the assumptions of the well-tested standard model. Events from data and simulation containing at least one electron or muon have been sorted into event classes based on their final-state topology, defined by the number of electrons, muons, photons, jets and b-tagged jets, and missing transverse momentum. The event yields were compared between the data and the expectation in a wide range of event classes. The kinematic distributions corresponding to the sum of transverse momenta, invariant (or transverse) mass, and missing transverse momentum in each of the event classes have been scanned using a region of interest algorithm. The algorithm identifies deviations of the data from the simulated standard model predictions, calculating a $p$-value of any observed deviation after correcting for the look-elsewhere effect. A global overview of the results from the different event classes and distributions has been presented. The sensitivity and robustness of the analysis has been shown in a variety of different studies. No significant deviations from the standard model expectations were found in the data analysed by the MUSiC algorithm. A wide range of final-state topologies has been studied, and there is agreement between data and the standard model simulation given the experimental and theoretical uncertainties. This analysis complements dedicated search analyses by significantly expanding the range of final states covered using a model independent approach with the largest data set to date to probe phase space regions beyond the reach of previous general searches. |
| Additional Figures | |
png pdf |
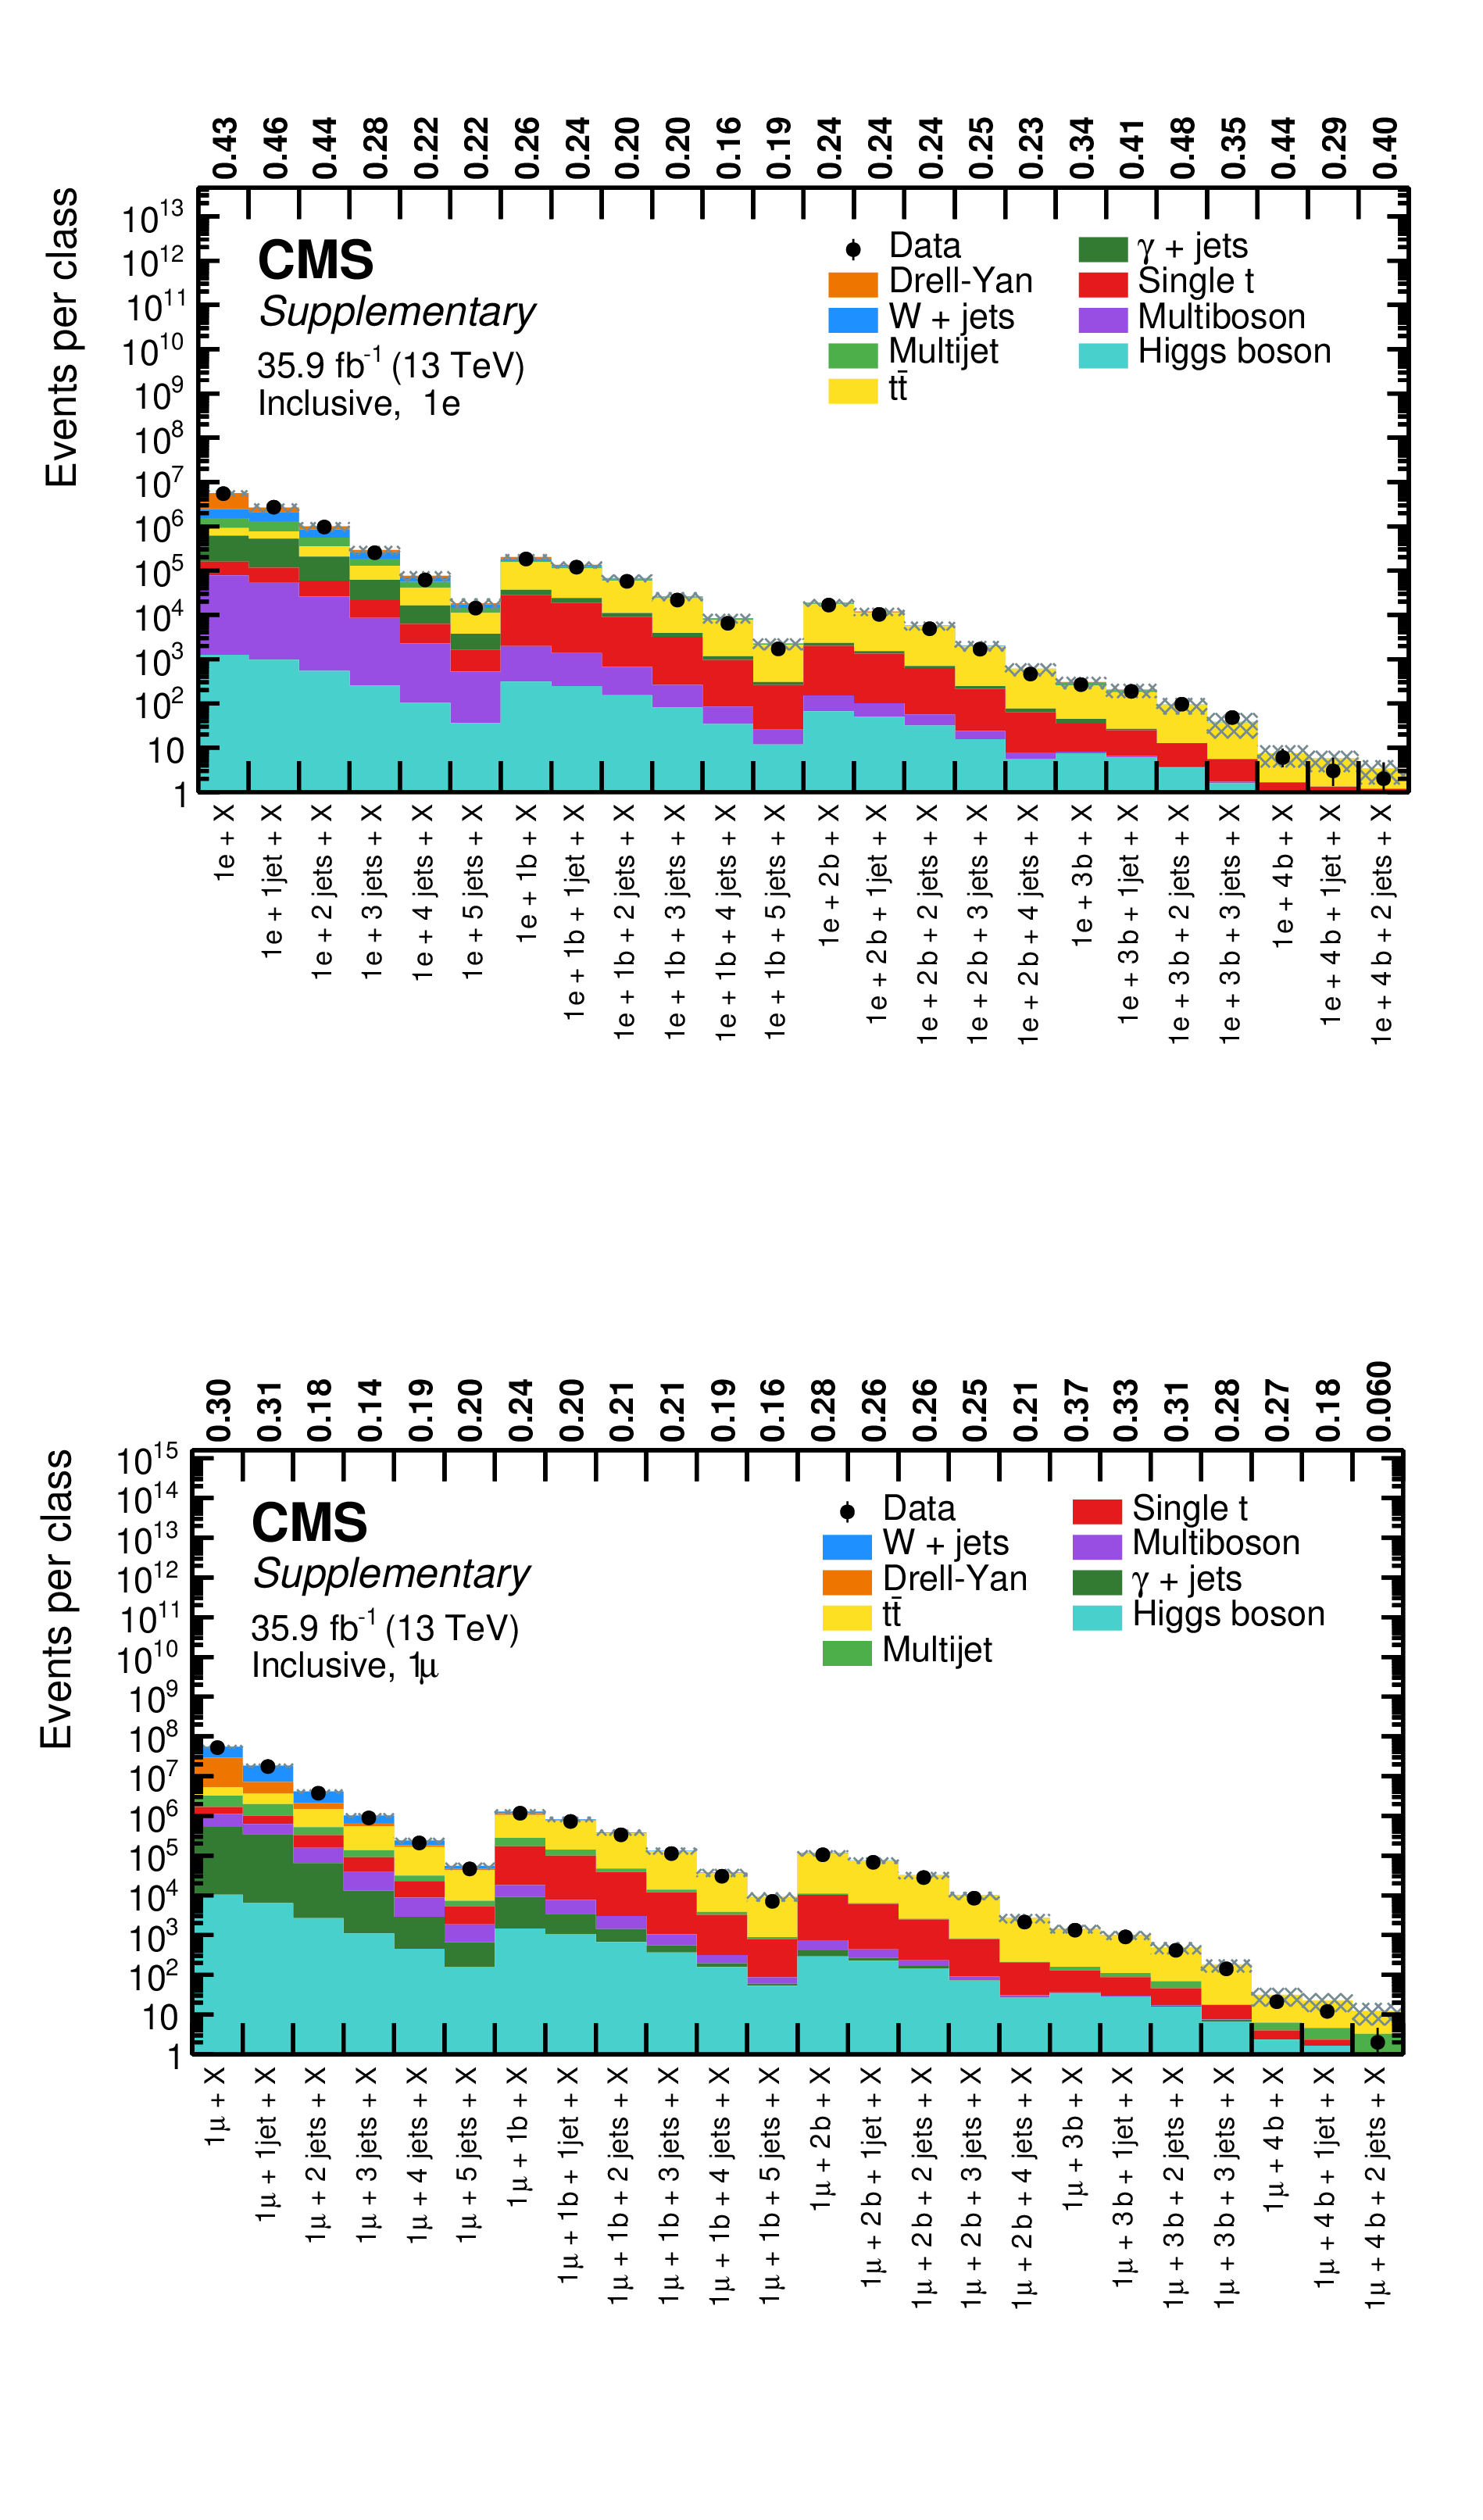
Additional Figure 1:
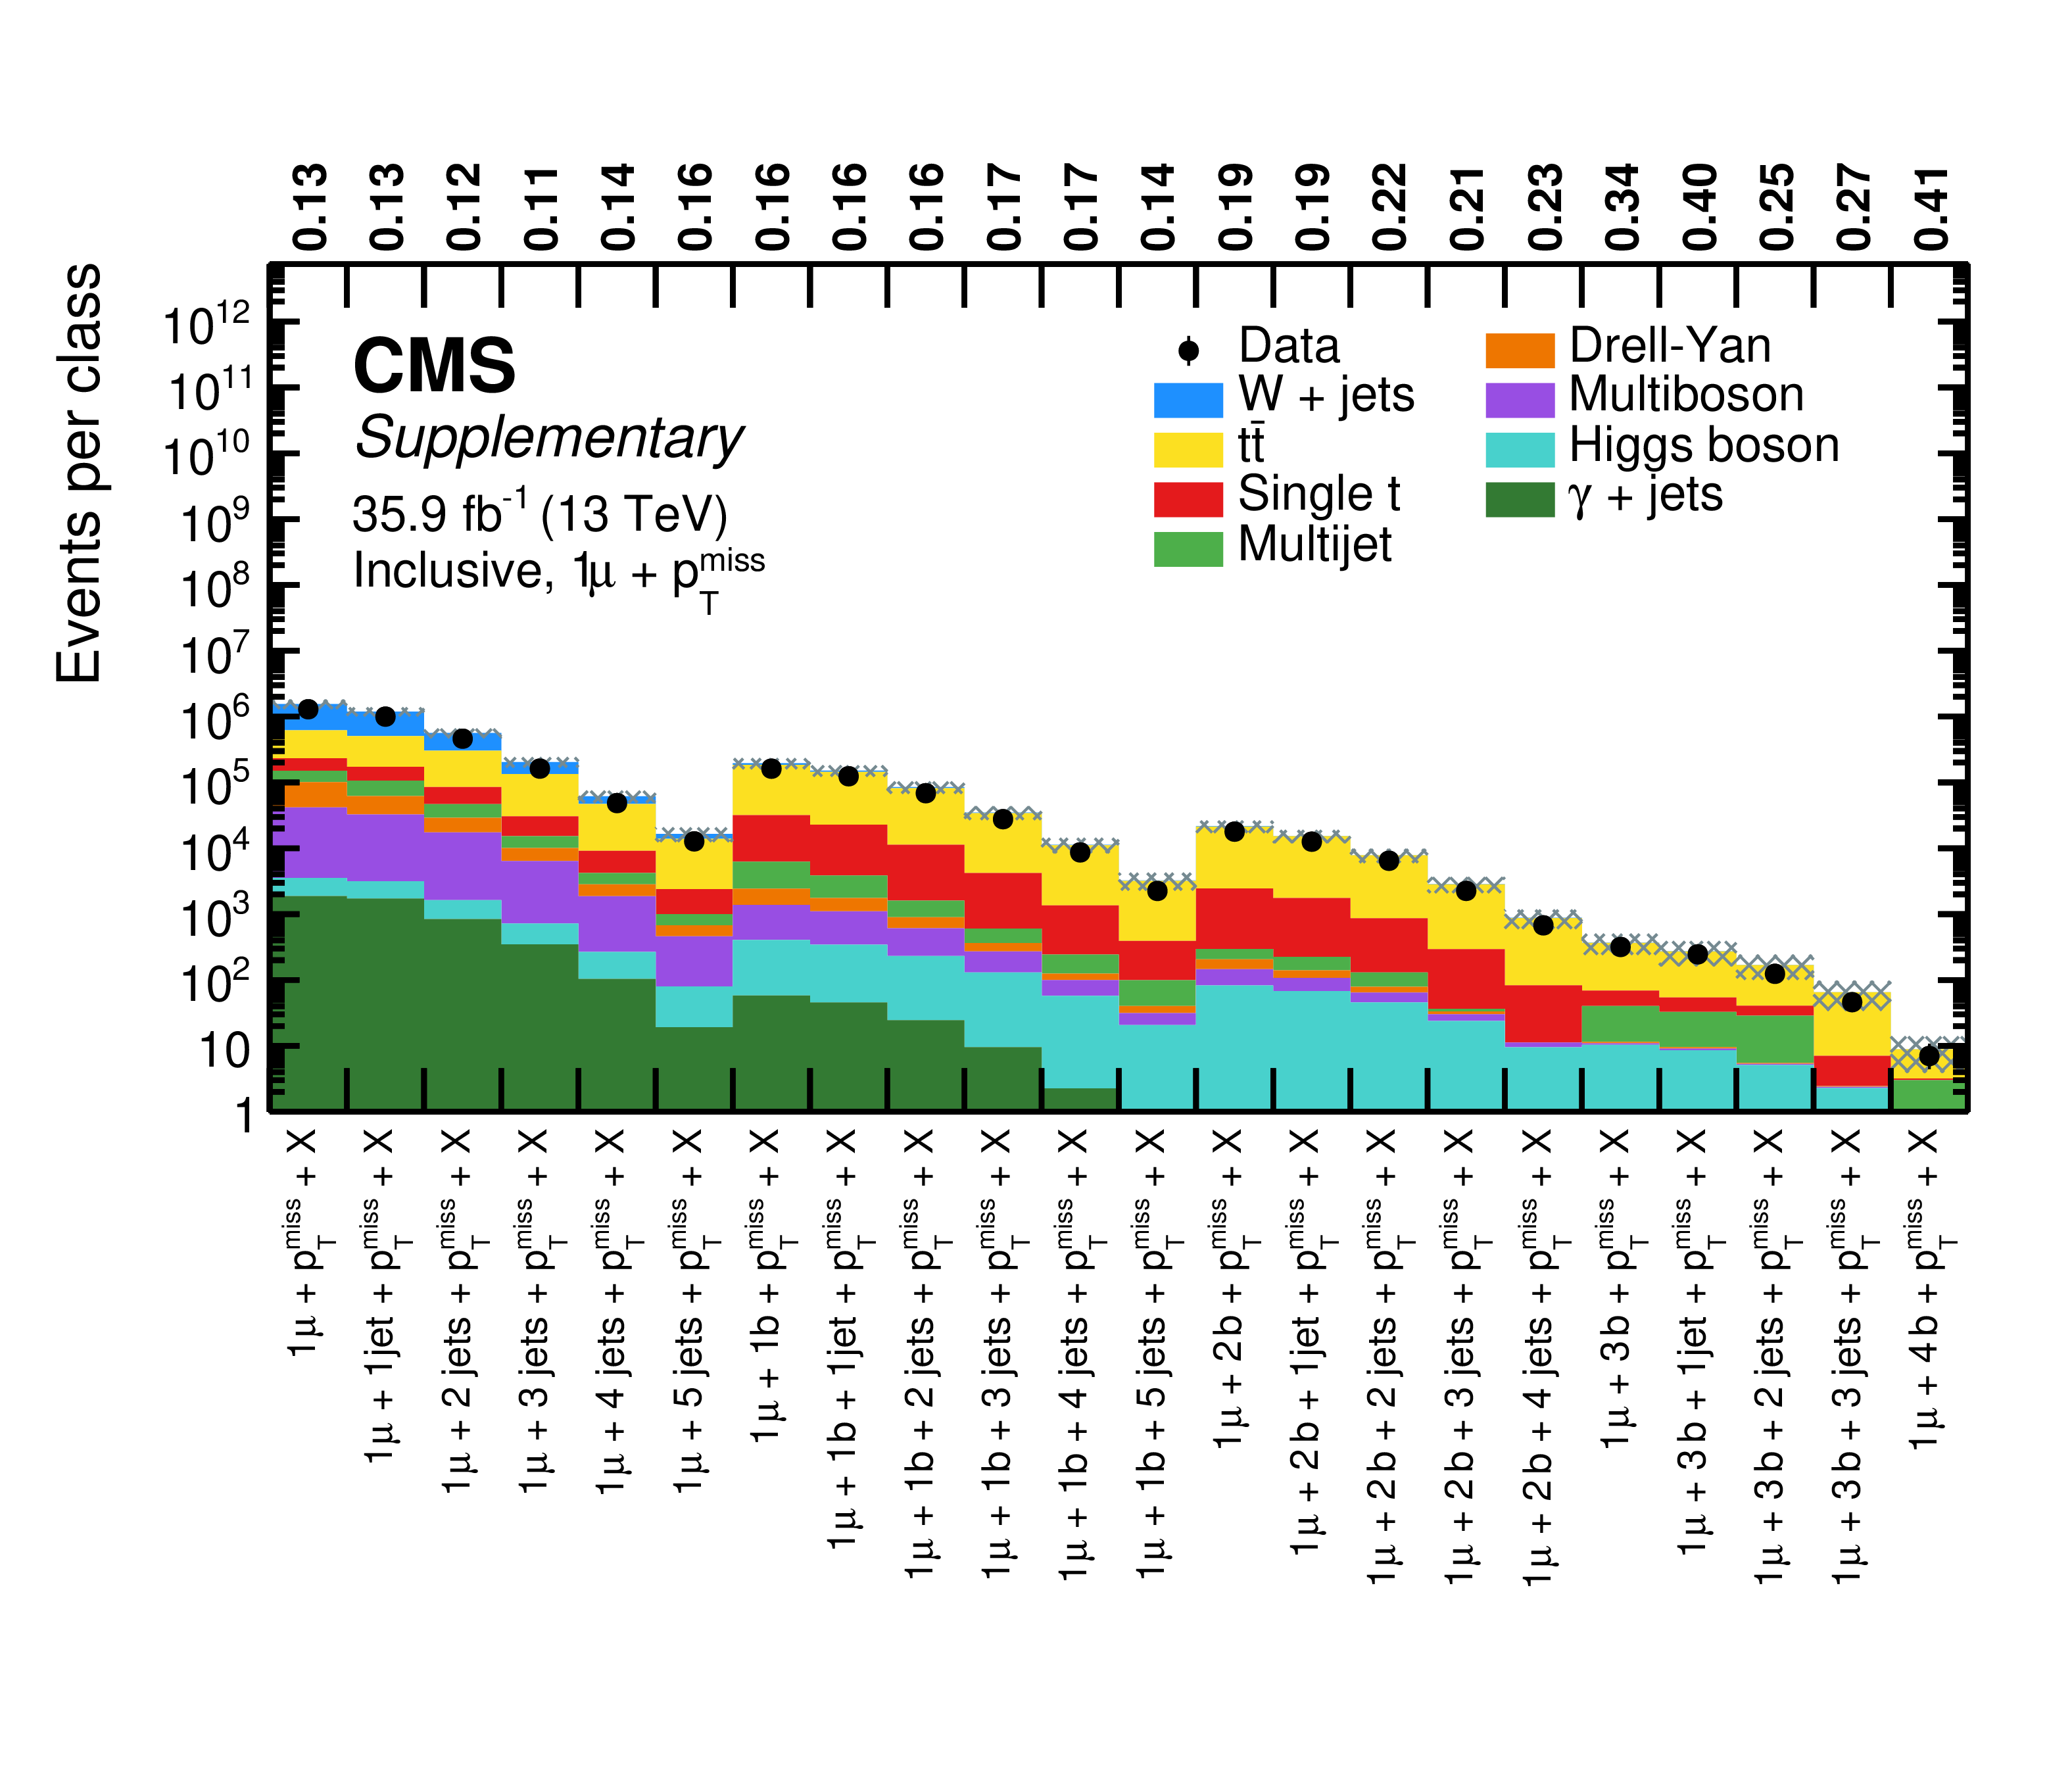
Overview of total event yields for the inclusive event classes of the single-electron (upper) and single-muon (lower) object groups. Measured data are shown as black markers, contributions from SM processes are represented by coloured histograms, and the shaded region represents the uncertainty in the SM background. The numbers above the plot indicate the observed p-value for the agreement of data and simulation. |
png pdf |
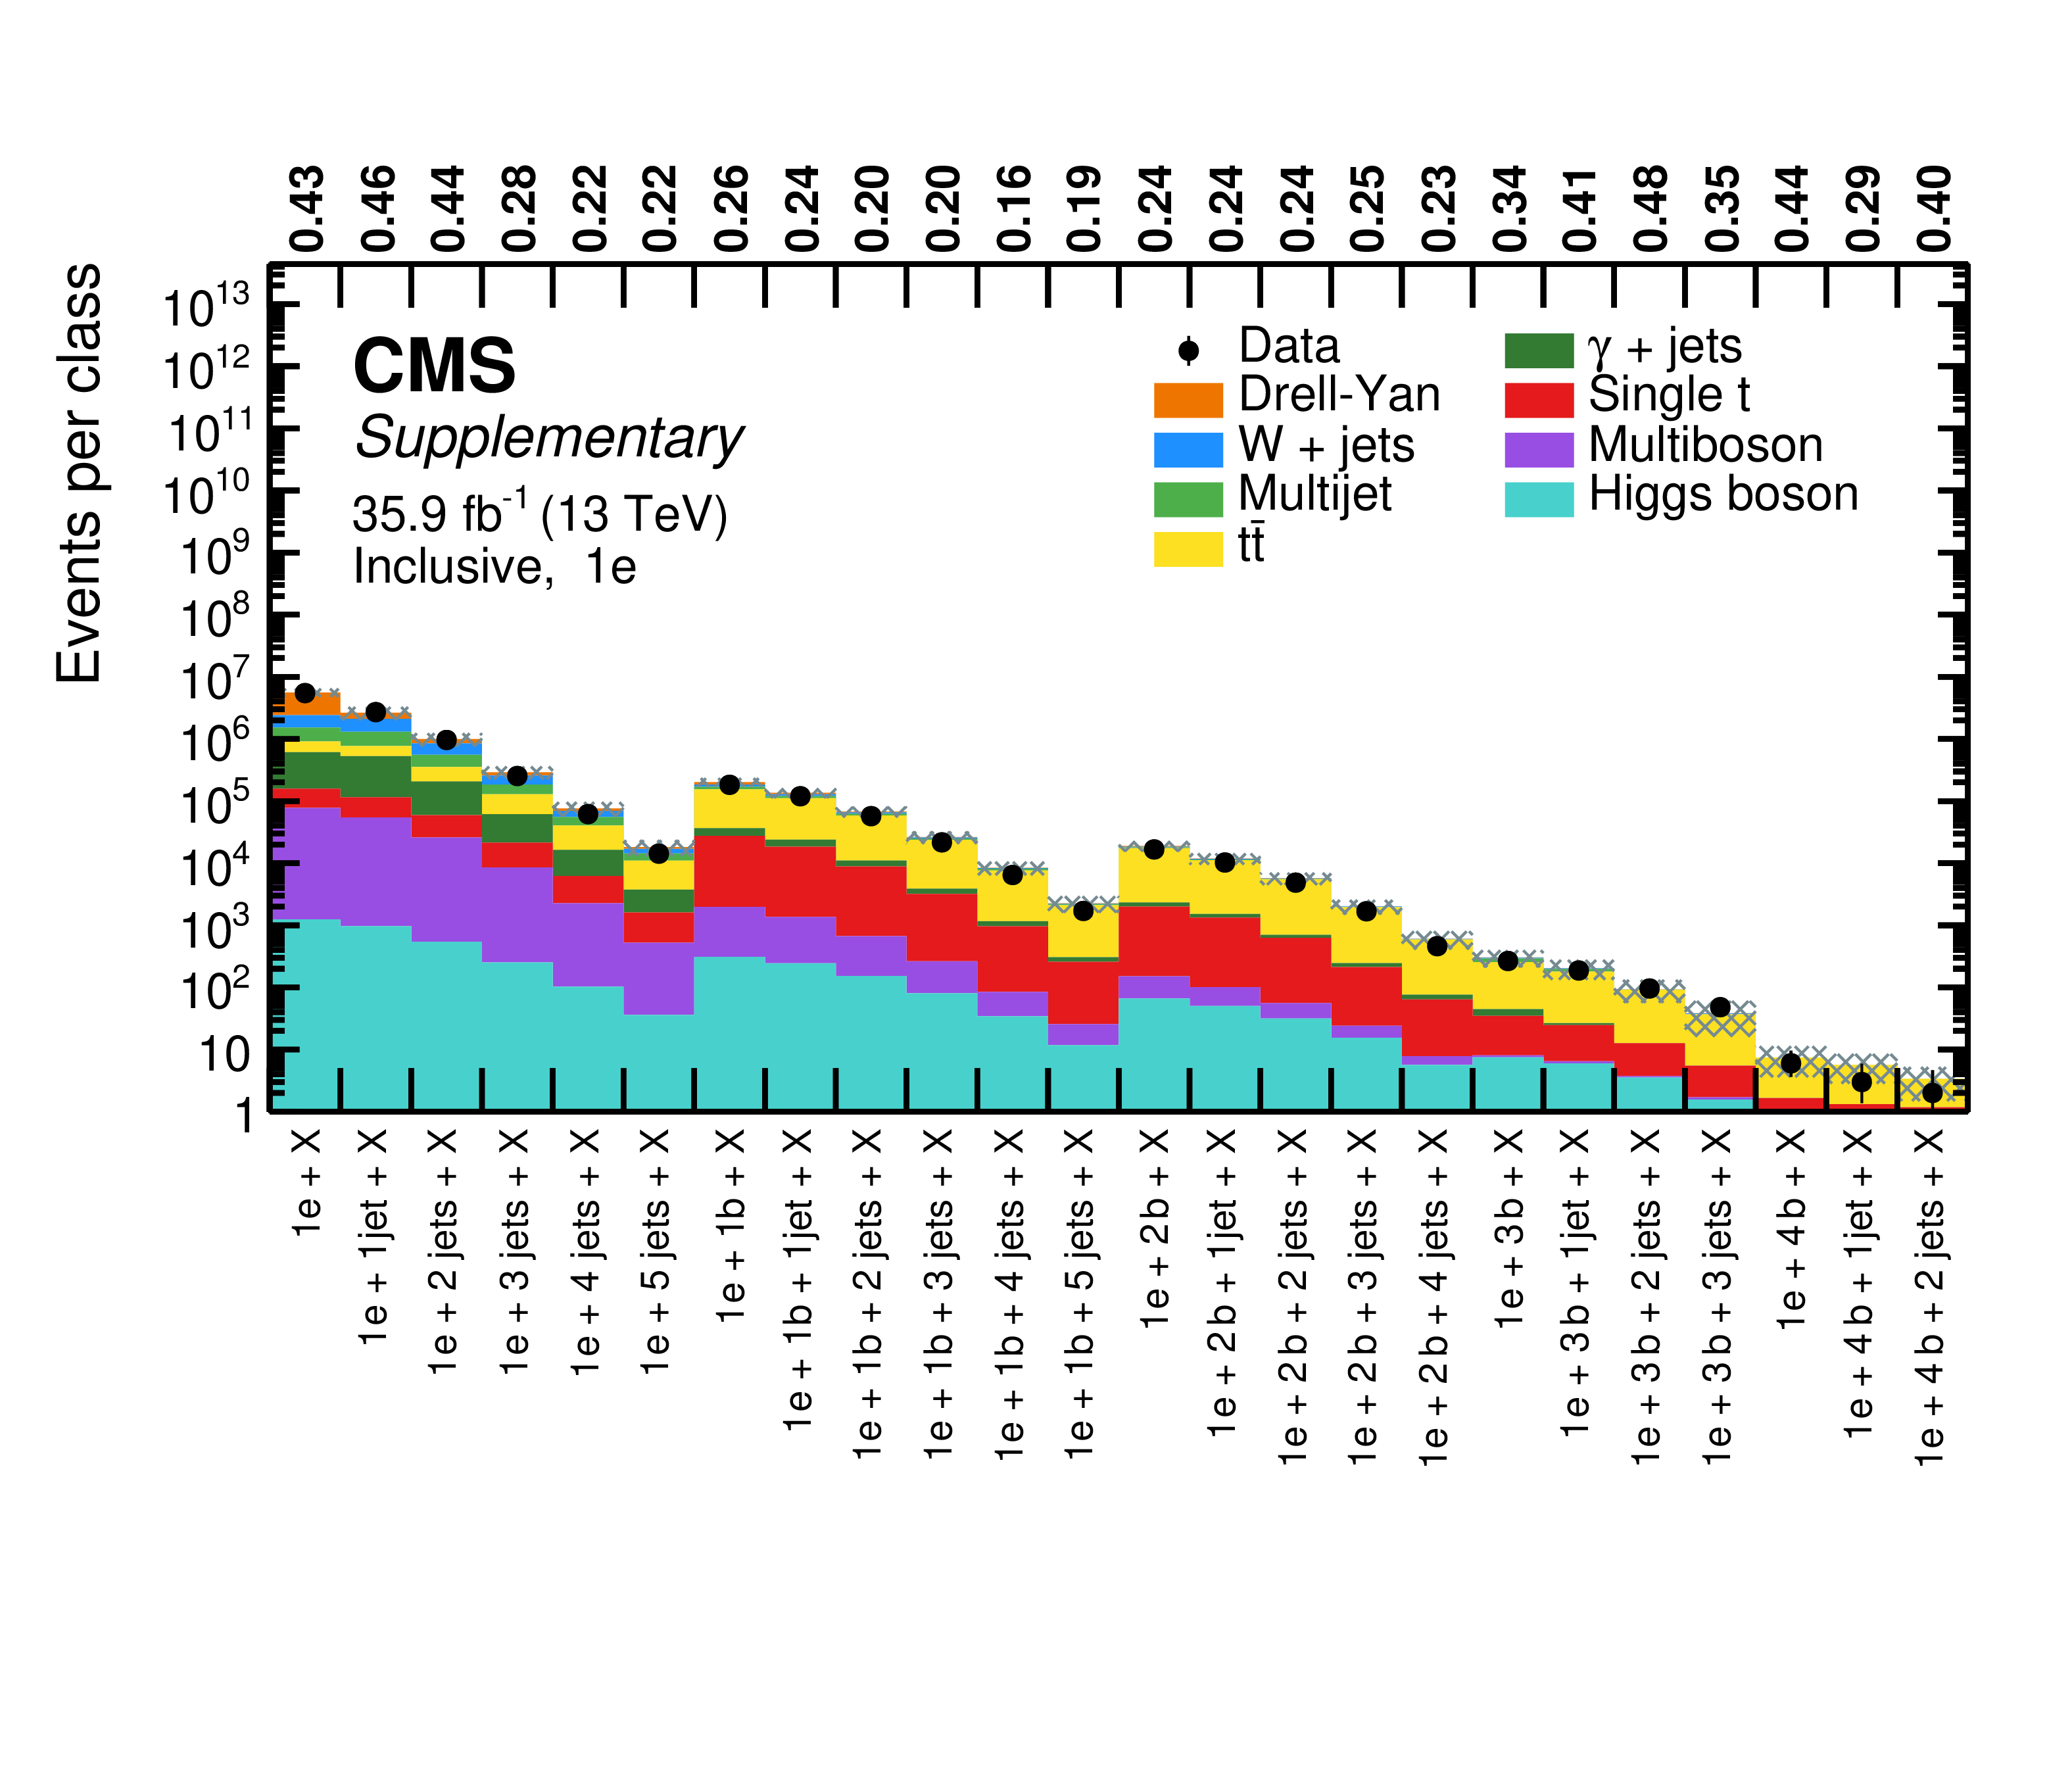
Additional Figure 1-a:
Overview of total event yields for the inclusive event classes of the single-electron object group. Measured data are shown as black markers, contributions from SM processes are represented by coloured histograms, and the shaded region represents the uncertainty in the SM background. The numbers above the plot indicate the observed p-value for the agreement of data and simulation. |
png pdf |
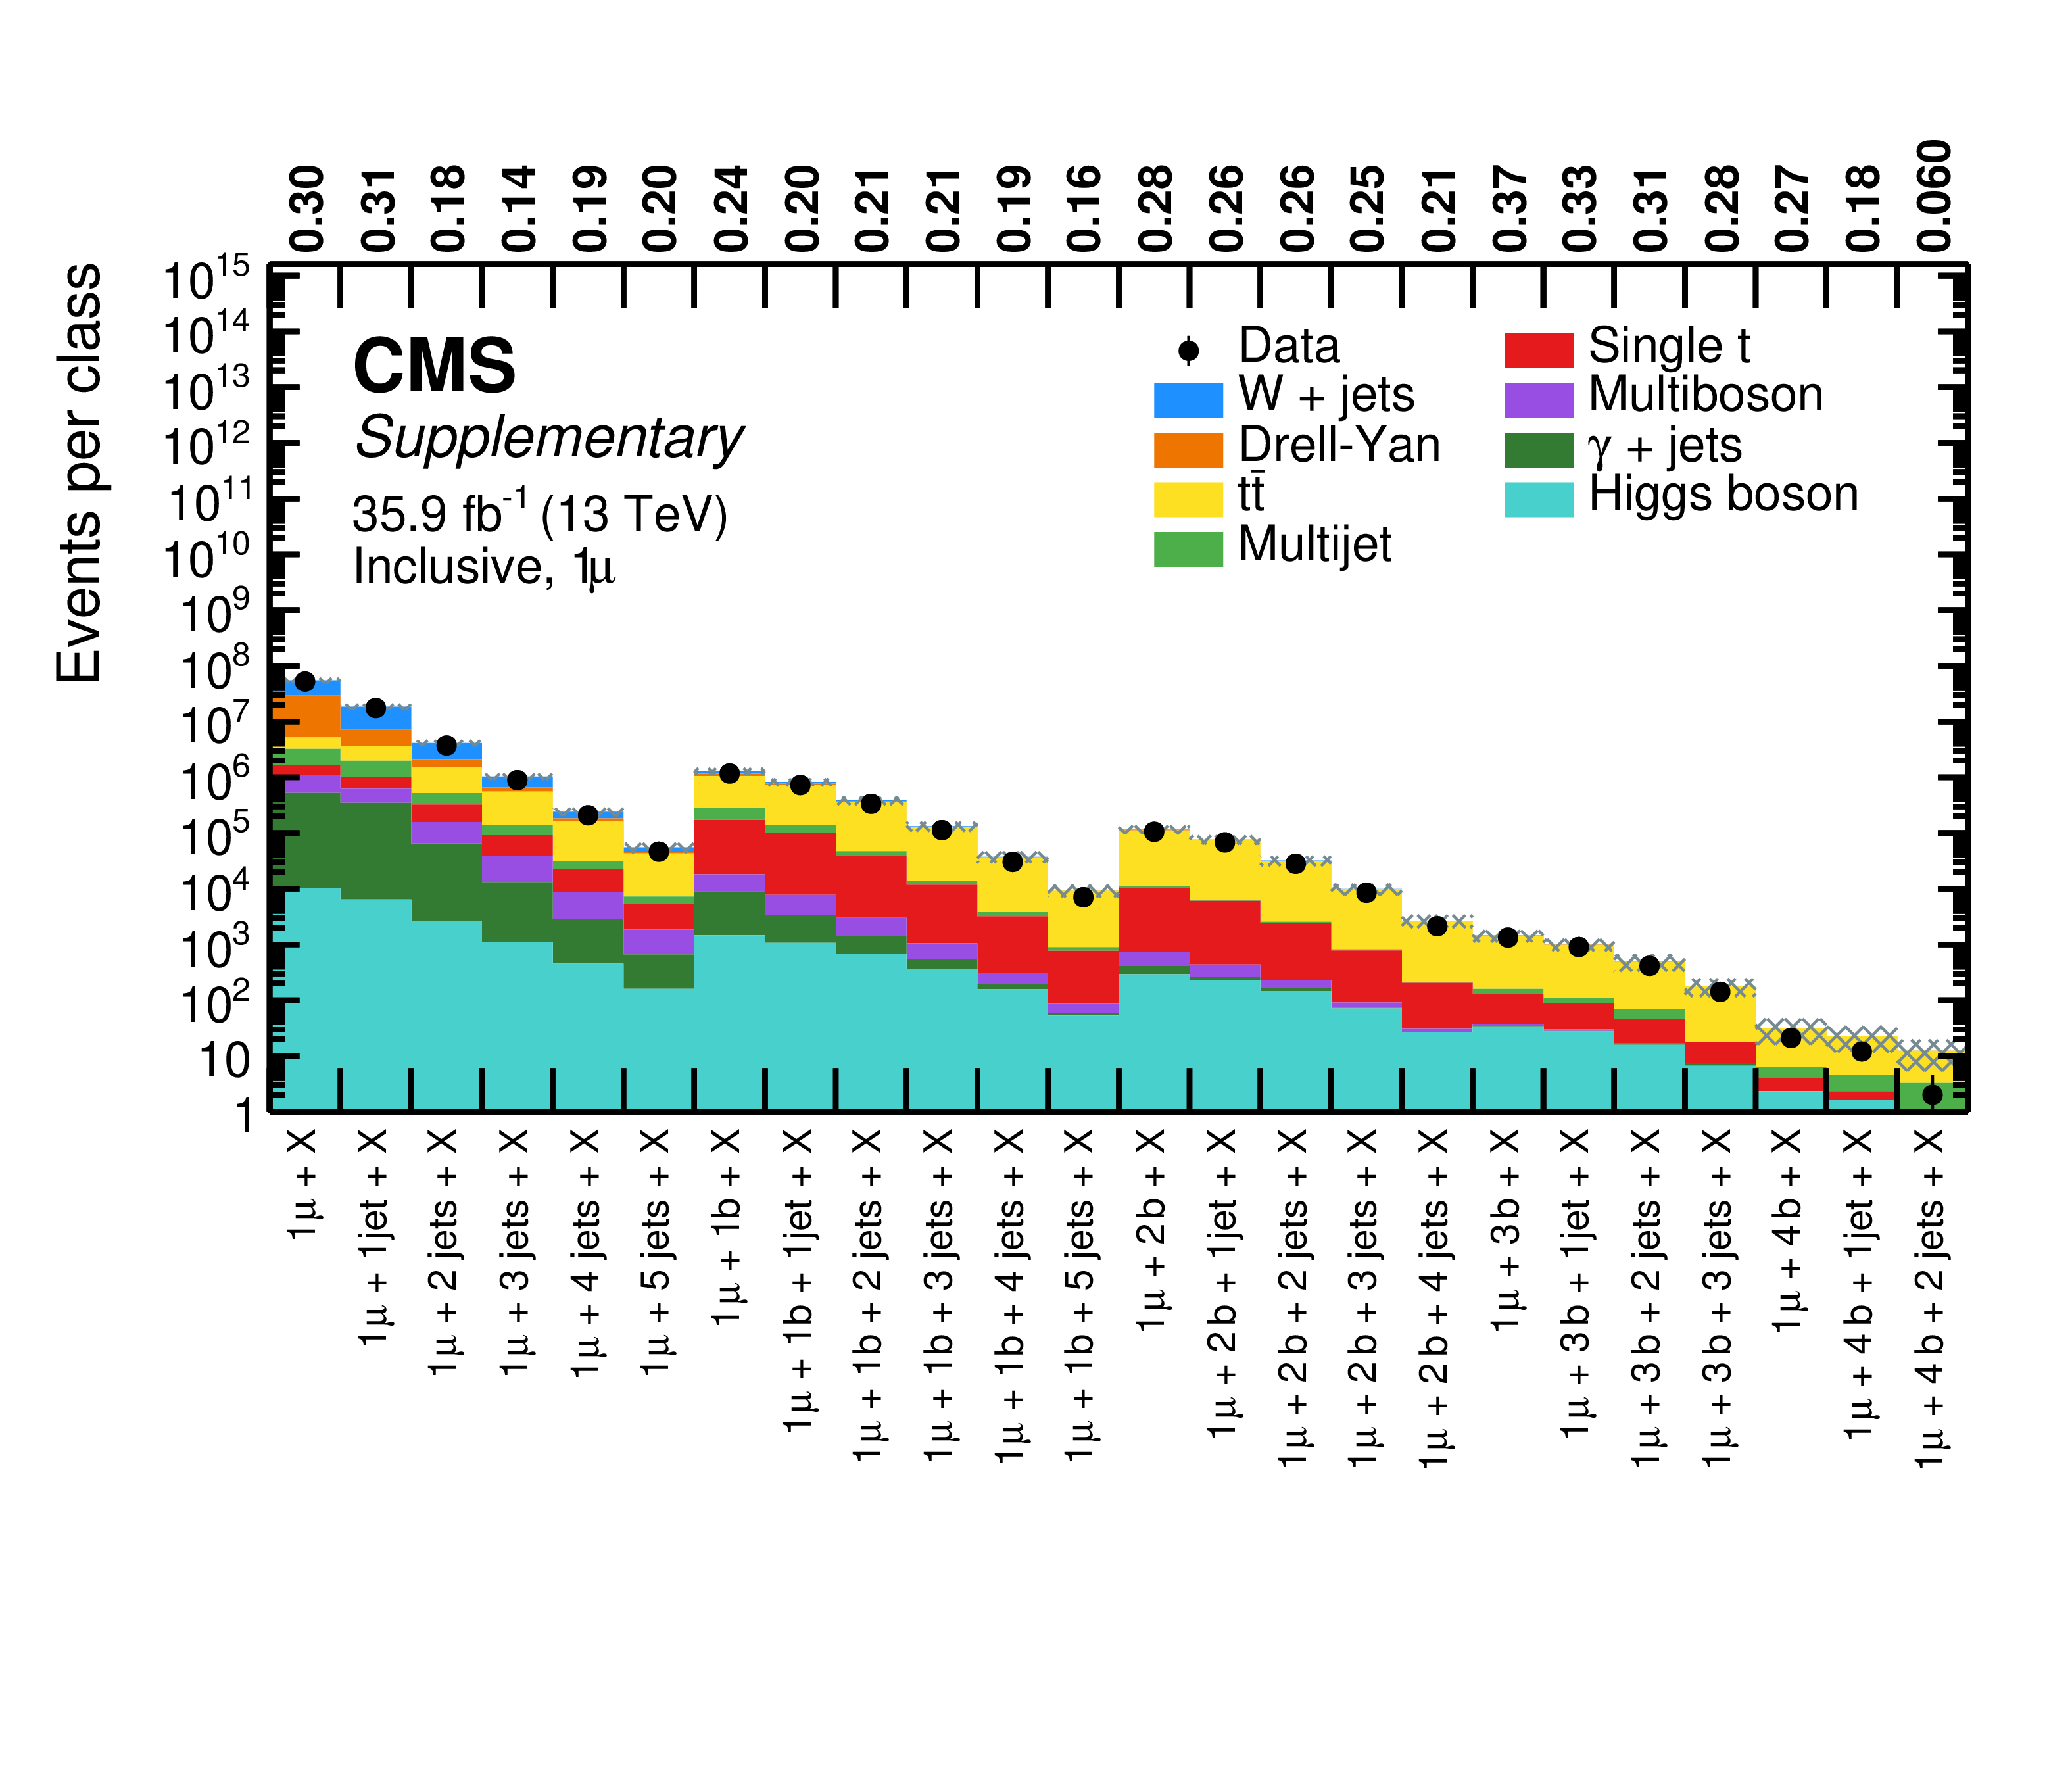
Additional Figure 1-b:
Overview of total event yields for the inclusive event classes of the single-muon object group. Measured data are shown as black markers, contributions from SM processes are represented by coloured histograms, and the shaded region represents the uncertainty in the SM background. The numbers above the plot indicate the observed p-value for the agreement of data and simulation. |

png pdf |
Additional Figure 2:
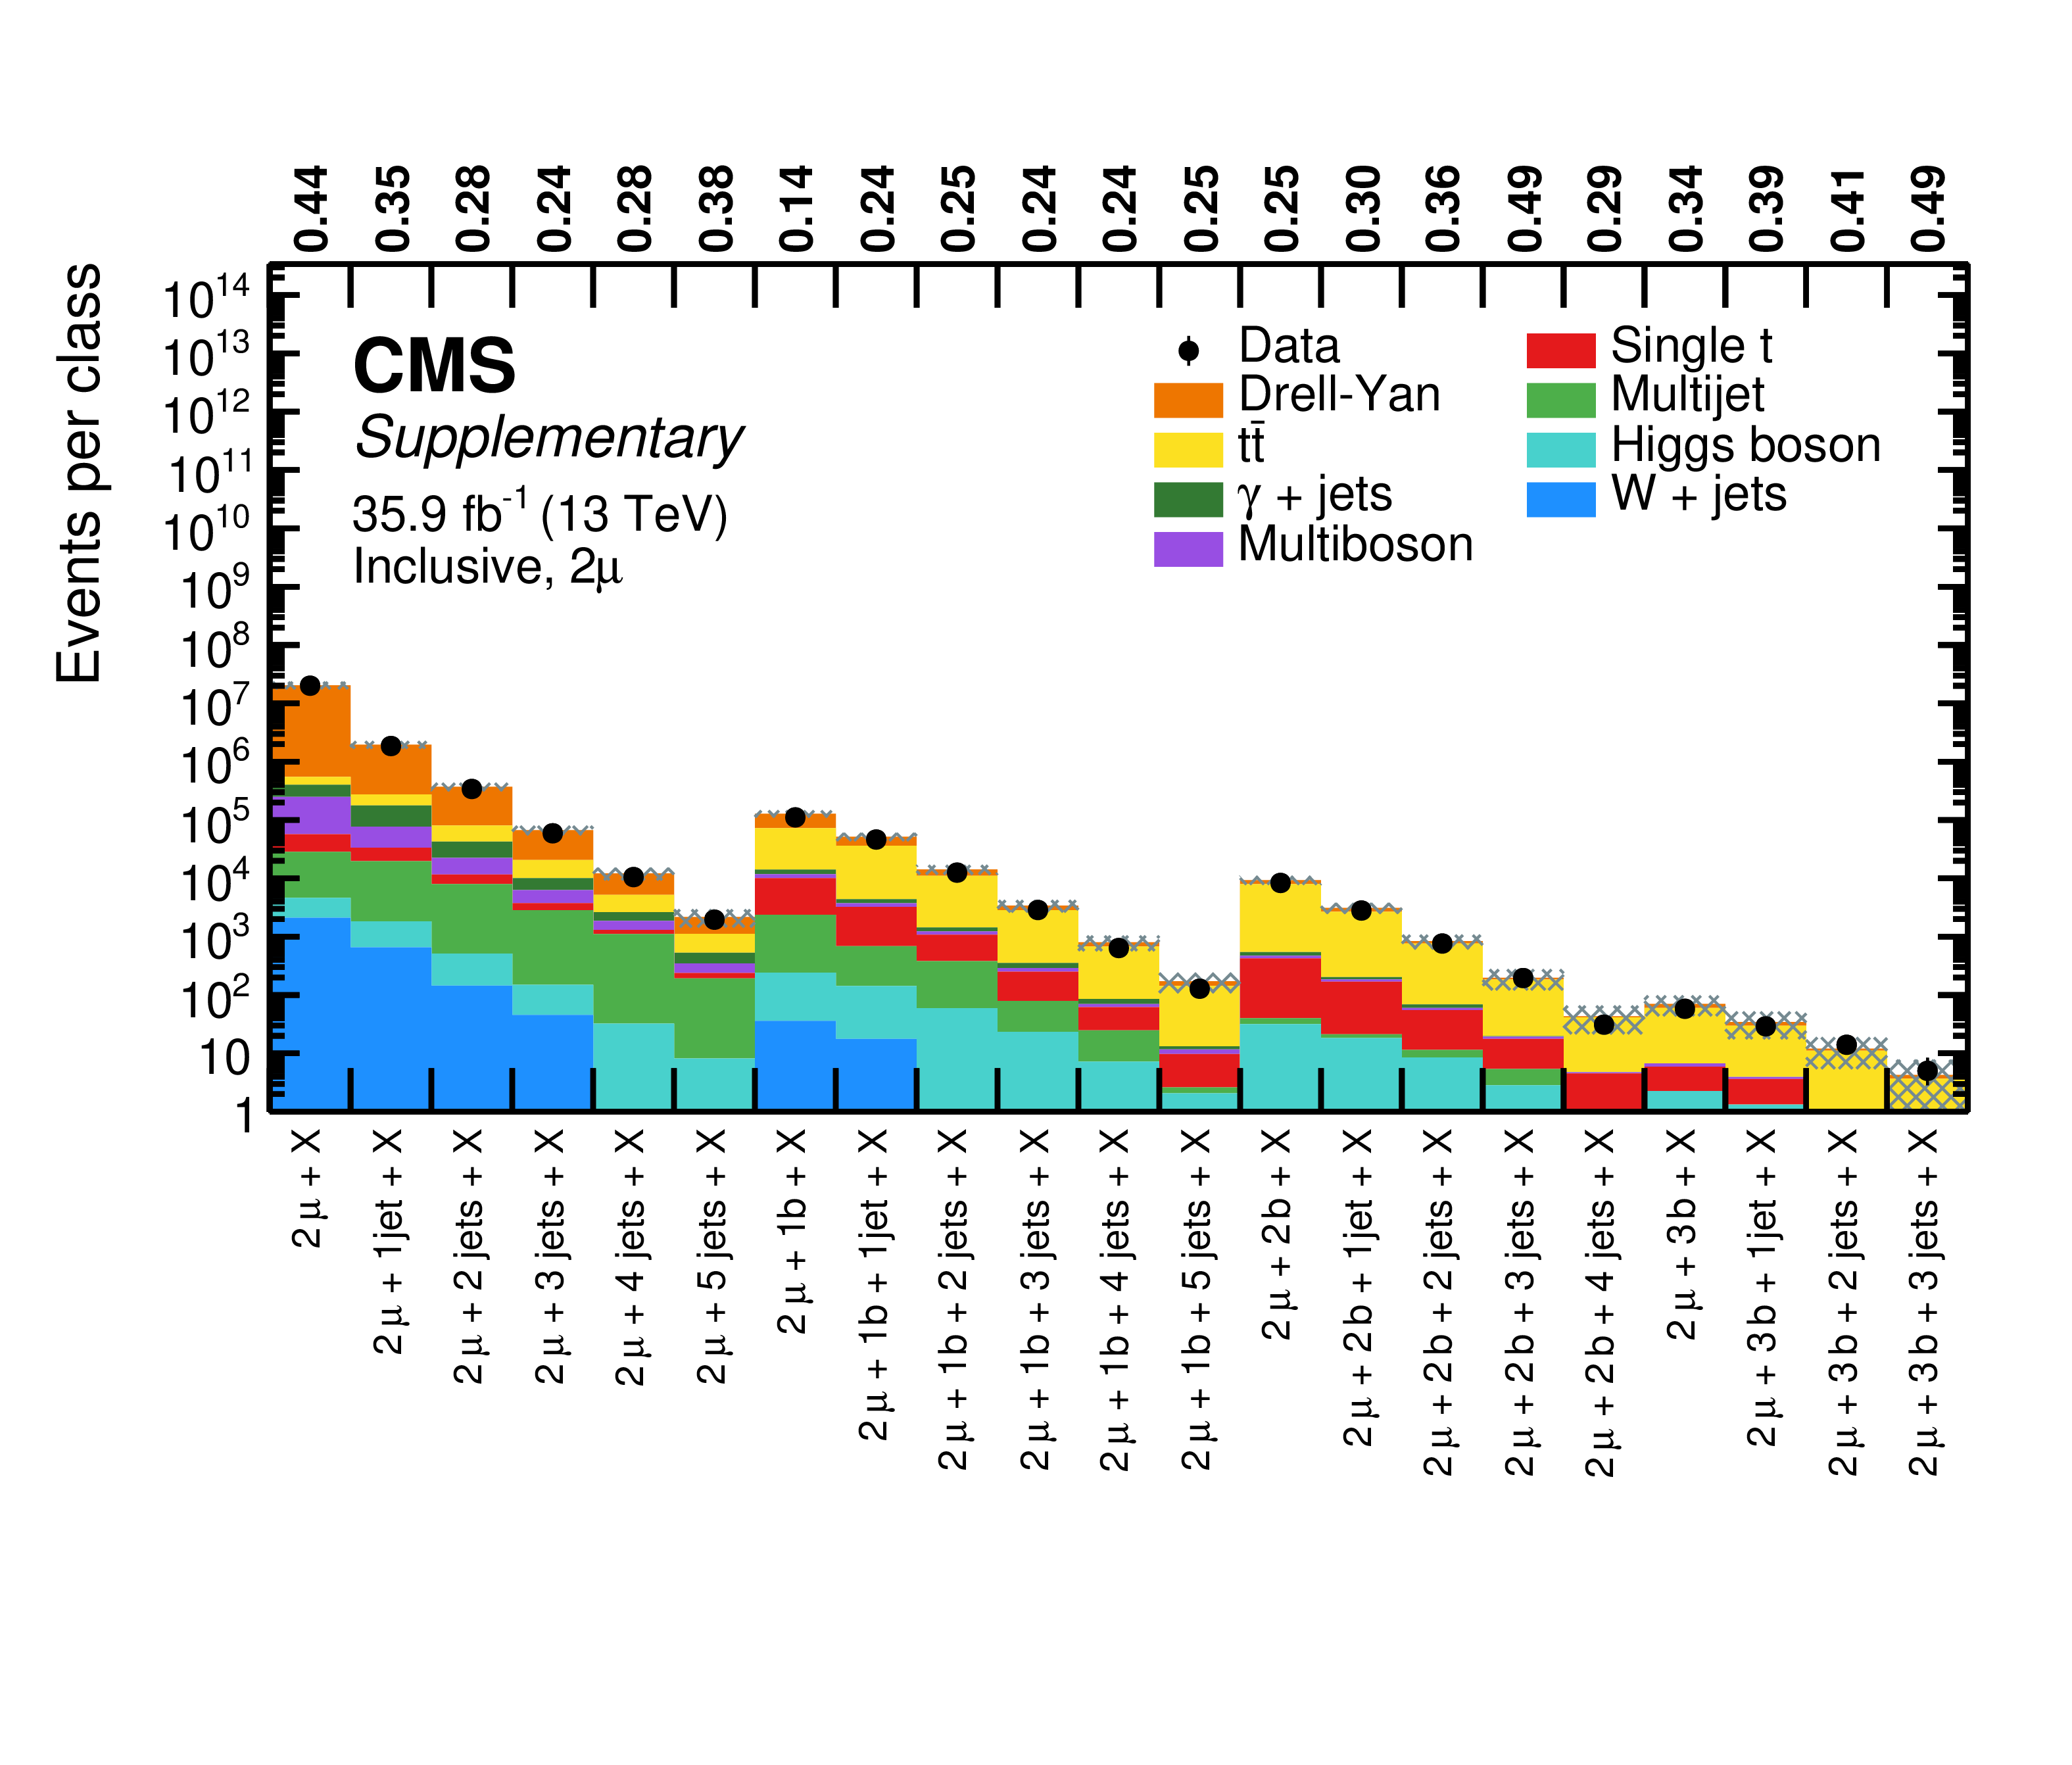
Overview of total event yields for the inclusive event classes of the double-electron (upper) and the double-muon (lower) object groups. Measured data are shown as black markers, contributions from SM processes are represented by coloured histograms, and the shaded region represents the uncertainty in the SM background. The numbers above the plot indicate the observed p-value for the agreement of data and simulation. |
png pdf |
Additional Figure 2-a:
Overview of total event yields for the inclusive event classes of the double-electron object group. Measured data are shown as black markers, contributions from SM processes are represented by coloured histograms, and the shaded region represents the uncertainty in the SM background. The numbers above the plot indicate the observed p-value for the agreement of data and simulation. |
png pdf |
Additional Figure 2-b:
Overview of total event yields for the inclusive event classes of the double-muon object group. Measured data are shown as black markers, contributions from SM processes are represented by coloured histograms, and the shaded region represents the uncertainty in the SM background. The numbers above the plot indicate the observed p-value for the agreement of data and simulation. |
png pdf |
Additional Figure 3:
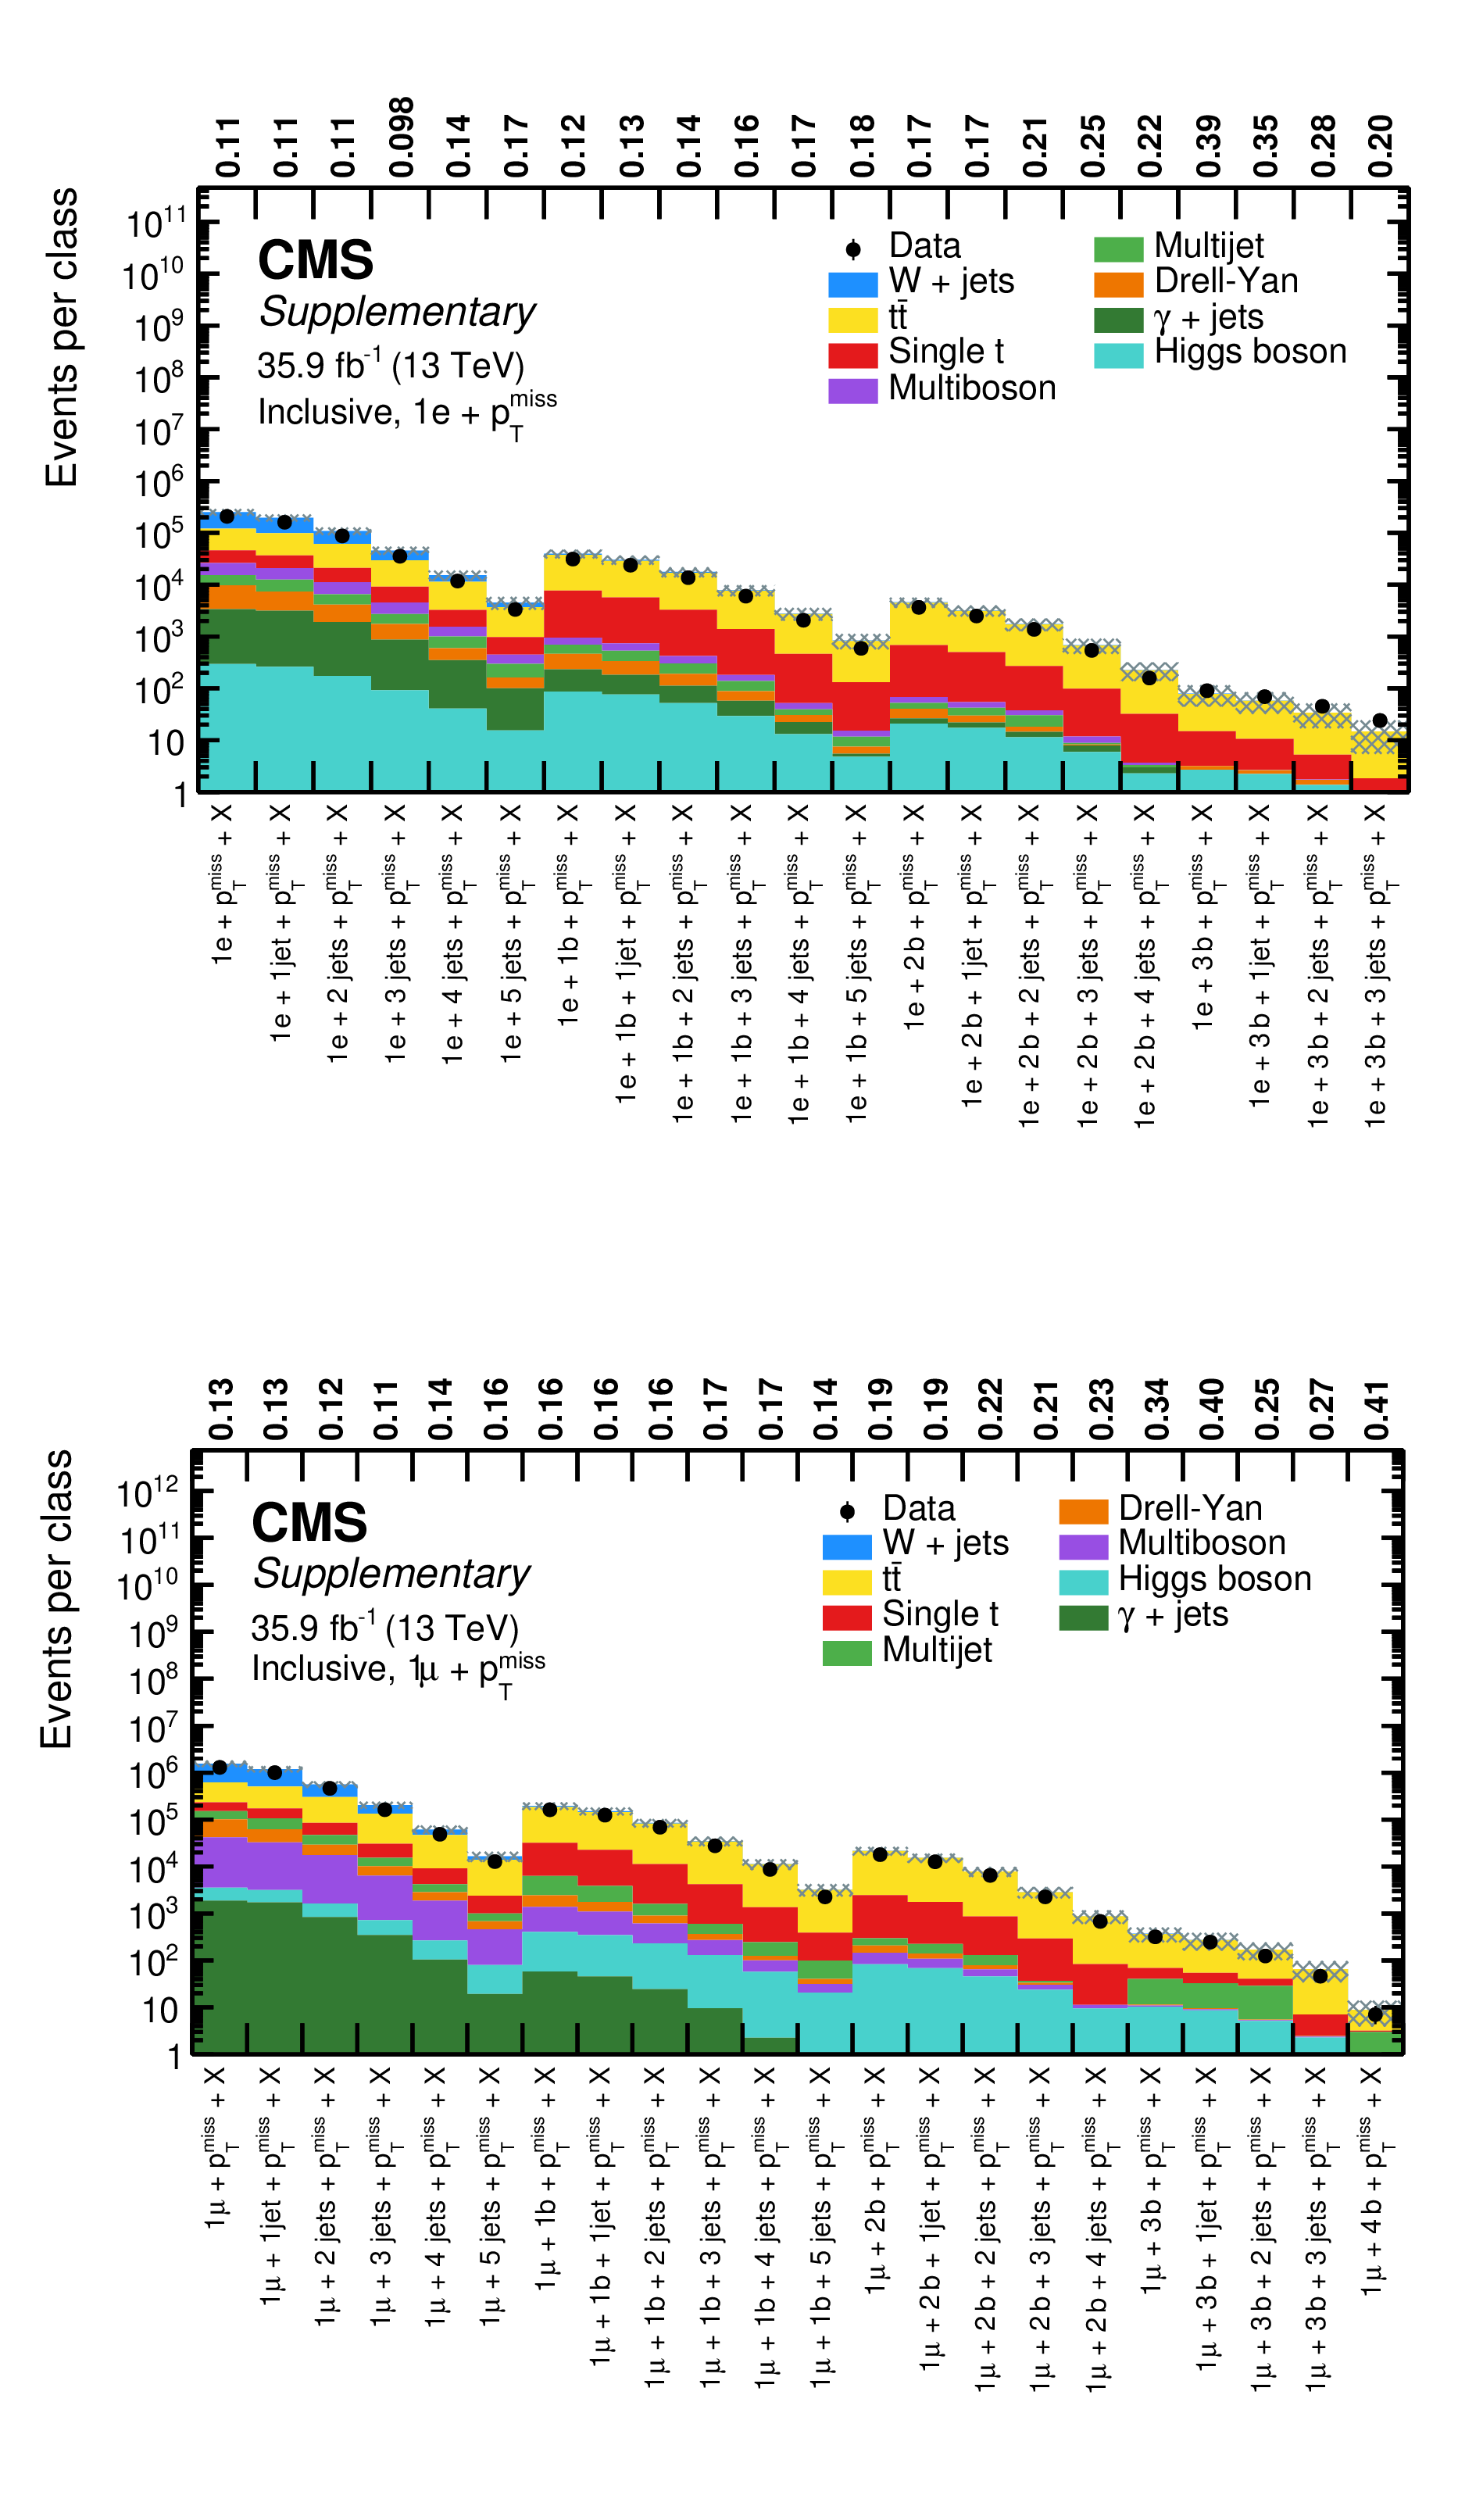
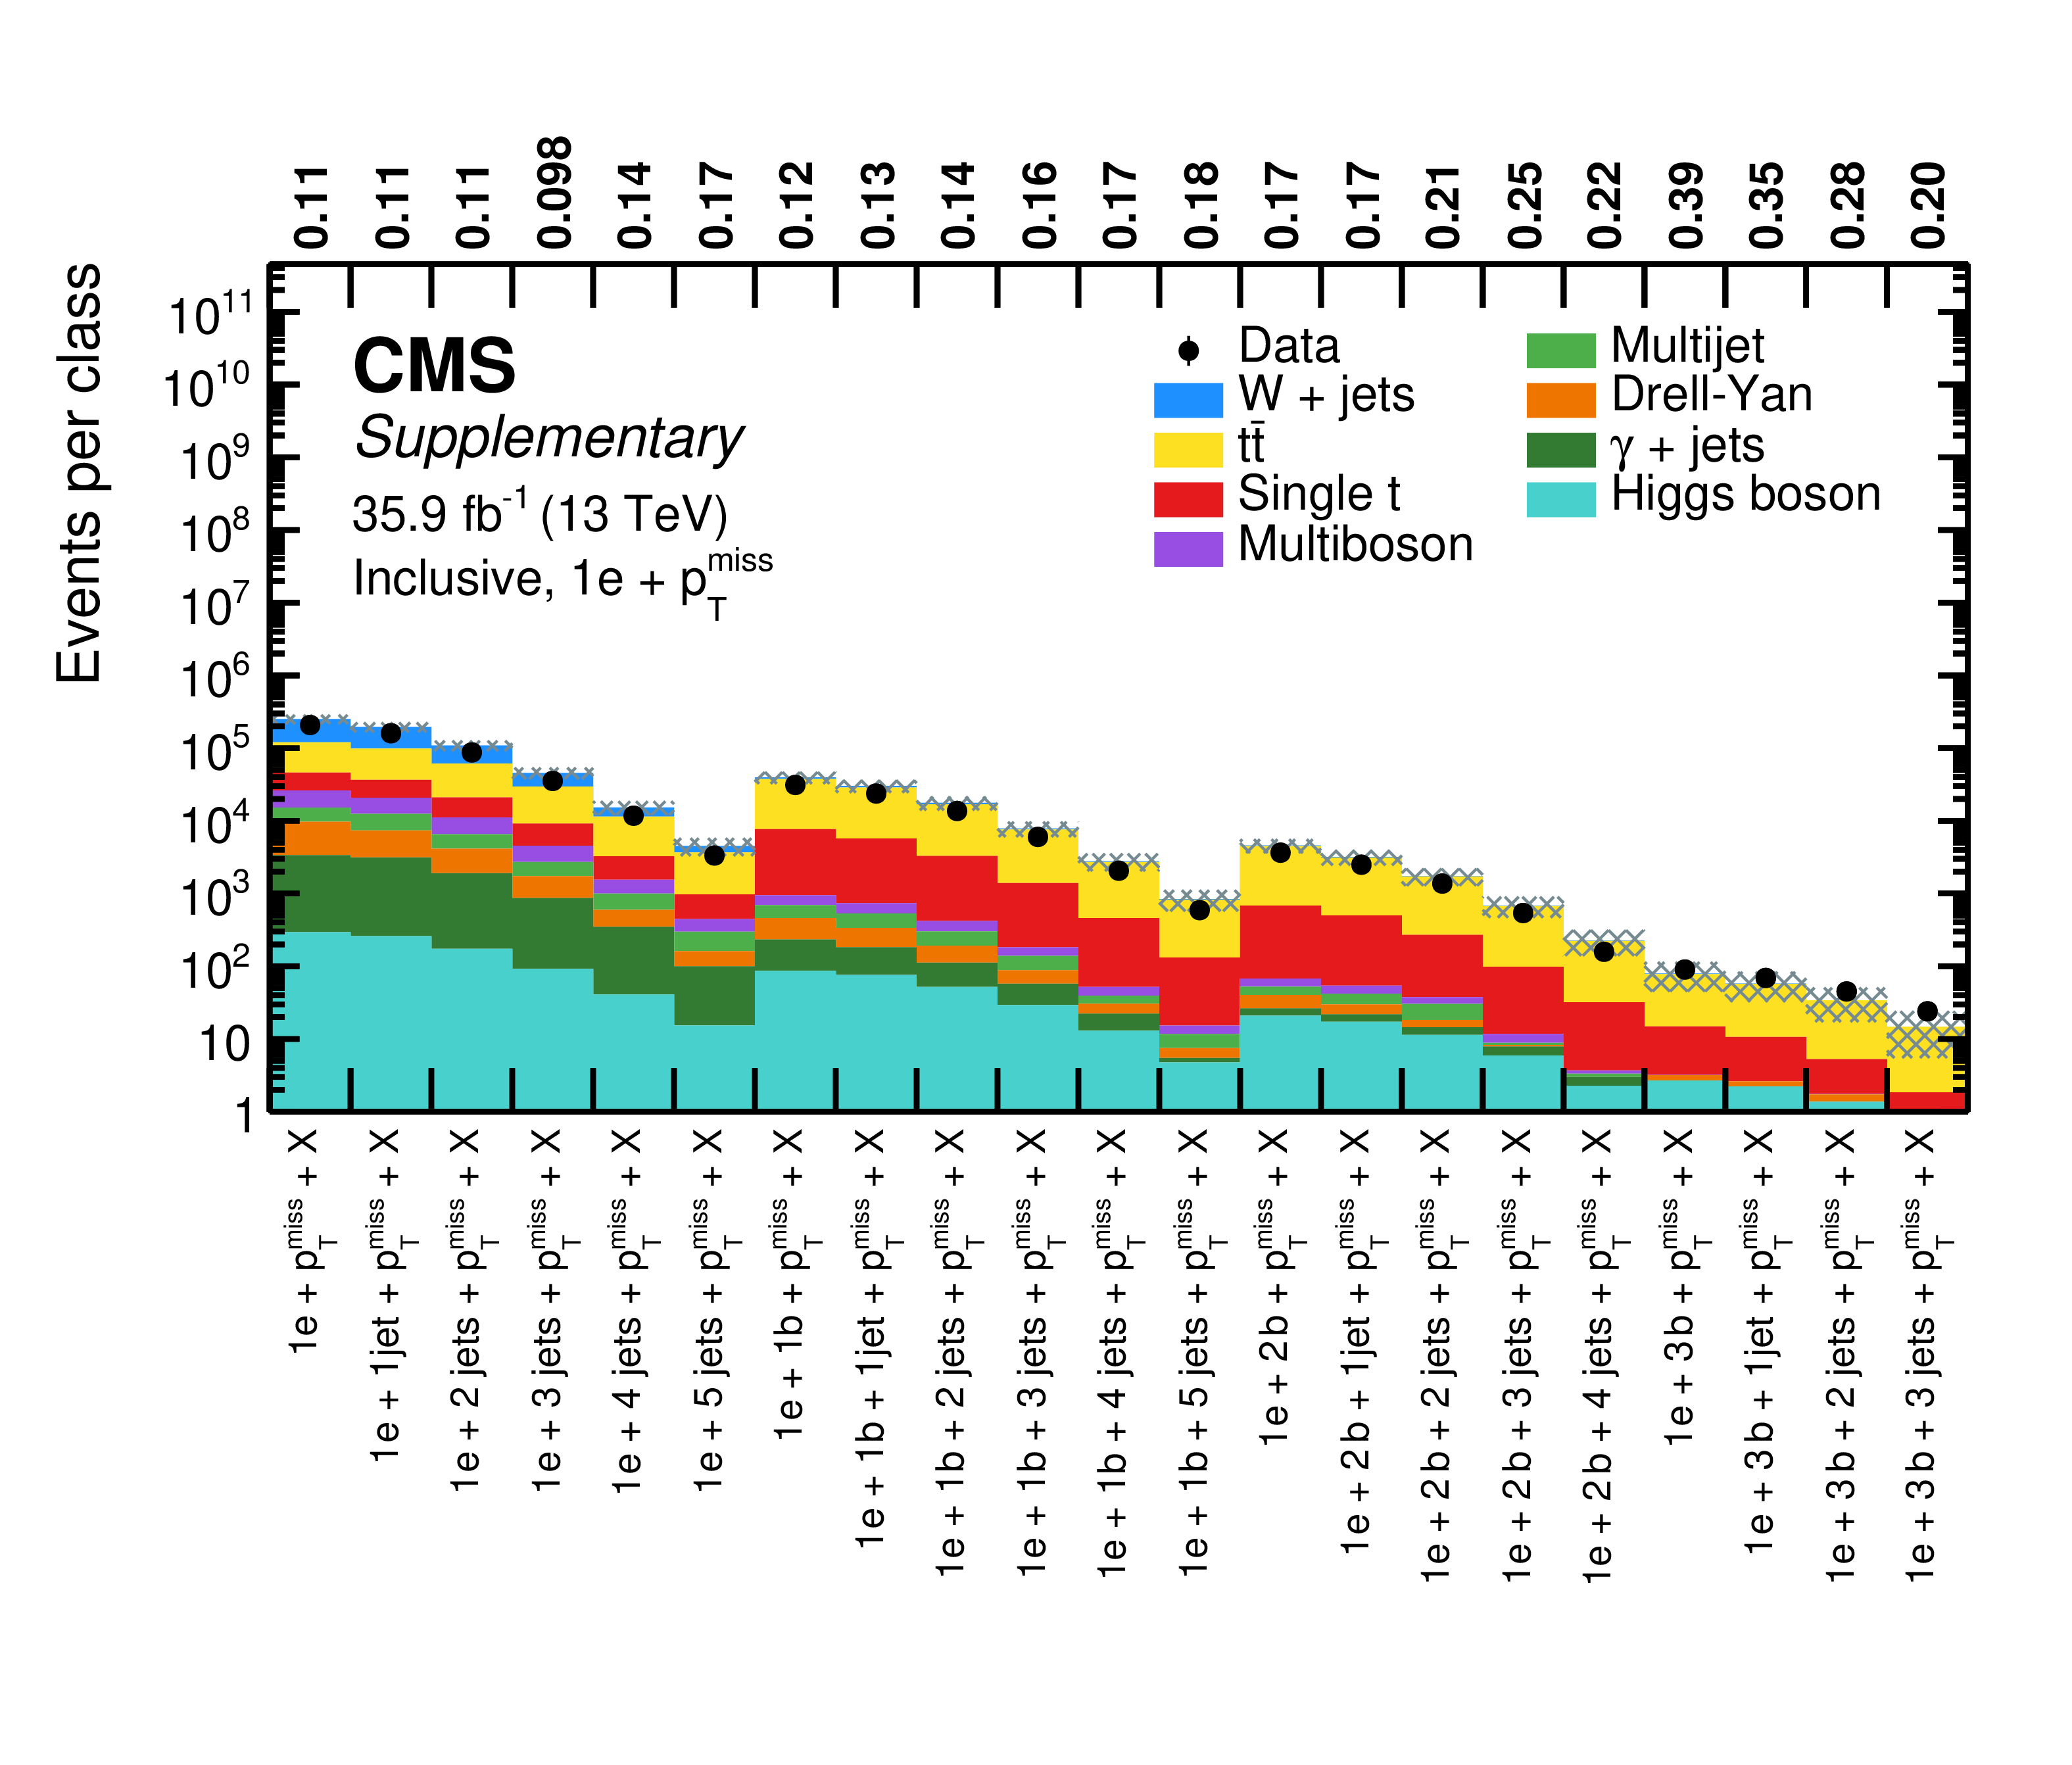
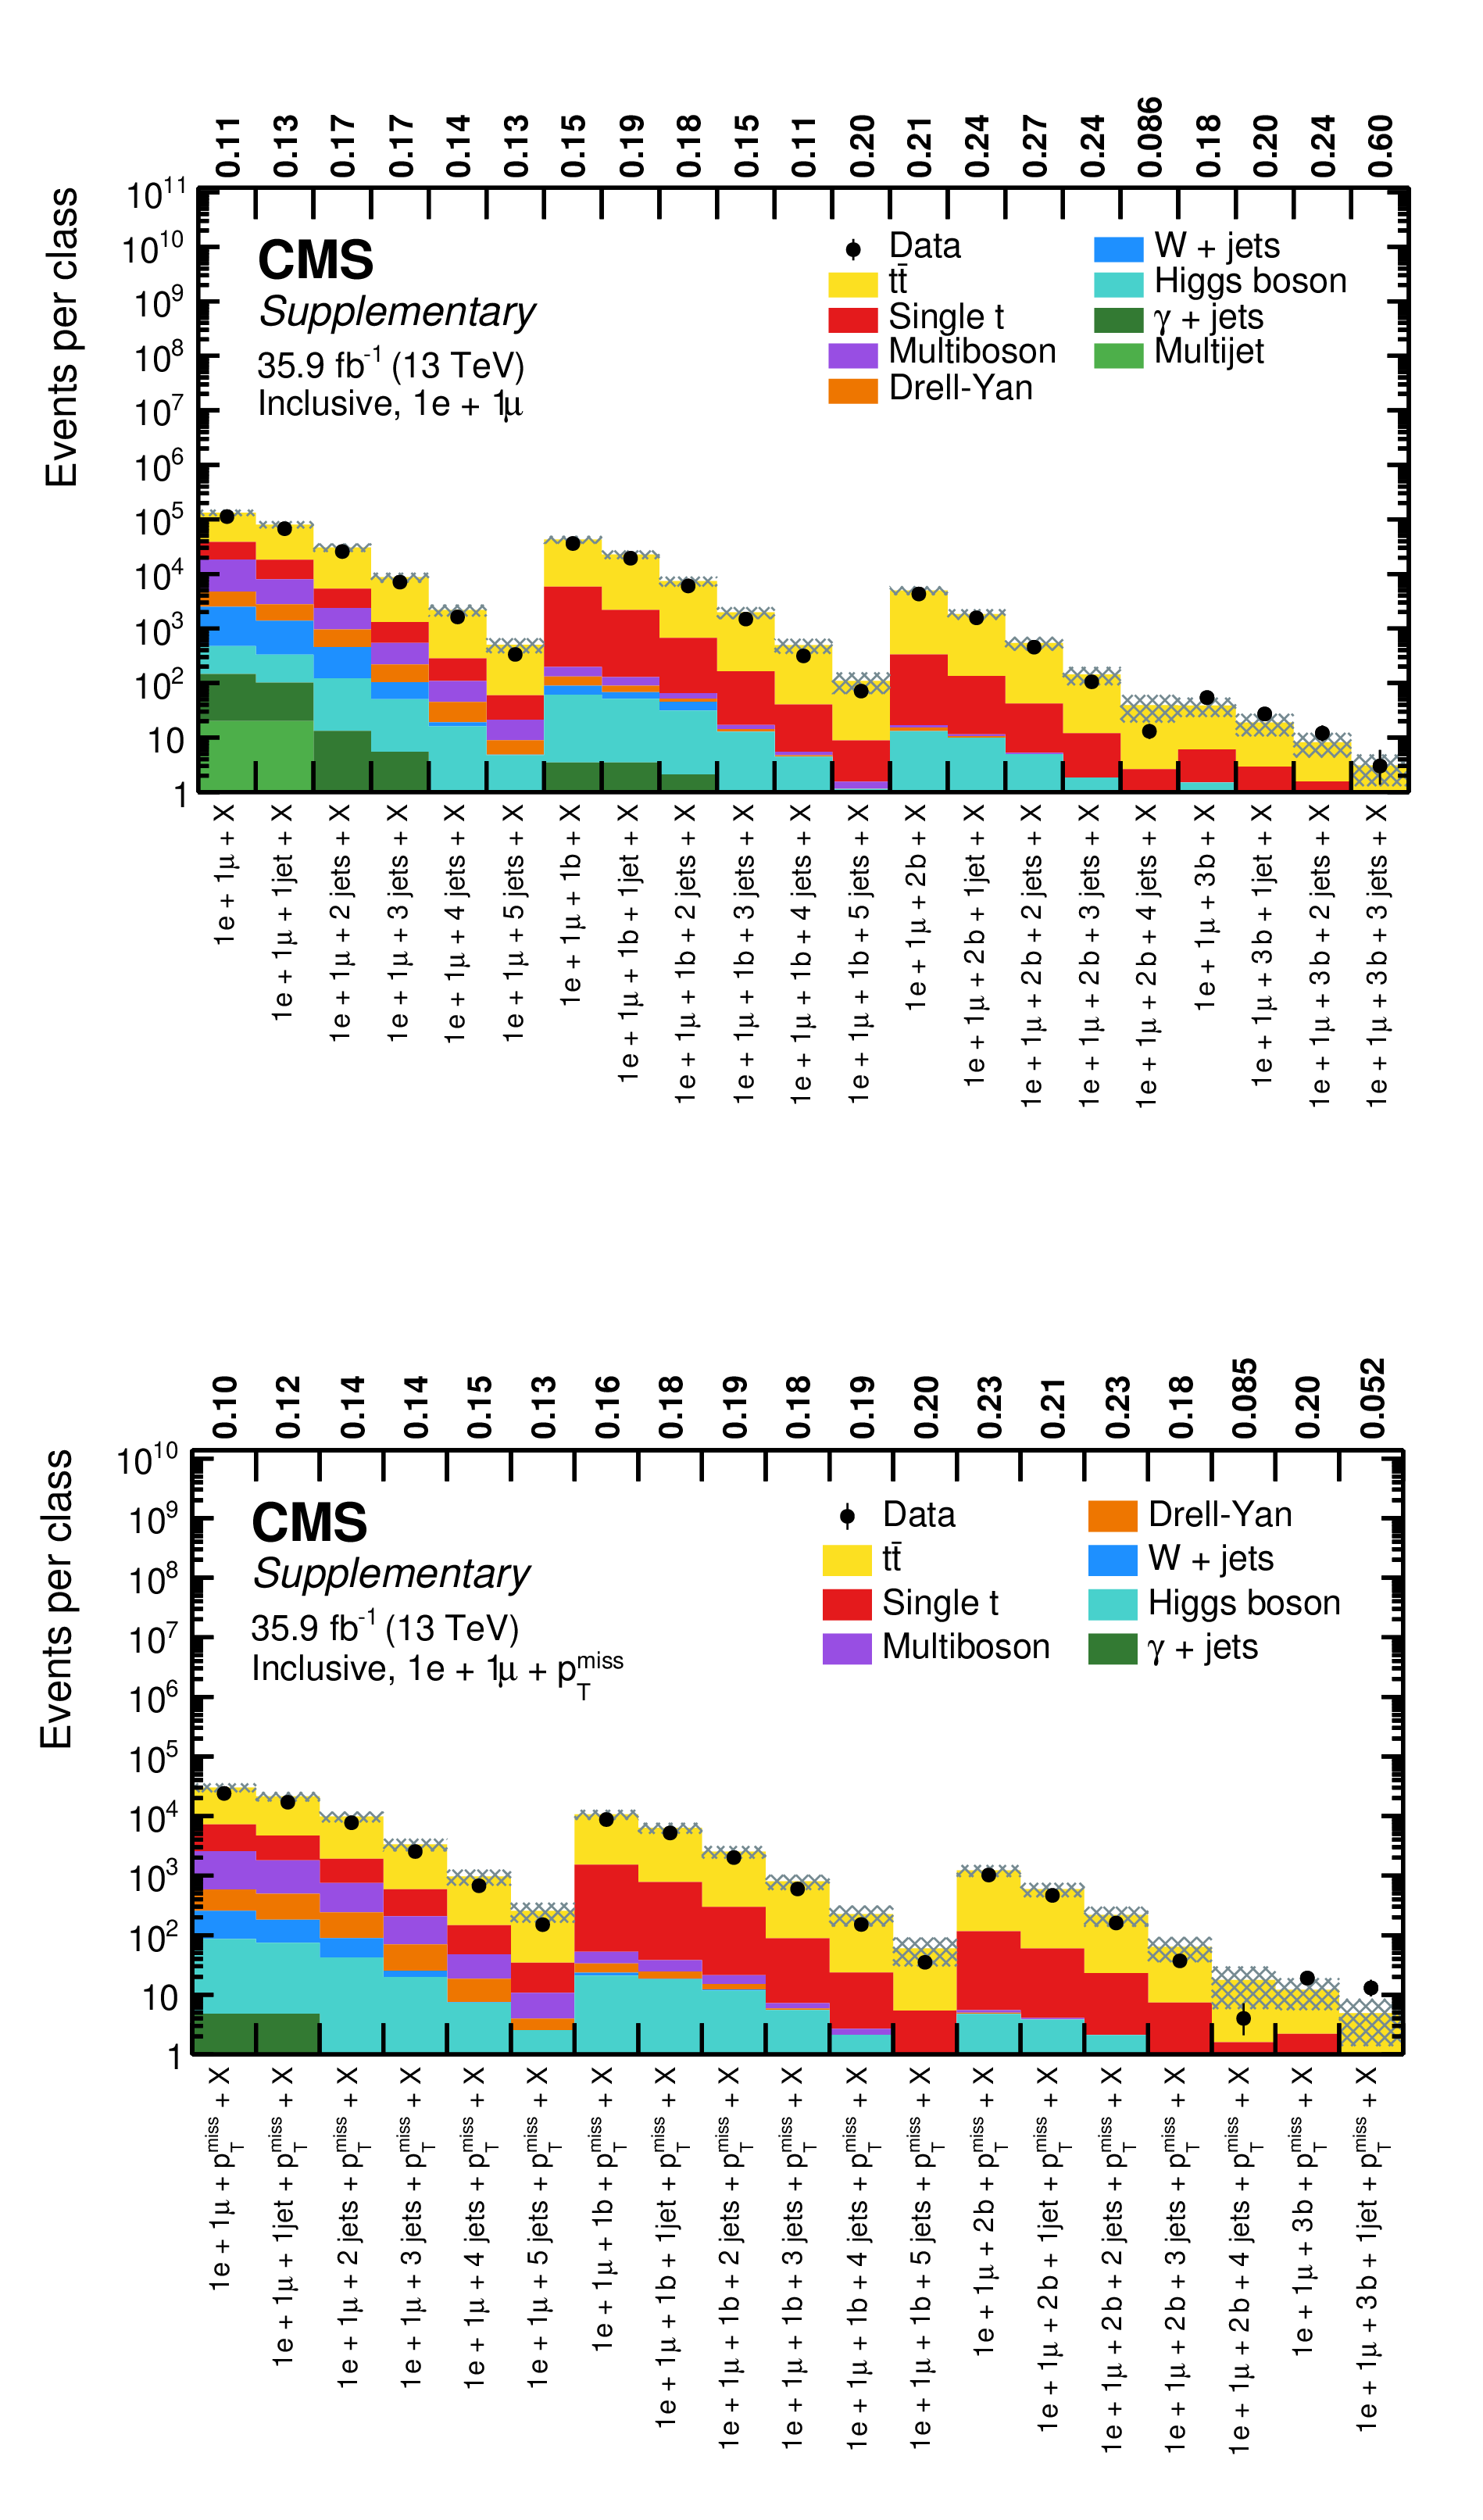
Overview of total event yields for the inclusive event classes of the single-electron $+$ ${{p_{\mathrm {T}}} ^\text {miss}}$ (upper) and the single-muon $+$ ${{p_{\mathrm {T}}} ^\text {miss}}$ (lower) object groups. Measured data are shown as black markers, contributions from SM processes are represented by coloured histograms, and the shaded region represents the uncertainty in the SM background. The numbers above the plot indicate the observed p-value for the agreement of data and simulation. |
png pdf |
Additional Figure 3-a:
Overview of total event yields for the inclusive event classes of the single-electron $+$ ${{p_{\mathrm {T}}} ^\text {miss}}$ object group. Measured data are shown as black markers, contributions from SM processes are represented by coloured histograms, and the shaded region represents the uncertainty in the SM background. The numbers above the plot indicate the observed p-value for the agreement of data and simulation. |
png pdf |
Additional Figure 3-b:
Overview of total event yields for the inclusive event classes of the single-muon $+$ ${{p_{\mathrm {T}}} ^\text {miss}}$ object group. Measured data are shown as black markers, contributions from SM processes are represented by coloured histograms, and the shaded region represents the uncertainty in the SM background. The numbers above the plot indicate the observed p-value for the agreement of data and simulation. |
png pdf |
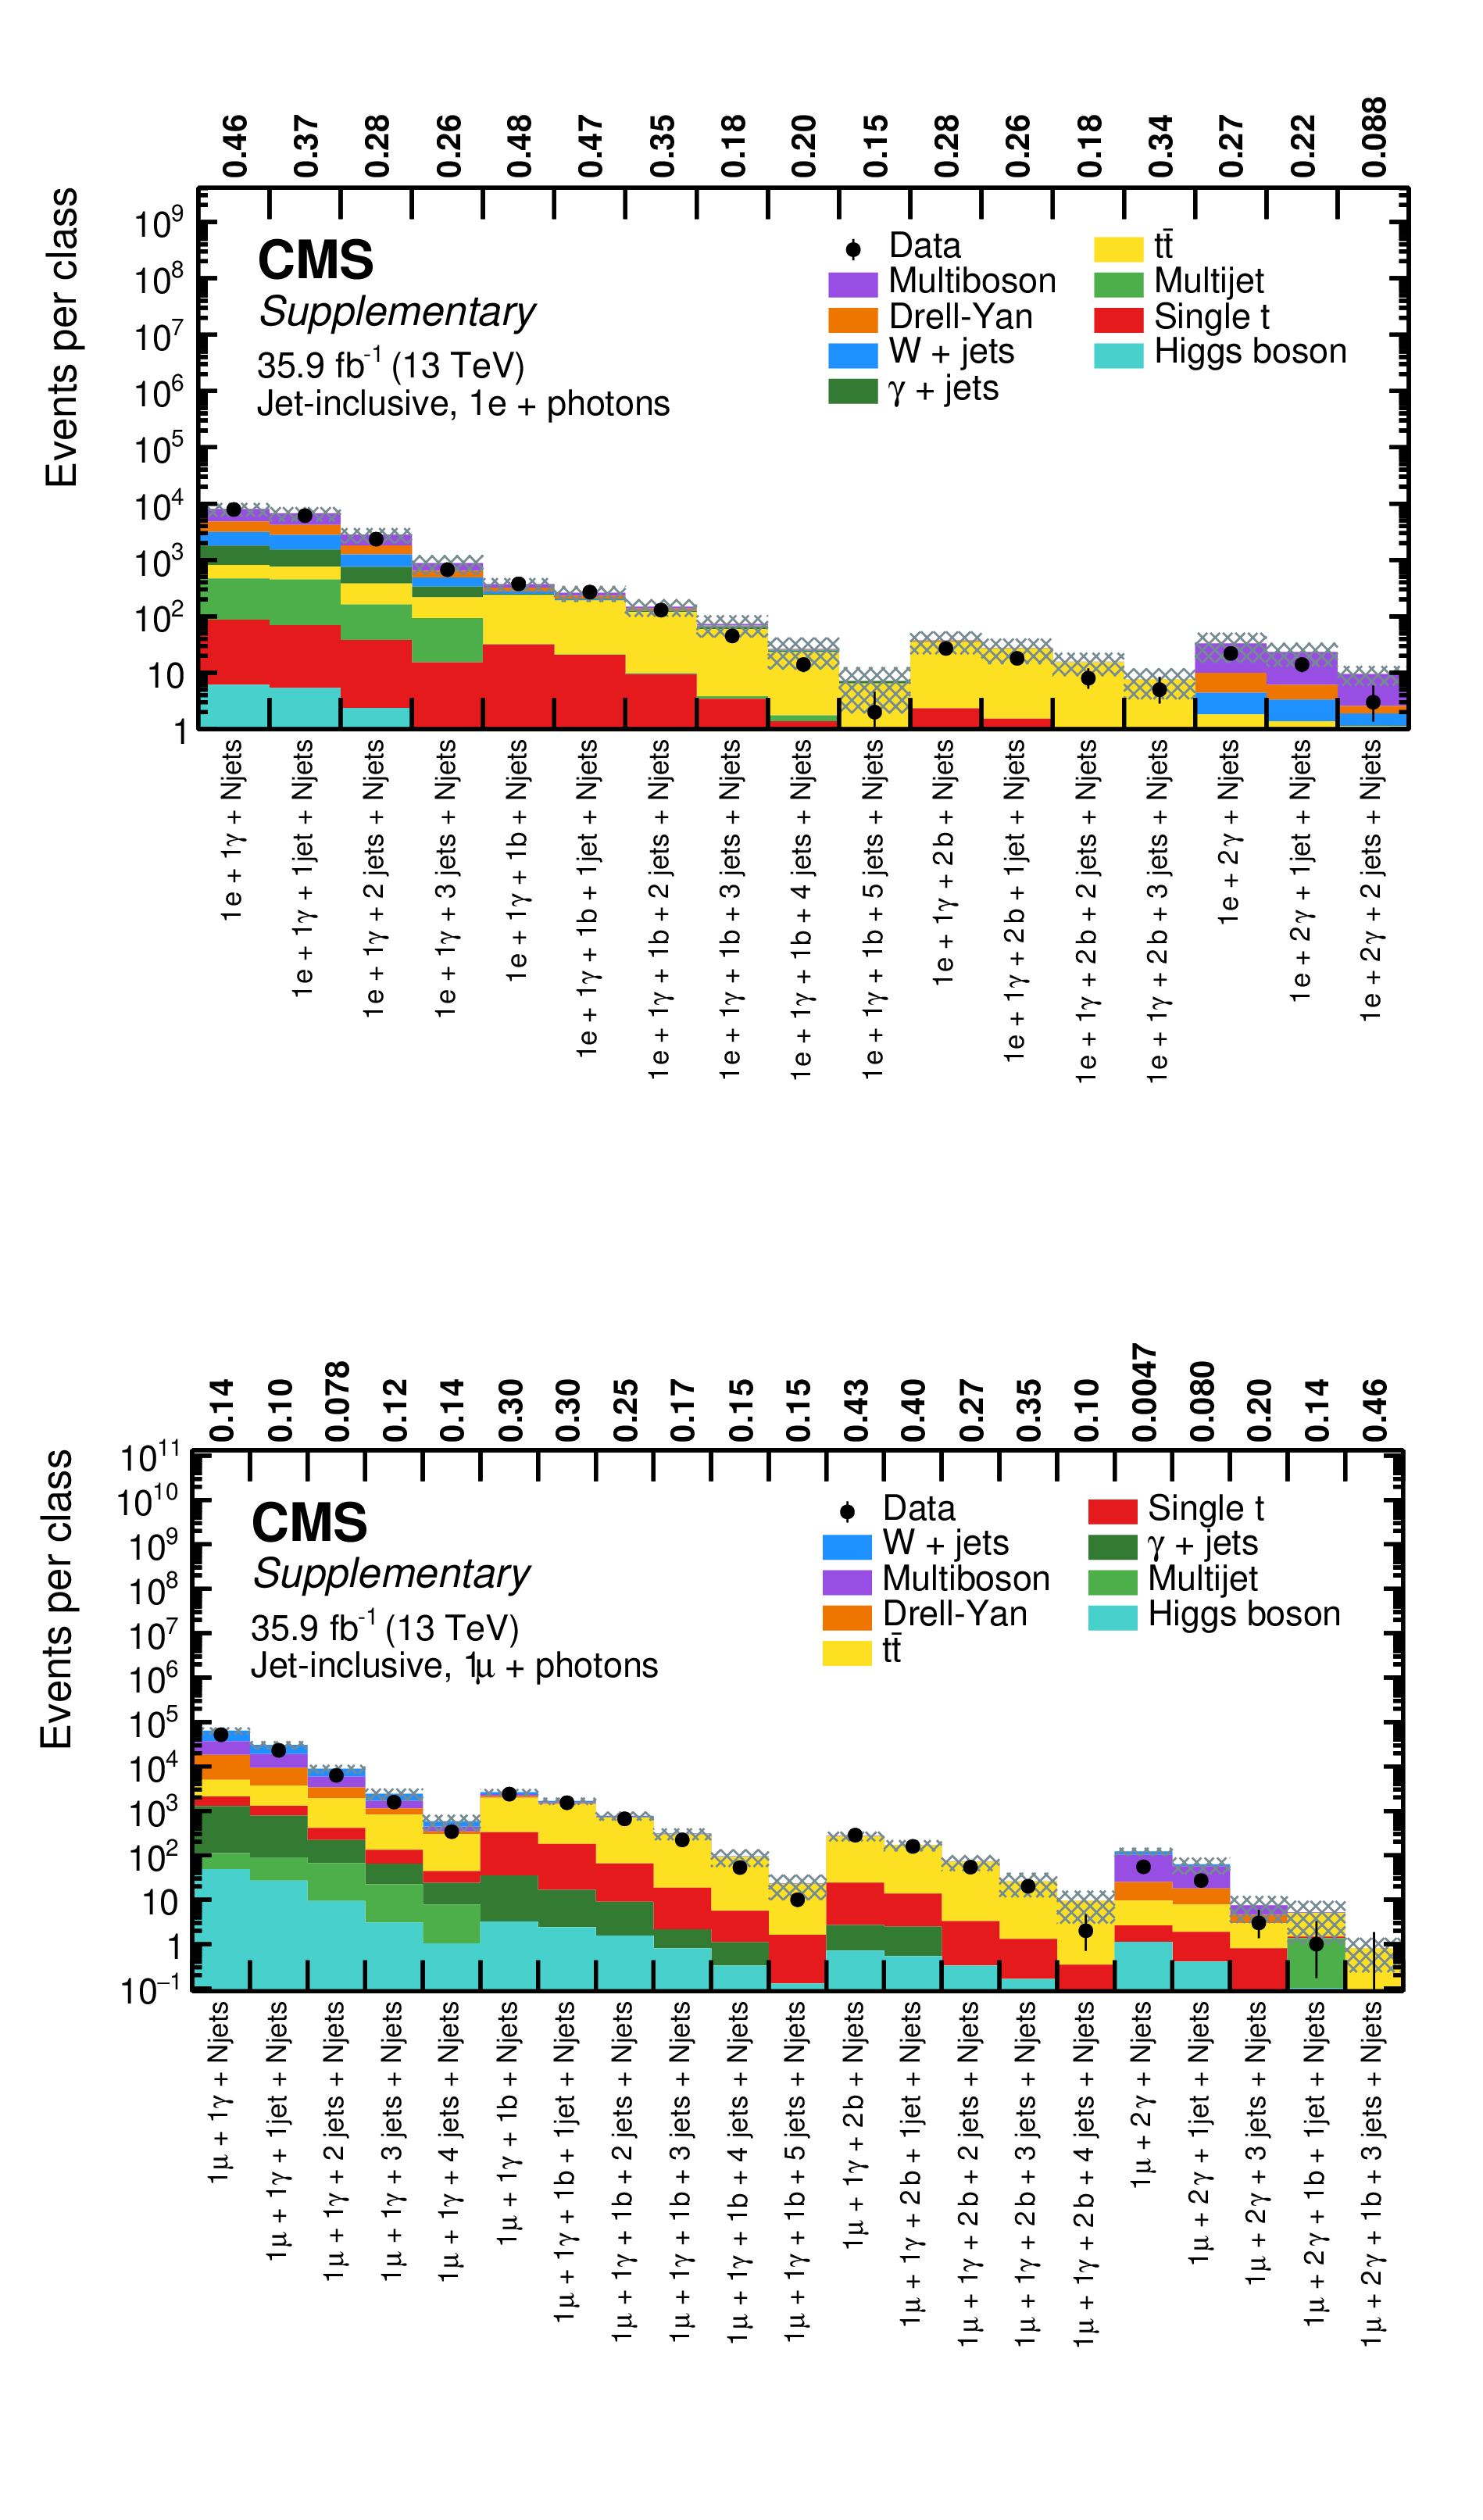
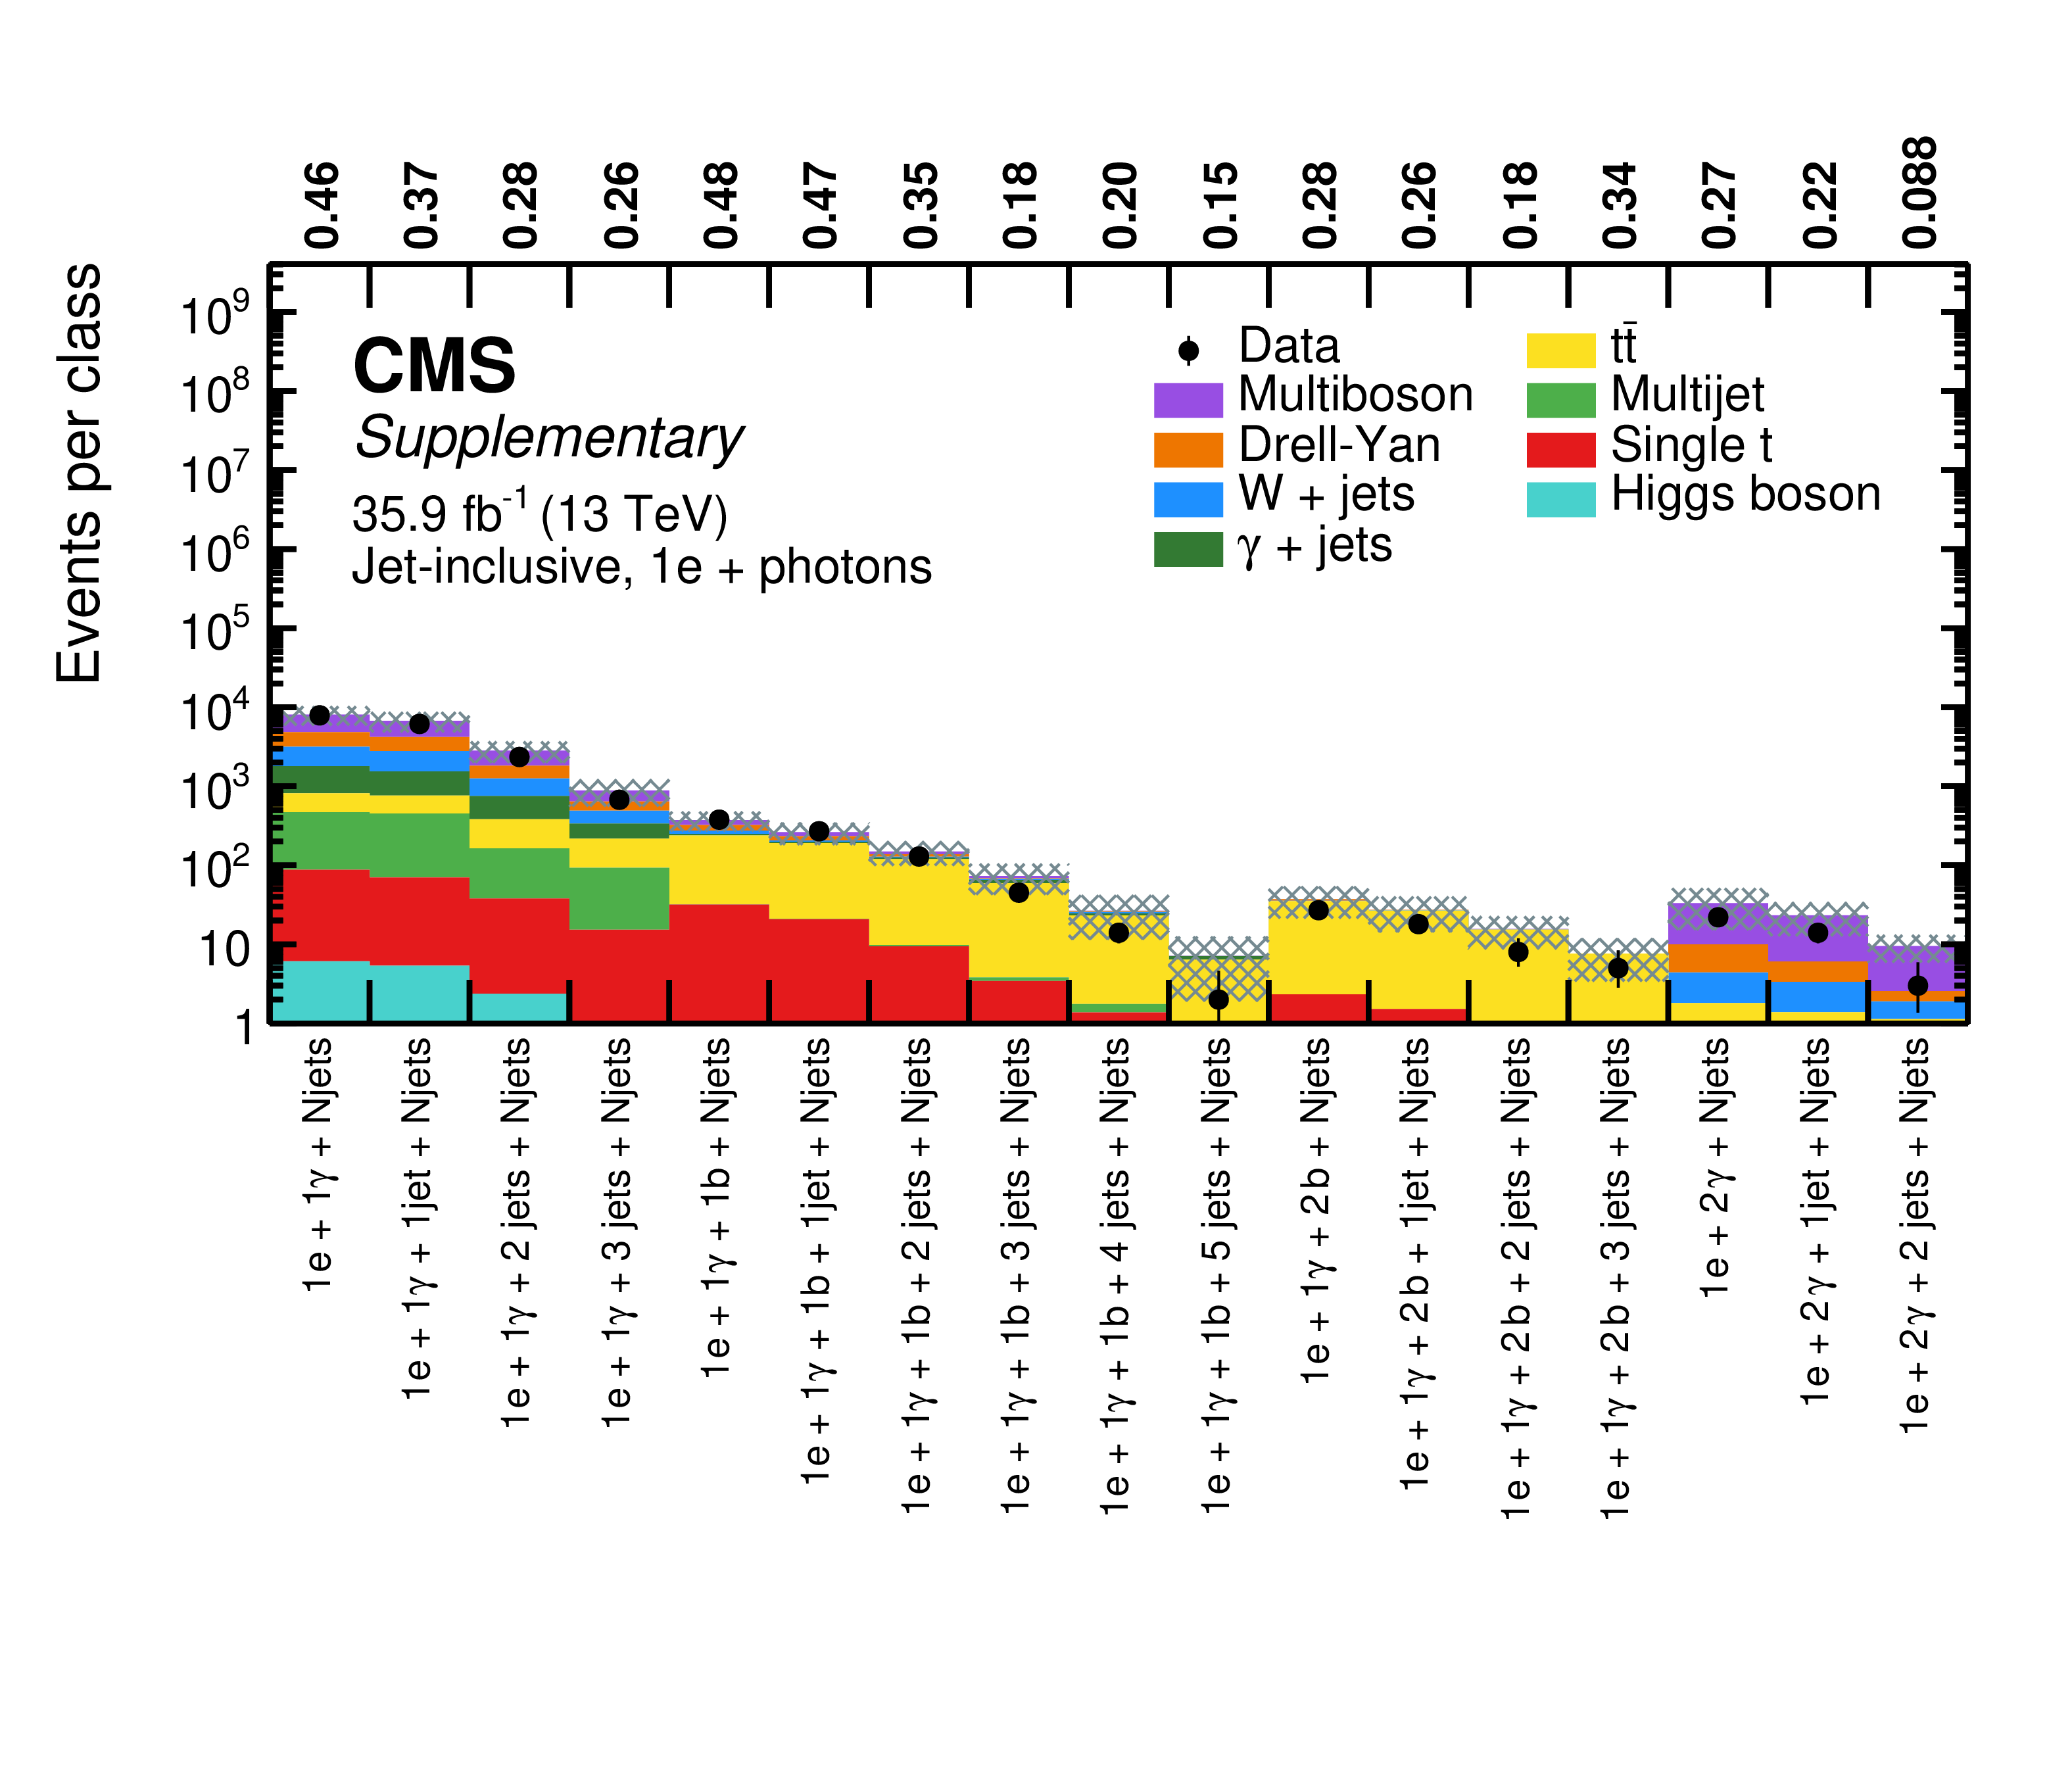
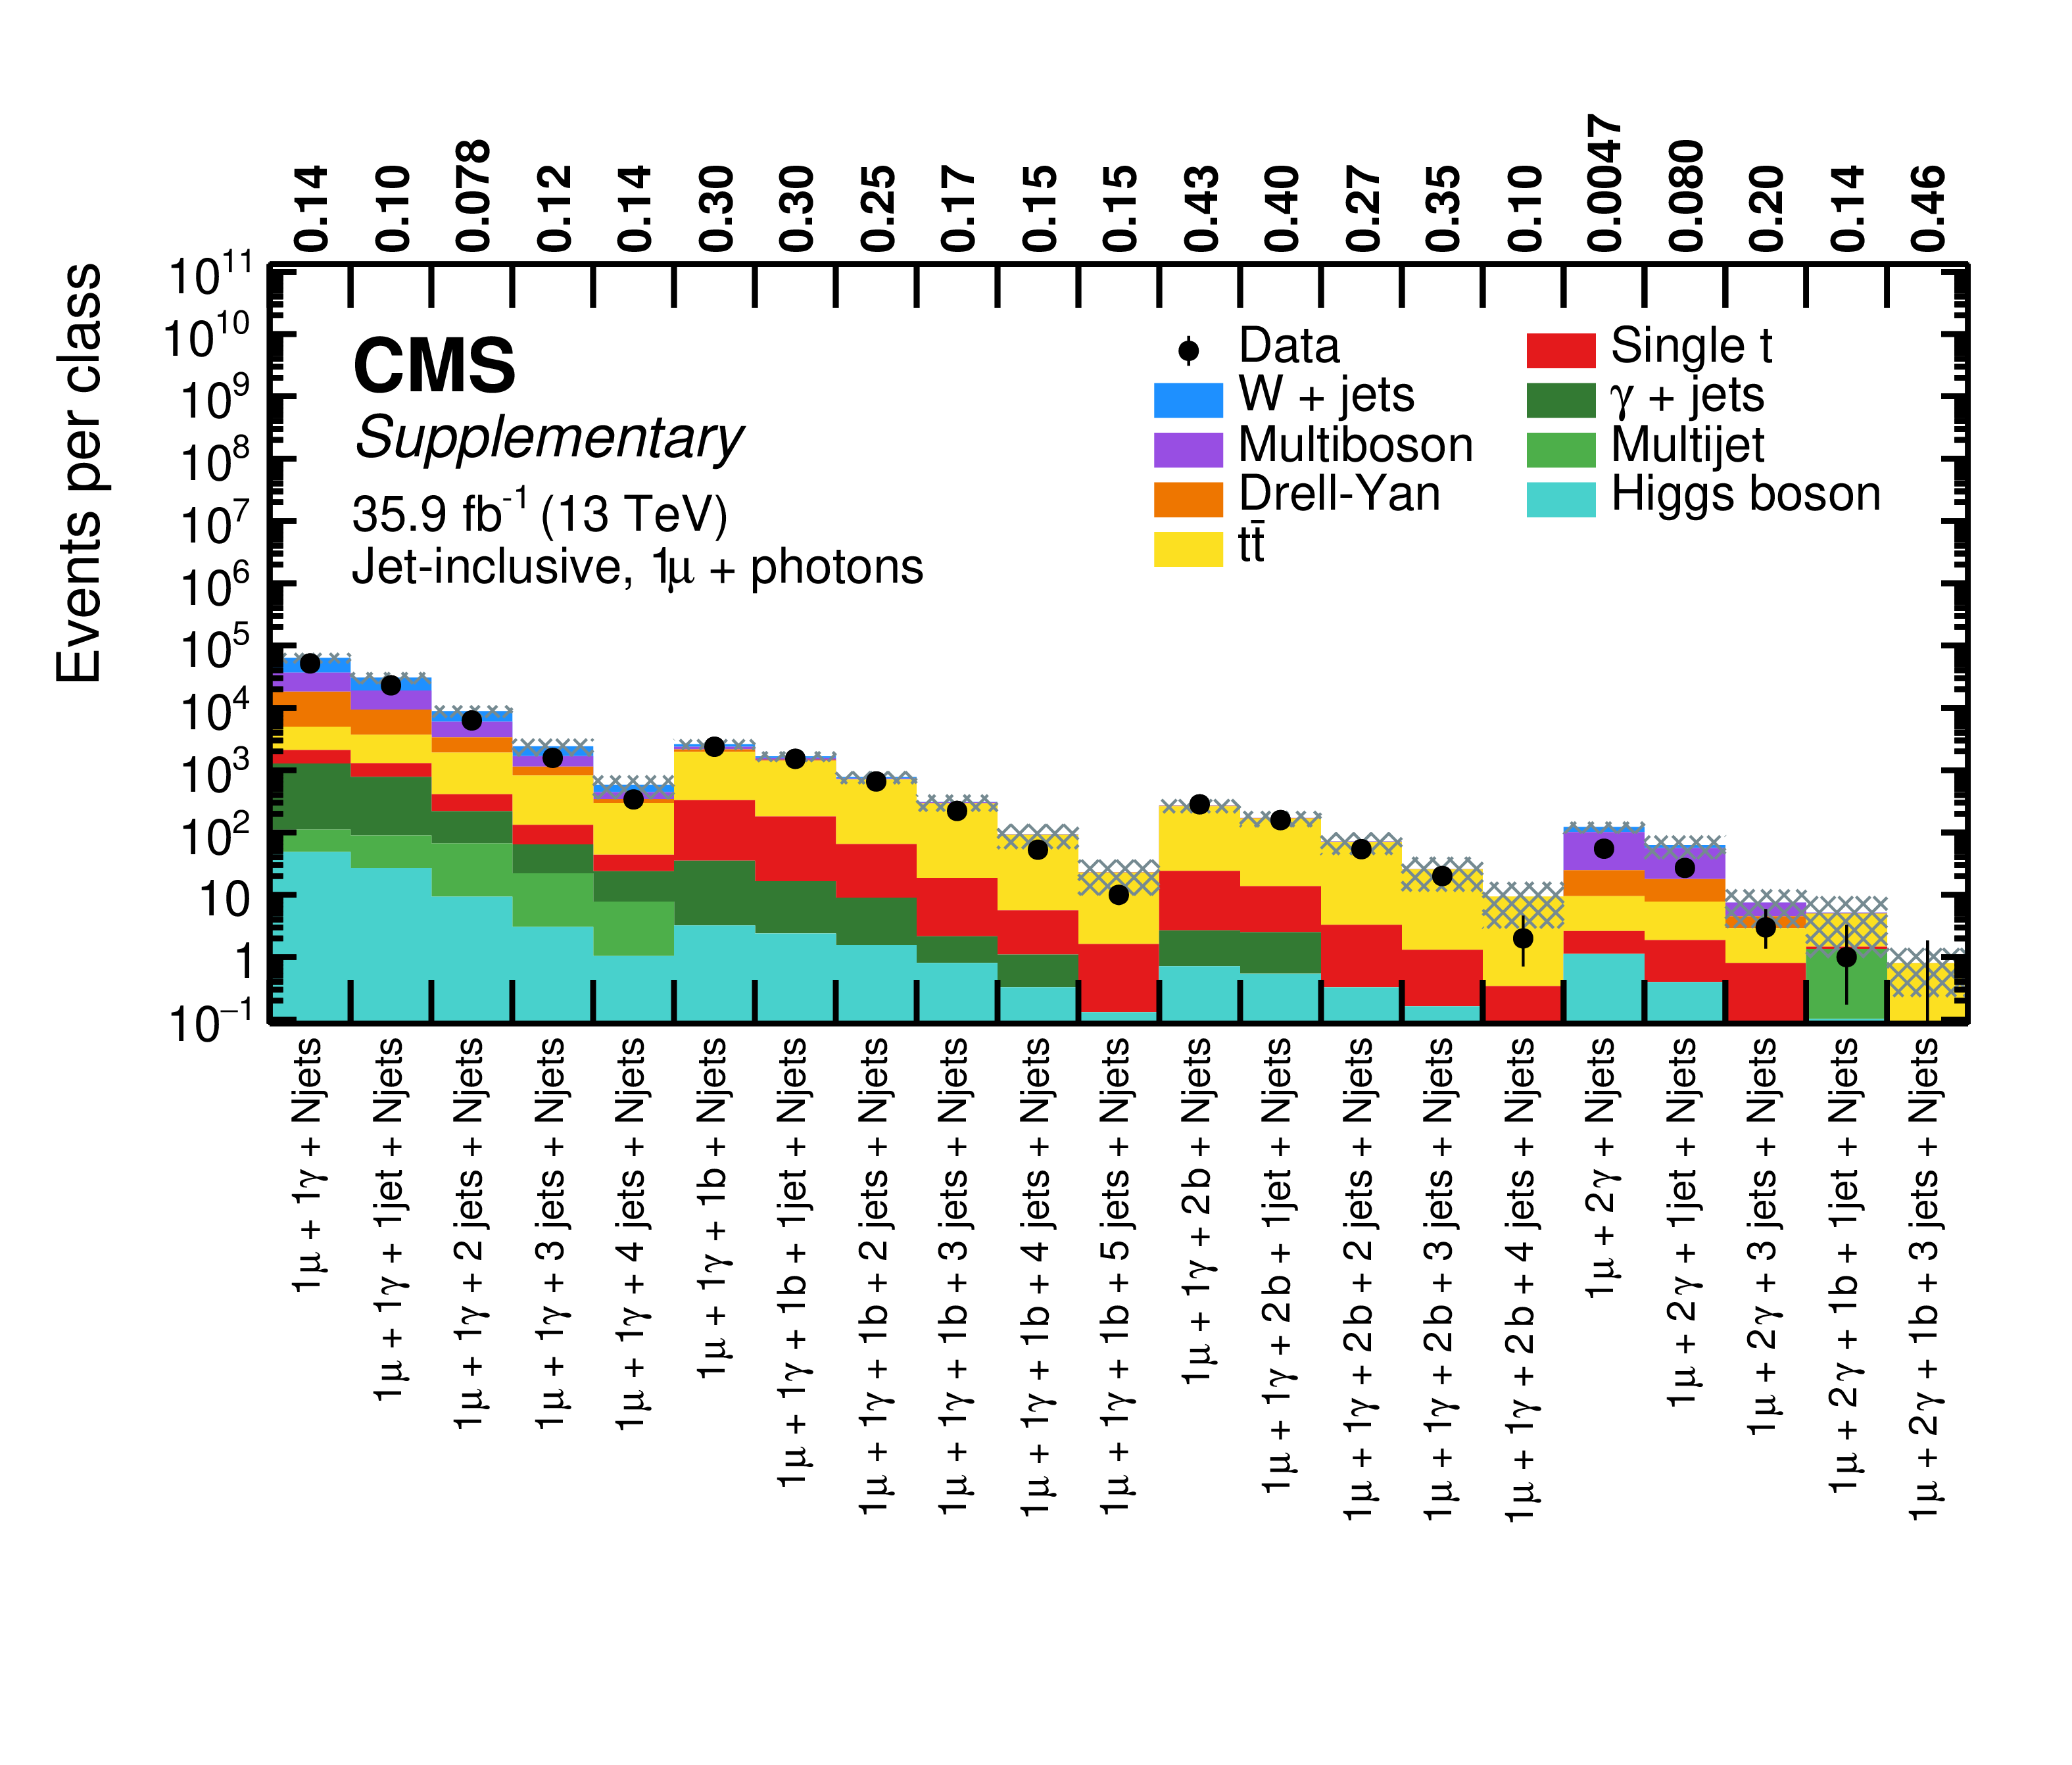
Additional Figure 4:
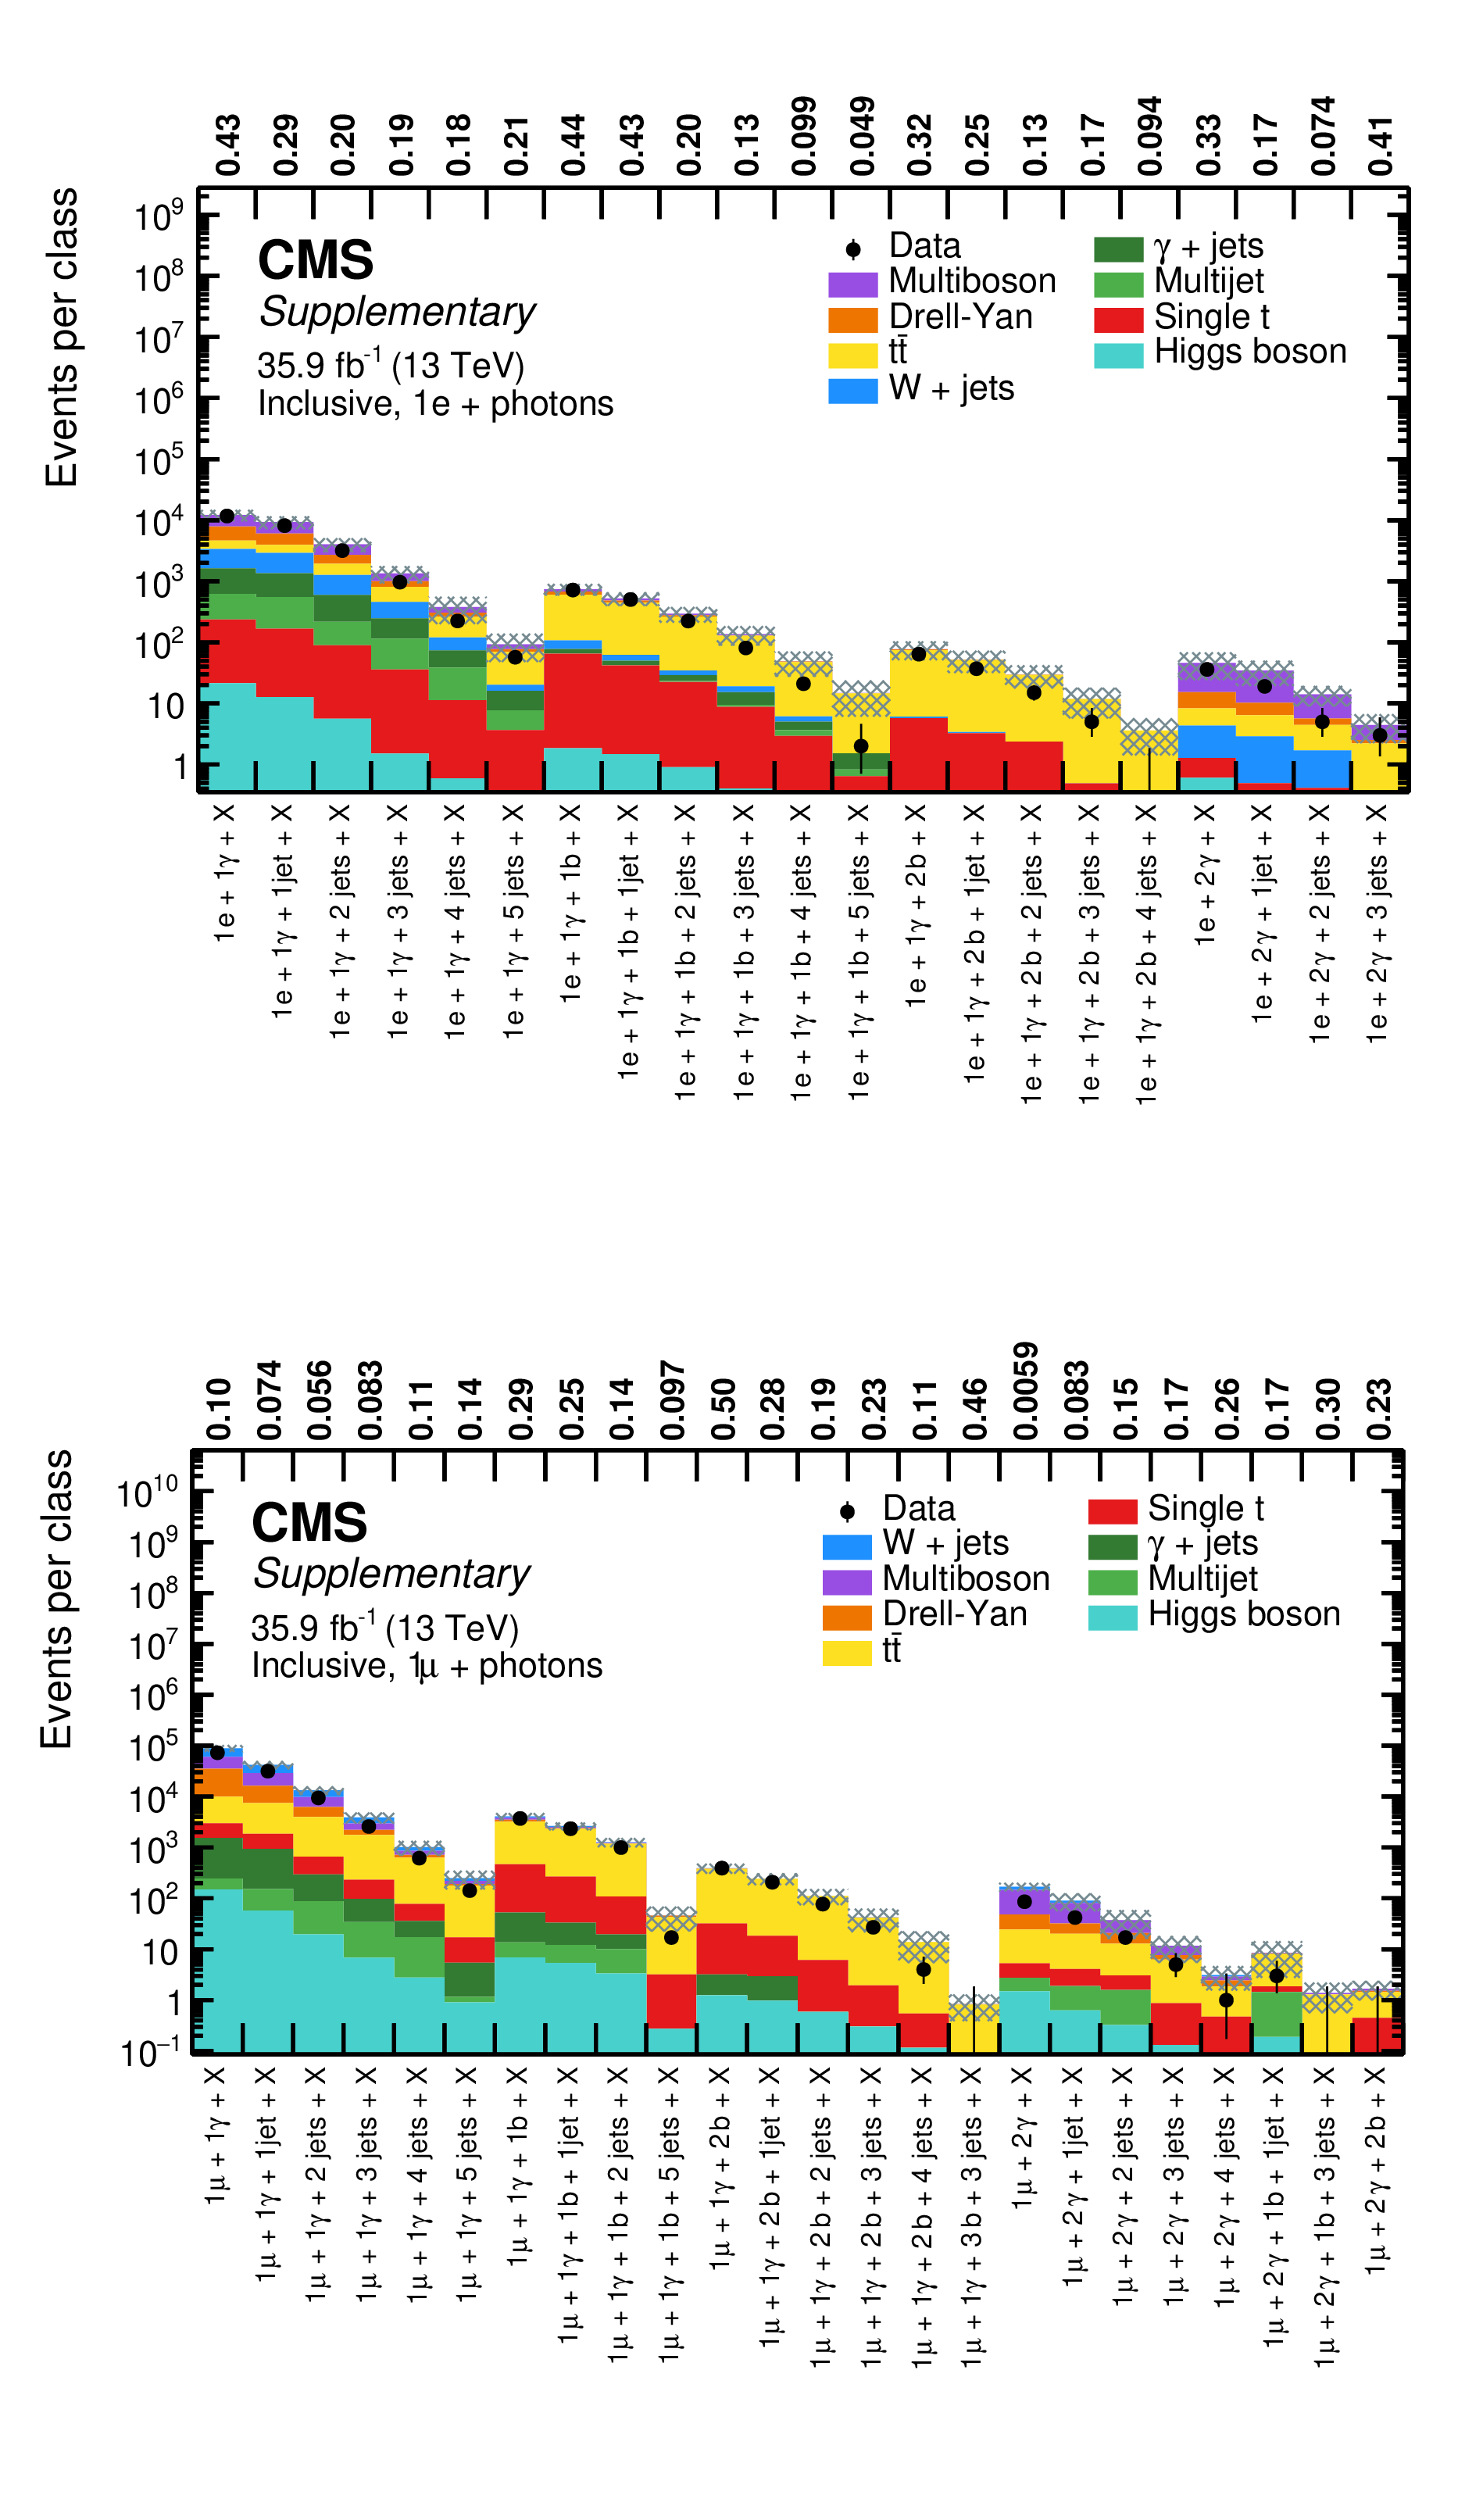
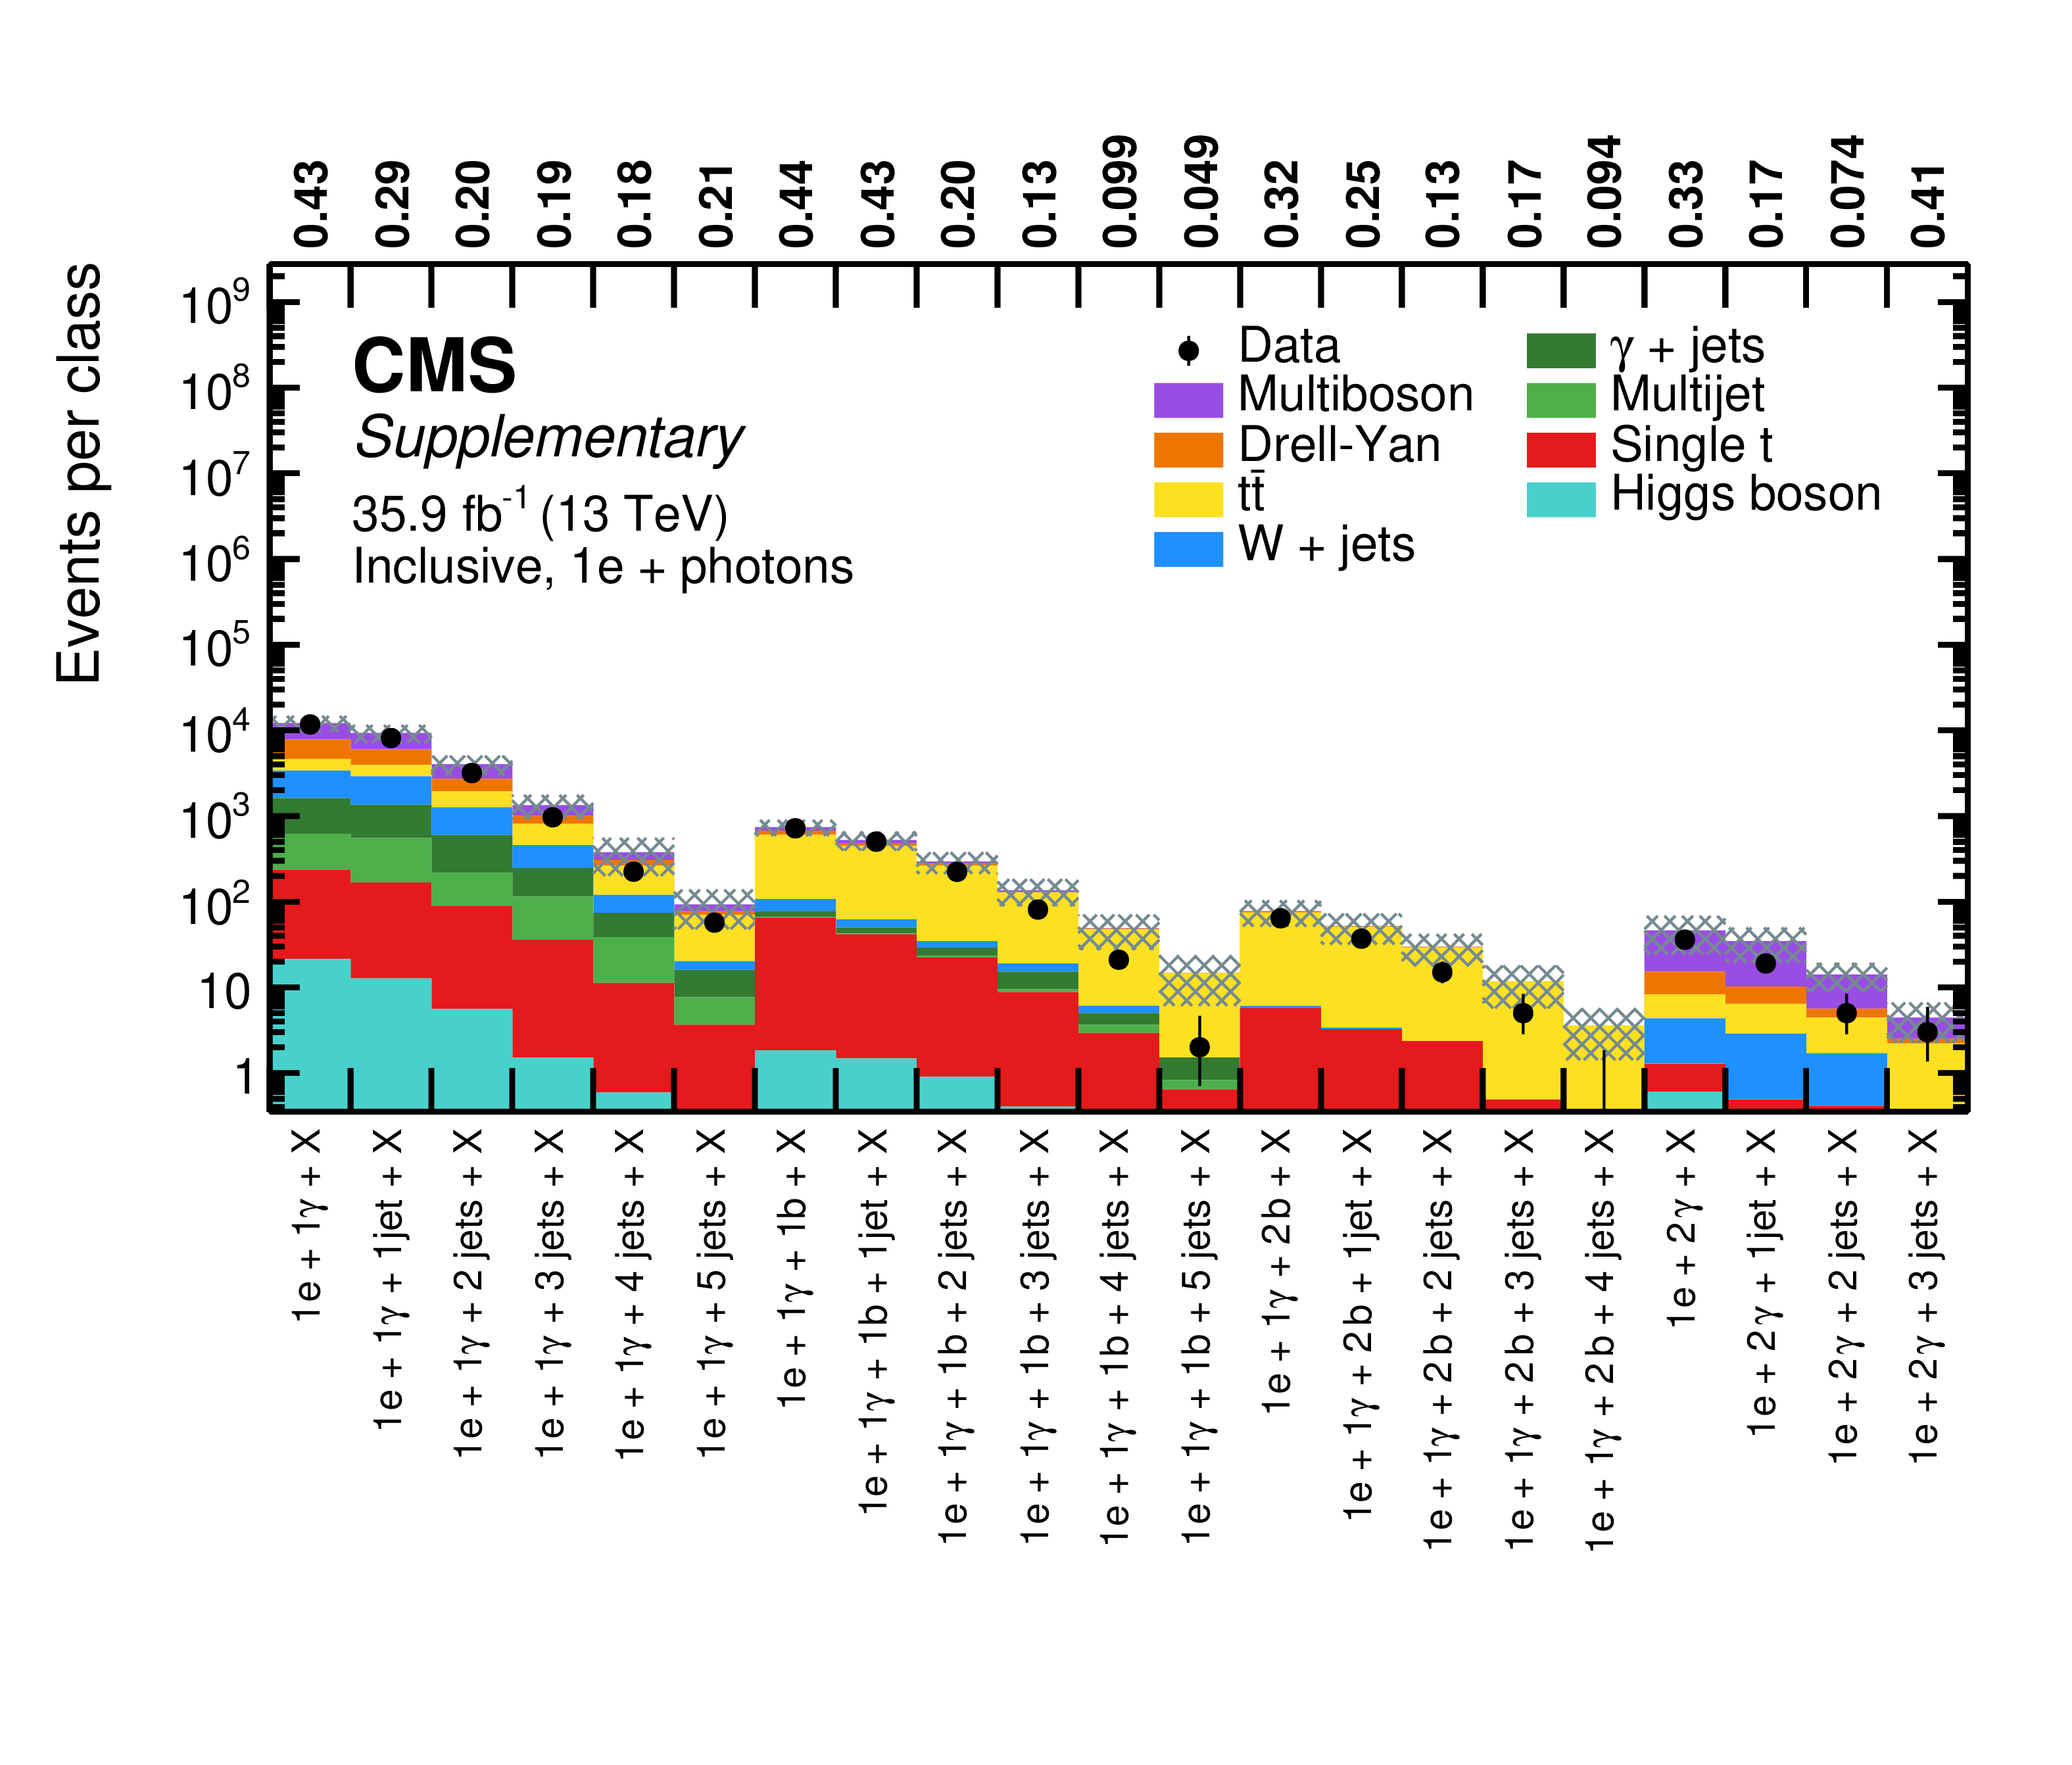
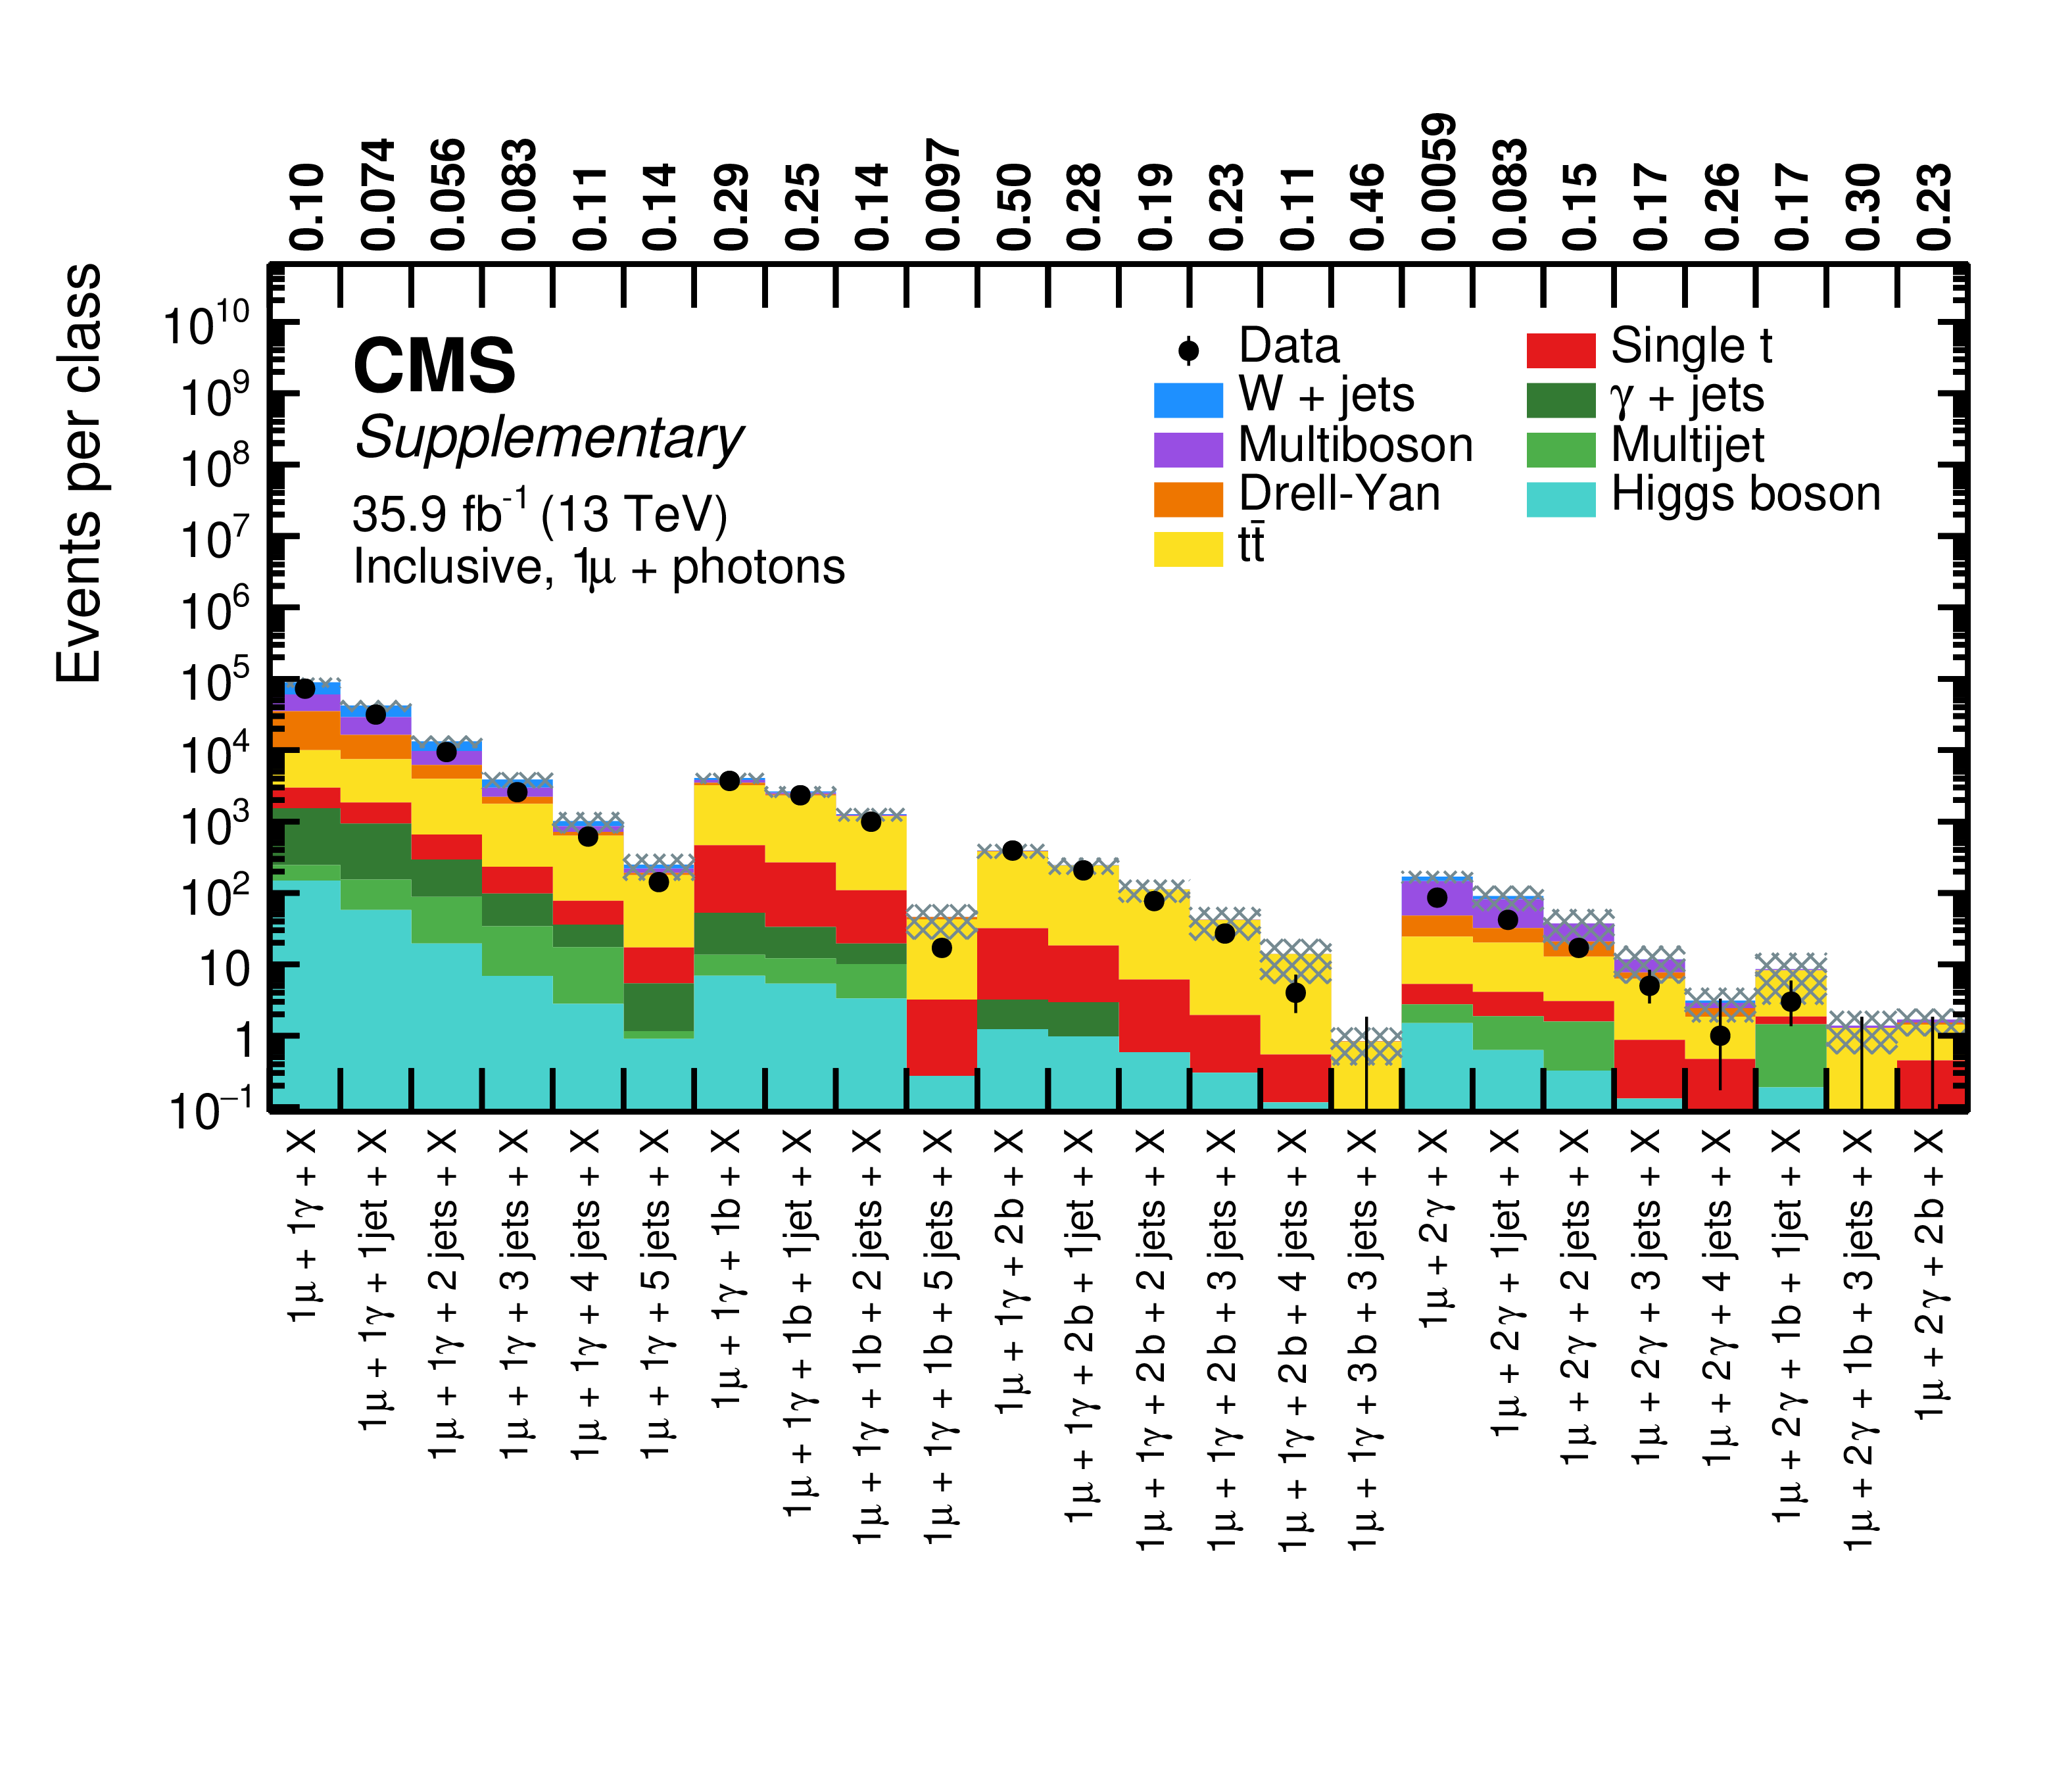
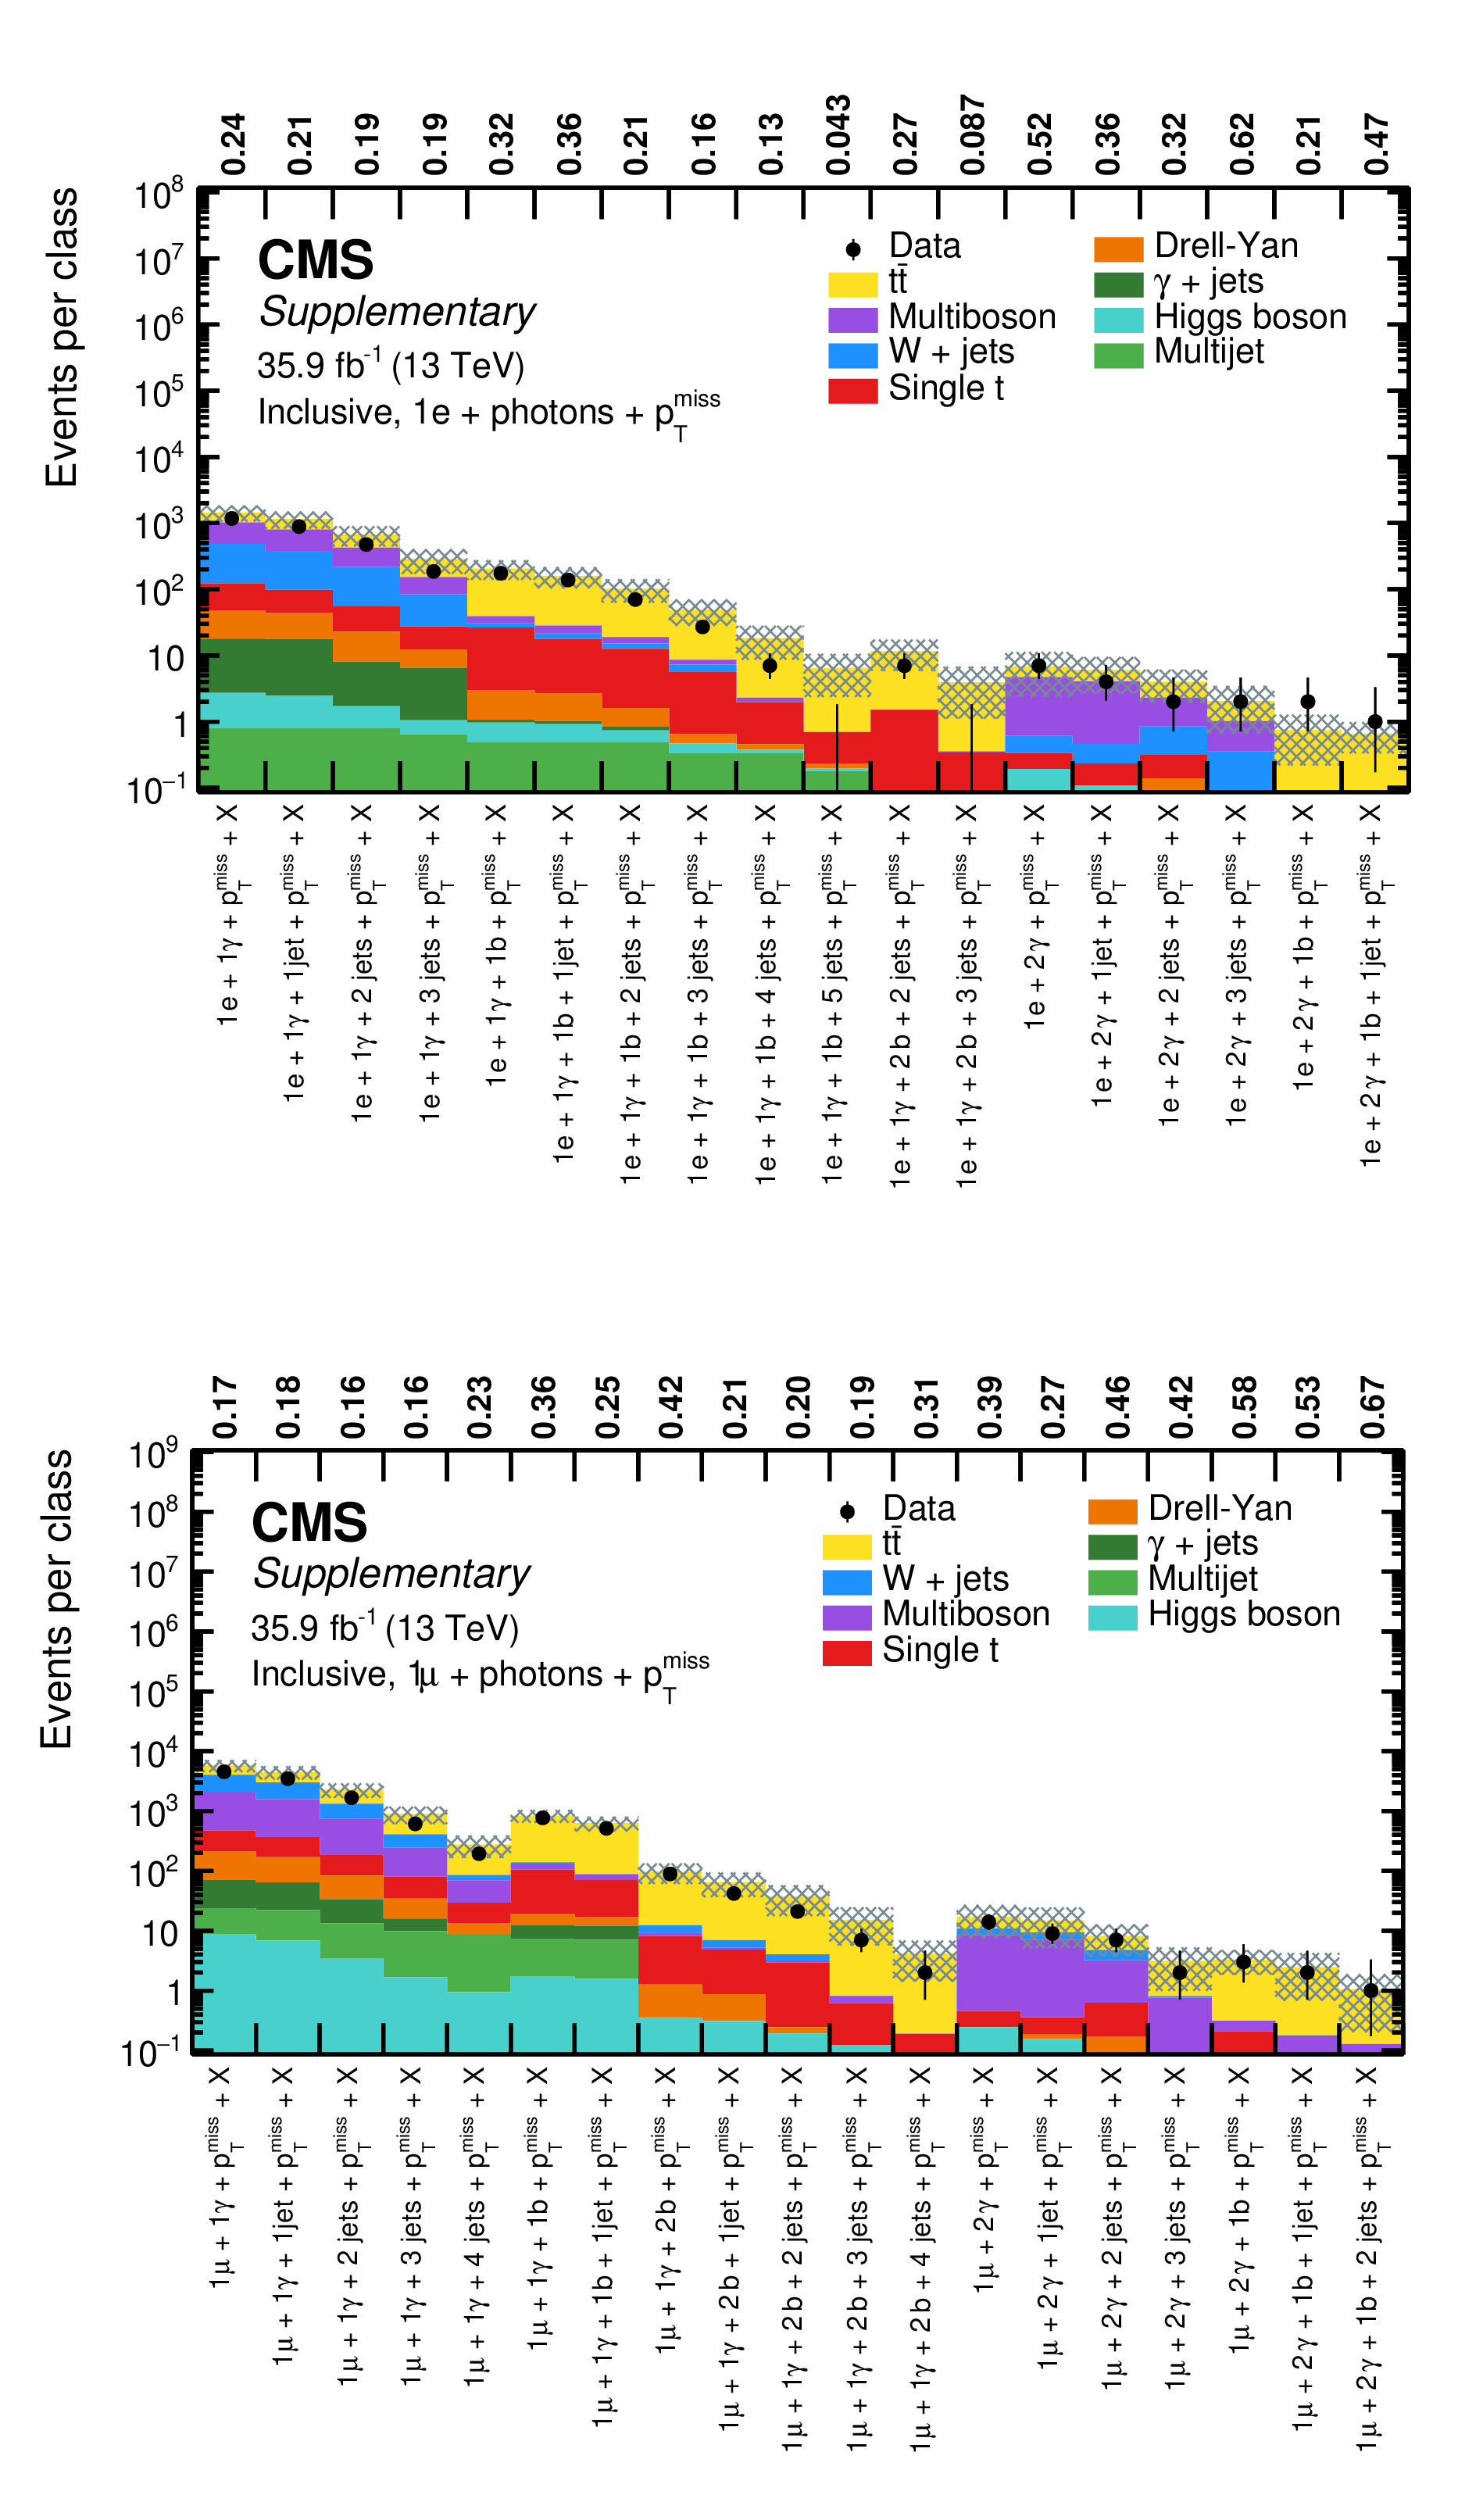
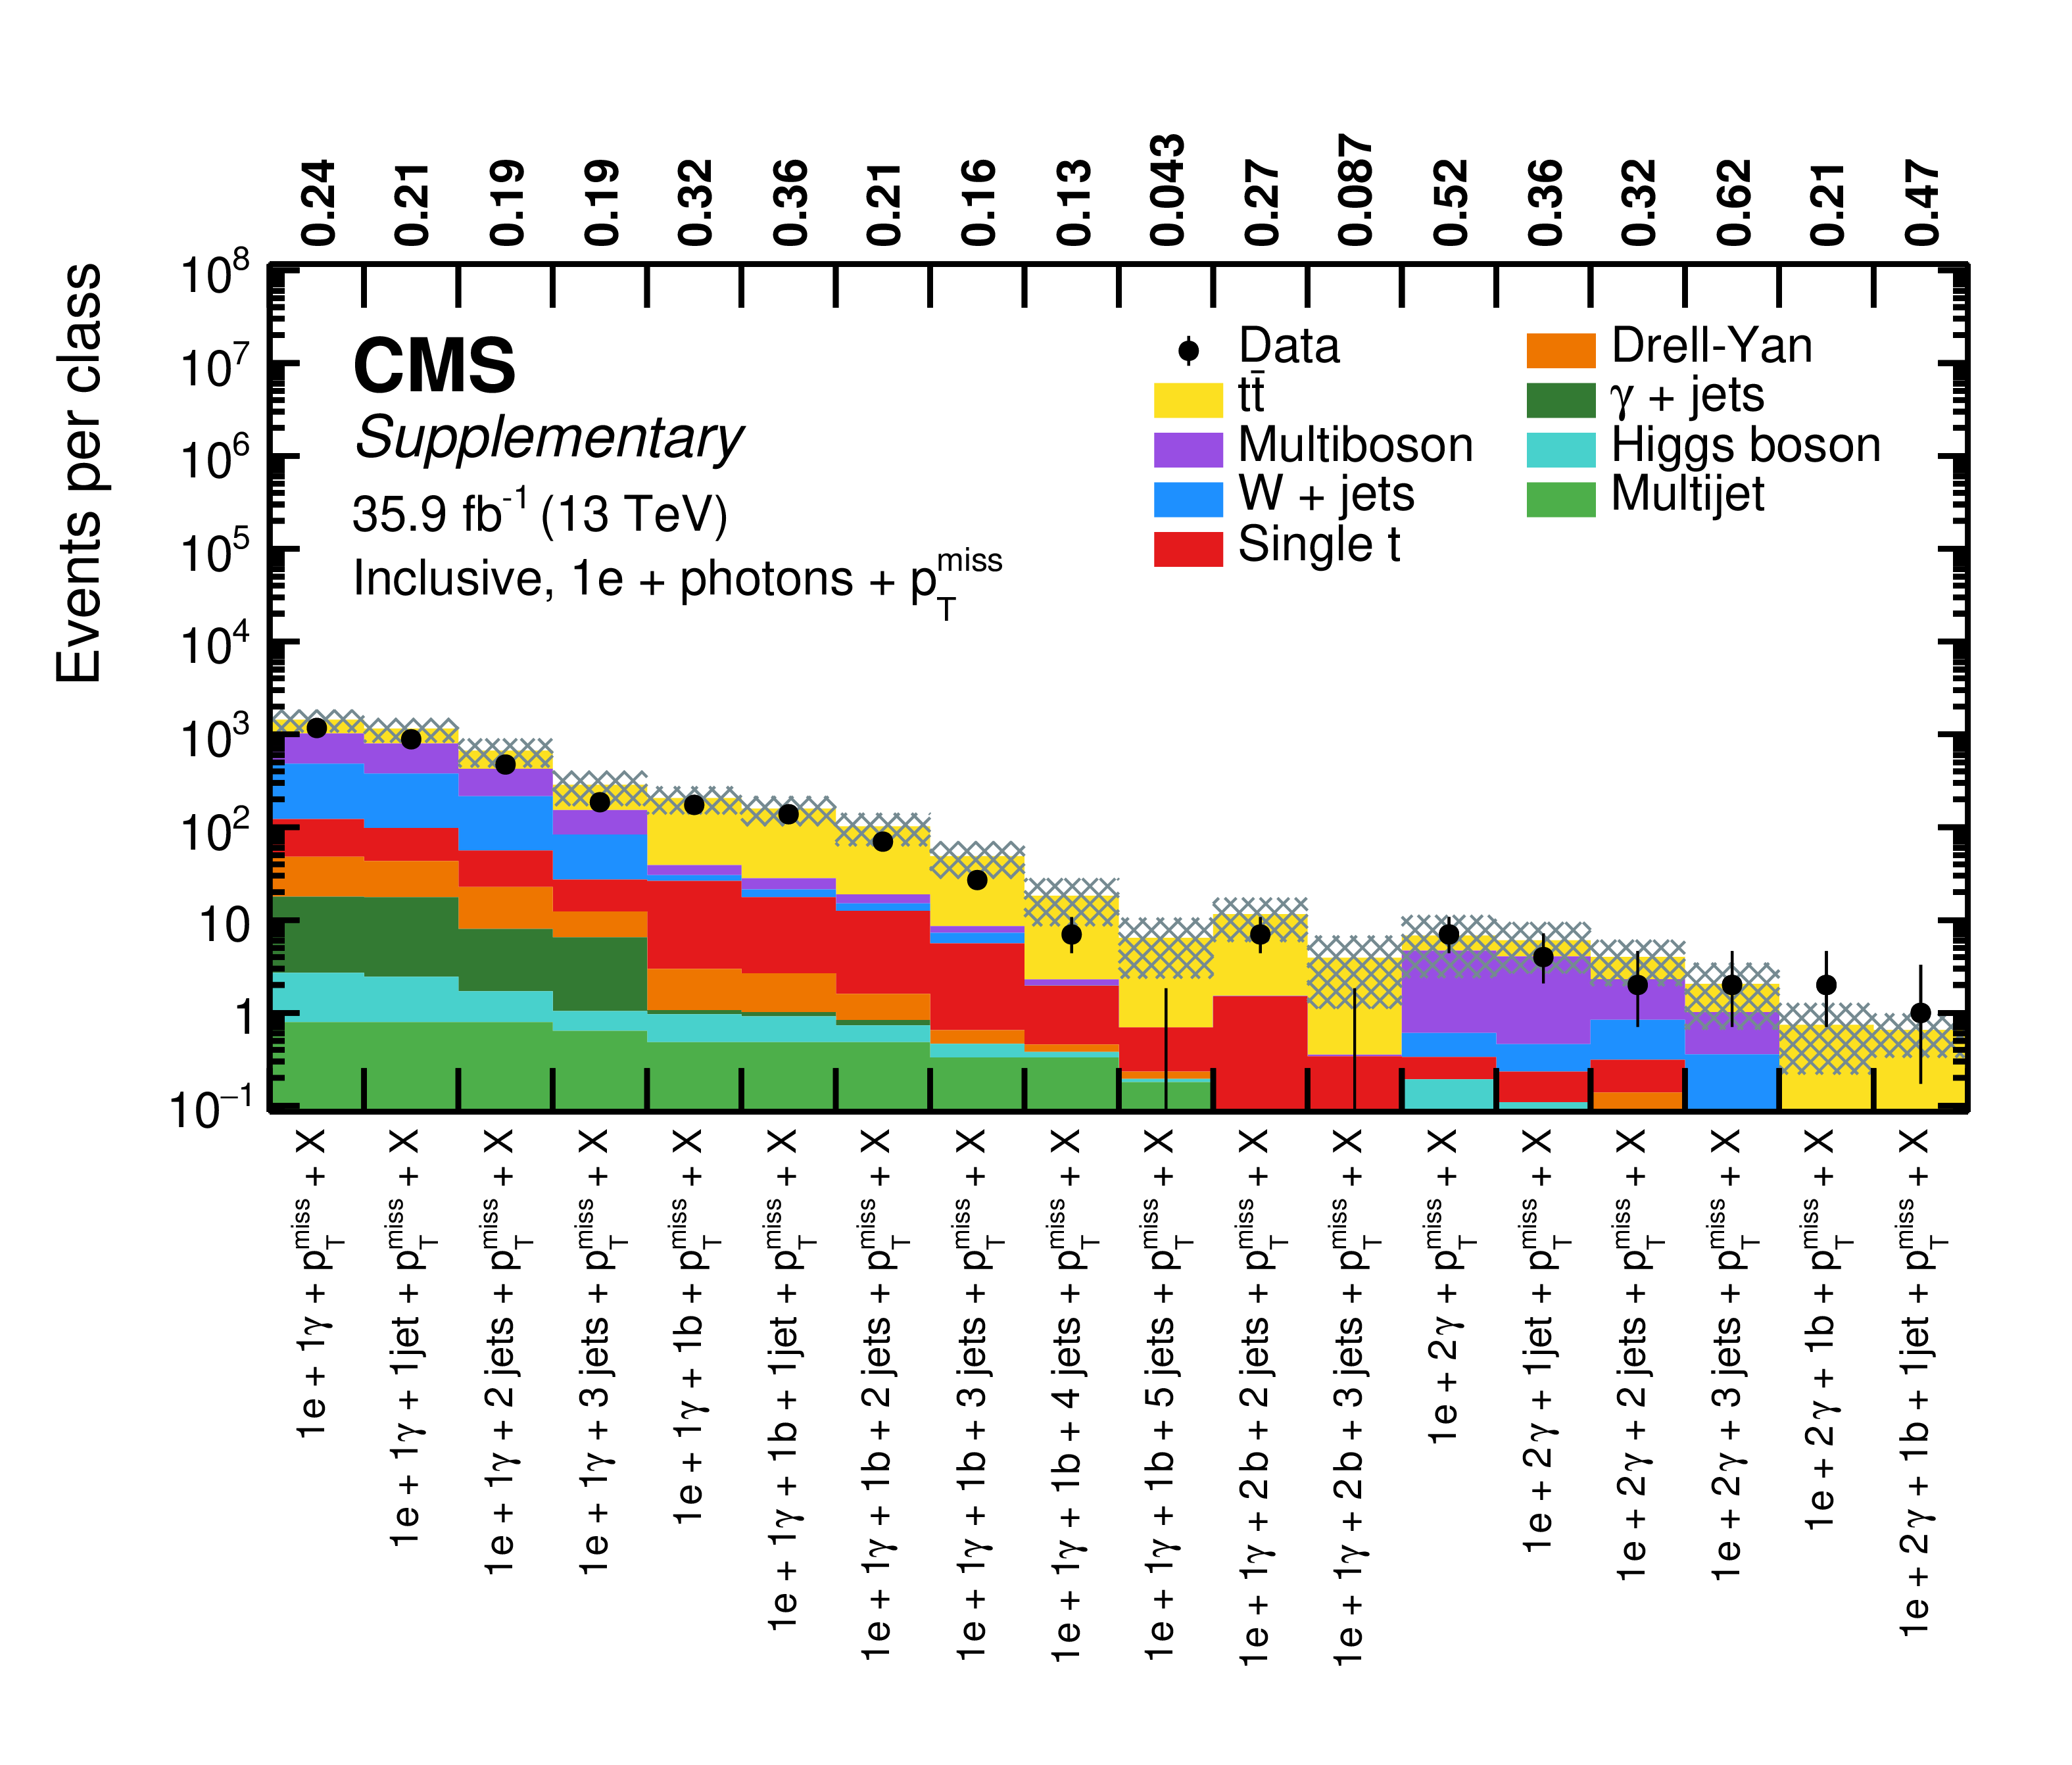
Overview of total event yields for the inclusive event classes of the single-electron $+$ photons (upper) and the single-muon $+$ photons (lower) object groups. Measured data are shown as black markers, contributions from SM processes are represented by coloured histograms, and the shaded region represents the uncertainty in the SM background. The numbers above the plot indicate the observed p-value for the agreement of data and simulation. |
png pdf |
Additional Figure 4-a:
Overview of total event yields for the inclusive event classes of the single-electron $+$ photons object group. Measured data are shown as black markers, contributions from SM processes are represented by coloured histograms, and the shaded region represents the uncertainty in the SM background. The numbers above the plot indicate the observed p-value for the agreement of data and simulation. |
png pdf |
Additional Figure 4-b:
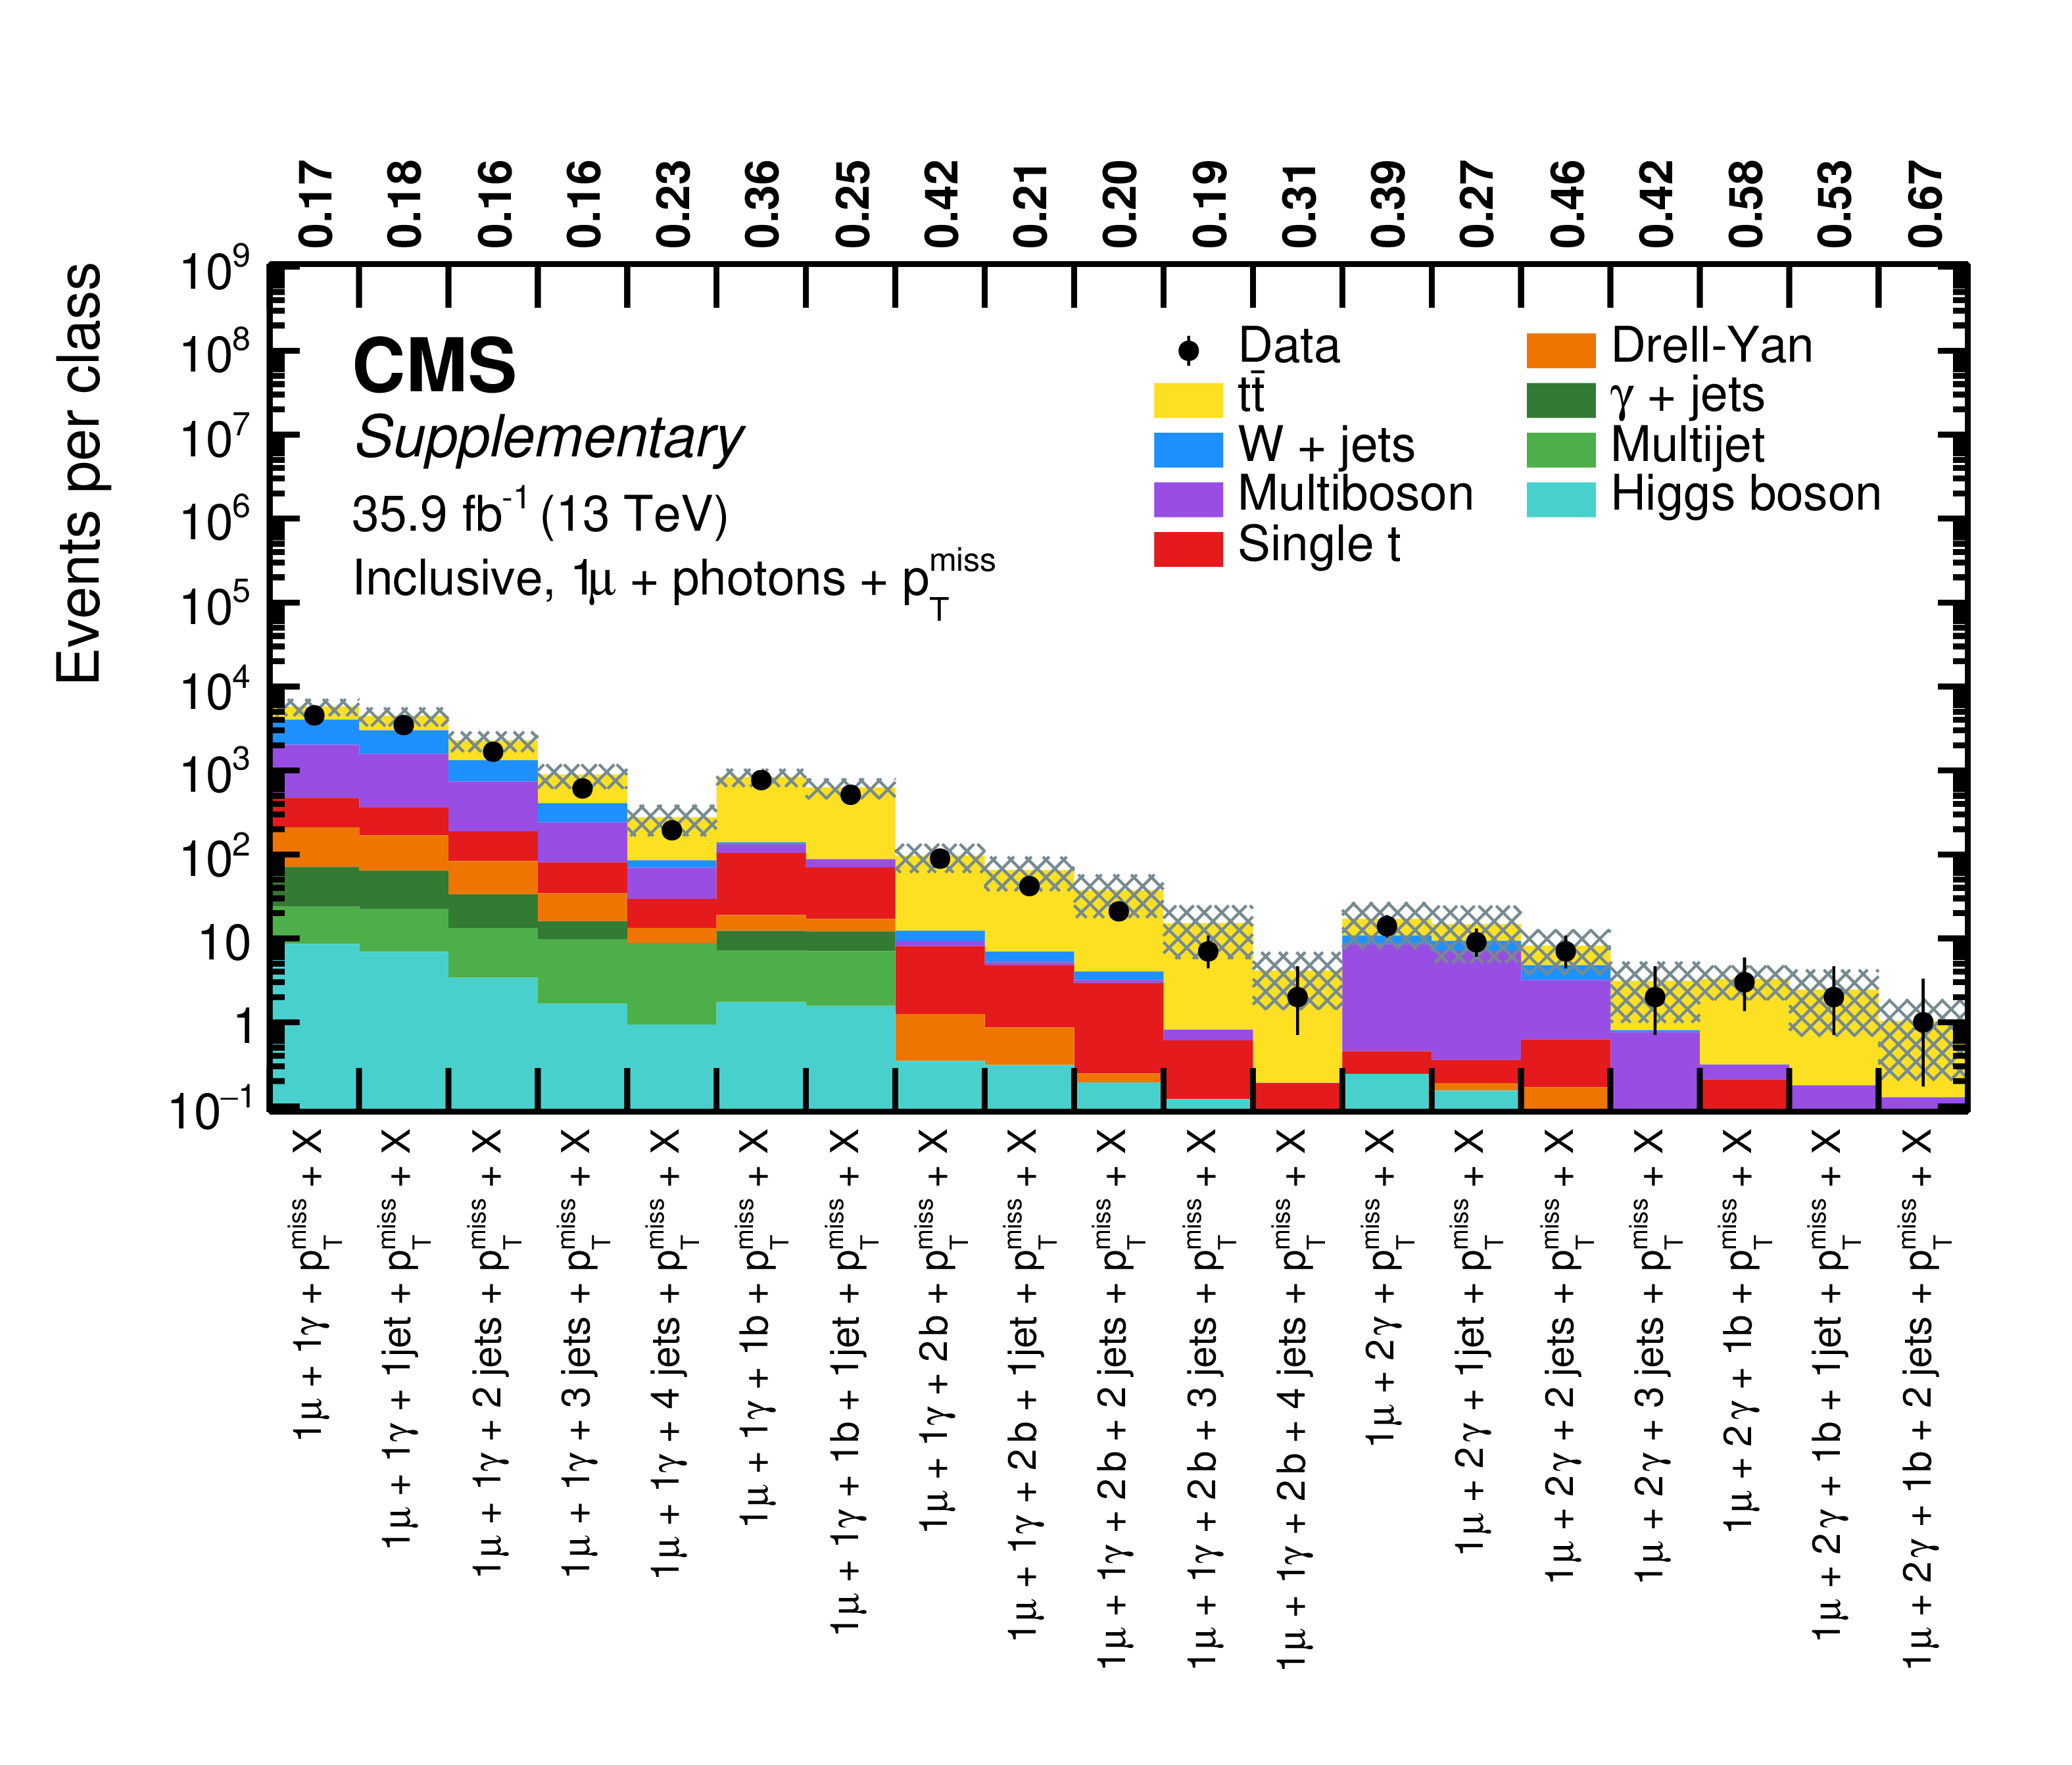
Overview of total event yields for the inclusive event classes of the single-muon $+$ photons object group. Measured data are shown as black markers, contributions from SM processes are represented by coloured histograms, and the shaded region represents the uncertainty in the SM background. The numbers above the plot indicate the observed p-value for the agreement of data and simulation. |
png pdf |
Additional Figure 5:
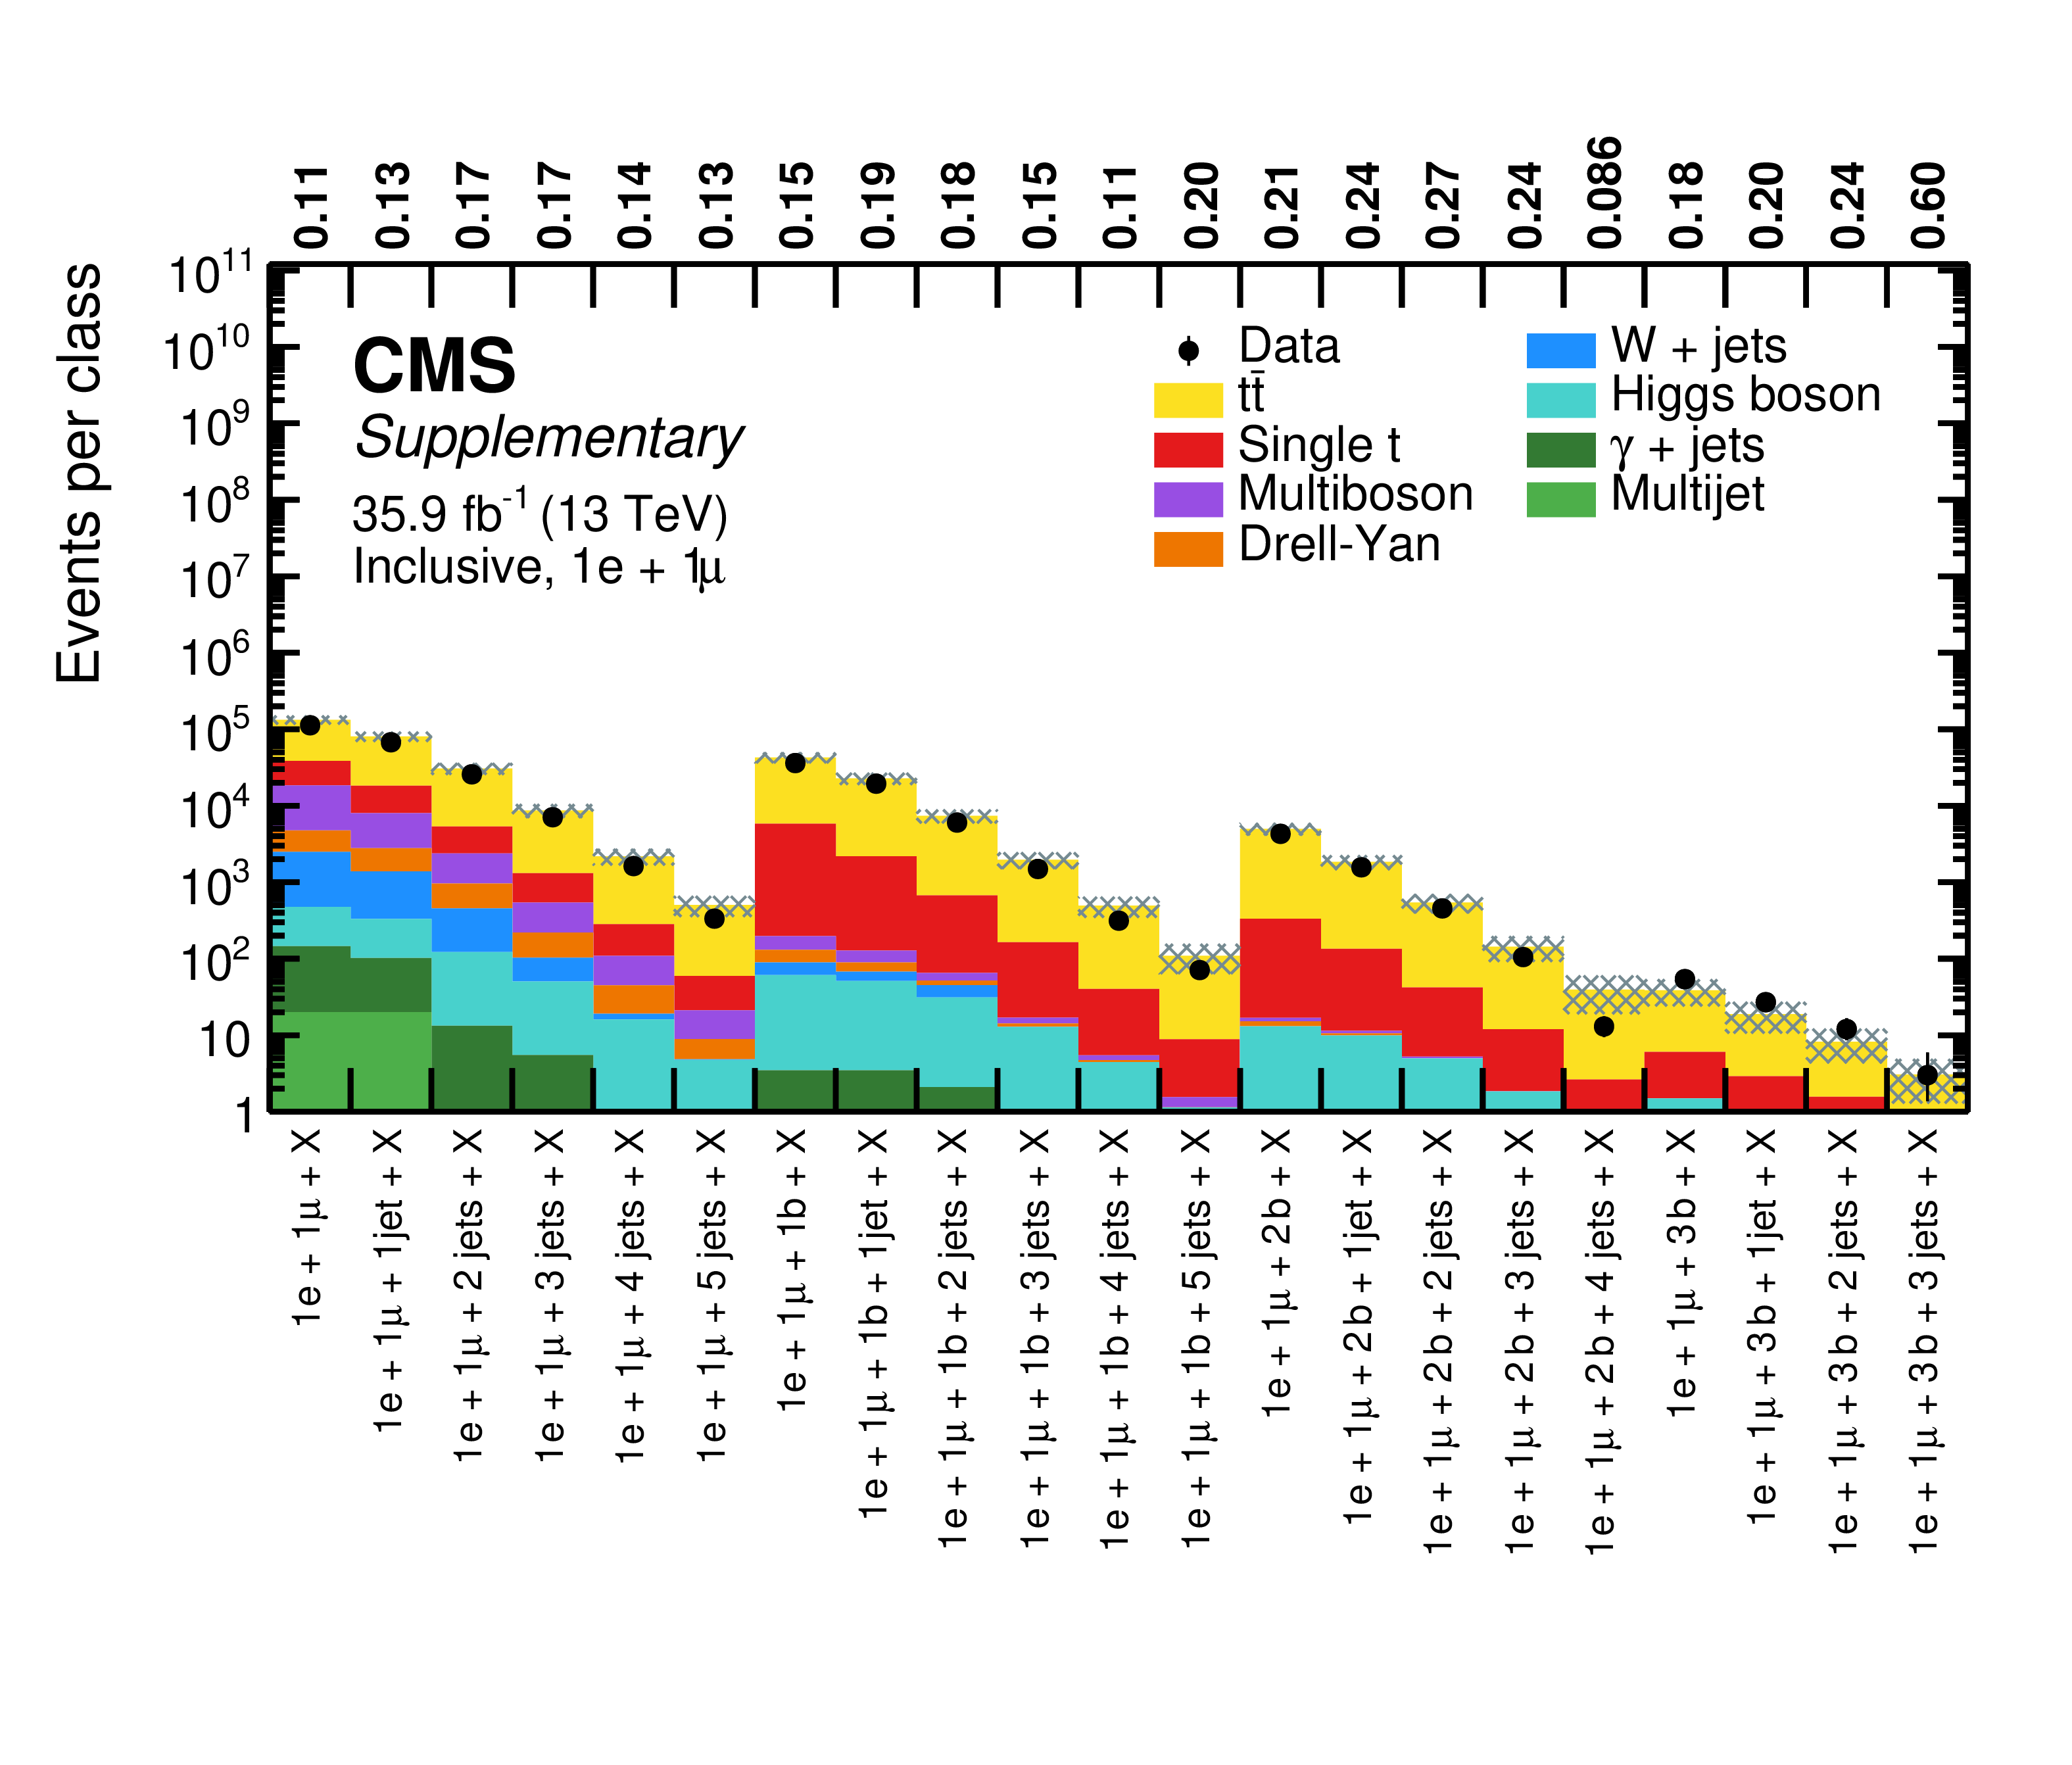
Overview of total event yields for the inclusive event classes of the single-electron $+$ single-muon (upper) and the single-electron $+$ single-muon $+$ ${{p_{\mathrm {T}}} ^\text {miss}}$ (lower) object groups. Measured data are shown as black markers, contributions from SM processes are represented by coloured histograms, and the shaded region represents the uncertainty in the SM background. The numbers above the plot indicate the observed p-value for the agreement of data and simulation. |
png pdf |
Additional Figure 5-a:
Overview of total event yields for the inclusive event classes of the single-electron $+$ single-muon object group. Measured data are shown as black markers, contributions from SM processes are represented by coloured histograms, and the shaded region represents the uncertainty in the SM background. The numbers above the plot indicate the observed p-value for the agreement of data and simulation. |

png pdf |
Additional Figure 5-b:
Overview of total event yields for the inclusive event classes of the single-electron $+$ single-muon $+$ ${{p_{\mathrm {T}}} ^\text {miss}}$ object group. Measured data are shown as black markers, contributions from SM processes are represented by coloured histograms, and the shaded region represents the uncertainty in the SM background. The numbers above the plot indicate the observed p-value for the agreement of data and simulation. |
png pdf |
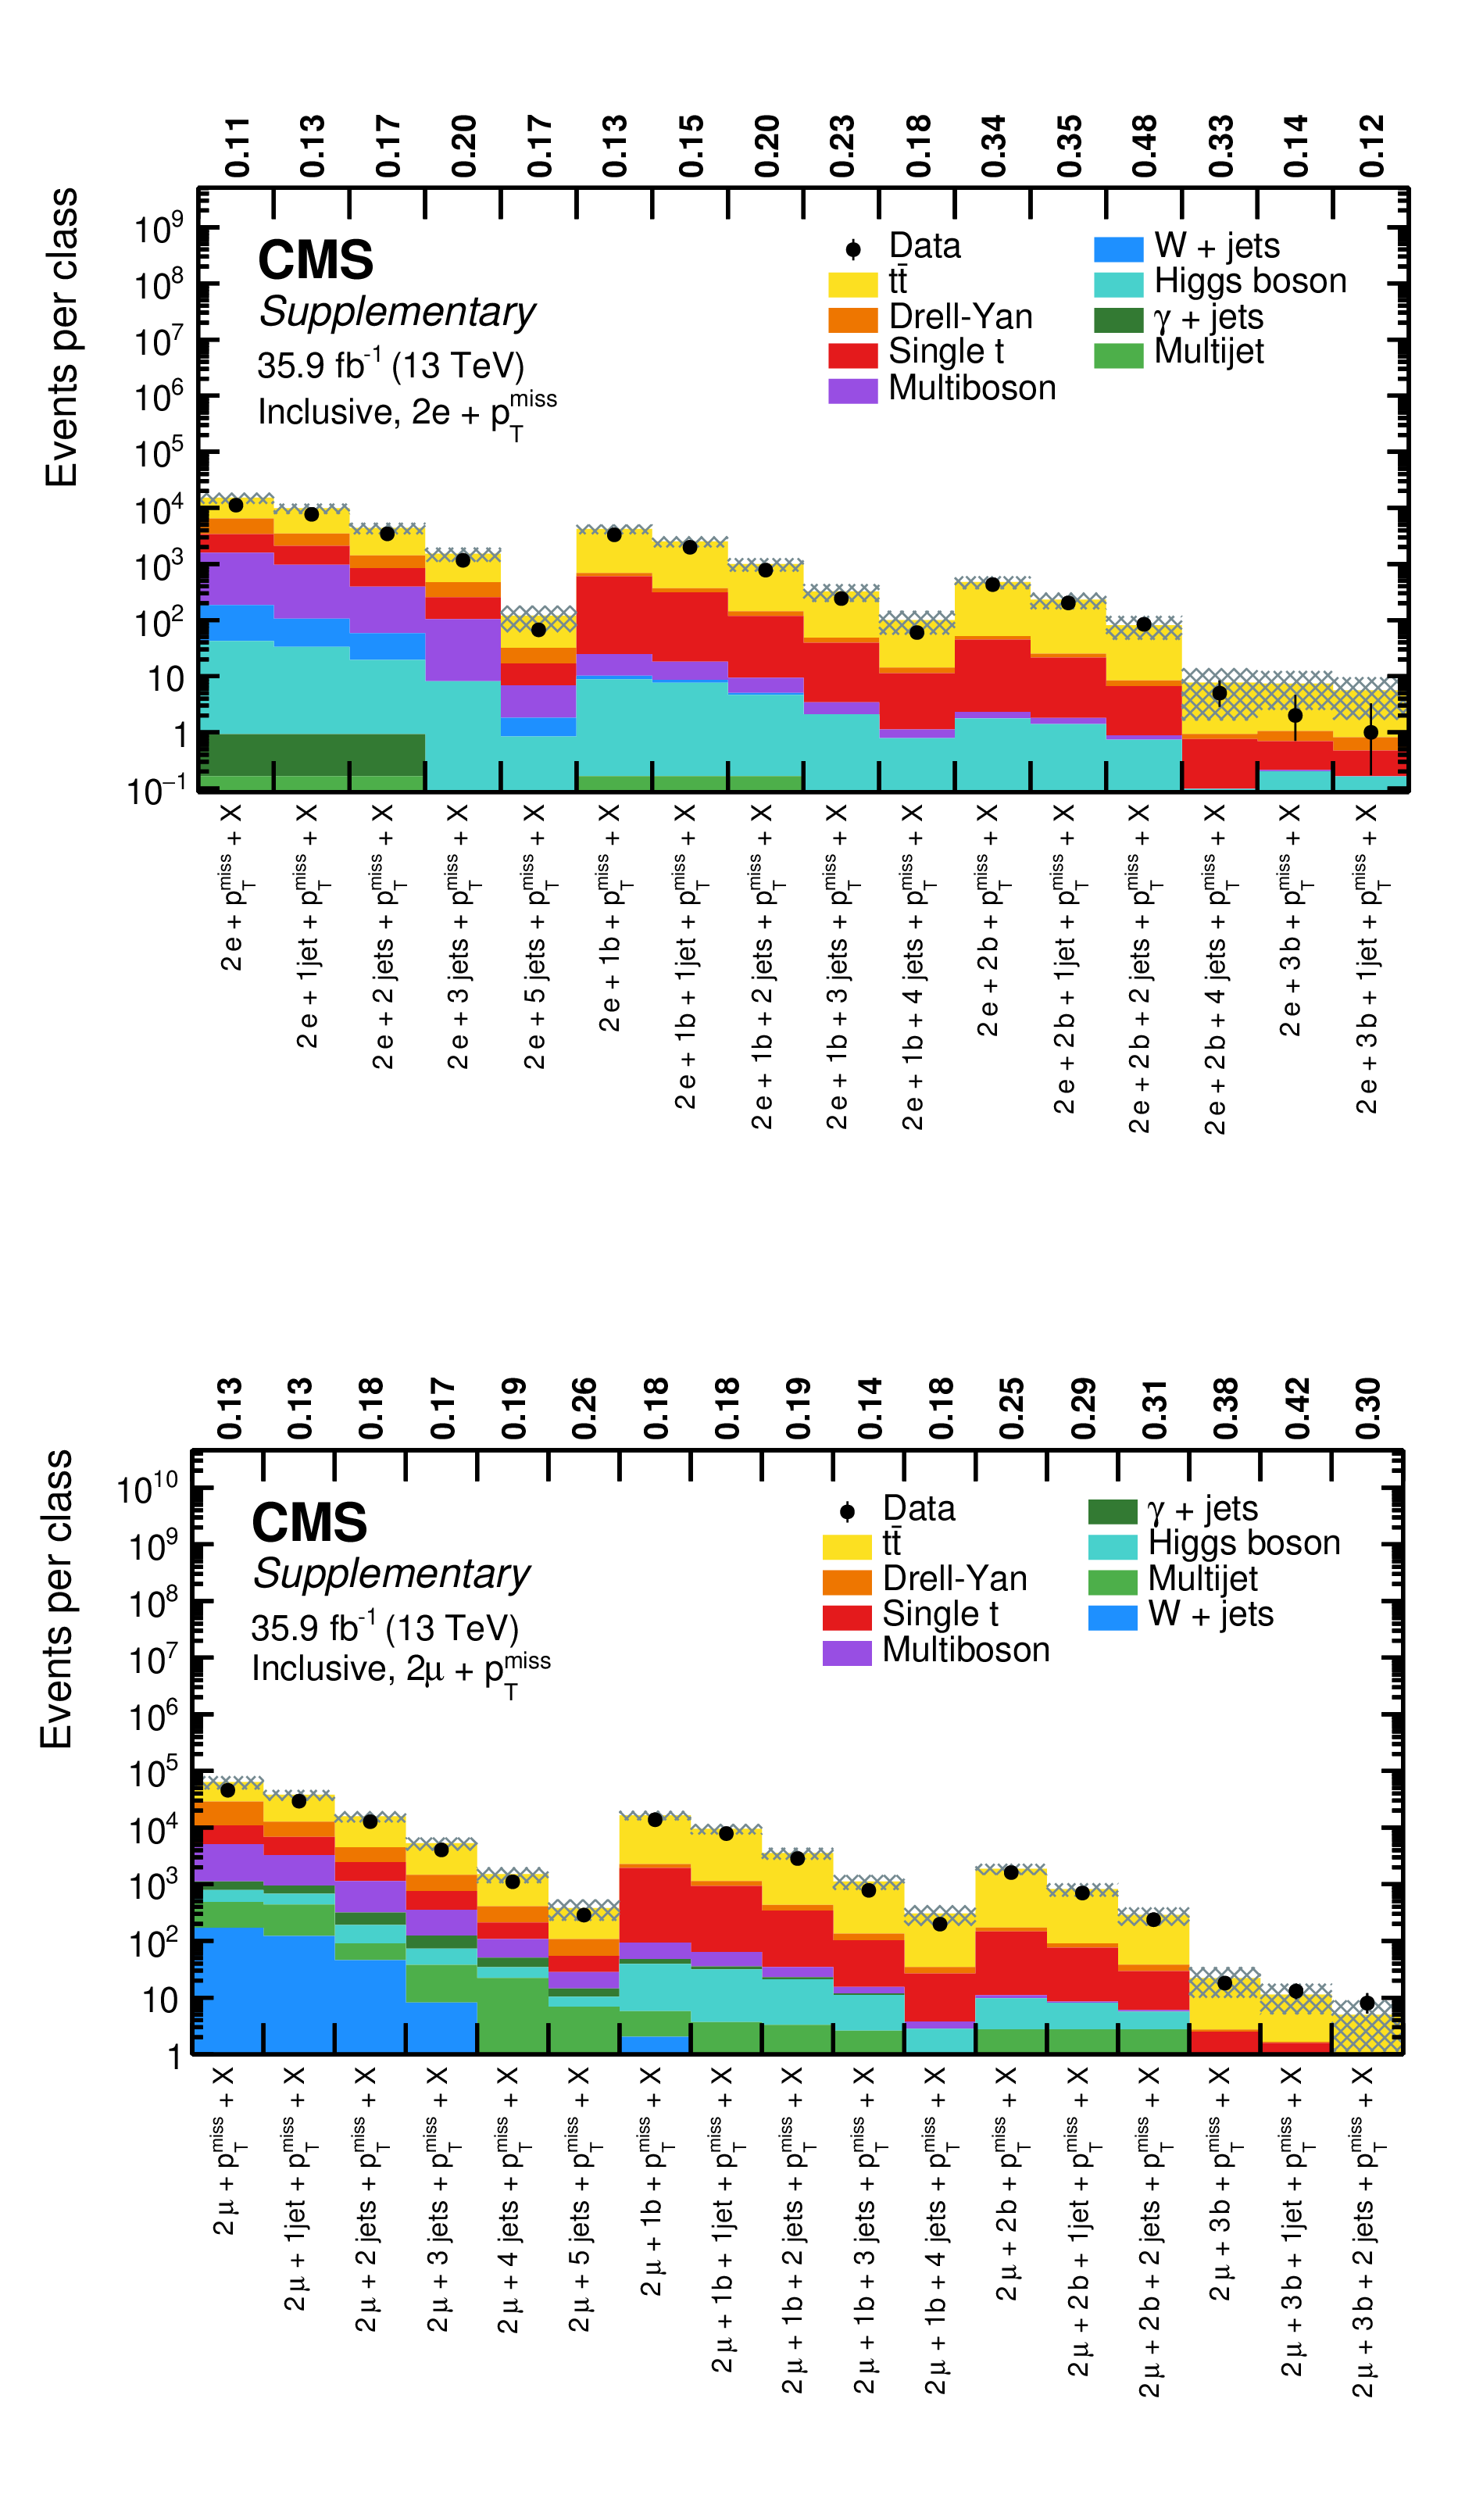
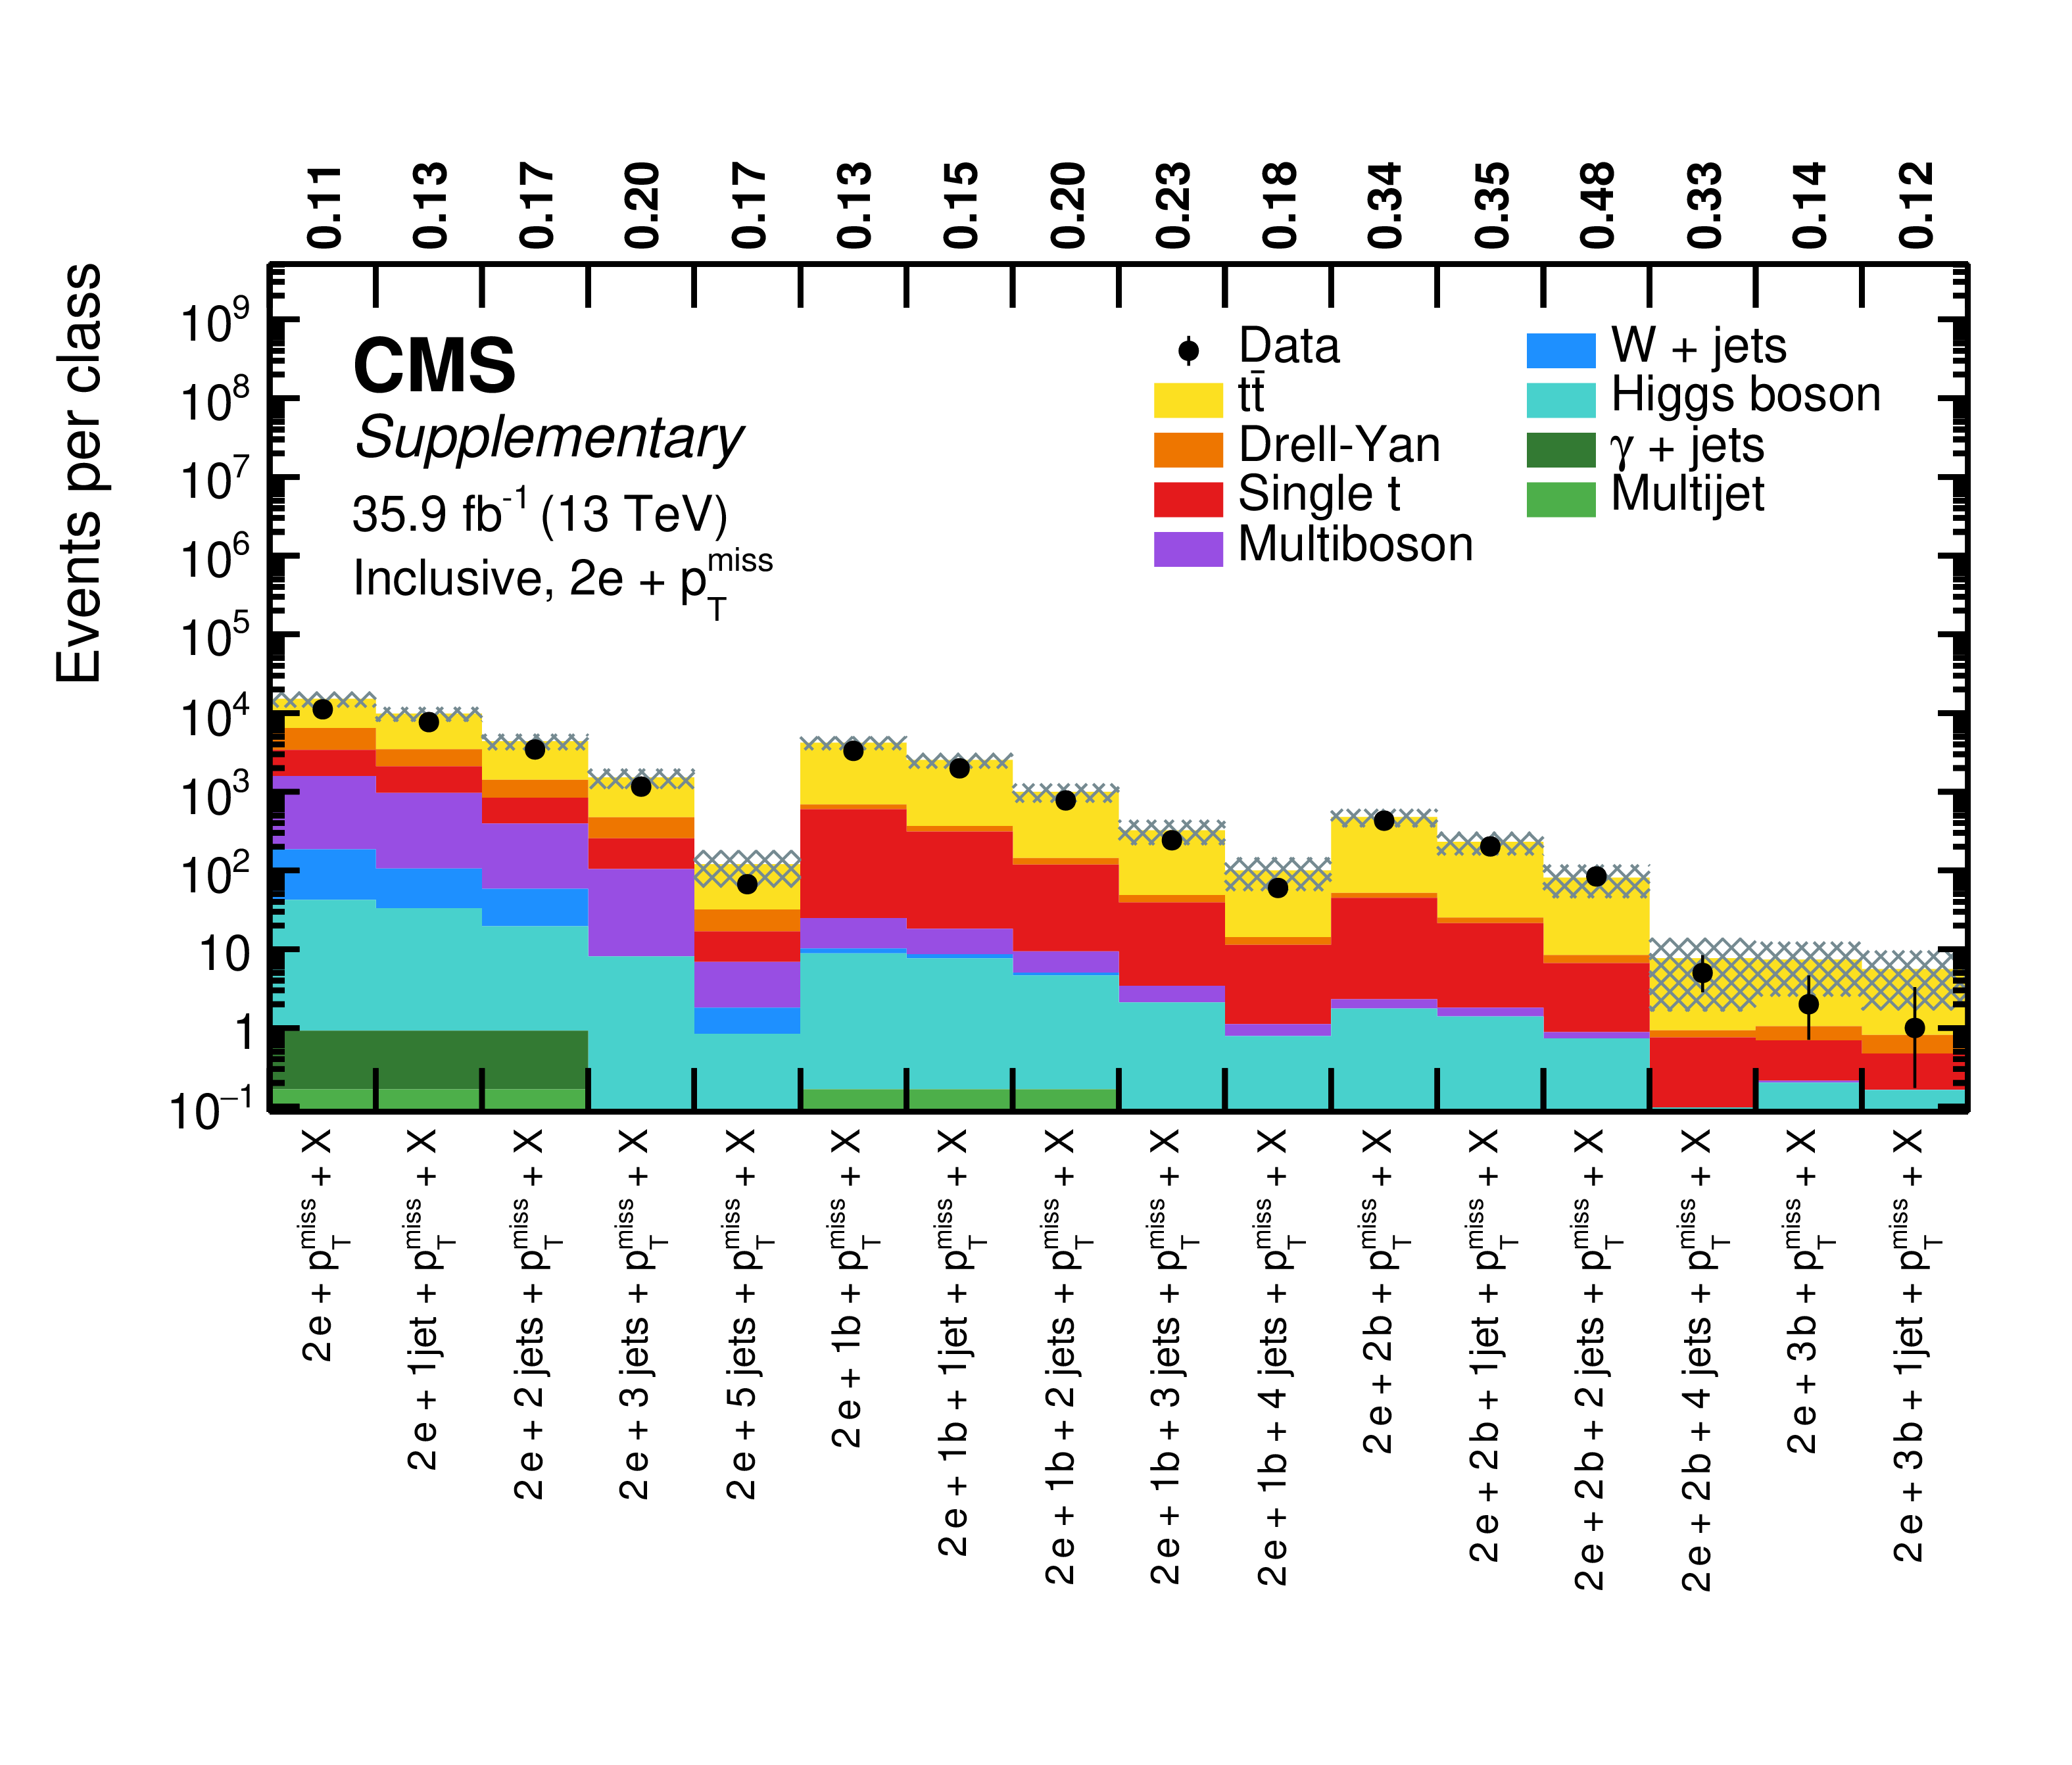
Additional Figure 6:
Overview of total event yields for the inclusive event classes of the double-electron $+$ ${{p_{\mathrm {T}}} ^\text {miss}}$ (upper) and the double-muon $+$ ${{p_{\mathrm {T}}} ^\text {miss}}$ (lower) object groups. Measured data are shown as black markers, contributions from SM processes are represented by coloured histograms, and the shaded region represents the uncertainty in the SM background. The numbers above the plot indicate the observed p-value for the agreement of data and simulation. |
png pdf |
Additional Figure 6-a:
Overview of total event yields for the inclusive event classes of the double-electron $+$ ${{p_{\mathrm {T}}} ^\text {miss}}$ object group. Measured data are shown as black markers, contributions from SM processes are represented by coloured histograms, and the shaded region represents the uncertainty in the SM background. The numbers above the plot indicate the observed p-value for the agreement of data and simulation. |
png pdf |
Additional Figure 6-b:
Overview of total event yields for the inclusive event classes of the double-muon $+$ ${{p_{\mathrm {T}}} ^\text {miss}}$ object group. Measured data are shown as black markers, contributions from SM processes are represented by coloured histograms, and the shaded region represents the uncertainty in the SM background. The numbers above the plot indicate the observed p-value for the agreement of data and simulation. |
png pdf |
Additional Figure 7:
Overview of total event yields for the inclusive event classes of the single-electron $+$ photons $+$ ${{p_{\mathrm {T}}} ^\text {miss}}$ (upper) and the single-muon $+$ photons $+$ ${{p_{\mathrm {T}}} ^\text {miss}}$ (lower) object groups. Measured data are shown as black markers, contributions from SM processes are represented by coloured histograms, and the shaded region represents the uncertainty in the SM background. The numbers above the plot indicate the observed p-value for the agreement of data and simulation. |
png pdf |
Additional Figure 7-a:
Overview of total event yields for the inclusive event classes of the single-electron $+$ photons $+$ ${{p_{\mathrm {T}}} ^\text {miss}}$ object group. Measured data are shown as black markers, contributions from SM processes are represented by coloured histograms, and the shaded region represents the uncertainty in the SM background. The numbers above the plot indicate the observed p-value for the agreement of data and simulation. |
png pdf |
Additional Figure 7-b:
Overview of total event yields for the inclusive event classes of the single-muon $+$ photons $+$ ${{p_{\mathrm {T}}} ^\text {miss}}$ object group. Measured data are shown as black markers, contributions from SM processes are represented by coloured histograms, and the shaded region represents the uncertainty in the SM background. The numbers above the plot indicate the observed p-value for the agreement of data and simulation. |
png pdf |
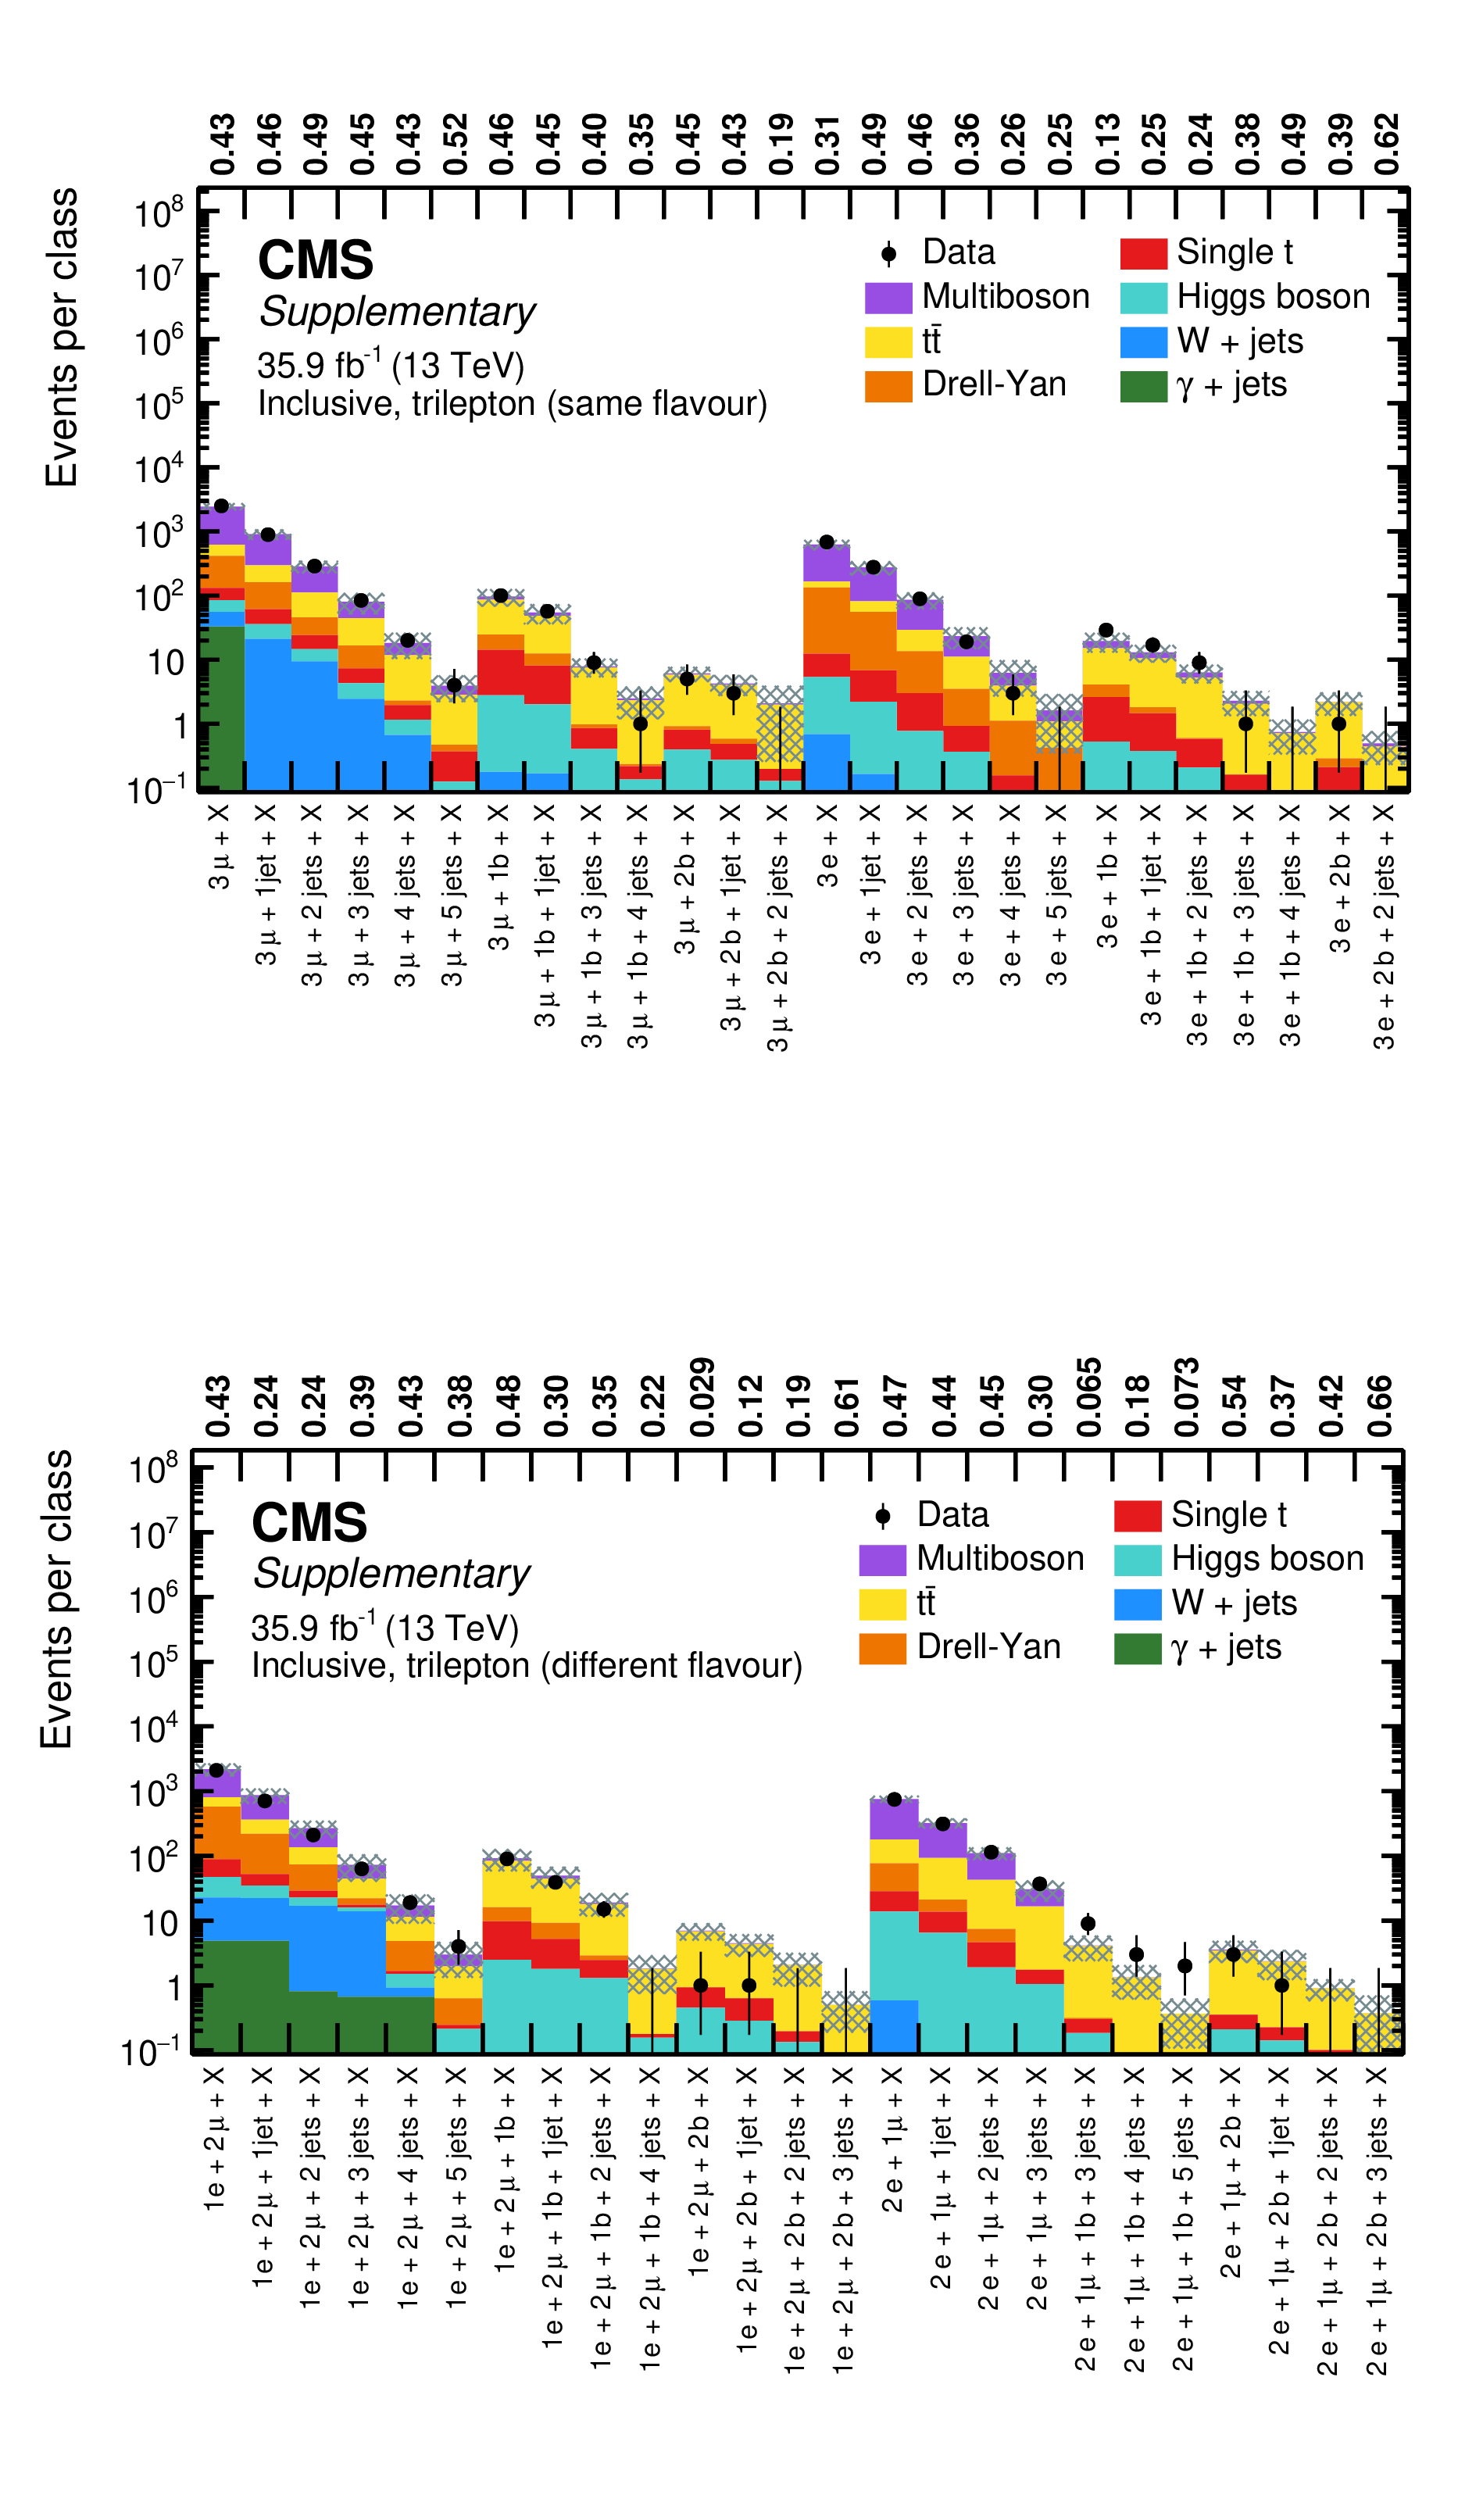
Additional Figure 8:
Overview of total event yields for the inclusive event classes of the three-lepton object groups with same flavour (upper) and different flavour (lower). Measured data are shown as black markers, contributions from SM processes are represented by coloured histograms, and the shaded region represents the uncertainty in the SM background. The numbers above the plot indicate the observed p-value for the agreement of data and simulation. |

png pdf |
Additional Figure 8-a:
Overview of total event yields for the inclusive event classes of the three-lepton object groups with same flavour. Measured data are shown as black markers, contributions from SM processes are represented by coloured histograms, and the shaded region represents the uncertainty in the SM background. The numbers above the plot indicate the observed p-value for the agreement of data and simulation. |
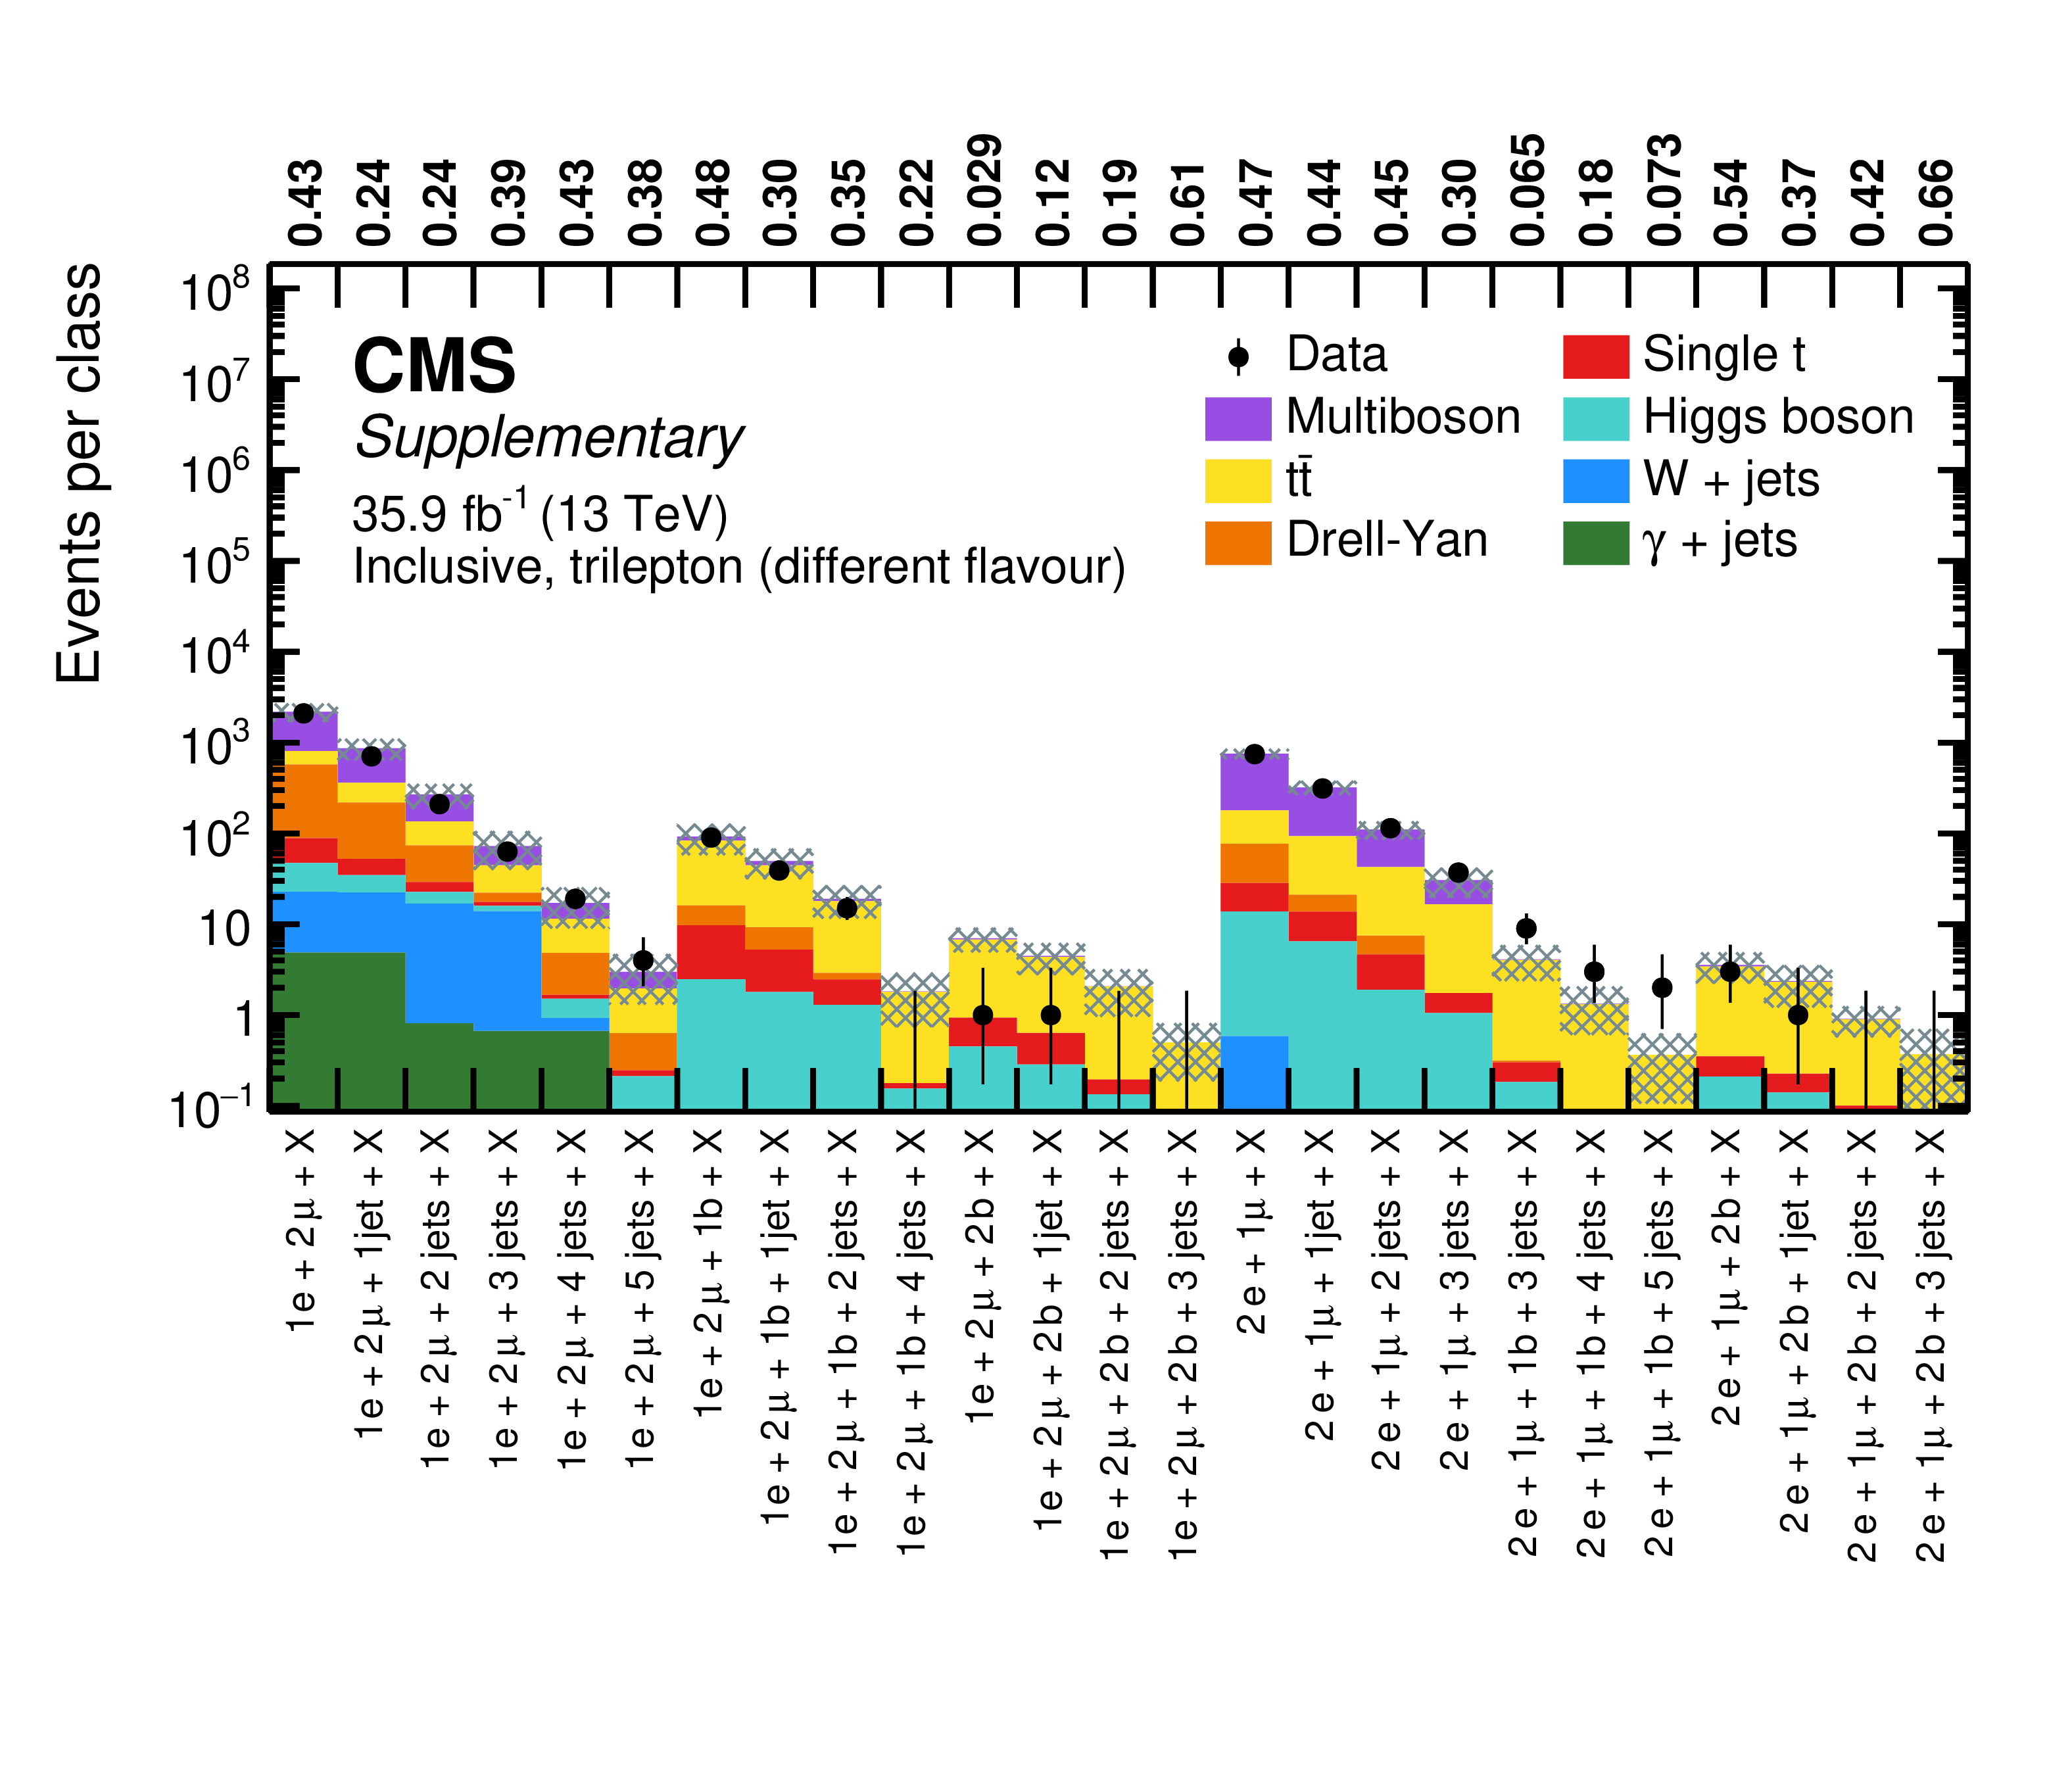
png pdf |
Additional Figure 8-b:
Overview of total event yields for the inclusive event classes of the three-lepton object groups with different flavour. Measured data are shown as black markers, contributions from SM processes are represented by coloured histograms, and the shaded region represents the uncertainty in the SM background. The numbers above the plot indicate the observed p-value for the agreement of data and simulation. |

png pdf |
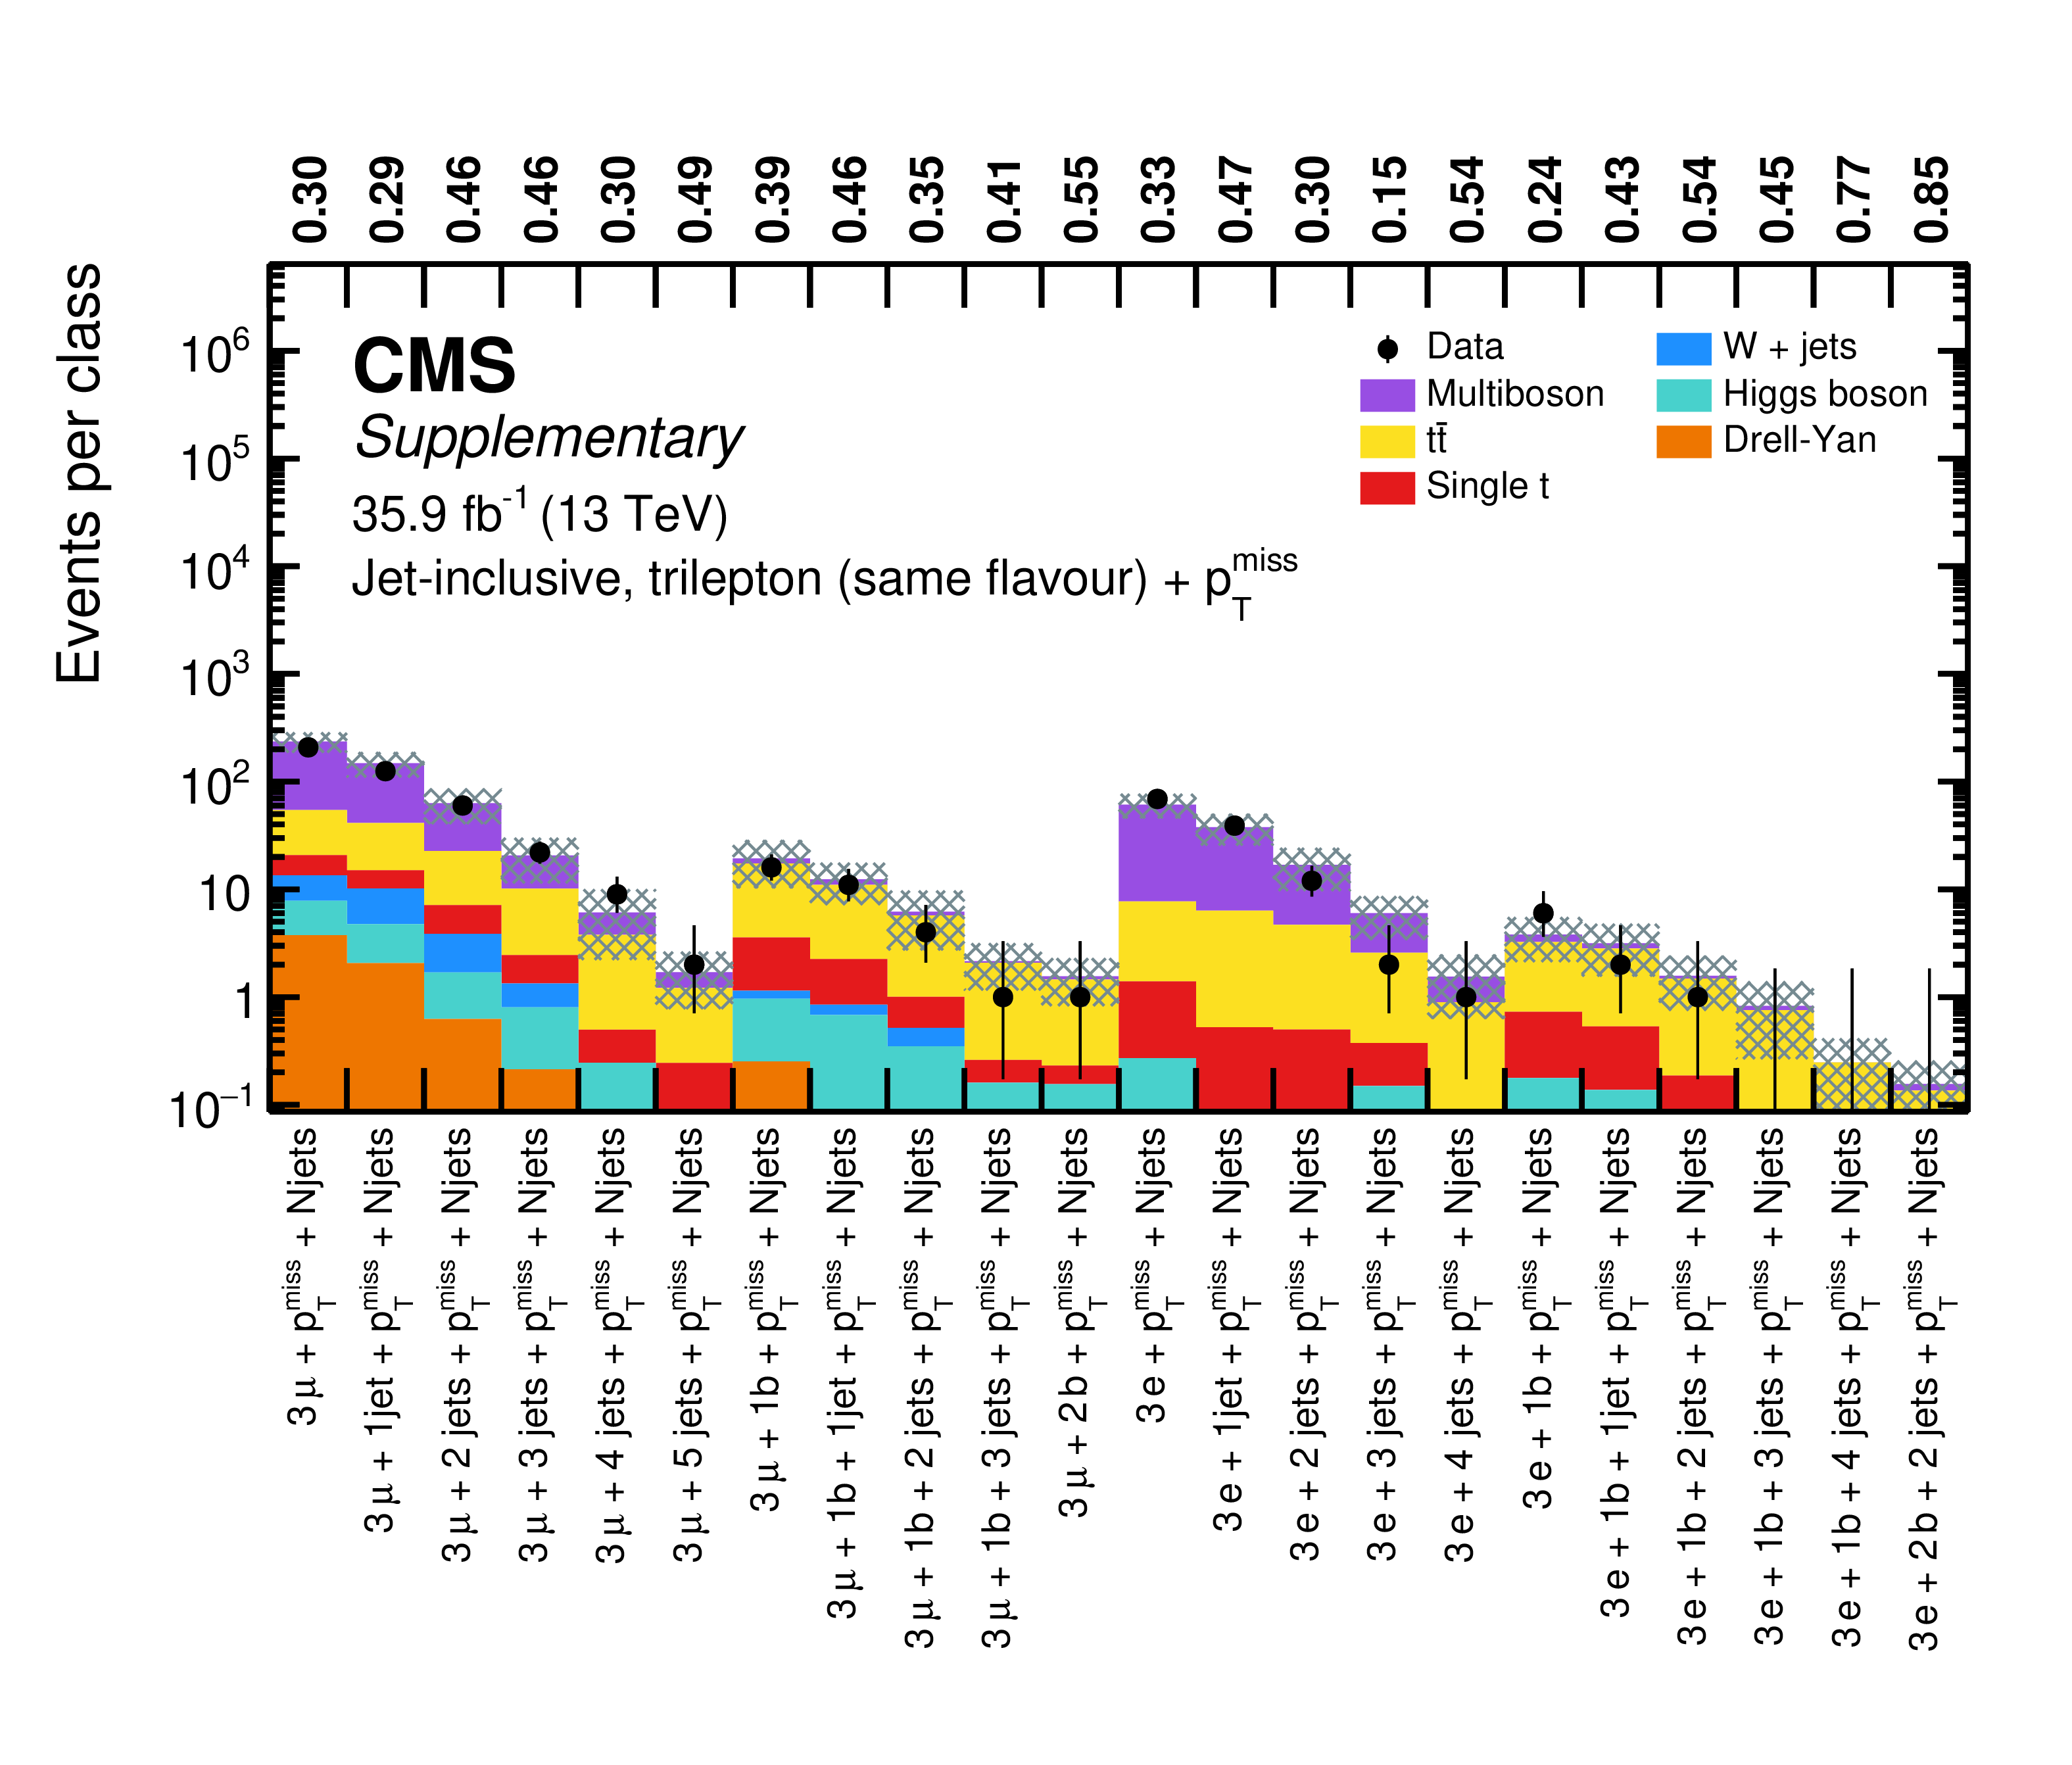
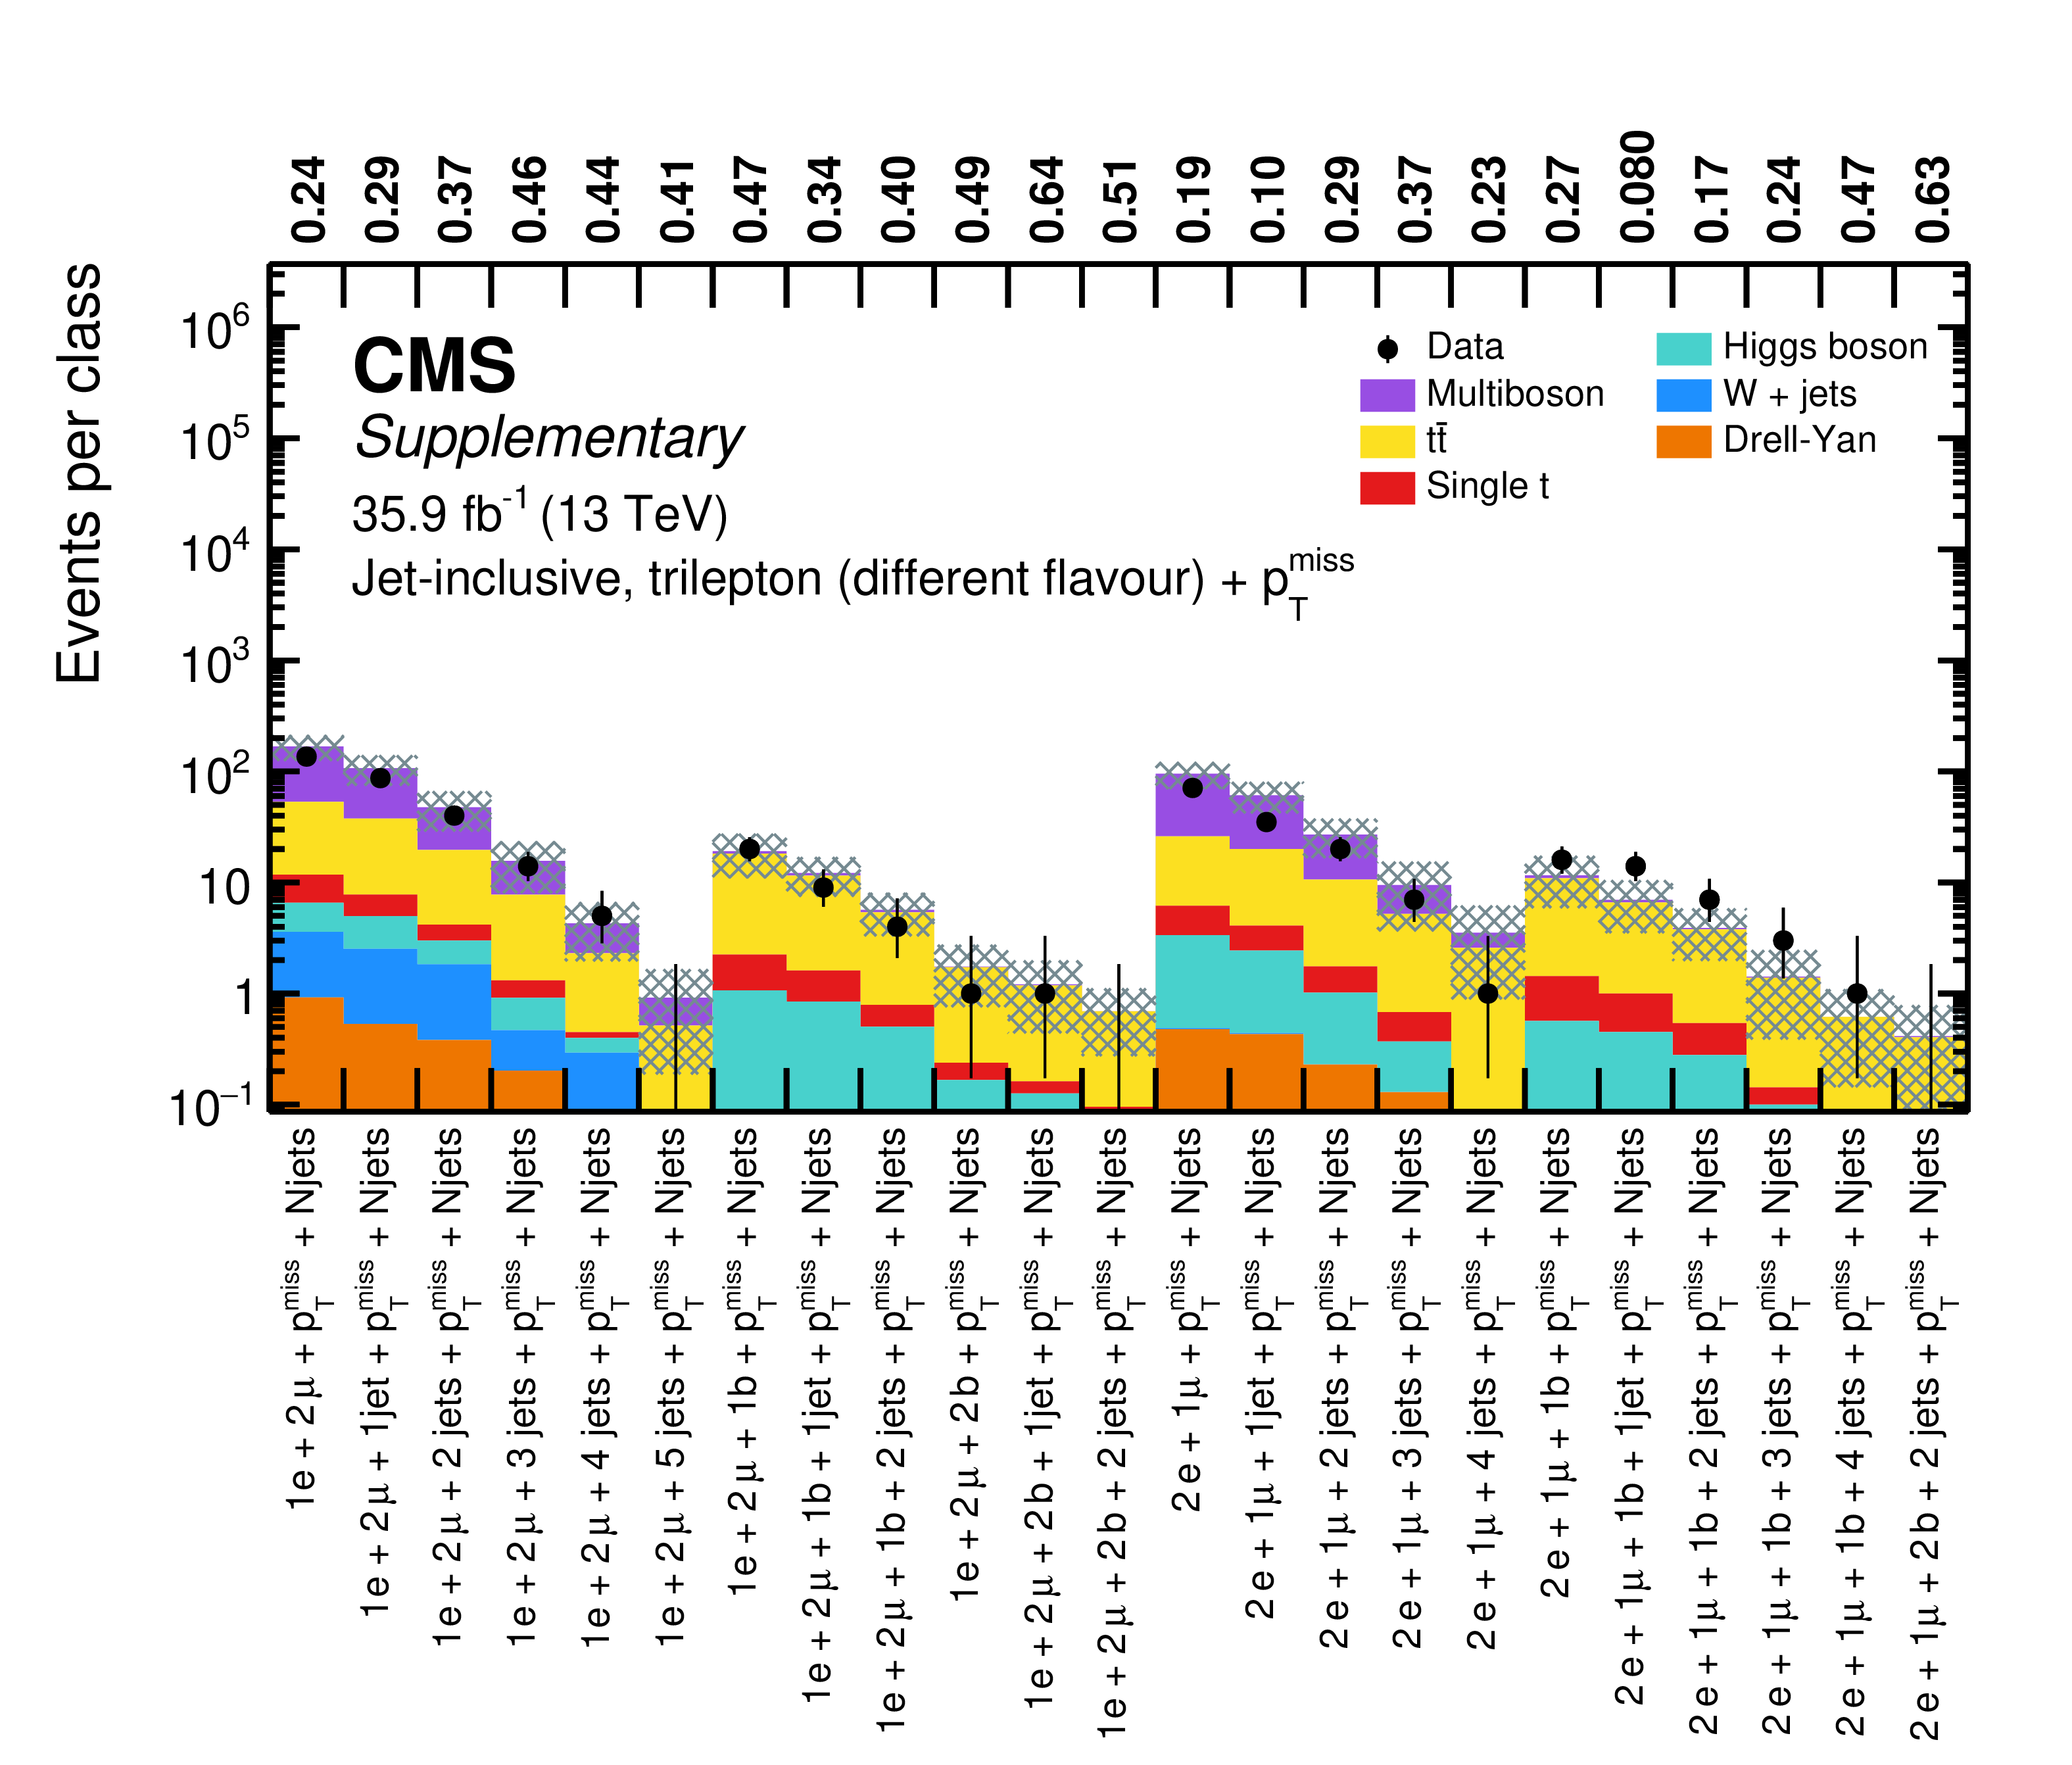
Additional Figure 9:
Overview of total event yields for the inclusive event classes of the three-lepton (same flavour) $+$ ${{p_{\mathrm {T}}} ^\text {miss}}$ object group (upper), and the three-lepton (different flavour) $+$ ${{p_{\mathrm {T}}} ^\text {miss}}$ object group (lower). Measured data are shown as black markers, contributions from SM processes are represented by coloured histograms, and the shaded region represents the uncertainty in the SM background. The numbers above the plot indicate the observed p-value for the agreement of data and simulation. |
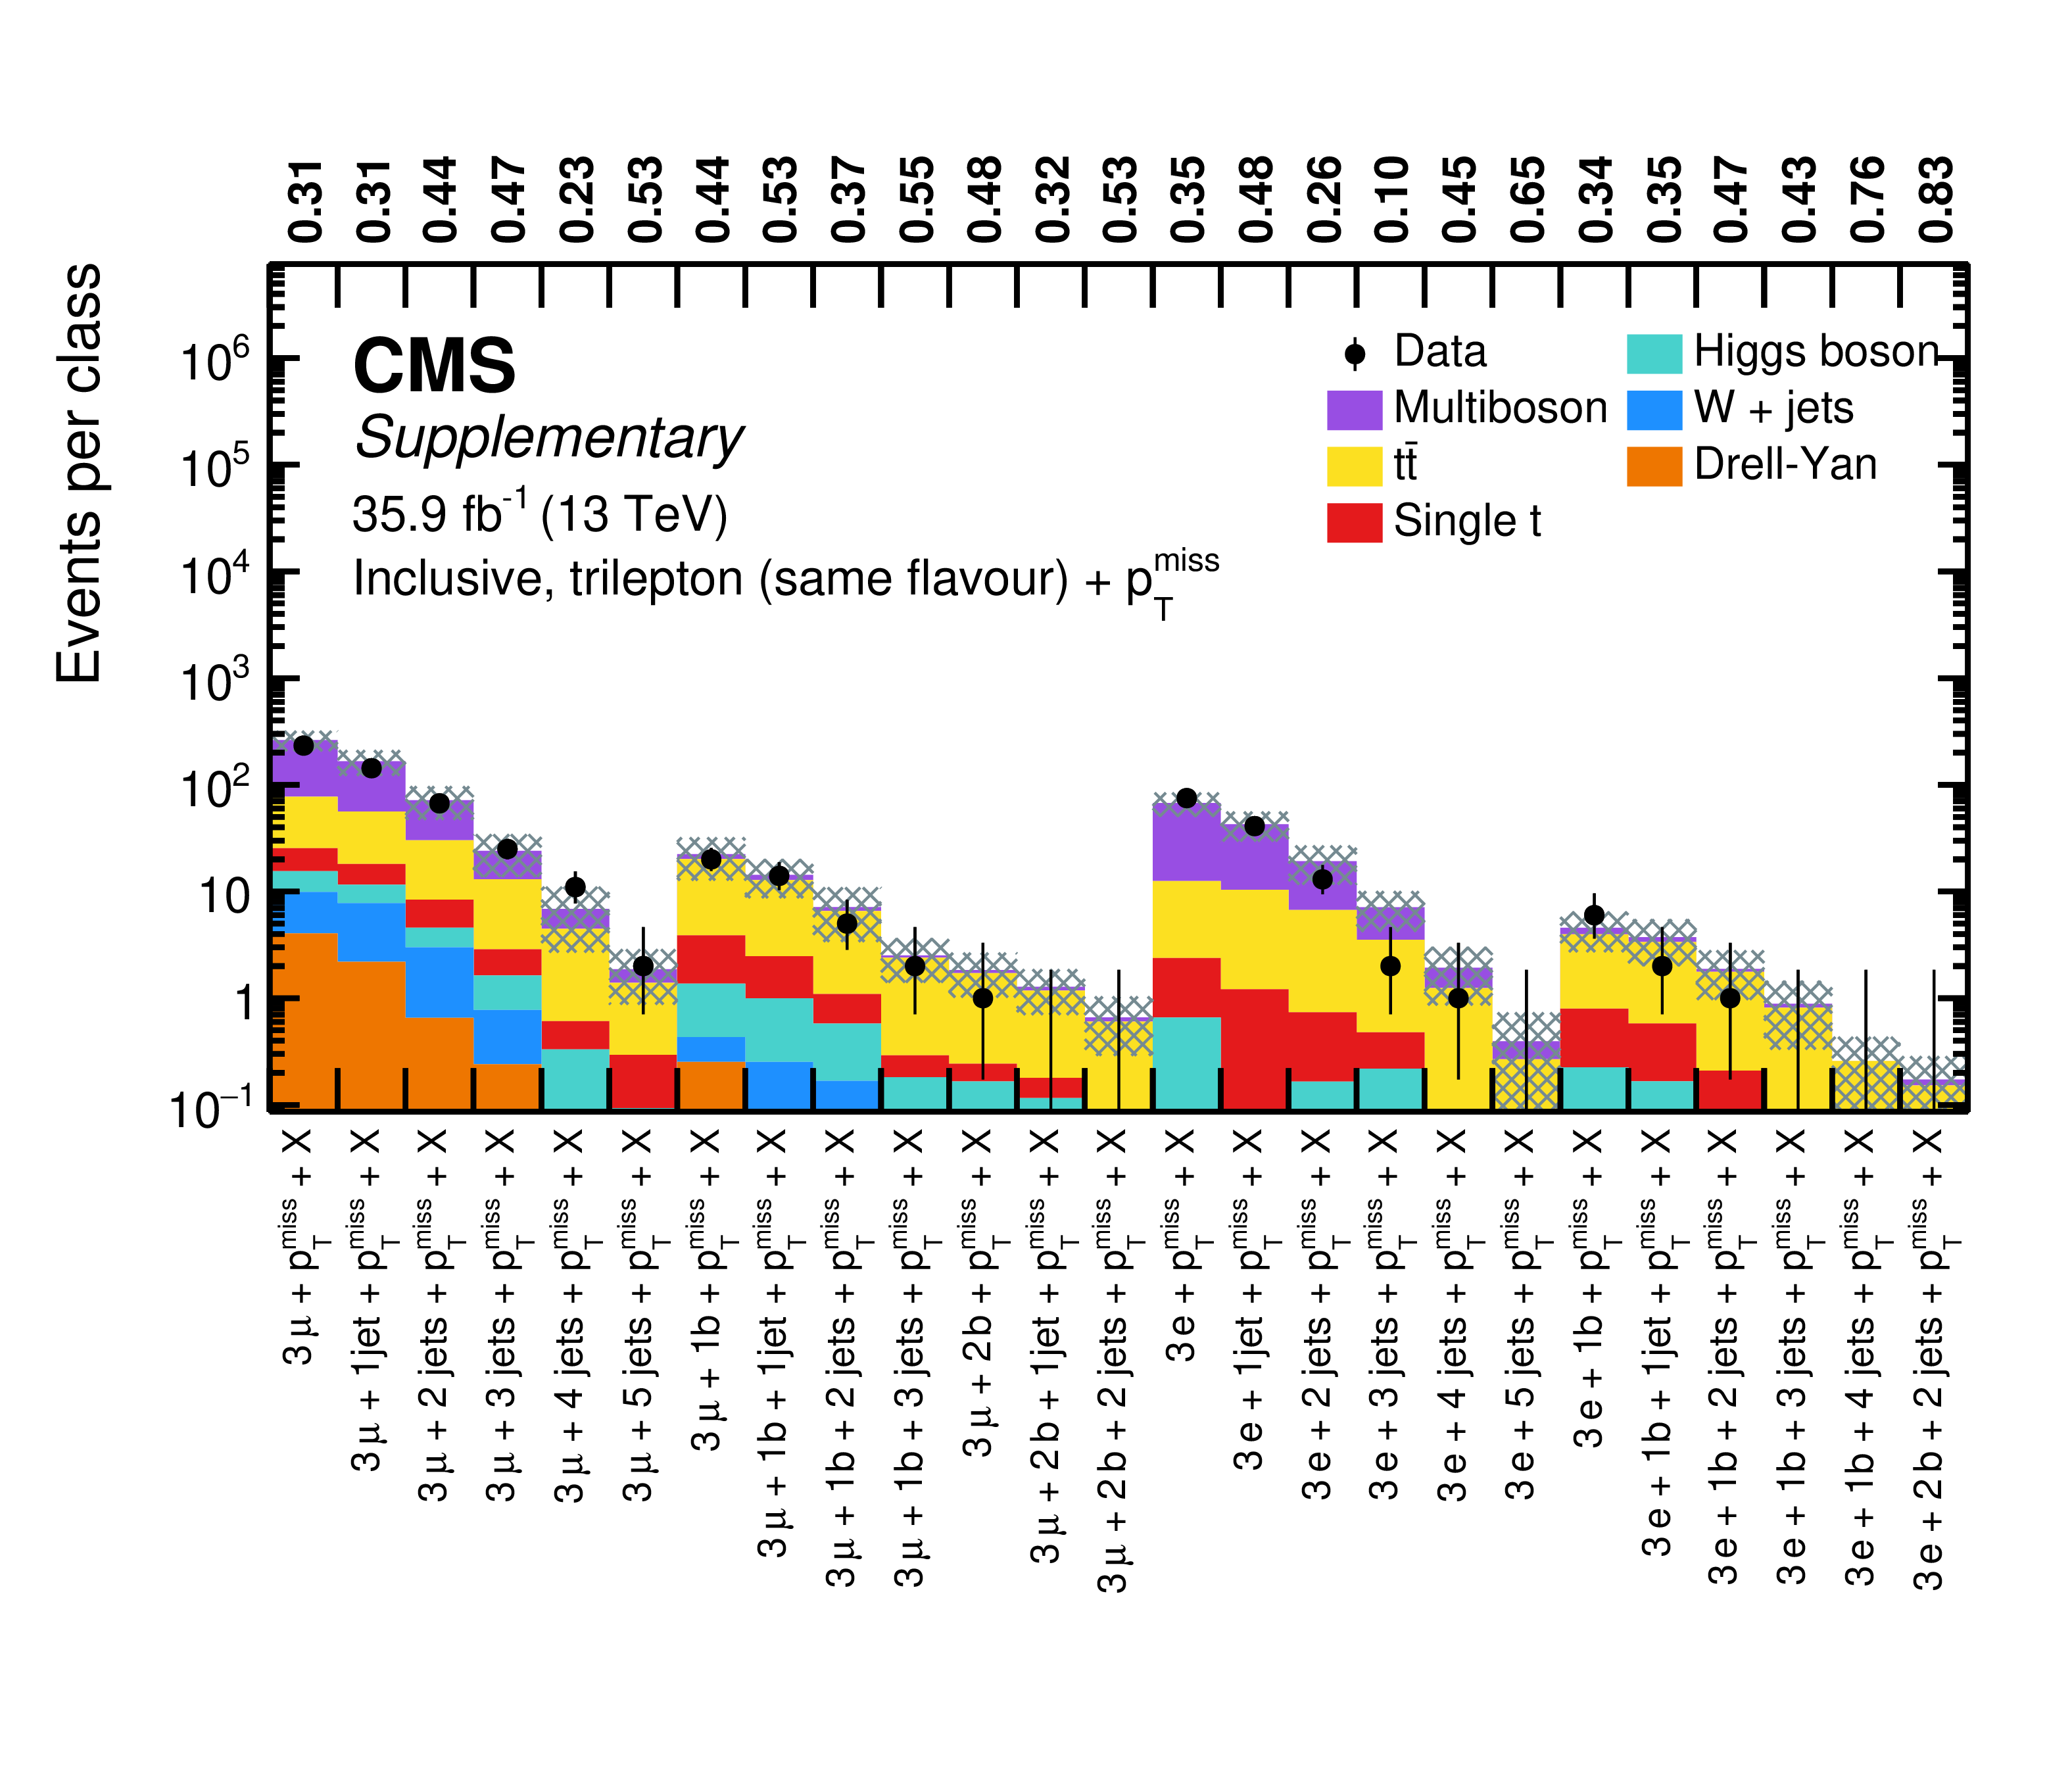
png pdf |
Additional Figure 9-a:
Overview of total event yields for the inclusive event classes of the three-lepton (same flavour) $+$ ${{p_{\mathrm {T}}} ^\text {miss}}$ object group. Measured data are shown as black markers, contributions from SM processes are represented by coloured histograms, and the shaded region represents the uncertainty in the SM background. The numbers above the plot indicate the observed p-value for the agreement of data and simulation. |
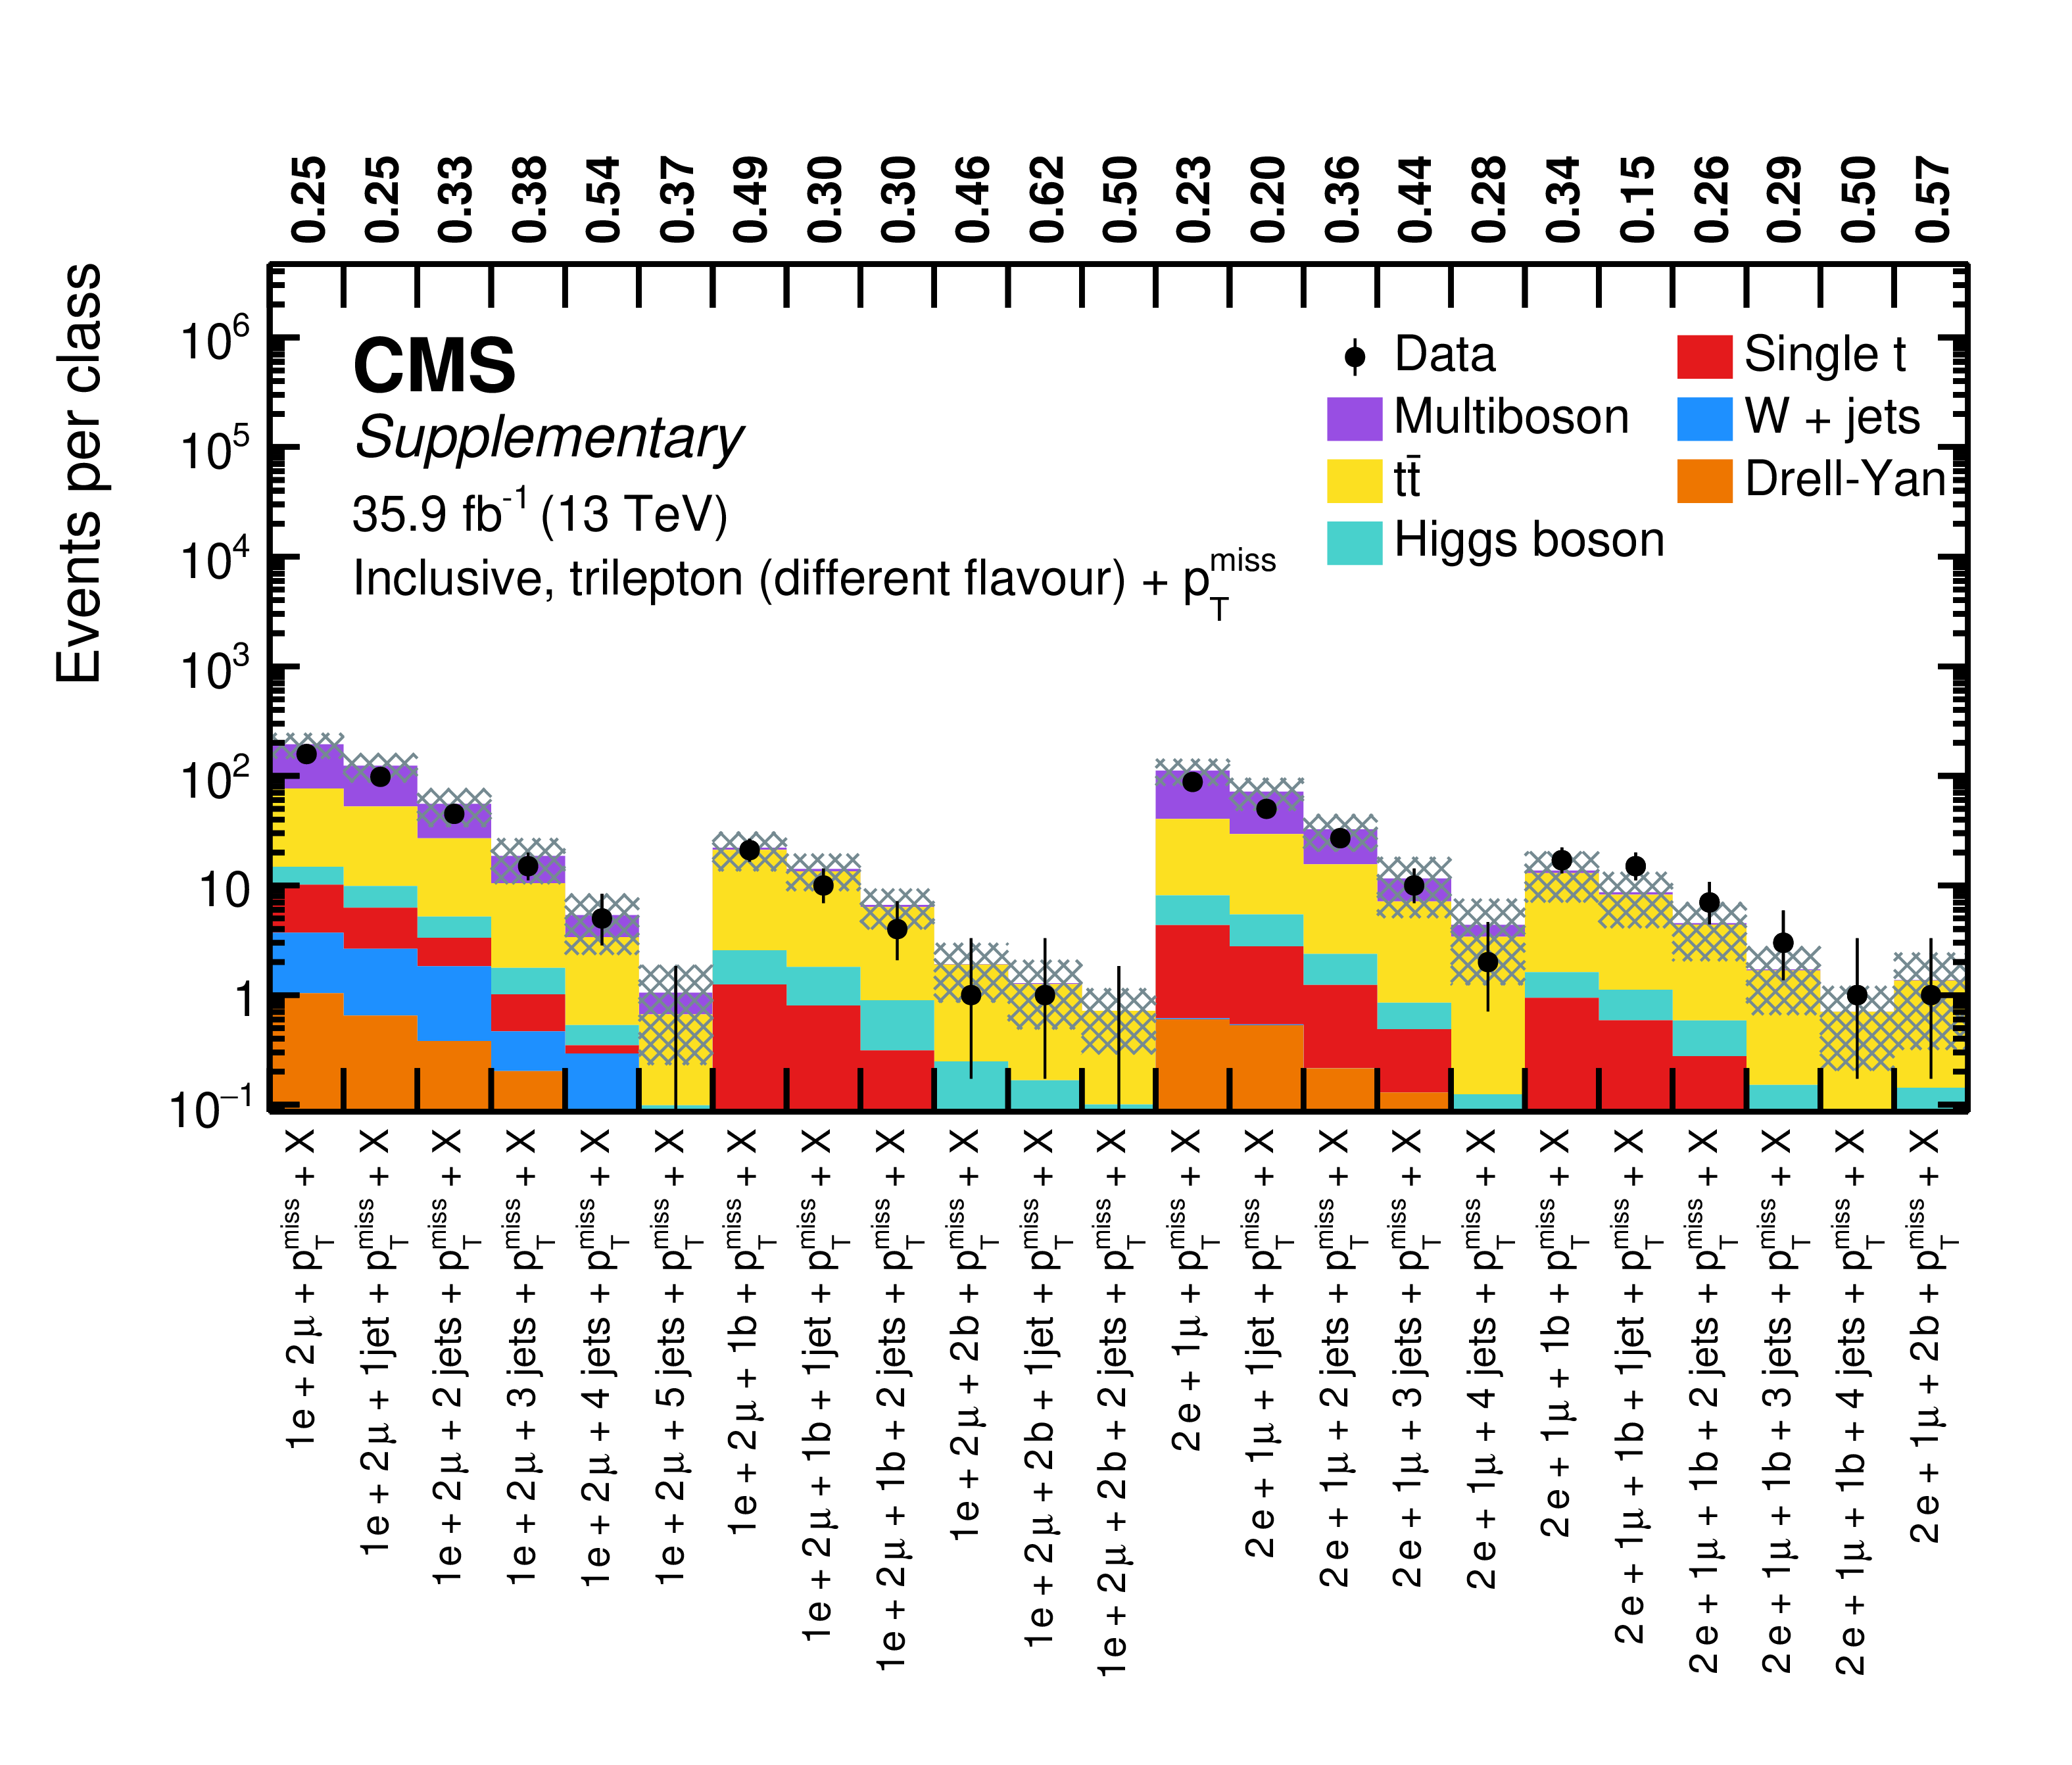
png pdf |
Additional Figure 9-b:
Overview of total event yields for the inclusive event classes of the three-lepton (different flavour) $+$ ${{p_{\mathrm {T}}} ^\text {miss}}$ object group. Measured data are shown as black markers, contributions from SM processes are represented by coloured histograms, and the shaded region represents the uncertainty in the SM background. The numbers above the plot indicate the observed p-value for the agreement of data and simulation. |
png pdf |
Additional Figure 10:
Overview of total event yields for the inclusive event classes of the ${\geq}$4 leptons object group (upper), and the ${\geq}$4 leptons $+$ ${{p_{\mathrm {T}}} ^\text {miss}}$ object group (lower). Measured data are shown as black markers, contributions from SM processes are represented by coloured histograms, and the shaded region represents the uncertainty in the SM background. The numbers above the plot indicate the observed p-value for the agreement of data and simulation. |
png pdf |
Additional Figure 10-a:
Overview of total event yields for the inclusive event classes of the ${\geq}$4 leptons object group. Measured data are shown as black markers, contributions from SM processes are represented by coloured histograms, and the shaded region represents the uncertainty in the SM background. The numbers above the plot indicate the observed p-value for the agreement of data and simulation. |

png pdf |
Additional Figure 10-b:
Overview of total event yields for the inclusive event classes of the ${\geq}$4 leptons $+$ ${{p_{\mathrm {T}}} ^\text {miss}}$ object group. Measured data are shown as black markers, contributions from SM processes are represented by coloured histograms, and the shaded region represents the uncertainty in the SM background. The numbers above the plot indicate the observed p-value for the agreement of data and simulation. |
png pdf |
Additional Figure 11:
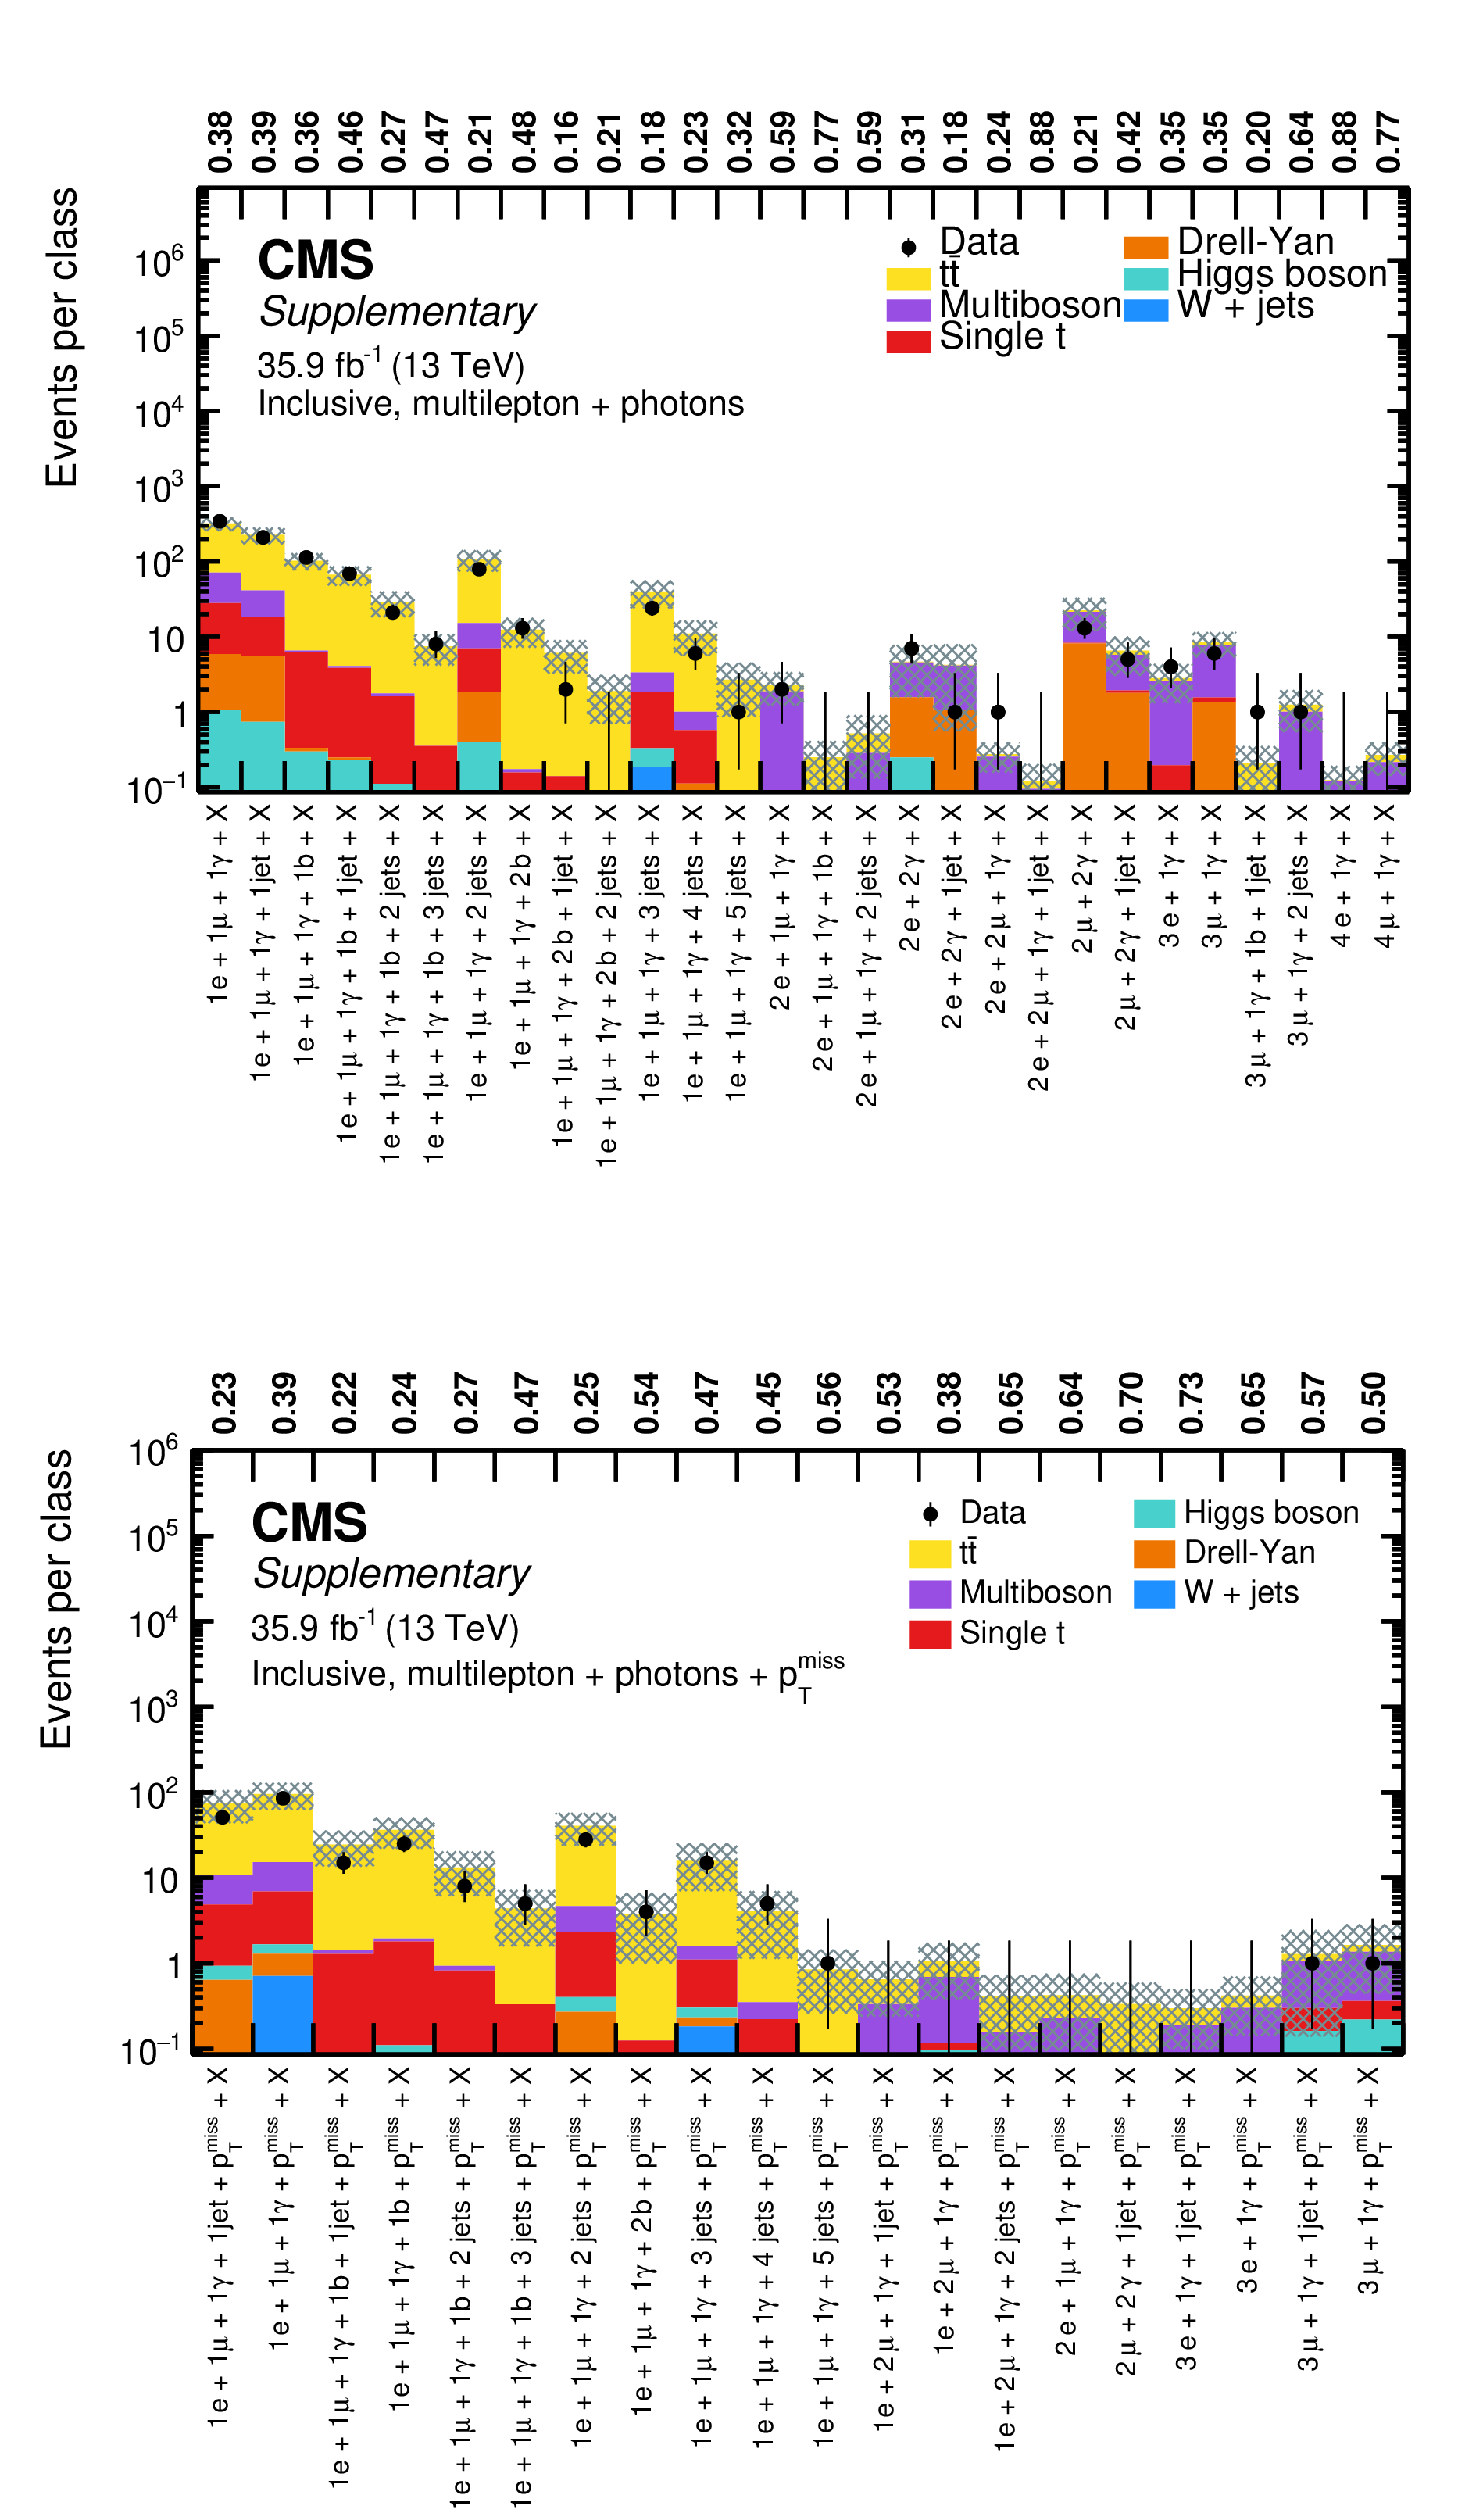
Overview of total event yields for the inclusive event classes of the $ > $1 lepton $+$ photons object group (upper), and the $ > $1 lepton $+$ photons $+$ ${{p_{\mathrm {T}}} ^\text {miss}}$ object group (lower). Measured data are shown as black markers, contributions from SM processes are represented by coloured histograms, and the shaded region represents the uncertainty in the SM background. The numbers above the plot indicate the observed p-value for the agreement of data and simulation. |

png pdf |
Additional Figure 11-a:
Overview of total event yields for the inclusive event classes of the $ > $1 lepton $+$ photons object group. Measured data are shown as black markers, contributions from SM processes are represented by coloured histograms, and the shaded region represents the uncertainty in the SM background. The numbers above the plot indicate the observed p-value for the agreement of data and simulation. |
png pdf |
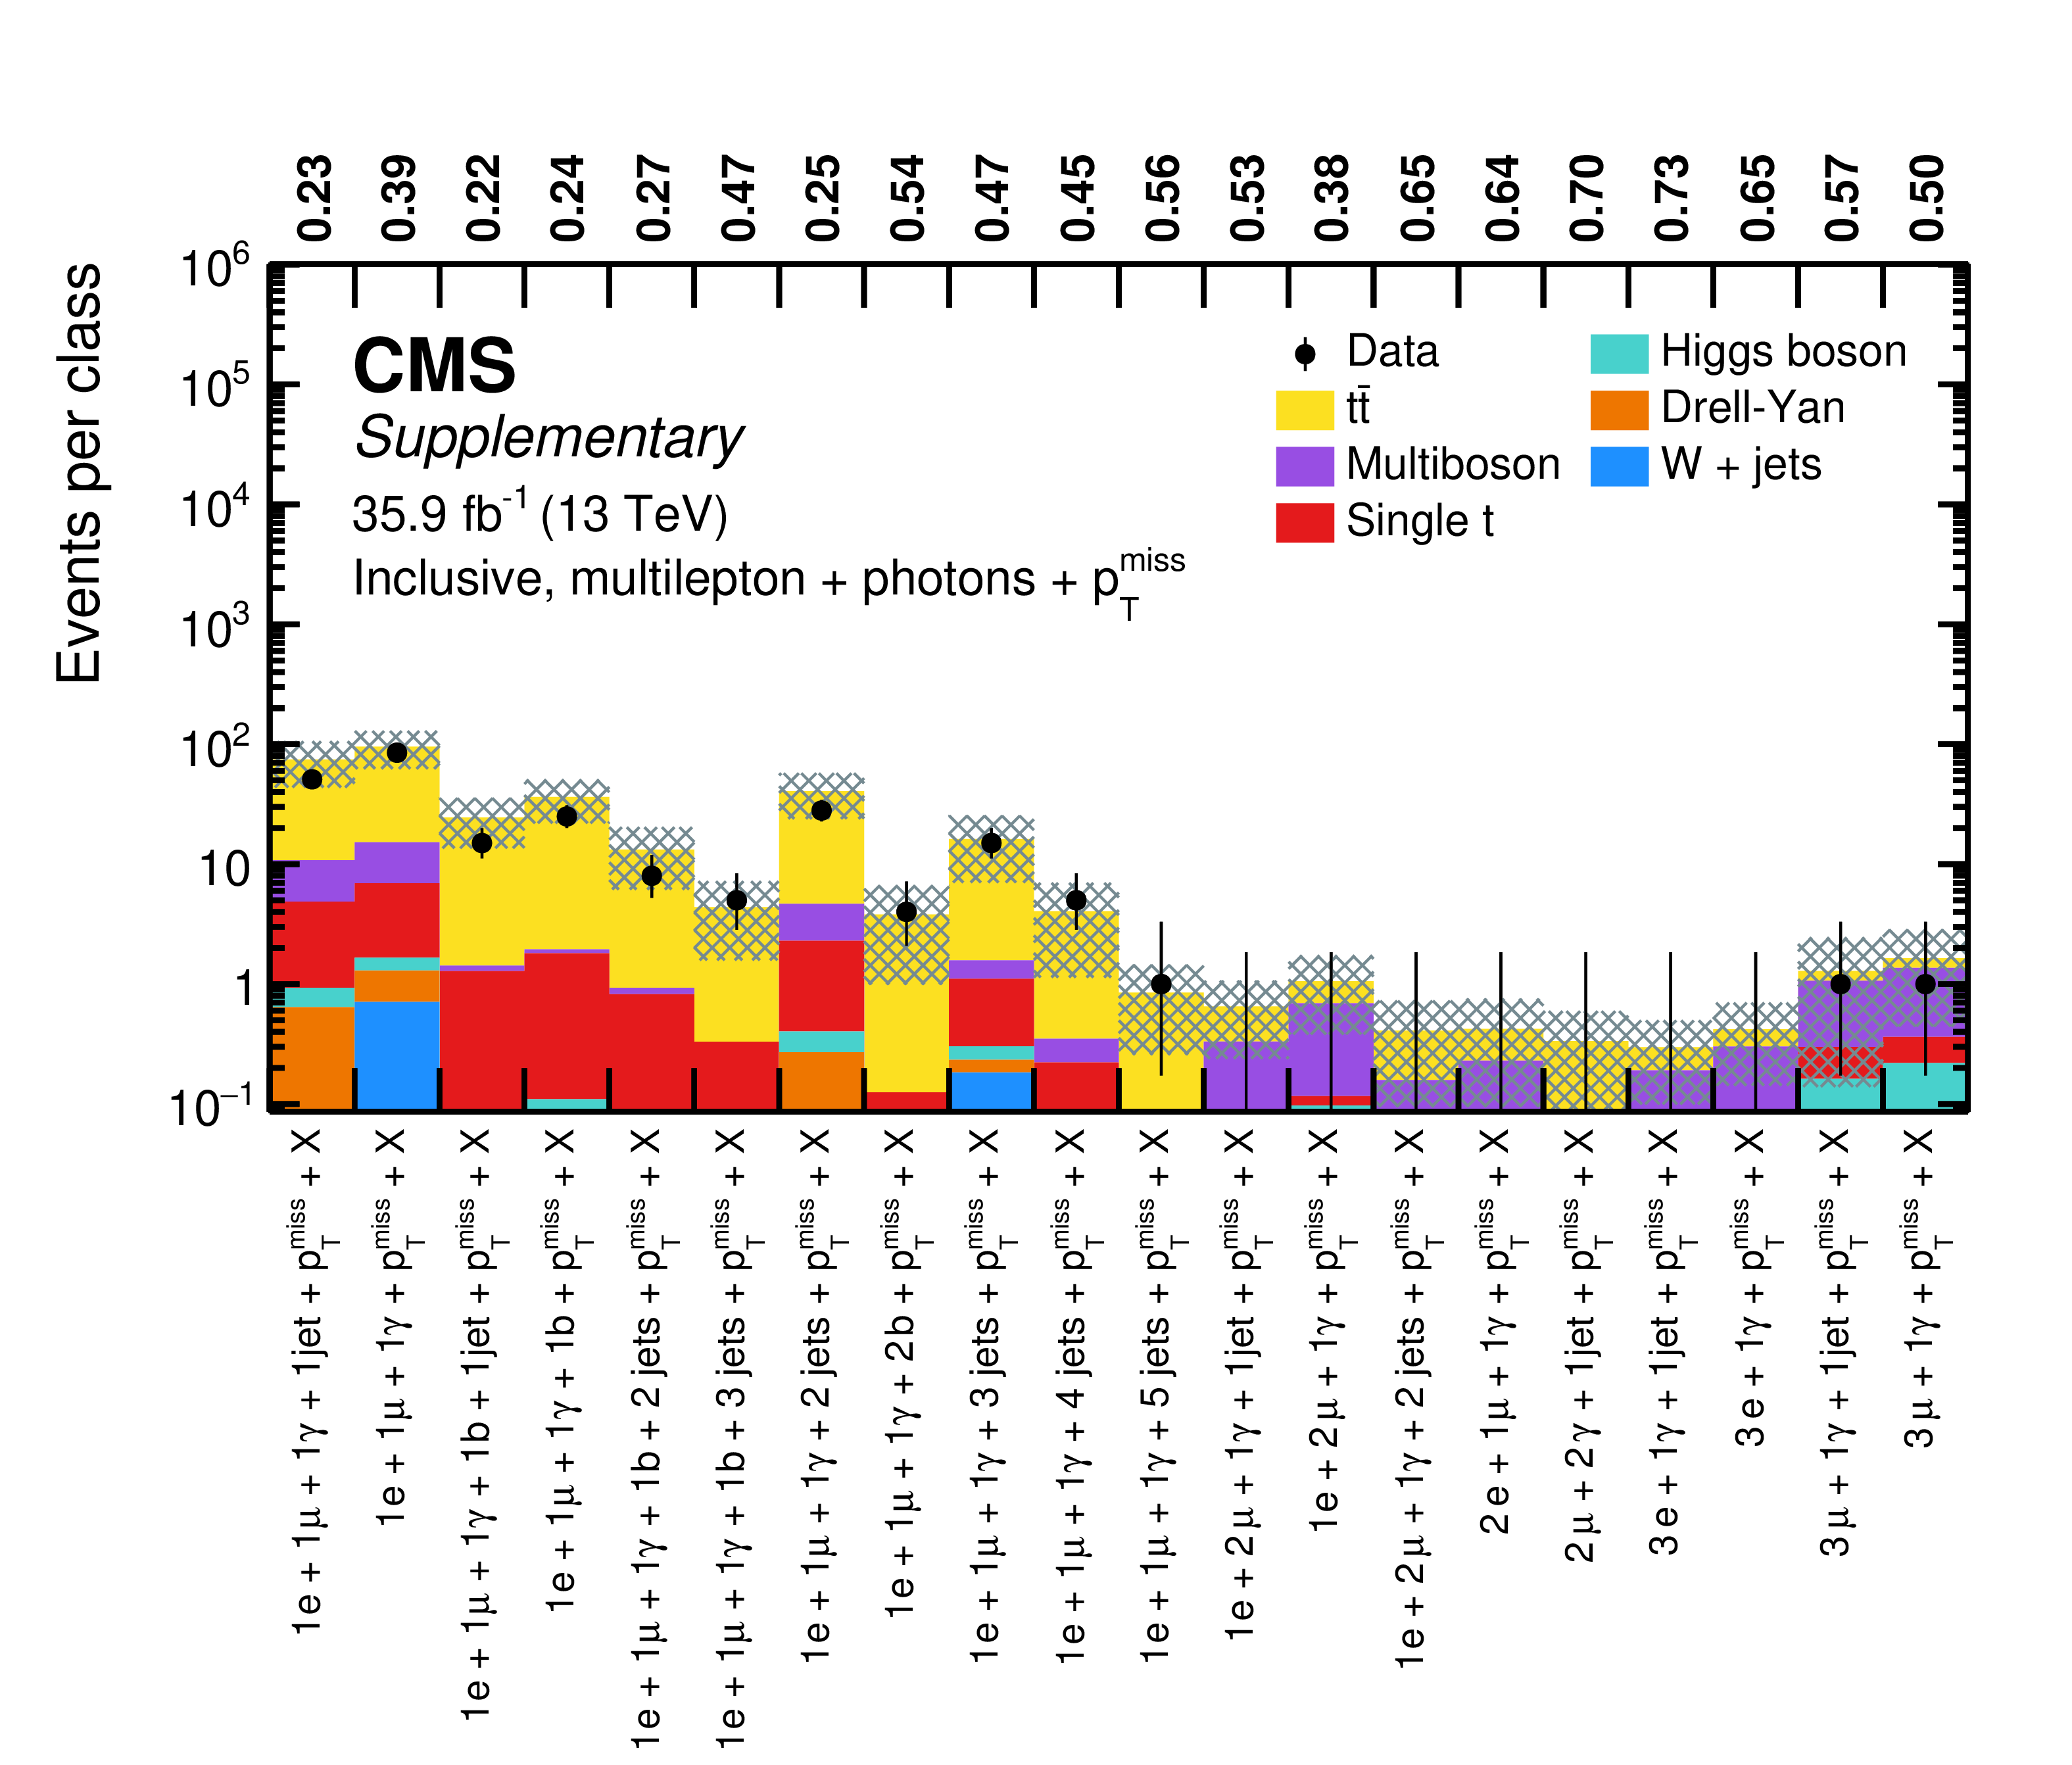
Additional Figure 11-b:
Overview of total event yields for the inclusive event classes of the $ > $1 lepton $+$ photons $+$ ${{p_{\mathrm {T}}} ^\text {miss}}$ object group. Measured data are shown as black markers, contributions from SM processes are represented by coloured histograms, and the shaded region represents the uncertainty in the SM background. The numbers above the plot indicate the observed p-value for the agreement of data and simulation. |
png pdf |
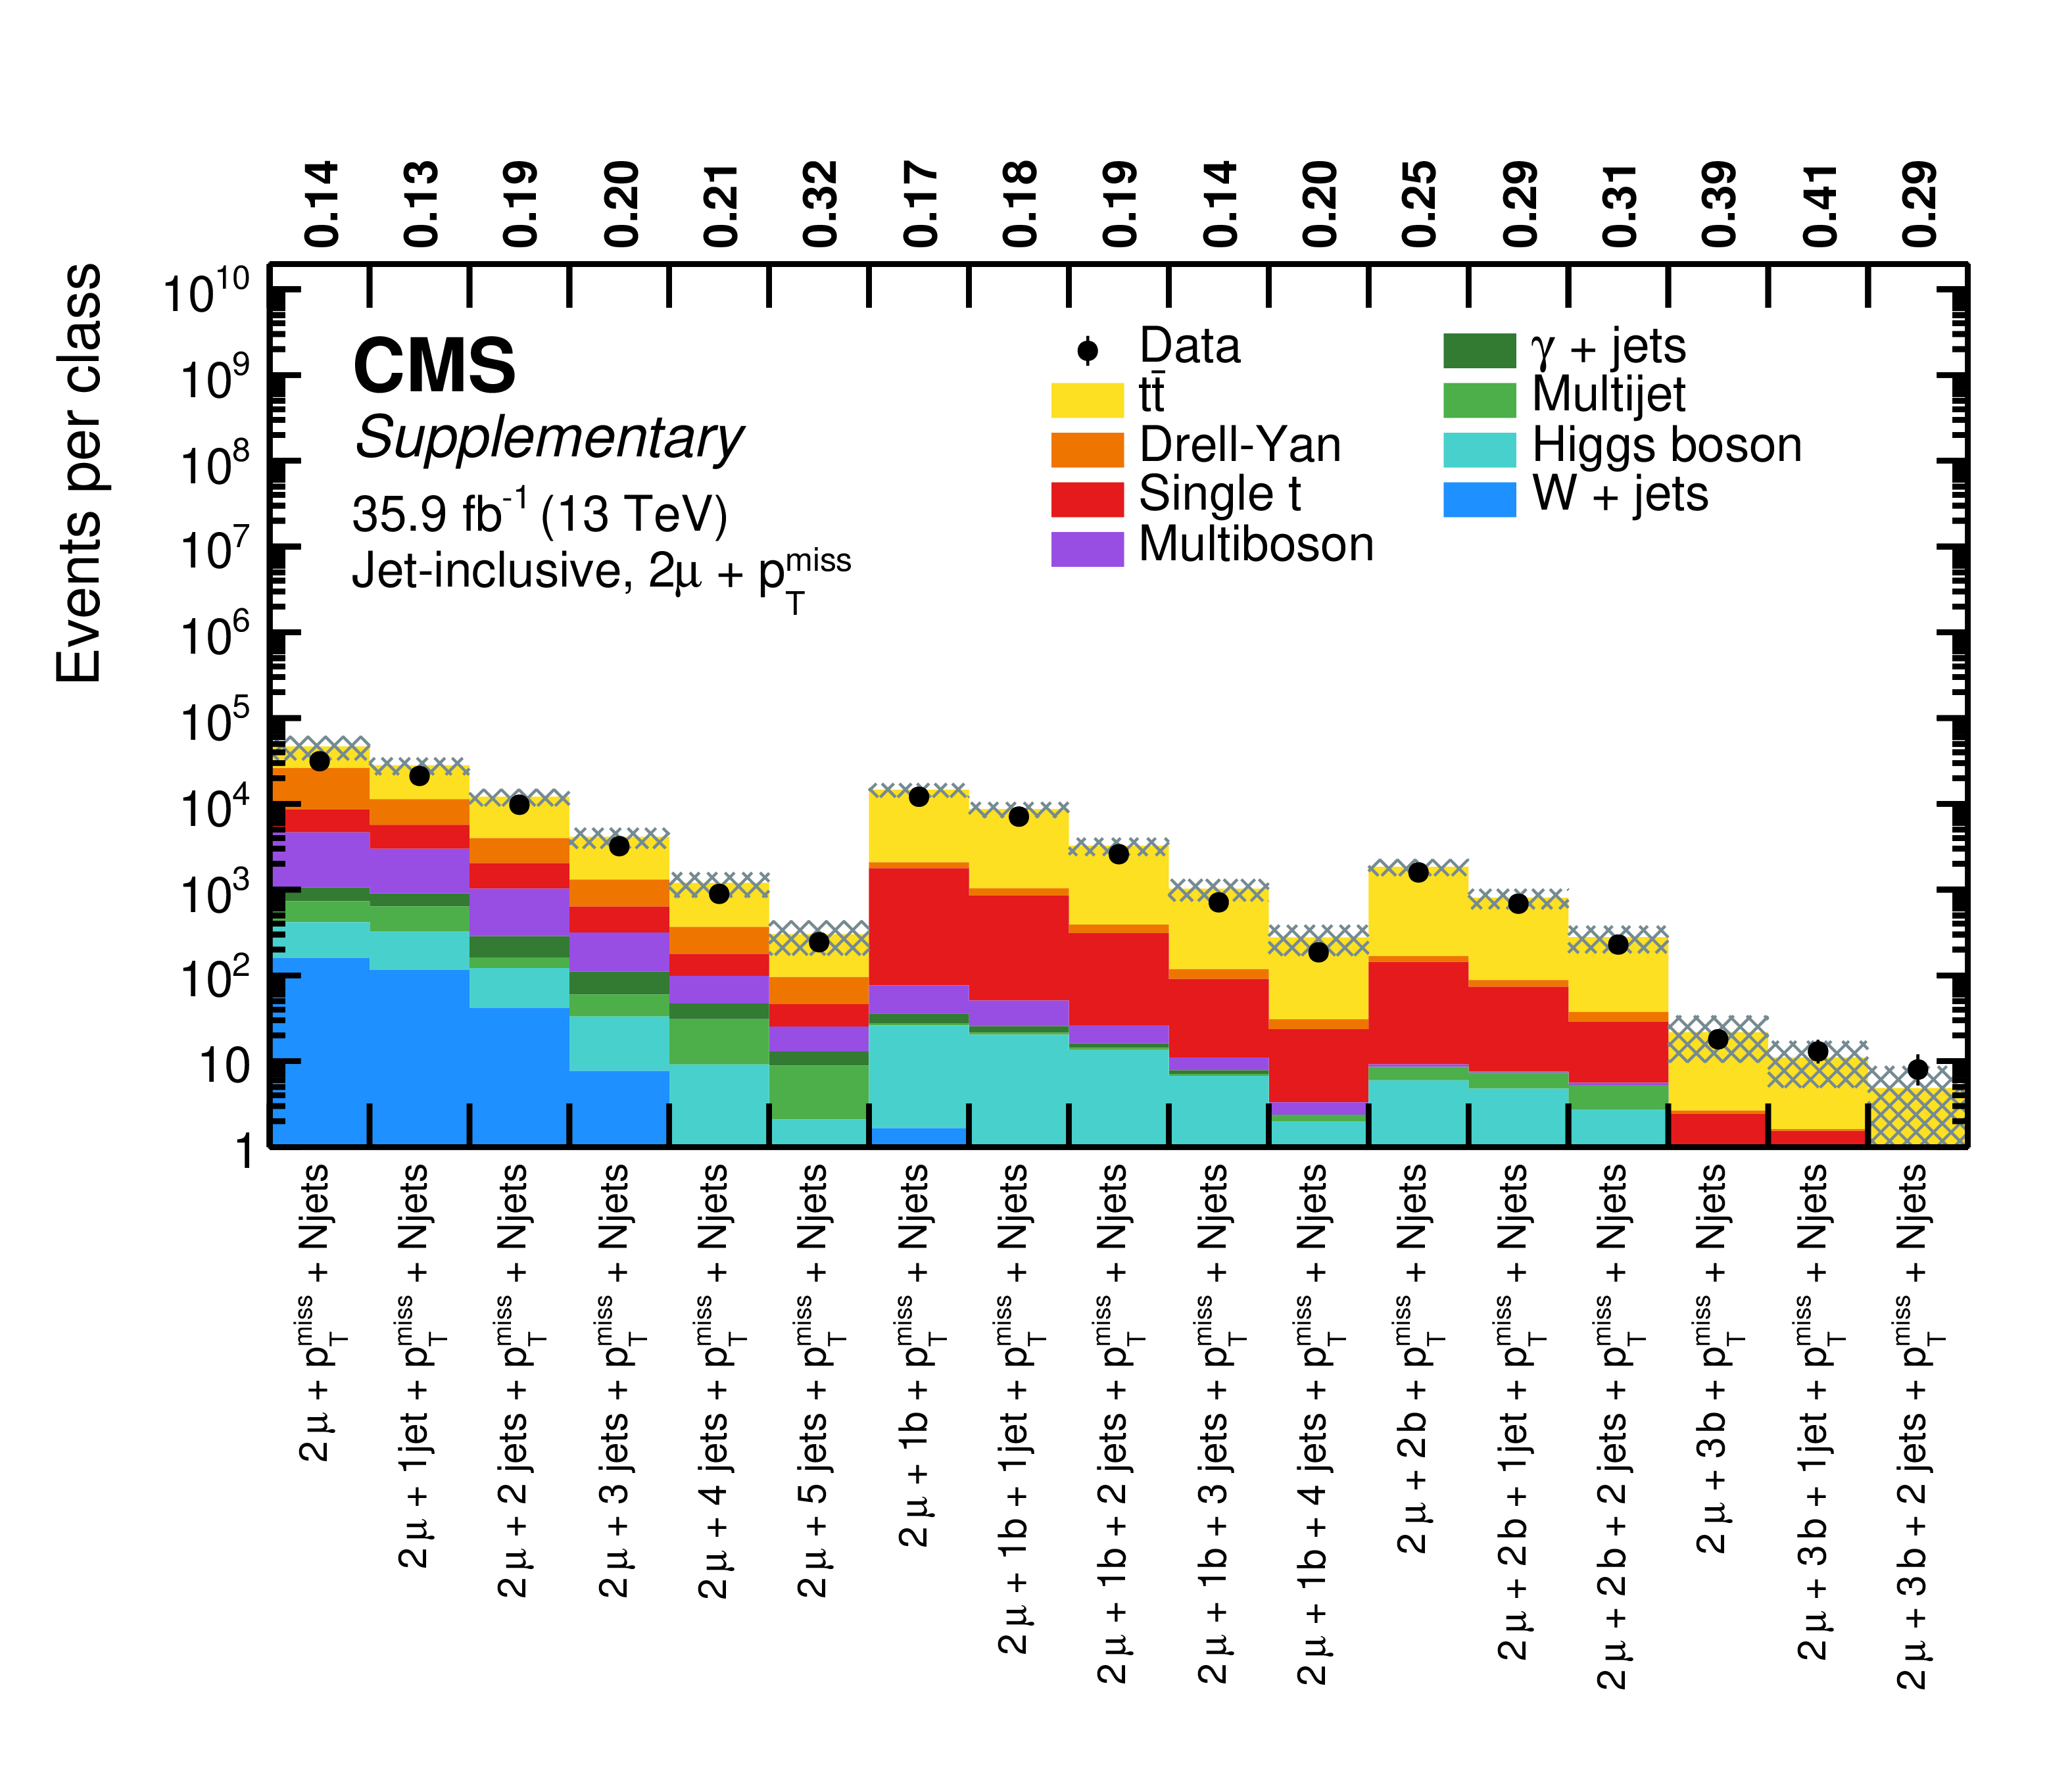
Additional Figure 12:
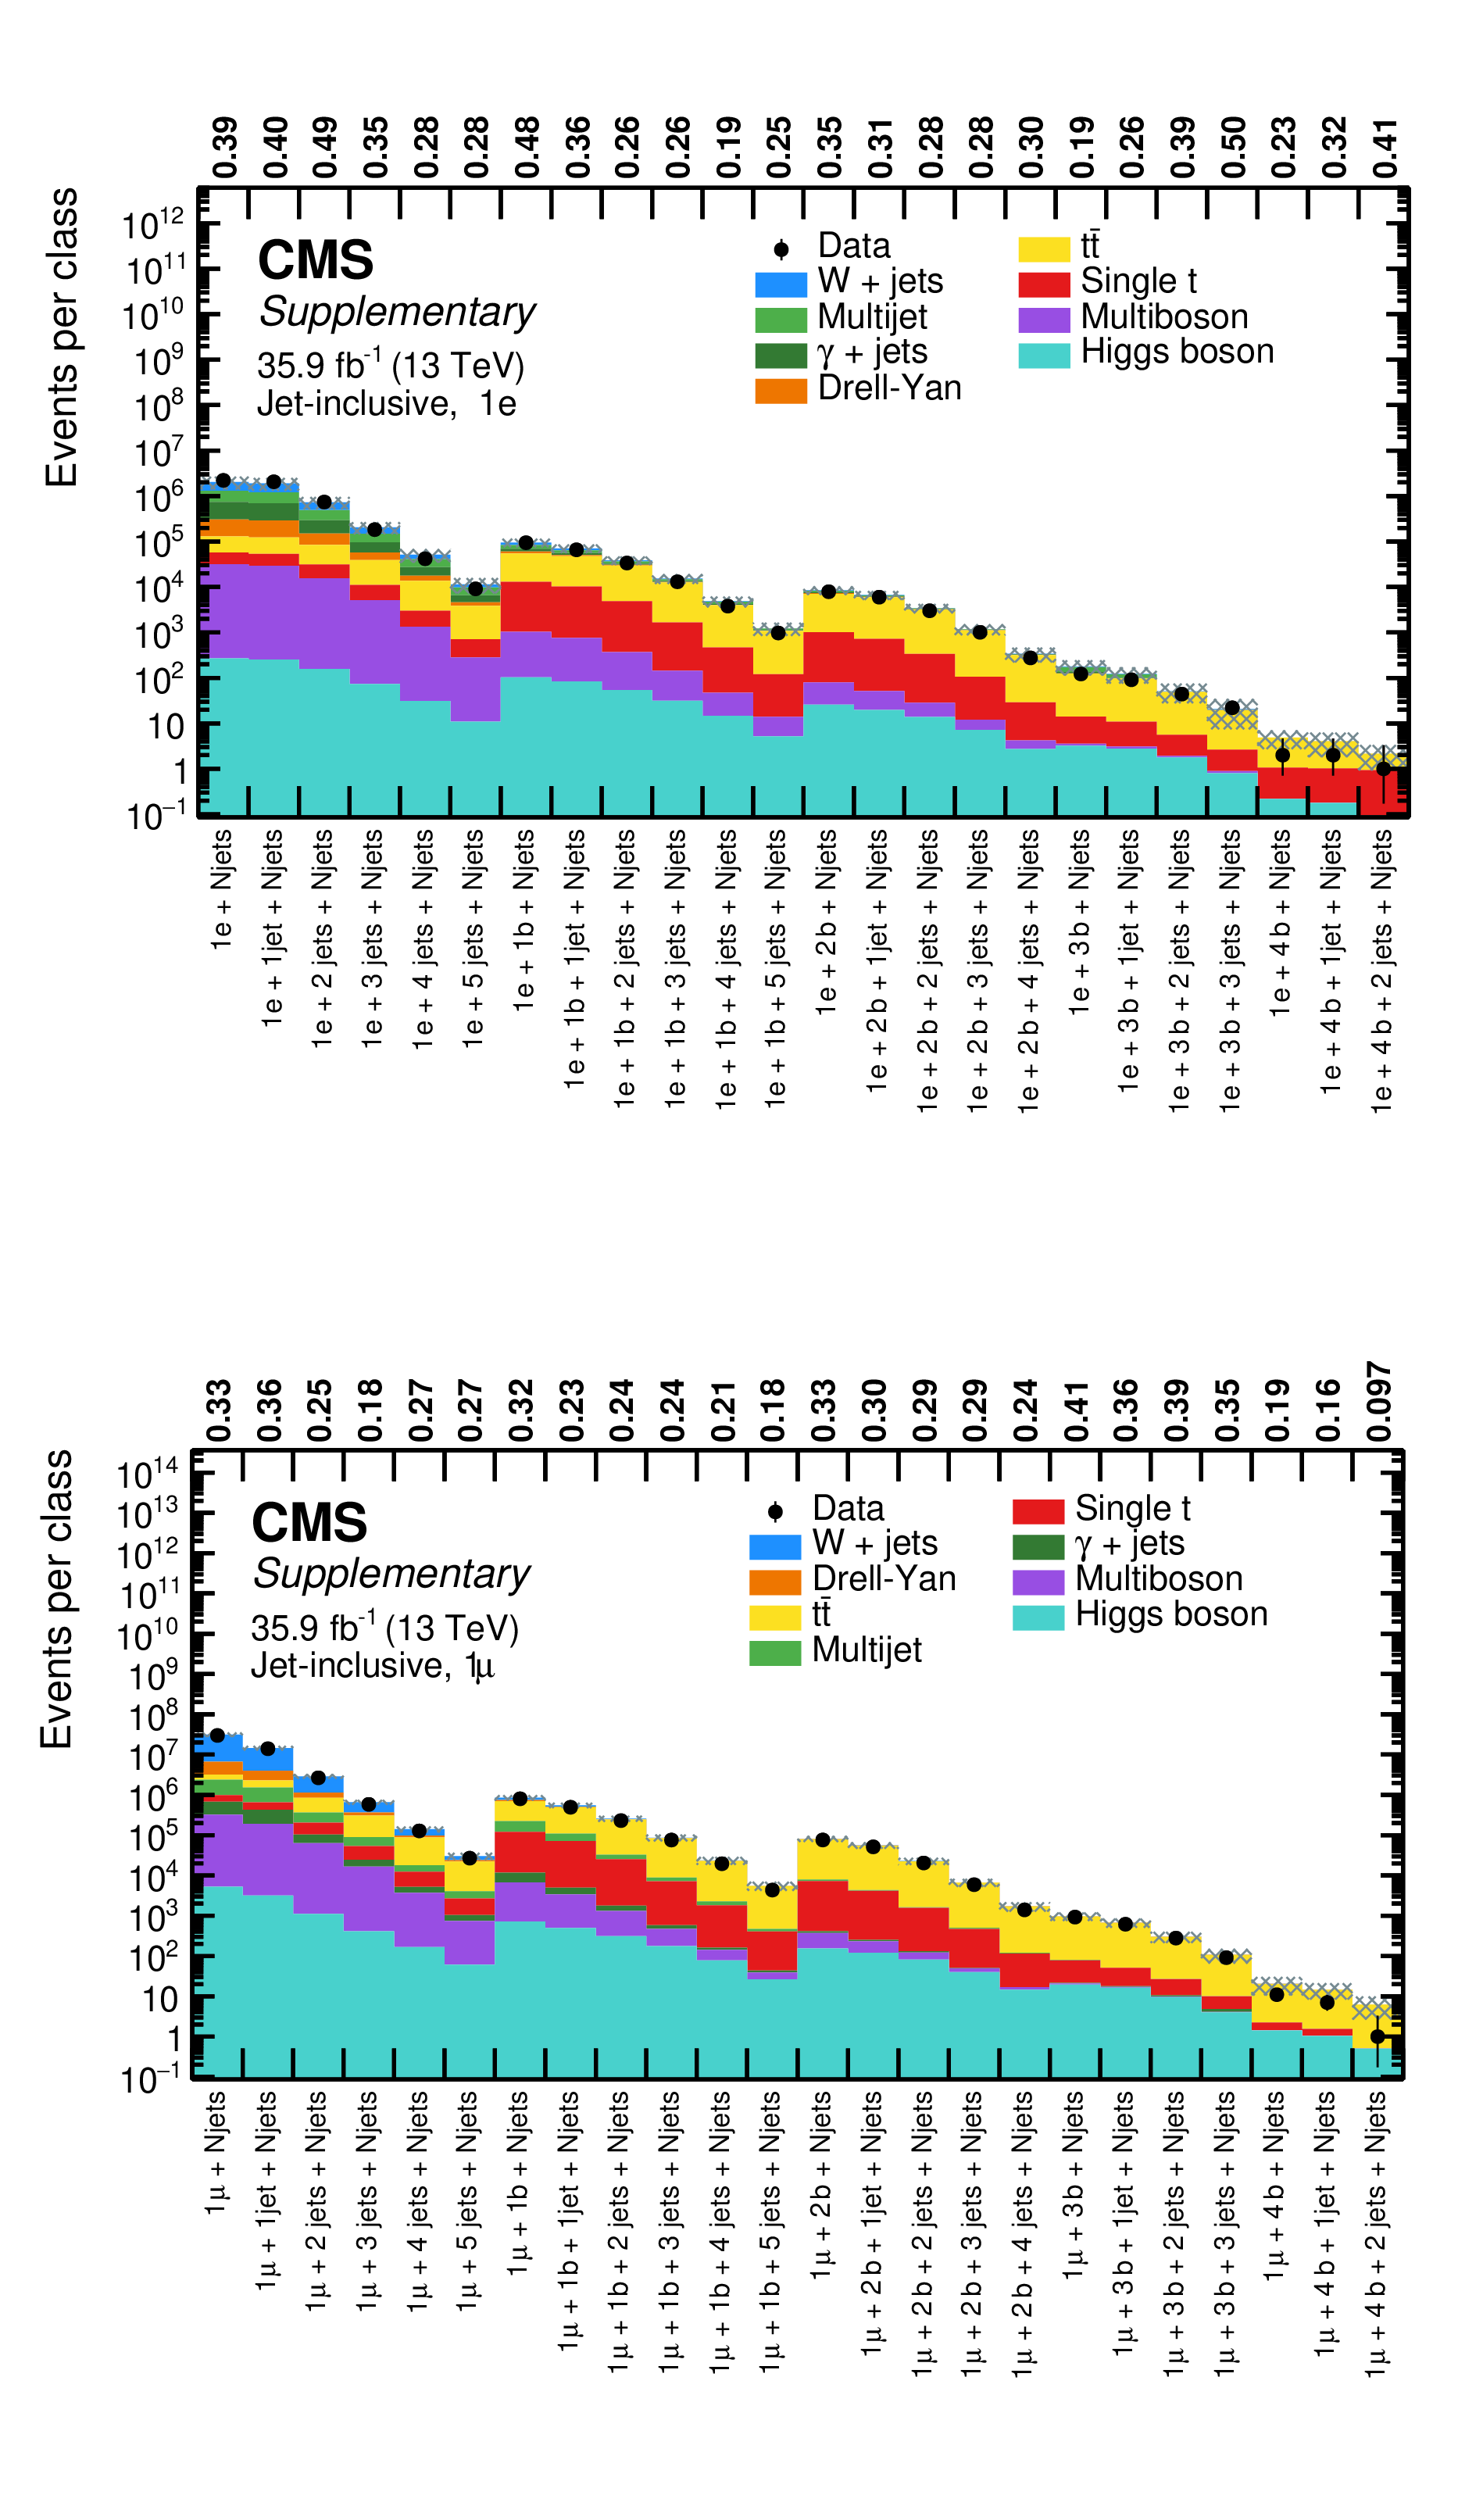
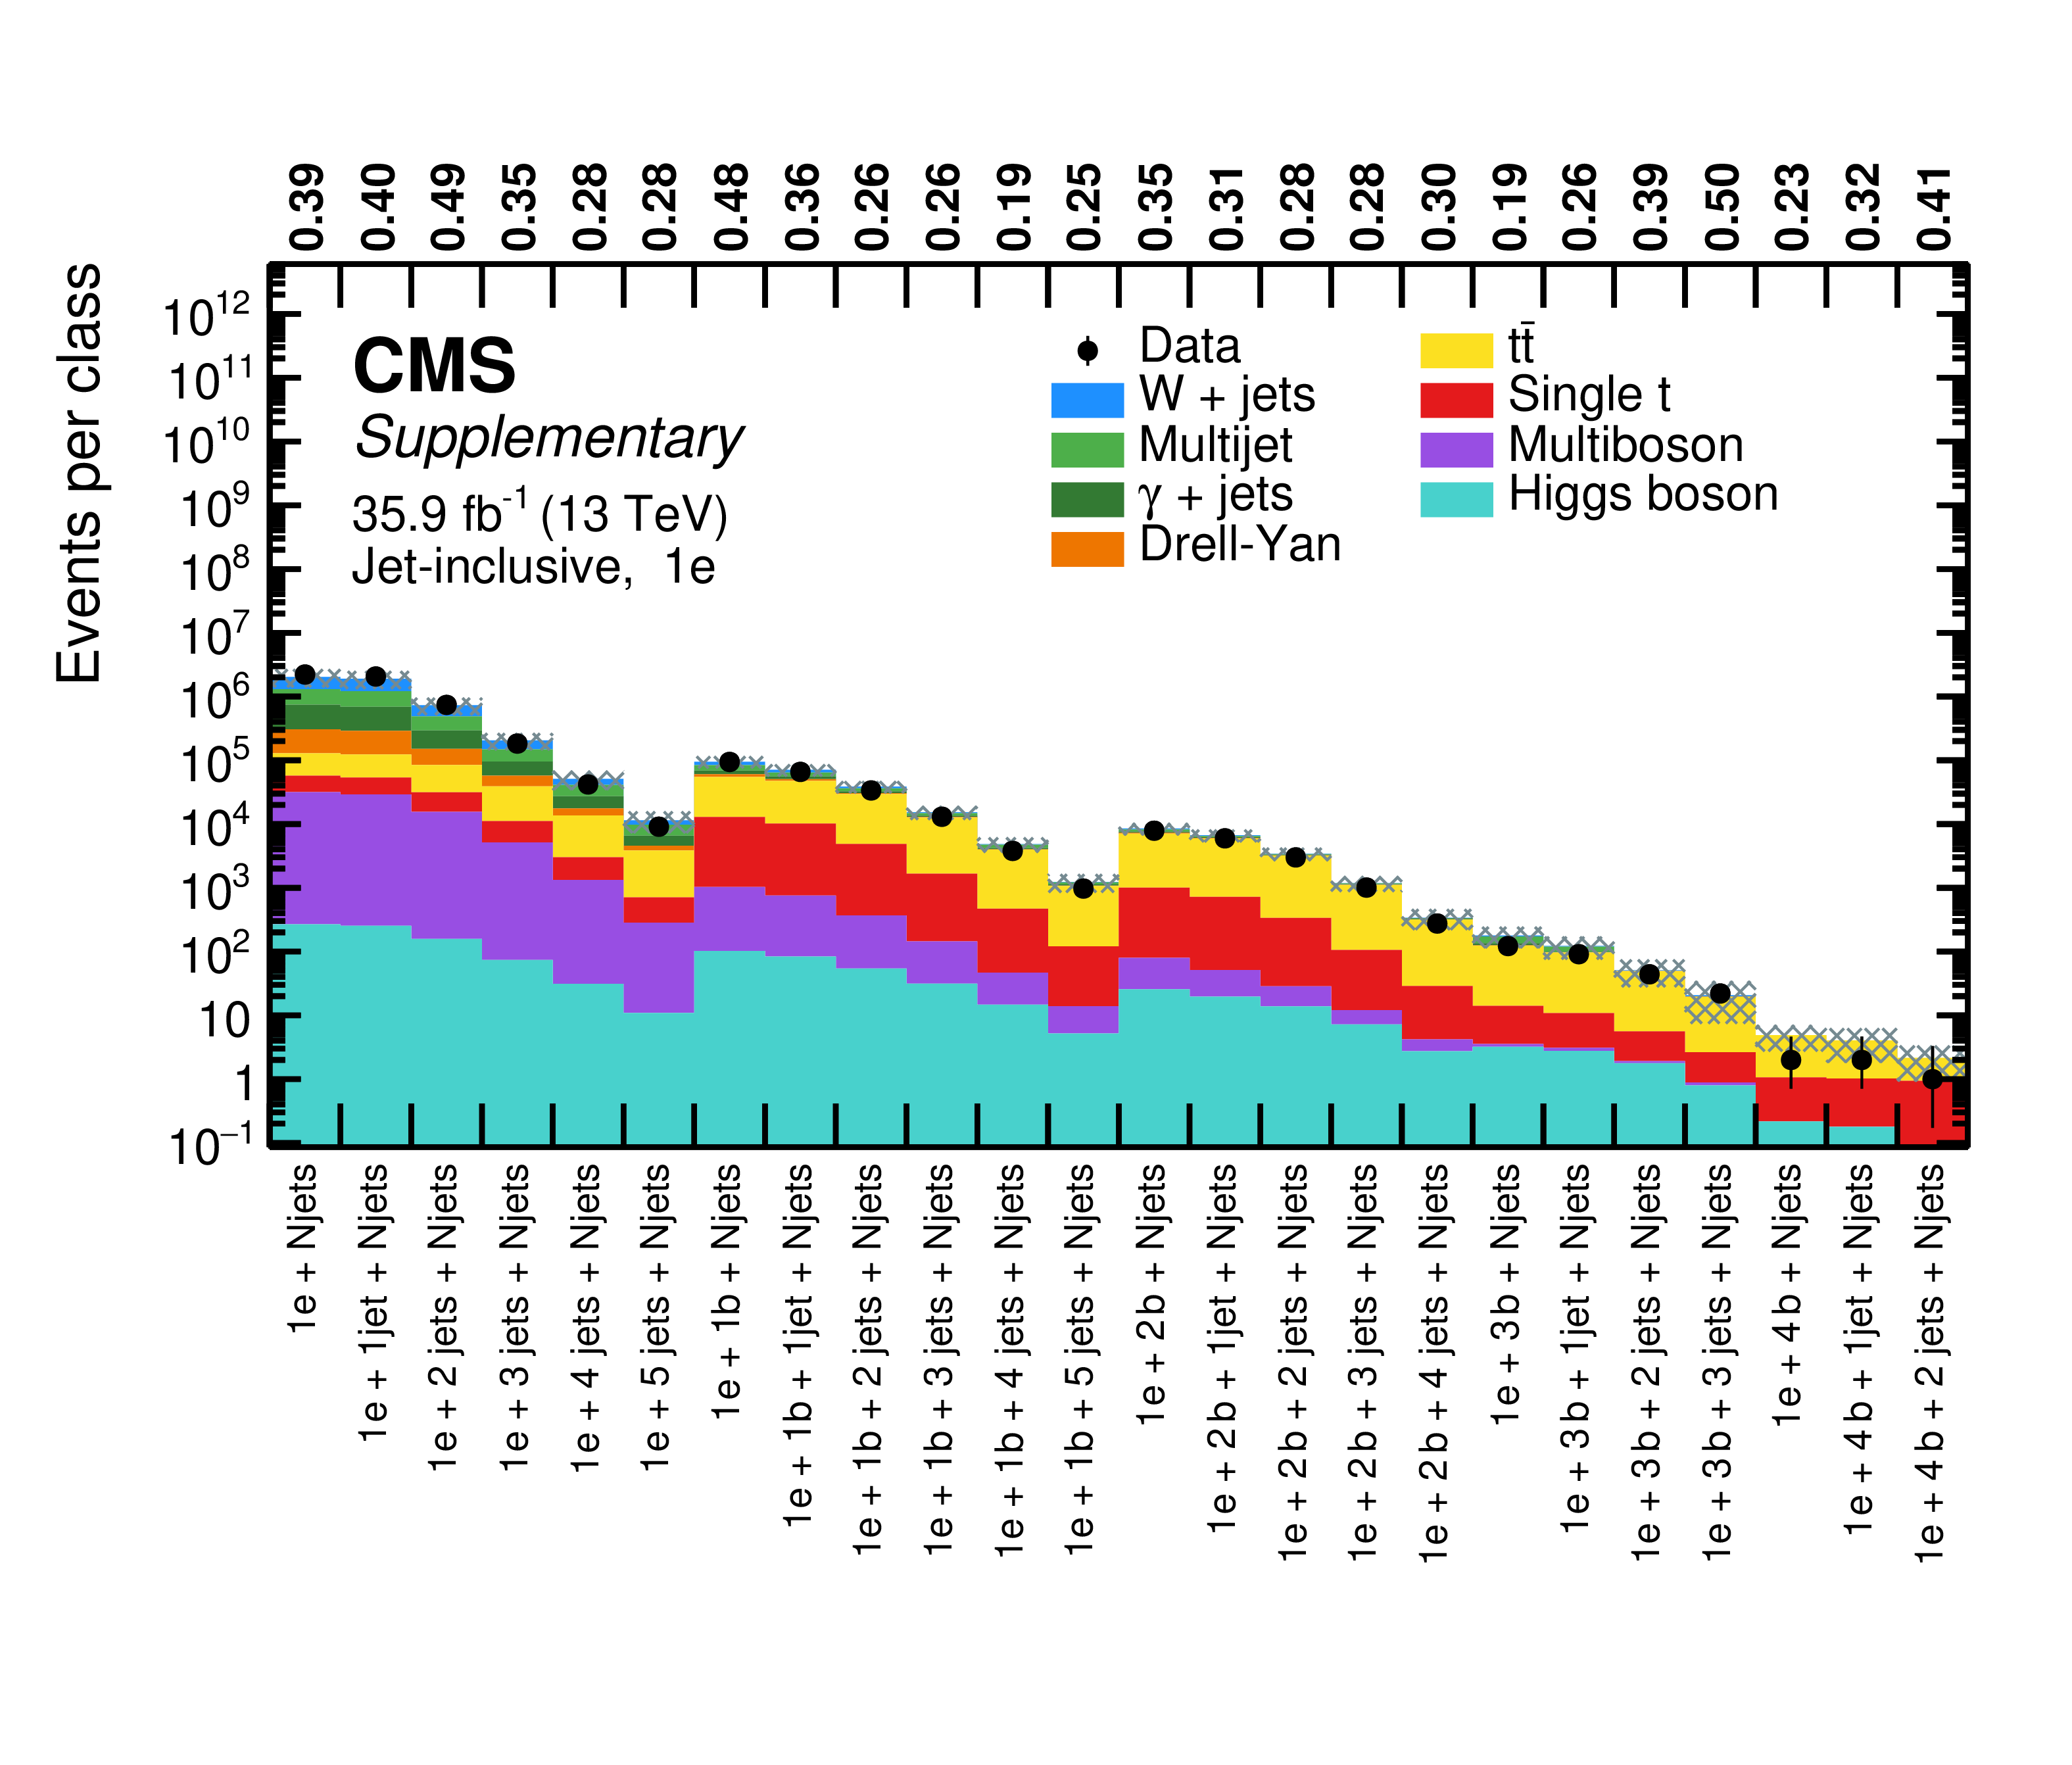
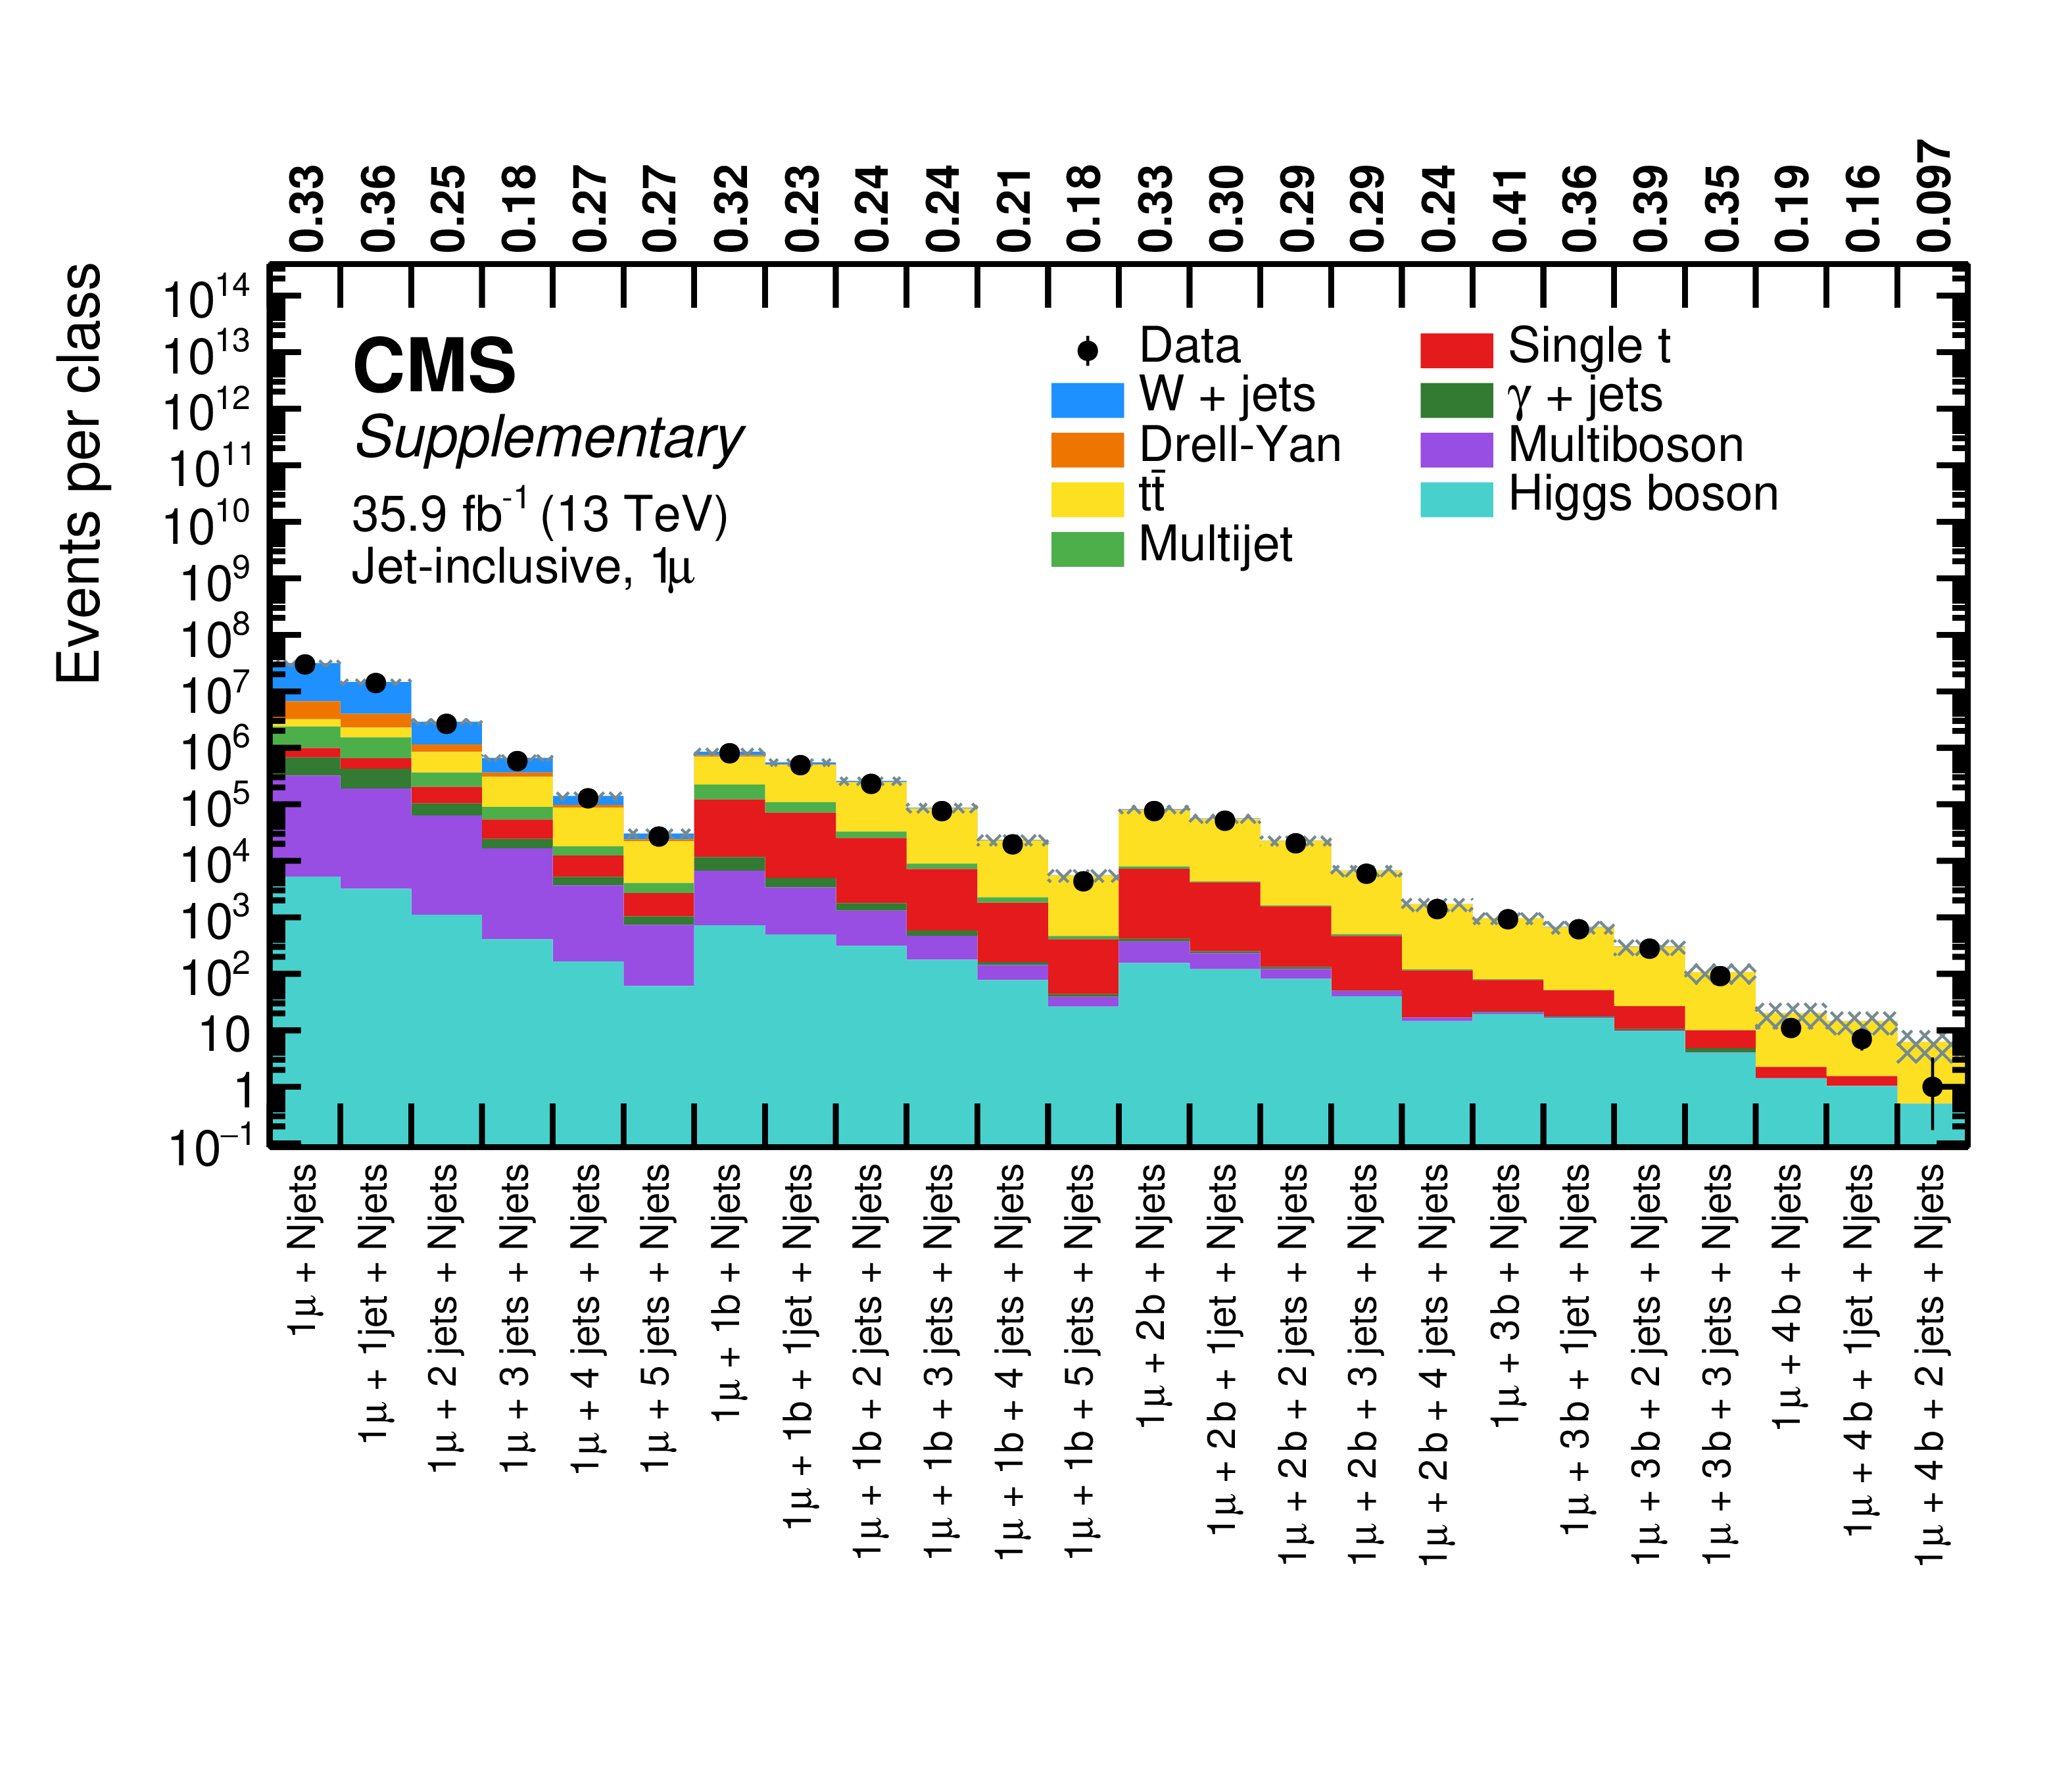
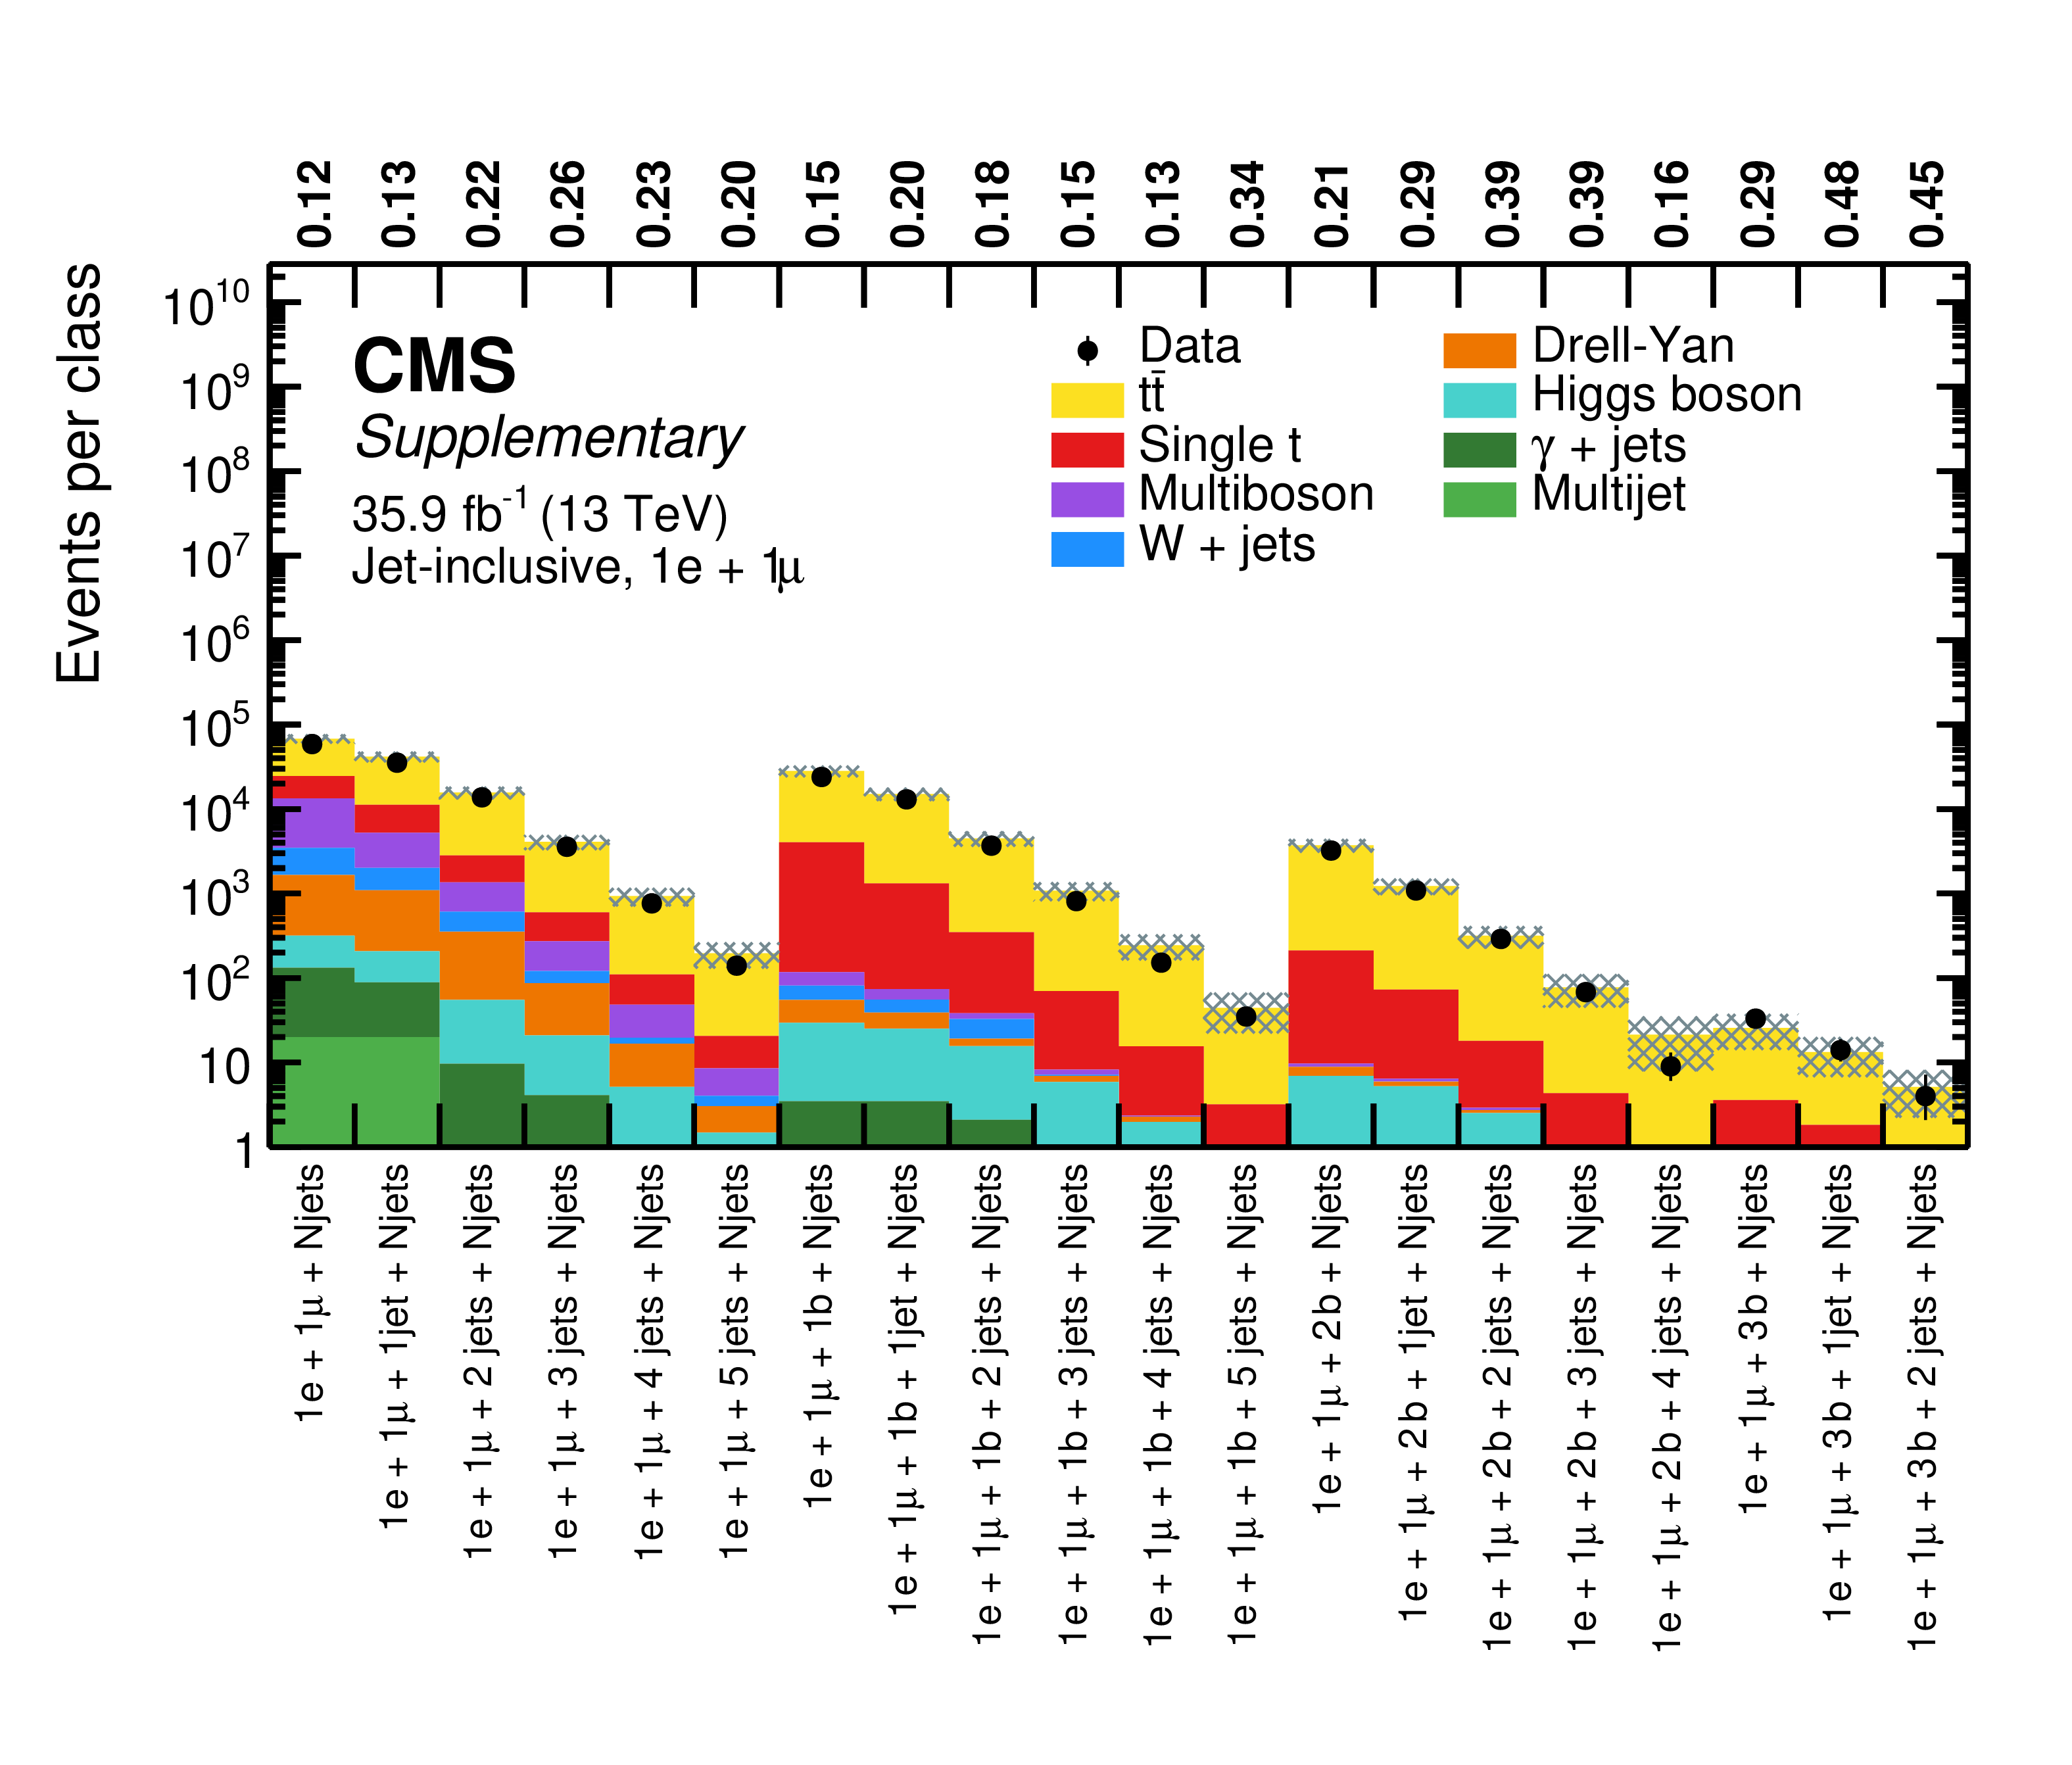
Overview of total event yields for the jet-inclusive event classes of the single-electron (upper) and single-muon (lower) object groups. Measured data are shown as black markers, contributions from SM processes are represented by coloured histograms, and the shaded region represents the uncertainty in the SM background. The numbers above the plot indicate the observed p-value for the agreement of data and simulation. |
png pdf |
Additional Figure 12-a:
Overview of total event yields for the jet-inclusive event classes of the single-electron object group. Measured data are shown as black markers, contributions from SM processes are represented by coloured histograms, and the shaded region represents the uncertainty in the SM background. The numbers above the plot indicate the observed p-value for the agreement of data and simulation. |
png pdf |
Additional Figure 12-b:
Overview of total event yields for the jet-inclusive event classes of the single-muon object group. Measured data are shown as black markers, contributions from SM processes are represented by coloured histograms, and the shaded region represents the uncertainty in the SM background. The numbers above the plot indicate the observed p-value for the agreement of data and simulation. |
png pdf |
Additional Figure 13:
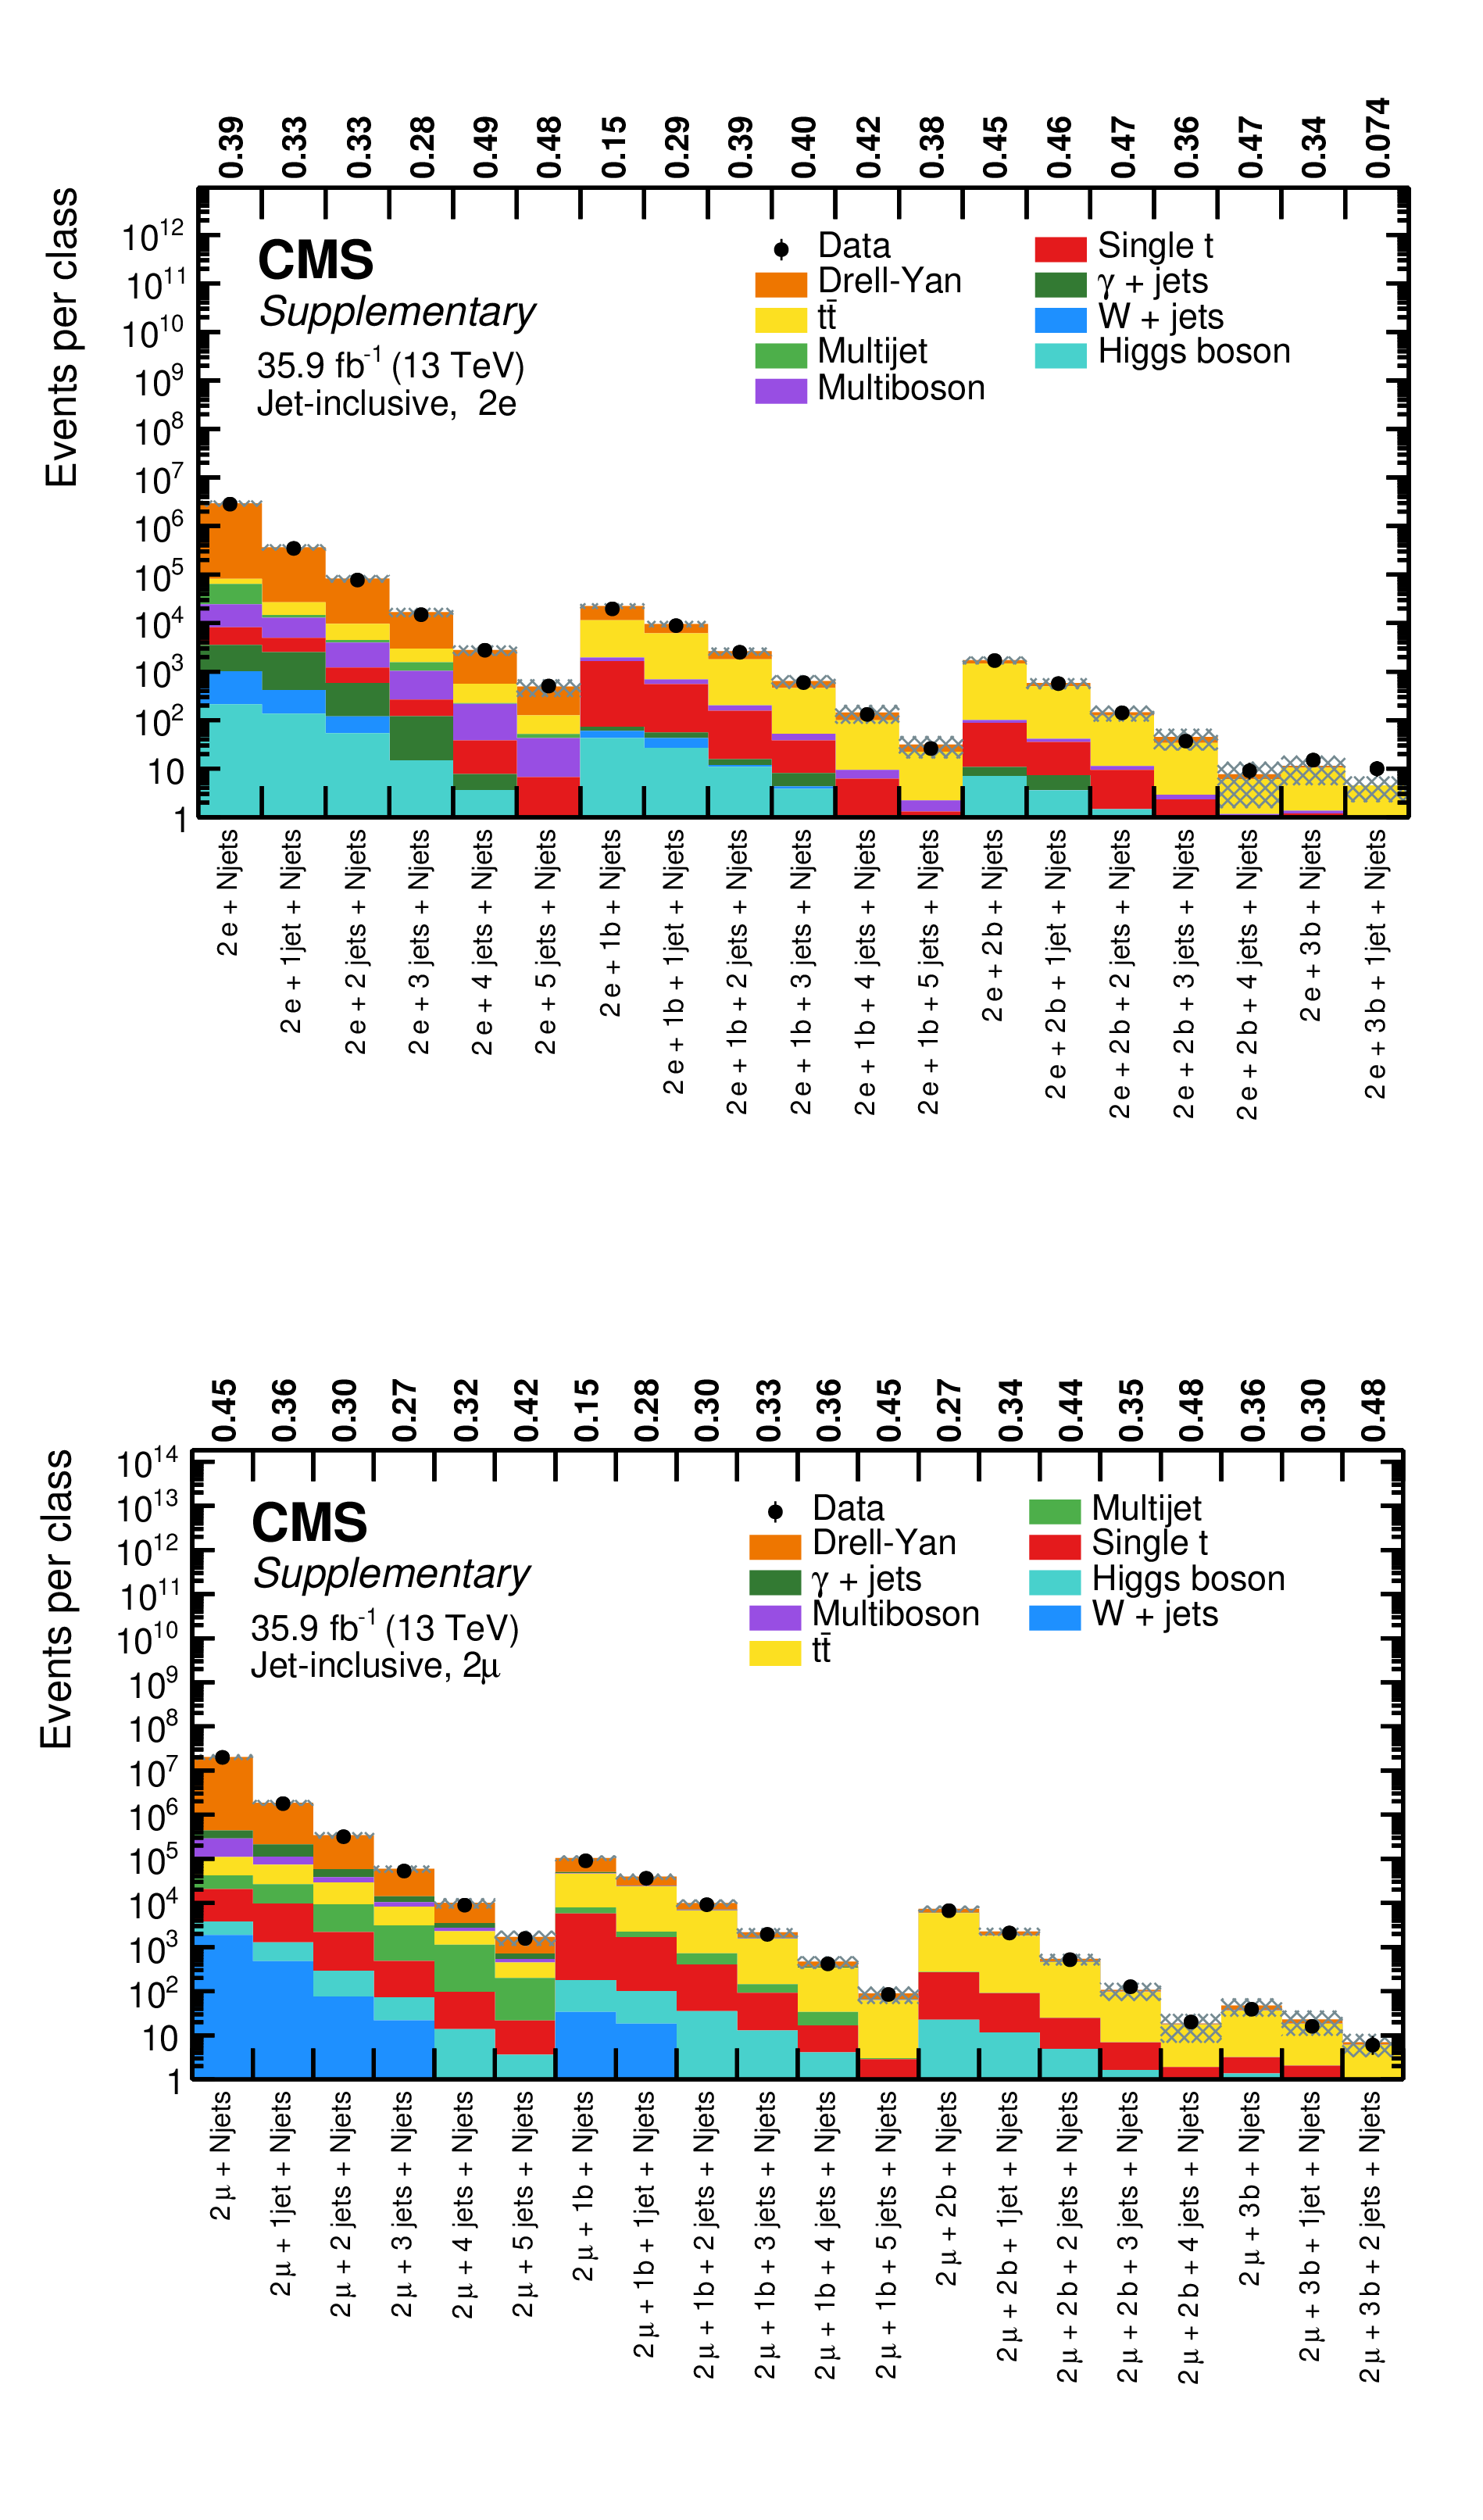
Overview of total event yields for the jet-inclusive event classes of the double-electron (upper) and the double-muon (lower) object groups. Measured data are shown as black markers, contributions from SM processes are represented by coloured histograms, and the shaded region represents the uncertainty in the SM background. The numbers above the plot indicate the observed p-value for the agreement of data and simulation. |
png pdf |
Additional Figure 13-a:
Overview of total event yields for the jet-inclusive event classes of the double-electron object group. Measured data are shown as black markers, contributions from SM processes are represented by coloured histograms, and the shaded region represents the uncertainty in the SM background. The numbers above the plot indicate the observed p-value for the agreement of data and simulation. |

png pdf |
Additional Figure 13-b:
Overview of total event yields for the jet-inclusive event classes of the double-muon object group. Measured data are shown as black markers, contributions from SM processes are represented by coloured histograms, and the shaded region represents the uncertainty in the SM background. The numbers above the plot indicate the observed p-value for the agreement of data and simulation. |
png pdf |
Additional Figure 14:
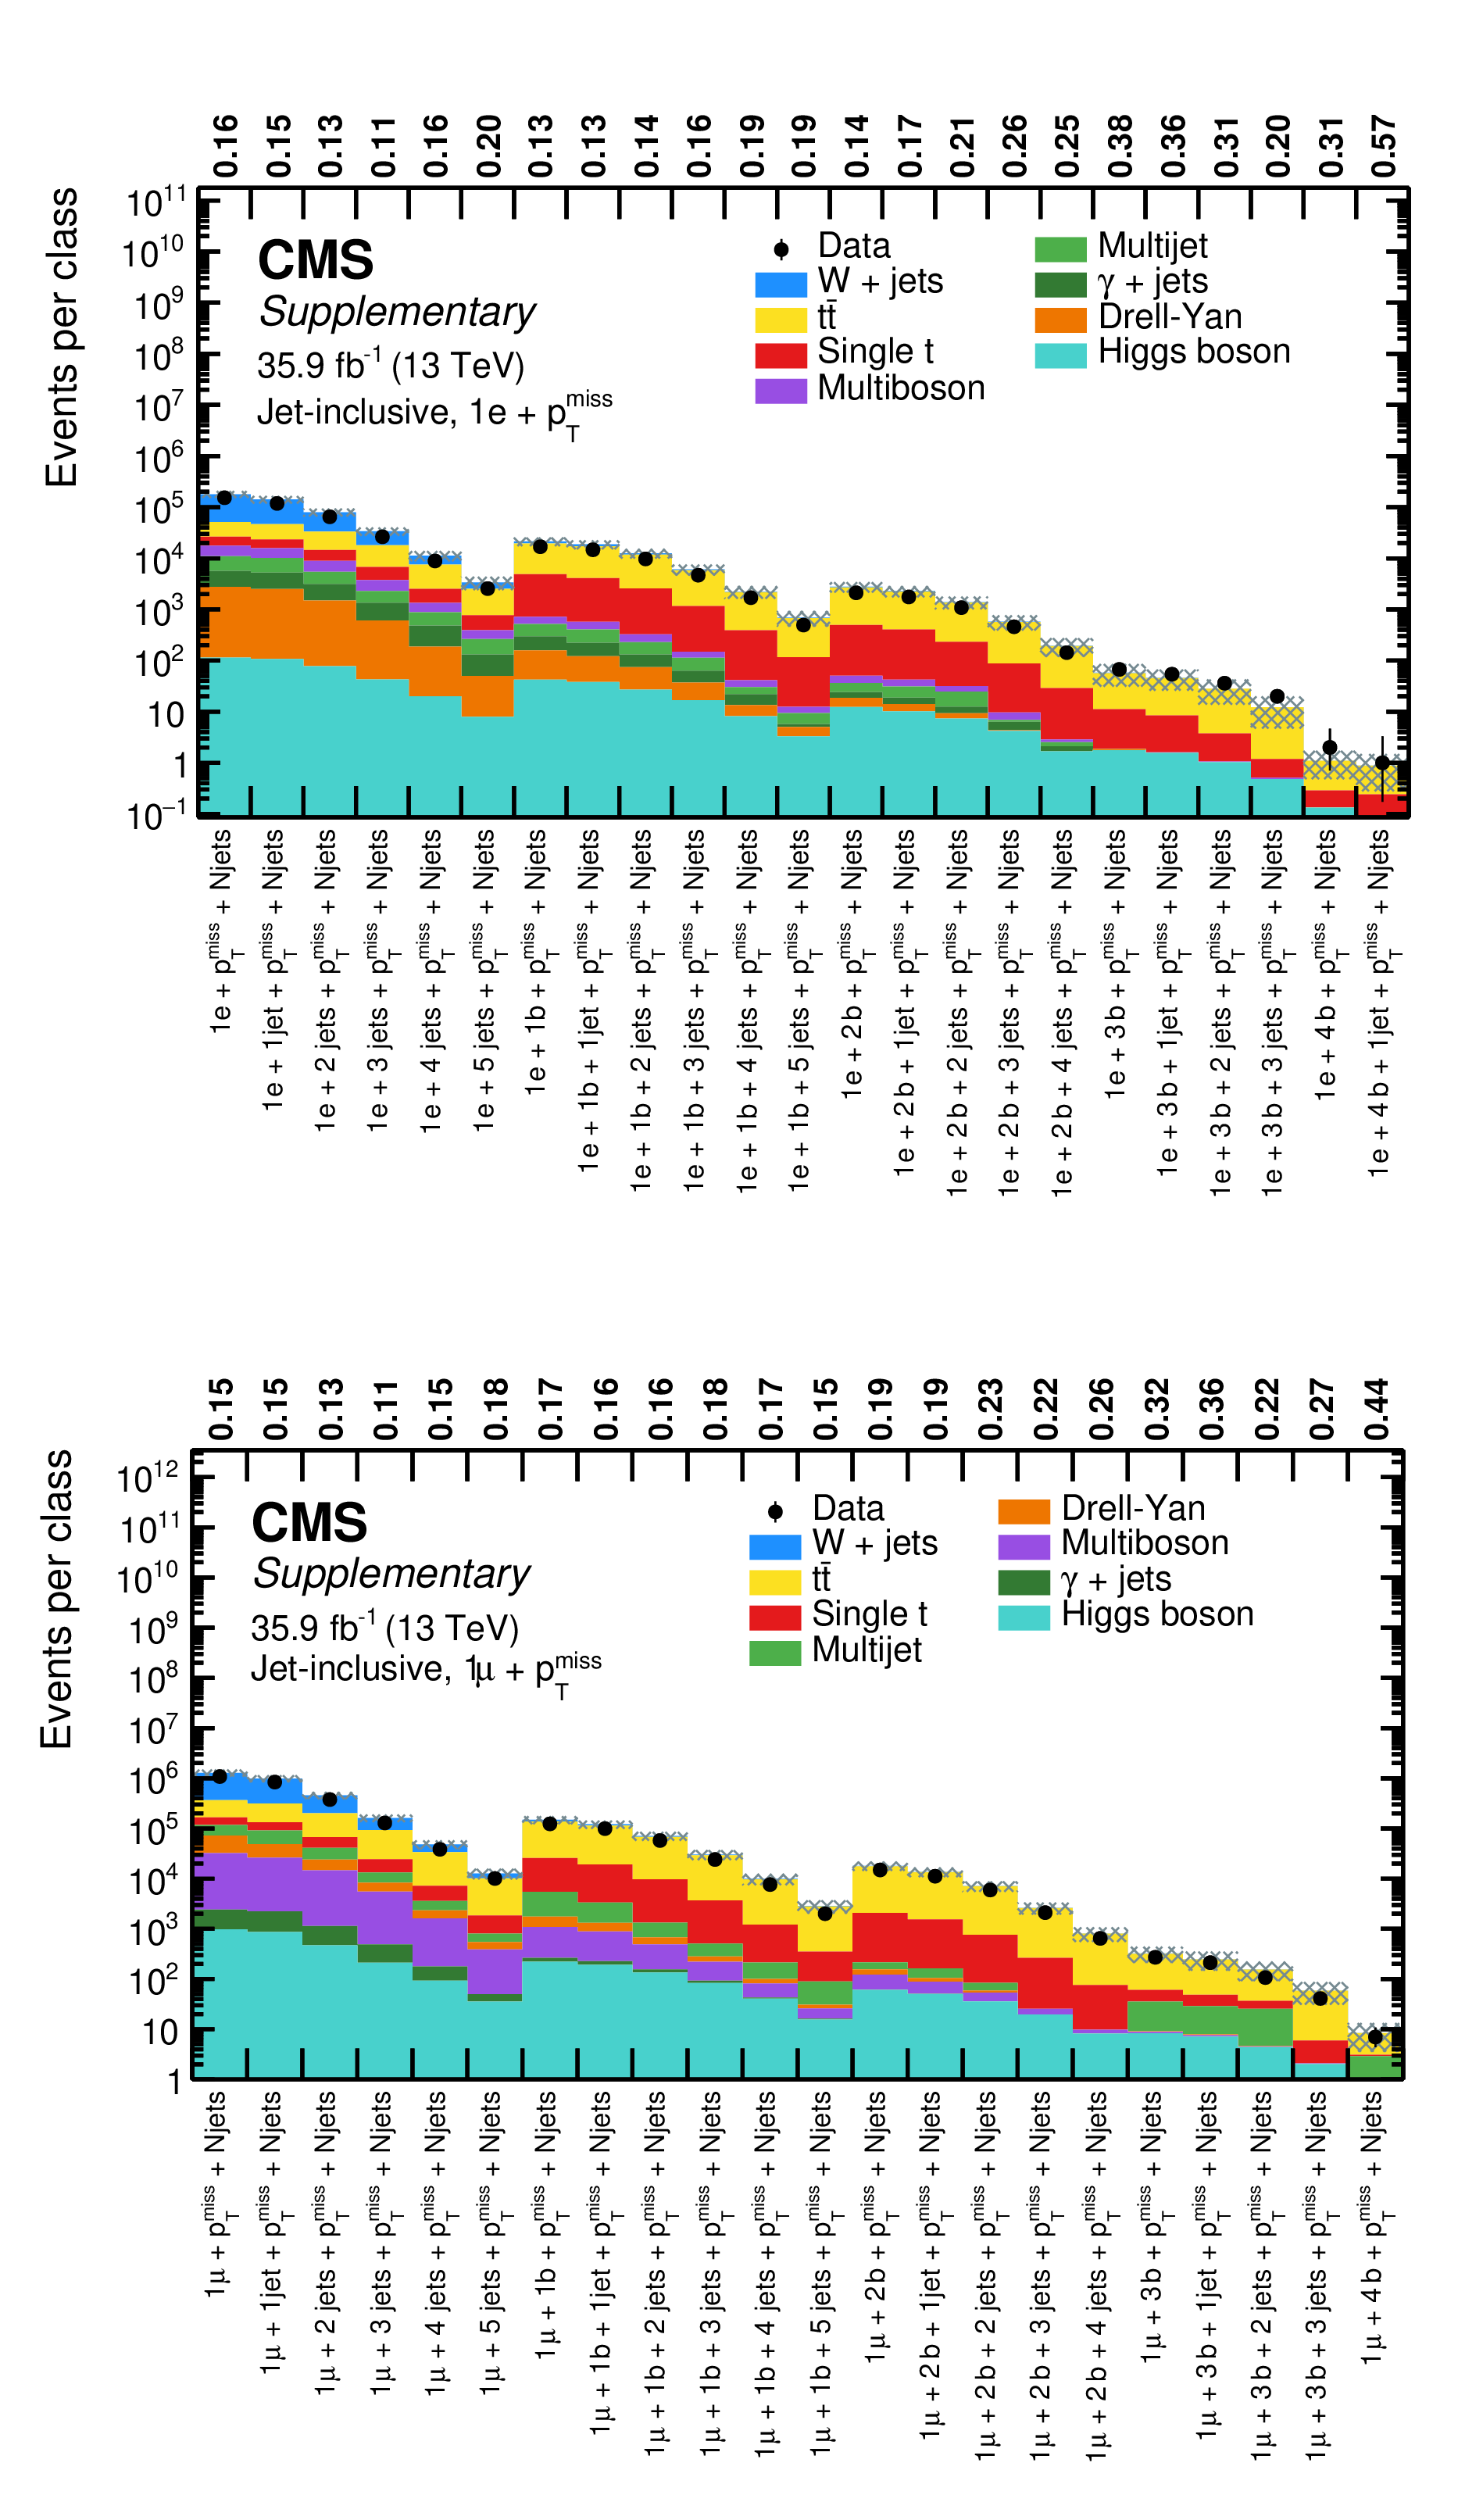
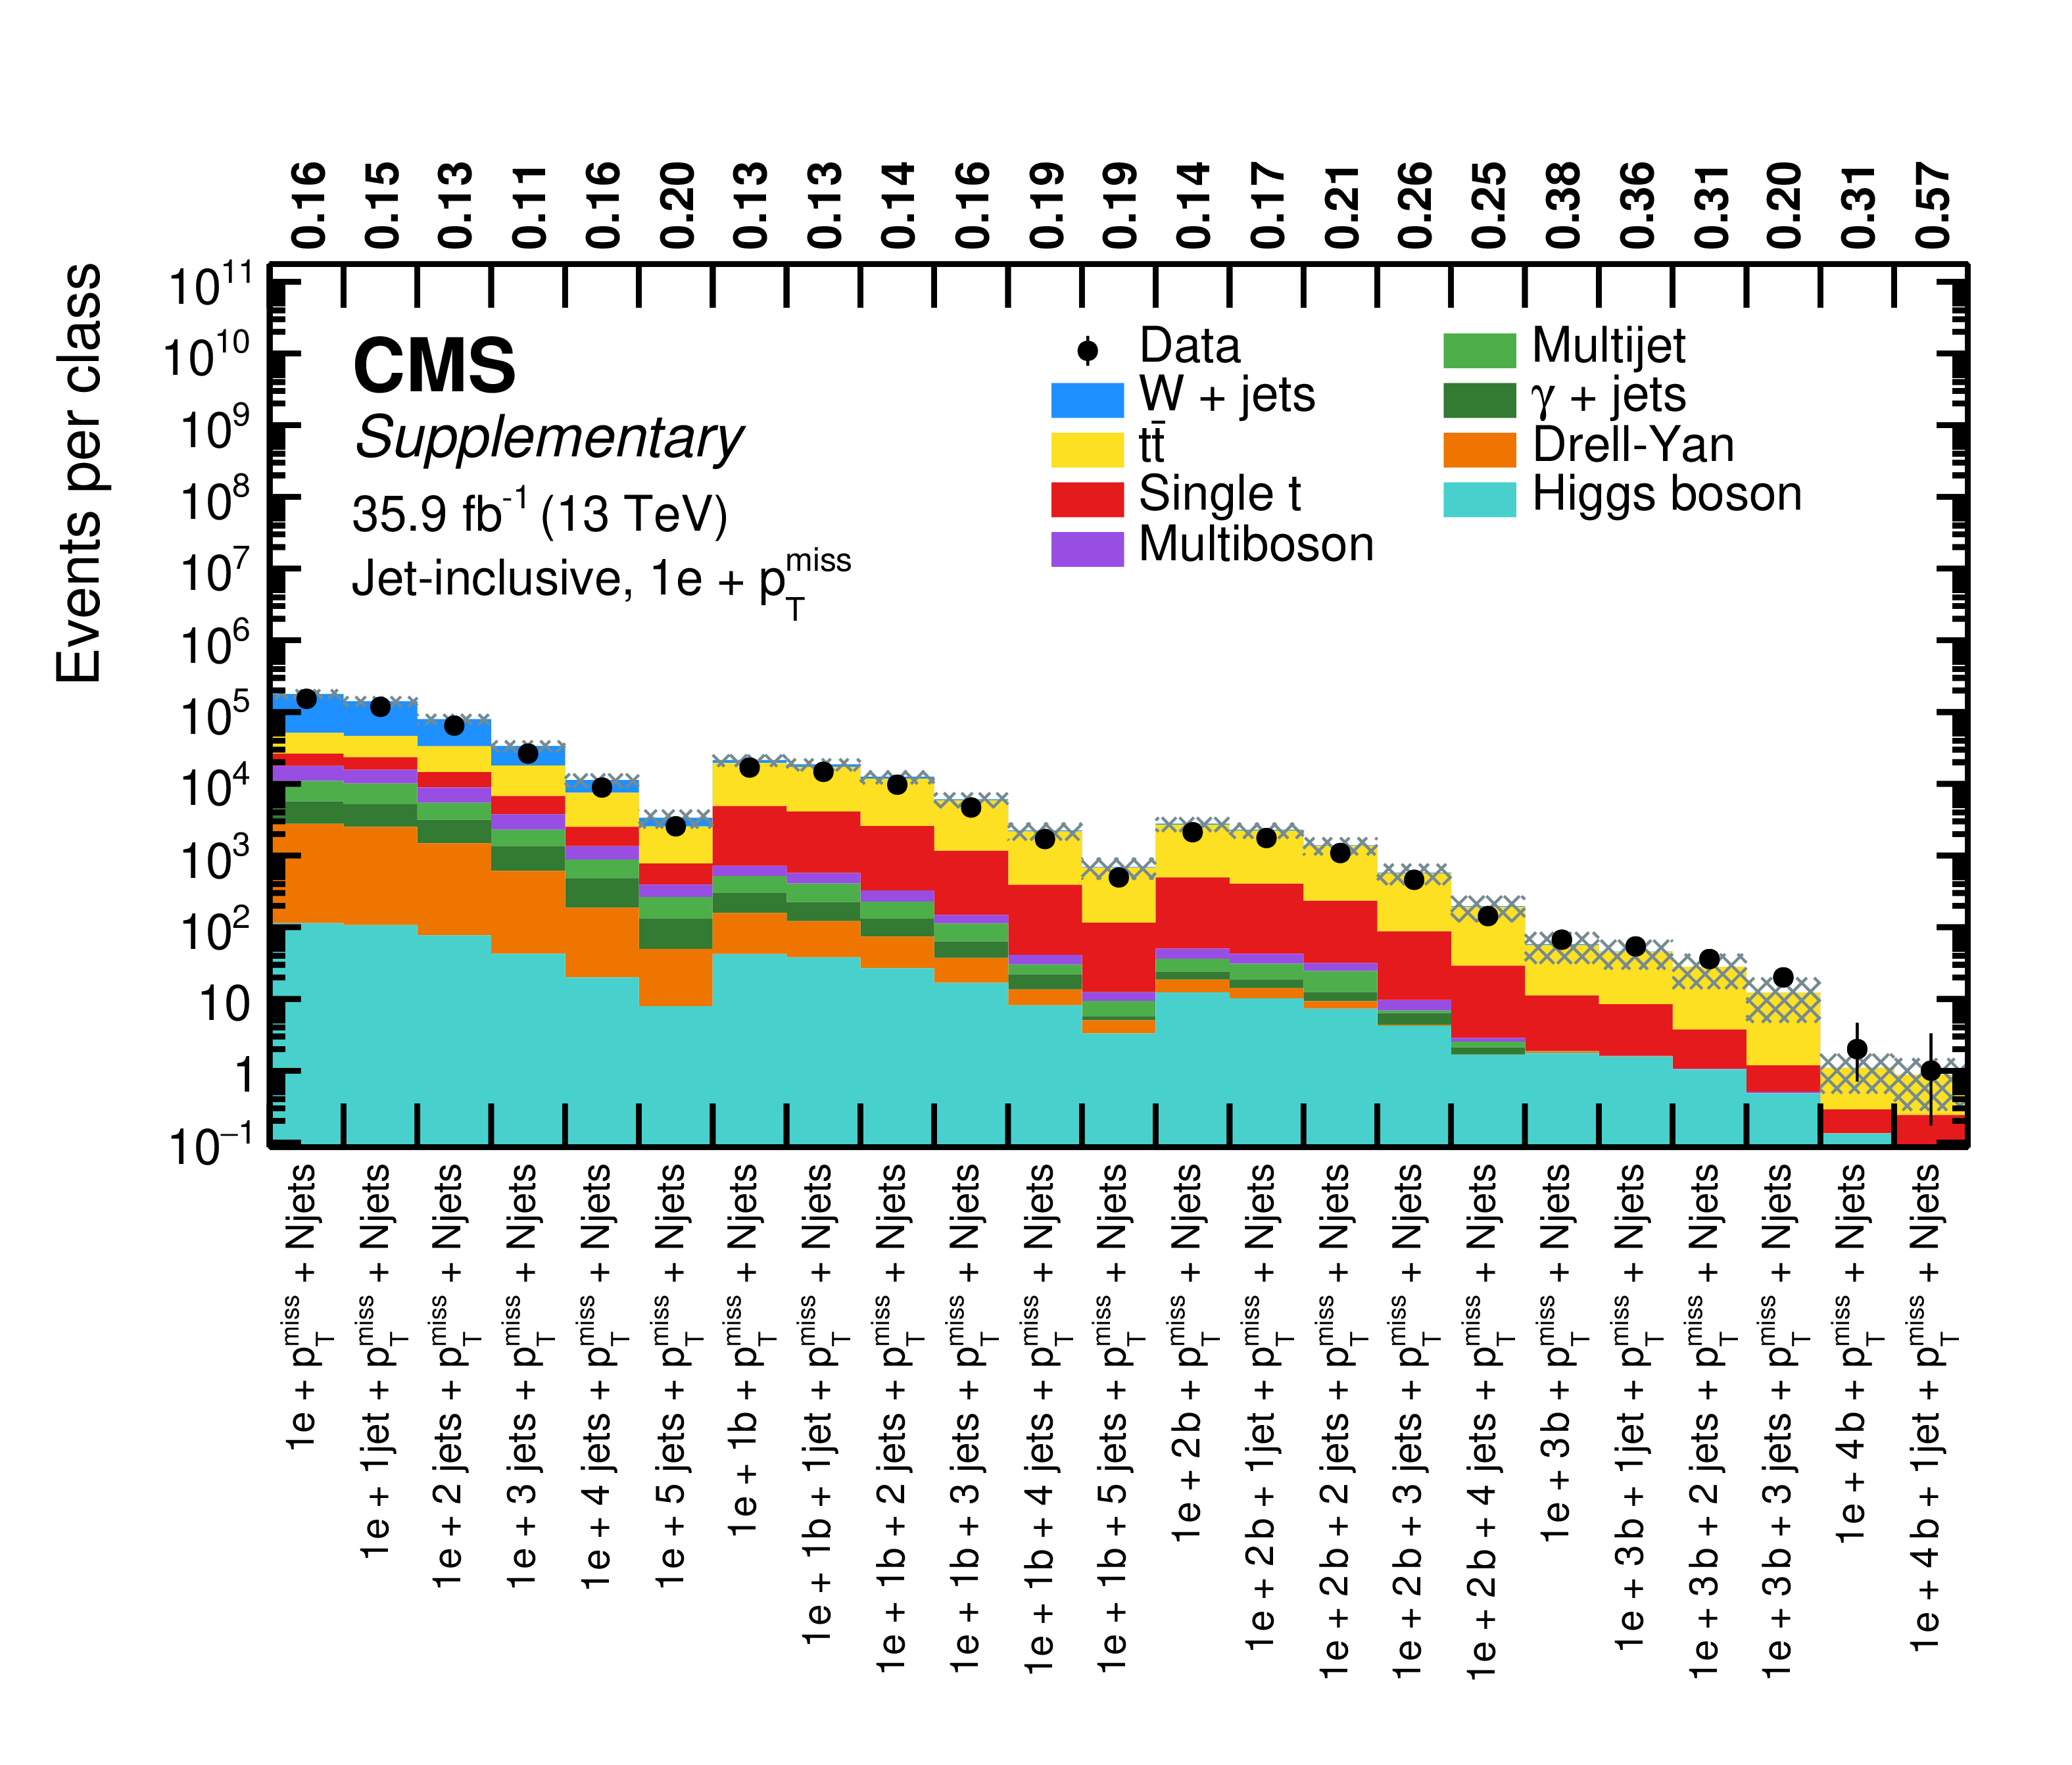
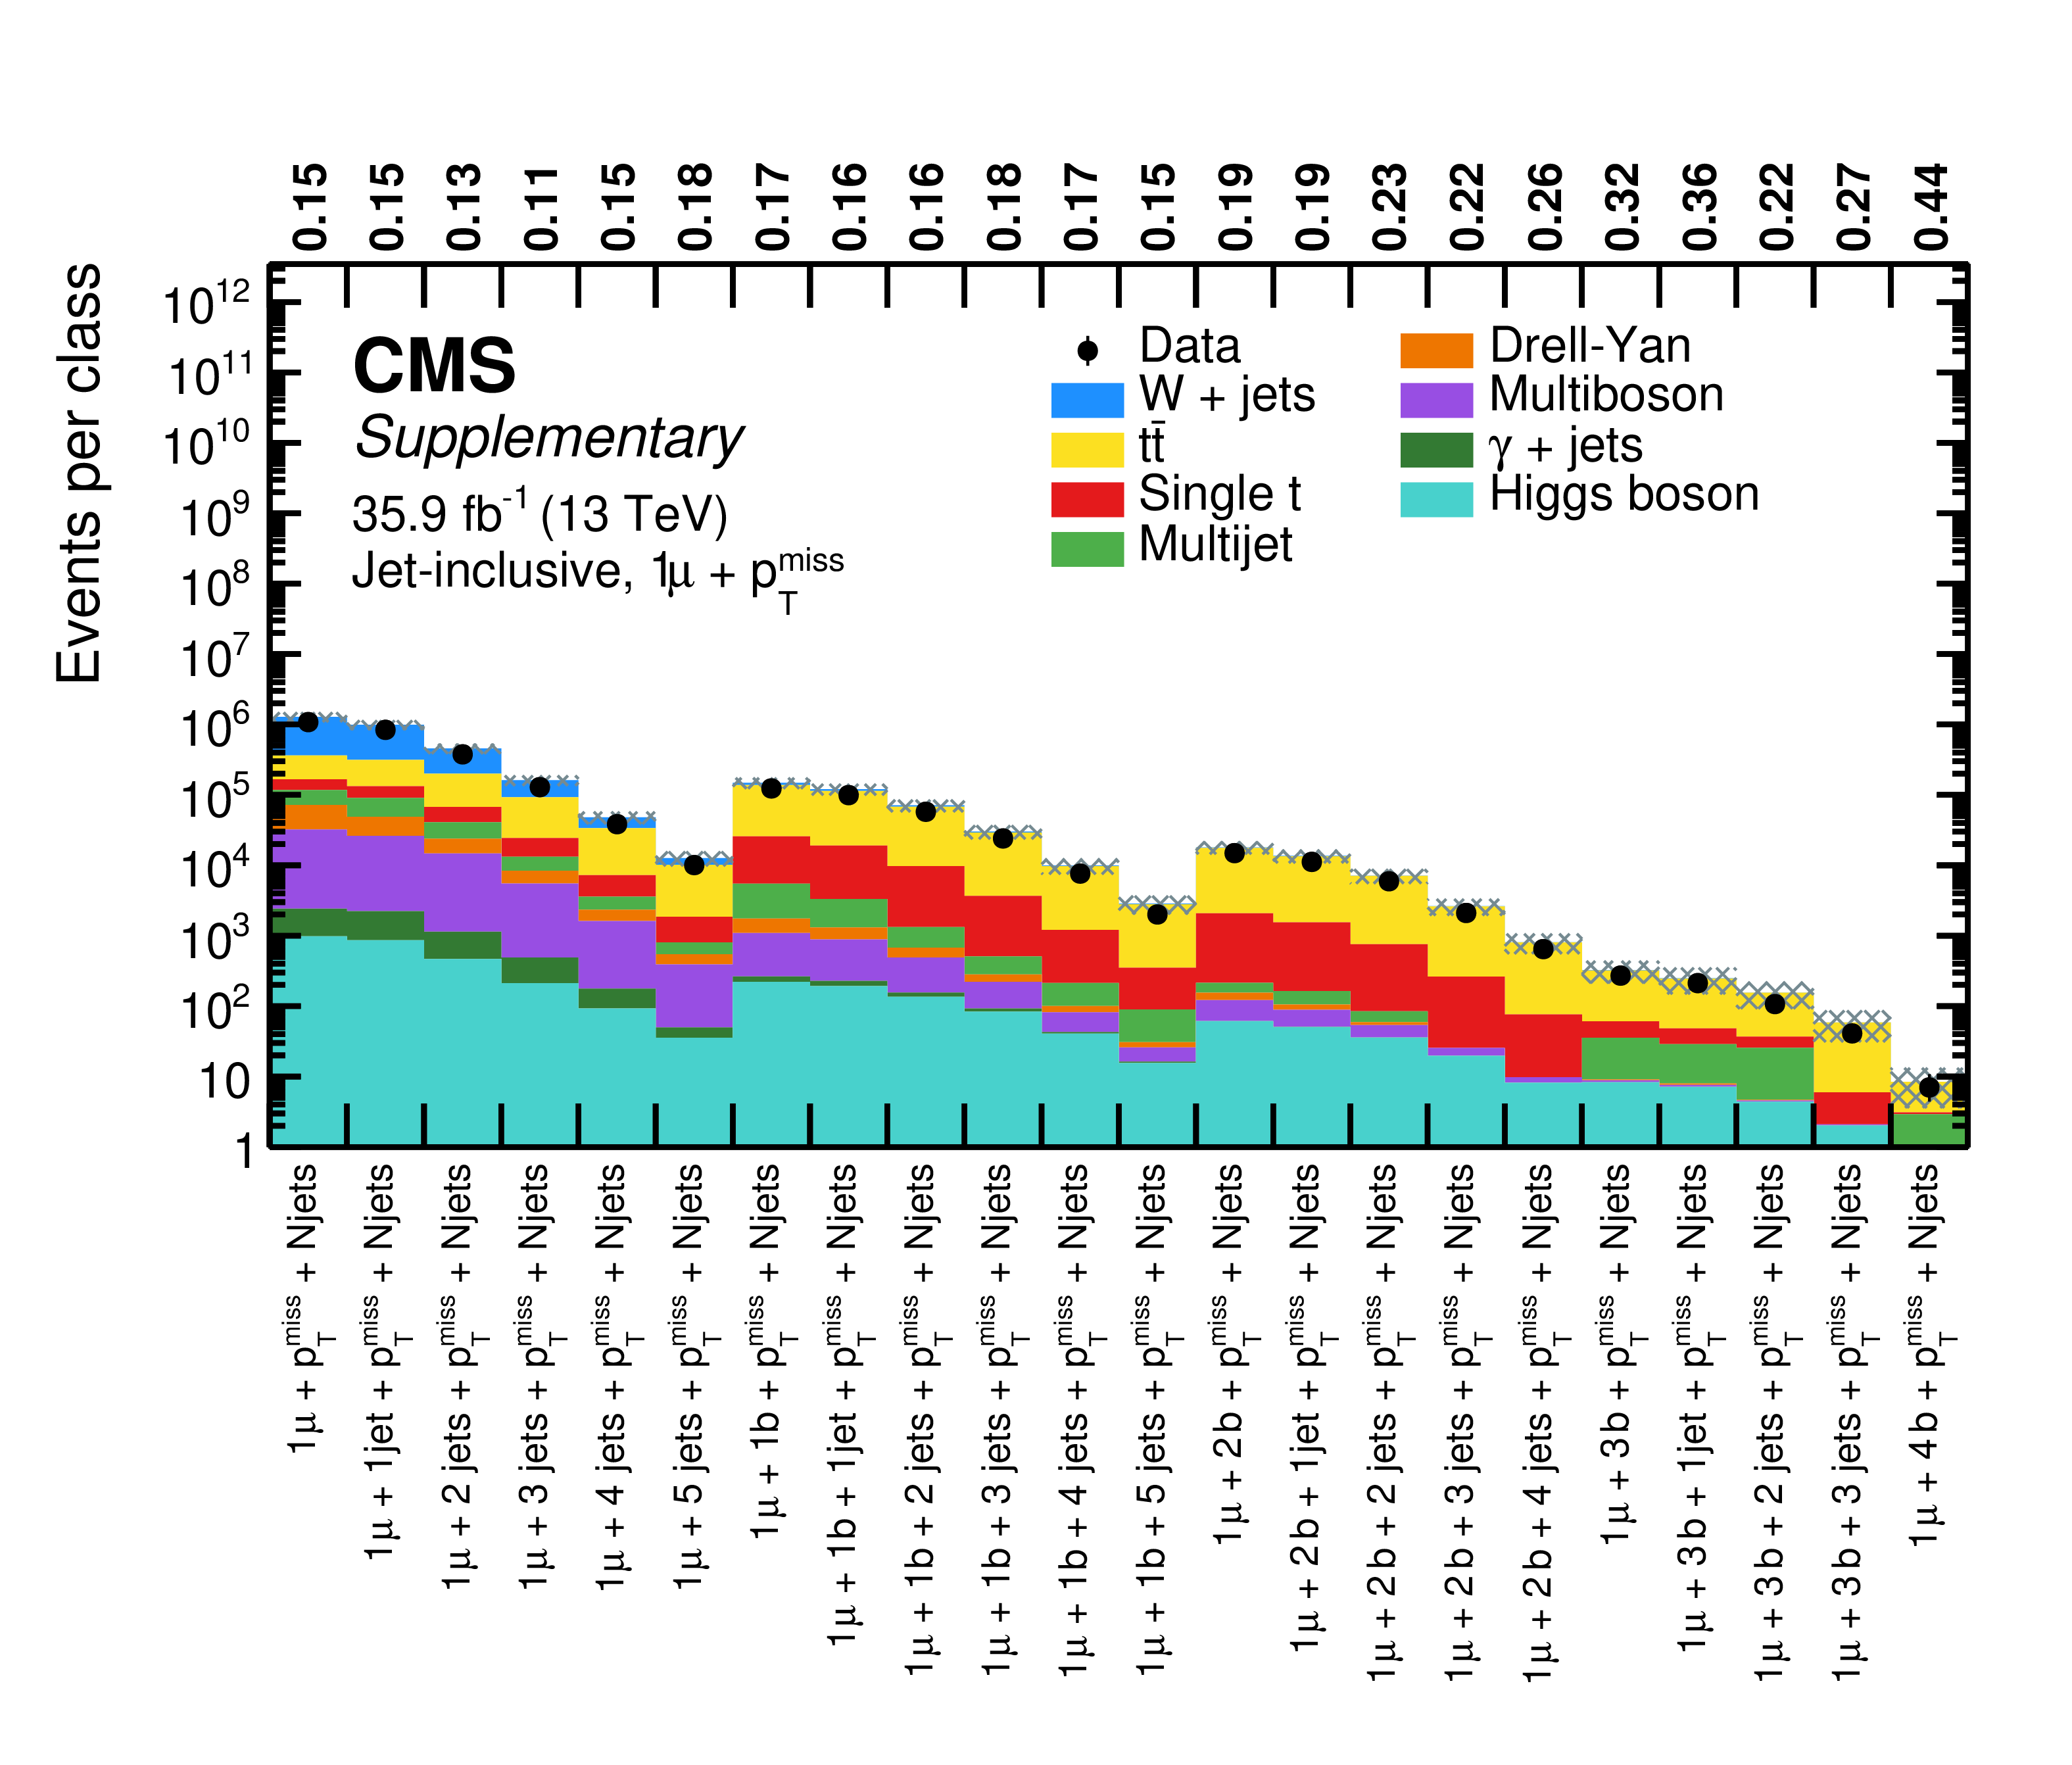
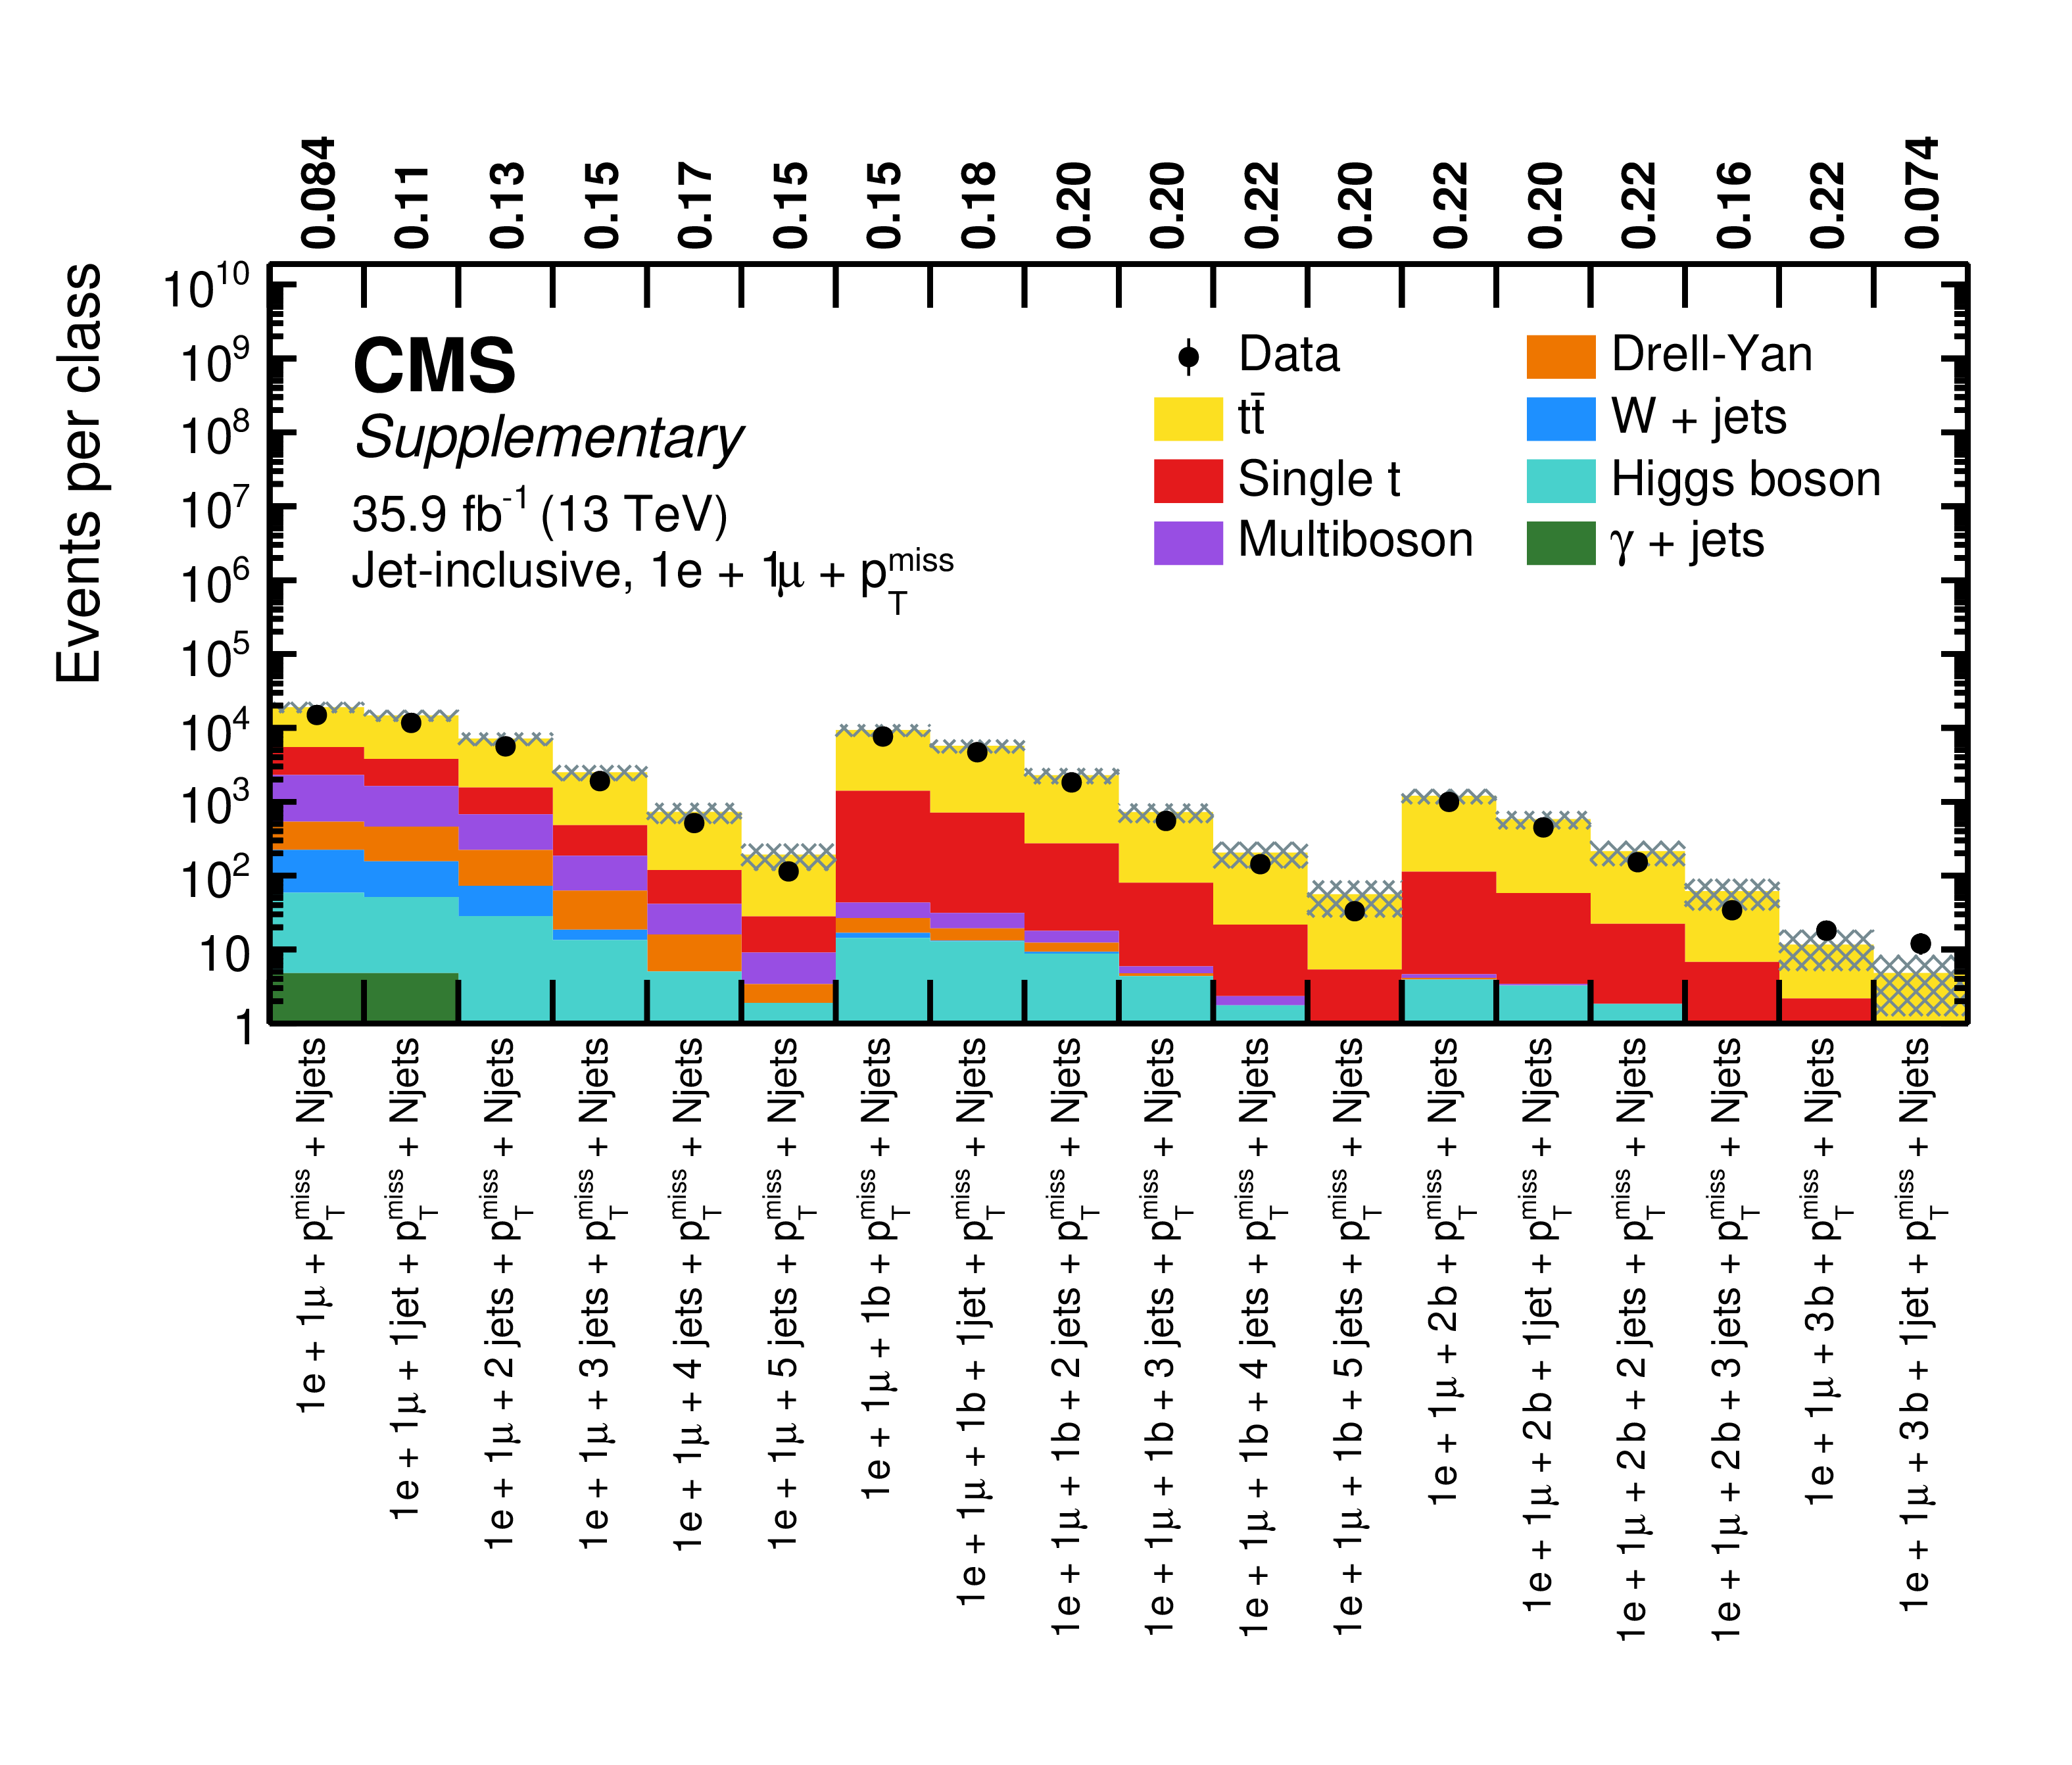
Overview of total event yields for the jet-inclusive event classes of the single-electron $+$ ${{p_{\mathrm {T}}} ^\text {miss}}$ (upper) and the single-muon $+$ ${{p_{\mathrm {T}}} ^\text {miss}}$ (lower) object groups. Measured data are shown as black markers, contributions from SM processes are represented by coloured histograms, and the shaded region represents the uncertainty in the SM background. The numbers above the plot indicate the observed p-value for the agreement of data and simulation. |
png pdf |
Additional Figure 14-a:
Overview of total event yields for the jet-inclusive event classes of the single-electron $+$ ${{p_{\mathrm {T}}} ^\text {miss}}$ object group. Measured data are shown as black markers, contributions from SM processes are represented by coloured histograms, and the shaded region represents the uncertainty in the SM background. The numbers above the plot indicate the observed p-value for the agreement of data and simulation. |
png pdf |
Additional Figure 14-b:
Overview of total event yields for the jet-inclusive event classes of the single-muon $+$ ${{p_{\mathrm {T}}} ^\text {miss}}$ object group. Measured data are shown as black markers, contributions from SM processes are represented by coloured histograms, and the shaded region represents the uncertainty in the SM background. The numbers above the plot indicate the observed p-value for the agreement of data and simulation. |
png pdf |
Additional Figure 15:
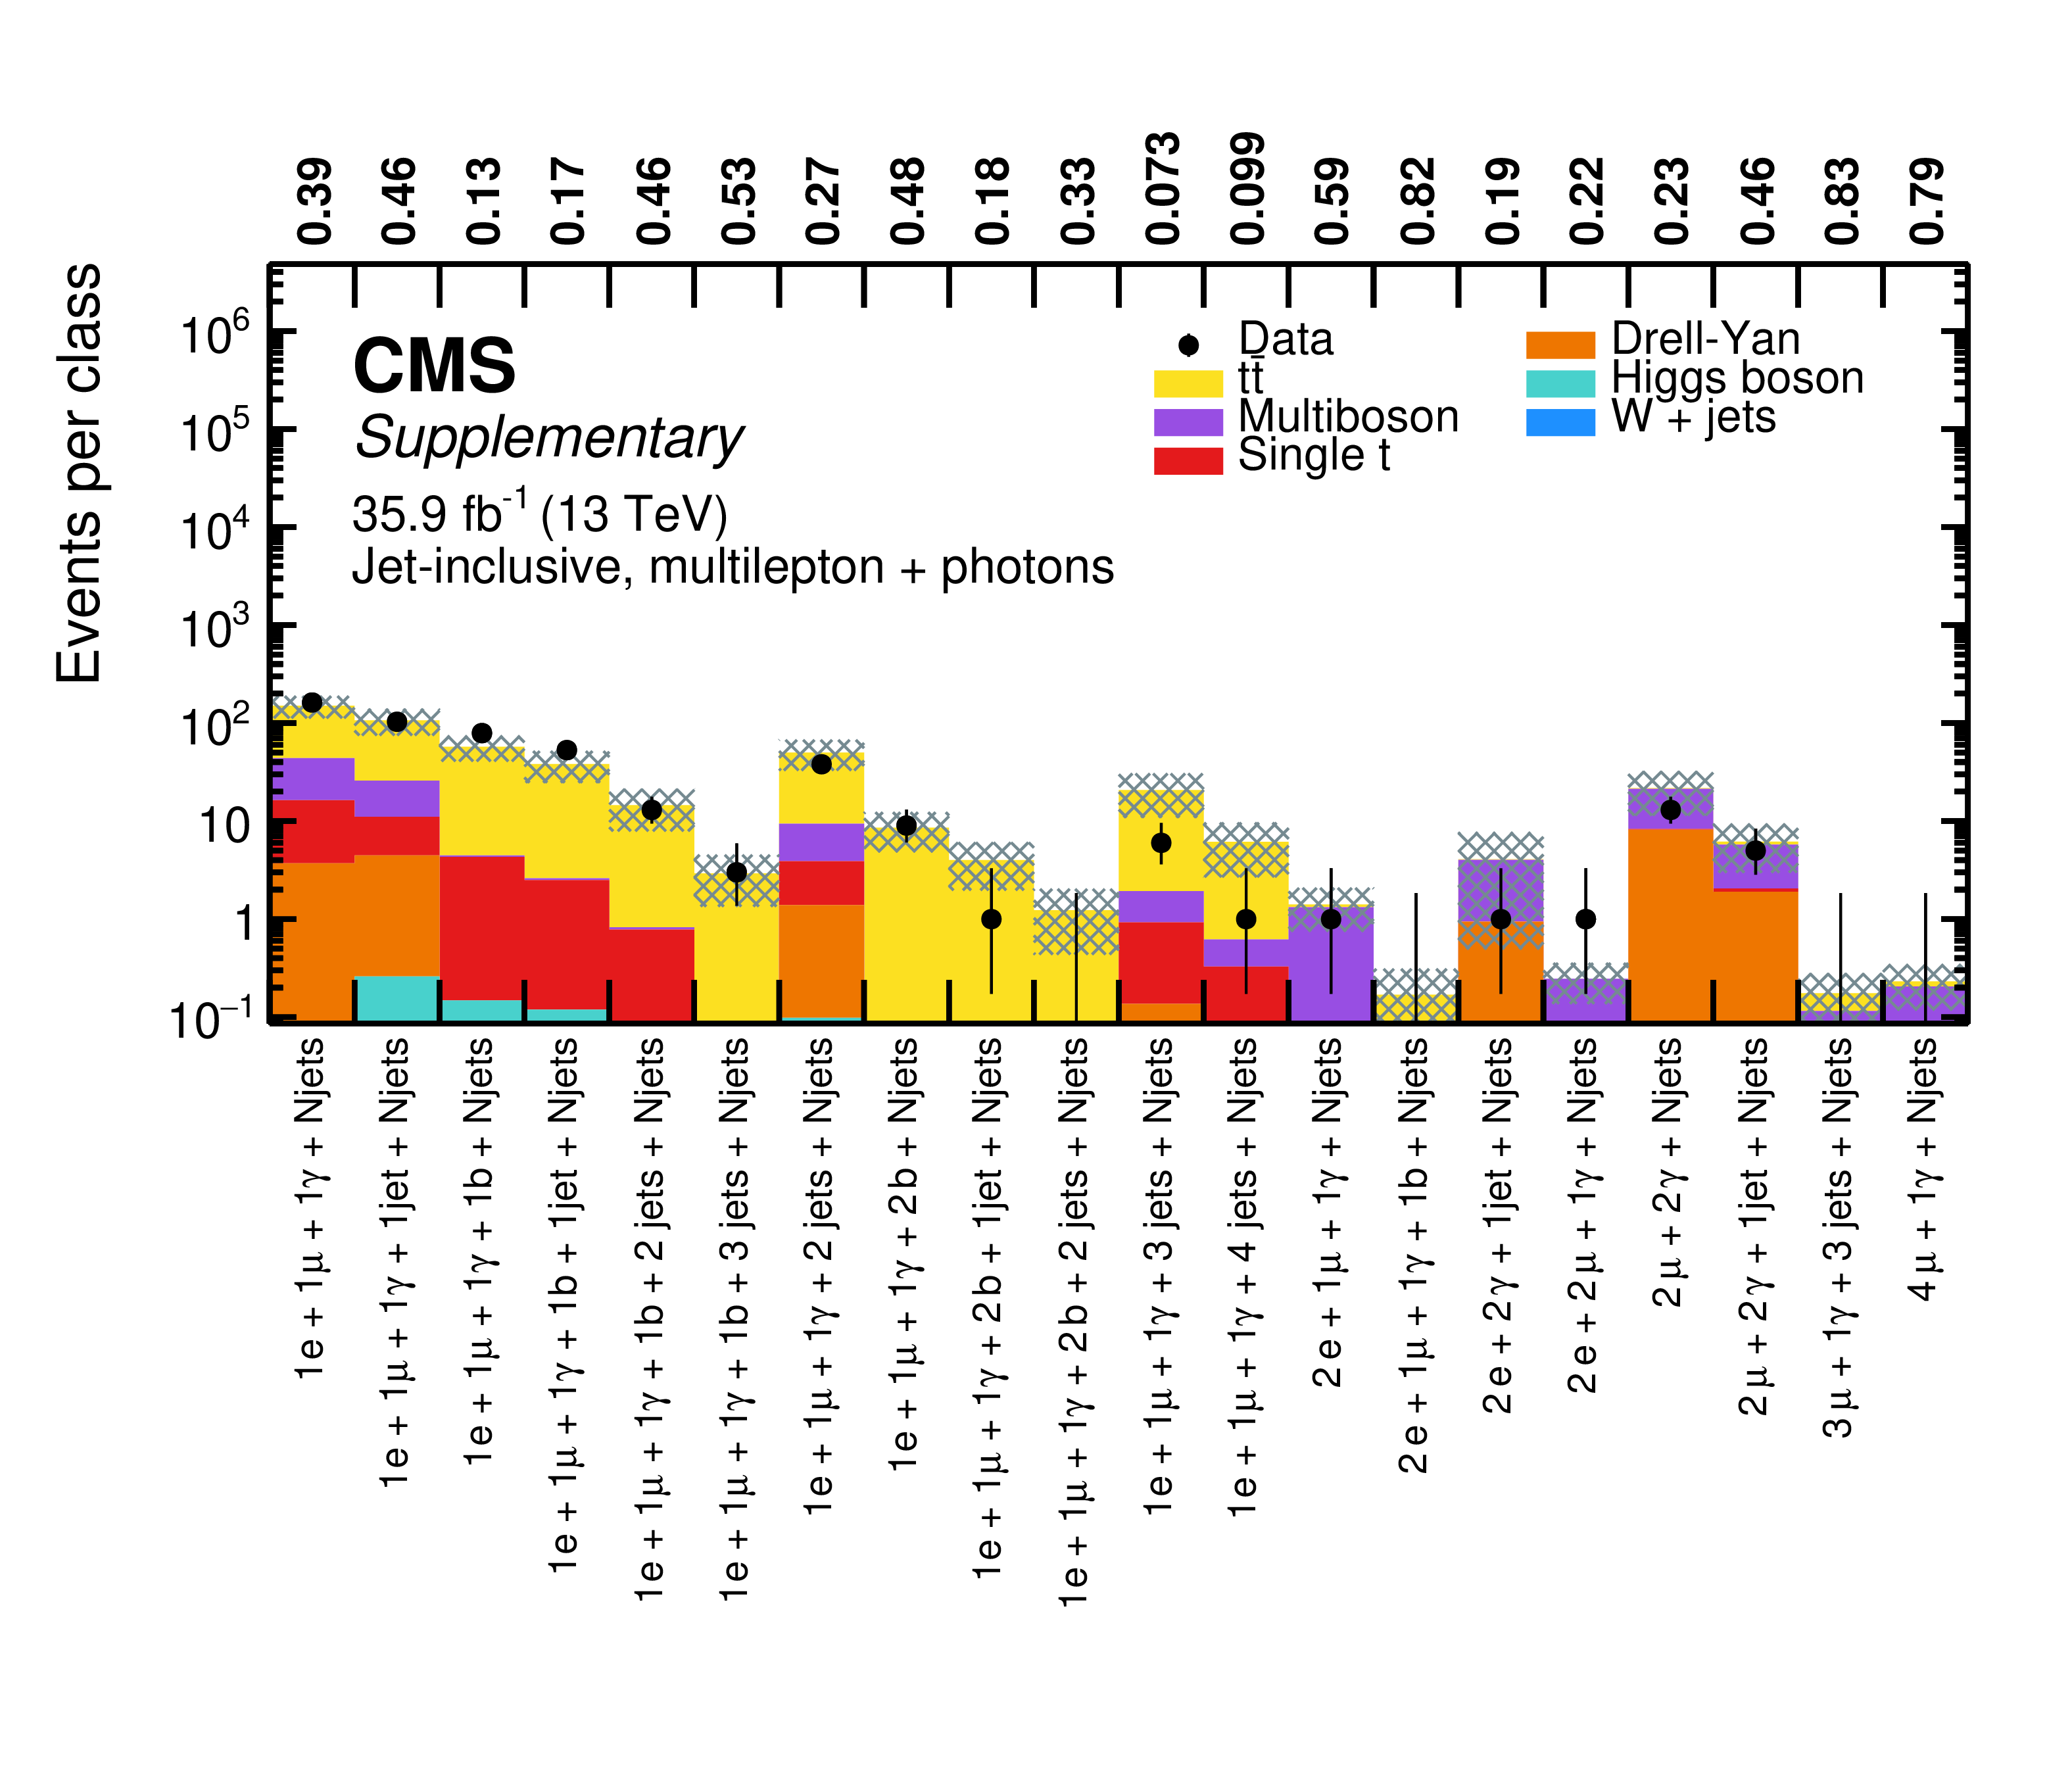
Overview of total event yields for the jet-inclusive event classes of the single-electron $+$ photons (upper) and the single-muon $+$ photons (lower) object groups. Measured data are shown as black markers, contributions from SM processes are represented by coloured histograms, and the shaded region represents the uncertainty in the SM background. The numbers above the plot indicate the observed p-value for the agreement of data and simulation. |
png pdf |
Additional Figure 15-a:
Overview of total event yields for the jet-inclusive event classes of the single-electron $+$ photons object group. Measured data are shown as black markers, contributions from SM processes are represented by coloured histograms, and the shaded region represents the uncertainty in the SM background. The numbers above the plot indicate the observed p-value for the agreement of data and simulation. |
png pdf |
Additional Figure 15-b:
Overview of total event yields for the jet-inclusive event classes of the single-muon $+$ photons object group. Measured data are shown as black markers, contributions from SM processes are represented by coloured histograms, and the shaded region represents the uncertainty in the SM background. The numbers above the plot indicate the observed p-value for the agreement of data and simulation. |
png pdf |
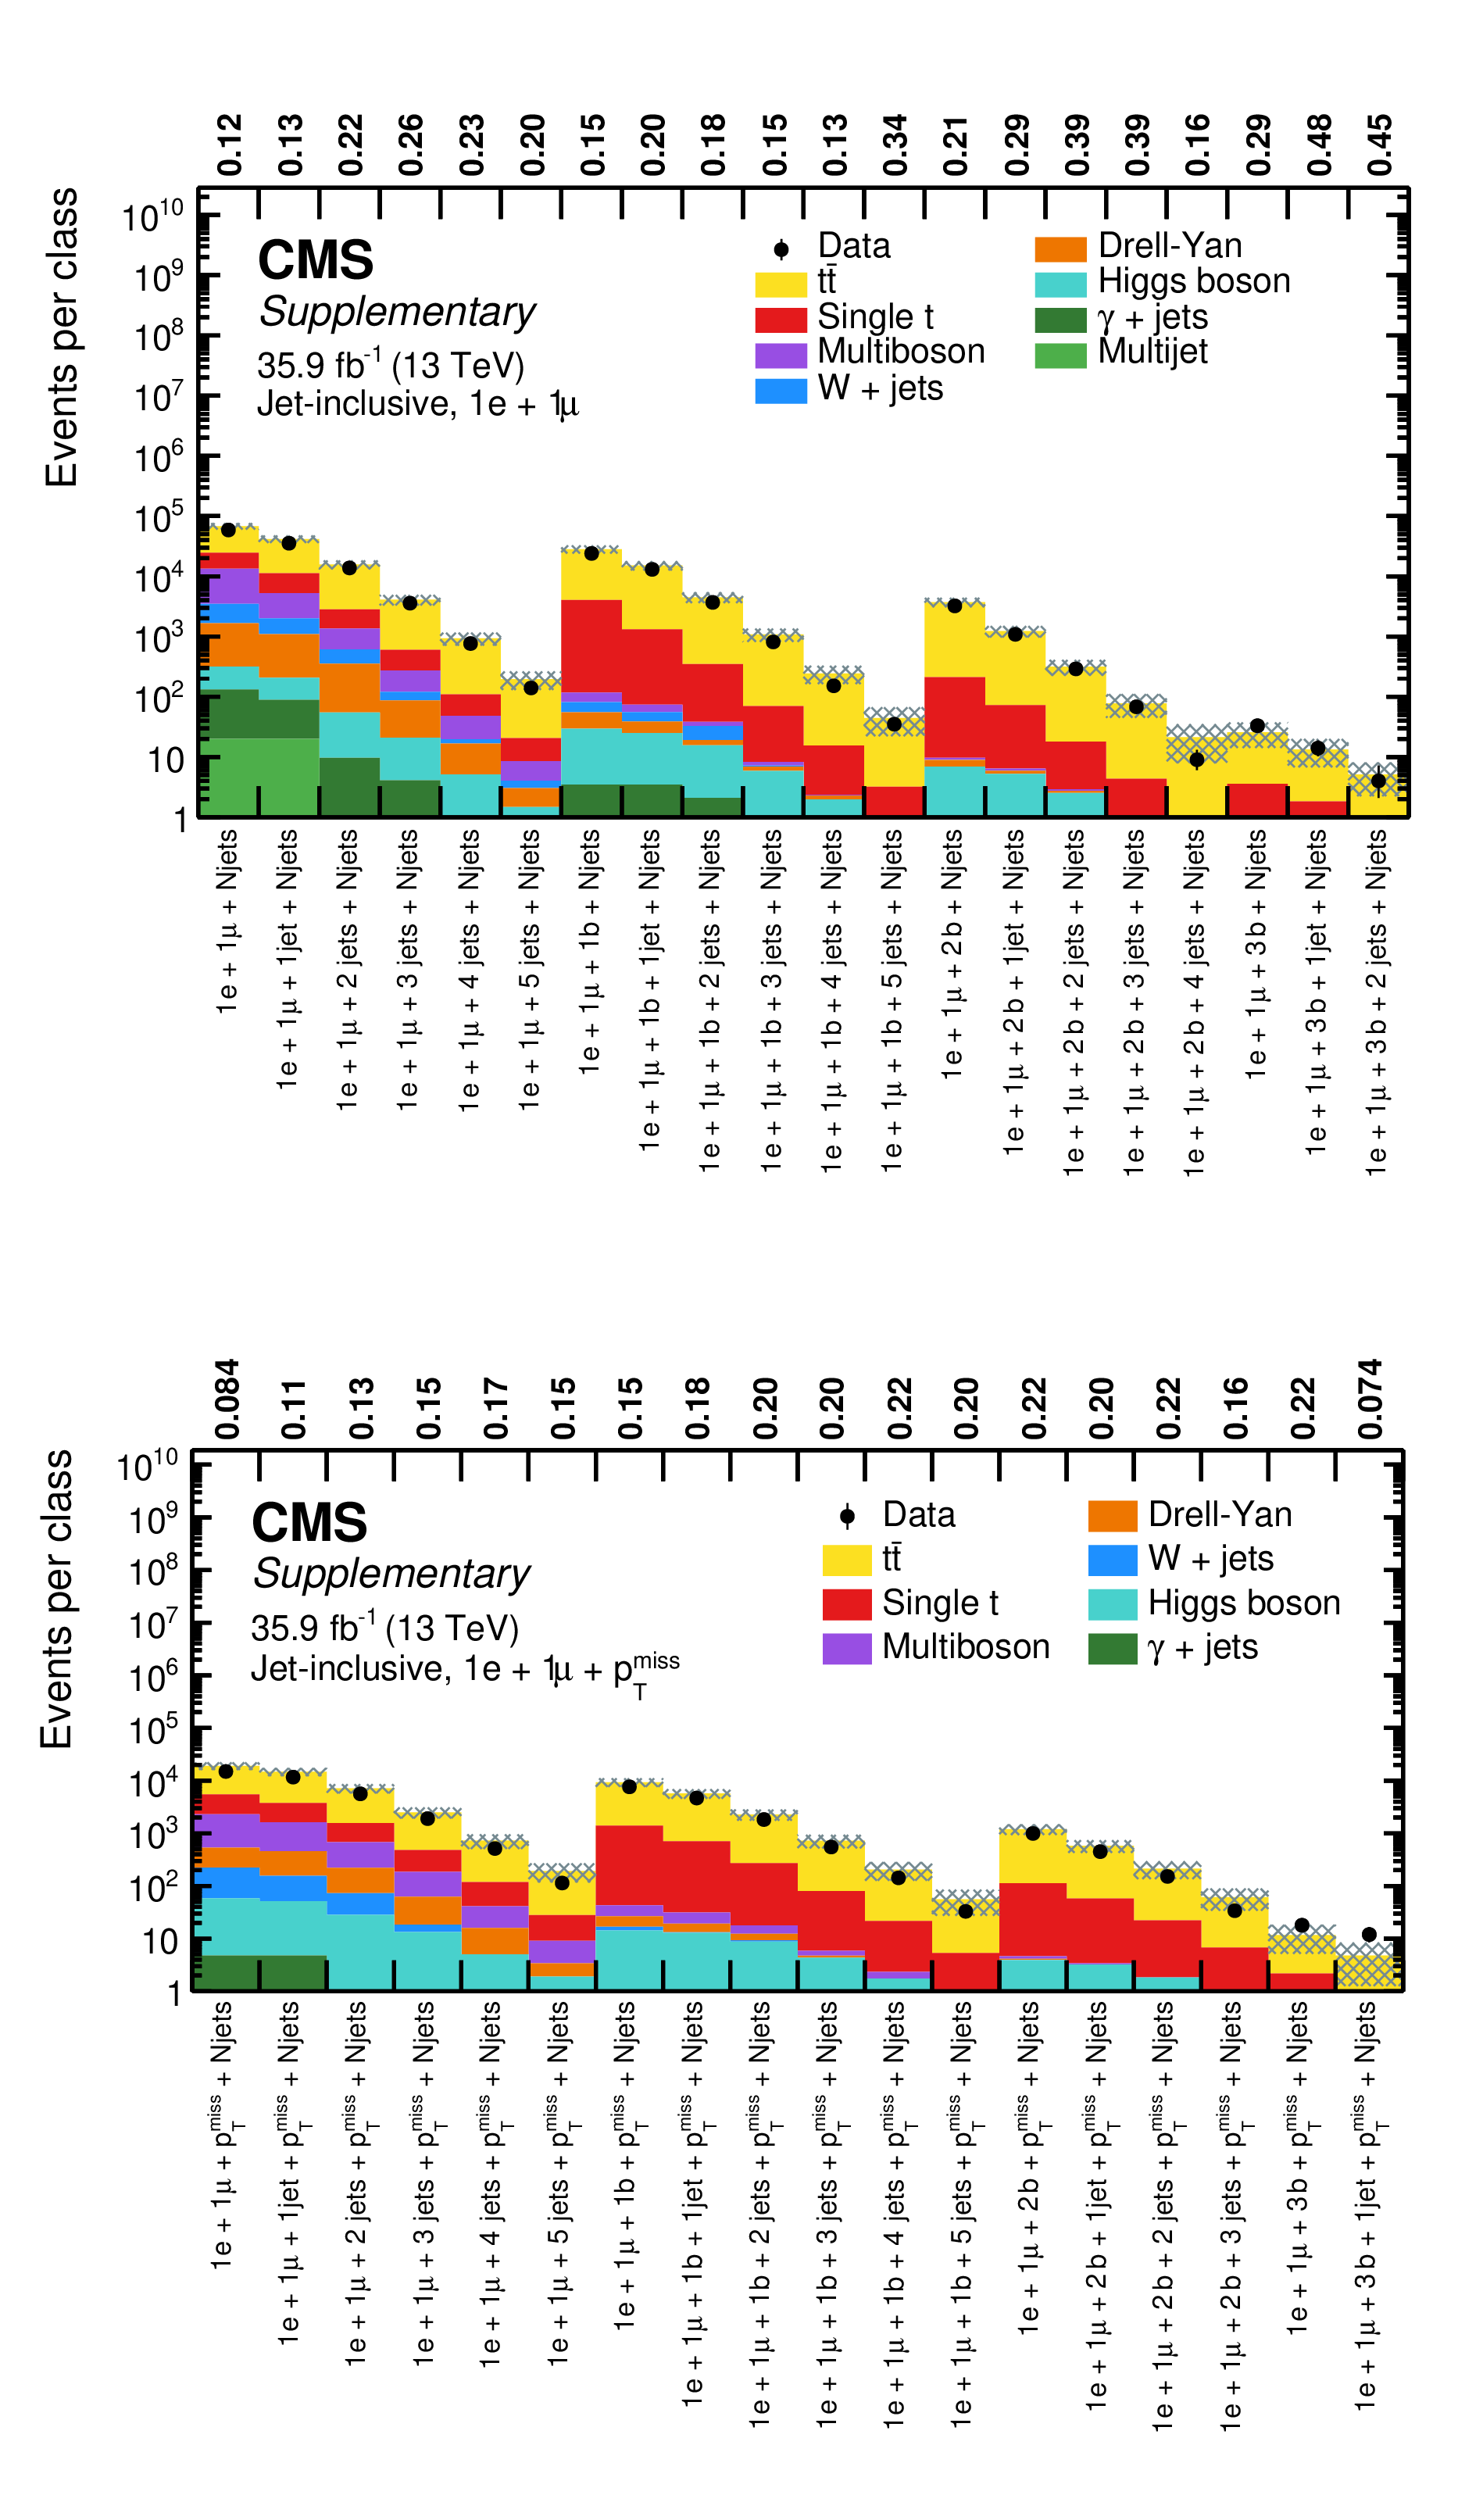
Additional Figure 16:
Overview of total event yields for the jet-inclusive event classes of the single-electron $+$ single-muon (upper) and the single-electron $+$ single-muon $+$ ${{p_{\mathrm {T}}} ^\text {miss}}$ (lower) object groups. Measured data are shown as black markers, contributions from SM processes are represented by coloured histograms, and the shaded region represents the uncertainty in the SM background. The numbers above the plot indicate the observed p-value for the agreement of data and simulation. |
png pdf |
Additional Figure 16-a:
Overview of total event yields for the jet-inclusive event classes of the single-electron $+$ single-muon object group. Measured data are shown as black markers, contributions from SM processes are represented by coloured histograms, and the shaded region represents the uncertainty in the SM background. The numbers above the plot indicate the observed p-value for the agreement of data and simulation. |
png pdf |
Additional Figure 16-b:
Overview of total event yields for the jet-inclusive event classes of the single-electron $+$ single-muon $+$ ${{p_{\mathrm {T}}} ^\text {miss}}$ object group. Measured data are shown as black markers, contributions from SM processes are represented by coloured histograms, and the shaded region represents the uncertainty in the SM background. The numbers above the plot indicate the observed p-value for the agreement of data and simulation. |
png pdf |
Additional Figure 17:
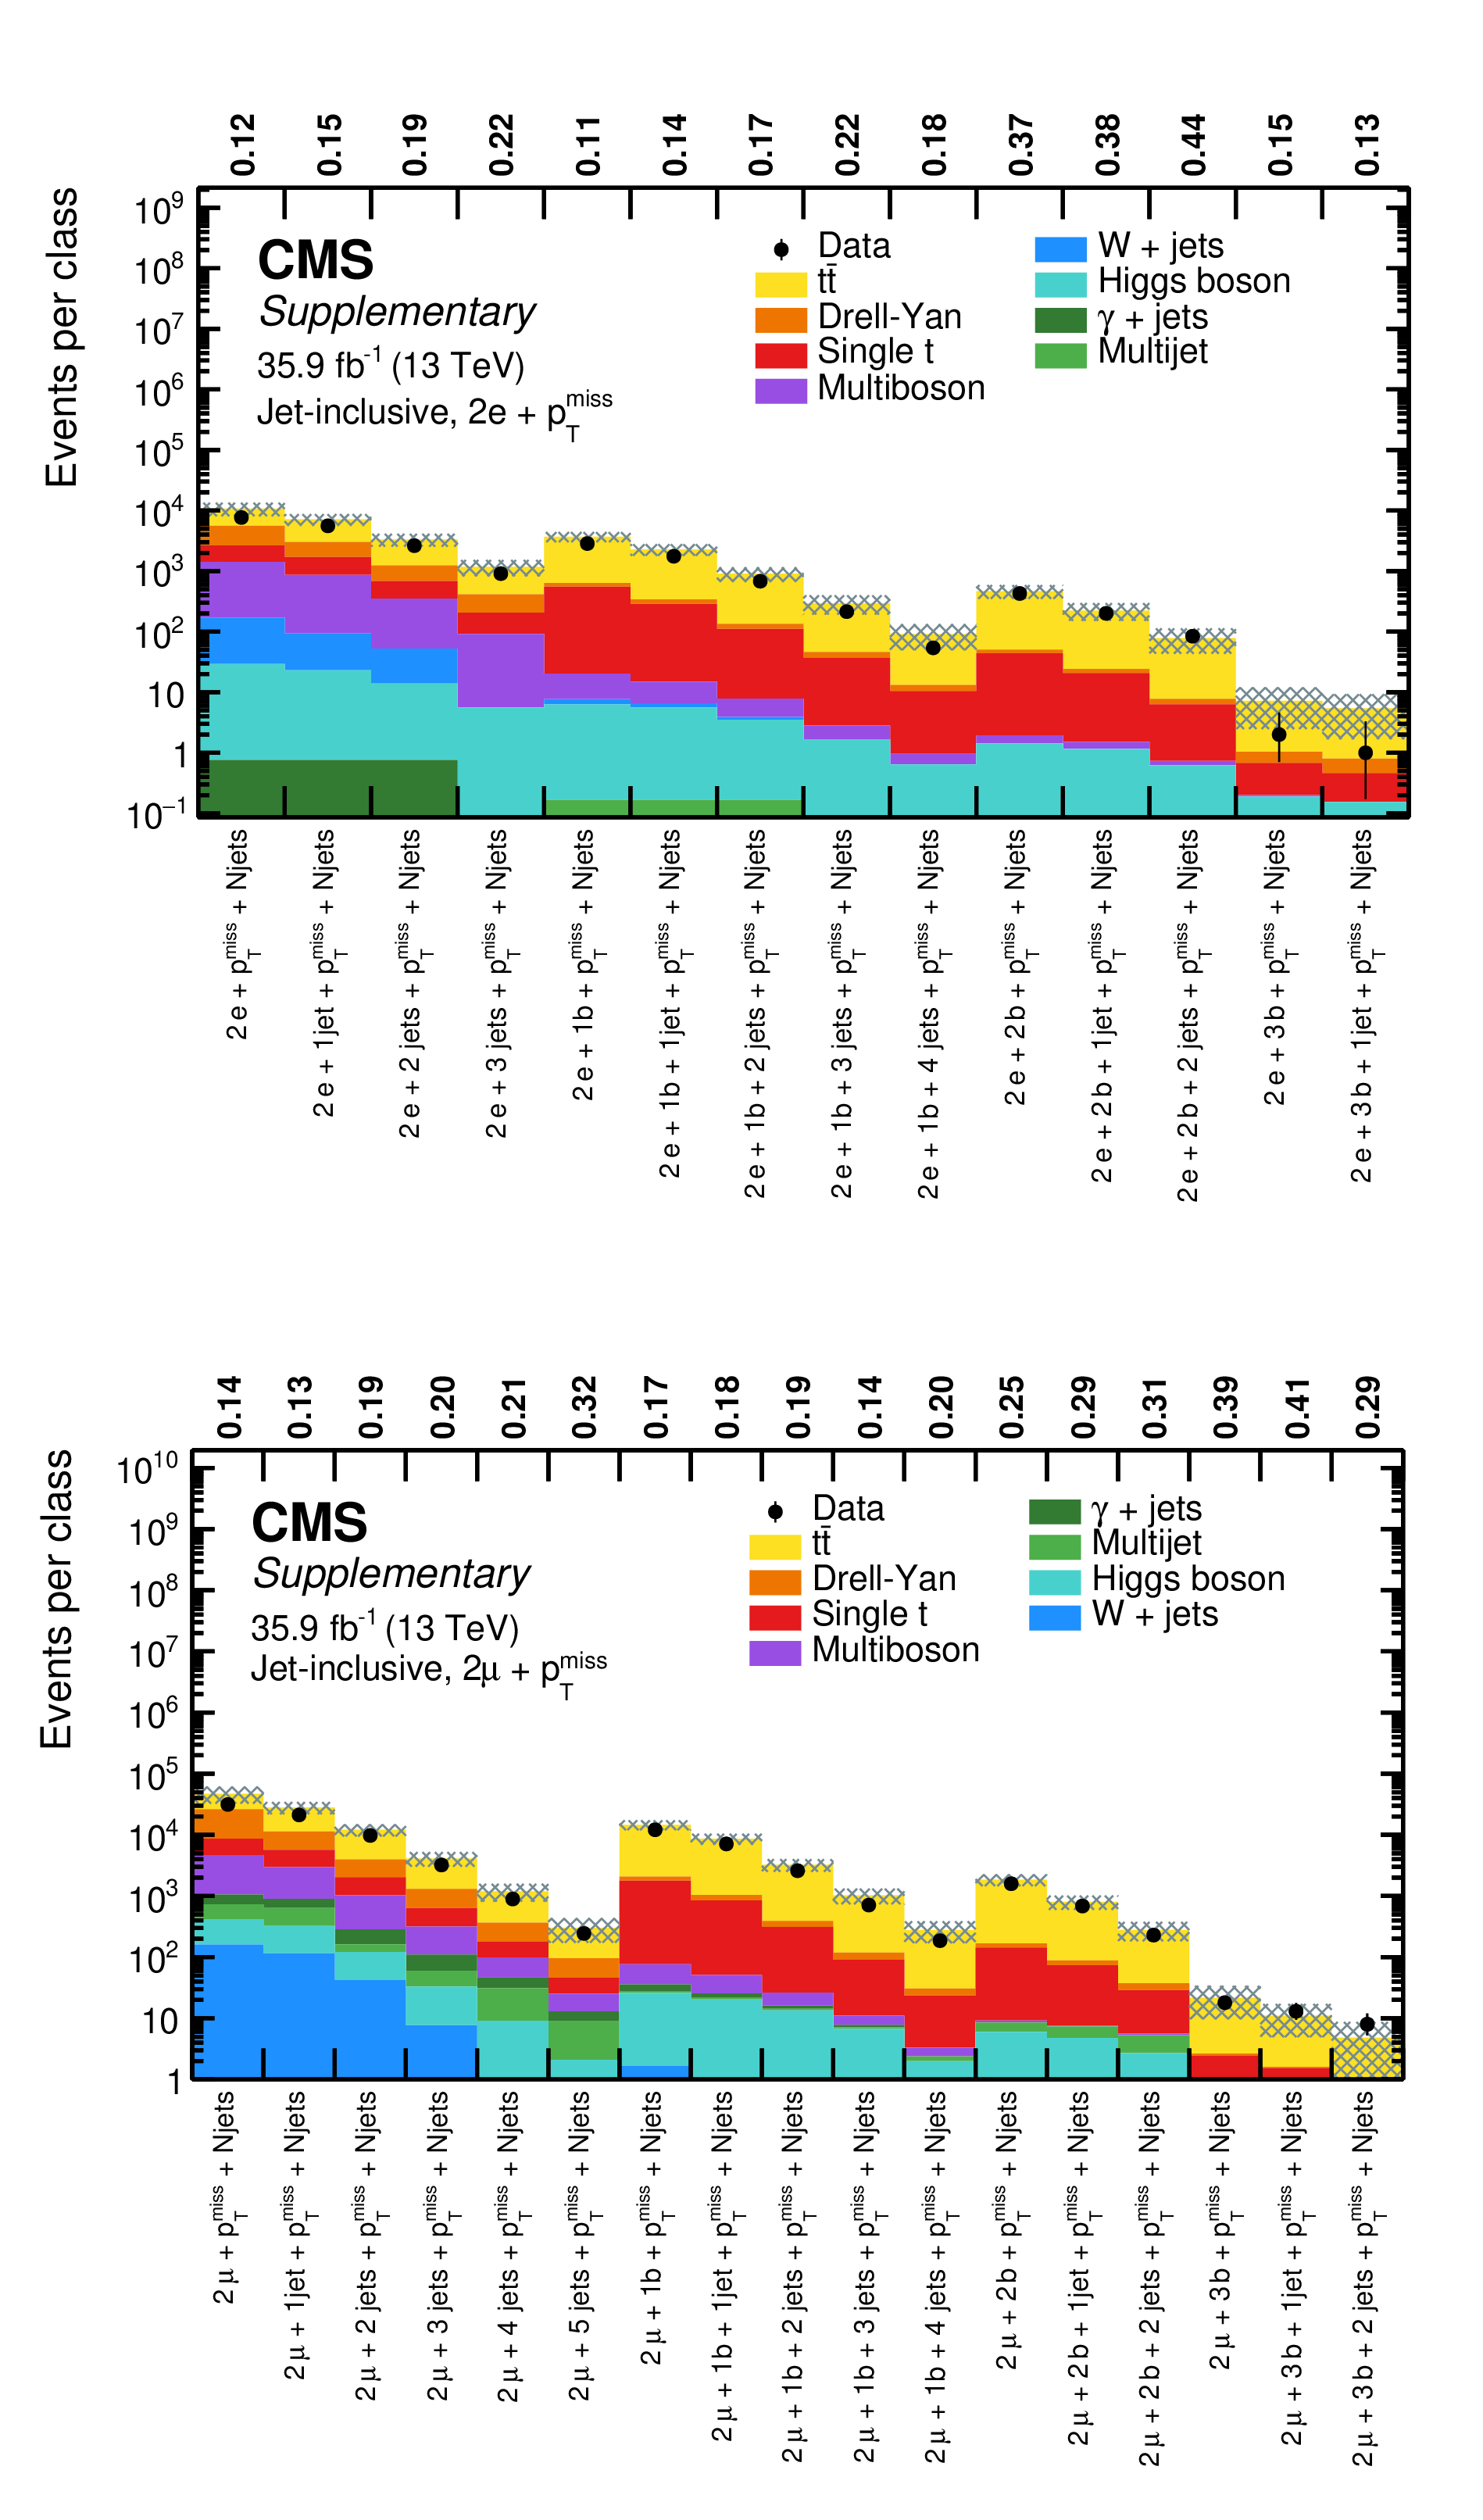
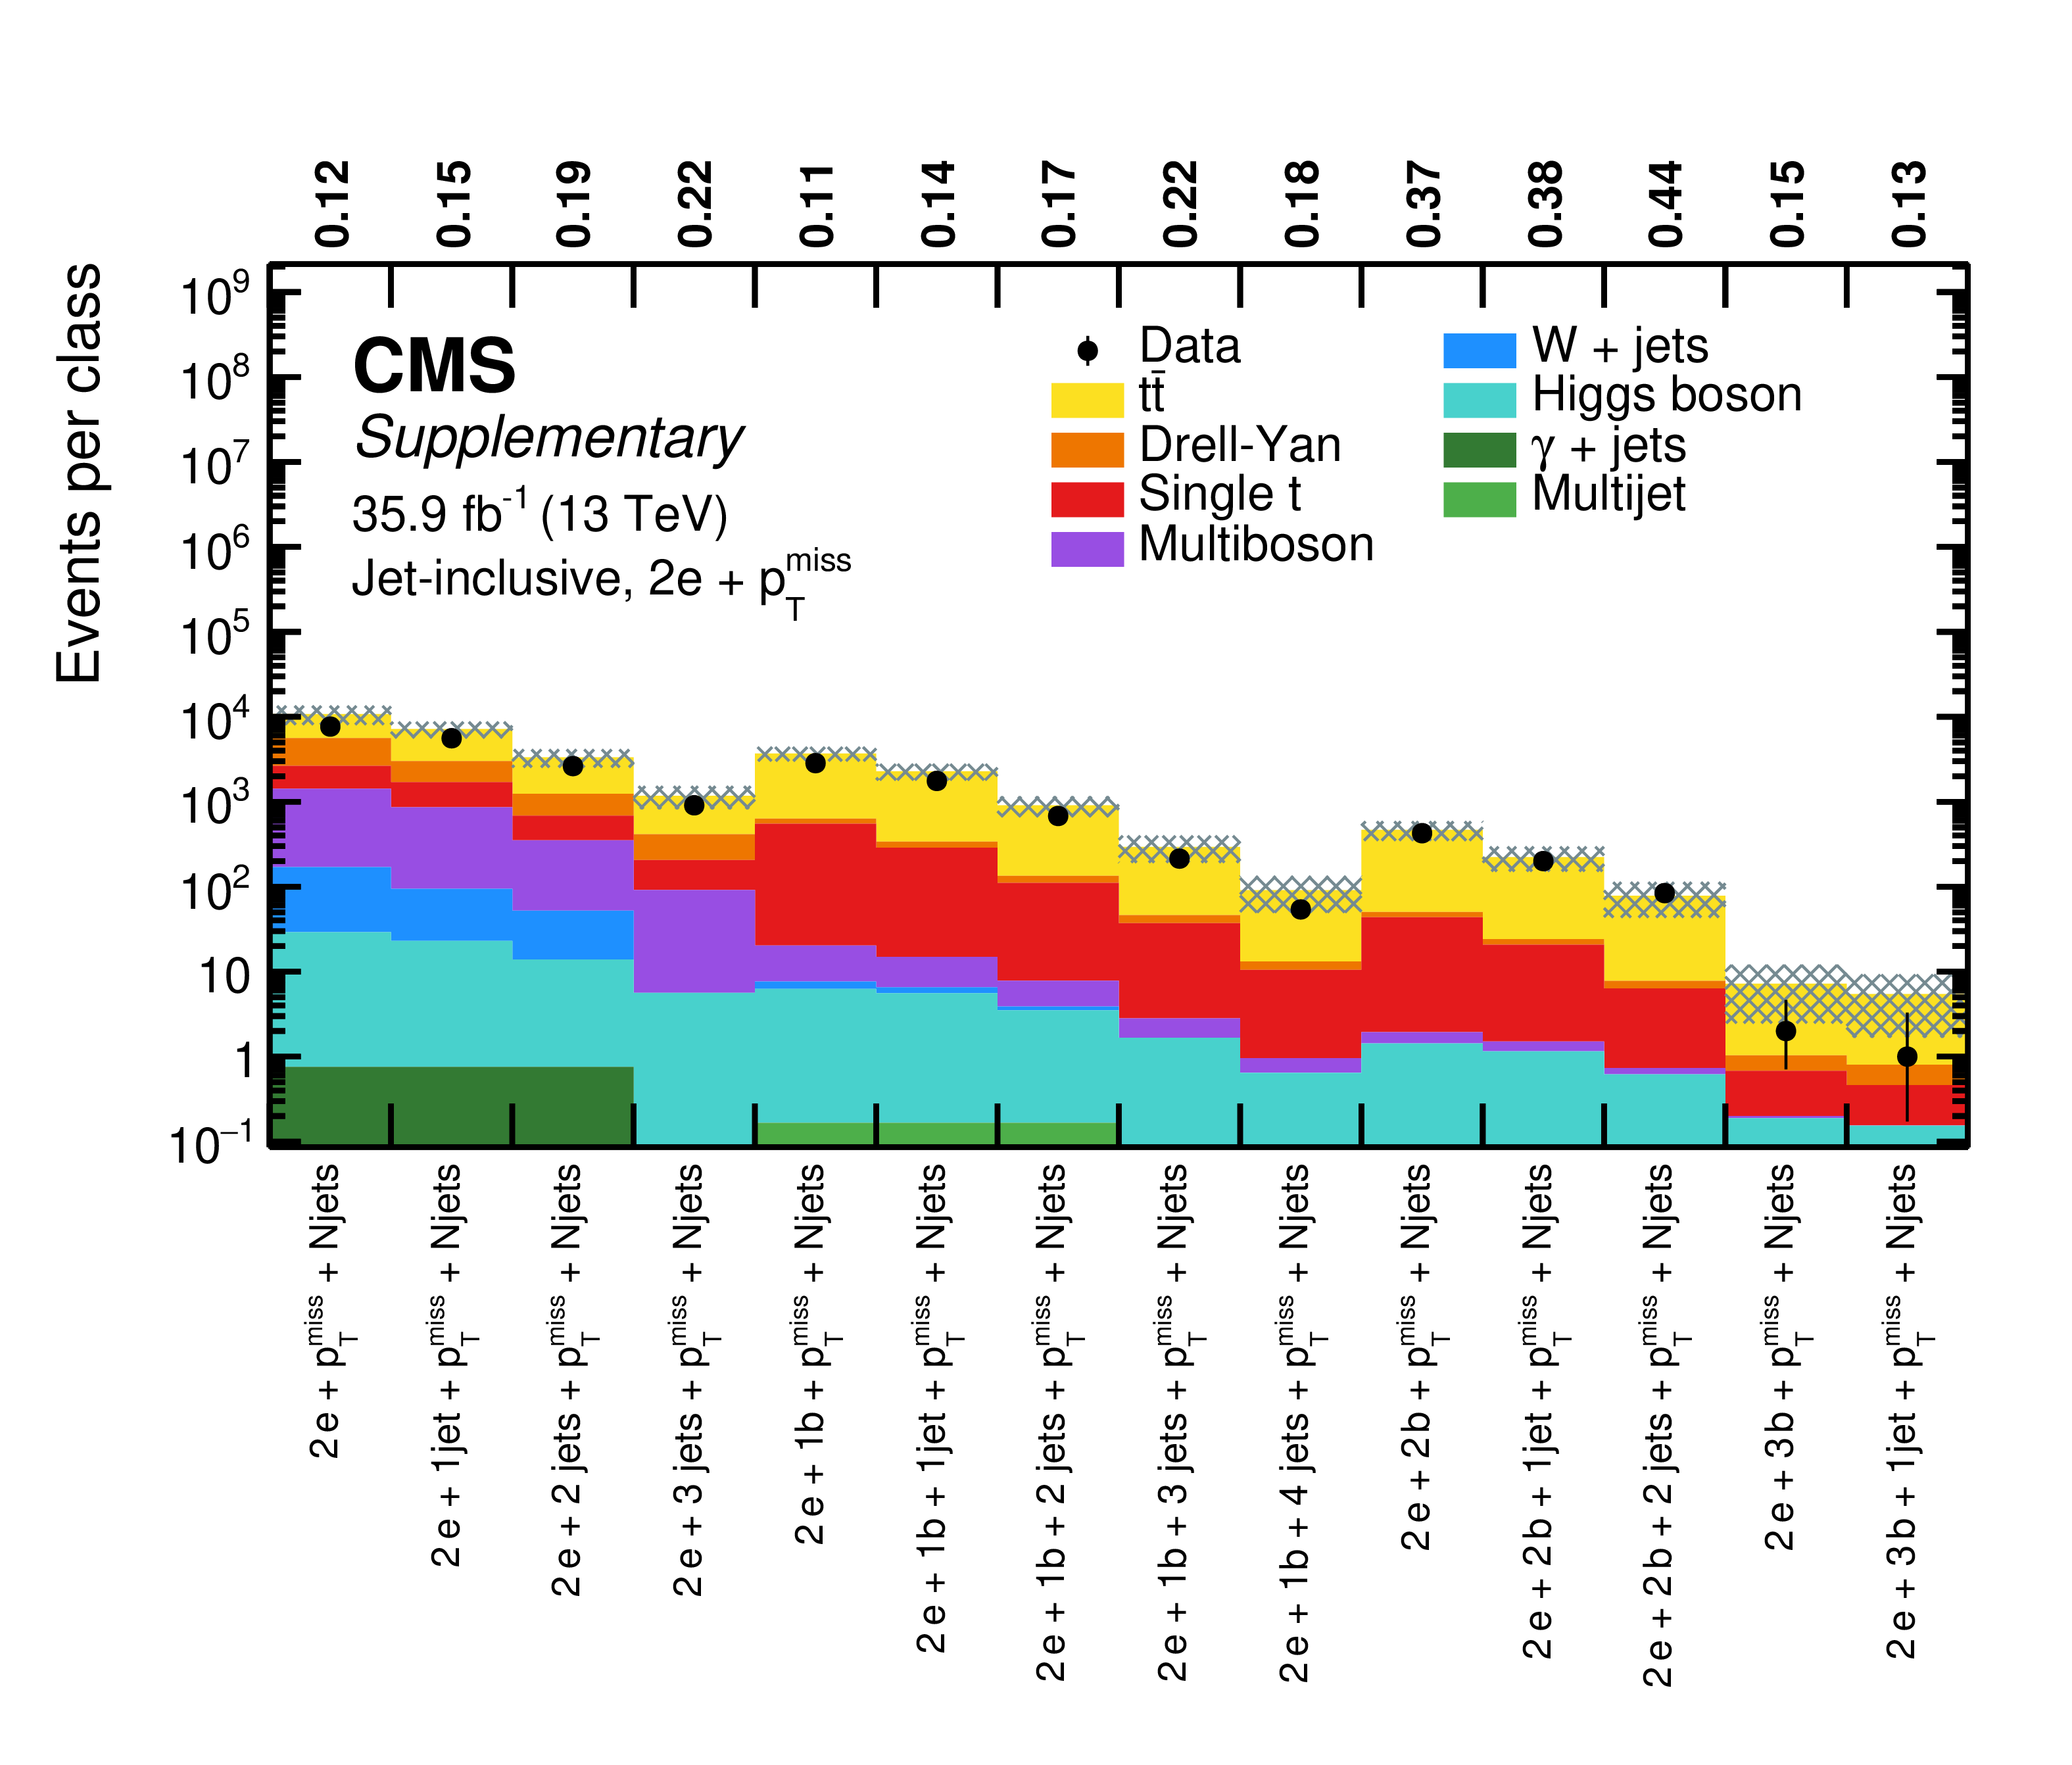
Overview of total event yields for the jet-inclusive event classes of the double-electron $+$ ${{p_{\mathrm {T}}} ^\text {miss}}$ (upper) and the double-muon $+$ ${{p_{\mathrm {T}}} ^\text {miss}}$ (lower) object groups. Measured data are shown as black markers, contributions from SM processes are represented by coloured histograms, and the shaded region represents the uncertainty in the SM background. The numbers above the plot indicate the observed p-value for the agreement of data and simulation. |
png pdf |
Additional Figure 17-a:
Overview of total event yields for the jet-inclusive event classes of the double-electron $+$ ${{p_{\mathrm {T}}} ^\text {miss}}$ object group. Measured data are shown as black markers, contributions from SM processes are represented by coloured histograms, and the shaded region represents the uncertainty in the SM background. The numbers above the plot indicate the observed p-value for the agreement of data and simulation. |
png pdf |
Additional Figure 17-b:
Overview of total event yields for the jet-inclusive event classes of the double-muon $+$ ${{p_{\mathrm {T}}} ^\text {miss}}$ object group. Measured data are shown as black markers, contributions from SM processes are represented by coloured histograms, and the shaded region represents the uncertainty in the SM background. The numbers above the plot indicate the observed p-value for the agreement of data and simulation. |
png pdf |
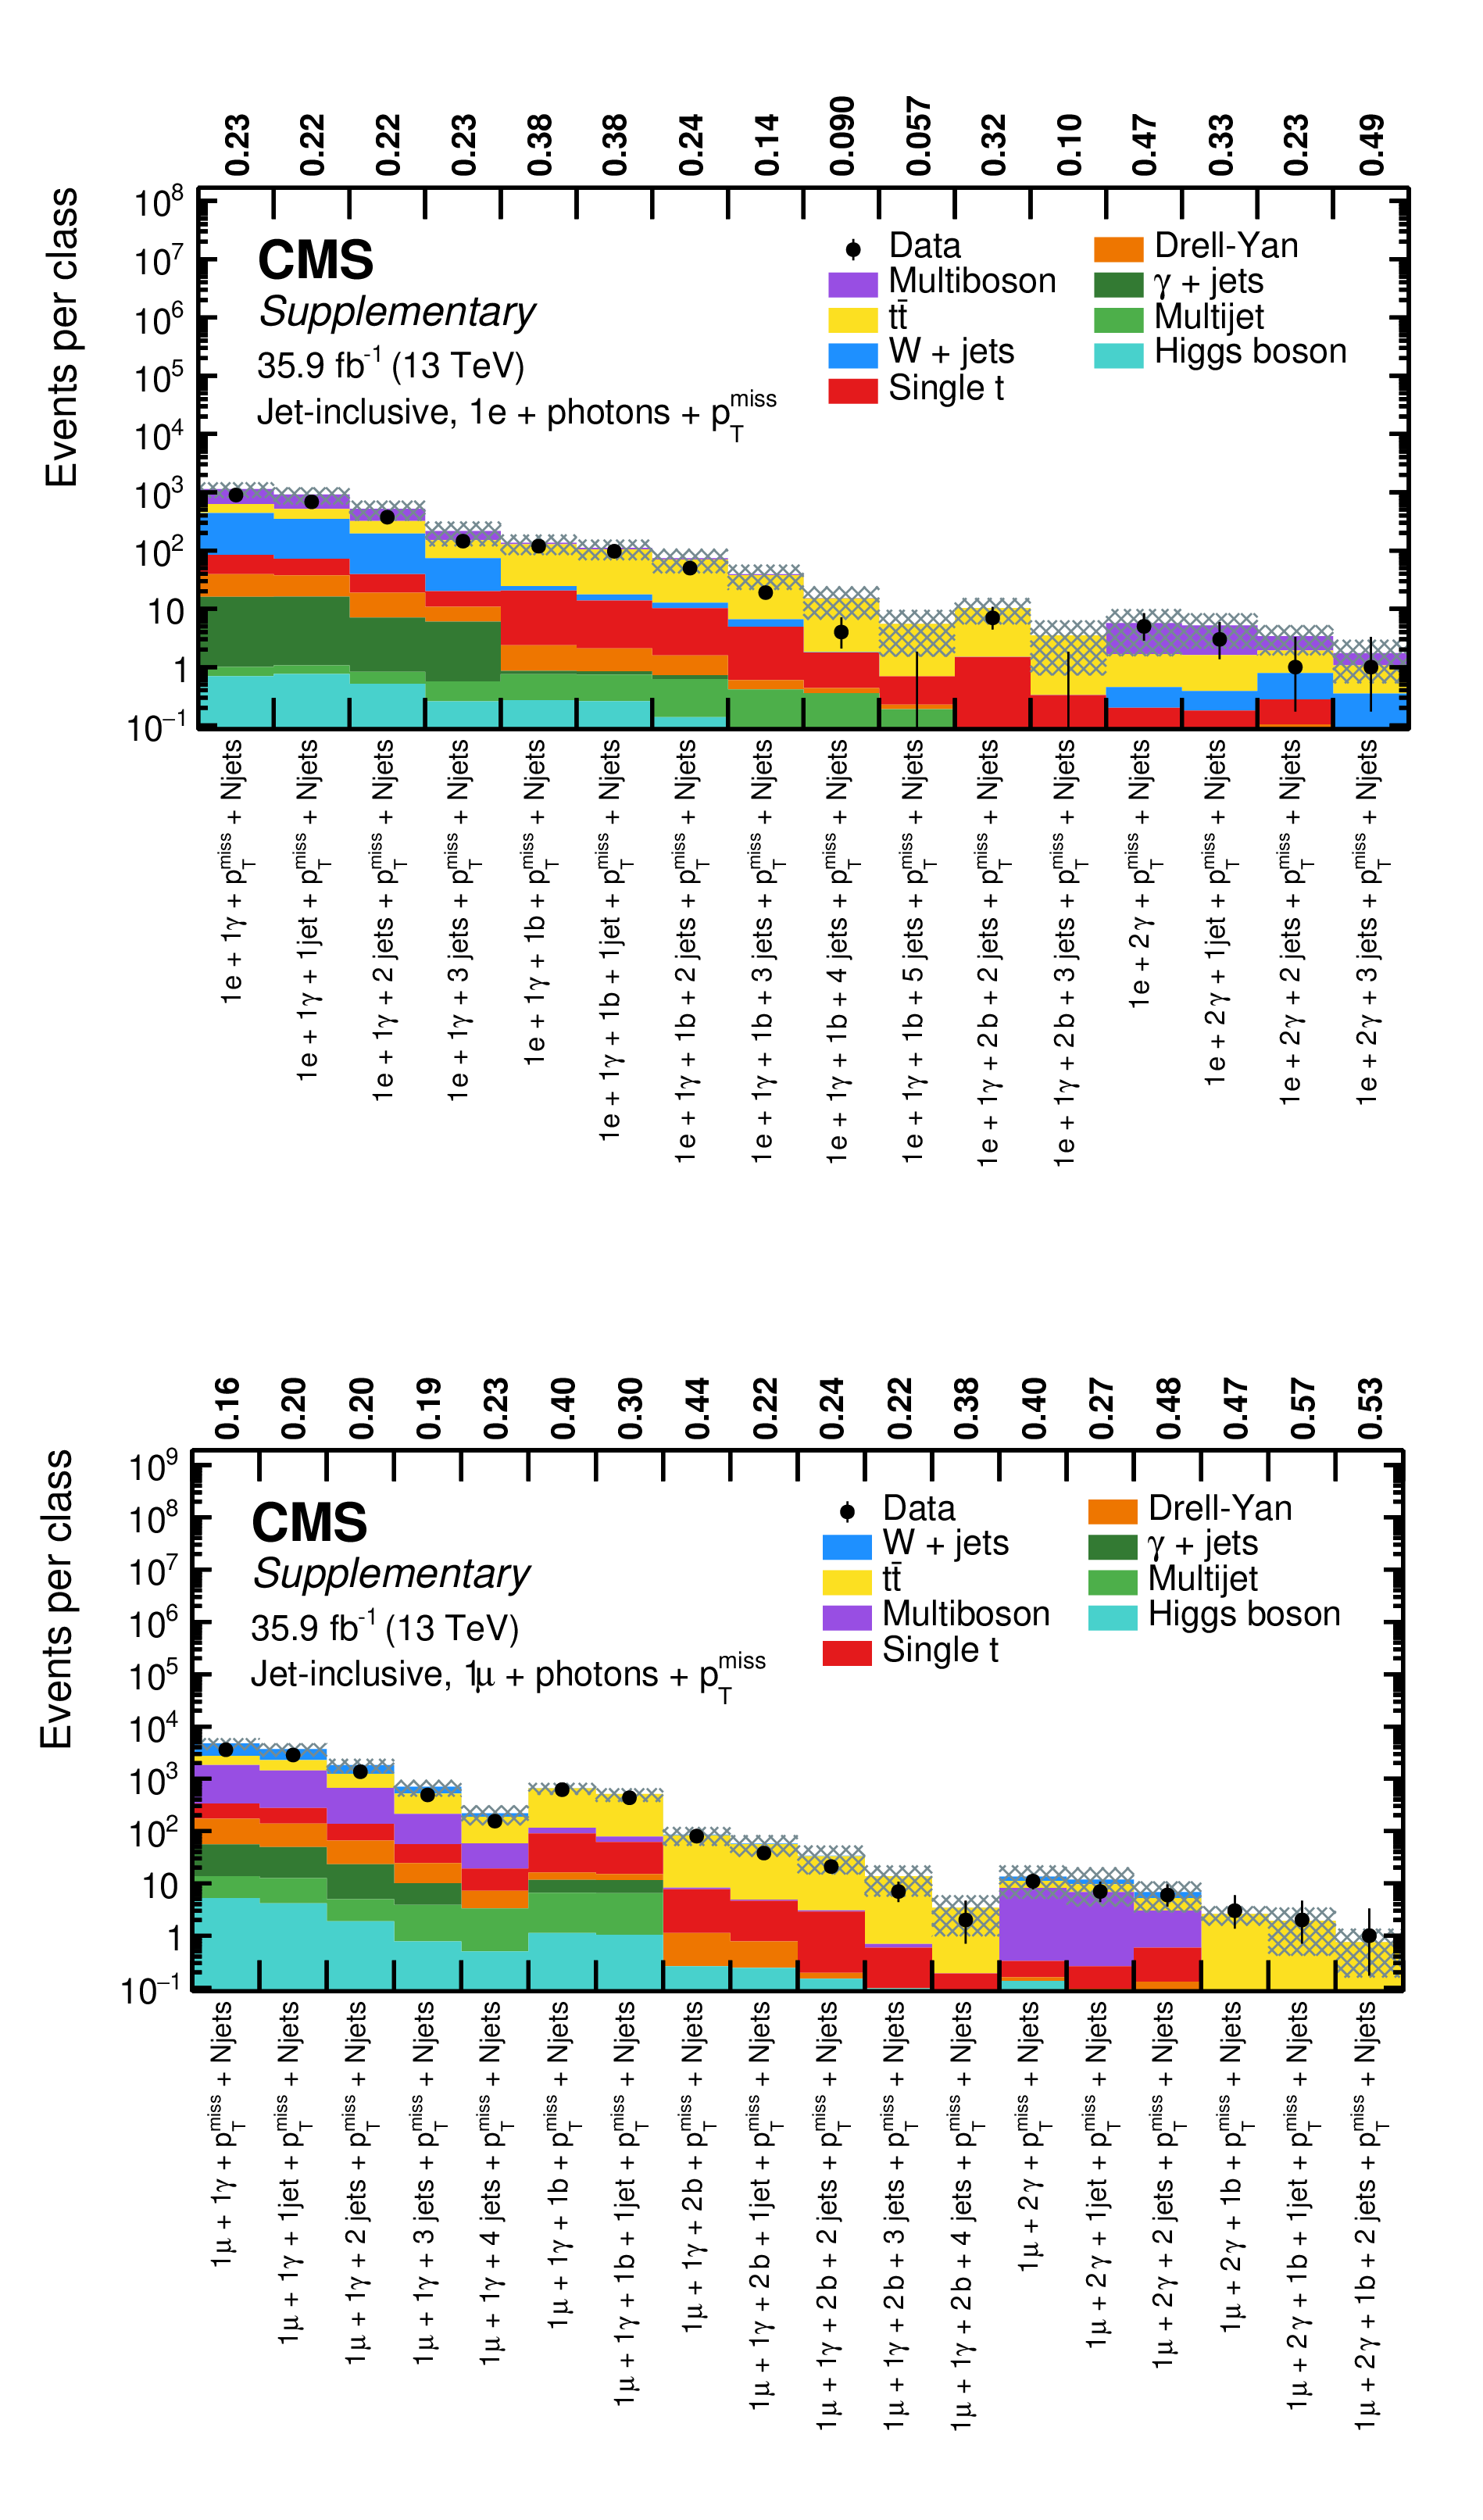
Additional Figure 18:
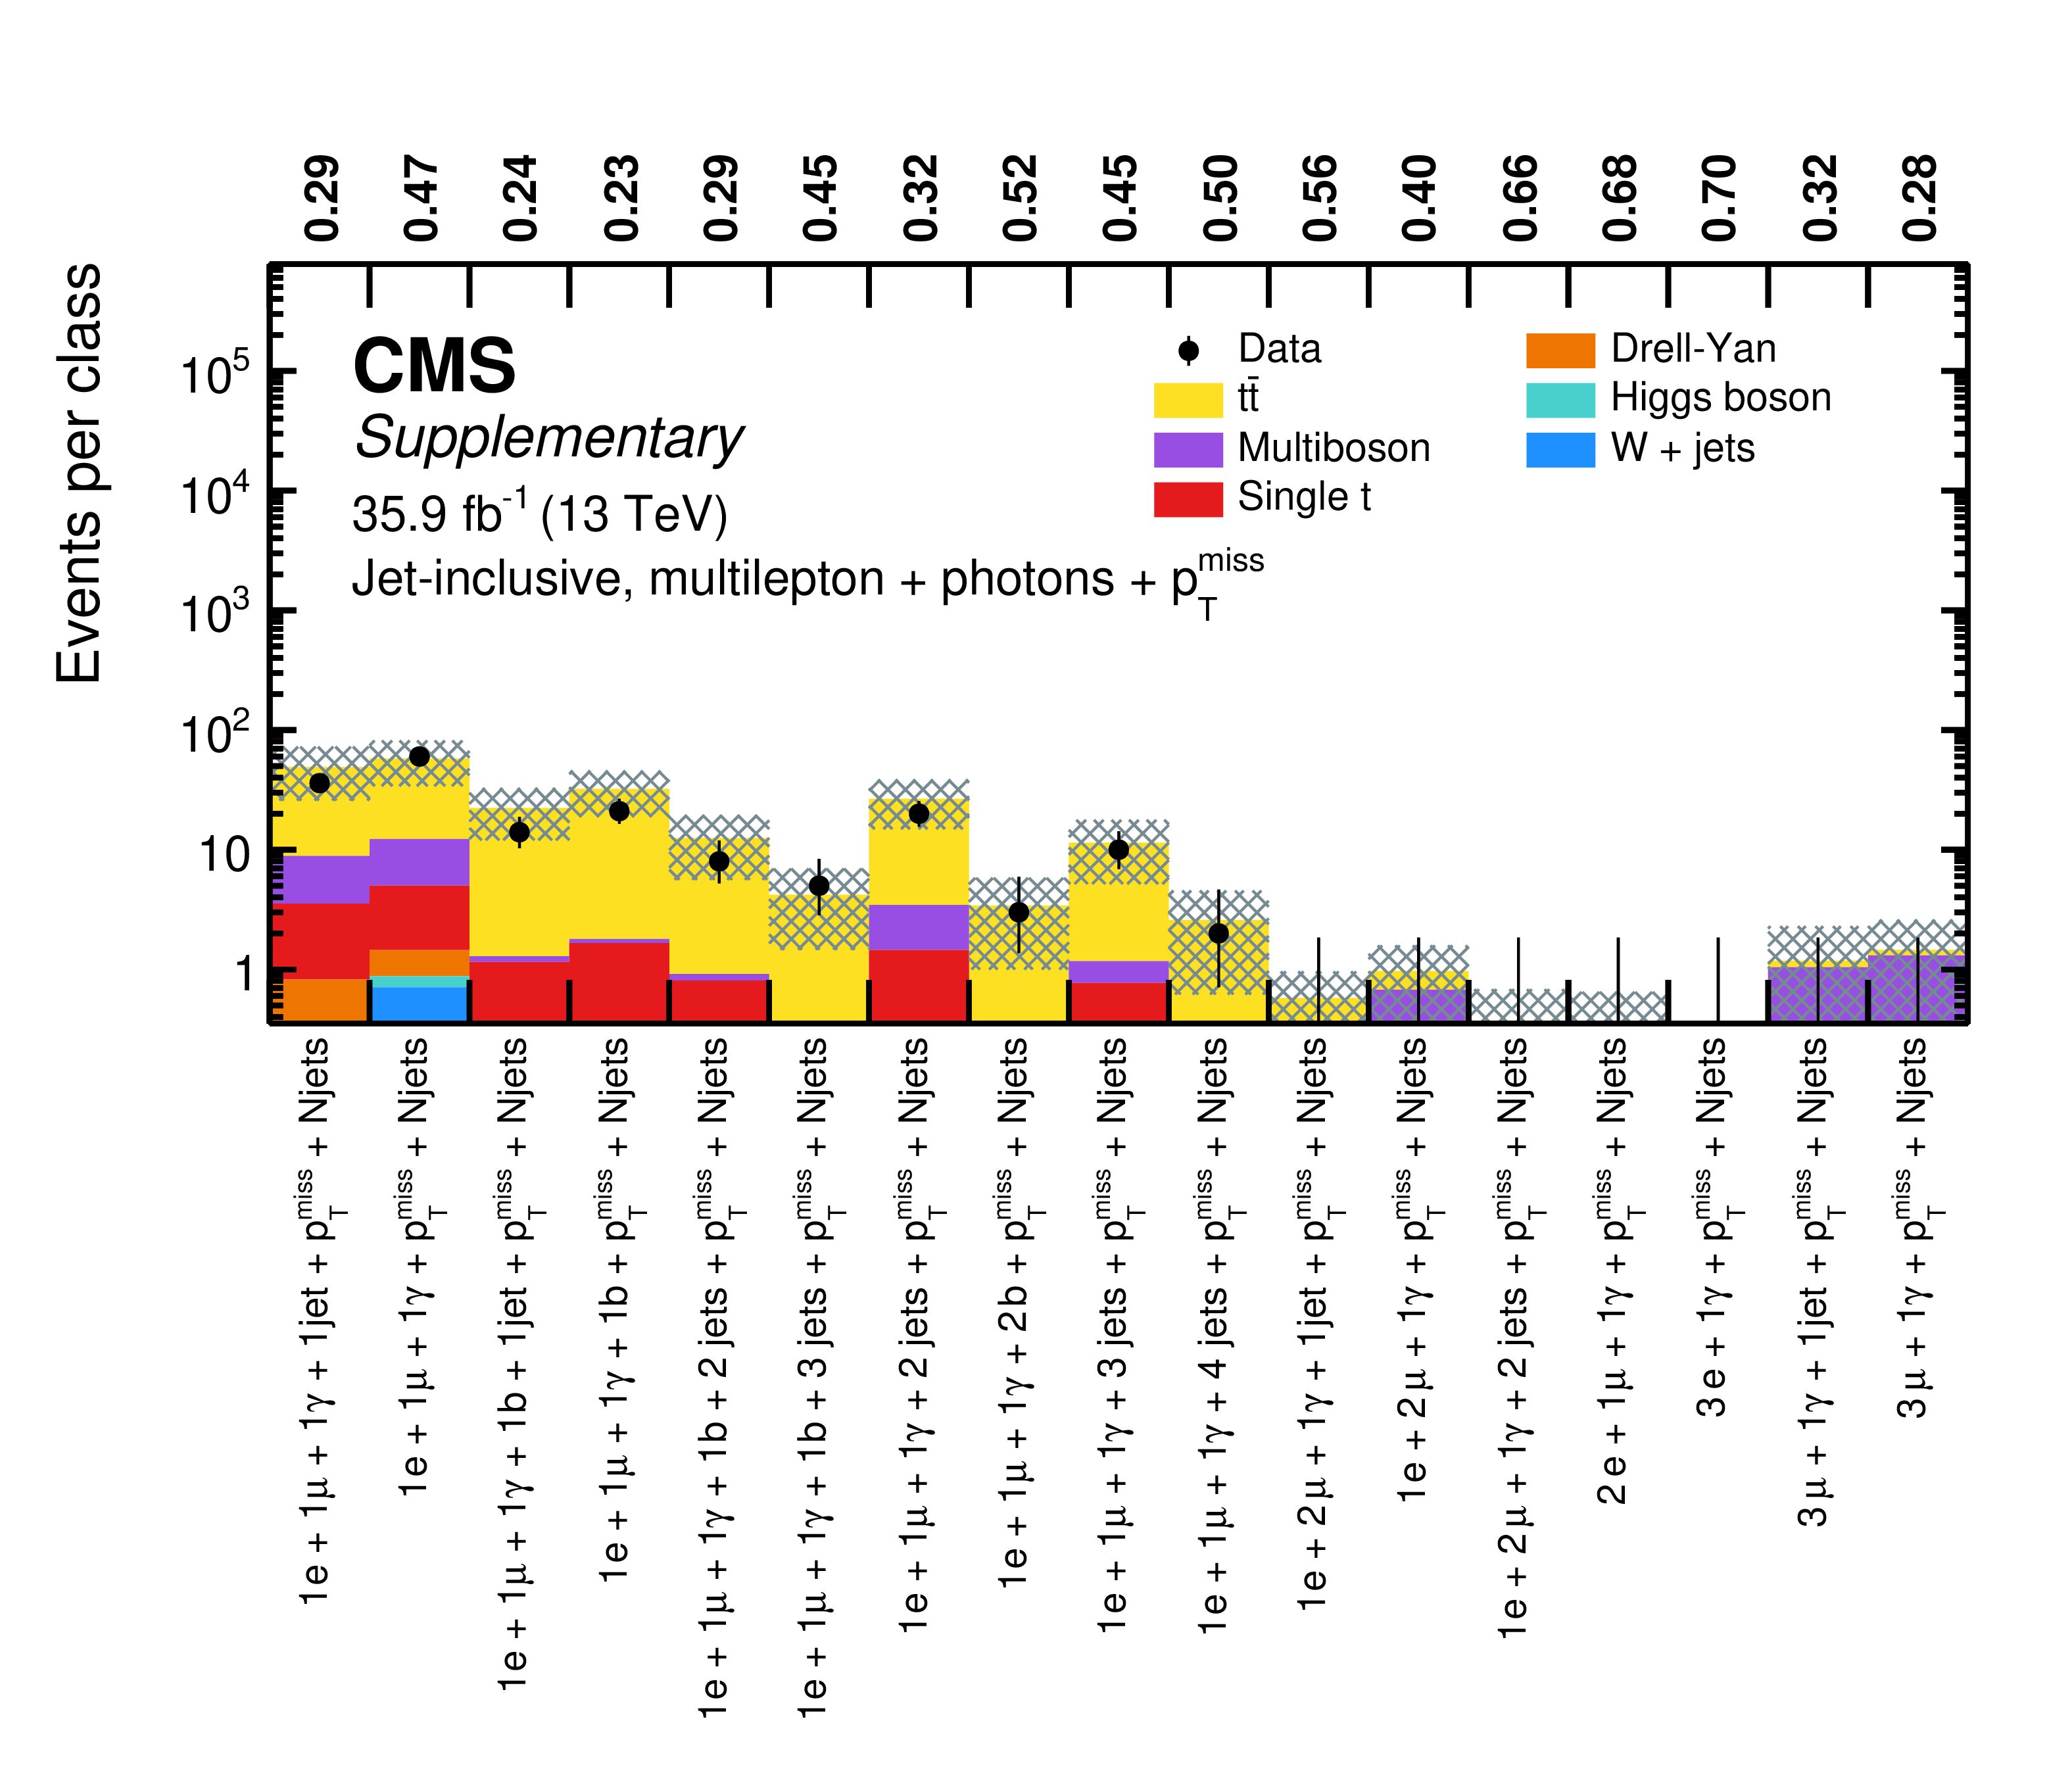
Overview of total event yields for the jet-inclusive event classes of the single-electron $+$ photons $+$ ${{p_{\mathrm {T}}} ^\text {miss}}$ (upper) and the single-muon $+$ photons $+$ ${{p_{\mathrm {T}}} ^\text {miss}}$ (lower) object groups. Measured data are shown as black markers, contributions from SM processes are represented by coloured histograms, and the shaded region represents the uncertainty in the SM background. The numbers above the plot indicate the observed p-value for the agreement of data and simulation. |

png pdf |
Additional Figure 18-a:
Overview of total event yields for the jet-inclusive event classes of the single-electron $+$ photons $+$ ${{p_{\mathrm {T}}} ^\text {miss}}$ object group. Measured data are shown as black markers, contributions from SM processes are represented by coloured histograms, and the shaded region represents the uncertainty in the SM background. The numbers above the plot indicate the observed p-value for the agreement of data and simulation. |

png pdf |
Additional Figure 18-b:
Overview of total event yields for the jet-inclusive event classes of the single-muon $+$ photons $+$ ${{p_{\mathrm {T}}} ^\text {miss}}$ object group. Measured data are shown as black markers, contributions from SM processes are represented by coloured histograms, and the shaded region represents the uncertainty in the SM background. The numbers above the plot indicate the observed p-value for the agreement of data and simulation. |
png pdf |
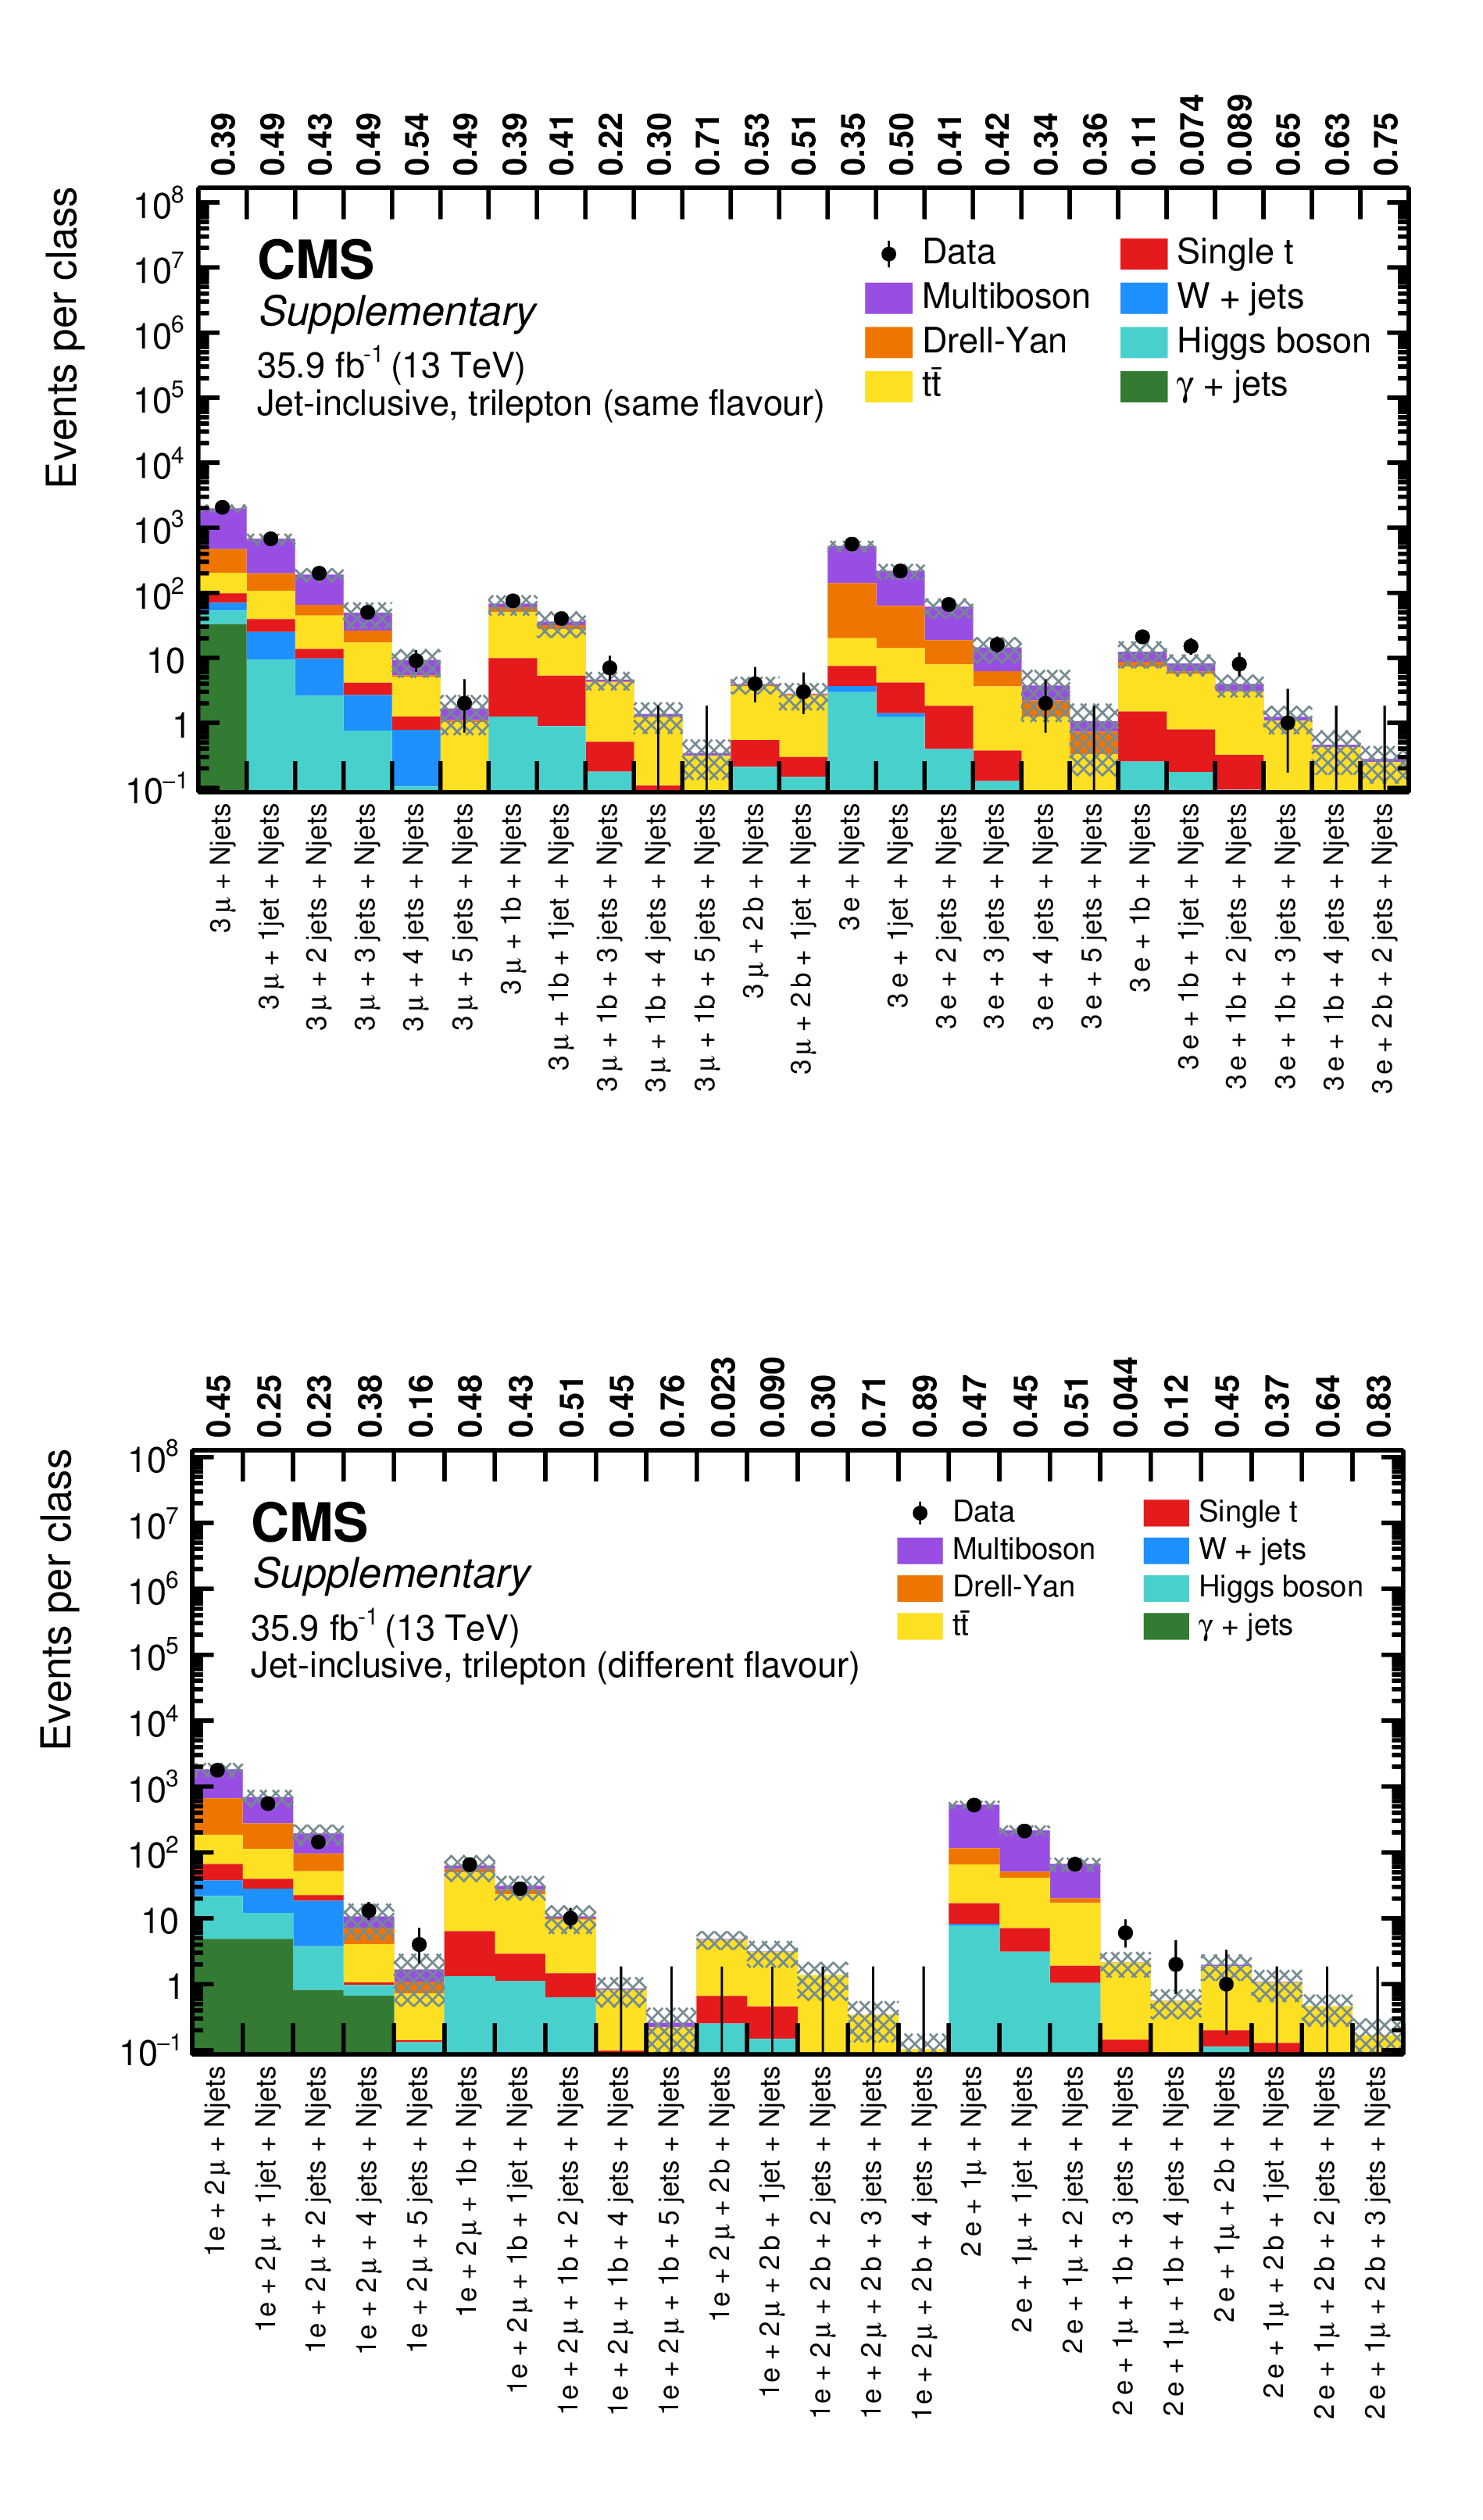
Additional Figure 19:
Overview of total event yields for the jet-inclusive event classes of the three-lepton object groups with same flavour (upper) and different flavour (lower). Measured data are shown as black markers, contributions from SM processes are represented by coloured histograms, and the shaded region represents the uncertainty in the SM background. The numbers above the plot indicate the observed p-value for the agreement of data and simulation. |

png pdf |
Additional Figure 19-a:
Overview of total event yields for the jet-inclusive event classes of the three-lepton object groups with same flavour. Measured data are shown as black markers, contributions from SM processes are represented by coloured histograms, and the shaded region represents the uncertainty in the SM background. The numbers above the plot indicate the observed p-value for the agreement of data and simulation. |
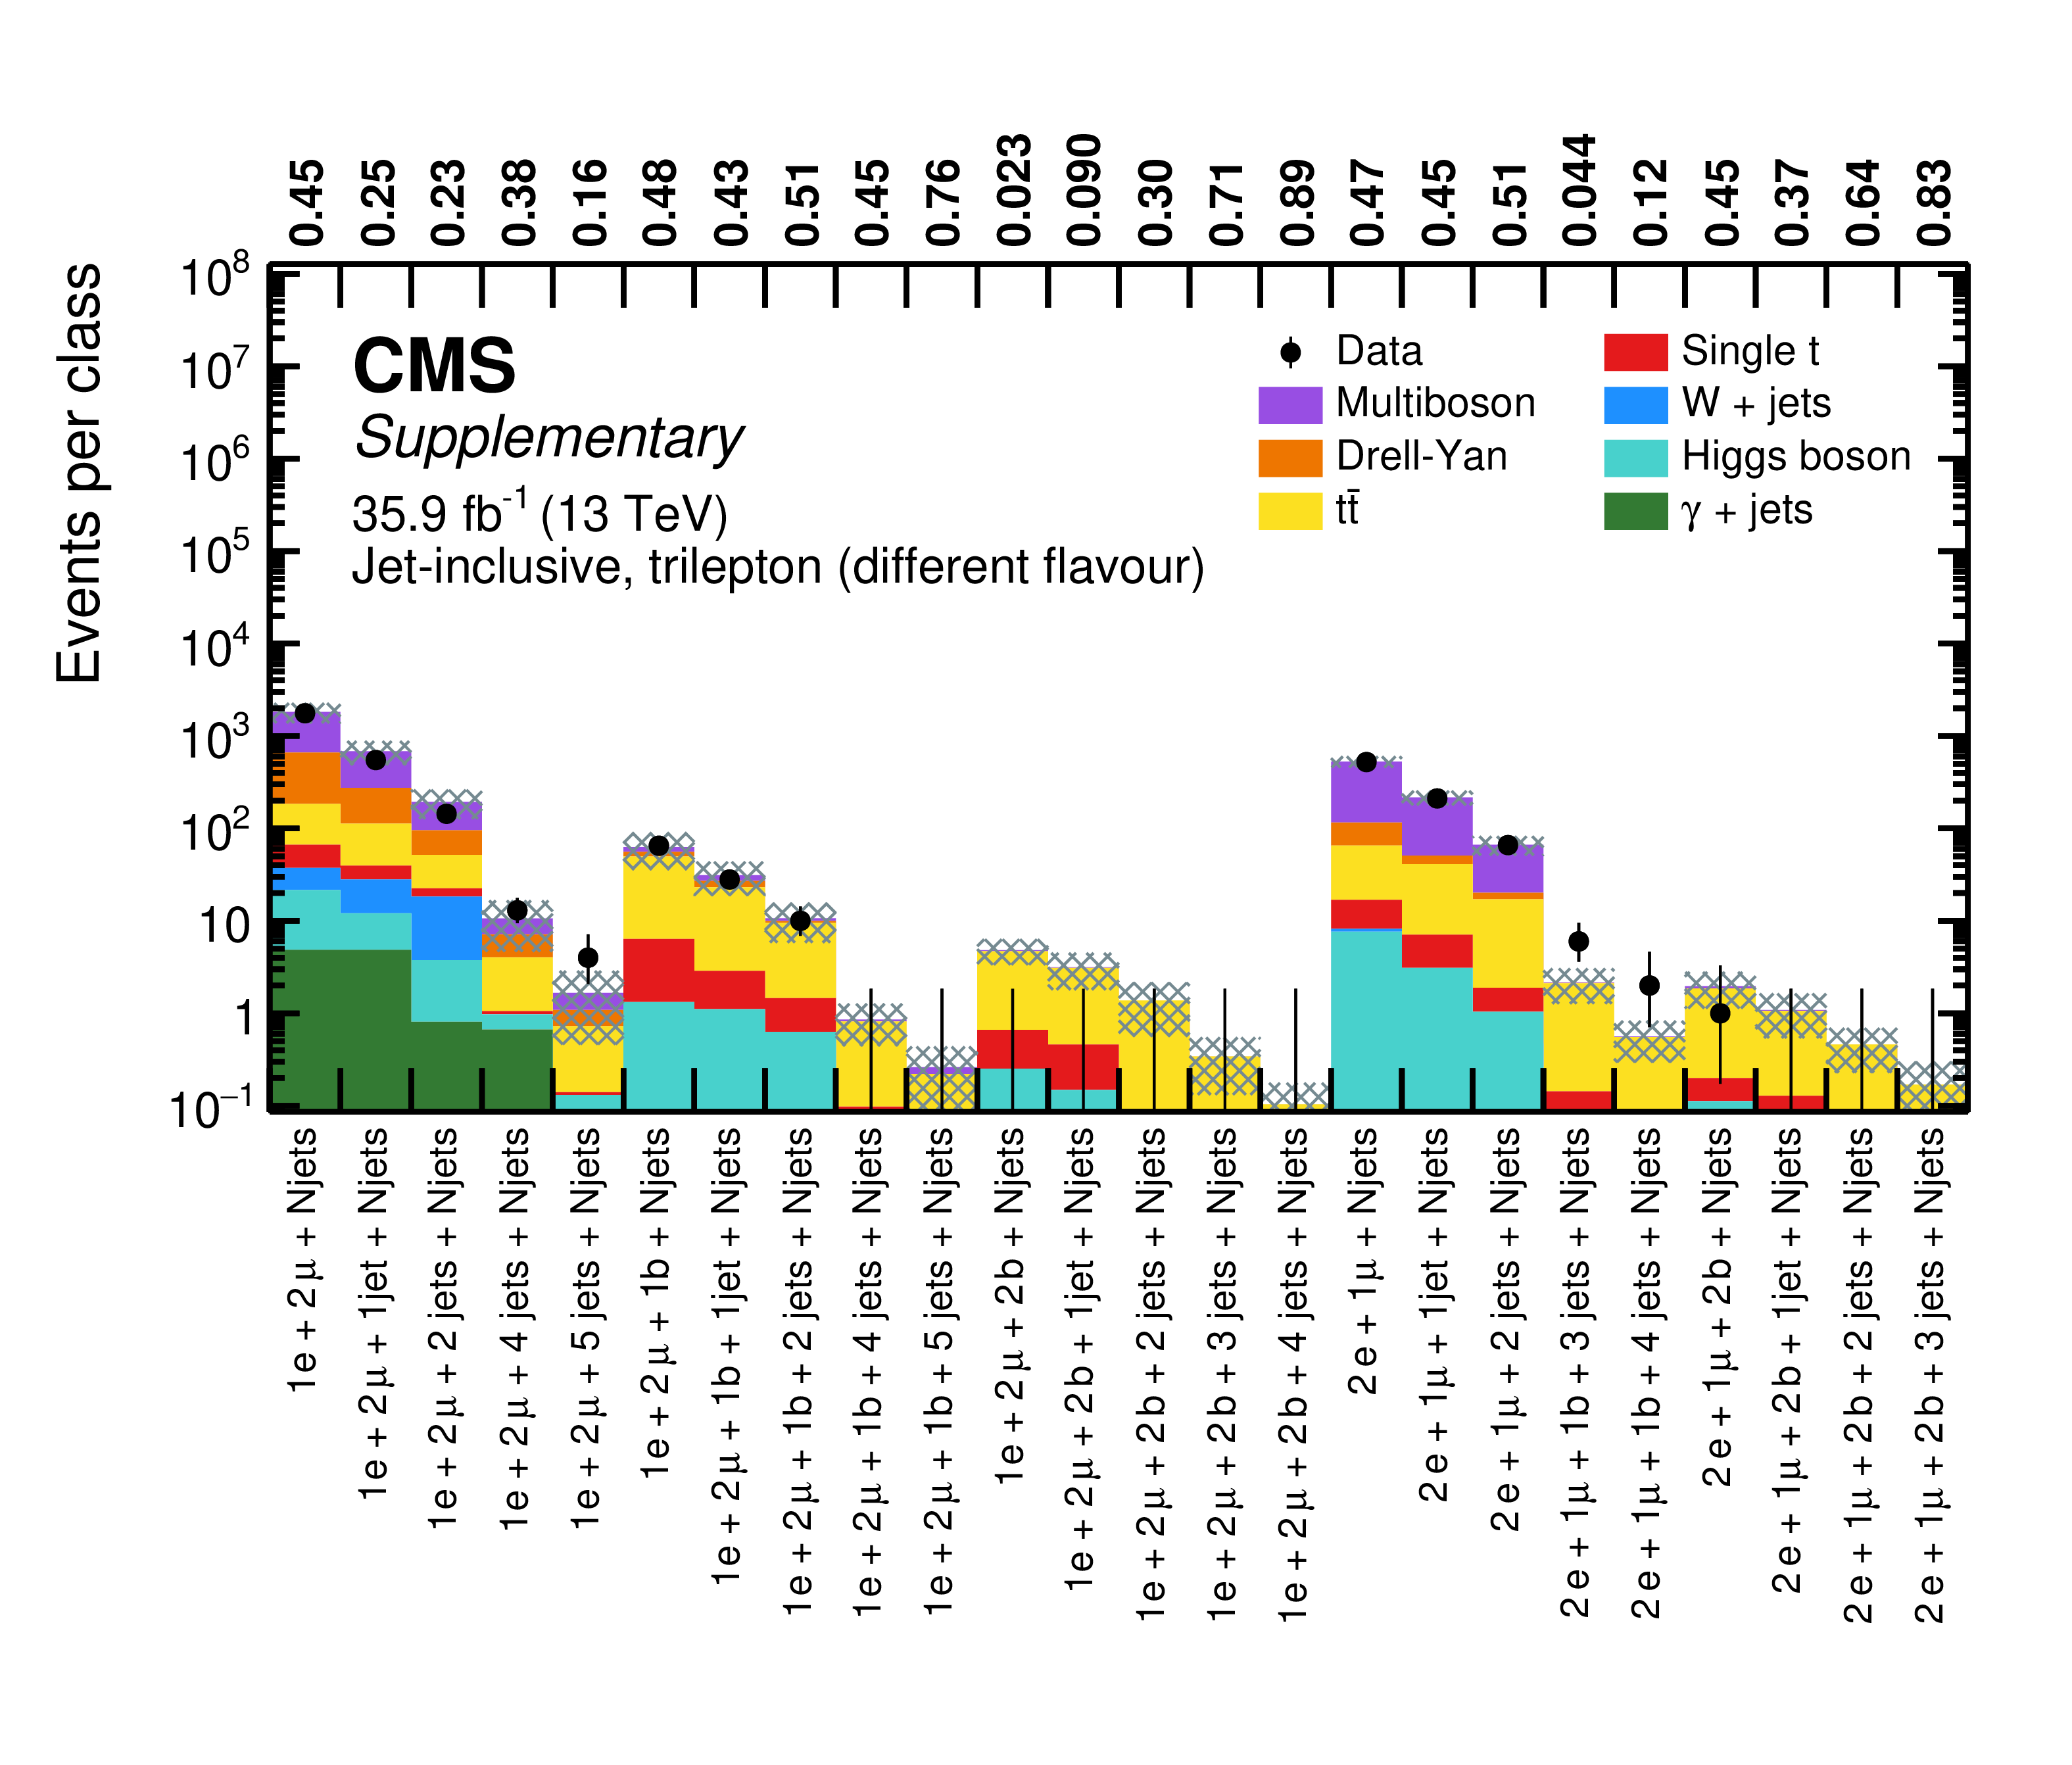
png pdf |
Additional Figure 19-b:
Overview of total event yields for the jet-inclusive event classes of the three-lepton object groups with different flavour. Measured data are shown as black markers, contributions from SM processes are represented by coloured histograms, and the shaded region represents the uncertainty in the SM background. The numbers above the plot indicate the observed p-value for the agreement of data and simulation. |

png pdf |
Additional Figure 20:
Overview of total event yields for the jet-inclusive event classes of the three-lepton (same flavour) $+$ ${{p_{\mathrm {T}}} ^\text {miss}}$ object group (upper), and the three-lepton (different flavour) $+$ ${{p_{\mathrm {T}}} ^\text {miss}}$ object group (lower). Measured data are shown as black markers, contributions from SM processes are represented by coloured histograms, and the shaded region represents the uncertainty in the SM background. The numbers above the plot indicate the observed p-value for the agreement of data and simulation. |
png pdf |
Additional Figure 20-a:
Overview of total event yields for the jet-inclusive event classes of the three-lepton (same flavour) $+$ ${{p_{\mathrm {T}}} ^\text {miss}}$ object group. Measured data are shown as black markers, contributions from SM processes are represented by coloured histograms, and the shaded region represents the uncertainty in the SM background. The numbers above the plot indicate the observed p-value for the agreement of data and simulation. |
png pdf |
Additional Figure 20-b:
Overview of total event yields for the jet-inclusive event classes of the three-lepton (different flavour) $+$ ${{p_{\mathrm {T}}} ^\text {miss}}$ object group. Measured data are shown as black markers, contributions from SM processes are represented by coloured histograms, and the shaded region represents the uncertainty in the SM background. The numbers above the plot indicate the observed p-value for the agreement of data and simulation. |

png pdf |
Additional Figure 21:
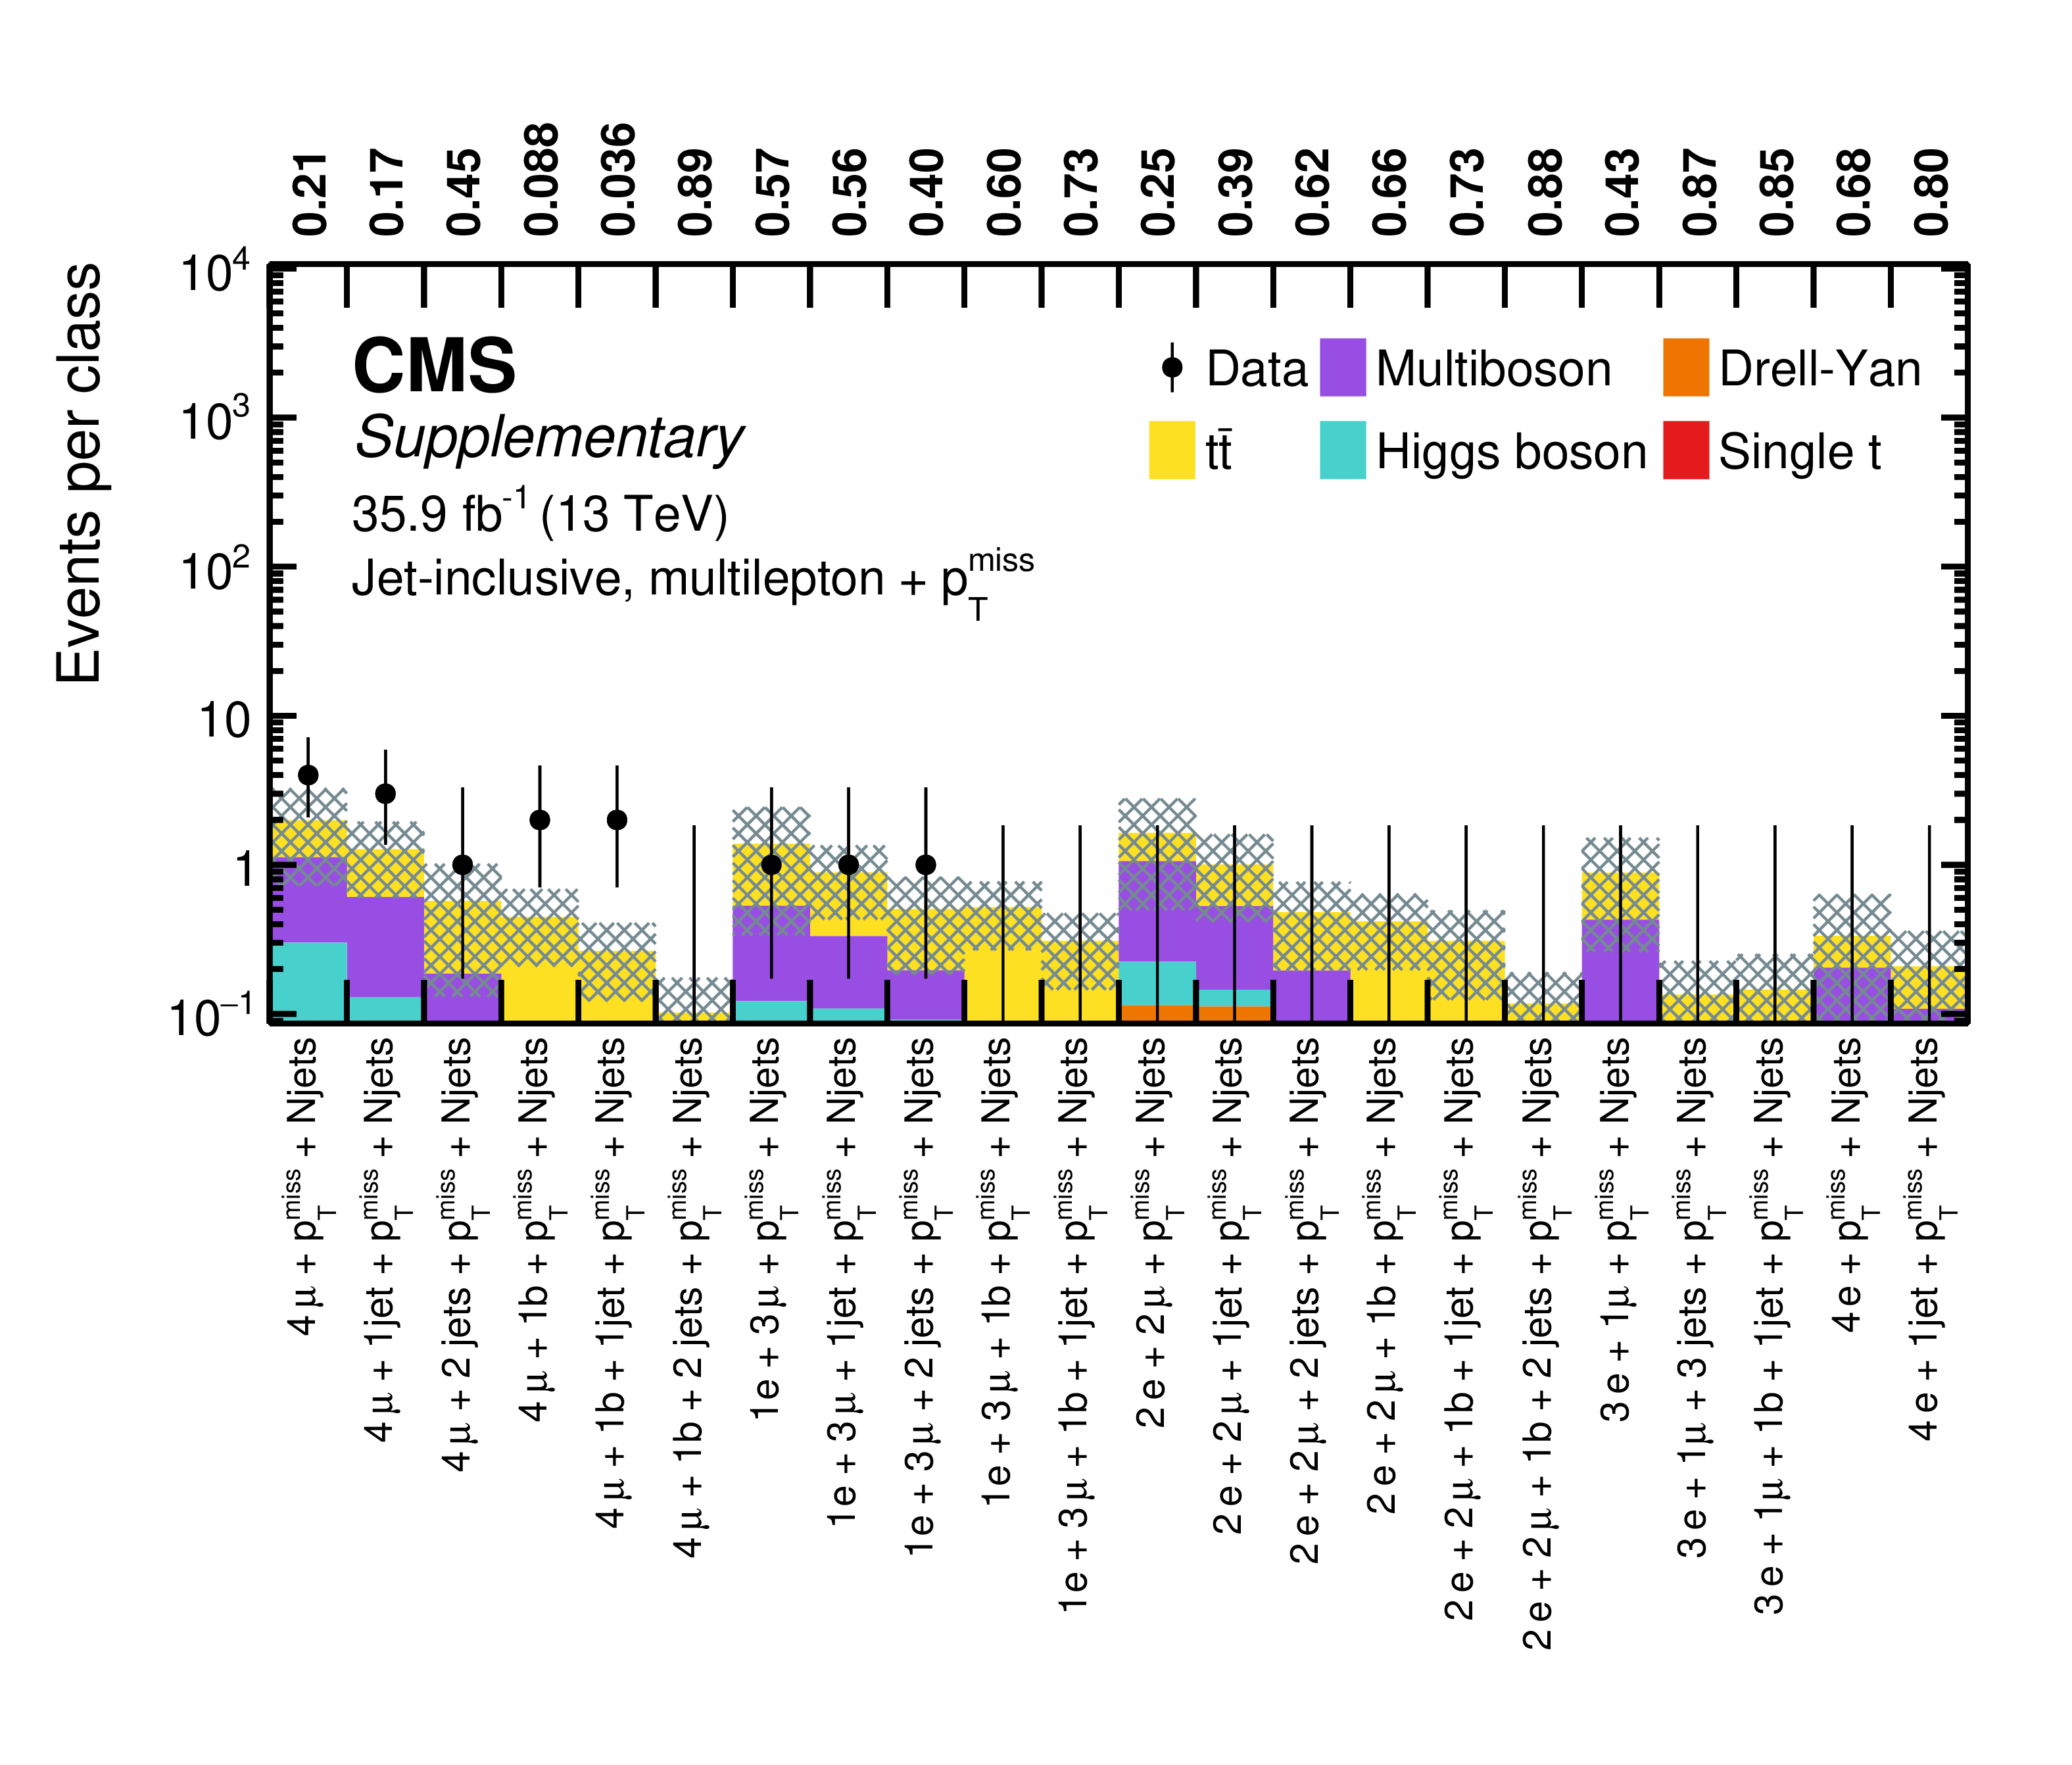
Overview of total event yields for the jet-inclusive event classes of the ${\geq}$4 leptons object group (upper), and the ${\geq}$4 leptons $+$ ${{p_{\mathrm {T}}} ^\text {miss}}$ object group (lower). Measured data are shown as black markers, contributions from SM processes are represented by coloured histograms, and the shaded region represents the uncertainty in the SM background. The numbers above the plot indicate the observed p-value for the agreement of data and simulation. |
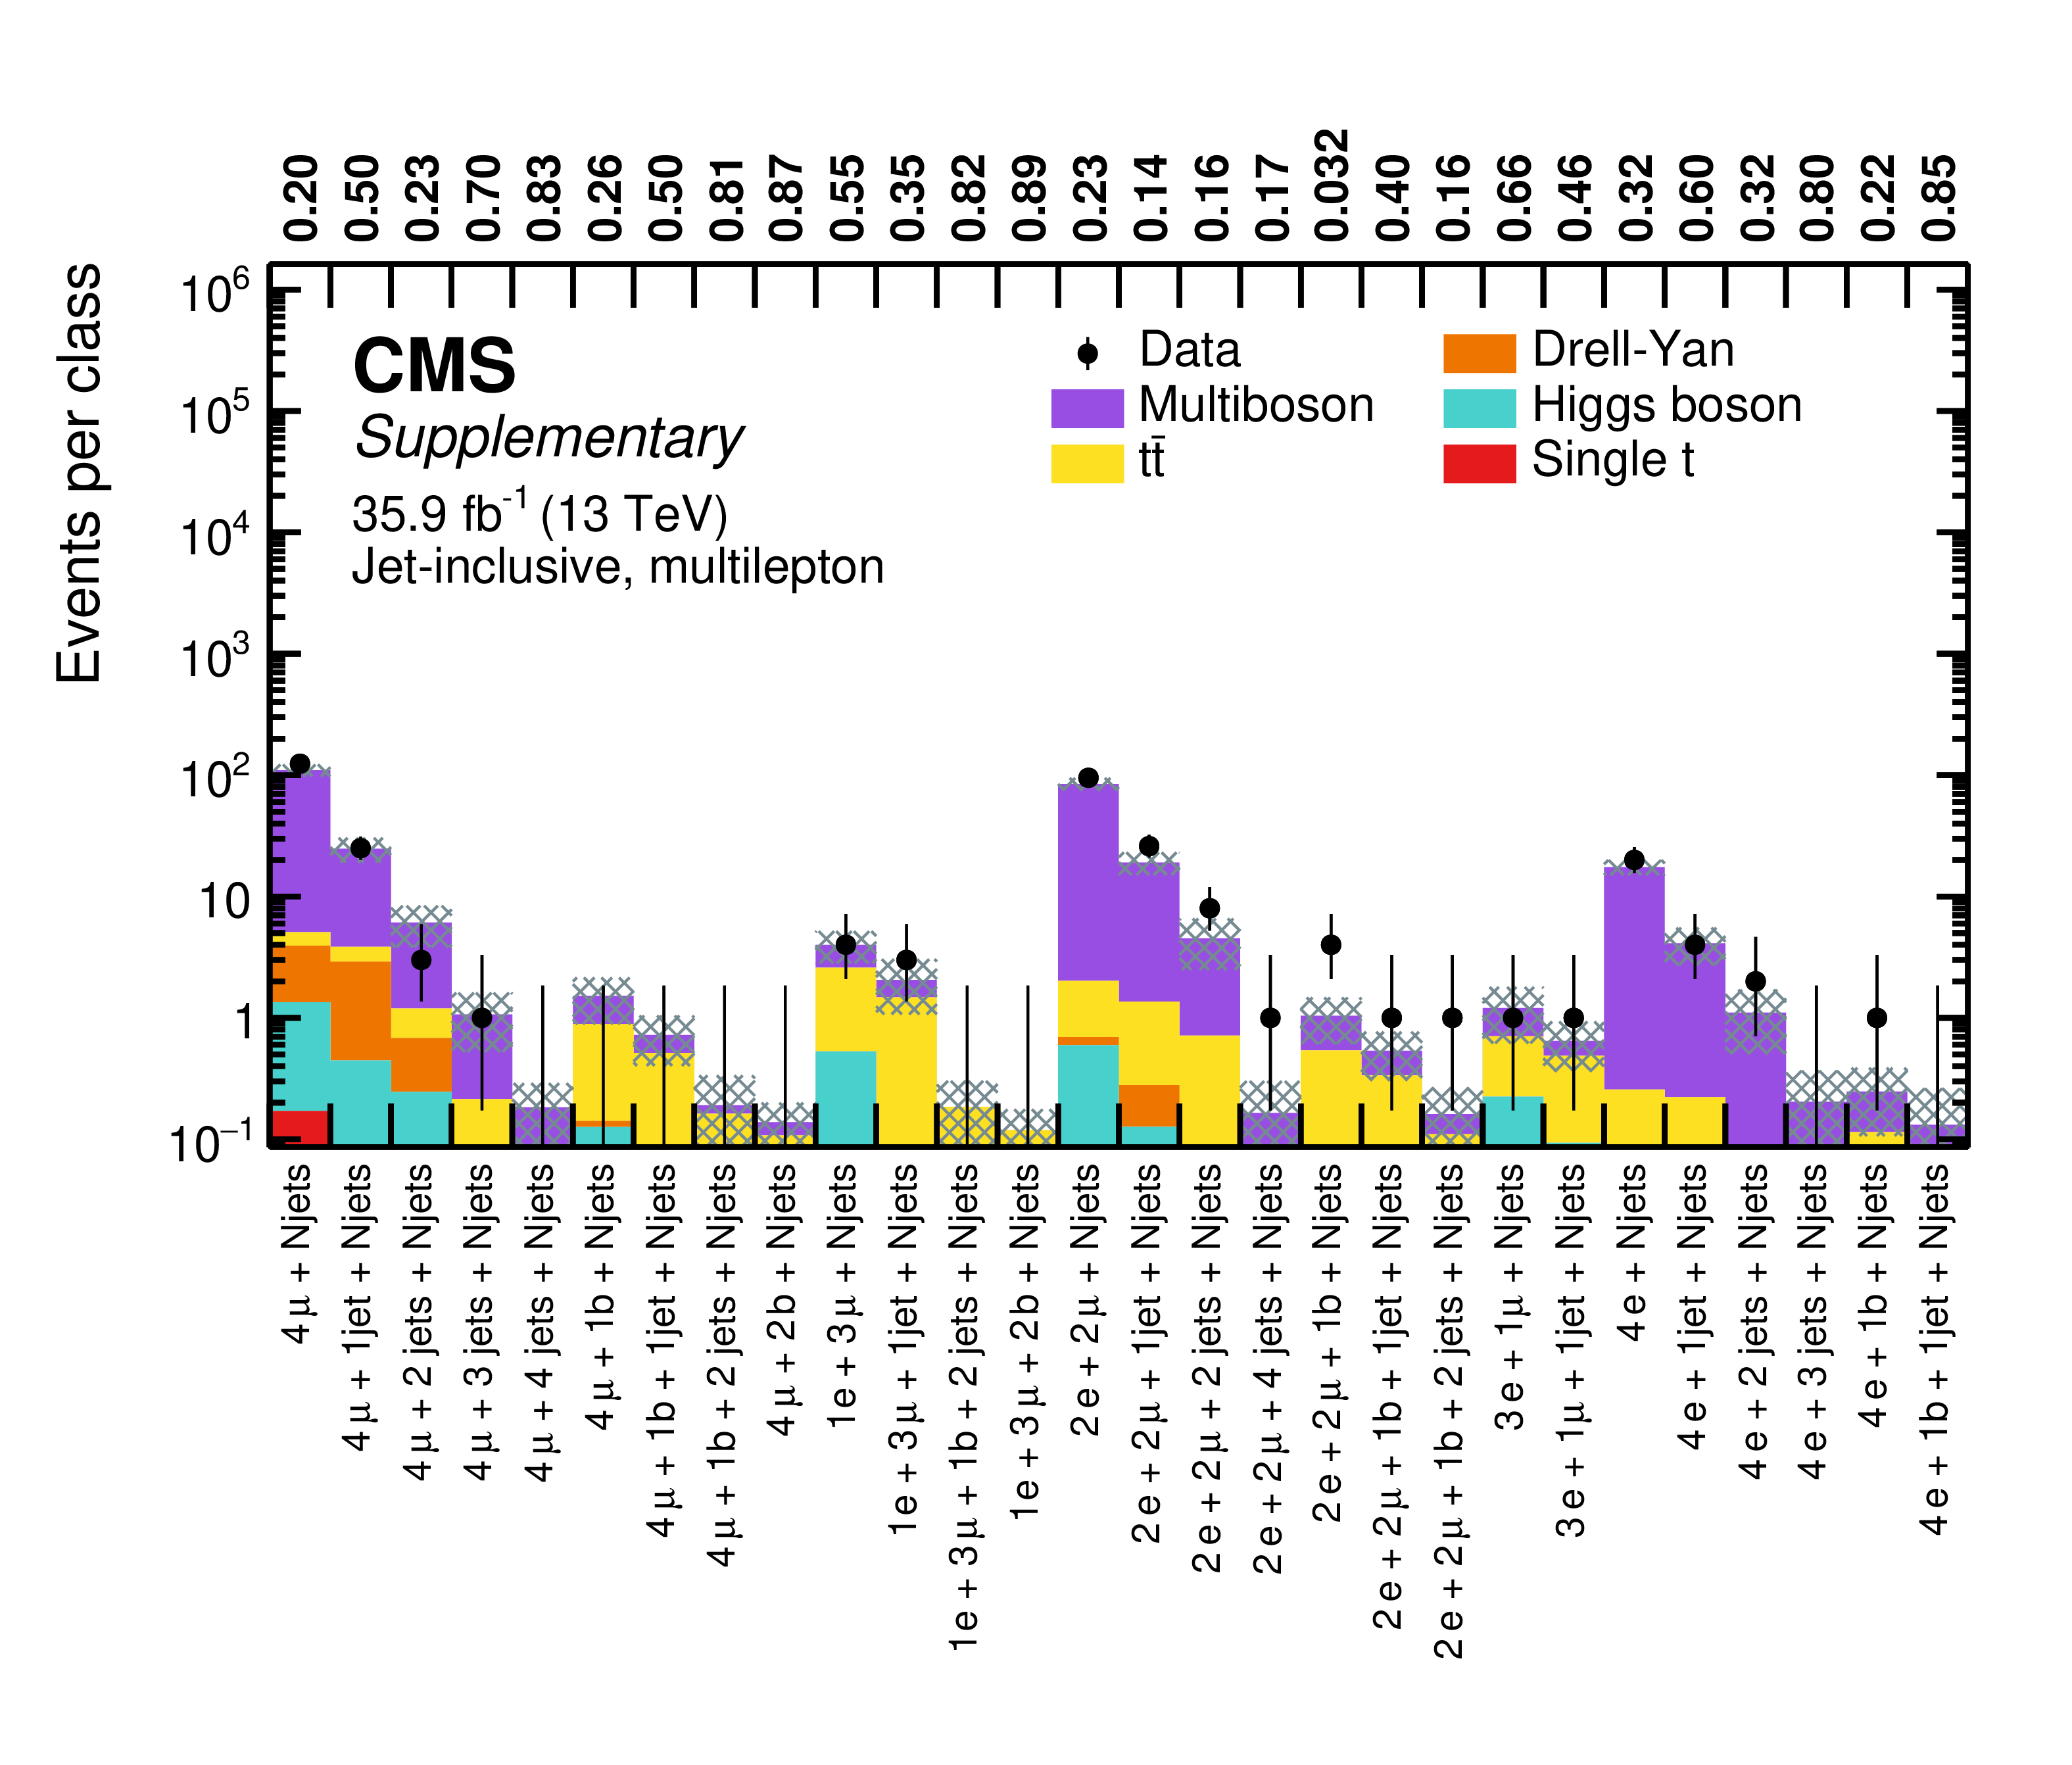
png pdf |
Additional Figure 21-a:
Overview of total event yields for the jet-inclusive event classes of the ${\geq}$4 leptons object group. Measured data are shown as black markers, contributions from SM processes are represented by coloured histograms, and the shaded region represents the uncertainty in the SM background. The numbers above the plot indicate the observed p-value for the agreement of data and simulation. |
png pdf |
Additional Figure 21-b:
Overview of total event yields for the jet-inclusive event classes of the ${\geq}$4 leptons $+$ ${{p_{\mathrm {T}}} ^\text {miss}}$ object group. Measured data are shown as black markers, contributions from SM processes are represented by coloured histograms, and the shaded region represents the uncertainty in the SM background. The numbers above the plot indicate the observed p-value for the agreement of data and simulation. |
png pdf |
Additional Figure 22:
Overview of total event yields for the jet-inclusive event classes of the $ > $1 lepton $+$ photons object group (upper), and the $ > $1 lepton $+$ photons $+$ ${{p_{\mathrm {T}}} ^\text {miss}}$ object group (lower). Measured data are shown as black markers, contributions from SM processes are represented by coloured histograms, and the shaded region represents the uncertainty in the SM background. The numbers above the plot indicate the observed p-value for the agreement of data and simulation. |
png pdf |
Additional Figure 22-a:
Overview of total event yields for the jet-inclusive event classes of the $ > $1 lepton $+$ photons object group. Measured data are shown as black markers, contributions from SM processes are represented by coloured histograms, and the shaded region represents the uncertainty in the SM background. The numbers above the plot indicate the observed p-value for the agreement of data and simulation. |
png pdf |
Additional Figure 22-b:
Overview of total event yields for the $ > $1 lepton $+$ photons $+$ ${{p_{\mathrm {T}}} ^\text {miss}}$ object group. Measured data are shown as black markers, contributions from SM processes are represented by coloured histograms, and the shaded region represents the uncertainty in the SM background. The numbers above the plot indicate the observed p-value for the agreement of data and simulation. |
png pdf |
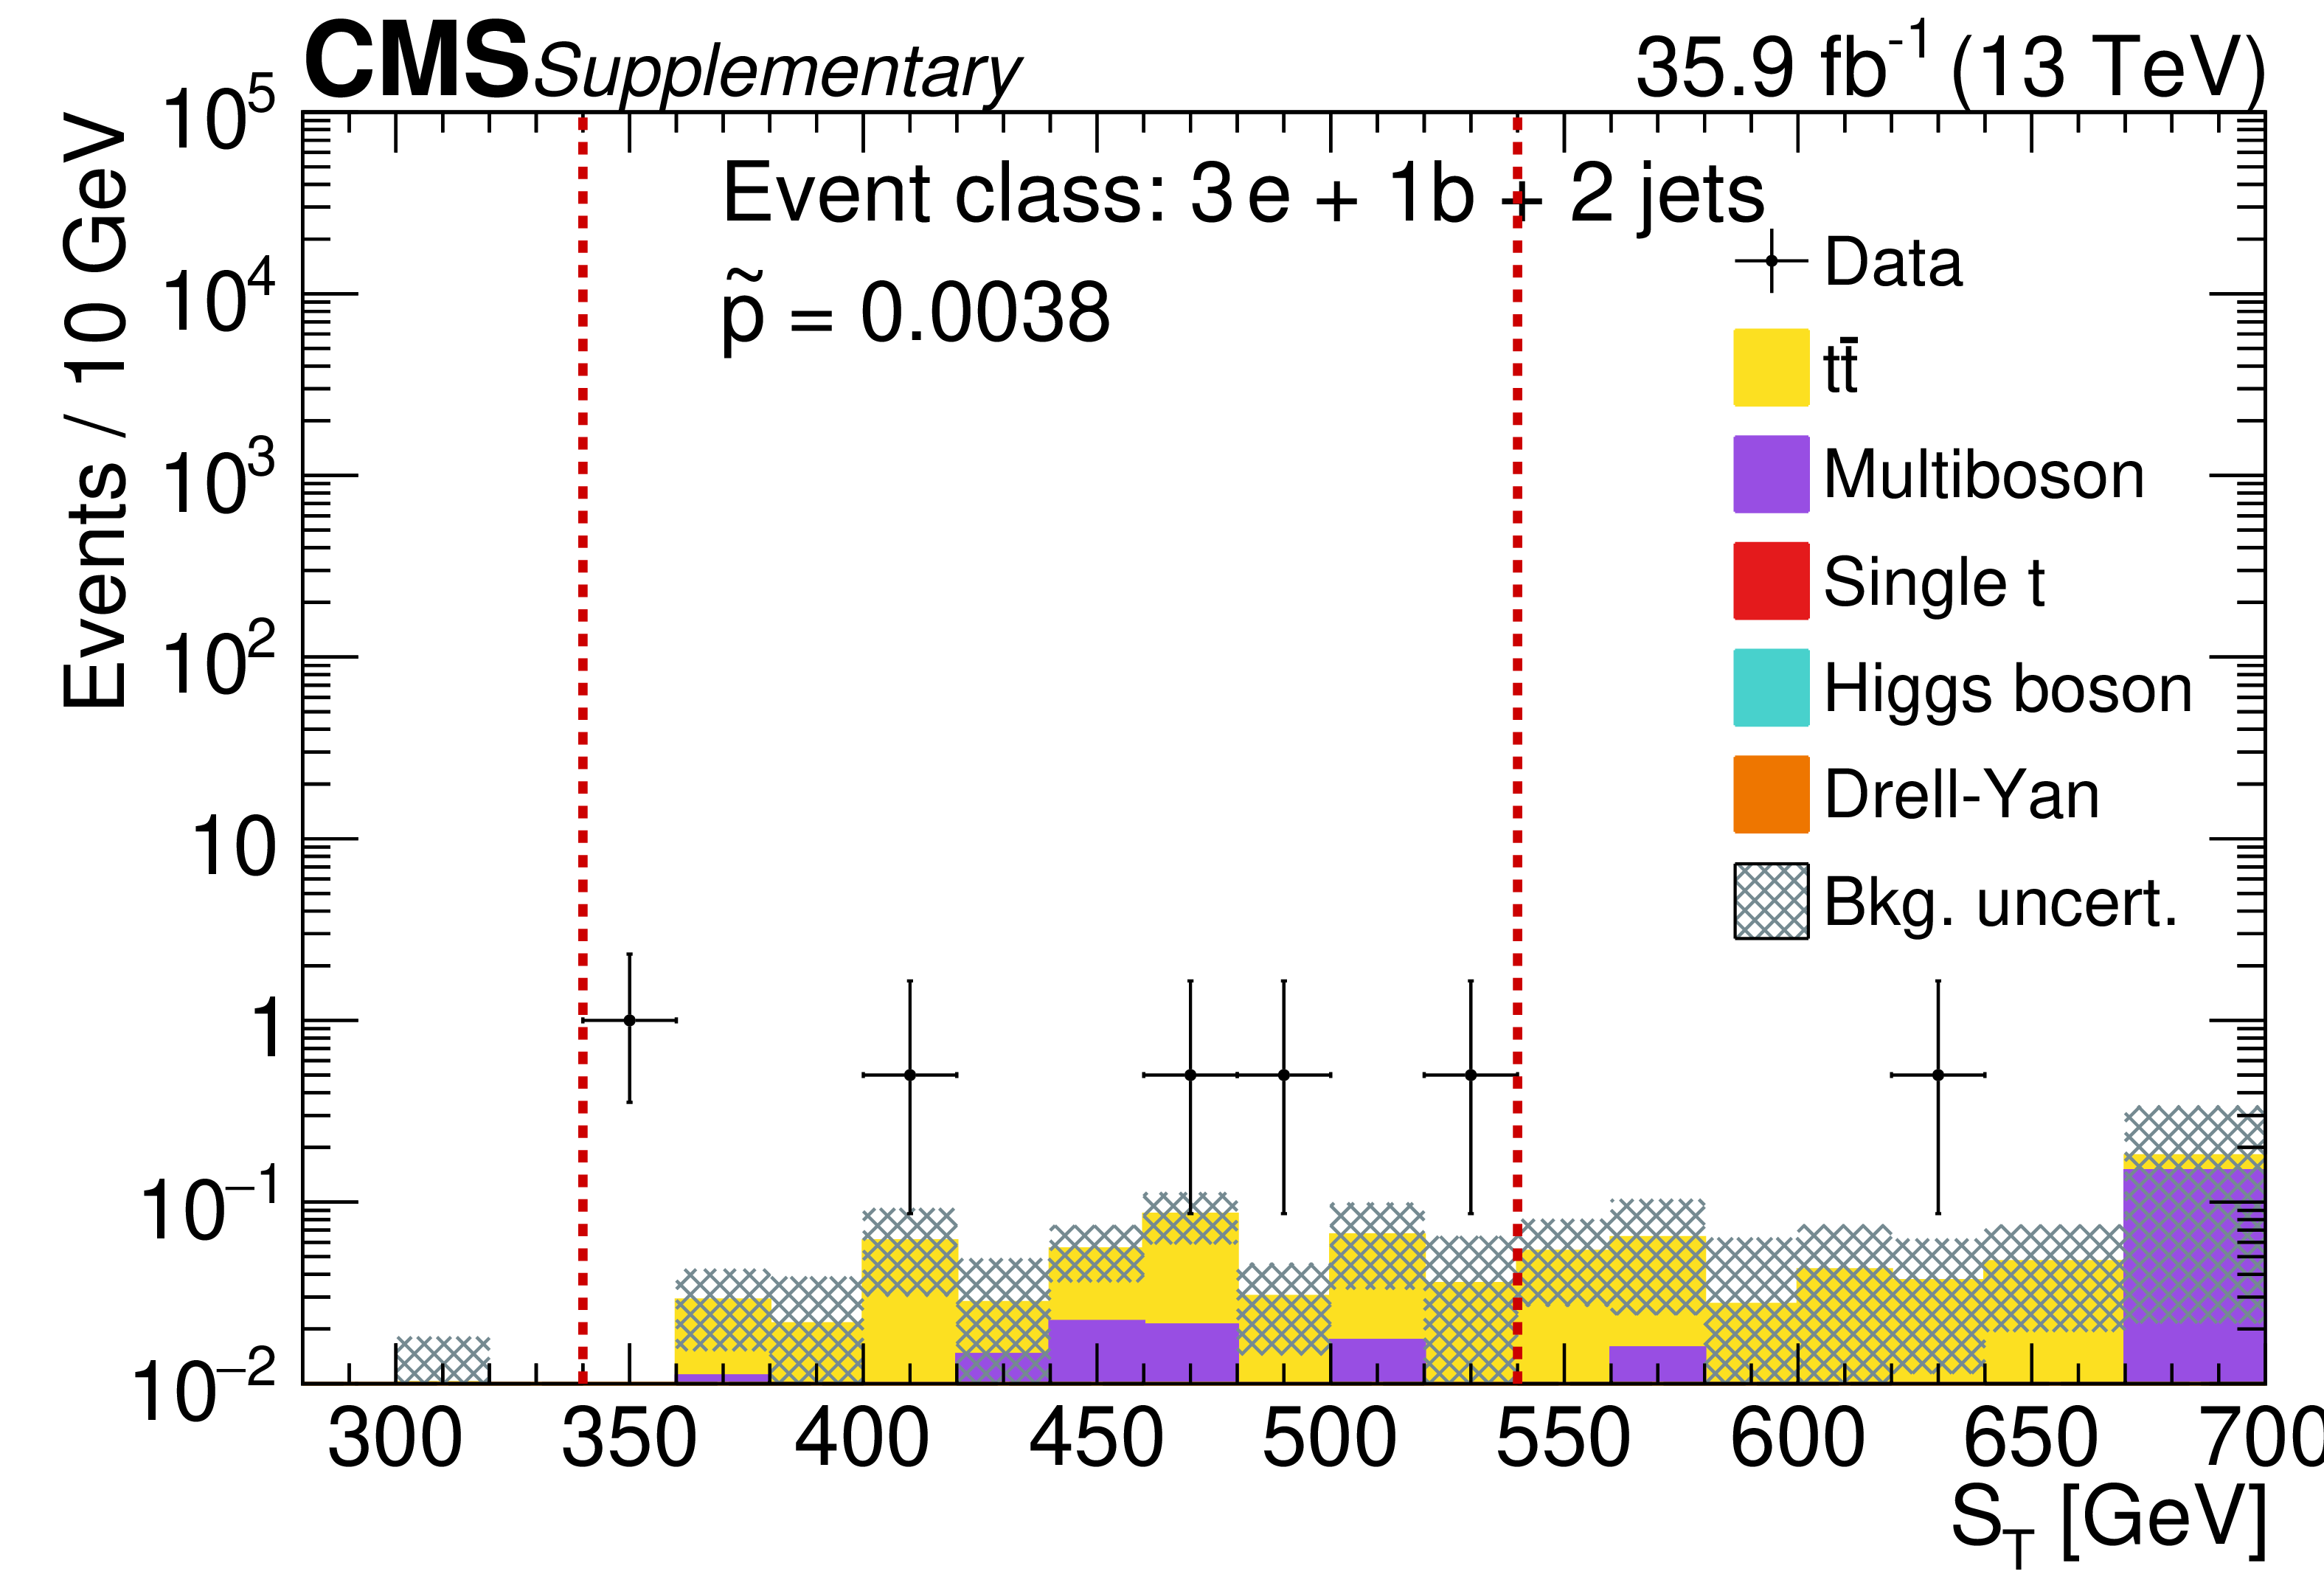
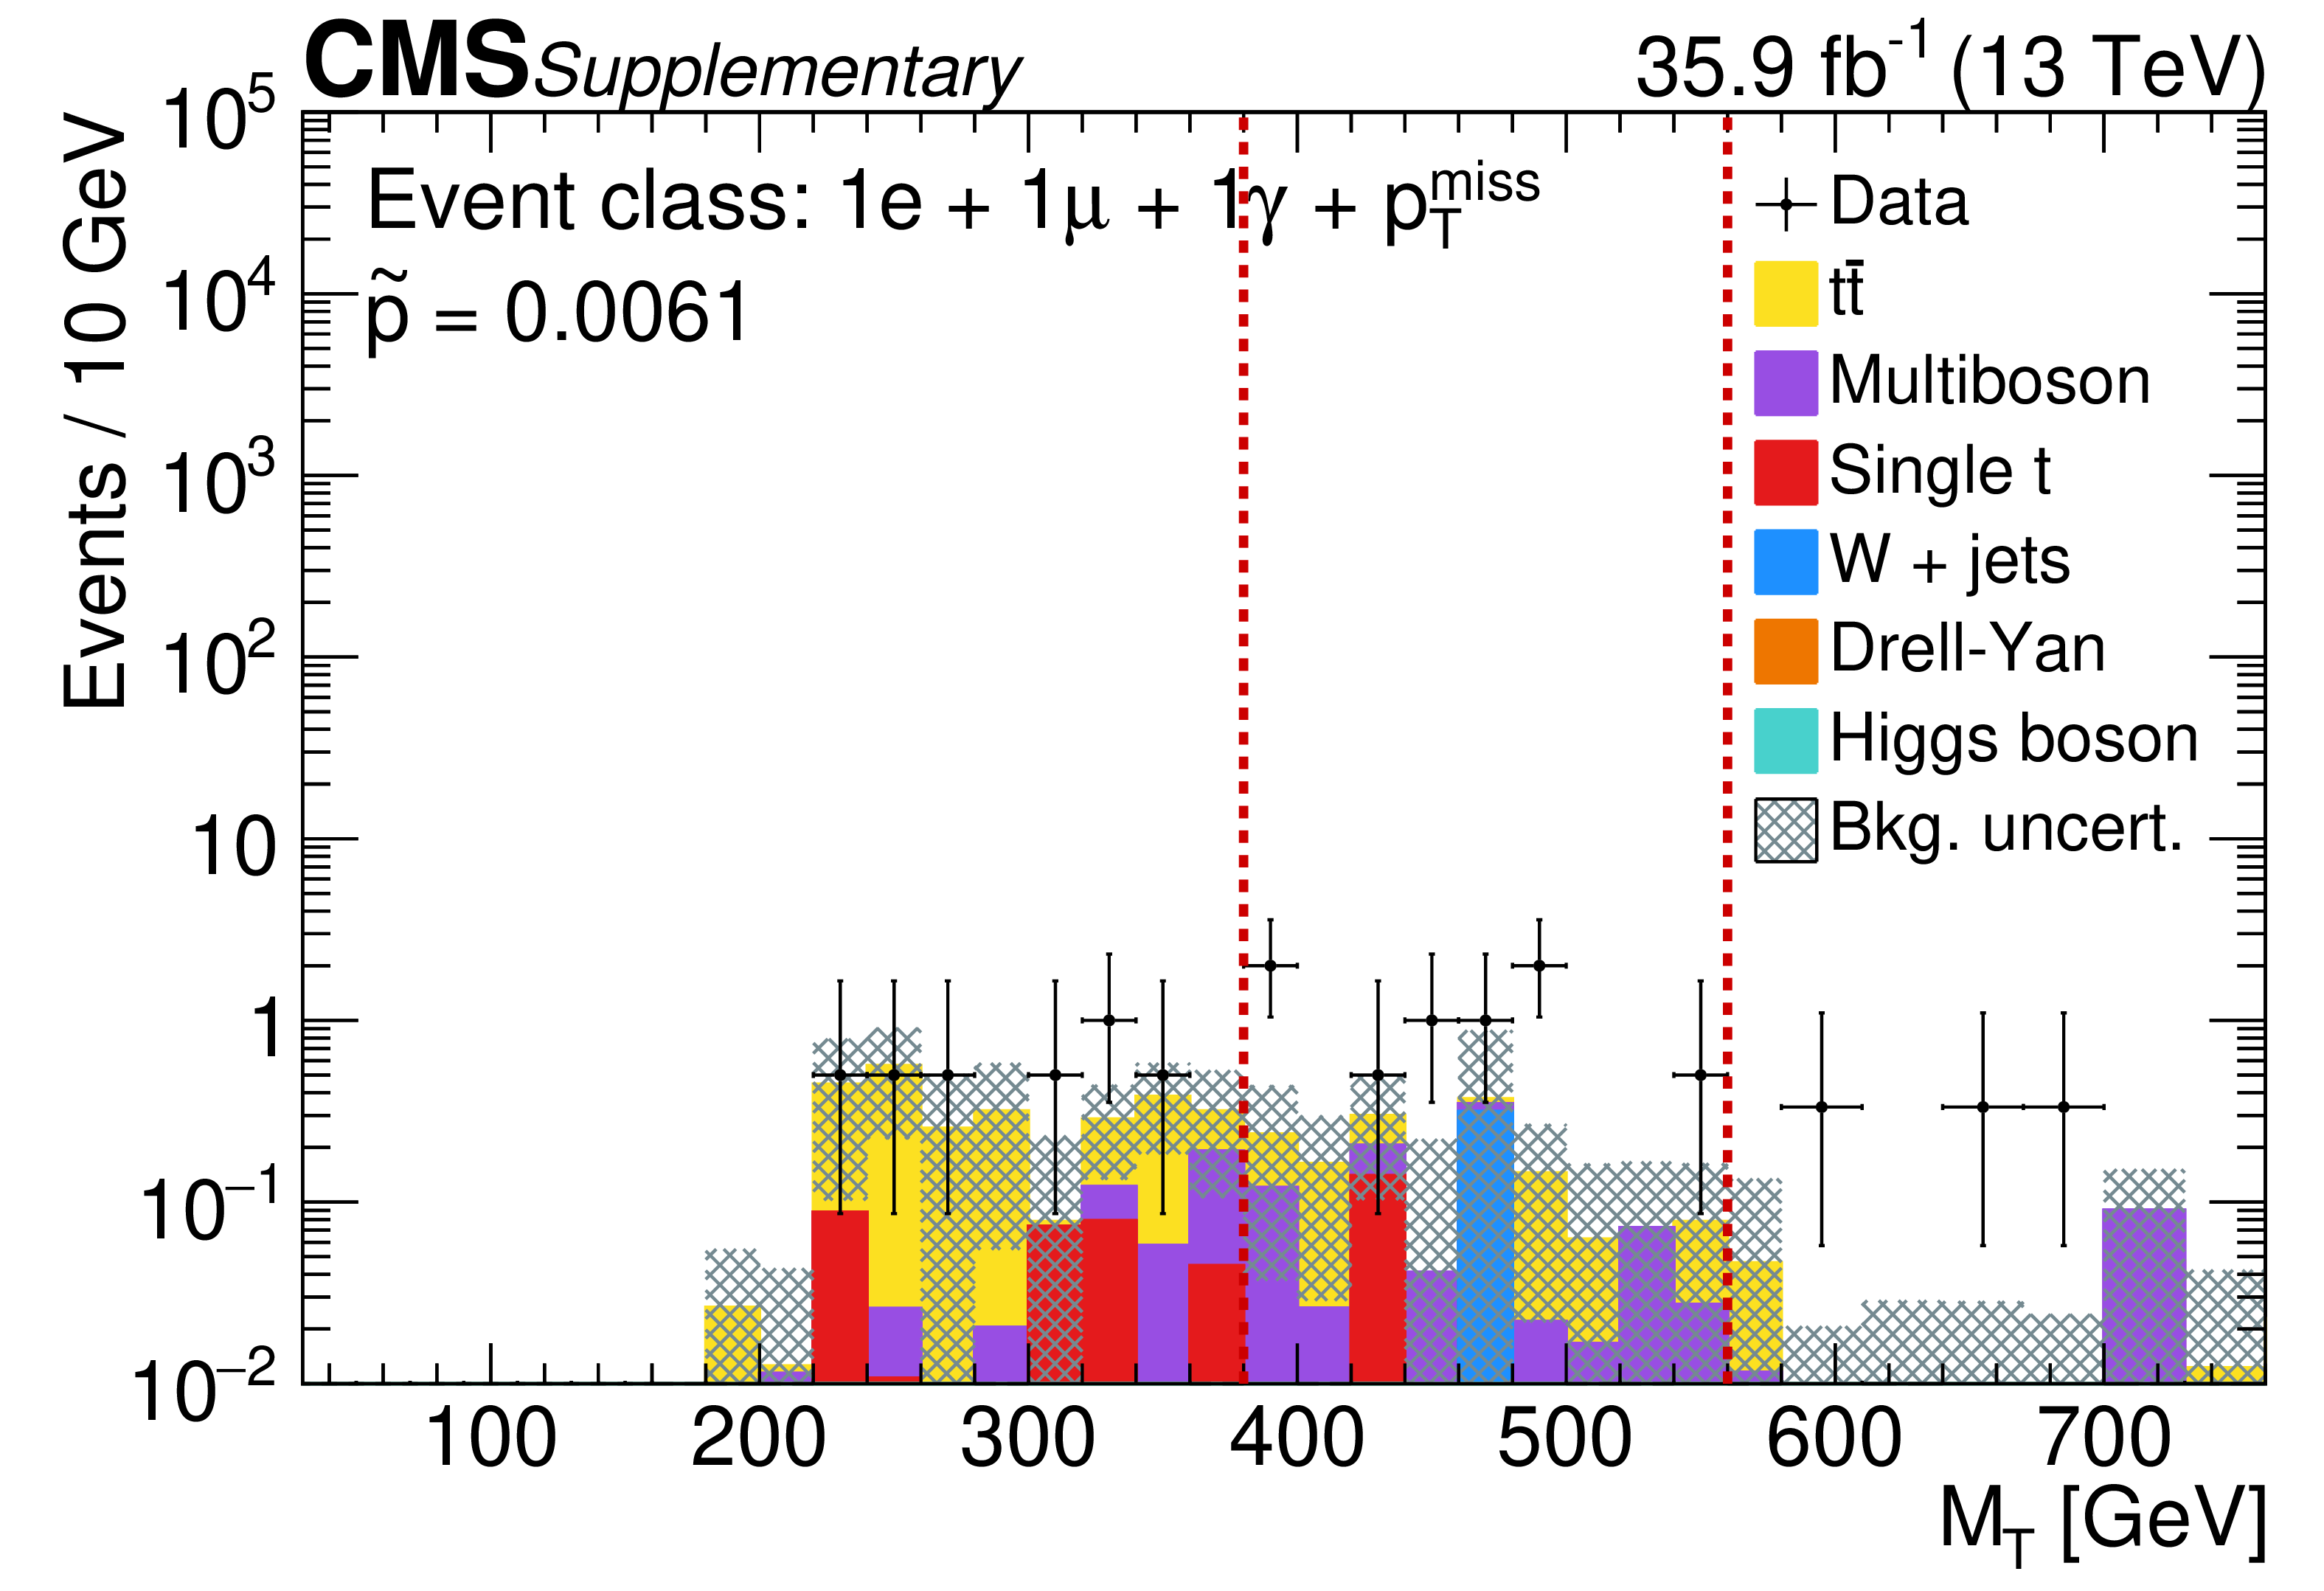
Additional Figure 23:
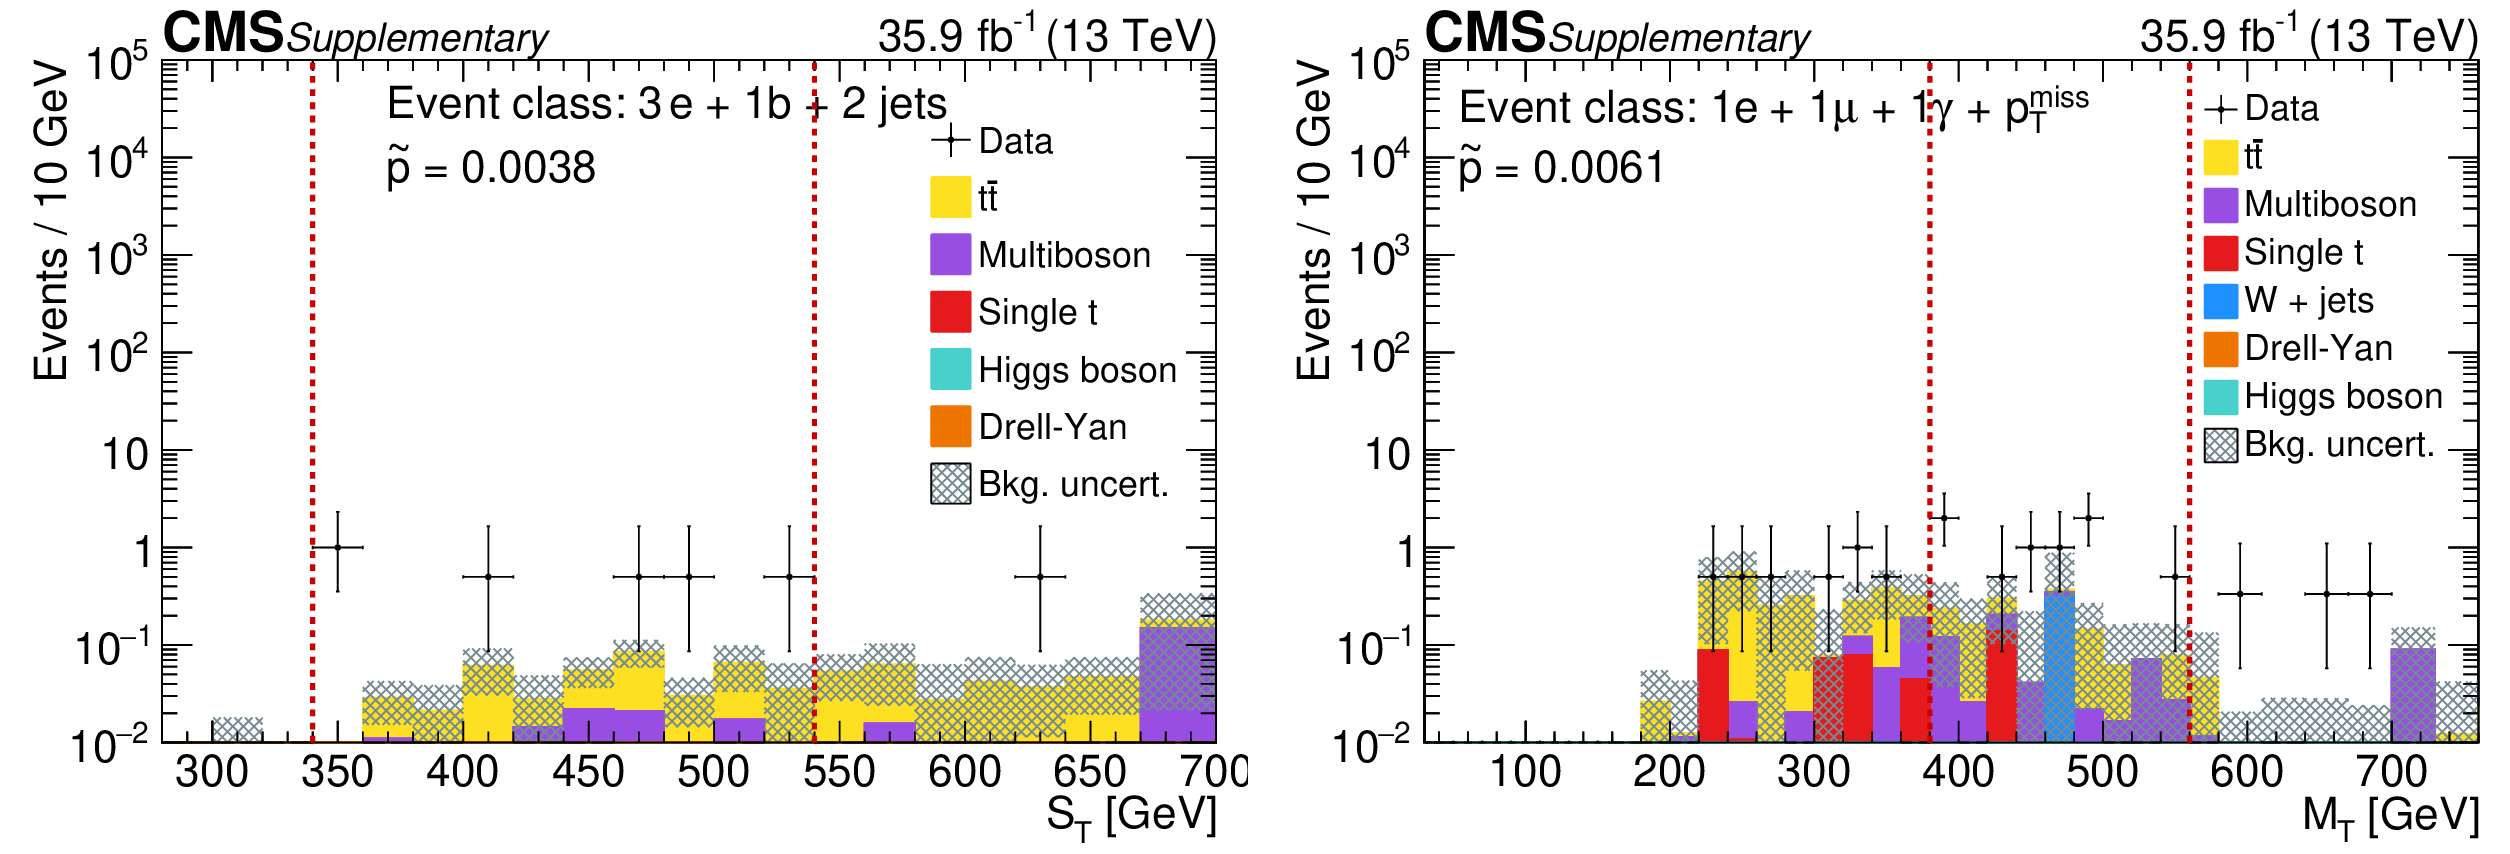
The relevant kinematic distributions for the two exclusive event classes with the largest deviation as determinded from the region of interest scan. The $\mathrm {S_{T}}$ distribution for the 3e $+$ 1b $+$ 2 jets event class (left) and the transverse mass distribution for the 1e $+$ 1$ {\mu}$ $+$ 1${\gamma}$ $+$ ${{p_{\mathrm {T}}} ^\text {miss}} $ event class (right) are shown. The data events are shown in black and the simulations of the SM processes are shown as coloured histograms. The region enclosed within the red dashed lines is the region of interest and the look-elsewhere-effect corrected $\mathrm {\tilde{p}}$-value is also displayed. For these final states, the flavour counterparts and corresponding inclusive and jet-inclusive event classes were checked and they did not show a large deviation. The $\mathrm {\tilde{p}}$-value distributions show that observing such deviations is still within the expectations from the SM only hypothesis given the number of event classes scanned. |
png pdf |
Additional Figure 23-a:
The relevant kinematic distributions for the two exclusive event classes with the largest deviation as determinded from the region of interest scan. The $\mathrm {S_{T}}$ distribution for the 3e $+$ 1b $+$ 2 jets event class is shown. The data events are shown in black and the simulations of the SM processes are shown as coloured histograms. The region enclosed within the red dashed lines is the region of interest and the look-elsewhere-effect corrected $\mathrm {\tilde{p}}$-value is also displayed. For these final states, the flavour counterparts and corresponding inclusive and jet-inclusive event classes were checked and they did not show a large deviation. The $\mathrm {\tilde{p}}$-value distributions show that observing such deviations is still within the expectations from the SM only hypothesis given the number of event classes scanned. |
png pdf |
Additional Figure 23-b:
The relevant kinematic distributions for the two exclusive event classes with the largest deviation as determinded from the region of interest scan. The transverse mass distribution for the 1e $+$ 1$ {\mu}$ $+$ 1${\gamma}$ $+$ ${{p_{\mathrm {T}}} ^\text {miss}} $ event class is shown. The data events are shown in black and the simulations of the SM processes are shown as coloured histograms. The region enclosed within the red dashed lines is the region of interest and the look-elsewhere-effect corrected $\mathrm {\tilde{p}}$-value is also displayed. For these final states, the flavour counterparts and corresponding inclusive and jet-inclusive event classes were checked and they did not show a large deviation. The $\mathrm {\tilde{p}}$-value distributions show that observing such deviations is still within the expectations from the SM only hypothesis given the number of event classes scanned. |
png pdf |
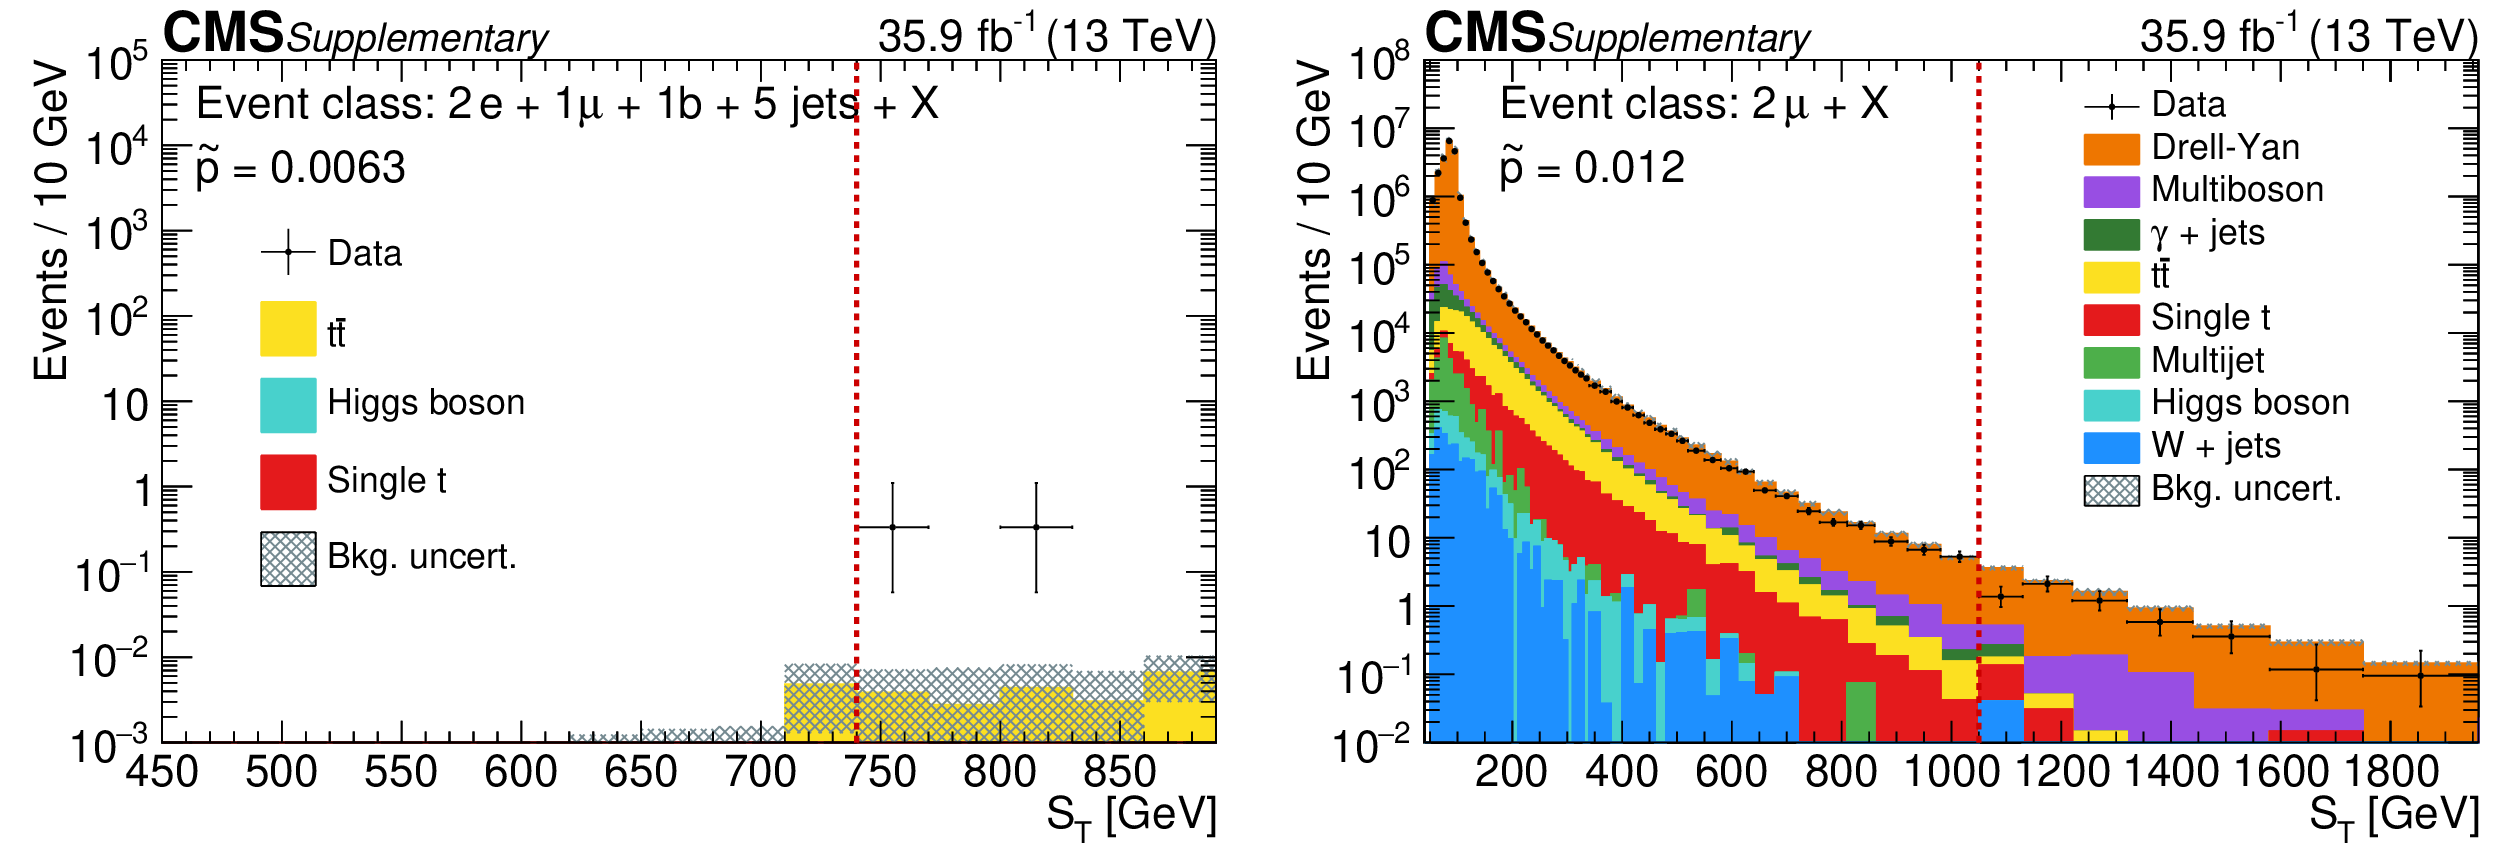
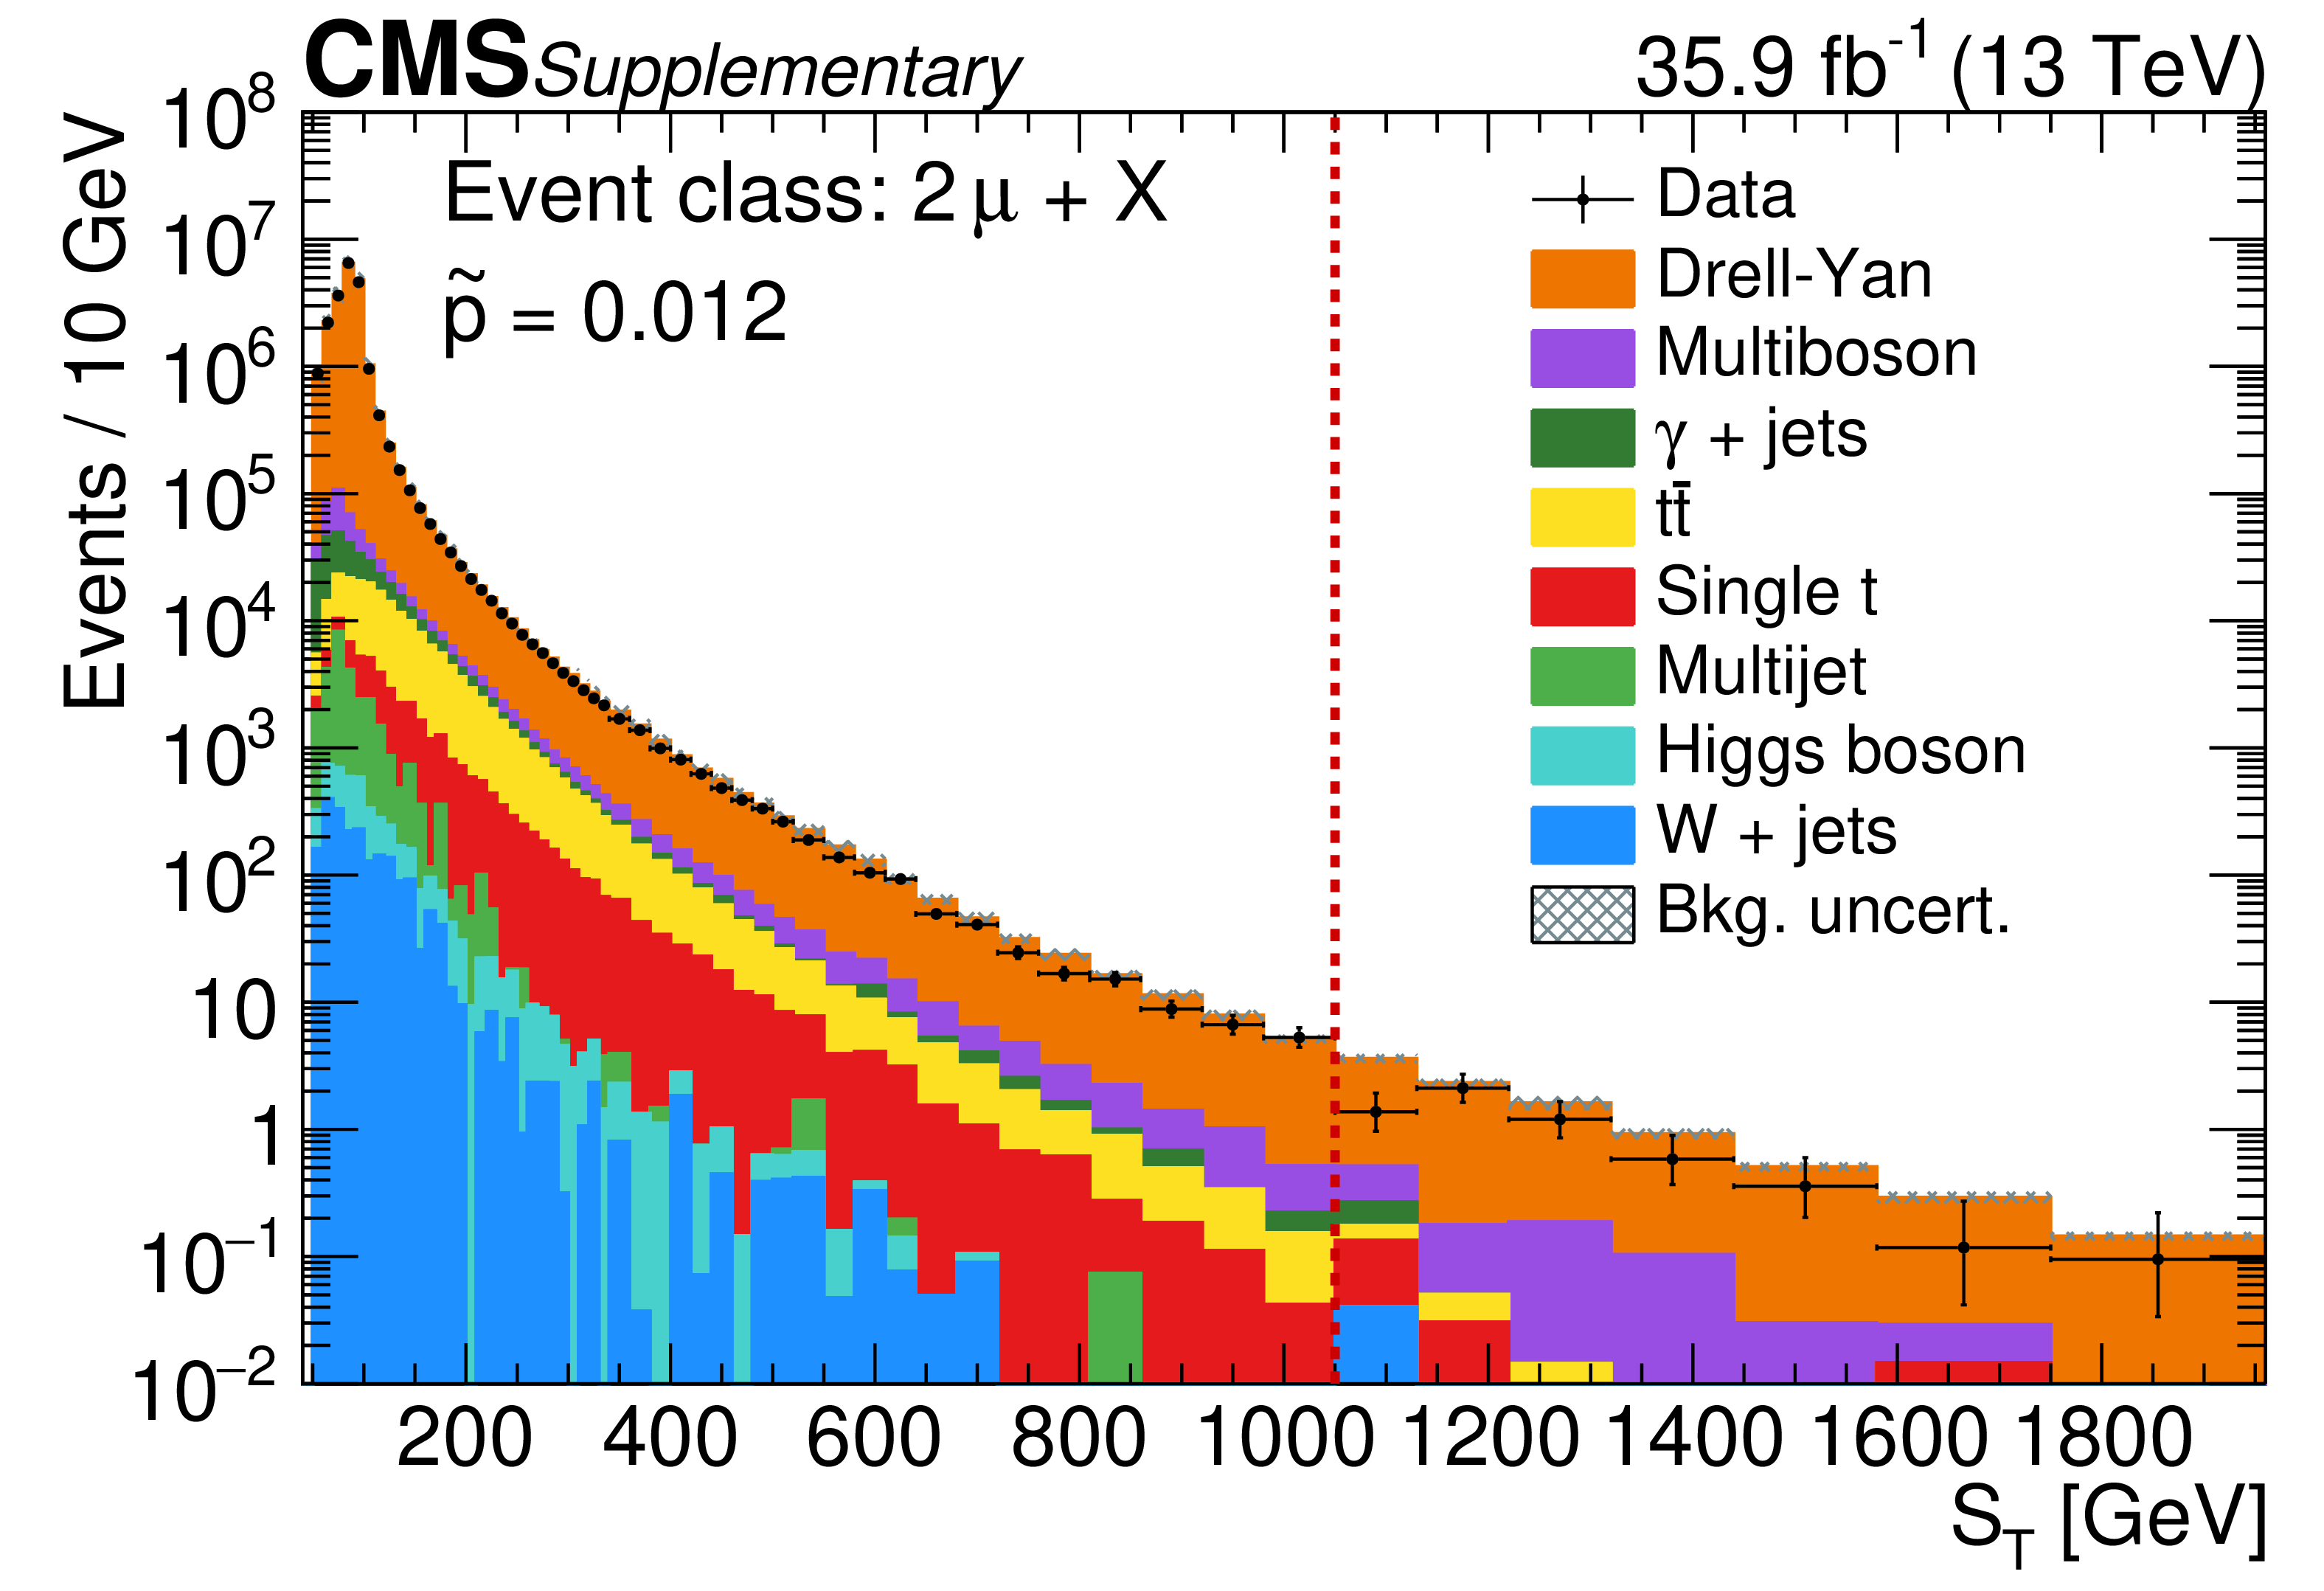
Additional Figure 24:
The relevant kinematic distributions for the two inclusive event classes with the largest deviation as determinded from the region of interest scan. The $\mathrm {S_{T}}$ distribution for the 2e $+$ 1$ {\mu}$ $+$ 1b $+$ 5 jets $+$ X event class (left) and the 2$ {\mu}$ $+$ X event class (right) are shown. The data events are shown in black and the simulations of the SM processes are shown as coloured histograms. The region to the right of the red dashed line is the region of interest and the look-elsewhere-effect corrected $\mathrm {\tilde{p}}$-value is also displayed. For these final states, the flavour counterparts and corresponding exclusive event classes were checked and they did not show a large deviation. The $\mathrm {\tilde{p}}$-value distributions show that observing such deviations is still within the expectations from the SM only hypothesis given the number of event classes scanned. |

png pdf |
Additional Figure 24-a:
The relevant kinematic distributions for the two inclusive event classes with the largest deviation as determinded from the region of interest scan. The $\mathrm {S_{T}}$ distribution for the 2e $+$ 1$ {\mu}$ $+$ 1b $+$ 5 jets $+$ X event class is shown. The data events are shown in black and the simulations of the SM processes are shown as coloured histograms. The region to the right of the red dashed line is the region of interest and the look-elsewhere-effect corrected $\mathrm {\tilde{p}}$-value is also displayed. For these final states, the flavour counterparts and corresponding exclusive event classes were checked and they did not show a large deviation. The $\mathrm {\tilde{p}}$-value distributions show that observing such deviations is still within the expectations from the SM only hypothesis given the number of event classes scanned. |
png pdf |
Additional Figure 24-b:
The relevant kinematic distributions for the two inclusive event classes with the largest deviation as determinded from the region of interest scan. The 2$ {\mu}$ $+$ X event class is shown. The data events are shown in black and the simulations of the SM processes are shown as coloured histograms. The region to the right of the red dashed line is the region of interest and the look-elsewhere-effect corrected $\mathrm {\tilde{p}}$-value is also displayed. For these final states, the flavour counterparts and corresponding exclusive event classes were checked and they did not show a large deviation. The $\mathrm {\tilde{p}}$-value distributions show that observing such deviations is still within the expectations from the SM only hypothesis given the number of event classes scanned. |

png pdf |
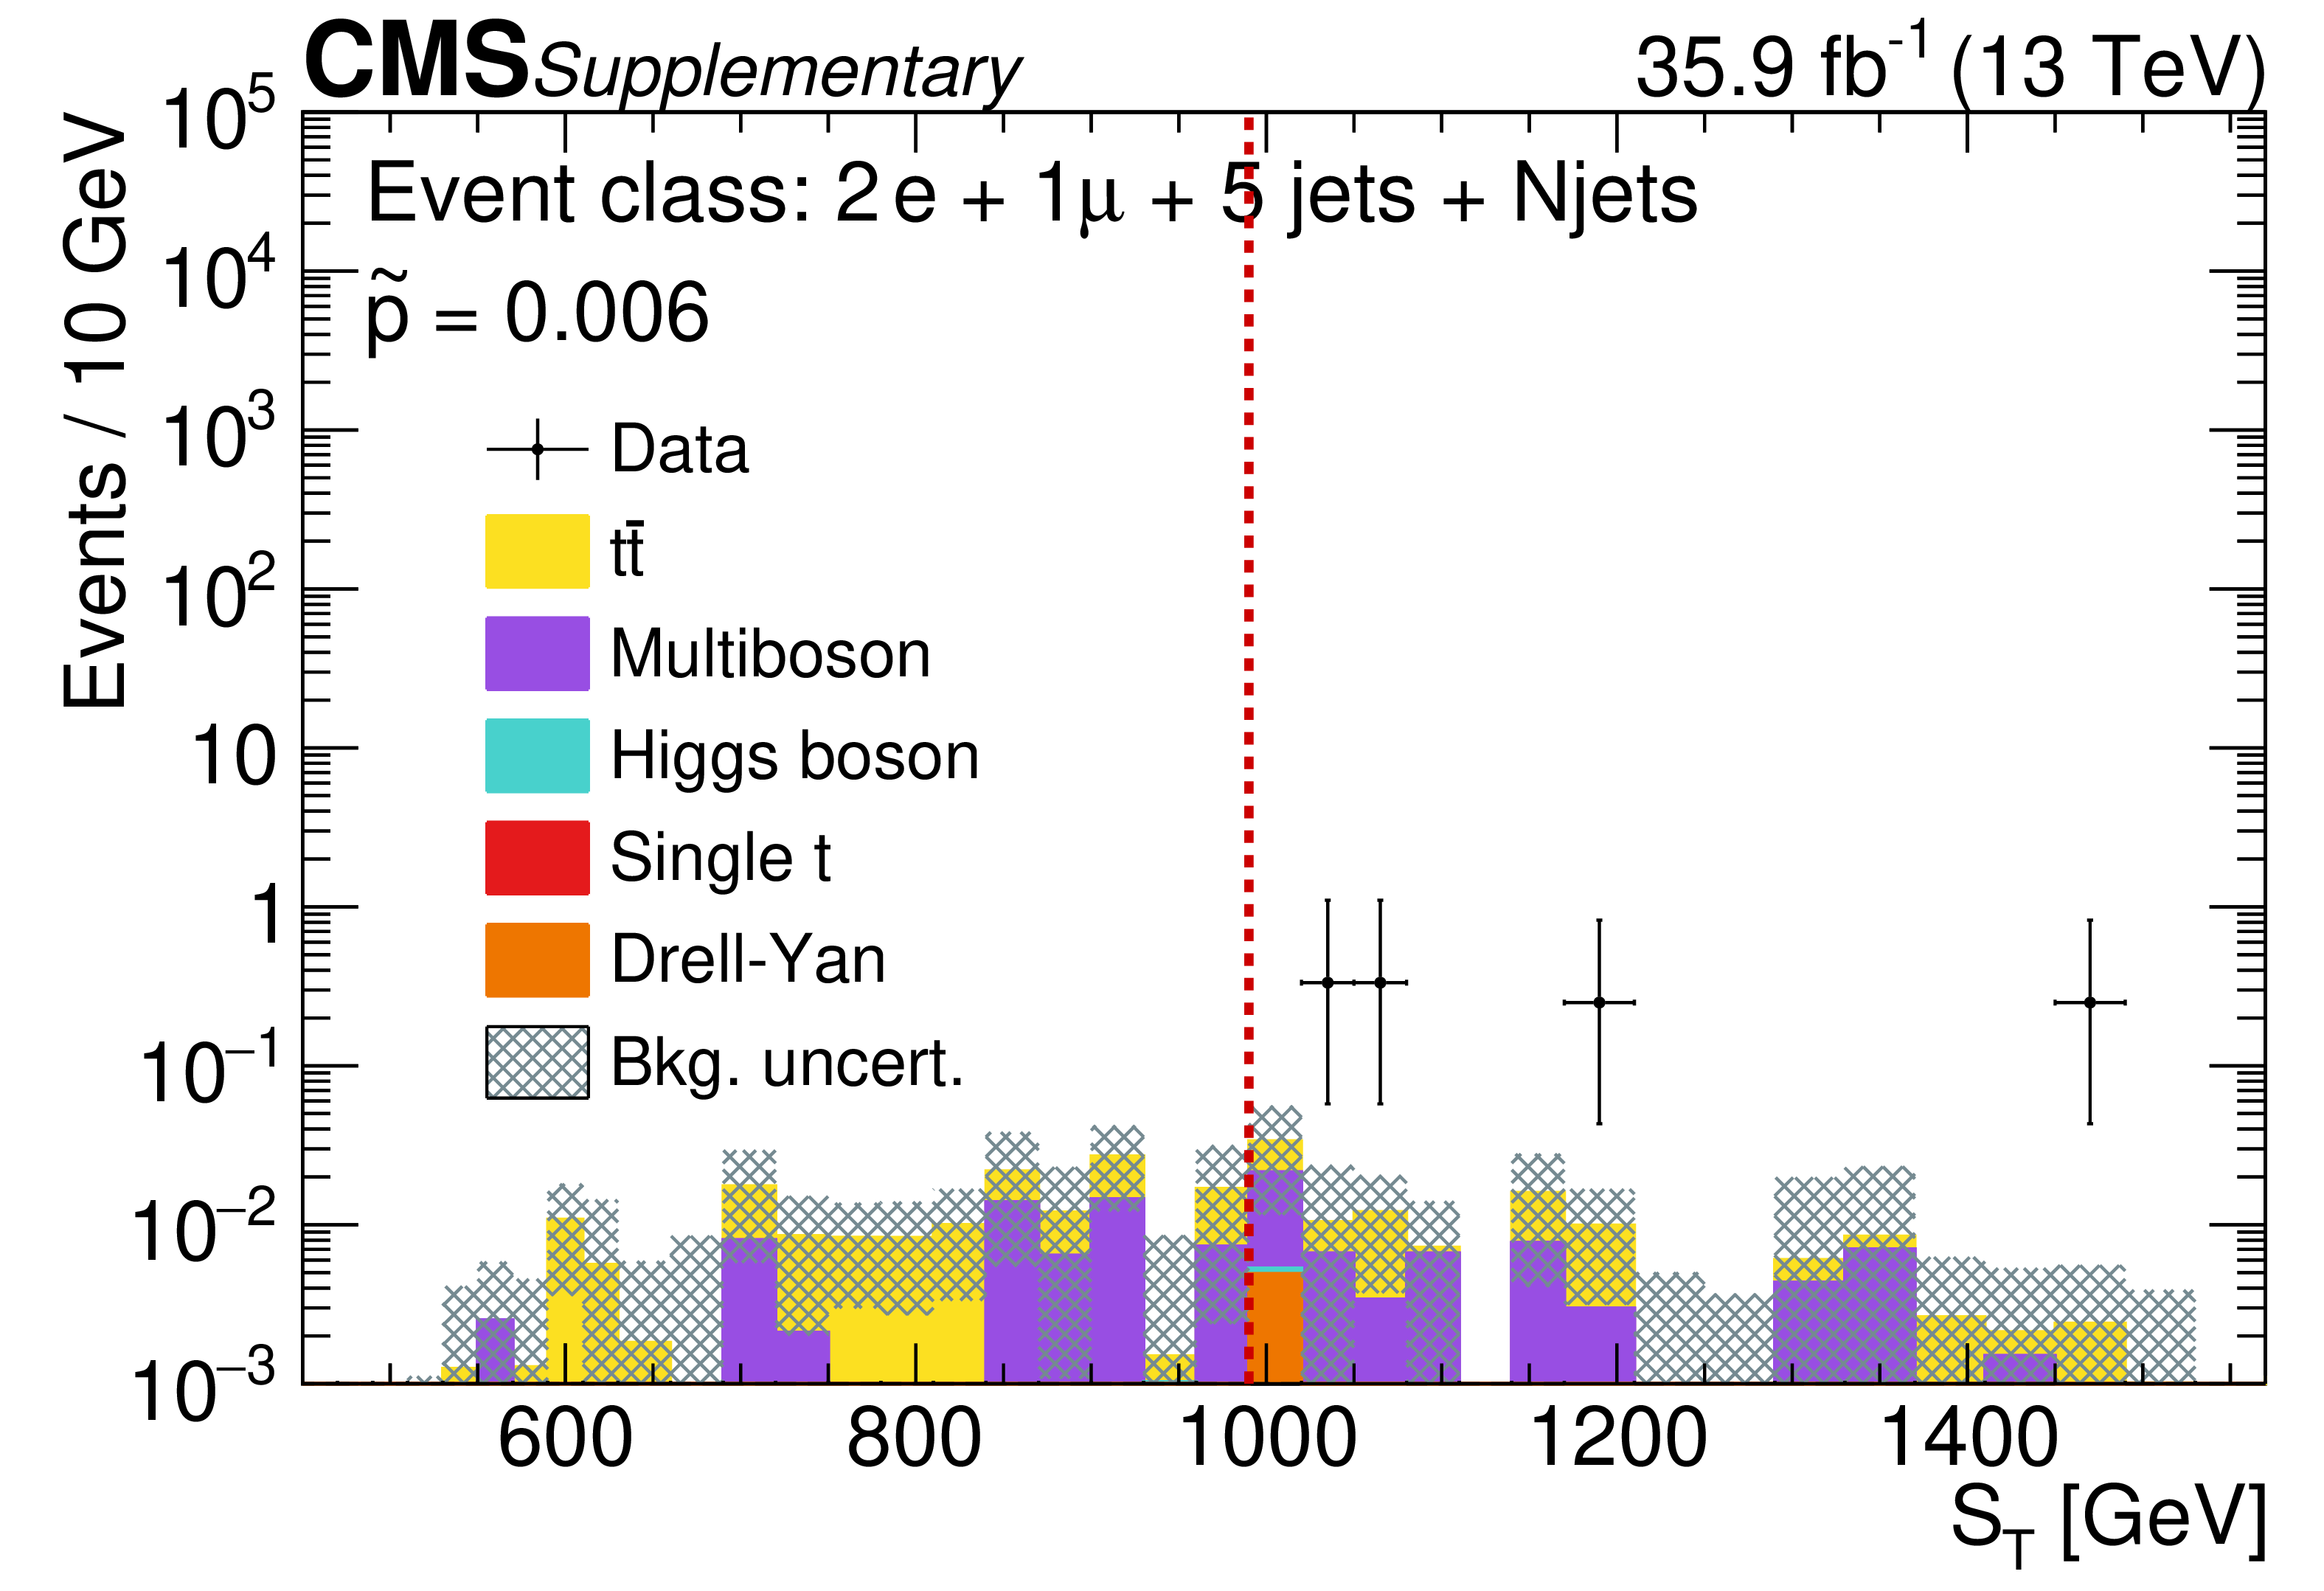
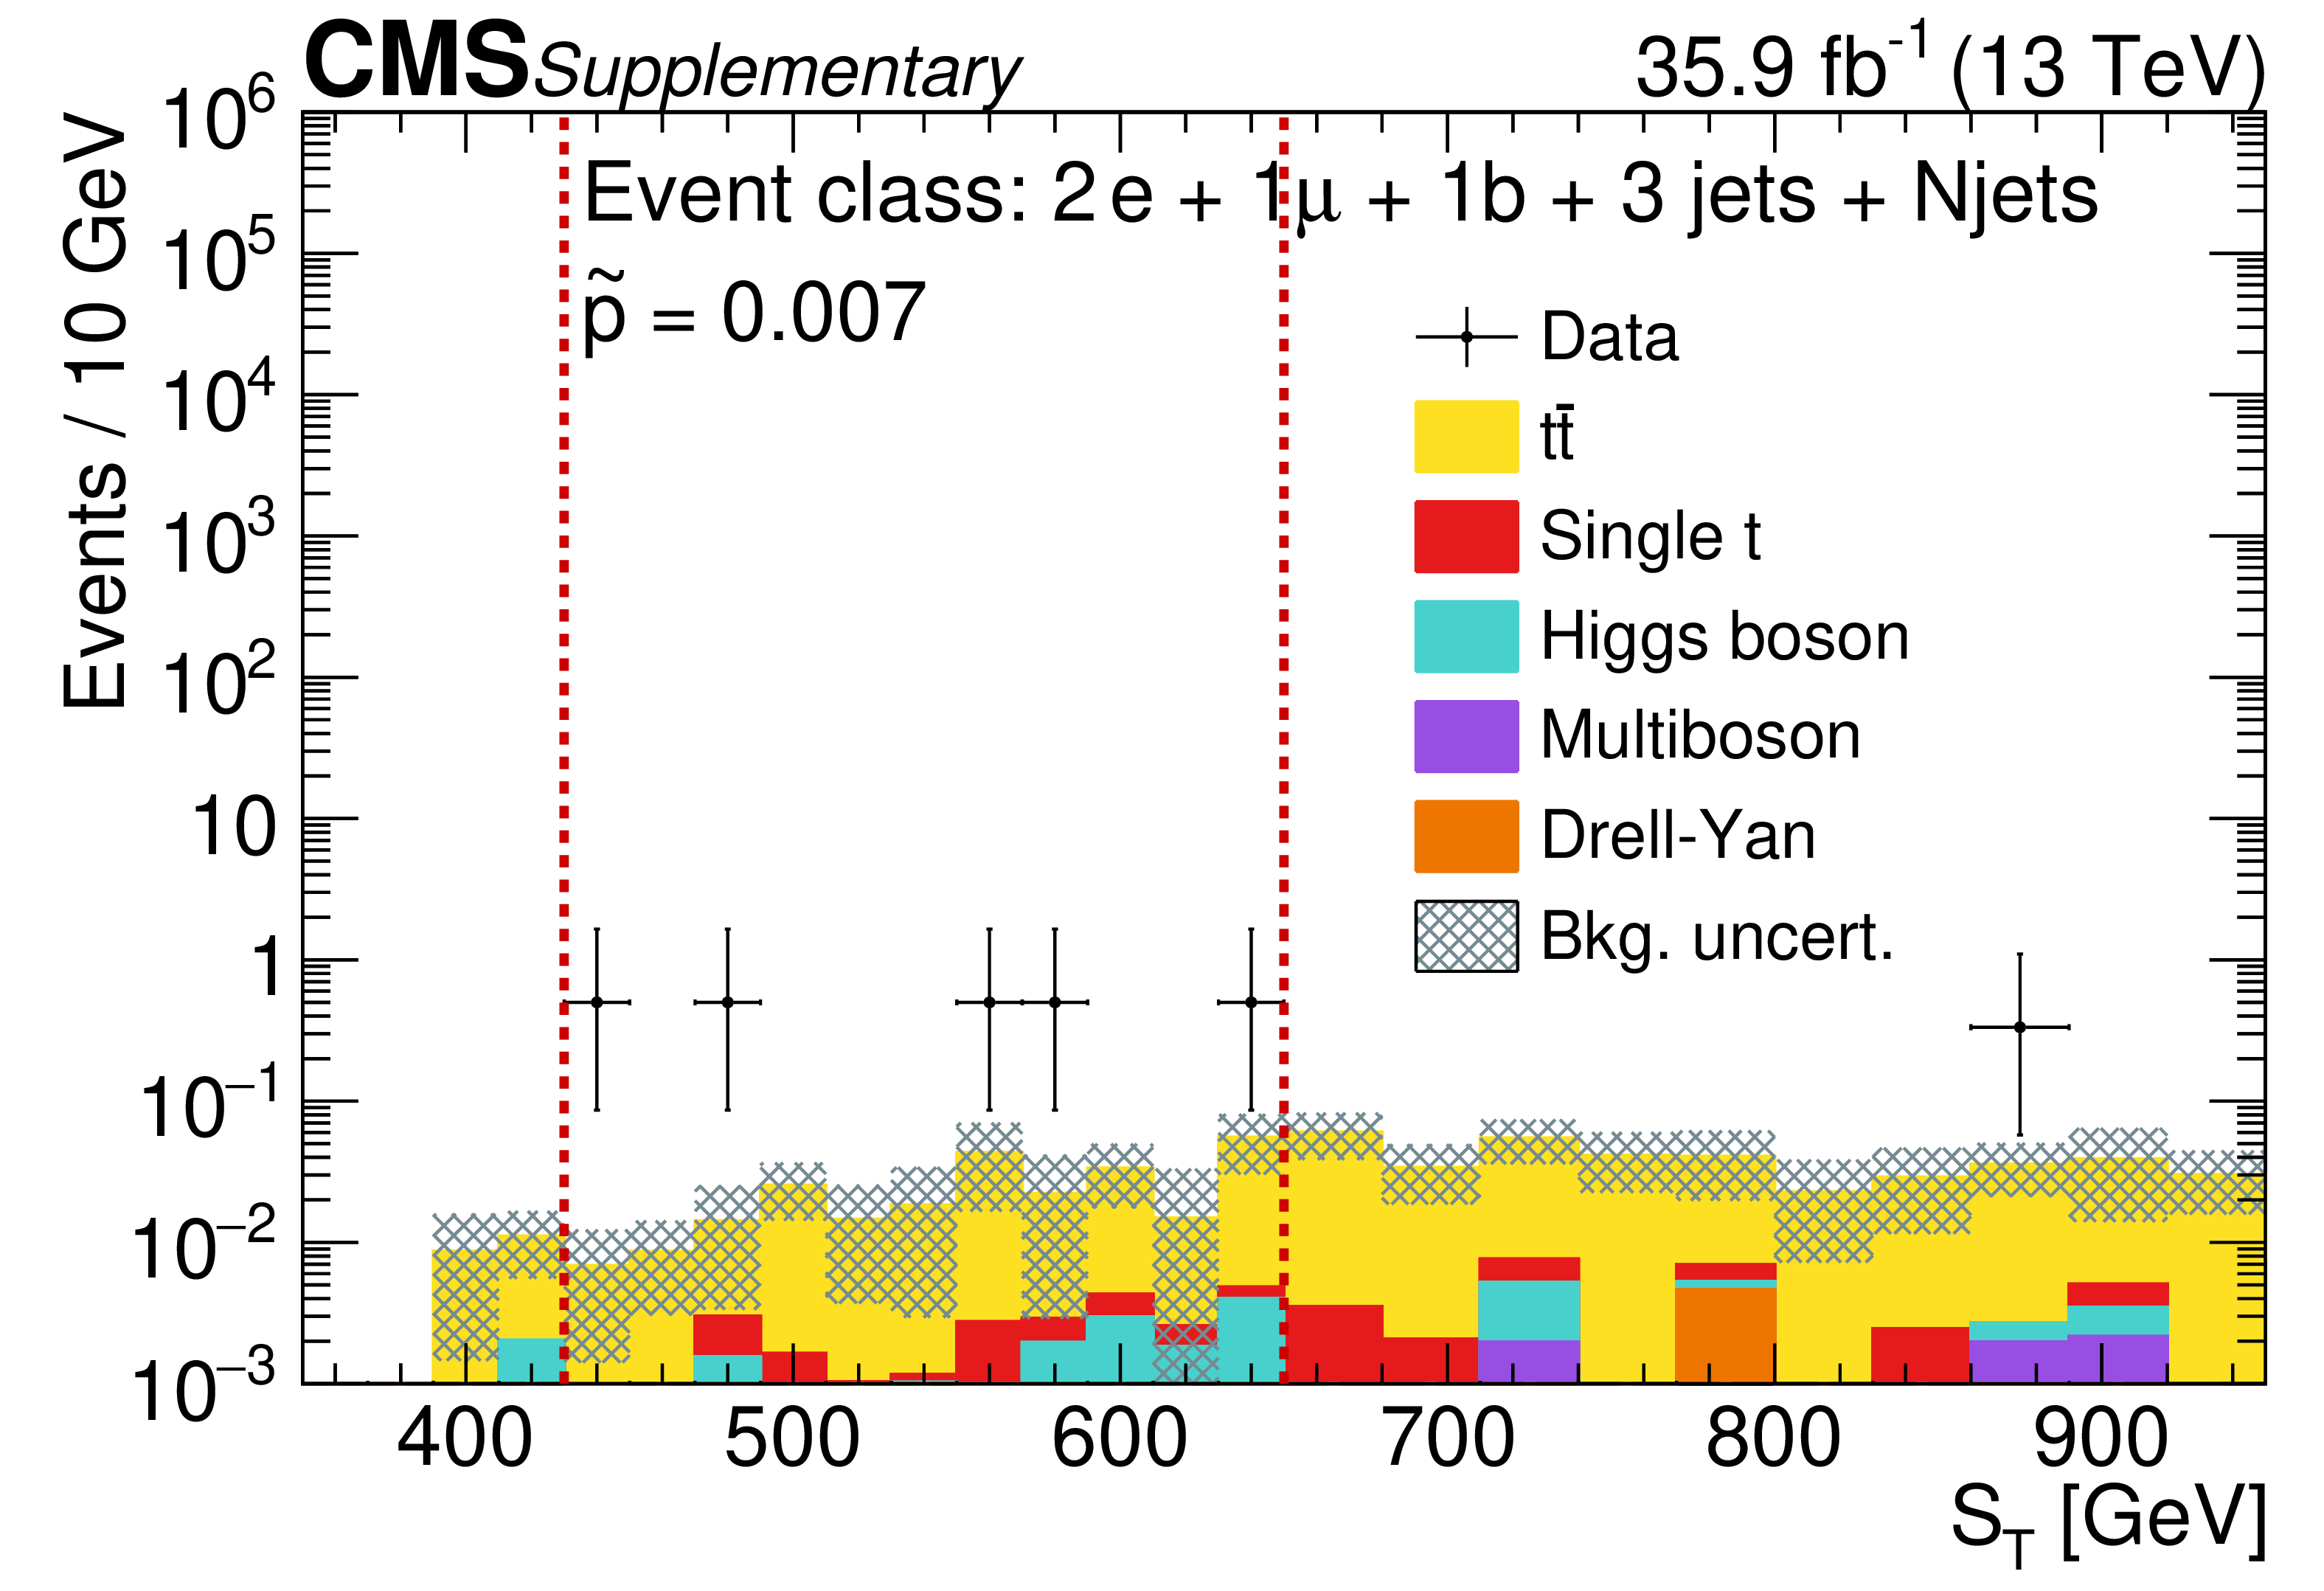
Additional Figure 25:
The relevant kinematic distributions for the two jet-inclusive event classes with the largest deviation as determinded from the region of interest scan. The $\mathrm {S_{T}}$ distribution for the 2e $+$ 1${\mu}$ $+$ 5 jets $+$ Njets event class (left) and the 2e $+$ 1${\mu}$ $+$ 1b $+$ 3 jets $+$ Njets event class (right) are shown. The data events are shown in black and the simulations of the SM processes are shown as coloured histograms. The region enclosed within the red dashed lines (or to the right of the red dashed line for the plot with a single line) is the region of interest and the look-elsewhere-effect corrected $\mathrm {\tilde{p}}$-value is also displayed. For these final states, the flavour counterparts and corresponding exclusive event classes were checked and they did not show a large deviation. The $\mathrm {\tilde{p}}$-value distributions show that observing such deviations is still within the expectations from the SM only hypothesis given the number of event classes scanned. |
png pdf |
Additional Figure 25-a:
The relevant kinematic distributions for the two jet-inclusive event classes with the largest deviation as determinded from the region of interest scan. The $\mathrm {S_{T}}$ distribution for the 2e $+$ 1${\mu}$ $+$ 5 jets $+$ Njets event class is shown. The data events are shown in black and the simulations of the SM processes are shown as coloured histograms. The region enclosed within the red dashed lines (or to the right of the red dashed line for the plot with a single line) is the region of interest and the look-elsewhere-effect corrected $\mathrm {\tilde{p}}$-value is also displayed. For these final states, the flavour counterparts and corresponding exclusive event classes were checked and they did not show a large deviation. The $\mathrm {\tilde{p}}$-value distributions show that observing such deviations is still within the expectations from the SM only hypothesis given the number of event classes scanned. |
png pdf |
Additional Figure 25-b:
The relevant kinematic distributions for the two jet-inclusive event classes with the largest deviation as determinded from the region of interest scan. The $\mathrm {S_{T}}$ distribution for the 2e $+$ 1${\mu}$ $+$ 1b $+$ 3 jets $+$ Njets event class is shown. The data events are shown in black and the simulations of the SM processes are shown as coloured histograms. The region enclosed within the red dashed lines (or to the right of the red dashed line for the plot with a single line) is the region of interest and the look-elsewhere-effect corrected $\mathrm {\tilde{p}}$-value is also displayed. For these final states, the flavour counterparts and corresponding exclusive event classes were checked and they did not show a large deviation. The $\mathrm {\tilde{p}}$-value distributions show that observing such deviations is still within the expectations from the SM only hypothesis given the number of event classes scanned. |
| References | ||||
| 1 | CMS Collaboration | The CMS experiment at the CERN LHC | JINST 3 (2008) S08004 | CMS-00-001 |
| 2 | D0 Collaboration | Search for new physics in e$ \mu $x data at D0 using SLEUTH: A quasi-model-independent search strategy for new physics | PRD 62 (2000) 092004 | hep-ex/0006011 |
| 3 | D0 Collaboration | Quasi-model-independent search for new physics at large transverse momentum | PRD 64 (2001) 012004 | hep-ex/0011067 |
| 4 | D0 Collaboration | Quasi-model-independent search for new high $ {p}_{T} $ physics at D0 | PRL 86 (2001) 3712 | hep-ex/0011071 |
| 5 | CDF Collaboration | Model-independent and quasi-model-independent search for new physics at CDF | PRD 78 (2008) 012002 | 0712.1311 |
| 6 | CDF Collaboration | Global search for new physics with 2.0 fb$ ^{-1} $ at CDF | PRD 79 (2009) 011101 | 0809.3781 |
| 7 | H1 Collaboration | A general search for new phenomena in ep scattering at HERA | PLB 602 (2004) 14 | hep-ex/0408044 |
| 8 | H1 Collaboration | A general search for new phenomena at HERA | PLB 674 (2009) 257 | 0901.0507 |
| 9 | ATLAS Collaboration | A strategy for a general search for new phenomena using data-derived signal regions and its application within the ATLAS experiment | EPJC 79 (2019) 120 | 1807.07447 |
| 10 | CMS Collaboration | Model unspecific search for new physics in pp collisions at $ \sqrt{s}=7 \mathrm{TeV} $ | CMS-PAS-EXO-10-021 | |
| 11 | CMS Collaboration | MUSiC, a model unspecific search for new physics, in pp collisions at $ \sqrt{s}=8 \mathrm{TeV} $ | CMS-PAS-EXO-14-016 | CMS-PAS-EXO-14-016 |
| 12 | CMS Collaboration | The CMS trigger system | JINST 12 (2017) P01020 | CMS-TRG-12-001 1609.02366 |
| 13 | CMS Collaboration | Particle-flow reconstruction and global event description with the CMS detector | JINST 12 (2017) P10003 | CMS-PRF-14-001 1706.04965 |
| 14 | M. Cacciari, G. P. Salam, and G. Soyez | The anti-$ {k_{\mathrm{T}}} $ jet clustering algorithm | JHEP 04 (2008) 063 | 0802.1189 |
| 15 | M. Cacciari, G. P. Salam, and G. Soyez | FastJet user manual | EPJC 72 (2012) 1896 | 1111.6097 |
| 16 | CMS Collaboration | Performance of photon reconstruction and identification with the CMS detector in proton-proton collisions at $ \sqrt{s} = $ 8 ~TeV | JINST 10 (2015) P08010 | CMS-EGM-14-001 1502.02702 |
| 17 | CMS Collaboration | Performance of electron reconstruction and selection with the CMS detector in proton-proton collisions at $ \sqrt{s} = $ 8 TeV | JINST 10 (2015) P06005 | CMS-EGM-13-001 1502.02701 |
| 18 | CMS Collaboration | Performance of the CMS muon detector and muon reconstruction with proton-proton collisions at $ \sqrt{s} = $ 13 TeV | JINST 13 (2018) P06015 | CMS-MUO-16-001 1804.04528 |
| 19 | CMS Collaboration | Jet energy scale and resolution in the CMS experiment in pp collisions at 8 TeV | JINST 12 (2017) P02014 | CMS-JME-13-004 1607.03663 |
| 20 | CMS Collaboration | Jet algorithms performance in 13 TeV data | CMS-PAS-JME-16-003 | CMS-PAS-JME-16-003 |
| 21 | CMS Collaboration | Identification of heavy-flavour jets with the CMS detector in pp collisions at 13 TeV | JINST 13 (2018) P05011 | CMS-BTV-16-002 1712.07158 |
| 22 | CMS Collaboration | Performance of missing transverse momentum reconstruction in proton-proton collisions at $ \sqrt{s}= $ 13 TeV using the CMS detector | JINST 14 (2019) P07004 | CMS-JME-17-001 1903.06078 |
| 23 | T. Sjostrand et al. | An introduction to PYTHIA 8.2 | CPC 191 (2015) 159 | 1410.3012 |
| 24 | J. Alwall et al. | The automated computation of tree-level and next-to-leading order differential cross sections, and their matching to parton shower simulations | JHEP 07 (2014) 079 | 1405.0301 |
| 25 | J. Alwall et al. | Comparative study of various algorithms for the merging of parton showers and matrix elements in hadronic collisions | EPJC 53 (2008) 473 | 0706.2569 |
| 26 | R. Frederix and S. Frixione | Merging meets matching in MC@NLO | JHEP 12 (2012) 061 | 1209.6215 |
| 27 | P. Nason | A new method for combining NLO QCD with shower Monte Carlo algorithms | JHEP 11 (2004) 040 | hep-ph/0409146 |
| 28 | S. Frixione, P. Nason, and C. Oleari | Matching NLO QCD computations with parton shower simulations: the POWHEG method | JHEP 11 (2007) 070 | 0709.2092 |
| 29 | S. Alioli, P. Nason, C. Oleari, and E. Re | A general framework for implementing NLO calculations in shower Monte Carlo programs: the POWHEG BOX | JHEP 06 (2010) 043 | 1002.2581 |
| 30 | S. Alioli, P. Nason, C. Oleari, and E. Re | NLO vector-boson production matched with shower in POWHEG | JHEP 07 (2008) 060 | 0805.4802 |
| 31 | E. Re | Single-top Wt-channel production matched with parton showers using the POWHEG method | EPJC 71 (2011) 1547 | 1009.2450 |
| 32 | S. Alioli, P. Nason, C. Oleari, and E. Re | NLO single-top production matched with shower in POWHEG: s- and t-channel contributions | JHEP 09 (2009) 111 | 0907.4076 |
| 33 | S. Alioli, P. Nason, C. Oleari, and E. Re | NLO Higgs boson production via gluon fusion matched with shower in POWHEG | JHEP 04 (2009) 002 | 0812.0578 |
| 34 | P. Nason and C. Oleari | NLO Higgs boson production via vector-boson fusion matched with shower in POWHEG | JHEP 02 (2010) 037 | 0911.5299 |
| 35 | T. Melia, P. Nason, R. Rontsch, and G. Zanderighi | W$ ^+ $W$ ^- $, WZ and ZZ production in the POWHEG BOX | JHEP 11 (2011) 078 | 1107.5051 |
| 36 | P. Nason and G. Zanderighi | W$ ^+ $W$ ^- $, WZ and ZZ production in the POWHEG-BOX-V2 | EPJC 74 (2014) 2702 | 1311.1365 |
| 37 | J. M. Campbell, R. K. Ellis, P. Nason, and E. Re | Top-pair production and decay at NLO matched with parton showers | JHEP 04 (2015) 114 | 1412.1828 |
| 38 | E. Bagnaschi, G. Degrassi, P. Slavich, and A. Vicini | Higgs production via gluon fusion in the POWHEG approach in the SM and in the MSSM | JHEP 02 (2012) 088 | 1111.2854 |
| 39 | Sherpa Collaboration | Event generation with Sherpa 2.2 | SciPost Phys. 7 (2019) 034 | 1905.09127 |
| 40 | T. Gleisberg et al. | Event generation with SHERPA 1.1 | JHEP 02 (2009) 007 | 0811.4622 |
| 41 | NNPDF Collaboration | Parton distributions for the LHC Run II | JHEP 04 (2015) 040 | 1410.8849 |
| 42 | CMS Collaboration | Event generator tunes obtained from underlying event and multiparton scattering measurements | EPJC 76 (2016) 155 | CMS-GEN-14-001 1512.00815 |
| 43 | GEANT4 Collaboration | GEANT4--a simulation toolkit | NIMA 506 (2003) 250 | |
| 44 | Y. Li and F. Petriello | Combining QCD and electroweak corrections to dilepton production in FEWZ | PRD 86 (2012) 094034 | 1208.5967 |
| 45 | S. G. Bondarenko and A. A. Sapronov | NLO EW and QCD proton-proton cross section calculations with mcsanc-v1.01 | CPC 184 (2013) 2343 | 1301.3687 |
| 46 | J. M. Campbell and R. K. Ellis | MCFM for the Tevatron and the LHC | NPPS 205--206 (2010) 10 | 1007.3492 |
| 47 | T. Gehrmann et al. | W$ ^+ $W$ ^- $ production at hadron colliders in next to next to leading order QCD | PRL 113 (2014) 212001 | 1408.5243 |
| 48 | M. Czakon and A. Mitov | Top++: A program for the calculation of the top-pair cross-section at hadron colliders | CPC 185 (2014) 2930 | 1112.5675 |
| 49 | M. Aliev et al. | HATHOR: HAdronic Top and Heavy quarks crOss section calculatoR | CPC 182 (2011) 1034 | 1007.1327 |
| 50 | P. Kant et al. | HATHOR for single top-quark production: Updated predictions and uncertainty estimates for single top-quark production in hadronic collisions | CPC 191 (2015) 74 | 1406.4403 |
| 51 | LHC Higgs Cross Section Working Group | Handbook of LHC Higgs cross sections: 4. deciphering the nature of the Higgs sector | CERN (2016) | 1610.07922 |
| 52 | CMS Collaboration | Performance of the reconstruction and identification of high-momentum muons in proton-proton collisions at $ \sqrt{s} = $ 13 TeV | JINST 15 (2020) P02027 | CMS-MUO-17-001 1912.03516 |
| 53 | CMS Collaboration | Search for high-mass resonances in dilepton final states in proton-proton collisions at $ \sqrt{s}= $ 13 TeV | JHEP 06 (2018) 120 | CMS-EXO-16-047 1803.06292 |
| 54 | J. Butterworth et al. | PDF4LHC recommendations for LHC Run II | JPG 43 (2016) 023001 | 1510.03865 |
| 55 | CMS Collaboration | CMS luminosity measurements for the 2016 data taking period | CMS-PAS-LUM-17-001 | CMS-PAS-LUM-17-001 |
| 56 | G. Altarelli, B. Mele, and M. Ruiz-Altaba | Searching for new heavy vector bosons in $ p \bar{p} $ colliders | Z. Phys. C 45 (1989) 109, .[Erratum: \DOI10.1007/BF01552335] | |
| 57 | CMS Collaboration | Search for high-mass resonances in final states with a lepton and missing transverse momentum at $ \sqrt{s}= $ 13 TeV | JHEP 06 (2018) 128 | CMS-EXO-16-033 1803.11133 |
| 58 | G. 't Hooft | Symmetry breaking through Bell-Jackiw anomalies | PRL 37 (1976) 8 | |
| 59 | F. R. Klinkhamer and N. S. Manton | A saddle-point solution in the Weinberg-Salam theory | PRD 30 (1984) 2212 | |
| 60 | A. Ringwald | High-energy breakdown of perturbation theory in the electroweak instanton sector | NPB 330 (1990) 1 | |
| 61 | J. Ellis and K. Sakurai | Search for sphalerons in proton-proton collisions | JHEP 04 (2016) 086 | 1601.03654 |
| 62 | M. Trodden | Electroweak baryogenesis | Rev. Mod. Phys. 71 (1999) 1463 | hep-ph/9803479 |
| 63 | CMS Collaboration | Search for black holes and sphalerons in high-multiplicity final states in proton-proton collisions at $ \sqrt{s}= $ 13 TeV | JHEP 11 (2018) 042 | CMS-EXO-17-023 1805.06013 |
| 64 | C. Bravo and J. Hauser | BaryoGEN, a Monte Carlo generator for sphaleron-like transitions in proton-proton collisions | JHEP 11 (2018) 041 | 1805.02786 |
| 65 | H.-L. Lai et al. | New parton distributions for collider physics | PRD 82 (2010) 074024 | 1007.2241 |
| 66 | CMS Collaboration | Search for Z$ \gamma $ resonances using leptonic and hadronic final states in proton-proton collisions at $ \sqrt{s}= $ 13 TeV | JHEP 09 (2018) 148 | CMS-EXO-17-005 1712.03143 |
|
|
Compact Muon Solenoid LHC, CERN |
|

|

|

|

|

|