

Compact Muon Solenoid
LHC, CERN
| CMS-EXO-17-005 ; CERN-EP-2017-301 | ||
| Search for Z$\gamma$ resonances using leptonic and hadronic final states in proton-proton collisions at $\sqrt{s}= $ 13 TeV | ||
| CMS Collaboration | ||
| 9 December 2017 | ||
| JHEP 09 (2018) 148 | ||
| Abstract: A search is presented for resonances decaying to a Z boson and a photon. The analysis is based on data from proton-proton collisions at a center-of-mass energy of 13 TeV, corresponding to an integrated luminosity of 35.9 fb$^{-1}$, and collected with the CMS detector at the LHC in 2016. Two decay modes of the Z boson are investigated. In the leptonic channels, the Z boson candidates are reconstructed using electron or muon pairs. In the hadronic channels, they are identified using a large-radius jet, containing either light-quark or b quark decay products of the Z boson, via jet substructure and advanced b quark tagging techniques. The results from these channels are combined and interpreted in terms of upper limits on the product of the production cross section and the branching fraction to Z$\gamma$ for narrow and broad spin-0 resonances with masses between 0.35 and 4.0 TeV, providing thereby the most stringent limits on such resonances. | ||
| Links: e-print arXiv:1712.03143 [hep-ex] (PDF) ; CDS record ; inSPIRE record ; CADI line (restricted) ; | ||
| Figures | |
png pdf |
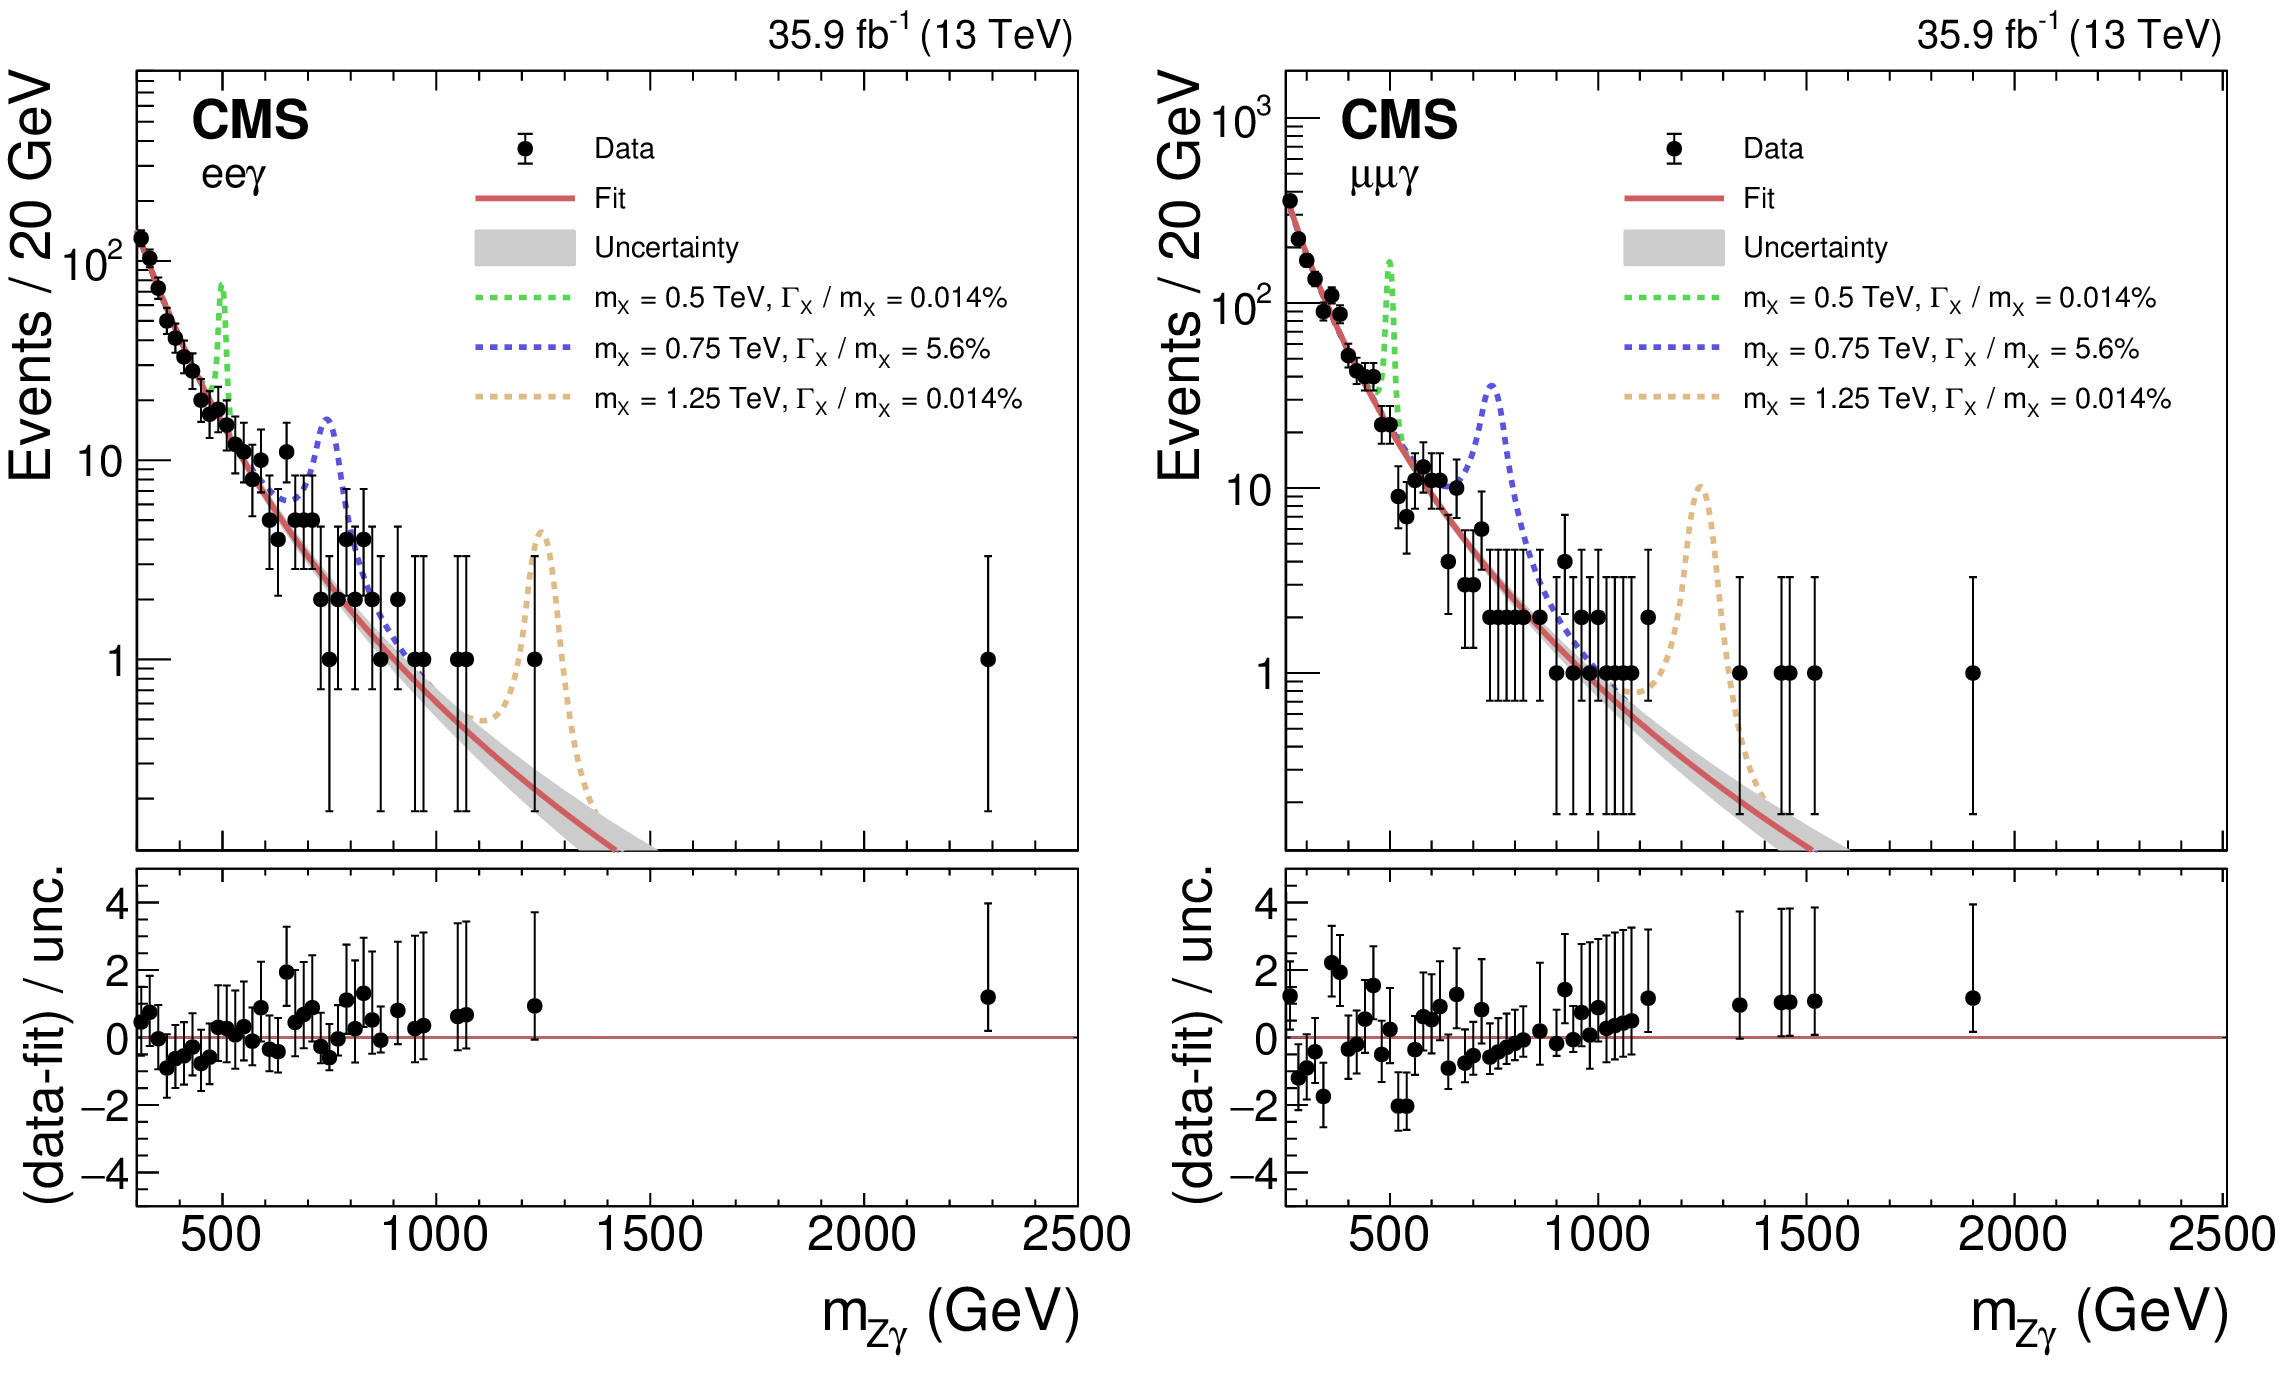
Figure 1:
Observed $ {m_{{\mathrm {Z}} \gamma}} $ invariant mass spectra in the $ {{\mathrm {e}} {\mathrm {e}}\gamma} $ (left) and $ {{{\mu}} {{\mu}}\gamma} $ (right) channels. The best fits to the background-only hypotheses are represented by the red lines, with their 68% CL uncertainty bands given by the gray shadings. Several narrow and broad signal benchmarks with arbitrary normalization are shown on top of the background prediction with the dashed lines. The lower panels show the difference between the data and the fits, divided by the uncertainty, which includes the statistical uncertainties in the data and the fit. For bins with a small number of entries, the error bars correspond to the Garwood confidence intervals [77]. |
png pdf |
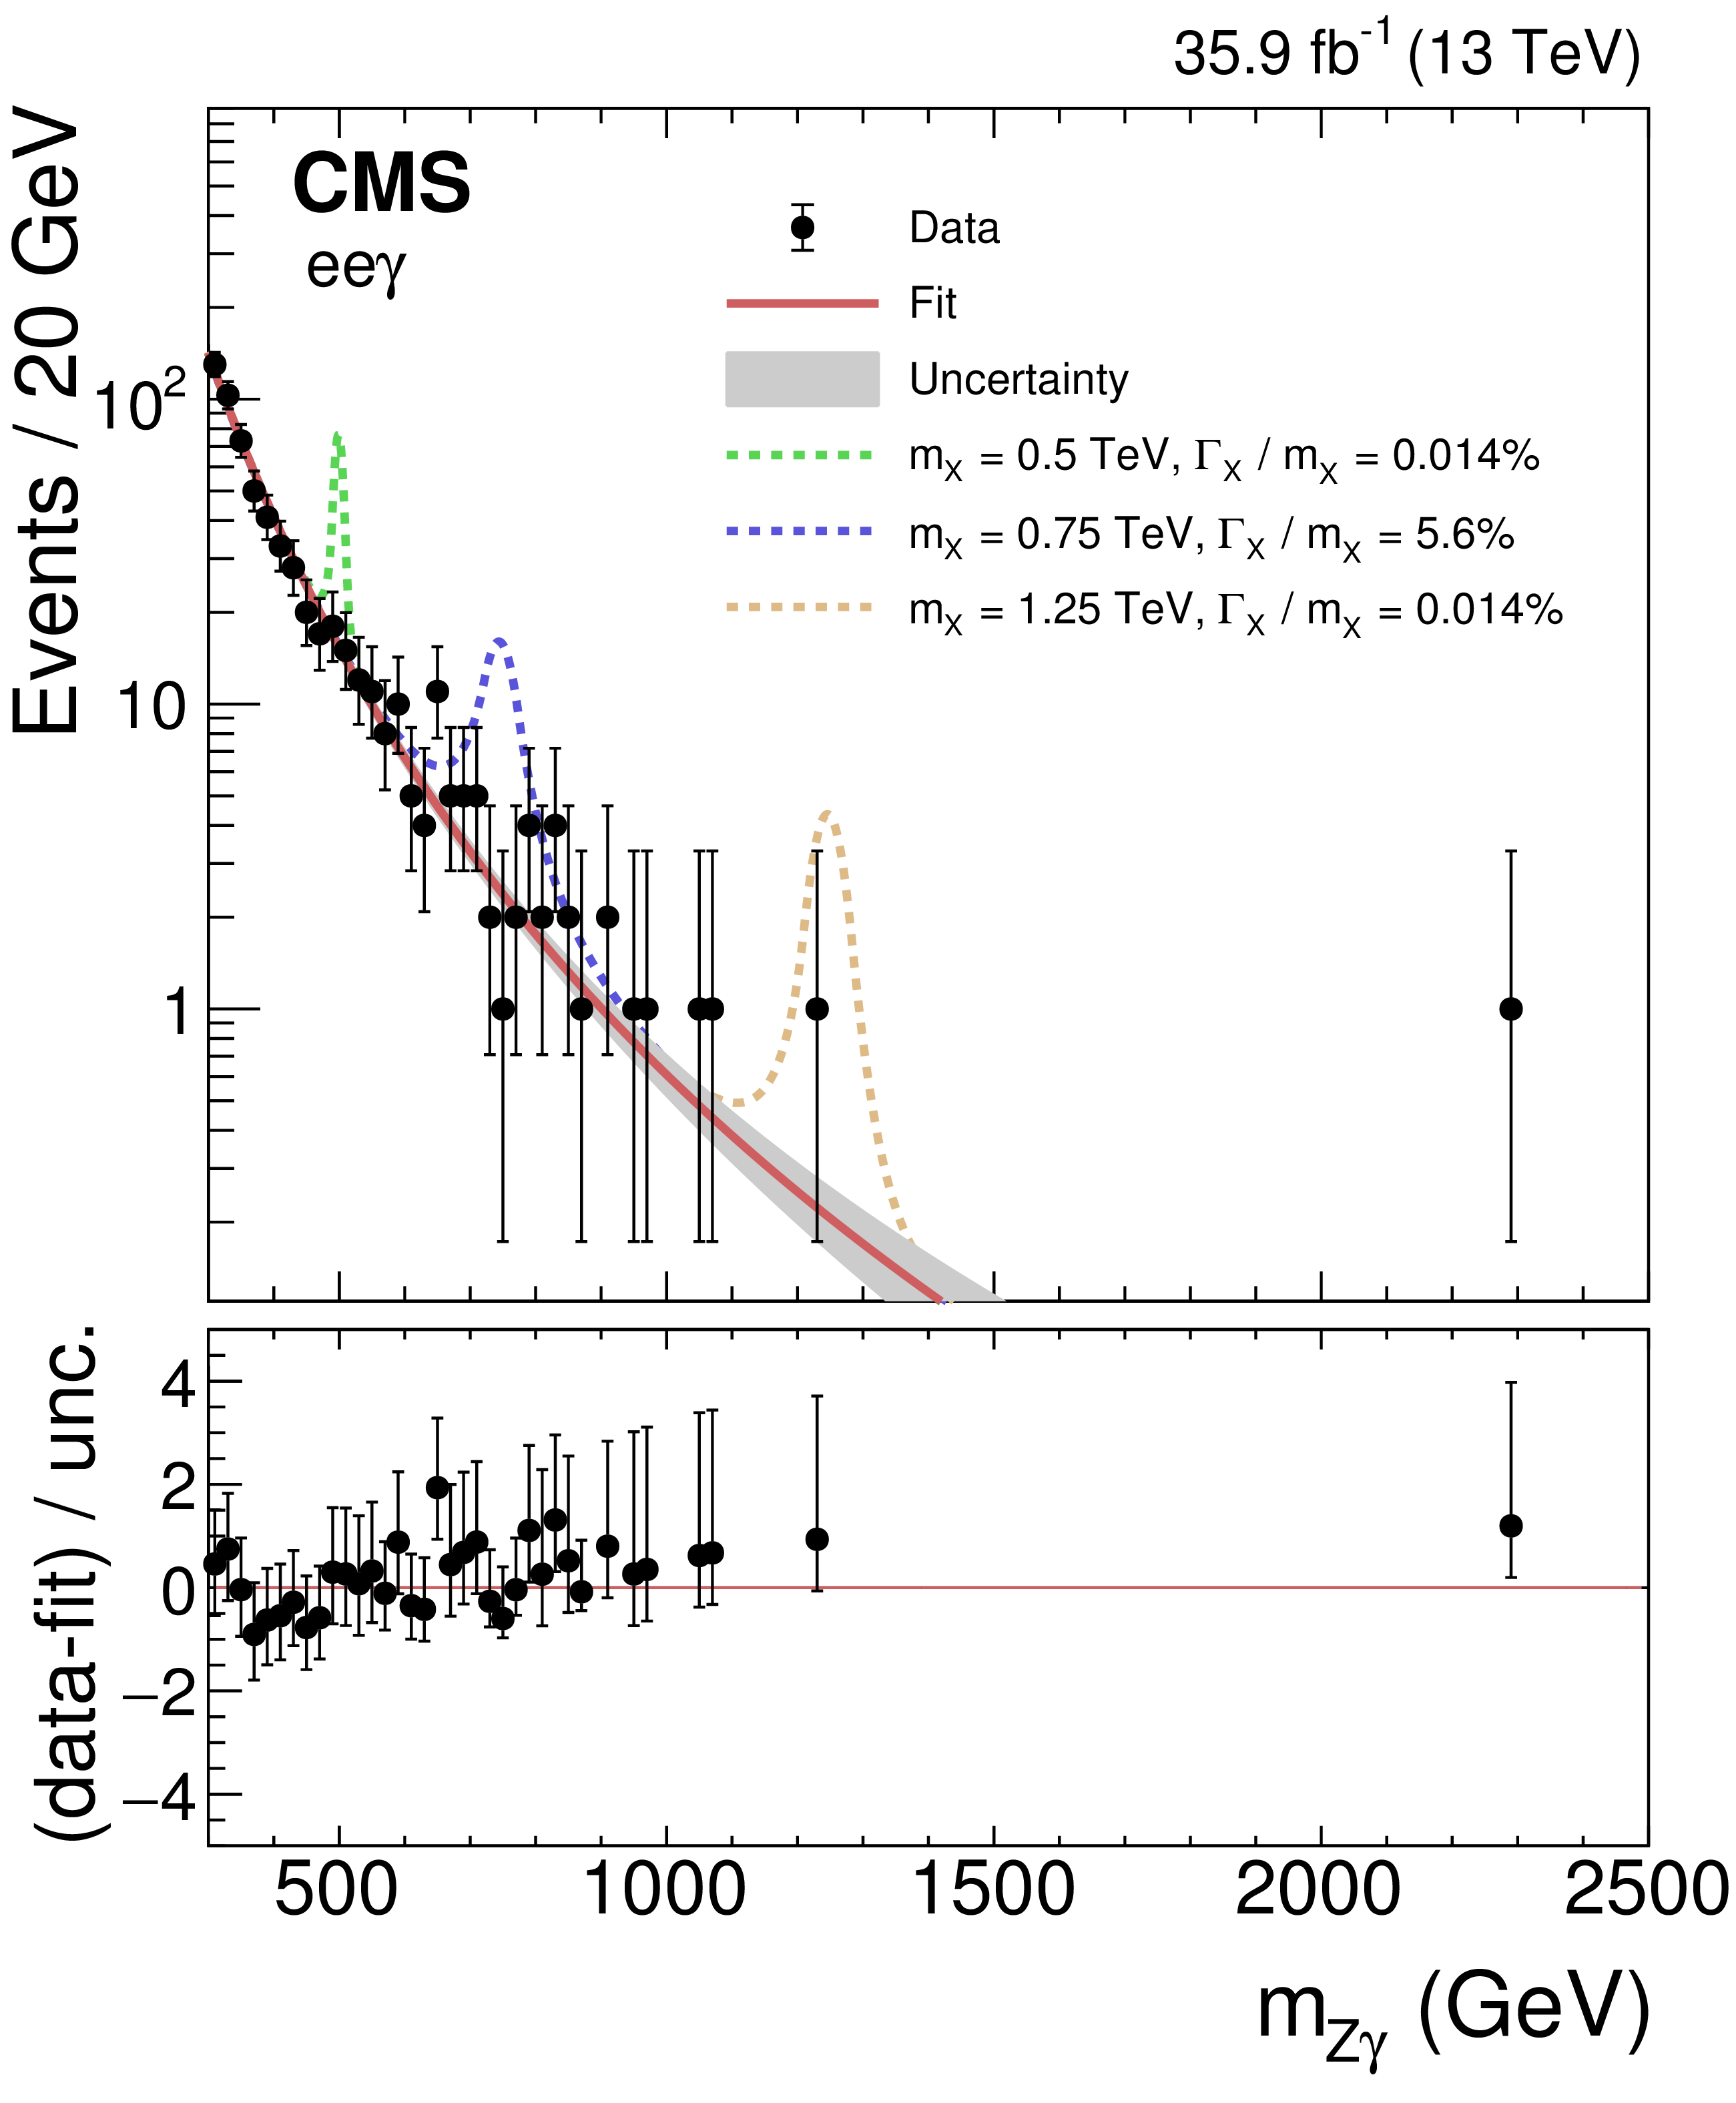
Figure 1-a:
Observed $ {m_{{\mathrm {Z}} \gamma}} $ invariant mass spectrum in the $ {{\mathrm {e}} {\mathrm {e}}\gamma} $ channel. The best fits to the background-only hypotheses are represented by the red lines, with their 68% CL uncertainty bands given by the gray shadings. Several narrow and broad signal benchmarks with arbitrary normalization are shown on top of the background prediction with the dashed lines. The lower panel shows the difference between the data and the fits, divided by the uncertainty, which includes the statistical uncertainties in the data and the fit. For bins with a small number of entries, the error bars correspond to the Garwood confidence intervals [77]. |
png pdf |
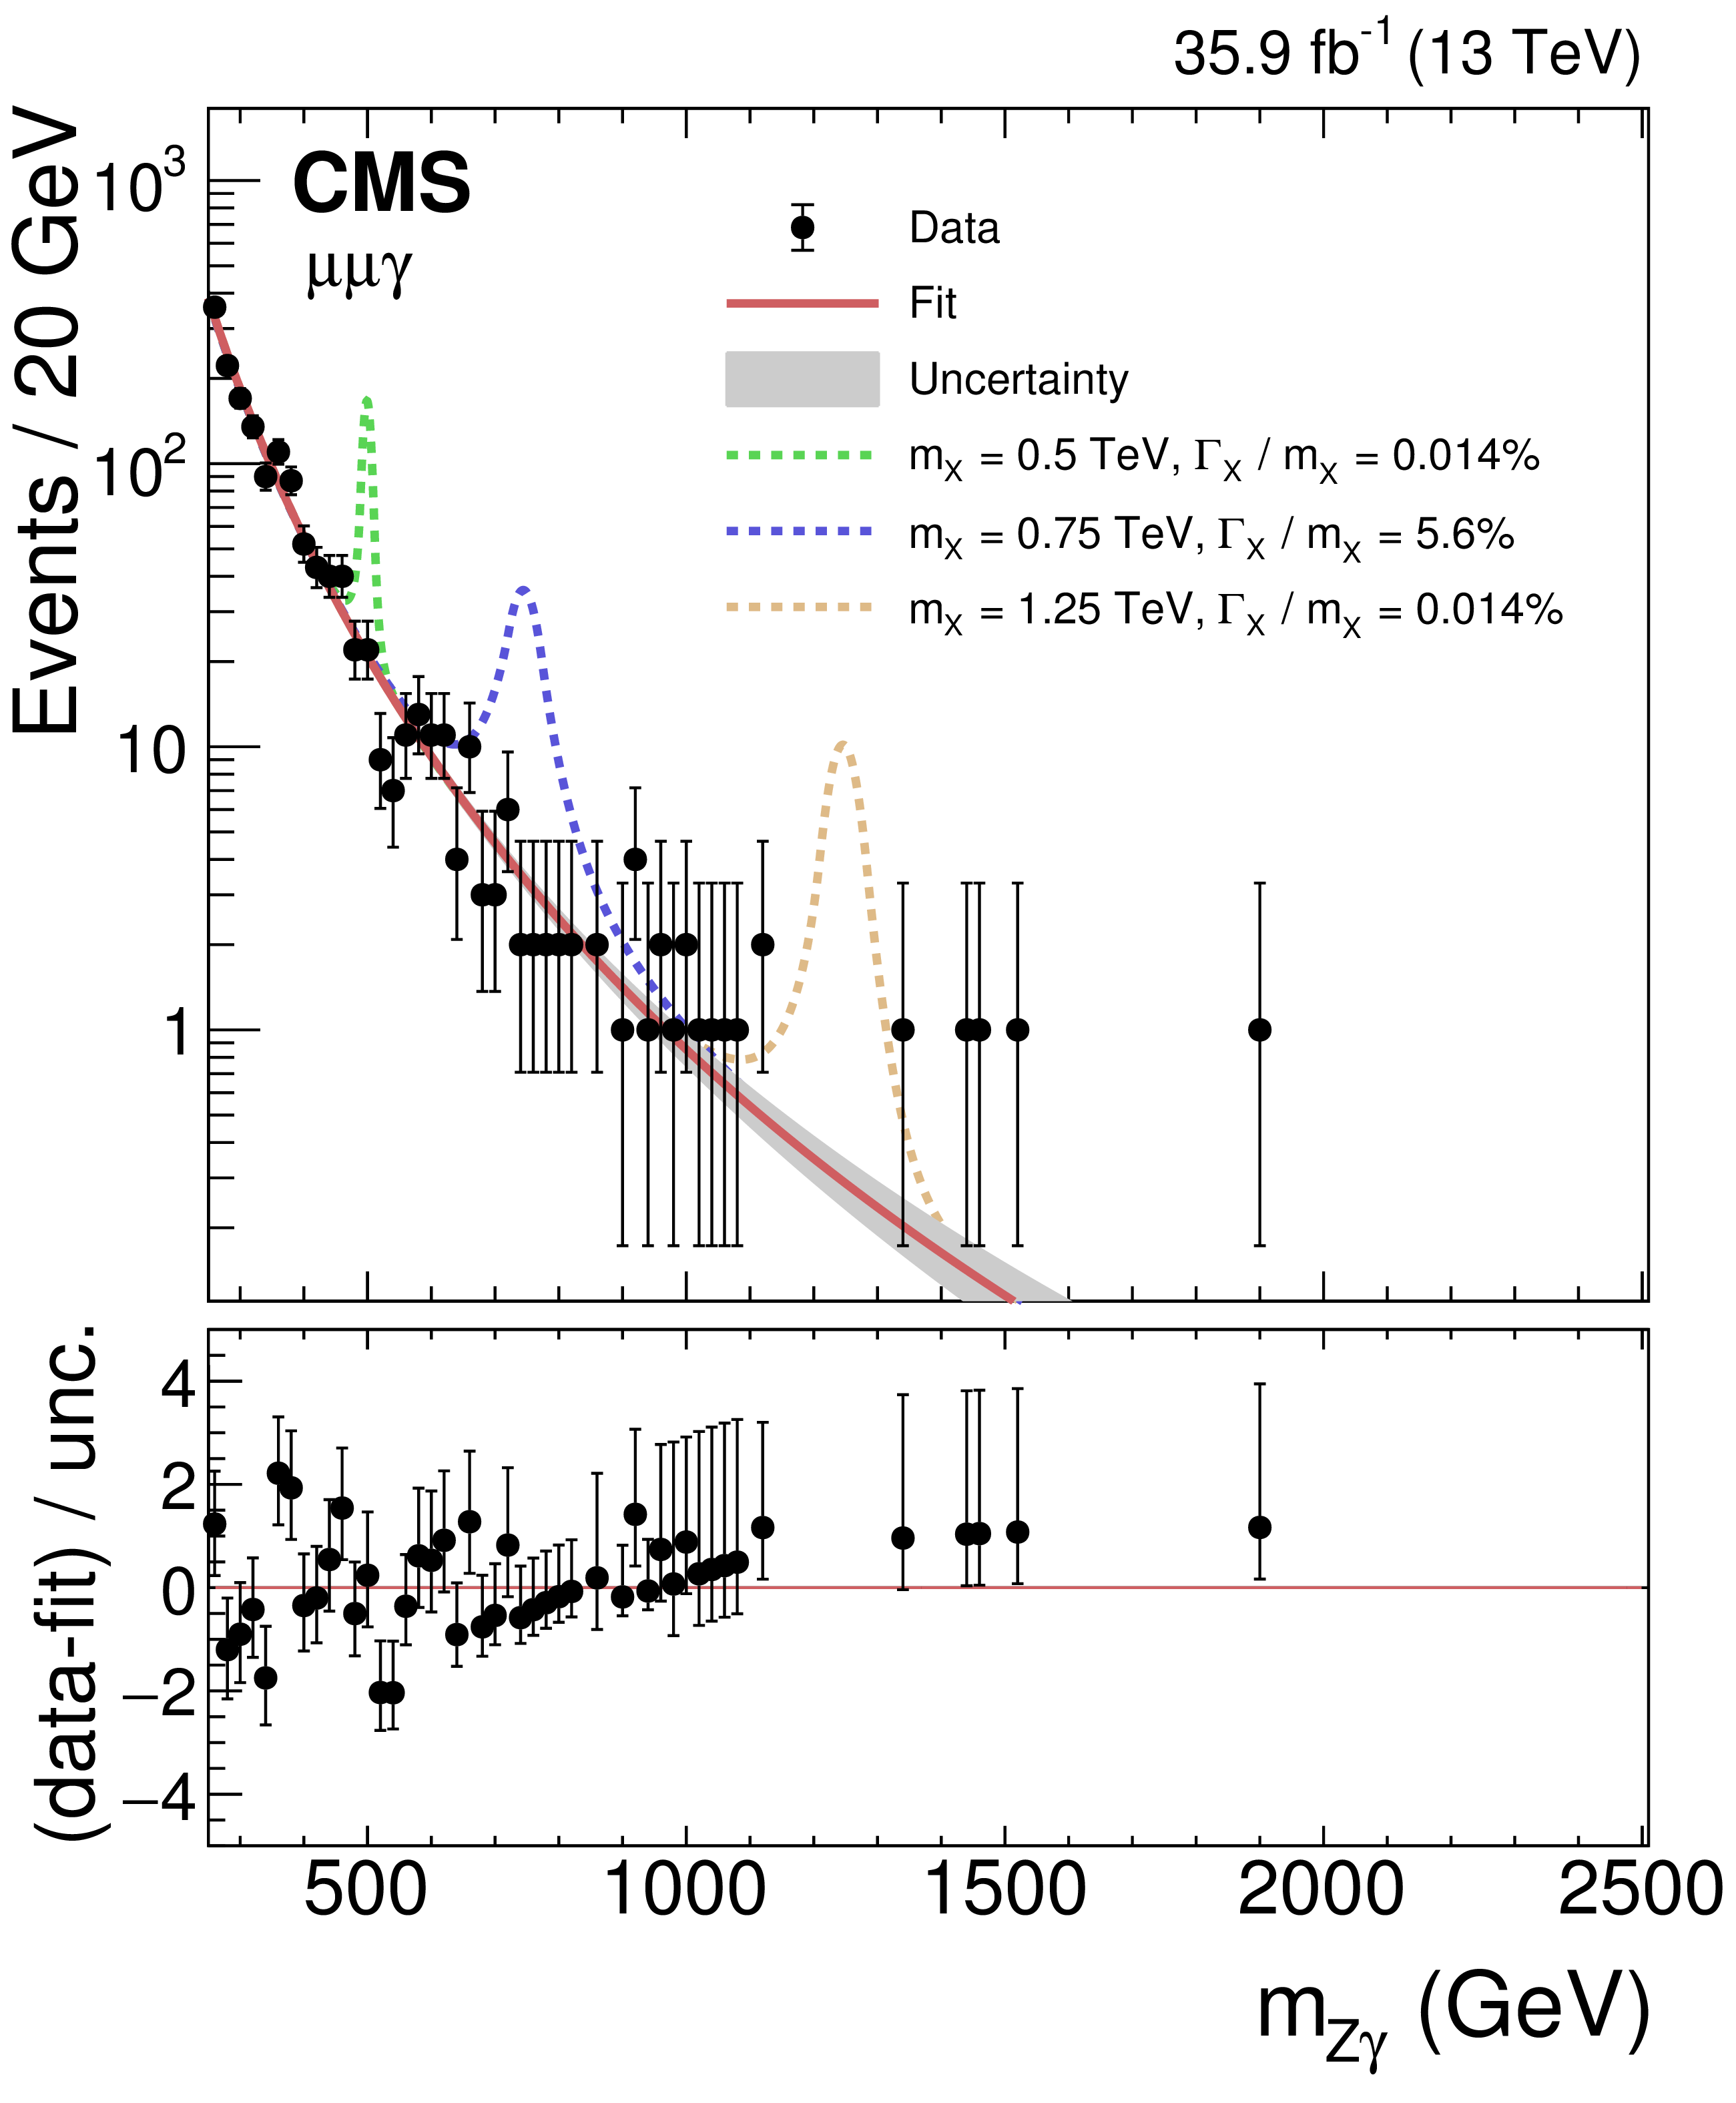
Figure 1-b:
Observed $ {m_{{\mathrm {Z}} \gamma}} $ invariant mass spectrum in the $ {{{\mu}} {{\mu}}\gamma} $ channel. The best fits to the background-only hypotheses are represented by the red lines, with their 68% CL uncertainty bands given by the gray shadings. Several narrow and broad signal benchmarks with arbitrary normalization are shown on top of the background prediction with the dashed lines. The lower panel shows the difference between the data and the fits, divided by the uncertainty, which includes the statistical uncertainties in the data and the fit. For bins with a small number of entries, the error bars correspond to the Garwood confidence intervals [77]. |

png pdf |
Figure 2:
Observed $ {m_{{\mathrm {Z}} \gamma}} $ invariant mass spectra in the ${\mathrm {J}\gamma}$ channel in the b-tagged (left), $\tau _{21}$-tagged (center), and untagged (right) categories. The best fits to the background-only hypotheses are represented by the red lines, with their 68% CL uncertainty bands given by the gray shadings. Several narrow and broad signal benchmarks with arbitrary normalization are shown on top of the background prediction with the dashed lines. The lower panels show the difference between the data and the fits, divided by the uncertainty, which includes the statistical uncertainties in the data and the fit. For bins with a small number of entries, the error bars correspond to the Garwood confidence intervals [77]. |

png pdf |
Figure 2-a:
Observed $ {m_{{\mathrm {Z}} \gamma}} $ invariant mass spectrum in the ${\mathrm {J}\gamma}$ channel in the b-tagged category. The best fits to the background-only hypotheses are represented by the red lines, with their 68% CL uncertainty bands given by the gray shadings. Several narrow and broad signal benchmarks with arbitrary normalization are shown on top of the background prediction with the dashed lines. The lower panel shows the difference between the data and the fits, divided by the uncertainty, which includes the statistical uncertainties in the data and the fit. For bins with a small number of entries, the error bars correspond to the Garwood confidence intervals [77]. |
png pdf |
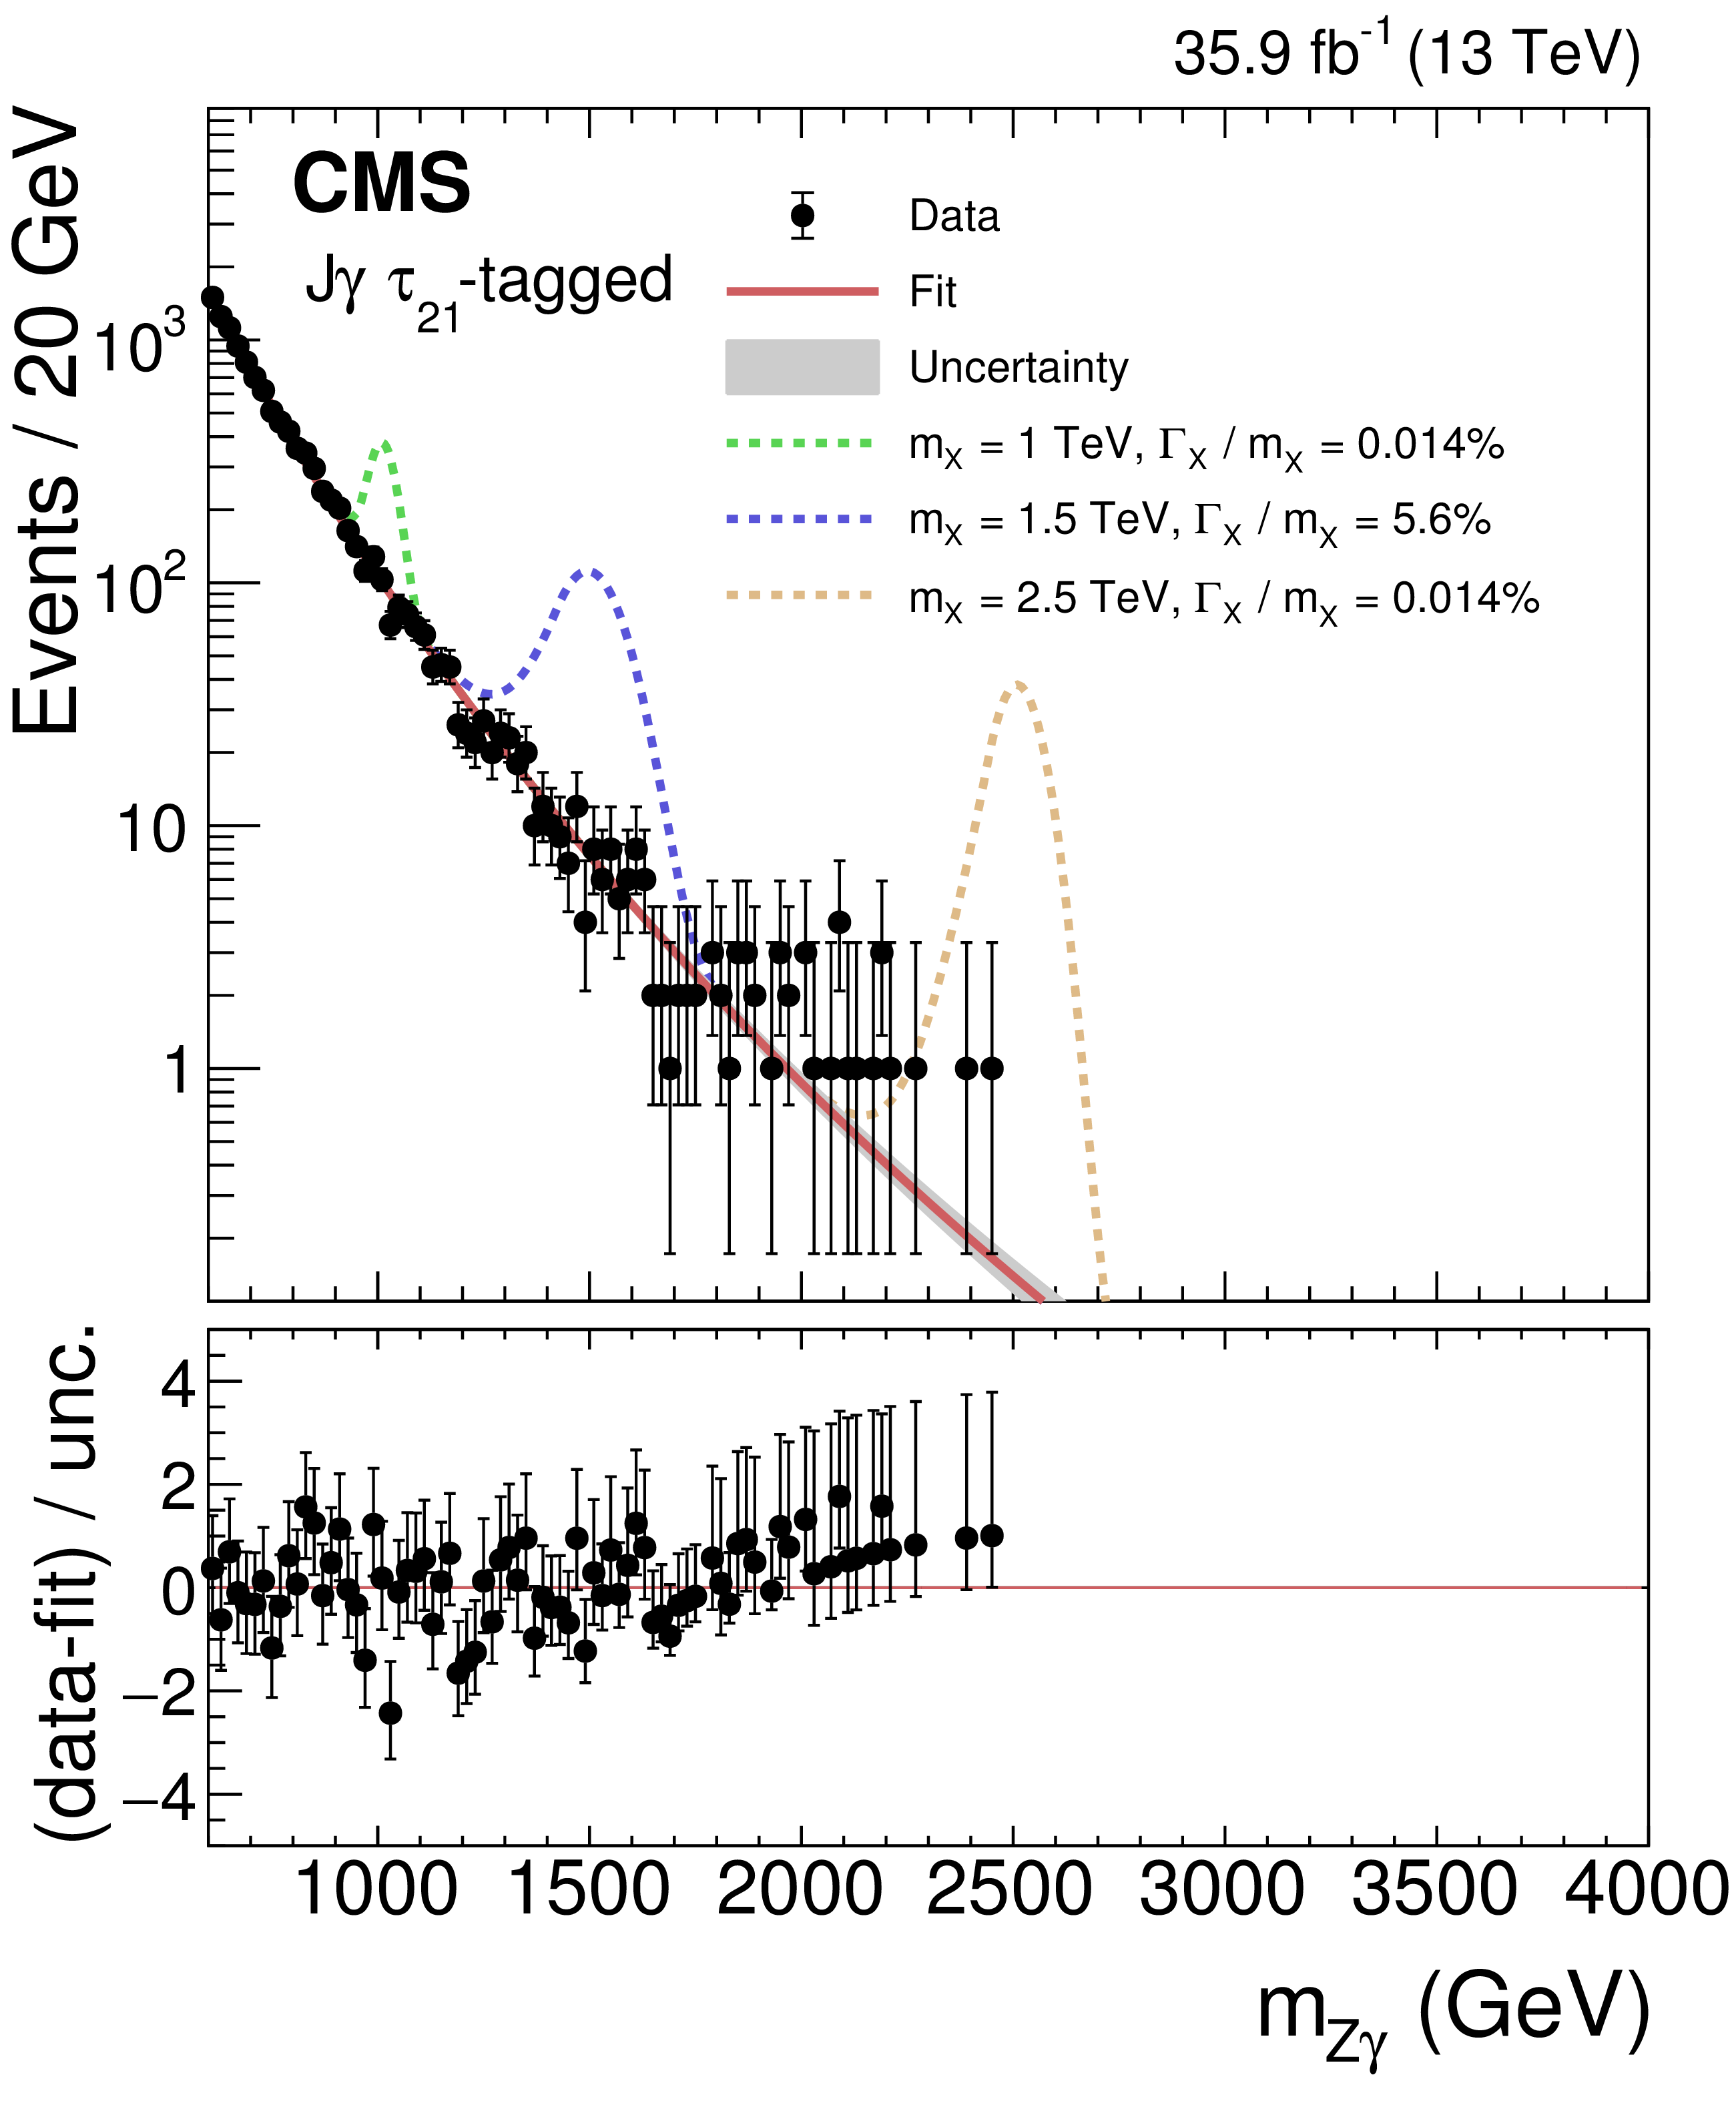
Figure 2-b:
Observed $ {m_{{\mathrm {Z}} \gamma}} $ invariant mass spectrum in the ${\mathrm {J}\gamma}$ channel in the $\tau _{21}$-tagged category. The best fits to the background-only hypotheses are represented by the red lines, with their 68% CL uncertainty bands given by the gray shadings. Several narrow and broad signal benchmarks with arbitrary normalization are shown on top of the background prediction with the dashed lines. The lower panel shows the difference between the data and the fits, divided by the uncertainty, which includes the statistical uncertainties in the data and the fit. For bins with a small number of entries, the error bars correspond to the Garwood confidence intervals [77]. |

png pdf |
Figure 2-c:
Observed $ {m_{{\mathrm {Z}} \gamma}} $ invariant mass spectrum in the ${\mathrm {J}\gamma}$ channel in the untagged category. The best fits to the background-only hypotheses are represented by the red lines, with their 68% CL uncertainty bands given by the gray shadings. Several narrow and broad signal benchmarks with arbitrary normalization are shown on top of the background prediction with the dashed lines. The lower panel shows the difference between the data and the fits, divided by the uncertainty, which includes the statistical uncertainties in the data and the fit. For bins with a small number of entries, the error bars correspond to the Garwood confidence intervals [77]. |

png pdf |
Figure 3:
Observed (solid) and expected (dashed) 95% CL upper limits on $\sigma (\mathrm {X}\to {\mathrm {Z}} {\gamma})\,\mathcal {B}({\mathrm {Z}} \to \ell \ell {\gamma})$, as a function of signal mass $m_\mathrm {X}$ for the ${{\mathrm {e}} {\mathrm {e}}\gamma}$ (left column) and ${{{\mu}} {{\mu}}\gamma}$ (right column) channels, and for narrow (upper row) and broad (lower row) spin-0 resonances. The green and yellow shaded bands correspond to respective 68 and 95% CL ranges in the expected limits for the background-only hypothesis. |
png pdf |
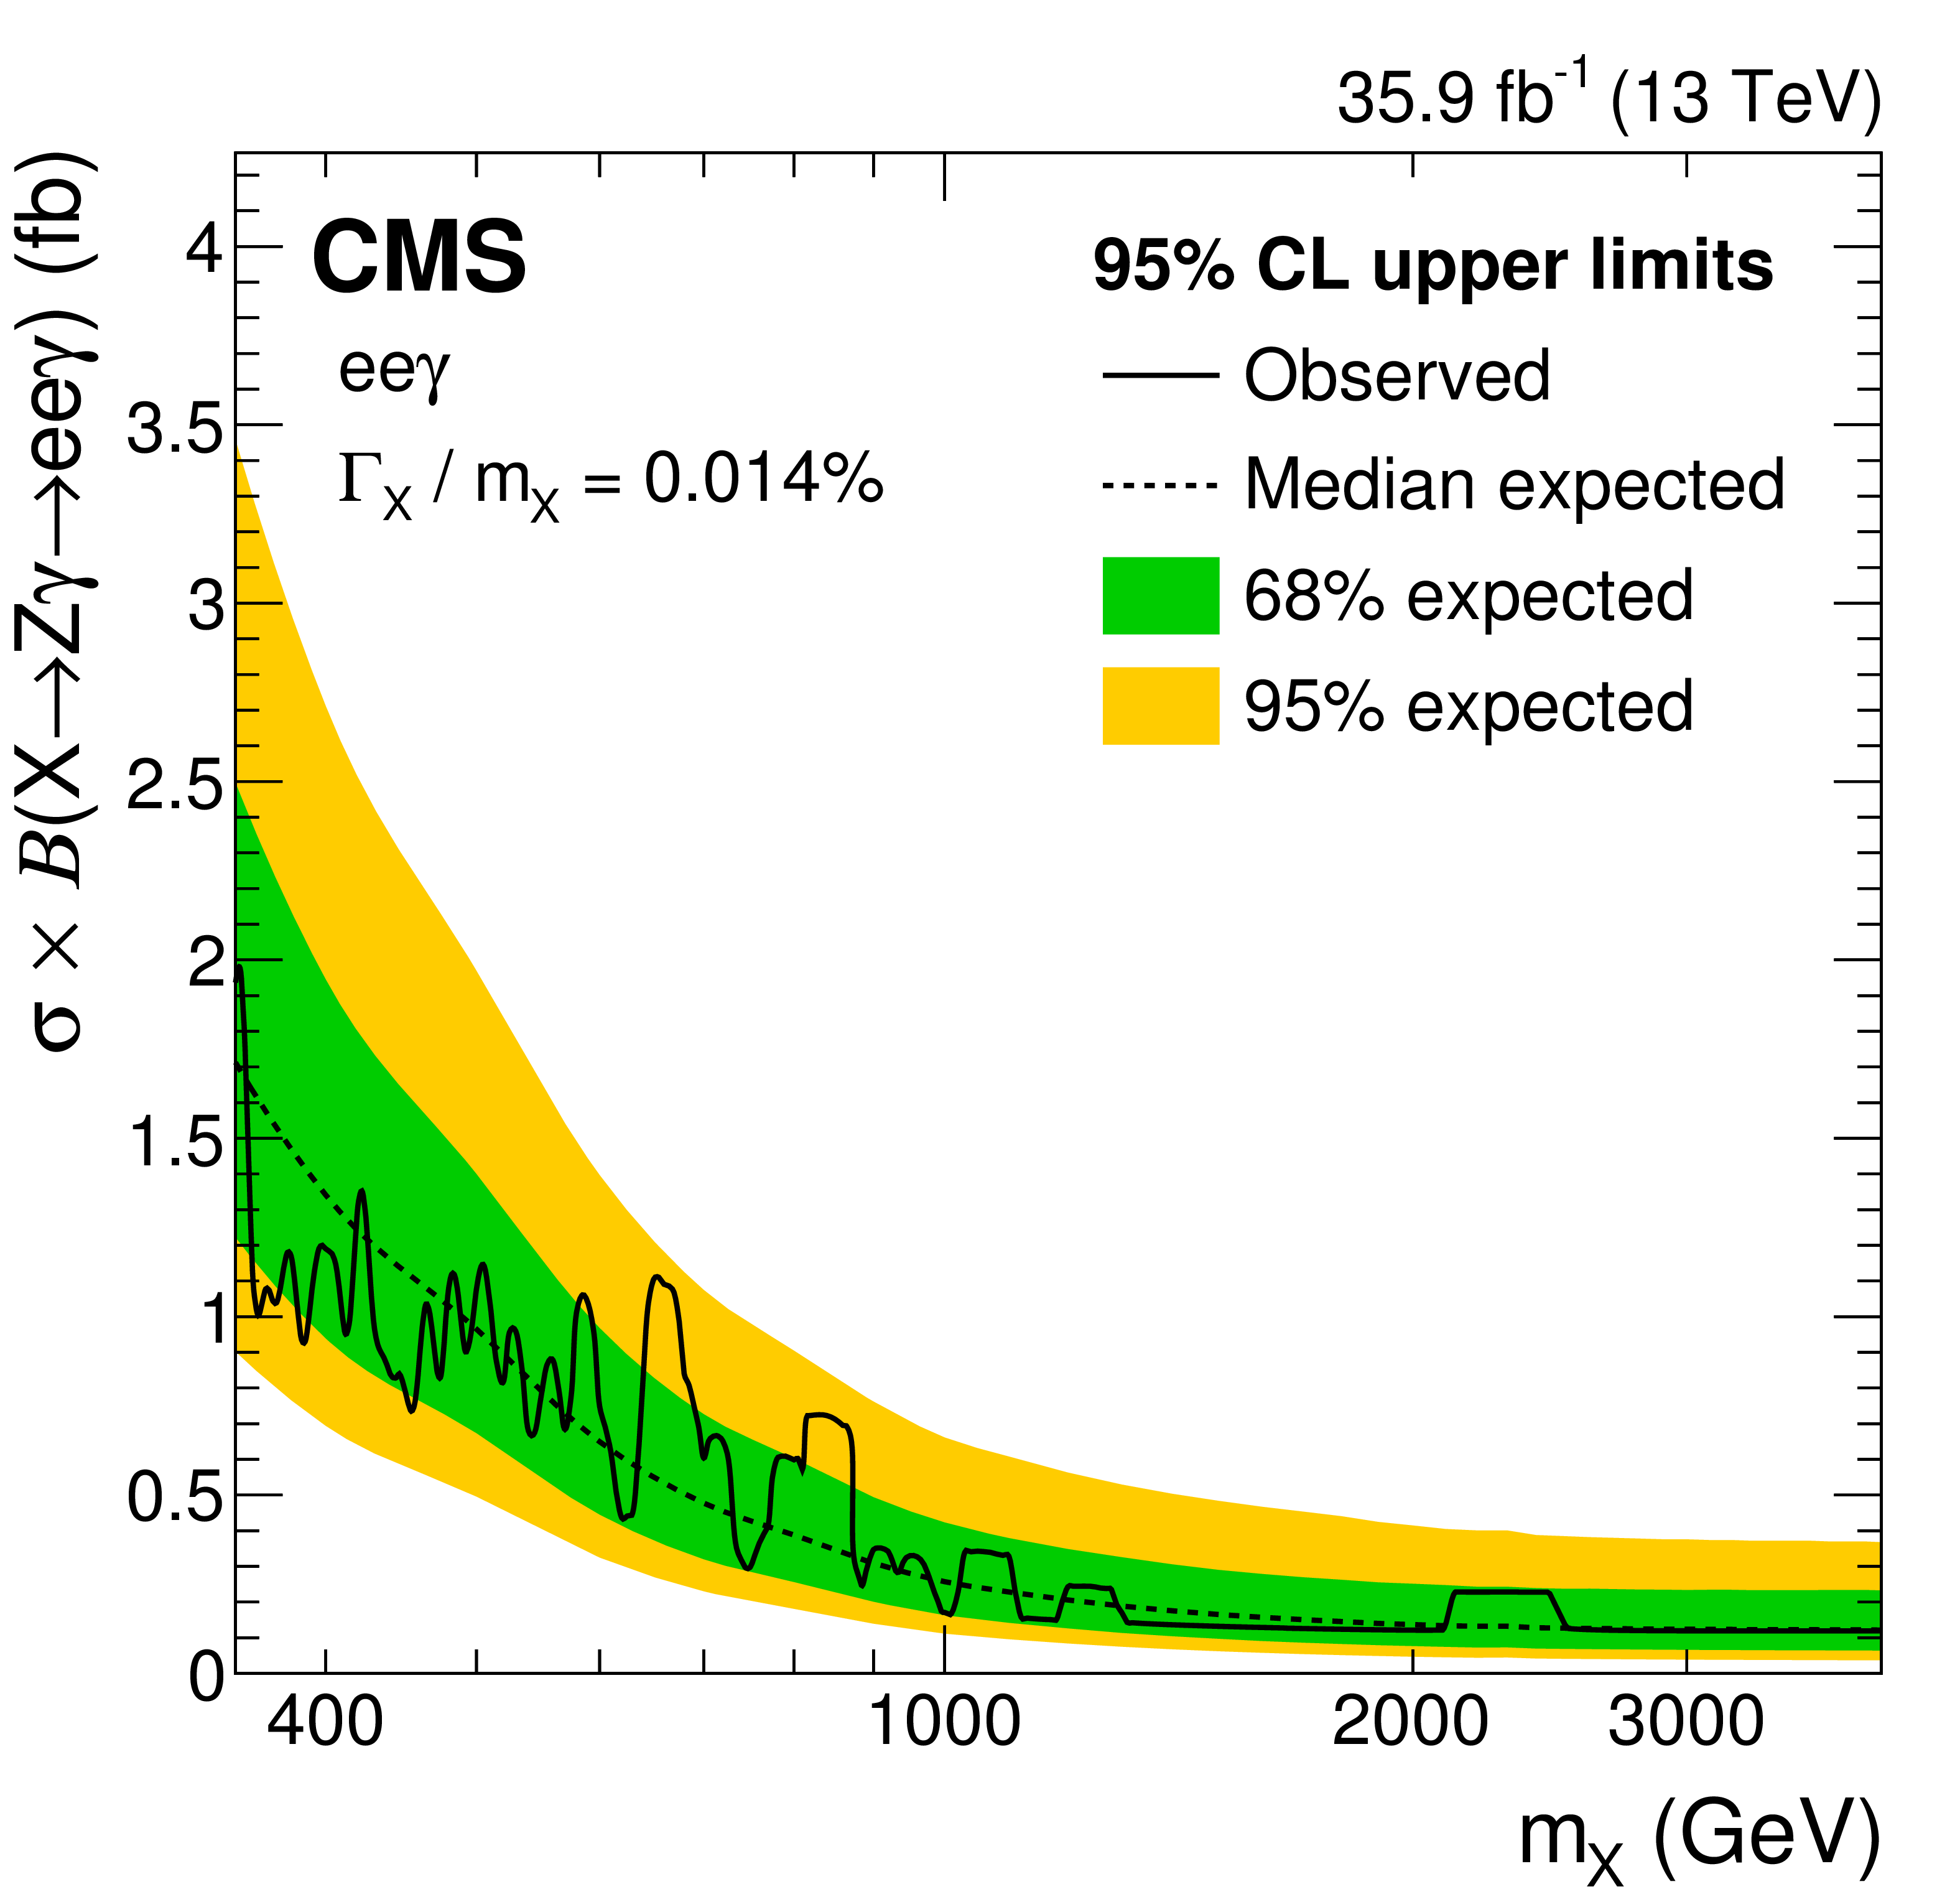
Figure 3-a:
Observed (solid) and expected (dashed) 95% CL upper limits on $\sigma (\mathrm {X}\to {\mathrm {Z}} {\gamma})\,\mathcal {B}({\mathrm {Z}} \to \ell \ell {\gamma})$, as a function of signal mass $m_\mathrm {X}$ for the ${{\mathrm {e}} {\mathrm {e}}\gamma}$ channel, and for a narrow spin-0 resonance. The green and yellow shaded bands correspond to respective 68 and 95% CL ranges in the expected limits for the background-only hypothesis. |

png pdf |
Figure 3-b:
Observed (solid) and expected (dashed) 95% CL upper limits on $\sigma (\mathrm {X}\to {\mathrm {Z}} {\gamma})\,\mathcal {B}({\mathrm {Z}} \to \ell \ell {\gamma})$, as a function of signal mass $m_\mathrm {X}$ for the ${{{\mu}} {{\mu}}\gamma}$ channel, and for a narrow spin-0 resonance. The green and yellow shaded bands correspond to respective 68 and 95% CL ranges in the expected limits for the background-only hypothesis. |

png pdf |
Figure 3-c:
Observed (solid) and expected (dashed) 95% CL upper limits on $\sigma (\mathrm {X}\to {\mathrm {Z}} {\gamma})\,\mathcal {B}({\mathrm {Z}} \to \ell \ell {\gamma})$, as a function of signal mass $m_\mathrm {X}$ for the ${{\mathrm {e}} {\mathrm {e}}\gamma}$ channel, and for a broad spin-0 resonance. The green and yellow shaded bands correspond to respective 68 and 95% CL ranges in the expected limits for the background-only hypothesis. |

png pdf |
Figure 3-d:
Observed (solid) and expected (dashed) 95% CL upper limits on $\sigma (\mathrm {X}\to {\mathrm {Z}} {\gamma})\,\mathcal {B}({\mathrm {Z}} \to \ell \ell {\gamma})$, as a function of signal mass $m_\mathrm {X}$ for the ${{{\mu}} {{\mu}}\gamma}$ channel, and for a broad spin-0 resonance. The green and yellow shaded bands correspond to respective 68 and 95% CL ranges in the expected limits for the background-only hypothesis. |

png pdf |
Figure 4:
Observed (solid) and expected (dashed) 95% CL upper limits on $\sigma (\mathrm {X}\to {\mathrm {Z}} {\gamma})$ as a function of signal mass $m_\mathrm {X}$, together with the 68% (green) and 95% (yellow) CL ranges of the expected limit for the background-only hypothesis, for the combination of the ${{\mathrm {e}} {\mathrm {e}}\gamma}$ and ${{{\mu}} {{\mu}}\gamma}$ channels for (left) narrow and (right) broad spin-0 resonances. |
png pdf |
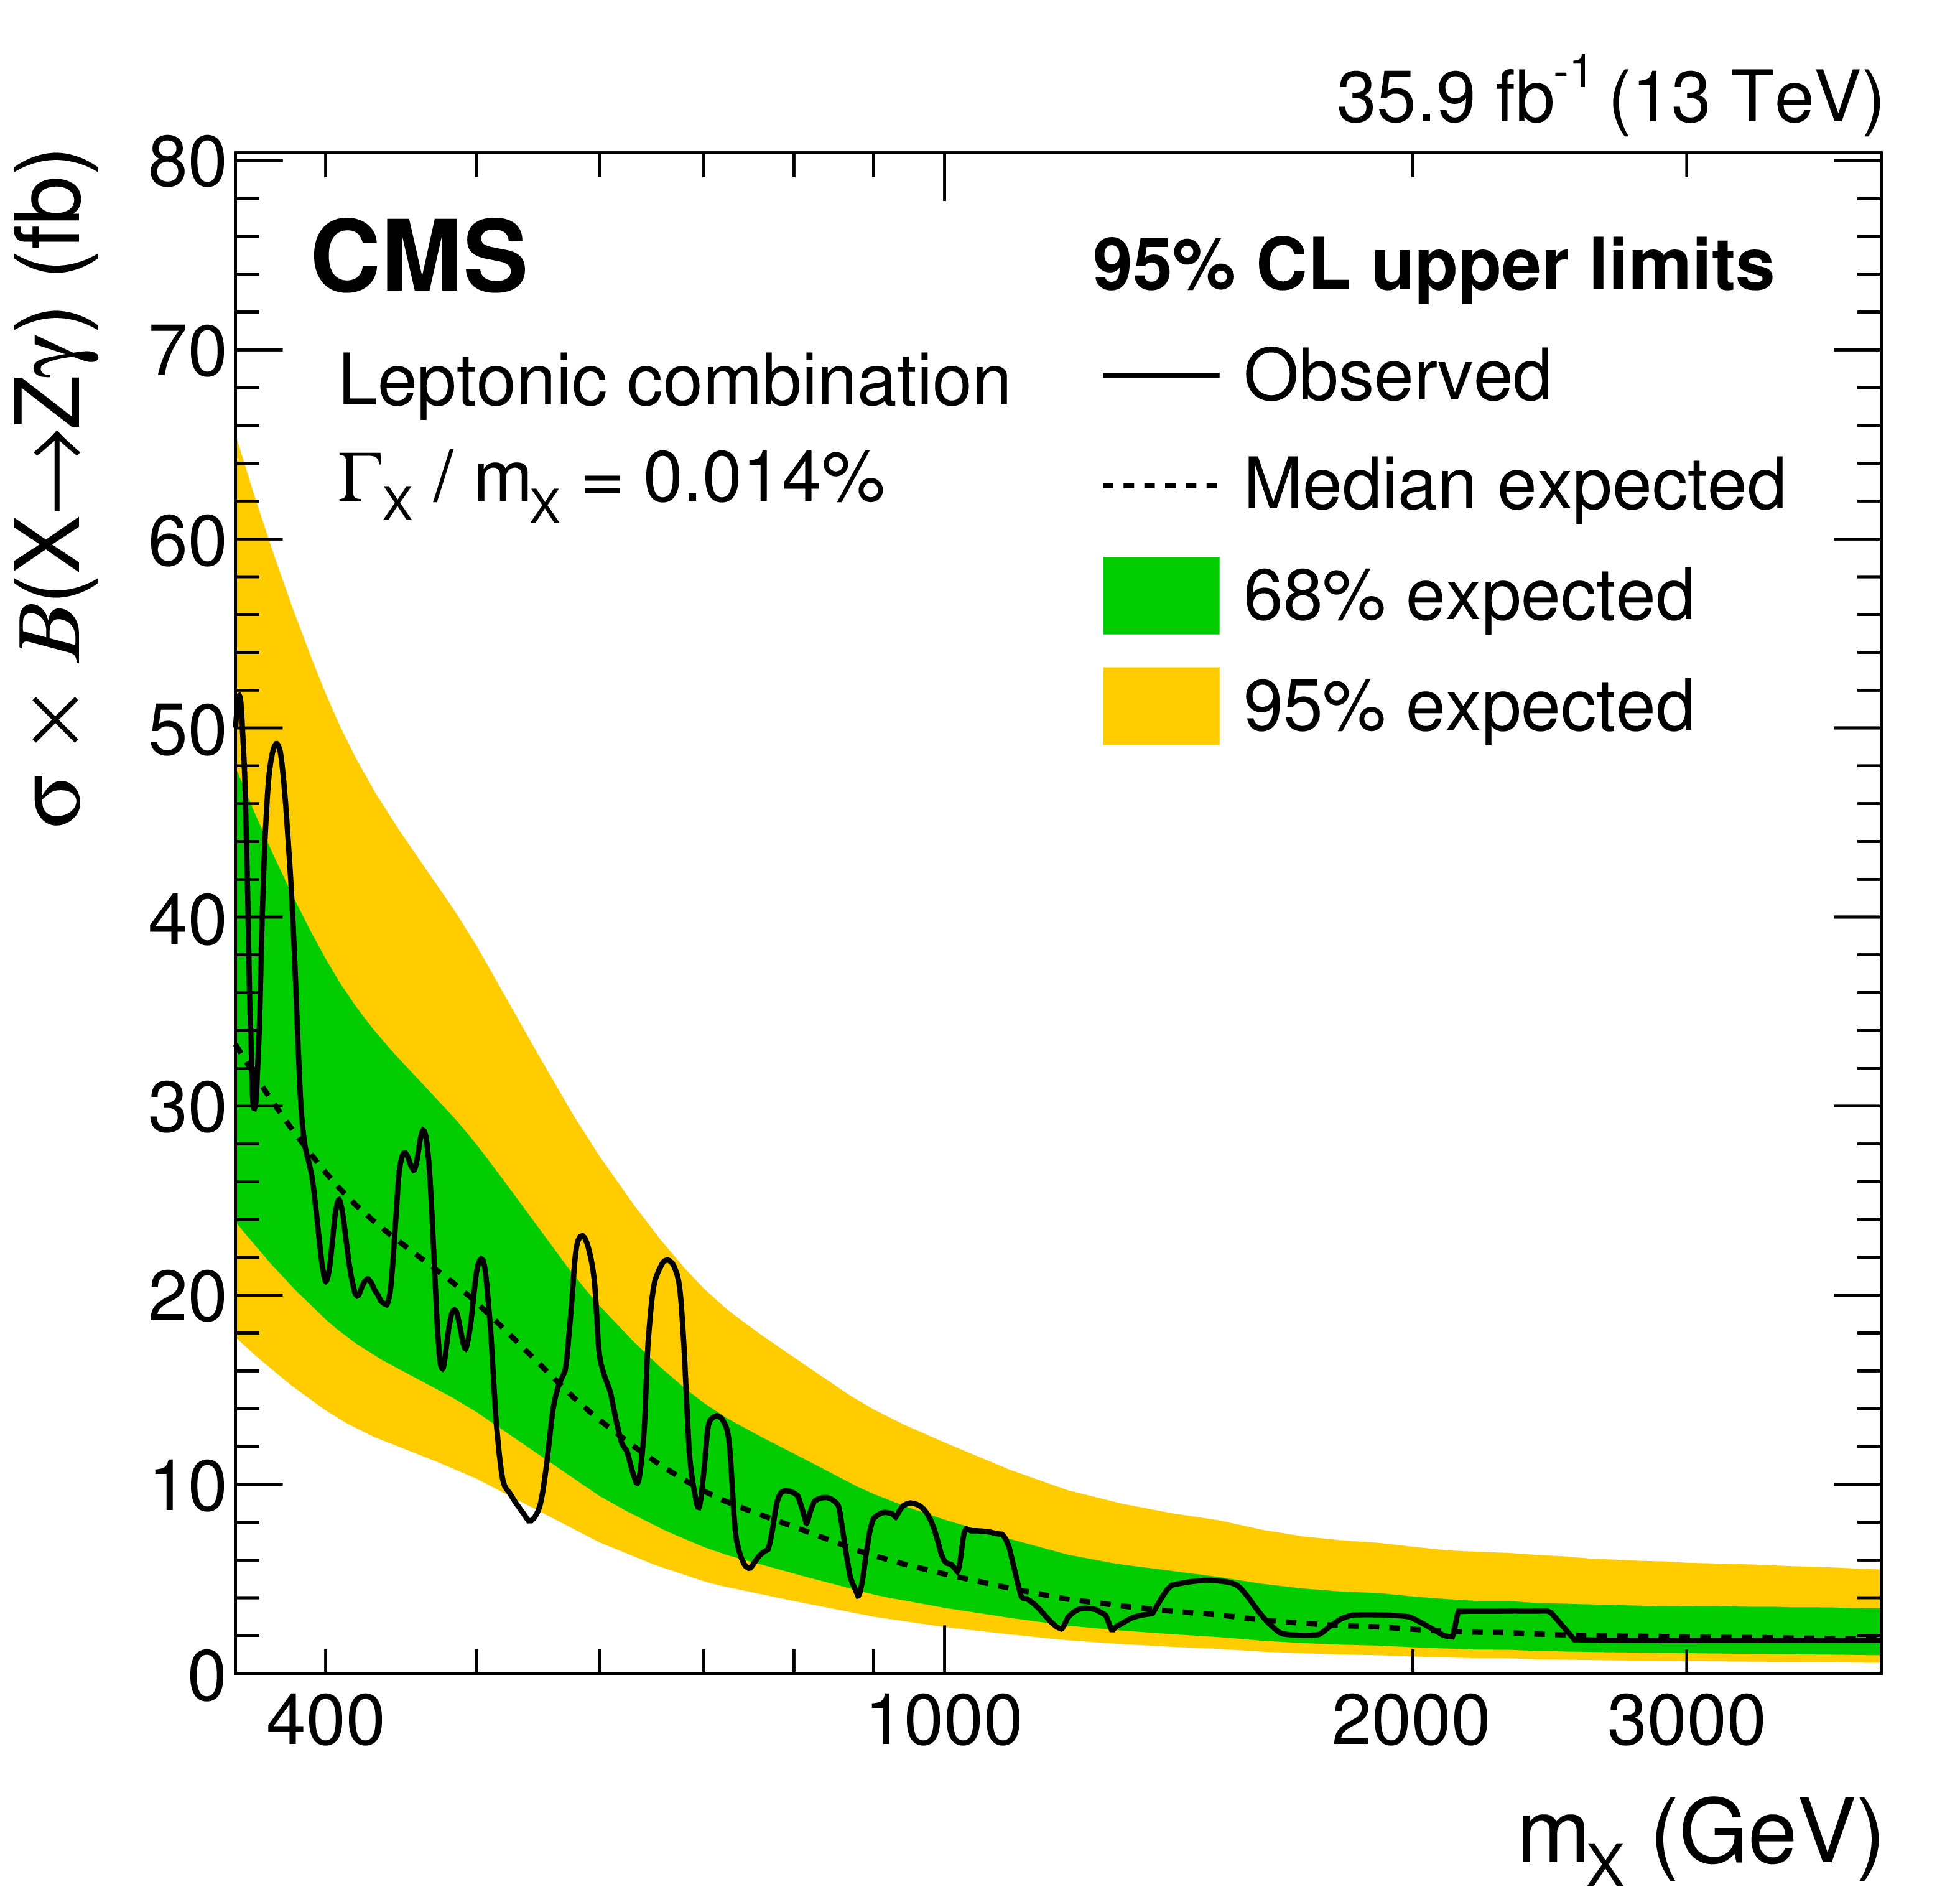
Figure 4-a:
Observed (solid) and expected (dashed) 95% CL upper limits on $\sigma (\mathrm {X}\to {\mathrm {Z}} {\gamma})$ as a function of signal mass $m_\mathrm {X}$, together with the 68% (green) and 95% (yellow) CL ranges of the expected limit for the background-only hypothesis, for the combination of the ${{\mathrm {e}} {\mathrm {e}}\gamma}$ and ${{{\mu}} {{\mu}}\gamma}$ channels for narrow spin-0 resonances. |

png pdf |
Figure 4-b:
Observed (solid) and expected (dashed) 95% CL upper limits on $\sigma (\mathrm {X}\to {\mathrm {Z}} {\gamma})$ as a function of signal mass $m_\mathrm {X}$, together with the 68% (green) and 95% (yellow) CL ranges of the expected limit for the background-only hypothesis, for the combination of the ${{\mathrm {e}} {\mathrm {e}}\gamma}$ and ${{{\mu}} {{\mu}}\gamma}$ channels for broad spin-0 resonances. |
png pdf |
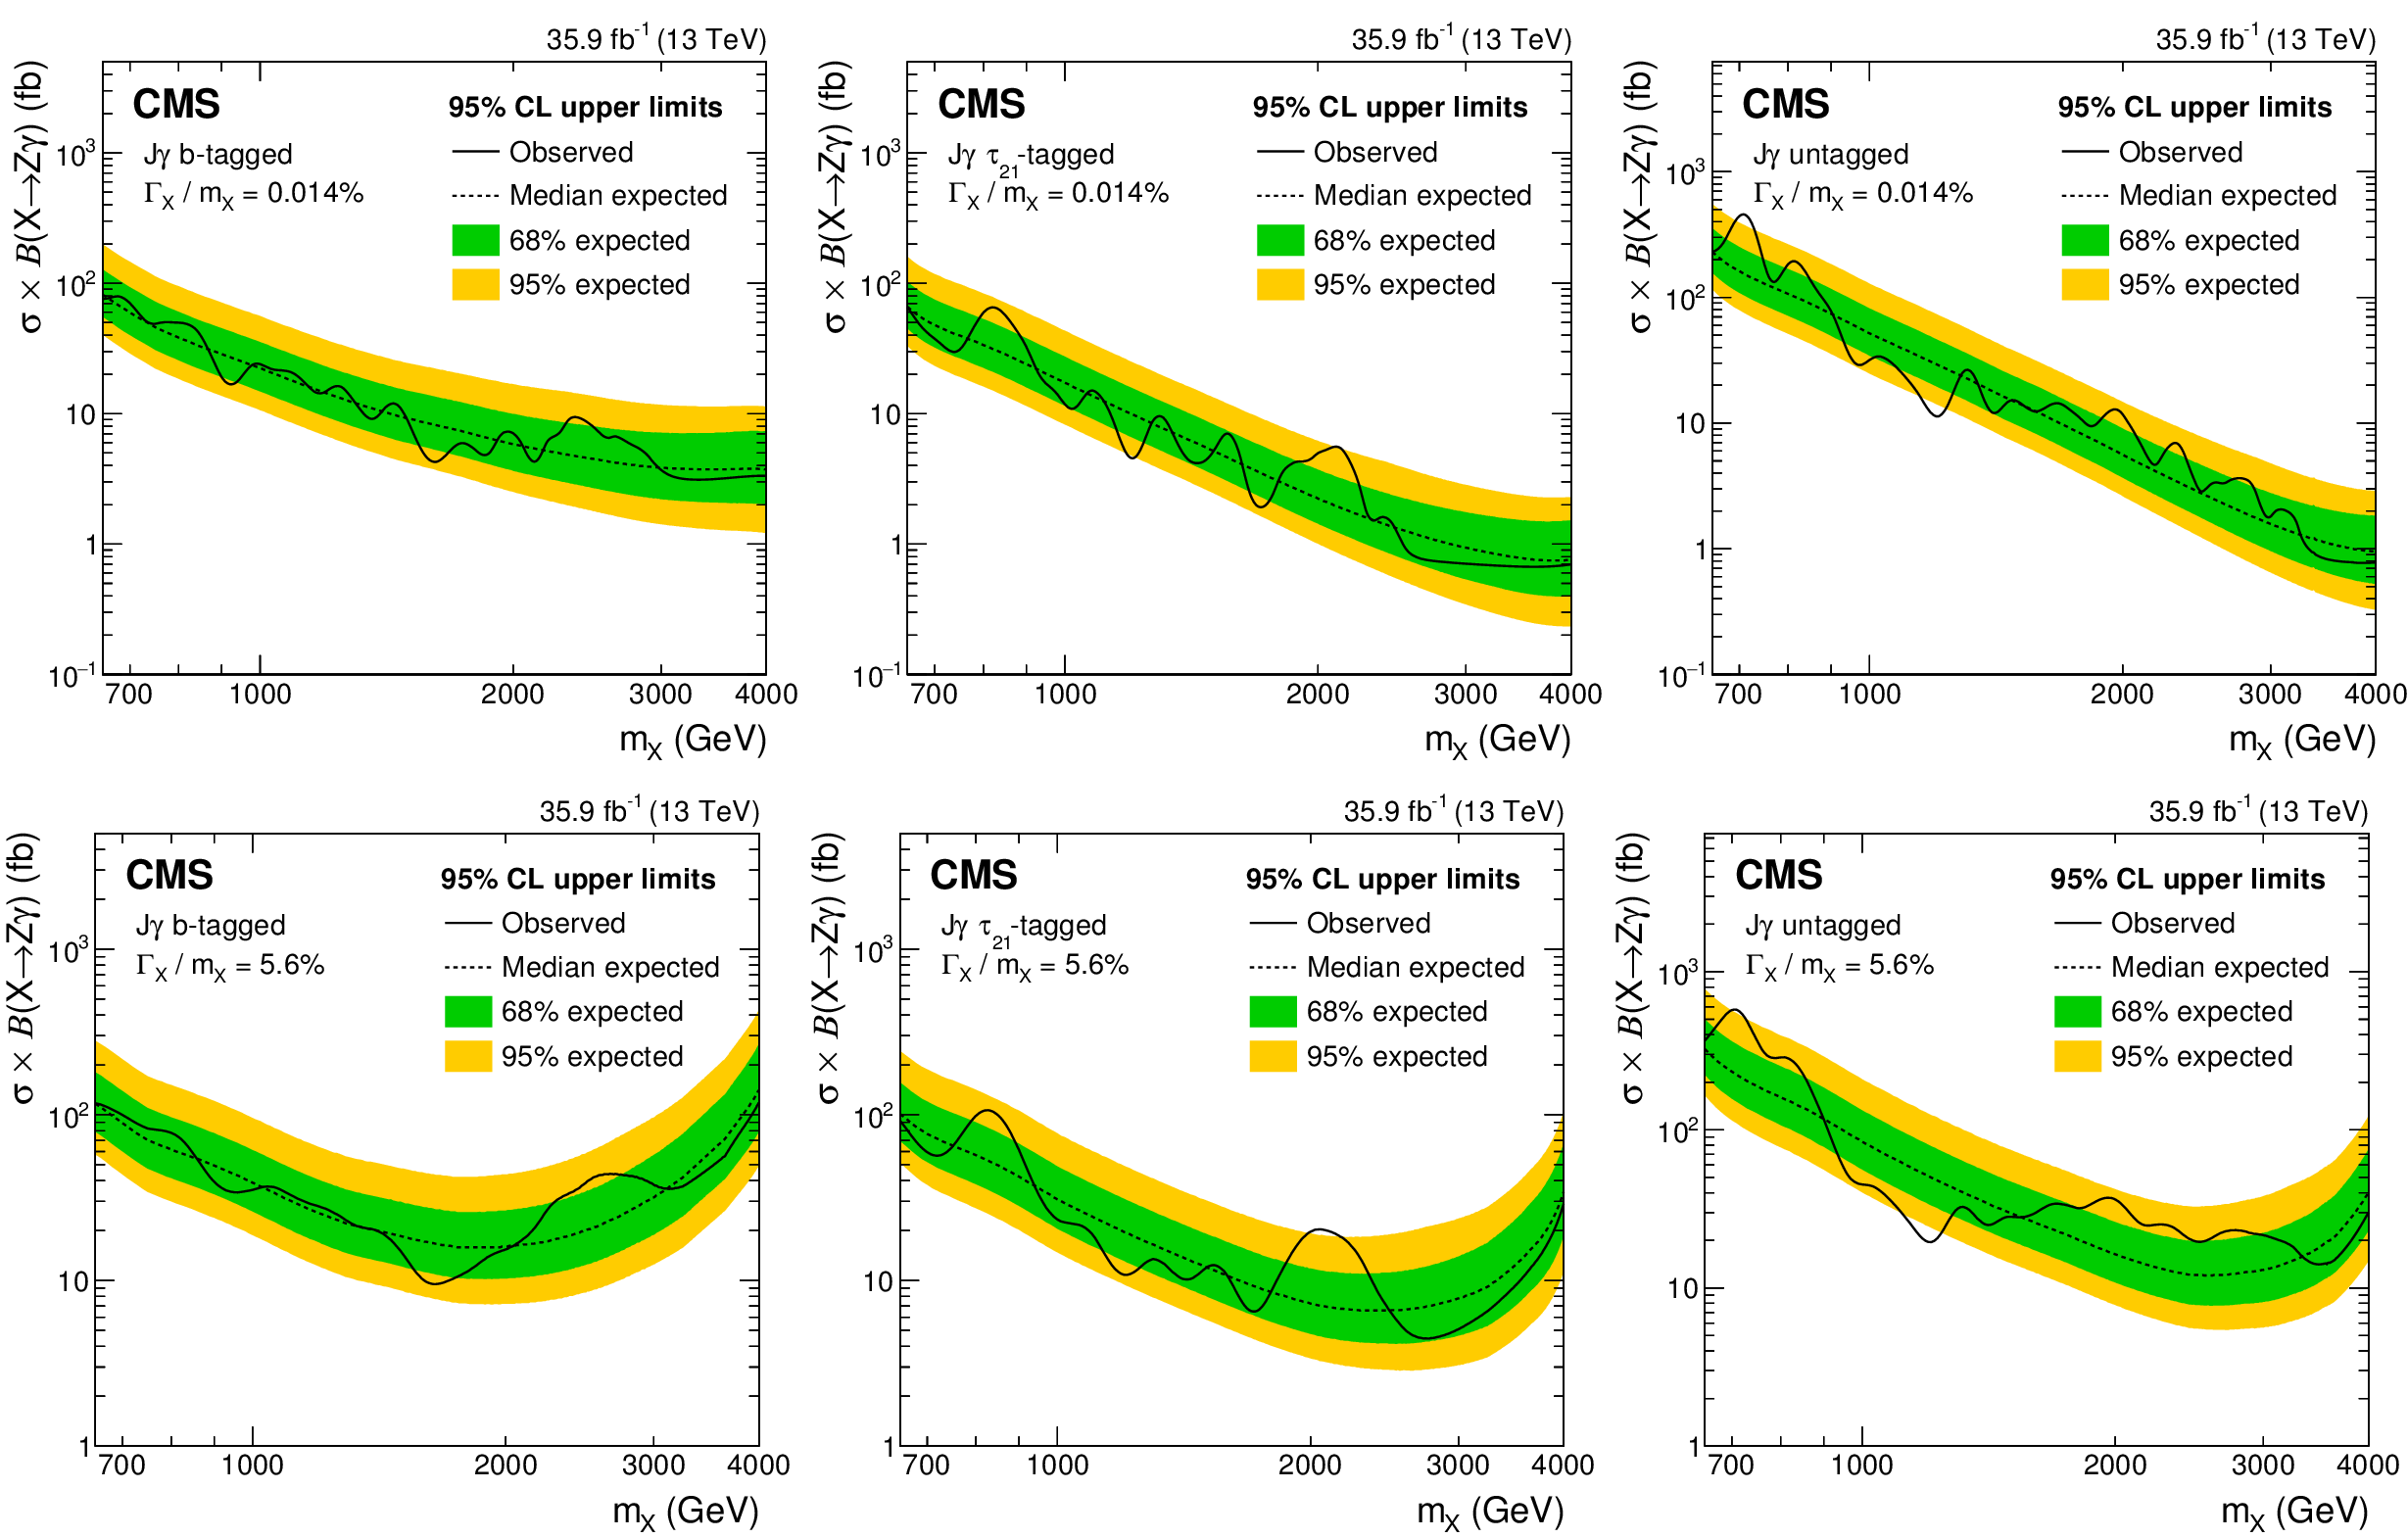
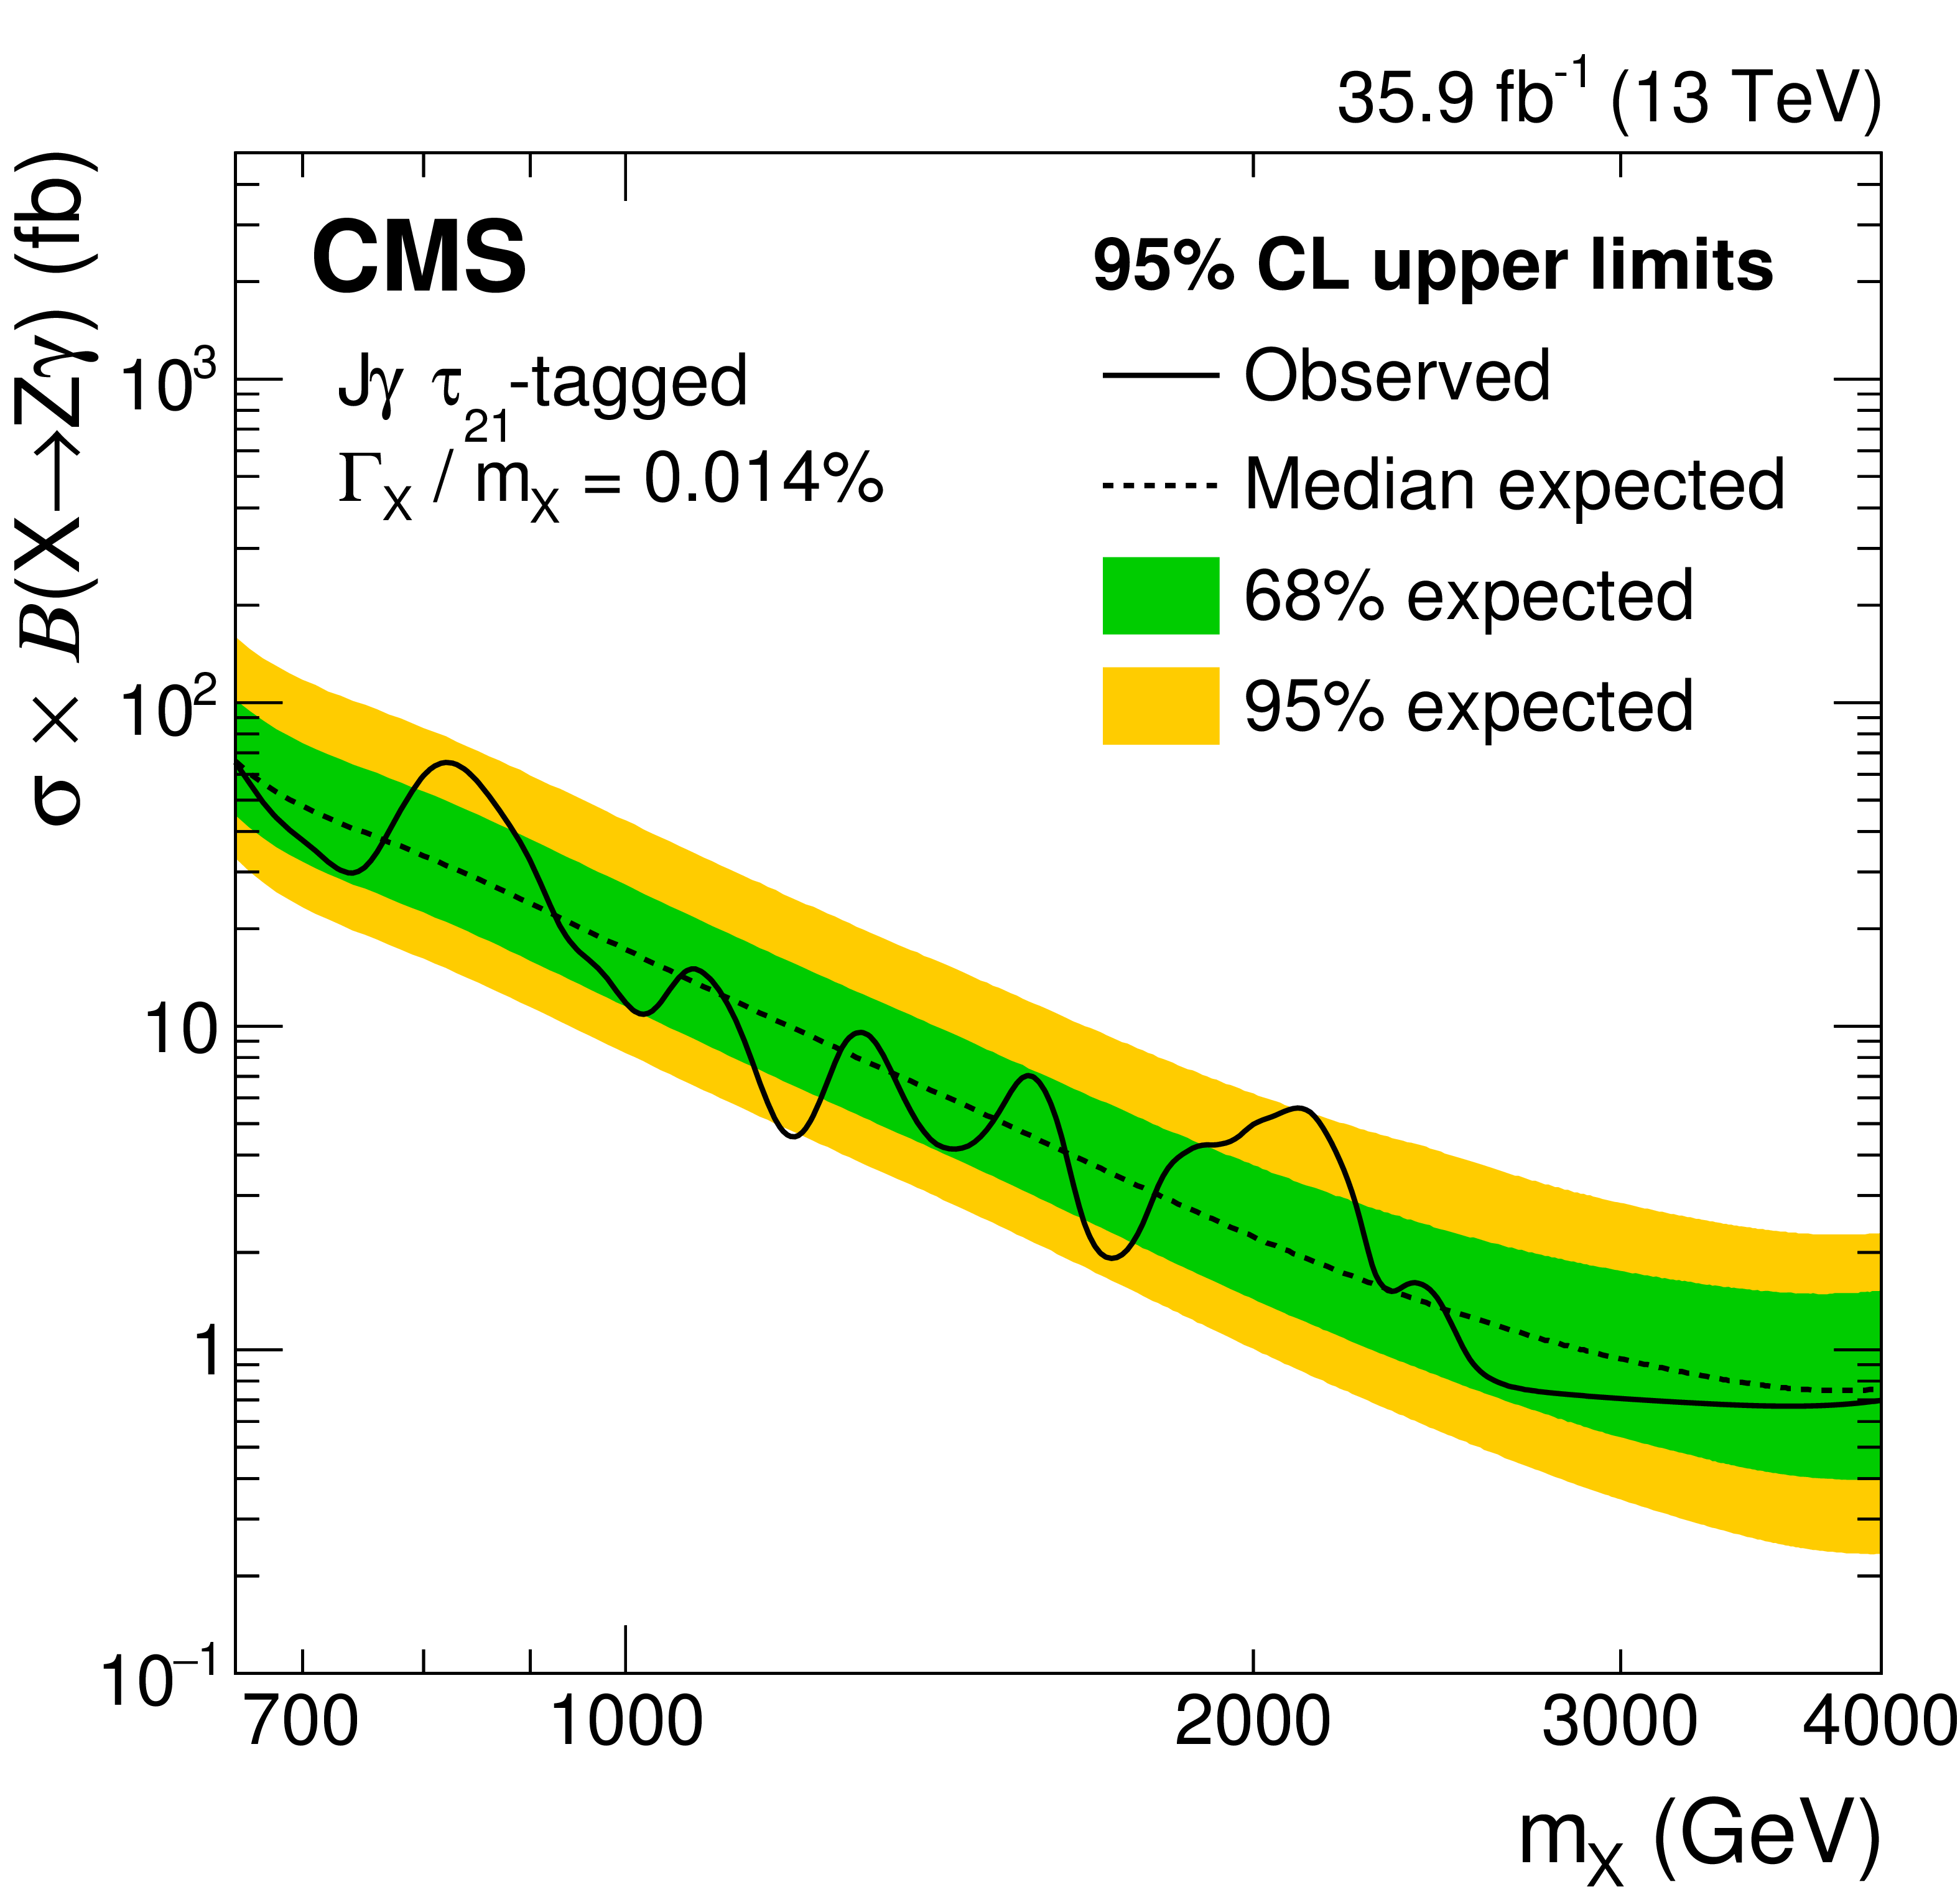
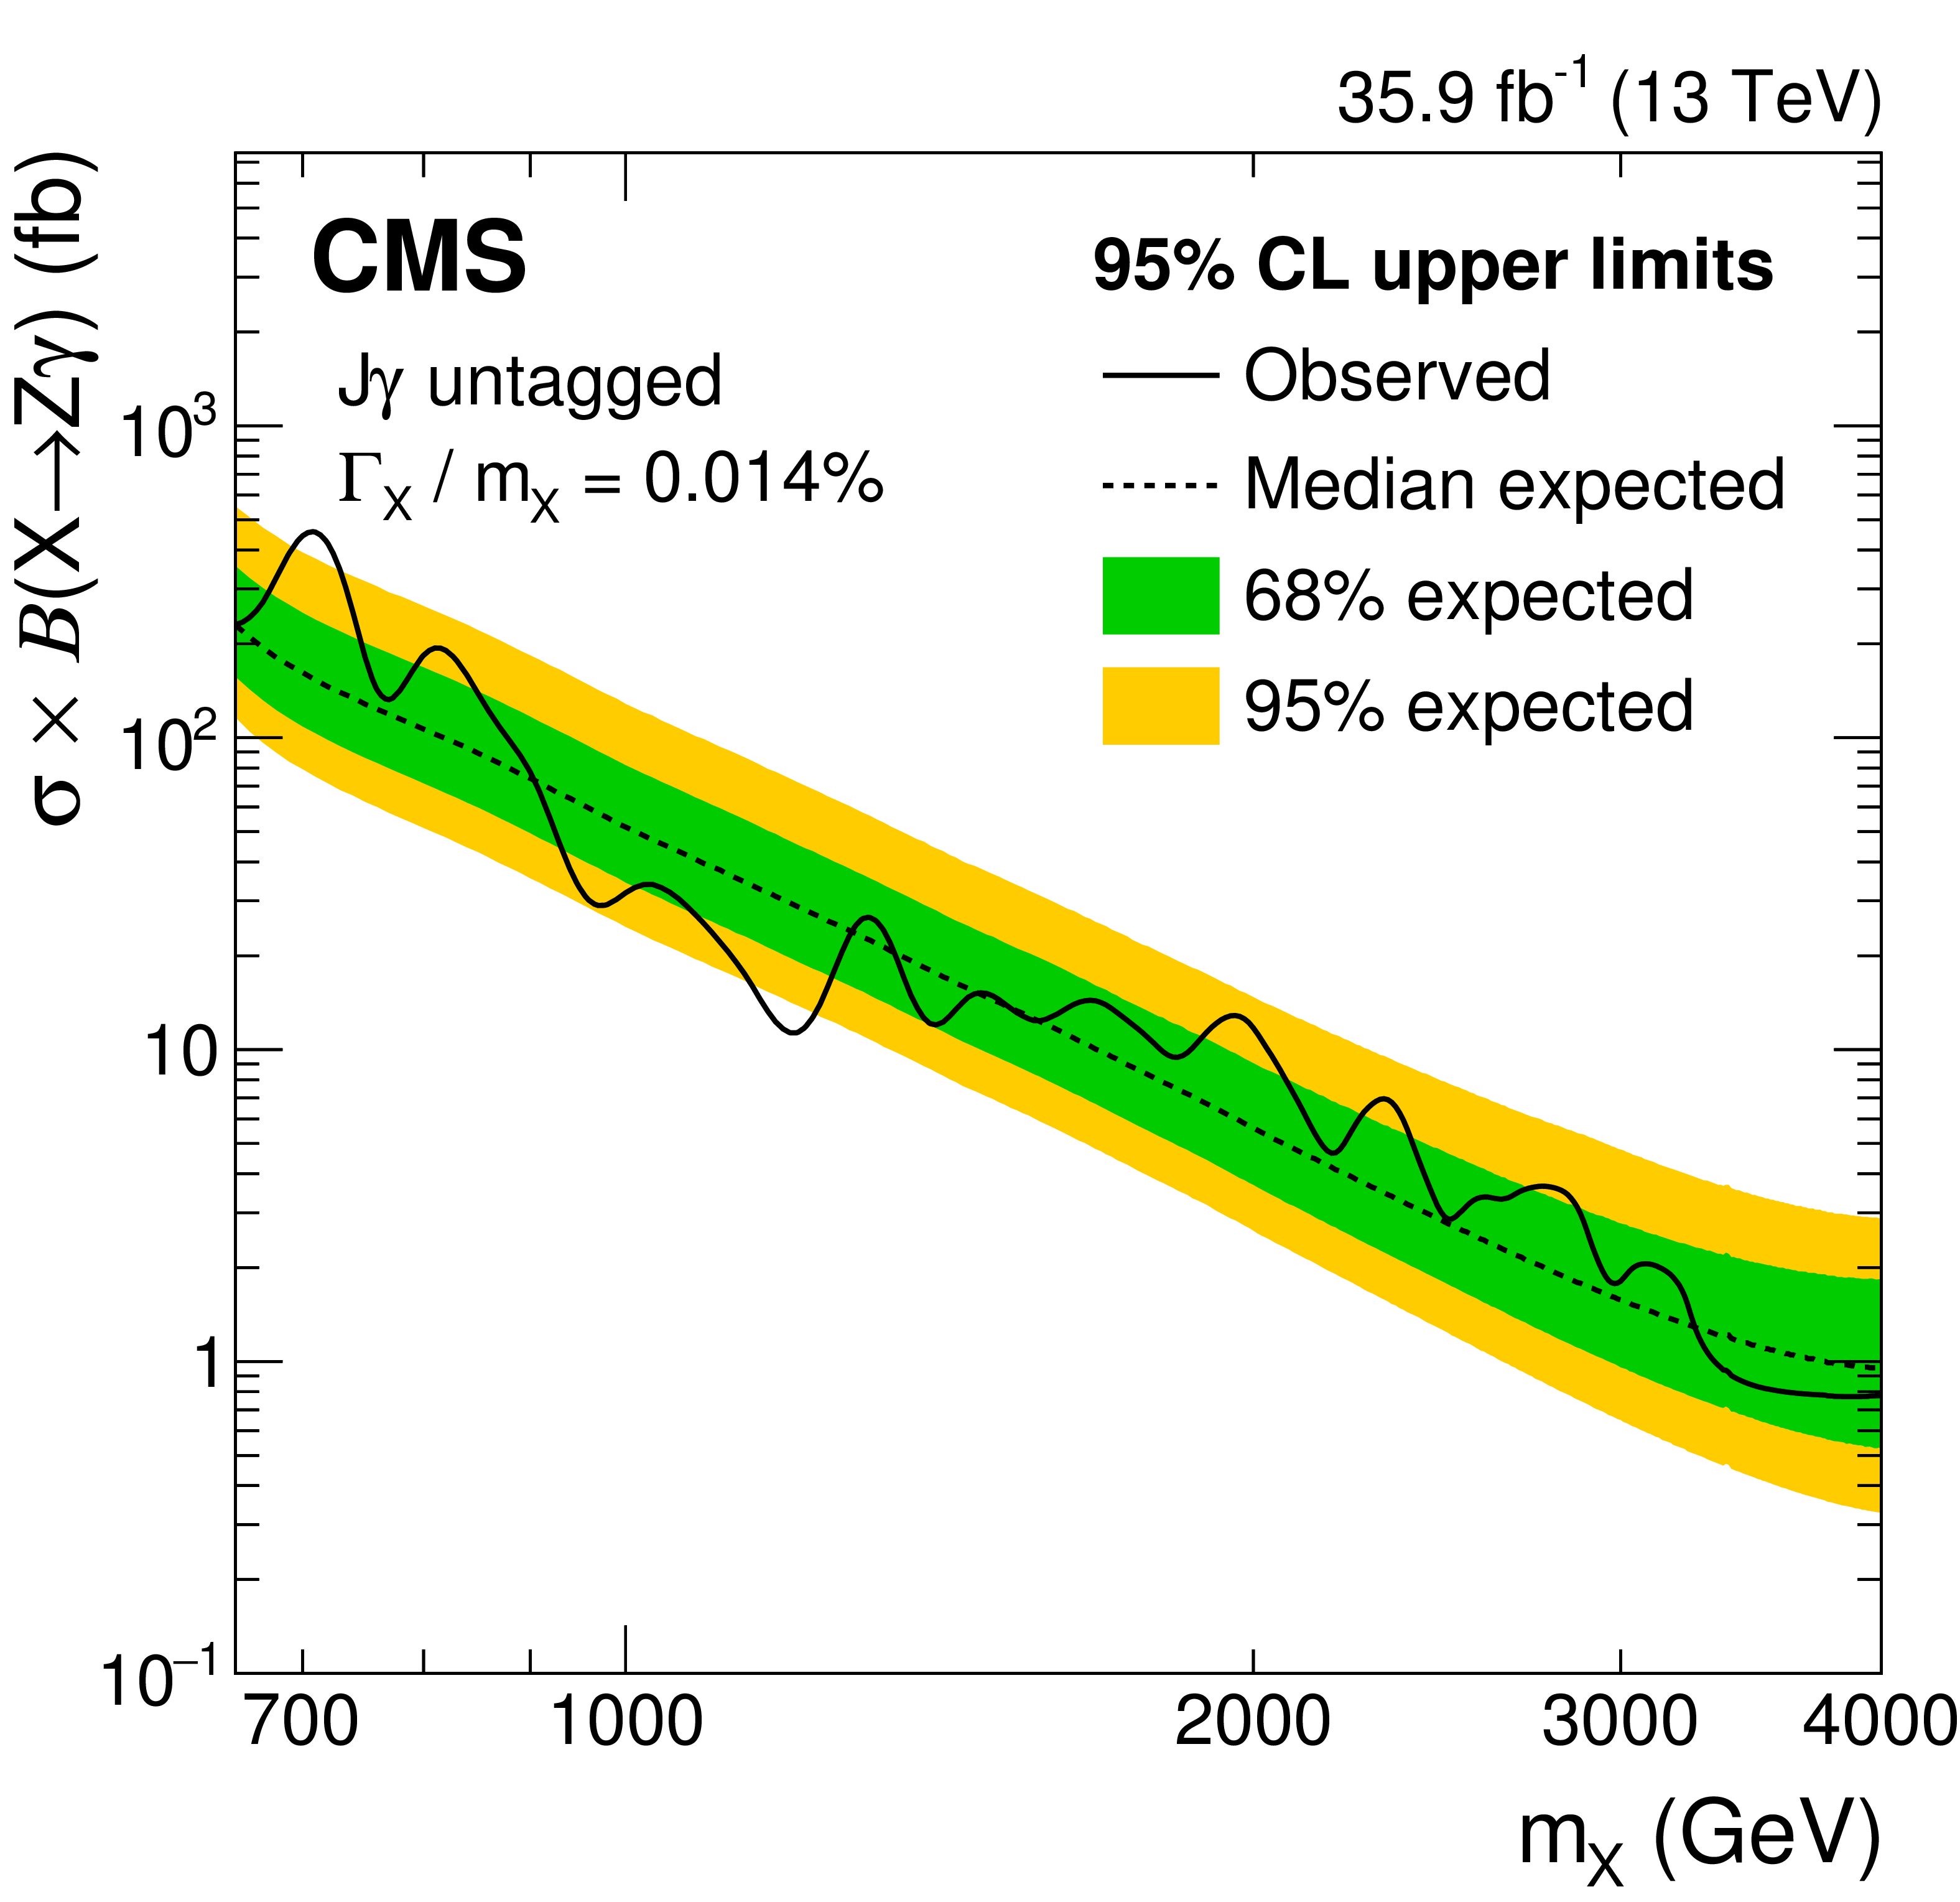
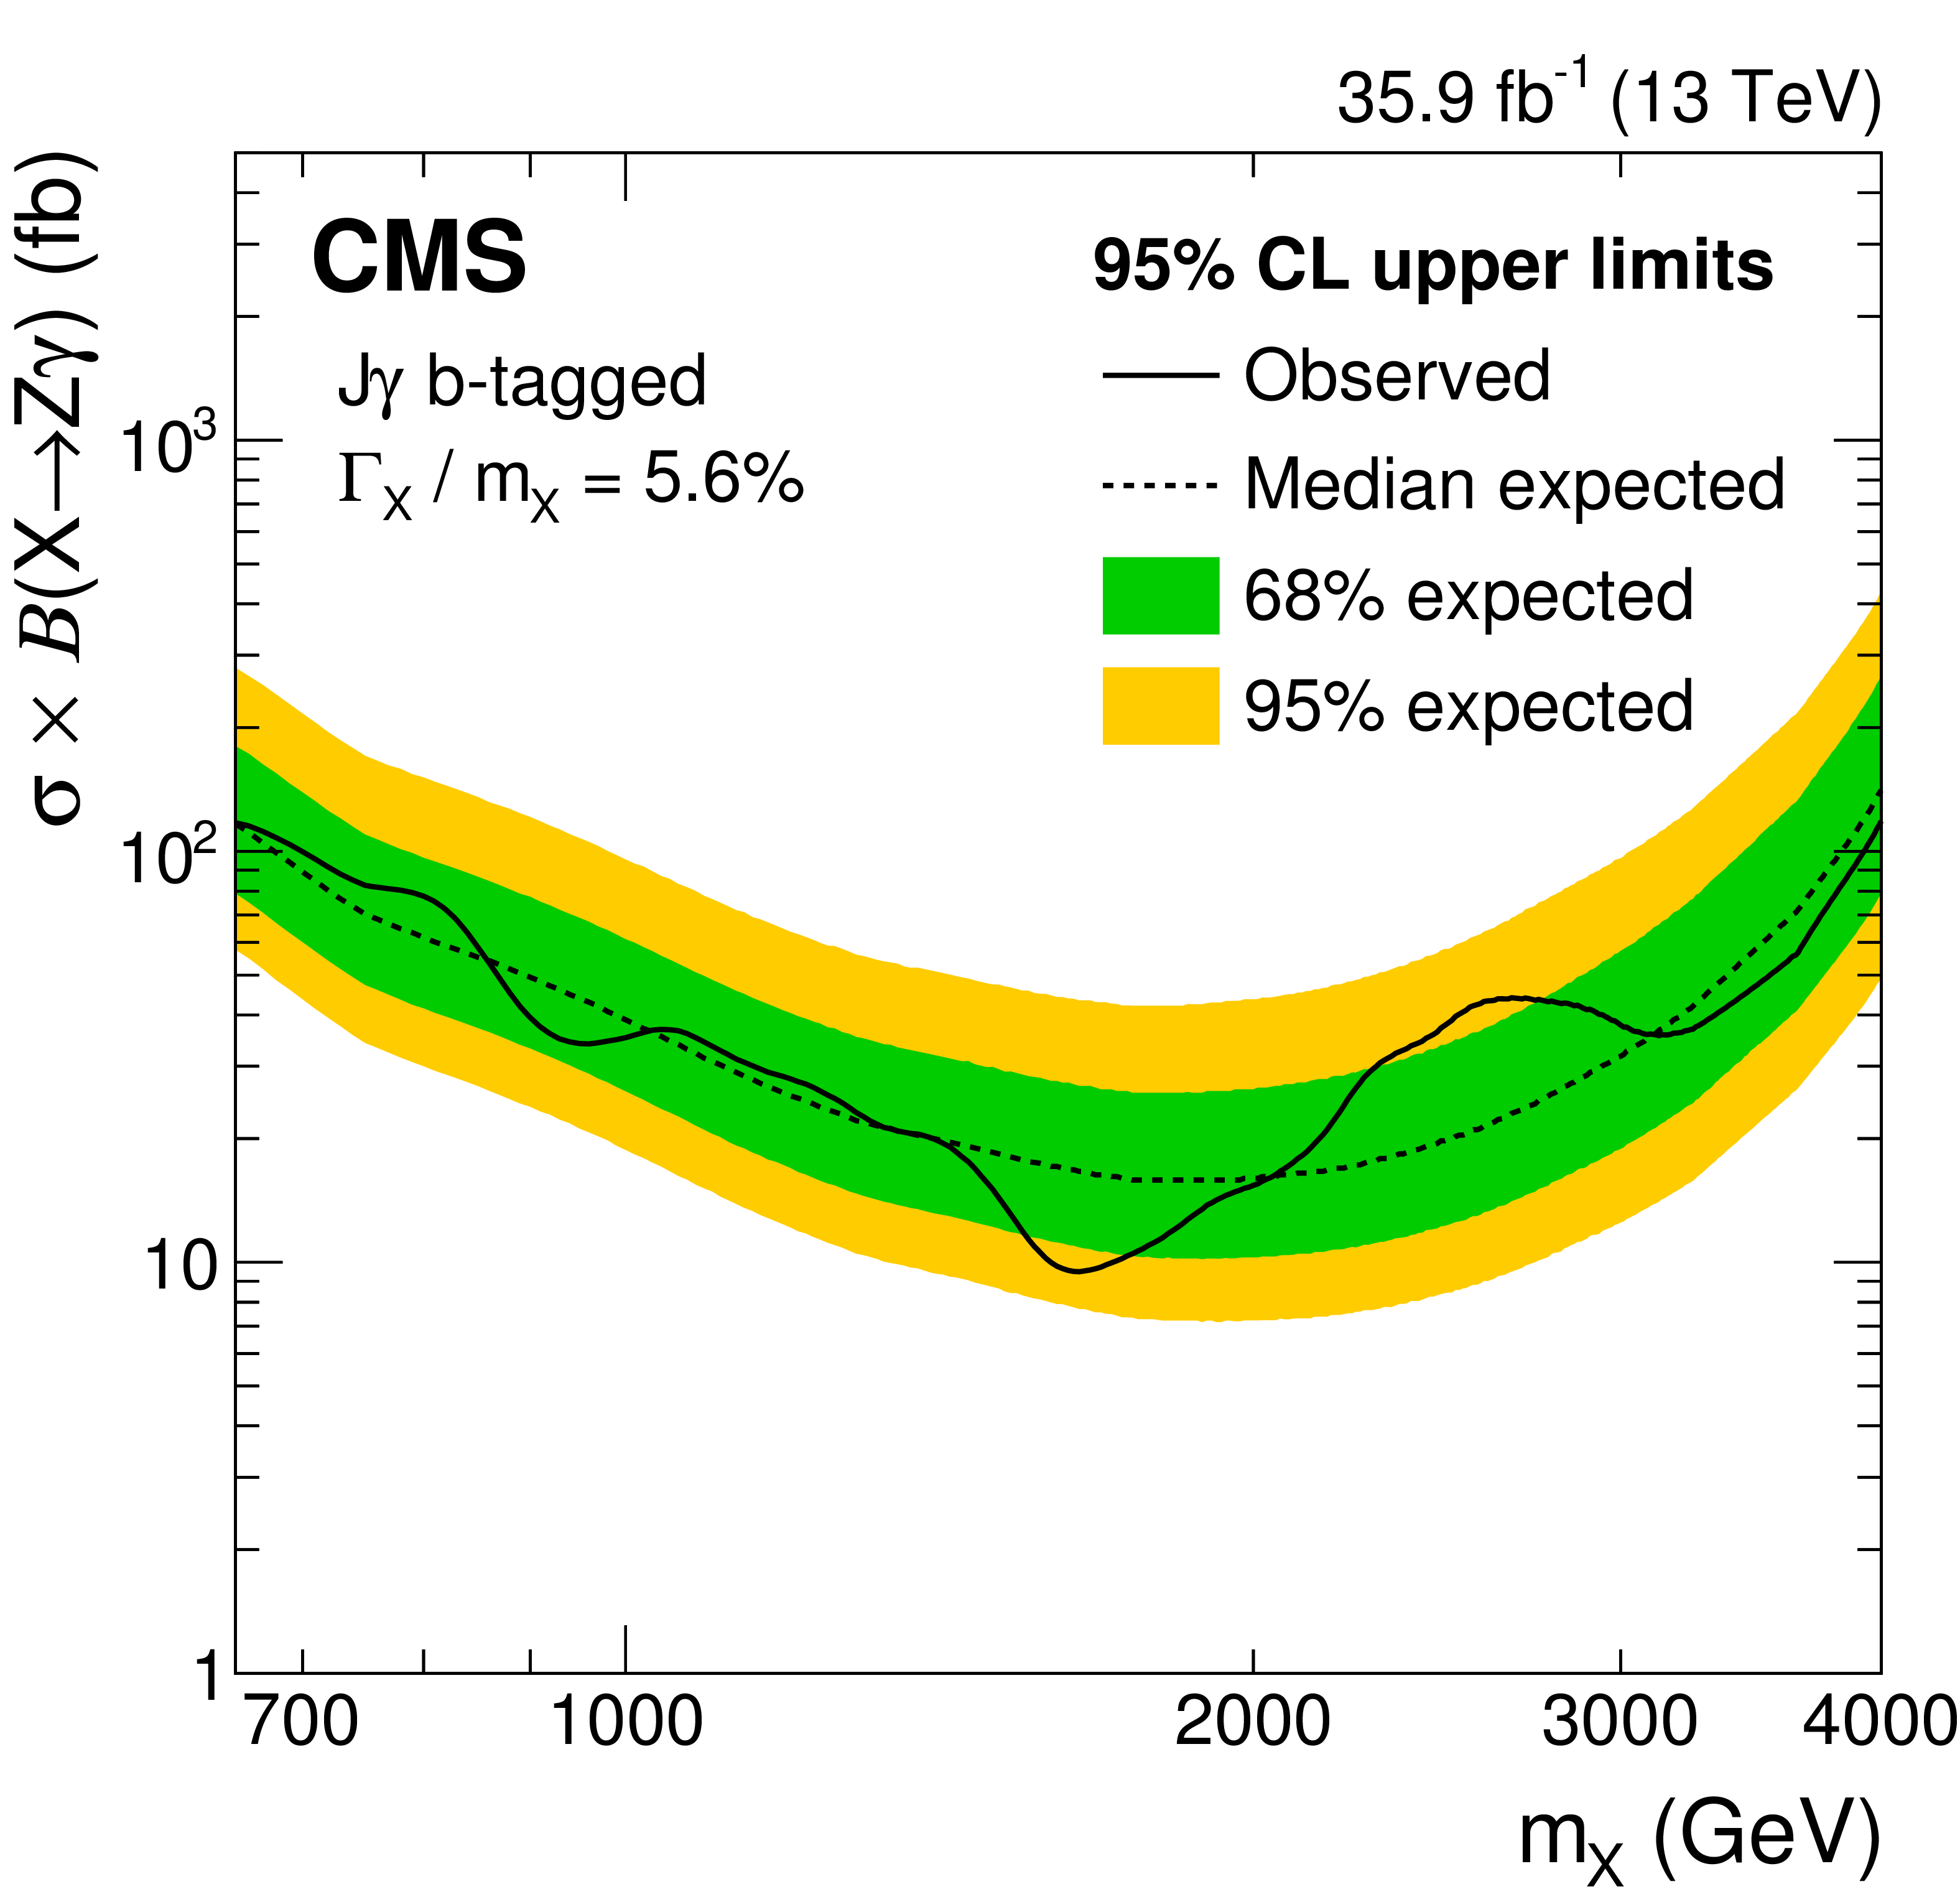
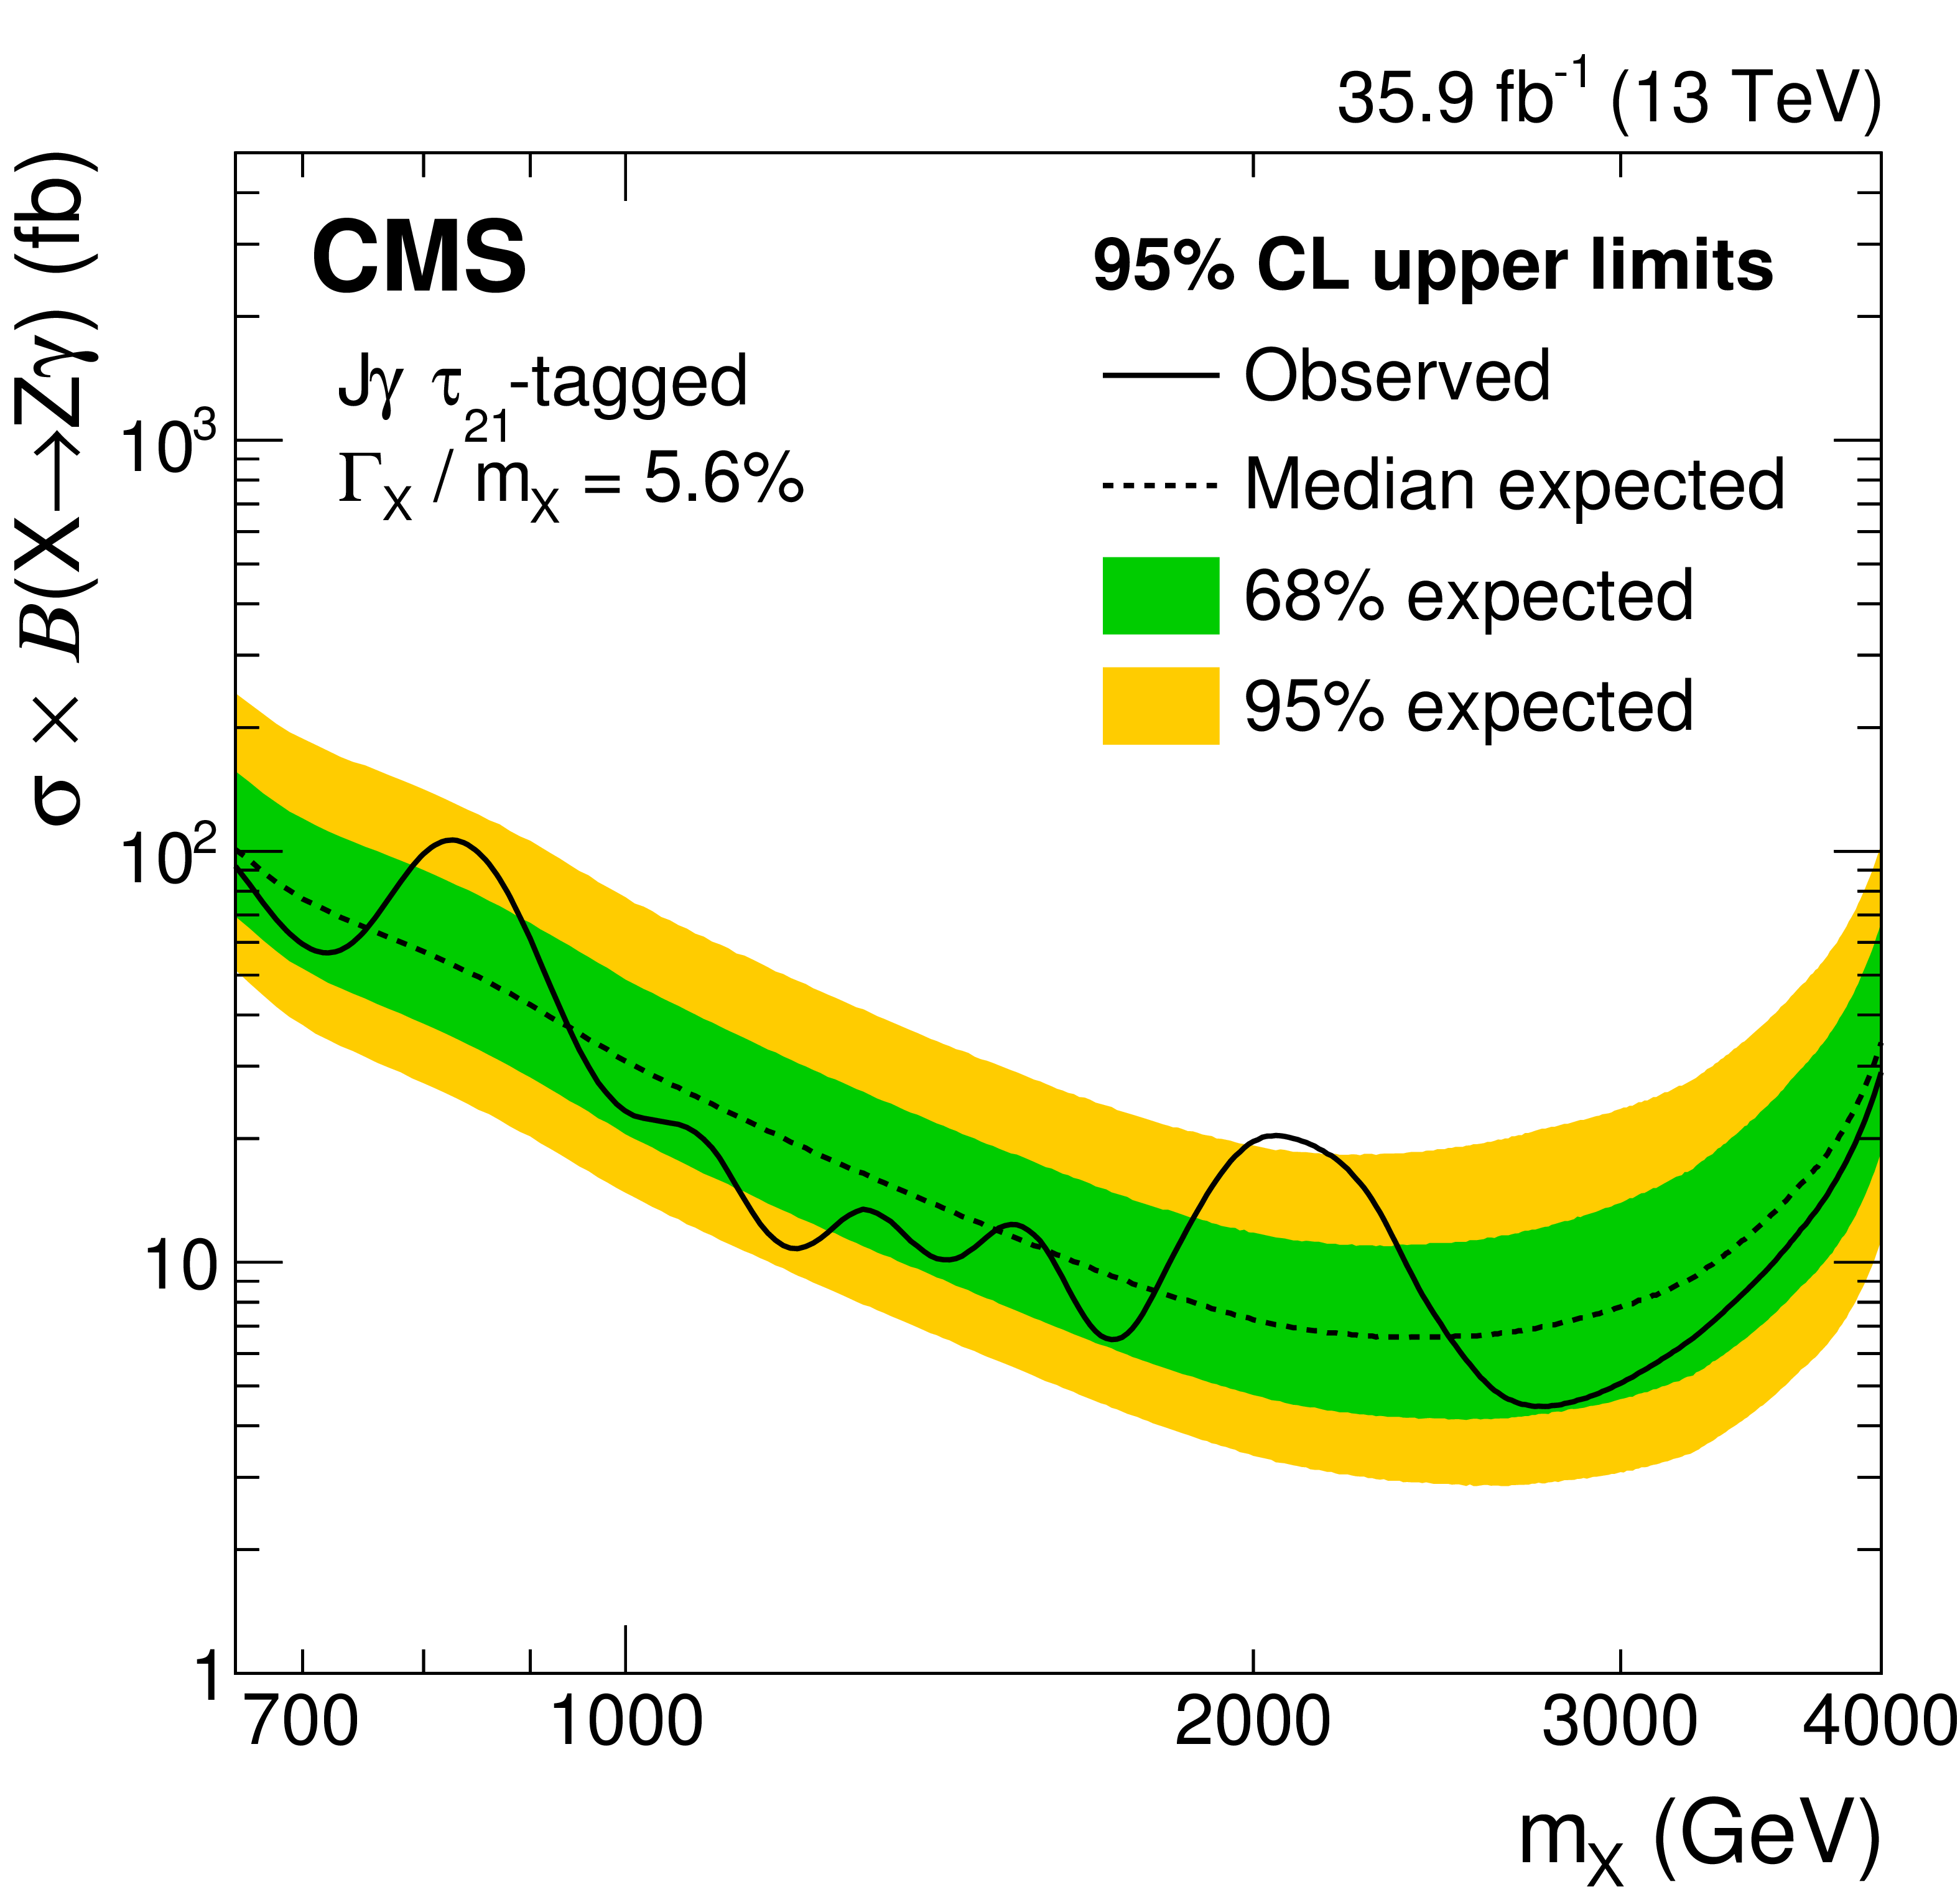
Figure 5:
Observed (solid) and expected (dashed) 95% CL upper limits on $\sigma (\mathrm {X}\to {\mathrm {Z}} {\gamma})$, as a function of signal mass $m_\mathrm {X}$, for the b-tagged (left column), $\tau _{21}$-tagged (middle column), and untagged (right column) categories, and for narrow (upper row) and broad (lower row) spin-0 resonances. The colored bands correspond to the 68% (green) and 95% (yellow) CL ranges of the expected limit for the background-only hypothesis. |
png pdf |
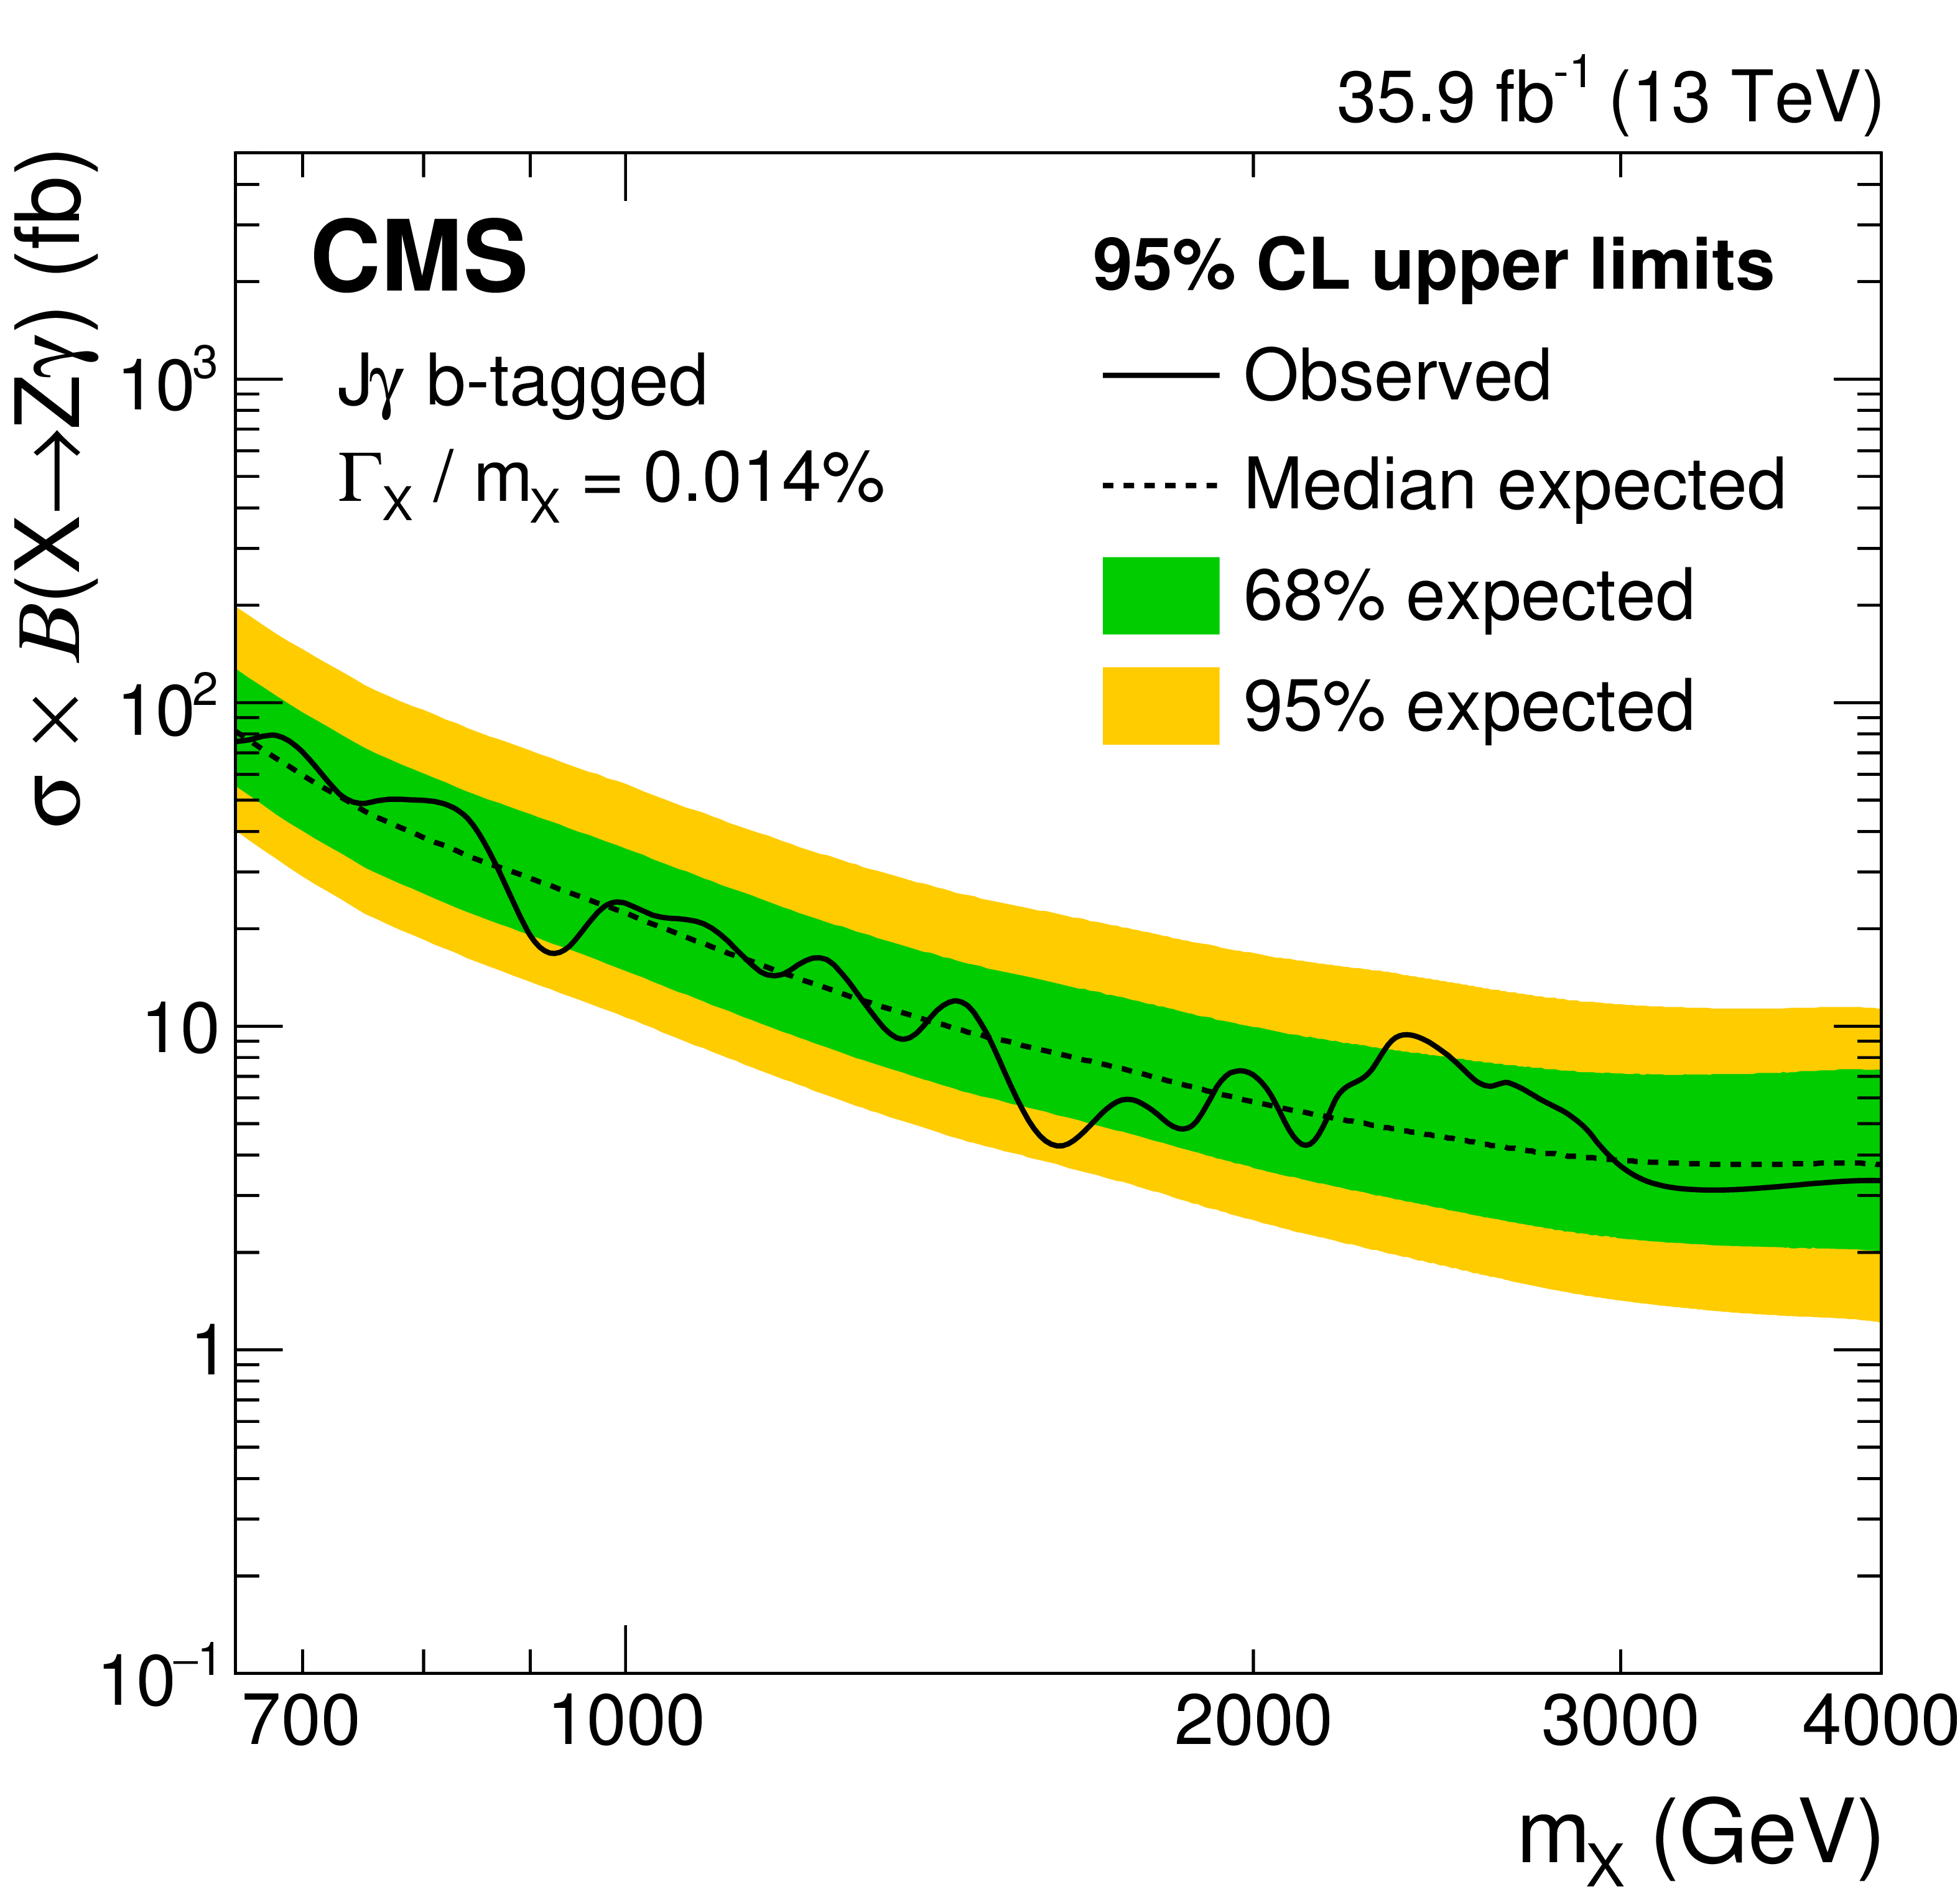
Figure 5-a:
Observed (solid) and expected (dashed) 95% CL upper limits on $\sigma (\mathrm {X}\to {\mathrm {Z}} {\gamma})$, as a function of signal mass $m_\mathrm {X}$, for the b-tagged category, and for narrow spin-0 resonances. The colored bands correspond to the 68% (green) and 95% (yellow) CL ranges of the expected limit for the background-only hypothesis. |
png pdf |
Figure 5-b:
Observed (solid) and expected (dashed) 95% CL upper limits on $\sigma (\mathrm {X}\to {\mathrm {Z}} {\gamma})$, as a function of signal mass $m_\mathrm {X}$, for the $\tau _{21}$-tagged category, and for narrow spin-0 resonances. The colored bands correspond to the 68% (green) and 95% (yellow) CL ranges of the expected limit for the background-only hypothesis. |
png pdf |
Figure 5-c:
Observed (solid) and expected (dashed) 95% CL upper limits on $\sigma (\mathrm {X}\to {\mathrm {Z}} {\gamma})$, as a function of signal mass $m_\mathrm {X}$, for the untagged category, and for narrow spin-0 resonances. The colored bands correspond to the 68% (green) and 95% (yellow) CL ranges of the expected limit for the background-only hypothesis. |
png pdf |
Figure 5-d:
Observed (solid) and expected (dashed) 95% CL upper limits on $\sigma (\mathrm {X}\to {\mathrm {Z}} {\gamma})$, as a function of signal mass $m_\mathrm {X}$, for the b-tagged category, and for broad spin-0 resonances. The colored bands correspond to the 68% (green) and 95% (yellow) CL ranges of the expected limit for the background-only hypothesis. |
png pdf |
Figure 5-e:
Observed (solid) and expected (dashed) 95% CL upper limits on $\sigma (\mathrm {X}\to {\mathrm {Z}} {\gamma})$, as a function of signal mass $m_\mathrm {X}$, for the $\tau _{21}$-tagged category, and for broad spin-0 resonances. The colored bands correspond to the 68% (green) and 95% (yellow) CL ranges of the expected limit for the background-only hypothesis. |

png pdf |
Figure 5-f:
Observed (solid) and expected (dashed) 95% CL upper limits on $\sigma (\mathrm {X}\to {\mathrm {Z}} {\gamma})$, as a function of signal mass $m_\mathrm {X}$, for the untagged category, and for broad spin-0 resonances. The colored bands correspond to the 68% (green) and 95% (yellow) CL ranges of the expected limit for the background-only hypothesis. |
png pdf |
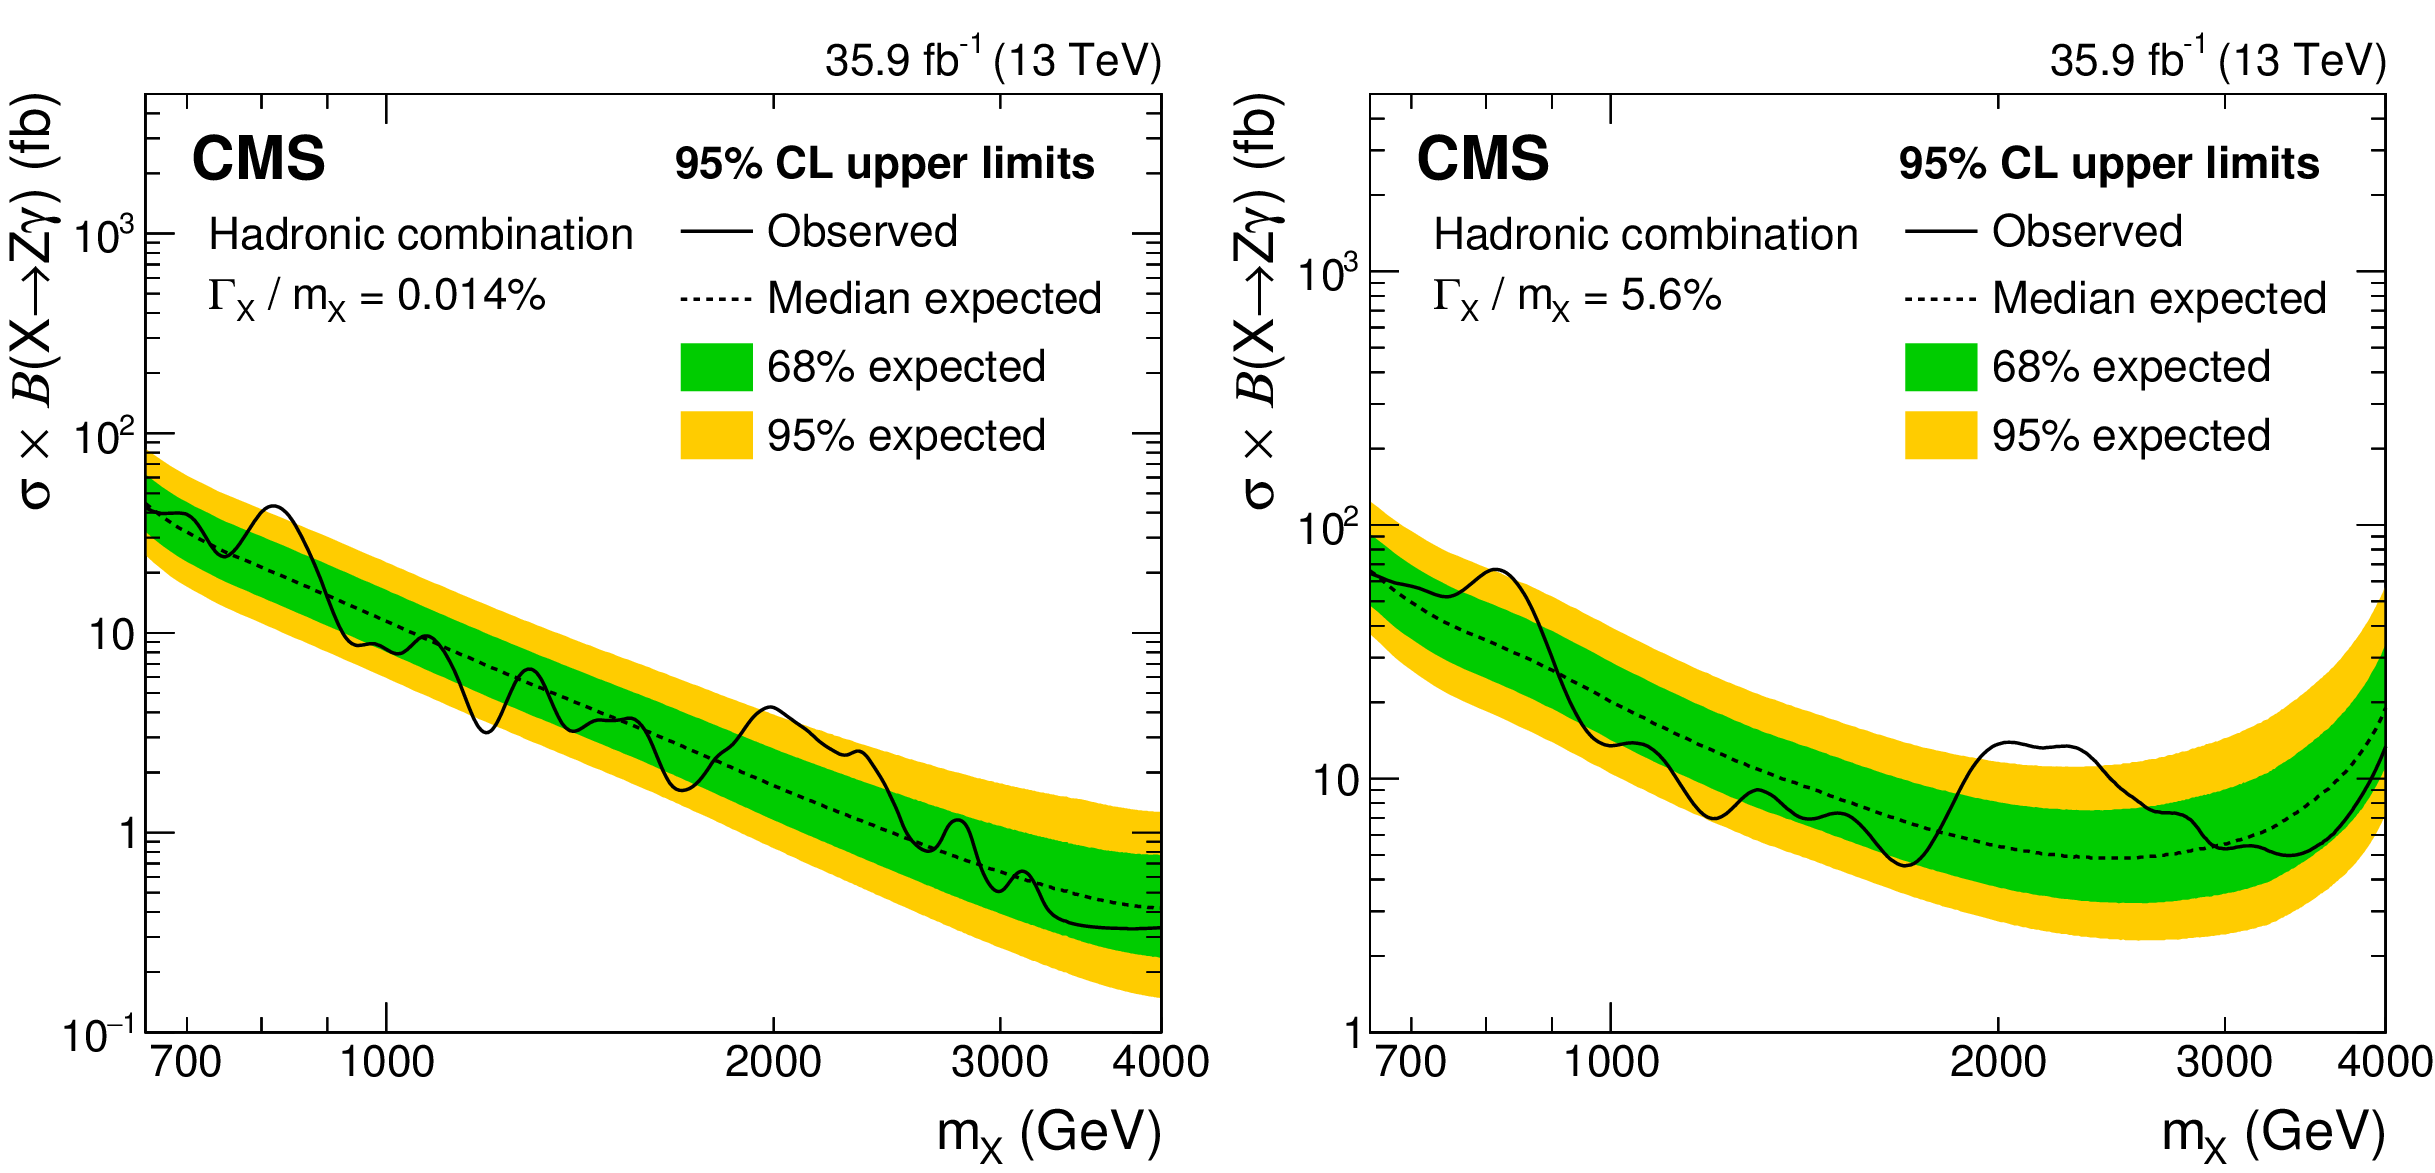
Figure 6:
Observed (solid) and expected (dashed) 95% CL upper limits on $\sigma (\mathrm {X}\to {\mathrm {Z}} {\gamma})$ as a function of signal mass $m_\mathrm {X}$, together with the 68% (green) and 95% (yellow) CL ranges of the expected limit for the background-only hypothesis, for the combination of the b-tagged, $\tau _{21}$-tagged, and untagged categories for (left) narrow and (right) broad spin-0 resonances. |

png pdf |
Figure 6-a:
Observed (solid) and expected (dashed) 95% CL upper limits on $\sigma (\mathrm {X}\to {\mathrm {Z}} {\gamma})$ as a function of signal mass $m_\mathrm {X}$, together with the 68% (green) and 95% (yellow) CL ranges of the expected limit for the background-only hypothesis, for the combination of the b-tagged, $\tau _{21}$-tagged, and untagged categories for narrow spin-0 resonances. |
png pdf |
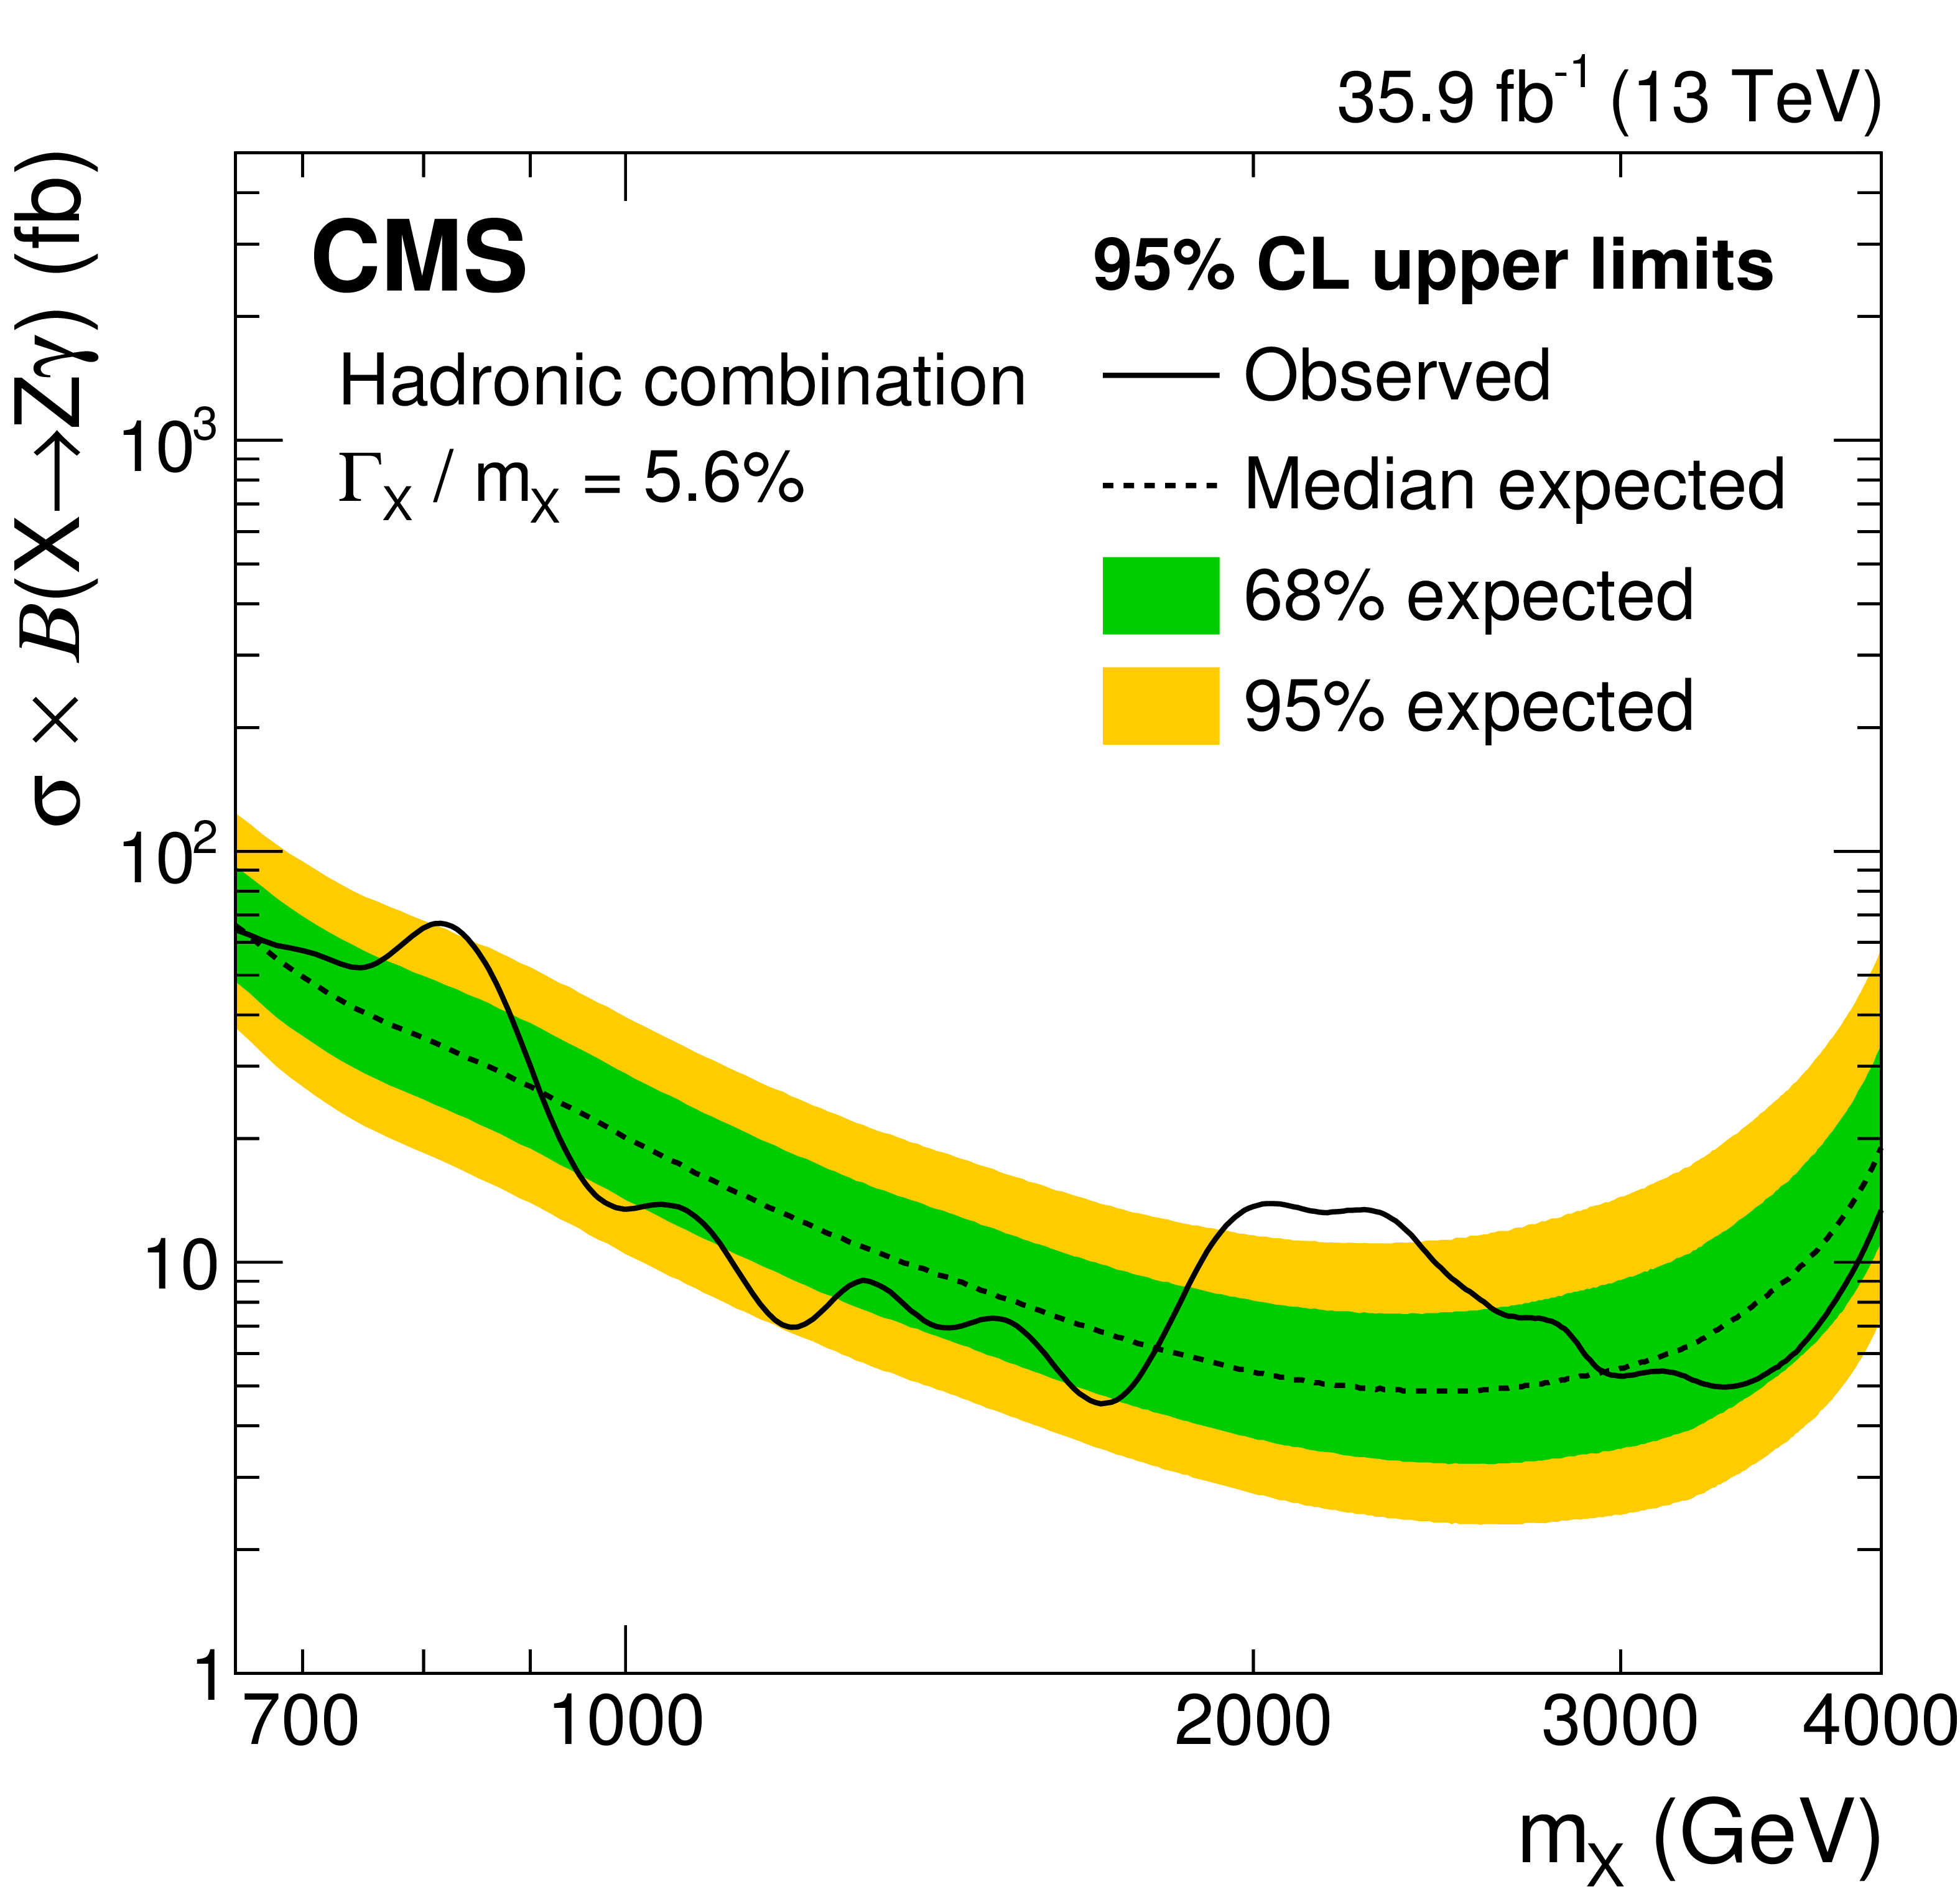
Figure 6-b:
Observed (solid) and expected (dashed) 95% CL upper limits on $\sigma (\mathrm {X}\to {\mathrm {Z}} {\gamma})$ as a function of signal mass $m_\mathrm {X}$, together with the 68% (green) and 95% (yellow) CL ranges of the expected limit for the background-only hypothesis, for the combination of the b-tagged, $\tau _{21}$-tagged, and untagged categories for broad spin-0 resonances. |
png pdf |
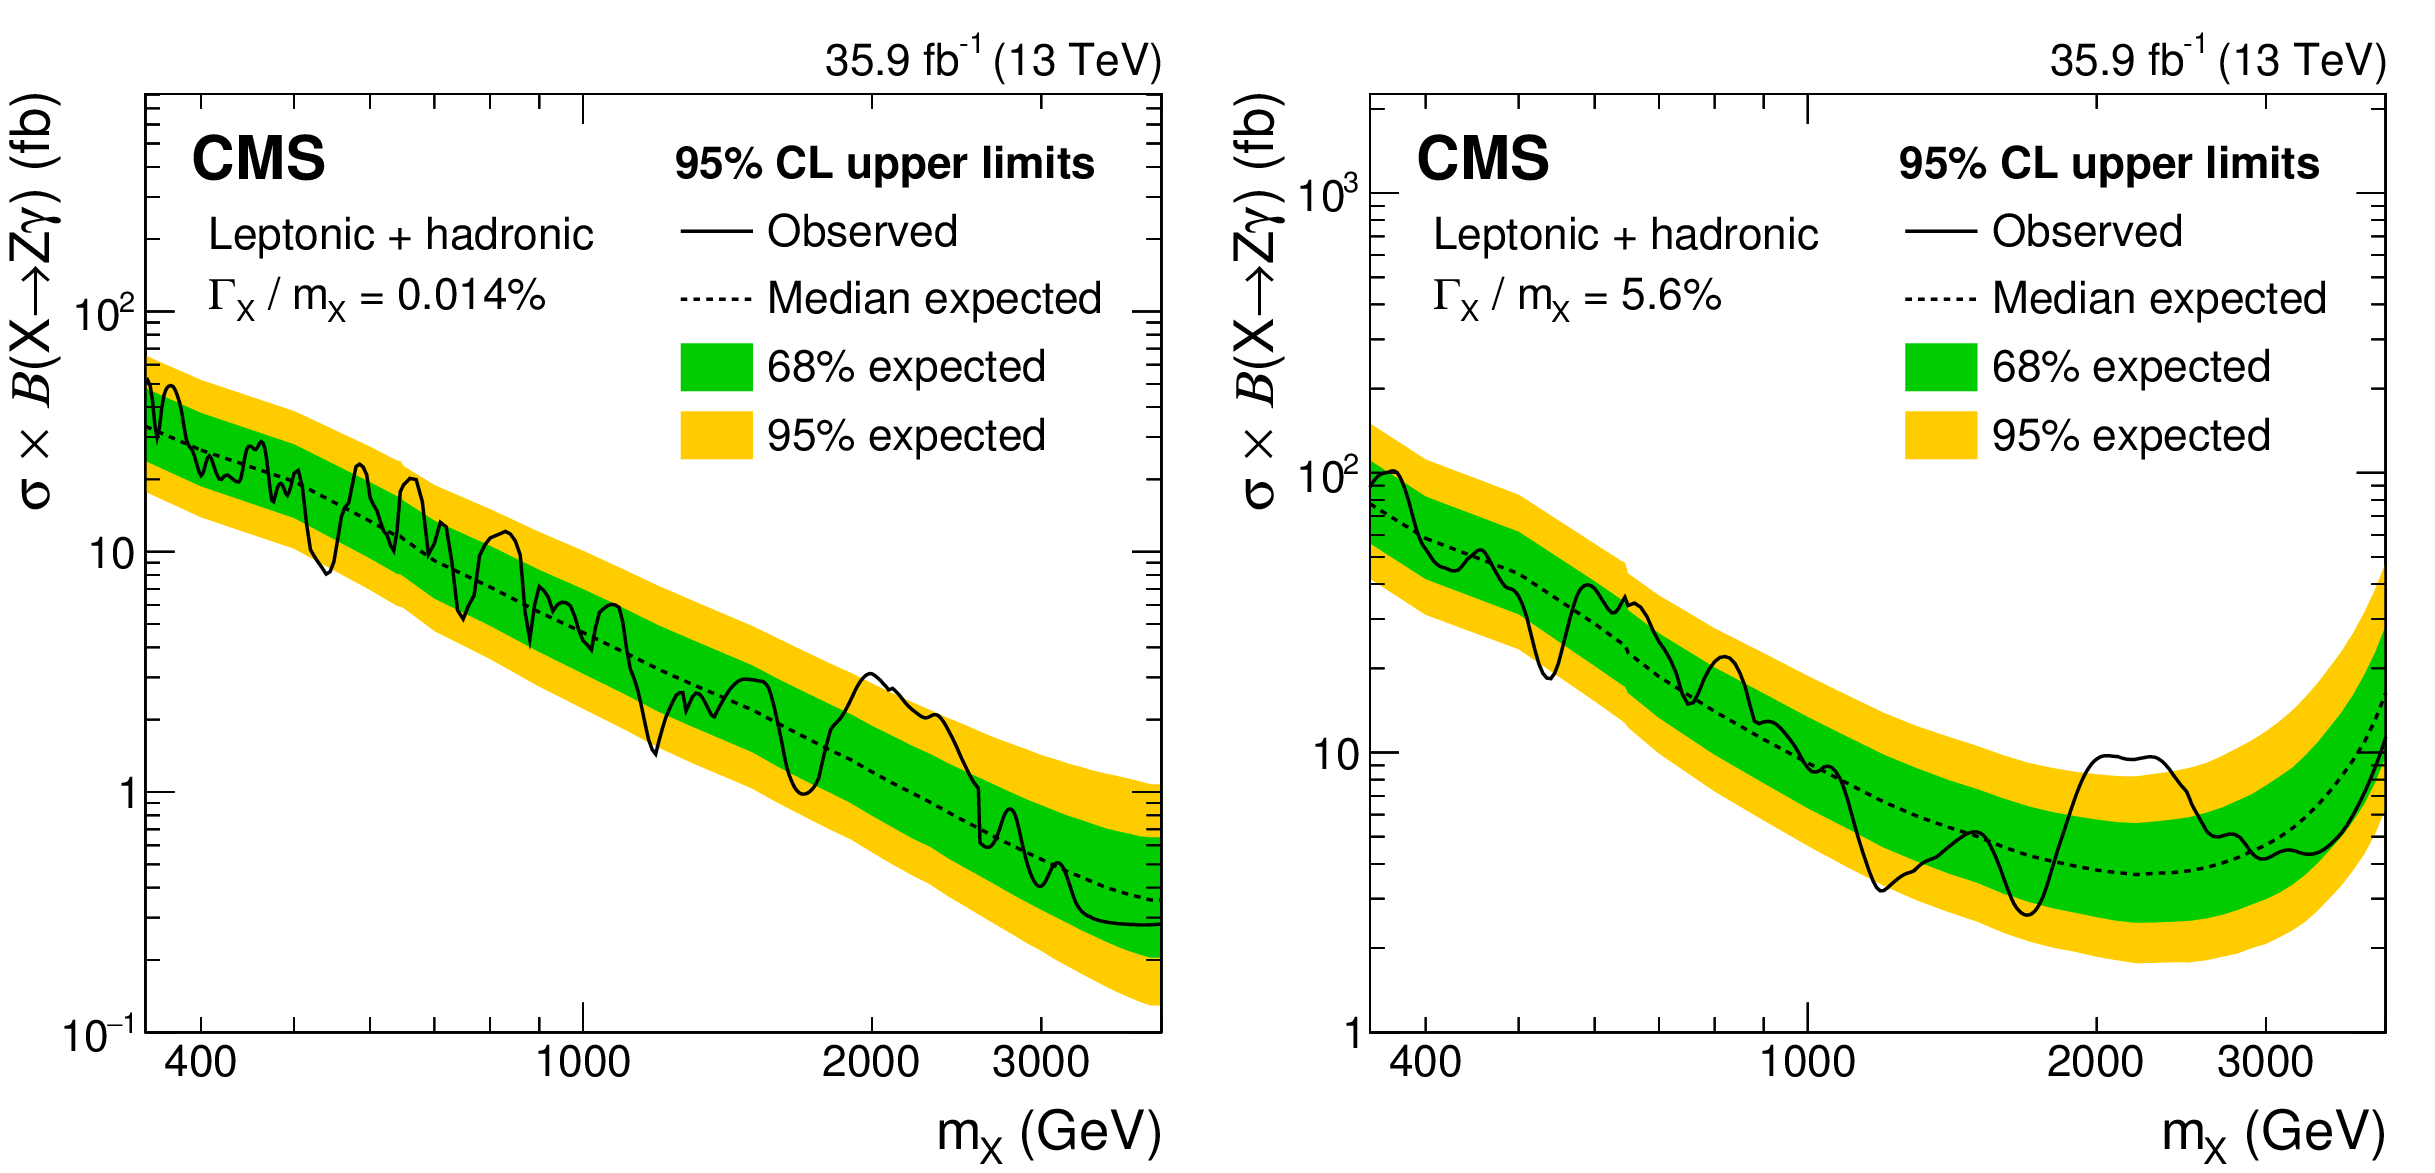
Figure 7:
Observed and expected limits on the product of the production cross section and branching fraction $\mathcal {B}(\mathrm {X} \to {\mathrm {Z}} {\gamma})$, as a function of signal mass $m_\mathrm {X}$, for (left) narrow and (right) broad spin-0 resonances, obtained from the combination of the leptonic and hadronic decay channels. |
png pdf |
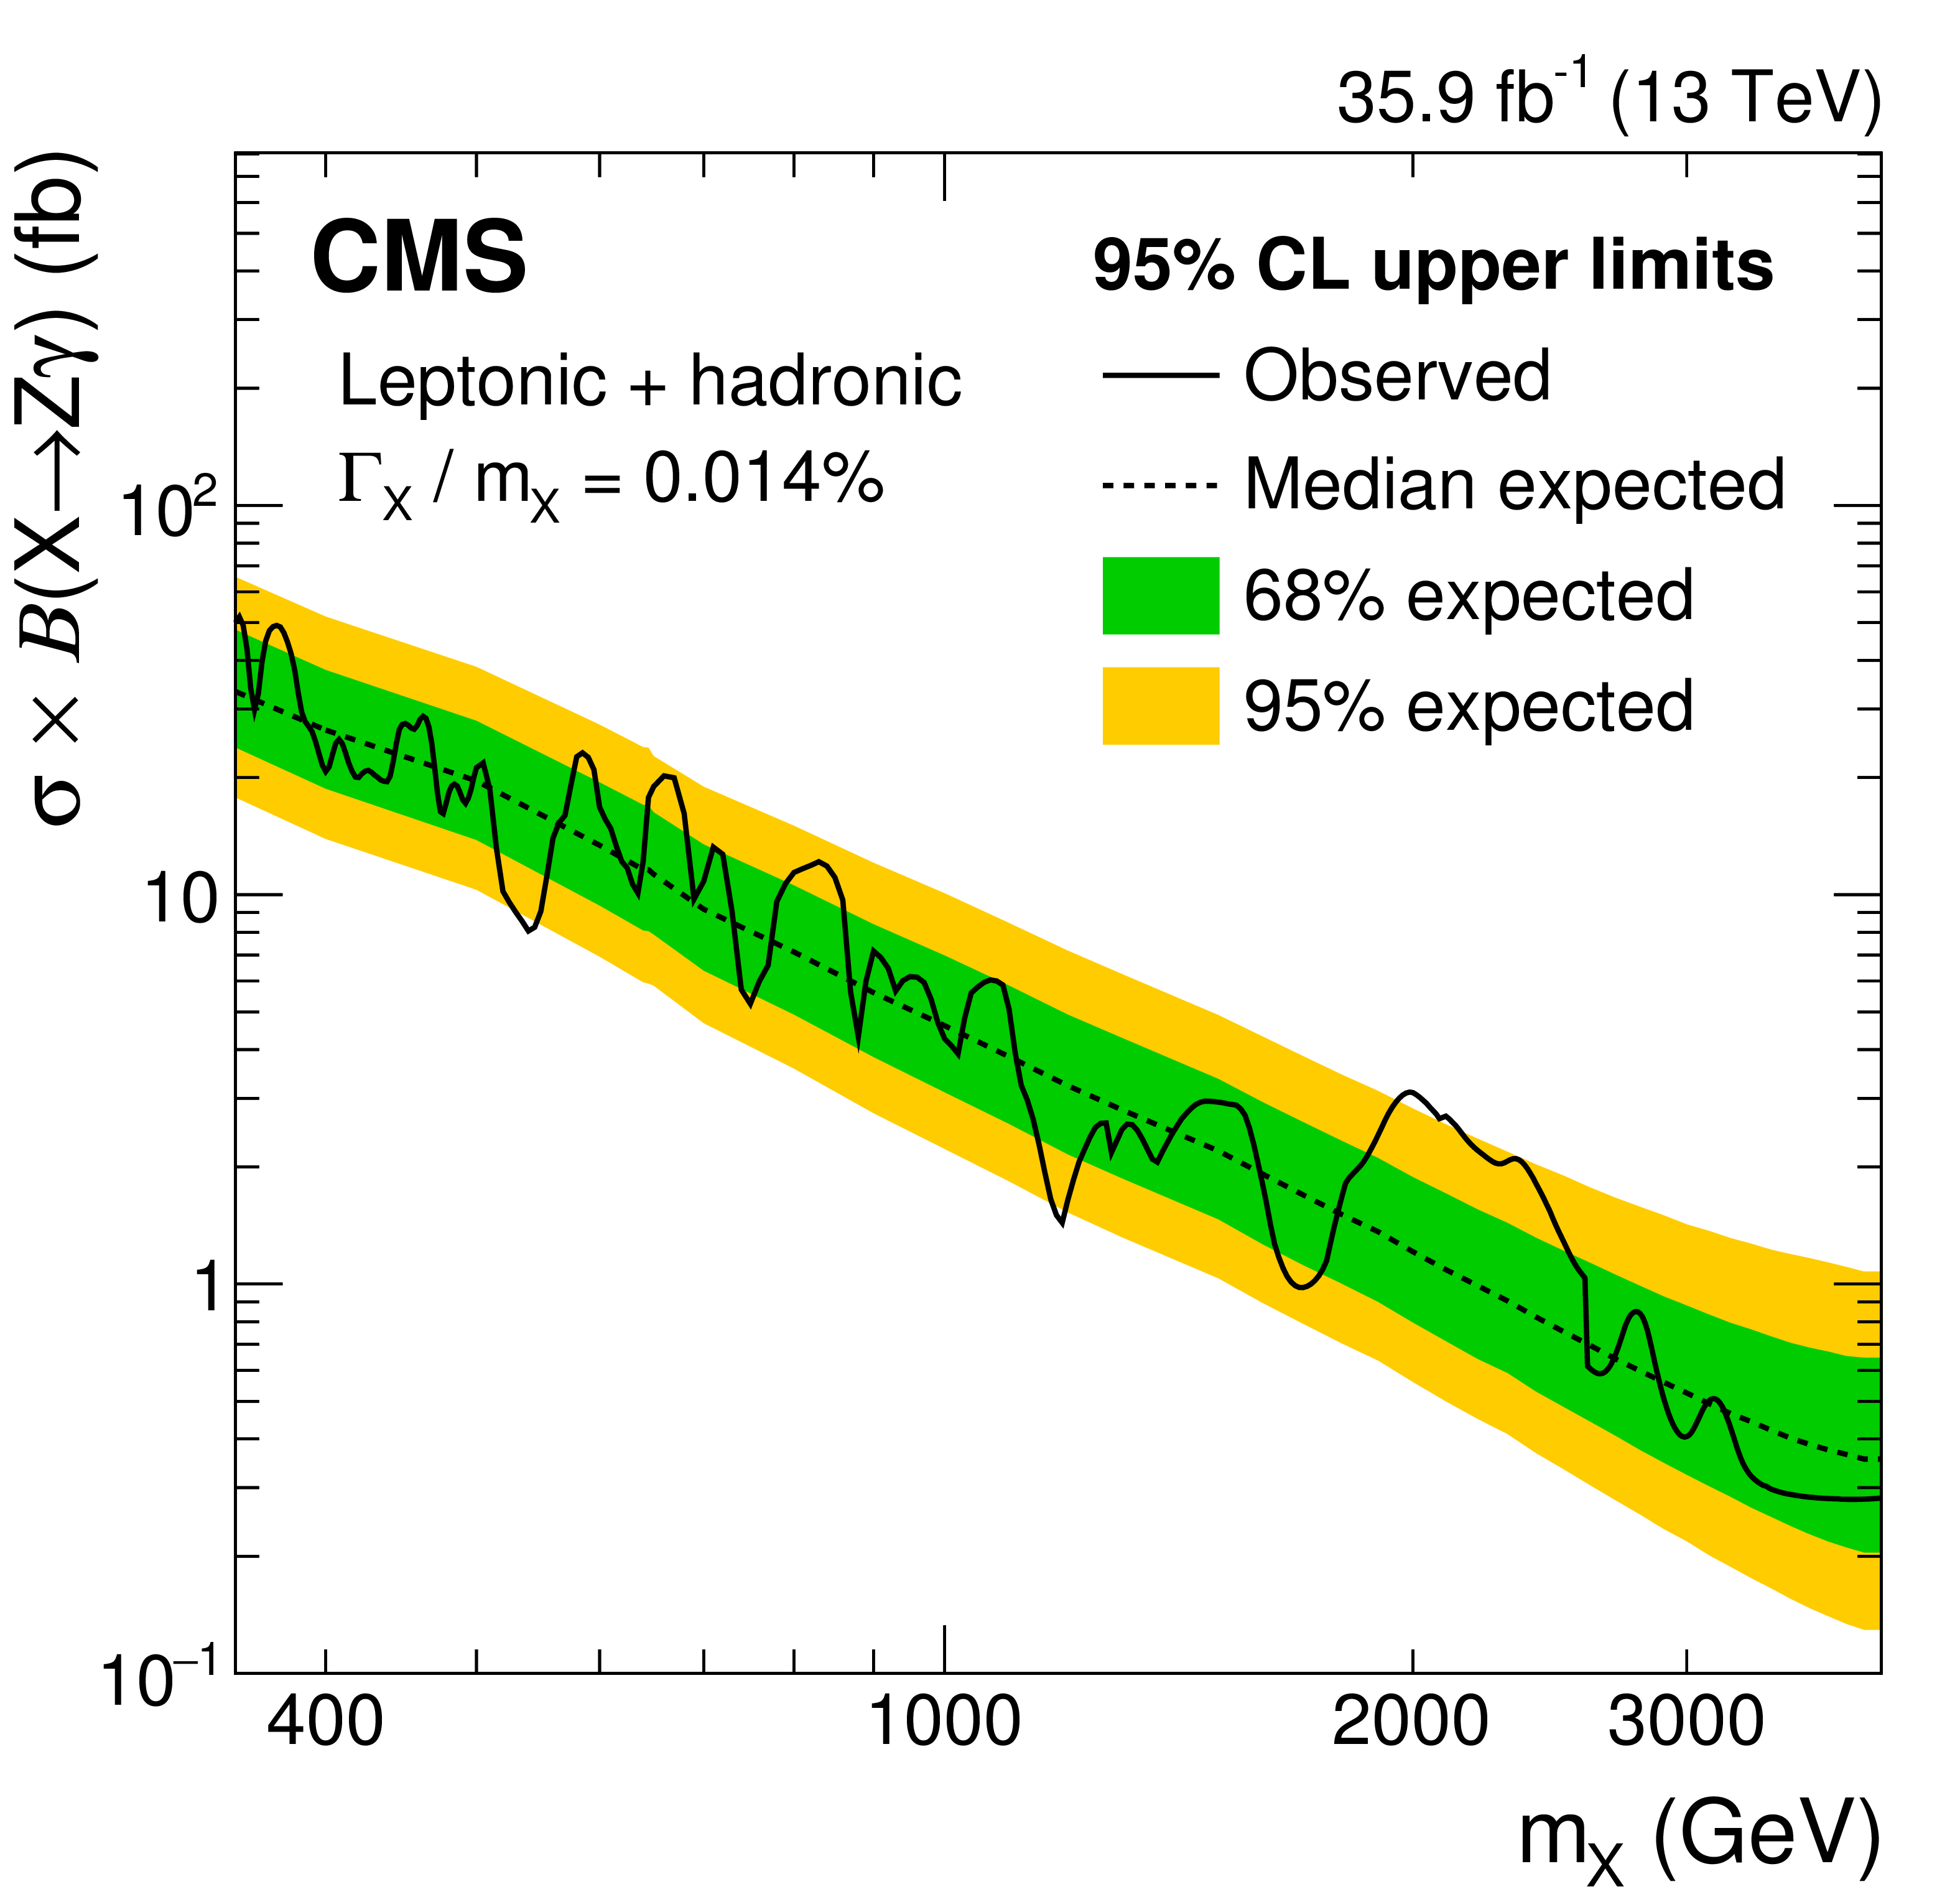
Figure 7-a:
Observed and expected limits on the product of the production cross section and branching fraction $\mathcal {B}(\mathrm {X} \to {\mathrm {Z}} {\gamma})$, as a function of signal mass $m_\mathrm {X}$, for narrow spin-0 resonances, obtained from the combination of the leptonic and hadronic decay channels. |

png pdf |
Figure 7-b:
Observed and expected limits on the product of the production cross section and branching fraction $\mathcal {B}(\mathrm {X} \to {\mathrm {Z}} {\gamma})$, as a function of signal mass $m_\mathrm {X}$, for broad spin-0 resonances, obtained from the combination of the leptonic and hadronic decay channels. |
| Tables | |

png pdf |
Table 1:
Summary of the systematic uncertainties in the signal yield (upper part of the table) or shape (lower part of the table). A dash indicates that the uncertainty does not apply. |
| Summary |
| A search is presented for resonances decaying to a Z boson and a photon. The analysis is based on data from proton-proton collisions at a center-of-mass energy of 13 TeV, corresponding to an integrated luminosity of 35.9 fb$^{-1}$, collected with the CMS detector at the LHC in 2016. Two decay modes of the Z boson are investigated. In the leptonic channels, the Z boson candidates are reconstructed using electron or muon pairs. In the hadronic channels, they are identified using a large-radius jet, containing either light-quark or b quark decay products of the Z boson, via jet substructure and advanced b tagging techniques. The results from these channels are combined and interpreted in terms of upper limits on the product of the production cross section and the branching fraction to Z$\gamma$ for narrow (broad) spin-0 resonances with masses between 0.35 and 4.0 TeV, ranging from 50 (100) to 0.3 (1.5) fb. These are the most stringent limits on such resonances to date. |
| References | ||||
| 1 | ATLAS Collaboration | Observation of a new particle in the search for the Standard Model Higgs boson with the ATLAS detector at the LHC | PLB 716 (2012) 1 | 1207.7214 |
| 2 | CMS Collaboration | Observation of a new boson at a mass of 125 GeV with the CMS experiment at the LHC | PLB 716 (2012) 30 | CMS-HIG-12-028 1207.7235 |
| 3 | CMS Collaboration | Observation of a new boson with mass near 125 GeV in pp collisions at $ \sqrt{s} = $ 7 and 8 TeV | JHEP 06 (2013) 081 | CMS-HIG-12-036 1303.4571 |
| 4 | CMS Collaboration | Search for massive resonances in dijet systems containing jets tagged as W or Z boson decays in pp collisions at $ \sqrt{s} = $ 8 TeV | JHEP 08 (2014) 173 | CMS-EXO-12-024 1405.1994 |
| 5 | CMS Collaboration | Search for massive resonances decaying into pairs of boosted bosons in semi-leptonic final states at $ \sqrt{s} = $ 8 TeV | JHEP 08 (2014) 174 | CMS-EXO-13-009 1405.3447 |
| 6 | ATLAS Collaboration | Combination of searches for WW, WZ, and ZZ resonances in pp collisions at $ \sqrt{s} = $ 8 TeV with the ATLAS detector | PLB 755 (2016) 285 | 1512.05099 |
| 7 | ATLAS Collaboration | Searches for heavy diboson resonances in pp collisions at $ \sqrt{s}= $ 13 TeV with the ATLAS detector | JHEP 09 (2016) 173 | 1606.04833 |
| 8 | CMS Collaboration | Search for massive resonances decaying into WW, WZ or ZZ bosons in proton-proton collisions at $ \sqrt{s} = $ 13 TeV | JHEP 03 (2017) 162 | CMS-B2G-16-004 1612.09159 |
| 9 | CMS Collaboration | Search for charged higgs bosons produced via vector boson fusion and decaying into a pair of $ W $ and $ Z $ bosons using $ pp $ collisions at $ \sqrt{s}= $ 13 TeV | PRL 119 (2017) 141802 | CMS-HIG-16-027 1705.02942 |
| 10 | CMS Collaboration | Combination of searches for heavy resonances decaying to WW, WZ, ZZ, WH, and ZH boson pairs in proton?proton collisions at $ \sqrt{s}= $ 8 and 13 TeV | PLB 774 (2017) 533 | CMS-B2G-16-007 1705.09171 |
| 11 | ATLAS Collaboration | Search for diboson resonances with boson-tagged jets in $ pp $ collisions at $ \sqrt{s}= $ 13 TeV with the ATLAS detector | PLB 777 (2018) 91 | 1708.04445 |
| 12 | ATLAS Collaboration | Searches for heavy $ ZZ $ and $ ZW $ resonances in the $ \ell\ell qq $ and $ \nu\nu qq $ final states in $ pp $ collisions at $ \sqrt{s}= $ 13 TeV with the ATLAS detector | JHEP 03 (2018) 009 | 1708.09638 |
| 13 | ATLAS Collaboration | Search for $ WW/WZ $ resonance production in $ \ell \nu qq $ final states in $ pp $ collisions at $ \sqrt{s} = $ 13 TeV with the ATLAS detector | JHEP 03 (2018) 042 | 1710.07235 |
| 14 | ATLAS Collaboration | Search for heavy resonances decaying into $ WW $ in the $ e\nu\mu\nu $ final state in $ pp $ collisions at $ \sqrt{s}= $ 13 TeV with the ATLAS detector | EPJC 78 (2018) 24 | 1710.01123 |
| 15 | CMS Collaboration | Search for ZZ resonances in the 2$ \ell 2 \nu $ final state in proton-proton collisions at 13 TeV | JHEP 03 (2018) 003 | CMS-B2G-16-023 1711.04370 |
| 16 | CMS Collaboration | Search for a massive resonance decaying into a Higgs boson and a W or Z boson in hadronic final states in proton-proton collisions at $ \sqrt{s}= $ 8 TeV | JHEP 02 (2016) 145 | CMS-EXO-14-009 1506.01443 |
| 17 | CMS Collaboration | Search for massive WH resonances decaying into the $ \ell \nu \mathrm{b} \overline{\mathrm{b}} $ final state at $ \sqrt{s}= $ 8 TeV | EPJC 76 (2016) 237 | CMS-EXO-14-010 1601.06431 |
| 18 | ATLAS Collaboration | Search for new resonances decaying to a $ W $ or $ Z $ boson and a Higgs boson in the $ \ell^+ \ell^-\text{b}\bar{\text{b}} $, $ \ell \nu\text{b}\bar{\text{b}} $, and $ \nu\bar{\nu}\text{b}\bar{\text{b}} $ channels with pp collisions at $ \sqrt s = $ 13 TeV with the ATLAS detector | PLB 765 (2017) 32 | 1607.05621 |
| 19 | CMS Collaboration | Search for heavy resonances decaying into a vector boson and a Higgs boson in final states with charged leptons, neutrinos, and b quarks | PLB 768 (2017) 137 | CMS-B2G-16-003 1610.08066 |
| 20 | CMS Collaboration | Search for heavy resonances that decay into a vector boson and a Higgs boson in hadronic final states at $ \sqrt{s} = $ 13 TeV | EPJC 77 (2017) 636 | CMS-B2G-17-002 1707.01303 |
| 21 | ATLAS Collaboration | Search for heavy resonances decaying to a $ W $ or $ Z $ boson and a Higgs boson in the $ q\bar{q}^{(\prime)}b\bar{b} $ final state in $ pp $ collisions at $ \sqrt{s} = $ 13 TeV with the ATLAS detector | PLB 774 (2017) 494 | 1707.06958 |
| 22 | L. D. Landau | On the angular momentum of a system of two photons | Dokl. Akad. Nauk Ser. Fiz. 60 (1948) 207 | |
| 23 | C.-N. Yang | Selection rules for the dematerialization of a particle into two photons | PR77 (1950) 242 | |
| 24 | E. Eichten and K. Lane | Low-scale technicolor at the Tevatron and LHC | PLB 669 (2008) 235 | 0706.2339 |
| 25 | A. Freitas and P. Schwaller | Multi-photon signals from composite models at LHC | JHEP 01 (2011) 022 | 1010.2528 |
| 26 | R. Barbieri and R. Torre | Signals of single particle production at the earliest LHC | PLB 695 (2011) 259 | 1008.5302 |
| 27 | I. Low, J. Lykken, and G. Shaughnessy | Singlet scalars as Higgs imposters at the Large Hadron Collider | PRD 84 (2011) 035027 | 1105.4587 |
| 28 | H. Davoudiasl, J. L. Hewett, and T. G. Rizzo | Experimental probes of localized gravity: On and off the wall | PRD 63 (2001) 075004 | hep-ph/0006041 |
| 29 | B. C. Allanach, J. P. Skittrall, and K. Sridhar | Z boson decay to photon plus Kaluza-Klein graviton in large extra dimensions | JHEP 11 (2007) 089 | 0705.1953 |
| 30 | ATLAS Collaboration | Searches for the $ Z\gamma $ decay mode of the Higgs boson and for new high-mass resonances in $ pp $ collisions at $ \sqrt{s} = $ 13 TeV with the ATLAS detector | JHEP 10 (2017) 112 | 1708.00212 |
| 31 | ATLAS Collaboration | Search for heavy resonances decaying to a $ \mathrm{Z} $ boson and a photon in pp collisions at $ \sqrt{s}= $ 13 TeV with the ATLAS detector | PLB 764 (2017) 11 | 1607.06363 |
| 32 | CMS Collaboration | Search for high-mass $ \mathrm{Z}\gamma $ resonances in proton-proton collisions at $ \sqrt{s}= $ 8 and 13 TeV using jet substructure techniques | PLB 772 (2017) 363 | CMS-EXO-16-025 1612.09516 |
| 33 | L3 Collaboration | Search for anomalous couplings in the Higgs sector at LEP | PLB 589 (2004) 89 | hep-ex/0403037 |
| 34 | D0 Collaboration | Search for particles decaying into a Z boson and a photon in $ {\rm p\bar{p}} $ collisions at $ \sqrt{s} = $ 1.96 TeV | PLB 641 (2006) 415 | hep-ex/0605064 |
| 35 | D0 Collaboration | Search for a scalar or vector particle decaying into $ \mathrm{Z} \gamma $ in $ \text{p} \bar{\text{p}} $ collisions at $ \sqrt{s}= $ 1.96 TeV | PLB 671 (2009) 349 | 0806.0611 |
| 36 | ATLAS Collaboration | Measurements of $ \mathrm{W}\gamma $ and $ \mathrm{Z}\gamma $ production in pp collisions at $ \sqrt{s}= $ 7 TeV with the ATLAS detector at the LHC | PRD 87 (2013) 112003 | 1302.1283 |
| 37 | ATLAS Collaboration | Search for new resonances in $ \mathrm{W}\gamma $ and $ \mathrm{Z}\gamma $ final states in pp collisions at $ \sqrt{s}= $ 8 TeV with the ATLAS detector | PLB 738 (2014) 428 | 1407.8150 |
| 38 | CMS Collaboration | Search for high-mass Z$ \gamma $ resonances in $ \mathrm{e}^+\mathrm{e}^-\gamma $ and $ \mu^+\mu^-\gamma $ final states in proton-proton collisions at $ \sqrt{s}= $ 8 and 13 TeV | JHEP 01 (2017) 076 | CMS-EXO-16-021 1610.02960 |
| 39 | CMS Collaboration | Search for a Higgs boson decaying into a Z and a photon in pp collisions at $ \sqrt{s} = $ 7 and 8 TeV | PLB 726 (2013) 587 | CMS-HIG-13-006 1307.5515 |
| 40 | ATLAS Collaboration | Search for Higgs boson decays to a photon and a Z boson in pp collisions at $ \sqrt{s}= $ 7 and 8 TeV with the ATLAS detector | PLB 732 (2014) 8 | 1402.3051 |
| 41 | CMS Collaboration | Description and performance of track and primary-vertex reconstruction with the CMS tracker | JINST 9 (2014) P10009 | CMS-TRK-11-001 1405.6569 |
| 42 | CMS Collaboration | Performance of electron reconstruction and selection with the CMS detector in proton-proton collisions at $ \sqrt{s} = $ 8 TeV | JINST 10 (2015) P06005 | CMS-EGM-13-001 1502.02701 |
| 43 | CMS Collaboration | Performance of CMS muon reconstruction in pp collision events at $ \sqrt{s} = $ 7 TeV | JINST 7 (2012) P10002 | CMS-MUO-10-004 1206.4071 |
| 44 | CMS Collaboration | The CMS trigger system | JINST 12 (2017) P01020 | CMS-TRG-12-001 1609.02366 |
| 45 | CMS Collaboration | The CMS experiment at the CERN LHC | JINST 3 (2008) S08004 | CMS-00-001 |
| 46 | T. Sjostrand, S. Mrenna, and P. Z. Skands | A brief introduction to PYTHIA 8.1 | CPC 178 (2008) 852 | 0710.3820 |
| 47 | P. Skands, S. Carrazza, and J. Rojo | Tuning PYTHIA 8.1: the Monash 2013 tune | EPJC 74 (2014) 3024 | 1404.5630 |
| 48 | CMS Collaboration | Event generator tunes obtained from underlying event and multiparton scattering measurements | EPJC 76 (2016) 155 | CMS-GEN-14-001 1512.00815 |
| 49 | J. Alwall et al. | MadGraph 5: going beyond | JHEP 06 (2011) 128 | 1106.0522 |
| 50 | J. Alwall et al. | The automated computation of tree-level and next-to-leading order differential cross sections, and their matching to parton shower simulations | JHEP 07 (2014) 079 | 1405.0301 |
| 51 | NNPDF Collaboration | Parton distributions for the LHC Run II | JHEP 04 (2015) 040 | 1410.8849 |
| 52 | GEANT4 Collaboration | GEANT4 --- a simulation toolkit | NIMA 506 (2003) 250 | |
| 53 | CMS Collaboration | Particle-flow reconstruction and global event description with the CMS detector | JINST 12 (2017) P10003 | CMS-PRF-14-001 1706.04965 |
| 54 | M. Cacciari, G. P. Salam, and G. Soyez | The anti-$ k_\text{t} $ jet clustering algorithm | JHEP 04 (2008) 063 | 0802.1189 |
| 55 | M. Cacciari, G. P. Salam, and G. Soyez | FastJet user manual | EPJC 72 (2012) 1896 | 1111.6097 |
| 56 | CMS Collaboration | Performance of the CMS muon detector and muon reconstruction with proton-proton collisions at $ \sqrt{s}= $ 13 TeV | JINST 13 (2018) P06015 | CMS-MUO-16-001 1804.04528 |
| 57 | M. Cacciari and G. P. Salam | Pileup subtraction using jet areas | PLB 659 (2008) 119 | 0707.1378 |
| 58 | H.-J. Yang, B. P. Roe, and J. Zhu | Studies of boosted decision trees for MiniBooNE particle identification | NIMA 555 (2005) 370 | physics/0508045 |
| 59 | H. Voss, A. Hocker, J. Stelzer, and F. Tegenfeldt | TMVA, the toolkit for multivariate data analysis with ROOT | in XIth International Workshop on Advanced Computing and Analysis Techniques in Physics Research (ACAT), p. 40 2007 [PoS(ACAT)040] | physics/0703039 |
| 60 | CMS Collaboration | Performance of photon reconstruction and identification with the CMS detector in proton-proton collisions at $ \sqrt{s} = $ 8 TeV | JINST 10 (2015) P08010 | CMS-EGM-14-001 1502.02702 |
| 61 | CMS Collaboration | Determination of jet energy calibration and transverse momentum resolution in CMS | JINST 6 (2011) P11002 | CMS-JME-10-011 1107.4277 |
| 62 | CMS Collaboration | Jet energy scale and resolution in the CMS experiment in pp collisions at 8 TeV | JINST 12 (2017) P02014 | CMS-JME-13-004 1607.03663 |
| 63 | S. D. Ellis, C. K. Vermilion, and J. R. Walsh | Techniques for improved heavy particle searches with jet substructure | PRD 80 (2009) 051501 | 0903.5081 |
| 64 | S. D. Ellis, C. K. Vermilion, and J. R. Walsh | Recombination algorithms and jet substructure: pruning as a tool for heavy particle searches | PRD 81 (2010) 094023 | 0912.0033 |
| 65 | Y. L. Dokshitzer, G. D. Leder, S. Moretti, and B. R. Webber | Better jet clustering algorithms | JHEP 08 (1997) 001 | hep-ph/9707323 |
| 66 | CMS Collaboration | Identification techniques for highly boosted W bosons that decay into hadrons | JHEP 12 (2014) 017 | CMS-JME-13-006 1410.4227 |
| 67 | J. Thaler and K. Van Tilburg | Identifying boosted objects with $ N $-subjettiness | JHEP 03 (2011) 015 | 1011.2268 |
| 68 | J. Thaler and K. Van Tilburg | Maximizing boosted top identification by minimizing $ N $-subjettiness | JHEP 02 (2012) 093 | 1108.2701 |
| 69 | CMS Collaboration | Jet algorithms performance in 13 TeV data | CMS-PAS-JME-16-003 | CMS-PAS-JME-16-003 |
| 70 | CMS Collaboration | Identification of b-quark jets with the CMS experiment | JINST 8 (2013) P04013 | CMS-BTV-12-001 1211.4462 |
| 71 | CMS Collaboration | Identification of heavy-flavour jets with the CMS detector in pp collisions at 13 TeV | JINST 13 (2018) P05011 | CMS-BTV-16-002 1712.07158 |
| 72 | ATLAS Collaboration | Search for strong gravity in multijet final states produced in pp collisions at $ \sqrt{s} = $ 13 TeV using the ATLAS detector at the LHC | JHEP 03 (2016) 026 | 1512.02586 |
| 73 | CDF Collaboration | Search for new particles decaying into dijets in proton-antiproton collisions at $ \sqrt{s} = $ 1.96 TeV | PRD 79 (2009) 112002 | 0812.4036 |
| 74 | UA2 Collaboration | A measurement of two-jet decays of the $ W $ and $ Z $ bosons at the CERN $ {\bar{p} p} $ collider | Z. Phys. C 49 (1991) 17 | |
| 75 | R. A. Fisher | On the interpretation of $ \chi^2 $ from contingency tables, and the calculation of $ p $ | J. Roy. Stat. Soc. 85 (1922) 87 | |
| 76 | CMS Collaboration | Search for Resonant Production of High-Mass Photon Pairs in Proton-Proton Collisions at $ \sqrt s = $ 8 and 13 TeV | PRL 117 (2016) 051802 | CMS-EXO-16-018 1606.04093 |
| 77 | F. Garwood | Fiducial limits for the Poisson distribution | Biometrika 28 (1936) 437 | |
| 78 | M. J. Oreglia | A study of the reactions $\psi' \to \gamma\gamma \psi$ | PhD thesis, Stanford University, 1980 SLAC Report SLAC-R-236, see A | |
| 79 | A. L. Read | Linear interpolation of histograms | NIMA 425 (1999) 357 | |
| 80 | CMS Collaboration | CMS luminosity measurements for the 2016 data-taking period | CMS-PAS-LUM-17-001 | CMS-PAS-LUM-17-001 |
| 81 | J. Butterworth et al. | PDF4LHC recommendations for LHC Run II | JPG 43 (2016) 023001 | 1510.03865 |
| 82 | ATLAS Collaboration | Measurement of the inelastic proton-proton cross section at $ \sqrt{s} = $ 13 TeV with the ATLAS detector at the LHC | PRL 117 (2016) 182002 | 1606.02625 |
| 83 | G. Cowan, K. Cranmer, E. Gross, and O. Vitells | Asymptotic formulae for likelihood-based tests of new physics | EPJC 71 (2011) 1554 | 1007.1727 |
| 84 | T. Junk | Confidence level computation for combining searches with small statistics | NIMA 434 (1999) 435 | hep-ex/9902006 |
| 85 | A. L. Read | Presentation of search results: the $ CL_s $ technique | in Durham IPPP Workshop: Advanced Statistical Techniques in Particle Physics, p. 2693 Durham, UK, March, 2002 [JPG 28 (2002) 2693] | |
| 86 | ATLAS and CMS Collaborations | Procedure for the LHC Higgs boson search combination in Summer 2011 | ATL-PHYS-PUB-2011-011, CMS NOTE-2011/005 | |
| 87 | Particle Data Group Collaboration | Review of Particle Physics | CPC 40 (2016) 100001 | |
|
|
Compact Muon Solenoid LHC, CERN |
|

|

|

|

|

|