

Compact Muon Solenoid
LHC, CERN
| CMS-HIG-18-004 ; CERN-EP-2019-164 | ||
| Search for a charged Higgs boson decaying into top and bottom quarks in proton-proton collisions at $\sqrt{s} = $ 13 TeV in events with electrons or muons | ||
| CMS Collaboration | ||
| 25 August 2019 | ||
| JHEP 01 (2020) 096 | ||
| Abstract: A search is presented for a charged Higgs boson heavier than the top quark, produced in association with a top quark, or with a top and a bottom quark, and decaying into a top-bottom quark-antiquark pair. The search is performed using proton-proton collision data collected by the CMS experiment at the LHC at a center-of-mass energy of 13 TeV, corresponding to an integrated luminosity of 35.9 fb$^{-1}$. Events are selected by the presence of a single isolated charged lepton (electron or muon) or an opposite-sign dilepton (electron or muon) pair, categorized according to the jet multiplicity and the number of jets identified as originating from b quarks. Multivariate analysis techniques are used to enhance the discrimination between signal and background in each category. The data are compatible with the standard model, and 95% confidence level upper limits of 9.6-0.01 pb are set on the charged Higgs boson production cross section times branching fraction to a top-bottom quark-antiquark pair, for charged Higgs boson mass hypotheses ranging from 200 GeV to 3 TeV. The upper limits are interpreted in different minimal supersymmetric extensions of the standard model. | ||
| Links: e-print arXiv:1908.09206 [hep-ex] (PDF) ; CDS record ; inSPIRE record ; HepData record ; CADI line (restricted) ; | ||
| Figures & Tables | Summary | Additional Figures | References | CMS Publications |
|---|
| Figures | |
png pdf |
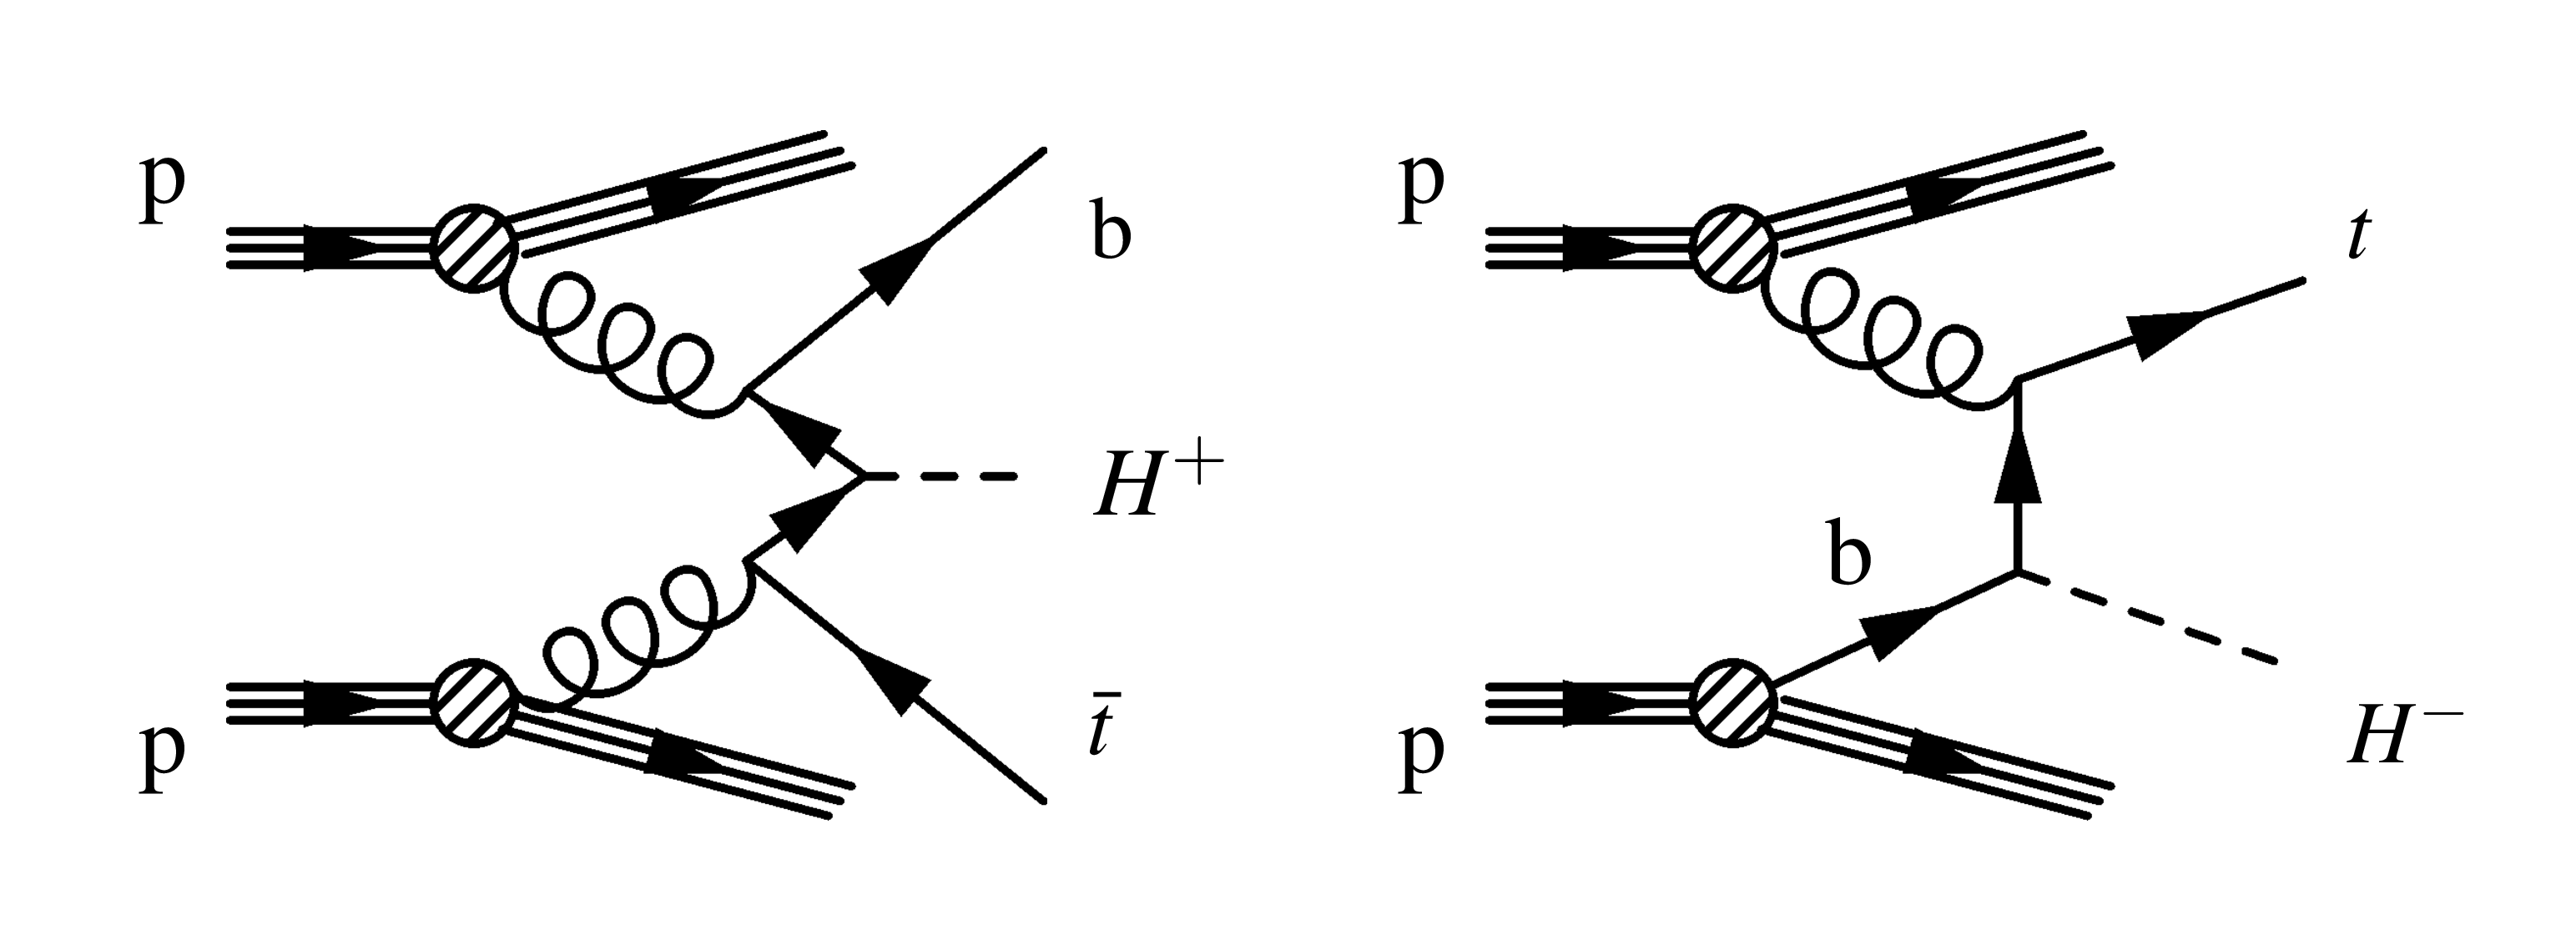
Figure 1:
Feynman diagrams for the production of a heavy charged Higgs boson in the four-flavor scheme (4FS, left) and in the five-flavor scheme (5FS, right). |
png pdf |
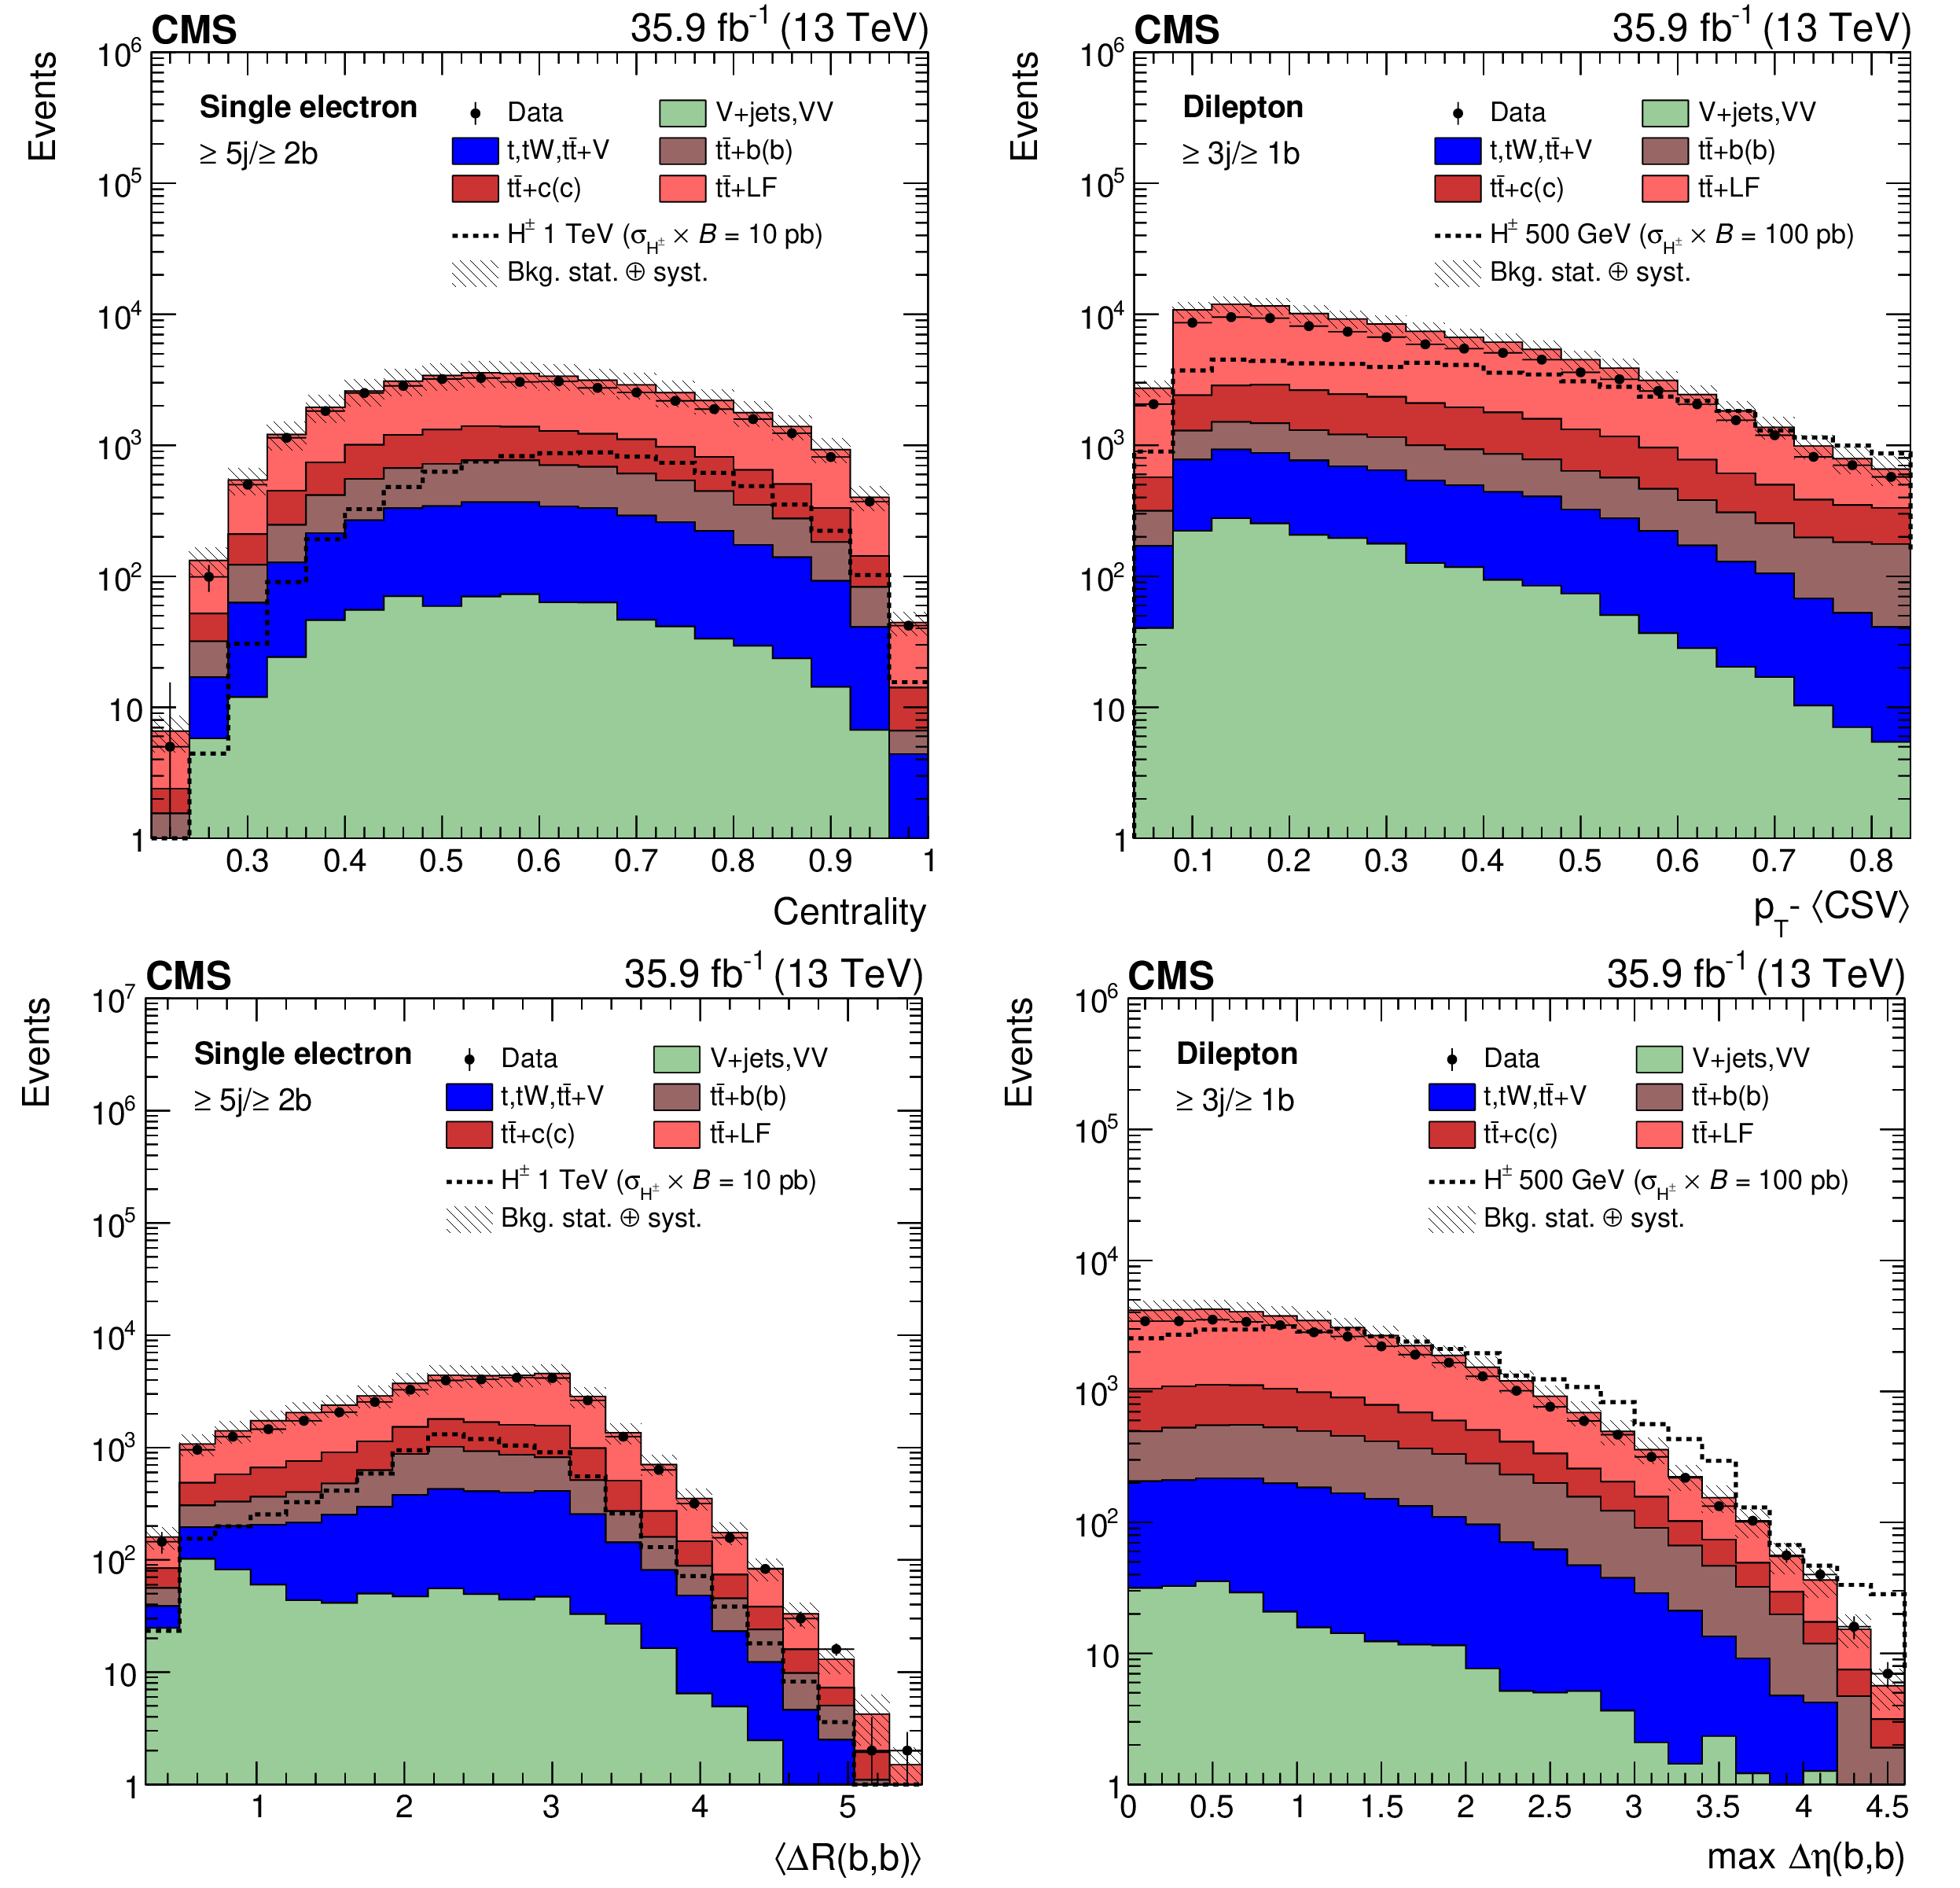
Figure 2:
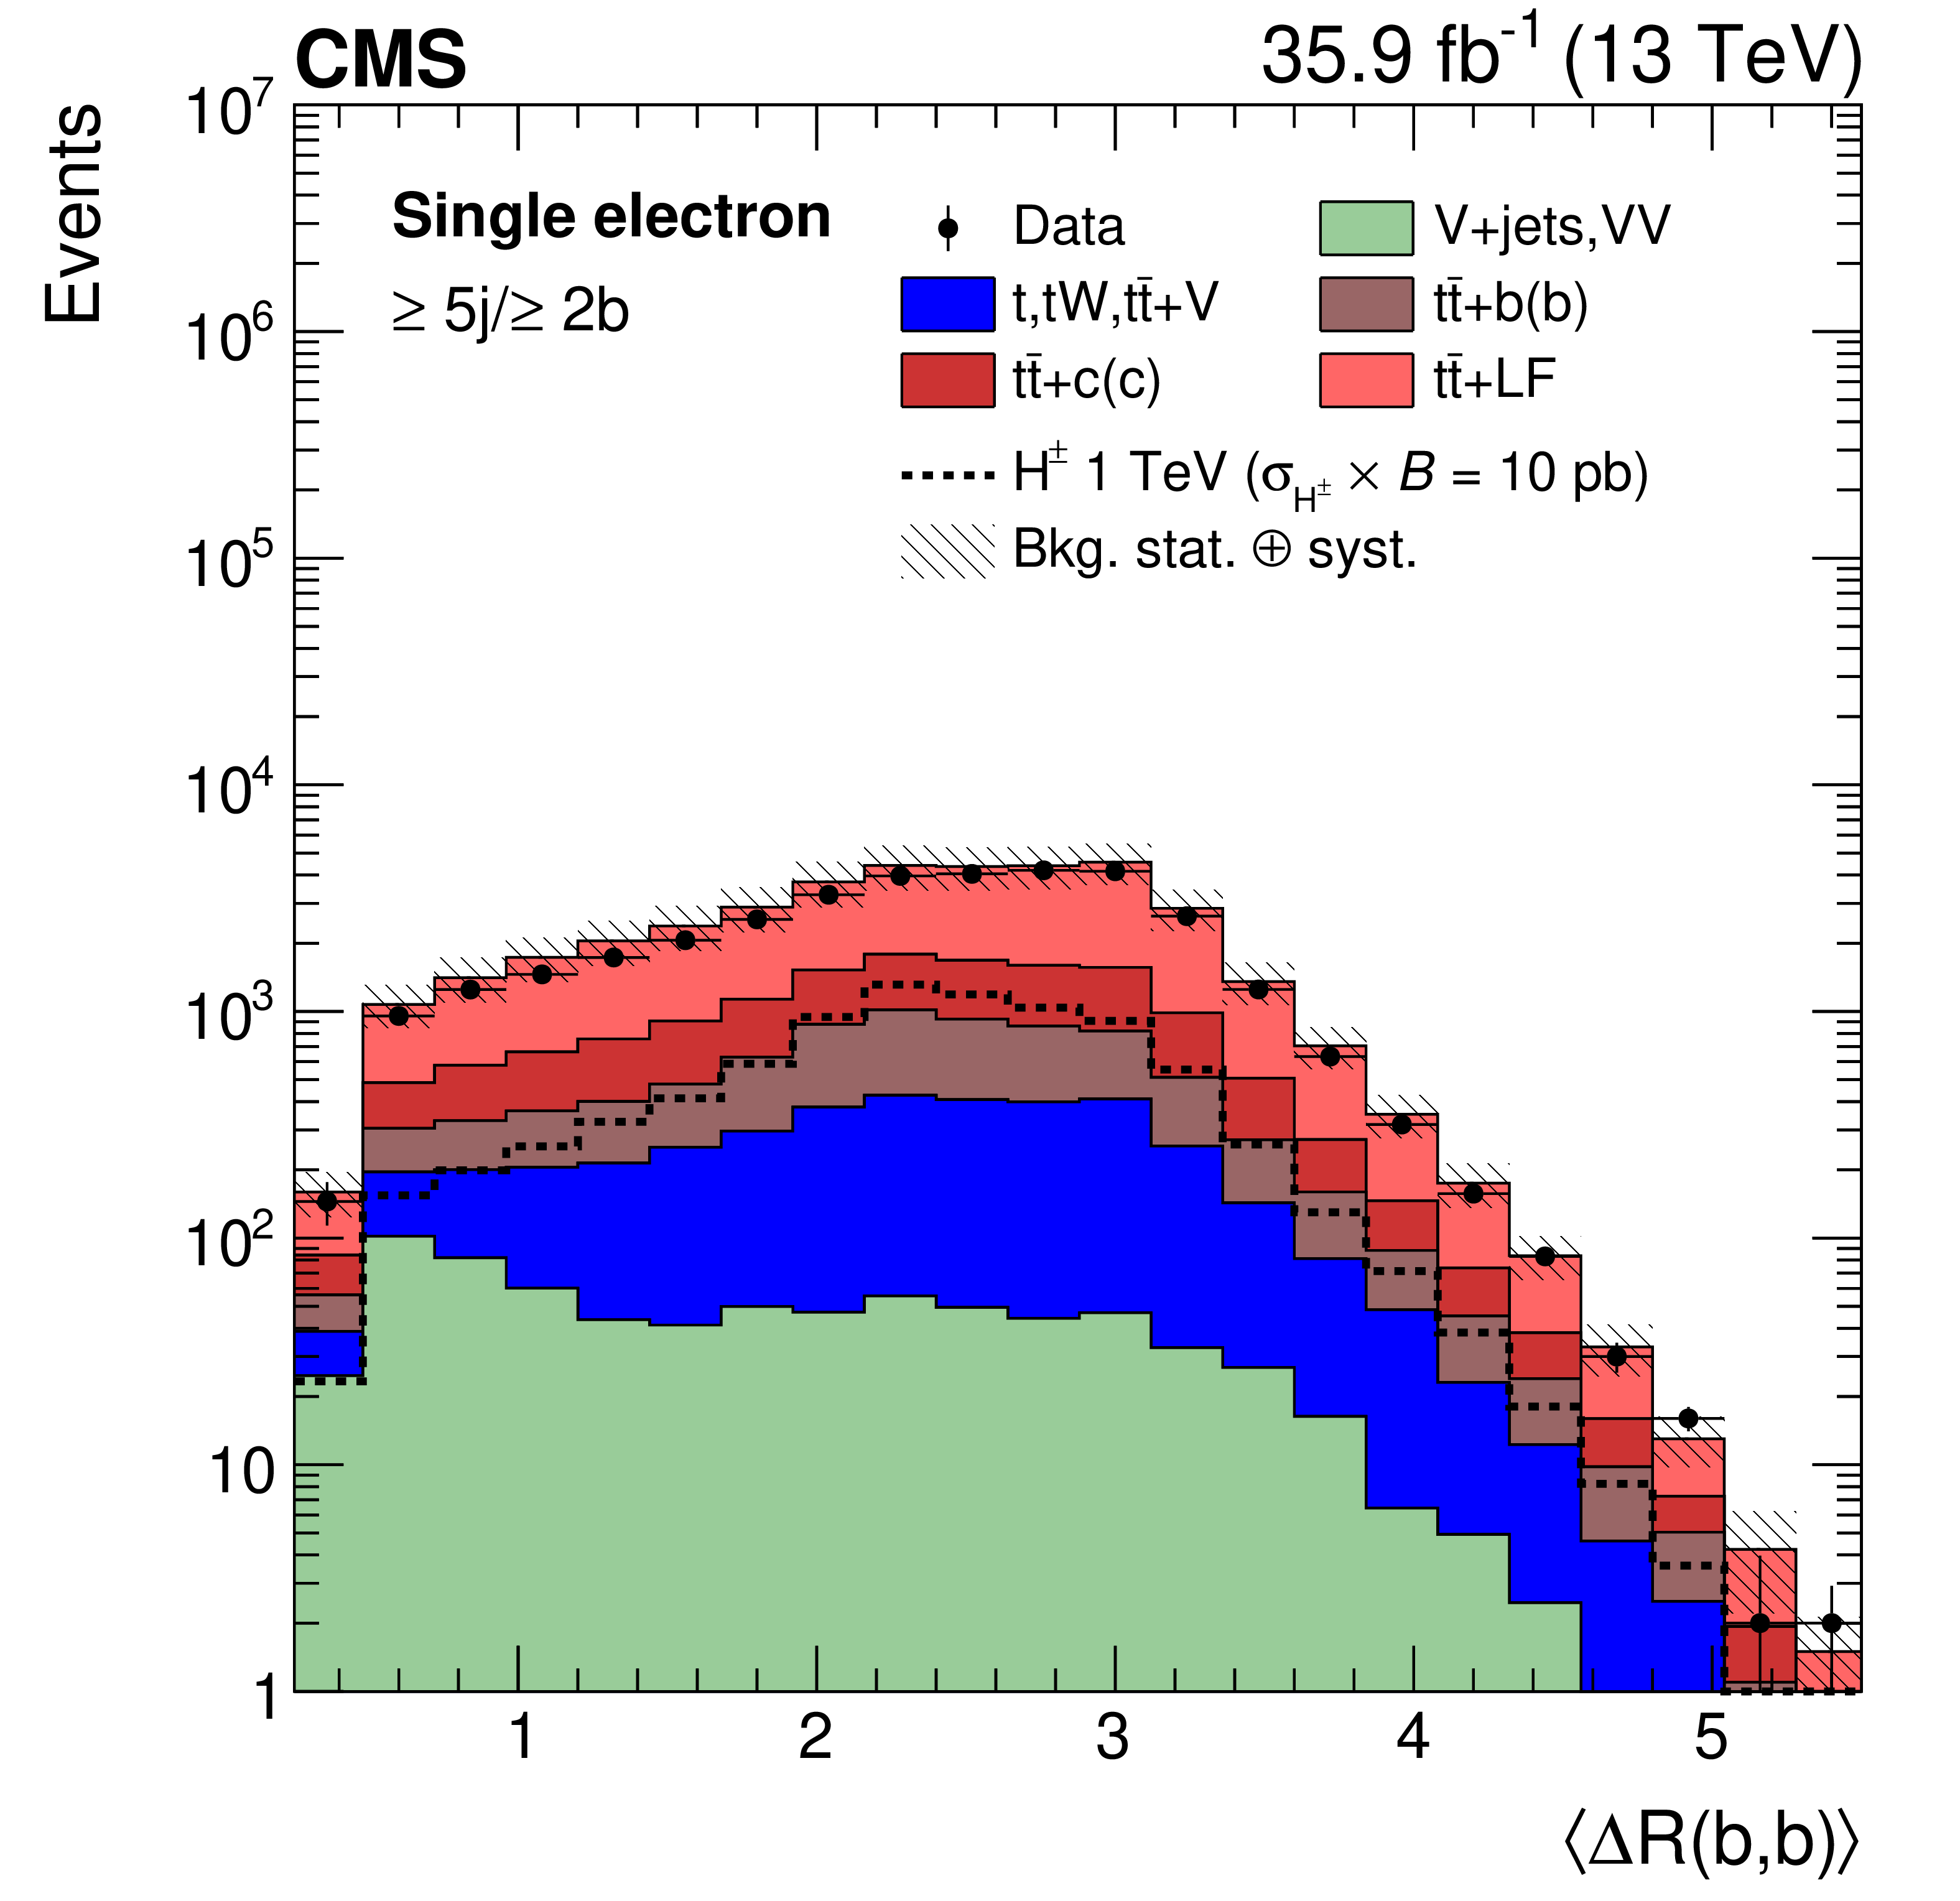
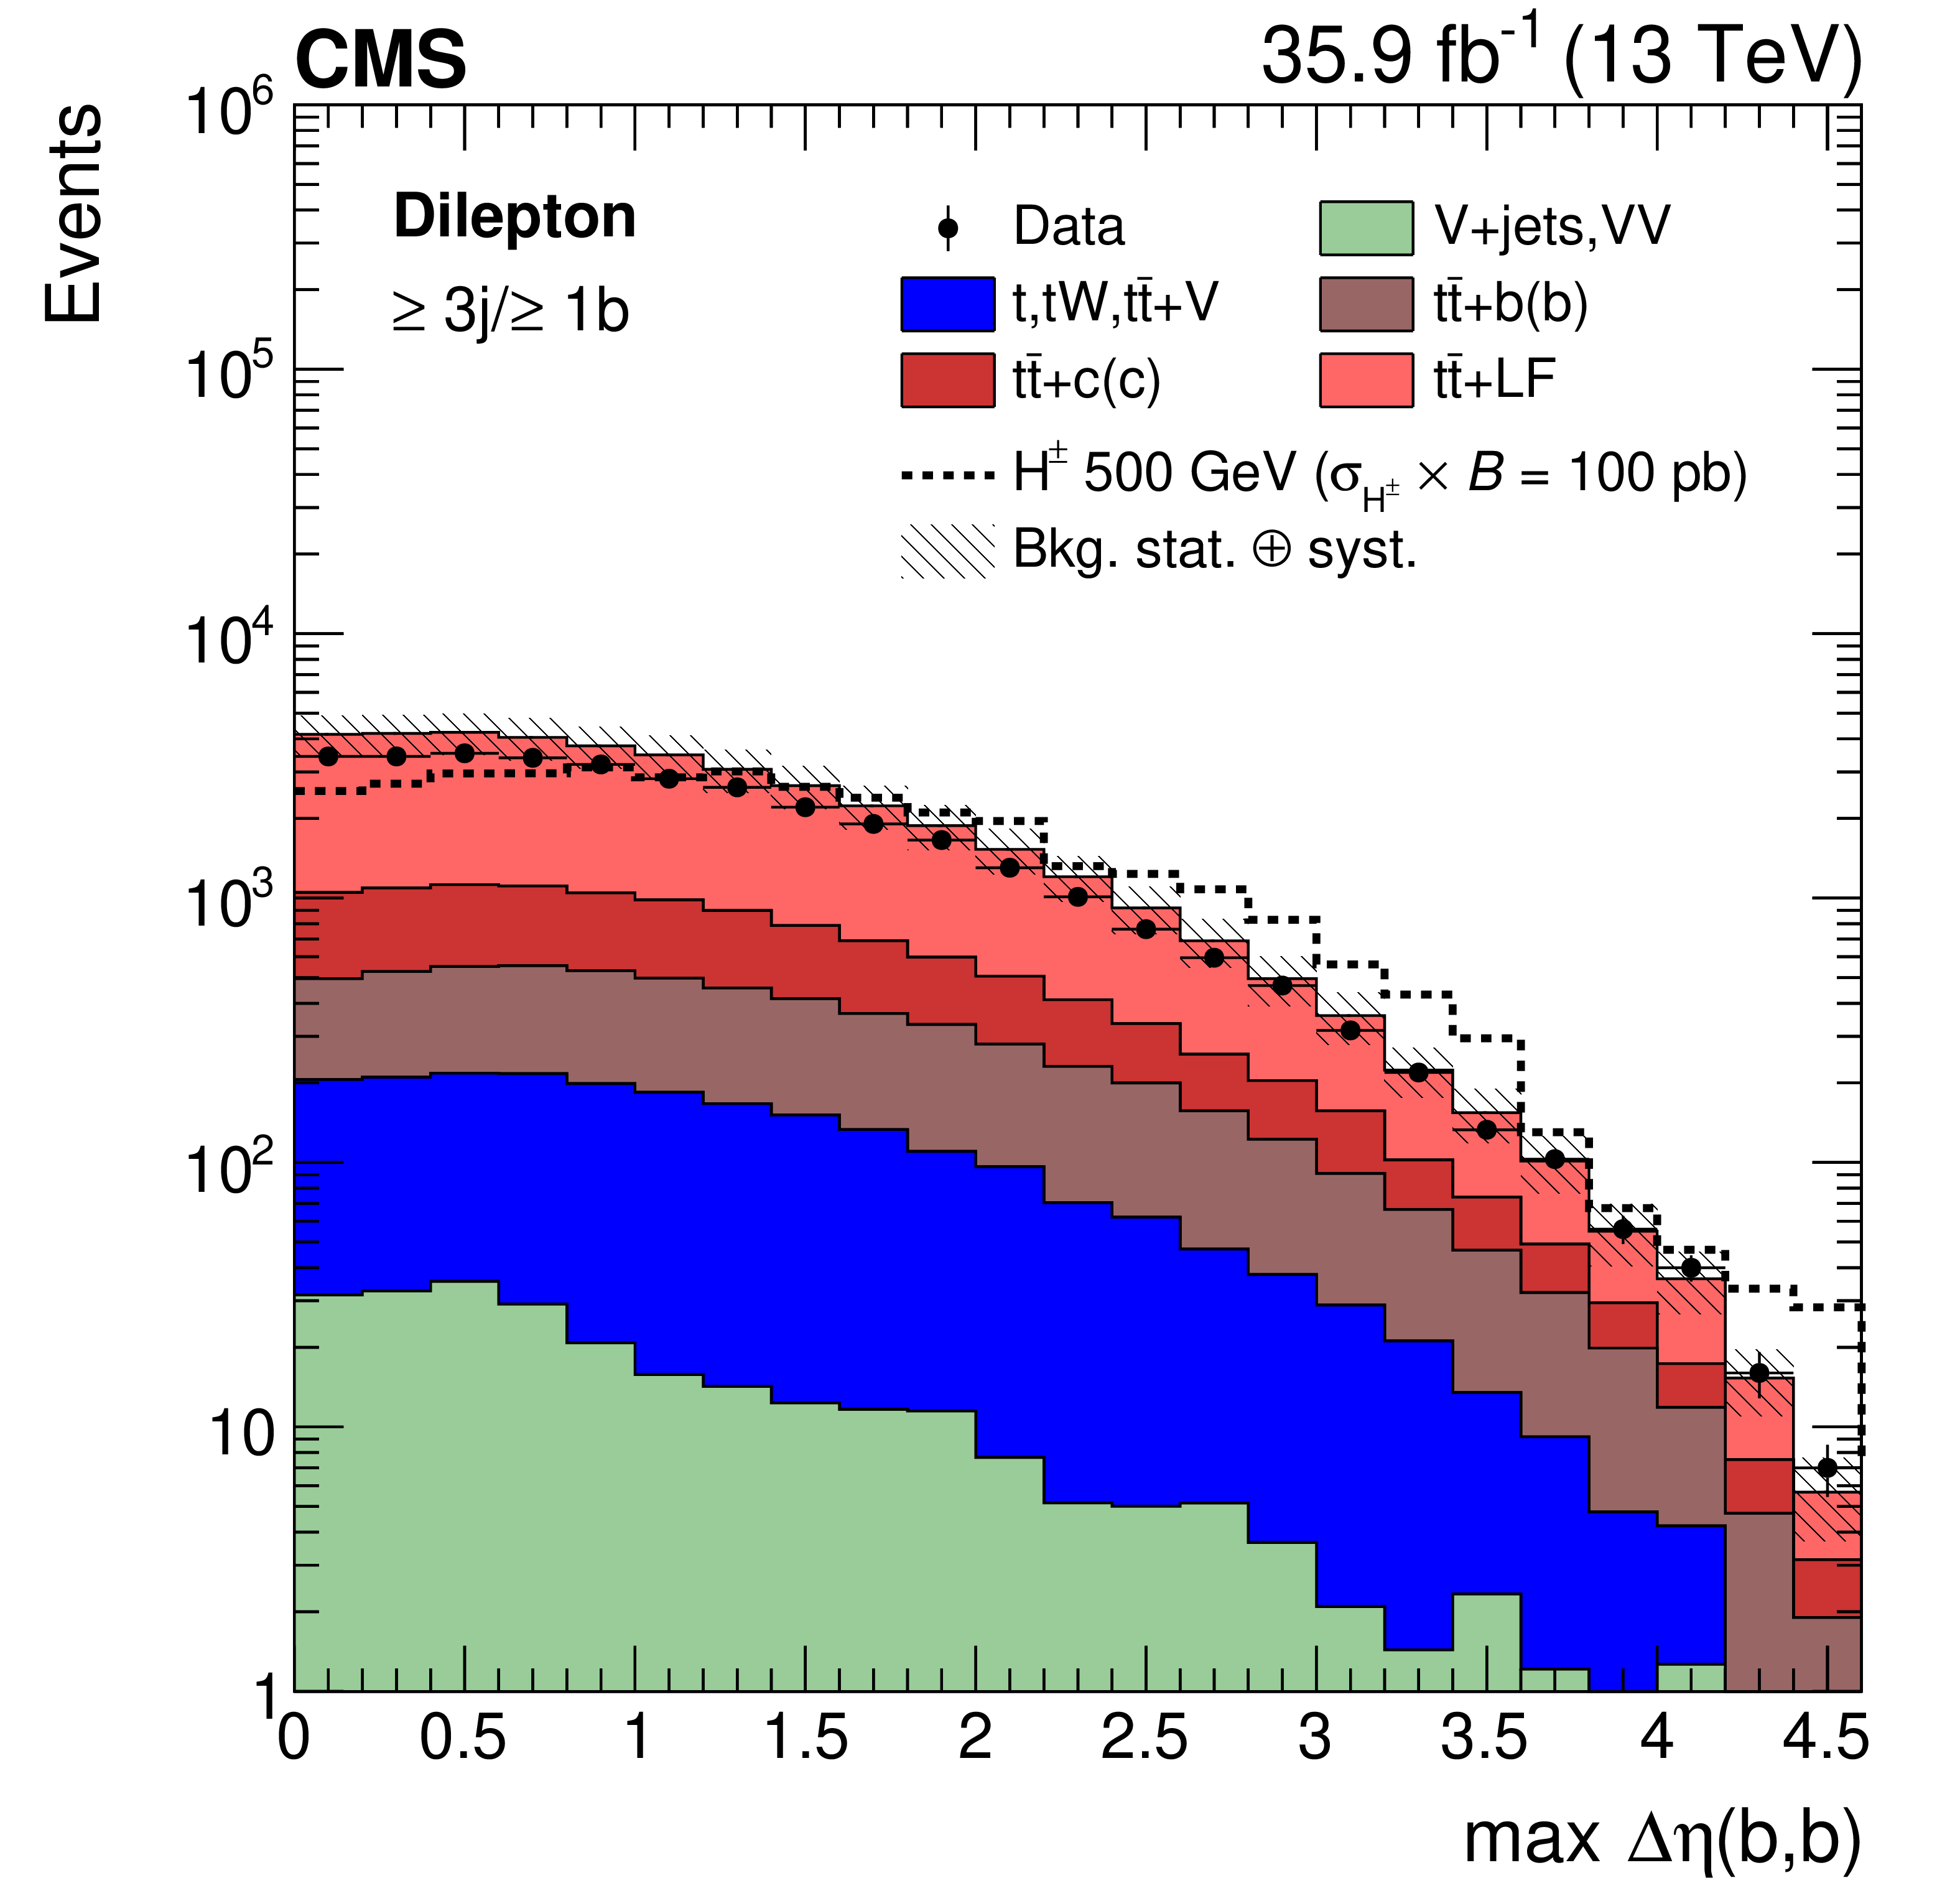
Representative input variables for the single-lepton $\ge $5j/$\ge $2b category (left) and for the dilepton $\ge $3j/$\ge $1b category (right) before the signal extraction fit. For the single-lepton final state, the centrality (top) and ${<} \Delta R(\mathrm{b},\mathrm{b}){>} $ (bottom) are shown; for the dilepton final state, the $p_{\mathrm {T}} $-${<} \text {CSV}{>} $ (top) and $\text{max}{\Delta \eta (\mathrm{b},\mathrm{b})}$ (bottom) are shown. The black markers show the data. The solid histograms represent the background prediction for $\mathrm{t} \mathrm{\bar{t}} $+LF (light red), $\mathrm{t} \mathrm{\bar{t}} $+$\mathrm{c} $($\mathrm{c} $) (dark red), $\mathrm{t} \mathrm{\bar{t}} $+$\mathrm{b} $($\mathrm{b} $) (brown), single top quark and ${\mathrm{t} \mathrm{\bar{t}}}$ in association with extra bosons (blue), and V+jets and multiboson production (light green). The dashed line represents the yields for a charged Higgs boson with a mass of 1 TeV (500 GeV) for the single lepton (dilepton) final state and a product of the cross section and branching fraction of 10 (100) pb for the single-lepton and dilepton final states, respectively. The hatched uncertainty bands include the total uncertainty before the signal extraction fit. |
png pdf |
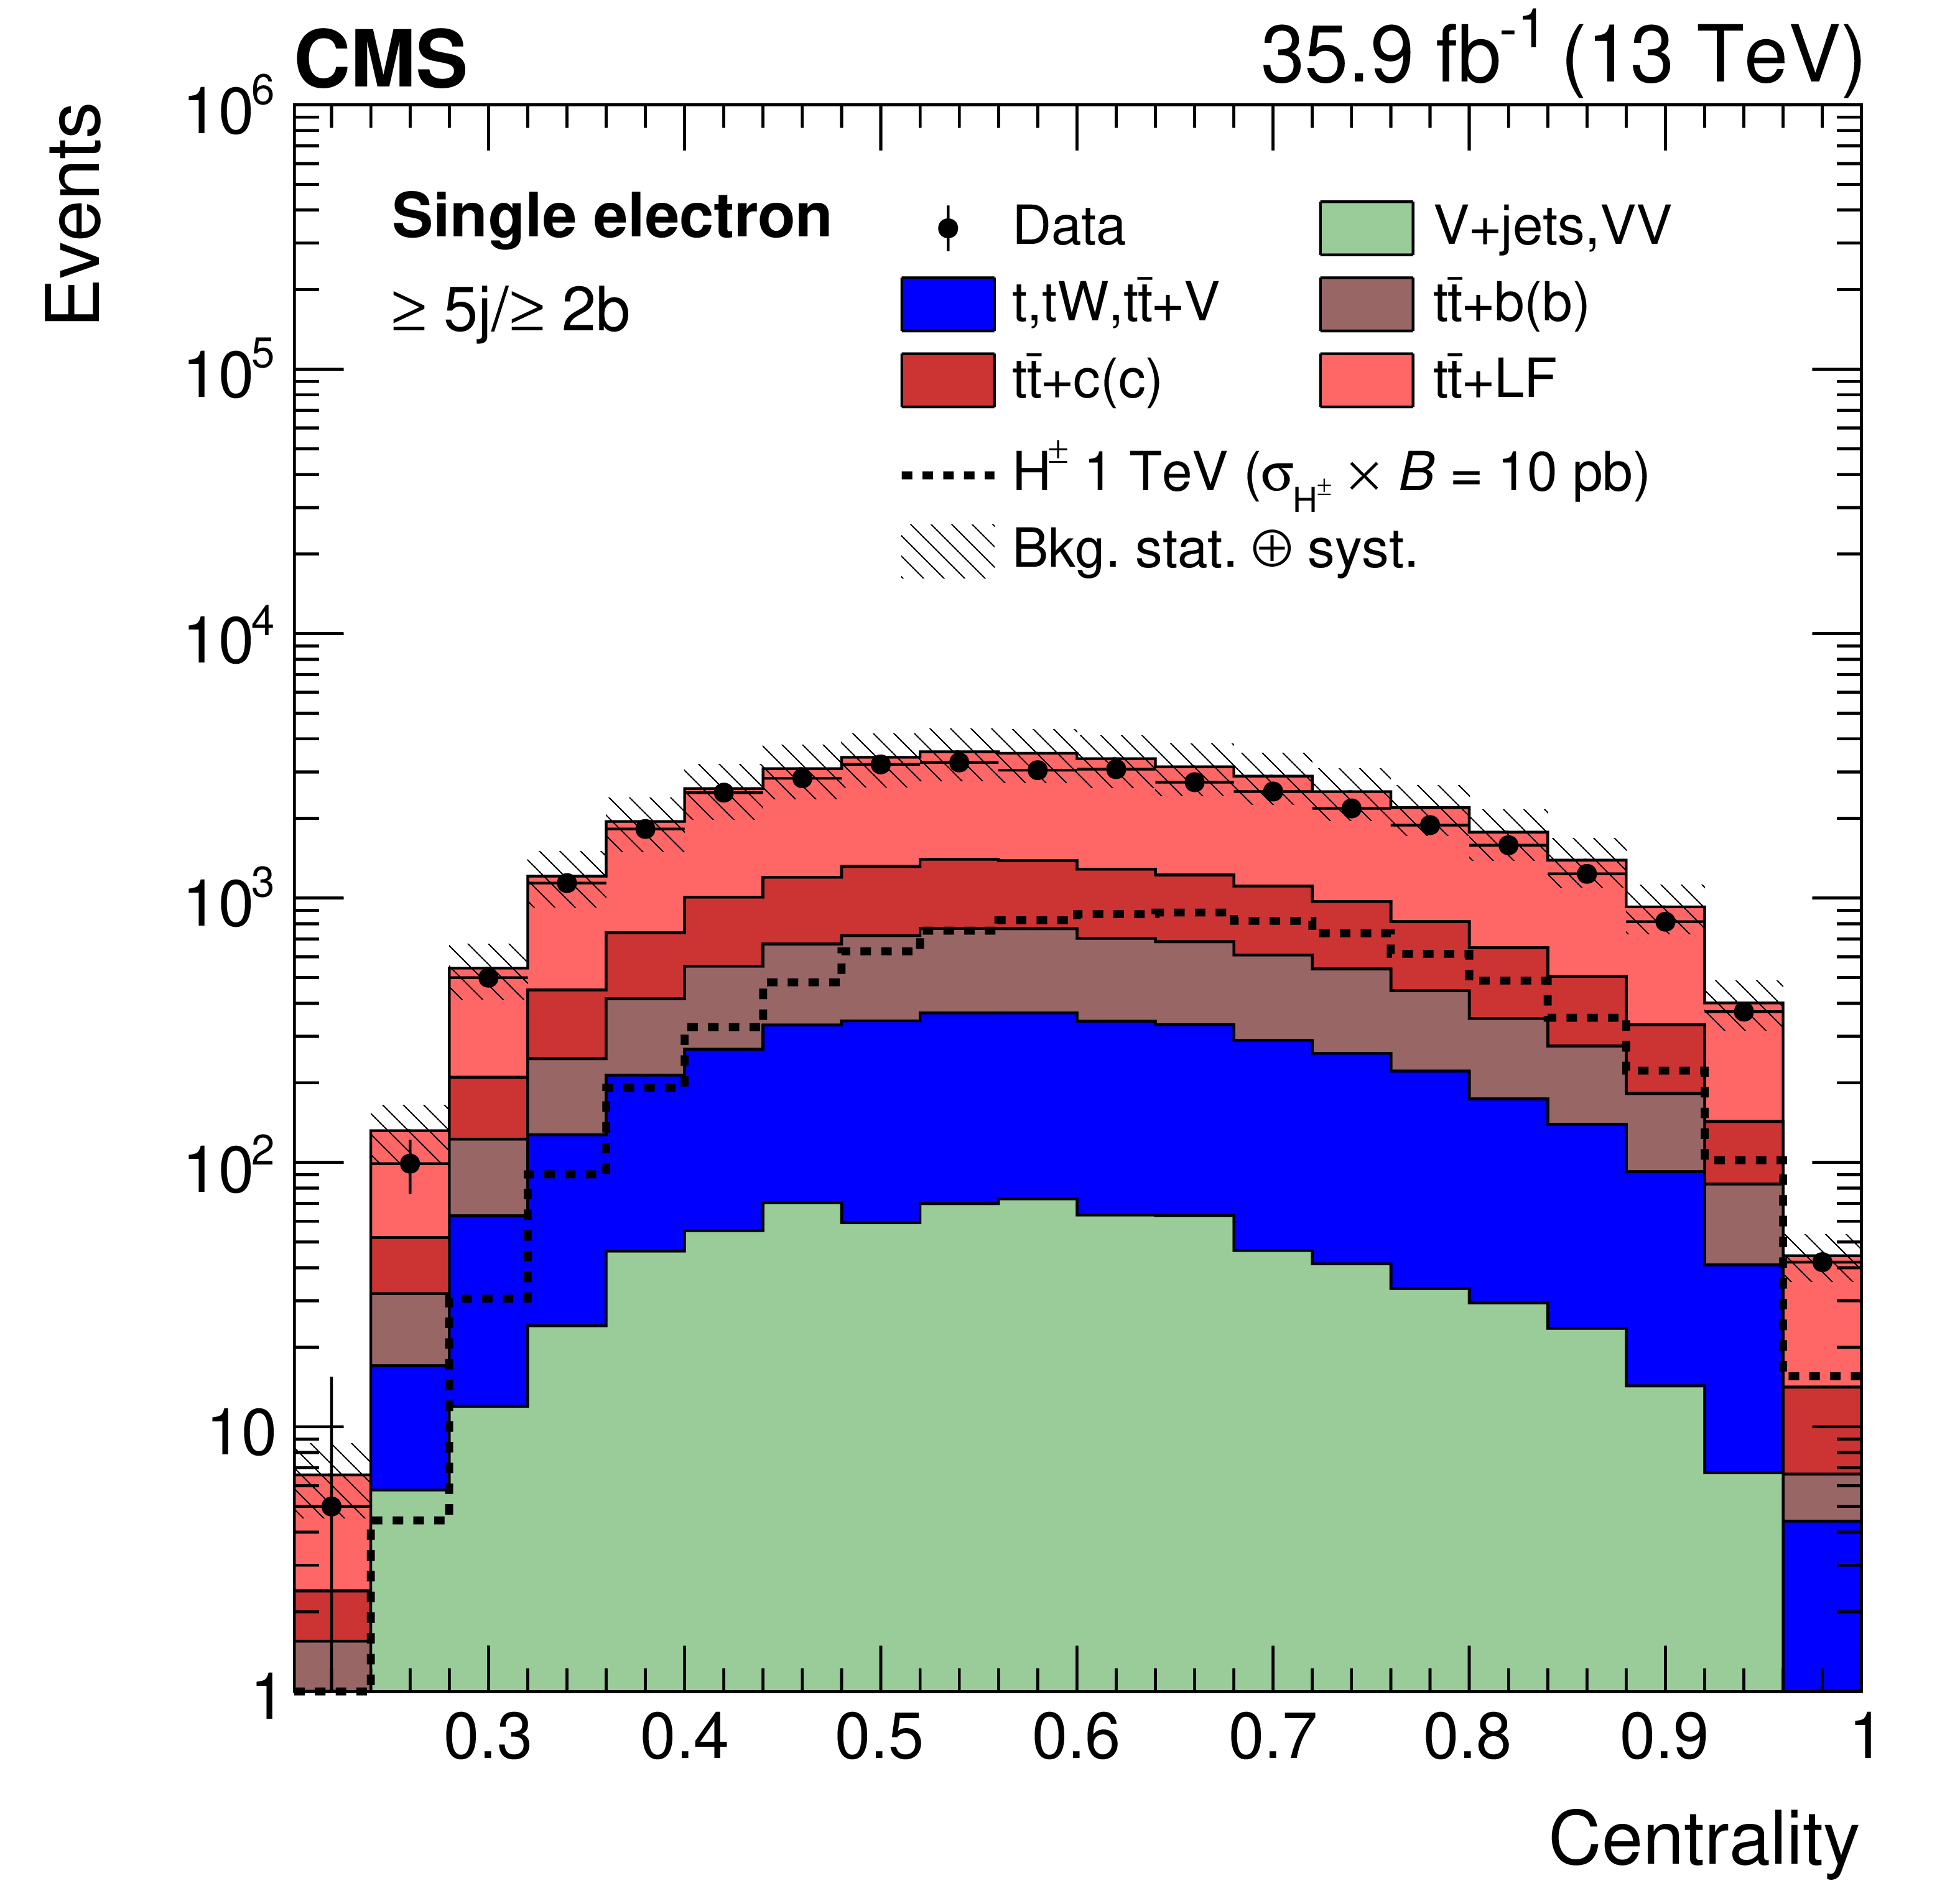
Figure 2-a:
Representative input variables for the single-lepton $\ge $5j/$\ge $2b category before the signal extraction fit. The centrality is shown. The black markers show the data. The solid histograms represent the background prediction for $\mathrm{t} \mathrm{\bar{t}} $+LF (light red), $\mathrm{t} \mathrm{\bar{t}} $+$\mathrm{c} $($\mathrm{c} $) (dark red), $\mathrm{t} \mathrm{\bar{t}} $+$\mathrm{b} $($\mathrm{b} $) (brown), single top quark and ${\mathrm{t} \mathrm{\bar{t}}}$ in association with extra bosons (blue), and V+jets and multiboson production (light green). The dashed line represents the yields for a charged Higgs boson with a mass of 1 TeV (500 GeV) for the single lepton (dilepton) final state and a product of the cross section and branching fraction of 10 (100) pb for the single-lepton and dilepton final states, respectively. The hatched uncertainty bands include the total uncertainty before the signal extraction fit. |
png pdf |
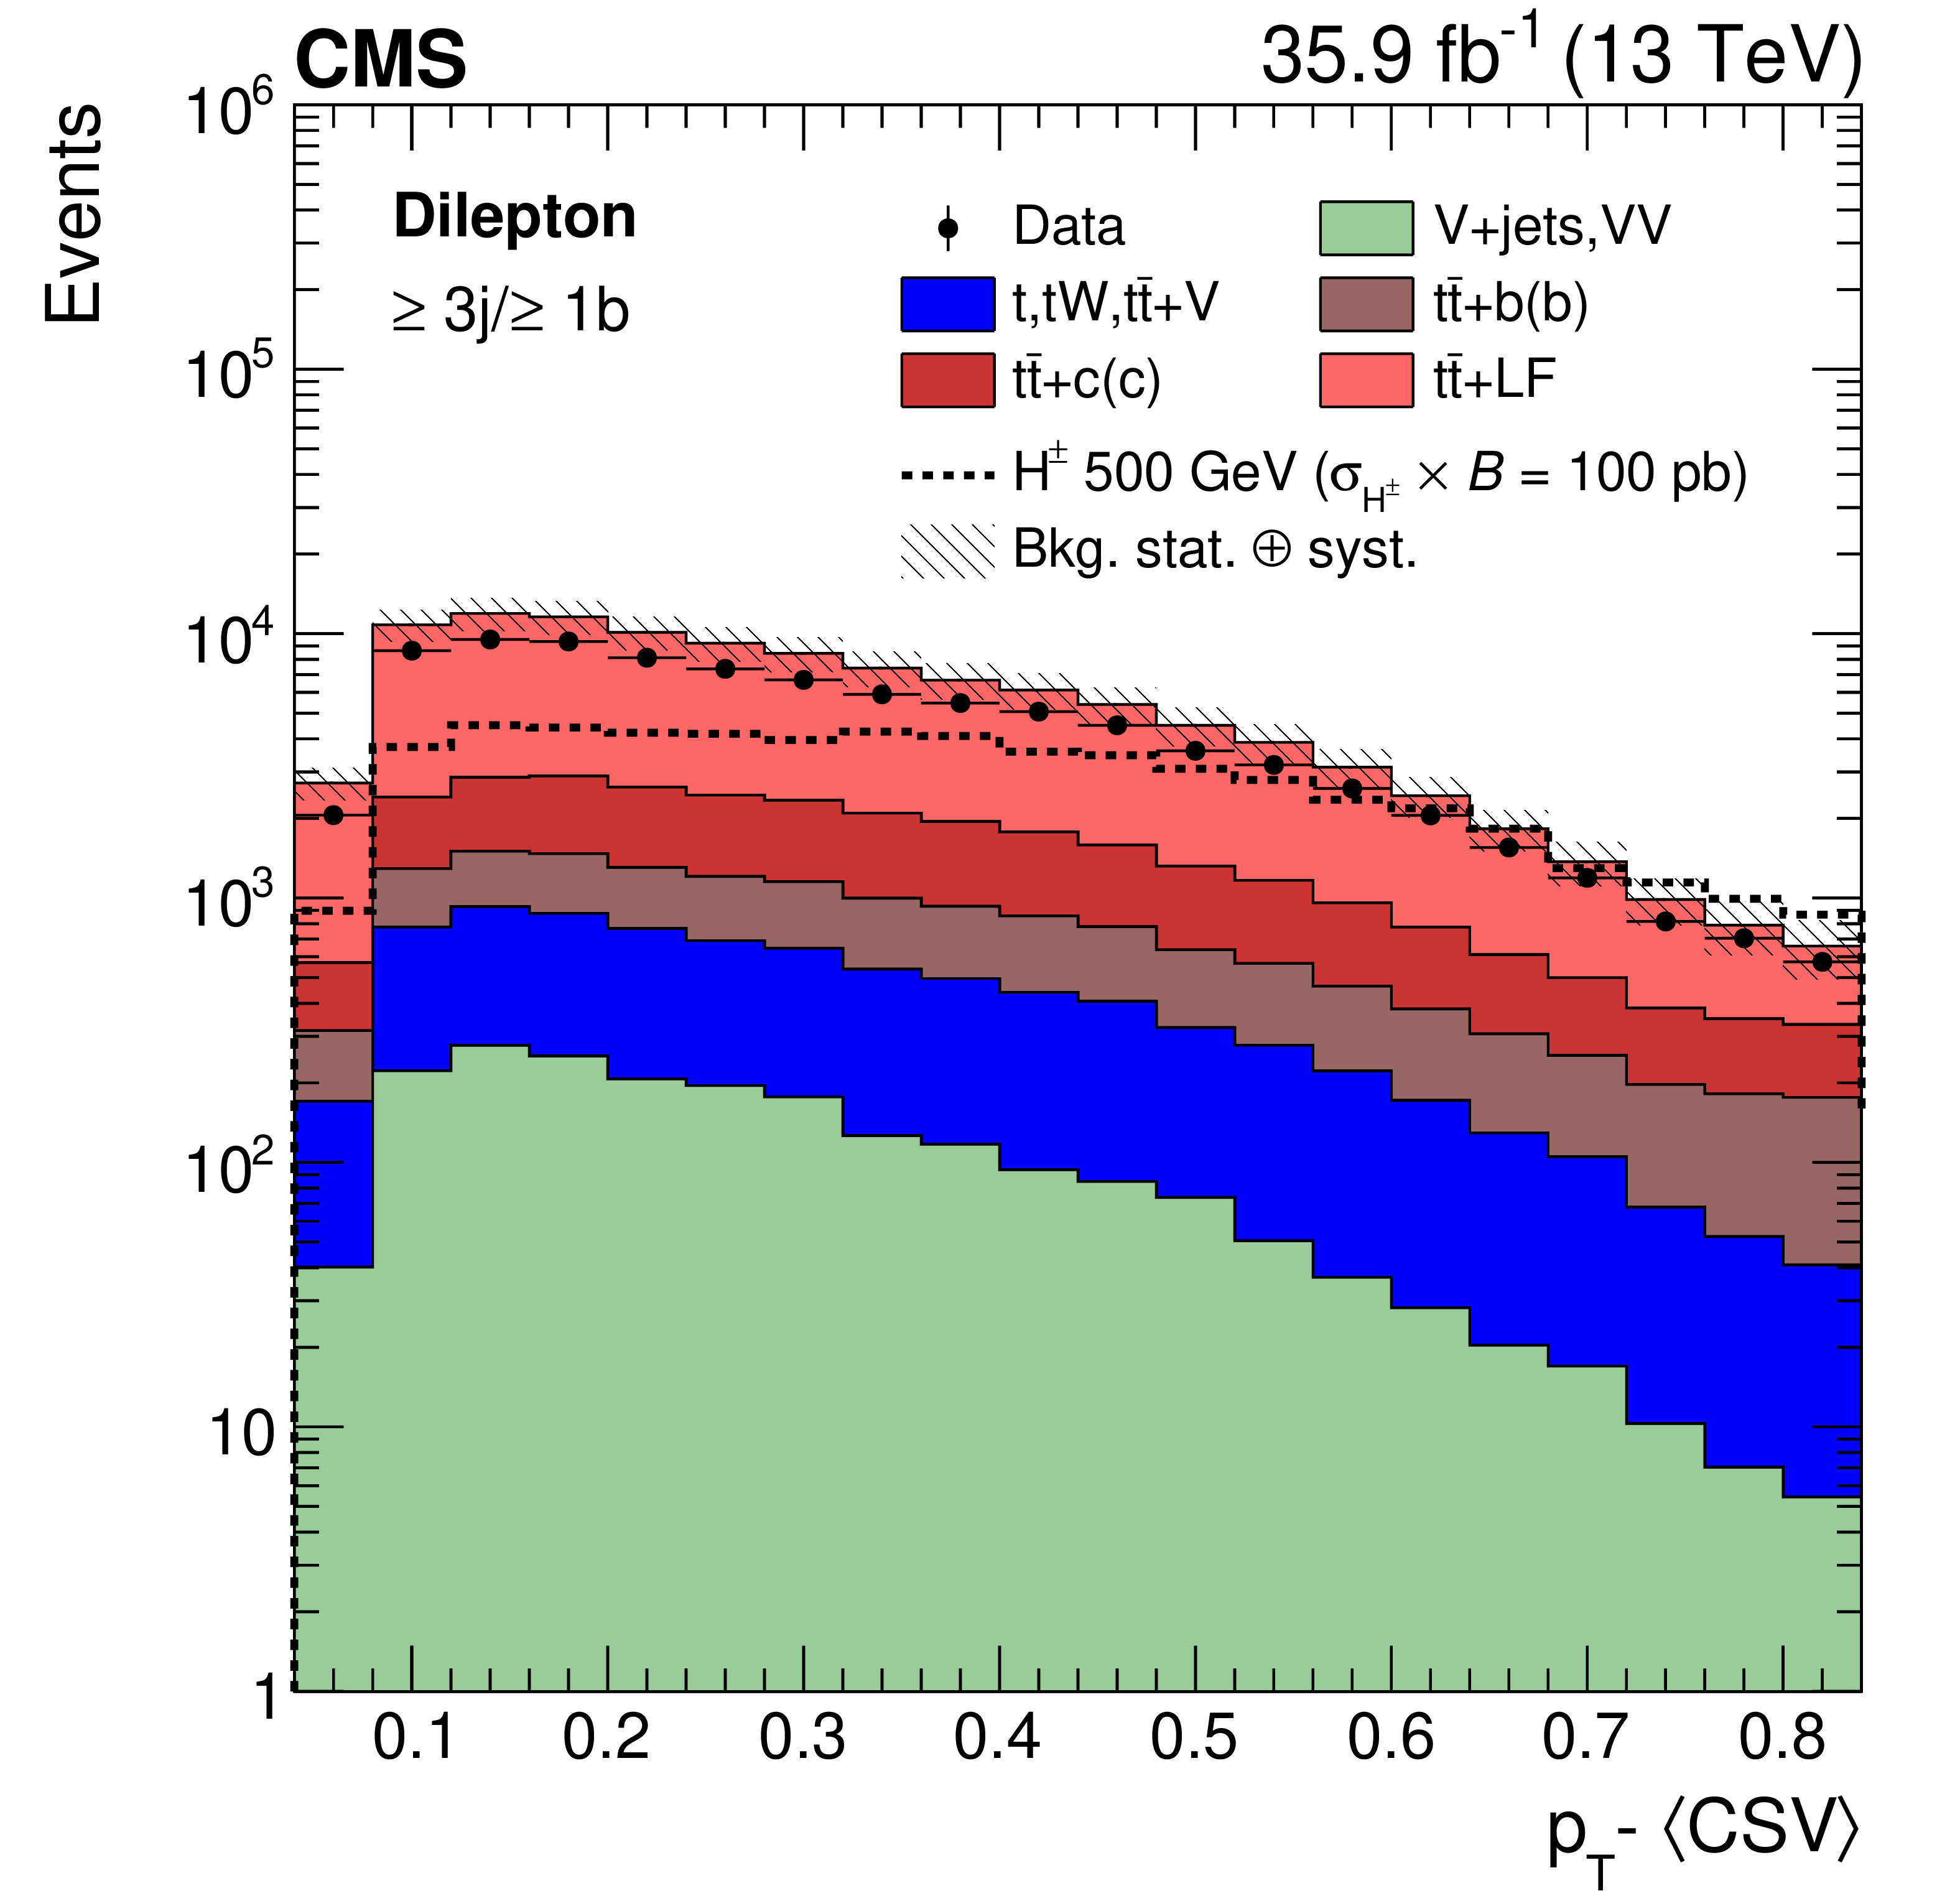
Figure 2-b:
Representative input variables for the dilepton $\ge $3j/$\ge $1b category before the signal extraction fit. The $p_{\mathrm {T}} $-${<} \text {CSV}{>} $ is shown. The black markers show the data. The solid histograms represent the background prediction for $\mathrm{t} \mathrm{\bar{t}} $+LF (light red), $\mathrm{t} \mathrm{\bar{t}} $+$\mathrm{c} $($\mathrm{c} $) (dark red), $\mathrm{t} \mathrm{\bar{t}} $+$\mathrm{b} $($\mathrm{b} $) (brown), single top quark and ${\mathrm{t} \mathrm{\bar{t}}}$ in association with extra bosons (blue), and V+jets and multiboson production (light green). The dashed line represents the yields for a charged Higgs boson with a mass of 1 TeV (500 GeV) for the single lepton (dilepton) final state and a product of the cross section and branching fraction of 10 (100) pb for the single-lepton and dilepton final states, respectively. The hatched uncertainty bands include the total uncertainty before the signal extraction fit. |
png pdf |
Figure 2-c:
Representative input variables for the single-lepton $\ge $5j/$\ge $2b category before the signal extraction fit. ${<} \Delta R(\mathrm{b},\mathrm{b}){>} $ is shown. The black markers show the data. The solid histograms represent the background prediction for $\mathrm{t} \mathrm{\bar{t}} $+LF (light red), $\mathrm{t} \mathrm{\bar{t}} $+$\mathrm{c} $($\mathrm{c} $) (dark red), $\mathrm{t} \mathrm{\bar{t}} $+$\mathrm{b} $($\mathrm{b} $) (brown), single top quark and ${\mathrm{t} \mathrm{\bar{t}}}$ in association with extra bosons (blue), and V+jets and multiboson production (light green). The dashed line represents the yields for a charged Higgs boson with a mass of 1 TeV (500 GeV) for the single lepton (dilepton) final state and a product of the cross section and branching fraction of 10 (100) pb for the single-lepton and dilepton final states, respectively. The hatched uncertainty bands include the total uncertainty before the signal extraction fit. |
png pdf |
Figure 2-d:
Representative input variables for the dilepton $\ge $3j/$\ge $1b category before the signal extraction fit. $\text{max}{\Delta \eta (\mathrm{b},\mathrm{b})}$ is shown. The black markers show the data. The solid histograms represent the background prediction for $\mathrm{t} \mathrm{\bar{t}} $+LF (light red), $\mathrm{t} \mathrm{\bar{t}} $+$\mathrm{c} $($\mathrm{c} $) (dark red), $\mathrm{t} \mathrm{\bar{t}} $+$\mathrm{b} $($\mathrm{b} $) (brown), single top quark and ${\mathrm{t} \mathrm{\bar{t}}}$ in association with extra bosons (blue), and V+jets and multiboson production (light green). The dashed line represents the yields for a charged Higgs boson with a mass of 1 TeV (500 GeV) for the single lepton (dilepton) final state and a product of the cross section and branching fraction of 10 (100) pb for the single-lepton and dilepton final states, respectively. The hatched uncertainty bands include the total uncertainty before the signal extraction fit. |

png pdf |
Figure 3:
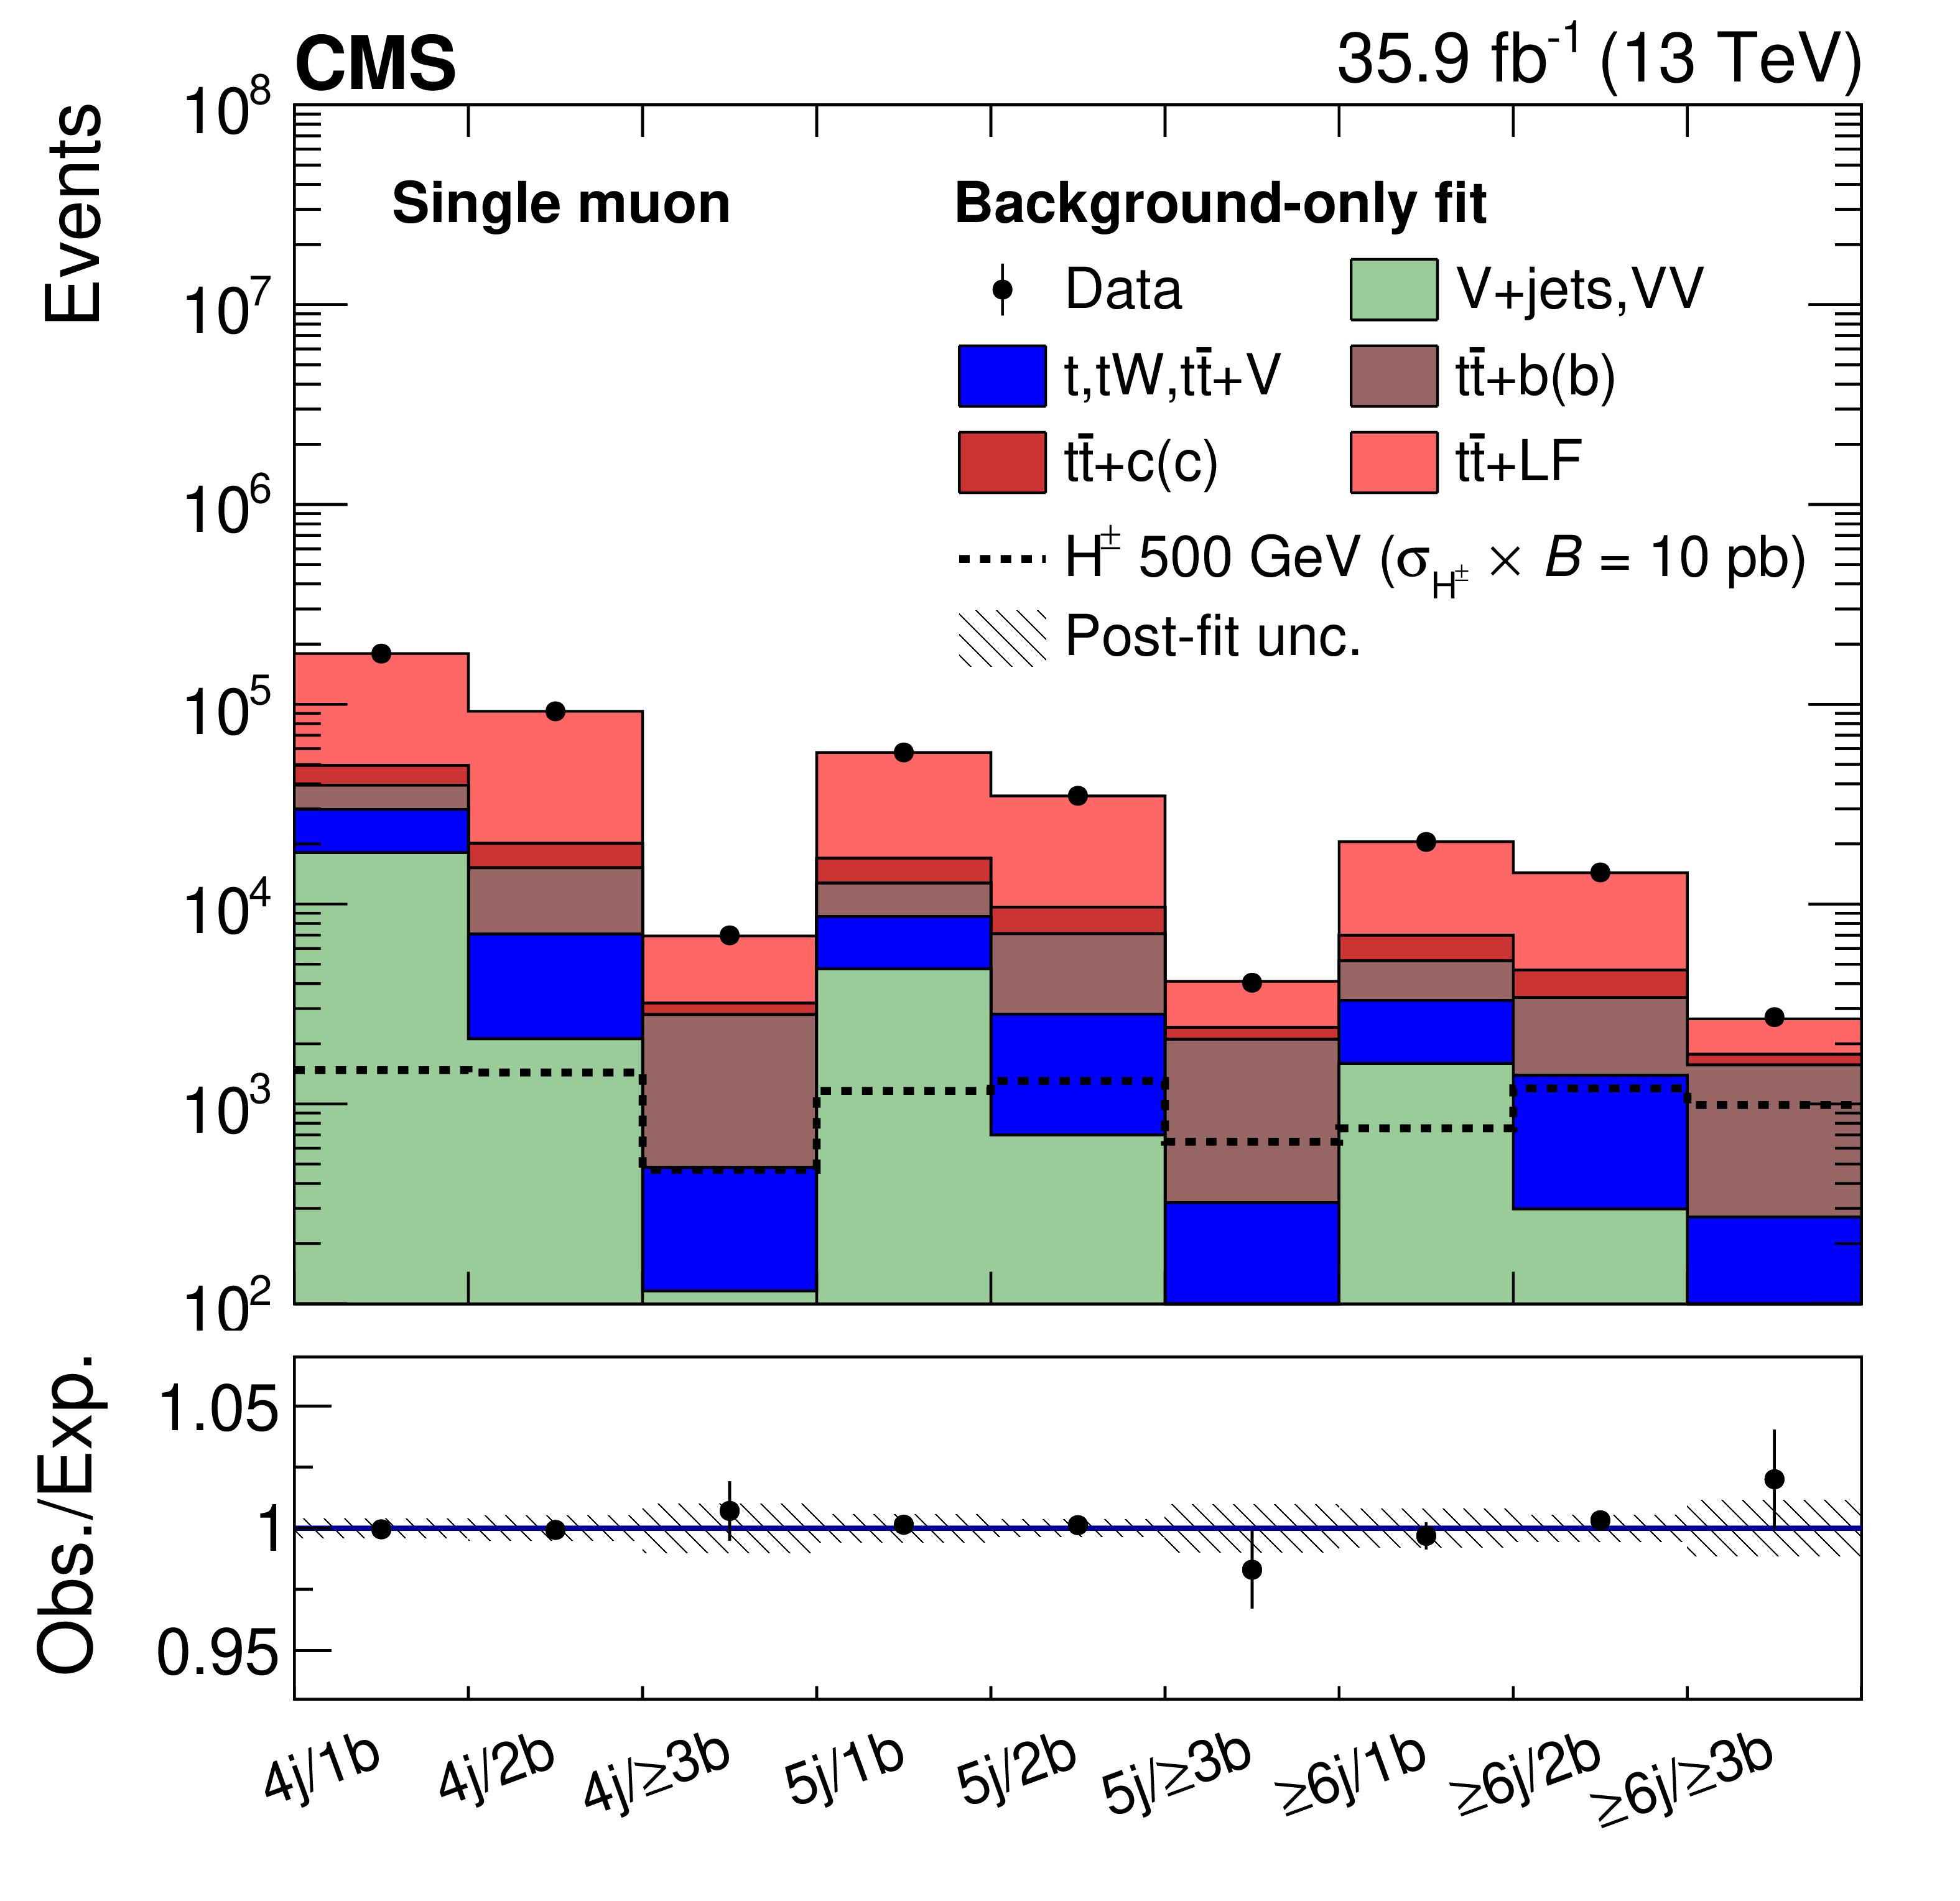
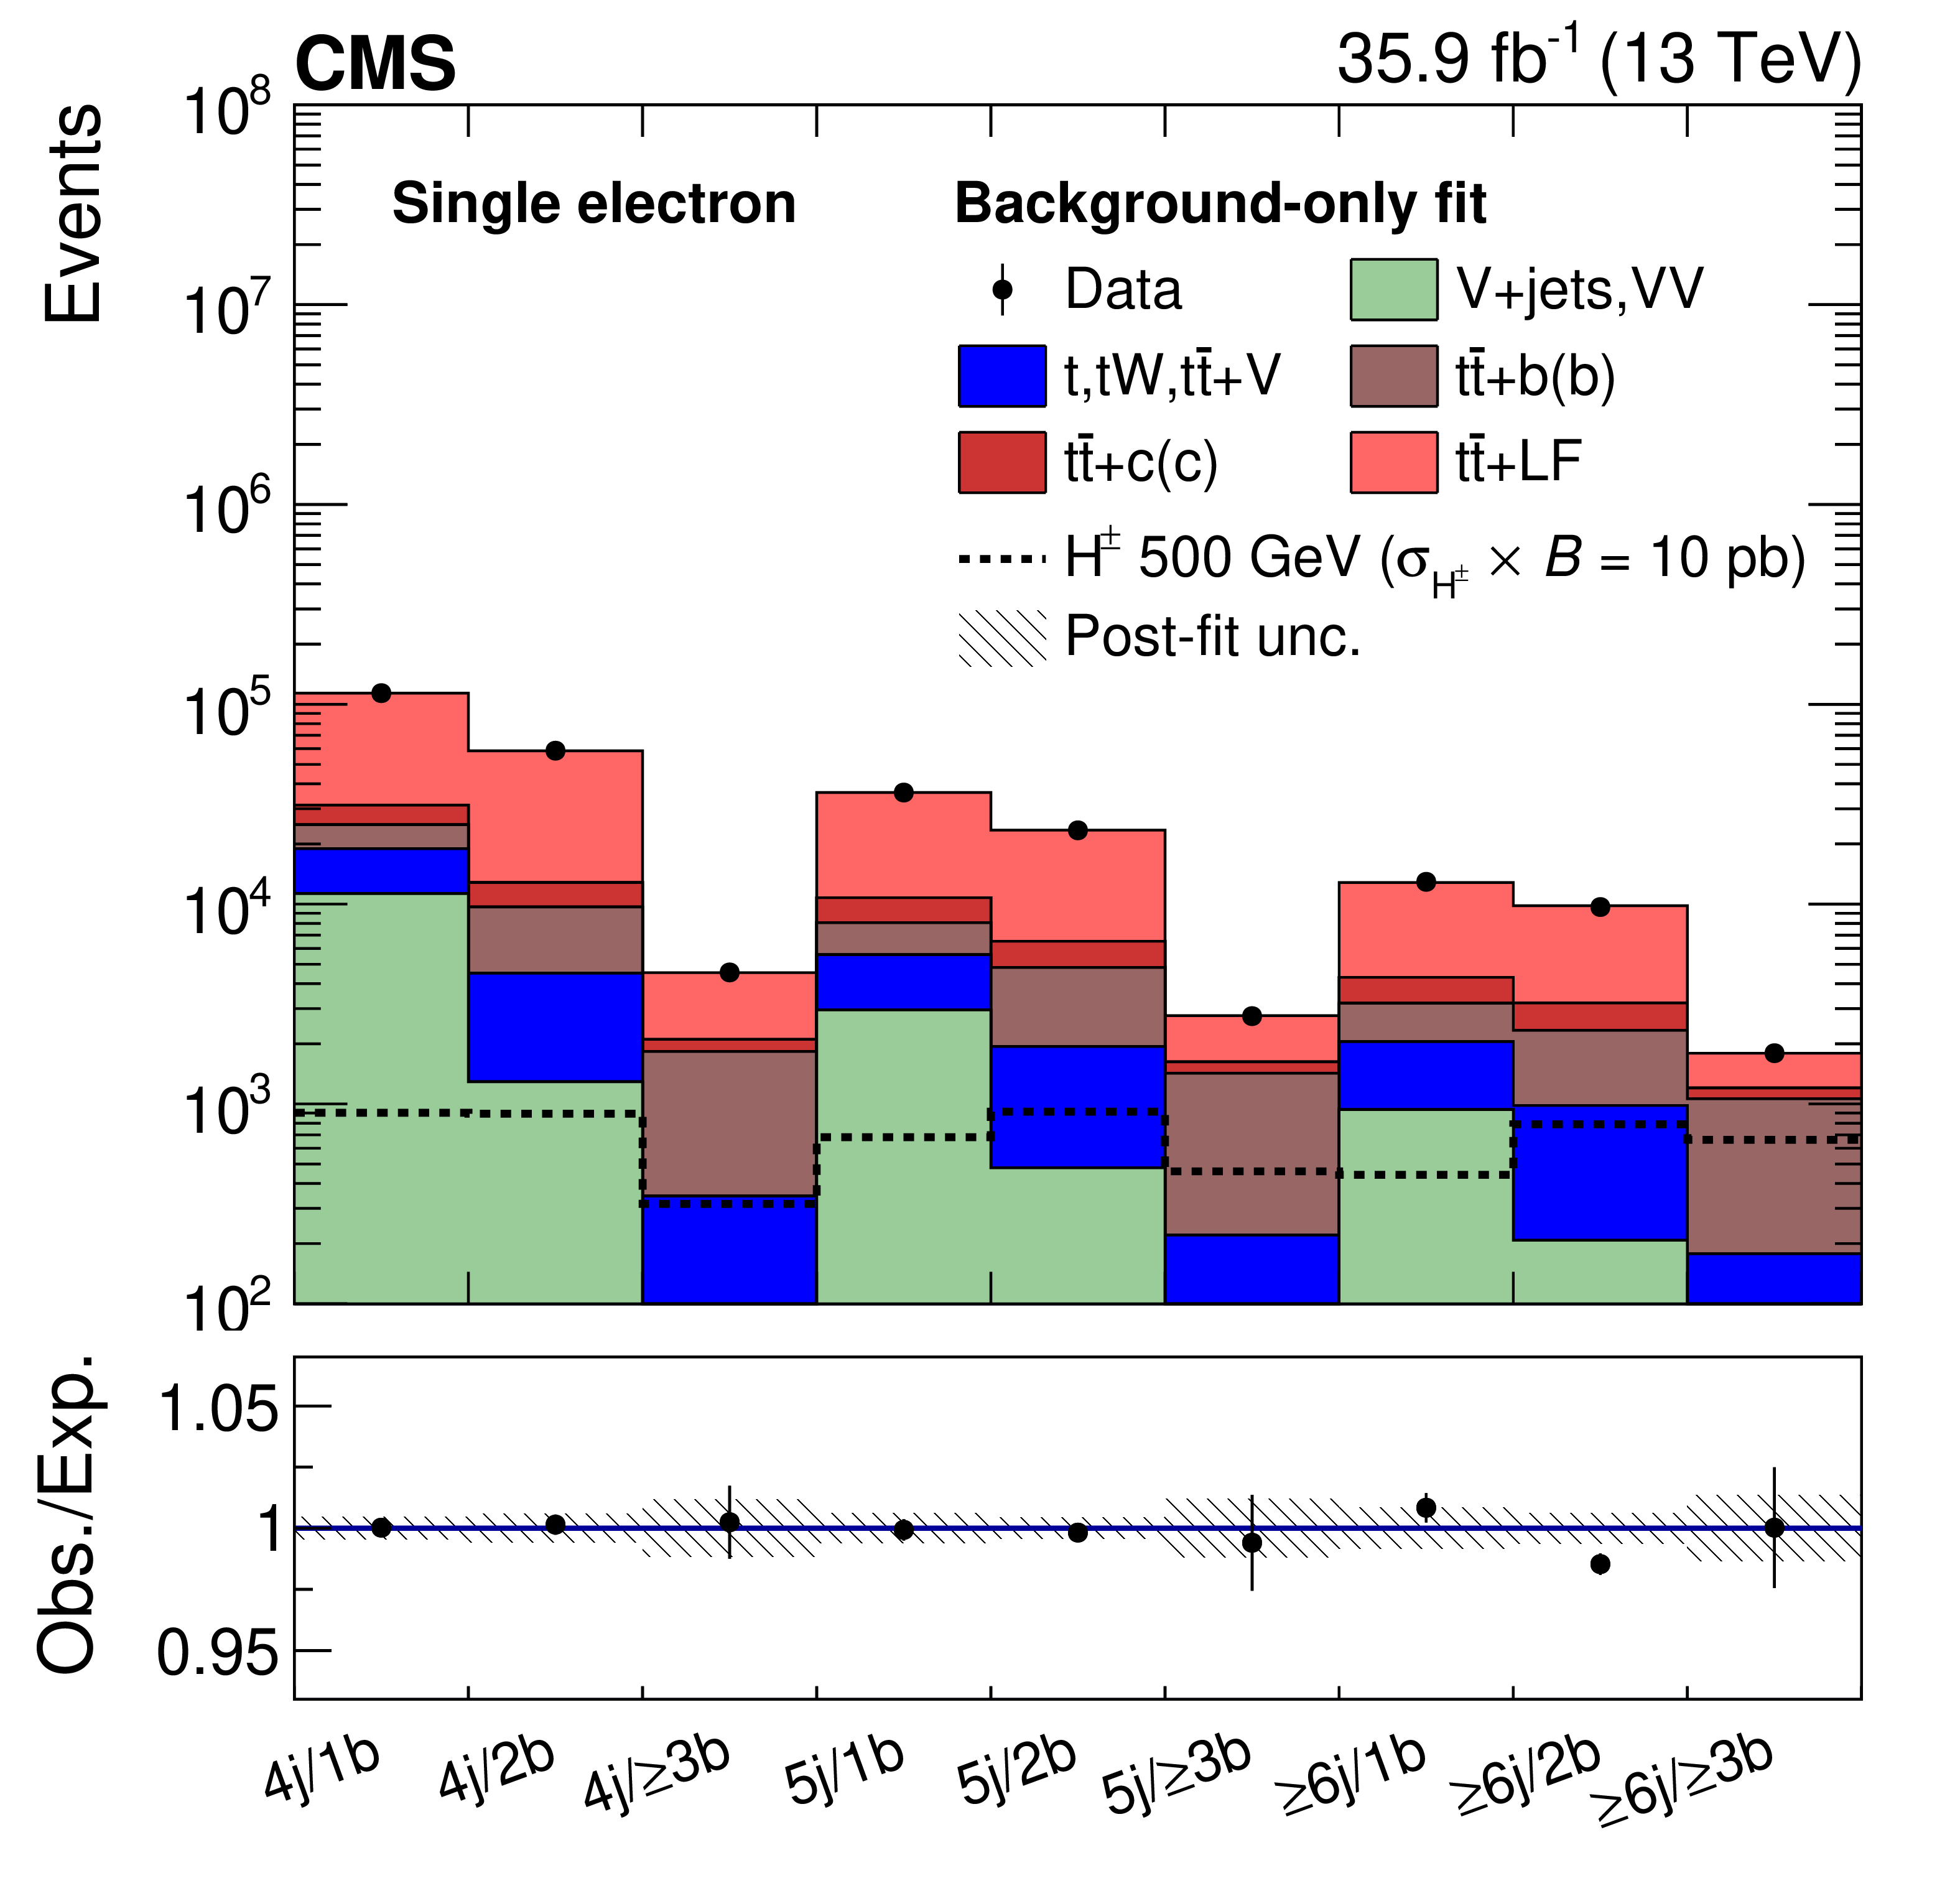
Summary of event yields in each analysis category for single-muon (top left), single-electron (top right), and dilepton (bottom) final states. The yields observed in data (black markers) are overlaid. The solid histograms represent the background prediction for $\mathrm{t} \mathrm{\bar{t}} $+LF (light red), $\mathrm{t} \mathrm{\bar{t}} $+$\mathrm{c} $($\mathrm{c} $) (dark red), $\mathrm{t} \mathrm{\bar{t}} $+$\mathrm{b} $($\mathrm{b} $) (brown), single top quark and ${\mathrm{t} \mathrm{\bar{t}}}$ in association with extra bosons (blue), and V+jets and multiboson production (light green). The dashed line represents the yields for a charged Higgs boson with a mass of 500 GeV and a product of the cross section and the branching fraction of 10 pb. The lower panel shows the ratio of data to the SM expectation after the background-only fit to the data and the hatched uncertainty bands include the total uncertainty. |
png pdf |
Figure 3-a:
Summary of event yields in each analysis category for the single-muon final state. The yields observed in data (black markers) are overlaid. The solid histograms represent the background prediction for $\mathrm{t} \mathrm{\bar{t}} $+LF (light red), $\mathrm{t} \mathrm{\bar{t}} $+$\mathrm{c} $($\mathrm{c} $) (dark red), $\mathrm{t} \mathrm{\bar{t}} $+$\mathrm{b} $($\mathrm{b} $) (brown), single top quark and ${\mathrm{t} \mathrm{\bar{t}}}$ in association with extra bosons (blue), and V+jets and multiboson production (light green). The dashed line represents the yields for a charged Higgs boson with a mass of 500 GeV and a product of the cross section and the branching fraction of 10 pb. The lower panel shows the ratio of data to the SM expectation after the background-only fit to the data and the hatched uncertainty bands include the total uncertainty. |
png pdf |
Figure 3-b:
Summary of event yields in each analysis category for the single-electron final state. The yields observed in data (black markers) are overlaid. The solid histograms represent the background prediction for $\mathrm{t} \mathrm{\bar{t}} $+LF (light red), $\mathrm{t} \mathrm{\bar{t}} $+$\mathrm{c} $($\mathrm{c} $) (dark red), $\mathrm{t} \mathrm{\bar{t}} $+$\mathrm{b} $($\mathrm{b} $) (brown), single top quark and ${\mathrm{t} \mathrm{\bar{t}}}$ in association with extra bosons (blue), and V+jets and multiboson production (light green). The dashed line represents the yields for a charged Higgs boson with a mass of 500 GeV and a product of the cross section and the branching fraction of 10 pb. The lower panel shows the ratio of data to the SM expectation after the background-only fit to the data and the hatched uncertainty bands include the total uncertainty. |

png pdf |
Figure 3-c:
Summary of event yields in each analysis category for the dilepton final state. The yields observed in data (black markers) are overlaid. The solid histograms represent the background prediction for $\mathrm{t} \mathrm{\bar{t}} $+LF (light red), $\mathrm{t} \mathrm{\bar{t}} $+$\mathrm{c} $($\mathrm{c} $) (dark red), $\mathrm{t} \mathrm{\bar{t}} $+$\mathrm{b} $($\mathrm{b} $) (brown), single top quark and ${\mathrm{t} \mathrm{\bar{t}}}$ in association with extra bosons (blue), and V+jets and multiboson production (light green). The dashed line represents the yields for a charged Higgs boson with a mass of 500 GeV and a product of the cross section and the branching fraction of 10 pb. The lower panel shows the ratio of data to the SM expectation after the background-only fit to the data and the hatched uncertainty bands include the total uncertainty. |
png pdf |
Figure 4:
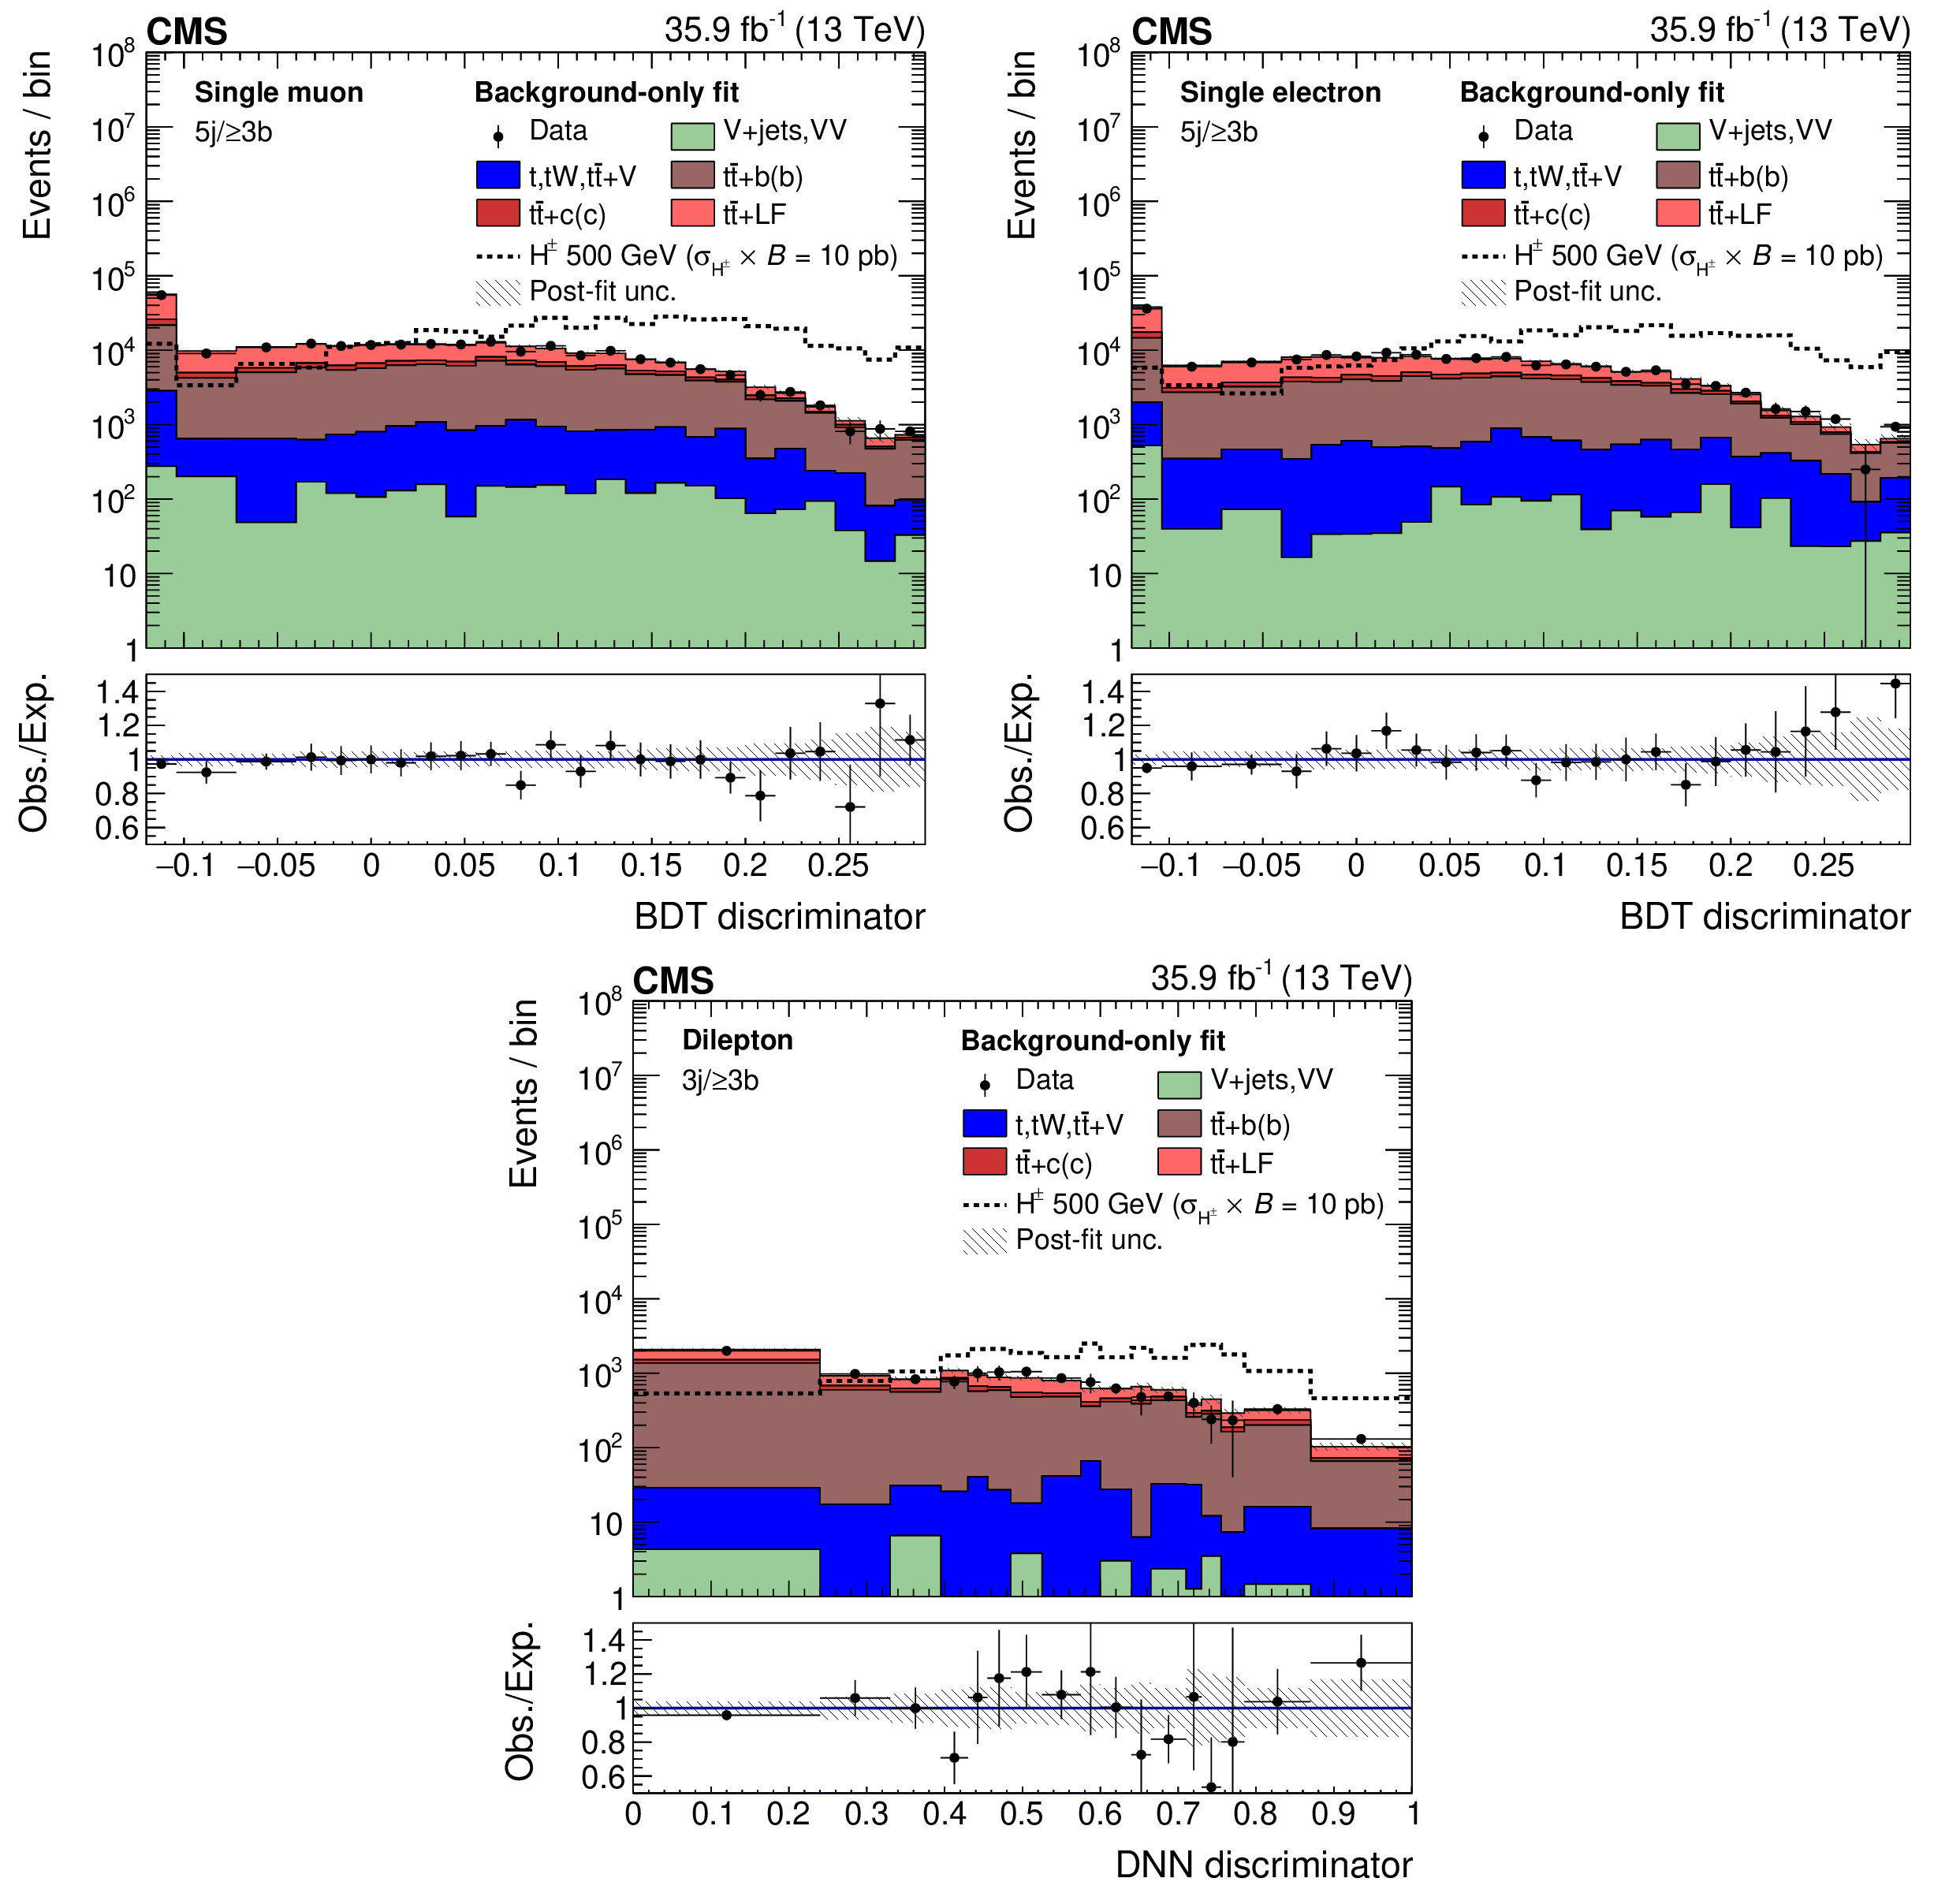
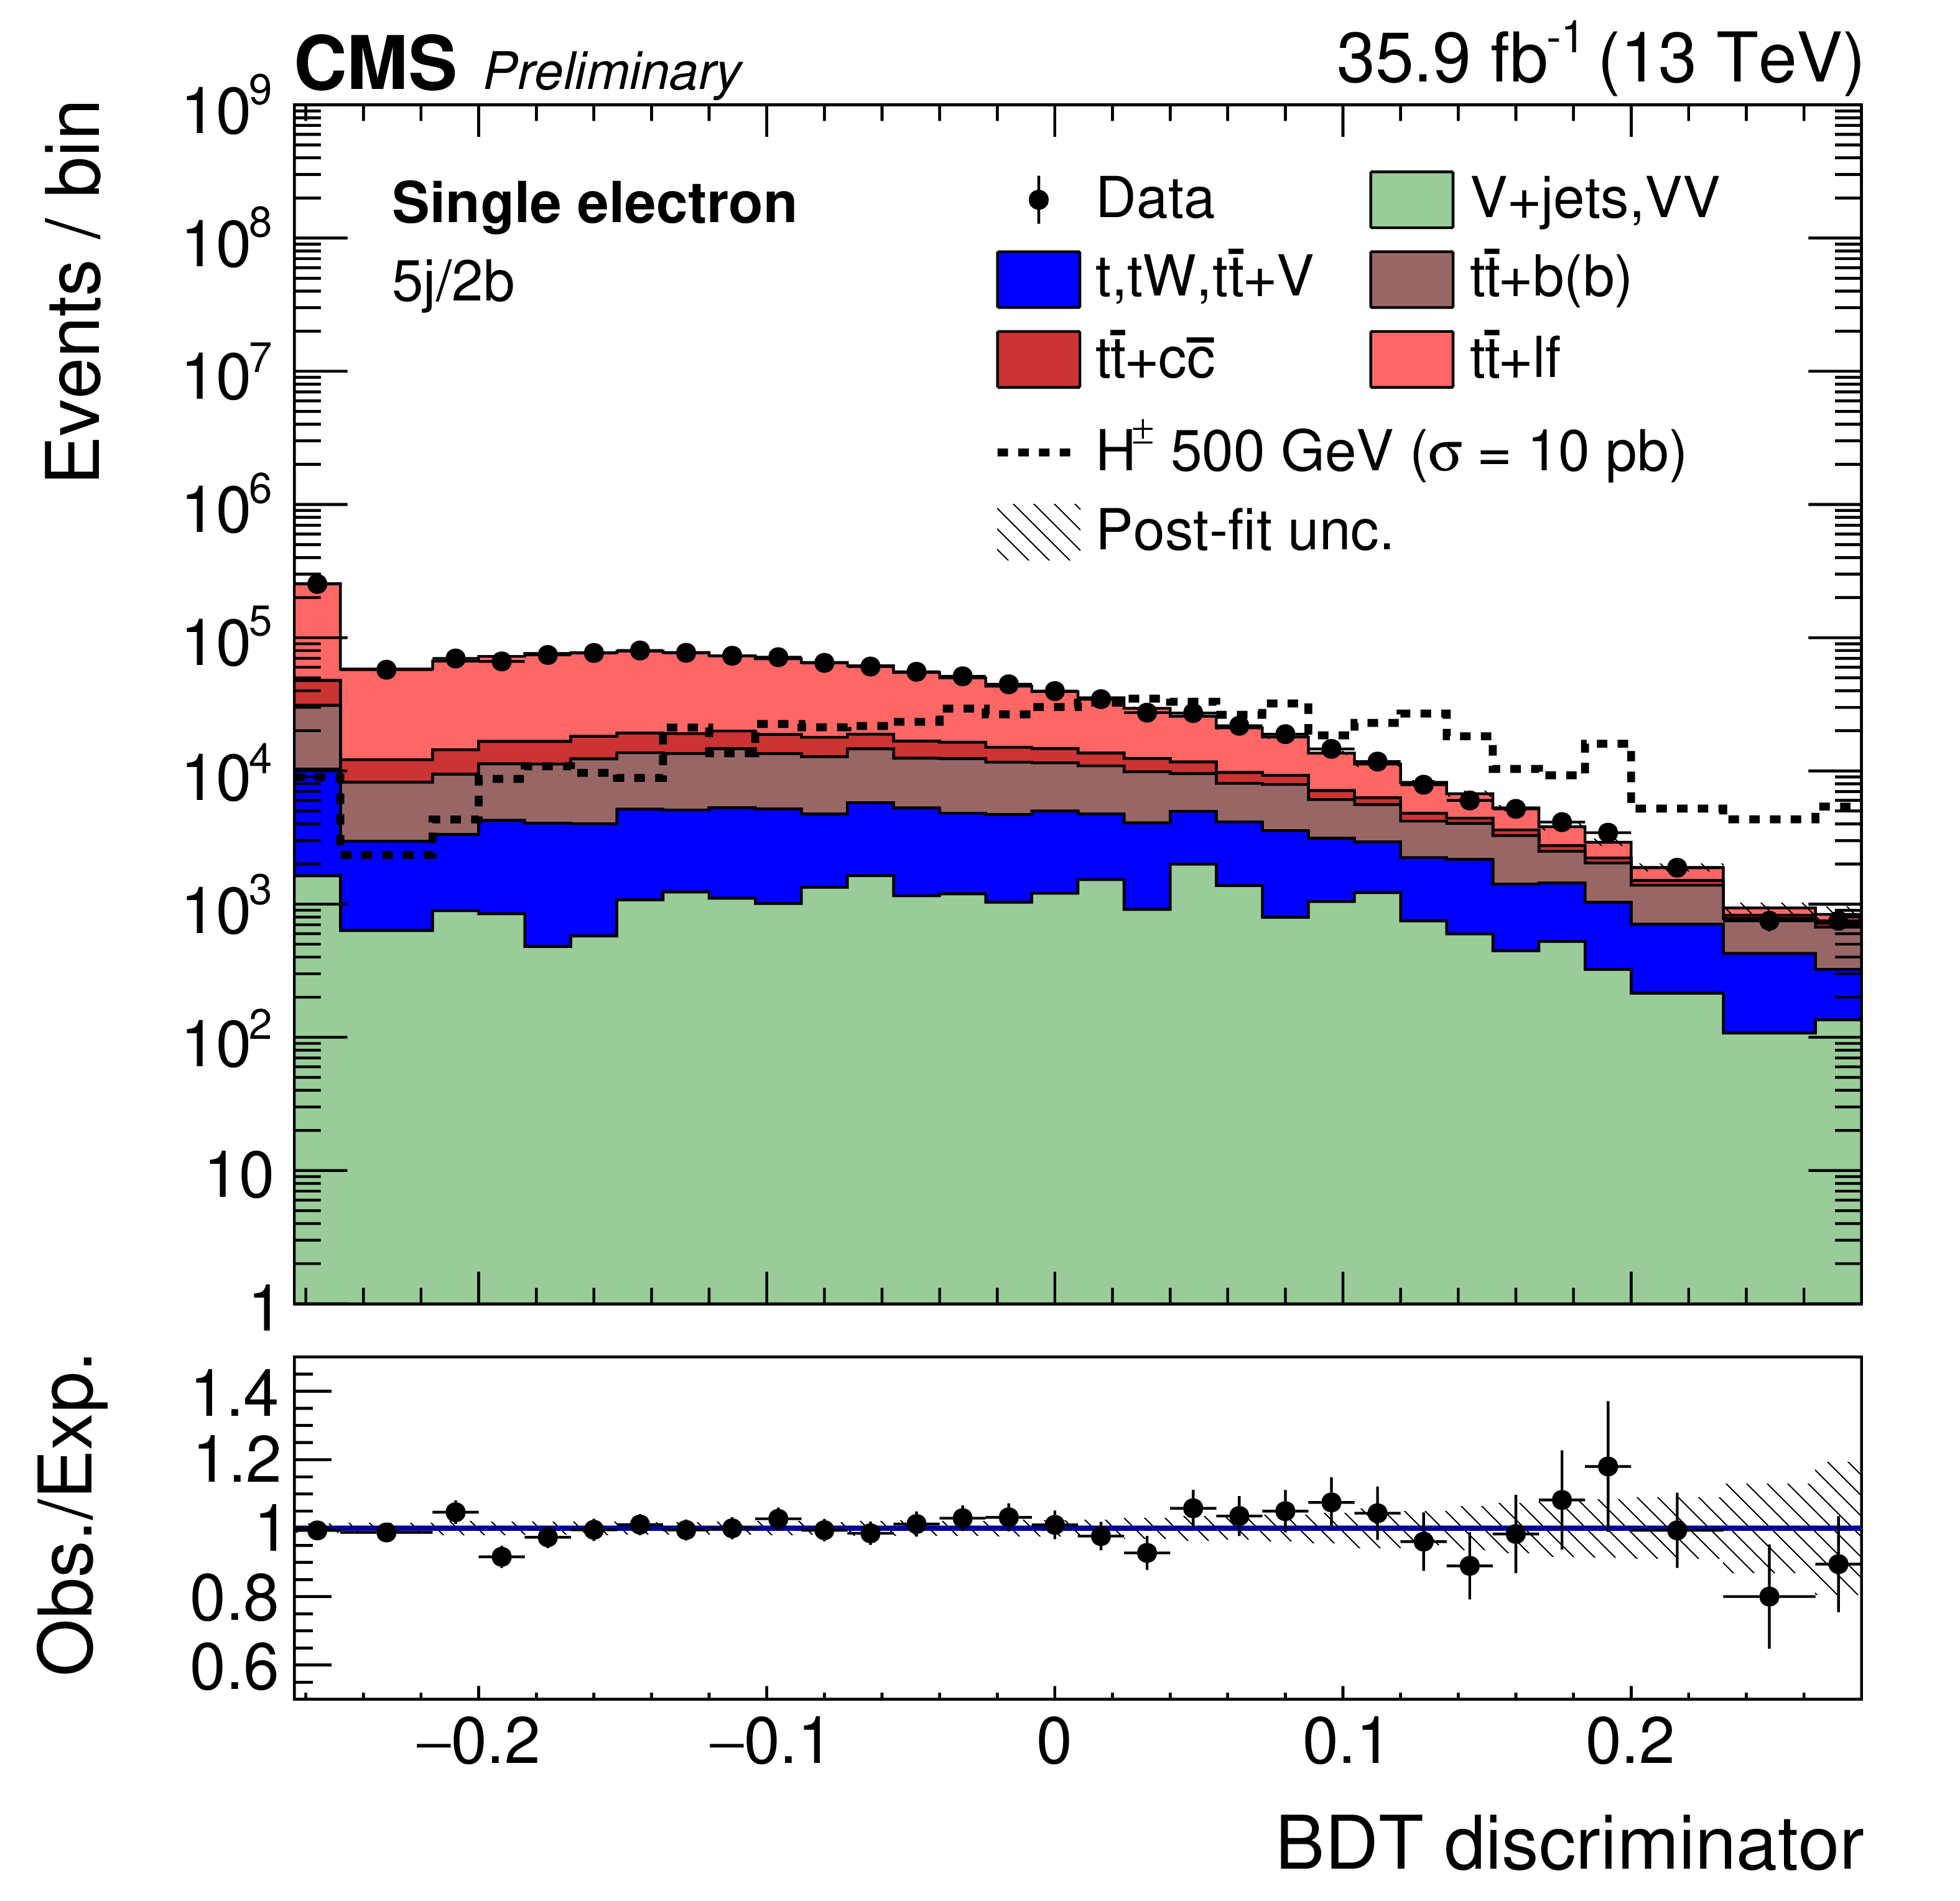
Distributions of the MVA outputs of the data and the SM expectation after the background-only fit to the data for the single-muon 5j/$\ge $3b category (top left), for the single-electron 5j/$\ge $3b category (top right), and for the dilepton 3j/$\ge $3b category (bottom). The black markers show the data. The solid histograms represent the background prediction for $\mathrm{t} \mathrm{\bar{t}} $+LF (light red), $\mathrm{t} \mathrm{\bar{t}} $+$\mathrm{c} $($\mathrm{c} $) (dark red), $\mathrm{t} \mathrm{\bar{t}} $+$\mathrm{b} $($\mathrm{b} $) (brown), single top quark and ${\mathrm{t} \mathrm{\bar{t}}}$ in association with extra bosons (blue), and V+jets and multiboson production (light green). The dashed line represents the yields for a charged Higgs boson with a mass of 500 GeV and a product of the cross section and branching fraction of 10 pb. The lower panel shows the ratio of data to the SM expectation after the background-only fit to the data and the hatched uncertainty bands include the total uncertainty. |
png pdf |
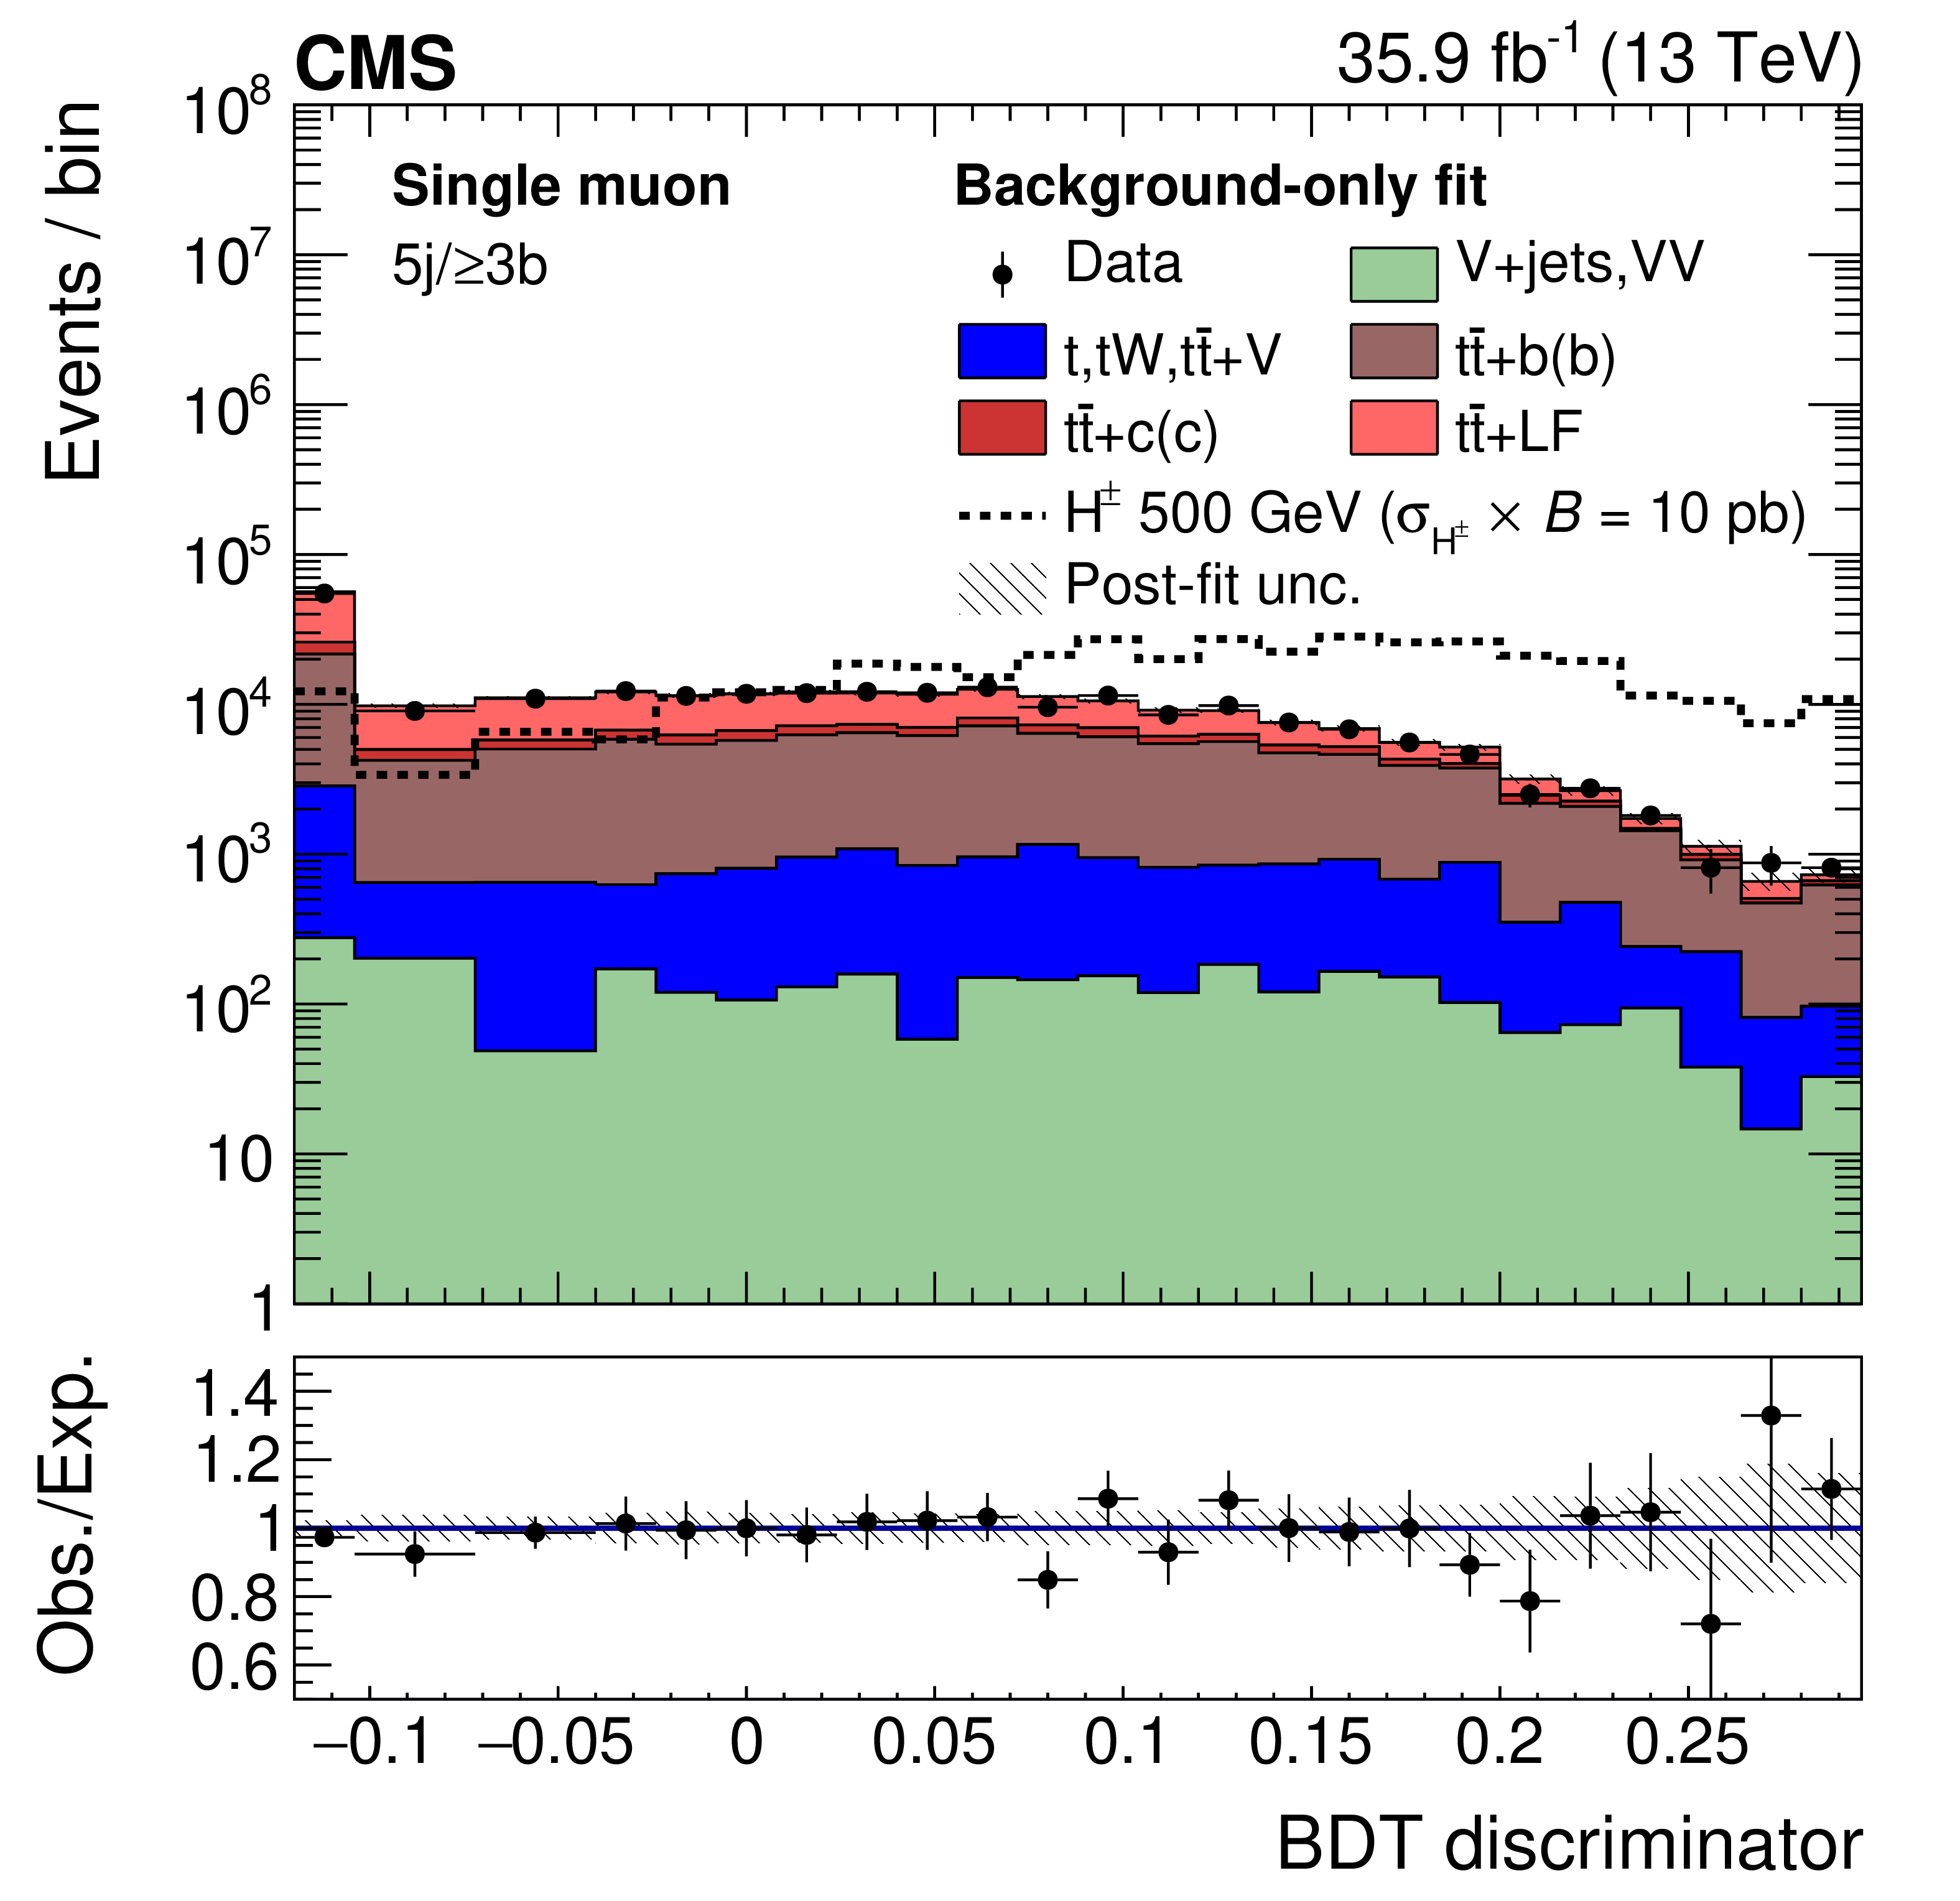
Figure 4-a:
Distributions of the MVA outputs of the data and the SM expectation after the background-only fit to the data for the single-muon 5j/$\ge $3b category. The black markers show the data. The solid histograms represent the background prediction for $\mathrm{t} \mathrm{\bar{t}} $+LF (light red), $\mathrm{t} \mathrm{\bar{t}} $+$\mathrm{c} $($\mathrm{c} $) (dark red), $\mathrm{t} \mathrm{\bar{t}} $+$\mathrm{b} $($\mathrm{b} $) (brown), single top quark and ${\mathrm{t} \mathrm{\bar{t}}}$ in association with extra bosons (blue), and V+jets and multiboson production (light green). The dashed line represents the yields for a charged Higgs boson with a mass of 500 GeV and a product of the cross section and branching fraction of 10 pb. The lower panel shows the ratio of data to the SM expectation after the background-only fit to the data and the hatched uncertainty bands include the total uncertainty. |

png pdf |
Figure 4-b:
Distributions of the MVA outputs of the data and the SM expectation after the background-only fit to the data for the single-electron 5j/$\ge $3b category. The black markers show the data. The solid histograms represent the background prediction for $\mathrm{t} \mathrm{\bar{t}} $+LF (light red), $\mathrm{t} \mathrm{\bar{t}} $+$\mathrm{c} $($\mathrm{c} $) (dark red), $\mathrm{t} \mathrm{\bar{t}} $+$\mathrm{b} $($\mathrm{b} $) (brown), single top quark and ${\mathrm{t} \mathrm{\bar{t}}}$ in association with extra bosons (blue), and V+jets and multiboson production (light green). The dashed line represents the yields for a charged Higgs boson with a mass of 500 GeV and a product of the cross section and branching fraction of 10 pb. The lower panel shows the ratio of data to the SM expectation after the background-only fit to the data and the hatched uncertainty bands include the total uncertainty. |
png pdf |
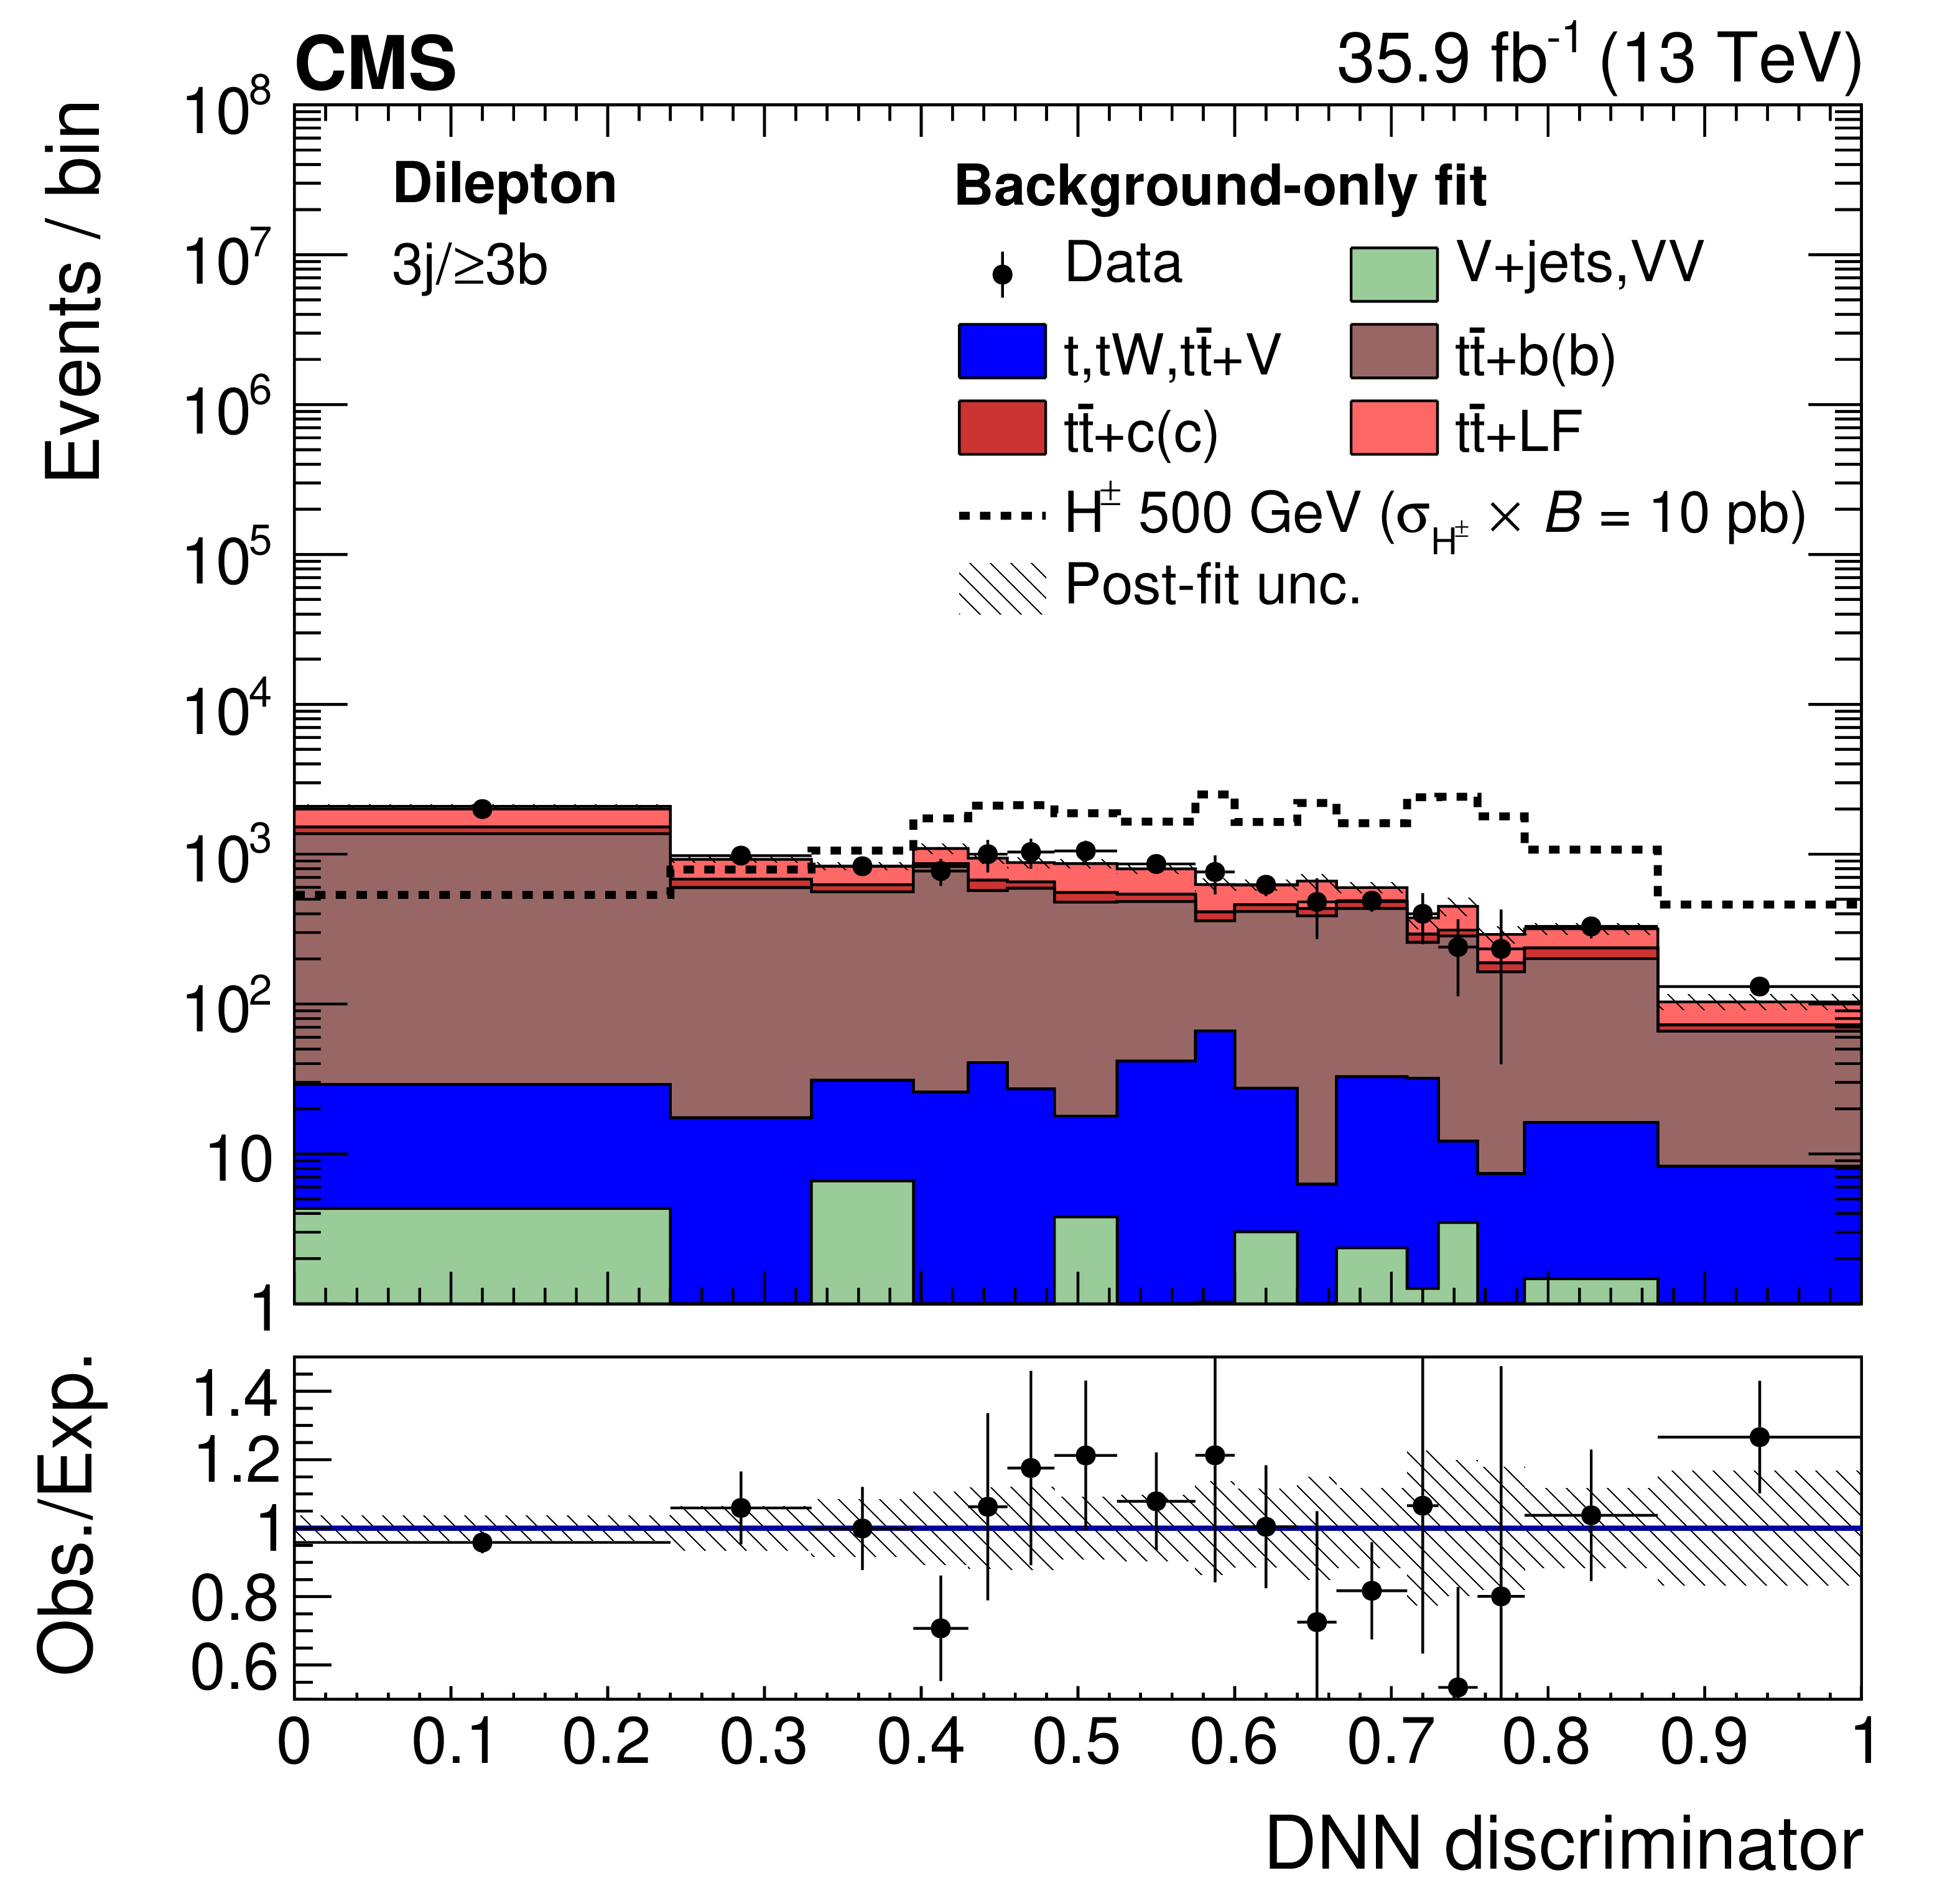
Figure 4-c:
Distributions of the MVA outputs of the data and the SM expectation after the background-only fit to the data for the dilepton 3j/$\ge $3b category. The black markers show the data. The solid histograms represent the background prediction for $\mathrm{t} \mathrm{\bar{t}} $+LF (light red), $\mathrm{t} \mathrm{\bar{t}} $+$\mathrm{c} $($\mathrm{c} $) (dark red), $\mathrm{t} \mathrm{\bar{t}} $+$\mathrm{b} $($\mathrm{b} $) (brown), single top quark and ${\mathrm{t} \mathrm{\bar{t}}}$ in association with extra bosons (blue), and V+jets and multiboson production (light green). The dashed line represents the yields for a charged Higgs boson with a mass of 500 GeV and a product of the cross section and branching fraction of 10 pb. The lower panel shows the ratio of data to the SM expectation after the background-only fit to the data and the hatched uncertainty bands include the total uncertainty. |
png pdf |
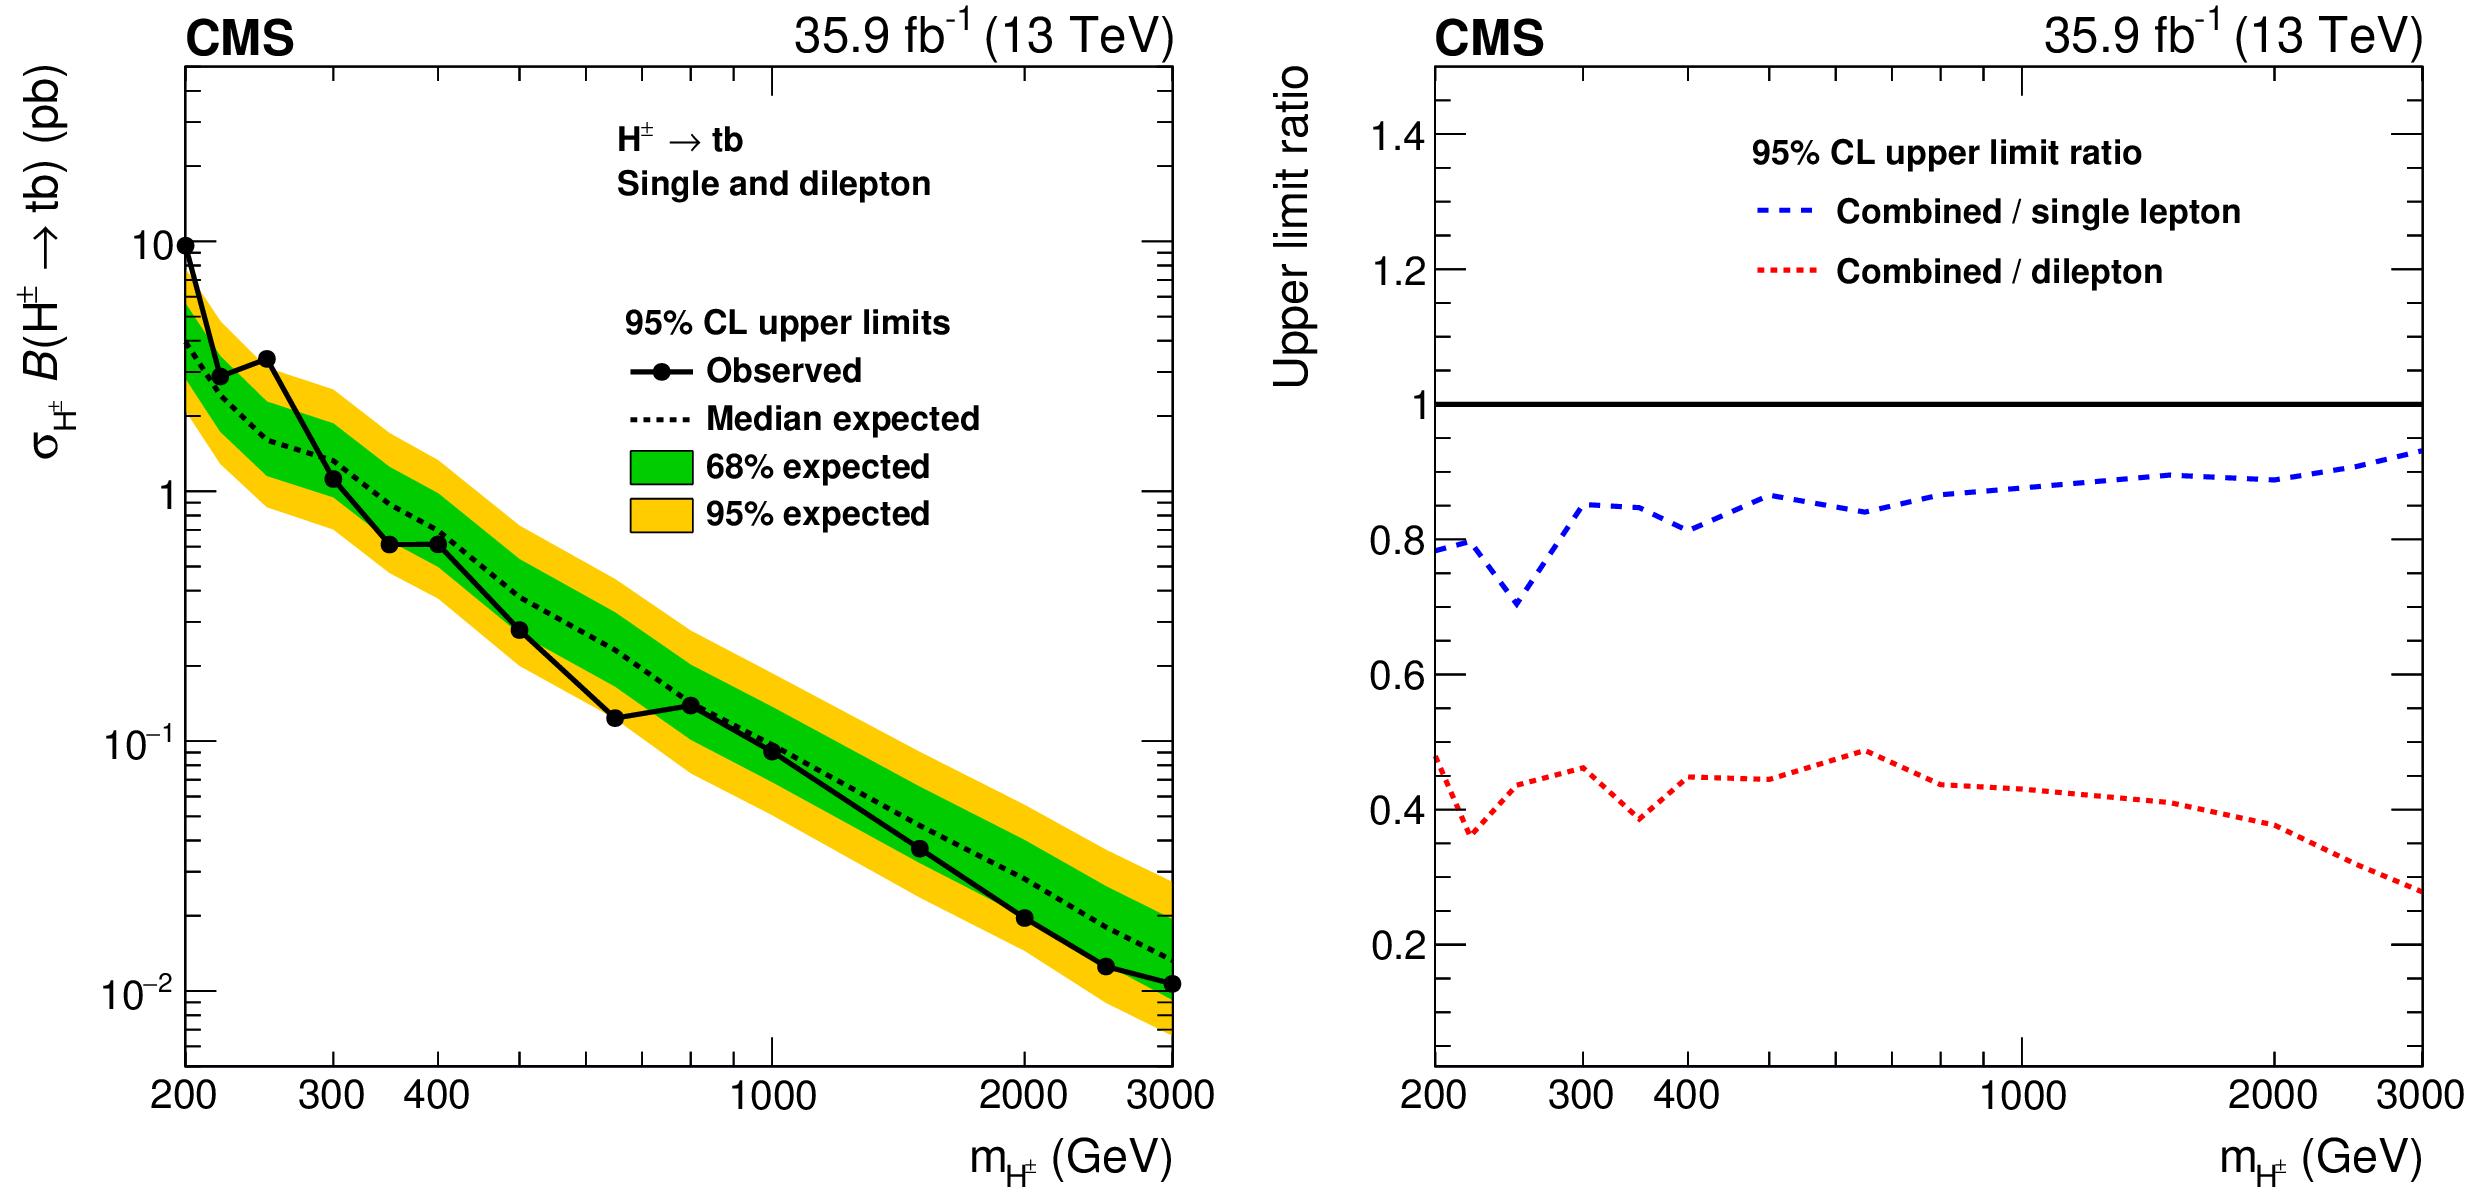
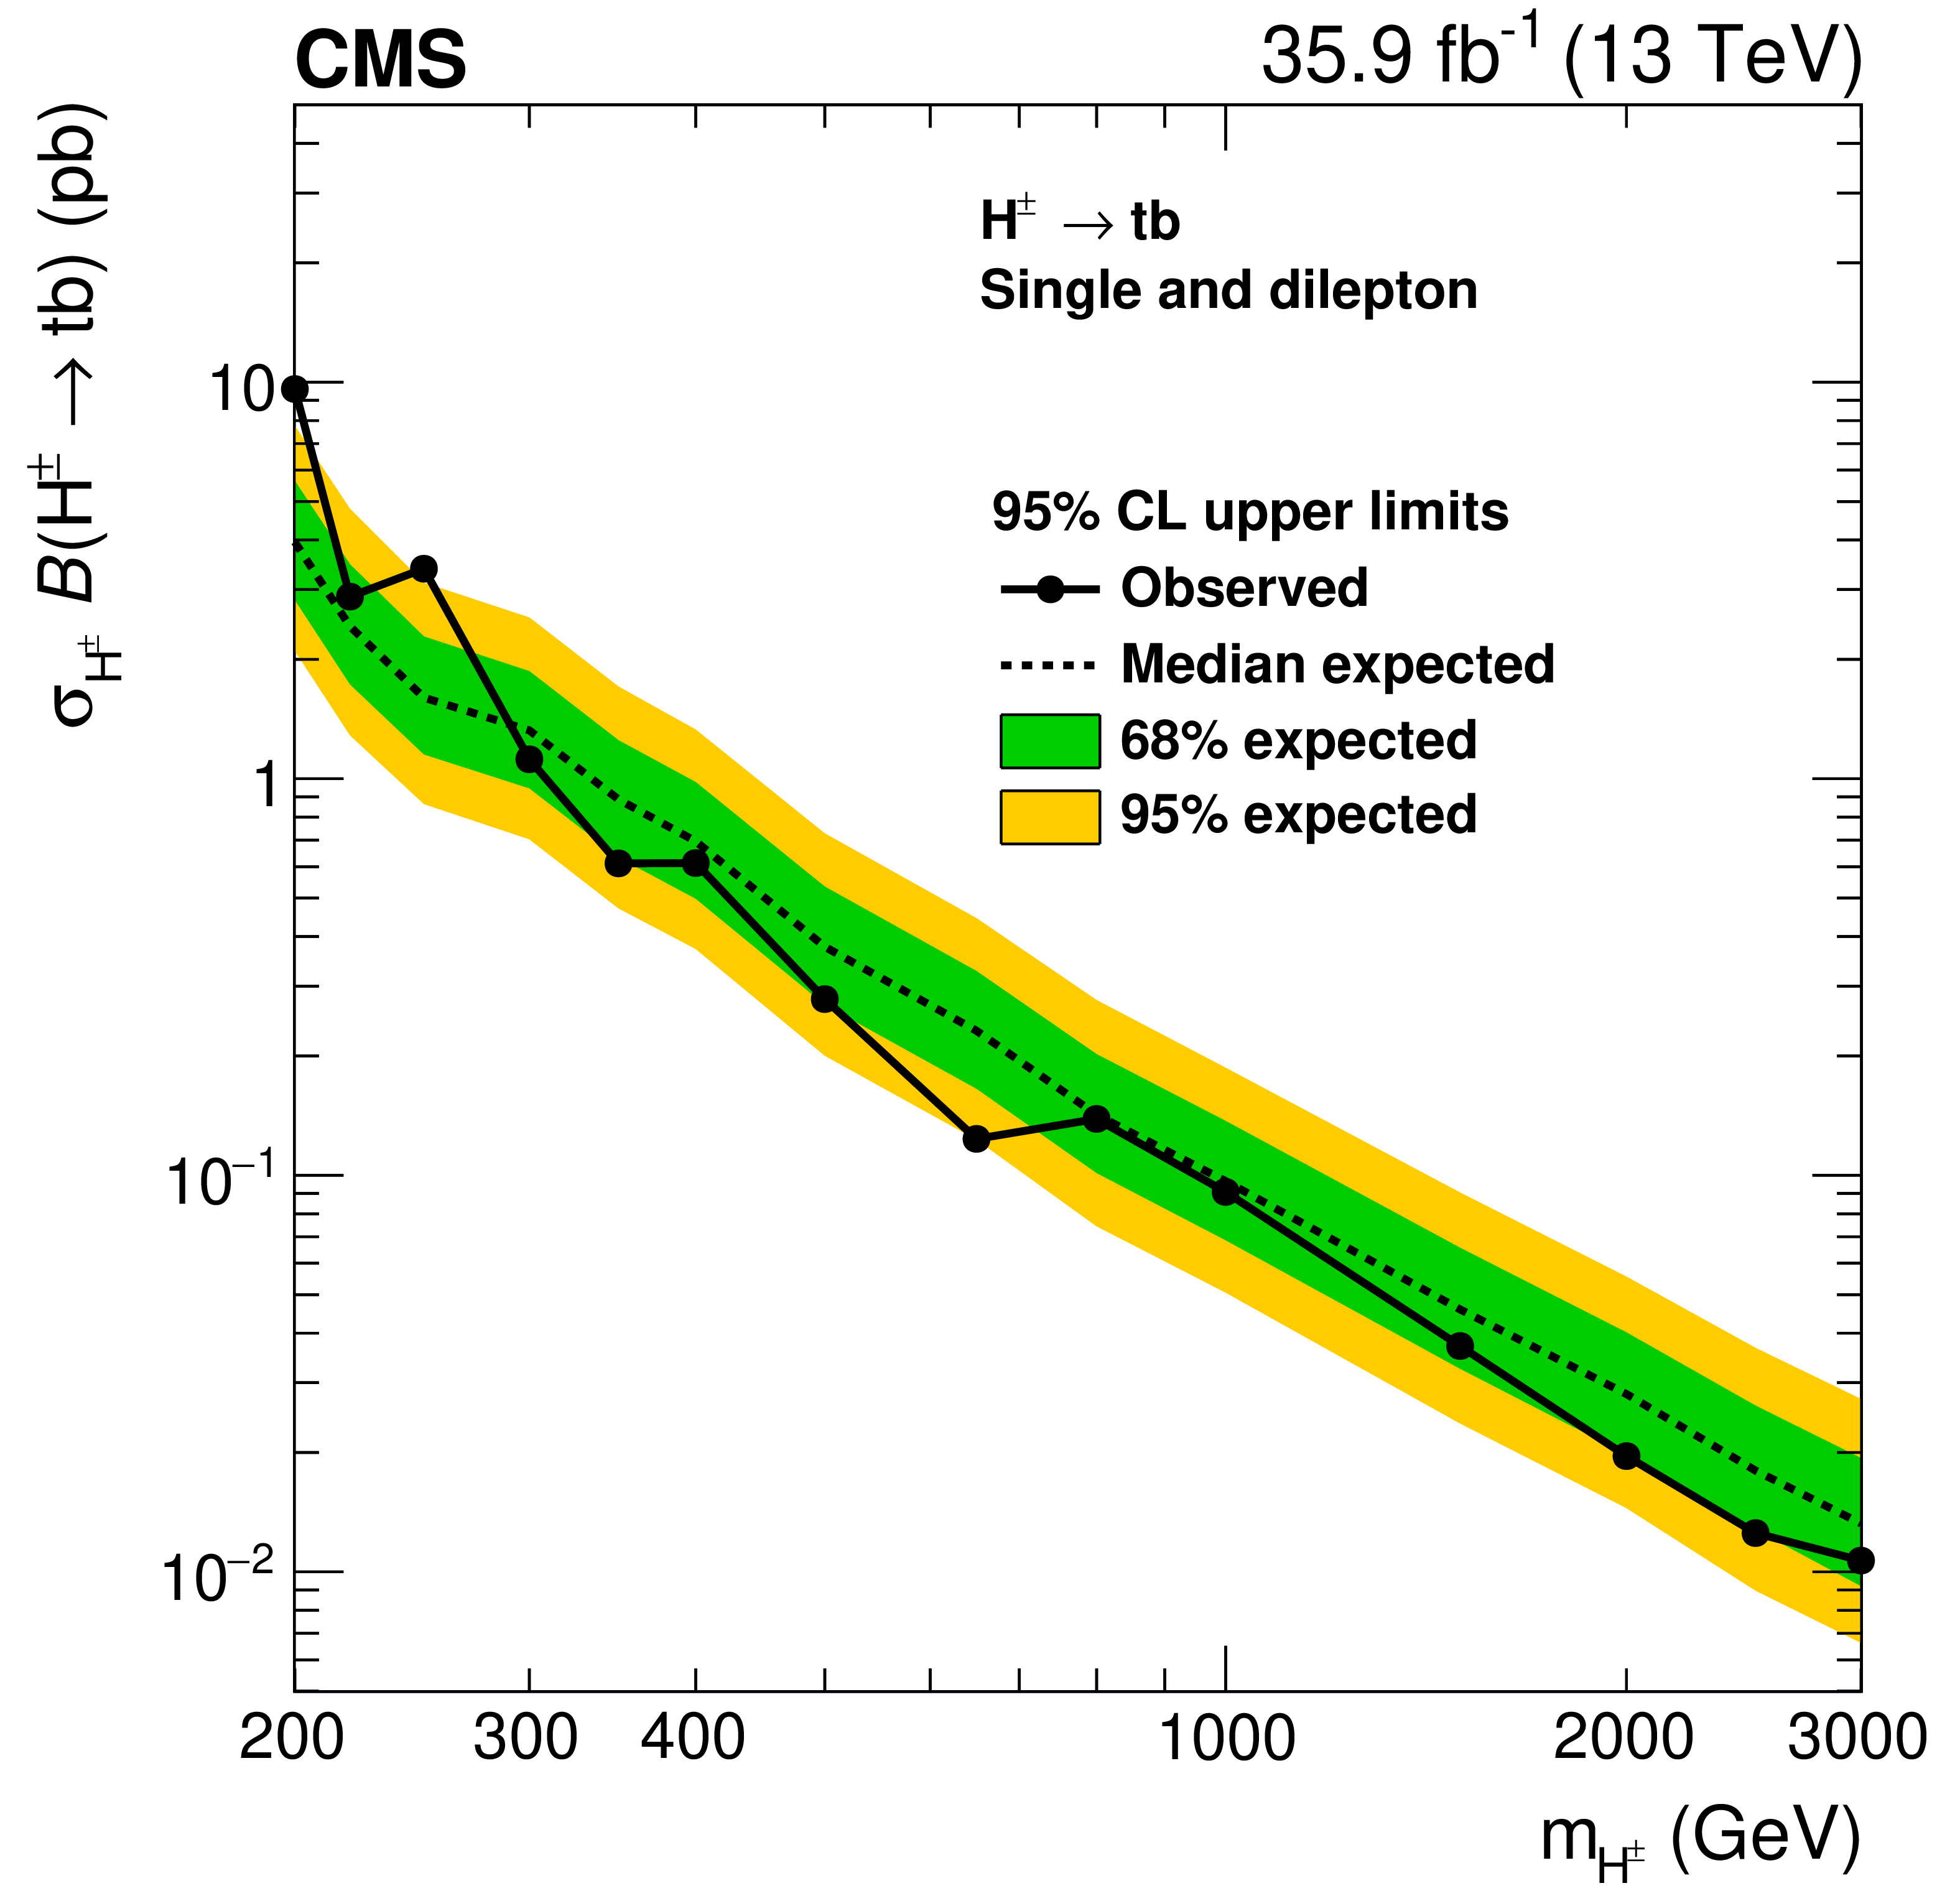
Figure 5:
The upper limit at 95% CL on $ {\sigma _{\mathrm{H} ^\pm}} {\mathcal {B}(\mathrm{H} ^\pm \to\mathrm{t} \mathrm{b})}$ with single-lepton and dilepton final states combined (left). The solid black markers describe the observed upper limits, while the dashed line corresponds to the expectations from the background. The green (yellow) band represents one (two) standard deviations from the expected median. The contribution of the single-lepton and dilepton regions to the combined limit is also represented, expressed as a ratio (right). |
png pdf |
Figure 5-a:
The upper limit at 95% CL on $ {\sigma _{\mathrm{H} ^\pm}} {\mathcal {B}(\mathrm{H} ^\pm \to\mathrm{t} \mathrm{b})}$ with single-lepton and dilepton final states combined. The solid black markers describe the observed upper limits, while the dashed line corresponds to the expectations from the background. The green (yellow) band represents one (two) standard deviations from the expected median. |

png pdf |
Figure 5-b:
The contribution of the single-lepton and dilepton regions to the combined limit is represented, expressed as a ratio. |
png pdf |
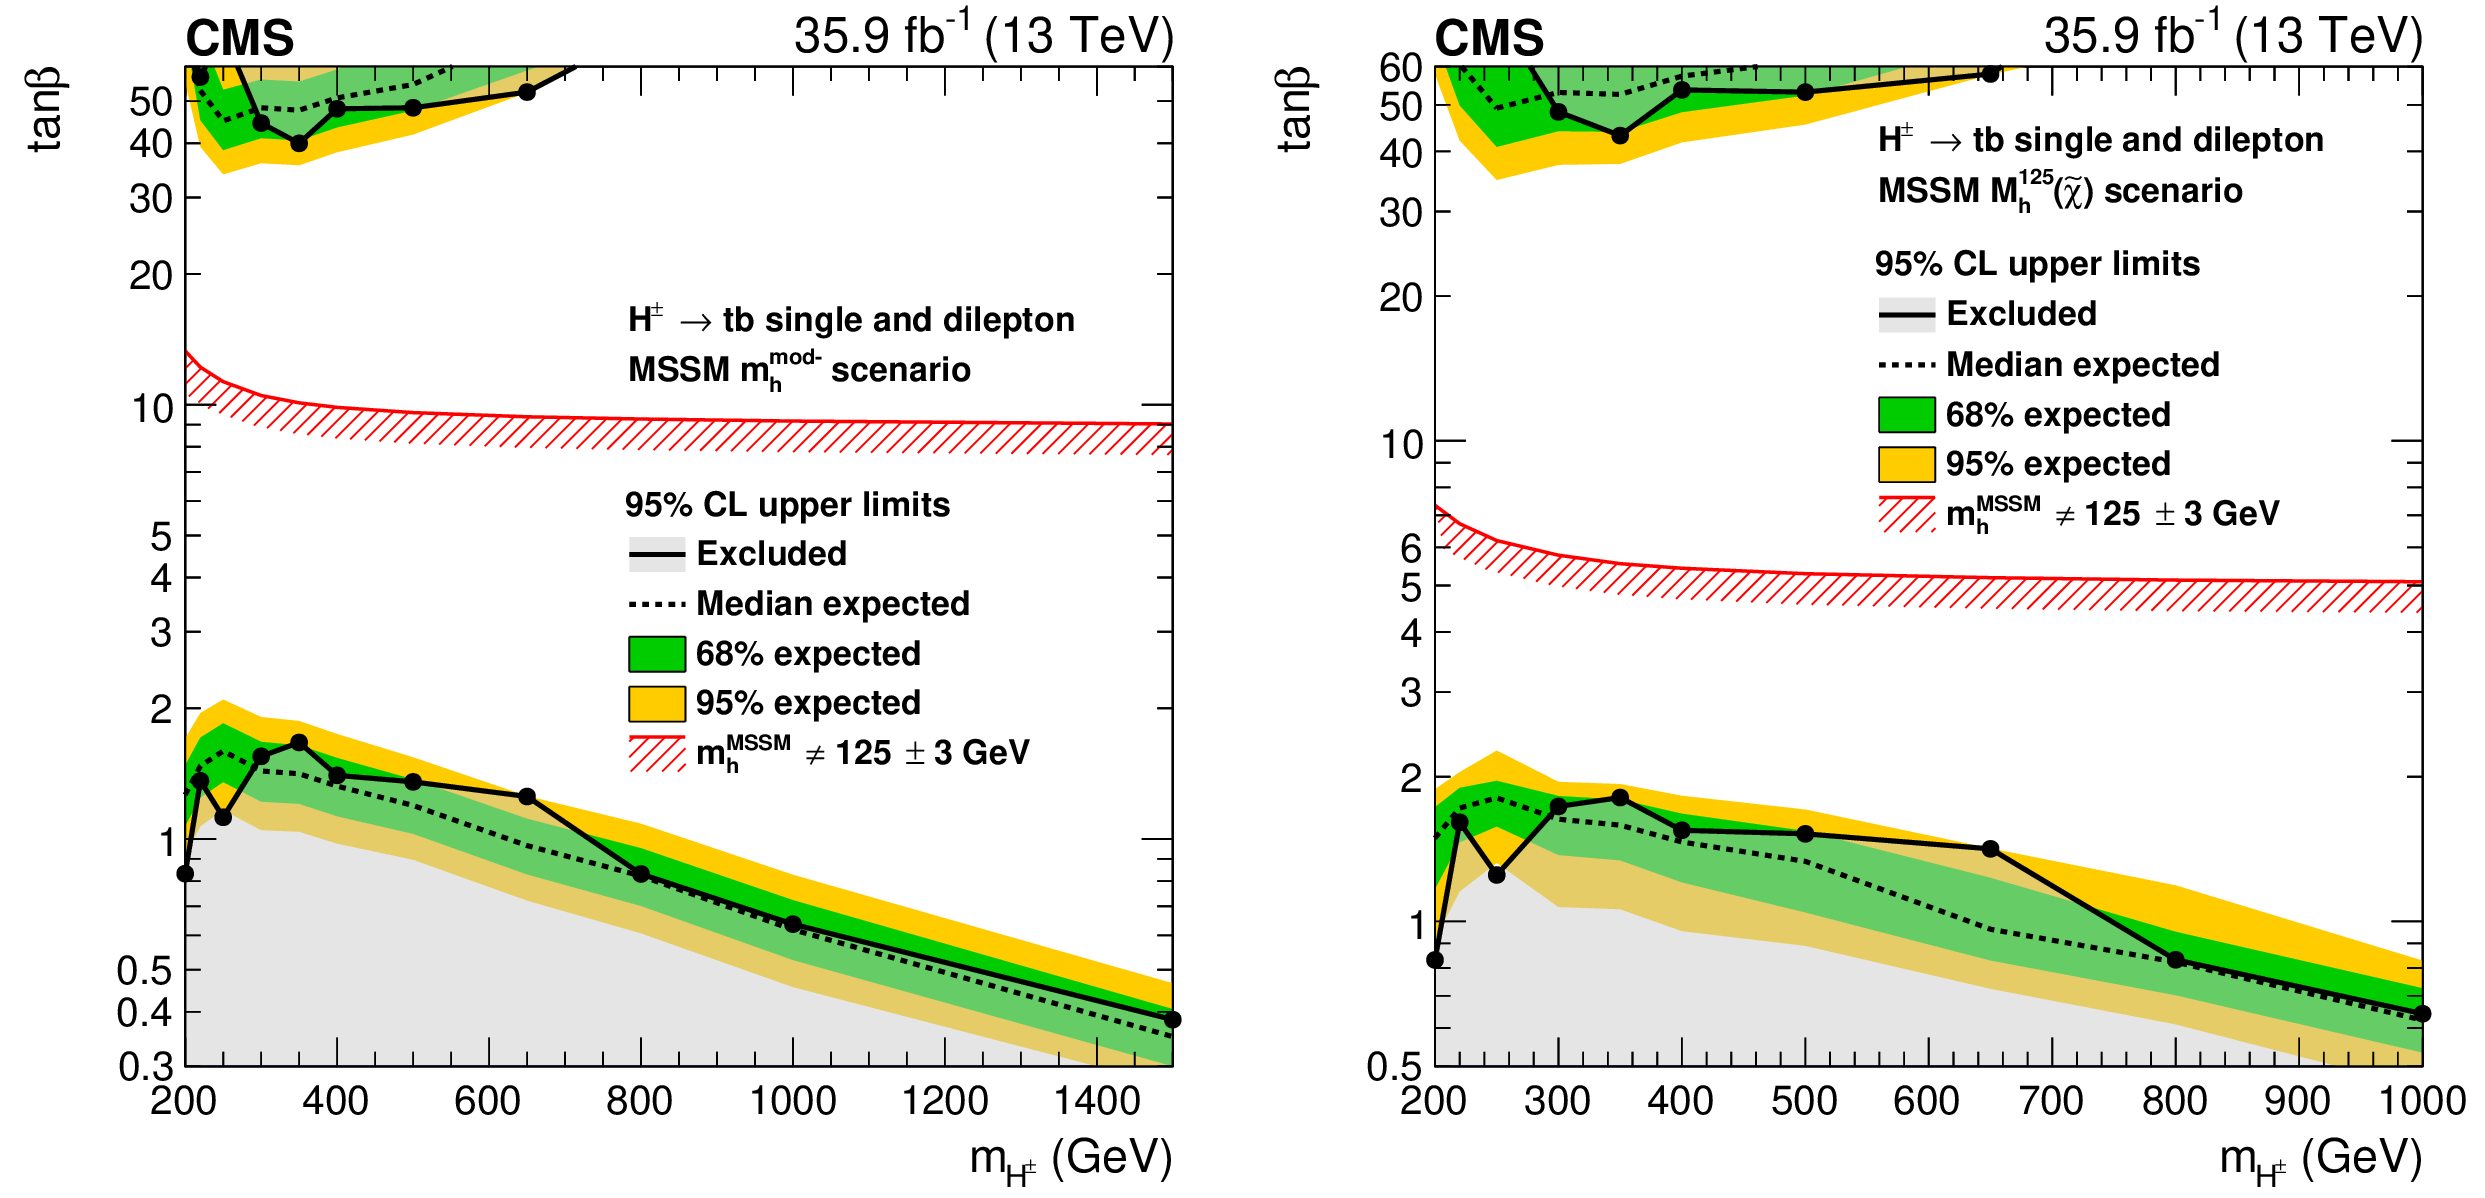
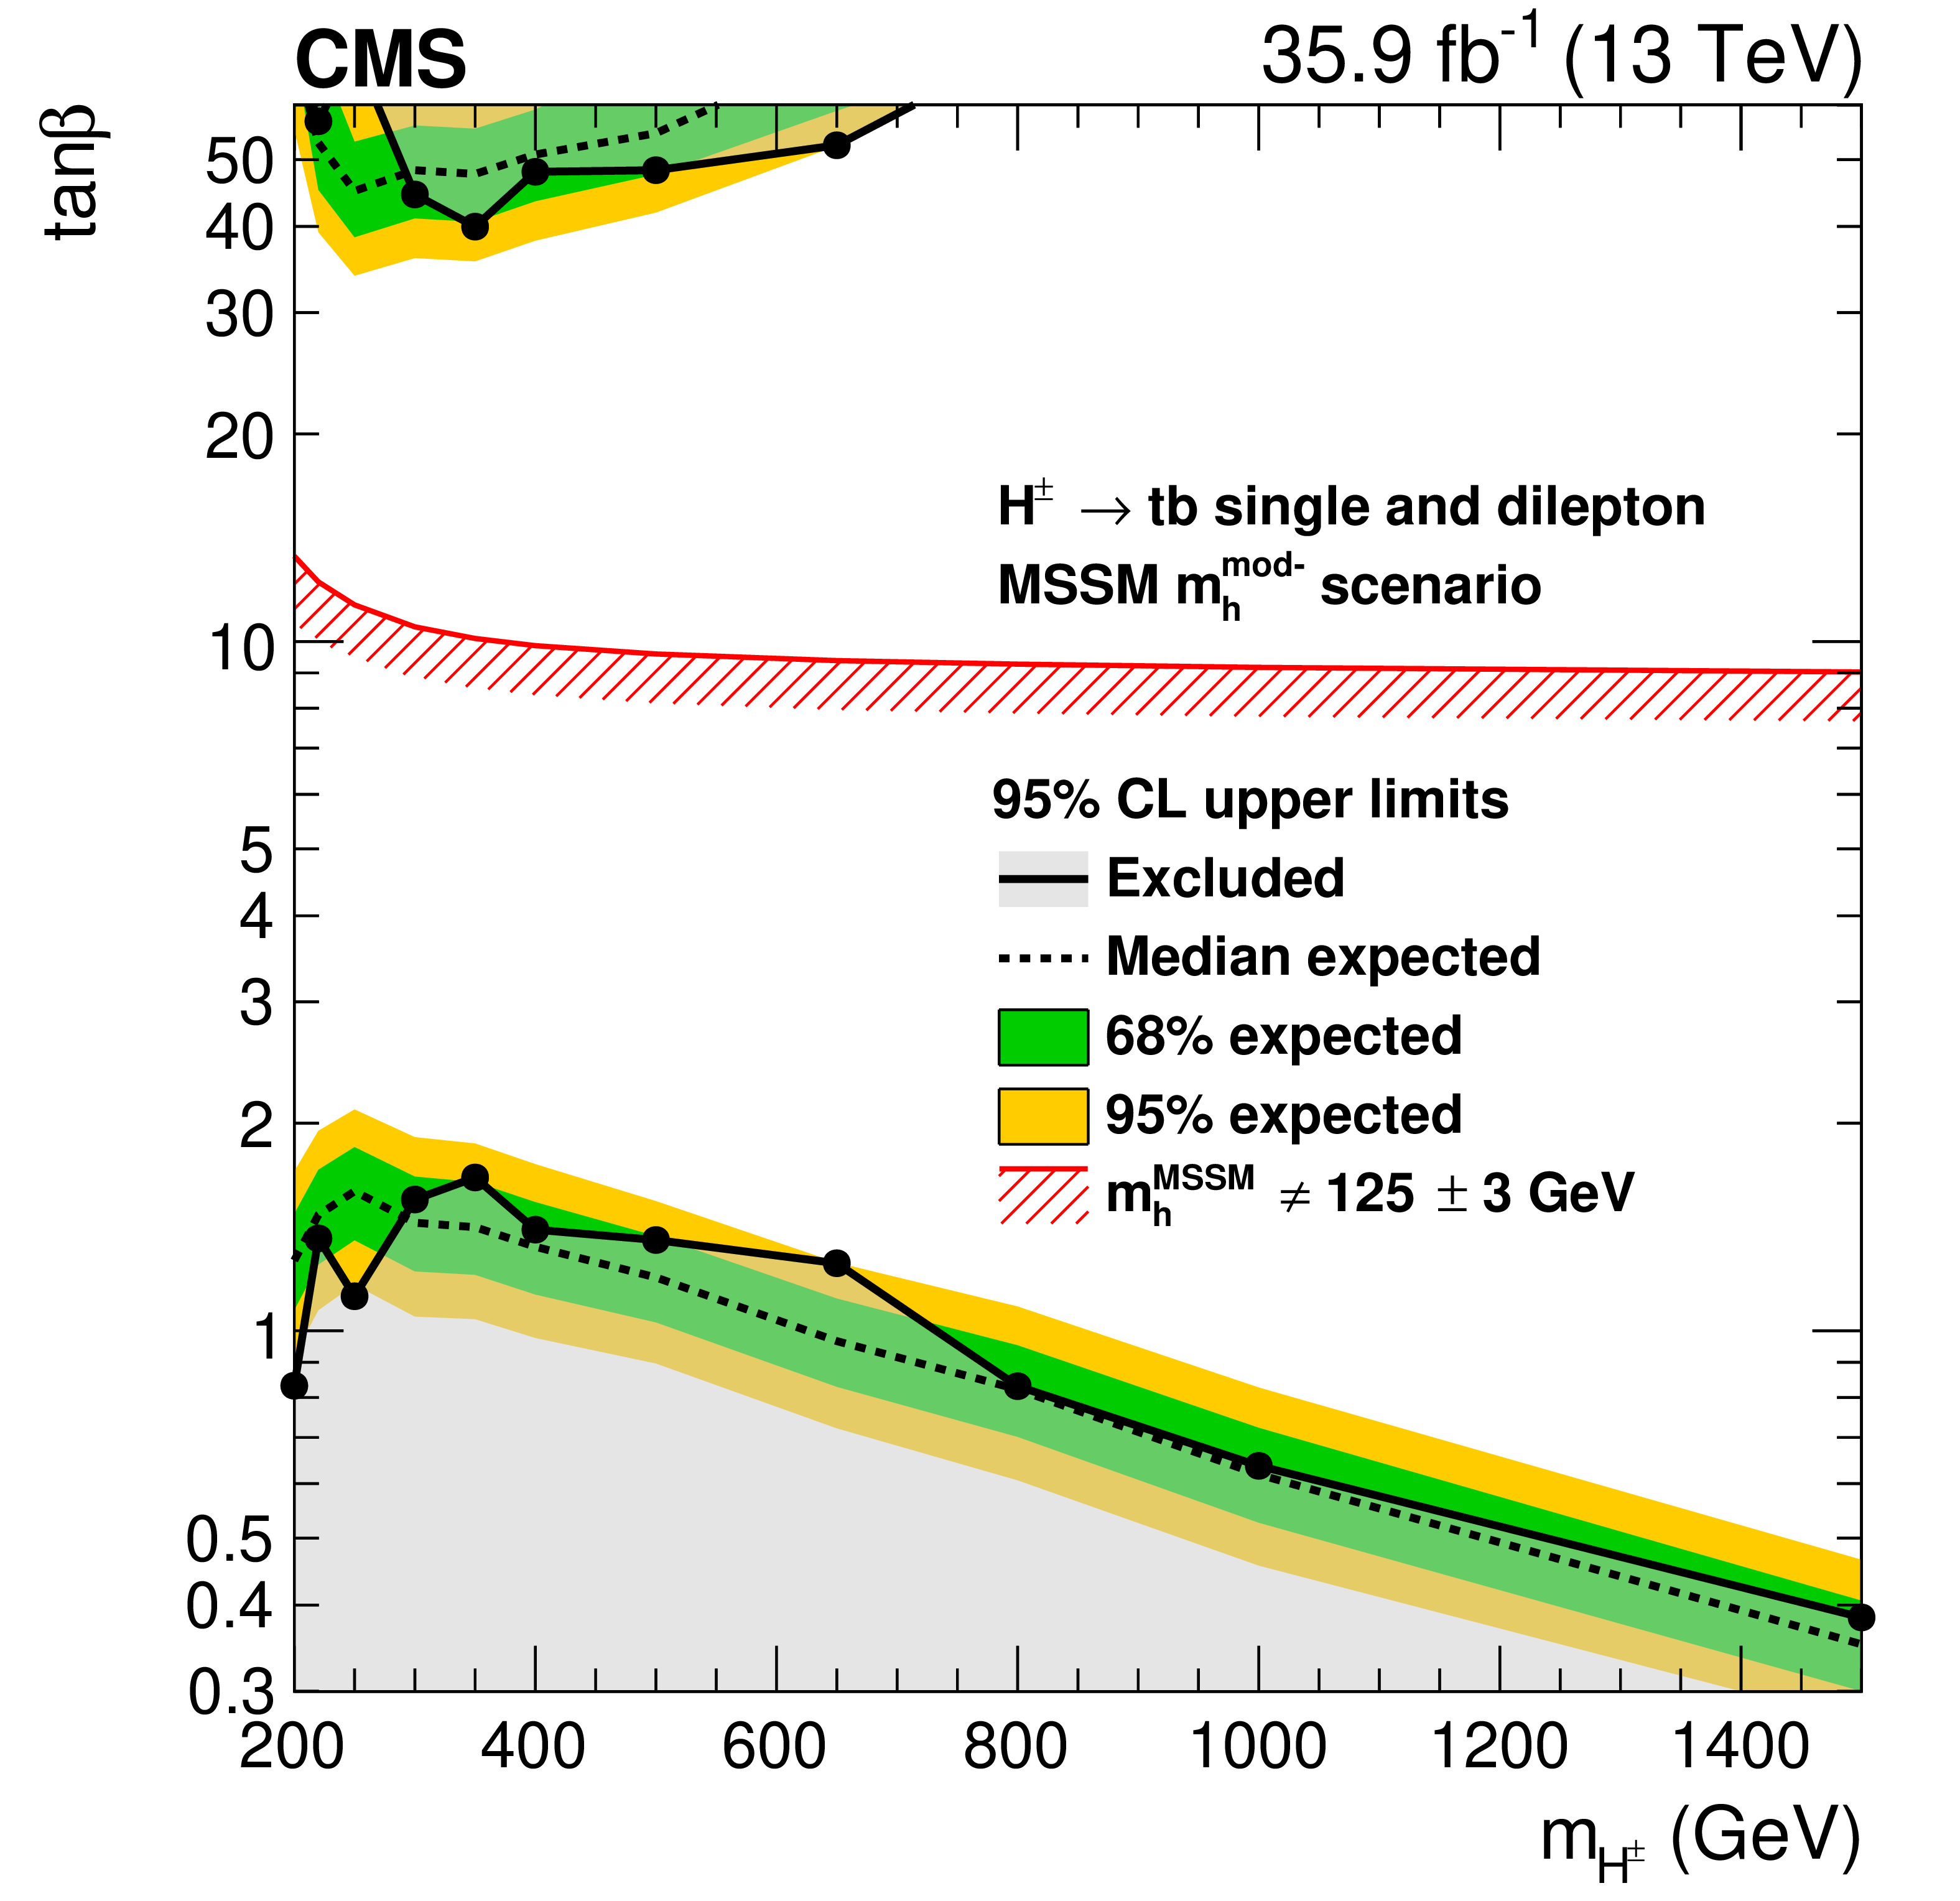
Figure 6:
Excluded parameter space regions in the ${m_\mathrm {h}^\mathrm {mod-}}$ scenario (left) and in the ${M_\mathrm {h}^\mathrm {125}(\tilde{\chi})}$ scenario (right). The grey area delimited by the solid black line and markers represents the observed excluded region. The dashed black line and the green (yellow) regions represent the median expected exclusion regions and one (two) standard deviations from the expected median, respectively. The region below the red line is excluded assuming that the observed neutral Higgs boson is the light CP-even 2HDM Higgs boson with a mass of 125 $\pm$ 3 GeV, where the uncertainty is the theoretical uncertainty in the mass calculation. |
png pdf |
Figure 6-a:
Excluded parameter space regions in the ${m_\mathrm {h}^\mathrm {mod-}}$ scenario. The grey area delimited by the solid black line and markers represents the observed excluded region. The dashed black line and the green (yellow) regions represent the median expected exclusion regions and one (two) standard deviations from the expected median, respectively. The region below the red line is excluded assuming that the observed neutral Higgs boson is the light CP-even 2HDM Higgs boson with a mass of 125 $\pm$ 3 GeV, where the uncertainty is the theoretical uncertainty in the mass calculation. |

png pdf |
Figure 6-b:
Excluded parameter space regions in the ${M_\mathrm {h}^\mathrm {125}(\tilde{\chi})}$ scenario. The grey area delimited by the solid black line and markers represents the observed excluded region. The dashed black line and the green (yellow) regions represent the median expected exclusion regions and one (two) standard deviations from the expected median, respectively. The region below the red line is excluded assuming that the observed neutral Higgs boson is the light CP-even 2HDM Higgs boson with a mass of 125 $\pm$ 3 GeV, where the uncertainty is the theoretical uncertainty in the mass calculation. |
| Tables | |
png pdf |
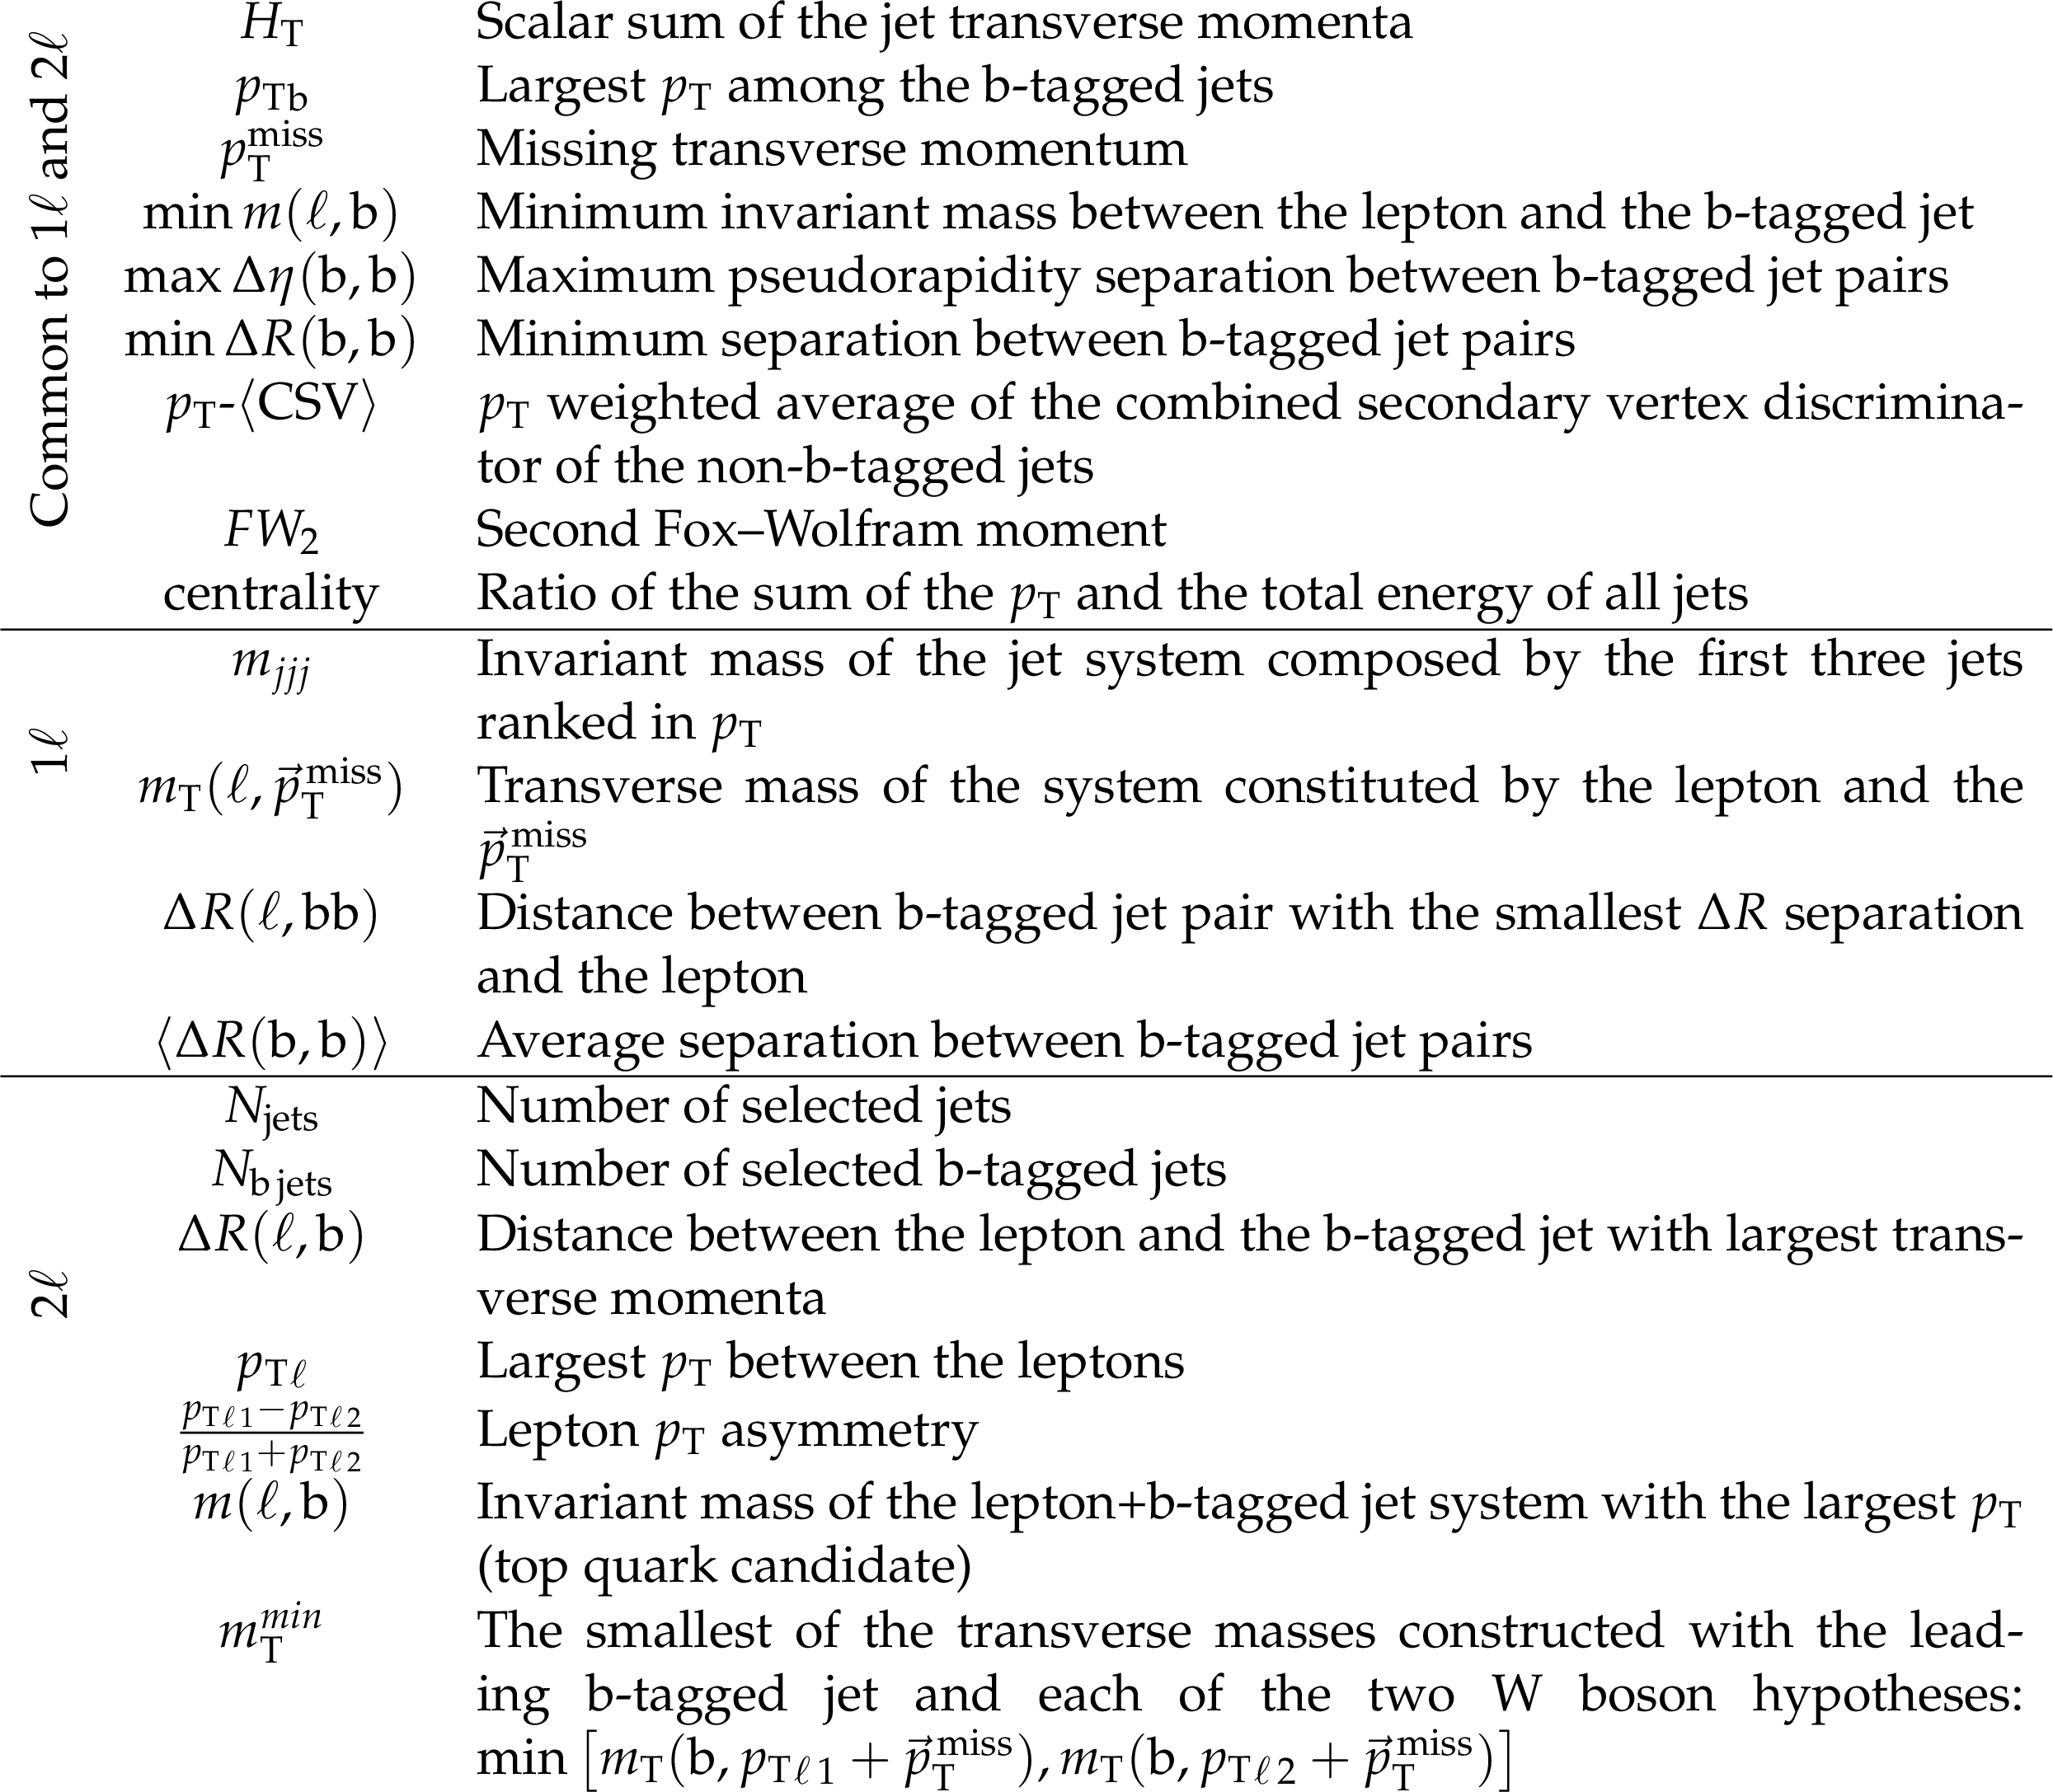
Table 1:
Summary of the discriminating variables used in the analysis of the single-lepton (1$\ell $) and dilepton (2$\ell $) final states. |
png pdf |
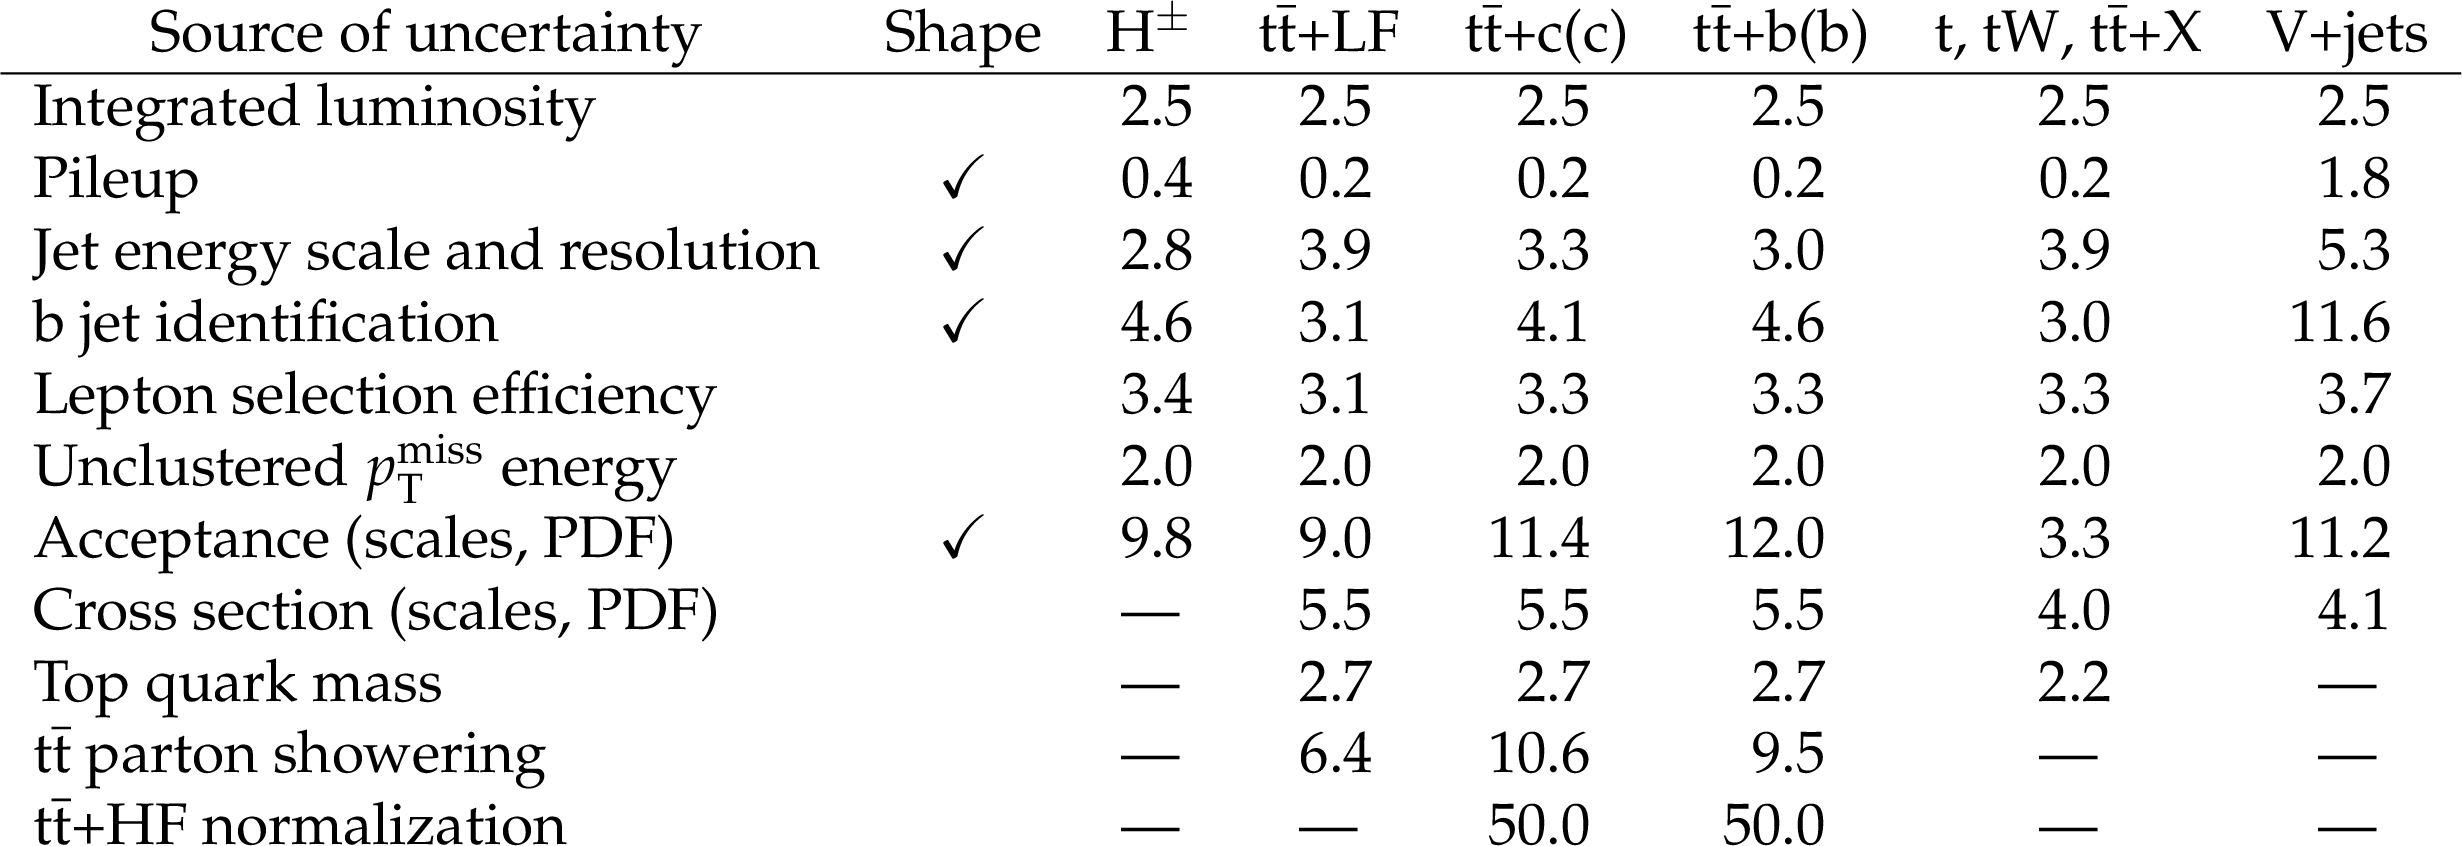
Table 2:
Effects of the systematic uncertainties as the variation (in percent) of the event yields prior to the fit to data, summed over all final states and regions. The column Shape reports whether a given uncertainty is considered a shape uncertainty or a rate uncertainty. |
png pdf |
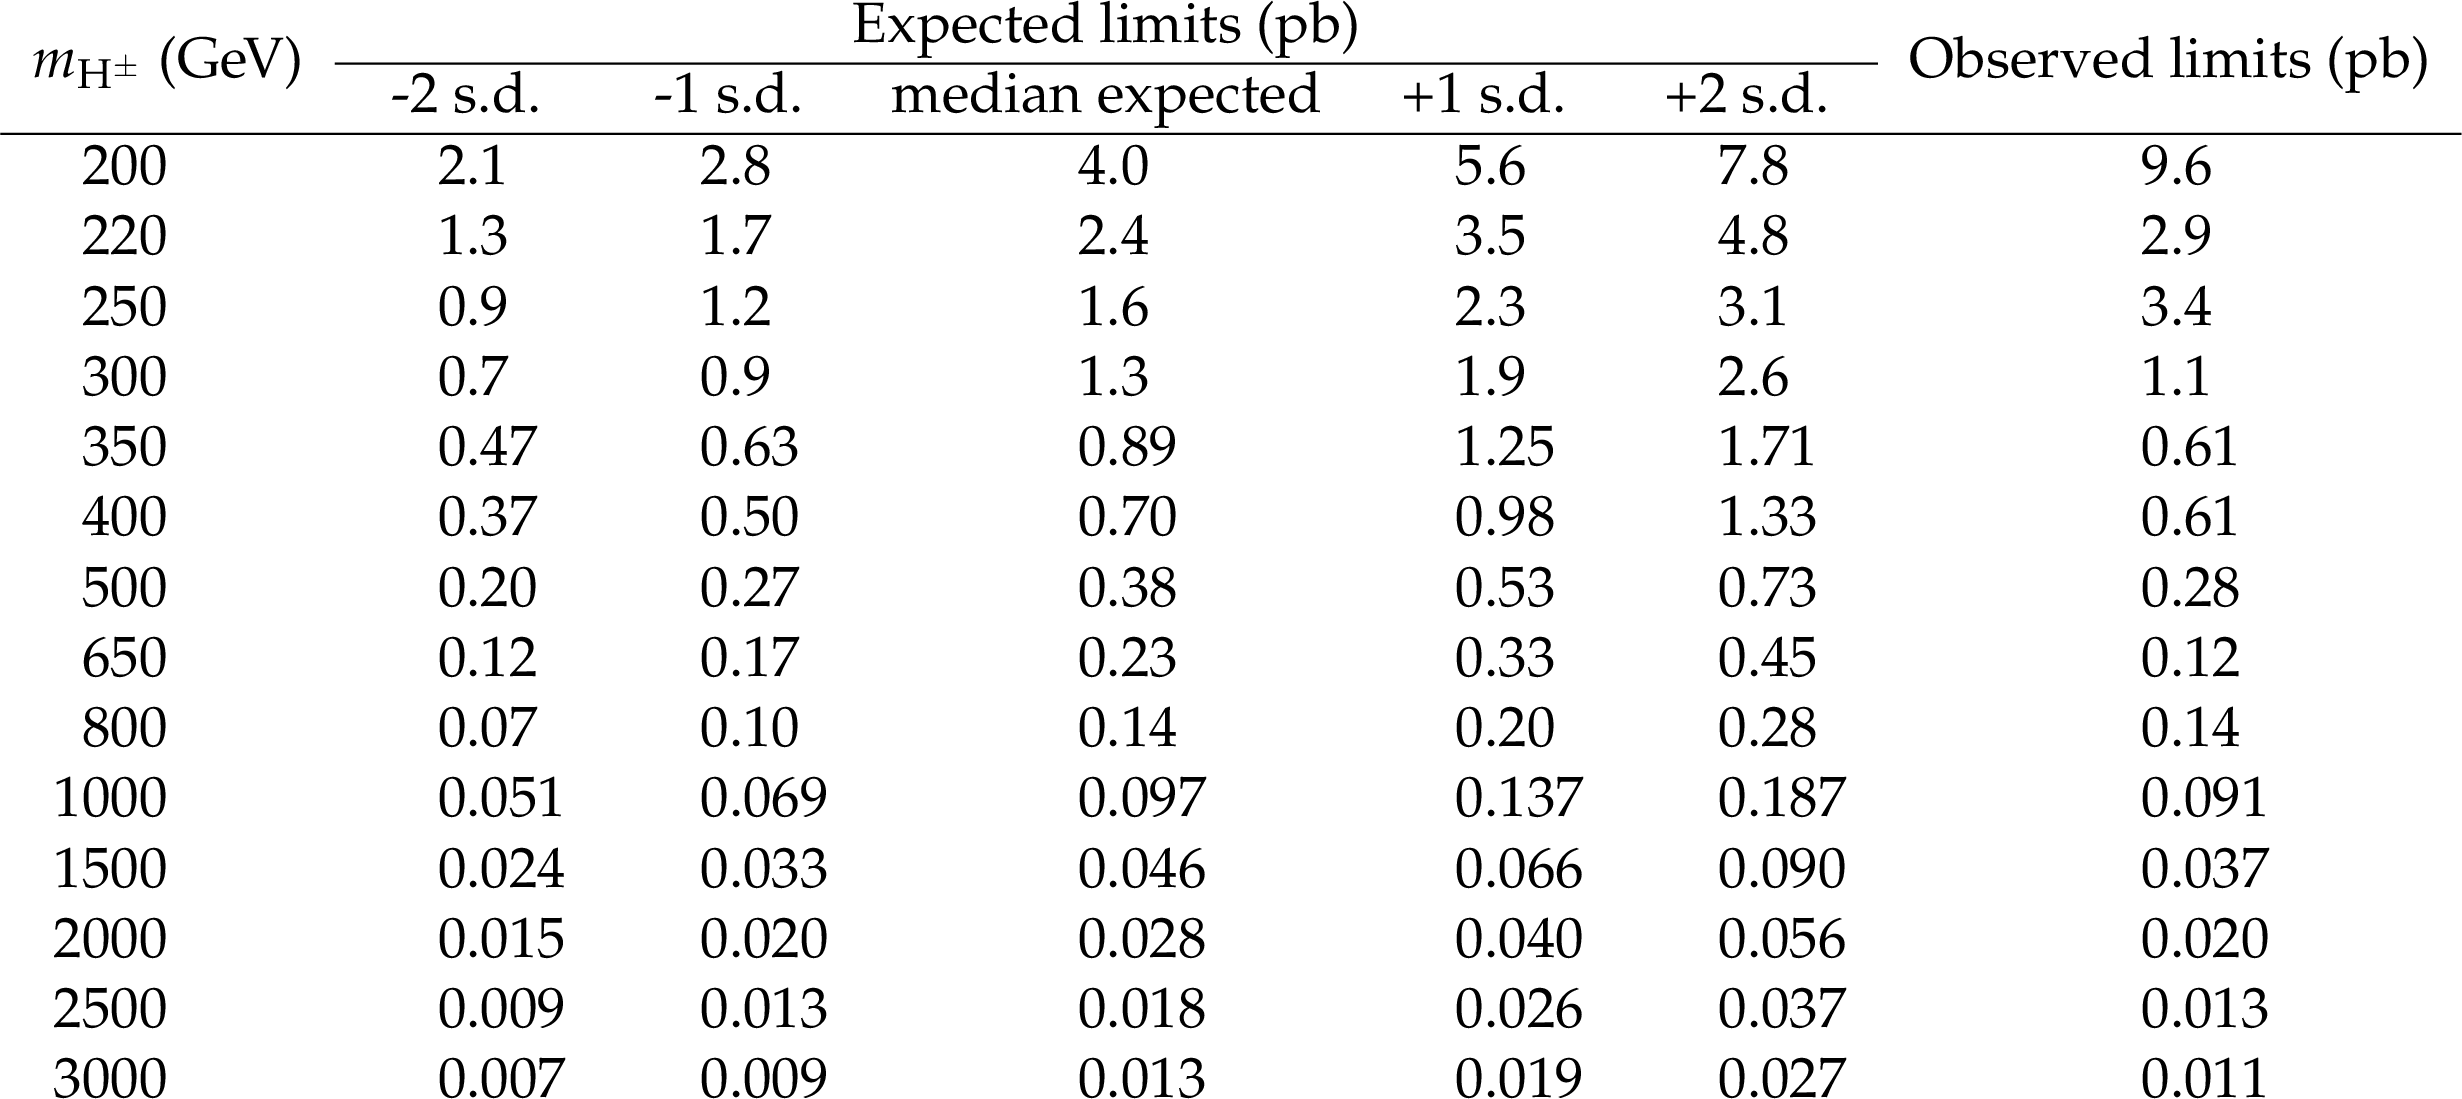
Table 3:
The upper limits at 95% CL on the $ {\sigma _{\mathrm{H} ^\pm}} {\mathcal {B}(\mathrm{H} ^\pm \to\mathrm{t} \mathrm{b})}$ with the single-lepton and dilepton final states combined. The one (two) standard deviations (s.d.) from the expected median are also reported. |
| Summary |
| A search is presented for a charged Higgs boson decaying into a top-bottom quark-antiquark pair when produced in association with a top quark or a top and a bottom quark. The analyzed proton-proton collision data, collected at $\sqrt{s}=$ 13 TeV with the CMS detector at the LHC, correspond to an integrated luminosity of 35.9 fb$^{-1}$. The search uses events with a single isolated electron or muon or an opposite-sign electron or muon pair. Events are categorized according to the jet multiplicity and the number of jets identified as containing a b-hadron decay. Multivariate techniques are used to discriminate between signal and background events, the latter being dominated by $\mathrm{t\bar{t}}$ production. Results are presented for a charged Higgs boson with a mass larger than the top quark mass. 95% confidence level upper limits of 9.6-0.01 pb are set on the product of the charged Higgs boson production cross section and the branching fraction into a top-bottom quark-antiquark pair, ${\sigma_{\mathrm{H}^\pm}}{\mathcal{B}(\mathrm{H}^\pm\!\to\!\mathrm{t}\mathrm{b})}={\sigma({\mathrm{p}}{\mathrm{p}}\!\to\mathrm{H}^{+}\bar{\mathrm{t}}\mathrm{b} + {\mathrm{p}}{\mathrm{p}}\!\to\mathrm{H}^{+}\bar{\mathrm{t}})}{\mathcal{B}(\mathrm{H}^+\!\to\!\mathrm{t}\bar{\mathrm{b}})}+{\sigma({\mathrm{p}}{\mathrm{p}}\!\to\mathrm{H}^{-}\mathrm{t}\bar{\mathrm{b}} + {\mathrm{p}}{\mathrm{p}}\!\to\mathrm{H}^{-}\mathrm{t})}{\mathcal{B}(\mathrm{H}^-\!\to\!\bar{\mathrm{t}}\mathrm{b})}$, in the mass range from 200 GeV to 3 TeV, representing an improvement over previous results [31,32,33] by a factor of about 2-7 in the given mass range. Exclusion regions in the parameter space of the minimal supersymmetric standard model ${m_\mathrm{h}^\mathrm{mod-}} $ and ${M_\mathrm{h}^\mathrm{125}(\tilde{\chi})} $ benchmark scenarios are presented. |
| Additional Figures | |
png pdf |
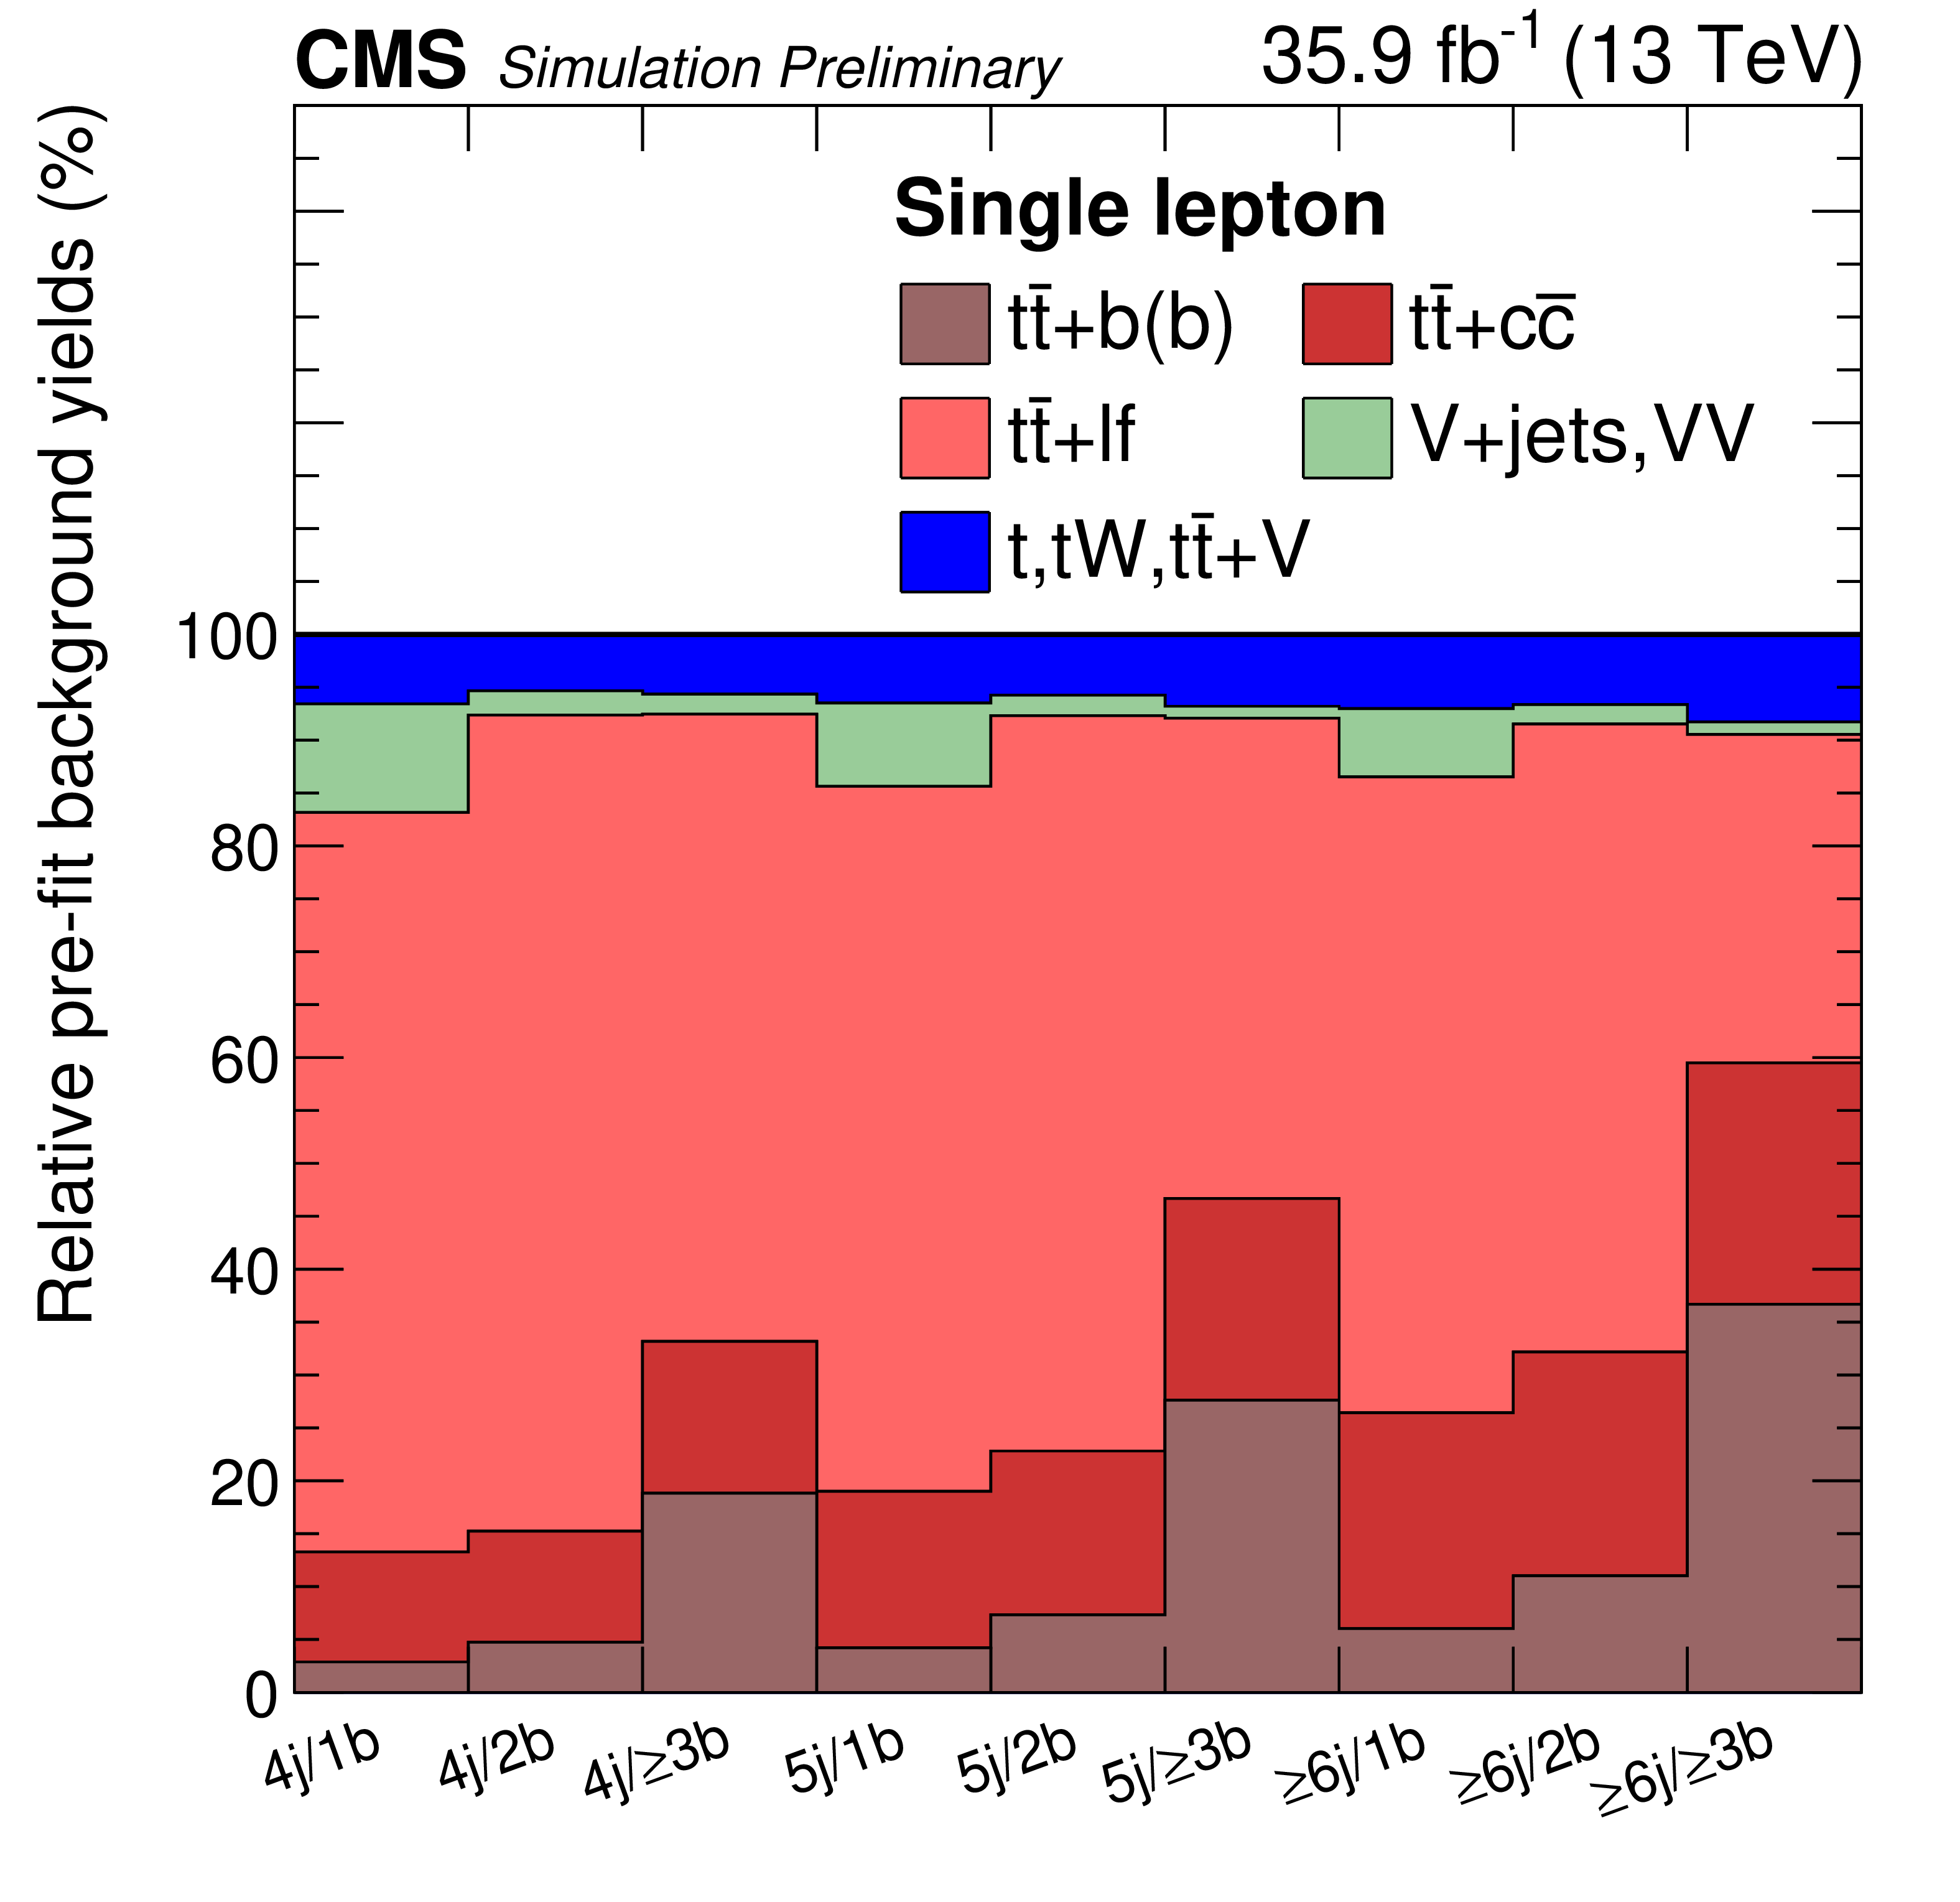
Additional Figure 1:
Relative background event yields in the single lepton final state, shown in the categories defined by the jet multiplicity and the number of jets passing the b jet identification, before the background-only fit of all categories. |

png pdf |
Additional Figure 2:
Relative background event yields in the dilepton final state, shown in the categories defined by the jet multiplicity and the number of jets passing the b jet identification, before the background-only fit of all categories. |
png pdf |
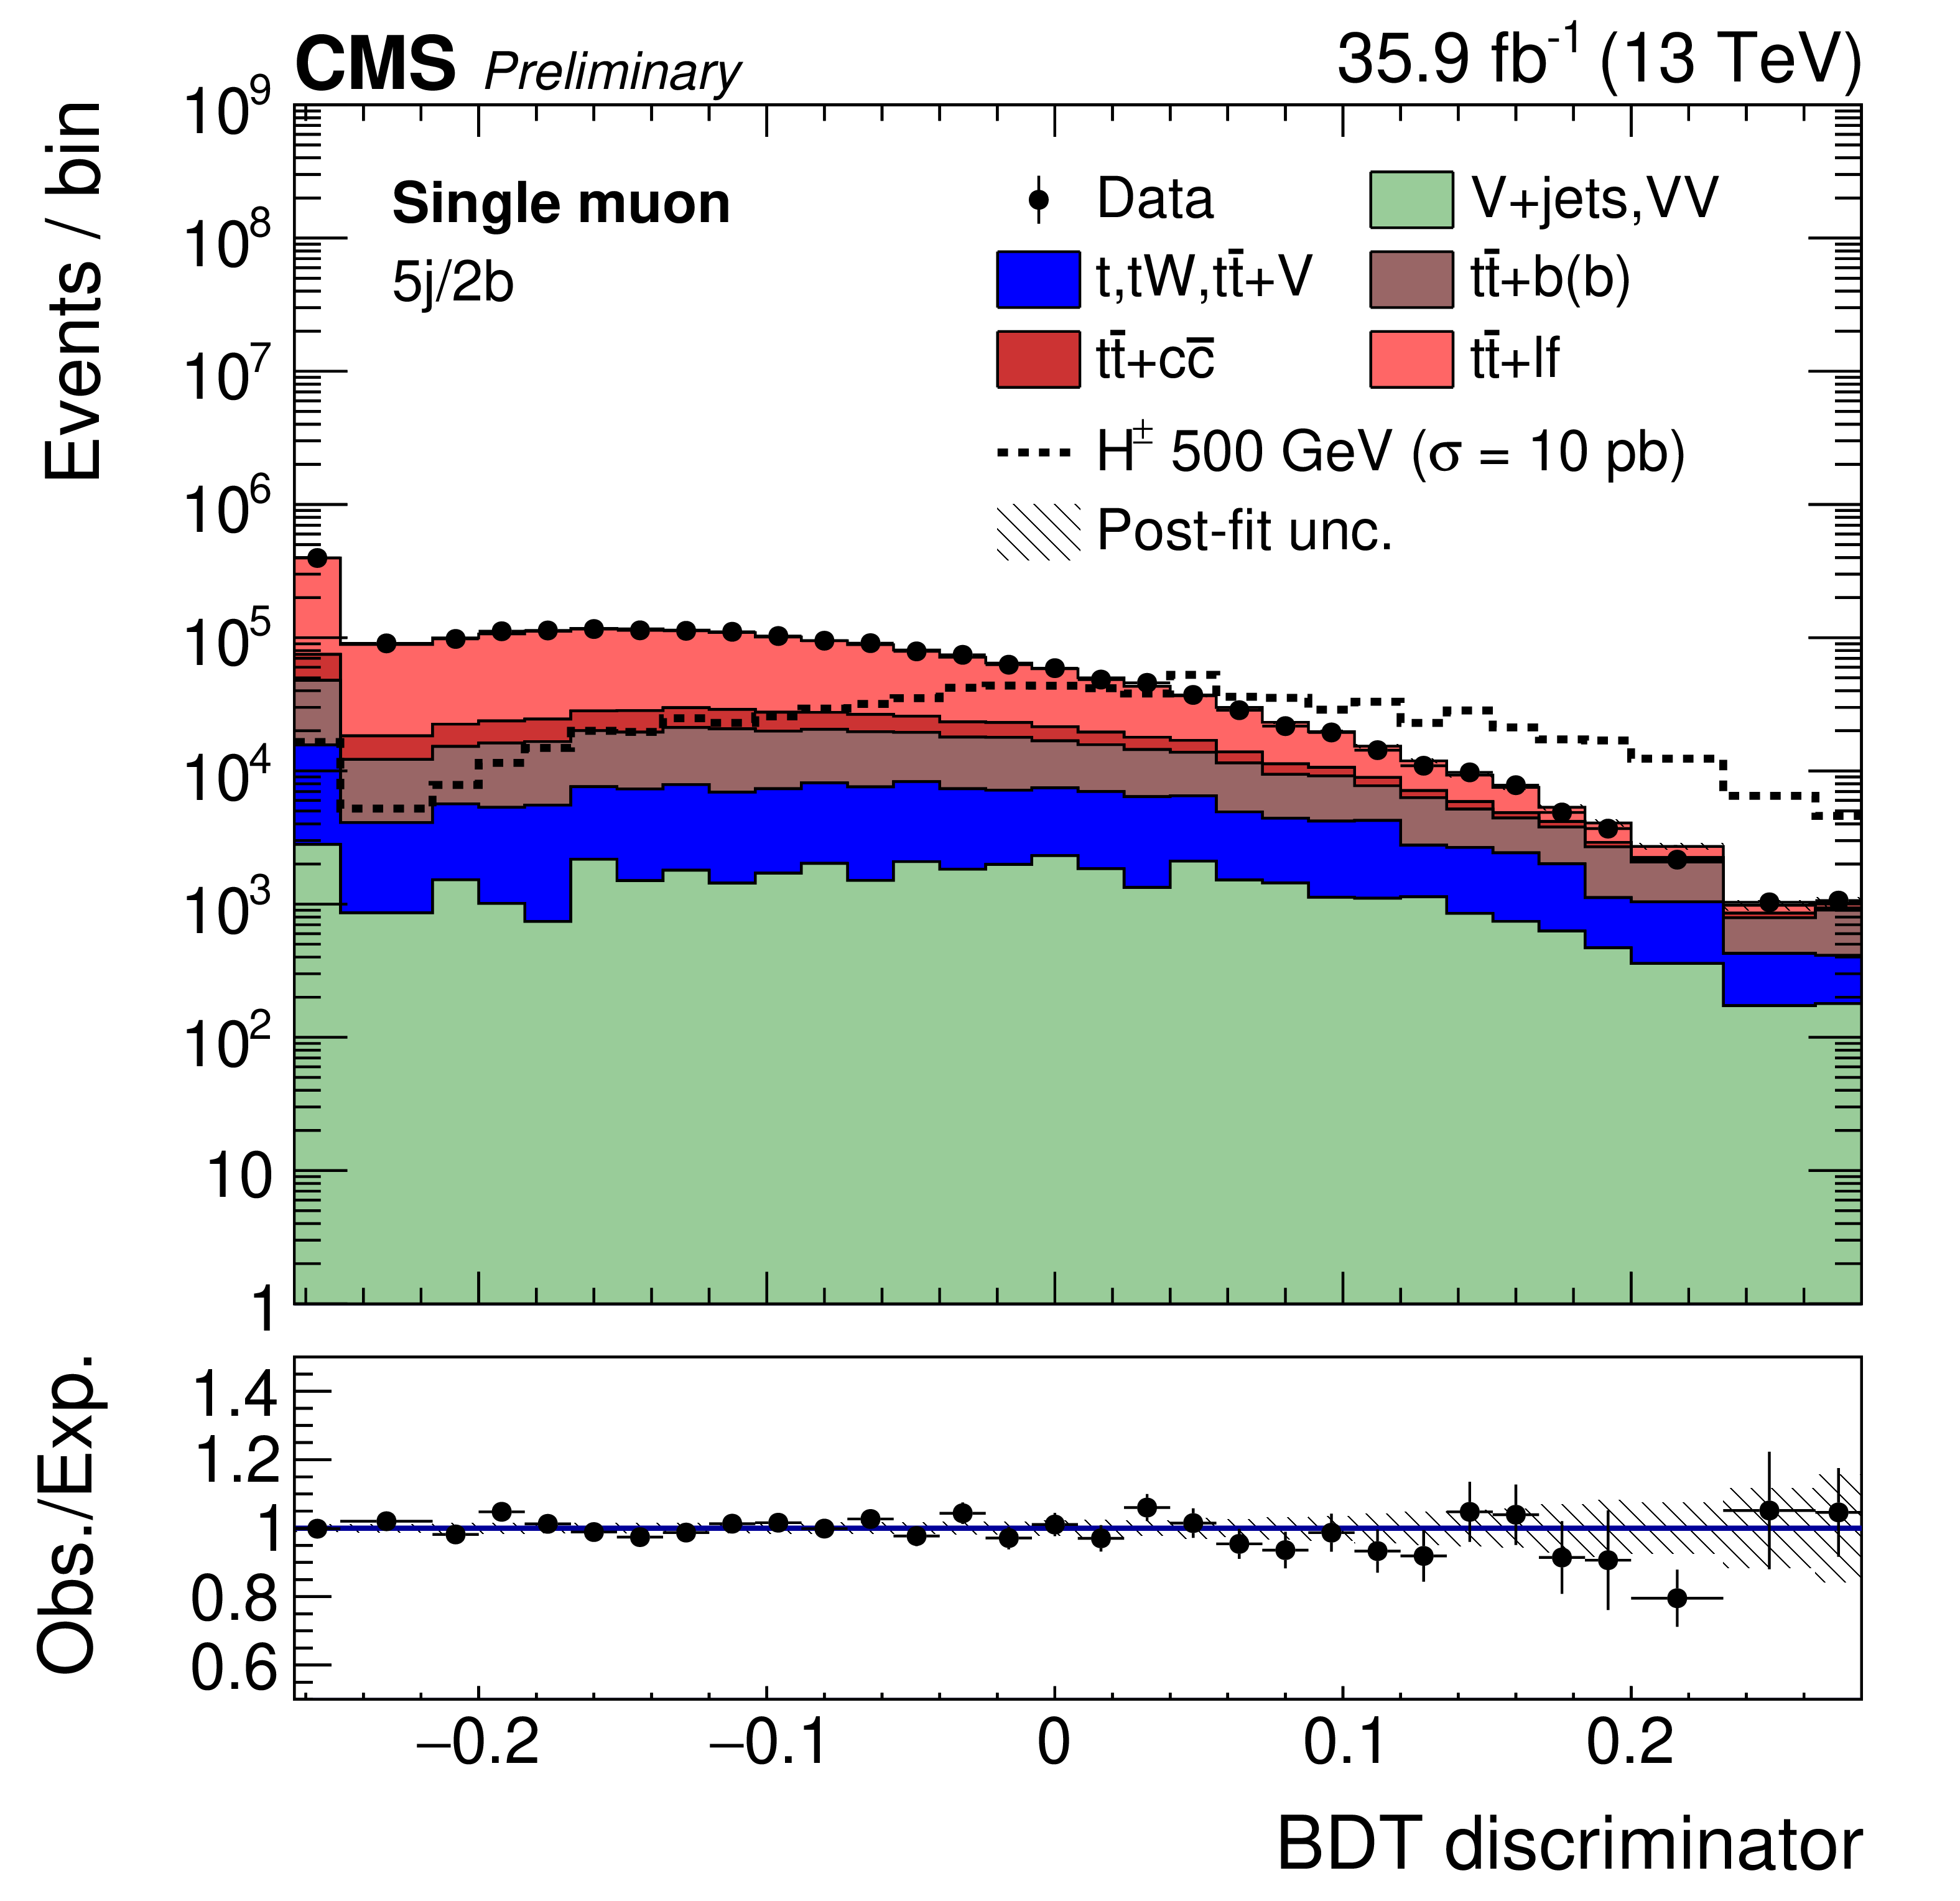
Additional Figure 3:
Distributions of the MVA outputs of the data and the SM expectation after the background-only fit to the data for the single muon 5j/2b category. The black markers show the data observation. The solid histograms represent the SM background prediction for ${\mathrm {t}} {\overline {\mathrm {t}}}$+LF (light red), ${\mathrm {t}} {\overline {\mathrm {t}}}$+$ {\mathrm {c}}({\overline {\mathrm {c}}}$) (dark red), ${\mathrm {t}} {\overline {\mathrm {t}}}$+$ {\mathrm {b}}({\overline {\mathrm {b}}}$) (brown), single top quark and ${{\mathrm {t}\overline {\mathrm {t}}}}$ in association with extra bosons (blue), and V+jets and multiboson production (light green). The dashed line represents the yields for a charged Higgs boson with a mass of 500 GeV and a cross section times branching fraction of 10 pb. The lower panel shows the ratio of data to the SM expectation after the background-only fit to the data and the hatched uncertainty bands include the total uncertainty. |
png pdf |
Additional Figure 4:
Distributions of the MVA outputs of the data and the SM expectation after the background-only fit to the data for the single electron 5j/2b category. The black markers show the data observation. The solid histograms represent the SM background prediction for ${\mathrm {t}} {\overline {\mathrm {t}}}$+LF (light red), ${\mathrm {t}} {\overline {\mathrm {t}}}$+$ {\mathrm {c}}({\overline {\mathrm {c}}}$) (dark red), ${\mathrm {t}} {\overline {\mathrm {t}}}$+$ {\mathrm {b}}({\overline {\mathrm {b}}}$) (brown), single top quark and ${{\mathrm {t}\overline {\mathrm {t}}}}$ in association with extra bosons (blue), and V+jets and multiboson production (light green). The dashed line represents the yields for a charged Higgs boson with a mass of 500 GeV and a cross section times branching fraction of 10 pb. The lower panel shows the ratio of data to the SM expectation after the background-only fit to the data and the hatched uncertainty bands include the total uncertainty. |
png pdf |
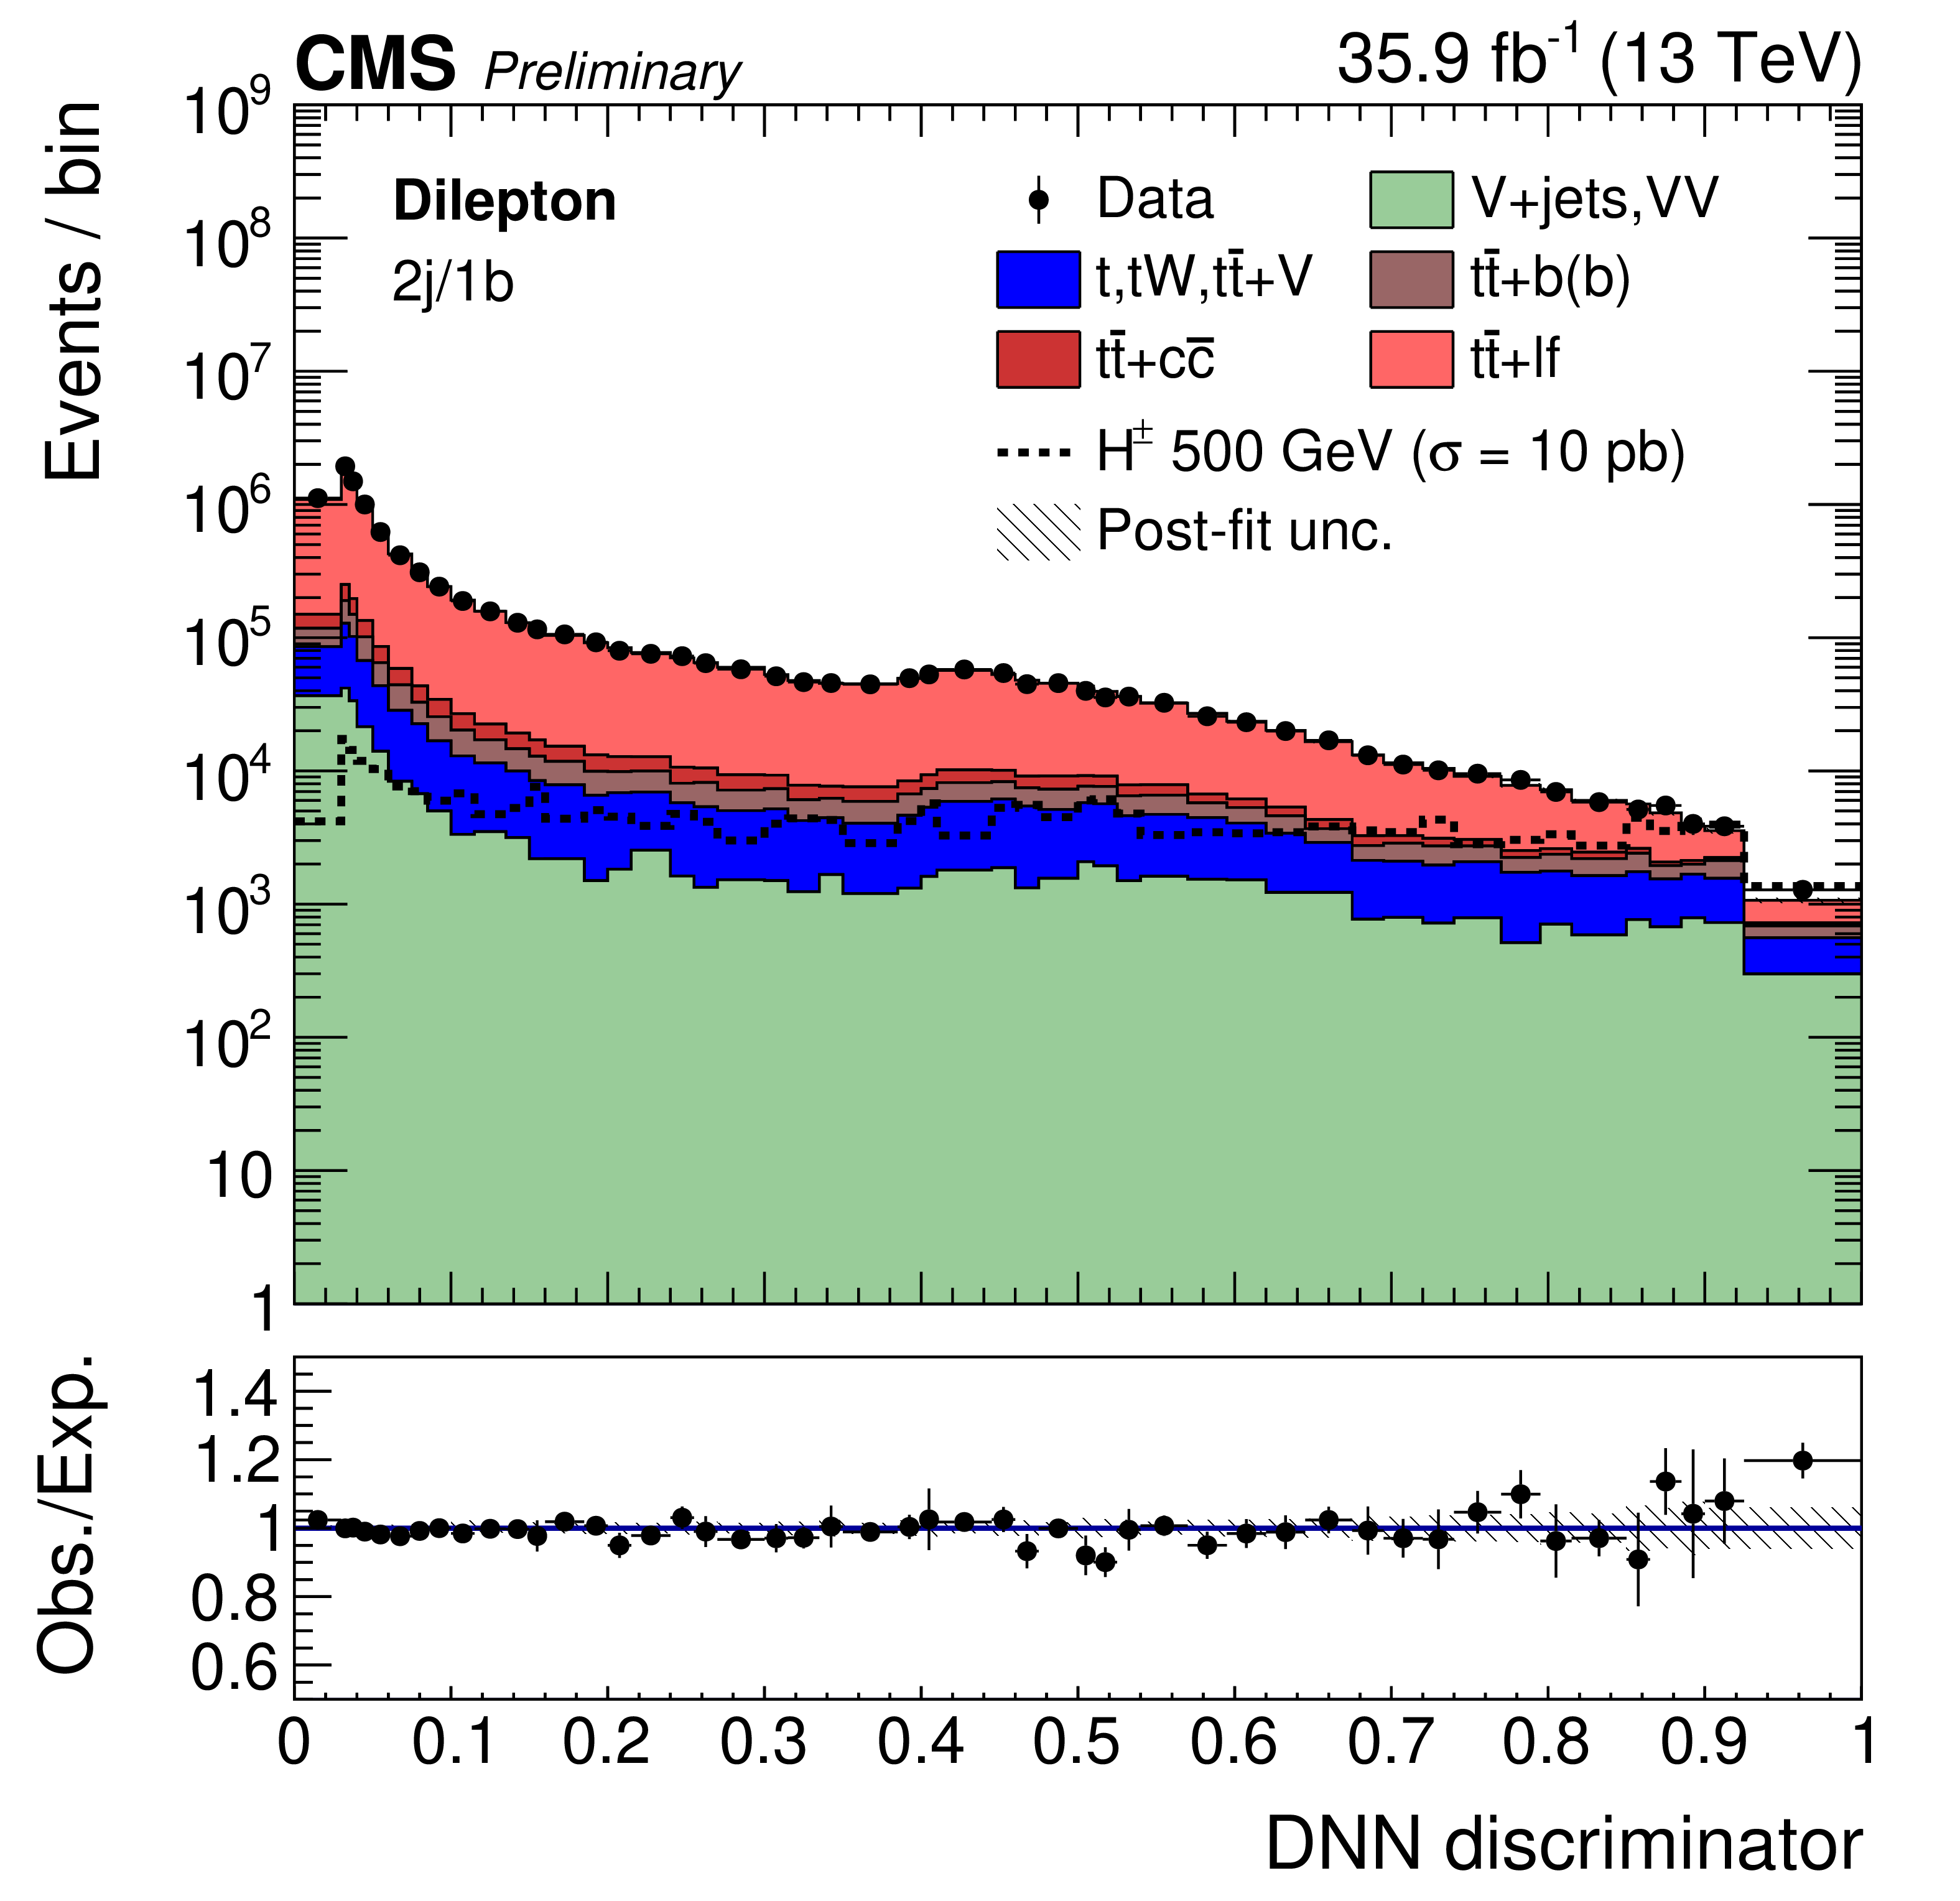
Additional Figure 5:
Distributions of the MVA outputs of the data and the SM expectation after the background-only fit to the data for the dilepton 2j/1b category. The black markers show the data observation. The solid histograms represent the SM background prediction for ${\mathrm {t}} {\overline {\mathrm {t}}}$+LF (light red), ${\mathrm {t}} {\overline {\mathrm {t}}}$+$ {\mathrm {c}}({\overline {\mathrm {c}}}$) (dark red), ${\mathrm {t}} {\overline {\mathrm {t}}}$+$ {\mathrm {b}}({\overline {\mathrm {b}}}$) (brown), single top quark and ${{\mathrm {t}\overline {\mathrm {t}}}}$ in association with extra bosons (blue), and V+jets and multiboson production (light green). The dashed line represents the yields for a charged Higgs boson with a mass of 500 GeV and a cross section times branching fraction of 10 pb. The lower panel shows the ratio of data to the SM expectation after the background-only fit to the data and the hatched uncertainty bands include the total uncertainty. |
png pdf |
Additional Figure 6:
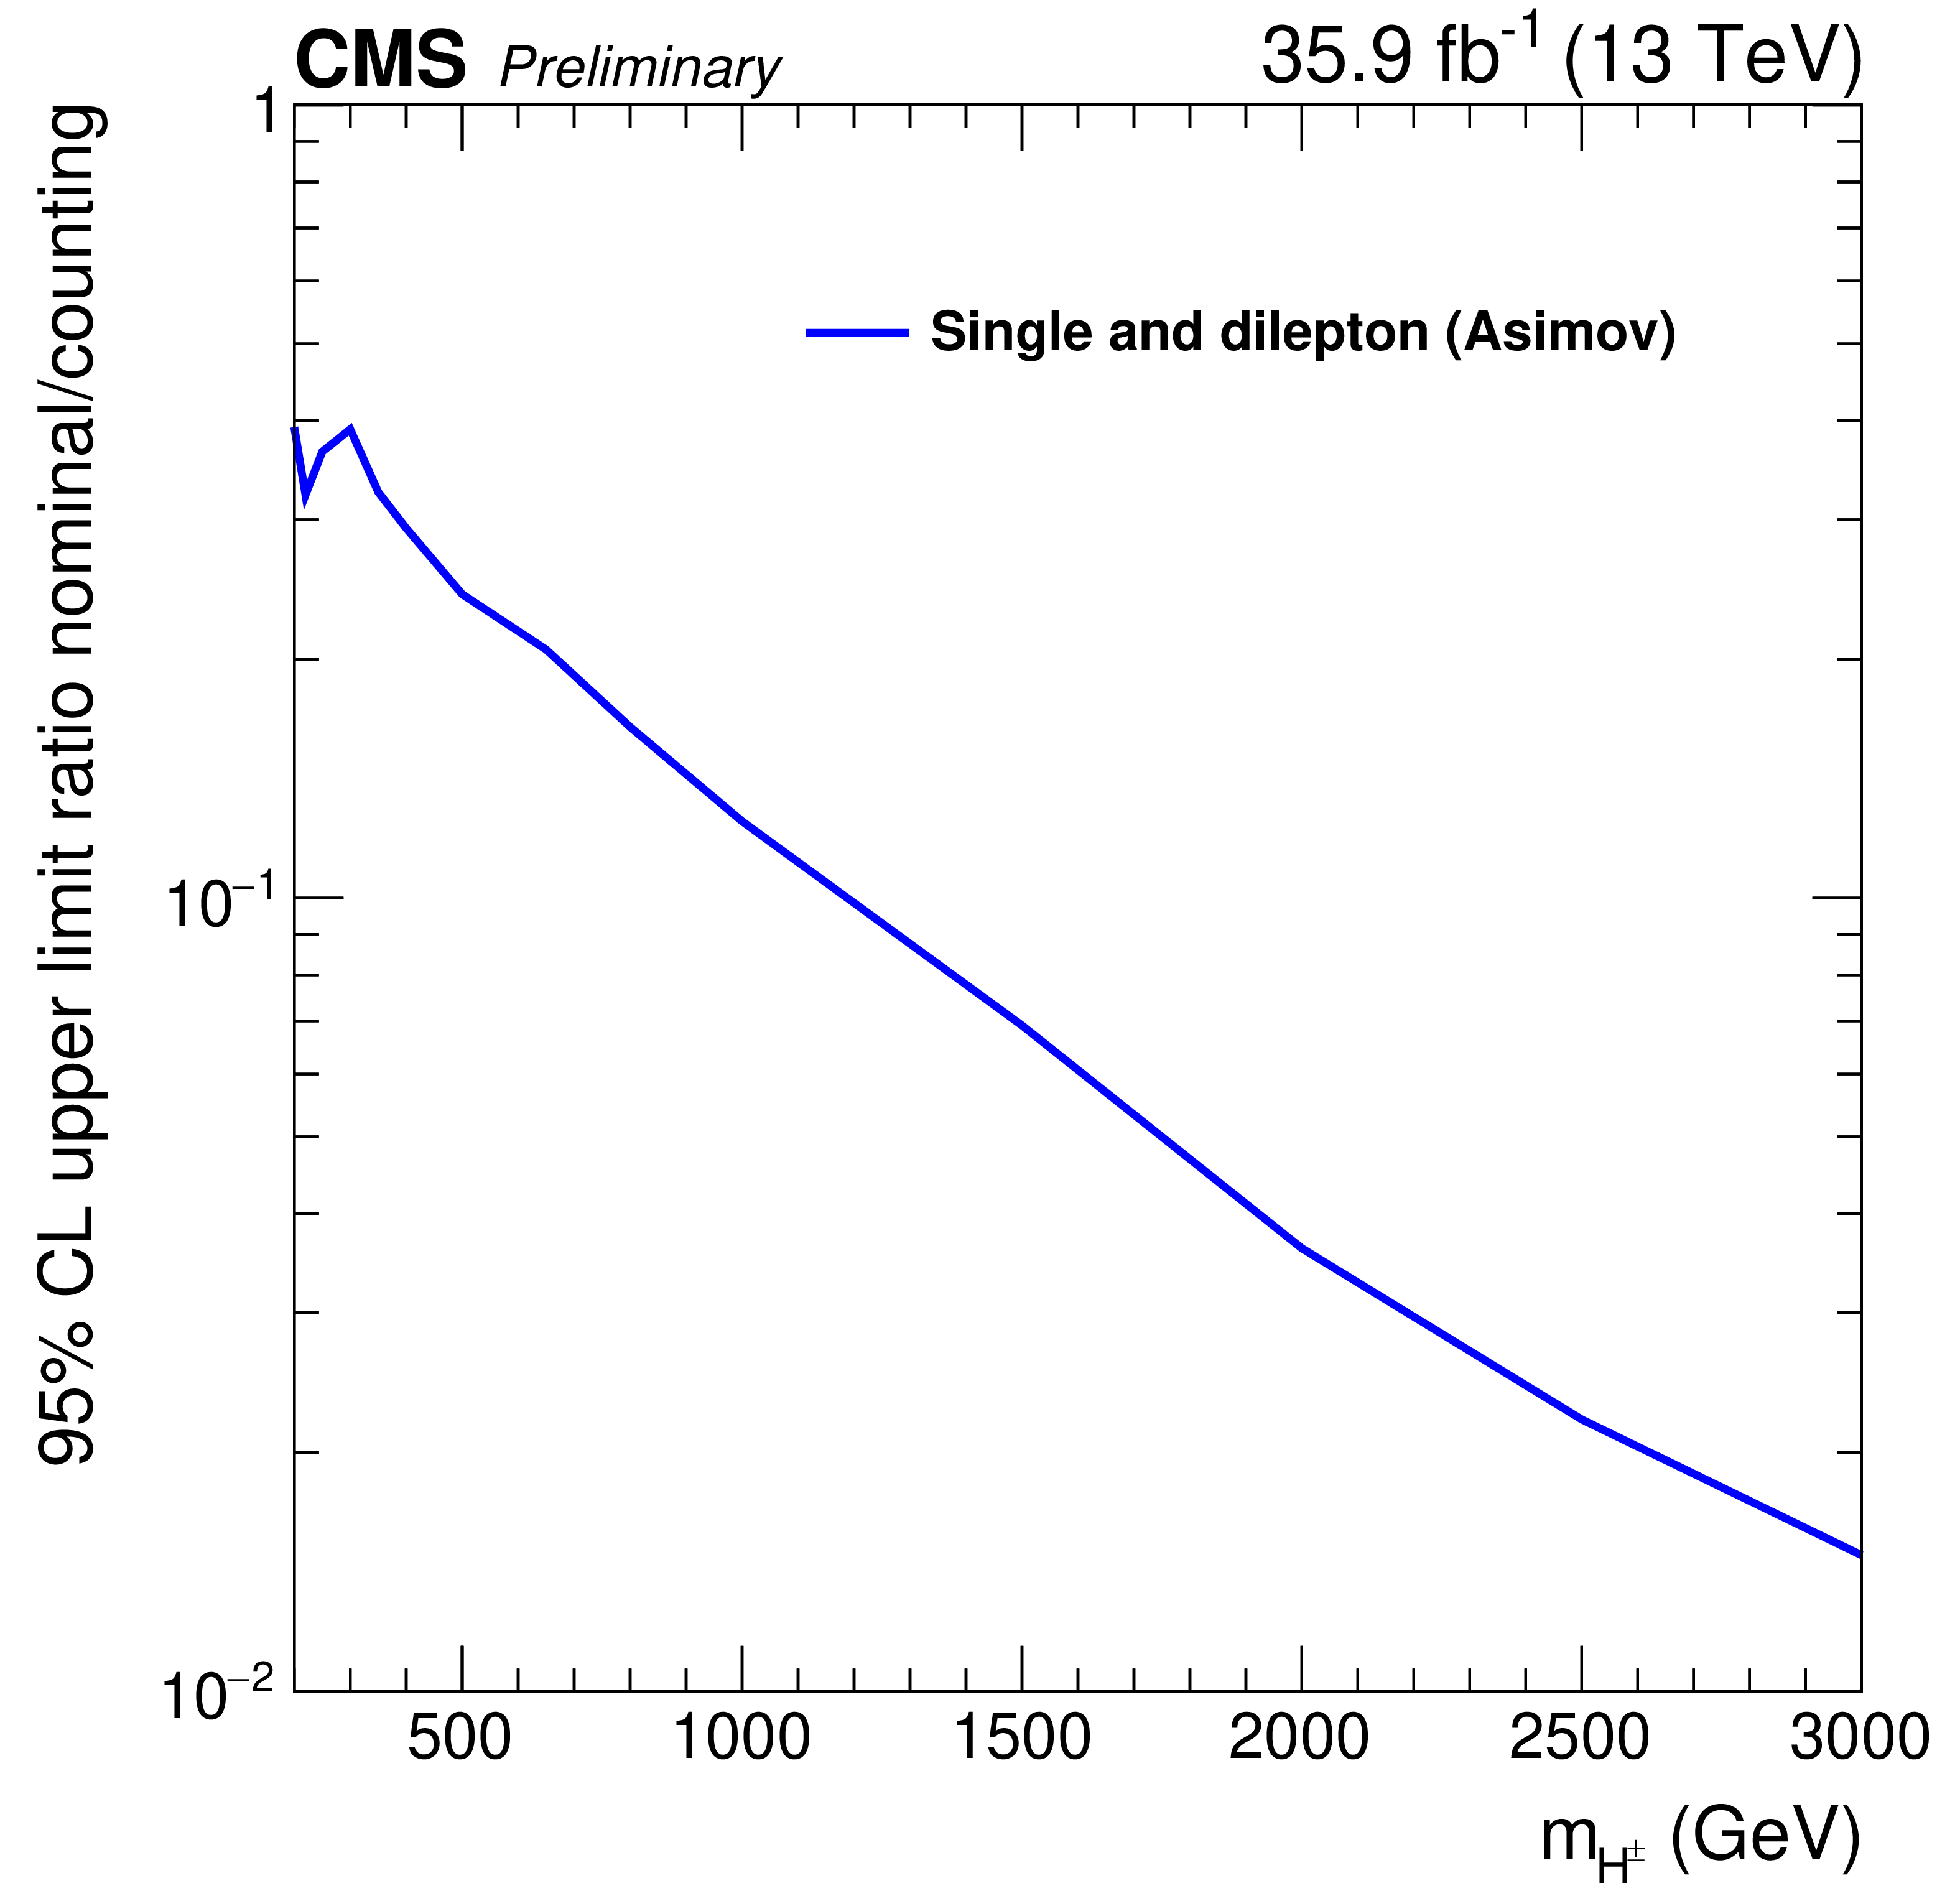
Ratio of the median expected 95% CL exclusion limits on ${\sigma ({\mathrm {p}} {\mathrm {p}}\,\rightarrow {\mathrm {H}} ^{+} {\overline {\mathrm {t}}} {\mathrm {b}}) \mathcal {B}({\mathrm {H}} ^{+}\,\rightarrow \, {\mathrm {t}} {\overline {\mathrm {b}}})} $+$ {\sigma ({\mathrm {p}} {\mathrm {p}}\,\rightarrow {\mathrm {H}} ^{-} {\mathrm {t}} {\overline {\mathrm {b}}}) \mathcal {B}({\mathrm {H}} ^{-}\,\rightarrow \, {\overline {\mathrm {t}}} {\mathrm {b}})}$ using the full MVA output over the median expected 95% CL exclusion limits using the event rates in all categories. The upper limits have been computed using the Asimov dataset. |

png pdf |
Additional Figure 7:
Ratio of the median expected 95% CL exclusion limits on ${\sigma ({\mathrm {p}} {\mathrm {p}}\,\rightarrow {\mathrm {H}} ^{+} {\overline {\mathrm {t}}} {\mathrm {b}}) \mathcal {B}({\mathrm {H}} ^{+}\,\rightarrow \, {\mathrm {t}} {\overline {\mathrm {b}}})} $+$ {\sigma ({\mathrm {p}} {\mathrm {p}}\,\rightarrow {\mathrm {H}} ^{-} {\mathrm {t}} {\overline {\mathrm {b}}}) \mathcal {B}({\mathrm {H}} ^{-}\,\rightarrow \, {\overline {\mathrm {t}}} {\mathrm {b}})}$ in the single lepton final state (dashed blue) and in the dileptonic final states (dotted red) to all final states combined (black). |
png pdf |
Additional Figure 8:
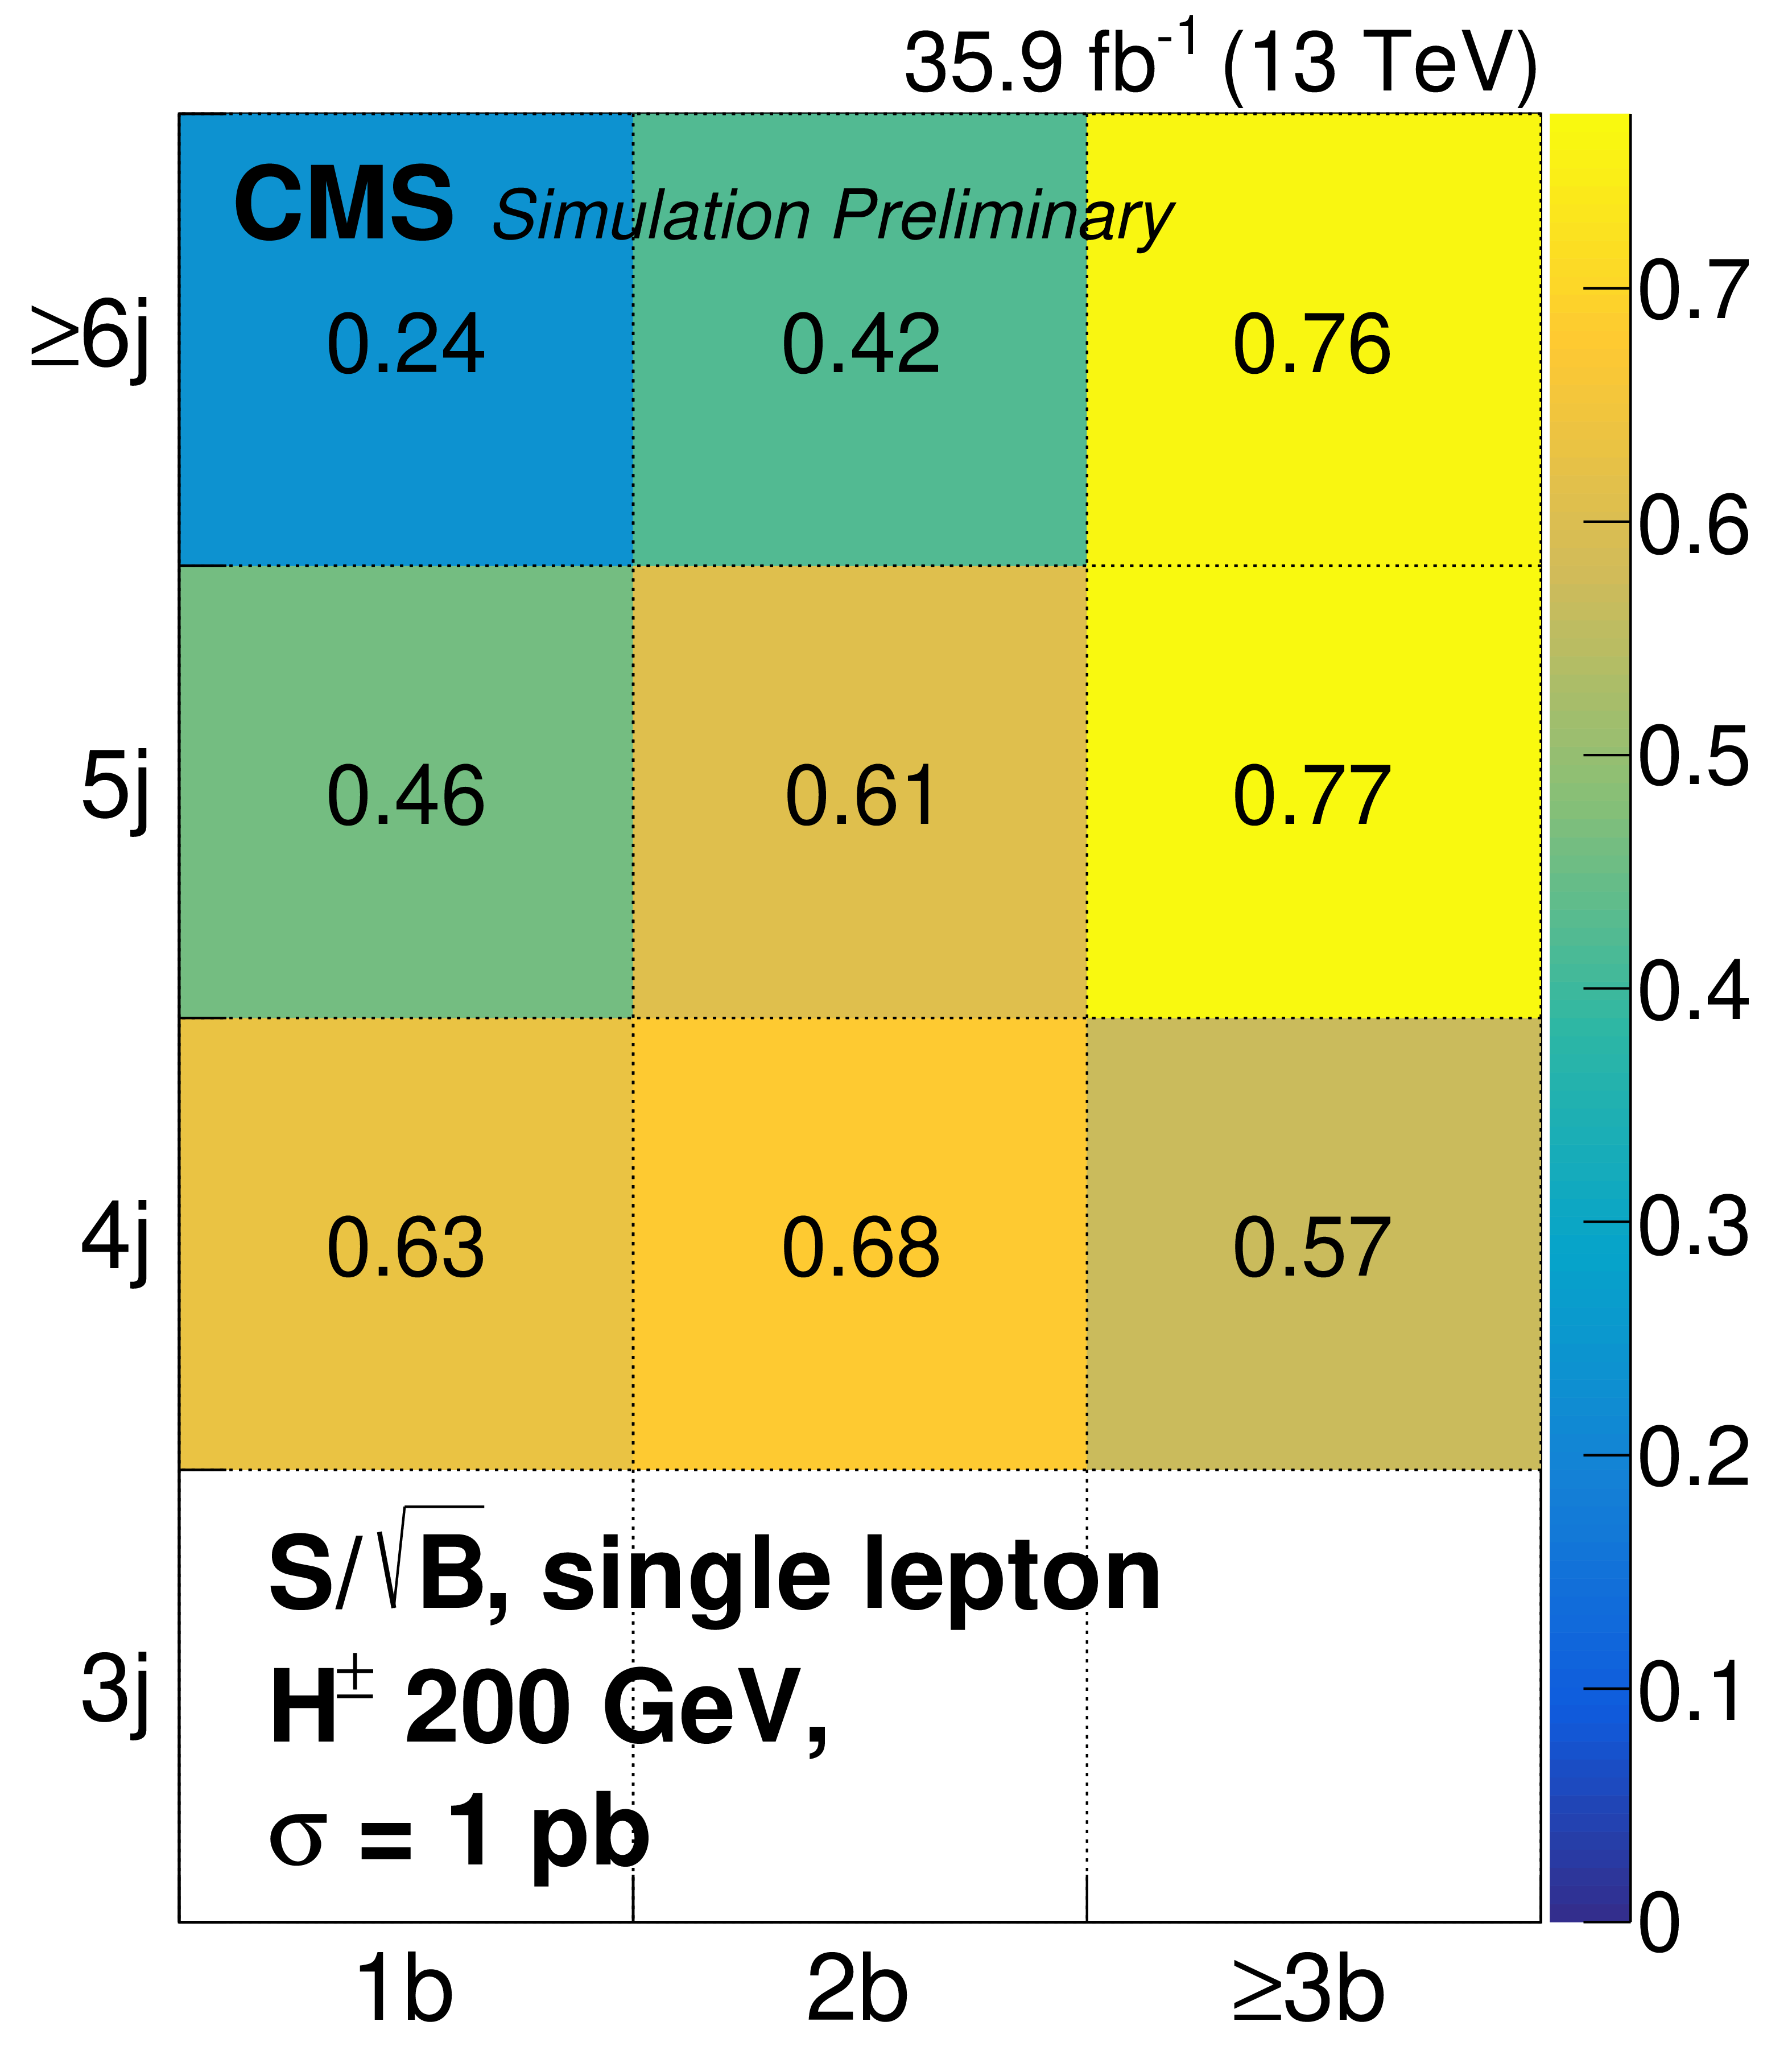
Significance $S/\sqrt {B}$ in the categories defined by the jet multiplicity and the number of jets passing the b jet identification, for the single lepton final state summed over electron/muon. $S$ represents the total signal yield for a charged Higgs boson with $m_{{\mathrm {H}} ^{\pm}} = $ 200 GeV, normalized to a cross section times branching fraction of 1 pb. $B$ represents the total background yield from simulation, prior to the fit to data. Systematic uncertainties are not taken into account. |
png pdf |
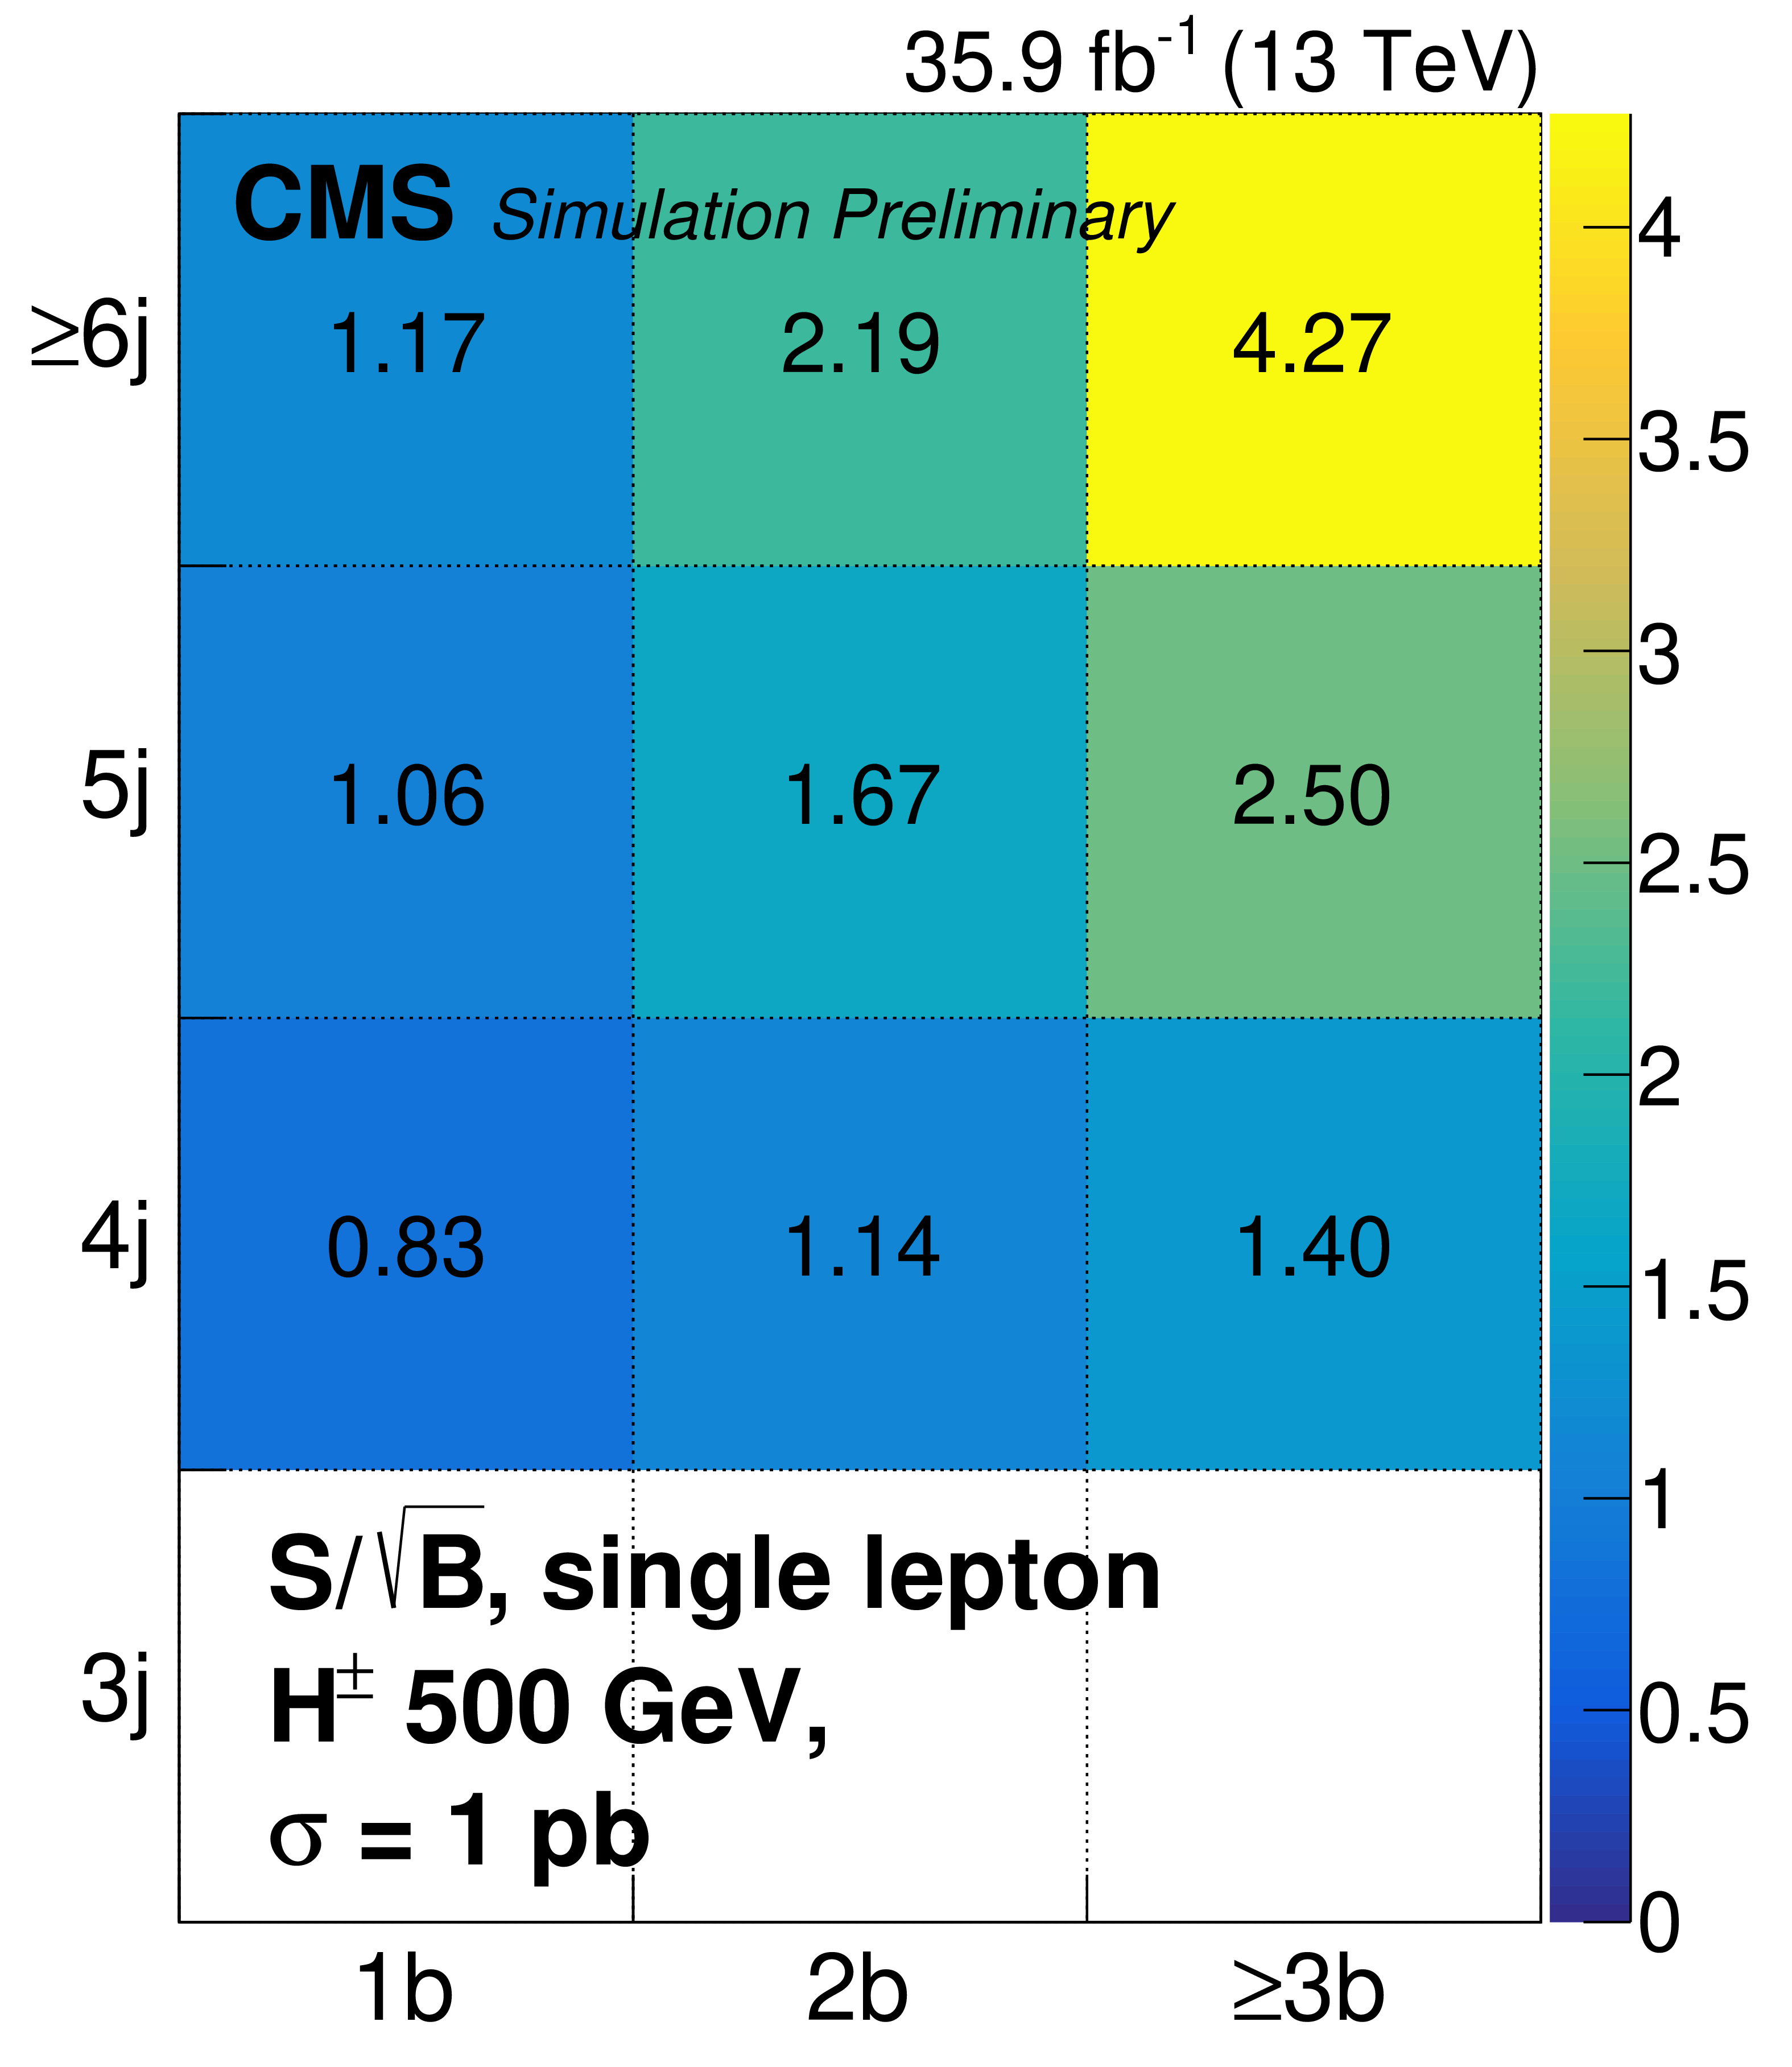
Additional Figure 9:
Significance $S/\sqrt {B}$ in the categories defined by the jet multiplicity and the number of jets passing the b jet identification, for the single lepton final state summed over electron/muon. $S$ represents the total signal yield for a charged Higgs boson with $m_{{\mathrm {H}} ^{\pm}} = $ 500 GeV, normalized to a cross section times branching fraction of 1 pb. $B$ represents the total background yield from simulation, prior to the fit to data. Systematic uncertainties are not taken into account. |
png pdf |
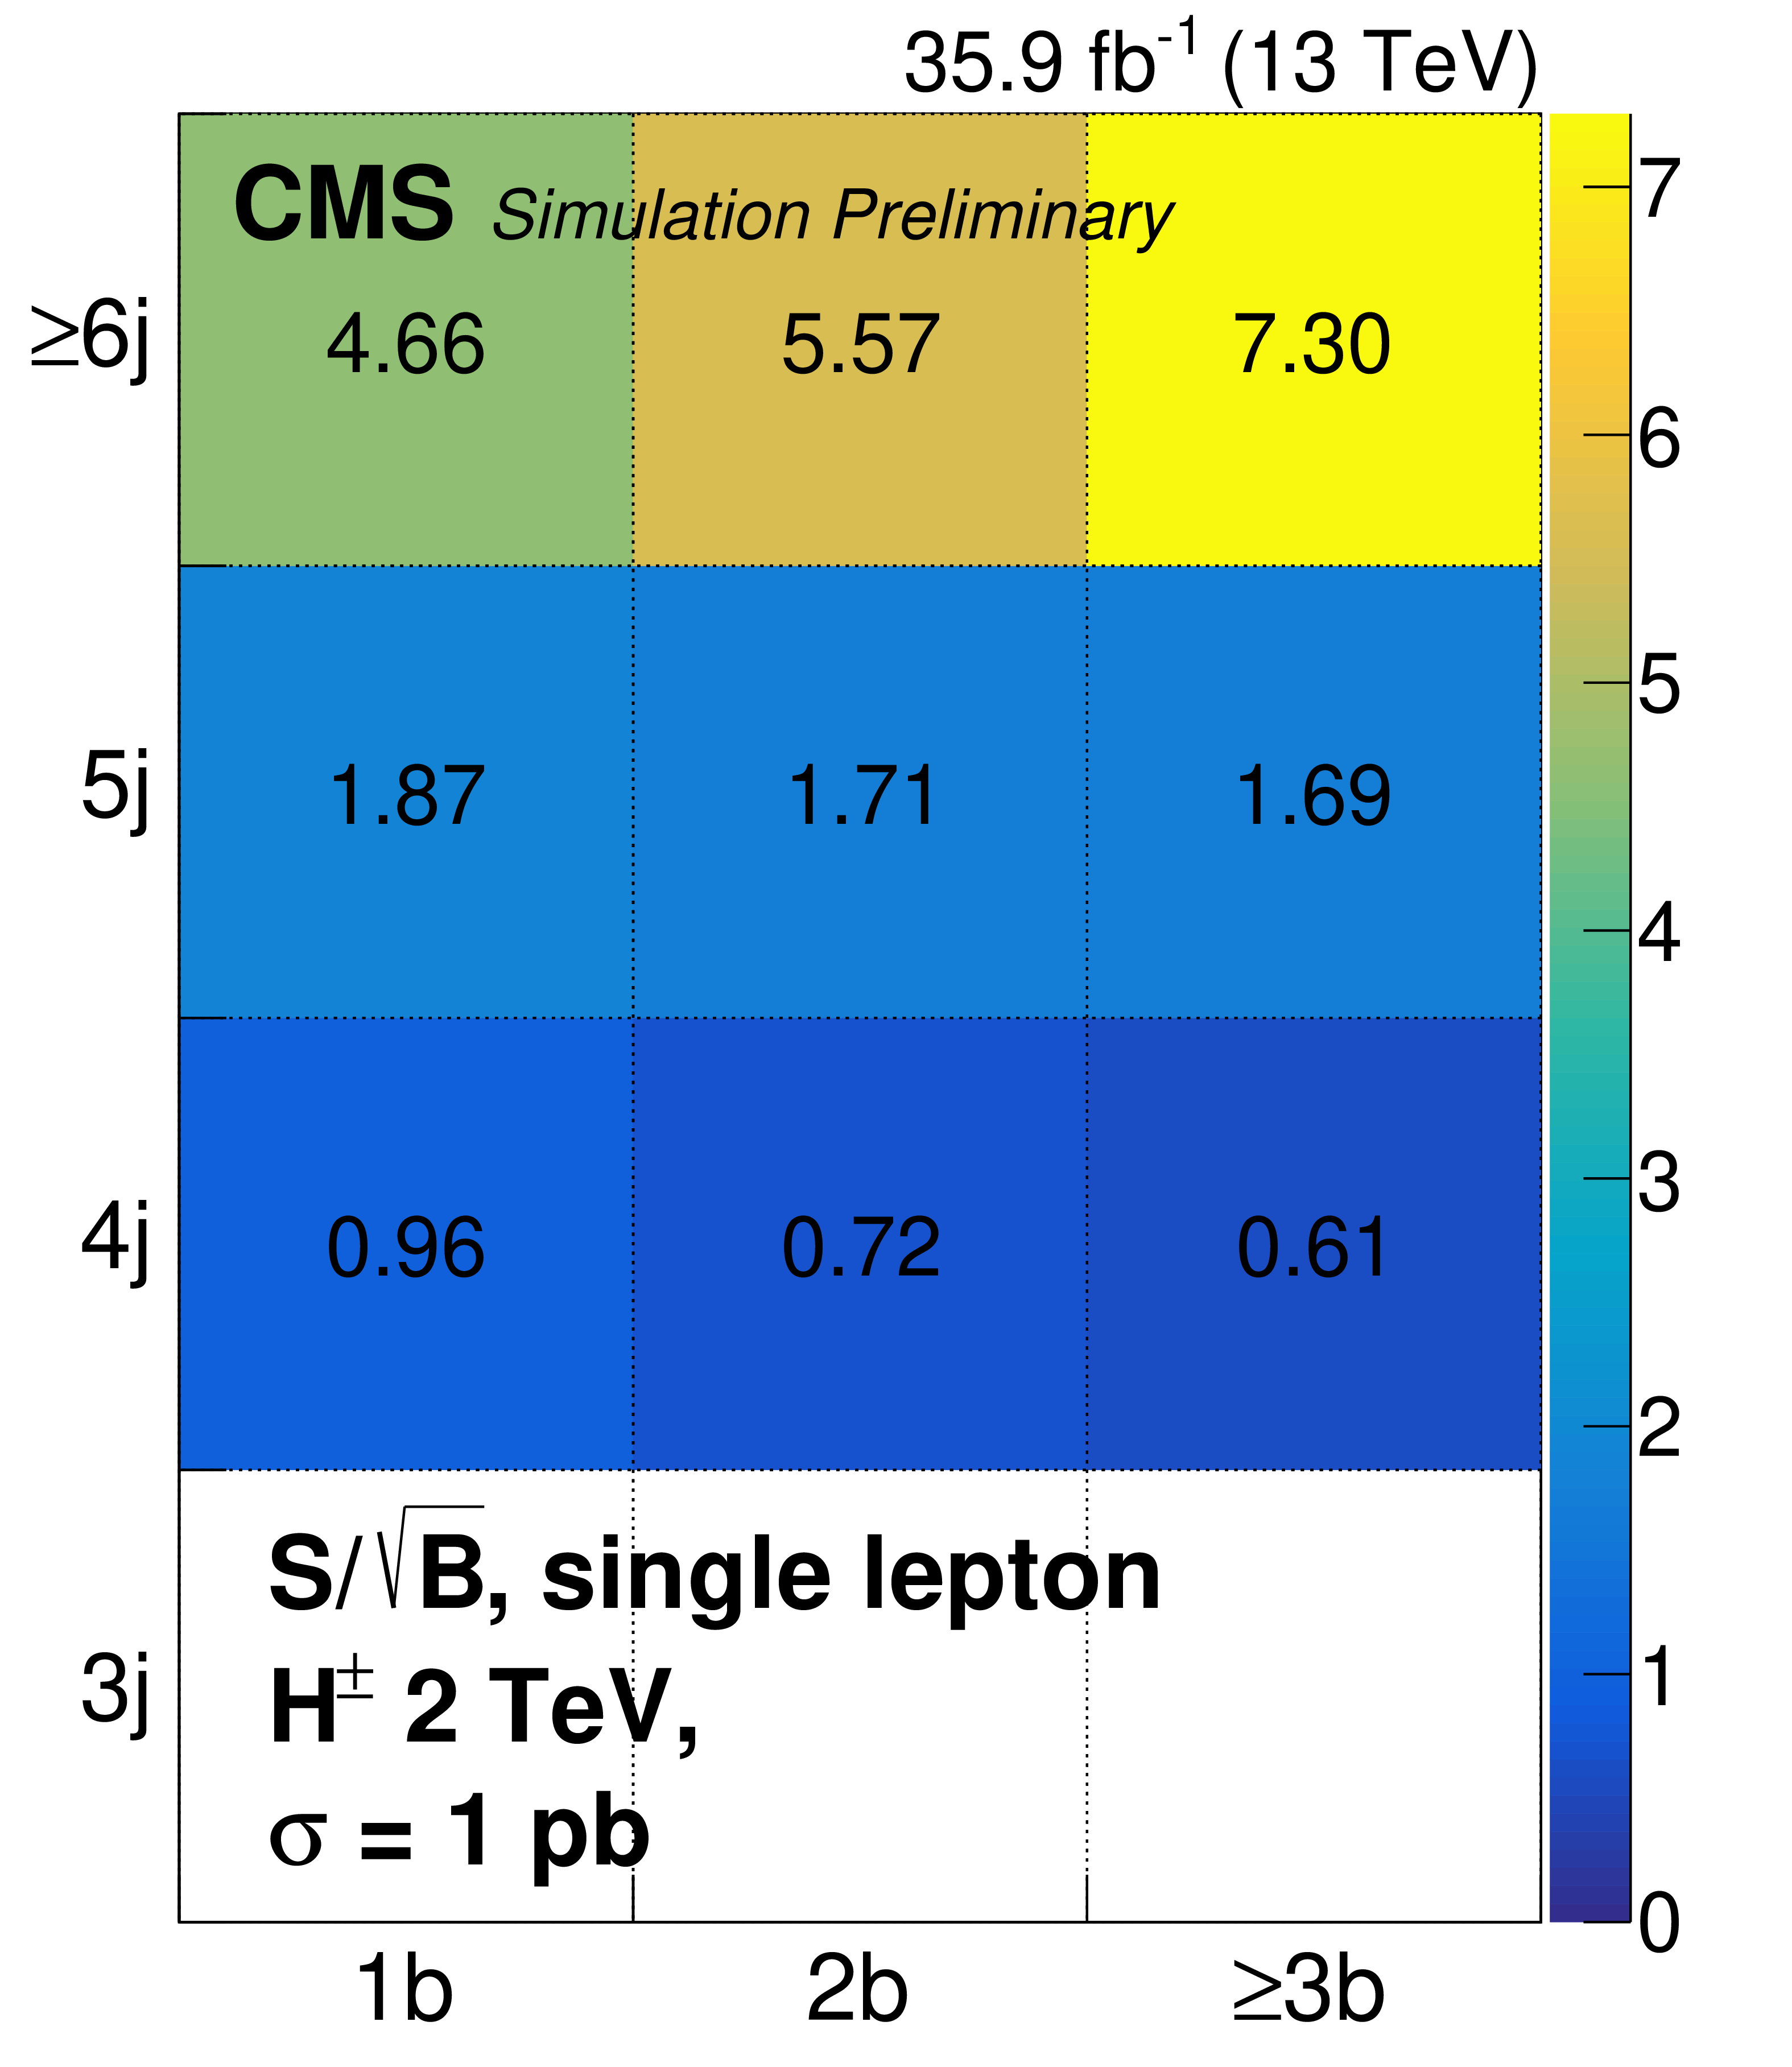
Additional Figure 10:
Significance $S/\sqrt {B}$ in the categories defined by the jet multiplicity and the number of jets passing the b jet identification, for the single lepton final state summed over electron/muon. $S$ represents the total signal yield for a charged Higgs boson with $m_{{\mathrm {H}} ^{\pm}} = $ 2 TeV, normalized to a cross section times branching fraction of 1 pb. $B$ represents the total background yield from simulation, prior to the fit to data. Systematic uncertainties are not taken into account. |
png pdf |
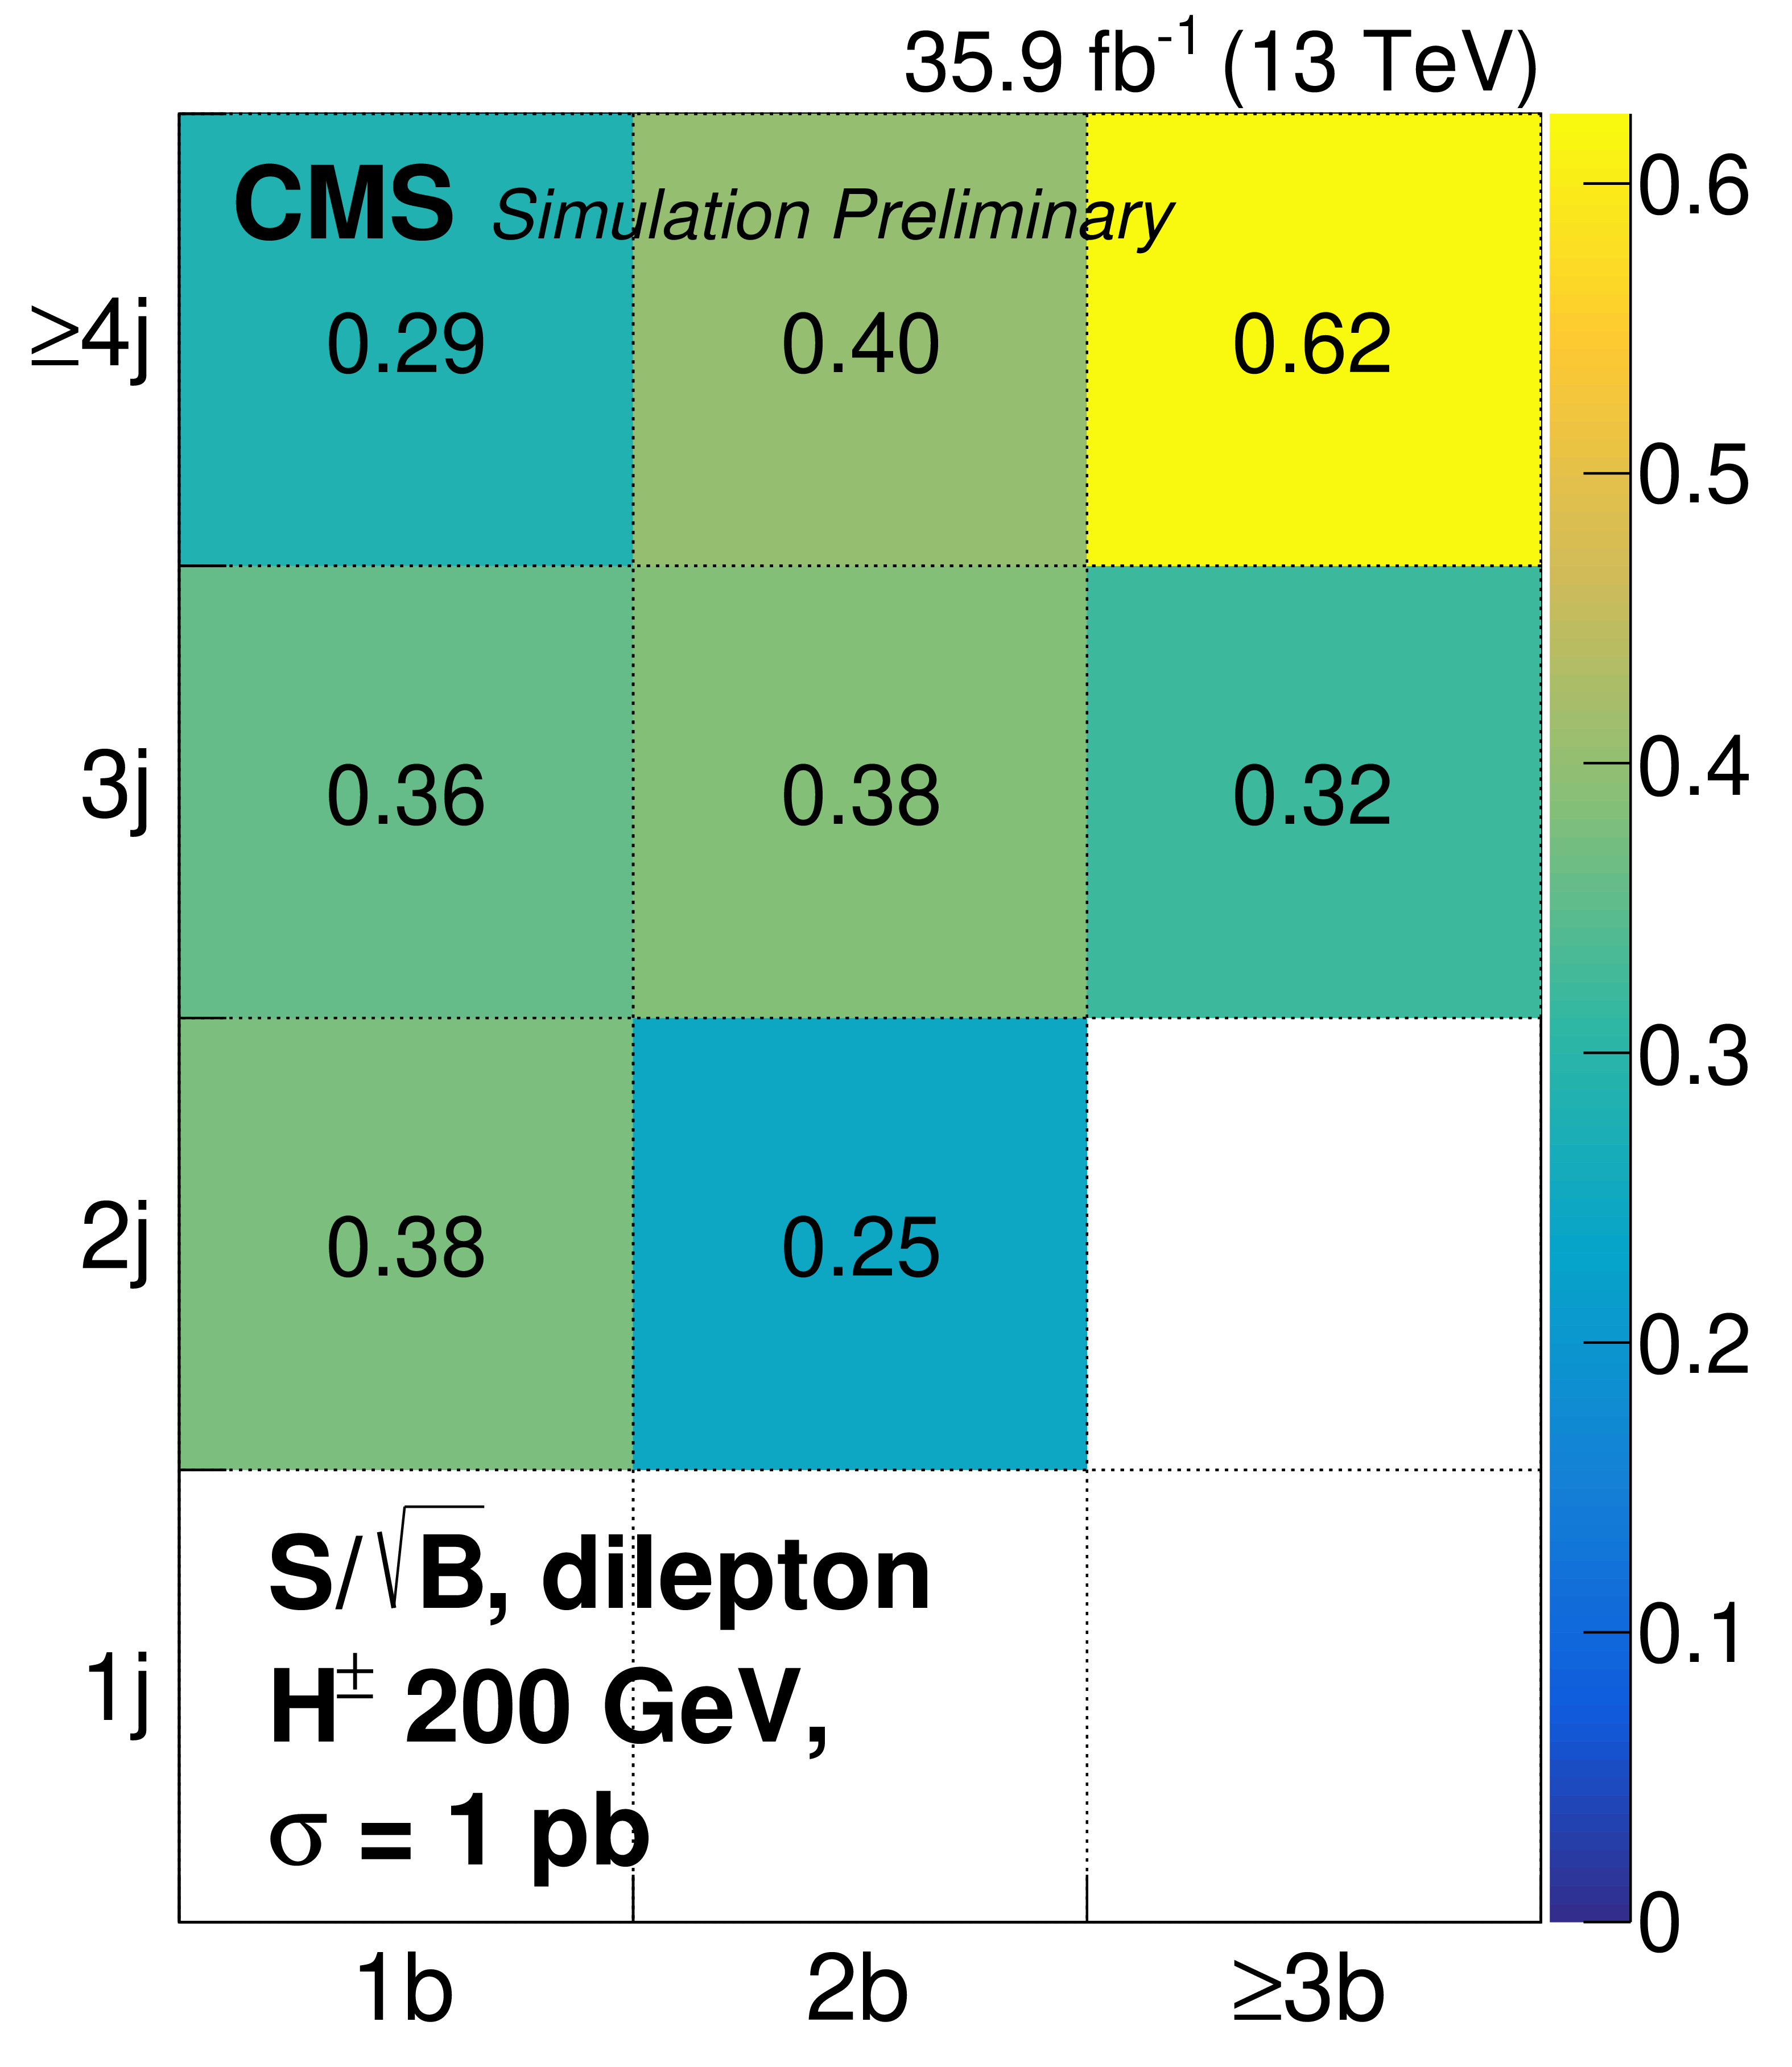
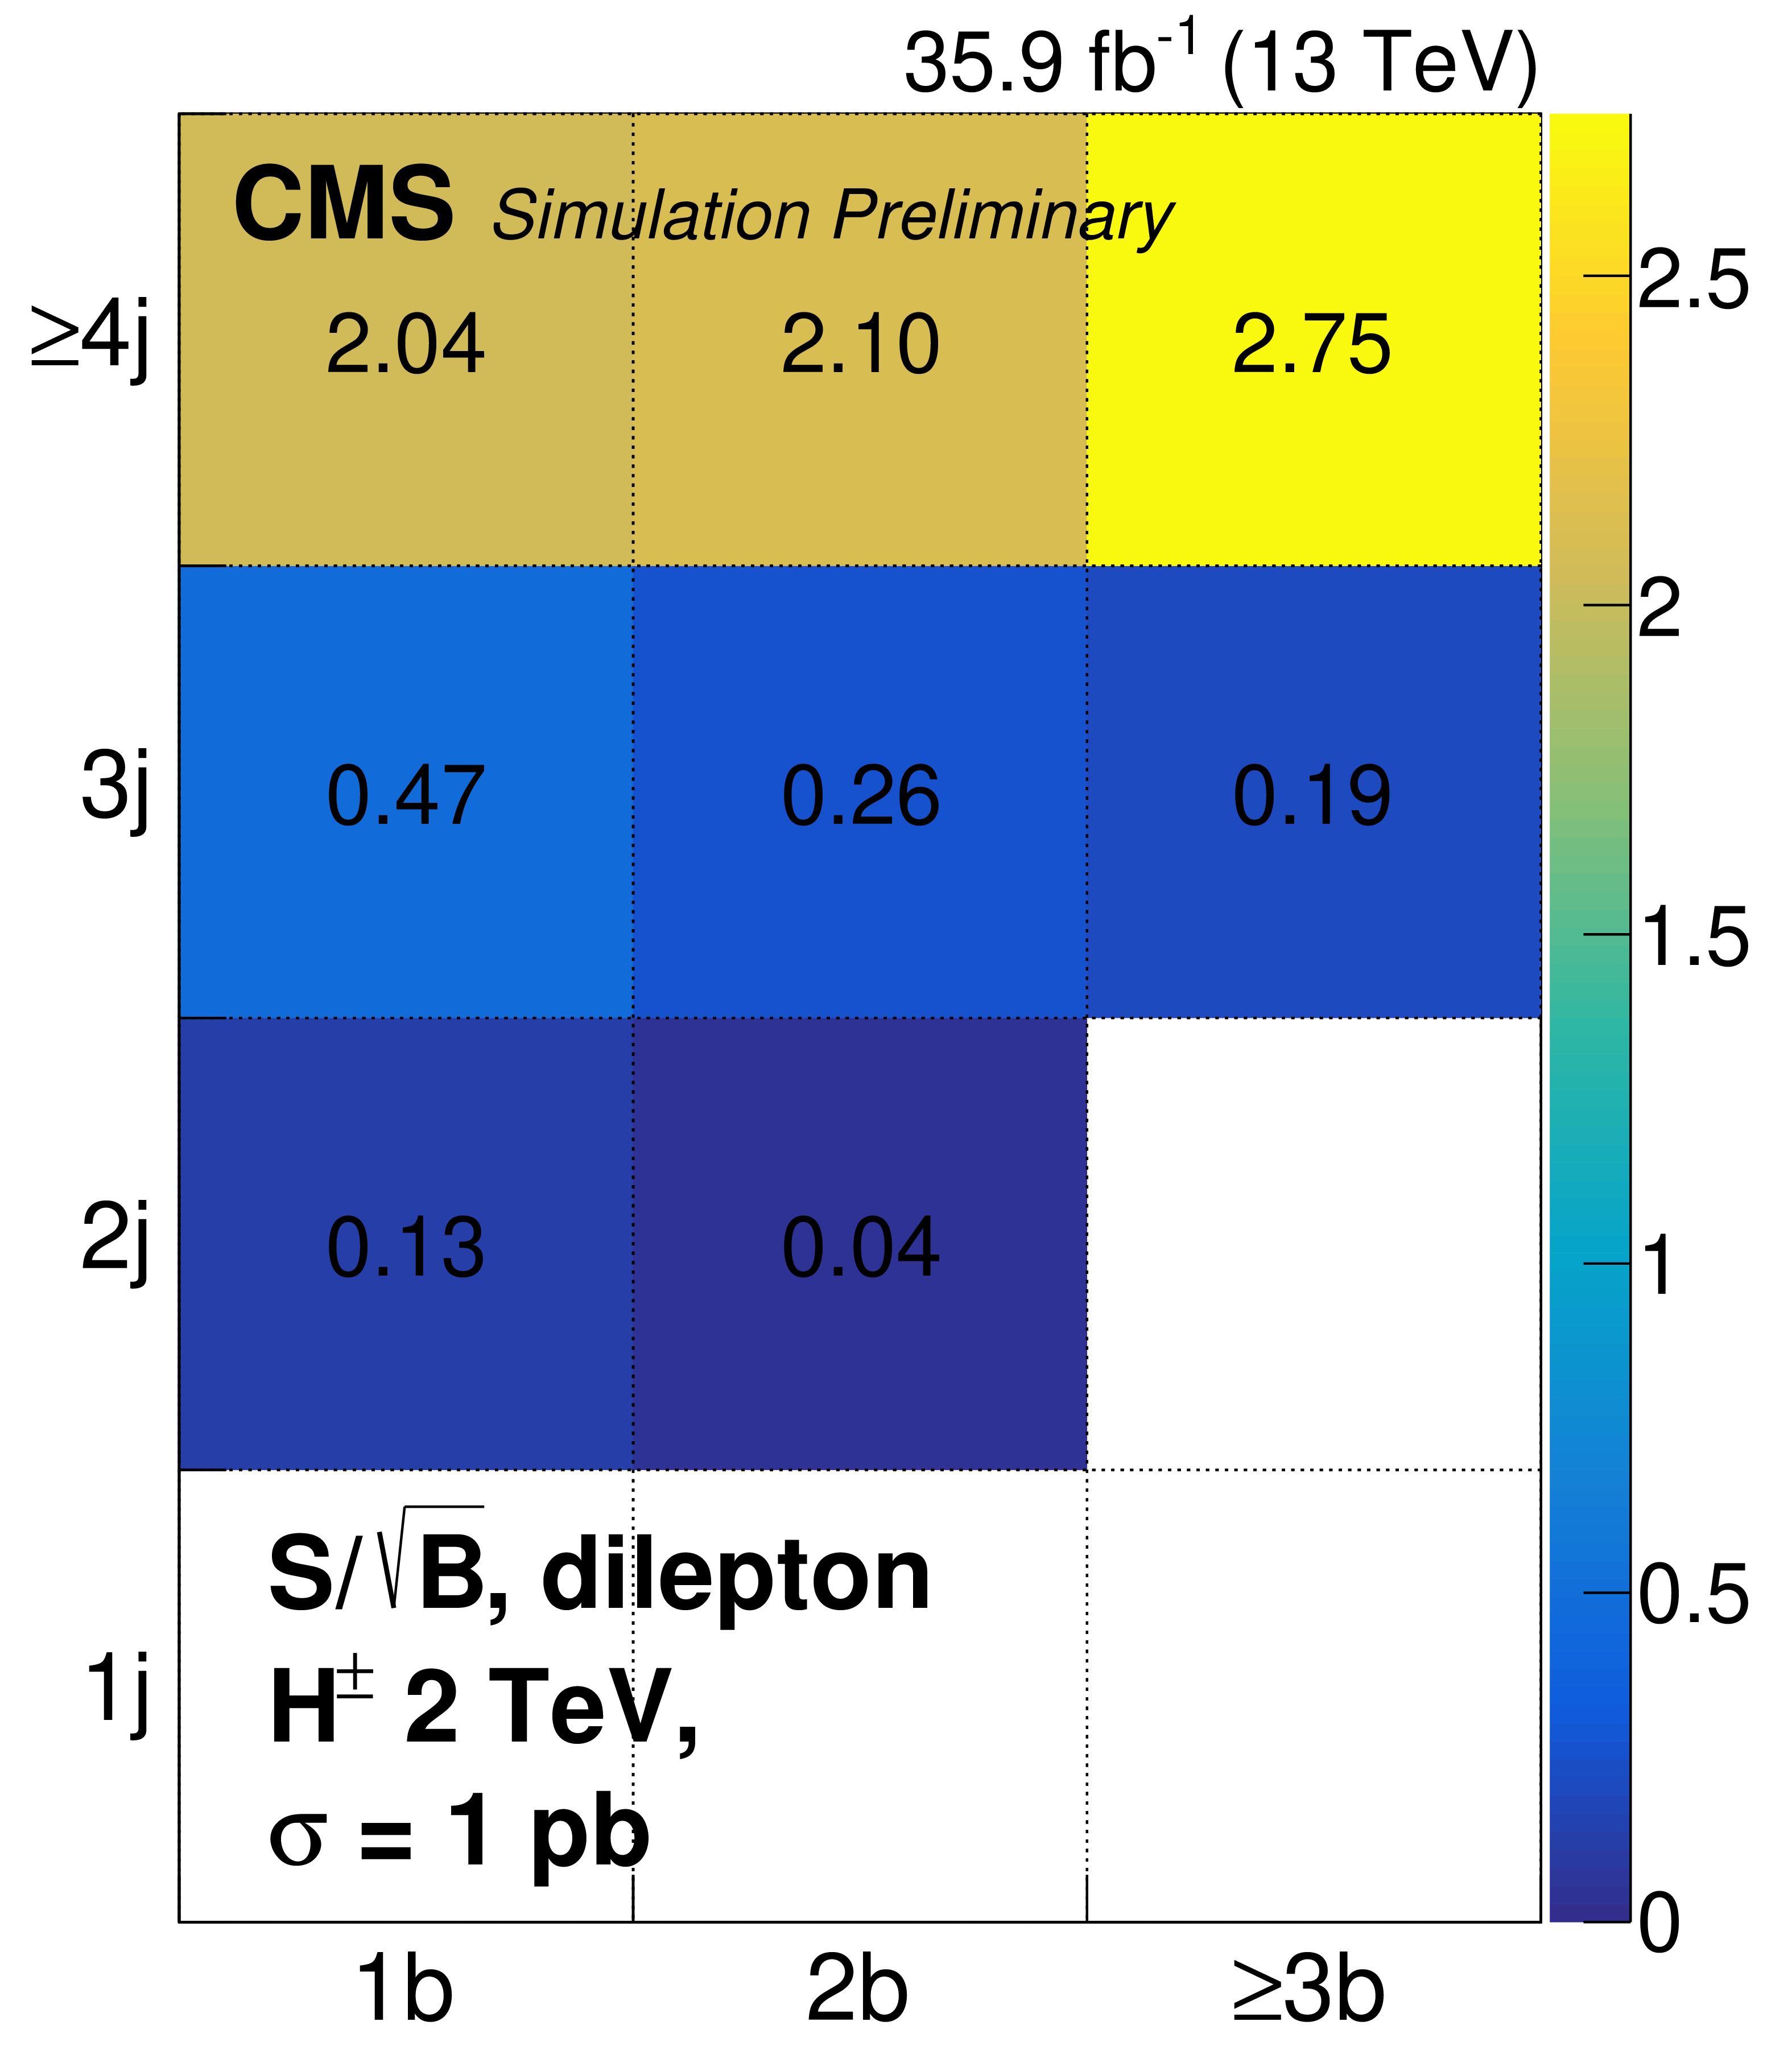
Additional Figure 11:
Significance $S/\sqrt {B}$ in the categories defined by the jet multiplicity and the number of jets passing the b jet identification, for the dilepton final state summed over electron/muon. $S$ represents the total signal yield for a charged Higgs boson with $m_{{\mathrm {H}} ^{\pm}} = $ 200 GeV, normalized to a cross section times branching fraction of 1 pb. $B$ represents the total background yield from simulation, prior to the fit to data. Systematic uncertainties are not taken into account. |
png pdf |
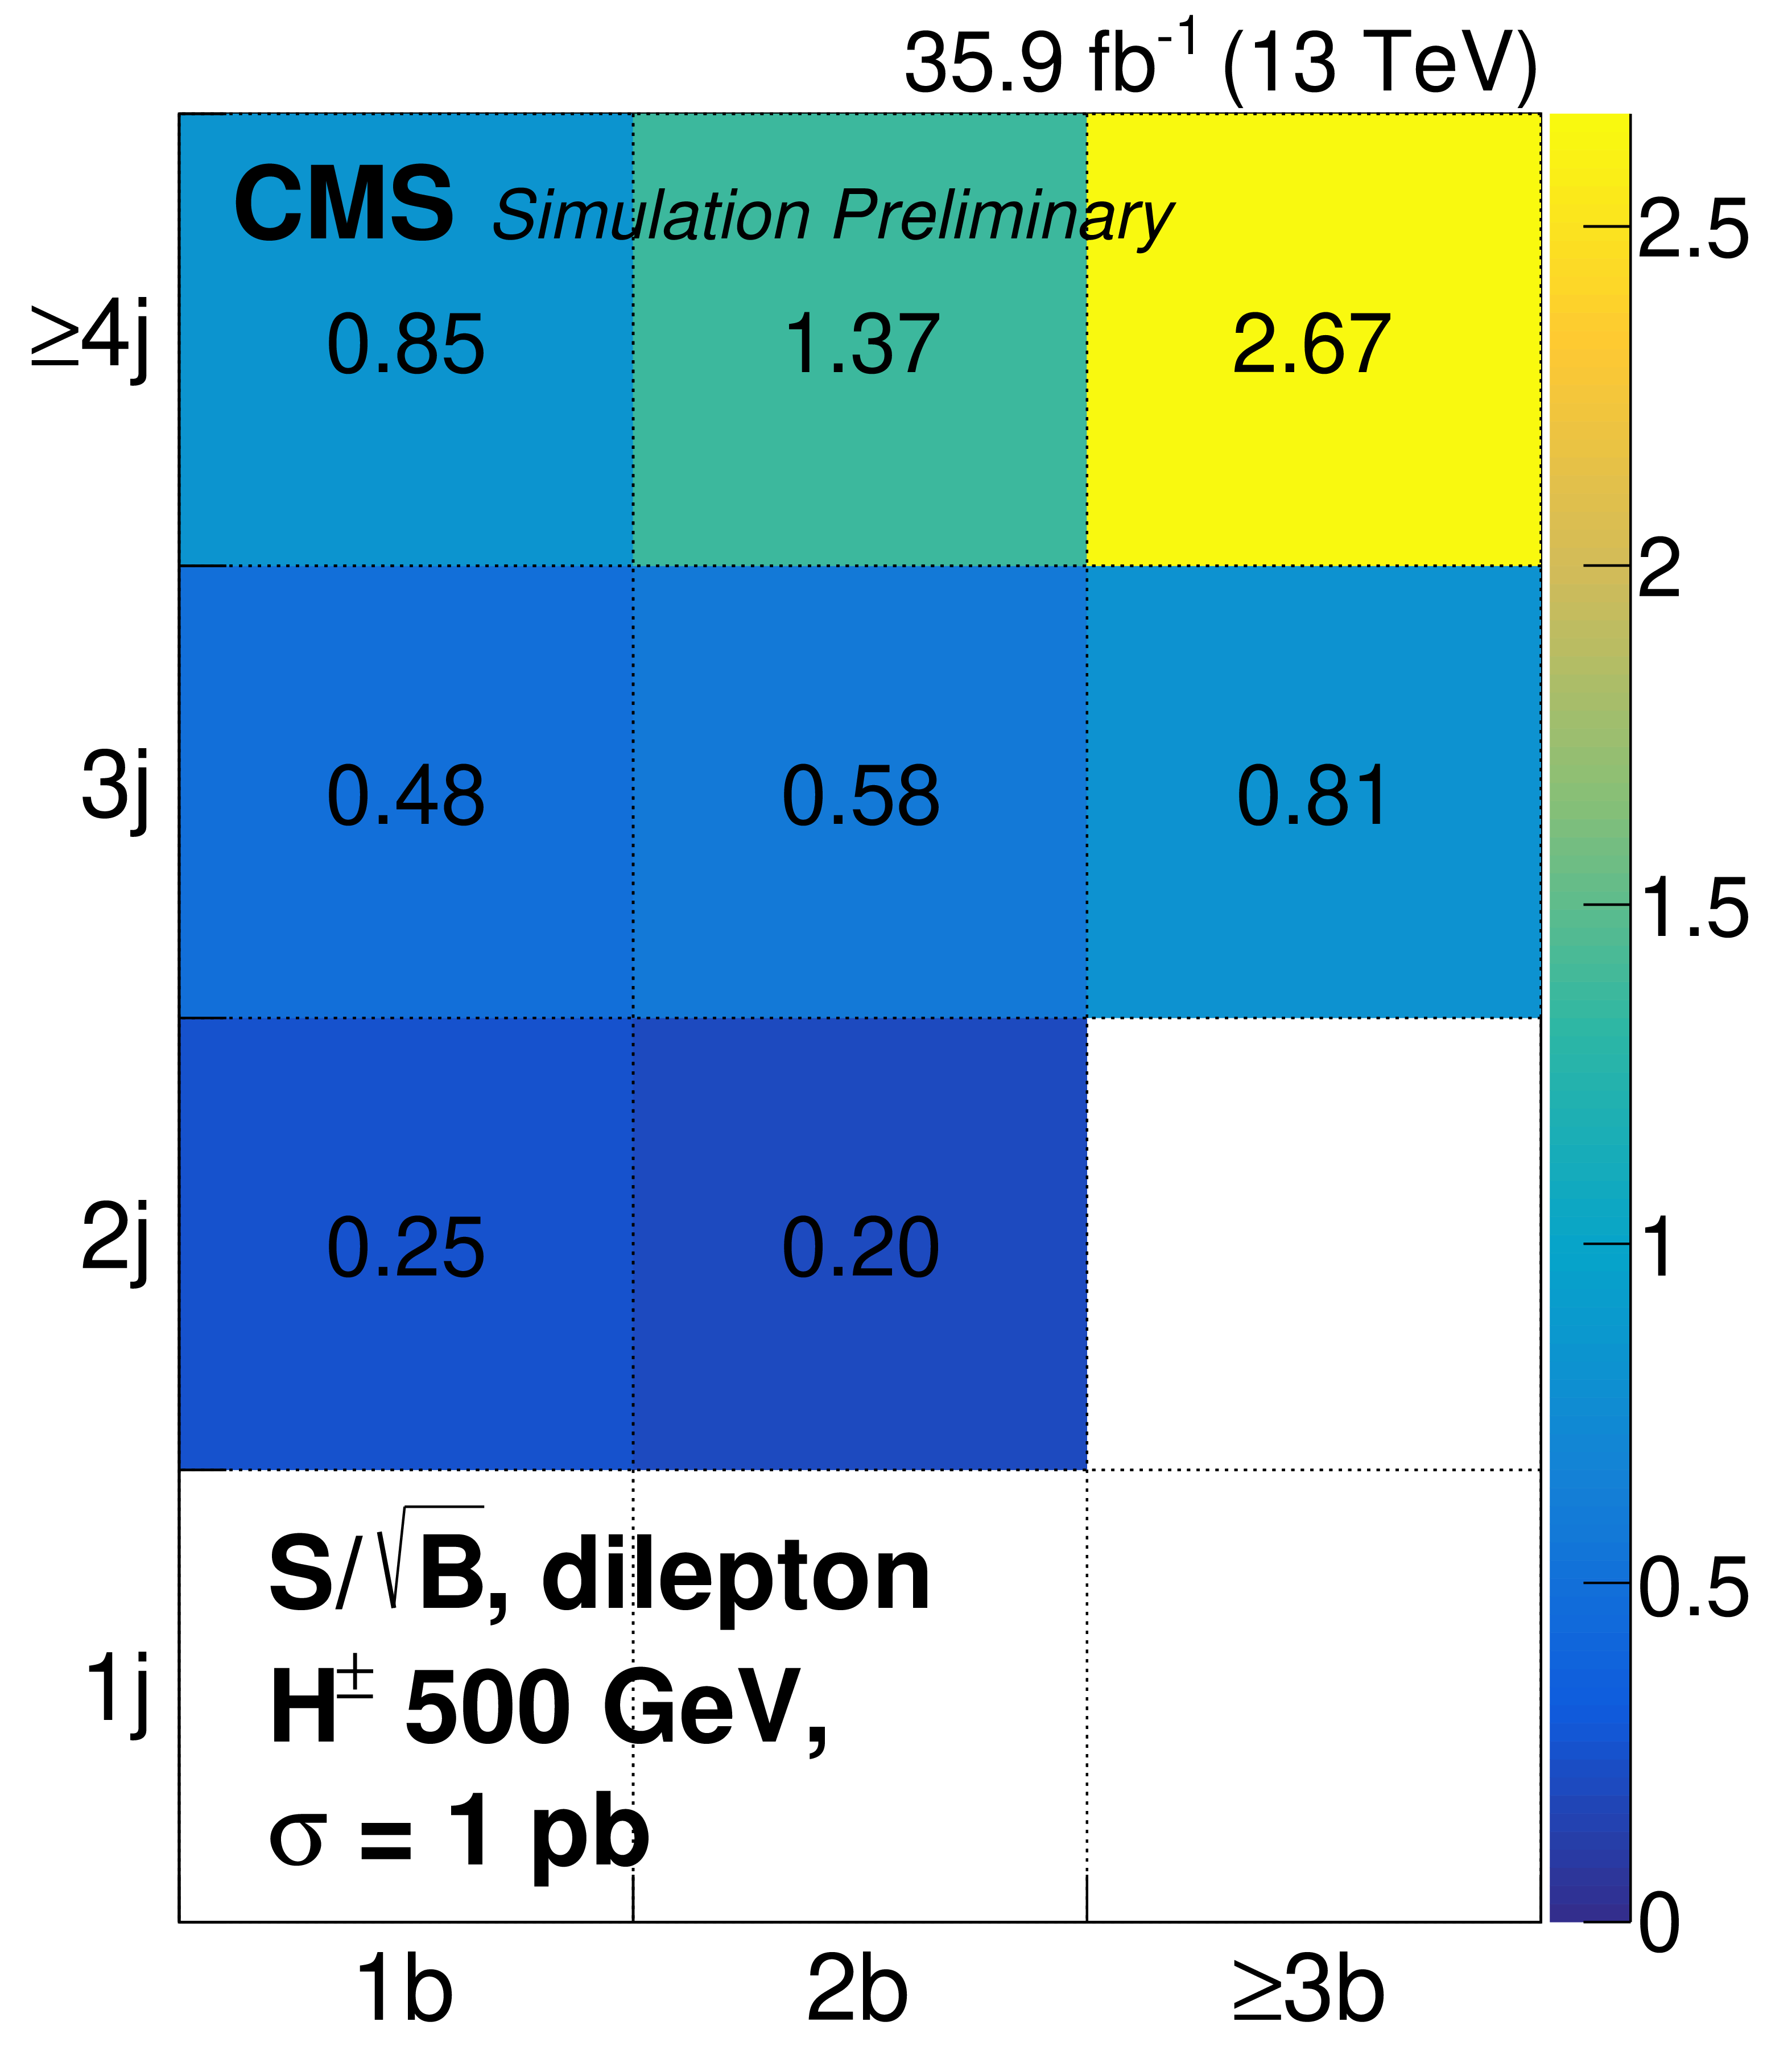
Additional Figure 12:
Significance $S/\sqrt {B}$ in the categories defined by the jet multiplicity and the number of jets passing the b jet identification, for the dilepton final state summed over electron/muon. $S$ represents the total signal yield for a charged Higgs boson with $m_{{\mathrm {H}} ^{\pm}} = $ 500 GeV, normalized to a cross section times branching fraction of 1 pb. $B$ represents the total background yield from simulation, prior to the fit to data. Systematic uncertainties are not taken into account. |
png pdf |
Additional Figure 13:
Significance $S/\sqrt {B}$ in the categories defined by the jet multiplicity and the number of jets passing the b jet identification, for the dilepton final state summed over electron/muon. $S$ represents the total signal yield for a charged Higgs boson with $m_{{\mathrm {H}} ^{\pm}} = $ 2 TeV, normalized to a cross section times branching fraction of 1 pb. $B$ represents the total background yield from simulation, prior to the fit to data. Systematic uncertainties are not taken into account. |
png pdf |
Additional Figure 14:
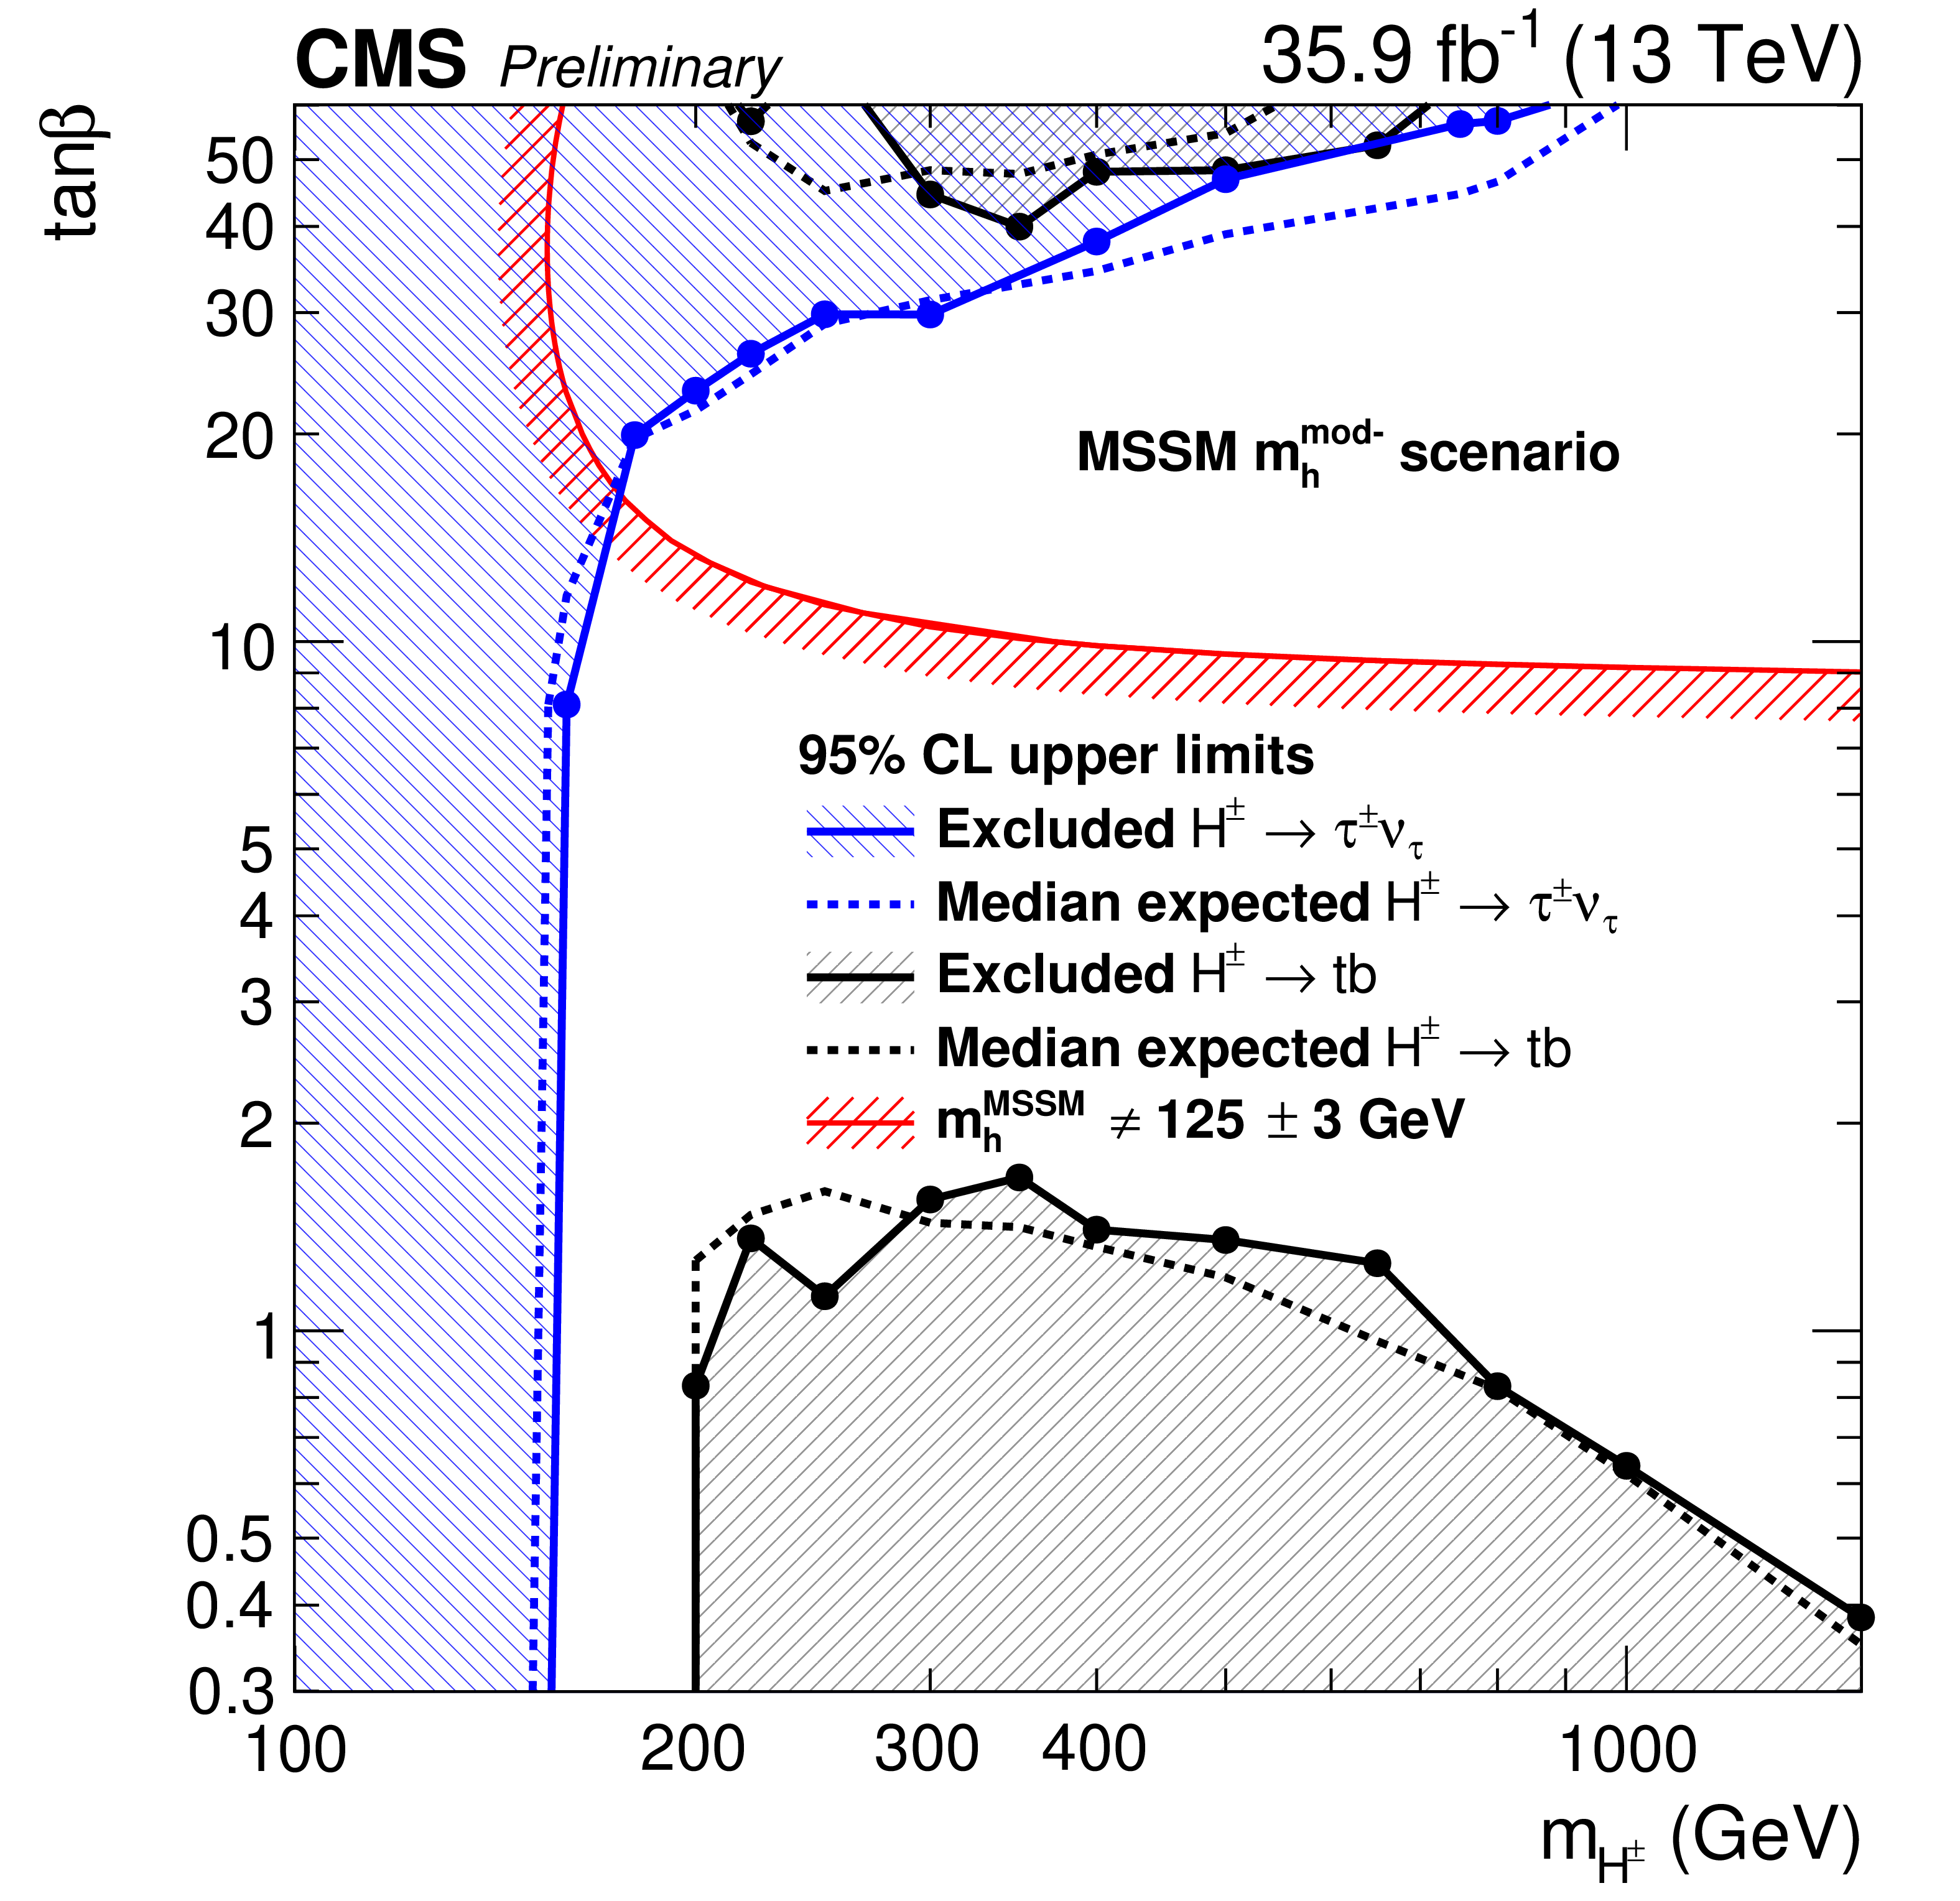
Observed limits (solid points) interpreted as a 95% CL exclusion region (hatched area) in the MSSM ($m_{{\mathrm {H}} ^{\pm}}$, $ {\tan\beta} $) parameter space in the ${m_\mathrm {h}^\mathrm {mod-}}$ benchmark scenario, compared to the expected limit assuming only standard model processes (dashed line). The black hatched area is excluded by the the $ {\mathrm {H}} ^{\pm}\rightarrow tb$ search while the blue hatched area is excluded by the $ {\mathrm {H}} ^{\pm} \rightarrow \tau \nu $ search. The region below the red line is excluded assuming that the observed neutral Higgs boson is the light CP-even 2HDM Higgs boson with a mass of 125 $\pm$ 3 GeV, where the uncertainty is the theoretical uncertainty in the mass calculation. |
png pdf |
Additional Figure 15:
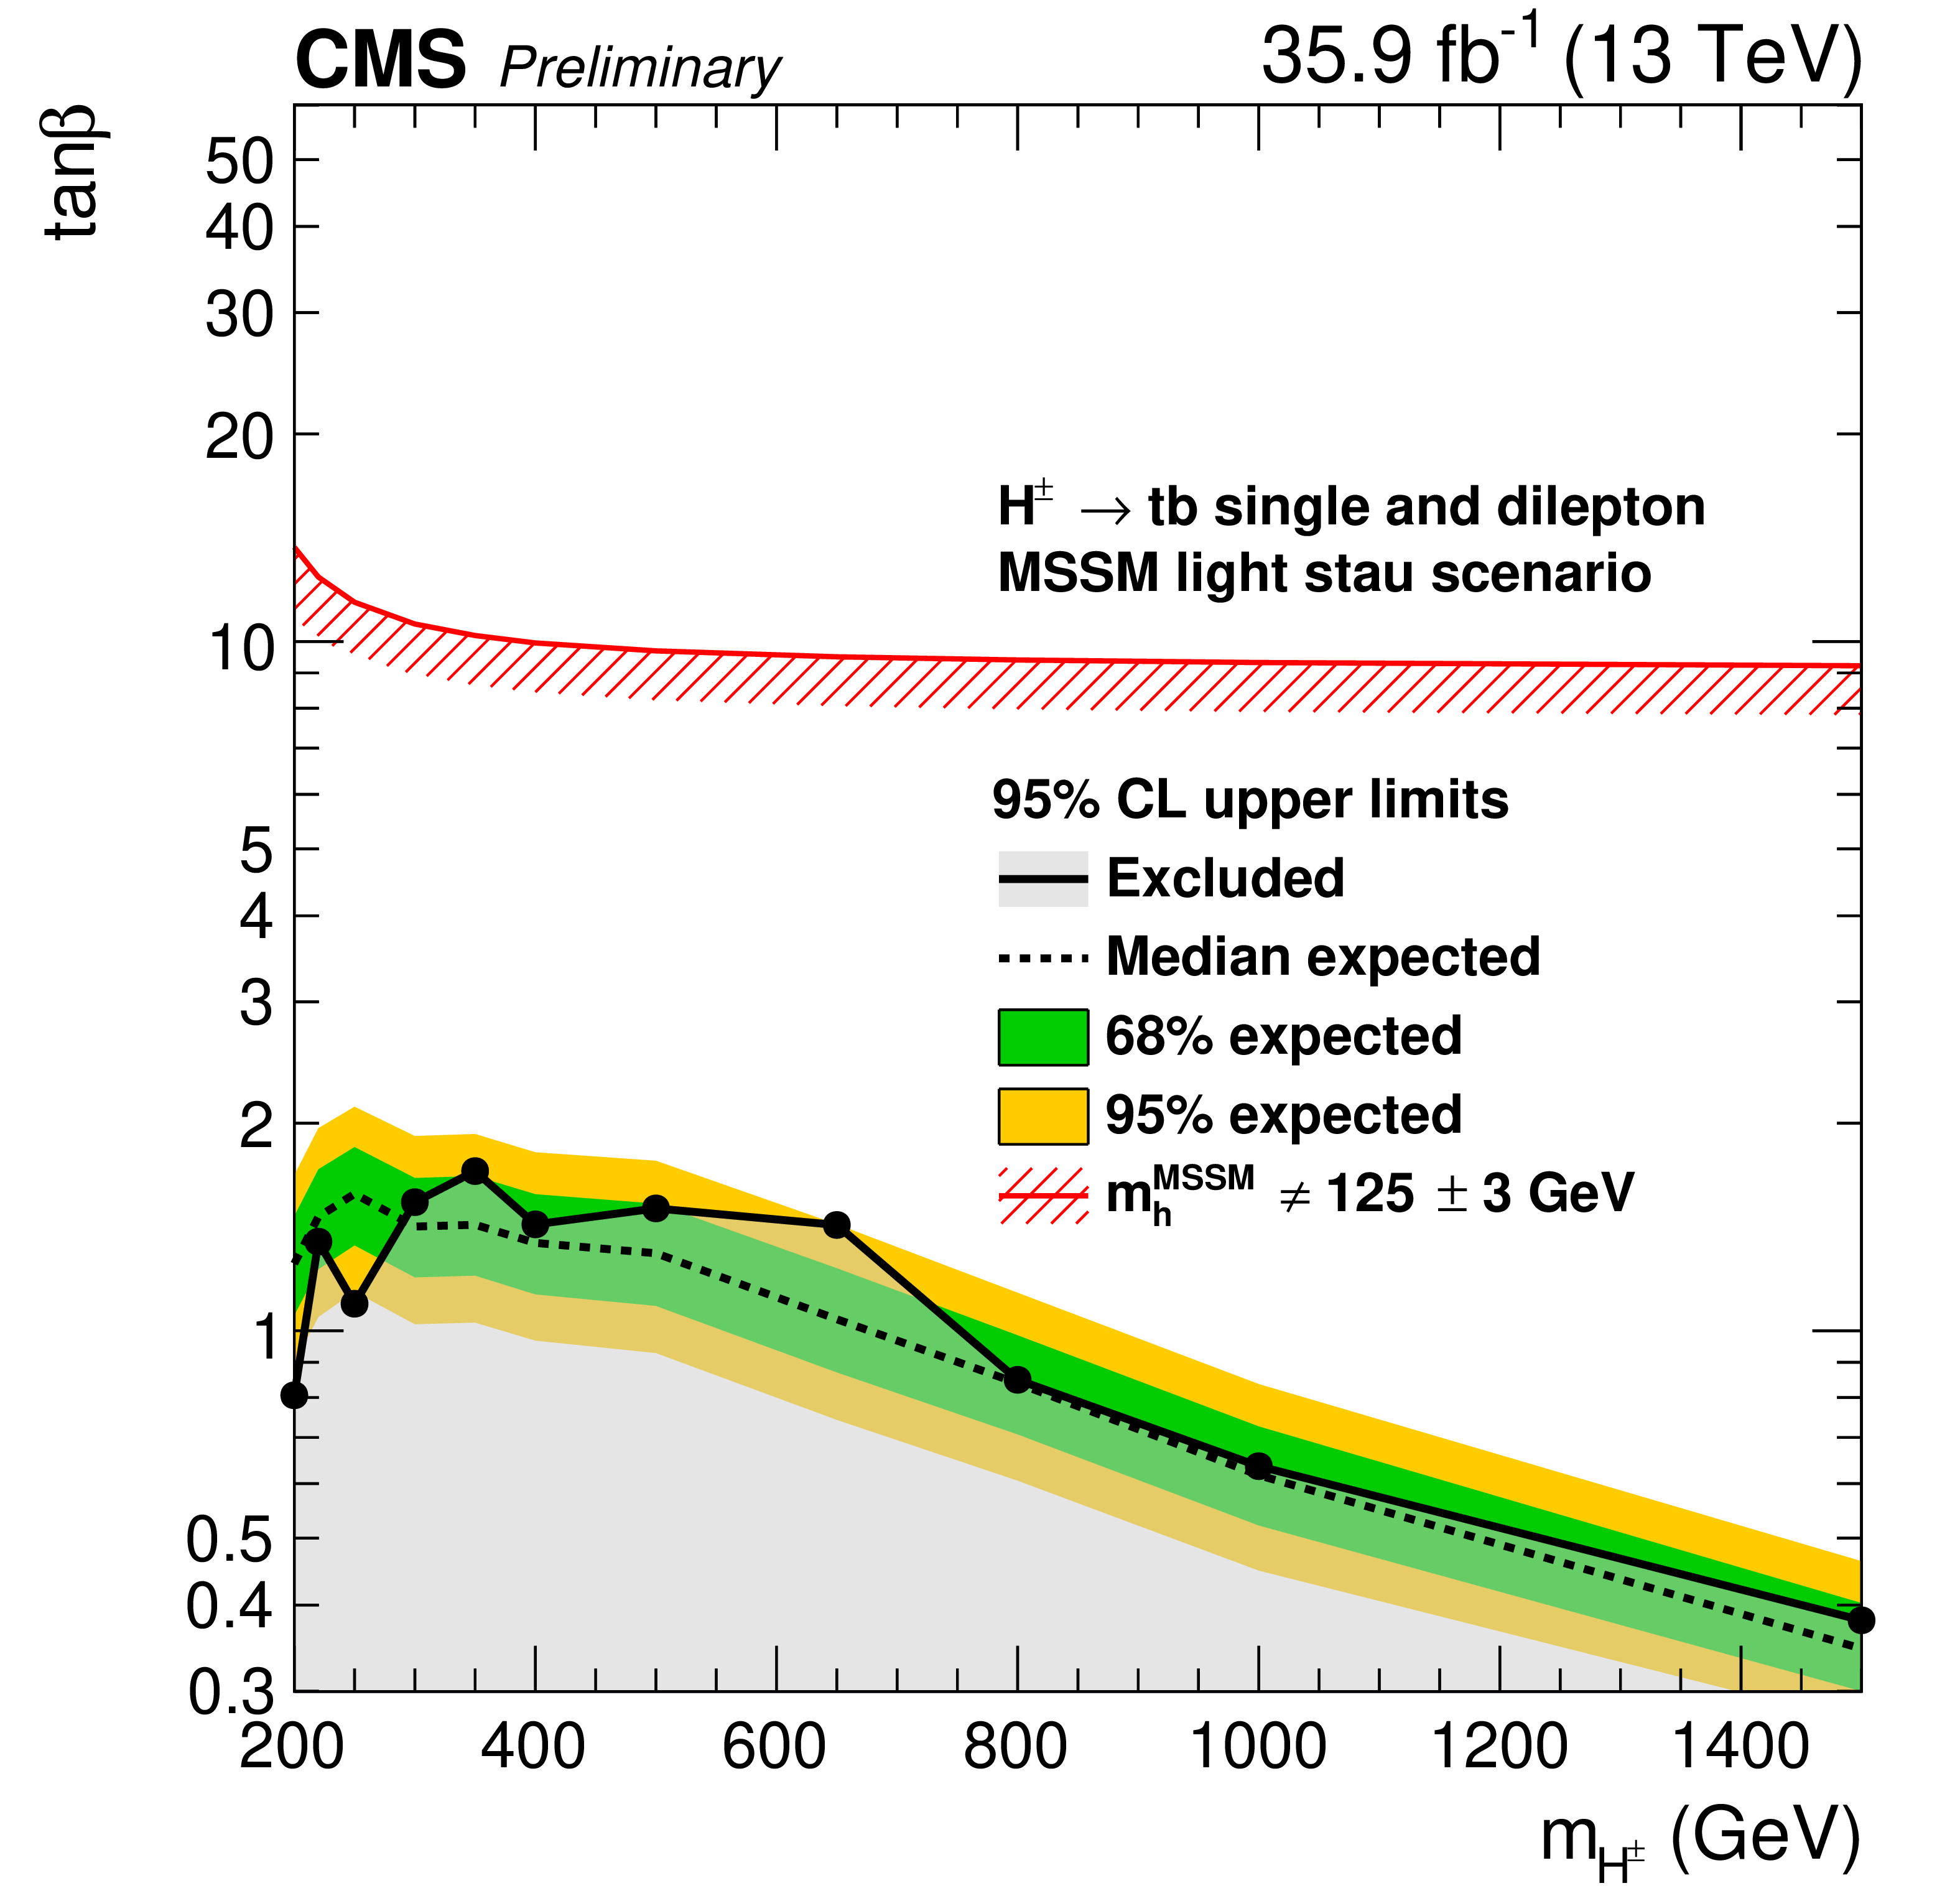
Observed limits (solid black points) interpreted as a 95% CL exclusion region (light-grey area) in the MSSM ($m_{{\mathrm {H}} ^{\pm}}$, $ {\tan\beta} $) parameter space in the light stau benchmark scenario, compared to the expected limit assuming only standard model processes (dashed line). The green (yellow) error bands represent one (two) standard deviations from the expected limit. The region below the red line is excluded assuming that the observed neutral Higgs boson is the light CP-even 2HDM Higgs boson with a mass of 125 $\pm$ 3 GeV, where the uncertainty is the theoretical uncertainty in the mass calculation. |

png pdf |
Additional Figure 16:
Observed limits (solid black points) interpreted as a 95% CL exclusion region (light-grey area) in the MSSM ($m_{{\mathrm {H}} ^{\pm}}$, $ {\tan\beta} $) parameter space in the ${m_\mathrm {h}^\text {max}}$ (updated) benchmark scenario, compared to the expected limit assuming only standard model processes (dashed line). The green (yellow) error bands represent one (two) standard deviations from the expected limit. The region below the red line is excluded assuming that the observed neutral Higgs boson is the light CP-even 2HDM Higgs boson with a mass of 125 $\pm$ 3 GeV, where the uncertainty is the theoretical uncertainty in the mass calculation. |

png pdf |
Additional Figure 17:
Observed limits (solid black points) interpreted as a 95% CL exclusion region (light-grey area) in the MSSM ($m_{{\mathrm {H}} ^{\pm}}$, $ {\tan\beta} $) parameter space in the ${M_\mathrm {h}^\text {125}}$ benchmark scenario, compared to the expected limit assuming only standard model processes (dashed line). The green (yellow) error bands represent one (two) standard deviations from the expected limit. The region below the red line is excluded assuming that the observed neutral Higgs boson is the light CP-even 2HDM Higgs boson with a mass of 125 $\pm$ 3 GeV, where the uncertainty is the theoretical uncertainty in the mass calculation. |

png pdf |
Additional Figure 18:
Observed limits (solid black points) interpreted as a 95% CL exclusion region (light-grey area) in the MSSM ($m_{{\mathrm {H}} ^{\pm}}$, $ {\tan\beta} $) parameter space in the ${M_\mathrm {h}^\text {125}(\tilde{\tau})}$ benchmark scenario, compared to the expected limit assuming only standard model processes (dashed line). The green (yellow) error bands represent one (two) standard deviations from the expected limit. The region below the red line is excluded assuming that the observed neutral Higgs boson is the light CP-even 2HDM Higgs boson with a mass of 125 $\pm$ 3 GeV, where the uncertainty is the theoretical uncertainty in the mass calculation. |
| References | ||||
| 1 | ATLAS Collaboration | Observation of a new particle in the search for the standard model Higgs boson with the ATLAS detector at the LHC | PLB 716 (2012) 1 | 1207.7214 |
| 2 | CMS Collaboration | Observation of a new boson at a mass of 125 GeV with the CMS experiment at the LHC | PLB 716 (2012) 30 | CMS-HIG-12-028 1207.7235 |
| 3 | CMS Collaboration | Observation of a new boson with mass near 125 GeV in pp collisions at $ \sqrt{s} = $ 7 and 8 TeV | JHEP 06 (2013) 081 | CMS-HIG-12-036 1303.4571 |
| 4 | ATLAS and CMS Collaborations | Combined measurement of the Higgs boson mass in pp collisions at $ \sqrt{s}= $ 7 and 8 TeV with the ATLAS and CMS experiments | PRL 114 (2015) 191803 | 1503.07589 |
| 5 | CMS Collaboration | Measurements of properties of the Higgs boson decaying into the four-lepton final state in pp collisions at $ \sqrt{s}= $ 13 TeV | JHEP 11 (2017) 047 | CMS-HIG-16-041 1706.09936 |
| 6 | J. F. Gunion and H. E. Haber | The CP conserving two Higgs doublet model: The approach to the decoupling limit | PRD 67 (2003) 075019 | hep-ph/0207010 |
| 7 | A. G. Akeroyd et al. | Prospects for charged Higgs searches at the LHC | EPJC 77 (2017) 276 | 1607.01320 |
| 8 | G. C. Branco et al. | Theory and phenomenology of two-Higgs-doublet models | PR 516 (2012) 1 | 1106.0034 |
| 9 | P. Fayet | Supergauge invariant extension of the Higgs mechanism and a model for the electron and its neutrino | NPB 90 (1975) 104 | |
| 10 | P. Fayet | Supersymmetry and weak, electromagnetic and strong interactions | PLB 64 (1976) 159 | |
| 11 | P. Fayet | Spontaneously broken supersymmetric theories of weak, electromagnetic and strong interactions | PLB 69 (1977) 489 | |
| 12 | S. Dimopoulos and H. Georgi | Softly broken supersymmetry and SU(5) | NPB 193 (1981) 150 | |
| 13 | N. Sakai | Naturalness in supersymmetric GUTS | Z. Phys. C 11 (1981) 153 | |
| 14 | K. Inoue, A. Kakuto, H. Komatsu, and S. Takeshita | Low-energy parameters and particle masses in a supersymmetric grand unified model | Prog. Theor. Phys. 67 (1982) 1889 | |
| 15 | A. Djouadi | The anatomy of electro-weak symmetry breaking. II. The Higgs bosons in the minimal supersymmetric model | PR 459 (2008) 1 | hep-ph/0503173 |
| 16 | M. Carena et al. | MSSM Higgs boson searches at the LHC: benchmark scenarios after the discovery of a Higgs-like particle | EPJC 73 (2013) 2552 | 1302.7033 |
| 17 | K. Lane and W. Shepherd | Natural stabilization of the Higgs boson's mass and alignment | PRD 99 (2019) 055015 | |
| 18 | R. Harlander, M. Kramer, and M. Schumacher | Bottom-quark associated Higgs-boson production: reconciling the four- and five-flavour scheme approach | CERN-PH-TH-2011-134 | 1112.3478 |
| 19 | LHC Higgs Cross Section Working Group Collaboration | Handbook of LHC Higgs cross sections: 4. deciphering the nature of the Higgs sector | 1610.07922 | |
| 20 | ALEPH Collaboration | Search for charged Higgs bosons in $ \mathrm{e}^+\mathrm{e}^- $ collisions at energies up to s=209 GeV | PLB 543 (2002) 1 | |
| 21 | DELPHI Collaboration | Search for charged Higgs bosons at LEP in general two Higgs doublet models | EPJC 34 (2004) 399 | hep-ex/0404012 |
| 22 | DELPHI Collaboration | Search for charged Higgs bosons at LEP-2 | PLB 460 (1999) 484 | |
| 23 | L3 Collaboration | Search for charged Higgs bosons at LEP | PLB 575 (2003) 208 | hep-ex/0309056 |
| 24 | OPAL Collaboration | Search for charged Higgs bosons in $ e^+e^- $ collisions at $ \sqrt{s} = $ 189 -- 209 GeV | EPJC 72 (2012) 2076 | 0812.0267 |
| 25 | OPAL Collaboration | Search for Higgs bosons in $ e^{+} e^{-} $ collisions at 183 GeV | EPJC 7 (1999) 407 | hep-ex/9811025 |
| 26 | ALEPH, DELPHI, L3, OPAL, LEP Collaboration | Search for charged Higgs bosons: combined results using LEP Data | EPJC 73 (2013) 2463 | 1301.6065 |
| 27 | CDF Collaboration | Search for Higgs bosons predicted in two-Higgs-doublet models via decays to tau lepton pairs in 1.96 $ TeV {\mathrm{p}}\mathrm{\bar{p}} $ collisions | PRL 103 (2009) 201801 | 0906.1014 |
| 28 | D0 Collaboration | Search for Higgs bosons of the minimal supersymmetric standard model in $ {\mathrm{p}}\mathrm{\bar{p}} $ collisions at $ \sqrt{s}= $ 1.96 TeV | PLB 710 (2012) 569 | 1112.5431 |
| 29 | A. Arbey, F. Mahmoudi, O. Stal, and T. Stefaniak | Status of the charged Higgs boson in two Higgs doublet models | EPJC 78 (2018) 182 | 1706.07414 |
| 30 | D0 Collaboration | Search for charged Higgs bosons decaying to top and bottom quarks in $ p \bar{p} $ collisions | PRL 102 (2009) 191802 | 0807.0859 |
| 31 | CMS Collaboration | Search for a charged Higgs boson in pp collisions at $ \sqrt{s}= $ 8 TeV | JHEP 11 (2015) 018 | CMS-HIG-14-023 1508.07774 |
| 32 | ATLAS Collaboration | Search for charged Higgs bosons in the $ H^{\pm} \rightarrow tb $ decay channel in pp collisions at $ \sqrt{s}= $ 8 TeV using the ATLAS detector | JHEP 03 (2016) 127 | 1512.03704 |
| 33 | ATLAS Collaboration | Search for charged Higgs bosons decaying into top and bottom quarks at $ \sqrt{s} = $ 13 TeV with the ATLAS detector | JHEP 11 (2018) 085 | 1808.03599 |
| 34 | ATLAS Collaboration | Search for charged Higgs bosons decaying via $ H^{\pm} \to \tau^{\pm}\nu_{\tau} $ in the $ \tau $+jets and $ \tau $+lepton final states with 36 fb$ ^{-1} $ of pp collision data recorded at $ \sqrt{s} = $ 13 TeV with the ATLAS experiment | JHEP 09 (2018) 139 | 1807.07915 |
| 35 | ATLAS Collaboration | Search for charged Higgs bosons produced in association with a top quark and decaying via $ H^{\pm} \rightarrow \tau\nu $ using pp collision data recorded at $ \sqrt{s} = $ 13 TeV by the ATLAS detector | PLB 759 (2016) 555 | 1603.09203 |
| 36 | ATLAS Collaboration | Search for charged Higgs bosons decaying via $ H^{\pm} \rightarrow \tau^{\pm}\nu $ in fully hadronic final states using pp collision data at $ \sqrt{s} = $ 8 TeV with the ATLAS detector | JHEP 03 (2015) 088 | 1412.6663 |
| 37 | CMS Collaboration | Search for a light charged Higgs boson decaying to $ \mathrm{c}\overline{\mathrm{s}} $ in pp collisions at $ \sqrt{s} = $ 8 TeV | JHEP 12 (2015) 178 | CMS-HIG-13-035 1510.04252 |
| 38 | CMS Collaboration | Search for a charged Higgs boson decaying to charm and bottom quarks in proton-proton collisions at $ \sqrt{s}= $ 8 TeV | JHEP 11 (2018) 115 | CMS-HIG-16-030 1808.06575 |
| 39 | CMS Collaboration | Search for charged Higgs bosons produced via vector boson fusion and decaying into a pair of W and Z bosons using pp collisions at $ \sqrt{s} = $ 13 TeV | PRL 119 (2017) 141802 | CMS-HIG-16-027 1705.02942 |
| 40 | CMS Collaboration | Search for beyond the standard model Higgs bosons decaying into a $ \mathrm{b\overline{b}} $ pair in pp collisions at $ \sqrt{s} = $ 13 TeV | JHEP 08 (2018) 113 | CMS-HIG-16-018 1805.12191 |
| 41 | CMS Collaboration | Search for additional neutral MSSM Higgs bosons in the $ \tau\tau $ final state in proton-proton collisions at $ \sqrt{s}= $ 13 TeV | JHEP 09 (2018) 007 | CMS-HIG-17-020 1803.06553 |
| 42 | ATLAS Collaboration | Search for additional heavy neutral Higgs and gauge bosons in the ditau final state produced in 36 fb$ ^{-1} $ of pp collisions at $ \sqrt{s} = $ 13 TeV with the ATLAS detector | JHEP 01 (2018) 055 | 1709.07242 |
| 43 | ATLAS Collaboration | Search for heavy Higgs bosons A/H decaying to a top quark pair in pp collisions at $ \sqrt{s} = $ 8 TeV with the ATLAS detector | PRL 119 (2017) 191803 | 1707.06025 |
| 44 | CMS Collaboration | Search for physics beyond the standard model in events with two leptons of same sign, missing transverse momentum, and jets in proton-proton collisions at $ \sqrt{s} = $ 13 TeV | EPJC 77 (2017) 578 | CMS-SUS-16-035 1704.07323 |
| 45 | CMS Collaboration | The CMS trigger system | JINST 12 (2017) P01020 | CMS-TRG-12-001 1609.02366 |
| 46 | CMS Collaboration | The CMS experiment at the CERN LHC | JINST 3 (2008) S08004 | CMS-00-001 |
| 47 | J. Alwall et al. | The automated computation of tree-level and next-to-leading order differential cross sections, and their matching to parton shower simulations | JHEP 07 (2014) 079 | 1405.0301 |
| 48 | S. Heinemeyer, W. Hollik, and G. Weiglein | FeynHiggs: a program for the calculation of the masses of the neutral CP even Higgs bosons in the MSSM | CPC 124 (2000) 76 | hep-ph/9812320 |
| 49 | E. L. Berger, T. Han, J. Jiang, and T. Plehn | Associated production of a top quark and a charged Higgs boson | PRD 71 (2005) 115012 | hep-ph/0312286 |
| 50 | M. Flechl et al. | Improved cross-section predictions for heavy charged Higgs boson production at the LHC | PRD 91 (2015) 075015 | 1409.5615 |
| 51 | C. Degrande, M. Ubiali, M. Wiesemann, and M. Zaro | Heavy charged Higgs boson production at the LHC | JHEP 10 (2015) 145 | 1507.02549 |
| 52 | S. Dittmaier, M. Kramer, M. Spira, and M. Walser | Charged-Higgs-boson production at the LHC: NLO supersymmetric QCD corrections | PRD 83 (2011) 055005 | 0906.2648 |
| 53 | A. Djouadi, J. Kalinowski, and M. Spira | HDECAY: a program for Higgs boson decays in the standard model and its supersymmetric extension | CPC 108 (1998) 56 | hep-ph/9704448 |
| 54 | S. Frixione, P. Nason, and C. Oleari | Matching NLO QCD computations with parton shower simulations: the POWHEG method | JHEP 11 (2007) 070 | 0709.2092 |
| 55 | P. Nason | A New method for combining NLO QCD with shower Monte Carlo algorithms | JHEP 11 (2004) 040 | hep-ph/0409146 |
| 56 | S. Alioli, P. Nason, C. Oleari, and E. Re | A general framework for implementing NLO calculations in shower Monte Carlo programs: the POWHEG BOX | JHEP 06 (2010) 043 | 1002.2581 |
| 57 | J. Alwall et al. | Comparative study of various algorithms for the merging of parton showers and matrix elements in hadronic collisions | EPJC 53 (2008) 473 | 0706.2569 |
| 58 | R. Frederix and S. Frixione | Merging meets matching in MC@NLO | JHEP 12 (2012) 061 | 1209.6215 |
| 59 | NNPDF Collaboration | Parton distributions for the LHC Run II | JHEP 04 (2015) 040 | 1410.8849 |
| 60 | T. Sjostrand et al. | An introduction to PYTHIA 8.2 | CPC 191 (2015) 159 | 1410.3012 |
| 61 | P. Skands, S. Carrazza, and J. Rojo | Tuning PYTHIA 8.1: the Monash 2013 tune | EPJC 74 (2014) 3024 | 1404.5630 |
| 62 | CMS Collaboration | Event generator tunes obtained from underlying event and multiparton scattering measurements | EPJC 76 (2016) 155 | CMS-GEN-14-001 1512.00815 |
| 63 | M. Cacciari et al. | Top-pair production at hadron colliders with next-to-next-to-leading logarithmic soft-gluon resummation | PLB 710 (2012) 612 | 1111.5869 |
| 64 | P. Barnreuther, M. Czakon, and A. Mitov | Percent level precision physics at the Tevatron: first genuine NNLO QCD corrections to $ q \bar{q} \to t \bar{t} + X $ | PRL 109 (2012) 132001 | 1204.5201 |
| 65 | M. Czakon and A. Mitov | NNLO corrections to top-pair production at hadron colliders: the all-fermionic scattering channels | JHEP 12 (2012) 054 | 1207.0236 |
| 66 | M. Czakon and A. Mitov | NNLO corrections to top pair production at hadron colliders: the quark-gluon reaction | JHEP 01 (2013) 080 | 1210.6832 |
| 67 | M. Beneke, P. Falgari, S. Klein, and C. Schwinn | Hadronic top-quark pair production with NNLL threshold resummation | NPB 855 (2012) 695 | 1109.1536 |
| 68 | M. Czakon, P. Fiedler, and A. Mitov | Total top-quark pair-production cross section at hadron colliders through $ O(\alpha_{S}^{4}) $ | PRL 110 (2013) 252004 | 1303.6254 |
| 69 | M. Czakon and A. Mitov | Top++: a program for the calculation of the top-pair cross-section at hadron colliders | CPC 185 (2014) 2930 | 1112.5675 |
| 70 | M. Aliev et al. | HATHOR: hadronic top and heavy quarks cross section calculator | CPC 182 (2011) 1034 | 1007.1327 |
| 71 | P. Kant et al. | HATHOR for single top-quark production: updated predictions and uncertainty estimates for single top-quark production in hadronic collisions | CPC 191 (2015) 74 | 1406.4403 |
| 72 | F. Maltoni, D. Pagani, and I. Tsinikos | Associated production of a top-quark pair with vector bosons at NLO in QCD: impact on $ \mathrm{t}\overline{\mathrm{t}}\mathrm{H} $ searches at the LHC | JHEP 02 (2016) 113 | 1507.05640 |
| 73 | J. M. Campbell, R. K. Ellis, and C. Williams | Vector boson pair production at the LHC | JHEP 07 (2011) 018 | 1105.0020 |
| 74 | N. Kidonakis | Two-loop soft anomalous dimensions for single top quark associated production with a $ W^{-} $ or $ H^{-} $ | PRD 82 (2010) 054018 | 1005.4451 |
| 75 | GEANT4 Collaboration | GEANT4 --- a simulation toolkit | NIMA 506 (2003) 250 | |
| 76 | CMS Collaboration | Particle-flow reconstruction and global event description with the CMS detector | JINST 12 (2017) P10003 | CMS-PRF-14-001 1706.04965 |
| 77 | CMS Collaboration | Description and performance of track and primary-vertex reconstruction with the CMS tracker | JINST 9 (2014) P10009 | CMS-TRK-11-001 1405.6569 |
| 78 | M. Cacciari, G. P. Salam, and G. Soyez | The anti-$ {k_{\mathrm{T}}} $ jet clustering algorithm | JHEP 04 (2008) 063 | 0802.1189 |
| 79 | M. Cacciari, G. P. Salam, and G. Soyez | FastJet user manual | EPJC 72 (2012) 1896 | 1111.6097 |
| 80 | CMS Collaboration | Performance of electron reconstruction and selection with the CMS detector in proton-proton collisions at $ \sqrt{s}= $ 8 TeV | JINST 10 (2015) P06005 | CMS-EGM-13-001 1502.02701 |
| 81 | CMS Collaboration | Search for vector-like T and B quark pairs in final states with leptons at $ \sqrt{s} = $ 13 TeV | JHEP 08 (2018) 177 | CMS-B2G-17-011 1805.04758 |
| 82 | CMS Collaboration | Performance of the CMS muon detector and muon reconstruction with proton-proton collisions at $ \sqrt{s}= $ 13 TeV | JINST 13 (2018) P06015 | CMS-MUO-16-001 1804.04528 |
| 83 | K. Rehermann and B. Tweedie | Efficient identification of boosted semileptonic top quarks at the LHC | JHEP 03 (2011) 059 | 1007.2221 |
| 84 | CMS Collaboration | Search for new physics in same-sign dilepton events in proton-proton collisions at $ \sqrt{s} = $ 13 TeV | EPJC 76 (2016) 439 | CMS-SUS-15-008 1605.03171 |
| 85 | CMS Collaboration | Jet algorithms performance in 13 TeV data | CMS-PAS-JME-16-003 | CMS-PAS-JME-16-003 |
| 86 | CMS Collaboration | Jet energy scale and resolution in the CMS experiment in pp collisions at 8 TeV | JINST 12 (2017) P02014 | CMS-JME-13-004 1607.03663 |
| 87 | CMS Collaboration | Identification of heavy-flavour jets with the CMS detector in pp collisions at 13 TeV | JINST 13 (2018) P05011 | CMS-BTV-16-002 1712.07158 |
| 88 | CMS Collaboration | Performance of the CMS missing transverse momentum reconstruction in pp data at $ \sqrt{s} = $ 8 TeV | JINST 10 (2015) P02006 | CMS-JME-13-003 1411.0511 |
| 89 | CMS Collaboration | Performance of reconstruction and identification of $ \tau $ leptons decaying to hadrons and $ \nu_\tau $ in pp collisions at $ \sqrt{s}= $ 13 TeV | JINST 13 (2018) P10005 | CMS-TAU-16-003 1809.02816 |
| 90 | CMS Collaboration | Study of the dijet mass spectrum in $ {\mathrm{p}}{\mathrm{p}} \rightarrow \mathrm{W} + $ jets events at $ \sqrt{s}= $ 7 TeV | PRL 109 (2012) 251801 | CMS-EWK-11-017 1208.3477 |
| 91 | CMS Collaboration | Performance of CMS muon reconstruction in pp collision events at $ \sqrt{s} = $ 7 TeV | JINST 7 (2012) P10002 | CMS-MUO-10-004 1206.4071 |
| 92 | G. C. Fox and S. Wolfram | Observables for the analysis of event shapes in $ {e}^{+}{e}^{{-}} $ annihilation and other processes | PRL 41 (1978) 1581 | |
| 93 | T. Hastie, R. Tibshirani, and J. Friedman | The elements of statistical learning | Springer-Verlag, second edition, 2013 , ISBN 978-0-387-84858-7 | |
| 94 | L. Breiman, J. Friedman, R. Olshen, and C. Stone | Classification and regression trees | Wadsworth, 1984 ISBN 978-0412048418 | |
| 95 | H. Voss, A. Hocker, J. Stelzer, and F. Tegenfeldt | TMVA, the toolkit for multivariate data analysis with ROOT | in XIth International Workshop on Advanced Computing and Analysis Techniques in Physics Research (ACAT), p. 40 2007 [PoS(ACAT)040] | physics/0703039 |
| 96 | P. Baldi et al. | Parameterized neural networks for high-energy physics | EPJC 76 (2016) 235 | 1601.07913 |
| 97 | M. Abadi et al. | TensorFlow: large-scale machine learning on heterogeneous systems | 2015 \url https://www.tensorflow.org | |
| 98 | F. Chollet et al. | Keras | 2015 \url https://keras.io | |
| 99 | ATLAS and CMS Collaborations | Procedure for the LHC Higgs boson search combination in Summer 2011 | CMS-NOTE-2011-005 | |
| 100 | CMS Collaboration | CMS luminosity measurements for the 2016 data taking period | CMS-PAS-LUM-17-001 | CMS-PAS-LUM-17-001 |
| 101 | J. Butterworth et al. | PDF4LHC recommendations for LHC Run II | JPG 43 (2016) 023001 | 1510.03865 |
| 102 | CMS Collaboration | Investigations of the impact of the parton shower tuning in PYTHIA 8 in the modelling of $ \mathrm{t\overline{t}} $ at $ \sqrt{s}= $ 8 and 13 TeV | CMS-PAS-TOP-16-021 | CMS-PAS-TOP-16-021 |
| 103 | CMS Collaboration | Investigations of the impact of the parton shower tuning in Pythia 8 in the modelling of $ \mathrm{t\overline{t}} $ at $ \sqrt{s}= $ 8 and 13 TeV | CMS-PAS-TOP-16-021 | CMS-PAS-TOP-16-021 |
| 104 | T. Je\vzo, J. M. Lindert, N. Moretti, and S. Pozzorini | New NLOPS predictions for $ t \bar{t} $+b-jet production at the LHC | EPJC 78 (2018) 502 | 1802.00426 |
| 105 | R. Barlow and C. Beeston | Fitting using finite Monte Carlo samples | CPC 77 (1993) 219 | |
| 106 | J. S. Conway | Incorporating nuisance parameters in likelihoods for multisource spectra | in Proceedings, PHYSTAT 2011 workshop on statistical issues related to discovery claims in search experiments and unfolding, CERN, Geneva, Switzerland 17--20 January 2011, p. 115 2011 | 1103.0354 |
| 107 | G. Cowan, K. Cranmer, E. Gross, and O. Vitells | Asymptotic formulae for likelihood-based tests of new physics | EPJC 71 (2011) 1554 | 1007.1727 |
| 108 | A. L. Read | Presentation of search results: The CL$ _{\text{s}} $ technique | JPG 28 (2002) 2693 | |
| 109 | T. Junk | Confidence level computation for combining searches with small statistics | NIMA 434 (1999) 435 | hep-ex/9902006 |
| 110 | H. Bahl et al. | MSSM Higgs boson searches at the LHC: benchmark scenarios for Run 2 and beyond | 1808.07542 | |
|
|
Compact Muon Solenoid LHC, CERN |
|

|

|

|

|

|