

Compact Muon Solenoid
LHC, CERN
| CMS-HIG-18-013 ; CERN-EP-2020-079 | ||
| Search for resonant pair production of Higgs bosons in the bbZZ channel in proton-proton collisions at $\sqrt{s}=$ 13 TeV | ||
| CMS Collaboration | ||
| 11 June 2020 | ||
| Phys. Rev. D 102 (2020) 032003 | ||
| Abstract: A search for the production of a narrow-width resonance decaying into a pair of Higgs bosons decaying into the bbZZ channel is presented. The analysis is based on data collected with the CMS detector during 2016, in proton-proton collisions at the LHC, corresponding to an integrated luminosity of 35.9 fb$^{-1}$. The final states considered are the ones where one of the Z bosons decays into a pair of muons or electrons, and the other Z boson decays either to a pair of quarks or a pair of neutrinos. Upper limits at 95% confidence level are placed on the production of narrow-width spin-0 or spin-2 particles decaying to a pair of Higgs bosons, in models with and without an extended Higgs sector. For a resonance mass range between 260 and 1000 GeV, limits on the production cross section times branching fraction of a spin-0 and spin-2 resonance range from 0.1 to 5.0 pb and 0.1 to 3.6 pb, respectively. These results set limits in parameter space in bulk Randall-Sundrum radion, Kaluza-Klein excitation of the graviton, and N2HDM models. For specific choices of parameters the N2HDM can be excluded in a mass range between 360 and 620 GeV for a resonance decaying to two Higgs bosons. This is the first search for Higgs boson resonant pair production in the bbZZ channel. | ||
| Links: e-print arXiv:2006.06391 [hep-ex] (PDF) ; CDS record ; inSPIRE record ; CADI line (restricted) ; | ||
| Figures | |
png pdf |
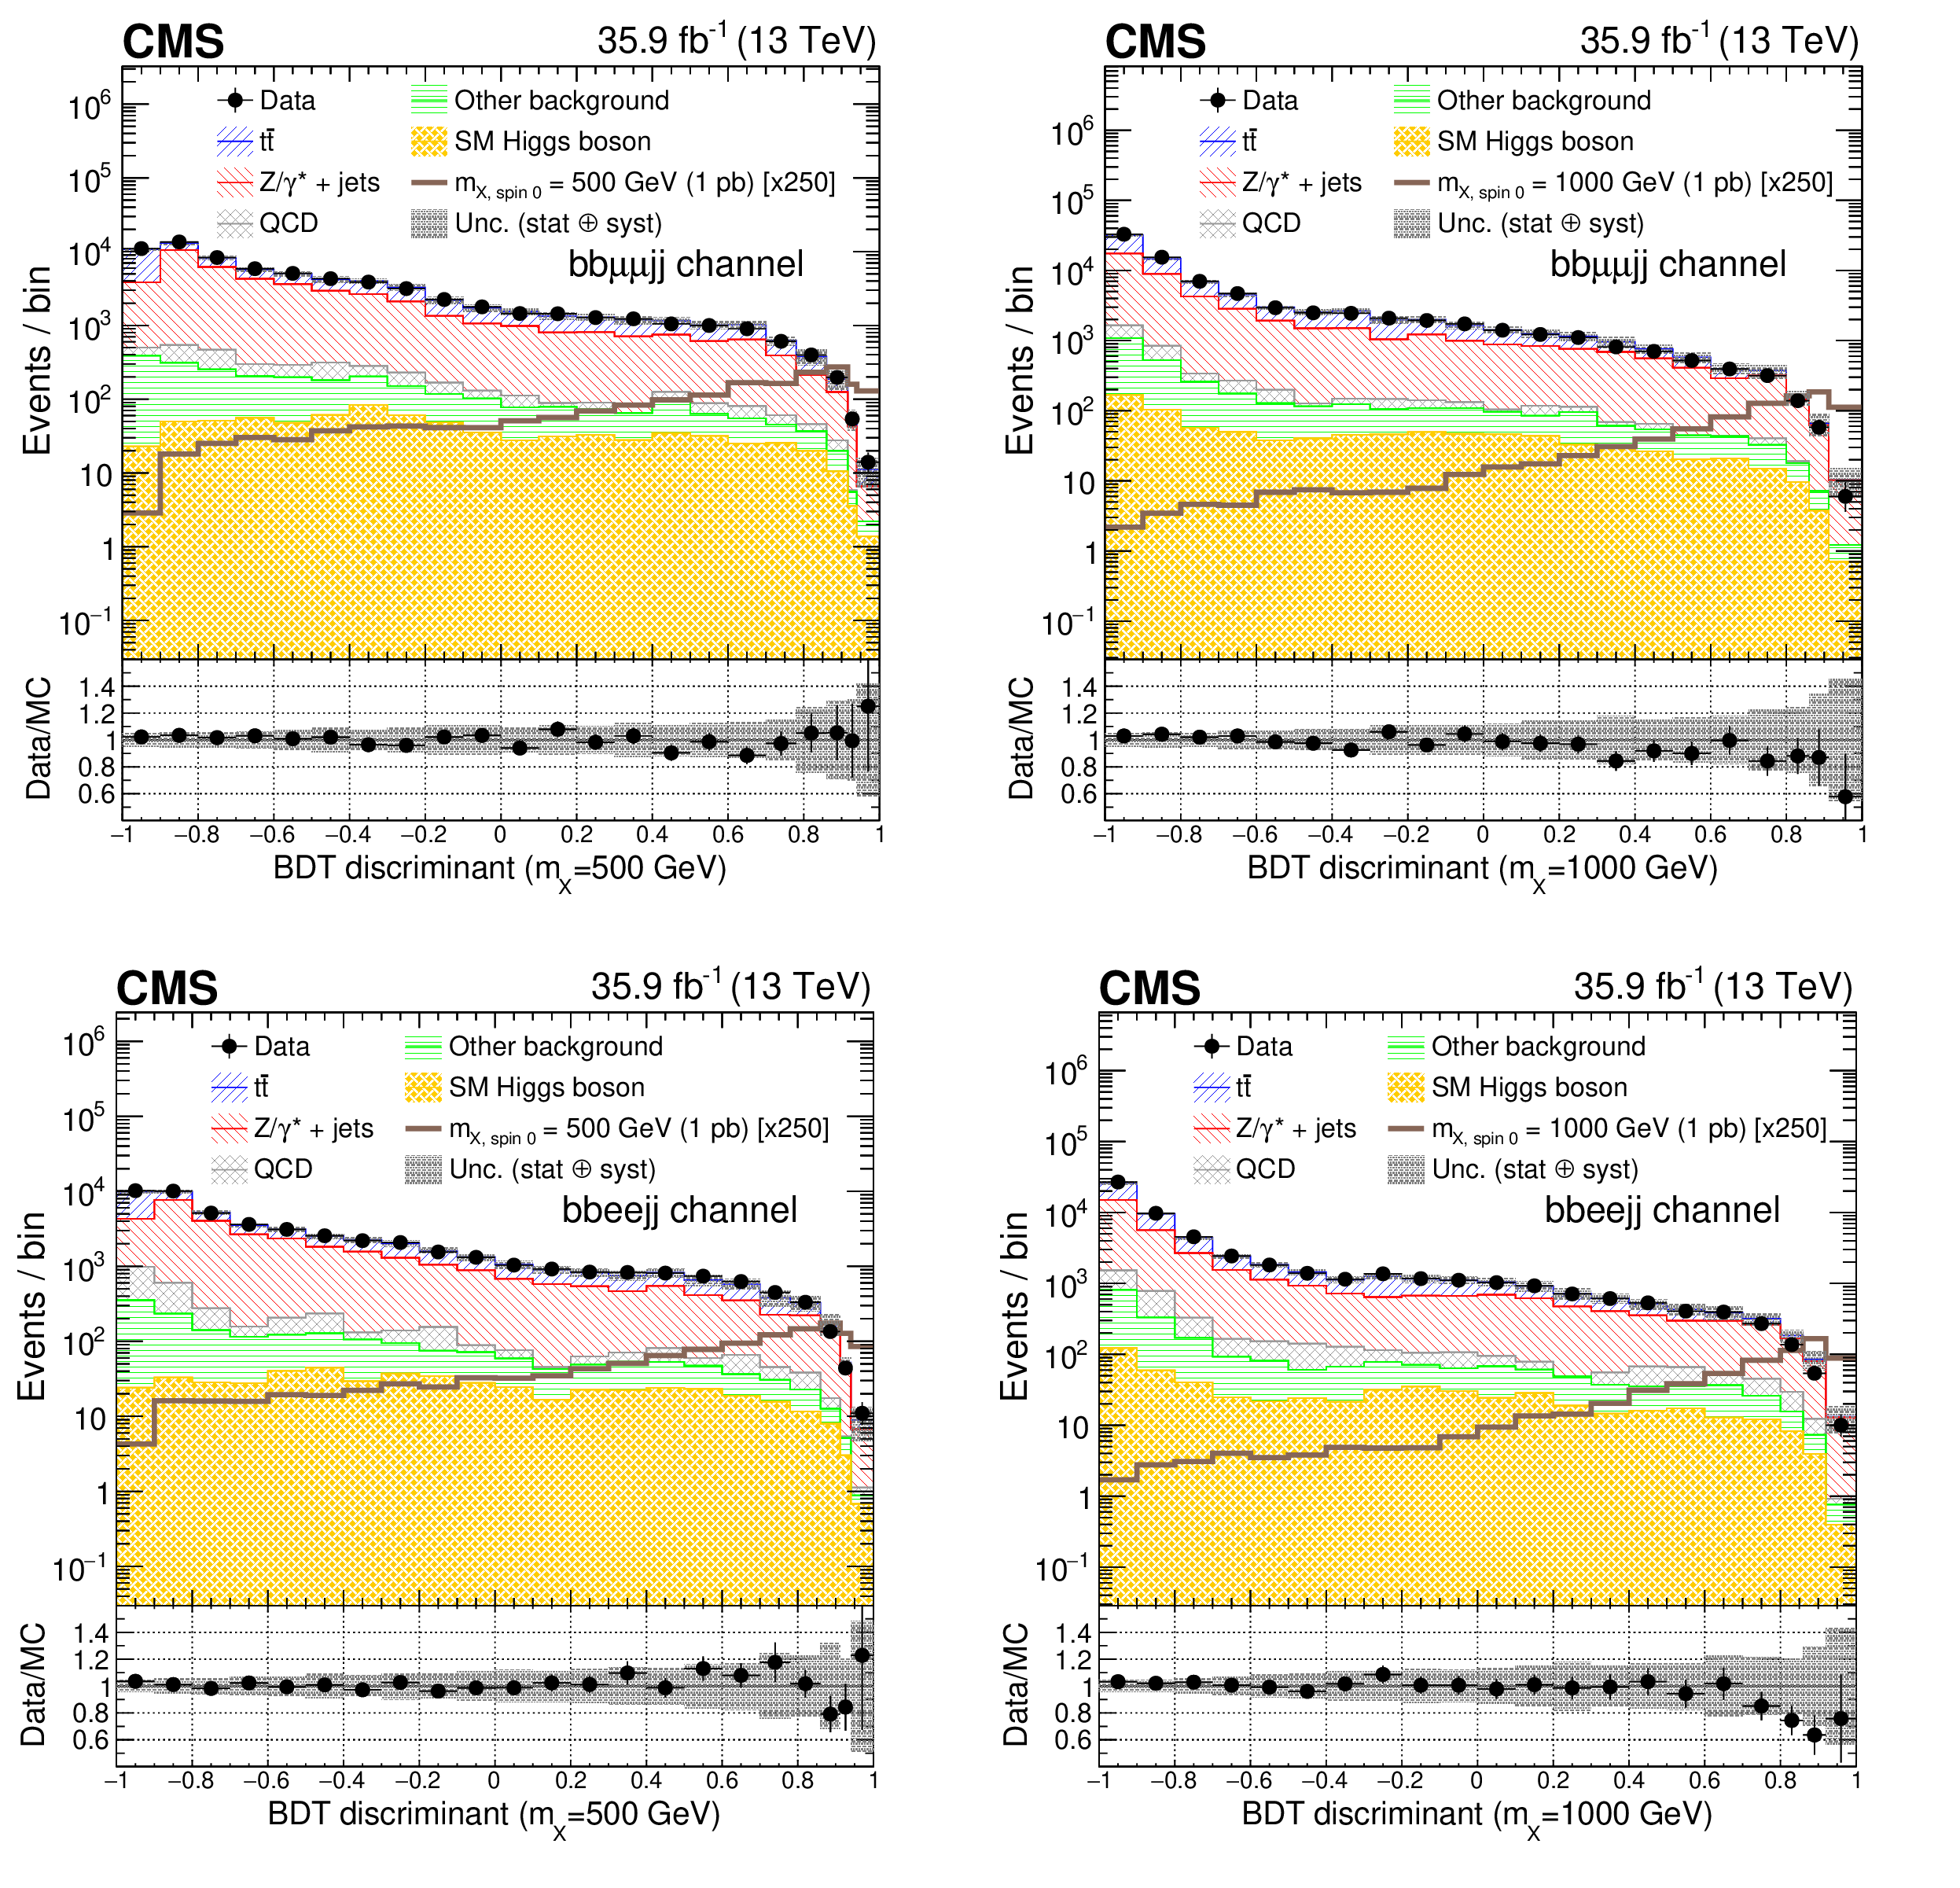
Figure 1:
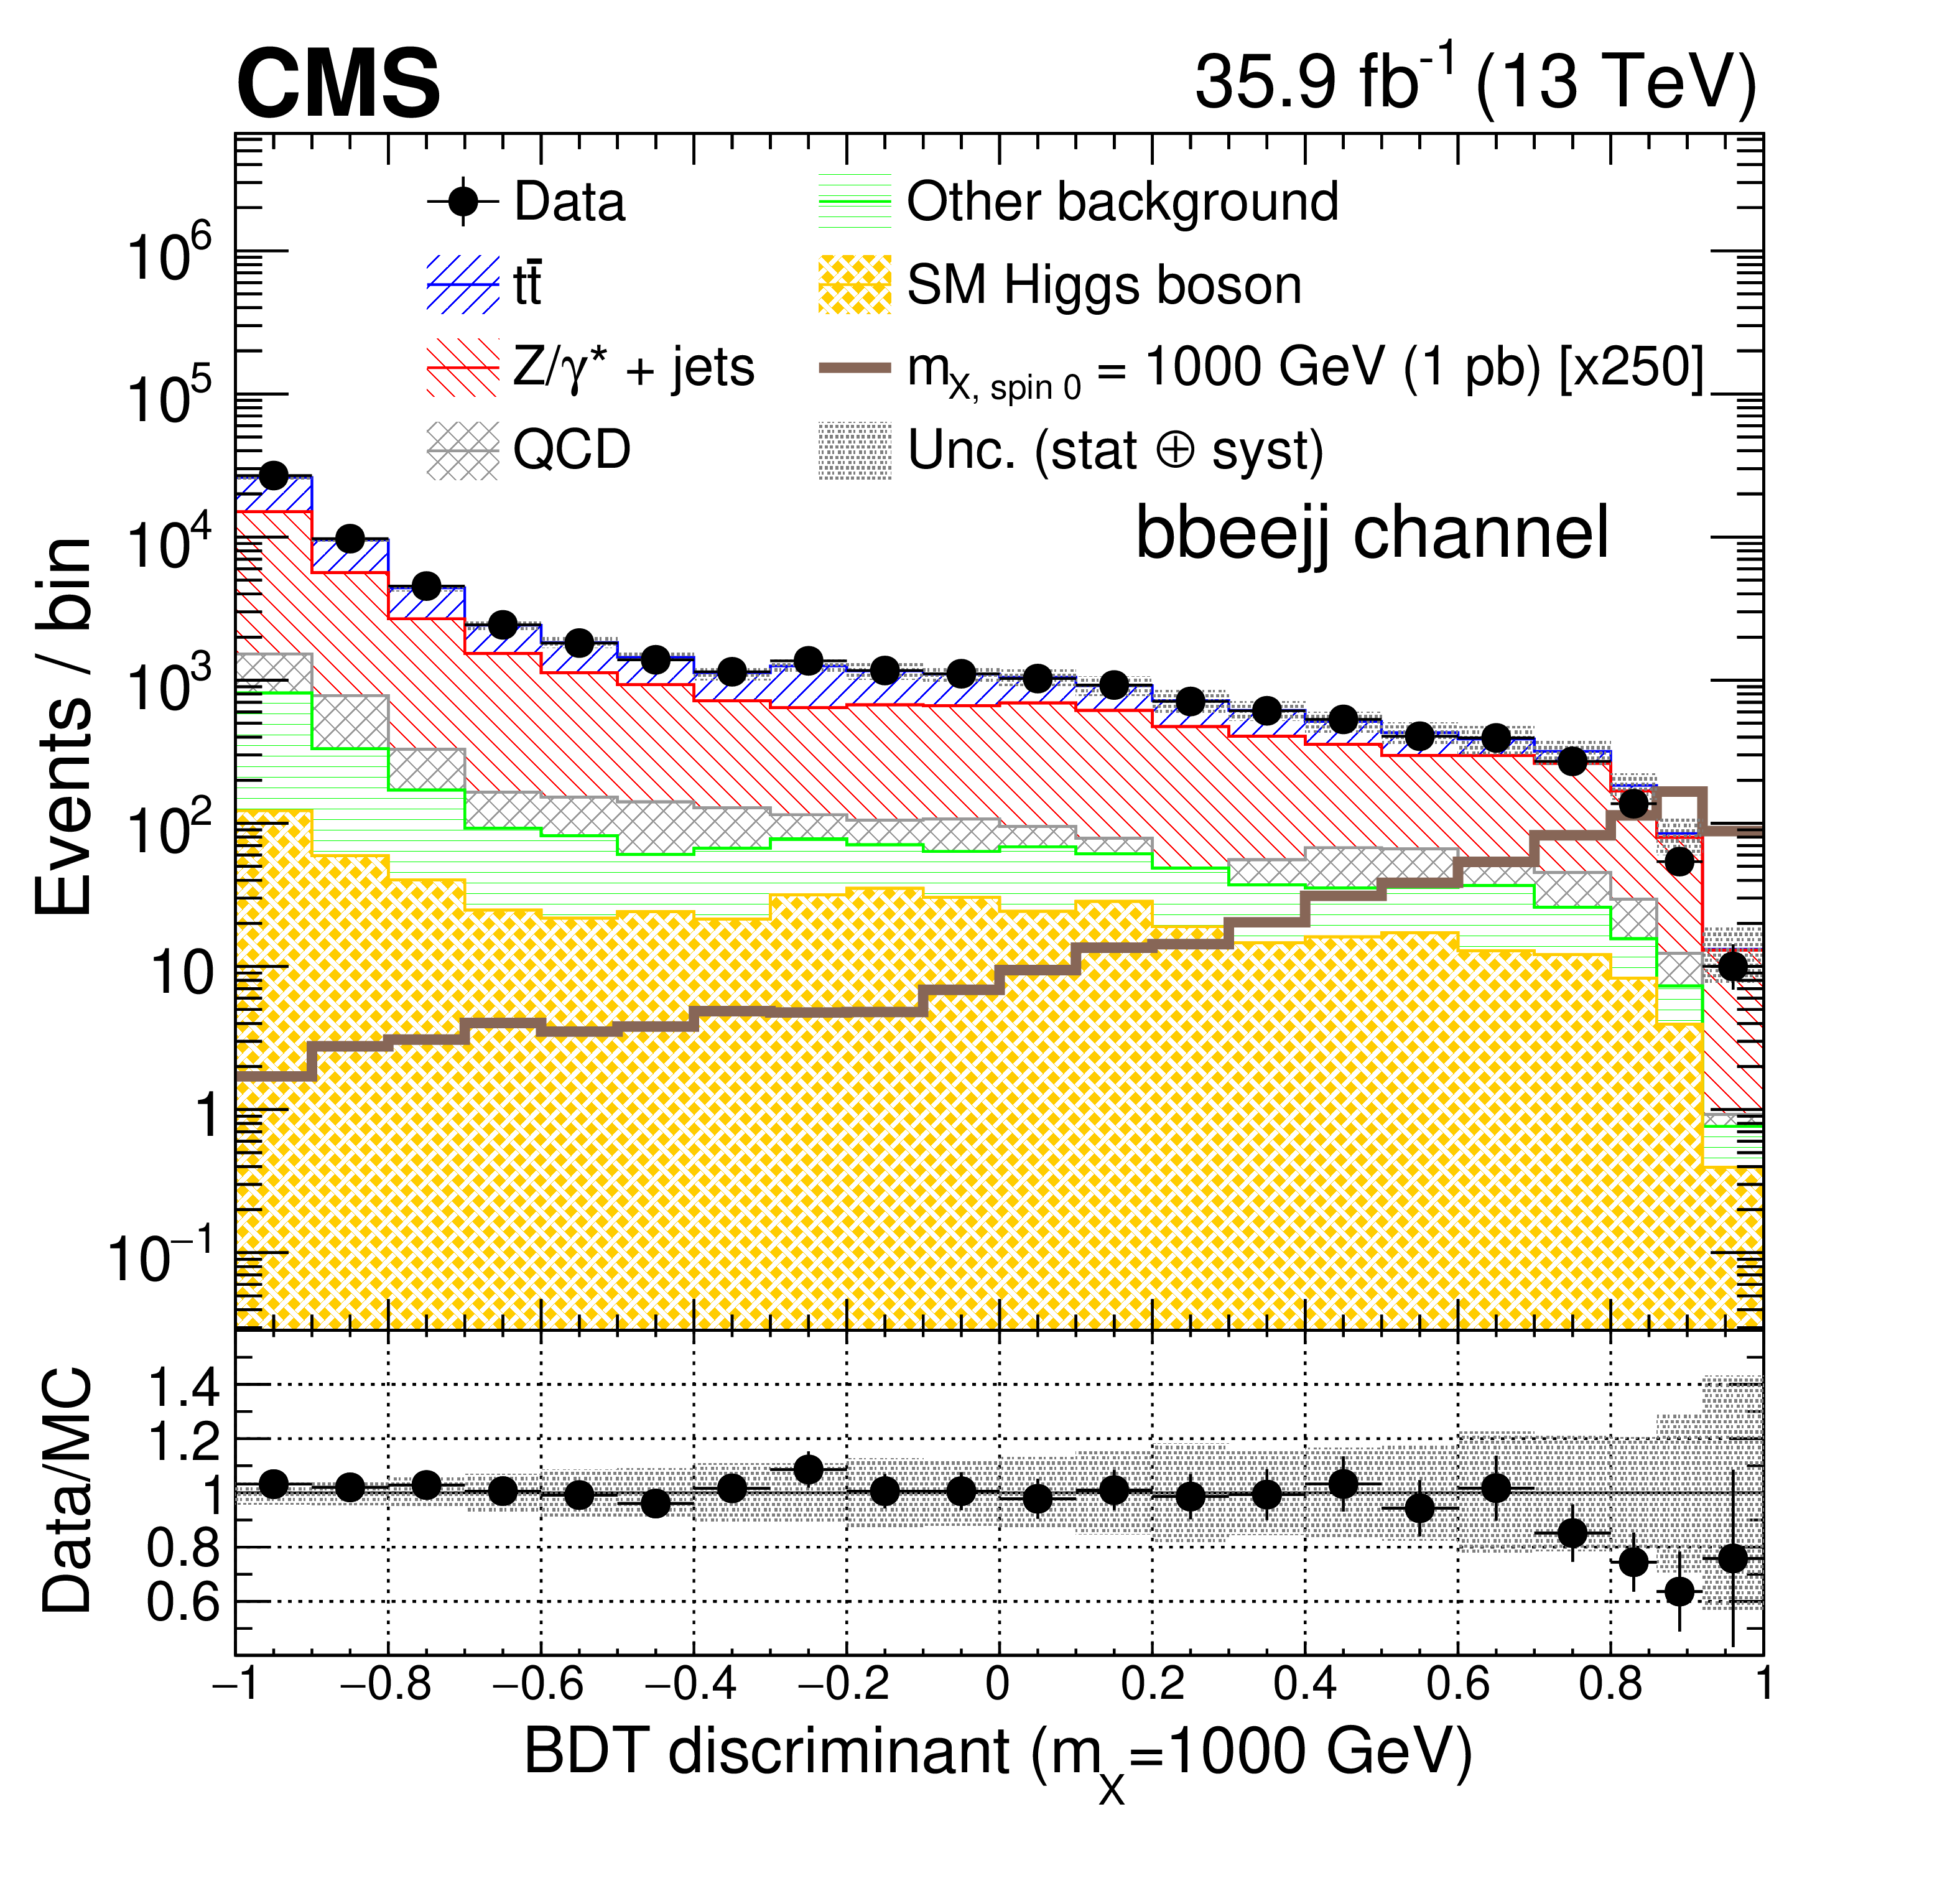
Comparison of the BDT discriminant for $m_\mathrm {X} =$ 500 and 1000 GeV after the final selection in the muon (upper row) and electron (lower row) final states of the ${\mathrm{b} \mathrm{b} \ell \ell \mathrm {jj}}$ channel. The signals of an RS1 radion with mass of 500 (left) and 1000 GeV (right) are normalized to a cross section of 1 pb for the ${\mathrm{p}} {\mathrm{p}} \to \mathrm {X}\to \mathrm{h} \mathrm{h} $ process. The shaded area represents the combined statistical and systematic uncertainties in the background estimate. |
png pdf |
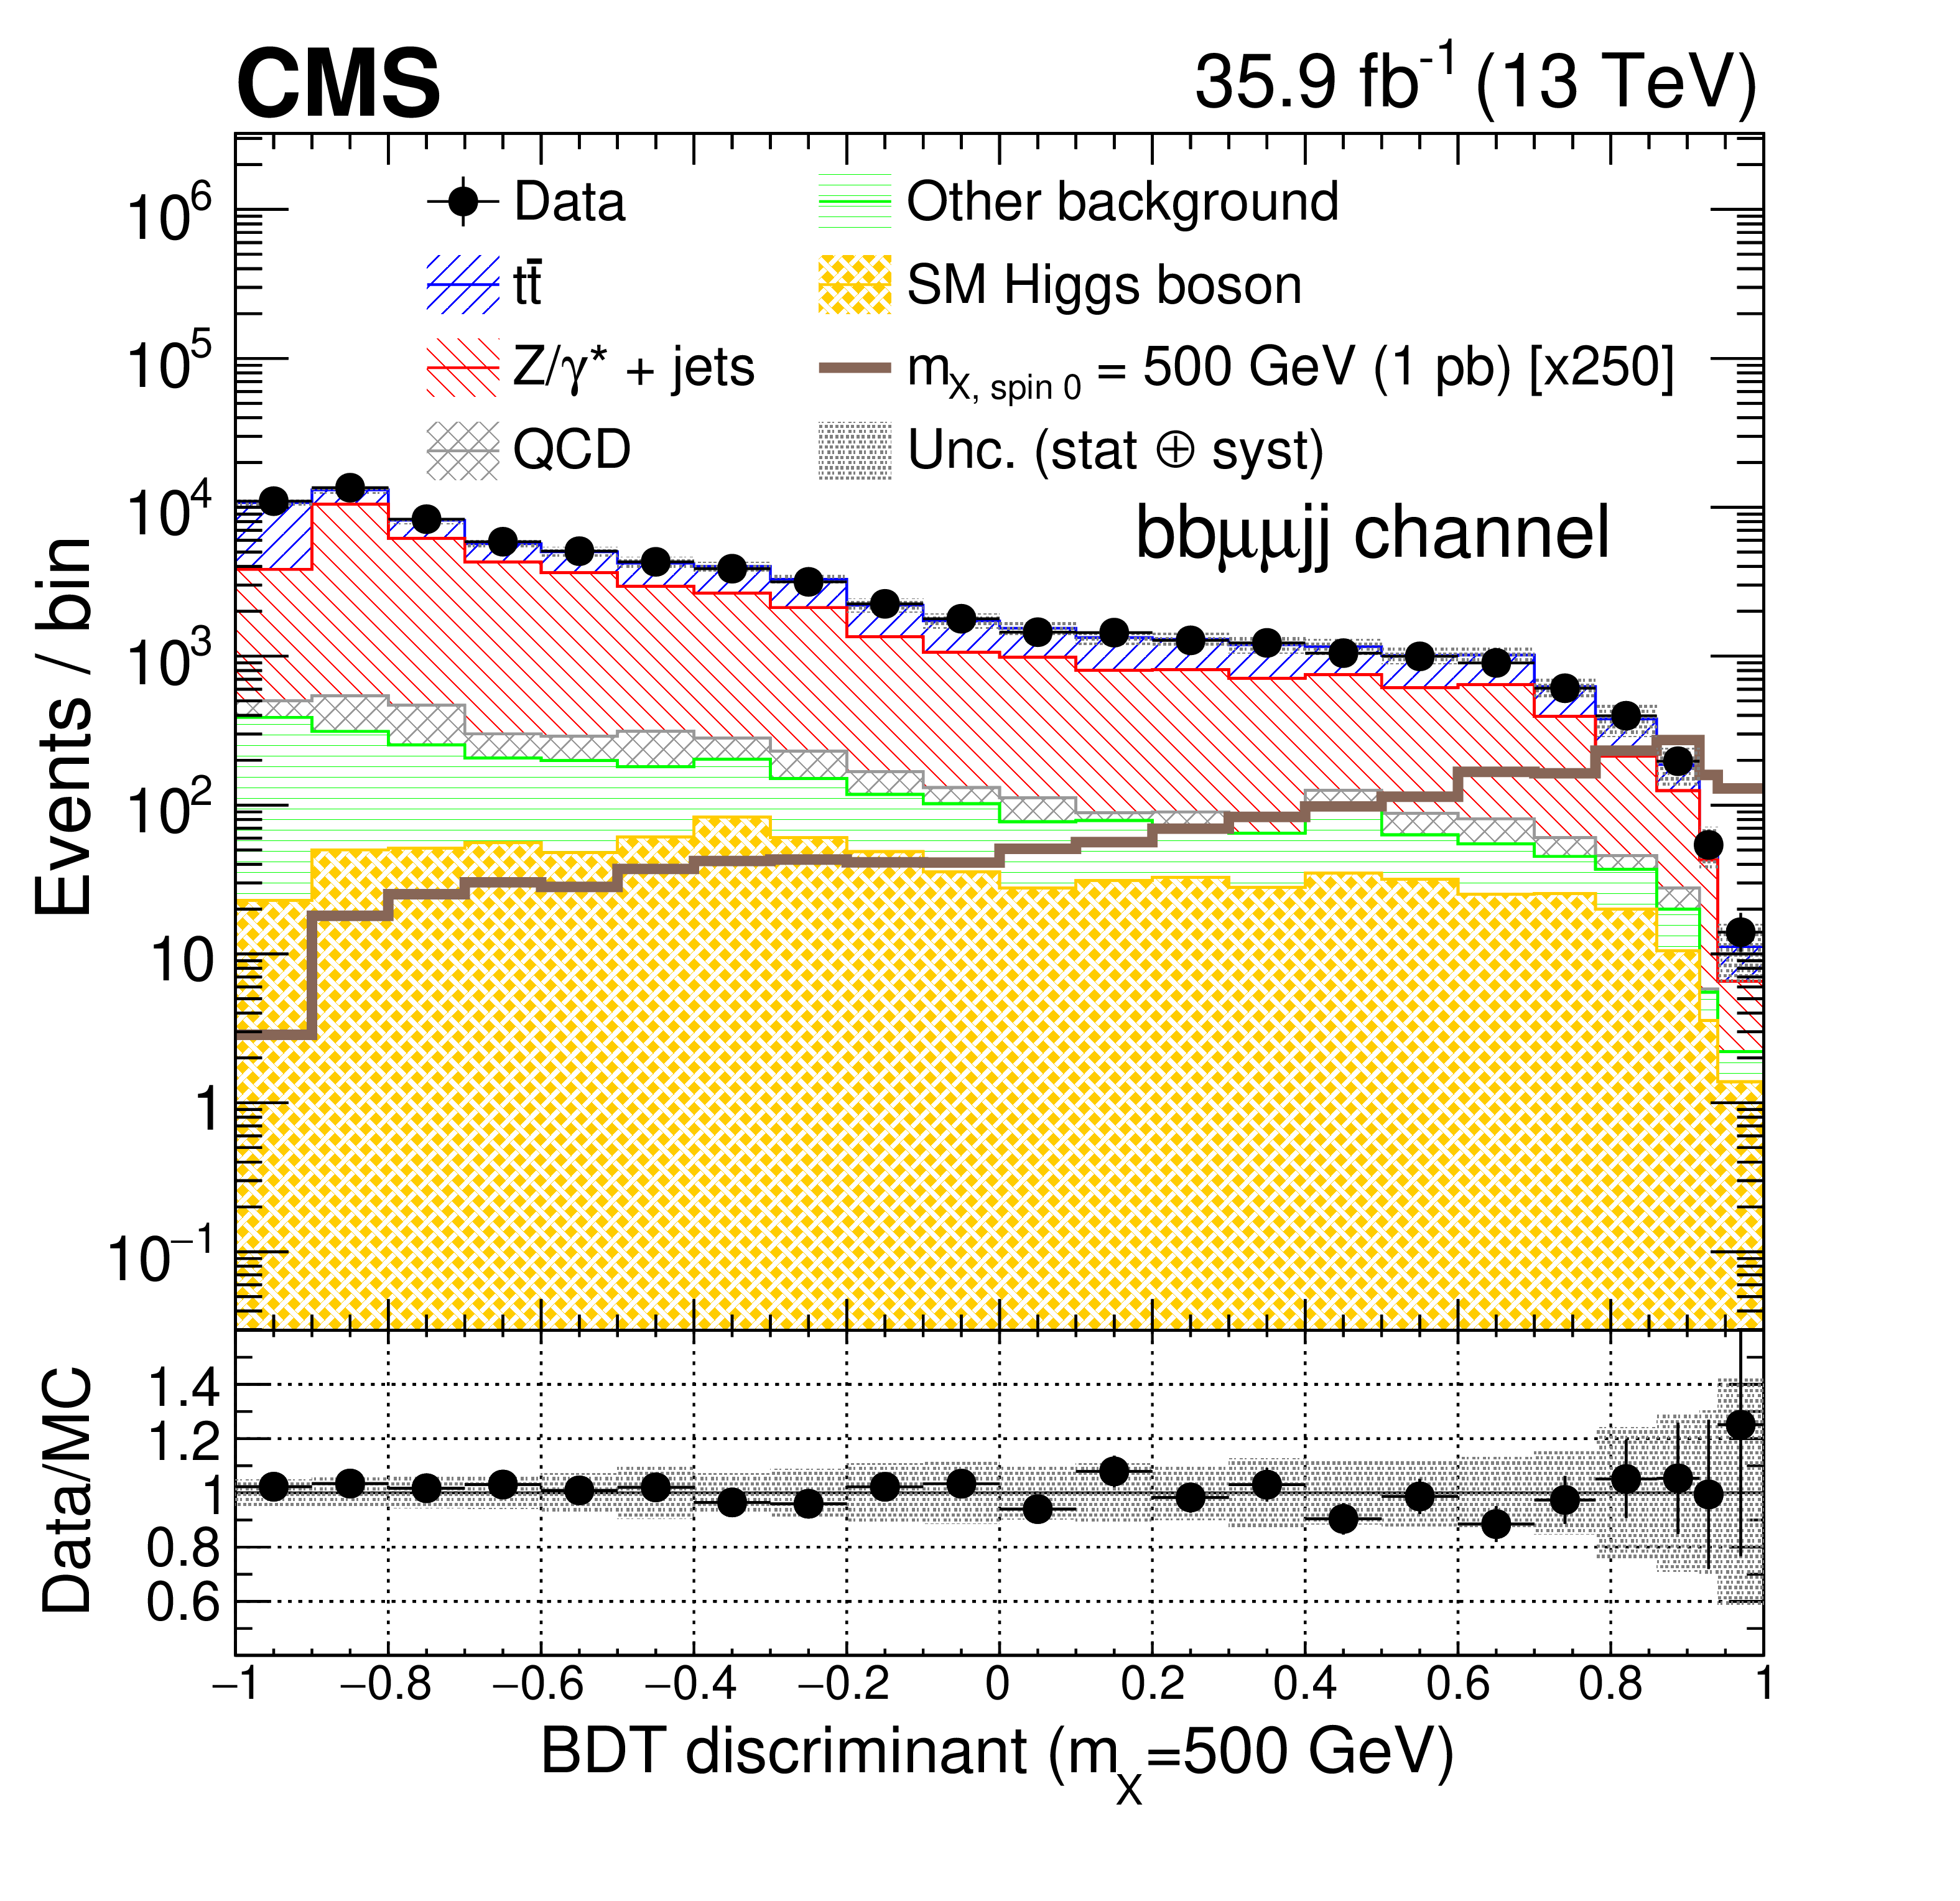
Figure 1-a:
Comparison of the BDT discriminant for $m_\mathrm {X} =$ 500 GeV after the final selection in the ${\mathrm{b} \mathrm{b} \mu\mu \mathrm {jj}}$ channel. The signals of an RS1 radion with mass of 500 GeV are normalized to a cross section of 1 pb for the ${\mathrm{p}} {\mathrm{p}} \to \mathrm {X}\to \mathrm{h} \mathrm{h} $ process. The shaded area represents the combined statistical and systematic uncertainties in the background estimate. |
png pdf |
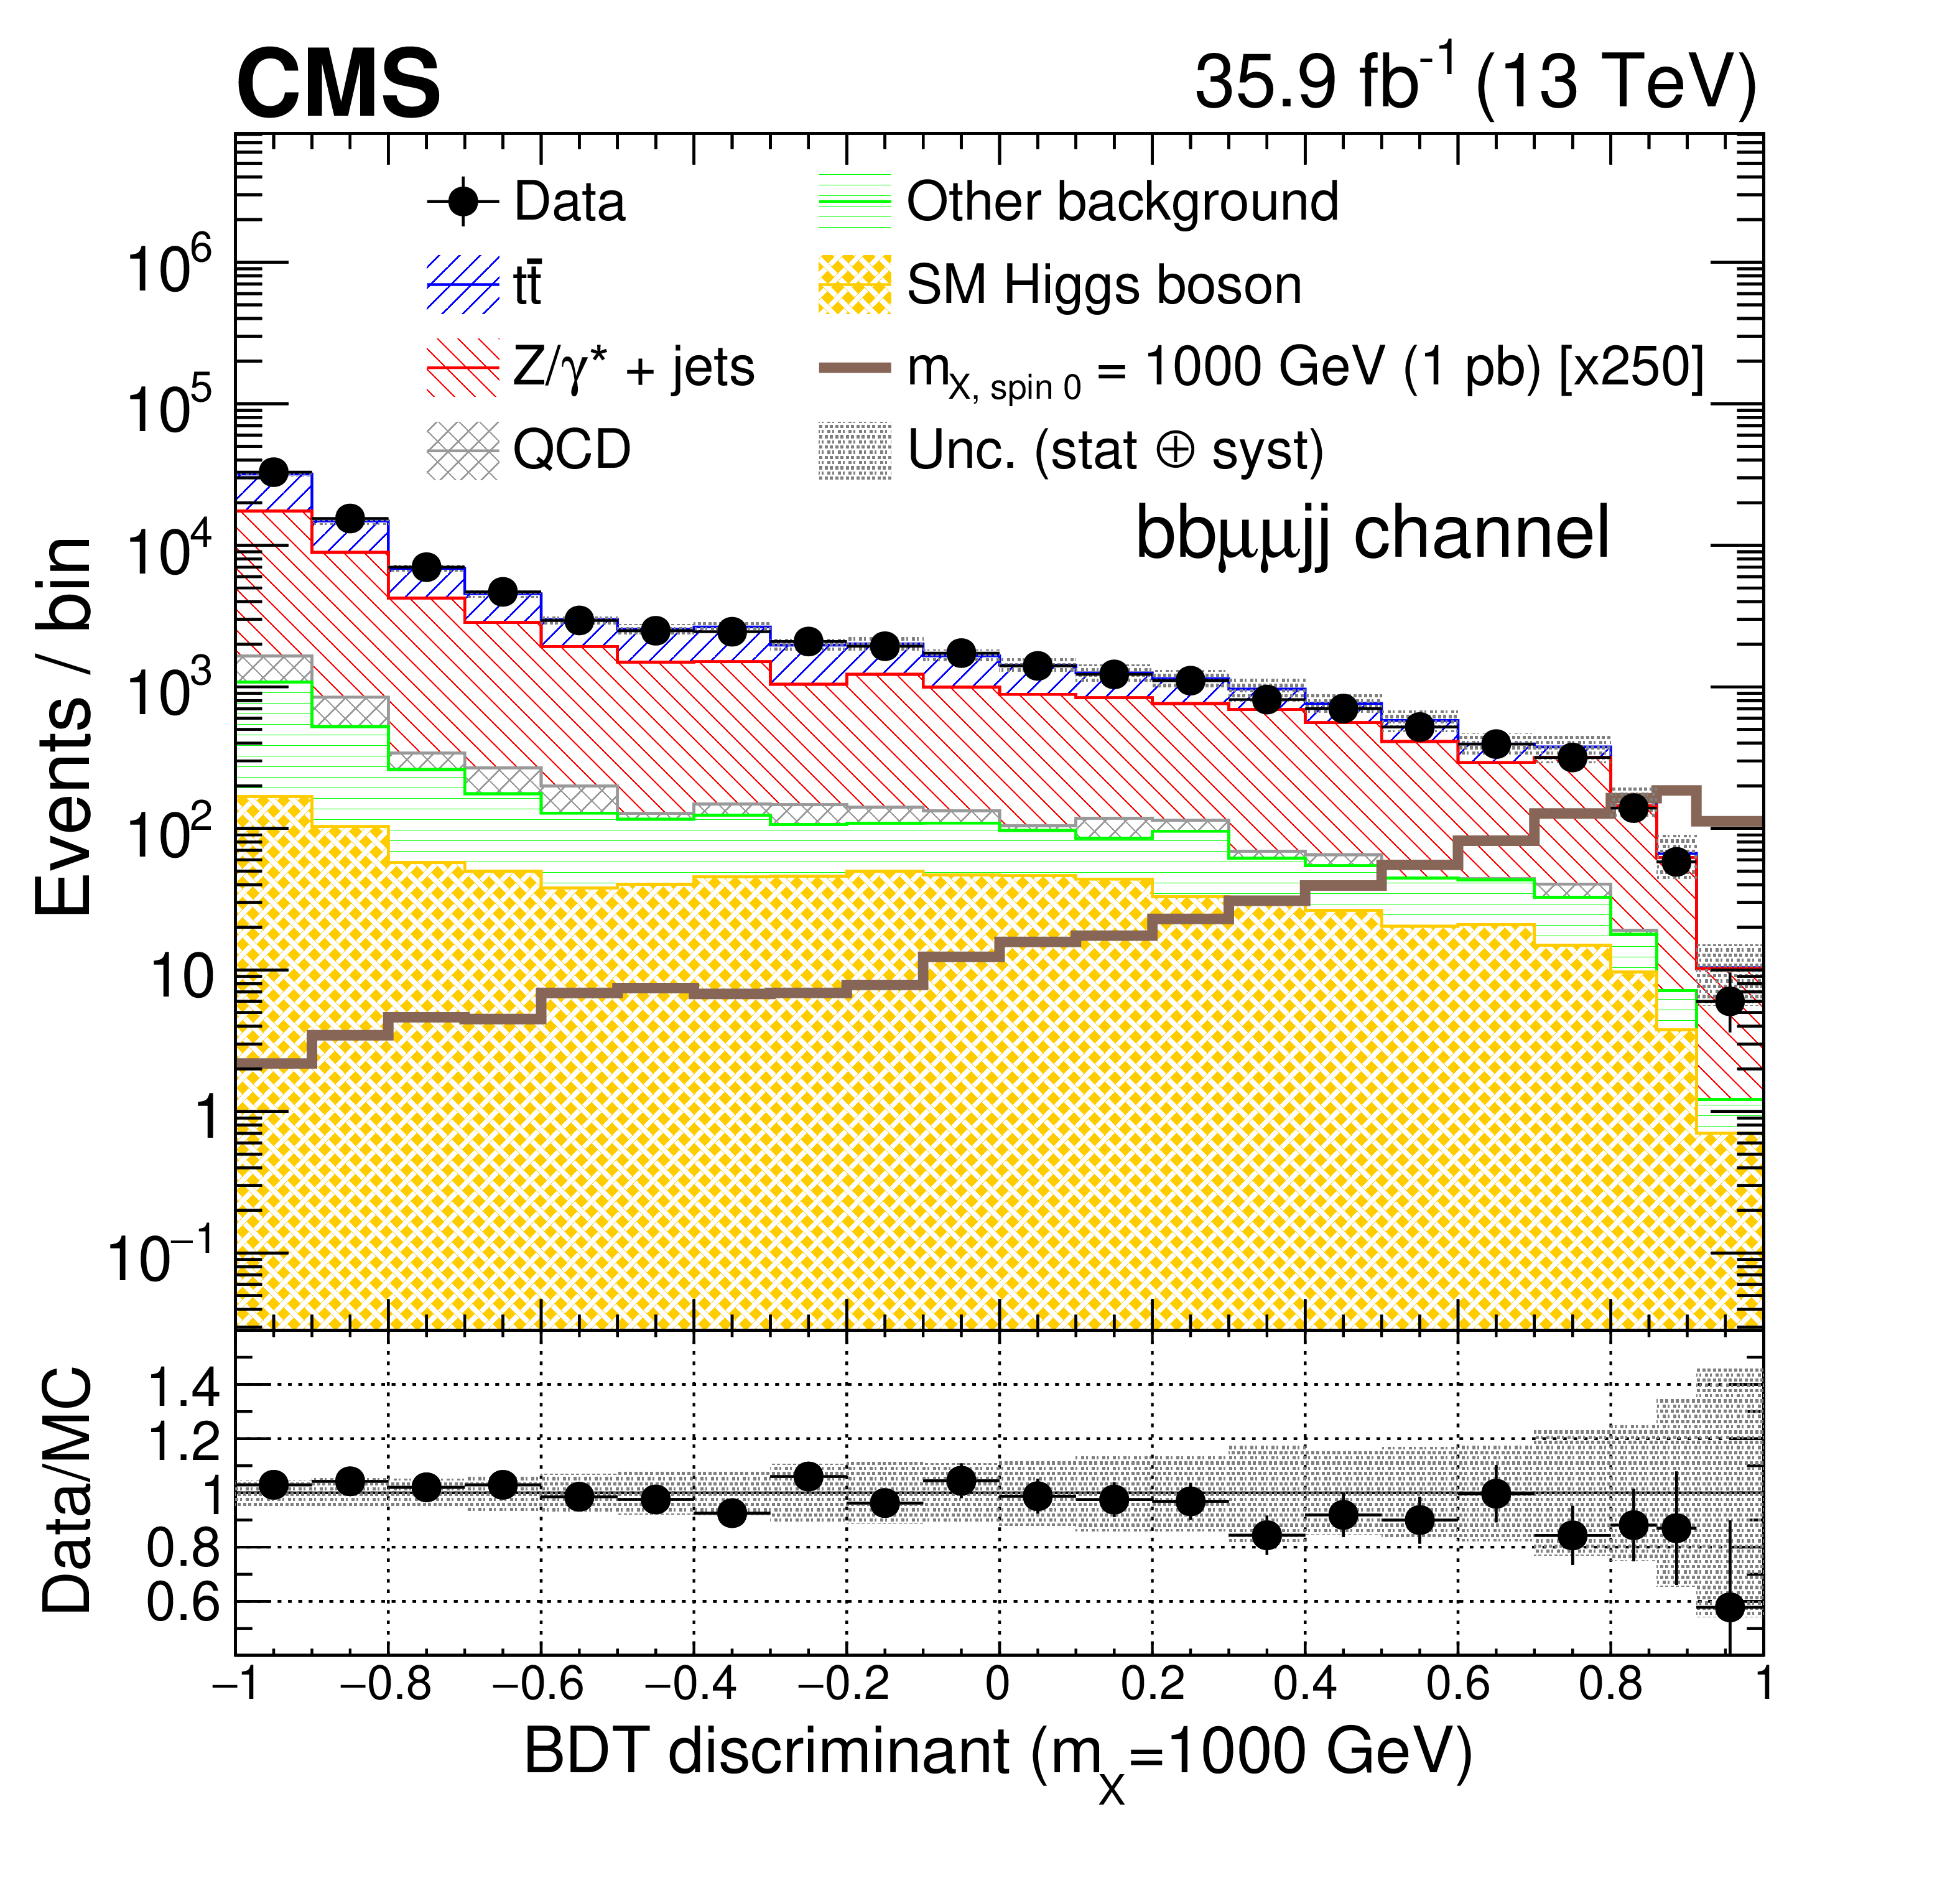
Figure 1-b:
Comparison of the BDT discriminant for $m_\mathrm {X} =$ 1000 GeV after the final selection in the ${\mathrm{b} \mathrm{b} \mu\mu \mathrm {jj}}$ channel. The signals of an RS1 radion with mass of 1000 GeV are normalized to a cross section of 1 pb for the ${\mathrm{p}} {\mathrm{p}} \to \mathrm {X}\to \mathrm{h} \mathrm{h} $ process. The shaded area represents the combined statistical and systematic uncertainties in the background estimate. |
png pdf |
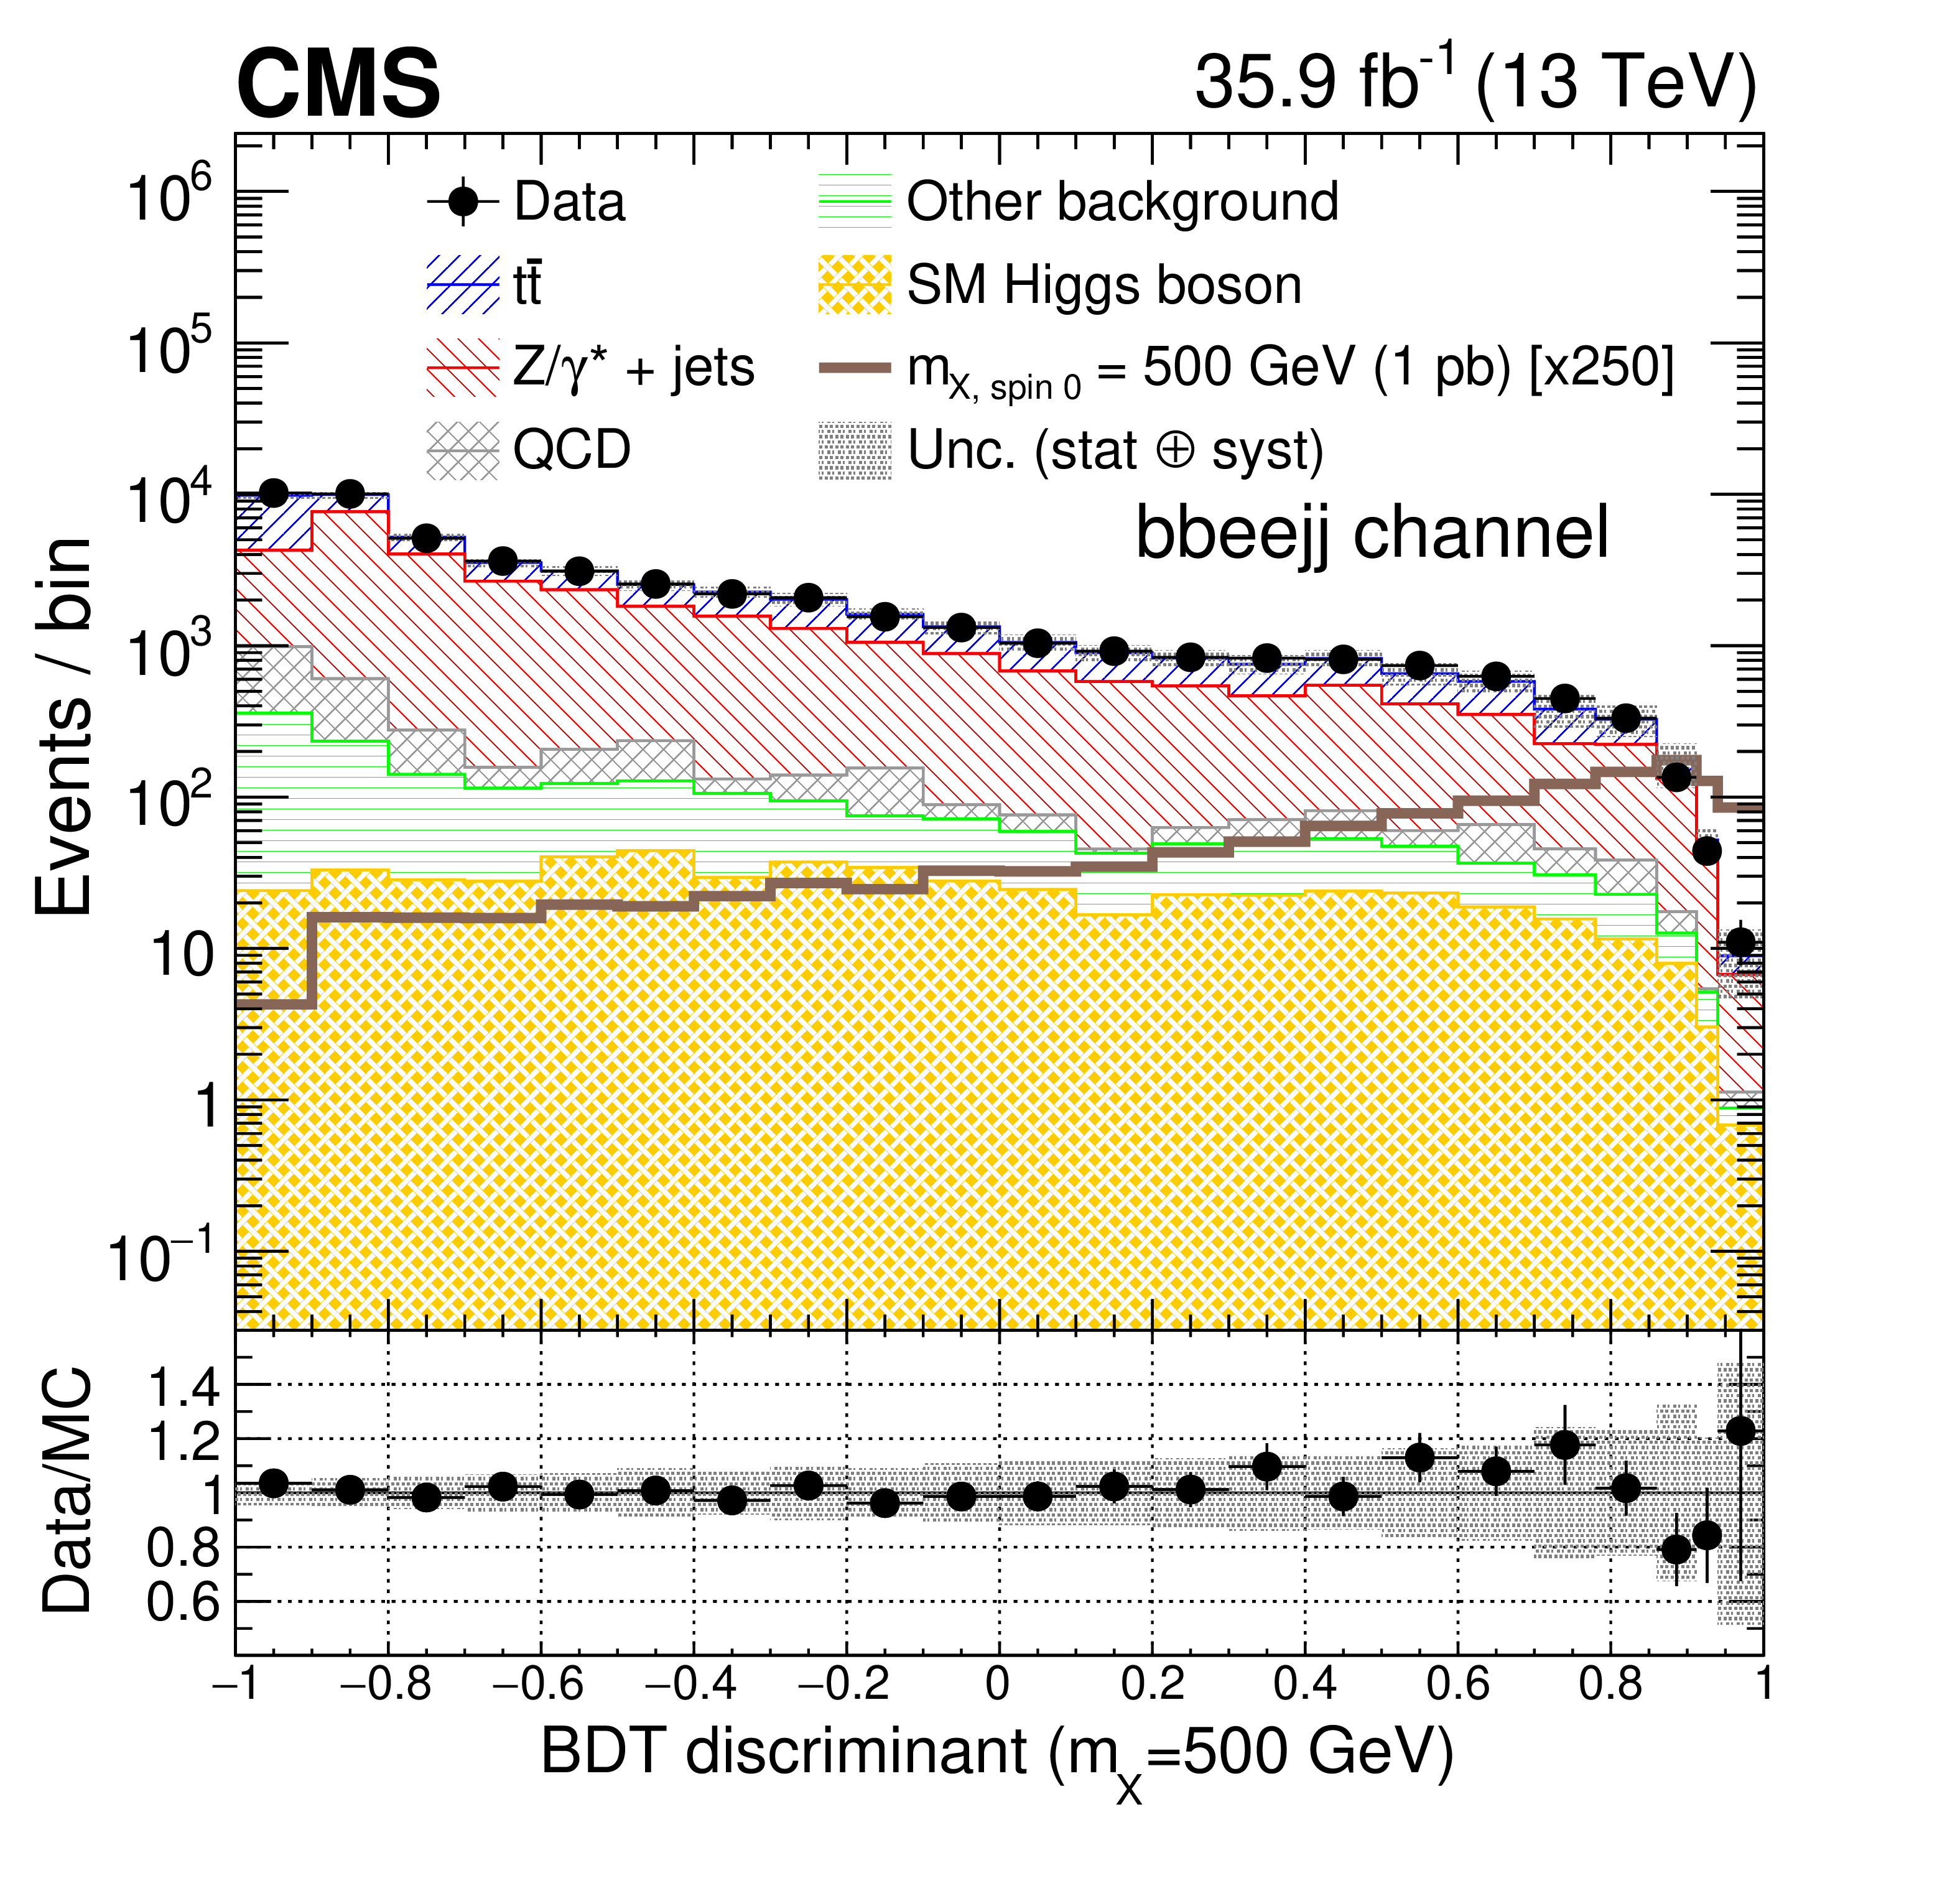
Figure 1-c:
Comparison of the BDT discriminant for $m_\mathrm {X} =$ 500 GeV after the final selection in the ${\mathrm{b} \mathrm{b} \mathrm{ee} \mathrm {jj}}$ channel. The signals of an RS1 radion with mass of 500 GeV are normalized to a cross section of 1 pb for the ${\mathrm{p}} {\mathrm{p}} \to \mathrm {X}\to \mathrm{h} \mathrm{h} $ process. The shaded area represents the combined statistical and systematic uncertainties in the background estimate. |
png pdf |
Figure 1-d:
Comparison of the BDT discriminant for $m_\mathrm {X} =$ 1000 GeV after the final selection in the ${\mathrm{b} \mathrm{b} \mathrm{ee} \mathrm {jj}}$ channel. The signals of an RS1 radion with mass of 1000 GeV are normalized to a cross section of 1 pb for the ${\mathrm{p}} {\mathrm{p}} \to \mathrm {X}\to \mathrm{h} \mathrm{h} $ process. The shaded area represents the combined statistical and systematic uncertainties in the background estimate. |
png pdf |
Figure 2:
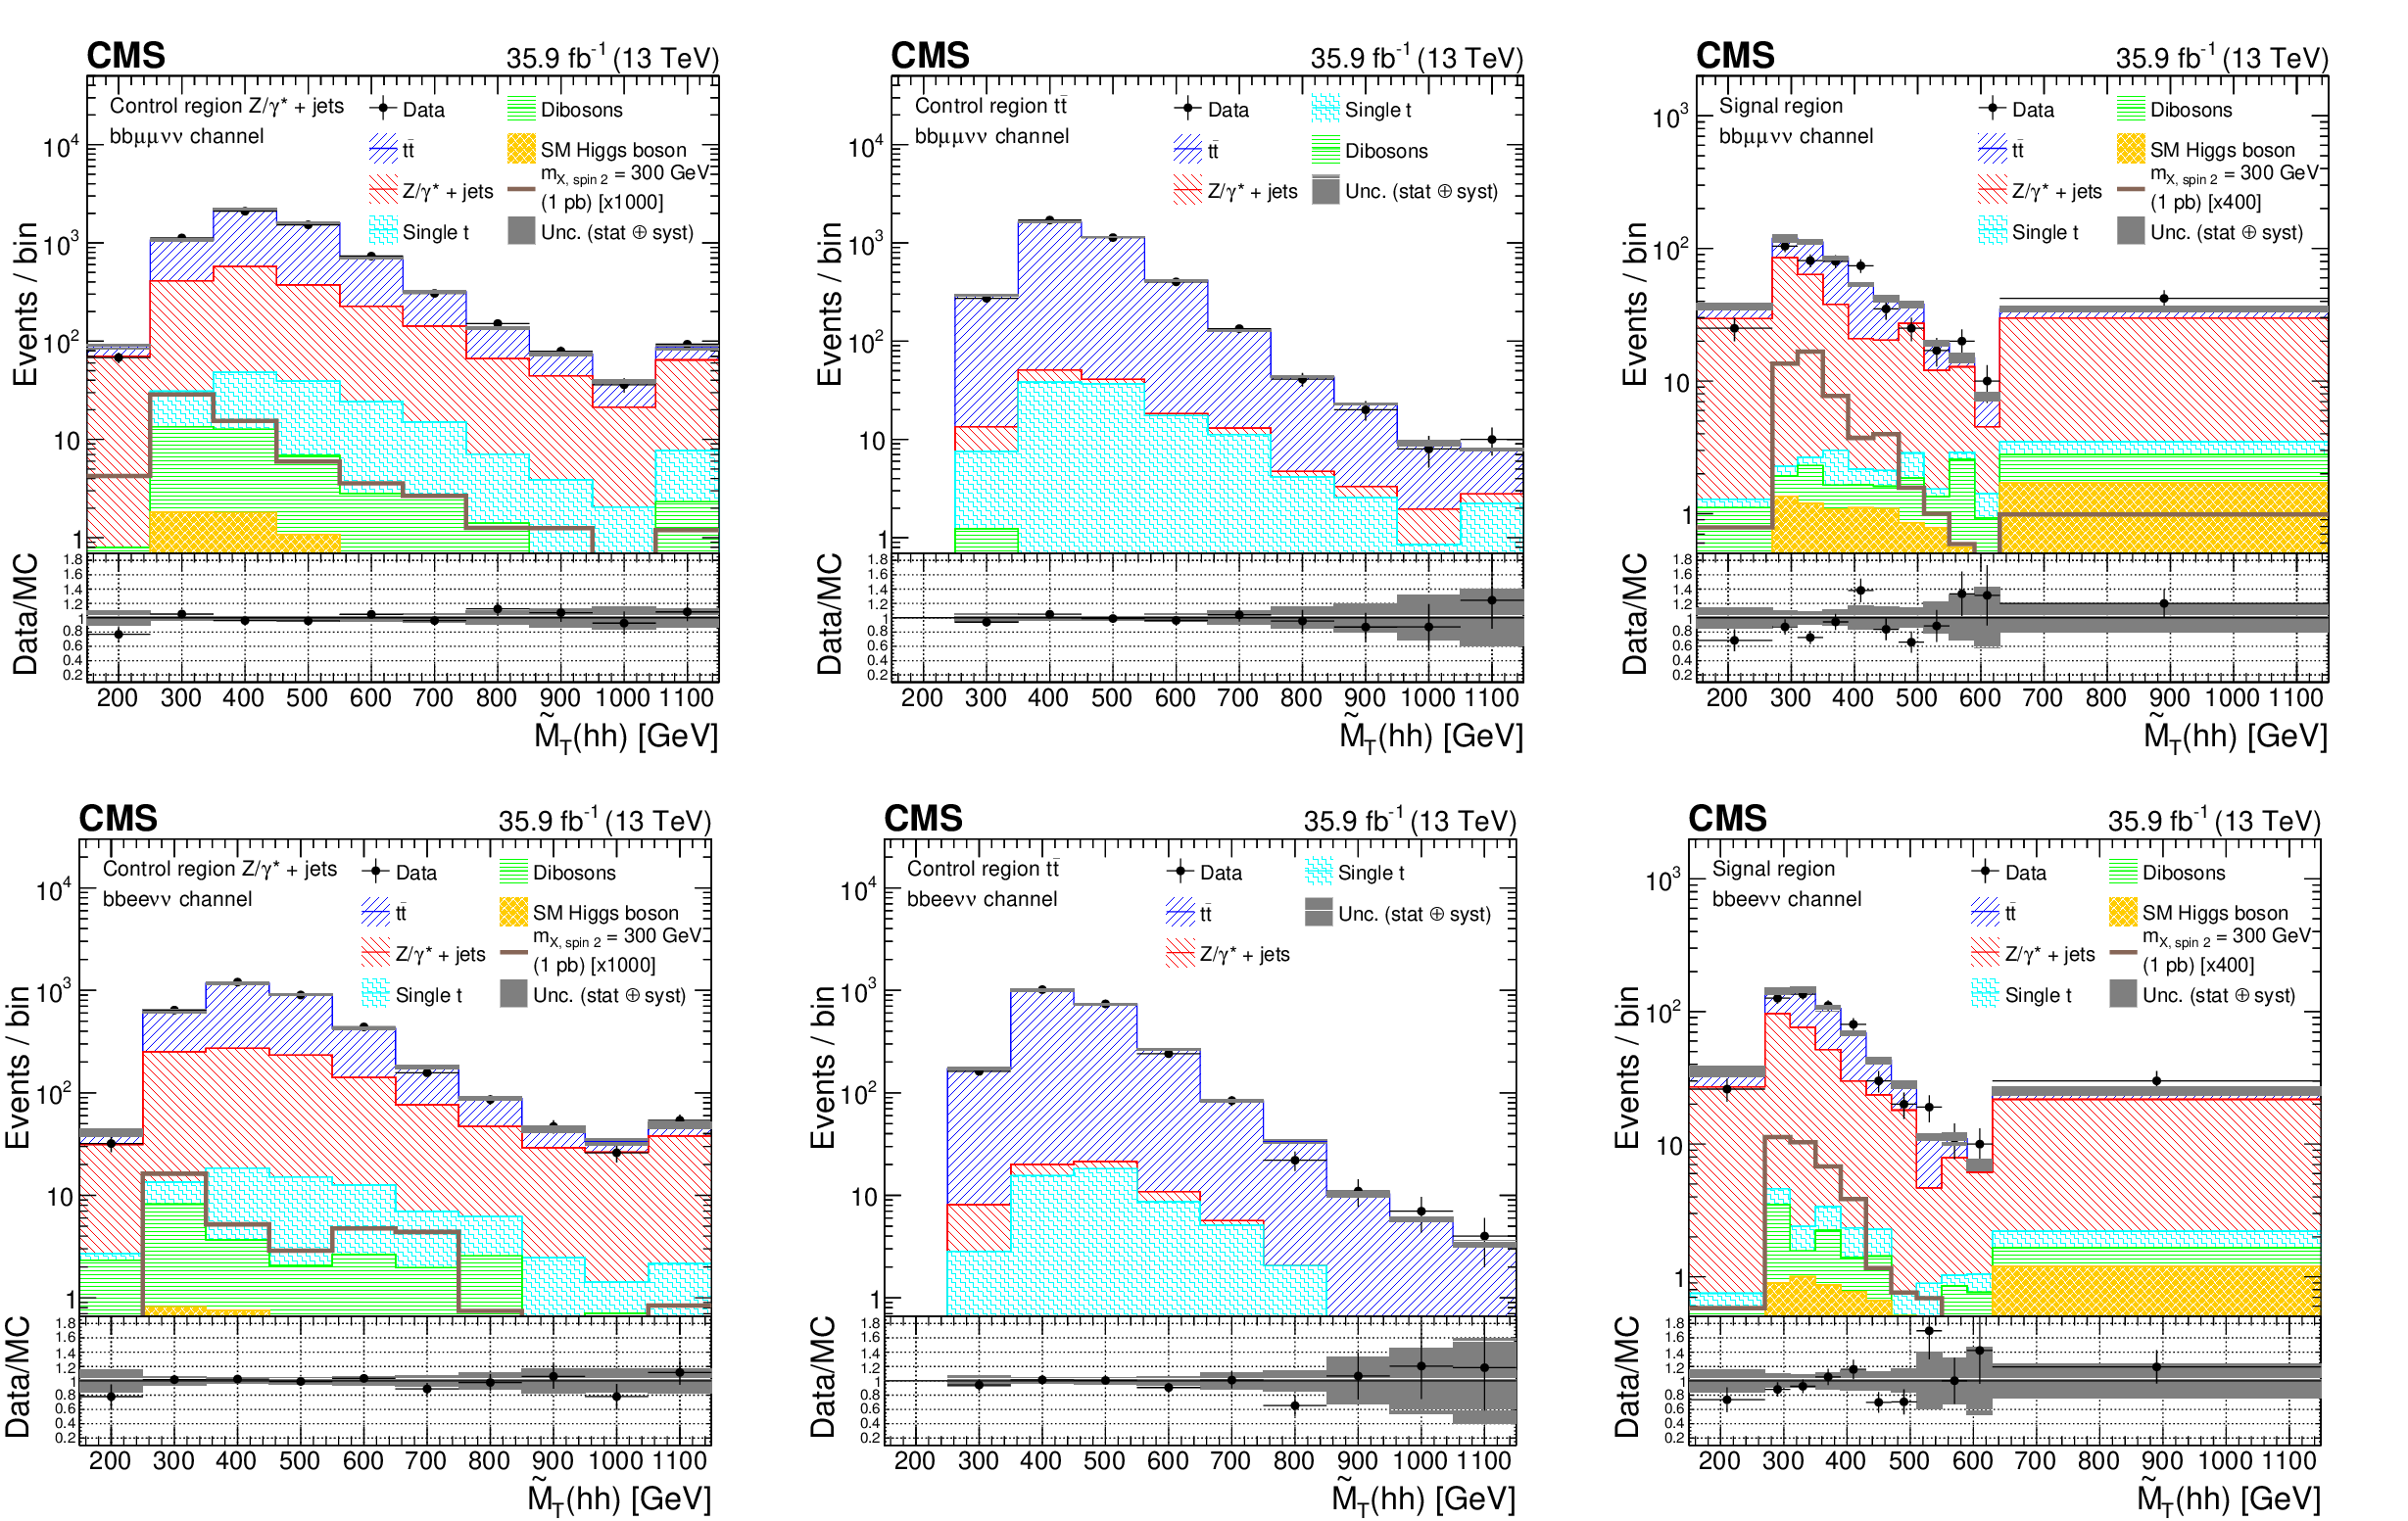
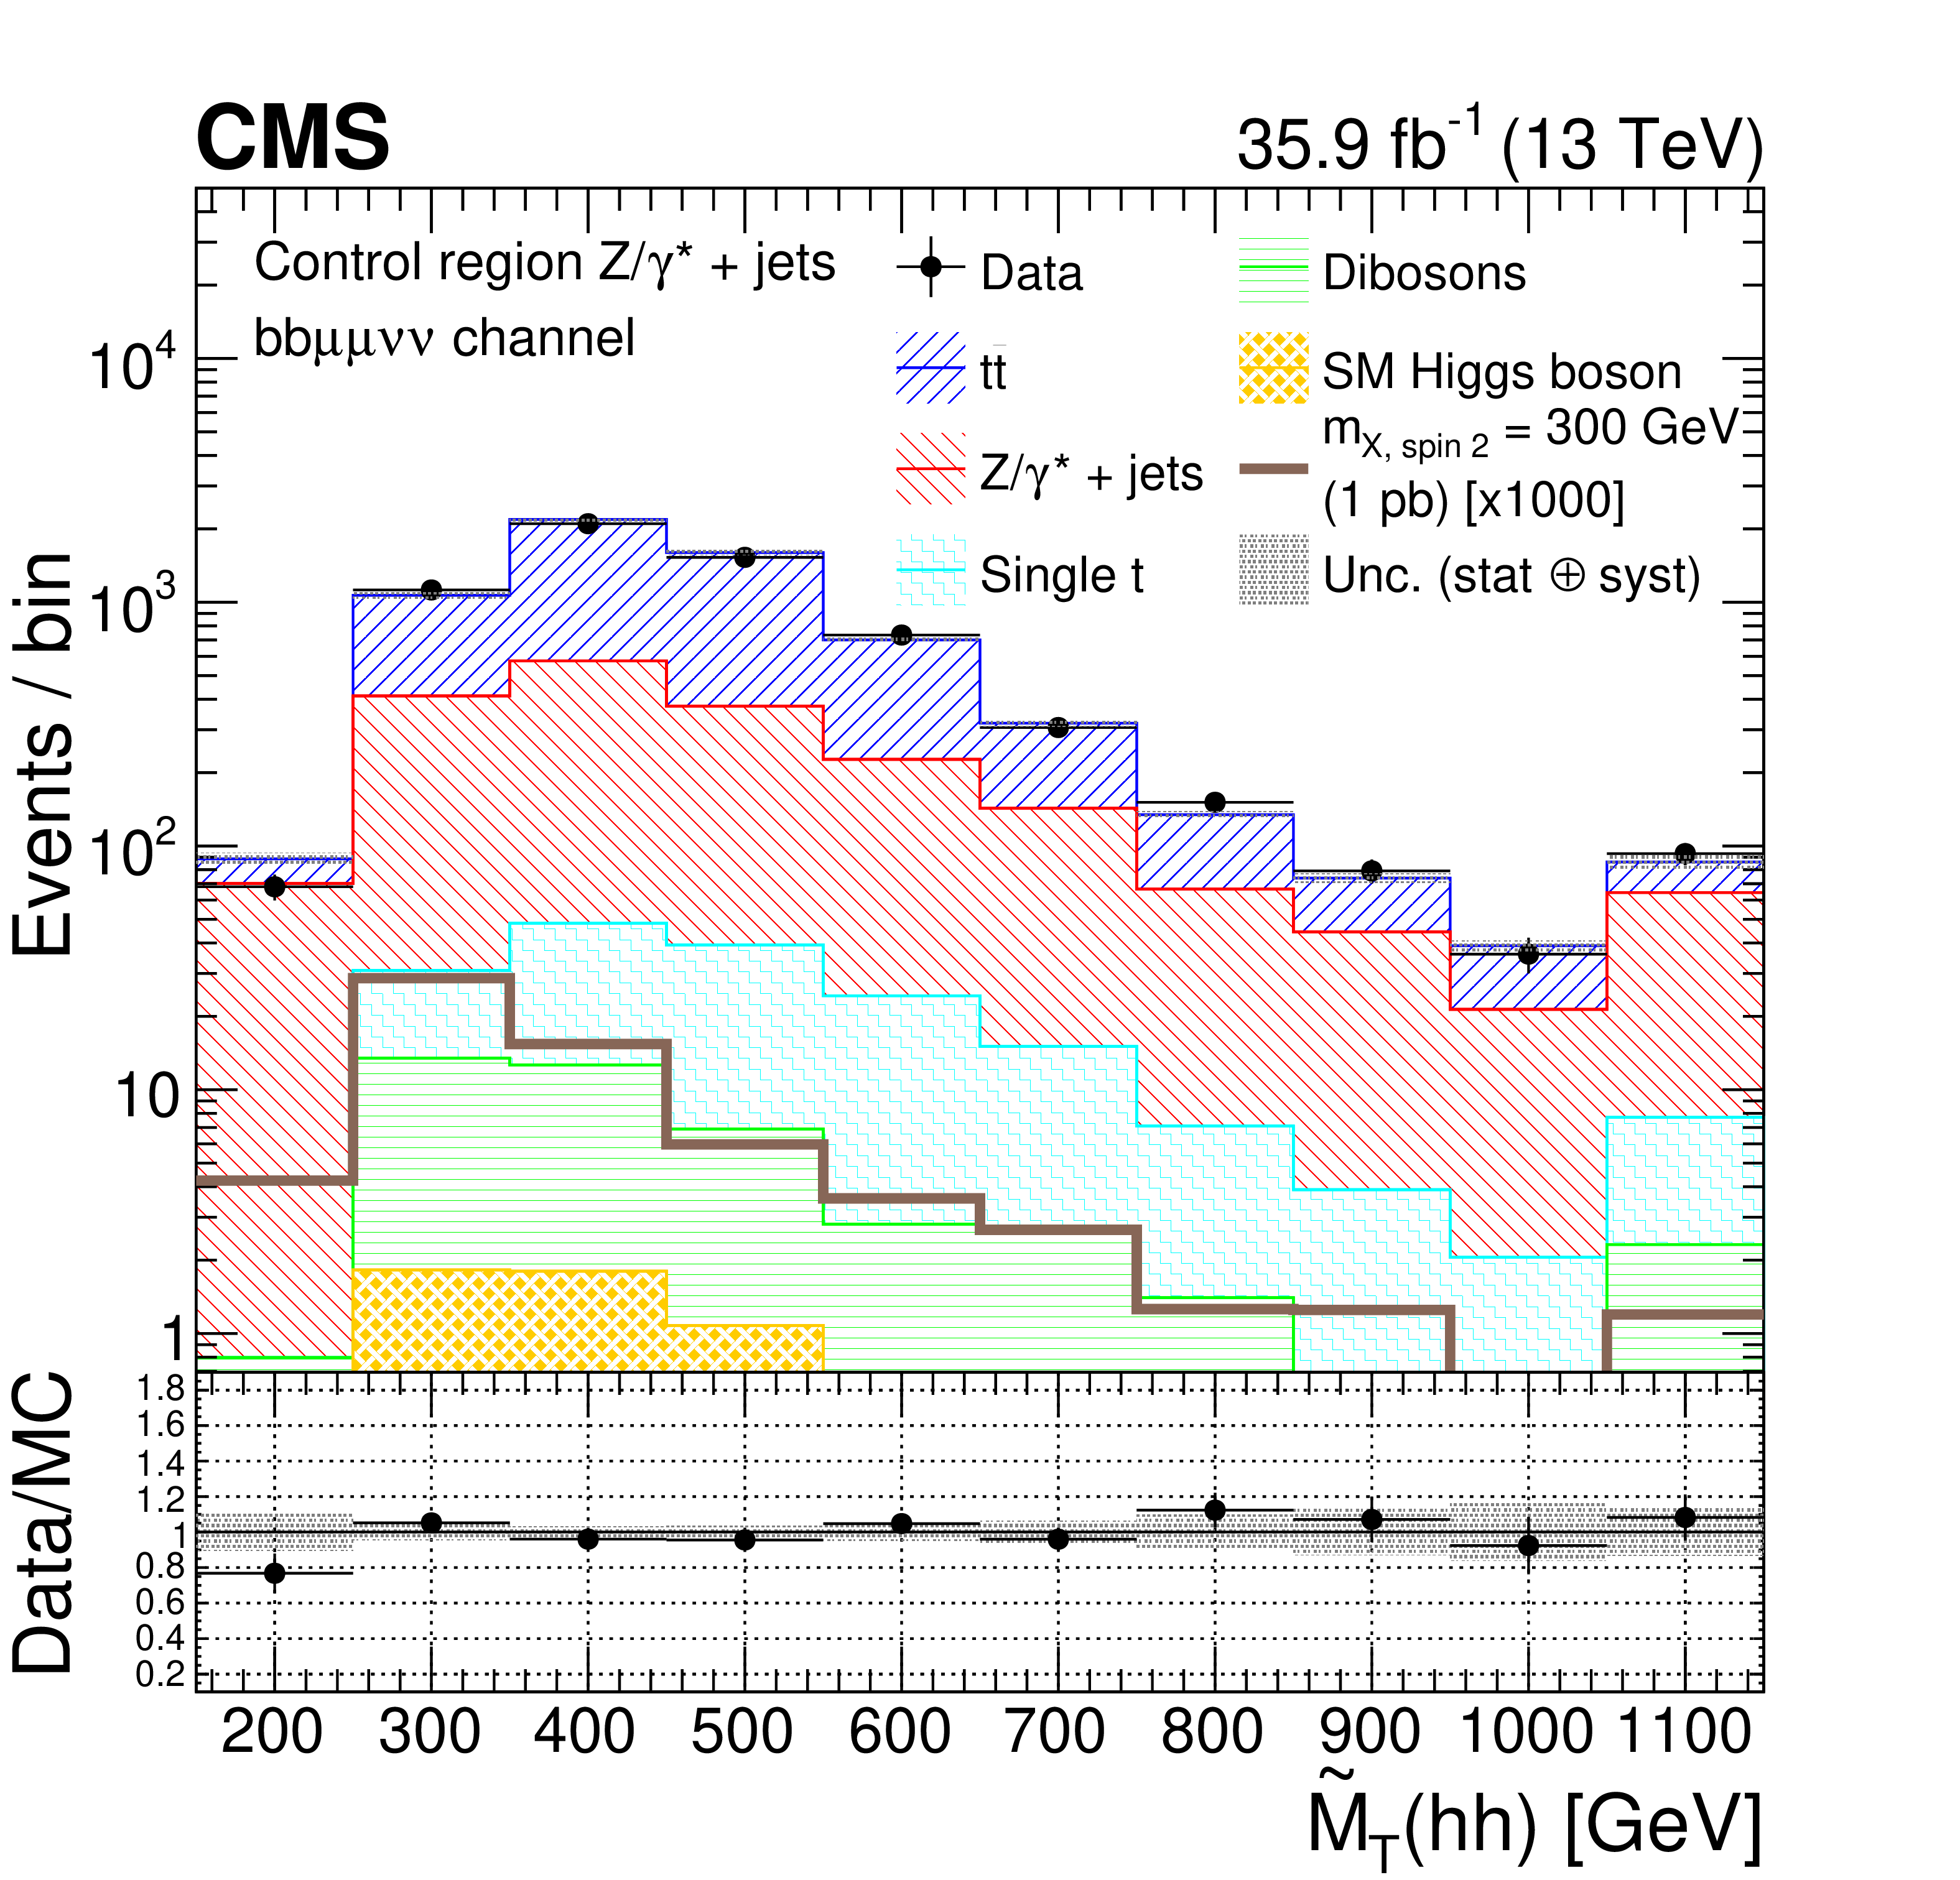
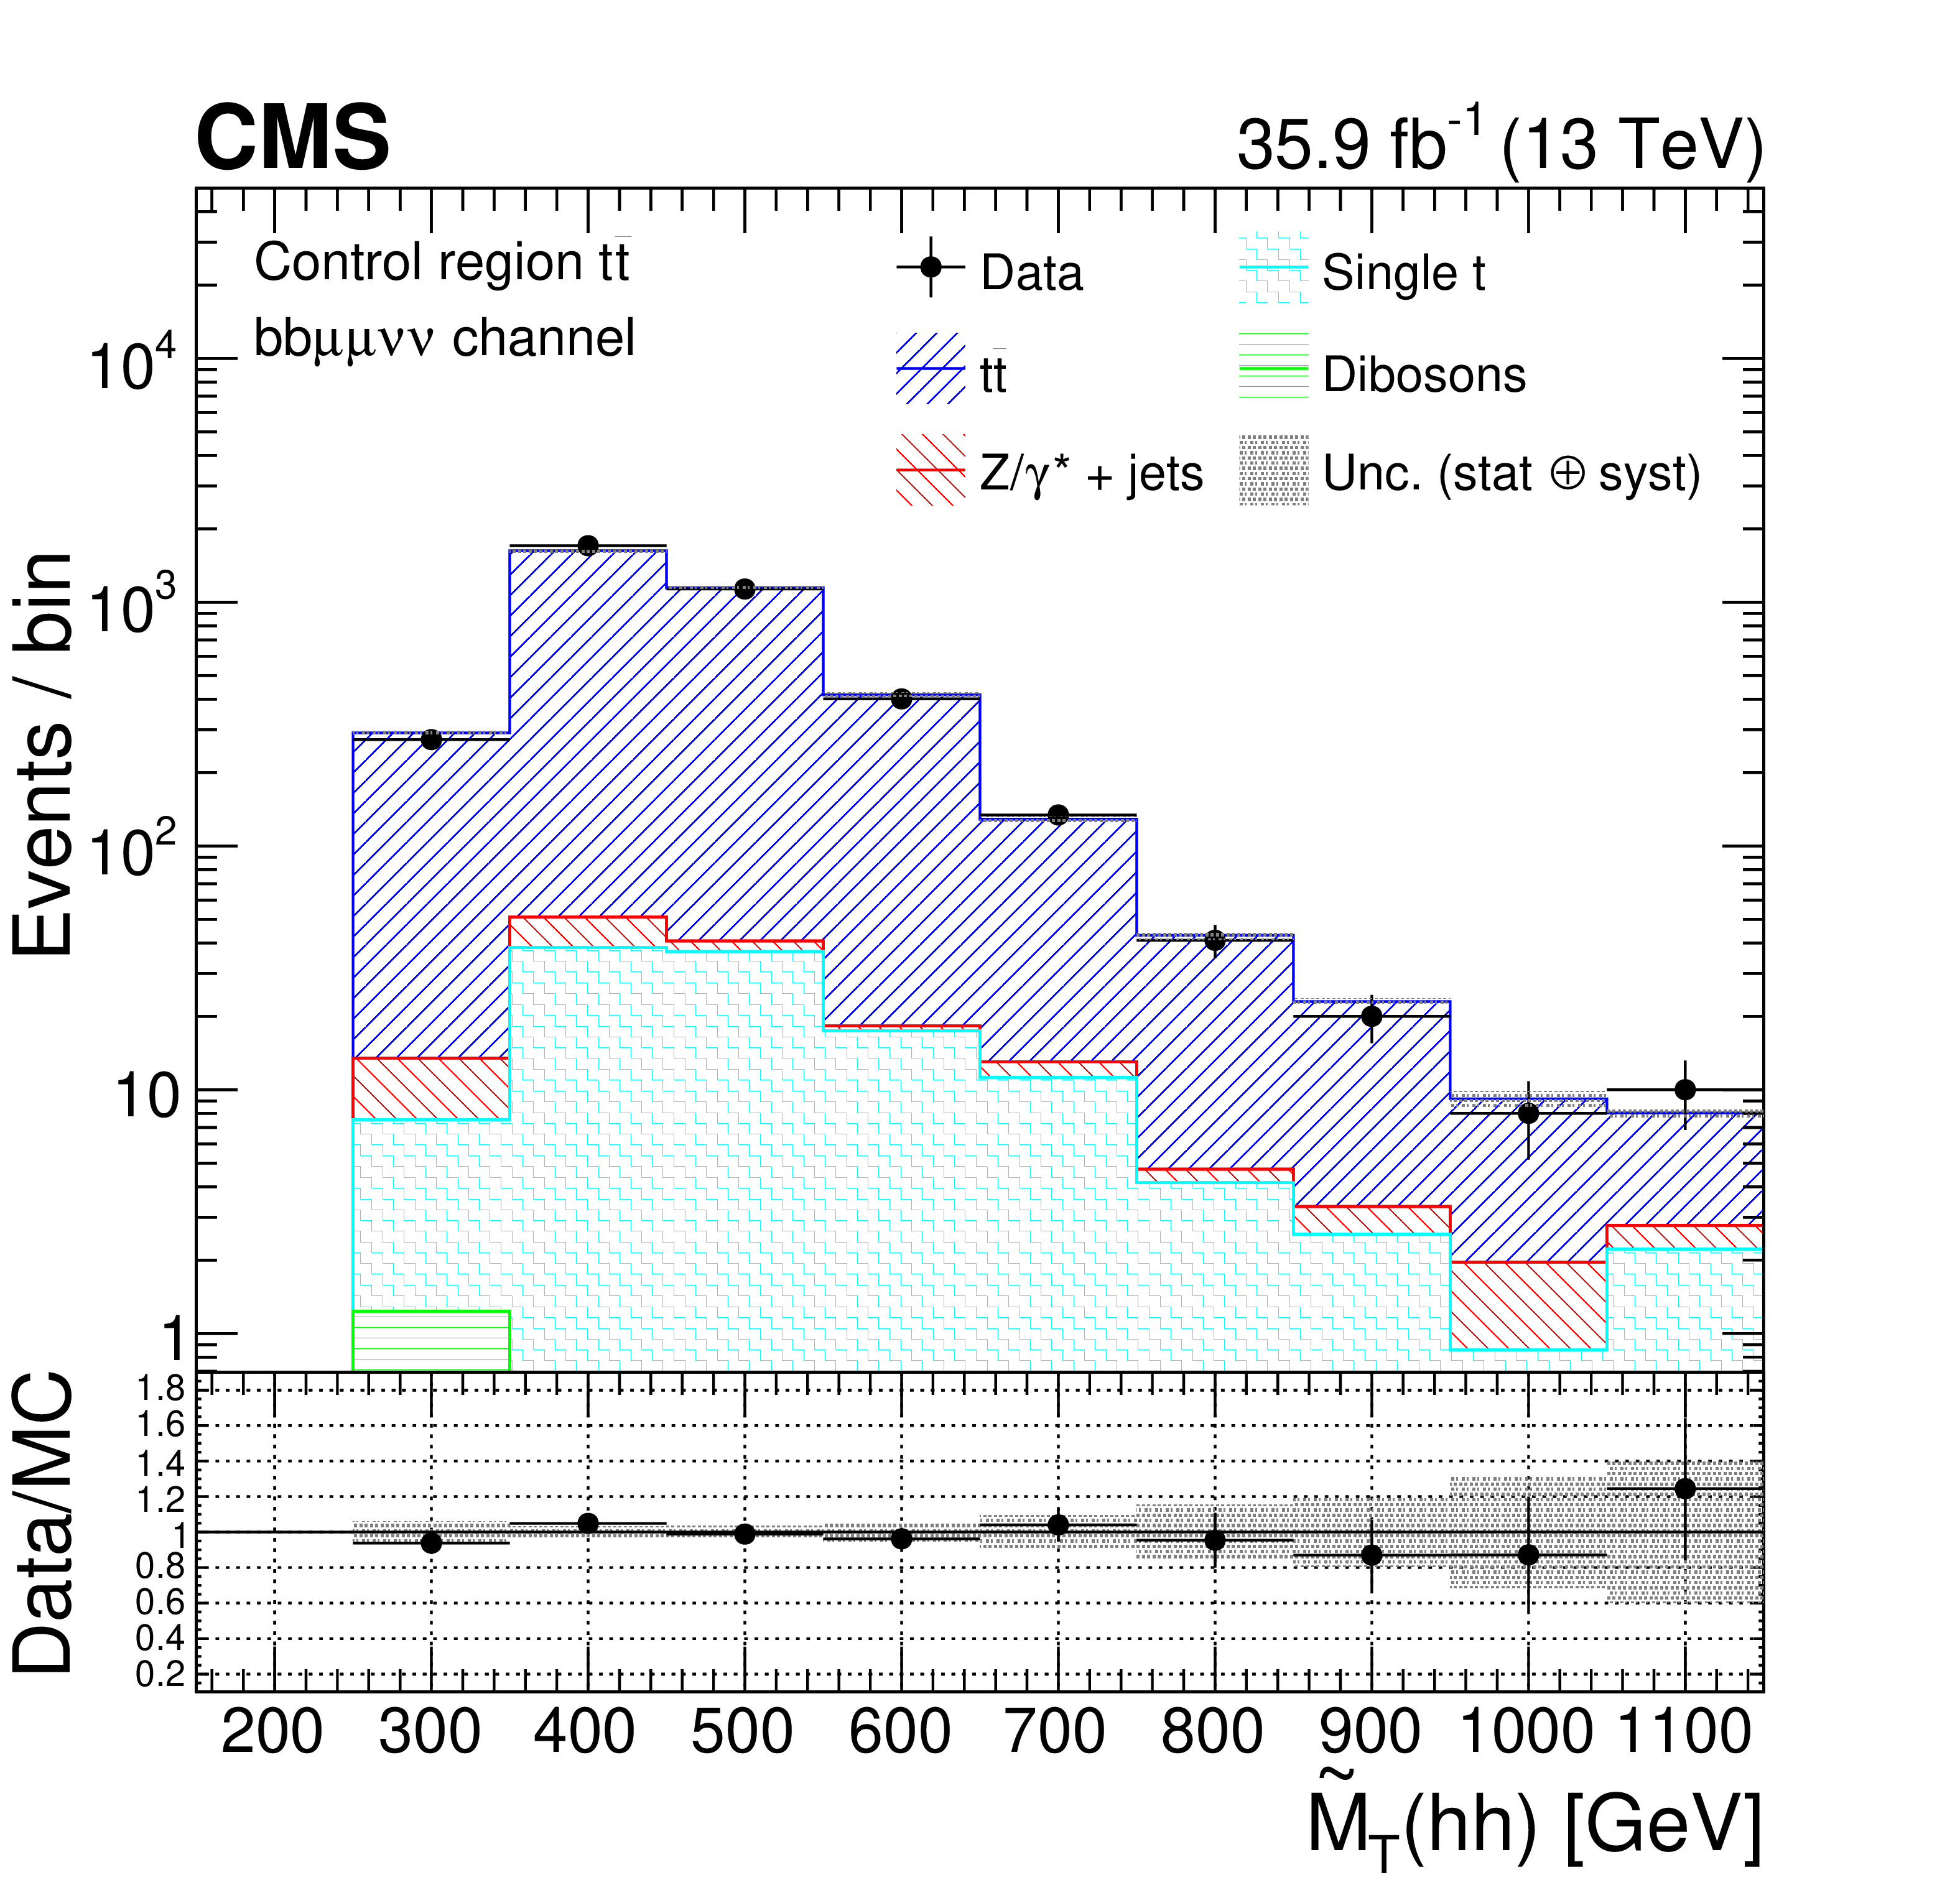
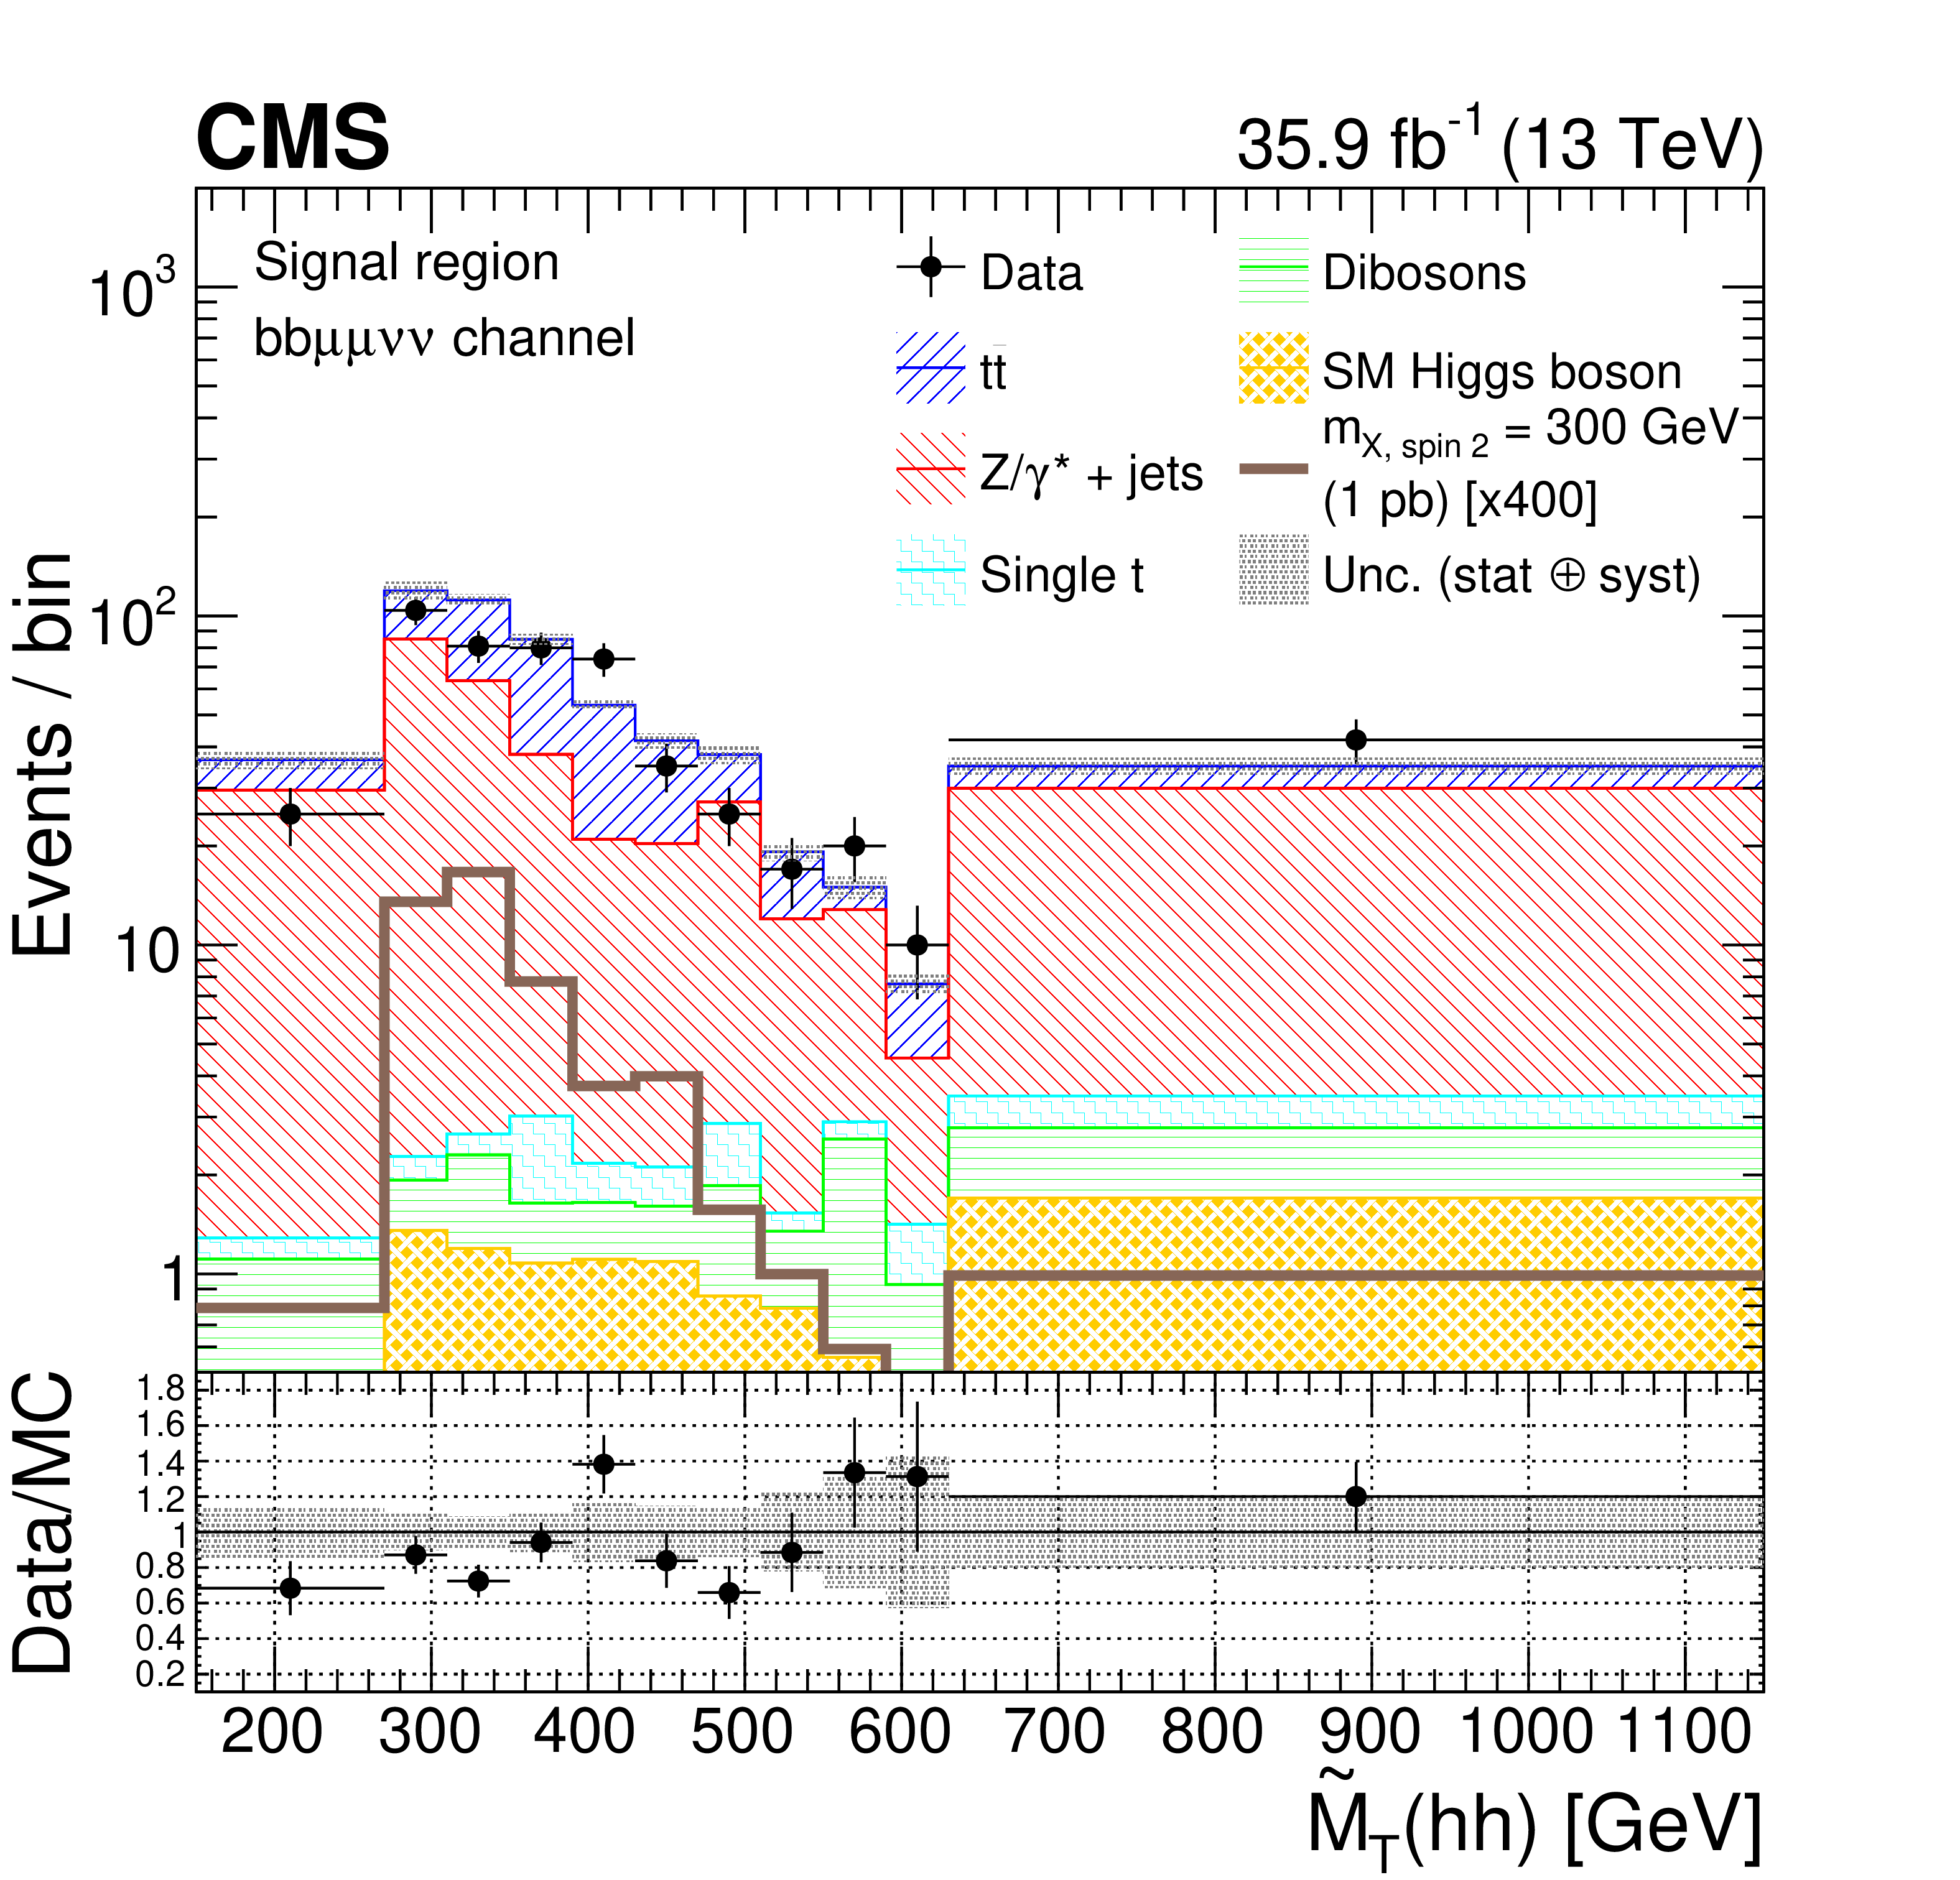
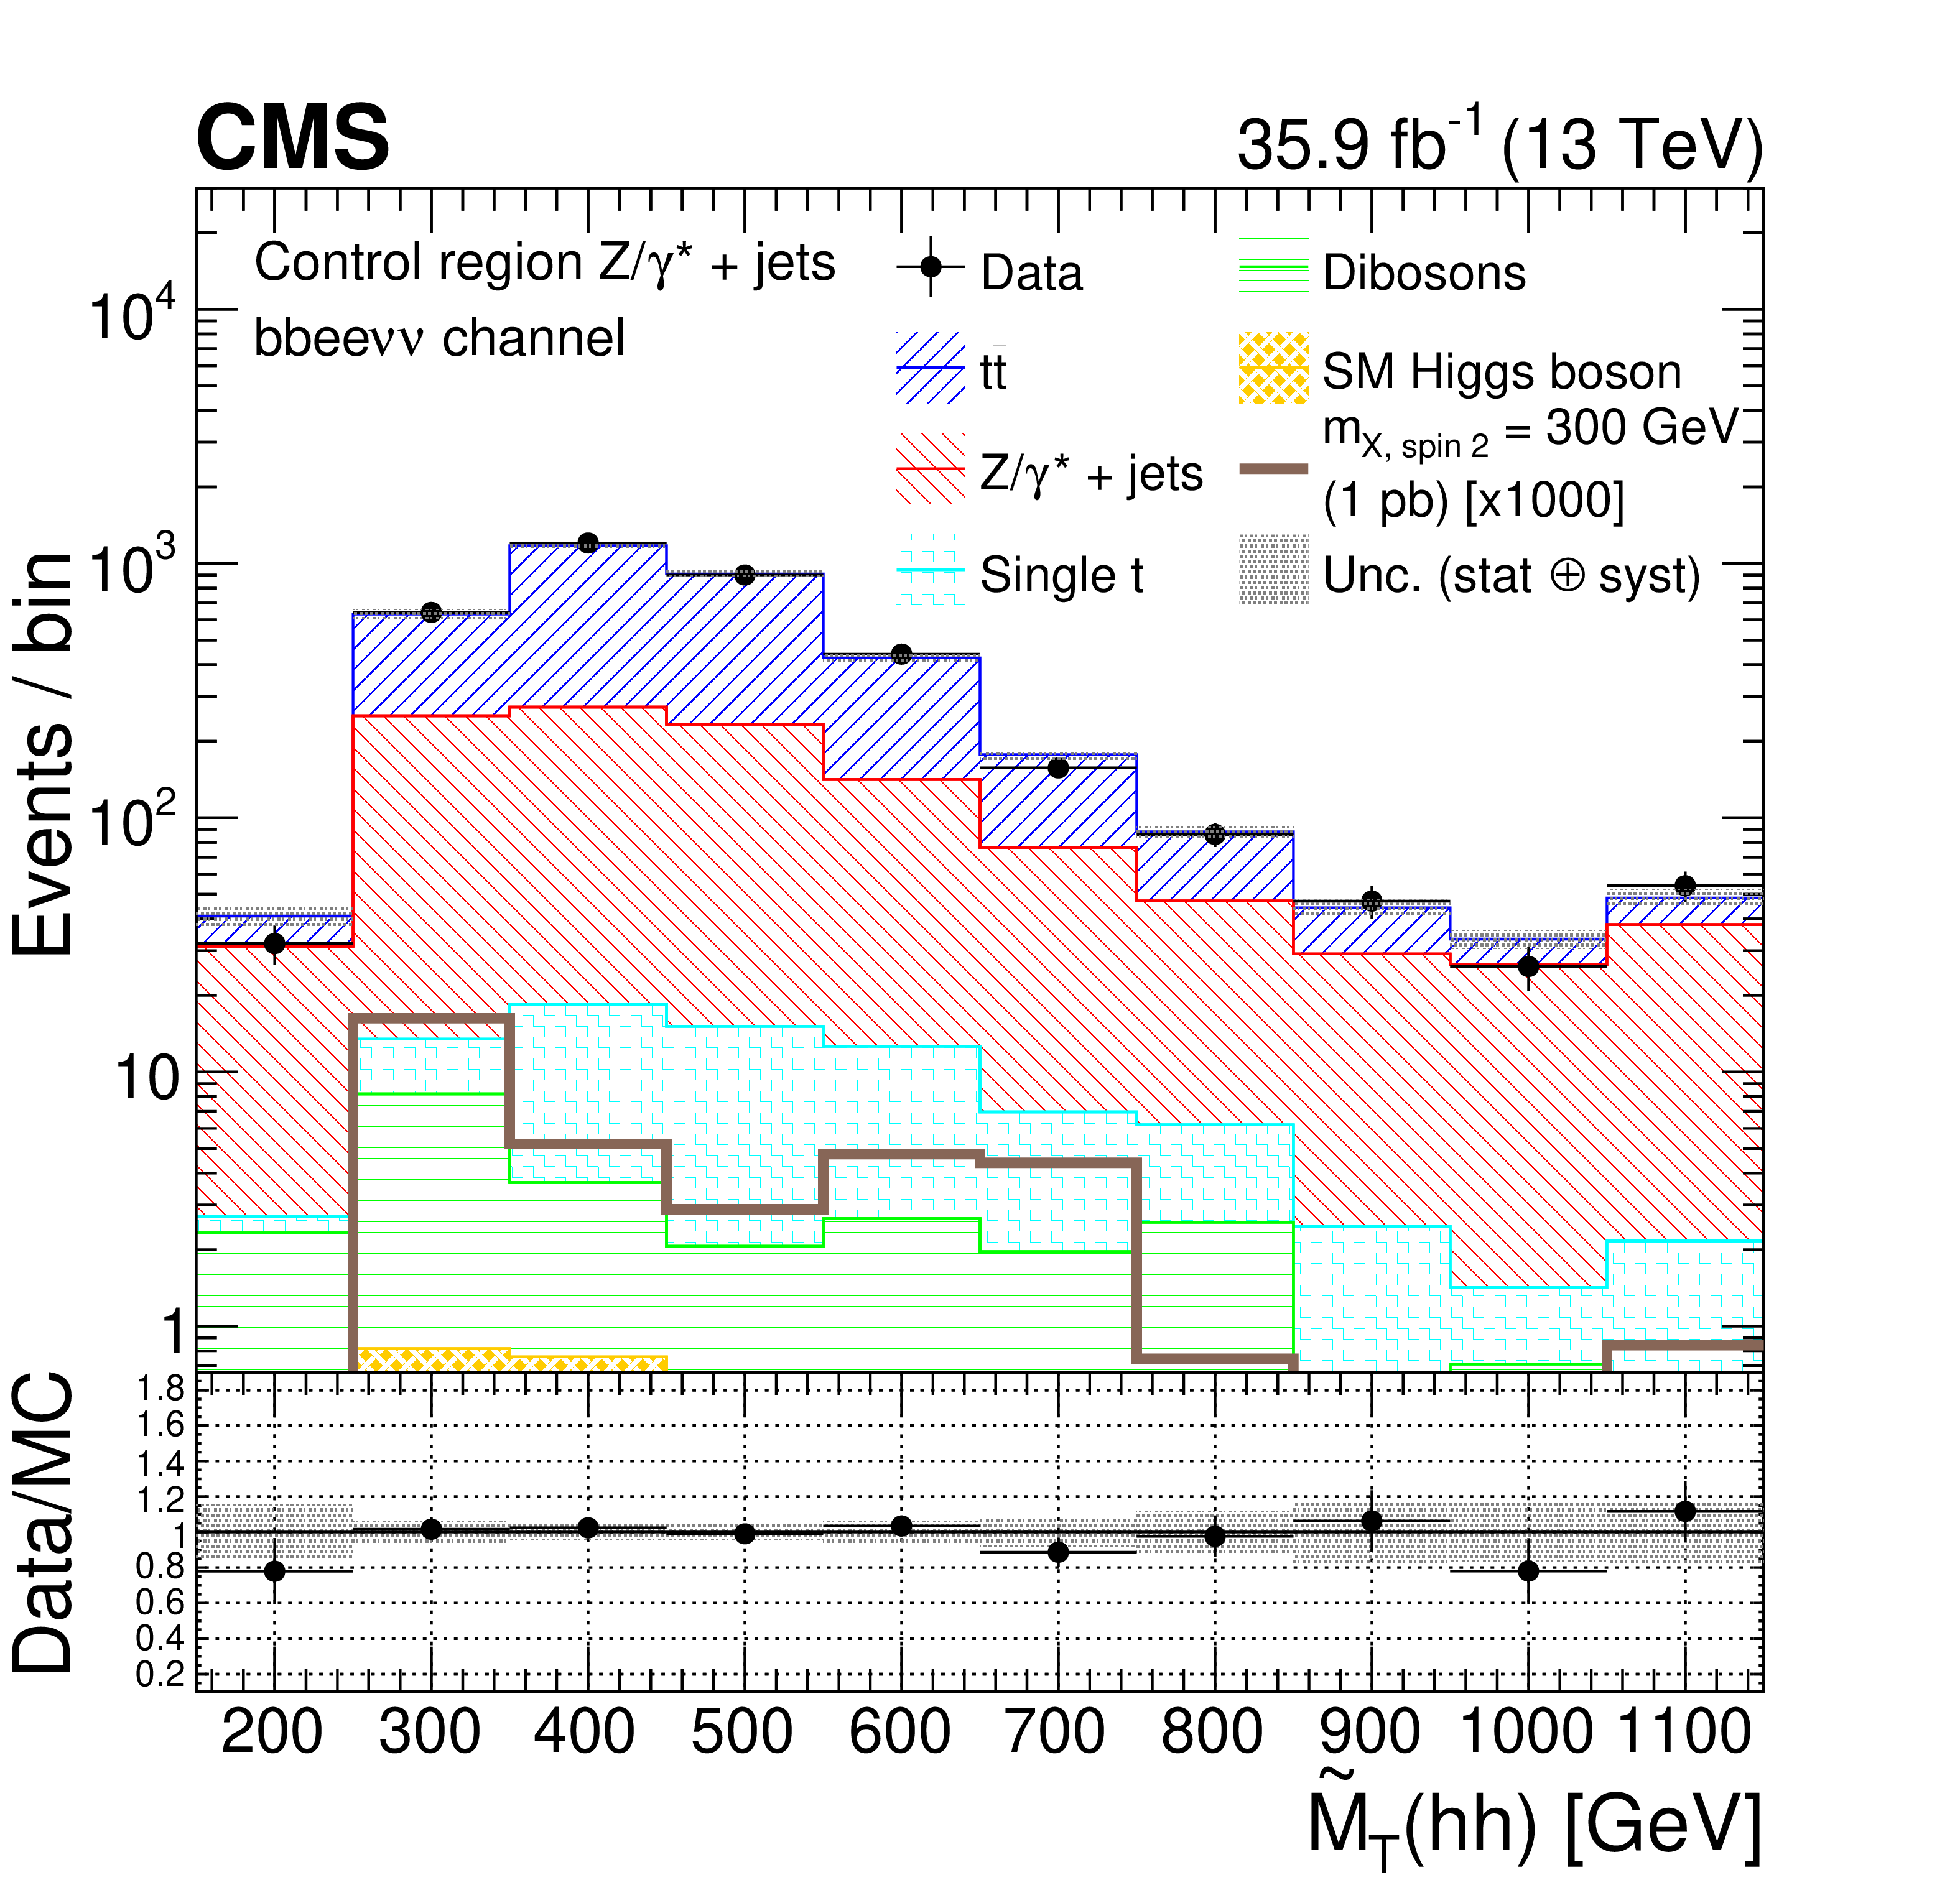
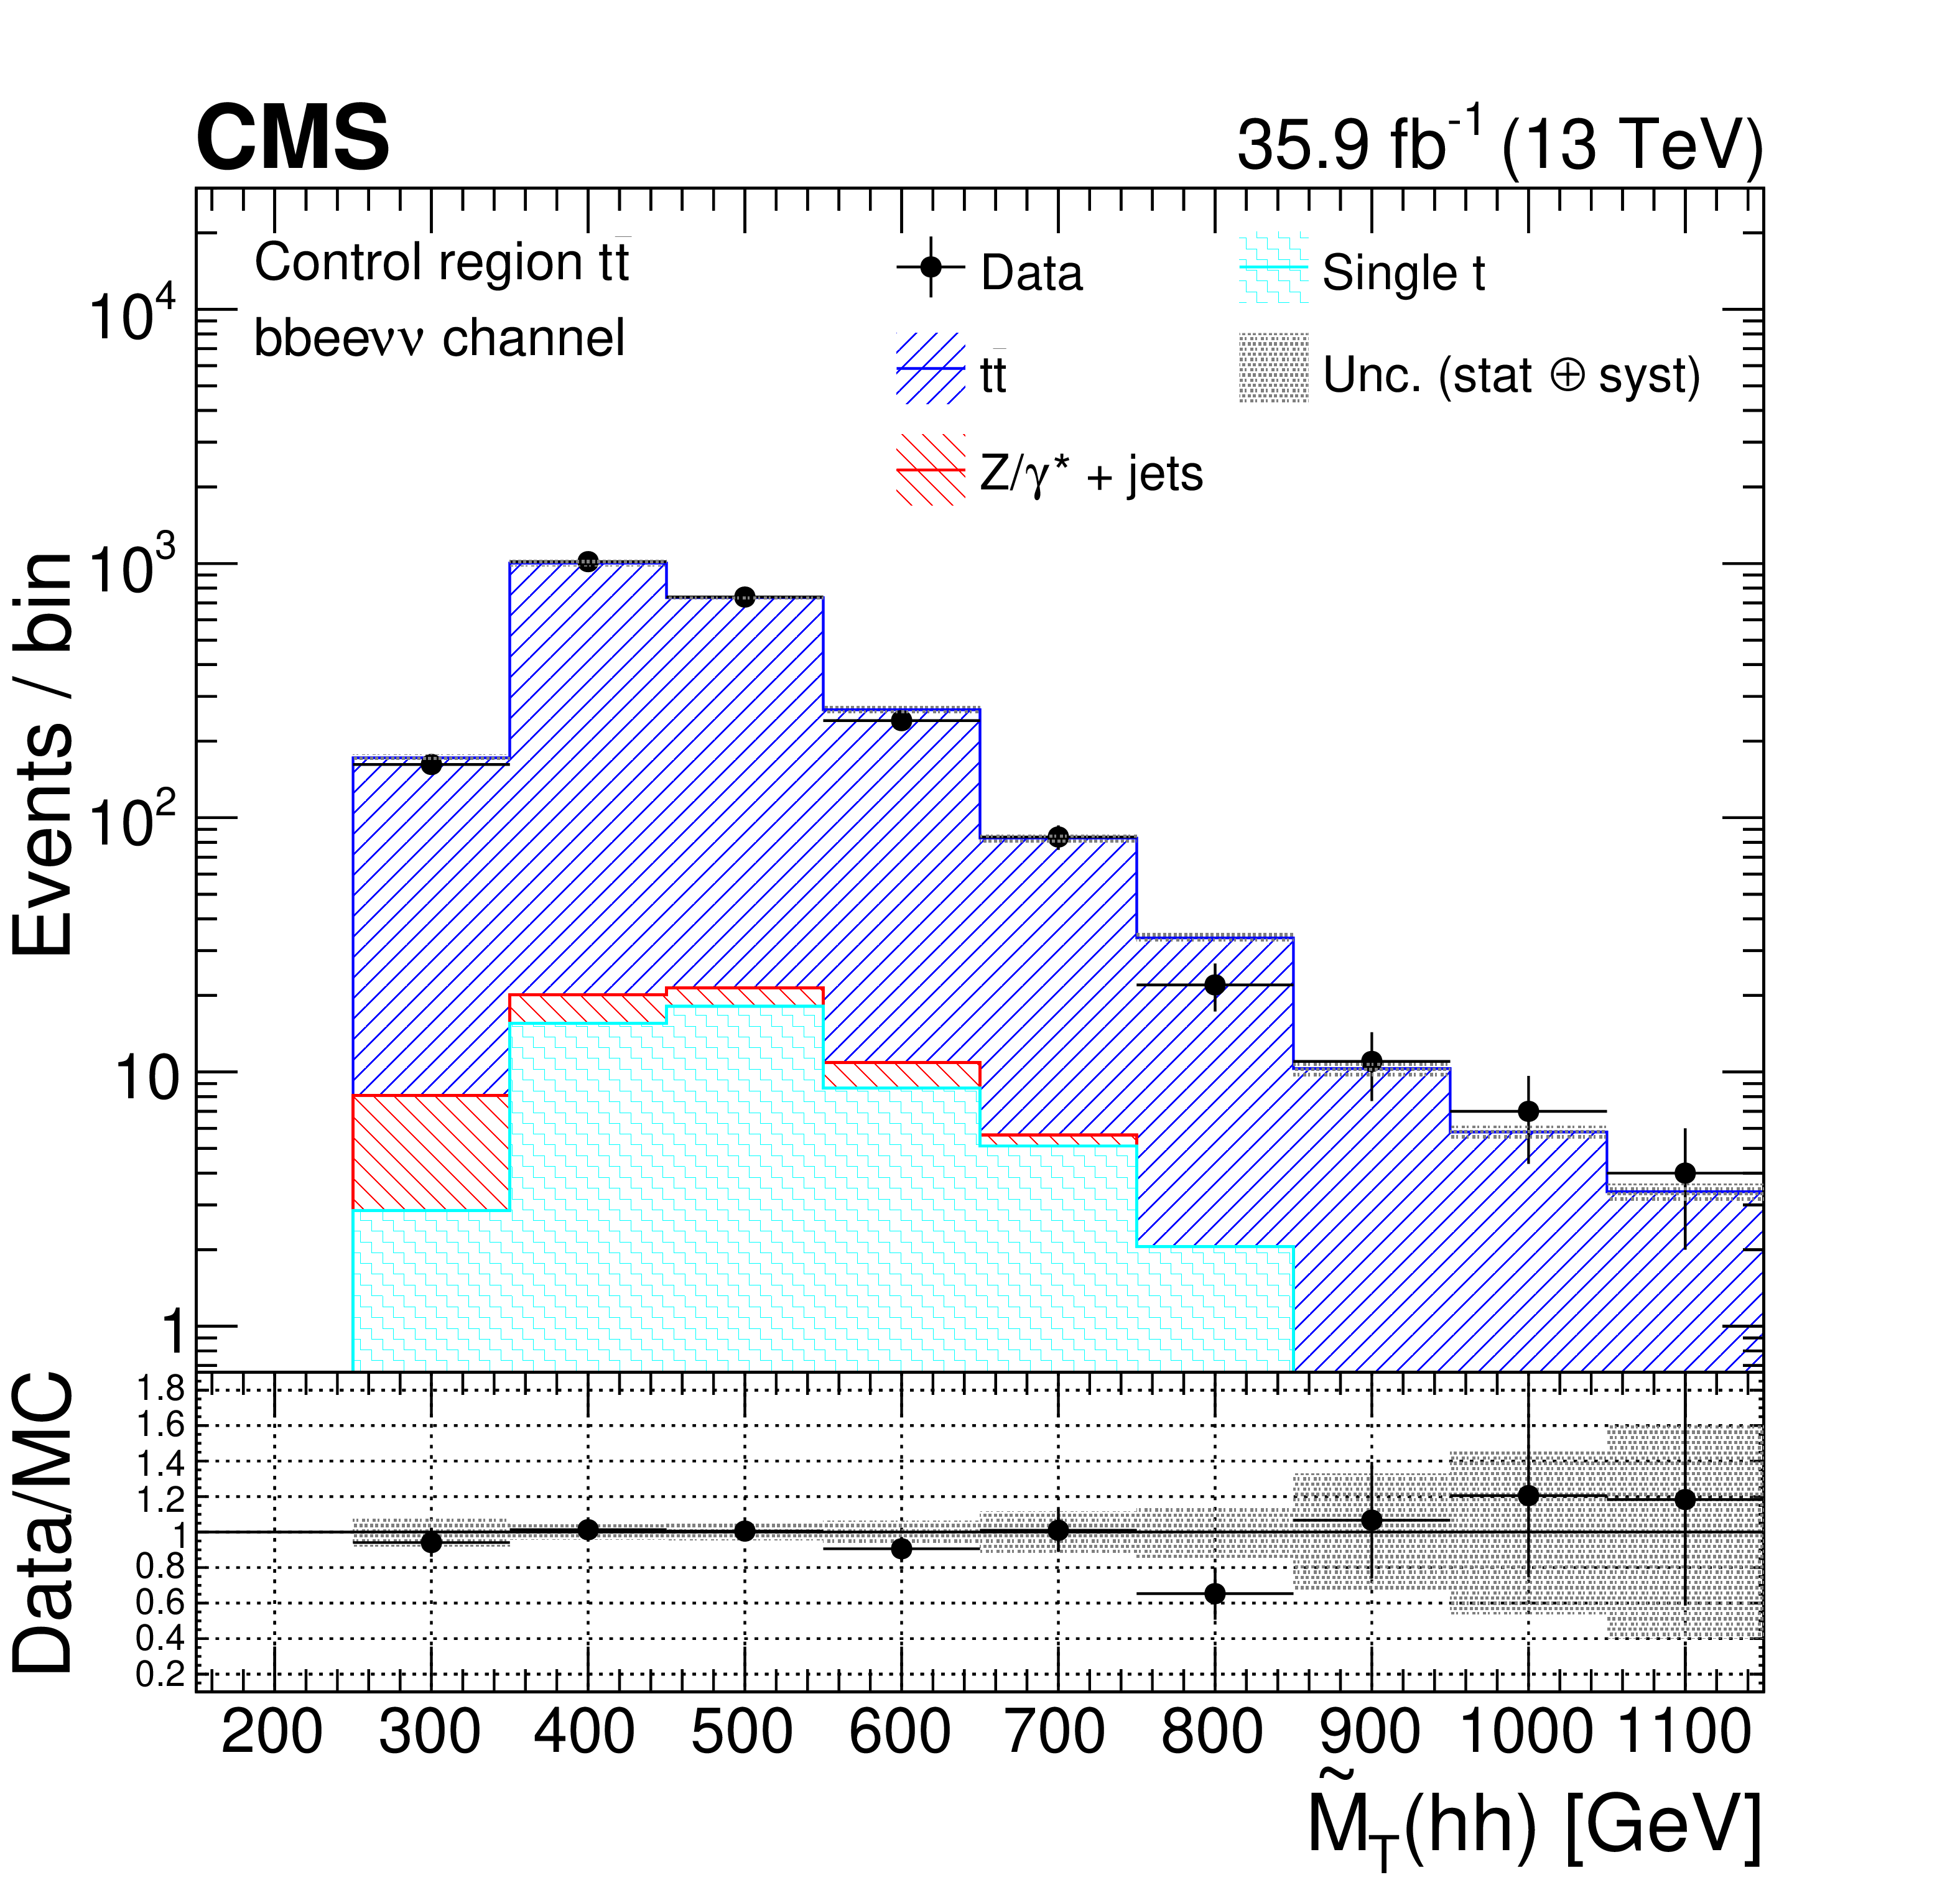
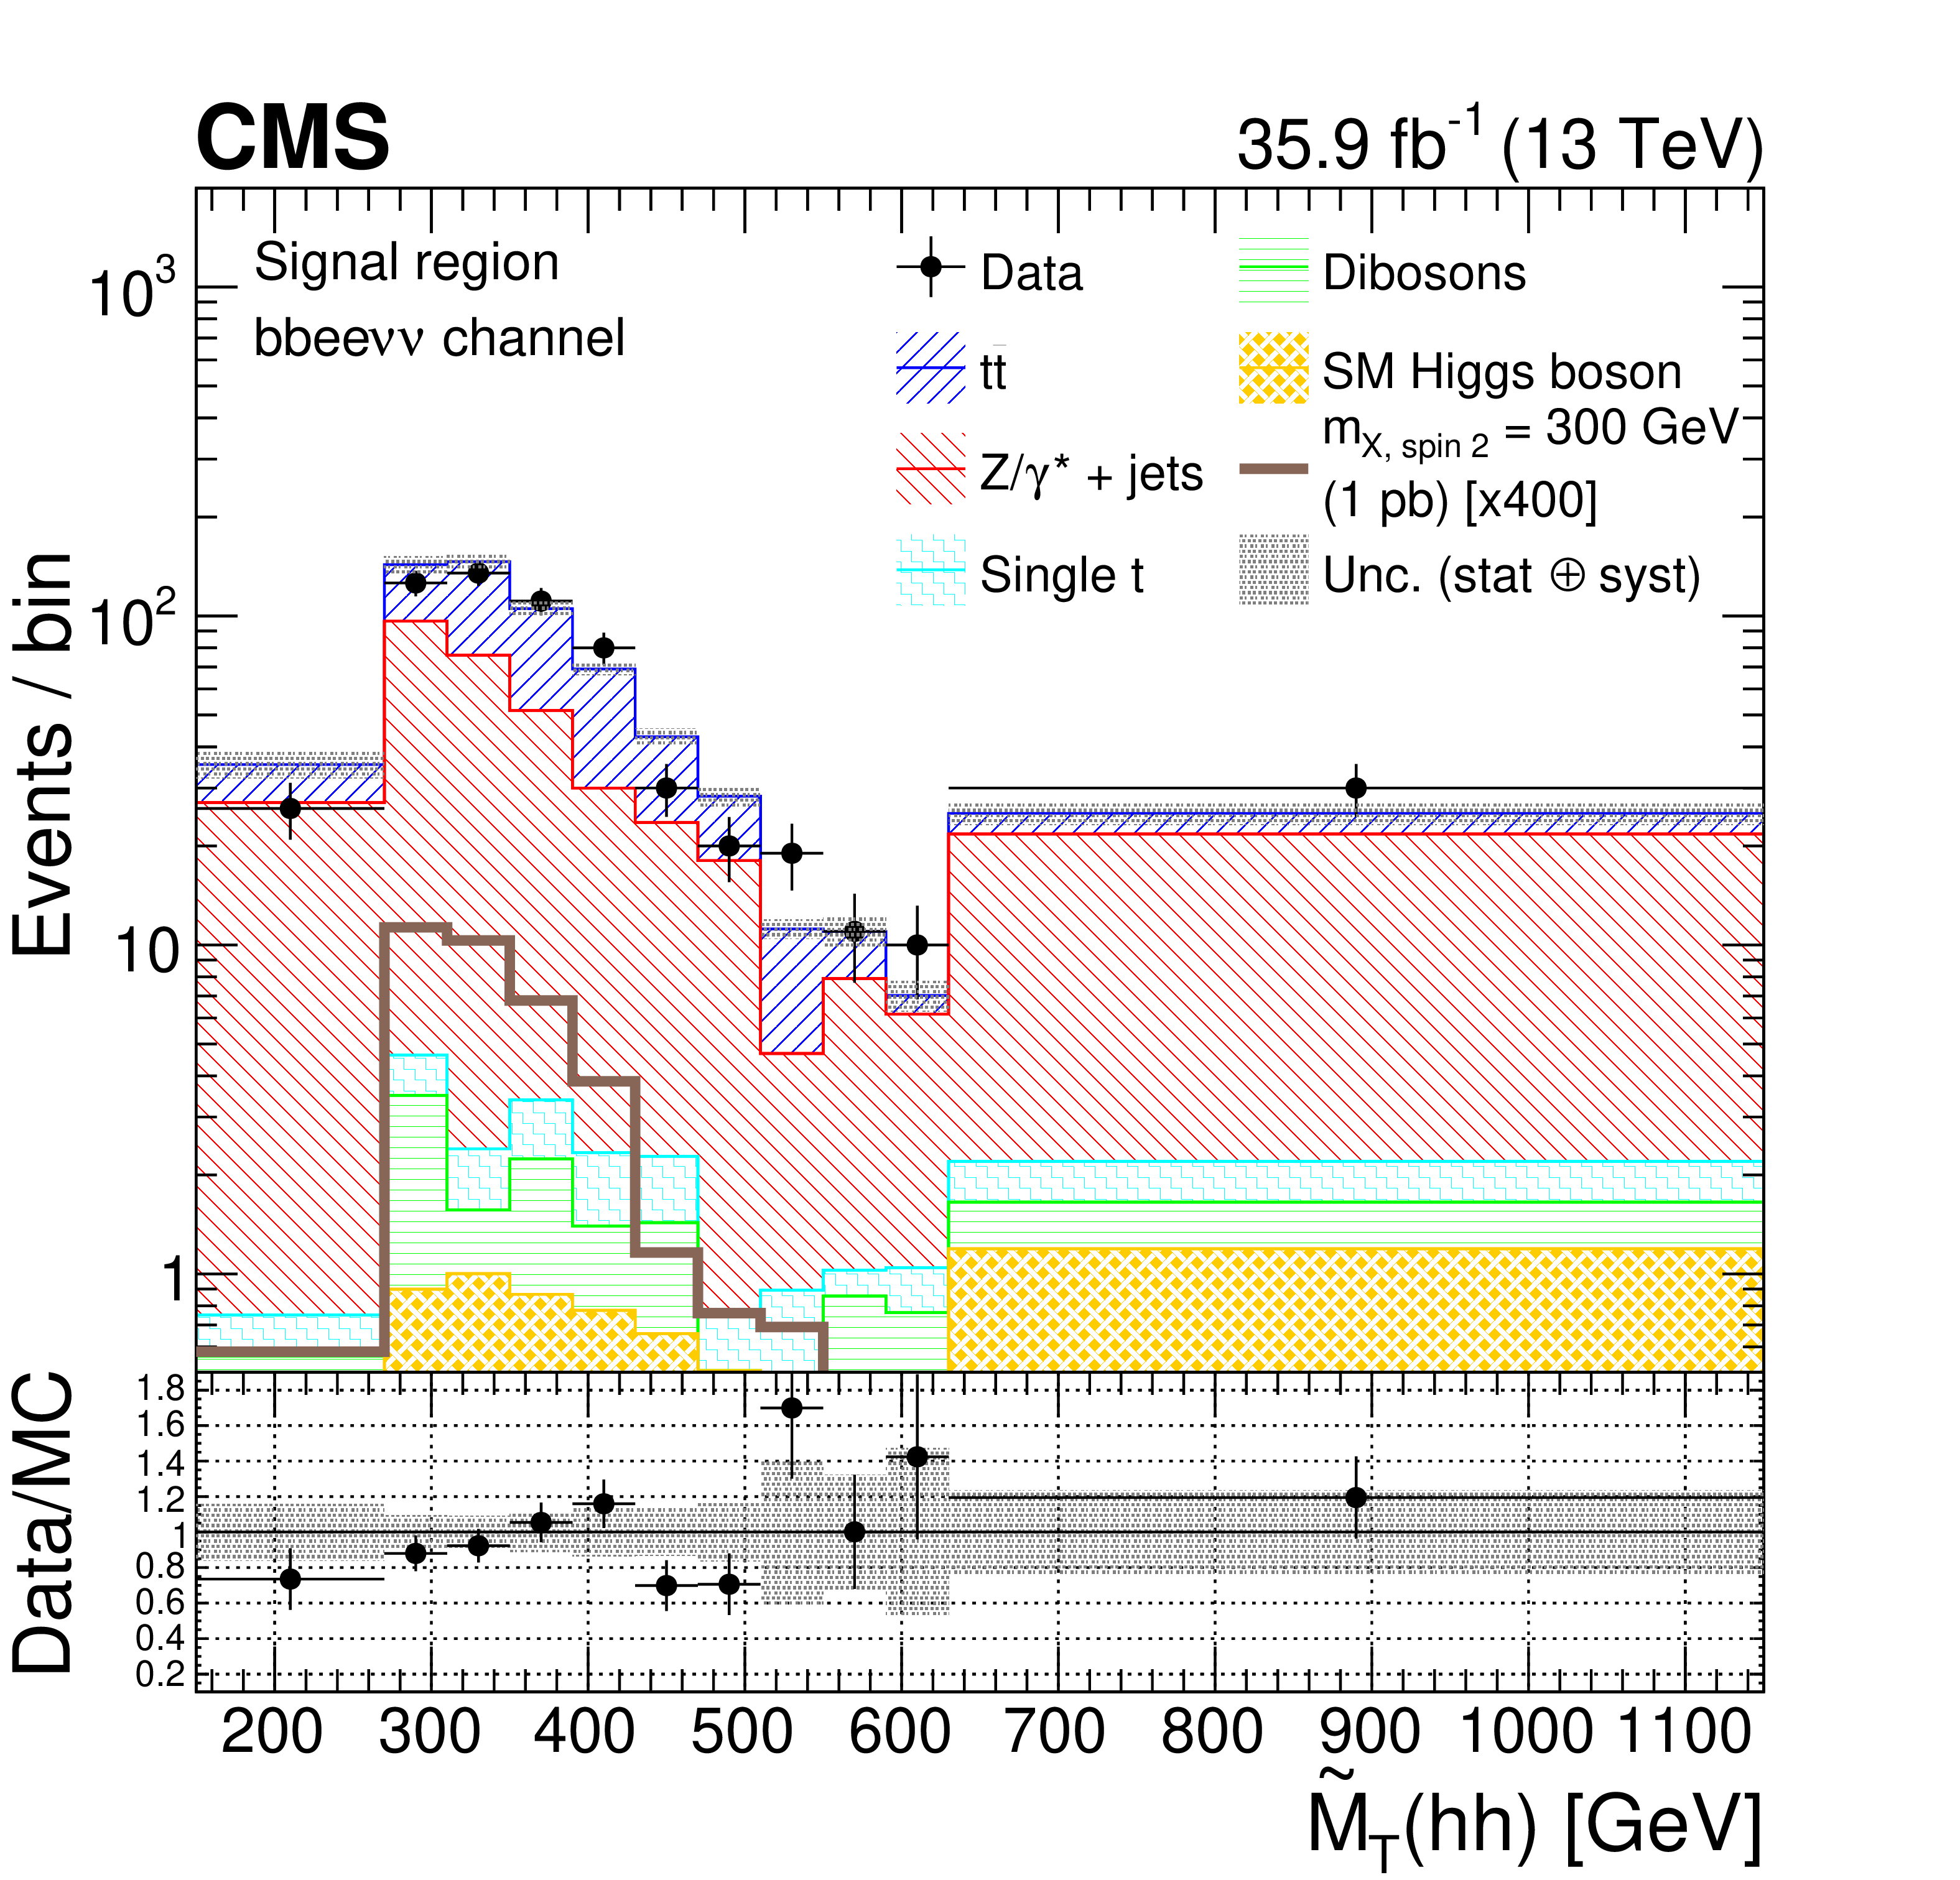
Pseudo transverse mass of the reconstructed $\mathrm{h} \mathrm{h} $ candidates, in the ${\mathrm{b} \mathrm{b} \ell \ell \nu \nu}$ channel, for data, simulated spin-2 RS1 graviton signal with a mass of 300 GeV, and simulated backgrounds scaled according to the fit results. The upper and lower rows correspond to the muon and electrons channels. For each row, the left and middle plots are for the $\mathrm{Z} /\gamma ^{*}$+jets and ${\mathrm{t} {}\mathrm{\bar{t}}}$ control regions, and the right is for the signal region. The signals are normalized to 1 pb for the ${\mathrm{p}} {\mathrm{p}} \to \mathrm {X}\to \mathrm{h} \mathrm{h} $ process. The shaded area represents the combined statistical and systematic uncertainties in the background estimate. |
png pdf |
Figure 2-a:
Pseudo transverse mass of the reconstructed $\mathrm{h} \mathrm{h} $ candidates, in the ${\mathrm{b} \mathrm{b} \mu\mu \nu \nu}$ channel, for data, simulated spin-2 RS1 graviton signal with a mass of 300 GeV, and simulated backgrounds scaled according to the fit results. The plot is for the $\mathrm{Z} /\gamma ^{*}$+jets control region. The signals are normalized to 1 pb for the ${\mathrm{p}} {\mathrm{p}} \to \mathrm {X}\to \mathrm{h} \mathrm{h} $ process. The shaded area represents the combined statistical and systematic uncertainties in the background estimate. |
png pdf |
Figure 2-b:
Pseudo transverse mass of the reconstructed $\mathrm{h} \mathrm{h} $ candidates, in the ${\mathrm{b} \mathrm{b} \mu\mu \nu \nu}$ channel, for data, simulated spin-2 RS1 graviton signal with a mass of 300 GeV, and simulated backgrounds scaled according to the fit results. The plot is for the ${\mathrm{t} {}\mathrm{\bar{t}}}$ control region. The shaded area represents the combined statistical and systematic uncertainties in the background estimate. |
png pdf |
Figure 2-c:
Pseudo transverse mass of the reconstructed $\mathrm{h} \mathrm{h} $ candidates, in the ${\mathrm{b} \mathrm{b} \mu\mu \nu \nu}$ channel, for data, simulated spin-2 RS1 graviton signal with a mass of 300 GeV, and simulated backgrounds scaled according to the fit results. The plot is for the signal region. The signals are normalized to 1 pb for the ${\mathrm{p}} {\mathrm{p}} \to \mathrm {X}\to \mathrm{h} \mathrm{h} $ process. The shaded area represents the combined statistical and systematic uncertainties in the background estimate. |
png pdf |
Figure 2-d:
Pseudo transverse mass of the reconstructed $\mathrm{h} \mathrm{h} $ candidates, in the ${\mathrm{b} \mathrm{b} \mathrm{ee} \nu \nu}$ channel, for data, simulated spin-2 RS1 graviton signal with a mass of 300 GeV, and simulated backgrounds scaled according to the fit results. The plot is for the $\mathrm{Z} /\gamma ^{*}$+jets ${\mathrm{t} {}\mathrm{\bar{t}}}$ control region. signal region. The signals are normalized to 1 pb for the ${\mathrm{p}} {\mathrm{p}} \to \mathrm {X}\to \mathrm{h} \mathrm{h} $ process. The shaded area represents the combined statistical and systematic uncertainties in the background estimate. |
png pdf |
Figure 2-e:
Pseudo transverse mass of the reconstructed $\mathrm{h} \mathrm{h} $ candidates, in the ${\mathrm{b} \mathrm{b} \mathrm{ee} \nu \nu}$ channel, for data, simulated spin-2 RS1 graviton signal with a mass of 300 GeV, and simulated backgrounds scaled according to the fit results. The plot is for the $\mathrm{Z} /\gamma ^{*}$+jets ${\mathrm{t} {}\mathrm{\bar{t}}}$ control region. signal region. The shaded area represents the combined statistical and systematic uncertainties in the background estimate. |
png pdf |
Figure 2-f:
Pseudo transverse mass of the reconstructed $\mathrm{h} \mathrm{h} $ candidates, in the ${\mathrm{b} \mathrm{b} \mathrm{ee} \nu \nu}$ channel, for data, simulated spin-2 RS1 graviton signal with a mass of 300 GeV, and simulated backgrounds scaled according to the fit results. The plot is for the $\mathrm{Z} /\gamma ^{*}$+jets ${\mathrm{t} {}\mathrm{\bar{t}}}$ control region. signal region. The signals are normalized to 1 pb for the ${\mathrm{p}} {\mathrm{p}} \to \mathrm {X}\to \mathrm{h} \mathrm{h} $ process. The shaded area represents the combined statistical and systematic uncertainties in the background estimate. |
png pdf |
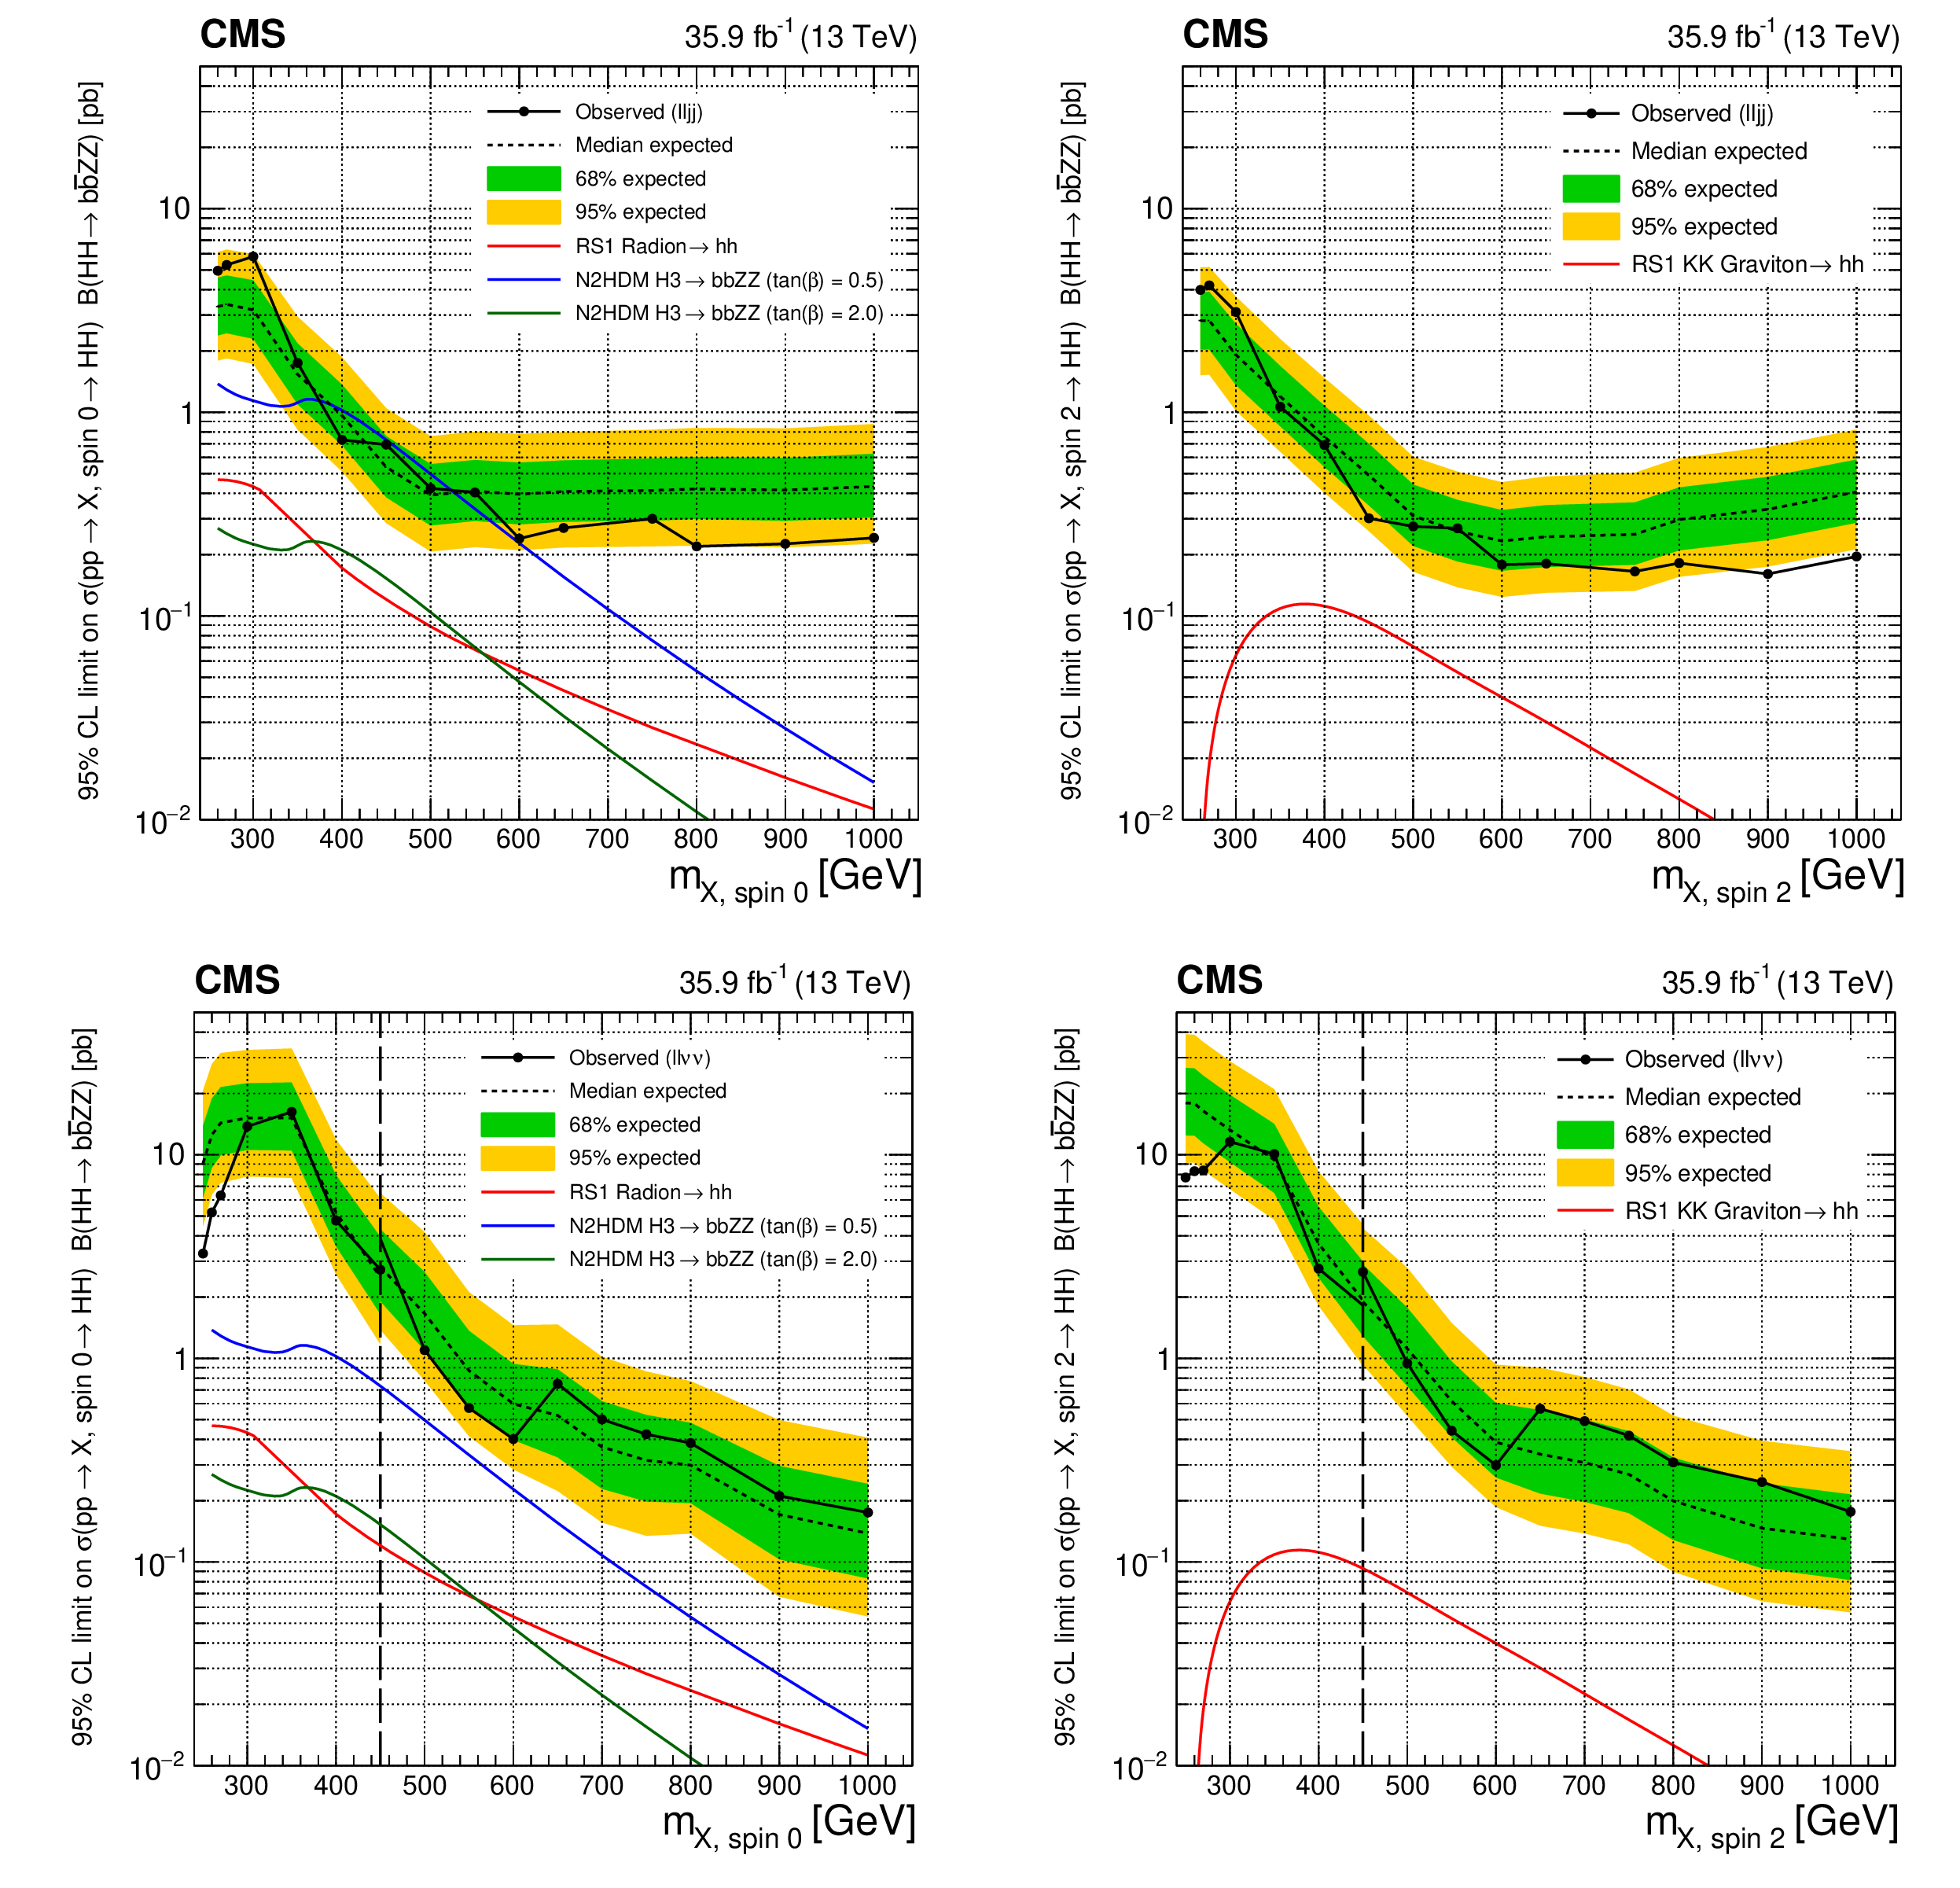
Figure 3:
Expected (black dashed line) and observed (black solid line) limits on the cross section of resonant $\mathrm{H} \mathrm{H} $ production times the branching fraction of $\mathrm{H} \mathrm{H} \to {\mathrm{b} \mathrm{b} \mathrm{Z} \mathrm{Z}} $ as a function of the resonance mass for the ${\mathrm{b} \mathrm{b} \ell \ell \mathrm {jj}}$ (upper row) and ${\mathrm{b} \mathrm{b} \ell \ell \nu \nu}$ (lower row) channels, where $\mathrm{H} $ can represent either the SM Higgs boson or an additional Higgs boson from an extended electroweak sector. The spin-0 case is shown on the left and the spin-2 case is shown on the right. The red solid line shows the theoretical prediction for the cross section of an RS1 radion with $\lambda _{\mathrm {R}} = $ 1 TeV and $kL=$ 35 (left) and an RS1 KK graviton with $\tilde{k} = $ 0.1 (right). In the spin-0 case only, the blue (green) line shows the decays of ${\mathrm{H}}_3\to {\mathrm{H}}_1{\mathrm{H}}_1/{\mathrm{H}}_1{\mathrm{H}}_2/{\mathrm{H}}_2{\mathrm{H}}_2\to {\mathrm{b} \mathrm{b} \mathrm{Z} \mathrm{Z}} $ in the N2HDM formulation, with $\tan\beta =$ 0.5 (2.0), the scalar ${\mathrm{H}}_3$ vev set to 45 GeV, and the mixing angles $\alpha _1$, $\alpha _2$, $\alpha _3$ set to 0.76, 0.48, and 1.00, respectively. The correction factor based on the relative partial width of ${\mathrm{H}}_3$ to two gluons is around 3.0 (0.7) for $\tan\beta =$ 0.5 (2.0). In the lower row, the vertical black dashed line indicates the resonance mass of 450 GeV, a mass point where the BDT used in the analysis is switched from the one trained for low mass resonance to the one trained for high mass resonance. |
png pdf |
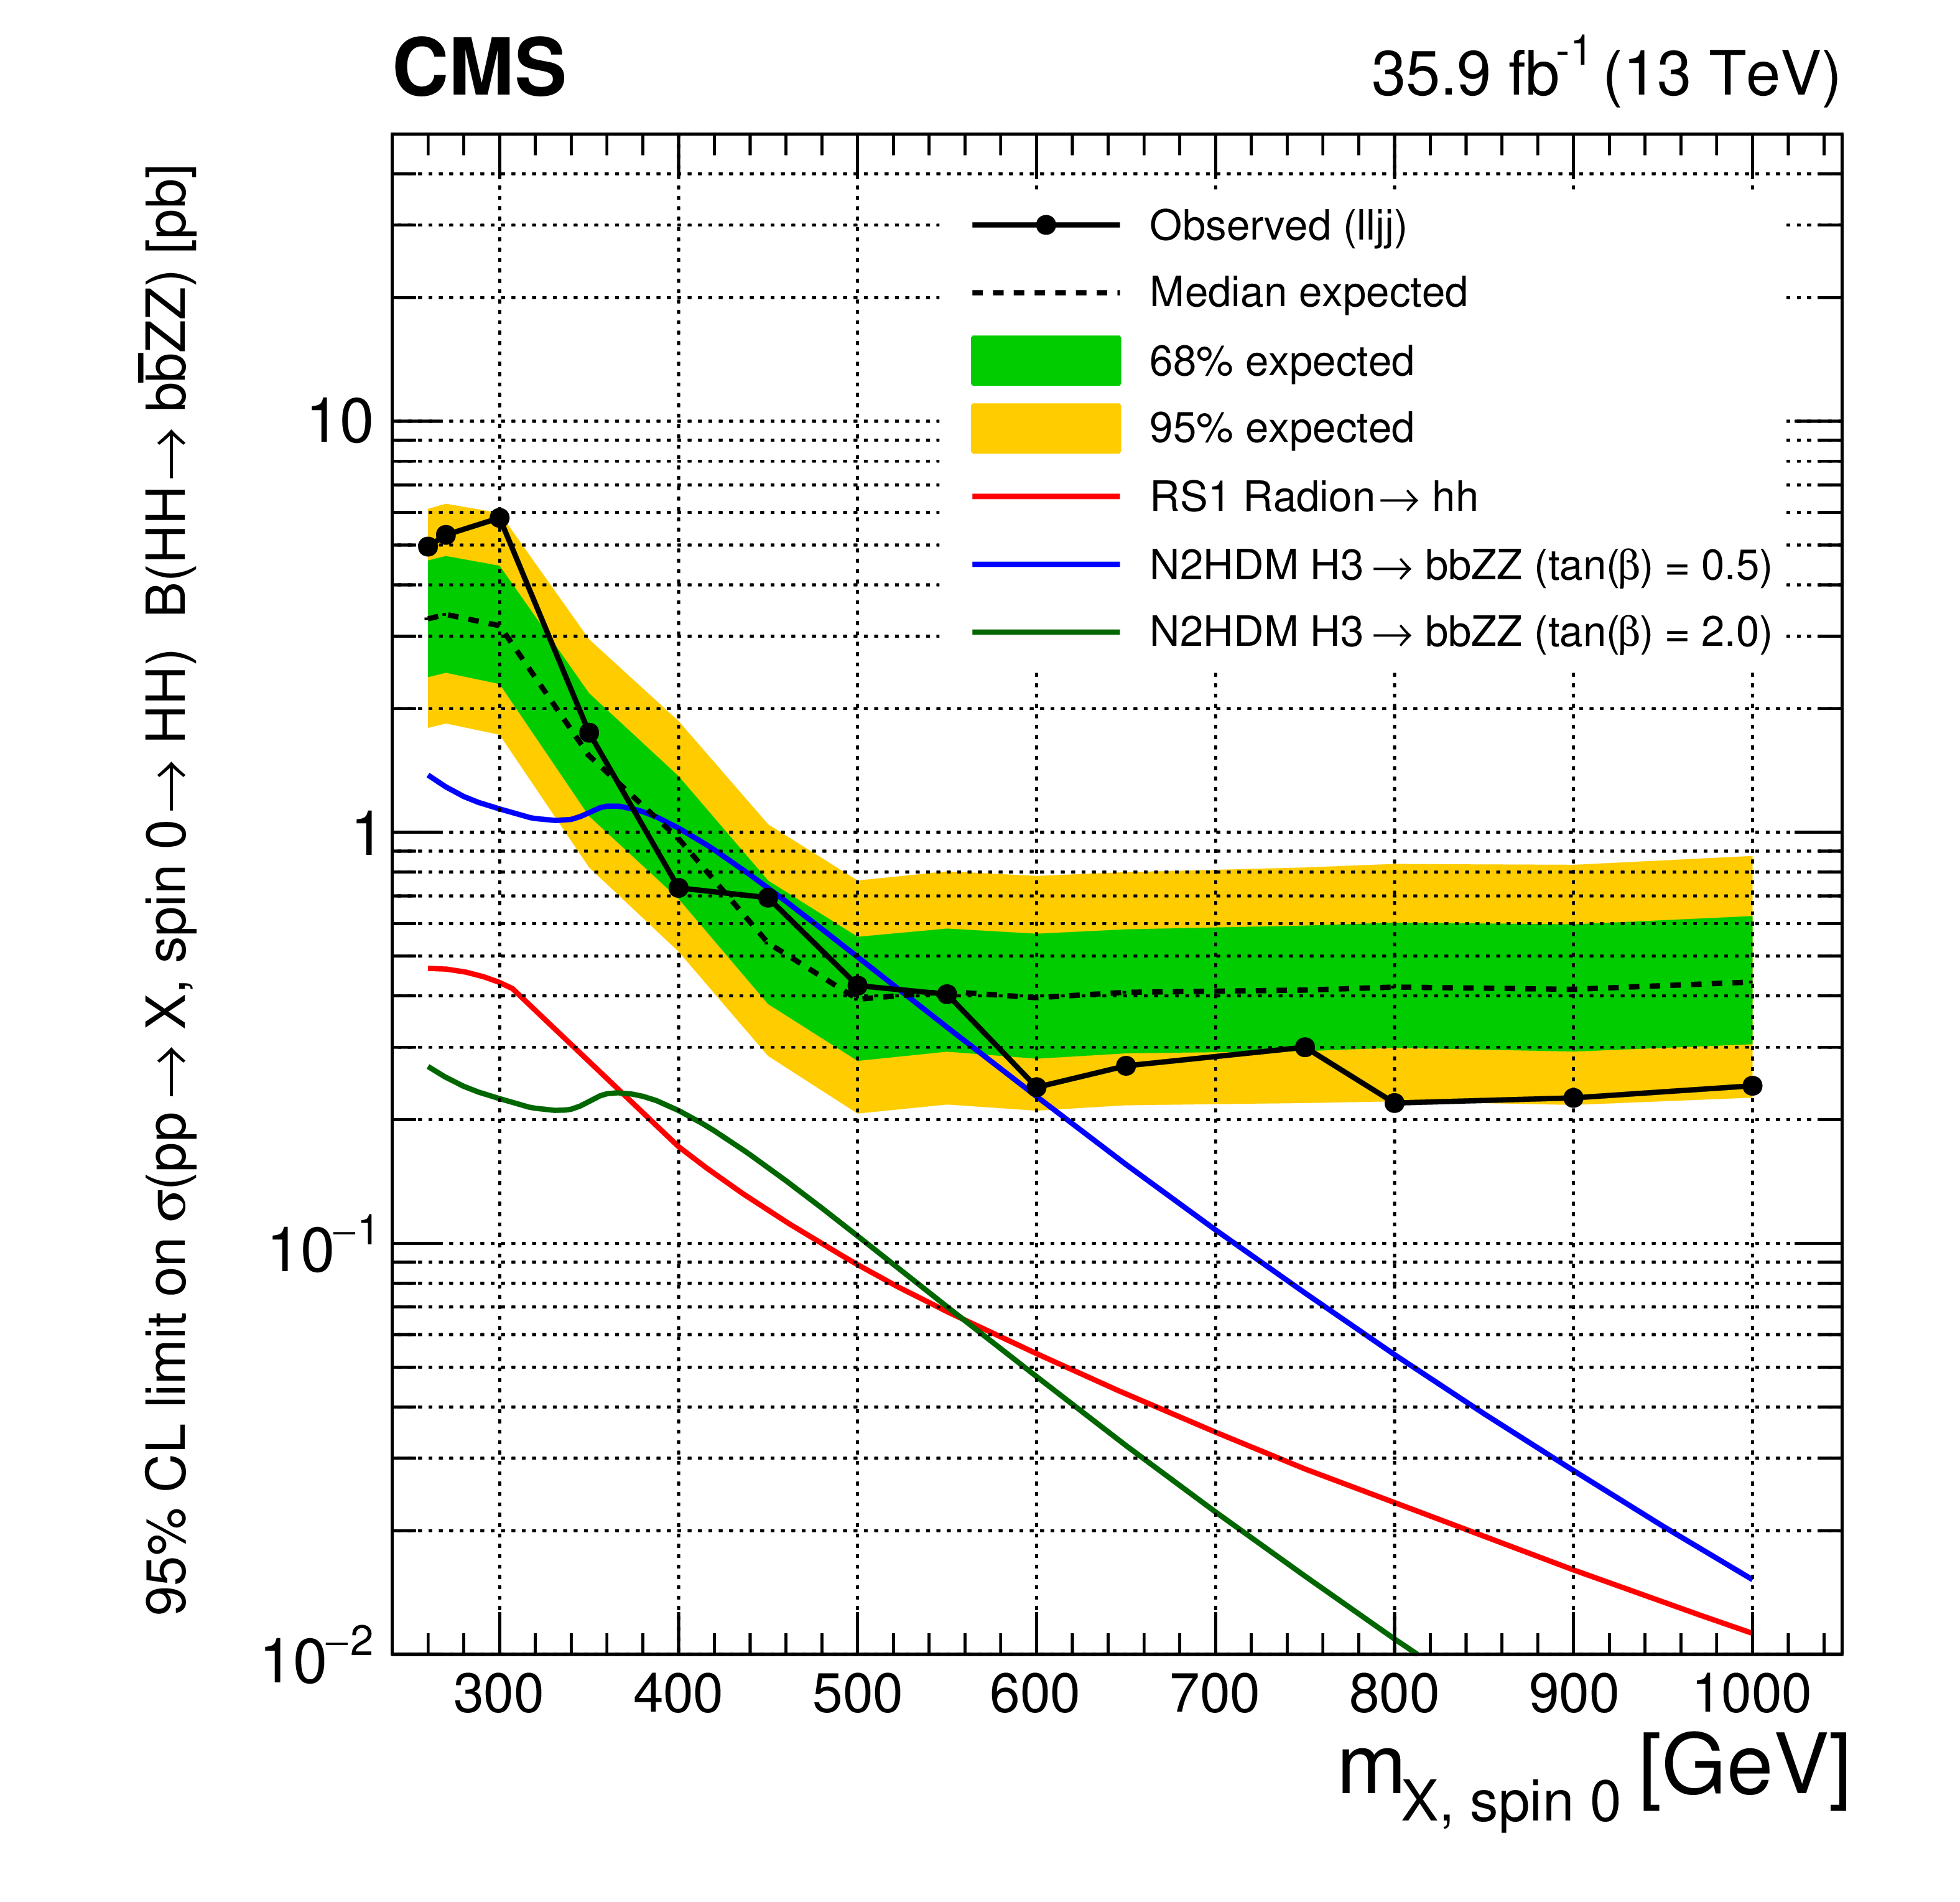
Figure 3-a:
Expected (black dashed line) and observed (black solid line) limits on the cross section of resonant $\mathrm{H} \mathrm{H} $ production times the branching fraction of $\mathrm{H} \mathrm{H} \to {\mathrm{b} \mathrm{b} \mathrm{Z} \mathrm{Z}} $ as a function of the resonance mass for the ${\mathrm{b} \mathrm{b} \ell \ell \mathrm {jj}}$ channel, where $\mathrm{H} $ can represent either the SM Higgs boson or an additional Higgs boson from an extended electroweak sector. The spin-0 case is shown. The red solid line shows the theoretical prediction for the cross section of an RS1 radion with $\lambda _{\mathrm {R}} = $ 1 TeV and $kL=$ 35. The blue (green) line shows the decays of ${\mathrm{H}}_3\to {\mathrm{H}}_1{\mathrm{H}}_1/{\mathrm{H}}_1{\mathrm{H}}_2/{\mathrm{H}}_2{\mathrm{H}}_2\to {\mathrm{b} \mathrm{b} \mathrm{Z} \mathrm{Z}} $ in the N2HDM formulation, with $\tan\beta =$ 0.5 (2.0), the scalar ${\mathrm{H}}_3$ vev set to 45 GeV, and the mixing angles $\alpha _1$, $\alpha _2$, $\alpha _3$ set to 0.76, 0.48, and 1.00, respectively. The correction factor based on the relative partial width of ${\mathrm{H}}_3$ to two gluons is around 3.0 (0.7) for $\tan\beta =$ 0.5 (2.0). |
png pdf |
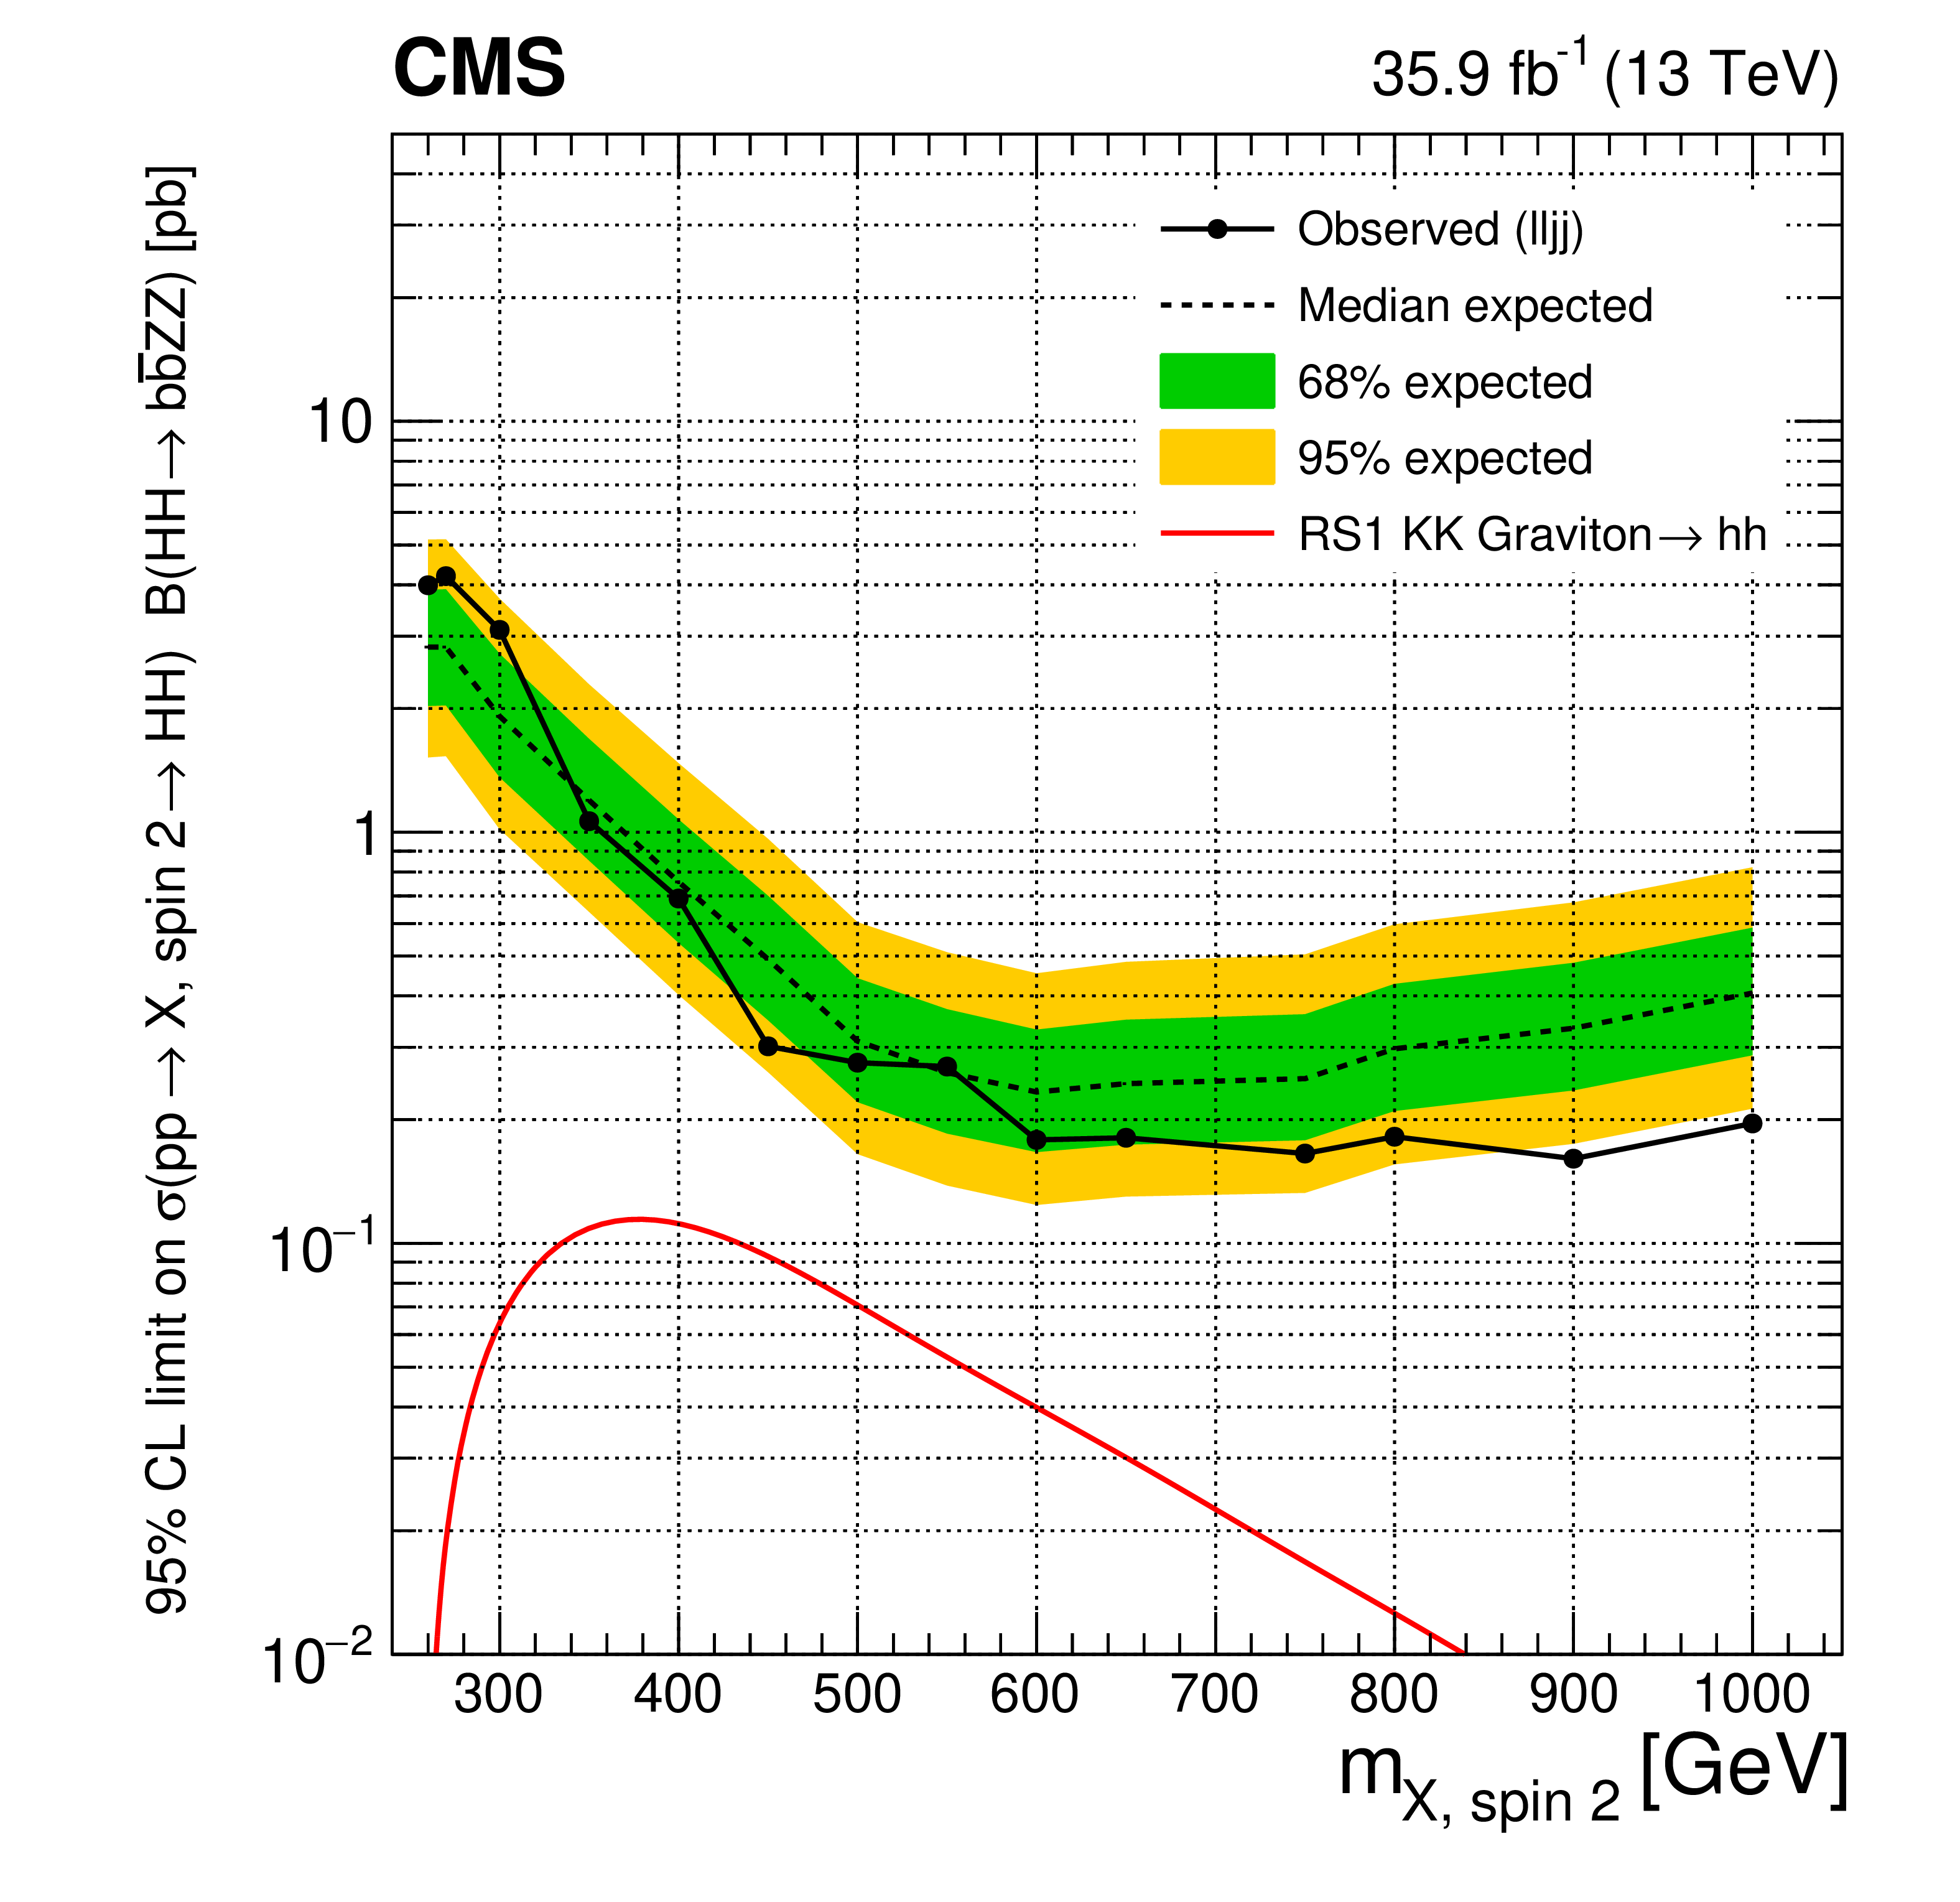
Figure 3-b:
Expected (black dashed line) and observed (black solid line) limits on the cross section of resonant $\mathrm{H} \mathrm{H} $ production times the branching fraction of $\mathrm{H} \mathrm{H} \to {\mathrm{b} \mathrm{b} \mathrm{Z} \mathrm{Z}} $ as a function of the resonance mass for the ${\mathrm{b} \mathrm{b} \ell \ell \mathrm {jj}}$ channel, where $\mathrm{H} $ can represent either the SM Higgs boson or an additional Higgs boson from an extended electroweak sector. The spin-2 case is shown. The red solid line shows the theoretical prediction for the cross section of an RS1 KK graviton with $\tilde{k} = $ 0.1. |
png pdf |
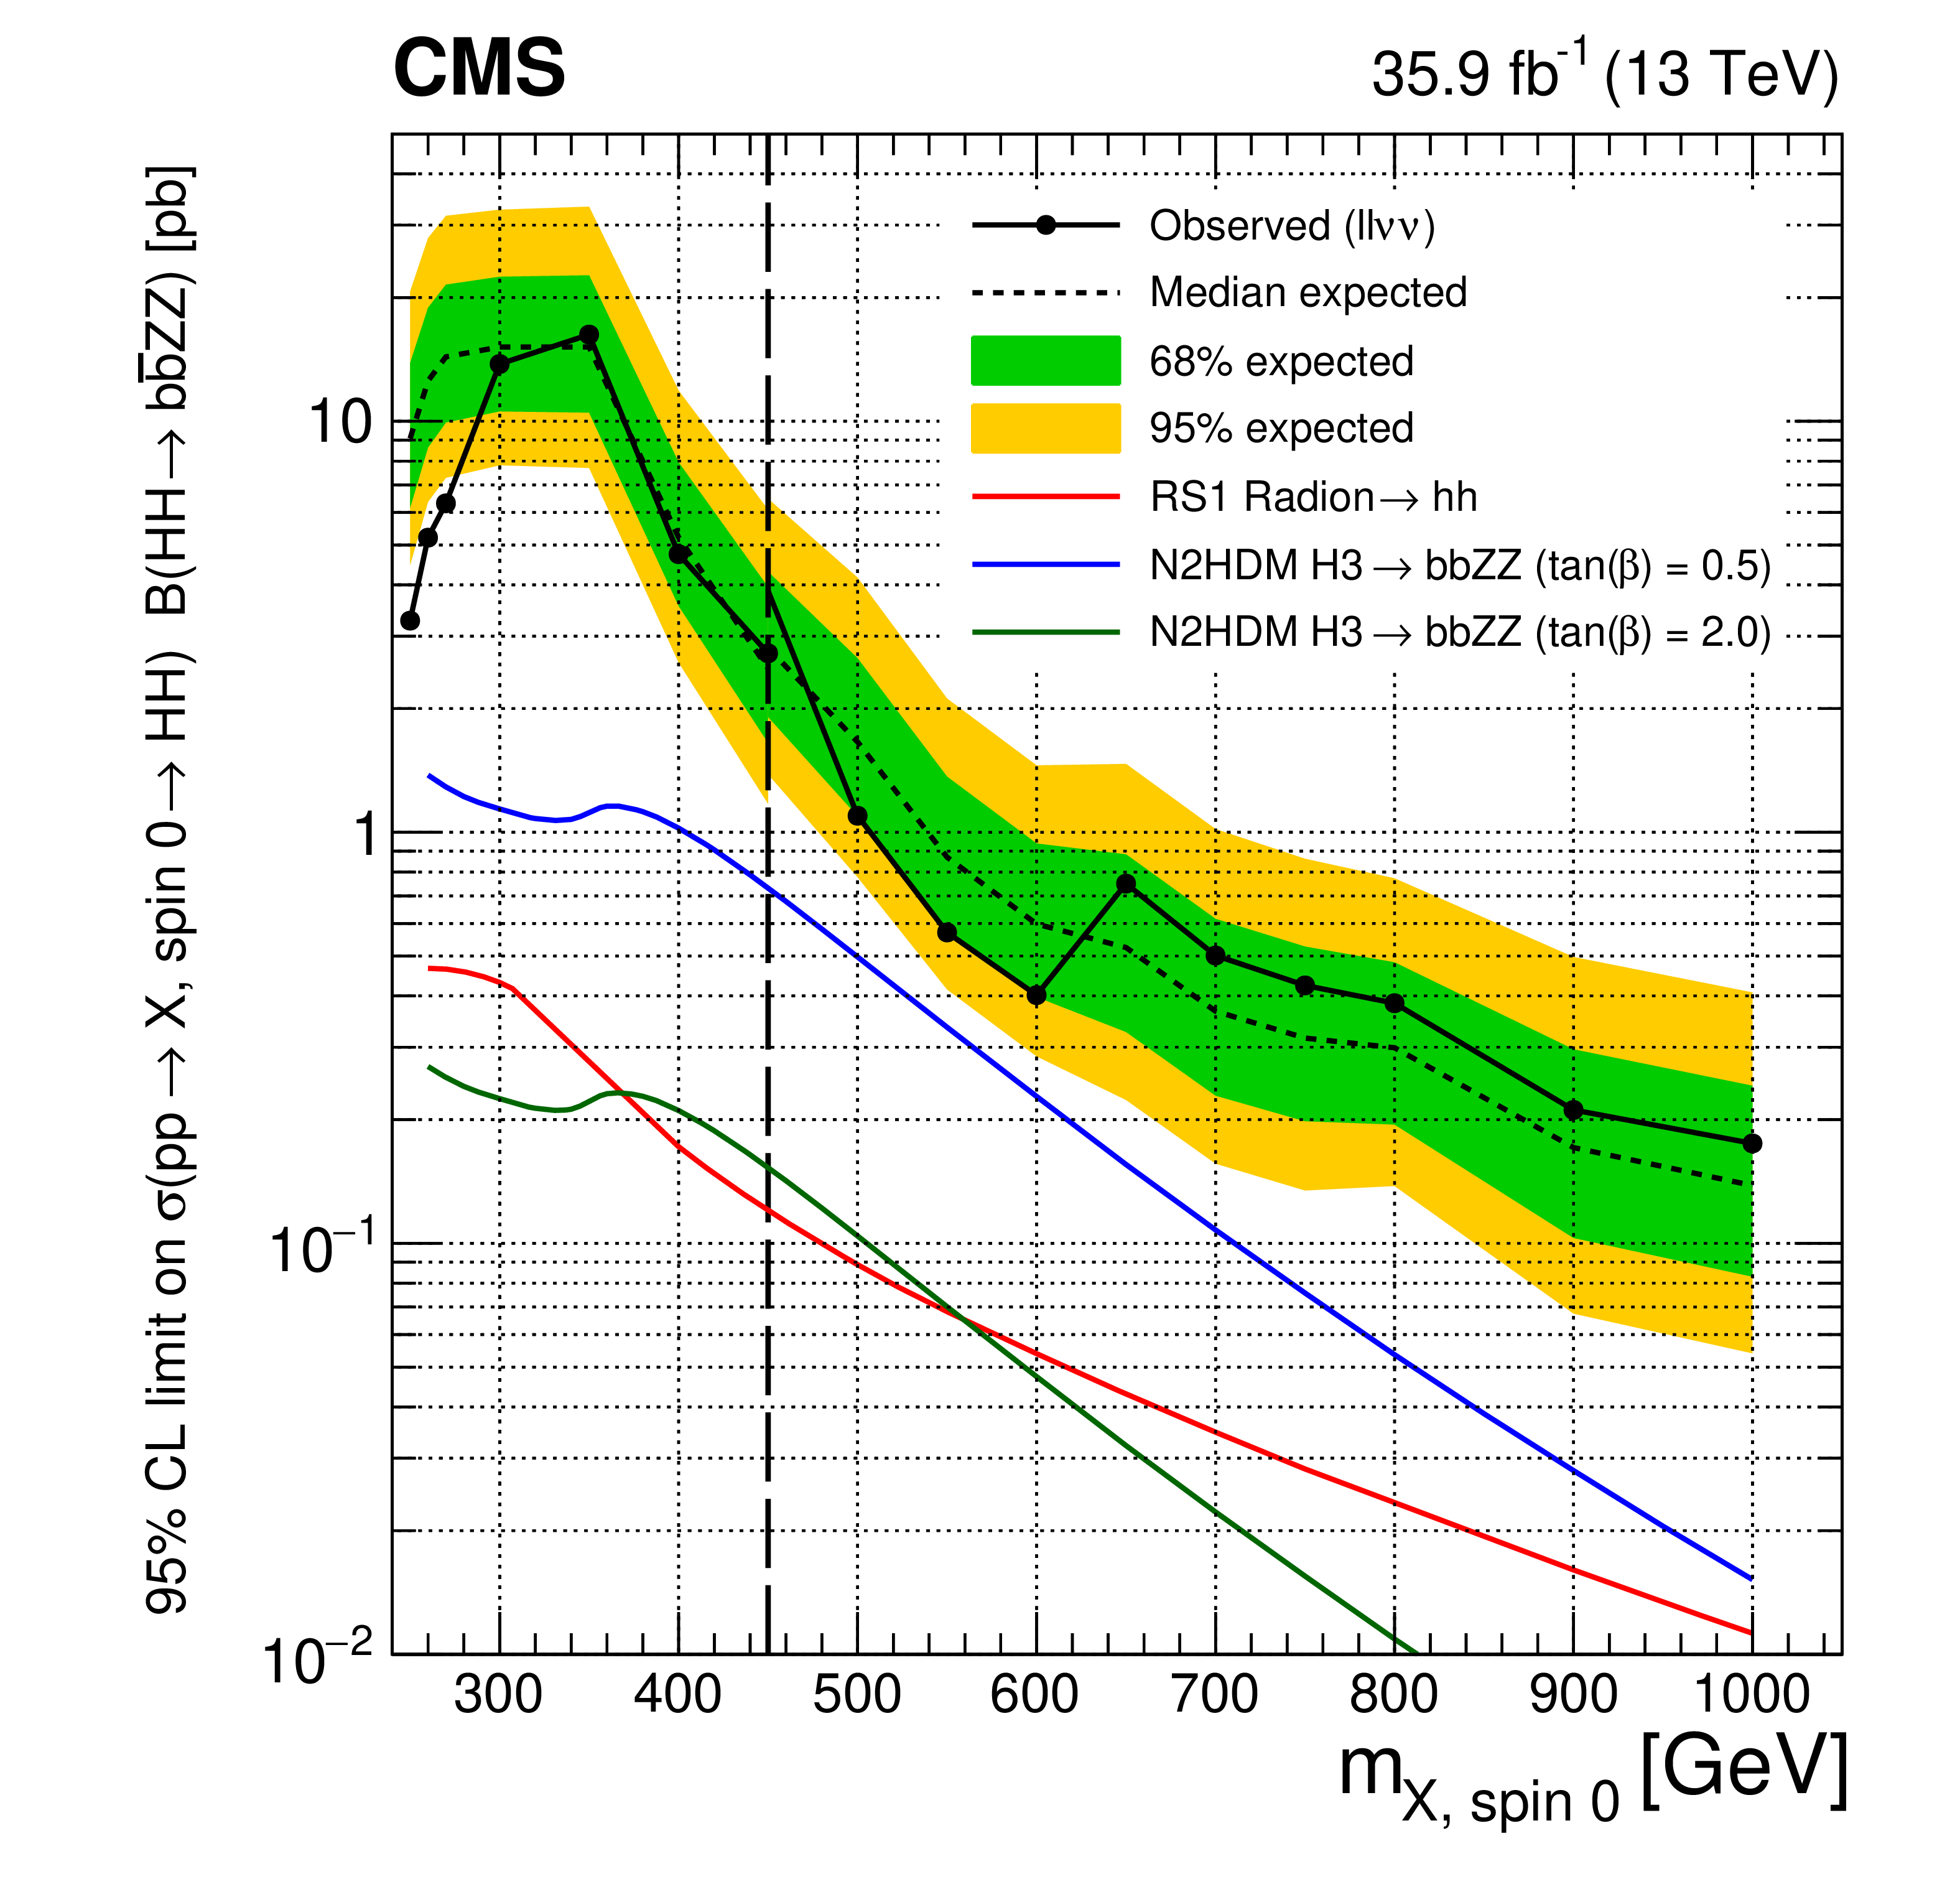
Figure 3-c:
Expected (black dashed line) and observed (black solid line) limits on the cross section of resonant $\mathrm{H} \mathrm{H} $ production times the branching fraction of $\mathrm{H} \mathrm{H} \to {\mathrm{b} \mathrm{b} \mathrm{Z} \mathrm{Z}} $ as a function of the resonance mass for the ${\mathrm{b} \mathrm{b} \ell \ell \nu \nu}$ channel, where $\mathrm{H} $ can represent either the SM Higgs boson or an additional Higgs boson from an extended electroweak sector. The spin-0 case is shown. The red solid line shows the theoretical prediction for the cross section of an RS1 radion with $\lambda _{\mathrm {R}} = $ 1 TeV and $kL=$ 35. The blue (green) line shows the decays of ${\mathrm{H}}_3\to {\mathrm{H}}_1{\mathrm{H}}_1/{\mathrm{H}}_1{\mathrm{H}}_2/{\mathrm{H}}_2{\mathrm{H}}_2\to {\mathrm{b} \mathrm{b} \mathrm{Z} \mathrm{Z}} $ in the N2HDM formulation, with $\tan\beta =$ 0.5 (2.0), the scalar ${\mathrm{H}}_3$ vev set to 45 GeV, and the mixing angles $\alpha _1$, $\alpha _2$, $\alpha _3$ set to 0.76, 0.48, and 1.00, respectively. The correction factor based on the relative partial width of ${\mathrm{H}}_3$ to two gluons is around 3.0 (0.7) for $\tan\beta =$ 0.5 (2.0). The vertical black dashed line indicates the resonance mass of 450 GeV, a mass point where the BDT used in the analysis is switched from the one trained for low mass resonance to the one trained for high mass resonance. |
png pdf |
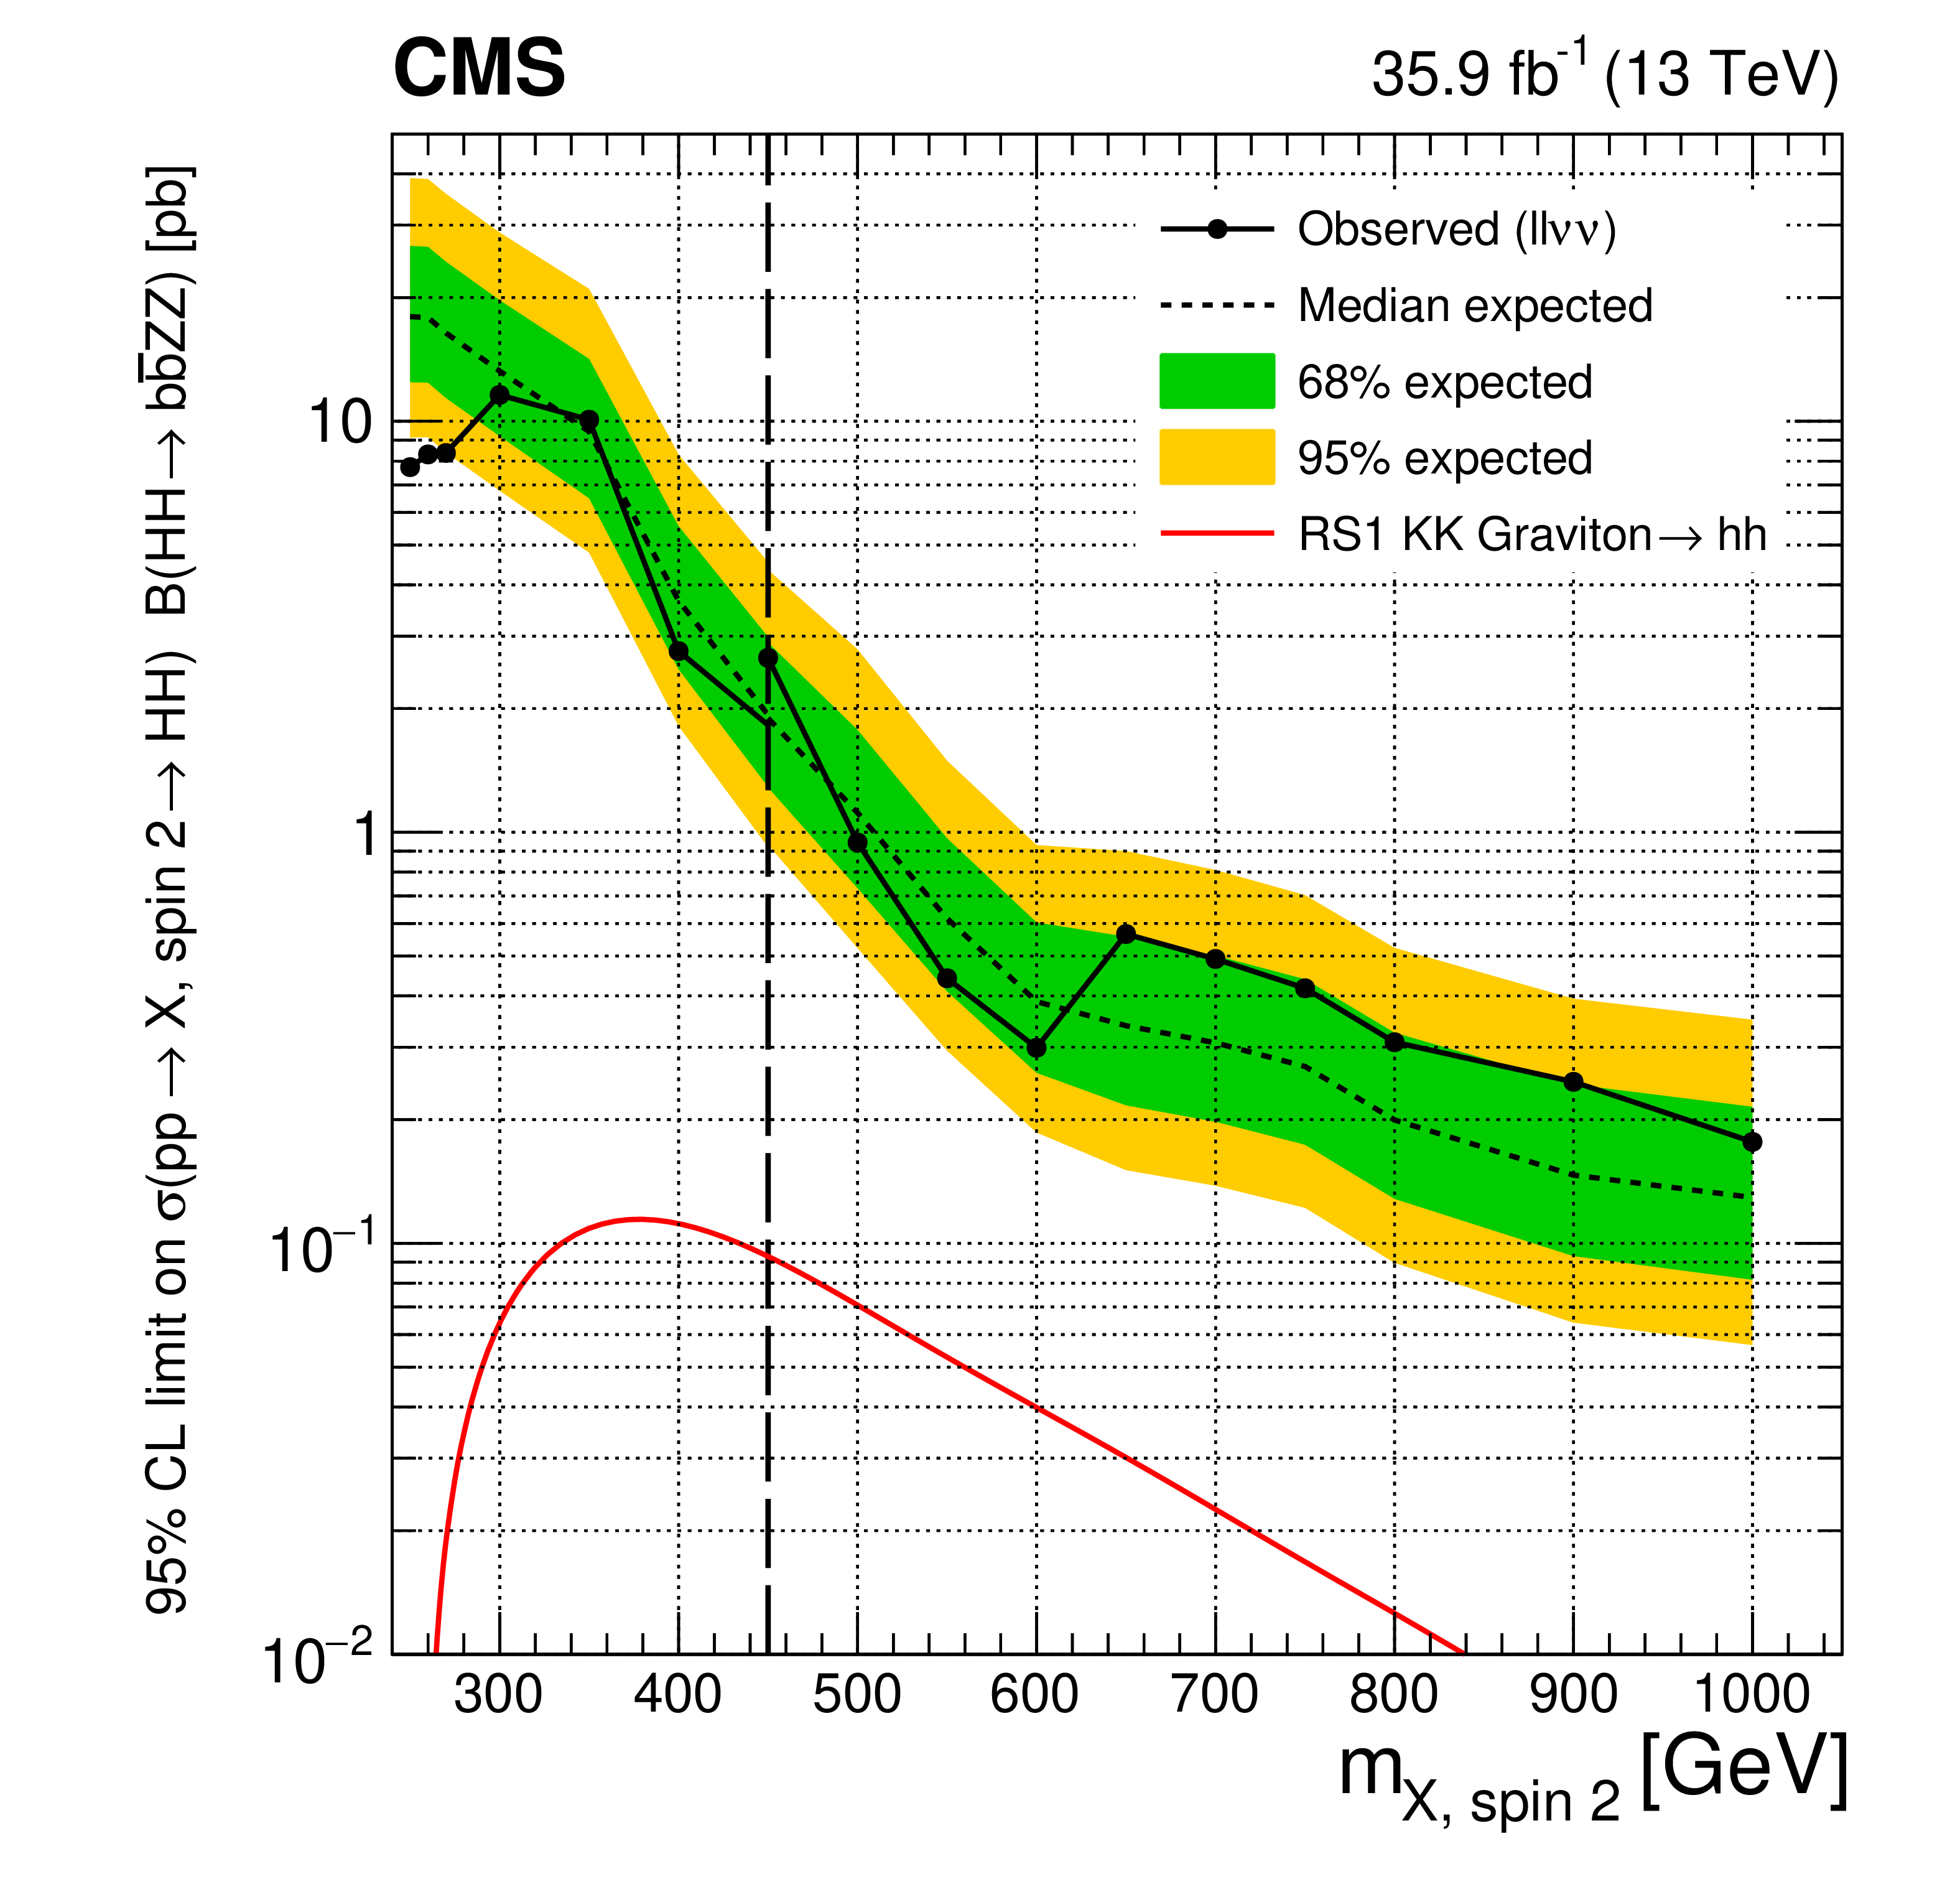
Figure 3-d:
Expected (black dashed line) and observed (black solid line) limits on the cross section of resonant $\mathrm{H} \mathrm{H} $ production times the branching fraction of $\mathrm{H} \mathrm{H} \to {\mathrm{b} \mathrm{b} \mathrm{Z} \mathrm{Z}} $ as a function of the resonance mass for the ${\mathrm{b} \mathrm{b} \ell \ell \nu \nu}$ channel, where $\mathrm{H} $ can represent either the SM Higgs boson or an additional Higgs boson from an extended electroweak sector. The spin-2 case is shown. The red solid line shows the theoretical prediction for the cross section of an RS1 KK graviton with $\tilde{k} = $ 0.1. The vertical black dashed line indicates the resonance mass of 450 GeV, a mass point where the BDT used in the analysis is switched from the one trained for low mass resonance to the one trained for high mass resonance. |
png pdf |
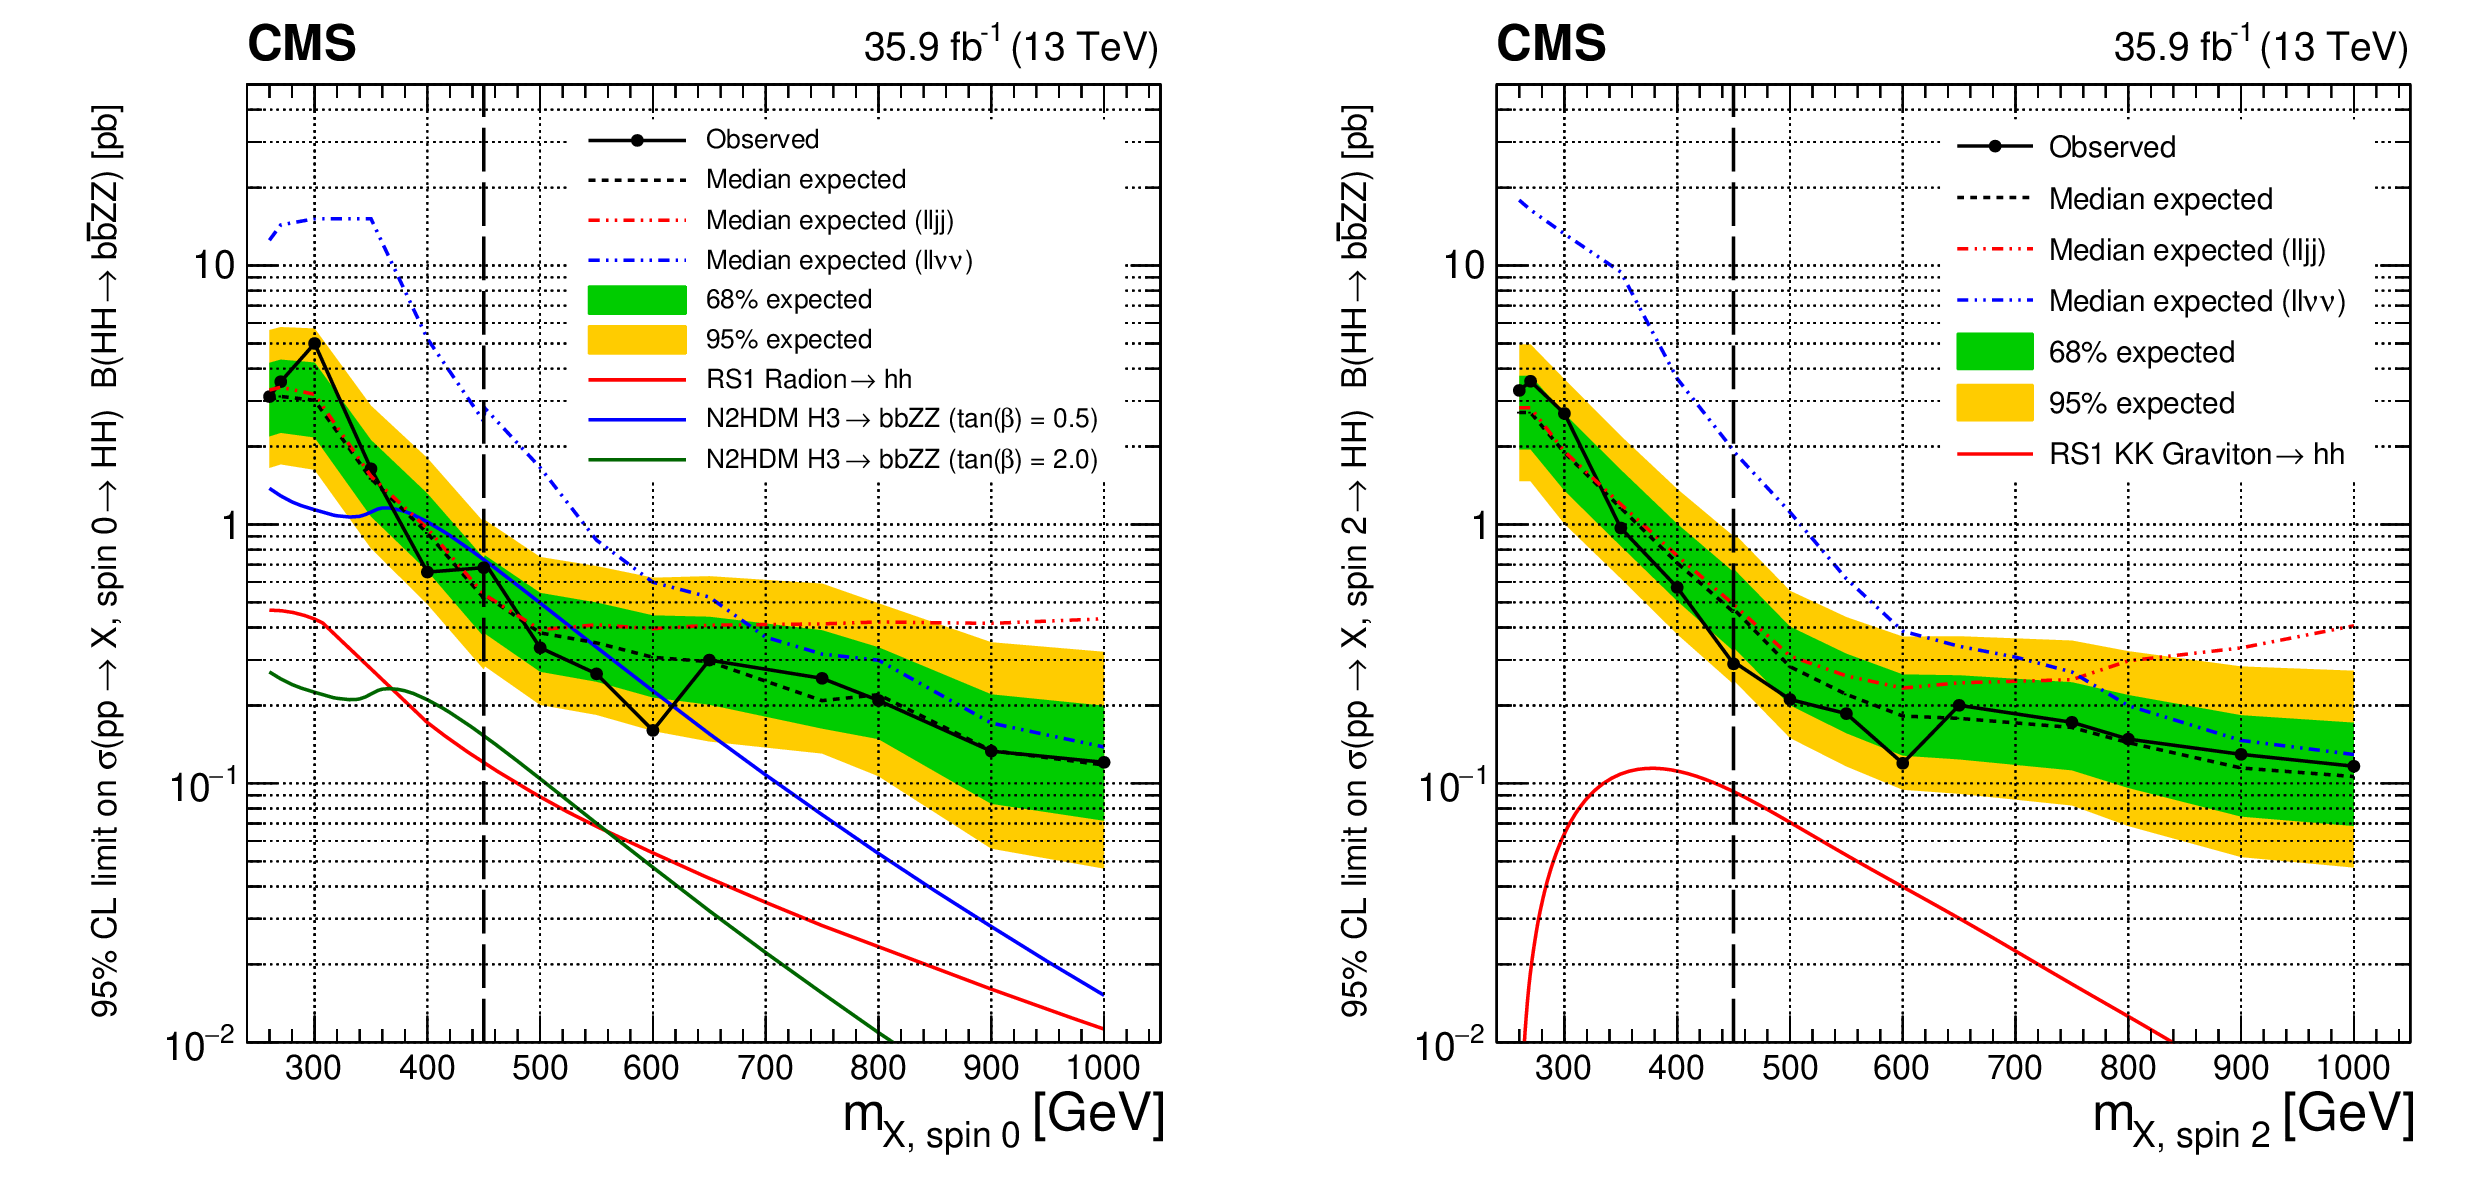
Figure 4:
Expected (black dashed line) and observed (black solid line) limits on the cross section of resonant $\mathrm{H} \mathrm{H} $ production times the branching fraction of $\mathrm{H} \mathrm{H} \to {\mathrm{b} \mathrm{b} \mathrm{Z} \mathrm{Z}} $ as a function of the mass of the resonance for the combination of the ${\mathrm{b} \mathrm{b} \ell \ell \mathrm {jj}}$ and ${\mathrm{b} \mathrm{b} \ell \ell \nu \nu}$ channels, where $\mathrm{H} $ can represent either the SM Higgs boson or an additional Higgs boson from an extended electroweak sector. The spin-0 case is shown on the left and the spin-2 case is shown on the right. The expected limits for each individual channel are shown with a red dashed line for the ${\mathrm{b} \mathrm{b} \ell \ell \mathrm {jj}}$ channel and blue dashed line for the ${\mathrm{b} \mathrm{b} \ell \ell \nu \nu}$ channel. The red solid lines show the theoretical prediction for the cross section of an RS1 radion with $\lambda _{\mathrm {R}} = $ 1 TeV and $kL=$ 35 (left) and an RS1 KK graviton with $\tilde{k} = $ 0.1 (right). In the spin-0 case only, the blue (green) line shows the decays of ${\mathrm{H}}_3\to {\mathrm{H}}_1{\mathrm{H}}_1/{\mathrm{H}}_1{\mathrm{H}}_2/{\mathrm{H}}_2{\mathrm{H}}_2\to {\mathrm{b} \mathrm{b} \mathrm{Z} \mathrm{Z}} $ in the N2HDM formulation, with $\tan\beta =$ 0.5 (2.0), the scalar ${\mathrm{H}}_3$ vev set to 45 GeV, and the mixing angles $\alpha _1$, $\alpha _2$, $\alpha _3$ set to 0.76, 0.48, and 1.00, respectively. The correction factor based on the relative partial width of ${\mathrm{H}}_3$ to two gluons is around 3.0 (0.7) for $\tan\beta =$ 0.5 (2.0). The vertical black dashed line indicates the resonance mass of 450 GeV, a mass point where the BDT used in the analysis is switched from the one trained for low mass resonance to the one trained for high mass resonance. |
png pdf |
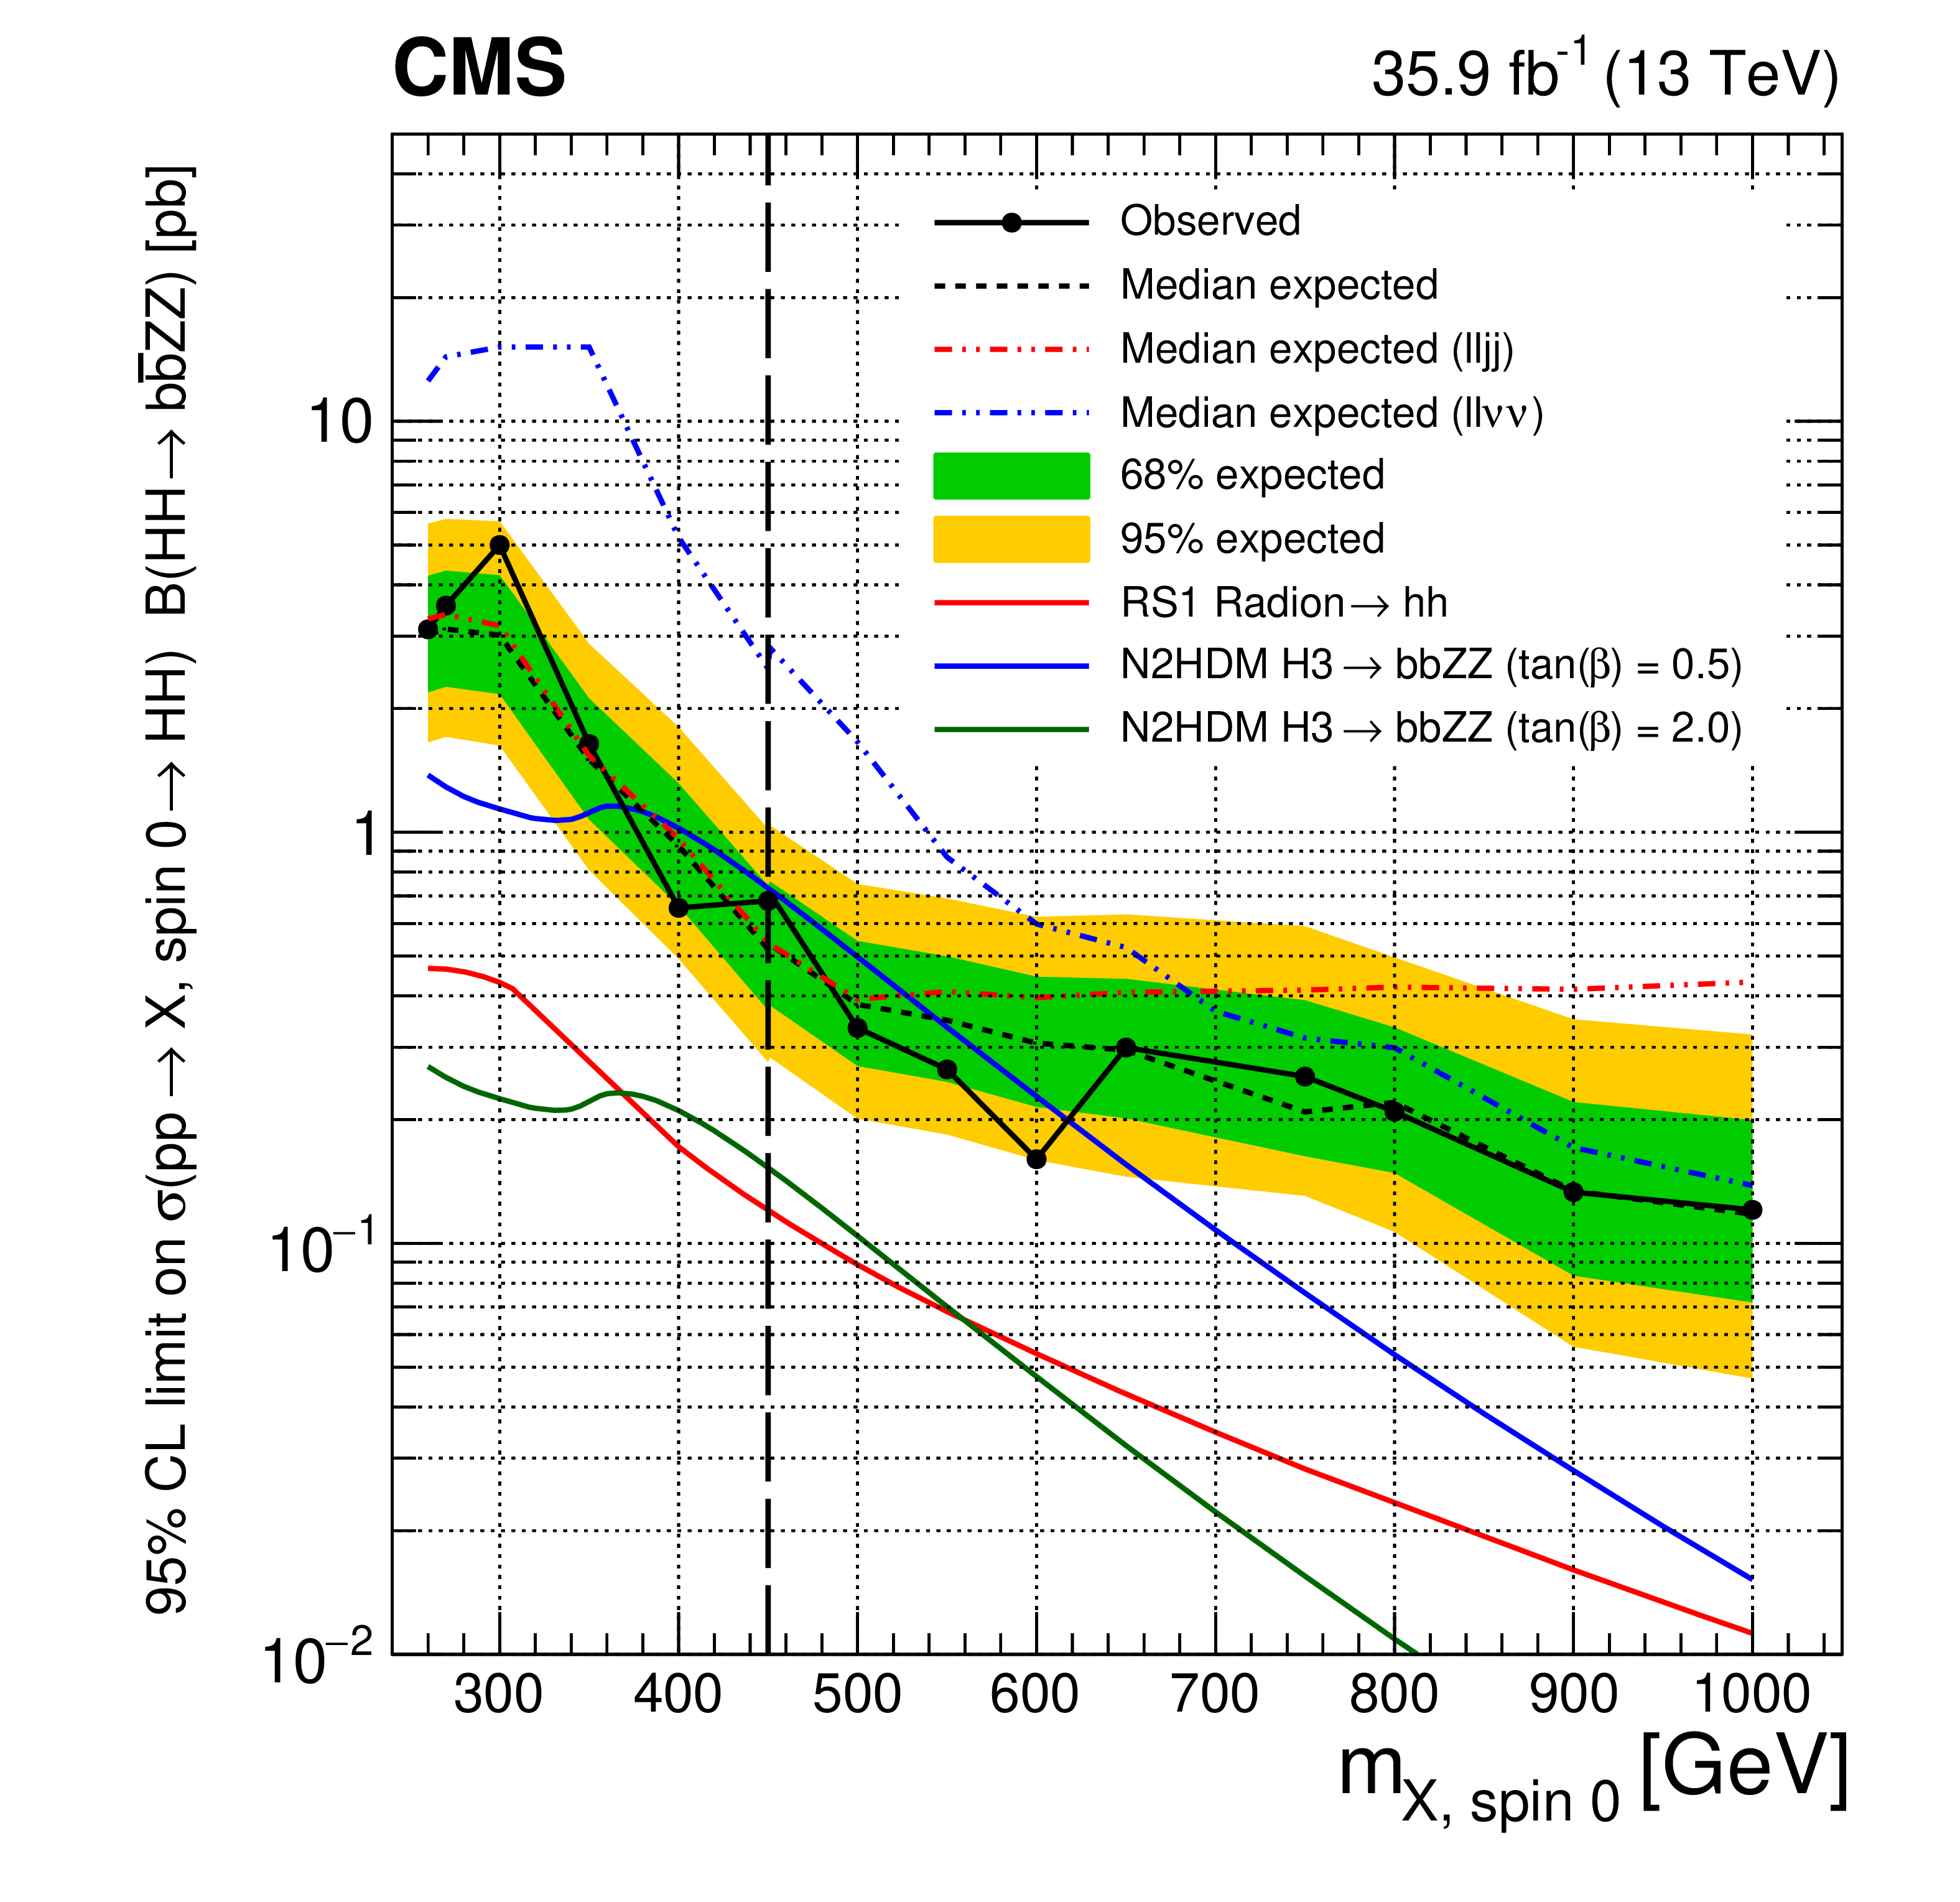
Figure 4-a:
Expected (black dashed line) and observed (black solid line) limits on the cross section of resonant $\mathrm{H} \mathrm{H} $ production times the branching fraction of $\mathrm{H} \mathrm{H} \to {\mathrm{b} \mathrm{b} \mathrm{Z} \mathrm{Z}} $ as a function of the mass of the resonance for the combination of the ${\mathrm{b} \mathrm{b} \ell \ell \mathrm {jj}}$ and ${\mathrm{b} \mathrm{b} \ell \ell \nu \nu}$ channels, where $\mathrm{H} $ can represent either the SM Higgs boson or an additional Higgs boson from an extended electroweak sector. The spin-0 case is shown.The expected limits for each individual channel are shown with a red dashed line for the ${\mathrm{b} \mathrm{b} \ell \ell \mathrm {jj}}$ channel and blue dashed line for the ${\mathrm{b} \mathrm{b} \ell \ell \nu \nu}$ channel. The red solid lines show the theoretical prediction for the cross section of an RS1 radion with $\lambda _{\mathrm {R}} = $ 1 TeV and $kL=$ 35. The blue (green) line shows the decays of ${\mathrm{H}}_3\to {\mathrm{H}}_1{\mathrm{H}}_1/{\mathrm{H}}_1{\mathrm{H}}_2/{\mathrm{H}}_2{\mathrm{H}}_2\to {\mathrm{b} \mathrm{b} \mathrm{Z} \mathrm{Z}} $ in the N2HDM formulation, with $\tan\beta =$ 0.5 (2.0), the scalar ${\mathrm{H}}_3$ vev set to 45 GeV, and the mixing angles $\alpha _1$, $\alpha _2$, $\alpha _3$ set to 0.76, 0.48, and 1.00, respectively. The correction factor based on the relative partial width of ${\mathrm{H}}_3$ to two gluons is around 3.0 (0.7) for $\tan\beta =$ 0.5 (2.0). The vertical black dashed line indicates the resonance mass of 450 GeV, a mass point where the BDT used in the analysis is switched from the one trained for low mass resonance to the one trained for high mass resonance. |
png pdf |
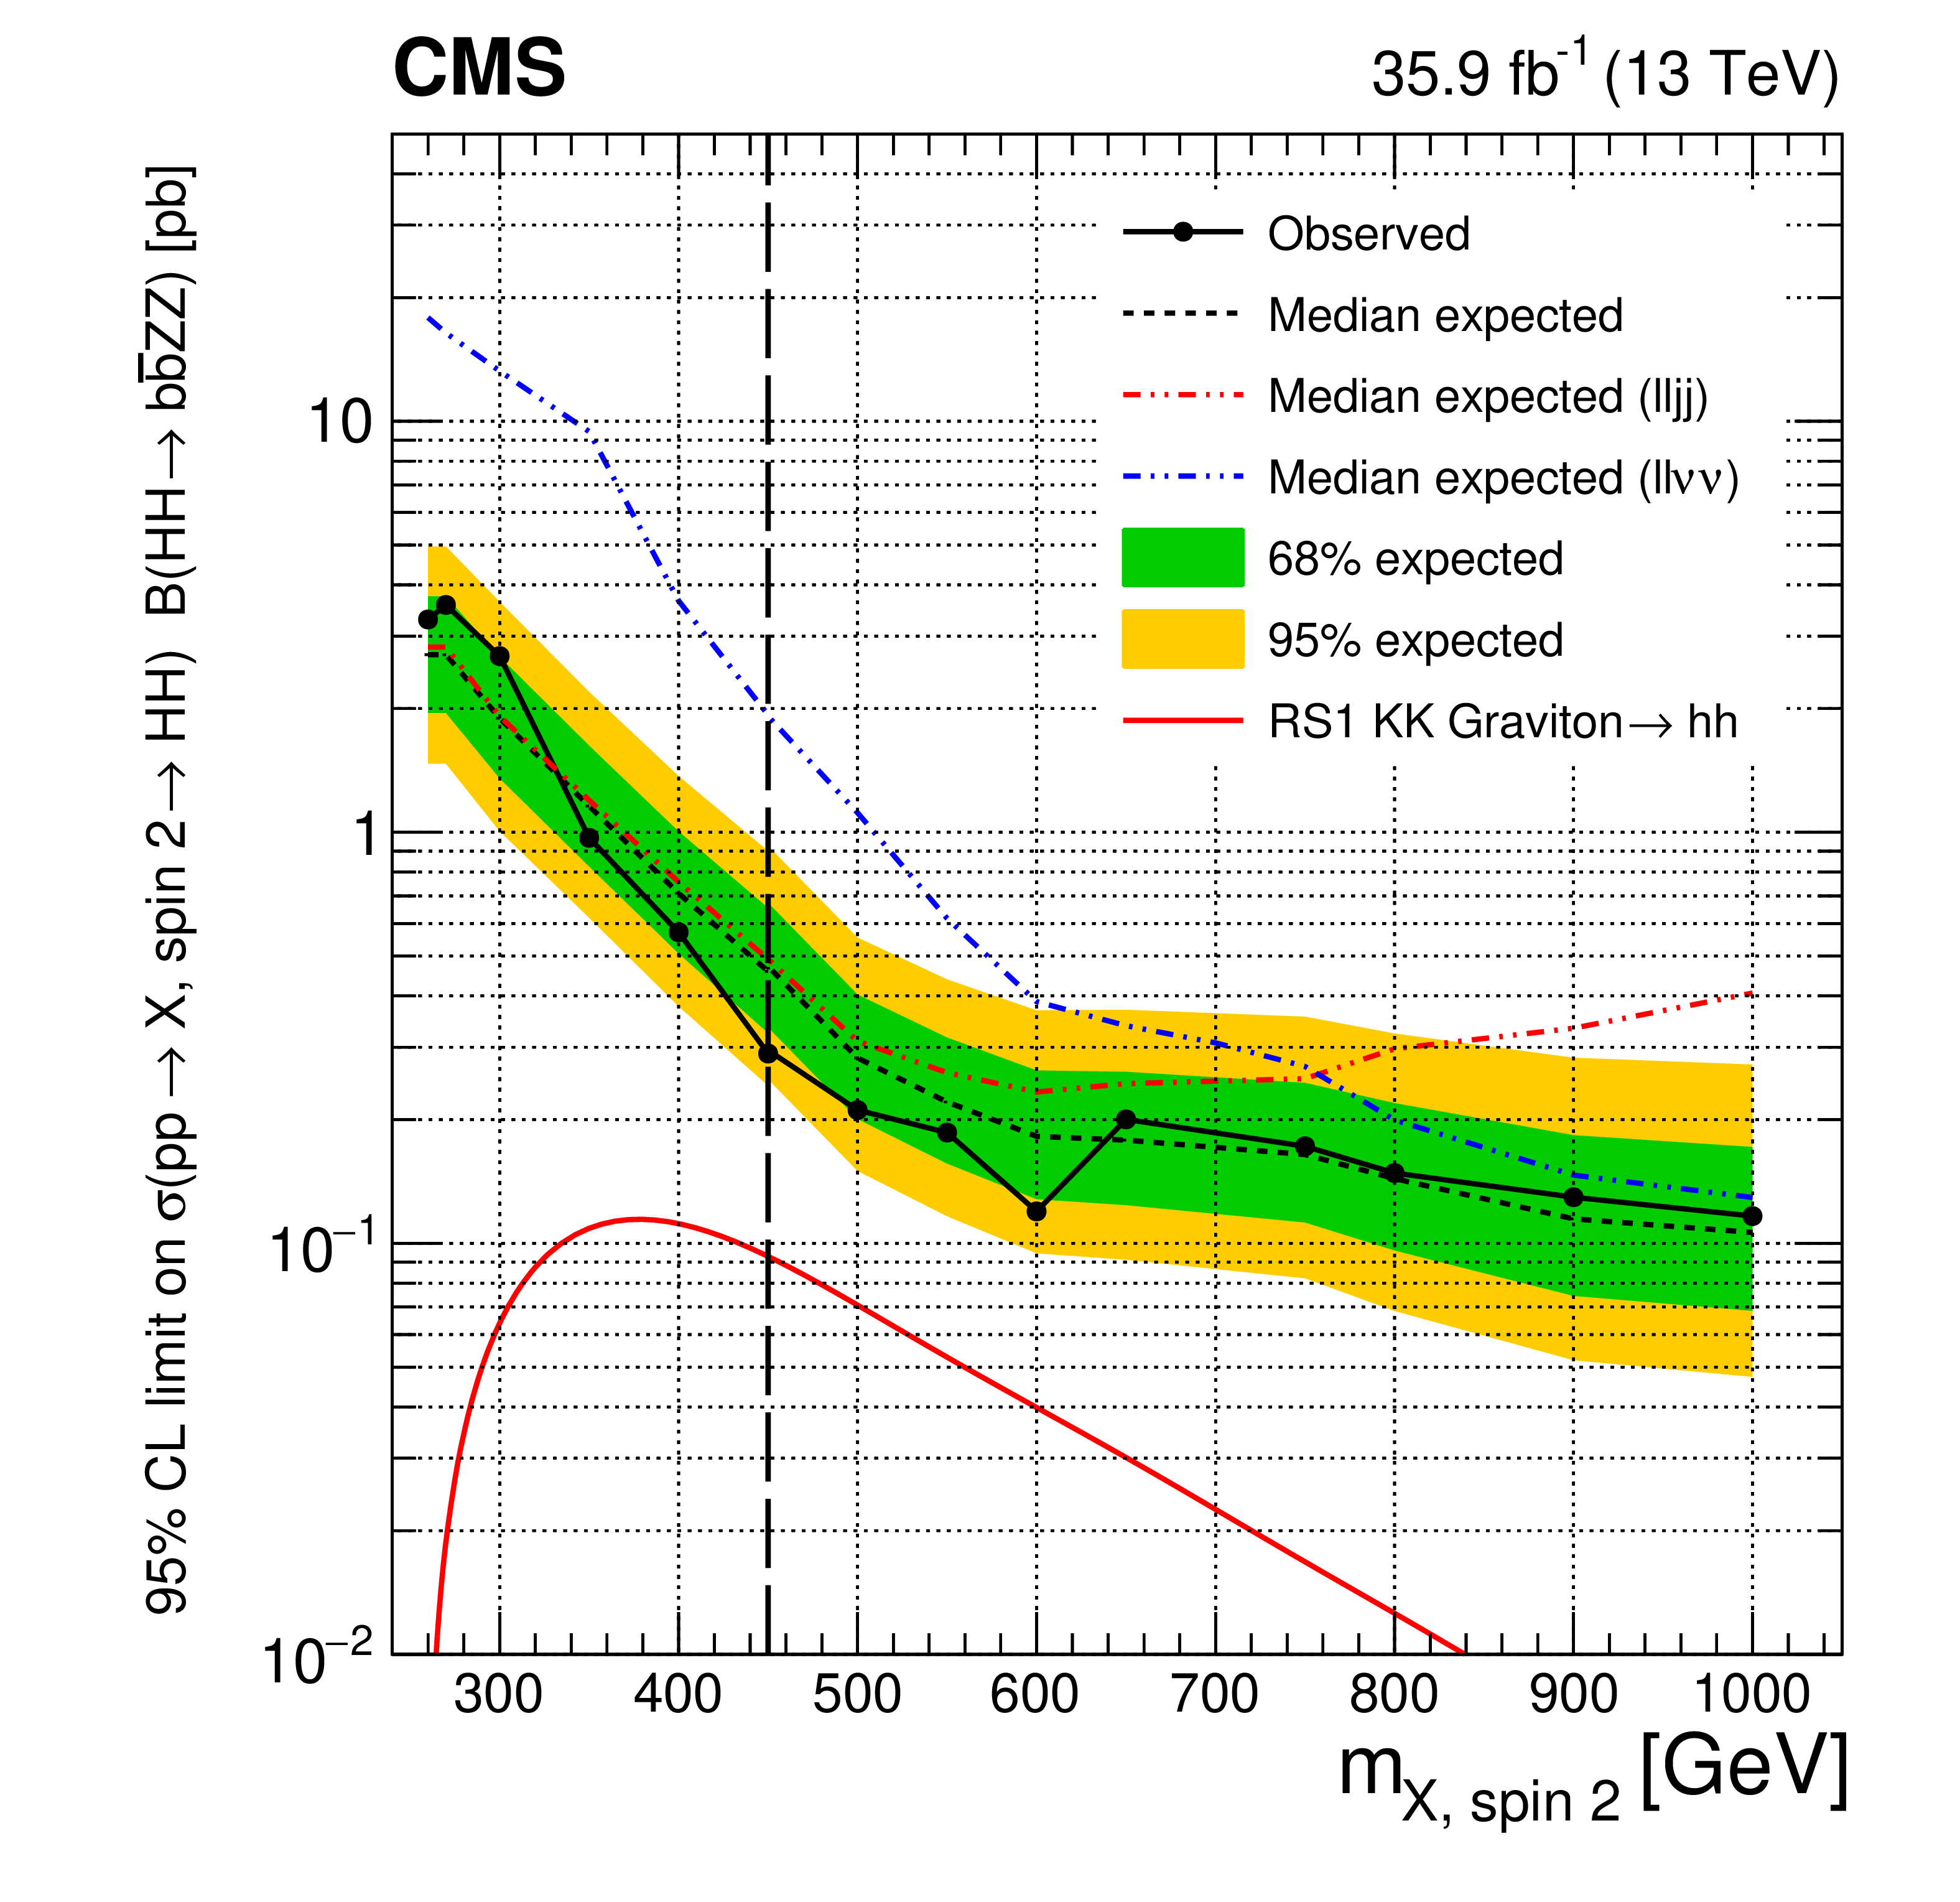
Figure 4-b:
Expected (black dashed line) and observed (black solid line) limits on the cross section of resonant $\mathrm{H} \mathrm{H} $ production times the branching fraction of $\mathrm{H} \mathrm{H} \to {\mathrm{b} \mathrm{b} \mathrm{Z} \mathrm{Z}} $ as a function of the mass of the resonance for the combination of the ${\mathrm{b} \mathrm{b} \ell \ell \mathrm {jj}}$ and ${\mathrm{b} \mathrm{b} \ell \ell \nu \nu}$ channels, where $\mathrm{H} $ can represent either the SM Higgs boson or an additional Higgs boson from an extended electroweak sector. The spin-2 case is shown. The expected limits for each individual channel are shown with a red dashed line for the ${\mathrm{b} \mathrm{b} \ell \ell \mathrm {jj}}$ channel and blue dashed line for the ${\mathrm{b} \mathrm{b} \ell \ell \nu \nu}$ channel. The red solid lines show the theoretical prediction for the cross section of an RS1 KK graviton with $\tilde{k} = $ 0.1. The vertical black dashed line indicates the resonance mass of 450 GeV, a mass point where the BDT used in the analysis is switched from the one trained for low mass resonance to the one trained for high mass resonance. |
png pdf |
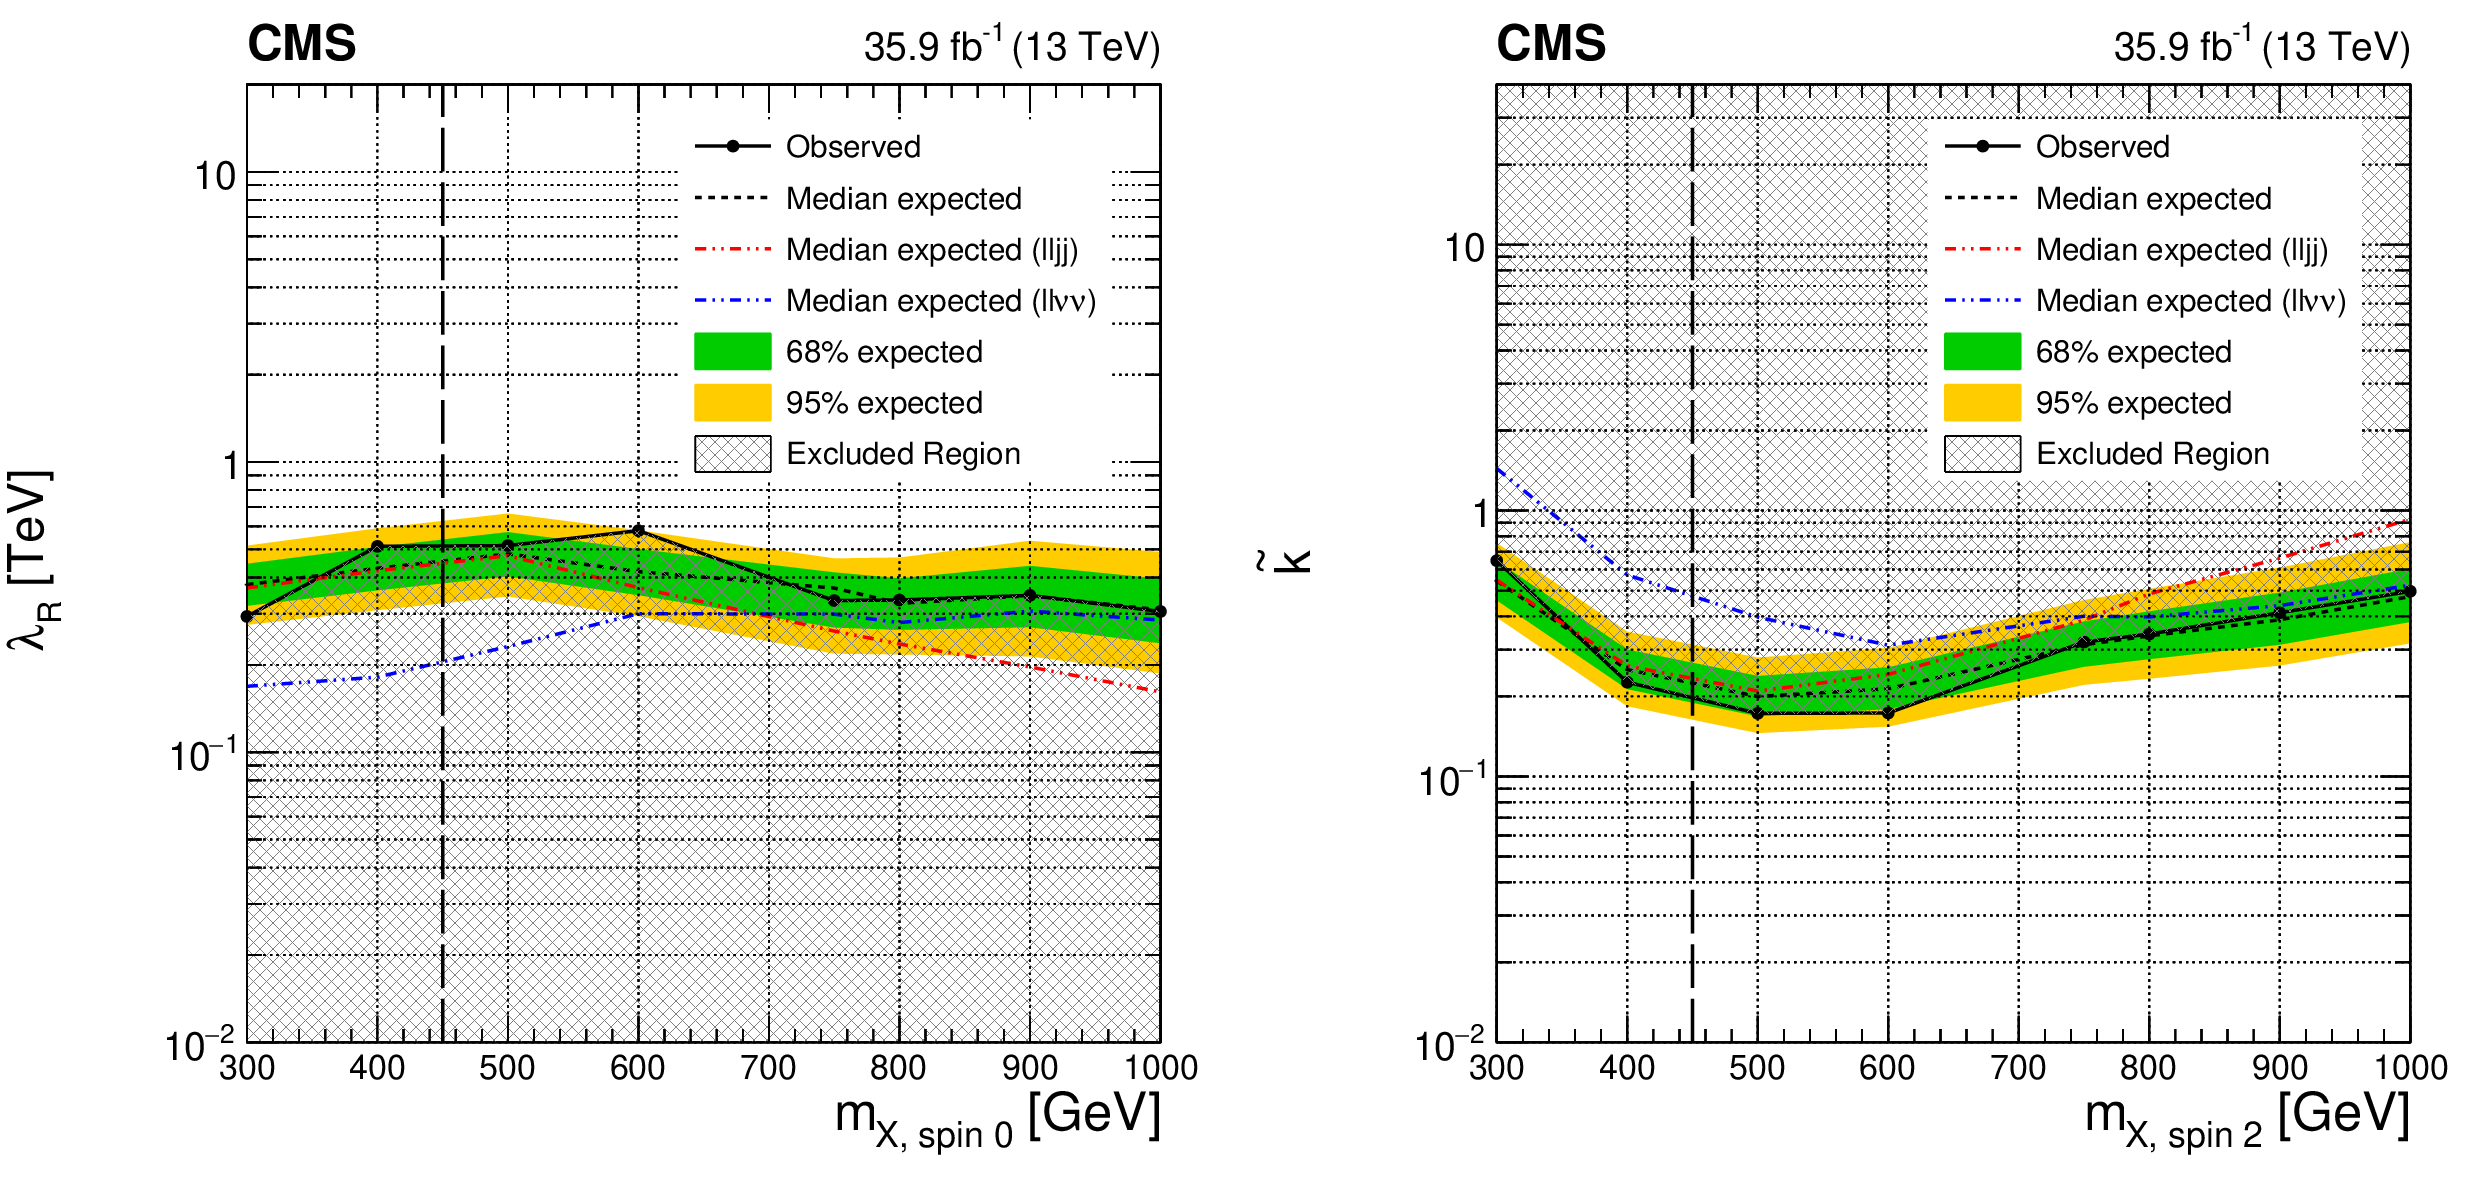
Figure 5:
The expected and observed exclusion limits at 95% CL on the RS1 radion with $kL=$ 35 (RS1 KK graviton) hypothesis in the $\lambda _{\mathrm {R}}$ ($\tilde{k}$) versus mass plane for the individual ${\mathrm{b} \mathrm{b} \ell \ell \mathrm {jj}}$ (red) and ${\mathrm{b} \mathrm{b} \ell \ell \nu \nu}$ (blue) channels and their combination (black). The dark green and light yellow expected limit uncertainty bands represent the 68 and 95% confidence intervals. Solid lines represent the observed limits and dashed lines represent the expected limits. The shaded region is excluded by the current limits. The vertical black dashed line indicates the resonance mass of 450 GeV, a mass point where the BDT used in the ${\mathrm{b} \mathrm{b} \ell \ell \nu \nu}$ analysis is switched from the one trained for low mass resonance to the one trained for high mass resonance. |
png pdf |
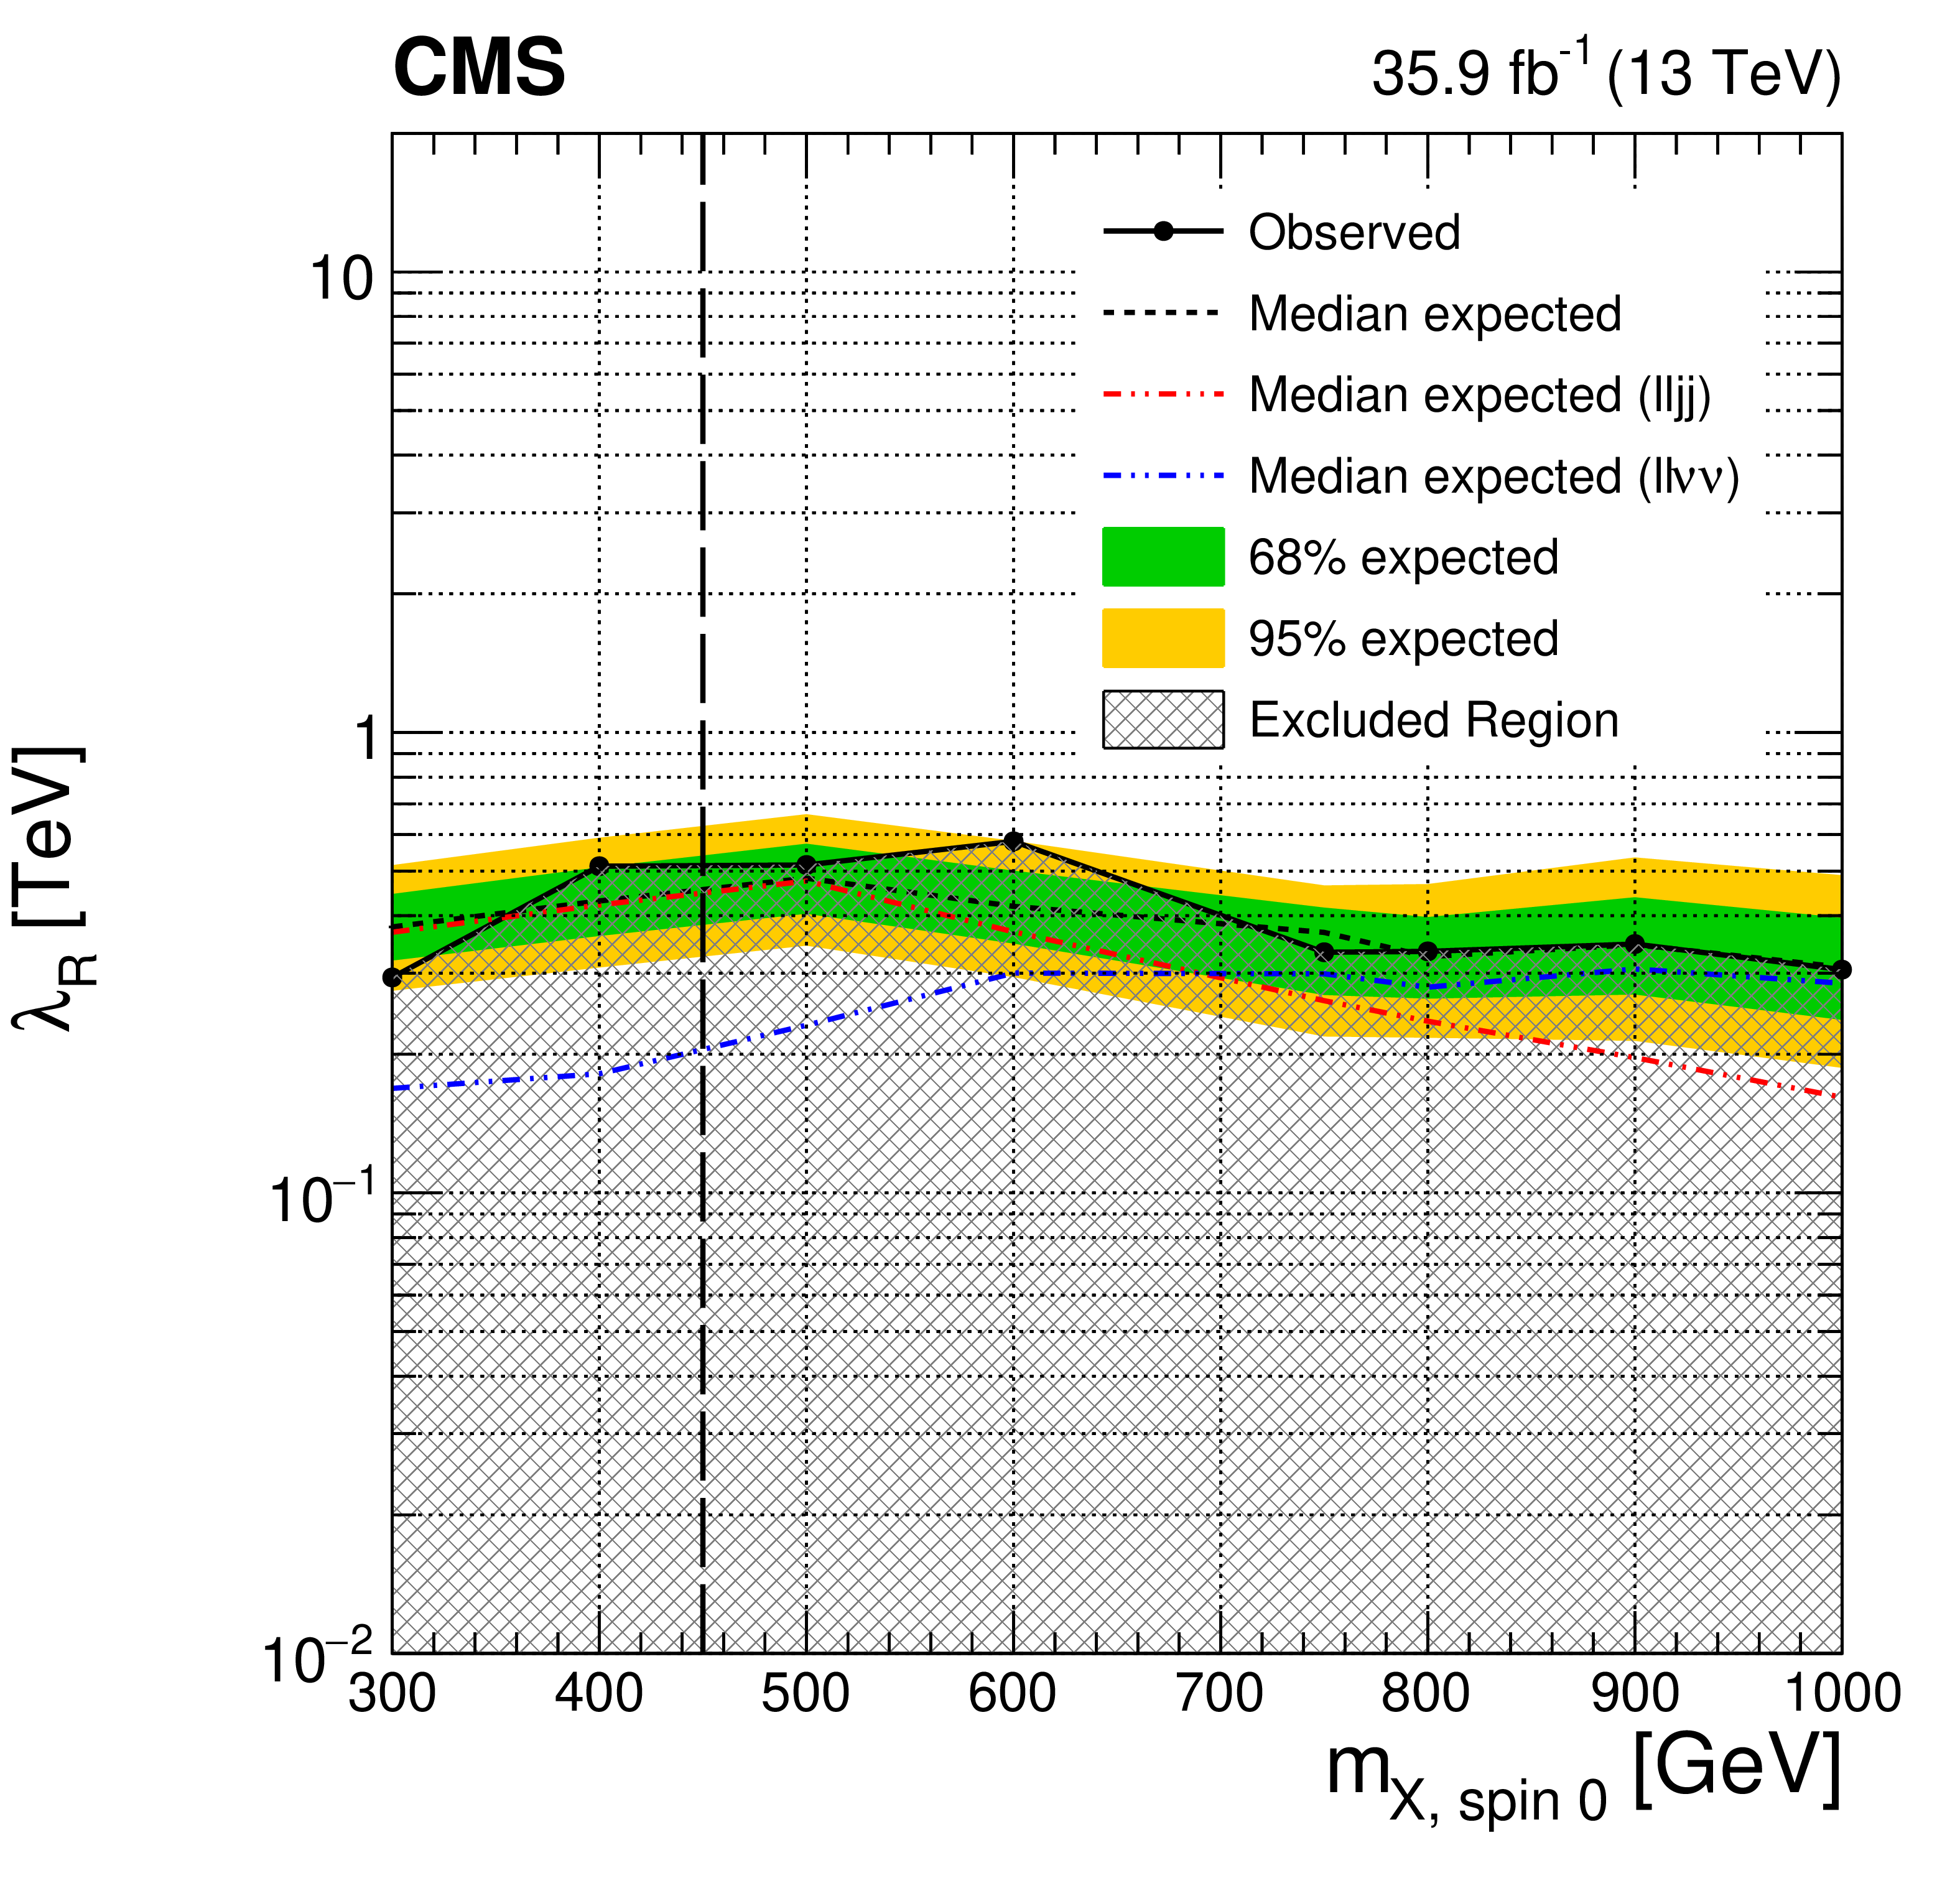
Figure 5-a:
The expected and observed exclusion limits at 95% CL on the RS1 radion with $kL=$ 35 hypothesis in the $\lambda _{\mathrm {R}}$ versus mass plane for the individual ${\mathrm{b} \mathrm{b} \ell \ell \mathrm {jj}}$ (red) and ${\mathrm{b} \mathrm{b} \ell \ell \nu \nu}$ (blue) channels and their combination (black). The dark green and light yellow expected limit uncertainty bands represent the 68 and 95% confidence intervals. Solid lines represent the observed limits and dashed lines represent the expected limits. The shaded region is excluded by the current limits. The vertical black dashed line indicates the resonance mass of 450 GeV, a mass point where the BDT used in the ${\mathrm{b} \mathrm{b} \ell \ell \nu \nu}$ analysis is switched from the one trained for low mass resonance to the one trained for high mass resonance. |
png pdf |
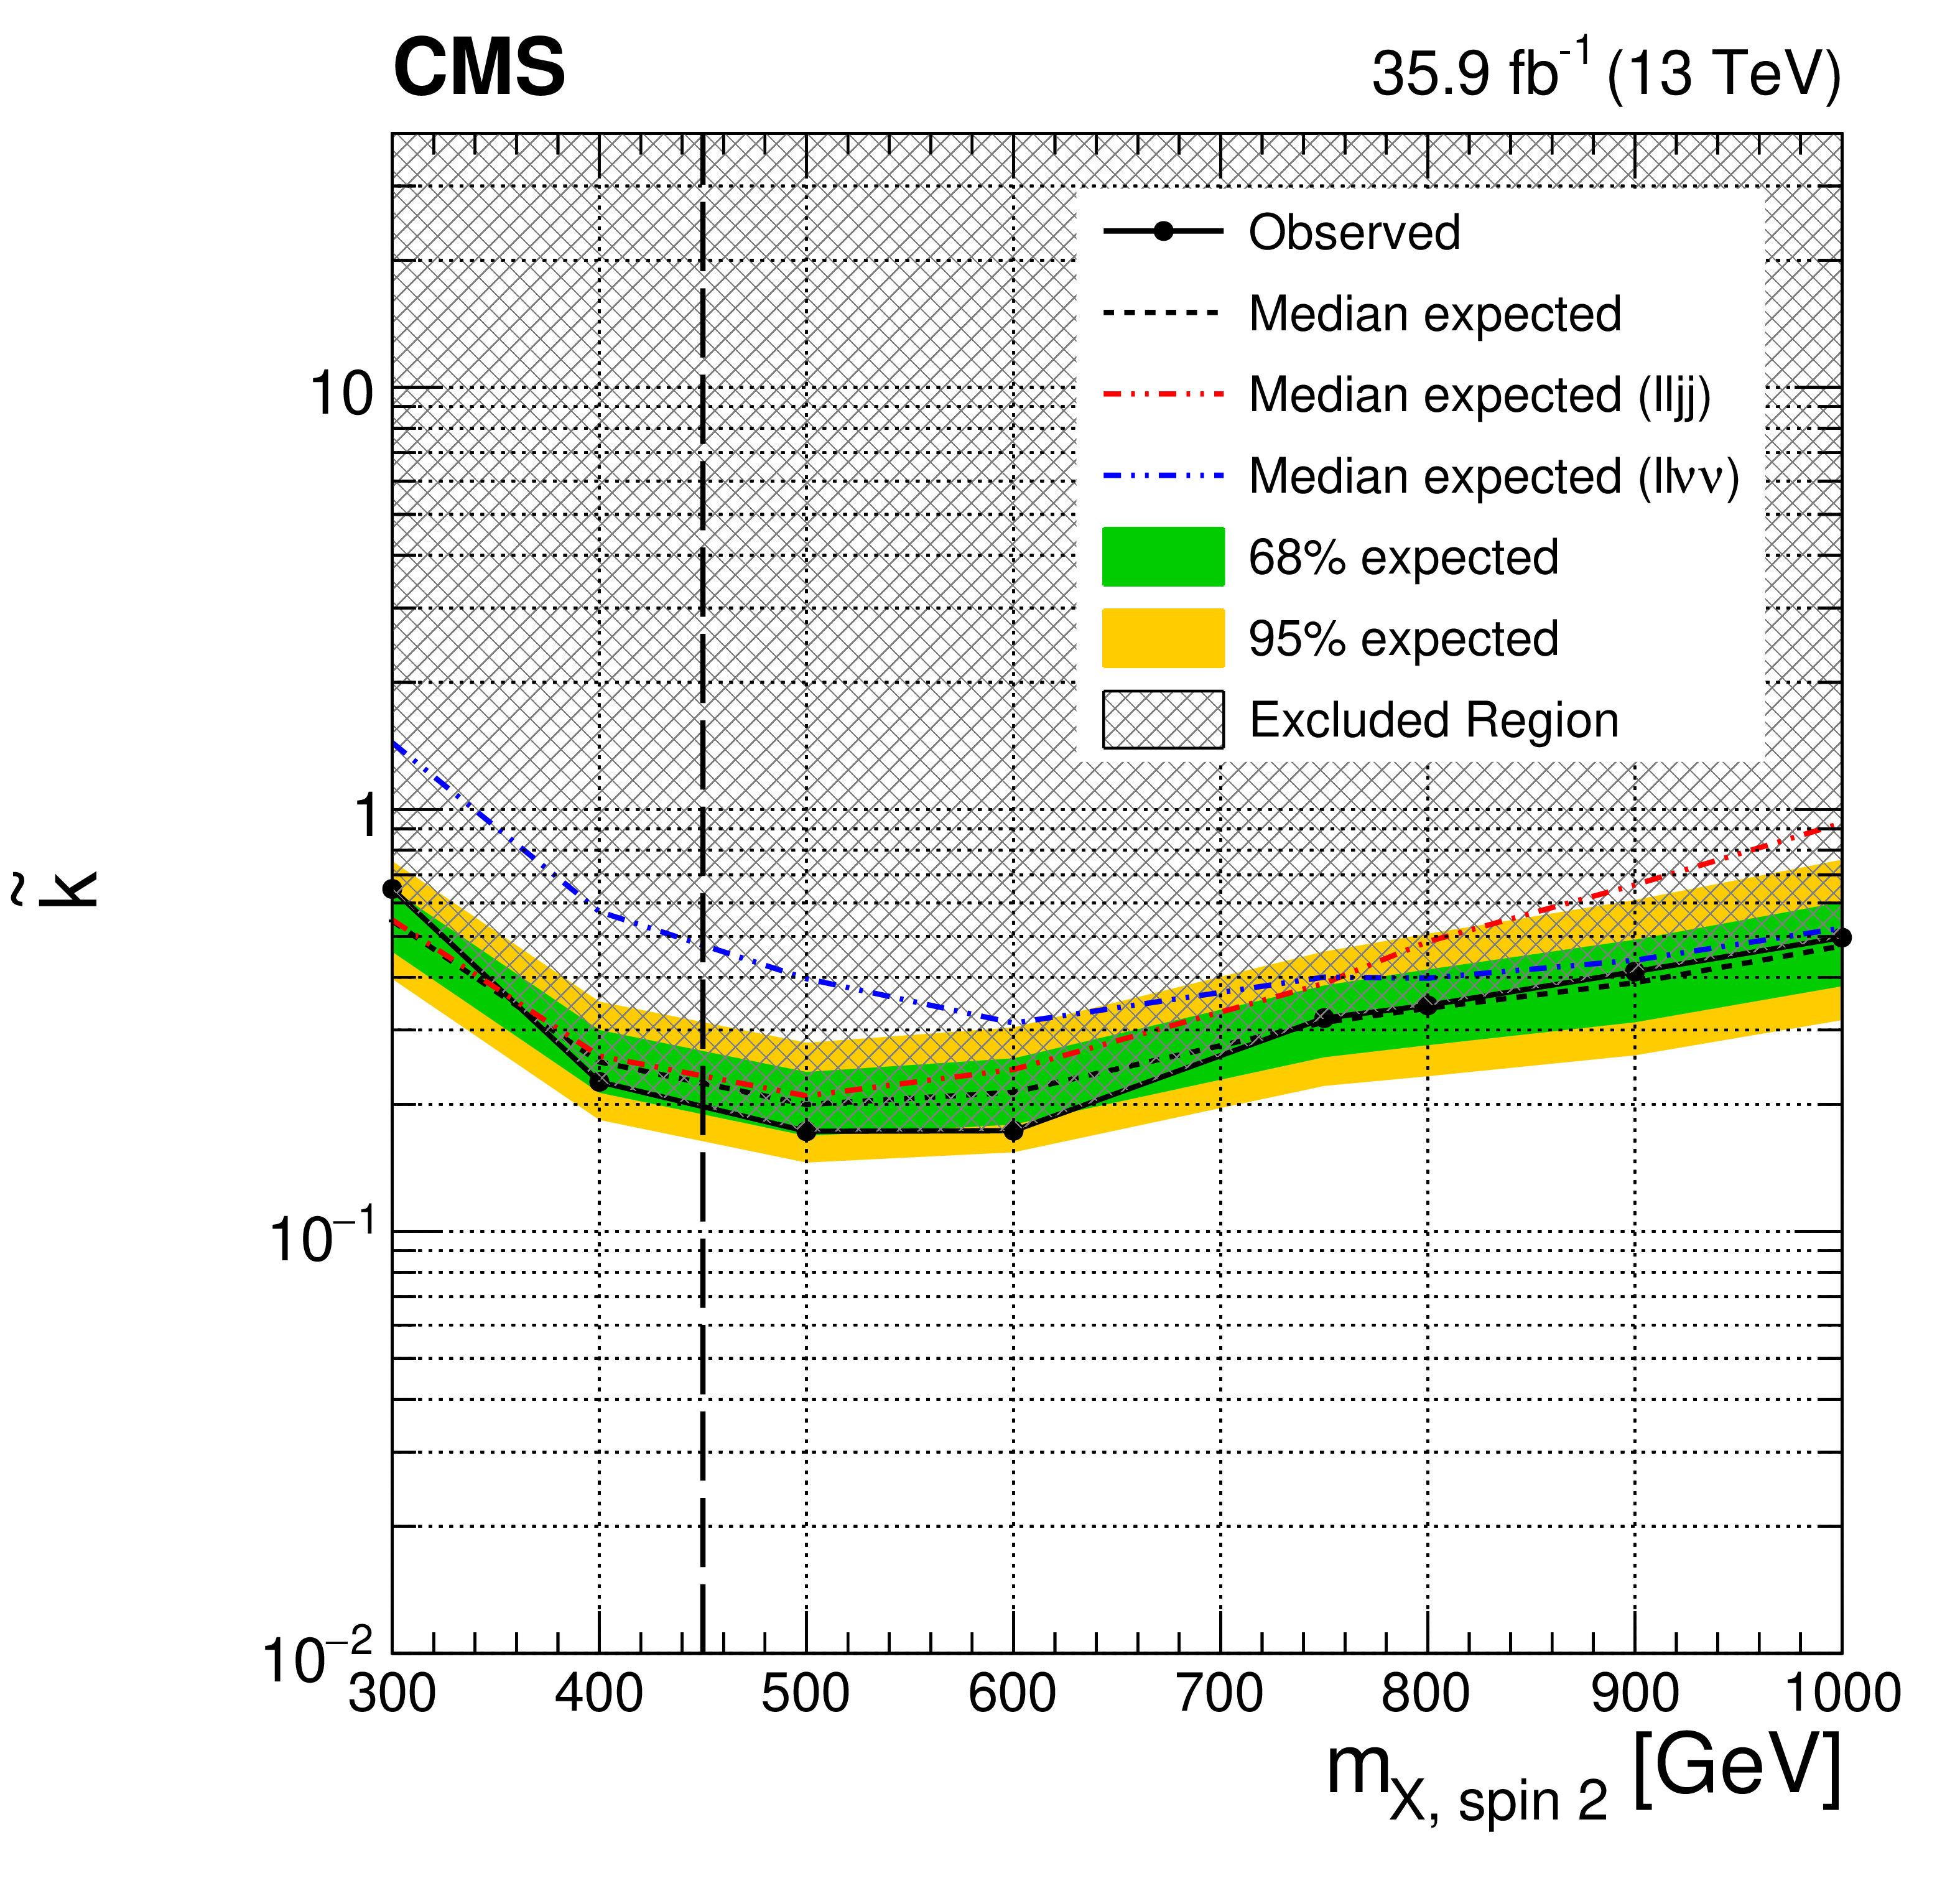
Figure 5-b:
The expected and observed exclusion limits at 95% CL on the RS1 KK graviton hypothesis in the $\tilde{k}$ versus mass plane for the individual ${\mathrm{b} \mathrm{b} \ell \ell \mathrm {jj}}$ (red) and ${\mathrm{b} \mathrm{b} \ell \ell \nu \nu}$ (blue) channels and their combination (black). The dark green and light yellow expected limit uncertainty bands represent the 68 and 95% confidence intervals. Solid lines represent the observed limits and dashed lines represent the expected limits. The shaded region is excluded by the current limits. The vertical black dashed line indicates the resonance mass of 450 GeV, a mass point where the BDT used in the ${\mathrm{b} \mathrm{b} \ell \ell \nu \nu}$ analysis is switched from the one trained for low mass resonance to the one trained for high mass resonance. |
| Summary |
| A search for the production of a narrow-width resonance decaying into a pair of Higgs bosons decaying into the bbZZ channel is presented. The analysis is based on data collected with the CMS detector during 2016, in proton-proton collisions at the LHC, corresponding to an integrated luminosity of 35.9 fb$^{-1}$. The final states considered are the ones where one of the Z bosons decays into a pair of muons or electrons, and the other Z boson decays either to a pair of quarks or a pair of neutrinos. Upper limits at 95% confidence level are placed on the production of narrow-width spin-0 or spin-2 particles decaying to a pair of Higgs bosons, in models with and without an extended Higgs sector. For a resonance mass range between 260 and 1000 GeV, limits on the production cross section times branching fraction of a spin-0 and spin-2 resonance range from 0.1 to 5.0 pb and 0.1 to 3.6 pb, respectively. These results set limits in parameter space in bulk Randall-Sundrum radion, Kaluza-Klein excitation of the graviton, and N2HDM models. For specific choices of parameters the N2HDM can be excluded in a mass range between 360 and 620 GeV for a resonance decaying to two Higgs bosons. This is the first search for Higgs boson resonant pair production in the bbZZ channel. |
| References | ||||
| 1 | CMS Collaboration | Observation of a new boson at a mass of 125 gev with the CMS experiment at the LHC | PLB 716 (2012) 30 | CMS-HIG-12-028 1207.7235 |
| 2 | CMS Collaboration | A new boson with a mass of 125 gev observed with the CMS experiment at the large hadron collider | Science 338 (2012) 1569 | |
| 3 | ATLAS Collaboration | Observation of a new particle in the search for the standard model Higgs boson with the ATLAS detector at the LHC | PLB 716 (2012) 1 | 1207.7214 |
| 4 | LHC Higgs Cross Section Working Group | Handbook of LHC Higgs cross sections: 4. Deciphering the nature of the Higgs sector | CERN (2016) | 1610.07922 |
| 5 | Y. Tang | Implications of LHC searches for massive graviton | JHEP 08 (2012) 078 | 1206.6949 |
| 6 | K. Cheung | Phenomenology of the radion in the Randall-Sundrum scenario | PRD 63 (2001) 056007 | hep-ph/0009232 |
| 7 | N. Kumar and S. P. Martin | LHC search for di-Higgs decays of stoponium and other scalars in events with two photons and two bottom jets | PRD 90 (2014) 055007 | 1404.0996 |
| 8 | G. C. Branco et al. | Theory and phenomenology of two-Higgs-doublet models | PR 516 (2012) 1 | 1106.0034 |
| 9 | N. Craig, J. Galloway, and S. Thomas | Searching for signs of the second Higgs doublet | 1305.2424 | |
| 10 | M. Carena et al. | Alignment limit of the NMSSM Higgs sector | PRD 93 (2016) 035013 | 1510.09137 |
| 11 | S. AbdusSalam | Testing Higgs boson scenarios in the phenomenological NMSSM | EPJC 79 (2019) 442 | 1710.10785 |
| 12 | E. Bagnaschi et al. | Benchmark scenarios for low $ \tan \beta $ in the MSSM | LHCHXSWG-2015-002 | |
| 13 | CMS Collaboration | Search for resonant pair production of Higgs bosons decaying to bottom quark-antiquark pairs in proton-proton collisions at 13 TeV | JHEP 08 (2018) 152 | CMS-HIG-17-009 1806.03548 |
| 14 | ATLAS Collaboration | Search for pair production of Higgs bosons in the $ \mathrm{b}\overline{\mathrm{b}}\mathrm{b}\overline{\mathrm{b}} $ final state using proton-proton collisions at $ \sqrt{s} = $ 13 TeV with the ATLAS detector | JHEP 01 (2019) 30 | 1804.06174 |
| 15 | CMS Collaboration | Search for Higgs boson pair production in events with two bottom quarks and two tau leptons in proton-proton collisions at $ \sqrt s = $ 13 TeV | PLB 778 (2018) 101 | CMS-HIG-17-002 1707.02909 |
| 16 | ATLAS Collaboration | Combination of searches for heavy resonances decaying into bosonic and leptonic final states using 36 fb$ ^{-1} $ of proton-proton collision data at $ \sqrt{s} = $ 13 TeV with the ATLAS detector | PRD 98 (2018) 052008 | 1808.02380 |
| 17 | CMS Collaboration | Search for Higgs boson pair production in the $ \gamma\gamma\mathrm{b\overline{b}} $ final state in pp collisions at $ \sqrt{s}= $ 13 TeV | PLB 788 (2019) 7 | CMS-HIG-17-008 1806.00408 |
| 18 | CMS Collaboration | Search for resonant and nonresonant Higgs boson pair production in the $ \mathrm{b}\overline{\mathrm{b}}\ell\nu\ell\nu $ final state in proton-proton collisions at $ \sqrt{s}= $ 13 TeV | JHEP 01 (2018) 54 | CMS-HIG-17-006 1708.04188 |
| 19 | L. Randall and R. Sundrum | A large mass hierarchy from a small extra dimension | PRL 83 (1999) 3370 | hep-ph/9905221 |
| 20 | W. D. Goldberger and M. B. Wise | Modulus stabilization with bulk fields | PRL 83 (1999) 4922 | hep-ph/9907447 |
| 21 | O. DeWolfe, D. Z. Freedman, S. S. Gubser, and A. Karch | Modeling the fifth-dimension with scalars and gravity | PRD 62 (2000) 046008 | hep-th/9909134 |
| 22 | C. Csaki, M. Graesser, L. Randall, and J. Terning | Cosmology of brane models with radion stabilization | PRD 62 (2000) 045015 | hep-ph/9911406 |
| 23 | C. Csaki, J. Hubisz, and S. J. Lee | Radion phenomenology in realistic warped space models | PRD 76 (2007) 125015 | 0705.3844 |
| 24 | A. Oliveira | Gravity particles from warped extra dimensions, predictions for LHC | 1404.0102 | |
| 25 | C.-Y. Chen, M. Freid, and M. Sher | Next-to-minimal two Higgs doublet model | PRD 89 (2014) 075009 | 1312.3949 |
| 26 | M. Muhlleitner, M. O. P. Sampaio, R. Santos, and J. Wittbrodt | The N2HDM under Theoretical and Experimental Scrutiny | JHEP 03 (2017) 094 | 1612.01309 |
| 27 | L. Bian et al. | Future prospects of mass-degenerate Higgs bosons in the CP-conserving two-Higgs-doublet model | PRD 97 (2018) 115007 | 1712.01299 |
| 28 | P. M. Ferreira, R. Santos, H. E. Haber, and J. P. Silva | Mass-degenerate Higgs bosons at 125 GeV in the two-Higgs-doublet model | PRD 87 (2013) 055009 | 1211.3131 |
| 29 | I. Engeln, M. Muhlleitner, and J. Wittbrodt | N2HDECAY: Higgs boson decays in the different phases of the N2HDM | CPC 234 (2019) 256 | 1805.00966 |
| 30 | CMS Collaboration | The CMS trigger system | JINST 12 (2017) 1020 | CMS-TRG-12-001 1609.02366 |
| 31 | CMS Collaboration | The CMS experiment at the CERN LHC | JINST 3 (2008) S08004 | CMS-00-001 |
| 32 | J. Alwall et al. | The automated computation of tree-level and next-to-leading order differential cross sections, and their matching to parton shower simulations | JHEP 07 (2014) 079 | 1405.0301 |
| 33 | R. Frederix and S. Frixione | Merging meets matching in MC@NLO | JHEP 12 (2012) 061 | 1209.6215 |
| 34 | J. Alwall et al. | Comparative study of various algorithms for the merging of parton showers and matrix elements in hadronic collisions | EPJC 53 (2008) 473 | 0706.2569 |
| 35 | S. Kallweit et al. | NLO QCD+EW predictions for V+jets including off-shell vector-boson decays and multijet merging | JHEP 04 (2016) 021 | 1511.08692 |
| 36 | P. Nason | A new method for combining NLO QCD with shower Monte Carlo algorithms | JHEP 11 (2004) 040 | hep-ph/0409146 |
| 37 | S. Frixione, P. Nason, and C. Oleari | Matching NLO QCD computations with Parton Shower simulations: the POWHEG method | JHEP 11 (2007) 070 | 0709.2092 |
| 38 | S. Alioli, P. Nason, C. Oleari, and E. Re | A general framework for implementing NLO calculations in shower Monte Carlo programs: the POWHEG BOX | JHEP 06 (2010) 043 | 1002.2581 |
| 39 | S. Alioli, P. Nason, C. Oleari, and E. Re | NLO single-top production matched with shower in POWHEG: s- and t-channel contributions | JHEP 09 (2009) 111 | 0907.4076 |
| 40 | E. Re | Single-top Wt-channel production matched with parton showers using the POWHEG method | EPJC 71 (2011) 1547 | 1009.2450 |
| 41 | S. Alioli, P. Nason, C. Oleari, and E. Re | NLO higgs boson production via gluon fusion matched with shower in POWHEG | JHEP 04 (2009) 002 | 0812.0578 |
| 42 | J. M. Campbell and R. K. Ellis | MCFM for the Tevatron and the LHC | NPPS 205 (2010) 10 | 1007.3492 |
| 43 | Y. Li and F. Petriello | Combining QCD and electroweak corrections to dilepton production in FEWZ | PRD 86 (2012) 094034 | 1208.5967 |
| 44 | T. Sjostrand et al. | An introduction to PYTHIA 8.2 | CPC 191 (2015) 159 | 1410.3012 |
| 45 | CMS Collaboration | Event generator tunes obtained from underlying event and multiparton scattering measurements | EPJC 76 (2016) 155 | CMS-GEN-14-001 1512.00815 |
| 46 | NNPDF Collaboration | Parton distributions for the LHC Run II | JHEP 04 (2015) 040 | 1410.8849 |
| 47 | GEANT4 Collaboration | GEANT4---a simulation toolkit | NIMA 506 (2003) 250 | |
| 48 | CMS Collaboration | Particle-flow reconstruction and global event description with the CMS detector | JINST 12 (2017) 10003 | CMS-PRF-14-001 1706.04965 |
| 49 | M. Cacciari, G. P. Salam, and G. Soyez | The anti-$ {k_{\mathrm{T}}} $ jet clustering algorithm | JHEP 04 (2008) 063 | 0802.1189 |
| 50 | M. Cacciari, G. P. Salam, and G. Soyez | FastJet user manual | EPJC 72 (2012) 1896 | 1111.6097 |
| 51 | CMS Collaboration | Jet algorithms performance in 13 TeV data | CMS-PAS-JME-16-003 | CMS-PAS-JME-16-003 |
| 52 | CMS Collaboration | Jet energy scale and resolution in the CMS experiment in pp collisions at 8 TeV | JINST 12 (2017) P02014 | CMS-JME-13-004 1607.03663 |
| 53 | CMS Collaboration | Identification of heavy-flavour jets with the CMS detector in pp collisions at 13 TeV | JINST 13 (2018) P05011 | CMS-BTV-16-002 1712.07158 |
| 54 | CMS Collaboration | Performance of missing transverse momentum reconstruction in proton-proton collisions at $ \sqrt{s} = $ 13 TeV using the CMS detector | JINST 14 (2019) P07004 | CMS-JME-17-001 1903.06078 |
| 55 | CMS Collaboration | Performance of the CMS muon detector and muon reconstruction with proton-proton collisions at $ \sqrt{s} = $ 13 TeV | JINST 13 (2018) P06015 | CMS-MUO-16-001 1804.04528 |
| 56 | CMS Collaboration | Performance of electron reconstruction and selection with the CMS detector in proton-proton collisions at $ \sqrt{s} = $ 8 TeV | JINST 10 (2015) P06005 | CMS-EGM-13-001 1502.02701 |
| 57 | H. Voss, A. Hocker, J. Stelzer, and F. Tegenfeldt | TMVA, the toolkit for multivariate data analysis with ROOT | in XIth International Workshop on Advanced Computing and Analysis Techniques in Physics Research (ACAT), p. 40 2007 [PoS(ACAT)040] | physics/0703039 |
| 58 | M. Cacciari and G. P. Salam | Pileup subtraction using jet areas | PLB 659 (2008) 119 | 0707.1378 |
| 59 | CMS Collaboration | Commissioning of the particle flow reconstruction in minimum-bias and jet events from pp collisions at 7 TeV | CDS | |
| 60 | J. H. Friedman | Greedy function approximation: A gradient boosting machine. | Ann. Statist. 29 (10, 2001) 1189 | |
| 61 | CMS Collaboration | Search for high-mass resonances in final states with a lepton and missing transverse momentum at $ \sqrt{s}= $ 13 TeV | JHEP 06 (2018) 128 | CMS-EXO-16-033 1803.11133 |
| 62 | J. Butterworth et al. | PDF4LHC recommendations for LHC Run II | JPG 43 (2016) 023001 | 1510.03865 |
| 63 | CMS Collaboration | CMS luminosity measurements for the 2016 data taking period | CMS-PAS-LUM-17-001 | |
| 64 | CMS Collaboration | Measurement of the inelastic proton-proton cross section at $ \sqrt{s}= $ 13 TeV | JHEP 07 (2018) 161 | CMS-FSQ-15-005 1802.02613 |
| 65 | The ATLAS Collaboration, The CMS Collaboration, The LHC Higgs Combination Group | Procedure for the LHC Higgs boson search combination in Summer 2011 | CMS-NOTE-2011-005 | |
| 66 | R. Barlow and C. Beeston | Fitting using finite Monte Carlo samples | CPC 77 (1993) 219 | |
| 67 | J. S. Conway | Incorporating nuisance parameters in likelihoods for multisource spectra | in Proceedings, PHYSTAT 2011 workshop on statistical issues related to discovery claims in search experiments and unfolding, CERN, Geneva, Switzerland 17--20 January 2011, p. 115 2011 | 1103.0354 |
| 68 | T. Junk | Confidence level computation for combining searches with small statistics | NIMA 434 (1999) 435 | hep-ex/9902006 |
| 69 | A. L. Read | Presentation of search results: the $ \mathrm{CL_s} $ technique | JPG 28 (2002) 2693 | |
| 70 | G. Cowan, K. Cranmer, E. Gross, and O. Vitells | Asymptotic formulae for likelihood-based tests of new physics | EPJC 71 (2011) 1554 | 1007.1727 |
|
|
Compact Muon Solenoid LHC, CERN |
|

|

|

|

|

|