

Compact Muon Solenoid
LHC, CERN
| CMS-SMP-18-010 ; CERN-EP-2023-169 | ||
| Measurement of the $ \tau $ lepton polarization in Z boson decays in proton-proton collisions at $ \sqrt{s} = $ 13 TeV | ||
| CMS Collaboration | ||
| 21 September 2023 | ||
| JHEP 01 (2024) 101 | ||
| Abstract: The polarization of $ \tau $ leptons is measured using leptonic and hadronic $ \tau $ lepton decays in $ \mathrm{Z}\to\tau^{+}\tau^{-} $ events in proton-proton collisions at $ \sqrt{s}= $ 13 TeV recorded by CMS at the CERN LHC with an integrated luminosity of 36.3 fb$ ^{-1} $. The measured $ \tau^{-} $ lepton polarization at the Z boson mass pole is $ \mathcal{P}_{\tau}(\mathrm{Z})=- $0.144 $ \pm $ 0.006 (stat) $ \pm $ 0.014 (syst) $ =- $0.144 $ \pm $ 0.015, in good agreement with the measurement of the $ \tau $ lepton asymmetry parameter of $ A_{\tau}= $ 0.1439 $ \pm $ 0.0043 $ =-\mathcal{P}_{\tau}(\mathrm{Z}) $ at LEP. The $ \tau $ lepton polarization depends on the ratio of the vector to axial-vector couplings of the $ \tau $ leptons in the neutral current expression, and thus on the effective weak mixing angle $ \sin^{2}\theta_{\mathrm{W}}^{\text{eff}} $, independently of the Z boson production mechanism. The obtained value $ \sin^{2}\theta_{\mathrm{W}}^{\text{eff}}= $ 0.2319 $ \pm $ 0.0008 (stat) $ \pm $ 0.0018 (syst) $ = $ 0.2319 $ \pm $ 0.0019 is in good agreement with measurements at $ \mathrm{e}^+\mathrm{e}^- $ colliders. | ||
| Links: e-print arXiv:2309.12408 [hep-ex] (PDF) ; CDS record ; inSPIRE record ; HepData record ; CADI line (restricted) ; | ||
| Figures | |

png pdf |
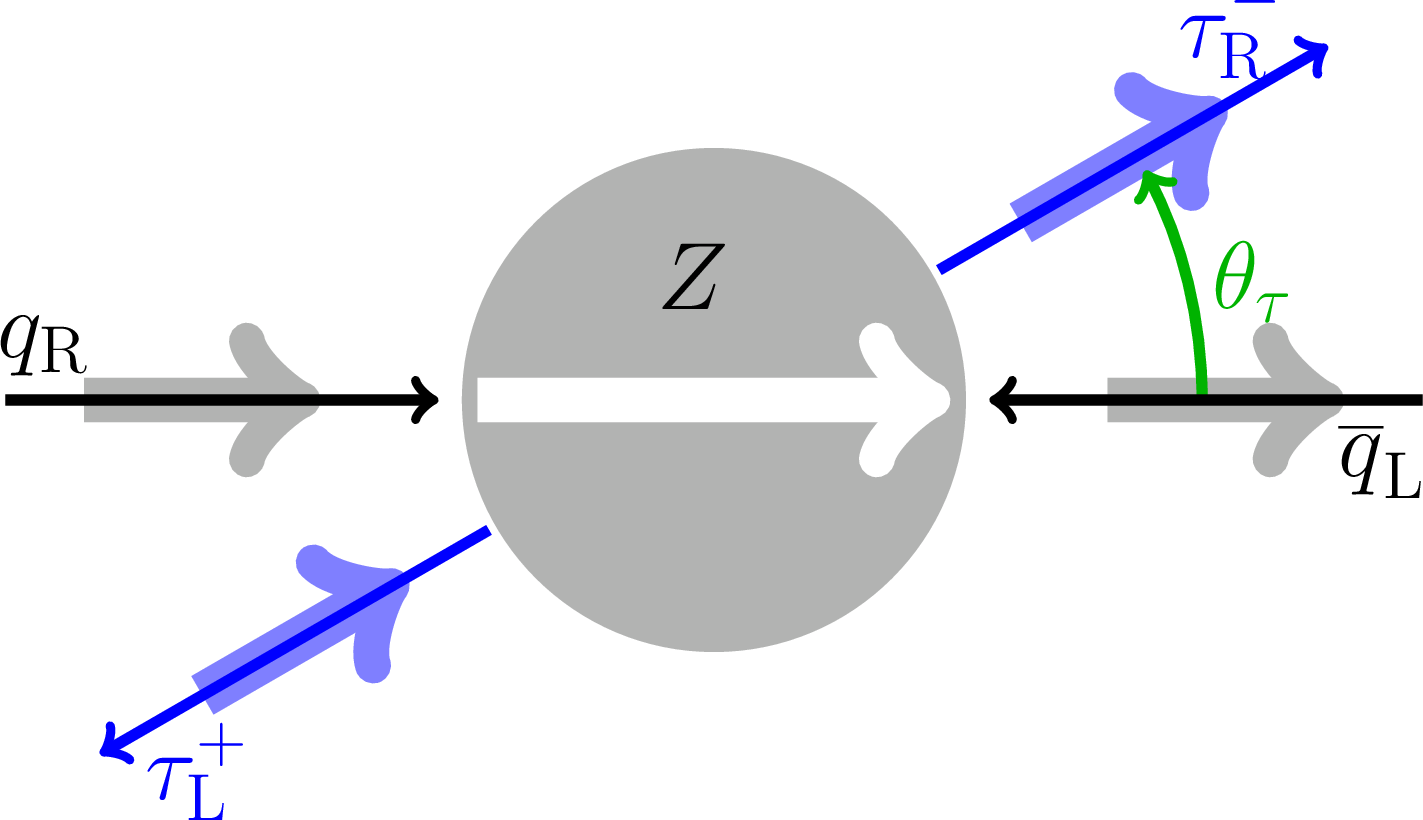
Figure 1:
The four possible helicity states of incoming quarks and outgoing $ \tau $ leptons. Thin arrows depict the direction of movement and the thick arrows show the spin of the particles. The angle $ \theta_{\tau} $ is the scattering angle of the $ \tau^{-} $ lepton with respect to the quark momentum in the rest frame of the Z boson. |
png pdf |
Figure 1-a:
Possible helicity state of incoming quarks and outgoing $ \tau $ leptons. Thin arrows depict the direction of movement and the thick arrows show the spin of the particles. The angle $ \theta_{\tau} $ is the scattering angle of the $ \tau^{-} $ lepton with respect to the quark momentum in the rest frame of the Z boson. |
png pdf |
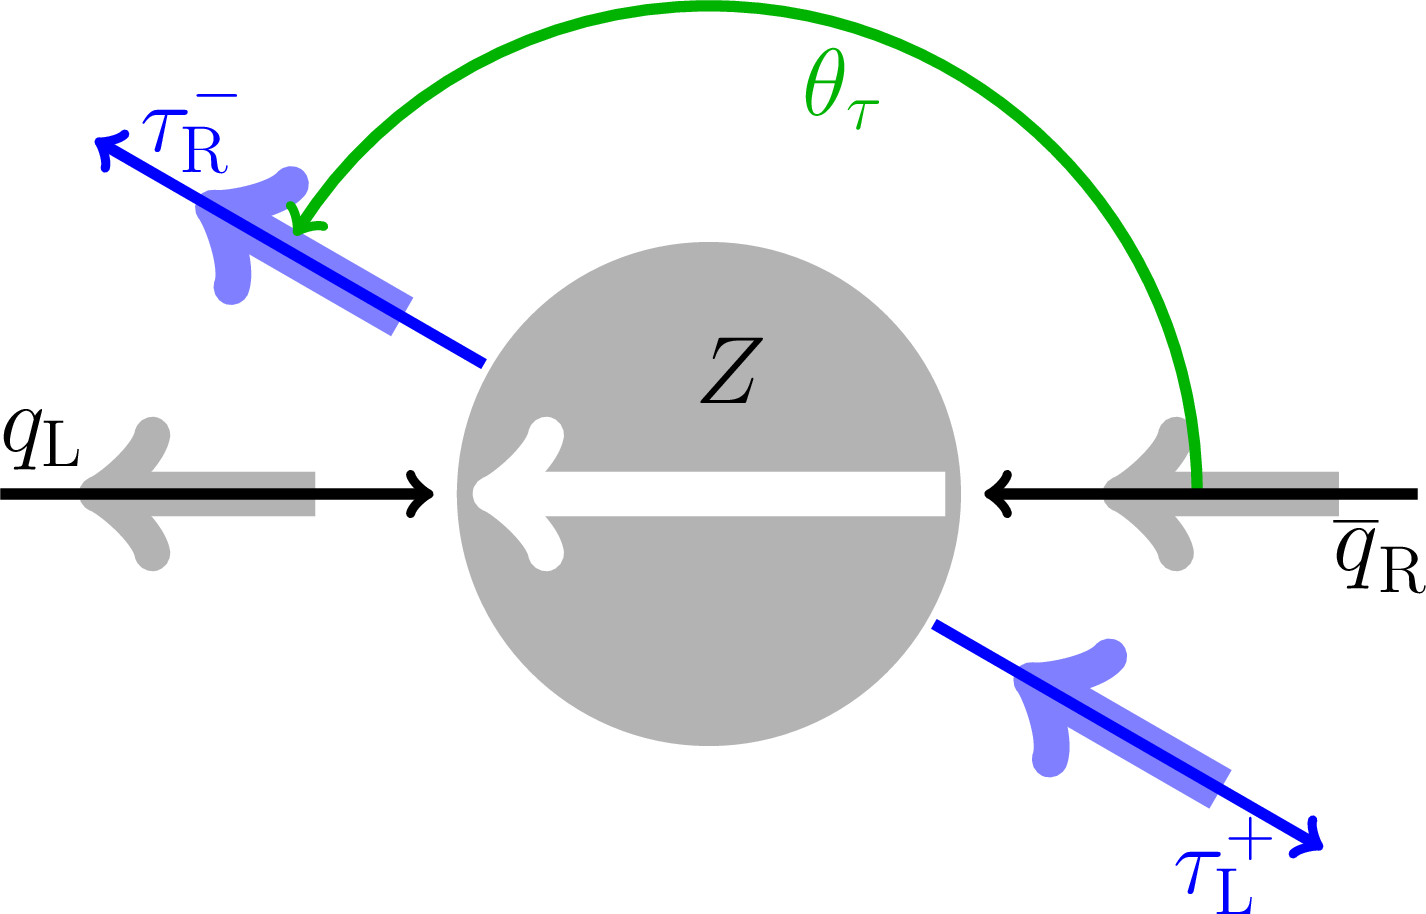
Figure 1-b:
Possible helicity state of incoming quarks and outgoing $ \tau $ leptons. Thin arrows depict the direction of movement and the thick arrows show the spin of the particles. The angle $ \theta_{\tau} $ is the scattering angle of the $ \tau^{-} $ lepton with respect to the quark momentum in the rest frame of the Z boson. |
png pdf |
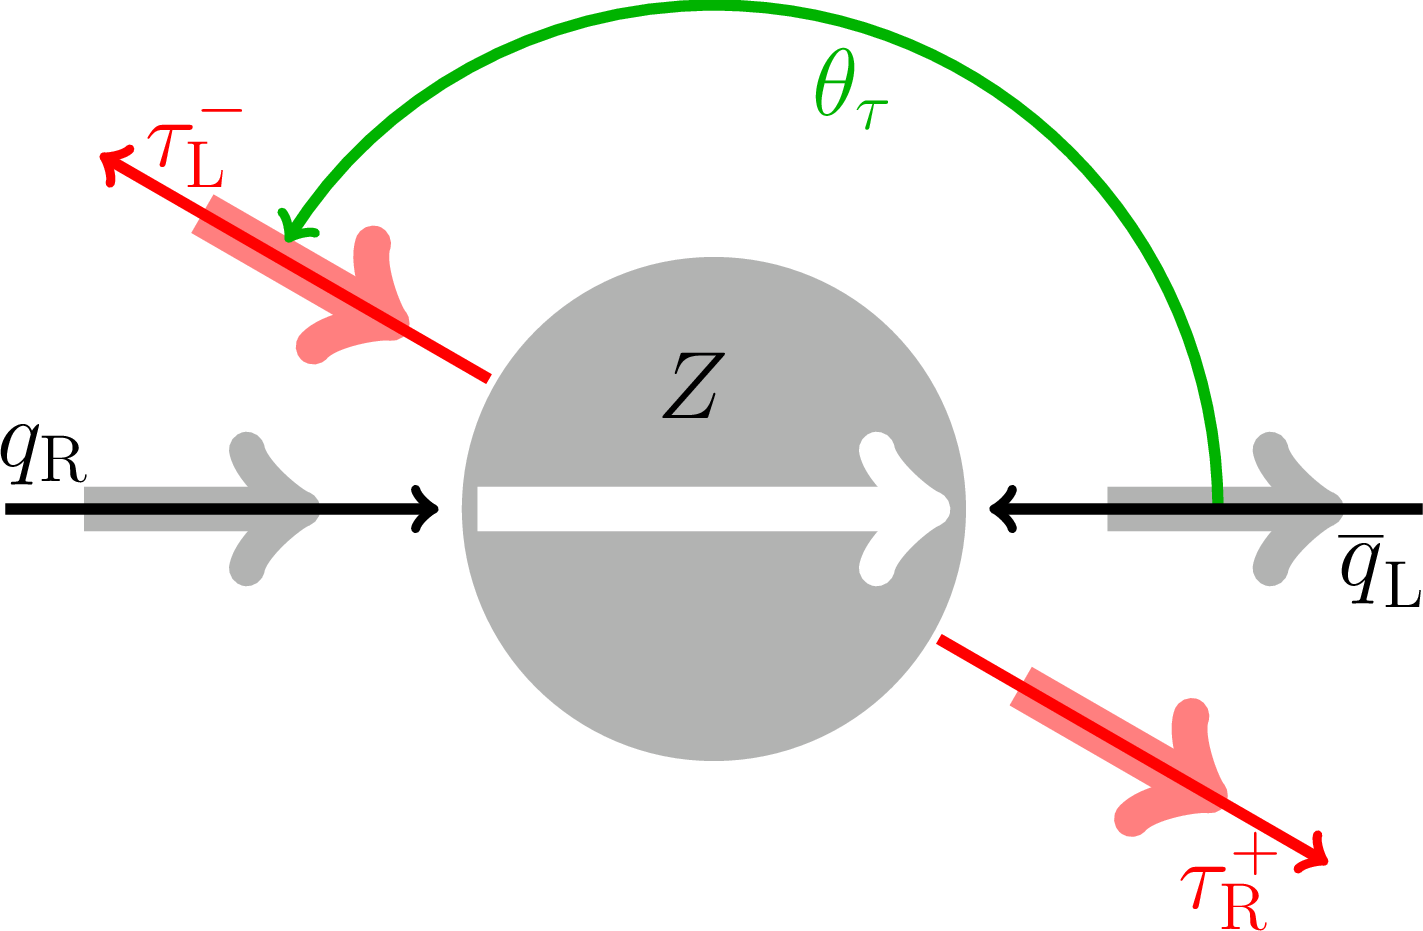
Figure 1-c:
Possible helicity state of incoming quarks and outgoing $ \tau $ leptons. Thin arrows depict the direction of movement and the thick arrows show the spin of the particles. The angle $ \theta_{\tau} $ is the scattering angle of the $ \tau^{-} $ lepton with respect to the quark momentum in the rest frame of the Z boson. |

png pdf |
Figure 1-d:
Possible helicity state of incoming quarks and outgoing $ \tau $ leptons. Thin arrows depict the direction of movement and the thick arrows show the spin of the particles. The angle $ \theta_{\tau} $ is the scattering angle of the $ \tau^{-} $ lepton with respect to the quark momentum in the rest frame of the Z boson. |
png pdf |
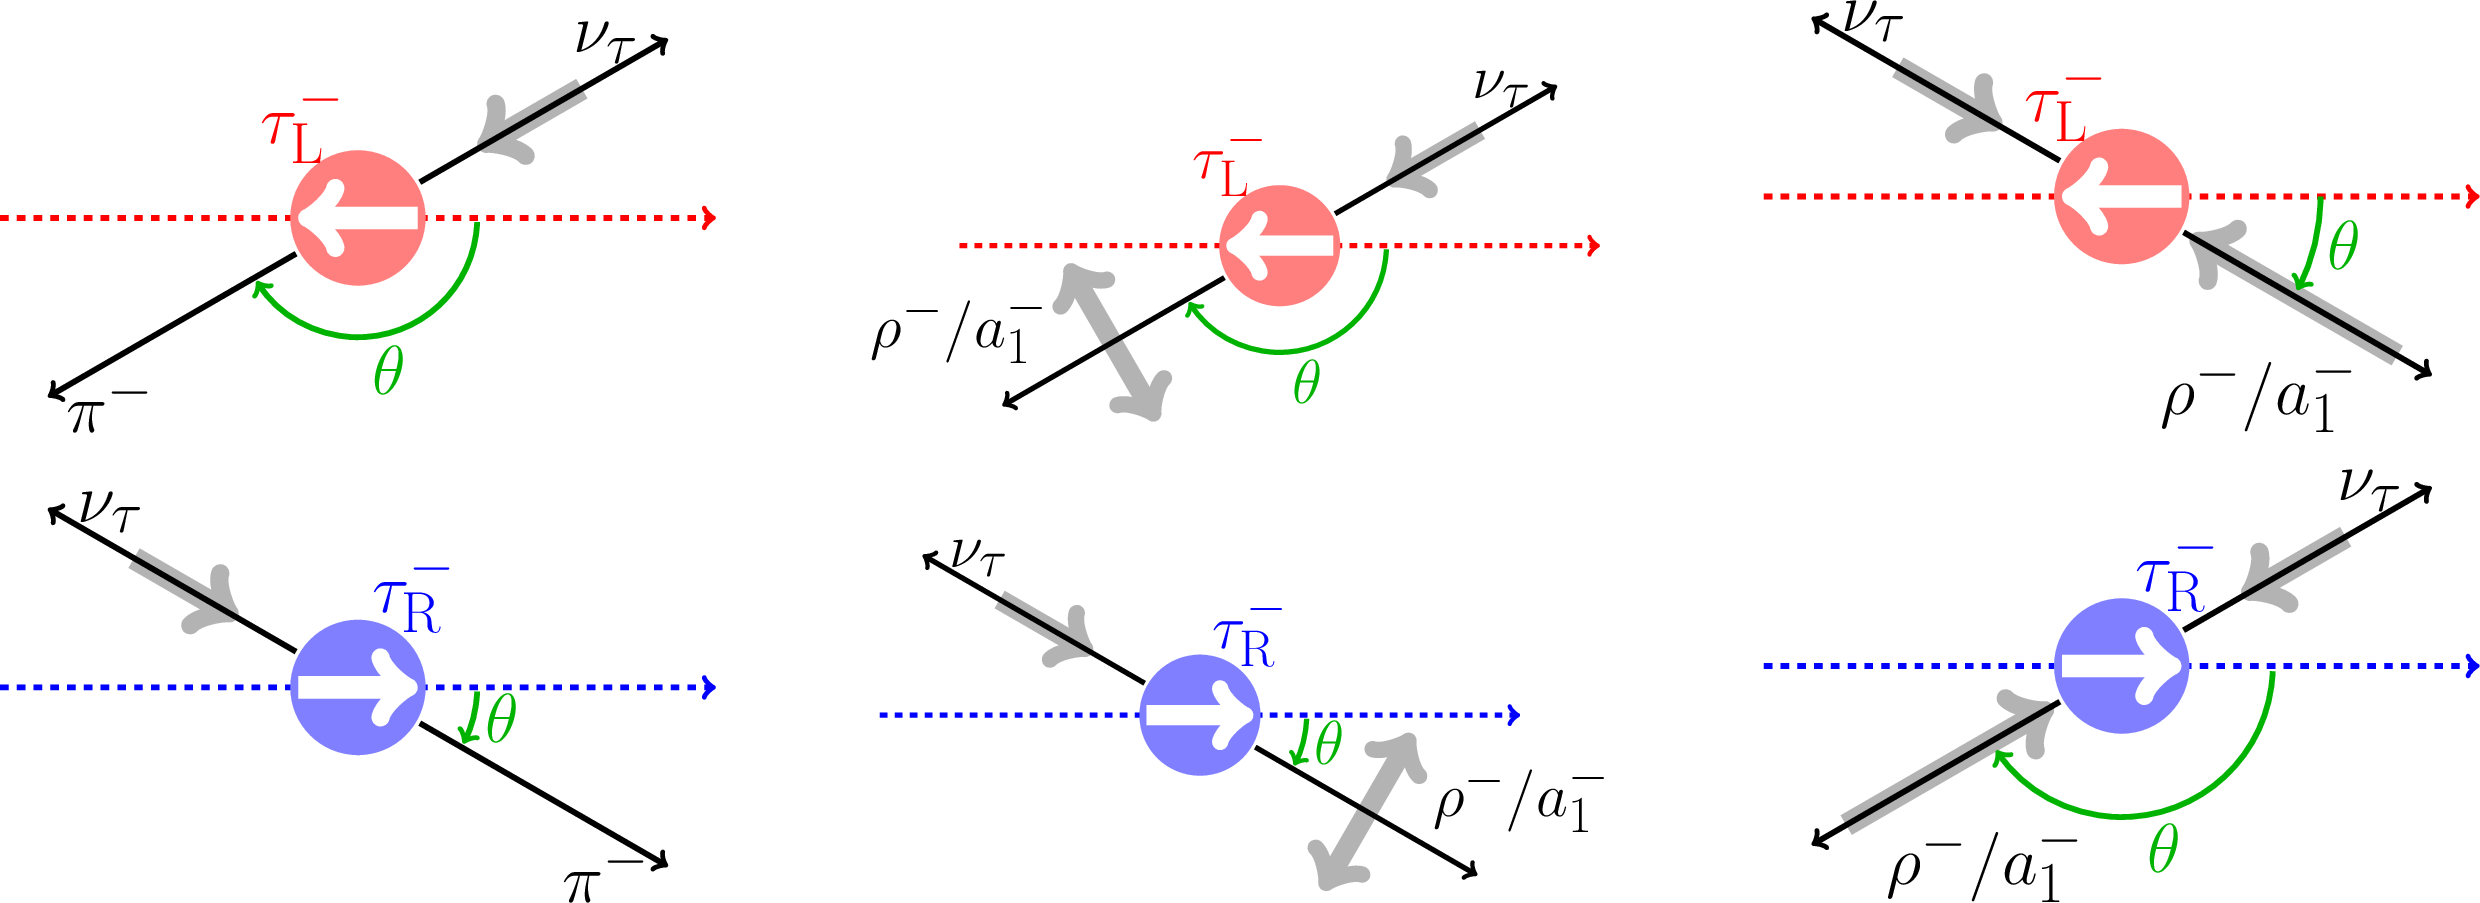
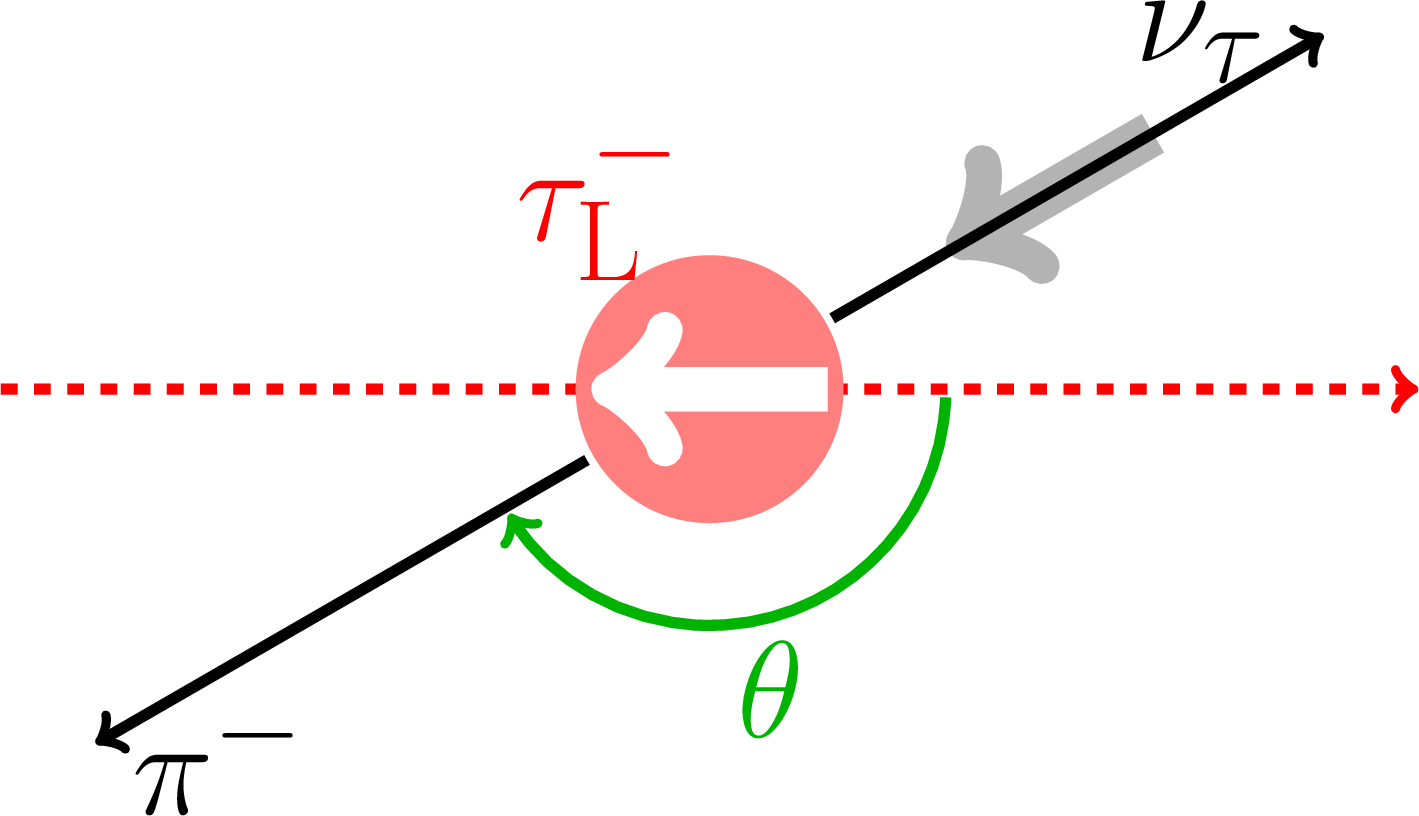
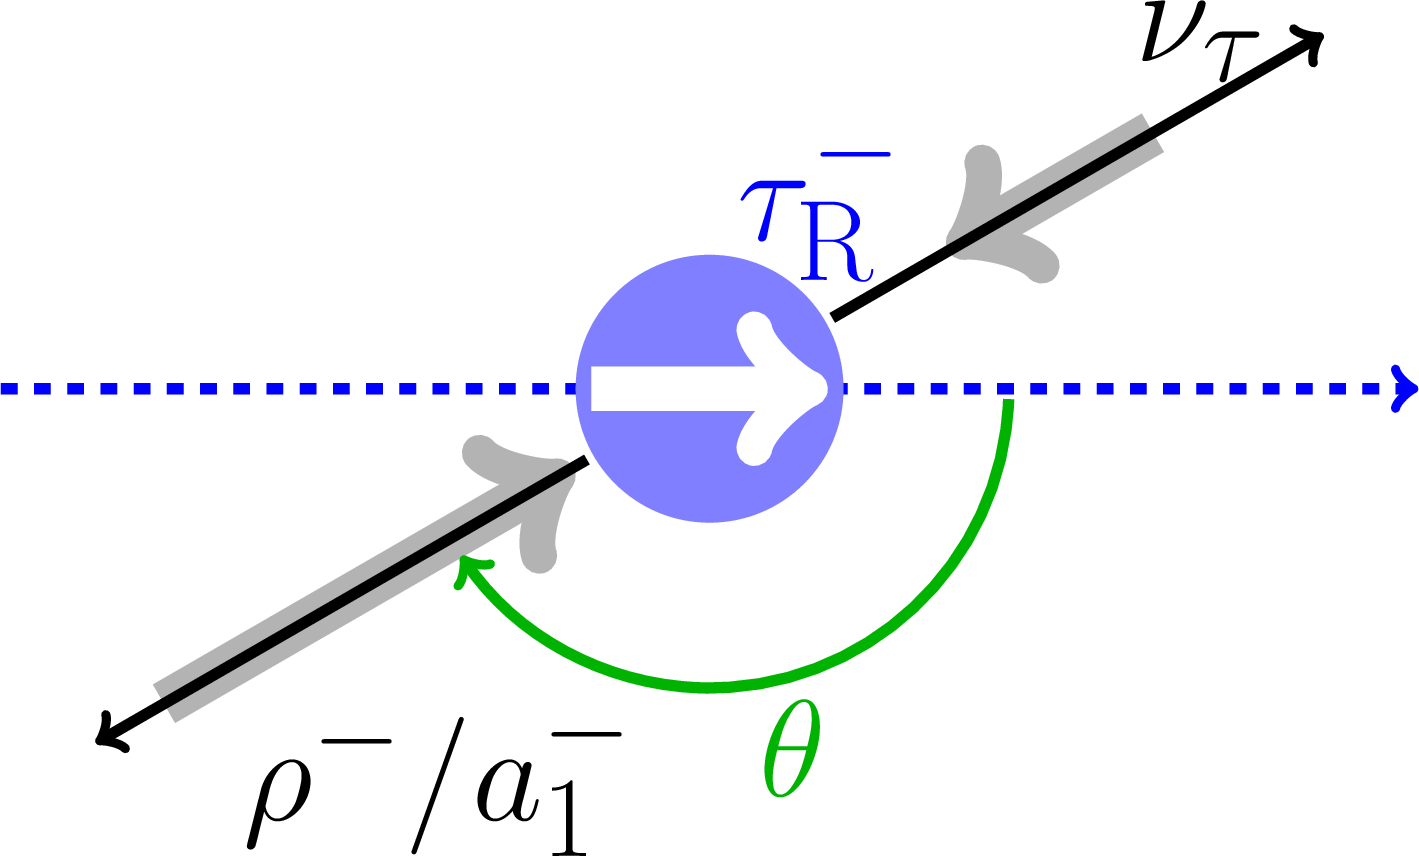
Figure 2:
Definition of the angle $ \theta $ in the $ \tau^{-} $ lepton rest frame for the decays $ \tau^{-}\to\mathrm{h}^-\nu \, (\mathrm{h}^-=\pi^{-},\,\rho^{-},\,\mathrm{a}_1^-) $, upper row for left-handed $ \tau $ lepton $ \tau_{\text{L}}^{-}$, lower row for right-handed $ \tau $ lepton $ \tau_{\text{R}}^{-}$. The thick arrows indicate the spin directions of the particles. |
png pdf |
Figure 2-a:
Definition of the angle $ \theta $ in the $ \tau^{-} $ lepton rest frame for the decay $ \tau^{-}\to\pi^-\nu$, for left-handed $ \tau $ lepton $ \tau_{\text{L}}^{-}$. The thick arrows indicate the spin directions of the particles. |

png pdf |
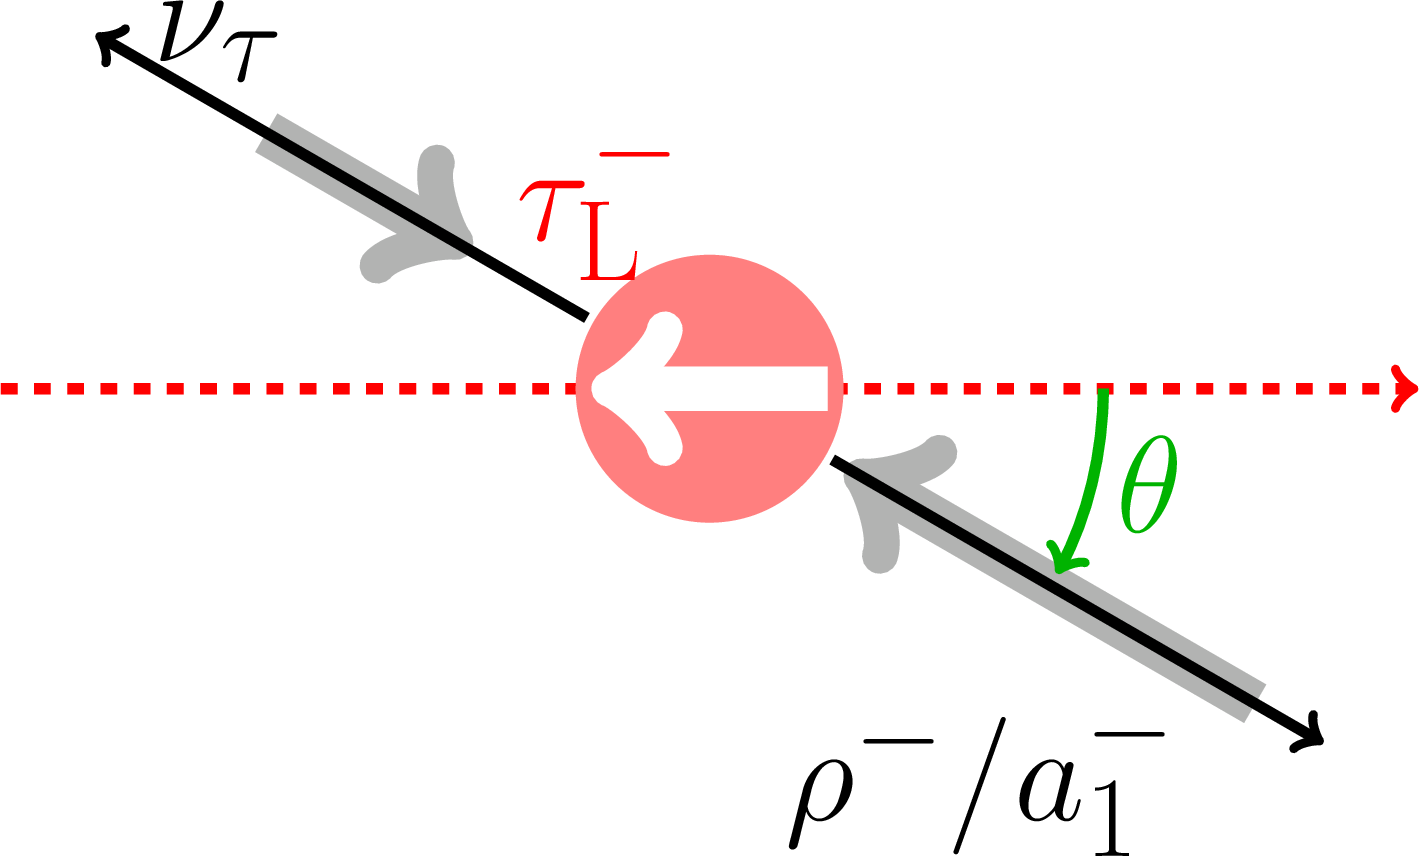
Figure 2-b:
Definition of the angle $ \theta $ in the $ \tau^{-} $ lepton rest frame for the decay $ \tau^{-}\to (\rho^-/\mathrm{a}_1^-)\nu$, for left-handed $ \tau $ lepton $ \tau_{\text{L}}^{-}$. The thick arrows indicate the spin directions of the particles. |
png pdf |
Figure 2-c:
Definition of the angle $ \theta $ in the $ \tau^{-} $ lepton rest frame for the decay $ \tau^{-}\to (\rho^-/\mathrm{a}_1^-)\nu$, for left-handed $ \tau $ lepton $ \tau_{\text{L}}^{-}$. The thick arrows indicate the spin directions of the particles. |
png pdf |
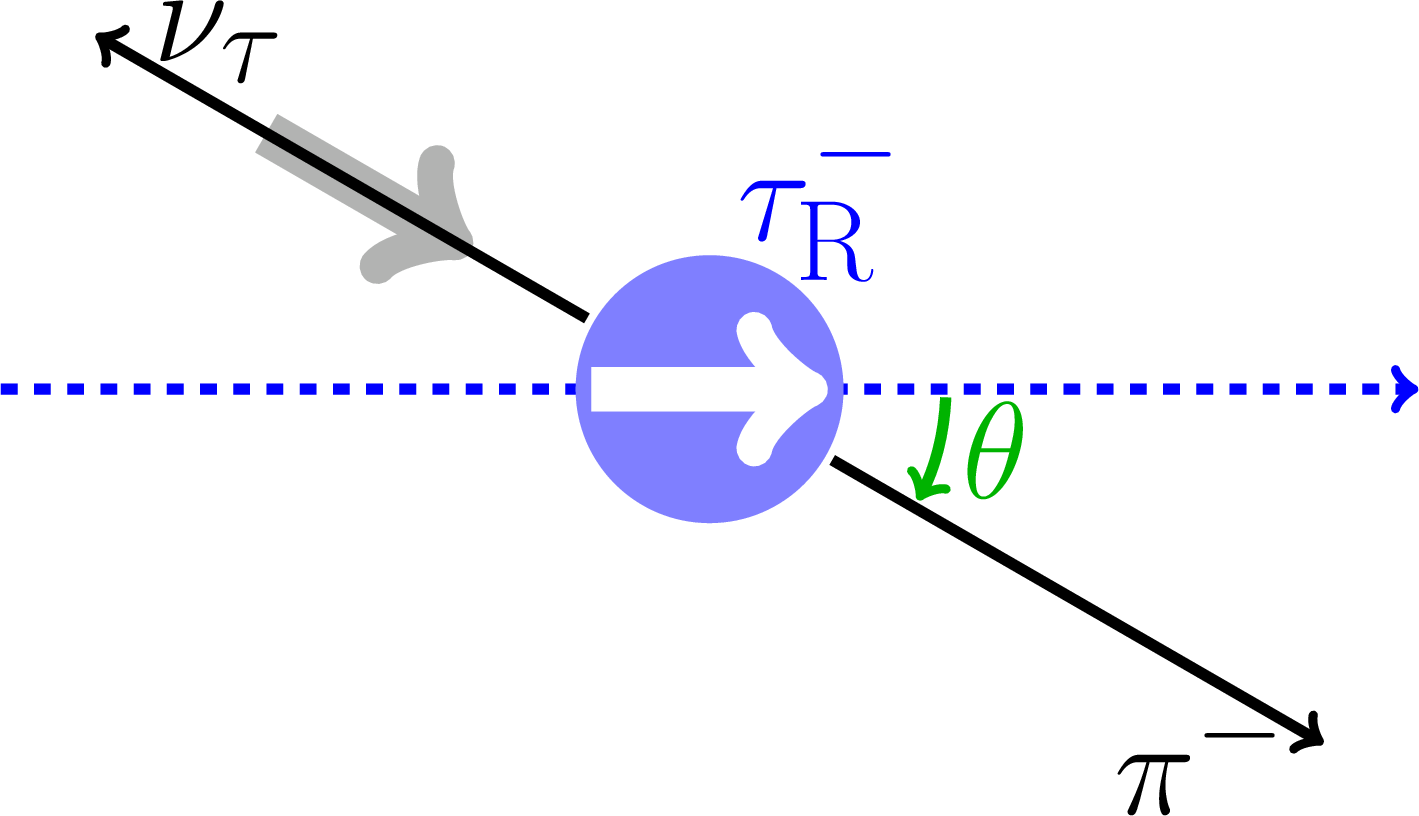
Figure 2-d:
Definition of the angle $ \theta $ in the $ \tau^{-} $ lepton rest frame for the decay $ \tau^{-}\to\pi^-\nu$, for right-handed $ \tau $ lepton $ \tau_{\text{R}}^{-}$. The thick arrows indicate the spin directions of the particles. |
png pdf |
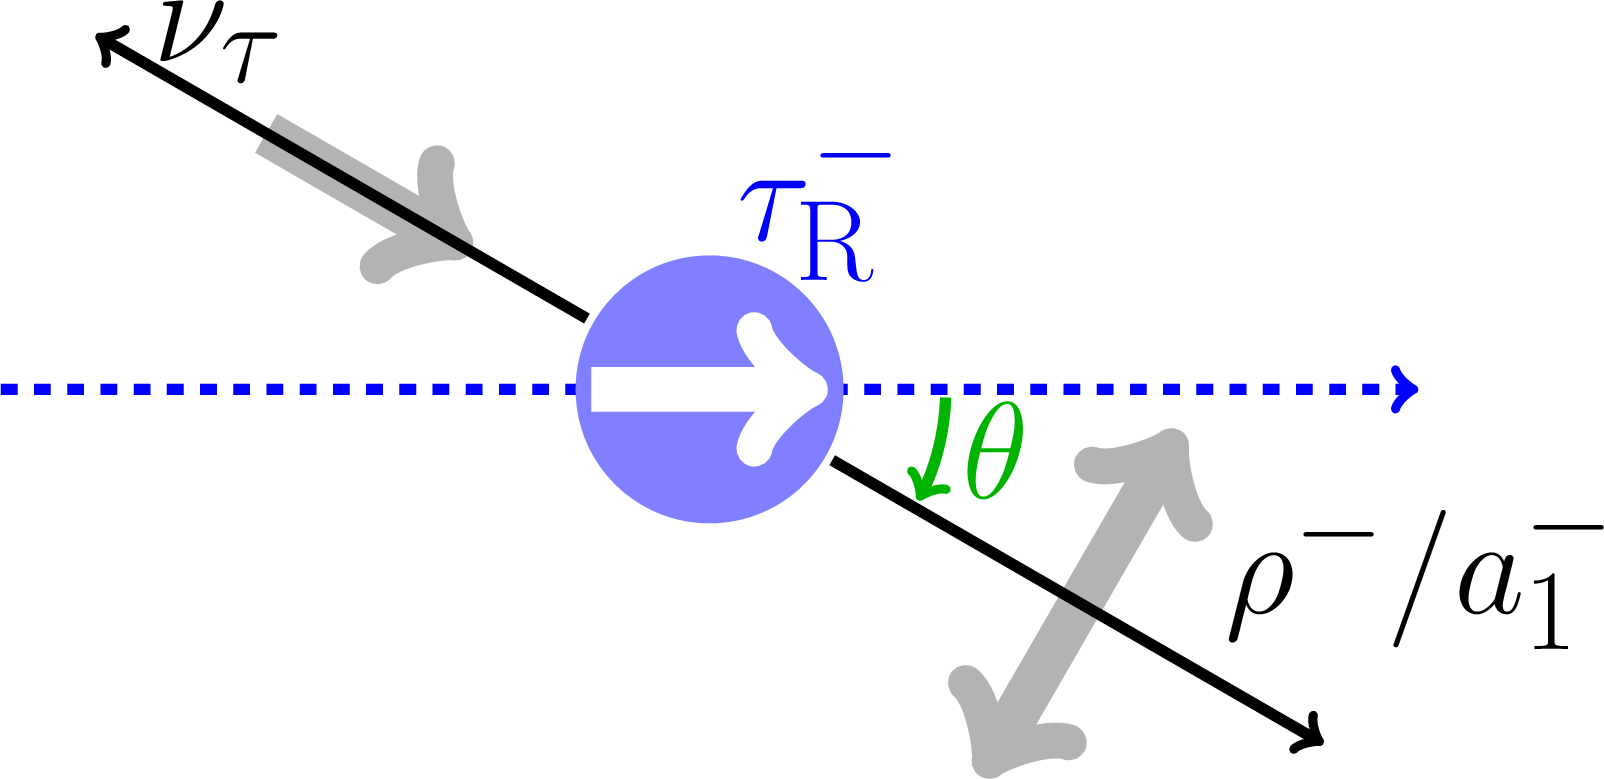
Figure 2-e:
Definition of the angle $ \theta $ in the $ \tau^{-} $ lepton rest frame for the decay $ \tau^{-}\to (\rho^-/\mathrm{a}_1^-)\nu$, for right-handed $ \tau $ lepton $ \tau_{\text{R}}^{-}$. The thick arrows indicate the spin directions of the particles. |
png pdf |
Figure 2-f:
Definition of the angle $ \theta $ in the $ \tau^{-} $ lepton rest frame for the decay $ \tau^{-}\to (\rho^-/\mathrm{a}_1^-)\nu$, for right-handed $ \tau $ lepton $ \tau_{\text{R}}^{-}$. The thick arrows indicate the spin directions of the particles. |
png pdf |
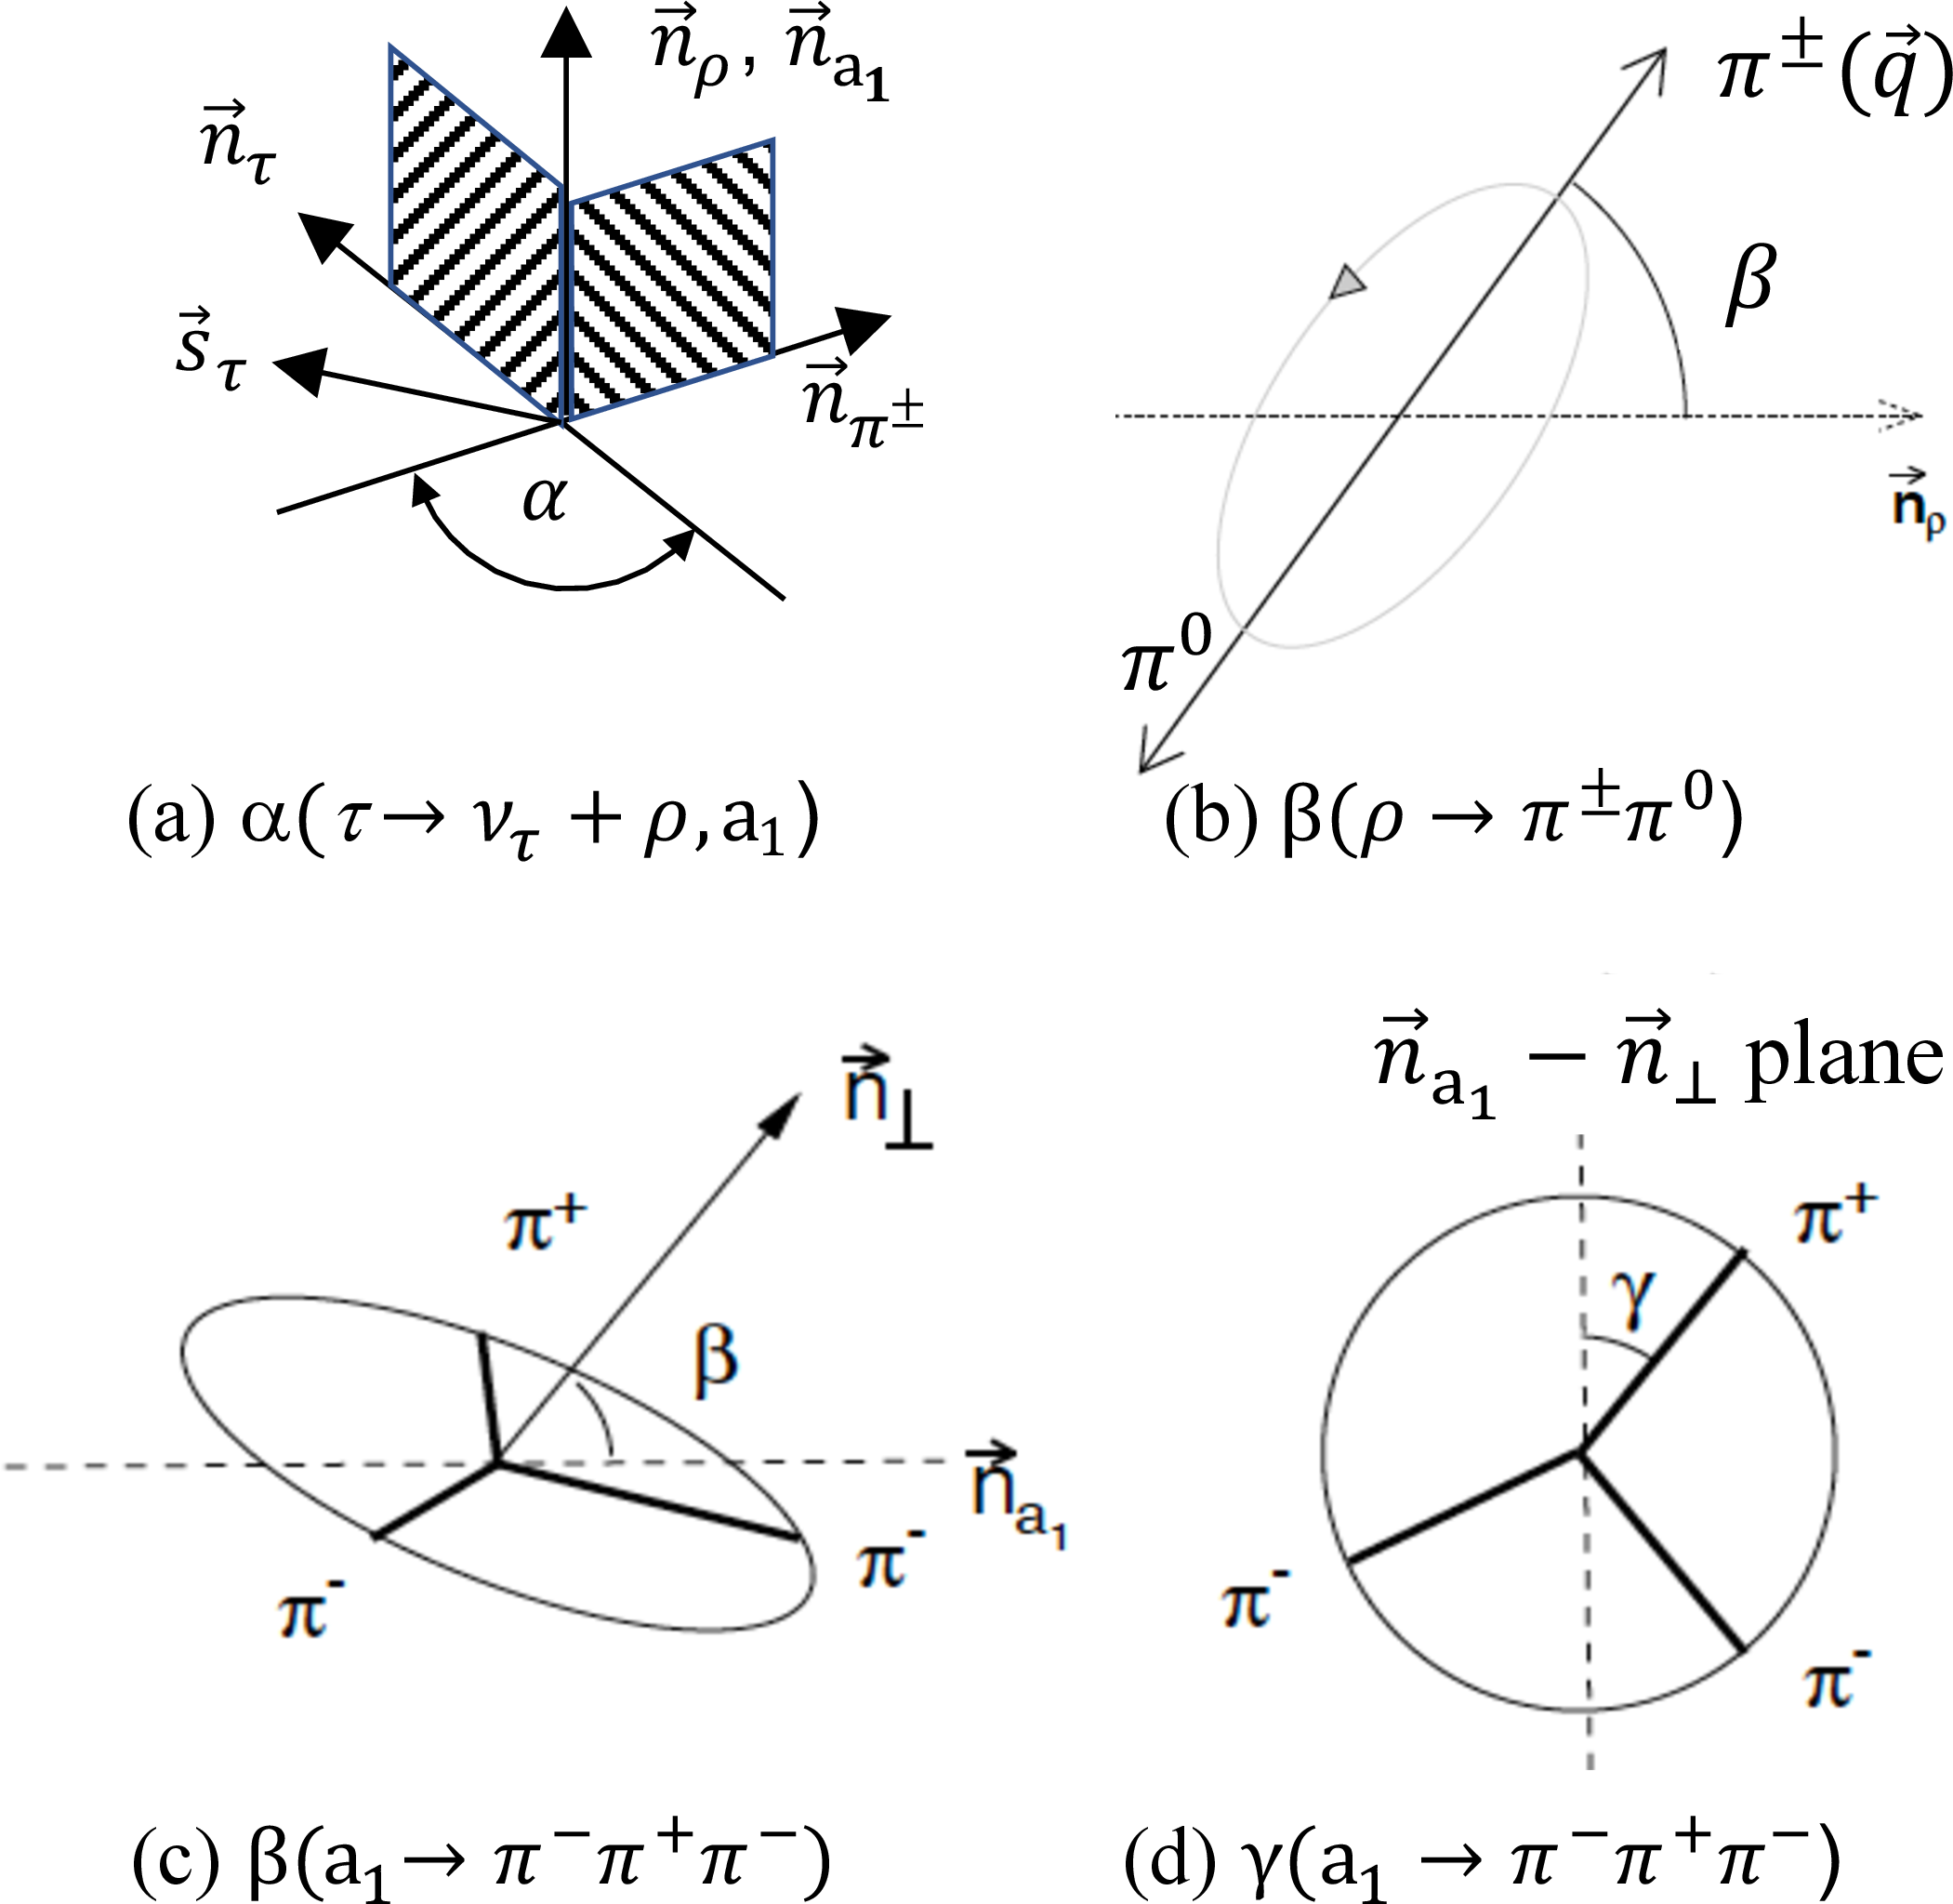
Figure 3:
Definitions of (a) the angle $ \alpha $ in both $ \tau^{-}\to\rho^{-}\nu $ and $ \tau^{-}\to\mathrm{a}^{-}_1\nu $, (b) the angle $ \beta $ in $ \tau^{-}\to\rho^{-}\nu, \rho^{-}\to\pi^{-}\pi^{0} $ and (c) in $ \tau^{-}\to\mathrm{a}^{-}_1\nu, \mathrm{a}^{-}_1\to\pi^{-}\pi^{+}\pi^{-} $, and finally (d) the angle $ \gamma $ for the decay of $ \mathrm{a}^{-}_1\to\pi^{-}\pi^{+}\pi^{-} $. Figures b, c, and d have been taken and refurbished from Ref. [38]. |

png pdf |
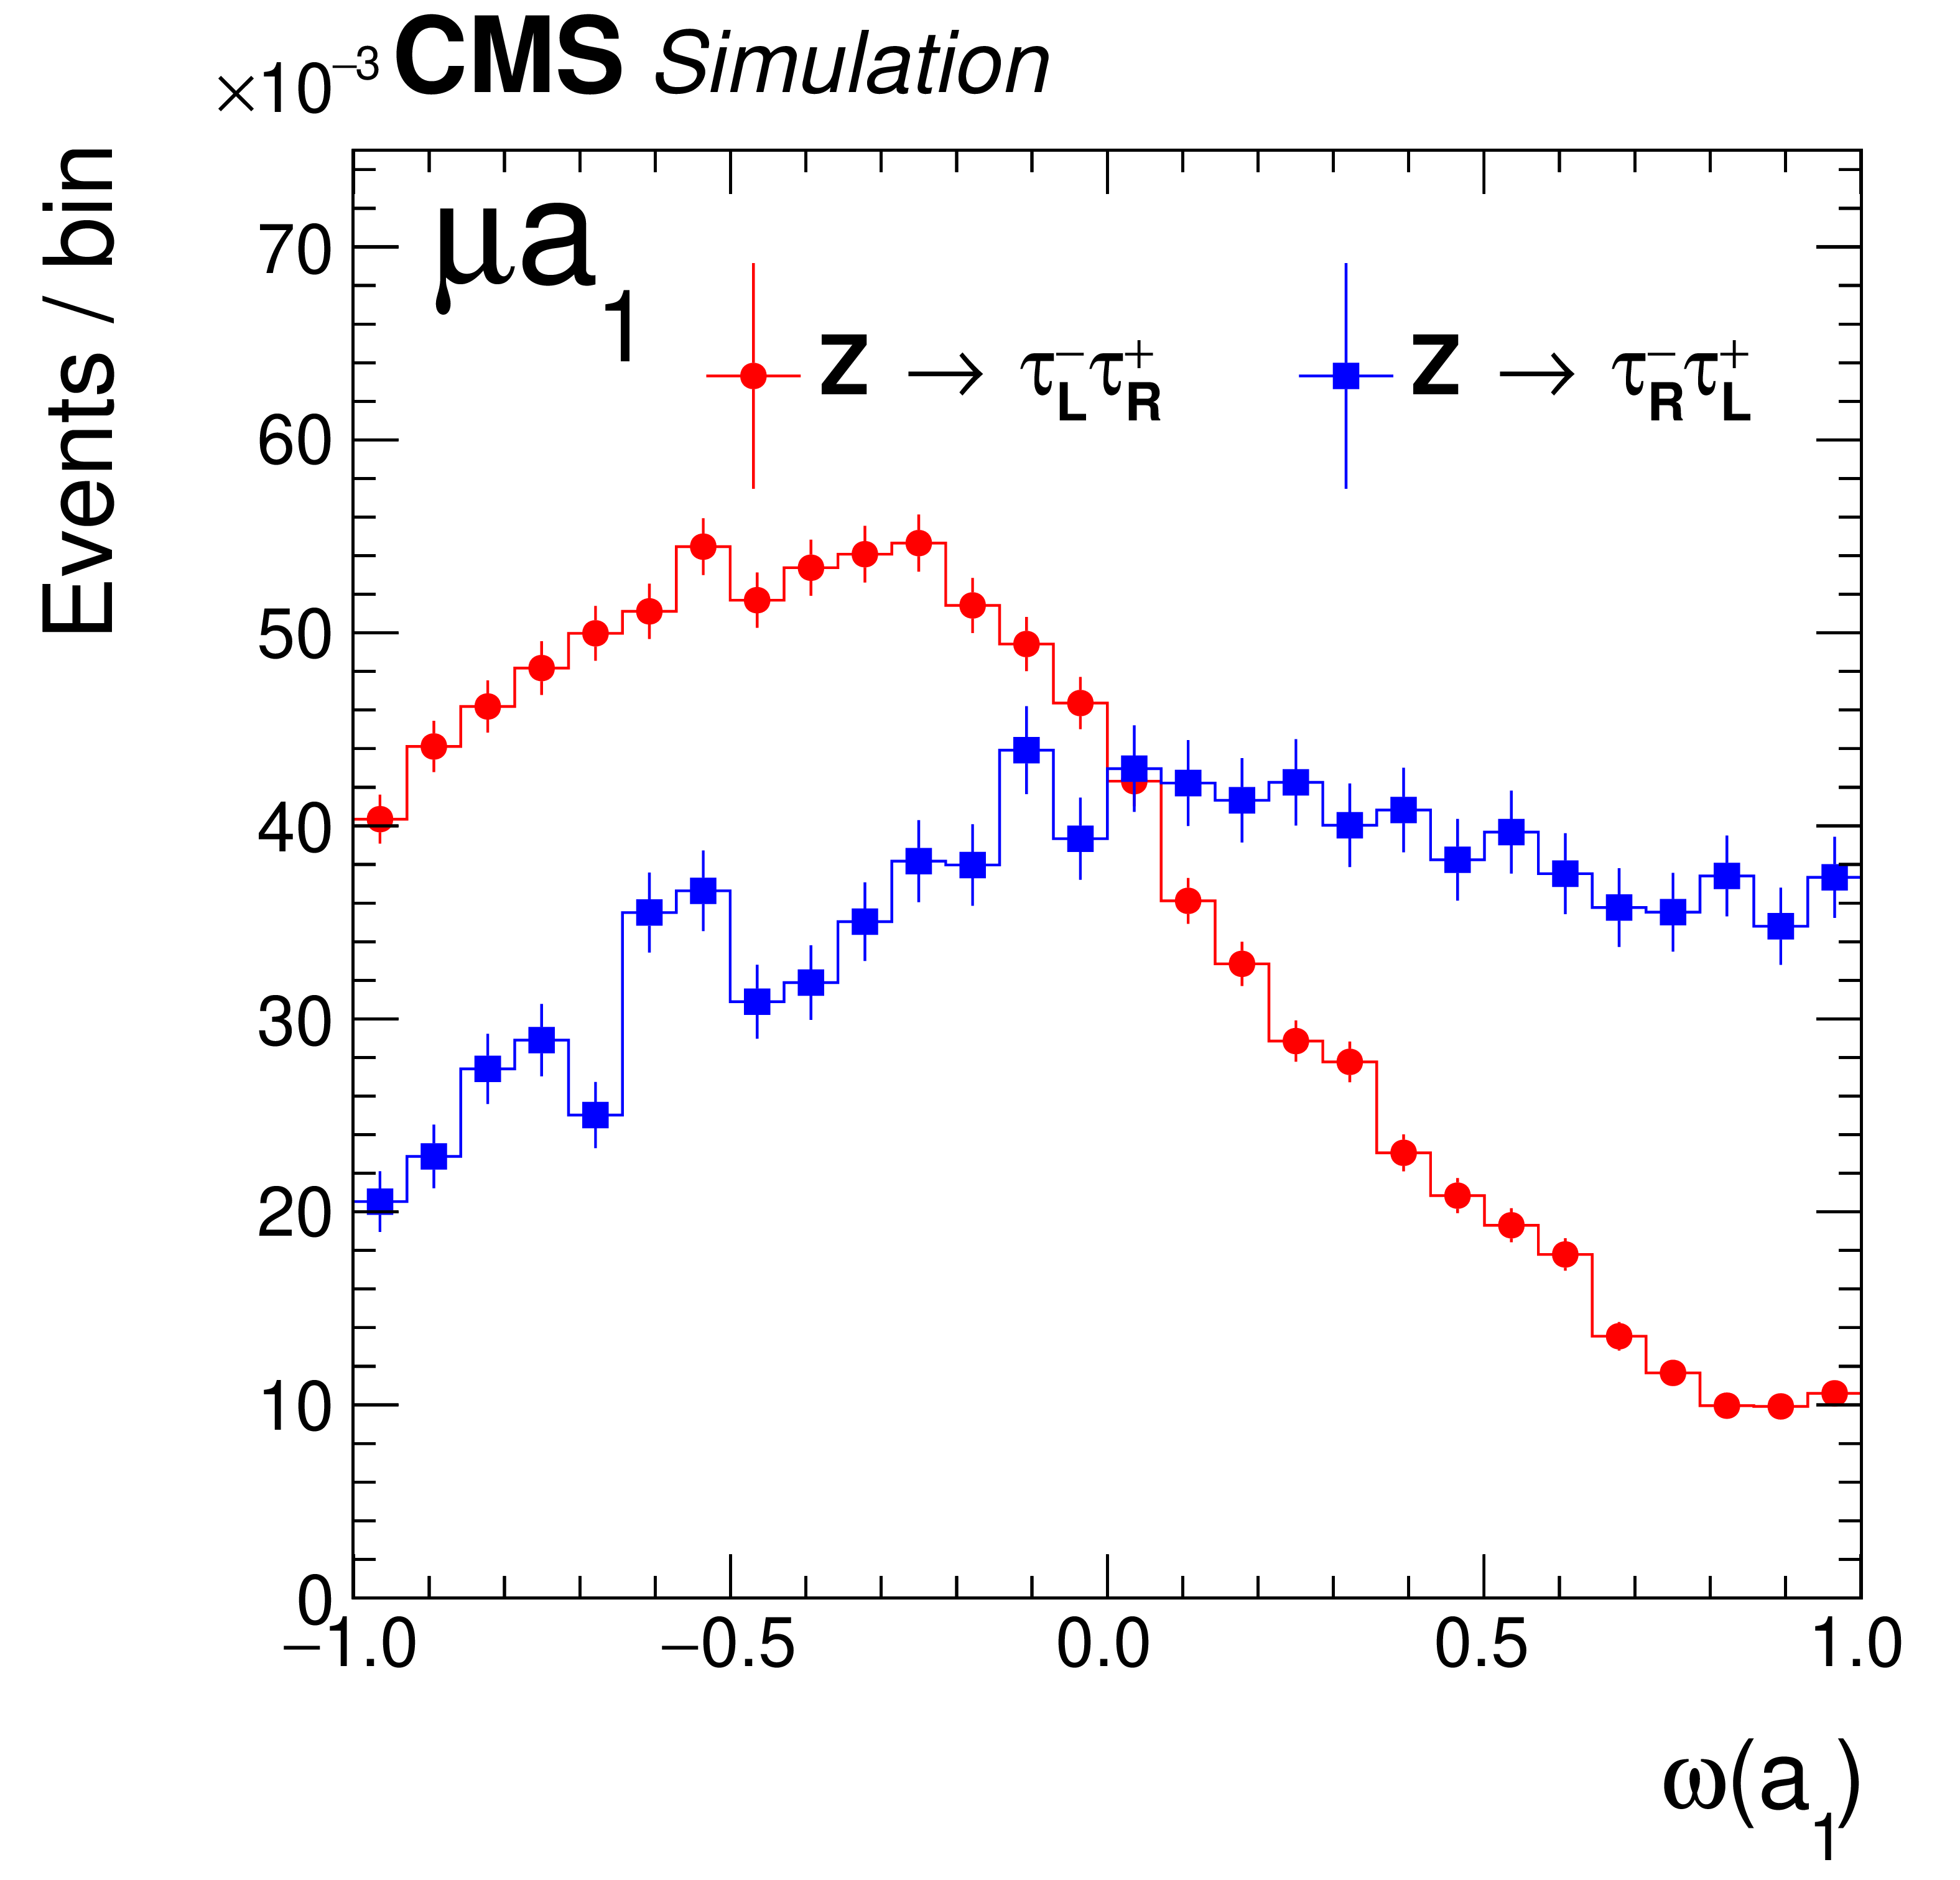
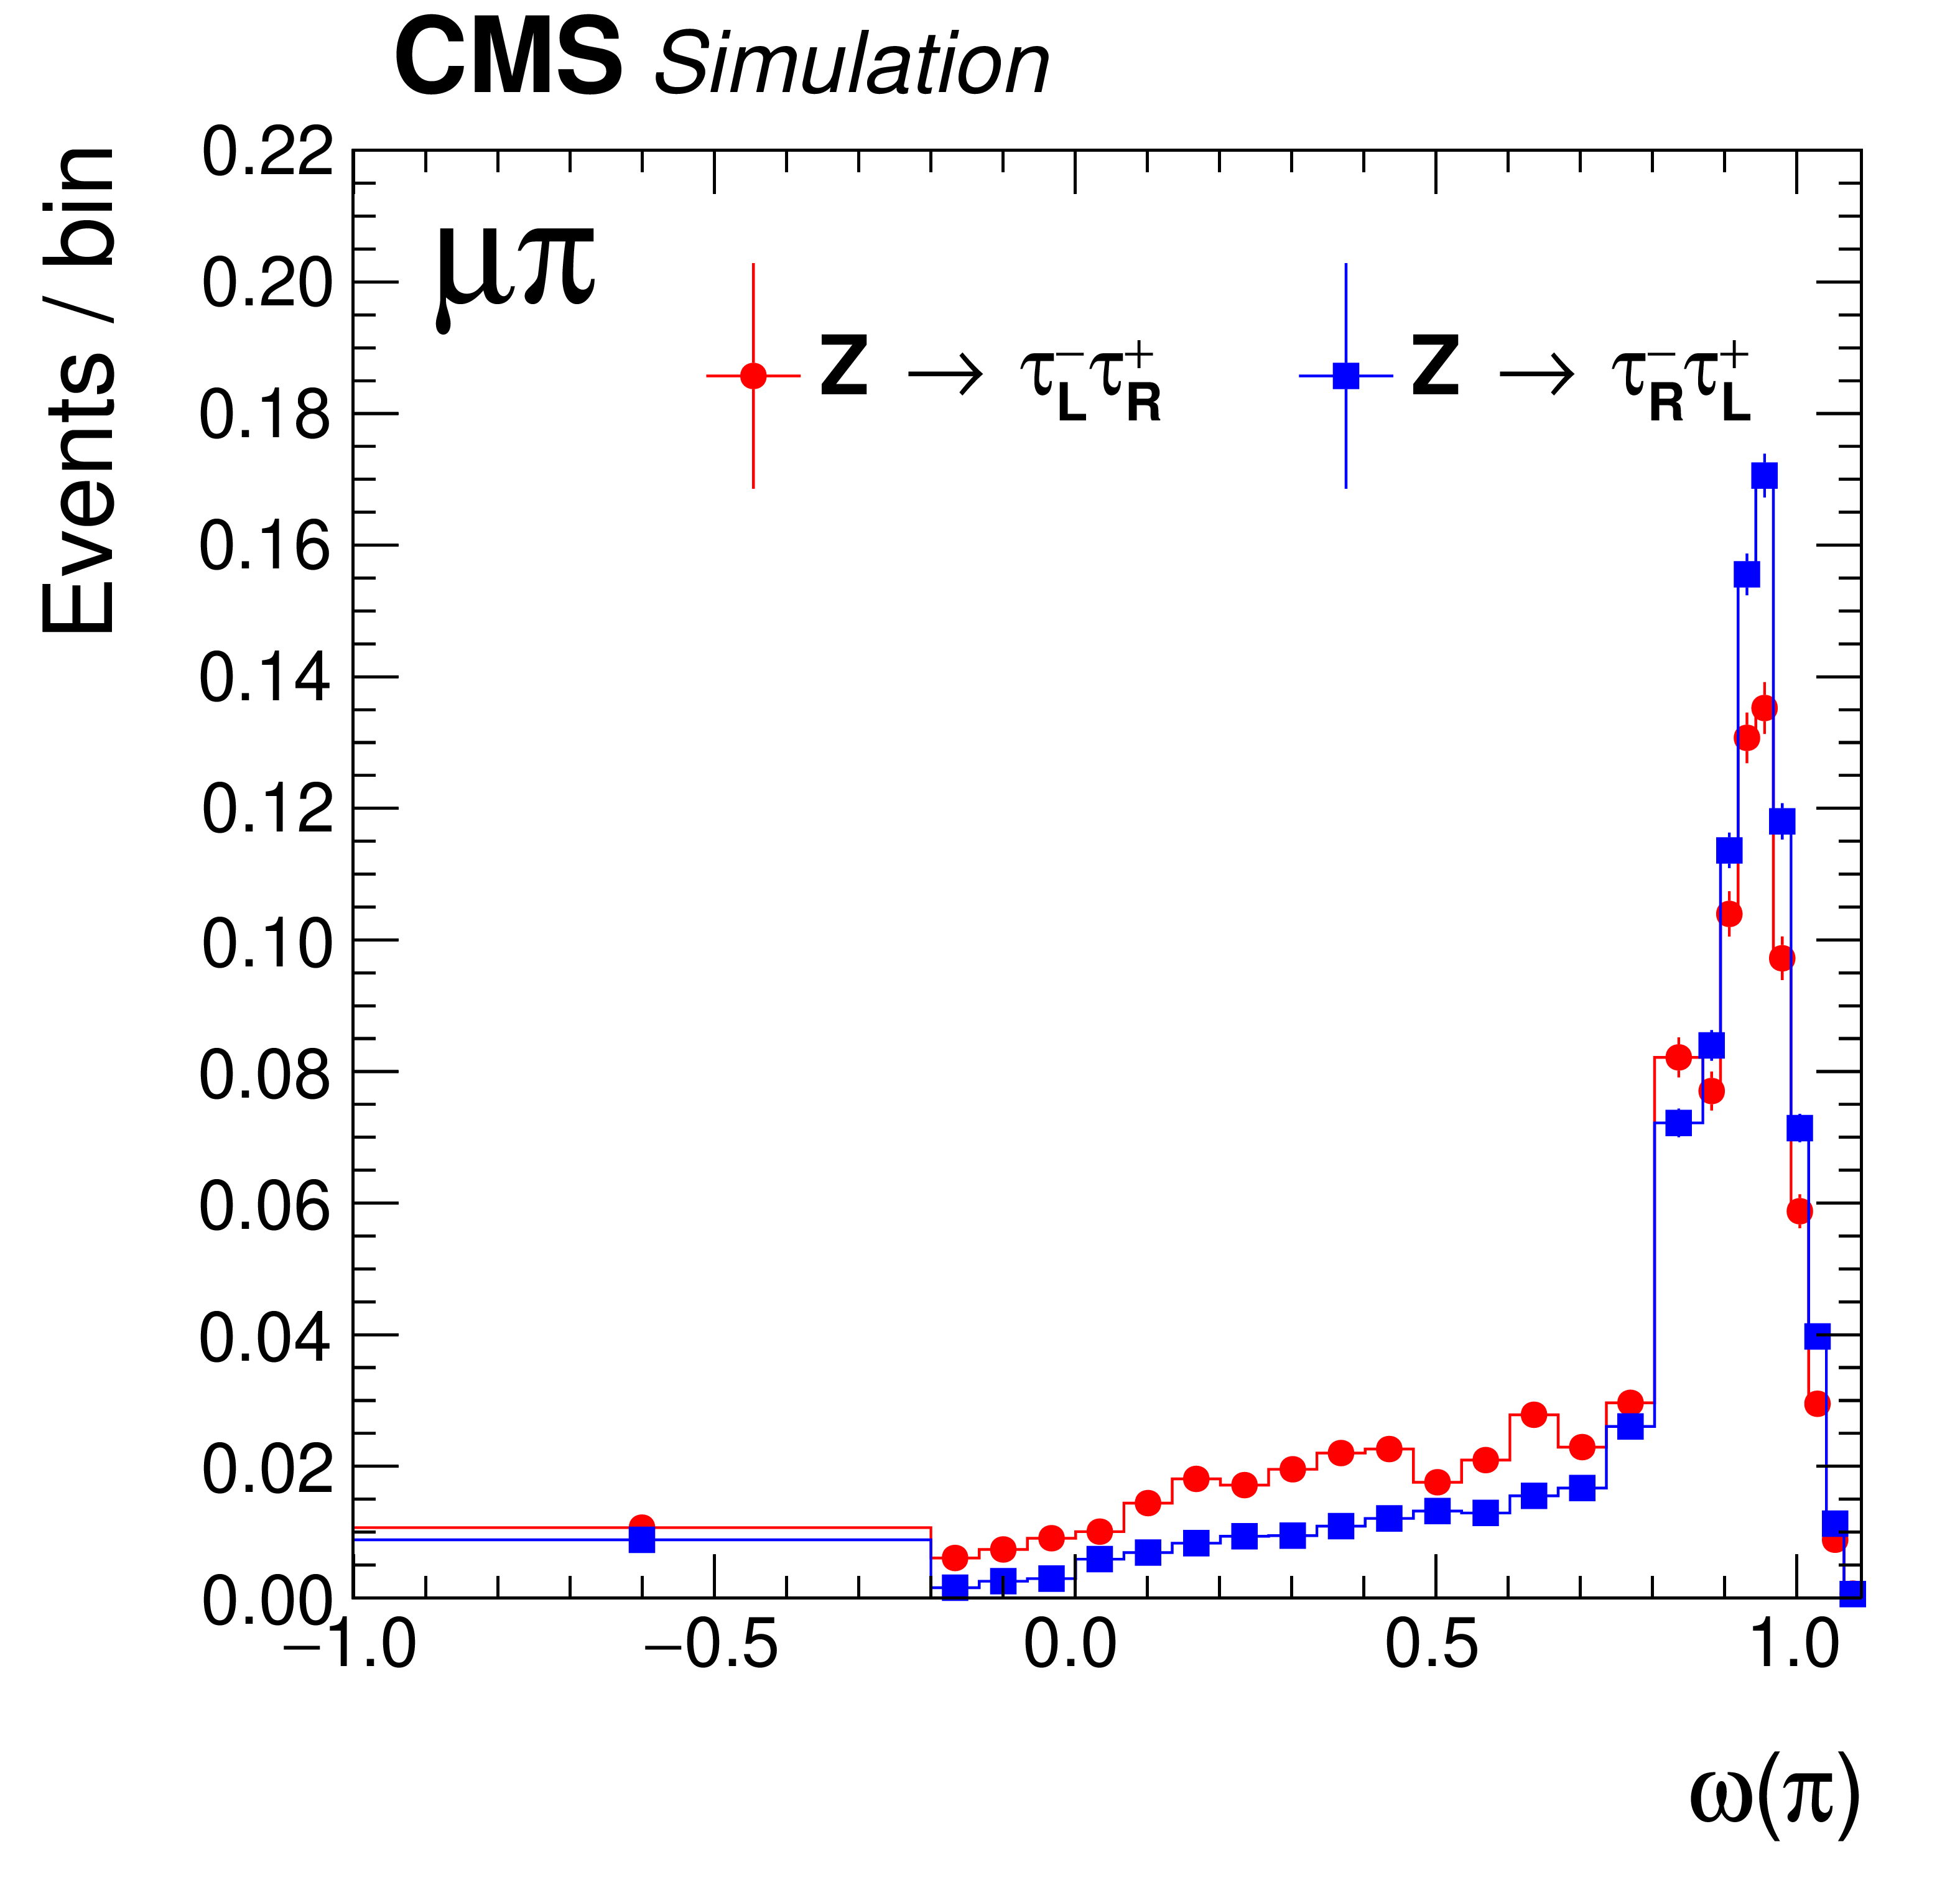
Figure 4:
Some examples of templates for six $ \tau^{-} $ lepton decays: $ \mathrm{e}+\rho$, $\mathrm{e}+\mathrm{a}_1$, $\mathrm{e}+\pi $ in the upper row and $ \mu+\rho$, $\mu+\mathrm{a}_1$, $\mu+\pi $ in the lower row. The blue and red lines indicate right and left-handed $ \tau^{-} $ leptons, respectively. The templates have been rescaled to correspond to zero polarization at the generator level. The uncertainty bars are statistical only and correspond to the limited MC samples after all selections. The shapes of the templates depend on the decay mode and on the nature of the chosen discriminating observables. |

png pdf |
Figure 4-a:
Example of template for $ \tau^{-} $ lepton decay to $ \mathrm{e}+\rho$. The blue and red lines indicate right and left-handed $ \tau^{-} $ leptons, respectively. The template has been rescaled to correspond to zero polarization at the generator level. The uncertainty bars are statistical only and correspond to the limited MC sample after all selections. |

png pdf |
Figure 4-b:
Example of template for $ \tau^{-} $ lepton decay to $\mathrm{e}+\mathrm{a}_1$. The blue and red lines indicate right and left-handed $ \tau^{-} $ leptons, respectively. The template has been rescaled to correspond to zero polarization at the generator level. The uncertainty bars are statistical only and correspond to the limited MC sample after all selections. |

png pdf |
Figure 4-c:
Example of template for $ \tau^{-} $ lepton decay to $\mathrm{e}+\pi $. The blue and red lines indicate right and left-handed $ \tau^{-} $ leptons, respectively. The template has been rescaled to correspond to zero polarization at the generator level. The uncertainty bars are statistical only and correspond to the limited MC sample after all selections. |

png pdf |
Figure 4-d:
Example of template for $ \tau^{-} $ lepton decay to $ \mu+\rho$. The blue and red lines indicate right and left-handed $ \tau^{-} $ leptons, respectively. The template has been rescaled to correspond to zero polarization at the generator level. The uncertainty bars are statistical only and correspond to the limited MC sample after all selections. |
png pdf |
Figure 4-e:
Example of template for $ \tau^{-} $ lepton decay to $\mu+\mathrm{a}_1$. The blue and red lines indicate right and left-handed $ \tau^{-} $ leptons, respectively. The template has been rescaled to correspond to zero polarization at the generator level. The uncertainty bars are statistical only and correspond to the limited MC sample after all selections. |
png pdf |
Figure 4-f:
Example of template for $ \tau^{-} $ lepton decay to $\mu+\pi $. The blue and red lines indicate right and left-handed $ \tau^{-} $ leptons, respectively. The template has been rescaled to correspond to zero polarization at the generator level. The uncertainty bars are statistical only and correspond to the limited MC sample after all selections. |

png pdf |
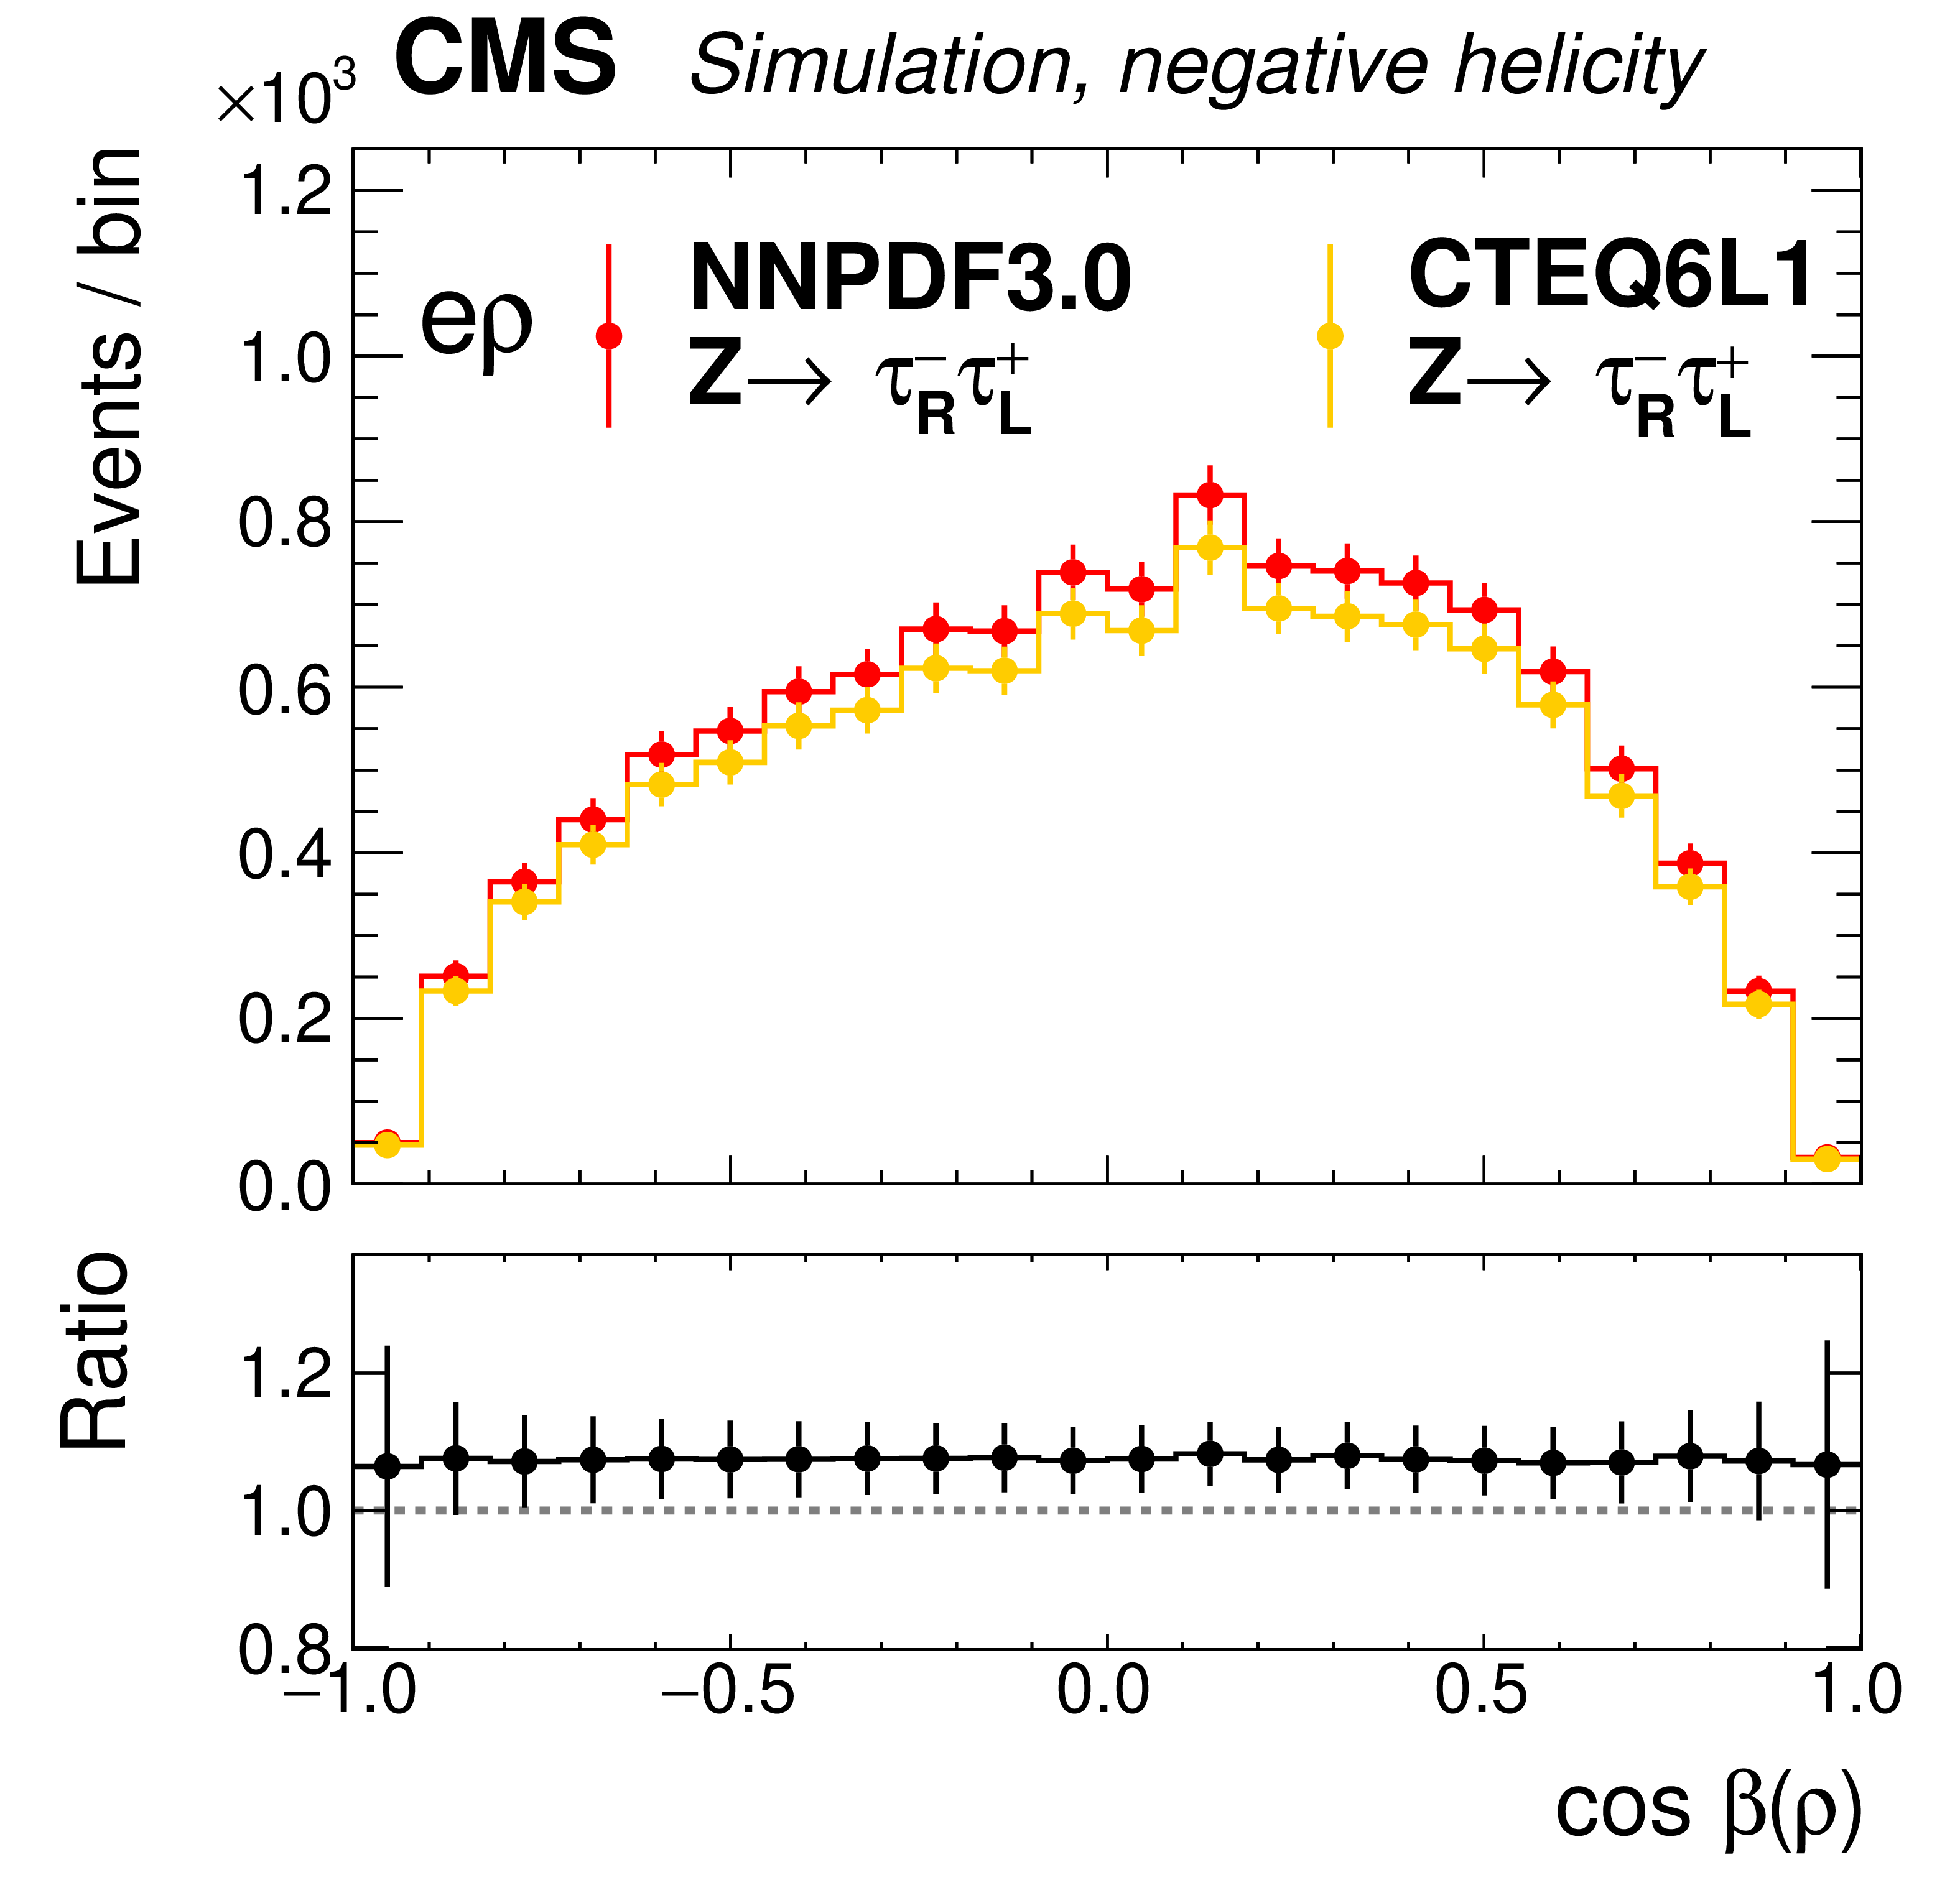
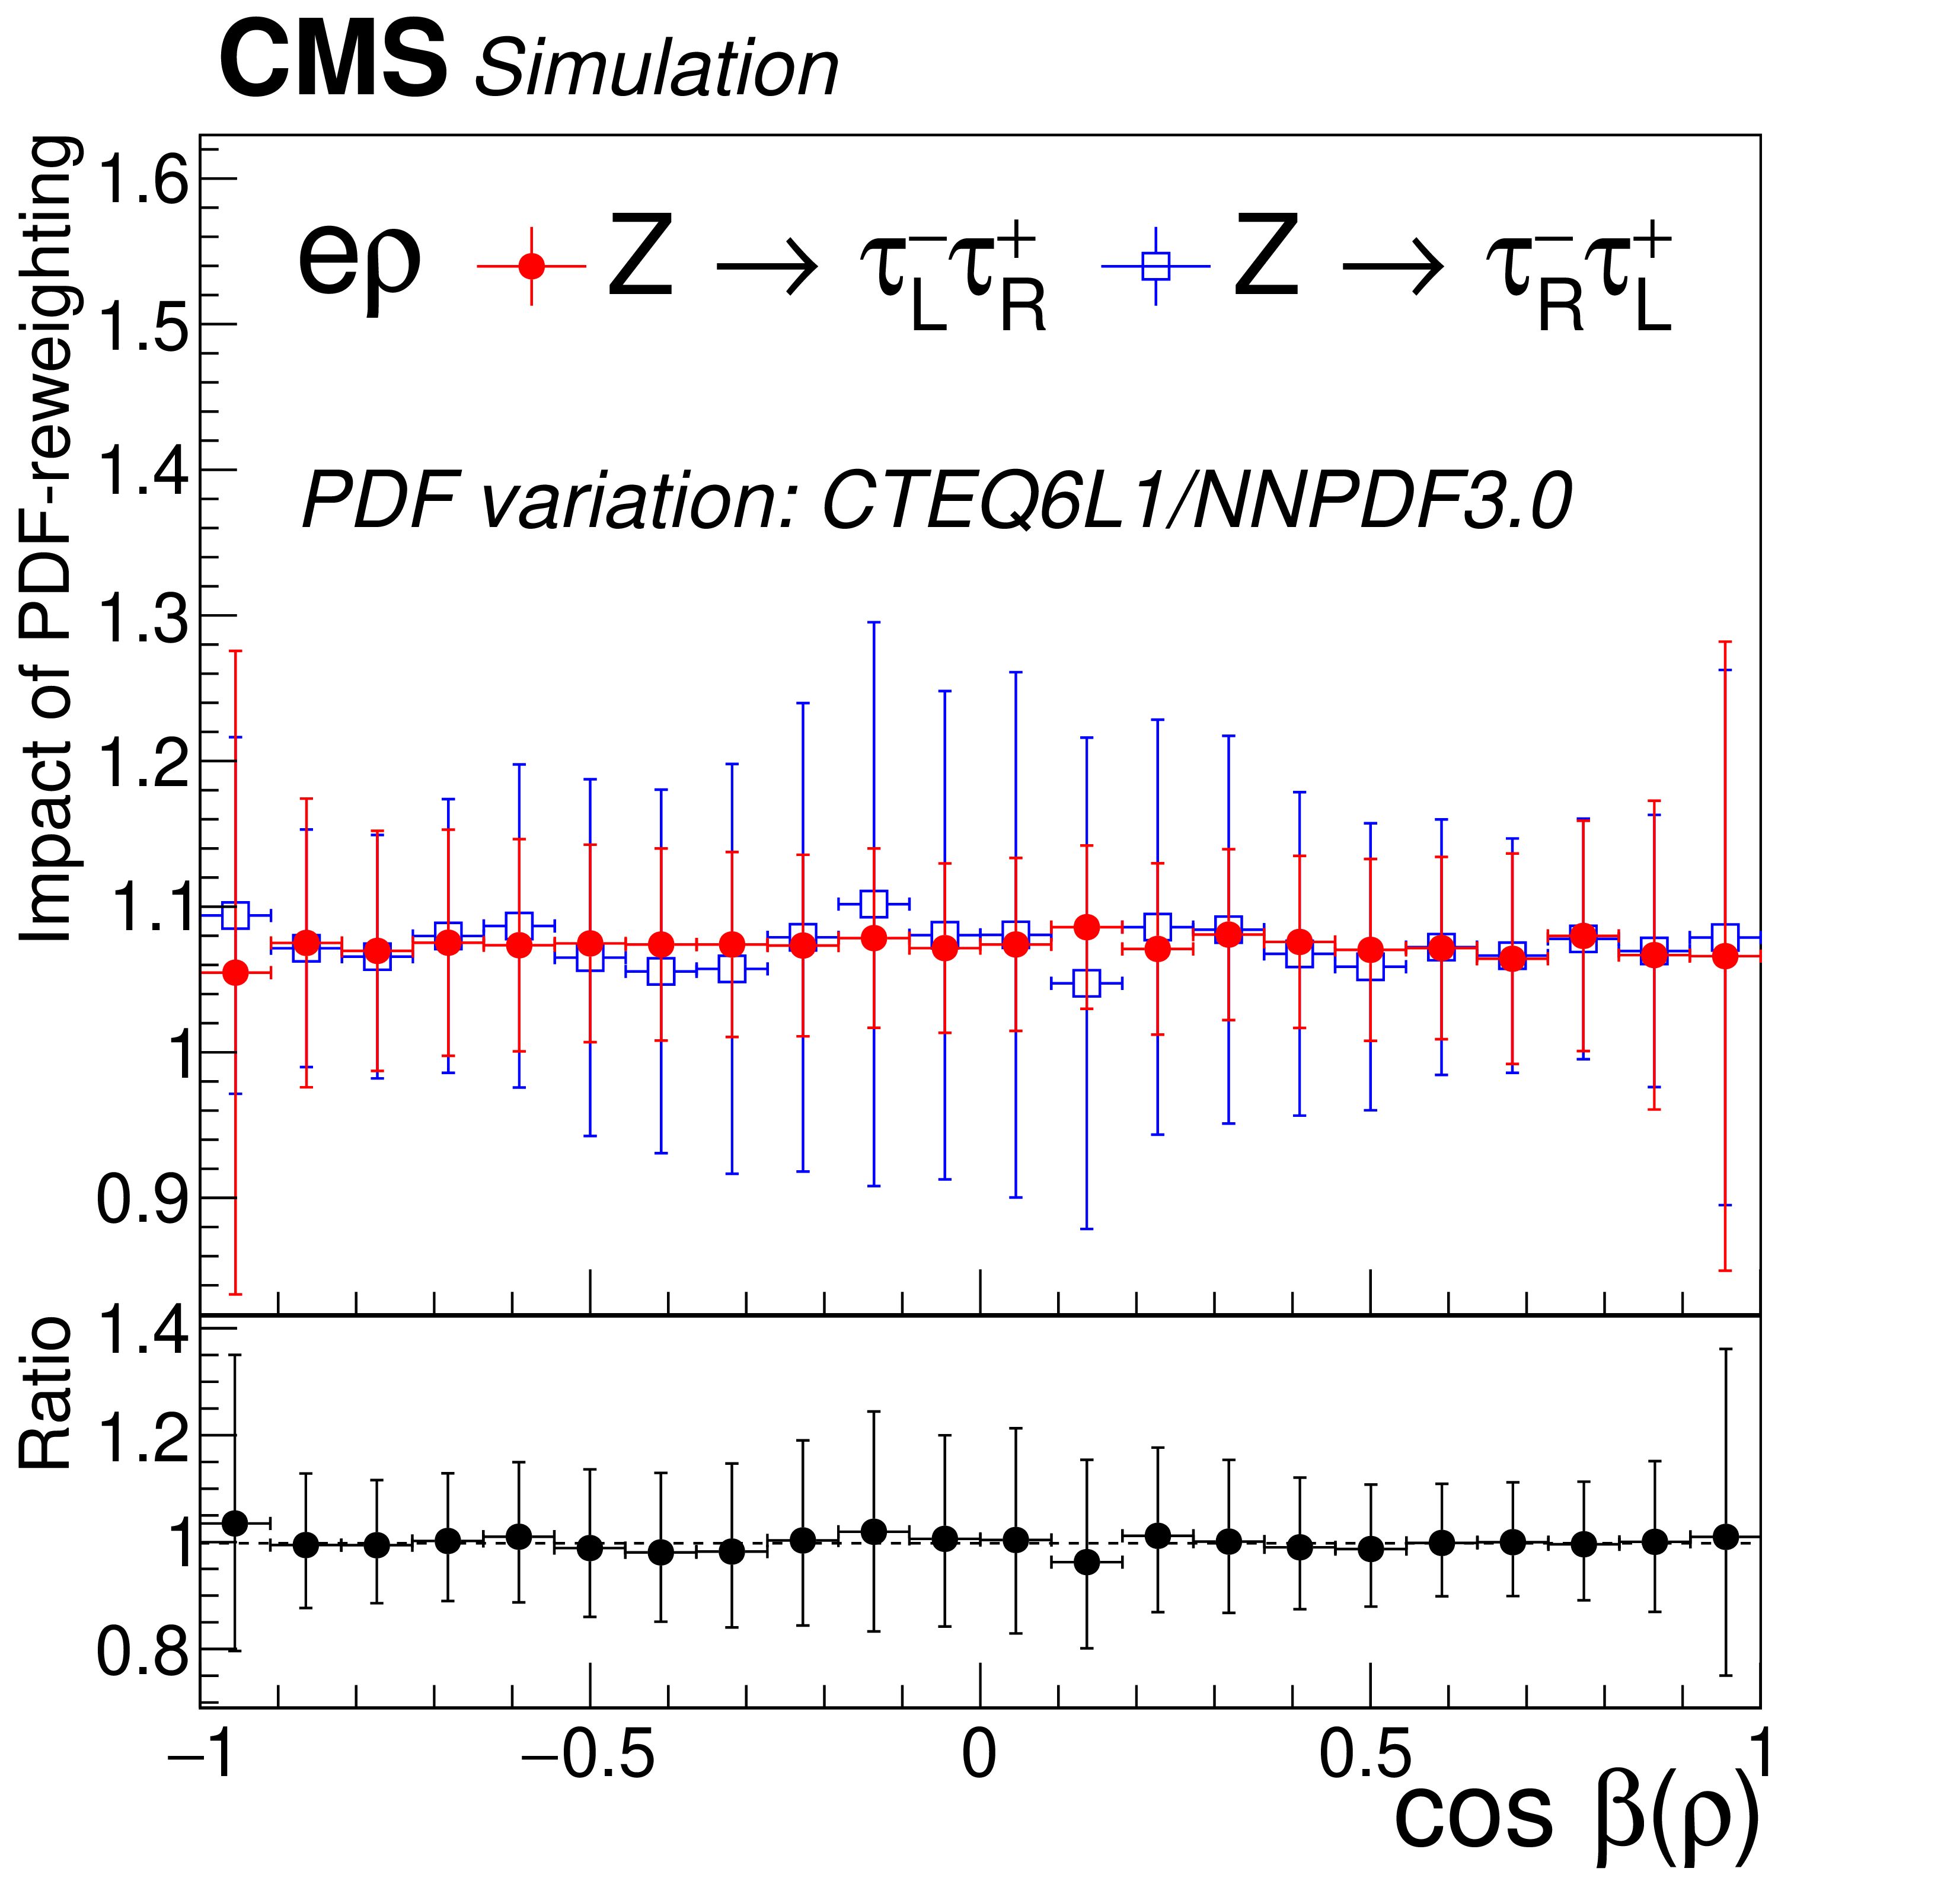
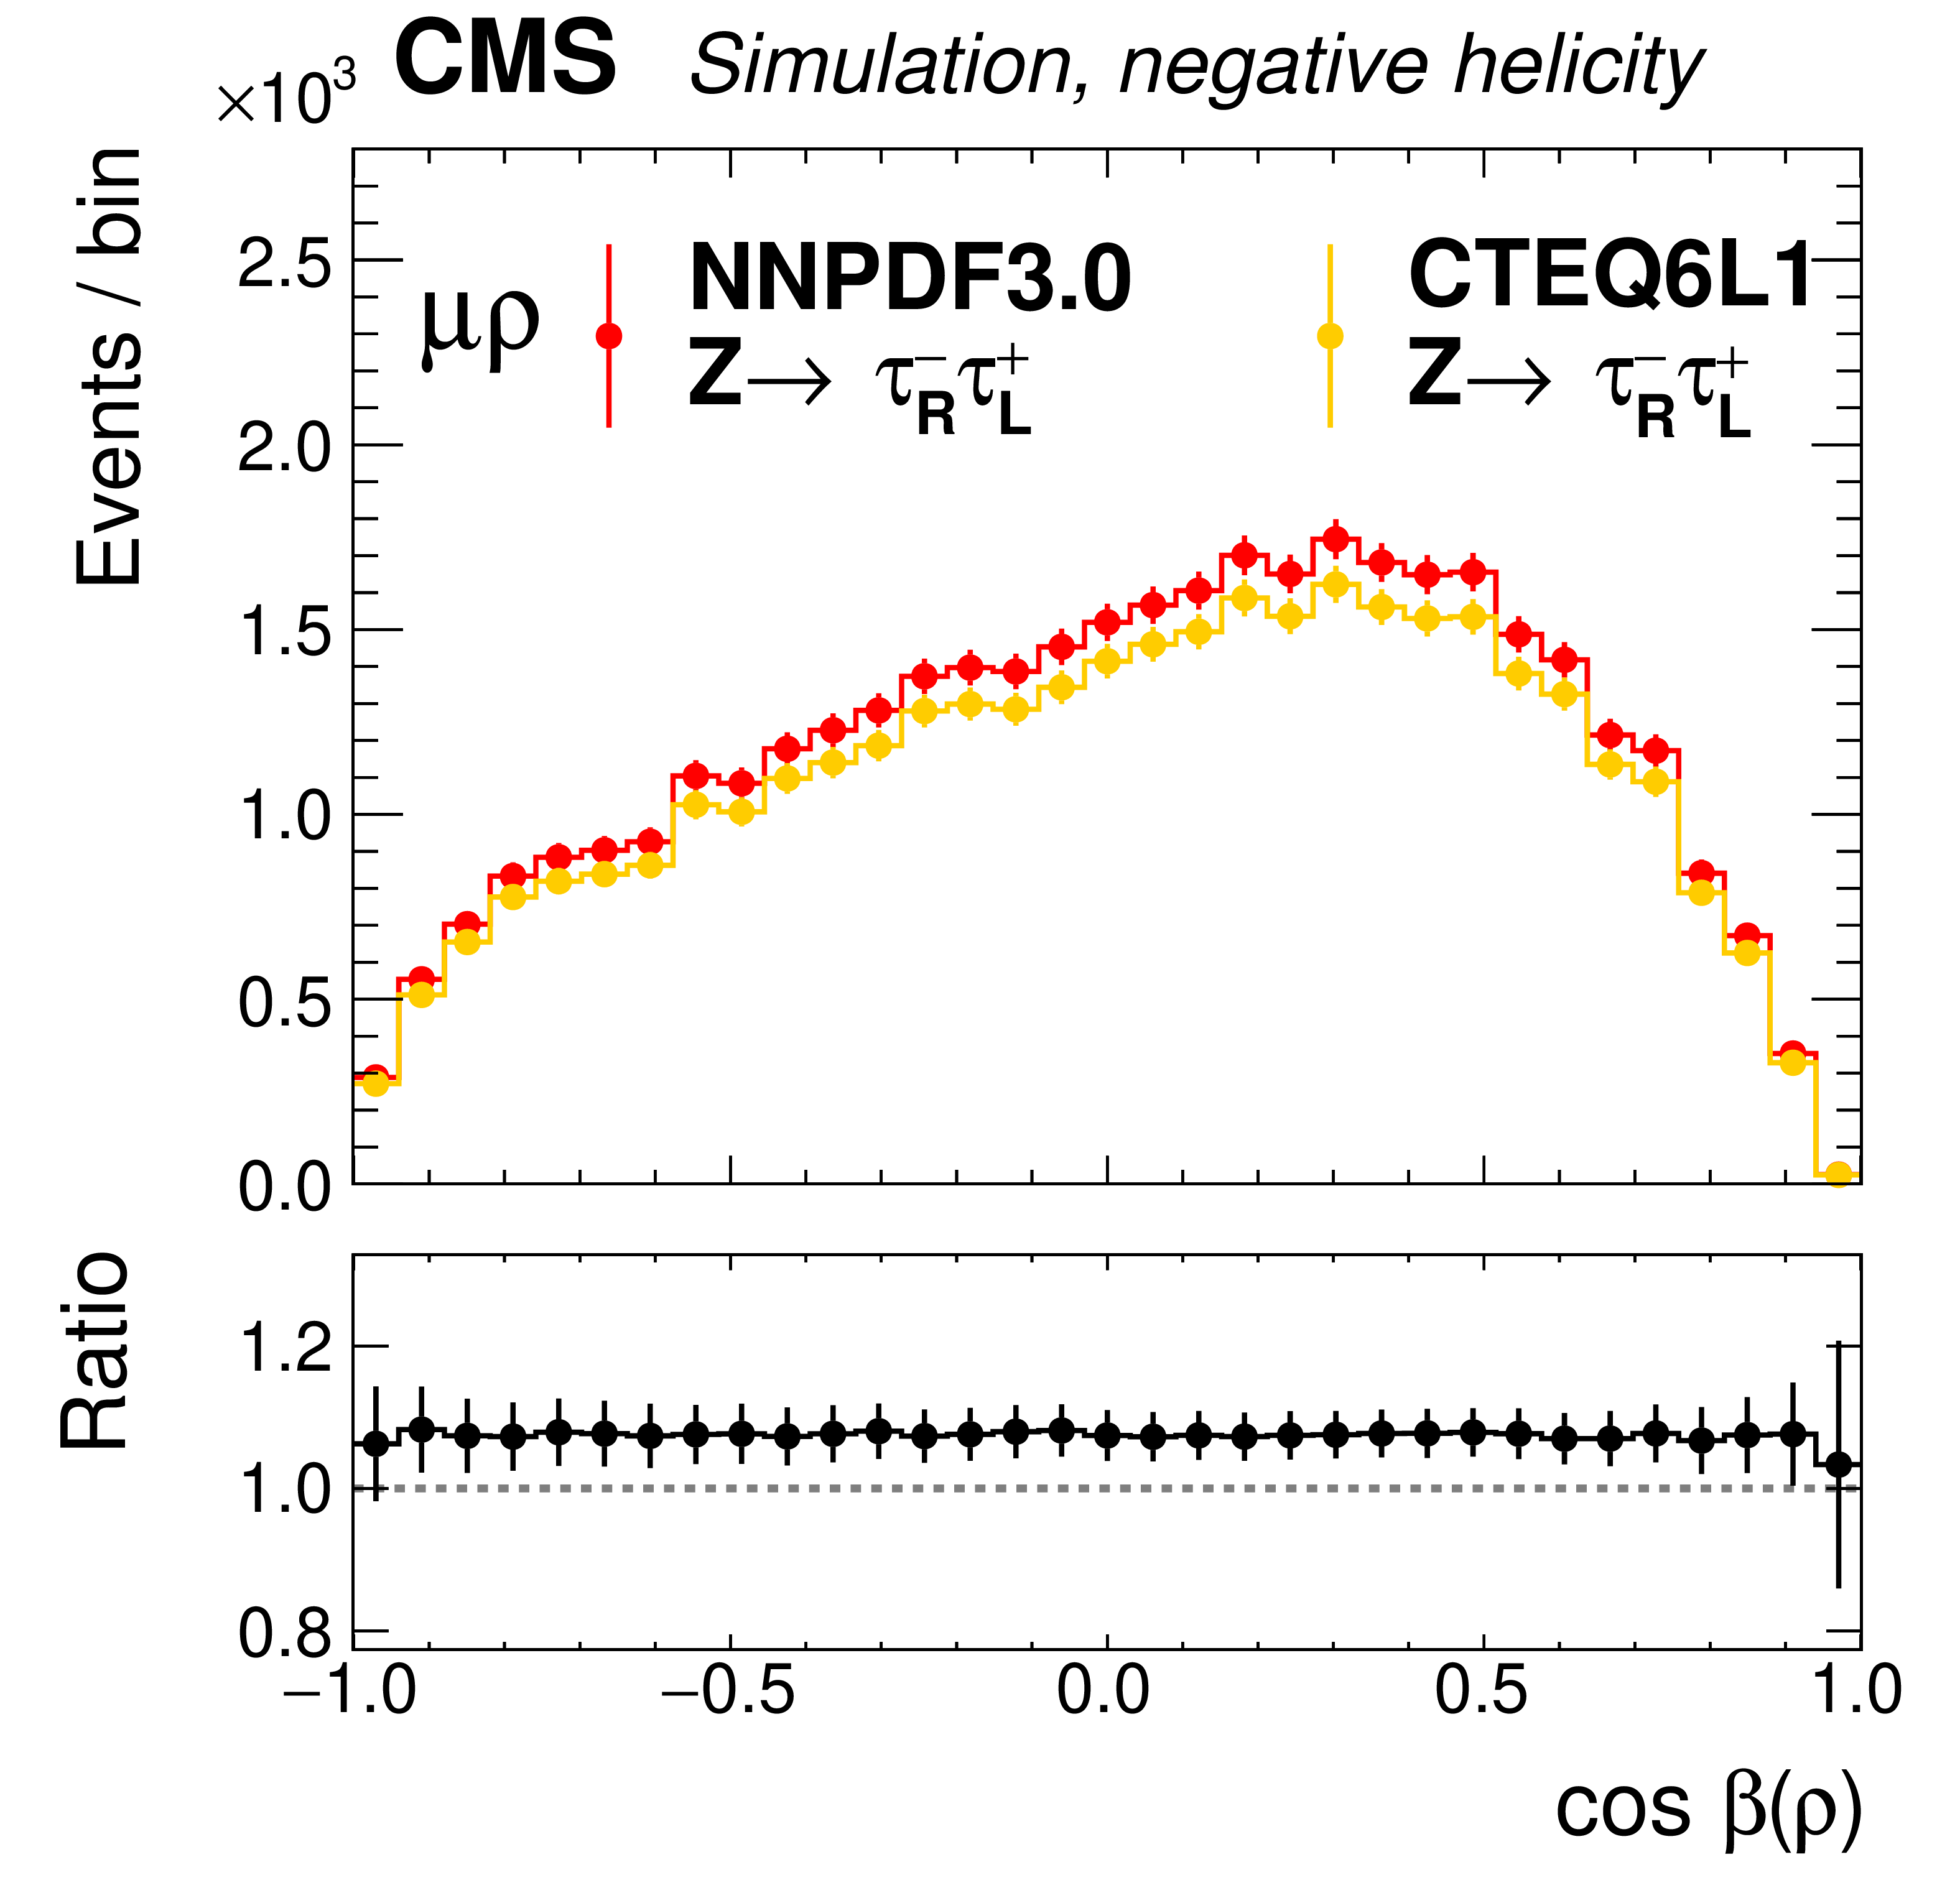
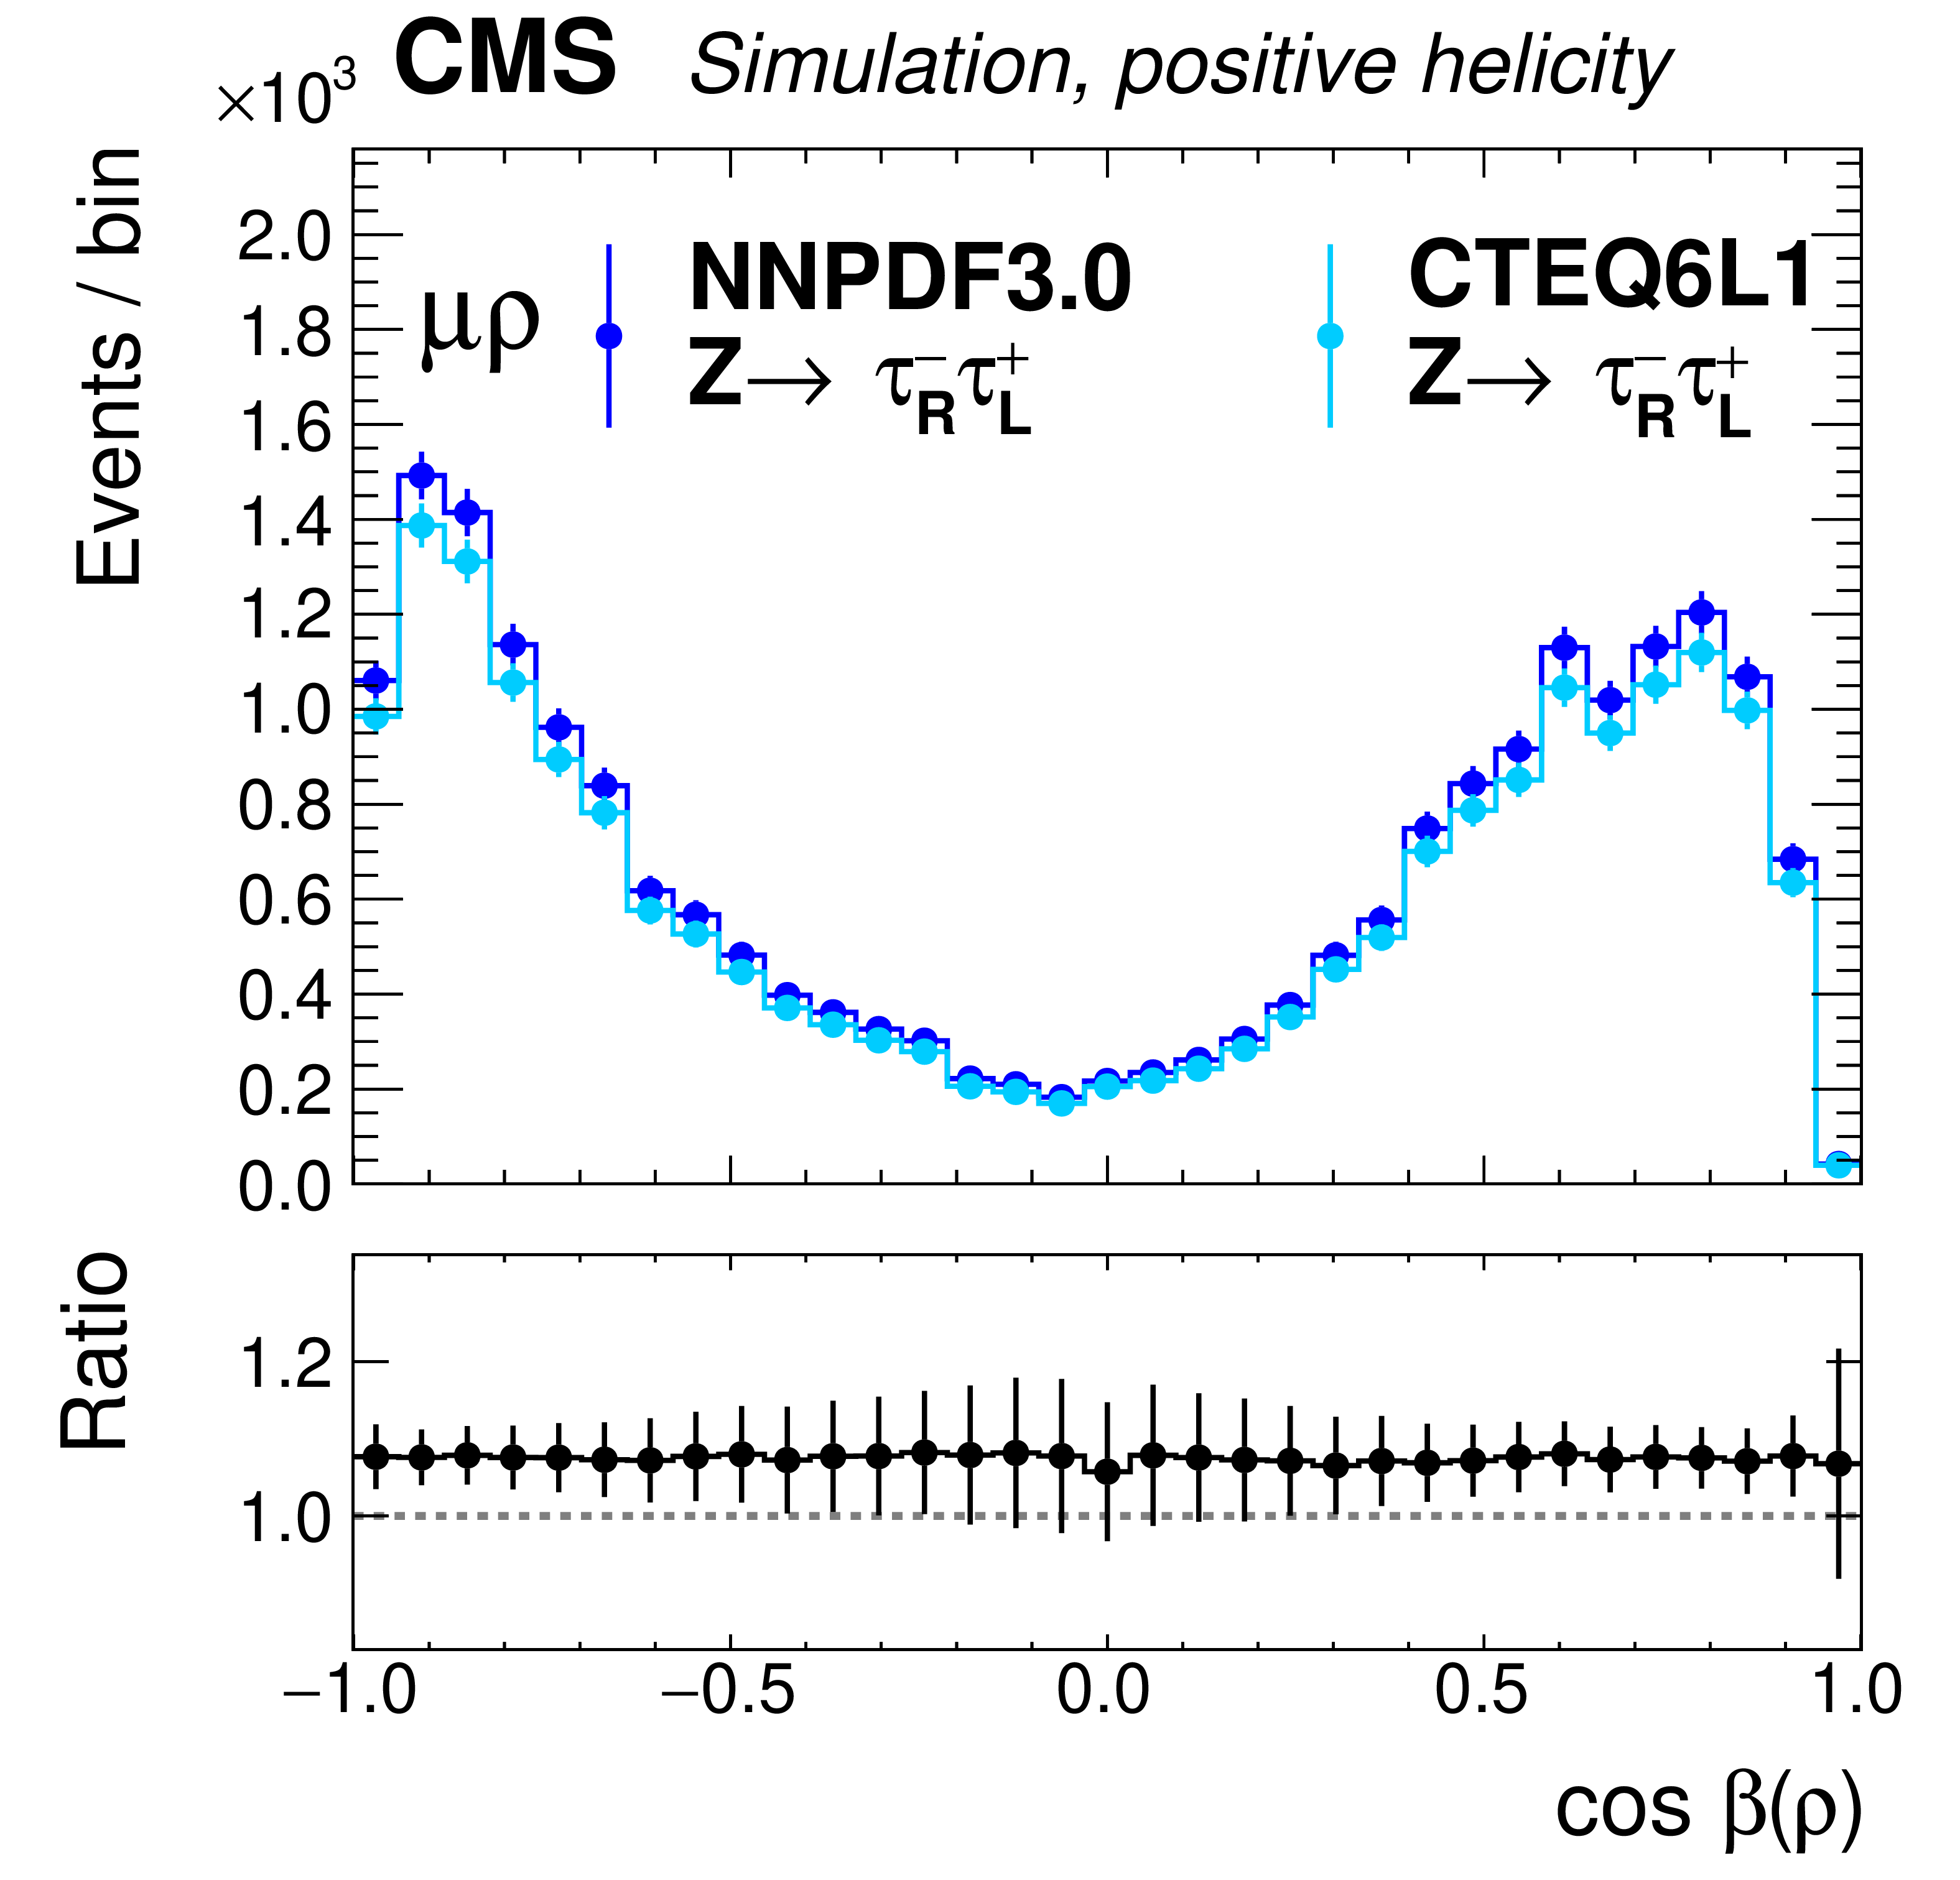
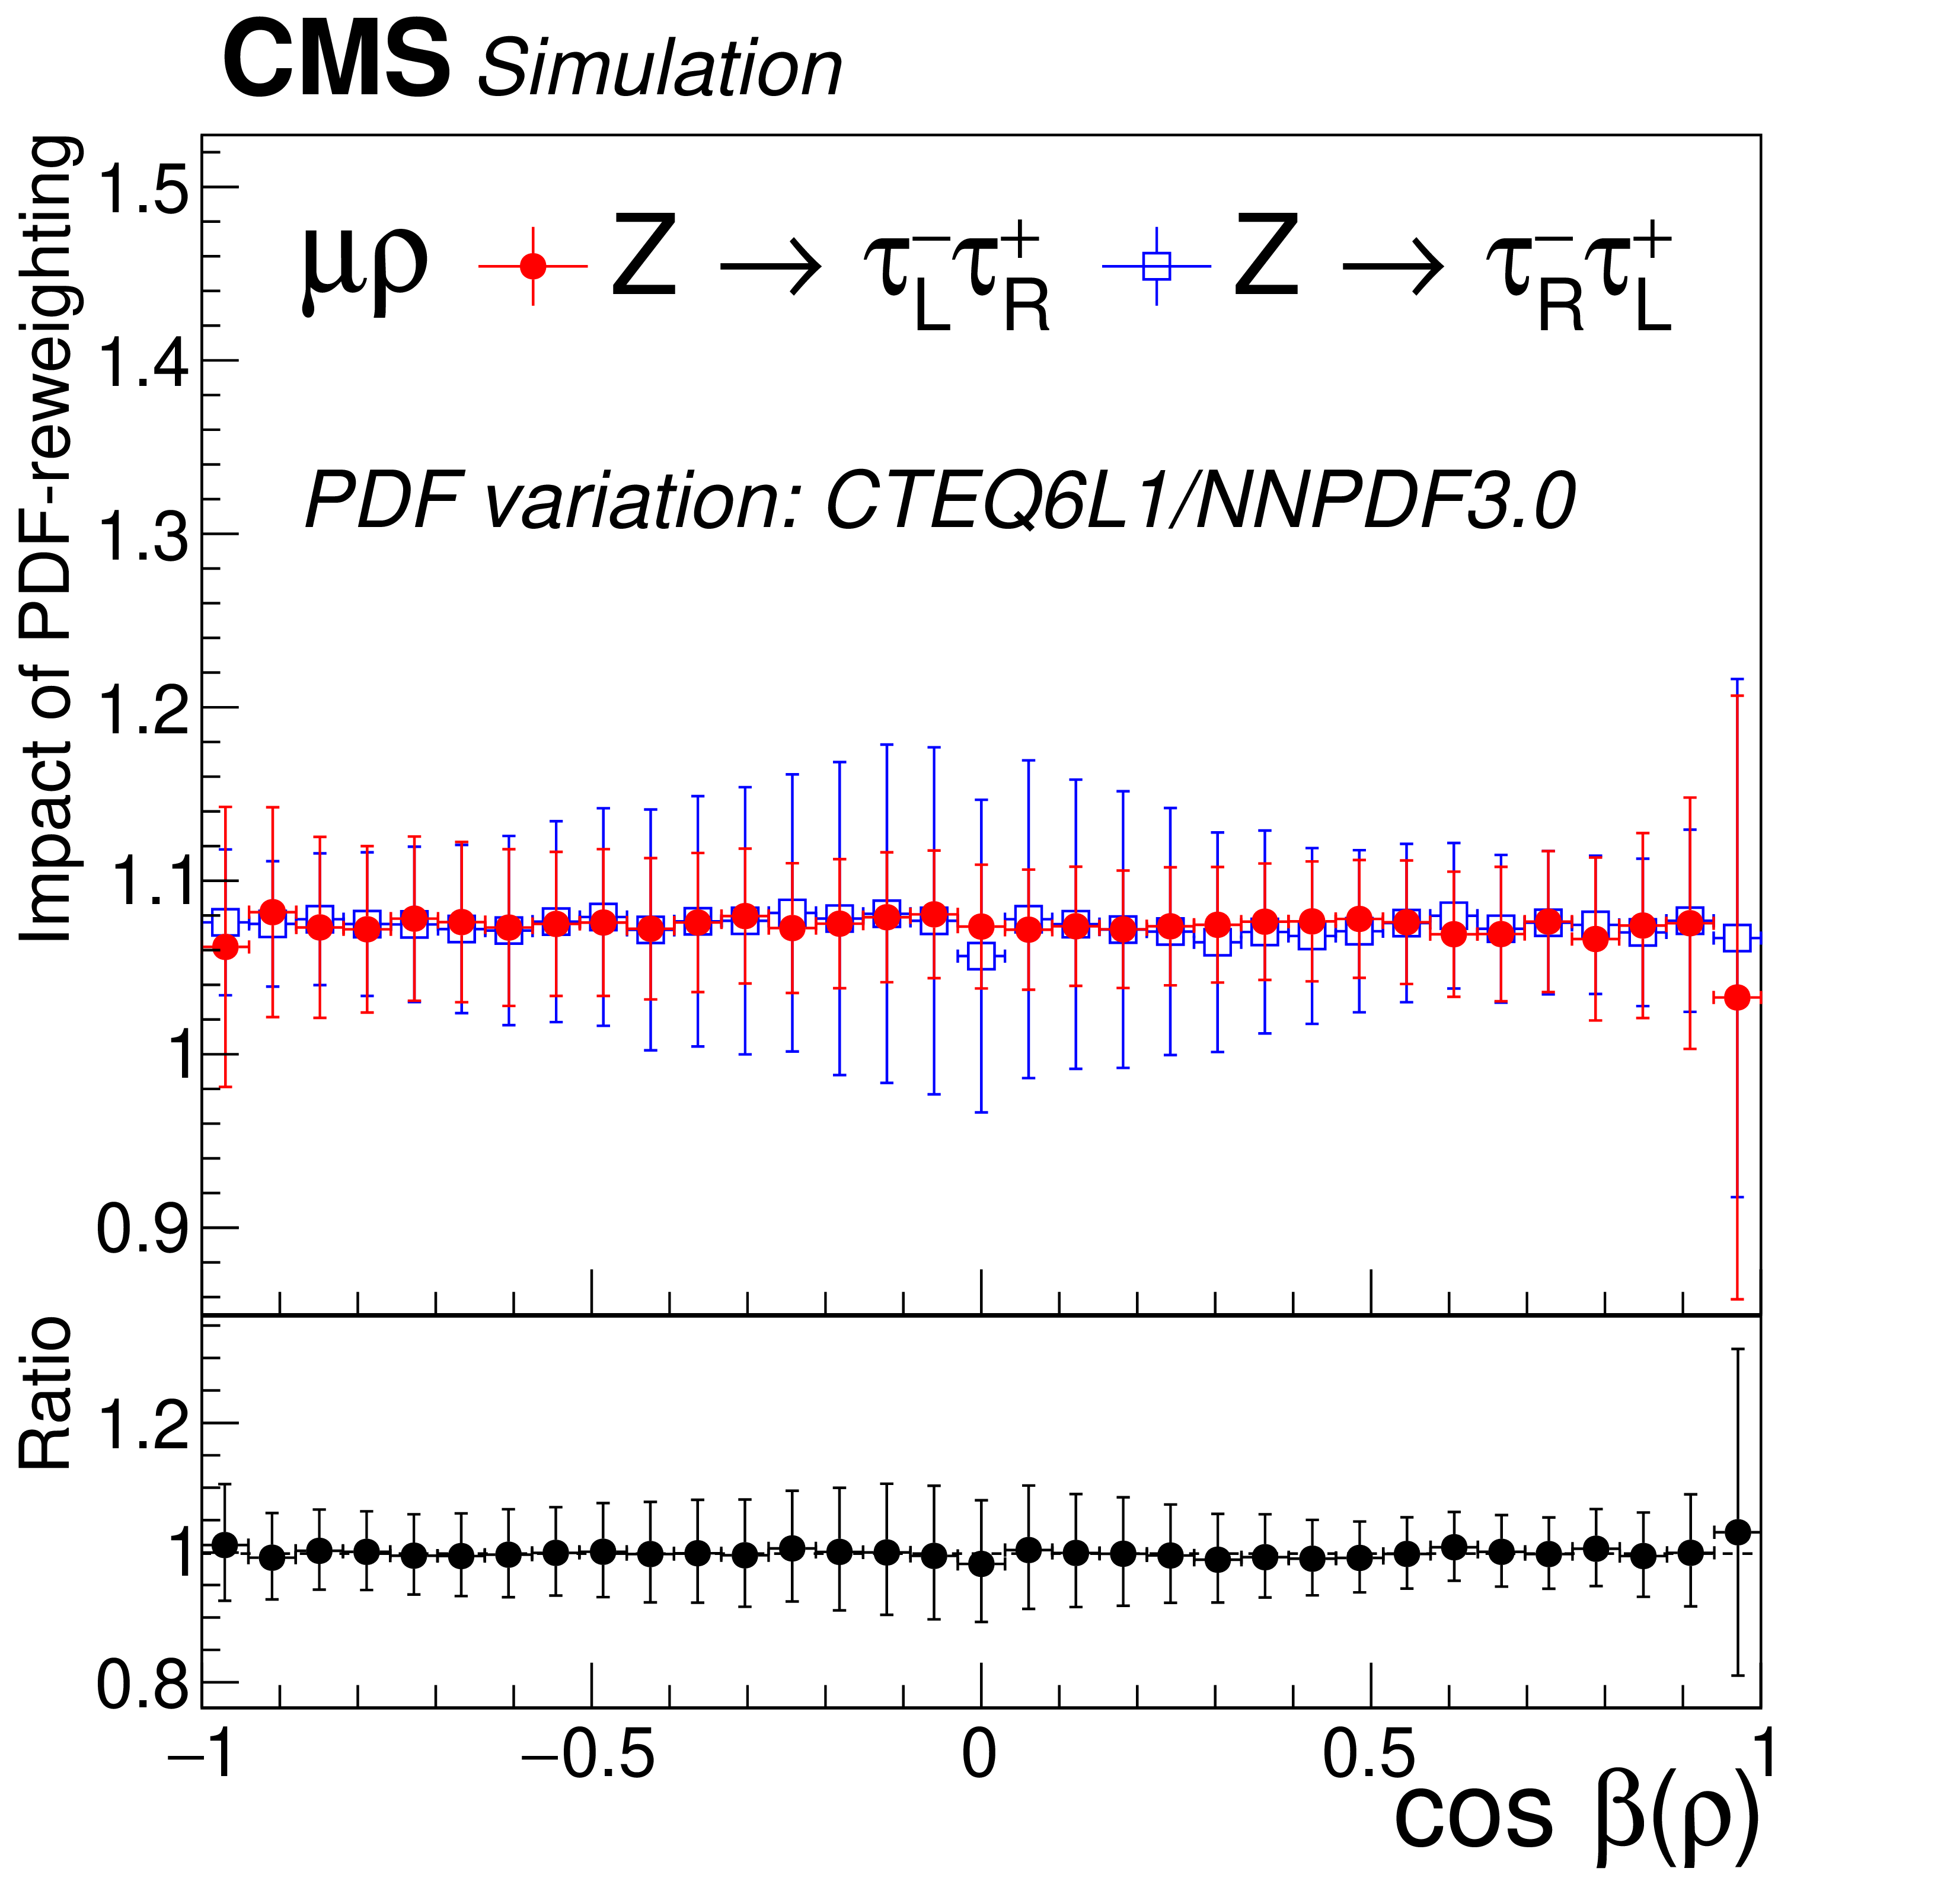
Figure 5:
Variation of the templates for negative (left) and positive (middle) $ \tau^{-} $ lepton helicities in the $ \mathrm{e}+\rho $ (upper row) and $ \mu+\rho $ (lower row) channels after a change of the PDFs from NNPDF3.0 to CTEQ6L1. The graphs on the right show the ratio of the ratios of the changes for negative and positive helicities, which is flat and centered exactly at 1 demonstrating that a possible PDF effect on the polarization is very small. The drawn error bars are large because the events in the ratios are correlated, so only the fluctuations of the points are relevant and are within approximately 1%, much smaller than other systematic uncertainties in this analysis. |
png pdf |
Figure 5-a:
Variation of the template for negative $ \tau^{-} $ lepton helicity in the $ \mathrm{e}+\rho $ channel after a change of the PDFs from NNPDF3.0 to CTEQ6L1. |

png pdf |
Figure 5-b:
Variation of the template for positive $ \tau^{-} $ lepton helicity in the $ \mathrm{e}+\rho $ channel after a change of the PDFs from NNPDF3.0 to CTEQ6L1. |
png pdf |
Figure 5-c:
Ratio of the ratios of the changes for negative and positive helicities ($ \mathrm{e}+\rho $ channel), which is flat and centered exactly at 1 demonstrating that a possible PDF effect on the polarization is very small. The drawn error bars are large because the events in the ratios are correlated, so only the fluctuations of the points are relevant and are within approximately 1%, much smaller than other systematic uncertainties in this analysis. |
png pdf |
Figure 5-d:
Variation of the template for negative $ \tau^{-} $ lepton helicity in the $ \mu+\rho $ channel after a change of the PDFs from NNPDF3.0 to CTEQ6L1. |
png pdf |
Figure 5-e:
Variation of the template for positive $ \tau^{-} $ lepton helicity in the $ \mu+\rho $ channel after a change of the PDFs from NNPDF3.0 to CTEQ6L1. |
png pdf |
Figure 5-f:
Ratio of the ratios of the changes for negative and positive helicities ($ \mu+\rho $ channel), which is flat and centered exactly at 1 demonstrating that a possible PDF effect on the polarization is very small. The drawn error bars are large because the events in the ratios are correlated, so only the fluctuations of the points are relevant and are within approximately 1%, much smaller than other systematic uncertainties in this analysis. |

png pdf |
Figure 6:
The final maximum likelihood fit of the template to the data for the $ \tau_\mathrm{e}\tau_\mu $ channel. The figure shows the contributions of all backgrounds and the fitted contributions from $ \tau_{\text{L}}^{-}$ and $ \tau_{\text{R}}^{-}$ helicity states. The bottom panel of shows the ratio of the experimental data to the sum of the expected contributions. The vertical error bars on the data points are the statistical uncertainties, the gray rectangles indicate the systematic experimental uncertainty in the total expectation. |
png pdf |
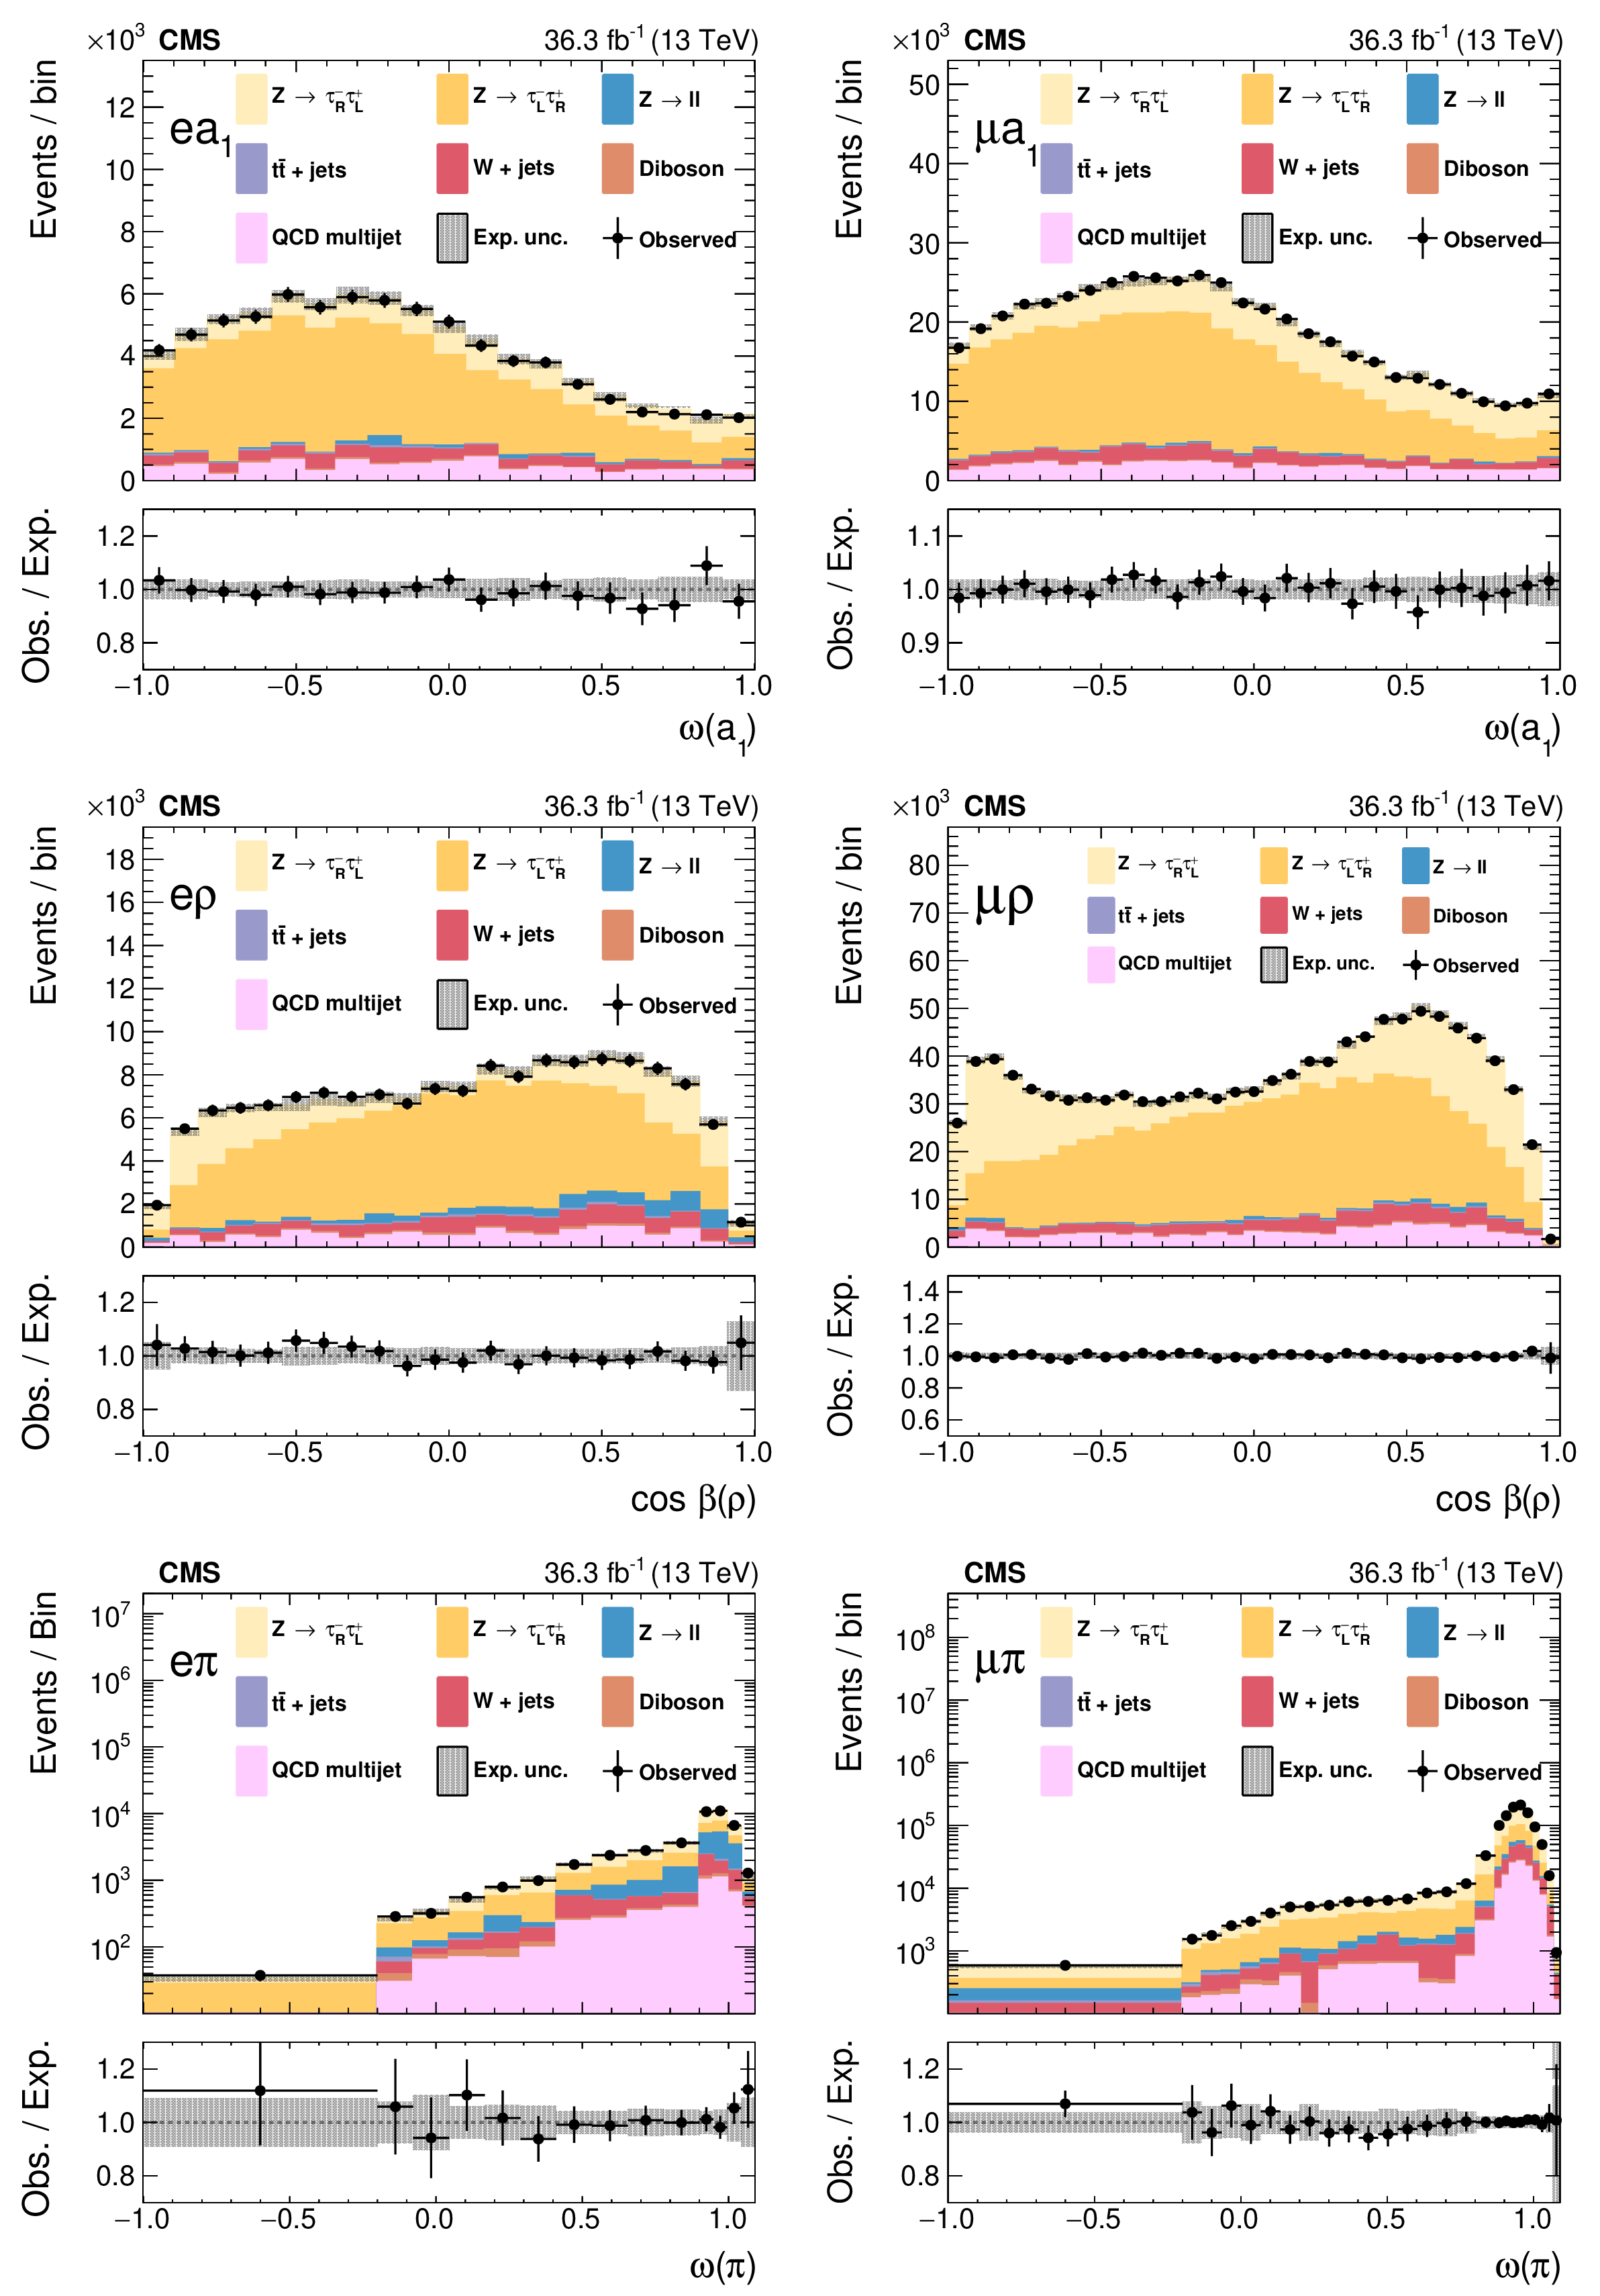
Figure 7:
The final maximum likelihood fits of templates to the data for the three $ \tau_\mathrm{e}\tau_\mathrm{h} $ (left) and three $ \tau_\mu\tau_\mathrm{h} $ (right) categories. The figures show the contributions of all backgrounds and the fitted contributions from $ \tau_{\text{L}}^{-}$ and $ \tau_{\text{R}}^{-}$ helicity states. The bottom panels show the ratio of the experimental data to the sum of the expected contributions. The vertical error bars on the data points are the statistical uncertainties, the gray rectangles indicate the systematic experimental uncertainty in the total expectation. |

png pdf |
Figure 7-a:
The final maximum likelihood fits of templates to the data for the $\mathrm{e}\mathrm{a}_1$ category. The figure shows the contributions of all backgrounds and the fitted contributions from $ \tau_{\text{L}}^{-}$ and $ \tau_{\text{R}}^{-}$ helicity states. The bottom panel shows the ratio of the experimental data to the sum of the expected contributions. The vertical error bars on the data points are the statistical uncertainties, the gray rectangles indicate the systematic experimental uncertainty in the total expectation. |
png pdf |
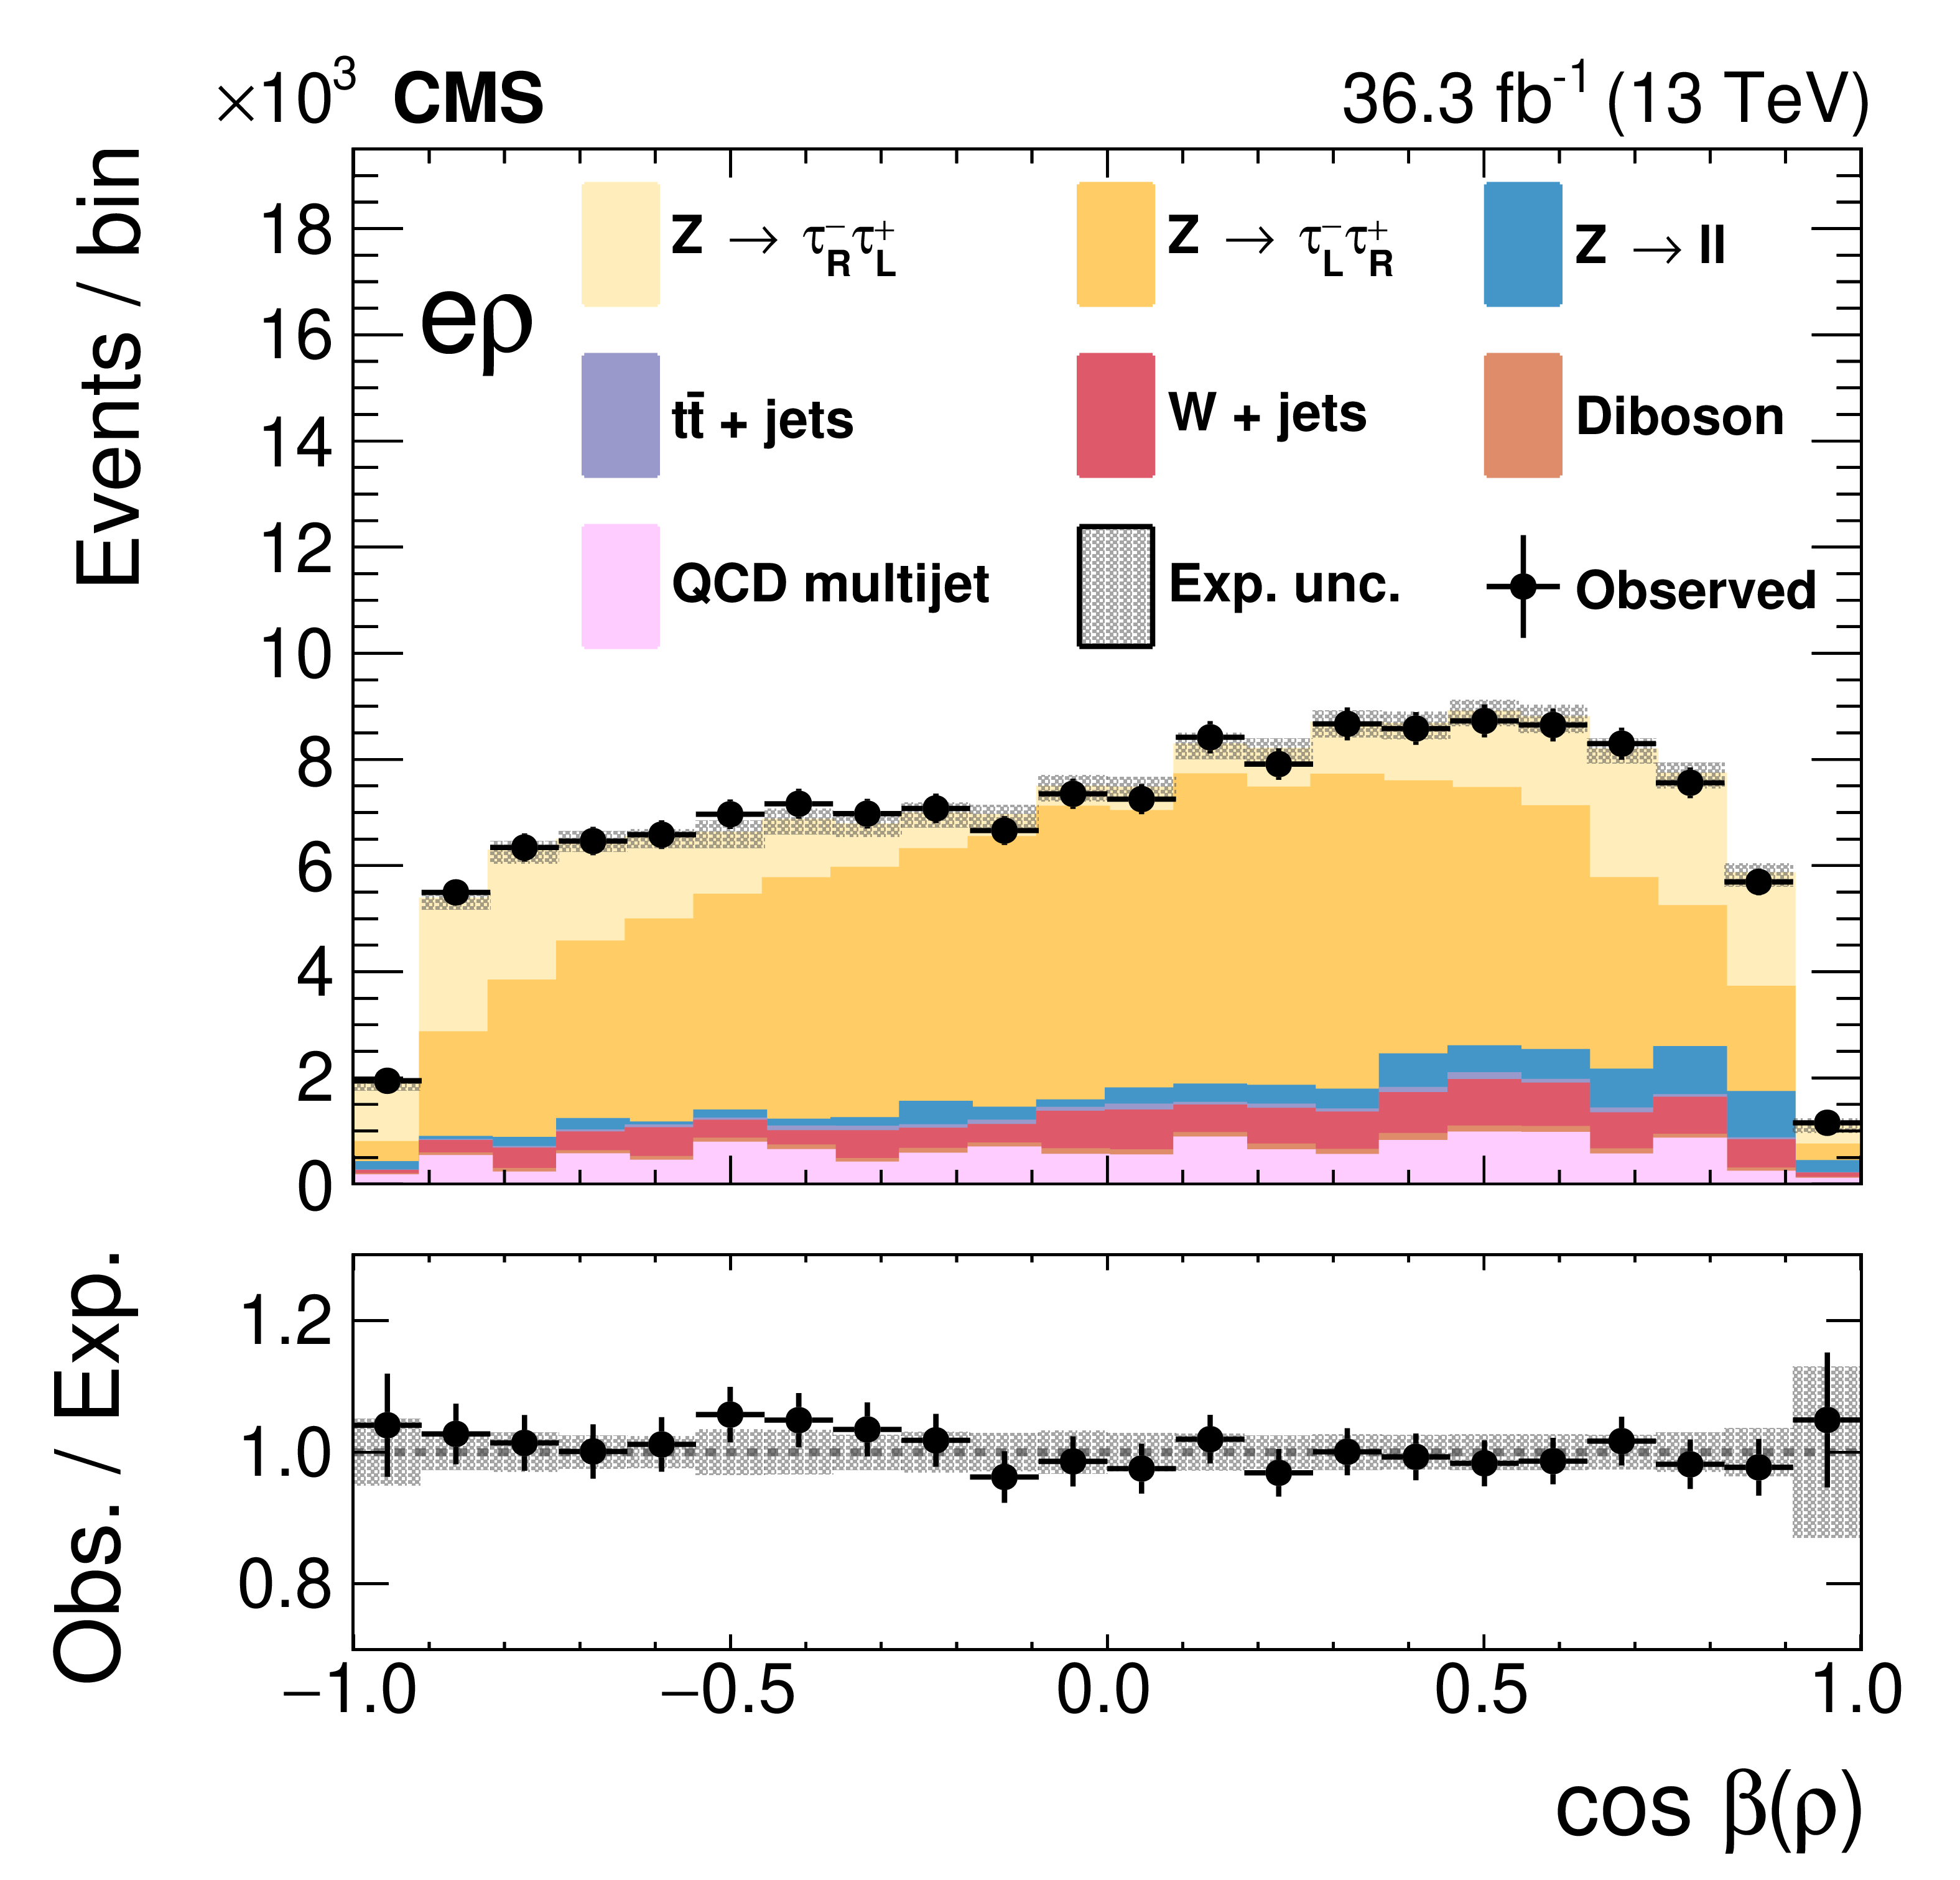
Figure 7-b:
The final maximum likelihood fits of templates to the data for the $ \mathrm{e}\rho$ category. The figure shows the contributions of all backgrounds and the fitted contributions from $ \tau_{\text{L}}^{-}$ and $ \tau_{\text{R}}^{-}$ helicity states. The bottom panel shows the ratio of the experimental data to the sum of the expected contributions. The vertical error bars on the data points are the statistical uncertainties, the gray rectangles indicate the systematic experimental uncertainty in the total expectation. |
png pdf |
Figure 7-c:
The final maximum likelihood fits of templates to the data for the $\mathrm{e}\pi$ category. The figure shows the contributions of all backgrounds and the fitted contributions from $ \tau_{\text{L}}^{-}$ and $ \tau_{\text{R}}^{-}$ helicity states. The bottom panel shows the ratio of the experimental data to the sum of the expected contributions. The vertical error bars on the data points are the statistical uncertainties, the gray rectangles indicate the systematic experimental uncertainty in the total expectation. |

png pdf |
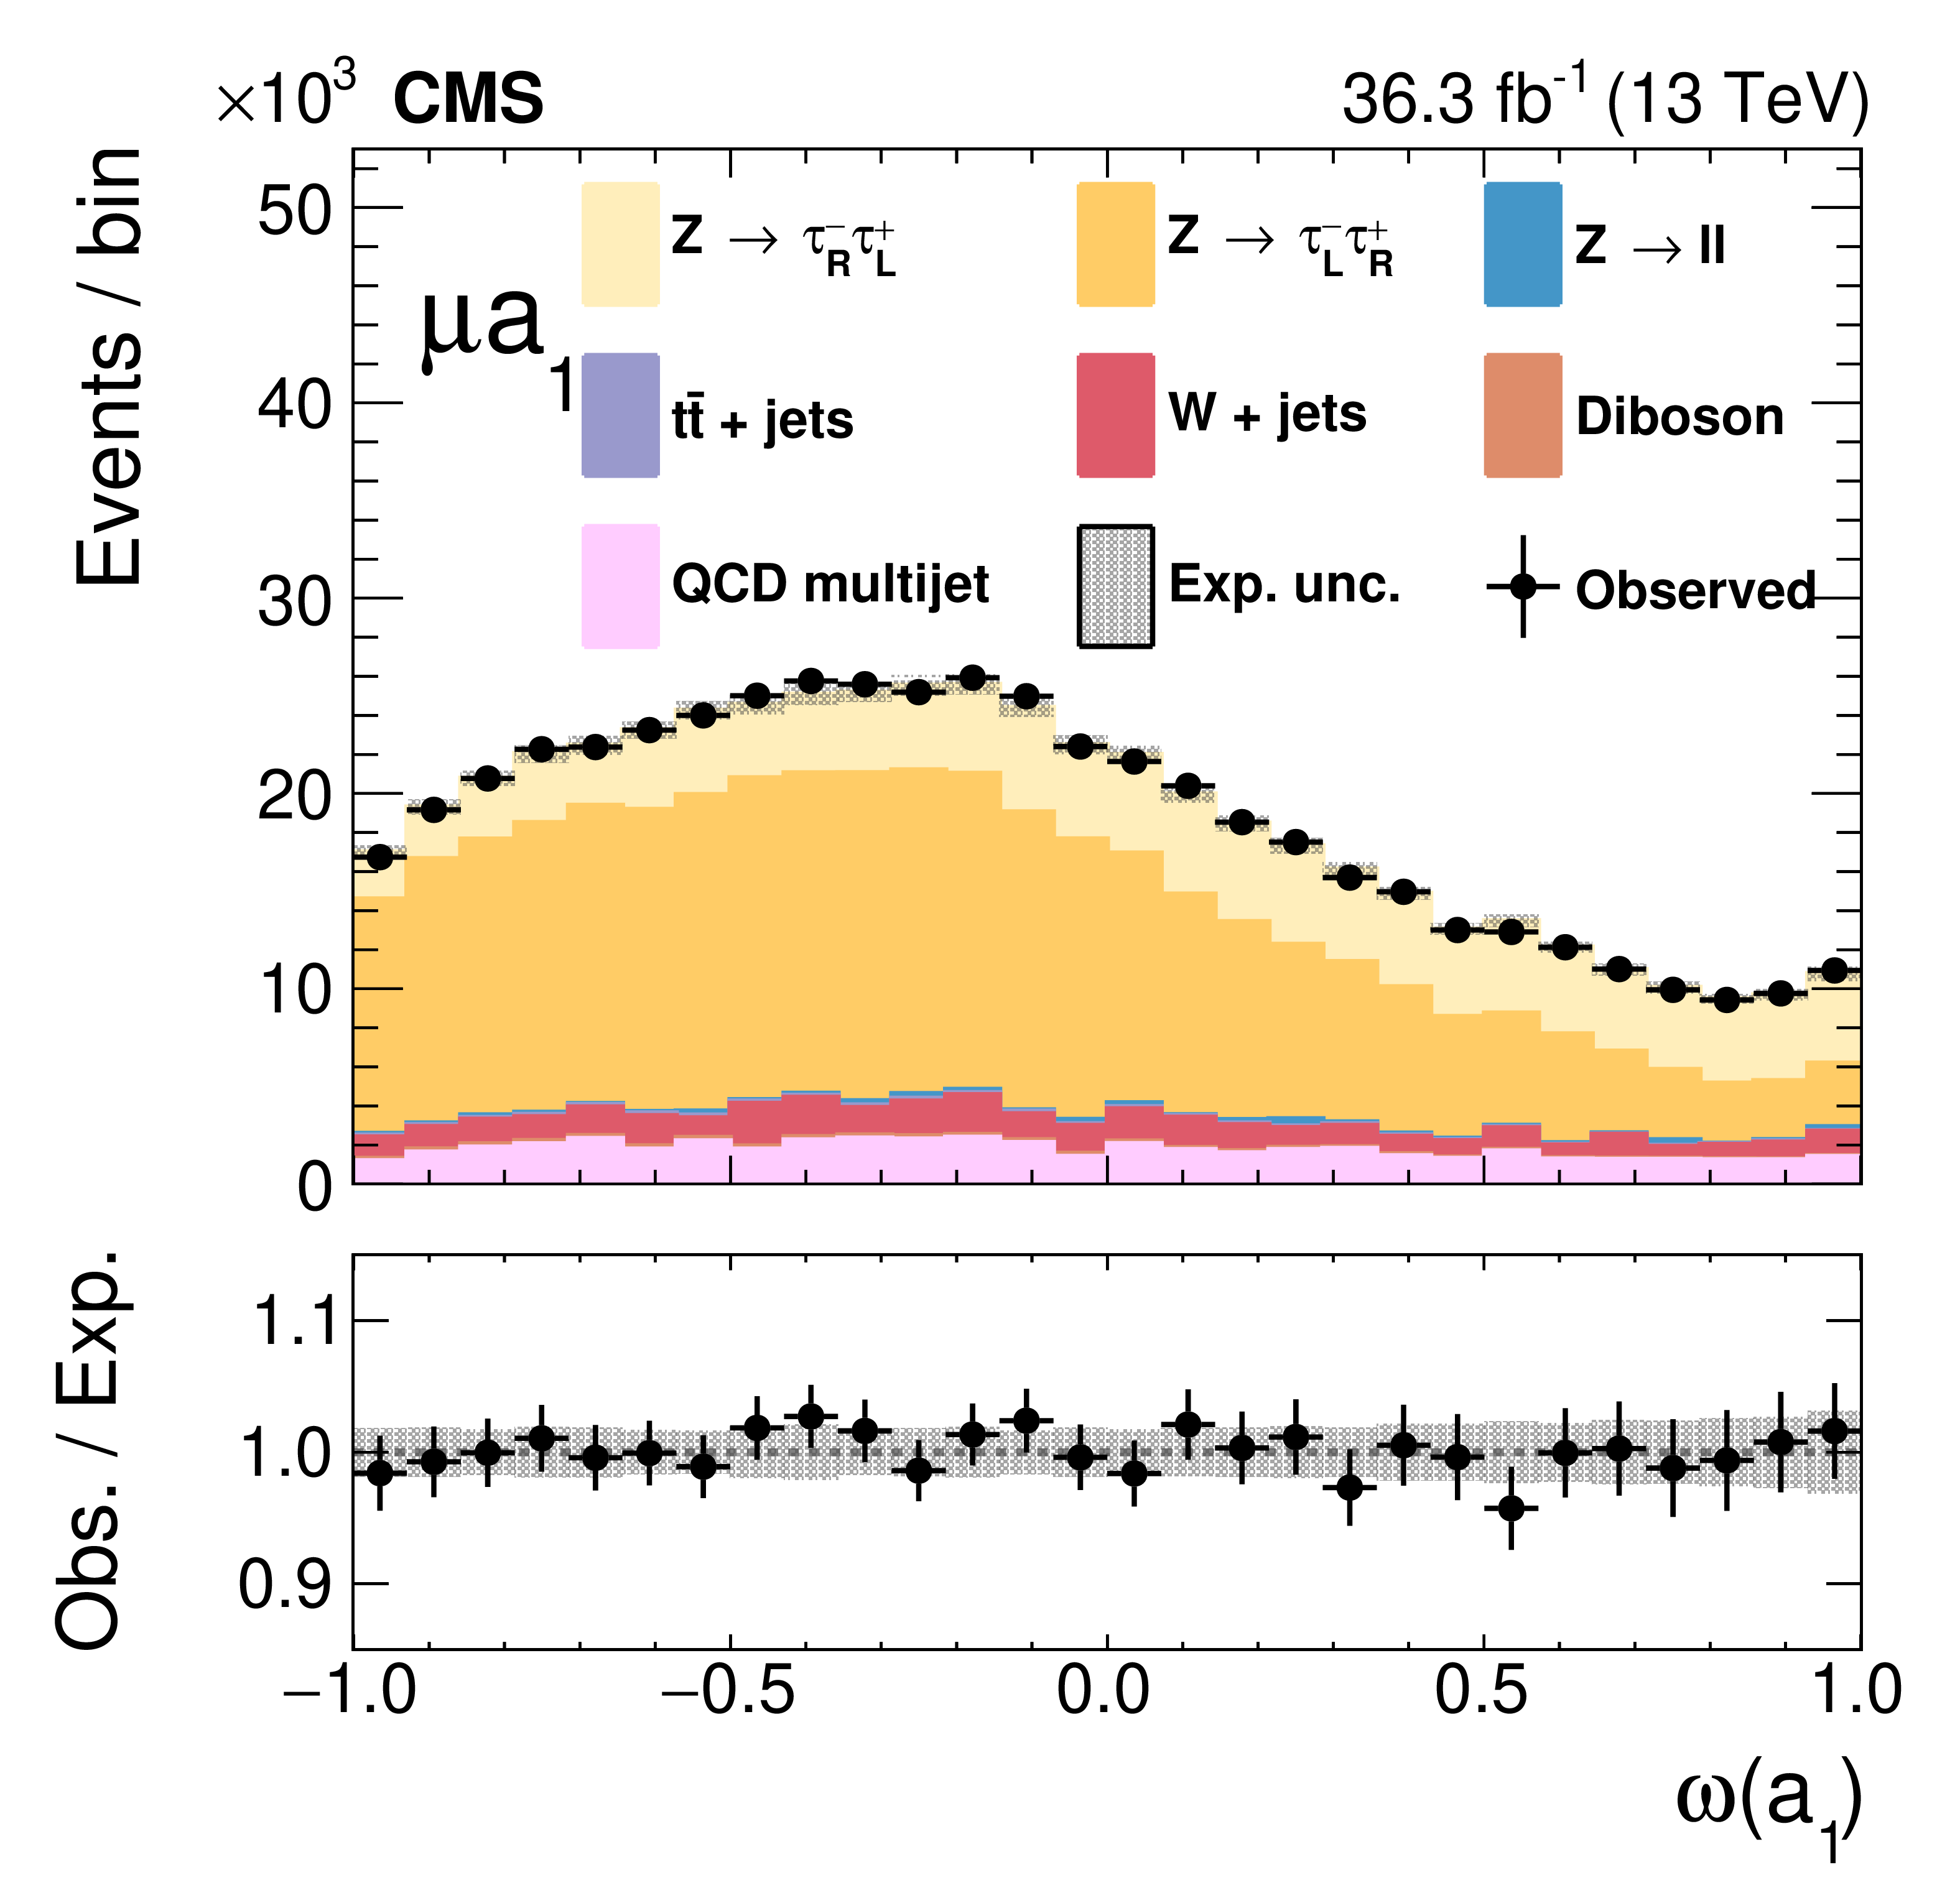
Figure 7-d:
The final maximum likelihood fits of templates to the data for the $\mu \mathrm{a}_1$ category. The figure shows the contributions of all backgrounds and the fitted contributions from $ \tau_{\text{L}}^{-}$ and $ \tau_{\text{R}}^{-}$ helicity states. The bottom panel shows the ratio of the experimental data to the sum of the expected contributions. The vertical error bars on the data points are the statistical uncertainties, the gray rectangles indicate the systematic experimental uncertainty in the total expectation. |

png pdf |
Figure 7-e:
The final maximum likelihood fits of templates to the data for the $\mu \rho$ category. The figure shows the contributions of all backgrounds and the fitted contributions from $ \tau_{\text{L}}^{-}$ and $ \tau_{\text{R}}^{-}$ helicity states. The bottom panel shows the ratio of the experimental data to the sum of the expected contributions. The vertical error bars on the data points are the statistical uncertainties, the gray rectangles indicate the systematic experimental uncertainty in the total expectation. |
png pdf |
Figure 7-f:
The final maximum likelihood fits of templates to the data for the $\mu \pi$ category. The figure shows the contributions of all backgrounds and the fitted contributions from $ \tau_{\text{L}}^{-}$ and $ \tau_{\text{R}}^{-}$ helicity states. The bottom panel shows the ratio of the experimental data to the sum of the expected contributions. The vertical error bars on the data points are the statistical uncertainties, the gray rectangles indicate the systematic experimental uncertainty in the total expectation. |
png pdf |
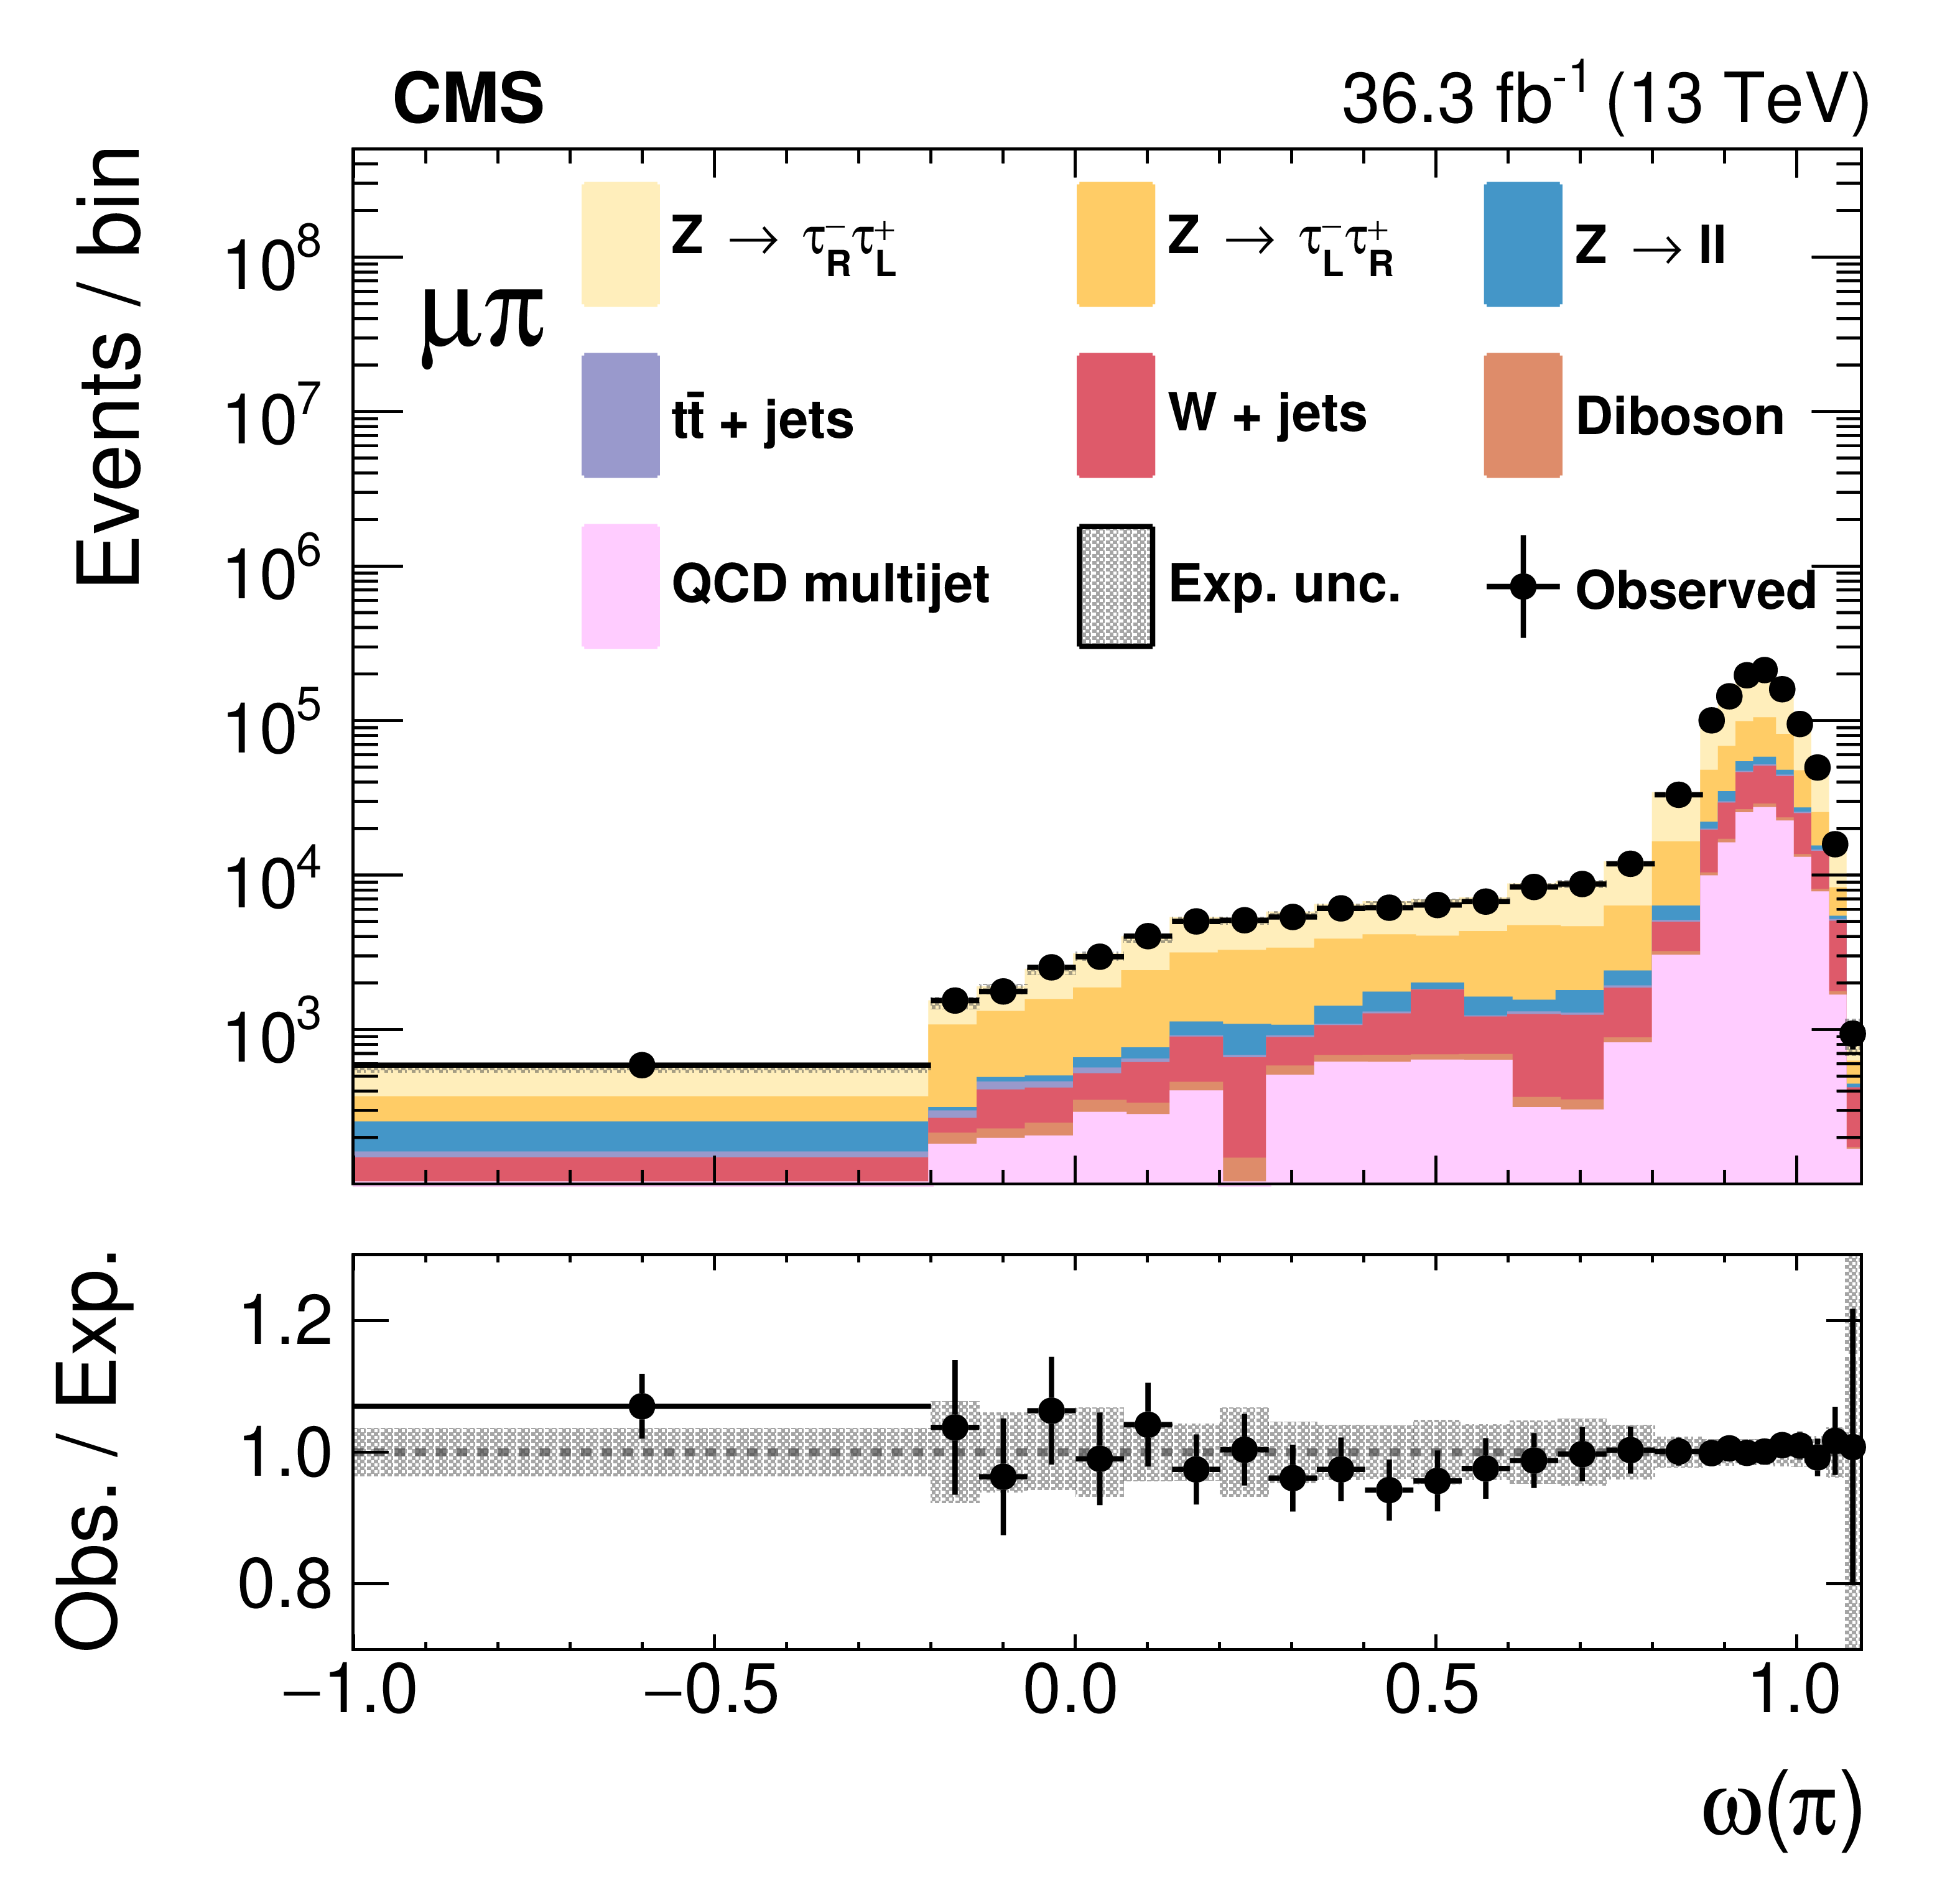
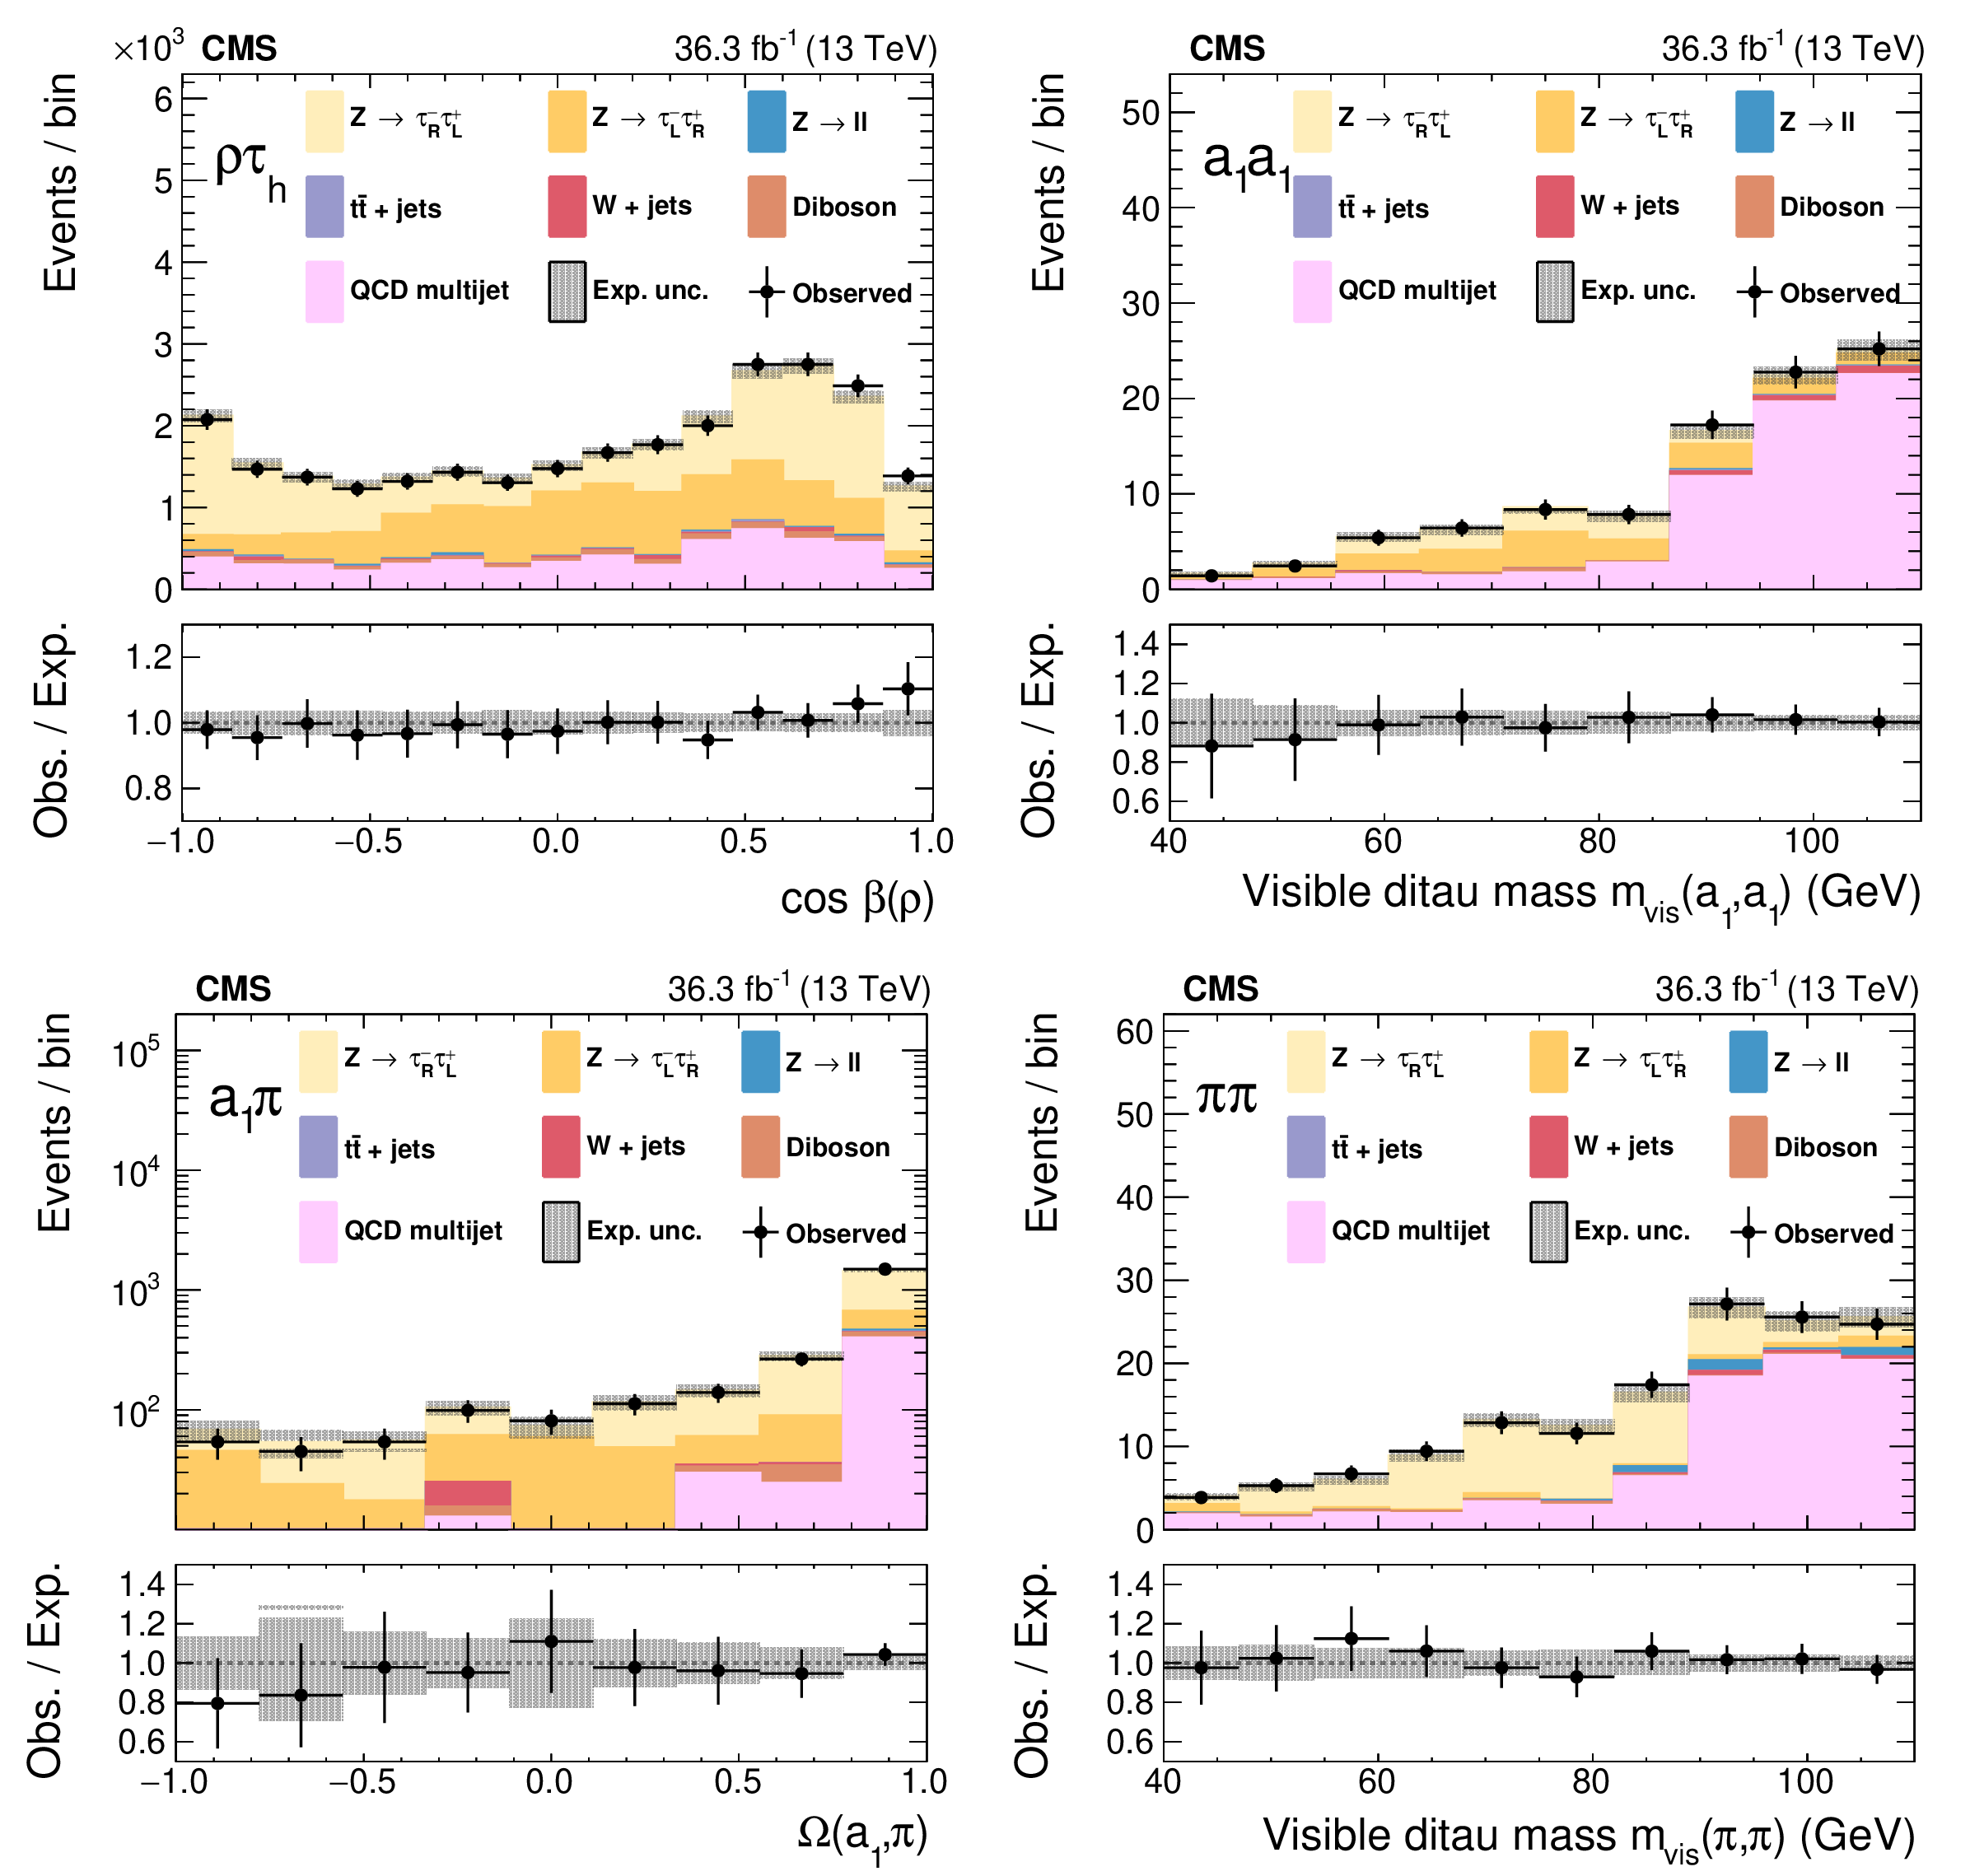
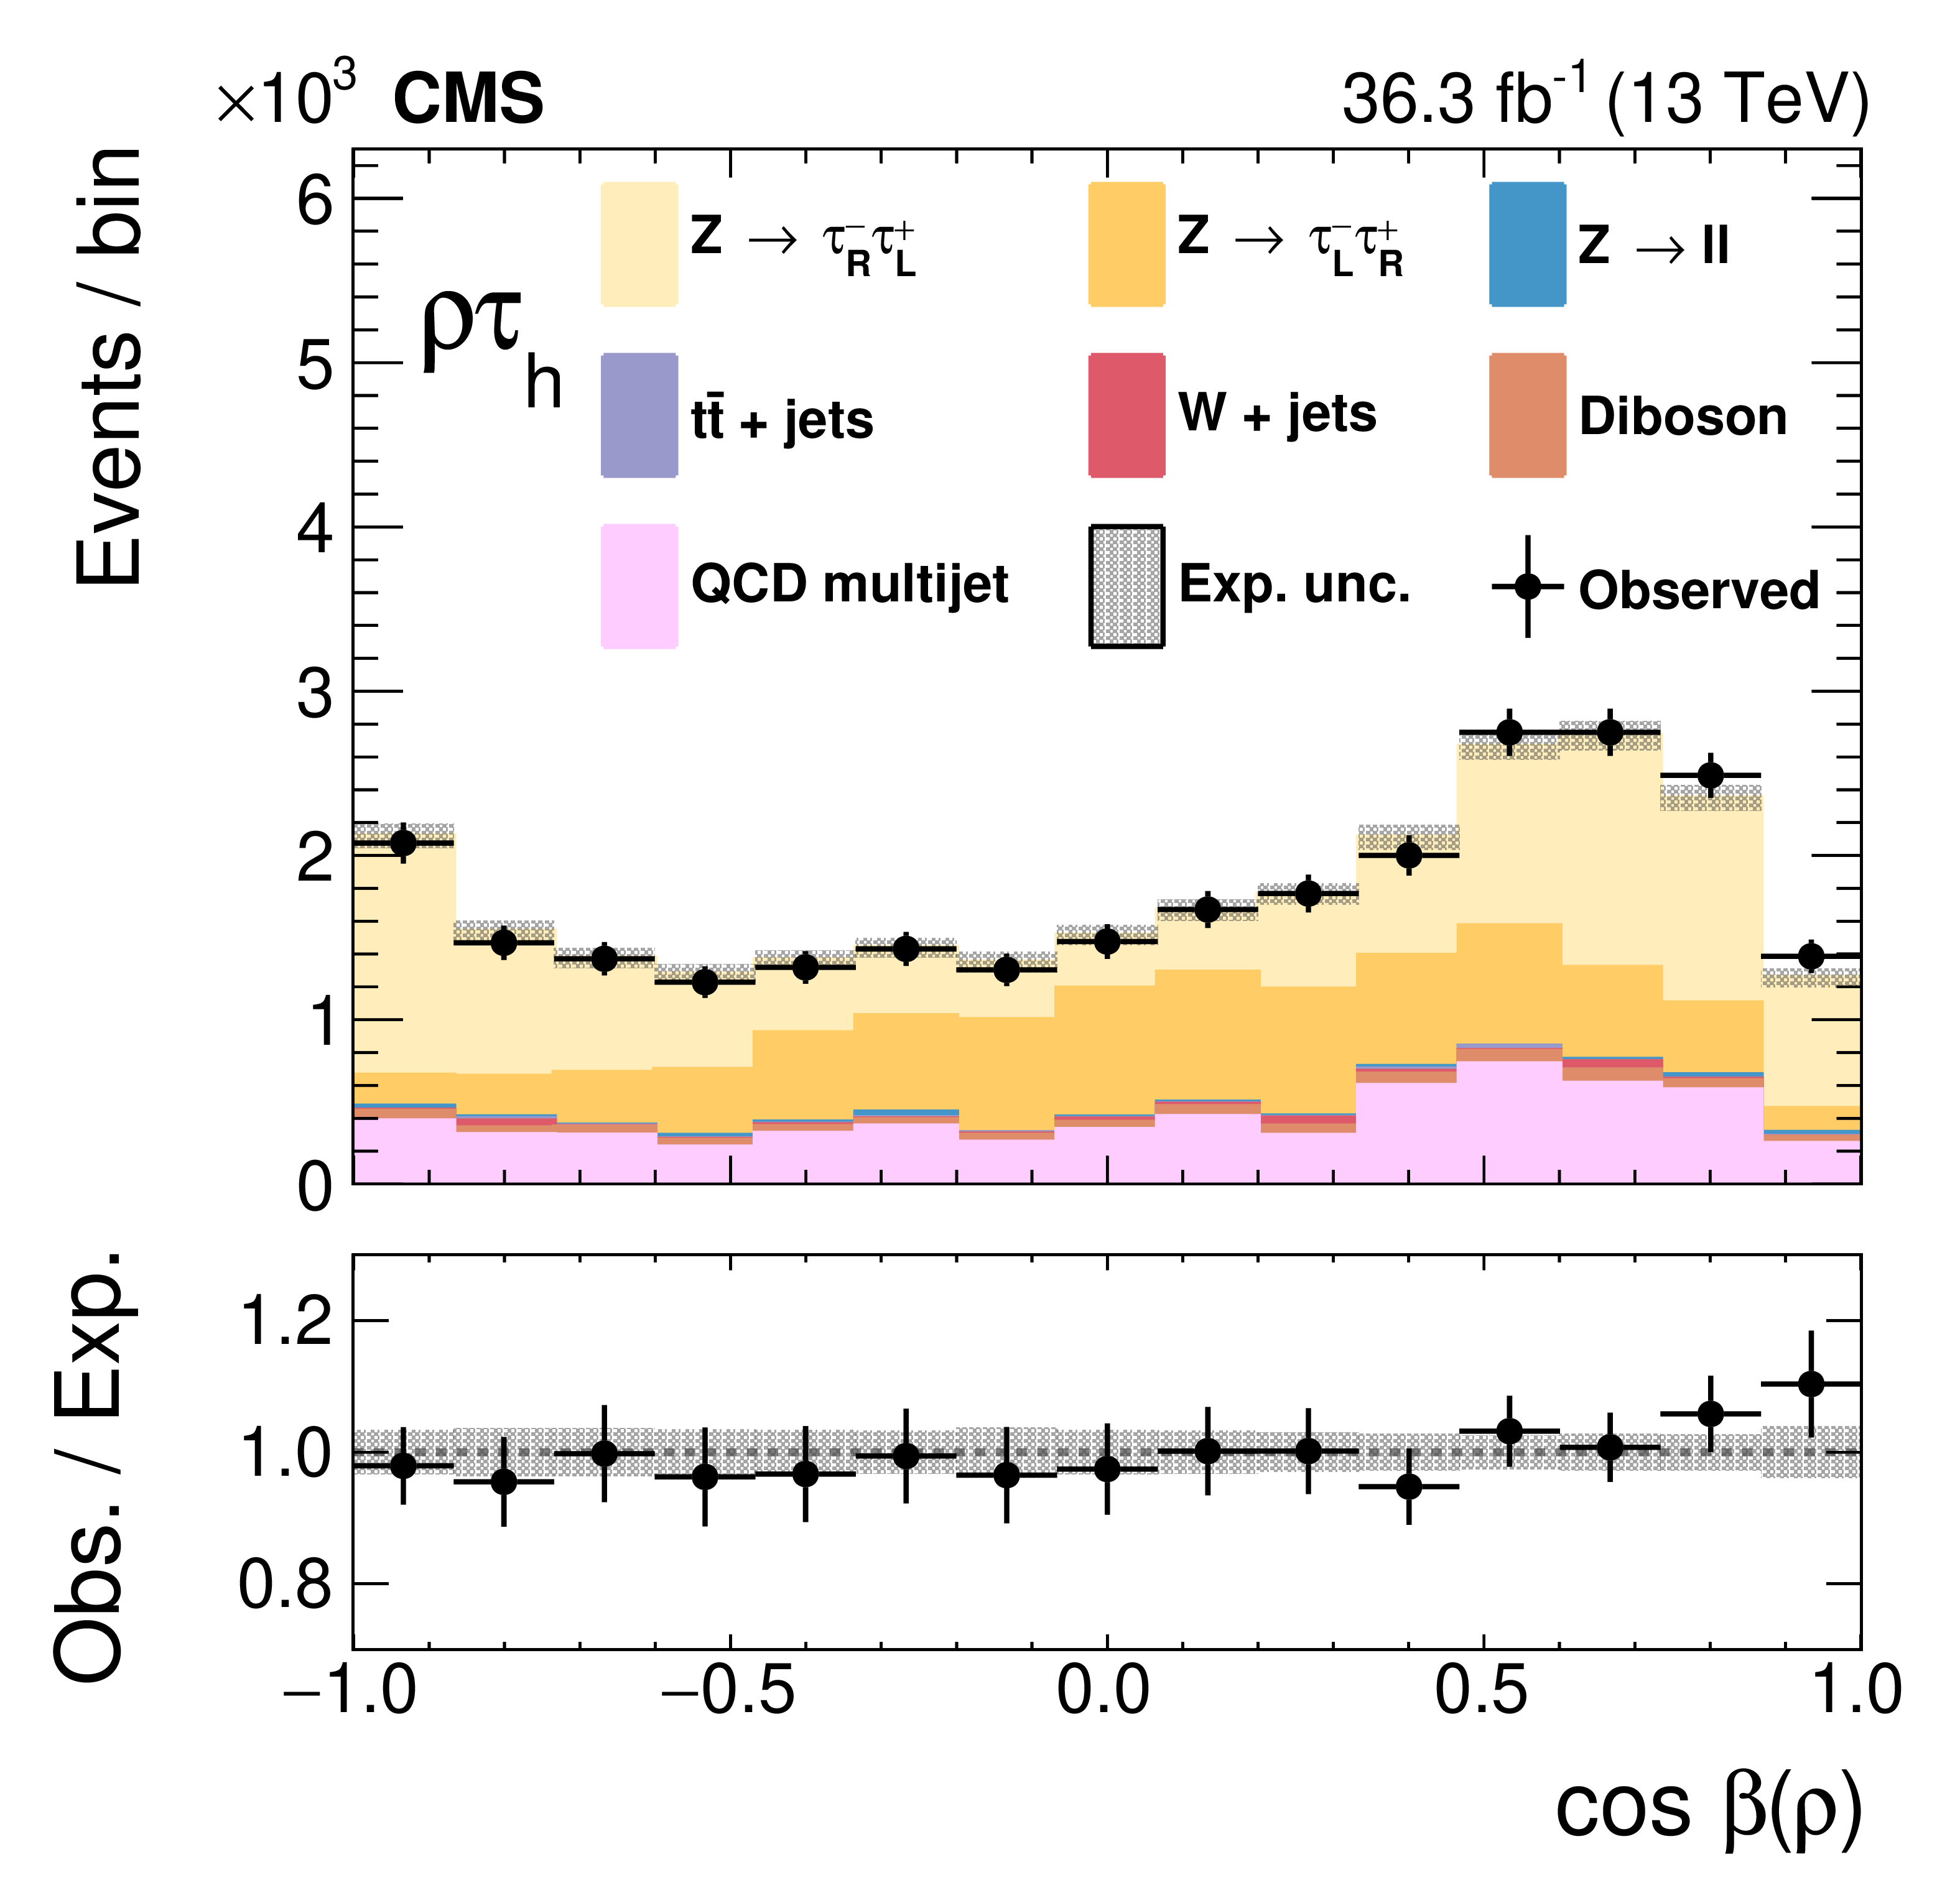
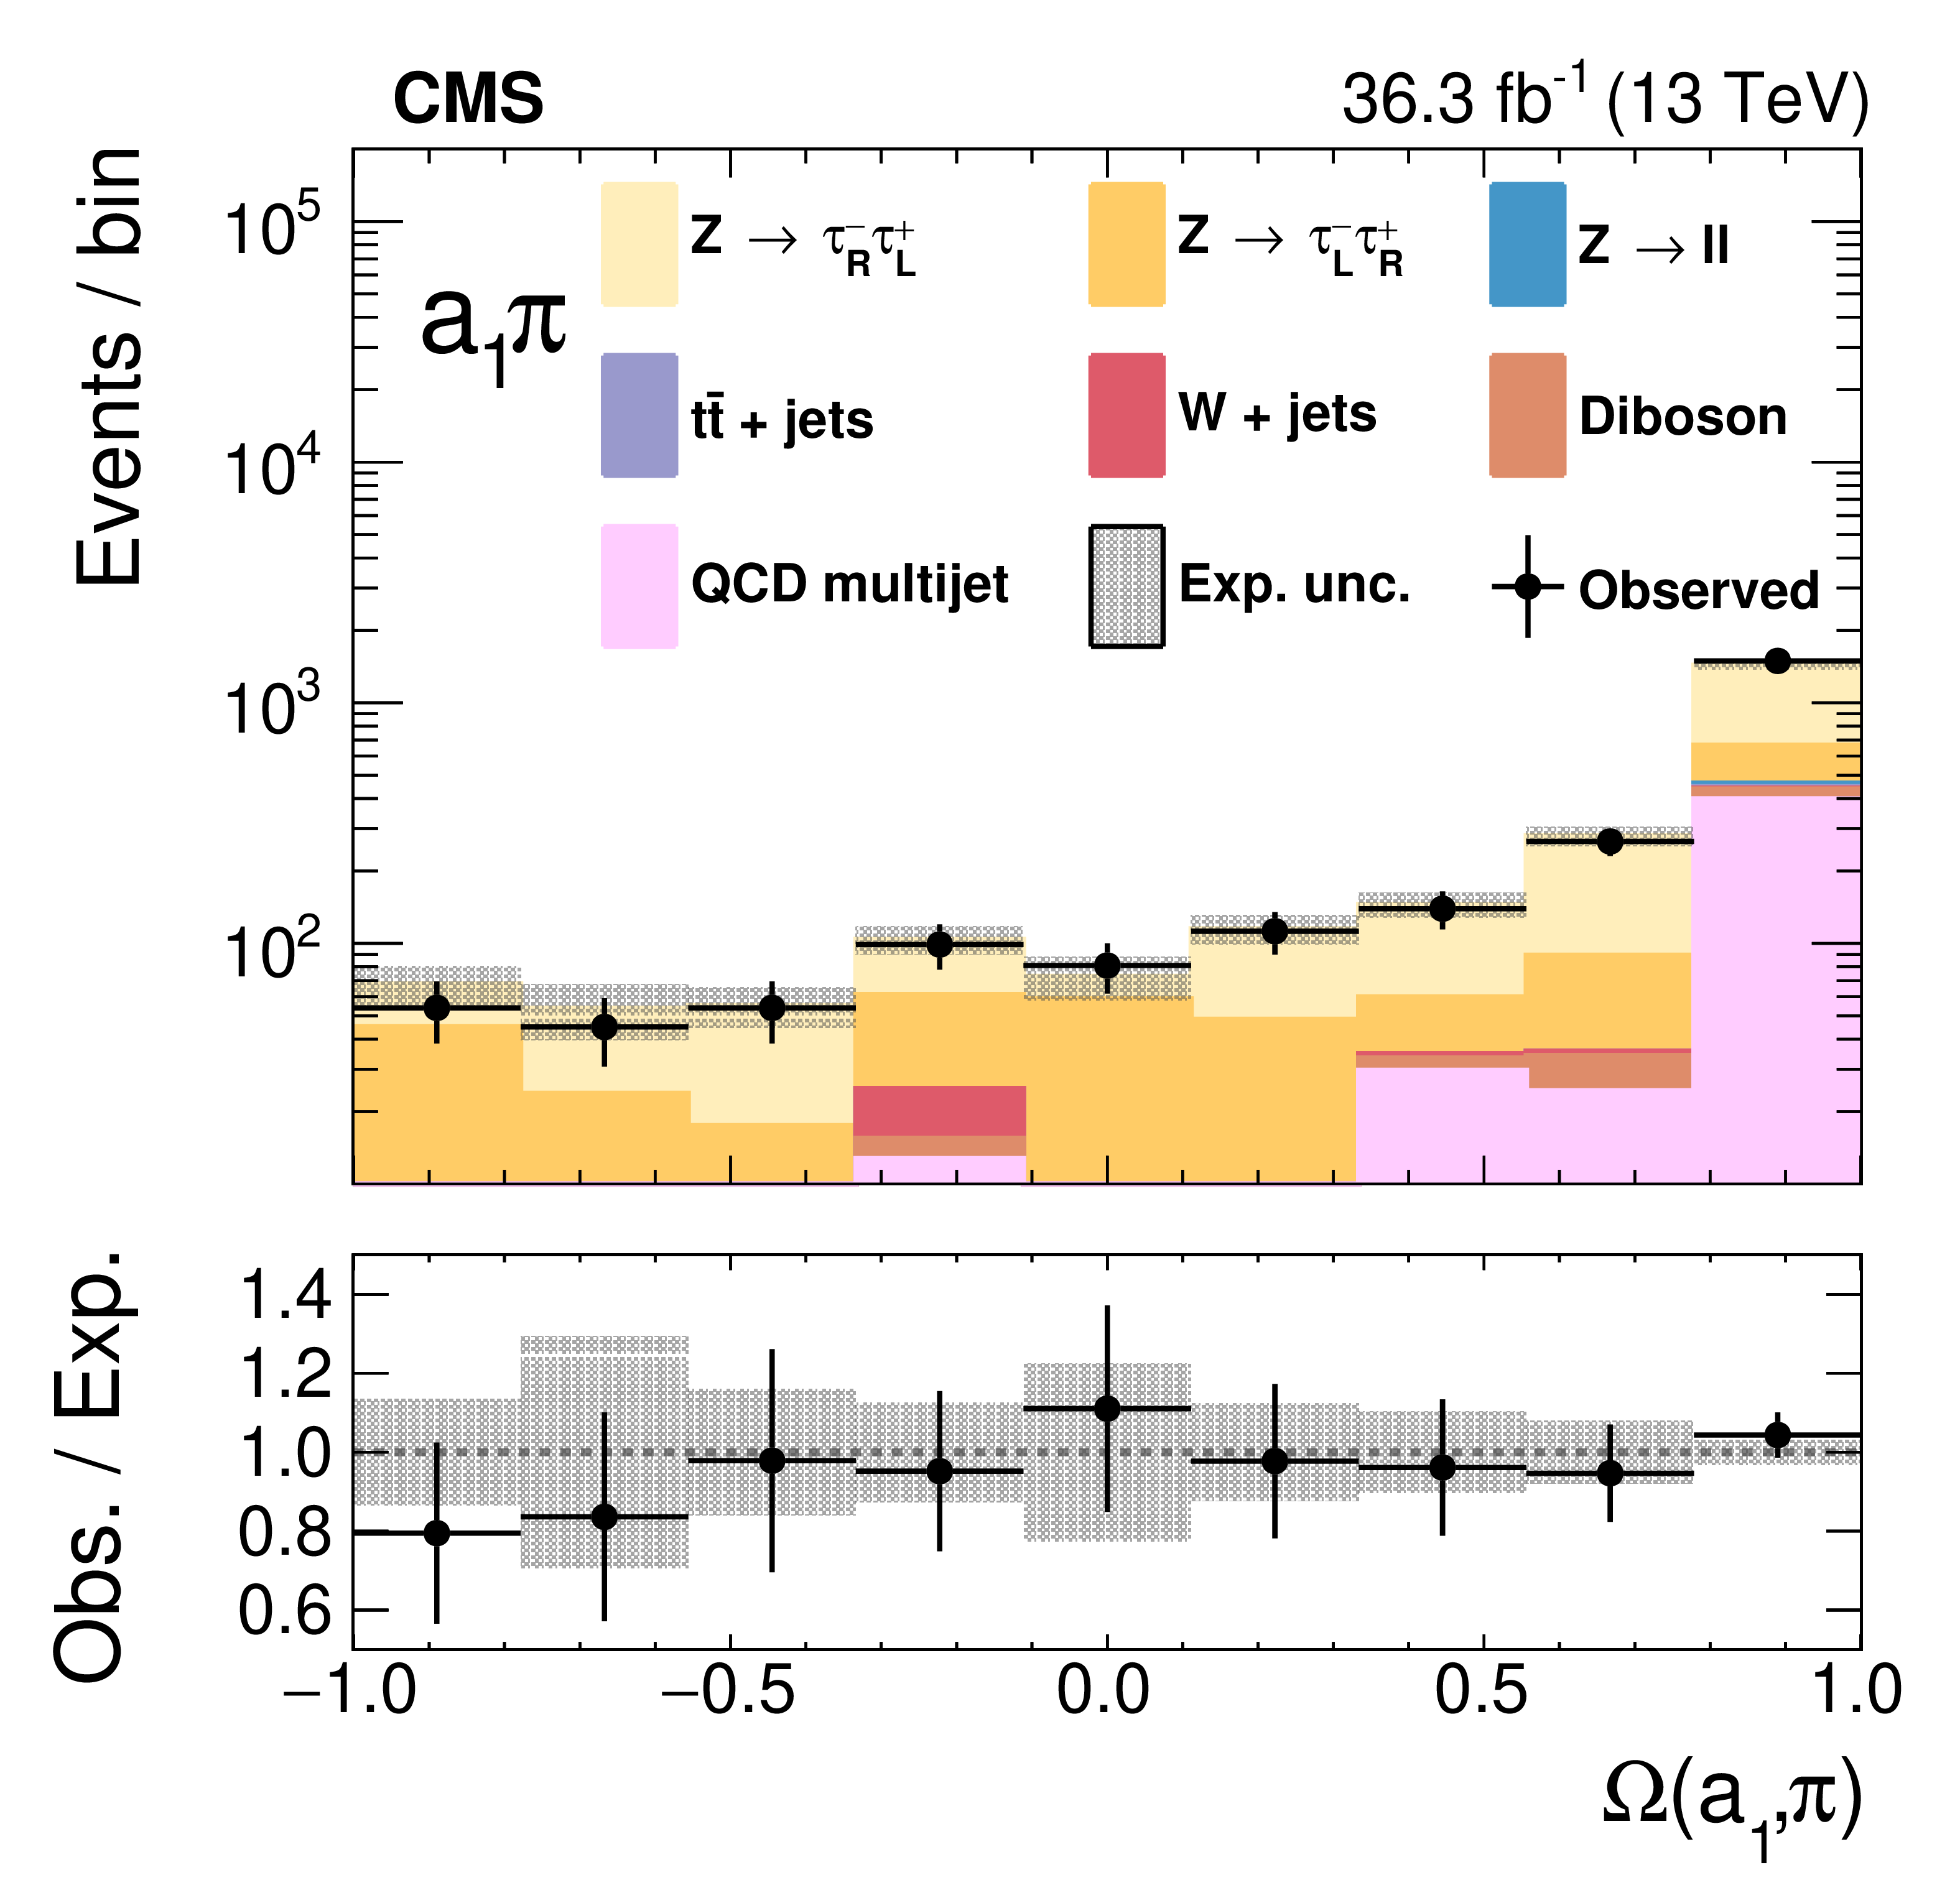
Figure 8:
The final maximum likelihood fits of the templates to the data for the $ \tau_\mathrm{h}\tau_\mathrm{h} $ channels. The figures show the contributions of all backgrounds and the fitted contributions from $ \tau_{\text{L}}^{-}$ and $ \tau_{\text{R}}^{-}$ helicity states. The bottom panels show the ratio of the experimental data to the sum of the expected contributions. The vertical error bars on the data points are the statistical uncertainties, the gray rectangles indicate the systematic experimental uncertainty in the total expectation. |
png pdf |
Figure 8-a:
The final maximum likelihood fit of the template to the data for the $ \rho \tau_\mathrm{h} $ channel. The figure shows the contributions of all backgrounds and the fitted contributions from $ \tau_{\text{L}}^{-}$ and $ \tau_{\text{R}}^{-}$ helicity states. The bottom panel shows the ratio of the experimental data to the sum of the expected contributions. The vertical error bars on the data points are the statistical uncertainties, the gray rectangles indicate the systematic experimental uncertainty in the total expectation. |

png pdf |
Figure 8-b:
The final maximum likelihood fit of the template to the data for the $ \mathrm{a}_1 \mathrm{a}_1 $ channel. The figure shows the contributions of all backgrounds and the fitted contributions from $ \tau_{\text{L}}^{-}$ and $ \tau_{\text{R}}^{-}$ helicity states. The bottom panel shows the ratio of the experimental data to the sum of the expected contributions. The vertical error bars on the data points are the statistical uncertainties, the gray rectangles indicate the systematic experimental uncertainty in the total expectation. |
png pdf |
Figure 8-c:
The final maximum likelihood fit of the template to the data for the $ \mathrm{a}_1 \pi $ channel. The figure shows the contributions of all backgrounds and the fitted contributions from $ \tau_{\text{L}}^{-}$ and $ \tau_{\text{R}}^{-}$ helicity states. The bottom panel shows the ratio of the experimental data to the sum of the expected contributions. The vertical error bars on the data points are the statistical uncertainties, the gray rectangles indicate the systematic experimental uncertainty in the total expectation. |
png pdf |
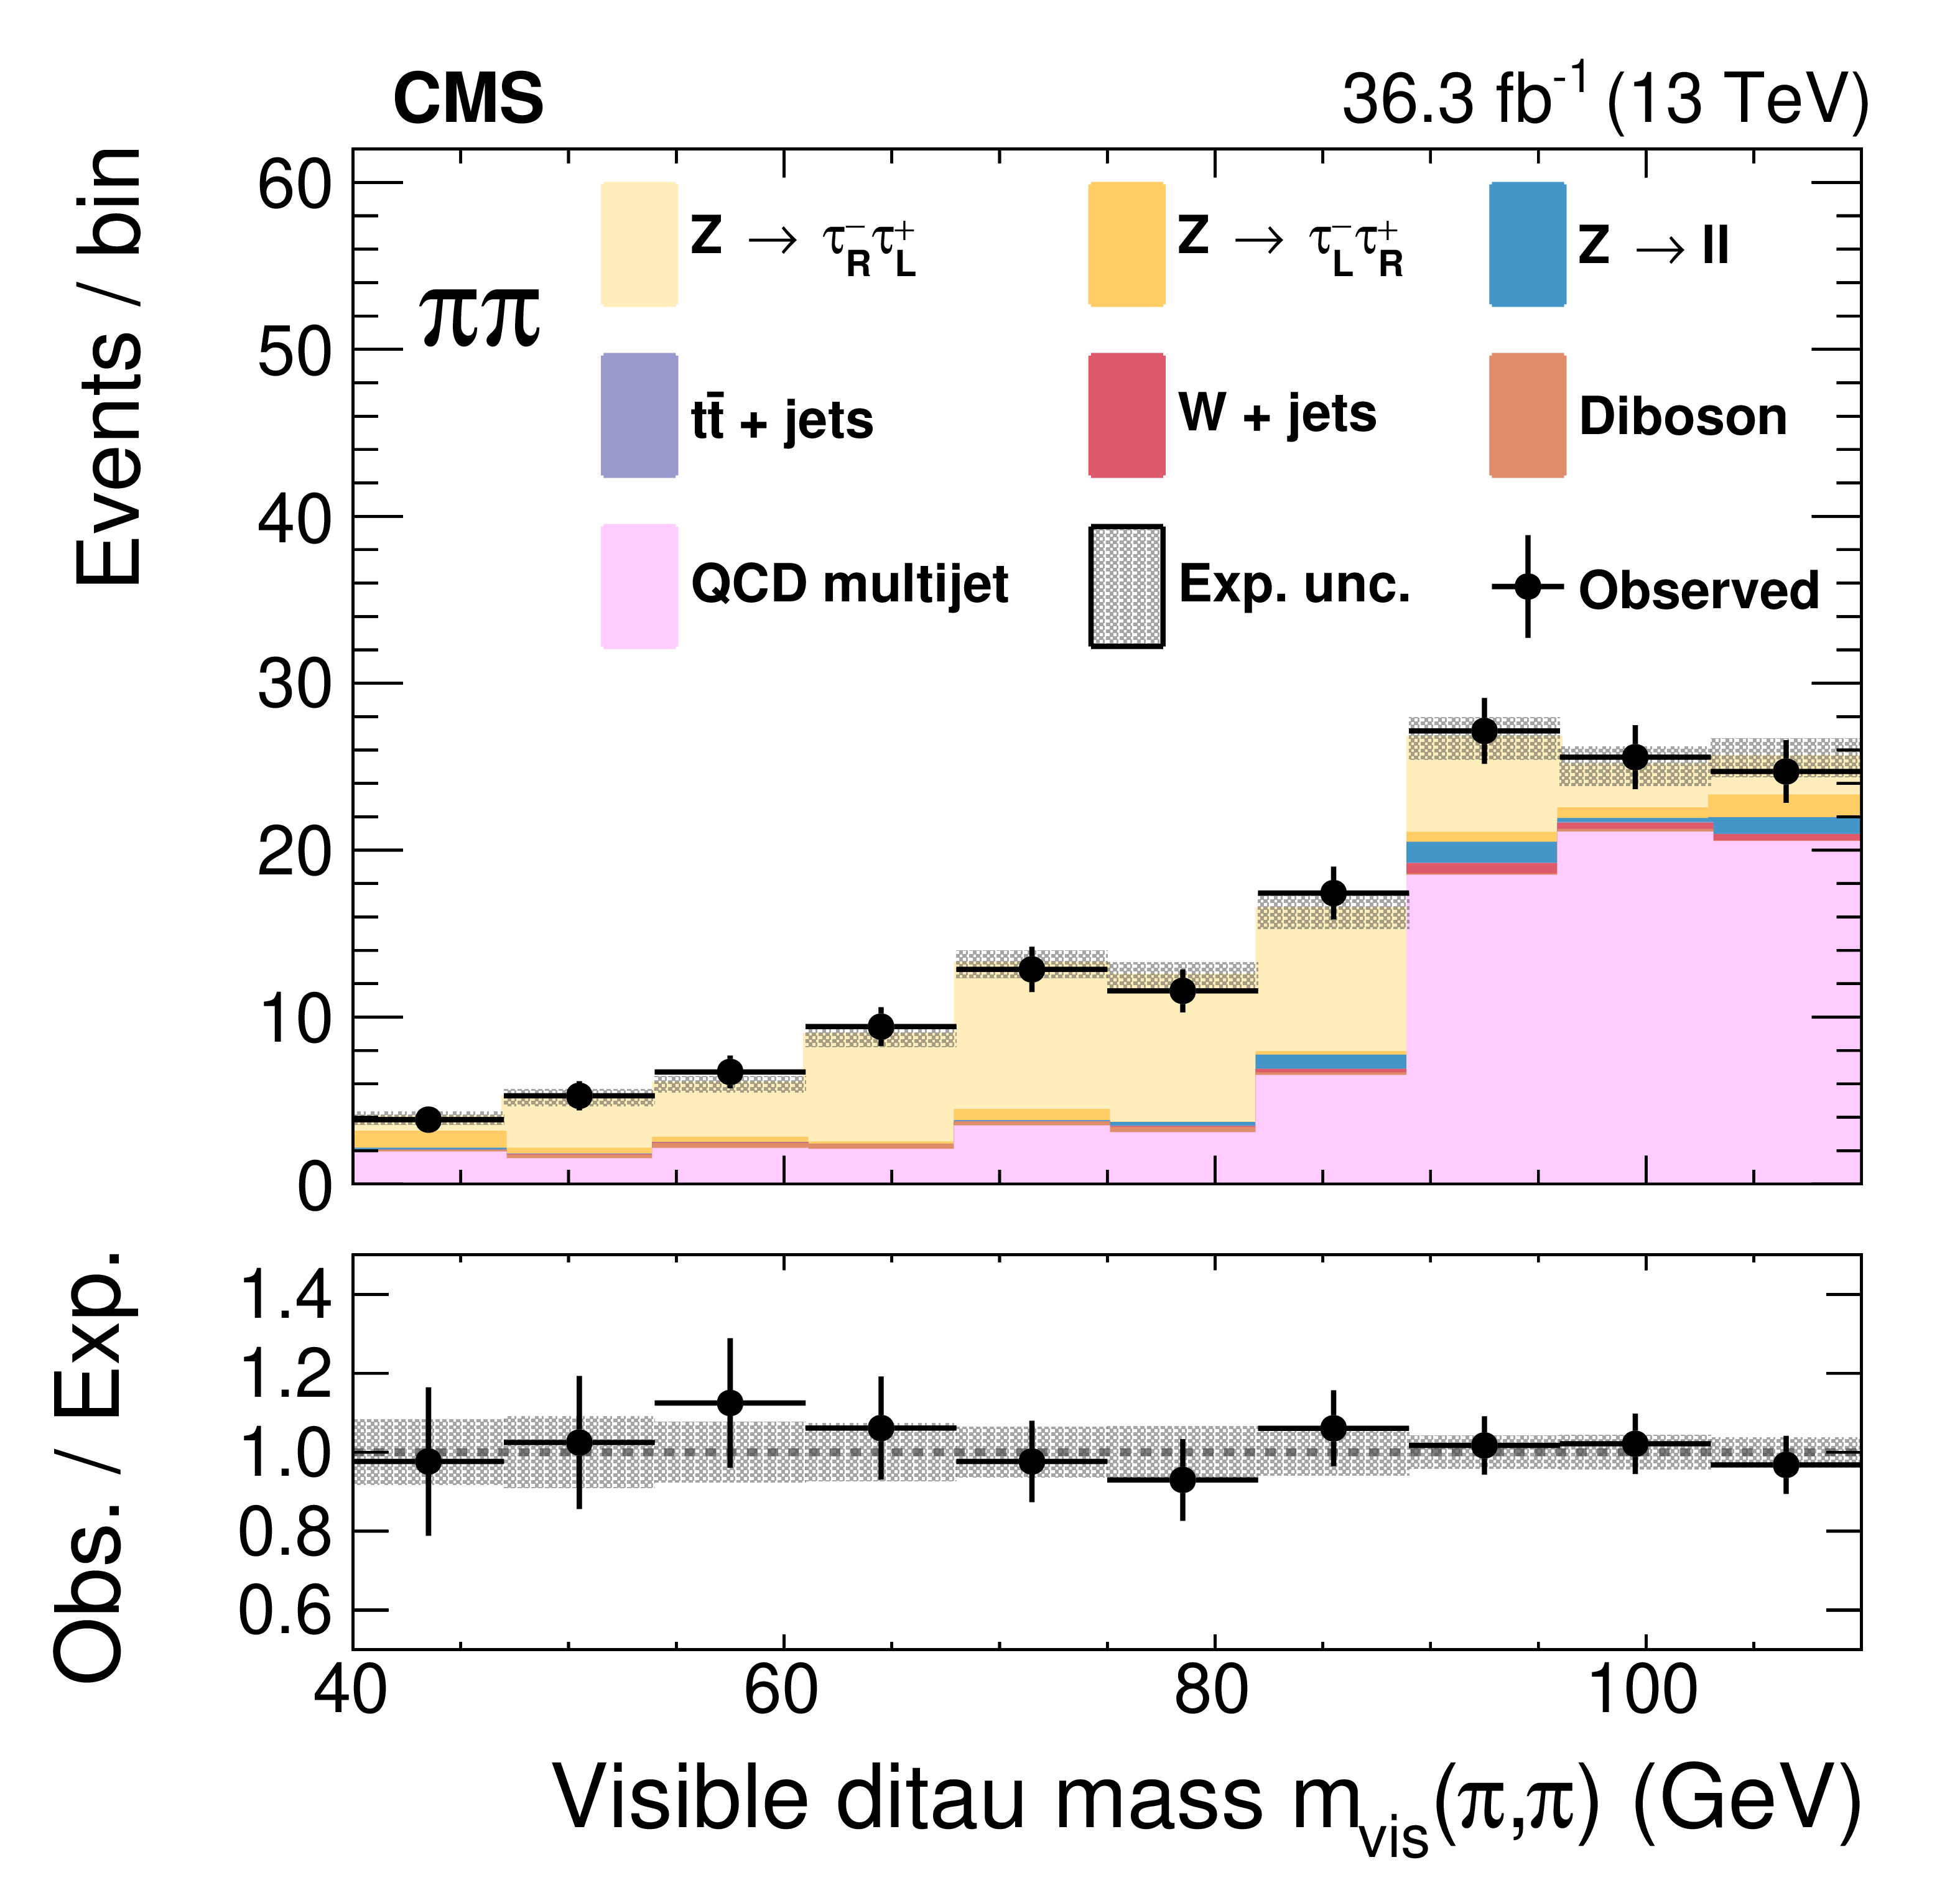
Figure 8-d:
The final maximum likelihood fit of the template to the data for the $\pi \pi$ channel. The figure shows the contributions of all backgrounds and the fitted contributions from $ \tau_{\text{L}}^{-}$ and $ \tau_{\text{R}}^{-}$ helicity states. The bottom panel shows the ratio of the experimental data to the sum of the expected contributions. The vertical error bars on the data points are the statistical uncertainties, the gray rectangles indicate the systematic experimental uncertainty in the total expectation. |

png pdf |
Figure 9:
Results of the maximum likelihood fits for the average $ \tau^{-} $ lepton polarization for the 11 event categories and the combined fit as the lowest point in the figure on the left. On the right the results for the categories are grouped into 4 channels separately and are shown together with the combined fit. The inner error bars represent the statistical uncertainty, and the outer bars include the systematic uncertainty. |

png pdf |
Figure 9-a:
Results of the maximum likelihood fits for the average $ \tau^{-} $ lepton polarization for the 11 event categories and the combined fit as the lowest point. The inner error bars represent the statistical uncertainty, and the outer bars include the systematic uncertainty. |

png pdf |
Figure 9-b:
Results for the categories, grouped into 4 channels separately, and shown together with the combined fit. The inner error bars represent the statistical uncertainty, and the outer bars include the systematic uncertainty. |

png pdf |
Figure 10:
A comparison of the $ \tau^{-} $ lepton asymmetry, $ A_{\tau} $ measured from the $ \tau^{-} $ lepton polarization in this paper and other measurements. The value of $ A_{\tau} $ for CMS is obtained based on the Z boson polarization Eq. (30) and using Eq. (4). The green band indicates the $ \tau^{-} $ lepton polarization value obtained by combining the SLD measurement [6] with the measurements performed at LEP (ALEPH [2], DELPHI [3], L3 [4], and OPAL [5]). The measurement performed by the ATLAS Collaboration at a lower center-of-mass energy of 8 TeV is documented in Ref. [7]. The CMS measurement refers to the result of the analysis presented in this paper. The inner horizontal bars represent the statistical uncertainly, the outer bars include the systematic uncertainty. |
| Tables | |
png pdf |
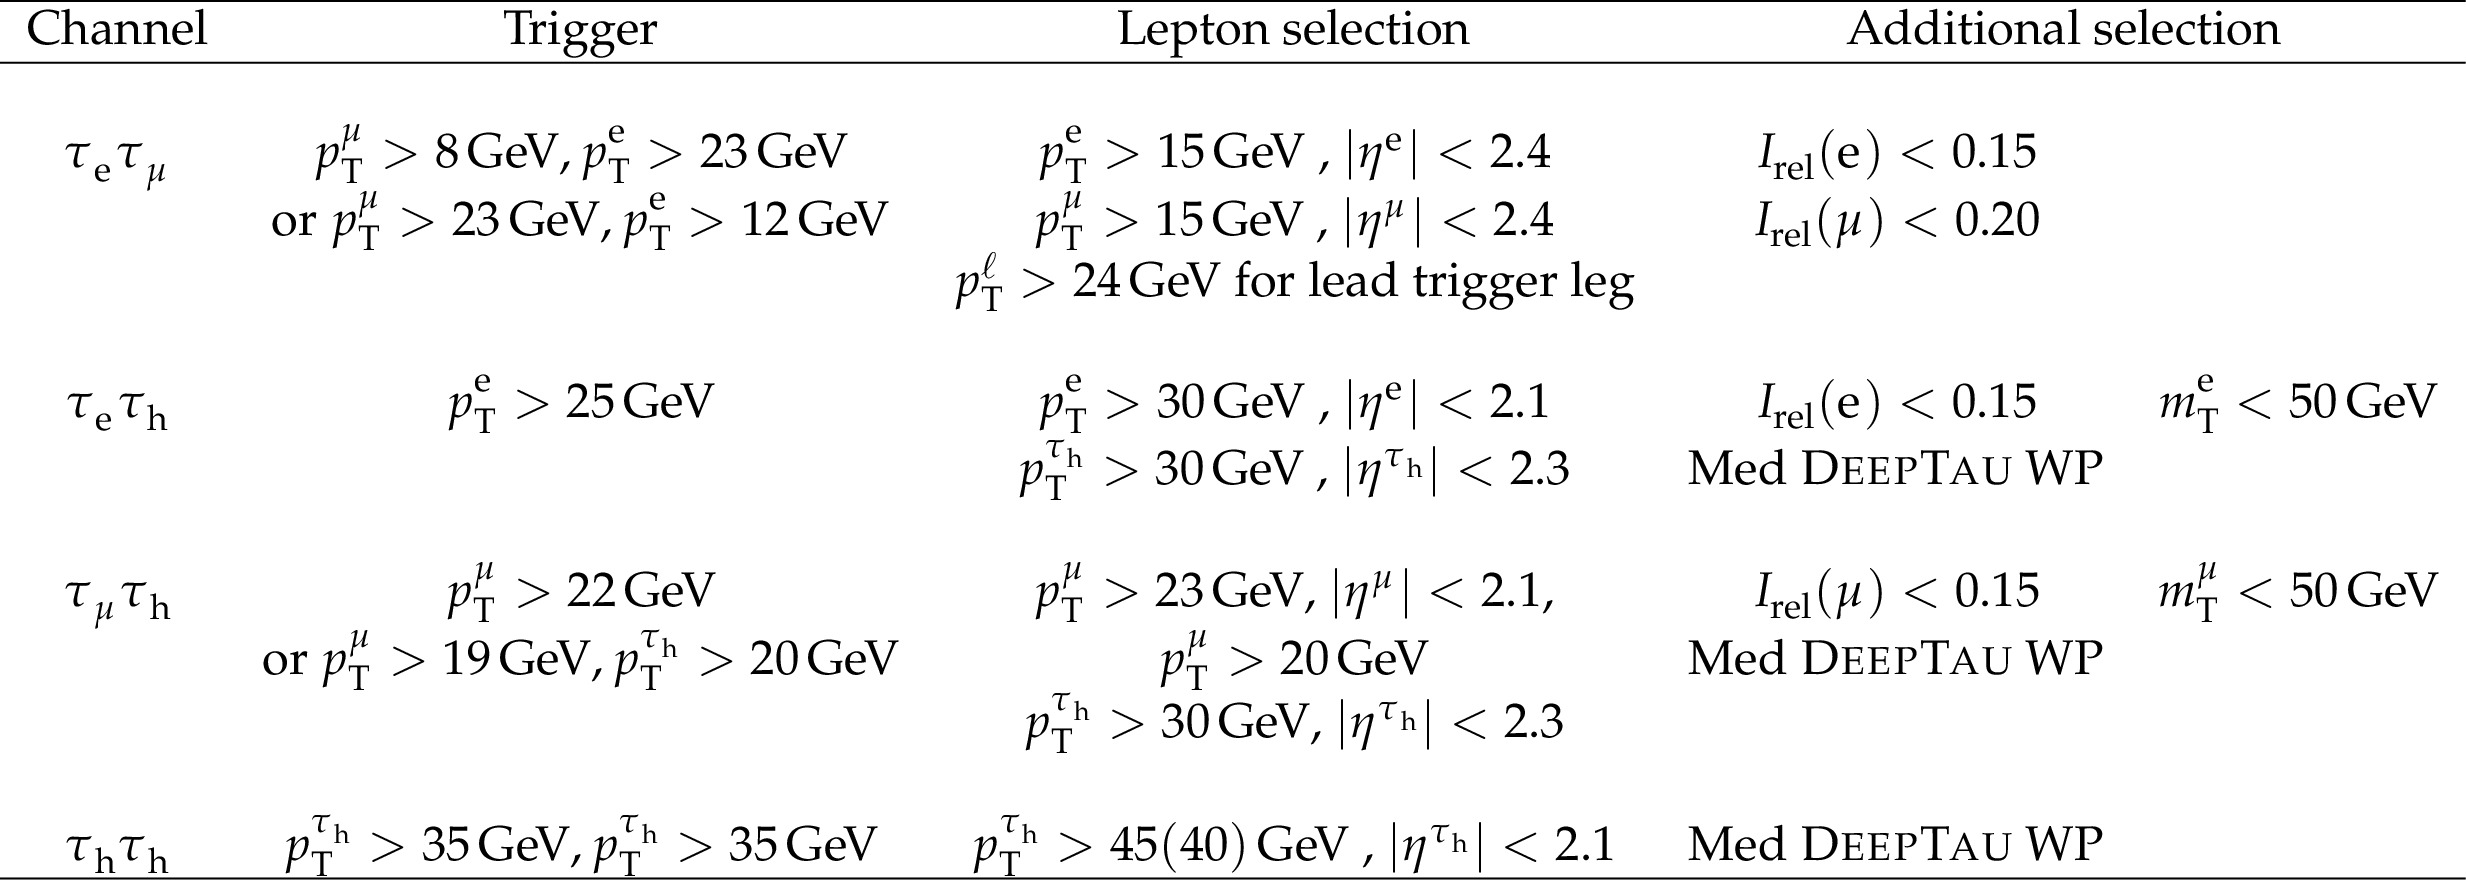
Table 1:
Selections applied in this analysis. For the $ \tau_\mu\tau_\mathrm{h} $ channel two triggers were used with different muon thresholds, the $ p_{\mathrm{T}} $ selection threshold for $ \tau_\mathrm{h} $ refers to both. For the $ \tau_\mathrm{h}\tau_\mathrm{h} $ channel, the $ p_{\mathrm{T}} $ selection threshold for the nonleading $ \tau_\mathrm{h} $ was lower by 5 GeV. The label Med DeepTau WP in the last column refers to the medium working point of the DeepTau discriminator against fake $ \tau_\mathrm{h} $. |
png pdf |
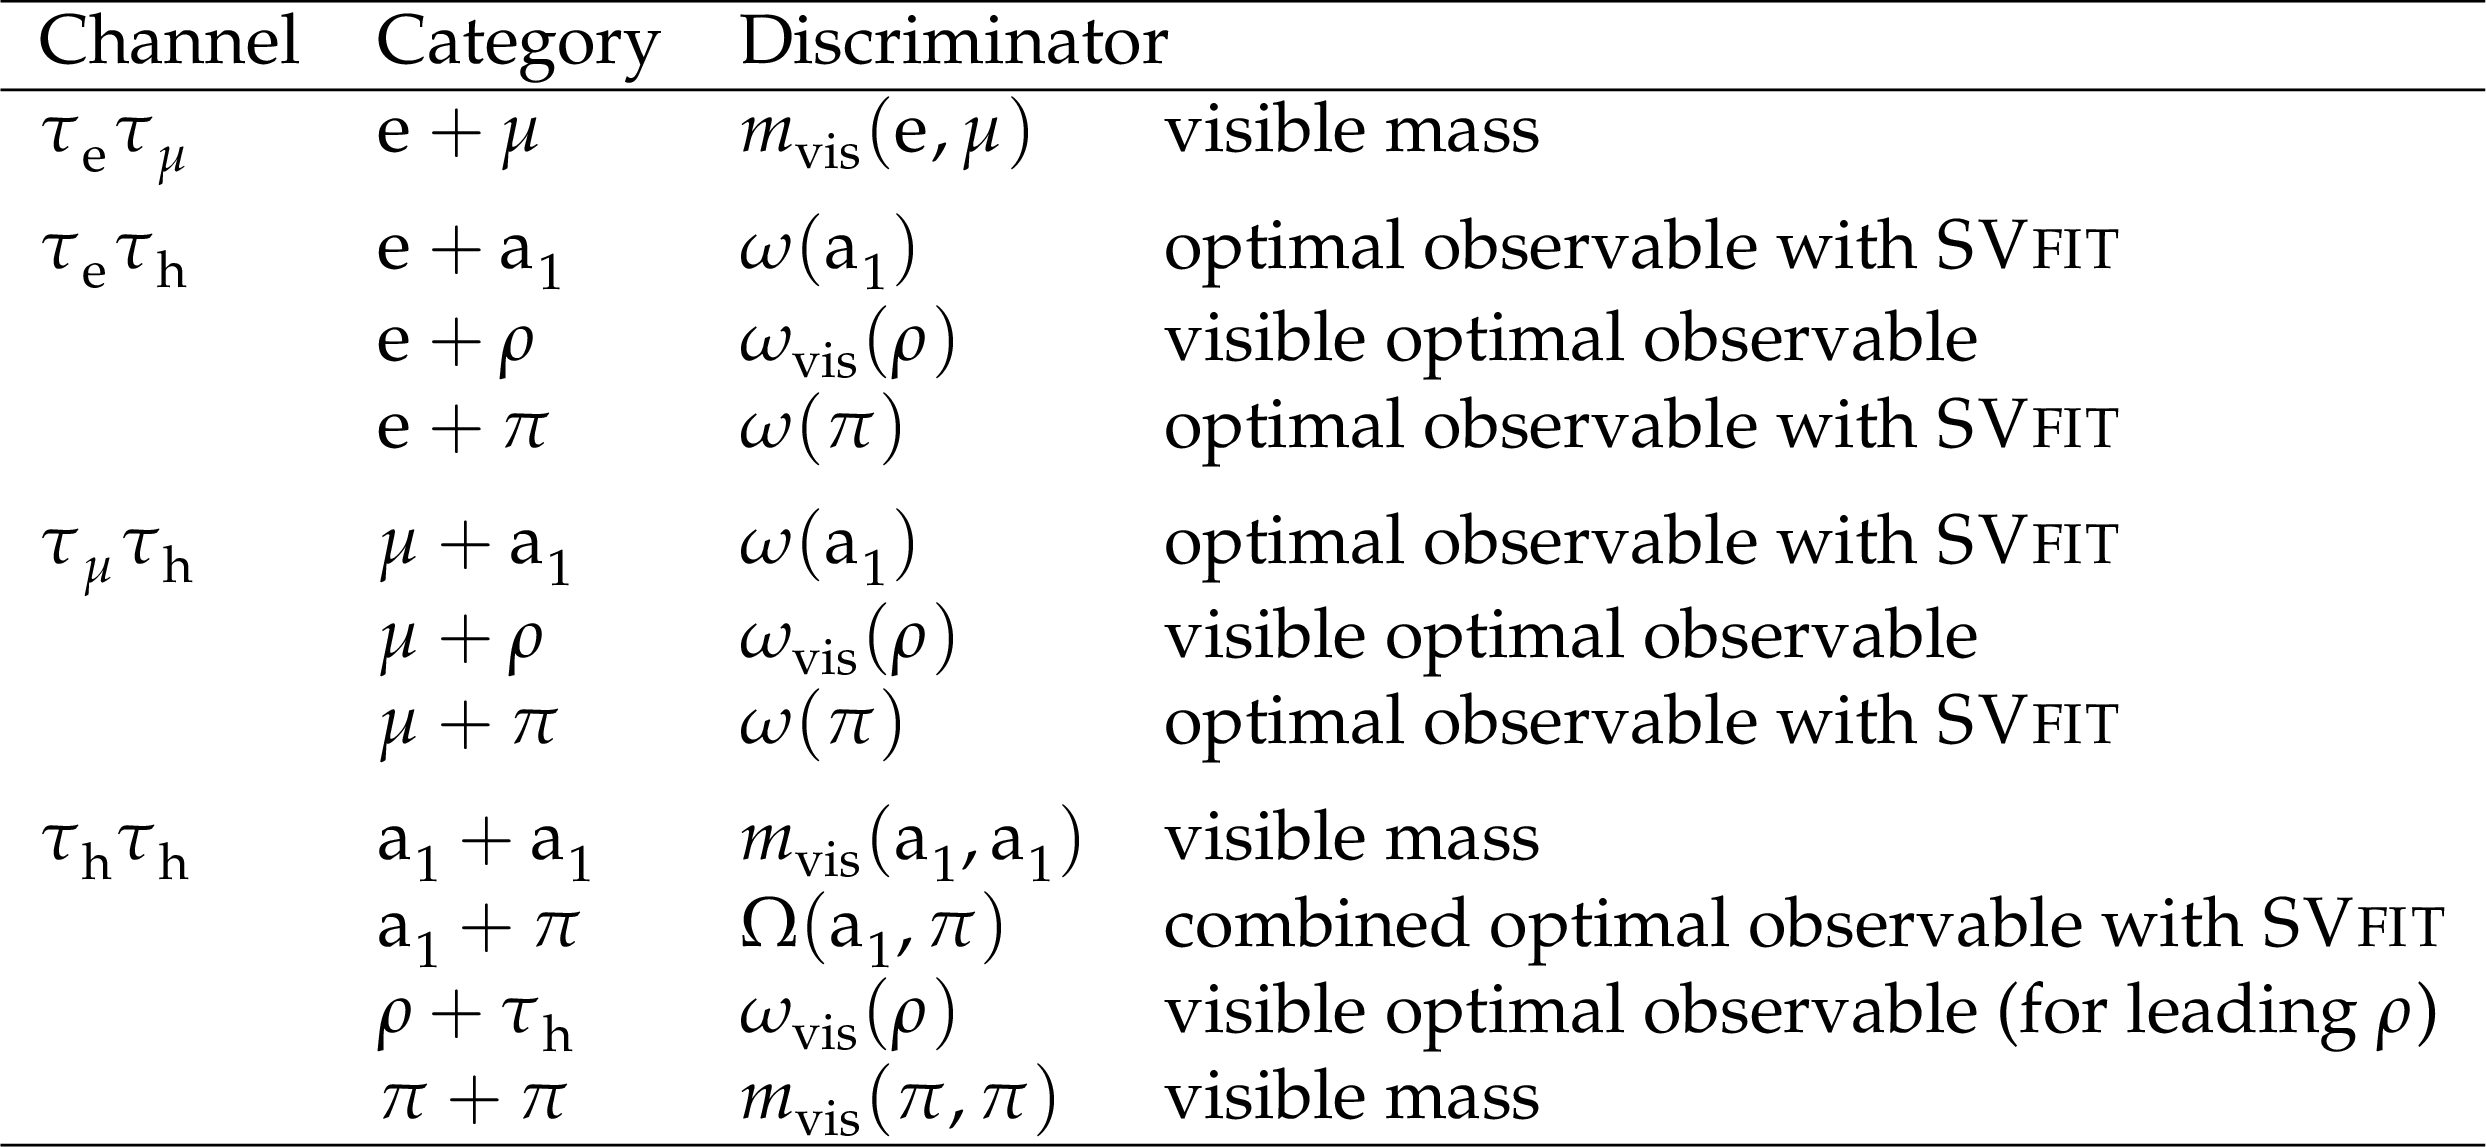
Table 2:
Final choice of discriminators in the various event categories |

png pdf |
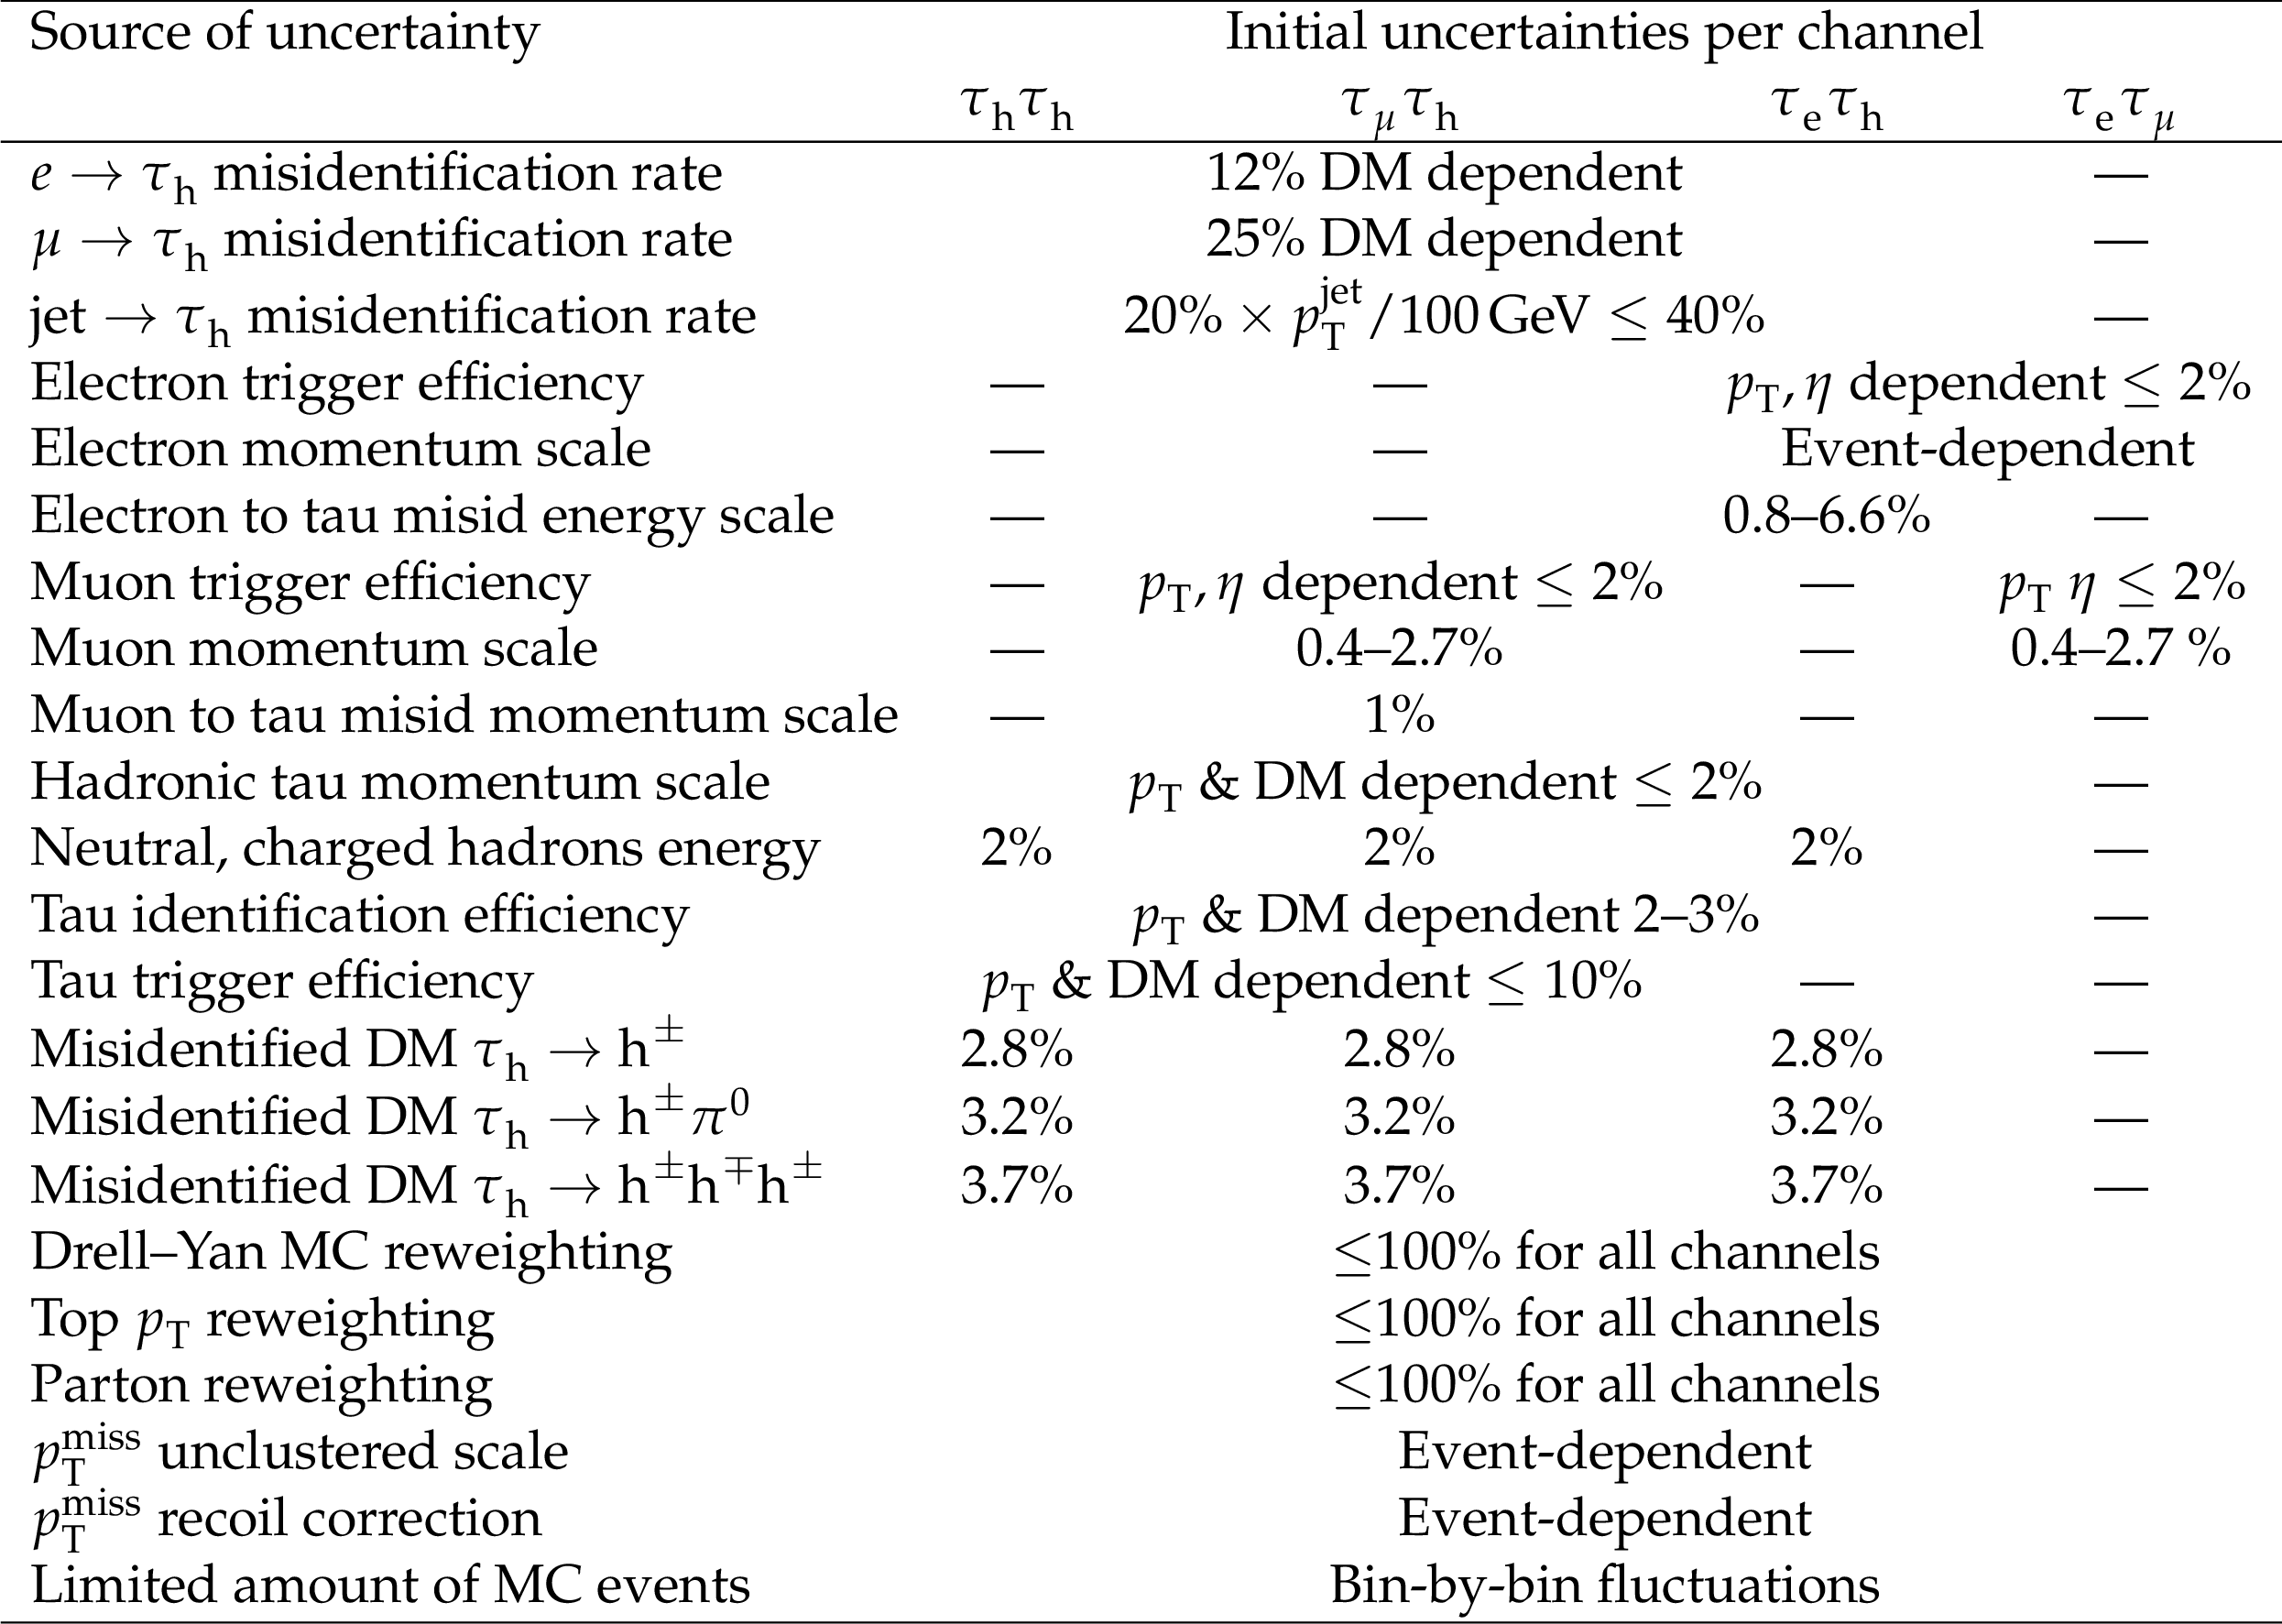
Table 3:
Systematic uncertainties affecting only the normalization of templates. The table lists the estimated inital uncertainties used in the fit for these nuisance parameters. The label correlated means that these uncertainties are common to the respective channels. |
png pdf |
Table 4:
Systematic uncertainties affecting the shapes of templates. The table lists the estimated initial uncertainties used in the fit for these nuisance parameters and their dependencies on $ p_{\mathrm{T}} $, decay mode (DM) or event selection. The comment ''Event-dependent'' for the $ p_{\mathrm{T}}^\text{miss} $ entries indicates that these corrections vary on an event-by-event basis due to the event selection. |
| Summary |
| The CMS detector was used to measure the polarization of $ \tau^{-} $ leptons in the decay of Z bosons produced in proton-proton collisions at the LHC at $ \sqrt{s}= $ 13 TeV in a data sample corresponding to an integrated luminosity of 36.3 fb$ ^{-1} $. Eleven different combinations of decay modes of the $ \tau $ leptons were used to study the polarization. The measured $ \tau^{-} $ lepton polarization, $ \mathcal{P}_{\tau}(\mathrm{Z}) = - $0.144 $ \pm $ 0.006 (stat) $ \pm $ 0.014 (syst) $ = - $0.144 $ \pm $ 0.015, is in good agreement with the SLD, LEP and ATLAS results. It is also compatible with the world average value of the lepton asymmetry parameter $ A_{\ell} $ [45]. This result is at present the most precise measurement at hadron colliders and reaches a similar precision to the SLD experiment. The measured polarization constrains the effective couplings of $ \tau^{-} $ leptons to the Z boson and determines the effective weak mixing angle to be $ \sin^{2}\theta_{\mathrm{W}}^\text{eff}= $ 0.2319 $ \pm $ 0.0019. This result has a precision of 0.8% and is independent of the production process of the Z boson. |
| References | ||||
| 1 | P. H. Eberhardet al. | The tau polarization measurement at LEP | CERN-EP-89-129, 1989 | |
| 2 | ALEPH Collaboration | Measurement of the tau polarization at LEP | EPJC 20 (2001) 401 | hep-ex/0104038 |
| 3 | DELPHI Collaboration | A precise measurement of the tau polarization at LEP-1 | EPJC 14 (2000) 585 | |
| 4 | L3 Collaboration | Measurement of tau polarization at LEP | PLB 429 (1998) 387 | |
| 5 | OPAL Collaboration | Precision neutral current asymmetry parameter measurements from the tau polarization at LEP | EPJC 21 (2001) 1 | hep-ex/0103045 |
| 6 | SLD Collaboration | An Improved direct measurement of leptonic coupling asymmetries with polarized Z bosons | PRL 86 (2001) 1162 | hep-ex/0010015 |
| 7 | ATLAS Collaboration | Measurement of $ \tau $ polarisation in $ Z/\gamma ^{*}\rightarrow \tau \tau $ decays in proton-proton collisions at $ \sqrt{s}= $ 8 TeV with the ATLAS detector | EPJC 78 (2018) 163 | 1709.03490 |
| 8 | CMS Collaboration | The CMS Experiment at the CERN LHC | JINST 3 (2008) S08004 | |
| 9 | CMS Collaboration | Performance of the CMS Level-1 trigger in proton-proton collisions at $ \sqrt{s} = $ 13 TeV | JINST 15 (2020) P10017 | CMS-TRG-17-001 2006.10165 |
| 10 | CMS Collaboration | The CMS trigger system | JINST 12 (2017) P01020 | CMS-TRG-12-001 1609.02366 |
| 11 | CMS Collaboration | Precision luminosity measurement in proton-proton collisions at $ \sqrt{s} = $ 13 TeV in 2015 and 2016 at CMS | EPJC 81 (2021) 800 | CMS-LUM-17-003 2104.01927 |
| 12 | J. Alwall et al. | The automated computation of tree-level and next-to-leading order differential cross sections, and their matching to parton shower simulations | JHEP 07 (2014) 079 | 1405.0301 |
| 13 | T. Sjöstrand et al. | An introduction to PYTHIA 8.2 | Comput. Phys. Commun. 191 (2015) 159 | 1410.3012 |
| 14 | CMS Collaboration | Event generator tunes obtained from underlying event and multiparton scattering measurements | EPJC 76 (2016) 155 | CMS-GEN-14-001 1512.00815 |
| 15 | S. Jadach, Z. Was, R. Decker, and J. H. Kuhn | The tau decay library TAUOLA: Version 2.4 | Comput. Phys. Commun. 76 (1993) 361 | |
| 16 | N. Davidson et al. | Universal Interface of TAUOLA Technical and Physics Documentation | Comput. Phys. Commun. 183 (2012) 821 | 1002.0543 |
| 17 | NNPDF Collaboration | Parton distributions for the LHC Run II | JHEP 04 (2015) 040 | 1410.8849 |
| 18 | GEANT 4 Collaboration | GEANT 4 --- a simulation toolkit | NIM A 506 (2003) 250 | |
| 19 | CMS Collaboration | Observation of the Higgs boson decay to a pair of $ \tau $ leptons with the CMS detector | PLB 779 (2018) 283 | CMS-HIG-16-043 1708.00373 |
| 20 | E. Re | Single-top Wt-channel production matched with parton showers using the POWHEG method | EPJC 71 (2011) 1547 | 1009.2450 |
| 21 | S. Alioli, P. Nason, C. Oleari, and E. Re | NLO single-top production matched with shower in POWHEG: s- and t-channel contributions | JHEP 09 (2009) 111 | 0907.4076 |
| 22 | S. Frixione, P. Nason, and G. Ridolfi | A positive-weight next-to-leading-order Monte Carlo for heavy flavour hadroproduction | JHEP 09 (2007) 126 | 0707.3088 |
| 23 | CMS Collaboration | Investigations of the impact of the parton shower tuning in PYTHIA 8 in the modelling of $ \mathrm{t\overline{t}} $ at $ \sqrt{s}= $ 8 and 13 TeV | CMS Physics Analysis Summary, 2016 CMS-PAS-TOP-16-021 |
CMS-PAS-TOP-16-021 |
| 24 | CMS Collaboration | Pileup mitigation at CMS in 13 TeV data | JINST 15 (2020) P09018 | CMS-JME-18-001 2003.00503 |
| 25 | CMS Collaboration | Particle-flow reconstruction and global event description with the CMS detector | JINST 12 (2017) P10003 | CMS-PRF-14-001 1706.04965 |
| 26 | M. Cacciari, G. P. Salam, and G. Soyez | The anti-$ k_{\mathrm{T}} $ jet clustering algorithm | JHEP 04 (2008) 063 | 0802.1189 |
| 27 | M. Cacciari, G. P. Salam, and G. Soyez | FastJet user manual | EPJC 72 (2012) 1896 | 1111.6097 |
| 28 | CMS Collaboration | Jet energy scale and resolution in the CMS experiment in pp collisions at 8 TeV | JINST 12 (2017) P02014 | CMS-JME-13-004 1607.03663 |
| 29 | CMS Collaboration | Electron and photon reconstruction and identification with the CMS experiment at the CERN LHC | JINST 16 (2021) P05014 | CMS-EGM-17-001 2012.06888 |
| 30 | CMS Collaboration | Performance of CMS Muon Reconstruction in pp Collision Events at $ \sqrt{s}= $ 7 TeV | JINST 7 (2012) P10002 | CMS-MUO-10-004 1206.4071 |
| 31 | CMS Collaboration | Performance of missing transverse momentum reconstruction in proton-proton collisions at $ \sqrt{s} = $ 13 TeV using the CMS detector | JINST 14 (2019) P07004 | CMS-JME-17-001 1903.06078 |
| 32 | D. Bertolini, P. Harris, M. Low, and N. Tran | Pileup per particle identification | JHEP 10 (2014) 059 | 1407.6013 |
| 33 | CMS Collaboration | Measurement of inclusive W and Z boson production cross sections in pp collisions at $ \sqrt{s} $ = 8 TeV | PRL 112 (2014) 191802 | CMS-SMP-12-011 1402.0923 |
| 34 | CMS Collaboration | Performance of reconstruction and identification of $ \tau $ leptons decaying to hadrons and $ \nu_\tau $ in pp collisions at $ \sqrt{s}= $ 13 TeV | JINST 13 (2018) P10005 | CMS-TAU-16-003 1809.02816 |
| 35 | CMS Collaboration | Analysis of the $ CP $ structure of the Yukawa coupling between the Higgs boson and $ \tau $ leptons in proton-proton collisions at $ \sqrt{s} $ = 13 TeV | JHEP 06 (2022) 012 | CMS-HIG-20-006 2110.04836 |
| 36 | CMS Collaboration | Identification of hadronic tau lepton decays using a deep neural network | JINST 17 (2022) P07023 | CMS-TAU-20-001 2201.08458 |
| 37 | Y.-S. Tsai | Decay correlations of heavy leptons in $ \mathrm{e}^{+}\mathrm{e}^{-} \rightarrow \ell^{+}\ell^{-} $ | PRD 4 (1971) 2821 | |
| 38 | V. Cherepanov and W. Lohmann | Methods for a measurement of $ \tau $ polarization asymmetry in the decay $ Z\to \tau\tau $ at LHC and determination of the effective weak mixing angle | 1805.10552 | |
| 39 | M. Davier, L. Duflot, F. Le Diberder, and A. Rouge | The optimal method for the measurement of tau polarization | PLB 306 (1993) 411 | |
| 40 | CLEO Collaboration | Hadronic structure in the decay $ \tau^{-} \rightarrow \pi^{-}\pi^{0}\pi^{0}\nu_{\tau} $ and the sign of the $ \nu_{\tau} $ helicity | PRD 61 (2000) 012002 | hep-ex/9902022 |
| 41 | L. Bianchini et al. | Reconstruction of the Higgs mass in events with Higgs bosons decaying into a pair of $ \tau $ leptons using matrix element techniques | NIM A 862 (2017) 54 | 1603.05910 |
| 42 | R. Alemany et al. | Tau polarization at the Z peak from the acollinearity between both tau decay products | NPB 379 (1992) 3 | |
| 43 | ALEPH, DELPHI, L3, OPAL, SLD, LEP Electroweak Working Group, SLD Electroweak Group, SLD Heavy Flavour Group Collaboration | Precision electroweak measurements on the Z resonance | Phys. Rept. 427 (2006) 257 | hep-ex/0509008 |
| 44 | A. Akhundov, A. Arbuzov, S. Riemann, and T. Riemann | The ZFITTER project | Phys. Part. Nucl. 45 (2014) 529 | 1302.1395 |
| 45 | Particle Data Group Collaboration | Review of Particle Physics | PTEP 2022 (2022) 083C01 | |
| 46 | CMS Collaboration | HEPData record for this analysis | link | |
|
|
Compact Muon Solenoid LHC, CERN |
|

|

|

|

|

|