

Compact Muon Solenoid
LHC, CERN
| CMS-SMP-20-013 ; CERN-EP-2021-225 | ||
| Evidence for WW/WZ vector boson scattering in the decay channel $ \ell\nu $qq produced in association with two jets in proton-proton collisions at $ \sqrt{s}= $ 13 TeV | ||
| CMS Collaboration | ||
| 9 December 2021 | ||
| Phys. Lett. B 834 (2022) 137438 | ||
| Abstract: Evidence is reported for electroweak (EW) vector boson scattering in the decay channel $ \ell\nu $qq of two weak vector bosons WV (V = W or Z), produced in association with two parton jets. The search uses a data set of proton-proton collisions at 13 TeV collected with the CMS detector during 2016--2018 with an integrated luminosity of 138 fb$ ^{-1} $. Events are selected requiring one lepton (electron or muon), moderate missing transverse momentum, two jets with a large pseudorapidity separation and a large dijet invariant mass, and a signature consistent with the hadronic decay of a W/Z boson. The cross section is computed in a fiducial phase space defined at parton level requiring all parton transverse momenta $ p_{\mathrm{T}} > $ 10 GeV and at least one pair of outgoing partons with invariant mass $ m_{\mathrm{q}\mathrm{q}} > $ 100 GeV. The measured and expected EW WV production cross sections are 1.90 $ ^{+0.53}_{-0.46} $ pb and 2.23 $ ^{+0.08}_{-0.11} $ (scale) $ \pm $ 0.05 (PDF) pb, respectively, where PDF is the parton distribution function. The observed EW signal strength is $ \mu_{\mathrm{EW}} = $ 0.85 $ \pm $ 0.12 (stat) $ ^{+0.19}_{-0.17} $ (syst), corresponding to a signal significance of 4.4 standard deviations with 5.1 expected, and it is measured keeping the quantum chromodynamics (QCD) associated diboson production fixed to the standard model prediction. This is the first evidence of vector boson scattering in the $ \ell\nu $qq decay channel at LHC. The simultaneous measurement of the EW and QCD associated diboson production agrees with the standard model prediction. | ||
| Links: e-print arXiv:2112.05259 [hep-ex] (PDF) ; CDS record ; inSPIRE record ; HepData record ; Physics Briefing ; CADI line (restricted) ; | ||
| Figures | |
png pdf |
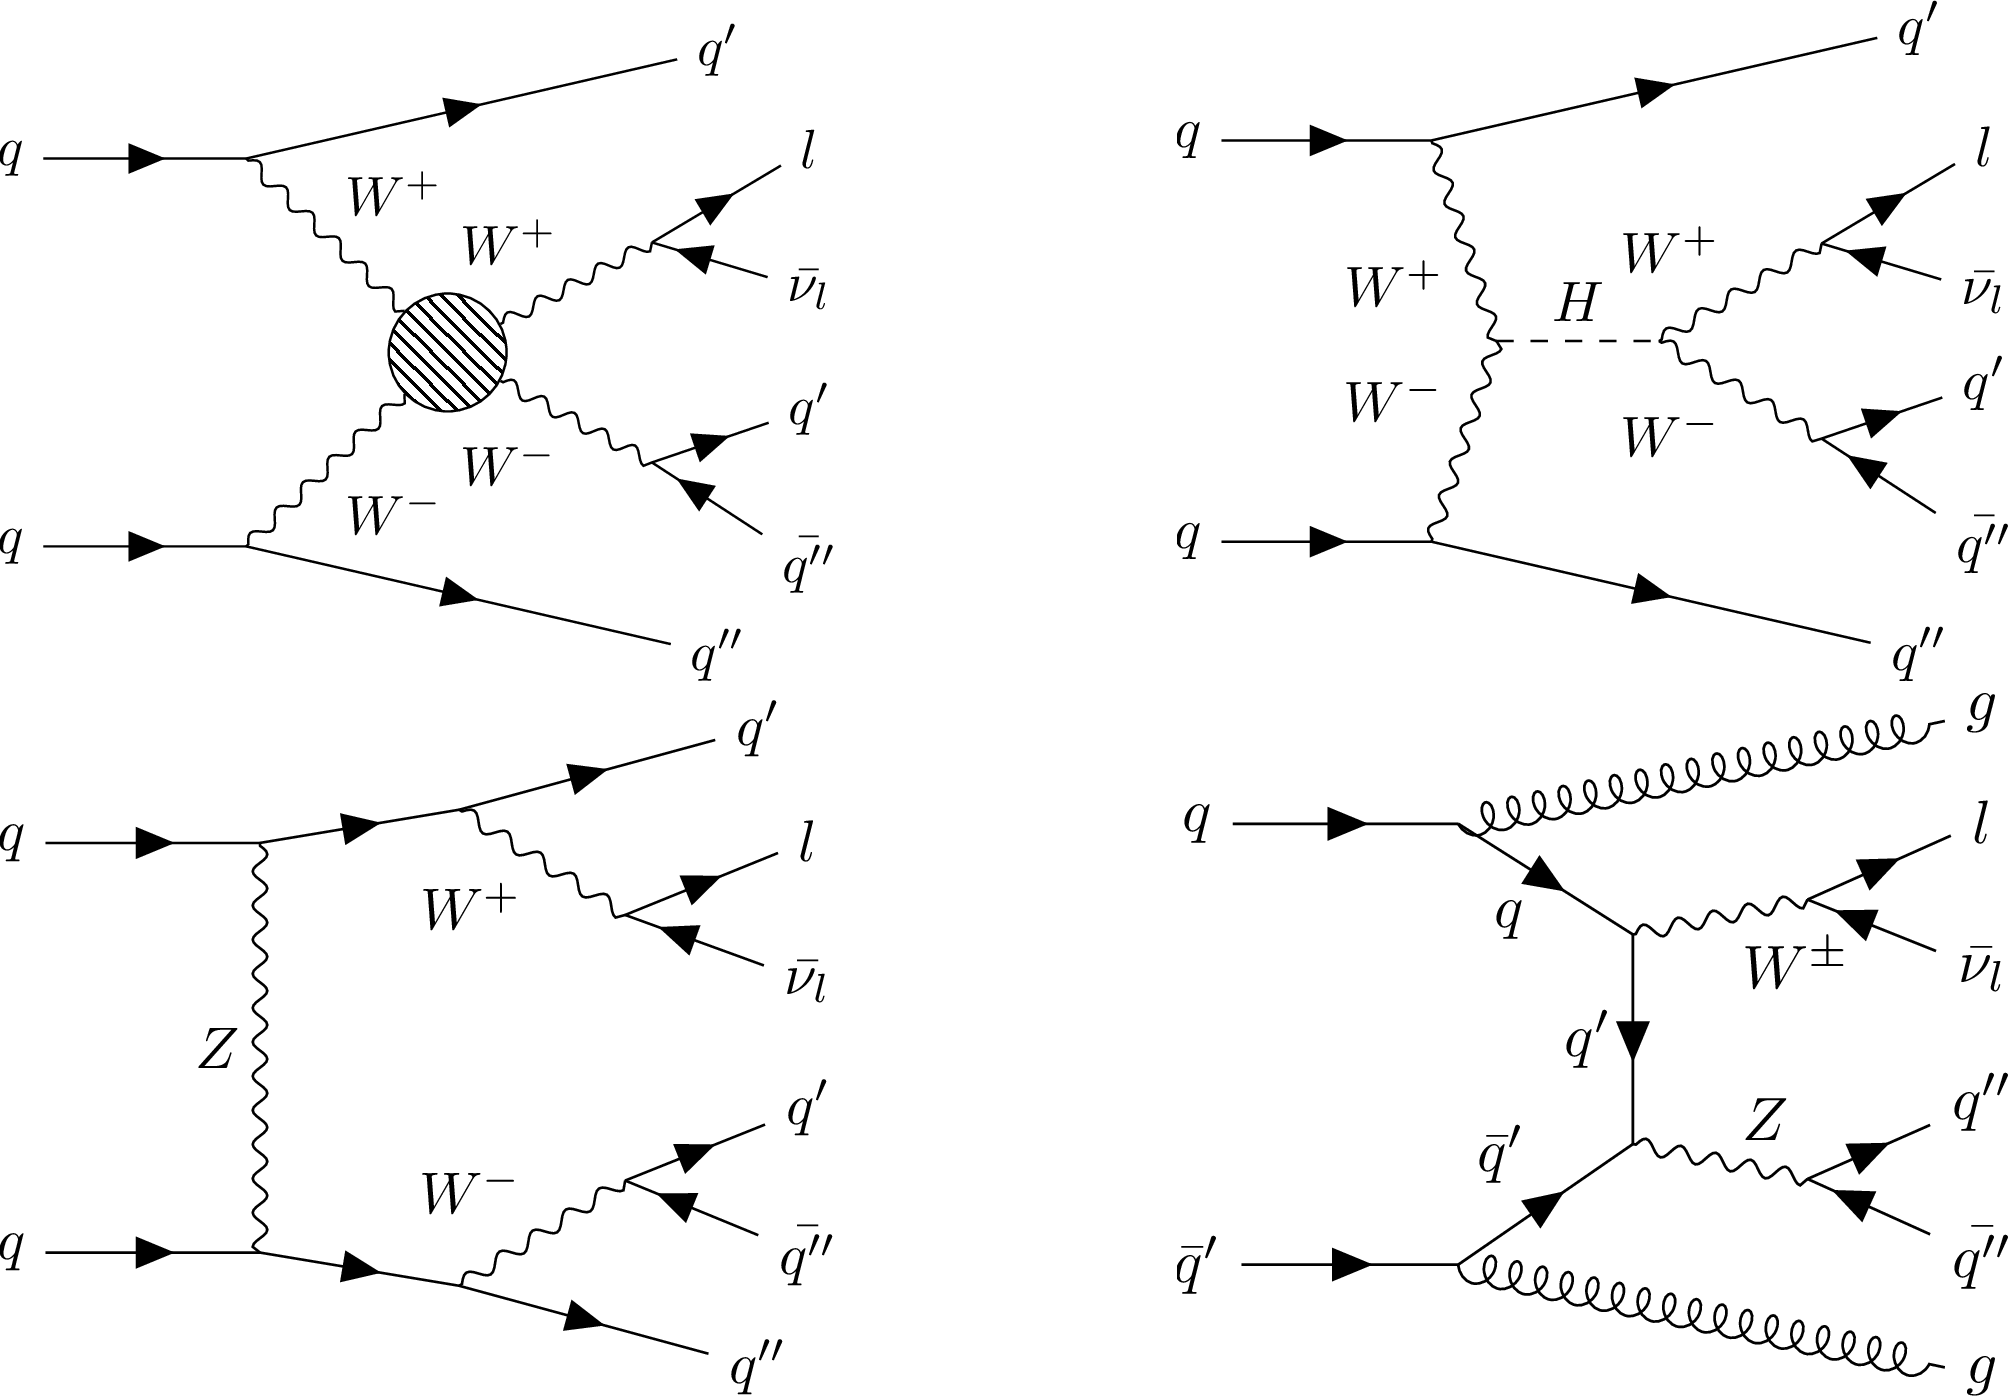
Figure 1:
Examples of Feynman diagrams contributing to the analyzed final state: general schema of purely EW VBS signal process contributions (upper left diagram), the $ s $-channel Higgs boson contribution (upper right diagram), the purely EW nonresonant diboson production (lower left diagram); and an example of non-EW nonresonant diboson production (lower right diagram), which is part of the irreducible background. |
png pdf |
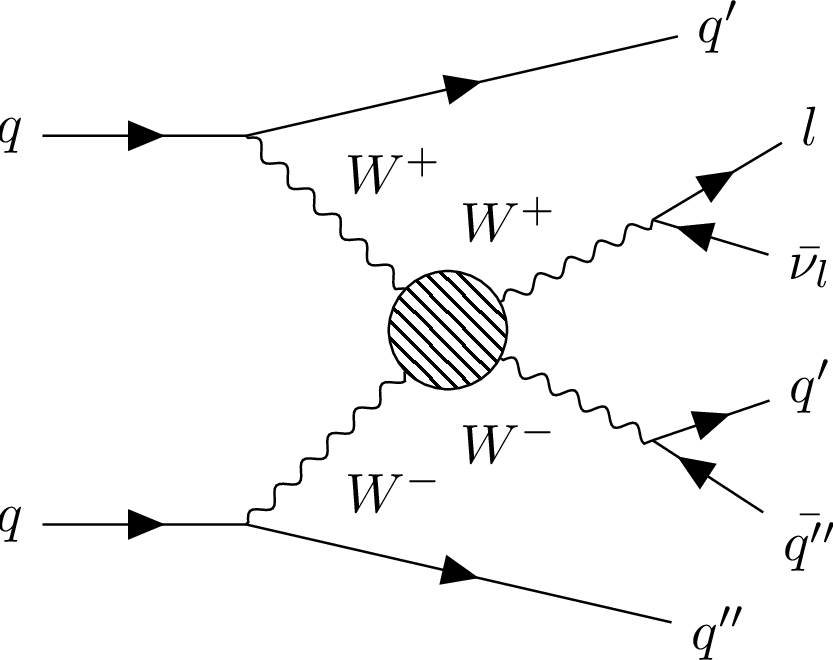
Figure 1-a:
Example of Feynman diagram for the purely EW VBS process contribution to the analyzed final state. |
png pdf |
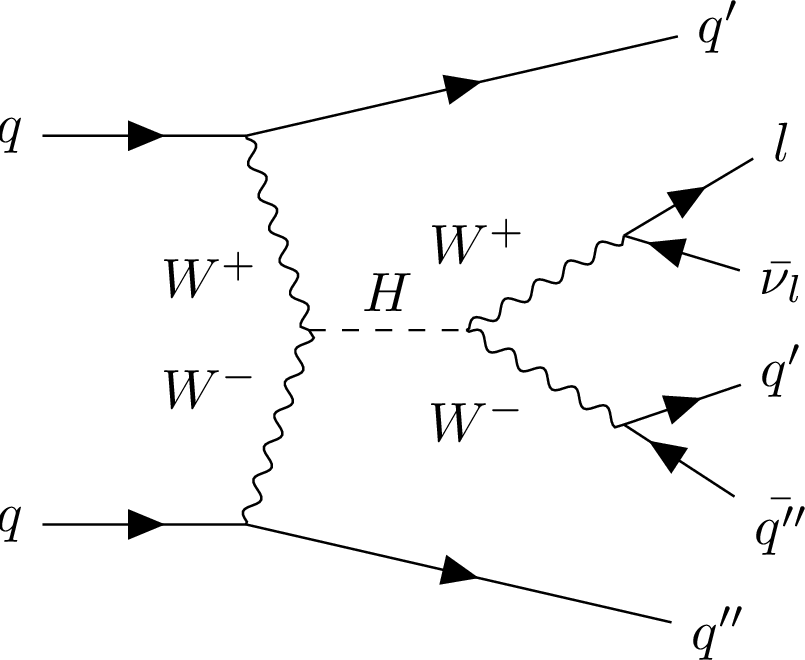
Figure 1-b:
Example of Feynman diagram for the $s$-channel Higgs boson contribution to the analyzed final state. |

png pdf |
Figure 1-c:
Example of Feynman diagram for the purely EW nonresonant diboson production contribution to the analyzed final state. |
png pdf |
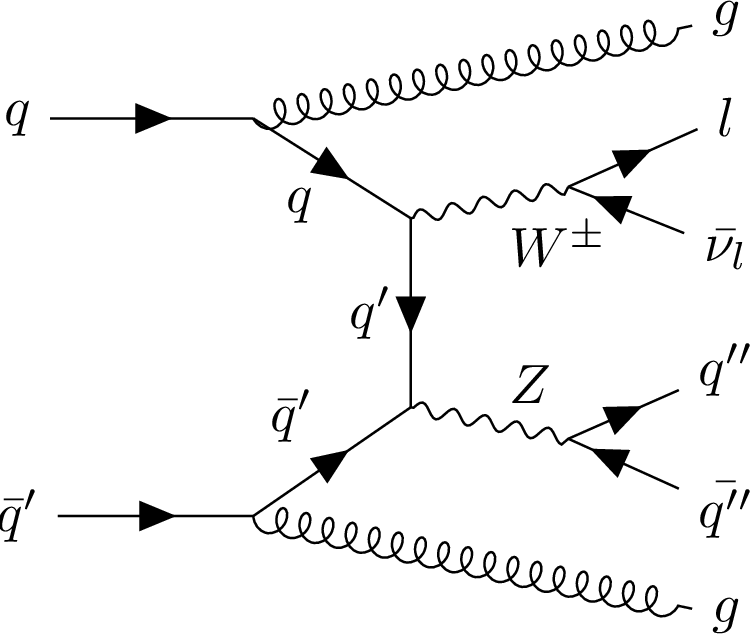
Figure 1-d:
Example of Feynman diagram for non-EW nonresonant diboson production, which is part of the irreducible background. |

png pdf |
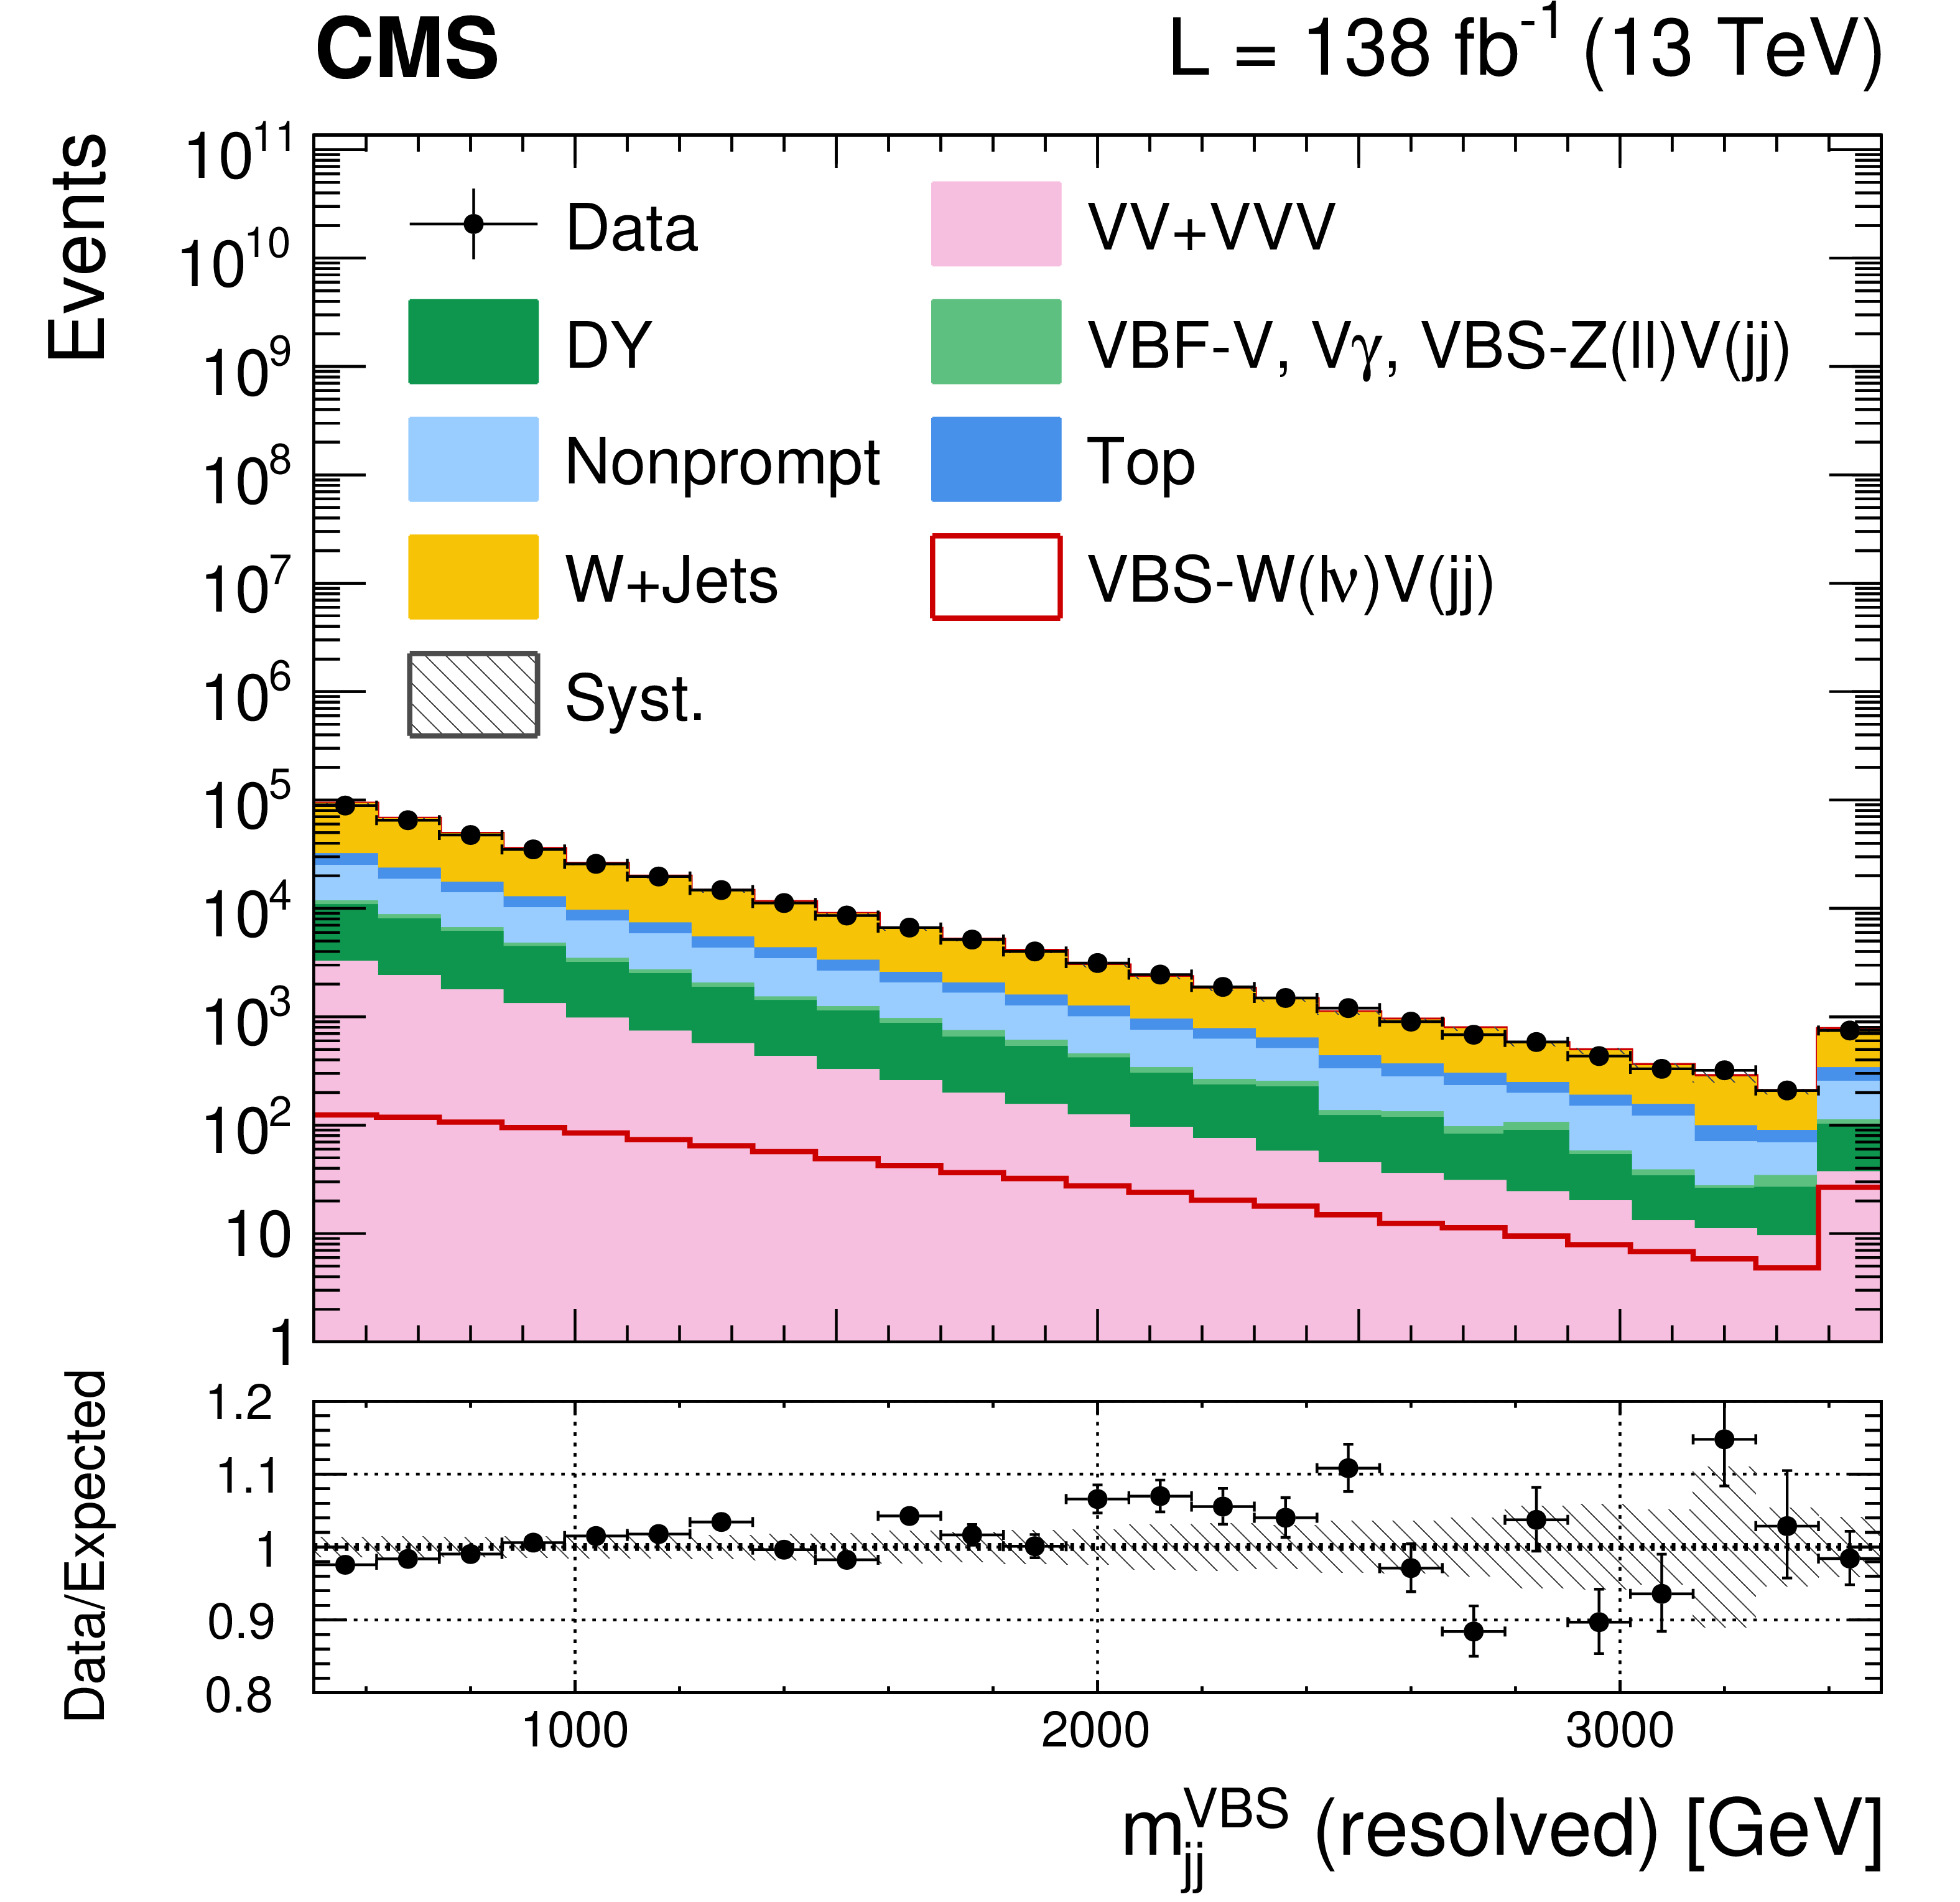
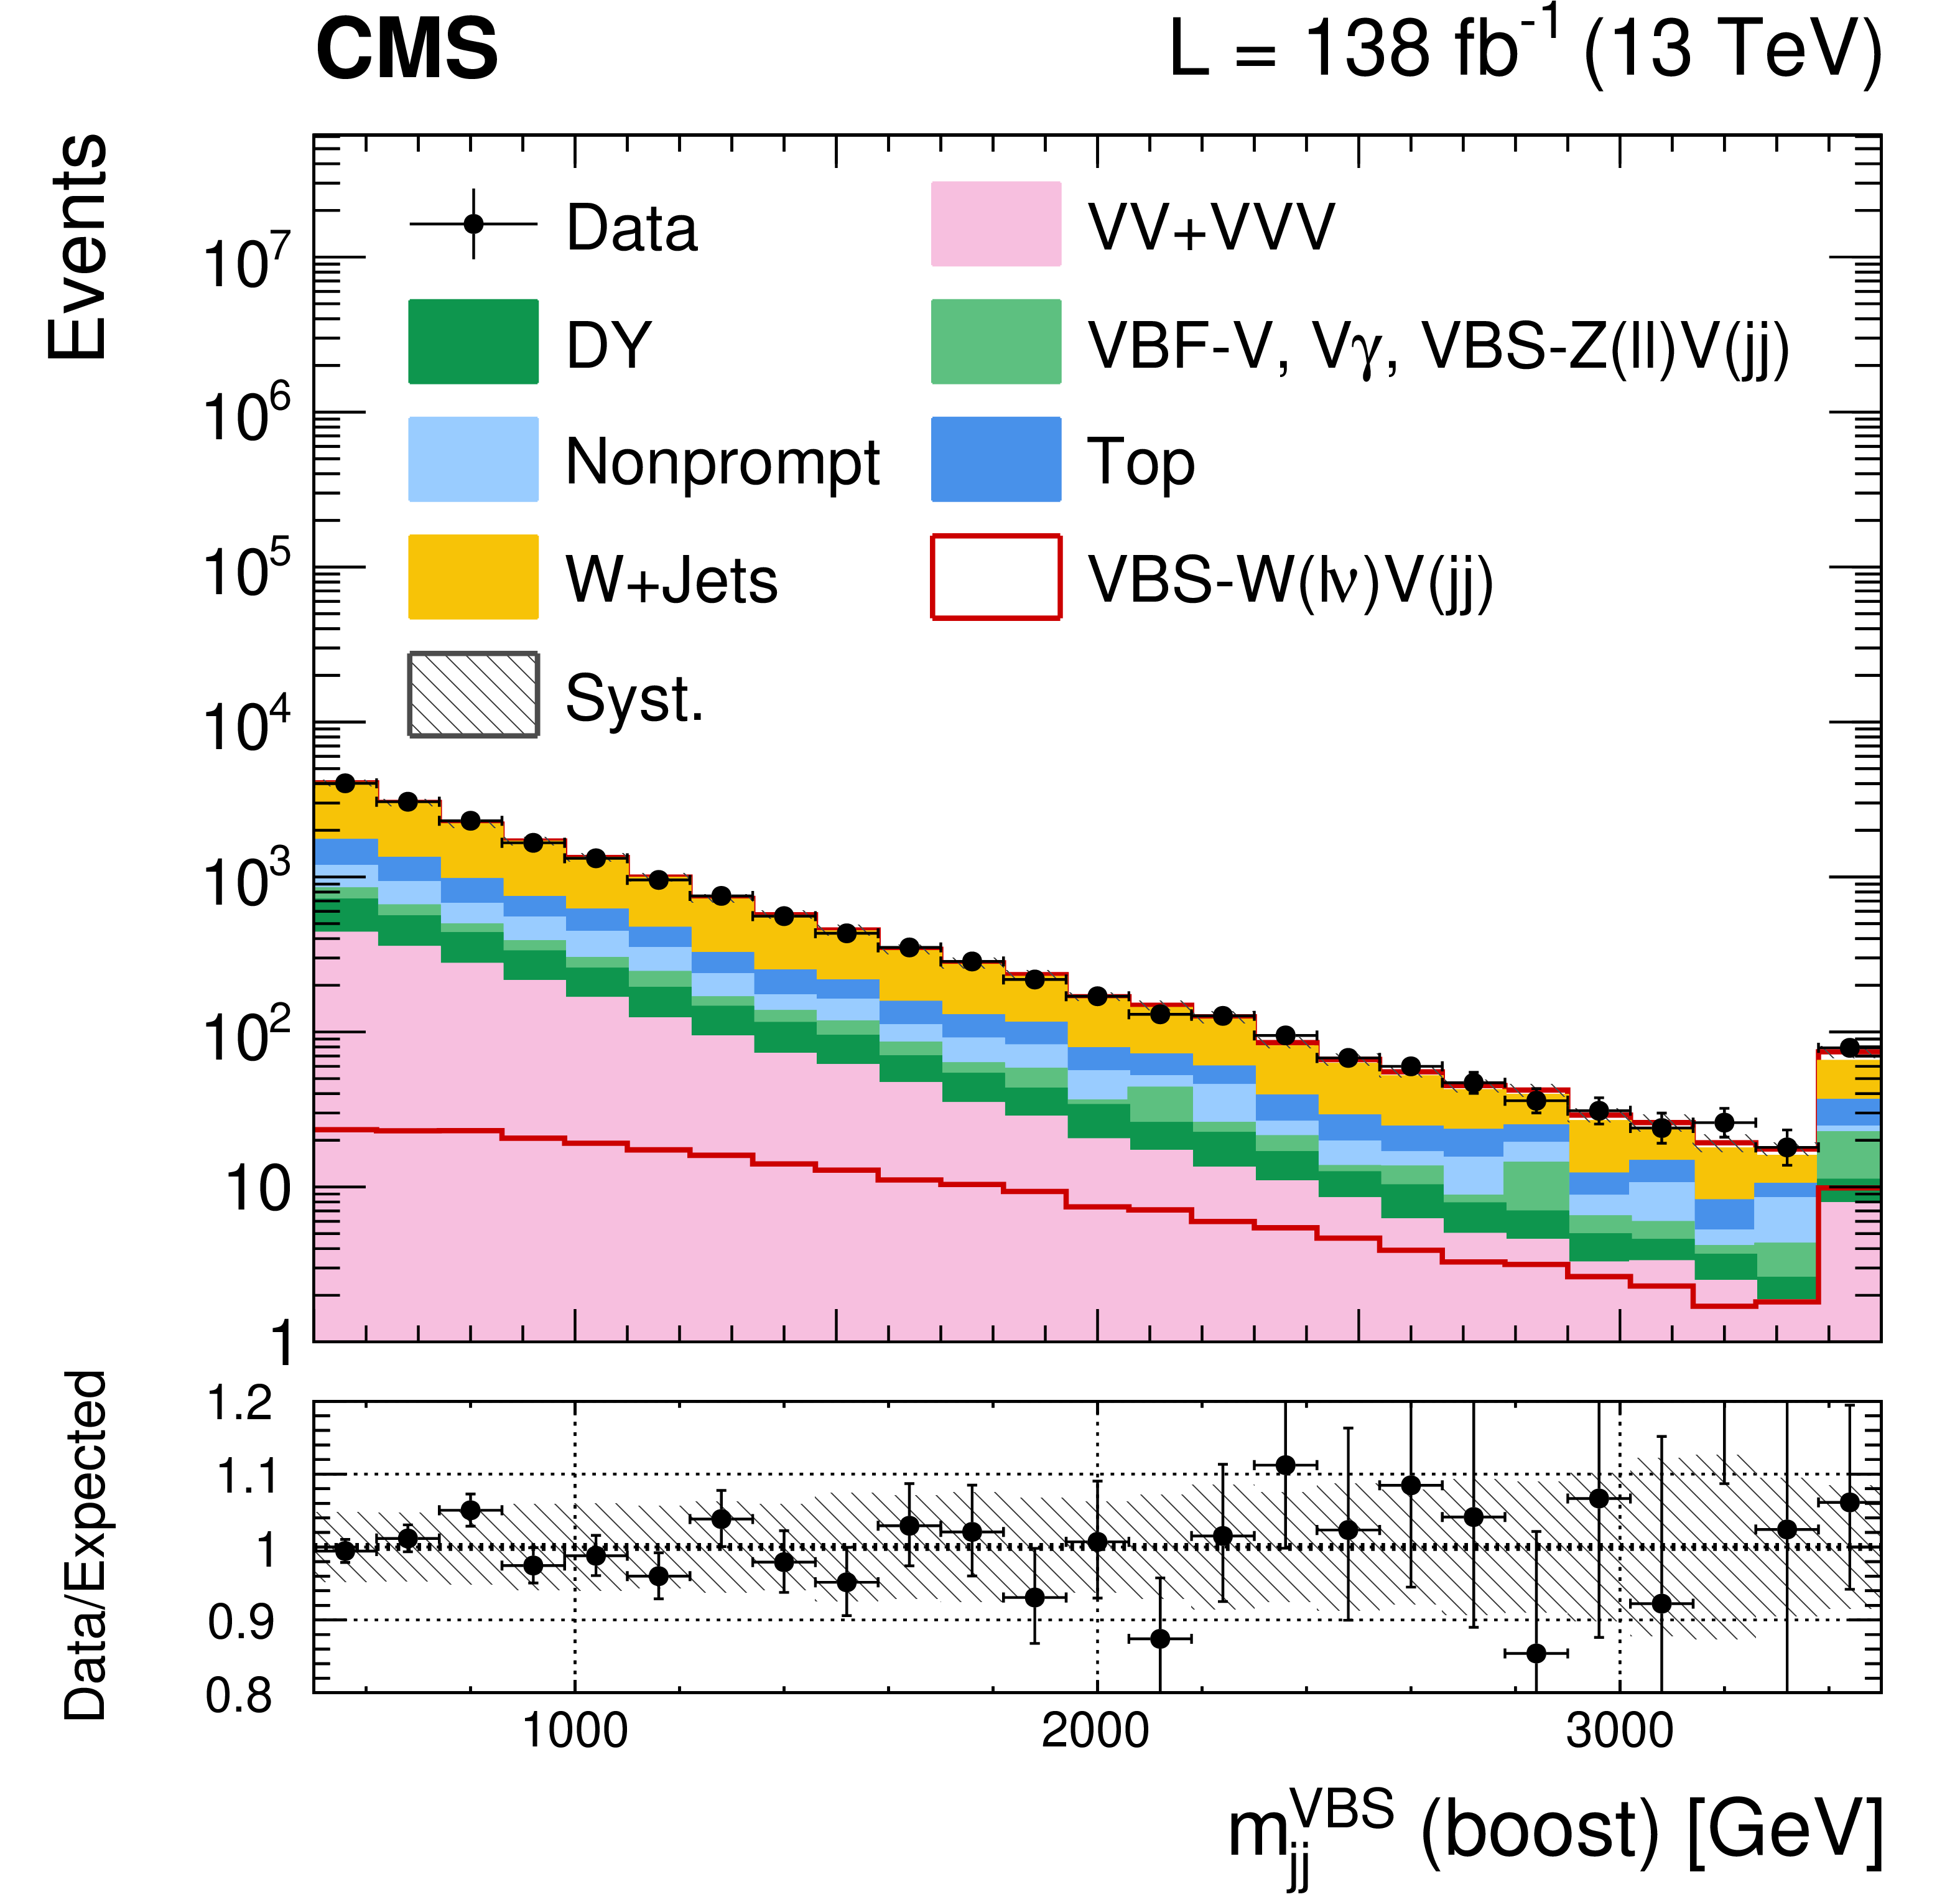
Figure 2:
Postfit distributions of the ${m_{\mathrm {jj}}^{\mathrm {VBS}}}$ observable in the resolved (left) and boosted (right) signal regions. Vertical bars on data points show the statistical error, whereas the gray band is the post-fit uncertainty on MC with all systematic uncertainties included. |
png pdf |
Figure 2-a:
Postfit distributions of the ${m_{\mathrm {jj}}^{\mathrm {VBS}}}$ observable in the resolved signal region. Vertical bars on data points show the statistical error, whereas the gray band is the post-fit uncertainty on MC with all systematic uncertainties included. |
png pdf |
Figure 2-b:
Postfit distributions of the ${m_{\mathrm {jj}}^{\mathrm {VBS}}}$ observable in the boosted signal region. Vertical bars on data points show the statistical error, whereas the gray band is the post-fit uncertainty on MC with all systematic uncertainties included. |
png pdf |
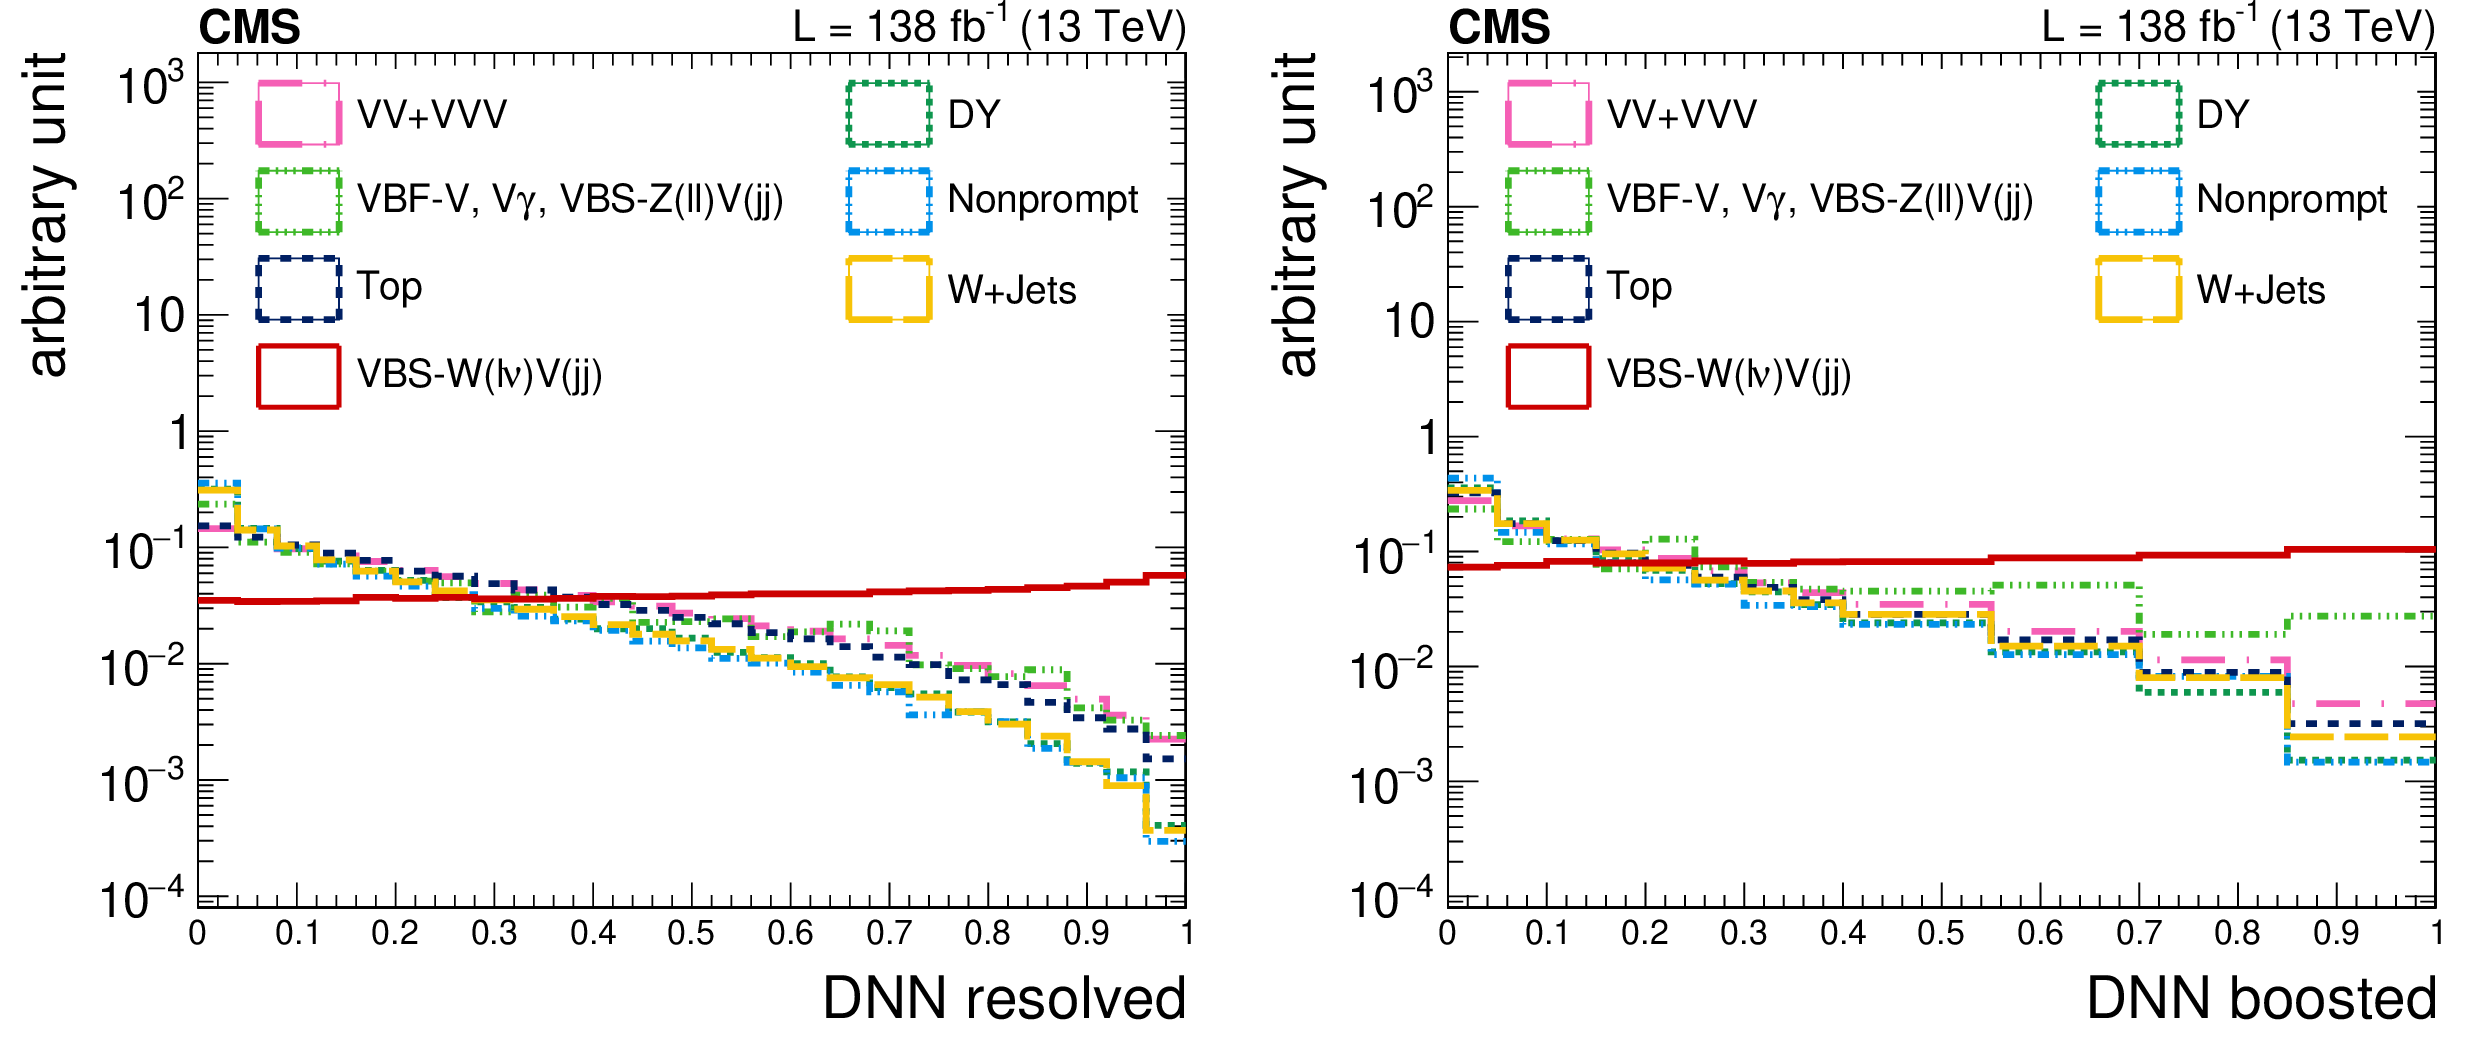
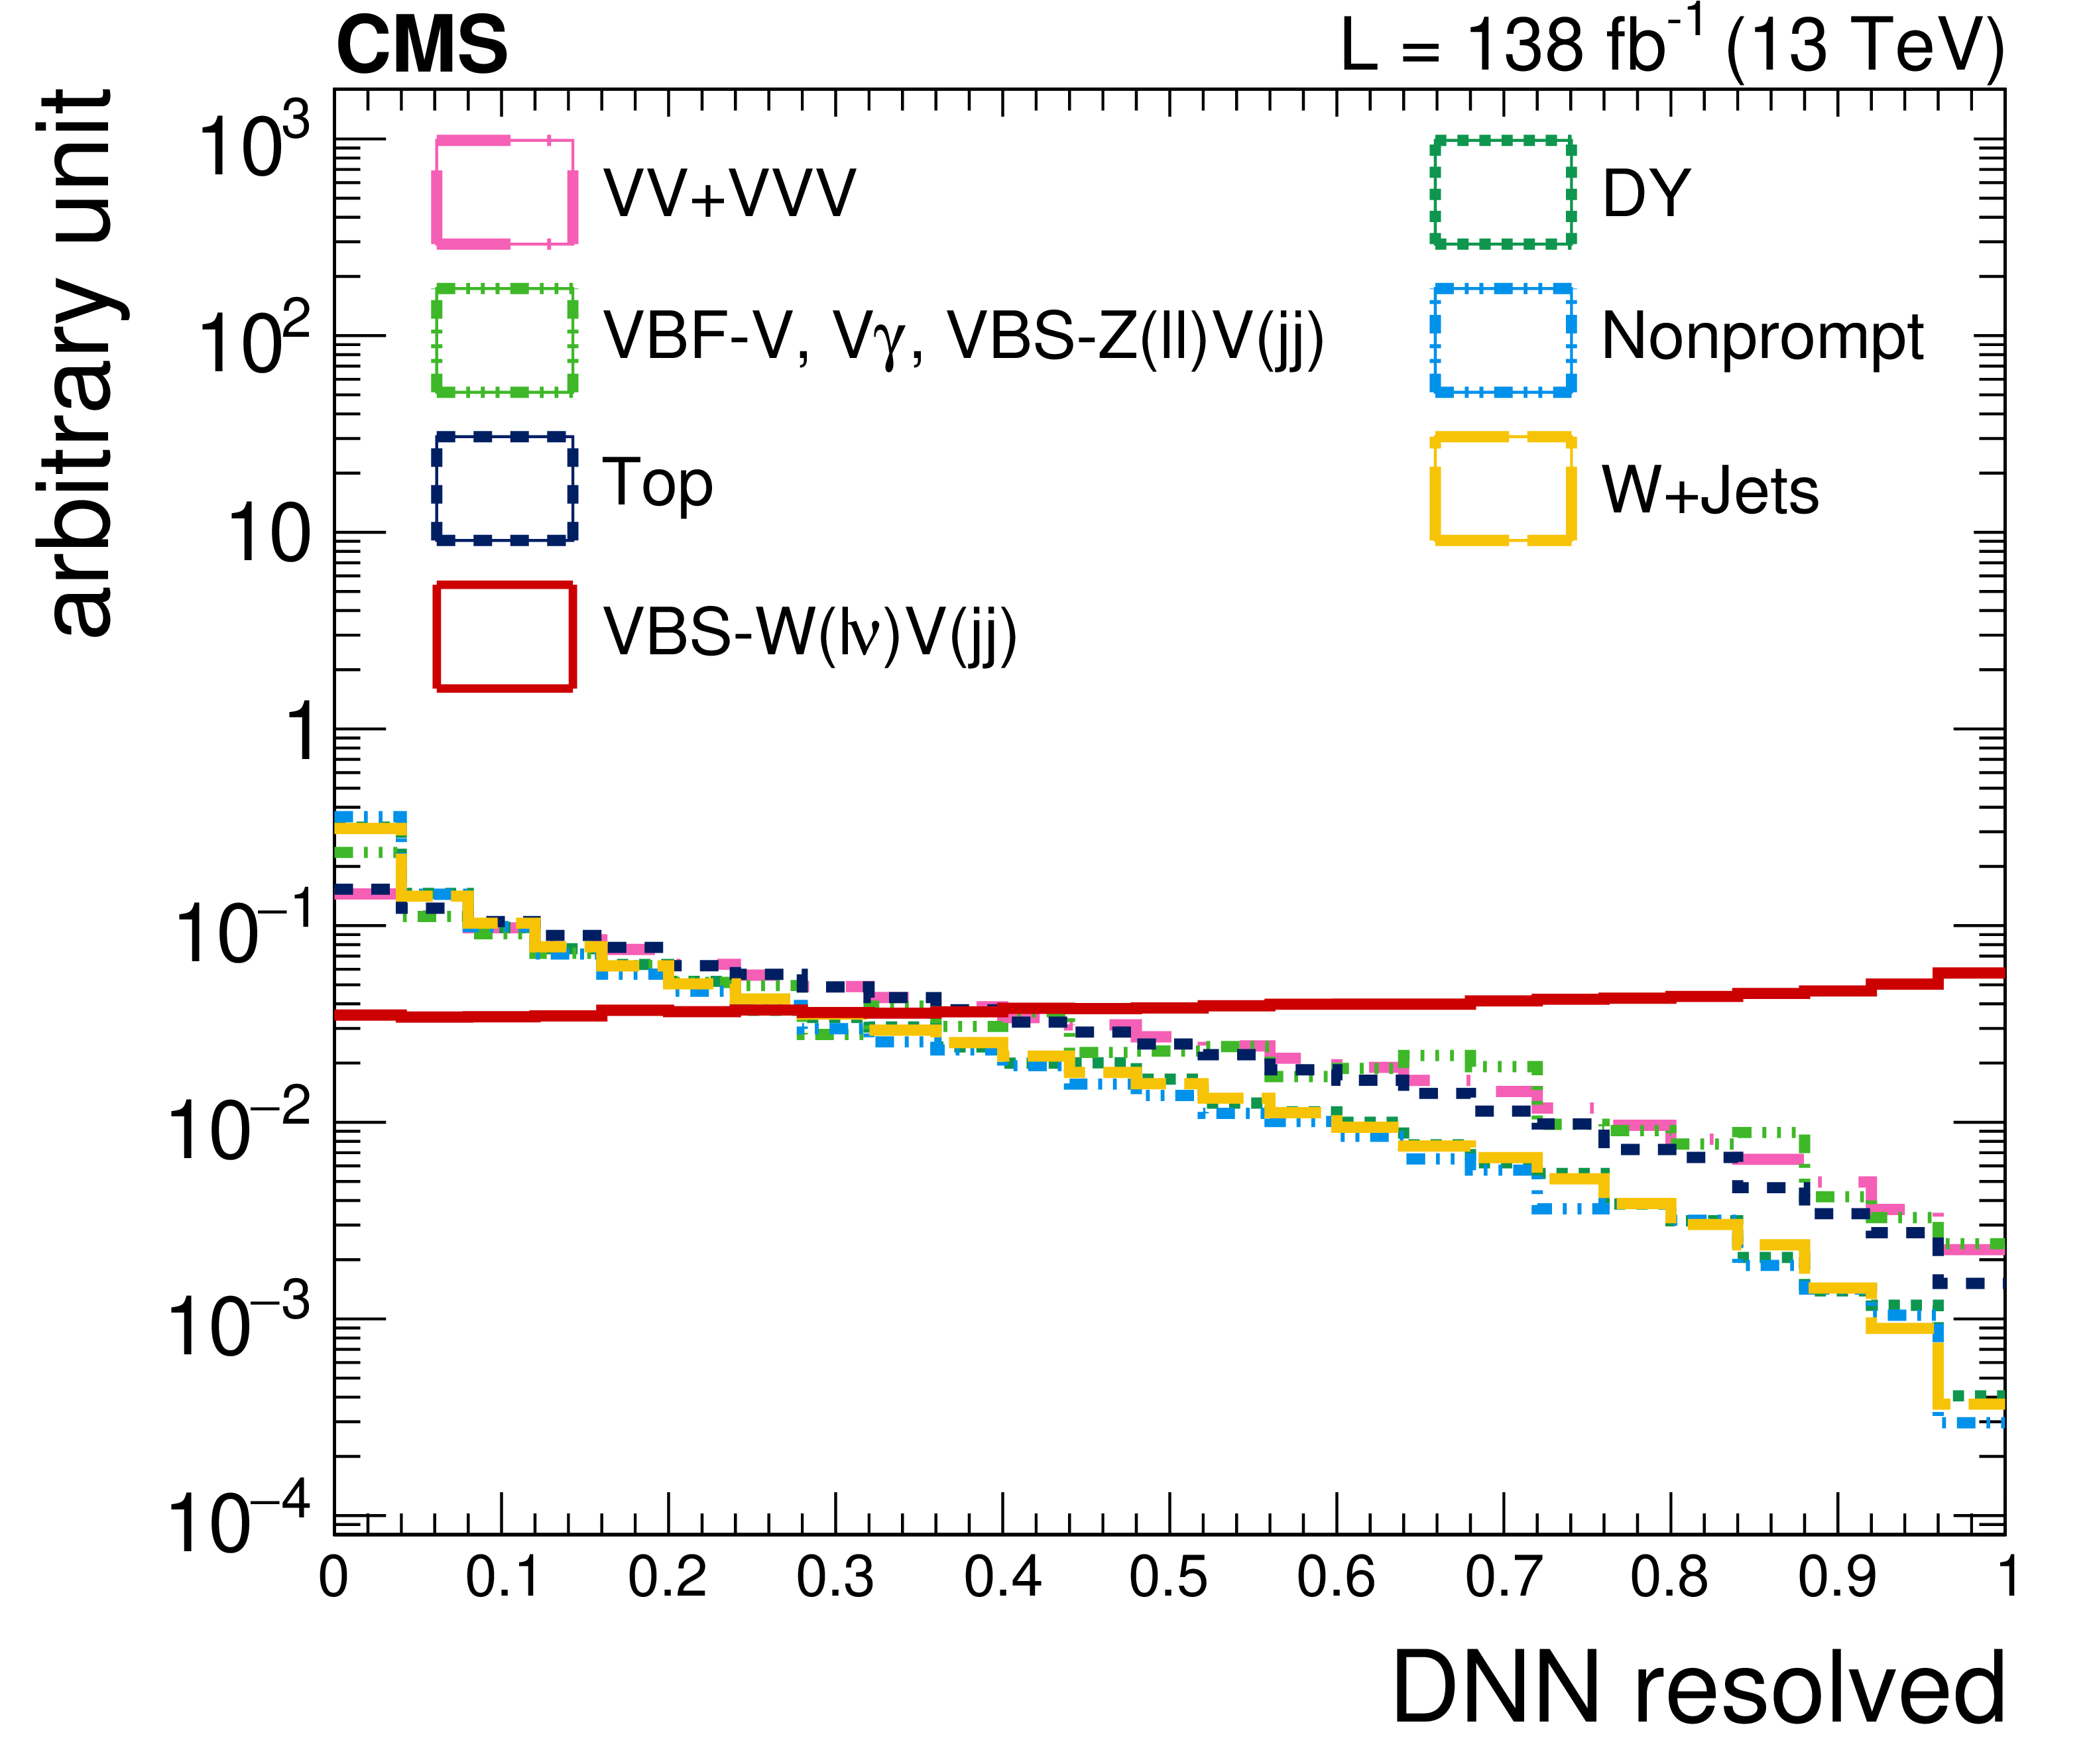
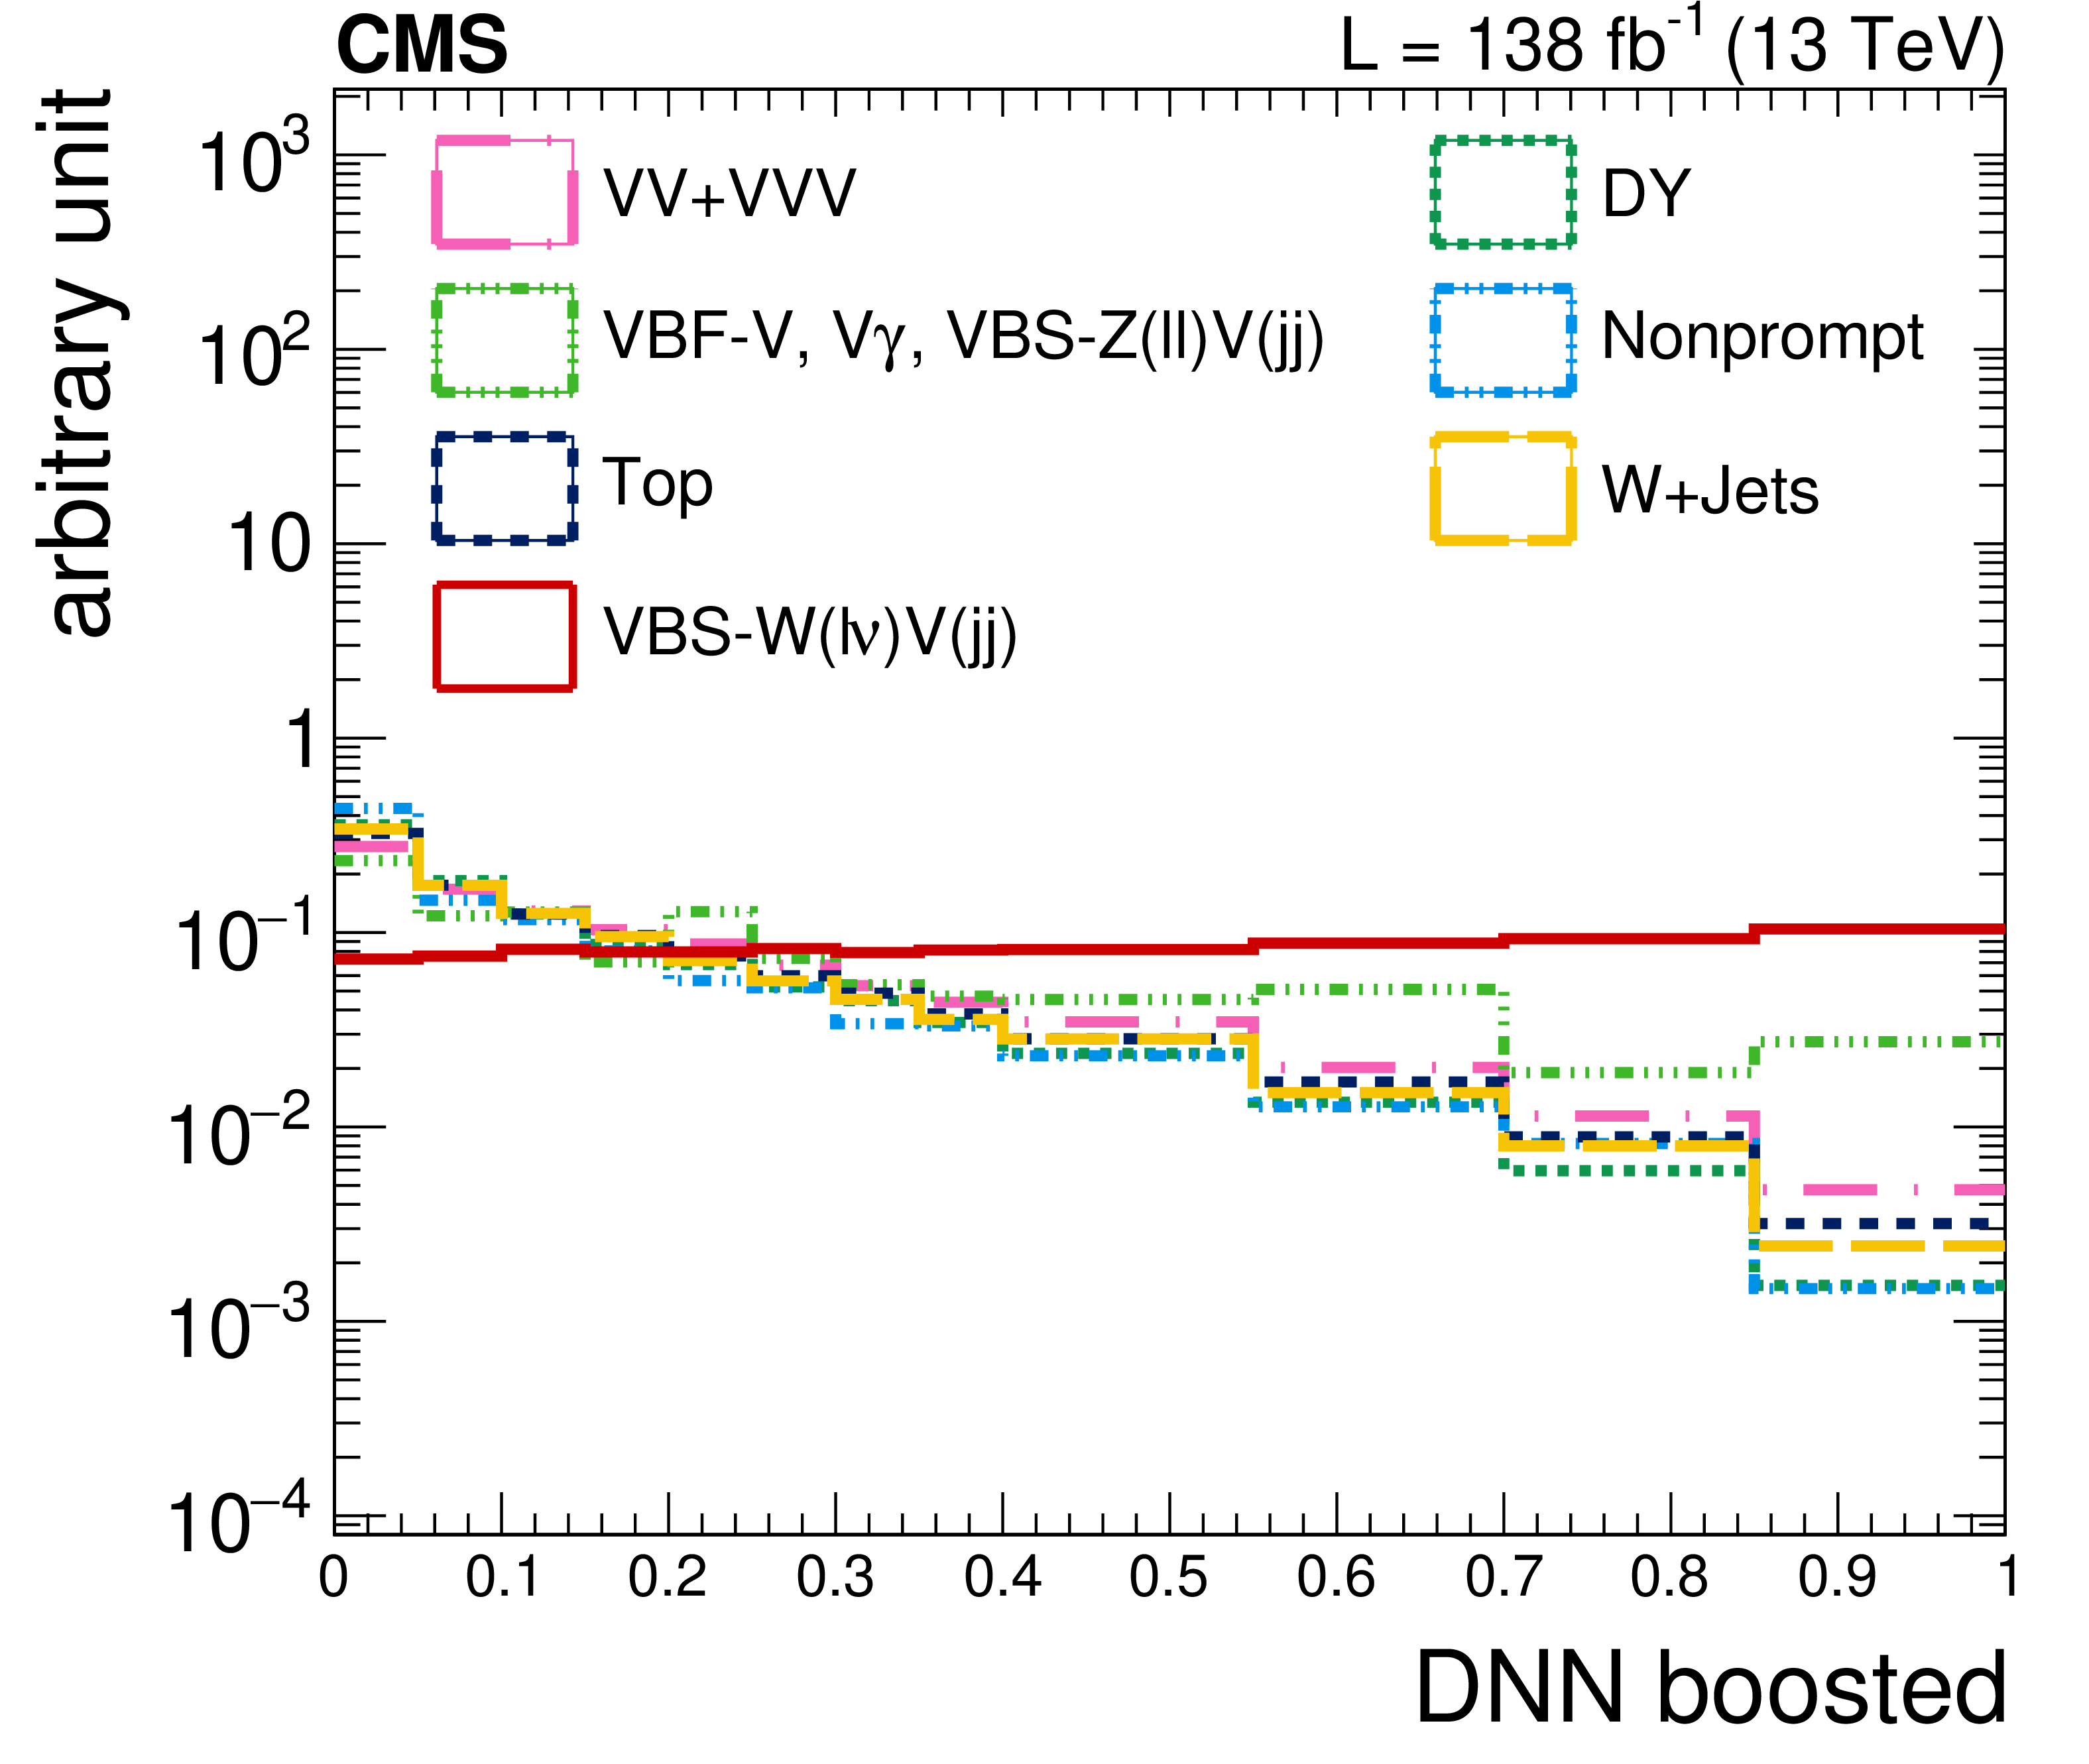
Figure 3:
The DNN discriminator distribution, taken from simulation, for VBS signal and backgrounds in the resolved (left) and boosted (right) signal regions normalized to unity. |
png pdf |
Figure 3-a:
The DNN discriminator distribution, taken from simulation, for VBS signal and backgrounds in the resolved signal region normalized to unity. |
png pdf |
Figure 3-b:
The DNN discriminator distribution, taken from simulation, for VBS signal and backgrounds in the boosted signal region normalized to unity. |
png pdf |
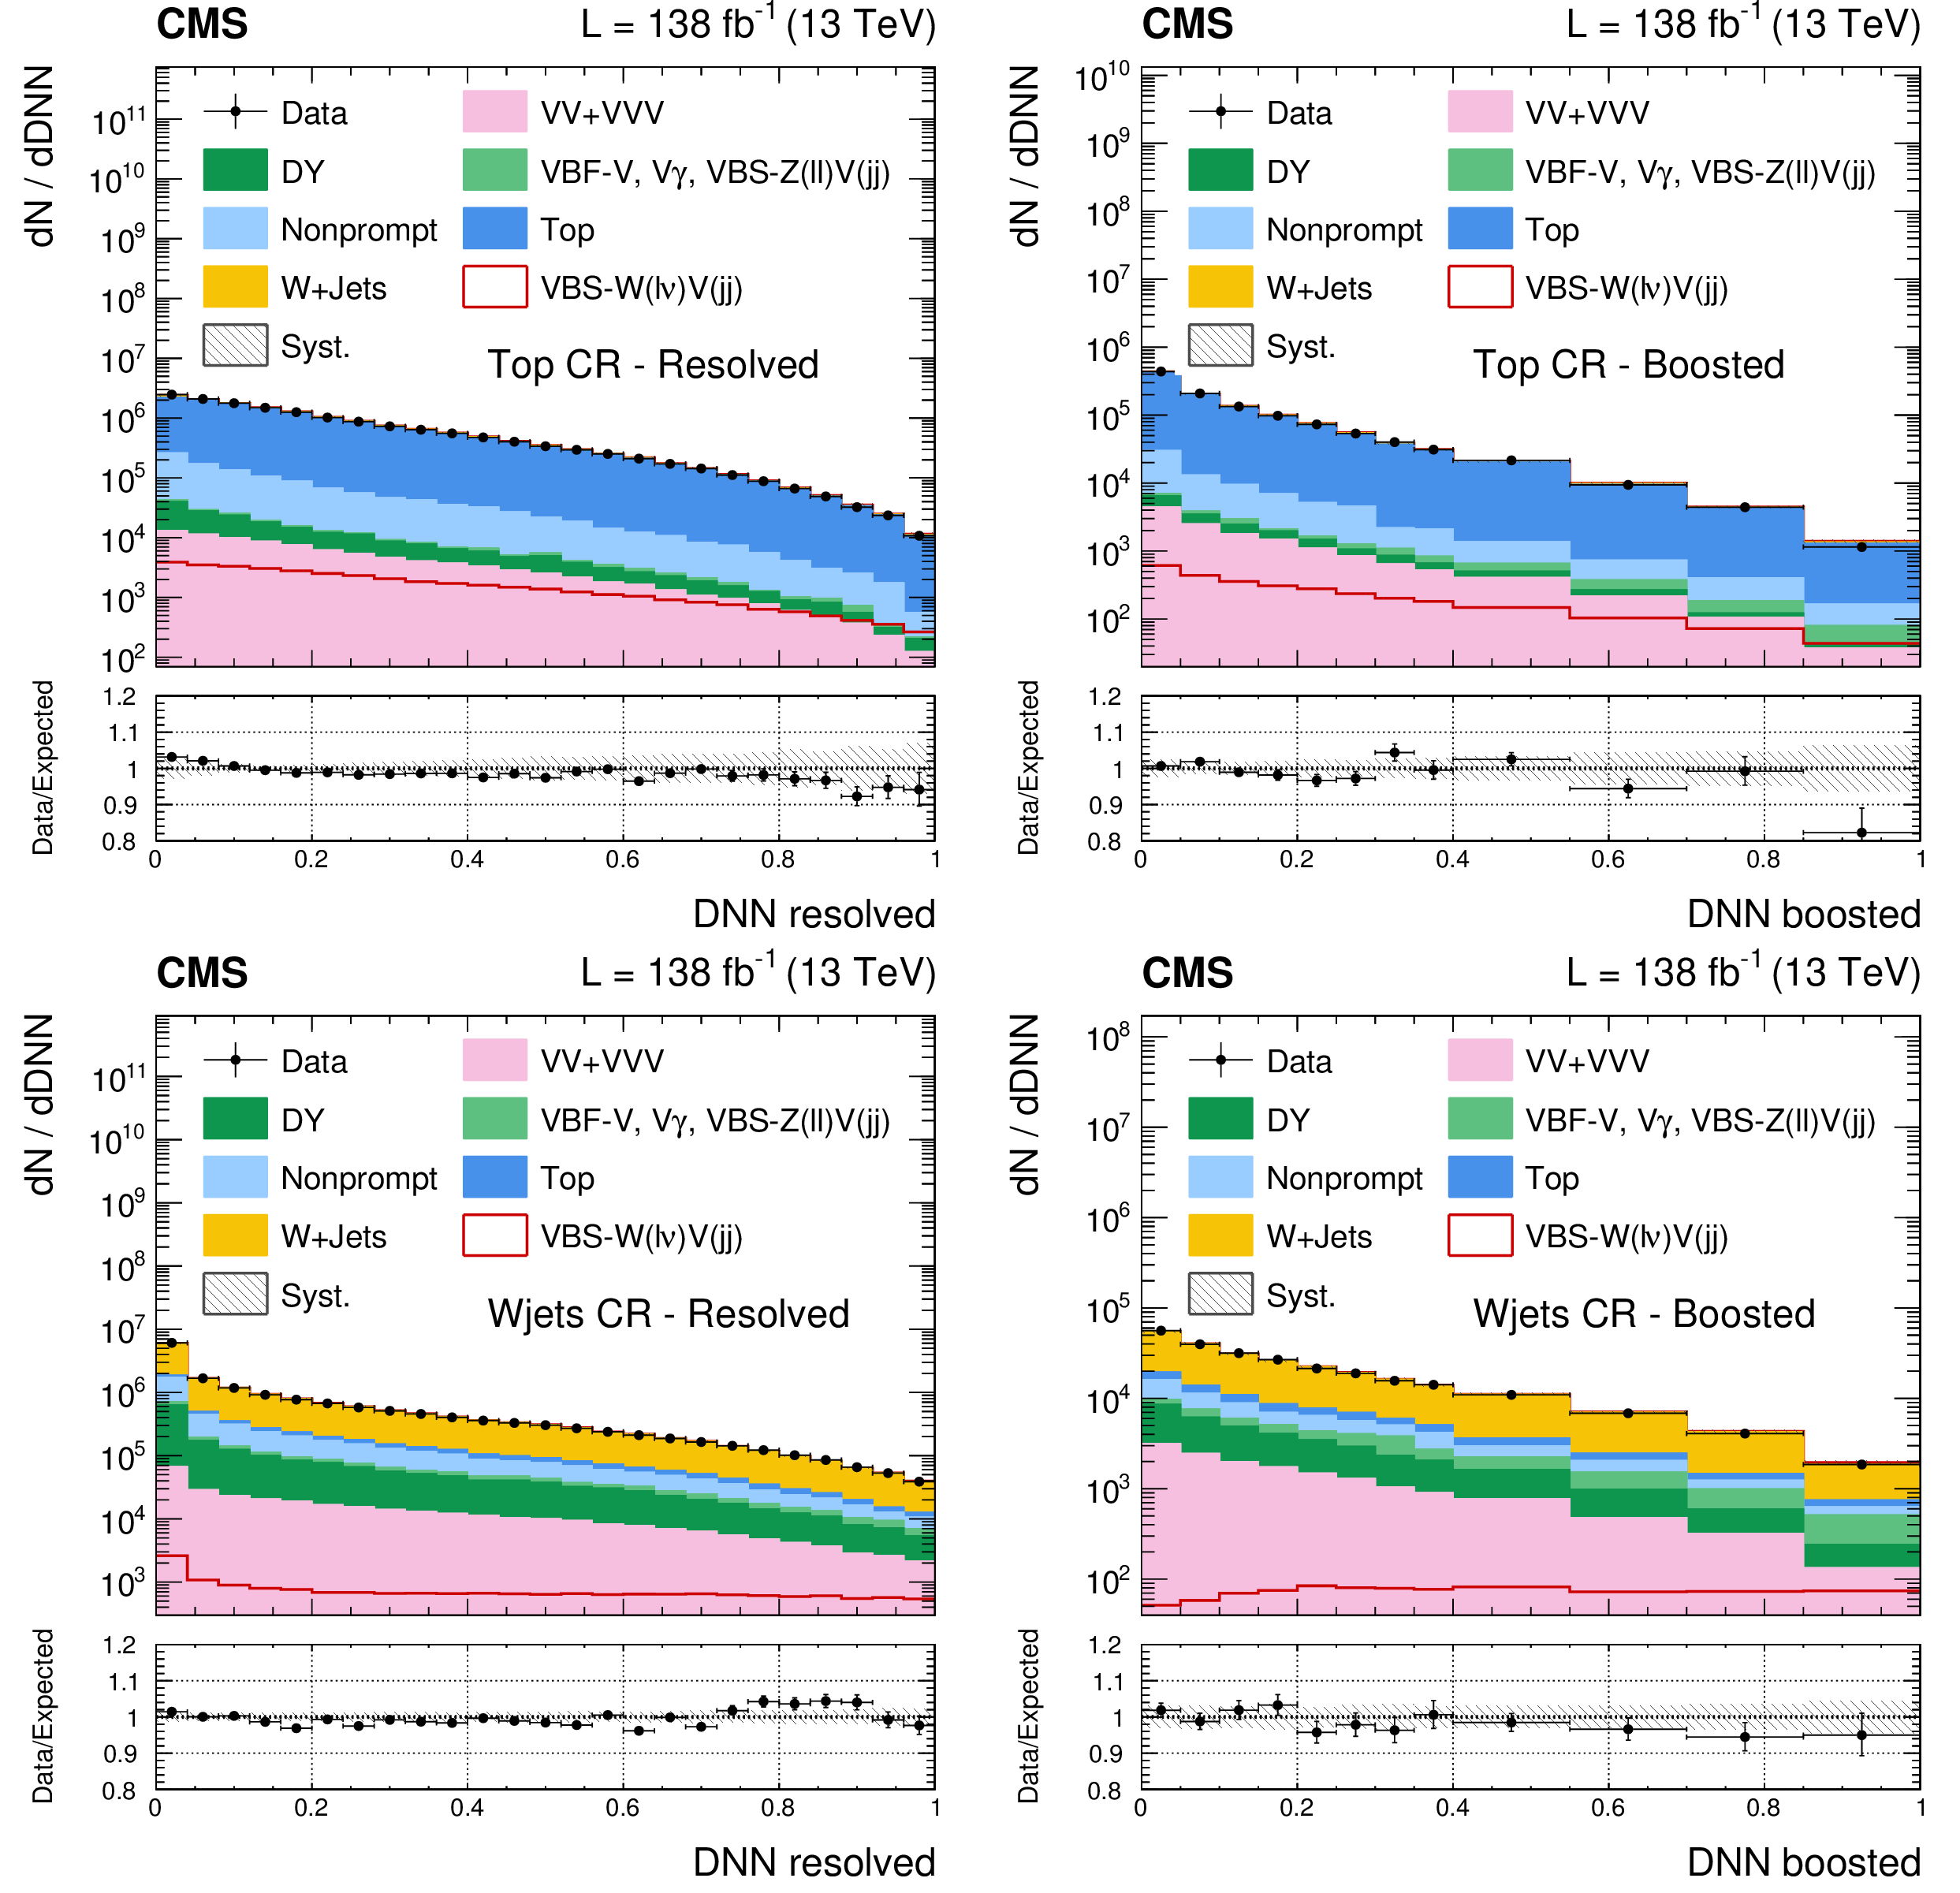
Figure 4:
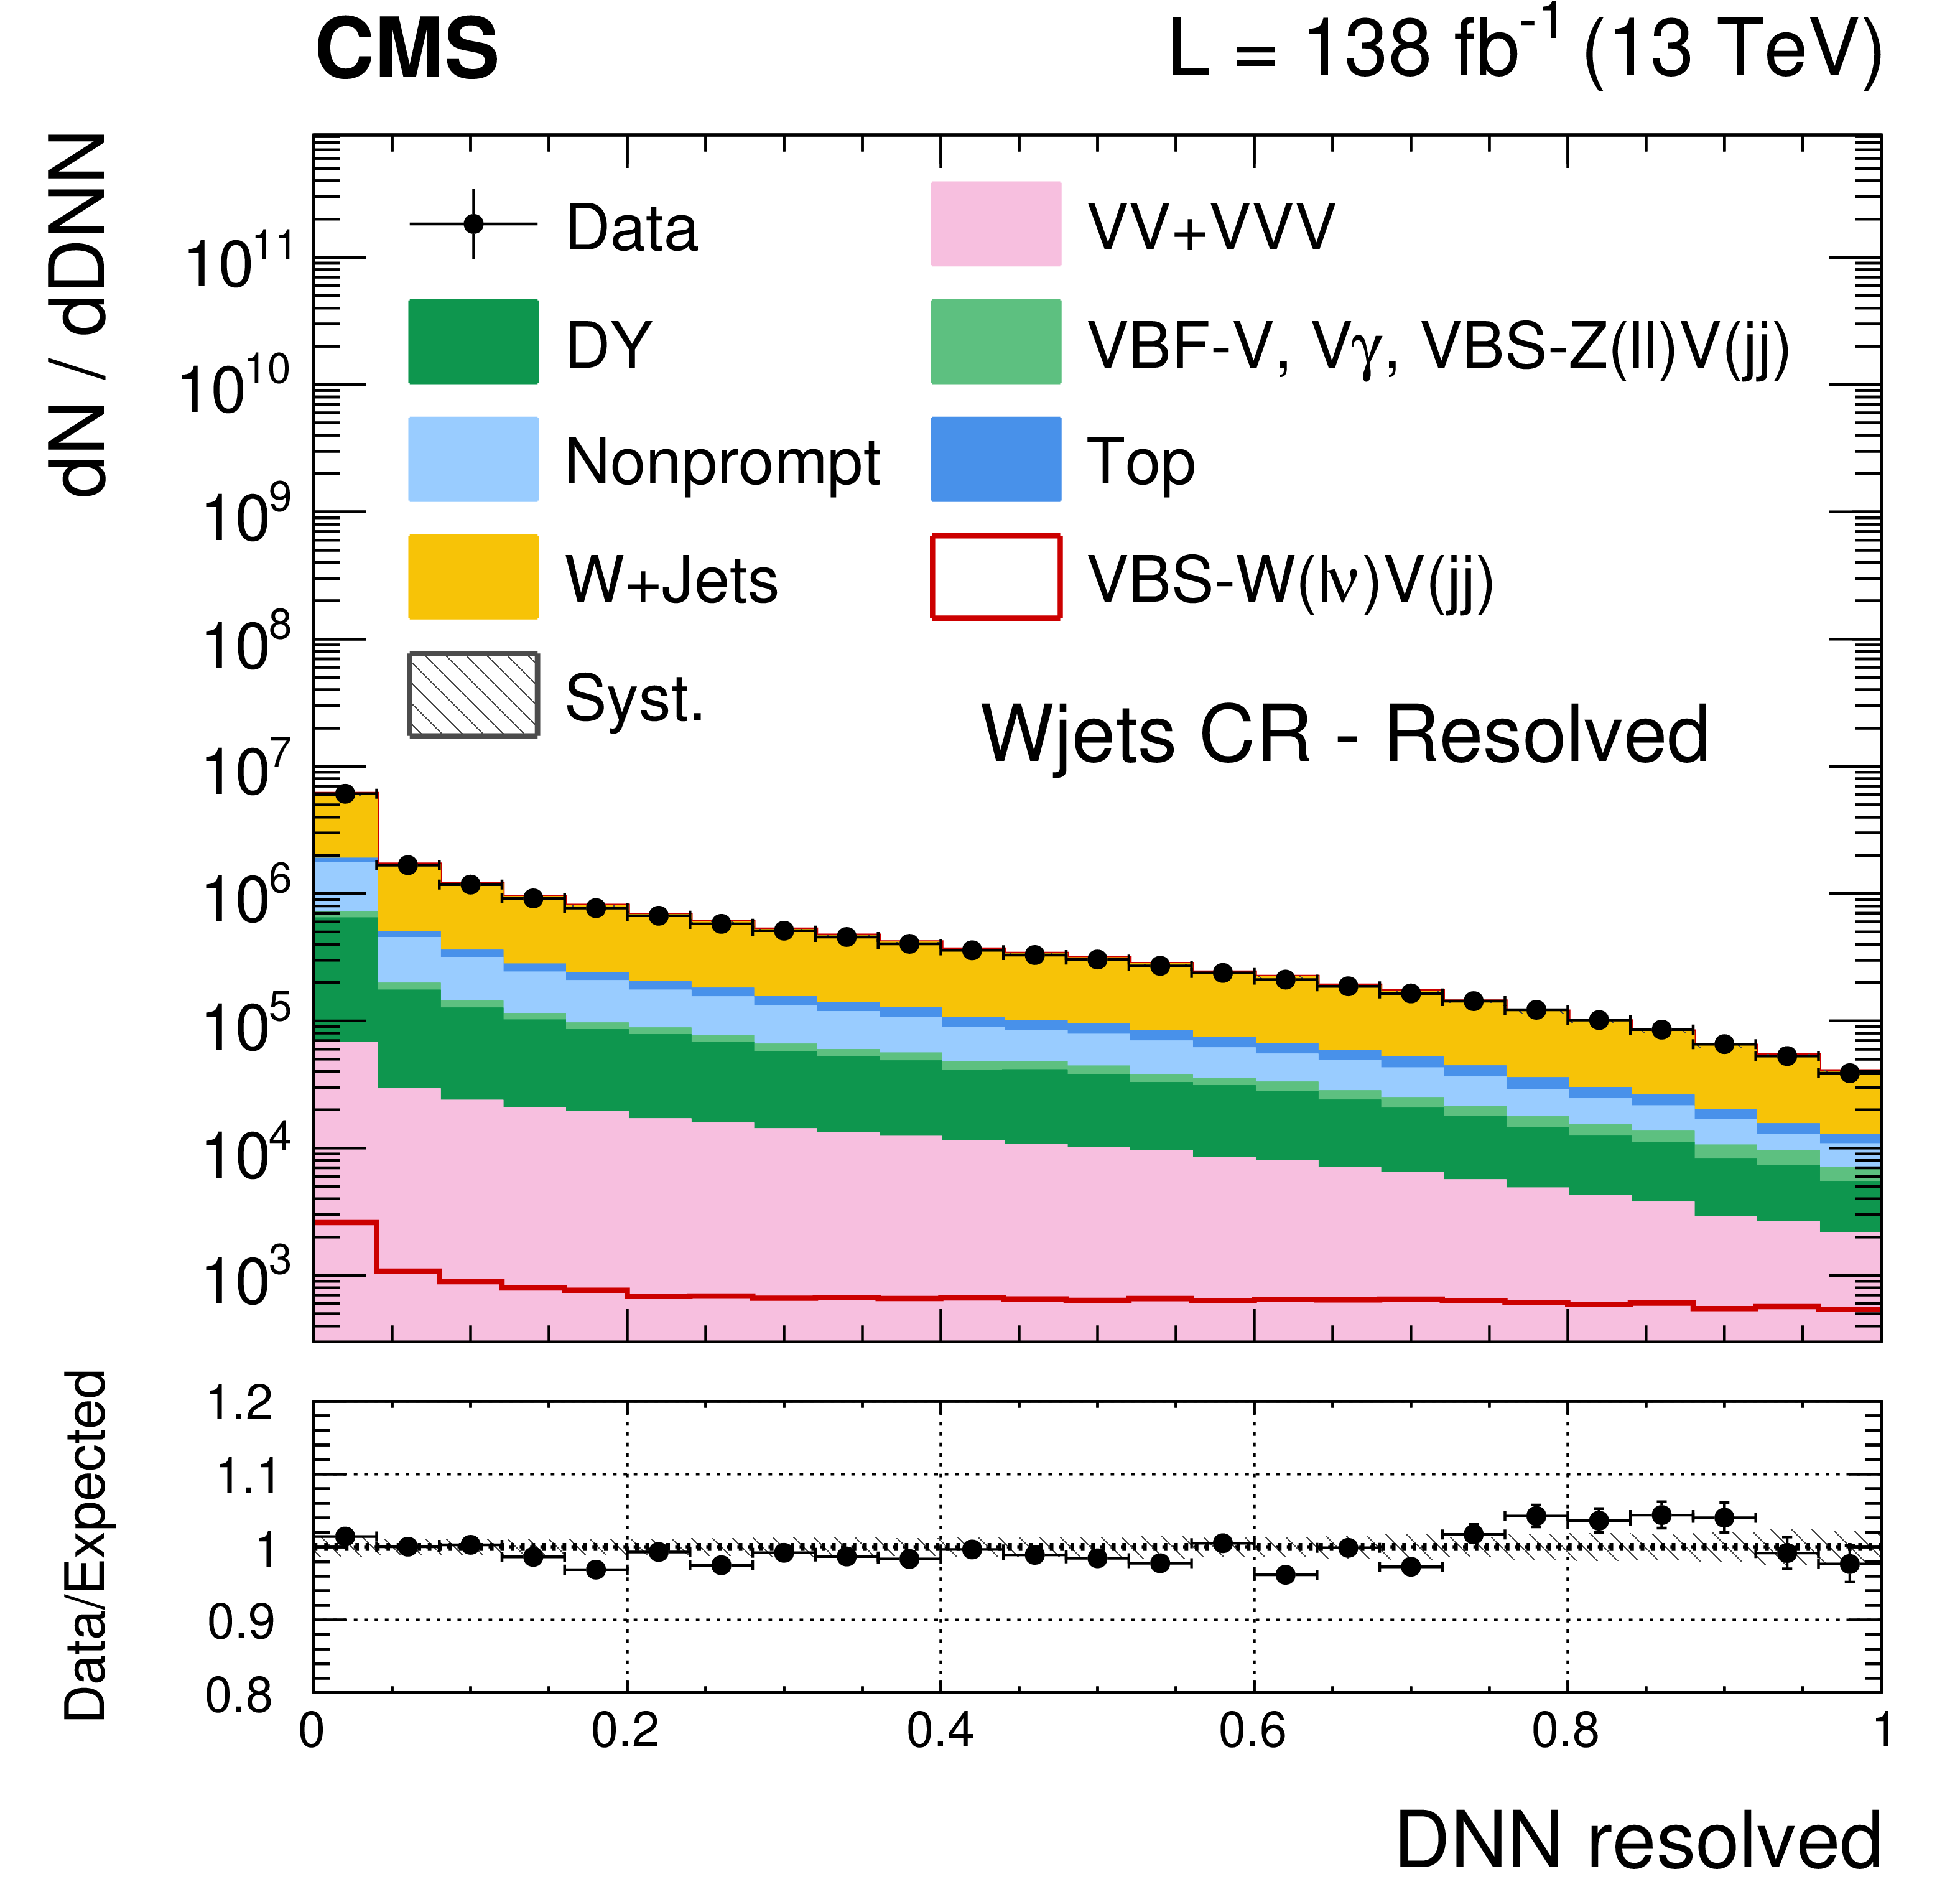
The DNN discriminator distribution for the resolved (left) and boosted (right) phase space region in the top quark (upper plots) and W+jets (lower plots) control regions. Vertical bars on data points show the statistical error, whereas the gray band is the post-fit uncertainty on MC with all systematic uncertainties included. |
png pdf |
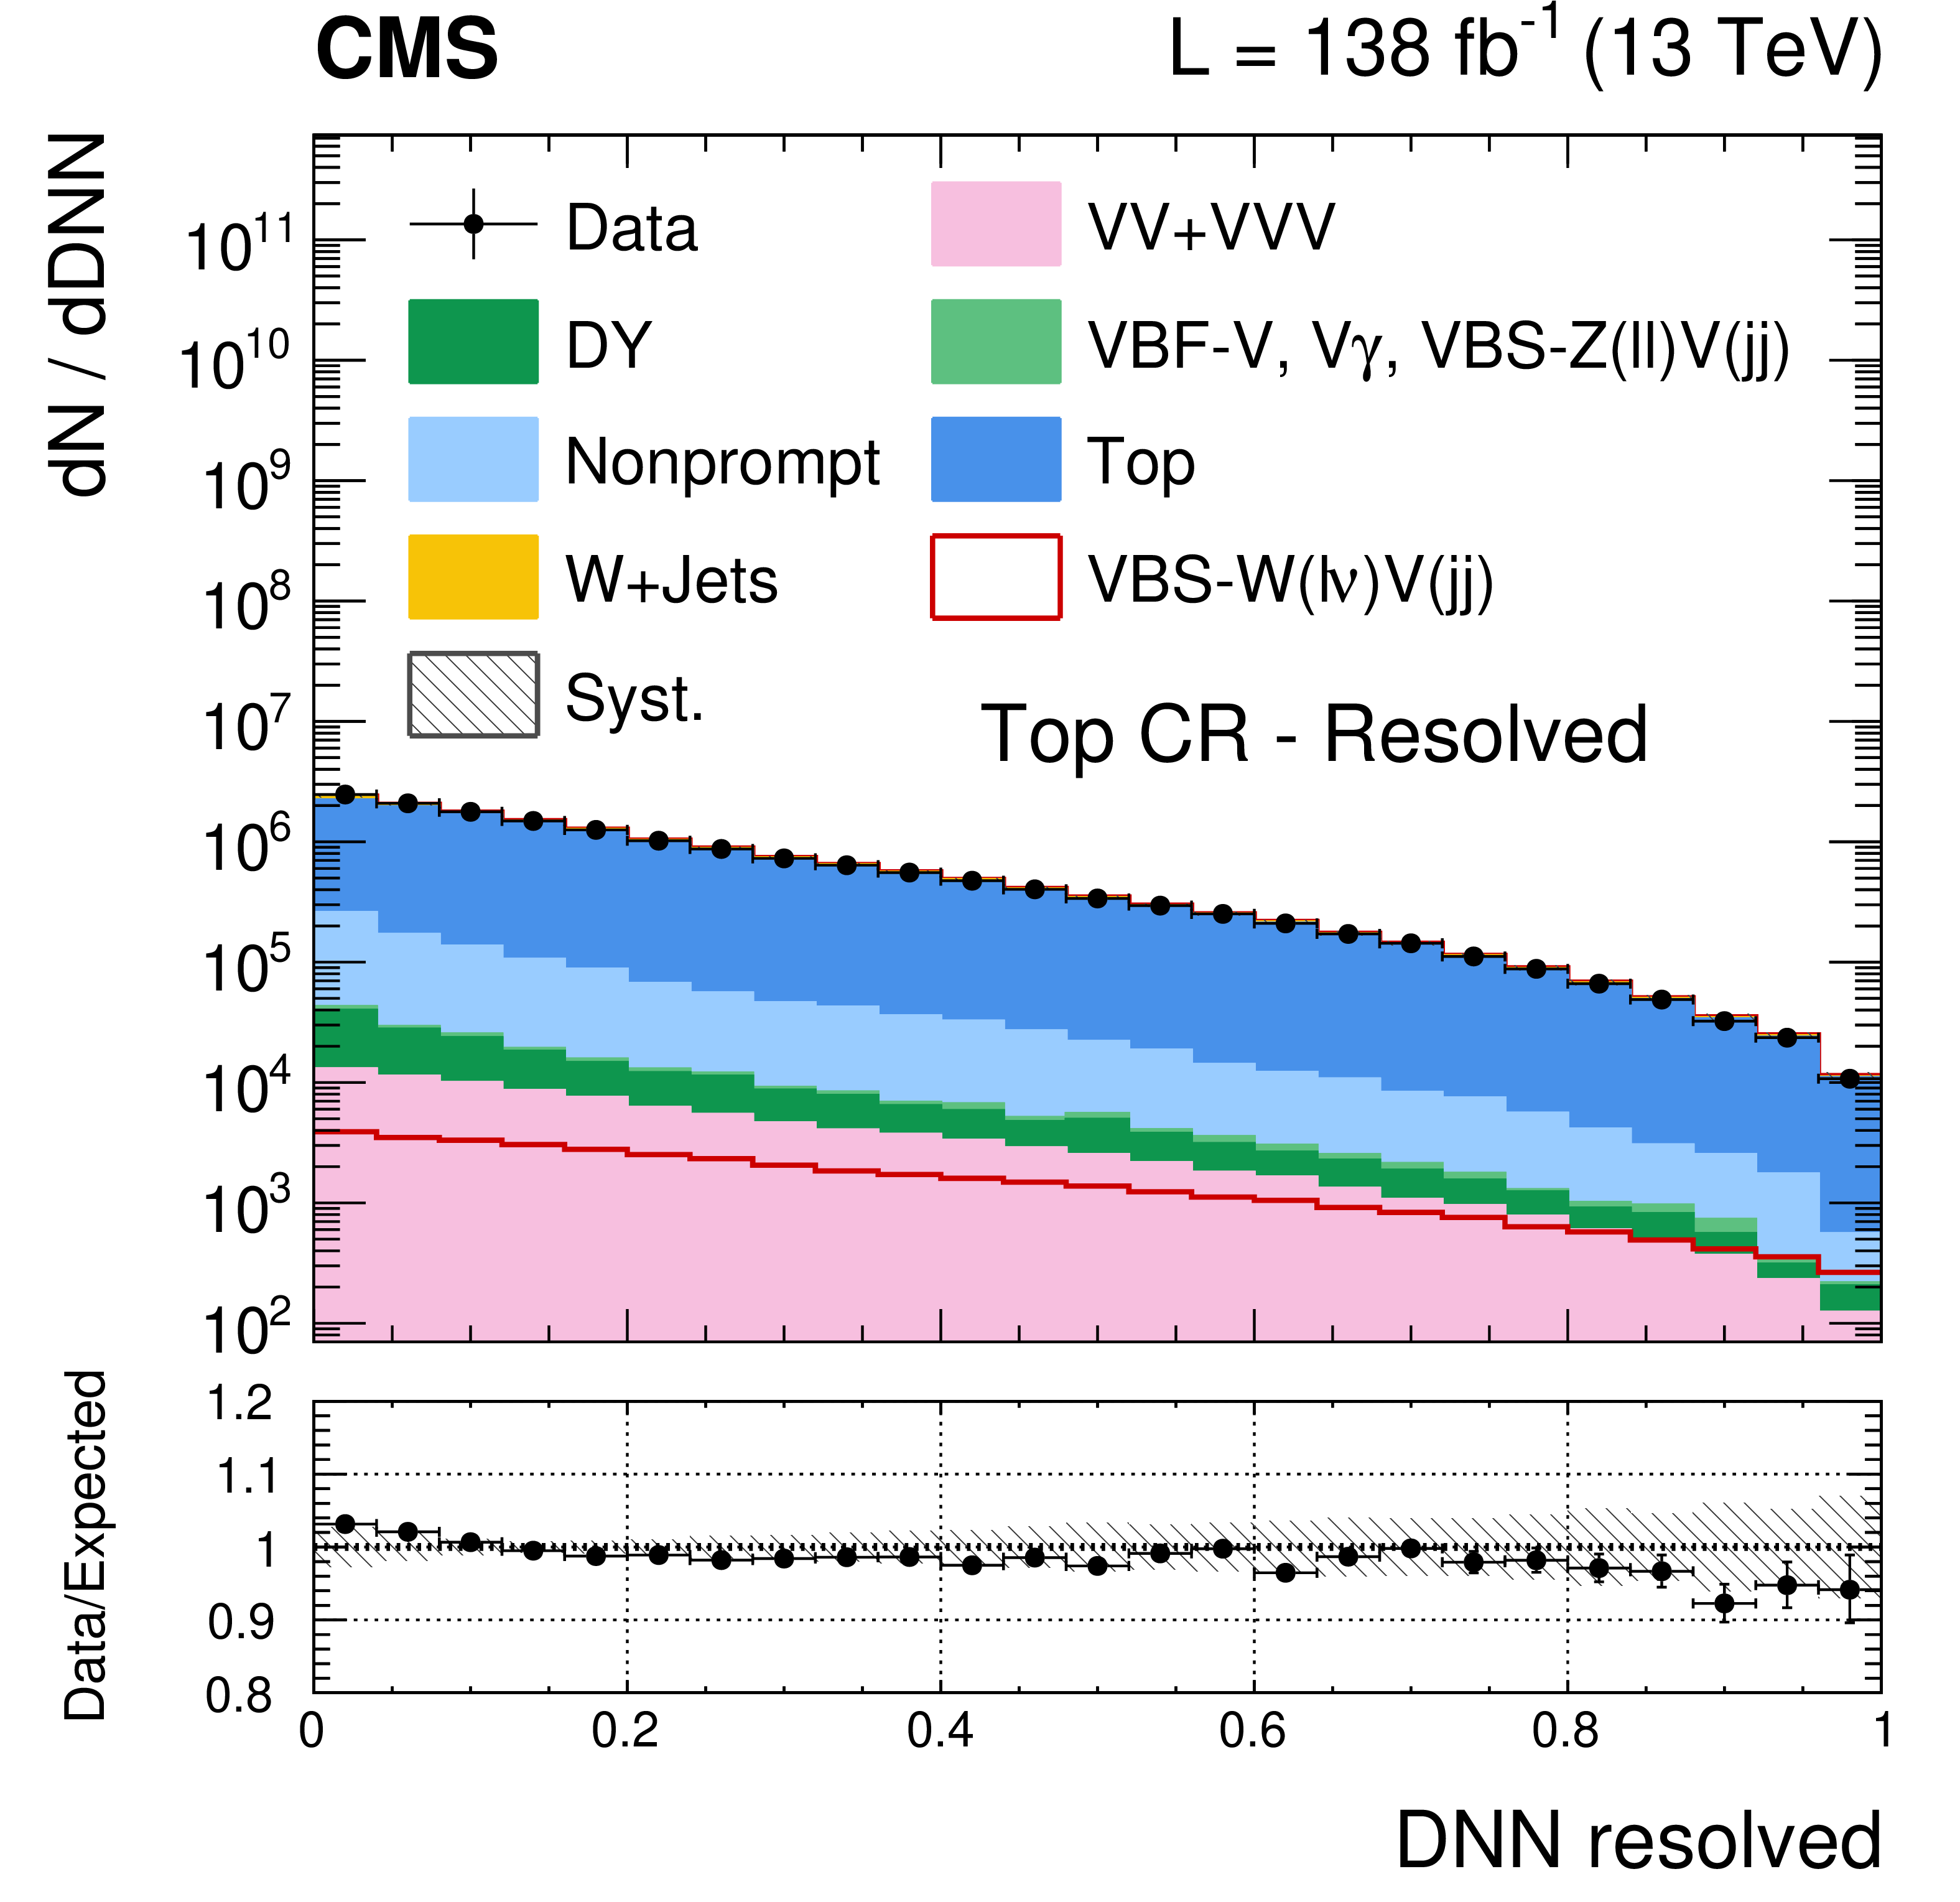
Figure 4-a:
The DNN discriminator distribution for the resolved phase space region in the top quark control region. Vertical bars on data points show the statistical error, whereas the gray band is the post-fit uncertainty on MC with all systematic uncertainties included. |
png pdf |
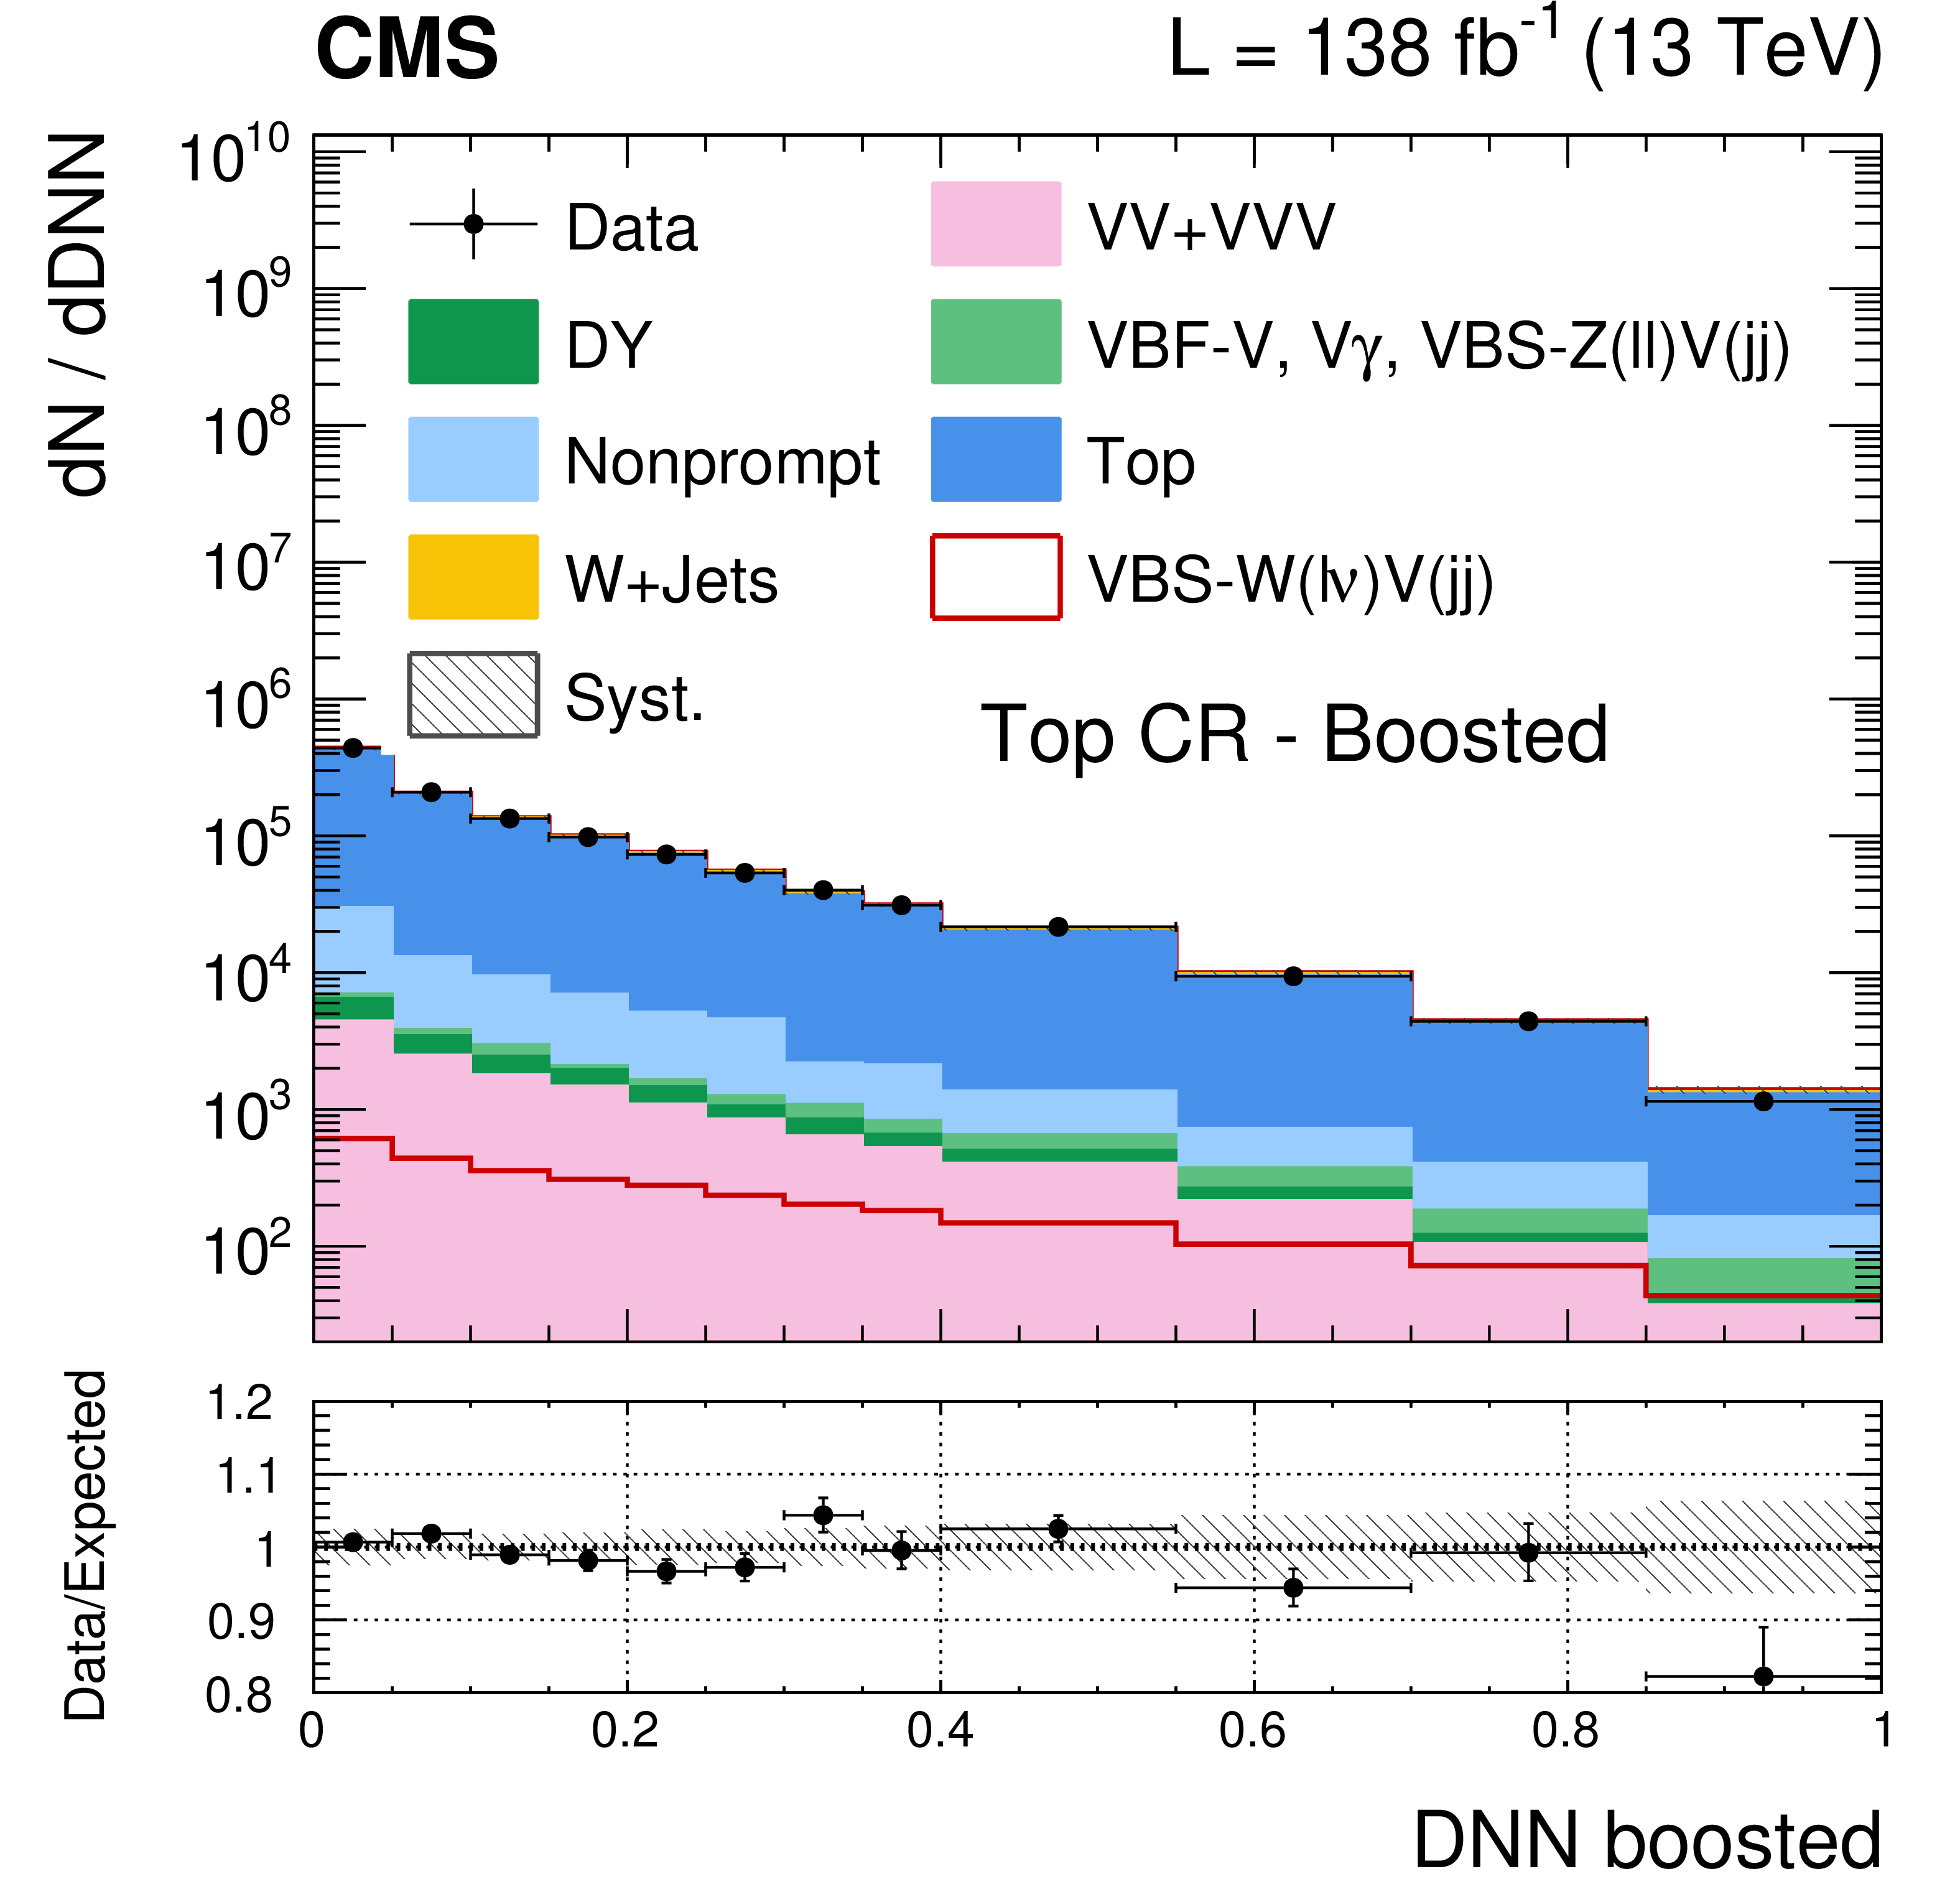
Figure 4-b:
The DNN discriminator distribution for the boosted phase space region in the top quark control region. Vertical bars on data points show the statistical error, whereas the gray band is the post-fit uncertainty on MC with all systematic uncertainties included. |
png pdf |
Figure 4-c:
The DNN discriminator distribution for the resolved phase space region in the W+jets control region. Vertical bars on data points show the statistical error, whereas the gray band is the post-fit uncertainty on MC with all systematic uncertainties included. |
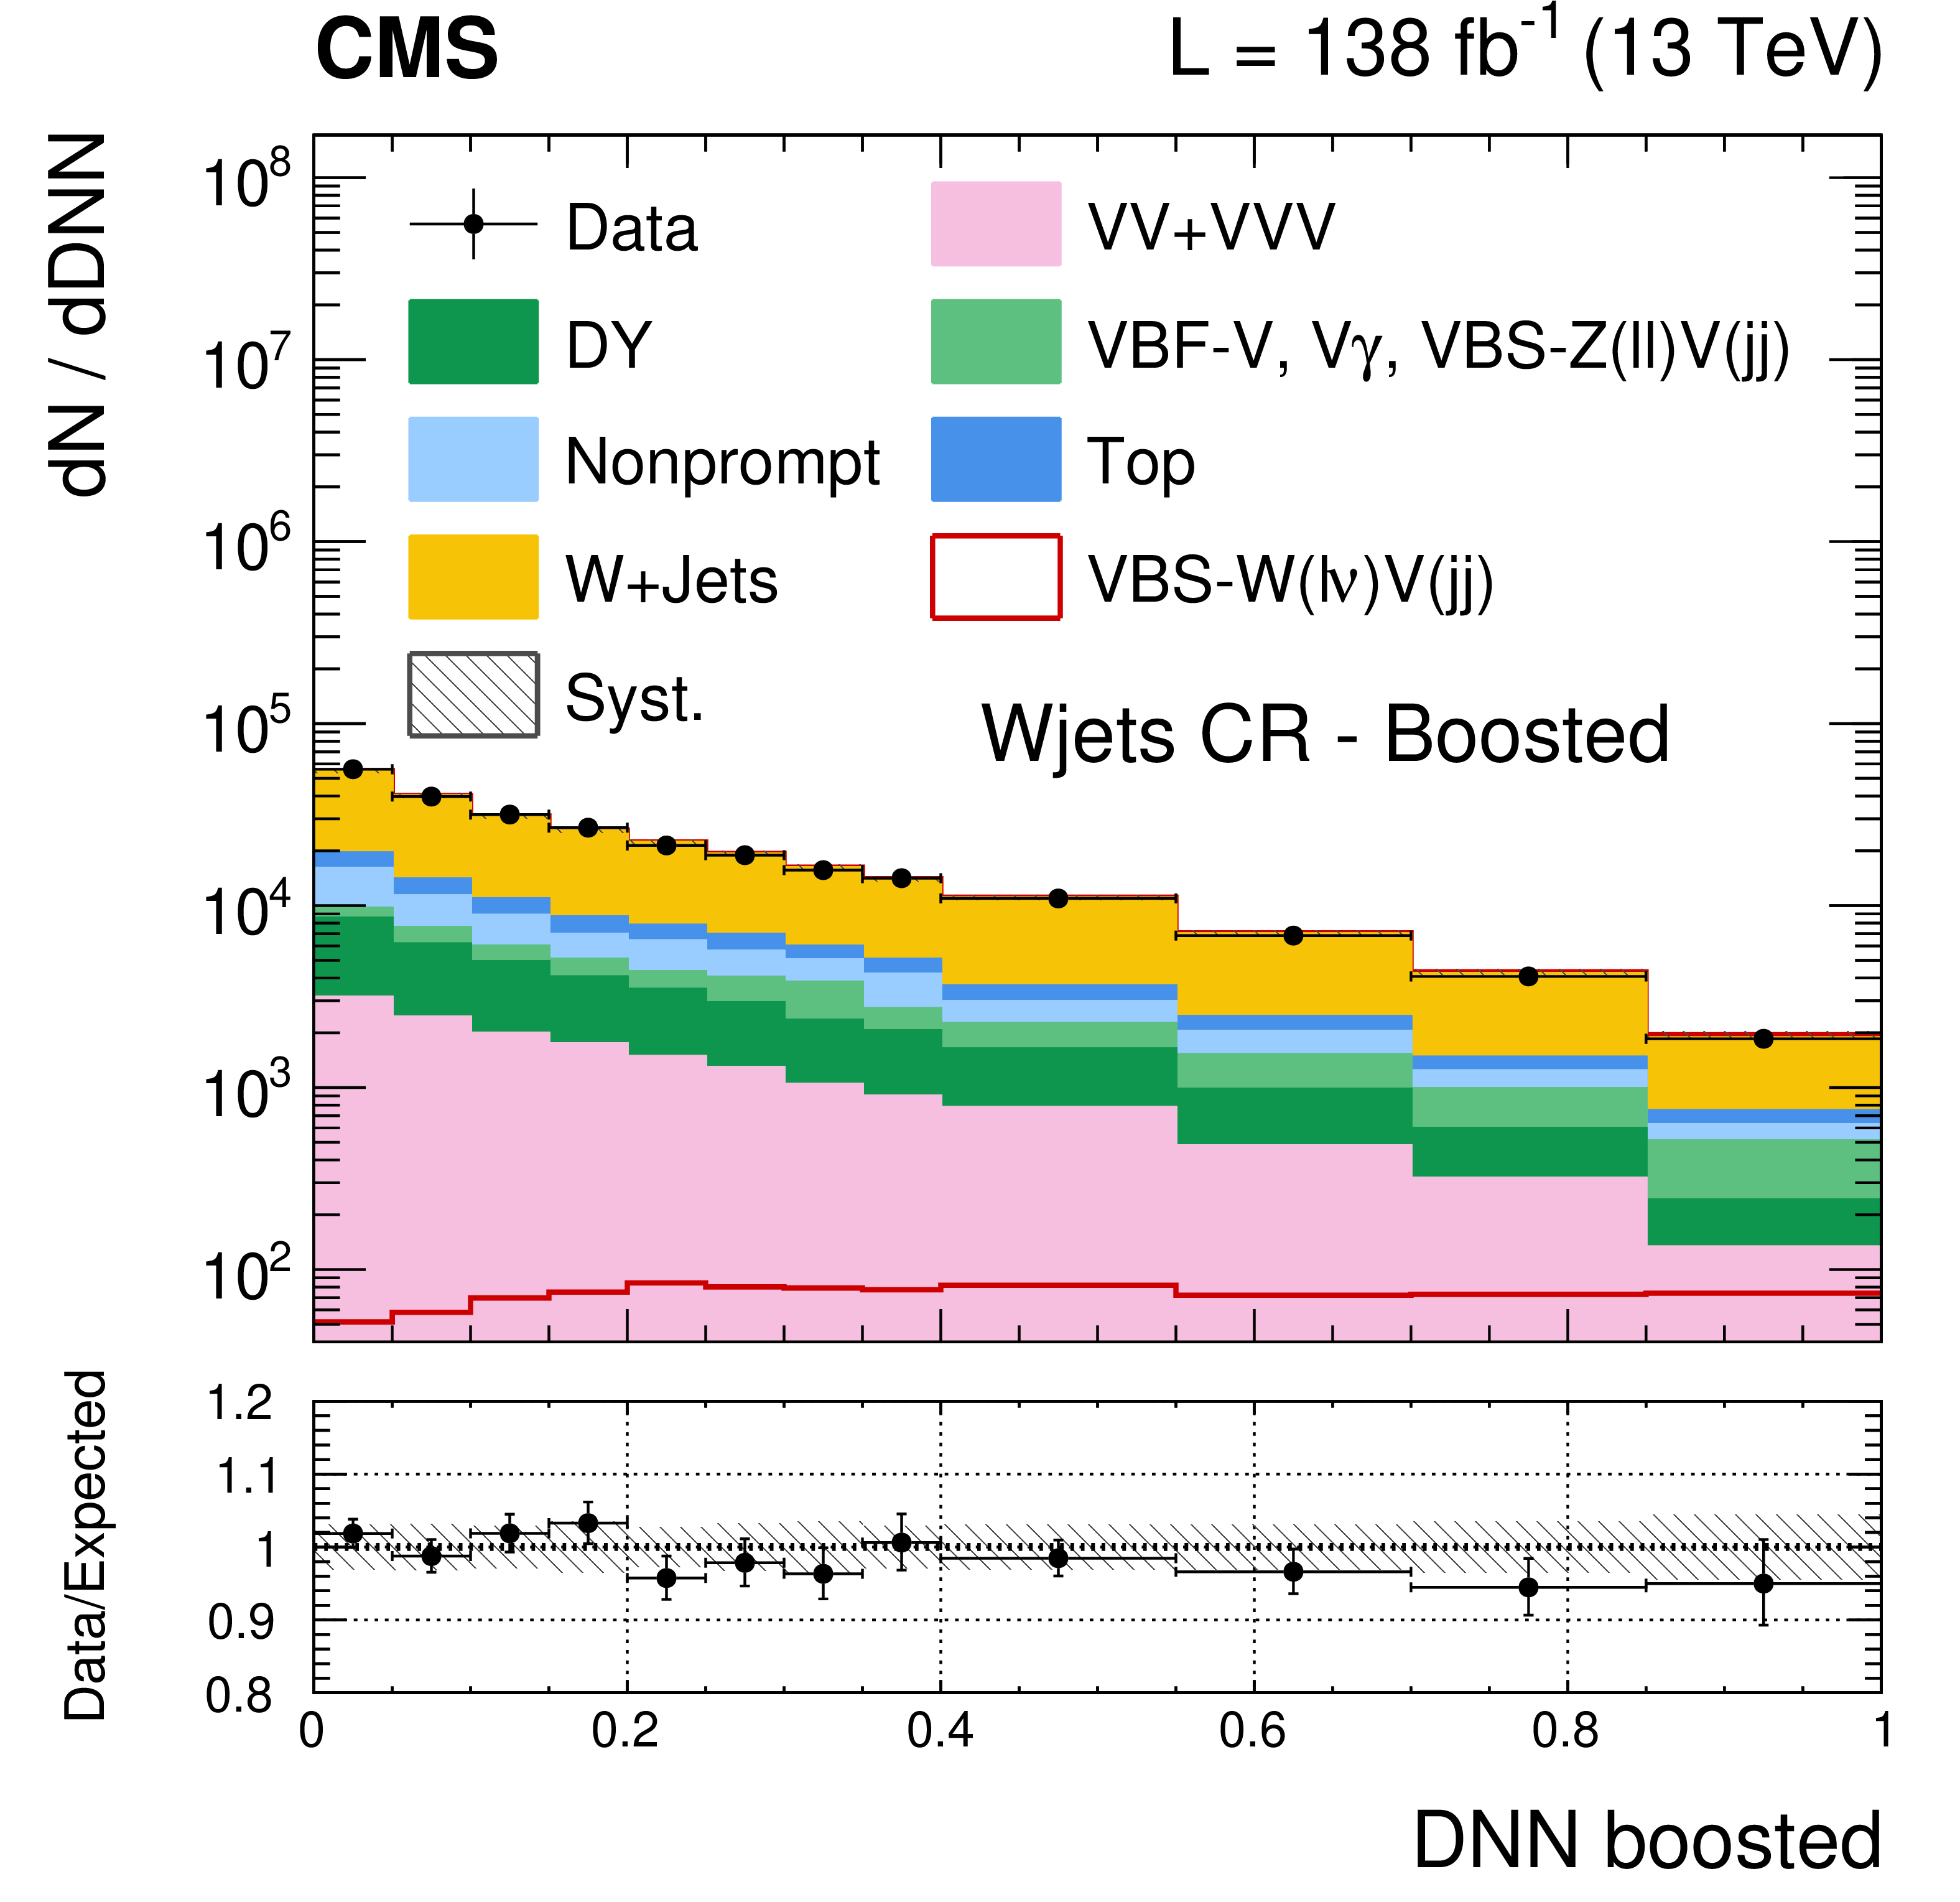
png pdf |
Figure 4-d:
The DNN discriminator distribution for the boosted phase space region in the W+jets control region. Vertical bars on data points show the statistical error, whereas the gray band is the post-fit uncertainty on MC with all systematic uncertainties included. |
png pdf |
Figure 5:
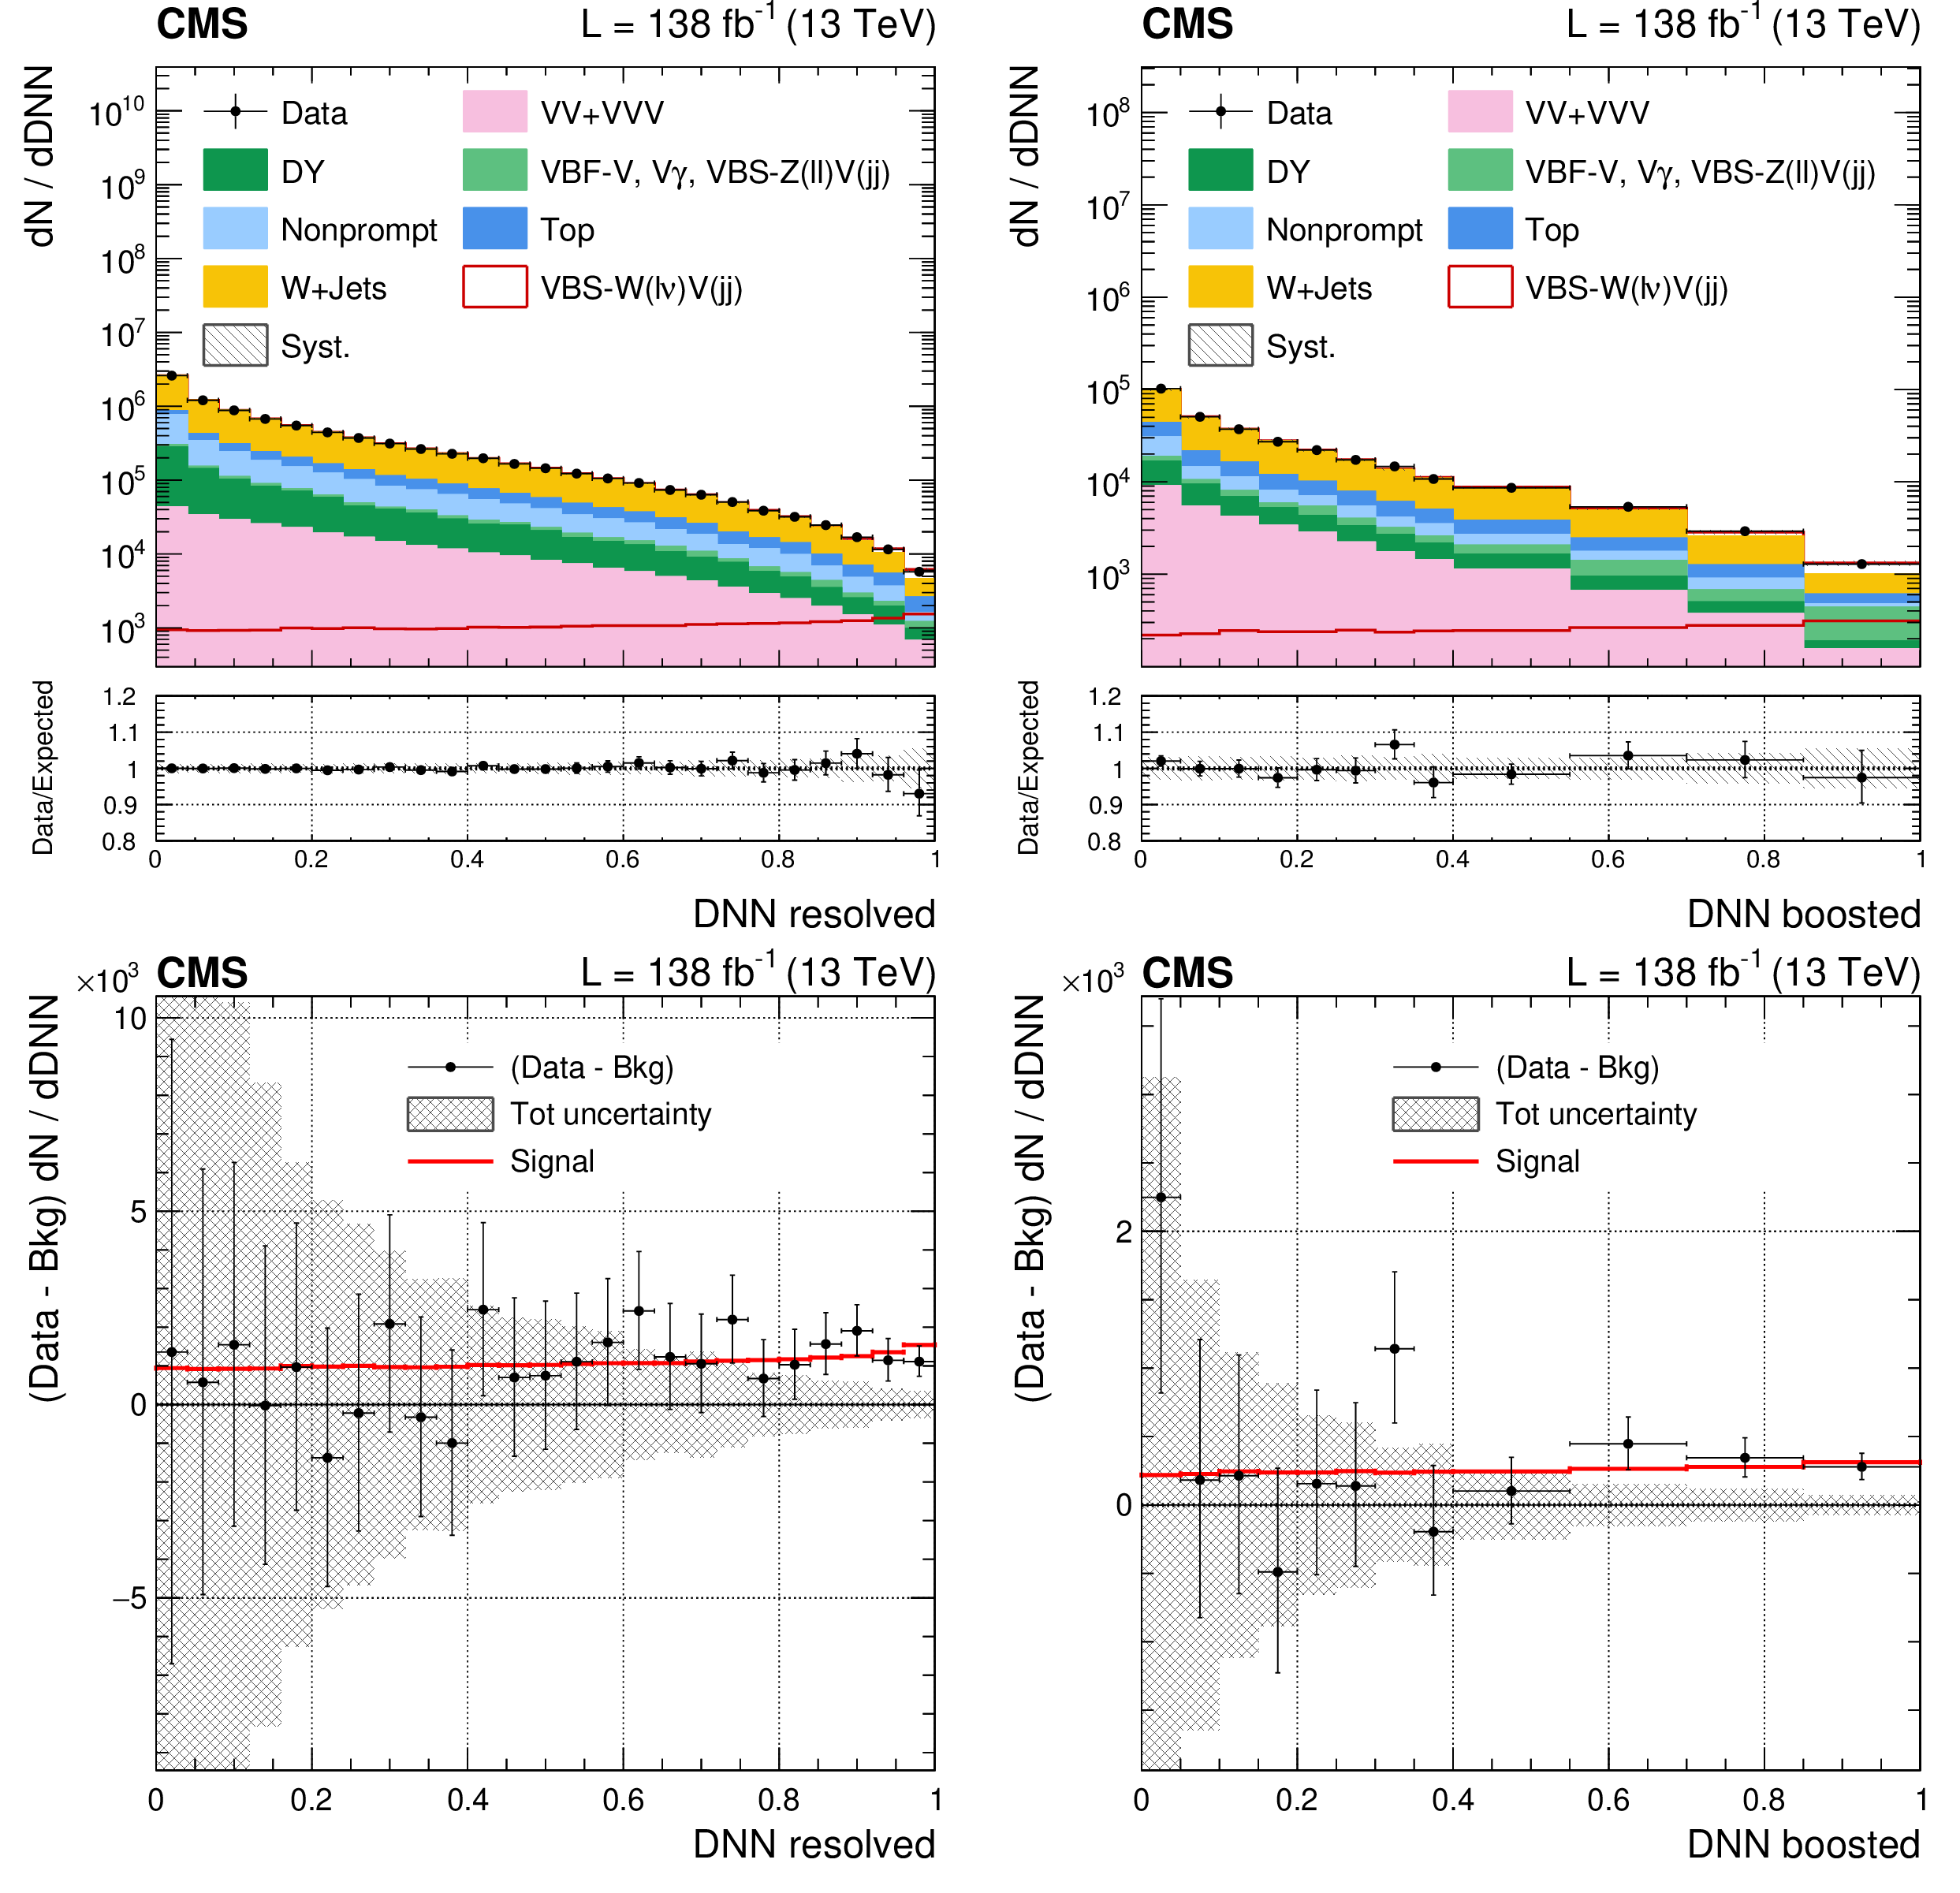
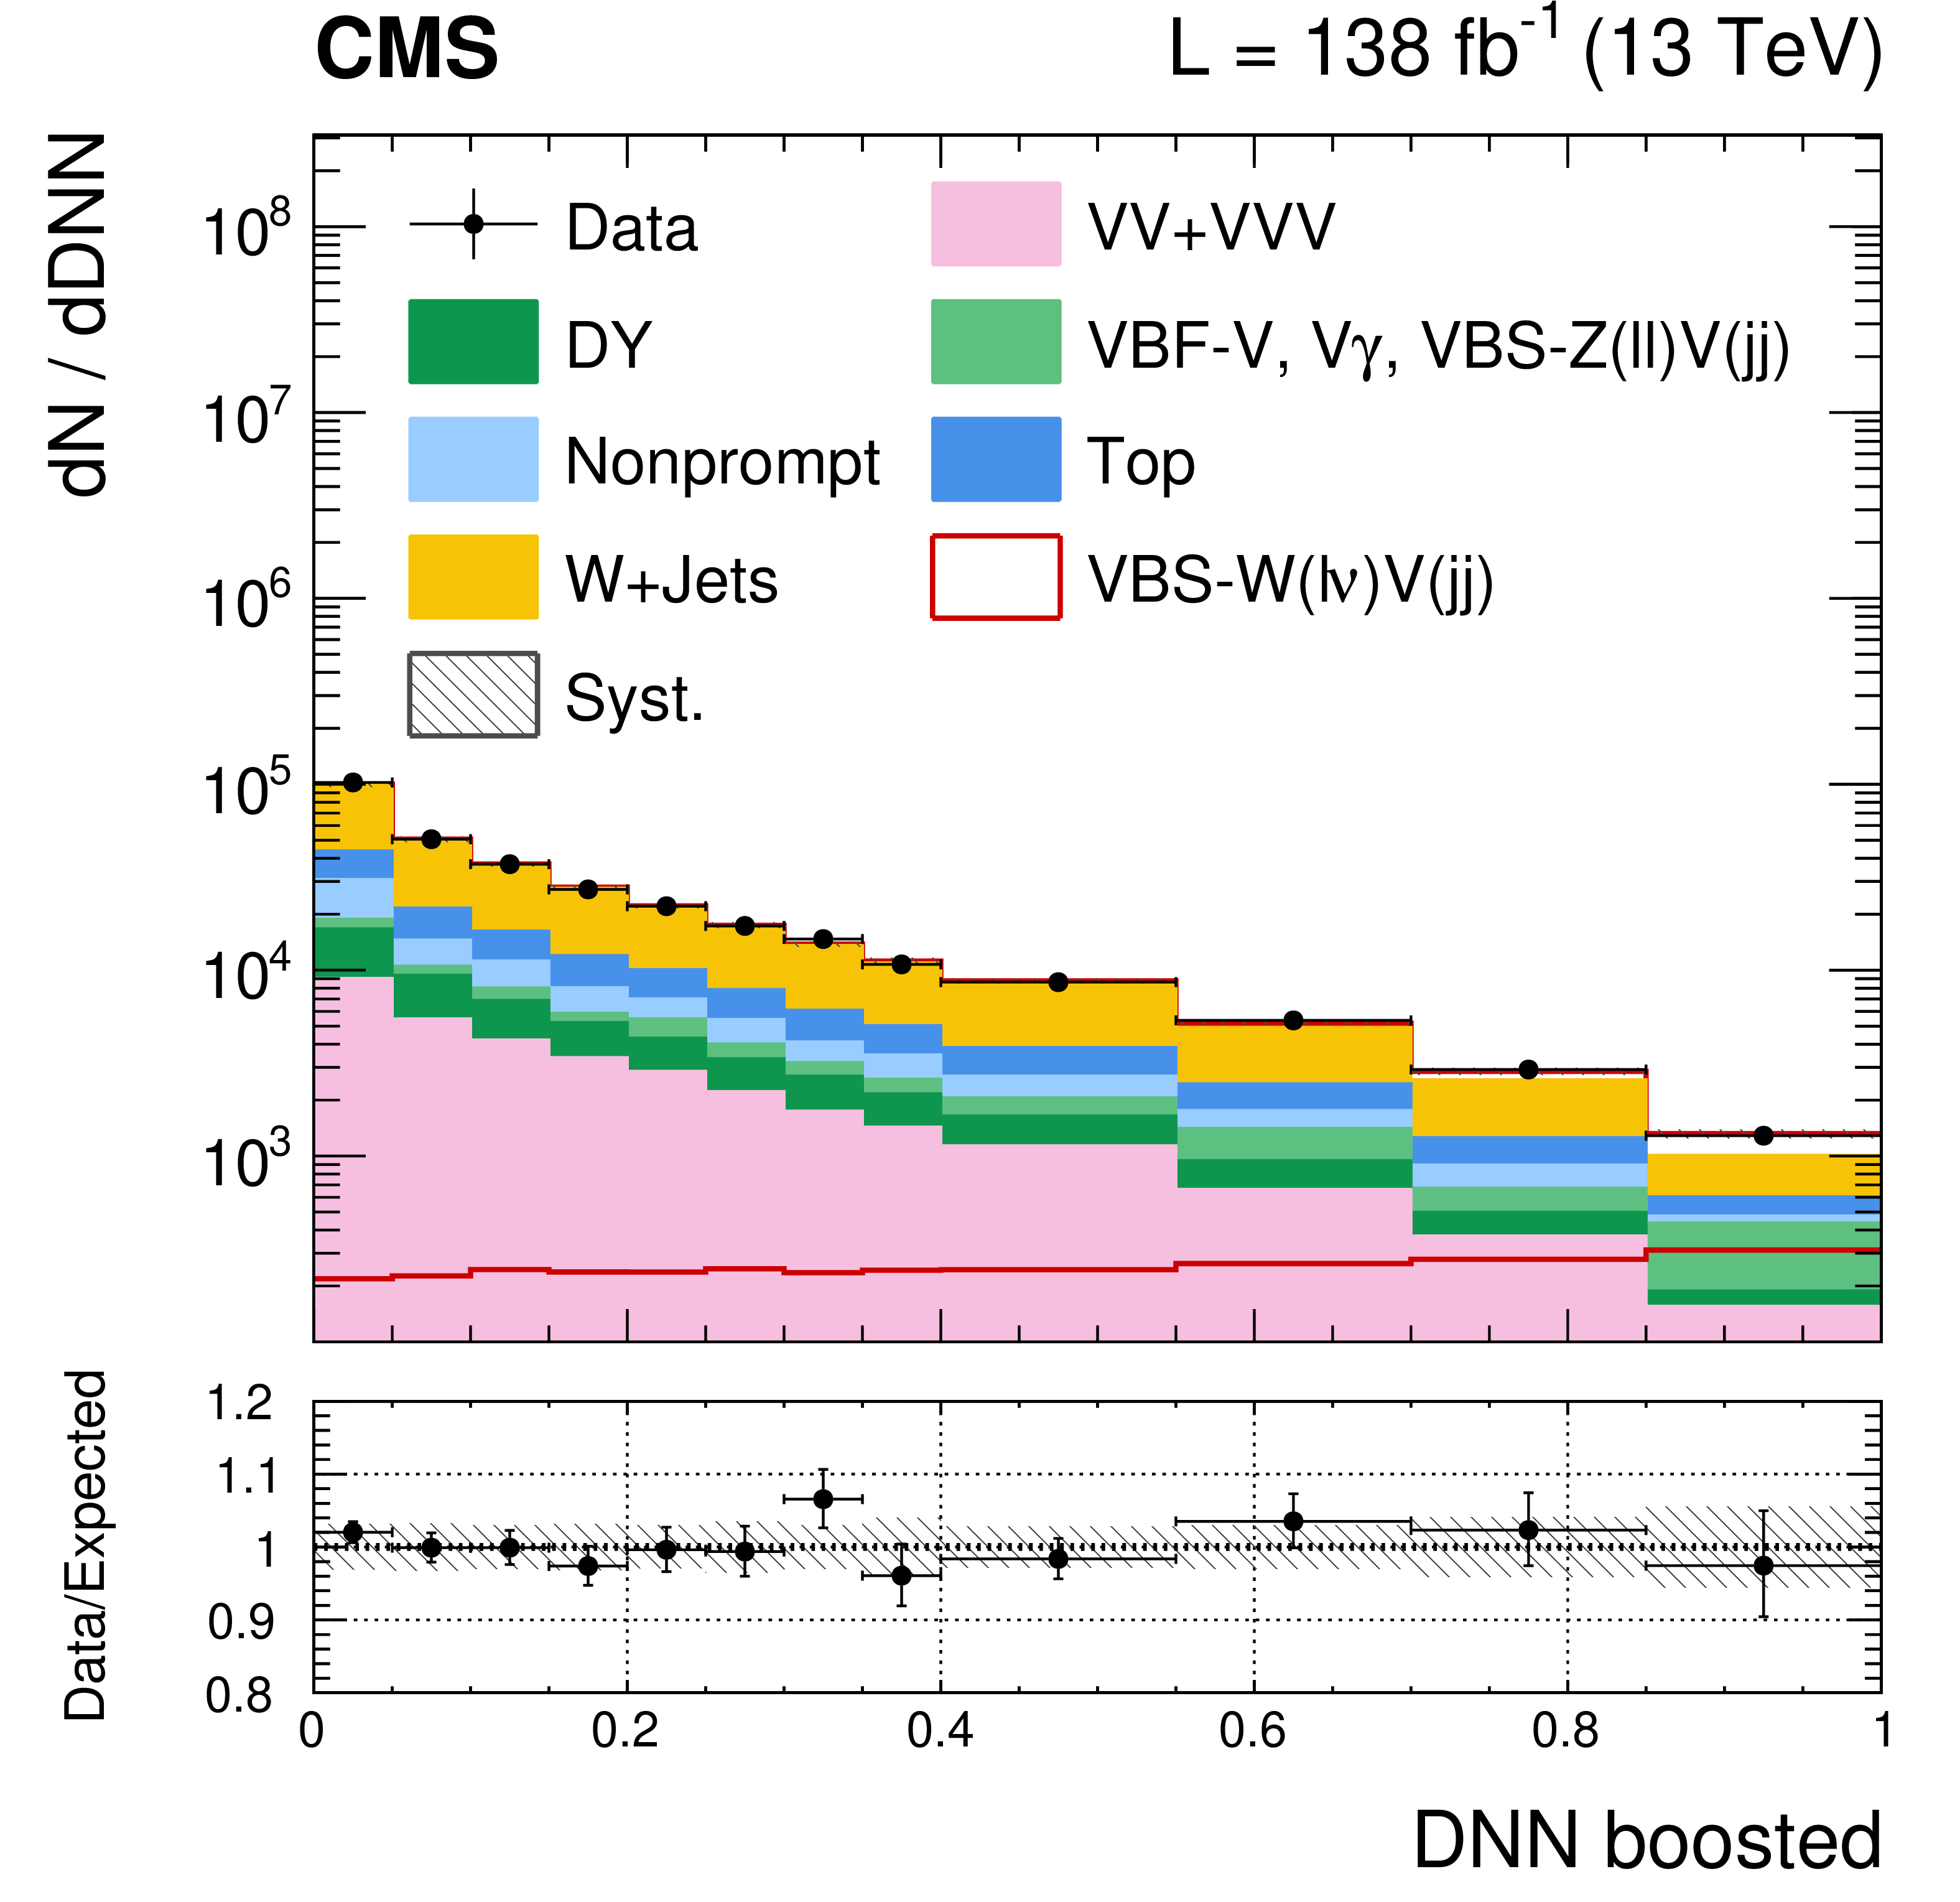
Results for the EW-signal-only fit, keeping the QCD WV contribution fixed to the SM prediction. Upper plots: post-fit DNN discriminator distributions for the resolved (left) and the boosted (right) signal regions. The signal contribution is plotted both stacked on top of the background processes and also overlaid to show the signal postfit distribution. The expected yield is the sum of signal and background. Lower plots: background-subtracted DNN discriminator distribution for the resolved (left) and the boosted (right) categories. Post-fit background yields in each bin are subtracted from data and compared with the signal post-fit distribution, plotted as a red line. Vertical bars on data points show the statistical error, whereas the gray band is the post-fit uncertainty on MC with all systematic uncertainties included. |

png pdf |
Figure 5-a:
Results for the EW-signal-only fit, keeping the QCD WV contribution fixed to the SM prediction: post-fit DNN discriminator distributions for the resolved signal region. The signal contribution is plotted both stacked on top of the background processes and also overlaid to show the signal postfit distribution. The expected yield is the sum of signal and background. |
png pdf |
Figure 5-b:
Results for the EW-signal-only fit, keeping the QCD WV contribution fixed to the SM prediction: post-fit DNN discriminator distributions for the boosted signal region. The signal contribution is plotted both stacked on top of the background processes and also overlaid to show the signal postfit distribution. The expected yield is the sum of signal and background. |

png pdf |
Figure 5-c:
Results for the EW-signal-only fit, keeping the QCD WV contribution fixed to the SM prediction: background-subtracted DNN discriminator distribution for the resolved category. Post-fit background yields in each bin are subtracted from data and compared with the signal post-fit distribution, plotted as a red line. Vertical bars on data points show the statistical error, whereas the gray band is the post-fit uncertainty on MC with all systematic uncertainties included. |

png pdf |
Figure 5-d:
Results for the EW-signal-only fit, keeping the QCD WV contribution fixed to the SM prediction: background-subtracted DNN discriminator distribution for the boosted category. Post-fit background yields in each bin are subtracted from data and compared with the signal post-fit distribution, plotted as a red line. Vertical bars on data points show the statistical error, whereas the gray band is the post-fit uncertainty on MC with all systematic uncertainties included. |
png pdf |
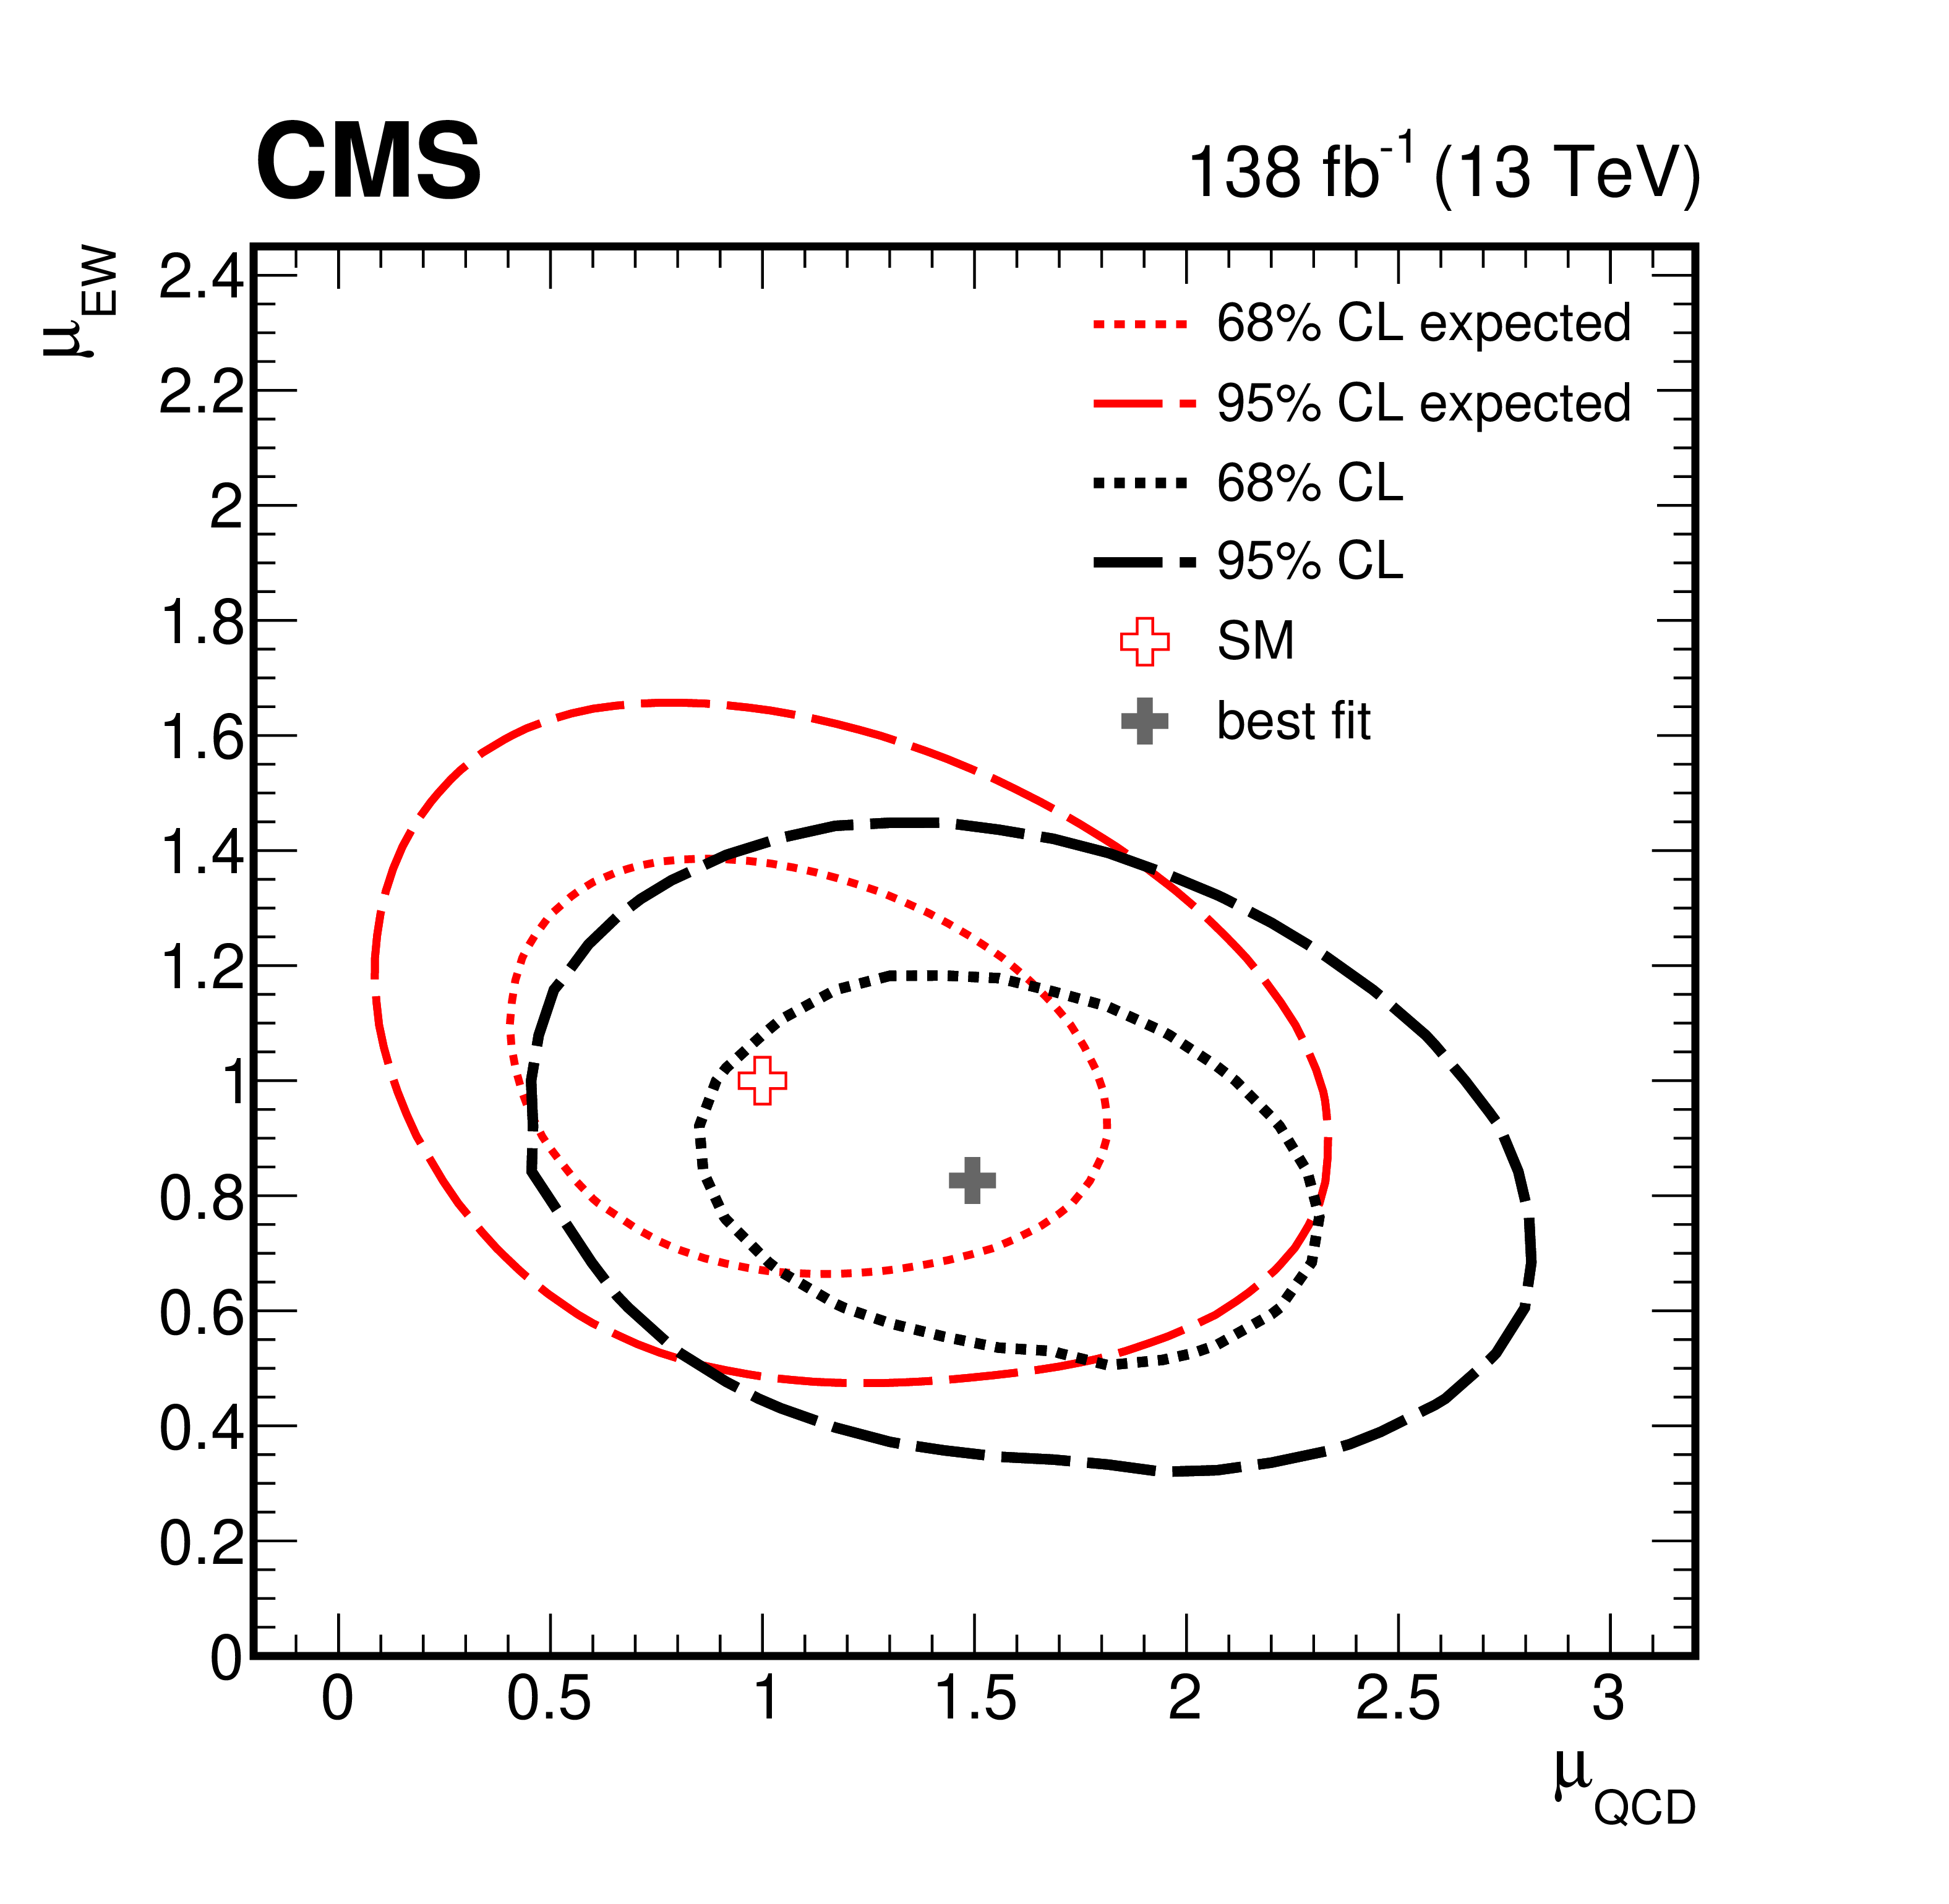
Figure 6:
Simultaneous EW and QCD WV production fit: the expected and observed 68 and 95% CL contours on the signal strengths. The best fit result is compatible with the SM prediction within the 68% CL area. |
| Tables | |
png pdf |
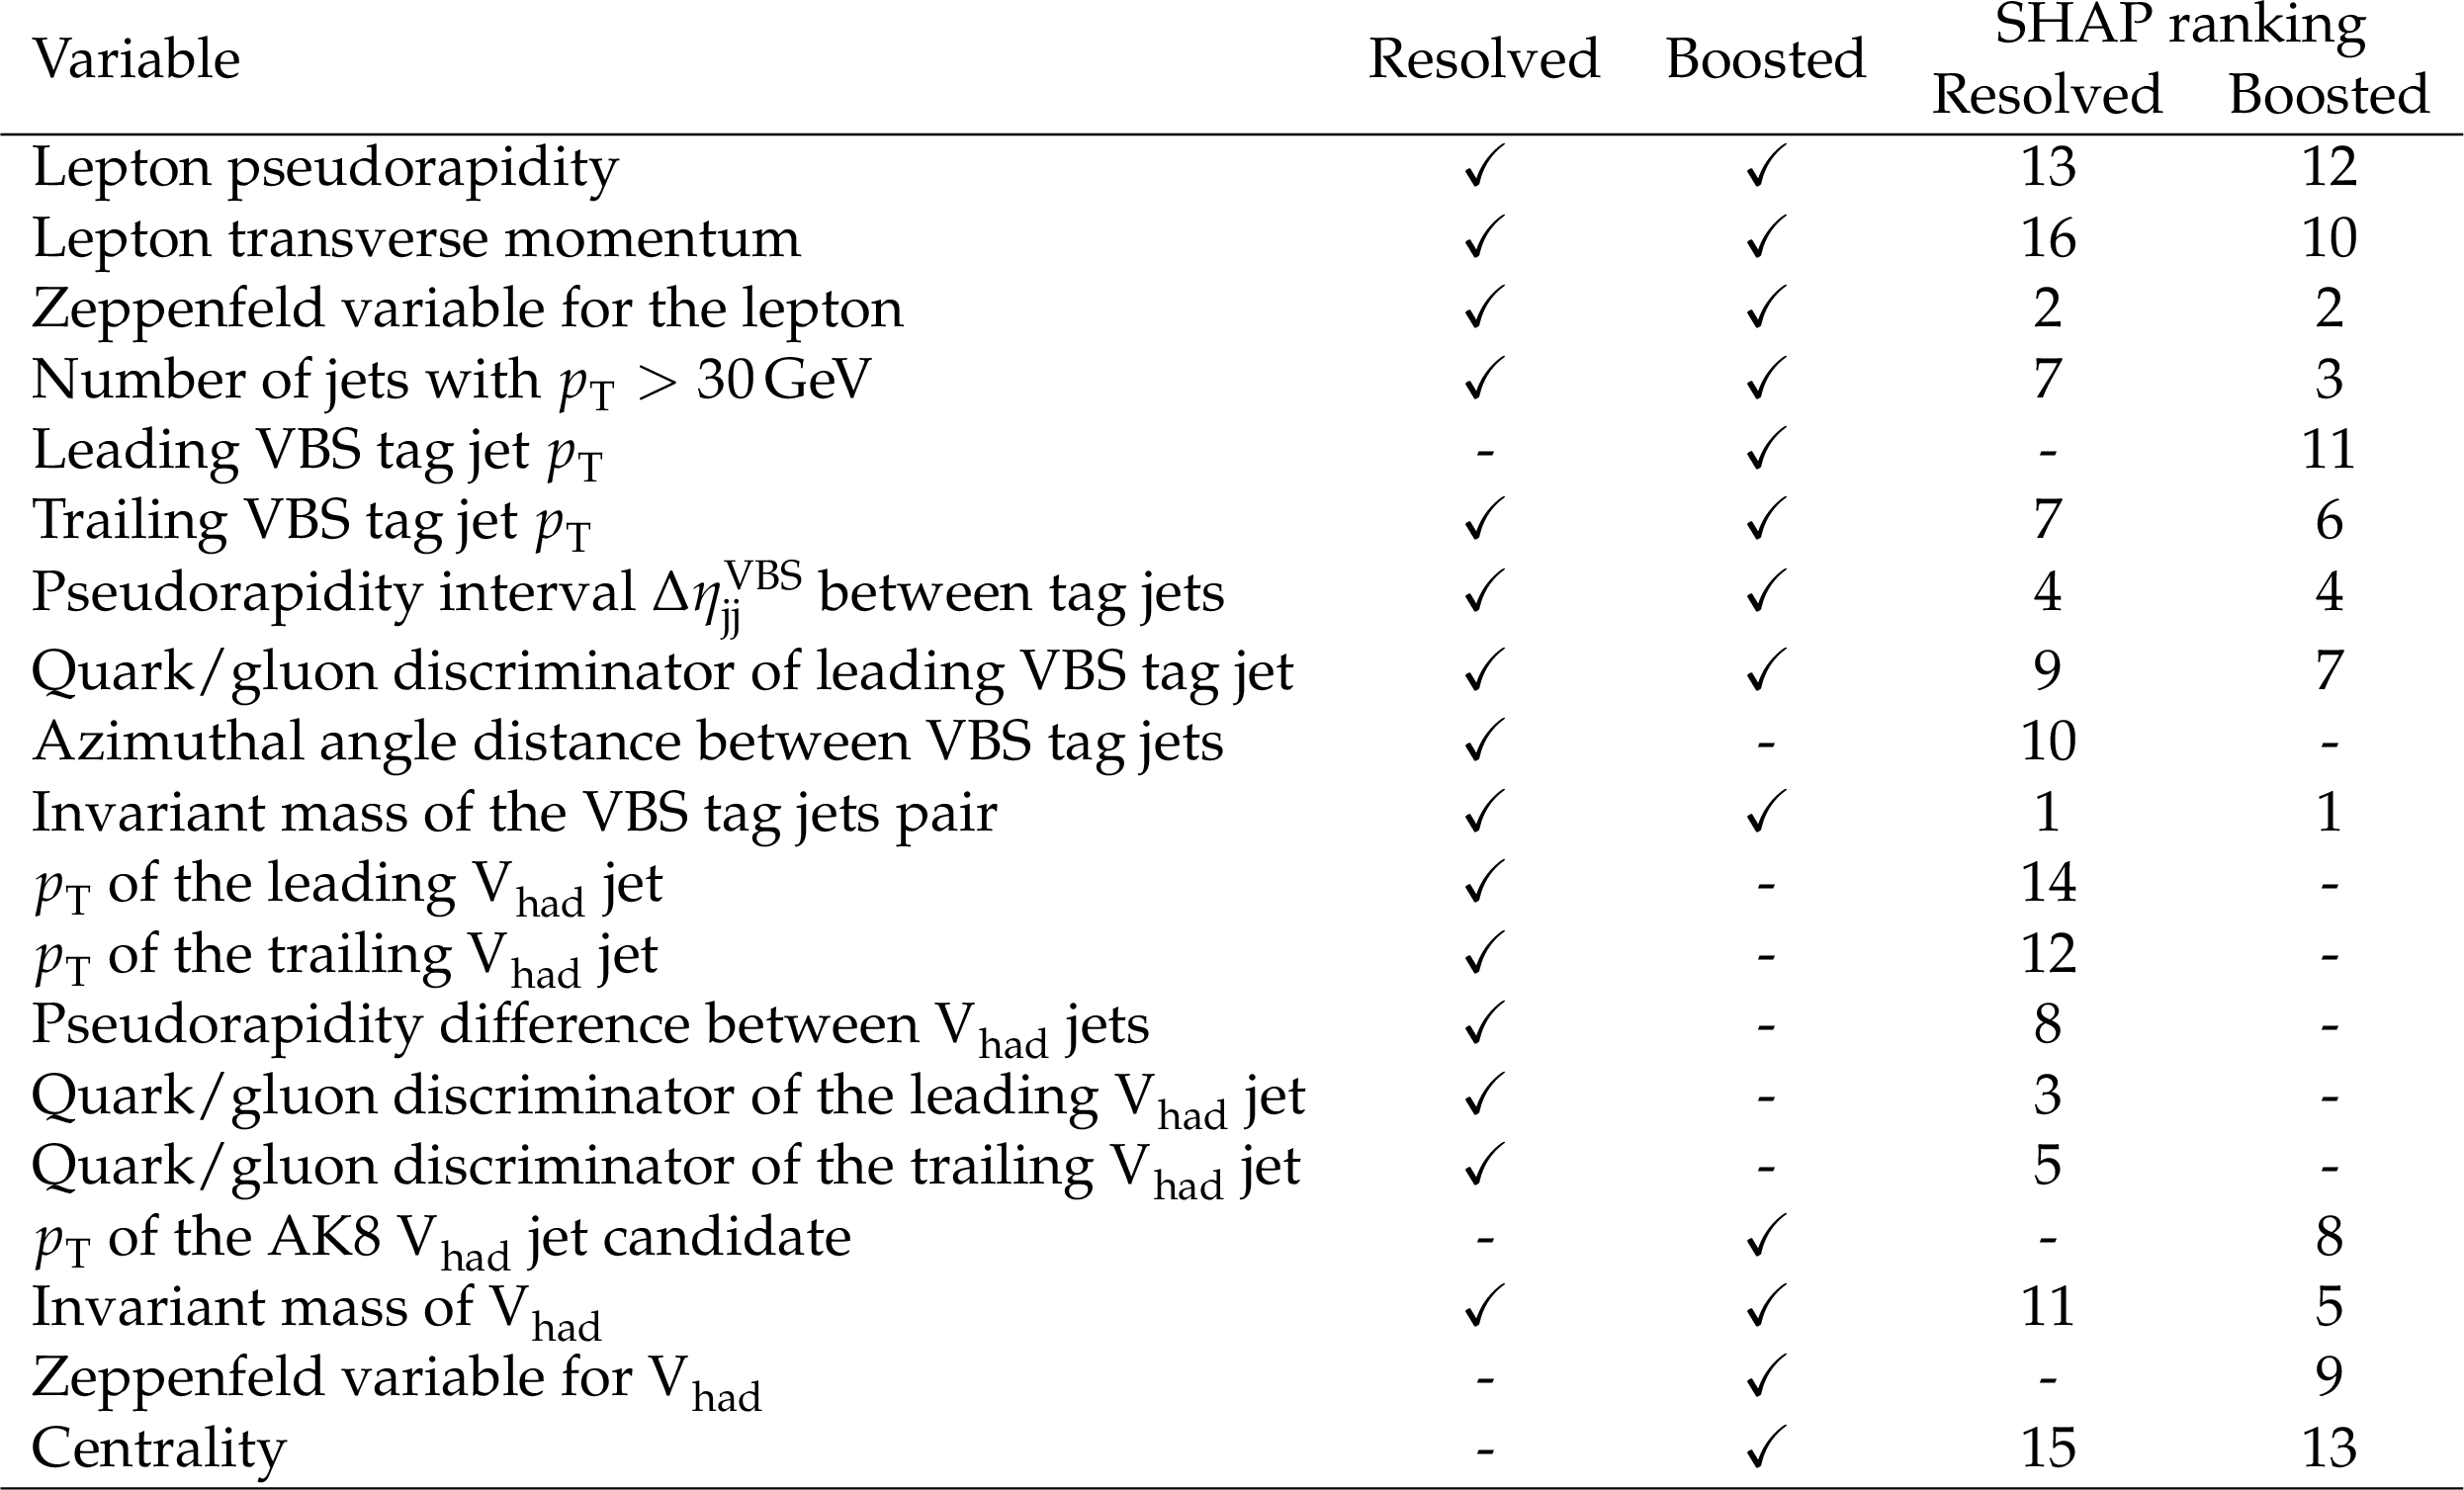
Table 1:
Variables used as input to the DNN for the resolved and boosted models. They are ranked by their contributions to the signal discrimination power of the DNN model using the SHAP [64,65] technique and their rank is shown in the table for the resolved and boosted categories models. |
png pdf |
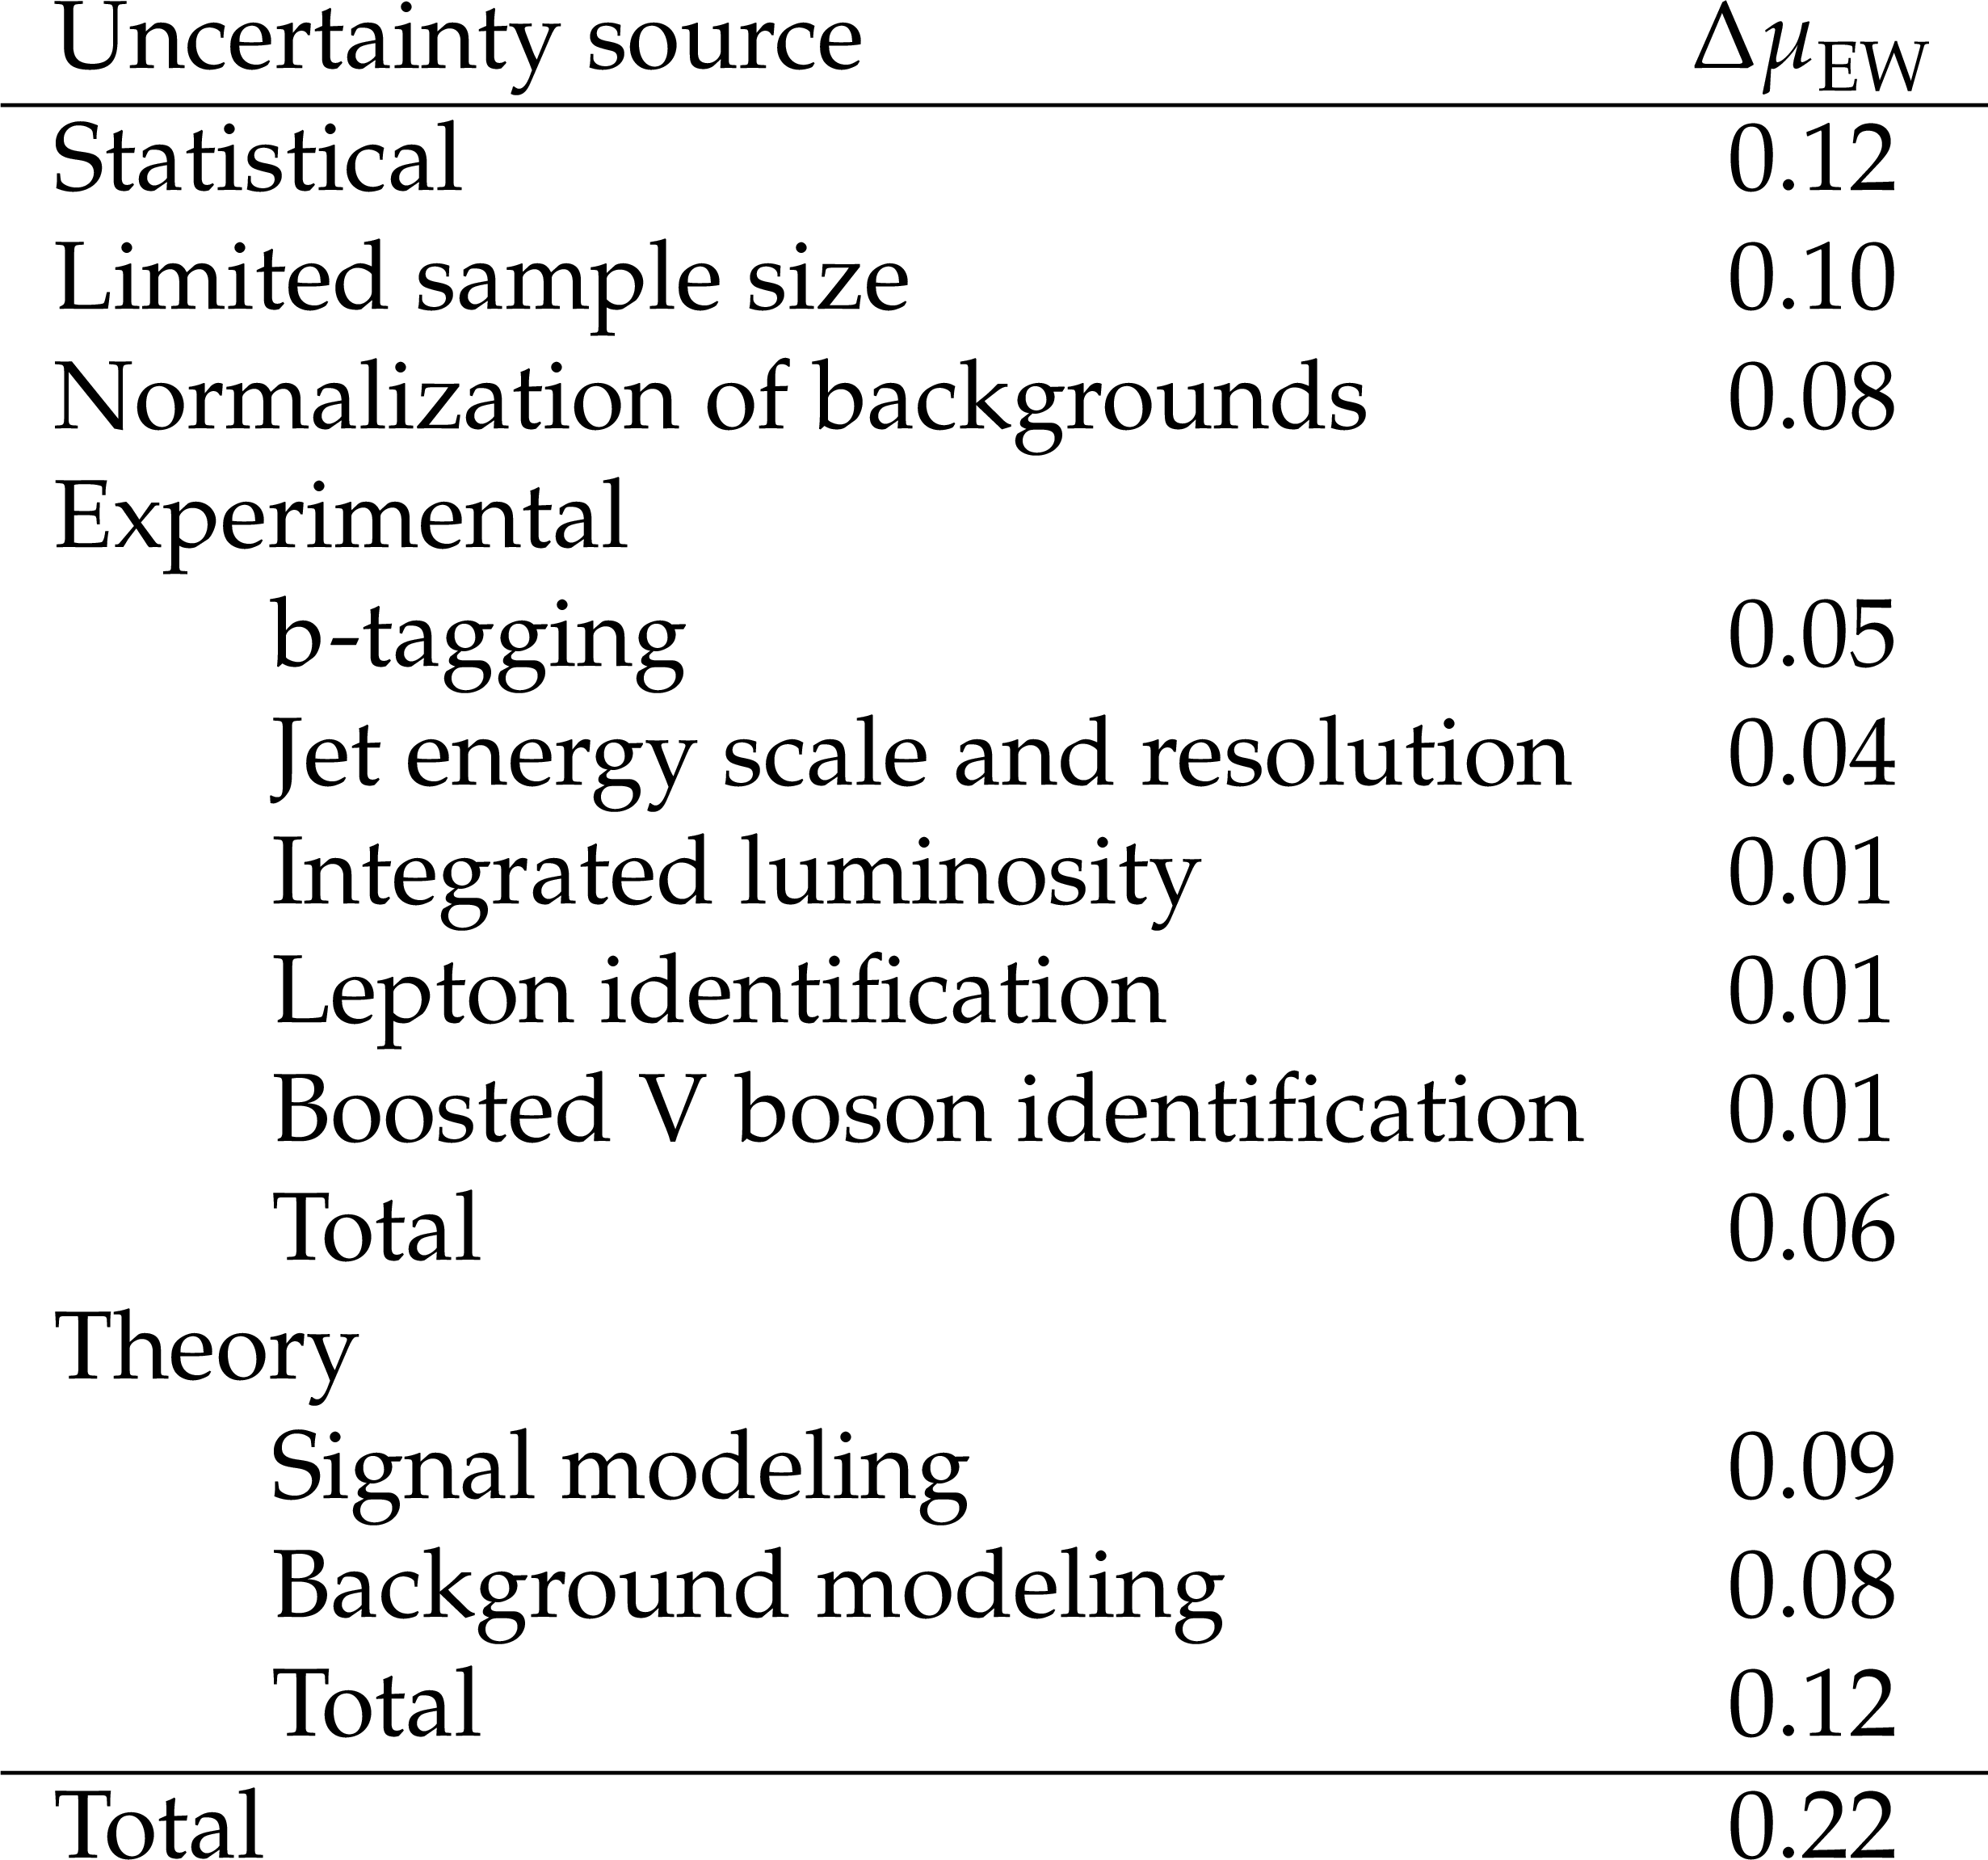
Table 2:
Breakdown of the uncertainties in the EW WV VBS signal strength measurement. |
| Summary |
| The first evidence for the electroweak (EW) production of a WV (V = W or Z ) pair plus two jets in the $ \ell\nu $qq decay channel is reported. Events are separated into two categories: either the hadronically decaying W or Z boson is reconstructed as one large-radius jet, or it is identified as a pair of jets with dijet mass close to the boson mass. Multivariate machine learning discriminators are optimized to separate the signal from the background in each category and their outputs are exploited in the statistical analysis. The large background from single W boson production accompanied by jets is estimated from control samples in the data to reduce the impact of Monte Carlo mismodeling in this multijet phase space region. Tabulated results are provided in the HEPData record for this analysis [81]. The EW-only WV signal strength, measured keeping the QCD-associated diboson production fixed to the standard model prediction, is: $ \mu_{\mathrm{EW}} = \sigma^{\text{obs}} / \sigma^{\text{SM}} = $ 0.85 $ \pm $ 0.12 (stat) $ ^{+0.19}_{-0.17} $ (syst) $ = $ 0.85 $ ^{+0.23}_{-0.21} $ at 1.00 $ ^{+0.24}_{-0.22} $ expected, where $ \sigma^{\text{obs}} $ and $ \sigma^{\text{SM}} $ are the observed and predicted cross sections, respectively. The observed significance for the SM EW WV signal is 4.4 standard deviations with 5.1 expected., it is measured keeping the quantum chromodynamics (QCD) associated diboson production fixed to the standard model prediction. When we consider the signal as the total EW and QCD-associated diboson yield, the overall signal strength $ \mu_{\mathrm{EW}+\mathrm{QCD}} $ is measured as: 0.97 $ \pm $ 0.06 (stat) $ ^{+0.19}_{-0.21} $ (syst) $ = $ 0.97 $ ^{+0.20}_{-0.22} $ with an expectation of 1.00 $ ^{+0.21}_{-0.20} $. Finally, a simultaneous two-dimensional fit of the EW and QCD WV production components is performed. Overall, both the WV EW-only measurement and the simultaneous EW and QCD WV measurements are in agreement with the SM predictions within the 68% confidence level. |
| References | ||||
| 1 | ATLAS Collaboration | Observation of a new particle in the search for the Standard Model Higgs boson with the ATLAS detector at the LHC | PLB 716 (2012) 1 | 1207.7214 |
| 2 | CMS Collaboration | Observation of a new boson at a mass of 125 GeV with the CMS experiment at the LHC | PLB 716 (2012) 30 | CMS-HIG-12-028 1207.7235 |
| 3 | B. W. Lee, C. Quigg, and H. B. Thacker | Weak interactions at very high energies: the role of the Higgs boson mass | PRD 16 (1977) 1519 | |
| 4 | CMS Collaboration | Observation of electroweak production of same-sign W boson pairs in the two jet and two same-sign lepton final state in proton-proton collisions at $ \sqrt{s} = $ 13 TeV | PRL 120 (2018) 081801 | CMS-SMP-17-004 1709.05822 |
| 5 | ATLAS Collaboration | Observation of electroweak production of a same-sign $ W $ boson pair in association with two jets in $ pp $ collisions at $ \sqrt{s}= $ 13 TeV with the ATLAS detector | PRL 123 (2019) 161801 | 1906.03203 |
| 6 | CMS Collaboration | Measurement of electroweak WZ boson production and search for new physics in WZ + two jets events in pp collisions at $ \sqrt{s} = $ 13 TeV | PLB 795 (2019) 281 | CMS-SMP-18-001 1901.04060 |
| 7 | ATLAS Collaboration | Observation of electroweak $ WZ $ boson pair production in association with two jets in $ pp $ collisions at $ \sqrt{s} = $ 13 TeV with the ATLAS detector | PLB 793 (2019) 469 | 1812.09740 |
| 8 | ATLAS Collaboration | Observation of electroweak production of two jets and a $ Z $-boson pair with the ATLAS detector at the LHC | Submitted to Nature Physics, 2020 | 2004.10612 |
| 9 | CMS Collaboration | Measurement of vector boson scattering and constraints on anomalous quartic couplings from events with four leptons and two jets in proton-proton collisions at $ \sqrt{s}= $ 13 TeV | PLB 774 (2017) 682 | CMS-SMP-17-006 1708.02812 |
| 10 | CMS Collaboration | Measurement of the electroweak production of Z$ \gamma $ and two jets in proton-proton collisions at $ \sqrt{s} = $ 13 TeV and constraints on anomalous quartic gauge couplings | PRD 104 (2021) 072001 | CMS-SMP-20-016 2106.11082 |
| 11 | ATLAS Collaboration | Evidence for electroweak production of two jets in association with a $ Z\gamma $ pair in $ pp $ collisions at $ \sqrt{s} = $ 13 TeV with the ATLAS detector | PLB 803 (2020) 135341 | 1910.09503 |
| 12 | ATLAS Collaboration | The ATLAS Experiment at the CERN Large Hadron Collider | JINST 3 (2008) S08003 | |
| 13 | CMS Collaboration | The CMS experiment at the CERN LHC | JINST 3 (2008) S08004 | |
| 14 | C. F. Anders et al. | Vector boson scattering: Recent experimental and theory developments | Rev. Phys. 3 (2018) 44 | 1801.04203 |
| 15 | CMS Collaboration | Search for anomalous electroweak production of vector boson pairs in association with two jets in proton-proton collisions at 13 TeV | PLB 798 (2019) 134985 | CMS-SMP-18-006 1905.07445 |
| 16 | ATLAS Collaboration | Search for the electroweak diboson production in association with a high-mass dijet system in semileptonic final states in $ pp $ collisions at $ \sqrt{s}= $ 13 TeV with the ATLAS detector | PRD 100 (2019) 032007 | 1905.07714 |
| 17 | ATLAS Collaboration | Search for anomalous electroweak production of $ WW/WZ $ in association with a high-mass dijet system in $ pp $ collisions at $ \sqrt{s}= $ 8 TeV with the ATLAS detector | PRD 95 (2017) 032001 | 1609.05122 |
| 18 | S. Frixione and B. R. Webber | Matching NLO QCD computations and parton shower simulations | JHEP 06 (2002) 029 | hep-ph/0204244 |
| 19 | P. Nason | A new method for combining NLO QCD with shower Monte Carlo algorithms | JHEP 11 (2004) 040 | hep-ph/0409146 |
| 20 | S. Frixione, P. Nason, and C. Oleari | Matching NLO QCD computations with parton shower simulations: the POWHEG method | JHEP 11 (2007) 070 | 0709.2092 |
| 21 | S. Alioli, P. Nason, C. Oleari, and E. Re | NLO vector-boson production matched with shower in POWHEG | JHEP 07 (2008) 060 | 0805.4802 |
| 22 | S. Alioli, P. Nason, C. Oleari, and E. Re | A general framework for implementing NLO calculations in shower Monte Carlo programs: the POWHEG BOX | JHEP 06 (2010) 043 | 1002.2581 |
| 23 | J. Alwall et al. | The automated computation of tree-level and next-to-leading order differential cross sections, and their matching to parton shower simulations | JHEP 07 (2014) 079 | 1405.0301 |
| 24 | J. Alwall et al. | Comparative study of various algorithms for the merging of parton showers and matrix elements in hadronic collisions | EPJC 53 (2008) 473 | 0706.2569 |
| 25 | J. Campbell and T. Neumann | Precision phenomenology with MCFM | JHEP 12 (2019) 034 | 1909.09117 |
| 26 | J. M. Campbell, R. K. Ellis, and W. T. Giele | A multi-threaded version of MCFM | EPJC 75 (2015) 246 | 1503.06182 |
| 27 | J. M. Campbell, R. K. Ellis, and C. Williams | Vector boson pair production at the LHC | JHEP 07 (2011) 018 | 1105.0020 |
| 28 | J. M. Campell and R. K. Ellis | An update on vector boson pair production at hadron colliders | PRD 60 (1999) 113006 | hep-ph/9905386 |
| 29 | M. Czakon et al. | Top-pair production at the LHC through NNLO QCD and NLO EW | JHEP 10 (2017) 186 | 1705.04105 |
| 30 | CMS Collaboration | Measurement of differential cross sections for top quark pair production using the lepton+jets final state in proton-proton collisions at 13 TeV | PRD 95 (2017) 092001 | CMS-TOP-16-008 1610.04191 |
| 31 | CMS Collaboration | Measurements of differential Z boson production cross sections in proton-proton collisions at $ \sqrt{s} = $ 13 TeV | JHEP 12 (2019) 061 | CMS-SMP-17-010 1909.04133 |
| 32 | P. Artoisenet, R. Frederix, O. Mattelaer, and R. Rietkerk | Automatic spin-entangled decays of heavy resonances in Monte Carlo simulations | JHEP 03 (2013) 015 | 1212.3460 |
| 33 | T. Sjöstrand et al. | An introduction to PYTHIA 8.2 | Comput. Phys. Commun. 191 (2015) 159 | 1410.3012 |
| 34 | NNPDF Collaboration | Parton distributions for the LHC Run II | JHEP 04 (2015) 040 | 1410.8849 |
| 35 | NNPDF Collaboration | Parton distributions from high-precision collider data | EPJC 77 (2017) 663 | 1706.00428 |
| 36 | P. Skands, S. Carrazza, and J. Rojo | Tuning PYTHIA 8.1: the Monash 2013 Tune | EPJC 74 (2014) 3024 | 1404.5630 |
| 37 | CMS Collaboration | Event generator tunes obtained from underlying event and multiparton scattering measurements | EPJC 76 (2016) 155 | CMS-GEN-14-001 1512.00815 |
| 38 | CMS Collaboration | Extraction and validation of a new set of CMS PYTHIA8 tunes from underlying-event measurements | EPJC 80 (2020) 4 | CMS-GEN-17-001 1903.12179 |
| 39 | R. Covarelli, M. Pellen, and M. Zaro | Vector-boson scattering at the LHC: unraveling the electroweak sector | Int. J. Mod. Phys. A 36 (2021) 2130009 | 2102.10991 |
| 40 | A. Ballestrero et al. | Precise predictions for same-sign W-boson scattering at the LHC | EPJC 78 (2018) 671 | 1803.07943 |
| 41 | B. J \"a ger et al. | Parton-shower effects in Higgs production via vector-boson fusion | EPJC 80 (2020) 756 | 2003.12435 |
| 42 | M. Bähr et al. | Herwig++ physics and manual | EPJC 58 (2008) 639 | 0803.0883 |
| 43 | J. Bellm et al. | Herwig 7.0/Herwig++ 3.0 release note | EPJC 76 (2016) 196 | 1512.01178 |
| 44 | GEANT4 Collaboration | GEANT 4---a simulation toolkit | NIM A 506 (2003) 250 | |
| 45 | CMS Collaboration | Particle-flow reconstruction and global event description with the CMS detector | JINST 12 (2017) P10003 | CMS-PRF-14-001 1706.04965 |
| 46 | CMS Collaboration | Performance of the CMS Level-1 trigger in proton-proton collisions at $ \sqrt{s} = $ 13 TeV | JINST 15 (2020) P10017 | CMS-TRG-17-001 2006.10165 |
| 47 | CMS Collaboration | The CMS trigger system | JINST 12 (2017) P01020 | CMS-TRG-12-001 1609.02366 |
| 48 | M. Cacciari, G. P. Salam, and G. Soyez | The anti-$k_{\mathrm{T}}$ jet clustering algorithm | JHEP 04 (2008) 063 | 0802.1189 |
| 49 | M. Cacciari, G. P. Salam, and G. Soyez | FastJet user manual | EPJC 72 (2012) 1896 | 1111.6097 |
| 50 | CMS Collaboration | Pileup mitigation at CMS in 13 TeV data | JINST 15 (2020) P09018 | CMS-JME-18-001 2003.00503 |
| 51 | D. Bertolini, P. Harris, M. Low, and N. Tran | Pileup per particle identification | JHEP 10 (2014) 059 | 1407.6013 |
| 52 | M. Dasgupta, A. Fregoso, S. Marzani, and G. P. Salam | Towards an understanding of jet substructure | JHEP 09 (2013) 029 | 1307.0007 |
| 53 | J. M. Butterworth, A. R. Davison, M. Rubin, and G. P. Salam | Jet substructure as a new Higgs search channel at the LHC | PRL 100 (2008) 242001 | 0802.2470 |
| 54 | A. J. Larkoski, S. Marzani, G. Soyez, and J. Thaler | Soft drop | JHEP 05 (2014) 146 | 1402.2657 |
| 55 | Y. L. Dokshitzer, G. D. Leder, S. Moretti, and B. R. Webber | Better jet clustering algorithms | JHEP 08 (1997) 001 | hep-ph/9707323 |
| 56 | M. Wobisch and T. Wengler | Hadronization corrections to jet cross-sections in deep inelastic scattering | in Proceedings of the Workshop on Monte Carlo Generators for HERA Physics, Hamburg, Germany, 1998 link |
hep-ph/9907280 |
| 57 | CMS Collaboration | Identification techniques for highly boosted W bosons that decay into hadrons | JHEP 12 (2014) 017 | CMS-JME-13-006 1410.4227 |
| 58 | J. Thaler and K. Van Tilburg | Identifying boosted objects with $ N $-subjettiness | JHEP 03 (2011) 015 | 1011.2268 |
| 59 | CMS Collaboration | Performance of electron reconstruction and selection with the CMS Detector in proton-proton collisions at $ \sqrt{s} = $ 8 TeV | JINST 10 (2015) P06005 | CMS-EGM-13-001 1502.02701 |
| 60 | CMS Collaboration | Performance of CMS muon reconstruction in pp collision events at $ \sqrt{s} = $ 7 TeV | JINST 7 (2012) P10002 | CMS-MUO-10-004 1206.4071 |
| 61 | CMS Collaboration | Performance of missing transverse momentum reconstruction in proton-proton collisions at $ \sqrt{s} = $ 13 TeV using the CMS detector | JINST 14 (2019) P07004 | CMS-JME-17-001 1903.06078 |
| 62 | CMS Collaboration | Identification of heavy-flavour jets with the CMS detector in pp collisions at 13 TeV | JINST 13 (2018) P05011 | CMS-BTV-16-002 1712.07158 |
| 63 | D. P. Kingma and J. Ba | Adam: A method for stochastic optimization | in 3rd International Conference on Learning Representations, ICLR, San Diego, CA, USA, Conference Track Proceedings, 2015 link |
1412.6980 |
| 64 | D. R. Cox | The regression analysis of binary sequences | J R Stat Soc Series B 20 (1958) 215 | |
| 65 | I. Goodfellow, Y. Bengio, and A. Courville | Deep learning | MIT Press, 2016 link |
|
| 66 | S. M. Lundberg and S.-I. Lee | A unified approach to interpreting model predictions | in Proceedings of the 31st International Conference on Neural Information Processing Systems, NIPS'17, . Curran Associates Inc., Red Hook, NY, USA, 2017 | 1705.07874 |
| 67 | L. S. Shapley | A value for n-person games | Contributions to the Theory of Games, 1953 link |
|
| 68 | D. L. Rainwater, R. Szalapski, and D. Zeppenfeld | Probing color singlet exchange in Z + two jet events at the CERN LHC | PRD 54 (1996) 6680 | hep-ph/9605444 |
| 69 | CMS Collaboration | Performance of quark/gluon discrimination in 8 TeV pp data | cms physics analysis summary, 2013 CDS |
|
| 70 | CMS Collaboration | Performance of quark/gluon discrimination in 13 TeV data | cms detector performance summary, 2016 CDS |
|
| 71 | ATLAS Collaboration | Measurement of $ W^{\pm}W^{\pm} $ vector-boson scattering and limits on anomalous quartic gauge couplings with the ATLAS detector | PRD 96 (2017) 012007 | 1611.02428 |
| 72 | G. Cowan, K. Cranmer, E. Gross, and O. Vitells | Asymptotic formulae for likelihood-based tests of new physics | EPJC 71 (2011) 1554 | 1007.1727 |
| 73 | CMS Collaboration | Precision luminosity measurement in proton-proton collisions at $ \sqrt{s} = $ 13 TeV in 2015 and 2016 at CMS | EPJC 9 (2021) 800 | CMS-LUM-17-003 2104.01927 |
| 74 | CMS Collaboration | CMS luminosity measurement for the 2017 data-taking period at $ \sqrt{s} = $ 13 TeV | technical report, CERN, Geneva, 2018 CDS |
|
| 75 | CMS Collaboration | CMS luminosity measurement for the 2018 data-taking period at $ \sqrt{s} = $ 13 TeV | technical report, CERN, Geneva, 2019 CDS |
|
| 76 | CMS Collaboration | Jet energy scale and resolution in the CMS experiment in pp collisions at 8 TeV | JINST 12 (2017) P02014 | CMS-JME-13-004 1607.03663 |
| 77 | CMS Collaboration | Measurement of the inelastic proton-proton cross section at $ \sqrt{s}= $ 13 TeV | JHEP 07 (2018) 161 | CMS-FSQ-15-005 1802.02613 |
| 78 | M. Cacciari et al. | The $ \mathrm{t}\overline{\mathrm{t}} $ cross-section at 1.8 TeV and 1.96 TeV: a study of the systematics due to parton densities and scale dependence | JHEP 04 (2004) 068 | hep-ph/0303085 |
| 79 | S. Catani, D. de Florian, M. Grazzini, and P. Nason | Soft gluon resummation for Higgs boson production at hadron colliders | JHEP 07 (2003) 028 | hep-ph/0306211 |
| 80 | J. Rojo | PDF4LHC recommendations for Run II | link | 1606.08243 |
| 81 | CMS Collaboration | HEPData record for this measurement | link | |
|
|
Compact Muon Solenoid LHC, CERN |
|

|

|

|

|

|