

Compact Muon Solenoid
LHC, CERN
| CMS-EXO-18-003 ; CERN-EP-2021-196 | ||
| Search for long-lived particles decaying to leptons with large impact parameter in proton-proton collisions at $\sqrt{s} = $ 13 TeV | ||
| CMS Collaboration | ||
| 10 October 2021 | ||
| Eur. Phys. J. C 82 (2022) 153 | ||
| Abstract: A search for new long-lived particles decaying to leptons using proton-proton collision data produced by the CERN LHC at $\sqrt{s} = $ 13 TeV is presented. Events are selected with two leptons (an electron and a muon, two electrons, or two muons) that both have transverse impact parameter values between 0.01 and 10 cm and are not required to form a common vertex. Data used for the analysis were collected with the CMS detector in 2016, 2017, and 2018, and correspond to an integrated luminosity of 118 (113) fb$^{-1}$ in the ee channel (e$\mu$ and $\mu\mu$ channels). The search is designed to be sensitive to a wide range of models with displaced e$\mu$, ee, and $\mu\mu$ final states. The results constrain several well-motivated models involving new long-lived particles that decay to displaced leptons. For some areas of the available phase space, these are the most stringent constraints to date. | ||
| Links: e-print arXiv:2110.04809 [hep-ex] (PDF) ; CDS record ; inSPIRE record ; HepData record ; Physics Briefing ; CADI line (restricted) ; | ||
| Figures & Tables | Summary | Additional Figures & Tables | References | CMS Publications |
|---|
| Figures | |

png pdf |
Figure 1:
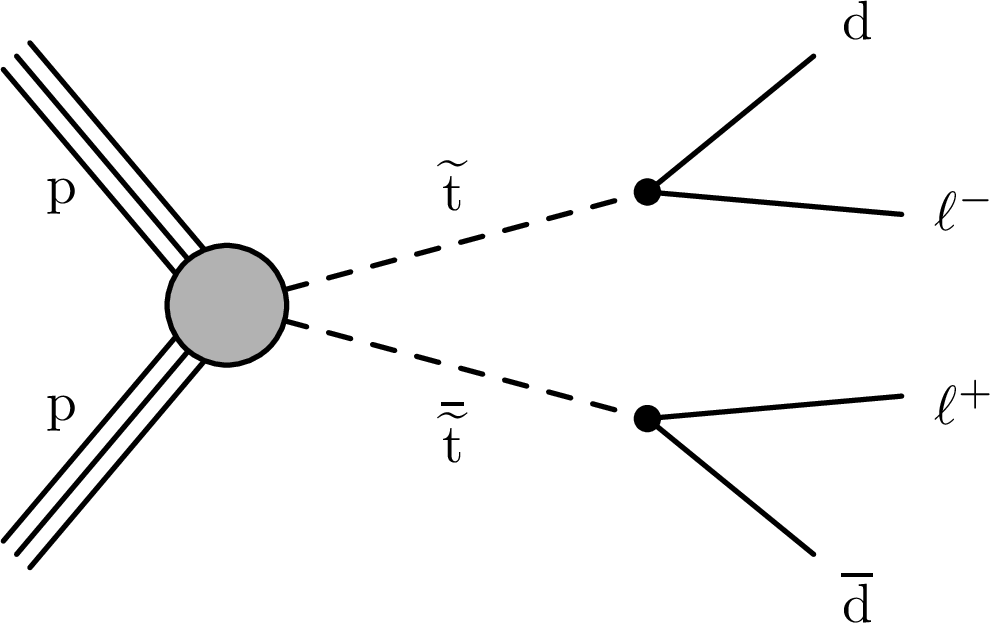
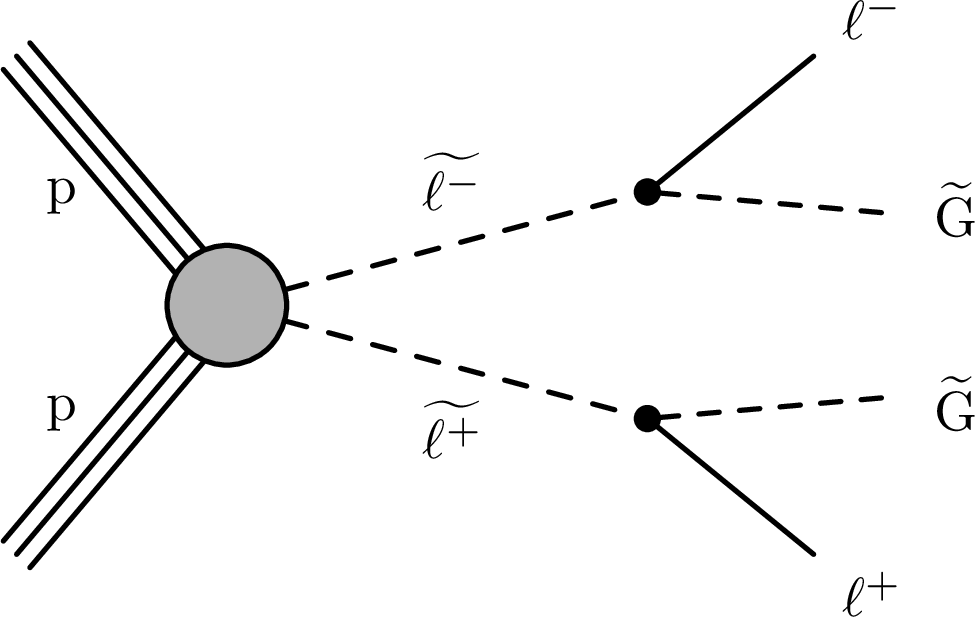
Feynman diagrams for ${\tilde{\mathrm{t}} \to \mathrm{b} \ell}$ (upper left), ${\tilde{\mathrm{t}} \to \mathrm{d} \ell}$ (upper right), $\tilde{\ell} \to \ell \tilde{\mathrm{G}} $ (lower left), and $\mathrm{H} \to \mathrm{S} \mathrm{S} $, $\mathrm{S} \to \ell ^{+}\ell ^{-}$ (lower right). |

png pdf |
Figure 1-a:
Feynman diagram for ${\tilde{\mathrm{t}} \to \mathrm{b} \ell}$. |
png pdf |
Figure 1-b:
Feynman diagram for ${\tilde{\mathrm{t}} \to \mathrm{d} \ell}$. |
png pdf |
Figure 1-c:
Feynman diagram for $\tilde{\ell} \to \ell \tilde{\mathrm{G}} $. |

png pdf |
Figure 1-d:
Feynman diagram for $\mathrm{H} \to \mathrm{S} \mathrm{S} $, $\mathrm{S} \to \ell ^{+}\ell ^{-}$. |
png pdf |
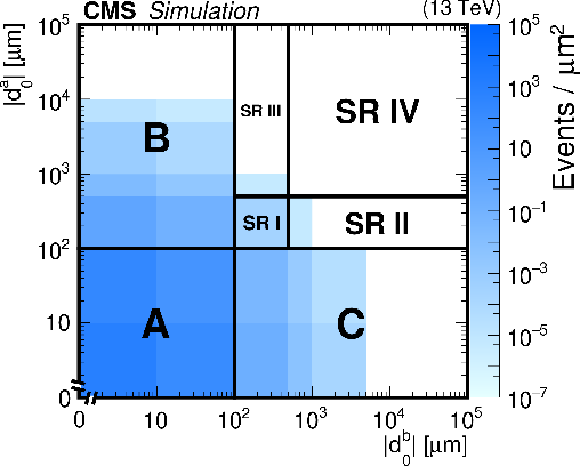
Figure 2:
A diagram of the ABCD method, shown for illustration on simulated background events passing the e$\mu $ preselection with 2018 conditions. In each ${{| d^{\text {a}}_0 |}} - {{| d^{\text {b}}_0 |}}$ bin, the number of events divided by the bin area is plotted. A, B, and C are CRs. SRs I-IV are described in Section 7.2. |
png pdf |
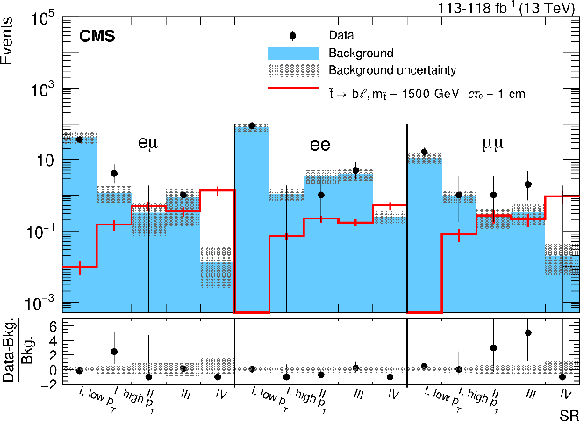
Figure 3:
The number of observed and estimated background events in each channel and SR, with a representative signal overlaid. The lower panel shows the fractional difference between the data and the background. For each background estimate and signal yield, the total uncertainty (statistical plus systematic) is given. The distributions shown are those obtained before the final maximum likelihood fit to the data. |
png pdf |
Figure 4:
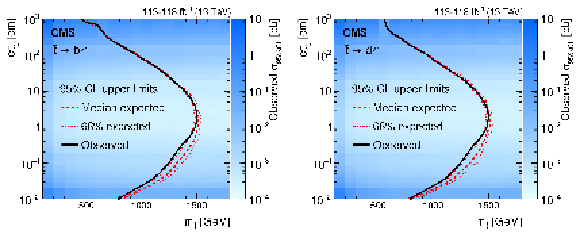
The observed 95% CL upper limits on the long-lived top squark production cross section, in the ${c\tau _0}$-mass plane, for the three channels combined. The ${\tilde{\mathrm{t}} \to \mathrm{b} \ell}$ (left) and ${\tilde{\mathrm{t}} \to \mathrm{d} \ell}$ (right) processes are shown. These limits assume either $\mathcal {B}({\tilde{\mathrm{t}} \to \mathrm{d} \ell})$ or $\mathcal {B}({\tilde{\mathrm{t}} \to \mathrm{b} \ell})$ is 100%, and each lepton has an equal probability of being an electron, a muon, or a tau lepton. The area to the left of the black curve represents the observed exclusion region, and the dashed red lines indicate the expected limits and their 68% confidence intervals. |

png pdf |
Figure 4-a:
The observed 95% CL upper limits on the long-lived top squark production cross section, in the ${c\tau _0}$-mass plane, for the three channels combined. The ${\tilde{\mathrm{t}} \to \mathrm{b} \ell}$ process is shown. These limits assume $\mathcal {B}({\tilde{\mathrm{t}} \to \mathrm{b} \ell})$ is 100%, and each lepton has an equal probability of being an electron, a muon, or a tau lepton. The area to the left of the black curve represents the observed exclusion region, and the dashed red lines indicate the expected limits and their 68% confidence intervals. |

png pdf |
Figure 4-b:
The observed 95% CL upper limits on the long-lived top squark production cross section, in the ${c\tau _0}$-mass plane, for the three channels combined. The ${\tilde{\mathrm{t}} \to \mathrm{d} \ell}$ process is shown. These limits assume $\mathcal {B}({\tilde{\mathrm{t}} \to \mathrm{d} \ell})$ is 100%, and each lepton has an equal probability of being an electron, a muon, or a tau lepton. The area to the left of the black curve represents the observed exclusion region, and the dashed red lines indicate the expected limits and their 68% confidence intervals. |
png pdf |
Figure 5:
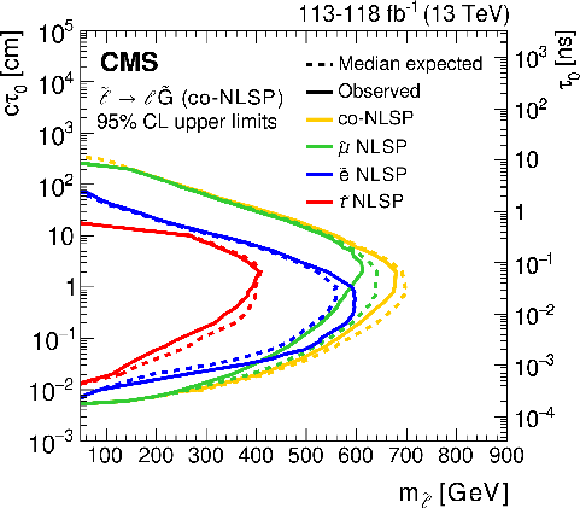
The 95% CL constraints on the long-lived slepton ${c\tau _0}$ and mass. The $\tilde{\tau}$ and co-NLSP limits are shown for the three channels combined, while the $\tilde{\mathrm{e}}$ and $\tilde{\mu}$ NLSP limits are shown for the ee and $\mu \mu $ channels, respectively. These limits assume that the superpartners of the left- and right-handed leptons are degenerate in mass and $\mathcal {B}(\tilde{\ell} \to \ell \tilde{\mathrm{G}})$ is 100%. The area to the left of the solid curves represents the observed exclusion region, and the dashed lines indicate the expected limits. |

png pdf |
Figure 6:
The 95% CL upper limits on the $\mathrm{H} \to \mathrm{S} \mathrm{S} $, $\mathrm{S} \to \ell ^{+}\ell ^{-}$ branching fraction as a function of ${c\tau _0}$, for a Higgs boson with a mass of 125 GeV and a long-lived scalar with a mass of 30 GeV or 50 GeV, for the three channels combined. These limits assume that $\mathcal {B}(\mathrm{H} \to \mathrm{S} \mathrm{S})=$ 100% and each S has a 50% probability of decaying to two electrons or two muons. The area above the solid (dashed) curve represents the observed (expected) exclusion region. |
| Tables | |
png pdf |
Table 1:
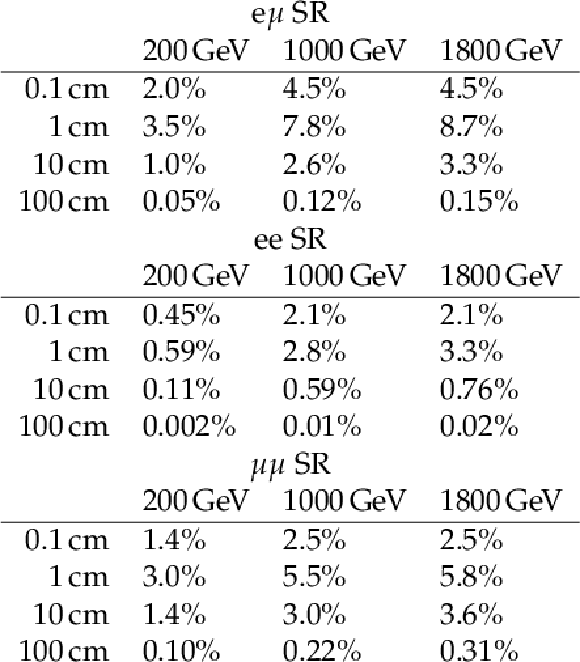
The cumulative efficiencies for ${\tilde{\mathrm{t}} \to \mathrm{b} \ell}$ signal events to pass the 2018 inclusive SR selection, for several choices of $\tilde{\mathrm{t}}$ mass (columns) and ${c\tau _0}$ (rows). For each entry, the numerator is the weighted number of events passing the SR selection, and the denominator is the total weighted number of generated signal events. The corrections described in Section 6 are applied. |
png pdf |
Table 2:
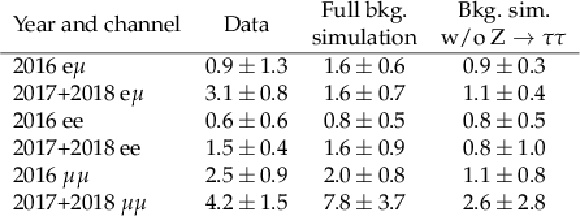
Closure test results in data, background simulation, and background simulation with the ${\mathrm{Z} \to \tau \tau}$ events removed in the 100-500 $\mu$m region. The extrapolated ratios of the actual yield to the estimated yield (averaged over the two one-prompt/one-displaced sidebands) and their statistical uncertainties are given. The last row lists the average of the six previous rows. |

png pdf |
Table 3:
Closure test results in data, background simulation, and background simulation with the ${\mathrm{Z} \to \tau \tau}$ events removed in the 500 $\mu$m -10 cm region. The ratios of the actual yield to the estimated yield (averaged over the two one-prompt/one-displaced sidebands) and their statistical uncertainties are given. The last row lists the average of the six previous rows. |

png pdf |
Table 4:
Closure test results in background simulation in the SRs, with the corrections applied. The estimated numbers of events, the actual numbers of events, and their total uncertainties (statistical plus systematic) are given. In cases where the actual number of events is zero, the uncertainty is given by the product of the average background simulation event weight and the upper bound of the 68% confidence level Poisson interval given by a single observation of zero events. |
png pdf |
Table 5:
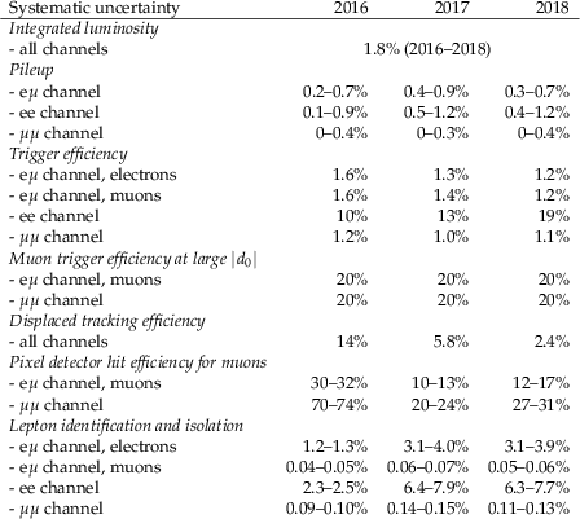
Systematic uncertainties in the signal efficiency, for all three years and the three channels. For many sources of uncertainty, a range indicating the 68% confidence level of the spread is given. Uncertainties in the same row are treated as correlated among the data-taking years, except for the displaced tracking and pixel detector hit efficiencies for muons, where the 2016 uncertainty is treated as uncorrelated with the 2017 and 2018 uncertainties, as explained in the text. |
| Summary |
| A search has been presented for long-lived particles decaying to displaced leptons in proton-proton collisions at $\sqrt{s} = $ 13 TeV at the LHC. With collision data recorded in 2016, 2017, and 2018, and corresponding to an integrated luminosity of 113-118 fb$^{-1}$, no excess above the estimated background has been observed. Exclusion limits have been set at 95% confidence level. Top squarks with masses between 100 and at least 460 GeV have been excluded for 0.01 $ < {c\tau_0} < $ 1000 cm, with a maximum exclusion of 1500 GeV occurring at ${c\tau_0} =$ 2 cm, where ${c\tau_0} $ is the proper decay length. These exclusions assume that 100% of the top squarks decay to a lepton and a d or b quark, where the lepton has an equal probability of being an electron, muon, or tau lepton. The following exclusions assume that the superpartners of the left- and right-handed leptons are mass degenerate. Electron superpartners with masses of at least 50 GeV have been excluded for 0.007 $ < {c\tau_0} < $ 70 cm, with a maximum exclusion of 610 GeV occurring at ${c\tau_0} =$ 0.7 cm. Muon superpartners with masses of at least 50 GeV have been excluded for 0.005 $ < {c\tau_0} < $ 265 cm, with a maximum exclusion of 610 GeV occurring at ${c\tau_0} =$ 3 cm. Tau lepton superpartners with masses of at least 50 GeV have been excluded for 0.015 $ < {c\tau_0} < $ 20 cm, with a maximum exclusion of 405 GeV occurring at ${c\tau_0} =$ 2 cm. In the case that electron, muon, and tau lepton superpartners are mass degenerate, lepton superpartners with masses between 50 and at least 270 GeV have been excluded for 0.005 $ < {c\tau_0} < $ 265 cm, with a maximum exclusion of 680 GeV occurring at ${c\tau_0} =$ 2 cm. For sleptons with ${c\tau_0} < $ 0.8 cm, these are the most sensitive results published to date. For 0.10 $ < {c\tau_0} < $ 12 cm, branching fractions greater than 0.03% have been excluded for 125 GeV Higgs bosons decaying to two long-lived scalar particles, assuming each has a mass of 30 GeV and decays with equal probability to electrons or muons. For scalar particles with 0.1 $ < {c\tau_0} < $ 1000 cm, these are the most sensitive results published to date. |
| Additional Figures | |

png pdf |
Additional Figure 1:
Diagram of a generic signal event, from a transverse view of the interaction point. The black arrows show the lepton $d_0$ vectors. |

png pdf |
Additional Figure 2:
The distribution of electron ${{| d_0 |}}$ for the events in data and signal that pass the e$\mu$ preselection. The last bin includes the overflow. The electron ${{| d_0 |}}$ distributions have a longer tail than those of muons because the muon ${{| d_0 |}}$ values are measured more precisely. |
png pdf |
Additional Figure 3:
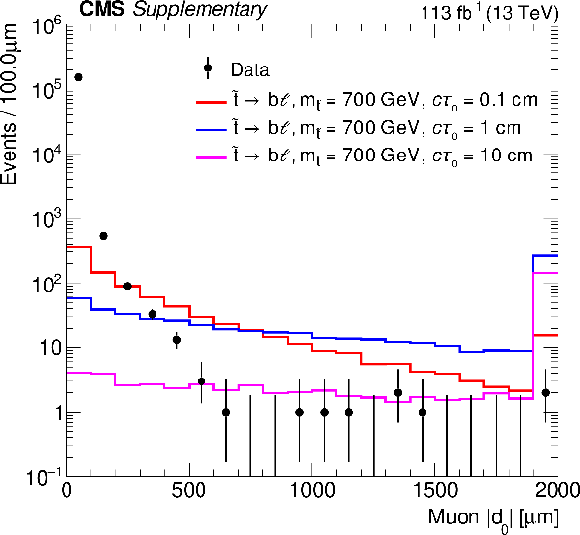
The distribution of muon ${{| d_0 |}}$ for the events in data and signal that pass the e$\mu$ preselection. The last bin includes the overflow. The electron ${{| d_0 |}}$ distributions have a longer tail than those of muons because the muon ${{| d_0 |}}$ values are measured more precisely. |

png pdf |
Additional Figure 4:
Two-dimensional distribution of the leading electron vs the leading muon ${{| d_0 |}}$ for the events in data that pass the e$\mu$ preselection. In each ${{| d_0 |}}$-${{| d_0 |}}$ bin, the number of events divided by the bin area is plotted. The inclusive signal region covers the region between 100 $\mu$m and 10 cm in each ${{| d_0 |}}$ variable shown. |
png pdf |
Additional Figure 5:
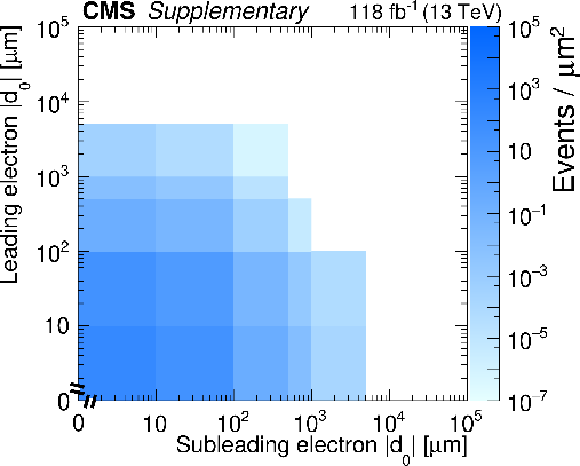
Two-dimensional distribution of the leading vs the subleading electron ${{| d_0 |}}$ for the events in data that pass the ee preselection. In each ${{| d_0 |}}$-${{| d_0 |}}$ bin, the number of events divided by the bin area is plotted. The inclusive signal region covers the region between 100 $\mu$m and 10 cm in each ${{| d_0 |}}$ variable shown. |
png pdf |
Additional Figure 6:
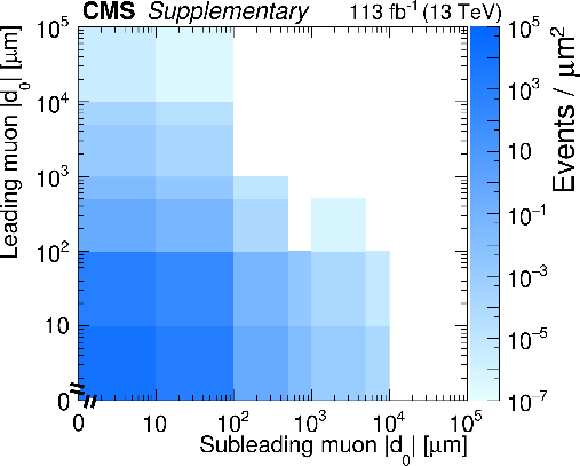
Two-dimensional distribution of the leading vs the subleading muon ${{| d_0 |}}$ for the events in data that pass the $ {{\mu}} {{\mu}}$ preselection. In each ${{| d_0 |}}$-${{| d_0 |}}$ bin, the number of events divided by the bin area is plotted. The inclusive signal region covers the region between 100 $\mu$m and 10 cm in each ${{| d_0 |}}$ variable shown. |

png pdf |
Additional Figure 7:
Two-dimensional distribution of the leading electron vs the leading muon ${{| d_0 |}}$ for $ {\tilde{\mathrm {t}}} \to {\mathrm {b} \ell}$ signal events with a $ {\tilde{\mathrm {t}}} $ mass of 700 GeV and a proper decay length of 1 cm that pass the e$\mu$ preselection and correspond to 2018 data-taking conditions. In each ${{| d_0 |}}$-${{| d_0 |}}$ bin, the number of events divided by the bin area is plotted. The inclusive signal region covers the region between 100 $\mu$m and 10 cm in each ${{| d_0 |}}$ variable shown. |

png pdf |
Additional Figure 8:
Two-dimensional distribution of the leading vs the subleading electron ${{| d_0 |}}$ for $ {\tilde{\mathrm {t}}} \to {\mathrm {b} \ell}$ signal events with a $ {\tilde{\mathrm {t}}} $ mass of 700 GeV and a proper decay length of 1 cm that pass the ee preselection and correspond to 2018 data-taking conditions. In each ${{| d_0 |}}$-${{| d_0 |}}$ bin, the number of events divided by the bin area is plotted. The inclusive signal region covers the region between 100 $\mu$m and 10 cm in each ${{| d_0 |}}$ variable shown. |
png pdf |
Additional Figure 9:
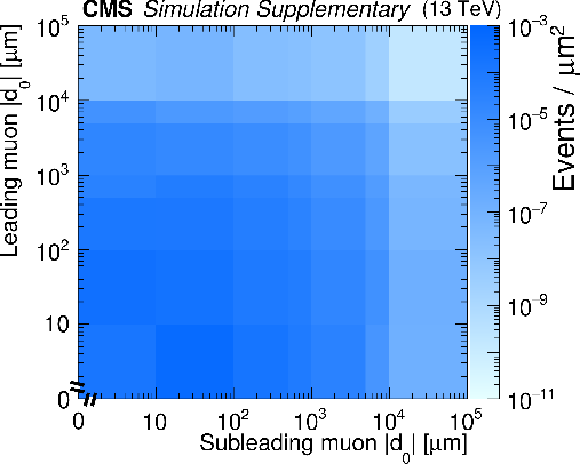
Two-dimensional distribution of the leading vs the subleading muon ${{| d_0 |}}$ for $ {\tilde{\mathrm {t}}} \to {\mathrm {b} \ell}$ signal events with a $ {\tilde{\mathrm {t}}} $ mass of 700 GeV and a proper decay length of 1 cm that pass the $ {{\mu}} {{\mu}}$ preselection and correspond to 2018 data-taking conditions. In each ${{| d_0 |}}$-${{| d_0 |}}$ bin, the number of events divided by the bin area is plotted. The inclusive signal region covers the region between 100 $\mu$m and 10 cm in each ${{| d_0 |}}$ variable shown. |
png pdf |
Additional Figure 10:
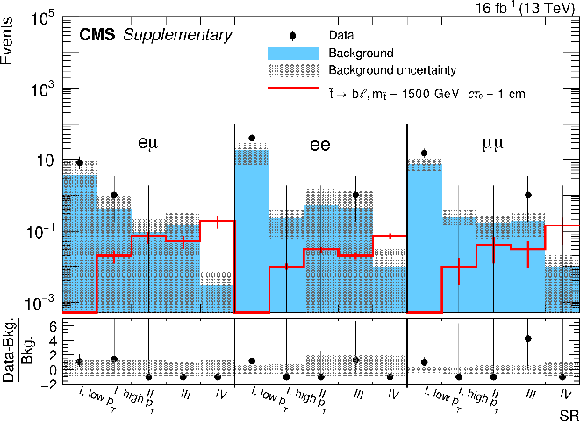
The number of observed and estimated background events in each channel and SR in 2016, with a representative signal overlaid. For each background estimate and signal yield, the total uncertainty is given. The distributions shown correspond to the events before the final maximum likelihood fit to the data. |
png pdf |
Additional Figure 11:
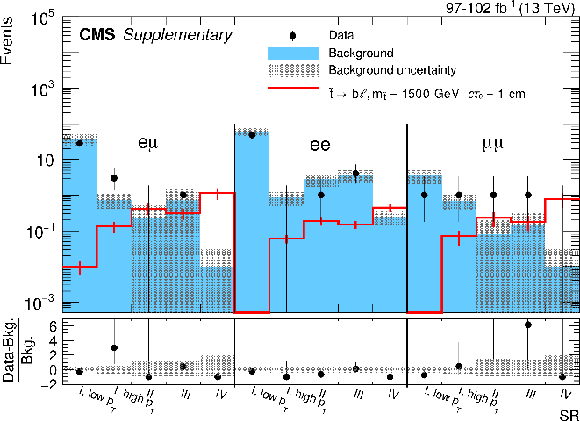
The number of observed and estimated background events in each channel and SR in 2017 and 2018, with a representative signal overlaid. For each background estimate and signal yield, the total uncertainty is given. The distributions shown correspond to the events before the final maximum likelihood fit to the data. |
png pdf |
Additional Figure 12:
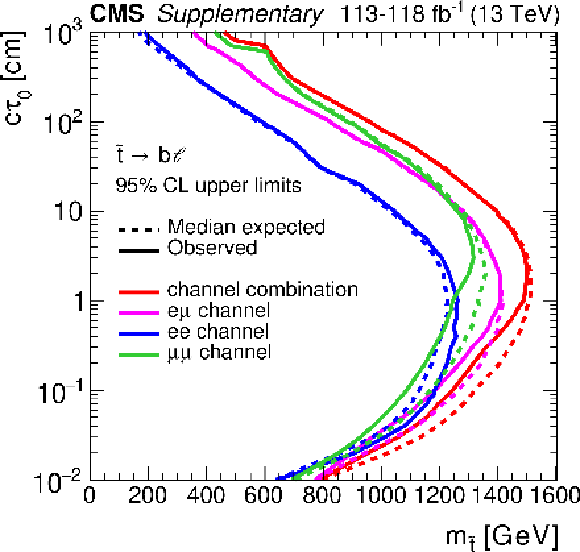
The 95% $ CL $ upper limits on the long-lived top squark proper decay length ($c\tau _0$) as a function of its mass, for the e$\mu$, ee, and $ {{\mu}} {{\mu}}$ channels, and their combination. The $ {\tilde{\mathrm {t}}} \to {\mathrm {b} \ell}$ process is shown. These limits assume $\mathcal {B}({\tilde{\mathrm {t}}} \to {\mathrm {b}}\ell)$ is 100%, and each lepton has an equal probability of being an electron, a muon, or a tau lepton. |

png pdf |
Additional Figure 13:
The 95% $ CL $ upper limits on the long-lived top squark proper decay length ($c\tau _0$) as a function of its mass, for the e$\mu$, ee, and $ {{\mu}} {{\mu}}$ channels, and their combination. The $ {\tilde{\mathrm {t}}} \to {\mathrm {d}}$ process is shown. These limits assume $\mathcal {B}({\tilde{\mathrm {t}}} \to {\mathrm {d}}\ell)$ is 100%, and each lepton has an equal probability of being an electron, a muon, or a tau lepton. |

png pdf |
Additional Figure 14:
The observed 95% $ CL $ upper limits on the long-lived slepton production cross section, in the $c\tau _0$-mass plane. The co-NLSP limits are shown for the three channels combined. These limits assume that the superpartners of the left- and right-handed leptons are degenerate in mass and $\mathcal {B}(\tilde{\ell} \to \ell {\tilde{{\mathrm {G}}}})$ is 100%. The area to the left of the black curve represents the observed exclusion region, and the dashed red lines indicate the expected limits and their 68% confidence intervals. |
png pdf |
Additional Figure 15:
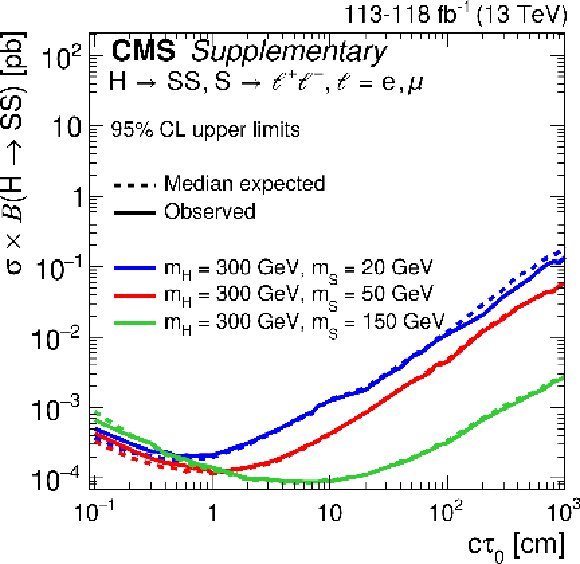
The 95% $ CL $ upper limits on the product of the cross section and branching fraction $ {\mathrm {H}} \to {{S}} {{S}} $, ${{S}} \to \ell^{+}\ell^{-}$ as a function of $c\tau _0$, for a 300 GeV Higgs boson and several long-lived scalar masses, for the three channels combined. These limits assume that $\mathcal {B}({\mathrm {H}} \to {{S}} {{S}})=$ 100% and each S has a 50% probability of decaying to two electrons or two muons. The area above the solid (dashed) curves represents the observed (expected) exclusion region. |

png pdf |
Additional Figure 16:
The 95% $ CL $ upper limits on the product of the cross section and branching fraction $ {\mathrm {H}} \to {{S}} {{S}} $, ${{S}} \to \ell^{+}\ell^{-}$ as a function of $c\tau _0$, for a 400 GeV Higgs boson and several long-lived scalar masses, for the three channels combined. These limits assume that $\mathcal {B}({\mathrm {H}} \to {{S}} {{S}})=$ 100% and each S has a 50% probability of decaying to two electrons or two muons. The area above the solid (dashed) curves represents the observed (expected) exclusion region. |
png pdf |
Additional Figure 17:
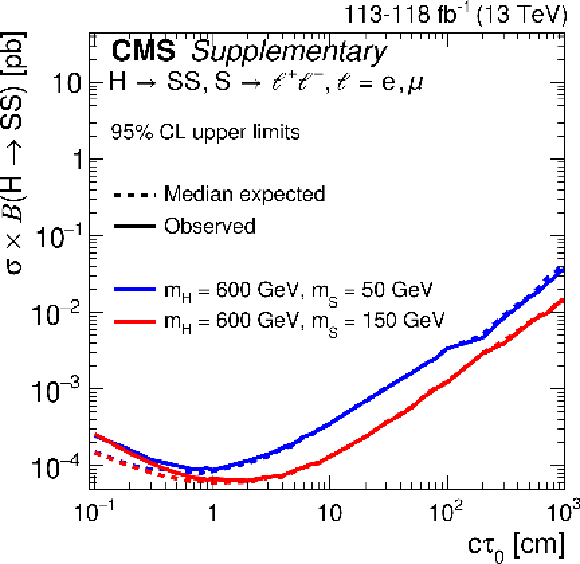
The 95% $ CL $ upper limits on the product of the cross section and branching fraction $ {\mathrm {H}} \to {{S}} {{S}} $, ${{S}} \to \ell^{+}\ell^{-}$ as a function of $c\tau _0$, for a 600 GeV Higgs boson and several long-lived scalar masses, for the three channels combined. These limits assume that $\mathcal {B}({\mathrm {H}} \to {{S}} {{S}})=$ 100% and each S has a 50% probability of decaying to two electrons or two muons. The area above the solid (dashed) curves represents the observed (expected) exclusion region. |
png pdf |
Additional Figure 18:
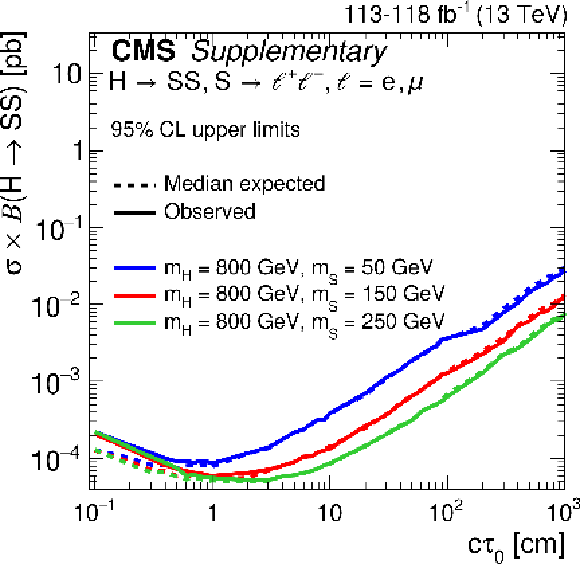
The 95% $ CL $ upper limits on the product of the cross section and branching fraction $ {\mathrm {H}} \to {{S}} {{S}} $, ${{S}} \to \ell^{+}\ell^{-}$ as a function of $c\tau _0$, for a 800 GeV Higgs boson and several long-lived scalar masses, for the three channels combined. These limits assume that $\mathcal {B}({\mathrm {H}} \to {{S}} {{S}})=$ 100% and each S has a 50% probability of decaying to two electrons or two muons. The area above the solid (dashed) curves represents the observed (expected) exclusion region. |
png pdf |
Additional Figure 19:
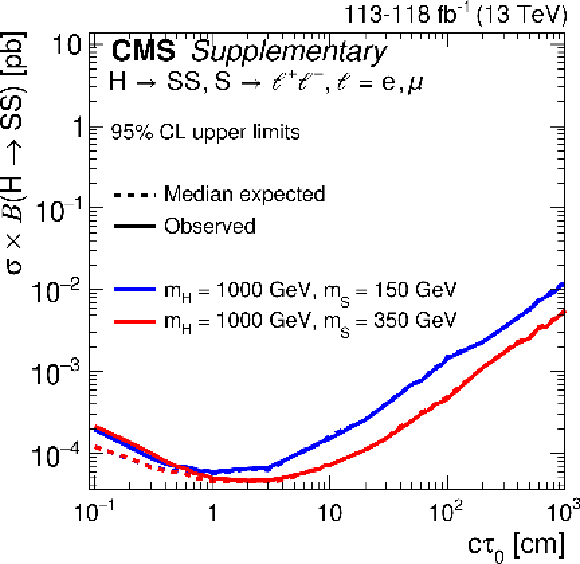
The 95% $ CL $ upper limits on the product of the cross section and branching fraction $ {\mathrm {H}} \to {{S}} {{S}} $, ${{S}} \to \ell^{+}\ell^{-}$ as a function of $c\tau _0$, for a 1000 GeV Higgs boson and several long-lived scalar masses, for the three channels combined. These limits assume that $\mathcal {B}({\mathrm {H}} \to {{S}} {{S}})=$ 100% and each S has a 50% probability of decaying to two electrons or two muons. The area above the solid (dashed) curves represents the observed (expected) exclusion region. |
png pdf |
Additional Figure 20:
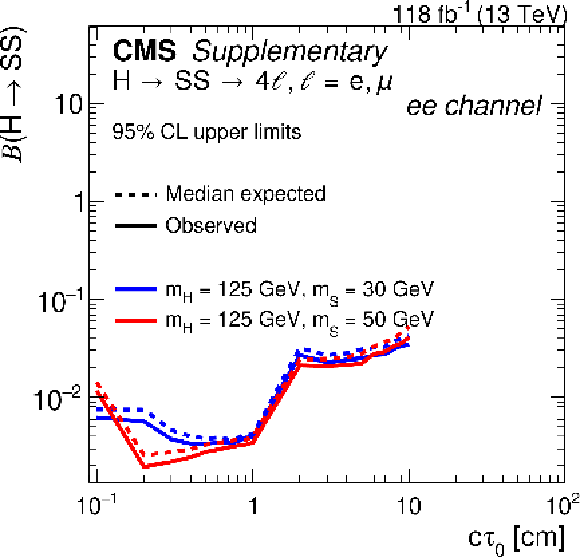
The 95% $ CL $ upper limits on the branching fraction $ {\mathrm {H}} \to {{S}} {{S}} \to 4\ell$ as a function of $c\tau _0$, for a 125 GeV Higgs boson and several long-lived scalar masses, for the ee channel only. These limits assume that $\mathcal {B}({\mathrm {H}} \to {{S}} {{S}})=$ 100% and each S has a 100% probability of decaying to two electrons. The area above the solid (dashed) curves represents the observed (expected) exclusion region. The curves are not smooth because very few ee channel events pass the preselection for the Higgs boson and scalar masses shown in this figure. |

png pdf |
Additional Figure 21:
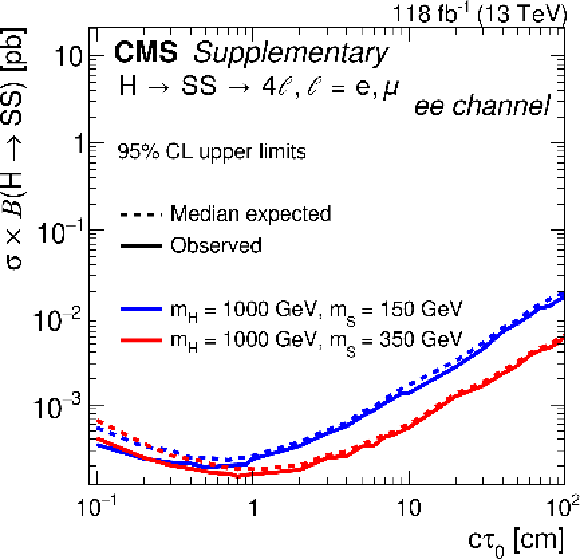
The 95% $ CL $ upper limits on the product of the cross section and branching fraction $ {\mathrm {H}} \to {{S}} {{S}} \to 4\ell$ as a function of $c\tau _0$, for a 600 GeV Higgs boson and several long-lived scalar masses, for the ee channel only. These limits assume that $\mathcal {B}({\mathrm {H}} \to {{S}} {{S}})=$ 100% and each S has a 100% probability of decaying to two electrons. The area above the solid (dashed) curves represents the observed (expected) exclusion region. |
png pdf |
Additional Figure 22:
The 95% $ CL $ upper limits on the product of the cross section and branching fraction $ {\mathrm {H}} \to {{S}} {{S}} \to 4\ell$ as a function of $c\tau _0$, for a 1000 GeV Higgs boson and several long-lived scalar masses, for the ee channel only. These limits assume that $\mathcal {B}({\mathrm {H}} \to {{S}} {{S}})=$ 100% and each S has a 100% probability of decaying to two electrons. The area above the solid (dashed) curves represents the observed (expected) exclusion region. |
png pdf |
Additional Figure 23:
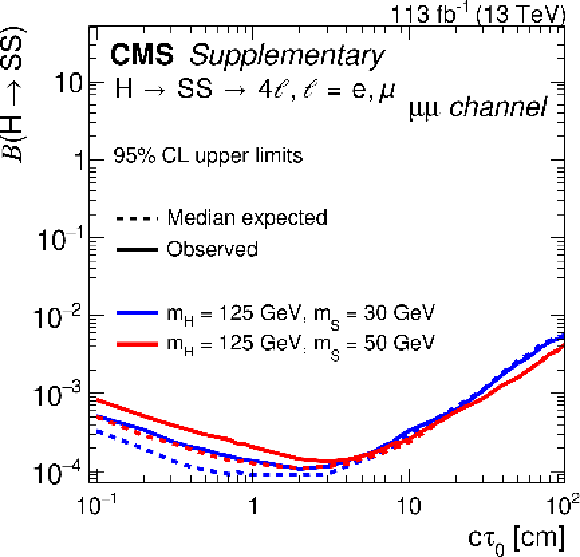
The 95% $ CL $ upper limits on the branching fraction $ {\mathrm {H}} \to {{S}} {{S}} \to 4\ell$ as a function of $c\tau _0$, for a 125 GeV Higgs boson and several long-lived scalar masses, for the $ {{\mu}} {{\mu}}$ channel only. These limits assume that $\mathcal {B}({\mathrm {H}} \to {{S}} {{S}})=$ 100% and each S has a 100% probability of decaying to two muons. The area above the solid (dashed) curves represents the observed (expected) exclusion region. |
png pdf |
Additional Figure 24:
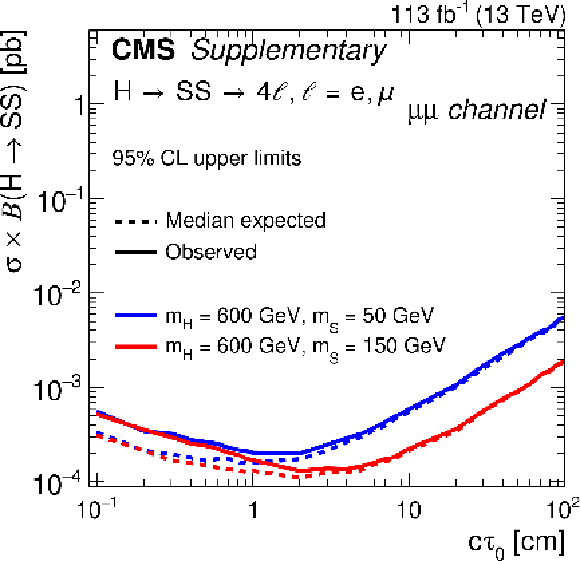
The 95% $ CL $ upper limits on the product of the cross section and branching fraction $ {\mathrm {H}} \to {{S}} {{S}} \to 4\ell$ as a function of $c\tau _0$, for a 600 GeV Higgs boson and several long-lived scalar masses, for the $ {{\mu}} {{\mu}}$ channel only. These limits assume that $\mathcal {B}({\mathrm {H}} \to {{S}} {{S}})=$ 100% and each S has a 100% probability of decaying to two muons. The area above the solid (dashed) curves represents the observed (expected) exclusion region. |

png pdf |
Additional Figure 25:
The 95% $ CL $ upper limits on the product of the cross section and branching fraction $ {\mathrm {H}} \to {{S}} {{S}} \to 4\ell$ as a function of $c\tau _0$, for a 1000 GeV Higgs boson and several long-lived scalar masses, for the $ {{\mu}} {{\mu}}$ channel only. These limits assume that $\mathcal {B}({\mathrm {H}} \to {{S}} {{S}})=$ 100% and each S has a 100% probability of decaying to two muons. The area above the solid (dashed) curves represents the observed (expected) exclusion region. |
png pdf |
Additional Figure 26:
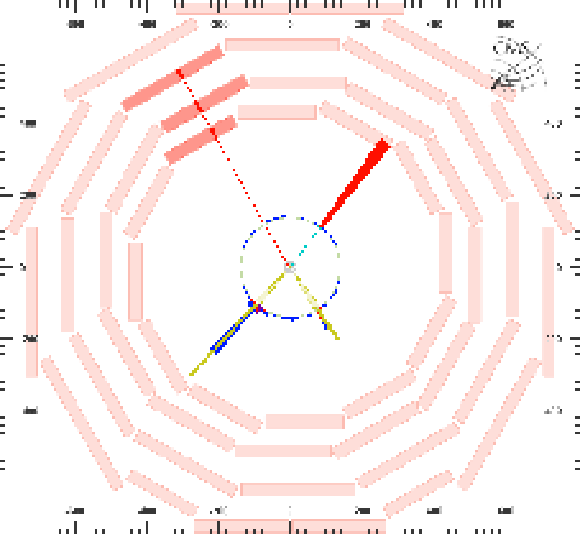
Display of a simulated signal event with a $ {\tilde{\mathrm {t}}} $ mass of 700 GeV and a proper decay length of 10 cm that resides in the e$\mu$ channel inclusive SR. The muon track is represented by the red line. The electron is represented by the blue line (showing its track) connected to the red wedge (showing its calorimeter energy deposit). The electron with ($\eta $, $\phi $) equal to (0.8, 0.9) has a ${p_{\mathrm {T}}}$ of 673 GeV and a ${{| d_0 |}}$ of 2700 $\mu$m, and the muon with ($\eta $, $\phi $) equal to (0.2, 2.1) has a ${p_{\mathrm {T}}}$ of 160 GeV and a ${{| d_0 |}}$ of 29000 $\mu$m. The scale in the figure frame is given in cm. |
png pdf |
Additional Figure 27:
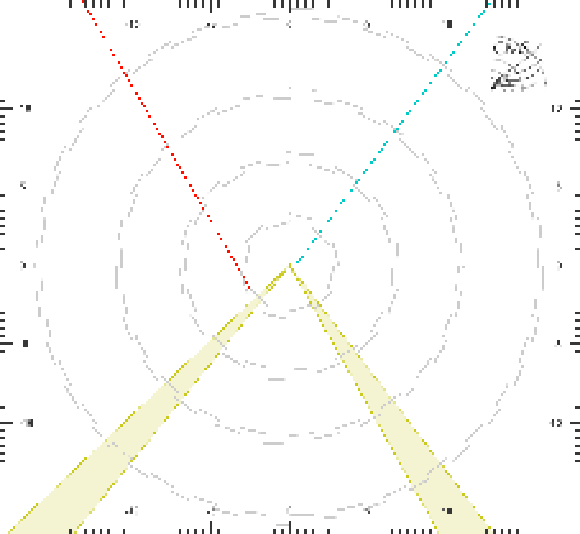
Zoomed-in display of a simulated signal event with a $ {\tilde{\mathrm {t}}} $ mass of 700 GeV and a proper decay length of 10 cm that resides in the e$\mu$ channel inclusive SR. The muon track is represented by the red line. The muon track is represented by the red line, and the electron track is represented by the blue line. Both tracks are visibly displaced from the interaction point. The electron with ($\eta $, $\phi $) equal to (0.8, 0.9) has a ${p_{\mathrm {T}}}$ of 673 GeV and a ${{| d_0 |}}$ of 2700 $\mu$m, and the muon with ($\eta $, $\phi $) equal to (0.2, 2.1) has a ${p_{\mathrm {T}}}$ of 160 GeV and a ${{| d_0 |}}$ of 29000 $\mu$m. The scale in the figure frame is given in cm. |
png pdf |
Additional Figure 28:
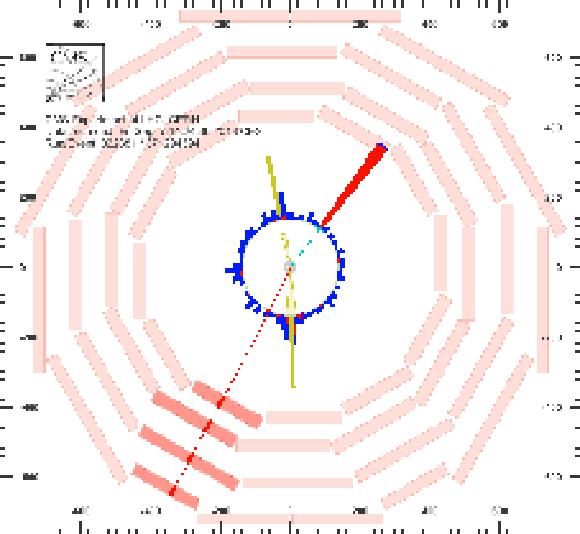
Display of an event in 2018 data that resides in the e$\mu$ channel, SR I, low ${p_{\mathrm {T}}}$ bin. The muon track is represented by the red line. The electron is represented by the blue line (showing its track) connected to the red wedge (showing its calorimeter energy deposit). The electron with ($\eta $, $\phi $) equal to (-0.9, 0.9) has a ${p_{\mathrm {T}}}$ of 118 GeV and a ${{| d_0 |}}$ of 250 $\mu$m, and the muon with ($\eta $, $\phi $) equal to (0.4, -2.0) has a ${p_{\mathrm {T}}}$ of 54 GeV and a ${{| d_0 |}}$ of 160 $\mu$m. The scale in the figure frame is given in cm. |
png pdf |
Additional Figure 29:
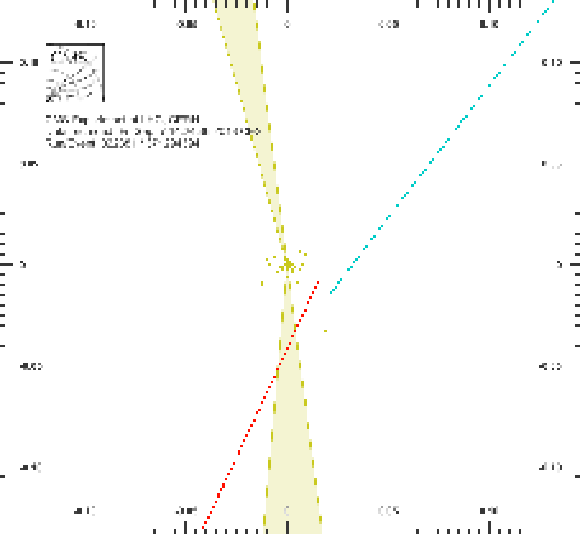
Zoomed-in display of an event in 2018 data that resides in the e$\mu$ channel, SR I, low ${p_{\mathrm {T}}}$ bin. The muon track is represented by the red line, and the electron track is represented by the blue line. Both tracks are visibly displaced from the interaction point. The electron with ($\eta $, $\phi $) equal to (-0.9, 0.9) has a ${p_{\mathrm {T}}}$ of 118 GeV and a ${{| d_0 |}}$ of 250 $\mu$m, and the muon with ($\eta $, $\phi $) equal to (0.4, -2.0) has a ${p_{\mathrm {T}}}$ of 54 GeV and a ${{| d_0 |}}$ of 160 $\mu$m. The scale in the figure frame is given in cm. |
| Additional Tables | |
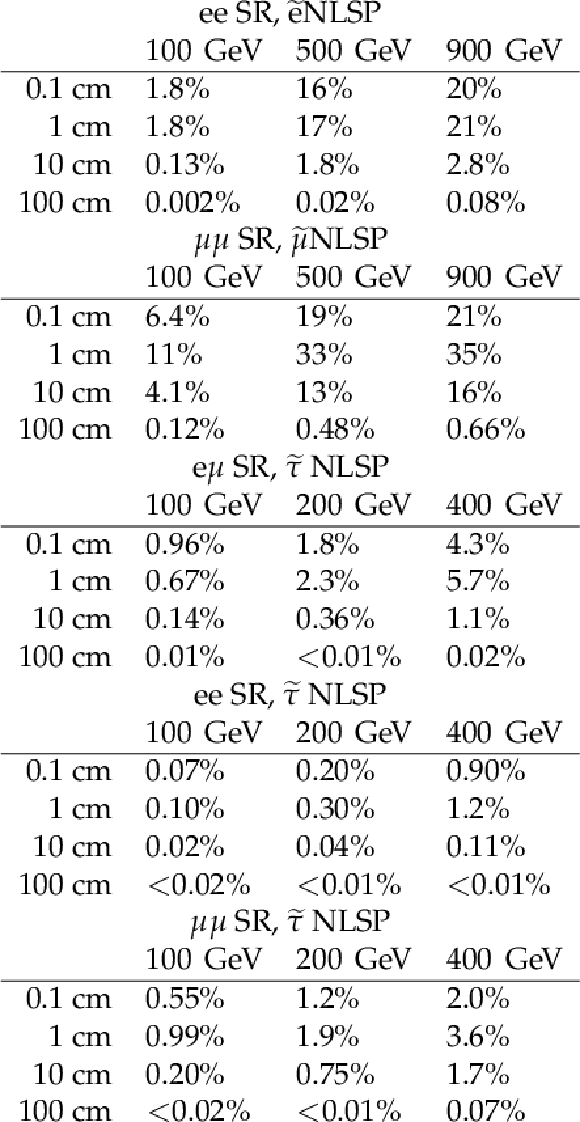
png pdf |
Additional Table 1:
The cumulative efficiencies for $\tilde{\ell} \to \bar{\ell} {\tilde{{\mathrm {G}}}} $ signal events to pass the 2018 inclusive signal region selection, for several choices of mass (columns) and $c\tau $ (rows). |
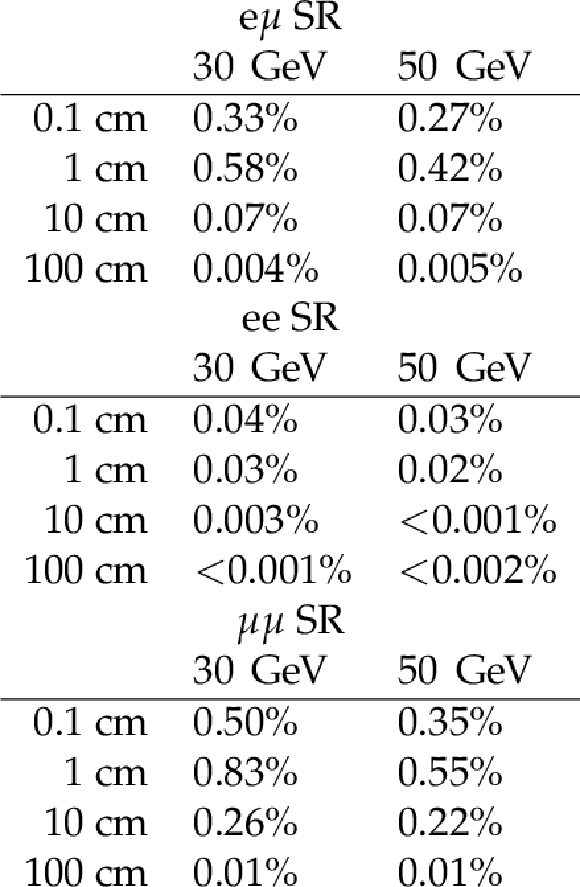
png pdf |
Additional Table 2:
The cumulative efficiencies for $ {\mathrm {H}} \to {{S}} {{S}} $, ${{S}} \to \ell^{+}\ell^{-}$ signal events to pass the 2018 inclusive signal region selection, for a Higgs mass of 125 GeV and several choices of S mass (columns) and $c\tau $ (rows). |
| References | ||||
| 1 | ATLAS Collaboration | Search for magnetic monopoles and stable high-electric-charge objects in 13 TeV proton-proton collisions with the ATLAS detector | PRL 124 (2020) 031802 | 1905.10130 |
| 2 | ATLAS Collaboration | Search for heavy charged long-lived particles in the ATLAS detector in 36.1 fb$ ^{-1} $ of proton-proton collision data at $ \sqrt{s} = $ 13 TeV | PRD 99 (2019) 092007 | 1902.01636 |
| 3 | CMS Collaboration | Search for disappearing tracks in proton-proton collisions at $ \sqrt{s} = $ 13 TeV | PLB 806 (2020) 135502 | CMS-EXO-19-010 2004.05153 |
| 4 | CMS Collaboration | Searches for physics beyond the standard model with the $ M_\mathrm{T2} $ variable in hadronic final states with and without disappearing tracks in proton-proton collisions at $ \sqrt{s}= $ 13 TeV | EPJC 80 (2020) 3 | CMS-SUS-19-005 1909.03460 |
| 5 | ATLAS Collaboration | Search for long-lived charginos based on a disappearing-track signature in pp collisions at $ \sqrt{s}= $ 13 TeV with the ATLAS detector | JHEP 06 (2018) 022 | 1712.02118 |
| 6 | CMS Collaboration | Search for long-lived particles using displaced jets in proton-proton collisions at $ \sqrt{s} = $ 13 TeV | PRD 104 (2021) 012015 | CMS-EXO-19-021 2012.01581 |
| 7 | CMS Collaboration | Search for long-lived particles using nonprompt jets and missing transverse momentum with proton-proton collisions at $ \sqrt{s} = $ 13 TeV | PLB 797 (2019) 134876 | CMS-EXO-19-001 1906.06441 |
| 8 | ATLAS Collaboration | Search for long-lived neutral particles in $ pp $ collisions at $ \sqrt{s} = $ 13 TeV that decay into displaced hadronic jets in the ATLAS calorimeter | EPJC 79 (2019) 481 | 1902.03094 |
| 9 | ATLAS Collaboration | Search for long-lived particles produced in $ pp $ collisions at $ \sqrt{s}= $ 13 TeV that decay into displaced hadronic jets in the ATLAS muon spectrometer | PRD 99 (2019) 052005 | 1811.07370 |
| 10 | ATLAS Collaboration | Search for long-lived neutral particles produced in $ pp $ collisions at $ \sqrt{s} = $ 13 TeV decaying into displaced hadronic jets in the ATLAS inner detector and muon spectrometer | PRD 101 (2020) 052013 | 1911.12575 |
| 11 | CMS Collaboration | Search for long-lived particles using delayed photons in proton-proton collisions at $ \sqrt{s}= $ 13 TeV | PRD 100 (2019) 112003 | CMS-EXO-19-005 1909.06166 |
| 12 | ATLAS Collaboration | Search for nonpointing and delayed photons in the diphoton and missing transverse momentum final state in 8 TeV pp collisions at the LHC using the ATLAS detector | PRD 90 (2014) 112005 | 1409.5542 |
| 13 | CMS Collaboration | Search for long-lived particles that decay into final states containing two electrons or two muons in proton-proton collisions at $ \sqrt{s}=$ 8 TeV | PRD 91 (2015) 052012 | CMS-EXO-12-037 1411.6977 |
| 14 | ATLAS Collaboration | Search for displaced leptons in $ \sqrt{s} = $ 13 TeV pp collisions with the ATLAS detector | PRL 127 (2021) 051802 | 2011.07812 |
| 15 | ATLAS Collaboration | Search for heavy neutral leptons in decays of $ W $ bosons produced in 13 TeV $pp$ collisions using prompt and displaced signatures with the ATLAS detector | JHEP 10 (2019) 265 | 1905.09787 |
| 16 | ATLAS Collaboration | Search for long-lived, massive particles in events with a displaced vertex and a muon with large impact parameter in $ pp $ collisions at $ \sqrt{s} = $ 13 TeV with the ATLAS detector | PRD 102 (2020) 032006 | 2003.11956 |
| 17 | ATLAS Collaboration | Search for displaced vertices of oppositely charged leptons from decays of long-lived particles in $ pp $ collisions at $ \sqrt {s} = $ 13 TeV with the ATLAS detector | PLB 801 (2020) 135114 | 1907.10037 |
| 18 | CMS Collaboration | Search for decays of stopped exotic long-lived particles produced in proton-proton collisions at $ \sqrt{s}= $ 13 TeV | JHEP 05 (2018) 127 | CMS-EXO-16-004 1801.00359 |
| 19 | ATLAS Collaboration | Search for light long-lived neutral particles produced in $ pp $ collisions at $ \sqrt{s} = $ 13 TeV and decaying into collimated leptons or light hadrons with the ATLAS detector | EPJC 80 (2020) 450 | 1909.01246 |
| 20 | CMS Collaboration | Search for displaced supersymmetry in events with an electron and a muon with large impact parameters | PRL 114 (2015) 061801 | CMS-B2G-12-024 1409.4789 |
| 21 | P. Graham, D. Kaplan, S. Rajendran, and P. Sarawat | Displaced supersymmetry | JHEP 07 (2012) 149 | 1204.6038 |
| 22 | R. Barbier et al. | $ R $-Parity-violating supersymmetry | PR 420 (2005) 1 | hep-ph/0406039 |
| 23 | J. A. Evans and J. Shelton | Long-lived staus and displaced leptons at the LHC | JHEP 04 (2016) 056 | 1601.01326 |
| 24 | M. J. Strassler and K. M. Zurek | Discovering the Higgs through highly-displaced vertices | PLB 661 (2008) 263 | hep-ph/0605193 |
| 25 | CMS Collaboration | HEPData record for this analysis | HEPData record for this analysis | |
| 26 | CMS Tracker Group Collaboration | The CMS Phase-1 pixel detector upgrade | JINST 16 (2021) P02027 | 2012.14304 |
| 27 | CMS Collaboration | Track impact parameter resolution for the full pseudorapidity coverage in the 2017 dataset with the CMS Phase-1 pixel detector | CDS | |
| 28 | CMS Collaboration | Description and performance of track and primary-vertex reconstruction with the CMS tracker | JINST 9 (2014) P10009 | CMS-TRK-11-001 1405.6569 |
| 29 | CMS Collaboration | Performance of the CMS Level-1 trigger in proton-proton collisions at $ \sqrt{s} = $ 13 TeV | JINST 15 (2020) P10017 | CMS-TRG-17-001 2006.10165 |
| 30 | CMS Collaboration | The CMS trigger system | JINST 12 (2017) P01020 | CMS-TRG-12-001 1609.02366 |
| 31 | CMS Collaboration | Performance of the CMS muon trigger system in proton-proton collisions at $ \sqrt{s} = $ 13 TeV | JINST 16 (2021) P07001 | CMS-MUO-19-001 2102.04790 |
| 32 | CMS Collaboration | The CMS experiment at the CERN LHC | JINST 3 (2008) S08004 | CMS-00-001 |
| 33 | NNPDF Collaboration | Parton distributions for the LHC Run II | JHEP 04 (2015) 040 | 1410.8849 |
| 34 | NNPDF Collaboration | Parton distributions from high-precision collider data | EPJC 77 (2017) 663 | 1706.00428 |
| 35 | T. Sjostrand et al. | An introduction to PYTHIA 8.2 | CPC 191 (2015) 159 | 1410.3012 |
| 36 | CMS Collaboration | Event generator tunes obtained from underlying event and multiparton scattering measurements | EPJC 76 (2016) 155 | CMS-GEN-14-001 1512.00815 |
| 37 | CMS Collaboration | Extraction and validation of a new set of CMS PYTHIA8 tunes from underlying-event measurements | EPJC 80 (2020) 4 | CMS-GEN-17-001 1903.12179 |
| 38 | GEANT4 Collaboration | GEANT4--a simulation toolkit | NIMA 506 (2003) 250 | |
| 39 | J. Alwall et al. | The automated computation of tree-level and next-to-leading order differential cross sections, and their matching to parton shower simulations | JHEP 07 (2014) 079 | 1405.0301 |
| 40 | J. Alwall et al. | Comparative study of various algorithms for the merging of parton showers and matrix elements in hadronic collisions | EPJC 53 (2008) 473 | 0706.2569 |
| 41 | S. Frixione and B. R. Webber | Matching NLO QCD computations and parton shower simulations | JHEP 06 (2002) 029 | hep-ph/0204244 |
| 42 | P. Nason | A new method for combining NLO QCD with shower Monte Carlo algorithms | JHEP 11 (2004) 040 | hep-ph/0409146 |
| 43 | S. Frixione, P. Nason, and C. Oleari | Matching NLO QCD computations with parton shower simulations: the POWHEG method | JHEP 11 (2007) 070 | 0709.2092 |
| 44 | S. Alioli, P. Nason, C. Oleari, and E. Re | NLO vector-boson production matched with shower in POWHEG | JHEP 07 (2008) 060 | 0805.4802 |
| 45 | S. Alioli, P. Nason, C. Oleari, and E. Re | A general framework for implementing NLO calculations in shower Monte Carlo programs: the POWHEG BOX | JHEP 06 (2010) 043 | 1002.2581 |
| 46 | R. Mackeprang and A. Rizzi | Interactions of coloured heavy stable particles in matter | EPJC 50 (2007) 353 | hep-ph/0612161 |
| 47 | R. Mackeprang and D. Milstead | An updated description of heavy-hadron interactions in GEANT4 | EPJC 66 (2010) 493 | 0908.1868 |
| 48 | CMS Collaboration | Performance of electron reconstruction and selection with the CMS detector in proton-proton collisions at $ \sqrt{s} = $ 8 TeV | JINST 10 (2015) P06005 | CMS-EGM-13-001 1502.02701 |
| 49 | CMS Collaboration | Electron and photon reconstruction and identification with the CMS experiment at the CERN LHC | JINST 16 (2021) P05014 | CMS-EGM-17-001 2012.06888 |
| 50 | CMS Collaboration | Performance of the CMS muon detector and muon reconstruction with proton-proton collisions at $ \sqrt{s} = $ 13 TeV | JINST 13 (2018) P06015 | CMS-MUO-16-001 1804.04528 |
| 51 | CMS Collaboration | Particle-flow reconstruction and global event description with the CMS detector | JINST 12 (2017) P10003 | CMS-PRF-14-001 1706.04965 |
| 52 | M. Cacciari, G. P. Salam, and G. Soyez | The anti-$ {k_{\mathrm{T}}} $ jet clustering algorithm | JHEP 04 (2008) 063 | 0802.1189 |
| 53 | M. Cacciari, G. P. Salam, and G. Soyez | FastJet user manual | EPJC 72 (2012) 1896 | 1111.6097 |
| 54 | CMS Collaboration | Precision measurement of the structure of the CMS inner tracking system using nuclear interactions | JINST 13 (2018) P10034 | CMS-TRK-17-001 1807.03289 |
| 55 | R. Fruhwirth | Application of Kalman filtering to track and vertex fitting | NIMA 262 (1987) 444 | |
| 56 | R. Fruhwirth, P. Kubinec, W. Mitaroff, and M. Regler | Vertex reconstruction and track bundling at the LEP collider using robust algorithms | CPC 96 (1996) 189 | |
| 57 | CMS Collaboration | Identification of heavy-flavour jets with the CMS detector in pp collisions at 13 TeV | JINST 13 (2018) P05011 | CMS-BTV-16-002 1712.07158 |
| 58 | CMS Collaboration | Precision luminosity measurement in proton-proton collisions at $ \sqrt{s} = $ 13 TeV in 2015 and 2016 at CMS | EPJC 81 (2021) 800 | CMS-LUM-17-003 2104.01927 |
| 59 | CMS Collaboration | CMS luminosity measurements for the 2017 data-taking period at $ \sqrt s= $ 13 TeV | CMS-PAS-LUM-17-004 | CMS-PAS-LUM-17-004 |
| 60 | CMS Collaboration | CMS luminosity measurements for the 2018 data-taking period at $ \sqrt s= $ 13 TeV | CMS-PAS-LUM-18-002 | CMS-PAS-LUM-18-002 |
| 61 | CMS Collaboration | Measurement of the inelastic proton-proton cross section at $ \sqrt{s}= $ 13 TeV | JHEP 07 (2018) 161 | CMS-FSQ-15-005 1802.02613 |
| 62 | T. Junk | Confidence level computation for combining searches with small statistics | NIMA 434 (1999) 435 | hep-ex/9902006 |
| 63 | A. L. Read | Presentation of search results: The CL$ _{\text{s}} $ technique | JPG 28 (2002) 2693 | |
| 64 | G. Cowan, K. Cranmer, E. Gross, and O. Vitells | Asymptotic formulae for likelihood-based tests of new physics | EPJC 71 (2011) 1554 | 1007.1727 |
| 65 | ATLAS and CMS Collaborations, and LHC Higgs Combination Group | Procedure for the LHC Higgs boson search combination in Summer 2011 | CMS-NOTE-2011-005 | |
| 66 | R. D. Cousins and V. L. Highland | Incorporating systematic uncertainties into an upper limit | NIMA 320 (1992) 331 | |

|
Compact Muon Solenoid LHC, CERN |

|

|

|

|

|

|