

Compact Muon Solenoid
LHC, CERN
| CMS-EXO-22-018 ; CERN-EP-2023-129 | ||
| Search for scalar leptoquarks produced via $ \tau $-lepton-quark scattering in pp collisions at $ \sqrt{s}= $ 13 TeV | ||
| CMS Collaboration | ||
| 12 August 2023 | ||
| Phys. Rev. Lett. 132 (2024) 061801 | ||
| Abstract: The first search for scalar leptoquarks produced in $ \tau $-lepton-quark collisions is presented. It is based on a set of proton-proton collision data recorded with the CMS detector at the LHC at a center-of-mass energy of 13 TeV corresponding to an integrated luminosity of 138 fb$ ^{-1} $. The reconstructed final state consists of a jet, significant missing transverse momentum, and a $ \tau $ lepton reconstructed through its hadronic or leptonic decays. Limits are set on the product of the leptoquark production cross section and branching fraction and interpreted as exclusions in the plane of the leptoquark mass and the leptoquark-$ \tau $-quark coupling strength. | ||
| Links: e-print arXiv:2308.06143 [hep-ex] (PDF) ; CDS record ; inSPIRE record ; HepData record ; CADI line (restricted) ; | ||
| Figures & Tables | Summary | Additional Figures | References | CMS Publications |
|---|
| Figures | |
png pdf |
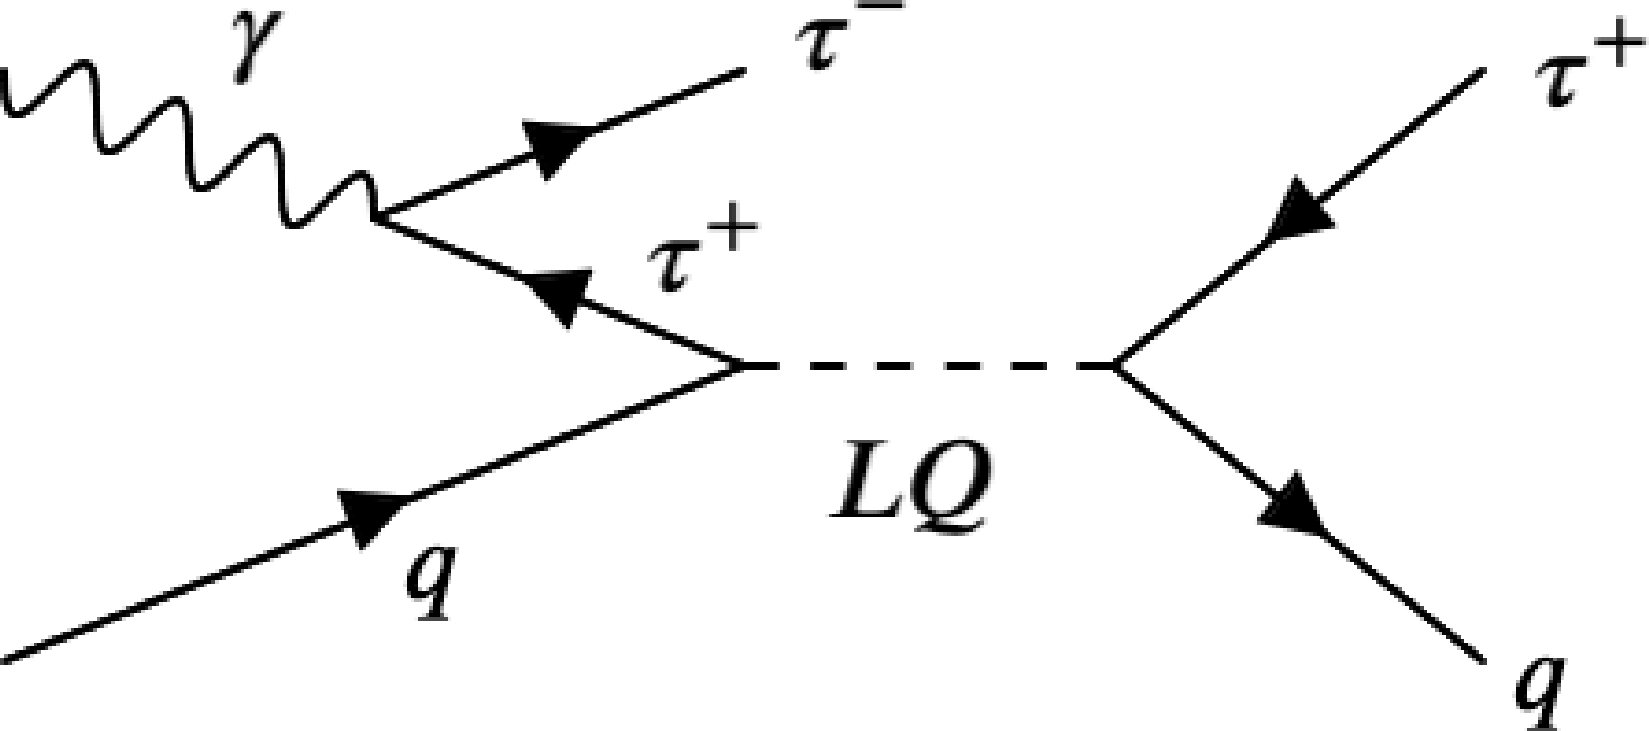
Figure 1:
Feynman diagram of the lepton-induced LQ production. |
png pdf |
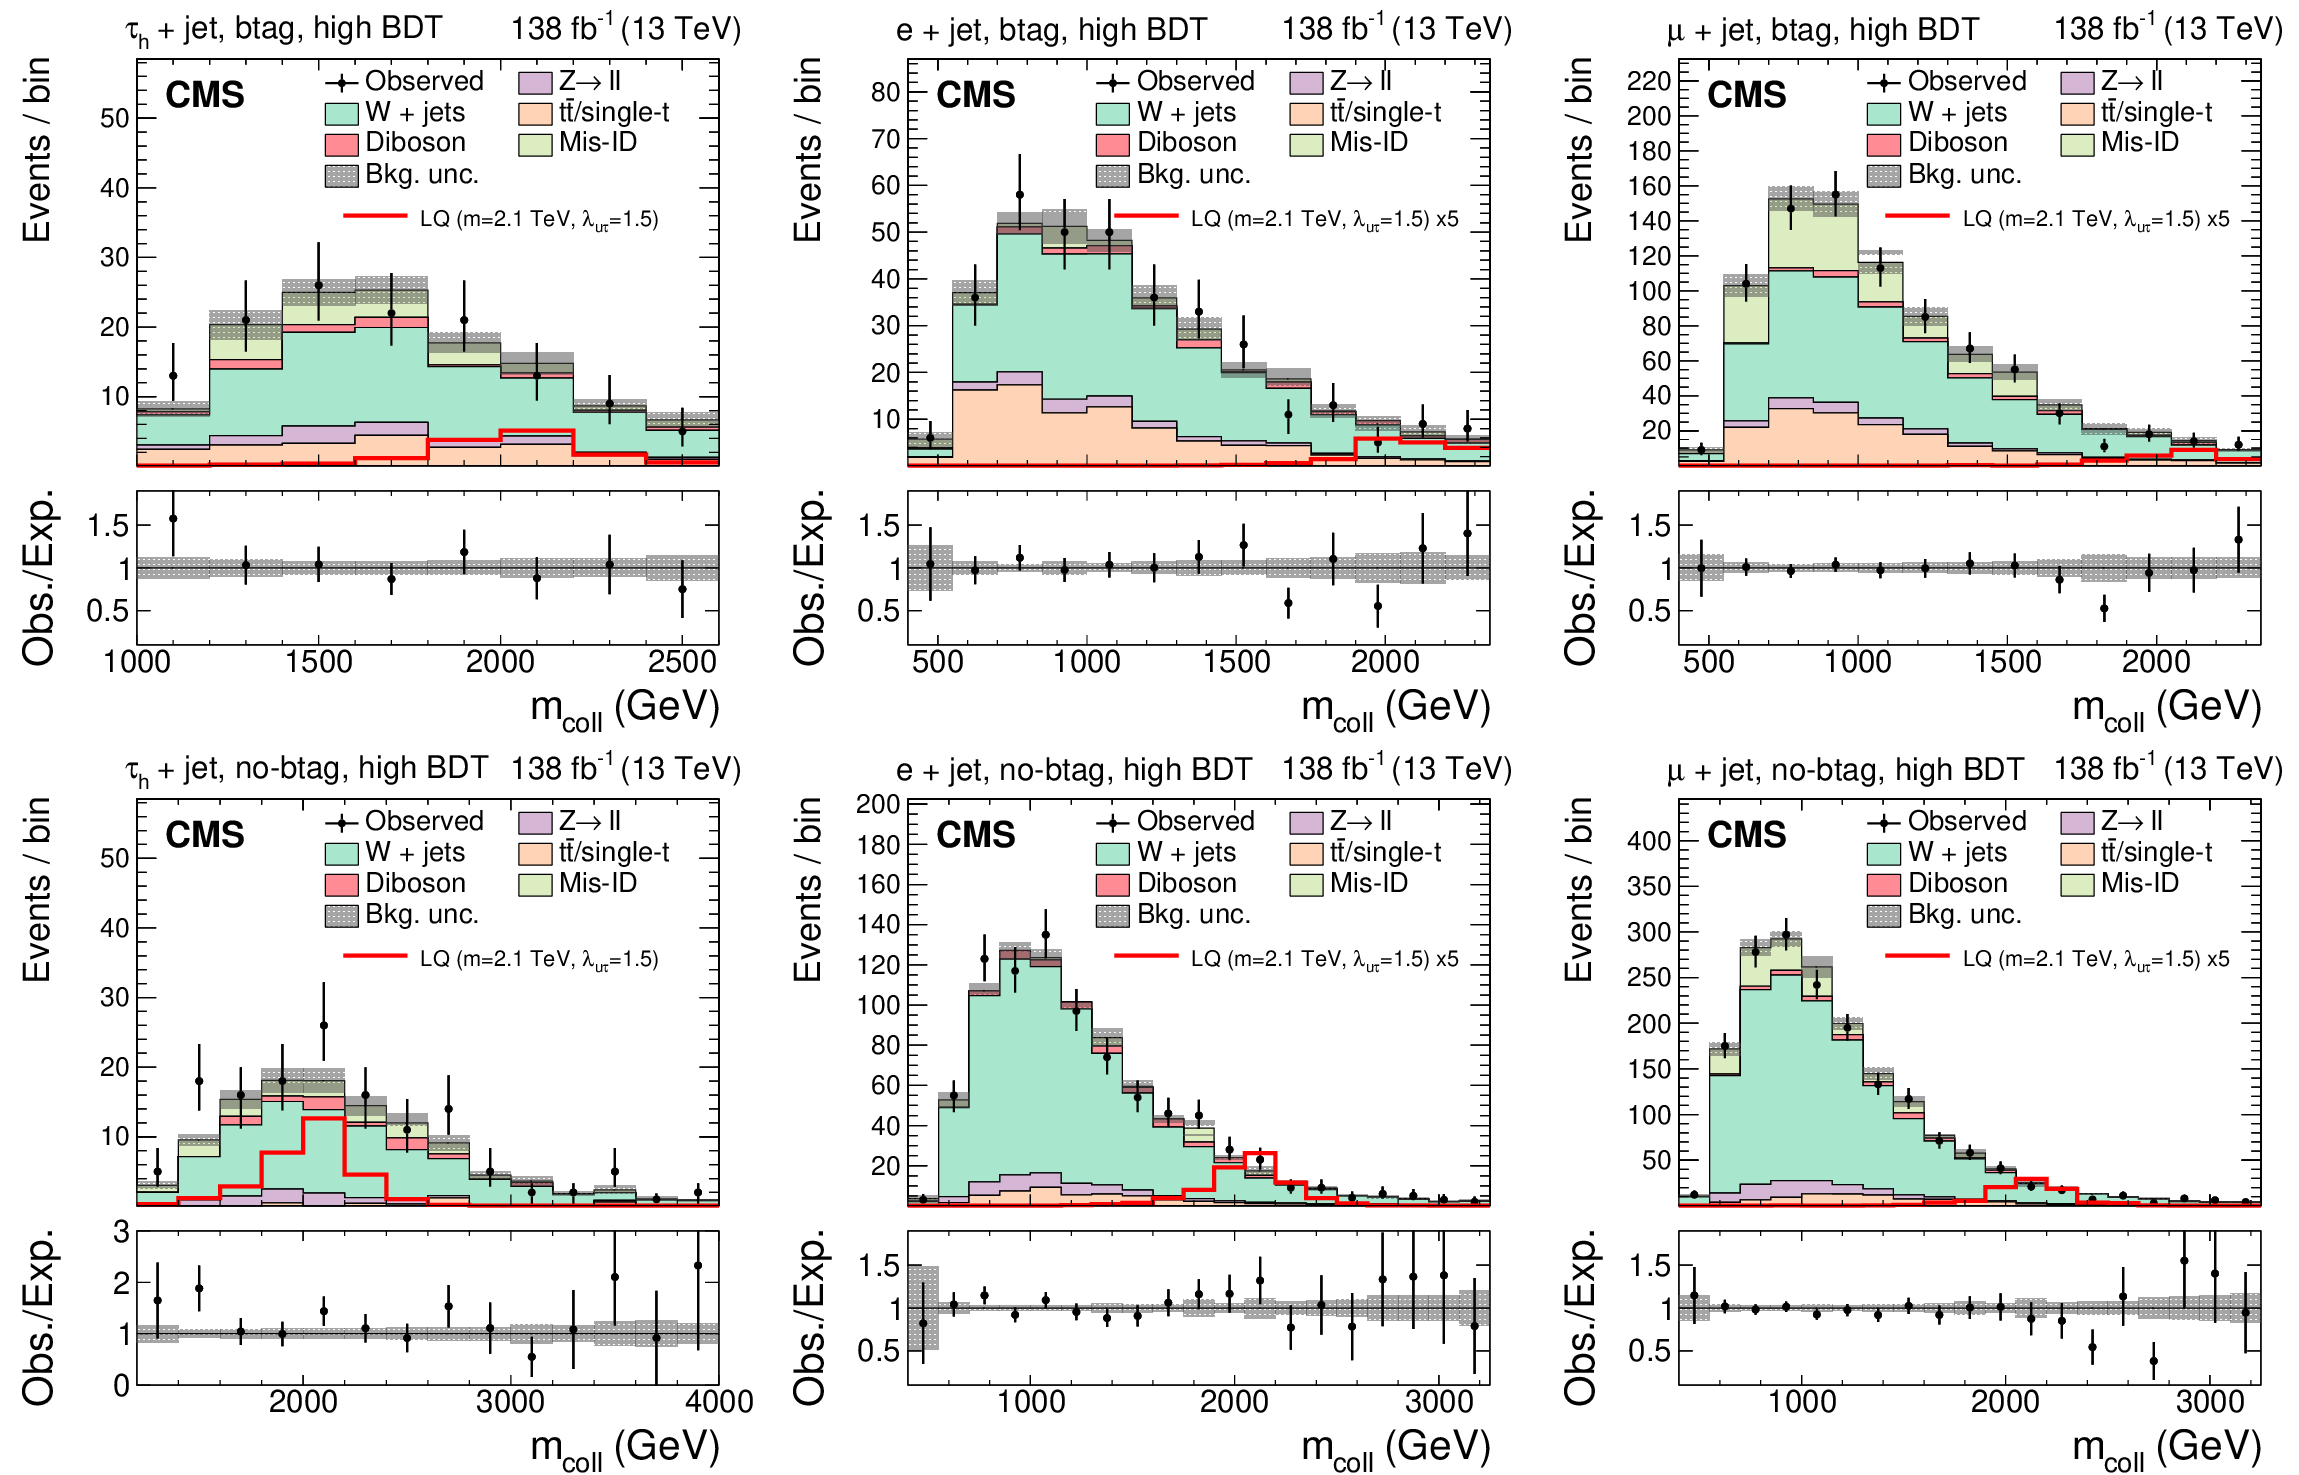
Figure 2:
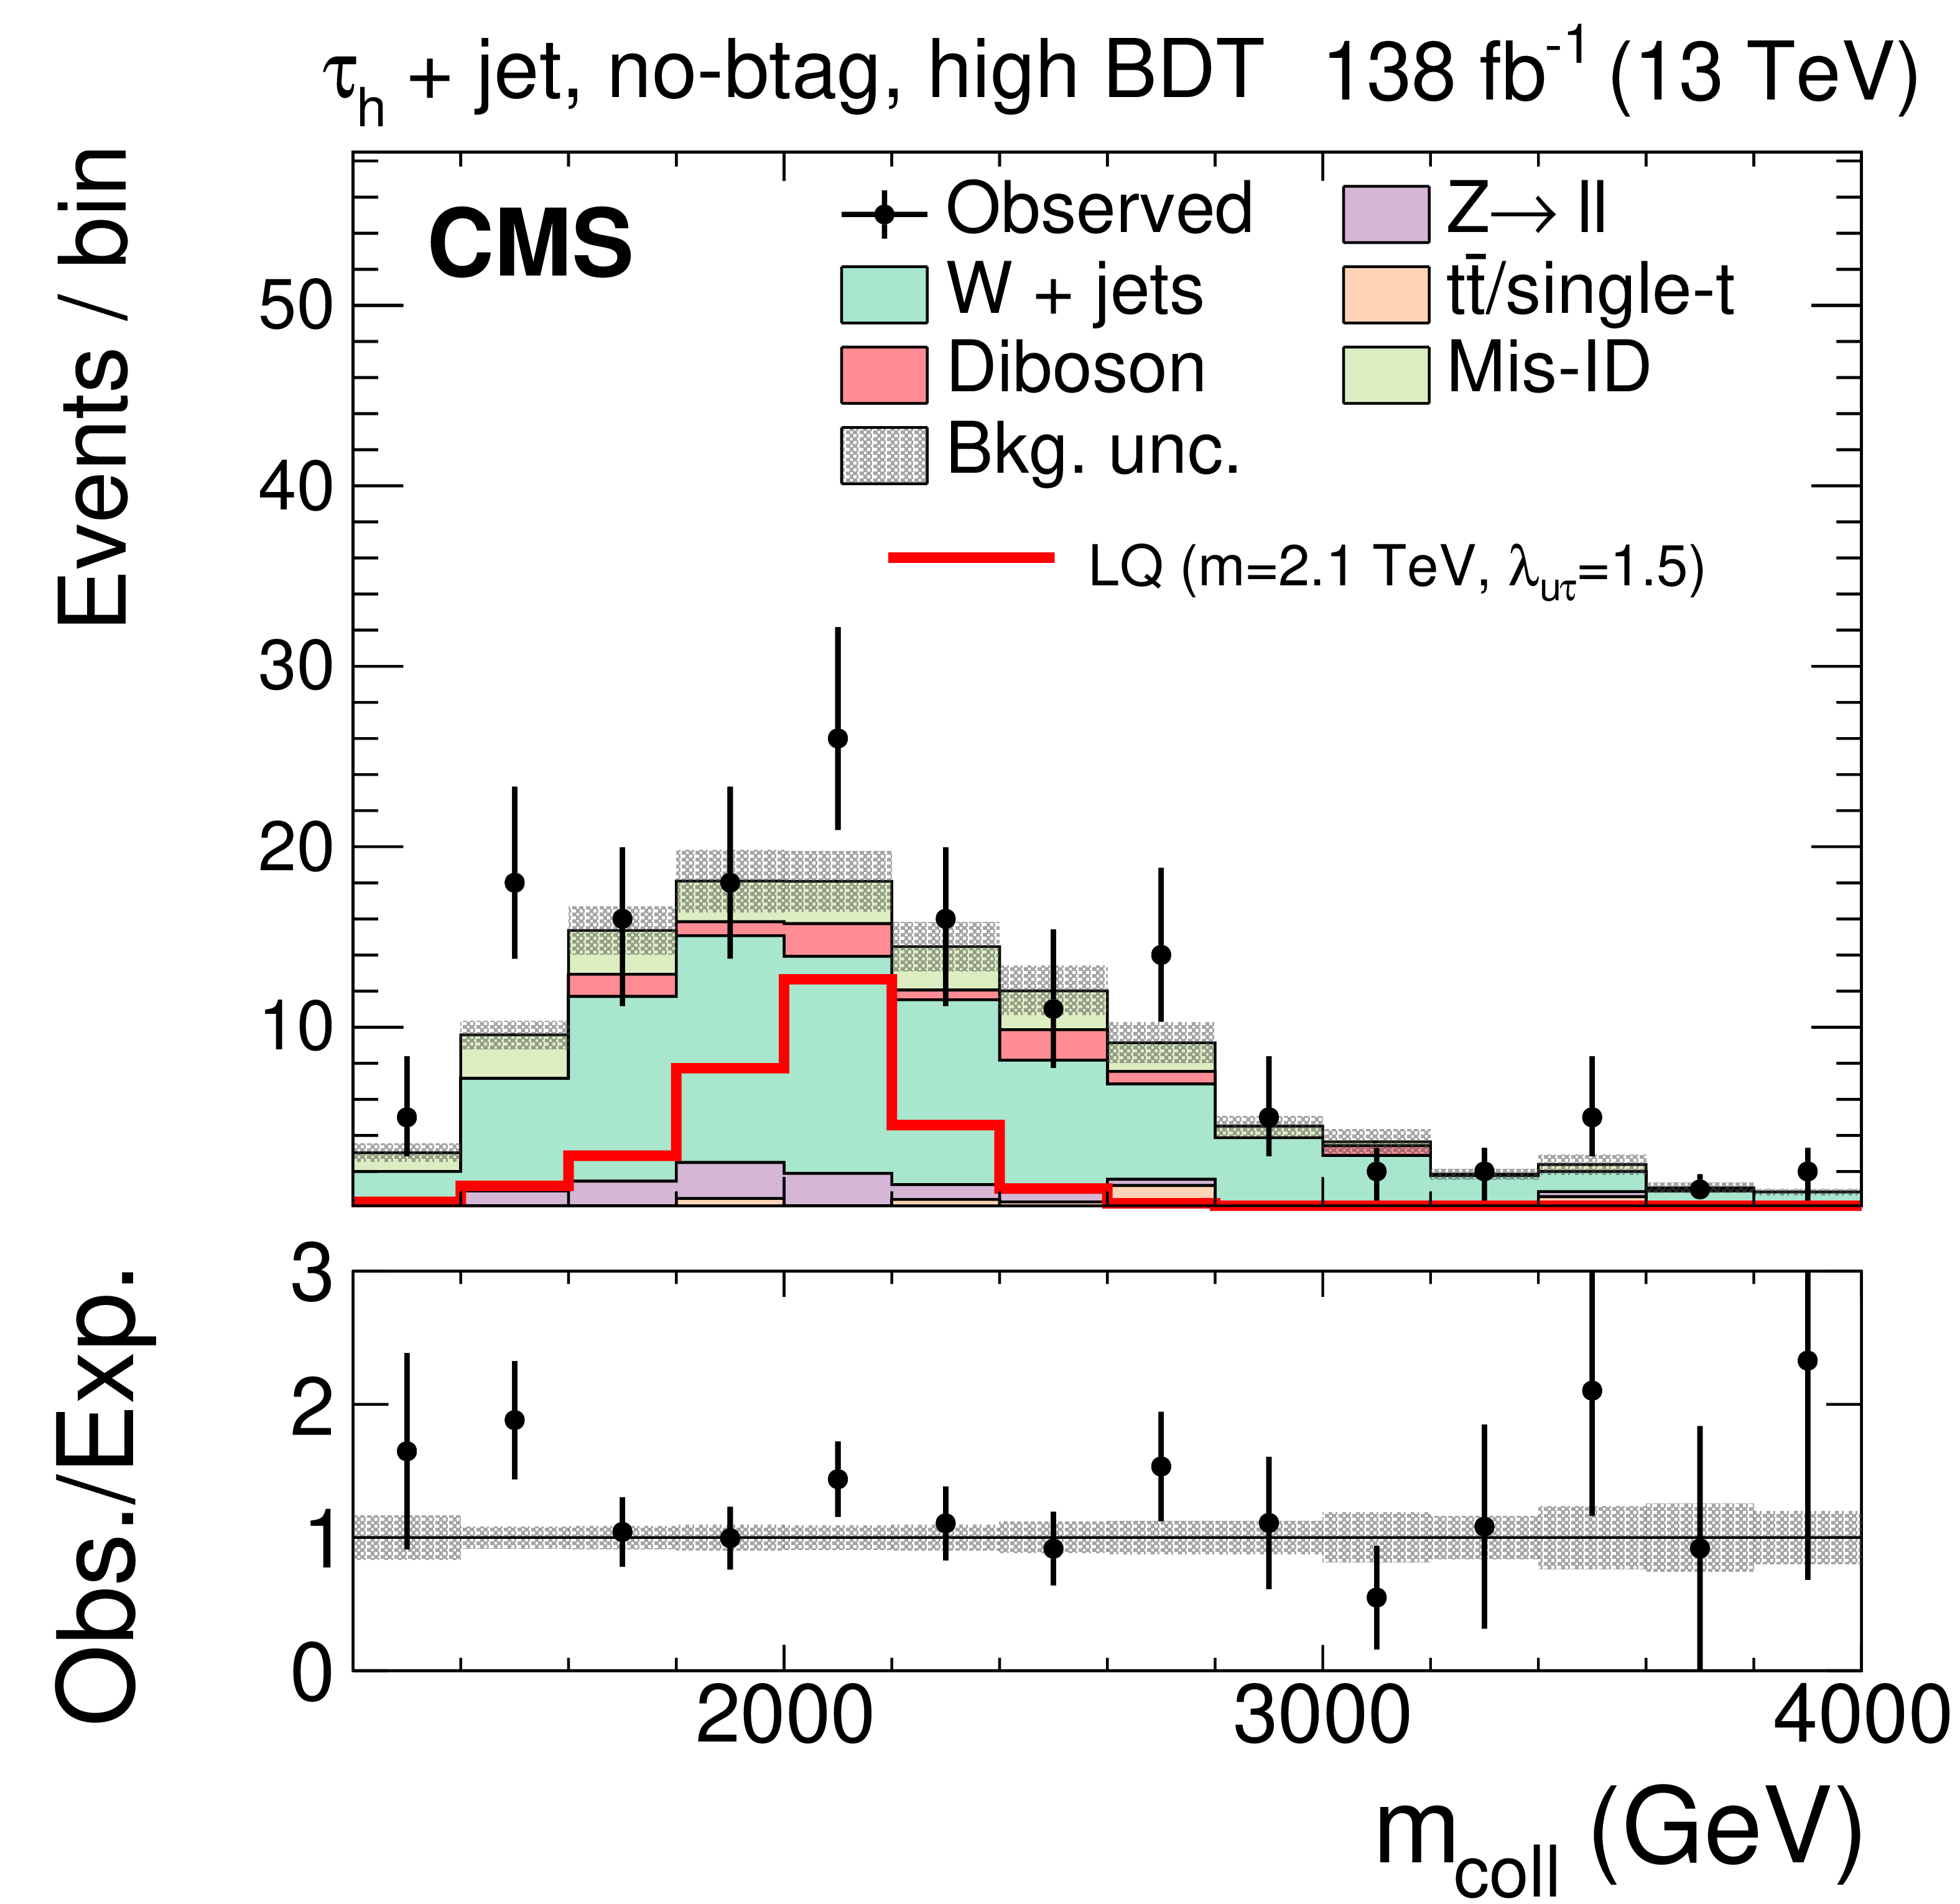
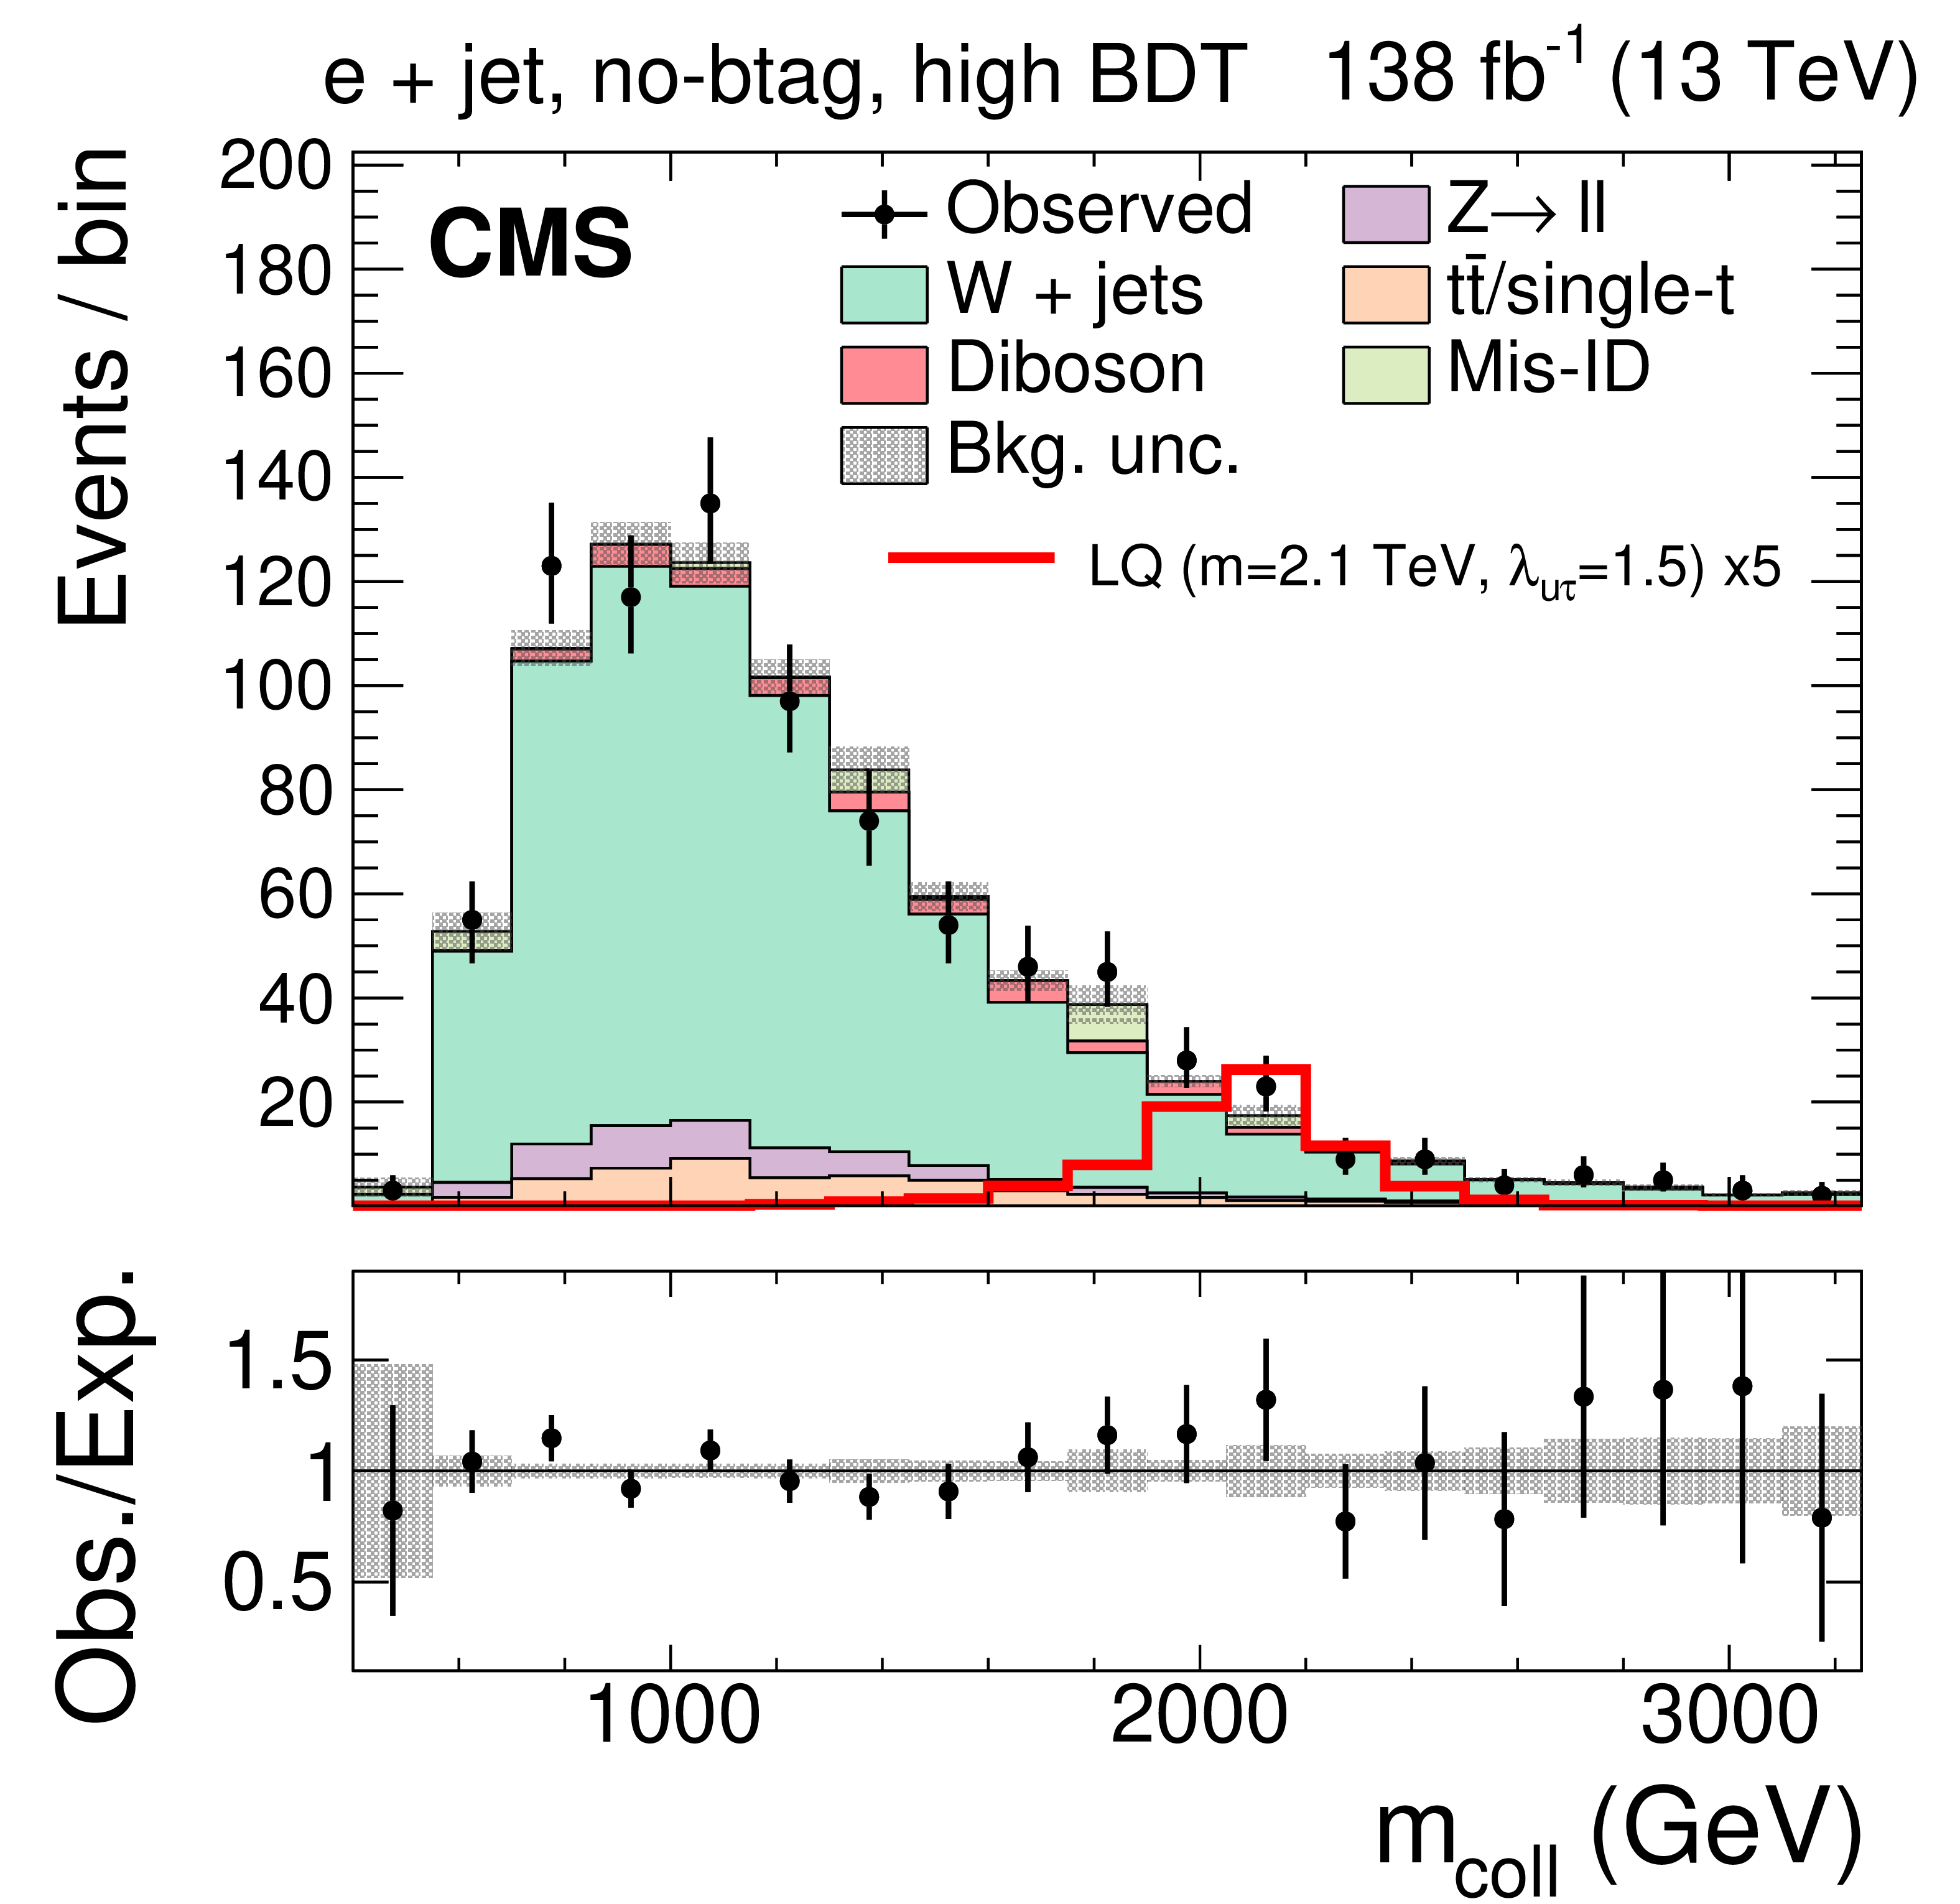
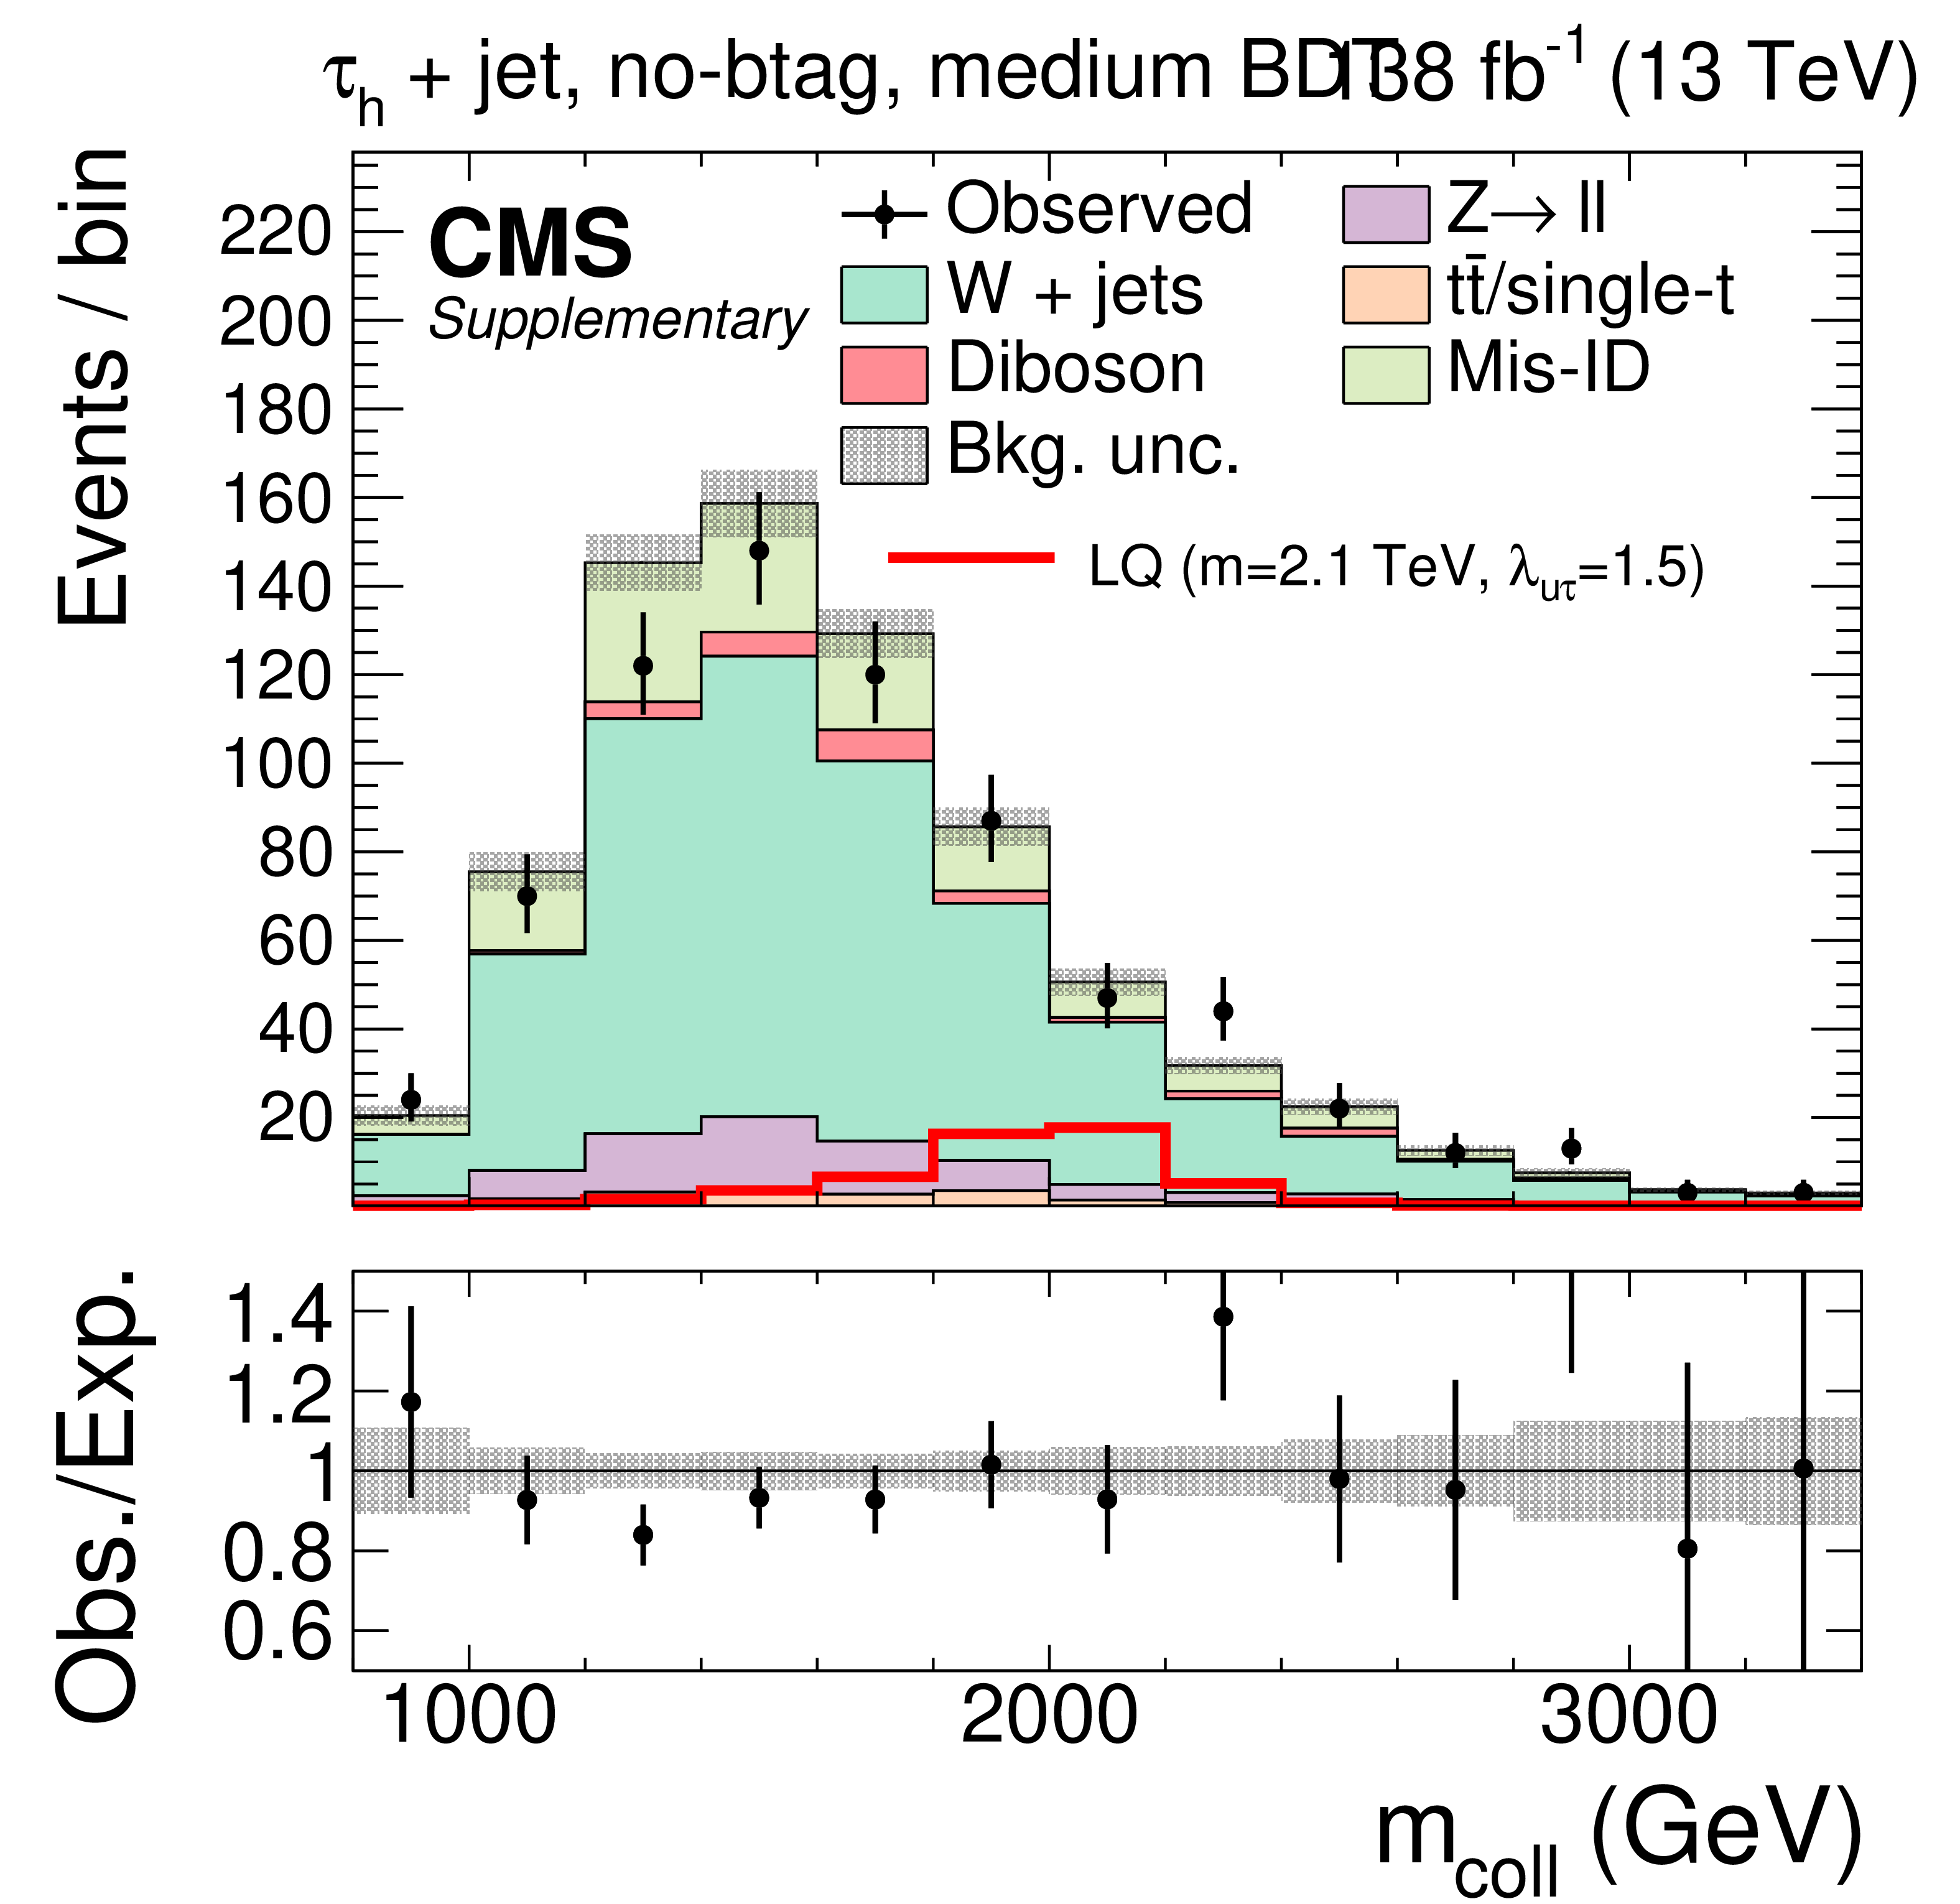
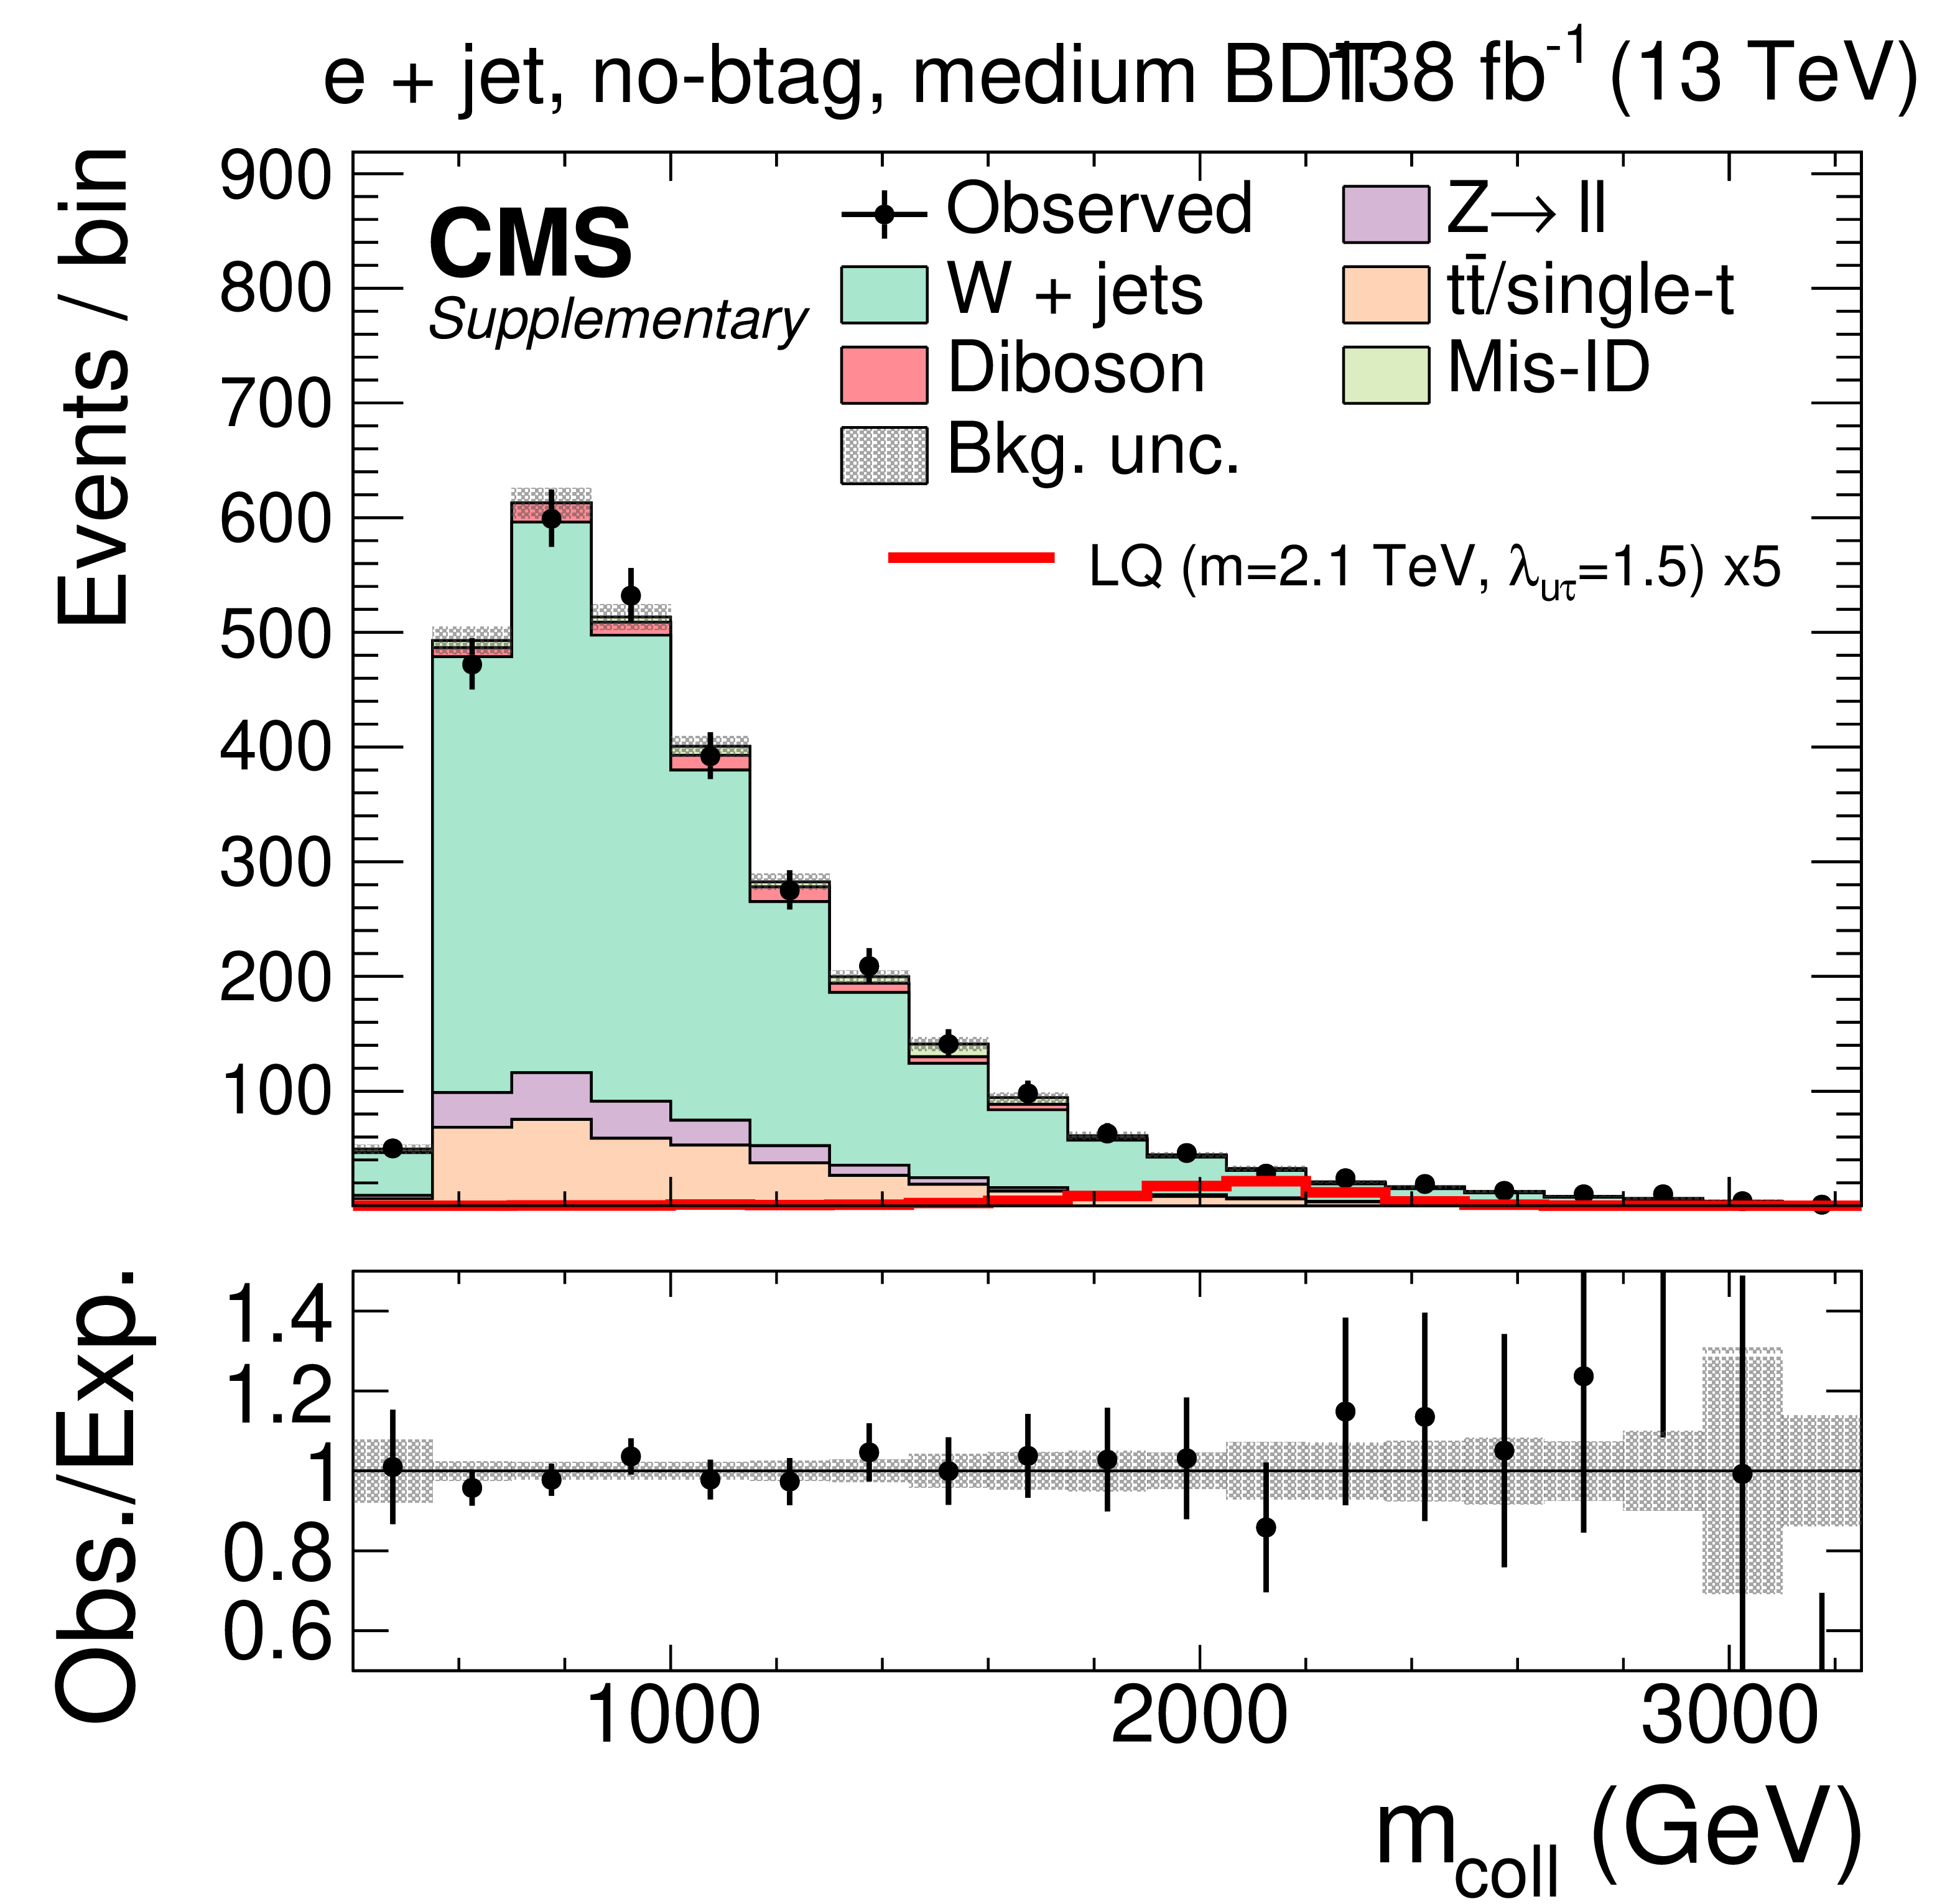
Observed and expected distributions of $ m_\text{coll} $ in the $ \tau_\mathrm{h}$+jet (left), e+jet (center), and $ \mu$+jet (right) channels for the btag (upper) and no-btag (lower) subcategories with the BDT requirements selecting the most signal-like events. The bands include statistical and systematic uncertainties. The background distributions are the results of the maximum likelihood fit. The signal distributions are multiplied by a factor of 5 in the e+jet and $ \mu$+jet final states to improve the readability. |

png pdf |
Figure 2-a:
Observed and expected distributions of $ m_\text{coll} $ in the $ \tau_\mathrm{h}$+jet channel for the btag subcategory with the BDT requirements selecting the most signal-like events. The band includes statistical and systematic uncertainties. The background distributions are the results of the maximum likelihood fit. |
png pdf |
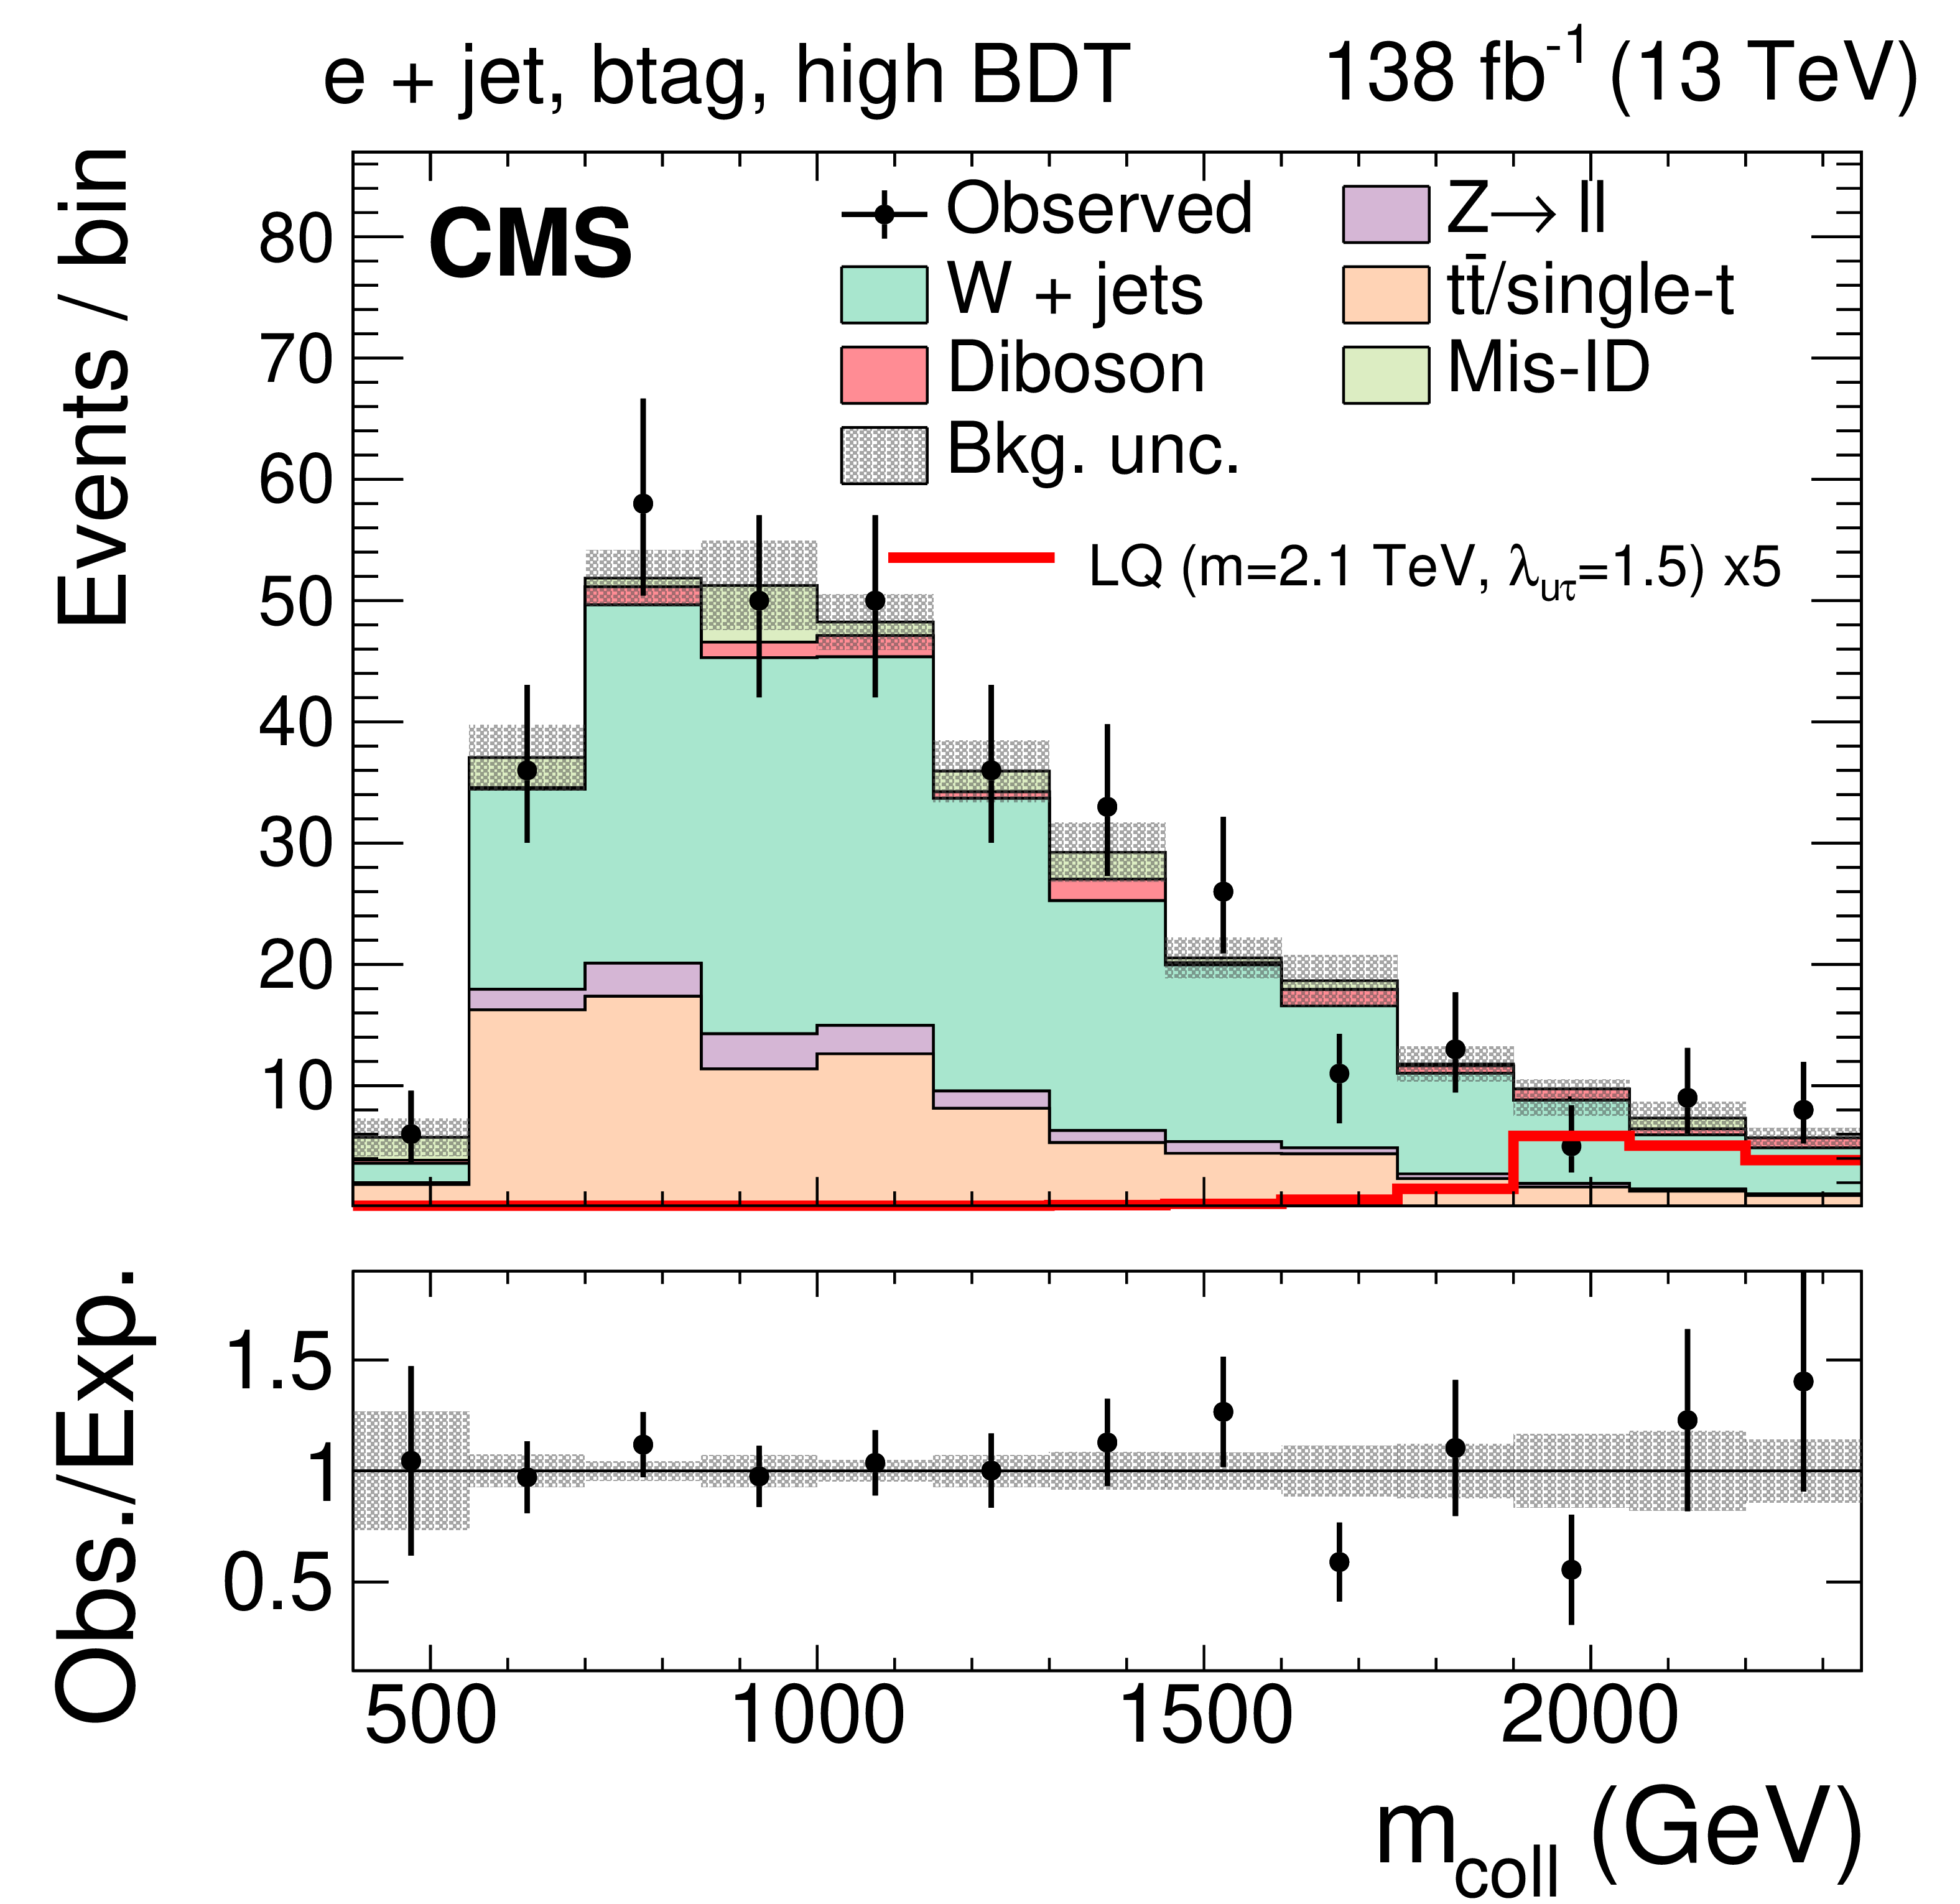
Figure 2-b:
Observed and expected distributions of $ m_\text{coll} $ in the e+jet channel for the btag subcategory with the BDT requirements selecting the most signal-like events. The band includes statistical and systematic uncertainties. The background distributions are the results of the maximum likelihood fit. The signal distribution is multiplied by a factor of 5 to improve the readability. |
png pdf |
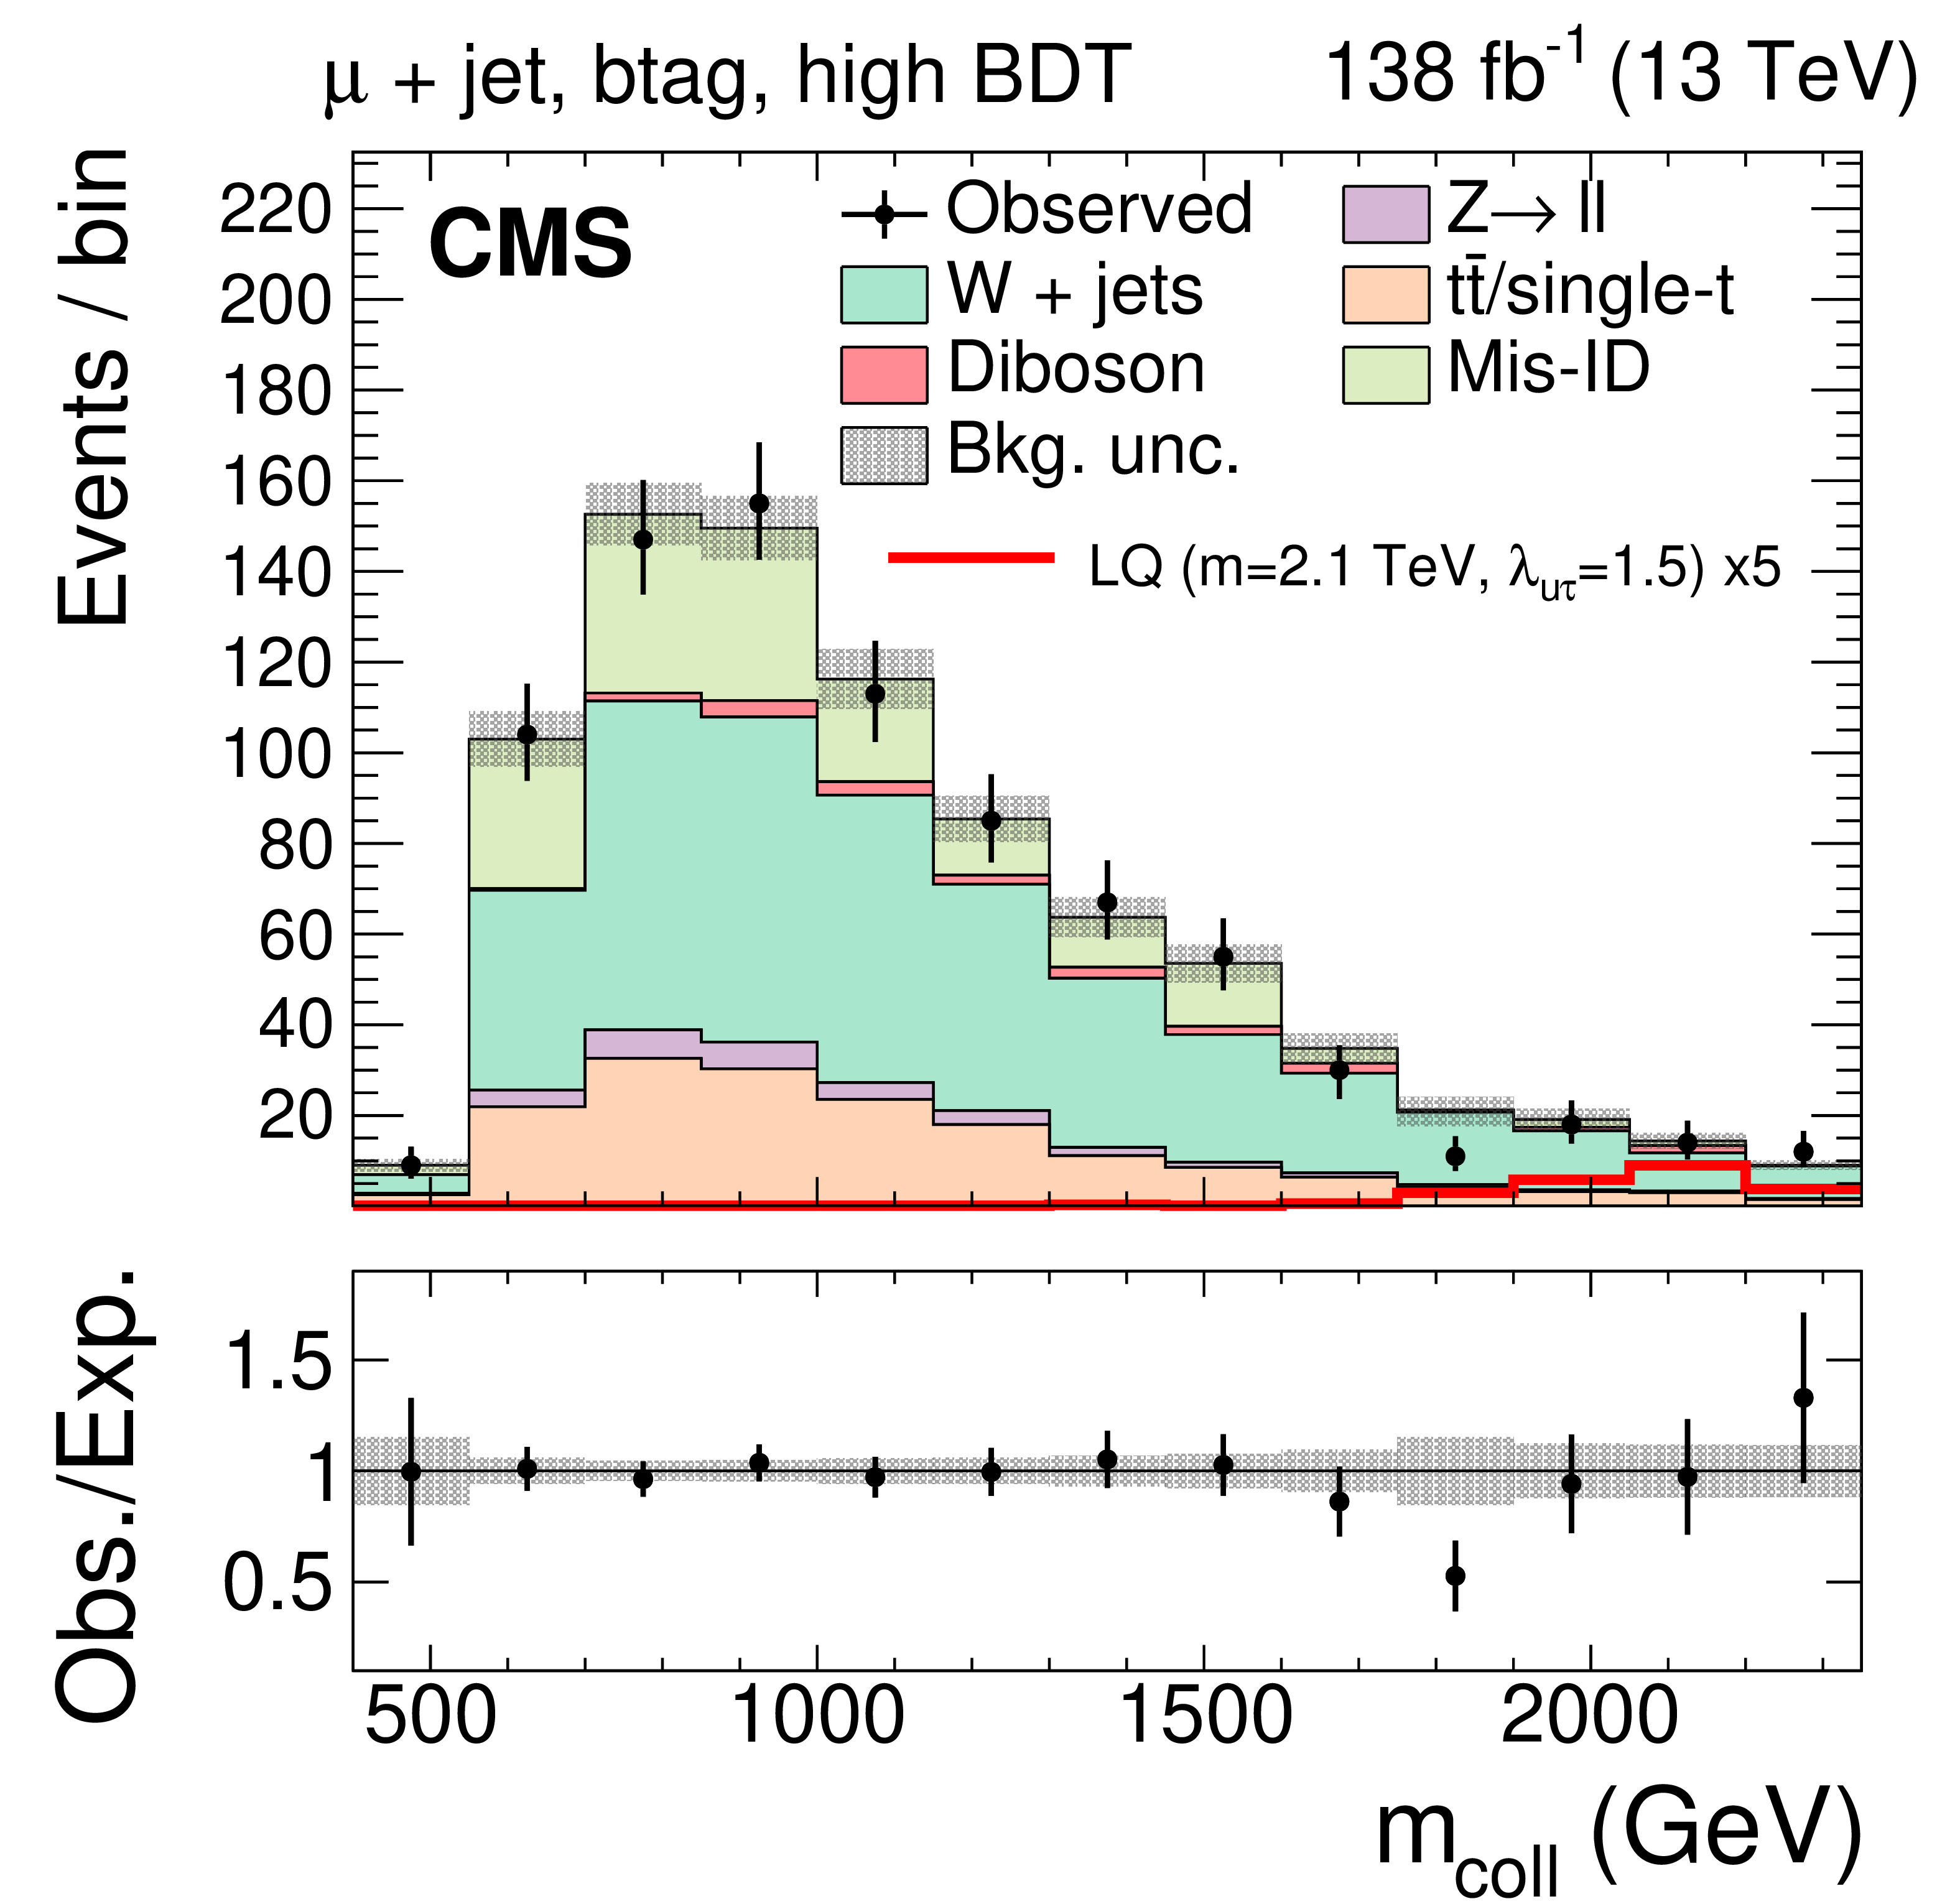
Figure 2-c:
Observed and expected distributions of $ m_\text{coll} $ in the $ \mu$+jet channel for the btag subcategory with the BDT requirements selecting the most signal-like events. The band includes statistical and systematic uncertainties. The background distributions are the results of the maximum likelihood fit. The signal distribution is multiplied by a factor of 5 to improve the readability. |
png pdf |
Figure 2-d:
Observed and expected distributions of $ m_\text{coll} $ in the $ \tau_\mathrm{h}$+jet channel for the no-btag subcategory with the BDT requirements selecting the most signal-like events. The band includes statistical and systematic uncertainties. The background distributions are the results of the maximum likelihood fit. |
png pdf |
Figure 2-e:
Observed and expected distributions of $ m_\text{coll} $ in the e+jet channel for the no-btag subcategory with the BDT requirements selecting the most signal-like events. The band includes statistical and systematic uncertainties. The background distributions are the results of the maximum likelihood fit. The signal distribution is multiplied by a factor of 5 to improve the readability. |

png pdf |
Figure 2-f:
Observed and expected distributions of $ m_\text{coll} $ in the $ \mu$+jet channel for the no-btag subcategory with the BDT requirements selecting the most signal-like events. The band includes statistical and systematic uncertainties. The background distributions are the results of the maximum likelihood fit. The signal distribution is multiplied by a factor of 5 to improve the readability. |
png pdf |
Figure 3:
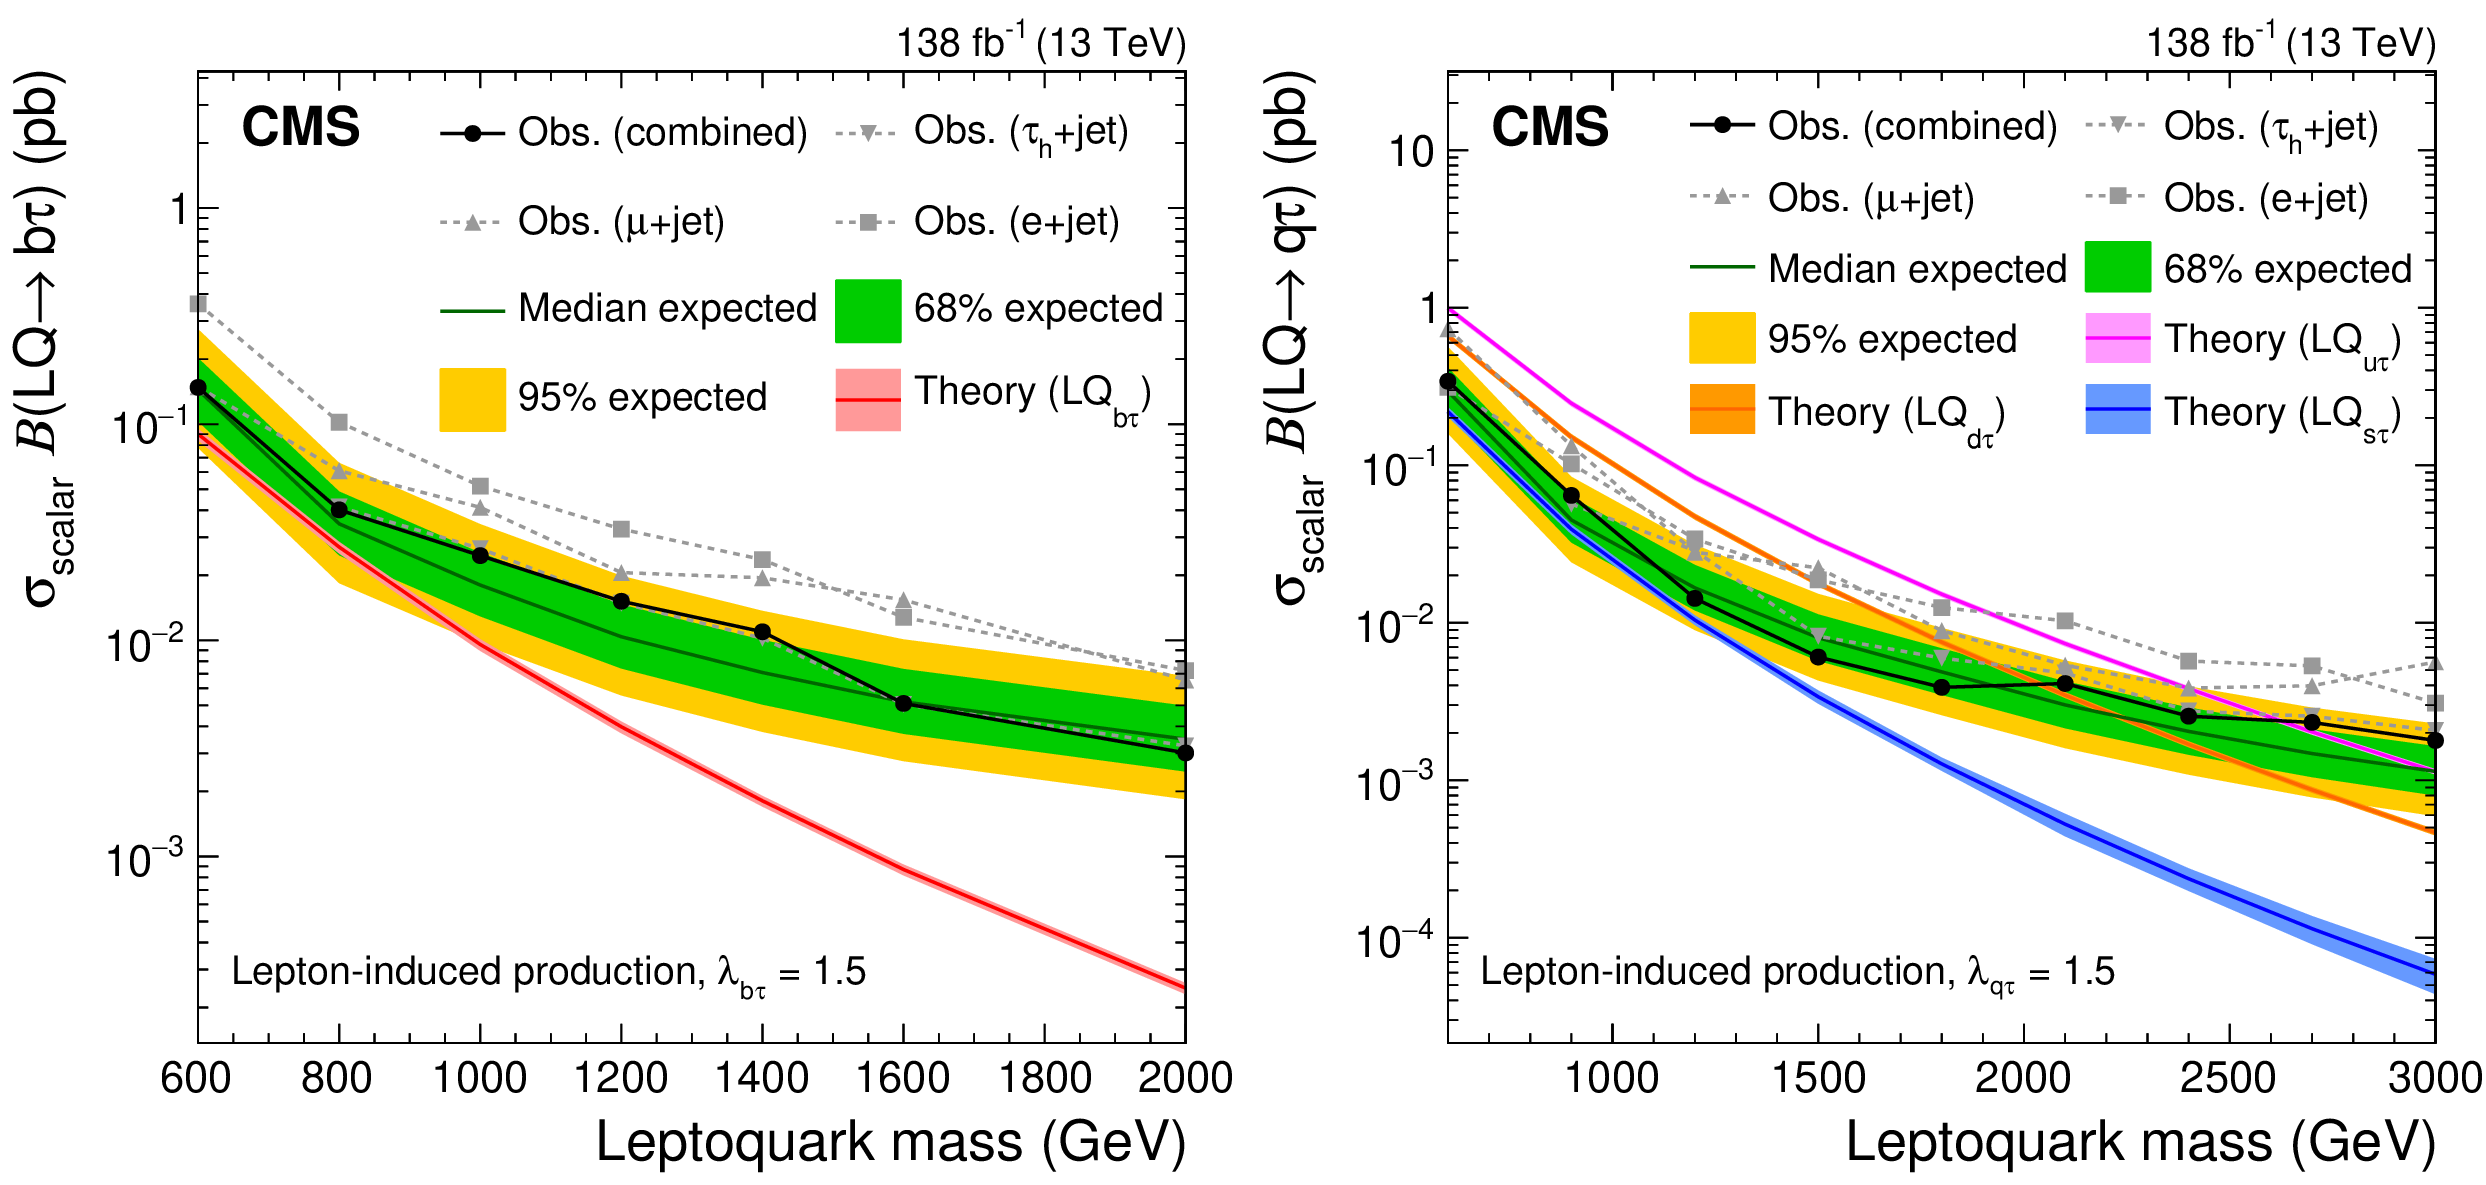
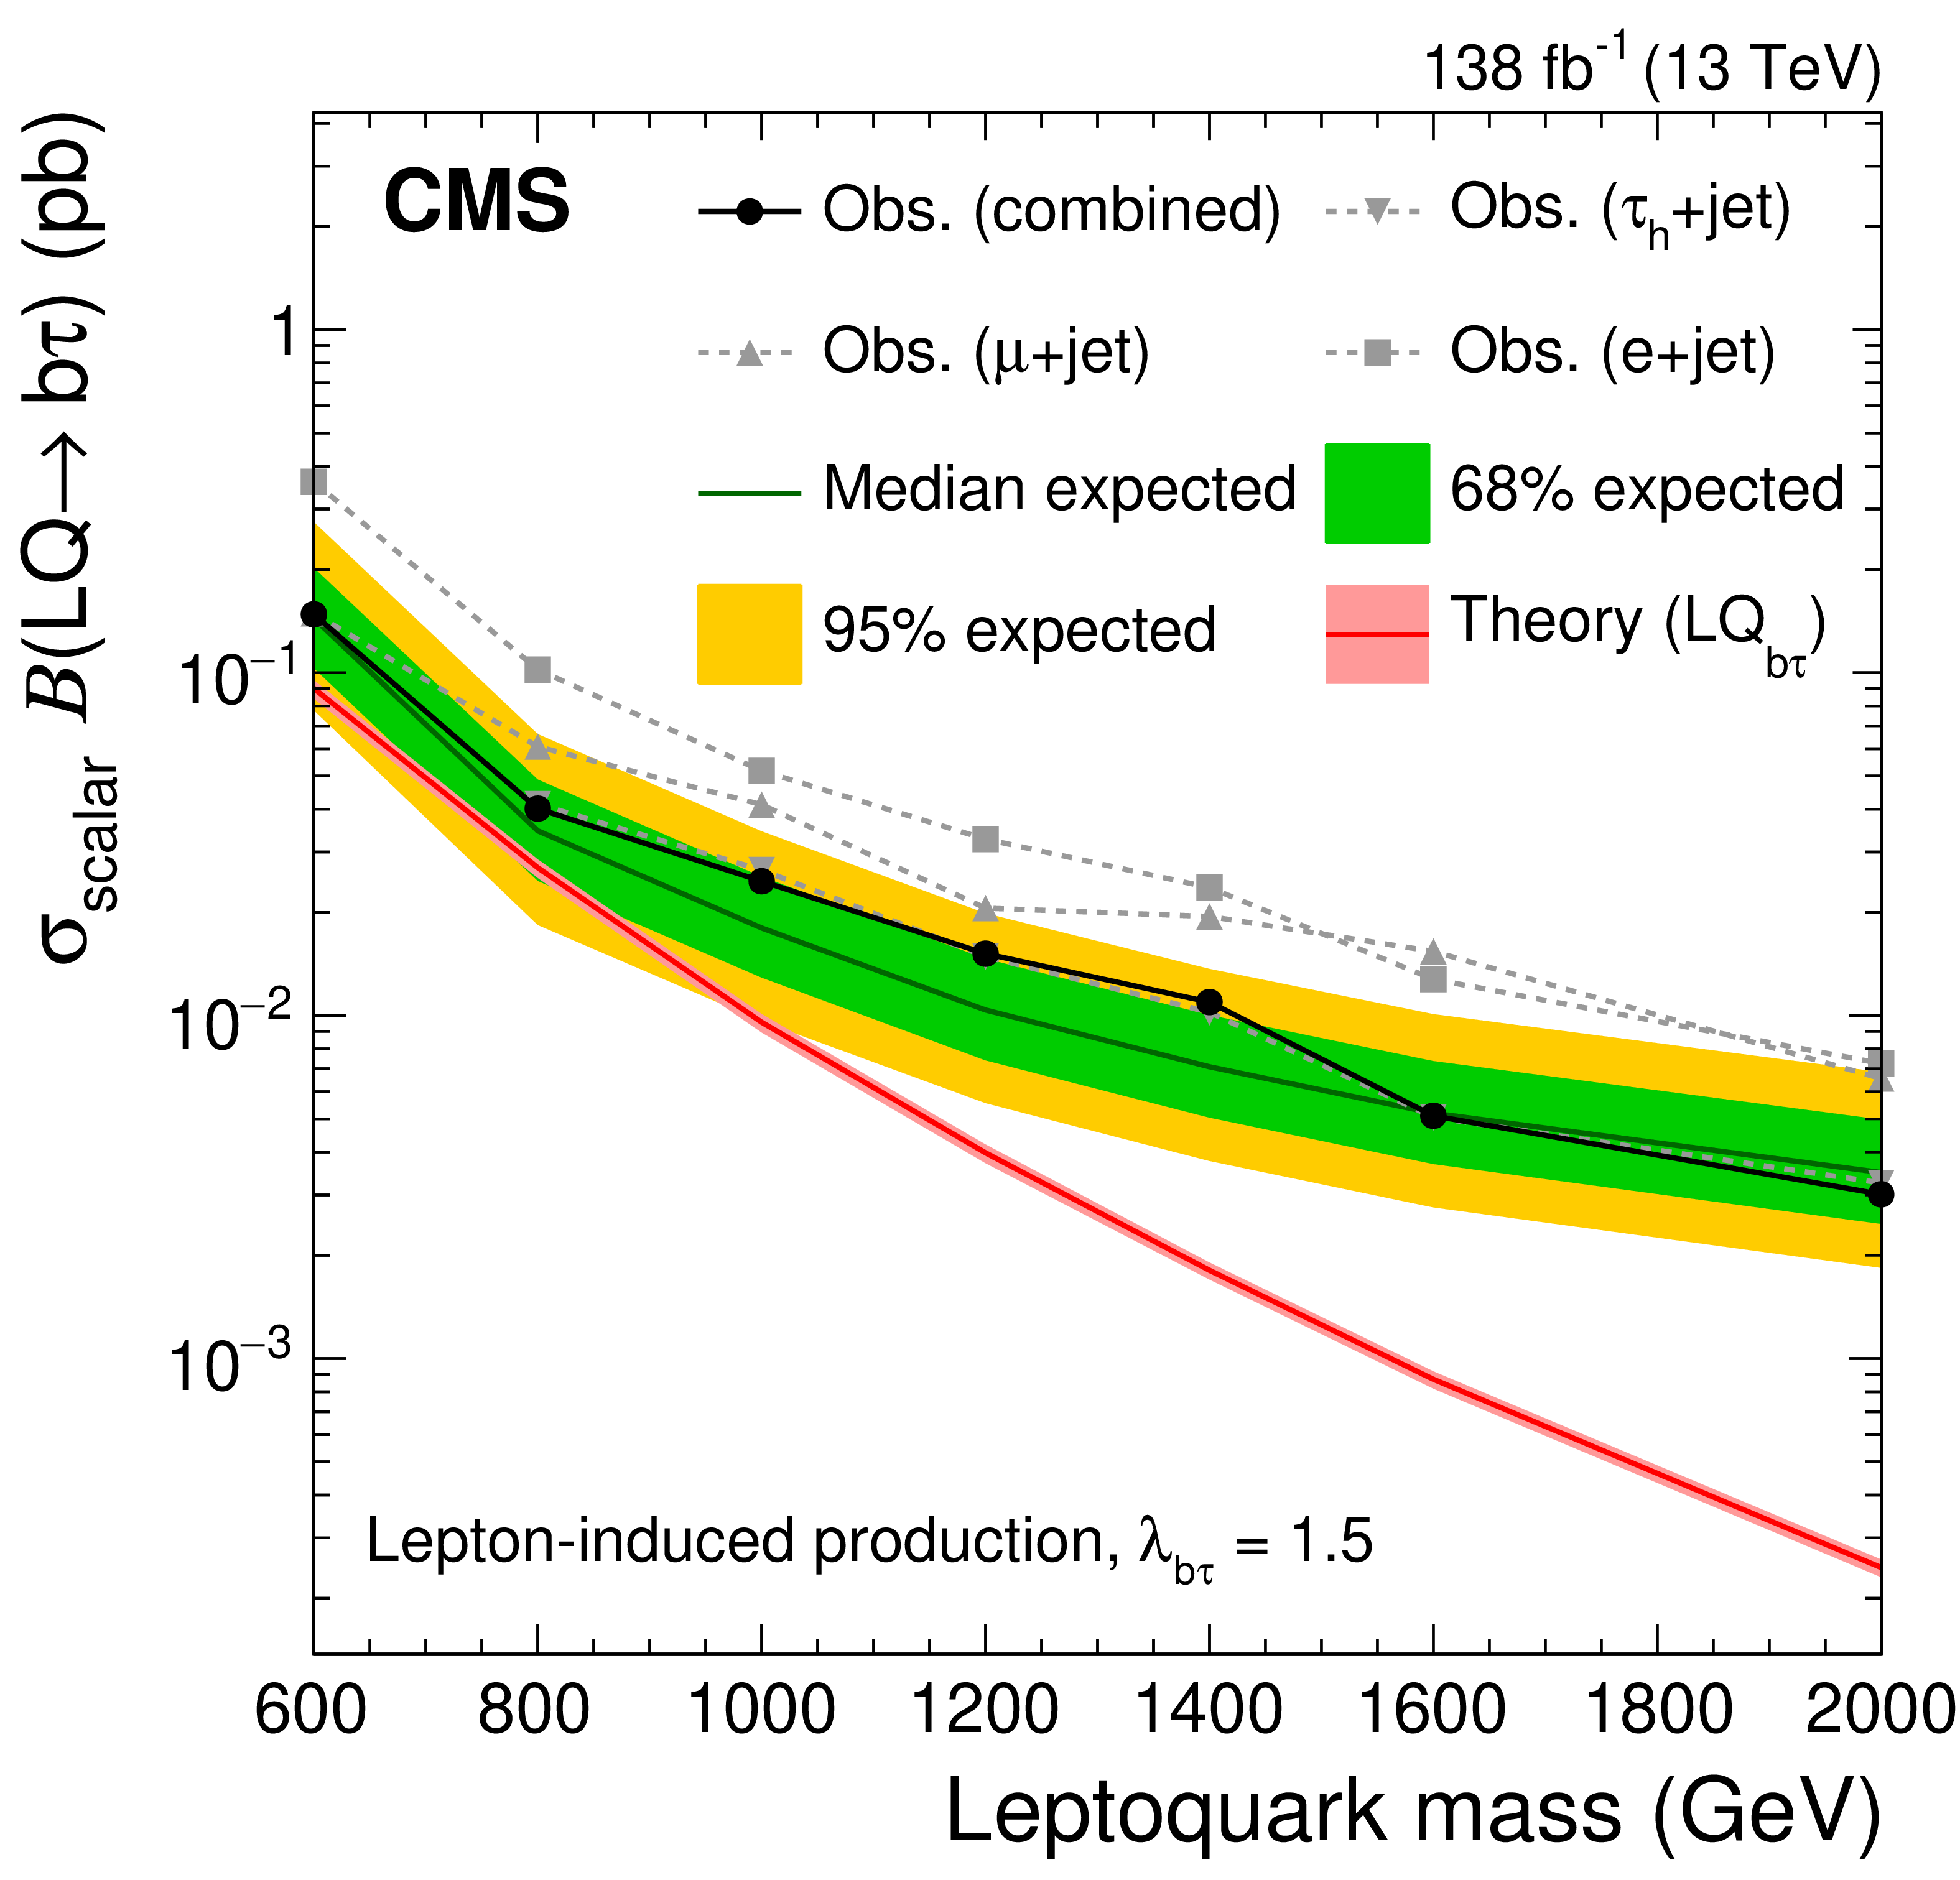
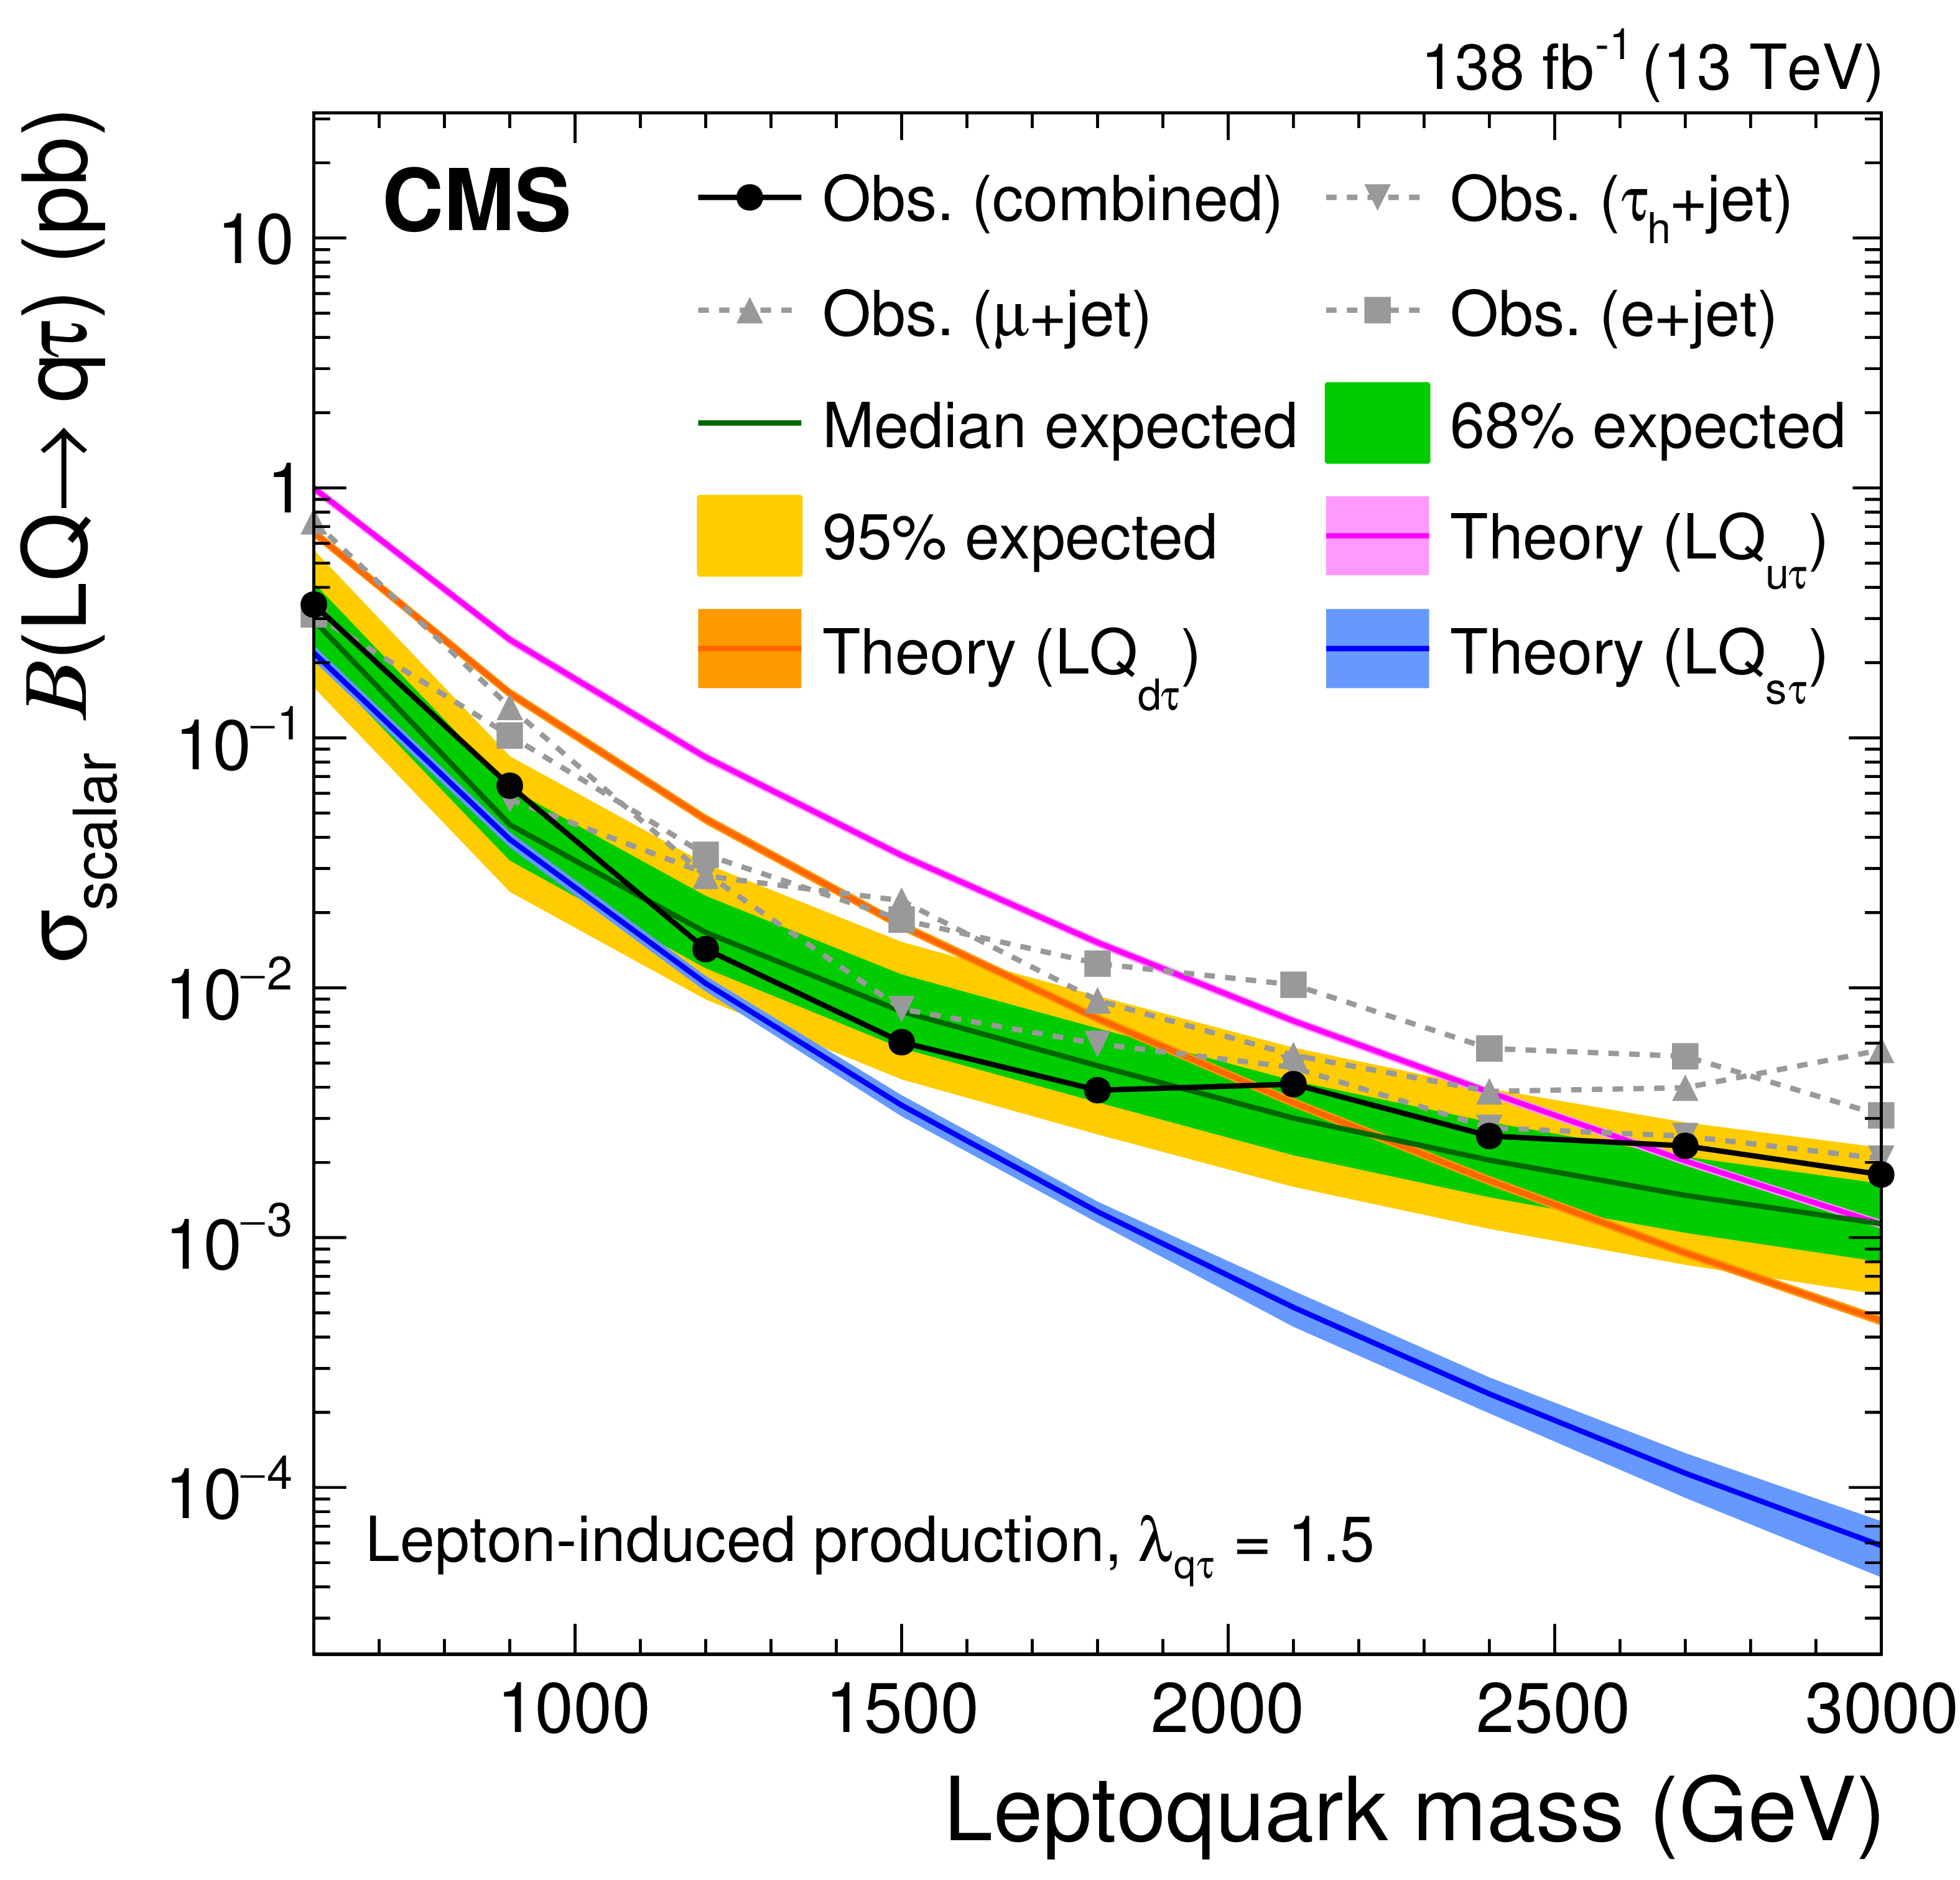
Expected and observed upper limits at 95% CL on the product of the scalar lepton-induced LQ production cross section and the branching fraction for a LQ coupled to b quarks and $ \tau $ leptons (left), or to light-flavor quarks and $ \tau $ leptons (right), using $ \lambda= $ 1.5. The theoretical cross sections correspond to the calculations of Refs. [40,41]. The inner (green) band and the outer (yellow) band indicate the regions containing 68 and 95%, respectively, of the distribution of limits expected under the background-only hypothesis. The filled circles show the observed limits for the combination of final states, while the other markers indicate the observed results per final state. |
png pdf |
Figure 3-a:
Expected and observed upper limits at 95% CL on the product of the scalar lepton-induced LQ production cross section and the branching fraction for a LQ coupled to b quarks and $ \tau $ leptons, using $ \lambda= $ 1.5. The theoretical cross sections correspond to the calculations of Refs. [40,41]. The inner (green) band and the outer (yellow) band indicate the regions containing 68 and 95%, respectively, of the distribution of limits expected under the background-only hypothesis. The filled circles show the observed limits for the combination of final states, while the other markers indicate the observed results per final state. |
png pdf |
Figure 3-b:
Expected and observed upper limits at 95% CL on the product of the scalar lepton-induced LQ production cross section and the branching fraction for a LQ coupled to light-flavor quarks and $ \tau $ leptons, using $ \lambda= $ 1.5. The theoretical cross sections correspond to the calculations of Refs. [40,41]. The inner (green) band and the outer (yellow) band indicate the regions containing 68 and 95%, respectively, of the distribution of limits expected under the background-only hypothesis. The filled circles show the observed limits for the combination of final states, while the other markers indicate the observed results per final state. |

png pdf |
Figure 4:
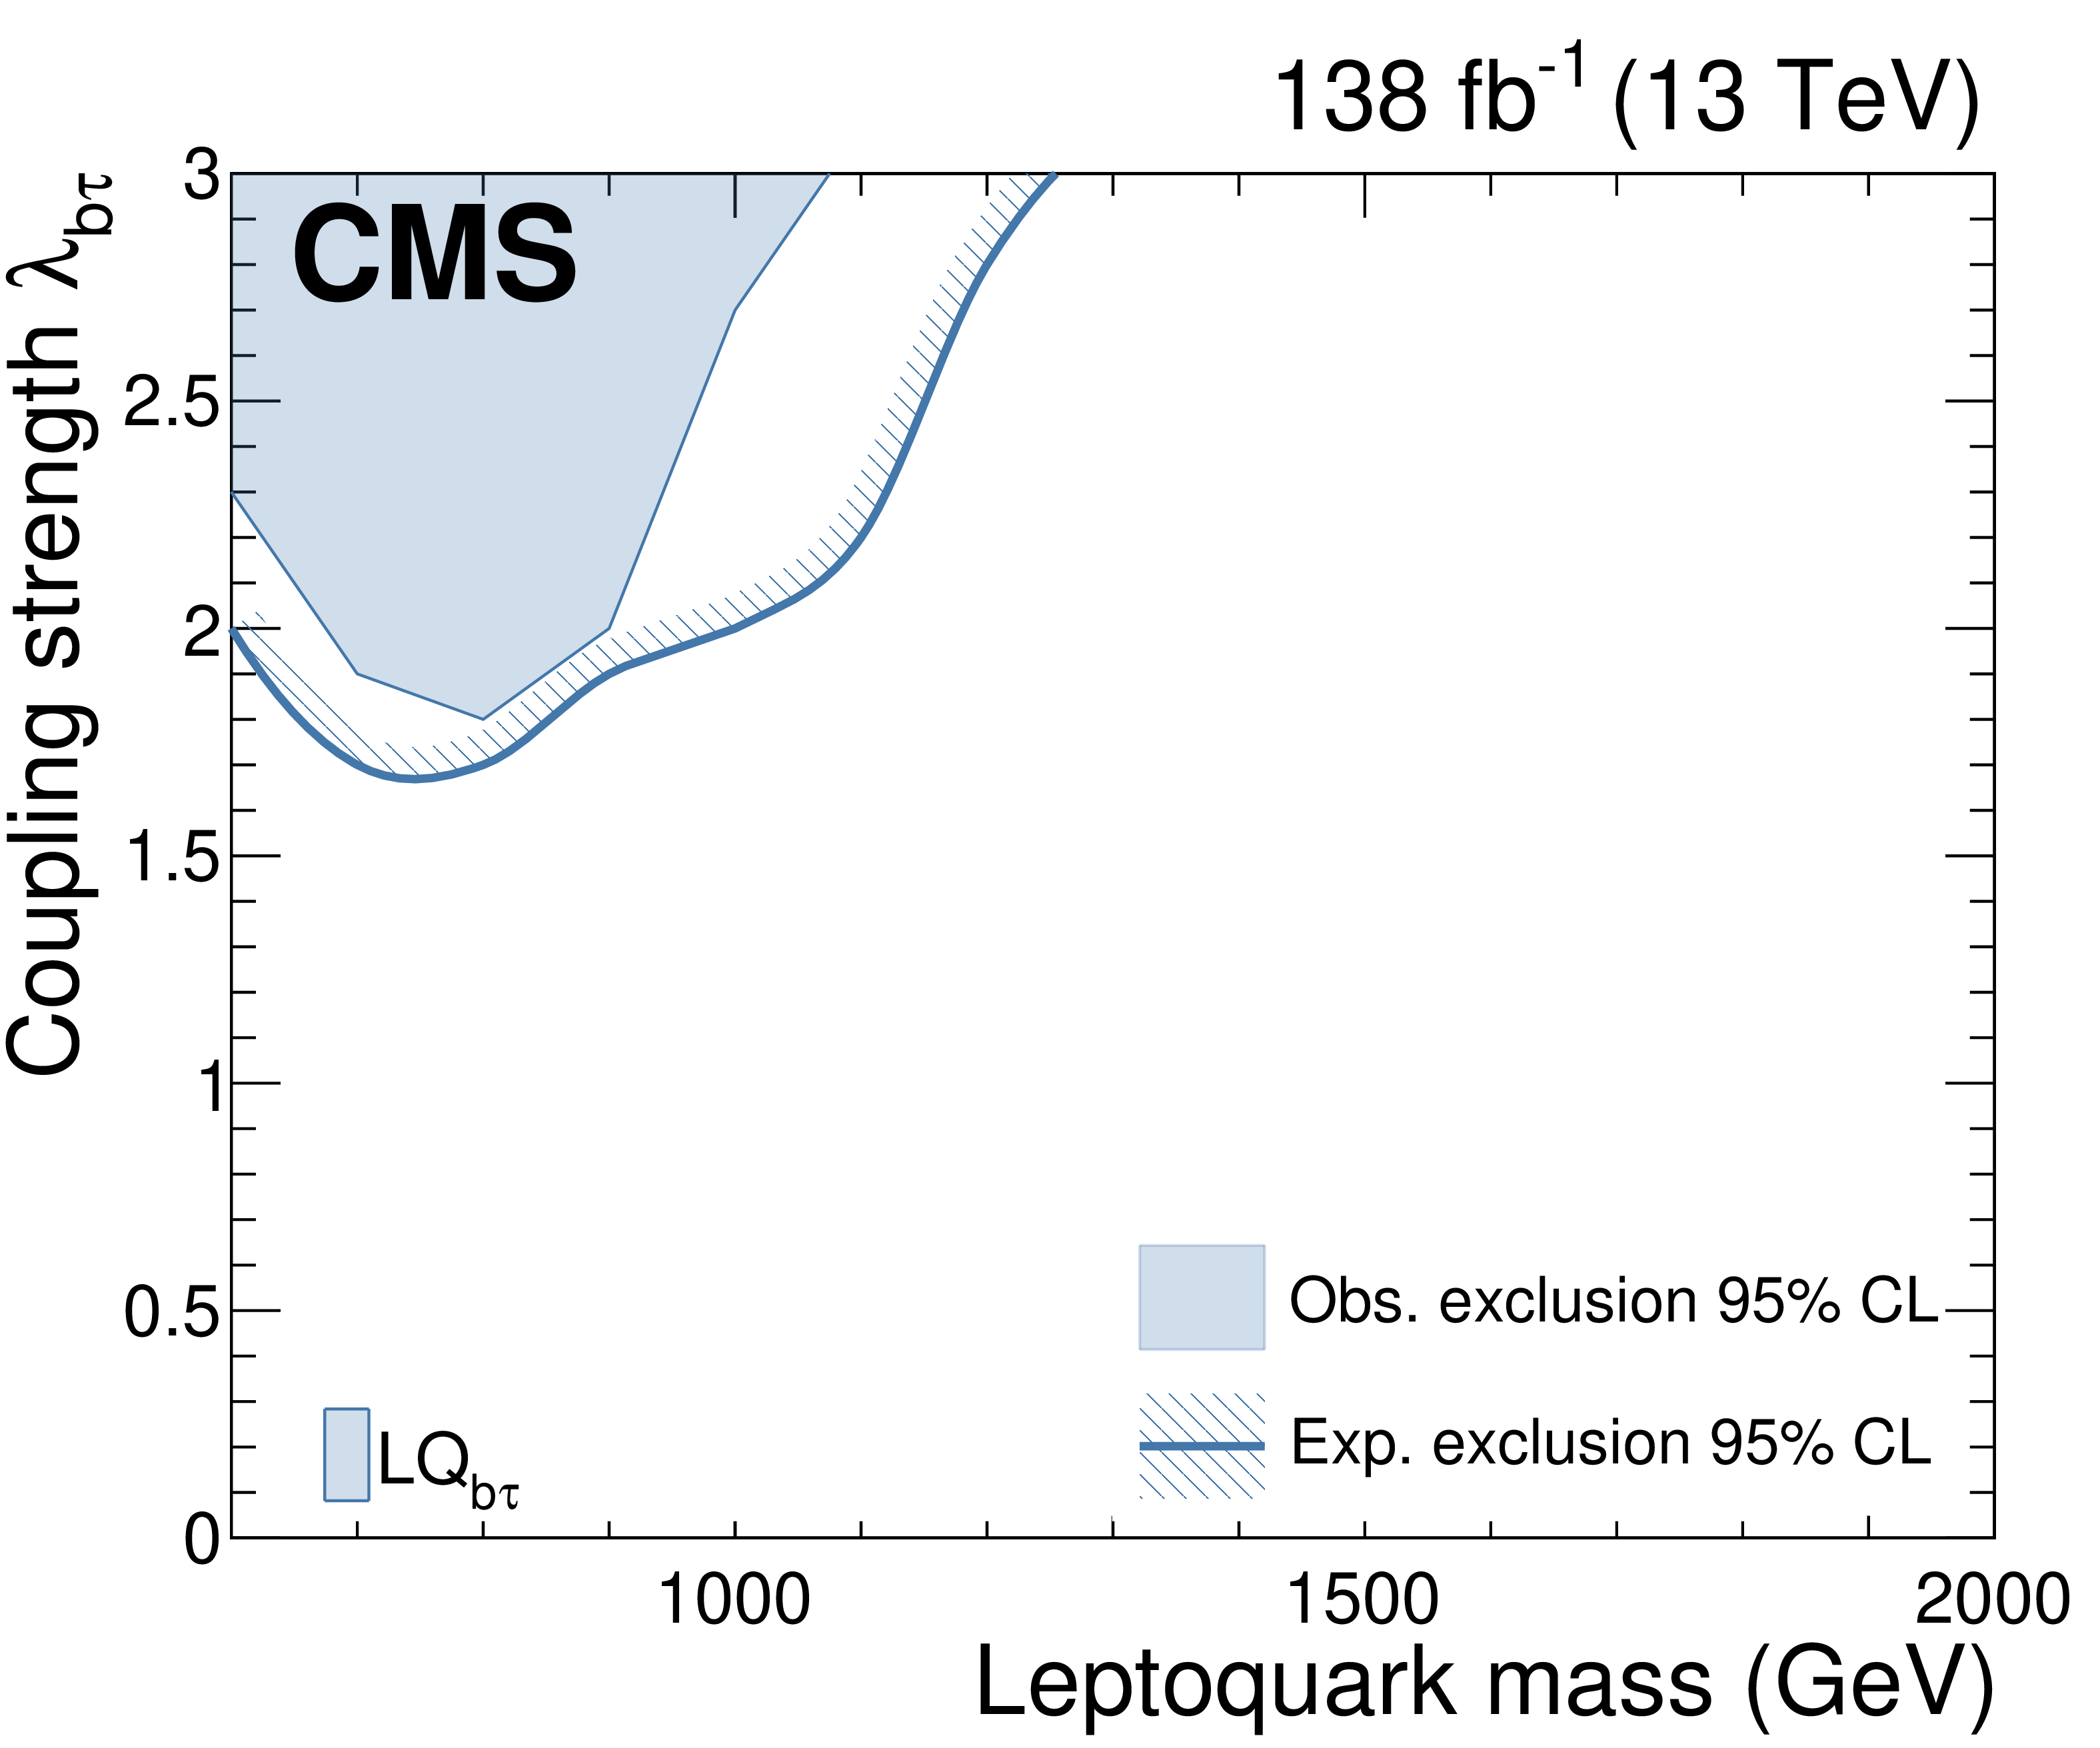
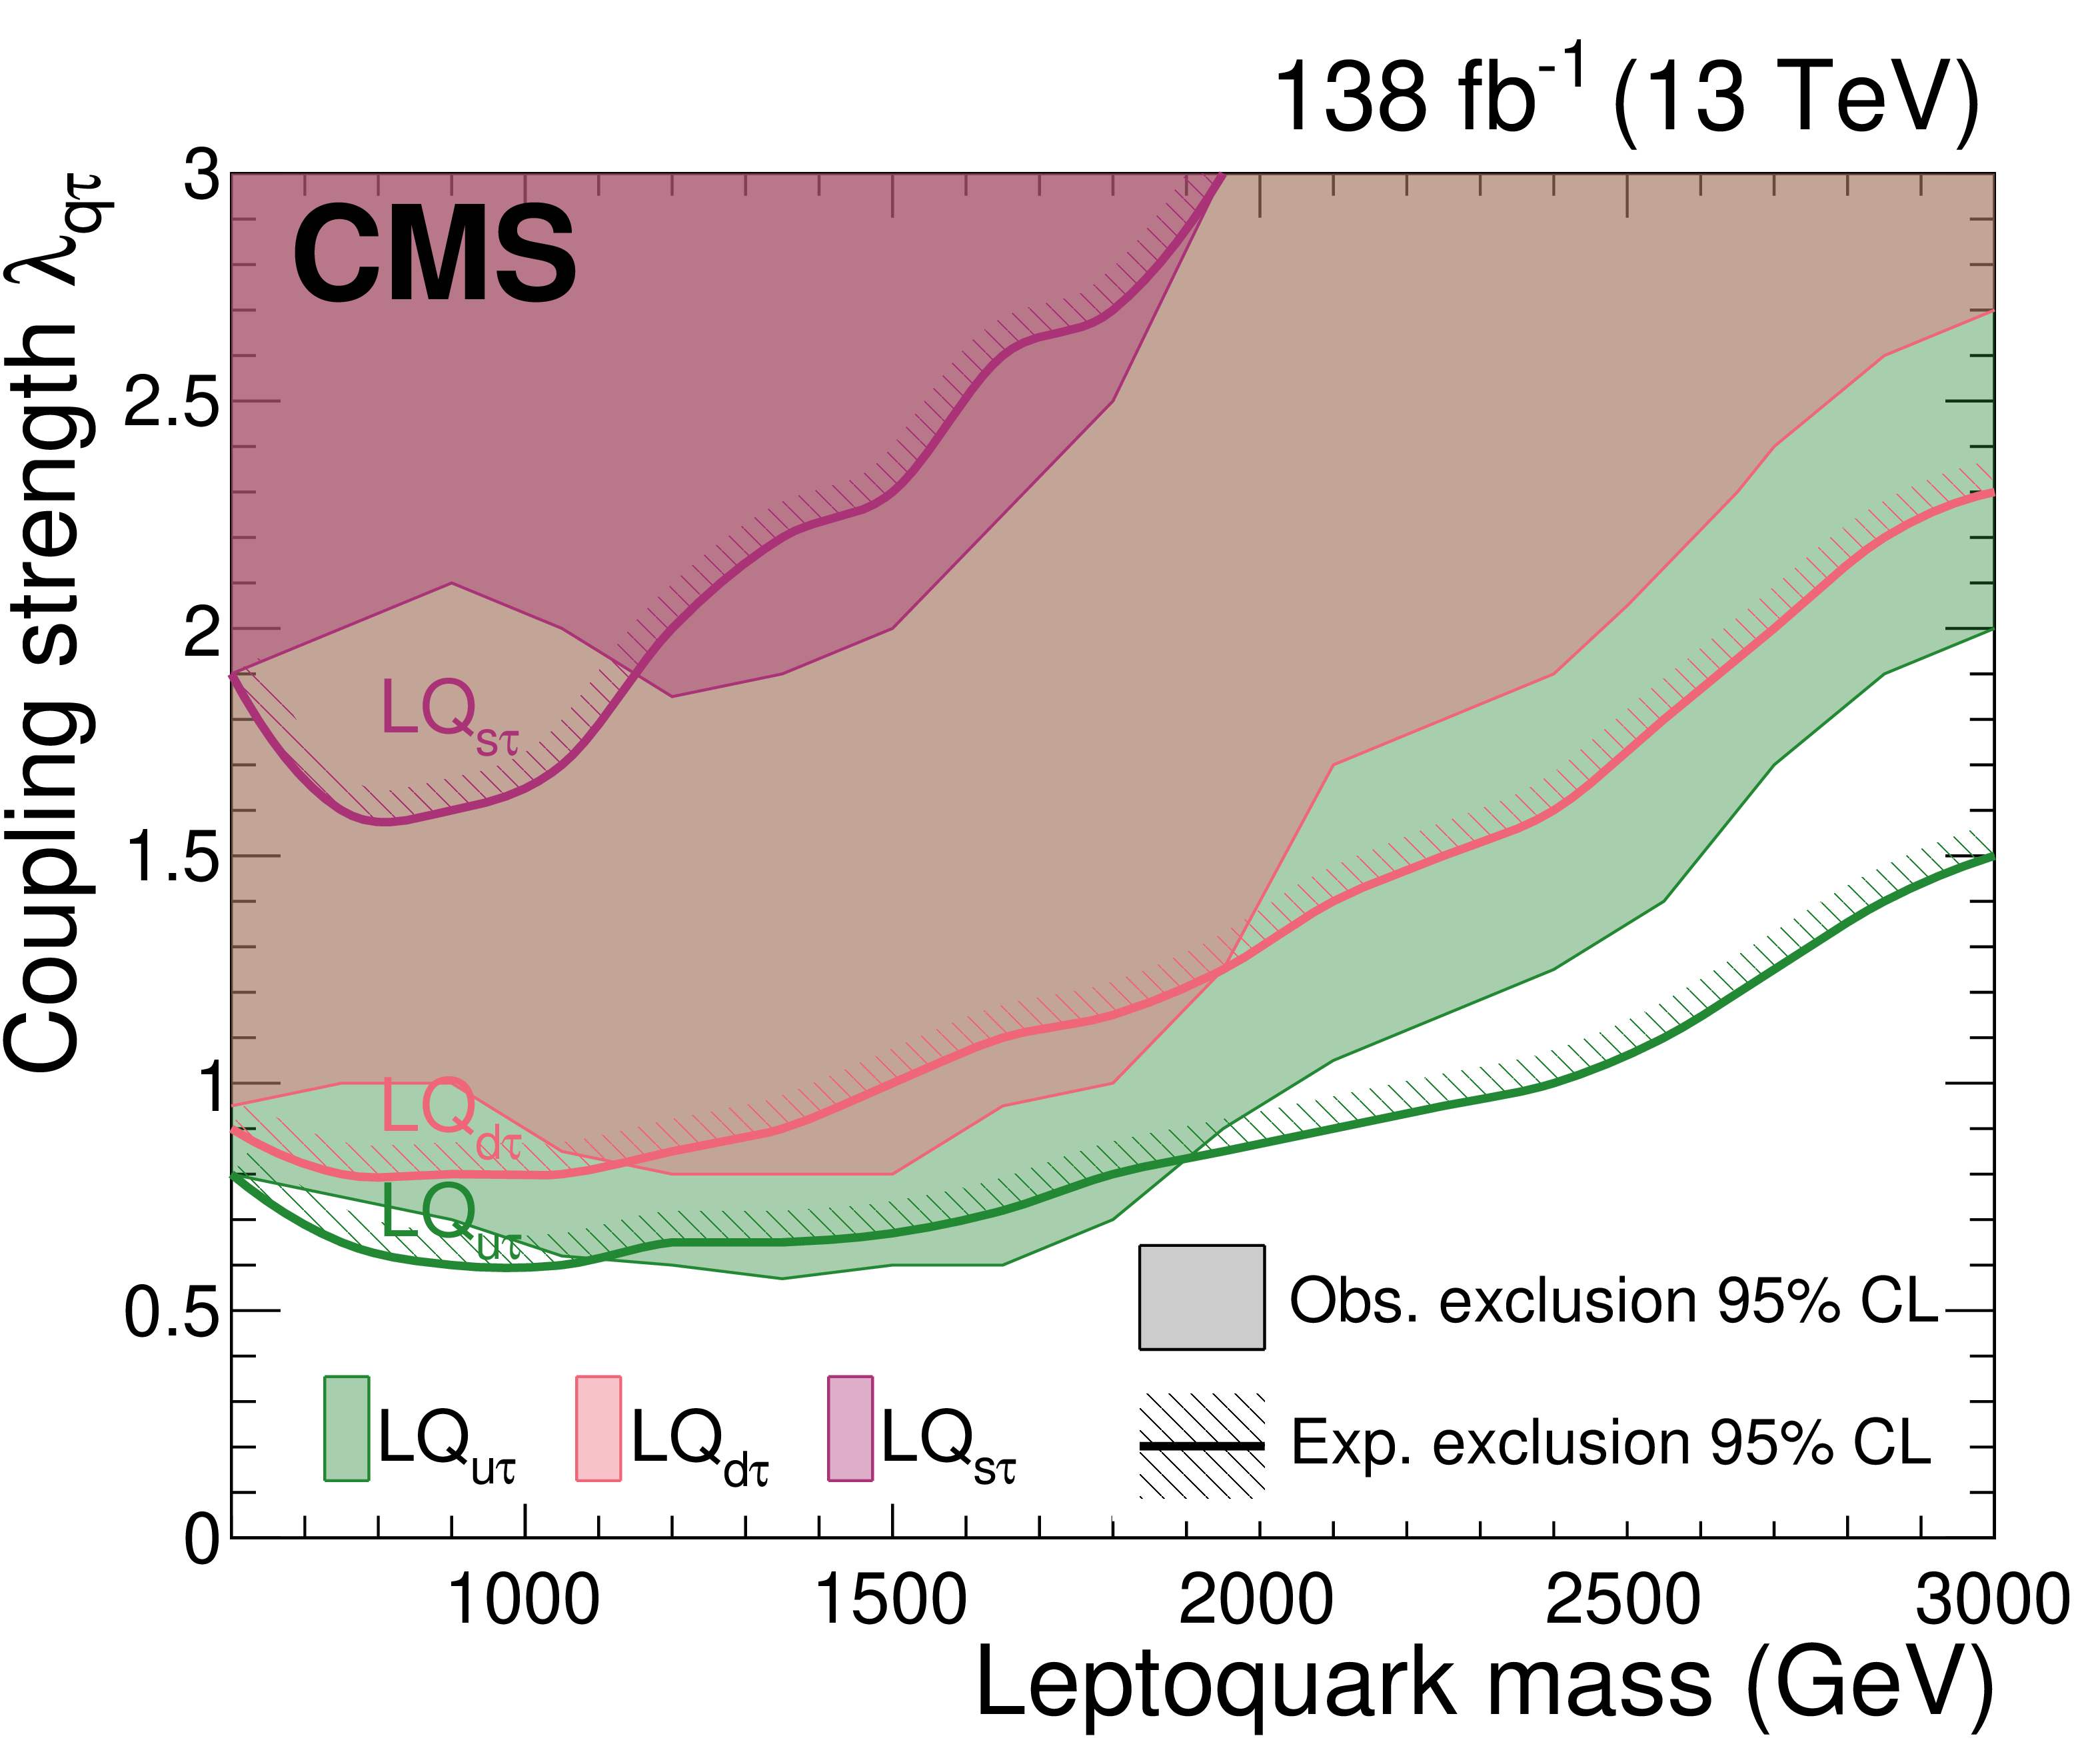
Upper limit at 95% CL on the coupling strength $ \lambda $ of a scalar LQ to b quarks and $ \tau $ leptons (left), and to light-flavor quarks and $ \tau $ leptons (right). Regions above the hatched lines are expected to be excluded. |
png pdf |
Figure 4-a:
Upper limit at 95% CL on the coupling strength $ \lambda $ of a scalar LQ to b quarks and $ \tau $ leptons. Regions above the hatched lines are expected to be excluded. |
png pdf |
Figure 4-b:
Upper limit at 95% CL on the coupling strength $ \lambda $ of a scalar LQ to light-flavor quarks and $ \tau $ leptons. Regions above the hatched lines are expected to be excluded. |
| Tables | |

png pdf |
Table 1:
Selection criteria, where $ \ell $ stands for $ \tau_\mathrm{h} $, e, or $ \mu $, depending on the final state. |
| Summary |
| In summary, a search for leptoquarks produced in lepton-quark collisions and coupled to $ \tau $ leptons has been performed for the first time, using data collected with the CMS detector in 2016--2018. These limits are complementary to those set using other production modes at high mass and coupling values for b$ \tau $ couplings, while the limits on the couplings of leptoquarks to light-flavor quarks extend the mass range excluded by previous searches in other production modes. |
| Additional Figures | |
png pdf |
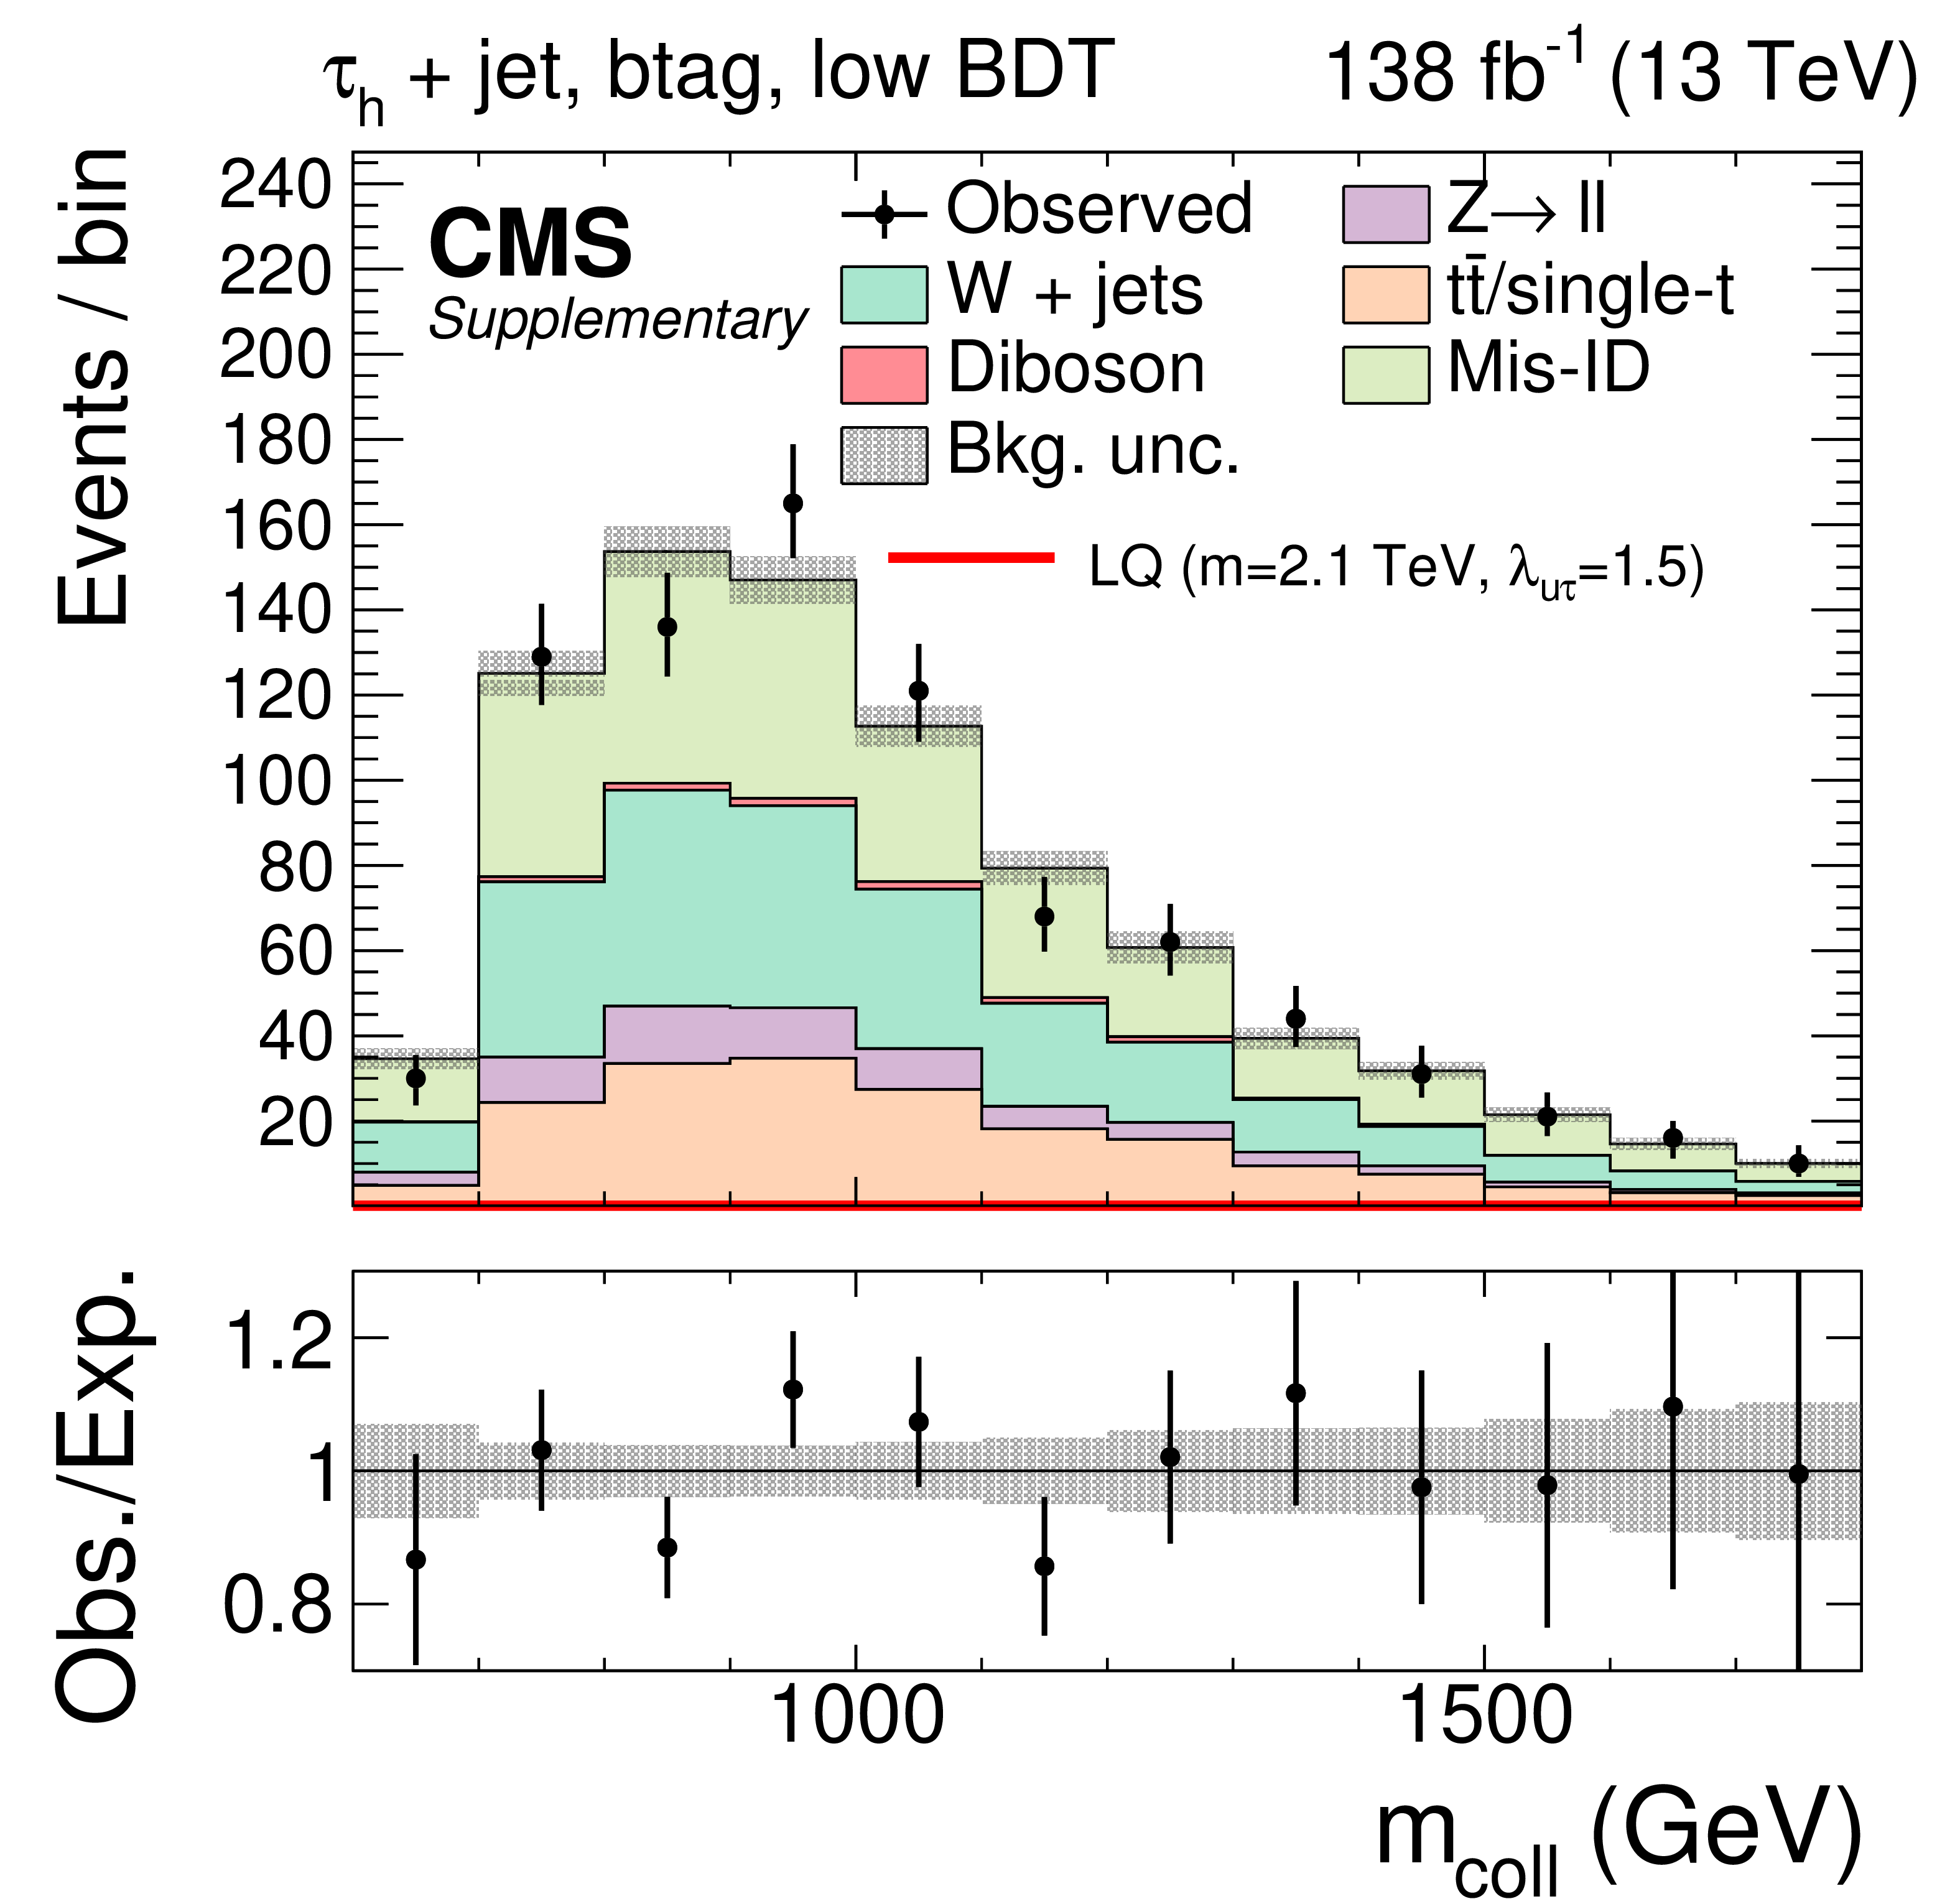
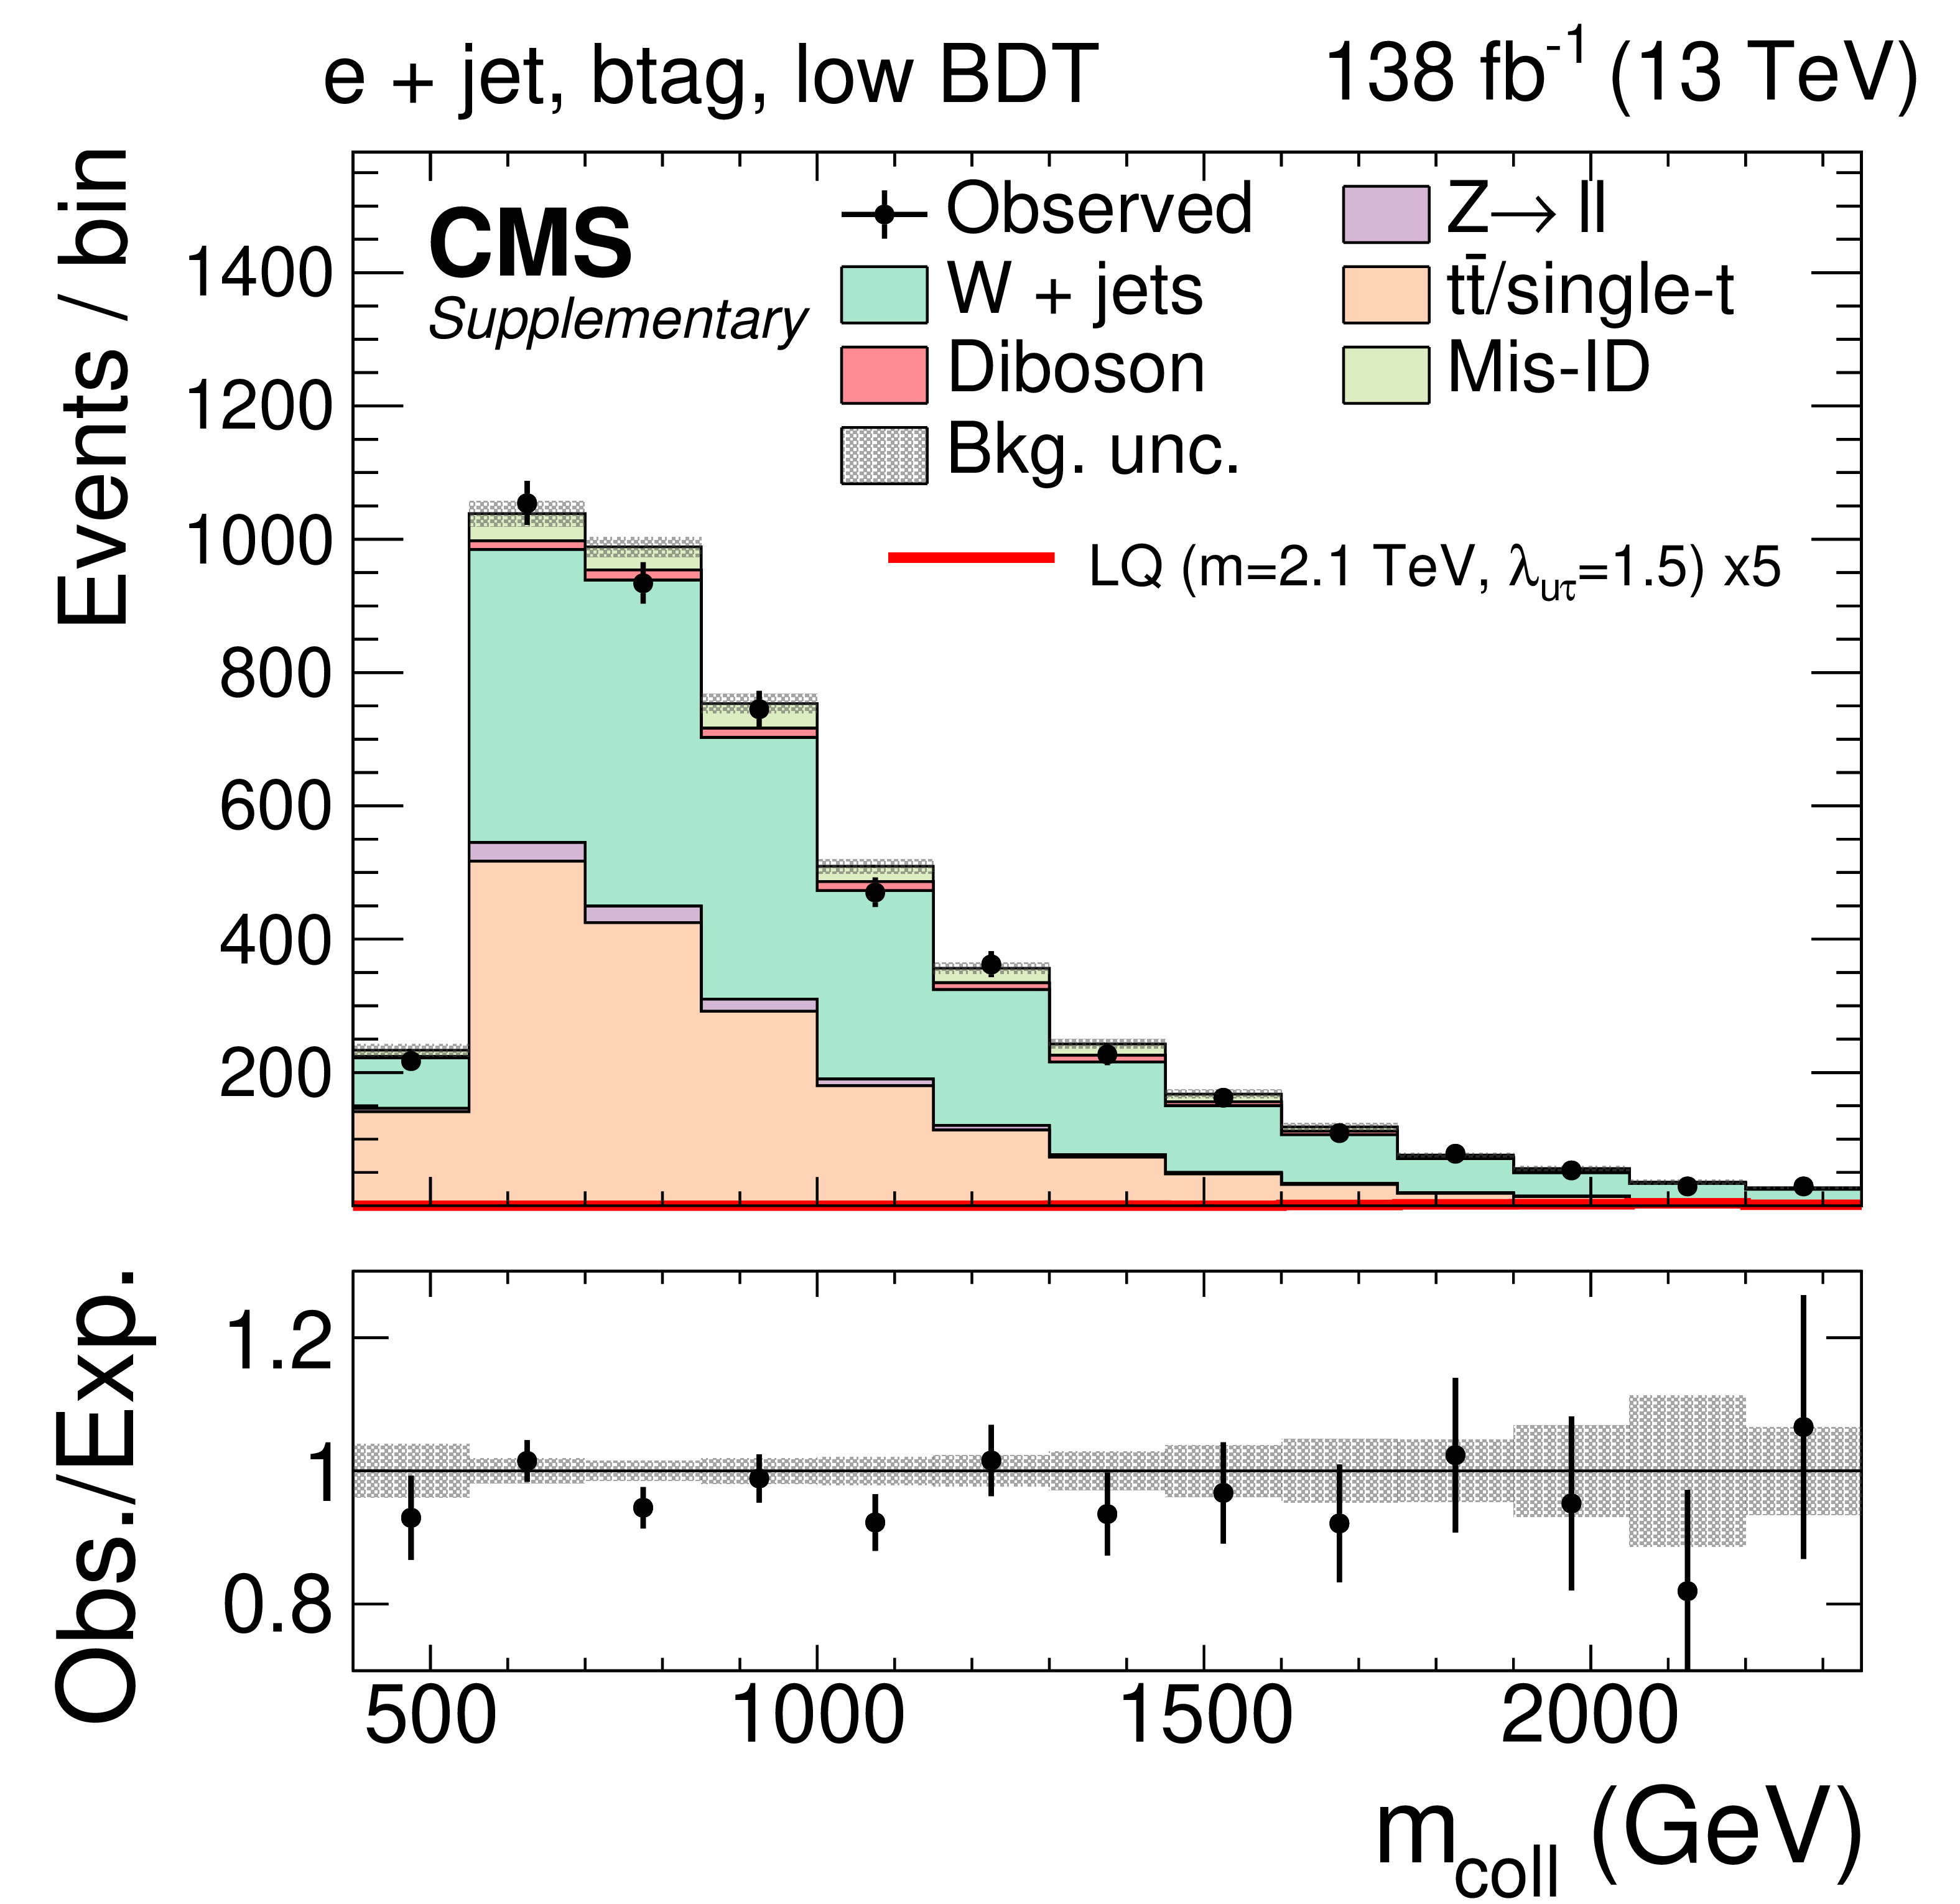
Additional Figure 1:
Observed and expected distributions of the collinear mass in the $ \tau_\mathrm{h}+ $ jet channels for the btag category with the lowest BDT output requirement. The uncertainty band includes statistical and systematic uncertainties, and the background distributions are the results of the maximum likelihood fit. |
png pdf |
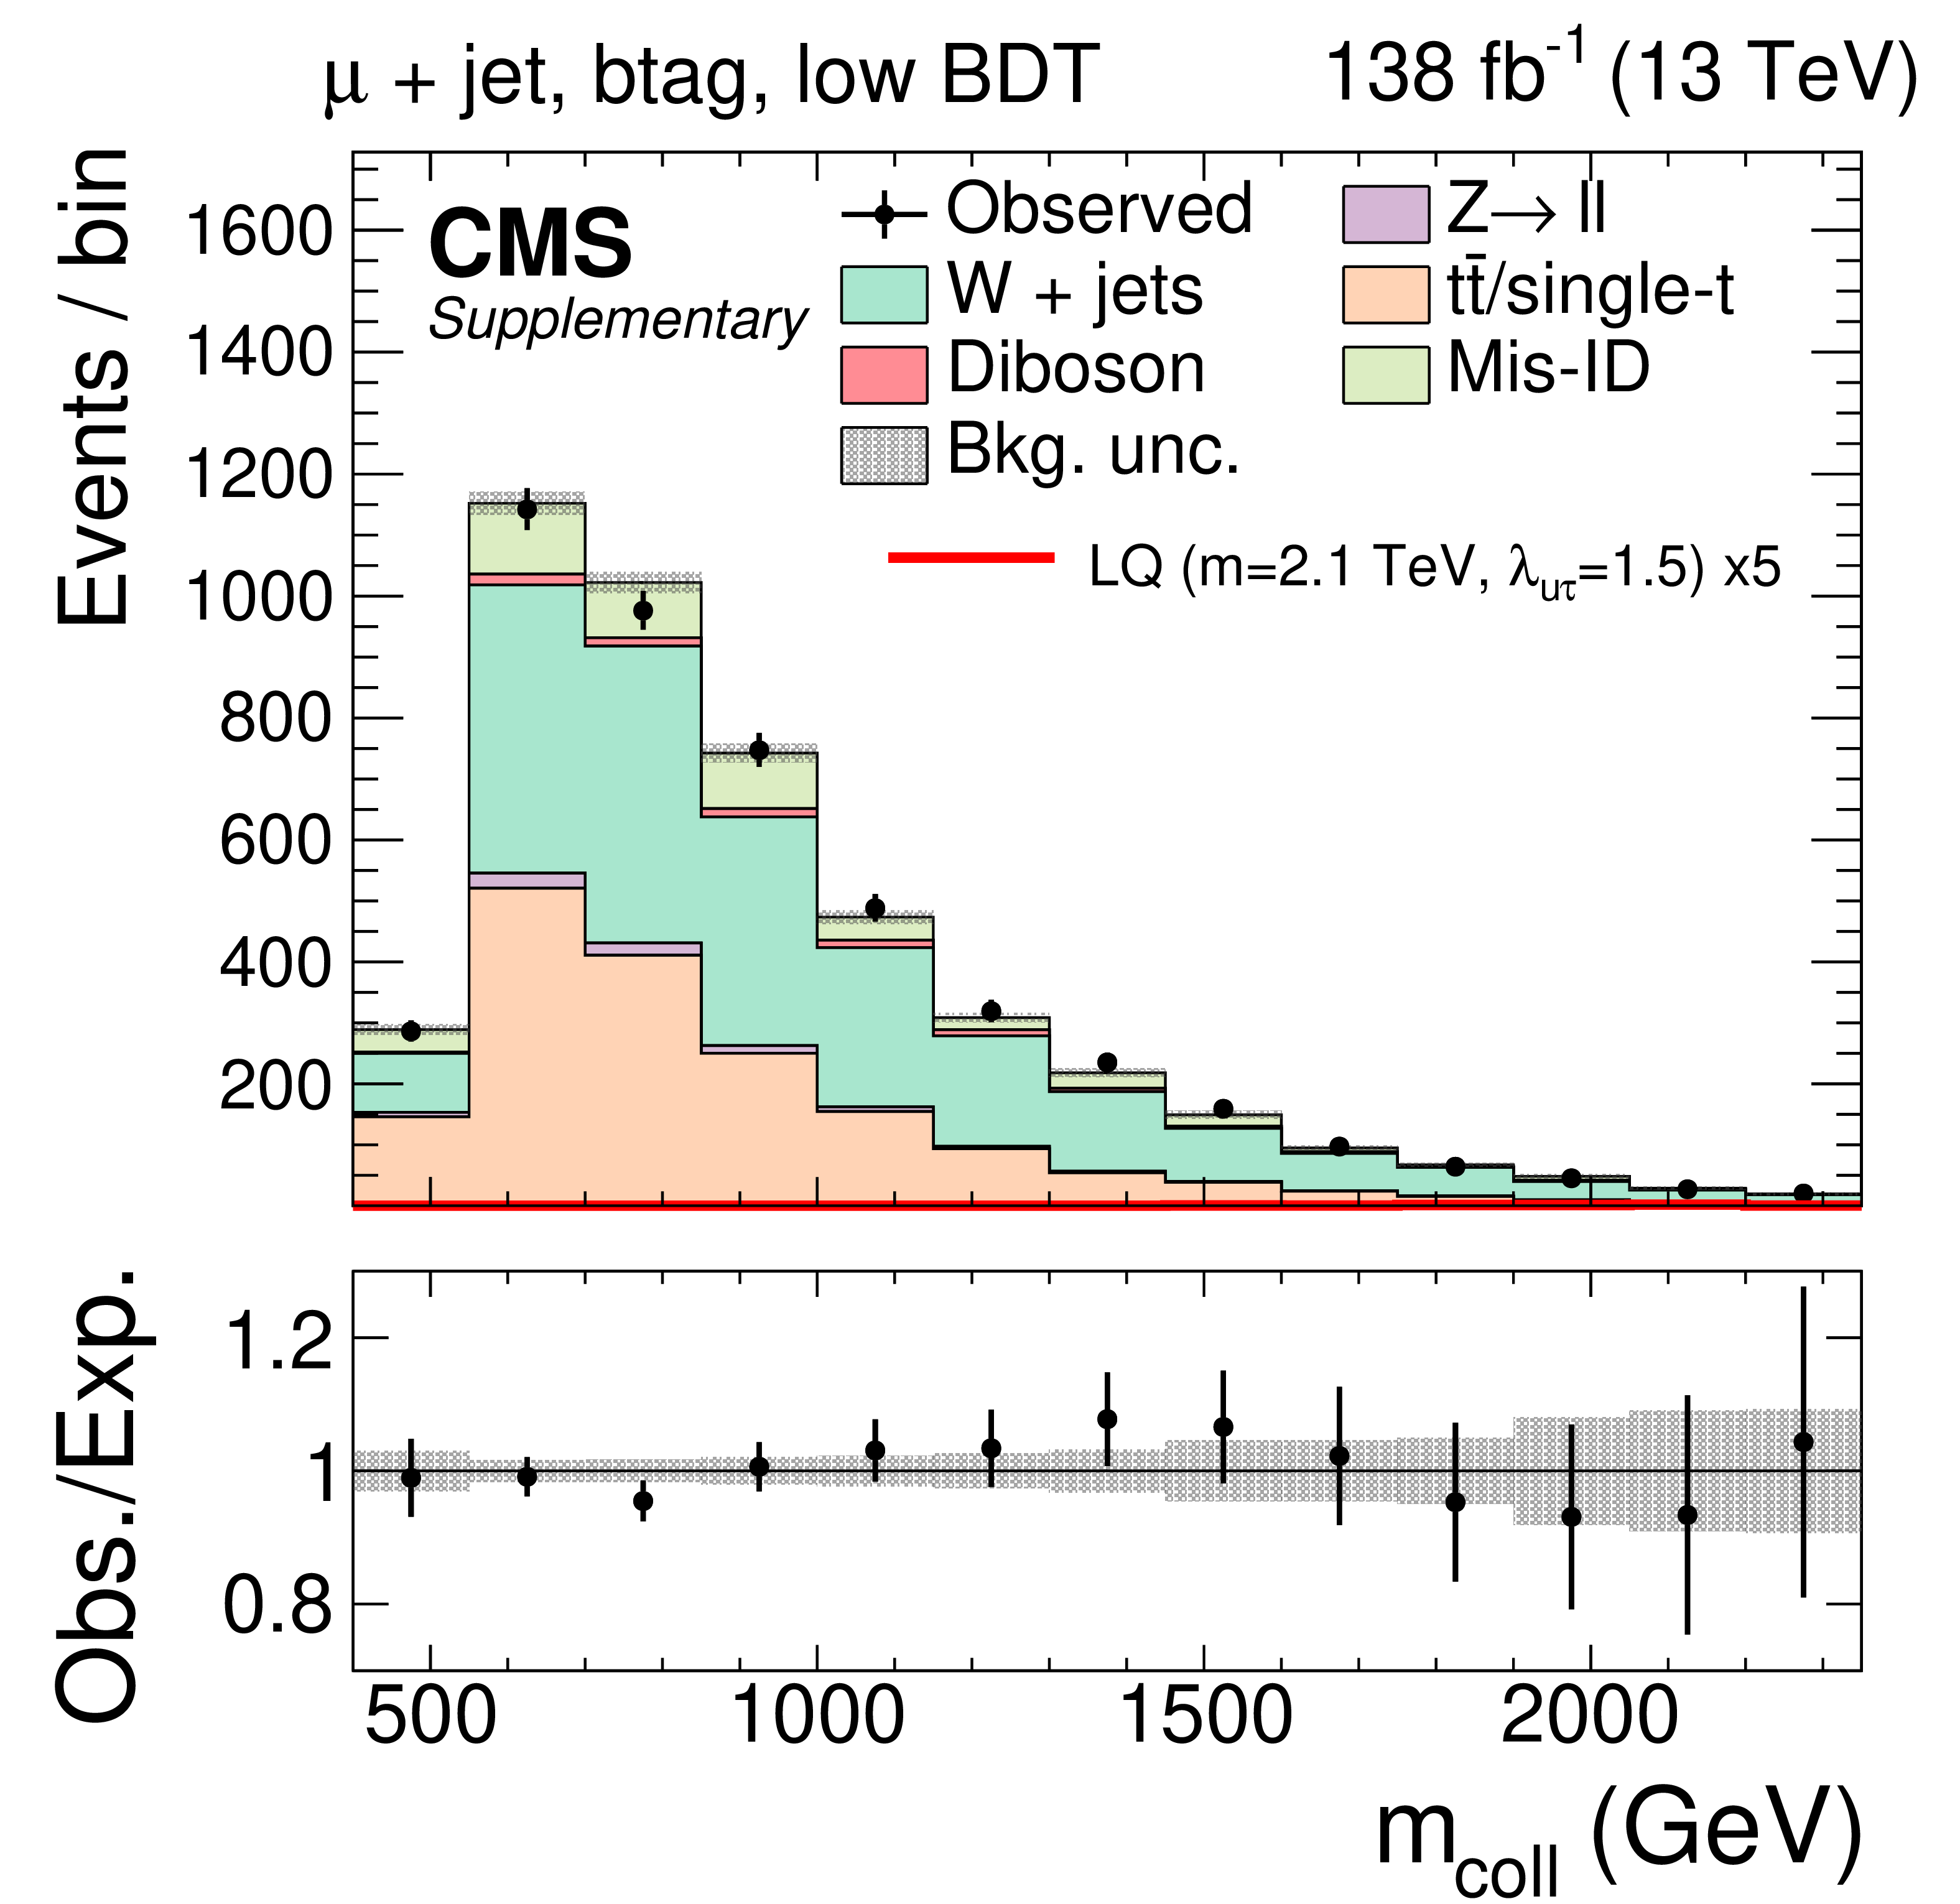
Additional Figure 2:
Observed and expected distributions of the collinear mass in the e $+ $ jet channels for the btag category with the lowest BDT output requirement. The uncertainty band includes statistical and systematic uncertainties, and the background distributions are the results of the maximum likelihood fit. |
png pdf |
Additional Figure 3:
Observed and expected distributions of the collinear mass in the $ \mu+ $ jet channels for the btag category with the lowest BDT output requirement. The uncertainty band includes statistical and systematic uncertainties, and the background distributions are the results of the maximum likelihood fit. |

png pdf |
Additional Figure 4:
Observed and expected distributions of the collinear mass in the $ \tau_\mathrm{h}+ $ jet channels for the btag category with intermediate BDT output requirement. The uncertainty band includes statistical and systematic uncertainties, and the background distributions are the results of the maximum likelihood fit. |
png pdf |
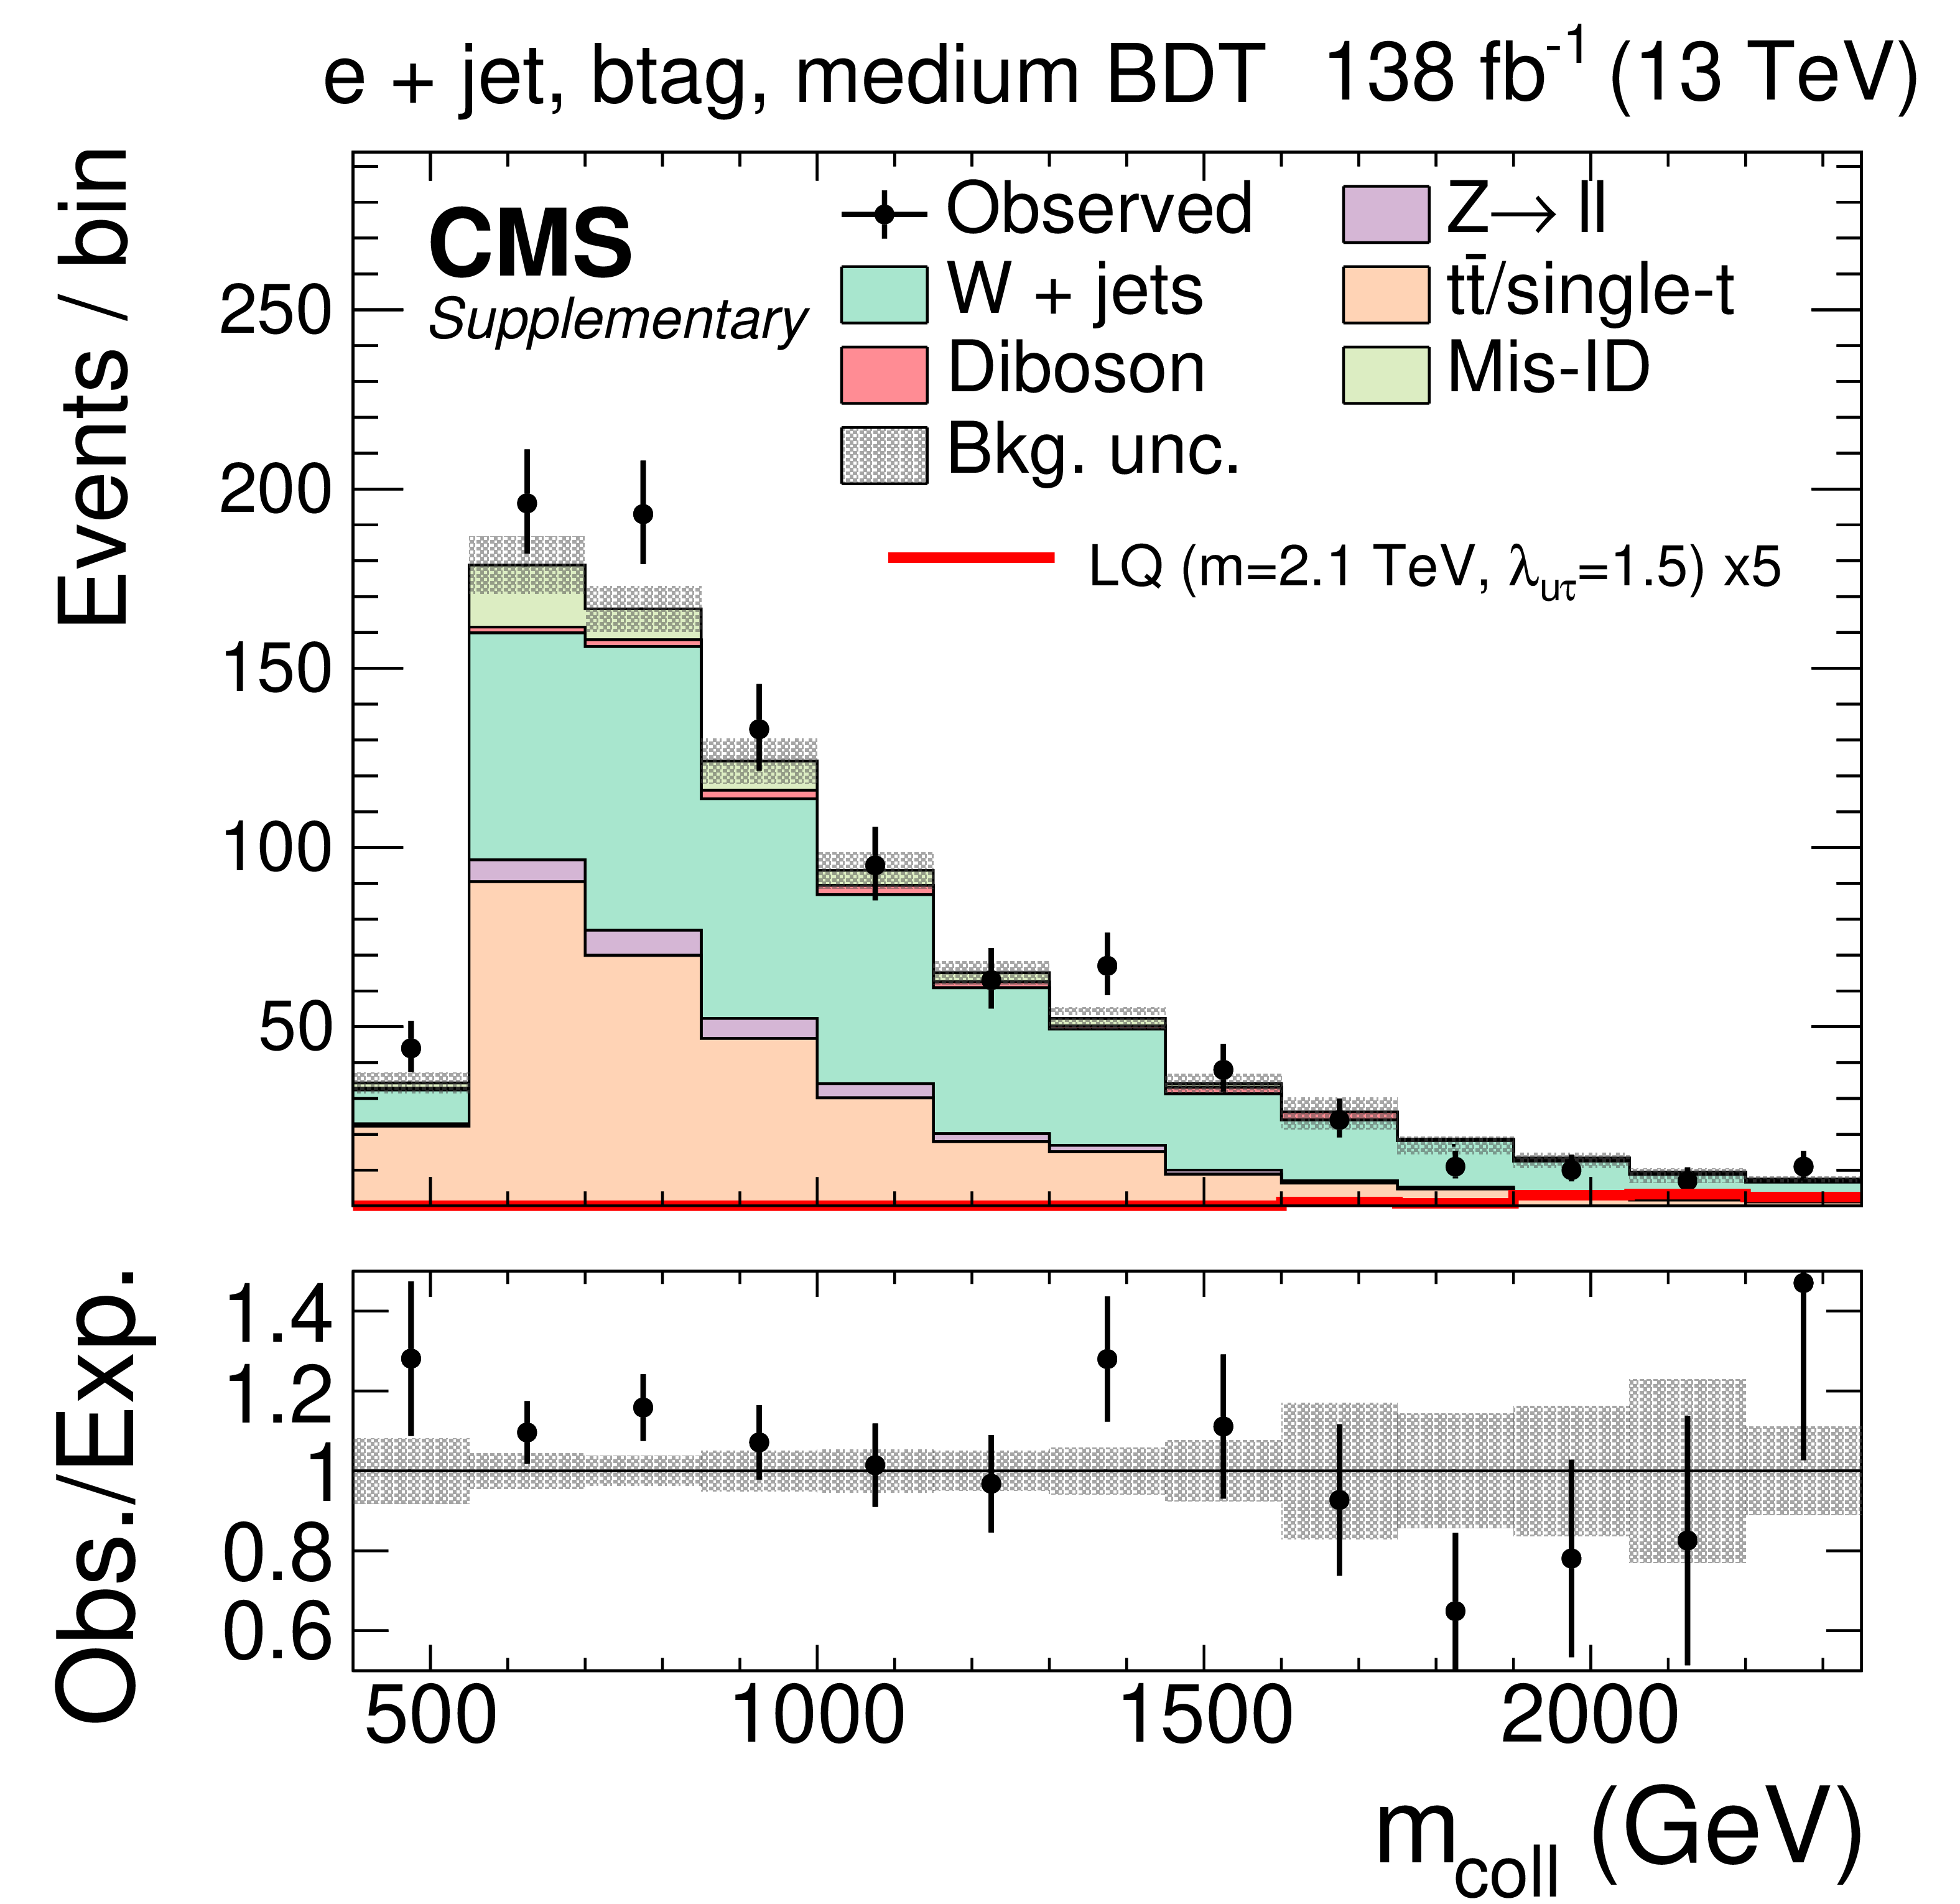
Additional Figure 5:
Observed and expected distributions of the collinear mass in the e $+ $ jet channels for the btag category with intermediate BDT output requirement. The uncertainty band includes statistical and systematic uncertainties, and the background distributions are the results of the maximum likelihood fit. |

png pdf |
Additional Figure 6:
Observed and expected distributions of the collinear mass in the $ \mu+ $ jet channels for the btag category with intermediate BDT output requirement. The uncertainty band includes statistical and systematic uncertainties, and the background distributions are the results of the maximum likelihood fit. |
png pdf |
Additional Figure 7:
Observed and expected distributions of the collinear mass in the $ \tau_\mathrm{h}+ $ jet channels for the no-btag category with the lowest BDT output requirement. The uncertainty band includes statistical and systematic uncertainties, and the background distributions are the results of the maximum likelihood fit. |
png pdf |
Additional Figure 8:
Observed and expected distributions of the collinear mass in the e $+ $ jet channels for the no-btag category with the lowest BDT output requirement. The uncertainty band includes statistical and systematic uncertainties, and the background distributions are the results of the maximum likelihood fit. |
png pdf |
Additional Figure 9:
Observed and expected distributions of the collinear mass in the $ \mu+ $ jet channels for the no-btag category with the lowest BDT output requirement. The uncertainty band includes statistical and systematic uncertainties, and the background distributions are the results of the maximum likelihood fit. |
png pdf |
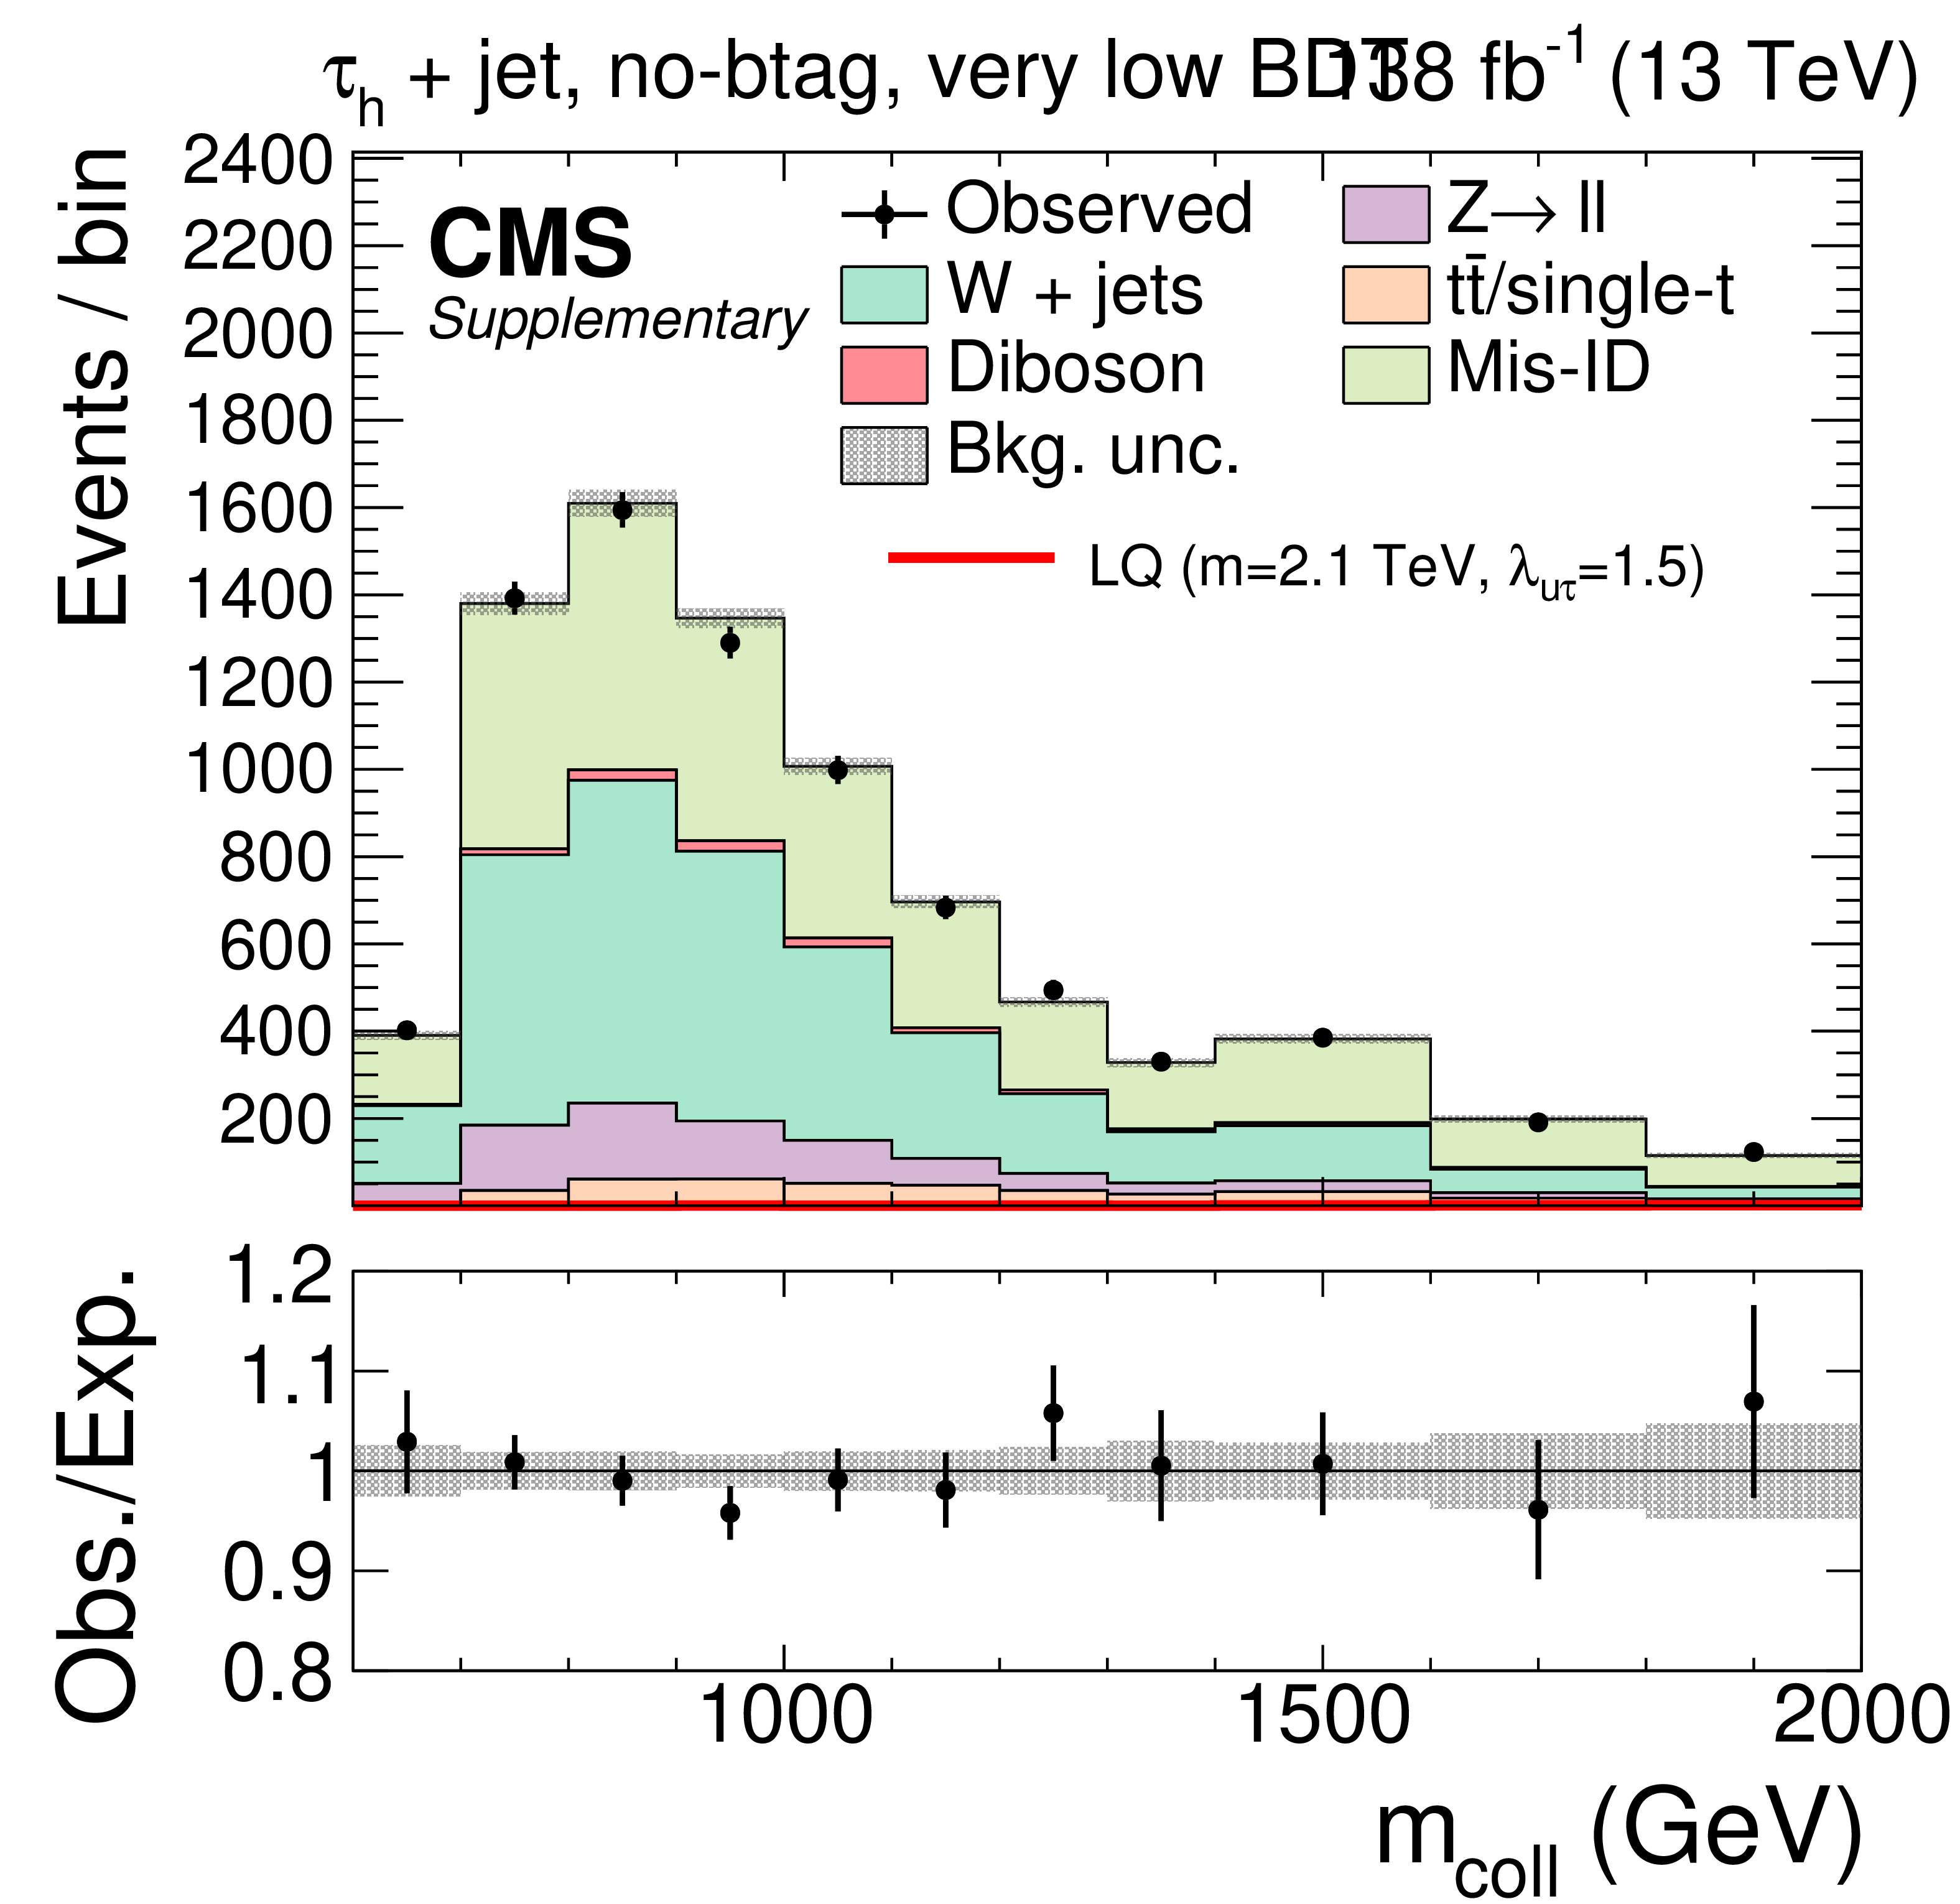
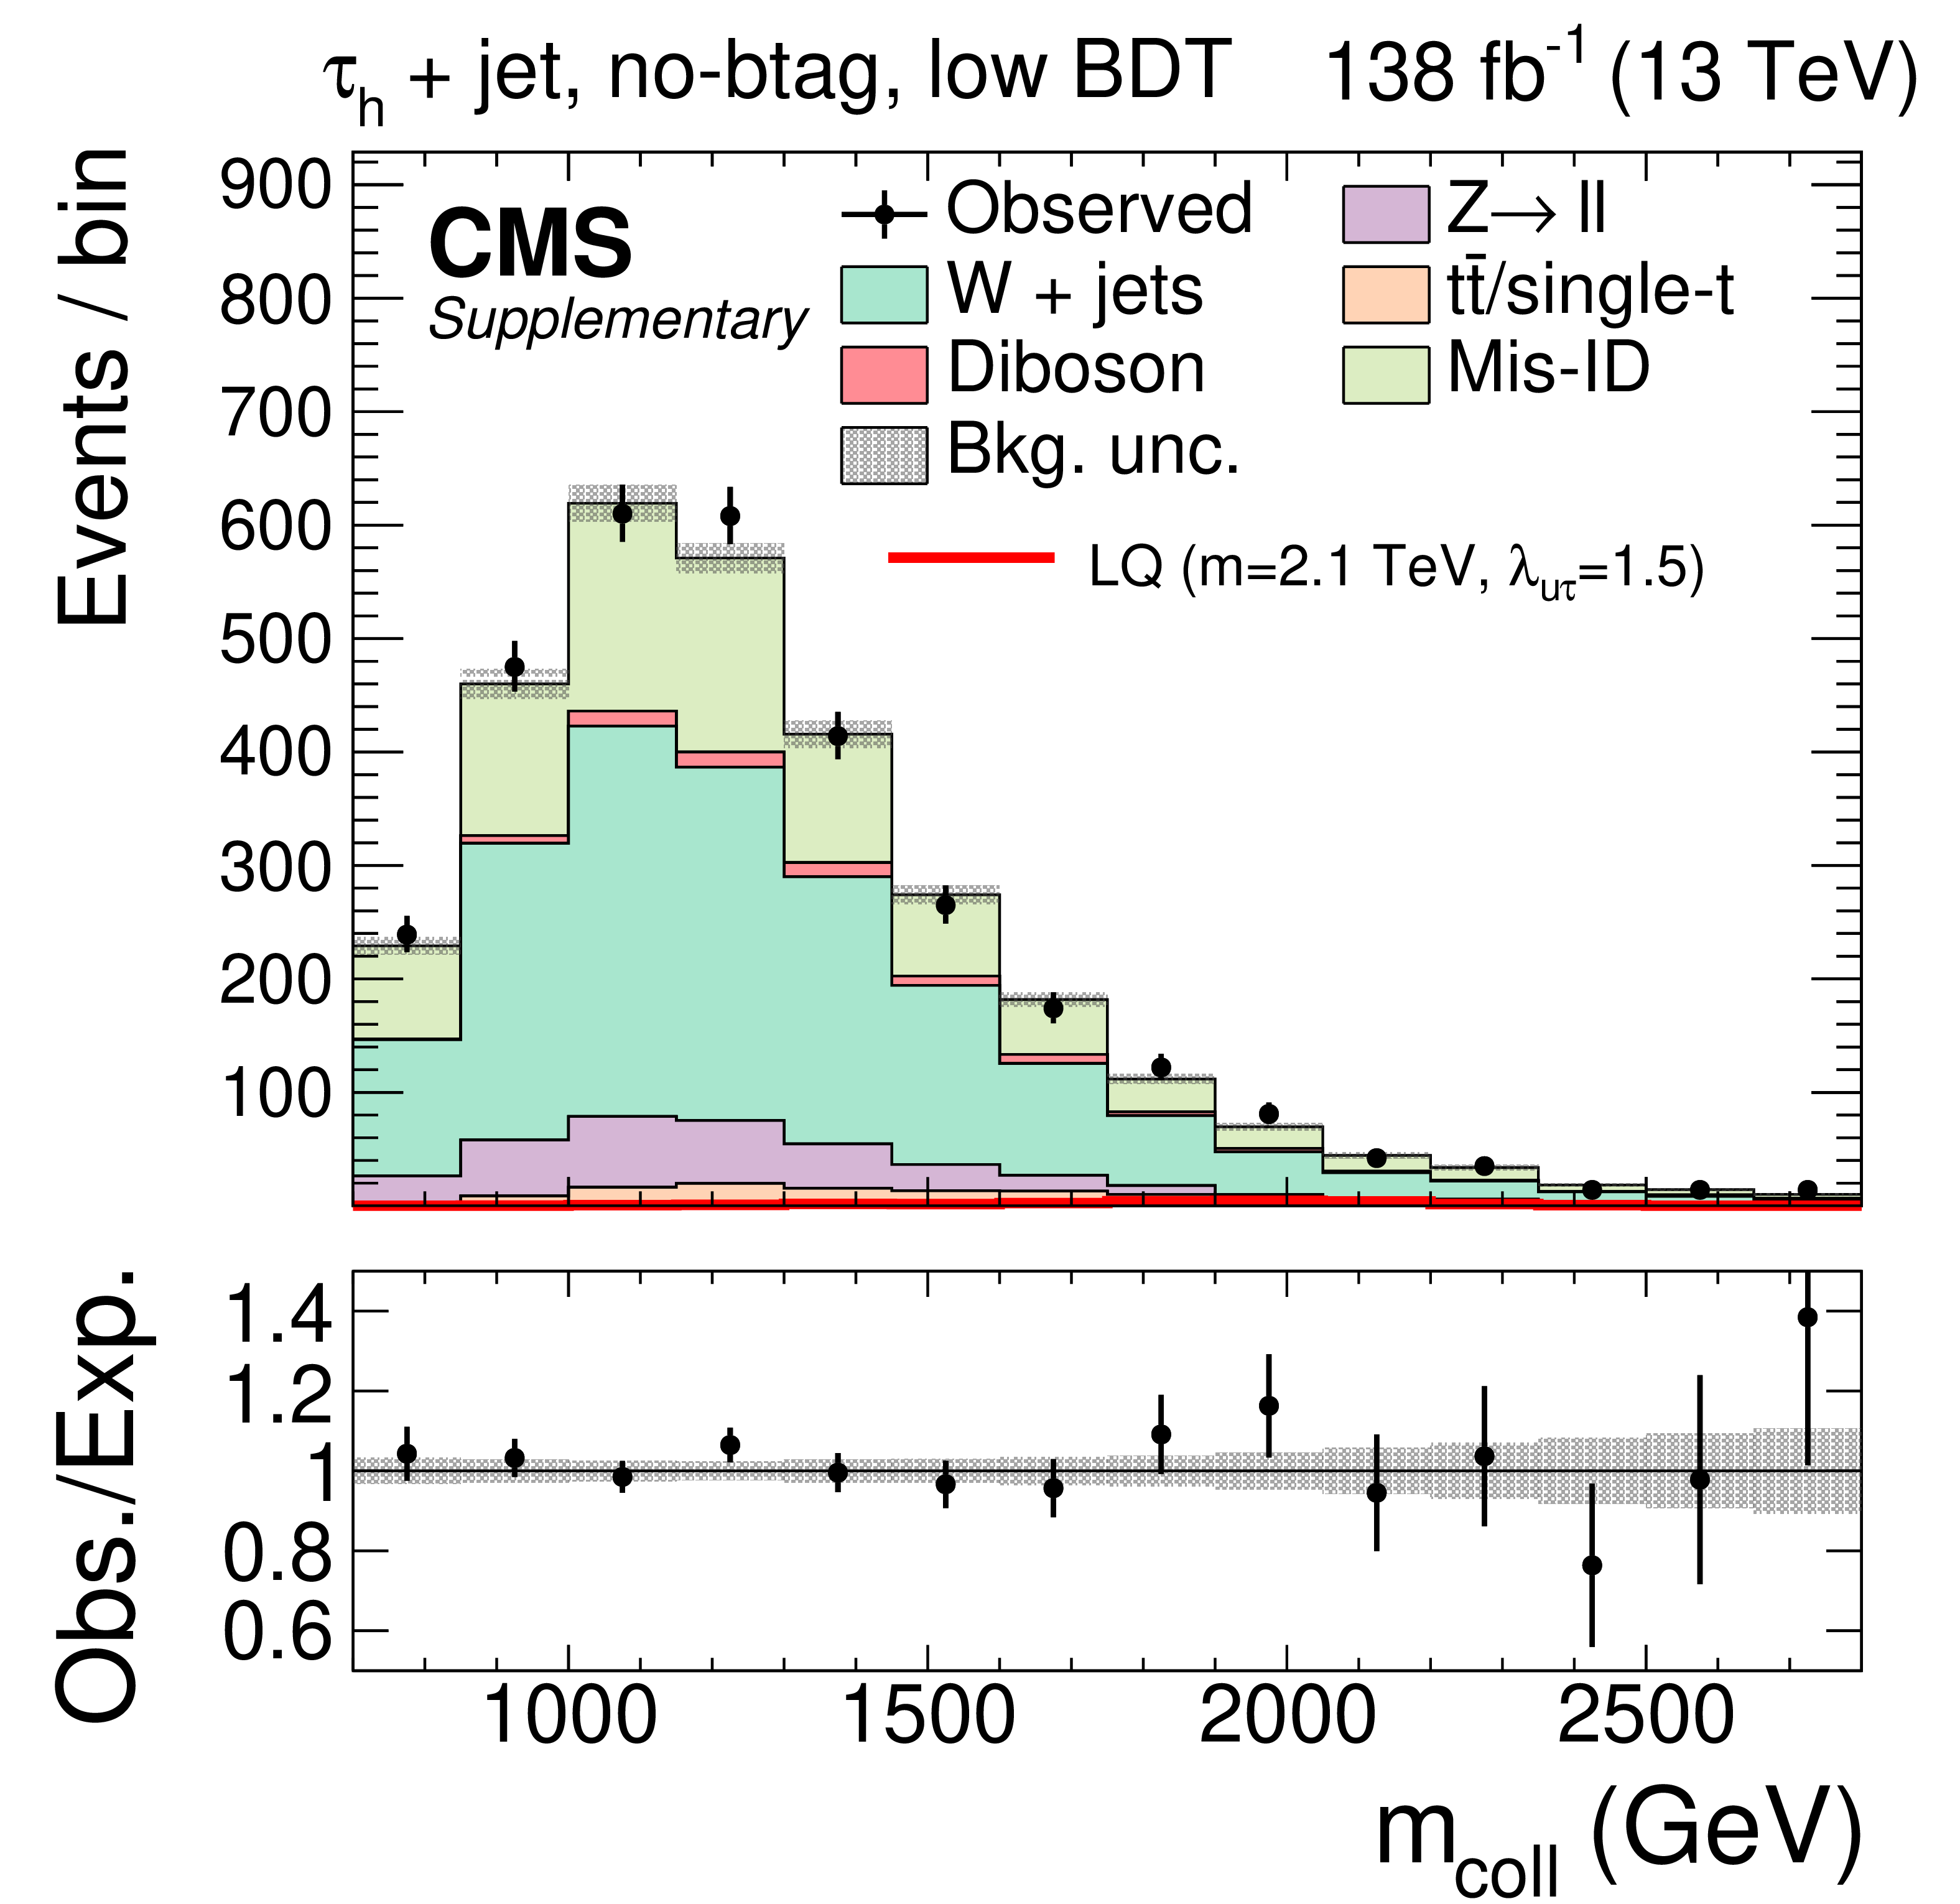
Additional Figure 10:
Observed and expected distributions of the collinear mass in the $ \tau_\mathrm{h}+ $ jet channels for the no-btag category with low BDT output requirement. The uncertainty band includes statistical and systematic uncertainties, and the background distributions are the results of the maximum likelihood fit. |

png pdf |
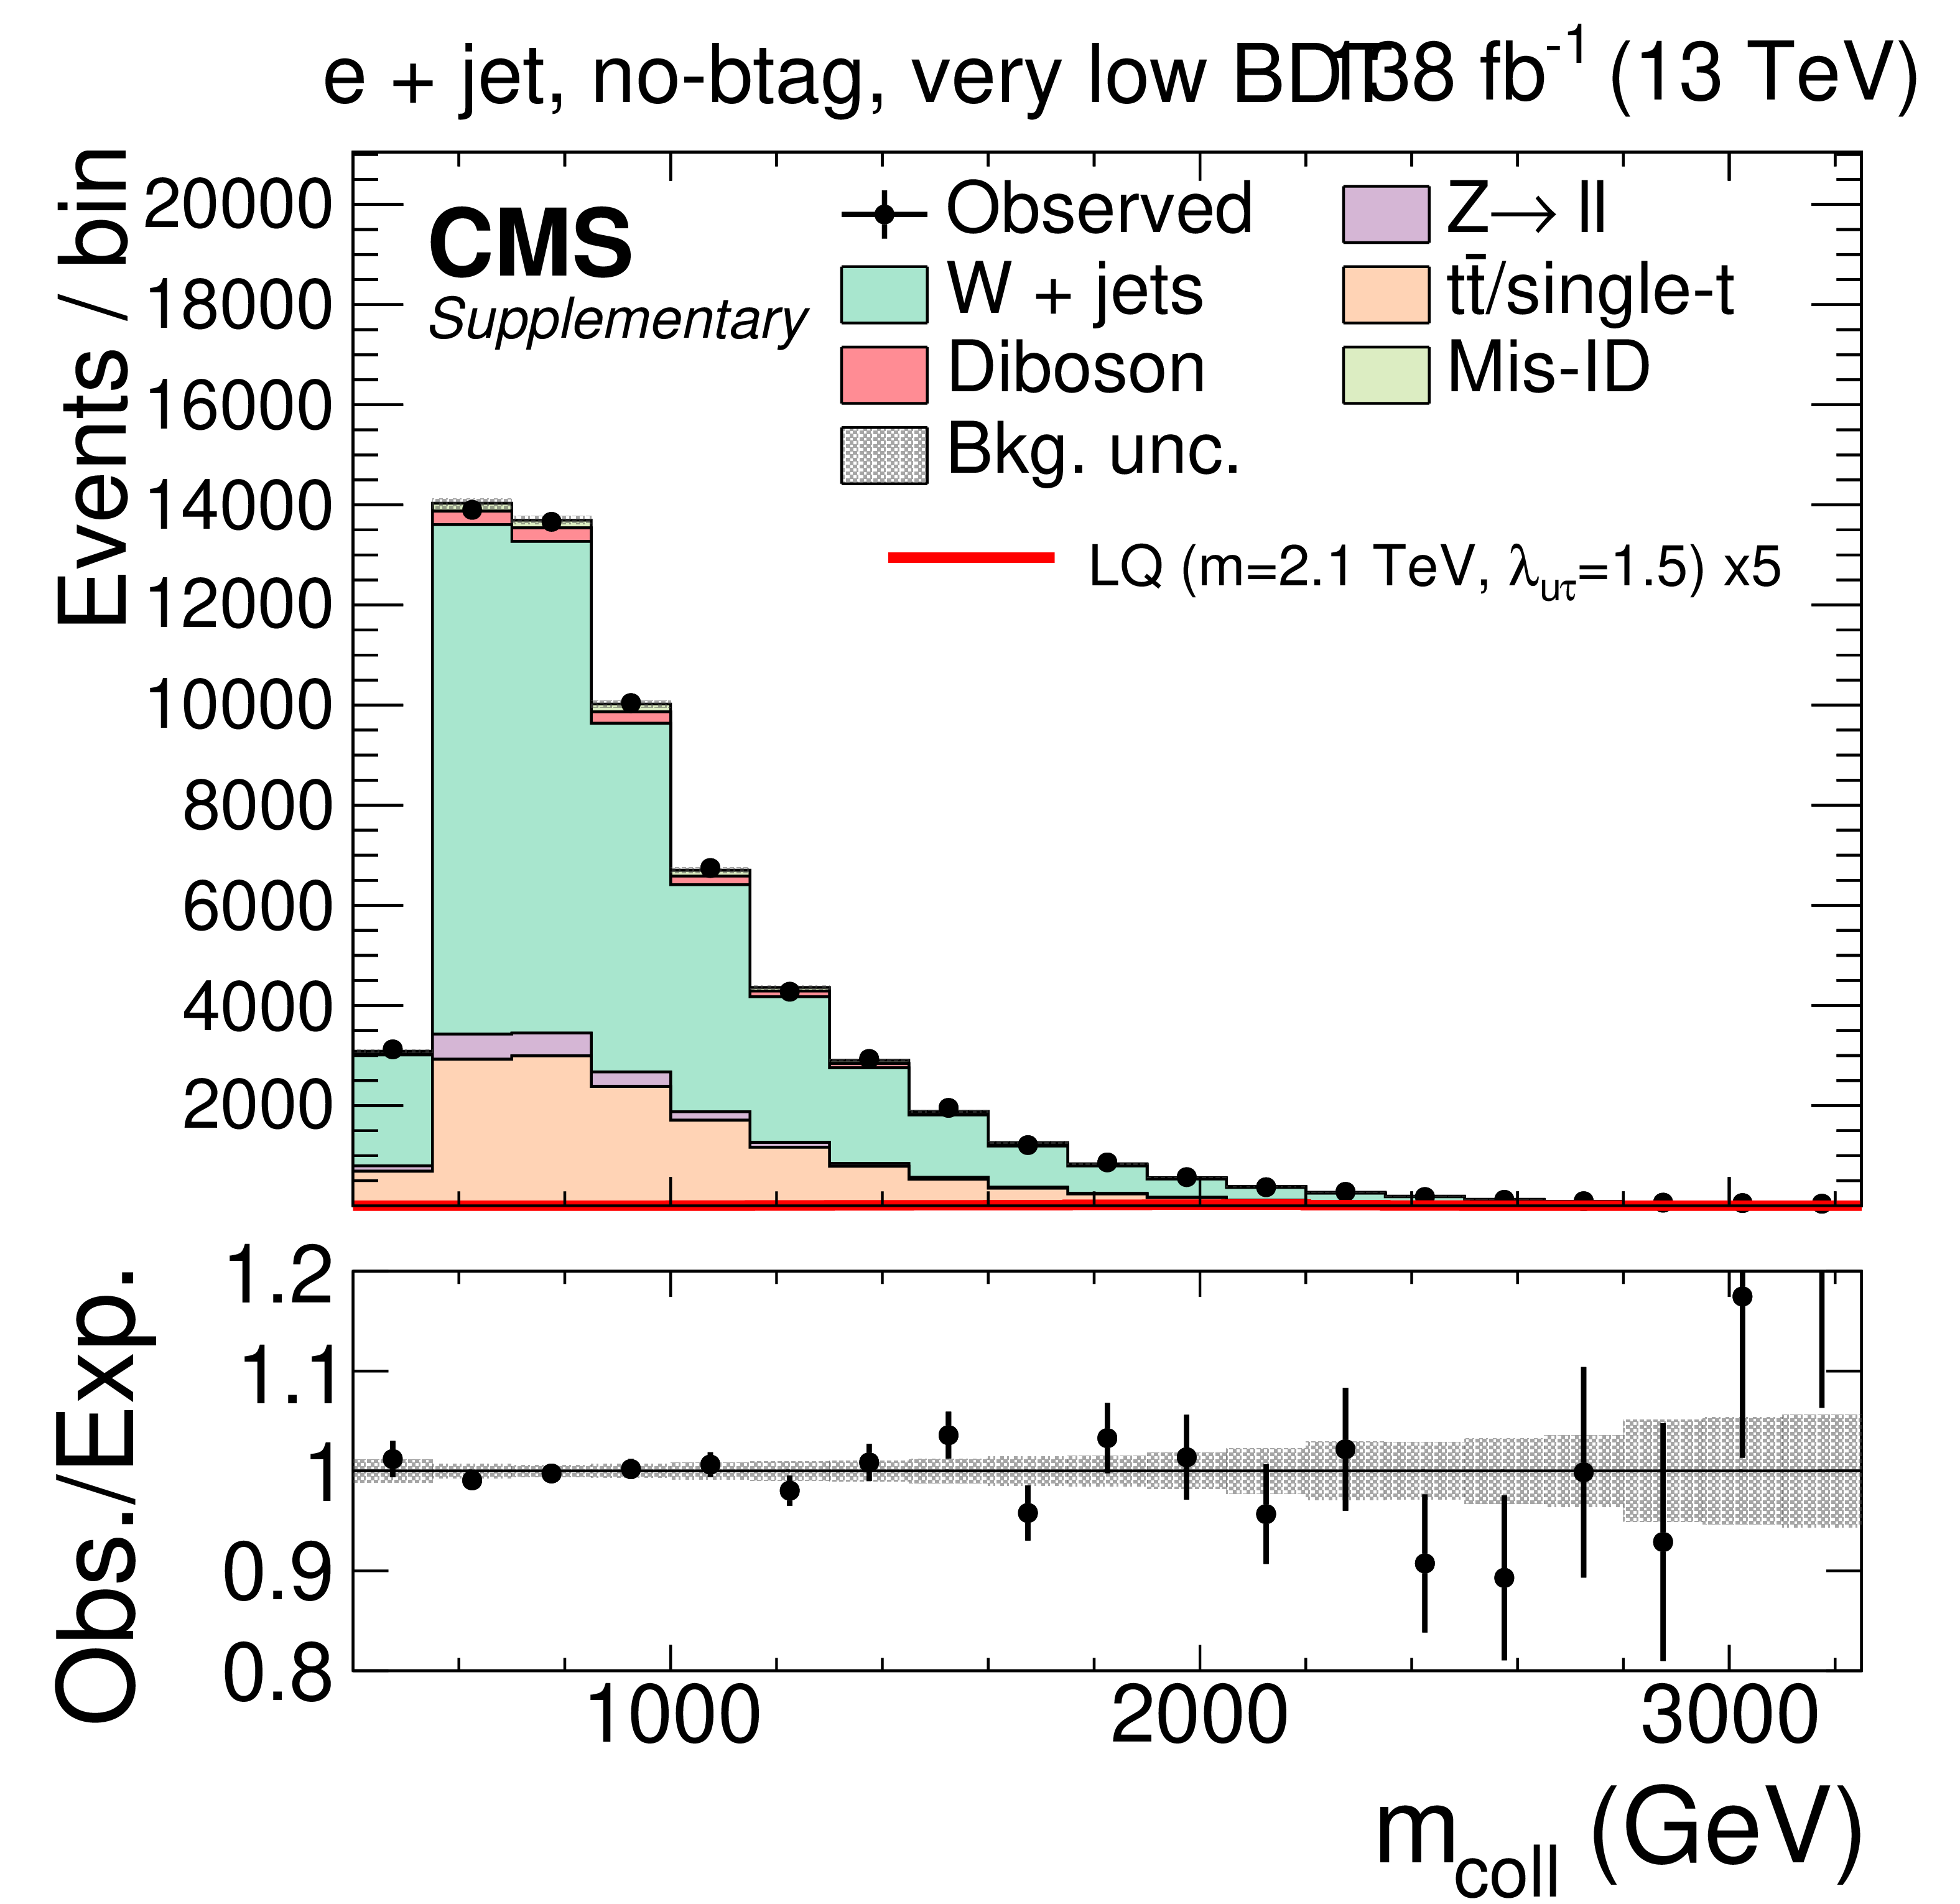
Additional Figure 11:
Observed and expected distributions of the collinear mass in the e $+ $ jet channels for the no-btag category with low BDT output requirement. The uncertainty band includes statistical and systematic uncertainties, and the background distributions are the results of the maximum likelihood fit. |
png pdf |
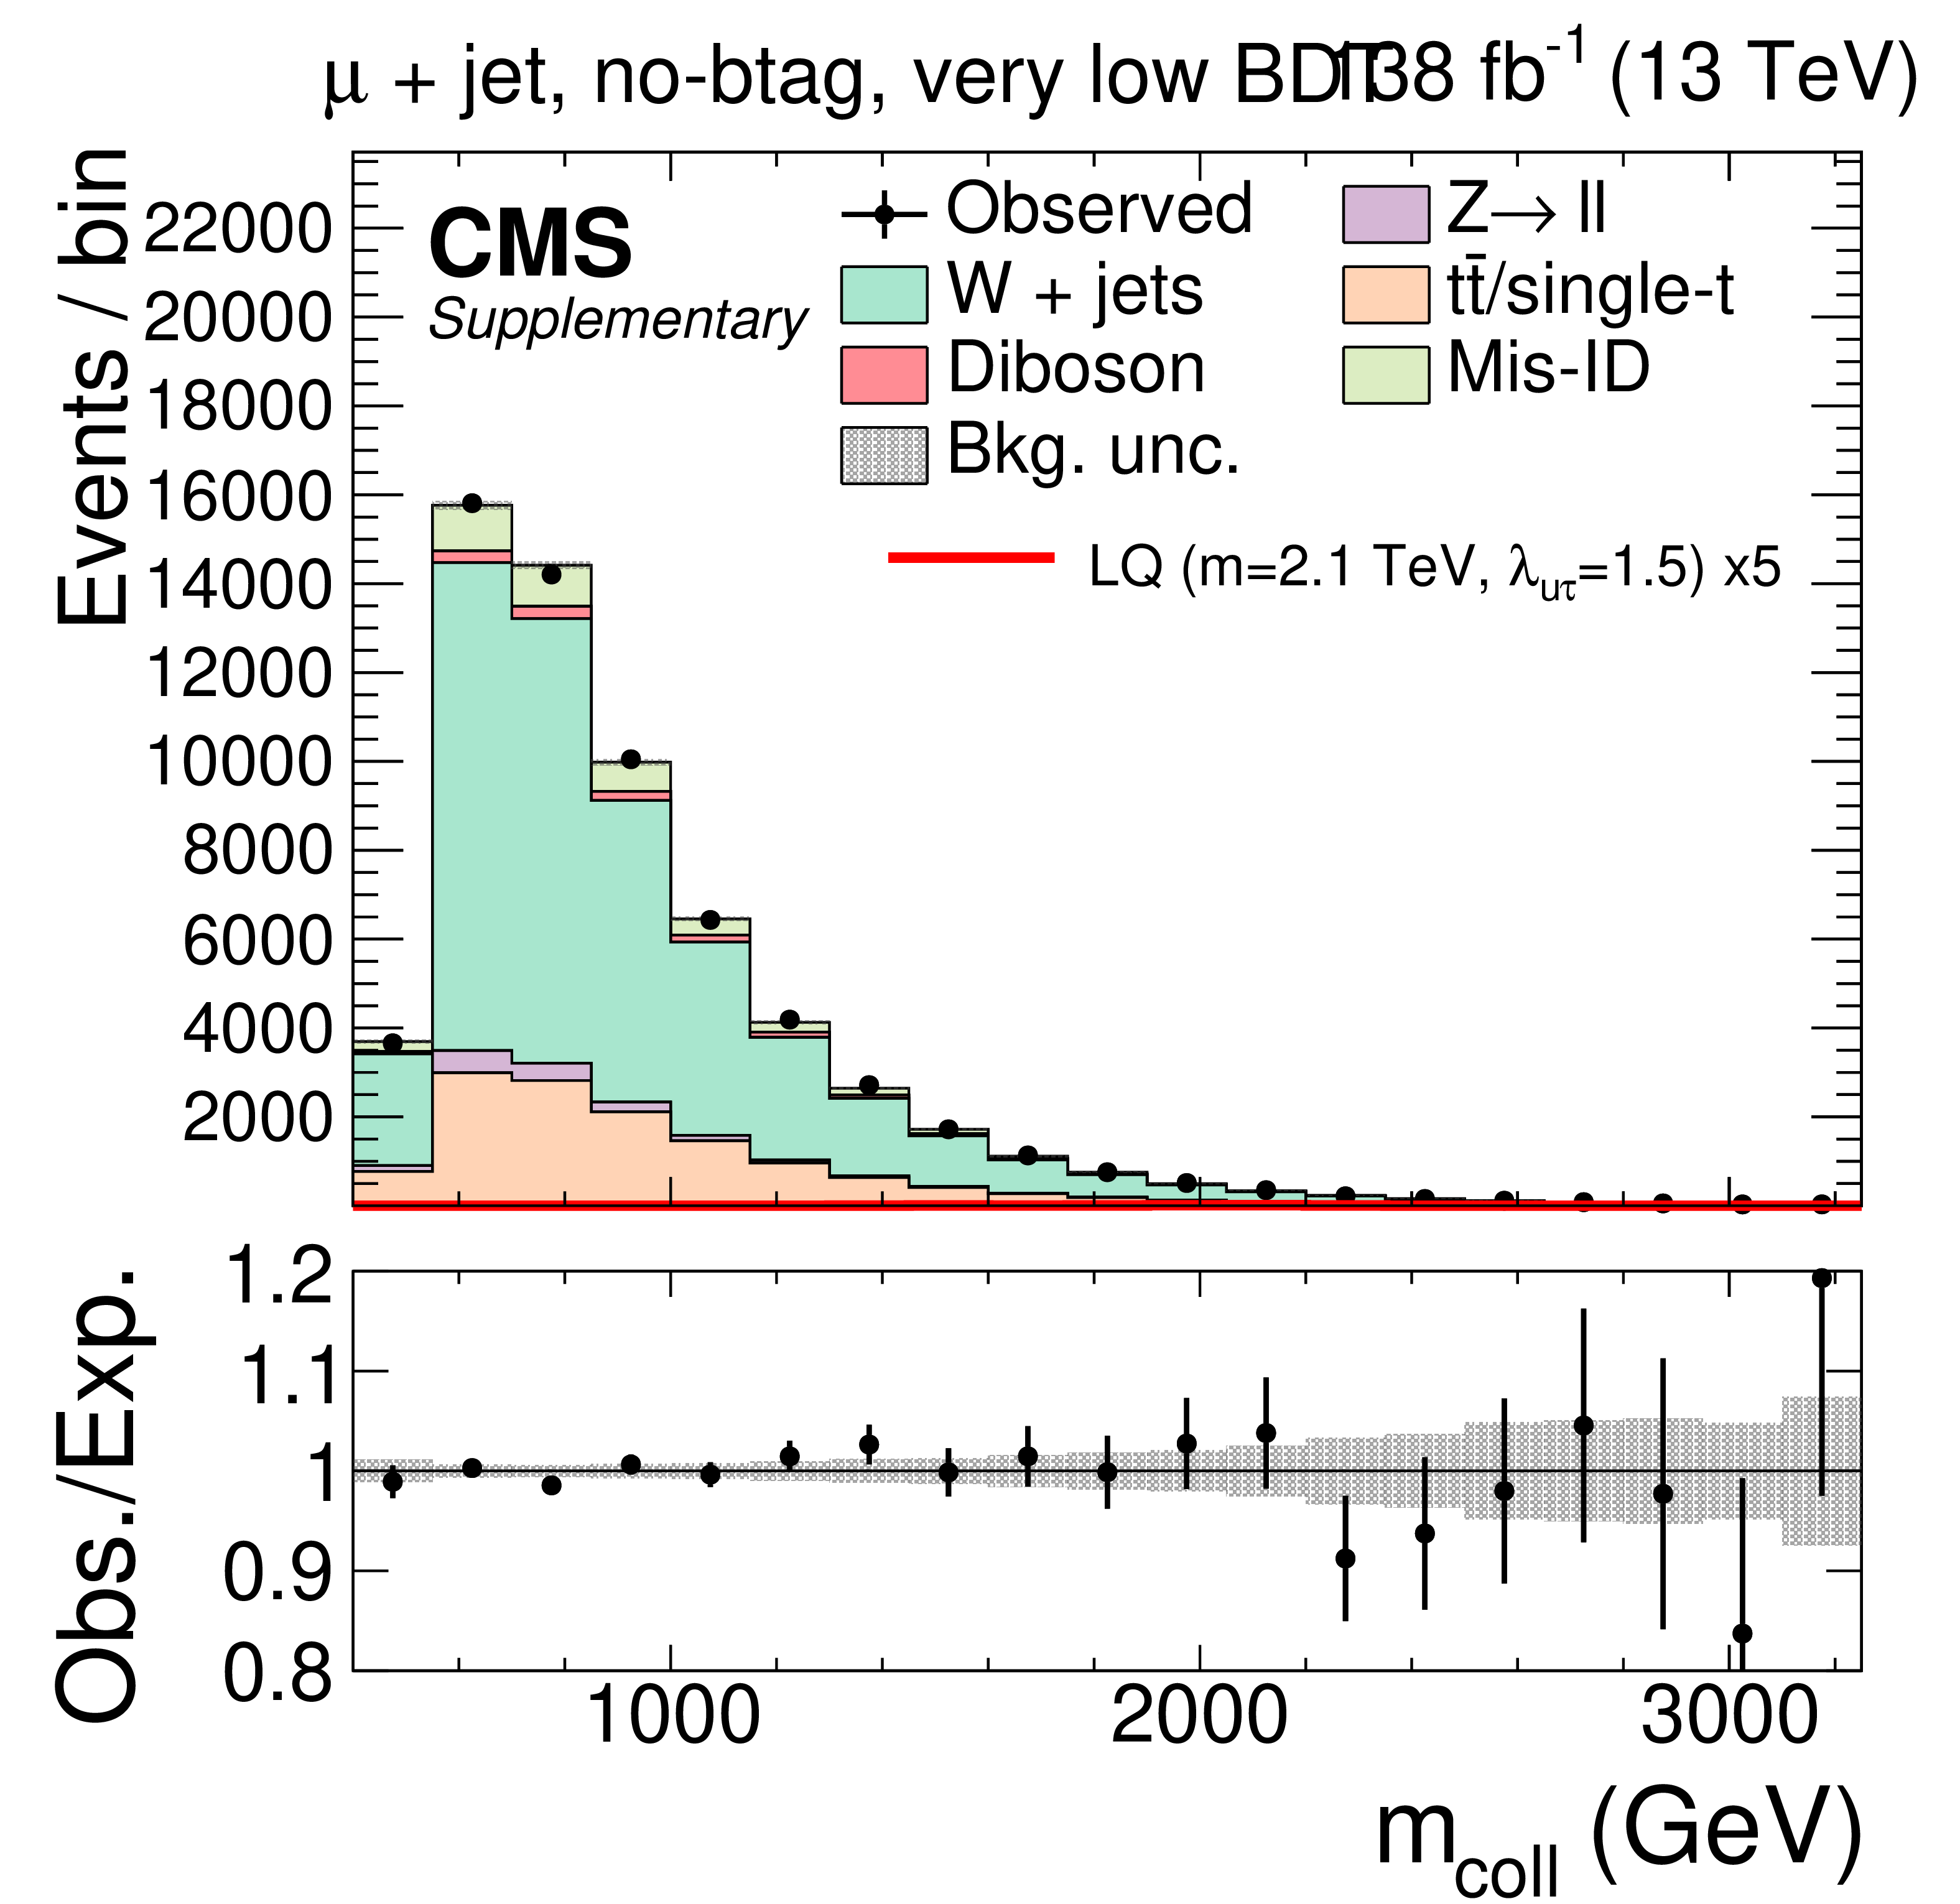
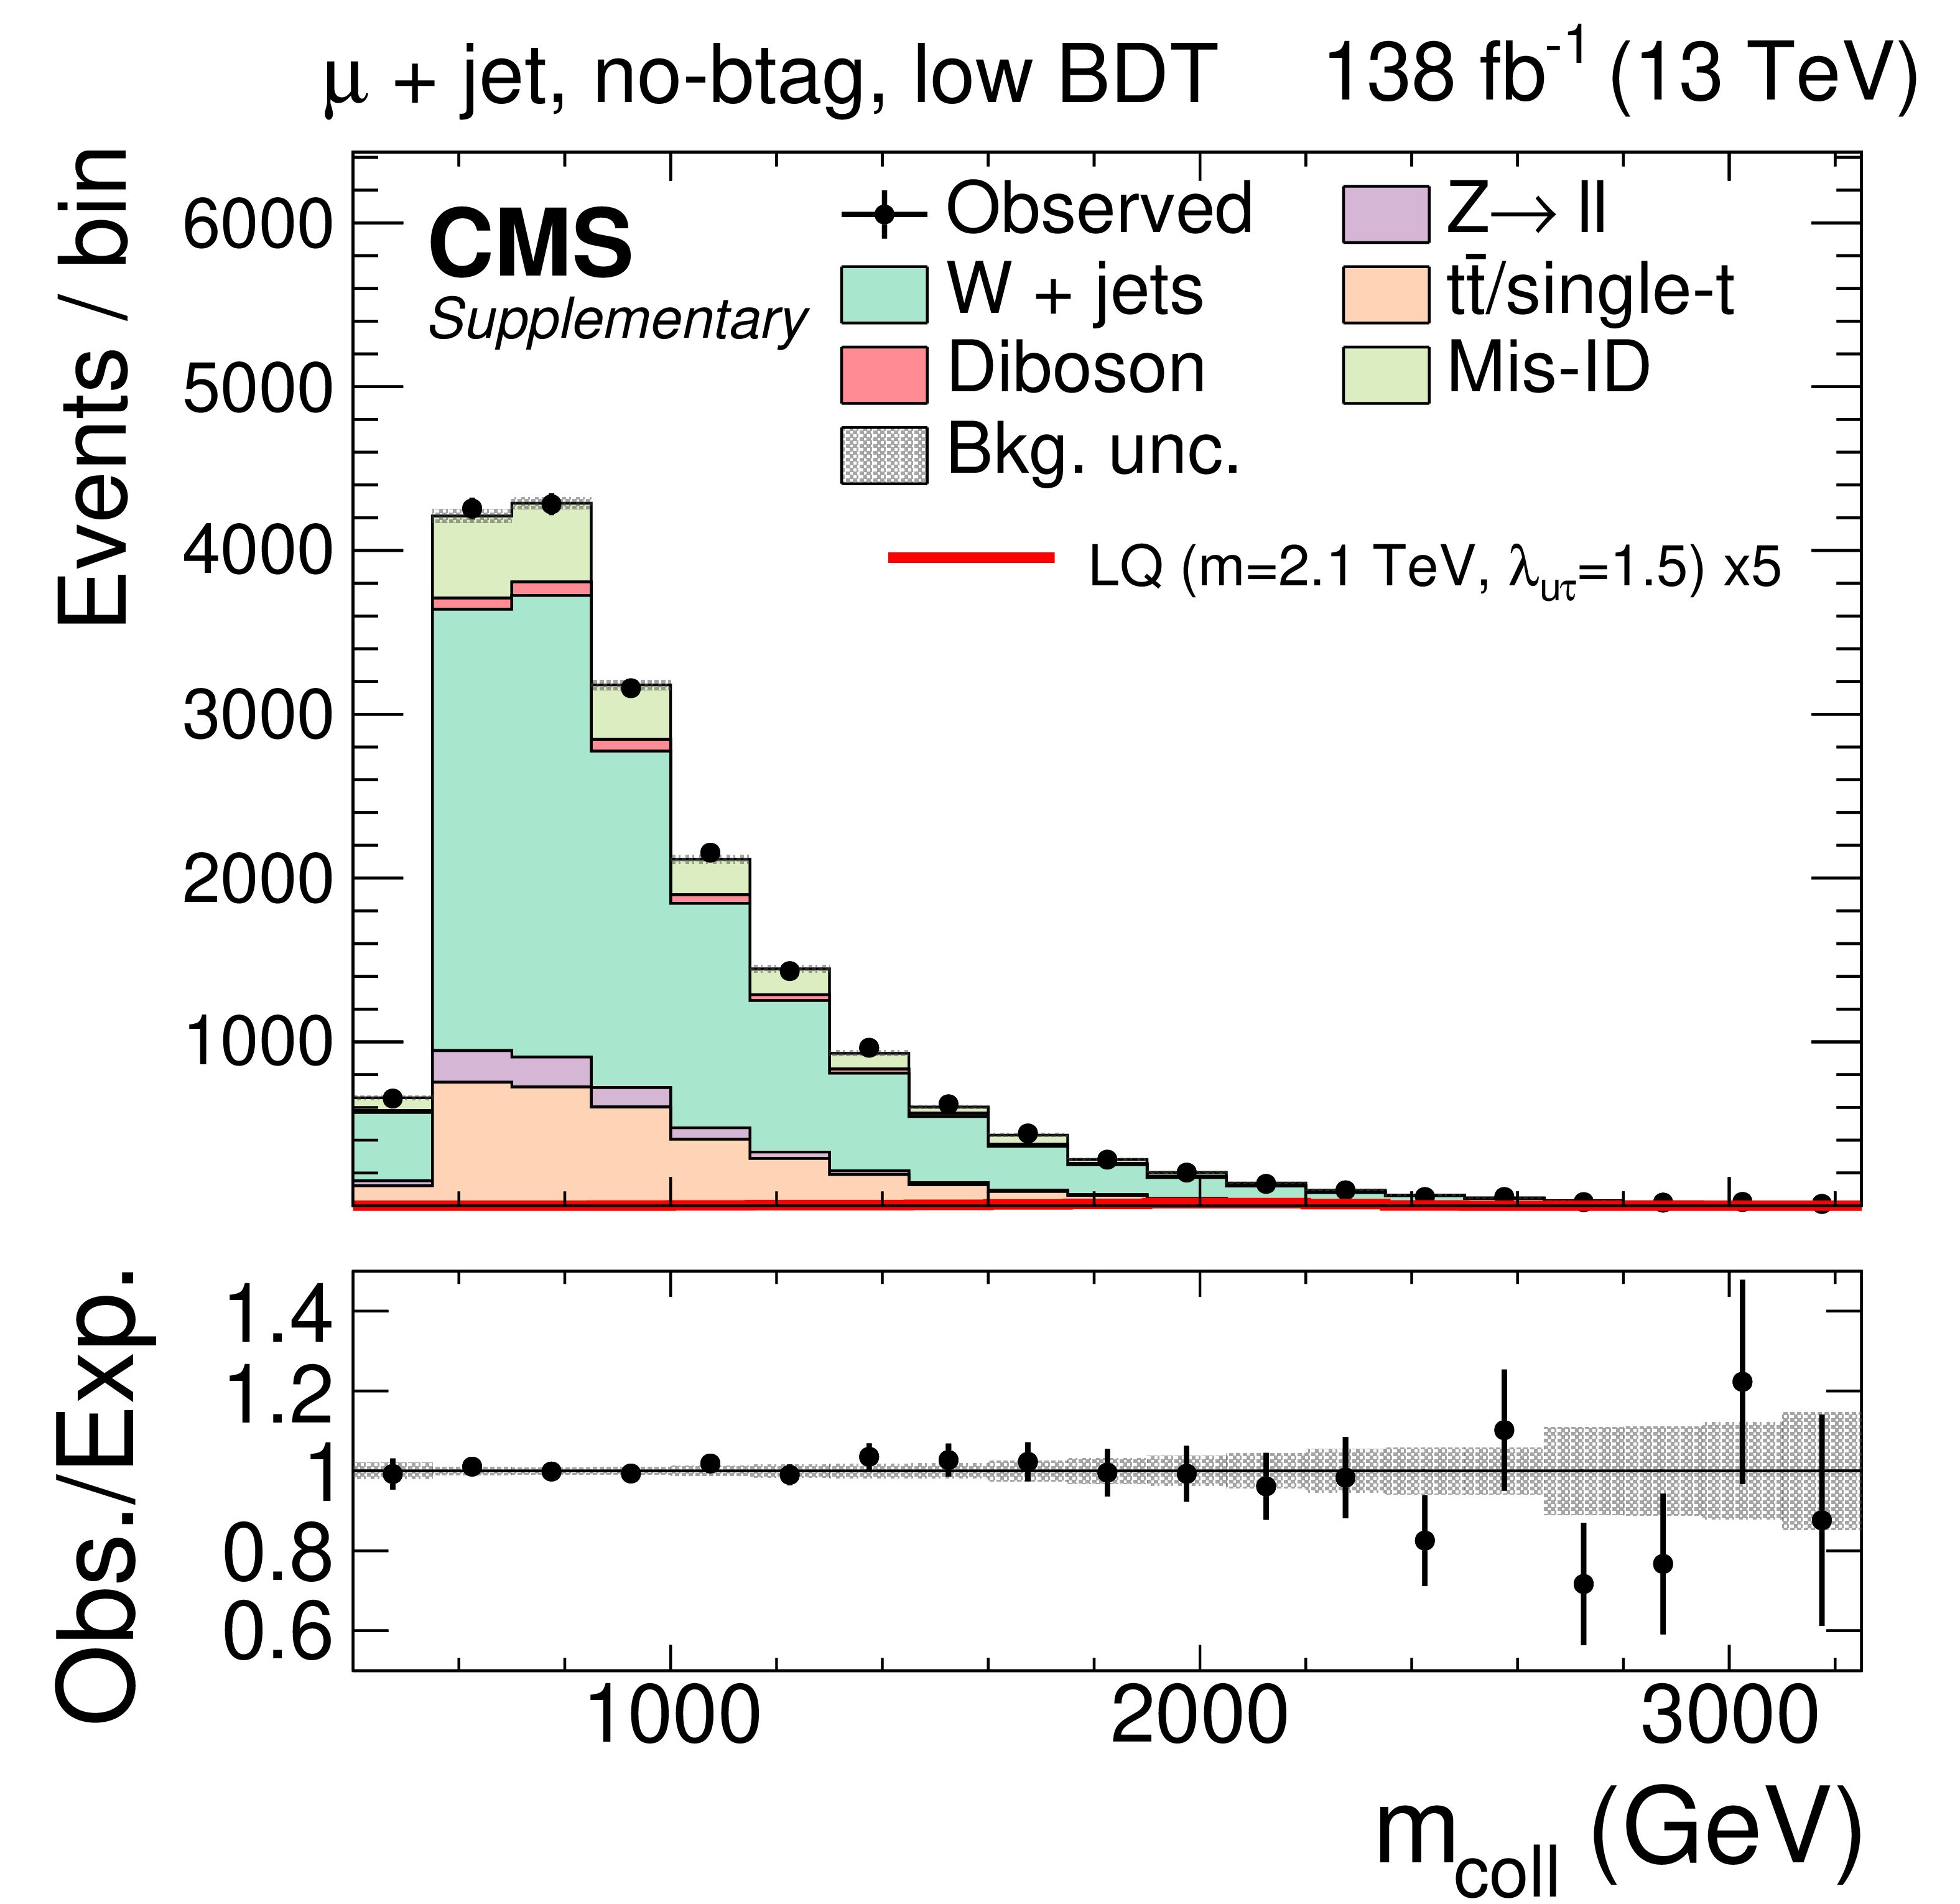
Additional Figure 12:
Observed and expected distributions of the collinear mass in the $ \mu+ $ jet channels for the no-btag category with low BDT output requirement. The uncertainty band includes statistical and systematic uncertainties, and the background distributions are the results of the maximum likelihood fit. |
png pdf |
Additional Figure 13:
Observed and expected distributions of the collinear mass in the $ \tau_\mathrm{h}+ $ jet channels for the no-btag category with intermediate BDT output requirement. The uncertainty band includes statistical and systematic uncertainties, and the background distributions are the results of the maximum likelihood fit. |
png pdf |
Additional Figure 14:
Observed and expected distributions of the collinear mass in the e $+ $ jet channels for the no-btag category with intermediate BDT output requirement. The uncertainty band includes statistical and systematic uncertainties, and the background distributions are the results of the maximum likelihood fit. |

png pdf |
Additional Figure 15:
Observed and expected distributions of the collinear mass in the $ \mu+ $ jet channels for the no-btag category with intermediate BDT output requirement. The uncertainty band includes statistical and systematic uncertainties, and the background distributions are the results of the maximum likelihood fit. |
png pdf |
Additional Figure 16:
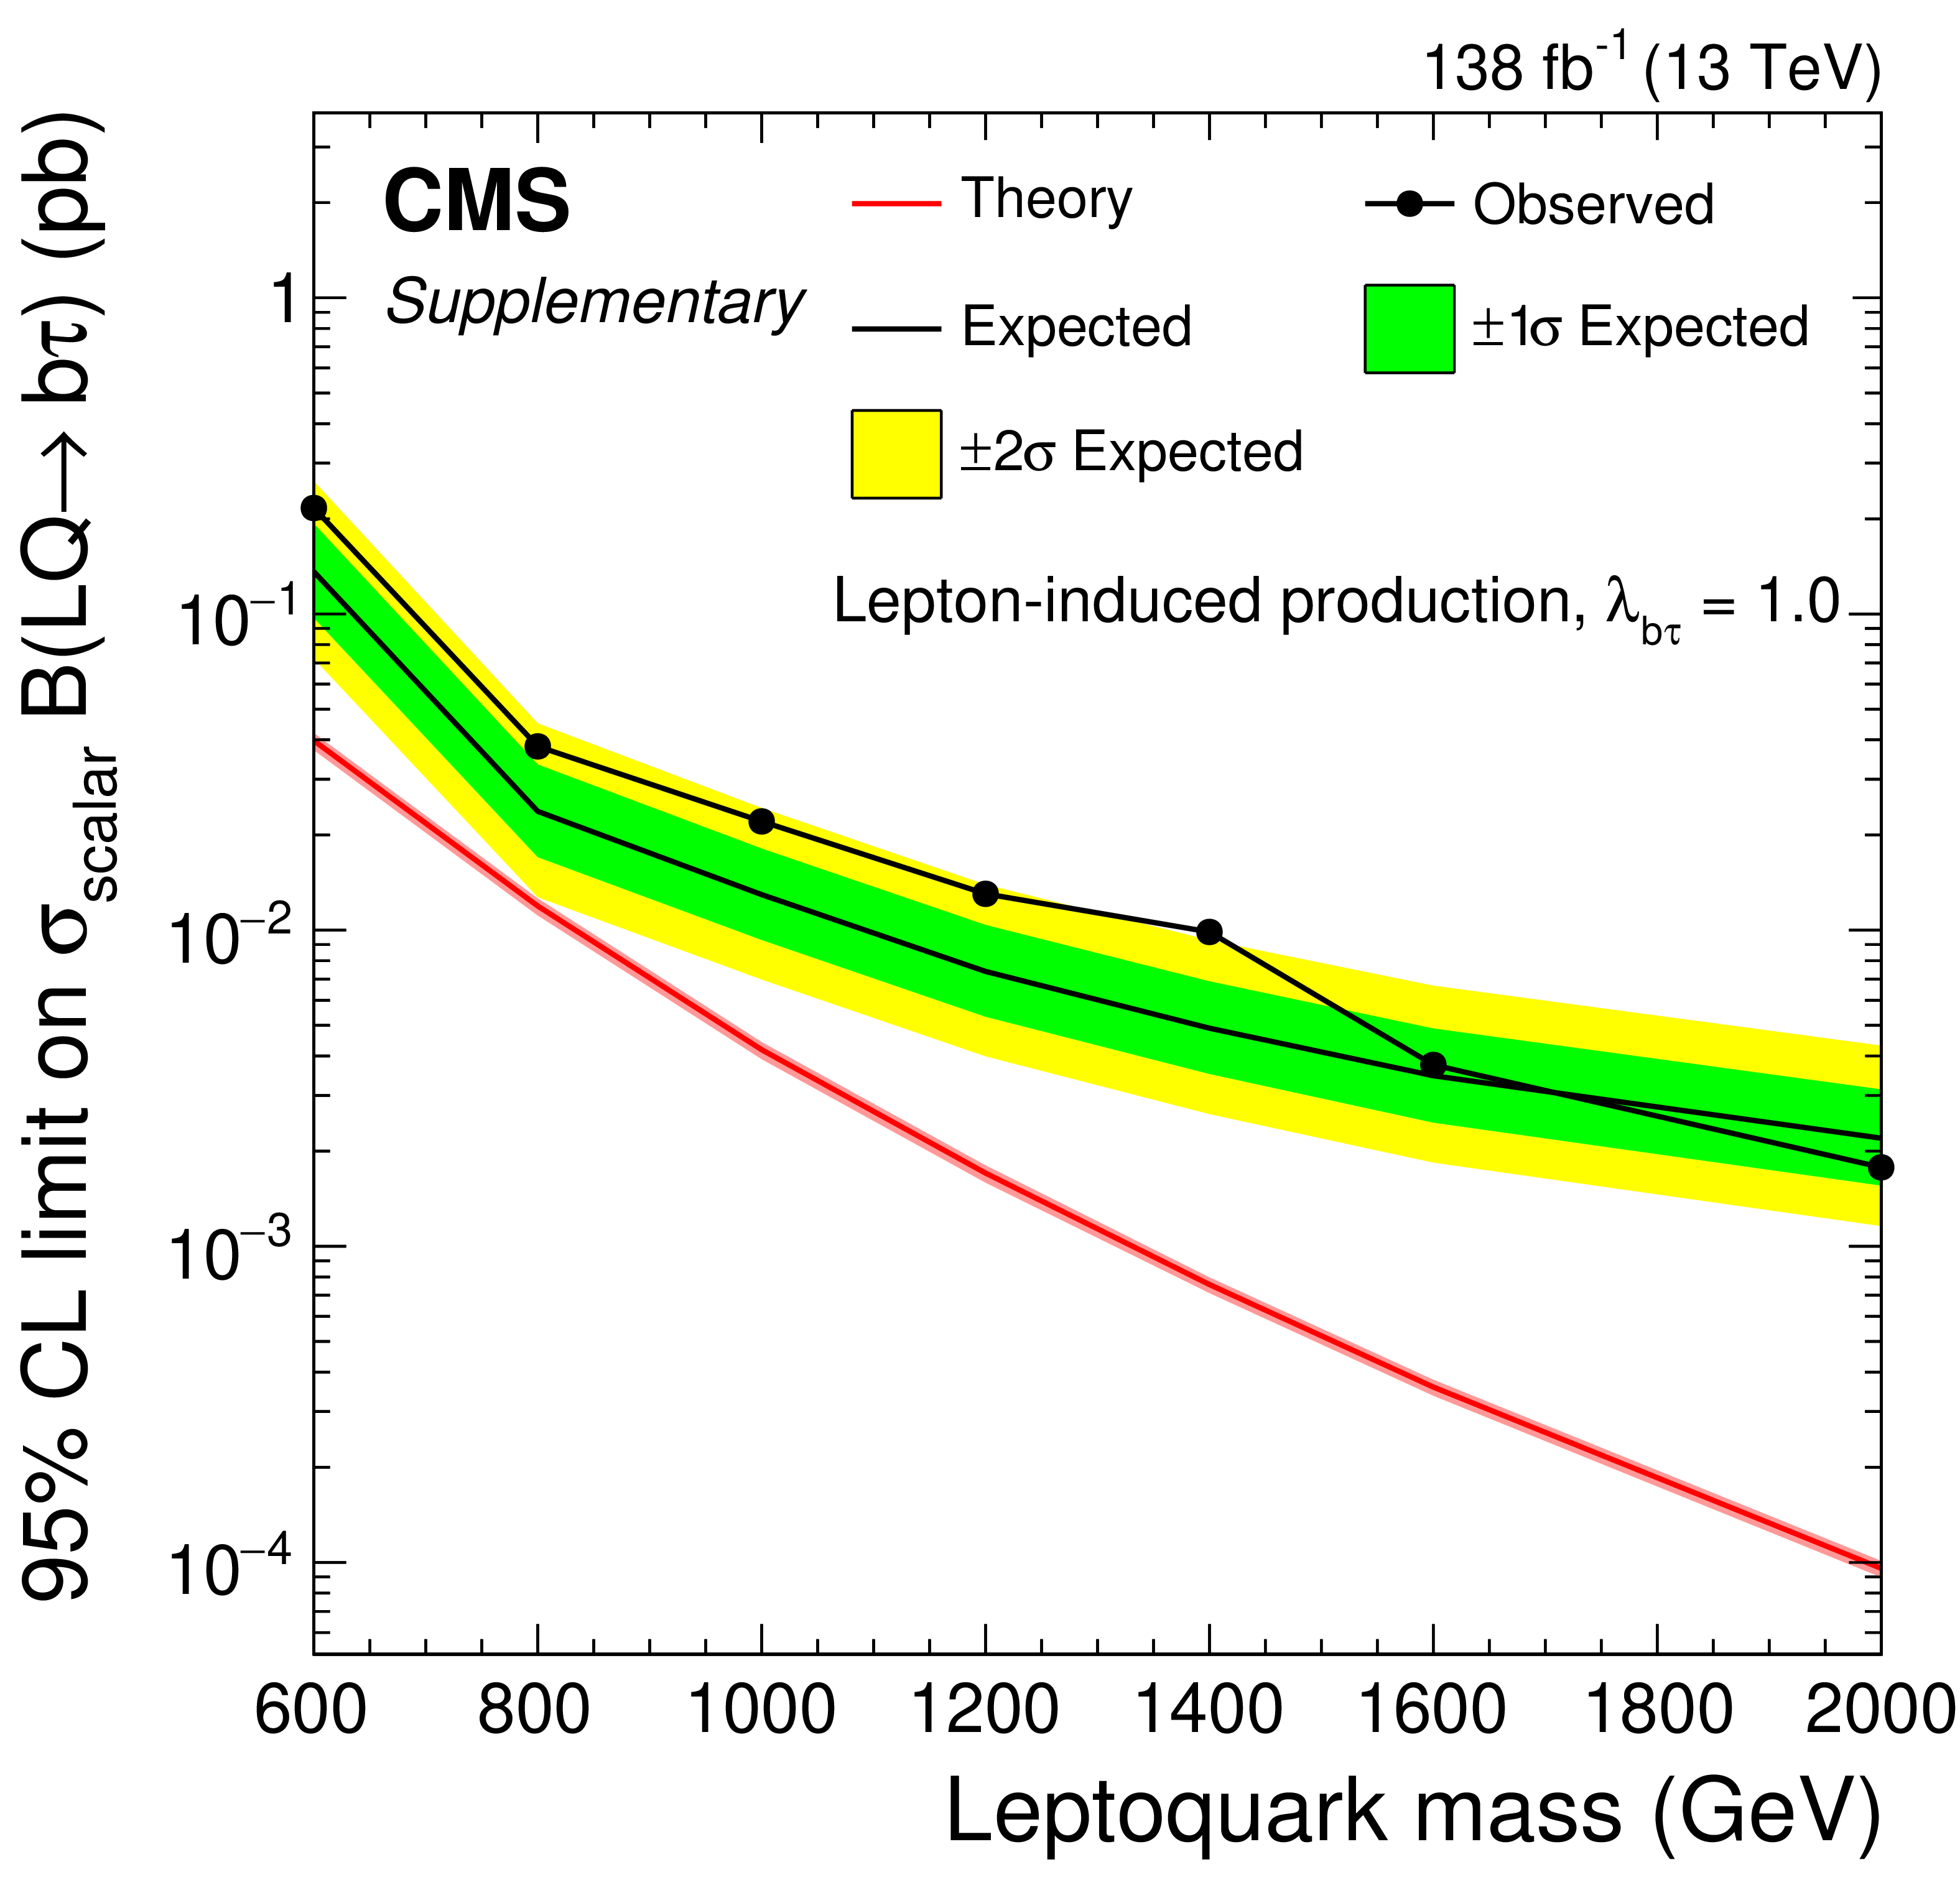
Expected and observed upper limits at 95% CL on the scalar lepton-induced LQ production cross section times branching fraction for a LQ coupling to b quarks and $ \tau $ leptons using $ \lambda_{\mathrm{b}\tau}= $ 1.0. The bands around the predictions represent the theoretical uncertainties in the renormalization and factorization scales, and in the PDF. |
png pdf |
Additional Figure 17:
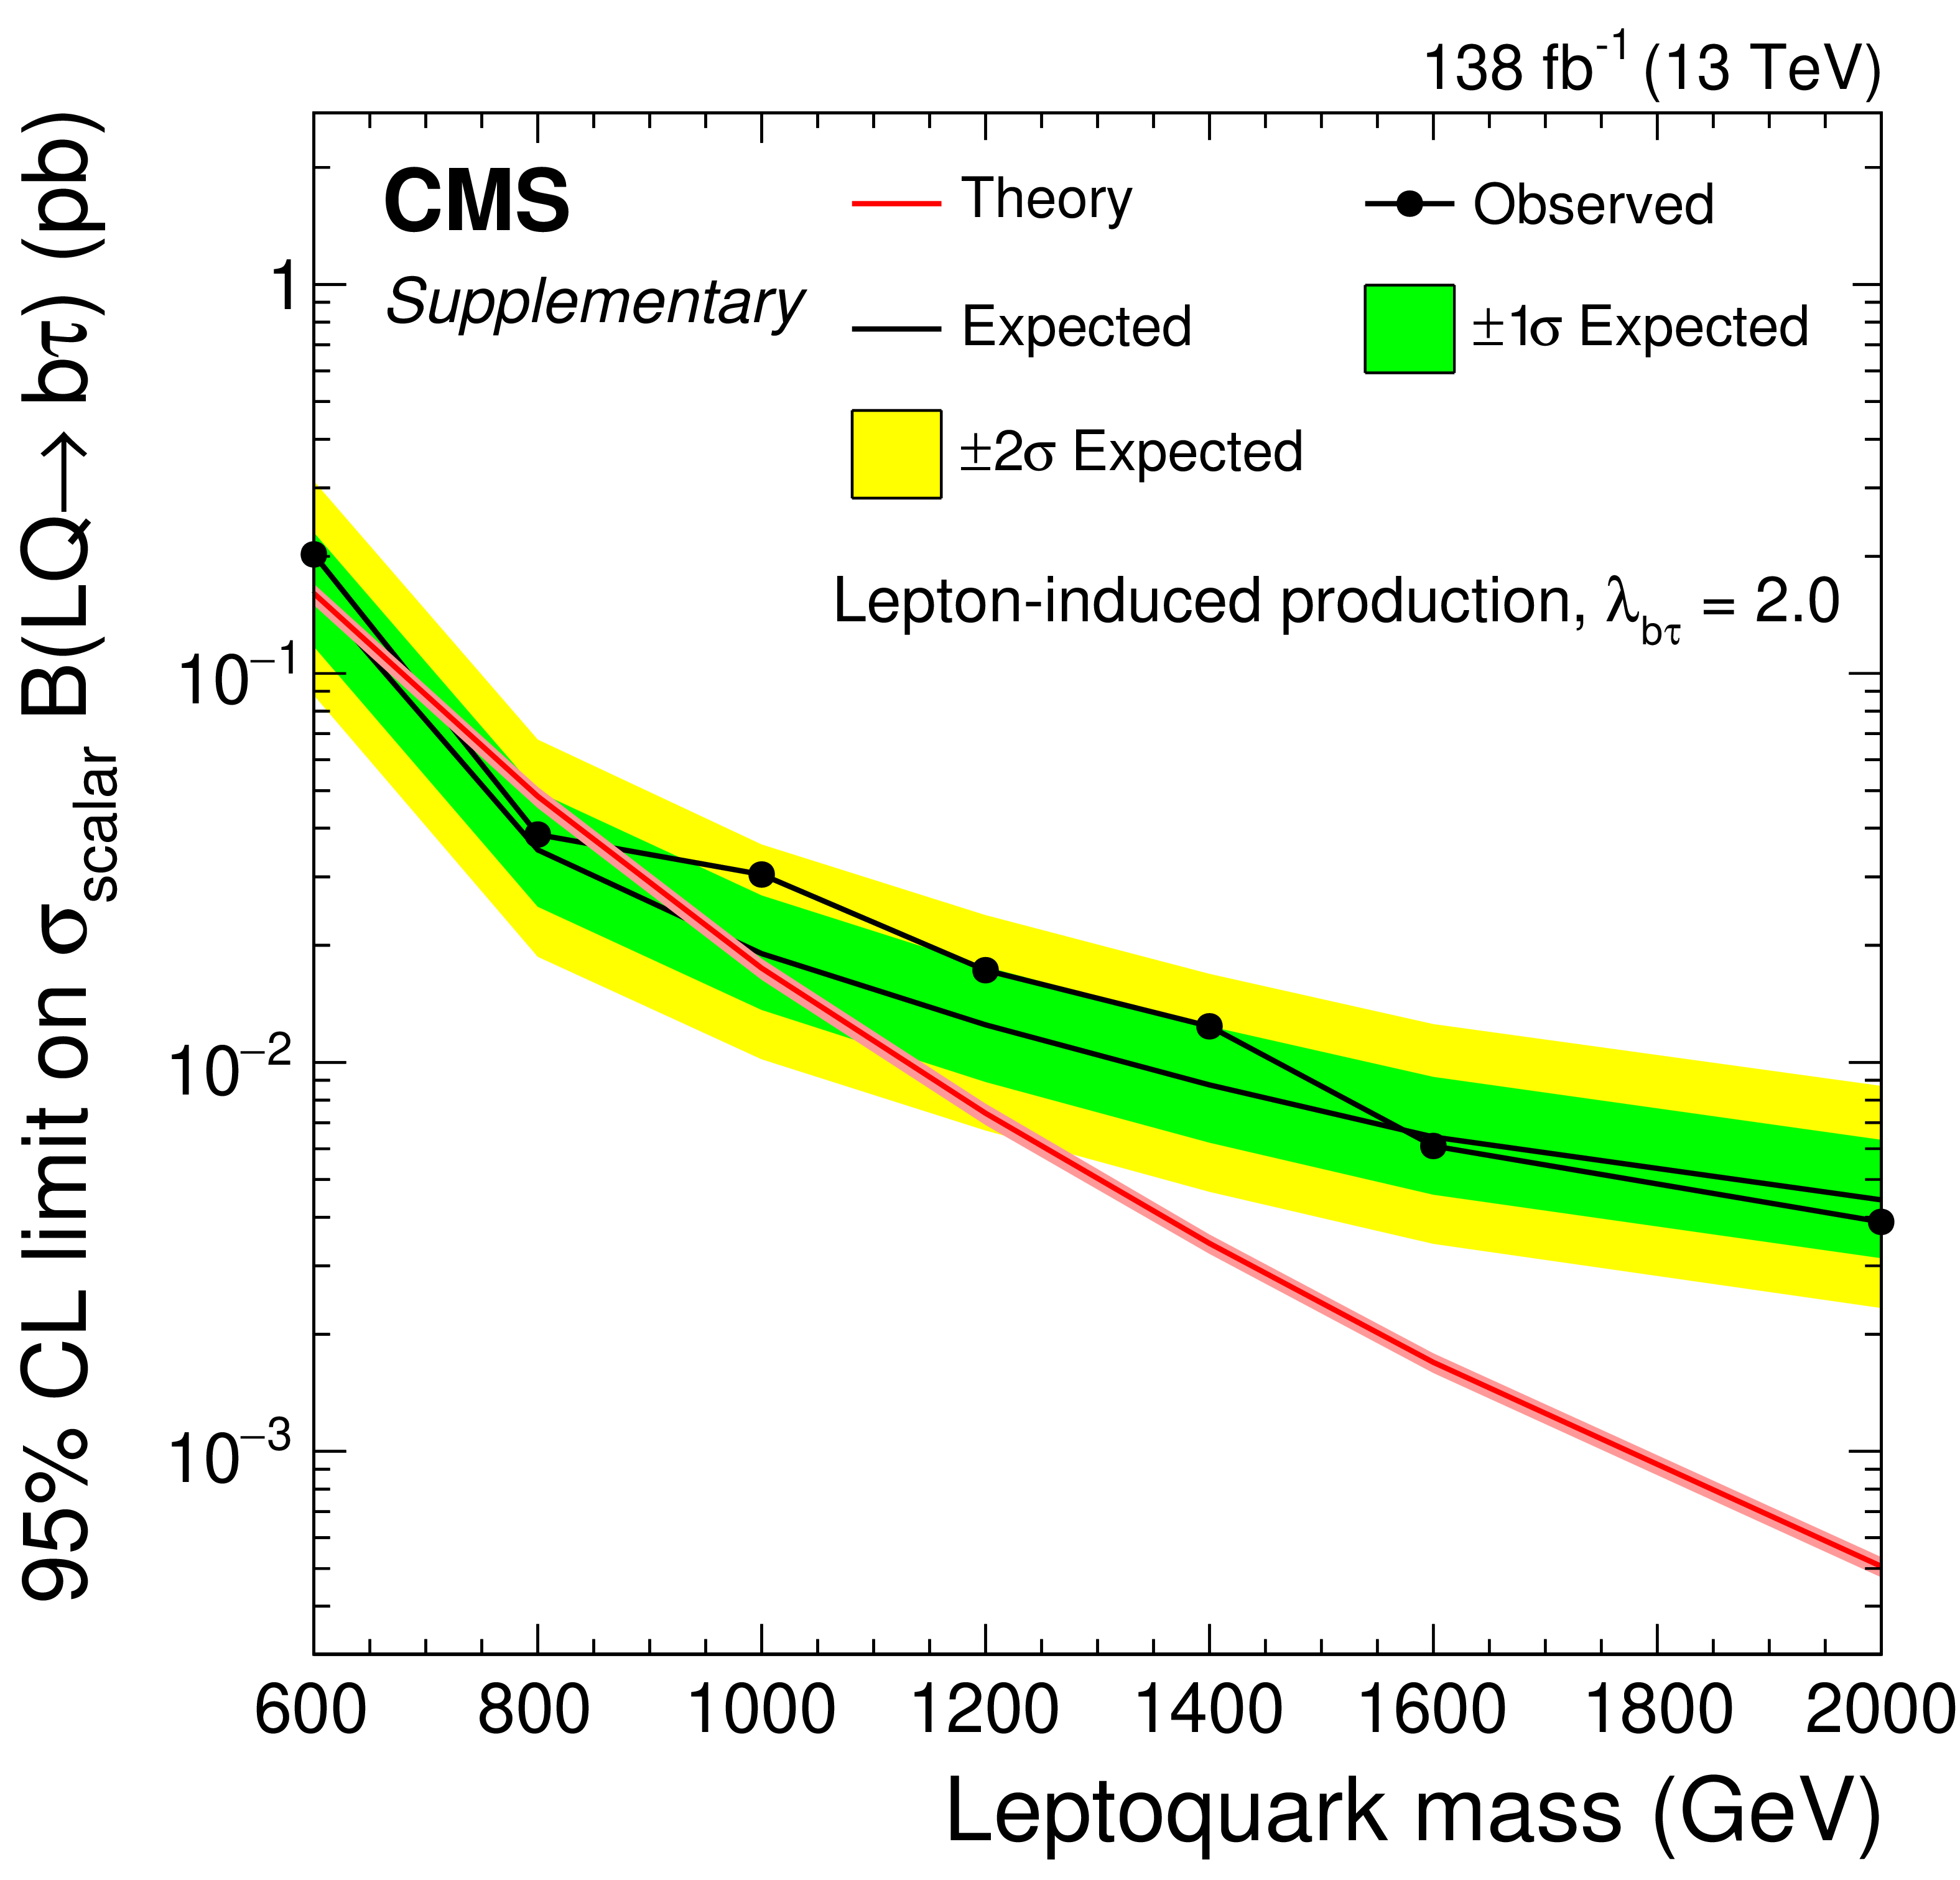
Expected and observed upper limits at 95% CL on the scalar lepton-induced LQ production cross section times branching fraction for a LQ coupling to b quarks and $ \tau $ leptons using $ \lambda_{\mathrm{b}\tau}= $ 2.0. The bands around the predictions represent the theoretical uncertainties in the renormalization and factorization scales, and in the PDF. |
png pdf |
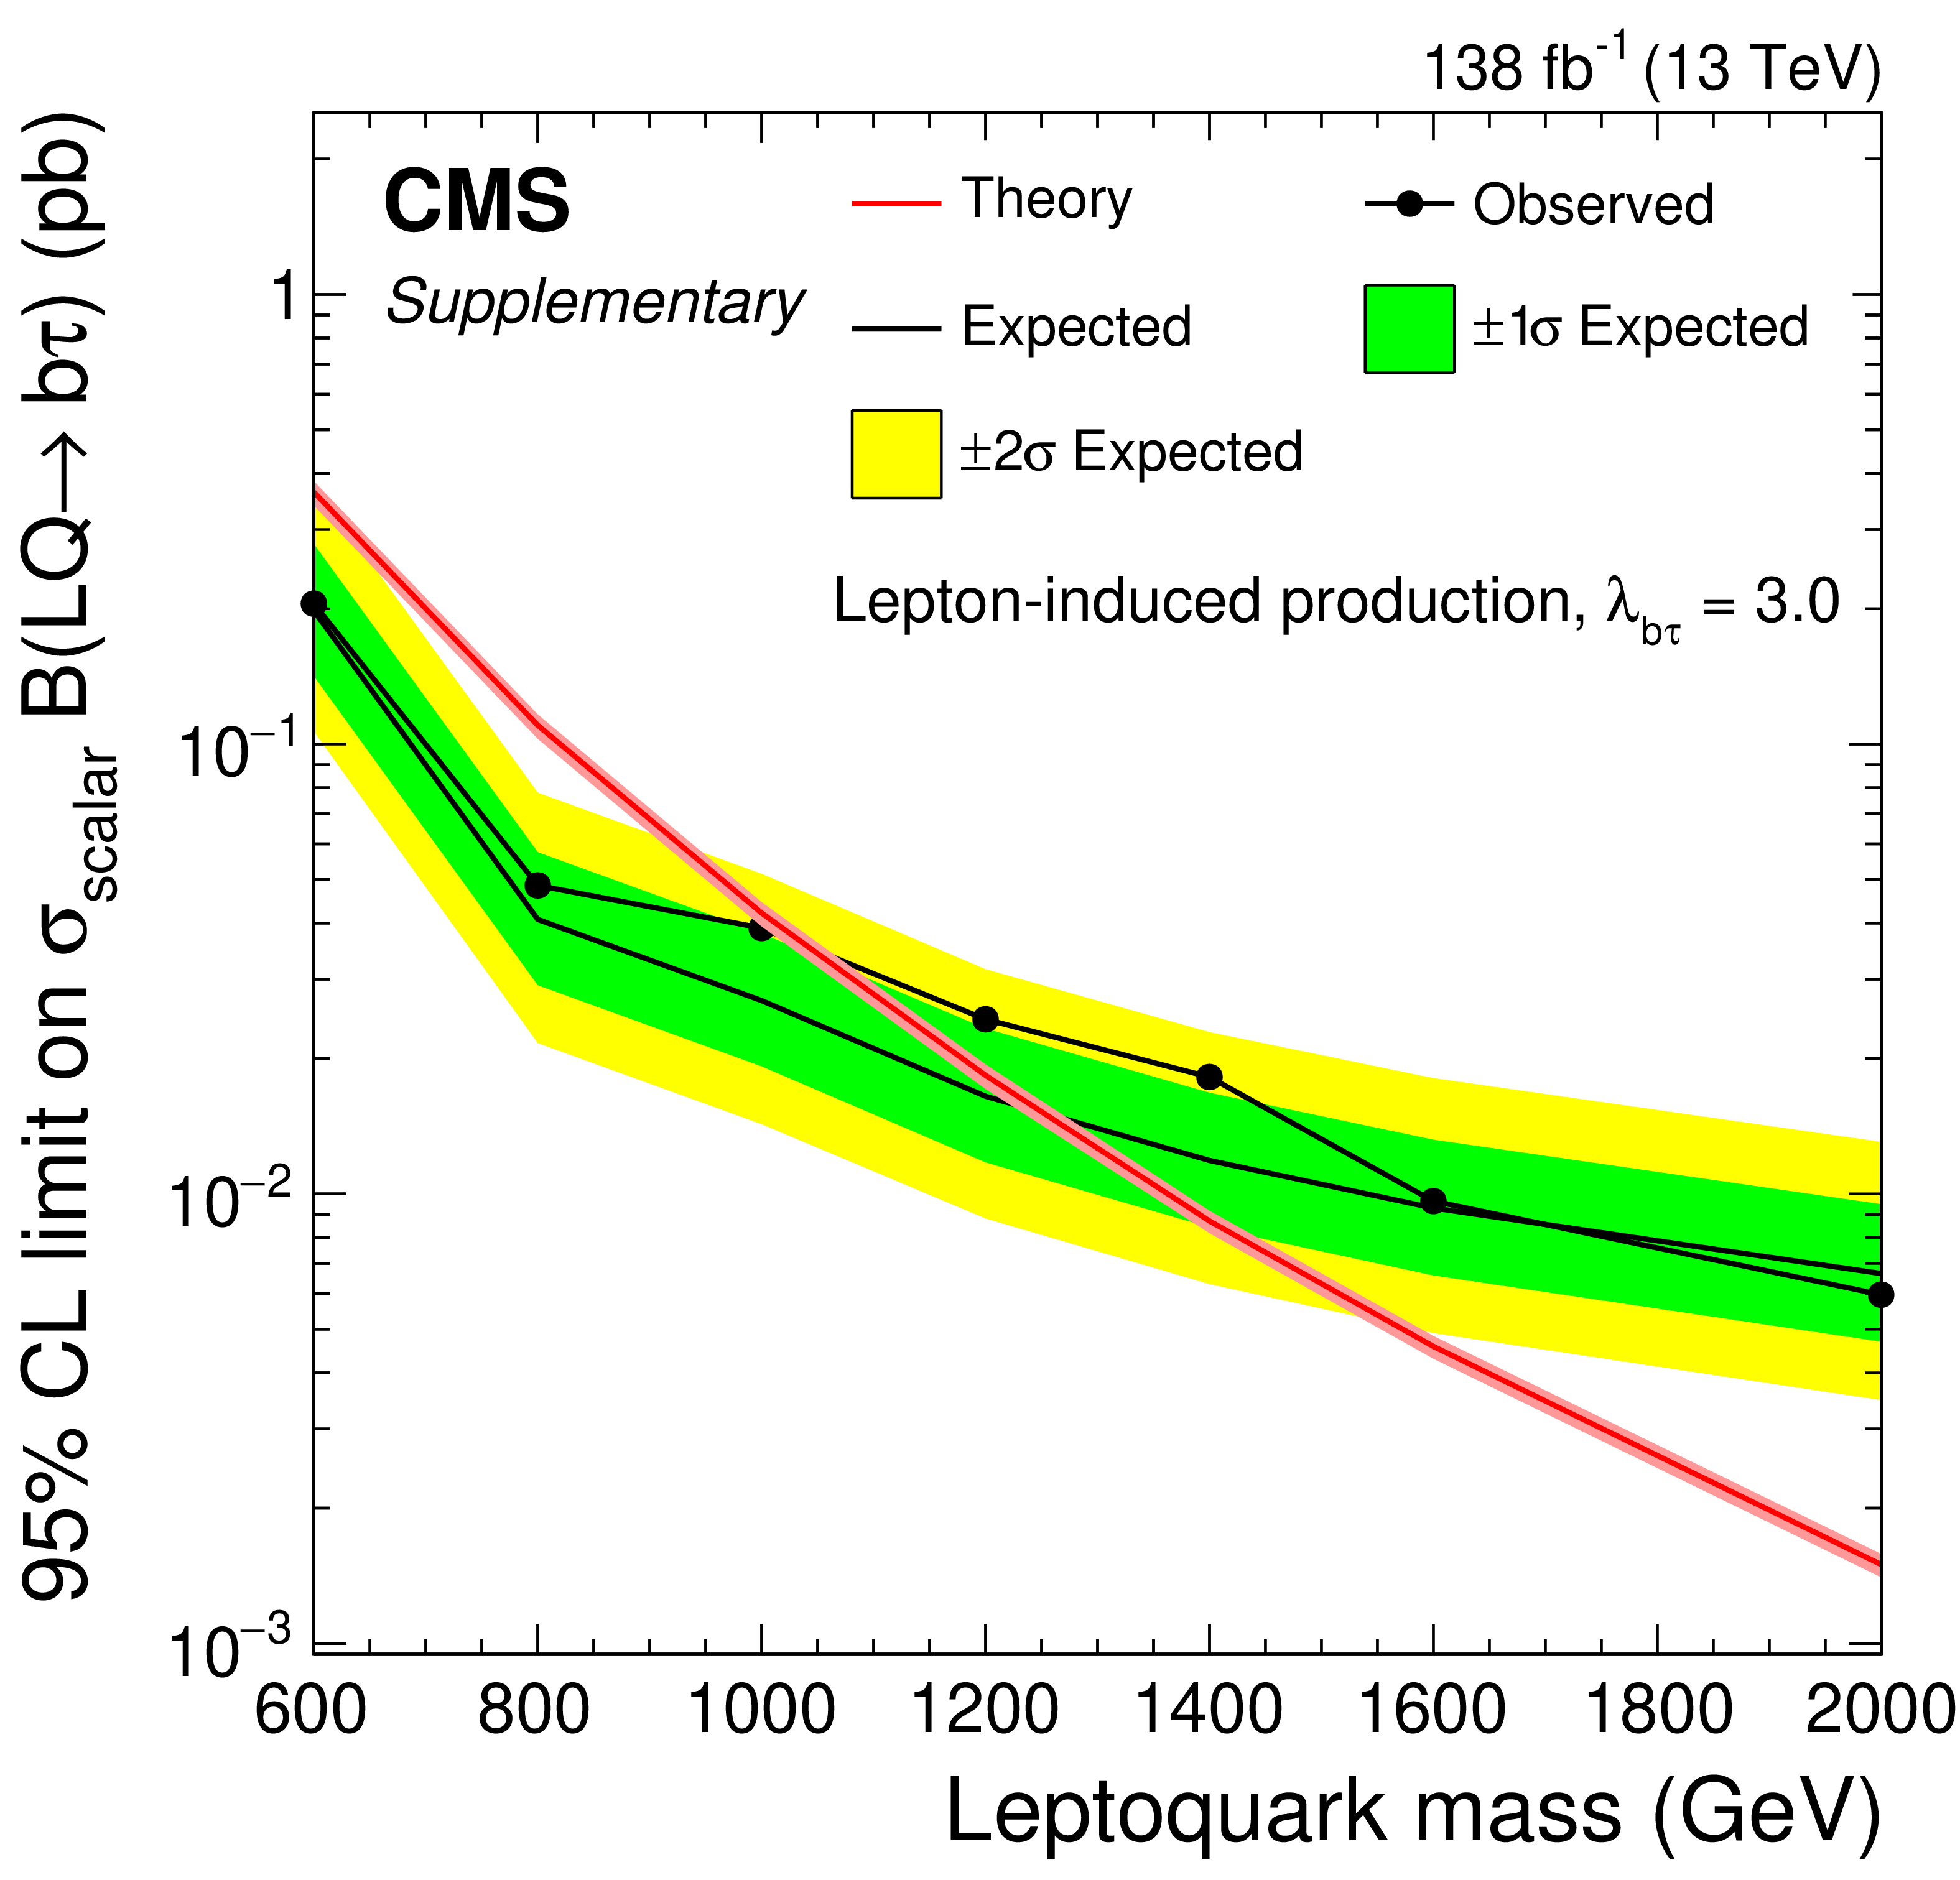
Additional Figure 18:
Expected and observed upper limits at 95% CL on the scalar lepton-induced LQ production cross section times branching fraction for a LQ coupling to b quarks and $ \tau $ leptons using $ \lambda_{\mathrm{b}\tau}= $ 3.0. The bands around the predictions represent the theoretical uncertainties in the renormalization and factorization scales, and in the PDF. |
png pdf |
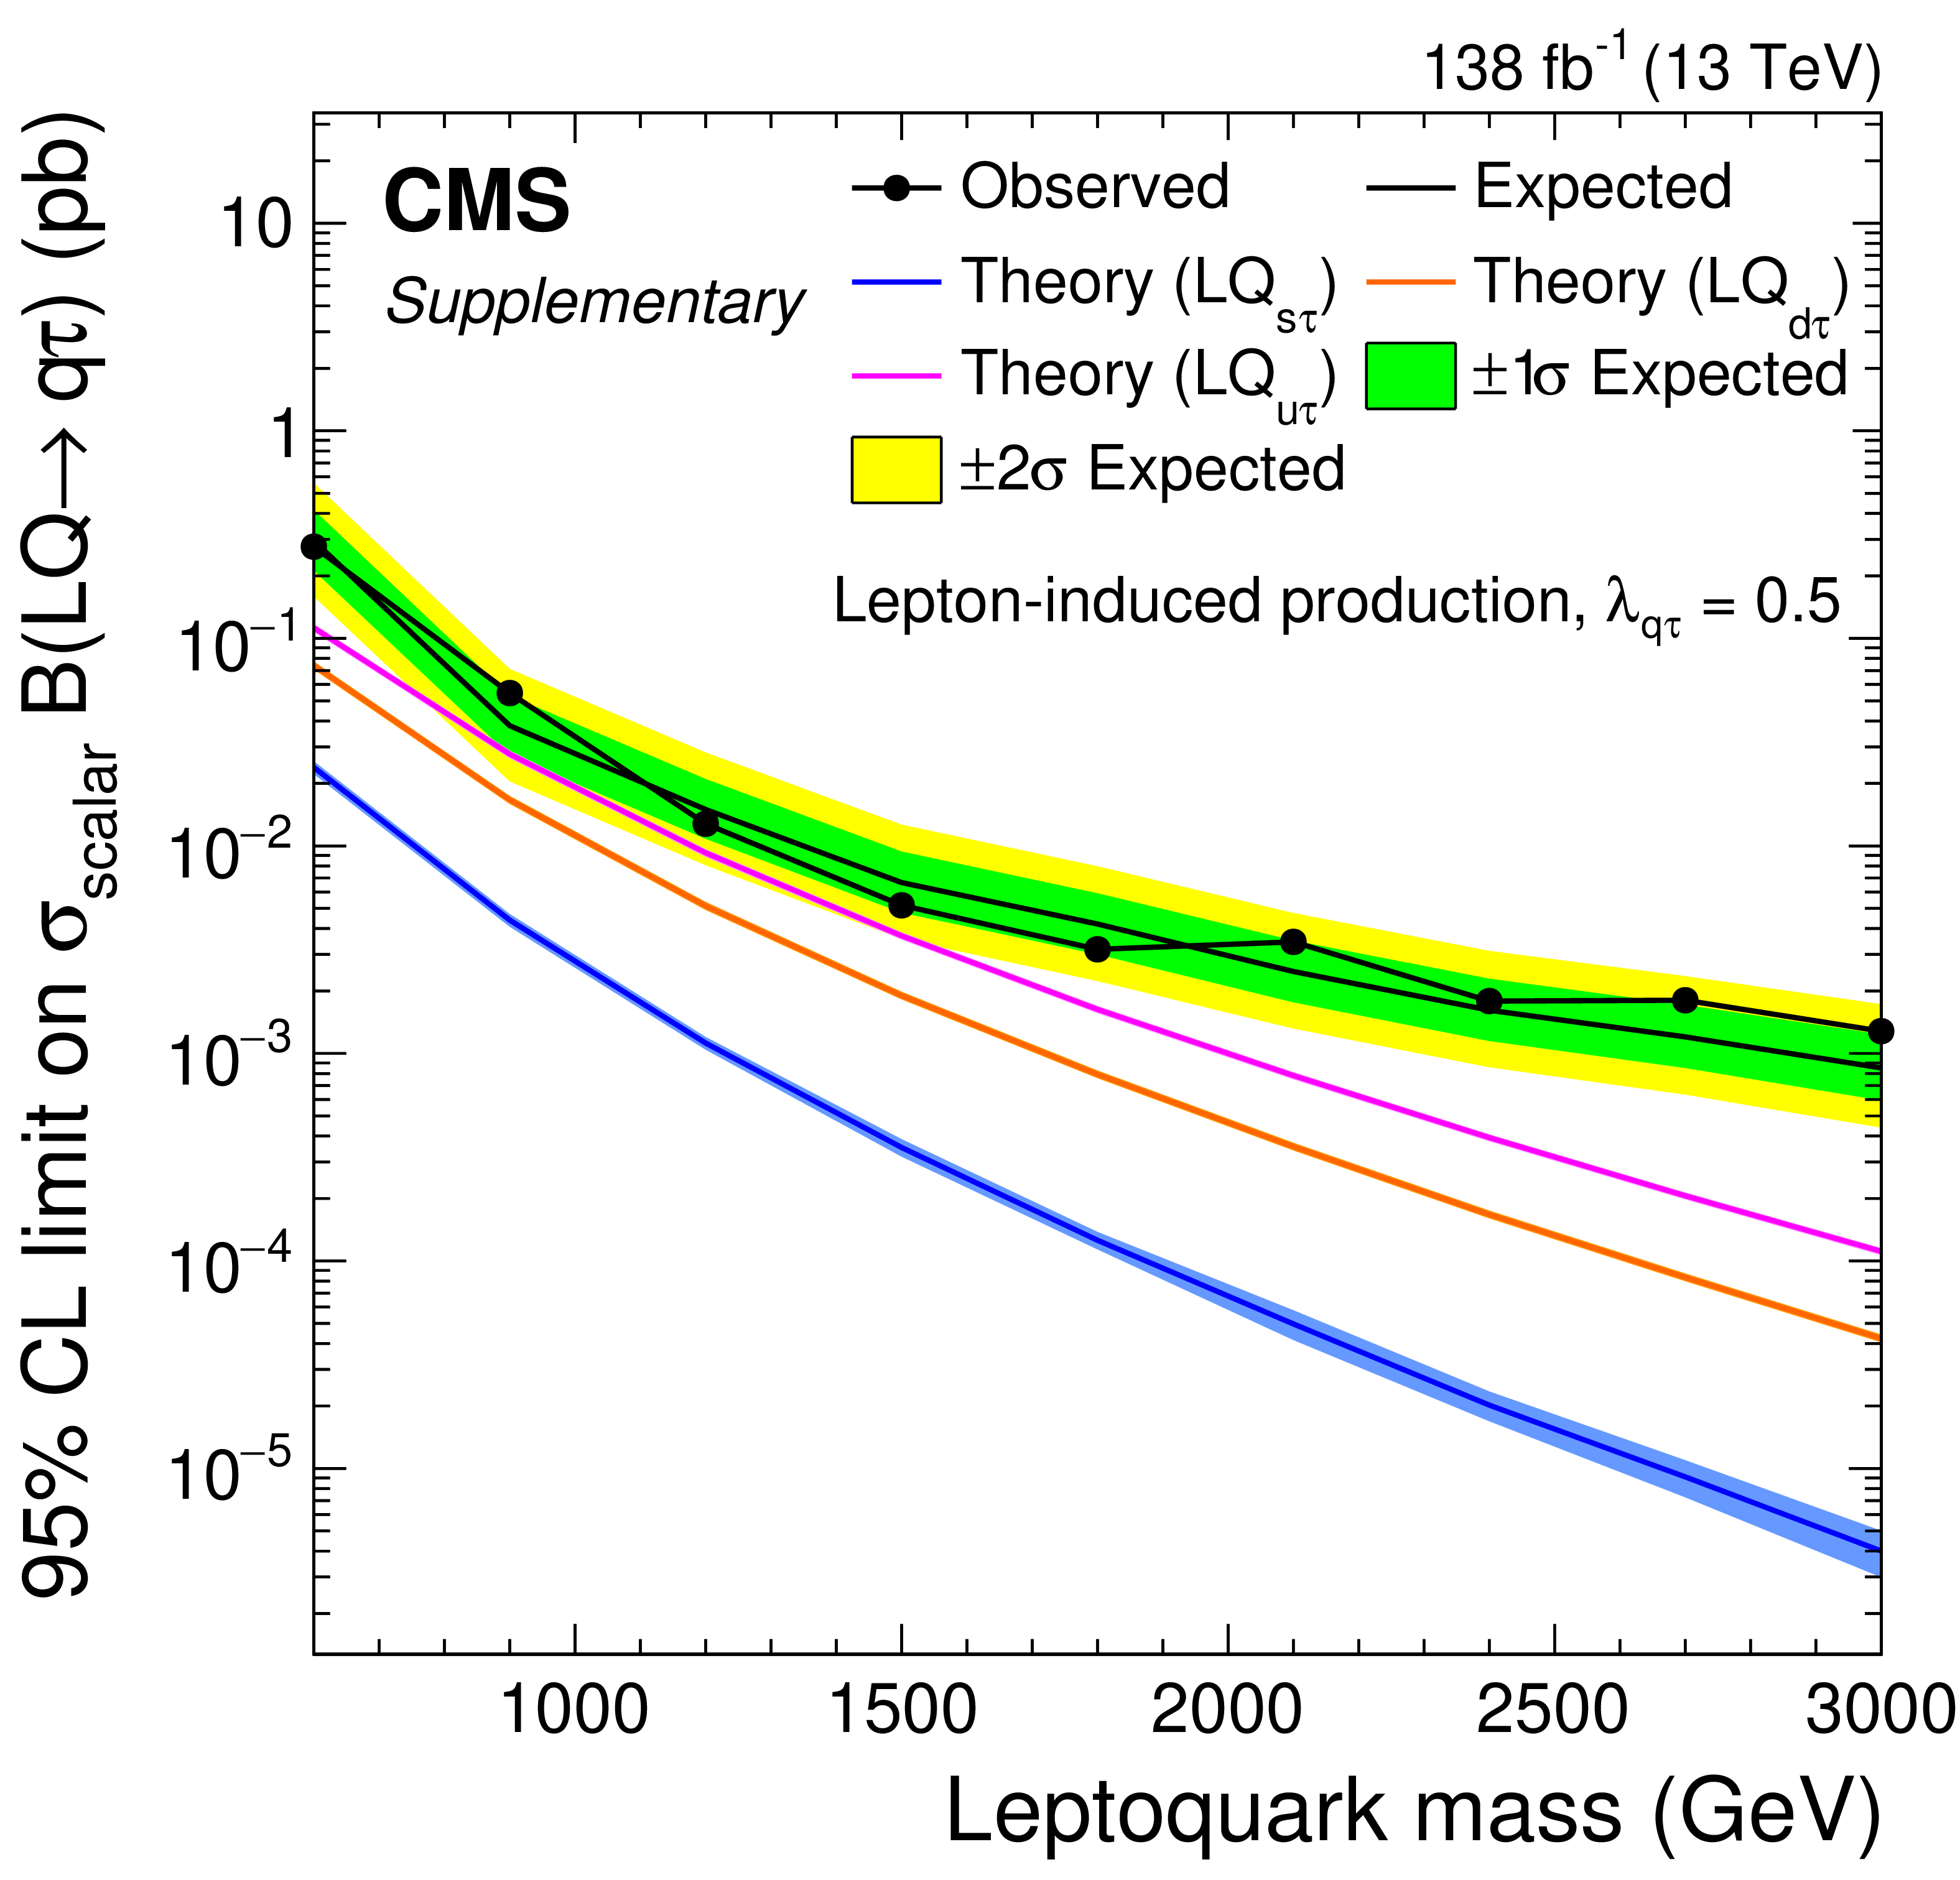
Additional Figure 19:
Expected and observed upper limits at 95% CL on the scalar lepton-induced LQ production cross section times branching fraction for a LQ coupling to light-flavor quarks and $ \tau $ leptons using $ \lambda_{\mathrm{q}\tau}= $ 0.5. The bands around the predictions represent the theoretical uncertainties in the renormalization and factorization scales, and in the PDF. |
png pdf |
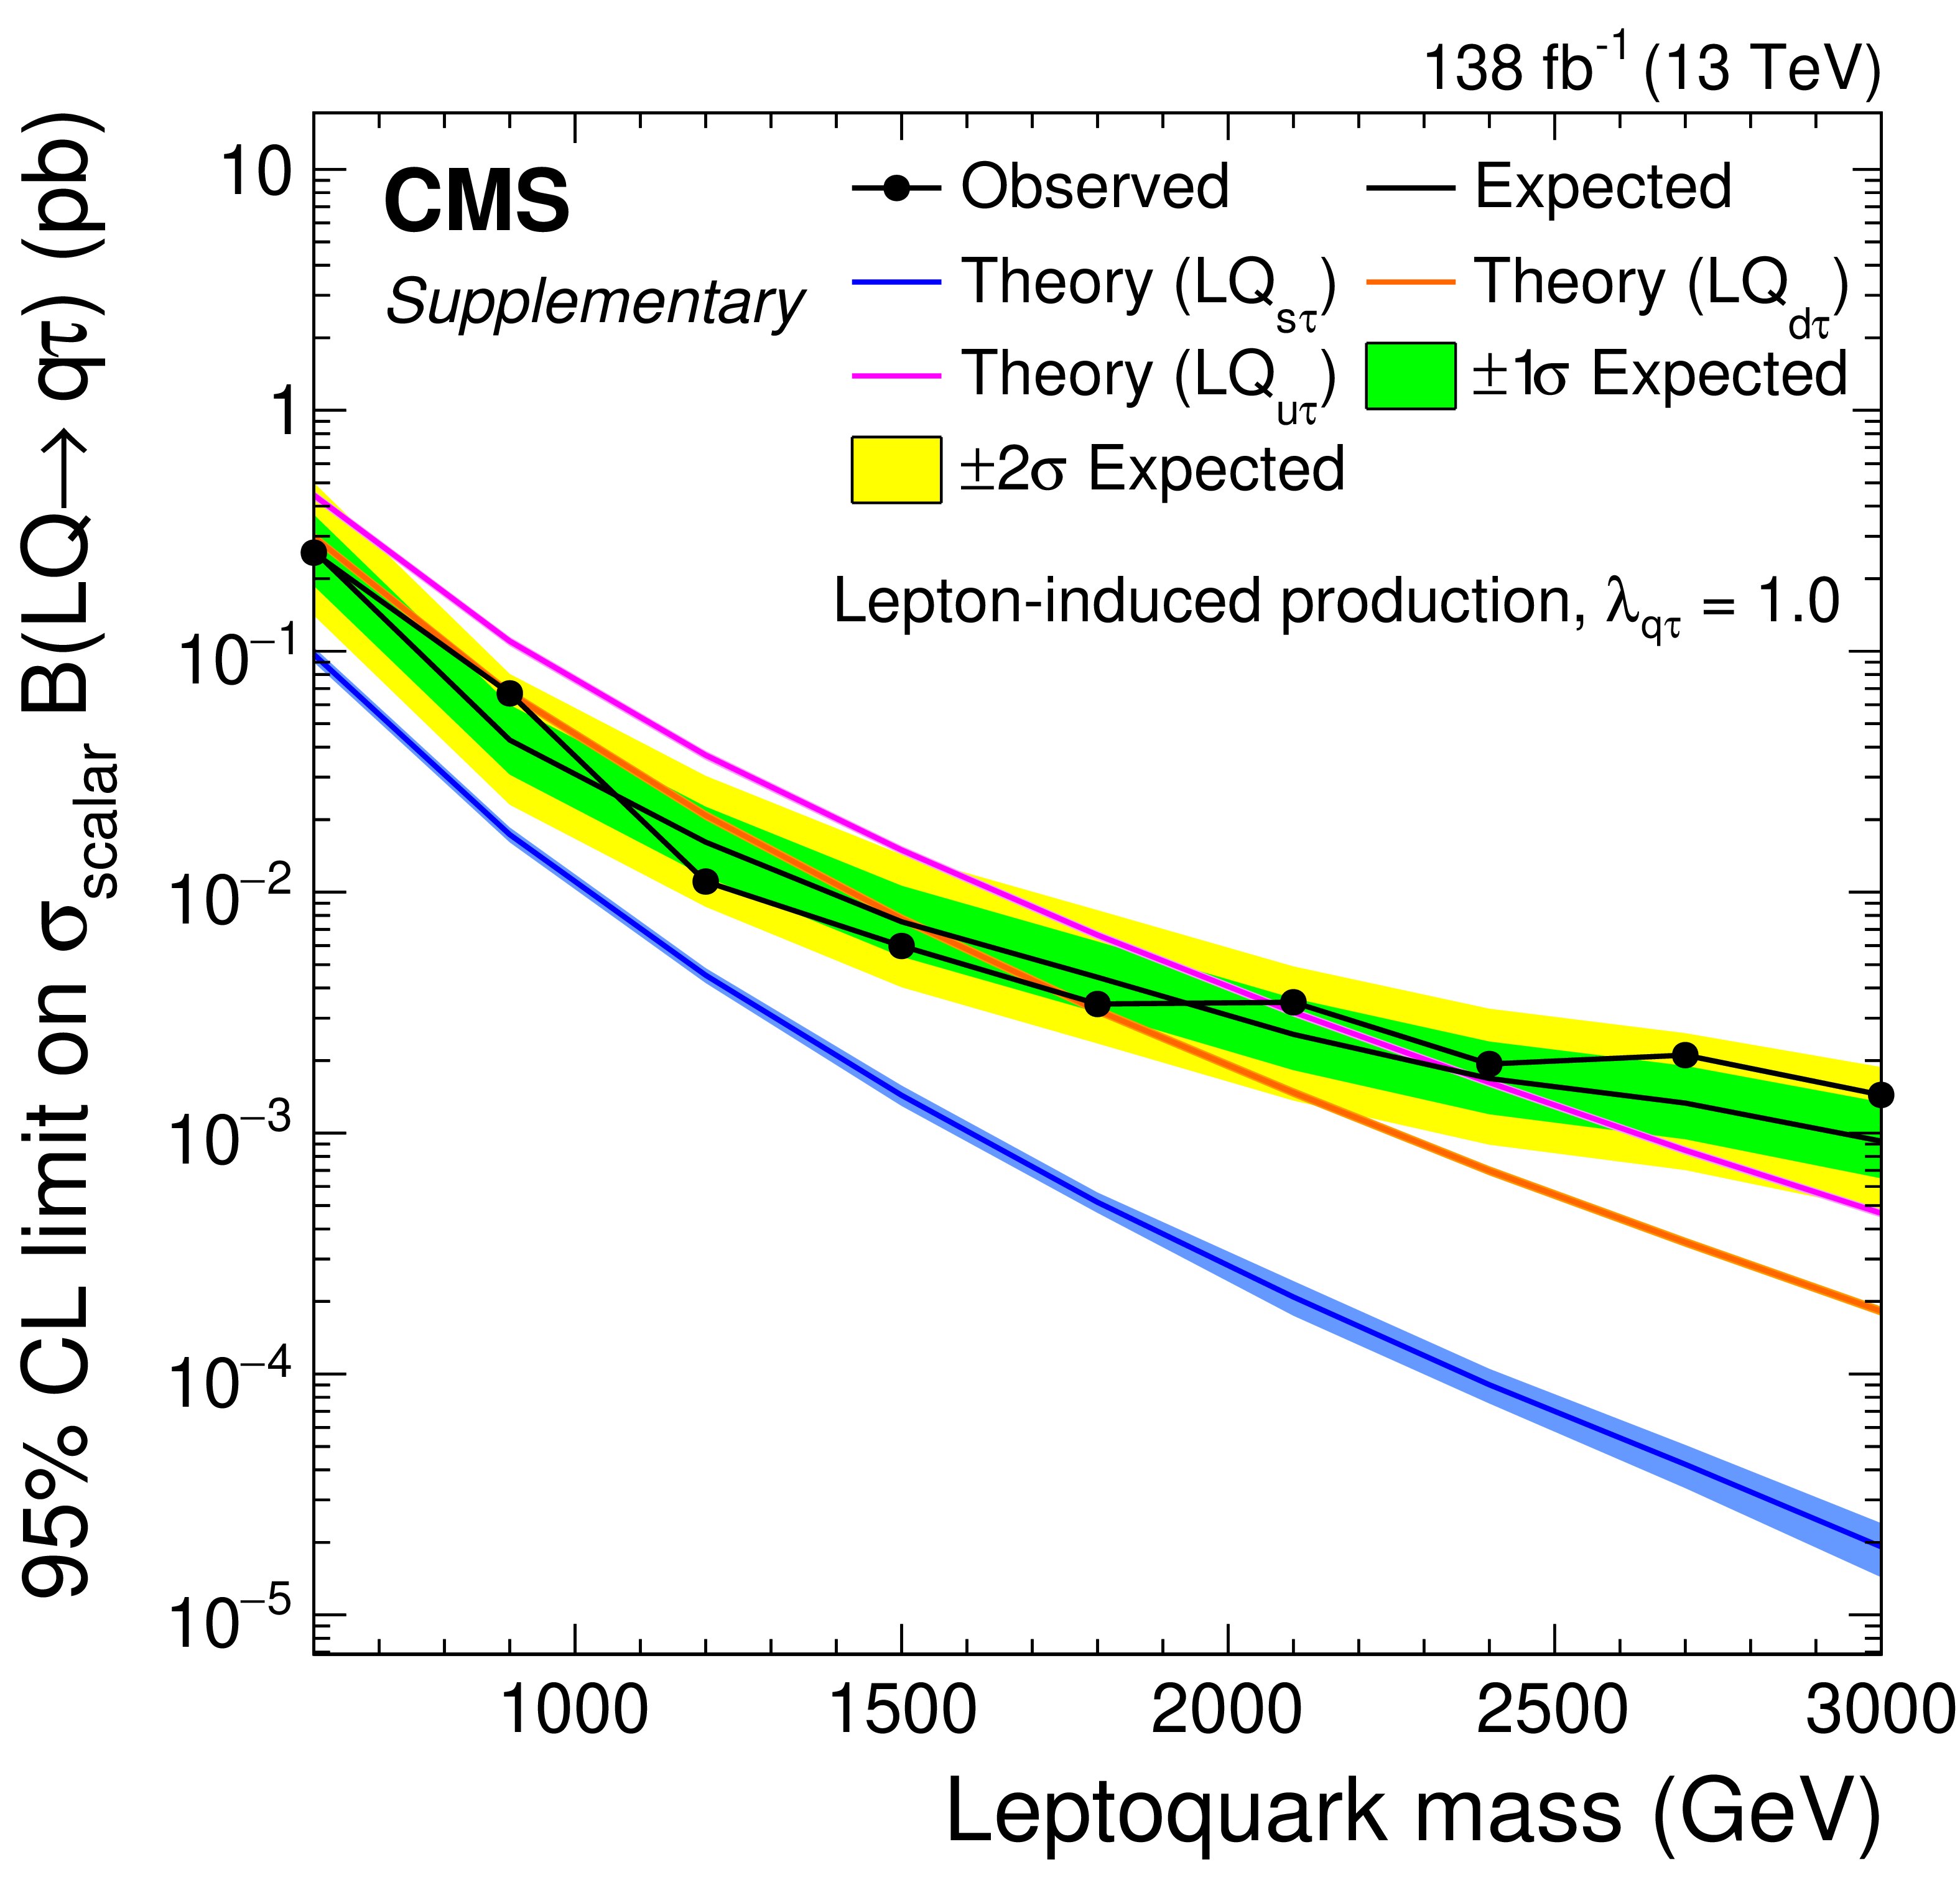
Additional Figure 20:
Expected and observed upper limits at 95% CL on the scalar lepton-induced LQ production cross section times branching fraction for a LQ coupling to light-flavor quarks and $ \tau $ leptons using $ \lambda_{\mathrm{q}\tau}= $ 1.0. The bands around the predictions represent the theoretical uncertainties in the renormalization and factorization scales, and in the PDF. |
png pdf |
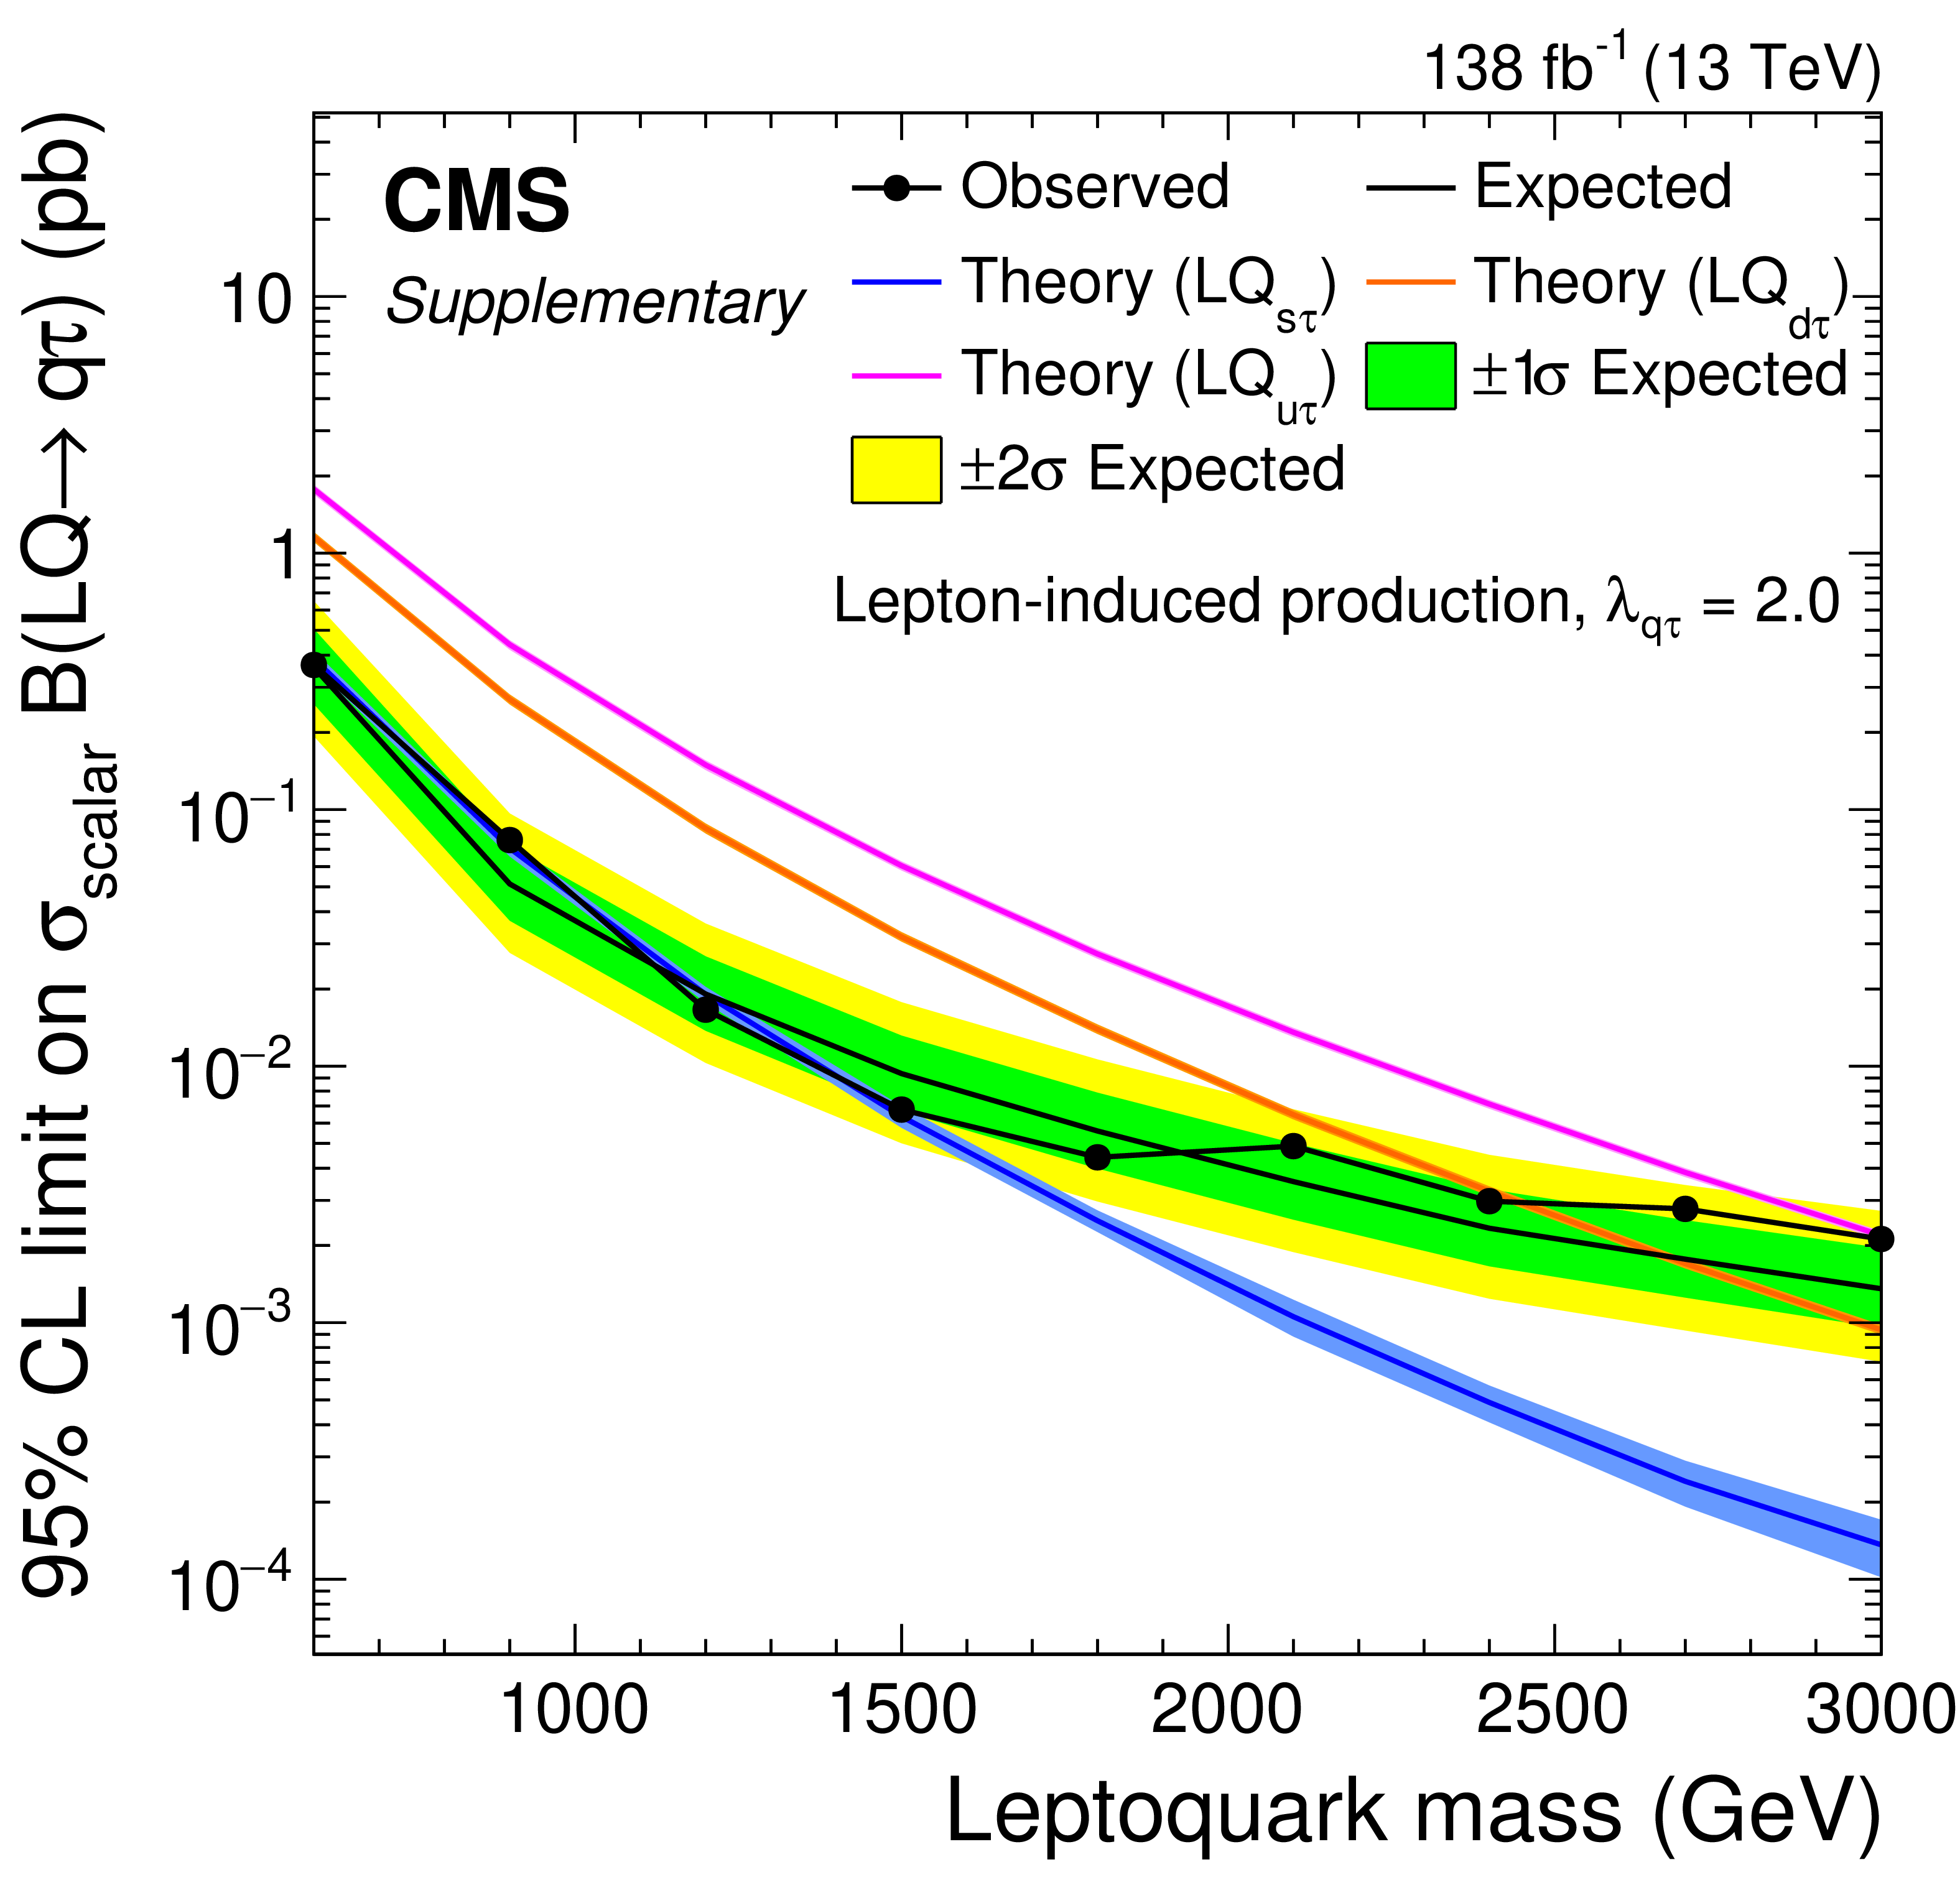
Additional Figure 21:
Expected and observed upper limits at 95% CL on the scalar lepton-induced LQ production cross section times branching fraction for a LQ coupling to light-flavor quarks and $ \tau $ leptons using $ \lambda_{\mathrm{q}\tau}= $ 2.0. The bands around the predictions represent the theoretical uncertainties in the renormalization and factorization scales, and in the PDF. |
png pdf |
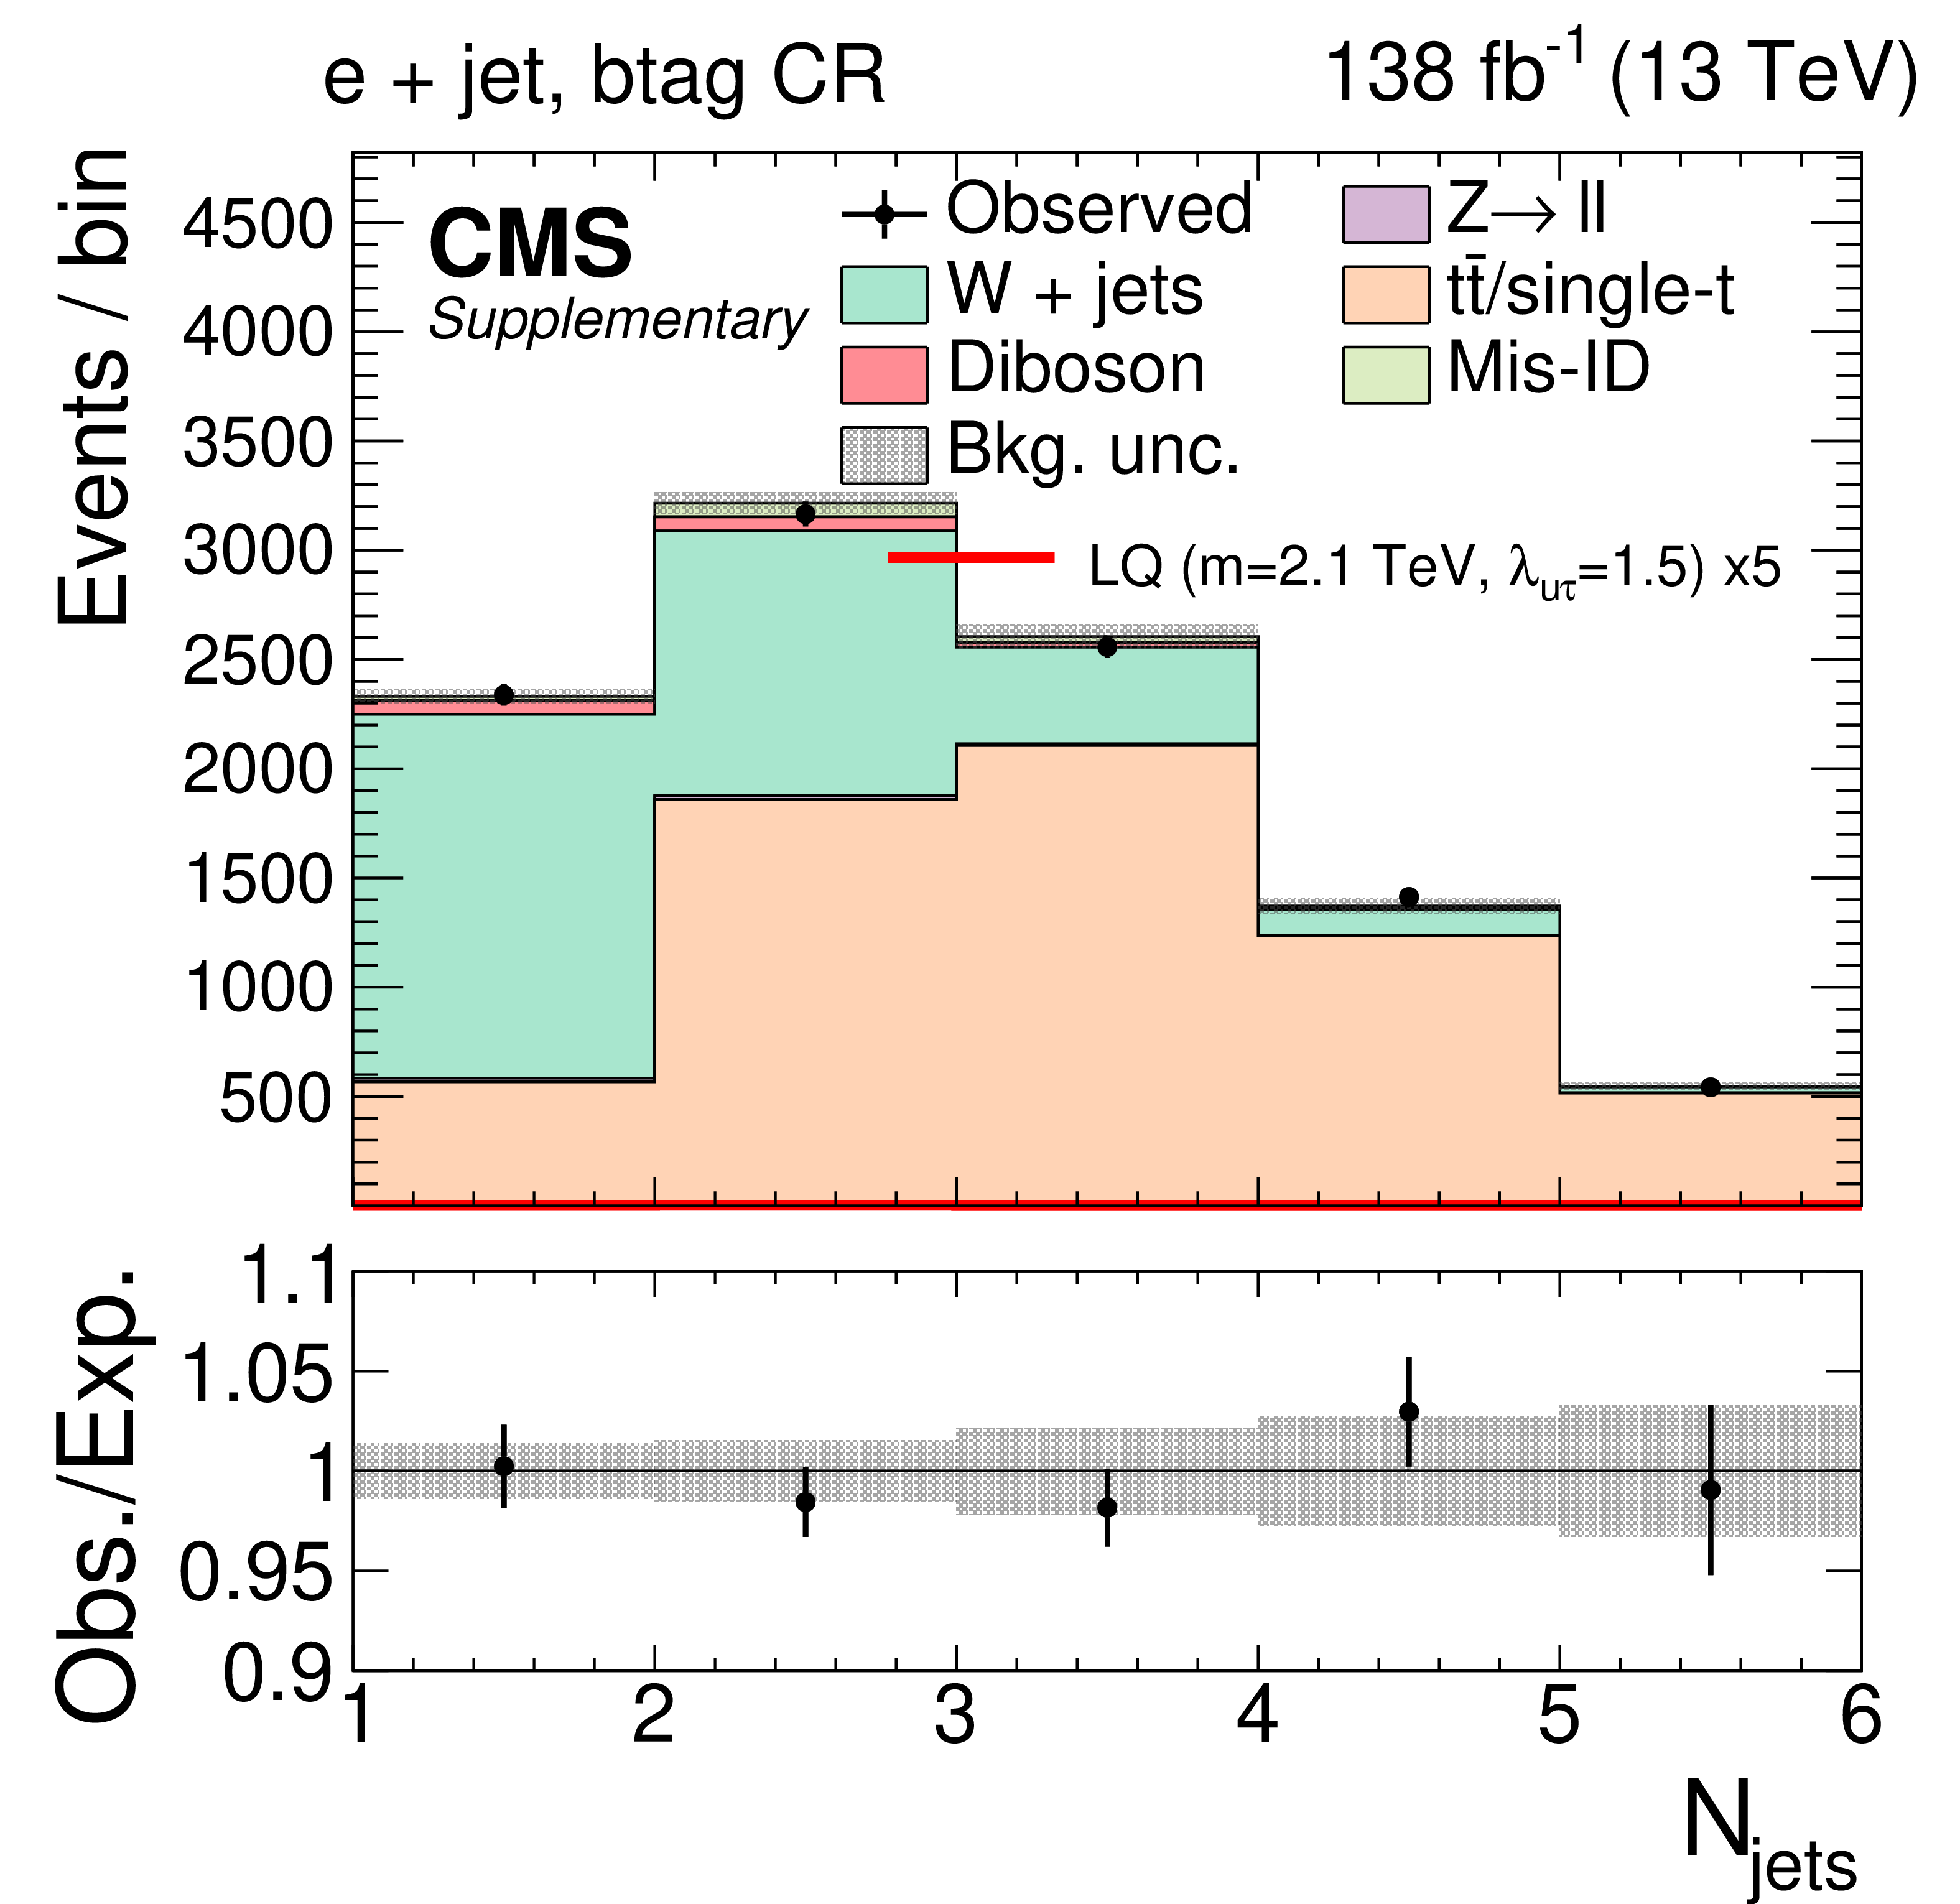
Additional Figure 22:
Observed and expected distributions of the jet multiplicity in the e $+ $ jet channels for the btag CR with 0.2 $ < |\Delta\phi(\mathrm{e},{\vec p}_{\mathrm{T}}^{\kern1pt\text{miss}})| < $ 0.4. The uncertainty band includes statistical and systematic uncertainties, and the background distributions are the results of the maximum likelihood fit. |
png pdf |
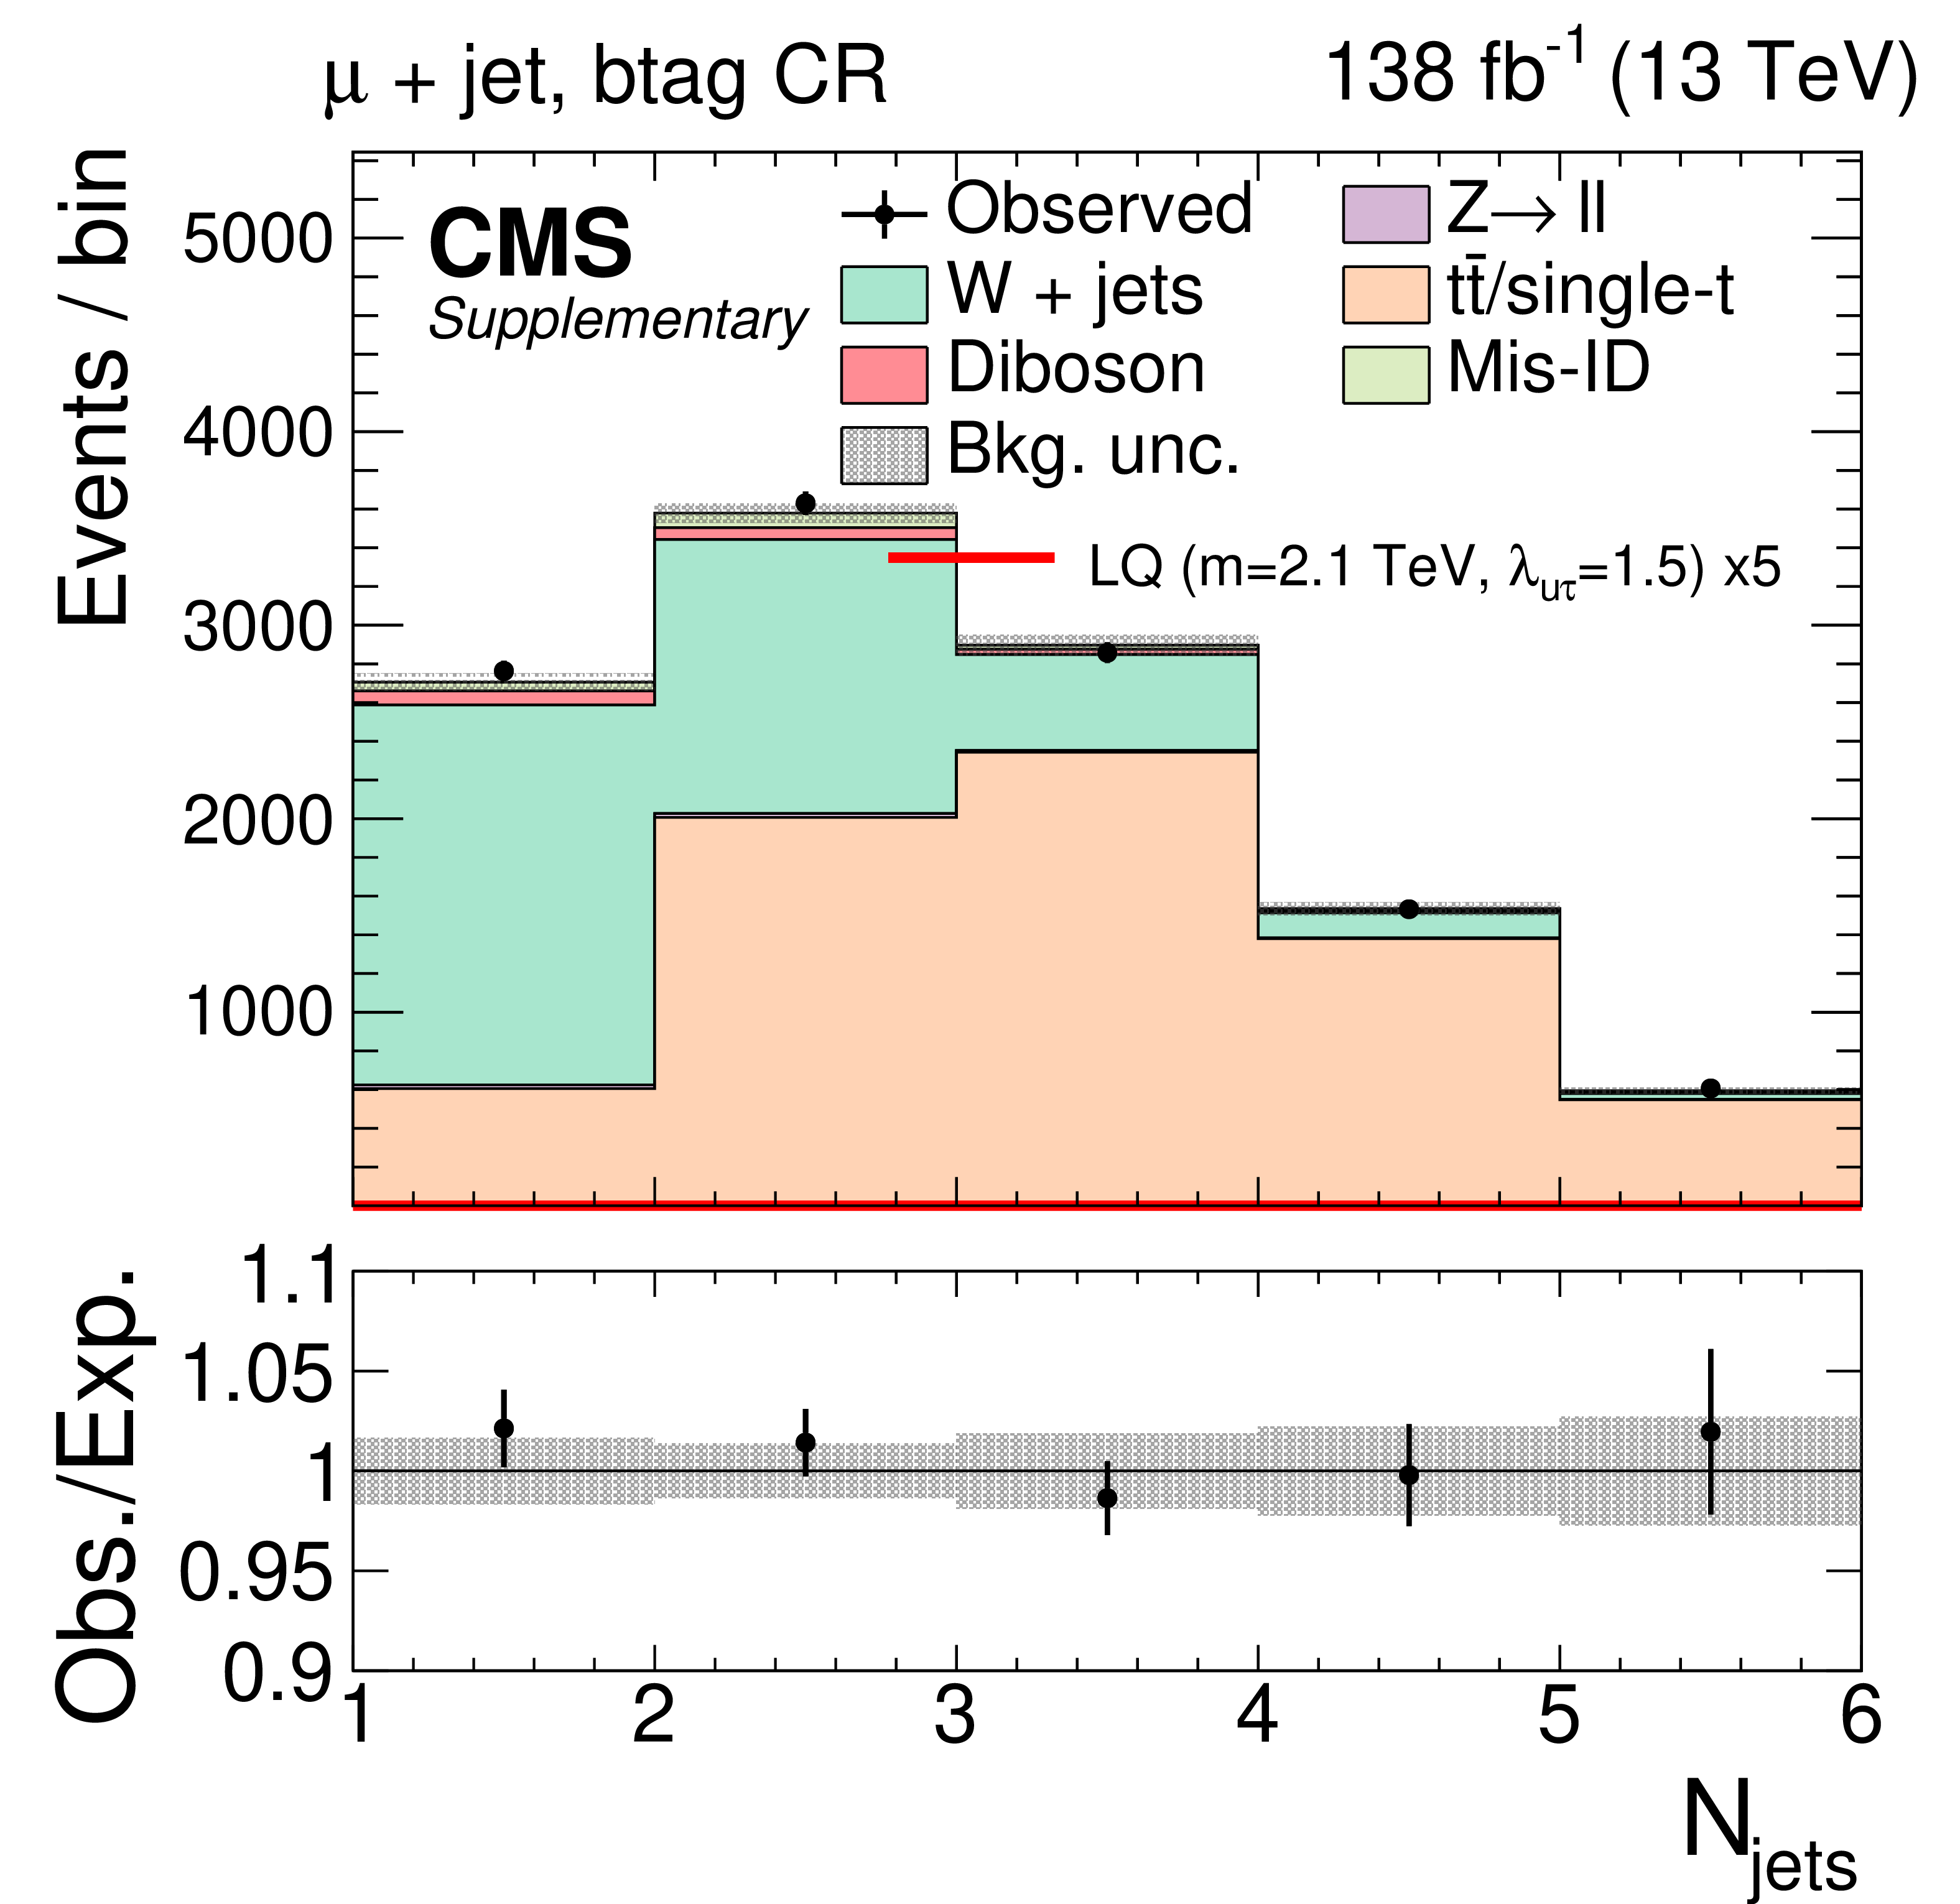
Additional Figure 23:
Observed and expected distributions of the jet multiplicity in the $ \mu+ $ jet channels for the btag CR with 0.2 $ < |\Delta\phi(\mu,{\vec p}_{\mathrm{T}}^{\kern1pt\text{miss}})| < $ 0.4. The uncertainty band includes statistical and systematic uncertainties, and the background distributions are the results of the maximum likelihood fit. |
| References | ||||
| 1 | J. C. Pati and A. Salam | Lepton number as the fourth color | PRD 10 (1974) 275 | |
| 2 | H. Georgi and S. L. Glashow | Unity of all elementary-particle forces | PRL 32 (1974) 438 | |
| 3 | S. Dimopoulos and L. Susskind | Mass without scalars | NPB 155 (1979) 237 | |
| 4 | S. Dimopoulos | Technicoloured signatures | NPB 168 (1980) 69 | |
| 5 | B. Schrempp and F. Schrempp | Light leptoquarks | PLB 153 (1985) 101 | |
| 6 | W. Buchmüller and D. Wyler | Constraints on SU(5)-type leptoquarks | PLB 177 (1986) 377 | |
| 7 | B. Dumont, K. Nishiwaki, and R. Watanabe | LHC constraints and prospects for $ S_1 $ scalar leptoquark explaining the $ \overline B \to D^{(*)} \tau \bar\nu $ anomaly | PRD 94 (2016) 034001 | 1603.05248 |
| 8 | D. Buttazzo, A. Greljo, G. Isidori, and D. Marzocca | B-physics anomalies: a guide to combined explanations | JHEP 11 (2017) 044 | 1706.07808 |
| 9 | J. Kumar, D. London, and R. Watanabe | Combined explanations of the $ b \to s \mu^+ \mu^- $ and $ b \to c \tau^- {\bar\nu} $ anomalies: a general model analysis | PRD 99 (2019) 015007 | 1806.07403 |
| 10 | A. Angelescu et al. | Single leptoquark solutions to the B-physics anomalies | PRD 104 (2021) 055017 | 2103.12504 |
| 11 | ATLAS Collaboration | Search for new phenomena in $ pp $ collisions in final states with tau leptons, b-jets, and missing transverse momentum with the ATLAS detector | PRD 104 (2021) 112005 | 2108.07665 |
| 12 | CMS Collaboration | Search for a singly produced third-generation scalar leptoquark decaying to a $ \tau $ lepton and a bottom quark in proton-proton collisions at $ \sqrt{s} = $ 13 TeV | JHEP 07 (2018) 115 | CMS-EXO-17-029 1806.03472 |
| 13 | CMS Collaboration | Search for singly and pair-produced leptoquarks coupling to third-generation fermions in proton-proton collisions at $ \sqrt{s}= $ 13 TeV | PLB 819 (2021) 136446 | CMS-EXO-19-015 2012.04178 |
| 14 | ATLAS Collaboration | Search for pair production of third-generation scalar leptoquarks decaying into a top quark and a $ \tau $-lepton in $ pp $ collisions at $ \sqrt{s} $ = 13 TeV with the ATLAS detector | JHEP 06 (2021) 179 | 2101.11582 |
| 15 | CMS Collaboration | Searches for additional Higgs bosons and for vector leptoquarks in $ \tau\tau $ final states in proton-proton collisions at $ \sqrt{s} $ = 13 TeV | Accepted by JHEP, 2022 | CMS-HIG-21-001 2208.02717 |
| 16 | CMS Collaboration | Search for new physics in the $ \tau $ lepton plus missing transverse momentum final state in proton-proton collisions at $ \sqrt s $ = 13 TeV | Accepted by JHEP, 2022 | CMS-EXO-21-009 2212.12604 |
| 17 | ATLAS Collaboration | Search for excited $\tau $-leptons and leptoquarks in the final state with $\tau $-leptons and jets in pp collisions at $ \sqrt{s} $ = 13 tev with the ATLAS detector | JHEP 06 (2023) 199 | 2303.09444 |
| 18 | L. Buonocore, P. Nason, F. Tramontano, and G. Zanderighi | Leptons in the proton | JHEP 08 (2020) 019 | 2005.06477 |
| 19 | A. Manohar, P. Nason, G. P. Salam, and G. Zanderighi | How bright is the proton? A precise determination of the photon parton distribution function | PRL 117 (2016) 242002 | 1607.04266 |
| 20 | A. V. Manohar, P. Nason, G. P. Salam, and G. Zanderighi | The photon content of the proton | JHEP 12 (2017) 046 | 1708.01256 |
| 21 | L. Buonocore et al. | Lepton-quark collisions at the Large Hadron Collider | PRL 125 (2020) 231804 | 2005.06475 |
| 22 | U. Haisch and G. Polesello | Resonant third-generation leptoquark signatures at the Large Hadron Collider | JHEP 05 (2021) 057 | 2012.11474 |
| 23 | A. Greljo and N. Selimovic | Lepton-quark fusion at hadron colliders, precisely | JHEP 03 (2021) 279 | 2012.02092 |
| 24 | L. Buonocore et al. | Resonant leptoquark at NLO with POWHEG | JHEP 11 (2022) 129 | 2209.02599 |
| 25 | CMS Collaboration | HEPData record for this analysis | link | |
| 26 | CMS Collaboration | The CMS experiment at the CERN LHC | JINST 3 (2008) S08004 | |
| 27 | CMS Collaboration | Performance of the CMS Level-1 trigger in proton-proton collisions at $ \sqrt{s} = $ 13 TeV | JINST 15 (2020) P10017 | CMS-TRG-17-001 2006.10165 |
| 28 | CMS Collaboration | The CMS trigger system | JINST 12 (2017) P01020 | CMS-TRG-12-001 1609.02366 |
| 29 | CMS Collaboration | Electron and photon reconstruction and identification with the CMS experiment at the CERN LHC | JINST 16 (2021) P05014 | CMS-EGM-17-001 2012.06888 |
| 30 | CMS Collaboration | Performance of the CMS muon detector and muon reconstruction with proton-proton collisions at $ \sqrt{s}= $ 13 TeV | JINST 13 (2018) P06015 | CMS-MUO-16-001 1804.04528 |
| 31 | CMS Collaboration | Description and performance of track and primary-vertex reconstruction with the CMS tracker | JINST 9 (2014) P10009 | CMS-TRK-11-001 1405.6569 |
| 32 | CMS Collaboration | Particle-flow reconstruction and global event description with the CMS detector | JINST 12 (2017) P10003 | CMS-PRF-14-001 1706.04965 |
| 33 | CMS Collaboration | Performance of reconstruction and identification of $ \tau $ leptons decaying to hadrons and $ \nu_\tau $ in pp collisions at $ \sqrt{s}= $ 13 TeV | JINST 13 (2018) P10005 | CMS-TAU-16-003 1809.02816 |
| 34 | CMS Collaboration | Jet energy scale and resolution in the CMS experiment in pp collisions at 8 TeV | JINST 12 (2017) P02014 | CMS-JME-13-004 1607.03663 |
| 35 | CMS Collaboration | Performance of missing transverse momentum reconstruction in proton-proton collisions at $ \sqrt{s} = $ 13 TeV using the CMS detector | JINST 14 (2019) P07004 | CMS-JME-17-001 1903.06078 |
| 36 | CMS Collaboration | Identification of hadronic tau lepton decays using a deep neural network | JINST 17 (2022) P07023 | CMS-TAU-20-001 2201.08458 |
| 37 | M. Bahr et al. | Herwig++ physics and manual | EPJC 58 (2008) 639 | 0803.0883 |
| 38 | NNPDF Collaboration | Illuminating the photon content of the proton within a global PDF analysis | SciPost Phys. 5 (2018) 008 | 1712.07053 |
| 39 | J. Alwall et al. | The automated computation of tree-level and next-to-leading order differential cross sections, and their matching to parton shower simulations | JHEP 07 (2014) 079 | 1405.0301 |
| 40 | R. Frederix and S. Frixione | Merging meets matching in MC@NLO | JHEP 12 (2012) 061 | 1209.6215 |
| 41 | J. M. Lindert et al. | Precise predictions for V+jets dark matter backgrounds | EPJC 77 (2017) 829 | 1705.04664 |
| 42 | P. Nason | A new method for combining NLO QCD with shower Monte Carlo algorithms | JHEP 11 (2004) 040 | hep-ph/0409146 |
| 43 | S. Frixione, P. Nason, and C. Oleari | Matching NLO QCD computations with parton shower simulations: the POWHEG method | JHEP 11 (2007) 070 | 0709.2092 |
| 44 | S. Alioli, P. Nason, C. Oleari, and E. Re | A general framework for implementing NLO calculations in shower Monte Carlo programs: the POWHEG BOX | JHEP 06 (2010) 043 | 1002.2581 |
| 45 | S. Alioli et al. | Jet pair production in POWHEG | JHEP 04 (2011) 081 | 1012.3380 |
| 46 | S. Alioli, P. Nason, C. Oleari, and E. Re | NLO Higgs boson production via gluon fusion matched with shower in POWHEG | JHEP 04 (2009) 002 | 0812.0578 |
| 47 | T. Sjöstrand et al. | An introduction to PYTHIA 8.2 | Comput. Phys. Commun. 191 (2015) 159 | 1410.3012 |
| 48 | CMS Collaboration | Extraction and validation of a new set of CMS PYTHIA 8 tunes from underlying-event measurements | EPJC 80 (2020) 4 | CMS-GEN-17-001 1903.12179 |
| 49 | R. D. Ball et al. | Unbiased global determination of parton distributions and their uncertainties at NNLO and at LO | NPB 855 (2012) 153 | 1107.2652 |
| 50 | NNPDF Collaboration | Parton distributions with QED corrections | NPB 877 (2013) 290 | 1308.0598 |
| 51 | NNPDF Collaboration | Parton distributions from high-precision collider data | EPJC 77 (2017) 663 | 1706.00428 |
| 52 | GEANT4 Collaboration | GEANT 4 --- a simulation toolkit | NIM A 506 (2003) 250 | |
| 53 | CMS Collaboration | Performance of the reconstruction and identification of high-momentum muons in proton-proton collisions at $ \sqrt{s} = $ 13 TeV | JINST 15 (2020) P02027 | CMS-MUO-17-001 1912.03516 |
| 54 | M. Cacciari, G. P. Salam, and G. Soyez | The anti-$ k_{\mathrm{T}} $ jet clustering algorithm | JHEP 04 (2008) 063 | 0802.1189 |
| 55 | CMS Collaboration | Jet algorithms performance in 13 TeV data | CMS Physics Analysis Summary, 2017 CMS-PAS-JME-16-003 |
CMS-PAS-JME-16-003 |
| 56 | CMS Collaboration | Jet energy scale and resolution performance with 13 TeV data collected by CMS in 2016-2018 | CMS Detector Performance Summary CMS-DP-2020-019, 2020 CDS |
|
| 57 | CMS Collaboration | Identification of heavy-flavour jets with the CMS detector in pp collisions at 13 TeV | JINST 13 (2018) P05011 | CMS-BTV-16-002 1712.07158 |
| 58 | E. Bols et al. | Jet flavour classification using DeepJet | JINST 15 (2020) P12012 | 2008.10519 |
| 59 | R. Gavin, Y. Li, F. Petriello, and S. Quackenbush | W physics at the LHC with FEWZ 2.1 | Comput. Phys. Commun. 184 (2013) 208 | 1201.5896 |
| 60 | R. Gavin, Y. Li, F. Petriello, and S. Quackenbush | FEWZ 2.0: A code for hadronic Z production at next-to-next-to-leading order | Comput. Phys. Commun. 182 (2011) 2388 | 1011.3540 |
| 61 | M. Czakon and A. Mitov | Top++: A program for the calculation of the top-pair cross-section at hadron colliders | Comput. Phys. Commun. 185 (2014) 2930 | 1112.5675 |
| 62 | T. Gehrmann et al. | W$^+$W$^- $ production at hadron colliders in next-to-next-to-leading order QCD | PRL 113 (2014) 212001 | 1408.5243 |
| 63 | J. Campbell, T. Neumann, and Z. Sullivan | Single-top-quark production in the $ t $-channel at NNLO | JHEP 02 (2021) 040 | 2012.01574 |
| 64 | N. Kidonakis and N. Yamanaka | Higher-order corrections for tW production at high-energy hadron colliders | JHEP 05 (2021) 278 | 2102.11300 |
| 65 | A. Höcker et al. | TMVA4 --- Toolkit for multivariate data analysis with ROOT. Users guide | physics/0703039 | |
| 66 | CMS Collaboration | Measurements of inclusive W and Z cross sections in pp collisions at $ \sqrt{s}= $ 7 TeV | JHEP 01 (2011) 080 | CMS-EWK-10-002 1012.2466 |
| 67 | CMS Collaboration | Precision luminosity measurement in proton-proton collisions at $ \sqrt{s} = $ 13 TeV in 2015 and 2016 at CMS | EPJC 81 (2021) 800 | CMS-LUM-17-003 2104.01927 |
| 68 | CMS Collaboration | CMS luminosity measurement for the 2017 data-taking period at $ \sqrt{s} = $ 13 TeV | CMS Physics Analysis Summary, 2018 CMS-PAS-LUM-17-004 |
CMS-PAS-LUM-17-004 |
| 69 | CMS Collaboration | CMS luminosity measurement for the 2018 data-taking period at $ \sqrt{s} = $ 13 TeV | CMS Physics Analysis Summary, 2019 CMS-PAS-LUM-18-002 |
CMS-PAS-LUM-18-002 |
| 70 | T. Junk | Confidence level computation for combining searches with small statistics | NIM A 434 (1999) 435 | hep-ex/9902006 |
| 71 | A. L. Read | Presentation of search results: the CL$_s $ technique | JPG 28 (2002) 2693 | |
| 72 | G. Cowan, K. Cranmer, E. Gross, and O. Vitells | Asymptotic formulae for likelihood-based tests of new physics | EPJC 71 (2011) 1554 | 1007.1727 |
|
|
Compact Muon Solenoid LHC, CERN |
|

|

|

|

|

|