

Compact Muon Solenoid
LHC, CERN
| CMS-HIG-17-014 ; CERN-EP-2019-035 | ||
| Search for a low-mass $\tau^{-}\tau^{+}$ resonance in association with a bottom quark in proton-proton collisions at $\sqrt{s} = $ 13 TeV | ||
| CMS Collaboration | ||
| 25 March 2019 | ||
| JHEP 05 (2019) 210 | ||
| Abstract: A general search is presented for a low-mass $\tau^{-}\tau^{+}$ resonance produced in association with a bottom quark. The search is based on proton-proton collision data at a center-of-mass energy of 13 TeV collected by the CMS experiment at the LHC, corresponding to an integrated luminosity of 35.9 fb$^{-1}$ . The data are consistent with the standard model expectation. Upper limits at 95% confidence level on the cross section times branching fraction are determined for two signal models: a light pseudoscalar Higgs boson decaying to a pair of $\tau$ leptons produced in association with bottom quarks, and a low-mass boson A decaying to a $\tau$-lepton pair that is produced in the decay of a bottom-like quark B such that B $\to$ bA. Masses between 25 and 70 GeV are probed for the light pseudoscalar boson with upper limits ranging from 250 to 44 pb. Upper limits from 20 to 0.3 pb are set on B masses between 170 and 450 GeV for A boson masses between 20 and 70 GeV. | ||
| Links: e-print arXiv:1903.10228 [hep-ex] (PDF) ; CDS record ; inSPIRE record ; HepData record ; CADI line (restricted) ; | ||
| Figures & Tables | Summary | Additional Figures & Tables | References | CMS Publications |
|---|
| Figures | |
png pdf |
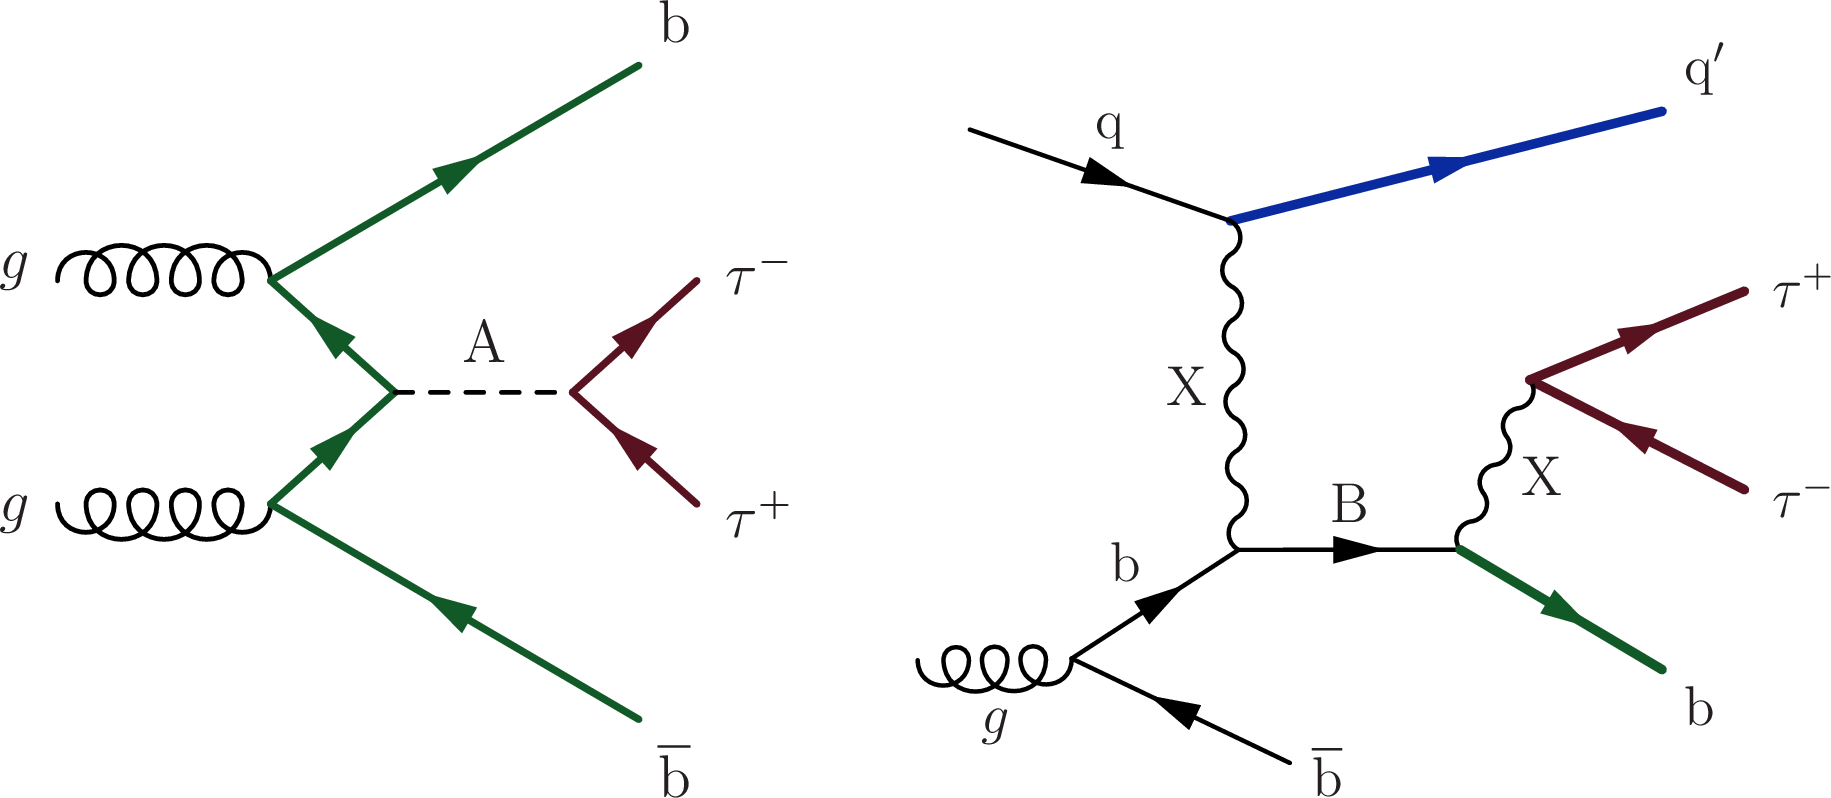
Figure 1:
Feynman diagrams of (left) a low-mass pseudoscalar Higgs boson (A) produced in association with bottom quarks, and (right) a bottom-like quark produced in $t$ channel, which decays into X and a bottom quark. The particle A decays into a $ {\tau}$-lepton pair. |

png pdf |
Figure 1-a:
Feynman diagram of a low-mass pseudoscalar Higgs boson (A) produced in association with bottom quarks. The particle A decays into a $ {\tau}$-lepton pair. |

png pdf |
Figure 1-b:
Feynman diagram of a bottom-like quark produced in $t$ channel, which decays into X and a bottom quark. The particle X decays into a $ {\tau}$-lepton pair. |
png pdf |
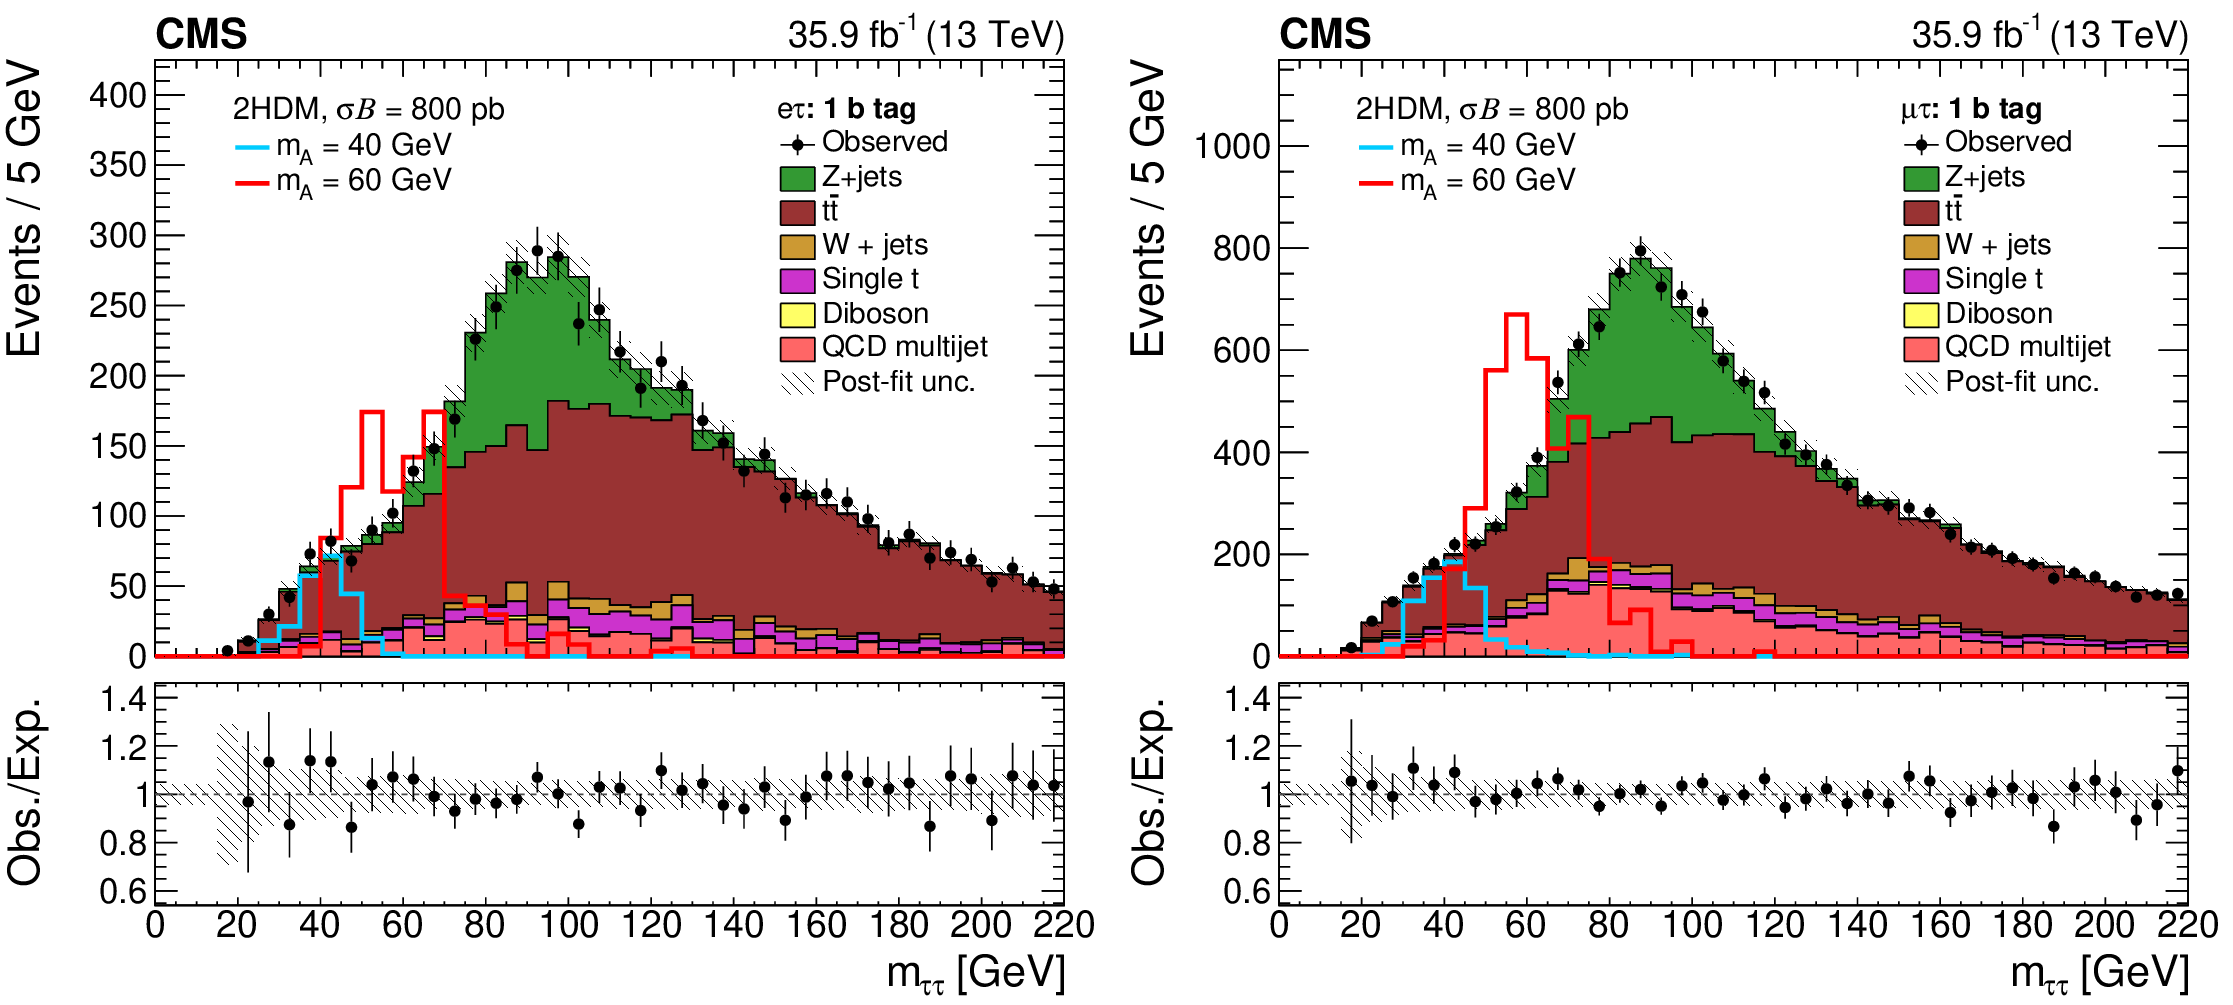
Figure 2:
Measured ${{m_{{\tau} {\tau}}}} $ distribution in the ${{{\mathrm {e}} {\tau}_\text {h}}} $ (left), and ${{{{\mu}} {\tau}_\text {h}}} $ (right) channel, compared to the expected SM background contributions. The signal distributions for ${{{{\mathrm {b}} {\overline {\mathrm {b}}}} \text {A}}} $ with a pseudoscalar mass of 40 and 60 GeV are overlaid to illustrate the sensitivity. They are normalized to the cross section times branching fraction of 800 pb. The uncertainty bands represent the sum in quadrature of statistical and systematic uncertainties obtained from the fit. The lower panels show the ratio between the observed and expected events in each bin. |

png pdf |
Figure 2-a:
Measured ${{m_{{\tau} {\tau}}}} $ distribution in the ${{{\mathrm {e}} {\tau}_\text {h}}} $ channel, compared to the expected SM background contributions. The signal distributions for ${{{{\mathrm {b}} {\overline {\mathrm {b}}}} \text {A}}} $ with a pseudoscalar mass of 40 and 60 GeV are overlaid to illustrate the sensitivity. They are normalized to the cross section times branching fraction of 800 pb. The uncertainty bands represent the sum in quadrature of statistical and systematic uncertainties obtained from the fit. The lower panel shows the ratio between the observed and expected events in each bin. |
png pdf |
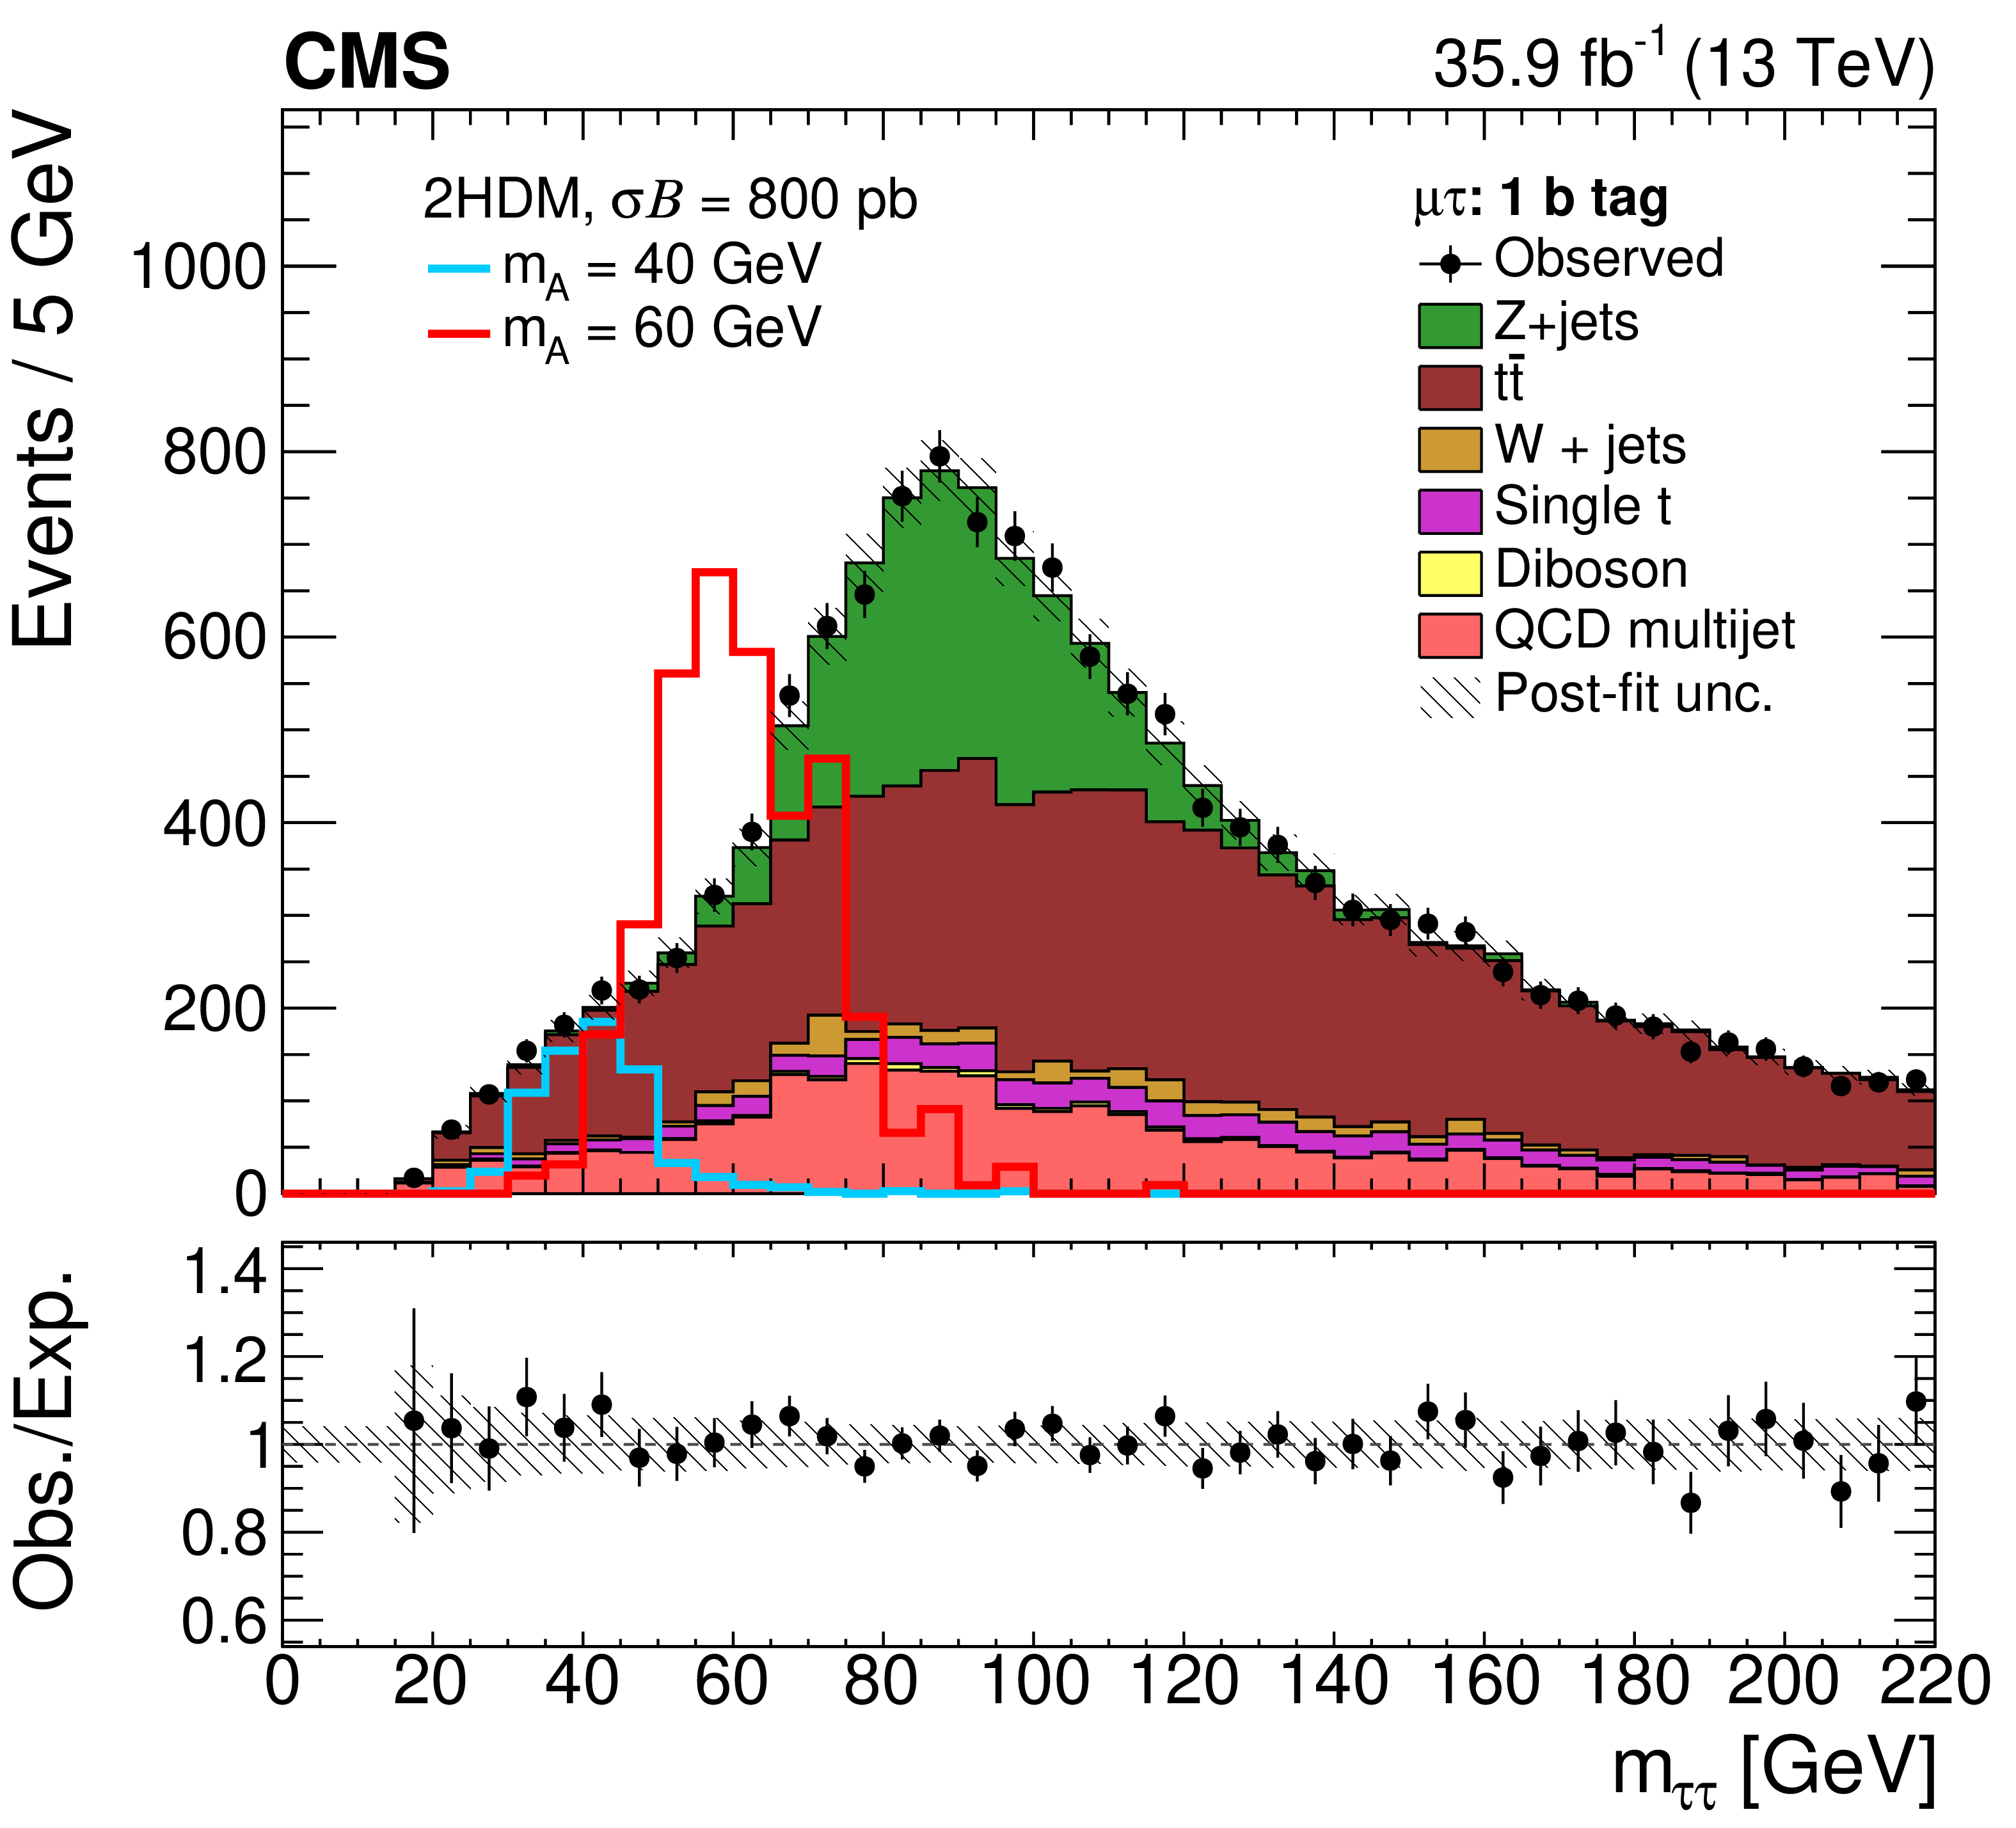
Figure 2-b:
Measured ${{m_{{\tau} {\tau}}}} $ distribution in the ${{{{\mu}} {\tau}_\text {h}}} $ channel, compared to the expected SM background contributions. The signal distributions for ${{{{\mathrm {b}} {\overline {\mathrm {b}}}} \text {A}}} $ with a pseudoscalar mass of 40 and 60 GeV are overlaid to illustrate the sensitivity. They are normalized to the cross section times branching fraction of 800 pb. The uncertainty bands represent the sum in quadrature of statistical and systematic uncertainties obtained from the fit. The lower panel shows the ratio between the observed and expected events in each bin. |
png pdf |
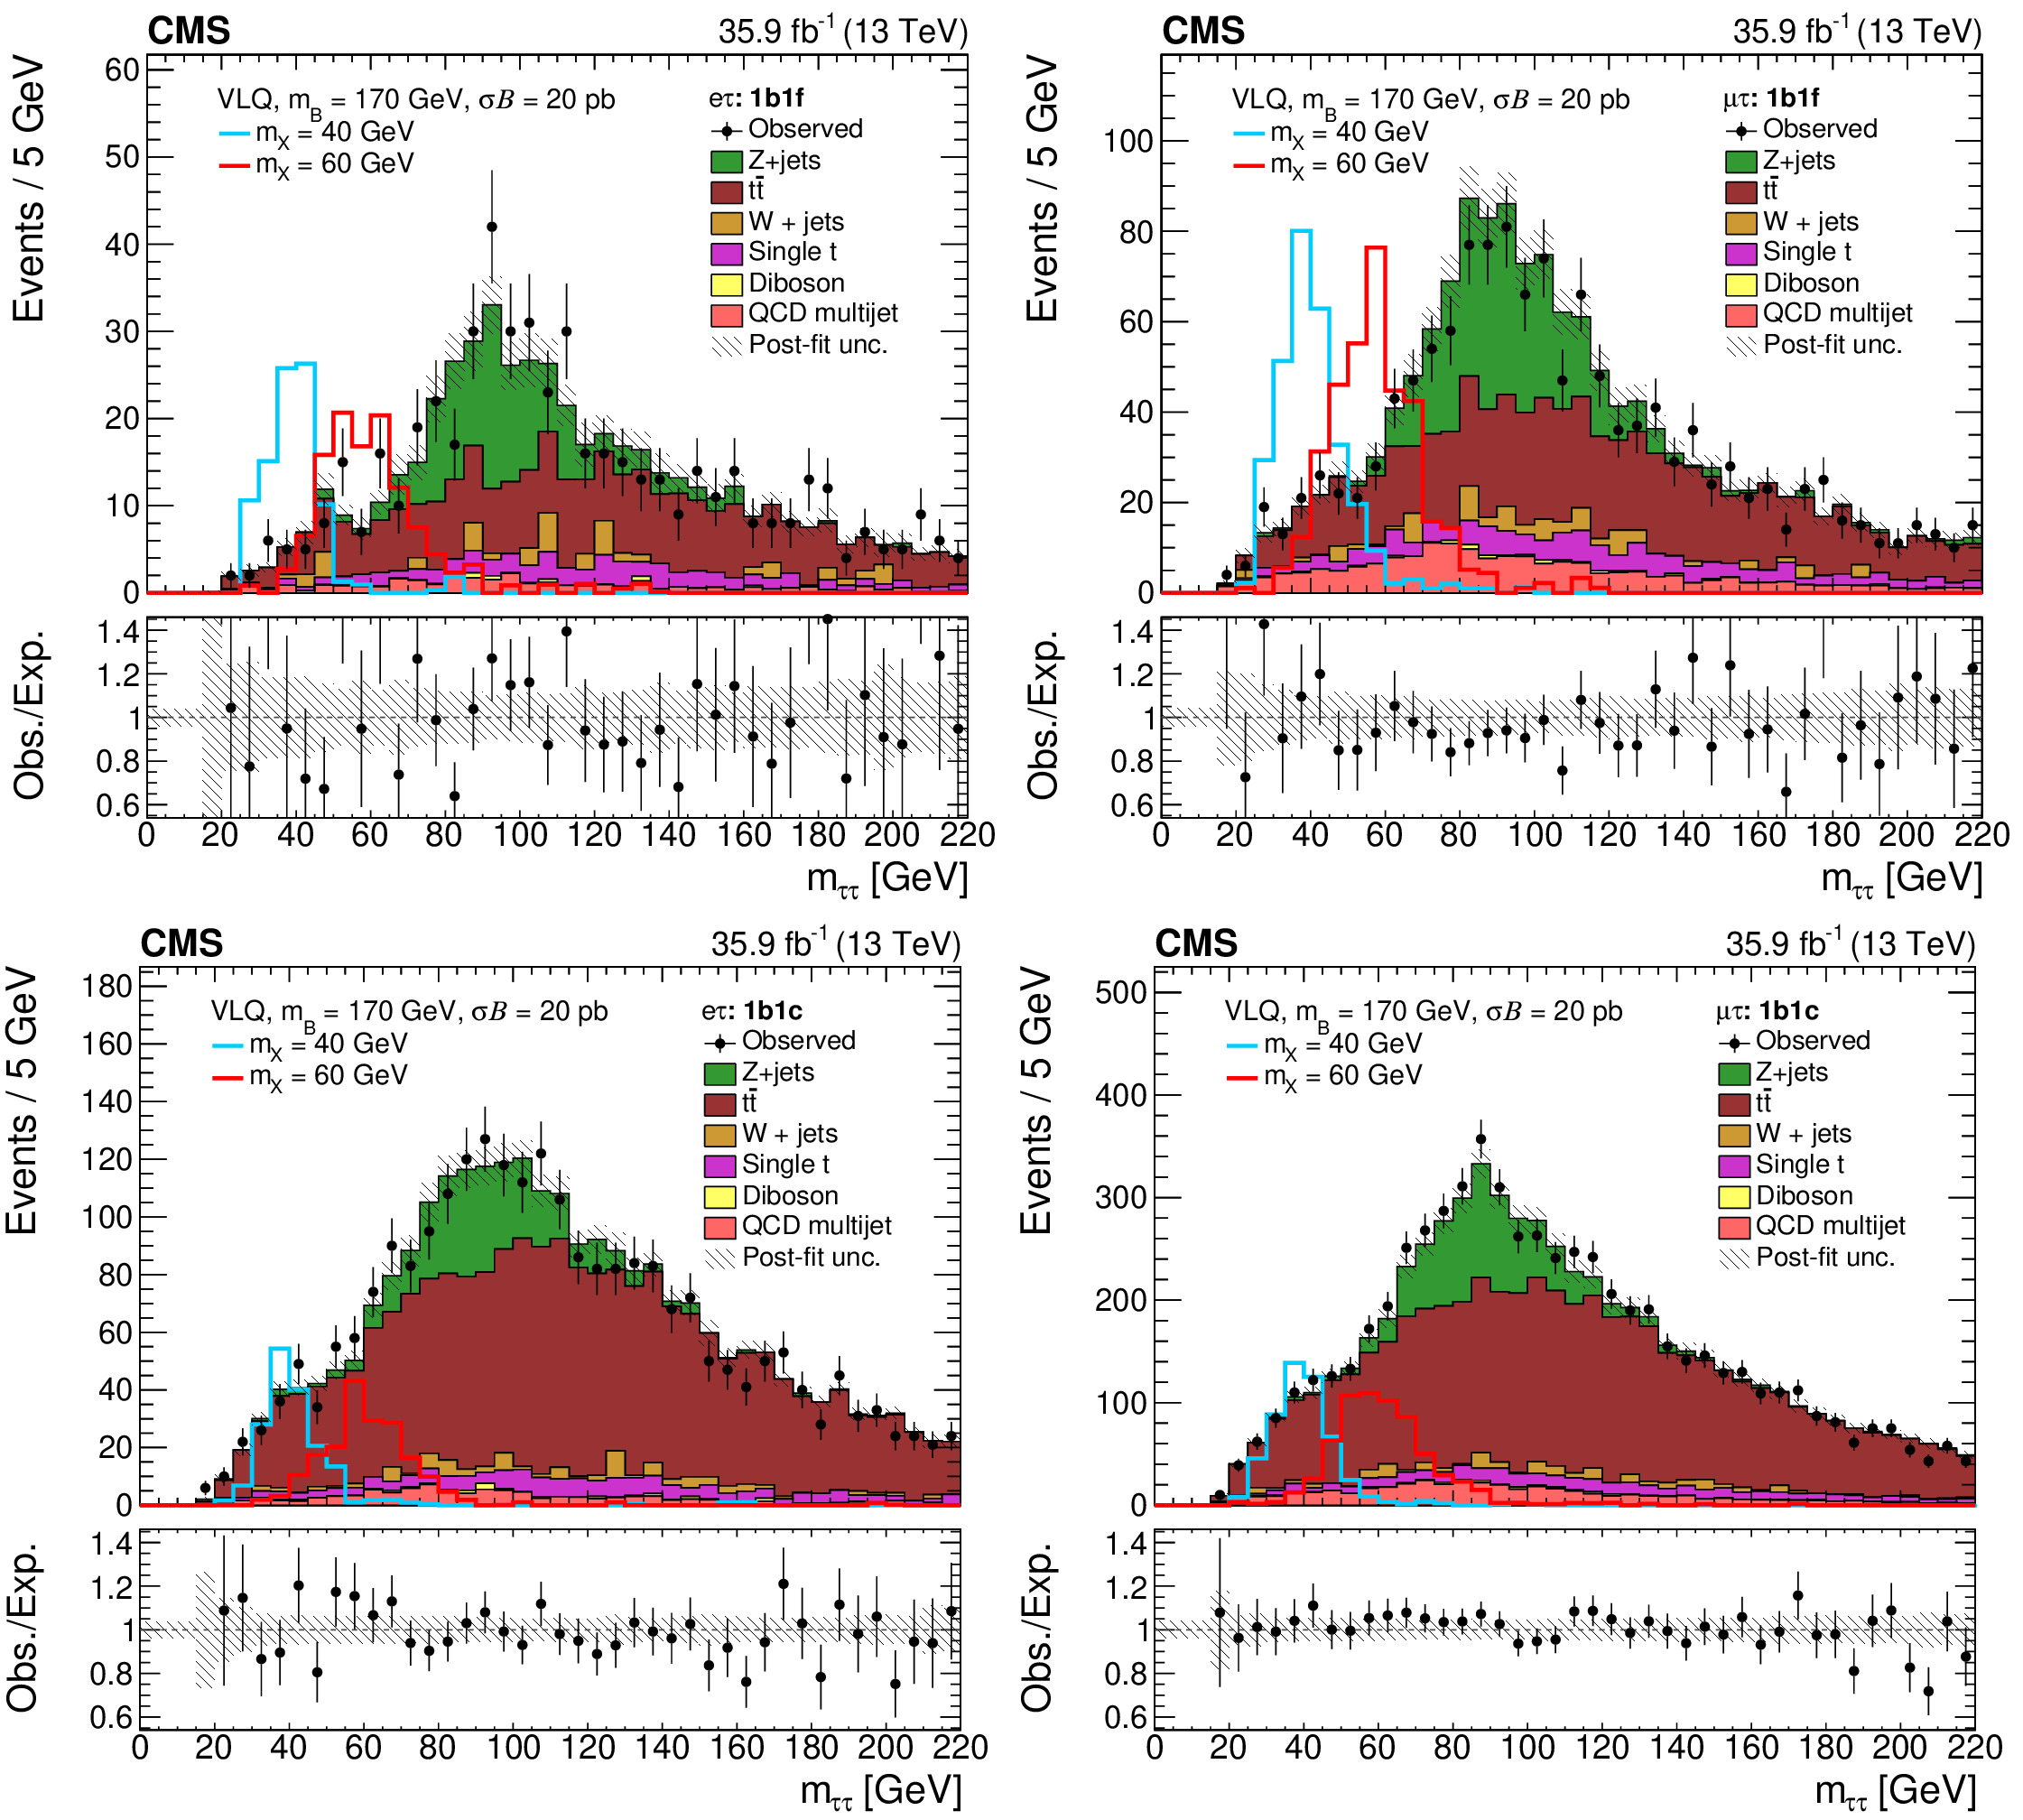
Figure 3:
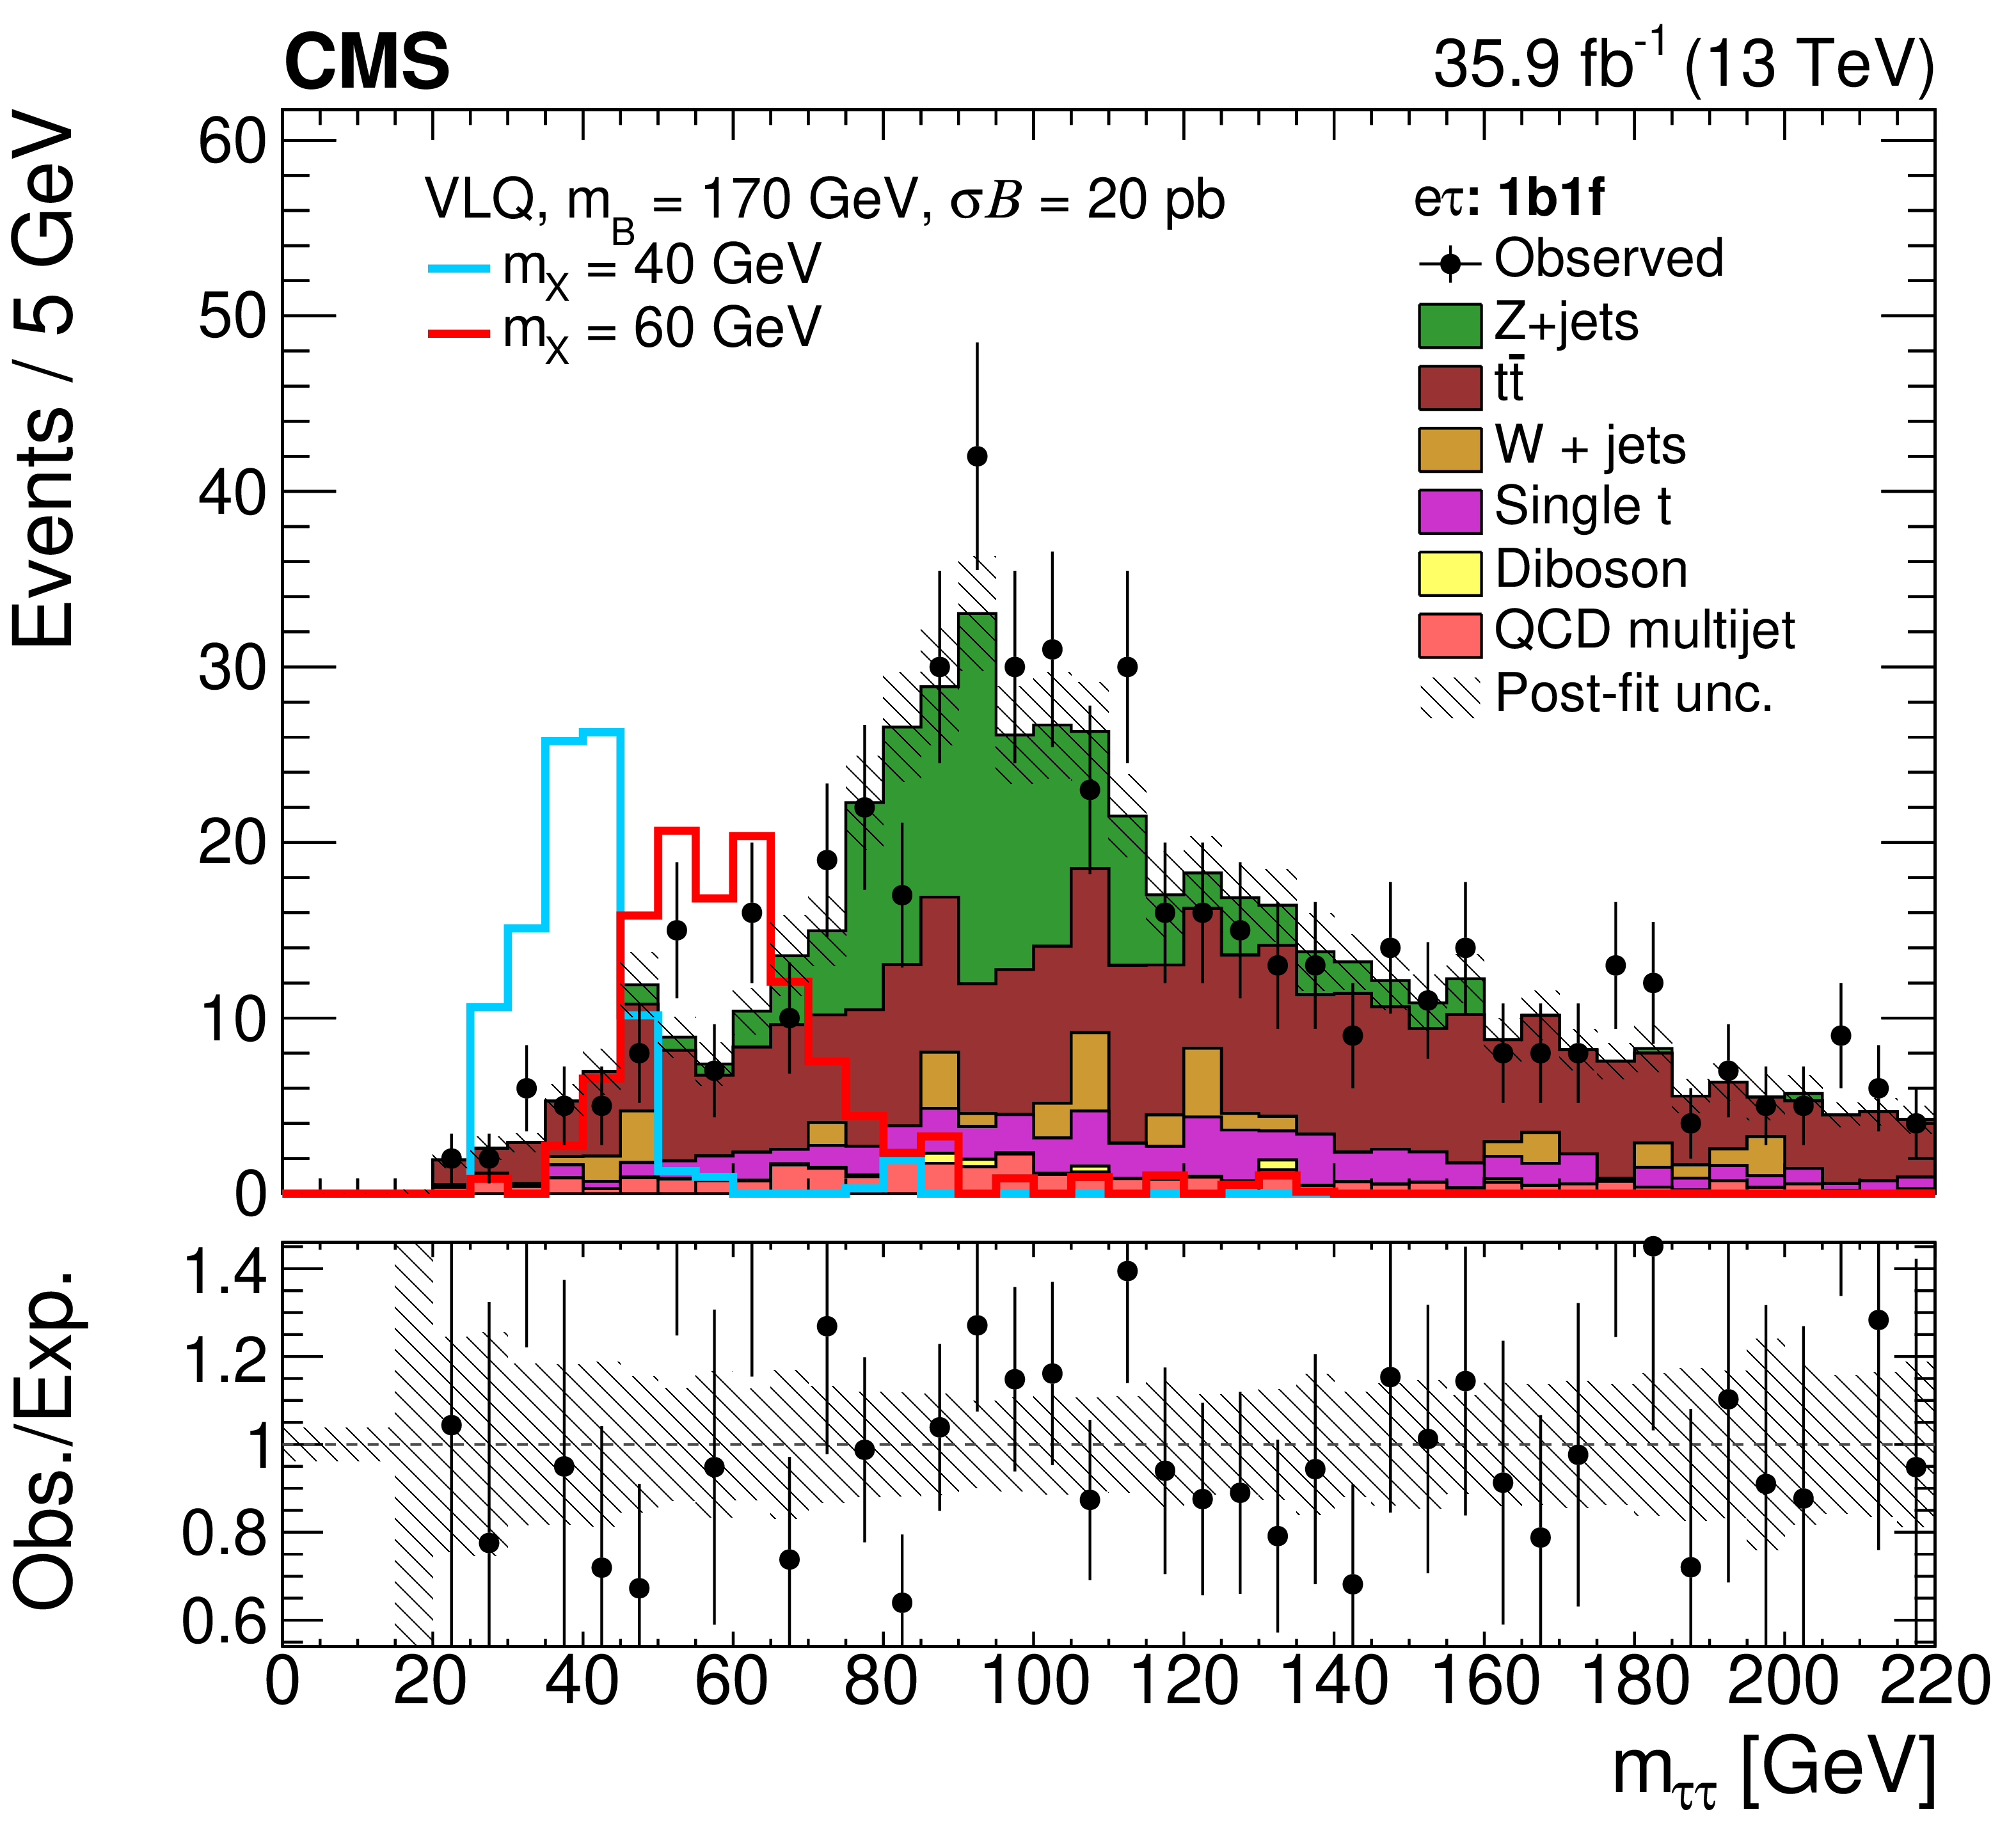
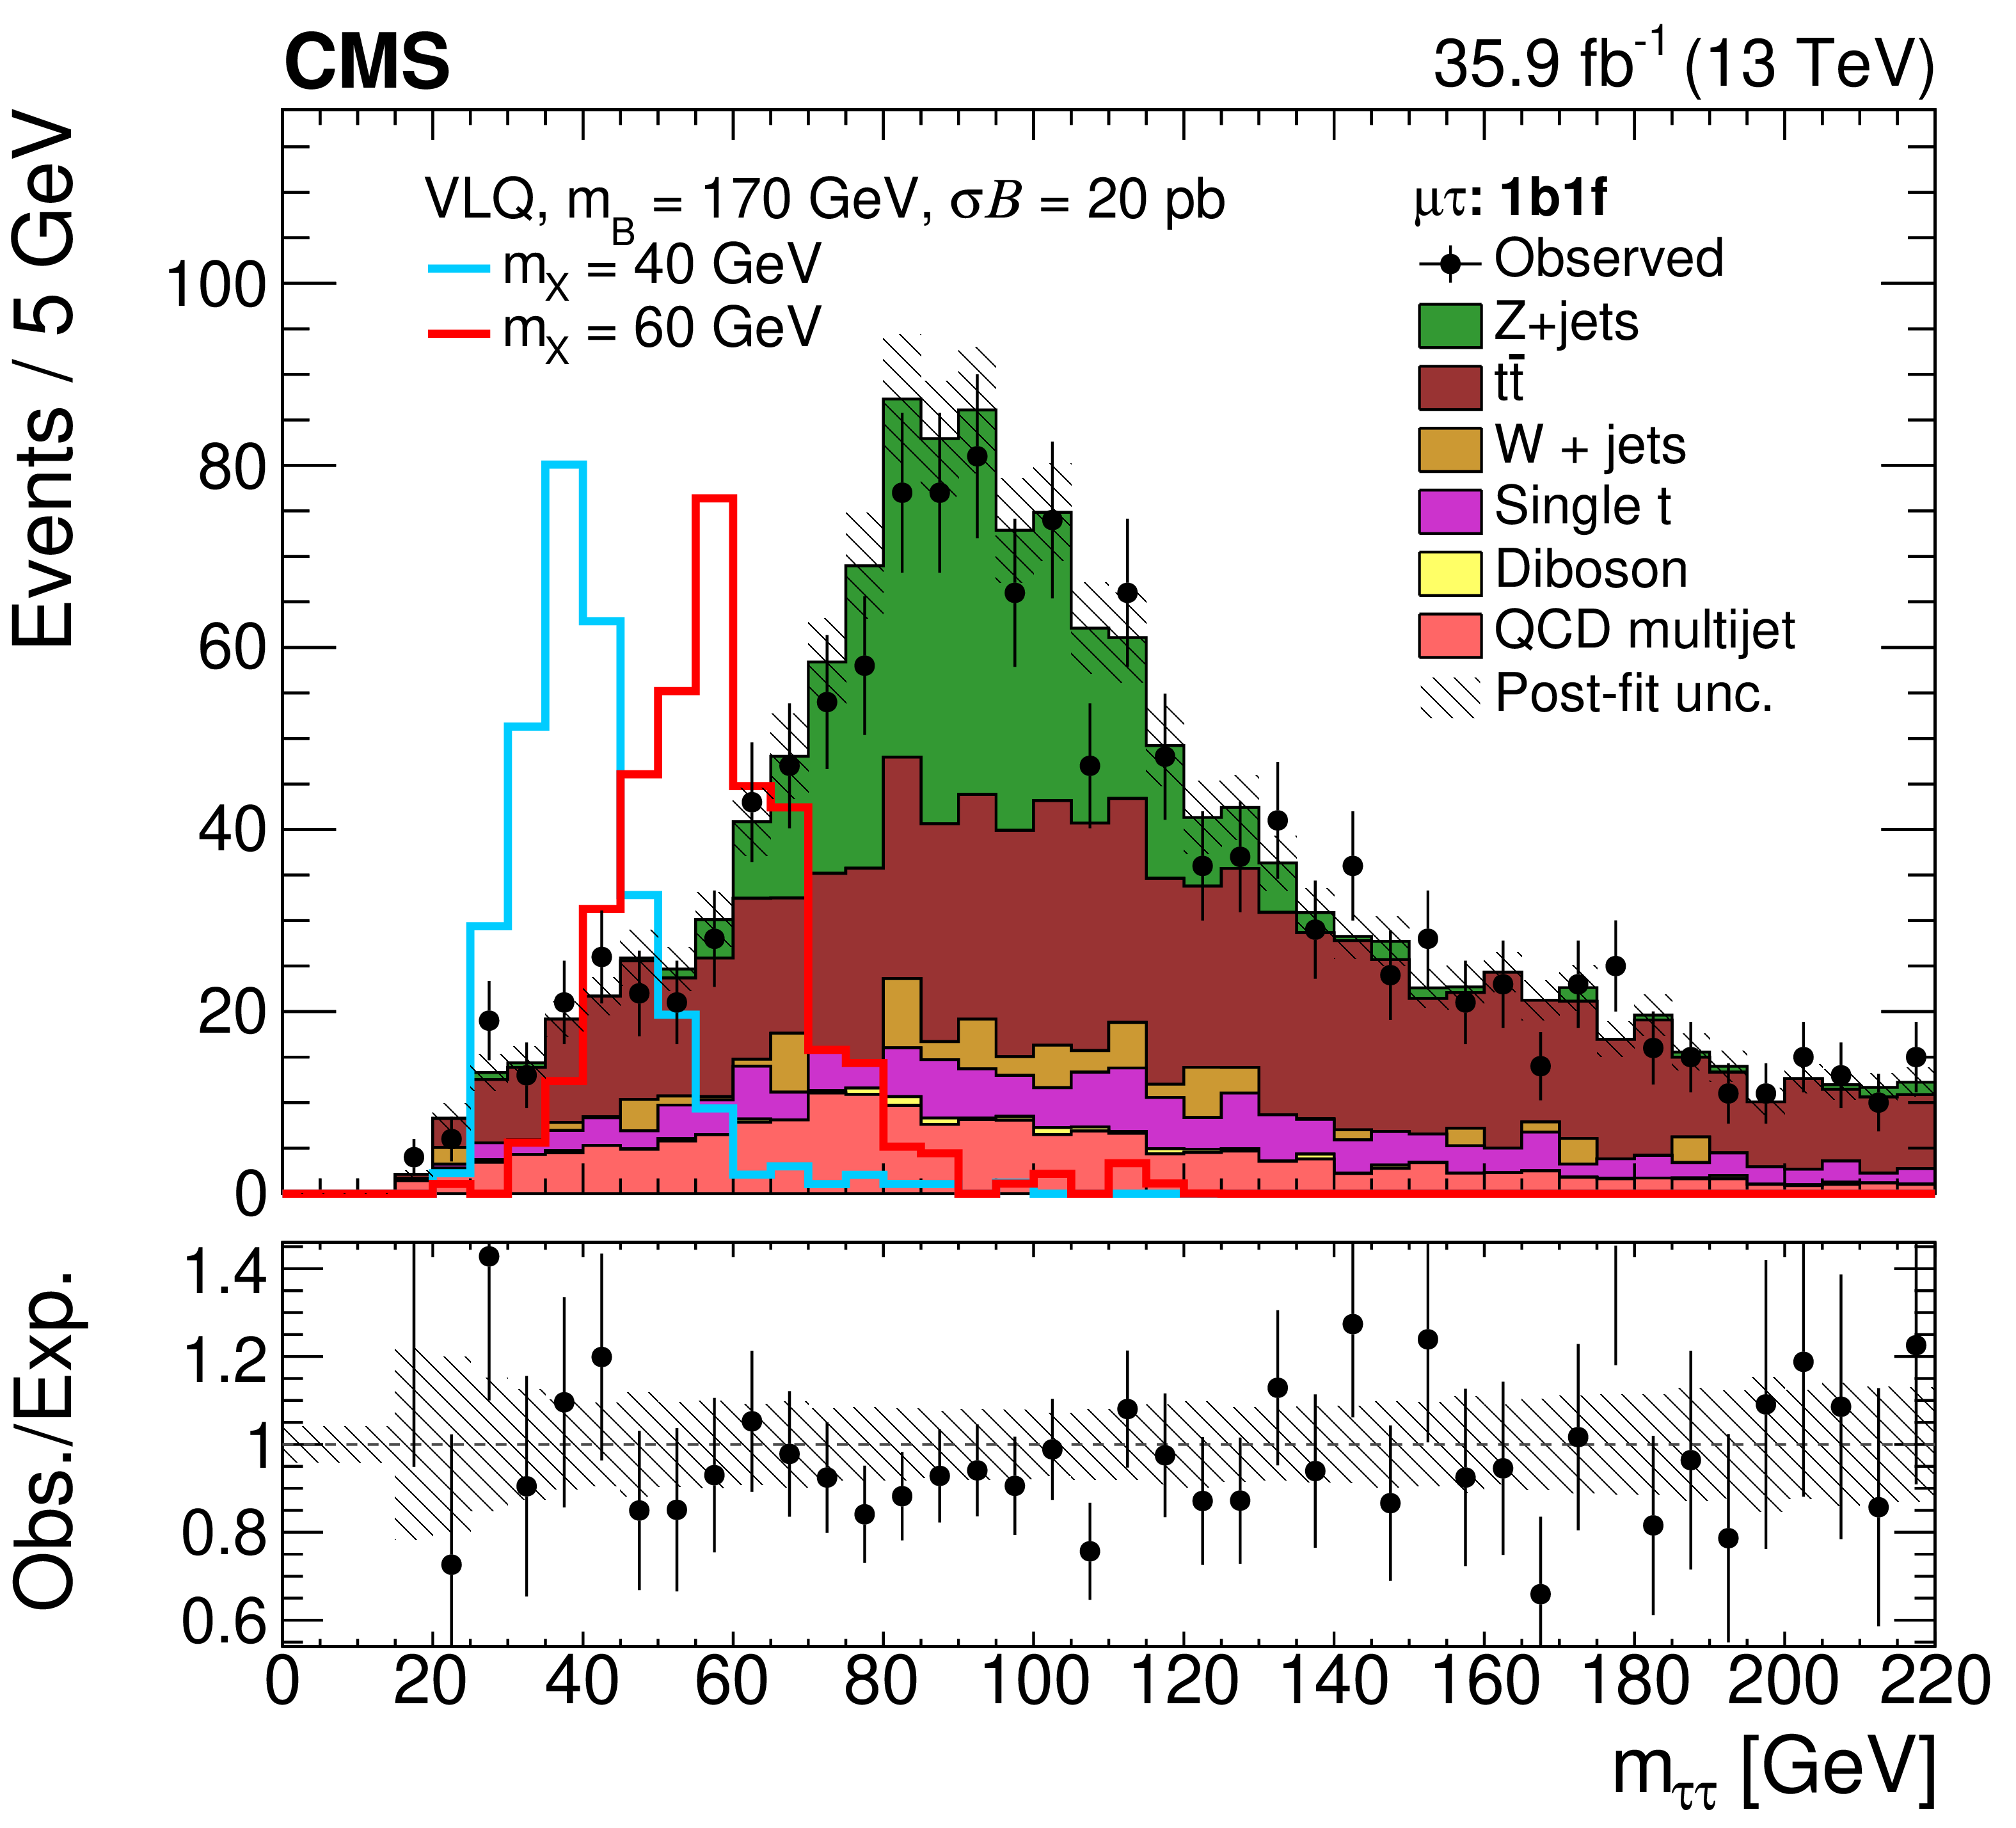
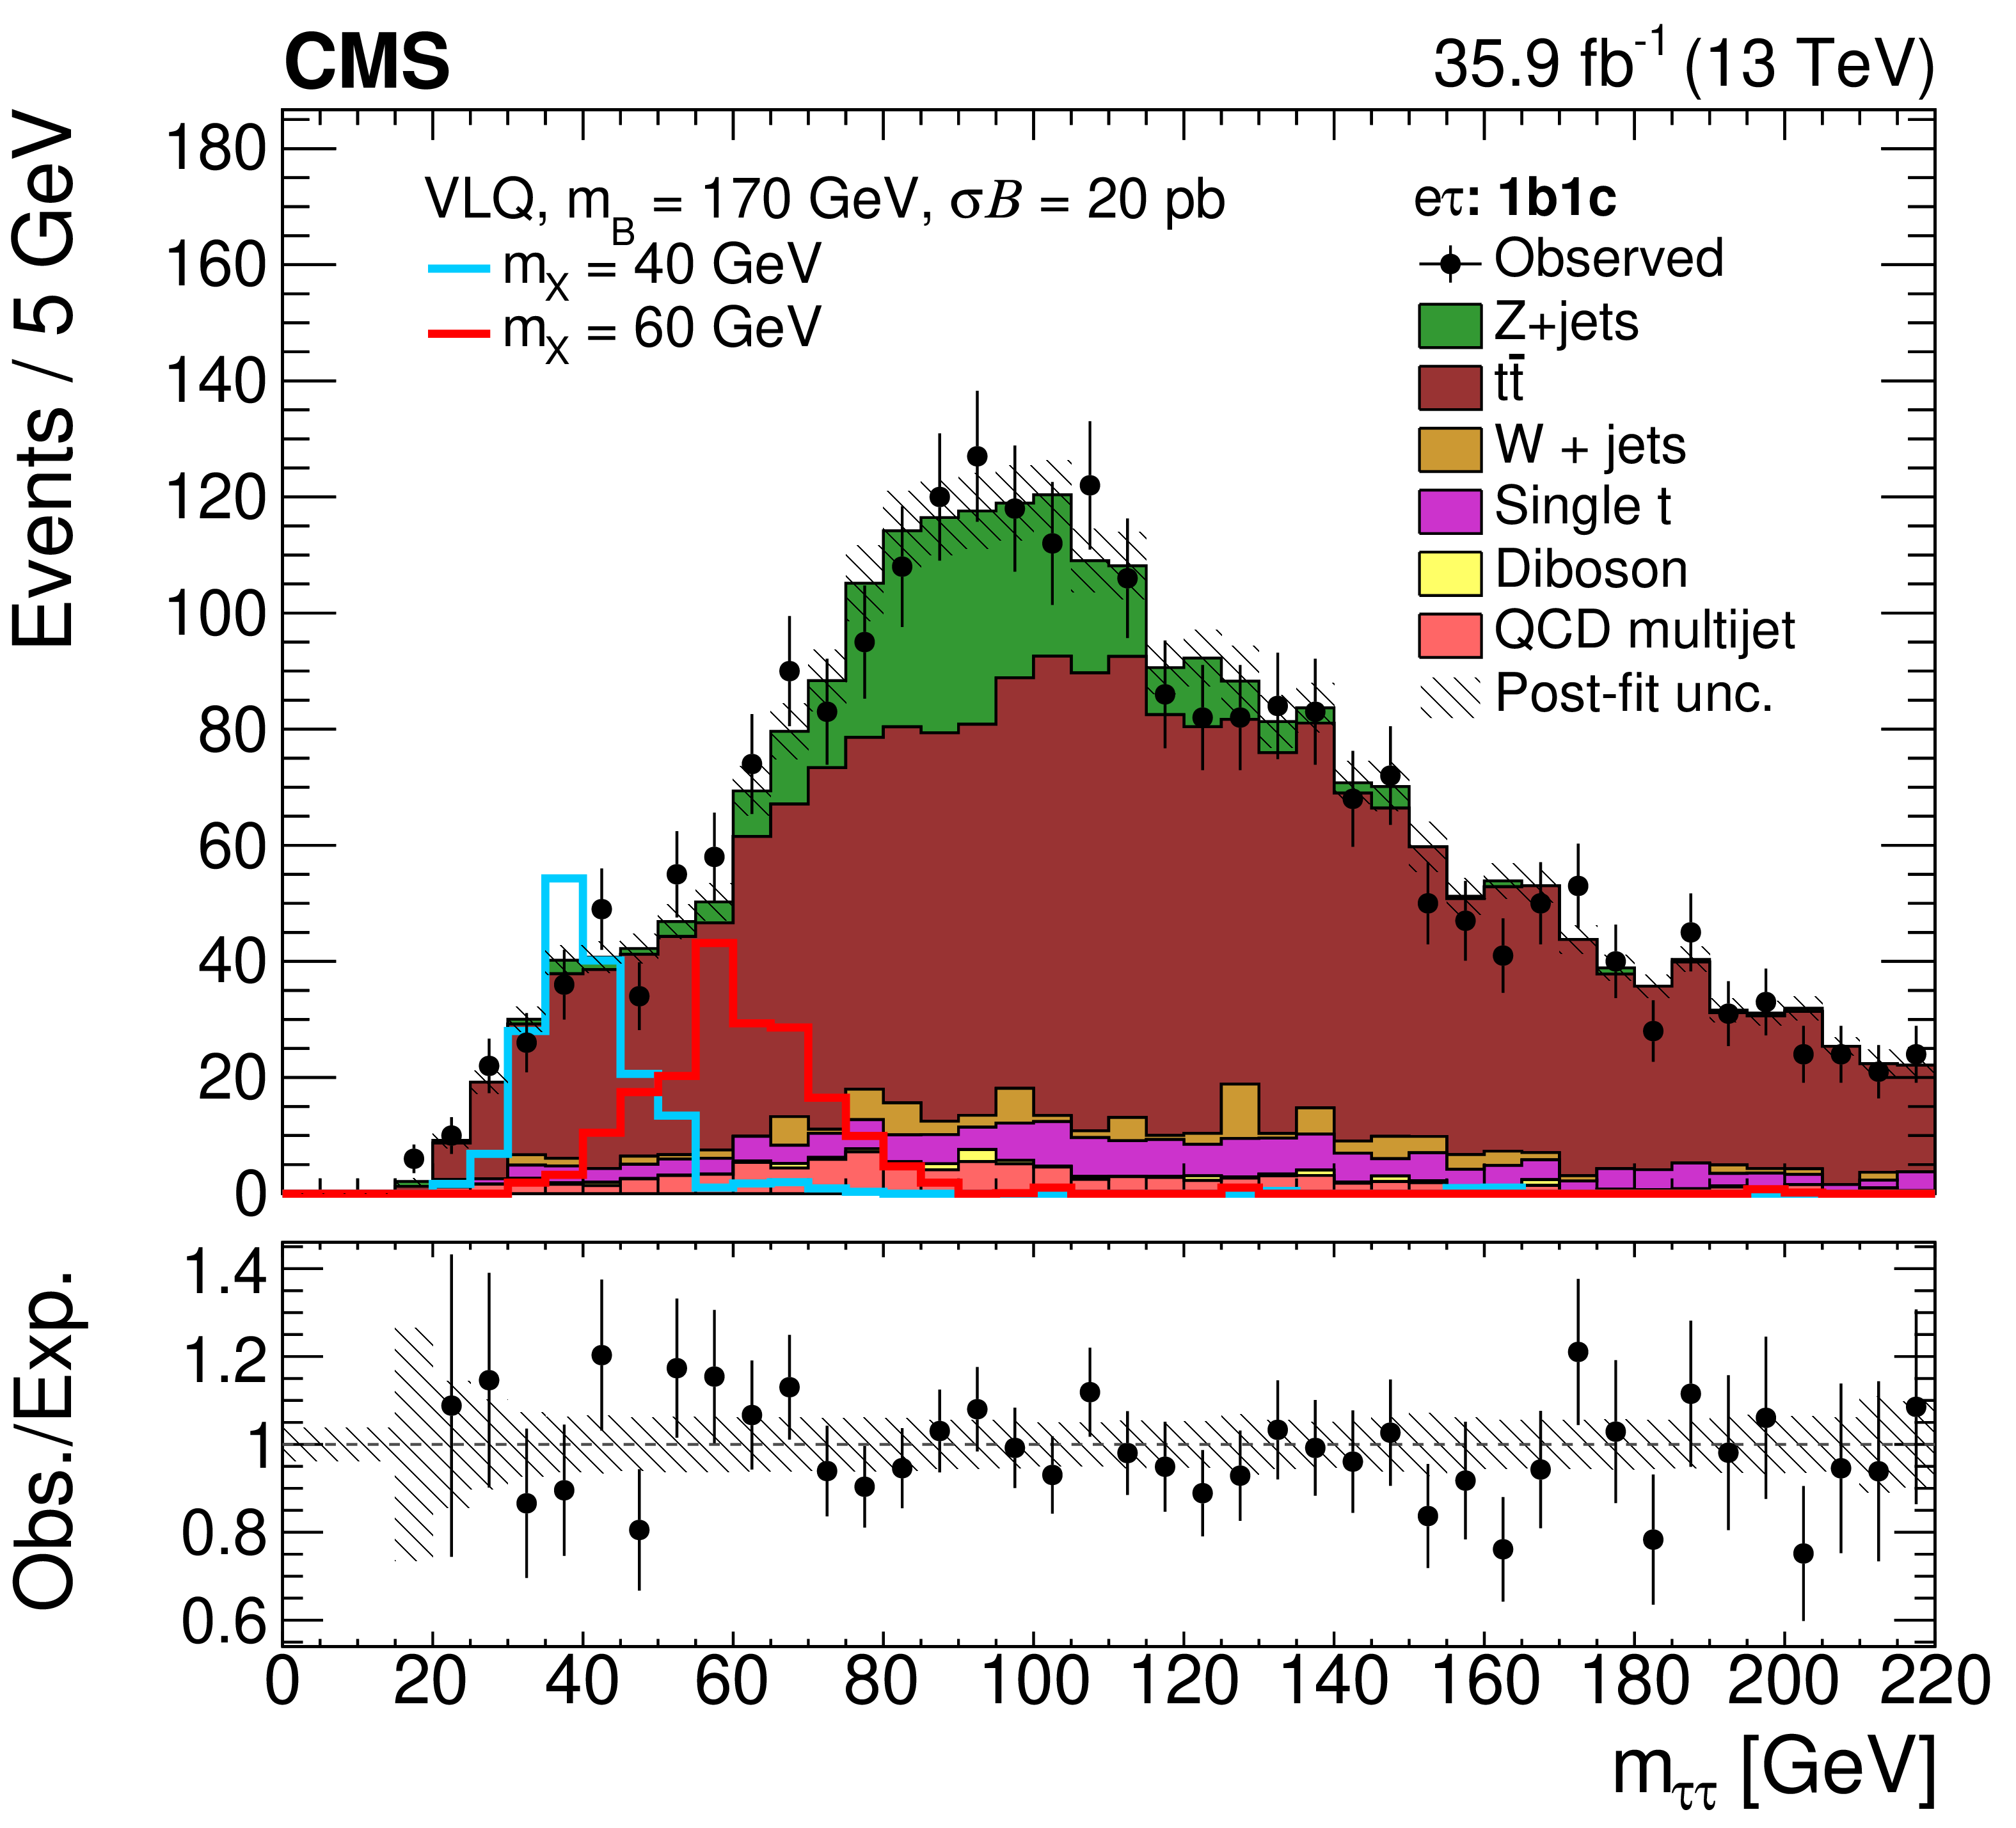
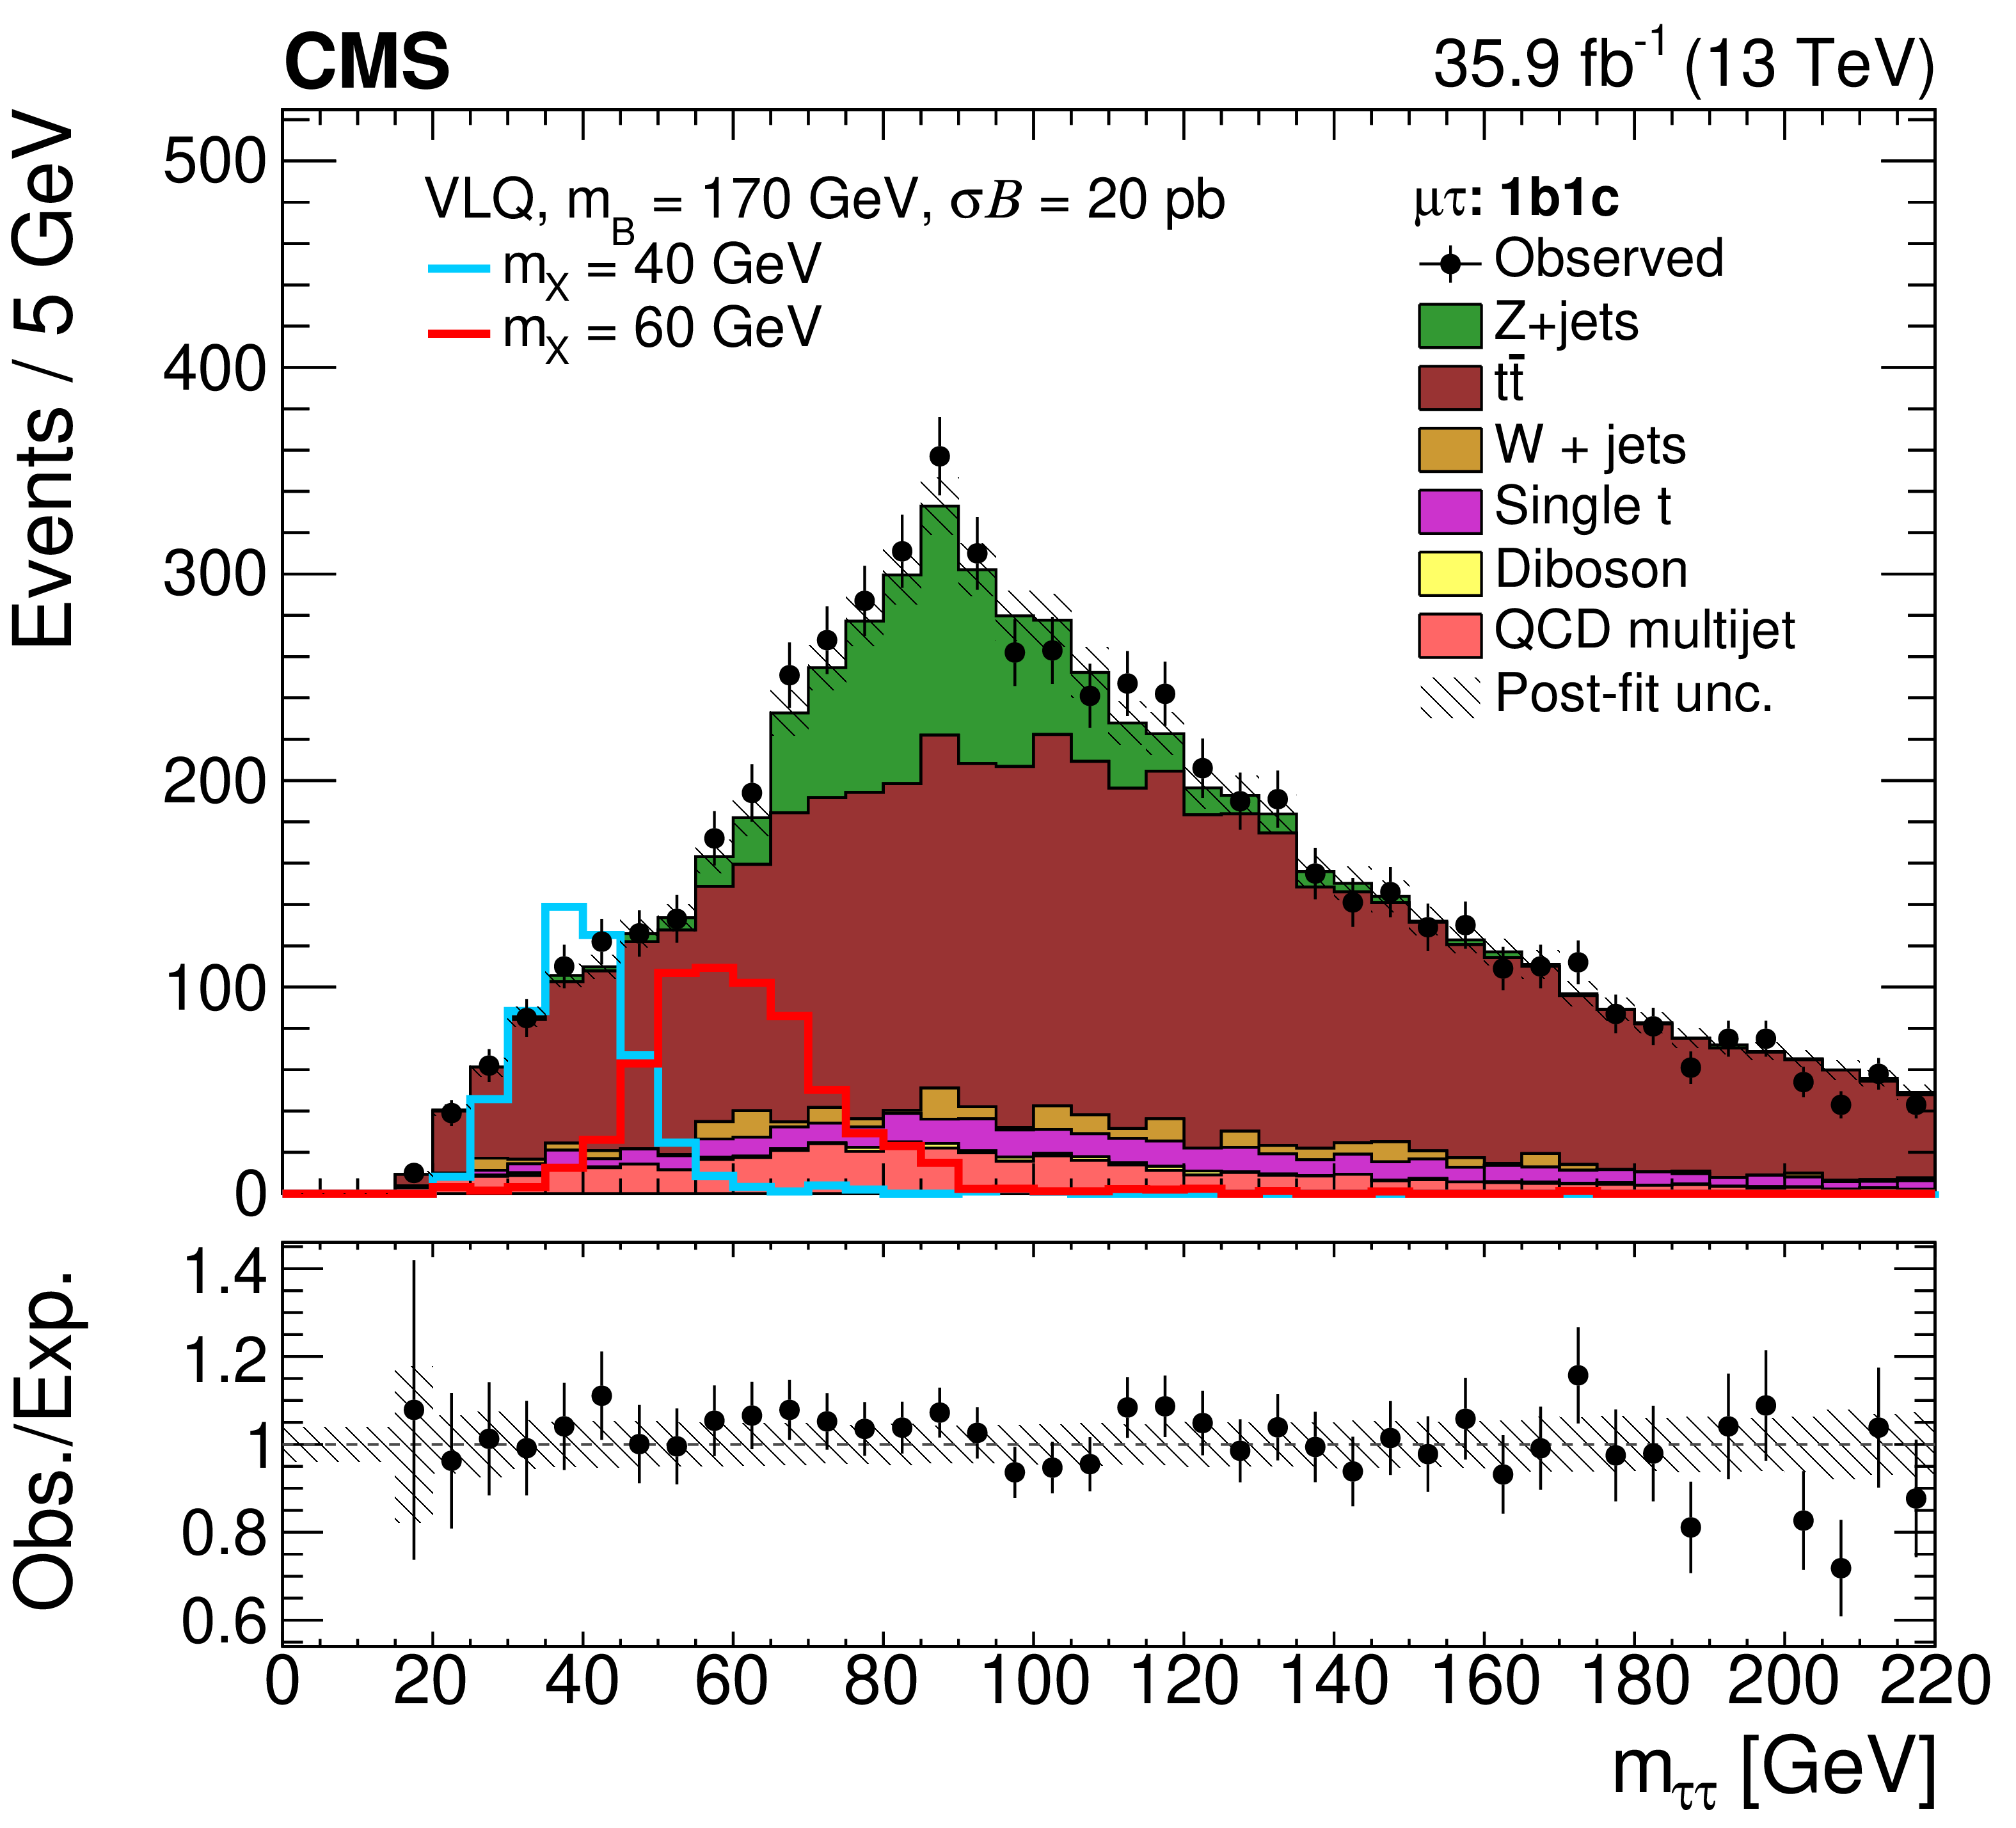
Measured ${{m_{{\tau} {\tau}}}} $ distribution in the ${{{\mathrm {e}} {\tau}_\text {h}}} $ (left), and ${{{{\mu}} {\tau}_\text {h}}} $ (right) final states, for the 1b1f (upper) and 1b1c (lower) categories, compared to the expected SM background contributions. The signal distributions for the VLQ model with ${{\mathrm {A}}} $ boson masses of 40 and 60 GeV are overlaid to illustrate the sensitivity. They are normalized to the cross section times branching fraction of 20 pb. The uncertainty bands represent the sum in quadrature of statistical and systematic uncertainties obtained from the fit. The lower panels show the ratio between the observed and expected events in each bin. |
png pdf |
Figure 3-a:
Measured ${{m_{{\tau} {\tau}}}} $ distribution in the ${{{\mathrm {e}} {\tau}_\text {h}}} $ final state, for the 1b1f category, compared to the expected SM background contributions. The signal distributions for the VLQ model with ${{\mathrm {A}}} $ boson masses of 40 and 60 GeV are overlaid to illustrate the sensitivity. They are normalized to the cross section times branching fraction of 20 pb. The uncertainty bands represent the sum in quadrature of statistical and systematic uncertainties obtained from the fit. The lower panel shows the ratio between the observed and expected events in each bin. |
png pdf |
Figure 3-b:
Measured ${{m_{{\tau} {\tau}}}} $ distribution in the ${{{{\mu}} {\tau}_\text {h}}} $ final state, for the 1b1c category, compared to the expected SM background contributions. The signal distributions for the VLQ model with ${{\mathrm {A}}} $ boson masses of 40 and 60 GeV are overlaid to illustrate the sensitivity. They are normalized to the cross section times branching fraction of 20 pb. The uncertainty bands represent the sum in quadrature of statistical and systematic uncertainties obtained from the fit. The lower panel shows the ratio between the observed and expected events in each bin. |
png pdf |
Figure 3-c:
Measured ${{m_{{\tau} {\tau}}}} $ distribution in the ${{{\mathrm {e}} {\tau}_\text {h}}} $ final state, for the 1b1f category, compared to the expected SM background contributions. The signal distributions for the VLQ model with ${{\mathrm {A}}} $ boson masses of 40 and 60 GeV are overlaid to illustrate the sensitivity. They are normalized to the cross section times branching fraction of 20 pb. The uncertainty bands represent the sum in quadrature of statistical and systematic uncertainties obtained from the fit. The lower panel shows the ratio between the observed and expected events in each bin. |
png pdf |
Figure 3-d:
Measured ${{m_{{\tau} {\tau}}}} $ distribution in the ${{{{\mu}} {\tau}_\text {h}}} $ final state, for the 1b1c category, compared to the expected SM background contributions. The signal distributions for the VLQ model with ${{\mathrm {A}}} $ boson masses of 40 and 60 GeV are overlaid to illustrate the sensitivity. They are normalized to the cross section times branching fraction of 20 pb. The uncertainty bands represent the sum in quadrature of statistical and systematic uncertainties obtained from the fit. The lower panel shows the ratio between the observed and expected events in each bin. |
png pdf |
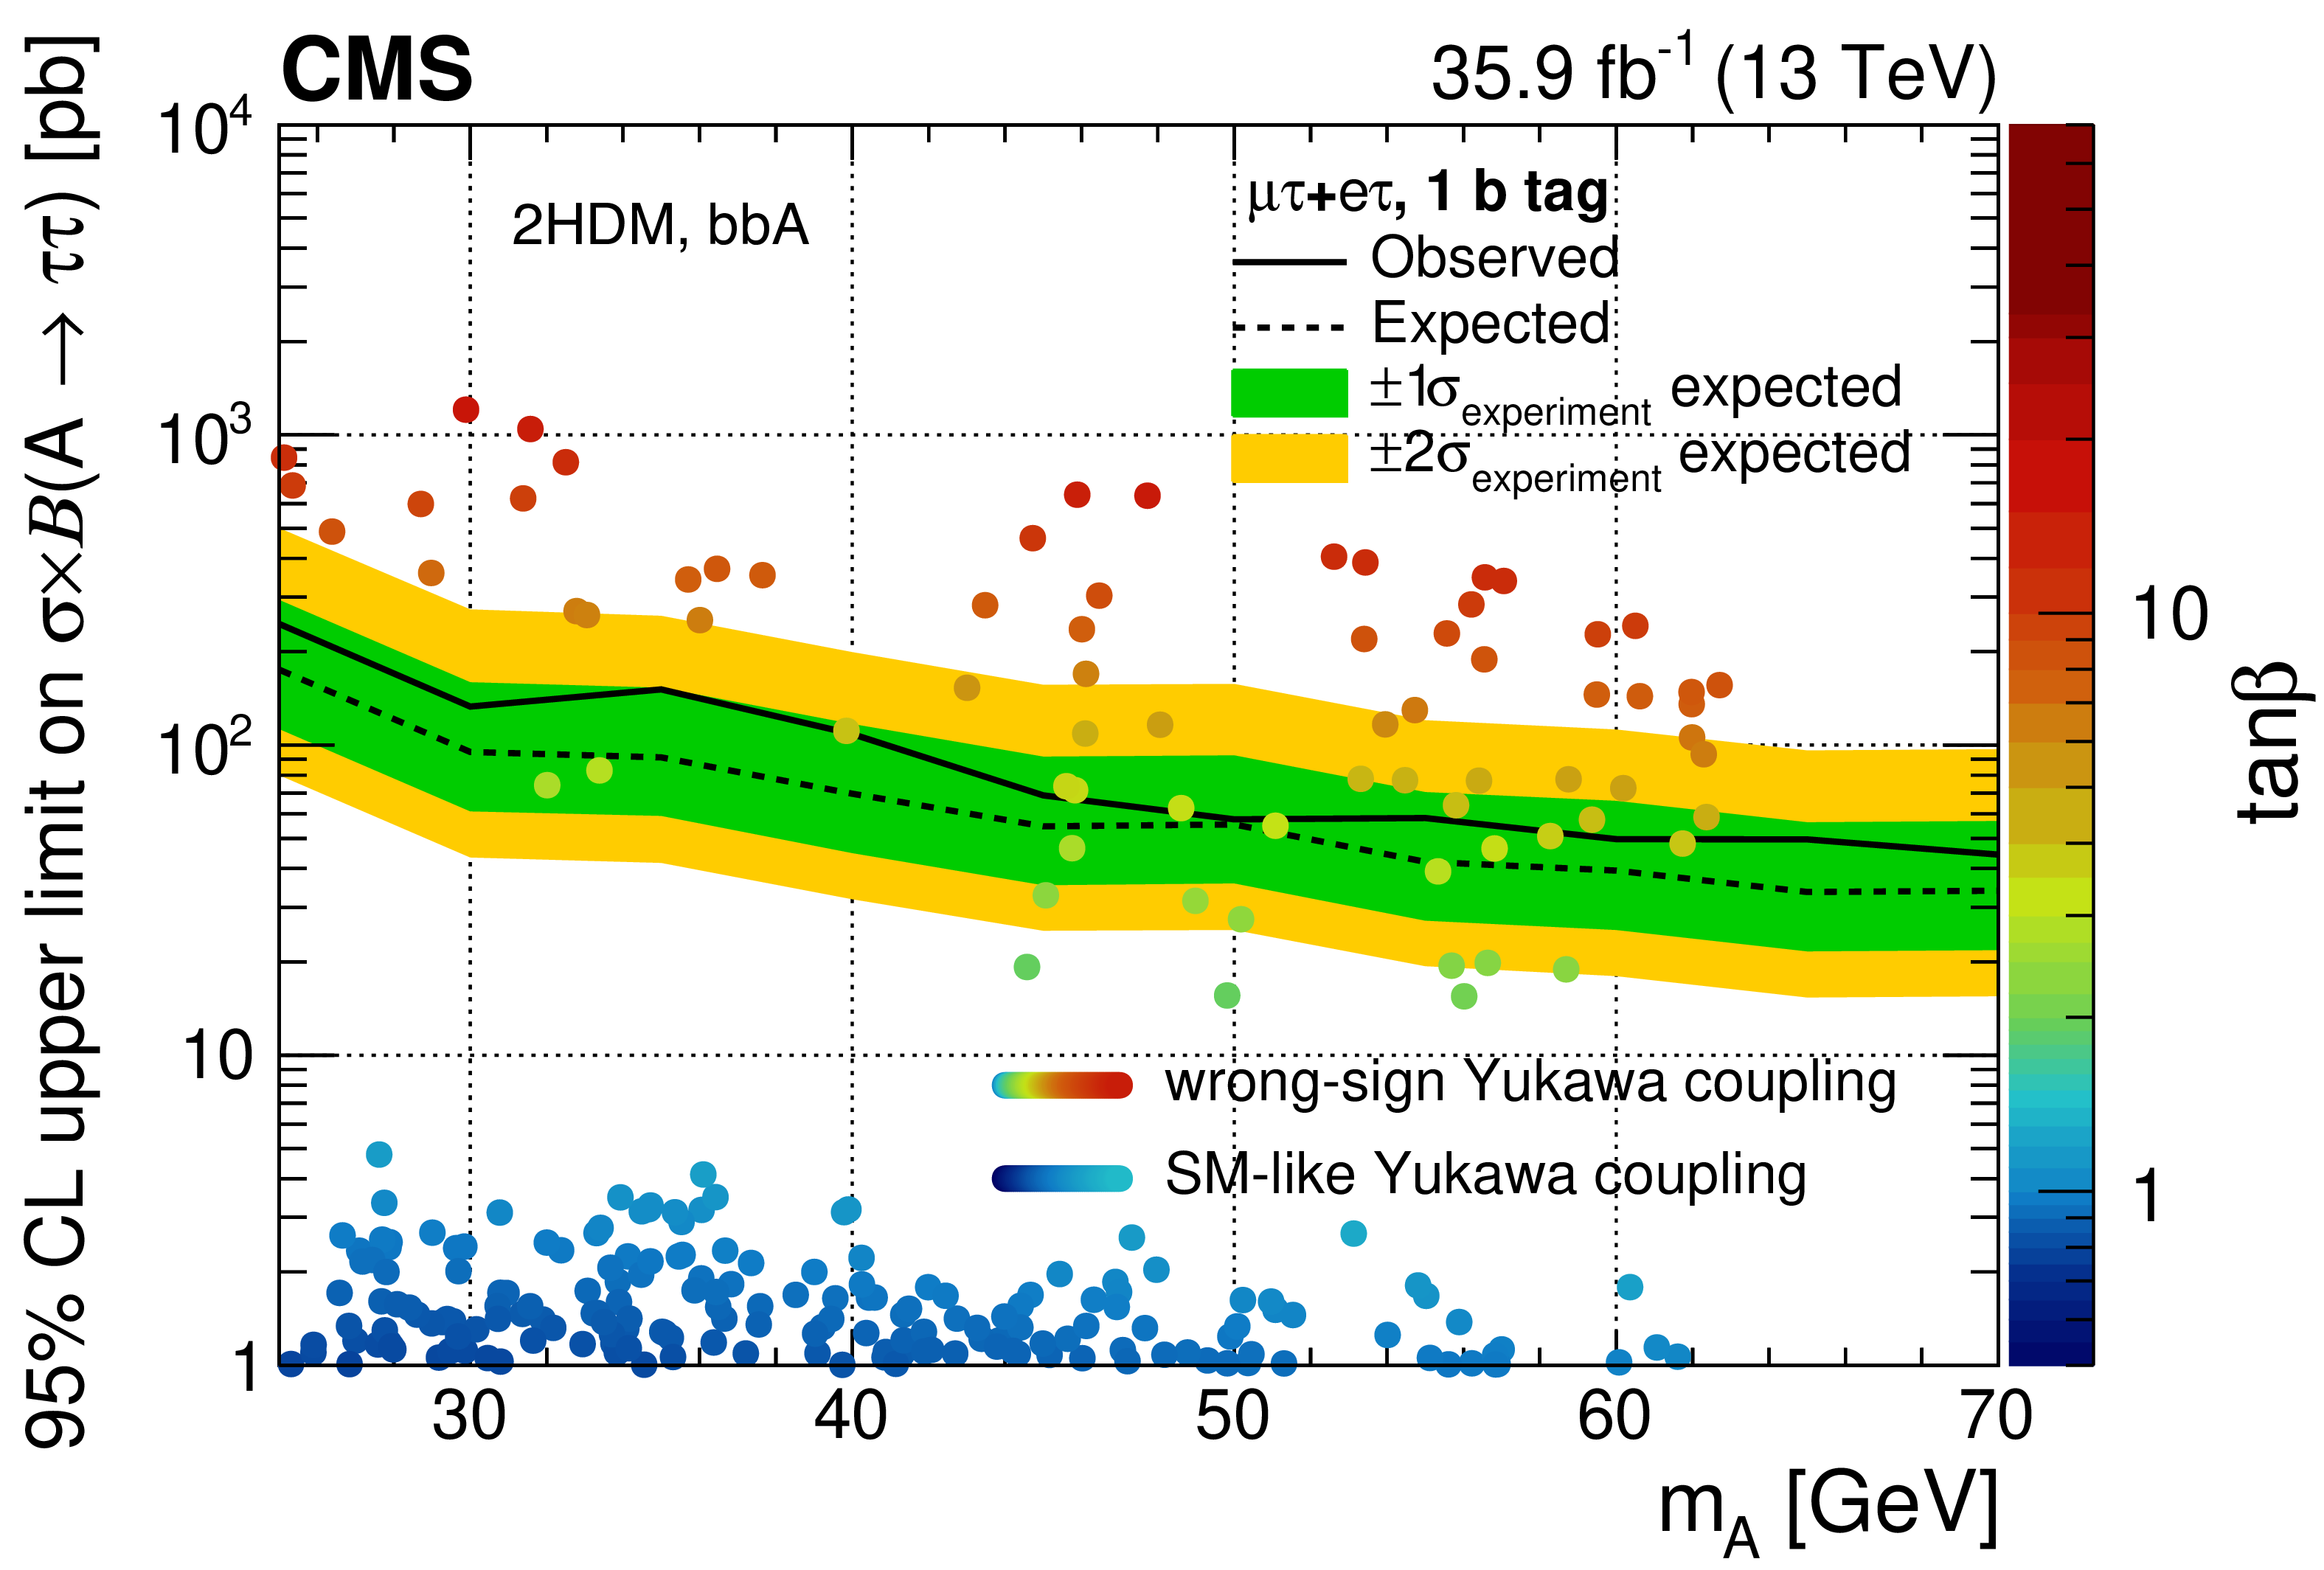
Figure 4:
Observed (solid) and expected (dashed) limits at 95% confidence level on the product of cross section for the production of the ${{{{\mathrm {b}} {\overline {\mathrm {b}}}} \text {A}}}$ signal and branching fraction ${{\text {A}}} \to {{\tau} {\tau}} $, obtained from the combination of the ${{{\mathrm {e}} {\tau}_\text {h}}} $ and ${{{{\mu}} {\tau}_\text {h}}} $ channels. The green and yellow bands represent the one and two standard deviation uncertainties in the expected limits. Representative 2HDMs with varied sets of the $\tan\beta $ and ${{m_\text {A}}} $ parameters are overlaid for two types of Yukawa couplings to the down-type fermions: one which is SM-like, and one in which the Yukawa coupling is negative ("wrong-sign''). |

png pdf |
Figure 5:
Observed (solid) and expected (dotted) limits at 95% confidence level on the product of cross section for the production of the ${{{\mathrm {q}} {\mathrm {b}}\text {A}}}$ signal and branching fraction ${{\mathrm {A}}} \to {{\tau} {\tau}} $, obtained from the combination of the ${{{\mathrm {e}} {\tau}_\text {h}}} $ and ${{{{\mu}} {\tau}_\text {h}}} $ channels. The ${{m_\text {B}}} $ values of 170 (upper left), 300 (upper right), and 450 GeV are considered. The green and yellow bands represent the one and two standard deviation uncertainties in the expected limits. |

png pdf |
Figure 5-a:
Observed (solid) and expected (dotted) limits at 95% confidence level on the product of cross section for the production of the ${{{\mathrm {q}} {\mathrm {b}}\text {A}}}$ signal and branching fraction ${{\mathrm {A}}} \to {{\tau} {\tau}} $, obtained from the combination of the ${{{\mathrm {e}} {\tau}_\text {h}}} $ and ${{{{\mu}} {\tau}_\text {h}}} $ channels. The ${{m_\text {B}}} $ value of 170 GeV is considered. The green and yellow bands represent the one and two standard deviation uncertainties in the expected limits. |
png pdf |
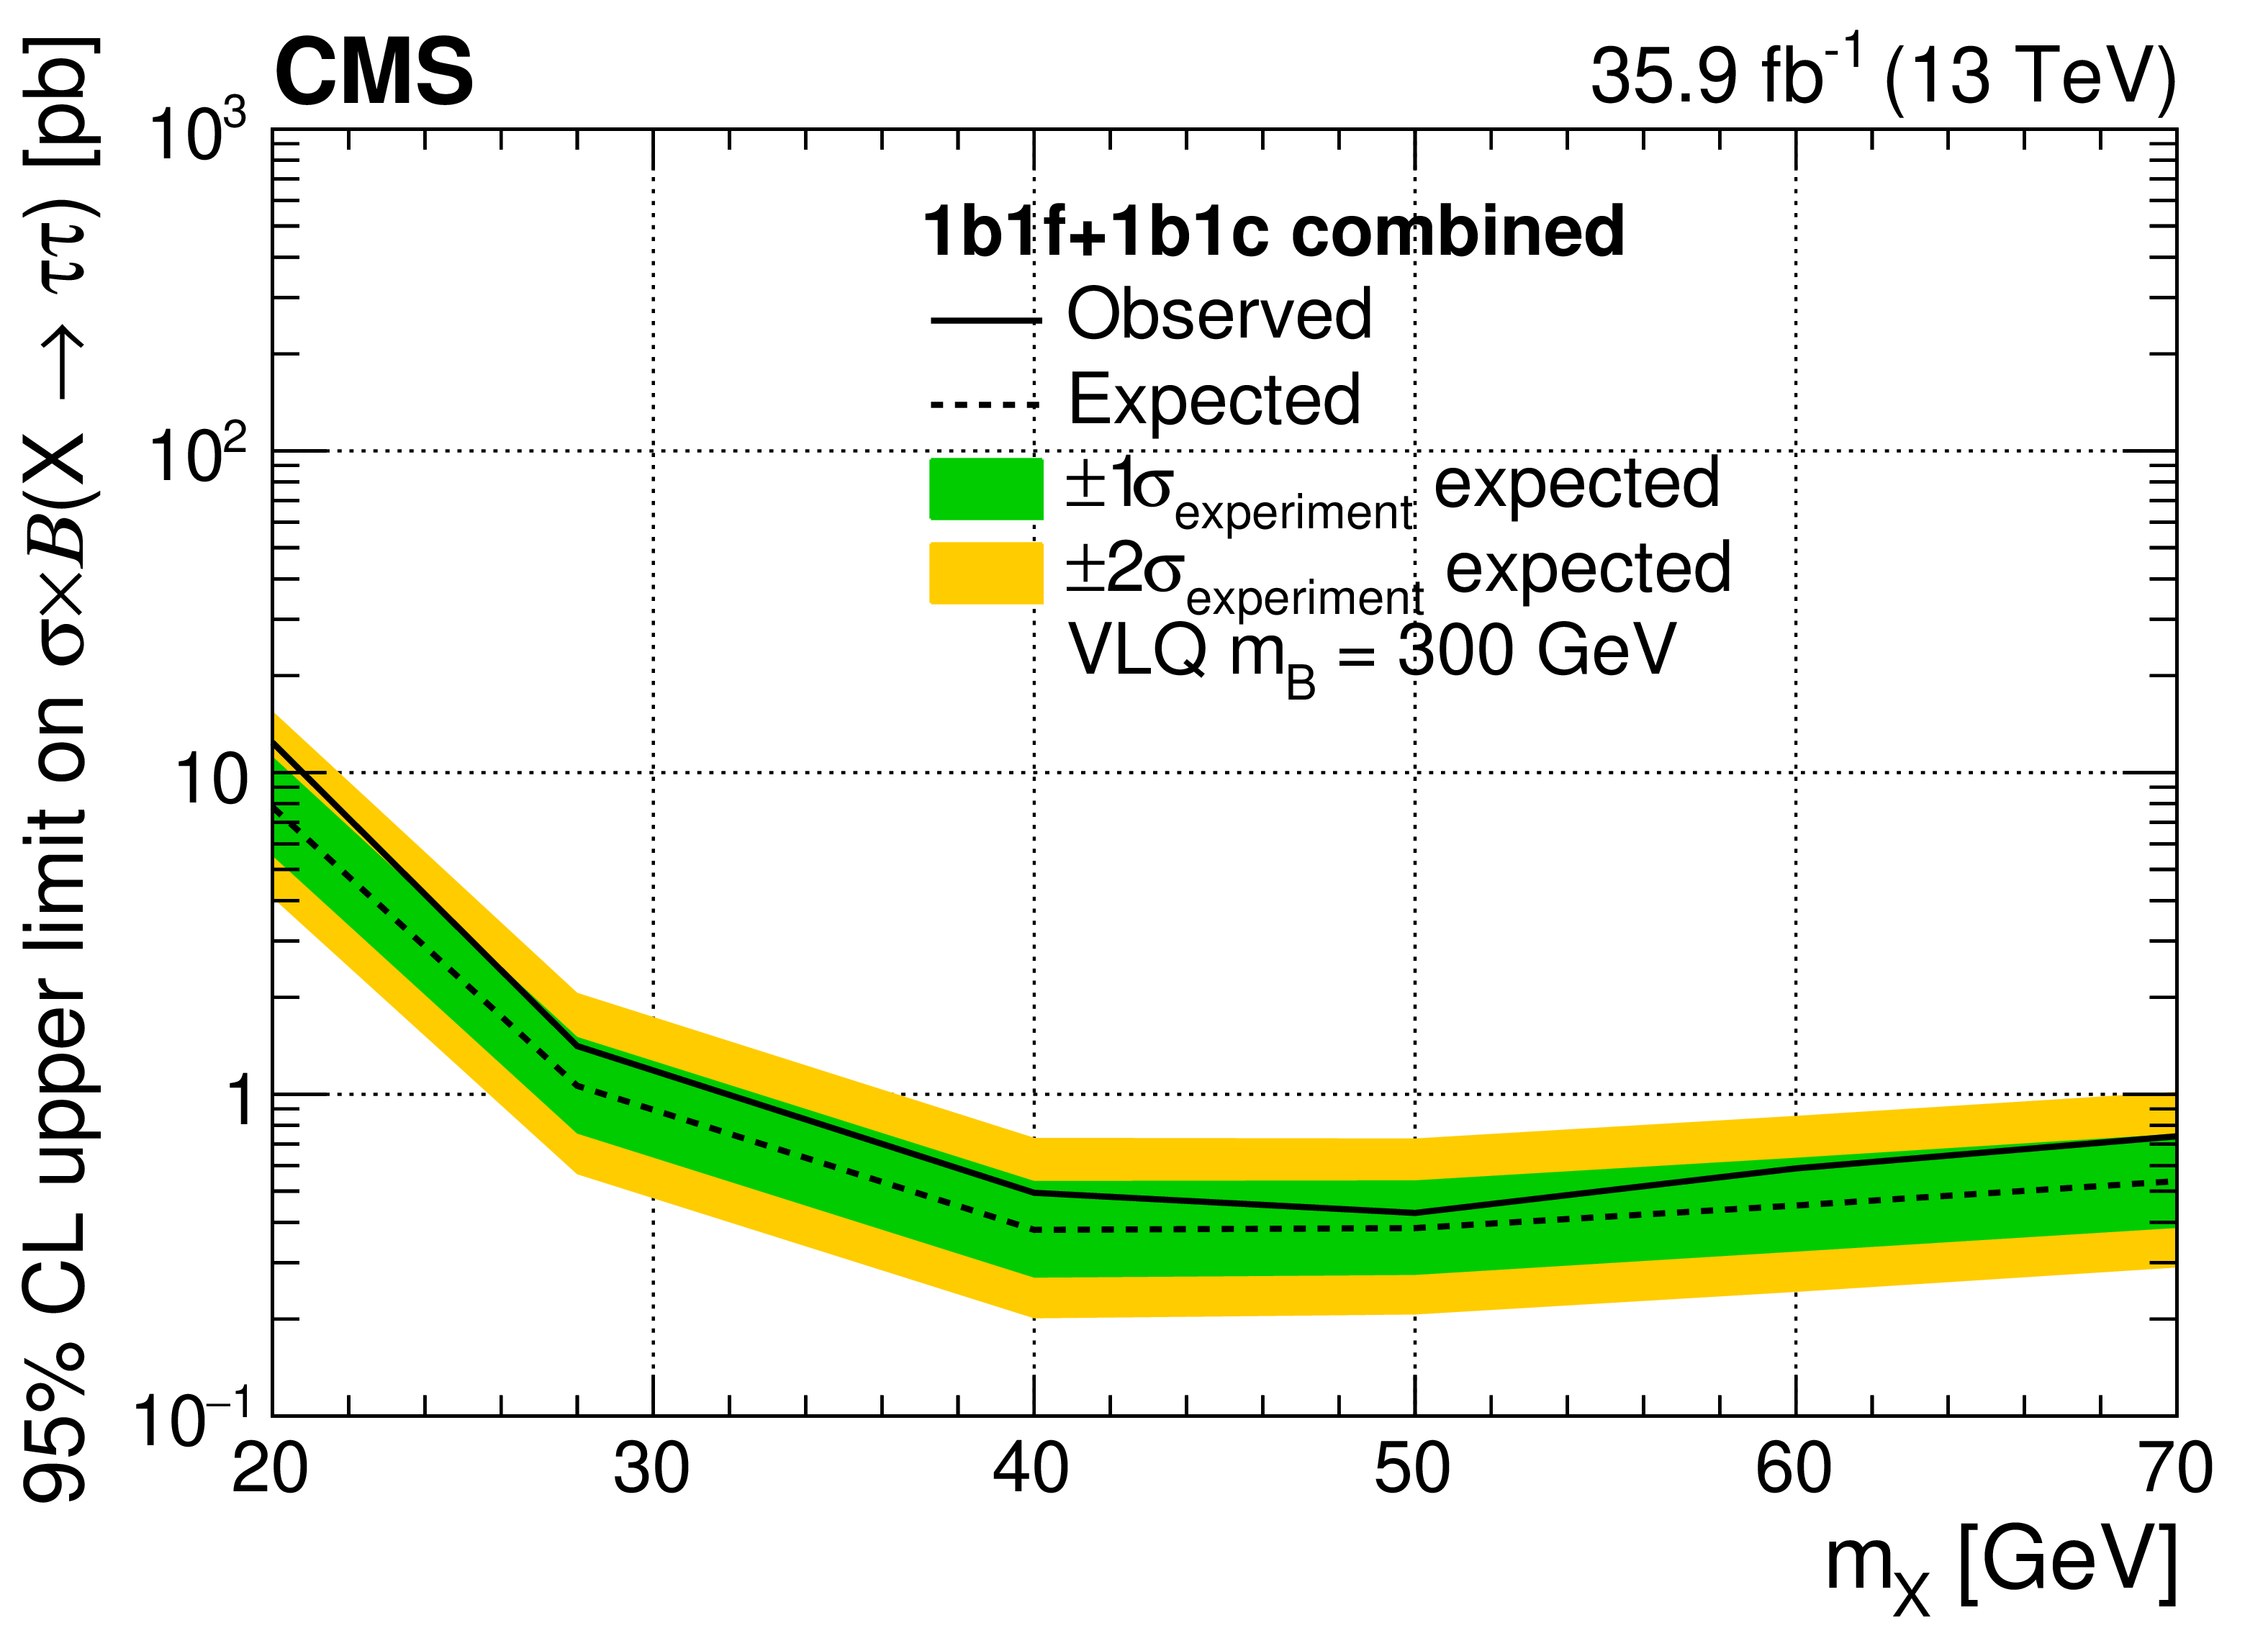
Figure 5-b:
Observed (solid) and expected (dotted) limits at 95% confidence level on the product of cross section for the production of the ${{{\mathrm {q}} {\mathrm {b}}\text {A}}}$ signal and branching fraction ${{\mathrm {A}}} \to {{\tau} {\tau}} $, obtained from the combination of the ${{{\mathrm {e}} {\tau}_\text {h}}} $ and ${{{{\mu}} {\tau}_\text {h}}} $ channels. The ${{m_\text {B}}} $ value of 300 GeV is considered. The green and yellow bands represent the one and two standard deviation uncertainties in the expected limits. |
png pdf |
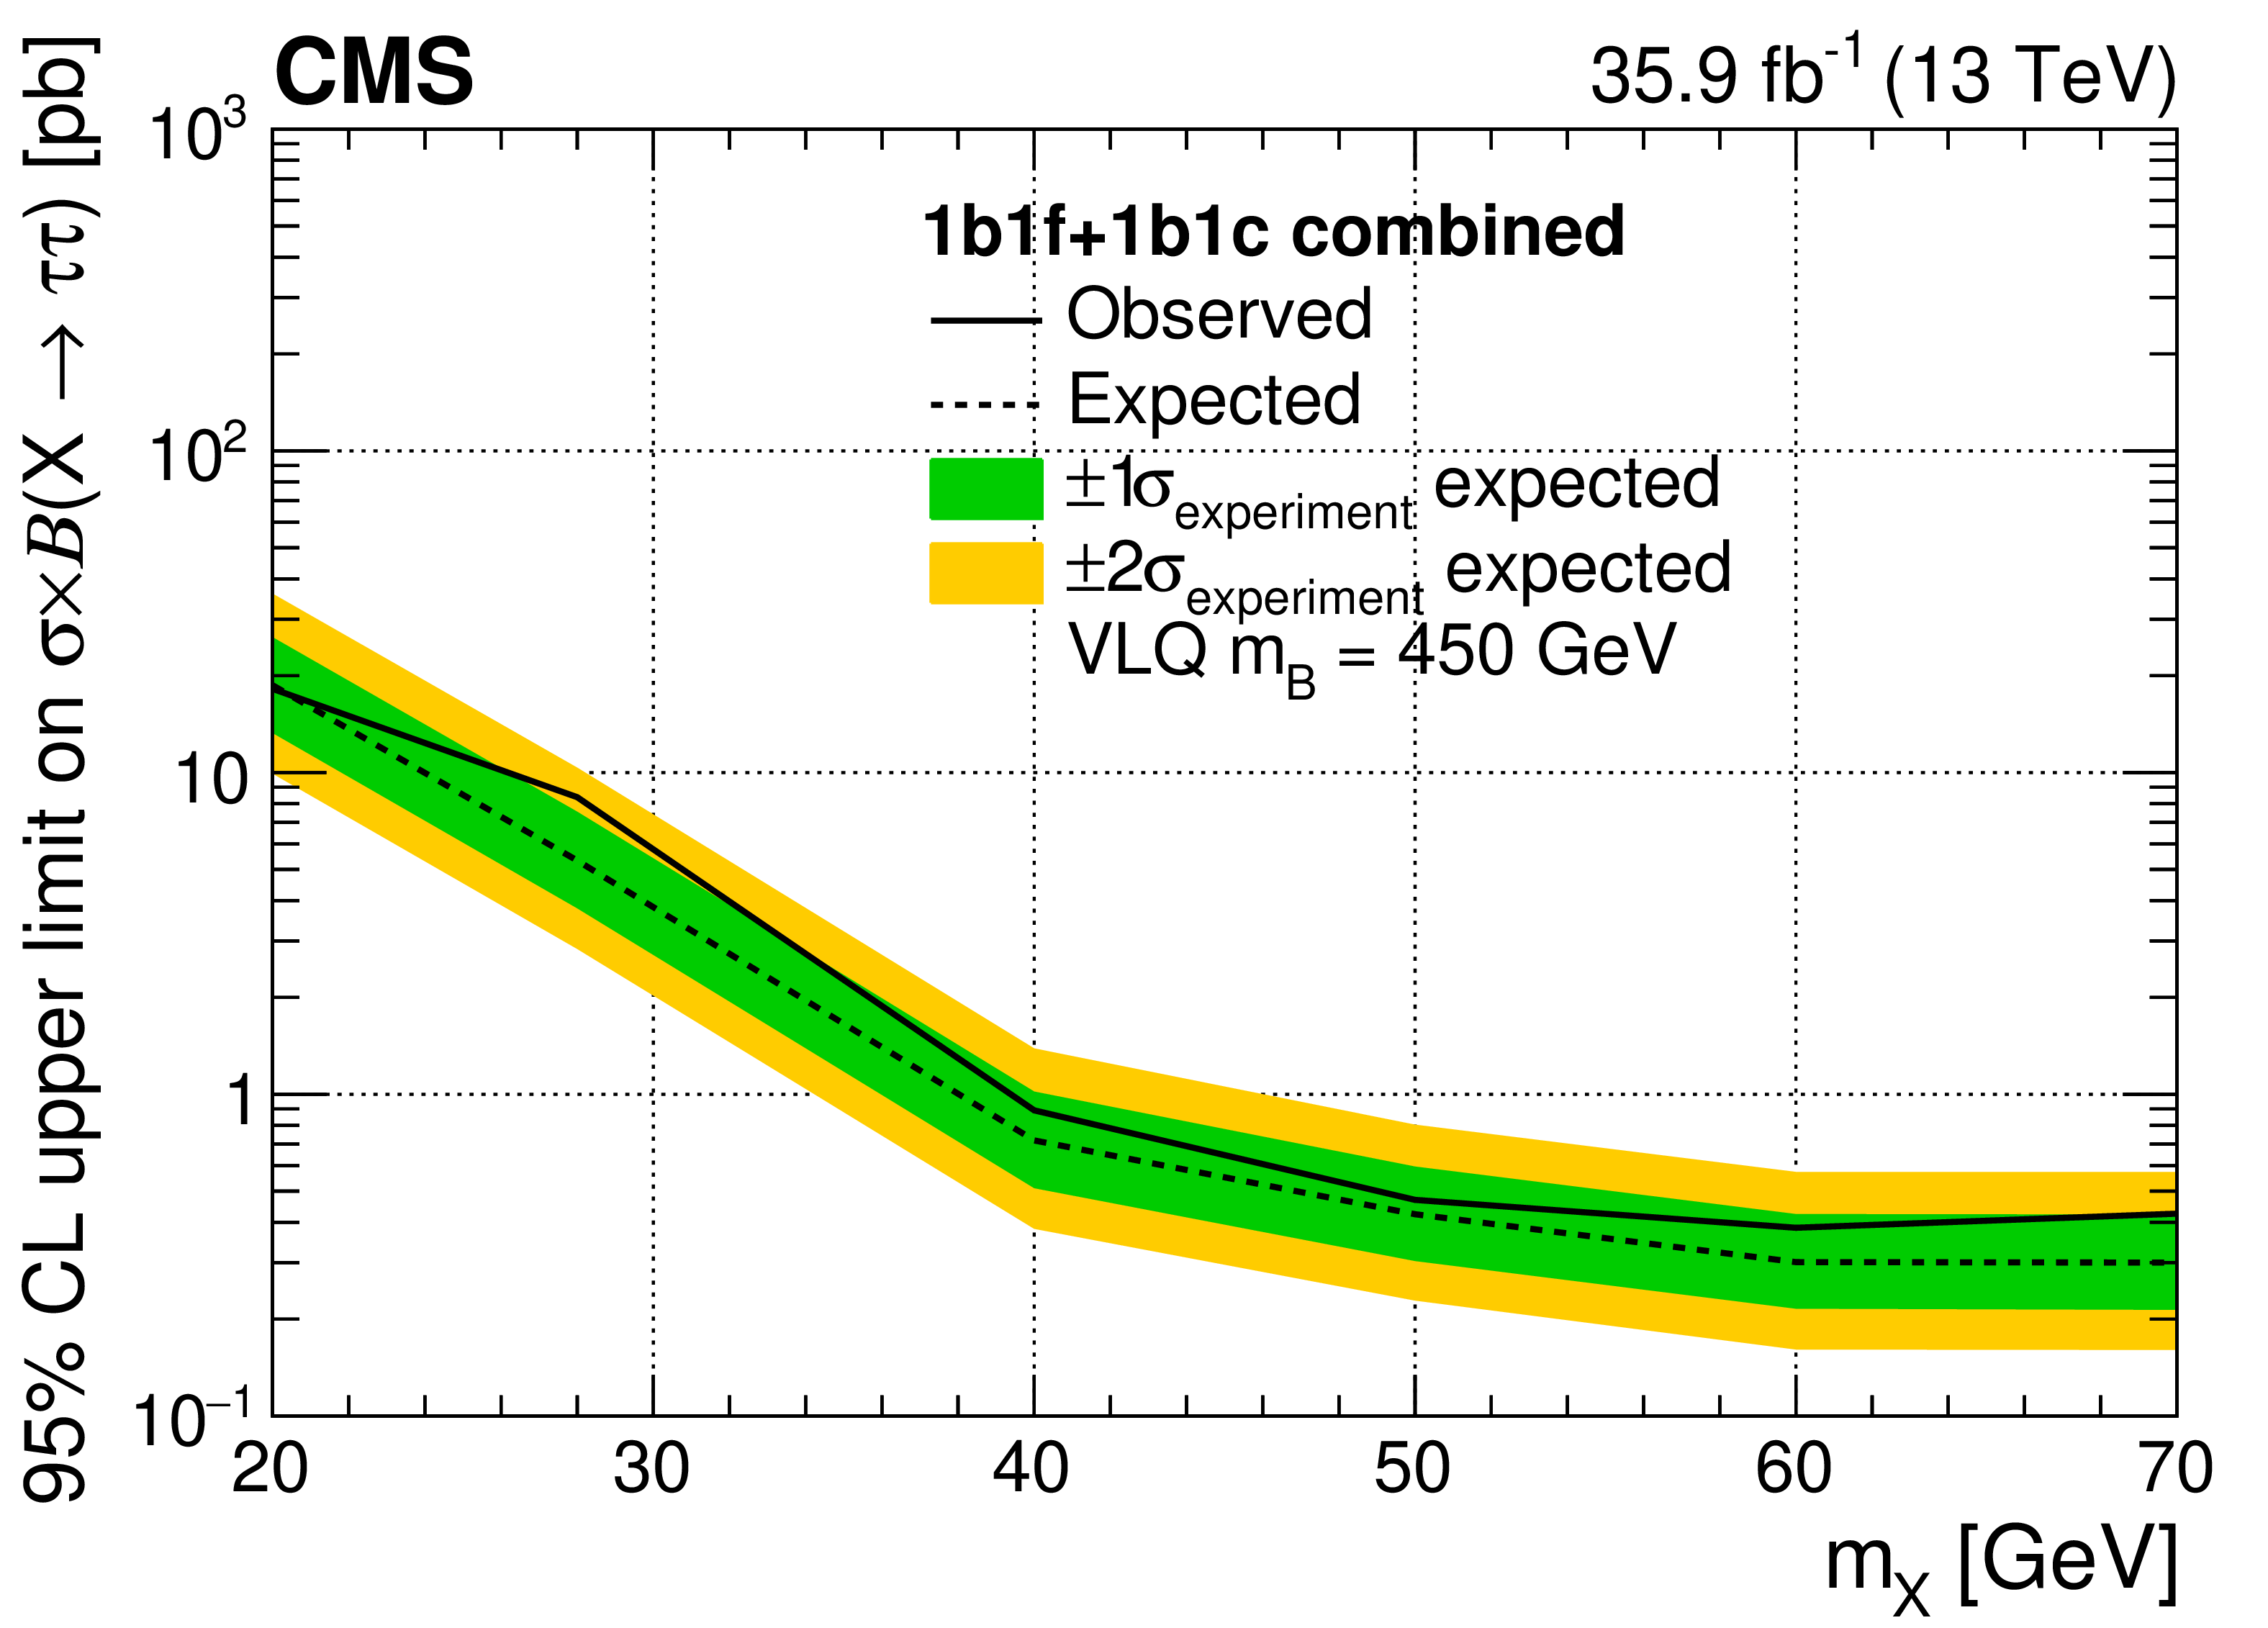
Figure 5-c:
Observed (solid) and expected (dotted) limits at 95% confidence level on the product of cross section for the production of the ${{{\mathrm {q}} {\mathrm {b}}\text {A}}}$ signal and branching fraction ${{\mathrm {A}}} \to {{\tau} {\tau}} $, obtained from the combination of the ${{{\mathrm {e}} {\tau}_\text {h}}} $ and ${{{{\mu}} {\tau}_\text {h}}} $ channels. The ${{m_\text {B}}} $ value of 450 GeV is considered. The green and yellow bands represent the one and two standard deviation uncertainties in the expected limits. |
| Tables | |
png pdf |
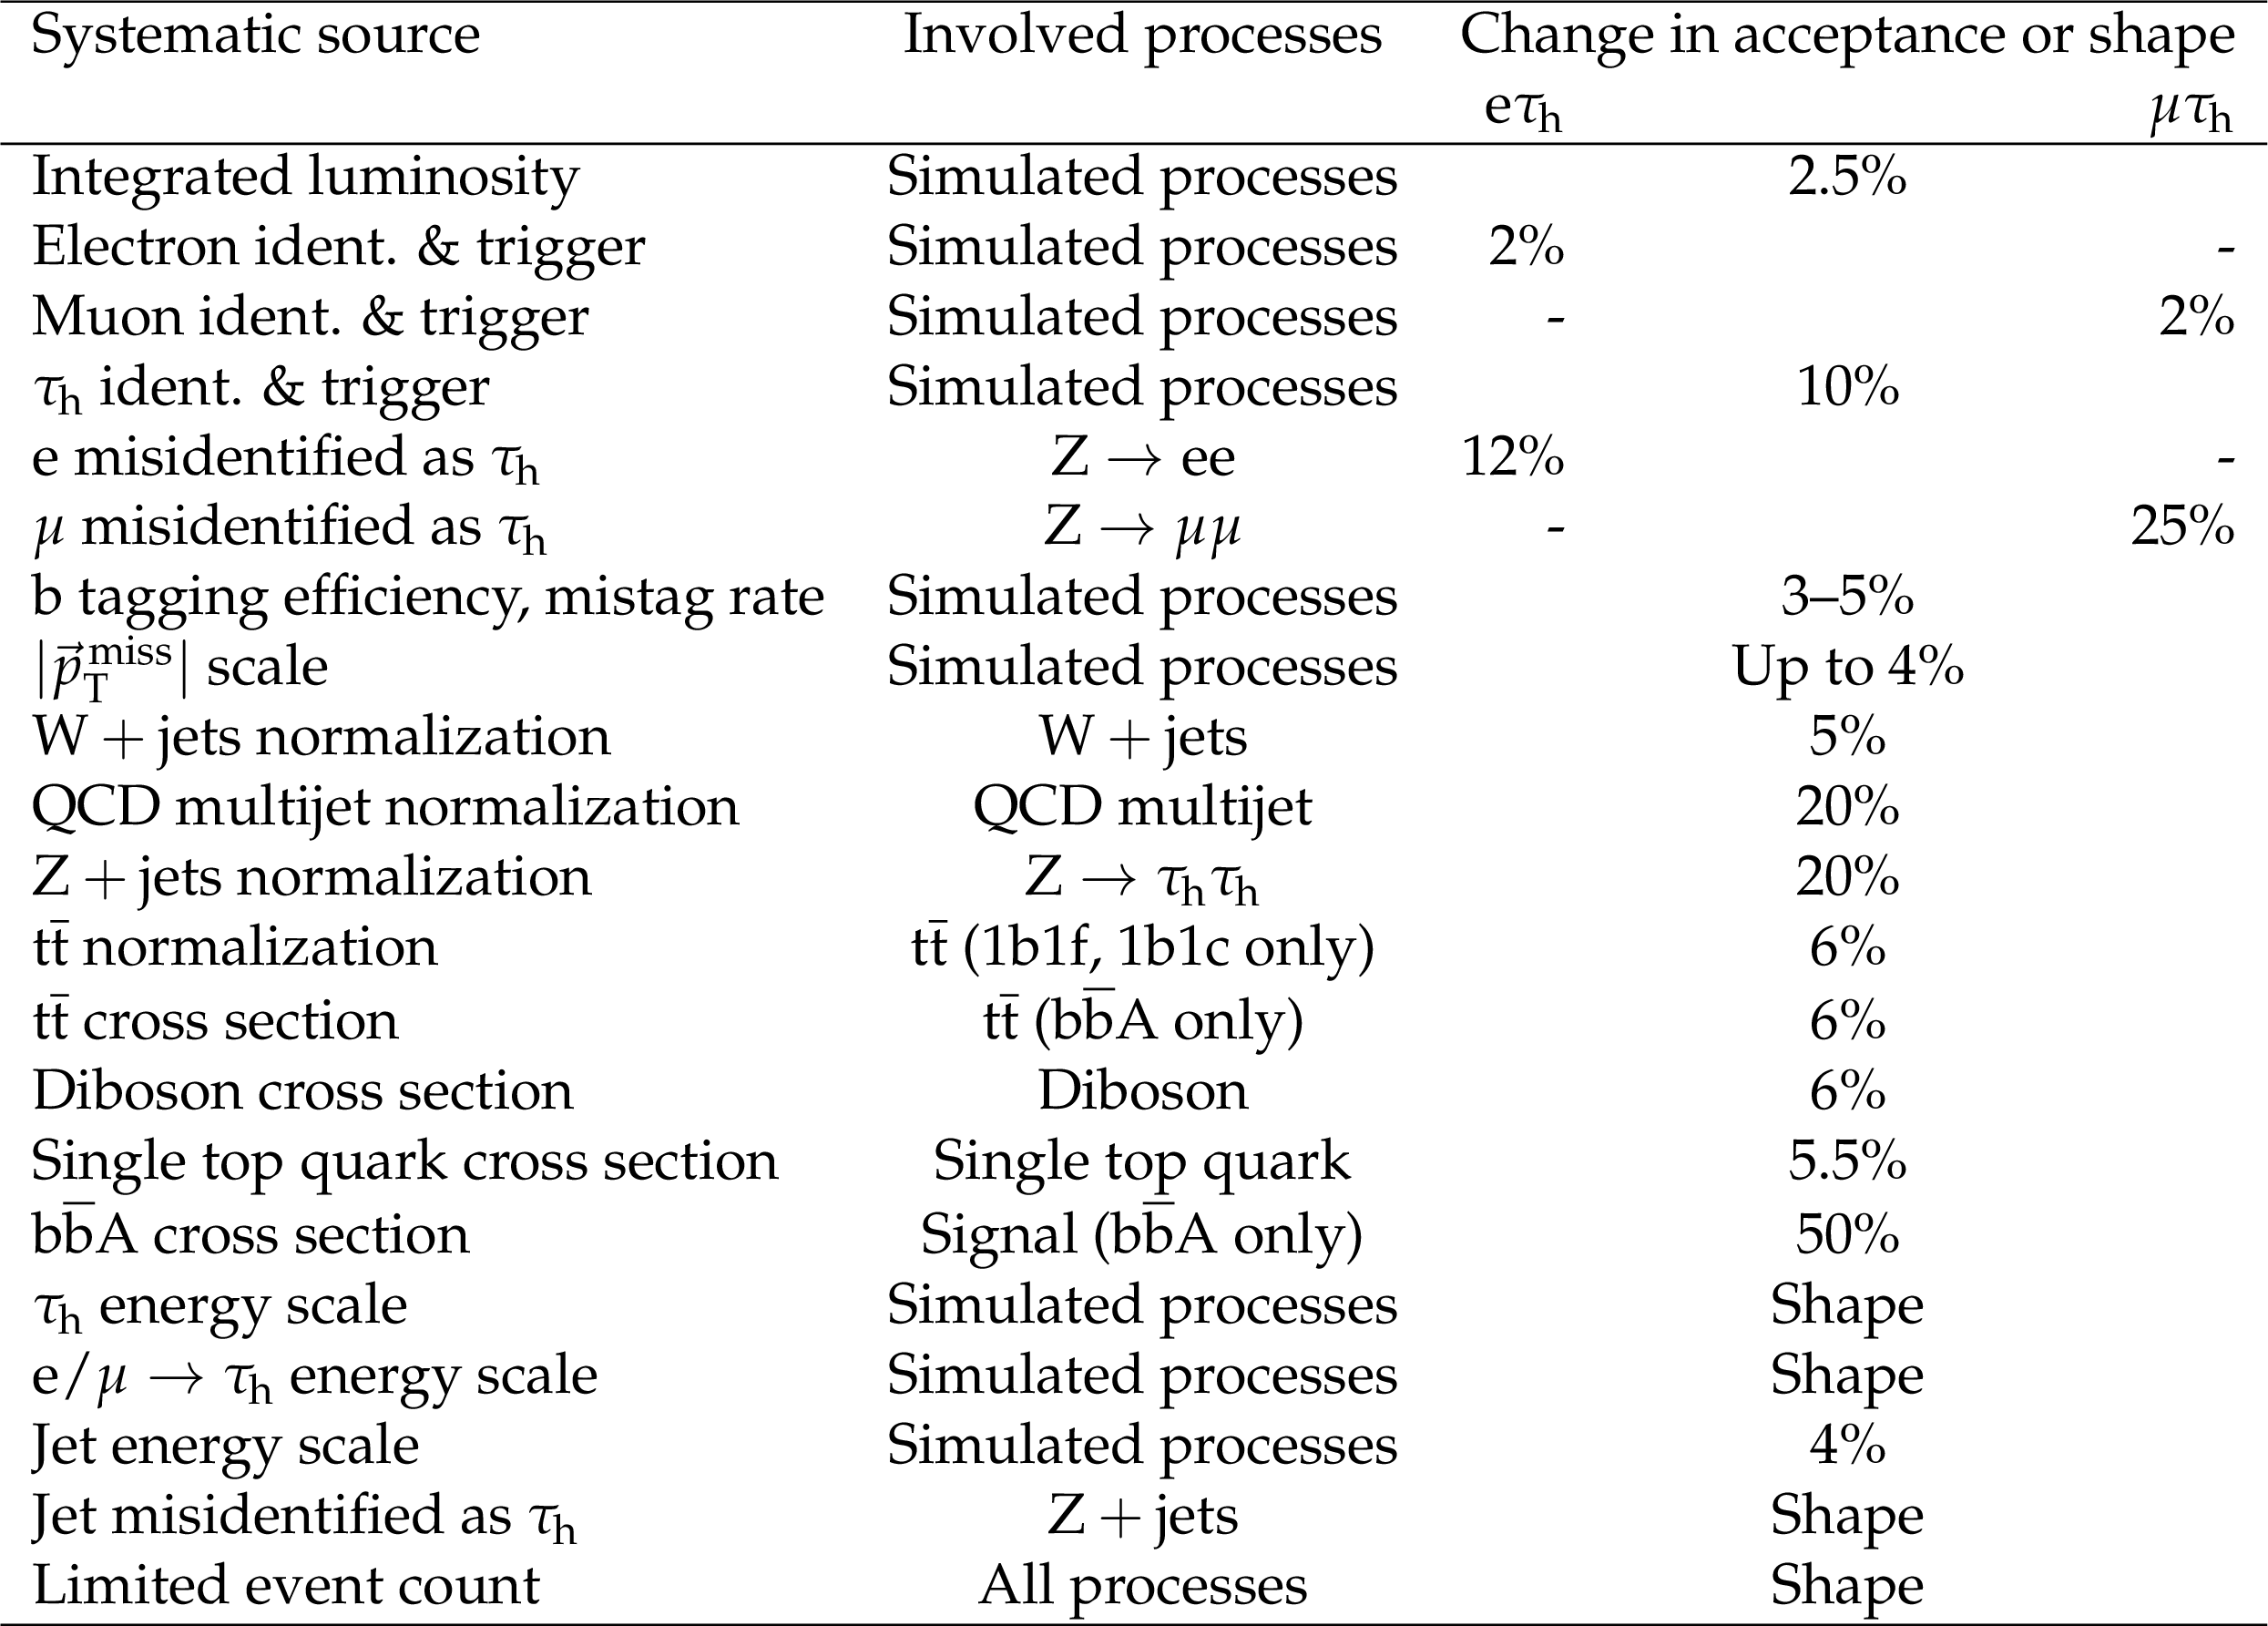
Table 1:
Sources of systematic uncertainties and their effects on the acceptance or shape resulting from a variation of the nuisance parameter equivalent to one standard deviation. |
| Summary |
|
This paper presents a general search for a low-mass $\tau^{-}\tau^{+}$ resonance produced in association with a bottom quark. After defining the signal region by the presence of an electron or muon consistent with the decay of a $\tau$ lepton, a hadronically decaying $\tau$ lepton, and a jet originating from a bottom quark, an excess over standard model background is searched for in the reconstructed invariant mass distribution of the inferred $\tau^{-}\tau^{+}$ system. The data are consistent with the standard model background. We set upper limits at 95% confidence level on the cross section times branching fraction for two signal models: a light pseudoscalar Higgs boson decaying to a pair of $\tau$ leptons produced in association with a bottom quark, and a low-mass boson A decaying to a $\tau$ lepton pair that is produced in the decay of a bottom-like quark B as $\mathrm{B}\to\mathrm{b}\mathrm{A}$. For both scenarios, A boson masses between 20 and 70 GeV are probed. Upper limits at 95% confidence level ranging from 250 to 44 pb are set on the light pseudoscalar, and from 20 to 0.3 pb on B masses between $170$ and 450 GeV. This is the first search for an A resonance in this final state using the center-of-mass energy of 13 TeV. Since many extensions of the standard model have similar event kinematics as this analysis, these results could also be applied to put constraints on other low-mass $\tau^{-}\tau^{+}$ resonances. If there were a Yukawa-type enhancement between the signal and the $\tau$ leptons, then the constraints on the signal production cross section by this analysis would improve by a factor of $m_\tau^2/m_\mu^2$. The optimized selection of this analysis targets previously unexplored decays of heavy bottom-like quarks, providing new sensitivity to vector-like quarks. |
| Additional Figures | |
png pdf |
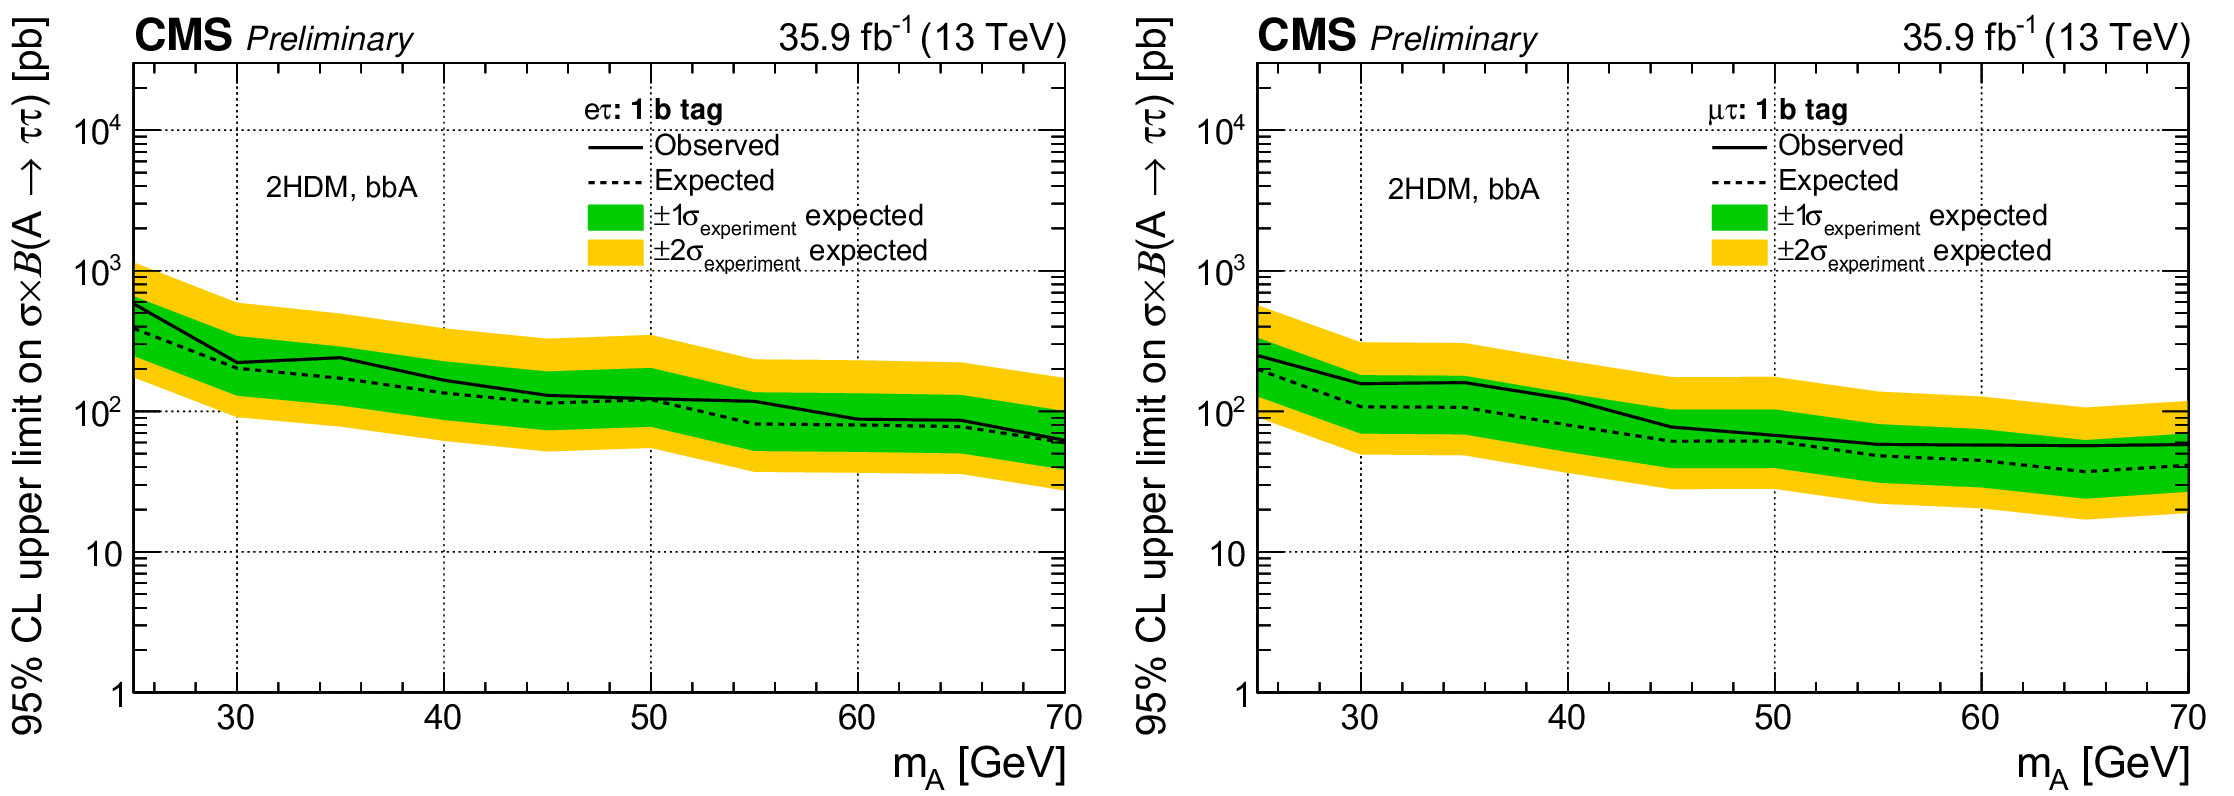
Additional Figure 1:
Observed (solid) and expected (dashed) limits at 95% confidence level on the product of cross section for the production of the ${{{{\mathrm {b}} {\overline {\mathrm {b}}}} \, {\mathrm {A}}}}$ signal and branching fraction ${{{\mathrm {A}}}} \to {{{\tau}\, {\tau}}} $, obtained for the ${{{\mathrm {e}}\, {\tau}_\mathrm {h}}} $ (left) and ${{{{\mu}}\, {\tau}_\mathrm {h}}} $ (right) channels. The green and yellow bands represent the one and two standard deviation uncertainties in the expected limits. |

png pdf |
Additional Figure 1-a:
Observed (solid) and expected (dashed) limits at 95% confidence level on the product of cross section for the production of the ${{{{\mathrm {b}} {\overline {\mathrm {b}}}} \, {\mathrm {A}}}}$ signal and branching fraction ${{{\mathrm {A}}}} \to {{{\tau}\, {\tau}}} $, obtained for the ${{{\mathrm {e}}\, {\tau}_\mathrm {h}}} $ channel. The green and yellow bands represent the one and two standard deviation uncertainties in the expected limits. |
png pdf |
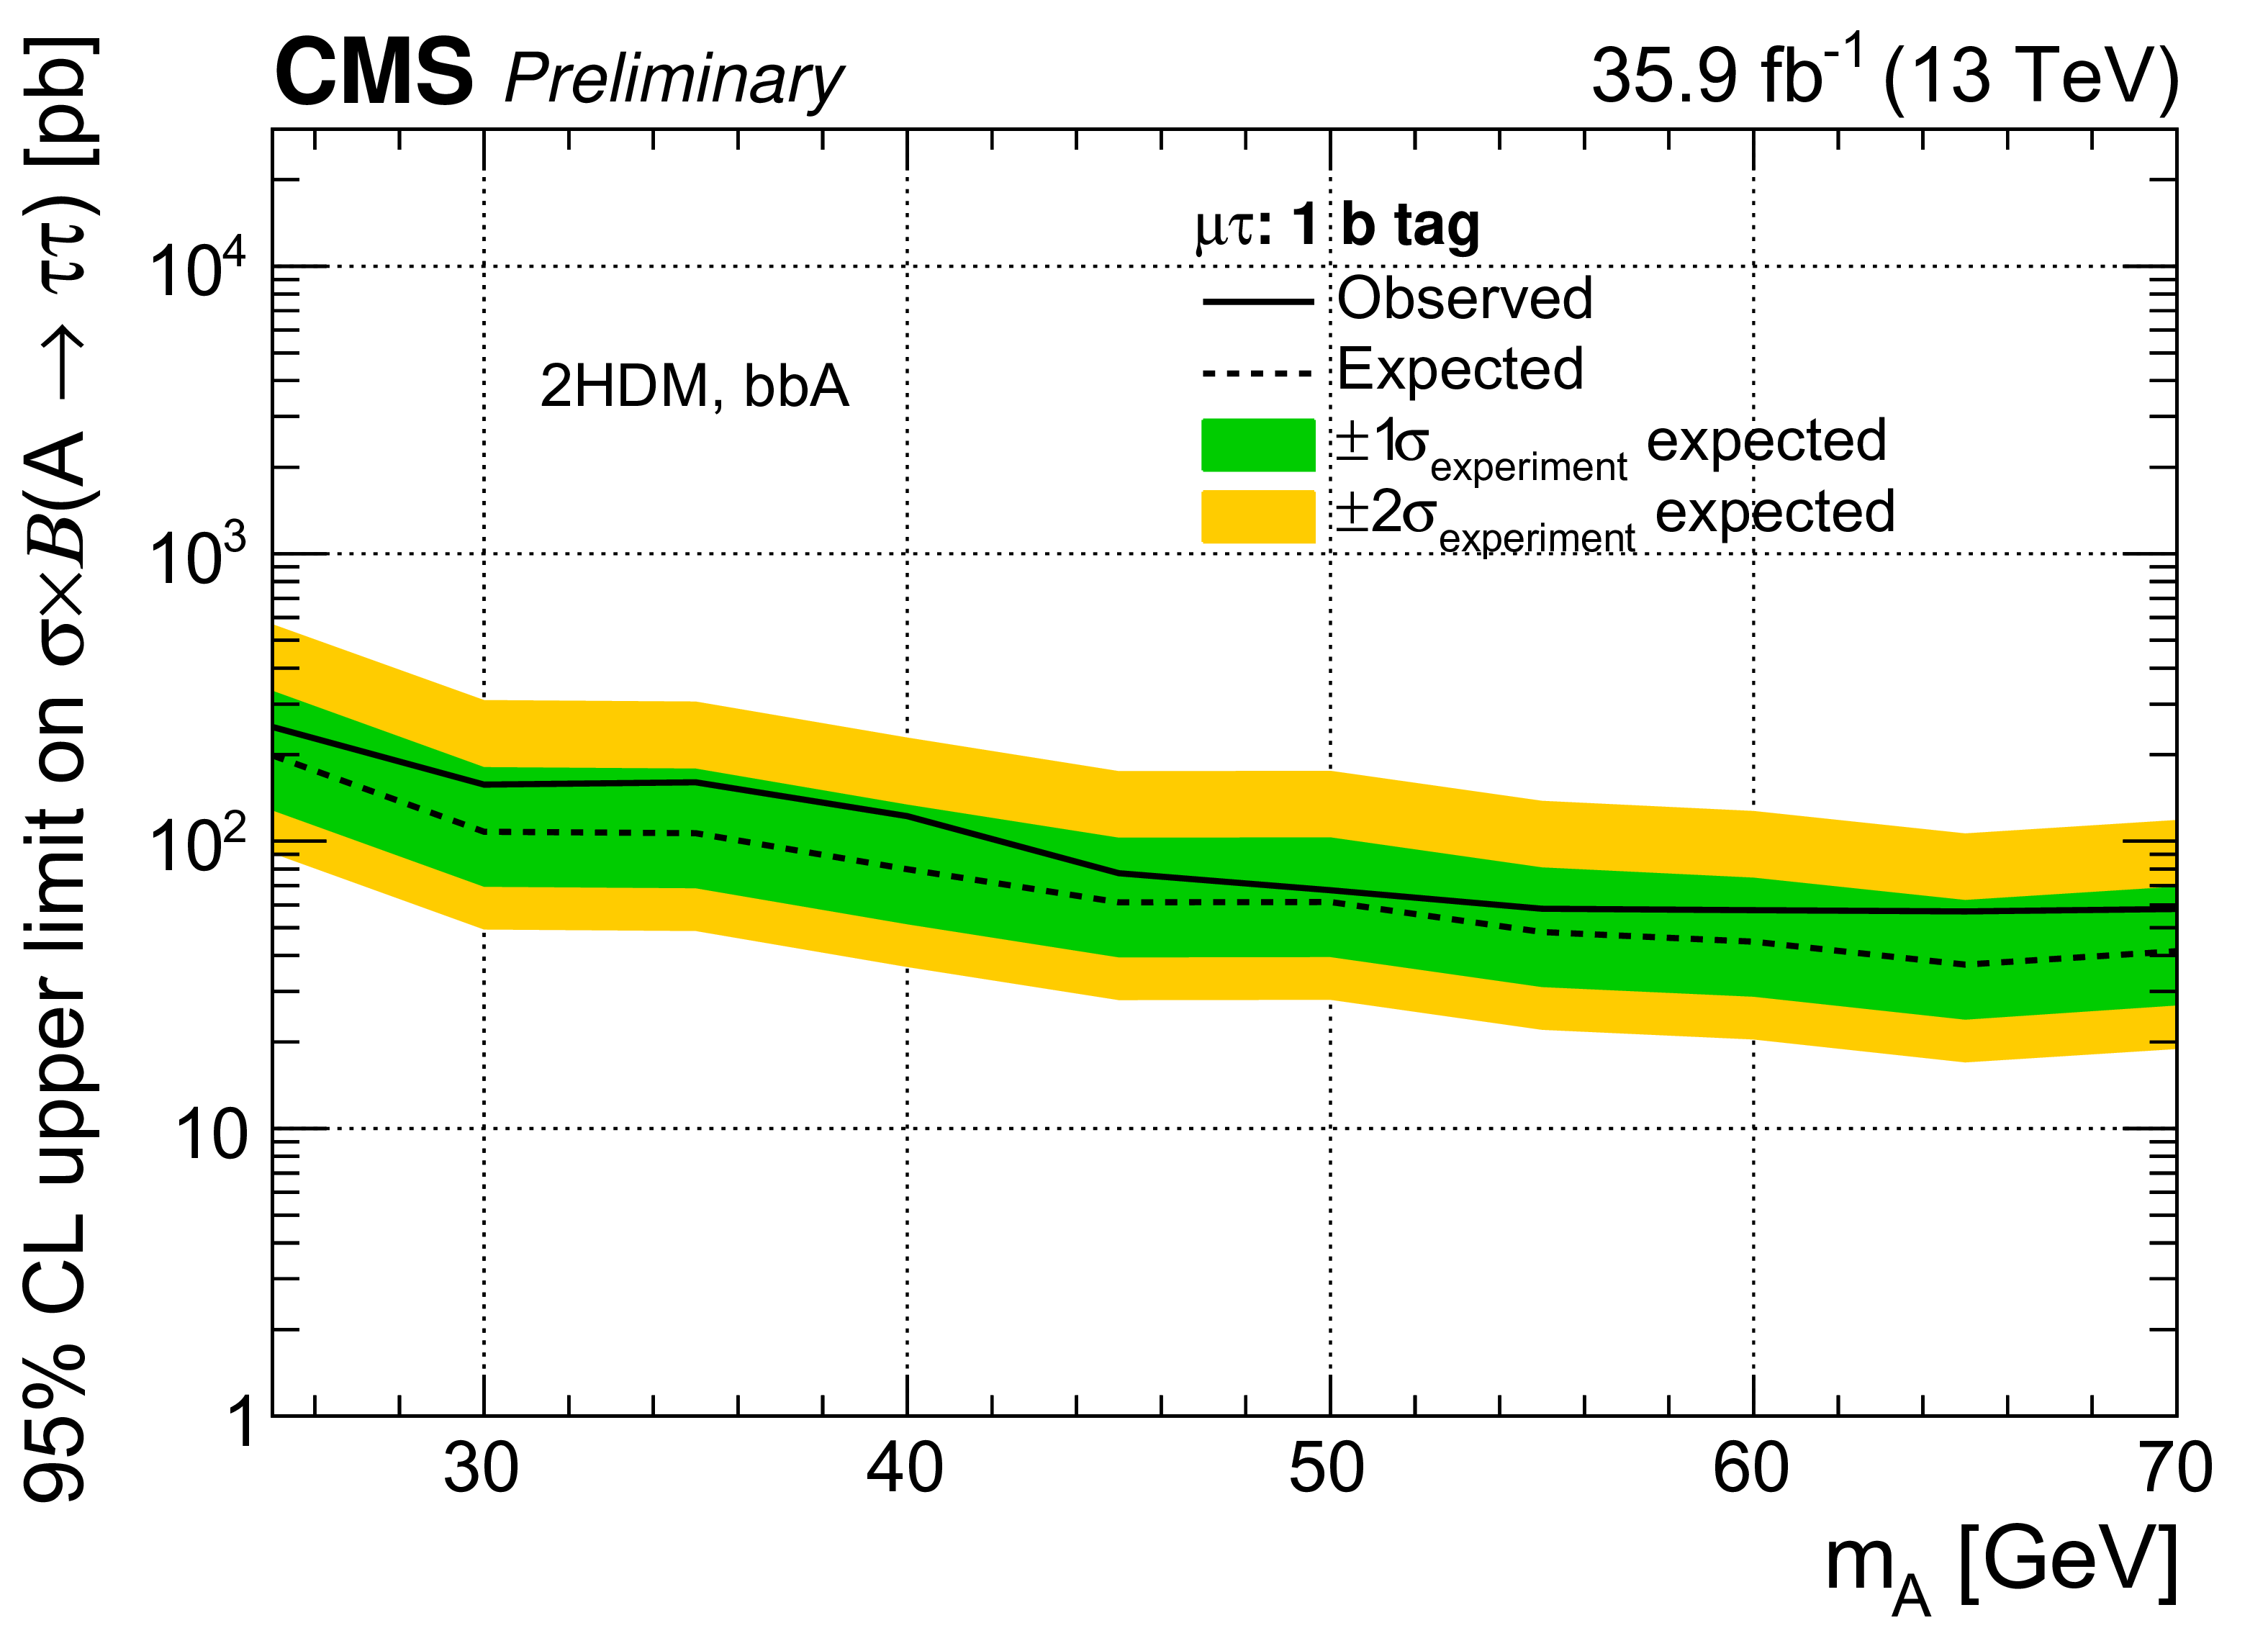
Additional Figure 1-b:
Observed (solid) and expected (dashed) limits at 95% confidence level on the product of cross section for the production of the ${{{{\mathrm {b}} {\overline {\mathrm {b}}}} \, {\mathrm {A}}}}$ signal and branching fraction ${{{\mathrm {A}}}} \to {{{\tau}\, {\tau}}} $, obtained for the ${{{{\mu}}\, {\tau}_\mathrm {h}}} $ channel. The green and yellow bands represent the one and two standard deviation uncertainties in the expected limits. |
png pdf |
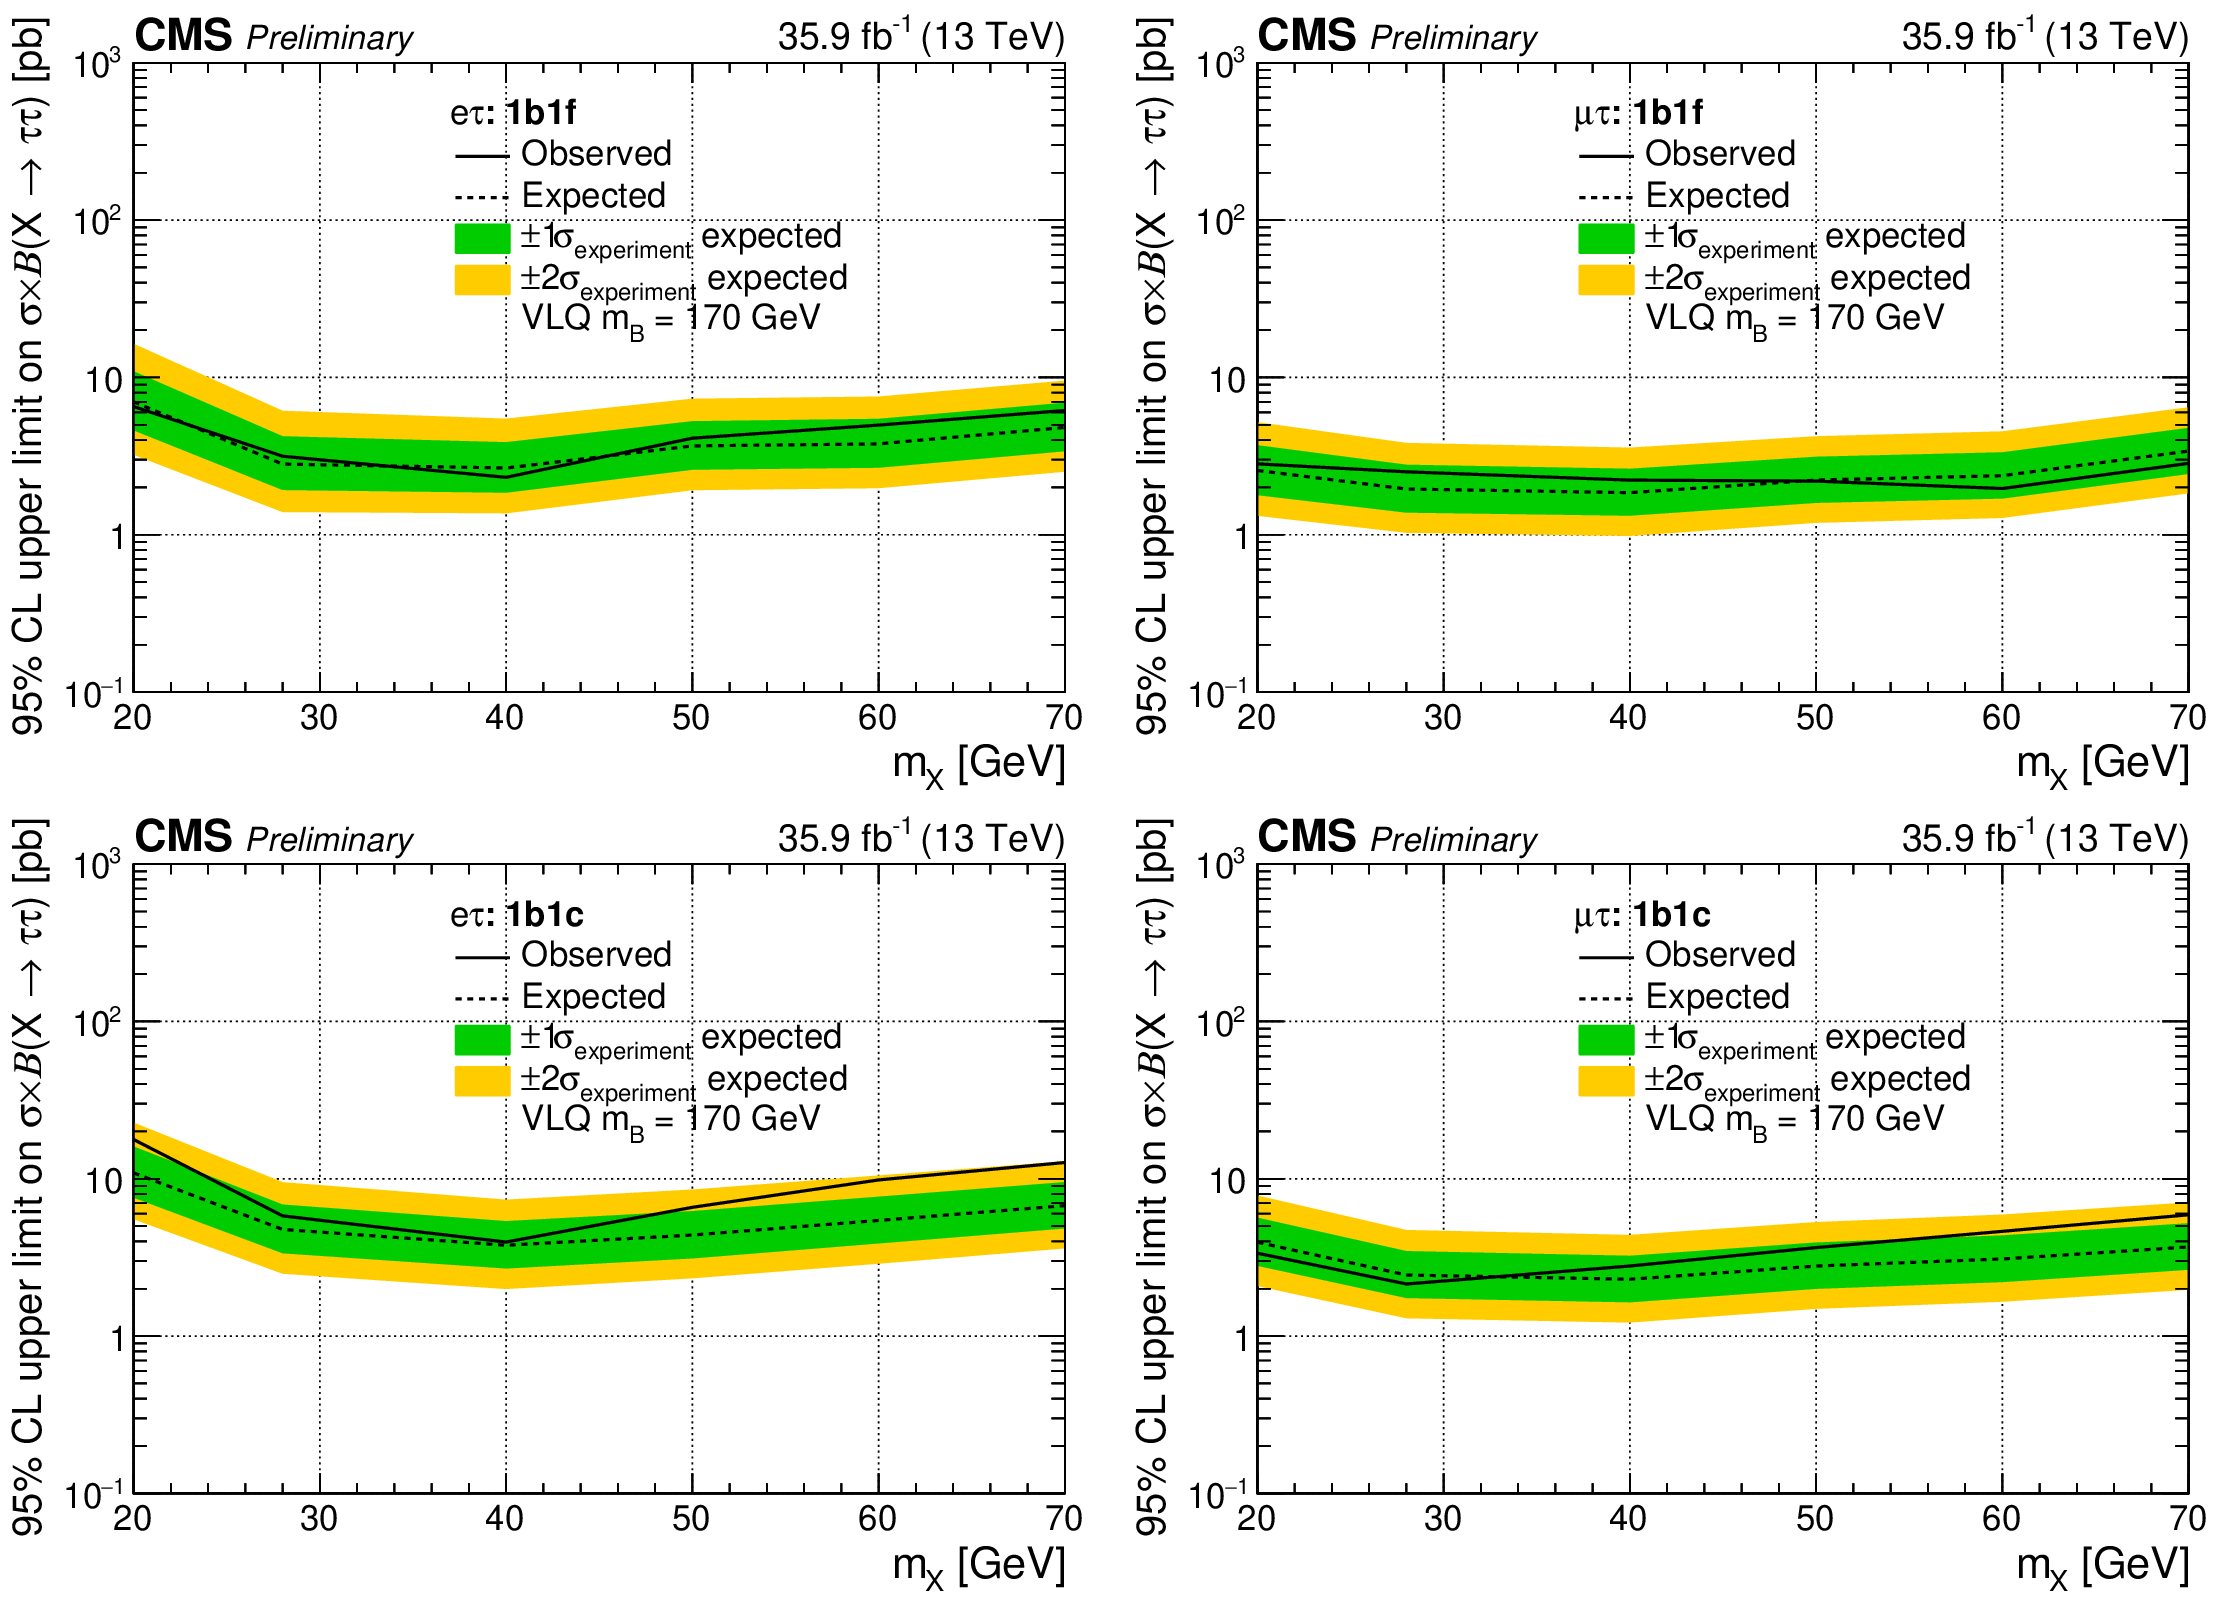
Additional Figure 2:
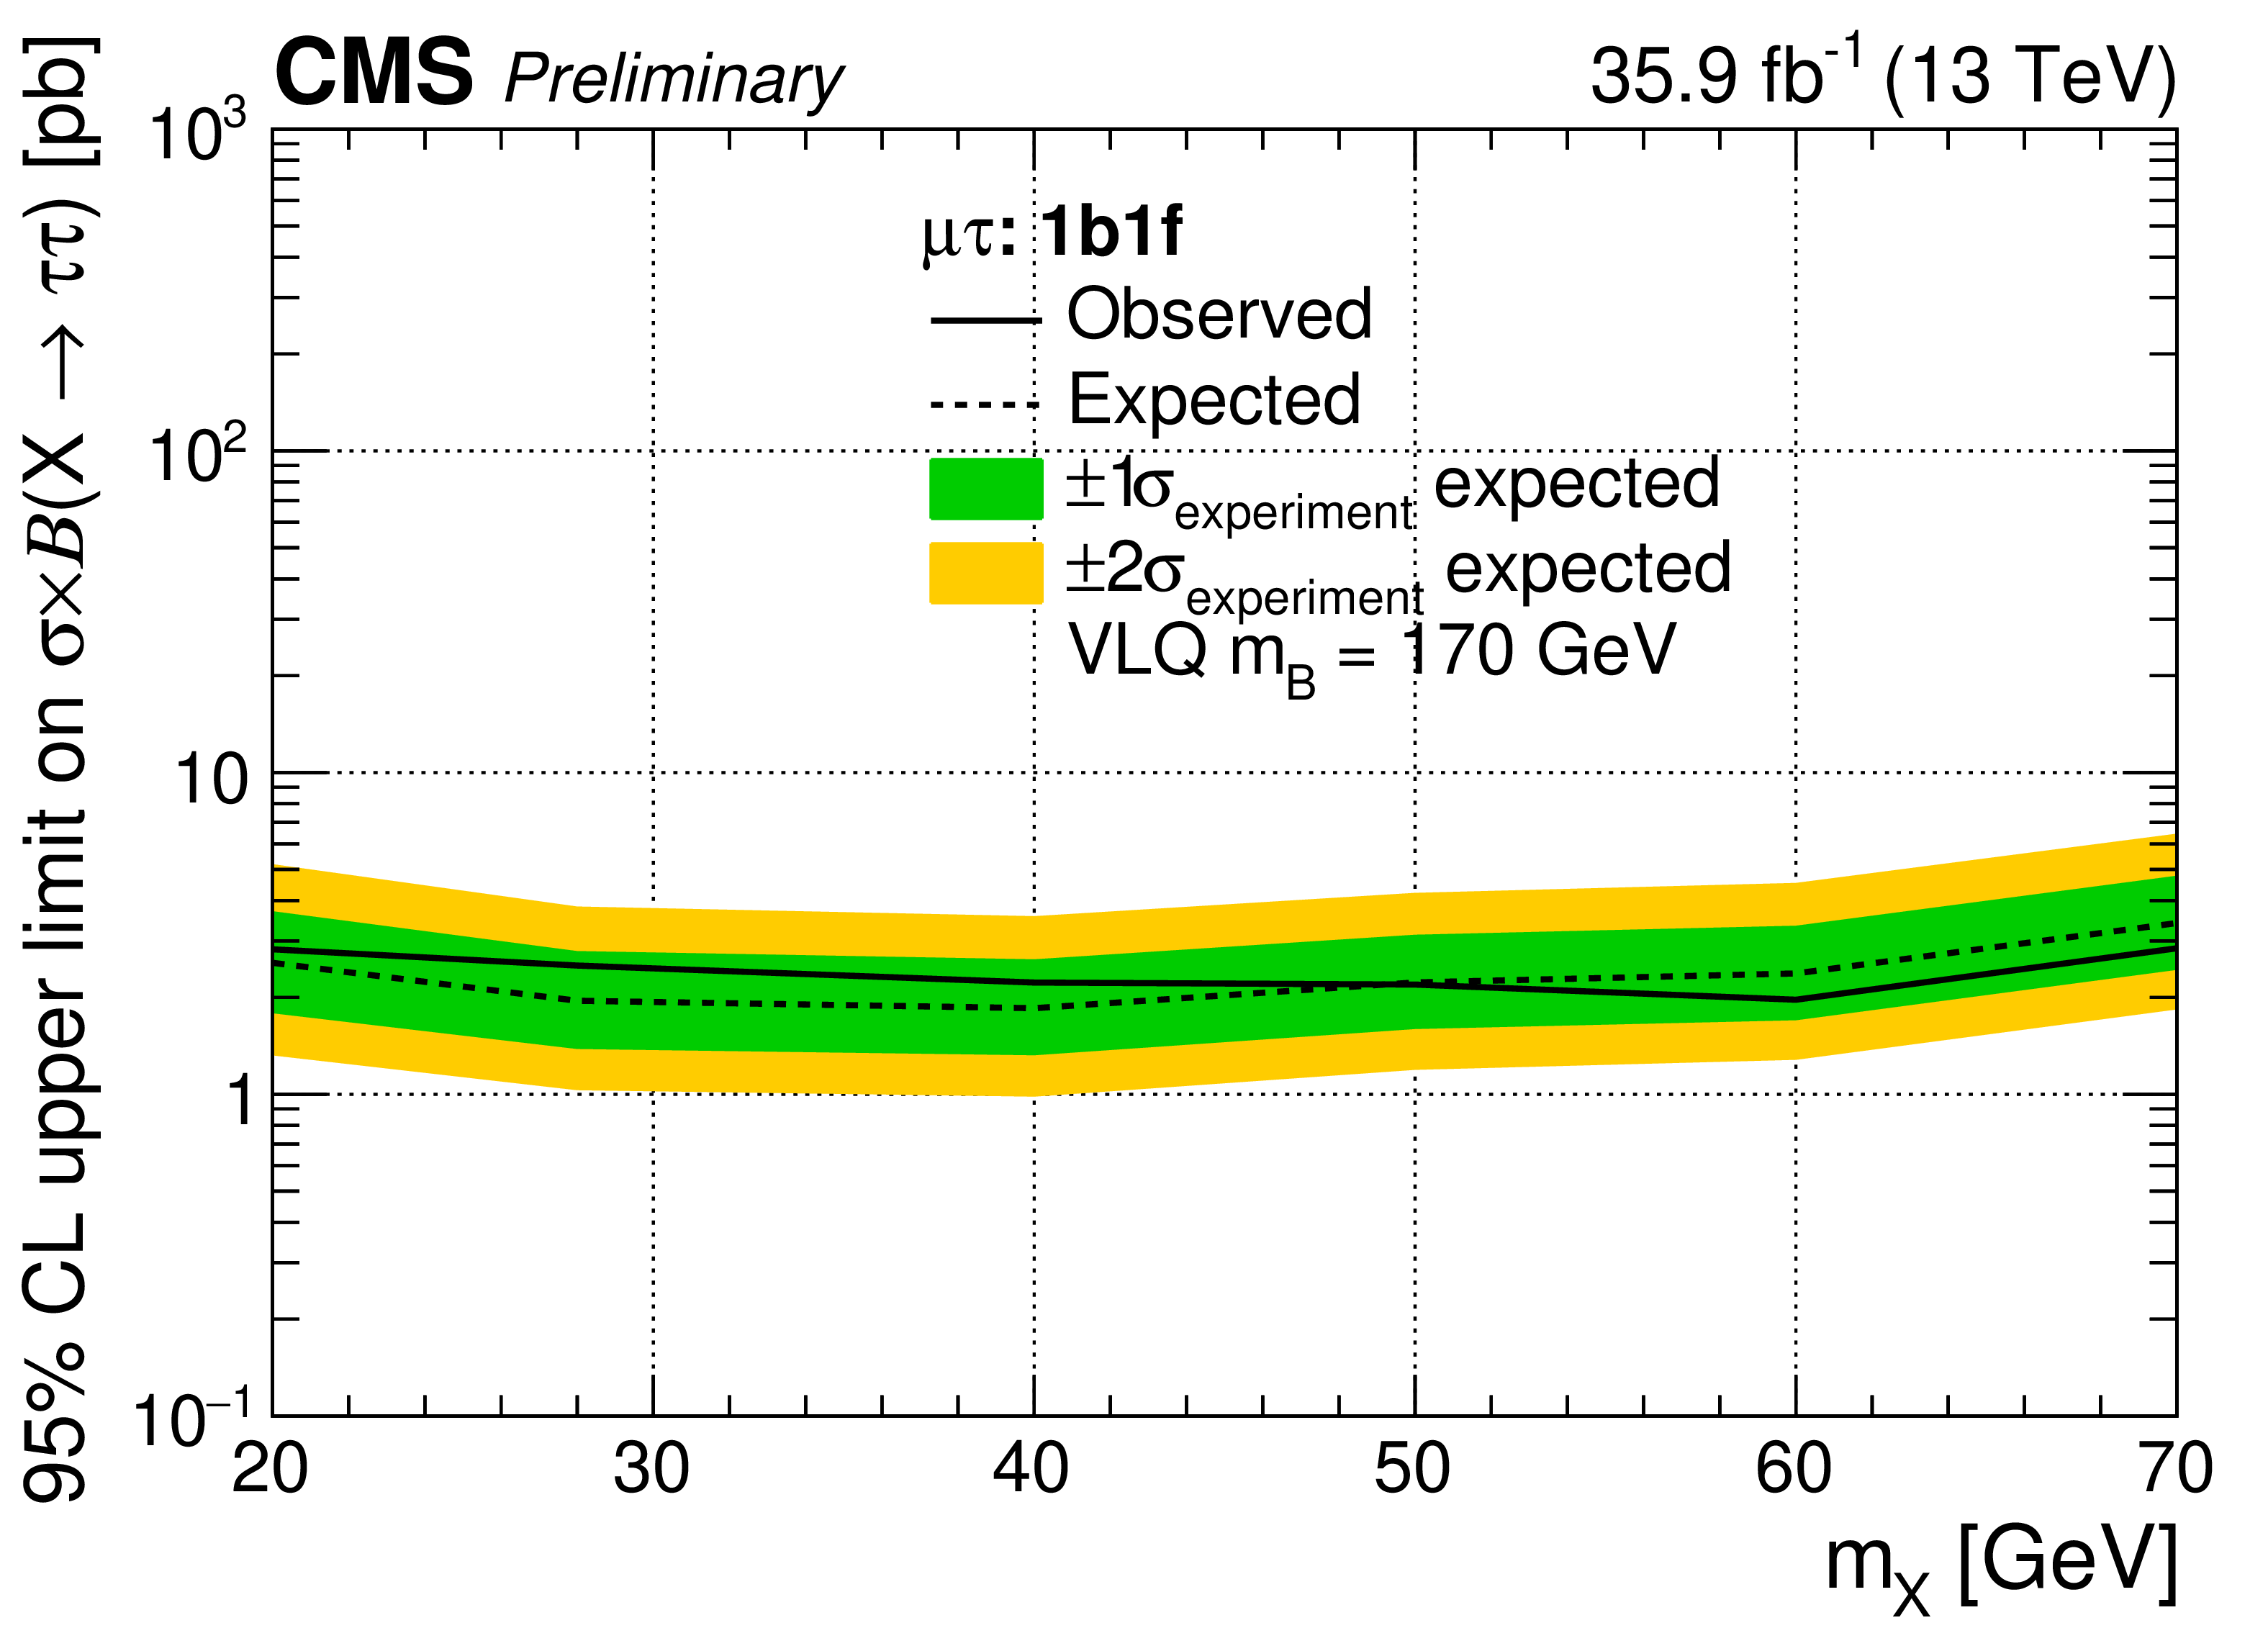
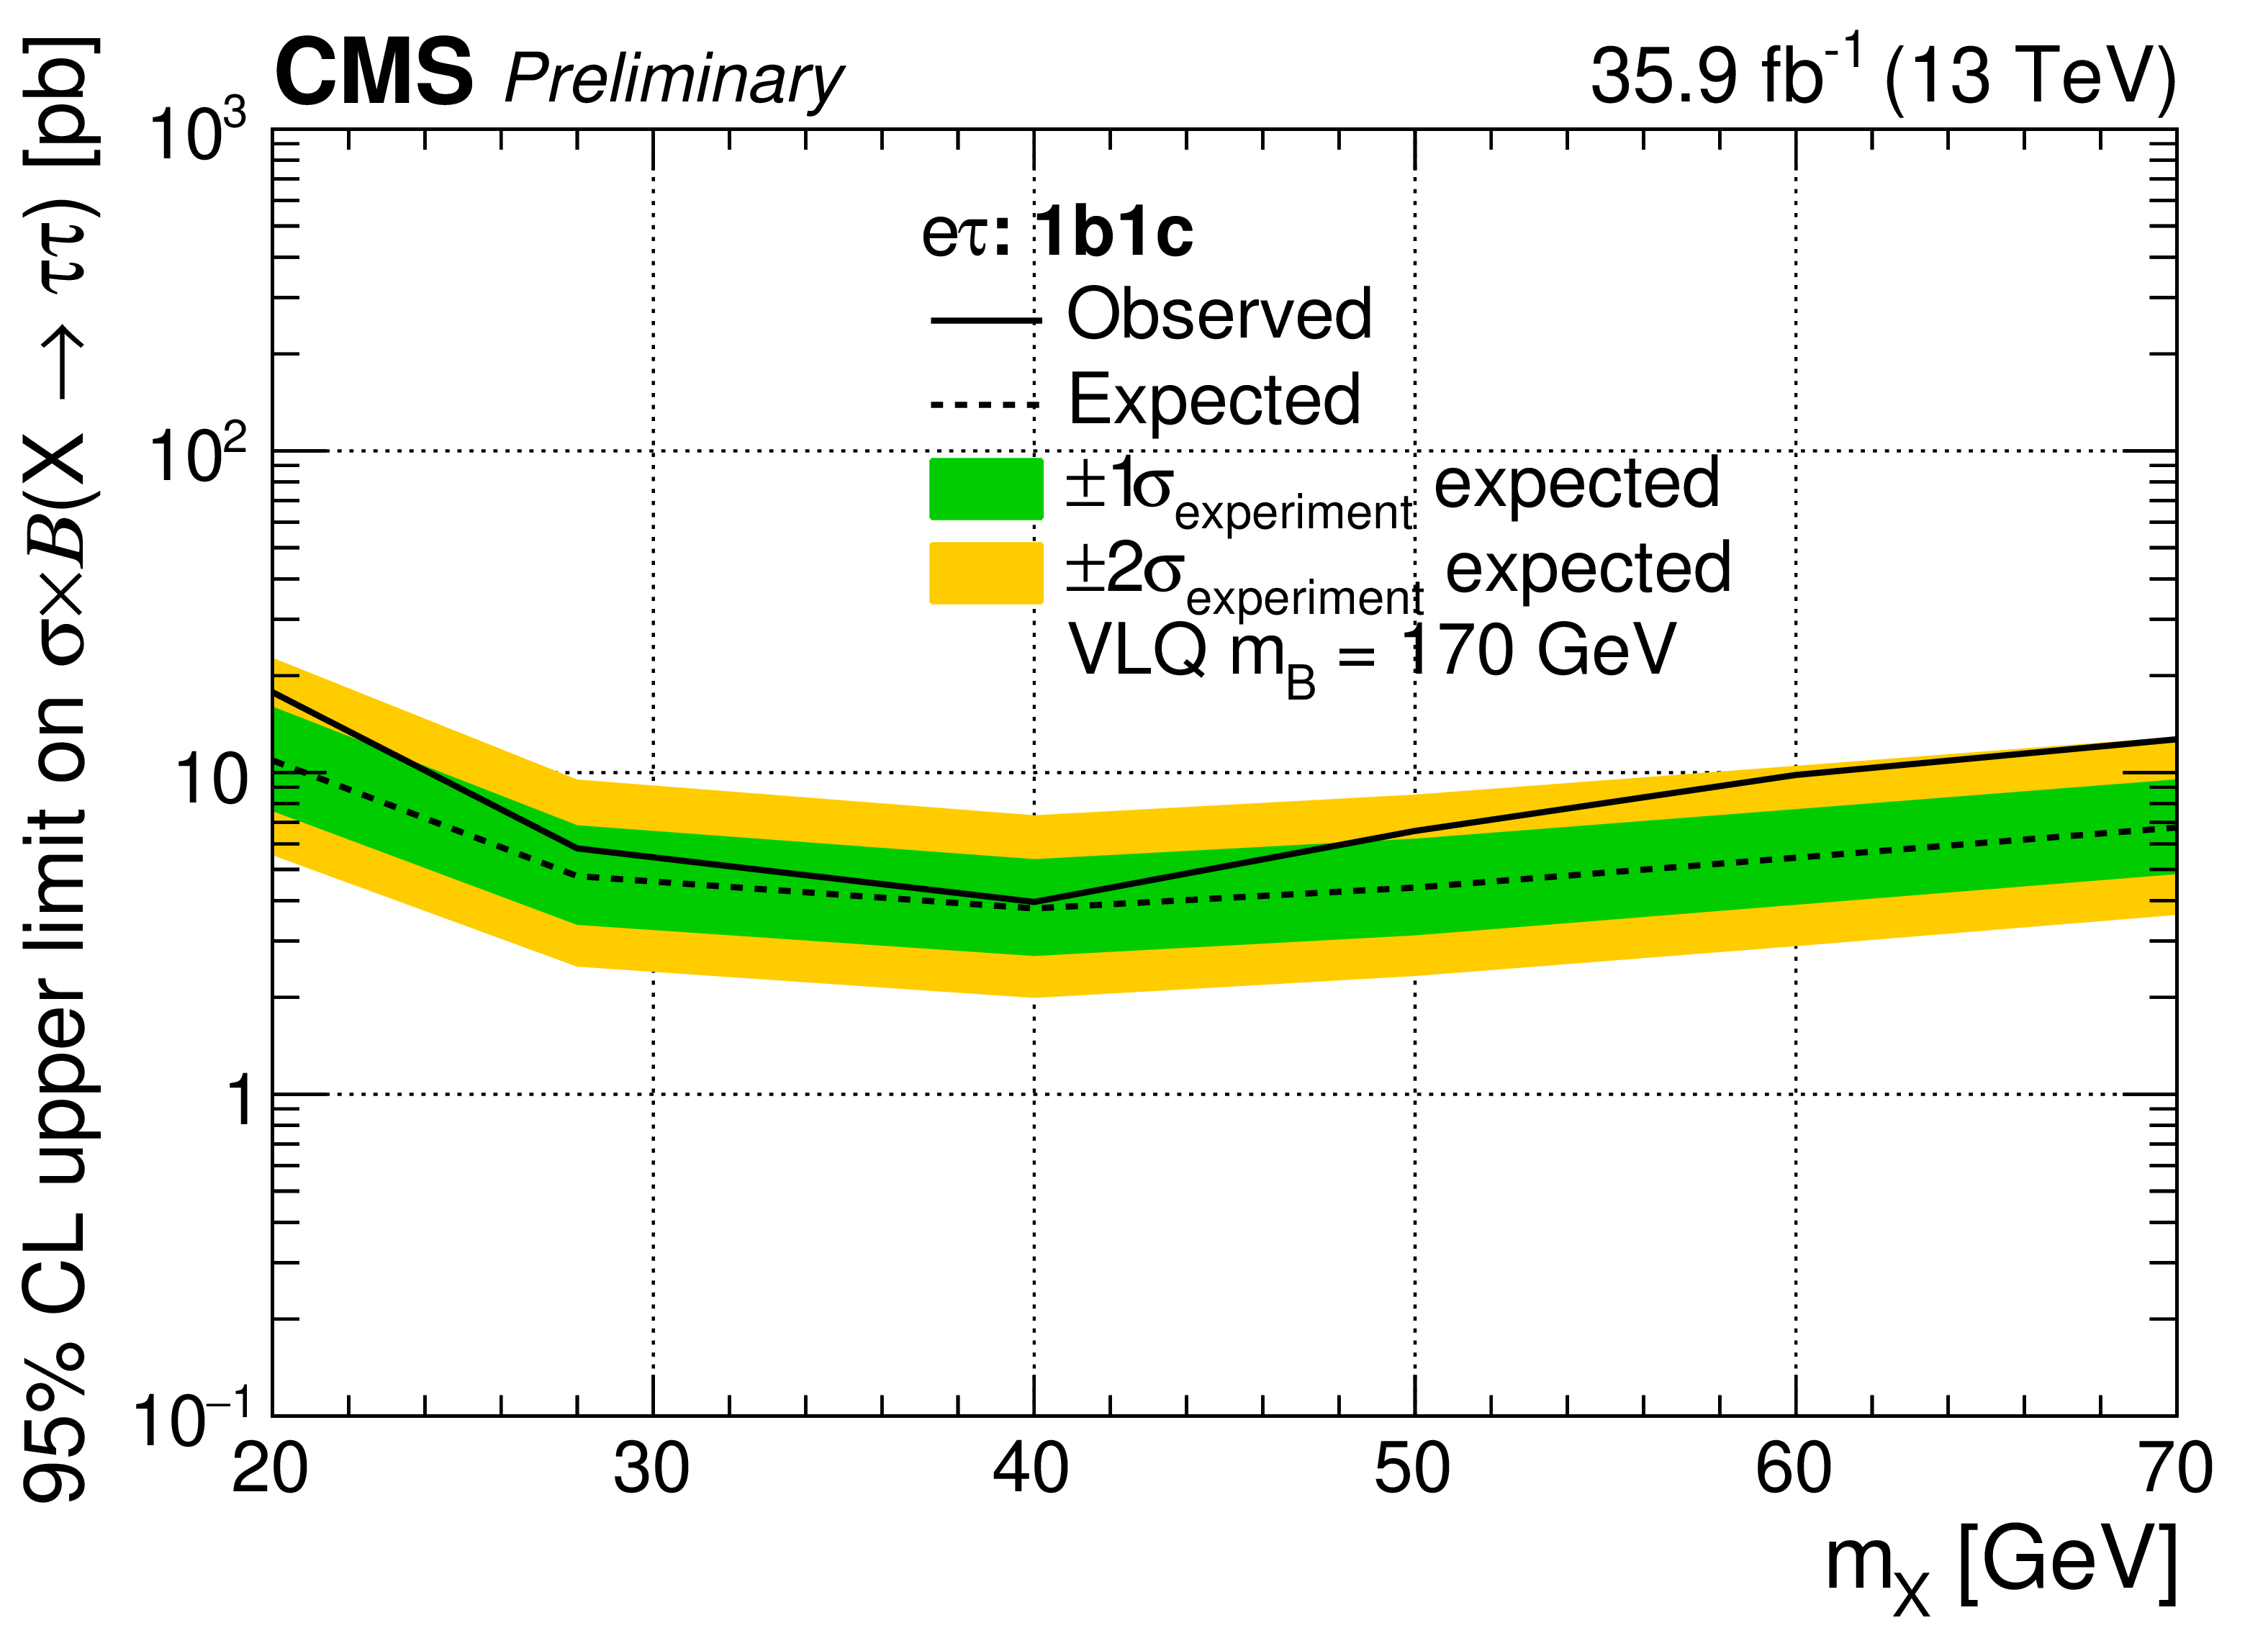
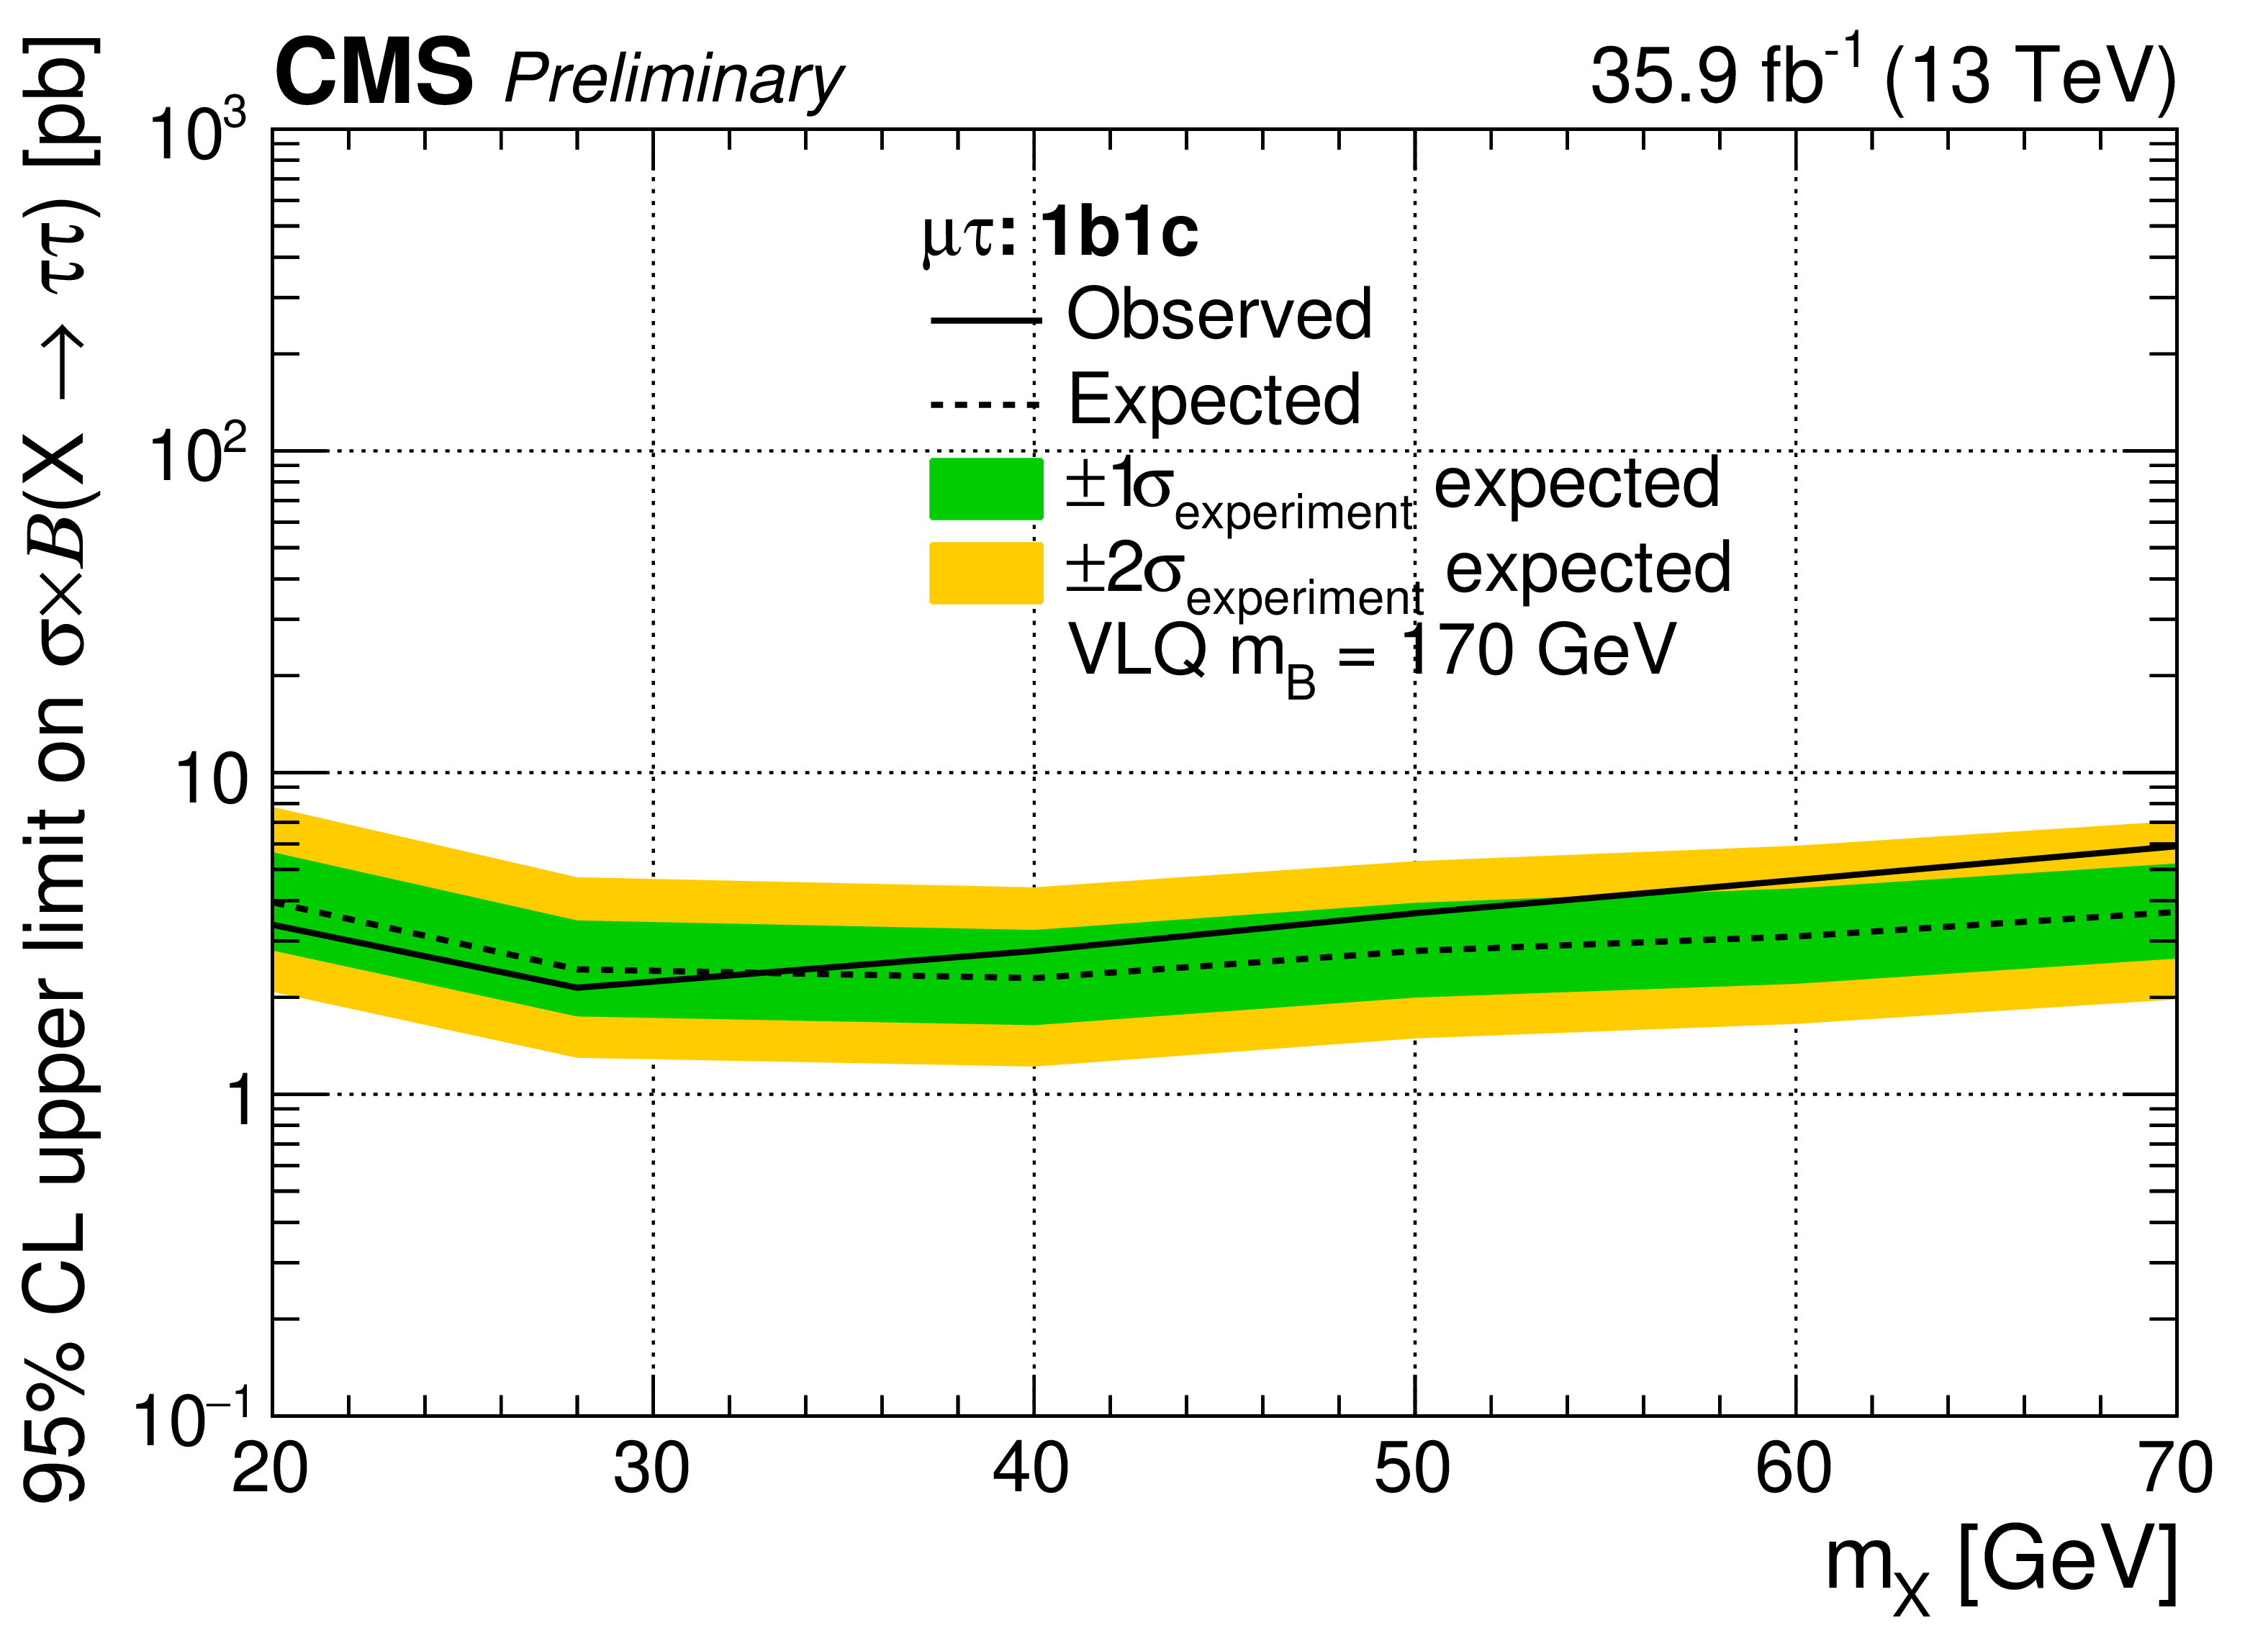
Observed (solid) and expected (dotted) limits at 95% confidence level on the product of cross section for the production of the signal and branching fraction ${{\mathrm {X}}} \to {{{\tau}\, {\tau}}} $, obtained for the ${{{\mathrm {e}}\, {\tau}_\mathrm {h}}} $ (left) and ${{{{\mu}}\, {\tau}_\mathrm {h}}} $ (right) channels in the 1b1f (top) and 1b1c (bottom) categories. The scenario with ${{m_{{{\mathrm {B}}}}}} = $ 170 GeV is considered. The green and yellow bands represent the one and two standard deviation uncertainties in the expected limits. |
png pdf |
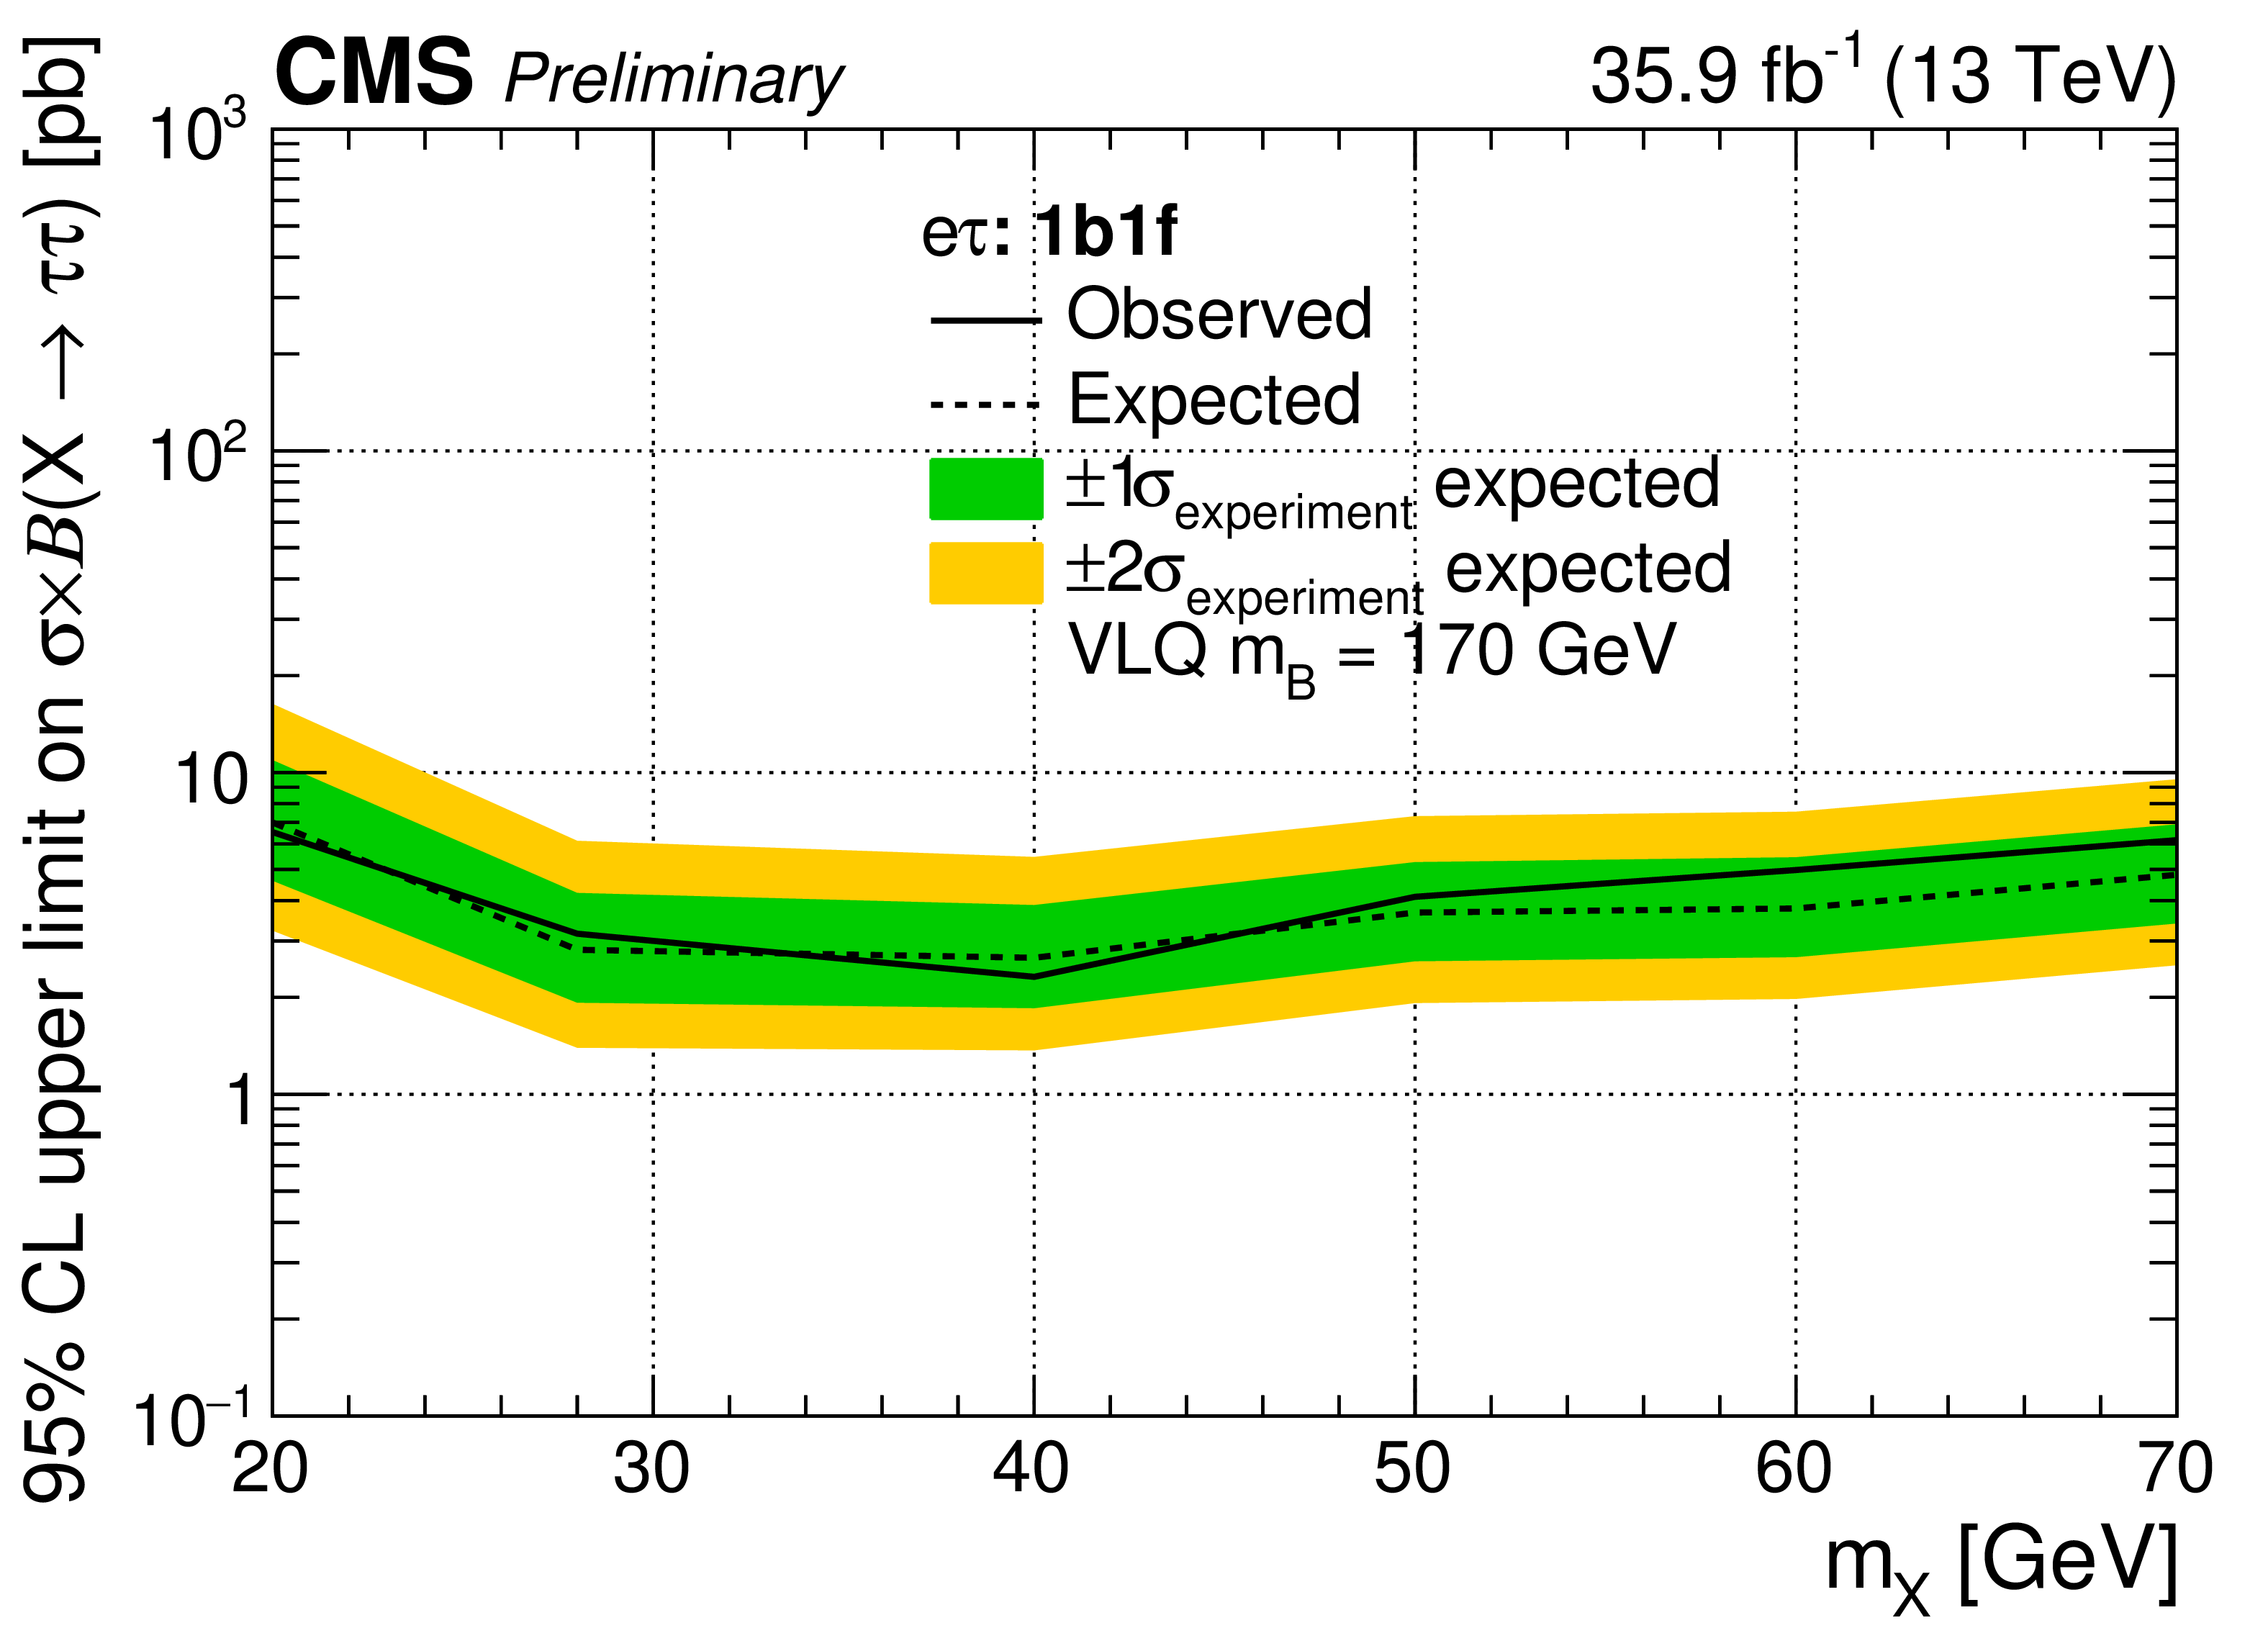
Additional Figure 2-a:
Observed (solid) and expected (dotted) limits at 95% confidence level on the product of cross section for the production of the signal and branching fraction ${{\mathrm {X}}} \to {{{\tau}\, {\tau}}} $, obtained for the ${{{\mathrm {e}}\, {\tau}_\mathrm {h}}} $ channel in the 1b1f category. The scenario with ${{m_{{{\mathrm {B}}}}}} = $ 170 GeV is considered. The green and yellow bands represent the one and two standard deviation uncertainties in the expected limits. |
png pdf |
Additional Figure 2-b:
Observed (solid) and expected (dotted) limits at 95% confidence level on the product of cross section for the production of the signal and branching fraction ${{\mathrm {X}}} \to {{{\tau}\, {\tau}}} $, obtained for the ${{{{\mu}}\, {\tau}_\mathrm {h}}} $ channel in the 1b1f category. The scenario with ${{m_{{{\mathrm {B}}}}}} = $ 170 GeV is considered. The green and yellow bands represent the one and two standard deviation uncertainties in the expected limits. |
png pdf |
Additional Figure 2-c:
Observed (solid) and expected (dotted) limits at 95% confidence level on the product of cross section for the production of the signal and branching fraction ${{\mathrm {X}}} \to {{{\tau}\, {\tau}}} $, obtained for the ${{{\mathrm {e}}\, {\tau}_\mathrm {h}}} $ channel in the 1b1c category. The scenario with ${{m_{{{\mathrm {B}}}}}} = $ 170 GeV is considered. The green and yellow bands represent the one and two standard deviation uncertainties in the expected limits. |
png pdf |
Additional Figure 2-d:
Observed (solid) and expected (dotted) limits at 95% confidence level on the product of cross section for the production of the signal and branching fraction ${{\mathrm {X}}} \to {{{\tau}\, {\tau}}} $, obtained for the ${{{{\mu}}\, {\tau}_\mathrm {h}}} $ channel in the 1b1c category. The scenario with ${{m_{{{\mathrm {B}}}}}} = $ 170 GeV is considered. The green and yellow bands represent the one and two standard deviation uncertainties in the expected limits. |
| Additional Tables | |
png pdf |
Additional Table 1:
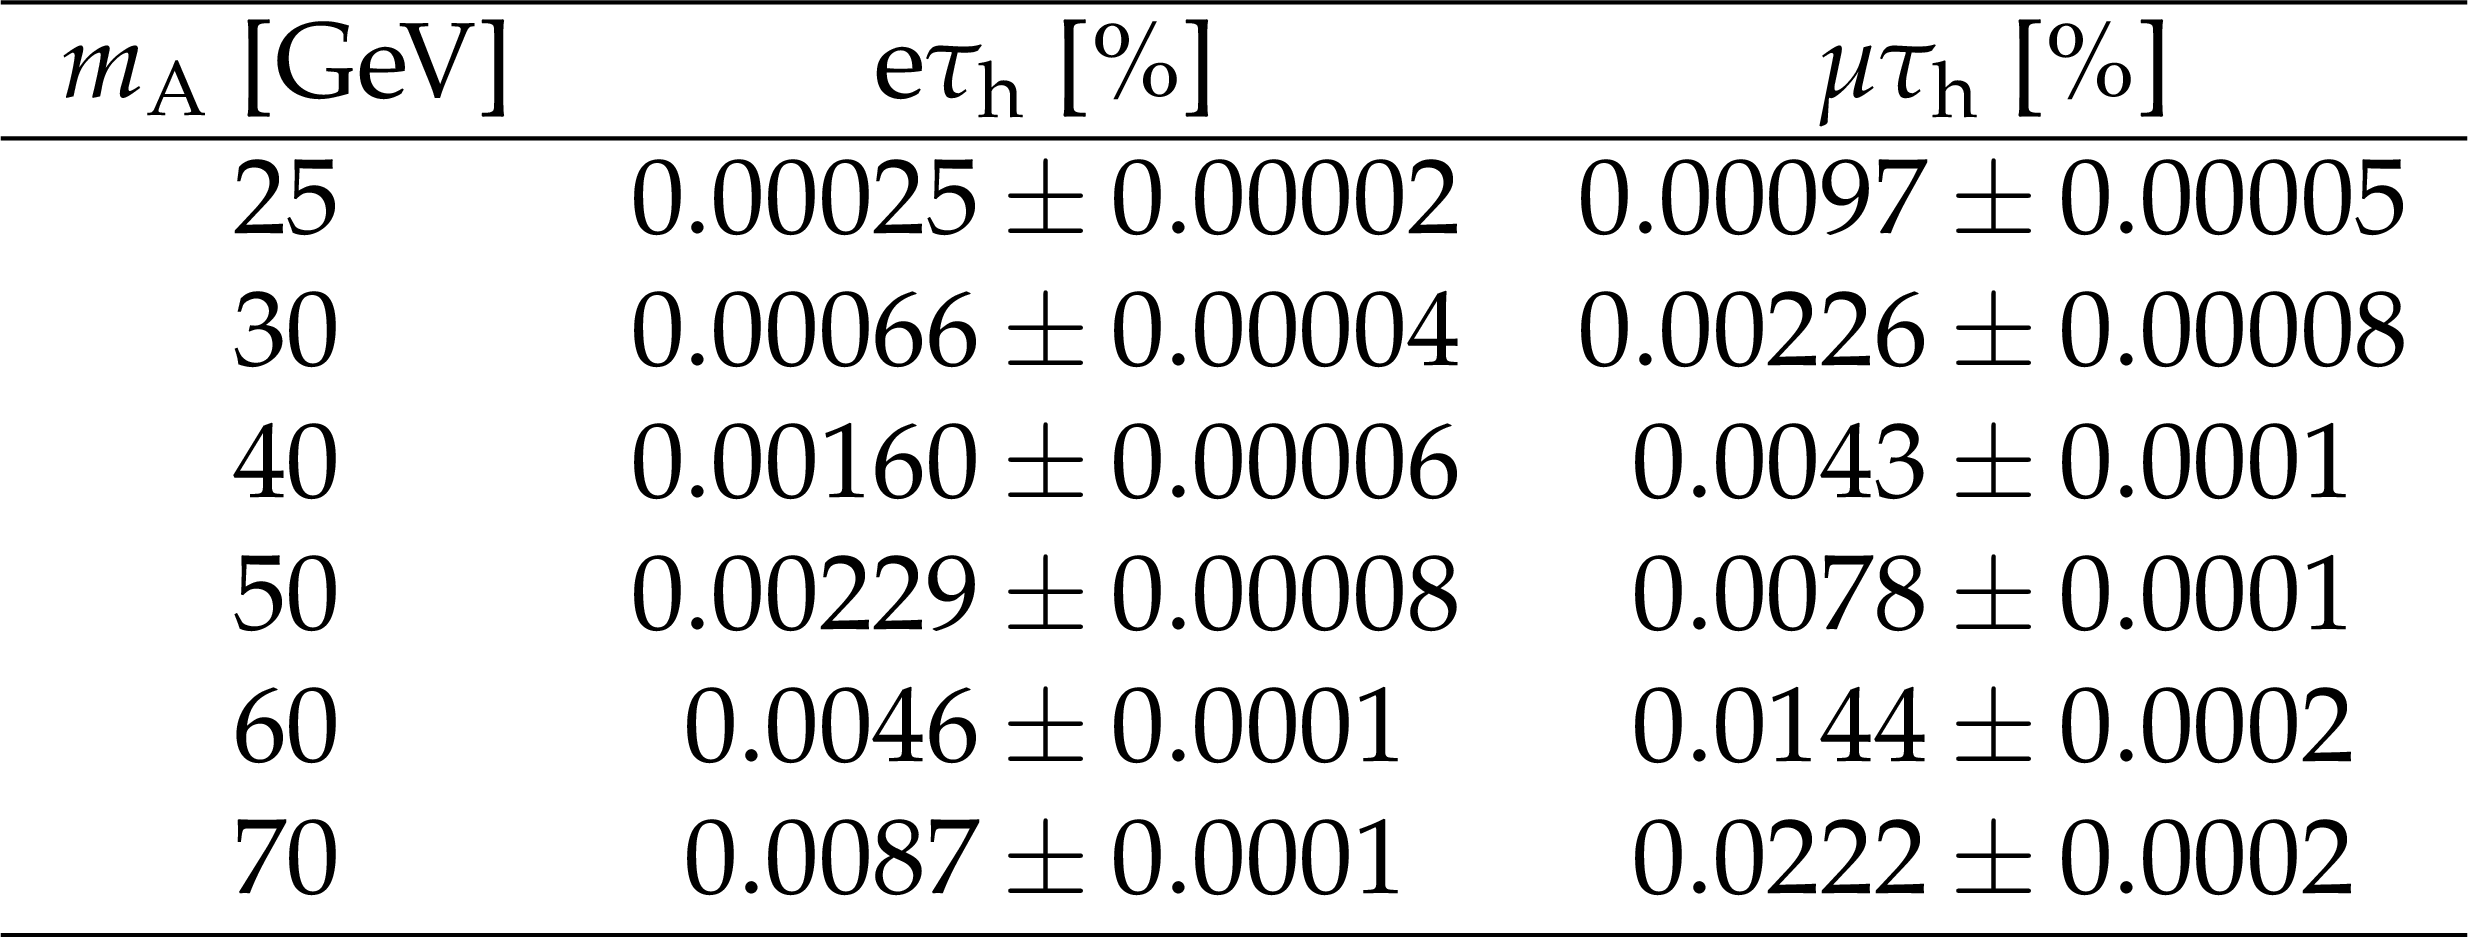
The product of acceptance, efficiency, and branching fraction of the ${{{{\mathrm {b}} {\overline {\mathrm {b}}}} \, {\mathrm {A}}}} $ signal with ${{{\mathrm {A}}}} \to {{{\tau}\, {\tau}}} $ in the ${{{{\mu}}\, {\tau}_\mathrm {h}}} $ and ${{{\mathrm {e}}\, {\tau}_\mathrm {h}}} $ channels of the 1 b tag category, for different A boson mass values. The selections are as described in Section 5. The uncertainty refers to the statistical uncertainty only. |
png pdf |
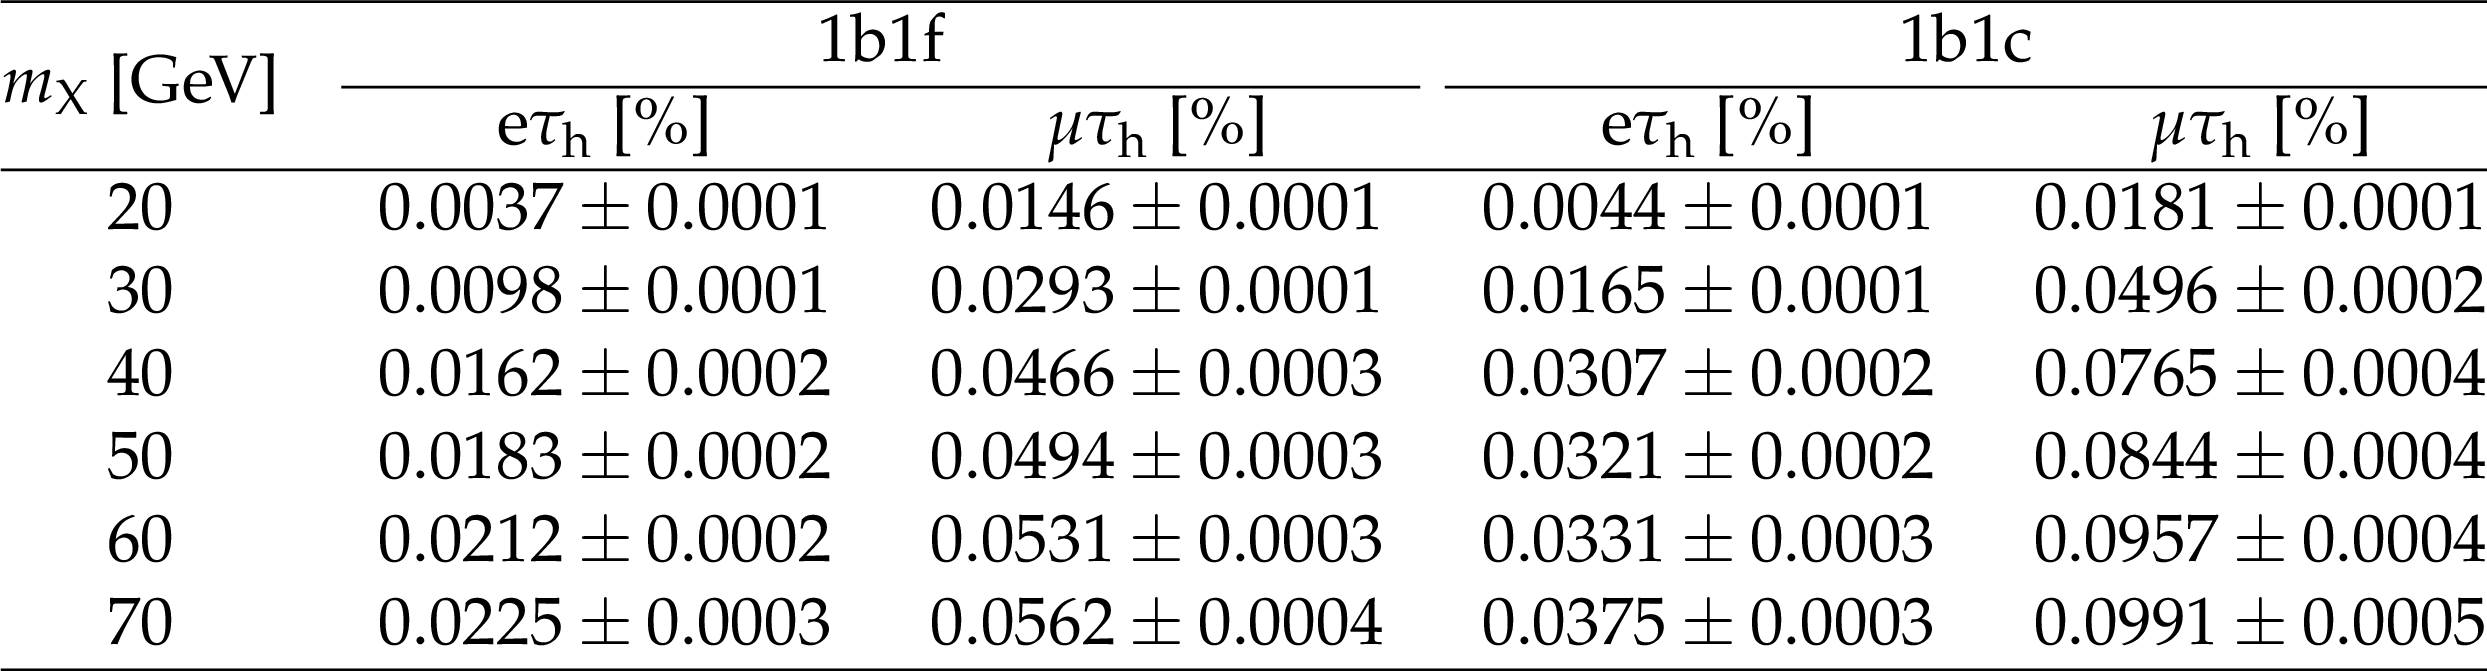
Additional Table 2:
The product of acceptance, efficiency, and branching fraction of the signal with ${{\mathrm {X}} }\to {{{\tau}\, {\tau}}} $ in the ${{{{\mu}}\, {\tau}_\mathrm {h}}} $ and ${{{\mathrm {e}}\, {\tau}_\mathrm {h}}} $ channels of the 1b1f and 1b1f categories, for different X boson mass values. The selections are as described in Section 5. The uncertainty refers to the statistical uncertainty only. |
| References | ||||
| 1 | ATLAS Collaboration | Observation of a new particle in the search for the Standard Model Higgs boson with the ATLAS detector at the LHC | PLB 716 (2012) 1 | 1207.7214 |
| 2 | CMS Collaboration | Observation of a new boson at a mass of 125 GeV with the CMS experiment at the LHC | PLB 716 (2012) 30 | CMS-HIG-12-028 1207.7235 |
| 3 | CMS Collaboration | Observation of a new boson with mass near 125 GeV in pp collisions at $ \sqrt{s} = $ 7 and 8 TeV | JHEP 06 (2013) 081 | CMS-HIG-12-036 1303.4571 |
| 4 | S. Weinberg | A Model of Leptons | PRL 19 (1967) 1264 | |
| 5 | F. Englert and R. Brout | Broken symmetry and the mass of gauge vector mesons | PRL 13 (1964) 321 | |
| 6 | P. Higgs | Broken symmetries and the masses of gauge bosons | PRL 13 (1964) 508 | |
| 7 | ATLAS Collaboration | Measurement of the Higgs boson mass from the $ \mathrm{H}\rightarrow \gamma\gamma $ and $ \mathrm{H}\rightarrow \mathrm{Z}\mathrm{Z}^* \rightarrow 4\ell $ channels in pp collisions at center-of-mass energies 7 and 8 TeV with the ATLAS detector | PRD 90 (2014) 052004 | 1406.3827 |
| 8 | CMS Collaboration | Precise determination of the mass of the Higgs boson and tests of compatibility of its couplings with the standard model predictions using proton collisions at 7 and 8 TeV | EPJC 75 (2015) 212 | CMS-HIG-14-009 1412.8662 |
| 9 | J. Wess and B. Zumino | Supergauge transformations in four dimensions | NPB 70 (1974) 39 | |
| 10 | H.-C. Cheng and I. Low | TeV symmetry and the little hierarchy problem | JHEP 09 (2003) 051 | hep-ph/0308199 |
| 11 | T. Appelquist, H.-C. Cheng, and B. A. Dobrescu | Bounds on universal extra dimensions | PRD 64 (2001) 035002 | hep-ph/0012100 |
| 12 | G. Bertone, D. Hooper, and J. Silk | Particle dark matter: evidence, candidates and constraints | PR 405 (2005) 279 | hep-ph/0404175 |
| 13 | T. D. Lee | A Theory of Spontaneous T Violation | PRD 8 (1973) 1226 | |
| 14 | N. G. Deshpande and E. Ma | Pattern of Symmetry Breaking with Two Higgs Doublets | PRD 18 (1978) 2574 | |
| 15 | H. E. Haber, G. L. Kane, and T. Sterling | The fermion mass scale and possible effects of higgs bosons on experimental observables | NPB 161 (1979) 493 | |
| 16 | G. C. Branco et al. | Theory and phenomenology of two-Higgs-doublet models | PR 516 (2012) 1 | 1106.0034 |
| 17 | J. F. Gunion, H. E. Haber, G. L. Kane, and S. Dawson | The Higgs Hunter's Guide | volume 80 of Frontiers in Physics Perseus Books | |
| 18 | CMS Collaboration | Search for a light pseudoscalar Higgs boson produced in association with bottom quarks in pp collisions at $ \sqrt{s}= $ 8 TeV | JHEP 11 (2017) | CMS-HIG-15-009 1707.07283 |
| 19 | CMS Collaboration | Search for light bosons in decays of the 125 GeV Higgs boson in proton-proton collisions at $ \sqrt{s}= $ 8 TeV | JHEP 10 (2017) 076 | CMS-HIG-16-015 1701.02032 |
| 20 | ATLAS Collaboration | Search for Higgs bosons decaying to $ aa $ in the $ \mu\mu\tau\tau $ final state in $ pp $ collisions at $ \sqrt{s} = $ 8 TeV with the ATLAS experiment | PRD 92 (2015) 052002 | 1505.01609 |
| 21 | CMS Collaboration | Search for an exotic decay of the Higgs boson to a pair of light pseudoscalars in the final state of two muons and two $ \tau $ leptons in proton-proton collisions at $ \sqrt{s}= $ 13 TeV | JHEP 11 (2018) 018 | CMS-HIG-17-029 1805.04865 |
| 22 | CMS Collaboration | Search for an exotic decay of the Higgs boson to a pair of light pseudoscalars in the final state with two b quarks and two $ \tau $ leptons in proton-proton collisions at $ \sqrt{s}= $ 13 TeV | PLB 785 (2018) 462 | CMS-HIG-17-024 1805.10191 |
| 23 | J. A. Aguilar-Saavedra, R. Benbrik, S. Heinemeyer, and M. P\'erez-Victoria | Handbook of vectorlike quarks: Mixing and single production | PRD 88 (2013) 094010 | 1306.0572 |
| 24 | P. W. Graham, A. Ismail, S. Rajendran, and P. Saraswat | Little solution to the little hierarchy problem: A vectorlike generation | PRD 81 (2010) 055016 | 0910.3020 |
| 25 | A. Angelescu, A. Djouadi, and G. Moreau | Vector-like top/bottom quark partners and Higgs physics at the LHC | EPJC 76 (2016) 99 | 1510.07527 |
| 26 | Y. Okada and L. Panizzi | LHC signatures of vector-like quarks | Adv. High Energy Phys. 2013 (2013) 364936 | 1207.5607 |
| 27 | J. S. Matthew and K. M. Zurek | Echoes of a hidden valley at hadron colliders | PLB 651 (2007) 374 | 0604261 |
| 28 | T. Han, Z. Si, K. M. Zurek, and M. J. Strassler | Phenomenology of hidden valleys at hadron colliders | JHEP 07 (2008) 008 | 0712.2041 |
| 29 | K. Kong, H. S. Lee, and M. Park | Dark decay of the top quark | PRD 89 (2014) 074007 | 1401.5020 |
| 30 | W. Altmannshofer, S. Gori, S. Profumo, and F. S. Queiroz | Explaining dark matter and b decay anomalies with an $ l_\mu - l_\tau $ model | JHEP 12 (2016) 106 | 1609.04026 |
| 31 | M. Abdullah et al. | Bottom-quark fusion processes at the LHC for probing Z$ ^{'} $ models and $ B $-meson decay anomalies | PRD 97 (2018) 075035 | 1707.07016 |
| 32 | S. Jung, H. Murayama, A. Pierce, and J. D. Wells | Top quark forward-backward asymmetry from new $ t $-channel physics | PRD 81 (2010) 015004 | hep-ph/0604261 |
| 33 | CMS Collaboration | Search for resonances in the mass spectrum of muon pairs produced in association with b quark jets in proton-proton collisions at $ \sqrt{s} = $ 8 and 13 TeV | JHEP 11 (2018) 161 | CMS-HIG-16-017 1808.01890 |
| 34 | CMS Collaboration | The CMS trigger system | JINST 12 (2017), no. 01, P01020 | CMS-TRG-12-001 1609.02366 |
| 35 | CMS Collaboration | The CMS experiment at the CERN LHC | JINST 3 (2008) S08004 | CMS-00-001 1510.07488 |
| 36 | J. Alwall et al. | The automated computation of tree-level and next-to-leading order differential cross sections, and their matching to parton shower simulations | JHEP 07 (2014) 079 | 1405.0301 |
| 37 | J. Alwall et al. | Comparative study of various algorithms for the merging of parton showers and matrix elements in hadronic collisions | EPJC 53 (2008) 473 | 0706.2569 |
| 38 | R. Frederix and S. Frixione | Merging meets matching in MC@NLO | JHEP 12 (2012) 061 | 1209.6215 |
| 39 | P. Nason | A new method for combining NLO QCD with shower Monte Carlo algorithms | JHEP 11 (2004) 040 | hep-ph/0409146 |
| 40 | S. Frixione, P. Nason, and C. Oleari | Matching NLO QCD computations with Parton Shower simulations: the POWHEG method | JHEP 11 (2007) 070 | 0709.2092 |
| 41 | S. Alioli, P. Nason, C. Oleari, and E. Re | A general framework for implementing NLO calculations in shower Monte Carlo programs: the POWHEG BOX | JHEP 06 (2010) 043 | 1002.2581 |
| 42 | S. Frixione, P. Nason, and G. Ridolfi | A positive-weight next-to-leading-order Monte Carlo for heavy flavour hadroproduction | JHEP 09 (2007) 126 | 0707.3088 |
| 43 | J. M. Campbell, R. K. Ellis, P. Nason, and E. Re | Top-Pair Production and Decay at NLO Matched with Parton Showers | JHEP 04 (2015) 114 | 1412.1828 |
| 44 | S. Alioli, P. Nason, C. Oleari, and E. Re | NLO single-top production matched with shower in POWHEG: $ s $- and $ t $-channel contributions | JHEP 09 (2009) 111 | 0907.4076 |
| 45 | E. Re | Single-top Wt-channel production matched with parton showers using the POWHEG method | EPJC 71 (2011) 1547 | 1009.2450 |
| 46 | Y. Li and F. Petriello | Combining QCD and electroweak corrections to production in FEWZ | PRD 86 (2012) 094034 | 1208.5967 |
| 47 | M. Czakon and A. Mitov | Top++: A Program for the Calculation of the Top-Pair Cross-Section at Hadron Colliders | CPC 185 (2014) 2930 | 1112.5675 |
| 48 | P. Kant et al. | HatHor for single top-quark production: Updated predictions and uncertainty estimates for single top-quark production in hadronic collisions | CPC 191 (2015) 74 | 1406.4403 |
| 49 | T. Sjostrand et al. | An introduction to PYTHIA 8.2 | CPC 191 (2015) 159 | 1410.3012 |
| 50 | CMS Collaboration | Measurement of the single top quark and antiquark production cross sections in the $ t $ channel and their ratio in proton-proton collisions at $ \sqrt{s}= $ 13 TeV | Submitted to PLB | CMS-TOP-17-011 1812.10514 |
| 51 | CMS Collaboration | Event generator tunes obtained from underlying event and multiparton scattering measurements | EPJC 76 (2016) 155 | CMS-GEN-14-001 1512.00815 |
| 52 | R. D. Ball et al. | Parton distributions for the LHC Run II | JHEP 15 (2015) 40 | 1410.8849 |
| 53 | GEANT4 Collaboration | GEANT4 --- a simulation toolkit | NIMA 506 (2003) 250 | |
| 54 | CMS Collaboration | CMS Luminosity Measurements for the 2016 Data Taking Period | CMS-PAS-LUM-17-001 | CMS-PAS-LUM-17-001 |
| 55 | CMS Collaboration | Particle-flow reconstruction and global event description with the CMS detector | JINST 12 (2017) P10003 | CMS-PRF-14-001 1706.04965 |
| 56 | H. Voss, A. Hocker, J. Stelzer, and F. Tegenfeldt | TMVA, the Toolkit for Multivariate Data Analysis with ROOT | in XI Int. Workshop on Advanced Computing and Analysis Techniques in Physics Research 2007 PoS ACAT:040 | physics/0703039 |
| 57 | CMS Collaboration | Performance of electron reconstruction and selection with the CMS detector in proton-proton collisions at $ \sqrt{s} = $ 8 TeV | JINST 10 (2015) P06005 | CMS-EGM-13-001 1502.02701 |
| 58 | CMS Collaboration | Performance of the CMS muon detector and muon reconstruction with proton-proton collisions at $ \sqrt{s}= $ 13 TeV | JINST 13 (2018) P06015 | CMS-MUO-16-001 1804.04528 |
| 59 | M. Cacciari, G. P. Salam, and G. Soyez | The $ \text{anti-k}_\text{t} $ jet clustering algorithm | JHEP 2008 (2008), no. 04, 063 | 0802.1189 |
| 60 | M. Cacciari, G. P. Salam, and G. Soyez | FastJet user manual | EPJC 72 (2012) 1896 | 1111.6097 |
| 61 | M. Cacciari and G. P. Salam | Dispelling the $ N^{3} $ myth for the $ {k_{\mathrm{T}}} $ jet-finder | PLB 641 (2006) 57 | hep-ph/0512210 |
| 62 | CMS Collaboration | Determination of jet energy calibration and transverse momentum resolution in CMS | JINST 6 (2011) P11002 | CMS-JME-10-011 1107.4277 |
| 63 | CMS Collaboration | Pileup jet identification | CMS-PAS-JME-13-005 | CMS-PAS-JME-13-005 |
| 64 | CMS Collaboration | Jet algorithms performance in 13 TeV data | CMS-PAS-JME-16-003 | CMS-PAS-JME-16-003 |
| 65 | CMS Collaboration | Identification of heavy-flavour jets with the CMS detector in pp collisions at 13 TeV | JINST 13 (2018) P05011 | CMS-BTV-16-002 1712.07158 |
| 66 | CMS Collaboration | Performance of reconstruction and identification of $ \tau $ leptons decaying to hadrons and $ \nu_\tau $ in pp collisions at $ \sqrt{s}= $ 13 TeV | JINST 13 (2018), no. 10, P10005 | CMS-TAU-16-003 1809.02816 |
| 67 | CMS Collaboration | Performance of missing energy reconstruction in 13 TeV pp collision data using the CMS detector | CMS-PAS-JME-16-004 | CMS-PAS-JME-16-004 |
| 68 | CMS Collaboration | Performance of missing transverse momentum in pp collisions at $ \sqrt{s}= $ 13 ~TeV using the CMS detector | CMS-PAS-JME-17-001 | CMS-PAS-JME-17-001 |
| 69 | CDF Collaboration | Search for neutral MSSM Higgs bosons decaying to tau pairs in $ p\bar{p} $ collisions at $ \sqrt{s} = $ 1.96 TeV | PRL 96 (2006) 011802 | hep-ex/0508051 |
| 70 | L. Bianchini, J. Conway, E. K. Friis, and C. Veelken | Reconstruction of the Higgs mass in $ H \to \tau\tau $ Events by Dynamical Likelihood techniques | J. Phys. Conf. Ser. 513 (2014) 022035 | |
| 71 | L. Bianchini et al. | Reconstruction of the Higgs mass in events with Higgs bosons decaying into a pair of $ \tau $ leptons using matrix element techniques | NIMA 862 (2017) 54 | 1603.05910 |
| 72 | ATLAS and CMS Collaborations | Procedure for the LHC Higgs boson search combination in Summer 2011 | CMS-NOTE-2011-005 | |
| 73 | CMS Collaboration | Observation of the Higgs boson decay to a pair of $ \tau $ leptons with the CMS detector | PLB 779 (2018) 283 | CMS-HIG-16-043 1708.00373 |
| 74 | CMS Collaboration | Performance of reconstruction and identification of tau leptons in their decays to hadrons and tau neutrino in LHC Run-2 | CMS-PAS-TAU-16-002 | CMS-PAS-TAU-16-002 |
| 75 | LHC Higgs Cross Section Working Group | Handbook of LHC Higgs Cross Sections: 4. Deciphering the Nature of the Higgs Sector | 1610.07922 | |
| 76 | G. Cowan, K. Cranmer, E. Gross, and O. Vitells | Asymptotic formulae for likelihood-based tests of new physics | EPJC 71 (2011) , [Erratum: \DOI10.1140/epjc/s10052-013-2501-z] | 1007.1727 |
| 77 | T. Junk | Confidence level computation for combining searches with small statistics | NIMA 434 (1999) 435 | hep-ex/9902006 |
| 78 | A. L. Read | Presentation of search results: The CL$ _\text{s} $ technique | JPG 28 (2002) 2693 | |
| 79 | J. Bernon, J. F. Gunion, Y. Jiang, and S. Kraml | Light Higgs bosons in Two-Higgs-Doublet Models | PRD 19 (2015) 075019 | 1412.3385 |
|
|
Compact Muon Solenoid LHC, CERN |
|

|

|

|

|

|