

Compact Muon Solenoid
LHC, CERN
| CMS-HIG-19-013 ; CERN-EP-2020-028 | ||
| Measurements of ${\mathrm{t\bar{t}}\mathrm{H}} $ production and the CP structure of the Yukawa interaction between the Higgs boson and top quark in the diphoton decay channel | ||
| CMS Collaboration | ||
| 25 March 2020 | ||
| Phys. Rev. Lett. 125 (2020) 061801 | ||
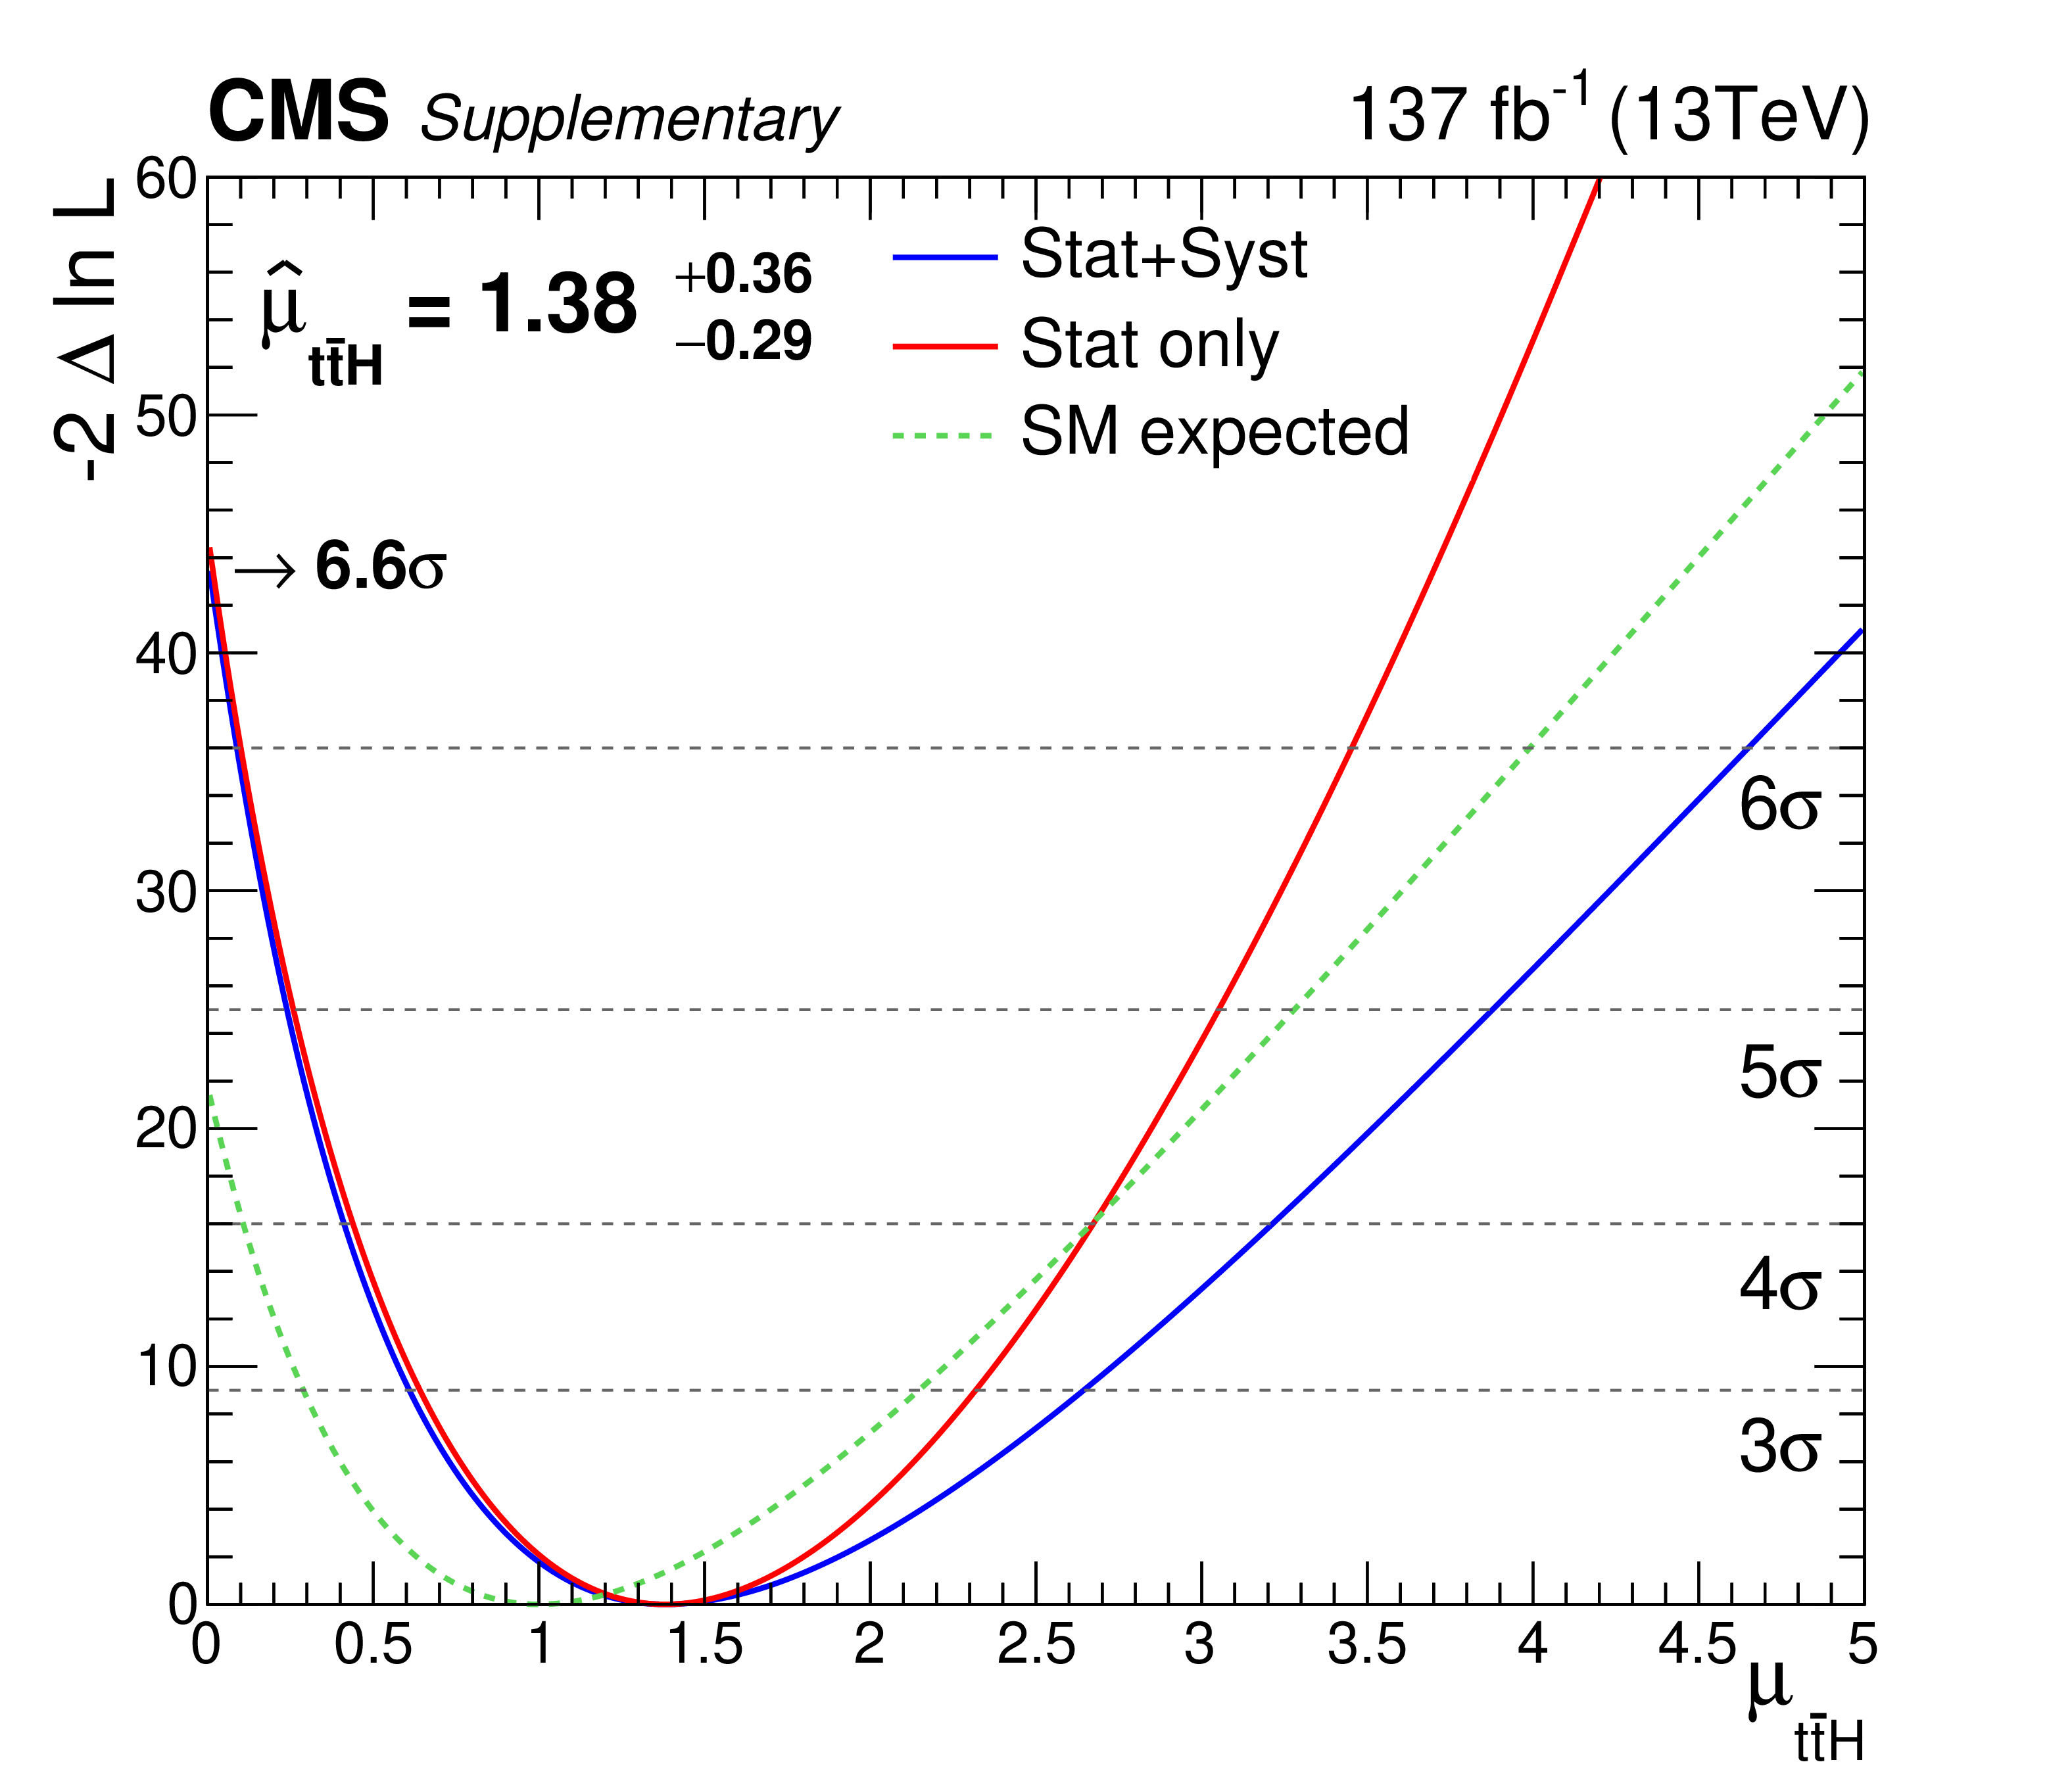
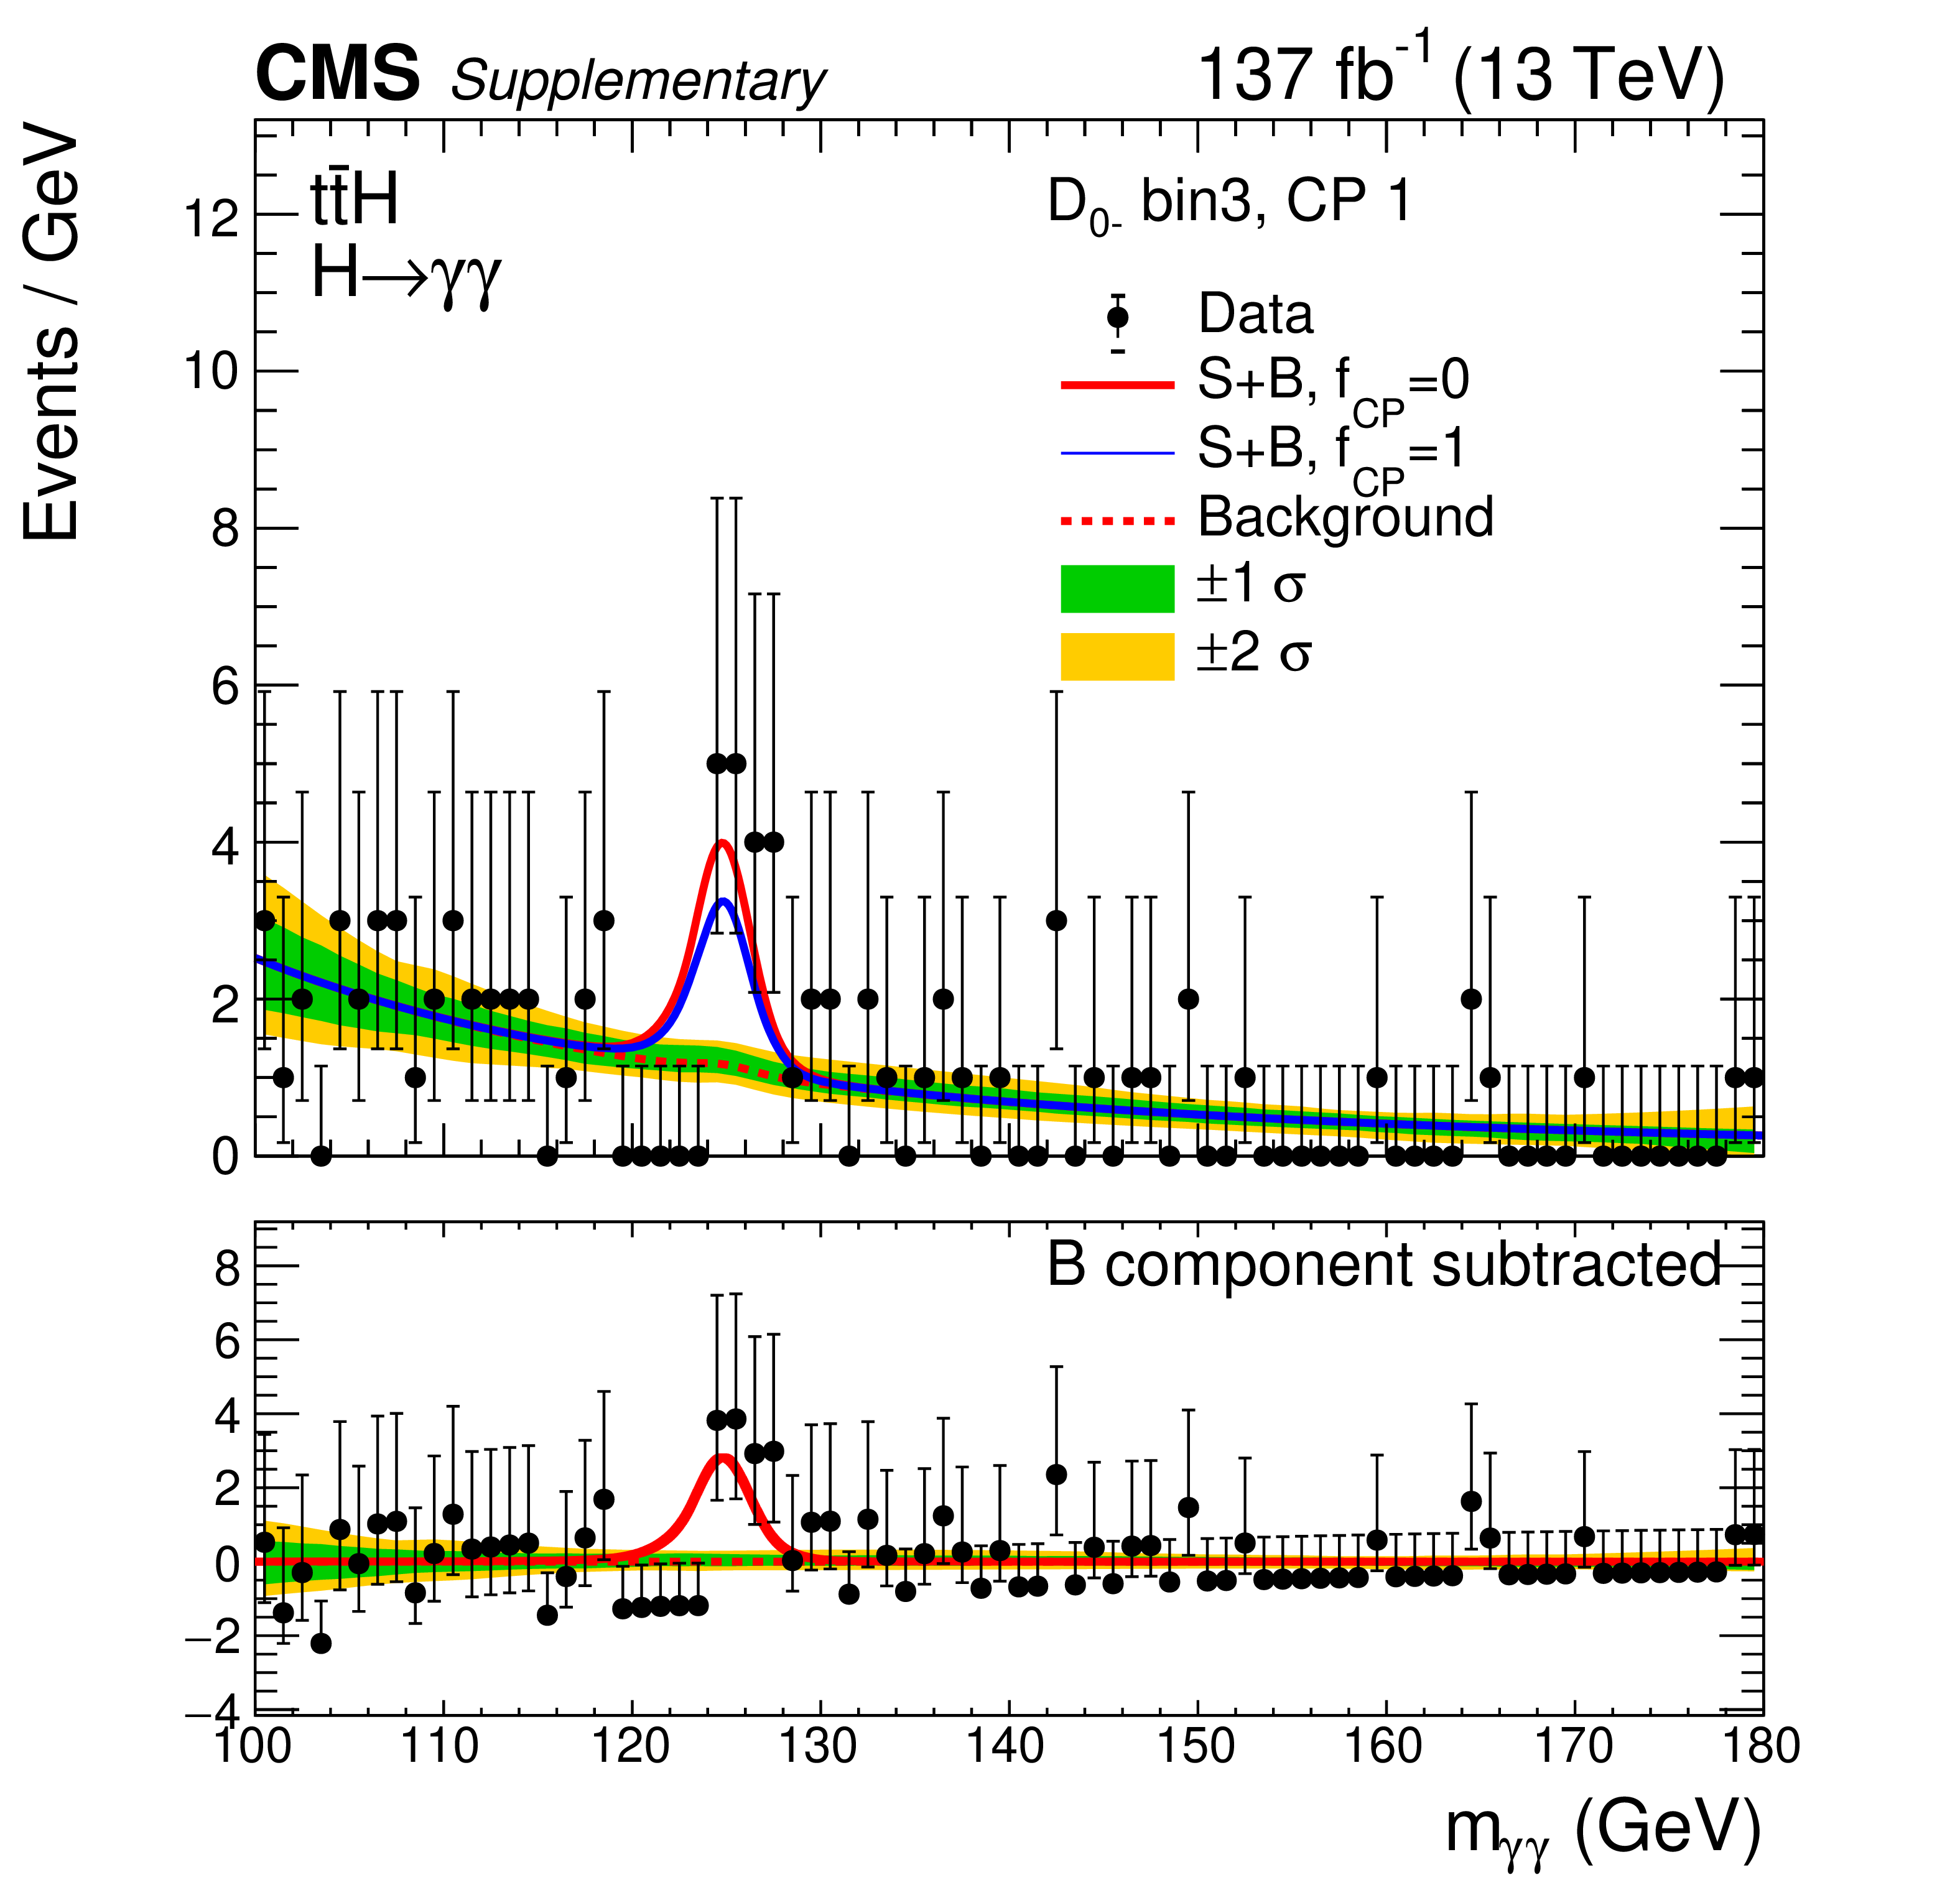
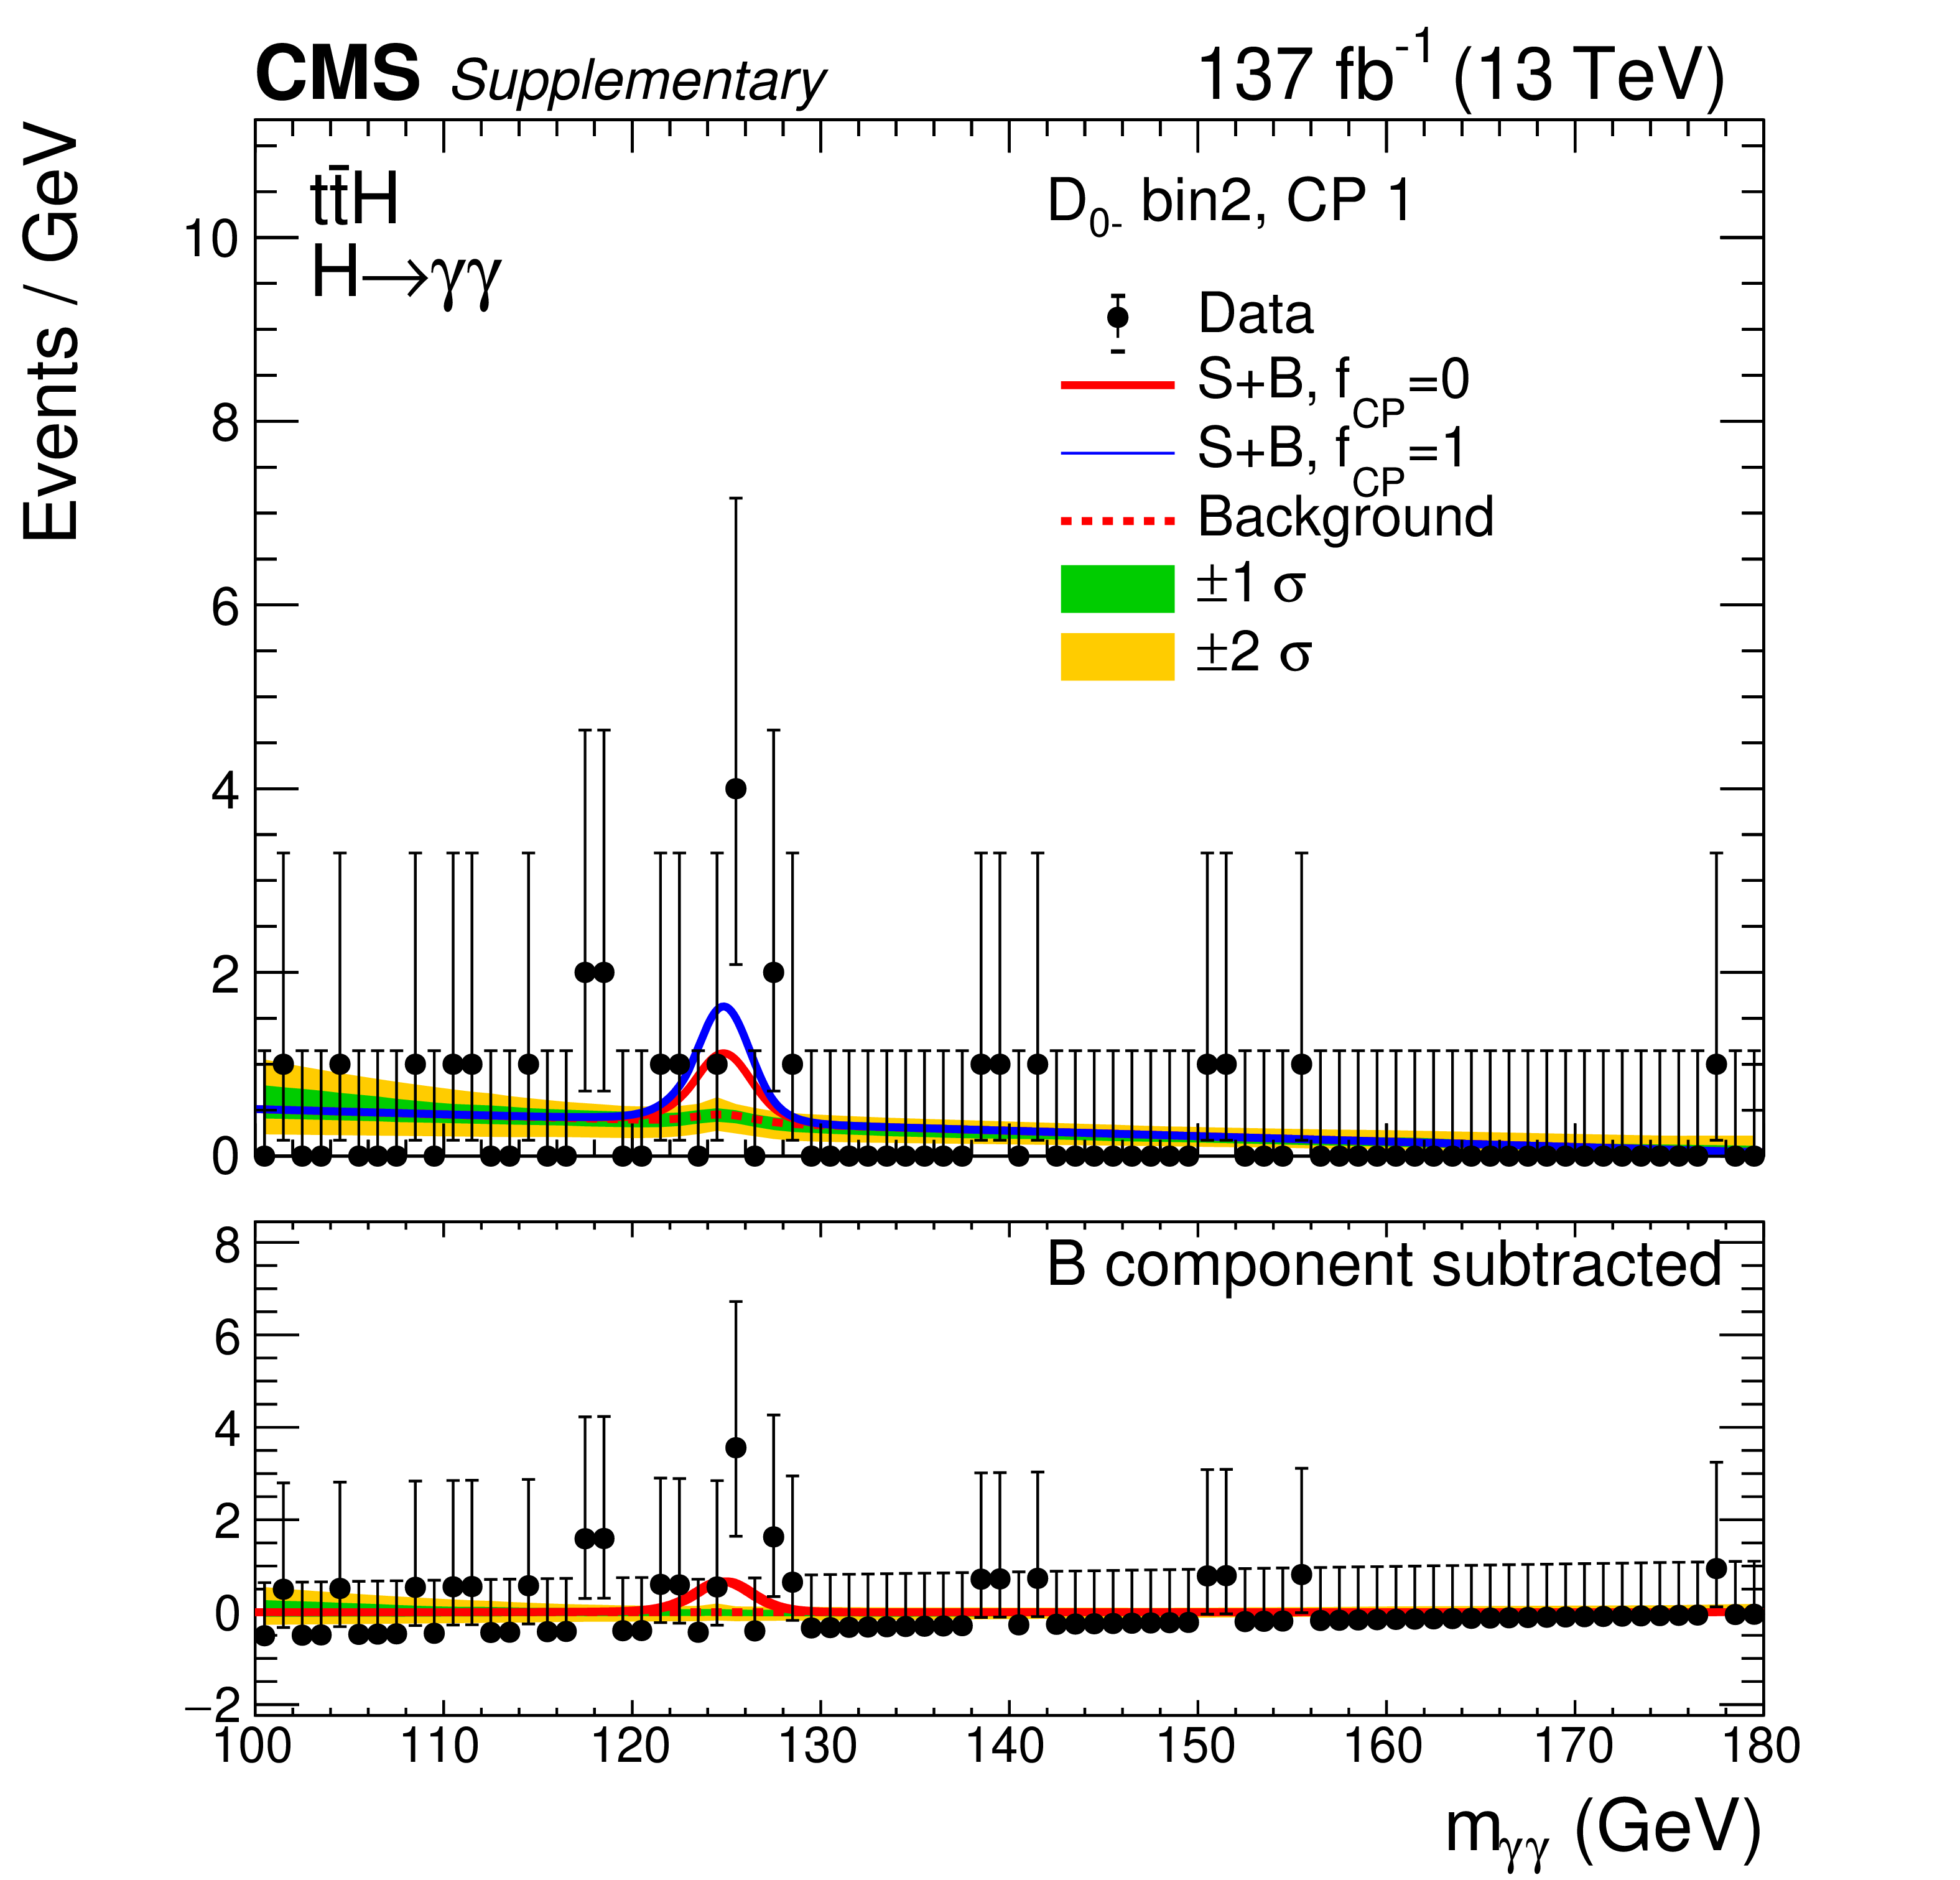
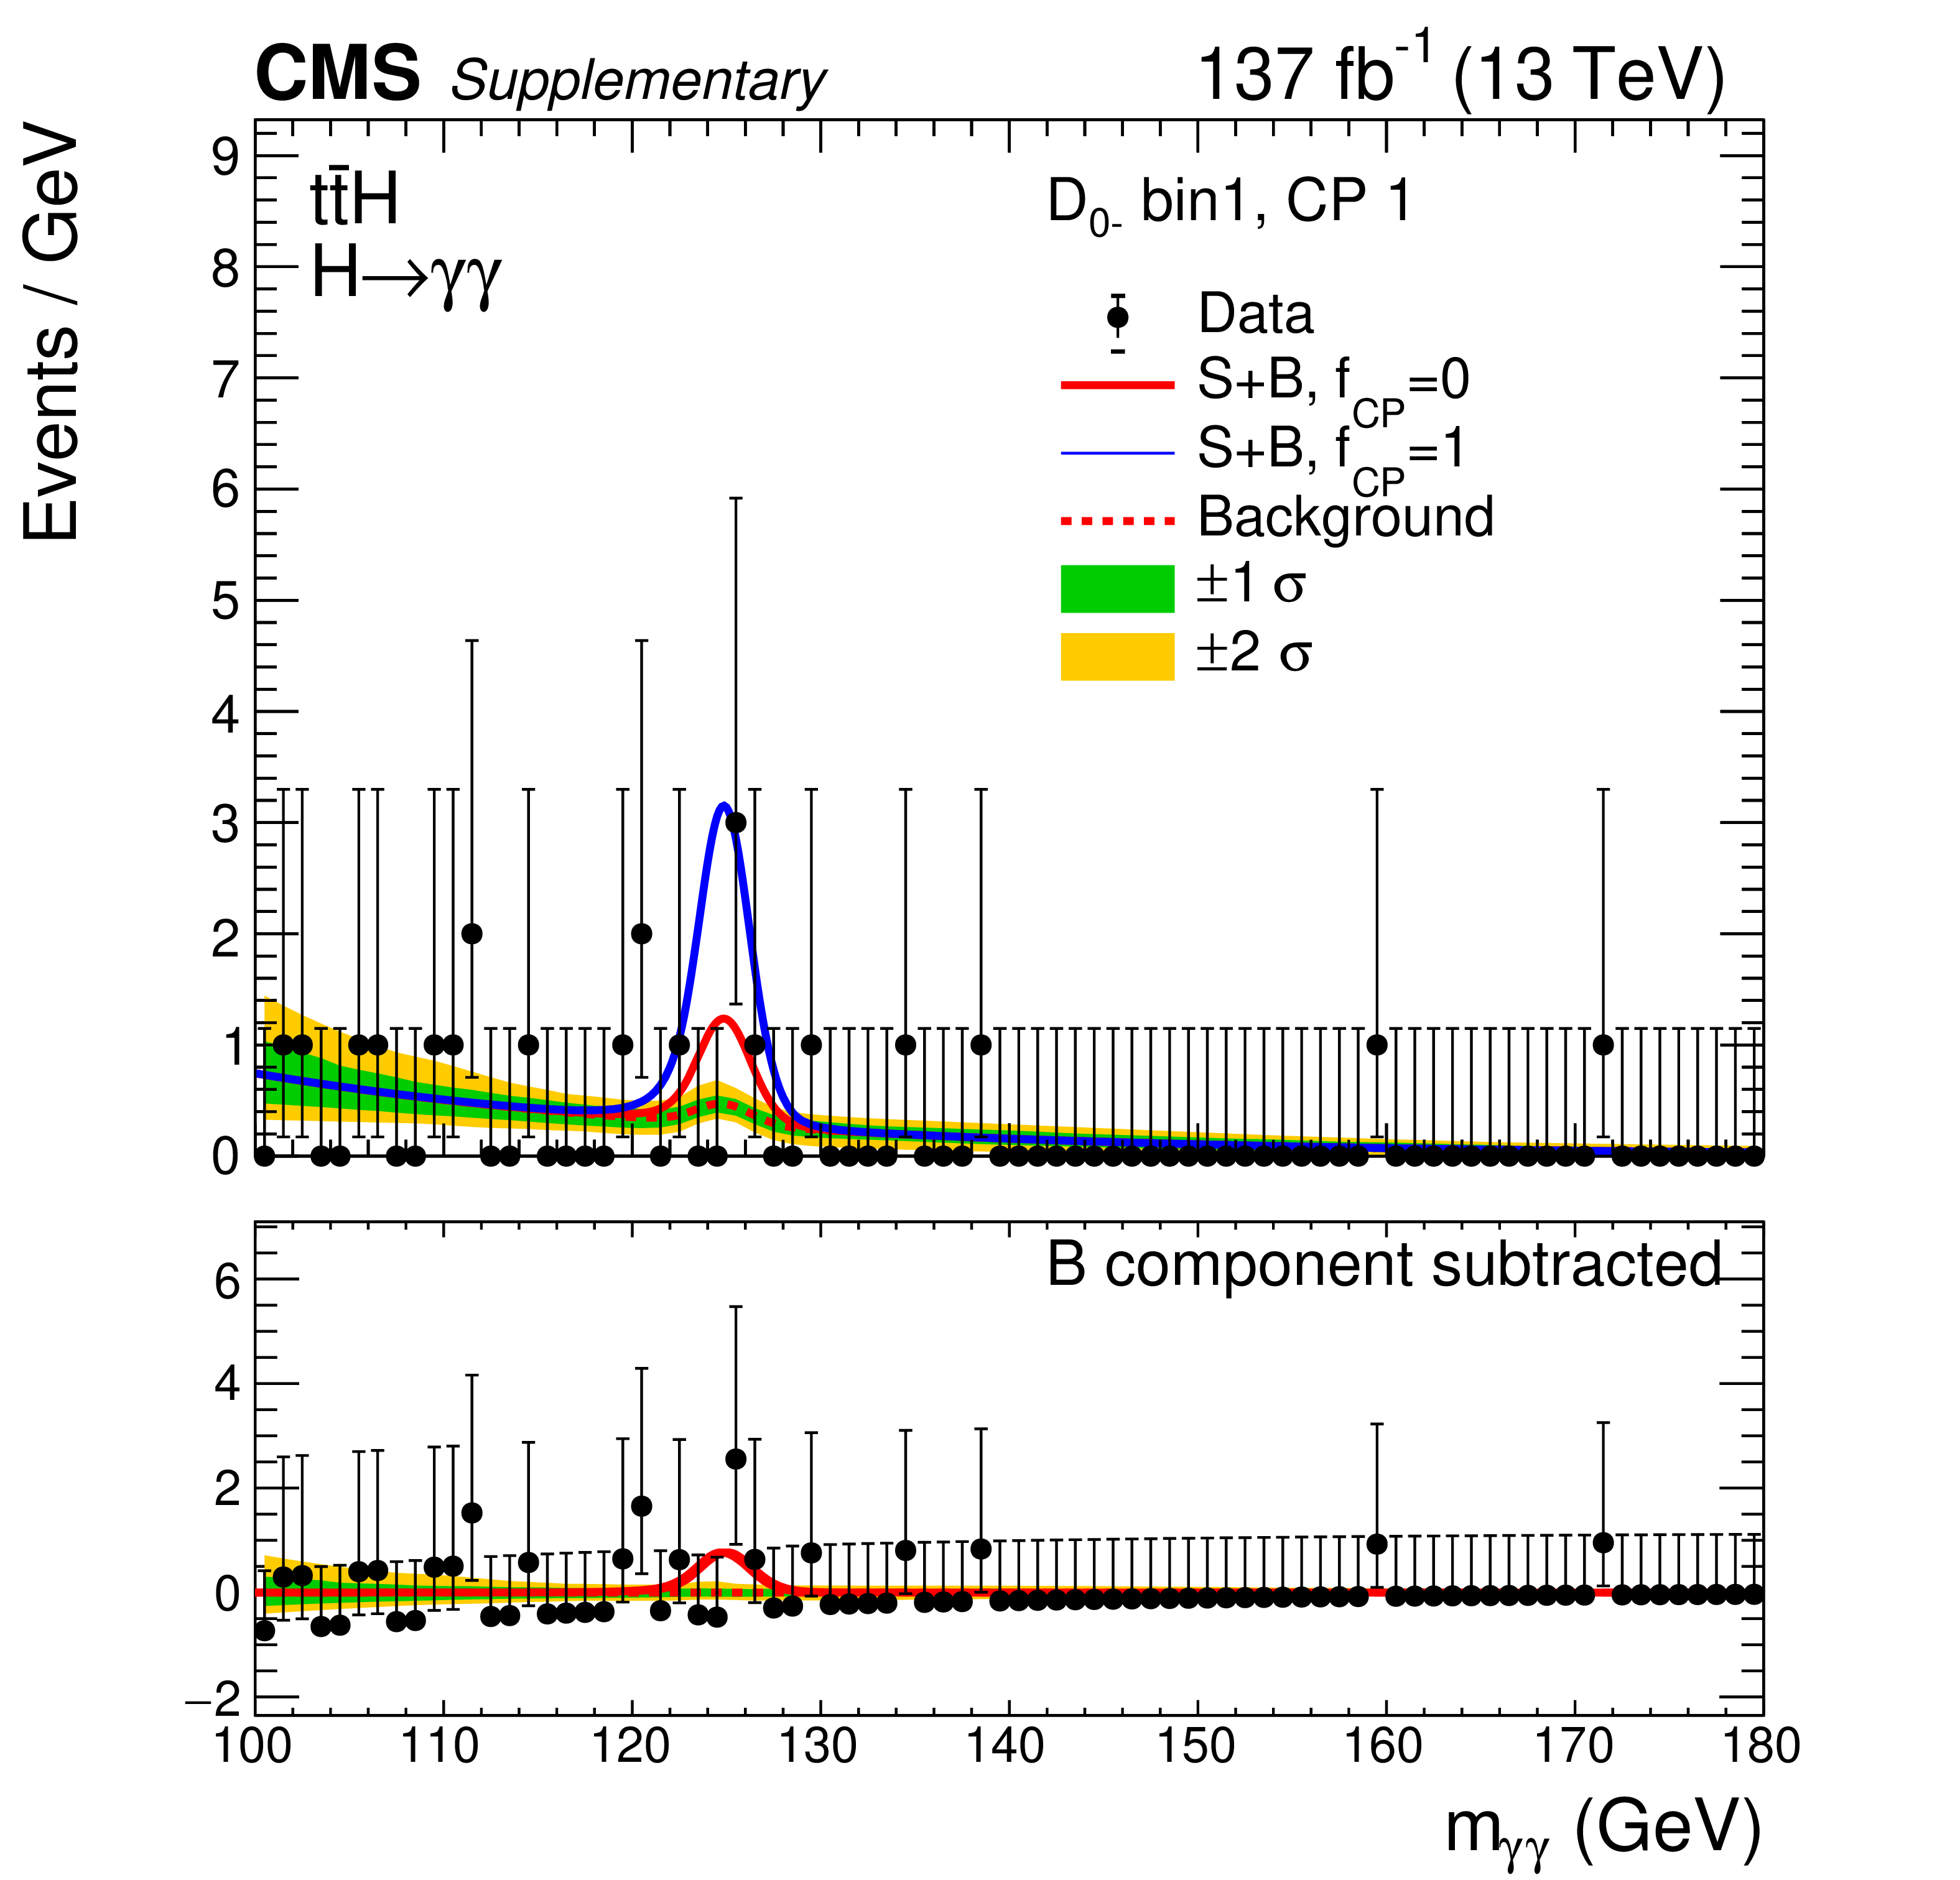
| Abstract: The first observation of the ${\mathrm{t\bar{t}}\mathrm{H}}$ process in a single Higgs boson decay channel with the full reconstruction of the final state (${\mathrm{H} \to \gamma\gamma} $) is presented, with a significance of 6.6 standard deviations ($\sigma$). The CP structure of Higgs boson couplings to fermions is measured, resulting in an exclusion of the pure CP-odd structure of the top Yukawa coupling at 3.2$\sigma$. The measurements are based on a sample of proton-proton collisions at a center-of-mass energy $\sqrt{s}=$ 13 TeV collected by the CMS detector at the LHC, corresponding to an integrated luminosity of 137 fb$^{-1}$. The cross section times branching fraction of the ${\mathrm{t\bar{t}}\mathrm{H}}$ process is measured to be ${\sigma_{{\mathrm{t\bar{t}}\mathrm{H}} } \mathcal{B}_{\gamma\gamma}}= $ 1.56$^{+0.34}_{-0.32}$ fb, which is compatible with the standard model prediction of 1.13$^{+0.08}_{-0.11}$ fb. The fractional contribution of the CP-odd component is measured to be ${f_{\mathrm{CP}}^{{\mathrm{H}\mathrm{t}\mathrm{t}} }} =$ 0.00 $\pm$ 0.33. | ||
| Links: e-print arXiv:2003.10866 [hep-ex] (PDF) ; CDS record ; inSPIRE record ; HepData record ; CADI line (restricted) ; | ||
| Figures & Tables | Summary | Additional Figures | References | CMS Publications |
|---|
| Figures | |
png pdf |
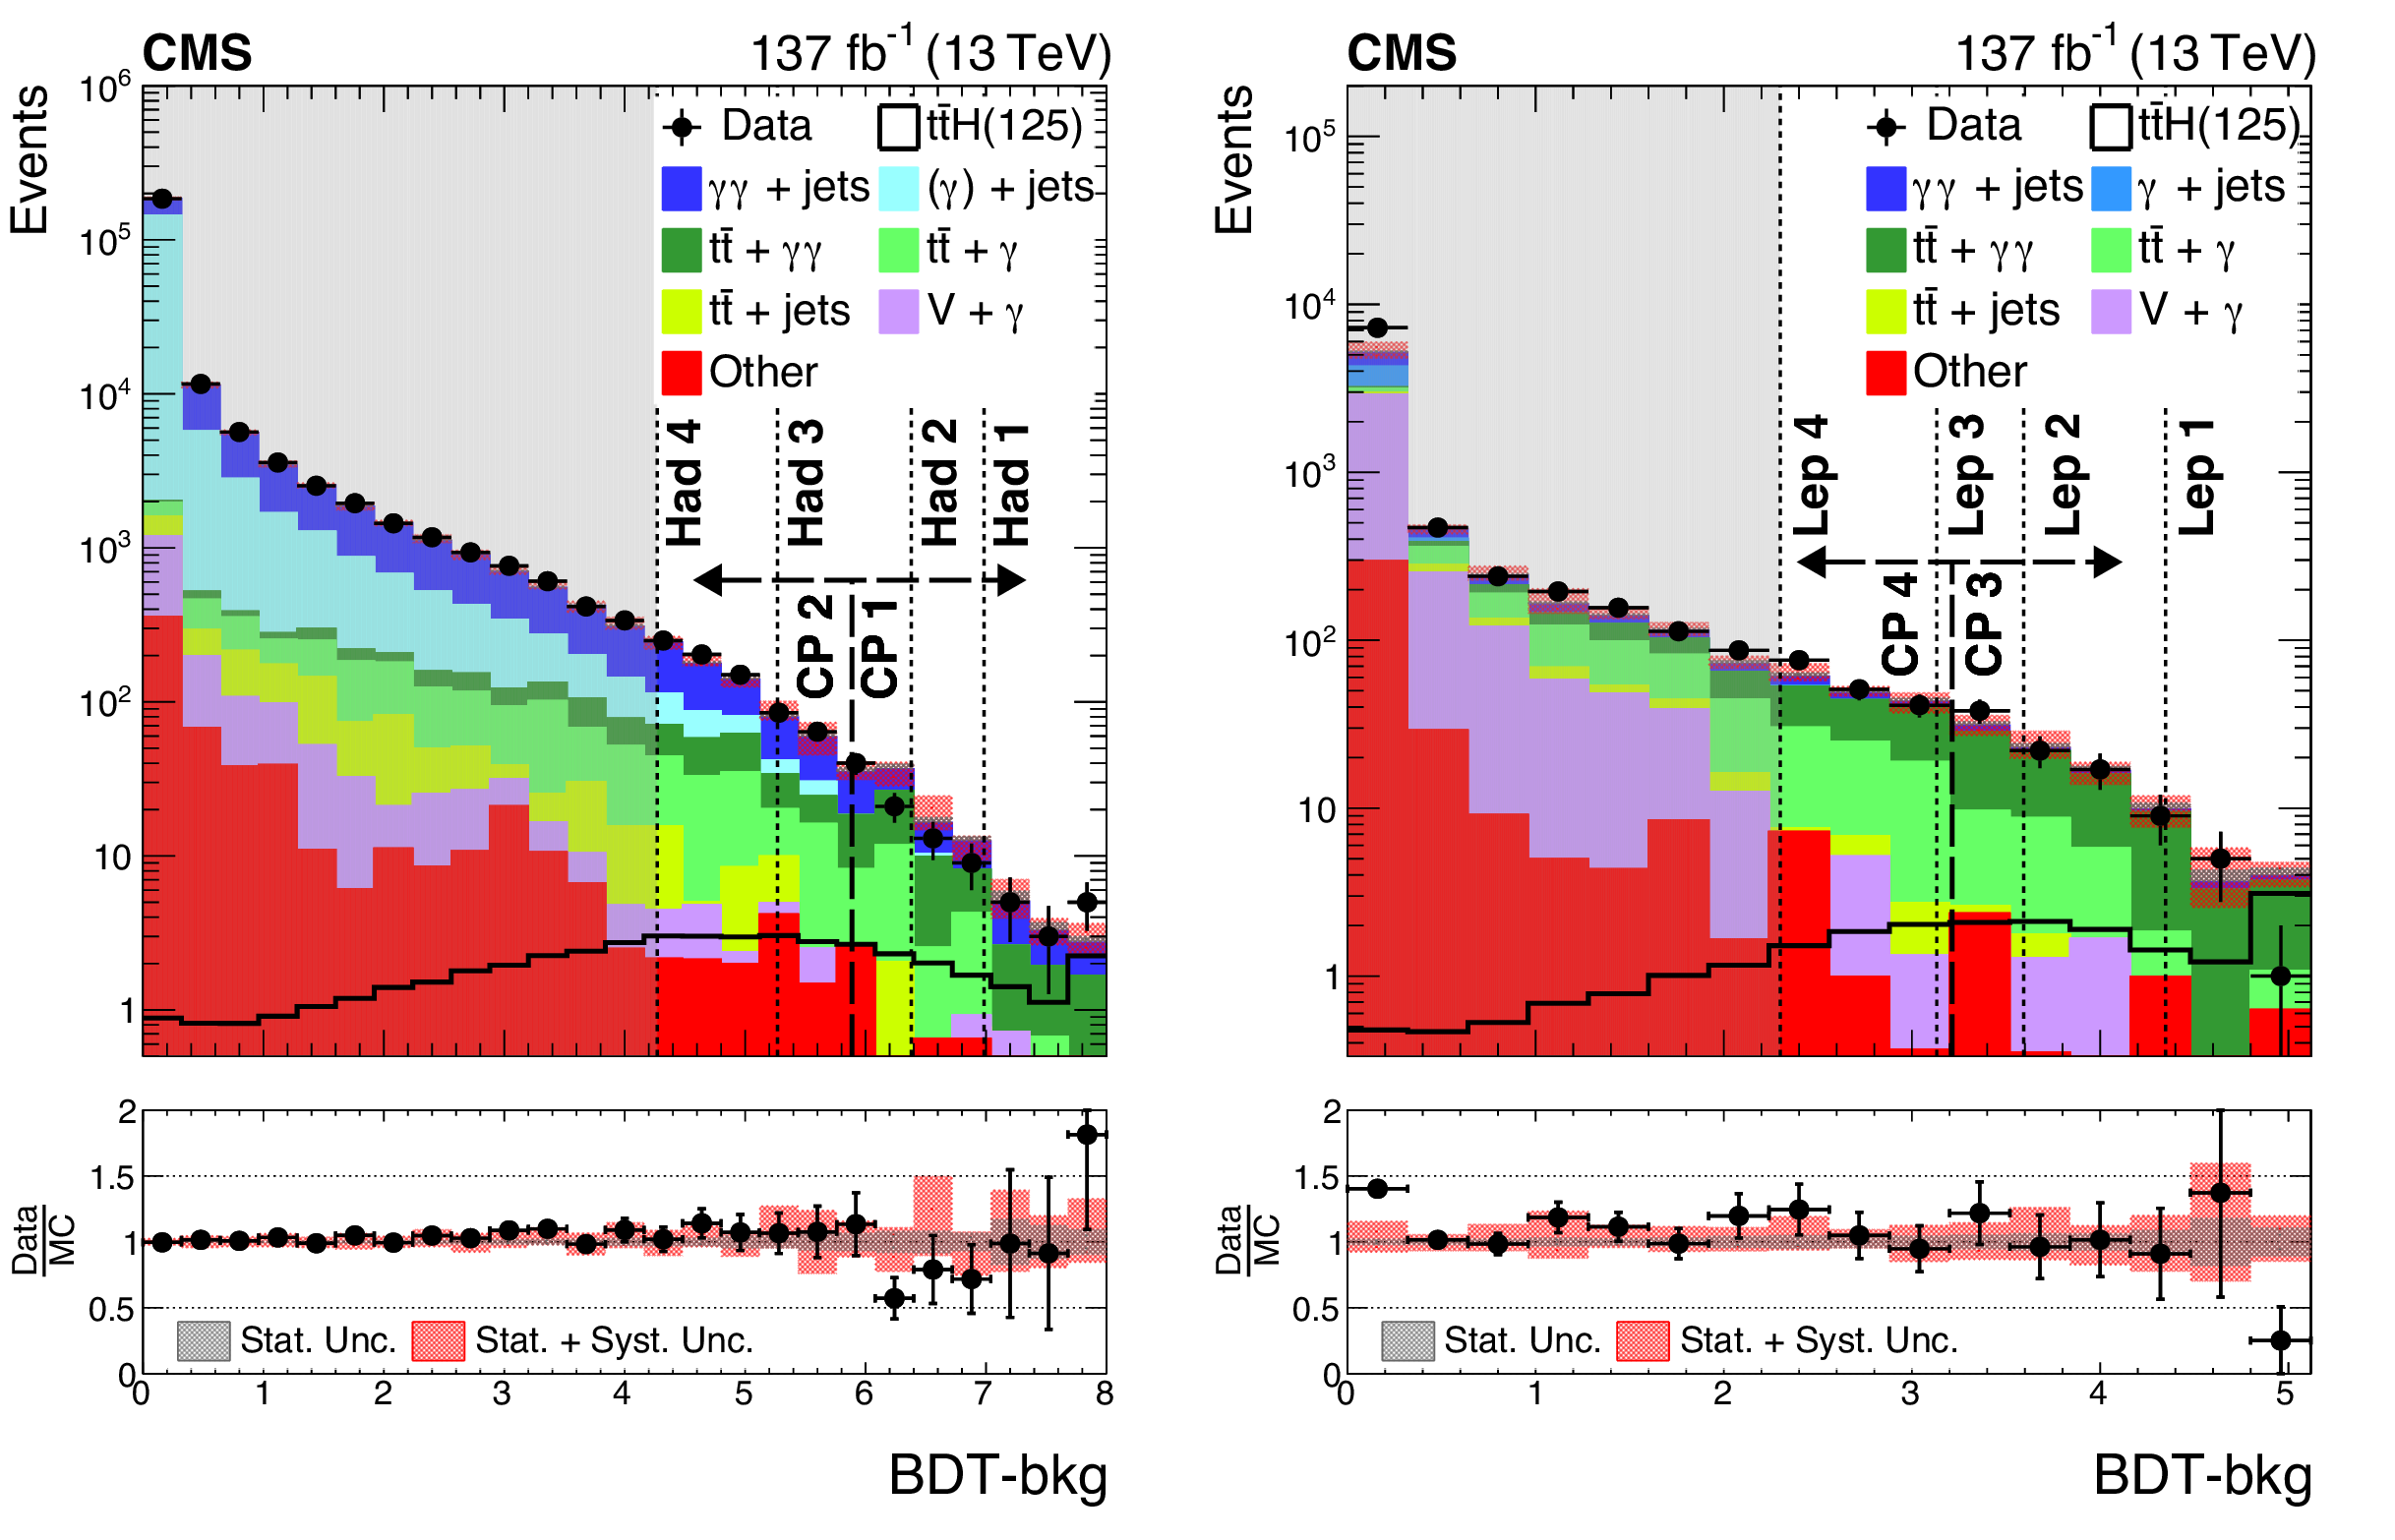
Figure 1:
Distributions of BDT-bkg output used for event categorization, for the hadronic (left) and the leptonic (right) channels. Category boundaries for the signal strength (CP) measurements are shown with thinly (thickly) dashed lines. Events shown are taken from the ${m_{\gamma \gamma}}$ sidebands, satisfying either 100 $ < {m_{\gamma \gamma}} < $ 120 GeV or 130 $ < {m_{\gamma \gamma}} < $ 180 GeV. Events in the grey shaded region are not considered in the analysis. Statistical (statistical $\oplus $ systematic) background uncertainties are represented by the black (red) shaded bands. |
png pdf |
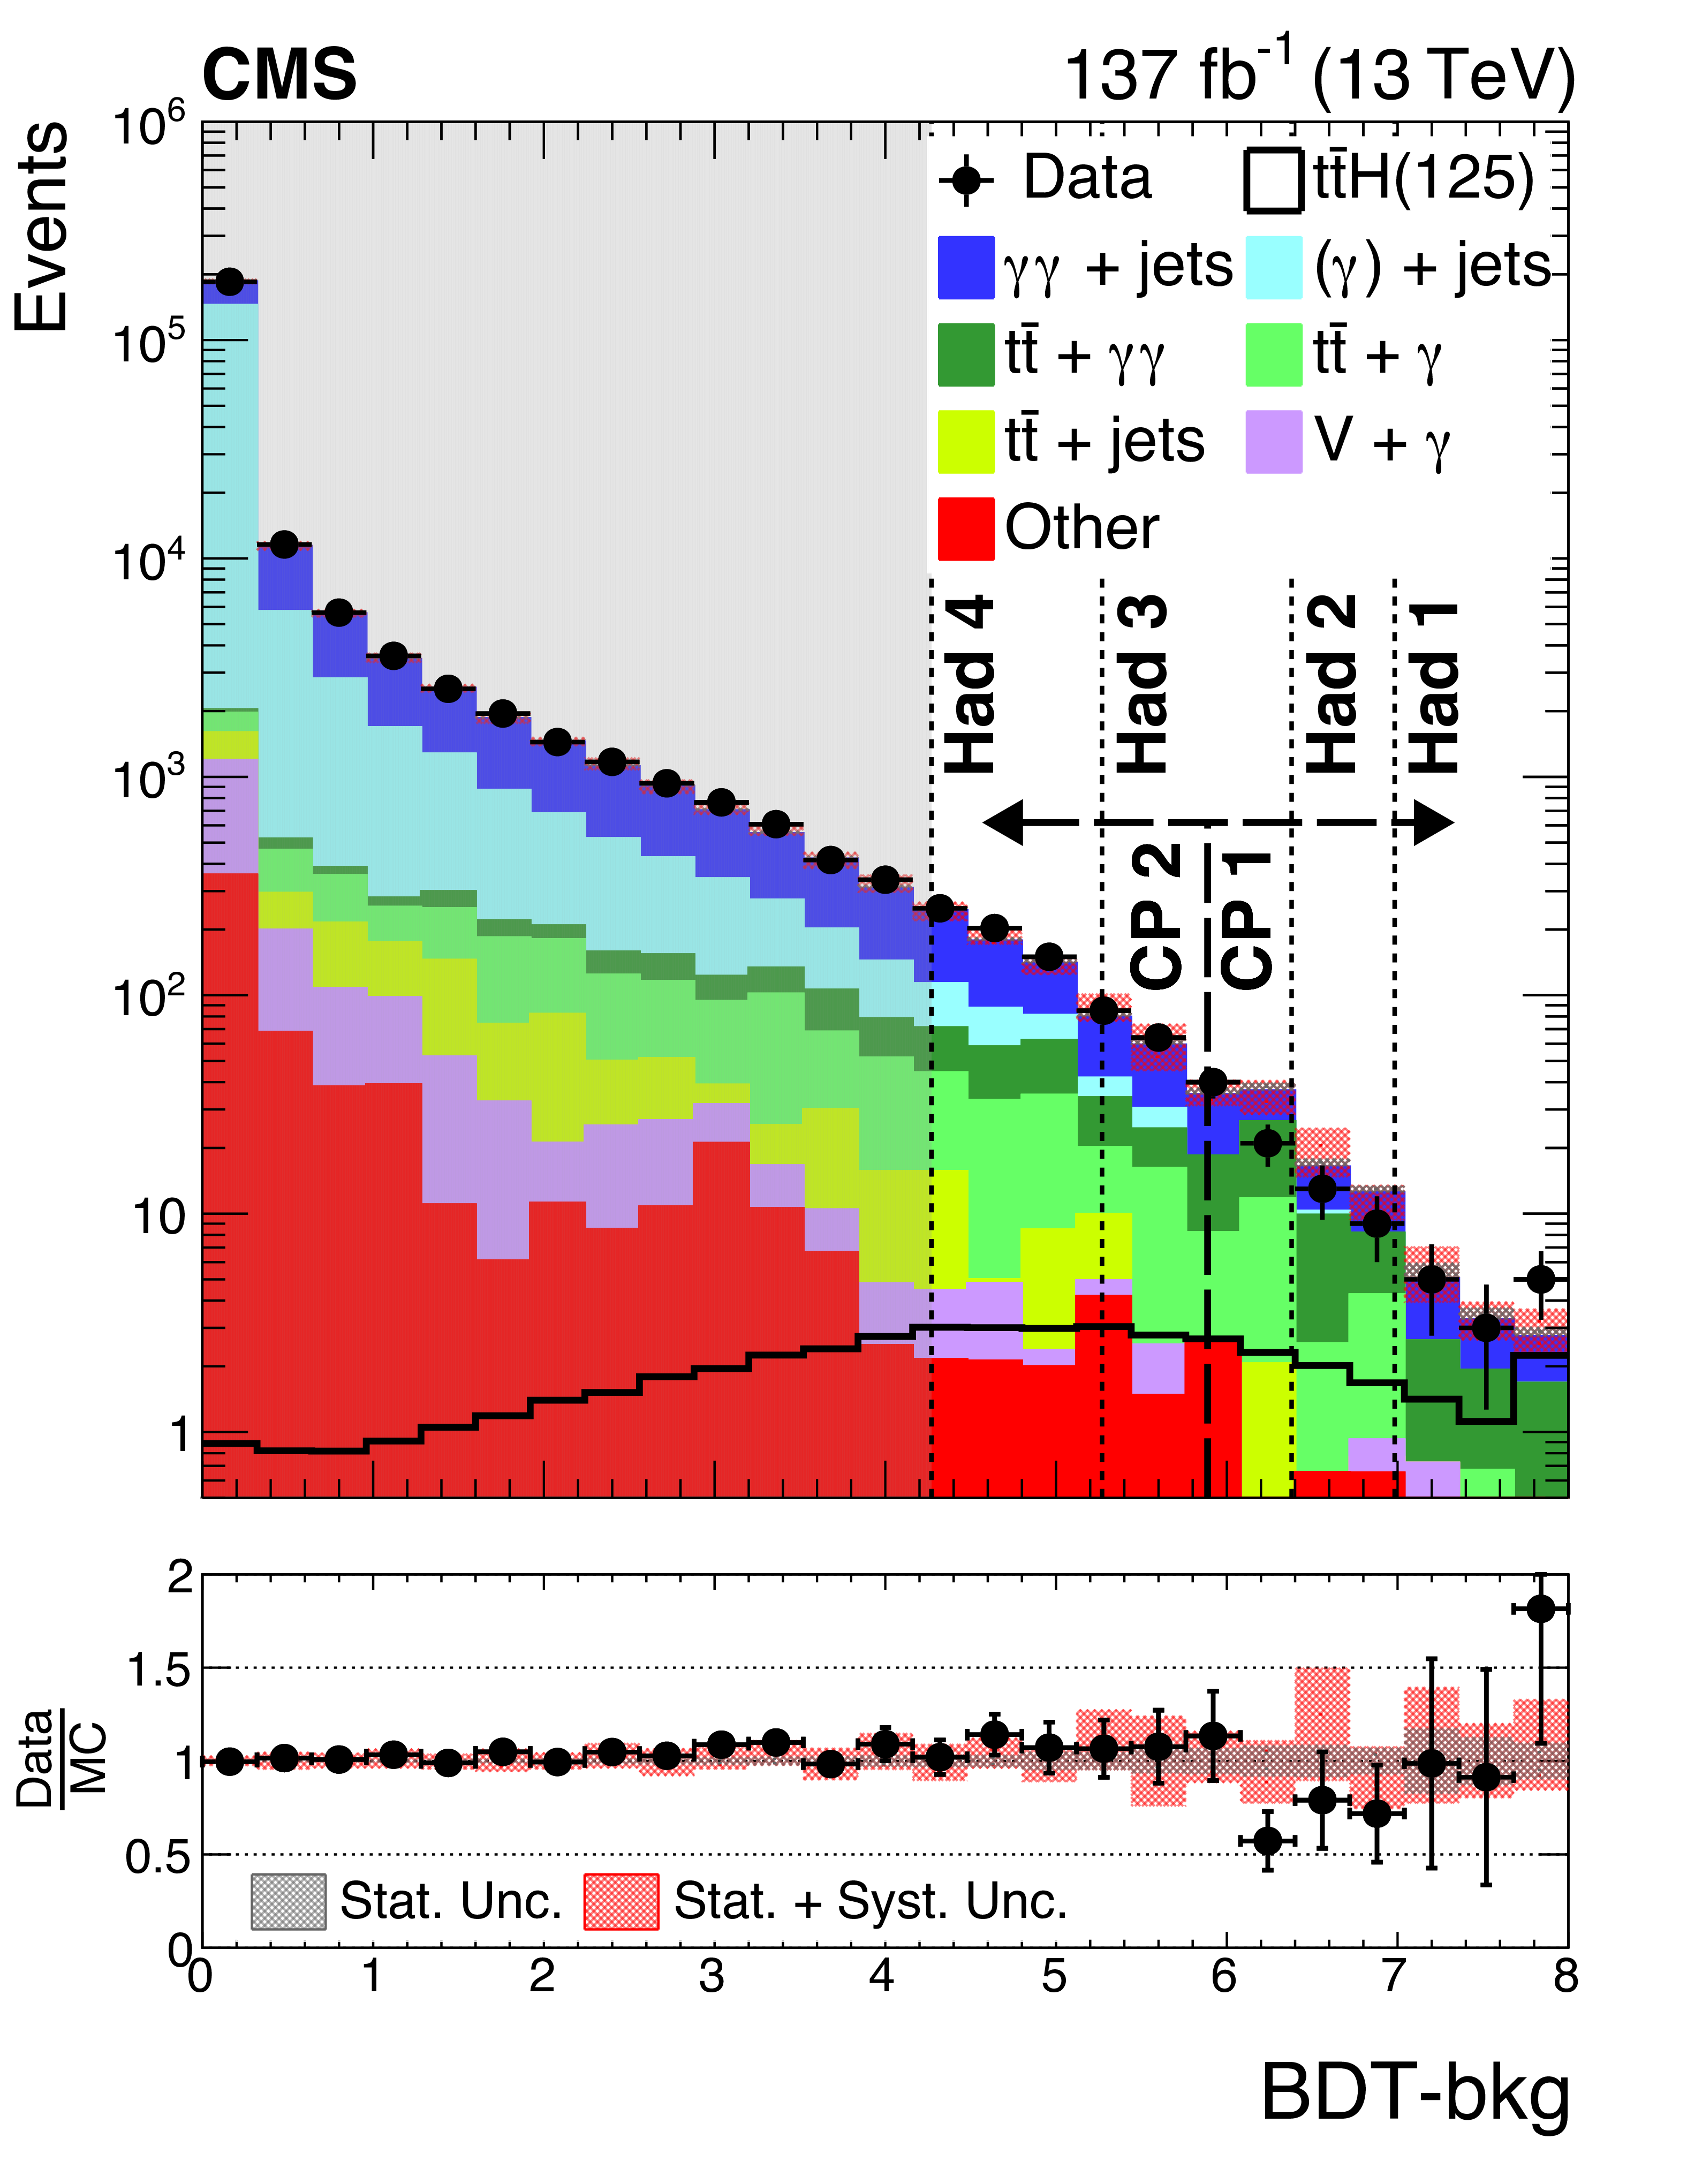
Figure 1-a:
Distribution of the BDT-bkg output used for event categorization, for the hadronic channel. Category boundaries for the signal strength (CP) measurements are shown with thinly (thickly) dashed lines. Events shown are taken from the ${m_{\gamma \gamma}}$ sidebands, satisfying either 100 $ < {m_{\gamma \gamma}} < $ 120 GeV or 130 $ < {m_{\gamma \gamma}} < $ 180 GeV. Events in the grey shaded region are not considered in the analysis. Statistical (statistical $\oplus $ systematic) background uncertainties are represented by the black (red) shaded bands. |
png pdf |
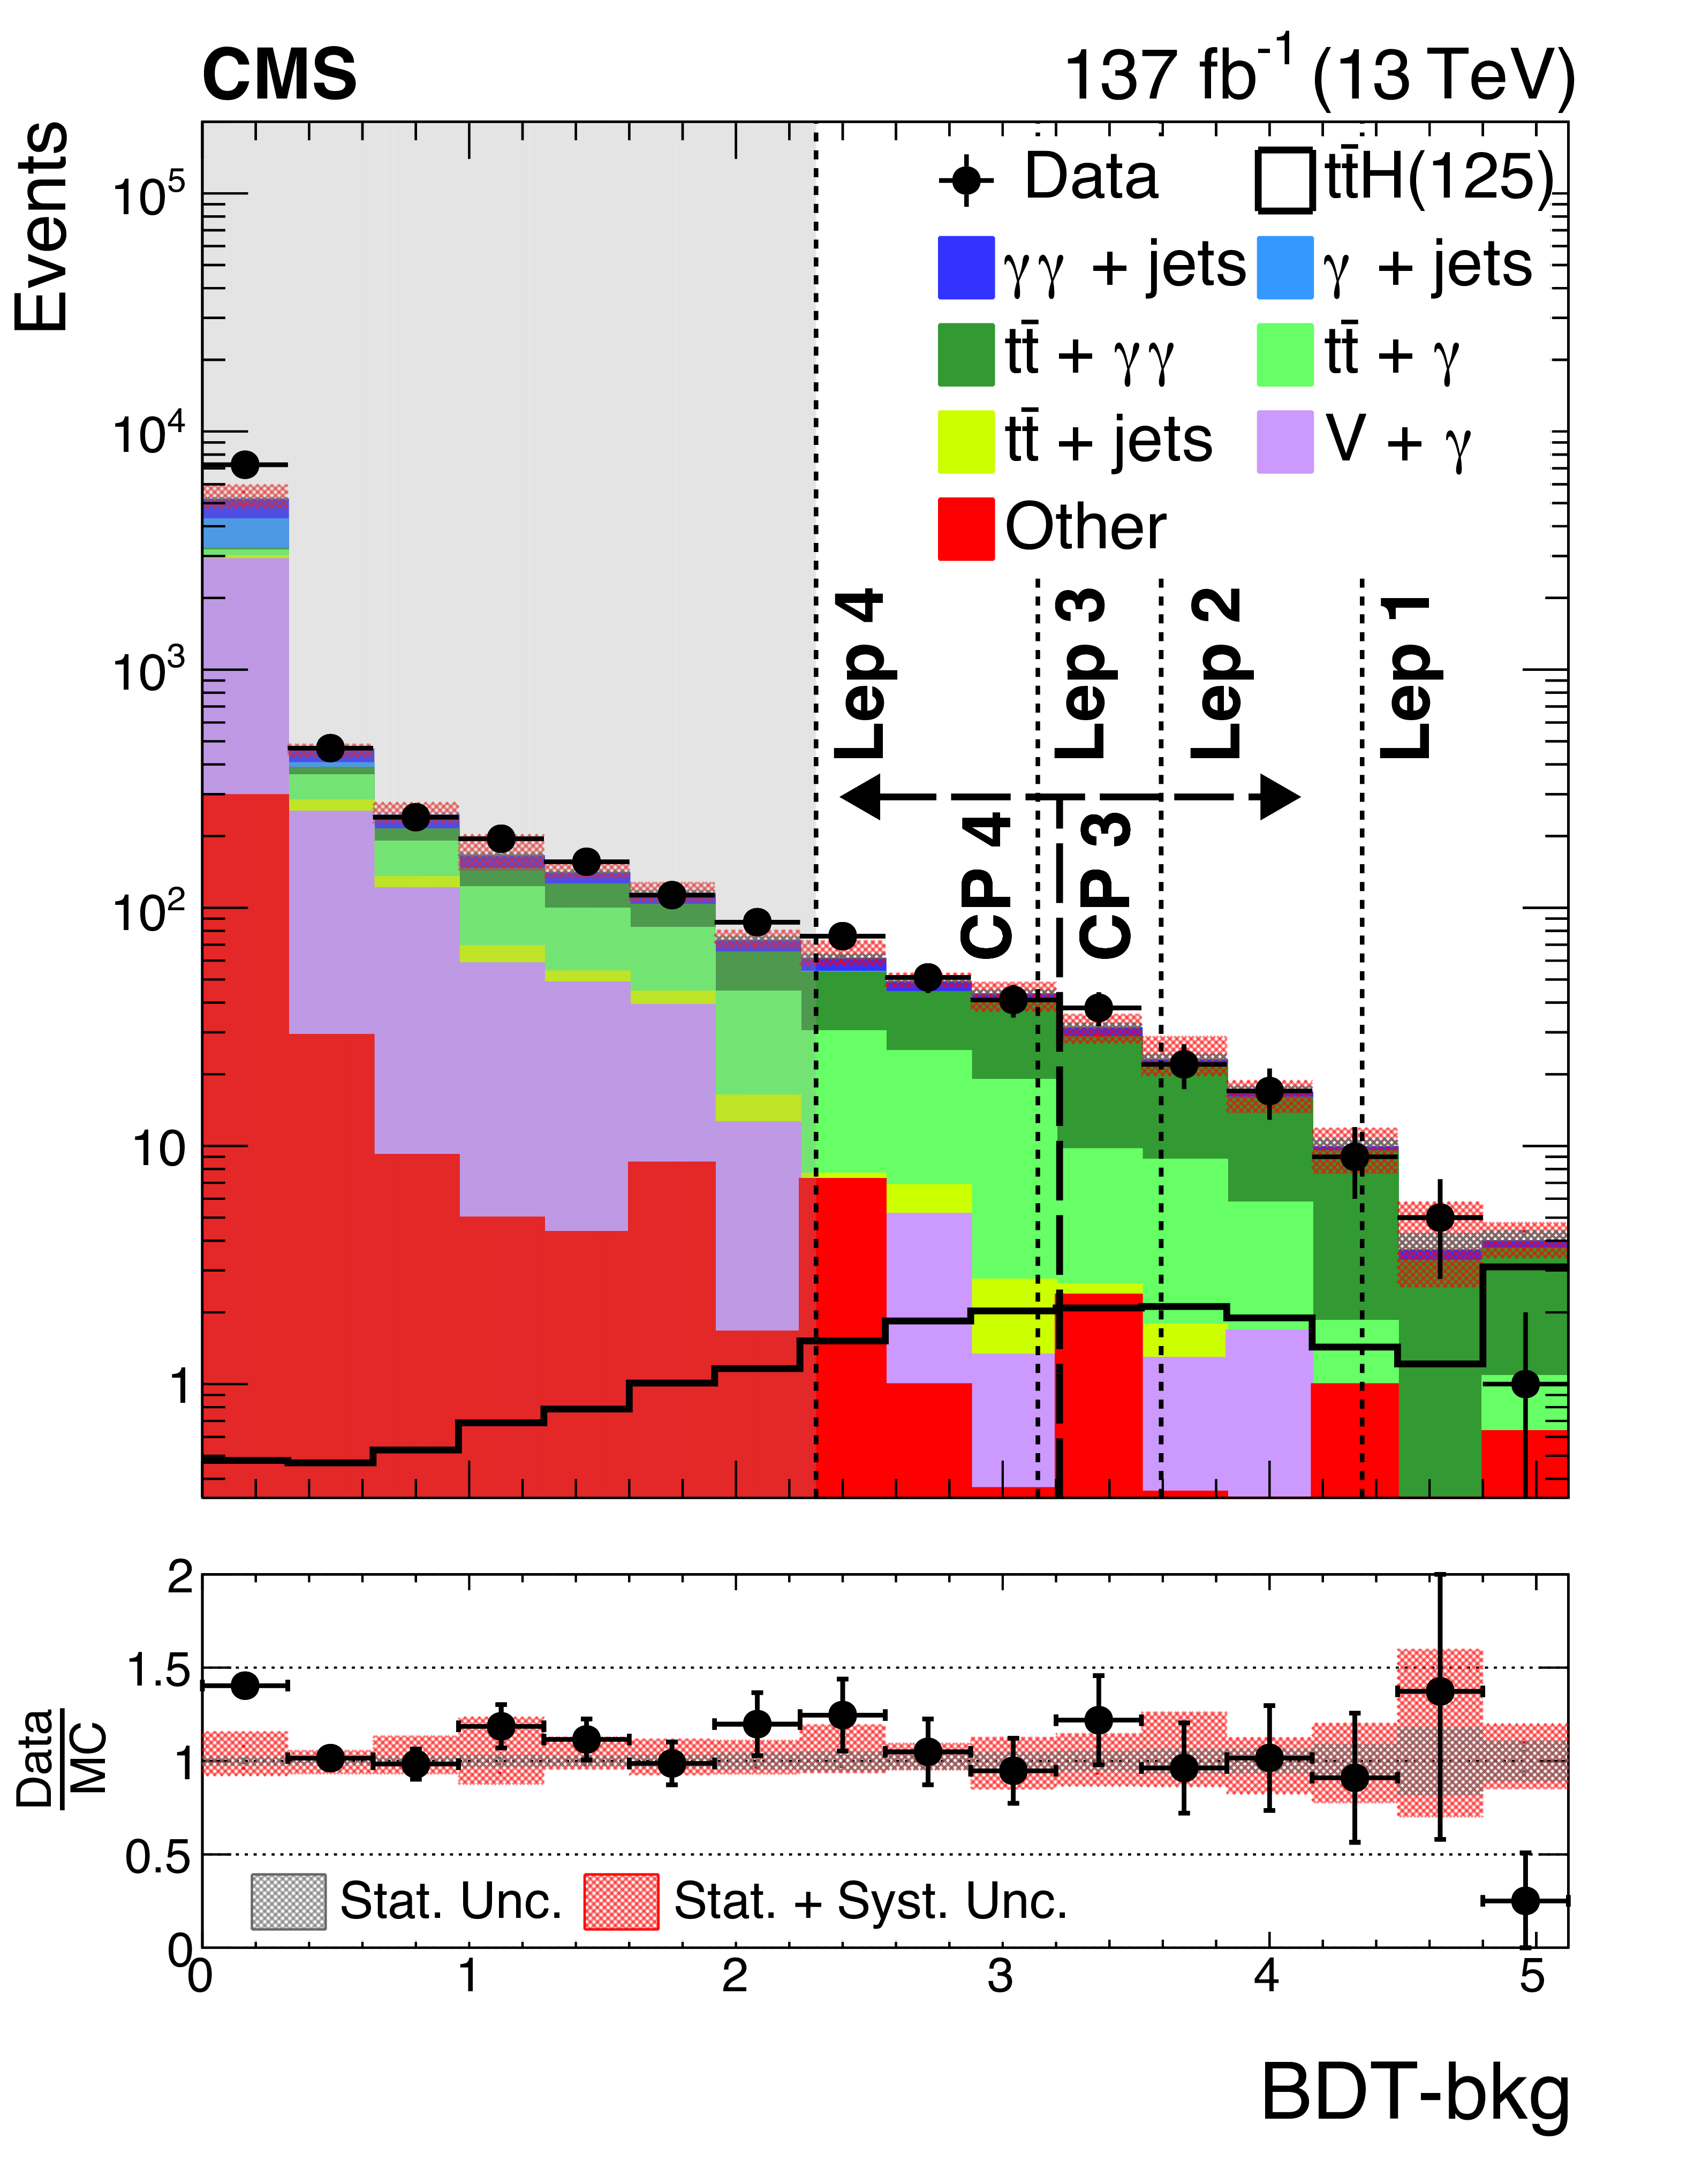
Figure 1-b:
Distribution of the BDT-bkg output used for event categorization, for the leptonic channel. Category boundaries for the signal strength (CP) measurements are shown with thinly (thickly) dashed lines. Events shown are taken from the ${m_{\gamma \gamma}}$ sidebands, satisfying either 100 $ < {m_{\gamma \gamma}} < $ 120 GeV or 130 $ < {m_{\gamma \gamma}} < $ 180 GeV. Events in the grey shaded region are not considered in the analysis. Statistical (statistical $\oplus $ systematic) background uncertainties are represented by the black (red) shaded bands. |
png pdf |
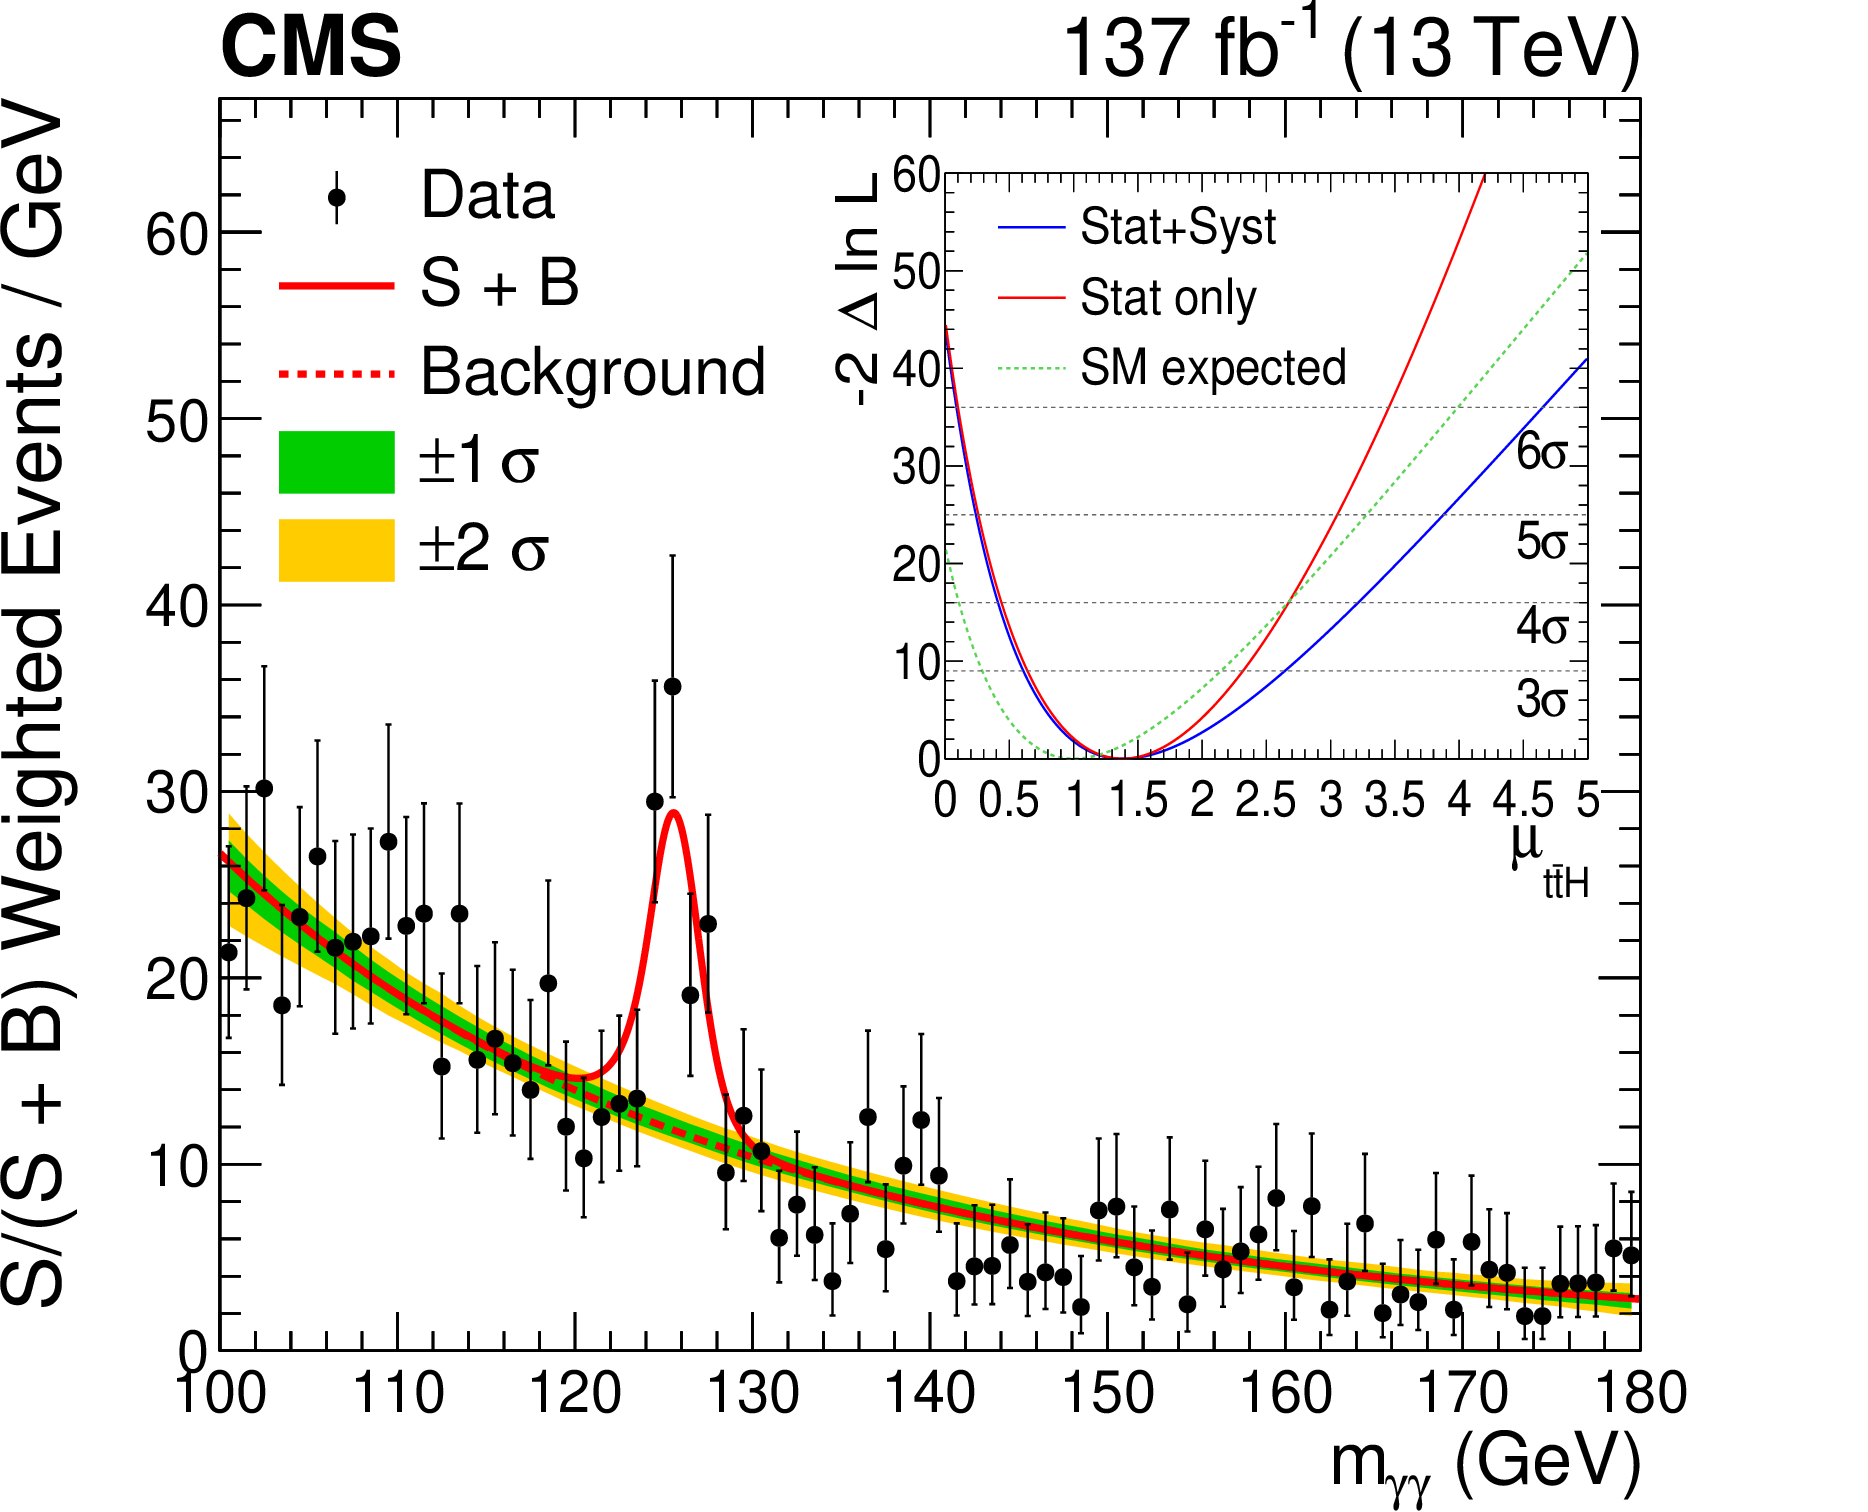
Figure 2:
Invariant mass distribution for the selected events (black points) weighted by S/(S + B), where S (B) is the numbers of expected signal (background) events in a $ \pm $1$\sigma _{\mathrm {eff}}$ mass window centered on ${m_{\mathrm{H}}}$. The $\sigma _{\mathrm {eff}}$ is defined as the smallest interval containing 68.3% of the ${m_{\gamma \gamma}}$ distribution, and ranges from 1.2 to 1.6% for different categories. We show curves for fitted signal $\oplus $ background (solid red) and for background only (dashed red), with bands covering the $ \pm $1$ \sigma $ and $ \pm$2$ \sigma $ uncertainties in the fitted background. The inner panel shows the likelihood scan for $\mu _{{{\mathrm{t} {}\mathrm{\bar{t}}} \mathrm{H}}}$ with ${m_{\mathrm{H}}}$ profiled. |

png pdf |
Figure 3:
The distribution of events weighted by S/(S + B), as in Fig. 2, in three bins of the $\mathcal {D}_{0-}$ discriminant. In this display, leptonic/hadronic channels and BDT-bkg categories are combined in the mass range 115 $ < {m_{\gamma \gamma}} < $ 135 GeV and the background contribution, as determined in the fit to data, is subtracted. The inner panel shows the likelihood scan for $ {| {f_{\mathrm {CP}}^{{\mathrm{H} \mathrm{t} \mathrm{t}}}} |}$. |
| Tables | |
png pdf |
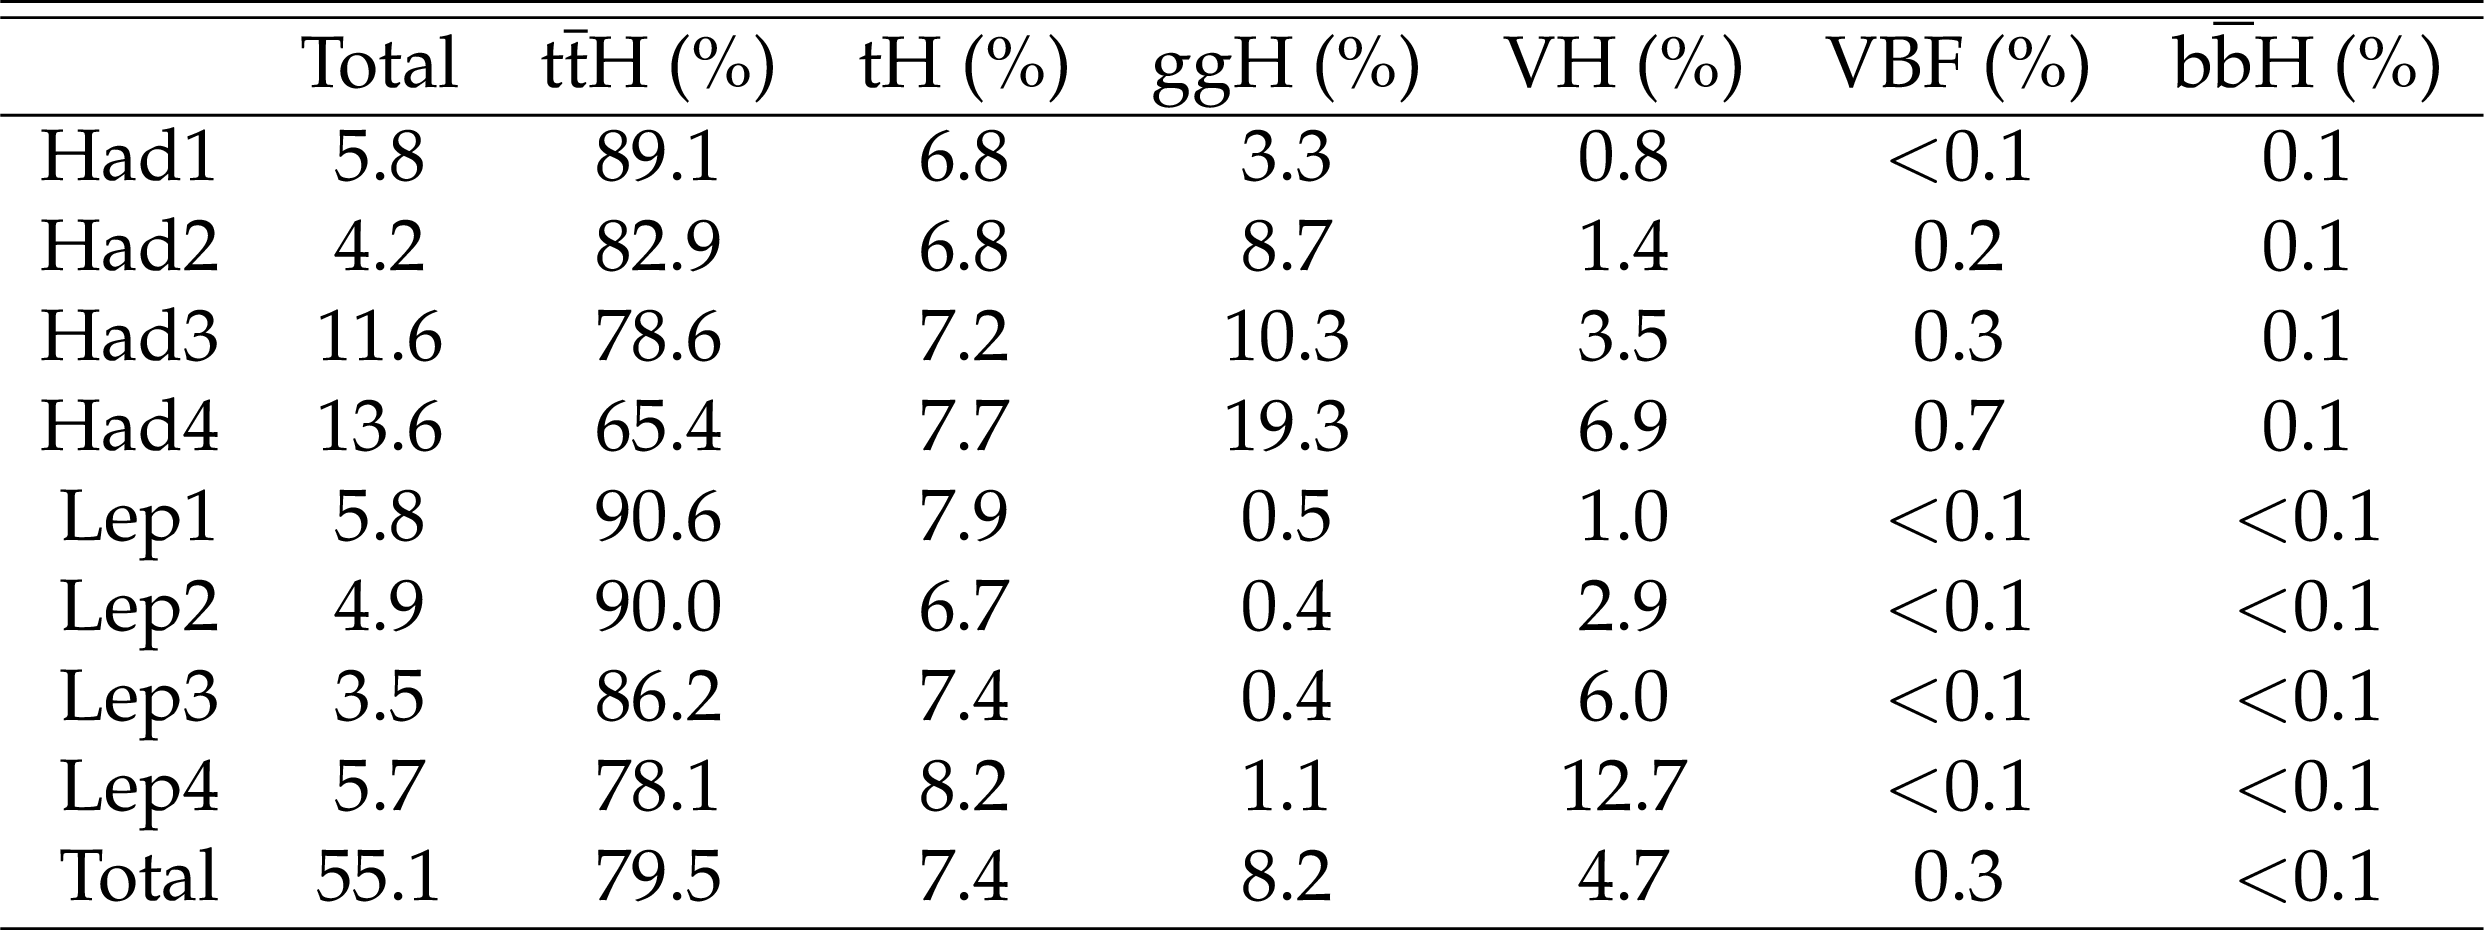
Table 1:
The expected number of H events in the hadronic and leptonic channels per category and the fractional contribution per H production mode. |
| Summary |
| To conclude, we presented the first single-channel observation of the ${\mathrm{t\bar{t}}\mathrm{H}}$ process and the first measurement of the CP structure of the Htt coupling using the ${\mathrm{H \to \gamma\gamma}}$ channel. The cross section of the ${\mathrm{t\bar{t}}\mathrm{H}}$ process is measured to be ${\sigma_{{\mathrm{t\bar{t}}\mathrm{H}} } \mathcal{B}_{\gamma\gamma}} = $ 1.56$^{+0.34}_{-0.32}$ fb, corresponding to 1.38$^{+0.36}_{-0.29}$ times the SM prediction, with a significance of 6.6$\sigma$. The data disfavor the pure CP-odd model of the ${\mathrm{Ht\bar{t}}}$ coupling at 3.2$\sigma$, and a possible fractional CP-odd contribution is constrained to be $f^{\text{Htt}}_{\text{CP}}=$ 0.00 $\pm$ 0.33 at 68% CL. |
| Additional Figures | |
png pdf |
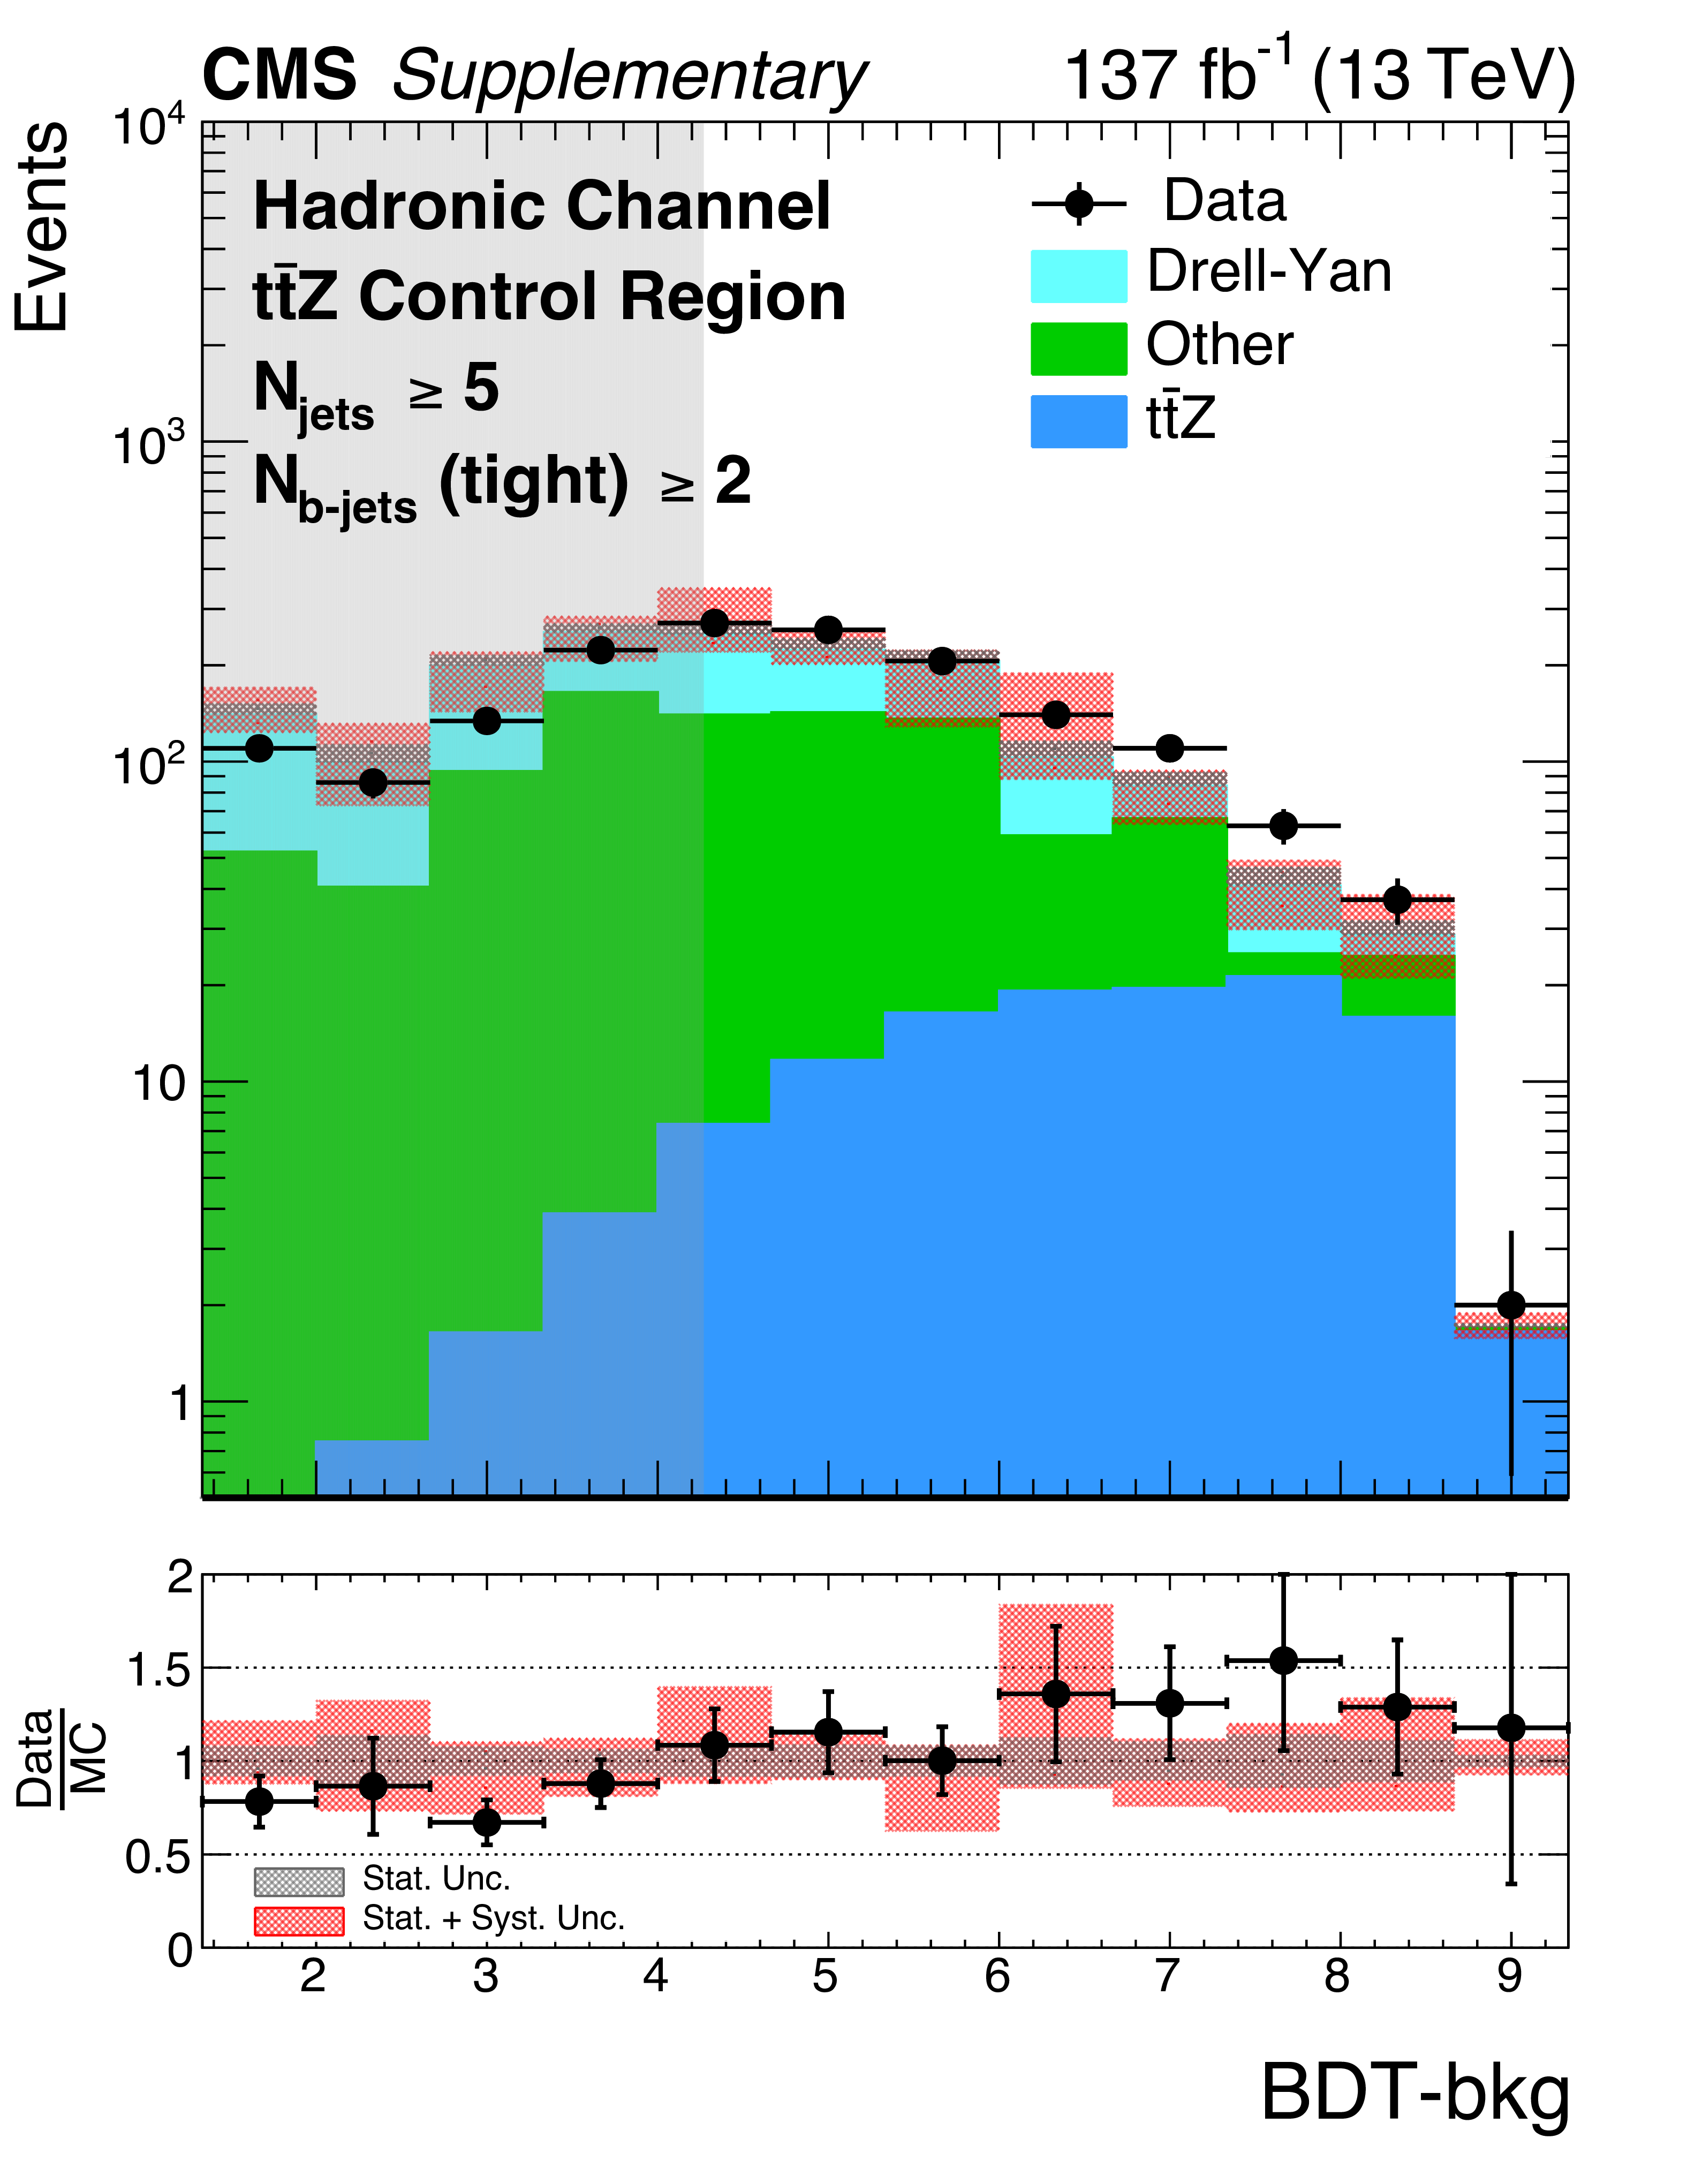
Additional Figure 1:
Distributions of the output of the BDTs evaluated with events from the ttZ control region, for the hadronic channel. The shaded bands show the statistical and systematic uncertainties. |
png pdf |
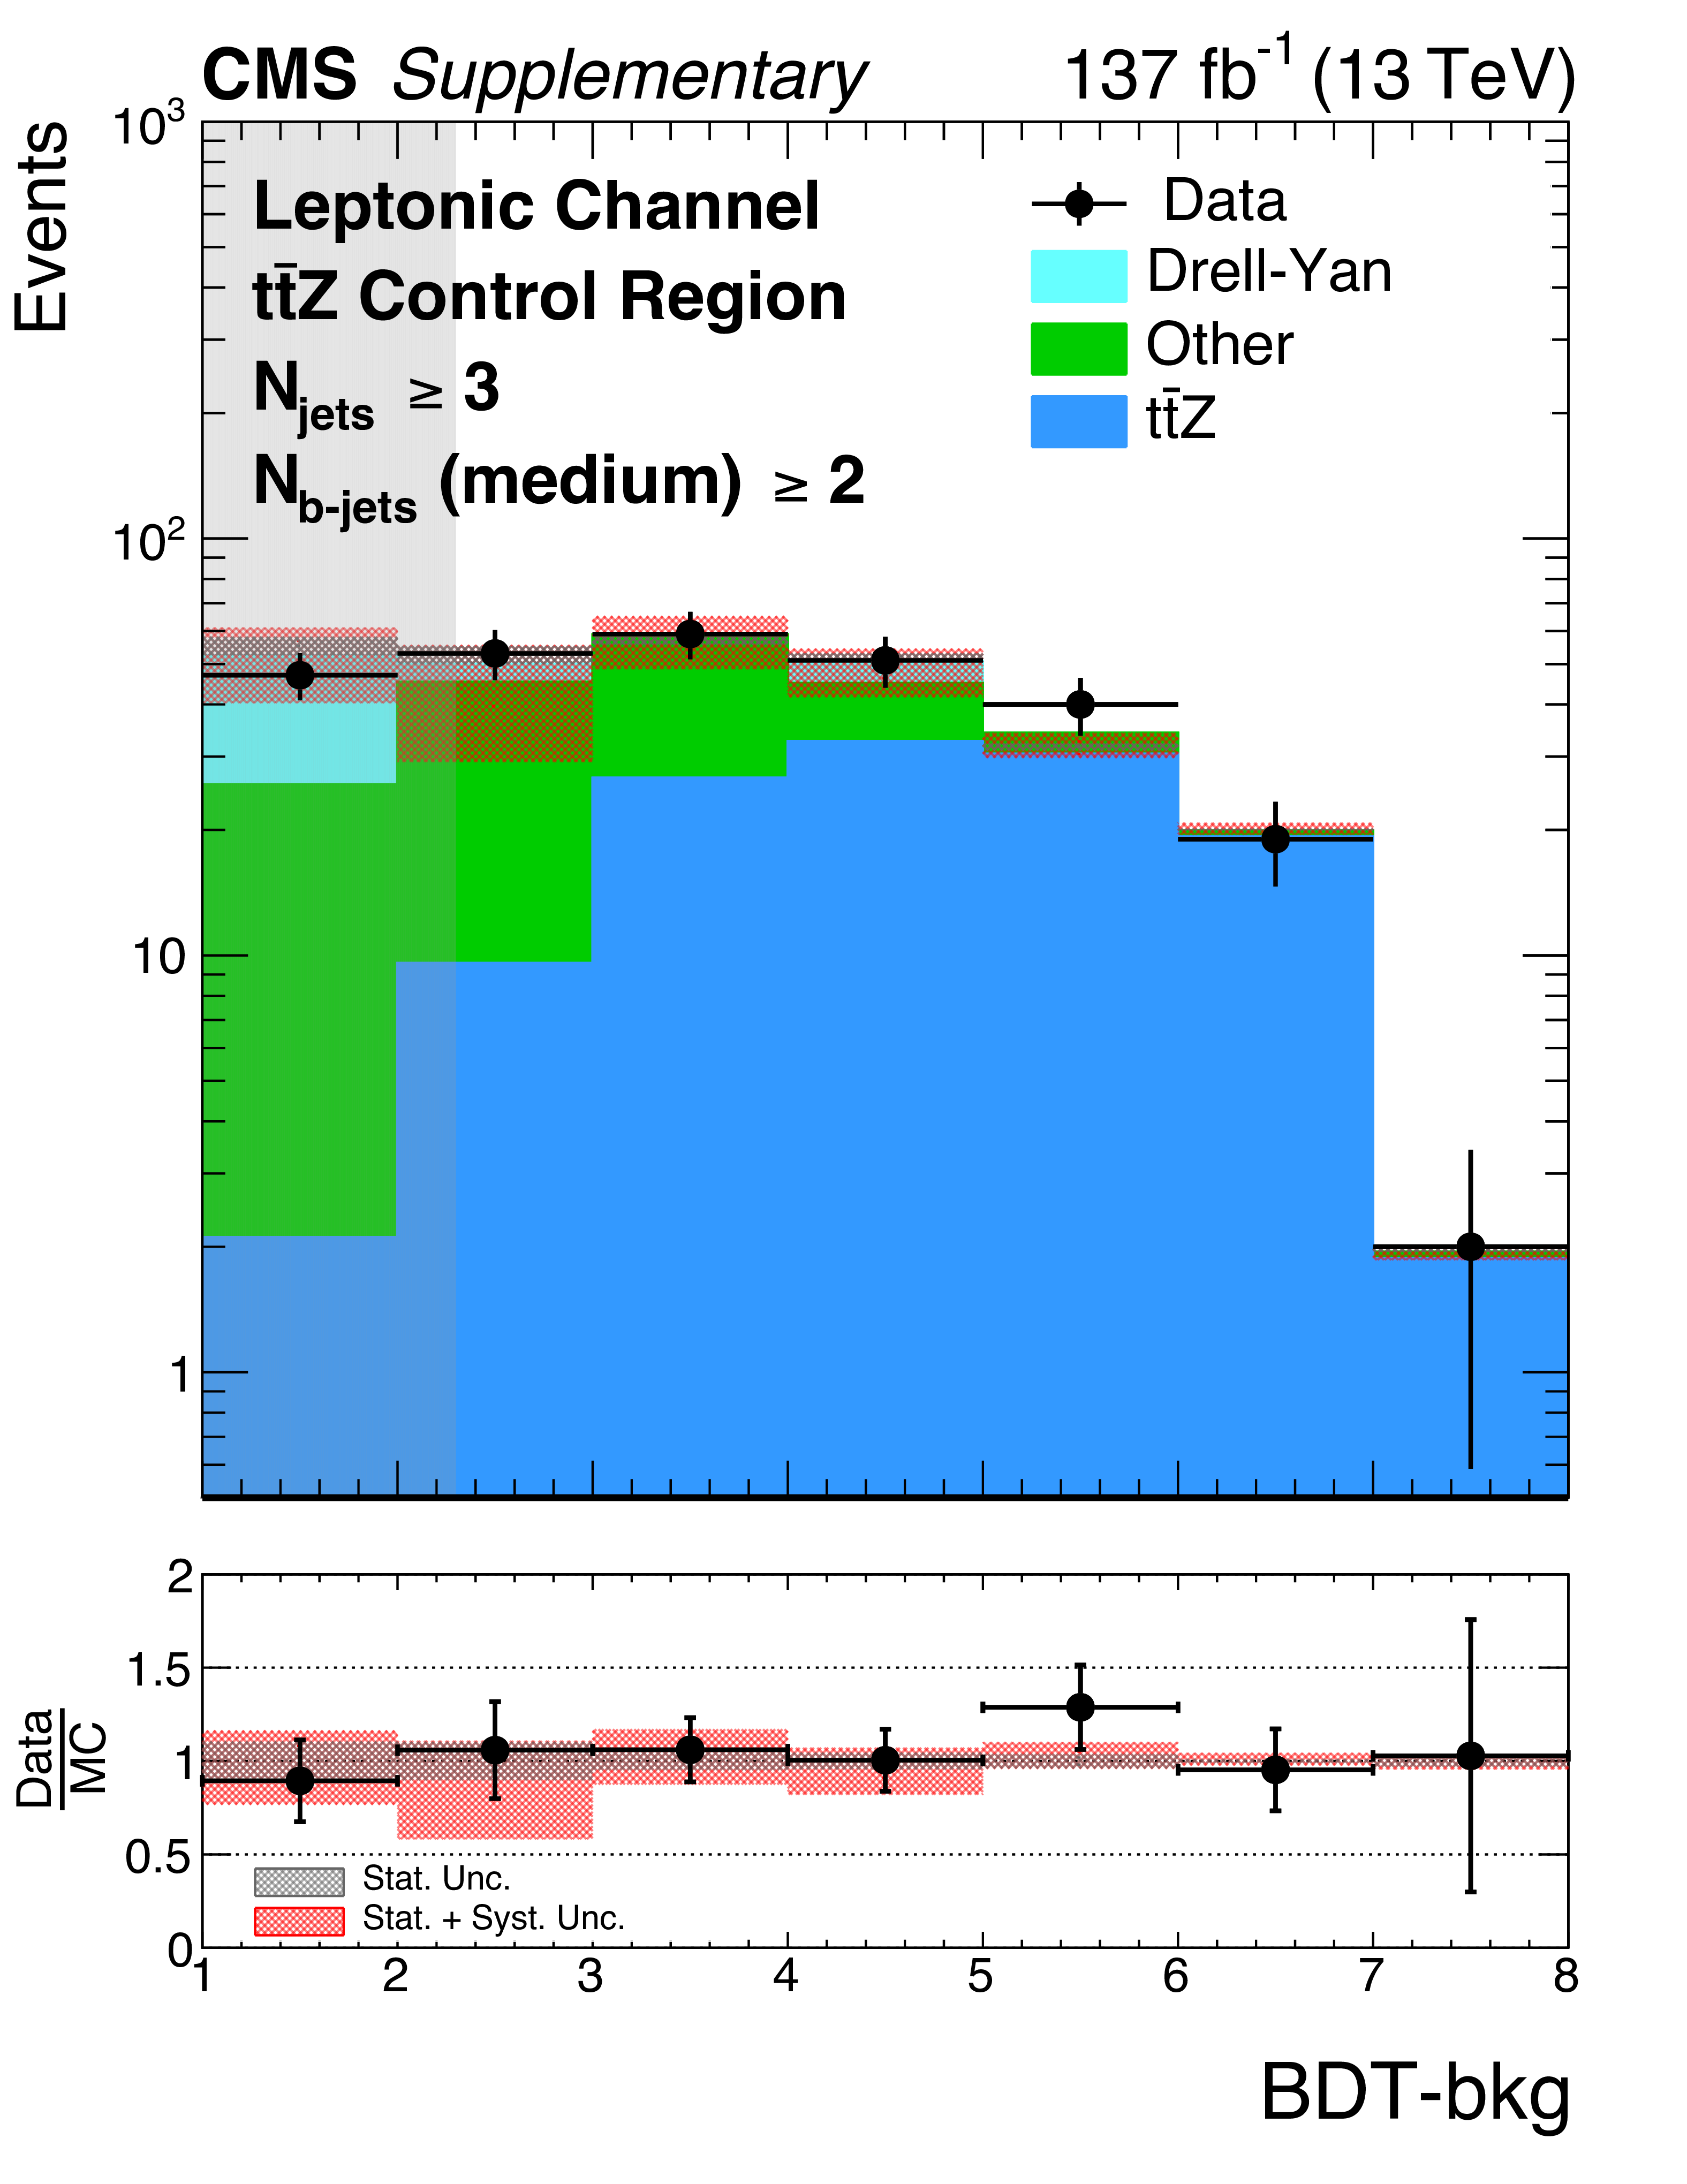
Additional Figure 2:
Distributions of the output of the BDTs evaluated with events from the ttZ control region, for the leptonic channel. The shaded bands show the statistical and systematic uncertainties. |
png pdf |
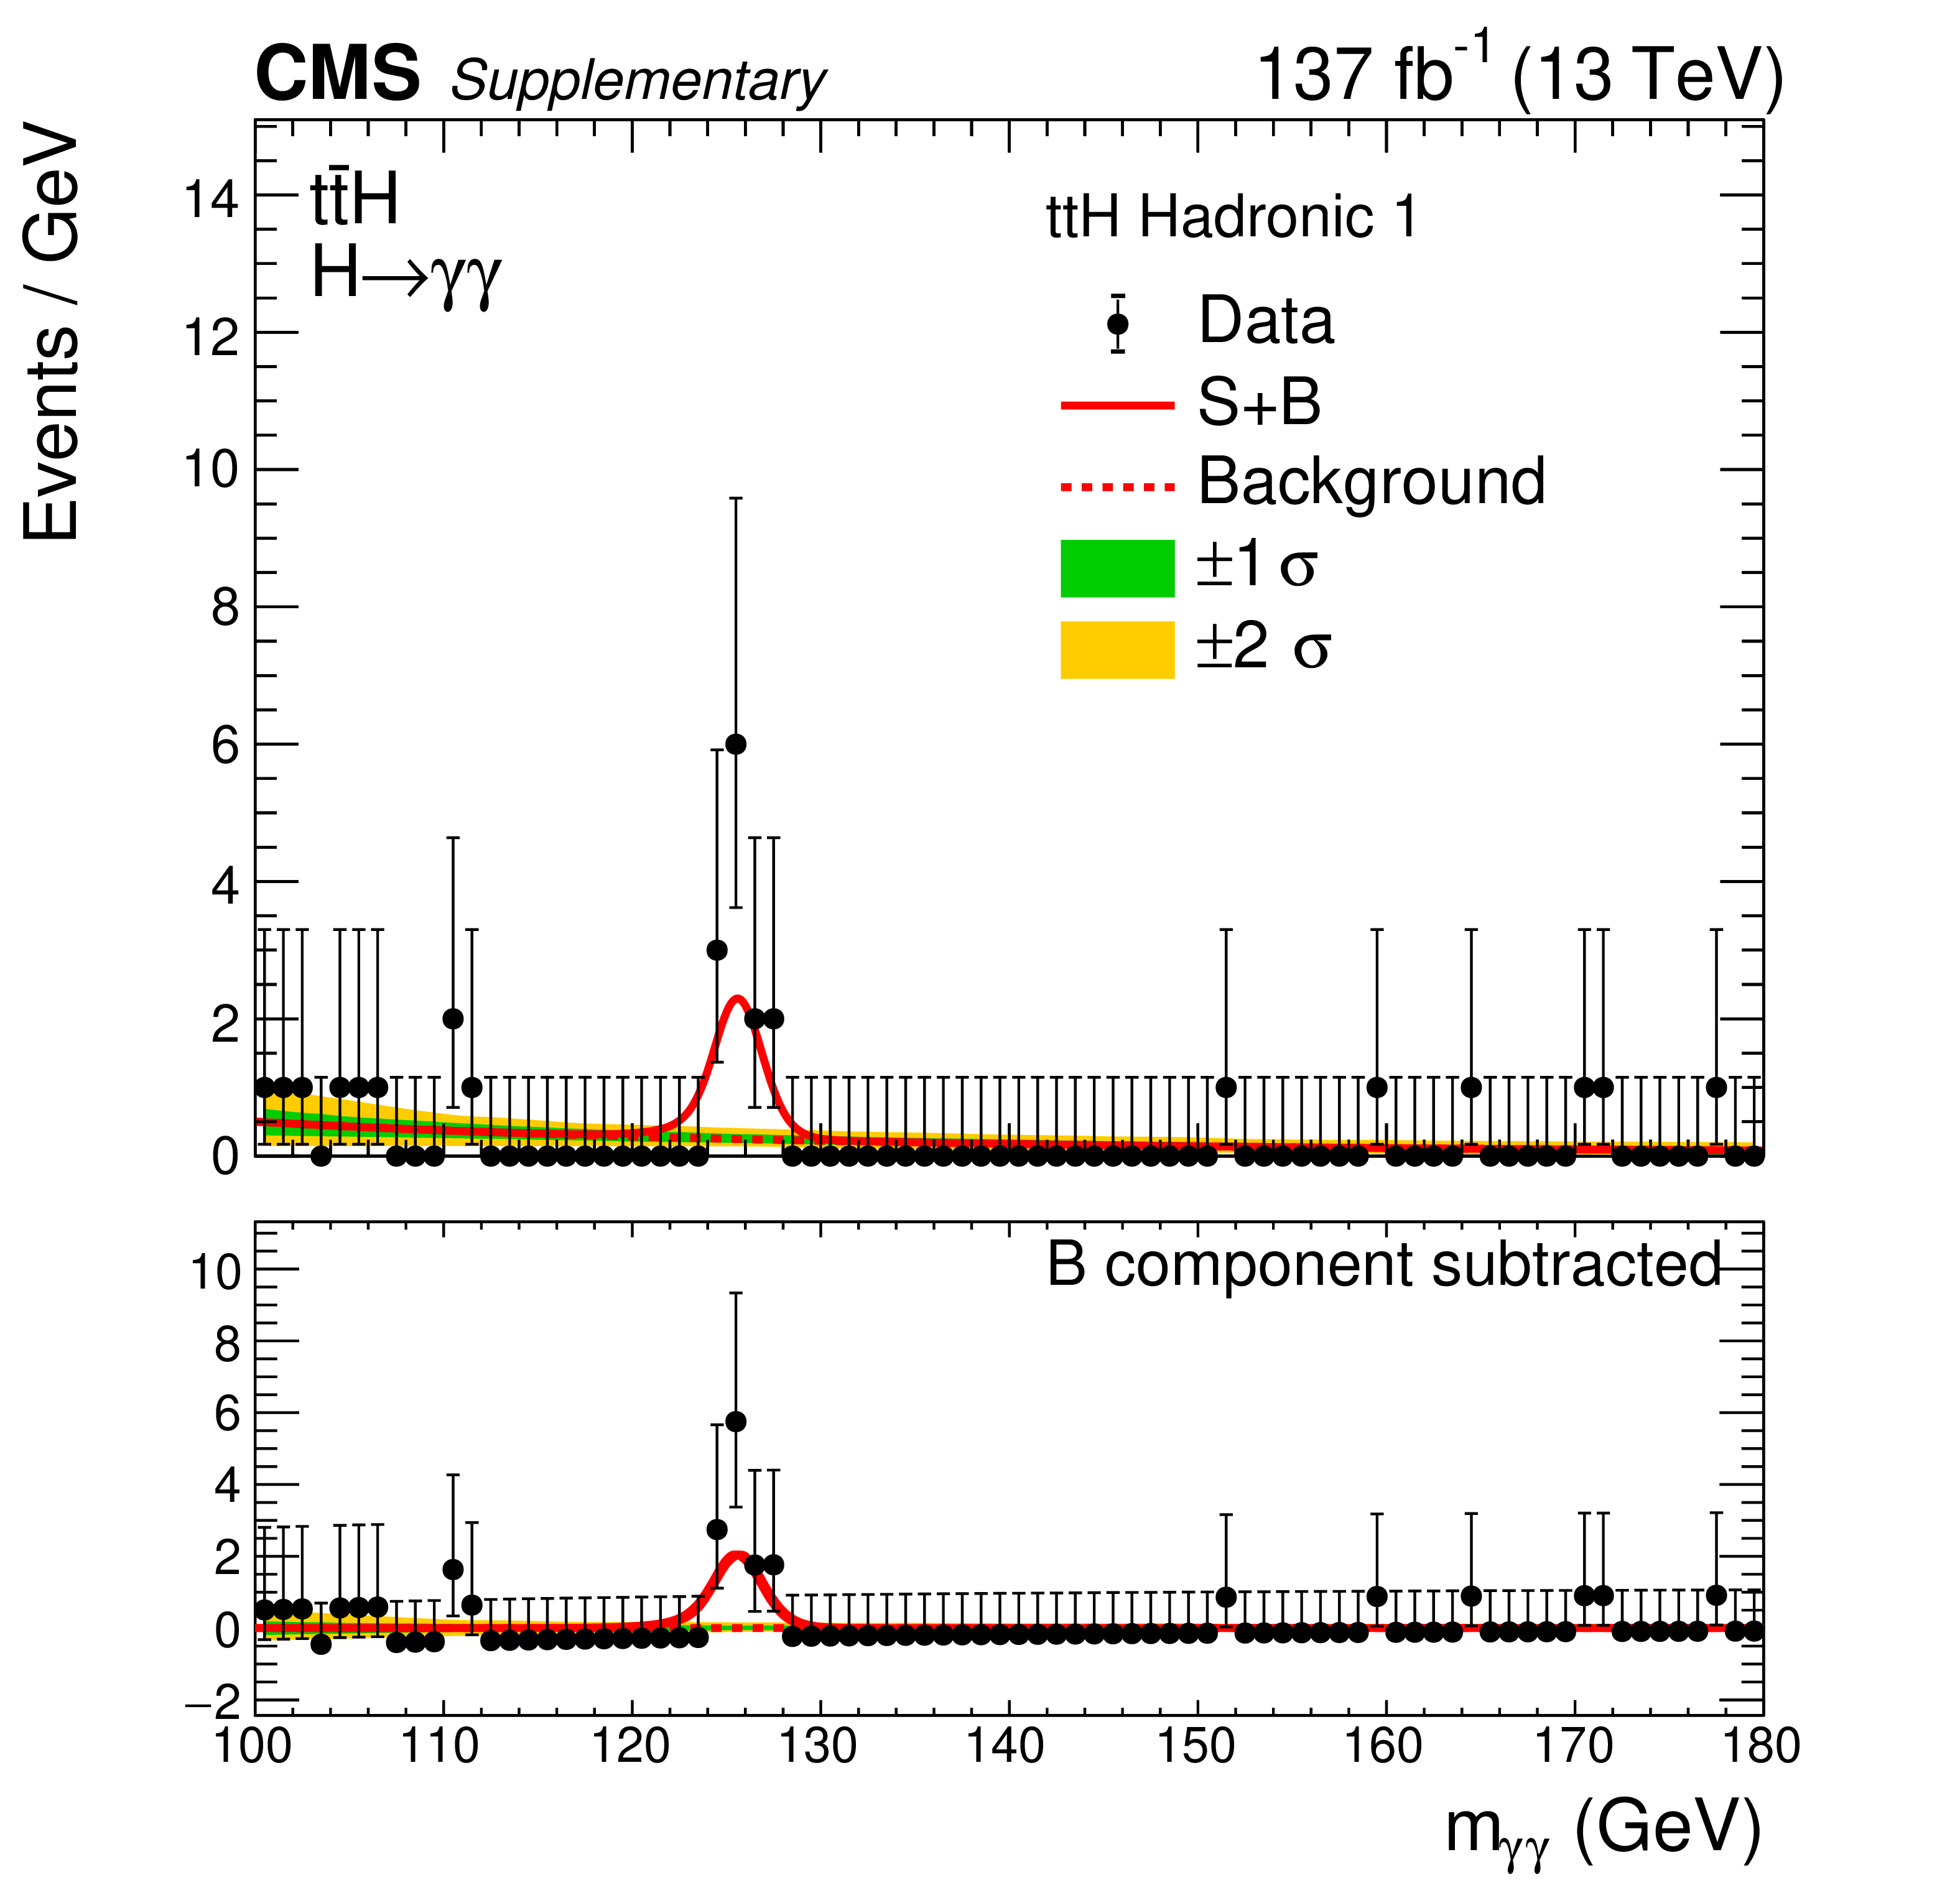
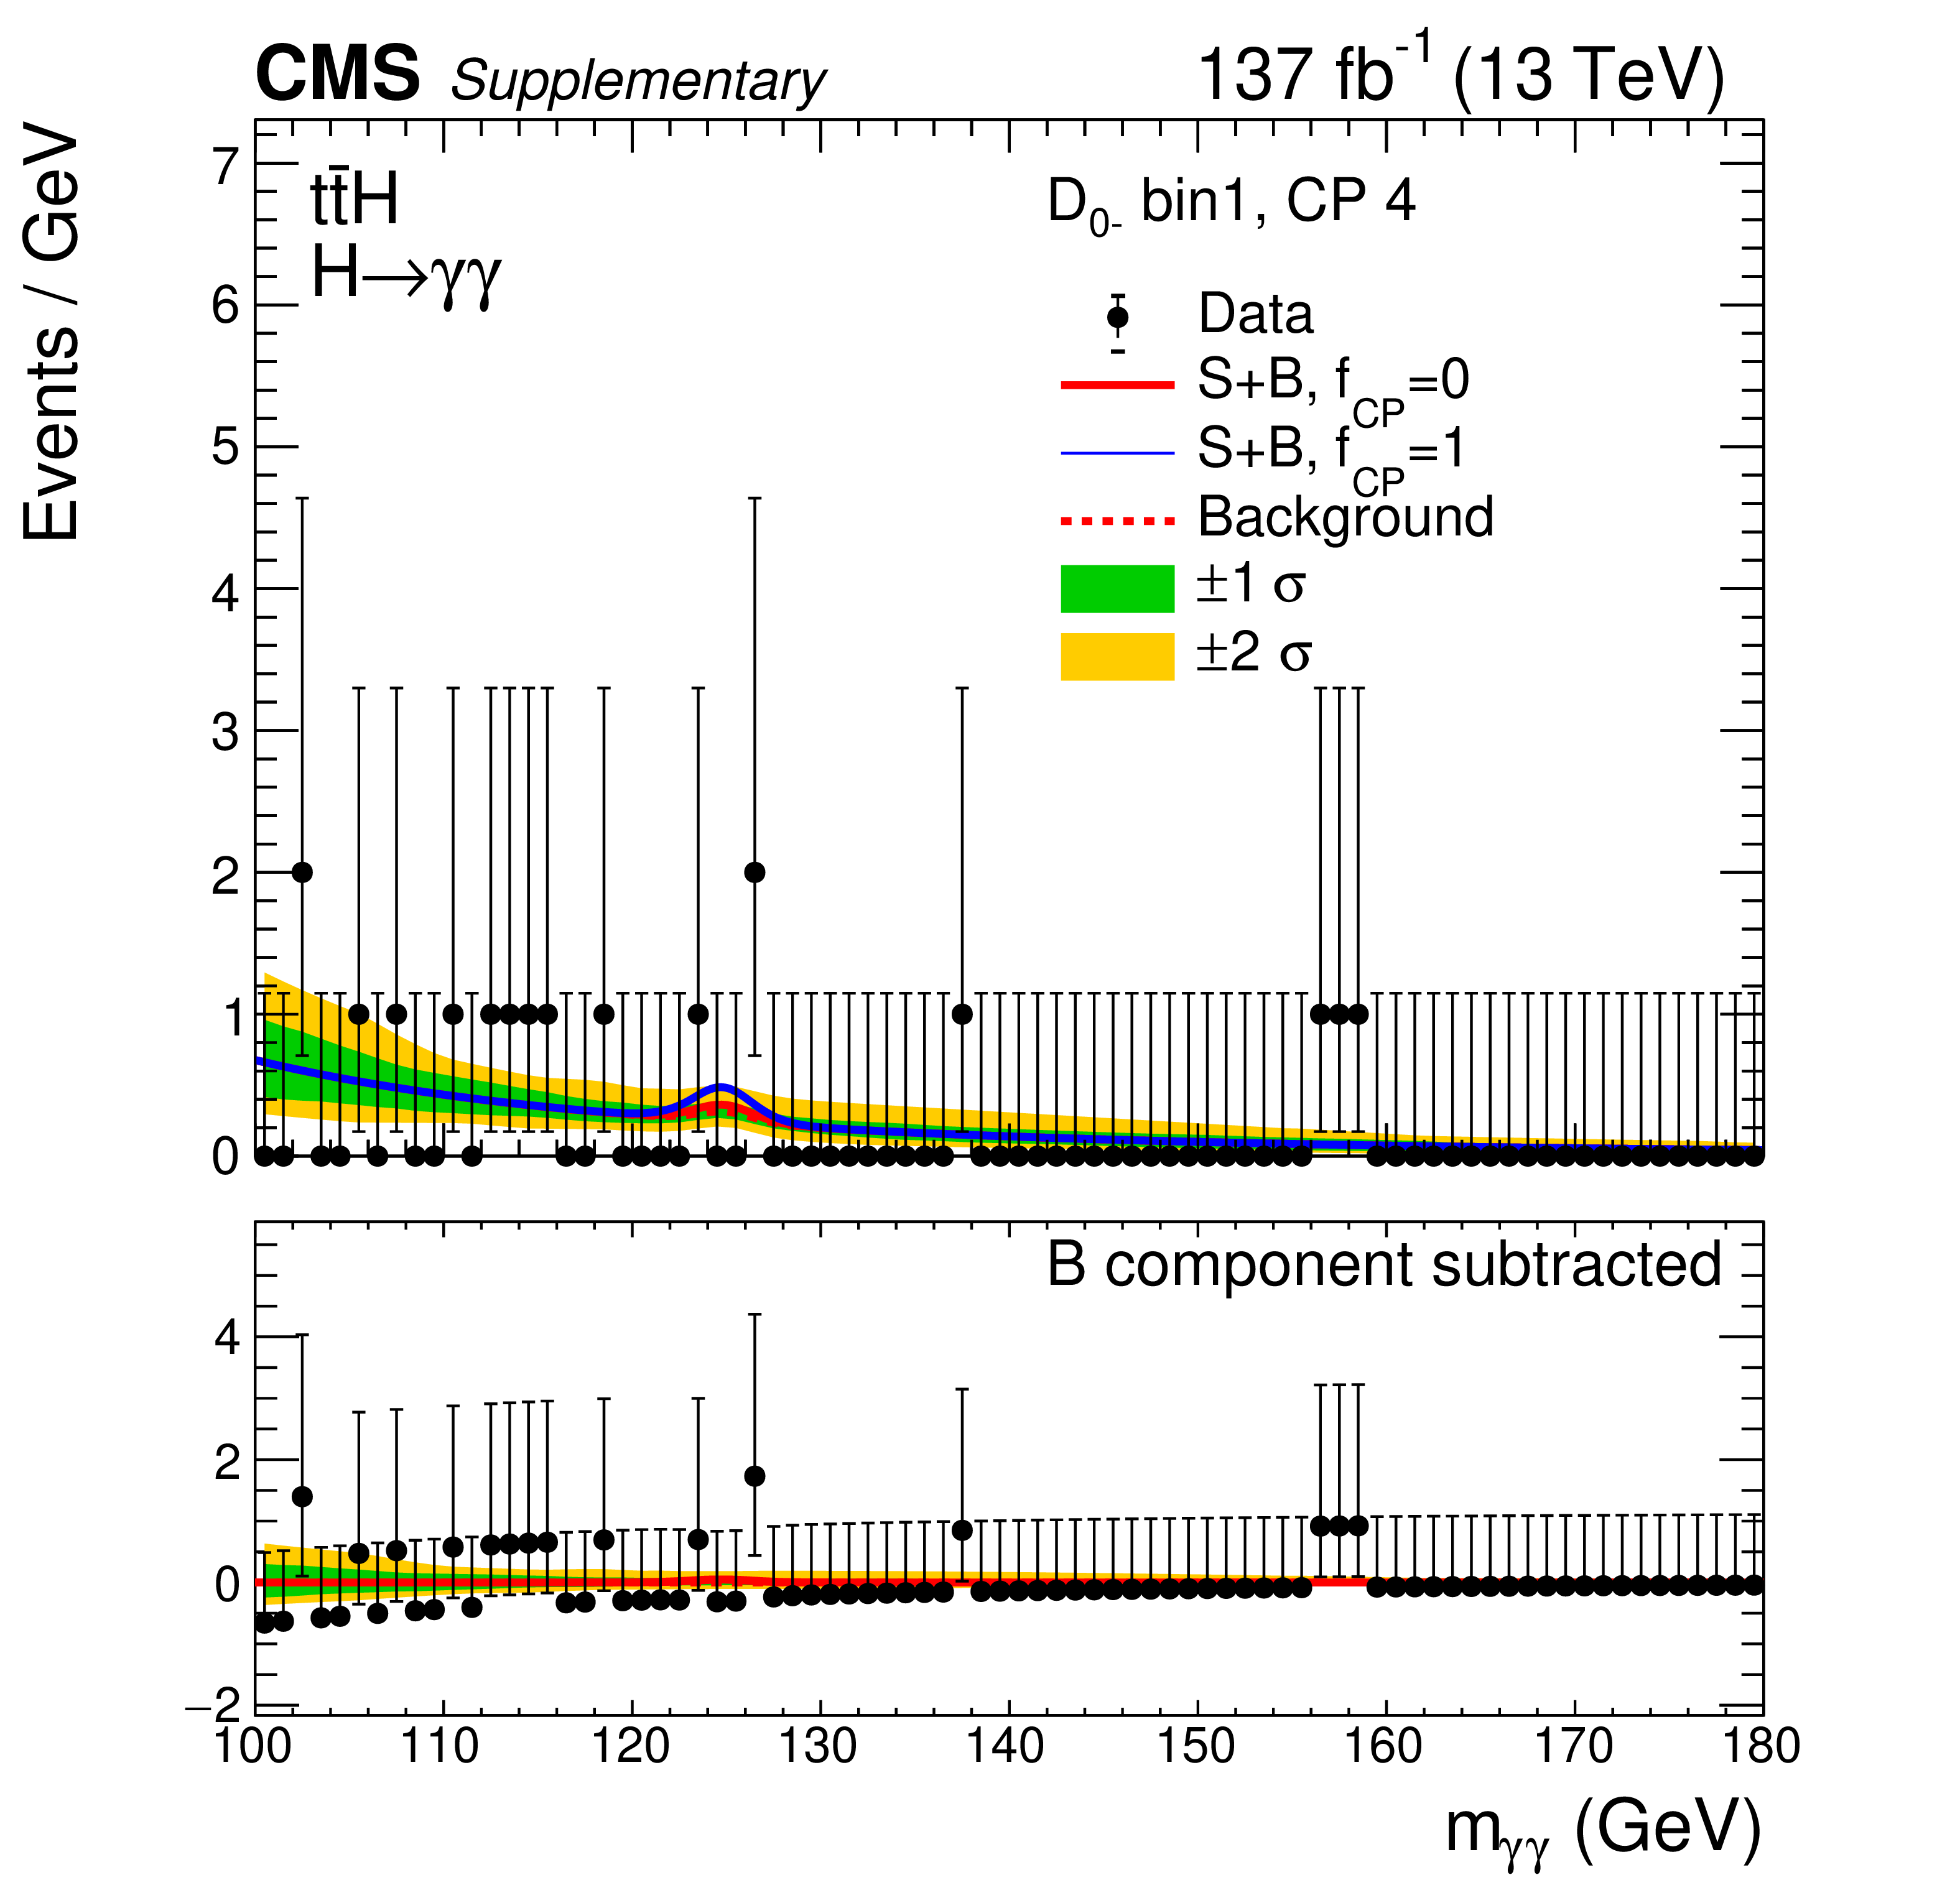
Additional Figure 3:
Data and signal-plus-background model fits in ttH Hadronic Tag 1 category are shown. The one (green) and two (yellow) standard deviation bands include the uncertainties in the background component of the fit. The lower panel shows the residuals after the background subtraction. |
png pdf |
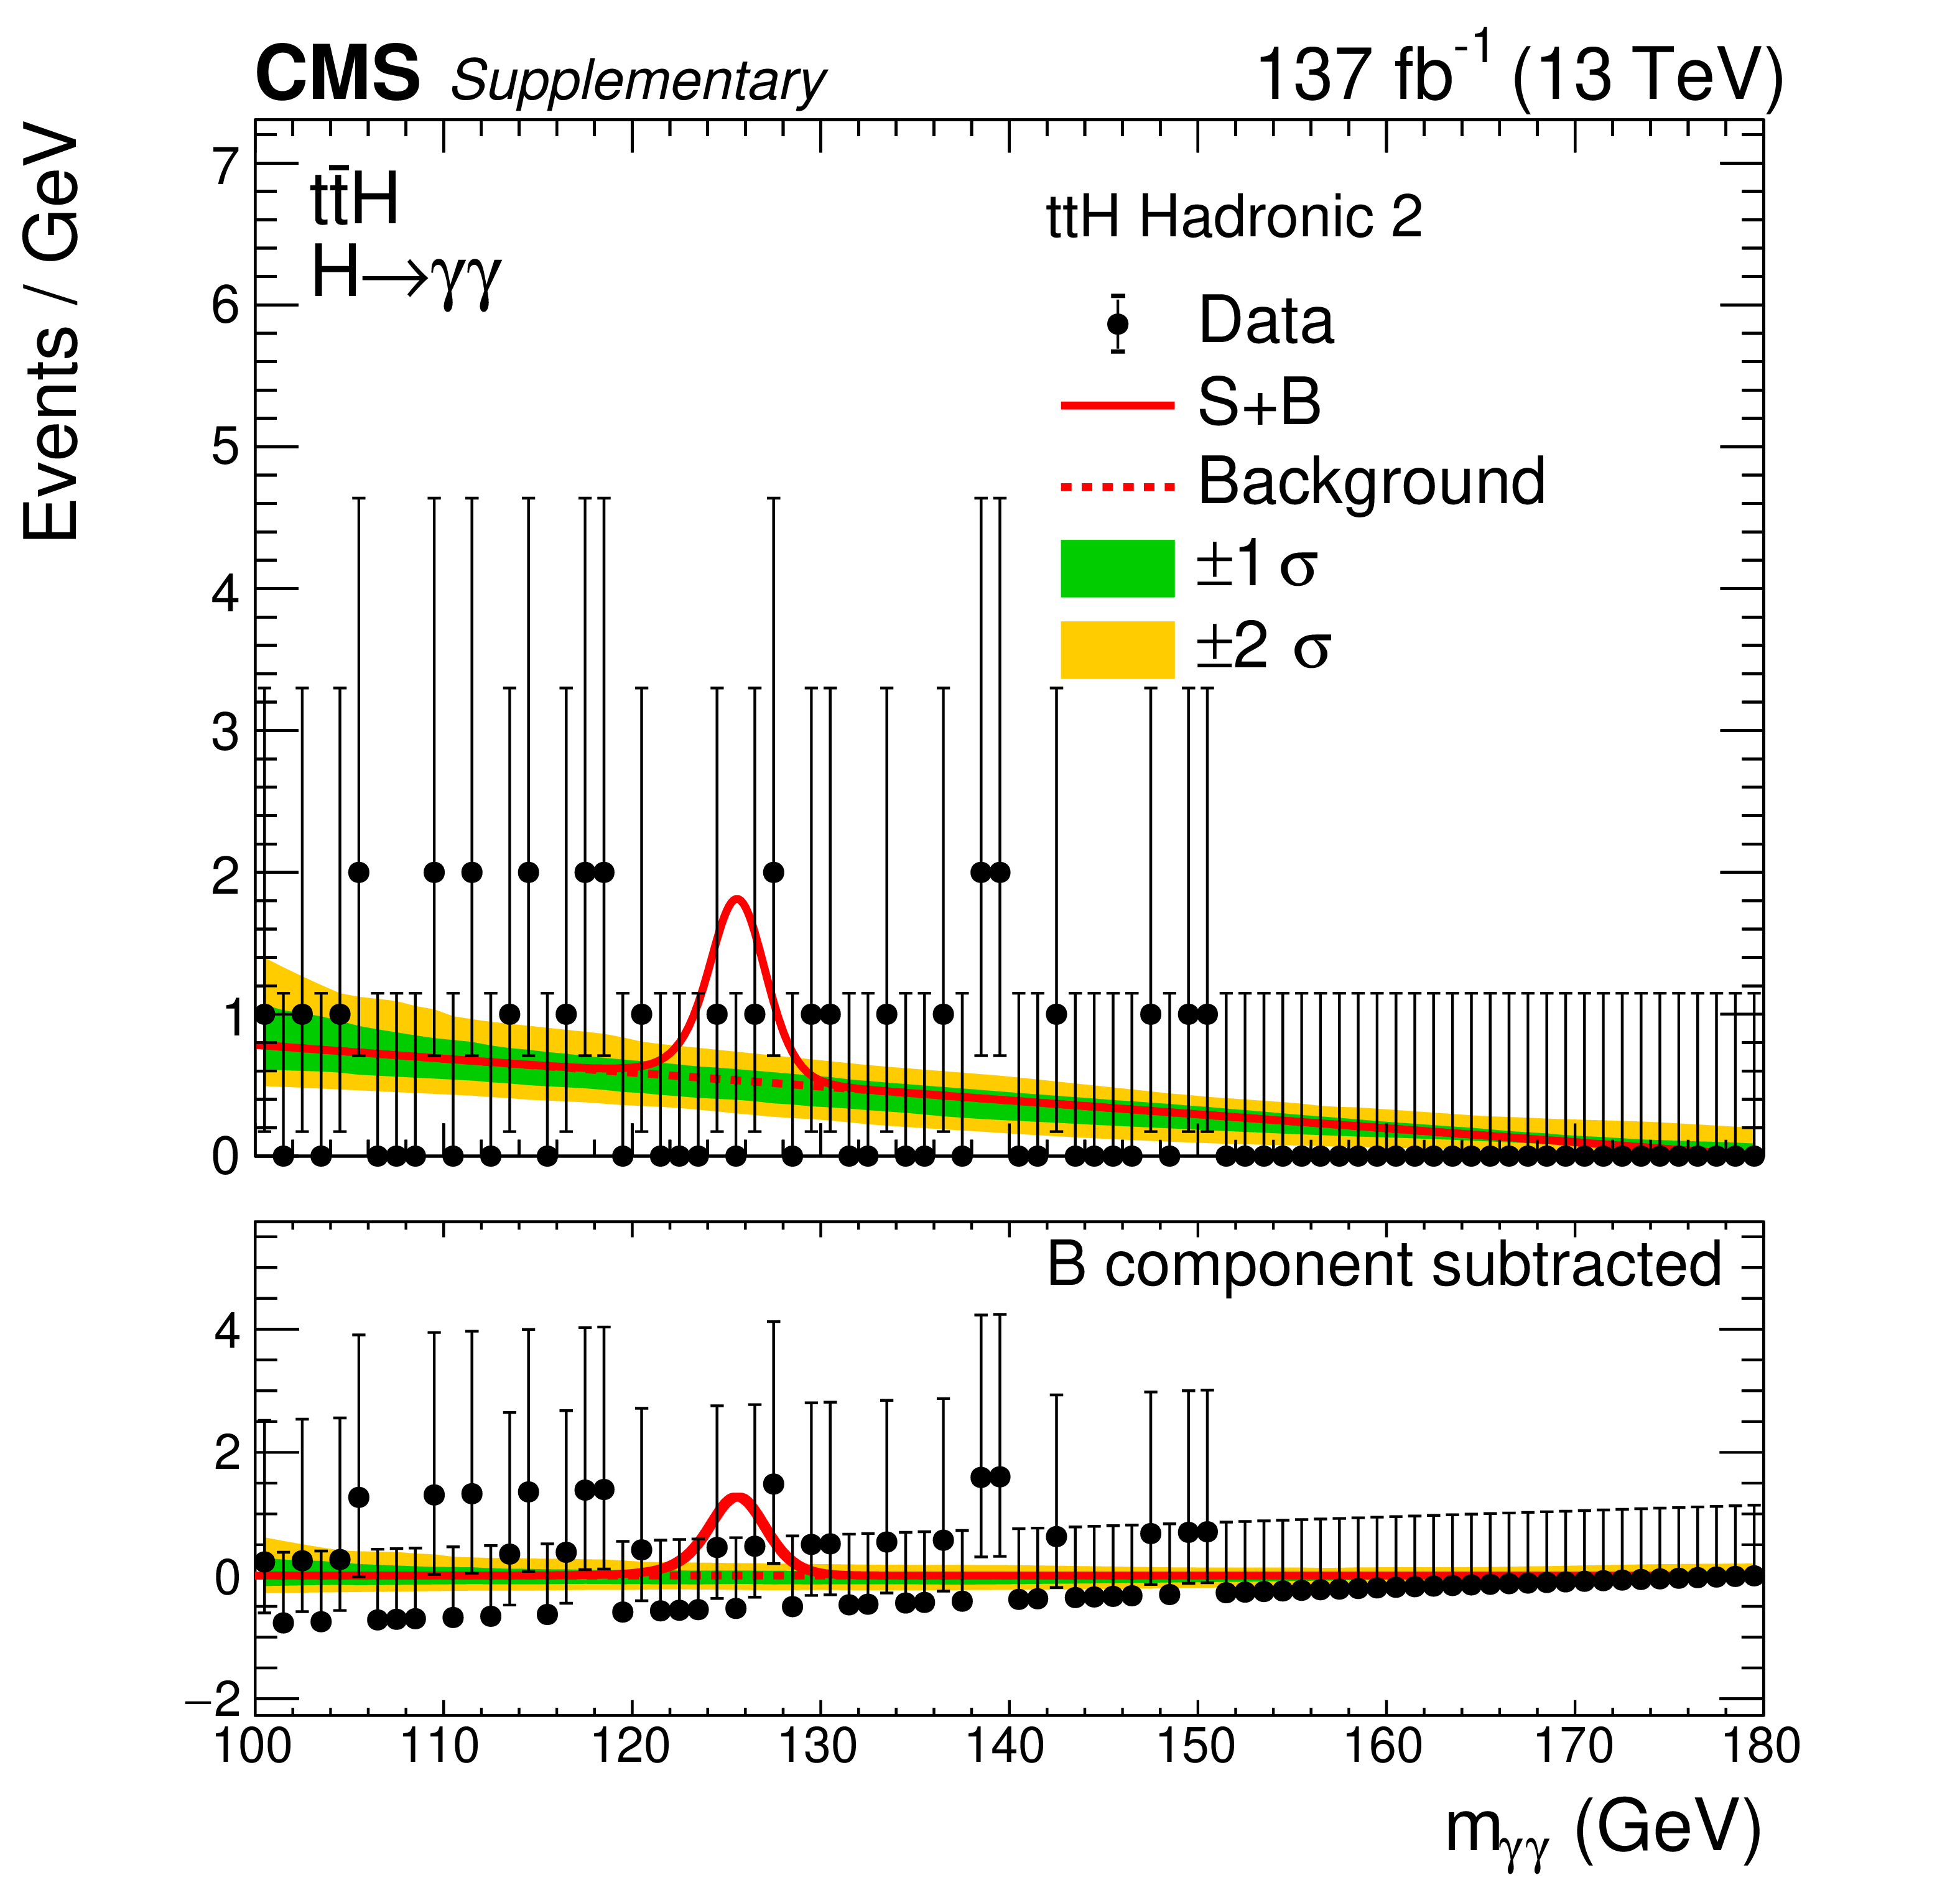
Additional Figure 4:
Data and signal-plus-background model fits in ttH Hadronic Tag 2 category are shown. The one (green) and two (yellow) standard deviation bands include the uncertainties in the background component of the fit. The lower panel shows the residuals after the background subtraction. |

png pdf |
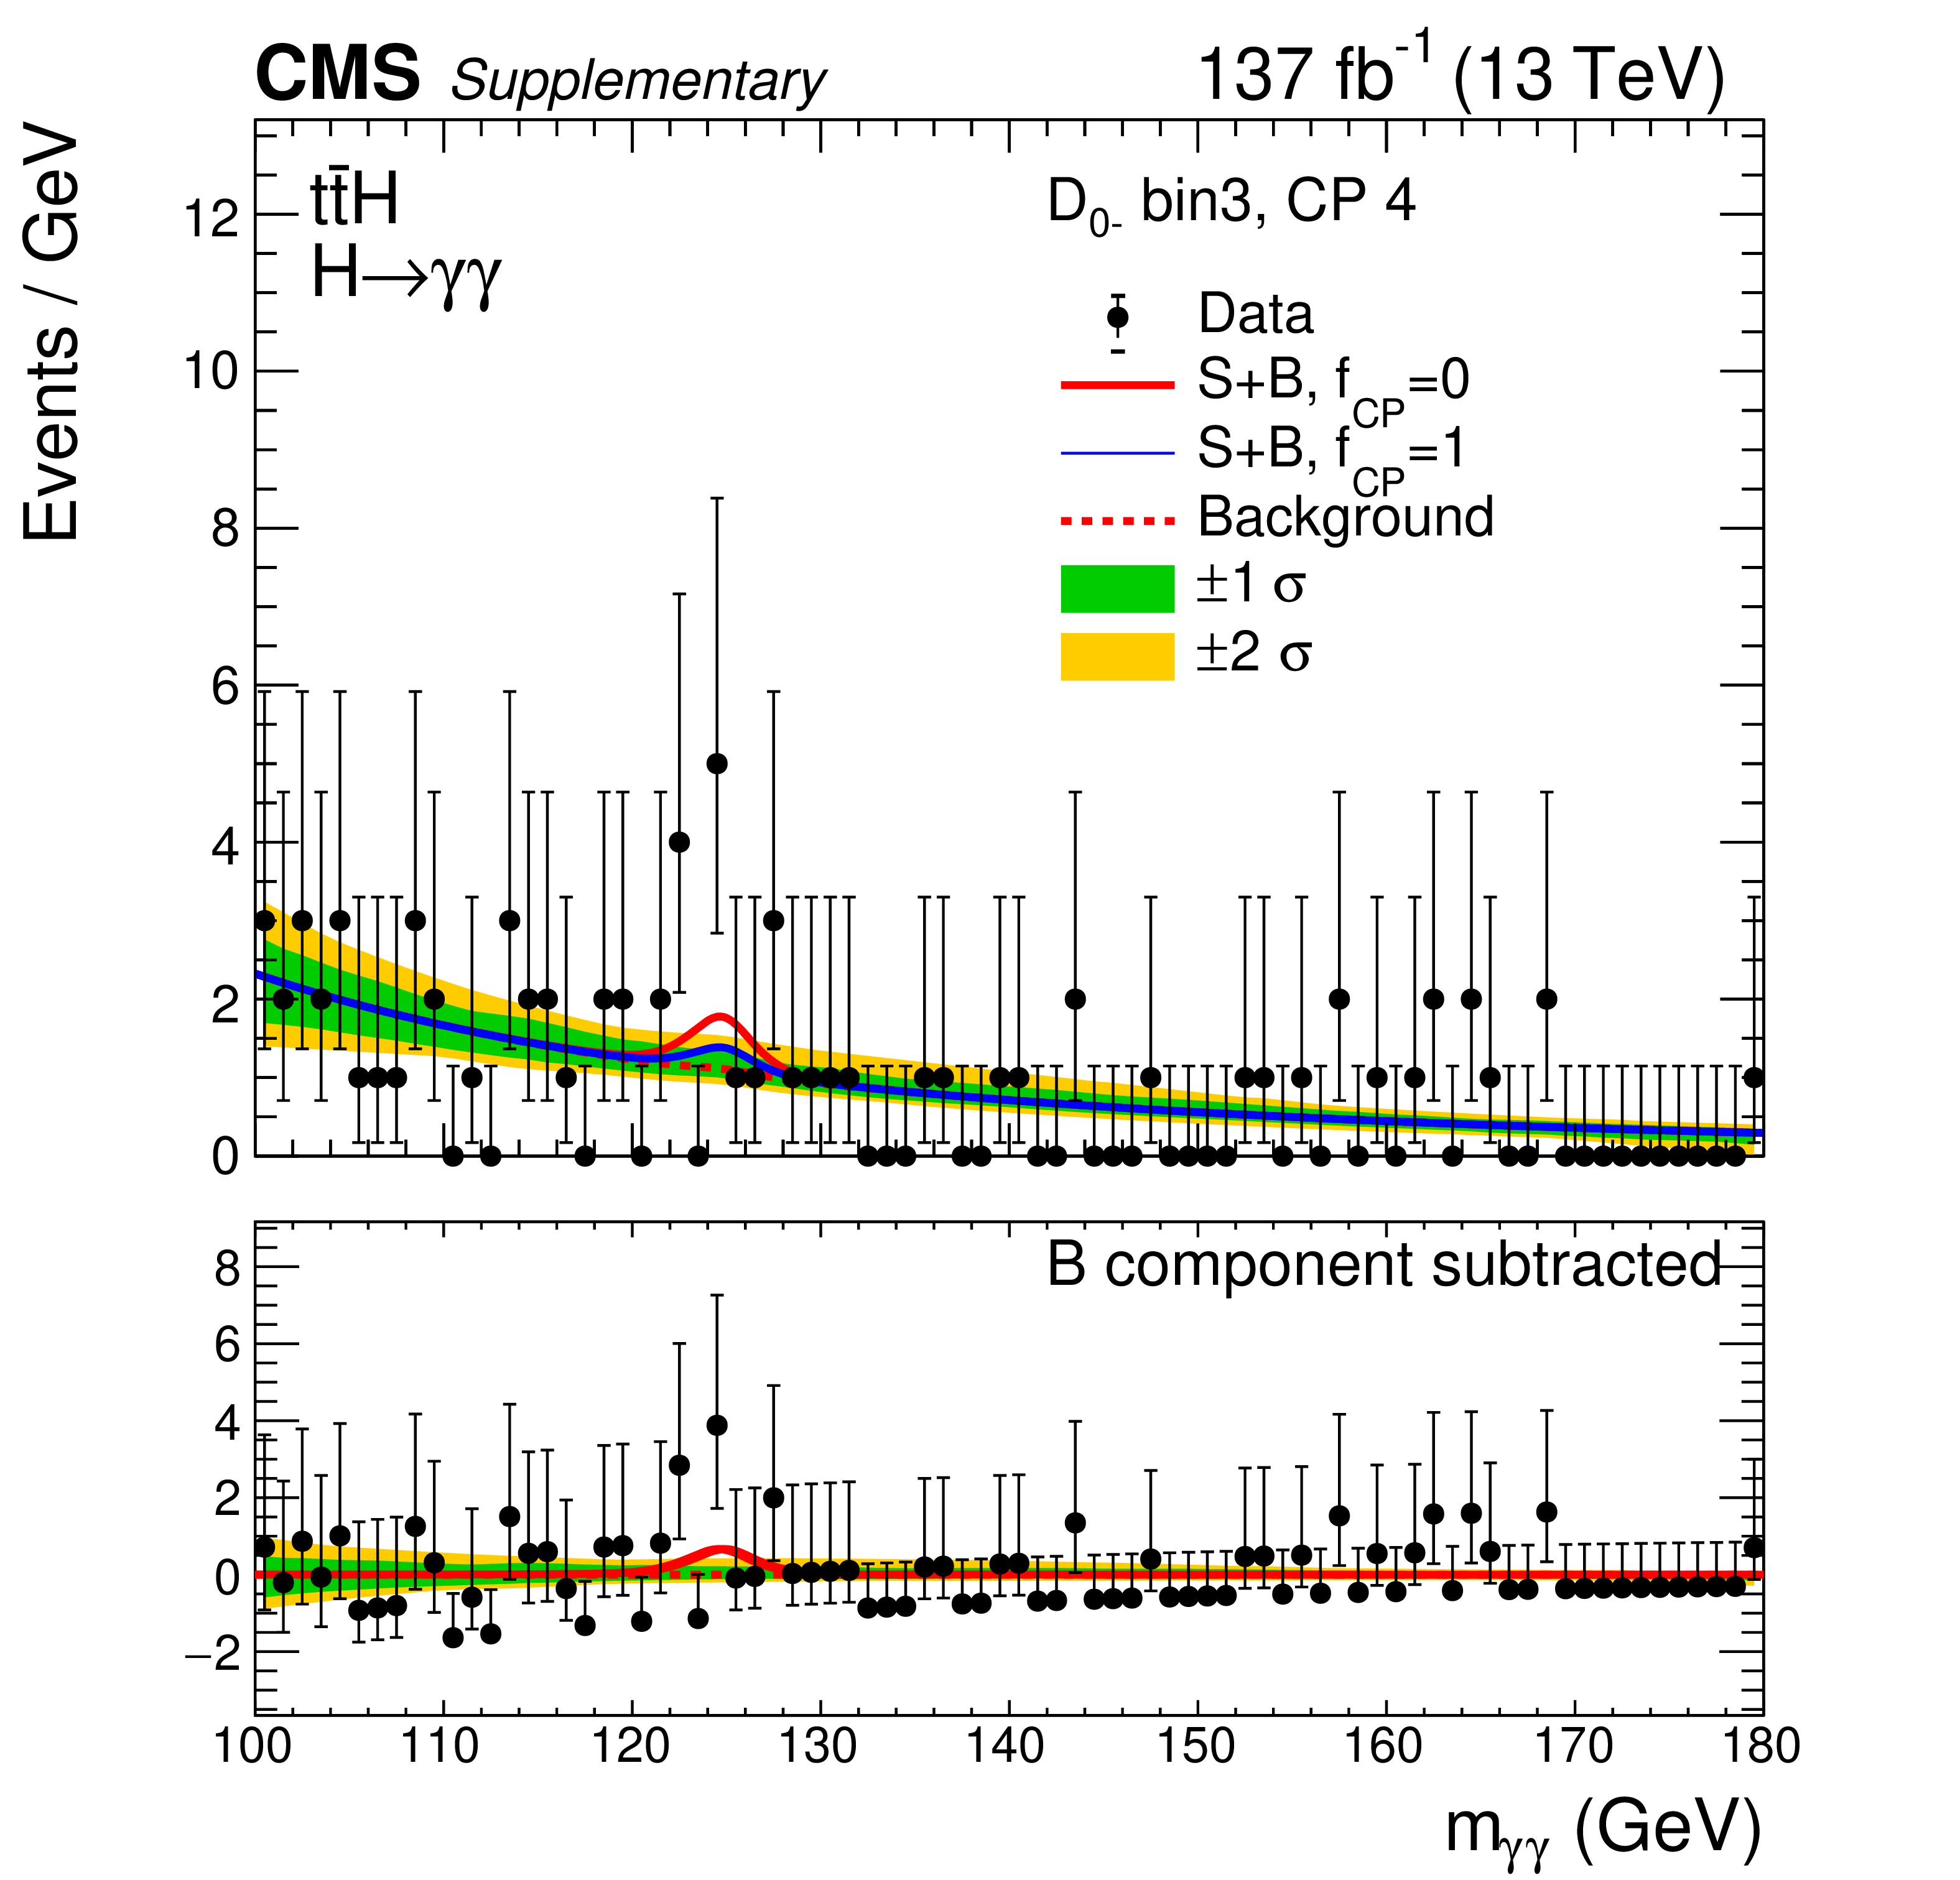
Additional Figure 5:
Data and signal-plus-background model fits in ttH Hadronic Tag 3 category are shown. The one (green) and two (yellow) standard deviation bands include the uncertainties in the background component of the fit. The lower panel shows the residuals after the background subtraction. |
png pdf |
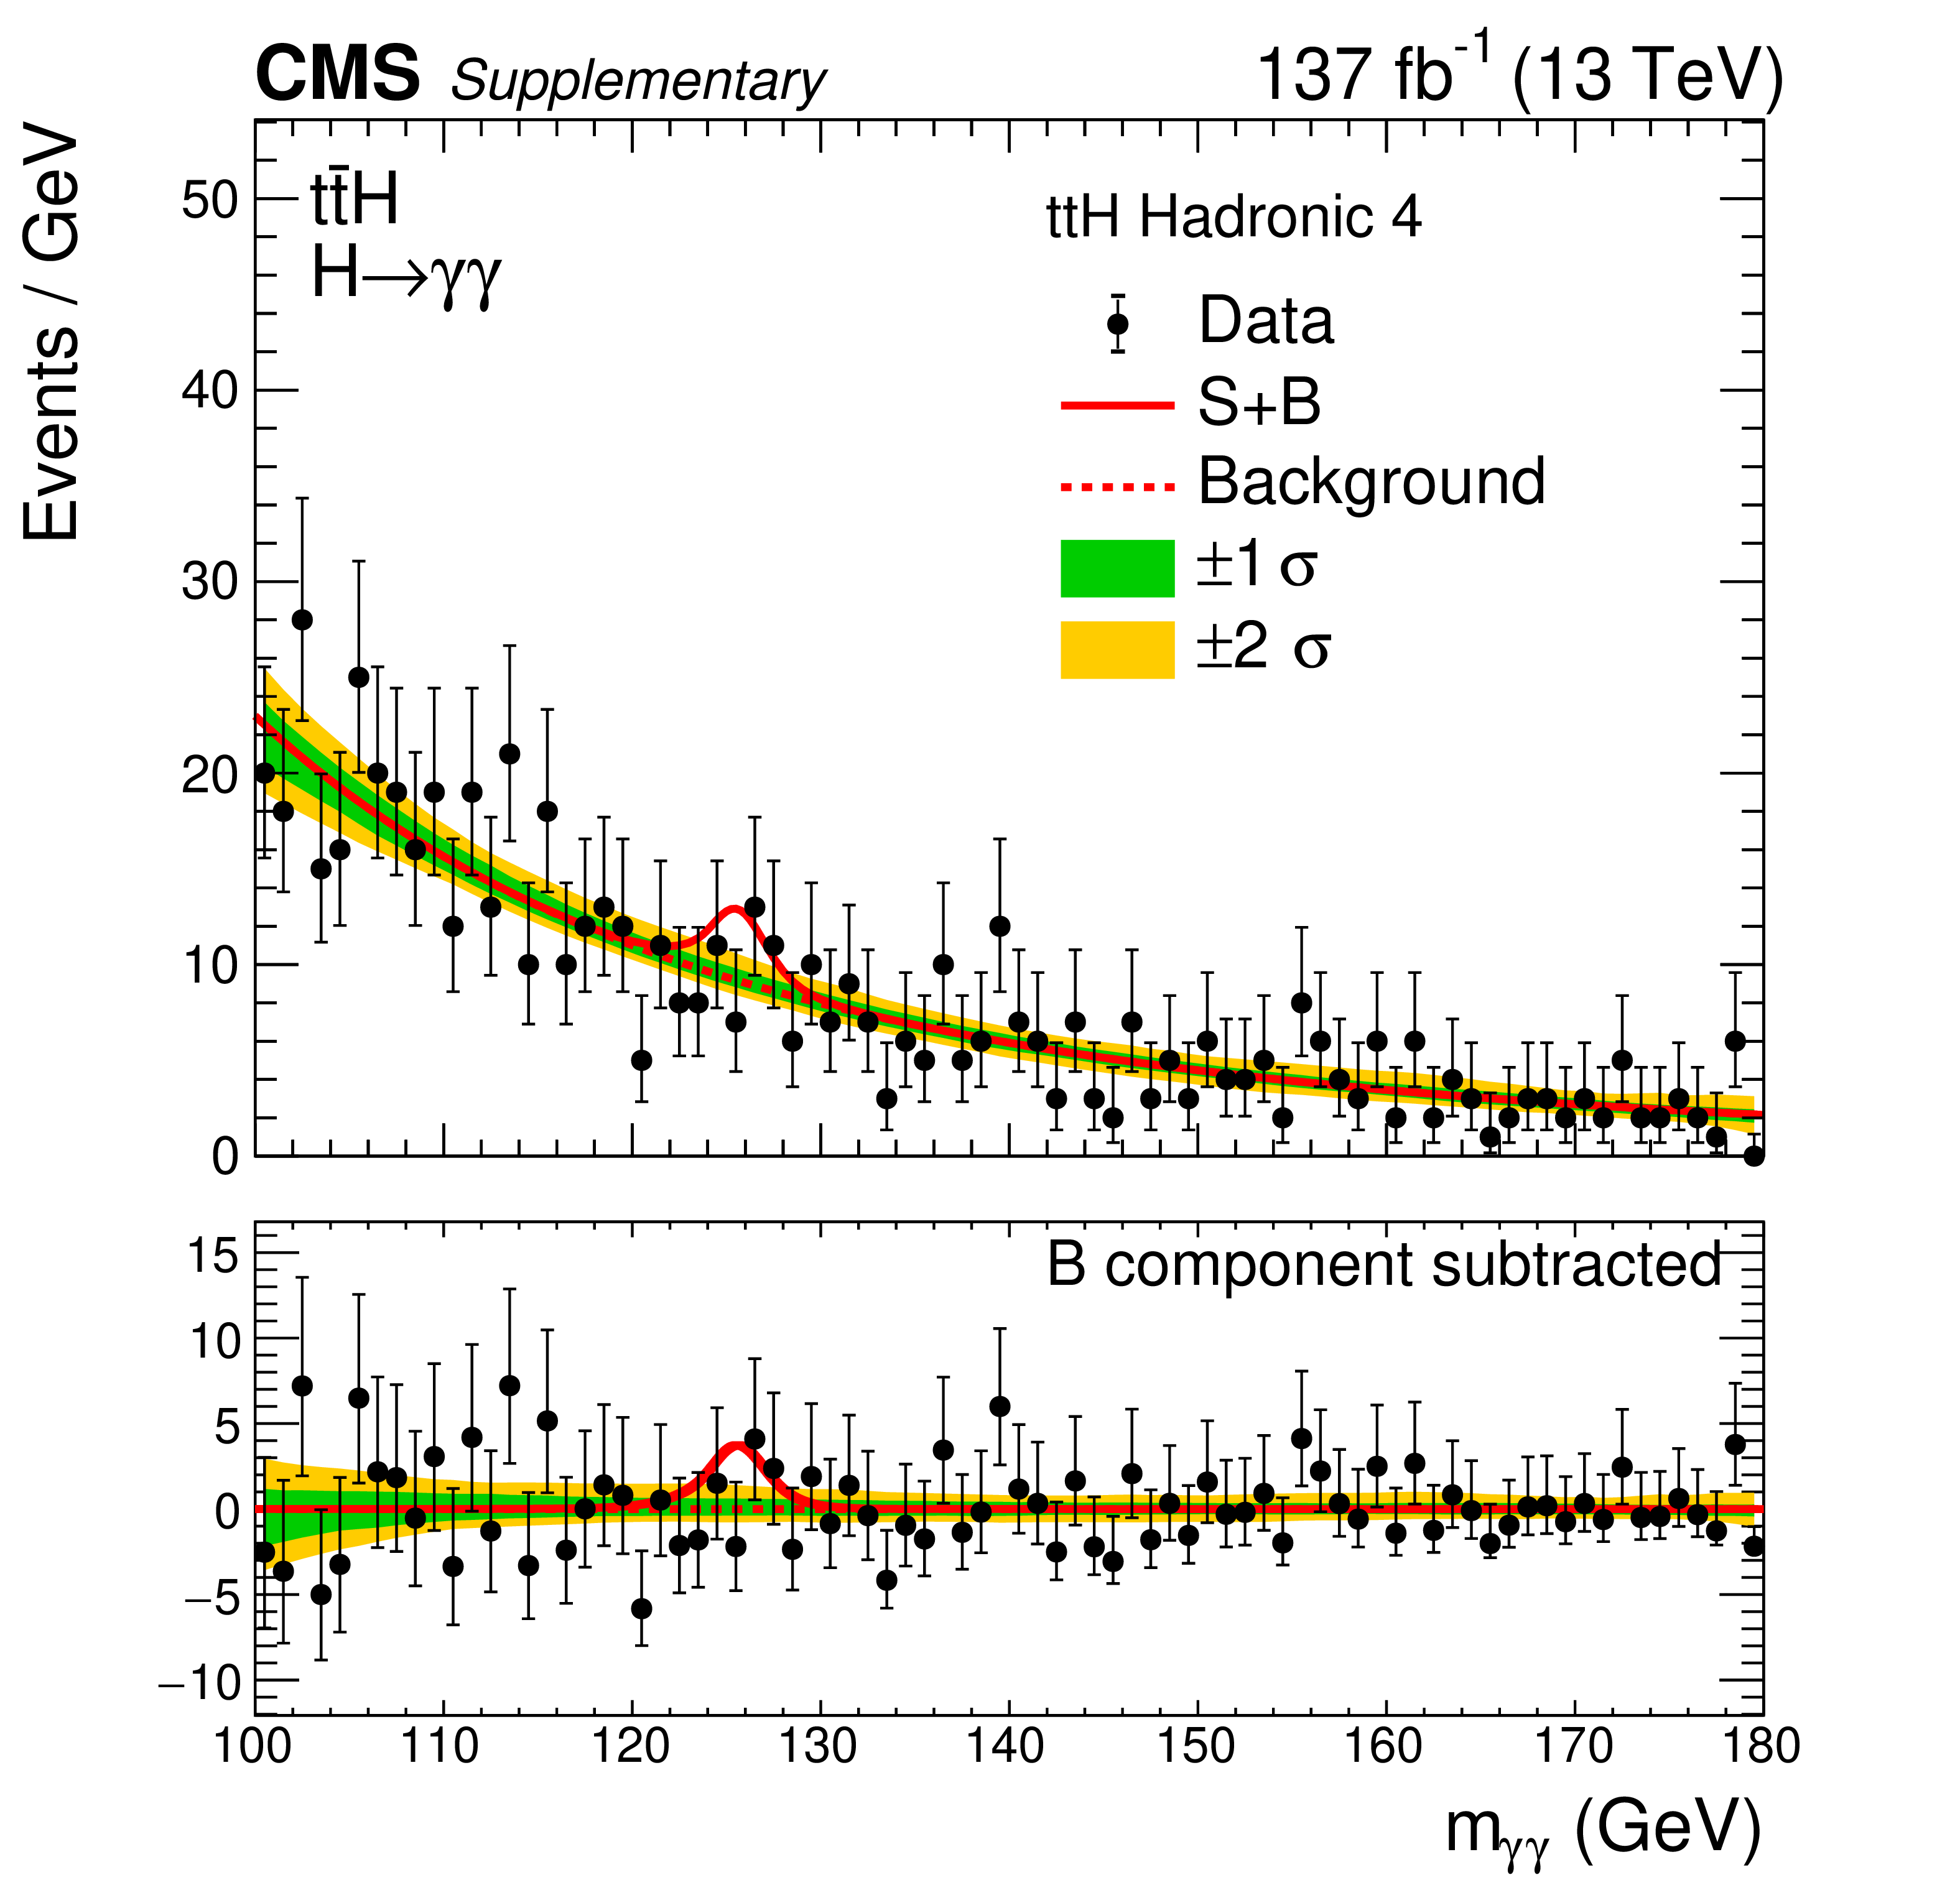
Additional Figure 6:
Data and signal-plus-background model fits in ttH Hadronic Tag 4 category are shown. The one (green) and two (yellow) standard deviation bands include the uncertainties in the background component of the fit. The lower panel shows the residuals after the background subtraction. |
png pdf |
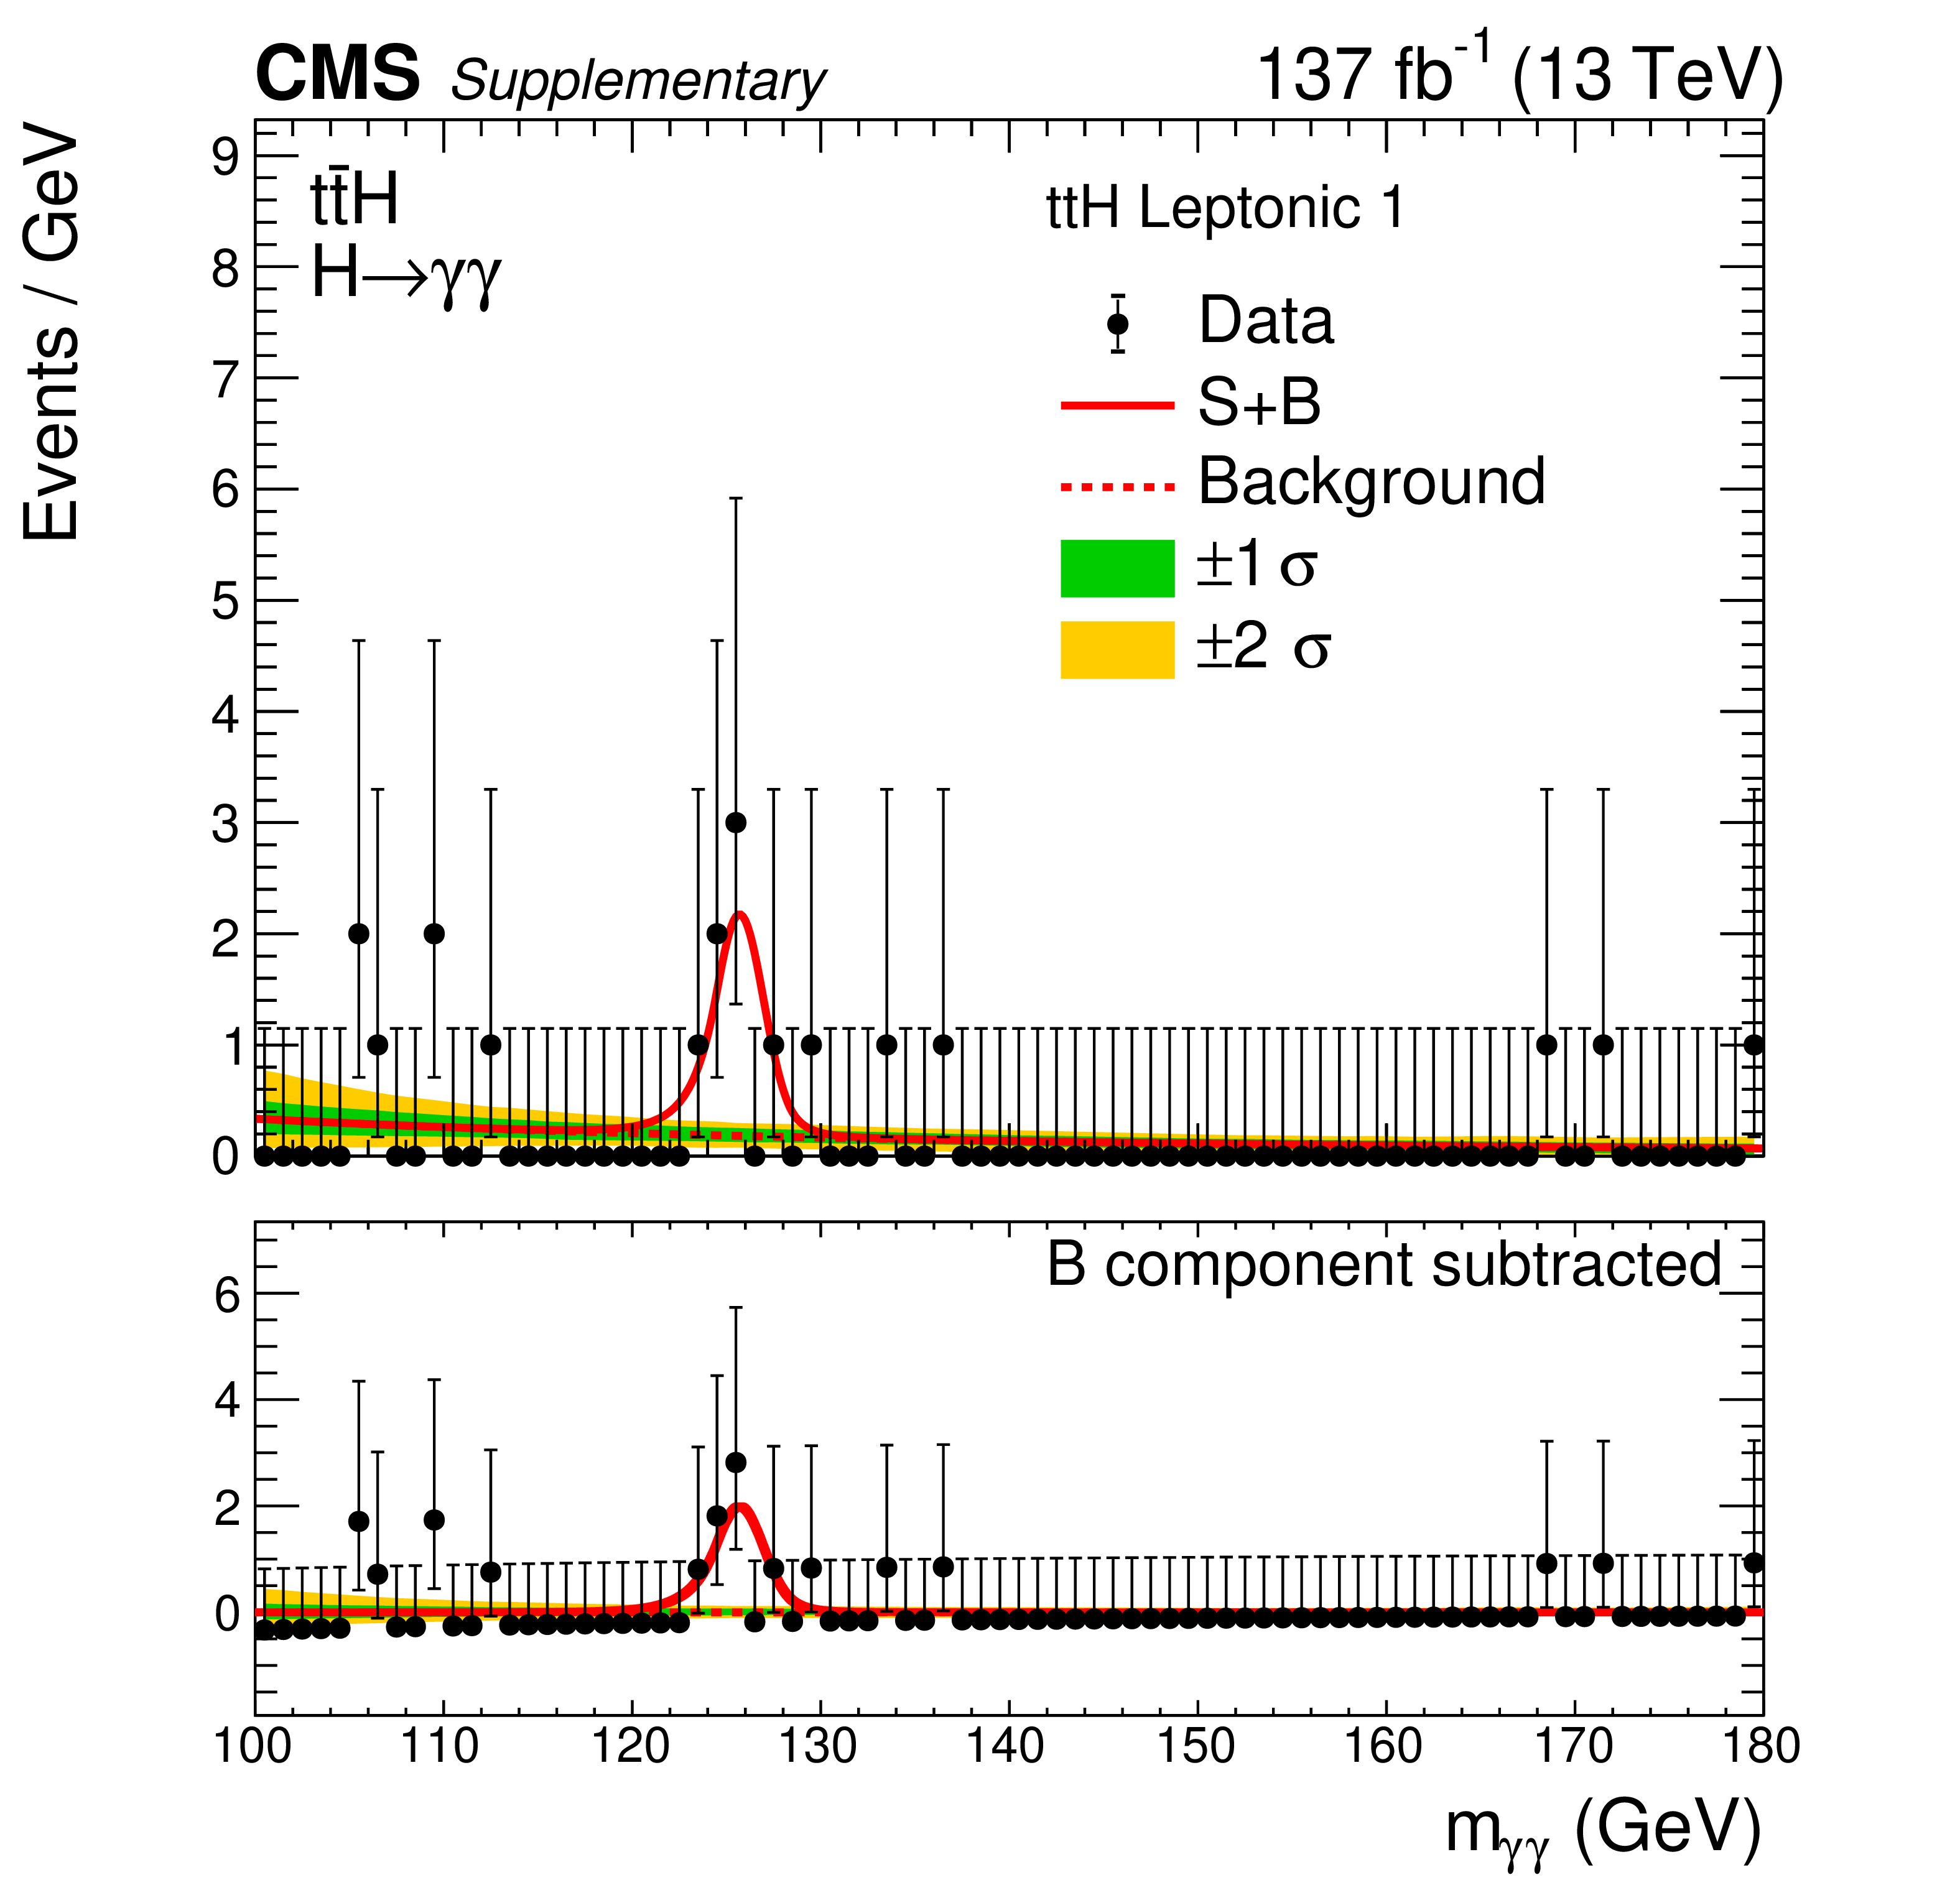
Additional Figure 7:
Data and signal-plus-background model fits in ttH Leptonic Tag 1 category are shown. The one (green) and two (yellow) standard deviation bands include the uncertainties in the background component of the fit. The lower panel shows the residuals after the background subtraction. |
png pdf |
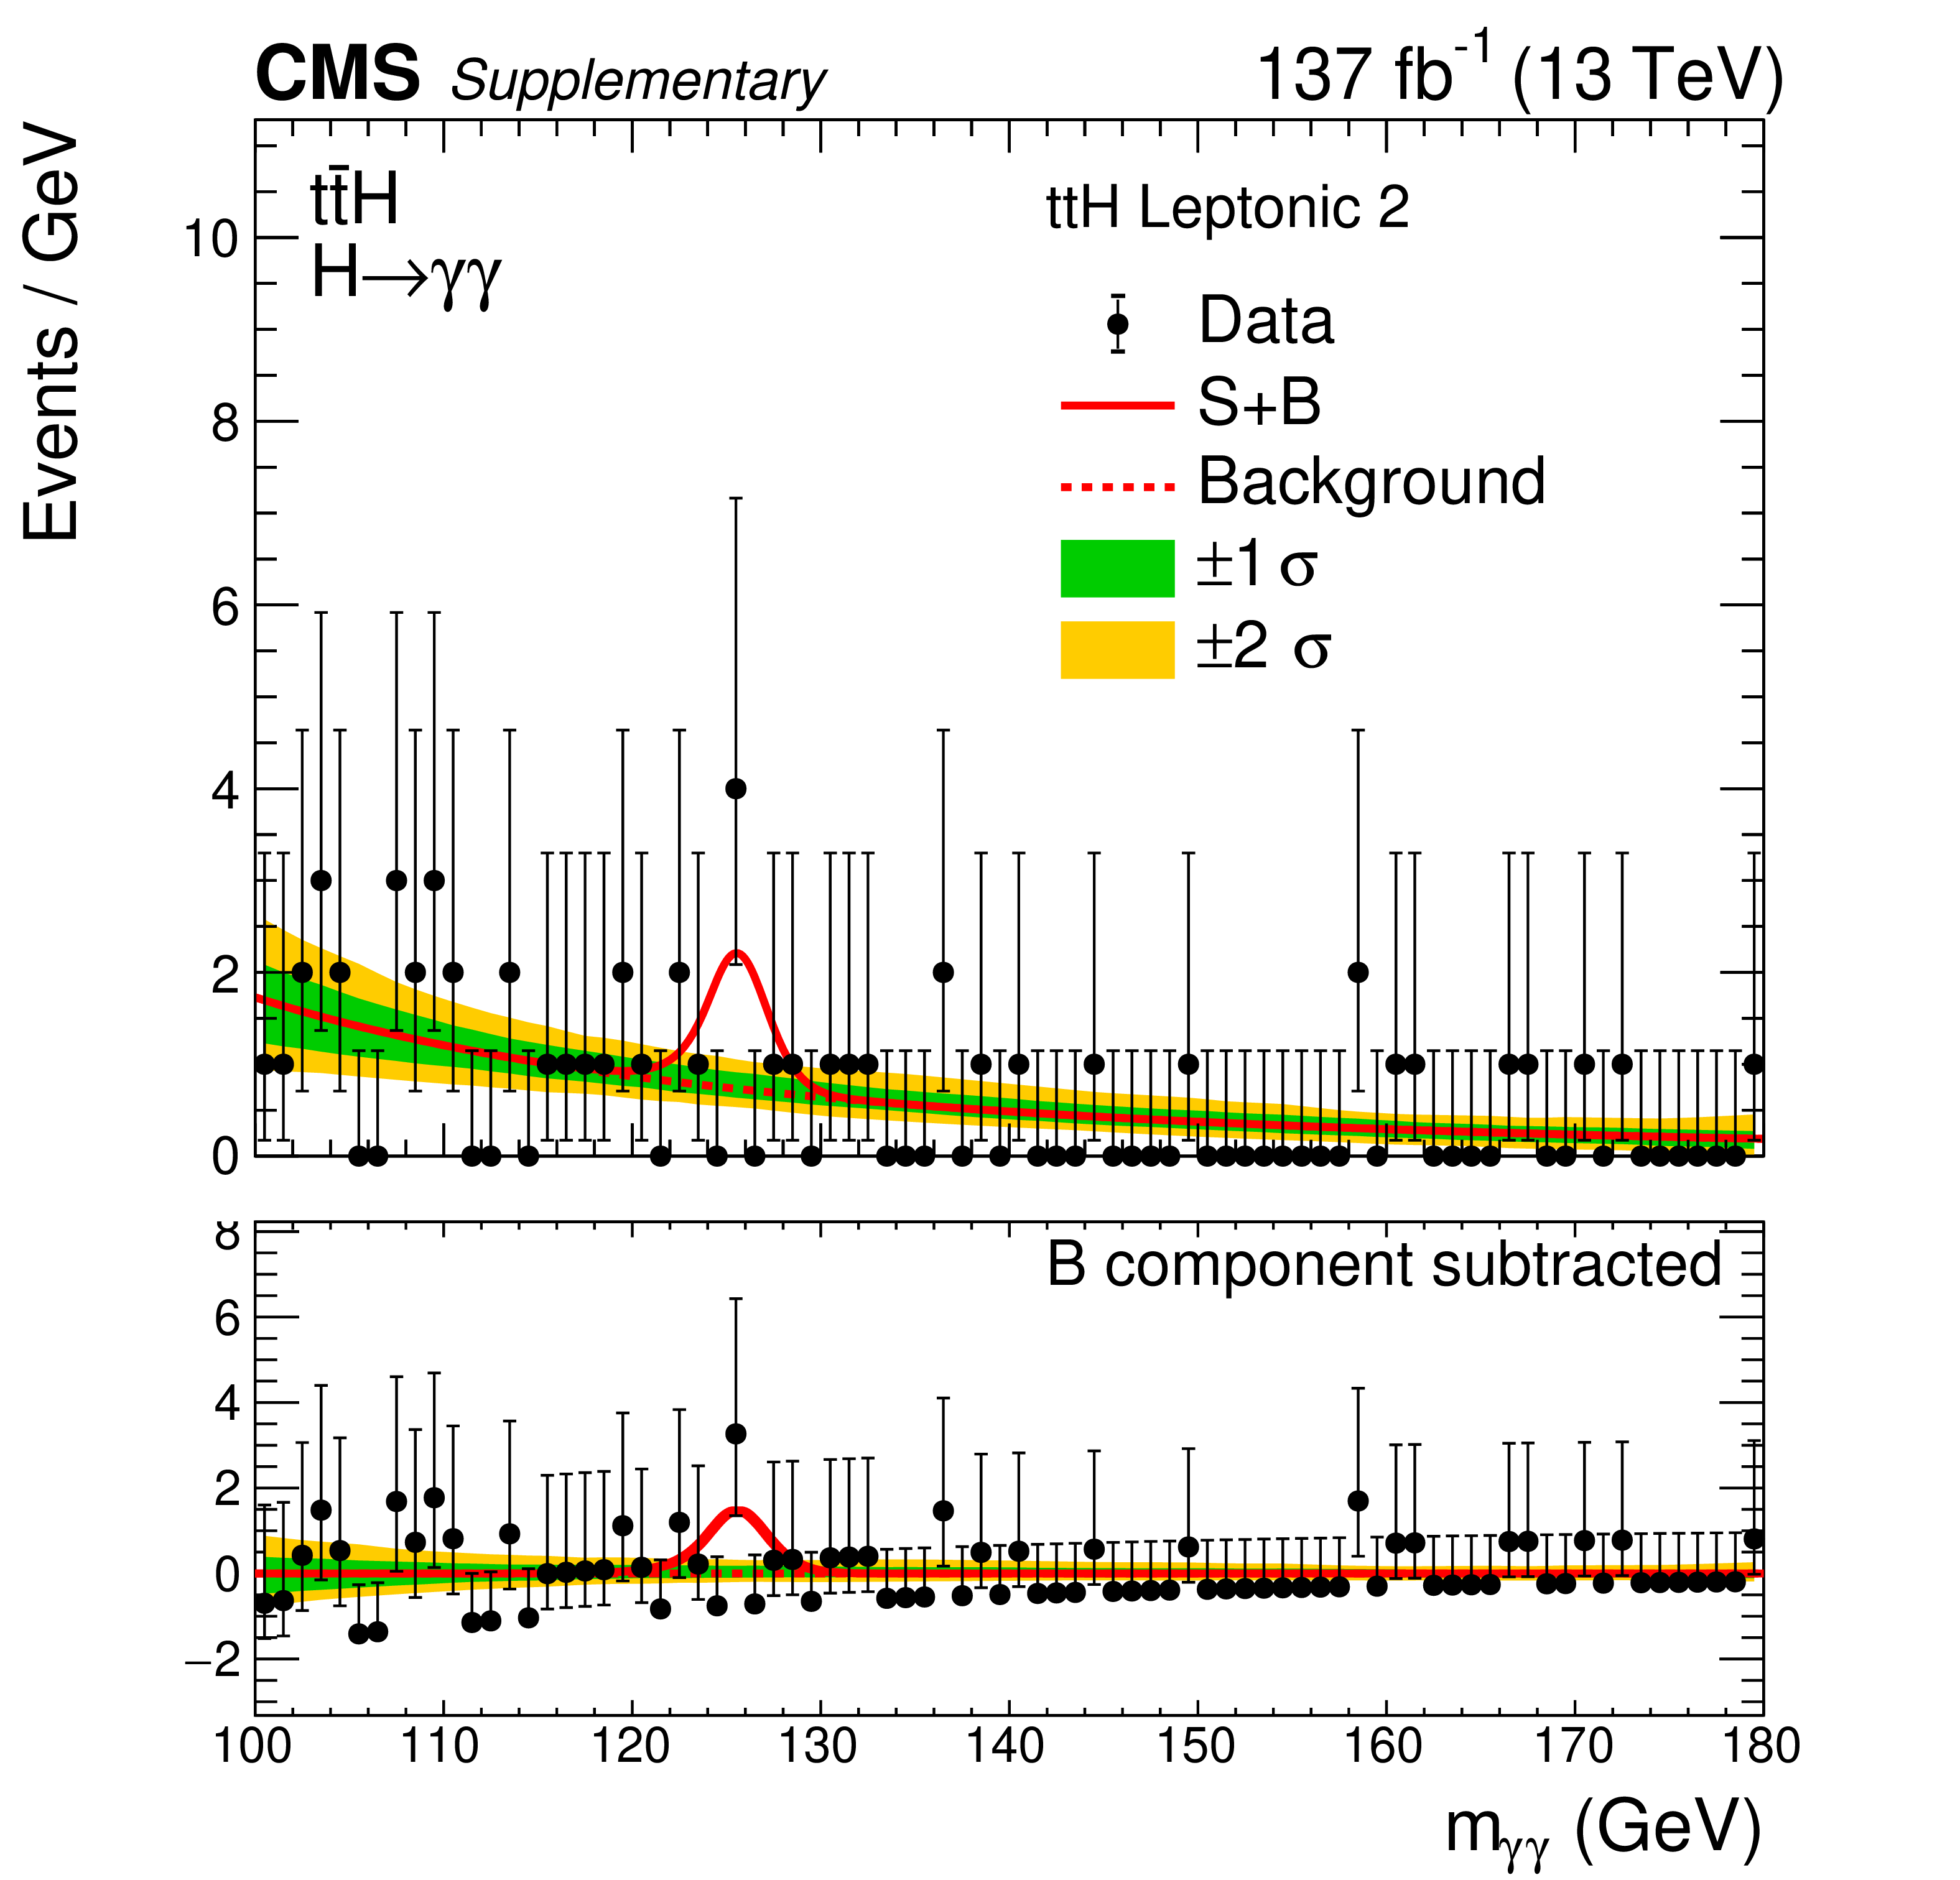
Additional Figure 8:
Data and signal-plus-background model fits in ttH Leptonic Tag 2 category are shown. The one (green) and two (yellow) standard deviation bands include the uncertainties in the background component of the fit. The lower panel shows the residuals after the background subtraction. |
png pdf |
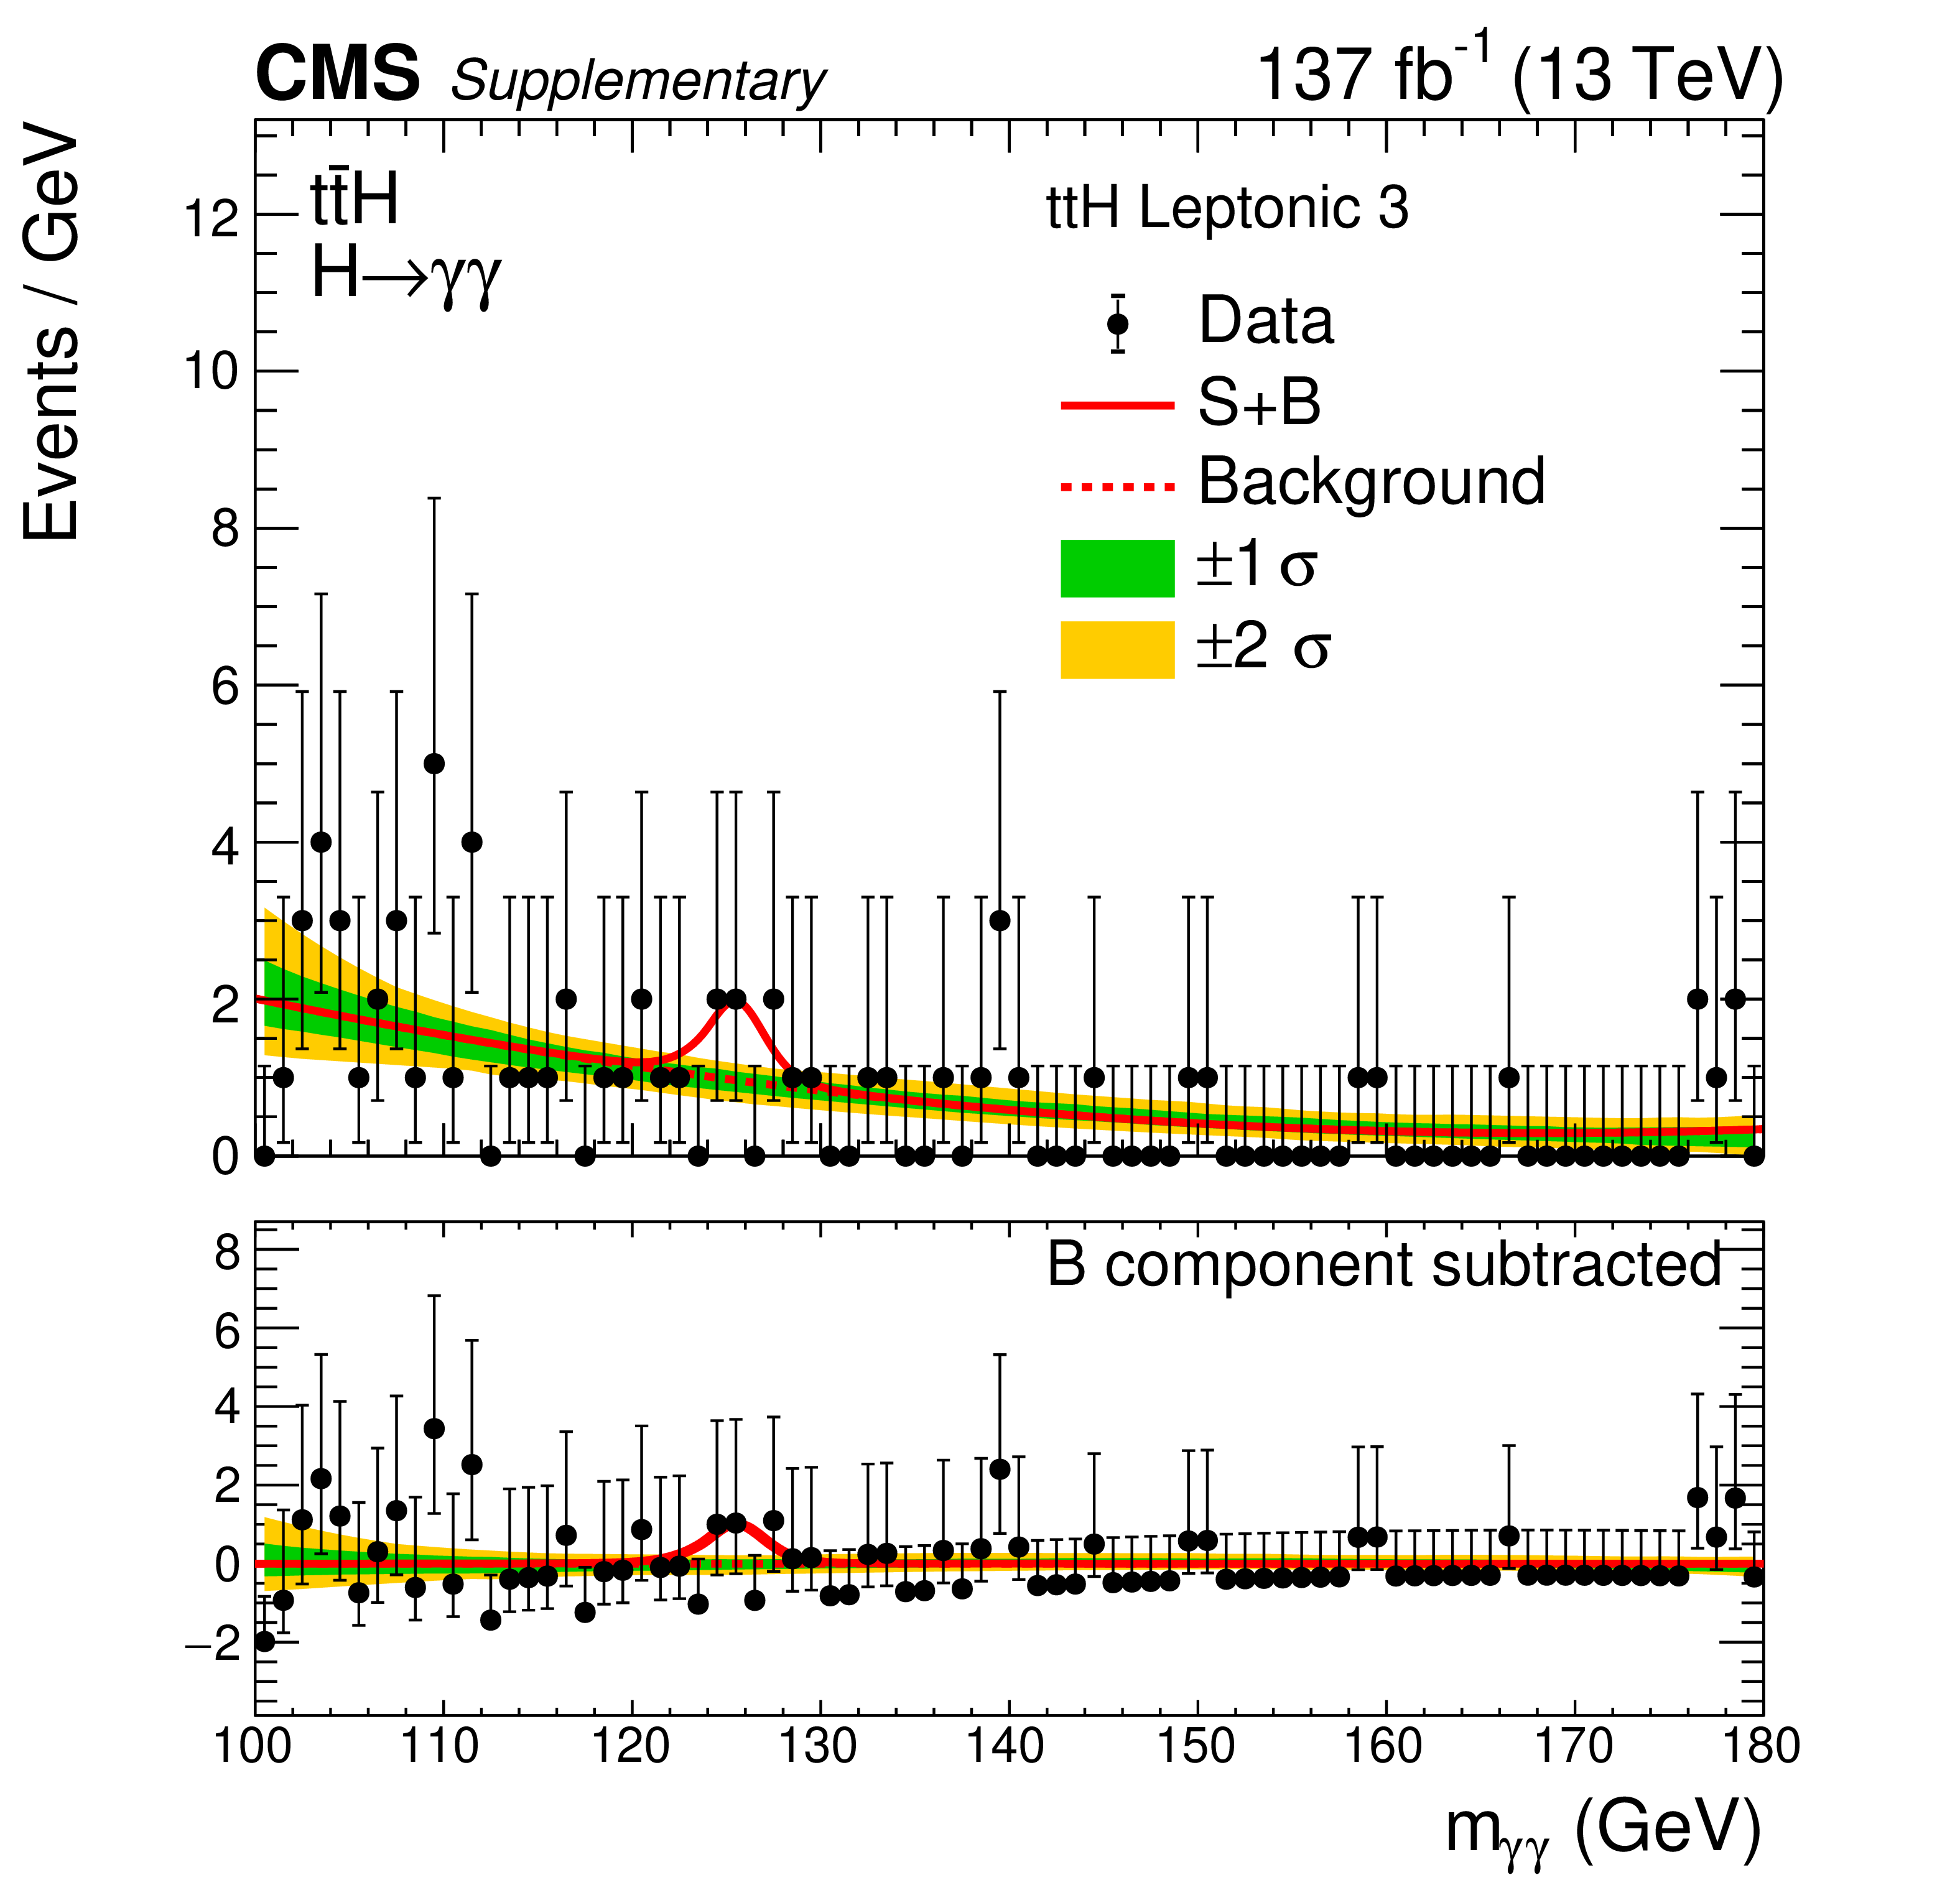
Additional Figure 9:
Data and signal-plus-background model fits in ttH Leptonic Tag 3 category are shown. The one (green) and two (yellow) standard deviation bands include the uncertainties in the background component of the fit. The lower panel shows the residuals after the background subtraction. |
png pdf |
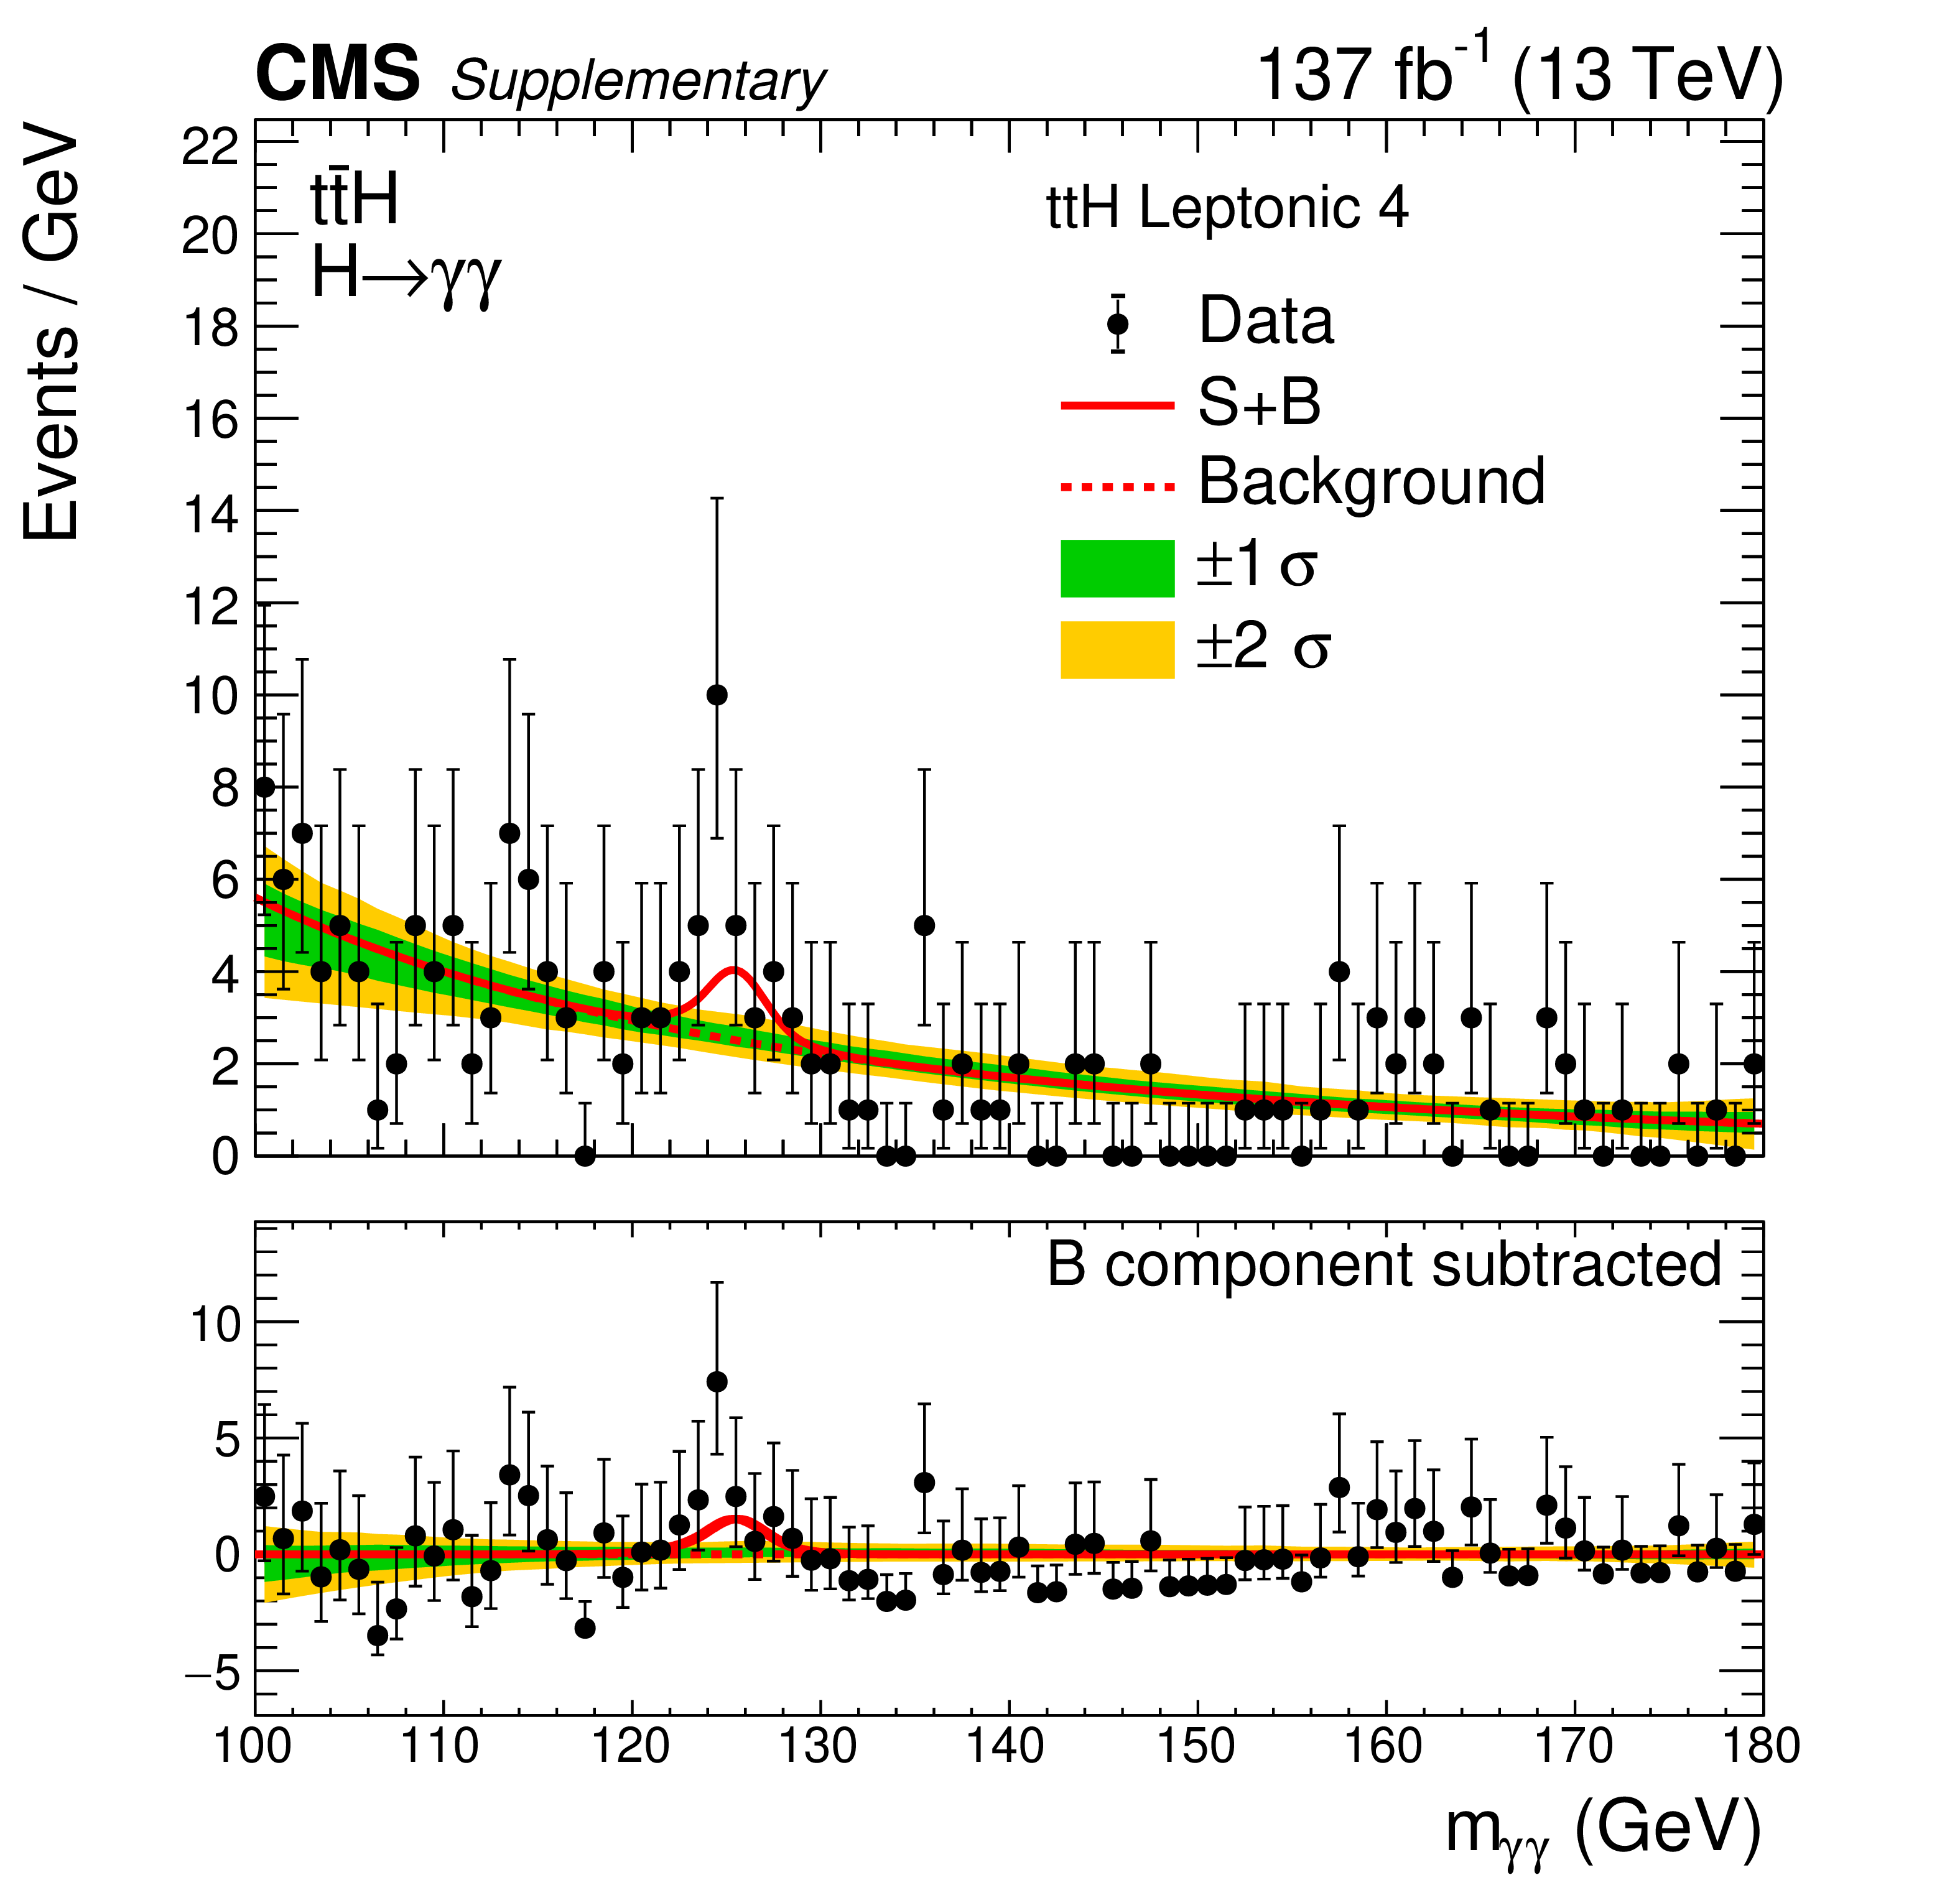
Additional Figure 10:
Data and signal-plus-background model fits in ttH Leptonic Tag 3 category are shown. The one (green) and two (yellow) standard deviation bands include the uncertainties in the background component of the fit. The lower panel shows the residuals after the background subtraction. |
png pdf |
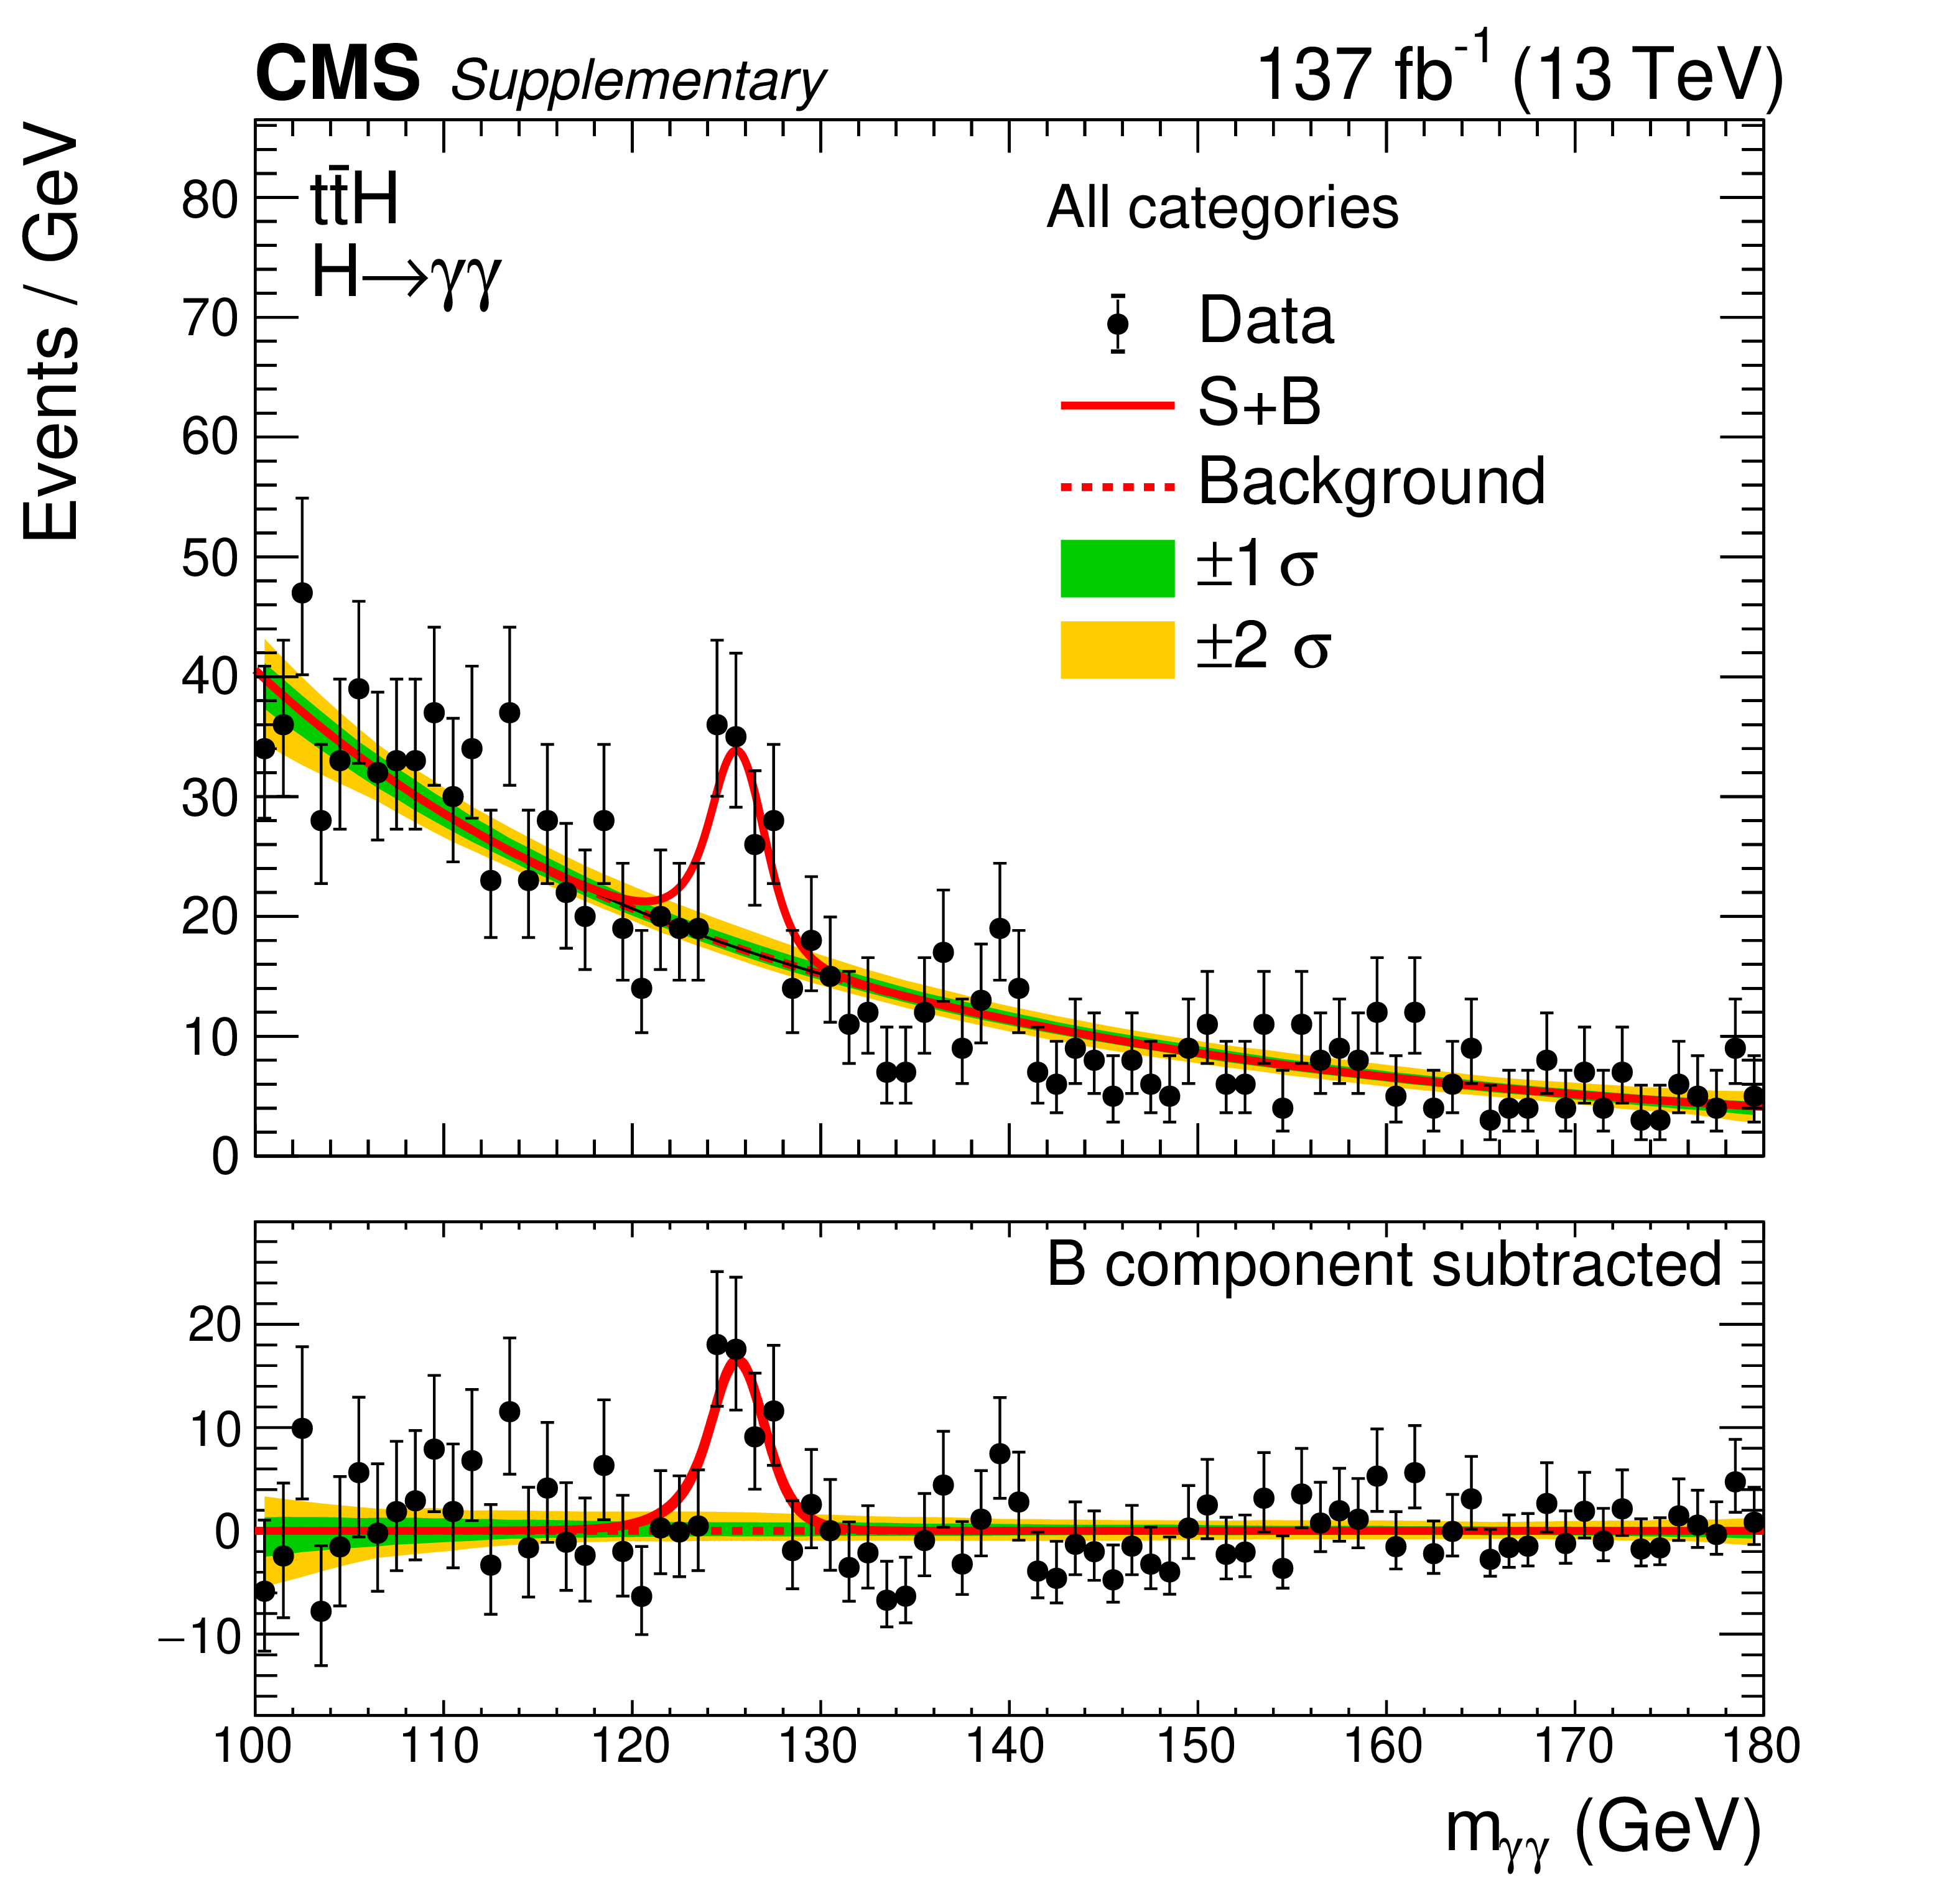
Additional Figure 11:
Data and signal-plus-background model fits for all categories summed. The one (green) and two (yellow) standard deviation bands include the uncertainties in the background component of the fit. The lower panel shows the residuals after the background subtraction. |
png pdf |
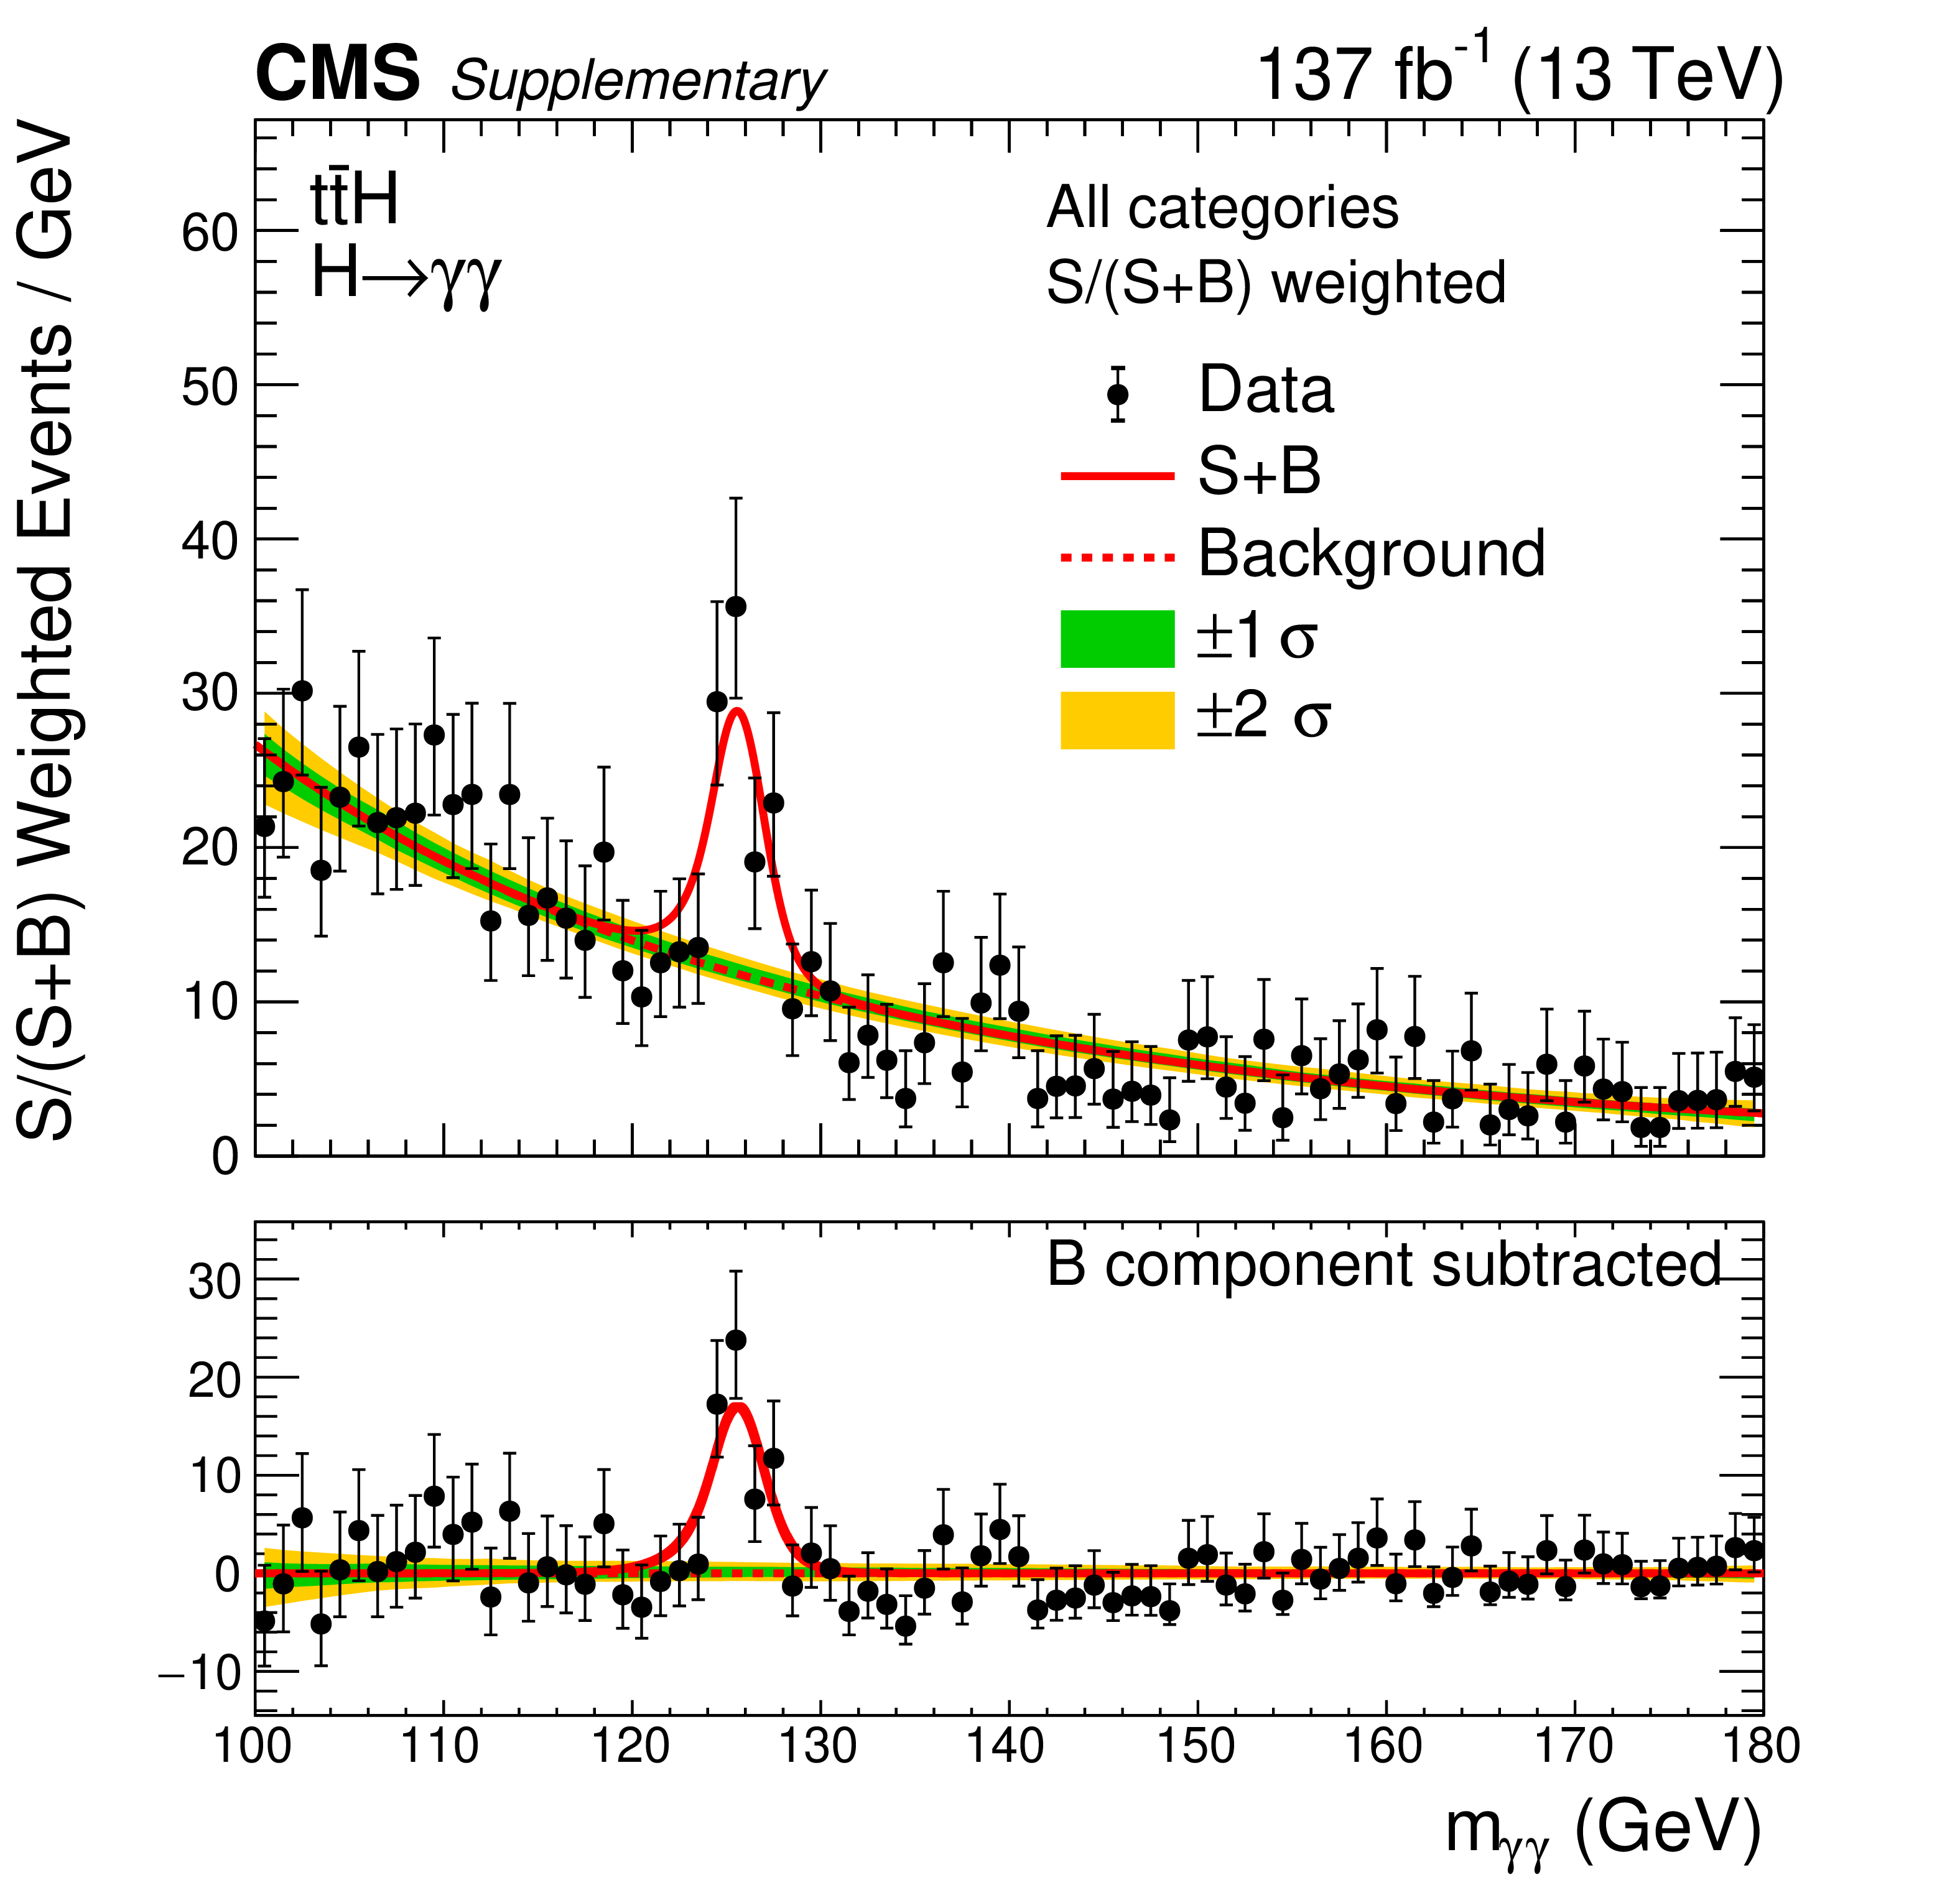
Additional Figure 12:
Data and signal-plus-background model fits for all categories summed weighted by their sensitivity (right). The one (green) and two (yellow) standard deviation bands include the uncertainties in the background component of the fit. The lower panel shows the residuals after the background subtraction. |
png pdf |
Additional Figure 13:
observed likelihood scan, produced with a simultaneous fit to the $m_{\gamma \gamma}$ distributions of all categories and with $m_H$ profiled. |
png pdf |
Additional Figure 14:
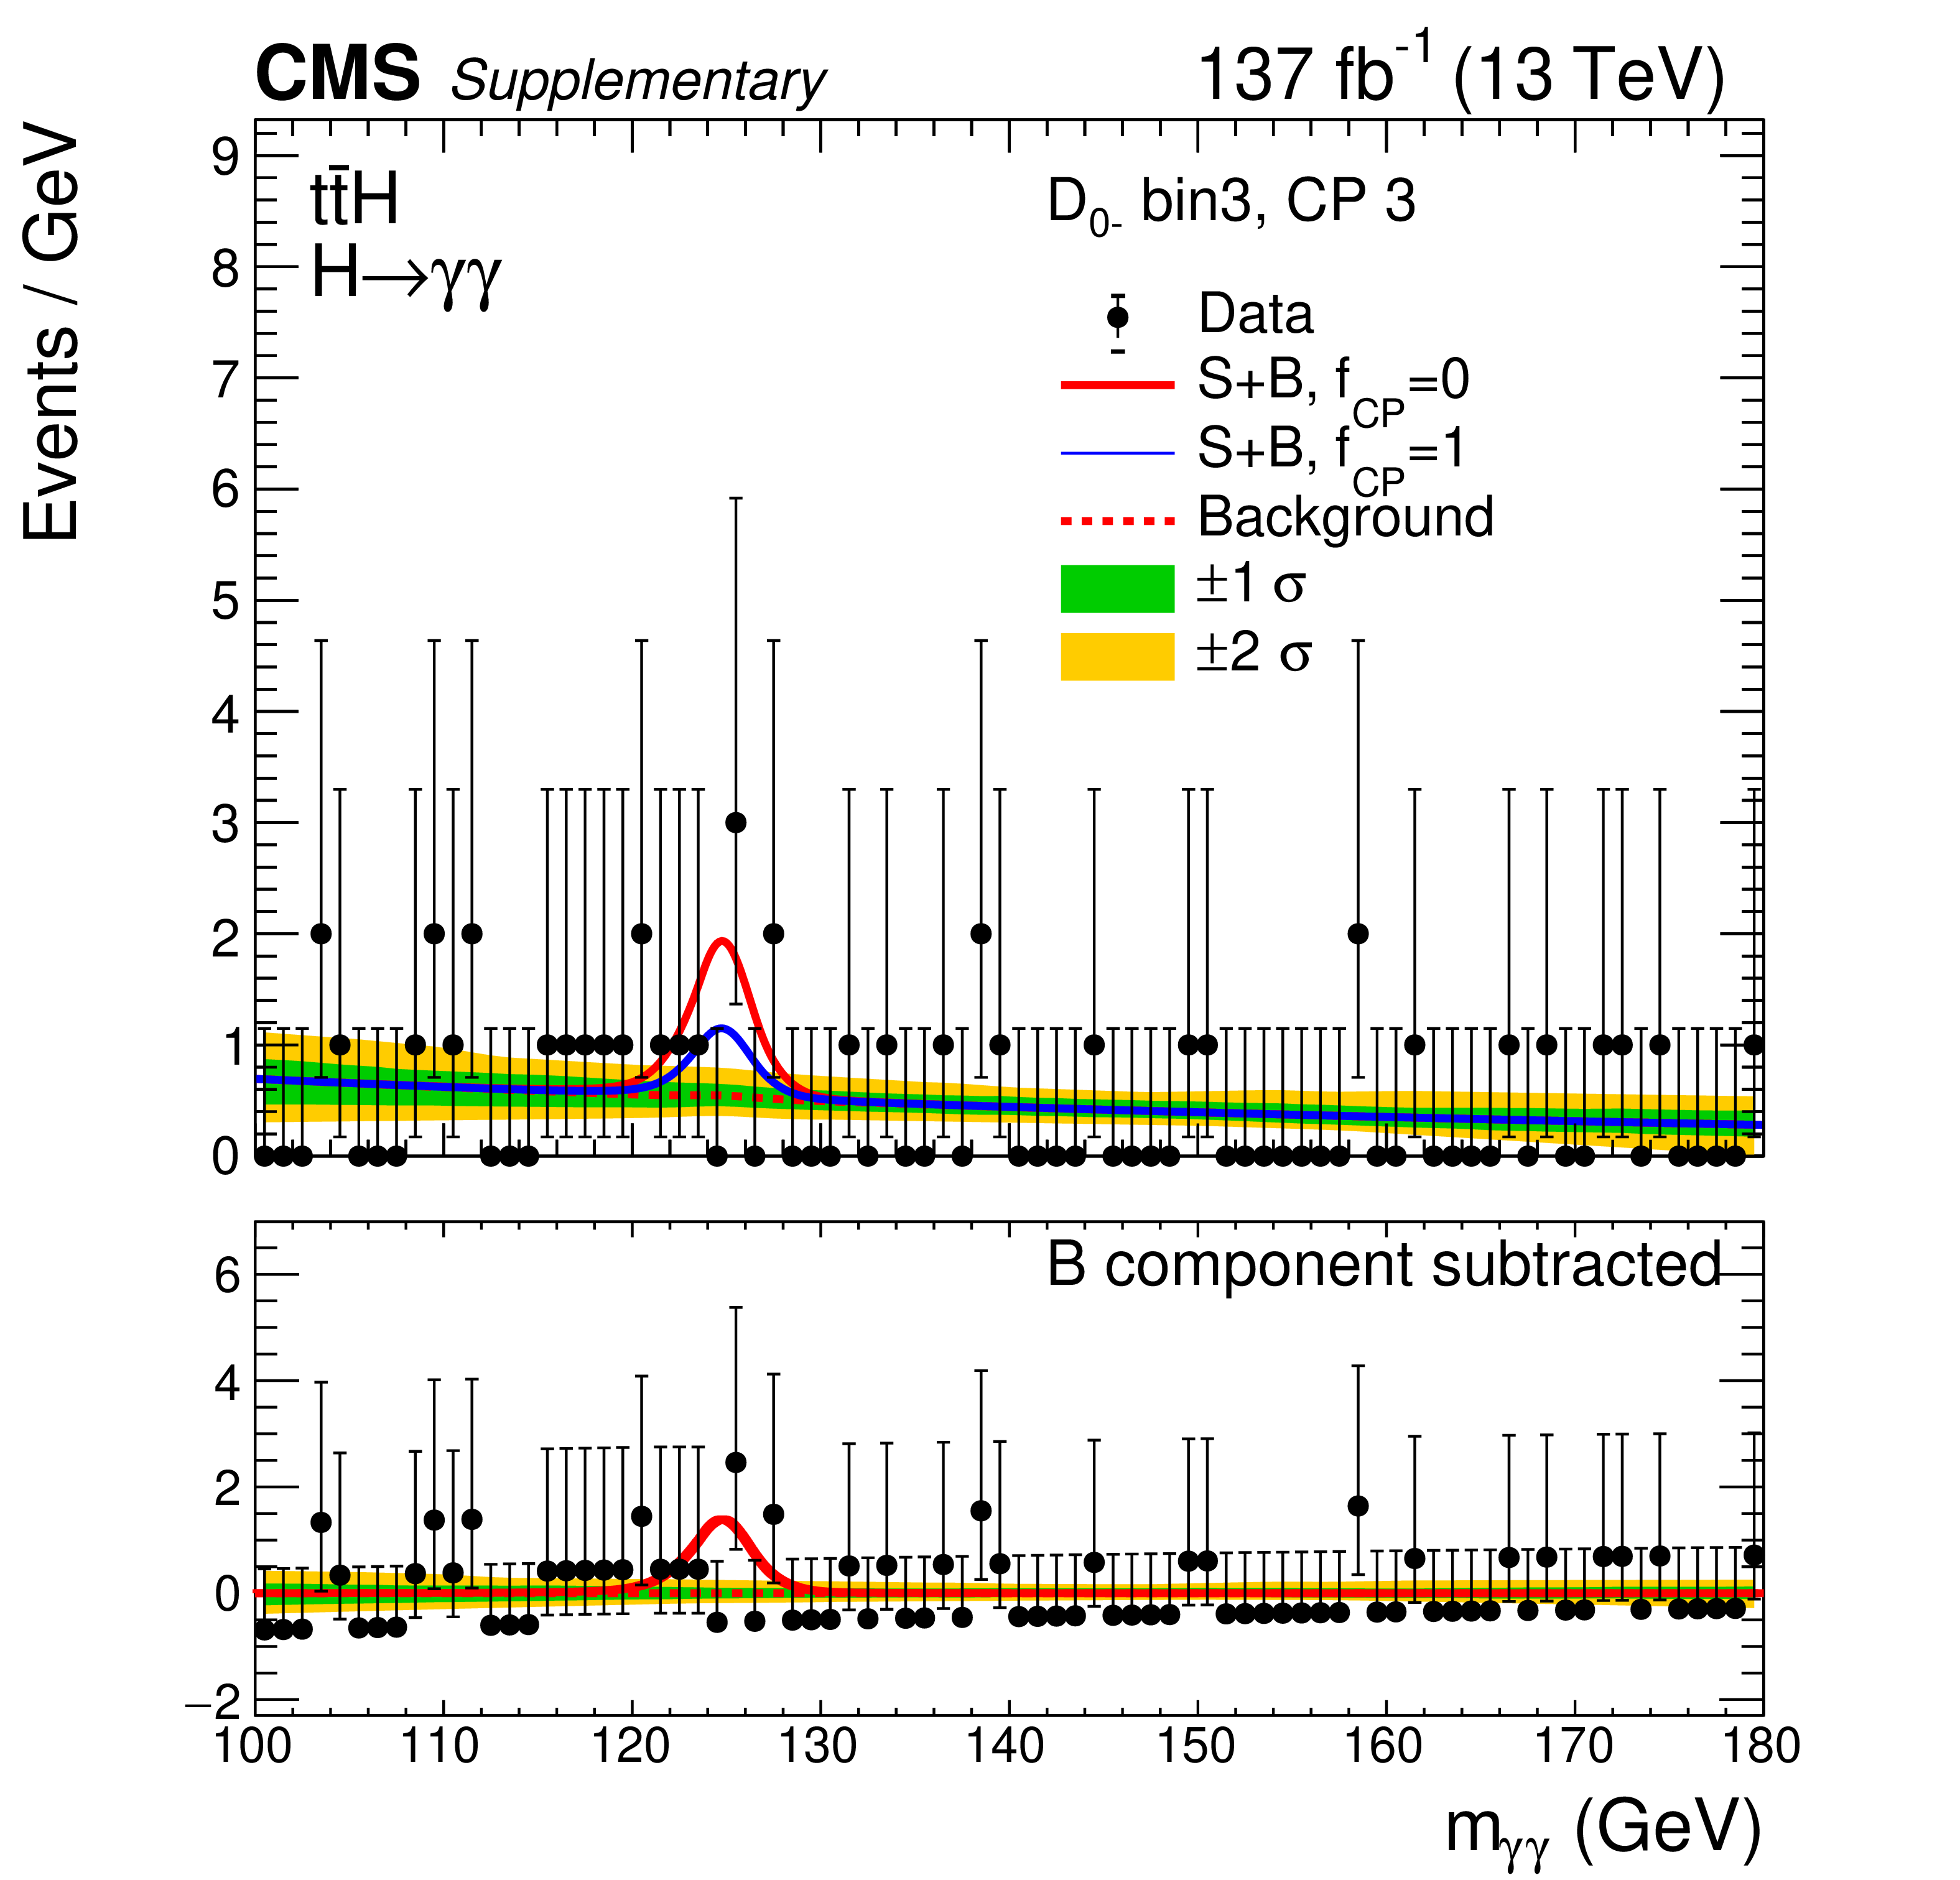
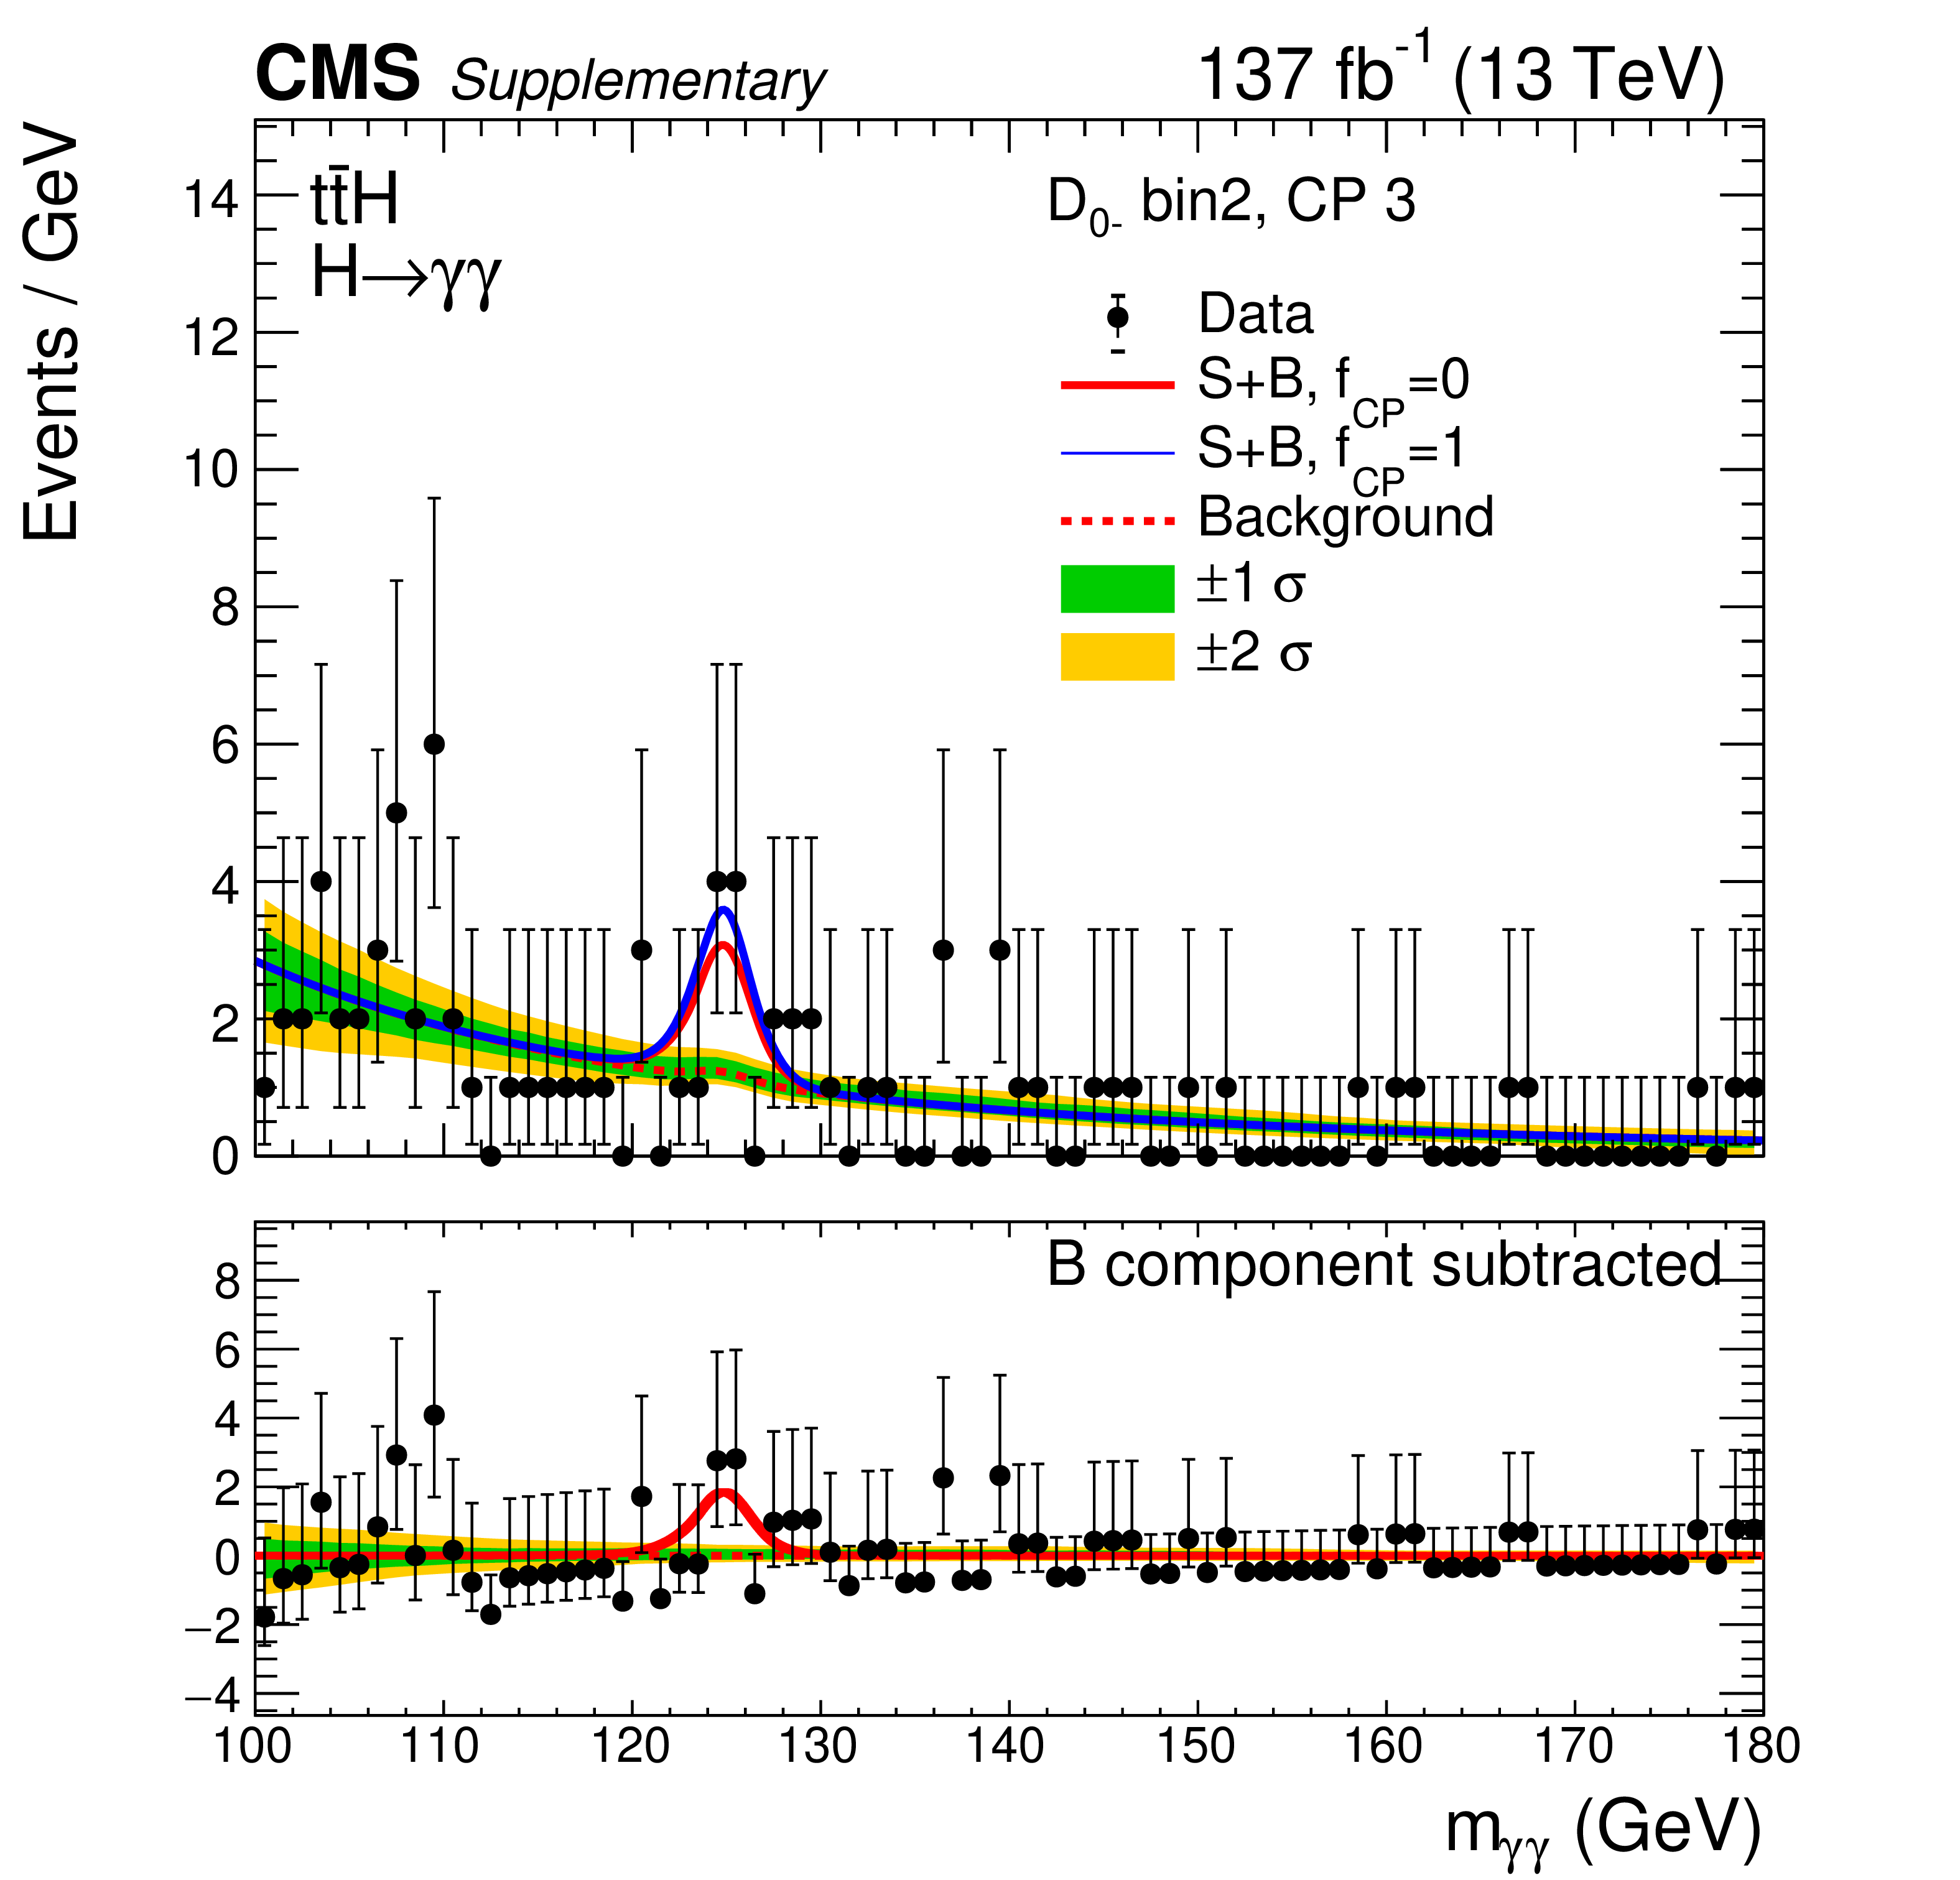
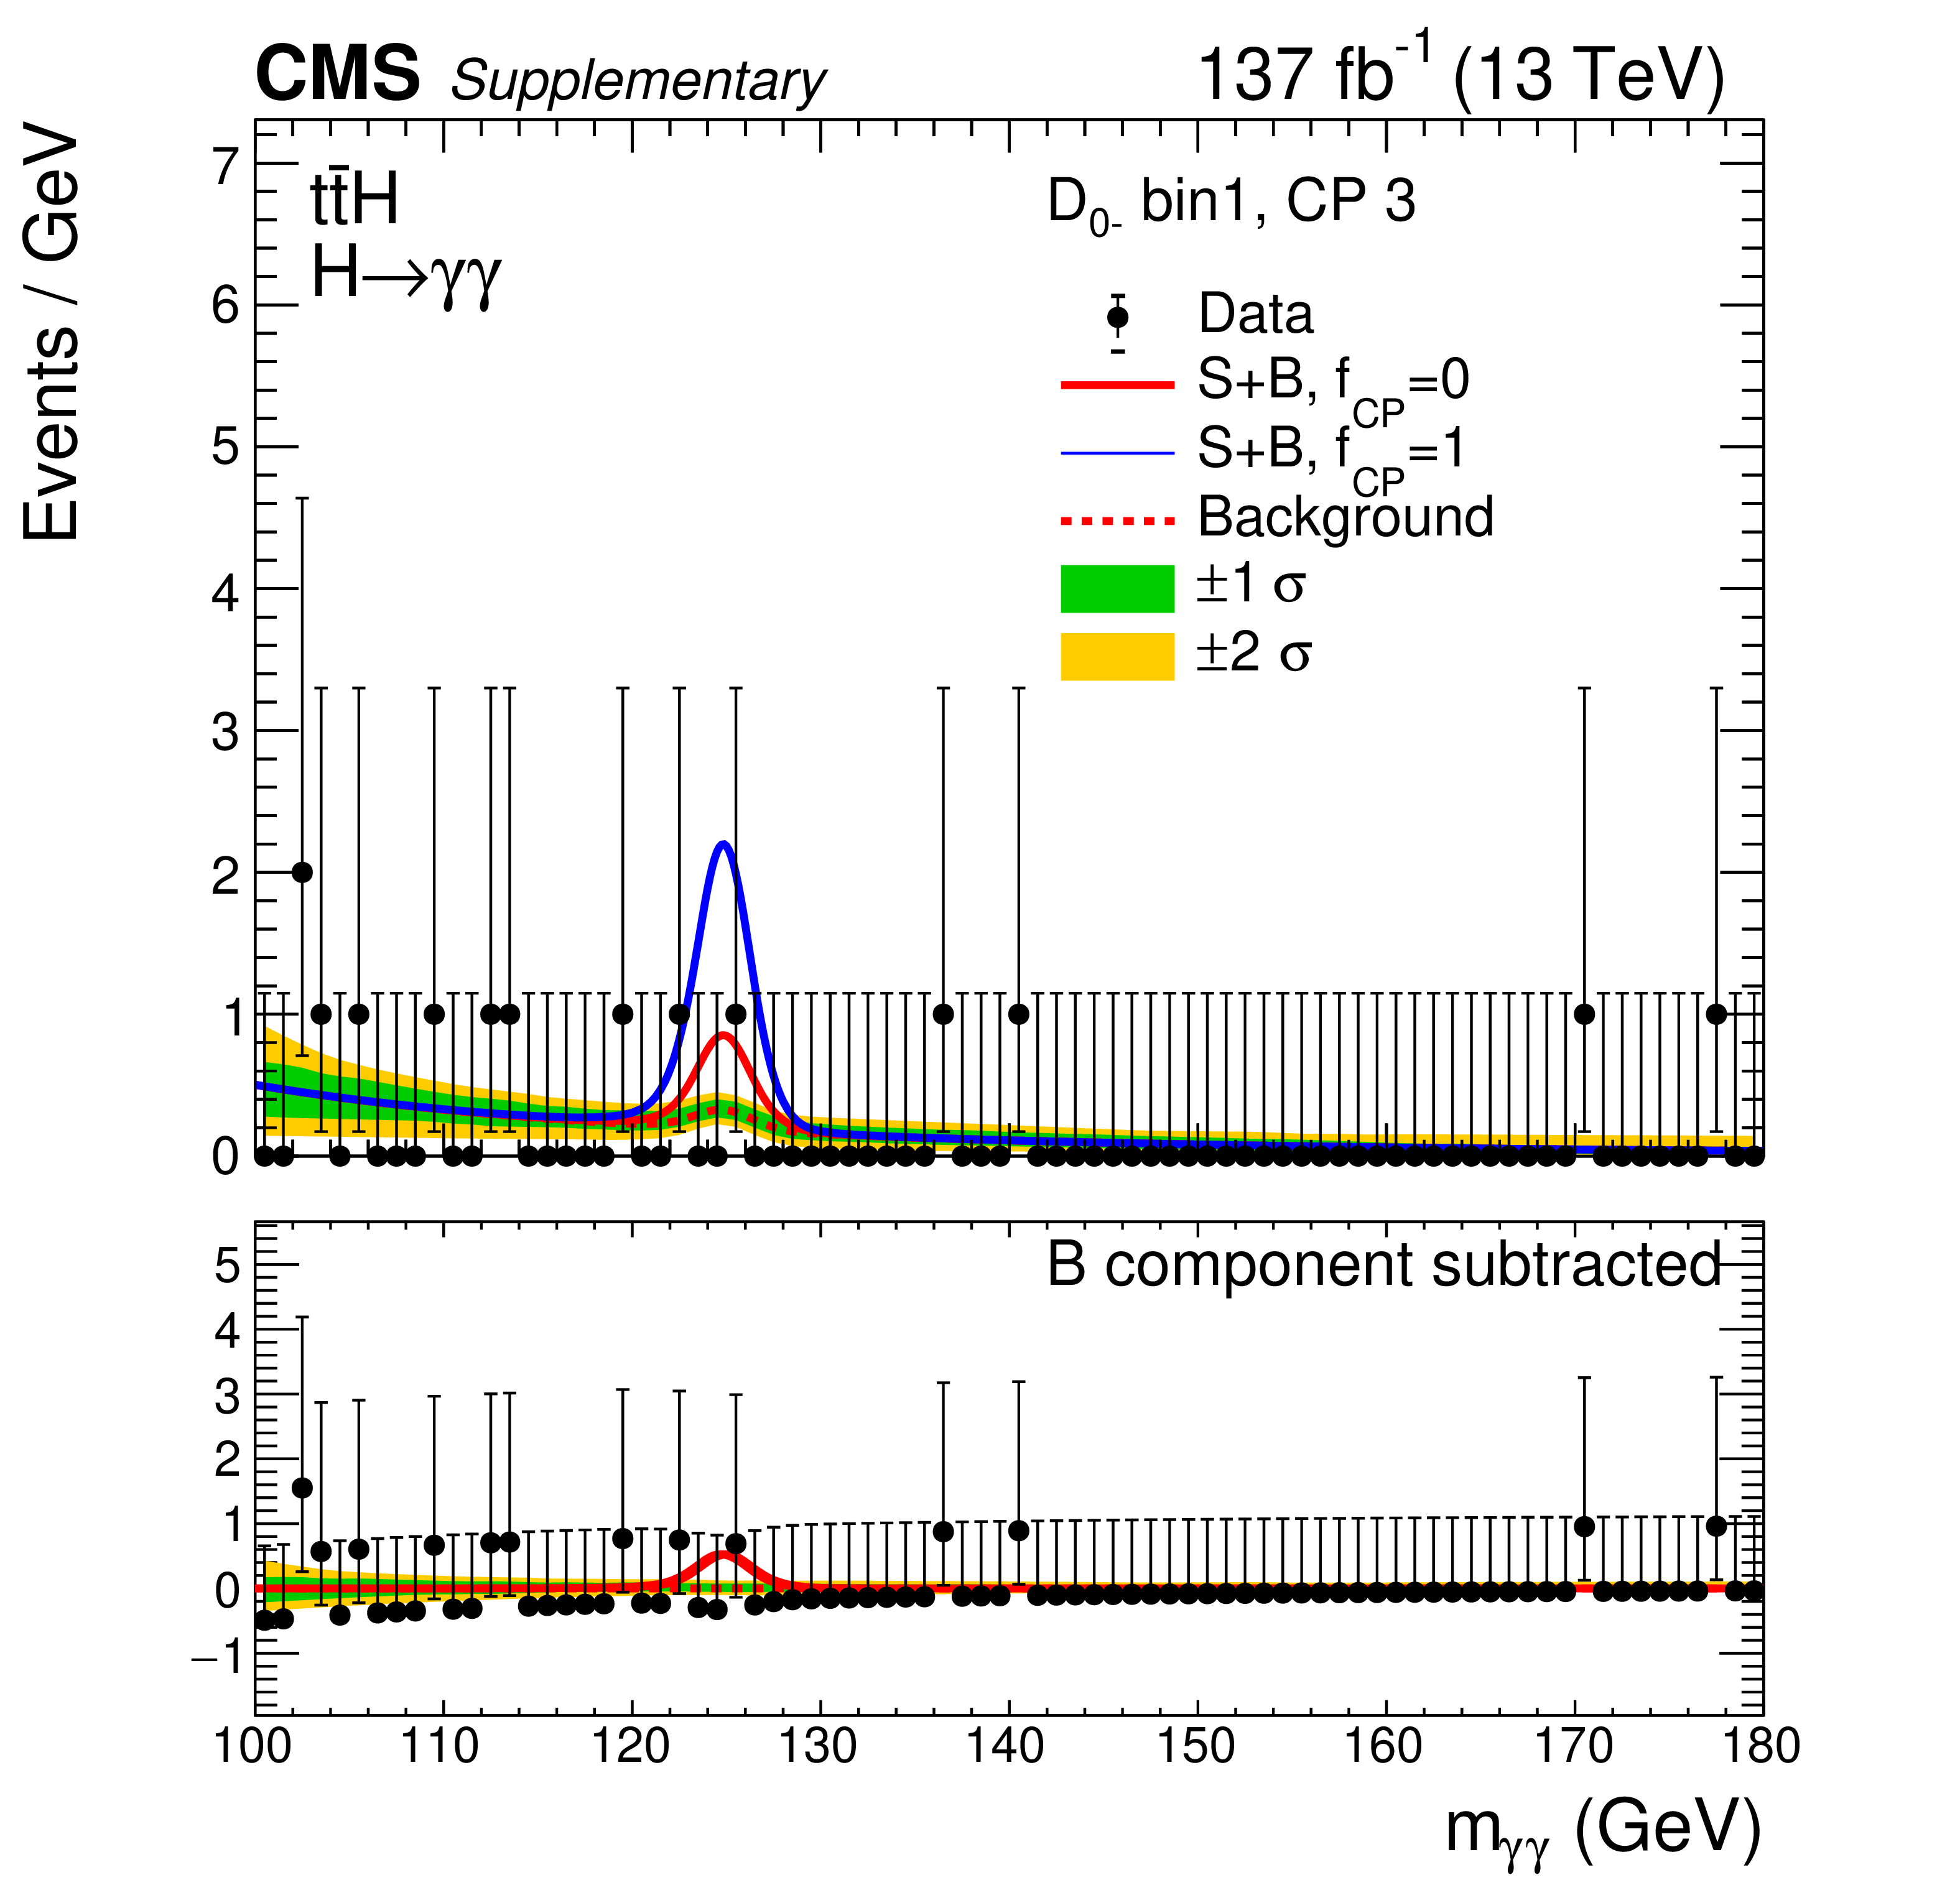
Data distribution in hadronic channel. The total signal and background models are shown in red ($f_{CP}=$ 0) and blue ($f_{CP}=$ 1). |
png pdf |
Additional Figure 15:
Data distribution in hadronic channel. The total signal and background models are shown in red ($f_{CP}=$ 0) and blue ($f_{CP}=$ 1). |
png pdf |
Additional Figure 16:
Data distribution in hadronic channel. The total signal and background models are shown in red ($f_{CP}=$ 0) and blue ($f_{CP}=$ 1). |

png pdf |
Additional Figure 17:
Data distribution in hadronic channel. The total signal and background models are shown in red ($f_{CP}=$ 0) and blue ($f_{CP}=$ 1). |
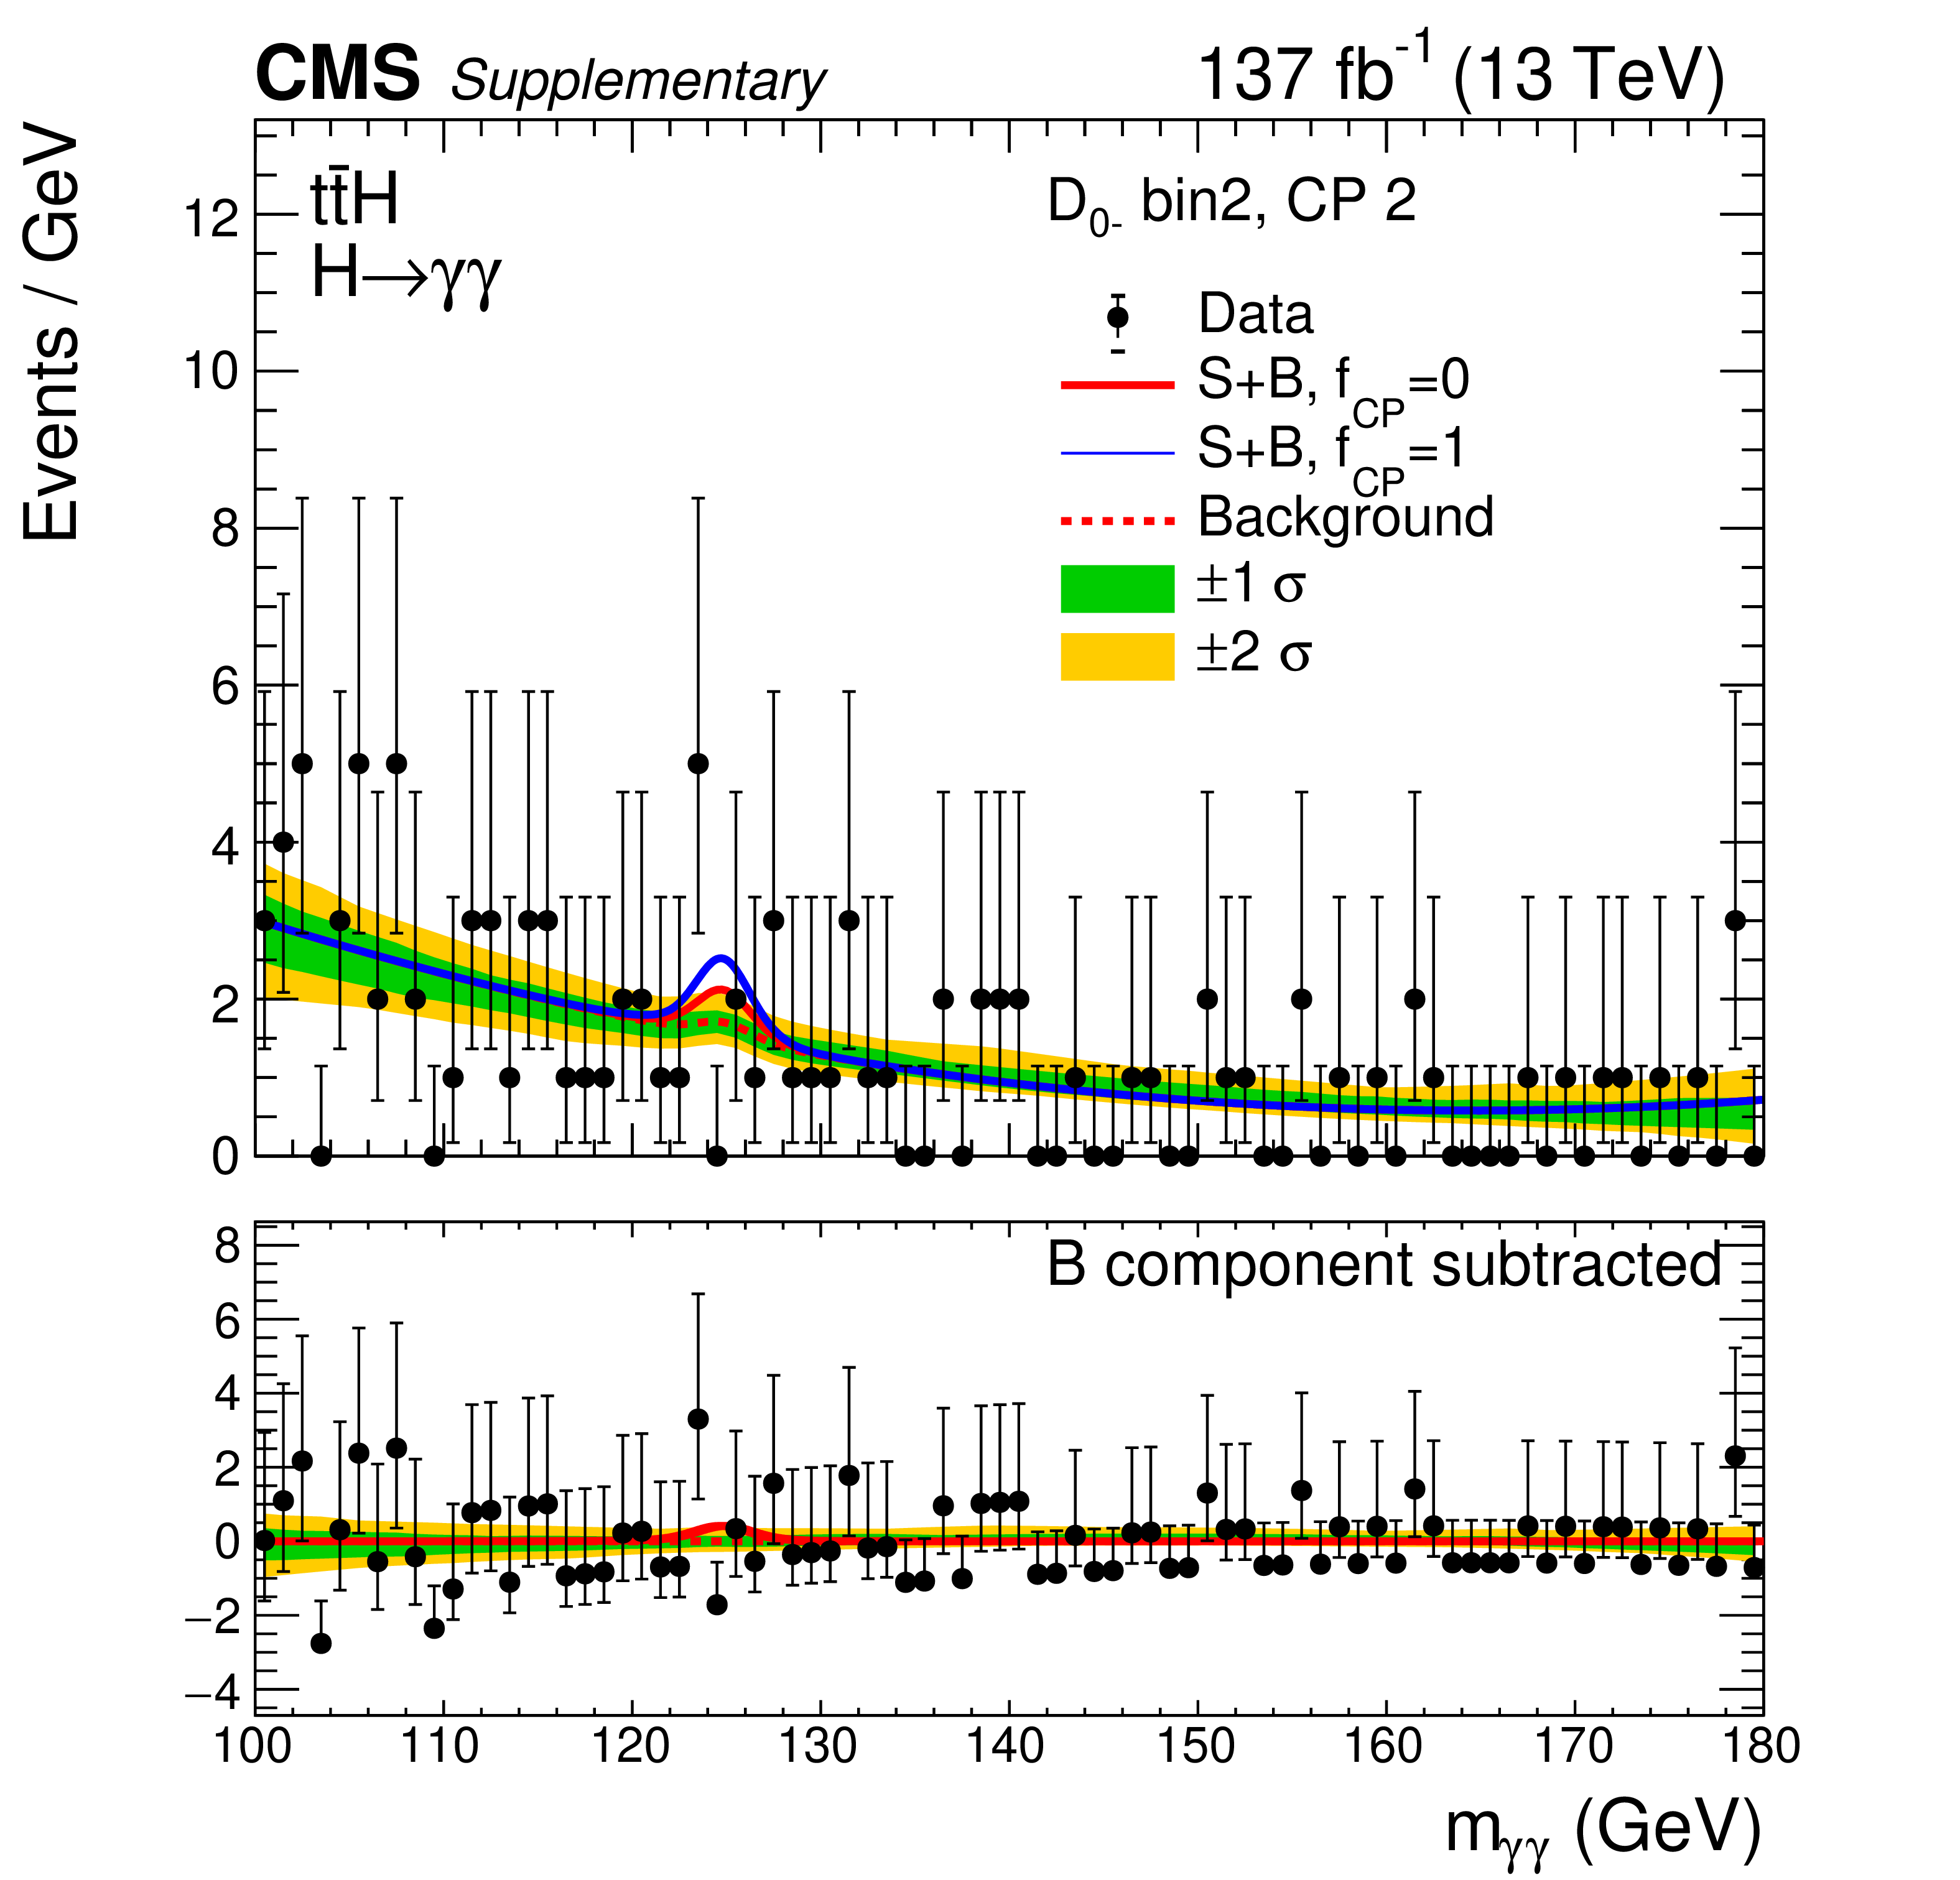
png pdf |
Additional Figure 18:
Data distribution in hadronic channel. The total signal and background models are shown in red ($f_{CP}=$ 0) and blue ($f_{CP}=$ 1). |

png pdf |
Additional Figure 19:
Data distribution in hadronic channel. The total signal and background models are shown in red ($f_{CP}=$ 0) and blue ($f_{CP}=$ 1). |
png pdf |
Additional Figure 20:
Data distribution in leptonic channel. The total signal and background models are shown in red ($f_{CP}=$ 0) and blue ($f_{CP}=$ 1). |
png pdf |
Additional Figure 21:
Data distribution in leptonic channel. The total signal and background models are shown in red ($f_{CP}=$ 0) and blue ($f_{CP}=$ 1). |
png pdf |
Additional Figure 22:
Data distribution in leptonic channel. The total signal and background models are shown in red ($f_{CP}=$ 0) and blue ($f_{CP}=$ 1). |
png pdf |
Additional Figure 23:
Data distribution in leptonic channel. The total signal and background models are shown in red ($f_{CP}=$ 0) and blue ($f_{CP}=$ 1). |

png pdf |
Additional Figure 24:
Data distribution in leptonic channel. The total signal and background models are shown in red ($f_{CP}=$ 0) and blue ($f_{CP}=$ 1). |
png pdf |
Additional Figure 25:
Data distribution in leptonic channel. The total signal and background models are shown in red ($f_{CP}=$ 0) and blue ($f_{CP}=$ 1). |
png pdf |
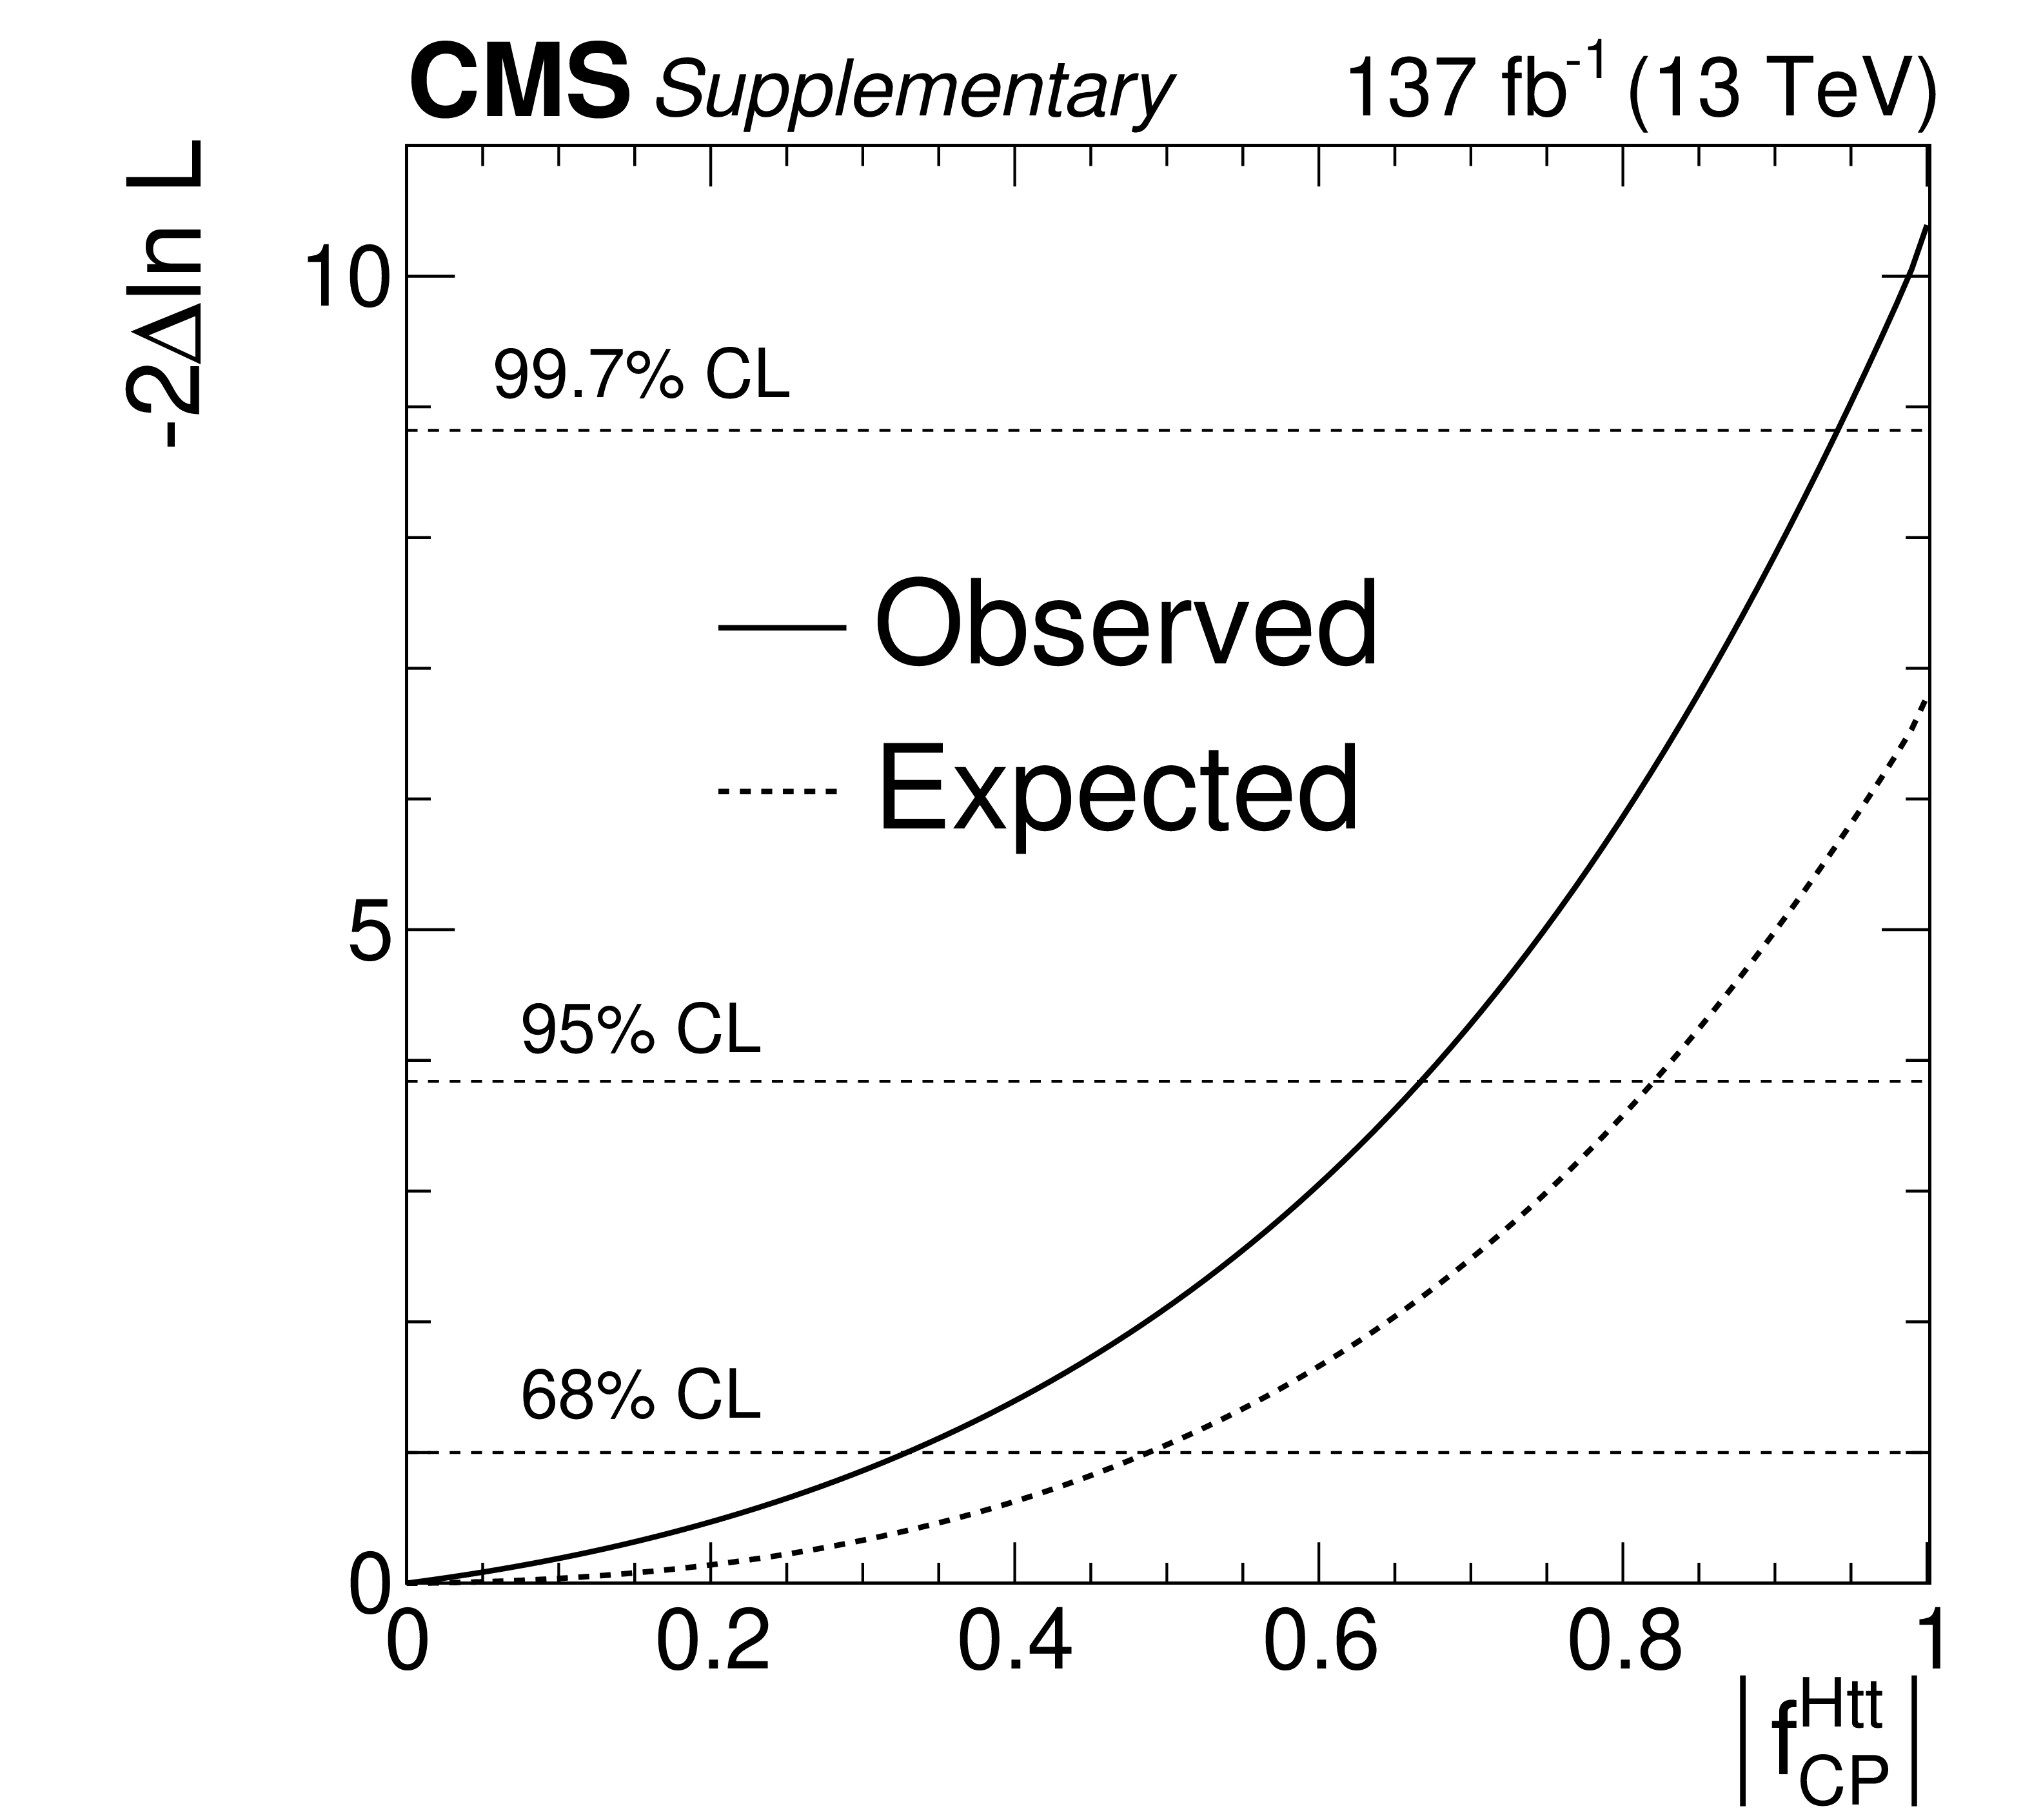
Additional Figure 26:
Expected and observed likelihood scans of the $f_{CP}$ parameter. |
| References | ||||
| 1 | ATLAS Collaboration | Observation of a new particle in the search for the standard model Higgs boson with the detector at the LHC | PLB 716 (2012) 1 | 1207.7214 |
| 2 | CMS Collaboration | Observation of a new boson at a mass of 125 GeV with the CMS experiment at the LHC | PLB 716 (2012) 30 | CMS-HIG-12-028 1207.7235 |
| 3 | CMS Collaboration | Observation of a new boson with mass near 125 GeV in pp collisions at $ \sqrt{s} = $ 7 and 8 TeV | JHEP 06 (2013) 081 | CMS-HIG-12-036 1303.4571 |
| 4 | CMS Collaboration | Observation of ttH production | PRL 120 (2018) 231801 | CMS-HIG-17-035 1804.02610 |
| 5 | ATLAS Collaboration | Observation of Higgs boson production in association with a top quark pair at the LHC with the ATLAS detector | PLB 784 (2018) 173 | 1806.00425 |
| 6 | CMS Collaboration | On the mass and spin-parity of the Higgs boson candidate via its decays to Z boson pairs | PRL 110 (2013) 081803 | CMS-HIG-12-041 1212.6639 |
| 7 | CMS Collaboration | Measurement of the properties of a Higgs boson in the four-lepton final state | PRD 89 (2014) 092007 | CMS-HIG-13-002 1312.5353 |
| 8 | CMS Collaboration | Constraints on the spin-parity and anomalous HVV couplings of the Higgs boson in proton collisions at 7 and 8 TeV | PRD 92 (2015) 012004 | CMS-HIG-14-018 1411.3441 |
| 9 | CMS Collaboration | Limits on the Higgs boson lifetime and width from its decay to four charged leptons | PRD 92 (2015) 072010 | CMS-HIG-14-036 1507.06656 |
| 10 | CMS Collaboration | Combined search for anomalous pseudoscalar HVV couplings in VH ($ \mathrm{H}\to\mathrm{b\bar{b}} $) production and $ \mathrm{H}\to\mathrm{VV} $ decay | PLB 759 (2016) 672 | CMS-HIG-14-035 1602.04305 |
| 11 | CMS Collaboration | Constraints on anomalous Higgs boson couplings using production and decay information in the four-lepton final state | PLB 775 (2017) 1 | CMS-HIG-17-011 1707.00541 |
| 12 | CMS Collaboration | Measurements of the Higgs boson width and anomalous HVV couplings from on-shell and off-shell production in the four-lepton final state | PRD 99 (2019) 112003 | CMS-HIG-18-002 1901.00174 |
| 13 | CMS Collaboration | Constraints on anomalous HVV couplings from the production of Higgs bosons decaying to $ \tau $ lepton pairs | PRD 100 (2019) 112002 | CMS-HIG-17-034 1903.06973 |
| 14 | ATLAS Collaboration | Evidence for the spin-0 nature of the Higgs boson using ATLAS data | PLB 726 (2013) 120 | 1307.1432 |
| 15 | ATLAS Collaboration | Study of the spin and parity of the Higgs boson in diboson decays with the ATLAS detector | EPJC 75 (2015) 476 | 1506.05669 |
| 16 | ATLAS Collaboration | Test of CP invariance in vector-boson fusion production of the Higgs boson using the optimal observable method in the ditau decay channel with the ATLAS detector | EPJC 76 (2016) 658 | 1602.04516 |
| 17 | ATLAS Collaboration | Measurement of inclusive and differential cross sections in the $ \mathrm{H} \rightarrow \mathrm{Z}\mathrm{Z}^{*} \rightarrow 4\ell $ decay channel in $ {\mathrm{p}}{\mathrm{p}} $ collisions at $ \sqrt{s} = $ 13 TeV with the ATLAS detector | JHEP 10 (2017) 132 | 1708.02810 |
| 18 | ATLAS Collaboration | Measurement of the Higgs boson coupling properties in the $ \mathrm{H}\rightarrow \mathrm{Z}\mathrm{Z}^{*} \rightarrow 4\ell $ decay channel at $ \sqrt{s} = $ 13 TeV with the ATLAS detector | JHEP 03 (2018) 095 | 1712.02304 |
| 19 | ATLAS Collaboration | Measurements of Higgs boson properties in the diphoton decay channel with 36 $ fb$^{-1} of $ {\mathrm{p}}{\mathrm{p}} $ collision data at $ \sqrt{s} = $ 13 TeV with the ATLAS detector | PRD 98 (2018) 052005 | 1802.04146 |
| 20 | J. F. Gunion and X.-G. He | Determining the CP nature of a neutral Higgs boson at the LHC | PRL 76 (1996) 4468 | hep-ph/9602226 |
| 21 | F. Demartin et al. | Higgs characterisation at NLO in QCD: CP properties of the top-quark Yukawa interaction | EPJC 74 (2014) 3065 | 1407.5089 |
| 22 | A. V. Gritsan, R. Rontsch, M. Schulze, and M. Xiao | Constraining anomalous Higgs boson couplings to the heavy flavor fermions using matrix element techniques | PRD 94 (2016) 055023 | 1606.03107 |
| 23 | CMS Collaboration | The CMS experiment at the CERN LHC | JINST 3 (2008) S08004 | CMS-00-001 |
| 24 | CMS Collaboration | Particle-flow reconstruction and global event description with the CMS detector | JINST 12 (2017) P10003 | CMS-PRF-14-001 1706.04965 |
| 25 | M. Cacciari, G. P. Salam, and G. Soyez | The anti-$ {k_{\mathrm{T}}} $ jet clustering algorithm | JHEP 04 (2008) 063 | 0802.1189 |
| 26 | M. Cacciari, G. P. Salam, and G. Soyez | FastJet user manual | EPJC 72 (2012) 1896 | 1111.6097 |
| 27 | CMS Collaboration | Technical proposal for the phase-II upgrade of the compact muon solenoid | CMS-PAS-TDR-15-002 | CMS-PAS-TDR-15-002 |
| 28 | CMS Collaboration | Identification of heavy-flavor jets with the CMS detector in pp collisions at 13 TeV | JINST 13 (2018) P05011 | CMS-BTV-16-002 1712.07158 |
| 29 | J. Alwall et al. | The automated computation of tree-level and next-to-leading order differential cross sections, and their matching to parton shower simulations | JHEP 07 (2014) 079 | 1405.0301 |
| 30 | LHC Higgs Cross Section Working Group | Handbook of LHC Higgs cross sections: 4. deciphering the nature of the Higgs sector | CERN (2016) | 1610.07922 |
| 31 | P. Nason | A new method for combining NLO QCD with shower Monte Carlo algorithms | JHEP 11 (2004) 040 | hep-ph/0409146 |
| 32 | S. Frixione, P. Nason, and C. Oleari | Matching NLO QCD computations with parton shower simulations: the POWHEG method | JHEP 11 (2007) 070 | 0709.2092 |
| 33 | S. Alioli, P. Nason, C. Oleari, and E. Re | A general framework for implementing NLO calculations in shower Monte Carlo programs: the POWHEG BOX | JHEP 06 (2010) 043 | 1002.2581 |
| 34 | H. B. Hartanto, B. Jager, L. Reina, and D. Wackeroth | Higgs boson production in association with top quarks in the POWHEG BOX | PRD 91 (2015) 094003 | 1501.04498 |
| 35 | Y. Gao et al. | Spin determination of single-produced resonances at hadron colliders | PRD 81 (2010) 075022 | 1001.3396 |
| 36 | S. Bolognesi et al. | Spin and parity of a single-produced resonance at the LHC | PRD 86 (2012) 095031 | 1208.4018 |
| 37 | I. Anderson et al. | Constraining anomalous HVV interactions at proton and lepton colliders | PRD 89 (2014) 035007 | 1309.4819 |
| 38 | T. Gleisberg et al. | Event generation with SHERPA 1.1 | JHEP 02 (2009) 007 | 0811.4622 |
| 39 | T. Sjostrand et al. | An introduction to PYTHIA 8.2 | CPC 191 (2015) 159 | 1410.3012 |
| 40 | CMS Collaboration | Event generator tunes obtained from underlying event and multiparton scattering measurements | EPJC 76 (2016) 155 | CMS-GEN-14-001 1512.00815 |
| 41 | CMS Collaboration | Extraction and validation of a new set of CMS PYTHIA8 tunes from underlying-event measurements | EPJC 80 (2020) | CMS-GEN-17-001 1903.12179 |
| 42 | \GEANTfour Collaboration | GEANT4--a simulation toolkit | NIMA 506 (2003) 250 | |
| 43 | CMS Collaboration | The CMS trigger system | JINST 12 (2017), no. 01, P01020 | CMS-TRG-12-001 1609.02366 |
| 44 | CMS Collaboration | Measurements of Higgs boson properties in the diphoton decay channel in proton-proton collisions at $ \sqrt{s} = $ 13 TeV | JHEP 11 (2018) 185 | CMS-HIG-16-040 1804.02716 |
| 45 | E. Spyromitros-Xioufis, W. Groves, G. Tsoumakas, and I. Vlahavas | Multi-target regression via input space expansion: treating targets as inputs | Mach Learn 104 (2016) | 1211.6581 |
| 46 | T. Chen and C. Guestrin | XGBoost: A scalable tree boosting system | in Proceedings of the 22nd ACM SIGKDD International Conference on Knowledge Discovery and Data Mining, New York, 2016 | |
| 47 | CMS Collaboration | Search for direct production of supersymmetric partners of the top quark in the all-jets final state in proton-proton collisions at $ \sqrt{s}= $ 13 TeV | JHEP 10 (2017) 005 | CMS-SUS-16-049 1707.03316 |
| 48 | S. Hochreiter and J. Schmidhuber | Long short-term memory | Neur. Comp. 9 (1997) 1735 | |
| 49 | M. J. Oreglia | A study of the reactions $\psi' \to \gamma\gamma \psi$ | PhD thesis, Stanford University, 1980 SLAC Report SLAC-R-236, see Appendix D | |
| 50 | P. D. Dauncey, M. Kenzie, N. Wardle, and G. J. Davies | Handling uncertainties in background shapes | JINST 10 (2015) P04015 | 1408.6865 |
| 51 | The ATLAS Collaboration, The CMS Collaboration, The LHC Higgs Combination Group | Procedure for the LHC Higgs boson search combination in Summer 2011 | CMS-NOTE-2011-005 | |
| 52 | G. Cowan, K. Cranmer, E. Gross, and O. Vitells | Asymptotic formulae for likelihood-based tests of new physics | EPJC 71 (2011) 1554 | 1007.1727 |
| 53 | CMS Collaboration | Precise determination of the mass of the Higgs boson and tests of compatibility of its couplings with the standard model predictions using proton collisions at 7 and 8 TeV | EPJC 75 (2015) 212 | CMS-HIG-14-009 1412.8662 |
| 54 | CMS Collaboration | CMS luminosity measurements for the 2016 data-taking period | CMS-PAS-LUM-17-001 | CMS-PAS-LUM-17-001 |
| 55 | CMS Collaboration | CMS luminosity measurement for the 2017 data-taking period at $ \sqrt{s} = $ 13 TeV | CMS-PAS-LUM-17-004 | CMS-PAS-LUM-17-004 |
| 56 | CMS Collaboration | CMS luminosity measurement for the 2018 data-taking period at $ \sqrt{s} = $ 13 TeV | CMS-PAS-LUM-18-002 | CMS-PAS-LUM-18-002 |
| 57 | A. V. Gritsan et al. | New features in the JHU generator framework | 2002.09888 | |
| 58 | CMS Collaboration | Search for associated production of a Higgs boson and a single top quark in proton-proton collisions at $ \sqrt{s} = $ 13 TeV | PRD 99 (2019) 092005 | CMS-HIG-18-009 1811.09696 |
| 59 | G. J. Feldman and R. D. Cousins | A unified approach to the classical statistical analysis of small signals | PRD 57 (1998) 3873 | physics/9711021 |
|
|
Compact Muon Solenoid LHC, CERN |
|

|

|

|

|

|